Embed Size (px)
Citation preview
HAL Id: tel-01558124https://tel.archives-ouvertes.fr/tel-01558124
Submitted on 7 Jul 2017
HAL is a multi-disciplinary open accessarchive for the deposit and dissemination of sci-entific research documents, whether they are pub-lished or not. The documents may come fromteaching and research institutions in France orabroad, or from public or private research centers.
L’archive ouverte pluridisciplinaire HAL, estdestinée au dépôt et à la diffusion de documentsscientifiques de niveau recherche, publiés ou non,émanant des établissements d’enseignement et derecherche français ou étrangers, des laboratoirespublics ou privés.
Species delienation and hybridization in the brownseaweed Ectocarpus complex
Alejandro Montecinos
To cite this version:Alejandro Montecinos. Species delienation and hybridization in the brown seaweed Ectocarpus com-plex. Populations and Evolution [q-bio.PE]. Université Pierre et Marie Curie - Paris VI; Universidadaustral de Chile, 2016. English. �NNT : 2016PA066328�. �tel-01558124�
Université Pierre et Marie Curie
Universidad Austral de Chile Sciences de la Nature et de l’Homme : Evolution et Ecologie
UPMC-MNHN Station Biologique de Roscoff / UMI 3614, Evolutionary Biology and Ecology of Algae
Species delineation and hybridization in the brown
seaweed Ectocarpus complex
Par Montecinos Alejandro
Thèse de doctorat
Dirigée par Myriam Valero et Marie-Laure Guillemin
Présentée et soutenue publiquement le 08 Novembre 2016
Devant un jury composé de :
Dr. Olivier de Clerck, Professor, Ghent University, Ghent Rapporteur
Dr. Guillaume Evanno, INRA Researcher HDR, Rennes Rapporteur
Dr. Eric Thiébaut, Professor, UPMC, Roscoff Examinateur
Dr. Akira F. Peters, Self-founded Researcher, Bezhin Rosko, Santec Examinateur
Dr. Pablo Saenz-Agudelo, Professor, UACH, Valdivia Examinateur
Dr. Myriam Valero, CNRS Researcher DR, CNRS, Roscoff Directrice de thèse
Dr. Marie-Laure Guillemin, Professor, UACH, Valdivia Directrice de thèse

UNIVERSIDAD AUSTRAL DE CHILE FACULTAD DE CIENCIAS
SPECIES DELINEATION AND HYBRIDIZATION IN THE BROWN SEAWEED ECTOCARPUS
COMPLEX
TESIS DOCTORAL
ALEJANDRO E. MONTECINOS ROSCOFF – FRANCIA
2016


AcknowledgmentsFirstly, I would like to express my gratitude to my two supervisors: Myriam Valero and
Marie-Laure Guillemin. Thank you very much for the continuous support of my PhD
and specially for your patience, motivation, and immense help. Their guidance helped
me in all the time of research and writing of this thesis. Besides my advisors, I would
like to thank the rest of my thesis committee: Didier Jollivet, Susana Coelho, Pierre-
Alexandre Gagnaire, Nicolas Bierne and specially to Akira F. Peters. Thank you very
much for their insightful comments and encouragement.
Thank you very much Akira for the nice Ectocarpus sampling through the Chile coast.
Thank you very much Komlan and Stephan for your help in the development of the
second chapter of this PhD Thesis.
Thank you very much to all my co-authors, it was really nice to work together. Also,
thank you very much Christophe Destombe for all your help in the academic and the
personal sense and for your jokes as well.
I thank my fellow labmates from BEDIM and DIVCO: Marie, Chloé, Bertrand, Jérôme,
Lucie, Jaro, Sarah, Aga, etc... For sure, I forgot more people but it is usual in me...but I
will improve it, is a promise. I want to thank my friends that I meet in the Station
Biologique de Roscoff. Thank you very much for especially for the soirées!!
I would like to thank my family: my parents, my sister, my brother in law and my
brothers/nephews for supporting me throughout this thesis.
Last but not the least, I want to thank to Katy, you were my partner in this adventure.
Thank you very much for supporting me and be part of this experience.
Finally, I want to thank to Becas Chile and all the founding involved in this PhD Thesis.
Well, no more to add.
Thank you very much again.

Generalcontents
Introduction
I. Hybridization,reproductiveisolationandspeciationprocesses.................................3
II. Speciesdelimitation................................................................................................13
III. Modelofstudy:thegenusEctocarpus.....................................................................21
IV. ObjectivesofthePHDthesis....................................................................................29
ChapterI:Speciesdelimitationandphylogeographicanalysesin
theEctocarpussubgroupsiliculosi(Ectocarpales,Phaeophyceae)
I. Abstract..................................................................................................................33
II. Introduction...........................................................................................................33
III. MaterialandMethods.............................................................................................35
- FieldcollectionsandisolationofEctocarpusstrains.....................................................35
- DNAextraction,sequencingandalignments.................................................................35
- Species-delimitationprocedure.....................................................................................35
- PhylogeneticanalysesofDNAsequences......................................................................35
- AutomaticBarcodeGapDiscovery.................................................................................35
- GeneralMixedYuleCoalescent......................................................................................35
- Networkreconstructions................................................................................................36
- Geneticdiversity.............................................................................................................36
- AMOVAanalysis.............................................................................................................36
IV. Results....................................................................................................................36
- EctocarpusputativespeciesdelineationbasedonCOI-5P.............................................36
- EctocarpusputativespeciesconsolidationusingITS1....................................................37
- Casesofincongruencesbetweenmarkers.....................................................................37
- Geographicdistributionofthe15Ectocarpusspecies...................................................37
- Haplotypenetwork.........................................................................................................38
- GeneticdiversityofE.siliculosus,E.crouaniorumandEctocarpus6.............................38
- AMOVAanalysisofthecosmopolitanspeciesE.siliculosusandE.crouaniorum...........40
- Tide-leveldistributionofE.siliculosus,E.crouaniorumandEctocarpus6.....................40
V. Discussion...............................................................................................................41
- Highspeciesdiversitywithinthesiliculosigroup...........................................................41
- Incongruencebetweenmarkers.....................................................................................43
- Speciesdistribution........................................................................................................43
VI. Conclusion...............................................................................................................44
VII. Acknowledgments...................................................................................................44
VIII. Appendix.................................................................................................................45
- AppendixI.1.FigureS1...................................................................................................45
- AppendixI.2.FigureS2...................................................................................................47
- AppendixI.3.FigureS3...................................................................................................49
- AppendixI.4.TableS3....................................................................................................51
- AppendixI.5.TableS4....................................................................................................53
- AppendixI.6.TableS5....................................................................................................55
- AppendixI.7.TableS6....................................................................................................57
ChapterII:PhylogeneticinferencesintheEctocarpussubgroup
siliculosiusinganext-generationsequencingapproach
I. Abstract..................................................................................................................63
II. Introduction...........................................................................................................65
III. MaterialandMethods.............................................................................................71
- CollectionsofEctocarpusstrains....................................................................................71
- DNAextractionandgenerationofRAD-seqdata...........................................................72
- AnalysisofddRAD-seqdata............................................................................................73
- Phylogeneticreconstructions........................................................................................75
IV. Results....................................................................................................................77
- ddRADsequencing..........................................................................................................77
- Phylogeneticreconstructions.........................................................................................78
V. Discussion...............................................................................................................85
- Abetterresolutionofthephylogeneticrelationshipsamongcrypticspecies...............85
- Differentpatternsofgeographicstructureforthetwocosmopolitanspecies.............88
VI. Appendix.................................................................................................................91
- ProblemsgeneratingRAD-seqdataduringthisPhDthesis...........................................91
ChapterIII:Hybridizationbetweentwocrypticfilamentous
brownseaweedalongtheshore:analyzingpreandpost-zygotic
barriersinpopulationsofindividualswithvaryingploidylevels.
I. Abstract..................................................................................................................97
II. Introduction...........................................................................................................99
III. MaterialandMethods............................................................................................105
- Fieldcollections,isolationofEctocarpusstrainsandDNAextraction..........................105
- Moleculardeterminationofploidyandsex................................................................105
- Preliminarysortingofsamplesinparentalspeciesorputativehybridscategoriesusing
therps14-atp8spacer,theITS1anddiagnosticmicrosatellitelociandalleles....................106
- Statisticalanalysesofadmixturelevels........................................................................109
- Populationstructureandmatingsystem....................................................................112
IV. Results...................................................................................................................113
- Speciesidentificationanddetectionofputativehybrids............................................113
- Multivariateclusteringofindividuals..........................................................................117
- Admixtureanalysisandassignationofputativehybridstogeneticcategories...........119
- Comparisonamongmethodsandfrequencyofhybridizationinpopulations............122
- Populationstructureandmatingsystem....................................................................125
V. Discussion..............................................................................................................127
- Species-diagnosticmarkerstodetecthybridizationincrypticspecies.......................127
- Lowlevelofhybridizationareprobablyassociatedwithreproductivebarriers.........129
- Presenceofrareallelesinhybrids...............................................................................132
- Rarityofhaploidhybridsandtheexistenceofreproductiveisolation........................134
- Conclusion...................................................................................................................136
VI. Acknowledgments..................................................................................................137
VII. Appendix................................................................................................................139
- AppendixIII.1.XPloidAssignment.................................................................................139
- AppendixIII.2.Assigninggenotypedindividualstogenepoolsandadmixedgenepools
usingmultiplegeneticmarkerswithvaryingploidylevels..................................................145
- AppendixIII.3.TableS1................................................................................................147
- AppendixIII.4.FigureS1...............................................................................................153
ConclusionandPerspectives
I. Speciesdivergence,diversityanddistributionwithinthegenusEctocarpussection
siliculosi.......................................................................................................................157
- Ahighnumberofcrypticspecieswithvariouslevelsofdivergence...........................157
- Speciesgeographicdistribution,phylogeographyandscenarioofintroduction........160
II. ReproductiveIsolation...........................................................................................163
- Newopportunitiestostudyhybridizationindifferentevolutionarycontexts.............163
- Consequenceofthehaploid-diploidlifecycleonreproductiveisolation....................165
References
- References...................................................................................................................167
AppendixGenbankaccessionandmicrosatellitegenotypes
- AppendixA.1.TableS1..................................................................................SectionAP-1
- AppendixA.2.TableS2...............................................................................SectionAP-31
- AppendixB.1.TableS2(Parentalsporophytesgenotypes).........................SectionAP-57
- AppendixB.2.TableS3(Parentalgametophytesgenotypes)......................SectionAP-77
1
Introduction
ContentsI. Hybridization,reproductiveisolationandspeciationprocesses.................................3
II. Speciesdelimitation................................................................................................13
III. Modelofstudy:thegenusEctocarpus.....................................................................21
IV. ObjectivesofthePHDthesis....................................................................................29

2
3
INTRODUCTION
I. Hybridization, reproductive isolation and speciation
processes
Speciation, the evolutionary process by which new biological species arise, is one
of the most fascinating and controversial processes in evolutionary biology (Mayr 1942,
Otte and Endler 1989, Coyne an Orr 1998, Feder et al. 2013a). This process of
divergence between taxa is generally described as complete when the reproductive
isolation induced by reproductive barriers is established (Dobzhansky 1937, Mayr 1942,
Coyne and Orr 2004). The numerous reproductive barriers described have been
classified into two types: (I) prezygotic barriers such as ecogeographic, temporal, and
behavioral differences between species that limit the formation of zygotes and (II)
postzygotic barriers such as hybrid inviability, hybrid sterility, and F2 breakdown
leading to lower fitness in hybrids than in the parental species (Dobzhansky 1937, Mayr
1942).
During the last 50 years, a major area of debate among biologists working on
speciation was the geographical context in which these reproductive barriers are
evolving (reviewed in Turelli et al. 2001, Fitzpatrick et al. 2009). While in allopatry
both pre and postzygotic reproductive isolating mechanisms arise as inevitable by-
products of genetic divergence without gene flow between divergent taxa, in sympatry
and parapatry, speciation occurs in spite of gene flow (i.e. speciation-with-gene-flow,
see review of Smadja and Butlin 2011 and Figure I.1). Processes of ‘speciation-with-
gene-flow’ have been described to explain how, at a given – non – null – level of

4
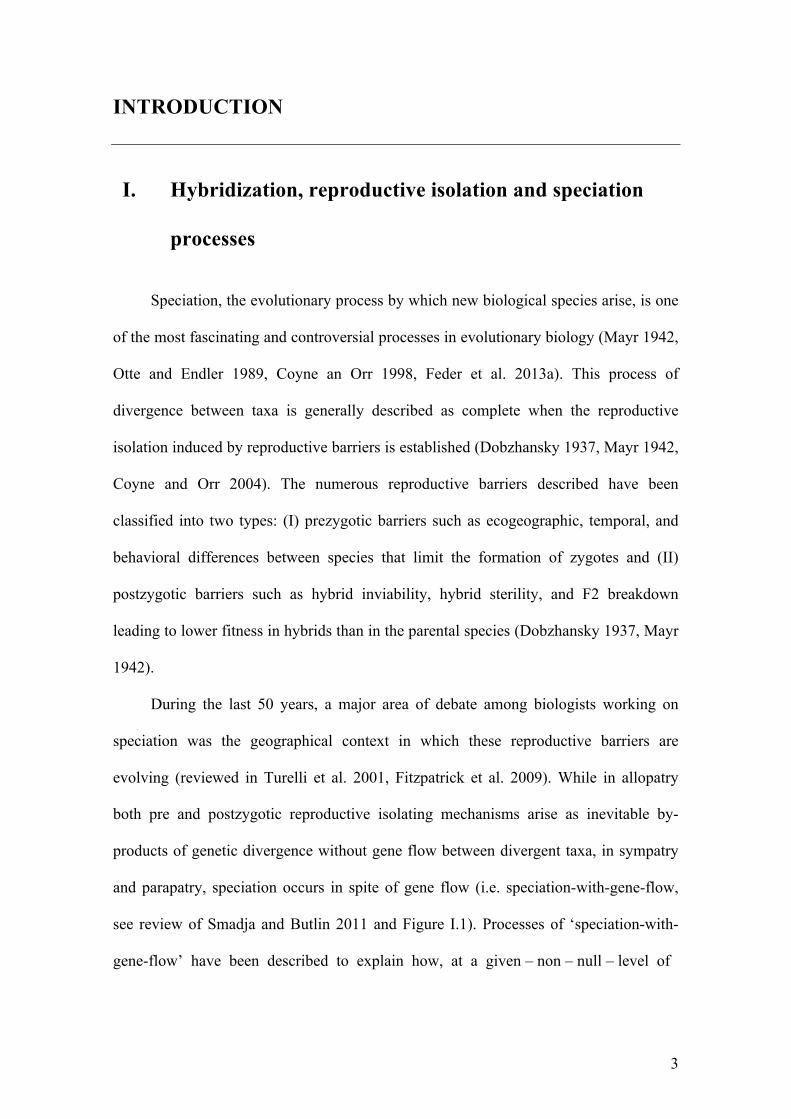
Figure I.1. Different scenario of speciation (from Smadja and Butlin, 2011).
The Figure distinguishes scenarios of speciation with no contact at all between diverging populations (left of dashed line) from those with geographical or ecological contact at least at some point in time and space (right of dashed line). The different types of evolutionary and selective forces potentially involved in each scenario (grey text) are used to define and delimit different modes and mechanisms of speciation (coloured frames). it is possible for increased reproductive isolation to evolve (Feder et al. 2013b).
Hybridization was already known by taxonomists in the 18th century and has remained
an active and productive area of research up to the present days (see reviews of Arnold
et al. 1999, Rieseberg and Carney 1998, Coyne and Orr 2004, Mallet 2005, Abbot et al.
2013). In nature, hybridization occurs in hybrid zones, these areas may have two
different origins depending on the geographical context in which divergence between

5
the parental species occurred. (1) Primary hybrid zones, where divergence is taking
place between adjacent populations of a previously homogeneous species, for example
through ecological speciation. (2) Secondary hybrid zones, where hybridization arise in
turn from a secondary contact between two populations that were previously allopatric.
In the last decades, the debate has shifted away from geographic modes of
speciation, towards the difficult challenge of assessing the frequency of speciation
processes involving gene flow in nature, and recent efforts have been made in
understanding and elucidating the factors that facilitate the occurrence of speciation
with gene flow (Smadja and Butlin 2011). Research on speciation has allowed to
pinpoint the main mechanisms causing divergence among organisms and some have
effectively been related to particular geographical modes of speciation (Smadja and
Butlin 2011). Figure I.1 is taken from this paper and summarizes the different modes
and mechanisms of speciation. It shows that the same mechanisms are involved
whatever the geographic/ecological contexts, except for speciation by reinforcement,
wich involves gene flow. In addition, Figure I.1 shows that each mechanism is not
exclusive and can sometimes act in synergy. Adaptive or ecological speciation has been
recognized as a central mechanism of evolutionary change within species, which
ultimately results in reproductive isolation between the diverging populations as a by-
product (Figure I.1). One well-studied example of incipient ecological speciation is the
case of the marine gastropod Littorina saxatilis, a common inhabitant of intertidal
shores of the north Atlantic (Johannesson 2003, Rolan-Alvarez 2007, Galindo et al.
2010). The intertidal zone represents a gradient of contrasted micro habitats in which
ecotypes can be formed multiple times along the coast by differential selection. In the
snail L. saxatilis in several sites along the coast, different ecotypes were shown to be the
result of repeated processes of local divergence, with reproductive barriers having
6
evolved in situ in the face of gene flow and forming primary rather than secondary
contact zones (see for review Johannesson 2016). Models including sexual selection
(Panhuis et al. 2001, Ritchie 2007) have also suggested that differential patterns of trait
variation related to reproductive success within populations contribute to reproductive
isolation among populations (Figure I.1). A compelling example is related to the
explosive radiation of cichlid fishes in the African Rift Lakes, where populations with
overlapping distributions are diverging as a function of the differential preference of
male color in mate selection (Seehausen et al. 2008). Other models of speciation based
on the action of random processes and drift do not include a role of selection of any sort
but rather invoke a key role of stochastic events (Figure I.1). Such models include
speciation by polyploidization, genetic drift and founder-events/population bottlenecks.
Although such models have a long history in speciation research (for example the
classical example of small populations colonizing different islands leading to species
formation, Thorpe et al. 1994), clear empirical support for such models in nature or in
laboratory is relatively limited except for the cases of speciation by polyploidization
(Coyne and Orr 2004). Polyploidy, or the presence of three or more complete sets of
chromosomes, has been documented in a wide variety of taxa and is particularly
prevalent in plants where between 47 and 70% of all angiosperms are described to be of
possible polyploid origin (Ramsey and Schemske 1998). Polyploidy is a mechanism
that has caused many rapid speciation events in sympatry because offspring of, for
example, tetraploid x diploid crosses often result in triploid sterile progeny (Ramsey and
Schemske 1998). Polyploidy is viewed as a mechanism that can rapidly lead to the
formation of new species, potentially without selection for the divergence of other
characters (Mallet et al. 2013).
7
Two complementary but different approaches were used to study the genetic basis
of reproductive isolation in the literature. First, barriers to gene flow were investigated
using laboratory crosses of well-established model species. These studies have been
successful in identifying genes that contribute to classical traits linked to the
establishment of reproductive barriers, such as hybrid sterility or unviability, and
ultimately to speciation processes. For example, crossing experiments and genetic
mapping in different Drosophila species have allowed to demonstrate that hybrid
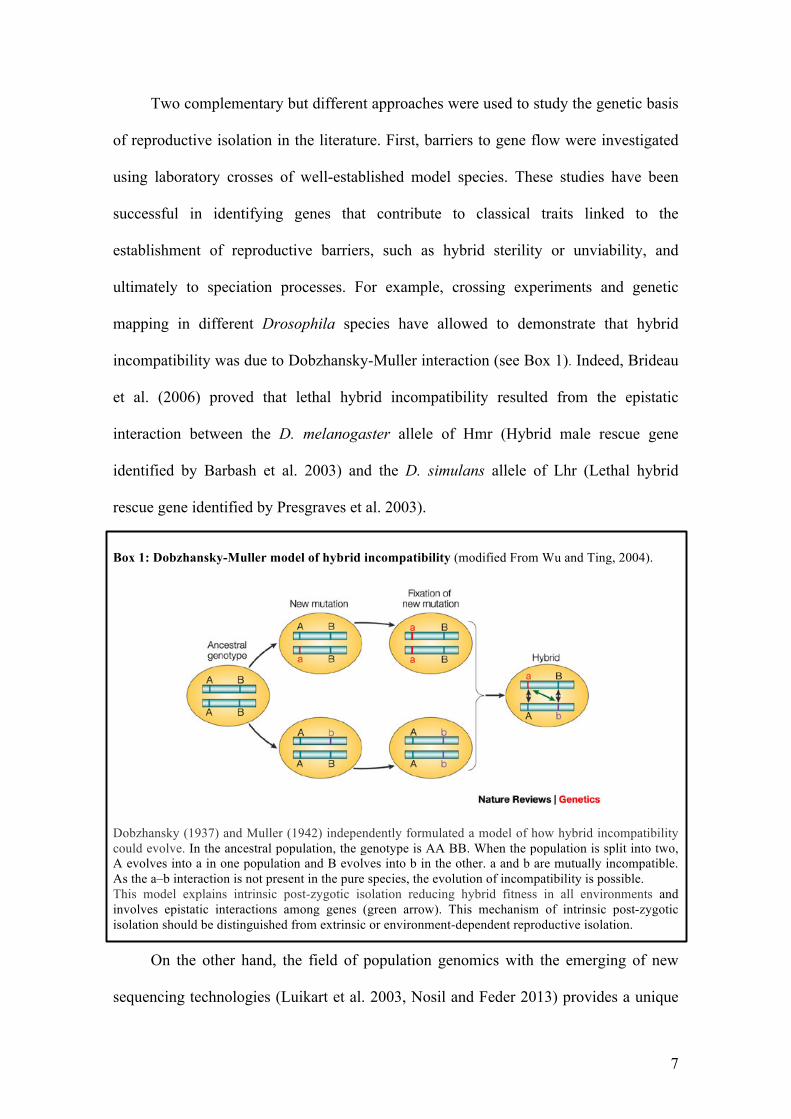
incompatibility was due to Dobzhansky-Muller interaction (see Box 1). Indeed, Brideau
et al. (2006) proved that lethal hybrid incompatibility resulted from the epistatic
interaction between the D. melanogaster allele of Hmr (Hybrid male rescue gene
identified by Barbash et al. 2003) and the D. simulans allele of Lhr (Lethal hybrid
rescue gene identified by Presgraves et al. 2003).
Box 1: Dobzhansky-Muller model of hybrid incompatibility (modified From Wu and Ting, 2004). Dobzhansky (1937) and Muller (1942) independently formulated a model of how hybrid incompatibility could evolve. In the ancestral population, the genotype is AA BB. When the population is split into two, A evolves into a in one population and B evolves into b in the other. a and b are mutually incompatible. As the a–b interaction is not present in the pure species, the evolution of incompatibility is possible. This model explains intrinsic post-zygotic isolation reducing hybrid fitness in all environments and involves epistatic interactions among genes (green arrow). This mechanism of intrinsic post-zygotic isolation should be distinguished from extrinsic or environment-dependent reproductive isolation.
On the other hand, the field of population genomics with the emerging of new
sequencing technologies (Luikart et al. 2003, Nosil and Feder 2013) provides a unique
8
opportunity to characterize the genetic basis of speciation (for a recent review see
Payseur and Rieseberg, 2016). Population genomics approaches are expected to point
out candidate loci possibly associated with components of reproductive isolation. When
the speciation process is incomplete, theory predicts that linkage between alleles that
favor reproductive isolation will increase and thus the question arises of how these
associated alleles are maintained in spite of recombination in sexually reproducing
organisms (Smadja and Butlin, 2011). Genomic divergence is thus expected to be
highly heterogeneous during the process of population divergence because genetic
differentiation associated with divergent natural selection could accumulate in some
regions of the genome while the homogenizing effects of gene flow or random
differentiation by genetic drift preclude divergence in other regions (Abbott et al. 2013,
Smadja and Butlin, 2011). During the speciation process, gene flow might be reduced
either at individual “barrier loci” or across a greater fraction of the genome through
associations with these loci depending on the genome architecture, the importance of
recombination and level of gene flow (Abbott et al. 2013). In their review, Abbott et al.
(2013) highlight three pressing questions that remain to be answered by biologists
studying speciation in order to better understand the evolutionary significance of
hybridization and gene flow in the speciation process: (I) How many genomic regions
differentiate during speciation?”, (II) “How small are regions where divergence
significantly exceeds the genomic average?” and (III) “How are regions of exceptional
divergence dispersed around the genome?”.
Taken together, major advances to current knowledge in plant and animals
speciation have been made using different population genomics approaches such as
whole genome sequencing of new promising study systems (i.e. in the butterfly,
Heliconius Genome Consortium, 2012); powerful analyses based on genome scans (i.e.
9
Geneticlinkagebetween genesforminga supergene-like locus
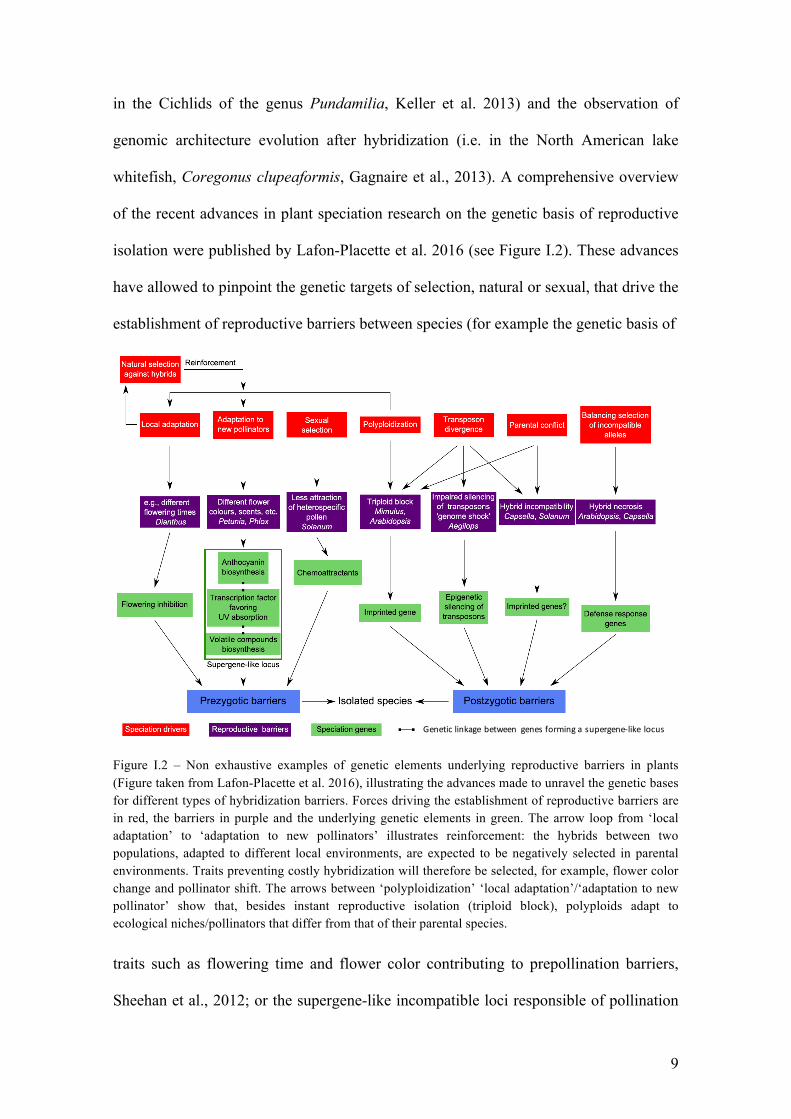
in the Cichlids of the genus Pundamilia, Keller et al. 2013) and the observation of
genomic architecture evolution after hybridization (i.e. in the North American lake
whitefish, Coregonus clupeaformis, Gagnaire et al., 2013). A comprehensive overview
of the recent advances in plant speciation research on the genetic basis of reproductive
isolation were published by Lafon-Placette et al. 2016 (see Figure I.2). These advances
have allowed to pinpoint the genetic targets of selection, natural or sexual, that drive the
establishment of reproductive barriers between species (for example the genetic basis of
Figure I.2 – Non exhaustive examples of genetic elements underlying reproductive barriers in plants (Figure taken from Lafon-Placette et al. 2016), illustrating the advances made to unravel the genetic bases for different types of hybridization barriers. Forces driving the establishment of reproductive barriers are in red, the barriers in purple and the underlying genetic elements in green. The arrow loop from ‘local adaptation’ to ‘adaptation to new pollinators’ illustrates reinforcement: the hybrids between two populations, adapted to different local environments, are expected to be negatively selected in parental environments. Traits preventing costly hybridization will therefore be selected, for example, flower color change and pollinator shift. The arrows between ‘polyploidization’ ‘local adaptation’/‘adaptation to new pollinator’ show that, besides instant reproductive isolation (triploid block), polyploids adapt to ecological niches/pollinators that differ from that of their parental species. traits such as flowering time and flower color contributing to prepollination barriers,
Sheehan et al., 2012; or the supergene-like incompatible loci responsible of pollination
10
syndromes in Petunia species, Hermann et al., 2013; see Figure I.2). They have also
confirmed the role of hybridization as a promoter of speciation rather than an inhibitor
of reproductive isolation, since it can acts as an additional source of adaptive genetic
variation.
Most data on hybridization in the wild come from analyses of vascular plant or
animal species. Investigating a greater diversity of biological models will help unravel
the general importance of hybridization in evolution. Nevertheless, data are
accumulating for species belonging to other phyla such as fungi (see for reviews Kohn
2005; Giraud et al. 2008), red algae (Zuccarello et al. 2005; Destombe et al., 2010;
Maggs et al. 2011; Hind and Saunders 2013; Niwa and Kobiyama 2014; Savoie and
Saunders 2015) and brown algae (Coyer et al. 2002; Engel et al. 2005; Peters et al.
2010a; Geoffroy et al. 2015 and references herein) which differ substantially in their life
cycle and life history traits.
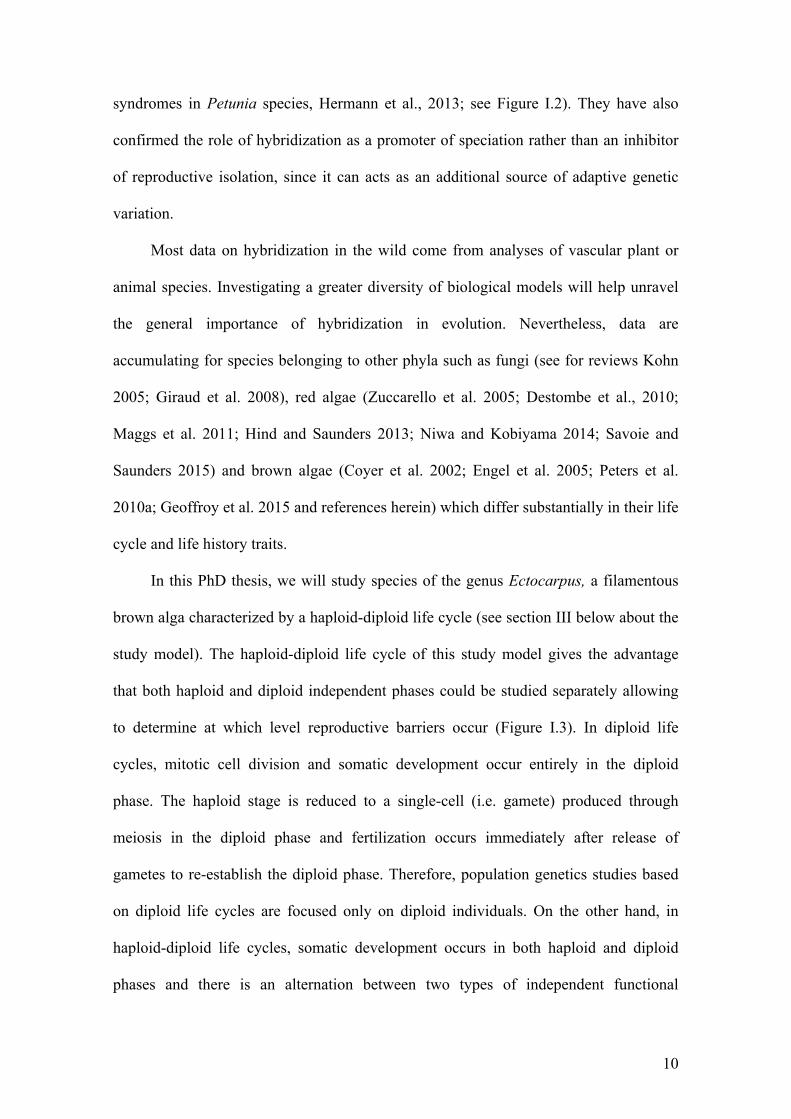
In this PhD thesis, we will study species of the genus Ectocarpus, a filamentous
brown alga characterized by a haploid-diploid life cycle (see section III below about the
study model). The haploid-diploid life cycle of this study model gives the advantage
that both haploid and diploid independent phases could be studied separately allowing
to determine at which level reproductive barriers occur (Figure I.3). In diploid life
cycles, mitotic cell division and somatic development occur entirely in the diploid
phase. The haploid stage is reduced to a single-cell (i.e. gamete) produced through
meiosis in the diploid phase and fertilization occurs immediately after release of
gametes to re-establish the diploid phase. Therefore, population genetics studies based
on diploid life cycles are focused only on diploid individuals. On the other hand, in
haploid-diploid life cycles, somatic development occurs in both haploid and diploid
phases and there is an alternation between two types of independent functional
11
n
n
Hybrids F1sporophytes
Parentalsporophytes
Parentalgametophytes
Hybrid F1recombinant gametophytes
Fertilization
Fertilization
Meiosis
Meiosis Meiosis
Fertilization
Meiosis
Fertilization
Meiosis
n
2n
n
2n
2n
Haploid-diploid organisms Diploid organisms
Hybrids F1
Parentaltypes
n
2n
n
2n
2n
Sampling
Sampling
Sampling
Sampling
SamplingSampling
Meiosis
Gametes
Gametes
Recombinant gametesRecombinant gametes
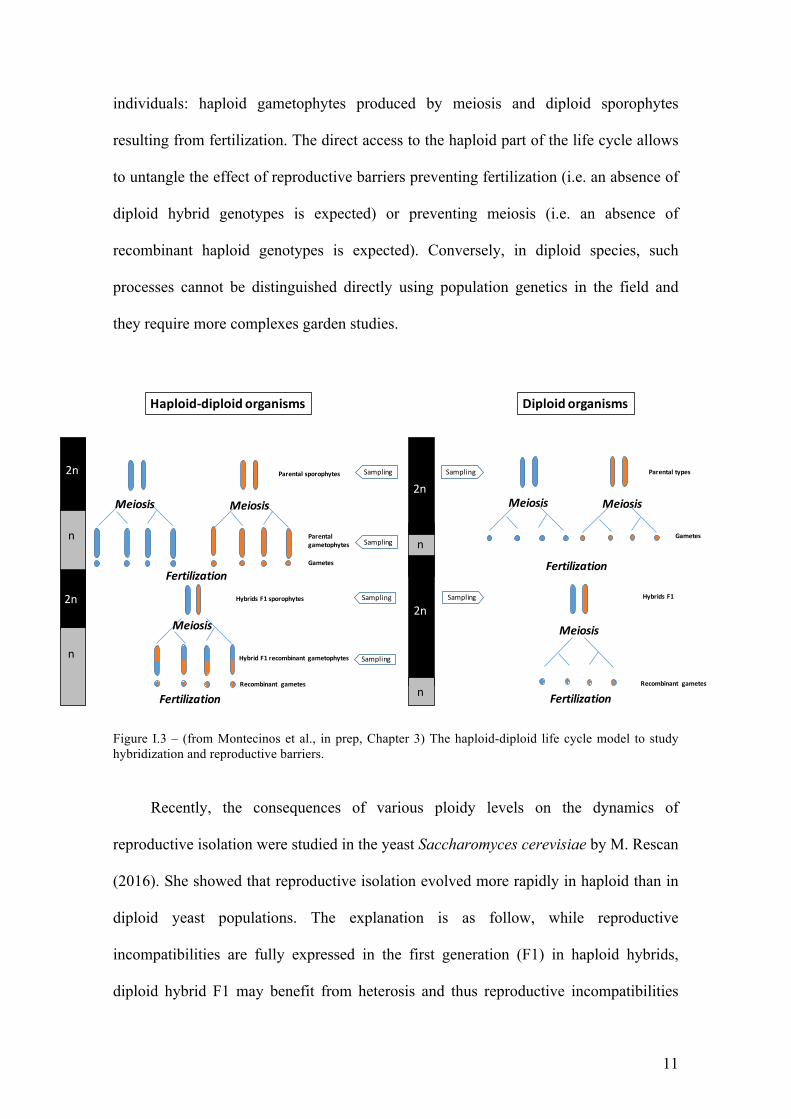
individuals: haploid gametophytes produced by meiosis and diploid sporophytes
resulting from fertilization. The direct access to the haploid part of the life cycle allows
to untangle the effect of reproductive barriers preventing fertilization (i.e. an absence of
diploid hybrid genotypes is expected) or preventing meiosis (i.e. an absence of
recombinant haploid genotypes is expected). Conversely, in diploid species, such
processes cannot be distinguished directly using population genetics in the field and
they require more complexes garden studies.
Figure I.3 – (from Montecinos et al., in prep, Chapter 3) The haploid-diploid life cycle model to study hybridization and reproductive barriers.
Recently, the consequences of various ploidy levels on the dynamics of
reproductive isolation were studied in the yeast Saccharomyces cerevisiae by M. Rescan
(2016). She showed that reproductive isolation evolved more rapidly in haploid than in
diploid yeast populations. The explanation is as follow, while reproductive
incompatibilities are fully expressed in the first generation (F1) in haploid hybrids,
diploid hybrid F1 may benefit from heterosis and thus reproductive incompatibilities
12
will evolve slower. Thus in haploid-diploid species, we may expect reproductive
isolation to evolve faster than in diploid species since, as in haploid species,
reproductive incompatibilities should be fully expressed in the F1 (Figure I.3). In fact,
the same mechanisms are involved in the classical phenomenon called Haldane’s rule
(Haldane 1922). In diploid species with chromosomic sex determination systems, the
heterogametic sex (XY or ZW) suffer from fully exposed incompatibilities involving
alleles on the X or the W chromosome, leading to the preferential sterility and
inviability of hybrids of the heterogametic sex. Note that in the haploid-diploid species,
sex is expressed in the haploid phase and the chromosomal sex determination system is
haploid (U, V, Ahmed et al., 2015) and thus asymmetry between sexes in hybrid fitness
is not expected.
13
TIME
SC1SC2SC3SC4SC5SC6SC7
SC9SC8
No lineage splitting
conspecific
Early lineage splitting:
different species concept
Advanced lineage splitting
II. Species delimitation
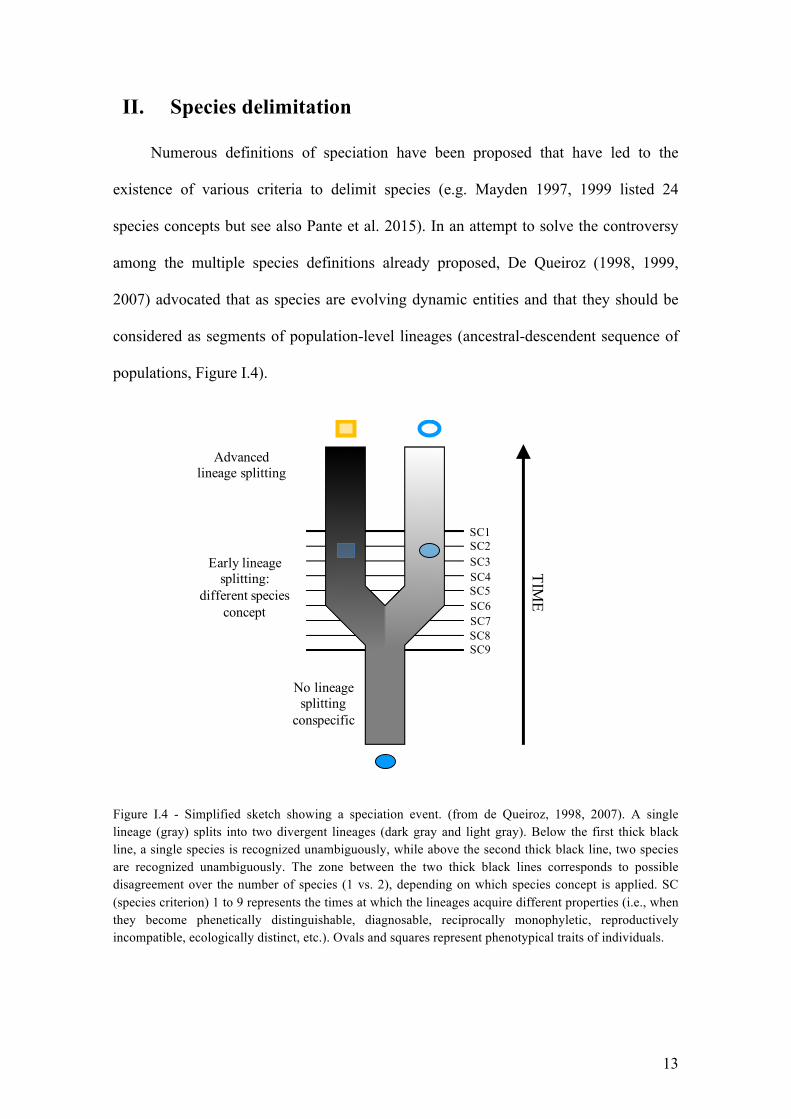
Numerous definitions of speciation have been proposed that have led to the
existence of various criteria to delimit species (e.g. Mayden 1997, 1999 listed 24
species concepts but see also Pante et al. 2015). In an attempt to solve the controversy
among the multiple species definitions already proposed, De Queiroz (1998, 1999,
2007) advocated that as species are evolving dynamic entities and that they should be
considered as segments of population-level lineages (ancestral-descendent sequence of
populations, Figure I.4).
Figure I.4 - Simplified sketch showing a speciation event. (from de Queiroz, 1998, 2007). A single lineage (gray) splits into two divergent lineages (dark gray and light gray). Below the first thick black line, a single species is recognized unambiguously, while above the second thick black line, two species are recognized unambiguously. The zone between the two thick black lines corresponds to possible disagreement over the number of species (1 vs. 2), depending on which species concept is applied. SC (species criterion) 1 to 9 represents the times at which the lineages acquire different properties (i.e., when they become phenetically distinguishable, diagnosable, reciprocally monophyletic, reproductively incompatible, ecologically distinct, etc.). Ovals and squares represent phenotypical traits of individuals.
14
De Queiroz (1998, 2007) has then proposed that contemporary species delimiting
criteria act as secondary proprieties that arise at different moments of the speciation
process (e.g. reproductive isolation, niche differentiation, monophyly, etc., SC1 to SC9
in Figure I.4). Species taxa could then be considered as scientific hypotheses (species
hypotheses) and species delimitation is only a process of falsification based on the
acquisition of new evidence on various species delimiting criteria (Pante et al. 2015).
Because speciation is not always accompanied by morphological change (Agapow
et al. 2004, Bickford et al. 2007, Lumbsch and Leavitt 2011), species delimitation using
only the organism morphology is often inadequate in some taxonomic groups.
Following the ever-growing facility in obtaining molecular data, DNA-based methods
have then become the standard tools to identify species (e.g. barcoding, Hebert et al.
2003, Hajibabaei et al. 2007). Numerous methods have been developed to detect
discontinuities in sequence variation associated with species boundaries (Sites and
Marshall 2004, Pons et al. 2006, Monaghan et al. 2009, Puillandre et al. 2012a).
Limitations and complementarity of these numerous methods have been discussed in the
review of Carstens et al. (2013) entitled “How to fail at species delimitation”. In this
review different useful methods were listed (see Box 2 below) and Carstens et al. (2013)
recommended that a wide range of species delimitation analyses should be applied to
each molecular data set in order to limit errors due to low power to detect cryptic
lineages of some of these approaches or in study cases where assumptions of these
methods could be violated. They propose to give confidence in the species delimitation
suggested only when all or most of the methods used give congruent results for a
specific data set and that researchers should only place their trust in delimitations that
are congruent across methods.
15
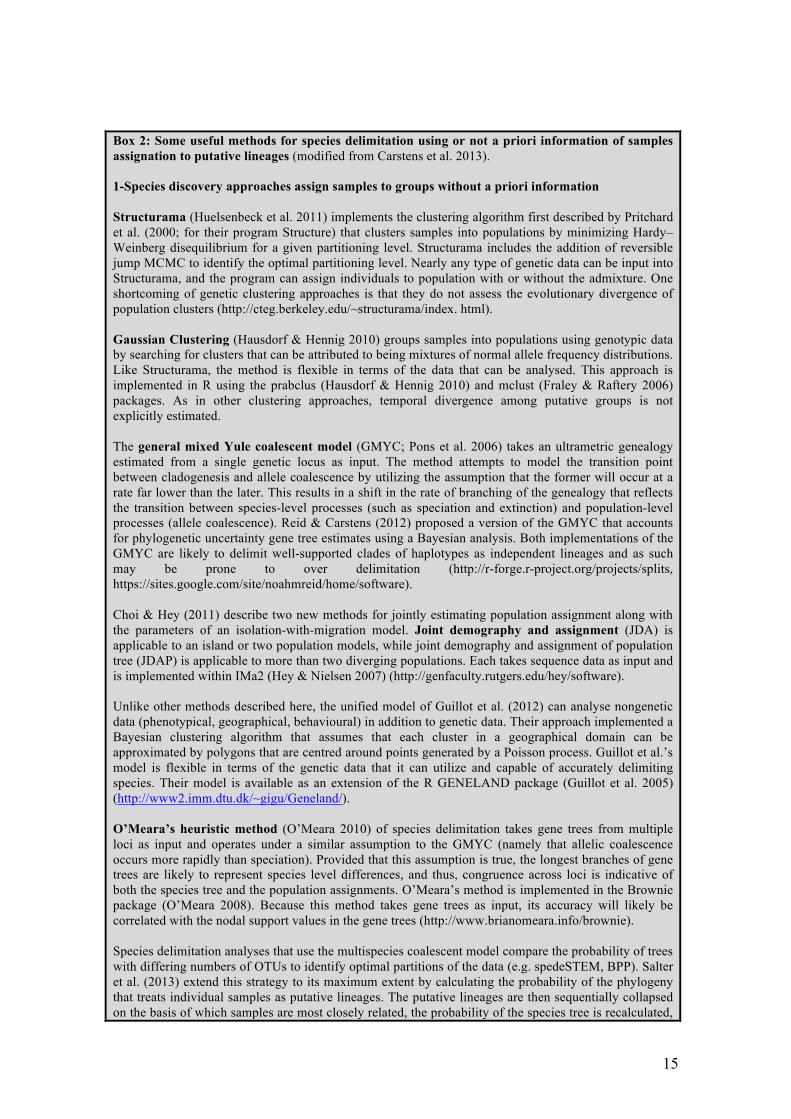
Box 2: Some useful methods for species delimitation using or not a priori information of samples assignation to putative lineages (modified from Carstens et al. 2013). 1-Species discovery approaches assign samples to groups without a priori information Structurama (Huelsenbeck et al. 2011) implements the clustering algorithm first described by Pritchard et al. (2000; for their program Structure) that clusters samples into populations by minimizing Hardy–Weinberg disequilibrium for a given partitioning level. Structurama includes the addition of reversible jump MCMC to identify the optimal partitioning level. Nearly any type of genetic data can be input into Structurama, and the program can assign individuals to population with or without the admixture. One shortcoming of genetic clustering approaches is that they do not assess the evolutionary divergence of population clusters (http://cteg.berkeley.edu/~structurama/index. html). Gaussian Clustering (Hausdorf & Hennig 2010) groups samples into populations using genotypic data by searching for clusters that can be attributed to being mixtures of normal allele frequency distributions. Like Structurama, the method is flexible in terms of the data that can be analysed. This approach is implemented in R using the prabclus (Hausdorf & Hennig 2010) and mclust (Fraley & Raftery 2006) packages. As in other clustering approaches, temporal divergence among putative groups is not explicitly estimated. The general mixed Yule coalescent model (GMYC; Pons et al. 2006) takes an ultrametric genealogy estimated from a single genetic locus as input. The method attempts to model the transition point between cladogenesis and allele coalescence by utilizing the assumption that the former will occur at a rate far lower than the later. This results in a shift in the rate of branching of the genealogy that reflects the transition between species-level processes (such as speciation and extinction) and population-level processes (allele coalescence). Reid & Carstens (2012) proposed a version of the GMYC that accounts for phylogenetic uncertainty gene tree estimates using a Bayesian analysis. Both implementations of the GMYC are likely to delimit well-supported clades of haplotypes as independent lineages and as such may be prone to over delimitation (http://r-forge.r-project.org/projects/splits, https://sites.google.com/site/noahmreid/home/software). Choi & Hey (2011) describe two new methods for jointly estimating population assignment along with the parameters of an isolation-with-migration model. Joint demography and assignment (JDA) is applicable to an island or two population models, while joint demography and assignment of population tree (JDAP) is applicable to more than two diverging populations. Each takes sequence data as input and is implemented within IMa2 (Hey & Nielsen 2007) (http://genfaculty.rutgers.edu/hey/software). Unlike other methods described here, the unified model of Guillot et al. (2012) can analyse nongenetic data (phenotypical, geographical, behavioural) in addition to genetic data. Their approach implemented a Bayesian clustering algorithm that assumes that each cluster in a geographical domain can be approximated by polygons that are centred around points generated by a Poisson process. Guillot et al.’s model is flexible in terms of the genetic data that it can utilize and capable of accurately delimiting species. Their model is available as an extension of the R GENELAND package (Guillot et al. 2005) (http://www2.imm.dtu.dk/~gigu/Geneland/). O’Meara’s heuristic method (O’Meara 2010) of species delimitation takes gene trees from multiple loci as input and operates under a similar assumption to the GMYC (namely that allelic coalescence occurs more rapidly than speciation). Provided that this assumption is true, the longest branches of gene trees are likely to represent species level differences, and thus, congruence across loci is indicative of both the species tree and the population assignments. O’Meara’s method is implemented in the Brownie package (O’Meara 2008). Because this method takes gene trees as input, its accuracy will likely be correlated with the nodal support values in the gene trees (http://www.brianomeara.info/brownie). Species delimitation analyses that use the multispecies coalescent model compare the probability of trees with differing numbers of OTUs to identify optimal partitions of the data (e.g. spedeSTEM, BPP). Salter et al. (2013) extend this strategy to its maximum extent by calculating the probability of the phylogeny that treats individual samples as putative lineages. The putative lineages are then sequentially collapsed on the basis of which samples are most closely related, the probability of the species tree is recalculated,
16
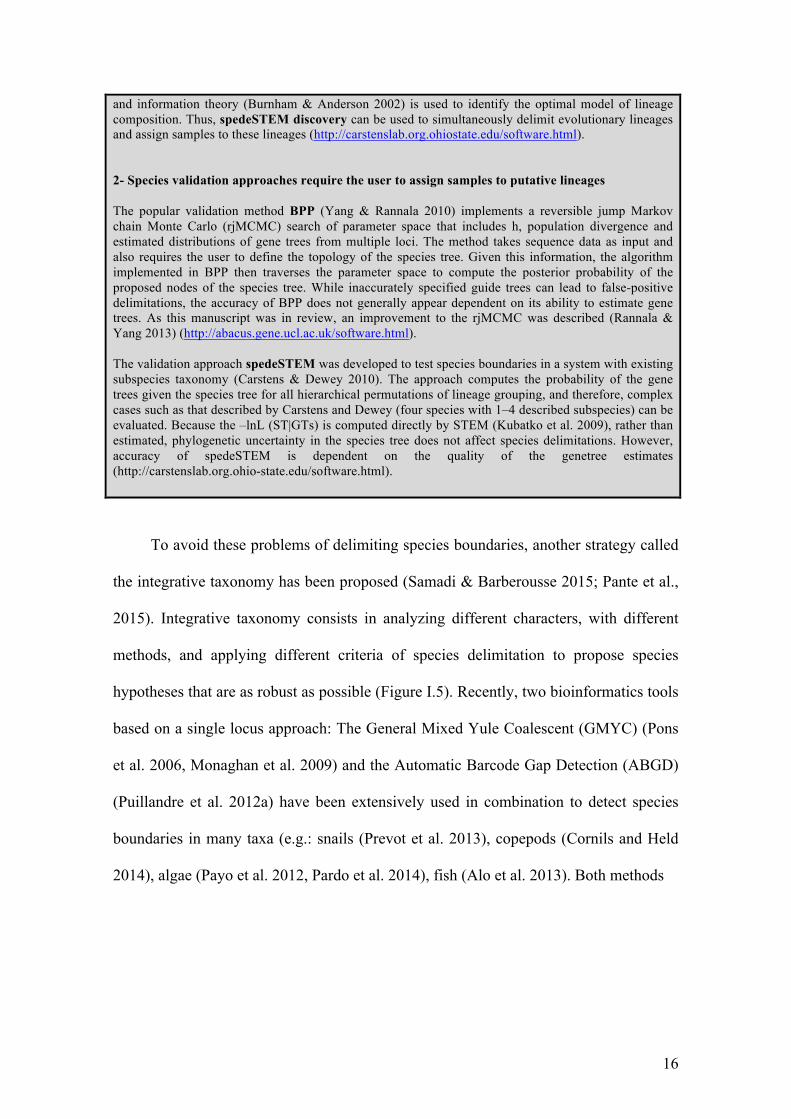
and information theory (Burnham & Anderson 2002) is used to identify the optimal model of lineage composition. Thus, spedeSTEM discovery can be used to simultaneously delimit evolutionary lineages and assign samples to these lineages (http://carstenslab.org.ohiostate.edu/software.html). 2- Species validation approaches require the user to assign samples to putative lineages The popular validation method BPP (Yang & Rannala 2010) implements a reversible jump Markov chain Monte Carlo (rjMCMC) search of parameter space that includes h, population divergence and estimated distributions of gene trees from multiple loci. The method takes sequence data as input and also requires the user to define the topology of the species tree. Given this information, the algorithm implemented in BPP then traverses the parameter space to compute the posterior probability of the proposed nodes of the species tree. While inaccurately specified guide trees can lead to false-positive delimitations, the accuracy of BPP does not generally appear dependent on its ability to estimate gene trees. As this manuscript was in review, an improvement to the rjMCMC was described (Rannala & Yang 2013) (http://abacus.gene.ucl.ac.uk/software.html). The validation approach spedeSTEM was developed to test species boundaries in a system with existing subspecies taxonomy (Carstens & Dewey 2010). The approach computes the probability of the gene trees given the species tree for all hierarchical permutations of lineage grouping, and therefore, complex cases such as that described by Carstens and Dewey (four species with 1–4 described subspecies) can be evaluated. Because the –lnL (ST|GTs) is computed directly by STEM (Kubatko et al. 2009), rather than estimated, phylogenetic uncertainty in the species tree does not affect species delimitations. However, accuracy of spedeSTEM is dependent on the quality of the genetree estimates (http://carstenslab.org.ohio-state.edu/software.html).
To avoid these problems of delimiting species boundaries, another strategy called
the integrative taxonomy has been proposed (Samadi & Barberousse 2015; Pante et al.,
2015). Integrative taxonomy consists in analyzing different characters, with different
methods, and applying different criteria of species delimitation to propose species
hypotheses that are as robust as possible (Figure I.5). Recently, two bioinformatics tools
based on a single locus approach: The General Mixed Yule Coalescent (GMYC) (Pons
et al. 2006, Monaghan et al. 2009) and the Automatic Barcode Gap Detection (ABGD)
(Puillandre et al. 2012a) have been extensively used in combination to detect species
boundaries in many taxa (e.g.: snails (Prevot et al. 2013), copepods (Cornils and Held
2014), algae (Payo et al. 2012, Pardo et al. 2014), fish (Alo et al. 2013). Both methods
17
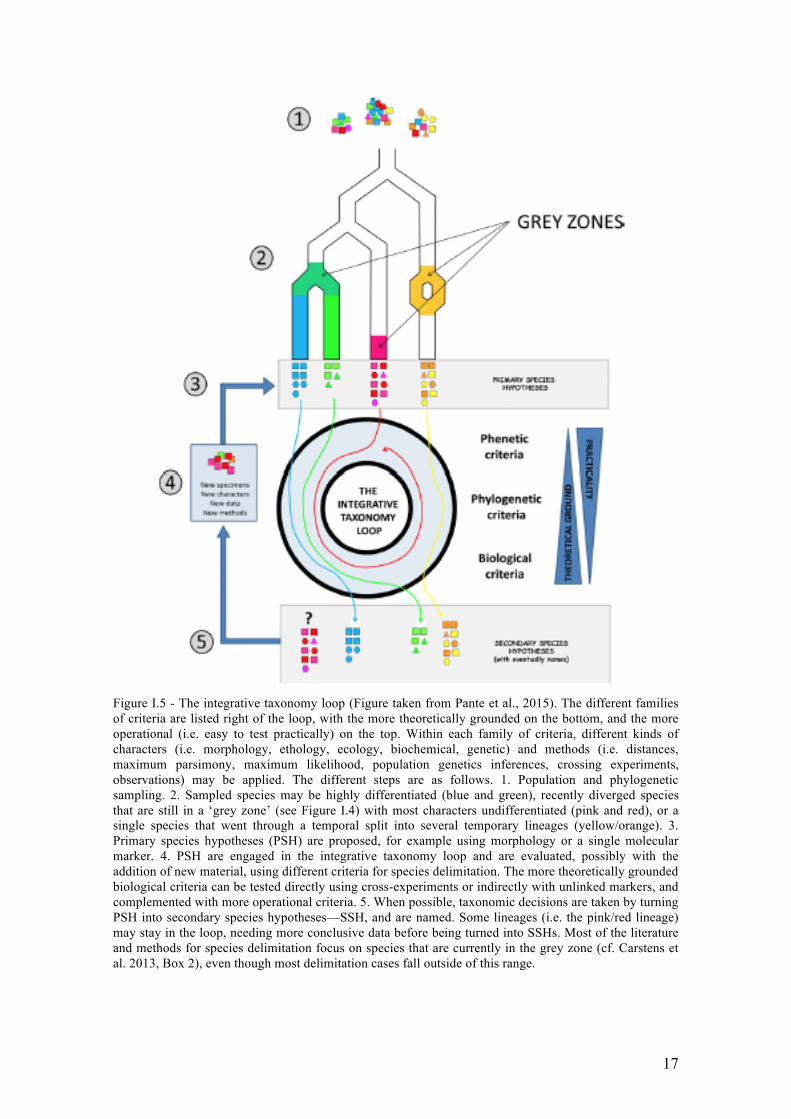
Figure I.5 - The integrative taxonomy loop (Figure taken from Pante et al., 2015). The different families of criteria are listed right of the loop, with the more theoretically grounded on the bottom, and the more operational (i.e. easy to test practically) on the top. Within each family of criteria, different kinds of characters (i.e. morphology, ethology, ecology, biochemical, genetic) and methods (i.e. distances, maximum parsimony, maximum likelihood, population genetics inferences, crossing experiments, observations) may be applied. The different steps are as follows. 1. Population and phylogenetic sampling. 2. Sampled species may be highly differentiated (blue and green), recently diverged species that are still in a ‘grey zone’ (see Figure I.4) with most characters undifferentiated (pink and red), or a single species that went through a temporal split into several temporary lineages (yellow/orange). 3. Primary species hypotheses (PSH) are proposed, for example using morphology or a single molecular marker. 4. PSH are engaged in the integrative taxonomy loop and are evaluated, possibly with the addition of new material, using different criteria for species delimitation. The more theoretically grounded biological criteria can be tested directly using cross-experiments or indirectly with unlinked markers, and complemented with more operational criteria. 5. When possible, taxonomic decisions are taken by turning PSH into secondary species hypotheses—SSH, and are named. Some lineages (i.e. the pink/red lineage) may stay in the loop, needing more conclusive data before being turned into SSHs. Most of the literature and methods for species delimitation focus on species that are currently in the grey zone (cf. Carstens et al. 2013, Box 2), even though most delimitation cases fall outside of this range.
18
have been described as complementary since they are based on different criteria to
delineate species boundaries. Moreover, since all gene trees do not necessarily reflect
the species tree (Wendel and Doyle 1998, Rubinoff and Holland 2005, Petit and
Excoffier 2009), the study of disagreements between genes have often led to an
enhanced understanding of the evolutionary history of taxa when various independent
genes where examined. In sister taxa in which hybridization may be common, this
pattern of incongruence due to introgression have been largely reported (e.g. see Cathey
et al. 1998, Rieseberg et al. 1996, Neiva et al. 2010, Fehrer et al. 2007, Neiva et al.
2012).
DNA based methods associated with these bioinformatics tools for species
delimitation and using various unlinked genes have been especially useful uncovering
cryptic species in groups, such as algae, where classical taxonomy has been
problematic, such as many algae (Leliaert et al. 2009, Tronholm et al. 2010, Payo et al.
2012, Tronholm et al. 2012, Leliaert et al. 2014, Pardo et al. 2014, Vieira et al. 2014).
These newly discovered species have presented new opportunities to study important
mechanisms of speciation, mate recognition and conservation planning.
However, next-generation sequencing tools can also generate significant advances
in species delimitation and phylogenomics. Among the genomic approaches that are
applicable to these fields, the usefulness of restriction site-associated DNA tag (RAD
tag; Baird et al. 2008) sequencing has been recently investigated. This methodology
allows gathering large-scale genome-wide data at moderate to low costs while only
providing short sequences (~100–150 bp). These sequences flank the cutting sites of a
restriction enzyme (or several enzymes) and RAD-seq generally yield thousands of loci
distributed throughout the genome. This approach does not require a reference genome
and can therefore be applied to non-model organisms. RAD-seq (Davey and Blaxter
19
2010) allows (1) creating phylogenetic datasets of unprecedented size (Eaton and Ree,
2013; Eaton, 2014; Escudero et al., 2014; Hipp et al. 2014; Takahashi et al. 2014), (2)
genotyping thousands of SNP throughout the genome (Baird et al. 2008), (3) detecting
hybridization and introgression among non-model organisms (Twyford and Ennos
2011, Eaton and Ree 2013), and (4) inferring species trees and species delimitation
(Leaché et al. 2014). Therefore, RADseq may be a promising tool to assess species
limits and phylogenetic relationships in closely related taxa for which traditional DNA
sequence approaches have failed to provide well-supported solutions. RAD sequencing
has proven useful in species delimitation and phylogeny reconstruction within recently
and rapidly diverged groups (for example, Orobanchaceae flowering plants in Eaton and
Ree, 2013; swordtails in Jones et al. 2013, Heliconius butterflies in Nadeau et al. 2013,
fishes in Wagner et al. 2013, geckos in Leaché et al. 2014). Moreover, reconstructing
the phylogeny of more distantly related taxa was also possible (for example, in Carabus
beetles, Cruaud et al. 2014 and oak trees, Hipp et al. 2014). To date, only one study of
phylogenomics in algae has been published (Fraser et al., 2016). This study aimed to
clarify the species status of the sympatric species Durvillaea chathamensis and D.
antarctica on Chatham Island (New Zealand). Previous studies based on molecular
markers have suggested that the two species were genetically similar and the status of
the former species was questioned. This study demonstrated a better resolution based on
RAD-seq data identifying a case of recent or incipient speciation, which traditional
approaches (e.g. Sanger sequencing of a few loci) were unable to detect or resolve.
20
mitospores
FUSION
“Sporophyte-(2n)”
“Gametophytes-(n)”-
meiospores
MITOSIS
MEIOSIS
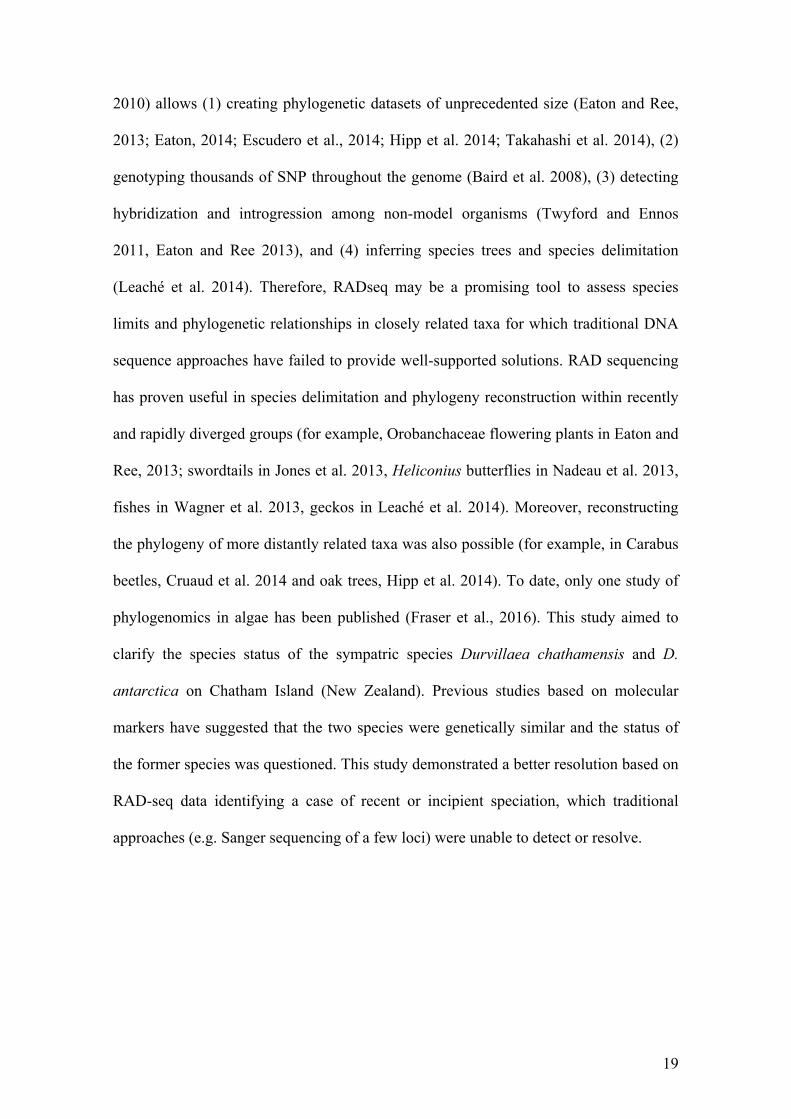
Figure I.6 - Simplified tree including all eukaryotic organisms (Figure taken from Cock and Coelho 2011 that was adapted from Baldauf 2008). Groups including photosynthetic organisms are indicated by green lettering. A single primary endosymbiotic event was at the origin of the plastids of all the members of the archaeplastida. Photosynthetic species within the stramenopiles, alveolates, haptophytes, cryptophytes, chlorarachnia, and euglenids obtained their plastids through multiple secondary or tertiary endosymbiotic events.
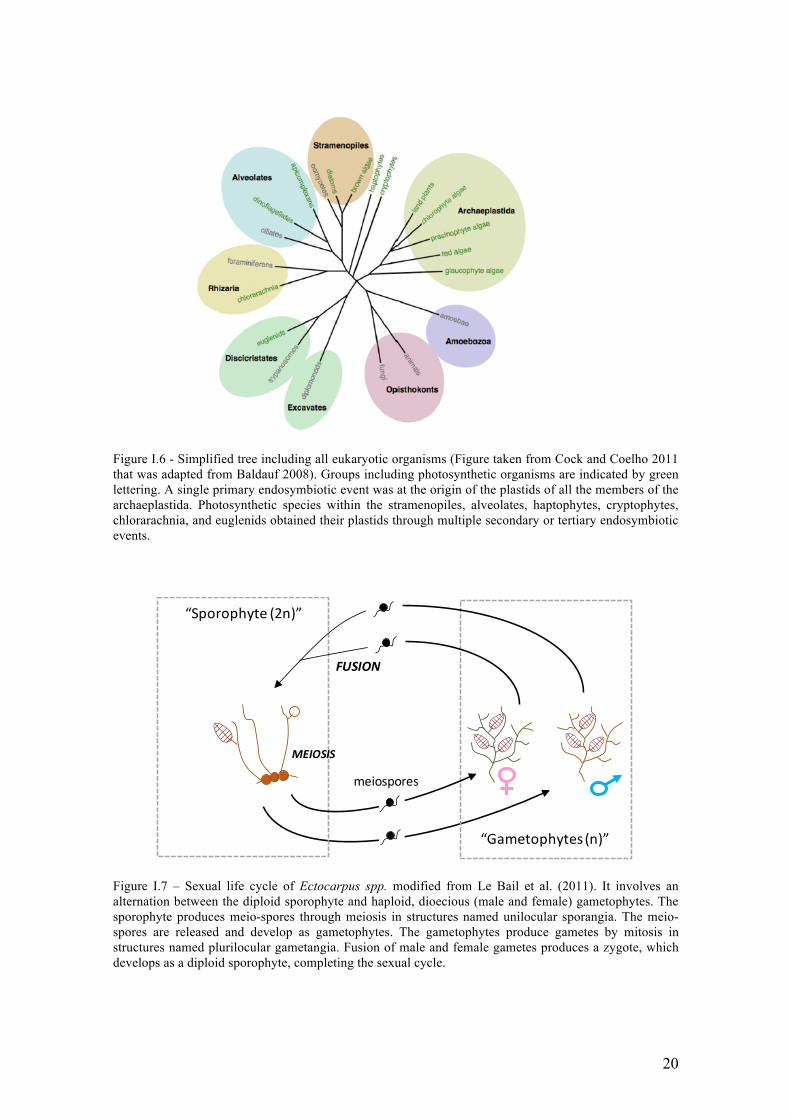
Figure I.7 – Sexual life cycle of Ectocarpus spp. modified from Le Bail et al. (2011). It involves an alternation between the diploid sporophyte and haploid, dioecious (male and female) gametophytes. The sporophyte produces meio-spores through meiosis in structures named unilocular sporangia. The meio-spores are released and develop as gametophytes. The gametophytes produce gametes by mitosis in structures named plurilocular gametangia. Fusion of male and female gametes produces a zygote, which develops as a diploid sporophyte, completing the sexual cycle.
21
III. Model of study: the genus Ectocarpus
The Phaeophyceae or brown algae, is a large group of mostly marine multicellular
algae, including seaweeds of high economic and ecologic importance in both
hemispheres. Brown seaweeds represent important resources with a wide range of uses
in the food, cosmetic, and fertilizer industries and are attracting increasing attention as a
source of active biomolecules (McHugh 2003). The brown algae represent one of only
five eukaryotic lineages (the other four being animals, fungi, green plants, and red
algae) where complex multicellularity have evolved independently. However, most
biological research has been focused on biological models developed in vascular plants
and animals and many gaps remain in other, much less studied lineages, including the
brown algae (Figure I.6). Many interesting features of the brown algae stem from their
phylogenetic distance from classical models of biology (See Stramenopiles, Figure I.6).
Moreover, the alternation between gametophyte and sporophyte (Figure I.7), which
involves sequential development of two independent complex multicellular organisms
of different ploidy, represents a novel situation compared with the life cycles of
classical model organisms, in which the gametophyte generation is usually highly
reduced or absent (e.g., vascular plants and animals) (reviewed in Charrier et al. 2008).
During the last decades, genome sequencing of model organisms (Arabidopsis
thaliana Kaul et al. 2000, Caenorhabditis elegans Kamath et al. 2003 and Drosophila
melanogaster Adams et al. 2000) have largely benefited the biological research focusing
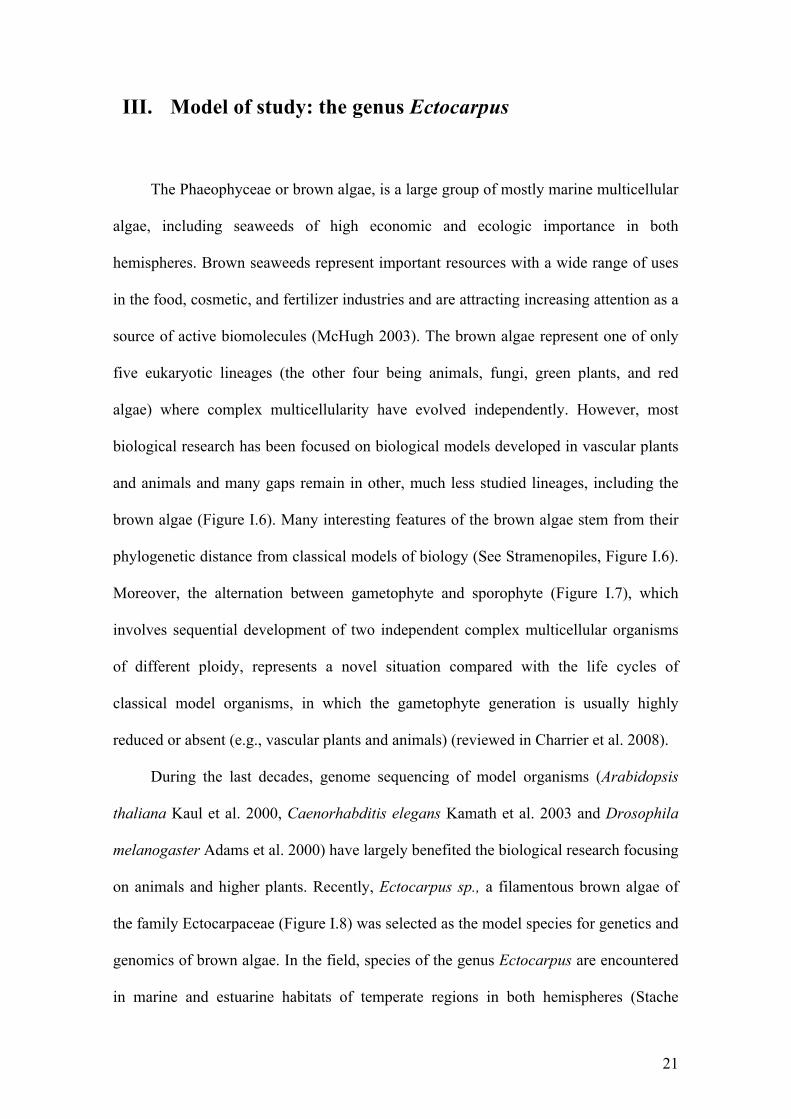
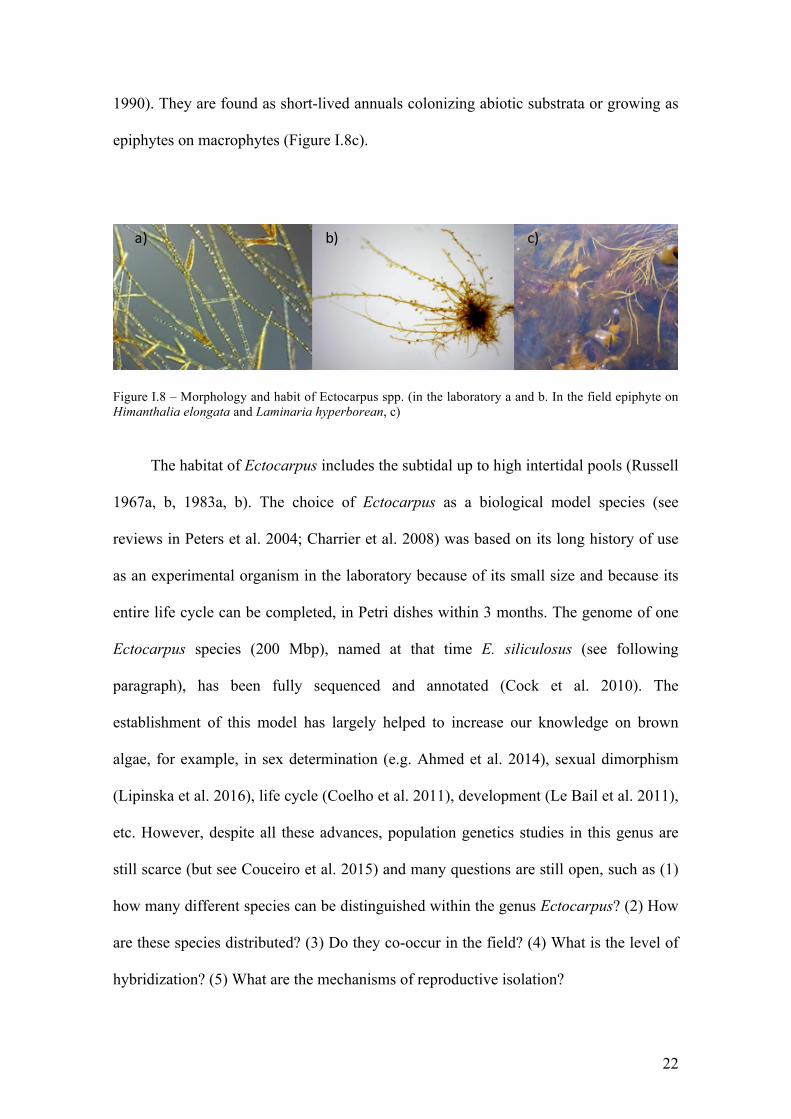
on animals and higher plants. Recently, Ectocarpus sp., a filamentous brown algae of
the family Ectocarpaceae (Figure I.8) was selected as the model species for genetics and
genomics of brown algae. In the field, species of the genus Ectocarpus are encountered
in marine and estuarine habitats of temperate regions in both hemispheres (Stache
22
1990). They are found as short-lived annuals colonizing abiotic substrata or growing as
epiphytes on macrophytes (Figure I.8c).
Figure I.8 – Morphology and habit of Ectocarpus spp. (in the laboratory a and b. In the field epiphyte on Himanthalia elongata and Laminaria hyperborean, c)
The habitat of Ectocarpus includes the subtidal up to high intertidal pools (Russell
1967a, b, 1983a, b). The choice of Ectocarpus as a biological model species (see
reviews in Peters et al. 2004; Charrier et al. 2008) was based on its long history of use
as an experimental organism in the laboratory because of its small size and because its
entire life cycle can be completed, in Petri dishes within 3 months. The genome of one
Ectocarpus species (200 Mbp), named at that time E. siliculosus (see following
paragraph), has been fully sequenced and annotated (Cock et al. 2010). The
establishment of this model has largely helped to increase our knowledge on brown
algae, for example, in sex determination (e.g. Ahmed et al. 2014), sexual dimorphism
(Lipinska et al. 2016), life cycle (Coelho et al. 2011), development (Le Bail et al. 2011),
etc. However, despite all these advances, population genetics studies in this genus are
still scarce (but see Couceiro et al. 2015) and many questions are still open, such as (1)
how many different species can be distinguished within the genus Ectocarpus? (2) How
are these species distributed? (3) Do they co-occur in the field? (4) What is the level of
hybridization? (5) What are the mechanisms of reproductive isolation?
a) b) c)
23
Descriptions of species in the genus Ectocarpus, was based on morphology and
have been controversial. The first classification based on the branching pattern and the
sporangium shape (Hamel 1931-1939), suggested the existence of five species clustered
into two major groups: the Ectocarpus sections “siliculosi” and “fasciculati”.
Conversely, Cardinal (1964) described four species with seven varieties in E. siliculosus
and three varieties in E. fasciculatus based on field material from the French Channel
coast. On the other hand, Russell (1966, 1967b) using isolates collected along the
French coast of Brittany, showed that sporangium morphology, formerly used to
distinguish species in the E. siliculosus complex in previous studies, was not
informative. However, branching pattern consistently revealed a difference between
thalli with conspicuous main axes and thinner, often fasciculate, laterals (E.
fasciculatus) and thalli showing subdichotomous branching (E. siliculosus). Based on
the works of Russell (1966, 1967b), the number of species in Ectocarpus worldwide
was then consensually reduced to two species. Laboratory crosses presented in the work
of Müller and Eichenberger (1995) supported this proposal. Indeed, using gametophytes
of E. siliculosus and E. fasciculatus derived from sporophytes collected along the
French coast of Brittany, Müller and Eichenberger (1995) showed that intraspecific
crosses gave viable zygotes, which developed into fertile sporophytes. Conversely,
interspecific crosses were unsuccessful. Gamete fusions did not occur between female
gametes of E. fasciculatus and male gametes of E. siliculosus and the authors proposed
the existence of a possible prezygotic barrier between the two species. However, hybrid
zygotes were formed in the reciprocal crosses “female E. siliculosus x male E.
fasciculatus” but died soon after germination. This outcome pointed to the existence of
a porous prezygotic barrier with a level of leakage depending on the strains involved in
the crosses and the existence of postzygotic barriers when fertilization occurs.
24
Biochemical studies comparing the two species reported the presence of the
chemotaxonomic marker betaine-lipid diacetylglycerylhydroxymethyltrimethyl-/β-
alanine in cultures of E. fasciculatus but not in the ones of E. siliculosus, seemingly
supporting the biological findings based on crosses and morphology (Müller &
Eichenberger 1995).
Even if all evidences supported the existence of these two highly diverging
species/groups, doubts had been raised about their status: are there only two species of
Ectocarpus worldwide or are E. fasciculatus and E. siliculosus in reality two clades
including various cryptic species? Evidences supporting the second idea have been
advanced. Indeed, complex patterns of cross-fertility have been reported between strains
identified morphologically as E. siliculosus but characterized by different geographical
origins (Müller 1976). E. siliculosus strains have been described as often but not always
cross-fertile. For example, prezygotic barriers were evidenced among populations of E.
siliculosus from NE America (Müller 1976). However, crossfertility experiments
between strains of E. siliculosus isolated from different hemispheres suggested the
presence of post-zygotic barriers. Zygotes from such crosses showed either a reduced
development or normal growth but inhibition of meiosis (Müller 1977, 1979, 1988,
Stache 1990). Based on these results Müller & Kawai (1991) proposed that all the
isolates of E. siliculosus are part of a single species showing a world-wide distribution
and encompassing many geographically separated populations that show full or slightly
reduced interbreeding.
More recently, studies using molecular tools aimed to describe the species
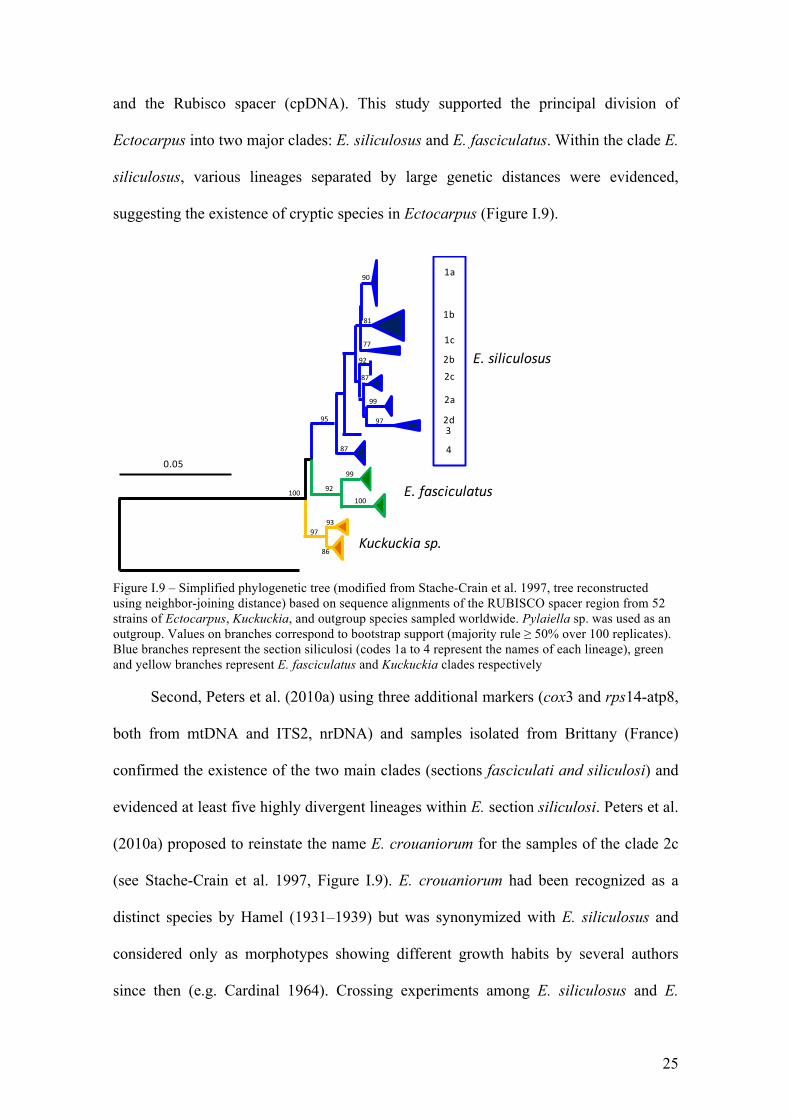
diversity within the genus Ectocarpus. First, Stache-Crain et al. (1997) carried out a
phylogenetic analysis (Figure I.9) using 43 Ectocarpus strains (which were isolated on
all continents except Antarctica) using the internal transcribed spacer (ITS1, nrDNA)
25
and the Rubisco spacer (cpDNA). This study supported the principal division of
Ectocarpus into two major clades: E. siliculosus and E. fasciculatus. Within the clade E.
siliculosus, various lineages separated by large genetic distances were evidenced,
suggesting the existence of cryptic species in Ectocarpus (Figure I.9).
Figure I.9 – Simplified phylogenetic tree (modified from Stache-Crain et al. 1997, tree reconstructed using neighbor-joining distance) based on sequence alignments of the RUBISCO spacer region from 52 strains of Ectocarpus, Kuckuckia, and outgroup species sampled worldwide. Pylaiella sp. was used as an outgroup. Values on branches correspond to bootstrap support (majority rule ≥ 50% over 100 replicates). Blue branches represent the section siliculosi (codes 1a to 4 represent the names of each lineage), green and yellow branches represent E. fasciculatus and Kuckuckia clades respectively
Second, Peters et al. (2010a) using three additional markers (cox3 and rps14-atp8,
both from mtDNA and ITS2, nrDNA) and samples isolated from Brittany (France)
confirmed the existence of the two main clades (sections fasciculati and siliculosi) and
evidenced at least five highly divergent lineages within E. section siliculosi. Peters et al.
(2010a) proposed to reinstate the name E. crouaniorum for the samples of the clade 2c
(see Stache-Crain et al. 1997, Figure I.9). E. crouaniorum had been recognized as a
distinct species by Hamel (1931–1939) but was synonymized with E. siliculosus and
considered only as morphotypes showing different growth habits by several authors
since then (e.g. Cardinal 1964). Crossing experiments among E. siliculosus and E.
1a
1b
1c
2b2c
2a
2d
4
3
E.siliculosus
E.fasciculatus
Kuckuckiasp.
Representative phylogenymodifiedfromStache-Crainetal.1997.NJbasedonsequencealignmentsoftheRUBISCOsparerregionfrom52strainsofEctocarpus,Kuckuckia,andoutgroup species(hebranchlengthsareproportionaltodistances.
77
86
87
92
95
90
81
92
87
99
97
9397
100100
990.05
26
crouaniorum formed viable hybrids in only one out of 12 experiments, but the meiosis
was not completed in the hybrids and abortive unilocular sporangia were formed (Peters
et al. 2010b). These results are reminiscent of the ones described for crosses between E.
siliculosus strains from geographically distant origins (Müller 1988). Peters et al.
(2010b), using the same four markers as in Peters et al (2010a), confirmed the presence
of most lineages obtained in Stache-Crain et al. (1997) in Southern Peru and Northern
Chile. They have also shown that the sequenced strain (lineage 1c in Stache-Crain et al.
1997) is part of the Ectocarpus subclade ‘siliculosi’ but forms a lineage clearly
separated from E. siliculosus and E. crouaniorum. Finally, using a single-locus
approach (COI-5P) on samples from North West France, Mediterranean Sea and Asia,
Peters et al. (2015) reported again several divergent lineages including the ones
previously described in Stache-Crain et al. (1997) and another 14 additional lineages, all
possibly representing different species. However, this last study also warned against
problems linked to a single-gene approach, such as incomplete lineage sorting or
introgression. These molecular findings showed the occurrence of different lineages
within Ectocarpus section “siliculosi” that probably represent cryptic species but the
number, distribution and evolutionary history of such lineages is still unclear.
Increasing even more the complexity of species recognition and delimitation in
the Ectocarpus section “siliculosi”, natural hybridization has been evidenced between
divergent lineages (Peters et al. 2010a). Putative field hybrids were identified based on
PCR-amplification of ITS, which differs in length between the two species; hybrids
showed both bands. However, the level and importance of hybridization and the
mechanisms underlying speciation between these two species is still an open question.
Indeed, it was not possible to study the potential level of hybridization among the
27
different lineages of Ectocarpus section “siliculosi” in previous studies due to the low
number of markers and the low number of samples used.
Thus, we chose the genus Ectocarpus as a study model to investigate species
delineation, hybridization and reproductive isolation in this complex of cryptic species.
Unlike most model organisms to date (with the exception of the yeast Saccharomyces
cerevisiae and the liverwort Marchantia polymorpha), species of the genus Ectocarpus
are characterized by a haploid–diploid life cycle involving an alternation between two
independent multicellular generations and both asexual and sexual reproduction are also
possible in these species (Figure I.7). Undoubtedly, the study of speciation and
hybridization based on a model with a complex life cycle, different from classical
systems, will increase our knowledge in the evolution of reproductive isolation (see
section II, above).

28
29
IV. Objectives of the PHD thesis
The general objective of my PHD thesis is to delineate species and study
hybridization success and the process of speciation within the group Ectocarpus section
siliculosi. The first chapter clarifies the number of species within the Ectocarpus section
siliculosi. The second chapter studies phylogenomics and species delimitation at the
whole genome level using NGS (i.e. ddRAD-seq) within this species complex. Finally,
the third chapter studies the importance and level of hybridization among E. siliculosus
and E. crouaniorum. In order to fulfill these objectives, I used several molecular
markers and a combination of phylogenetic, population genetic and population genomic
approaches. Moreover, an extensive sampling of Ectocarpus was realized along the
Chilean and European coasts during this project and a comprehensive collection of
Ectocarpus strains is now available for the scientific community.
In the first chapter, in order to clarify the number of cryptic species within the
Ectocarpus section siliculosi, I used two unlinked loci (i.e. COI-5P, mitochondrial and
ITS1, nuclear DNA markers) and an integrative approach developed to delimit species.
A collection of 729 specimens sampled mainly along the European and Chilean coasts
have been used. As a first approximation, we searched traces of natural hybridization
and introgression in this group by examining incongruences between the independent
nuclear and mitochondrial markers. In addition, phylogeographic patterns, range and
depth distributions of the most common Ectocarpus species were reported. In the
second chapter we have carried out RAD-sequencing on 322 strains of the different
cryptic species identified in chapter 1 in order to better resolve their phylogenetics
relationships using 13,859 polymorphic SNP. The idea was also to use SNP data to
investigate the genomic pattern of introgression between these species. However,
because of technical reasons, only the phylogenomics approach has so far been
30
completed yet. In the third chapter, I studied the potential importance of hybridization in
the field between the two most common species of the Ectocarpus section siliculosi
group: E. siliculosus and E. crouaniorum that belongs to two highly divergent clades.
The study was based on a collection of more than 900 uni-algal cultures sampled in
eight sites located along the European coast. Information from species-specific nuclear
and cytoplasmic markers jointly with 9 microsatellite loci was combined to determine if
sampled individuals belonged to one of the parental species or were potential hybrids.
We then determined how common where haploid and diploid hybrids and described
their genetic composition. Ultimately our results help in better understanding the
geographical framework of hybridization between E. siliculosus and E. crouaniorum
and the relative importance of pre and post-zygotic barriers in this haploid-diploid
genus. In this study, we have not only used classical data treatments to test for the
existence of hybrids but have also specifically developed a new Bayesian method,
named XPloidAssignment, to assign genotyped individuals to parental species and
different genetic classes of hybrids. The new method can be applied to data sets with
varying degrees of ploidy between individuals or loci.
31
Chapter1
Speciesdelimitationandphylogeographicanalysesinthe
Ectocarpussubgroupsiliculosi(Ectocarpales,Phaeophyceae)
ContentsI. Abstract............................................................................................................................33
II. Introduction.....................................................................................................................33
III. MaterialandMethods.......................................................................................................35
- FieldcollectionsandisolationofEctocarpusstrains...............................................................35
- DNAextraction,sequencingandalignments...........................................................................35
- Species-delimitationprocedure...............................................................................................35
- PhylogeneticanalysesofDNAsequences................................................................................35
- AutomaticBarcodeGapDiscovery...........................................................................................35
- GeneralMixedYuleCoalescent................................................................................................35
- Networkreconstructions..........................................................................................................36
- Geneticdiversity.......................................................................................................................36
- AMOVAanalysis.......................................................................................................................36
IV. Results..............................................................................................................................36
- EctocarpusputativespeciesdelineationbasedonCOI-5P.......................................................36
- EctocarpusputativespeciesconsolidationusingITS1..............................................................37
- Casesofincongruencesbetweenmarkers...............................................................................37
- Geographicdistributionofthe15Ectocarpusspecies.............................................................37
- Haplotypenetwork...................................................................................................................38
- GeneticdiversityofE.siliculosus,E.crouaniorumandEctocarpus6.......................................38
- AMOVAanalysisofthecosmopolitanspeciesE.siliculosusandE.crouaniorum.....................40
- Tide-leveldistributionofE.siliculosus,E.crouaniorumandEctocarpus6...............................40
V. Discussion.........................................................................................................................41
- Highspeciesdiversitywithinthesiliculosigroup.....................................................................41
32
- Incongruencebetweenmarkers...............................................................................................43
- Speciesdistribution..................................................................................................................43
VI. Conclusion.........................................................................................................................44
VII. Acknowledgments.............................................................................................................44
VIII. Appendix...........................................................................................................................45
- AppendixI.1.FigureS1.............................................................................................................45
- AppendixI.2.FigureS2.............................................................................................................47
- AppendixI.3.FigureS3.............................................................................................................49
- AppendixI.4.TableS3..............................................................................................................51
- AppendixI.5.TableS4..............................................................................................................53
- AppendixI.6.TableS5..............................................................................................................55
- AppendixI.7.TableS6..............................................................................................................57
AppendixGenbankaccessionnumbers..............................................................SectionAP-1
- AppendixA.1.TableS1.............................................................................................SectionAP-1
- AppendixA.2.TableS2..........................................................................................SectionAP-31

33
SPECIES DELIMITATION AND PHYLOGEOGRAPHIC ANALYSES IN THE ECTOCARPUSSUBGROUP SILICULOSI (ECTOCARPALES, PHAEOPHYCEAE)1
Alejandro E. Montecinos
CNRS, Sorbonne Universit!es, UPMC University Paris VI, PUC, UACH, UMI 3614, Evolutionary Biology and Ecology of Algae,
Station Biologique de Roscoff, CS 90074, Place G. Teissier, 29680 Roscoff, France
Instituto de Ciencias Ambientales y Evolutivas, Facultad de Ciencias, Universidad Austral de Chile, Casilla 567 Valdivia, Chile
Lucia Couceiro2
CNRS, Sorbonne Universit!es, UPMC University Paris VI, PUC, UACH, UMI 3614, Evolutionary Biology and Ecology of Algae,
Station Biologique de Roscoff, CS 90074, Place G. Teissier, 29680 Roscoff, France
Akira F. Peters
Bezhin Rosko, 40 rue des pecheurs, 29250 Santec, France
Antoine Desrut, Myriam Valero
CNRS, Sorbonne Universit!es, UPMC University Paris VI, PUC, UACH, UMI 3614, Evolutionary Biology and Ecology of Algae,
Station Biologique de Roscoff, CS 90074, Place G. Teissier, 29680 Roscoff, France
and Marie-Laure Guillemin3
CNRS, Sorbonne Universit!es, UPMC University Paris VI, PUC, UACH, UMI 3614, Evolutionary Biology and Ecology of Algae,
Station Biologique de Roscoff, CS 90074, Place G. Teissier, 29680 Roscoff, France
Instituto de Ciencias Ambientales y Evolutivas, Facultad de Ciencias, Universidad Austral de Chile, Casilla 567 Valdivia, Chile
The genus Ectocarpus (Ectocarpales, Phaeophy-ceae) contains filamentous algae widely distributedin marine and estuarine habitats of temperateregions in both hemispheres. While E. siliculosus hasbecome a model organism for genomics andgenetics of the brown macroalgae, accurate speciesdelineation, distribution patterns and diversity forthe genus Ectocarpus remain problematic. In thisstudy, we used three independent speciesdelimitation approaches to generate a robust specieshypothesis for 729 Ectocarpus specimens collectedmainly along the European and Chilean coasts.These approaches comprised phylogeneticreconstructions and two bioinformatics toolsdeveloped to objectively define species boundaries(General Mixed Yule Coalescence Method andAutomatic Barcode Gap Discovery). Our analyseswere based on DNA sequences of two loci: themitochondrial cytochrome oxidase subunit 1 andthe nuclear internal transcribed spacer 1 of theribosomal DNA. Our analyses showed the presenceof at least 15 cryptic species and suggest theexistence of incomplete lineage sorting orintrogression between five of them. These results
suggested the possible existence of different levelsof reproductive barriers within this speciescomplex. We also detected differences amongspecies in their phylogeographic patterns, range anddepth distributions, which may suggest differentbiogeographic histories (e.g., endemic species orrecent introductions).
Key index words: barcode; brown alga; COI-5P; cryp-tic species; Ectocarpus; hybridization; introgression;ITS1; species delimitation
Abbreviations: ABGD, Automatic Barcode Gap Dis-covery; BI, Bayesian Inference; COI-5P, 50-partialcytochrome c oxidase subunit 1; GMYC, GeneralMixed Yule Coalescent; ITS1, internal transcribedspacer 1; ML, Maximum Likelihood; mtDNA, mito-chondrial DNA; NEA, North European Atlantic;nrDNA, nuclear ribosomal DNA; NW France, North-West France; SEP, South-East Pacific
Delineating species boundaries is a long-standingmethodological and conceptual challenge, especiallyin algal systems. Some of the problems arise fromthe fact that species are dynamic entities thatchange with time (Sites and Marshall 2003, 2004)and a plethora of species concepts has been pro-posed (Mayden 1997, 1999, Coyne and Orr 2004).Recently, a new line of thinking was put forthamong biologists whereby species are considered as
1Received 24 November 2015. Accepted 10 June 2016.2Present address: Department of Animal Biology, Plant Biology
and Ecology, University of A Coru~na, A Coru~na, Spain.3Author for correspondence: e-mail marielaure.guillemin@gmail.
com.Editorial Responsibility: M. Cock (Associate Editor)
J. Phycol. *, ***–*** (2016)© 2016 Phycological Society of AmericaDOI: 10.1111/jpy.12452
1
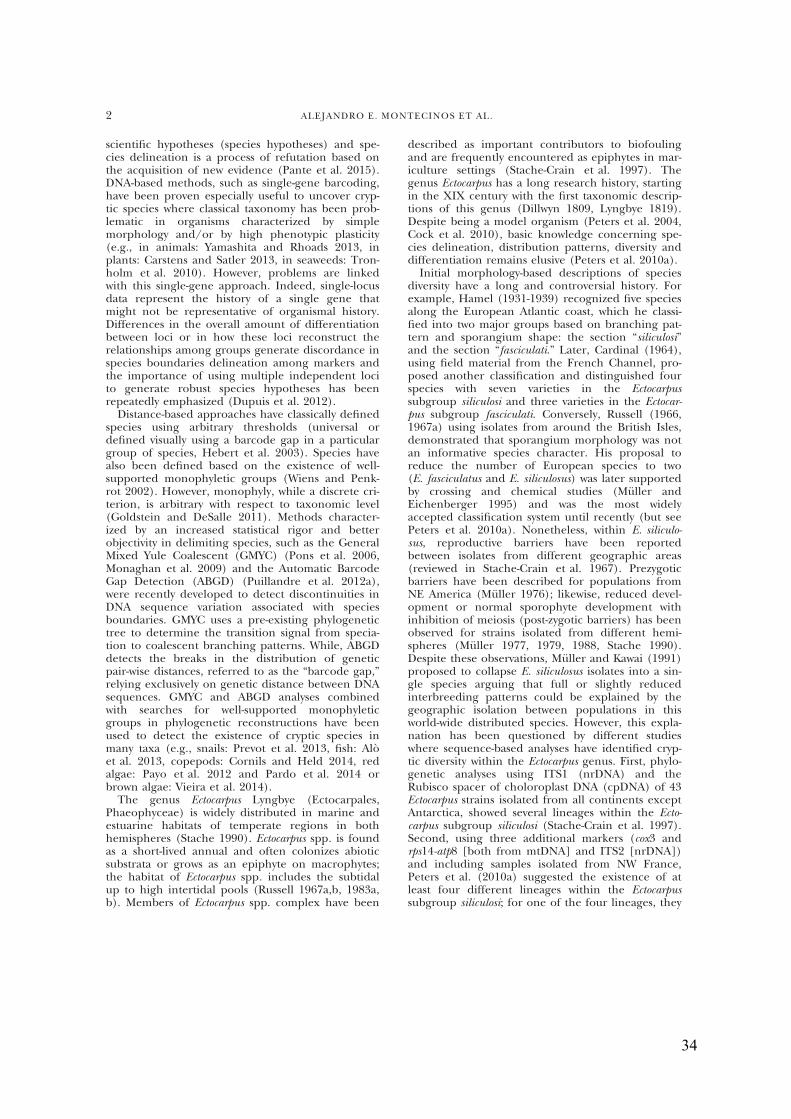
34
scientific hypotheses (species hypotheses) and spe-cies delineation is a process of refutation based onthe acquisition of new evidence (Pante et al. 2015).DNA-based methods, such as single-gene barcoding,have been proven especially useful to uncover cryp-tic species where classical taxonomy has been prob-lematic in organisms characterized by simplemorphology and/or by high phenotypic plasticity(e.g., in animals: Yamashita and Rhoads 2013, inplants: Carstens and Satler 2013, in seaweeds: Tron-holm et al. 2010). However, problems are linkedwith this single-gene approach. Indeed, single-locusdata represent the history of a single gene thatmight not be representative of organismal history.Differences in the overall amount of differentiationbetween loci or in how these loci reconstruct therelationships among groups generate discordance inspecies boundaries delineation among markers andthe importance of using multiple independent locito generate robust species hypotheses has beenrepeatedly emphasized (Dupuis et al. 2012).
Distance-based approaches have classically definedspecies using arbitrary thresholds (universal ordefined visually using a barcode gap in a particulargroup of species, Hebert et al. 2003). Species havealso been defined based on the existence of well-supported monophyletic groups (Wiens and Penk-rot 2002). However, monophyly, while a discrete cri-terion, is arbitrary with respect to taxonomic level(Goldstein and DeSalle 2011). Methods character-ized by an increased statistical rigor and betterobjectivity in delimiting species, such as the GeneralMixed Yule Coalescent (GMYC) (Pons et al. 2006,Monaghan et al. 2009) and the Automatic BarcodeGap Detection (ABGD) (Puillandre et al. 2012a),were recently developed to detect discontinuities inDNA sequence variation associated with speciesboundaries. GMYC uses a pre-existing phylogenetictree to determine the transition signal from specia-tion to coalescent branching patterns. While, ABGDdetects the breaks in the distribution of geneticpair-wise distances, referred to as the “barcode gap,”relying exclusively on genetic distance between DNAsequences. GMYC and ABGD analyses combinedwith searches for well-supported monophyleticgroups in phylogenetic reconstructions have beenused to detect the existence of cryptic species inmany taxa (e.g., snails: Prevot et al. 2013, fish: Al!oet al. 2013, copepods: Cornils and Held 2014, redalgae: Payo et al. 2012 and Pardo et al. 2014 orbrown algae: Vieira et al. 2014).
The genus Ectocarpus Lyngbye (Ectocarpales,Phaeophyceae) is widely distributed in marine andestuarine habitats of temperate regions in bothhemispheres (Stache 1990). Ectocarpus spp. is foundas a short-lived annual and often colonizes abioticsubstrata or grows as an epiphyte on macrophytes;the habitat of Ectocarpus spp. includes the subtidalup to high intertidal pools (Russell 1967a,b, 1983a,b). Members of Ectocarpus spp. complex have been
described as important contributors to biofoulingand are frequently encountered as epiphytes in mar-iculture settings (Stache-Crain et al. 1997). Thegenus Ectocarpus has a long research history, startingin the XIX century with the first taxonomic descrip-tions of this genus (Dillwyn 1809, Lyngbye 1819).Despite being a model organism (Peters et al. 2004,Cock et al. 2010), basic knowledge concerning spe-cies delineation, distribution patterns, diversity anddifferentiation remains elusive (Peters et al. 2010a).Initial morphology-based descriptions of species
diversity have a long and controversial history. Forexample, Hamel (1931-1939) recognized five speciesalong the European Atlantic coast, which he classi-fied into two major groups based on branching pat-tern and sporangium shape: the section “siliculosi”and the section “fasciculati.” Later, Cardinal (1964),using field material from the French Channel, pro-posed another classification and distinguished fourspecies with seven varieties in the Ectocarpussubgroup siliculosi and three varieties in the Ectocar-pus subgroup fasciculati. Conversely, Russell (1966,1967a) using isolates from around the British Isles,demonstrated that sporangium morphology was notan informative species character. His proposal toreduce the number of European species to two(E. fasciculatus and E. siliculosus) was later supportedby crossing and chemical studies (M€uller andEichenberger 1995) and was the most widelyaccepted classification system until recently (but seePeters et al. 2010a). Nonetheless, within E. siliculo-sus, reproductive barriers have been reportedbetween isolates from different geographic areas(reviewed in Stache-Crain et al. 1967). Prezygoticbarriers have been described for populations fromNE America (M€uller 1976); likewise, reduced devel-opment or normal sporophyte development withinhibition of meiosis (post-zygotic barriers) has beenobserved for strains isolated from different hemi-spheres (M€uller 1977, 1979, 1988, Stache 1990).Despite these observations, M€uller and Kawai (1991)proposed to collapse E. siliculosus isolates into a sin-gle species arguing that full or slightly reducedinterbreeding patterns could be explained by thegeographic isolation between populations in thisworld-wide distributed species. However, this expla-nation has been questioned by different studieswhere sequence-based analyses have identified cryp-tic diversity within the Ectocarpus genus. First, phylo-genetic analyses using ITS1 (nrDNA) and theRubisco spacer of choloroplast DNA (cpDNA) of 43Ectocarpus strains isolated from all continents exceptAntarctica, showed several lineages within the Ecto-carpus subgroup siliculosi (Stache-Crain et al. 1997).Second, using three additional markers (cox3 andrps14-atp8 [both from mtDNA] and ITS2 [nrDNA])and including samples isolated from NW France,Peters et al. (2010a) suggested the existence of atleast four different lineages within the Ectocarpussubgroup siliculosi; for one of the four lineages, they
2 ALEJANDRO E. MONTECINOS ET AL.
35
proposed to reinstate the name E. crouaniorumThuret coined by Thuret in Le Jolis. Third, thepresence of most lineages described by Stache-Crainet al. (1997) was later confirmed for strains sampledalong the South-East Pacific coast (Peters et al.2010b). Finally, using a single-locus approach (COI-5P) on samples from NW France, MediterraneanSea and Asia, Peters et al. (2015) reported again sev-eral lineages previously described in Stache-Crainet al. (1997) as well as 14 additional lineages possi-bly representing different species. However, this laststudy also warned against problems linked to a sin-gle-gene approach, such as incomplete lineage sort-ing or introgression.
The molecular findings discussed above supportthe probable occurrence of highly divergent geneticlineages, including cryptic species, within the Ecto-carpus section “siliculosi.” However, none of the pre-vious studies has employed an integrative approachto clarify the species diversity within Ectocarpus andevaluate introgression levels within and among natu-ral populations. This study uses two unlinked loci(i.e., COI-5P and ITS1 DNA-markers) and a set ofmethods developed to delimit species to clarify thenumber of cryptic species within this group using729 specimens collected mainly along the Europeanand Chilean coasts. The extent to which naturalhybridization and introgression occur in the fieldwas investigated by searching for incongruencebetween the independent nuclear and mitochon-drial markers. Finally, phylogeographic patterns,range and depth distributions of the most commonEctocarpus species were studied.
MATERIALS AND METHODS
Field collections and isolation of Ectocarpus strains. Sevenhundred and twenty-one Ectocarpus samples were collectedfrom 37 sites located along the North-East Atlantic (NEA),Mediterranean and South-East Pacific (SEP) coasts. Theywere complemented with eight strains isolated from UnitedStates, South Korea, Australia and New Zealand (Table 1).Samples collected in the field were isolated and maintainedas clonal cultures, as described in Couceiro et al. (2015).Position on the shore of the collected individuals wasrecorded using a coarse classification (high intertidal, H; midintertidal, M; low intertidal, L; upper subtidal, US; subtidal,S; or drifting, Drift), to examine whether putative cryptic spe-cies occupy different tidal zones.
DNA extraction, sequencing and alignments. Total DNA wasextracted from lyophilized samples using the NucleoSpinR 96Plant Kit (Macherey-Nagel, Duren, Germany). Partial COI(COI-5P, mitochondrial) was amplified using the primersGAZF2 and GAZR2 (Lane et al. 2007) as described in Peterset al. (2015). A nuclear fragment containing the ITS1 regionand 224 bp of the flanking genes 18S and 5.8S was amplifiedusing the primers and PCR conditions described by Peterset al. (2010a). PCR amplicons for both markers weresequenced at Genoscope facilities (Evry, France) or at Eurofi-nis Genomics (Ebersberg, Germany). Individuals showingphylogenetic incongruences between markers were sequencedtwice to discard contamination errors in the preparation ofthe samples before the sequencing. Sequences were aligned
manually using MEGA v6.06 (Tamura et al. 2013) andchecked by eye; only traces with high quality values and noambiguities were retained for further analyses.
Species-delimitation procedure. First, 729 Ectocarpus COI-5Psequences were used to define putative species within theEctocarpus section “siliculosi” group. Among them, 710sequences were generated in this study and deposited inGENBANK (Table 1 and Table S1 in the Supporting Infor-mation) while 19 were published by Peters et al. (2015) anddownloaded from the same public database (Table S1). Toestablish putative species, two species delineation methods(ABGD and GMYC) were combined with two phylogeneticinference methods (Maximum Likelihood, ML and Bayesianinference, BI). Thereafter, putative species delineated withthe COI-5P were consolidated using 630 sequences of thenrDNA marker ITS1. Five hundred and eighty sequenceswere generated in this study (Table 1 and Table S2 in theSupporting Information) and 50 were downloaded fromGENBANK (Table S2). A single alignment including all ITS1sequences could not be generated due to the partly highsequence variability including the presence of indels (Stache-Crain et al. 1997); the ITS1 data set was therefore dividedinto four subgroups (see results on species consolidationbelow for more information about the composition of thesefour subgroups). Sequence alignment, tree reconstructionsand ABGD tests were carried out independently for each sub-group. Sample groups were considered as species when all(or nearly all) the methods employed to test their boundariesand the results obtained for two independent genes wereconcordant.
Phylogenetic analyses of DNA sequences. Phylogenetic analyseswere conducted separately for the COI-5P and ITS1 regionsusing both ML and BI methods. ML analyses were performedusing RAxML v8 (Stamatakis 2014). We selected the best-fitsubstitution model using the Akaike information criterionimplemented in jModelTest v2.1.8 (Darriba et al. 2012). Theselected model was GTR I+G for COI-5P, GTR +G for the first,second, and fourth ITS1-subgroups and GTR I+G for the thirdITS1-subgroup. Statistical support was estimated using 1,000replicates and a rapid bootstrap heuristic (Stamatakis et al.2008). BI analyses were conducted using MrBayes v3.2.3(Huelsenbeck and Ronquist 2001). Two independent analyseswere run using four chains each and 20 million generations.Trees and parameters were sampled every 1,000 generationsand the default parameters for temperature and branch swap-ping were used. The first 20% of sampled trees were discardedas “burn-in” to ensure stabilization. The remaining trees wereused to compute a consensus topology and posterior probabil-ity values. The split frequency (variance among the four inde-pendent runs) was below 0.003, confirming that the posteriorprobability distribution was accurately sampled.
Automatic Barcode Gap Discovery. ABGD identifies a limitbetween the frequency distribution of intra- and interspecificpair-wise genetic distances, even if they overlap, using severala priori thresholds of genetic distances chosen by the user(Puillandre et al. 2012a). Then, it is recursively applied topreviously obtained groups to get finer partitions until thereis no further partitioning. ABGD was remotely run at http://wwwabi.snv.jussieu.fr/public/abgd/abgdweb.html. We com-puted Kimura two-parameter (K2P) genetic distances amongspecimens using default settings.
General Mixed Yule Coalescent. GMYC identifies a thresholdvalue for the shift in branching rate from coalescent lineagebranching to interspecific diversification on an ultrametrictree and explicitly delimits “independently evolving” clusters(i.e., putative species; Pons et al. 2006, Monaghan et al.2009). Before the analysis, duplicated haplotypes wereremoved from our data set using DnaSP v5.10.1 (Librado and
SPECIES DELIMITATION IN THE ECTOCARPUS SUBGROUP SILICULOSI 3
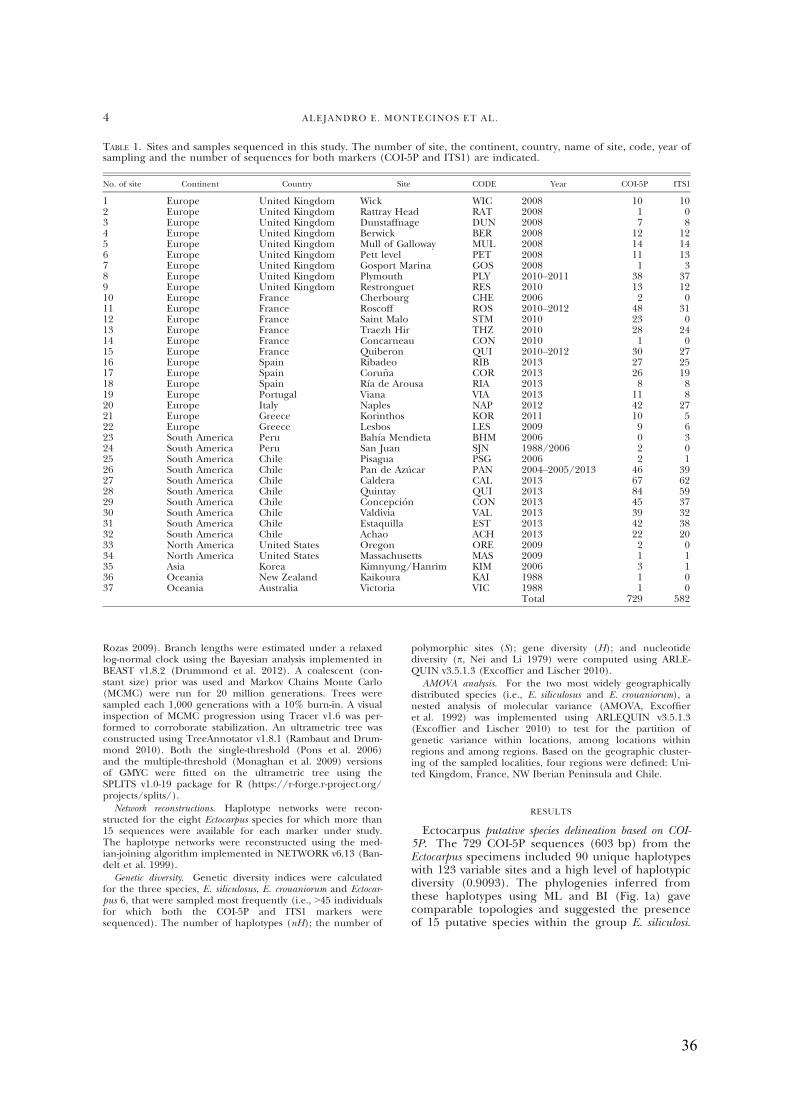
36
Rozas 2009). Branch lengths were estimated under a relaxedlog-normal clock using the Bayesian analysis implemented inBEAST v1.8.2 (Drummond et al. 2012). A coalescent (con-stant size) prior was used and Markov Chains Monte Carlo(MCMC) were run for 20 million generations. Trees weresampled each 1,000 generations with a 10% burn-in. A visualinspection of MCMC progression using Tracer v1.6 was per-formed to corroborate stabilization. An ultrametric tree wasconstructed using TreeAnnotator v1.8.1 (Rambaut and Drum-mond 2010). Both the single-threshold (Pons et al. 2006)and the multiple-threshold (Monaghan et al. 2009) versionsof GMYC were fitted on the ultrametric tree using theSPLITS v1.0-19 package for R (https://r-forge.r-project.org/projects/splits/).
Network reconstructions. Haplotype networks were recon-structed for the eight Ectocarpus species for which more than15 sequences were available for each marker under study.The haplotype networks were reconstructed using the med-ian-joining algorithm implemented in NETWORK v6.13 (Ban-delt et al. 1999).
Genetic diversity. Genetic diversity indices were calculatedfor the three species, E. siliculosus, E. crouaniorum and Ectocar-pus 6, that were sampled most frequently (i.e., >45 individualsfor which both the COI-5P and ITS1 markers weresequenced). The number of haplotypes (nH); the number of
polymorphic sites (S); gene diversity (H); and nucleotidediversity (p, Nei and Li 1979) were computed using ARLE-QUIN v3.5.1.3 (Excoffier and Lischer 2010).
AMOVA analysis. For the two most widely geographicallydistributed species (i.e., E. siliculosus and E. crouaniorum), anested analysis of molecular variance (AMOVA, Excoffieret al. 1992) was implemented using ARLEQUIN v3.5.1.3(Excoffier and Lischer 2010) to test for the partition ofgenetic variance within locations, among locations withinregions and among regions. Based on the geographic cluster-ing of the sampled localities, four regions were defined: Uni-ted Kingdom, France, NW Iberian Peninsula and Chile.
RESULTS
Ectocarpus putative species delineation based on COI-5P. The 729 COI-5P sequences (603 bp) from theEctocarpus specimens included 90 unique haplotypeswith 123 variable sites and a high level of haplotypicdiversity (0.9093). The phylogenies inferred fromthese haplotypes using ML and BI (Fig. 1a) gavecomparable topologies and suggested the presenceof 15 putative species within the group E. siliculosi.
TABLE 1. Sites and samples sequenced in this study. The number of site, the continent, country, name of site, code, year ofsampling and the number of sequences for both markers (COI-5P and ITS1) are indicated.
No. of site Continent Country Site CODE Year COI-5P ITS1
1 Europe United Kingdom Wick WIC 2008 10 102 Europe United Kingdom Rattray Head RAT 2008 1 03 Europe United Kingdom Dunstaffnage DUN 2008 7 84 Europe United Kingdom Berwick BER 2008 12 125 Europe United Kingdom Mull of Galloway MUL 2008 14 146 Europe United Kingdom Pett level PET 2008 11 137 Europe United Kingdom Gosport Marina GOS 2008 1 38 Europe United Kingdom Plymouth PLY 2010–2011 38 379 Europe United Kingdom Restronguet RES 2010 13 1210 Europe France Cherbourg CHE 2006 2 011 Europe France Roscoff ROS 2010–2012 48 3112 Europe France Saint Malo STM 2010 23 013 Europe France Traezh Hir THZ 2010 28 2414 Europe France Concarneau CON 2010 1 015 Europe France Quiberon QUI 2010–2012 30 2716 Europe Spain Ribadeo RIB 2013 27 2517 Europe Spain Coru~na COR 2013 26 1918 Europe Spain R!ıa de Arousa RIA 2013 8 819 Europe Portugal Viana VIA 2013 11 820 Europe Italy Naples NAP 2012 42 2721 Europe Greece Korinthos KOR 2011 10 522 Europe Greece Lesbos LES 2009 9 623 South America Peru Bah!ıa Mendieta BHM 2006 0 324 South America Peru San Juan SJN 1988/2006 2 025 South America Chile Pisagua PSG 2006 2 126 South America Chile Pan de Az!ucar PAN 2004–2005/2013 46 3927 South America Chile Caldera CAL 2013 67 6228 South America Chile Quintay QUI 2013 84 5929 South America Chile Concepci!on CON 2013 45 3730 South America Chile Valdivia VAL 2013 39 3231 South America Chile Estaquilla EST 2013 42 3832 South America Chile Achao ACH 2013 22 2033 North America United States Oregon ORE 2009 2 034 North America United States Massachusetts MAS 2009 1 135 Asia Korea Kimnyung/Hanrim KIM 2006 3 136 Oceania New Zealand Kaikoura KAI 1988 1 037 Oceania Australia Victoria VIC 1988 1 0
Total 729 582
4 ALEJANDRO E. MONTECINOS ET AL.
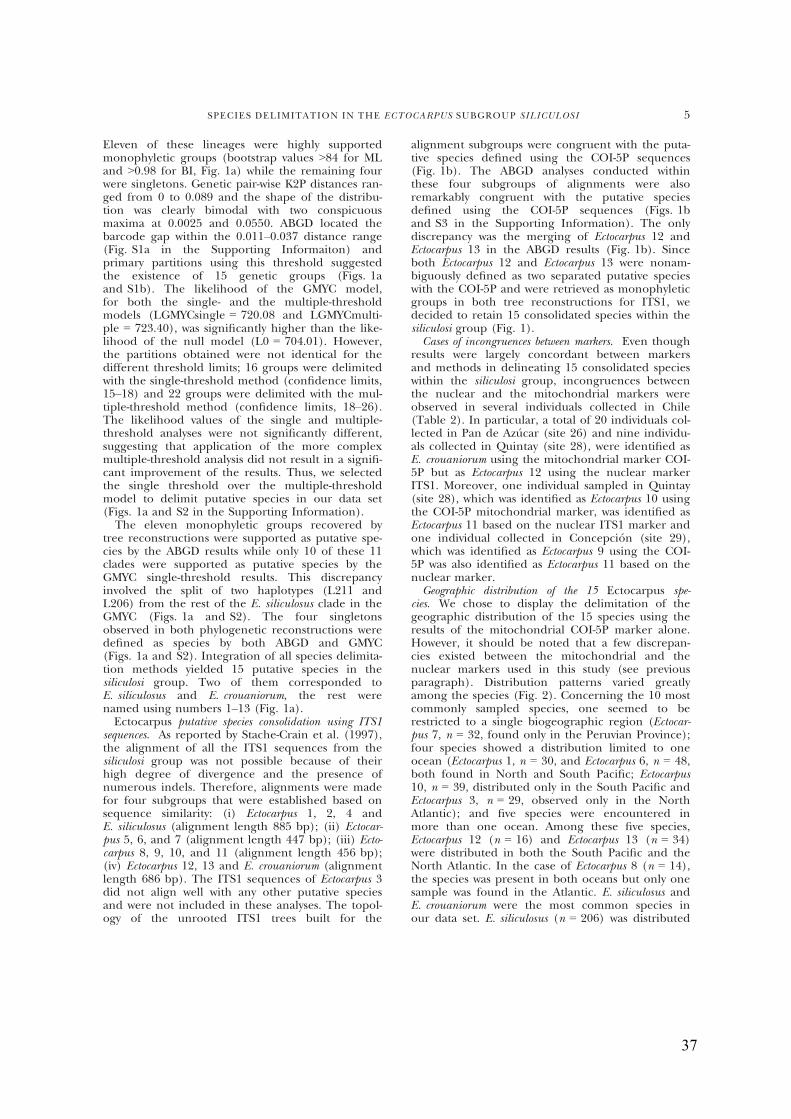
37
Eleven of these lineages were highly supportedmonophyletic groups (bootstrap values >84 for MLand >0.98 for BI, Fig. 1a) while the remaining fourwere singletons. Genetic pair-wise K2P distances ran-ged from 0 to 0.089 and the shape of the distribu-tion was clearly bimodal with two conspicuousmaxima at 0.0025 and 0.0550. ABGD located thebarcode gap within the 0.011–0.037 distance range(Fig. S1a in the Supporting Informaiton) andprimary partitions using this threshold suggestedthe existence of 15 genetic groups (Figs. 1aand S1b). The likelihood of the GMYC model,for both the single- and the multiple-thresholdmodels (LGMYCsingle = 720.08 and LGMYCmulti-ple = 723.40), was significantly higher than the like-lihood of the null model (L0 = 704.01). However,the partitions obtained were not identical for thedifferent threshold limits; 16 groups were delimitedwith the single-threshold method (confidence limits,15–18) and 22 groups were delimited with the mul-tiple-threshold method (confidence limits, 18–26).The likelihood values of the single and multiple-threshold analyses were not significantly different,suggesting that application of the more complexmultiple-threshold analysis did not result in a signifi-cant improvement of the results. Thus, we selectedthe single threshold over the multiple-thresholdmodel to delimit putative species in our data set(Figs. 1a and S2 in the Supporting Information).
The eleven monophyletic groups recovered bytree reconstructions were supported as putative spe-cies by the ABGD results while only 10 of these 11clades were supported as putative species by theGMYC single-threshold results. This discrepancyinvolved the split of two haplotypes (L211 andL206) from the rest of the E. siliculosus clade in theGMYC (Figs. 1a and S2). The four singletonsobserved in both phylogenetic reconstructions weredefined as species by both ABGD and GMYC(Figs. 1a and S2). Integration of all species delimita-tion methods yielded 15 putative species in thesiliculosi group. Two of them corresponded toE. siliculosus and E. crouaniorum, the rest werenamed using numbers 1–13 (Fig. 1a).Ectocarpus putative species consolidation using ITS1
sequences. As reported by Stache-Crain et al. (1997),the alignment of all the ITS1 sequences from thesiliculosi group was not possible because of theirhigh degree of divergence and the presence ofnumerous indels. Therefore, alignments were madefor four subgroups that were established based onsequence similarity: (i) Ectocarpus 1, 2, 4 andE. siliculosus (alignment length 885 bp); (ii) Ectocar-pus 5, 6, and 7 (alignment length 447 bp); (iii) Ecto-carpus 8, 9, 10, and 11 (alignment length 456 bp);(iv) Ectocarpus 12, 13 and E. crouaniorum (alignmentlength 686 bp). The ITS1 sequences of Ectocarpus 3did not align well with any other putative speciesand were not included in these analyses. The topol-ogy of the unrooted ITS1 trees built for the
alignment subgroups were congruent with the puta-tive species defined using the COI-5P sequences(Fig. 1b). The ABGD analyses conducted withinthese four subgroups of alignments were alsoremarkably congruent with the putative speciesdefined using the COI-5P sequences (Figs. 1band S3 in the Supporting Information). The onlydiscrepancy was the merging of Ectocarpus 12 andEctocarpus 13 in the ABGD results (Fig. 1b). Sinceboth Ectocarpus 12 and Ectocarpus 13 were nonam-biguously defined as two separated putative specieswith the COI-5P and were retrieved as monophyleticgroups in both tree reconstructions for ITS1, wedecided to retain 15 consolidated species within thesiliculosi group (Fig. 1).Cases of incongruences between markers. Even though
results were largely concordant between markersand methods in delineating 15 consolidated specieswithin the siliculosi group, incongruences betweenthe nuclear and the mitochondrial markers wereobserved in several individuals collected in Chile(Table 2). In particular, a total of 20 individuals col-lected in Pan de Az!ucar (site 26) and nine individu-als collected in Quintay (site 28), were identified asE. crouaniorum using the mitochondrial marker COI-5P but as Ectocarpus 12 using the nuclear markerITS1. Moreover, one individual sampled in Quintay(site 28), which was identified as Ectocarpus 10 usingthe COI-5P mitochondrial marker, was identified asEctocarpus 11 based on the nuclear ITS1 marker andone individual collected in Concepci!on (site 29),which was identified as Ectocarpus 9 using the COI-5P was also identified as Ectocarpus 11 based on thenuclear marker.Geographic distribution of the 15 Ectocarpus spe-
cies. We chose to display the delimitation of thegeographic distribution of the 15 species using theresults of the mitochondrial COI-5P marker alone.However, it should be noted that a few discrepan-cies existed between the mitochondrial and thenuclear markers used in this study (see previousparagraph). Distribution patterns varied greatlyamong the species (Fig. 2). Concerning the 10 mostcommonly sampled species, one seemed to berestricted to a single biogeographic region (Ectocar-pus 7, n = 32, found only in the Peruvian Province);four species showed a distribution limited to oneocean (Ectocarpus 1, n = 30, and Ectocarpus 6, n = 48,both found in North and South Pacific; Ectocarpus10, n = 39, distributed only in the South Pacific andEctocarpus 3, n = 29, observed only in the NorthAtlantic); and five species were encountered inmore than one ocean. Among these five species,Ectocarpus 12 (n = 16) and Ectocarpus 13 (n = 34)were distributed in both the South Pacific and theNorth Atlantic. In the case of Ectocarpus 8 (n = 14),the species was present in both oceans but only onesample was found in the Atlantic. E. siliculosus andE. crouaniorum were the most common species inour data set. E. siliculosus (n = 206) was distributed
SPECIES DELIMITATION IN THE ECTOCARPUS SUBGROUP SILICULOSI 5
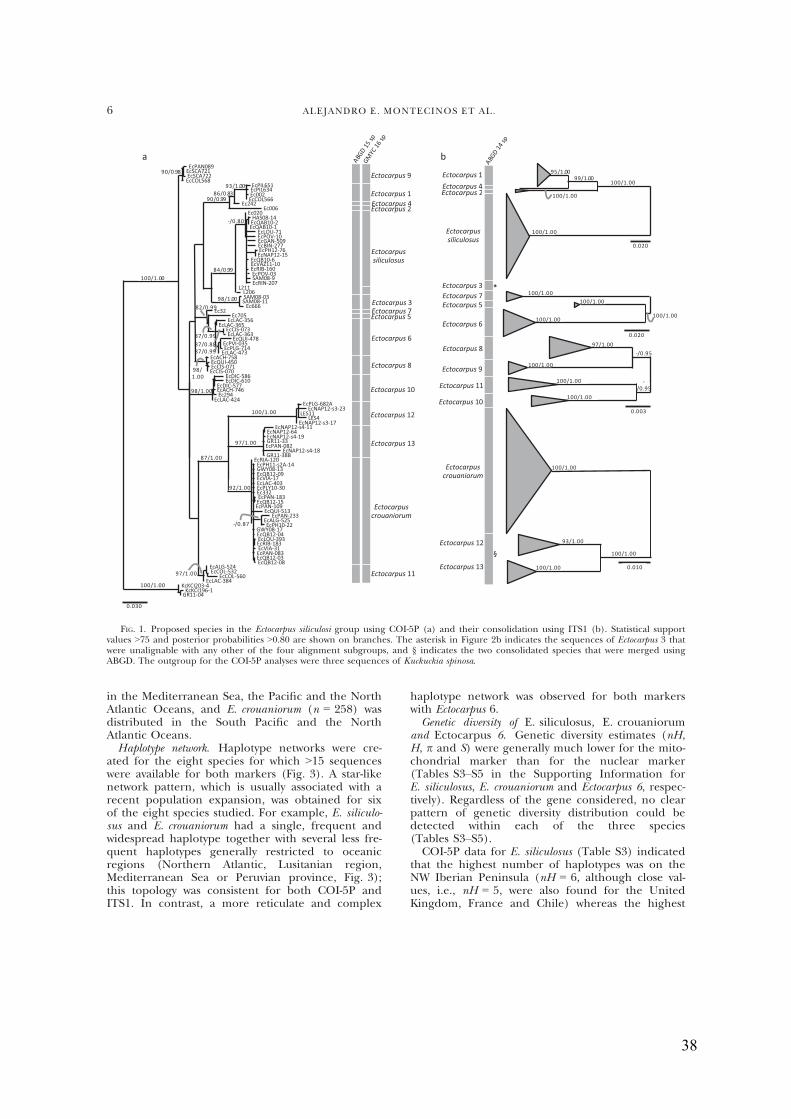
38
in the Mediterranean Sea, the Pacific and the NorthAtlantic Oceans, and E. crouaniorum (n = 258) wasdistributed in the South Pacific and the NorthAtlantic Oceans.Haplotype network. Haplotype networks were cre-
ated for the eight species for which >15 sequenceswere available for both markers (Fig. 3). A star-likenetwork pattern, which is usually associated with arecent population expansion, was obtained for sixof the eight species studied. For example, E. siliculo-sus and E. crouaniorum had a single, frequent andwidespread haplotype together with several less fre-quent haplotypes generally restricted to oceanicregions (Northern Atlantic, Lusitanian region,Mediterranean Sea or Peruvian province, Fig. 3);this topology was consistent for both COI-5P andITS1. In contrast, a more reticulate and complex
haplotype network was observed for both markerswith Ectocarpus 6.Genetic diversity of E. siliculosus, E. crouaniorum
and Ectocarpus 6. Genetic diversity estimates (nH,H, p and S) were generally much lower for the mito-chondrial marker than for the nuclear marker(Tables S3–S5 in the Supporting Information forE. siliculosus, E. crouaniorum and Ectocarpus 6, respec-tively). Regardless of the gene considered, no clearpattern of genetic diversity distribution could bedetected within each of the three species(Tables S3–S5).COI-5P data for E. siliculosus (Table S3) indicated
that the highest number of haplotypes was on theNW Iberian Peninsula (nH = 6, although close val-ues, i.e., nH = 5, were also found for the UnitedKingdom, France and Chile) whereas the highest
FIG. 1. Proposed species in the Ectocarpus siliculosi group using COI-5P (a) and their consolidation using ITS1 (b). Statistical supportvalues >75 and posterior probabilities >0.80 are shown on branches. The asterisk in Figure 2b indicates the sequences of Ectocarpus 3 thatwere unalignable with any other of the four alignment subgroups, and § indicates the two consolidated species that were merged usingABGD. The outgroup for the COI-5P analyses were three sequences of Kuckuckia spinosa.
6 ALEJANDRO E. MONTECINOS ET AL.
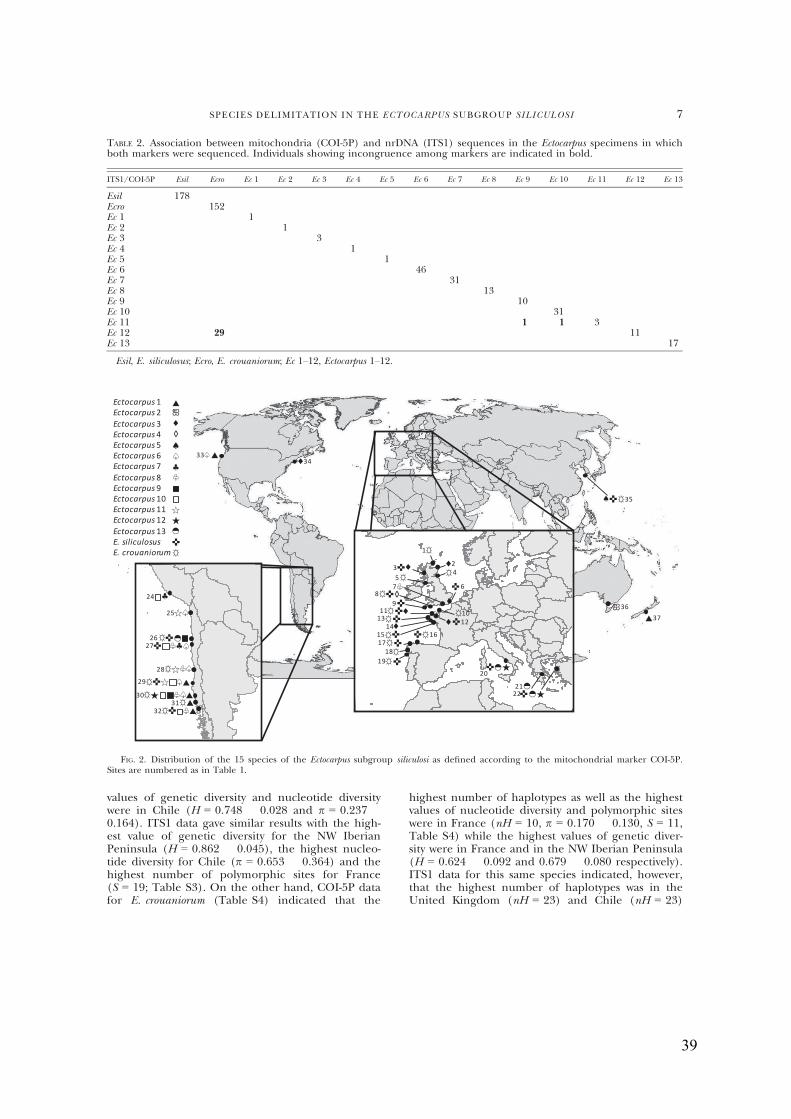
39
values of genetic diversity and nucleotide diversitywere in Chile (H = 0.748 ! 0.028 and p = 0.237 !0.164). ITS1 data gave similar results with the high-est value of genetic diversity for the NW IberianPeninsula (H = 0.862 ! 0.045), the highest nucleo-tide diversity for Chile (p = 0.653 ! 0.364) and thehighest number of polymorphic sites for France(S = 19; Table S3). On the other hand, COI-5P datafor E. crouaniorum (Table S4) indicated that the
highest number of haplotypes as well as the highestvalues of nucleotide diversity and polymorphic siteswere in France (nH = 10, p = 0.170 ! 0.130, S = 11,Table S4) while the highest values of genetic diver-sity were in France and in the NW Iberian Peninsula(H = 0.624 ! 0.092 and 0.679 ! 0.080 respectively).ITS1 data for this same species indicated, however,that the highest number of haplotypes was in theUnited Kingdom (nH = 23) and Chile (nH = 23)
TABLE 2. Association between mitochondria (COI-5P) and nrDNA (ITS1) sequences in the Ectocarpus specimens in whichboth markers were sequenced. Individuals showing incongruence among markers are indicated in bold.
ITS1/COI-5P Esil Ecro Ec 1 Ec 2 Ec 3 Ec 4 Ec 5 Ec 6 Ec 7 Ec 8 Ec 9 Ec 10 Ec 11 Ec 12 Ec 13
Esil 178Ecro 152Ec 1 1Ec 2 1Ec 3 3Ec 4 1Ec 5 1Ec 6 46Ec 7 31Ec 8 13Ec 9 10Ec 10 31Ec 11 1 1 3Ec 12 29 11Ec 13 17
Esil, E. siliculosus; Ecro, E. crouaniorum; Ec 1–12, Ectocarpus 1–12.
FIG. 2. Distribution of the 15 species of the Ectocarpus subgroup siliculosi as defined according to the mitochondrial marker COI-5P.Sites are numbered as in Table 1.
SPECIES DELIMITATION IN THE ECTOCARPUS SUBGROUP SILICULOSI 7
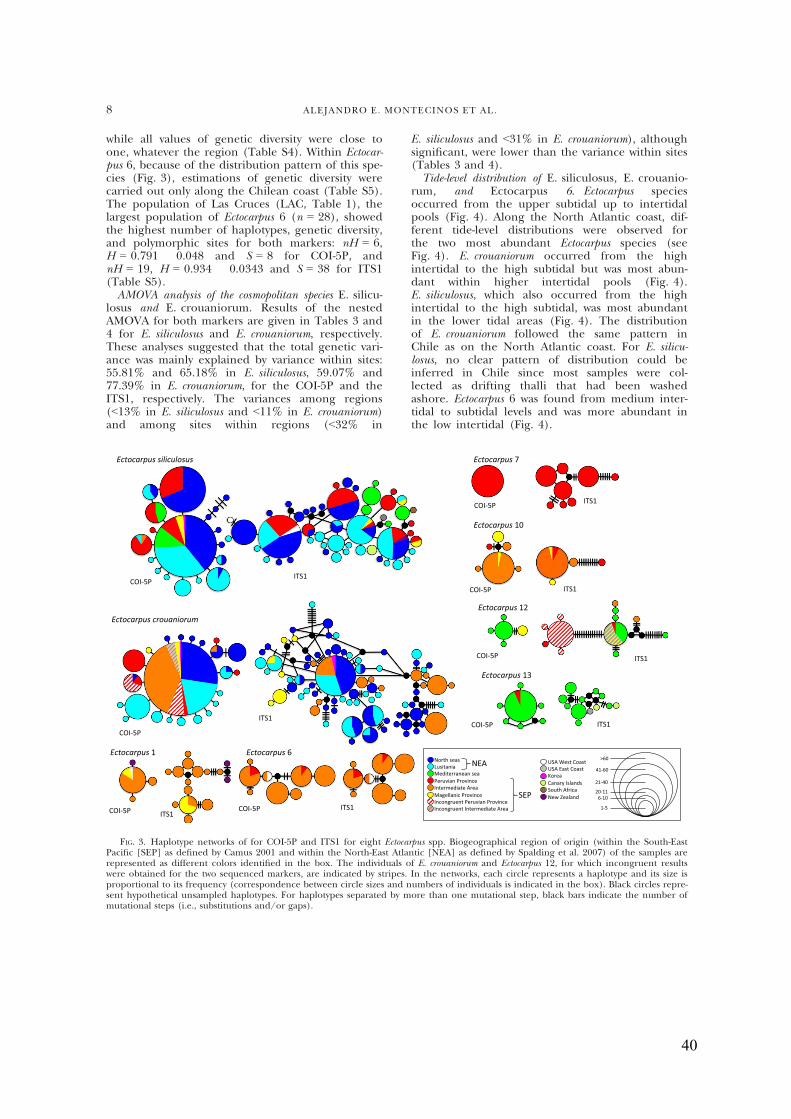
40
while all values of genetic diversity were close toone, whatever the region (Table S4). Within Ectocar-pus 6, because of the distribution pattern of this spe-cies (Fig. 3), estimations of genetic diversity werecarried out only along the Chilean coast (Table S5).The population of Las Cruces (LAC, Table 1), thelargest population of Ectocarpus 6 (n = 28), showedthe highest number of haplotypes, genetic diversity,and polymorphic sites for both markers: nH = 6,H = 0.791 ! 0.048 and S = 8 for COI-5P, andnH = 19, H = 0.934 ! 0.0343 and S = 38 for ITS1(Table S5).AMOVA analysis of the cosmopolitan species E. silicu-
losus and E. crouaniorum. Results of the nestedAMOVA for both markers are given in Tables 3 and4 for E. siliculosus and E. crouaniorum, respectively.These analyses suggested that the total genetic vari-ance was mainly explained by variance within sites:55.81% and 65.18% in E. siliculosus, 59.07% and77.39% in E. crouaniorum, for the COI-5P and theITS1, respectively. The variances among regions(<13% in E. siliculosus and <11% in E. crouaniorum)and among sites within regions (<32% in
E. siliculosus and <31% in E. crouaniorum), althoughsignificant, were lower than the variance within sites(Tables 3 and 4).Tide-level distribution of E. siliculosus, E. crouanio-
rum, and Ectocarpus 6. Ectocarpus speciesoccurred from the upper subtidal up to intertidalpools (Fig. 4). Along the North Atlantic coast, dif-ferent tide-level distributions were observed forthe two most abundant Ectocarpus species (seeFig. 4). E. crouaniorum occurred from the highintertidal to the high subtidal but was most abun-dant within higher intertidal pools (Fig. 4).E. siliculosus, which also occurred from the highintertidal to the high subtidal, was most abundantin the lower tidal areas (Fig. 4). The distributionof E. crouaniorum followed the same pattern inChile as on the North Atlantic coast. For E. silicu-losus, no clear pattern of distribution could beinferred in Chile since most samples were col-lected as drifting thalli that had been washedashore. Ectocarpus 6 was found from medium inter-tidal to subtidal levels and was more abundant inthe low intertidal (Fig. 4).
FIG. 3. Haplotype networks of for COI-5P and ITS1 for eight Ectocarpus spp. Biogeographical region of origin (within the South-EastPacific [SEP] as defined by Camus 2001 and within the North-East Atlantic [NEA] as defined by Spalding et al. 2007) of the samples arerepresented as different colors identified in the box. The individuals of E. crouaniorum and Ectocarpus 12, for which incongruent resultswere obtained for the two sequenced markers, are indicated by stripes. In the networks, each circle represents a haplotype and its size isproportional to its frequency (correspondence between circle sizes and numbers of individuals is indicated in the box). Black circles repre-sent hypothetical unsampled haplotypes. For haplotypes separated by more than one mutational step, black bars indicate the number ofmutational steps (i.e., substitutions and/or gaps).
8 ALEJANDRO E. MONTECINOS ET AL.
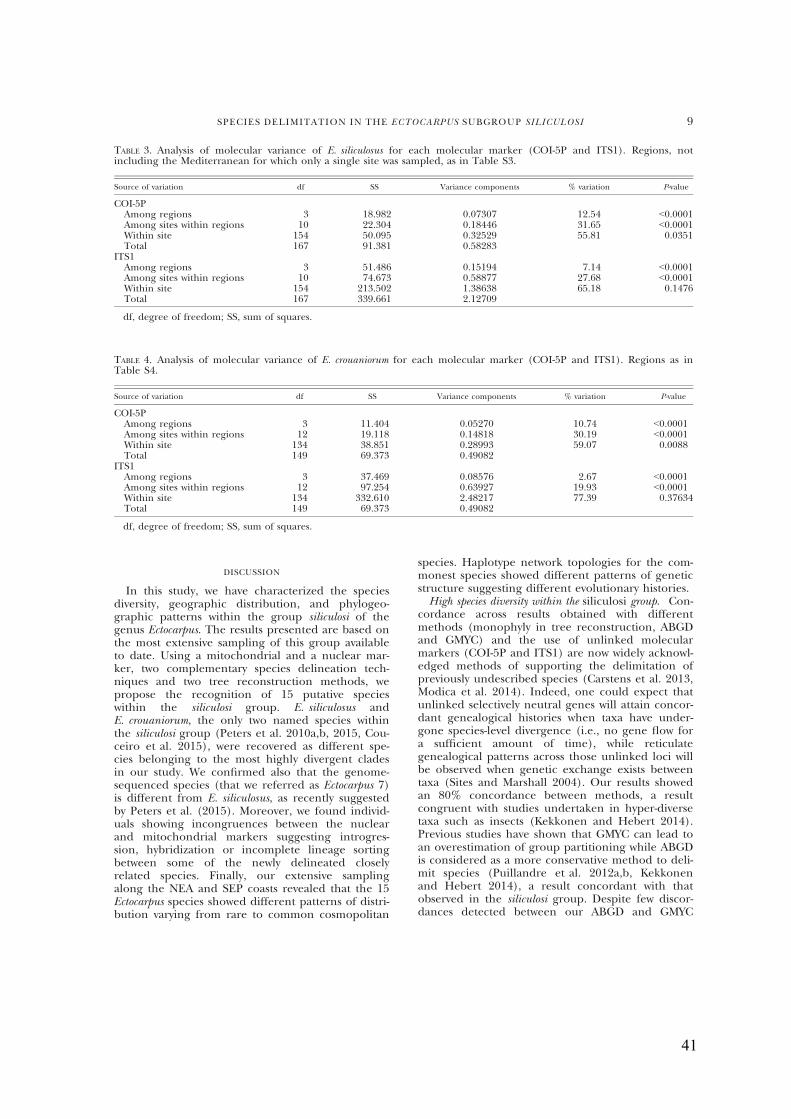
41
DISCUSSION
In this study, we have characterized the speciesdiversity, geographic distribution, and phylogeo-graphic patterns within the group siliculosi of thegenus Ectocarpus. The results presented are based onthe most extensive sampling of this group availableto date. Using a mitochondrial and a nuclear mar-ker, two complementary species delineation tech-niques and two tree reconstruction methods, wepropose the recognition of 15 putative specieswithin the siliculosi group. E. siliculosus andE. crouaniorum, the only two named species withinthe siliculosi group (Peters et al. 2010a,b, 2015, Cou-ceiro et al. 2015), were recovered as different spe-cies belonging to the most highly divergent cladesin our study. We confirmed also that the genome-sequenced species (that we referred as Ectocarpus 7)is different from E. siliculosus, as recently suggestedby Peters et al. (2015). Moreover, we found individ-uals showing incongruences between the nuclearand mitochondrial markers suggesting introgres-sion, hybridization or incomplete lineage sortingbetween some of the newly delineated closelyrelated species. Finally, our extensive samplingalong the NEA and SEP coasts revealed that the 15Ectocarpus species showed different patterns of distri-bution varying from rare to common cosmopolitan
species. Haplotype network topologies for the com-monest species showed different patterns of geneticstructure suggesting different evolutionary histories.High species diversity within the siliculosi group. Con-
cordance across results obtained with differentmethods (monophyly in tree reconstruction, ABGDand GMYC) and the use of unlinked molecularmarkers (COI-5P and ITS1) are now widely acknowl-edged methods of supporting the delimitation ofpreviously undescribed species (Carstens et al. 2013,Modica et al. 2014). Indeed, one could expect thatunlinked selectively neutral genes will attain concor-dant genealogical histories when taxa have under-gone species-level divergence (i.e., no gene flow fora sufficient amount of time), while reticulategenealogical patterns across those unlinked loci willbe observed when genetic exchange exists betweentaxa (Sites and Marshall 2004). Our results showedan 80% concordance between methods, a resultcongruent with studies undertaken in hyper-diversetaxa such as insects (Kekkonen and Hebert 2014).Previous studies have shown that GMYC can lead toan overestimation of group partitioning while ABGDis considered as a more conservative method to deli-mit species (Puillandre et al. 2012a,b, Kekkonenand Hebert 2014), a result concordant with thatobserved in the siliculosi group. Despite few discor-dances detected between our ABGD and GMYC
TABLE 3. Analysis of molecular variance of E. siliculosus for each molecular marker (COI-5P and ITS1). Regions, notincluding the Mediterranean for which only a single site was sampled, as in Table S3.
Source of variation df SS Variance components % variation P-value
COI-5PAmong regions 3 18.982 0.07307 12.54 <0.0001Among sites within regions 10 22.304 0.18446 31.65 <0.0001Within site 154 50.095 0.32529 55.81 0.0351Total 167 91.381 0.58283
ITS1Among regions 3 51.486 0.15194 7.14 <0.0001Among sites within regions 10 74.673 0.58877 27.68 <0.0001Within site 154 213.502 1.38638 65.18 0.1476Total 167 339.661 2.12709
df, degree of freedom; SS, sum of squares.
TABLE 4. Analysis of molecular variance of E. crouaniorum for each molecular marker (COI-5P and ITS1). Regions as inTable S4.
Source of variation df SS Variance components % variation P-value
COI-5PAmong regions 3 11.404 0.05270 10.74 <0.0001Among sites within regions 12 19.118 0.14818 30.19 <0.0001Within site 134 38.851 0.28993 59.07 0.0088Total 149 69.373 0.49082
ITS1Among regions 3 37.469 0.08576 2.67 <0.0001Among sites within regions 12 97.254 0.63927 19.93 <0.0001Within site 134 332.610 2.48217 77.39 0.37634Total 149 69.373 0.49082
df, degree of freedom; SS, sum of squares.
SPECIES DELIMITATION IN THE ECTOCARPUS SUBGROUP SILICULOSI 9
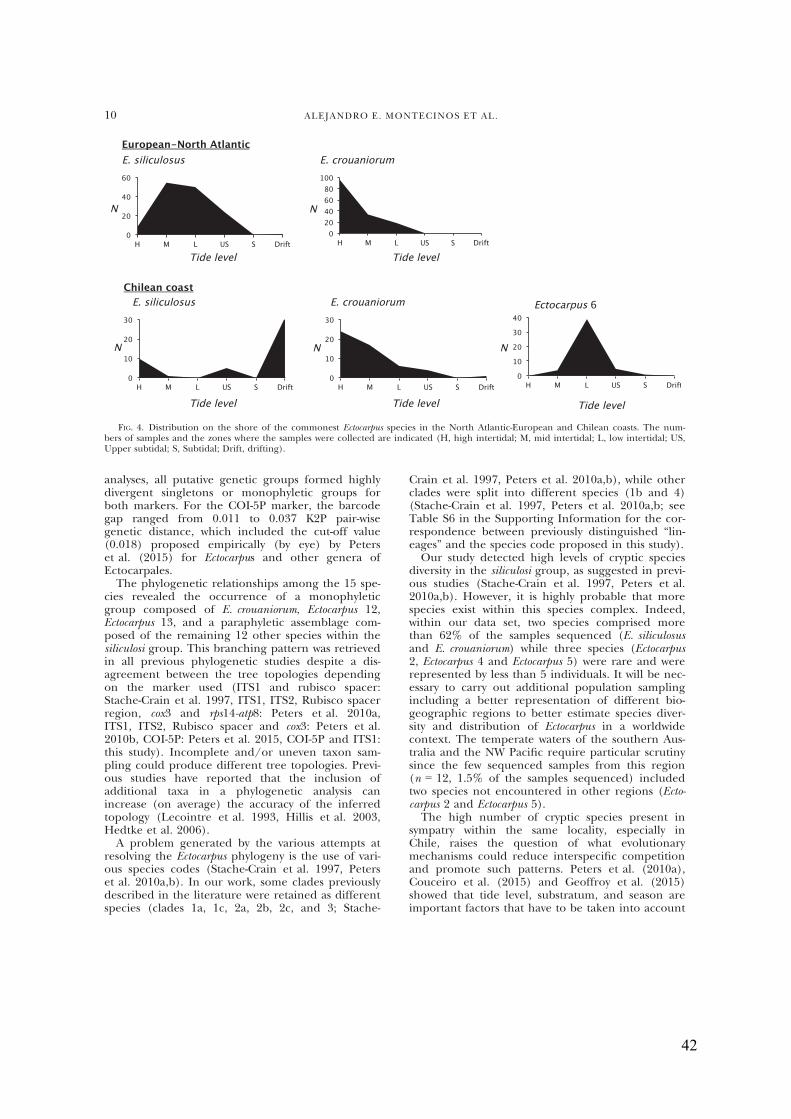
42
analyses, all putative genetic groups formed highlydivergent singletons or monophyletic groups forboth markers. For the COI-5P marker, the barcodegap ranged from 0.011 to 0.037 K2P pair-wisegenetic distance, which included the cut-off value(0.018) proposed empirically (by eye) by Peterset al. (2015) for Ectocarpus and other genera ofEctocarpales.
The phylogenetic relationships among the 15 spe-cies revealed the occurrence of a monophyleticgroup composed of E. crouaniorum, Ectocarpus 12,Ectocarpus 13, and a paraphyletic assemblage com-posed of the remaining 12 other species within thesiliculosi group. This branching pattern was retrievedin all previous phylogenetic studies despite a dis-agreement between the tree topologies dependingon the marker used (ITS1 and rubisco spacer:Stache-Crain et al. 1997, ITS1, ITS2, Rubisco spacerregion, cox3 and rps14-atp8: Peters et al. 2010a,ITS1, ITS2, Rubisco spacer and cox3: Peters et al.2010b, COI-5P: Peters et al. 2015, COI-5P and ITS1:this study). Incomplete and/or uneven taxon sam-pling could produce different tree topologies. Previ-ous studies have reported that the inclusion ofadditional taxa in a phylogenetic analysis canincrease (on average) the accuracy of the inferredtopology (Lecointre et al. 1993, Hillis et al. 2003,Hedtke et al. 2006).
A problem generated by the various attempts atresolving the Ectocarpus phylogeny is the use of vari-ous species codes (Stache-Crain et al. 1997, Peterset al. 2010a,b). In our work, some clades previouslydescribed in the literature were retained as differentspecies (clades 1a, 1c, 2a, 2b, 2c, and 3; Stache-
Crain et al. 1997, Peters et al. 2010a,b), while otherclades were split into different species (1b and 4)(Stache-Crain et al. 1997, Peters et al. 2010a,b; seeTable S6 in the Supporting Information for the cor-respondence between previously distinguished “lin-eages” and the species code proposed in this study).Our study detected high levels of cryptic species
diversity in the siliculosi group, as suggested in previ-ous studies (Stache-Crain et al. 1997, Peters et al.2010a,b). However, it is highly probable that morespecies exist within this species complex. Indeed,within our data set, two species comprised morethan 62% of the samples sequenced (E. siliculosusand E. crouaniorum) while three species (Ectocarpus2, Ectocarpus 4 and Ectocarpus 5) were rare and wererepresented by less than 5 individuals. It will be nec-essary to carry out additional population samplingincluding a better representation of different bio-geographic regions to better estimate species diver-sity and distribution of Ectocarpus in a worldwidecontext. The temperate waters of the southern Aus-tralia and the NW Pacific require particular scrutinysince the few sequenced samples from this region(n = 12, 1.5% of the samples sequenced) includedtwo species not encountered in other regions (Ecto-carpus 2 and Ectocarpus 5).The high number of cryptic species present in
sympatry within the same locality, especially inChile, raises the question of what evolutionarymechanisms could reduce interspecific competitionand promote such patterns. Peters et al. (2010a),Couceiro et al. (2015) and Geoffroy et al. (2015)showed that tide level, substratum, and season areimportant factors that have to be taken into account
FIG. 4. Distribution on the shore of the commonest Ectocarpus species in the North Atlantic-European and Chilean coasts. The num-bers of samples and the zones where the samples were collected are indicated (H, high intertidal; M, mid intertidal; L, low intertidal; US,Upper subtidal; S, Subtidal; Drift, drifting).
10 ALEJANDRO E. MONTECINOS ET AL.
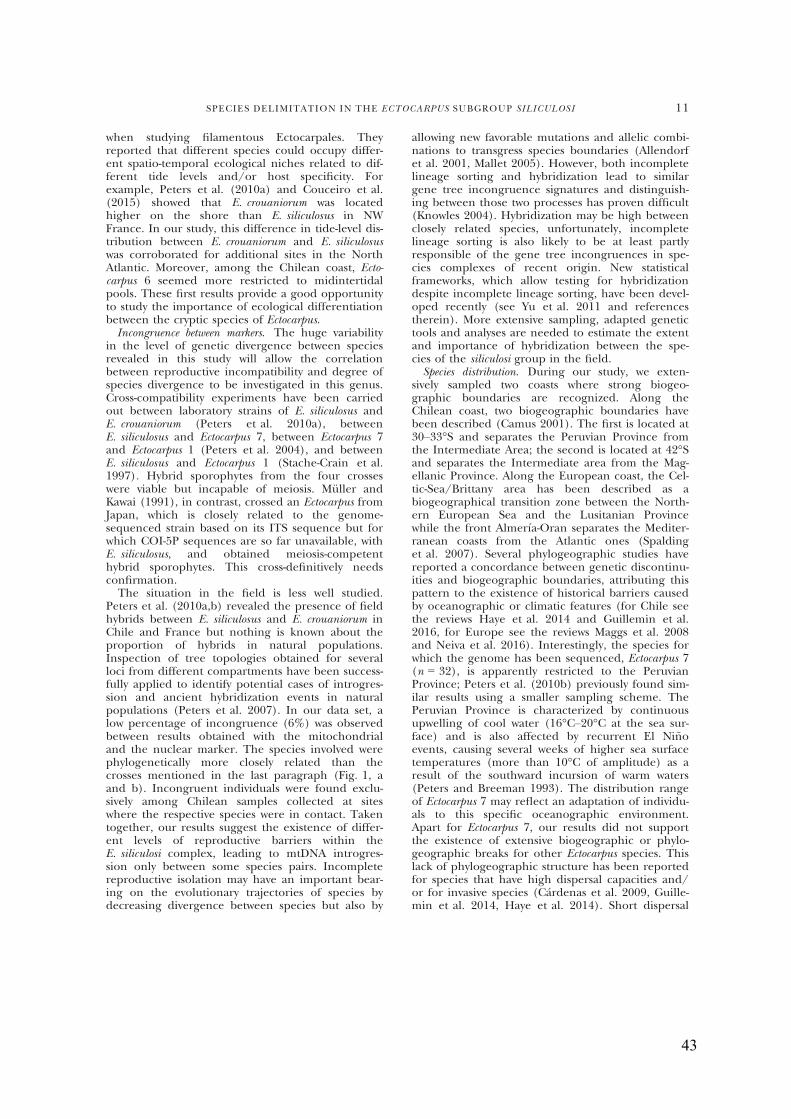
43
when studying filamentous Ectocarpales. Theyreported that different species could occupy differ-ent spatio-temporal ecological niches related to dif-ferent tide levels and/or host specificity. Forexample, Peters et al. (2010a) and Couceiro et al.(2015) showed that E. crouaniorum was locatedhigher on the shore than E. siliculosus in NWFrance. In our study, this difference in tide-level dis-tribution between E. crouaniorum and E. siliculosuswas corroborated for additional sites in the NorthAtlantic. Moreover, among the Chilean coast, Ecto-carpus 6 seemed more restricted to midintertidalpools. These first results provide a good opportunityto study the importance of ecological differentiationbetween the cryptic species of Ectocarpus.Incongruence between markers. The huge variability
in the level of genetic divergence between speciesrevealed in this study will allow the correlationbetween reproductive incompatibility and degree ofspecies divergence to be investigated in this genus.Cross-compatibility experiments have been carriedout between laboratory strains of E. siliculosus andE. crouaniorum (Peters et al. 2010a), betweenE. siliculosus and Ectocarpus 7, between Ectocarpus 7and Ectocarpus 1 (Peters et al. 2004), and betweenE. siliculosus and Ectocarpus 1 (Stache-Crain et al.1997). Hybrid sporophytes from the four crosseswere viable but incapable of meiosis. M€uller andKawai (1991), in contrast, crossed an Ectocarpus fromJapan, which is closely related to the genome-sequenced strain based on its ITS sequence but forwhich COI-5P sequences are so far unavailable, withE. siliculosus, and obtained meiosis-competenthybrid sporophytes. This cross-definitively needsconfirmation.
The situation in the field is less well studied.Peters et al. (2010a,b) revealed the presence of fieldhybrids between E. siliculosus and E. crouaniorum inChile and France but nothing is known about theproportion of hybrids in natural populations.Inspection of tree topologies obtained for severalloci from different compartments have been success-fully applied to identify potential cases of introgres-sion and ancient hybridization events in naturalpopulations (Peters et al. 2007). In our data set, alow percentage of incongruence (6%) was observedbetween results obtained with the mitochondrialand the nuclear marker. The species involved werephylogenetically more closely related than thecrosses mentioned in the last paragraph (Fig. 1, aand b). Incongruent individuals were found exclu-sively among Chilean samples collected at siteswhere the respective species were in contact. Takentogether, our results suggest the existence of differ-ent levels of reproductive barriers within theE. siliculosi complex, leading to mtDNA introgres-sion only between some species pairs. Incompletereproductive isolation may have an important bear-ing on the evolutionary trajectories of species bydecreasing divergence between species but also by
allowing new favorable mutations and allelic combi-nations to transgress species boundaries (Allendorfet al. 2001, Mallet 2005). However, both incompletelineage sorting and hybridization lead to similargene tree incongruence signatures and distinguish-ing between those two processes has proven difficult(Knowles 2004). Hybridization may be high betweenclosely related species, unfortunately, incompletelineage sorting is also likely to be at least partlyresponsible of the gene tree incongruences in spe-cies complexes of recent origin. New statisticalframeworks, which allow testing for hybridizationdespite incomplete lineage sorting, have been devel-oped recently (see Yu et al. 2011 and referencestherein). More extensive sampling, adapted genetictools and analyses are needed to estimate the extentand importance of hybridization between the spe-cies of the siliculosi group in the field.Species distribution. During our study, we exten-
sively sampled two coasts where strong biogeo-graphic boundaries are recognized. Along theChilean coast, two biogeographic boundaries havebeen described (Camus 2001). The first is located at30–33°S and separates the Peruvian Province fromthe Intermediate Area; the second is located at 42°Sand separates the Intermediate area from the Mag-ellanic Province. Along the European coast, the Cel-tic-Sea/Brittany area has been described as abiogeographical transition zone between the North-ern European Sea and the Lusitanian Provincewhile the front Almer"ıa-Oran separates the Mediter-ranean coasts from the Atlantic ones (Spaldinget al. 2007). Several phylogeographic studies havereported a concordance between genetic discontinu-ities and biogeographic boundaries, attributing thispattern to the existence of historical barriers causedby oceanographic or climatic features (for Chile seethe reviews Haye et al. 2014 and Guillemin et al.2016, for Europe see the reviews Maggs et al. 2008and Neiva et al. 2016). Interestingly, the species forwhich the genome has been sequenced, Ectocarpus 7(n = 32), is apparently restricted to the PeruvianProvince; Peters et al. (2010b) previously found sim-ilar results using a smaller sampling scheme. ThePeruvian Province is characterized by continuousupwelling of cool water (16°C–20°C at the sea sur-face) and is also affected by recurrent El Ni~noevents, causing several weeks of higher sea surfacetemperatures (more than 10°C of amplitude) as aresult of the southward incursion of warm waters(Peters and Breeman 1993). The distribution rangeof Ectocarpus 7 may reflect an adaptation of individu-als to this specific oceanographic environment.Apart for Ectocarpus 7, our results did not supportthe existence of extensive biogeographic or phylo-geographic breaks for other Ectocarpus species. Thislack of phylogeographic structure has been reportedfor species that have high dispersal capacities and/or for invasive species (C"ardenas et al. 2009, Guille-min et al. 2014, Haye et al. 2014). Short dispersal
SPECIES DELIMITATION IN THE ECTOCARPUS SUBGROUP SILICULOSI 11
44
distances of spores, gametes, or zygotes coupledwith rare events of long-distance colonization seemto be the rule for the Phaeophyceae (Reed 1990,Raimondi et al. 2004, Neiva et al. 2012, Robuchonet al. 2014). However, Ectocarpus is described as animportant contributor to biofouling and long-dis-tance dispersal might be associated with humantransport (Stache-Crain et al. 1997). Indeed, wedetected two truly cosmopolitan species (E. siliculo-sus and E. crouaniorum) showing a star-like haplo-type network and shared haplotypes betweencontinents, a pattern characteristic of a recentexpansion that may be facilitated by human activi-ties. Ectocarpus 1 and Ectocarpus 6 occur in boththe northern and the southern Pacific Ocean.Despite the large distances separating the sampledpopulations of these two species, no genetic struc-ture was detected in their haplotype networks, apattern suggestive of recent dispersal eventsbetween the North and South Pacific coasts. Simi-larly, no phylogeographic structure was observedfor three South Pacific species (Ectocarpus 9, Ecto-carpus 10 and Ectocarpus 11) nor for one NorthAtlantic species (Ectocarpus 3). It has been sug-gested that recent colonization events can elimi-nate genetic structure linked to historical barriers(Smith et al. 2011, DiBattista et al. 2012), thus theintroductions of Ectocarpus species through ship-ping activities could explain the lack of phylogeo-graphic structure in our study. Stache-Crain et al.(1997) have indeed reported that strains belong-ing to E. siliculosus sensu stricto (referred as lin-eage 1a) sampled from different continents showa maximum of five substitutions for the ITS mar-ker; these authors suggest that recent dispersalevents could have shaped the genetic diversity inthis species. Both natural dispersal after the Pleis-tocene and transport via shipping have been pro-posed for this species (Stache-Crain et al. 1997).In our study, the distribution of Ectocarpus 8 seemsrelated to dispersal associated with human trans-port. This species was present in the South Pacificand a single sample was found in the NorthAtlantic. This sample corresponds to an individualcollected in the Kingsbridge Estuary (Devon, Eng-land). This could suggest a recent arrival of thisspecies in the English Channel in ballast water orattached to a ship hull. Even if the dispersalcapacity of Ectocarpus might be favored by ship-ping, when the number of samples was sufficientto perform within-species genetic differentiationanalyses, we always found a slight but significanthierarchical pattern of genetic differentiation (i.e.,see Tables 3 and 4; results of the nestedAMOVA). Consequently, the pattern of genetic dif-ferentiation may be more complex than what wefound in this study and sampling effort needs tobe improved for all species to get a comprehen-sive idea of species distribution, species phylogeog-raphy and population connectivity.
CONCLUSION
Using DNA sequence data and species delimita-tion methods, we have observed the presence of atleast 15 species within the Ectocarpus siliculosi group.Species showed different patterns of distributionand suggested different evolutionary histories. Fur-ther scrutiny of individuals cultivated in controlledlaboratory conditions may reveal consistent morpho-logical differences between species. However, futureresearch on speciation in these filamentous brownalgae will have to take into account that in the field,it is impossible to distinguish between species withinthe E. siliculosi group. This contrasts clearly with thesignificant morphological differences observedbetween recently diverging species in other Phaeo-phyceae, such as Fucus (C!anovas et al. 2011, Coyeret al. 2011). In any case, the complex pattern ofphylogenetic relationships among the 15 speciesrevealed in this study, opens a very interesting fieldof research deciphering the process of evolutionand diversification in this group using the toolsavailable from the model organism for genomicsand genetics of the brown macroalgae.
We are particularly grateful to C. Destombe, S. Faugeron, A.Mann, D.G. M€uller, P. Mur!ua, D. Pati~no, D. Schroeder, J.West and R. Westermeier, who helped by collecting samples.The authors thank Biogenouest Core Facility for technicalassistance and the members of Grupo BioCost of Coru~naUniversity for advice and logistic support during sampling inGalicia and North Portugal. We also thank to S. Mauger forassistance in the molecular laboratory and L. Dartevelle andJ. Coudret for help in maintaining strains in the Station Bio-logique de Roscoff. We particularly appreciated insightfuland constructive comments from C. Destombe and J. M.Cock. Principal funding came from a doctoral grant to A. E.Montecinos (Becas-Chile, CONICYT, advanced humanresources program), additional support from the projectsIDEALG (France: ANR-10-BTBR-04), “Biblioth#eque du vivant”(France: INRA-MNHN-INEE-CNRS) and Bi-Cycle (France:ANR10-BLAN-1727), the EU FP7 “capacities” specific programASSEMBLE (grant no. 227799), the EU Interreg programFrance (Channel)—England (project Marinexus), theTOTAL Foundation (Project “Brown algal biodiversity andecology in the Eastern Mediterranean Sea”), and a Ray-Lanke-ster Fellowship (UK: Marine Biological Association, Ply-mouth) to A. F. Peters. The work was carried out within thecontext of the international research network “Diversity, Evo-lution and Biotechnology of Marine Algae” (GDRI No. 0803).The authors have declared that no competing interests exist.
Allendorf, F. W., Leary, R. F., Spruell, P. & Wenburg, J. K. 2001.The problems with hybrids: setting conservation guidelines.Trends Ecol. Evol. 16:613–22.
Al#o, D., Correa, C., Arias, C. & C!ardenas, L. 2013. Diversity ofAplochiton fishes (Galaxiidea) and the taxonomic resurrectionof A. marinus. PLoS ONE 8:e71577.
Bandelt, H. J., Forster, P. & R€ohl, A. 1999. Median-joining net-works for inferring intraspecific phylogenies. Mol. Biol. Evol.16:37–48.
Camus, P. 2001. Biogeograf!ıa marina de Chile continental. Rev.Chil. Hist. Nat. 74:587–617.
C!anovas, F. G., Mota, C. F., Serrao, E. A. & Pearson, G. A. 2011.Driving south: a multi-gene phylogeny of the brown algal
12 ALEJANDRO E. MONTECINOS ET AL.
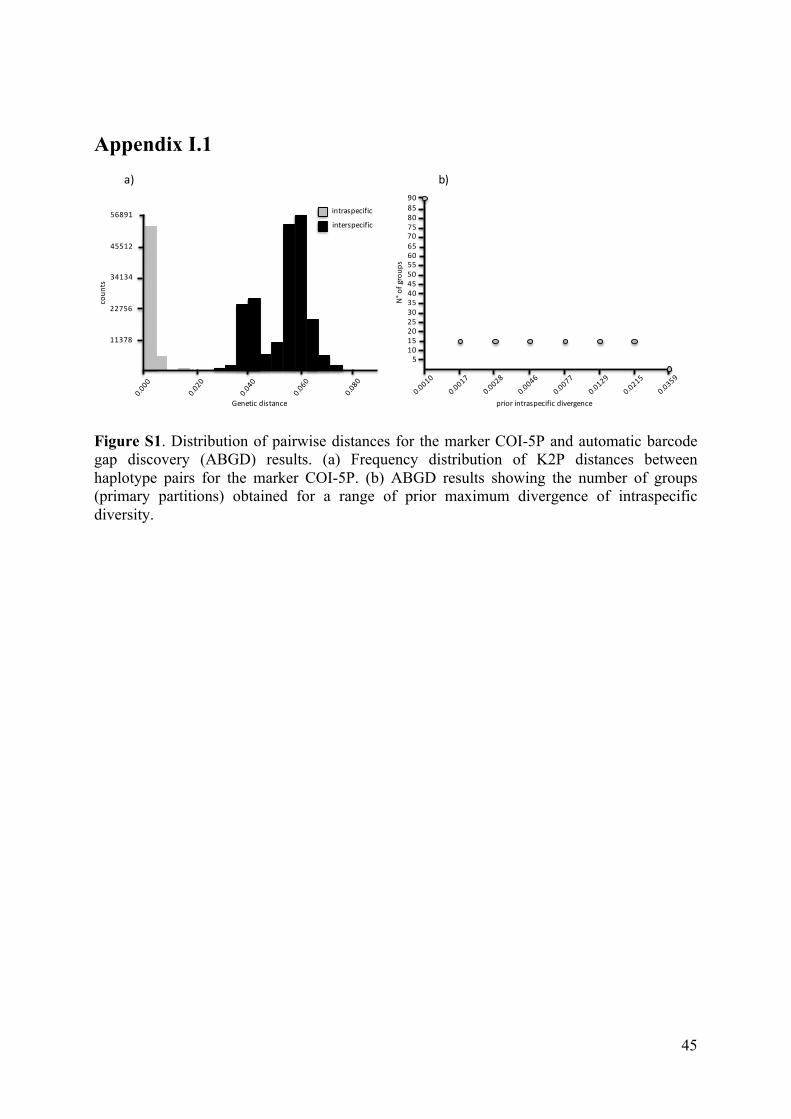
45
Appendix I.1
Figure S1. Distribution of pairwise distances for the marker COI-5P and automatic barcode gap discovery (ABGD) results. (a) Frequency distribution of K2P distances between haplotype pairs for the marker COI-5P. (b) ABGD results showing the number of groups (primary partitions) obtained for a range of prior maximum divergence of intraspecific diversity.
510152025303540
9085
45505560
80757065
priorintraspecific divergenceN°o
fgroup
s
56891
45512
34134
22756
11378
Geneticdistance
coun
ts
intraspecific
interspecific
a) b)

46
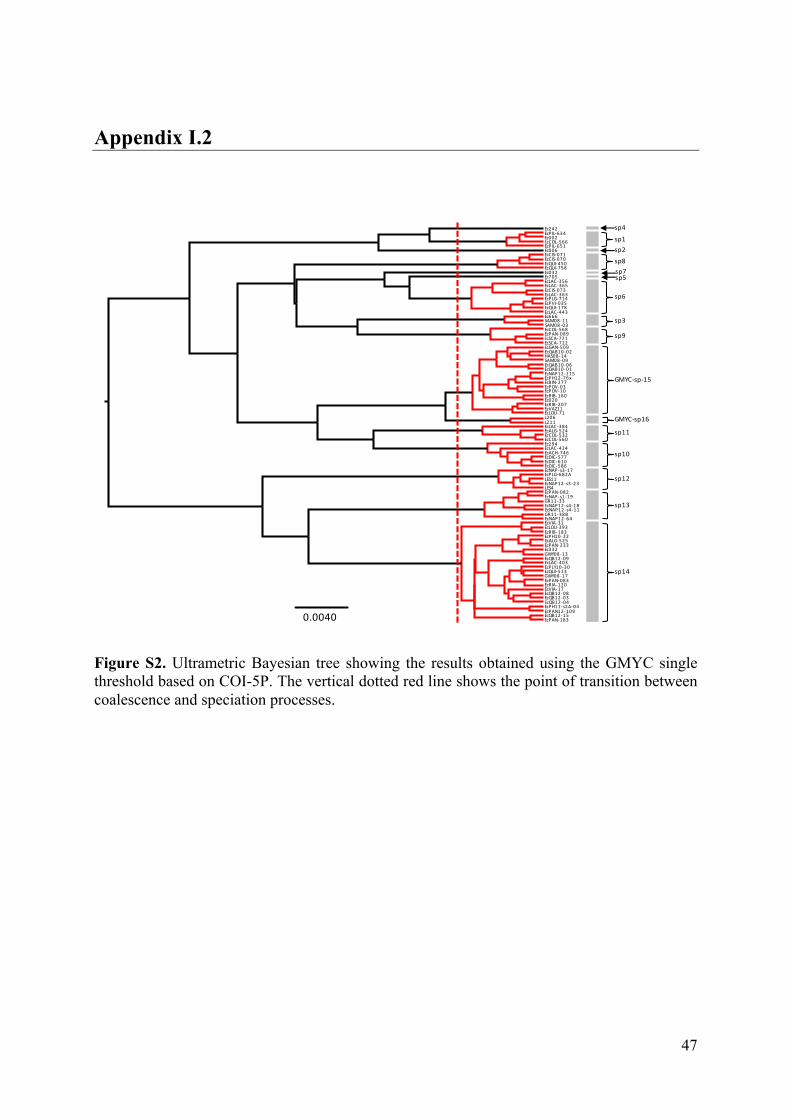
47
Appendix I.2
Figure S2. Ultrametric Bayesian tree showing the results obtained using the GMYC single threshold based on COI-5P. The vertical dotted red line shows the point of transition between coalescence and speciation processes.
1
GR11-38B
EcNAP12-s4-18
Ec242EcPIL-634
EcCOL-566Ec002EcPIL-651Ec006EcCIS-071
EcQUI-450
EcPAN-183
EcNAP12-s4-11
EcGAN-509EcQAB10-02
Ec032EcQUI-758
Ec705EcLAC-356EcLAC-365EcCIS-073EcLAC-363EcPLG-714EcPVI-035EcQUI-178EcLAC-443Ec666SAM08-11SAM08-03EcCOL-568EcPAN-089EcSCA-721EcSCA-722
HAS08-14SAM08-09EcQAB10-06EcQAB10-01EcNAP12-115EcPH12-76xEcBIN-277EcPOV-03EcPOV-10EcRIB-160Ec020EcRIB-207EcVAZ11EcLOU-71L206L211EcLAC-384EcALG-524EcCOL-532EcCOL-560Ec294EcLAC-424EcACH-746EcDIC-577EcDIC-610EcDIC-586EcNAP-s3-17EcPLG-682ALES11EcNAP12-s3-23LES4EcPAN-082EcNAP-s1-19GR11-33
EcNAP12-64EcVIA-31EcLOU-393EcRIB-183EcPH10-22EcALG-525EcPAN-233Ec332GWY08-13EcQB12-09EcLAC-403EcPLY10-30EcQUI-513GWY08-17EcPAN-083EcRIA-120EcVIA-17EcQB12-08EcQB12-03EcQB12-04EcPH11-s2A-04EcPAN12-109EcQB12-15
EcCIS-070
0.0040
sp4sp1sp2sp8sp7sp5
sp6
sp3
sp9
GMYC-sp-15
GMYC-sp16
sp11
sp10
sp12
sp13
sp14
1

48
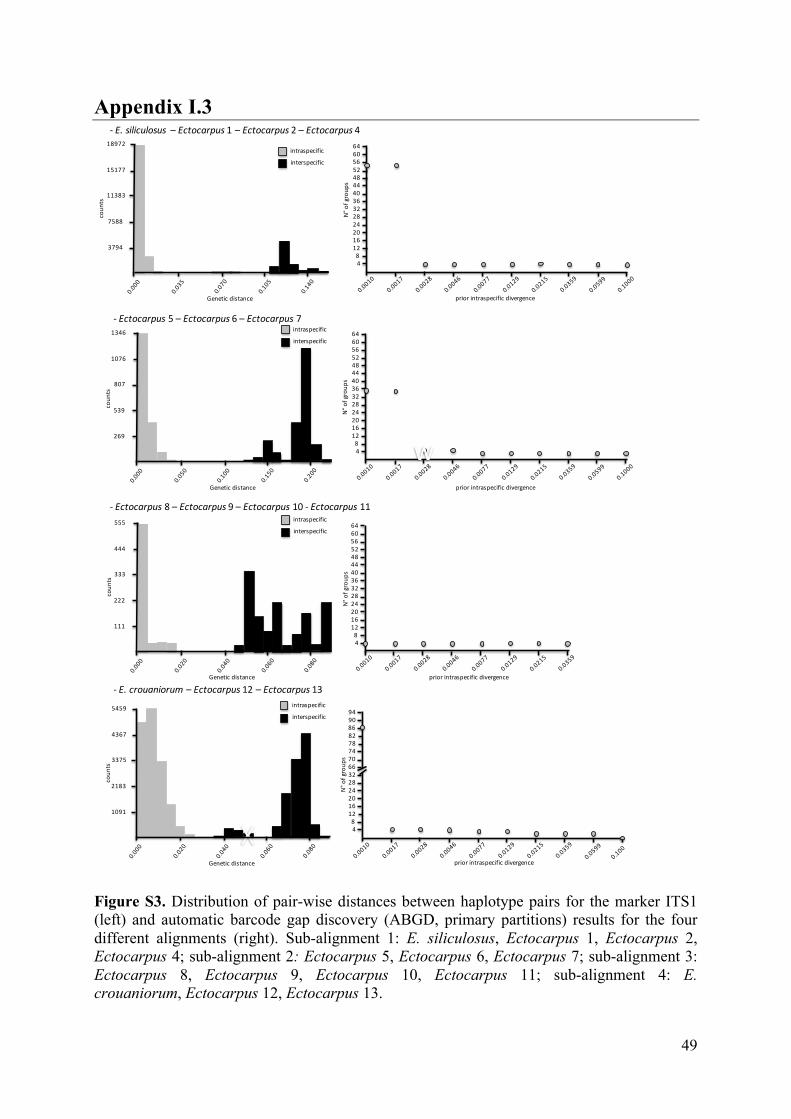
49
Appendix I.3
Figure S3. Distribution of pair-wise distances between haplotype pairs for the marker ITS1 (left) and automatic barcode gap discovery (ABGD, primary partitions) results for the four different alignments (right). Sub-alignment 1: E. siliculosus, Ectocarpus 1, Ectocarpus 2, Ectocarpus 4; sub-alignment 2: Ectocarpus 5, Ectocarpus 6, Ectocarpus 7; sub-alignment 3: Ectocarpus 8, Ectocarpus 9, Ectocarpus 10, Ectocarpus 11; sub-alignment 4: E. crouaniorum, Ectocarpus 12, Ectocarpus 13.
18972
15177
11383
7588
3794
Geneticdistance
coun
ts
4812162024283236404448
64605652
priorintraspecificdivergence
N°ofgrou
ps
- E.siliculosus – Ectocarpus1– Ectocarpus2– Ectocarpus4
- Ectocarpus5 – Ectocarpus6– Ectocarpus7
intraspecific
interspecific
1346
1076
807
539
269
Geneticdistance
coun
ts
intraspecific
interspecific
w4812162024283236404448
64605652
priorintraspecificdivergence
N°ofgroup
s
- Ectocarpus8– Ectocarpus9– Ectocarpus10- Ectocarpus11555
444
333
222
111
Genetic distance
coun
ts
intraspecific
interspecific
4812162024283236404448
64605652
priorintraspecificdivergence
N°ofgroup
s
5459
4367
3375
2183
1091
Geneticdistance
coun
ts
intraspecific
interspecific
4812162024283266707478
94908682
priorintraspecificdivergence
N°ofgroup
s
X
- E.crouaniorum– Ectocarpus12– Ectocarpus13

50
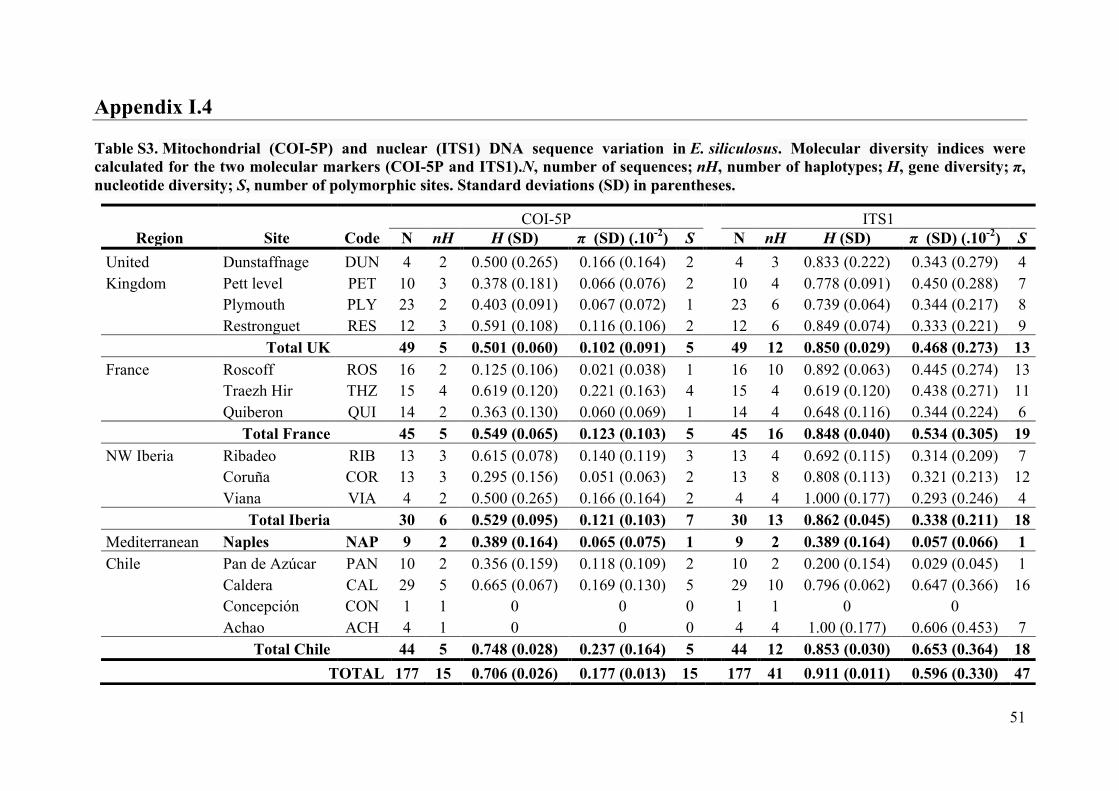
51
Appendix I.4 Table S3. Mitochondrial (COI-5P) and nuclear (ITS1) DNA sequence variation in E. siliculosus. Molecular diversity indices were calculated for the two molecular markers (COI-5P and ITS1).N, number of sequences; nH, number of haplotypes; H, gene diversity; π, nucleotide diversity; S, number of polymorphic sites. Standard deviations (SD) in parentheses.
COI-5P ITS1 Region Site Code N nH H (SD) π (SD) (.10-2) S N nH H (SD) π (SD) (.10-2) S
United Dunstaffnage DUN 4 2 0.500 (0.265) 0.166 (0.164) 2 4 3 0.833 (0.222) 0.343 (0.279) 4 Kingdom Pett level PET 10 3 0.378 (0.181) 0.066 (0.076) 2 10 4 0.778 (0.091) 0.450 (0.288) 7 Plymouth PLY 23 2 0.403 (0.091) 0.067 (0.072) 1 23 6 0.739 (0.064) 0.344 (0.217) 8 Restronguet RES 12 3 0.591 (0.108) 0.116 (0.106) 2 12 6 0.849 (0.074) 0.333 (0.221) 9
Total UK 49 5 0.501 (0.060) 0.102 (0.091) 5 49 12 0.850 (0.029) 0.468 (0.273) 13 France Roscoff ROS 16 2 0.125 (0.106) 0.021 (0.038) 1 16 10 0.892 (0.063) 0.445 (0.274) 13 Traezh Hir THZ 15 4 0.619 (0.120) 0.221 (0.163) 4 15 4 0.619 (0.120) 0.438 (0.271) 11 Quiberon QUI 14 2 0.363 (0.130) 0.060 (0.069) 1 14 4 0.648 (0.116) 0.344 (0.224) 6
Total France 45 5 0.549 (0.065) 0.123 (0.103) 5 45 16 0.848 (0.040) 0.534 (0.305) 19 NW Iberia Ribadeo RIB 13 3 0.615 (0.078) 0.140 (0.119) 3 13 4 0.692 (0.115) 0.314 (0.209) 7 Coruña COR 13 3 0.295 (0.156) 0.051 (0.063) 2 13 8 0.808 (0.113) 0.321 (0.213) 12 Viana VIA 4 2 0.500 (0.265) 0.166 (0.164) 2 4 4 1.000 (0.177) 0.293 (0.246) 4
Total Iberia 30 6 0.529 (0.095) 0.121 (0.103) 7 30 13 0.862 (0.045) 0.338 (0.211) 18 Mediterranean Naples NAP 9 2 0.389 (0.164) 0.065 (0.075) 1 9 2 0.389 (0.164) 0.057 (0.066) 1 Chile Pan de Azúcar PAN 10 2 0.356 (0.159) 0.118 (0.109) 2 10 2 0.200 (0.154) 0.029 (0.045) 1 Caldera CAL 29 5 0.665 (0.067) 0.169 (0.130) 5 29 10 0.796 (0.062) 0.647 (0.366) 16 Concepción CON 1 1 0 0 0 1 1 0 0 Achao ACH 4 1 0 0 0 4 4 1.00 (0.177) 0.606 (0.453) 7
Total Chile 44 5 0.748 (0.028) 0.237 (0.164) 5 44 12 0.853 (0.030) 0.653 (0.364) 18 TOTAL 177 15 0.706 (0.026) 0.177 (0.013) 15 177 41 0.911 (0.011) 0.596 (0.330) 47

52
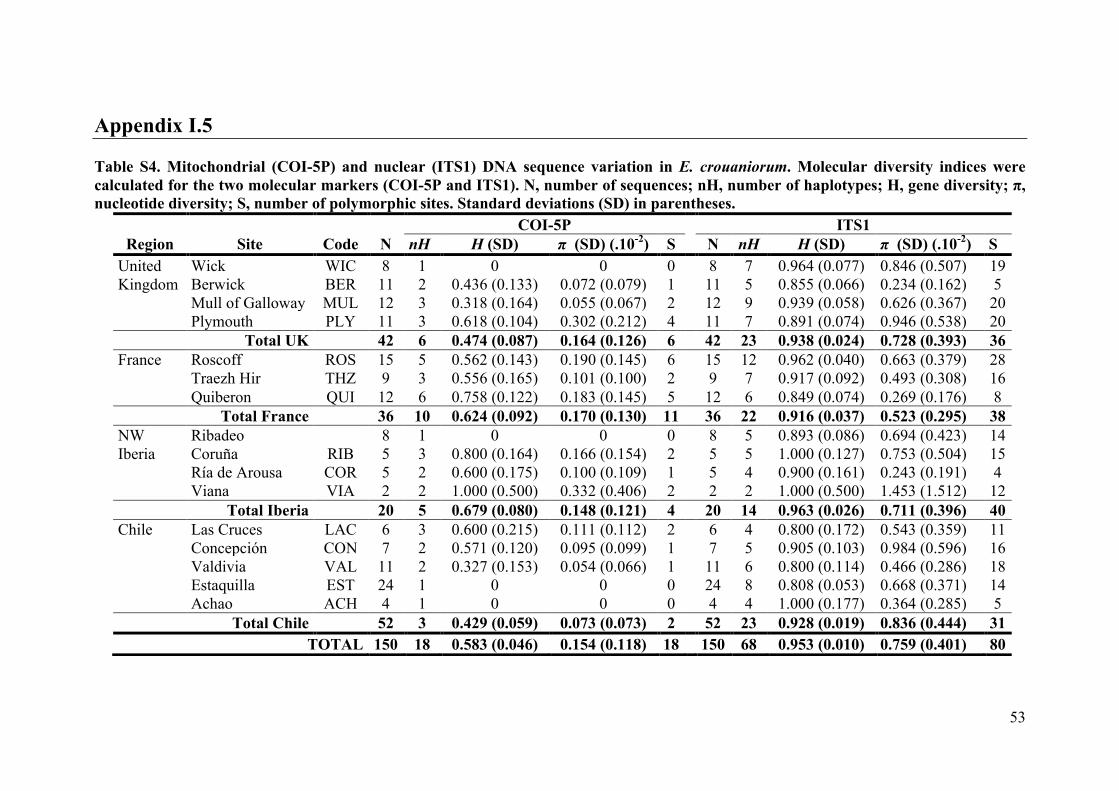
53
Appendix I.5 Table S4. Mitochondrial (COI-5P) and nuclear (ITS1) DNA sequence variation in E. crouaniorum. Molecular diversity indices were calculated for the two molecular markers (COI-5P and ITS1). N, number of sequences; nH, number of haplotypes; H, gene diversity; π, nucleotide diversity; S, number of polymorphic sites. Standard deviations (SD) in parentheses.
COI-5P ITS1 Region Site Code N nH H (SD) π (SD) (.10-2) S N nH H (SD) π (SD) (.10-2) S
United Wick WIC 8 1 0 0 0 8 7 0.964 (0.077) 0.846 (0.507) 19 Kingdom Berwick BER 11 2 0.436 (0.133) 0.072 (0.079) 1 11 5 0.855 (0.066) 0.234 (0.162) 5 Mull of Galloway MUL 12 3 0.318 (0.164) 0.055 (0.067) 2 12 9 0.939 (0.058) 0.626 (0.367) 20 Plymouth PLY 11 3 0.618 (0.104) 0.302 (0.212) 4 11 7 0.891 (0.074) 0.946 (0.538) 20
Total UK 42 6 0.474 (0.087) 0.164 (0.126) 6 42 23 0.938 (0.024) 0.728 (0.393) 36 France Roscoff ROS 15 5 0.562 (0.143) 0.190 (0.145) 6 15 12 0.962 (0.040) 0.663 (0.379) 28 Traezh Hir THZ 9 3 0.556 (0.165) 0.101 (0.100) 2 9 7 0.917 (0.092) 0.493 (0.308) 16 Quiberon QUI 12 6 0.758 (0.122) 0.183 (0.145) 5 12 6 0.849 (0.074) 0.269 (0.176) 8
Total France 36 10 0.624 (0.092) 0.170 (0.130) 11 36 22 0.916 (0.037) 0.523 (0.295) 38 NW Ribadeo 8 1 0 0 0 8 5 0.893 (0.086) 0.694 (0.423) 14 Iberia Coruña RIB 5 3 0.800 (0.164) 0.166 (0.154) 2 5 5 1.000 (0.127) 0.753 (0.504) 15 Ría de Arousa COR 5 2 0.600 (0.175) 0.100 (0.109) 1 5 4 0.900 (0.161) 0.243 (0.191) 4 Viana VIA 2 2 1.000 (0.500) 0.332 (0.406) 2 2 2 1.000 (0.500) 1.453 (1.512) 12
Total Iberia 20 5 0.679 (0.080) 0.148 (0.121) 4 20 14 0.963 (0.026) 0.711 (0.396) 40 Chile Las Cruces LAC 6 3 0.600 (0.215) 0.111 (0.112) 2 6 4 0.800 (0.172) 0.543 (0.359) 11 Concepción CON 7 2 0.571 (0.120) 0.095 (0.099) 1 7 5 0.905 (0.103) 0.984 (0.596) 16 Valdivia VAL 11 2 0.327 (0.153) 0.054 (0.066) 1 11 6 0.800 (0.114) 0.466 (0.286) 18 Estaquilla EST 24 1 0 0 0 24 8 0.808 (0.053) 0.668 (0.371) 14 Achao ACH 4 1 0 0 0 4 4 1.000 (0.177) 0.364 (0.285) 5
Total Chile 52 3 0.429 (0.059) 0.073 (0.073) 2 52 23 0.928 (0.019) 0.836 (0.444) 31 TOTAL 150 18 0.583 (0.046) 0.154 (0.118) 18 150 68 0.953 (0.010) 0.759 (0.401) 80

54
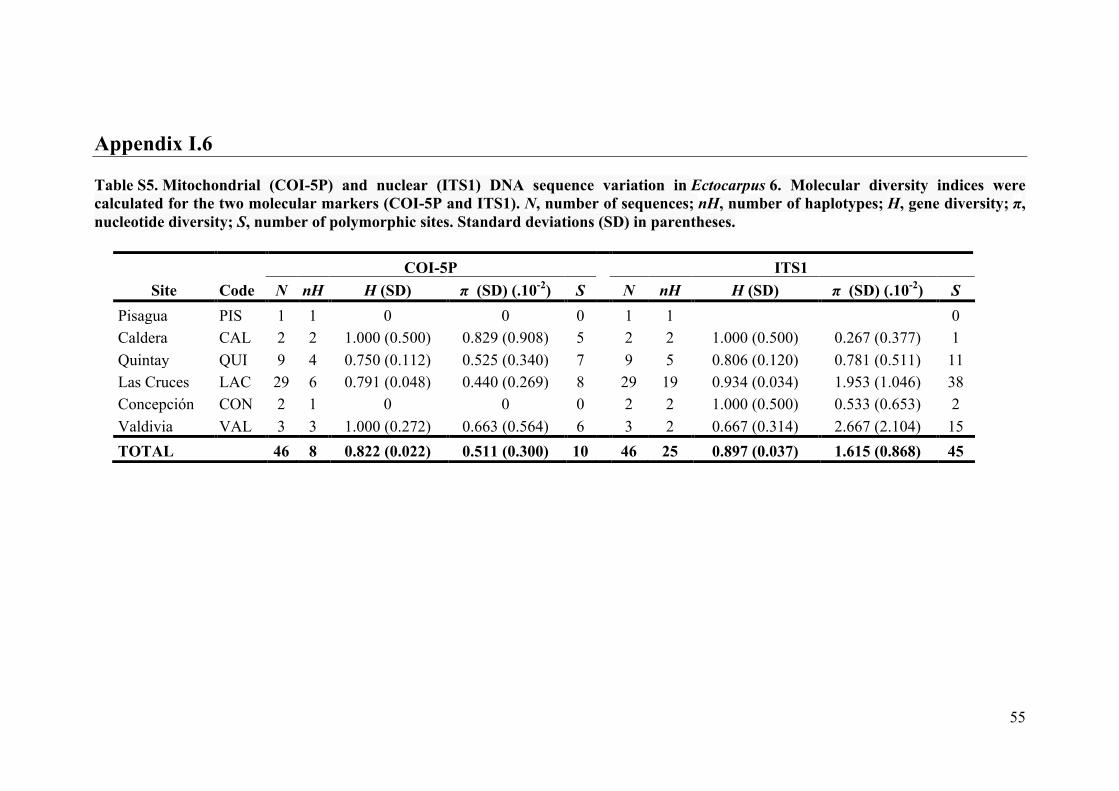
55
Appendix I.6 Table S5. Mitochondrial (COI-5P) and nuclear (ITS1) DNA sequence variation in Ectocarpus 6. Molecular diversity indices were calculated for the two molecular markers (COI-5P and ITS1). N, number of sequences; nH, number of haplotypes; H, gene diversity; π, nucleotide diversity; S, number of polymorphic sites. Standard deviations (SD) in parentheses.
COI-5P ITS1 Site Code N nH H (SD) π (SD) (.10-2) S N nH H (SD) π (SD) (.10-2) S
Pisagua PIS 1 1 0 0 0 1 1 0 Caldera CAL 2 2 1.000 (0.500) 0.829 (0.908) 5 2 2 1.000 (0.500) 0.267 (0.377) 1 Quintay QUI 9 4 0.750 (0.112) 0.525 (0.340) 7 9 5 0.806 (0.120) 0.781 (0.511) 11 Las Cruces LAC 29 6 0.791 (0.048) 0.440 (0.269) 8 29 19 0.934 (0.034) 1.953 (1.046) 38 Concepción CON 2 1 0 0 0 2 2 1.000 (0.500) 0.533 (0.653) 2 Valdivia VAL 3 3 1.000 (0.272) 0.663 (0.564) 6 3 2 0.667 (0.314) 2.667 (2.104) 15 TOTAL 46 8 0.822 (0.022) 0.511 (0.300) 10 46 25 0.897 (0.037) 1.615 (0.868) 45

56
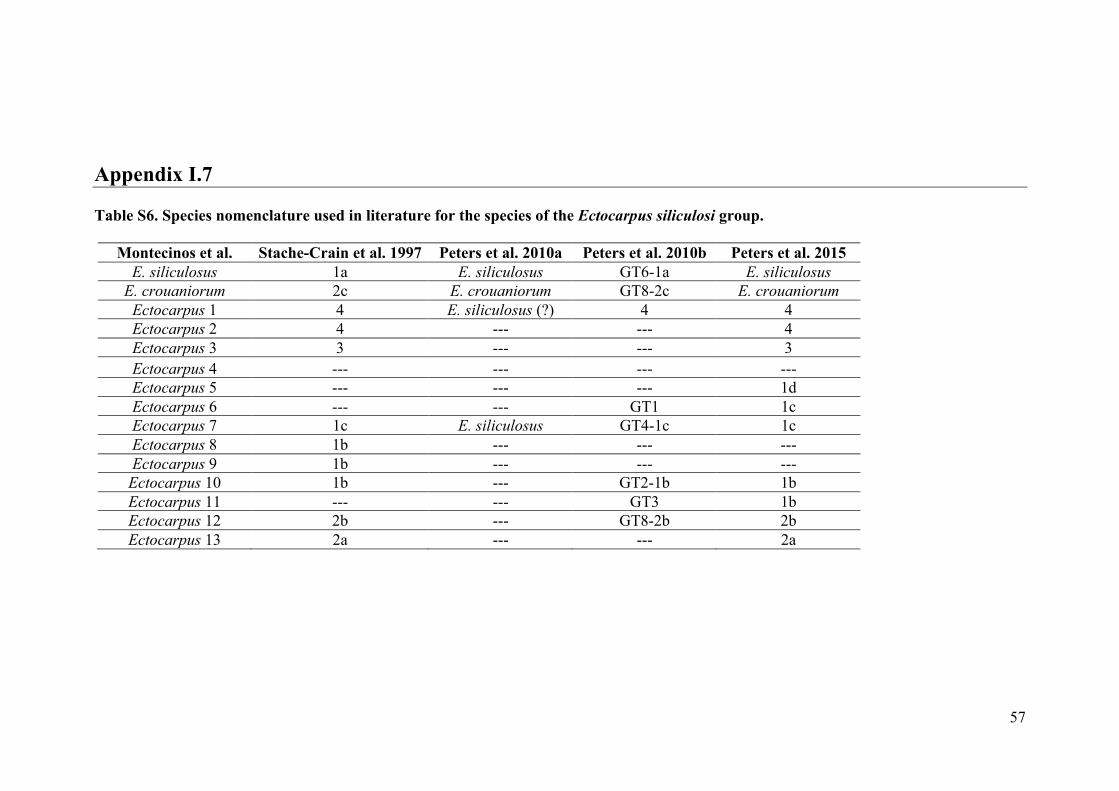
57
Appendix I.7 Table S6. Species nomenclature used in literature for the species of the Ectocarpus siliculosi group.
Montecinos et al. Stache-Crain et al. 1997 Peters et al. 2010a Peters et al. 2010b Peters et al. 2015 E. siliculosus 1a E. siliculosus GT6-1a E. siliculosus
E. crouaniorum 2c E. crouaniorum GT8-2c E. crouaniorum Ectocarpus 1 4 E. siliculosus (?) 4 4 Ectocarpus 2 4 --- --- 4 Ectocarpus 3 3 --- --- 3 Ectocarpus 4 --- --- --- --- Ectocarpus 5 --- --- --- 1d Ectocarpus 6 --- --- GT1 1c Ectocarpus 7 1c E. siliculosus GT4-1c 1c Ectocarpus 8 1b --- --- --- Ectocarpus 9 1b --- --- --- Ectocarpus 10 1b --- GT2-1b 1b Ectocarpus 11 --- --- GT3 1b Ectocarpus 12 2b --- GT8-2b 2b Ectocarpus 13 2a --- --- 2a

58
59
Chapter2
PhylogeneticinferencesintheEctocarpussubgroup
siliculosiusinganext-generationsequencingapproach
ContentsI. Abstract..................................................................................................................63
II. Introduction...........................................................................................................65
III. MaterialandMethods.............................................................................................71
- CollectionsofEctocarpusstrains...................................................................................71
- DNAextractionandgenerationofRAD-seqdata..........................................................72
- AnalysisofddRAD-seqdata...........................................................................................73
- Phylogeneticreconstructions.......................................................................................75
IV. Results....................................................................................................................77
- ddRADsequencing.........................................................................................................77
- Phylogeneticreconstructions........................................................................................78
V. Discussion...............................................................................................................85
- Abetterresolutionofthephylogeneticrelationshipsamongcrypticspecies..............85
- Differentpatternsofgeographicstructureforthetwocosmopolitanspecies............88
VII. Appendix.................................................................................................................91
- ProblemsgeneratingRAD-seqdataduringthisPhDthesis..........................................91

60
61
CHAPTER 2.
Phylogenetic inferences in the Ectocarpus subgroup siliculosi
using a next-generation sequencing approach
Alejandro E. Montecinos1,2, Komlan Avia3, Myriam Valero1, Stephane Mauger1 and
Marie-Laure Guillemin1,2
1CNRS, Sorbonne Universités, UPMC University Paris VI, PUC, UACH, UMI 3614,
Evolutionary Biology and Ecology of Algae, Station Biologique de Roscoff, CS 90074,
Place G. Teissier, 29680 Roscoff, France 2Instituto de Ciencias Ambientales y Evolutivas, Facultad de Ciencias, Universidad
Austral de Chile, Casilla 567 Valdivia, Chile 3CNRS, Sorbonne Université, UPMC Univ Paris 06, CNRS, Algal Genetics Group,
UMR 8227, Integrative Biology of Marine Models, Station Biologique de Roscoff, CS
90074, Place G. Teissier, 29680 Roscoff, France

62
63
I. Abstract
The genus Ectocarpus (Lyngb.) Hamel (Ectocarpales, Phaeophyceae) is widely
distributed in marine and estuarine habitats of temperate regions of both hemispheres.
Recent studies based on few molecular markers and phylogenetic reconstructions have
shown that the group Ectocarpus siliculosi forms a complex of sibling species. All
studies agree in the occurrence of a strongly supported monophyletic group including E.
crouaniorum, Ectocarpus 12 and Ectocarpus 13 but the phylogenetic relationships of
the remaining 12 species were not fully resolved. In this work we aimed to test the
capacity of unlinked nuclear loci obtained via RAD sequencing in resolving
phylogenetic relationship within the Ectocarpus subgroup siliculosi. Our results
retrieved a branching pattern concordant with the patterns recovered in the previous
studies. Phylogenetics trees retrieved all eight species involved in this study as well-
separated genetic groups. In addition, RAD sequencing was able to precise close
relationships between species described before as paraphyletic. Moreover, occurrence of
potential hybridization between closely related and sympatric species was suggested.
Different patterns of geographic structure were demonstrated for two cosmopolitan
species suggesting different scenarios of introduction. Together, these findings confirm
the high power of RAD sequencing to resolve phylogenetics and population level
structure.

64
65
II. Introduction
Sampling as many informative data from the genomes of as many taxa as possible
to accurately and comprehensively infer phylogenetic relationships is one of the typical
goals of molecular systematics. Thus, the selection of appropriate and sufficiently
informative molecular markers has always been considered fundamental to phylogenetic
reconstruction (Patwardhan et al. 2014). Generally, molecular systematic targets loci
having desirable properties for phylogenetic inference that include (1) a high reliability
of amplification and sequencing across the taxa of interest, (2) a confirmed orthology
and (3) an appropriate rate of nucleotide substitution across the clades of interest.
Historically, the study of only a few orthologous genes relative to the number of taxa
was the rule. Traditional Sanger sequencing (Sanger et al. 1977) of plastid or
mitochondrial DNA markers or nuclear ribosomal markers such as the internal
transcribed spacer (ITS) have been widely applied to reconstruct phylogenies at the
species and genus level of many taxa (e.g. plants, see review of Alvarez and Wendel
2003). However, due to the commonly uni-parental inheritance of plastids and
mitochondria, phylogenies inferred from cytoplasmic markers are limited in their
capacity to reflect the evolutionary history of a lineage (Hou et al. 2015). On the other
hand, multi-copy nuclear markers such as ITS can mislead phylogenetic inferences
because of concerted evolution (Alvarez and Wendel 2003). Searching for
phylogenetically informative low-copy orthologous nuclear genes using traditional
Sanger sequencing is a costly and laborious work and, even if they have been
successfully applied to generate interspecific phylogenetic inference in some taxa
(Zimmer and Wen 2013), their use remains limited.
Advances in next-generation sequencing (NGS) technologies are rapidly
enhancing our capacity to study a plethora of markers over the whole genome (Andrews
66
and Luikart 2014). These advances present new opportunities and challenges for
molecular systematics (Lemmon and Lemmon 2013, McCormack et al. 2013). In
contrast to the traditional gene-centric approach, second generation short-read
sequencing technology (e.g. Illumina and SOLiD) offers alternative methods to sample
genome-wide nucleotide variation in the form of restriction site associated DNA (RAD)
sequencing (Baird et al. 2008). RAD sequencing targets specific flanking regions of
restriction sites. By producing short sequence reads (50–300 bp) with a wide genomic
distribution, the method is expected to provide a genomewide view (Miller et al. 2007a,
b, Baird et al. 2008, Davey et al. 2011, McCluskey and Postlethwait 2014). Since the
data are sequence-based, RAD-seq loci can be mapped back to genetic or physical maps
if appropriate reference genomes are available, potentially allowing researchers to
assess the genomic distribution of divergence and introgression in a phylogenetic
context (Nadeau et al. 2012, Hipp et al. 2014). RAD sequencing is one of the so-called
“reduced representation” approaches that allow sampling a small but repeatable portion
of the genome and have been proven a very cost effective methodology to generate high
quality information of genetic diversity at thousands of identical loci for population
level comparisons (Davey and Blaxter 2010). The ability of RAD sequencing in
targeting repetitively the same portion of the genome, adjacent to the restriction sites,
enables to select loci without access to previously develop genomic resources and to
assess their orthology in silico (e.g. Catchen et al. 2011, Lu et al. 2013, Eaton 2014).
The use of RAD sequencing, which increases the number of unlinked molecular
markers studied, can dramatically improve the accuracy of phylogenetic reconstruction
when compared to traditional Sanger sequencing and gene-centric approaches (Rokas
and Carroll 2005). Individual loci may have different evolutionary histories due to
incomplete lineage sorting, gene duplication or loss, and processes of admixture such as

67
hybridization and introgression (Wendell 1998). RAD sequencing is then a promising
tool to resolve phylogenetic relationships in taxa challenging the classical methods, as it
is the case for recently diverging clades where reproductive barriers are incomplete.
Indeed, a recent study based on a RAD-seq data set of more than 3 million base pairs
(Wagner 2013), have successfully resolved the phylogenetic relationships among
sympatric cichlid species in the Lake Victoria despite the fact that this group is
characterized by recent adaptive radiation, incomplete lineage sorting and ongoing
hybridization. However, RAD sequencing is not without limitations and new challenges
have arisen when inferring phylogenies using these tools. Indeed, both sampling error
(stochastic failure of a locus to be genotyped due to low read coverage) and the
disruption of restriction sites by mutation lead to the recovering of sparse genotype
matrices where missing data abound. The number of missing sites increases with the
phylogenetic distance among the studied samples and the problem generated by missing
data could be challenging for phylogenetic reconstruction using RAD sequencing
(Rubin et al. 2012; Cariou et al. 2013; Hipp et al. 2014; Viricel et al. 2014). New
methods to circumvent this problem have been proposed in recent studies. For example,
the evaluation of phylogenetic reconstructions based on several matrices composed by
different levels of missing data has been shown to be an excellent approach to evaluate
the power of RAD-seq in phylogeny (e.g., Wagner et al. 2013, Hipp et al. 2014).
The genus Ectocarpus (Lyngb.) Hamel (Ectocarpales, Phaeophyceae) is widely
distributed in marine and estuarine habitats of temperate regions of both hemispheres
(Stache 1990). On the shore, Ectocarpus occurs from high intertidal pools to the
subtidal and is found on abiotic substrata (rocks, wood, plastic, ship hulls), epiphytic on
macroalgae or free-floating (Russell 1967a, b, 1983a, b). It has been described as an
important contributor to biofouling and is frequently encountered as epiphyte in
68
mariculture (Stache-Crain et al. 1997). Ectocarpus has a long research history and the
genome of one species of this genus (referred as Ectocarpus 7 in Montecinos et al 2016,
Chapter 1, and the current study) has been completely sequenced, annotated (Cock et al.
2010) and mapped (Heesch et al. 2010).
Recent studies based on molecular markers and phylogenetic reconstructions have
shown that the group Ectocarpus siliculosi forms a complex of sibling species adapted
to different hosts and/or habitats along the shore gradient (Peters et al. 2010a,b, Peters et
al. 2015, Montecinos et al 2016). The work of Montecinos et al. (2016) was able to
uncover 15 cryptic species in the group Ectocarpus siliculosi using two loci (the
mitochondrial COI - cytochrome oxidase subunit 1 and the nuclear ITS1) and a
combination of bioinformatics tools specifically developed to define species boundaries.
However, discrepancies between tree topologies are observed depending on the markers
used (ITS1 and rubisco spacer: Stache-Crain et al. 1997, ITS1, ITS2, Rubisco spacer
region, cox3 and rps14-atp8: Peters et al. 2010a, ITS1, ITS2, Rubisco spacer and cox3:
Peters et al. 2010b, COI-5P: Peters et al. 20151, COI-5P and ITS1 Montecinos et al.
2016) when comparing results from different studies, and thus the phylogenetic
relationships within the group Ectocarpus siliculosi have remained elusive. All studies
agree only in the presence of a strongly supported monophyletic group consisting of E.
crouaniorum, Ectocarpus 12 and Ectocarpus 13 (designations as in Montecinos et al.
2016). The study of Montecinos et al. (2016) included a large number of Ectocarpus
specimens (N=729) but the markers chosen were not able to fully resolve the
phylogenetic relationships of the remaining 12 species in the E. siliculosi group. Indeed,
the 12 species formed an unresolved paraphyletic assemblage when using the
mitochondrial marker. For ITS1, due to the presence of various large indels (a problem
recurrent in this group, see Stache-Crain et al. 1997), it was not possible to generate a

69
unique alignment including all species and test for their relationship (Montecinos et al.
2016).
In this chapter we aimed to test the capacity of unlinked nuclear loci obtained via
RAD sequencing in resolving phylogenetics relationship within the Ectocarpus
subgroup siliculosi. The impact of historical biogeographical barriers along the Pacific
coast on the process of divergence and speciation and the possible introduction events
among the Pacific and Atlantic coasts will also be discussed.

70
Table II.1 – Individuals selected to generate the distinct dataset matrices. All 120 individuals were used to construct the M50-120 matrix while only 75 individuals (the ones in parentheses) remain in the M20-75 matrix.
Ec1- Ec13 = Ectocarpus 1 – Ectocarpus 13, Esil= E. siliculosus, Ecro = E. crouaniorum.
Population Country Esil Ecro Ec1 Ec6 Ec7 Ec8 Ec9 Ec12 Ec13 Total
Roscoff France 4 (3) 5 (4)
9 (7)
Ribadeo Spain 4 (3) 4 (4)
8 (7)
Naples Italy 4 (2)
8 (7) 14 (4) 26 (13)
Pan de Azúcar Chile 4 (4)
5 (3)
9 (7)
Caldera Chile 4 (1)
1 (1) 12 (11) 1 (0)
18 (13)
Las Cruces Chile
3 (2)
12 (3)
1 (0)
16 (5)
Quintay Chile
6 (6)
1 (0)
7 (6)
Valdivia Chile
4 (2) 8 (3)
12 (5)
Estaquilla Chile
4 (4) 11 (8)
15 (12)
Total 20 (13) 20 (16) 19 (11) 19 (10) 12 (11) 3 (0) 5 (3) 8 (7) 14 (4) 120 (75)
71
III. Material and Methods
- Collections of Ectocarpus strains
We selected 120 (19 haploids and 101 diploids) Ectocarpus unialgal strains that
were identified at the species level using various molecular markers (COI5P, ITS1,
microsatellite loci, see Chapter 1 and Chapter 3). Nine of the fifteen putative species
belonging to the Ectocarpus subgroup siliculosi (Montecinos et al. 2016) were selected;
including: Ectocarpus 1 (n = 19), Ectocarpus 6 (n = 19), Ectocarpus 7 (n = 12),
Ectocarpus 8 (n = 3), Ectocarpus 9 (n = 5), Ectocarpus 12 (n = 8), Ectocarpus 13 (n =
14), E. siliculosus (n = 20), E. crouaniorum (n = 20) (Table II.1). Only the more
common species for which various samples were available were considered for this
study. Samples were collected in different biogeographical regions in Europe and in
Chile (the temperate South East Pacific). In Europe, phylogeographic studies have
shown that populations from the Atlantic are highly differentiated from the
Mediterranean ones and that in the Atlantic, the Celtic-Sea/Brittany area is a transition
zone between the Northern European Seas and Lusitanian provinces (see for review
Maggs et al 2008). Three sites were sampled in this study, one located in the Celtic-
Sea/Brittany area (Roscoff), the second in Lusitanian region (Ribadeo) and the third in
the Mediterranean Sea (Naples). In Chile, phylogeographic studies of seaweeds have
confirmed that genetic breaks are broadly congruent with two major biogeographic
boundaries along the South East Pacific (30-33°S and 42°S, see for review Guillemin et
al., 2016a). The Peruvian biogeographic lies north of the 30-33°S boundary, the
Magellan province south to the 42°S boundary and the Intermediate Area between the
two boundaries (Camus et al. 2001). Six sites were sampled in Chile, of which two were
located in the Peruvian Province (Pan de Azúcar and Caldera), three in the Intermediate
72
Area (Las Cruces, Quintay, Valdivia) and one at the northern limit of the Magellan
Province (Estaquilla) (Table II.1).
- DNA extraction and generation of RAD-seq data
All individuals were grown in sterile standard seawater medium (Coelho et al.
2012) for 8 weeks under 12-hours light photoperiod at 13°C in a growth chamber. To
ensure that almost fully axenic material will be obtained, 5 ml of a mix of antibiotics (9
mg/ml of Penicillin G, 4.5 mg/ml of Streptomycin and 0.9 mg/ml of chloramphenicol)
(Coelho et al. 2012) were added to each liter of seawater used for the culture three days
before the DNA extraction to reduce the bacterial load. Harvested individuals were
lyophilized and DNA was extracted using the NucleoSpin® 96 Plant II kit (Macherey-
Nagel GmbH & Co. KG, Germany) according to the manufacturer’s instructions. DNA
quality was checked on agarose gels and the quantity measured by PicoGreen® (Fisher
Scientific).
Preparation of the double digest RAD library (ddRAD-seq) was carried out
following Peterson et al. (2012) with a slight modification since sample tracking was
ensured by using individual-specific nucleotide barcodes of 6 bp long (instead of the 5
bp long used in Peterson et al. 2012). The restriction enzymes PstI and HhaI (New
England Biolabs, https://www.neb.com/) were selected based on in silico digestion
simulations carried out using the published genome of Ectocarpus 7 (Cock et al. 2010).
Samples individually barcoded with a unique adapter were pooled prior to 150-600 bp
size selection using a Pippin Prep 1.5% agarose gel (Sage Science) and AMPure XP
beads (Agencourt, Beckman Coulter Genomics, Danvers, MA) cleaning. The generated
libraries were quantified by both an Agilent® 2100 Bioanalyzer® (Agilent
Technologies) and real-time PCR using the KAPA Library Quantification Kit (KAPA

73
Biosystems). Libraries with distinct multiplexing indices were then combined in
equimolar ratios to compose a final pool of libraries for paired-end sequencing in two
lanes of an Illumina Hiseq 2500 platform. Our targeted yield was to sequence ~27,000
fragments to a depth of coverage of at least 30X (Komlan Avia, com. pers.).
- Analysis of ddRAD-seq data
The ddRAD sequencing data were analyzed using the Stacks pipeline (Catchen et
al. 2011, 2013). Raw sequence reads with ambiguous barcodes or restriction enzyme
sites were discarded. The program Cutadapt (Martin 2011) was used to remove adapter
sequences from raw reads. A sliding window of 25% of the length of a read was set to
check sequence average quality and reads under 90% base call accuracy (phred score of
10) were discarded. We first used the program PEAR (Zhang et al. 2014) to identify
paired-end non-overlapping reads and to merge reads from overlapping read pairs in a
single consensus sequence. Unpaired reads (i.e. missing their mates) were leaved as
singletons. For each individual, all those singletons and the new single consensus
sequences were gathered in a unique group of singleton sequences and then trimmed to
94 bp with the program TRIMMOMATIC (Bolger et al. 2014). The paired-end read
mates were also trimmed to 94 bp. Sequences were then aligned to the Ectocarpus
reference genome (Cock et al. 2010; i.e. Ectocarpus 7 in Montecinos et al. 2016) using
Bowtie 2 (Langmead and Salzberg 2012). End-to-end alignment with the “sensitive”
mode was performed. Loci were discarded when two or more reportable alignment
existed (i.e. potential paralogous sequences in the data). Loci that did not align with the
reference genome (missing data) were also discarded. The obtained .sam files were
imported into the Stacks pipeline (Catchen et al. 2013) to generate a final VCF file
containing all observed SNPs, or the SAMtools package (Li et al. 2009) was used to call

74
variants with the mpileup function in conjunction with bcftools for multiallelic calling
model. SAMtools was configured to generate VCF files that retain both variable and
invariables sites. We used this configuration because models of molecular evolution
used in maximum likelihood-based phylogenetic inferences are intended for sequence
data, not SNPs alone, and the complete sequence of each fragment is better suited to
reconstruct phylogenetic trees (Wagner et al. 2013). Indeed, while some studies still
filter out invariant sites (e.g. Coghill et al. 2014), it has been observed that likelihood
based tree inferences does not typically condition on all characters being variable, and
thus may reconstruct biased branch lengths and topologies if invariant sites are excluded
(Felsenstein 1992, Lewis 2001).
Figure II.1 – Boxplots depicting median, first and third quartile and standard deviation of the number of reads obtained per species. The number of haploid individuals varied from 1 (in Ectocarpus 8 and 13) to 11 (in E. siliculosus) and in diploid varied from 2 (in Ectocarpus 8) to 60 (in E. siliculosus). Ec1- Ec13 = Ectocarpus 1 – Ectocarpus 13, Esil= E. siliculosus, Ecro = E. crouaniorum.
Depending on the percentage of missing data across samples allowed (0%, 10%,
30%, 50%, 70% and 90%, Table II.2), six data matrices were built using all 120
20.000.000
15.000.000
10.000.000
5.000.000
0
N°ofre
ads
species
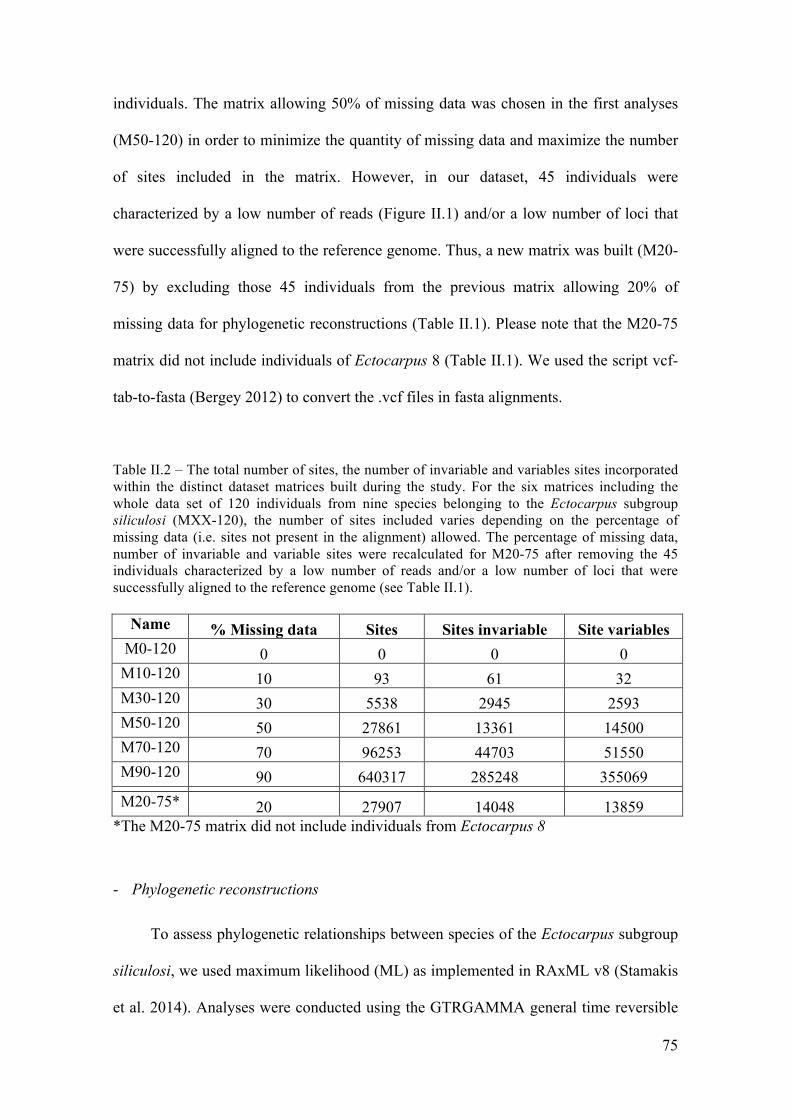
75
individuals. The matrix allowing 50% of missing data was chosen in the first analyses
(M50-120) in order to minimize the quantity of missing data and maximize the number
of sites included in the matrix. However, in our dataset, 45 individuals were
characterized by a low number of reads (Figure II.1) and/or a low number of loci that
were successfully aligned to the reference genome. Thus, a new matrix was built (M20-
75) by excluding those 45 individuals from the previous matrix allowing 20% of
missing data for phylogenetic reconstructions (Table II.1). Please note that the M20-75
matrix did not include individuals of Ectocarpus 8 (Table II.1). We used the script vcf-
tab-to-fasta (Bergey 2012) to convert the .vcf files in fasta alignments.
Table II.2 – The total number of sites, the number of invariable and variables sites incorporated within the distinct dataset matrices built during the study. For the six matrices including the whole data set of 120 individuals from nine species belonging to the Ectocarpus subgroup siliculosi (MXX-120), the number of sites included varies depending on the percentage of missing data (i.e. sites not present in the alignment) allowed. The percentage of missing data, number of invariable and variable sites were recalculated for M20-75 after removing the 45 individuals characterized by a low number of reads and/or a low number of loci that were successfully aligned to the reference genome (see Table II.1).
Name % Missing data Sites Sites invariable Site variables M0-120 0 0 0 0 M10-120 10 93 61 32 M30-120 30 5538 2945 2593 M50-120 50 27861 13361 14500 M70-120 70 96253 44703 51550 M90-120 90 640317 285248 355069
M20-75* 20 27907 14048 13859 *The M20-75 matrix did not include individuals from Ectocarpus 8
- Phylogenetic reconstructions
To assess phylogenetic relationships between species of the Ectocarpus subgroup
siliculosi, we used maximum likelihood (ML) as implemented in RAxML v8 (Stamakis
et al. 2014). Analyses were conducted using the GTRGAMMA general time reversible
76
model of nucleotide evolution, with branch support assessed using 1000 bootstrap
replicates. First unrooted trees were built using both the M50-120 and M20-75 matrices.
Moreover, two ML rooted trees were built in order to have a closer look at
biogeographical relationships between samples within each clade using the M20-75
matrix. The first tree included the species E. siliculosus, Ectocarpus 1, Ectocarpus 6,
Ectocarpus 7, Ectocarpus 8, Ectocarpus 9 and was rooted using E. crouaniorum as
outgroup. The second tree included the species E. crouaniorum, Ectocarpus 12 and
Ectocarpus 13 and was rooted using E. siliculosus as outgroup.
77
IV. RESULTS
- ddRAD sequencing
We obtained a total of 276.633.510 base pair reads over the whole 120 individuals
sequenced in our study. The total number of reads per individual in the data set varied
from 6391 (in Ectocarpus 6) to more than 20 millions of reads (in Ectocarpus 9). The
mean number of read per species was variable ranging from 313.475 in Ectocarpus 8 to
6.385.741 in Ectocarpus 12 (Figure II.1).
Following the pipeline described previously, those reads produced a raw .vcf file
containing a total of 196.804.589 sites for the 120 individuals (including variable and
invariable sites). After quality filtering a total of 34.467.721 sites remained and were
used to build the dataset matrices. The number of sites retained varied widely depending
on the percentage of missing data allowed (Table II.2). When all 120 individuals from
the nine species belonging to the Ectocarpus subgroup siliculosi were considered, none
of the 34.467.721 sites was sequenced in all samples (M0-120, no missing data allowed,
total number of site retained = 0, Table II.2). The number of sites retained varied from
93 (i.e. only one ddRAD locus), when only 10% of missing data were allowed, to
640.317 sites (i.e. > 7000 loci) when 90% of missing data were allowed (Table II.2).
Removing the individuals showing a low number of reads (45 individuals, Table II.1,
Figure II.1) from the M50-120 matrix greatly decreased the percentage of missing data
(from 50% in M50-120 to only 20% in M20-75, Table II.2) while it had little effect on
the number of variable sites included (from 14500 variable sites in M50-120 to 13859
variable sites in M20-75, Table II.2).
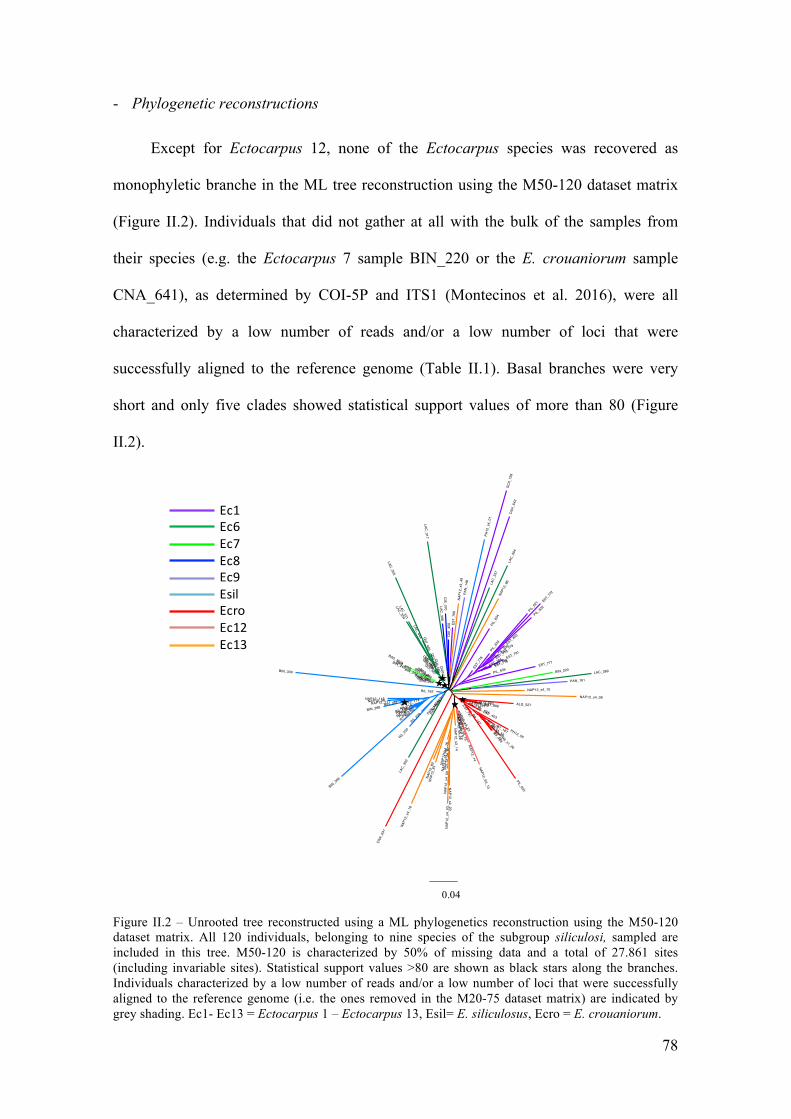
78
0.04
BIN_346
BAS_298
PIL_633
QUI_469
BIN_002
NAP12_14
PIL_616
NAP12_15
EST_808LAC_403R6
_197
NAP12_s4_20
EST_781
PIL_621
NAP12_115
EST_797
EST_777
CIS_070
R7_187R6_s1_26
BIN_220
PAN_149A
LAC_444
CNA_641
R7_78
QUI_455
QUI_456
R7_213
CNA_642
BIN_001
R7_s1_63
BIN_309
BAS_264
QUI_480
PAN_148 LAC_357
NAP
12Ns4_16
NAP12_82
BIN_331
PIL_63
6
EST_7
79
EST_802
LAC_445
ALG_520
LAC_389
NAP12_s3_22
PIL_625
NAP12_96
EST_77
5
NAP
12_s4_07
PH12_55
BIN_005
PAN_143A
NAP12_s3_19
LAC_373
R7_80
NAP12_174
PIL_635
NAP12_s3_11
LAC_355
PIL_634
EST_772
R5_235
BIN_224
PIL_624
PAN_163
R5_236
PH12_s4_01
QUI_450
ALG_527
NAP12_12
NAP12_s3_23
BIN_288
NAP12_81
R7_s2
a_13
BAS_305B
R7_168
LAC_392
BINN226
EST_791
LAC_394
NAP
12_s4_19
NAP12_S3_13
EST_769
NAP12_86
EST_78
4
R7_21
R6_157
BAS_302A
R5_195
PAN_161
BIN_243 QUIN477
NAP
12_s3_49
NAP12_s3_14
LAC_317
NAP12_s4_08
EST_778
R6_210
R6_192
CIS_073
BIN_306
EST_780
LAC_354
NAP12_111
LAC_398
SCA_726
NAP
12_s4_09
NAP12_s4_10
EST_803
NAP12_s4_18
LAC_371
QUI_467
NAP
12_s4_03
R5_272
EST_776
R6_s1_12
PIL_632
R6_208
Ec1Ec6Ec7Ec8Ec9EsilEcroEc12Ec13
0.04
- Phylogenetic reconstructions
Except for Ectocarpus 12, none of the Ectocarpus species was recovered as
monophyletic branche in the ML tree reconstruction using the M50-120 dataset matrix
(Figure II.2). Individuals that did not gather at all with the bulk of the samples from
their species (e.g. the Ectocarpus 7 sample BIN_220 or the E. crouaniorum sample
CNA_641), as determined by COI-5P and ITS1 (Montecinos et al. 2016), were all
characterized by a low number of reads and/or a low number of loci that were
successfully aligned to the reference genome (Table II.1). Basal branches were very
short and only five clades showed statistical support values of more than 80 (Figure
II.2).
Figure II.2 – Unrooted tree reconstructed using a ML phylogenetics reconstruction using the M50-120 dataset matrix. All 120 individuals, belonging to nine species of the subgroup siliculosi, sampled are included in this tree. M50-120 is characterized by 50% of missing data and a total of 27.861 sites (including invariable sites). Statistical support values >80 are shown as black stars along the branches. Individuals characterized by a low number of reads and/or a low number of loci that were successfully aligned to the reference genome (i.e. the ones removed in the M20-75 dataset matrix) are indicated by grey shading. Ec1- Ec13 = Ectocarpus 1 – Ectocarpus 13, Esil= E. siliculosus, Ecro = E. crouaniorum.
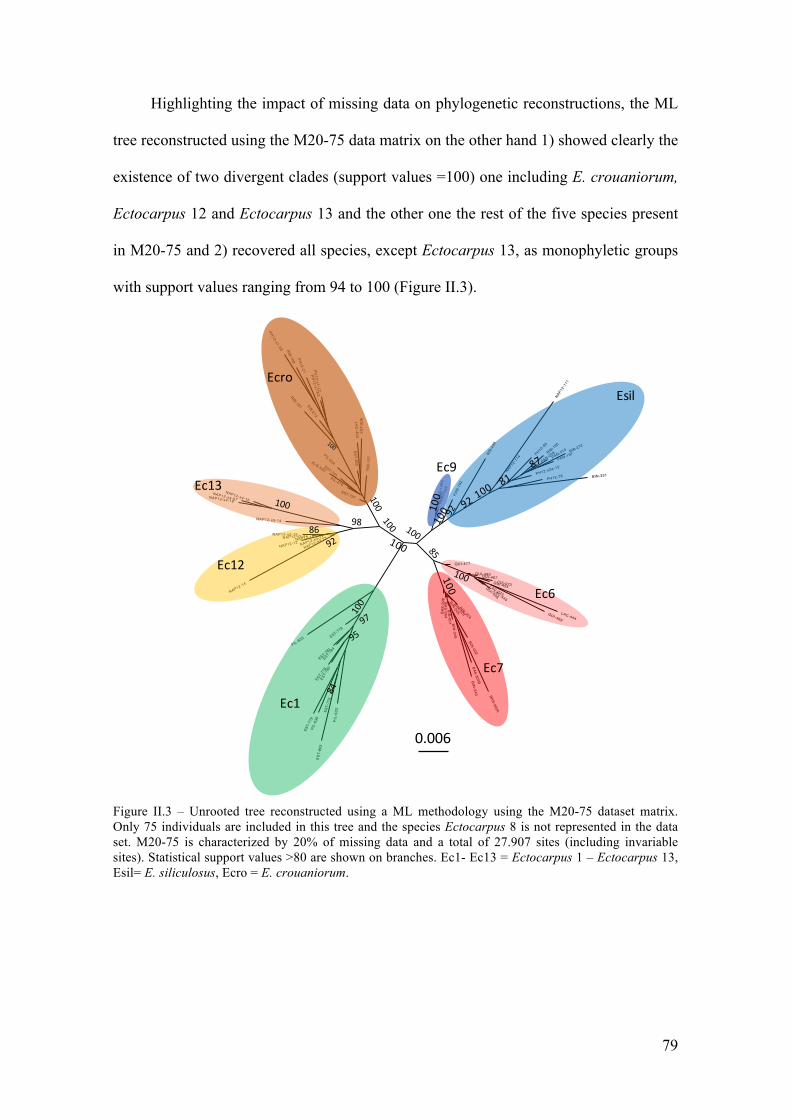
79
Highlighting the impact of missing data on phylogenetic reconstructions, the ML
tree reconstructed using the M20-75 data matrix on the other hand 1) showed clearly the
existence of two divergent clades (support values =100) one including E. crouaniorum,
Ectocarpus 12 and Ectocarpus 13 and the other one the rest of the five species present
in M20-75 and 2) recovered all species, except Ectocarpus 13, as monophyletic groups
with support values ranging from 94 to 100 (Figure II.3).
Figure II.3 – Unrooted tree reconstructed using a ML methodology using the M20-75 dataset matrix. Only 75 individuals are included in this tree and the species Ectocarpus 8 is not represented in the data set. M20-75 is characterized by 20% of missing data and a total of 27.907 sites (including invariable sites). Statistical support values >80 are shown on branches. Ec1- Ec13 = Ectocarpus 1 – Ectocarpus 13, Esil= E. siliculosus, Ecro = E. crouaniorum.
0.0060
RIB-236
PIL-616
EST-781
PH12-s1-26
LAC-403
ALG-520
NAP12-s3-14
PH12-21
PH12-s1-63
BIN-002
BIN-346
BAS-298
NAP12-s3-19
PH12-s1-12
EST-784
BIN-001
PIL-636
EST-797
EST-803
NAP12-s4-07
NAP12-s3-22
QUI-467
LAC-373
PAN-197
EST-775
RIB-157
BAS-305B
NAP12-15
NAP12-s
3-23
PH12-78
CIS-073
QUI-480
NAP12-s4-16
PAN-2
08
PIL-63
5
NAP12-12
QUI-469
RIB-272
PAN-143A
PAN-192
EST-780
NAP12
-14
RIB-187
RIB-195
PIL-633
EST-802
BIN-331
EST-776
RIB-213
LAC-444
PIL-624
BIN-243
BIN-224
BIN-005
BAS-302A
EST-7
78
RIB-168
PH12-80
BAS-264
NAP12-174 PA
N-210
QUI-456
PAN-149A
EST-791 PH12-s2a-
13
QUI-477
EST-779
BIN-226
NAP12-111
PAN-163NAP12-s4-19
EST-808
NAP12-s
3-11
LAC-445
QUI-455
Esil
Ec9
Ec6
Ec7
Ec1
Ec12
Ec13
Ecro
86
0.006
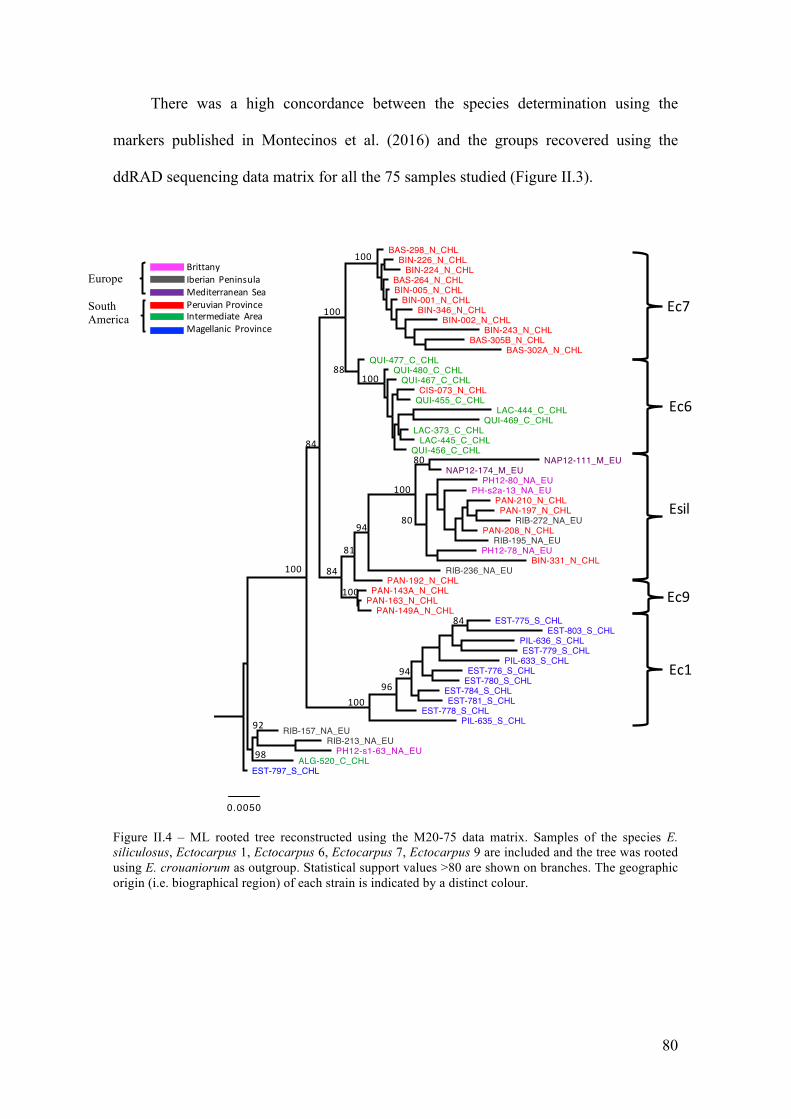
80
There was a high concordance between the species determination using the
markers published in Montecinos et al. (2016) and the groups recovered using the
ddRAD sequencing data matrix for all the 75 samples studied (Figure II.3).
Figure II.4 – ML rooted tree reconstructed using the M20-75 data matrix. Samples of the species E. siliculosus, Ectocarpus 1, Ectocarpus 6, Ectocarpus 7, Ectocarpus 9 are included and the tree was rooted using E. crouaniorum as outgroup. Statistical support values >80 are shown on branches. The geographic origin (i.e. biographical region) of each strain is indicated by a distinct colour.
0.0050
RIB-236_NA_EU
LAC-373_C_CHL
PIL-633_S_CHL
BIN-224_N_CHL
LAC-445_C_CHL
EST-779_S_CHL
QUI-480_C_CHL
BIN-346_N_CHL
LAC-444_C_CHL
PH12-80_NA_EU
BIN-226_N_CHL
PAN-163_N_CHL
BIN-243_N_CHL
QUI-455_C_CHL
EST-780_S_CHL
RIB-195_NA_EU
BAS-305B_N_CHL
EST-781_S_CHL
CIS-073_N_CHL
NAP12-174_M_EU
RIB-157_NA_EU
NAP12-111_M_EU
PH12-s1-63_NA_EU
PAN-143A_N_CHL
PIL-636_S_CHL
EST-778_S_CHL
ALG-520_C_CHL
EST-803_S_CHL
BIN-331_N_CHL
PH-s2a-13_NA_EU
QUI-467_C_CHL
EST-775_S_CHL
PAN-197_N_CHL
EST-797_S_CHL
RIB-272_NA_EU
PH12-78_NA_EU
QUI-477_C_CHL
BIN-001_N_CHL
BIN-002_N_CHL
QUI-456_C_CHL
BAS-298_N_CHL
RIB-213_NA_EU
PIL-635_S_CHL
PAN-192_N_CHL
BAS-302A_N_CHL
PAN-210_N_CHL
PAN-208_N_CHL
BIN-005_N_CHLBAS-264_N_CHL
PAN-149A_N_CHL
EST-776_S_CHL
EST-784_S_CHL
QUI-469_C_CHL
100
100
88100
84
100
80
94
100
80
81
84
100
96100
94
84
98
92
Esil
Ec6
Ec7
Ec9
Ec1
NorthAtlanticMediterraneanseaNorthChileCenter ChileSouthChile
NorthAtlanticMediterraneanseaNorthChileCenter ChileSouthChile
BrittanyIberianPeninsulaMediterraneanSeaPeruvianProvinceIntermediate AreaMagellanic Province
NorthAtlanticMediterraneanseaNorthChileCenter ChileSouthChile
NorthAtlanticMediterraneanseaNorthChileCenter ChileSouthChile
NorthAtlanticMediterraneanseaNorthChileCenter ChileSouthChile
Europe South America
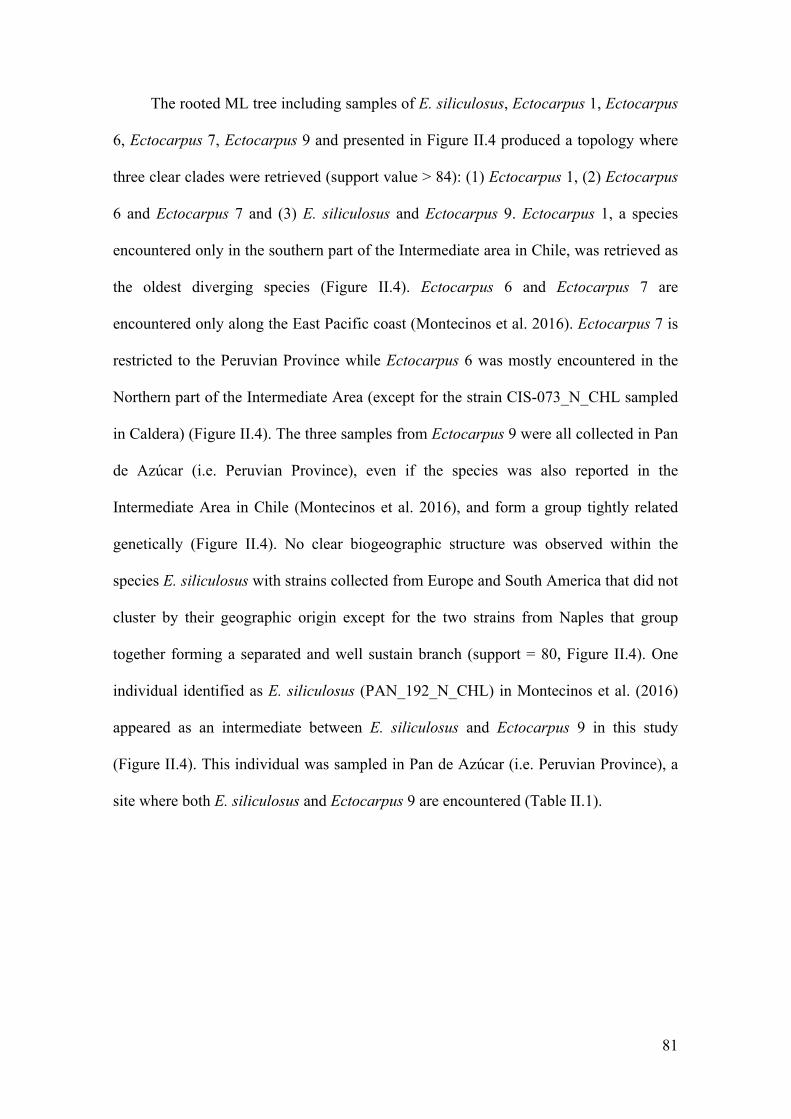
81
The rooted ML tree including samples of E. siliculosus, Ectocarpus 1, Ectocarpus
6, Ectocarpus 7, Ectocarpus 9 and presented in Figure II.4 produced a topology where
three clear clades were retrieved (support value > 84): (1) Ectocarpus 1, (2) Ectocarpus
6 and Ectocarpus 7 and (3) E. siliculosus and Ectocarpus 9. Ectocarpus 1, a species
encountered only in the southern part of the Intermediate area in Chile, was retrieved as
the oldest diverging species (Figure II.4). Ectocarpus 6 and Ectocarpus 7 are
encountered only along the East Pacific coast (Montecinos et al. 2016). Ectocarpus 7 is
restricted to the Peruvian Province while Ectocarpus 6 was mostly encountered in the
Northern part of the Intermediate Area (except for the strain CIS-073_N_CHL sampled
in Caldera) (Figure II.4). The three samples from Ectocarpus 9 were all collected in Pan
de Azúcar (i.e. Peruvian Province), even if the species was also reported in the
Intermediate Area in Chile (Montecinos et al. 2016), and form a group tightly related
genetically (Figure II.4). No clear biogeographic structure was observed within the
species E. siliculosus with strains collected from Europe and South America that did not
cluster by their geographic origin except for the two strains from Naples that group
together forming a separated and well sustain branch (support = 80, Figure II.4). One
individual identified as E. siliculosus (PAN_192_N_CHL) in Montecinos et al. (2016)
appeared as an intermediate between E. siliculosus and Ectocarpus 9 in this study
(Figure II.4). This individual was sampled in Pan de Azúcar (i.e. Peruvian Province), a
site where both E. siliculosus and Ectocarpus 9 are encountered (Table II.1).
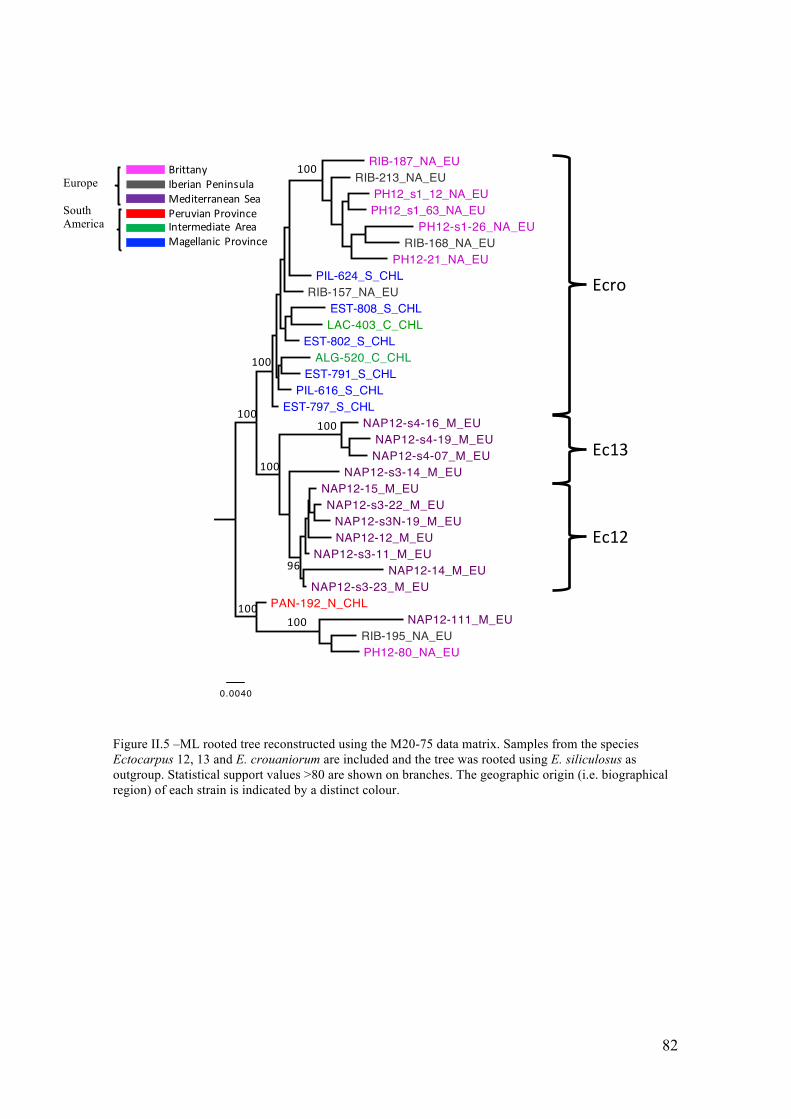
82
Figure II.5 –ML rooted tree reconstructed using the M20-75 data matrix. Samples from the species Ectocarpus 12, 13 and E. crouaniorum are included and the tree was rooted using E. siliculosus as outgroup. Statistical support values >80 are shown on branches. The geographic origin (i.e. biographical region) of each strain is indicated by a distinct colour.
0.0040
RIB-168_NA_EU
NAP12-15_M_EU
PH12-80_NA_EU
NAP12-s4-07_M_EU
NAP12-14_M_EU
PIL-624_S_CHL
NAP12-s3-22_M_EU
NAP12-s4-16_M_EU
PAN-192_N_CHL
PIL-616_S_CHL
NAP12-111_M_EU
NAP12-s3N-19_M_EU
PH12-21_NA_EU
NAP12-s3-14_M_EU
EST-797_S_CHL
PH12_s1_12_NA_EU
EST-791_S_CHL
NAP12-12_M_EU
PH12-s1-26_NA_EU
LAC-403_C_CHL
ALG-520_C_CHL
NAP12-s4-19_M_EU
RIB-195_NA_EU
NAP12-s3-11_M_EU
EST-802_S_CHL
NAP12-s3-23_M_EU
PH12_s1_63_NA_EU
EST-808_S_CHLRIB-157_NA_EU
RIB-187_NA_EURIB-213_NA_EU
100
100
100
100
100100
100
96
Ecro
Ec13
Ec12
NorthAtlanticMediterraneanseaNorthChileCenter ChileSouthChile
NorthAtlanticMediterraneanseaNorthChileCenter ChileSouthChile
BrittanyIberianPeninsulaMediterraneanSeaPeruvianProvinceIntermediate AreaMagellanic Province
NorthAtlanticMediterraneanseaNorthChileCenter ChileSouthChile
NorthAtlanticMediterraneanseaNorthChileCenter ChileSouthChile
NorthAtlanticMediterraneanseaNorthChileCenter ChileSouthChile
Europe South America
83
Two clades were observed (support value = 100) within the rooted ML tree
presented in Figure II.5: (1) E. crouaniorum and (2) Ectocarpus 12 and Ectocarpus 13.
Contrarily with what was observed for the cosmopolitan species E. siliculosus, a
geographic structure was detected for the widely distributed E. crouaniorum. Indeed, all
strains collected in the European North Atlantic, except for one (i.e. RIB-157_NA_EU)
formed a clade (support value = 100) embedded within a paraphyletic group formed by
eight samples collected in Chile (Intermediate Area) and the remaining RIB-
157_NA_EU sample collected in Ribadeo-Spain (Figure II.5). One strain identified as
Ectocarpus 13 (NAP12-s3-14_M_EU) in Montecinos et al. (2016) appeared as an
intermediate between Ectocarpus 12 and Ectocarpus 13, preventing the retrieval of
Ectocarpus 13 as a monophyletic group (Figure II.5). Again, the samples from both
Ectocarpus 12 and Ectocarpus 13 and the intermediate NAP12-s3-14_M_EU were
encountered within the same locality in the Mediterranean Sea (Naples, Figure II.5).
Note that when strains from various sites from the same biogeographic region
were sampled (i.e. E. siliculosus, E. crouaniorum, Ectocarpus 1 and Ectocarpus 6),
clustering by site origin was never observed (Figure II.4 and II.5).

84

85
V. DISCUSSION
- A better resolution of the phylogenetic relationships among cryptic species
Inferring phylogenetic relationships between taxa can be problematic because of:
(1) the lack of informative molecular variation at short evolutionary timescale; (2) the
lack of established markers in poorly studied taxa; and (3) the potential phylogenetic
conflicts among different genomic regions due to incomplete lineage sorting or
introgression. In this context, RAD-sequencing seems promising since this technique
can generate sequence data from numerous DNA fragments scattered throughout the
genome, from a large number of samples, and without preliminary knowledge on the
taxa under study. The use of RAD-seq has successfully resolved phylogenetic
relationships of both closely related groups of species and divergent taxa (e.g. Wagner
et al. 2012, Cariou et al. 2013, Hipp et al. 2013). Phylogenetic relationships in
Ectocarpus and species delimitation in this genus of recently diverging cryptic species
have always been problematic (Peters et al. 2010a, b, Montecinos et al. 2016). Using
RAD-seq, our results retrieved a branching pattern largely concordant with the one
recovered in previous studies using only few molecular markers (Peters et al. 2010a, b,
2015, Montecinos et al. 2016), showing two major monophyletic clades (with E.
crouaniorum, Ectocarpus 12 and 13 highly separated from all the other species) in the
Ectocarpus siliculosi group. Even if the sequencing results of all the samples of
Ectocarpus 8 were of low quality and this species was not included in the tree
reconstructions, our RAD-seq data set was able to retrieved all eight species -
Ectocarpus 1, Ectocarpus 6, Ectocarpus 7, Ectocarpus 9, Ectocarpus 12, Ectocarpus
13, E. siliculosus and E. crouaniorum - defined by Montecinos et al. (2016) as well-
separated genetic groups. We were also able to precise the close relationship between
Ectocarpus 6 and Ectocarpus 7 and E. siliculosus and Ectocarpus 9. We detected two
86
intermediate individuals between E. siliculosus and Ectocarpus 9 and between
Ectocarpus 12 and 13 at sites where they were encountered in sympatry, a results that
we interpret as potential hybridization or introgression between closely related species
pairs. It could be confirmed using adequate molecular and statistical tools as showed in
the chapter 3 of this PhD Thesis.
The pipeline Stacks (Catchen et al. 2011, 2013) has been used extensively to
generate RAD-seq data matrices for phylogenetic studies (e.g. Jones et al. 2013, Lexer
et al. 2013, Reitzel et al. 2013, Wagner et al. 2013, Cruaud et al. 2014, Herrera et al.
2014, Leaché et al. 2014, Viricel et al. 2014, Pante et al. 2015). Originally, this pipeline
was designed for genetic mapping but it has been extended to include features necessary
to develop population genetic and phylogenetic studies. The software is self-sufficient
and implements an off-by-N clustering strategy and may therefore be best suited to very
fine-scale phylogenetic questions (Eaton 2014). Using the M20-75 data set matrix, we
clearly recovered eight genetic groups (Ectocarpus 1, Ectocarpus 6, Ectocarpus 7,
Ectocarpus 9, Ectocarpus 12, Ectocarpus 13, E. siliculosus, E. crouaniorum;
Ectocarpus 8 samples are included in M20-75) showing a perfect concordance with the
species determination based on mitochondrial COI-5P and the nuclear ITS1
(Montecinos et al. 2016) (Chapter 1). Moreover, the use of numerous loci scattered
across the genome have allowed us to clarify some previously uncertain phylogenetic
relationships within the clade including Ectocarpus 1, Ectocarpus 6, Ectocarpus 7,
Ectocarpus 9 and E. siliculosus (Peters et al. 2010a,b, Montecinos et al. 2016). First, E.
siliculosus and Ectocarpus 9 were retrieved as two closely related monophyletic groups
using RAD-seq, while in Montecinos et al. (2016) Ectocarpus 9 was retrieved as
paraphyletic to E. siliculosus with the only marker available, the COI-5P (the ITS1 of
both species were unalignable). Ectocarpus 6 was retrieved as the closest species to the
87
model species Ectocarpus 7 using RAD-seq, confirming the results of previous studies
(Peters et al. 2010b, Montecinos et al. 2016). Ectocarpus 1, Ectocarpus 6, Ectocarpus 9
and Ectocarpus 7 are all from the Pacific. Ectocarpus 1, the earliest diverging species in
this clade, was found only in the Magellanic Province. Interestingly, Ectocarpus 7
showed a distribution limited to the Peruvian Province, while all others, except for one
Ectocarpus 6 strain, were found in the center of Chile (Northern part of the Intermediate
Area). E. siliculosus, the only cosmopolitan species in this clade, appeared as one of the
recently diverging species with a branch embedded in the clades from the South Pacific.
The strong geographical pattern of species distribution along the South East Pacific
coast observed for Ectocarpus 1, Ectocarpus 6, Ectocarpus 9 and Ectocarpus 7,
questions about the role of biogeographic barriers on species divergence. Indeed, recent
phylogeographic studies of seaweeds revealed the existence of different cryptic species
along the South East Pacific coast and that most of the genetic breaks between them
were broadly congruent with two biogeographic boundaries (the red alga Mazzaella
laminarioides, Montecinos et al. 2012; the kelp Lessonia spp., Tellier et al. 2011, others
see review of Guillemin et al. 2016a). Moreover, the cold temperate coasts of Chile and
South Peru have been considered as possible center of origin and diversification for
various algae (see for example the case of the bladed Bangiales in Guillemin et al.
2016c). It is possible that part of the recently diverging clades of Ectocarpus also take
origin in the cold waters of the Pacific, however more samples from New Zealand,
southern Australia and the NW Pacific will be needed to confirm this hypothesis.
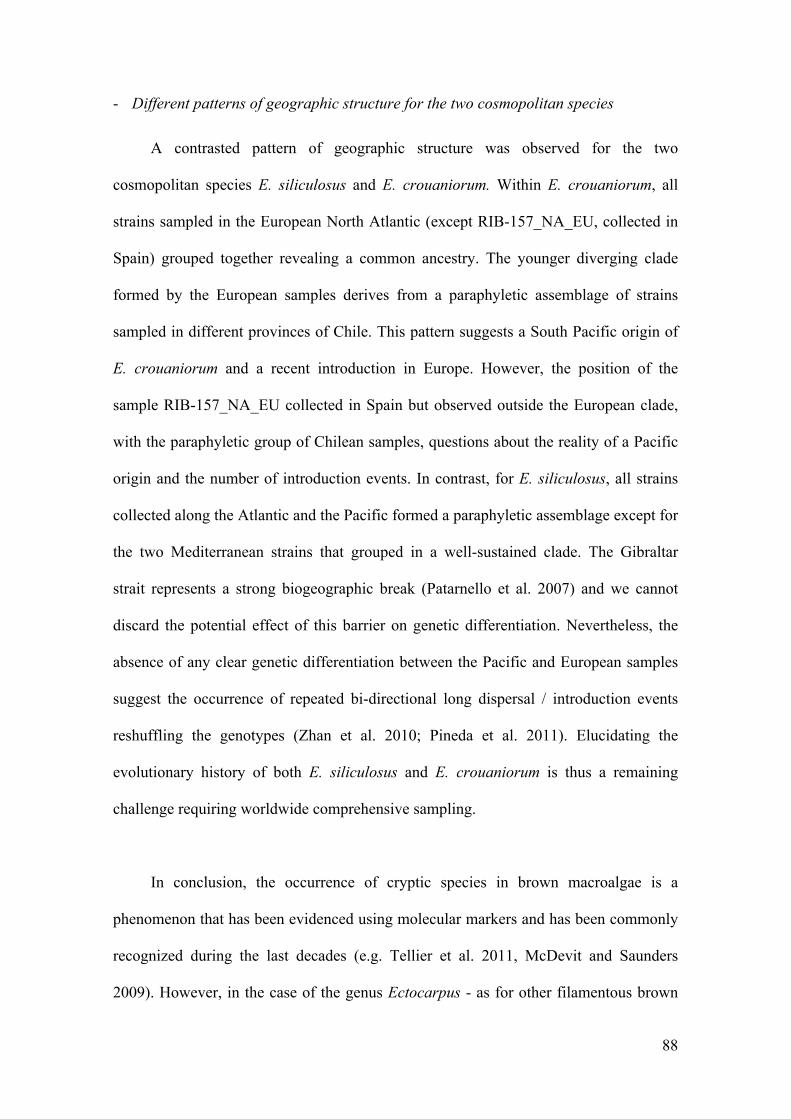
88
- Different patterns of geographic structure for the two cosmopolitan species
A contrasted pattern of geographic structure was observed for the two
cosmopolitan species E. siliculosus and E. crouaniorum. Within E. crouaniorum, all
strains sampled in the European North Atlantic (except RIB-157_NA_EU, collected in
Spain) grouped together revealing a common ancestry. The younger diverging clade
formed by the European samples derives from a paraphyletic assemblage of strains
sampled in different provinces of Chile. This pattern suggests a South Pacific origin of
E. crouaniorum and a recent introduction in Europe. However, the position of the
sample RIB-157_NA_EU collected in Spain but observed outside the European clade,
with the paraphyletic group of Chilean samples, questions about the reality of a Pacific
origin and the number of introduction events. In contrast, for E. siliculosus, all strains
collected along the Atlantic and the Pacific formed a paraphyletic assemblage except for
the two Mediterranean strains that grouped in a well-sustained clade. The Gibraltar
strait represents a strong biogeographic break (Patarnello et al. 2007) and we cannot
discard the potential effect of this barrier on genetic differentiation. Nevertheless, the
absence of any clear genetic differentiation between the Pacific and European samples
suggest the occurrence of repeated bi-directional long dispersal / introduction events
reshuffling the genotypes (Zhan et al. 2010; Pineda et al. 2011). Elucidating the
evolutionary history of both E. siliculosus and E. crouaniorum is thus a remaining
challenge requiring worldwide comprehensive sampling.
In conclusion, the occurrence of cryptic species in brown macroalgae is a
phenomenon that has been evidenced using molecular markers and has been commonly
recognized during the last decades (e.g. Tellier et al. 2011, McDevit and Saunders
2009). However, in the case of the genus Ectocarpus - as for other filamentous brown
89
algae – some additional difficulties arise due to their simple morphology and the almost
“blind” field sampling that has to be performed. Indeed, in the field, most Ectocarpus
samples are microscopic and are found as settled spores or few-celled individuals
growing on abiotic or biotic substrata. Pebbles, shells and macroalgae recognized as
Ectocarpus hosts have to be sampled blindly and Ectocarpus individuals obtained after
germling emergence (Couceiro et al. 2015, Peters et al., 2015, Montecinos et al. 2016).
Even when adult individuals are visible in the field, Ectocarpus samples cannot be
distinguished from morphologically similar filamentous brown algae. The characteristic
ribbon-shaped plastids of Ectocarpus have to be confirmed under the microscope.
However, there are at present no morphological characters for the identification of the
different species of Ectocarpus except for the branching pattern of E. fasciculatus, and
reliable identification requires diagnostic molecular markers. Due to these sampling
limitations, it is difficult to design a priori a minimum sampling size per site for the
different species or even for the genus Ectocarpus per se. However, such sampling
effort using (1) a blind sampling of different hard substrata as well as individuals visible
by eye and (2) a sampling design across the depth gradient of the shore repeated in
several sites, was made during this PhD thesis to better understand the importance of
hybridization and reproductive isolation between the divergent but most commonly
encountered species E. crouaniorum and E. siliculosus along the European coast
(Chapter 3).

90
91
Appendix II.1
Problems generating RAD-seq data during this PhD thesis.
We have encountered many technical problems when we attempted to obtain RAD-seq
data. The aim of this Appendix is to advert future research using NGS on Ectocarpus
species differing from the sequenced strain..
1) In order to get good DNA, we used the method developed in the sequenced
strain and tried to obtain axenic material by cultivating our strains in a medium
with antibiotics. However, we have detected a very slow growth of the strains
and detected fungal contamination in more than 50% of the isolates. We have
tried to redo each strain cultures more than three times but never succeed to get
rid of the fungal contaminations and to increase the growth rate. We concluded
that bacteria were necessary for strain growth in laboratory conditions. The
solution was then to add antibiotics to the cultures only 3 days before DNA
extraction.
2) The data presented in this Chapter reveal a huge variation in the number of reads
for each individual. The problem was that in each PCR after the ligation of
barcodes 12 individuals were pooled. This allowed reducing considerably the
time and price in Rad-seq materials. However, individual PCR has been shown
to give better results with more similar number of reads obtained for each
individual, since the competition between samples for nucleotides in the
amplification is avoided. Future work should take this issue into account.

92
93
Chapter3
Hybridizationbetweentwocrypticfilamentousbrown
seaweedalongtheshore:analyzingpreandpost-zygotic
barriersinpopulationsofindividualswithvaryingploidy
levels.1
Contents I. Abstract..................................................................................................................97
II. Introduction...........................................................................................................99
III. MaterialandMethods...........................................................................................105
- Fieldcollections,isolationofEctocarpusstrainsandDNAextraction.........................105
- Moleculardeterminationofploidyandsex...............................................................105
- Preliminarysortingofsamplesinparentalspeciesorputativehybridscategoriesusing
therps14-atp8spacer,theITS1anddiagnosticmicrosatellitelociandalleles...................106
- Statisticalanalysesofadmixturelevels.......................................................................109
- Populationstructureandmatingsystem...................................................................112
IV. Results..................................................................................................................113
- Speciesidentificationanddetectionofputativehybrids...........................................113
- Multivariateclusteringofindividuals.........................................................................117
- Admixtureanalysisandassignationofputativehybridstogeneticcategories..........119
- Comparisonamongmethodsandfrequencyofhybridizationinpopulations...........122
- Populationstructureandmatingsystem...................................................................125
V. Discussion.............................................................................................................127
- Species-diagnosticmarkerstodetecthybridizationincrypticspecies......................127
- Lowlevelofhybridizationareprobablyassociatedwithreproductivebarriers........129 1 Paper submitted in Molecular Ecology
94
- Presenceofrareallelesinhybrids..............................................................................132
- Rarityofhaploidhybridsandtheexistenceofreproductiveisolation.......................134
- Conclusion..................................................................................................................136
VI. Acknowledgments.................................................................................................137
VII. Appendix...............................................................................................................139
- AppendixIII.1.XPloidAssignment................................................................................139
- AppendixIII.2.Assigninggenotypedindividualstogenepoolsandadmixedgenepools
usingmultiplegeneticmarkerswithvaryingploidylevels.................................................145
- AppendixIII.3.TableS1...............................................................................................147
- AppendixIII.4.FigureS1..............................................................................................153
- AppendixB.1.TableS2(Parentalsporophytegenotypes)..........................SectionAP-57
- AppendixB.2.TableS3(Parentalgametophytegenotypes).......................SectionAP-79
95
CHAPTER 3.
Hybridizationbetweentwocrypticfilamentousbrownseaweedalong
theshore:analyzingpreandpost-zygoticbarriersinpopulationsof
individualswithvaryingploidylevels
Alejandro E. Montecinos1,2, Marie-Laure Guillemin1,2, Lucia Couceiro1,3, Akira F.
Peters4, Solenn Stoeckel5 and Myriam Valero1
1CNRS, Sorbonne Universités, UPMC University Paris VI, PUC, UACH, UMI 3614,
Evolutionary Biology and Ecology of Algae, Station Biologique de Roscoff, CS 90074,
Place G. Teissier, 29680 Roscoff, France 2Instituto de Ciencias Ambientales y Evolutivas, Facultad de Ciencias, Universidad
Austral de Chile, Casilla 567 Valdivia, Chile 3current address: Dep. Animal Biology, Plant Biology and Ecology; University of A
Coruña; A Coruña; Spain 4Bezhin Rosko, 40 rue des pêcheurs, 29250 Santec, France 5IGEPP, Agrocampus Ouest, INRA, Université de Rennes 1, Rennes, France
Keywords: reproductive barrier, meiosis, haploid-diploid life cycle, shore gradient,
contact zone, Ectocarpus.

96
97
I. Abstract
Hybridization between two cryptic species of the brown algal genus Ectocarpus
was studied along the European coast. Clonal cultures (568 diploid and 336 haploid)
isolated from field samples (10 populations) were genotyped to detect hybrid diploid
sporophytes and recombinant haploid gametophytes. We analysed haploid and diploid
sub-populations separately to identify admixed individuals, using STRUCTURE and
GENECLASS; but those classical assignment methods are not formalized to analyse
populations of individuals with varying ploidy levels and aneuploidy. We thus
developed our own Bayesian method, independent of ploidy per locus, implemented in
the software XPloidAssignment, which provides the posterior probabilities to assess the
level of admixture under various scenarios of hybridization. We show that our method
is particularly relevant when studying hybridization in species with complex life cycles
and for most secondary contacts where variations in ploidy levels are observed. Over all
Ectocarpus populations, the level of hybridization was estimated at 8.7%. However,
hybrids were exclusively observed in sympatric populations (where the two species
come in contact along the shore gradient) with a high frequency of rare alleles. More
than 98% of hybrids were diploids (40% of which showed signs of aneuploidy). These
results suggested the occurrence of post-meiotic reproductive isolation and demonstrate
that hybridization can be quantitatively assessed using the analysis of population genetic
structure in haploid-diploid species, allowing the distinction of pre- from post-zygotic
isolation barriers.

98
99
II. Introduction
Hybridization has been defined by Barton & Hewitt (1985) as reproduction
between individuals from genetically different populations. Even if hybridization was
first considered as preventing the process of speciation, it is now recognized that it can
“act as an additional, perhaps more abundant, source of adaptive genetic variation than
mutation” thereby potentially promoting speciation (Seehausen 2004; Abbott et al.
2013). Hybridization is a common phenomenon in many multicellular animal and plant
species (Elstrand et al. 1996; Mallet 2005) and is more frequent between closely related
than genetically highly diverged species. In particular, species within rapidly
diversifying groups (e.g. adaptive radiations) may be particularly prone to hybridization
(Seehausen 2004; Moyle 2004; Gourbière & Mallet 2010).
Hybridization implies sexual reproduction, which in turn entails cyclic alternation
between syngamy and meiosis. However, the relative timing of syngamy and meiosis
varies widely across the eukaryotic tree of life (Valero et al. 1992; Mable & Otto 1998;
Coelho et al. 2007). For example, syngamy and meiosis are clearly separated in time in
haploid–diploid species. In such life cycles, there is an alternation between haploid
individuals (gametophytes) produced by meiosis and diploid individuals (sporophytes)
resulting from syngamy. Unlike the diploid-dominant plants and animals, the haploid
stage in a haploid-diploid life cycle is an independent, functional organism with somatic
development (reviewed in Mable & Otto 1998). Consequently, in haploid-diploid
species the two hallmarks of the sexual life cycle can be studied separately by analysing
the population genetic structure of the haploid gametophytes and the diploid
sporophytes. In particular, the importance of post – zygotic barriers in the wild
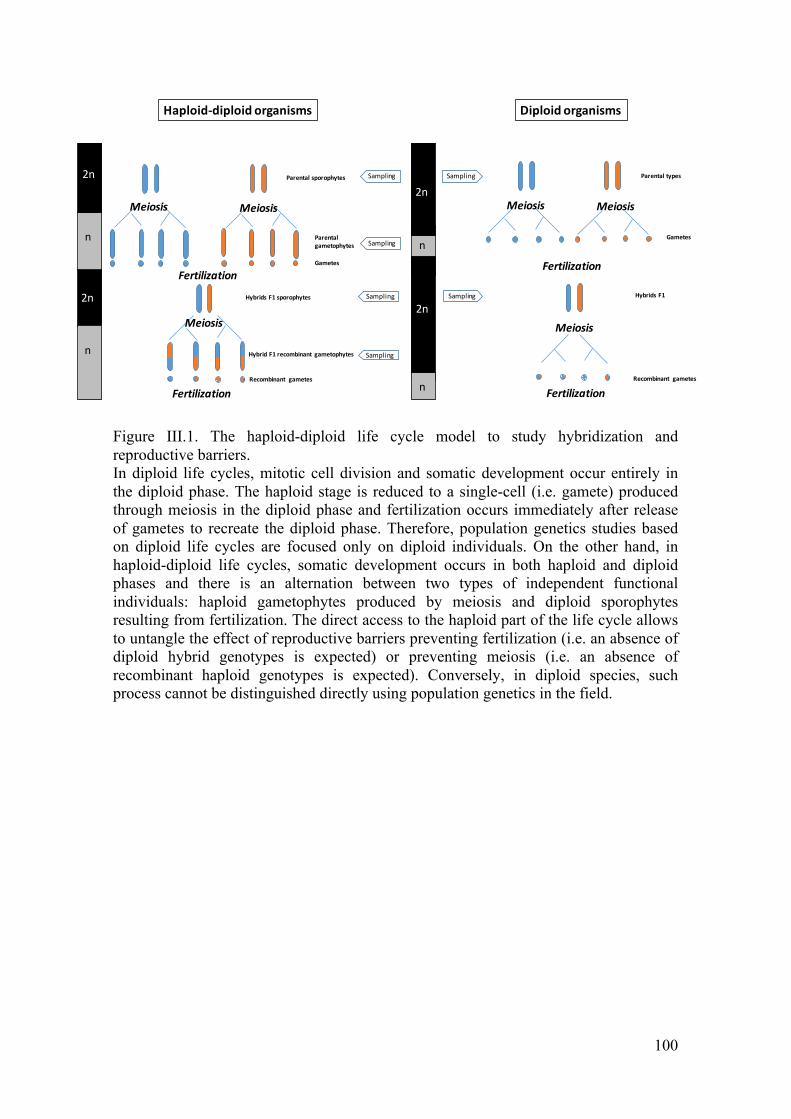
100
Figure III.1. The haploid-diploid life cycle model to study hybridization and reproductive barriers. In diploid life cycles, mitotic cell division and somatic development occur entirely in the diploid phase. The haploid stage is reduced to a single-cell (i.e. gamete) produced through meiosis in the diploid phase and fertilization occurs immediately after release of gametes to recreate the diploid phase. Therefore, population genetics studies based on diploid life cycles are focused only on diploid individuals. On the other hand, in haploid-diploid life cycles, somatic development occurs in both haploid and diploid phases and there is an alternation between two types of independent functional individuals: haploid gametophytes produced by meiosis and diploid sporophytes resulting from fertilization. The direct access to the haploid part of the life cycle allows to untangle the effect of reproductive barriers preventing fertilization (i.e. an absence of diploid hybrid genotypes is expected) or preventing meiosis (i.e. an absence of recombinant haploid genotypes is expected). Conversely, in diploid species, such process cannot be distinguished directly using population genetics in the field.
n
n
Hybrids F1sporophytes
Parentalsporophytes
Parentalgametophytes
Hybrid F1recombinant gametophytes
Fertilization
Fertilization
Meiosis
Meiosis Meiosis
Fertilization
Meiosis
Fertilization
Meiosis
n
2n
n
2n
2n
Haploid-diploid organisms Diploid organisms
Hybrids F1
Parentaltypes
n
2n
n
2n
2n
Sampling
Sampling
Sampling
Sampling
SamplingSampling
Meiosis
Gametes
Gametes
Recombinant gametesRecombinant gametes
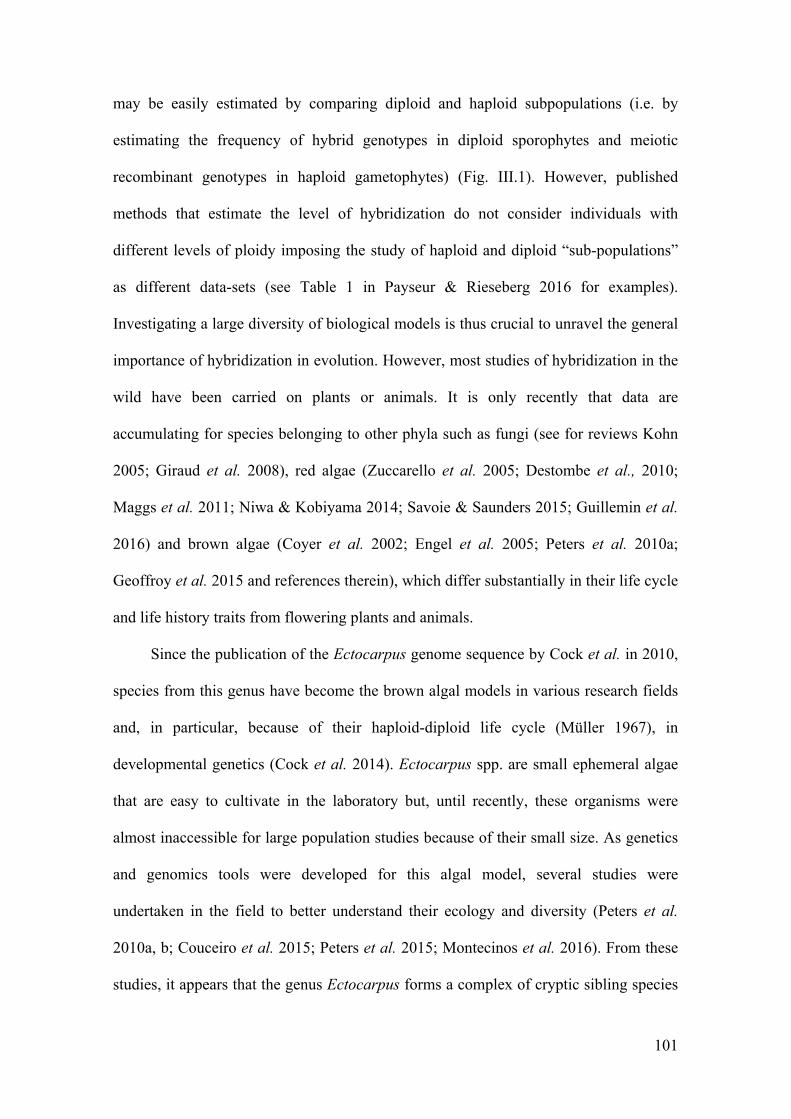
101
may be easily estimated by comparing diploid and haploid subpopulations (i.e. by
estimating the frequency of hybrid genotypes in diploid sporophytes and meiotic
recombinant genotypes in haploid gametophytes) (Fig. III.1). However, published
methods that estimate the level of hybridization do not consider individuals with
different levels of ploidy imposing the study of haploid and diploid “sub-populations”
as different data-sets (see Table 1 in Payseur & Rieseberg 2016 for examples).
Investigating a large diversity of biological models is thus crucial to unravel the general
importance of hybridization in evolution. However, most studies of hybridization in the
wild have been carried on plants or animals. It is only recently that data are
accumulating for species belonging to other phyla such as fungi (see for reviews Kohn
2005; Giraud et al. 2008), red algae (Zuccarello et al. 2005; Destombe et al., 2010;
Maggs et al. 2011; Niwa & Kobiyama 2014; Savoie & Saunders 2015; Guillemin et al.
2016) and brown algae (Coyer et al. 2002; Engel et al. 2005; Peters et al. 2010a;
Geoffroy et al. 2015 and references therein), which differ substantially in their life cycle
and life history traits from flowering plants and animals.
Since the publication of the Ectocarpus genome sequence by Cock et al. in 2010,
species from this genus have become the brown algal models in various research fields
and, in particular, because of their haploid-diploid life cycle (Müller 1967), in
developmental genetics (Cock et al. 2014). Ectocarpus spp. are small ephemeral algae
that are easy to cultivate in the laboratory but, until recently, these organisms were
almost inaccessible for large population studies because of their small size. As genetics
and genomics tools were developed for this algal model, several studies were
undertaken in the field to better understand their ecology and diversity (Peters et al.
2010a, b; Couceiro et al. 2015; Peters et al. 2015; Montecinos et al. 2016). From these
studies, it appears that the genus Ectocarpus forms a complex of cryptic sibling species
102
adapted to different hosts and/or habitats along the shore gradient. Moreover,
incongruences between a nuclear (internal transcribed spacer 1 of the ribosomal DNA;
ITS1) and a cytoplasmic marker (cytochrome oxidase subunit 1; COI-5P) were recently
reported by Montecinos et al. (2016) among some species pairs suggesting the
occurrence of hybridization and introgression in the field. The occurrence of putative
hybrids between E. siliculosus and E. crouaniorum in the Atlantic coasts was reported
by Peters et al. (2010a), who used a barcode approach based on ITS1 length difference.
Indeed, individual species can be rapidly identified based on their ITS length using a
simple PCR and the electrophoresis technique and individuals bearing both species-
specific bands were regarded as putative hybrids (Peters et al. 2010a). However,
although E. siliculosus and E. crouaniorum were the most frequently sampled species
along the North Atlantic coast by Montecinos et al. (2016), no incongruences between
the nuclear and cytoplasmic markers were reported between these two species by these
authors. These results question the importance of hybridization in nature between E.
siliculosus and E. crouaniorum and might indicate the occurrence of post-zygotic
barriers preventing gene flow and introgression between these two species.
To address these issues, we completed a collection of more than 900 unialgal
cultures derived from samples collected in ten sites along the European coast. We first
combined information from cytoplasmic and nuclear markers to estimate the frequency
of each parental species and putative hybrids along the European coast and the
occurrence of sympatric populations. We then analysed microsatellite genetic data to
conduct admixture analyses with the classical STRUCTURE and GENECLASS
methods on separate diploid and haploid subpopulations. But those clustering models
were not adapted to answer our question. We thus formalized a new Bayesian method to
assign individuals to quantitative levels of admixture between the two cryptic species

103
using all individuals whatever their ploidy (ie haploid, diploid or aneuploid). The
objectives of this study were (1) to test whether hybrids were restricted to sympatric
zones where the two species are in contact along the shore, and (2) to determine the
relative abundance of haploid and diploid hybrids and describe their genetic
composition. In addition to contributing to important information concerning the
biology of Ectocarpus, this study aimed to broaden our understanding of speciation and
hybridization processes in benthic marine environments.
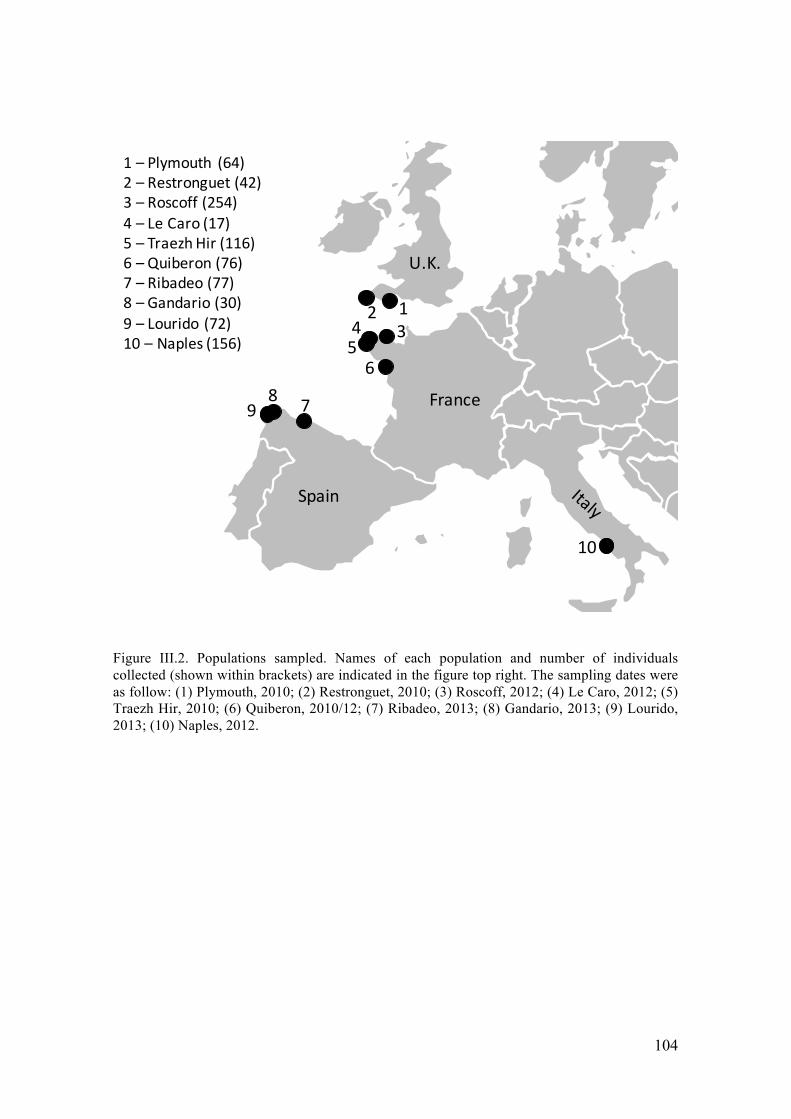
104
Figure III.2. Populations sampled. Names of each population and number of individuals collected (shown within brackets) are indicated in the figure top right. The sampling dates were as follow: (1) Plymouth, 2010; (2) Restronguet, 2010; (3) Roscoff, 2012; (4) Le Caro, 2012; (5) Traezh Hir, 2010; (6) Quiberon, 2010/12; (7) Ribadeo, 2013; (8) Gandario, 2013; (9) Lourido, 2013; (10) Naples, 2012.
1234
56
7
10
France
U.K.
Spain
1– Plymouth (64)2– Restronguet (42)3– Roscoff (254)4– LeCaro(17)5– TraezhHir (116)6– Quiberon (76)7– Ribadeo (77)8– Gandario (30)9 – Lourido (72)10– Naples(156)
89
105
III. Material and Methods
- Field collections, isolation of Ectocarpus strains and DNA extraction
A total of 904 Ectocarpus samples from the North East Atlantic (NEA) and the
Mediterranean Sea were used in this study (Fig. III.2). Four hundred and ninety-four
samples were collected from seven sites along the NEA in the framework of this study,
while the remaining 410 samples (Roscoff and Naples sites) were previously obtained
by Couceiro et al. (2015). As Ectocarpus species cannot be distinguished in the field
(see below), sampling was blind and it was not possible to select, a priori, sites where
the two species co-occurred in sympatry. Nonetheless, since E. siliculosus and E.
crouaniorum have been shown to inhabit different levels of the intertidal (Peters et al.
2010a; Couceiro et al. 2015; Montecinos et al. 2016), whenever possible, samples were
collected from high to lower tide levels on the shore. Unialgal cultures were established
from all 494 newly collected samples and maintained as clonal cultures using the
protocol described in Couceiro et al. (2015). After two months of laboratory culture,
enough biomass was available for DNA extraction and total DNA was extracted from
lyophilized samples using the NucleoSpinR 96 Plant Kit (Macherey-Nagel, Duren,
Germany).
- Molecular determination of ploidy and sex
In Ectocarpus, sex is expressed during the haploid phase (UV system) and is
determined by two different sex-determining regions (Ahmed et al. 2014),
corresponding to the two sexes. Both the male and female sex-determining regions are
present in the diploid sporophytes (heterozygous for the sex locus) whereas the haploid
106
gametophytes carry either the male or female allele (hemizygous for the sex locus). In
order to determine the sex and the ploidy of our samples, we amplified the sex-specific
regions following Couceiro et al. (2015). Positive/negative amplifications for male and
female specific PCR primers were checked on 2% agarose gels stained with ethidium
bromide.
- Preliminary sorting of samples in parental species or putative hybrids categories
using the rps14-atp8 spacer, the ITS1 and diagnostic microsatellite loci and alleles
Neither the two cryptic species E. siliculosus (hereafter Esil) and E. crouaniorum
(hereafter Ecro) nor their putative hybrids can be distinguished using morphological
characters (Peters et al. 2010a, b; Montecinos et al. 2016). We therefore first amplified
the species-specific mitochondrial rps14-atp8 spacer region developed by Couceiro et
al. (2015) to classify each sample cytoplasm by its species of origin. Peters et al.
(2004b) have demonstrated that mitochondria are maternally inherited in Ectocarpus.
The presence/absence of PCR products corresponding to the rps14-atp8 spacers of Esil
or Ecro was determined on 2% agarose gel as described in Couceiro et al. (2015).
Second, as a preliminary method to distinguish parental species from putative hybrids,
we amplified the ITS1 and tested for linkage disequilibrium between this nuclear
marker and the cytoplasmic marker rps14-atp8. A fragment containing the ITS1 region
together with 224 bp of the flanking 18S and 5.8S genes was amplified using the
primers described by Peters et al. (2010a). These primers allow distinguishing both
parental species based on the different length of the amplified region (850 bp in Esil but
1100 bp in Ecro). PCR conditions followed Peters et al. (2010a) and the number and
length of the ITS1 fragments were determined by electrophoretic size separation in 2%
agarose gels. Individuals were considered as putative hybrids if they bore the two ITS1
107
fragments (850bp and 1100bp) or showed incongruence between the mitochondrial and
nuclear markers.
Finally, nine nuclear microsatellite loci were amplified using the primers and PCR
conditions described by Couceiro et al. (2015). Microsatellite alleles were analysed in
an ABI 3130 automated sequencer and scored manually using GeneMapper ® version 4
software (Life Technologies Corporation). Amplification success and allele frequency
were computed with GENALEX (Peakall & Smouse 2012) for each locus. The
occurrence of species-diagnostic loci (i.e. loci showing no cross-amplification between
both parental species), as well as species-diagnostic alleles (i.e. alleles at loci showing
cross-amplification between both parental species but otherwise exhibiting non-
overlapping allele size ranges), was evaluated by determining the amplification success
and allele size range of the nine microsatellite loci in the individuals previously
classified as Esil or Ecro based on the cytoplasmic information. All individuals showing
amplification products for at least one diagnostic locus size inconsistent with the
expected species based on the cytoplasmic markers were added to a list of putative
hybrids. Because diagnostic loci do not amplify in both species they generate missing
data for one of the parental species. This non-amplification corresponds to a
phylogenetic signal but should be distinguished from a null allele. In order to
distinguish missing data caused by species-diagnostic loci from missing data caused by
null alleles, the first kind of data were replaced by an artificial allele of an arbitrary size
of 800bp in the individuals classified as parental species. Indeed, in the parental species,
we expect complete linkage disequilibrium between these diagnostic loci (i.e. none of
the loci diagnostic for Esil should amplify in Ecro and vice versa for the loci diagnostic
of Ecro). In contrast, for putative hybrid individuals, recombination between diagnostic
loci is expected for all generations after the F1. Thus, it was necessary to distinguish if
108
missing data at these loci indicated recombination or null alleles. In order to do this, we
first estimated the frequency of null alleles within each parental species by assessing the
frequency of non-amplification at their diagnostic loci (i.e. the frequency of missing
data in species A for the loci that amplify in species A but not species B and, vice versa,
the frequency of missing data in species B for the loci that amplify in species B but not
in species A). Second, we estimated the frequency of null alleles within the individuals
classified as putative hybrids at all diagnostic loci. Finally, we compared the frequency
of null alleles between parental species and putative hybrids using a Fisher exact test
implemented in GENEPOP'007 (Rousset 2008). If the frequency of null alleles was not
significantly different between parental species and putative hybrids, the missing data
were recoded as null alleles in the hybrids; however, if the frequency of missing data
was higher in hybrids than in parental species, the missing data were recoded using the
800 bp artificial allele denoting non-amplification due to a species-specific locus. The
previous comparisons between putative hybrids and parental species for all diagnostic
loci were made independently on the haploid and diploid sub-populations. In addition,
to ensure the reliability of the null allele estimation, each sample showing missing data
was re-amplified up to three times.
We also recorded some genotypes with 3 alleles per locus at one or more loci (23
sporophytes, see results below). In all these cases, their genotypes at one given locus
involved two alleles diagnostic of one species and one allele diagnostic of the second
species. Because aneuploidy cannot be taken into account for most of the classical
analyses, these individuals were re-categorised as diploid heterozygotes and, one allele
diagnostic of each species was selected in order to retain information indicating
admixture between species. The most frequent allele in each species gene pool was
conserved in the re-categorised diploids.
109
- Statistical analyses of admixture levels
To gain insight into hybridization between Esil and Ecro, the nuclear
microsatellite dataset was analyzed following four complementary methods. First, a
Principal Component Analyses (PCA) of the multilocus genotypes was carried out
using the R-package ADEGENET (Jombart 2008). Second, the Bayesian clustering
method STRUCTURE v2.3.4 (Pritchard et al. 2000) was used to identify the number of
genetically distinct clusters that maximize the likelihood of the data, and to assign the
individuals to the clusters Esil or Ecro using only genetic information. It is important to
note that, unlike multivariate analyses (such as PCA), Bayesian clustering methods rely
on explicit models and assumptions such as random mating and absence of linkage
disequilibrium, which are often difficult to verify and can restrict their applicability. In
STRUCTURE, the number K of populations was estimated using a burn-in period of
10.000 and 100.000 MCMC replicates, applying the admixture model and correlated
allele frequencies. Each run was replicated 10 times and a range of clusters (K) from 1
to 10 was tested. To verify that the K value that best fitted our data was K = 2 (two
species), the ∆K statistic developed by Evanno et al. (2005) was calculated. Combined
results from the independent runs were obtained using the greedy algorithm with
100.000 random input orders in CLUMPP (Jakobsson & Rosenberg 2007) before
exporting the results to DISTRUCT (Rosenberg 2004) for viewing. The estimated
membership coefficients Q for each individual in each cluster were calculated using the
results obtained by CLUMPP and those individuals for which the secondary cluster
represented more than 10% of the genome were regarded as putative hybrids (Vähä &
Primmer 2006). Since PCA multivariate analyses and STRUCTURE allow neither
different ploidy levels within the same dataset or aneuploidy, both analyses were run on
110
the haploid and diploid sub-populations separately using the recoded aneuploid
genotypes.
The third procedure employed to analyse our microsatellite dataset involved a
new Bayesian method specifically developed for this study, implemented in the
software XPLOIDASSIGNMENT (Supplementary File 1, Supporting information),
which assigns genotyped individuals with different ploidy levels, both between
individuals and between markers in a same individual, to quantitative levels of
admixture between two genetic groups a priori defined as two previously-isolated pure
cryptic species. The method is described in the Supplementary File 2 (Supporting
information). Briefly, this method uses the genotyped individuals a priori considered as
pure breed and belonging to historically-isolated groups of populations to compute, for
each marker, two differentiated gene pools (the two cryptic species in our study). The
likelihood that an allele belongs to one of the differentiated gene pool, for example to
species A or B is its frequency within this differentiated gene pool. The method then
computes the posterior probabilities that putative hybrids were obtained from different
quantitative admixture scenarios. In our case, five distinct scenarios were tested:
Scenario 1 and 2, a putative hybrid belongs to one of the two parental species; Scenario
3, a putative hybrid genotype is formed by 50% of each parental species as expected in
F1 hybrids; Scenario 4 and 5, a putative hybrid genotype results from an introgressive
hybridization (25% of alleles from one parental species and 75% from the other) as
expected in backcrosses or in ancient secondary contacts.
Here, we used XPLOIDASSIGNMENT to compute the posterior probabilities
that each putative hybrid belonged to one of the two parental species (ie Esil and Ecro)
or one of the three hybrid classes defined by the quantitative scenarios of admixture (i.e.
½Esil-½Ecro, ¾Ecro-¼Esil, ¾Esil-¼Ecro). In order to define the genetic pools of the
111
two parental species, Esil and Ecro, we constructed a data file combining both haploid
and diploid samples but excluding the putative hybrids (as defined using the
combination of rps14-atp8 spacer, ITS1 and microsatellite diagnostic loci); as
XPLOIDASSIGNMENT allows the use of samples with varying ploidy levels,
aneuploid genotypes were included with no recoding.
In our fourth method, we used the function “HYBRIDIZE” included in the R-
package ADEGENET (Jombart 2008) to simulate 500 artificial genotypes for the three
hybrid scenarios previously mentioned (i.e. F1, backcrosses with Esil and backcrosses
with Ecro) using the parental species dataset as input (i.e. after excluding putative
hybrids as defined using the rps14-atp8, ITS1 markers and diagnostic loci). Thereafter,
we used GENECLASS v2.0 (Piry & Cornuet 1999) to assign all putative hybrids to one
of these five groups (i.e. the two parental species and the three simulated hybrid
classes). The Rannala & Mountain (1997) assignment algorithm was used as criterion
for computation following the methods outlined in Paetkau et al. (2004) and the
assignment probabilities of all putative hybrids to each group were tested using the
‘‘assign or exclude individuals’’ option (p=0.05). Since both ADEGENET and
GENECLASS analyses are limited to diploid samples, only the diploid dataset with
recoded aneuploid genotypes could be employed in our fourth approach.
Results from STRUCTURE, XPLOIDASSIGNMENT and GENECLASS were
compared and combined to classify each putative hybrid into five different genetic
classes corresponding to five different scenarios of hybridisation between Esil and Ecro:
(1) hybrids with an equal proportion of Esil and Ecro genomes, parsimoniously
interpreted as potential F1; (2) hybrids with ≥ 0.75 Esil genome, interpreted as admixed
individuals derived from backcrosses or repeated interbreeding with Esil; (3) hybrids
with ≥ 0.75 Ecro genome, interpreted as admixed individuals derived from backcrosses
112
or repeated interbreeding with Ecro; (4) individuals with ≥ 0.90 Esil genome,
interpreted as part of the parental species Esil and (5) individuals with ≥ 0.90 Ecro
genome, interpreted as part of the parental species Ecro. When using GENECLASS or
XPLOIDASSIGNMENT methods, individuals were classified into a single hybrid class
category (i.e. the one showing the maximum posterior probability) if the probability of
assignment to this category was at least two times higher than to any other category;
otherwise, individuals were assigned to the two or three equally probable categories.
- Population structure and mating system
For both species, the degree of clonality was assessed at each site in both haploid
and diploid subpopulations. The number of repeated multilocus genotypes was
calculated and the genotypic diversity R was computed by dividing the number of
distinct genotypes (G) by the number of individuals, corrected for sample size (i.e. R =
G-1/N-1, Dorken & Eckert 2001) using GENECLONE 2.0 v6.41 (Arnaud-Haond &
Belkhir 2007). In addition, to explore the departure from random mating in each diploid
sub-population, FIS values were calculated using the software GENETIX v4.05
(Belkhir et al. 2004). Significance of departure from random mating was tested by
running 1000 permutations of alleles among individuals within samples. Finally, in
order to study the importance of genetic differentiation among sites within each parental
species (i.e. excluding potential hybrids), the global FST statistic (as defined by Weir &
Cockerham 1984) was calculated independently for the haploid and diploid
subpopulations of each species using GENETIX v4.05 (Belkhir et al. 2004). The level
of significance was estimated using 1000 permutations.
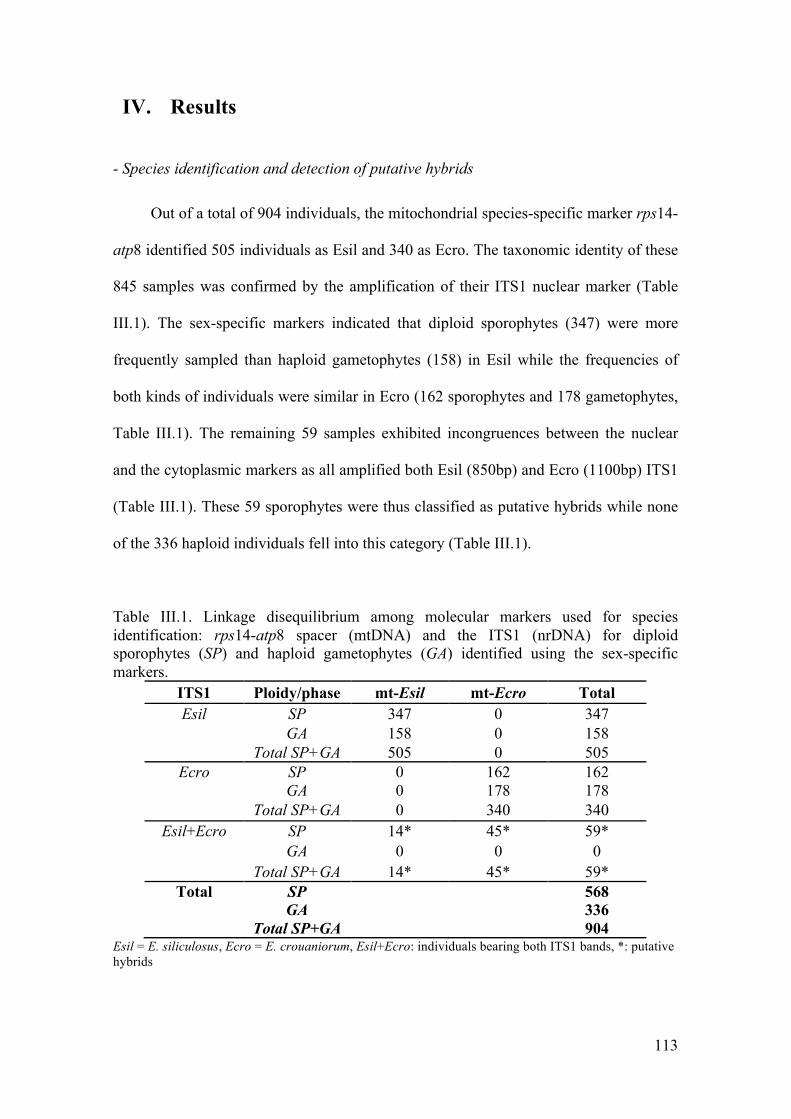
113
IV. Results
- Species identification and detection of putative hybrids
Out of a total of 904 individuals, the mitochondrial species-specific marker rps14-
atp8 identified 505 individuals as Esil and 340 as Ecro. The taxonomic identity of these
845 samples was confirmed by the amplification of their ITS1 nuclear marker (Table
III.1). The sex-specific markers indicated that diploid sporophytes (347) were more
frequently sampled than haploid gametophytes (158) in Esil while the frequencies of
both kinds of individuals were similar in Ecro (162 sporophytes and 178 gametophytes,
Table III.1). The remaining 59 samples exhibited incongruences between the nuclear
and the cytoplasmic markers as all amplified both Esil (850bp) and Ecro (1100bp) ITS1
(Table III.1). These 59 sporophytes were thus classified as putative hybrids while none
of the 336 haploid individuals fell into this category (Table III.1).
Table III.1. Linkage disequilibrium among molecular markers used for species identification: rps14-atp8 spacer (mtDNA) and the ITS1 (nrDNA) for diploid sporophytes (SP) and haploid gametophytes (GA) identified using the sex-specific markers.
ITS1 Ploidy/phase mt-Esil mt-Ecro Total Esil SP 347 0 347
GA 158 0 158 Total SP+GA 505 0 505
Ecro SP 0 162 162 GA 0 178 178 Total SP+GA 0 340 340
Esil+Ecro SP 14* 45* 59* GA 0 0 0 Total SP+GA 14* 45* 59*
Total SP 568 GA 336 Total SP+GA 904
Esil = E. siliculosus, Ecro = E. crouaniorum, Esil+Ecro: individuals bearing both ITS1 bands, *: putative hybrids
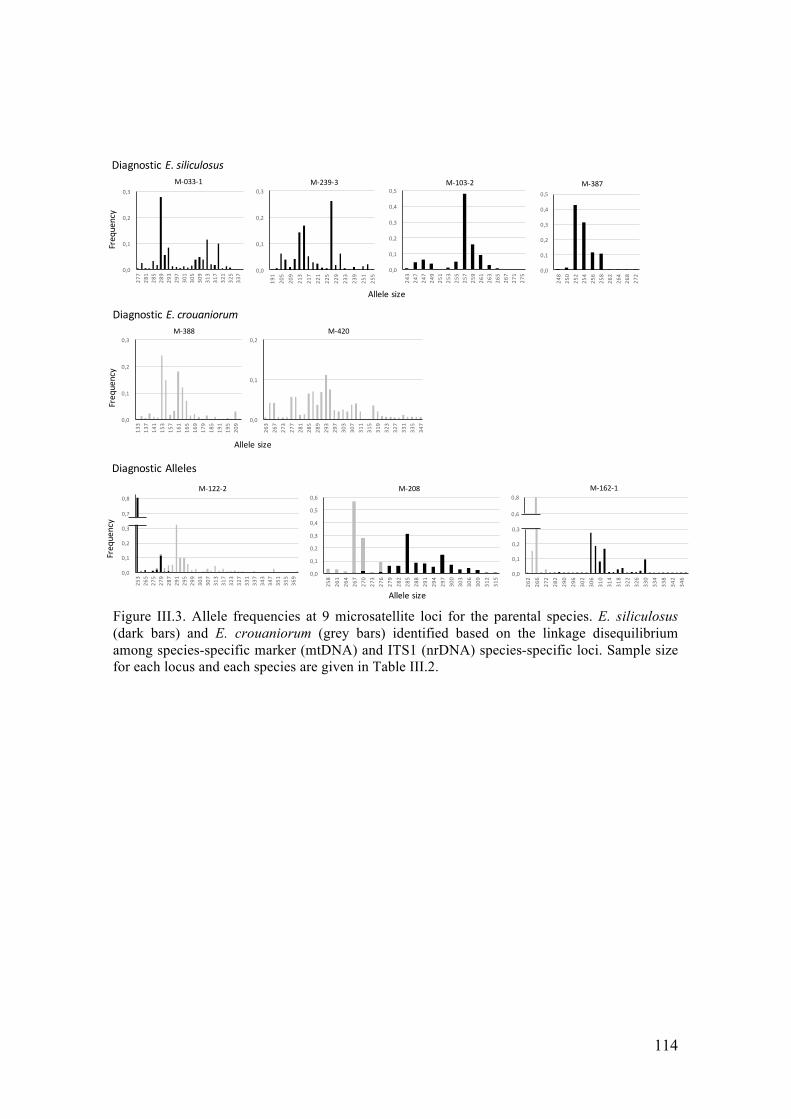
114
0,0
0,1
0,2
0,3
0,4
0,5
0,6
0,7
0,8
253
265
275
279
287
291
295
299
303
307
313
317
323
327
331
337
343
347
351
355
369
0,0
0,1
0,2
0,3
0,4
0,5
0,6
0,7
0,8
253
265
275
279
287
291
295
299
303
307
313
317
323
327
331
337
343
347
351
355
369
M-162-1M-208
0,0
0,1
0,2
0,3
0,4
0,5
0,6
258
261
264
267
270
273
276
279
282
285
288
291
294
297
300
303
306
309
312
315
M-122-2
0,0
0,1
0,2
0,326
226
627
228
229
029
630
230
631
031
431
832
232
633
033
433
834
234
6
0,6
0,8
Allelesize
Frequency
Allelesize
Frequency
Allelesize
Frequency
DiagnosticE.siliculosus
DiagnosticE.crouaniorum
DiagnosticAlleles
M-388 M-420
0,0
0,1
0,2
0,3
133
137
141
153
157
161
165
169
179
185
191
195
209
0,0
0,1
0,2
263
267
273
277
281
285
289
293
297
303
307
311
315
319
323
327
331
335
347
M-033-1 M-239-3 M-103-2 M-387
0,0
0,1
0,2
0,3
277
281
285
289
293
297
301
305
309
313
317
321
325
337
0,0
0,1
0,2
0,3
191
205
209
213
217
221
225
229
233
239
251
255
0,0
0,1
0,2
0,3
0,4
0,5
243
247
247
249
251
253
255
257
259
261
263
265
267
271
275
0,0
0,1
0,2
0,3
0,4
0,5
248
250
252
254
256
258
262
264
268
272
Figure III.3. Allele frequencies at 9 microsatellite loci for the parental species. E. siliculosus (dark bars) and E. crouaniorum (grey bars) identified based on the linkage disequilibrium among species-specific marker (mtDNA) and ITS1 (nrDNA) species-specific loci. Sample size for each locus and each species are given in Table III.2.
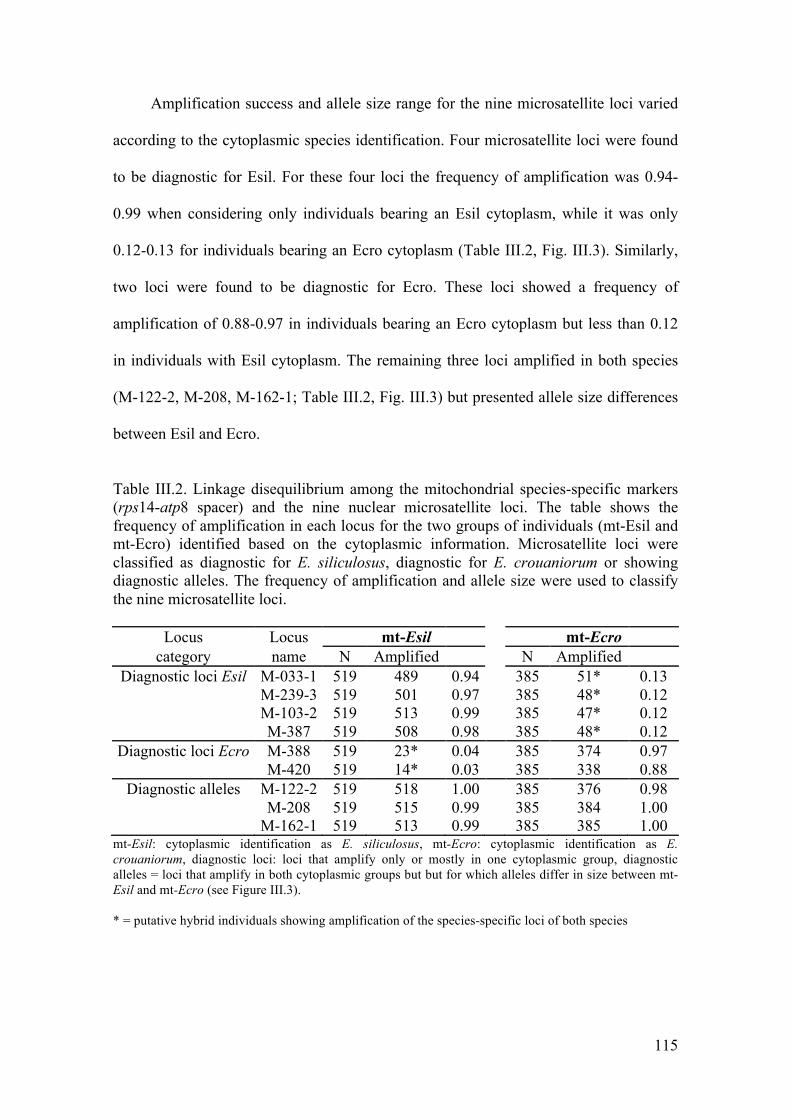
115
Amplification success and allele size range for the nine microsatellite loci varied
according to the cytoplasmic species identification. Four microsatellite loci were found
to be diagnostic for Esil. For these four loci the frequency of amplification was 0.94-
0.99 when considering only individuals bearing an Esil cytoplasm, while it was only
0.12-0.13 for individuals bearing an Ecro cytoplasm (Table III.2, Fig. III.3). Similarly,
two loci were found to be diagnostic for Ecro. These loci showed a frequency of
amplification of 0.88-0.97 in individuals bearing an Ecro cytoplasm but less than 0.12
in individuals with Esil cytoplasm. The remaining three loci amplified in both species
(M-122-2, M-208, M-162-1; Table III.2, Fig. III.3) but presented allele size differences
between Esil and Ecro.
Table III.2. Linkage disequilibrium among the mitochondrial species-specific markers (rps14-atp8 spacer) and the nine nuclear microsatellite loci. The table shows the frequency of amplification in each locus for the two groups of individuals (mt-Esil and mt-Ecro) identified based on the cytoplasmic information. Microsatellite loci were classified as diagnostic for E. siliculosus, diagnostic for E. crouaniorum or showing diagnostic alleles. The frequency of amplification and allele size were used to classify the nine microsatellite loci.
Locus Locus mt-Esil mt-Ecro category name N Amplified N Amplified
Diagnostic loci Esil M-033-1 519 489 0.94 385 51* 0.13
M-239-3 519 501 0.97 385 48* 0.12
M-103-2 519 513 0.99 385 47* 0.12 M-387 519 508 0.98 385 48* 0.12 Diagnostic loci Ecro M-388 519 23* 0.04 385 374 0.97 M-420 519 14* 0.03 385 338 0.88
Diagnostic alleles M-122-2 519 518 1.00 385 376 0.98
M-208 519 515 0.99 385 384 1.00 M-162-1 519 513 0.99 385 385 1.00
mt-Esil: cytoplasmic identification as E. siliculosus, mt-Ecro: cytoplasmic identification as E. crouaniorum, diagnostic loci: loci that amplify only or mostly in one cytoplasmic group, diagnostic alleles = loci that amplify in both cytoplasmic groups but but for which alleles differ in size between mt-Esil and mt-Ecro (see Figure III.3). * = putative hybrid individuals showing amplification of the species-specific loci of both species
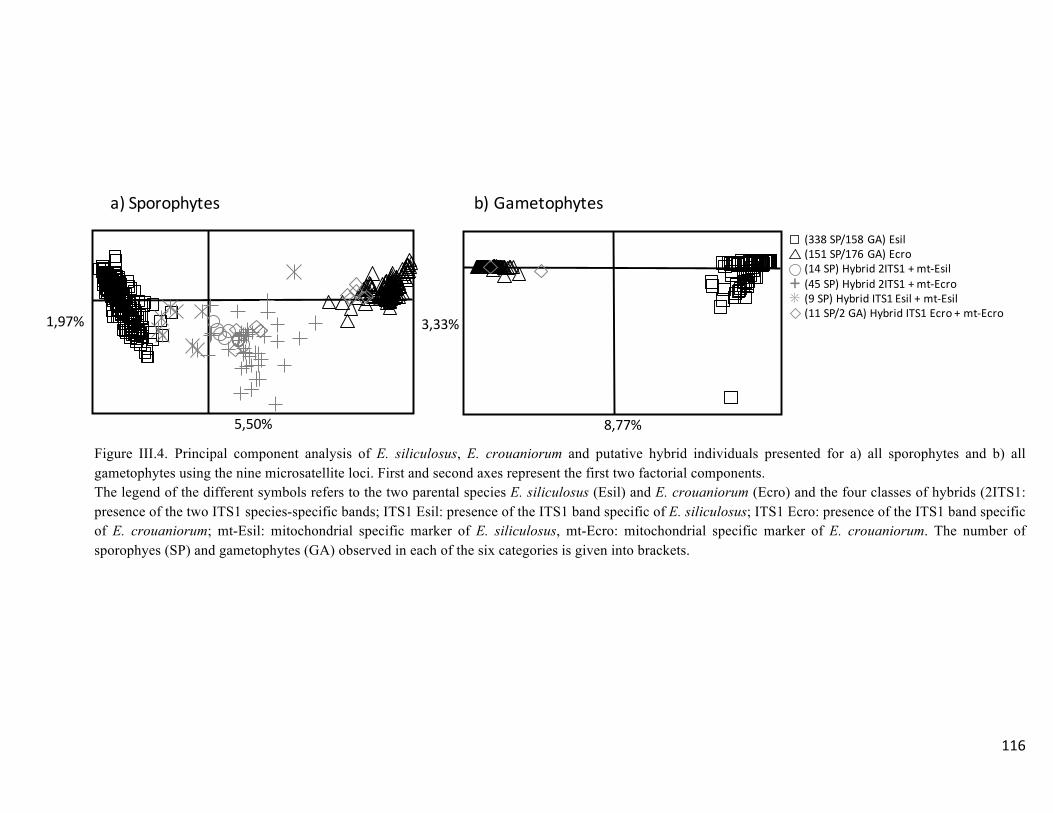
116
Figure III.4. Principal component analysis of E. siliculosus, E. crouaniorum and putative hybrid individuals presented for a) all sporophytes and b) all gametophytes using the nine microsatellite loci. First and second axes represent the first two factorial components. The legend of the different symbols refers to the two parental species E. siliculosus (Esil) and E. crouaniorum (Ecro) and the four classes of hybrids (2ITS1: presence of the two ITS1 species-specific bands; ITS1 Esil: presence of the ITS1 band specific of E. siliculosus; ITS1 Ecro: presence of the ITS1 band specific of E. crouaniorum; mt-Esil: mitochondrial specific marker of E. siliculosus, mt-Ecro: mitochondrial specific marker of E. crouaniorum. The number of sporophyes (SP) and gametophytes (GA) observed in each of the six categories is given into brackets.
a)Sporophytes b)Gametophytes
5,50%
1,97%
8,77%
3,33%
(338SP/158GA)Esil(151SP/176GA)Ecro(14SP)Hybrid2ITS1+mt-Esil(45SP)Hybrid2ITS1+mt-Ecro(9SP)HybridITS1Esil +mt-Esil(11SP/2GA)HybridITS1Ecro +mt-Ecro
+�
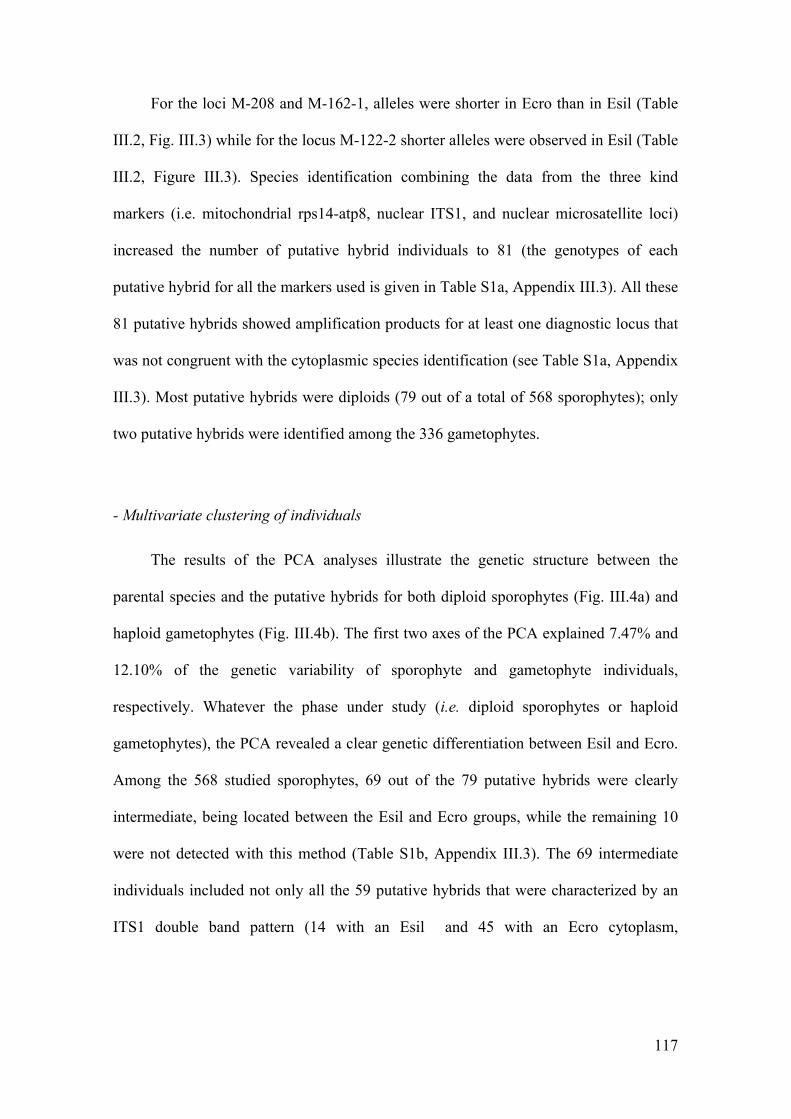
117
For the loci M-208 and M-162-1, alleles were shorter in Ecro than in Esil (Table
III.2, Fig. III.3) while for the locus M-122-2 shorter alleles were observed in Esil (Table
III.2, Figure III.3). Species identification combining the data from the three kind
markers (i.e. mitochondrial rps14-atp8, nuclear ITS1, and nuclear microsatellite loci)
increased the number of putative hybrid individuals to 81 (the genotypes of each
putative hybrid for all the markers used is given in Table S1a, Appendix III.3). All these
81 putative hybrids showed amplification products for at least one diagnostic locus that
was not congruent with the cytoplasmic species identification (see Table S1a, Appendix
III.3). Most putative hybrids were diploids (79 out of a total of 568 sporophytes); only
two putative hybrids were identified among the 336 gametophytes.
- Multivariate clustering of individuals
The results of the PCA analyses illustrate the genetic structure between the
parental species and the putative hybrids for both diploid sporophytes (Fig. III.4a) and
haploid gametophytes (Fig. III.4b). The first two axes of the PCA explained 7.47% and
12.10% of the genetic variability of sporophyte and gametophyte individuals,
respectively. Whatever the phase under study (i.e. diploid sporophytes or haploid
gametophytes), the PCA revealed a clear genetic differentiation between Esil and Ecro.
Among the 568 studied sporophytes, 69 out of the 79 putative hybrids were clearly
intermediate, being located between the Esil and Ecro groups, while the remaining 10
were not detected with this method (Table S1b, Appendix III.3). The 69 intermediate
individuals included not only all the 59 putative hybrids that were characterized by an
ITS1 double band pattern (14 with an Esil and 45 with an Ecro cytoplasm,
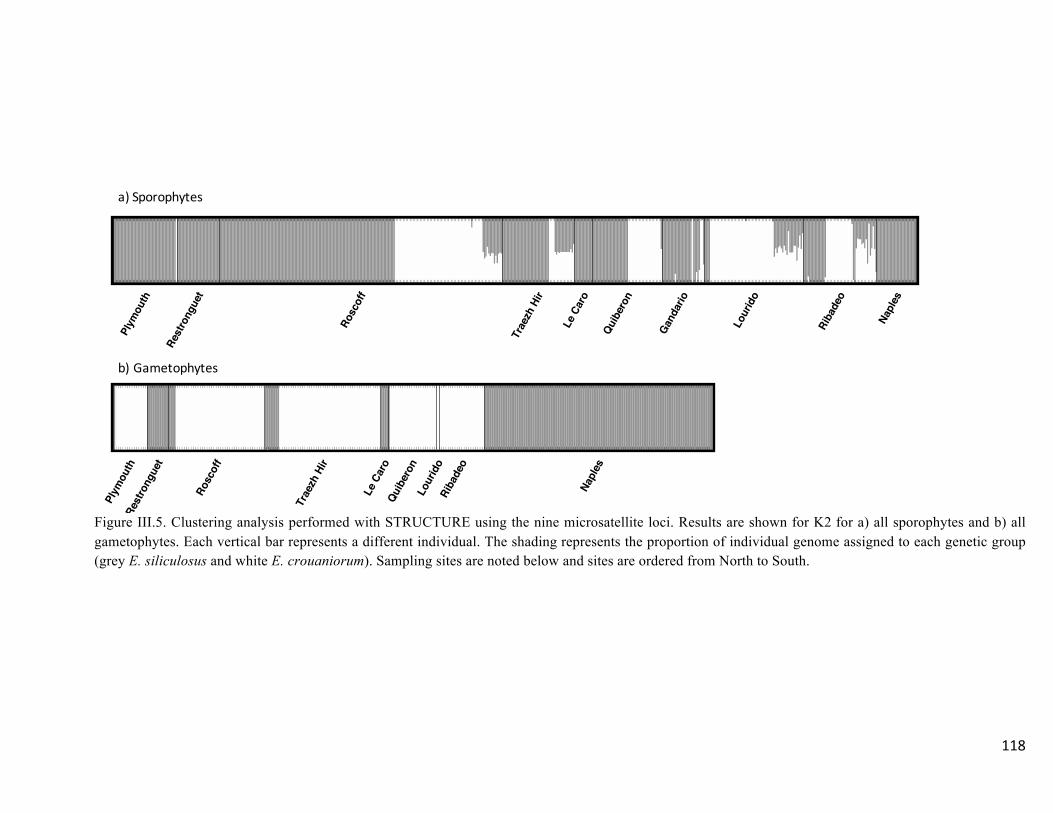
118
Figure III.5. Clustering analysis performed with STRUCTURE using the nine microsatellite loci. Results are shown for K2 for a) all sporophytes and b) all gametophytes. Each vertical bar represents a different individual. The shading represents the proportion of individual genome assigned to each genetic group (grey E. siliculosus and white E. crouaniorum). Sampling sites are noted below and sites are ordered from North to South.
Plym
outh
Rest
rong
uet
Rosc
off
Trae
zh H
ir
Le C
aro
Quib
eron
Gand
ario
Lour
ido
Riba
deo
Napl
es
a)Sporophytes
b)Gametophytes
Plym
outh
Rest
rong
uet
Rosc
off
Trae
zh H
ir
Le C
aro
Quib
eron
Lour
ido
Riba
deo
Napl
es
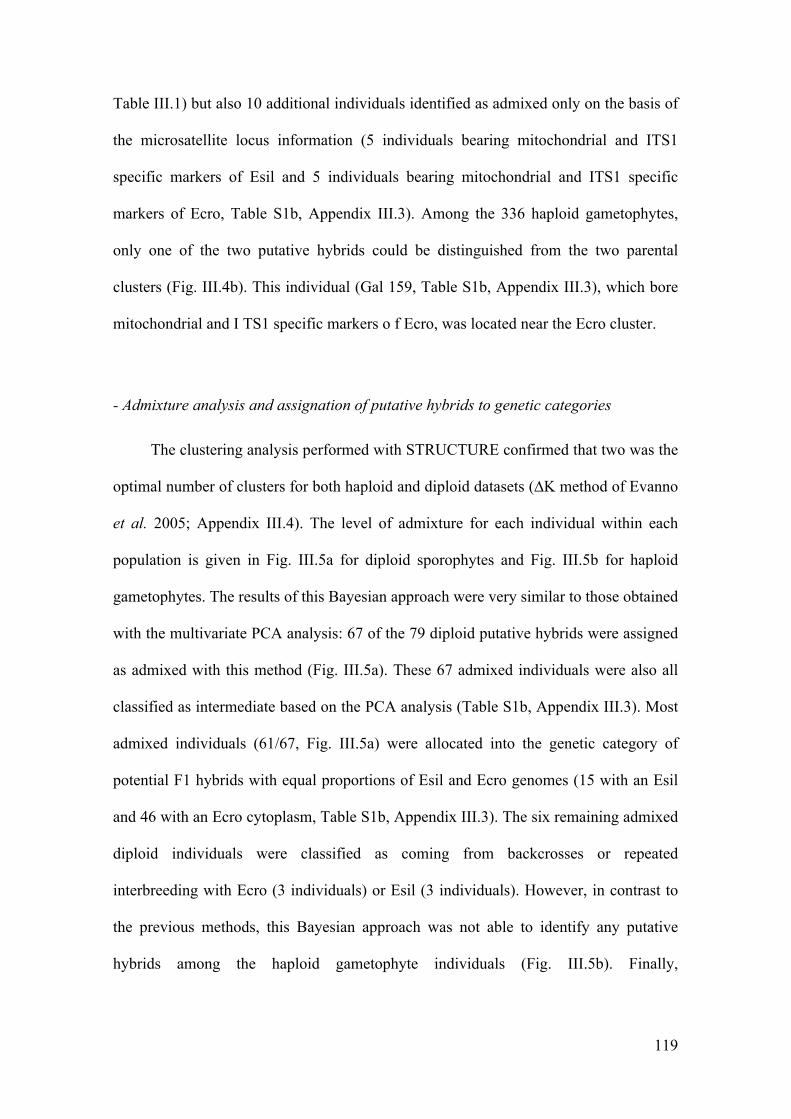
119
Table III.1) but also 10 additional individuals identified as admixed only on the basis of
the microsatellite locus information (5 individuals bearing mitochondrial and ITS1
specific markers of Esil and 5 individuals bearing mitochondrial and ITS1 specific
markers of Ecro, Table S1b, Appendix III.3). Among the 336 haploid gametophytes,
only one of the two putative hybrids could be distinguished from the two parental
clusters (Fig. III.4b). This individual (Gal 159, Table S1b, Appendix III.3), which bore
mitochondrial and I TS1 specific markers o f Ecro, was located near the Ecro cluster.
- Admixture analysis and assignation of putative hybrids to genetic categories
The clustering analysis performed with STRUCTURE confirmed that two was the
optimal number of clusters for both haploid and diploid datasets (∆K method of Evanno
et al. 2005; Appendix III.4). The level of admixture for each individual within each
population is given in Fig. III.5a for diploid sporophytes and Fig. III.5b for haploid
gametophytes. The results of this Bayesian approach were very similar to those obtained
with the multivariate PCA analysis: 67 of the 79 diploid putative hybrids were assigned
as admixed with this method (Fig. III.5a). These 67 admixed individuals were also all
classified as intermediate based on the PCA analysis (Table S1b, Appendix III.3). Most
admixed individuals (61/67, Fig. III.5a) were allocated into the genetic category of
potential F1 hybrids with equal proportions of Esil and Ecro genomes (15 with an Esil
and 46 with an Ecro cytoplasm, Table S1b, Appendix III.3). The six remaining admixed
diploid individuals were classified as coming from backcrosses or repeated
interbreeding with Ecro (3 individuals) or Esil (3 individuals). However, in contrast to
the previous methods, this Bayesian approach was not able to identify any putative
hybrids among the haploid gametophyte individuals (Fig. III.5b). Finally,
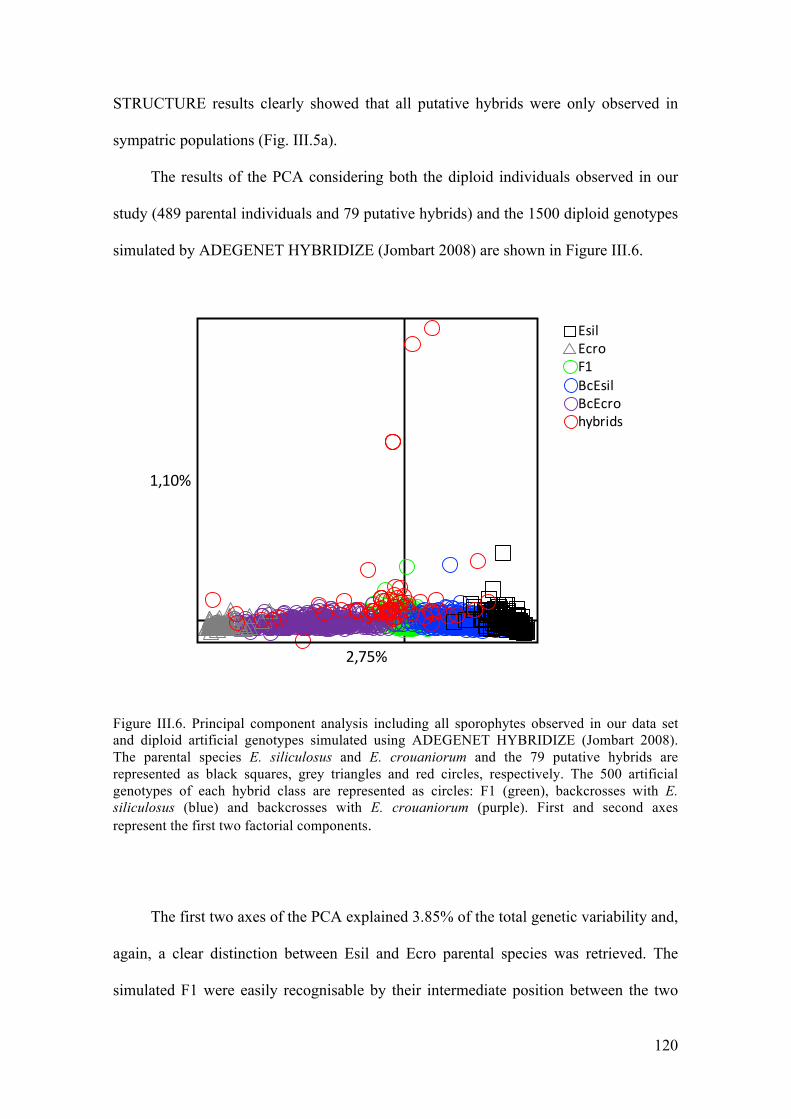
120
STRUCTURE results clearly showed that all putative hybrids were only observed in
sympatric populations (Fig. III.5a).
The results of the PCA considering both the diploid individuals observed in our
study (489 parental individuals and 79 putative hybrids) and the 1500 diploid genotypes
simulated by ADEGENET HYBRIDIZE (Jombart 2008) are shown in Figure III.6.
Figure III.6. Principal component analysis including all sporophytes observed in our data set and diploid artificial genotypes simulated using ADEGENET HYBRIDIZE (Jombart 2008). The parental species E. siliculosus and E. crouaniorum and the 79 putative hybrids are represented as black squares, grey triangles and red circles, respectively. The 500 artificial genotypes of each hybrid class are represented as circles: F1 (green), backcrosses with E. siliculosus (blue) and backcrosses with E. crouaniorum (purple). First and second axes represent the first two factorial components.
The first two axes of the PCA explained 3.85% of the total genetic variability and,
again, a clear distinction between Esil and Ecro parental species was retrieved. The
simulated F1 were easily recognisable by their intermediate position between the two
2,75%
1,10%
EsilEcroF1BcEsilBcEcrohybrids
121
parental species while simulated backcrosses overlapped partly with the simulated F1
hybrids and their respective parental species (Fig. III.6). Again, most of the 79 putative
hybrids sporophytes substantially overlapped the simulated F1 while fewer could be
identified as older generations of hybrids closely related to parental species (details
about assignment to the different simulated hybrid classes are given below). Finally,
three outliers were detected on the Y axis (Fig.III.6). These outliers corresponded to
five individuals with three different multi-locus genotypes from the Ribadeo population
(GAL 176,177, 217, 237 and 239, Table S1a, Appendix III.3) that share the same rare
diagnostic allele (allele 298 at locus M-162-1).
GENECLASS assigned 76 of the 79 putative hybrid sporophytes to one of the
three simulated hybrid classes with only 3 individuals classified as either the parental
species Esil (GAL541) or Ecro (GAL101 and EcPly10-8) (Table S1b, Appendix III.3).
Again, we found that most putative hybrids (54/76) were classified as simulated F1 (15
with an Esil and 39 with an Ecro cytoplasm, Table S1b, Appendix III.3). Five hybrid
individuals were assigned as simulated backcrosses with Esil and 14 as backcrosses
with Ecro (Table S1b, Appendix III.3). Only three individuals could not be assigned to
a single hybrid class (EcPH12-s#4-04, GAL217 and GAL200, Table S1b, Appendix
III.3).
Our new method XPLOIDASSIGNMENT allowed a simultaneous analysis of all
the 81 putative hybrids regardless of their ploidy and without the needs to recode
aneuploid genotypes. It identified the highest number of hybrids (79/81) as compared to
the other analyses described above. Note that two individuals (GAL541 and GAL101),
yet identified as putative hybrid using our preliminary method based on detecting
conflicting results with the mitochondrial markers, on one hand, with both the ITS1 and
the species-specific microsatellite loci on the other, were assigned by all the different
122
admixture analyses used in this study (Table S1b, Appendix III.3) to only one of the
parental species Esil (GAL541) and Ecro (GAL101). Only half of the 79 putative
hybrids (43 diploids and 2 haploids) could be assigned to a single hybrid class with
confidence (Table S1b, Appendix III.3). Sixty per cent of diploid sporophytes (26/43)
were assigned to F1 hybrids, 11 were assigned as backcrosses with Esil and six as
backcrosses with Ecro (Table S1b, Appendix III.3). The two haploid hybrids were
classified as backcrosses (Table S1b, Appendix III.3). The 36 remaining putative
diploid hybrids were classified in two equally possible hybrid classes, with most of
them (31/36) being classified as F1 or backcrosses with Esil (Table S1b, Appendix
III.3).
- Comparison among methods and frequency of hybridization in populations
The four methods were mostly congruent to distinguish admixed individuals from
parental species. However, the classification of individuals into the different hybrid
classes was challenging. The information of the different methods was thus combined to
classify hybrids in one or more than one hybrid categories when methods were not
congruent (Table S1b, Appendix III.3). The objective was to roughly distinguish
hybrids recently formed from those resulting from subsequent generations of
backcrosses. As two individuals (GAL541, GAL101) were consistently classified as
parental species by STRUCTURE, GENECLASS and XPLOIDASSIGNMENT, a total
of 79 hybrids (77 diploids and 2 haploids) out of the 81 putative hybrids detected
previously were finally retained (Table S1b, Appendix III.3). 35% of the alleles
genotyped in the 79 putative hybrids were rare alleles (i.e. observed at a frequency less
than 5% in the parental species, Table S1a, Appendix III.3). A total of 96 rare alleles
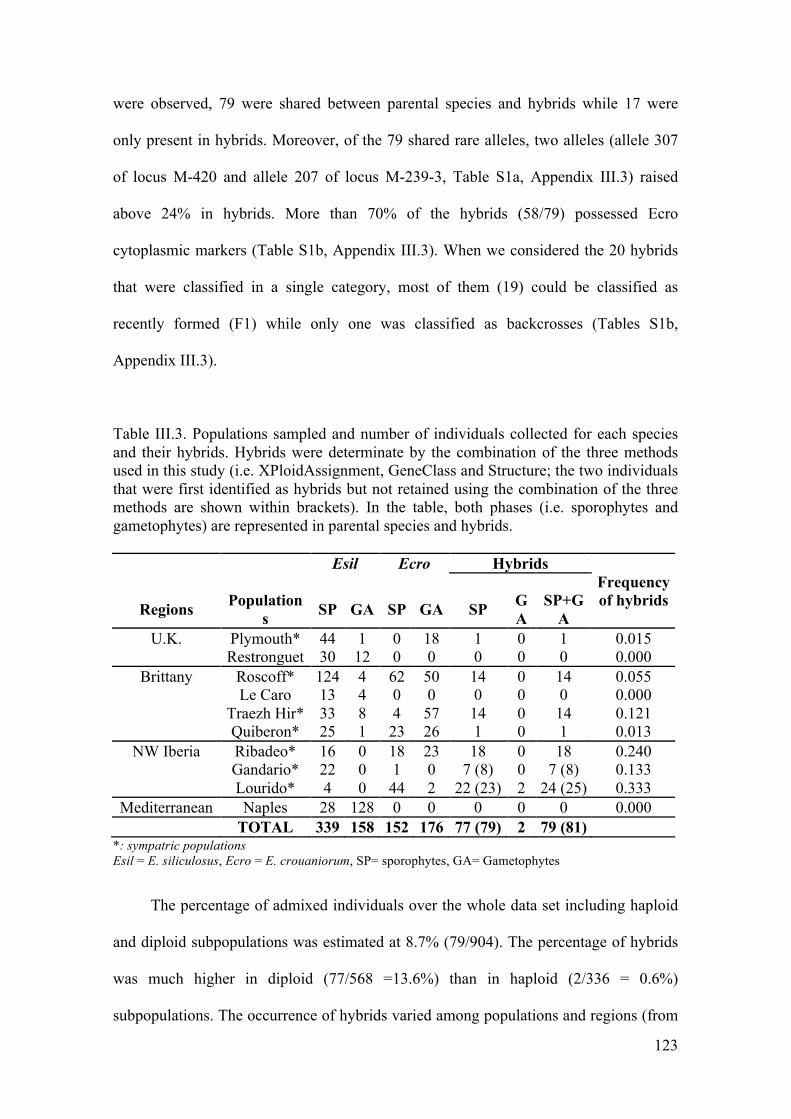
123
were observed, 79 were shared between parental species and hybrids while 17 were
only present in hybrids. Moreover, of the 79 shared rare alleles, two alleles (allele 307
of locus M-420 and allele 207 of locus M-239-3, Table S1a, Appendix III.3) raised
above 24% in hybrids. More than 70% of the hybrids (58/79) possessed Ecro
cytoplasmic markers (Table S1b, Appendix III.3). When we considered the 20 hybrids
that were classified in a single category, most of them (19) could be classified as
recently formed (F1) while only one was classified as backcrosses (Tables S1b,
Appendix III.3).
Table III.3. Populations sampled and number of individuals collected for each species and their hybrids. Hybrids were determinate by the combination of the three methods used in this study (i.e. XPloidAssignment, GeneClass and Structure; the two individuals that were first identified as hybrids but not retained using the combination of the three methods are shown within brackets). In the table, both phases (i.e. sporophytes and gametophytes) are represented in parental species and hybrids. Esil Ecro Hybrids
Frequency of hybrids
Regions Populations SP GA SP GA SP G
A SP+G
A U.K. Plymouth* 44 1 0 18 1 0 1 0.015
Restronguet 30 12 0 0 0 0 0 0.000 Brittany Roscoff* 124 4 62 50 14 0 14 0.055
Le Caro 13 4 0 0 0 0 0 0.000
Traezh Hir* 33 8 4 57 14 0 14 0.121 Quiberon* 25 1 23 26 1 0 1 0.013
NW Iberia Ribadeo* 16 0 18 23 18 0 18 0.240
Gandario* 22 0 1 0 7 (8) 0 7 (8) 0.133 Lourido* 4 0 44 2 22 (23) 2 24 (25) 0.333 Mediterranean Naples 28 128 0 0 0 0 0 0.000 TOTAL 339 158 152 176 77 (79) 2 79 (81)
*: sympatric populations Esil = E. siliculosus, Ecro = E. crouaniorum, SP= sporophytes, GA= Gametophytes
The percentage of admixed individuals over the whole data set including haploid
and diploid subpopulations was estimated at 8.7% (79/904). The percentage of hybrids
was much higher in diploid (77/568 =13.6%) than in haploid (2/336 = 0.6%)
subpopulations. The occurrence of hybrids varied among populations and regions (from
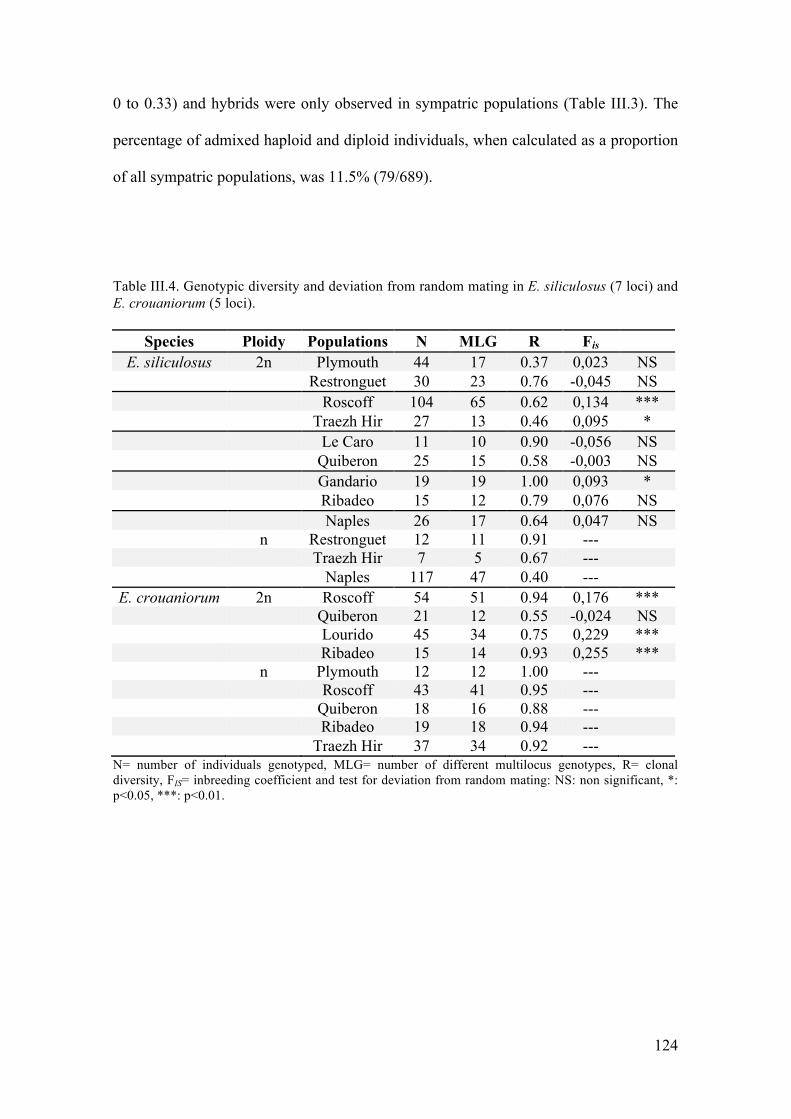
124
0 to 0.33) and hybrids were only observed in sympatric populations (Table III.3). The
percentage of admixed haploid and diploid individuals, when calculated as a proportion
of all sympatric populations, was 11.5% (79/689).
Table III.4. Genotypic diversity and deviation from random mating in E. siliculosus (7 loci) and E. crouaniorum (5 loci).
Species Ploidy Populations N MLG R Fis E. siliculosus 2n Plymouth 44 17 0.37 0,023 NS
Restronguet 30 23 0.76 -0,045 NS Roscoff 104 65 0.62 0,134 *** Traezh Hir 27 13 0.46 0,095 * Le Caro 11 10 0.90 -0,056 NS Quiberon 25 15 0.58 -0,003 NS Gandario 19 19 1.00 0,093 * Ribadeo 15 12 0.79 0,076 NS Naples 26 17 0.64 0,047 NS
n Restronguet 12 11 0.91 --- Traezh Hir 7 5 0.67 --- Naples 117 47 0.40 --- E. crouaniorum 2n Roscoff 54 51 0.94 0,176 *** Quiberon 21 12 0.55 -0,024 NS
Lourido 45 34 0.75 0,229 *** Ribadeo 15 14 0.93 0,255 ***
n Plymouth 12 12 1.00 --- Roscoff 43 41 0.95 ---
Quiberon 18 16 0.88 --- Ribadeo 19 18 0.94 --- Traezh Hir 37 34 0.92 ---
N= number of individuals genotyped, MLG= number of different multilocus genotypes, R= clonal diversity, FIS= inbreeding coefficient and test for deviation from random mating: NS: non significant, *: p<0.05, ***: p<0.01.
125
- Population structure and mating system
The efficiency of the nine microsatellite loci to discriminate individuals varied
between species and among populations. Less than 10% of the sites harboured samples
that consisted only of unique multilocus genotypes (i.e. Gandario for Esil and Plymouth
for Ecro, Table III.4), all the other sites showed repeated multilocus genotypes. Clonal
diversity (R values, Table III.4) ranged from 0.37 to 1 in Esil and from 0.55 to 1 in
Ecro, suggesting that clonal propagation might be important in some sites. However, we
did not find any significant relationship between the pattern of clonal diversity and the
frequency of hybrids in our data. Moreover, we never observed significant excesses of
heterozygotes as expected under clonal reproduction (Table III.4). Instead, FIS values
were either not significantly different from zero or significantly positive depending on
the species and populations (Table III.4). All but one Ecro population exhibited
significantly high heterozygote deficiencies, while most Esil populations (6 over 9,
Table III.4) did not show any significant departure from random mating. Differentiation
among populations (global FST value, Weir & Cockerham, 1984) calculated for each
species and each haploid and diploid subpopulations was higher for Esil than Ecro (Esil:
FST sporophytes = 0.15, FST gametophytes = 0.45; Ecro: FST sporophytes = 0.11, FST
gametophytes = 0.08). All these FST values were significantly higher than 0.

126
127
V. Discussion
- Species-diagnostic markers to detect hybridization in cryptic species
The lack of any obvious phenotypic divergence between Ectocarpus species of
the siliculosi group made the study of hybridization in the field a challenge (but see
Peters et al. 2010a; Couceiro et al. 2015 and Montecinos et al. 2016) since neither the
cryptic parental species nor their intermediate hybrid forms can be recognised in the
field or even in the laboratory. The use of the cytoplasmic species-specific marker
rps14-atp8 and the nuclear marker ITS1 in combination with 9 microsatellite loci (6
being diagnostic of one of the parental species and 3 showing diagnostic alleles),
however, allowed us to identify them and to detect signals of genetic admixture between
E. siliculosus and E. crouaniorum. The use of microsatellites to estimate hybridization
has been criticised because of the possible homoplasy that can arise when alleles are
shared between related species (Balloux & Goudet 2002). However, if homoplasy may
decrease identifiability when classifying hybrids in different hybrid scenarios, our
results rather argue that, even from a handful of microsatellites, we can harvest relevant
information with adapted methods. Moreover, this argument cannot hold when
diagnostic alleles and diagnostic loci are used. Admixture and assignment analyses
showed a high discriminatory power of the microsatellite species-diagnostic markers to
distinguish at least parental from admixed individuals. The Bayesian method we
developed showed congruent results with the classical STRUCTURE approaches (e.g.
Ito et al. 2015; Turchetto et al. 2015) but has the advantage that it mathematically
formalizes and automates the computation of the posterior probabilities of individuals to
distinct scenarios of hybridization. As secondary contacts are often associated with
changes in ploidy that either affect the entire genome or only some chromosomes
128
(aneuploidy) and as clonal reproduction may favour the emergence of duplicated genes,
our method can be applied to raw genetic data without correcting them for ploidy.
Although our method still requires the provision of the genotypes of the individuals
identified as belonging exclusively (as far as possible) to the parental species involved,
it can assign individuals to hybrid categories without clustering them into populations
and thus doesn’t rely on biological assumptions like Hardy-Weinberg equilibrium,
sexual reproduction or maximal divergence between populations. Indeed, a higher
number of true hybrids could be identified with XPLOIDASSIGNMENT and in
particular the method allowed the identification of hybrids in the haploid subpopulation.
Only half of the hybrids could be assigned to a single hybrid class with confidence but
the distribution of posterior probabilities between admixture scenarios help to
reconstruct more complex hybridization histories than only assess with our 5 scenarios.
Finally, combining the four admixture methods and the results obtained for different
marker types, we were able to detect 79 (8.7%) admixed individuals between E.
siliculosus and E. crouaniorum.
The species-specific ITS1 marker was generally consistent with the species-diagnostic
microsatellite markers and all the individuals bearing both ITS1 lengths were identified
as admixed. However, of the 79 admixed individuals revealed by our study, 8 presented
only the ITS1 band specific of E. siliculosus and 12 presented only the ITS1 band
specific of E. crouaniorum (Table S1b, Appendix III.3). The process of concerted
evolution (Arnheim et al. 1980) is possibly the mechanism that could explain why these
hybrid individuals lost the ITS1 sequence of one parental species. This process causes
the homogenization of tandem repeat sequences through genomic mechanisms of
turnover like gene conversion and unequal crossing over (Dover 1994) and has been
invoked as the mechanism responsible for ITS homogenization after hybridization
129
events in plants. Five hybrids identified as F1 in our study showed only one parental
ITS1 band, which suggests that the process of concerted evolution may happen in the
first hybrid generation. Moreover, three different outcomes have been reported for the
ribosomal repeat following hybridization in higher plants: (i) both parental ITS
sequences are retained (Kim & Jansen 1994; O’Kane et al. 1996; Franzke &
Mummenhoff 1999) (ii) only one parental type is retained after homogenisation
(Wendel et al. 1995, Franzke & Mummenhoff 1999) (iii) the ribosomal repeat is
homogenized but contains scattered elements of both parents (Wendel et al. 1995; van
Houten et al. 1993). In marine seaweeds this process is less studied but intraspecific and
intra-individual polymorphisms of ITS are well documented and have been related
presumably to incomplete homogenization under concerted evolution after events of
recent speciation, hybridization, shift to asexual reproduction or polyploidization
(Pillmann et al. 1997; Serrão et al. 1999; Famá et al. 2000; Coyer et al. 2001). In
practice, our results confirm that barcoding methods based on single markers should be
used with caution.
- Low level of hybridization are probably associated with reproductive barriers
The frequency of hybridization between E. siliculosus and E. crouaniorum was
estimated to 8.7% based on the whole data set (haploid and diploid individuals). In
addition, hybrids showed positive amplification of the cytoplasmic marker of both
species suggesting that inter-specific crosses occurred in both directions. Interestingly,
hybridization was only detected in sympatric/parapatric populations and almost
exclusively in diploid sporophytes. In addition, most hybrids seemed to be recently
formed. Together these results suggest that postzygotic mechanisms limit sexual
130
fertility in admixed individuals. Indeed, the near absence of admixture in haploid
subpopulations suggests that meiosis probably acts as a strong post-zygotic barrier in
the first hybrid generation (Fig. III.1). However, the detection of a small number of
hybrids that correspond to subsequent generations of backcrosses in haploids and
diploid hybrids on the one hand and the occurrence of aneuploidy on the other, suggest
that the reproductive barrier, although strong, is probably not complete. Below, we
discuss the importance of hybridization between these closely related species in the
light of their biological and ecological characteristics and compare with the small
number of other documented studies of hybridization in seaweeds. In particular, we
consider the possibility of occurrence of post-zygotic barriers in these haploid-diploid
species and question which mechanisms might be involved in reproductive isolation.
The environmental gradient of the shore is a classic example of a tension zone in
which parental types are favoured at the opposite ends with hybrids occurring in
between (see for example in marine invertebrates: Johannesson 2009; Bierne et al.
2003; Bouchemousse et al. 2016). Among seaweeds, the best-studied examples of
hybridization come from various species of the genus Fucus that dominate the intertidal
rocky shores of the North Atlantic (Coyer et al. 2002; Wallace et al. 2004; Billard et al.
2005; Engel et al. 2005; Coyer et al. 2007; Neiva et al. 2010; Coyer et al. 2011,
Monteiro et al. 2012). The occurrence of hybridization between these species was first
explained by their recent and rapid radiation within the last 3.8 million years, which
resulted in a complex of highly related sister species (Serrão et al. 1999; Coyer et al.
2006). In addition, habitat-driven speciation has been invoked to explain divergence
despite the occurrence of gene flow in this genus (in F. vesiculosus/F. radicans:
Bergström et al. 2005; Pereyra et al. 2009; and in F. spiralis/F. vesiculosus/ F. guyrii:
Zardi et al. 2011). Indeed, the different species are often found in sympatry/parapatry
131
along the European coast while distributed along the vertical selective gradient of the
intertidal zone (i.e. in different abiotic and biotic micro-environmental habitats). In such
a complex context, Hoarau et al. (2015) showed that the level of hybridization and
interspecific fertilization success decreased with increasing time of sympatry between
F. serratus and F. distichus suggesting reinforcement of isolation mechanisms.
In filamentous Ectocarpales, the lack of obvious phenotypic divergences between
cryptic species (see Peters et al. 2015) explains that relatively little is known about their
distribution, the importance of species co-occurrence and their level of hybridization in
the wild. These brown filamentous algae were described as short-lived annuals, found
on abiotic substrata or epiphytic on macrophytes, along the shore gradient from subtidal
up to high intertidal pools (Russell 1967a, b, 1983). However, due to the development
of species-specific molecular markers, recent studies have reported that cryptic species
may be distinguished on the basis of their spatio-temporal ecological niches related to
different tide levels and/or host specificity (in Ectocarpus spp., see references below; in
Pylaiella spp., Christophe Destombe com. pers.). In particular, Peters et al. (2010a),
Couceiro et al. (2015) and Montecinos et al. (2016) showed that E. crouaniorum was
located higher on the shore than E. siliculosus in several sites of the North Atlantic. In
addition, in a detailed spatio-temporal study of North-Western French population,
Couceiro et al. (2015), reported differences in host specificity between these two
species with E. crouaniorum being exclusively found on a single species while E.
siliculosus could be found on more than five species. However, all three studies
mentioned that along the shore gradient the two cryptic species could co-occur in a
contact zone where their distributions overlap. In the same way, the study of Couceiro
et al. (2015) reported that the two species could be found on the same host, since E.
siliculosus was able to grow on Scytosiphon lomentaria, the only host species for E.
132
crouaniorum. This situation resembles that of the Fucus hybridization zone along the
steep gradient of the shore.
At sites where the two Ectocarpus species are found in sympatry, ecological
barriers such as habitat preference combined with host specificity may limit
hybridization and explain why only 11.2% of hybrids are observed. However, unlike
Fucus species which have a classical diploid life cycle, the distinguishing feature of the
haploid-diploid life cycle of Ectocarpus species makes it possible to distinguish the
results of fertilization and meiosis by comparing diploid and haploid sub-populations.
Consequently, it is possible to directly assess the importance of prezygotic compared to
postzygotic reproductive barriers. In this study, we observed very few recombinant
haploid individuals suggesting the presence of strong post-zygotic barriers, which
confirmed previous results from crossing experiments between few individuals (Peters
et al. 2010a), in which most hybrid zygotes did not develop beyond an early
germination stage.
- Presence of rare alleles in hybrids.
Our results revealed that all 96 rare alleles were present in hybrids and two
displayed a considerably higher frequency in hybrids compared to parental species. This
observation may explain some of the discrepancies between the three assignment
methods used to detect hybridization depending on the weight that is given to rare
alleles. Interestingly, the presence of rare alleles in hybrid individuals (the rare allele
phenomenon) has been observed in hybrid zones of land plants and animals using a
wide range of markers, including intron haplotypes (Schilthuizen et al. 1999), rDNA
spacer variants (Liao et al. 2010), microsatellites (Lexer et al. 2007) and SNPs
(Lammers et al. 2013). The rare allele phenomenon refers to the observation of certain
133
alleles that are normally rare or virtually non-existent in both parental species rise to
high frequencies in the centre of the hybrid zone. Coyne & Orr (2004) have
hypothesized that, in the centre of a tension zone, the continuous generation of low-
fitness recombinants will favour any allele that decreases hybrid disadvantage. Since
this selective environment is uniquely restricted to the hybrid zone itself, the centre of
the zone is expected to show not only clinal transition for alleles fixed in one of the two
species but also a sharp increase in those gene variants (and any linked genetic markers)
that help to increase the fitness of hybrids. In this study with Ectocarpus species, it
remains unclear if the zone in which the two species are in contact in sympatric
populations can be considered as a tension zone. Whether or not the presence of rare
alleles in hybrids is a product of the rare allele phenomena will require a further
sampling specifically designed to address this question.
134
- Rarity of haploid hybrids and the existence of reproductive isolation
Crossing experiments carried out by Peters et al. (2010a) showed that,
occasionally, E. crouaniorum may form viable sporophyte hybrids with E. siliculosus.
However, the presence of abortive unilocular sporangia (i.e. the site where spores are
formed by meiosis on diploid sporophytes) was observed in crosses among Ectocarpus
strains from geographically distant origins (Müller 1988; Stache 1990). Müller (1988)
attributed the abortive unilocular sporangia to severe problems in chromosome pairing
probably linked to differences in genome sizes (Peters et al. 2004a). Interestingly, in
this study, we observed that 40% of hybrid sporophytes possessed three alleles for at
least one microsatellite locus. In all these cases, heterozygotes with 3 alleles were
composed of two alleles diagnostic of one species with the third allele diagnostic of the
second species. These triallelic heterozygotes might reflect the occurrence of aneuploid
gametes. Such patterns of abnormal segregation during meiosis could be a consequence
of karyotypic rearrangements in chromosomes between E. siliculosus and E.
crouaniorum creating chromatids with duplications and deficiencies in gene content
(recombination suppressors as described in the review of Livingstone & Rieseberg
2004). Such karyotypic rearrangements could explain the very low frequency of
recombinant hybrid haploids detected in our study. In plant species, reproductive
isolation has been largely linked to translocations that rearrange the genome of one
species relative to another (Stebbins 1971, Quillet et al. 1995, Spirito 1998, Rieseberg
2001). Moreover, in angiosperms, hybrid fertility is often restored by experimentally
inducing tetraploidy, suggesting that meiotic recombination between different
karyotypes led to F1 hybrid sterility (Stebbins 1958). Such chromosomal
rearrangements also have been linked to reduced fertility in hybrids produced in
haploid-diploid species (e. g. mosses: Anderson & Snider 1982, yeasts: Liti et al. 2006,
135
ferns: Wagner 1987). However, whether such rearrangements contribute to the
speciation process is a matter of debate (Sites & Moritz 1987; Coyne & Orr 2004). We
observed that some of the identified diploid sporophyte hybrids shared the same multi-
locus genotypes suggesting the occurrence of clonal multiplication of these hybrids.
However, as asexual reproduction does also occur in the parental populations, it is
difficult to ascertain that the observed clonal multiplication of diploid sporophytes is
favoured because of post-zygotic barriers. Finally, despite the extreme rarity of
recombinant genotypes in the haploid dataset, analyses of simulated backcrosses
suggested the occurrence of subsequent generations after F1 sporophyte hybrids in our
dataset. This result suggests that post-zygotic incompatibility might not be total between
both species. However, several studies have argued that identifying individuals with
hybrid ancestry could become increasingly difficult after the first three generations
using the classical methods we employed in this paper (e.g. Lavrestky et al. 2016). Thus
we cannot reject the hypothesis that these later hybrid generations were misidentified. In
order to verify the importance of post-zygotic isolation, several further experiments can
be suggested. First, as all genotyped individuals are kept as uni-algal culture in the lab,
the possible occurrence of regular meiosis can be tested experimentally for each of the
77 identified hybrid sporophyte strains. Second, using next-generation sequencing, it is
now possible to examine genome-wide patterns of introgression and identify genomic
regions that show signatures of selection.
136
- Conclusion
In conclusion, our study demonstrates that brown algae of the genus Ectocarpus
can be used to study hybridisation in haploid-diploid species. The diversity of taxa with
various levels of divergence in Ectocarpus (Stache-Crain et al. 1997; Peters et al.
2010b; Peters et al. 2015, Montecinos et al. 2016) makes this genus a good model for
studies of reproductive isolation. Crossing experiments between E. siliculosus and the
genetically more distant species E. fasciculatus have shown that plasmogamy was only
possible between male gametes of E. fasciculatus and females of E. siliculosus,
however the hybrids died after germination (Müller & Gassmann 1980). In contrast,
cytoplasmic introgression among closely related species belonging to the E. siliculosi
group was suggested by Montecinos et al. (2016). Together, these results suggest a
probable relationship between genetic distance and cross-compatibility in this genus.
Follow-up studies on this system could provide further insights into the evolutionary
consequences of hybridization and introgression for the maintenance or breakdown of
species.
137
VI. Acknowledgments
We would like to thank Chloé Jollivet, Laurence Dartevelle and Jérôme Coudret for
help in maintaining strains in the Station Biologique de Roscoff. We also thank
Stéphane Mauger and Murray Brown for assistance in the molecular laboratory and the
field, respectively. Declan Schroeder (MBA, Plymouth) and Ignacio Bárbara
(Universidade da Coruña) kindly welcomed us for isolation work in their laboratories.
We particularly appreciated insightful and constructive comments from Thomas
Broquet, Christophe Destombe and Mark Cock. Special thanks to Christophe Destombe
who conceived and drew Figure III.1. Principal funding came from a doctoral grant to
Alejandro Montecinos (Becas-Chile, CONICYT, advanced human resources program),
additional support from the projects MARINEXUS (EU INTERREG programme
France (Channel)-UK), Bi-Cycle (France: ANR10-BLAN-1727), Clonix
(France:ANR11-BSV7-00704), IDEALG (France: ANR-10-BTBR-04), “Bibliothèque
du vivant” (France: INRA-MNHN-INEE-CNRS) and from the international research
network “Diversity, Evolution and Biotechnology of Marine Algae” (GDRI No. 0803).
The authors have declared that no competing interests exist.

138
XPloidAssignment 1.0, user guide
139
Appendix III.1
XPloidAssignment
version1.0,July2016
Asoftwaretoassigngenotypedindividualstopopulationsorgeneticpoolswhenploidyvaries
betweenindividualsorloci.
Author:SolennStoeckel,researcheratINRA,Rennes,France.
InstituteforGenetics,EnvironmentandPlantProtectionUMR1349,INRA/AgroCampusRennes/UniversitéRennes1DomainedelaMotte,BP35327F-35653LeRheucedex,France
HowtociteClonEstiMate:
MontecinosAE,GuilleminML,CouceiroL,PetersAF,StoeckelS,ValeroM;(submitted).
Hybridization between two cryptic filamentous brown seaweeds along the shore:
Analysing pre- and post-zygotic barriers in populations of individuals with varying
ploidylevels.
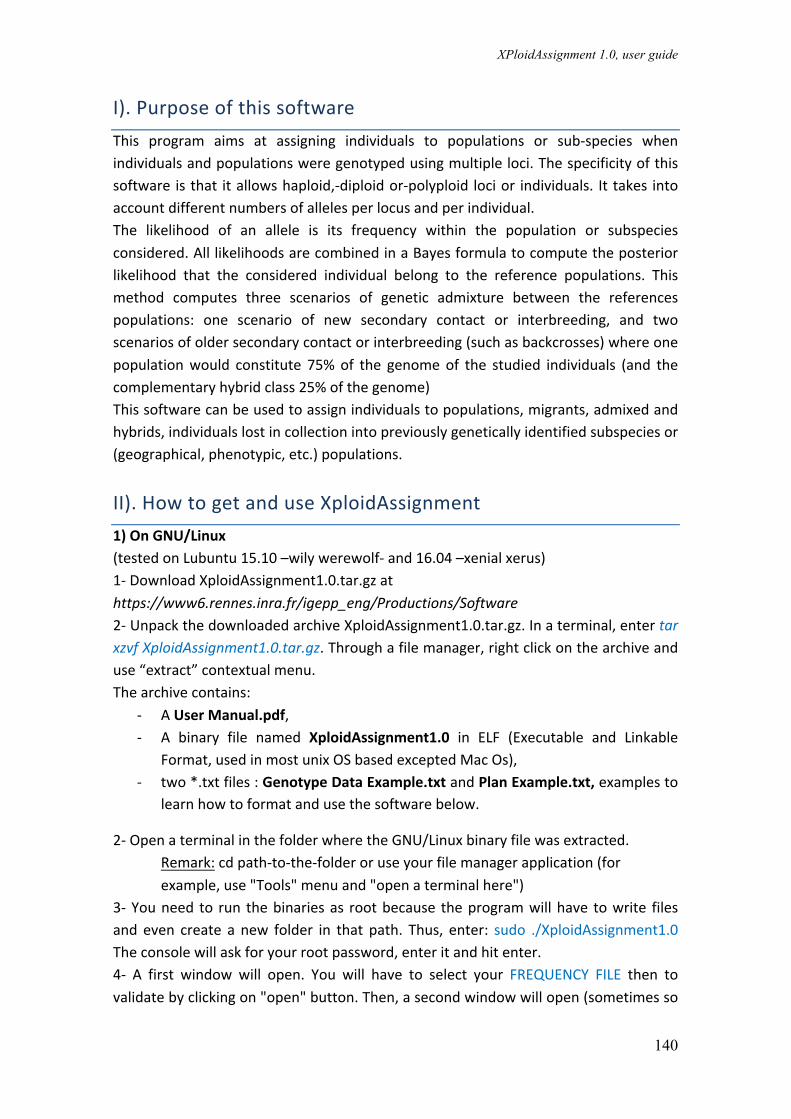
XPloidAssignment 1.0, user guide
140
I).PurposeofthissoftwareThis program aims at assigning individuals to populations or sub-species whenindividualsandpopulationsweregenotypedusingmultipleloci.Thespecificityofthissoftware isthat itallowshaploid,-diploidor-polyploid locior individuals. It takes intoaccountdifferentnumbersofallelesperlocusandperindividual.The likelihood of an allele is its frequency within the population or subspeciesconsidered.AlllikelihoodsarecombinedinaBayesformulatocomputetheposteriorlikelihood that the considered individual belong to the reference populations. Thismethod computes three scenarios of genetic admixture between the referencespopulations: one scenario of new secondary contact or interbreeding, and twoscenariosofoldersecondarycontactorinterbreeding(suchasbackcrosses)whereonepopulationwould constitute 75%of the genomeof the studied individuals (and thecomplementaryhybridclass25%ofthegenome)Thissoftwarecanbeusedtoassignindividualstopopulations,migrants,admixedandhybrids,individualslostincollectionintopreviouslygeneticallyidentifiedsubspeciesor(geographical,phenotypic,etc.)populations.
II).HowtogetanduseXploidAssignment1)OnGNU/Linux(testedonLubuntu15.10–wilywerewolf-and16.04–xenialxerus)1-DownloadXploidAssignment1.0.tar.gzathttps://www6.rennes.inra.fr/igepp_eng/Productions/Software2-UnpackthedownloadedarchiveXploidAssignment1.0.tar.gz.Inaterminal,entertarxzvfXploidAssignment1.0.tar.gz.Throughafilemanager,rightclickonthearchiveanduse“extract”contextualmenu.Thearchivecontains:
- AUserManual.pdf,- A binary file named XploidAssignment1.0 in ELF (Executable and Linkable
Format,usedinmostunixOSbasedexceptedMacOs),- two*.txtfiles:GenotypeDataExample.txtandPlanExample.txt,examplesto
learnhowtoformatandusethesoftwarebelow.
2-OpenaterminalinthefolderwheretheGNU/Linuxbinaryfilewasextracted.Remark:cdpath-to-the-folderoruseyourfilemanagerapplication(forexample,use"Tools"menuand"openaterminalhere")
3-Youneed to run thebinariesas rootbecause theprogramwillhave towrite filesand even create a new folder in that path. Thus, enter: sudo ./XploidAssignment1.0Theconsolewillaskforyourrootpassword,enteritandhitenter.4- A first window will open. You will have to select your FREQUENCY FILE then tovalidatebyclickingon"open"button.Then,asecondwindowwillopen(sometimesso

XPloidAssignment 1.0, user guide
141
fastthatyoucanthinkthatyouomittedtoclickontheopenbuttonfromthepreviousselection,sopleasetakecare).SelectthefilecontainingyourIndividualtobeassignedFILE.5-Theprogramwillrunandwillprovidesomeinformationaboutwhatitiscomputing.6-Togetyourresults,gointothenewfoldertheprogramcreated,named“results”.Inthe terminal, cd results.Here,youwill findone*.txt filewhosenamebeginswithadate.SeeOuputsectionforhelpwithreadingthisresultfile.
2)OnWindows
(testedonwindows7andwindows10)1-DownloadXploidAssignment1.0.zipathttps://www6.rennes.inra.fr/igepp_eng/Productions/Software2-UnzipthedownloadedarchiveXploidAssignment1.0.zip.Werecommend7ziporthewindows-integratedziparchivemanager.ThroughtheExplorerfilemanager,rightclickonthearchiveanduse“extract”contextualmenu.Thearchivecontains:
- AUserGuide.pdf,- AbinaryfilenamedXploidAssignment1.0.exe,- two*.txtfiles:GenotypeDataExample.txtandPlanExample.txt,examplesto
learnhowtoformatandusethesoftwarebelow.
3- Run the binaries as root because the program will have to write files and evencreateanewfolderinthatpath.Double-clickonXploidAssignment1.0.exetorunit.4- A first window will open. You will have to select your FREQUENCY FILE then tovalidatebyclickingon"open"button.Then,asecondwindowwillopen(sometimessofastthatyoucanthinkthatyouomittedtoclickontheopenbuttonfromthepreviousselection,sopleasetakecare).SelectthefilecontainingyourIndividualtobeassignedFILE.5- The program will run by opening a terminal in which it will provide someinformationaboutwhatitiscomputing.6-Togetyourresults,gointhenewfoldertheprogramcreated,named“results”.Inthe terminal, cd results.Here,youwill findone*.txt filewhosenamebeginswithadate.SeeOuputsectionsectionforhelpwithreadingthisresultfile.
III).HowtoformatyourdataWeprovided2example filesyoucanrefer to.Thesoftwarewillask for2 files:First,one containing the allele frequencies in each reference populations, Then, one filecontainingthegenotypedindividualsyouwanttoassigntoreferencepopulations.
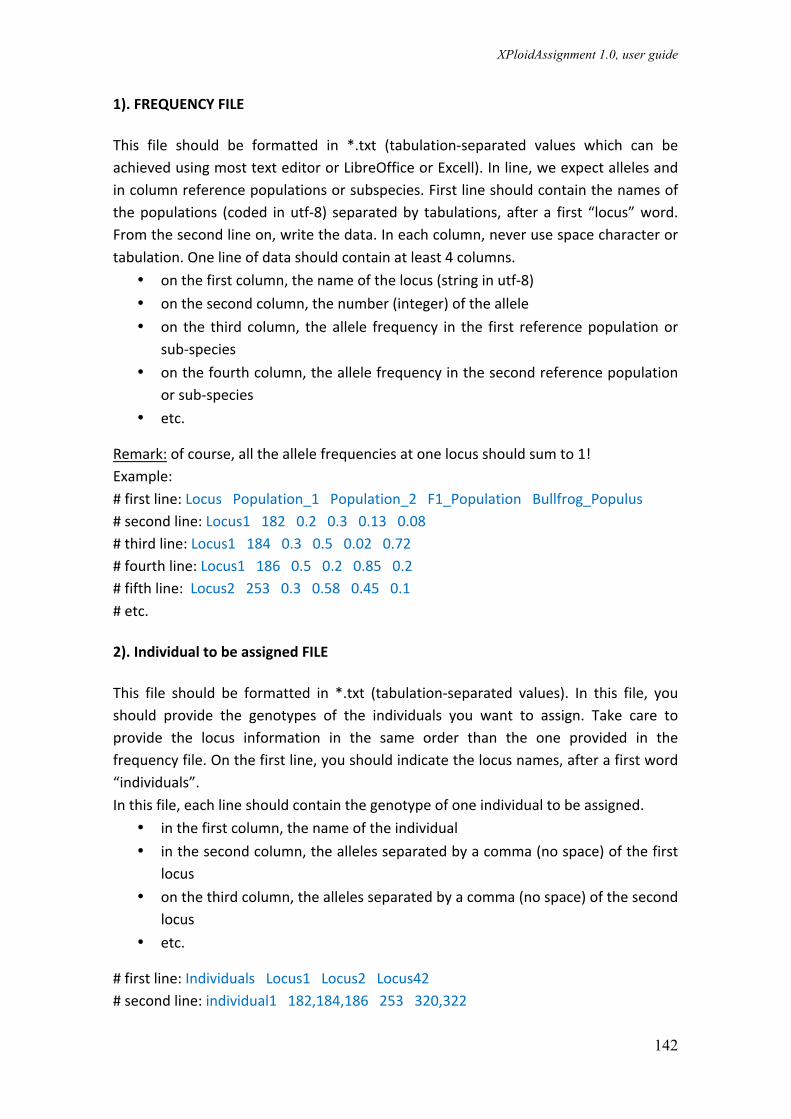
XPloidAssignment 1.0, user guide
142
1).FREQUENCYFILE
This file should be formatted in *.txt (tabulation-separated values which can beachievedusingmosttexteditororLibreOfficeorExcell).Inline,weexpectallelesandincolumnreferencepopulationsorsubspecies.Firstlineshouldcontainthenamesofthepopulations (coded inutf-8) separatedby tabulations, after a first “locus”word.Fromthesecondlineon,writethedata.Ineachcolumn,neverusespacecharacterortabulation.Onelineofdatashouldcontainatleast4columns.
• onthefirstcolumn,thenameofthelocus(stringinutf-8)• onthesecondcolumn,thenumber(integer)oftheallele• on the third column, theallele frequency in the first referencepopulationor
sub-species• onthefourthcolumn,theallelefrequencyinthesecondreferencepopulation
orsub-species• etc.
Remark:ofcourse,alltheallelefrequenciesatonelocusshouldsumto1!Example:#firstline:LocusPopulation_1Population_2F1_PopulationBullfrog_Populus#secondline:Locus11820.20.30.130.08#thirdline:Locus11840.30.50.020.72#fourthline:Locus11860.50.20.850.2#fifthline:Locus22530.30.580.450.1#etc.
2).IndividualtobeassignedFILE
This file should be formatted in *.txt (tabulation-separated values). In this file, youshould provide the genotypes of the individuals you want to assign. Take care toprovide the locus information in the same order than the one provided in thefrequencyfile.Onthefirstline,youshouldindicatethelocusnames,afterafirstword“individuals”.Inthisfile,eachlineshouldcontainthegenotypeofoneindividualtobeassigned.
• inthefirstcolumn,thenameoftheindividual• inthesecondcolumn,theallelesseparatedbyacomma(nospace)ofthefirst
locus• onthethirdcolumn,theallelesseparatedbyacomma(nospace)ofthesecond
locus• etc.
#firstline:IndividualsLocus1Locus2Locus42#secondline:individual1182,184,186253320,322
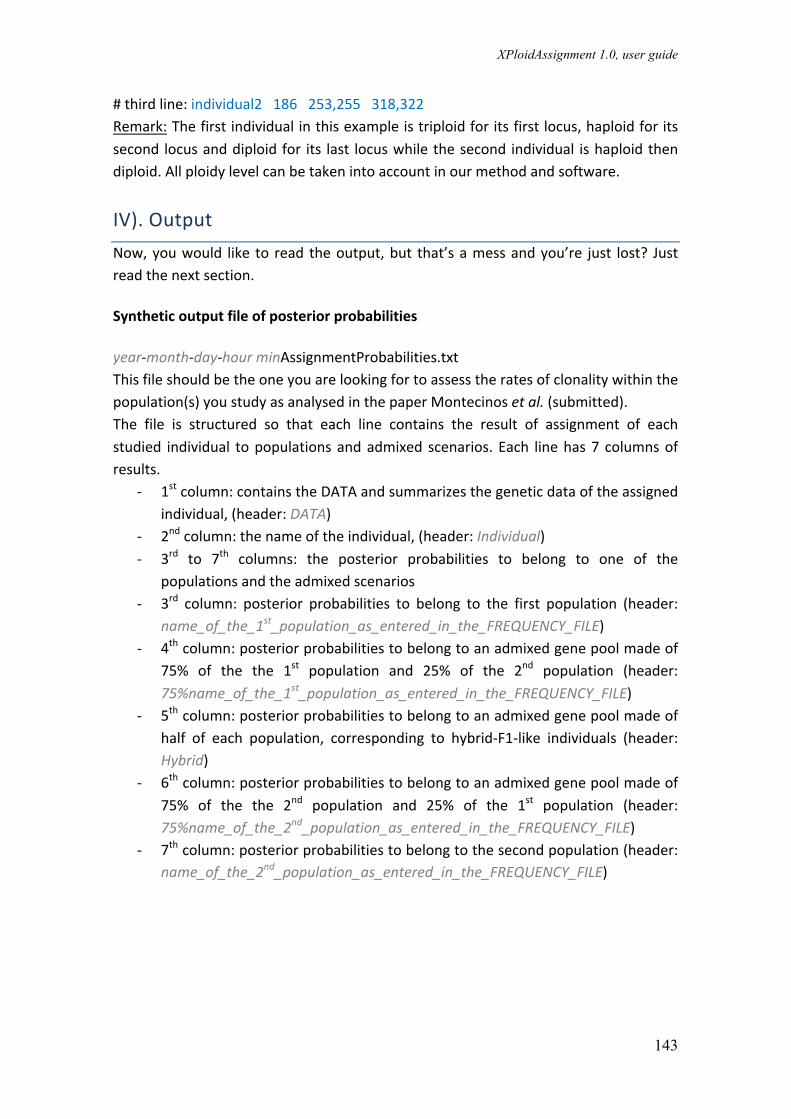
XPloidAssignment 1.0, user guide
143
#thirdline:individual2186253,255318,322Remark:Thefirstindividualinthisexampleistriploidforitsfirstlocus,haploidforitssecond locusanddiploid for its last locuswhilethesecond individual ishaploidthendiploid.Allploidylevelcanbetakenintoaccountinourmethodandsoftware.
IV).OutputNow,youwould like to read theoutput,but that’samessandyou’re just lost? Justreadthenextsection.
Syntheticoutputfileofposteriorprobabilities
year-month-day-hourminAssignmentProbabilities.txtThisfileshouldbetheoneyouarelookingfortoassesstheratesofclonalitywithinthepopulation(s)youstudyasanalysedinthepaperMontecinosetal.(submitted).The file is structured so that each line contains the result of assignment of eachstudied individual topopulationsandadmixed scenarios. Each linehas7 columnsofresults.
- 1stcolumn:containstheDATAandsummarizesthegeneticdataoftheassignedindividual,(header:DATA)
- 2ndcolumn:thenameoftheindividual,(header:Individual)- 3rd to 7th columns: the posterior probabilities to belong to one of the
populationsandtheadmixedscenarios- 3rd column: posterior probabilities to belong to the first population (header:
name_of_the_1st_population_as_entered_in_the_FREQUENCY_FILE)- 4thcolumn:posteriorprobabilitiestobelongtoanadmixedgenepoolmadeof
75% of the the 1st population and 25% of the 2nd population (header:75%name_of_the_1st_population_as_entered_in_the_FREQUENCY_FILE)
- 5thcolumn:posteriorprobabilitiestobelongtoanadmixedgenepoolmadeofhalf of each population, corresponding to hybrid-F1-like individuals (header:Hybrid)
- 6thcolumn:posteriorprobabilitiestobelongtoanadmixedgenepoolmadeof75% of the the 2nd population and 25% of the 1st population (header:75%name_of_the_2nd_population_as_entered_in_the_FREQUENCY_FILE)
- 7thcolumn:posteriorprobabilitiestobelongtothesecondpopulation(header:name_of_the_2nd_population_as_entered_in_the_FREQUENCY_FILE)
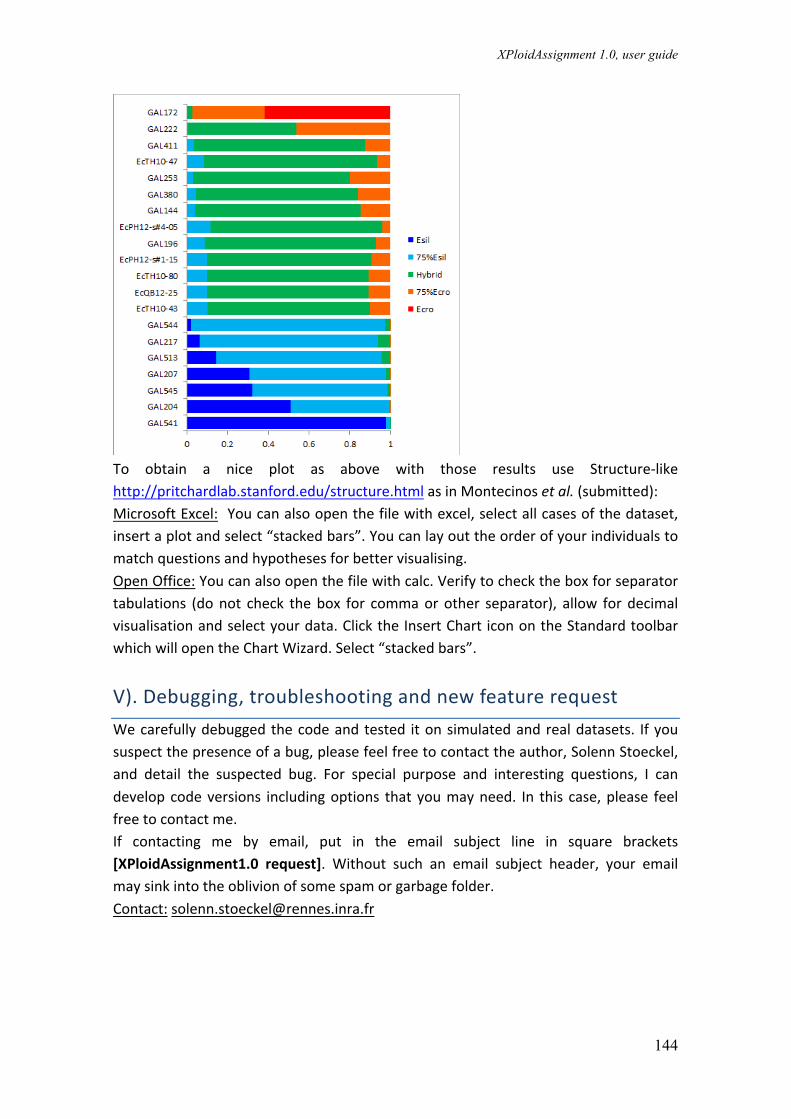
XPloidAssignment 1.0, user guide
144
To obtain a nice plot as above with those results use Structure-likehttp://pritchardlab.stanford.edu/structure.htmlasinMontecinosetal.(submitted):MicrosoftExcel:Youcanalsoopenthefilewithexcel,selectallcasesofthedataset,insertaplotandselect“stackedbars”.Youcanlayouttheorderofyourindividualstomatchquestionsandhypothesesforbettervisualising.OpenOffice:Youcanalsoopenthefilewithcalc.Verifytochecktheboxforseparatortabulations (donot check thebox for commaorother separator), allow for decimalvisualisationandselectyourdata.ClicktheInsertChart iconontheStandardtoolbarwhichwillopentheChartWizard.Select“stackedbars”.
V).Debugging,troubleshootingandnewfeaturerequestWecarefullydebuggedthecodeandtested itonsimulatedandrealdatasets. Ifyoususpectthepresenceofabug,pleasefeelfreetocontacttheauthor,SolennStoeckel,and detail the suspected bug. For special purpose and interesting questions, I candevelopcodeversions includingoptions thatyoumayneed. In this case,please feelfreetocontactme.If contacting me by email, put in the email subject line in square brackets[XPloidAssignment1.0 request]. Without such an email subject header, your emailmaysinkintotheoblivionofsomespamorgarbagefolder.Contact:[email protected]
145
Appendix III.2 Assigning genotyped individuals to gene pools and admixed gene pools using multiple genetic markers with varying ploidy levels Let’s consider ! different geographical or phenotypical populations or subspecies characterized by their specific genetic pools, denoted ", encoded at each of its # loci by $% allelic frequencies. Let’s consider that the likelihood of an ℎ'( allele of a locus ) denoted *+,( to belong to a population - is its frequency in the gene pool "., i.e. 0 *+,( .. The posterior probability of an allele ℎ at locus ) to come from a population
-∗ would thus be
2 *+,( ∈ ".∗ "4, … , "., … , "6 =8 9:,; <∗
8 9:,; <=<>?
(eq.1)
We sampled @ studied individuals named AB with C ∈ [1, … , C, … , @] to estimate their probabilities to come from each single population or from admixed gene pools between those populations. Those individuals are genotyped and we denote the DNA fingerprinting of one individual AB as GB =[ *4,4, … , *4,H? , … , (… , *+,J:, … ), … , *%,4, … , *%,HL ]. In GB, one locus can have M alleles where M ∈ [1,∞[ (from haplo- to polyploidy) and M can vary along loci (M+) and between individuals. The posterior probability of one individual AB to come from one population -∗ knowing its DNA fingerprinting GB over all genotyped markers and the genetic composition of populations and admixed scenarios is
2 AB ∈ ".∗ "4, … , "., … , "(, GB =8 9:,O: <∗
P:O>?
L:>?
QRSPR>?
TS>?
;<>? (eq.2)
In this equation we consider a flat prior of assignation between gene pools. If studied individuals can be assumed to descend from at least one sexual reproduction with massive recombination between markers and independent segregation/fusion of alleles at the studied loci, we expect that genetic pool of hybrid F1 between two populations, e.g. "4 and "U, should exhibit allele V at a locus ) at a frequencies following
0 *+,W(XJYBZ = 8 9:,S
[?\8 9:,S[]
U Admixed individuals coming from backcrosses or multiple interbreedings between populations should be assigned to admixed genetic pools in which allele frequencies can be assessed as
0 *+,WQZ^B_`Z = ab? ∗ 0 *+,W
b? + ab] ∗ 0 *+,Wb]
With ab? the proportion of genetic pool coming from "4 and ab], the proportion coming from "U, with "4 + "U = 1. The posterior probabilities provide a direct quantitative estimate of the probability that an individual belongs to an identified population and scenarios of admixture. Absolute assignment can be done considering the maximum a posteriori of those values only in cases where one posterior probability of one scenario dominates all the others.
146
XPloidAssignment: a software to compute the posterior probabilities of genotyped individuals with varying ploidies to come from previously identified gene pools and admixed scenarios between those gene pools We implemented this method in a software named XPloidAssignment that allows users to compute the posterior probabilities of belonging to identified populations and scenarios of genetic admixture between those populations. The software can be downloaded for Linux and Windows at https://www6.rennes.inra.fr/igepp_eng/Productions/Software. See User Guide for further explanations. XPloidAssignment: a software to compute the posterior probabilities of genotyped individuals with varying ploidies to come from previously identified gene pools and admixed scenarios between those gene pools We implemented this method in a software named XPloidAssignment that allows users to compute the posterior probabilities of belonging to identified populations and scenarios of genetic admixture between those populations. The software can be downloaded for Linux and Windows at https://www6.rennes.inra.fr/igepp_eng/Productions/Software. See User Guide for further explanations.
147
Appendix III.3: Table S1. Genotypes of the 81 "putative" hybrid for the markers used and their assignation in the different class of hybrids or parental species by combining the result of the different admixture analyses
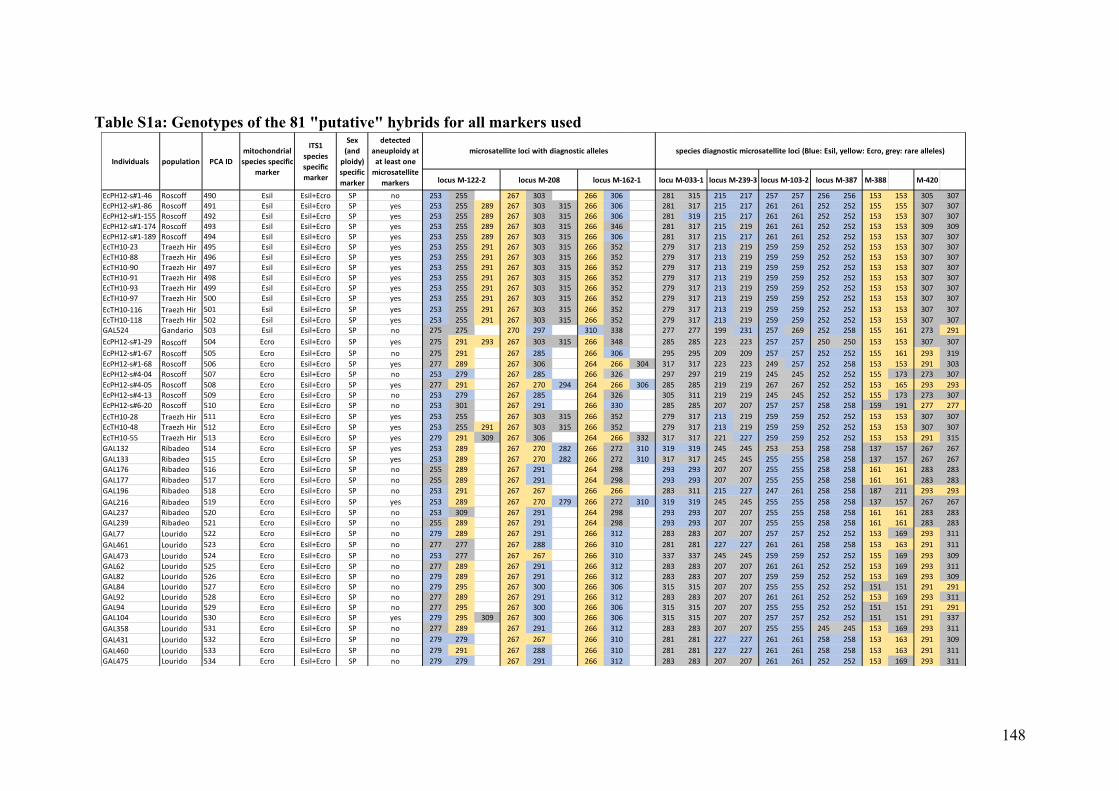
148
Table S1a: Genotypes of the 81 "putative" hybrids for all markers used
M-388 M-420
EcPH12-s#1-46 Roscoff 490 Esil Esil+Ecro SP no 253 255 267 303 266 306 281 315 215 217 257 257 256 256 153 153 305 307EcPH12-s#1-86 Roscoff 491 Esil Esil+Ecro SP yes 253 255 289 267 303 315 266 306 281 317 215 217 261 261 252 252 155 155 307 307EcPH12-s#1-155 Roscoff 492 Esil Esil+Ecro SP yes 253 255 289 267 303 315 266 306 281 319 215 217 261 261 252 252 153 153 307 307EcPH12-s#1-174 Roscoff 493 Esil Esil+Ecro SP yes 253 255 289 267 303 315 266 346 281 317 215 219 261 261 252 252 153 153 309 309EcPH12-s#1-189 Roscoff 494 Esil Esil+Ecro SP yes 253 255 289 267 303 315 266 306 281 317 215 217 261 261 252 252 153 153 307 307EcTH10-23 TraezhHir 495 Esil Esil+Ecro SP yes 253 255 291 267 303 315 266 352 279 317 213 219 259 259 252 252 153 153 307 307EcTH10-88 TraezhHir 496 Esil Esil+Ecro SP yes 253 255 291 267 303 315 266 352 279 317 213 219 259 259 252 252 153 153 307 307EcTH10-90 TraezhHir 497 Esil Esil+Ecro SP yes 253 255 291 267 303 315 266 352 279 317 213 219 259 259 252 252 153 153 307 307EcTH10-91 TraezhHir 498 Esil Esil+Ecro SP yes 253 255 291 267 303 315 266 352 279 317 213 219 259 259 252 252 153 153 307 307EcTH10-93 TraezhHir 499 Esil Esil+Ecro SP yes 253 255 291 267 303 315 266 352 279 317 213 219 259 259 252 252 153 153 307 307EcTH10-97 TraezhHir 500 Esil Esil+Ecro SP yes 253 255 291 267 303 315 266 352 279 317 213 219 259 259 252 252 153 153 307 307EcTH10-116 TraezhHir 501 Esil Esil+Ecro SP yes 253 255 291 267 303 315 266 352 279 317 213 219 259 259 252 252 153 153 307 307EcTH10-118 TraezhHir 502 Esil Esil+Ecro SP yes 253 255 291 267 303 315 266 352 279 317 213 219 259 259 252 252 153 153 307 307GAL524 Gandario 503 Esil Esil+Ecro SP no 275 275 270 297 310 338 277 277 199 231 257 269 252 258 155 161 273 291EcPH12-s#1-29 Roscoff 504 Ecro Esil+Ecro SP yes 275 291 293 267 303 315 266 348 285 285 223 223 257 257 250 250 153 153 307 307EcPH12-s#1-67 Roscoff 505 Ecro Esil+Ecro SP no 275 291 267 285 266 306 295 295 209 209 257 257 252 252 155 161 293 319EcPH12-s#1-68 Roscoff 506 Ecro Esil+Ecro SP yes 277 289 267 306 264 266 304 317 317 223 223 249 257 252 258 153 153 291 303EcPH12-s#4-04 Roscoff 507 Ecro Esil+Ecro SP no 253 279 267 285 266 326 297 297 219 219 245 245 252 252 155 173 273 307EcPH12-s#4-05 Roscoff 508 Ecro Esil+Ecro SP yes 277 291 267 270 294 264 266 306 285 285 219 219 267 267 252 252 153 165 293 293EcPH12-s#4-13 Roscoff 509 Ecro Esil+Ecro SP no 253 279 267 285 264 326 305 311 219 219 245 245 252 252 155 173 273 307EcPH12-s#6-20 Roscoff 510 Ecro Esil+Ecro SP no 253 301 267 291 266 330 285 285 207 207 257 257 258 258 159 191 277 277EcTH10-28 TraezhHir 511 Ecro Esil+Ecro SP yes 253 255 267 303 315 266 352 279 317 213 219 259 259 252 252 153 153 307 307EcTH10-48 TraezhHir 512 Ecro Esil+Ecro SP yes 253 255 291 267 303 315 266 352 279 317 213 219 259 259 252 252 153 153 307 307EcTH10-55 TraezhHir 513 Ecro Esil+Ecro SP yes 279 291 309 267 306 264 266 332 317 317 221 227 259 259 252 252 153 153 291 315GAL132 Ribadeo 514 Ecro Esil+Ecro SP yes 253 289 267 270 282 266 272 310 319 319 245 245 253 253 258 258 137 157 267 267GAL133 Ribadeo 515 Ecro Esil+Ecro SP yes 253 289 267 270 282 266 272 310 317 317 245 245 255 255 258 258 137 157 267 267GAL176 Ribadeo 516 Ecro Esil+Ecro SP no 255 289 267 291 264 298 293 293 207 207 255 255 258 258 161 161 283 283GAL177 Ribadeo 517 Ecro Esil+Ecro SP no 255 289 267 291 264 298 293 293 207 207 255 255 258 258 161 161 283 283GAL196 Ribadeo 518 Ecro Esil+Ecro SP no 253 291 267 267 266 266 283 311 215 227 247 261 258 258 187 211 293 293GAL216 Ribadeo 519 Ecro Esil+Ecro SP yes 253 289 267 270 279 266 272 310 319 319 245 245 255 255 258 258 137 157 267 267GAL237 Ribadeo 520 Ecro Esil+Ecro SP no 253 309 267 291 264 298 293 293 207 207 255 255 258 258 161 161 283 283GAL239 Ribadeo 521 Ecro Esil+Ecro SP no 255 289 267 291 264 298 293 293 207 207 255 255 258 258 161 161 283 283GAL77 Lourido 522 Ecro Esil+Ecro SP no 279 289 267 291 266 312 283 283 207 207 257 257 252 252 153 169 293 311GAL461 Lourido 523 Ecro Esil+Ecro SP no 277 277 267 288 266 310 281 281 227 227 261 261 258 258 153 163 291 311GAL473 Lourido 524 Ecro Esil+Ecro SP no 253 277 267 267 266 310 337 337 245 245 259 259 252 252 155 169 293 309GAL62 Lourido 525 Ecro Esil+Ecro SP no 277 289 267 291 266 312 283 283 207 207 261 261 252 252 153 169 293 311GAL82 Lourido 526 Ecro Esil+Ecro SP no 279 289 267 291 266 312 283 283 207 207 259 259 252 252 153 169 293 309GAL84 Lourido 527 Ecro Esil+Ecro SP no 279 295 267 300 266 306 315 315 207 207 255 255 252 252 151 151 291 291GAL92 Lourido 528 Ecro Esil+Ecro SP no 277 289 267 291 266 312 283 283 207 207 261 261 252 252 153 169 293 311GAL94 Lourido 529 Ecro Esil+Ecro SP no 277 295 267 300 266 306 315 315 207 207 255 255 252 252 151 151 291 291GAL104 Lourido 530 Ecro Esil+Ecro SP yes 279 295 309 267 300 266 306 315 315 207 207 257 257 252 252 151 151 291 337GAL358 Lourido 531 Ecro Esil+Ecro SP no 277 289 267 291 266 312 283 283 207 207 255 255 245 245 153 169 293 311GAL431 Lourido 532 Ecro Esil+Ecro SP no 279 279 267 267 266 310 281 281 227 227 261 261 258 258 153 163 291 309GAL460 Lourido 533 Ecro Esil+Ecro SP no 279 291 267 288 266 310 281 281 227 227 261 261 258 258 153 163 291 311GAL475 Lourido 534 Ecro Esil+Ecro SP no 279 279 267 291 266 312 283 283 207 207 261 261 252 252 153 169 293 311
Sex(andploidy)specificmarker
Individuals population PCAIDmitochondrialspeciesspecific
marker
ITS1speciesspecificmarker locusM-103-2 locusM-387
detectedaneuploidyatatleastonemicrosatellite
markers
microsatellitelociwithdiagnosticalleles speciesdiagnosticmicrosatelliteloci(Blue:Esil,yellow:Ecro,grey:rarealleles)
locusM-122-2 locusM-208 locusM-162-1 locuM-033-1 locusM-239-3
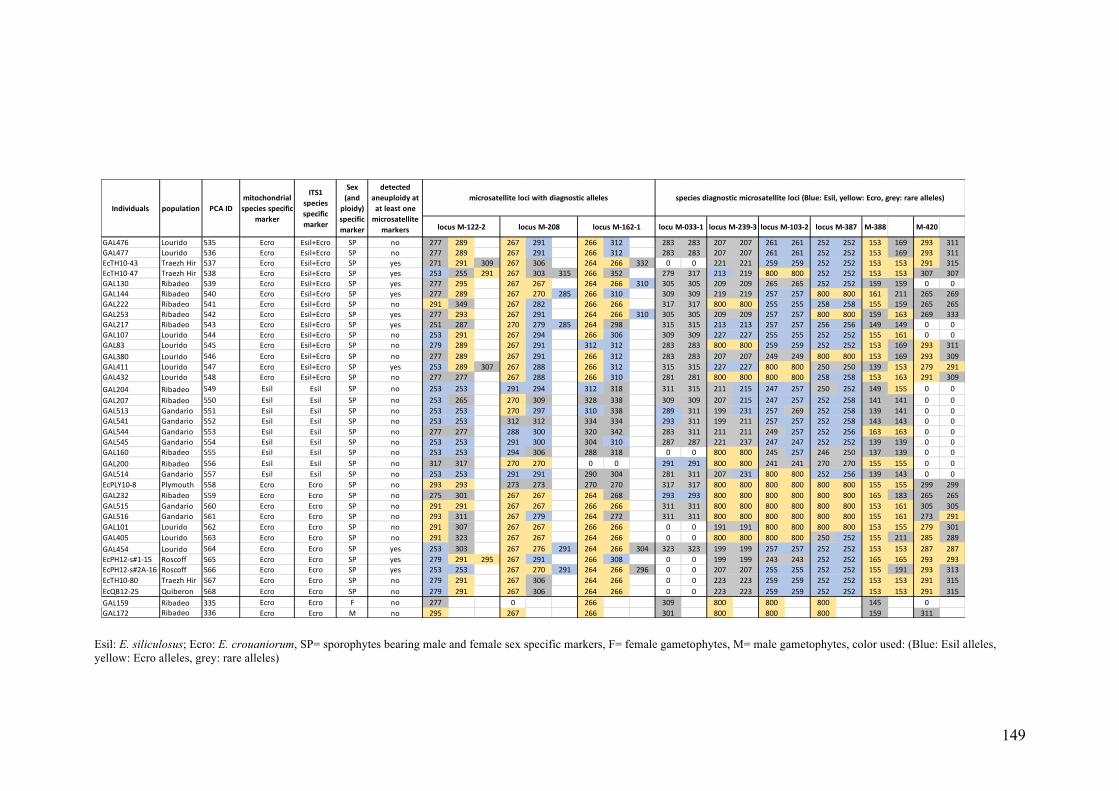
149
Esil: E. siliculosus; Ecro: E. crouaniorum, SP= sporophytes bearing male and female sex specific markers, F= female gametophytes, M= male gametophytes, color used: (Blue: Esil alleles, yellow: Ecro alleles, grey: rare alleles)
M-388 M-420
GAL476 Lourido 535 Ecro Esil+Ecro SP no 277 289 267 291 266 312 283 283 207 207 261 261 252 252 153 169 293 311GAL477 Lourido 536 Ecro Esil+Ecro SP no 277 289 267 291 266 312 283 283 207 207 261 261 252 252 153 169 293 311EcTH10-43 TraezhHir 537 Ecro Esil+Ecro SP yes 271 291 309 267 306 264 266 332 0 0 221 221 259 259 252 252 153 153 291 315EcTH10-47 TraezhHir 538 Ecro Esil+Ecro SP yes 253 255 291 267 303 315 266 352 279 317 213 219 800 800 252 252 153 153 307 307GAL130 Ribadeo 539 Ecro Esil+Ecro SP yes 277 295 267 267 264 266 310 305 305 209 209 265 265 252 252 159 159 0 0GAL144 Ribadeo 540 Ecro Esil+Ecro SP yes 277 289 267 270 285 266 310 309 309 219 219 257 257 800 800 161 211 265 269GAL222 Ribadeo 541 Ecro Esil+Ecro SP no 291 349 267 282 266 266 317 317 800 800 255 255 258 258 155 159 265 265GAL253 Ribadeo 542 Ecro Esil+Ecro SP yes 277 293 267 291 264 266 310 305 305 209 209 257 257 800 800 159 163 269 333GAL217 Ribadeo 543 Ecro Esil+Ecro SP yes 251 287 270 279 285 264 298 315 315 213 213 257 257 256 256 149 149 0 0GAL107 Lourido 544 Ecro Esil+Ecro SP no 253 291 267 294 266 306 309 309 227 227 255 255 252 252 155 161 0 0GAL83 Lourido 545 Ecro Esil+Ecro SP no 279 289 267 291 312 312 283 283 800 800 259 259 252 252 153 169 293 311GAL380 Lourido 546 Ecro Esil+Ecro SP no 277 289 267 291 266 312 283 283 207 207 249 249 800 800 153 169 293 309GAL411 Lourido 547 Ecro Esil+Ecro SP yes 253 289 307 267 288 266 312 315 315 227 227 800 800 250 250 139 153 279 291GAL432 Lourido 548 Ecro Esil+Ecro SP no 277 277 267 288 266 310 281 281 800 800 800 800 258 258 153 163 291 309GAL204 Ribadeo 549 Esil Esil SP no 253 253 291 294 312 318 311 315 211 215 247 257 250 252 149 155 0 0GAL207 Ribadeo 550 Esil Esil SP no 253 265 270 309 328 338 309 309 207 215 247 257 252 258 141 141 0 0GAL513 Gandario 551 Esil Esil SP no 253 253 270 297 310 338 289 311 199 231 257 269 252 258 139 141 0 0GAL541 Gandario 552 Esil Esil SP no 253 253 312 312 334 334 293 311 199 211 257 257 252 258 143 143 0 0GAL544 Gandario 553 Esil Esil SP no 277 277 288 300 320 342 283 311 211 211 249 257 252 256 163 163 0 0GAL545 Gandario 554 Esil Esil SP no 253 253 291 300 304 310 287 287 221 237 247 247 252 252 139 139 0 0GAL160 Ribadeo 555 Esil Esil SP no 253 253 294 306 288 318 0 0 800 800 245 257 246 250 137 139 0 0GAL200 Ribadeo 556 Esil Esil SP no 317 317 270 270 0 0 291 291 800 800 241 241 270 270 155 155 0 0GAL514 Gandario 557 Esil Esil SP no 253 253 291 291 290 304 281 311 207 231 800 800 252 256 139 143 0 0EcPLY10-8 Plymouth 558 Ecro Ecro SP no 293 293 273 273 270 270 317 317 800 800 800 800 800 800 155 155 299 299GAL232 Ribadeo 559 Ecro Ecro SP no 275 301 267 267 264 268 293 293 800 800 800 800 800 800 165 183 265 265GAL515 Gandario 560 Ecro Ecro SP no 291 291 267 267 266 266 311 311 800 800 800 800 800 800 153 161 305 305GAL516 Gandario 561 Ecro Ecro SP no 293 311 267 279 264 272 311 311 800 800 800 800 800 800 155 161 273 291GAL101 Lourido 562 Ecro Ecro SP no 291 307 267 267 266 266 0 0 191 191 800 800 800 800 153 155 279 301GAL405 Lourido 563 Ecro Ecro SP no 291 323 267 267 264 266 0 0 800 800 800 800 250 252 155 211 285 289GAL454 Lourido 564 Ecro Ecro SP yes 253 303 267 276 291 264 266 304 323 323 199 199 257 257 252 252 153 153 287 287EcPH12-s#1-15 Roscoff 565 Ecro Ecro SP yes 279 291 295 267 291 266 308 0 0 199 199 243 243 252 252 165 165 293 293EcPH12-s#2A-16 Roscoff 566 Ecro Ecro SP yes 253 253 267 270 291 264 266 296 0 0 207 207 255 255 252 252 155 191 293 313EcTH10-80 TraezhHir 567 Ecro Ecro SP no 279 291 267 306 264 266 0 0 223 223 259 259 252 252 153 153 291 315EcQB12-25 Quiberon 568 Ecro Ecro SP no 279 291 267 306 264 266 0 0 223 223 259 259 252 252 153 153 291 315GAL159 Ribadeo 335 Ecro Ecro F no 277 0 266 309 800 800 800 145 0GAL172 Ribadeo 336 Ecro Ecro M no 295 267 266 301 800 800 800 159 311
Sex(andploidy)specificmarker
Individuals population PCAIDmitochondrialspeciesspecific
marker
ITS1speciesspecificmarker locusM-103-2 locusM-387
detectedaneuploidyatatleastonemicrosatellite
markers
microsatellitelociwithdiagnosticalleles speciesdiagnosticmicrosatelliteloci(Blue:Esil,yellow:Ecro,grey:rarealleles)
locusM-122-2 locusM-208 locusM-162-1 locuM-033-1 locusM-239-3
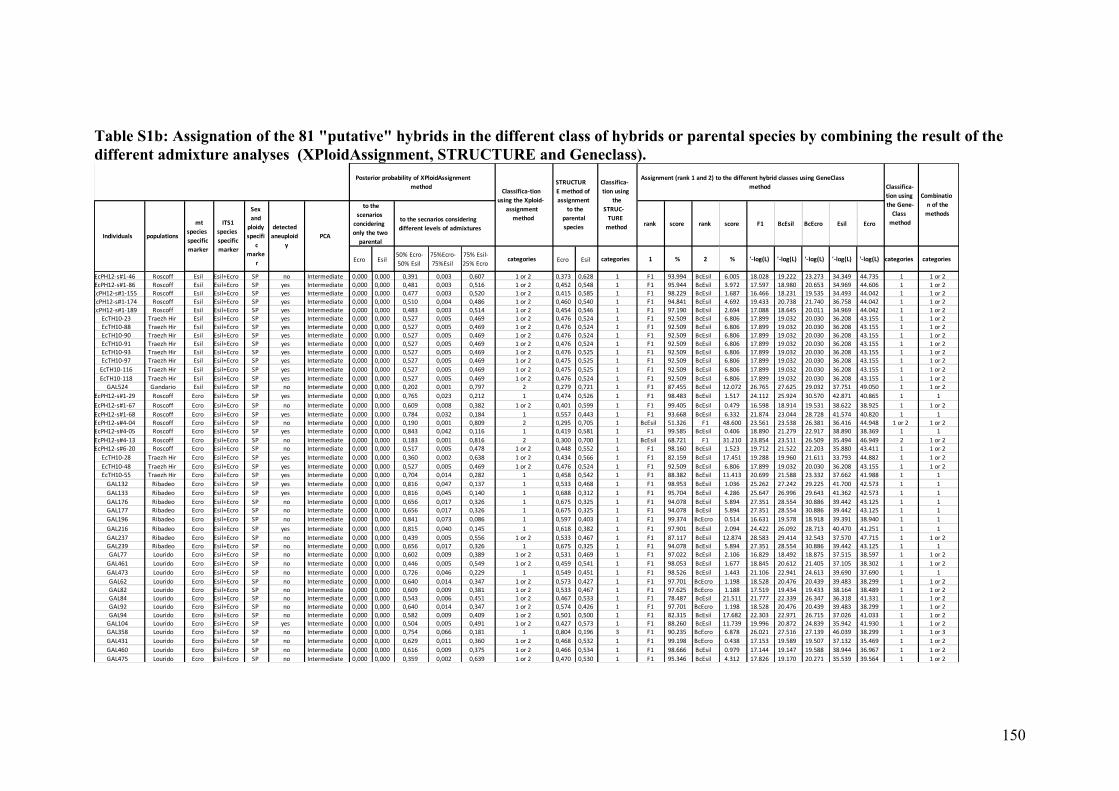
150
Table S1b: Assignation of the 81 "putative" hybrids in the different class of hybrids or parental species by combining the result of the different admixture analyses (XPloidAssignment, STRUCTURE and Geneclass).
rank score rank score F1 BcEsil BcEcro Esil Ecro
Ecro Esil50%Ecro-50%Esil
75%Ecro-75%Esil
75%Esil-25%Ecro
categories Ecro Esil categories 1 % 2 % '-log(L) '-log(L) '-log(L) '-log(L) '-log(L) categories categories
EcPH12-s#1-46 Roscoff Esil Esil+Ecro SP no Intermediate 0,000 0,000 0,391 0,003 0,607 1or2 0,373 0,628 1 F1 93.994 BcEsil 6.005 18.028 19.222 23.273 34.349 44.735 1 1or2EcPH12-s#1-86 Roscoff Esil Esil+Ecro SP yes Intermediate 0,000 0,000 0,481 0,003 0,516 1or2 0,452 0,548 1 F1 95.944 BcEsil 3.972 17.597 18.980 20.653 34.969 44.606 1 1or2EcPH12-s#1-155 Roscoff Esil Esil+Ecro SP yes Intermediate 0,000 0,000 0,477 0,003 0,520 1or2 0,415 0,585 1 F1 98.229 BcEsil 1.687 16.466 18.231 19.535 34.493 44.042 1 1or2EcPH12-s#1-174 Roscoff Esil Esil+Ecro SP yes Intermediate 0,000 0,000 0,510 0,004 0,486 1or2 0,460 0,540 1 F1 94.841 BcEsil 4.692 19.433 20.738 21.740 36.758 44.042 1 1or2EcPH12-s#1-189 Roscoff Esil Esil+Ecro SP yes Intermediate 0,000 0,000 0,483 0,003 0,514 1or2 0,454 0,546 1 F1 97.190 BcEsil 2.694 17.088 18.645 20.011 34.969 44.042 1 1or2
EcTH10-23 TraezhHir Esil Esil+Ecro SP yes Intermediate 0,000 0,000 0,527 0,005 0,469 1or2 0,476 0,524 1 F1 92.509 BcEsil 6.806 17.899 19.032 20.030 36.208 43.155 1 1or2EcTH10-88 TraezhHir Esil Esil+Ecro SP yes Intermediate 0,000 0,000 0,527 0,005 0,469 1or2 0,476 0,524 1 F1 92.509 BcEsil 6.806 17.899 19.032 20.030 36.208 43.155 1 1or2EcTH10-90 TraezhHir Esil Esil+Ecro SP yes Intermediate 0,000 0,000 0,527 0,005 0,469 1or2 0,476 0,524 1 F1 92.509 BcEsil 6.806 17.899 19.032 20.030 36.208 43.155 1 1or2EcTH10-91 TraezhHir Esil Esil+Ecro SP yes Intermediate 0,000 0,000 0,527 0,005 0,469 1or2 0,476 0,524 1 F1 92.509 BcEsil 6.806 17.899 19.032 20.030 36.208 43.155 1 1or2EcTH10-93 TraezhHir Esil Esil+Ecro SP yes Intermediate 0,000 0,000 0,527 0,005 0,469 1or2 0,476 0,525 1 F1 92.509 BcEsil 6.806 17.899 19.032 20.030 36.208 43.155 1 1or2EcTH10-97 TraezhHir Esil Esil+Ecro SP yes Intermediate 0,000 0,000 0,527 0,005 0,469 1or2 0,475 0,525 1 F1 92.509 BcEsil 6.806 17.899 19.032 20.030 36.208 43.155 1 1or2EcTH10-116 TraezhHir Esil Esil+Ecro SP yes Intermediate 0,000 0,000 0,527 0,005 0,469 1or2 0,475 0,525 1 F1 92.509 BcEsil 6.806 17.899 19.032 20.030 36.208 43.155 1 1or2EcTH10-118 TraezhHir Esil Esil+Ecro SP yes Intermediate 0,000 0,000 0,527 0,005 0,469 1or2 0,476 0,524 1 F1 92.509 BcEsil 6.806 17.899 19.032 20.030 36.208 43.155 1 1or2GAL524 Gandario Esil Esil+Ecro SP no Intermediate 0,000 0,000 0,202 0,001 0,797 2 0,279 0,721 1 F1 87.455 BcEsil 12.072 26.765 27.625 29.032 37.751 49.050 1 1or2
EcPH12-s#1-29 Roscoff Ecro Esil+Ecro SP yes Intermediate 0,000 0,000 0,765 0,023 0,212 1 0,474 0,526 1 F1 98.483 BcEsil 1.517 24.112 25.924 30.570 42.871 40.865 1 1
EcPH12-s#1-67 Roscoff Ecro Esil+Ecro SP no Intermediate 0,000 0,000 0,609 0,008 0,382 1or2 0,401 0,599 1 F1 99.405 BcEsil 0.479 16.598 18.914 19.531 38.622 38.925 1 1or2EcPH12-s#1-68 Roscoff Ecro Esil+Ecro SP yes Intermediate 0,000 0,000 0,784 0,032 0,184 1 0,557 0,443 1 F1 93.668 BcEsil 6.332 21.874 23.044 28.728 41.574 40.820 1 1EcPH12-s#4-04 Roscoff Ecro Esil+Ecro SP no Intermediate 0,000 0,000 0,190 0,001 0,809 2 0,295 0,705 1 BcEsil 51.326 F1 48.600 23.561 23.538 26.381 36.416 44.948 1or2 1or2EcPH12-s#4-05 Roscoff Ecro Esil+Ecro SP yes Intermediate 0,000 0,000 0,843 0,042 0,116 1 0,419 0,581 1 F1 99.585 BcEsil 0.406 18.890 21.279 22.917 38.890 38.369 1 1EcPH12-s#4-13 Roscoff Ecro Esil+Ecro SP no Intermediate 0,000 0,000 0,183 0,001 0,816 2 0,300 0,700 1 BcEsil 68.721 F1 31.210 23.854 23.511 26.509 35.494 46.949 2 1or2EcPH12-s#6-20 Roscoff Ecro Esil+Ecro SP no Intermediate 0,000 0,000 0,517 0,005 0,478 1or2 0,448 0,552 1 F1 98.160 BcEsil 1.523 19.712 21.522 22.203 35.880 43.411 1 1or2
EcTH10-28 TraezhHir Ecro Esil+Ecro SP yes Intermediate 0,000 0,000 0,360 0,002 0,638 1or2 0,434 0,566 1 F1 82.159 BcEsil 17.451 19.288 19.960 21.611 33.793 44.882 1 1or2EcTH10-48 TraezhHir Ecro Esil+Ecro SP yes Intermediate 0,000 0,000 0,527 0,005 0,469 1or2 0,476 0,524 1 F1 92.509 BcEsil 6.806 17.899 19.032 20.030 36.208 43.155 1 1or2EcTH10-55 TraezhHir Ecro Esil+Ecro SP yes Intermediate 0,000 0,000 0,704 0,014 0,282 1 0,458 0,542 1 F1 88.382 BcEsil 11.413 20.699 21.588 23.332 37.662 41.988 1 1GAL132 Ribadeo Ecro Esil+Ecro SP yes Intermediate 0,000 0,000 0,816 0,047 0,137 1 0,533 0,468 1 F1 98.953 BcEsil 1.036 25.262 27.242 29.225 41.700 42.573 1 1GAL133 Ribadeo Ecro Esil+Ecro SP yes Intermediate 0,000 0,000 0,816 0,045 0,140 1 0,688 0,312 1 F1 95.704 BcEsil 4.286 25.647 26.996 29.643 41.362 42.573 1 1GAL176 Ribadeo Ecro Esil+Ecro SP no Intermediate 0,000 0,000 0,656 0,017 0,326 1 0,675 0,325 1 F1 94.078 BcEsil 5.894 27.351 28.554 30.886 39.442 43.125 1 1GAL177 Ribadeo Ecro Esil+Ecro SP no Intermediate 0,000 0,000 0,656 0,017 0,326 1 0,675 0,325 1 F1 94.078 BcEsil 5.894 27.351 28.554 30.886 39.442 43.125 1 1GAL196 Ribadeo Ecro Esil+Ecro SP no Intermediate 0,000 0,000 0,841 0,073 0,086 1 0,597 0,403 1 F1 99.374 BcEcro 0.514 16.631 19.578 18.918 39.391 38.940 1 1
GAL216 Ribadeo Ecro Esil+Ecro SP yes Intermediate 0,000 0,000 0,815 0,040 0,145 1 0,618 0,382 1 F1 97.901 BcEsil 2.094 24.422 26.092 28.713 40.470 41.251 1 1GAL237 Ribadeo Ecro Esil+Ecro SP no Intermediate 0,000 0,000 0,439 0,005 0,556 1or2 0,533 0,467 1 F1 87.117 BcEsil 12.874 28.583 29.414 32.543 37.570 47.715 1 1or2GAL239 Ribadeo Ecro Esil+Ecro SP no Intermediate 0,000 0,000 0,656 0,017 0,326 1 0,675 0,325 1 F1 94.078 BcEsil 5.894 27.351 28.554 30.886 39.442 43.125 1 1GAL77 Lourido Ecro Esil+Ecro SP no Intermediate 0,000 0,000 0,602 0,009 0,389 1or2 0,531 0,469 1 F1 97.022 BcEsil 2.106 16.829 18.492 18.875 37.515 38.597 1 1or2GAL461 Lourido Ecro Esil+Ecro SP no Intermediate 0,000 0,000 0,446 0,005 0,549 1or2 0,459 0,541 1 F1 98.053 BcEsil 1.677 18.845 20.612 21.405 37.105 38.302 1 1or2GAL473 Lourido Ecro Esil+Ecro SP no Intermediate 0,000 0,000 0,726 0,046 0,229 1 0,549 0,451 1 F1 98.526 BcEsil 1.443 21.106 22.941 24.613 39.690 37.690 1 1GAL62 Lourido Ecro Esil+Ecro SP no Intermediate 0,000 0,000 0,640 0,014 0,347 1or2 0,573 0,427 1 F1 97.701 BcEcro 1.198 18.528 20.476 20.439 39.483 38.299 1 1or2GAL82 Lourido Ecro Esil+Ecro SP no Intermediate 0,000 0,000 0,609 0,009 0,381 1or2 0,533 0,467 1 F1 97.625 BcEcro 1.188 17.519 19.434 19.433 38.164 38.489 1 1or2GAL84 Lourido Ecro Esil+Ecro SP no Intermediate 0,000 0,000 0,543 0,006 0,451 1or2 0,467 0,533 1 F1 78.487 BcEsil 21.511 21.777 22.339 26.347 36.318 41.331 1 1or2GAL92 Lourido Ecro Esil+Ecro SP no Intermediate 0,000 0,000 0,640 0,014 0,347 1or2 0,574 0,426 1 F1 97.701 BcEcro 1.198 18.528 20.476 20.439 39.483 38.299 1 1or2GAL94 Lourido Ecro Esil+Ecro SP no Intermediate 0,000 0,000 0,582 0,009 0,409 1or2 0,501 0,500 1 F1 82.315 BcEsil 17.682 22.303 22.971 26.715 37.026 41.033 1 1or2GAL104 Lourido Ecro Esil+Ecro SP yes Intermediate 0,000 0,000 0,504 0,005 0,491 1or2 0,427 0,573 1 F1 88.260 BcEsil 11.739 19.996 20.872 24.839 35.942 41.930 1 1or2GAL358 Lourido Ecro Esil+Ecro SP no Intermediate 0,000 0,000 0,754 0,066 0,181 1 0,804 0,196 3 F1 90.235 BcEcro 6.878 26.021 27.516 27.139 46.039 38.299 1 1or3GAL431 Lourido Ecro Esil+Ecro SP no Intermediate 0,000 0,000 0,629 0,011 0,360 1or2 0,468 0,532 1 F1 99.198 BcEcro 0.438 17.153 19.589 19.507 37.132 35.469 1 1or2GAL460 Lourido Ecro Esil+Ecro SP no Intermediate 0,000 0,000 0,616 0,009 0,375 1or2 0,466 0,534 1 F1 98.666 BcEsil 0.979 17.144 19.147 19.588 38.944 36.967 1 1or2GAL475 Lourido Ecro Esil+Ecro SP no Intermediate 0,000 0,000 0,359 0,002 0,639 1or2 0,470 0,530 1 F1 95.346 BcEsil 4.312 17.826 19.170 20.271 35.539 39.564 1 1or2
detectedaneuploid
y
tothescenariosconcideringonlythetwoparental
tothesecnariosconsideringdifferentlevelsofadmixtures
Individuals populations
mtspeciesspecificmarker
ITS1speciesspecificmarker
Sexandploidyspecifi
cmarke
r
PCA
Combinationofthemethods
PosteriorprobabilityofXPloidAssignmentmethod Classifica-tion
usingtheXploid-assignmentmethod
STRUCTUREmethodofassignment
totheparentalspecies
Classifica-tionusing
theSTRUC-TUREmethod
Classifica-tionusingtheGene-Classmethod
Assignment(rank1and2)tothedifferenthybridclassesusingGeneClassmethod
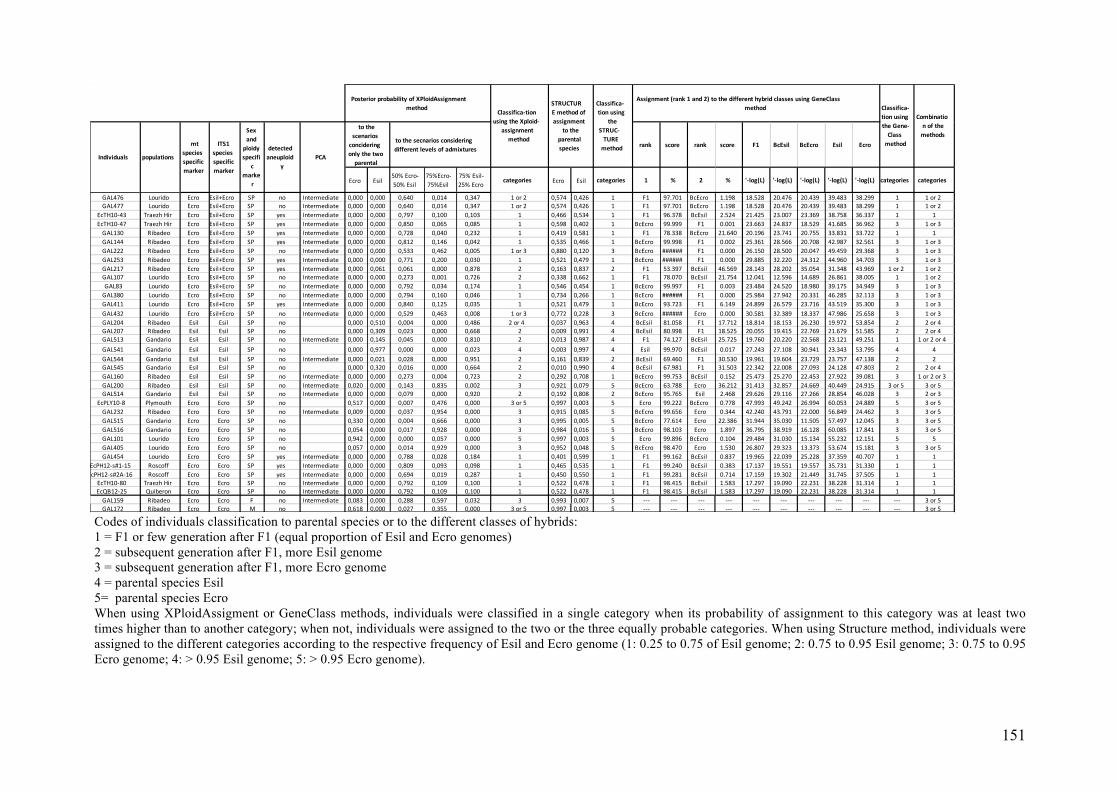
151
rank score rank score F1 BcEsil BcEcro Esil Ecro
Ecro Esil50%Ecro-50%Esil
75%Ecro-75%Esil
75%Esil-25%Ecro
categories Ecro Esil categories 1 % 2 % '-log(L) '-log(L) '-log(L) '-log(L) '-log(L) categories categories
GAL476 Lourido Ecro Esil+Ecro SP no Intermediate 0,000 0,000 0,640 0,014 0,347 1or2 0,574 0,426 1 F1 97.701 BcEcro 1.198 18.528 20.476 20.439 39.483 38.299 1 1or2GAL477 Lourido Ecro Esil+Ecro SP no Intermediate 0,000 0,000 0,640 0,014 0,347 1or2 0,574 0,426 1 F1 97.701 BcEcro 1.198 18.528 20.476 20.439 39.483 38.299 1 1or2
EcTH10-43 TraezhHir Ecro Esil+Ecro SP yes Intermediate 0,000 0,000 0,797 0,100 0,103 1 0,466 0,534 1 F1 96.378 BcEsil 2.524 21.425 23.007 23.369 38.758 36.337 1 1EcTH10-47 TraezhHir Ecro Esil+Ecro SP yes Intermediate 0,000 0,000 0,850 0,065 0,085 1 0,598 0,402 1 BcEcro 99.999 F1 0.001 23.663 24.837 18.529 41.685 36.962 3 1or3GAL130 Ribadeo Ecro Esil+Ecro SP yes Intermediate 0,000 0,000 0,728 0,040 0,232 1 0,419 0,581 1 F1 78.338 BcEcro 21.640 20.196 23.741 20.755 33.831 33.722 1 1GAL144 Ribadeo Ecro Esil+Ecro SP yes Intermediate 0,000 0,000 0,812 0,146 0,042 1 0,535 0,466 1 BcEcro 99.998 F1 0.002 25.361 28.566 20.708 42.987 32.561 3 1or3GAL222 Ribadeo Ecro Esil+Ecro SP no Intermediate 0,000 0,000 0,533 0,462 0,005 1or3 0,880 0,120 3 BcEcro ###### F1 0.000 26.150 28.500 20.047 49.459 29.368 3 1or3GAL253 Ribadeo Ecro Esil+Ecro SP yes Intermediate 0,000 0,000 0,771 0,200 0,030 1 0,521 0,479 1 BcEcro ###### F1 0.000 29.885 32.220 24.312 44.960 34.703 3 1or3GAL217 Ribadeo Ecro Esil+Ecro SP yes Intermediate 0,000 0,061 0,061 0,000 0,878 2 0,163 0,837 2 F1 53.397 BcEsil 46.569 28.143 28.202 35.054 31.348 43.969 1or2 1or2GAL107 Lourido Ecro Esil+Ecro SP no Intermediate 0,000 0,000 0,273 0,001 0,726 2 0,338 0,662 1 F1 78.070 BcEsil 21.754 12.041 12.596 14.689 26.861 38.005 1 1or2GAL83 Lourido Ecro Esil+Ecro SP no Intermediate 0,000 0,000 0,792 0,034 0,174 1 0,546 0,454 1 BcEcro 99.997 F1 0.003 23.484 24.520 18.980 39.175 34.949 3 1or3GAL380 Lourido Ecro Esil+Ecro SP no Intermediate 0,000 0,000 0,794 0,160 0,046 1 0,734 0,266 1 BcEcro ###### F1 0.000 25.984 27.942 20.331 46.285 32.113 3 1or3GAL411 Lourido Ecro Esil+Ecro SP yes Intermediate 0,000 0,000 0,840 0,125 0,035 1 0,521 0,479 1 BcEcro 93.723 F1 6.149 24.899 26.579 23.716 43.519 35.300 3 1or3GAL432 Lourido Ecro Esil+Ecro SP no Intermediate 0,000 0,000 0,529 0,463 0,008 1or3 0,772 0,228 3 BcEcro ###### Ecro 0.000 30.581 32.389 18.337 47.986 25.658 3 1or3GAL204 Ribadeo Esil Esil SP no 0,000 0,510 0,004 0,000 0,486 2or4 0,037 0,963 4 BcEsil 81.058 F1 17.712 18.814 18.153 26.230 19.972 53.854 2 2or4GAL207 Ribadeo Esil Esil SP no 0,000 0,309 0,023 0,000 0,668 2 0,009 0,991 4 BcEsil 80.998 F1 18.525 20.055 19.415 22.769 21.679 51.585 2 2or4GAL513 Gandario Esil Esil SP no Intermediate 0,000 0,145 0,045 0,000 0,810 2 0,013 0,987 4 F1 74.127 BcEsil 25.725 19.760 20.220 22.568 23.121 49.251 1 1or2or4GAL541 Gandario Esil Esil SP no 0,000 0,977 0,000 0,000 0,023 4 0,003 0,997 4 Esil 99.970 BcEsil 0.017 27.243 27.108 30.941 23.343 53.795 4 4GAL544 Gandario Esil Esil SP no Intermediate 0,000 0,021 0,028 0,000 0,951 2 0,161 0,839 2 BcEsil 69.460 F1 30.530 19.961 19.604 23.729 23.757 47.138 2 2GAL545 Gandario Esil Esil SP no 0,000 0,320 0,016 0,000 0,664 2 0,010 0,990 4 BcEsil 67.981 F1 31.503 22.342 22.008 27.093 24.128 47.803 2 2or4GAL160 Ribadeo Esil Esil SP no Intermediate 0,000 0,000 0,273 0,004 0,723 2 0,292 0,708 1 BcEcro 99.753 BcEsil 0.152 25.473 25.270 22.453 27.922 39.081 3 1or2or3GAL200 Ribadeo Esil Esil SP no Intermediate 0,020 0,000 0,143 0,835 0,002 3 0,921 0,079 5 BcEcro 63.788 Ecro 36.212 31.413 32.857 24.669 40.449 24.915 3or5 3or5GAL514 Gandario Esil Esil SP no Intermediate 0,000 0,000 0,079 0,000 0,920 2 0,192 0,808 2 BcEcro 95.765 Esil 2.468 29.626 29.116 27.266 28.854 46.028 3 2or3
EcPLY10-8 Plymouth Ecro Ecro SP no 0,517 0,000 0,007 0,476 0,000 3or5 0,997 0,003 5 Ecro 99.222 BcEcro 0.778 47.993 49.242 26.994 60.053 24.889 5 3or5GAL232 Ribadeo Ecro Ecro SP no Intermediate 0,009 0,000 0,037 0,954 0,000 3 0,915 0,085 5 BcEcro 99.656 Ecro 0.344 42.240 43.791 22.000 56.849 24.462 3 3or5GAL515 Gandario Ecro Ecro SP no 0,330 0,000 0,004 0,666 0,000 3 0,995 0,005 5 BcEcro 77.614 Ecro 22.386 31.944 35.030 11.505 57.497 12.045 3 3or5GAL516 Gandario Ecro Ecro SP no 0,054 0,000 0,017 0,928 0,000 3 0,984 0,016 5 BcEcro 98.103 Ecro 1.897 36.795 38.919 16.128 60.085 17.841 3 3or5GAL101 Lourido Ecro Ecro SP no 0,942 0,000 0,000 0,057 0,000 5 0,997 0,003 5 Ecro 99.896 BcEcro 0.104 29.484 31.030 15.134 55.232 12.151 5 5GAL405 Lourido Ecro Ecro SP no 0,057 0,000 0,014 0,929 0,000 3 0,952 0,048 5 BcEcro 98.470 Ecro 1.530 26.807 29.323 13.373 53.674 15.181 3 3or5GAL454 Lourido Ecro Ecro SP yes Intermediate 0,000 0,000 0,788 0,028 0,184 1 0,401 0,599 1 F1 99.162 BcEsil 0.837 19.965 22.039 25.228 37.359 40.707 1 1
EcPH12-s#1-15 Roscoff Ecro Ecro SP yes Intermediate 0,000 0,000 0,809 0,093 0,098 1 0,465 0,535 1 F1 99.240 BcEsil 0.383 17.137 19.551 19.557 35.731 31.330 1 1EcPH12-s#2A-16 Roscoff Ecro Ecro SP yes Intermediate 0,000 0,000 0,694 0,019 0,287 1 0,450 0,550 1 F1 99.281 BcEsil 0.714 17.159 19.302 21.449 31.745 37.505 1 1
EcTH10-80 TraezhHir Ecro Ecro SP no Intermediate 0,000 0,000 0,792 0,109 0,100 1 0,522 0,478 1 F1 98.415 BcEsil 1.583 17.297 19.090 22.231 38.228 31.314 1 1EcQB12-25 Quiberon Ecro Ecro SP no Intermediate 0,000 0,000 0,792 0,109 0,100 1 0,522 0,478 1 F1 98.415 BcEsil 1.583 17.297 19.090 22.231 38.228 31.314 1 1GAL159 Ribadeo Ecro Ecro F no Intermediate 0,083 0,000 0,288 0,597 0,032 3 0,993 0,007 5 --- --- --- --- --- --- --- --- --- --- 3or5GAL172 Ribadeo Ecro Ecro M no 0,618 0,000 0,027 0,355 0,000 3or5 0,997 0,003 5 --- --- --- --- --- --- --- --- --- --- 3or5
detectedaneuploid
y
tothescenariosconcideringonlythetwoparental
tothesecnariosconsideringdifferentlevelsofadmixtures
Individuals populations
mtspeciesspecificmarker
ITS1speciesspecificmarker
Sexandploidyspecifi
cmarke
r
PCA
Combinationofthemethods
PosteriorprobabilityofXPloidAssignmentmethod Classifica-tion
usingtheXploid-assignmentmethod
STRUCTUREmethodofassignment
totheparentalspecies
Classifica-tionusing
theSTRUC-TUREmethod
Classifica-tionusingtheGene-Classmethod
Assignment(rank1and2)tothedifferenthybridclassesusingGeneClassmethod
Codes of individuals classification to parental species or to the different classes of hybrids: 1 = F1 or few generation after F1 (equal proportion of Esil and Ecro genomes) 2 = subsequent generation after F1, more Esil genome 3 = subsequent generation after F1, more Ecro genome 4 = parental species Esil 5= parental species Ecro When using XPloidAssigment or GeneClass methods, individuals were classified in a single category when its probability of assignment to this category was at least two times higher than to another category; when not, individuals were assigned to the two or the three equally probable categories. When using Structure method, individuals were assigned to the different categories according to the respective frequency of Esil and Ecro genome (1: 0.25 to 0.75 of Esil genome; 2: 0.75 to 0.95 Esil genome; 3: 0.75 to 0.95 Ecro genome; 4: > 0.95 Esil genome; 5: > 0.95 Ecro genome).

152
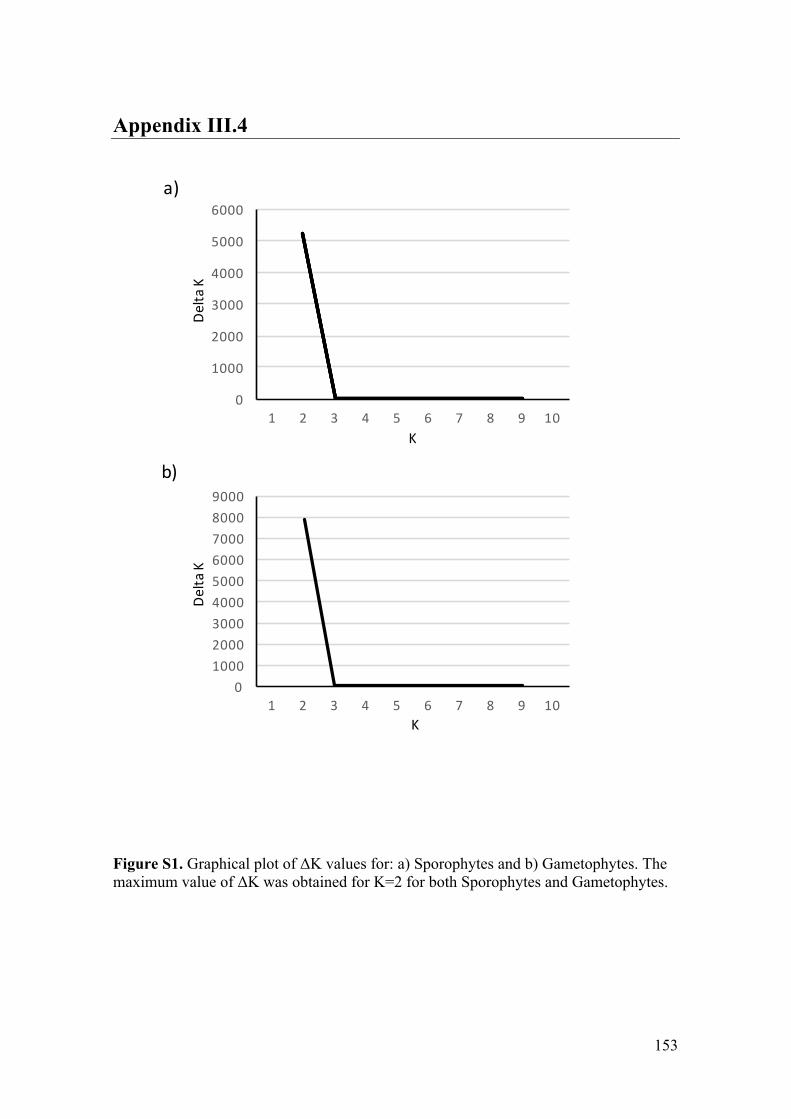
153
0
1000
2000
3000
4000
5000
6000
1 2 3 4 5 6 7 8 9 10
0100020003000400050006000700080009000
1 2 3 4 5 6 7 8 9 10
K
Delta
K
K
Delta
Ka)
b)
Appendix III.4
Figure S1. Graphical plot of ΔK values for: a) Sporophytes and b) Gametophytes. The maximum value of ΔK was obtained for K=2 for both Sporophytes and Gametophytes.

154

155
ConclusionsandPerspectives
ContentsI. Speciesdivergence,diversityanddistributionwithinthegenusEctocarpussection
siliculosi............................................................................................................................157
- Ahighnumberofcrypticspecieswithvariouslevelsofdivergence..........................157
- Speciesgeographicdistribution,phylogeographyandscenarioofintroduction.......160
II. ReproductiveIsolation..........................................................................................163
- Newopportunitiestostudyhybridizationindifferentevolutionarycontexts............163
- Consequencesofthehaploid-diploidlifecycleonreproductiveisolation..................165

156
157
CONCLUSIONS AND PERSPECTIVE
I. Species divergence, diversity and distribution within the
genus Ectocarpus section siliculosi
- A high number of cryptic species with various levels of divergence
We have doubled the number of cryptic species defined within the genus
Ectocarpus section siliculosi (15 species) compared with what was previously published
(two species were formally recognized jointly with 6 different “lineages” by Stache-
Crain et al. 1997, Peters et al. 2010a, b, 2015). The higher number of identified species
can be explained by the increased sampling effort (we have used the most extensive
sampling done so far in this genus to the date) and the increased power of the markers
and the methods used. In addition, we have shown good congruence between the
different markers tested, ITS1, COI-5P and SNPs and between the different analyses. It
is clear that, in the genus Ectocarpus, morphology alone is inadequate to recognize
species and its use have led to gross underestimation of the species diversity in this
group. Our study thus supports the value of molecular identification in filamentous
brown algae (such as barcoding, Hebert et al. 2003, Hajibabaei et al. 2007). Future
research on these algae will have to take into account that (1) it is impossible to
distinguish species morphologically and (2) that they could form groups of cryptic
species characterized by various levels of divergence. For example, in our
phylogenomics study (Chapter 2), the total number of sites available for the whole data
set was low, due to the level of species divergence in Ectocarpus and the difficulty in
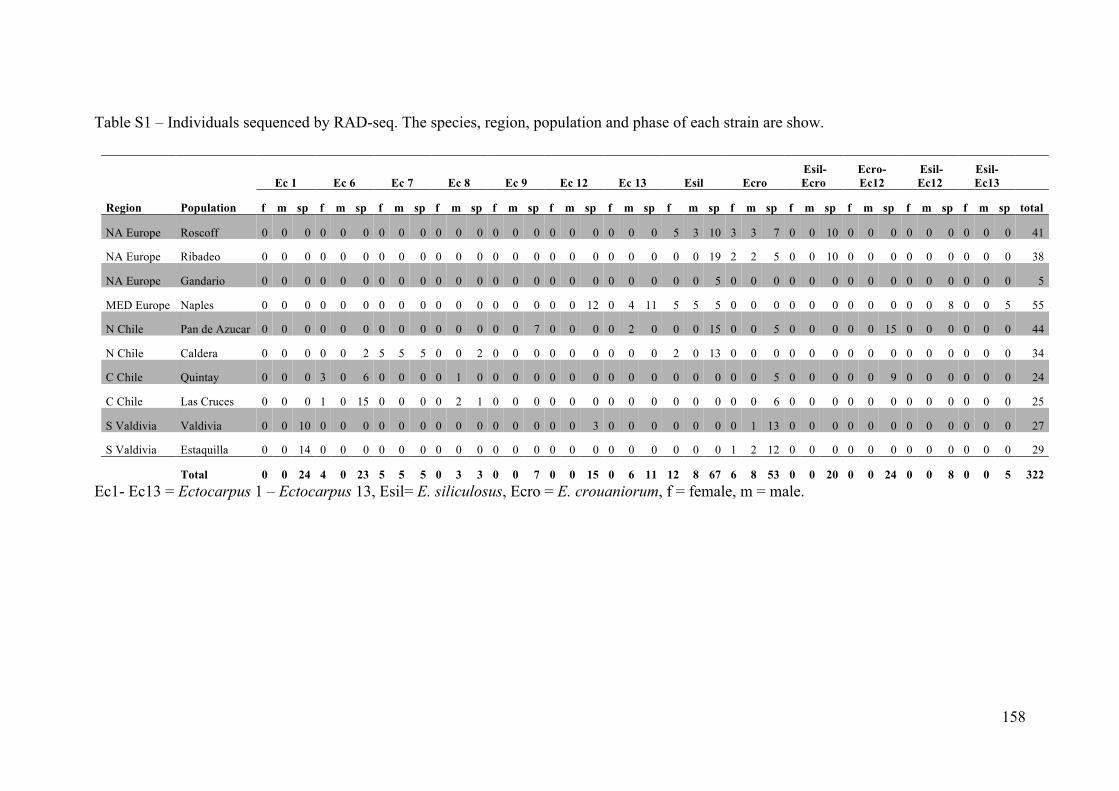
158
Table S1 – Individuals sequenced by RAD-seq. The species, region, population and phase of each strain are show.
Ec1- Ec13 = Ectocarpus 1 – Ectocarpus 13, Esil= E. siliculosus, Ecro = E. crouaniorum, f = female, m = male.
Ec 1 Ec 6 Ec 7 Ec 8 Ec 9 Ec 12 Ec 13 Esil Ecro Esil-Ecro
Ecro-Ec12
Esil-Ec12
Esil-Ec13
Region Population f m sp f m sp f m sp f m sp f m sp f m sp f m sp f m sp f m sp f m sp f m sp f m sp f m sp total
NA Europe Roscoff 0 0 0 0 0 0 0 0 0 0 0 0 0 0 0 0 0 0 0 0 0 5 3 10 3 3 7 0 0 10 0 0 0 0 0 0 0 0 0 41
NA Europe Ribadeo 0 0 0 0 0 0 0 0 0 0 0 0 0 0 0 0 0 0 0 0 0 0 0 19 2 2 5 0 0 10 0 0 0 0 0 0 0 0 0 38
NA Europe Gandario 0 0 0 0 0 0 0 0 0 0 0 0 0 0 0 0 0 0 0 0 0 0 0 5 0 0 0 0 0 0 0 0 0 0 0 0 0 0 0 5
MED Europe Naples 0 0 0 0 0 0 0 0 0 0 0 0 0 0 0 0 0 12 0 4 11 5 5 5 0 0 0 0 0 0 0 0 0 0 0 8 0 0 5 55
N Chile Pan de Azucar 0 0 0 0 0 0 0 0 0 0 0 0 0 0 7 0 0 0 0 2 0 0 0 15 0 0 5 0 0 0 0 0 15 0 0 0 0 0 0 44
N Chile Caldera 0 0 0 0 0 2 5 5 5 0 0 2 0 0 0 0 0 0 0 0 0 2 0 13 0 0 0 0 0 0 0 0 0 0 0 0 0 0 0 34
C Chile Quintay 0 0 0 3 0 6 0 0 0 0 1 0 0 0 0 0 0 0 0 0 0 0 0 0 0 0 5 0 0 0 0 0 9 0 0 0 0 0 0 24
C Chile Las Cruces 0 0 0 1 0 15 0 0 0 0 2 1 0 0 0 0 0 0 0 0 0 0 0 0 0 0 6 0 0 0 0 0 0 0 0 0 0 0 0 25
S Valdivia Valdivia 0 0 10 0 0 0 0 0 0 0 0 0 0 0 0 0 0 3 0 0 0 0 0 0 0 1 13 0 0 0 0 0 0 0 0 0 0 0 0 27
S Valdivia Estaquilla 0 0 14 0 0 0 0 0 0 0 0 0 0 0 0 0 0 0 0 0 0 0 0 0 1 2 12 0 0 0 0 0 0 0 0 0 0 0 0 29
Total 0 0 24 4 0 23 5 5 5 0 3 3 0 0 7 0 0 15 0 6 11 12 8 67 6 8 53 0 0 20 0 0 24 0 0 8 0 0 5 322
159
aligning reads to the reference genome of Ectocarpus 7 using the Stacks pipeline.
Taking into account the various levels of divergence among these cryptic species, a de
novo approach should have been preferred. It would have allowed, to raise the number
of markers available in order to analyze the 322 strains that were sequenced using
RAD-seq during my PhD including nine cryptic species and four types of hybrids
(Table 1). However, we did not succeed to get the matrices using the stack de novo
analysis because the time taken for the pipeline to run the clustering between reads was
too long. Thus we had to select the reads using the reference genome, and only 75 of the
332 strains sequenced were used for the phylogenomics study.
In further analyses, we are thinking of re-analyzing the data with another pipeline,
PyRAD (Eaton 2014). Eaton (2014) showed through a simulation that these clustering
and alignment algorithms were less prone to locus splitting than Stacks. Indeed, Pante et
al. (2015) compared PyRAD and Stacks in an empirical analysis of octocorals and
found that PyRAD returned matrices with a greater number of loci that resolved more
nodes of the phylogeny. PyRAD has been used in a relatively small but growing
number of studies (e.g. Escudero et al. 2014, Herrera et al. 2014, Hipp et al. 2014, Pante
et al. 2015). In addition, in PyRad, it is possible for each individual, to generate a
consensus sequence based on each locus information and then to investigate the
possible function and cellular localization of RAD-seq loci based on their homology
with expressed sequences tags (ESTs). Note that in this genus, datasets of expressed
sequences can be tested on a database of ESTs from the Ectocarpus genome project
(Cock et al. 2010). These analyses could help to link variable and / or fixed SNPs to
genes sustaining genetic differentiation and speciation process in this group.
The phylogenomics analyses performed on the reduced data set of 75 individuals,
nevertheless, allowed to reconstruct phylogenetic relationships among and within the
160
two clades of the Ectocarpus siliculosi group that were unresolved in earlier studies.
Within the two clades “Esil” (including E. siliculosus) and “Ecro” (including E.
crouaniorum), our results indicated potential hybridization or introgression between
closely related species pairs. Interestingly, a high diversity of taxa with various levels of
divergence was revealed within the clade Esil. Follow-up studies on this system should
now include experimental crossing design and genomic analyses of sympatric and
allopatric populations to provide further insights into the evolutionary consequences of
hybridization for the maintenance or breakdown of species in these brown algae. The
strain collection that was established during this PhD thesis opens new opportunities to
study the relationship between genetic distance and cross compatibility in this genus. In
addition, as mentioned above, the RAD-seq data set build during this PhD provide
short-term prospects to study the genomics of speciation within the genus Ectocarpus.
- Species geographic distribution, phylogeography and scenario of introduction
The different Ectocarpus species showed highly contrasted geographic
distribution patterns. Even if the sampling needs to be increased since large geographic
areas were not sampled in the present study, we have evidenced patterns ranging from
species restricted to one biogeographic region (Ectocarpus 7) to cosmopolitan species
(E. siliculosus and E. crouaniorum). Moreover, the high number of cryptic species
present in sympatry within the same locality raised the question of which evolutionary
mechanisms could reduce interspecific competition and promote such patterns. In this
context, the intertidal rocky shores, have been an important object of ecological study
for over a century (Jonsson et al. 2006) investigating how the sharp gradients of
physical and biotic selective pressures shapes species distribution. More recently,
genetics and evolutionary population genetics approaches were used to examine how
161
the habitat-driven divergence is sufficiently strong to drive sympatric speciation (in the
marine snail Littorina saxatilis Johannesson, 2016) or to maintain species integrity
(between Fucus sp., Billard et al. 2010 and Zardi et al. 2011) despite existing gene flow.
The blind population sampling performed in this PhD was designed to survey the
species distribution along the shore gradient following Peters et al. (2010a) and
Couceiro et al. (2015). Indeed, these previous studies showed that E. crouaniorum was
located higher on the shore than E. siliculosus in the North Atlantic. The new sites from
the Iberian Peninsula and from Chile analyzed during this PhD confirmed this pattern
(Montecinos et al. 2016, Chapter 1). Moreover, Ectocarpus 6, which is present only
along the southern most localities sampled in Chile, was more restricted to mid
intertidal pools (Montecinos et al. 2016).
In contrast, the closely related Ectocarpus 6 and Ectocarpus 7 showed contrasting
distribution patterns that could be the result of allopatric or parapatric speciation across
the 30-33°S major biogeographic boundary of the Chilean coast. Indeed, the congruence
of genetic divergence with these biogeographic breaks has been demonstrated for
various species of marine invertebrates (Haye et al. 2014) and of brown and red
seaweed (Guillemin et al. 2016a) suggesting a major role of this barrier in allopatric or
parapatric speciation events. While Ectocarpus 6 is encountered in the cold waters of
the northern limit of the Magellan biogeographic province, Ectocarpus 7 is restricted to
the Peruvian Province which is characterized by continuous upwelling of cold water
(16°C–20°C at the sea surface) but is also affected by recurrent El Niño events, causing
several weeks of higher sea surface temperatures (more than 10°C of amplitude) as a
result of the southward incursion of warm waters (Peters and Breeman 1993). Future
research and adequate tools based on population genomic data sets could help to address
these questions and elucidate the mechanisms underlying such patterns.

162
Finally, signals of recent introduction were hypothesized for the two cosmopolitan
species E. siliculosus and E. crouaniorum. While in E. siliculosus no clear separation
between European and Chilean strains could be observed, within E. crouaniorum, all
European strains except one were grouped in a clade deriving from the Pacific. These
results suggested recurrent numerous introductions for E. siliculosus and a recent
introduction in Europe from the South East Pacific for E. crouaniorum. However, the
sampling was not sufficient to confirm these hypotheses, worldwide sampling is
requested and further analyses testing different scenarios of colonization and expansion
could help to clarify the recent evolutionary history of these two species.
163
II. Reproductive Isolation
- New opportunities to study hybridization in different evolutionary contexts
We have already pointed out in the previous paragraph, how the diversity of taxa
with various levels of divergence revealed in this PhD makes the Ectocarpus genus a
good model for the study of reproductive isolation. The existence of porous
reproductive barriers within this group suggests that speciation is still ongoing and the
integration of several findings suggests a probable relationship between genetic distance
and cross compatibility in this genus. Moreover, the results obtained in this PhD should
now allow to study hybridization in nature but in different evolutionary contexts by
selecting the species of interest. Coyne and Orr (2004) have distinguished primary
hybrid zones, where divergence is taking place in situ as natural selection alters allele
frequencies between populations, from secondary hybrid zones, where hybridization
arise in turn from a secondary contact between two divergent species that were
previously allopatric. The results of this PhD project suggest that we have encountered
situations of primary contact zone where speciation is still in progress. This may be the
case for the three closely related species of the Ecro clade for which patterns of
incongruence between nuclear and cytoplasmic patterns were observed and in
agreement with the recognition of an individual occupying an intermediate position
between sympatric Ectocarpus 12 and Ectocarpus 13 evidenced using the SNPs data
set.
In contrast, the results of the chapter 3 suggest that hybridization between E.
siliculosus and E. crouaniorum could be a consequence of a secondary contact zone.
Cytoplasmic introgression was not detected between these species belonging to the two

164
highly divergent clades Esil and Ecro and we detected a strong reproductive barrier
acting at the F1 hybrid generation between both species. With the new possibilities to
use whole genome sequencing data, it is now possible to identify the actual genomic
regions being homogenized by gene flow or those that resist introgression using a
reference genome or a genetic map (reviewed in Payseur and Rieseberg et al. 2016).
Thus, using the RAD-seq data produced during this PhD, it will be possible to contrast
the situations of primary and secondary contact zones to produce key results for
understanding the evolution of reproductive isolation.
The most popular strategy used to find genes associated with speciation
processes has been to scan genomes for genomic signatures of selection (reviewed in
Feder et al. 2012). These narrow regions containing genes putatively involved in
speciation processes have been termed “speciation islands” implying a probable link
between the observed pattern of high differentiation and reproductive isolation (Noor
and Bennet, 2009). Furthermore, several empirical studies and theoretical models of
speciation have argued that loci involved in reproductive isolation will preferentially
accumulate in regions with little recombination such as the regions near the centromeres
or located in the sex chromosome (Butlin 2005, Noor et al. 2001, Rieseberg 2001,
Navarro and Barton 2003). Indeed, this is explained by the fact that recombination
counteracts the effect of genetic divergence. Because of the existence of a reference
genome in Ectocarpus, it will be possible to explore patterns of divergence in non-
recombining regions in comparison to the recombining autosomal regions. In particular,
as sex is expressed during the haploid phase of the life cycle, in diploid individuals both
the female (U) and the male (V) sex chromosomes contain non-recombining regions
(SDR). The idea is to separate the reads that are located in the SDR region from the
others in order to perform genome scans using the two sets of SNPs. Moreover, the idea
165
will be to complete this RAD-seq approach by sequencing the male and female markers
that were developed for all the Ectocarpus species (markers used in chapter 3 to
determine sex/phase by simple amplification, Ahmed et al. 2014). These sequences will
be used to build phylogenetic reconstructions and will be compared to the phylogenetics
reconstructions obtained in this PhD. If true, the hypothesis of accumulation of loci
associated to speciation in the sex-determining region, implies that we will obtain
deeper separation between clades for phylogenetic reconstructions using the sex
markers than for the rest of the nuclear loci studied.
- Consequences of the haploid-diploid life cycle on reproductive isolation
Our results exemplified the relative ease to detect at which level reproductive
barriers occur in a haploid-diploid life cycle (Chapter 3). In commonly studied organism
characterized by diploid life cycles, the haploid stage is reduced to a single-cell (i.e.
gamete), produced through meiosis, and fertilization occurs immediately after release of
gametes to re-establish the diploid phase. In haploid-diploid life cycles, somatic
development occurs in both haploid and diploid phases and there is an alternation
between two types of independent functional individuals: haploid gametophytes
produced by meiosis and diploid sporophytes resulting from fertilization. This direct
access to the haploid part of the life cycle allows untangling the effect of reproductive
barriers preventing fertilization (i.e. an absence of diploid hybrid genotypes is expected)
or preventing meiosis (i.e. an absence of recombinant haploid genotypes is expected).
Conversely, the two kinds of reproductive barriers cannot be distinguished directly
using population genetics in the field and more complex garden experiments are needed.
Recently, Rescan (2016) discussed the possible consequences various ploidy
levels on the dynamics of reproductive isolation. In particular, she demonstrated that
166
reproductive isolation evolved more rapidly in the haploid than in the diploid life cycle
using an experimental evolution approach in the yeast Saccharomyces cerevisiae. She
explained that, while reproductive incompatibilities are fully expressed in the first
generation (F1) in haploid hybrids, diploid hybrid F1 may benefit from heterosis and
thus reproductive incompatibilities will evolve slower. Thus in haploid-diploid species
(as in the case of Ectocarpus), we may expect reproductive isolation to evolve faster
than in diploid species since, as in haploid species, reproductive incompatibilities
should be fully expressed in the F1. We might question if the high diversity of species
revealed in this PhD thesis could not be the consequence of the haploid-diploid life
cycle on the rate of genetic divergence. Interestingly, many biogeographic and
phylogenetic studies have shown a surprisingly high level of species diversity in genera
composed of haploid-diploid organisms such as in red (e.g., Payo et al. 2012, Pardo et
al. 2014, 2015, Guillemin et al. 2016b, Robuchon et al. 2015) or in brown algae
(Kogame et al. 2015, Leliaert et al. 2014, Montecinos et al. 2016). In this context, it
would be interesting to compare the speciation rate in groups, in which various life
cycles co-exist, such as brown algae. This comparative approach could be realized
within the context of the “Phaeoexplorer” project that is currently in progress in
Roscoff. The aim of this project is to generate annotated genome assemblies for a broad
range of brown algal species at different phylogenetic distances from the model brown
alga Ectocarpus. For the comparative approach, we will select within different clades of
the brown algal species that differ by the extent of their haploid phase and test if the
divergence rate is repeatedly higher in species characterized by a more prolonged
haploid phase.

167
References
Abbott R, Albach D, Ansell S, et al. (2013) Hybridization and speciation. Journal of Evolutionary Biology 26, 229-246.
Adams MD, Celniker SE, Holt RA, et al. (2000) The genome sequence of Drosophila
melanogaster. Science 287, 2185-2195. Agapow PM, Bininda-Emonds OR, Crandall KA, et al. (2004) The impact of species concept
on biodiversity studies. The quarterly review of biology 79, 161-179. Ahmed S, Cock JM, Pessia E, et al. (2014) A haploid system of sex determination in the
brown alga Ectocarpus sp. Current Biology 24, 1945-1957. Allendorf FW, Leary RF, Spruell P, Wenburg JK (2001) The problems with hybrids: setting
conservation guidelines. Trends in Ecology & Evolution 16, 613-622. Alò D, Correa C, Arias C, Cárdenas L (2013) Diversity of Aplochiton fishes (Galaxiidea) and
the Taxonomic Resurrection of A. marinus. PLoS One 8, e71577. Álvarez I, Wendel JF (2003) Ribosomal ITS sequences and plant phylogenetic inference.
Molecular Phylogenetics and Evolution 29, 417-434. Anderson LE, Snider JA (1982) Cytological and genetic barriers in mosses. Journal of the
Hattori Botanical Laboratory 52, 241–254. Anderson E, Thompson E (2002) A model-based method for identifying species hybrids
using multilocus genetic data. Genetics 160, 1217-1229. Andrews KR, Luikart G (2014) Recent novel approaches for population genomics data
analysis. Molecular Ecology 23, 1661-1667. Arnaud-Haond S, Belkhir K (2007) GENCLONE: a computer program to analyse genotypic
data, test for clonality and describe spatial clonal organization. Molecular Ecology Notes 7, 15-17.
Arnheim N, Krystal M, Schmickel R, et al. (1980) Molecular evidence for genetic exchanges
among ribosomal genes on nonhomologous chromosomes in man and apes. Proceedings of the National Academy of Sciences 77, 7323-7327.
Arnold ML, Bulger MR, Burke JM, Hempel AL, Williams JH (1999) Natural hybridization:
how low can you go and still be important? Ecology 80, 371-381. Baird NA, Etter PD, Atwood TS, et al. (2008) Rapid SNP discovery and genetic mapping
using sequenced RAD markers. PLoS One 3, e3376.
168
Baldauf SL (2008) An overview of the phylogeny and diversity of eukaryotes. Journal of Systematics and Evolution 46, 263-273.
Balloux F, Lugon-Moulin N (2002) The estimation of population differentiation with
microsatellite markers. Molecular Ecology 11, 155-165. Bandelt H-J, Forster P, Röhl A (1999) Median-joining networks for inferring intraspecific
phylogenies. Molecular Biology and Evolution 16, 37-48. Barbash DA, Siino DF, Tarone AM, Roote J (2003) A rapidly evolving MYB-related protein
causes species isolation in Drosophila. Proceedings of the National Academy of Sciences 100, 5302-5307.
Barton NH, Hewitt GM (1985) Analysis of hybrid zones. Annual Review of Ecology and
Systematics 16, 113-148. Belkhir K, Borsa P, Chikhi L, Raufaste N, Bonhomme F (2004) GENETIX 4.05, Population
genetics software for Windows TM. Université de Montpellier II. Montpellier. Benestan L, Gosselin T, Perrier C, et al. (2015) RAD genotyping reveals fine-scale genetic
structuring and provides powerful population assignment in a widely distributed marine species, the American lobster (Homarus americanus). Molecular Ecology 24, 3299-3315.
Bergström L, Tatarenkov A, Johannesson K, Jönsson RB, Kautsky L (2005) Genetic and
morphological identification of Fucus radicans sp Nov. (Fucales, Phaeophyceae) in the brackish Baltic Sea. Journal of Phycology 41, 1025-1038.
Bickford D, Lohman DJ, Sodhi NS, et al. (2007) Cryptic species as a window on diversity
and conservation. Trends in Ecology & Evolution 22, 148-155. Bierne N, Borsa P, Daguin C, et al. (2003) Introgression patterns in the mosaic hybrid zone
between Mytilus edulis and M. galloprovincialis. Molecular Ecology 12, 447-461. Billard E, Daguin C, Pearson G, et al. (2005) Genetic isolation between three closely related
taxa: Fucus vesiculosus, F. spiralis, and F. ceranoides (Phaophyceae). Journal of Phycology 41, 900-905.
Billard E, Serrao E, Pearson G, Destombe C, Valero M (2010) Fucus vesiculosus and spiralis
species complex: a nested model of local adaptation at the shore level. Marine Ecology Progress Series 405, 163-174.
Bolger AM, Lohse M, Usadel B (2014) Trimmomatic: a flexible trimmer for Illumina
sequence data. Bioinformatics, btu170. Bouchemousse S, Lévêque L, Dubois G, Viard F (2016) Co-occurrence and reproductive
synchrony do not ensure hybridization between an alien tunicate and its interfertile native congener. Evolutionary Ecology 30, 69-87.
Brideau NJ, Flores HA, Wang J, et al. (2006) Two Dobzhansky-Muller genes interact to
169
cause hybrid lethality in Drosophila. Science 314, 1292-1295. Burnham KP, Anderson DA (2002) Model selection and multimodel inference: a practical
information-theoretic approach. Springer, New York. Butlin RK (2005) Recombination and speciation. Molecular Ecology 14, 2621-2635. Camus PA (2001) Biogeografía marina de Chile continental. Revista Chilena de Historia
Natural 74, 587-617. Cánovas FG, Mota CF, Serrão EA, Pearson GA (2011) Driving south: a multi-gene
phylogeny of the brown algal family Fucaceae reveals relationships and recent drivers of a marine radiation. BMC Evolutionary Biology 11, 1.
Cárdenas L, Castilla JC, Viard F (2009) A phylogeographical analysis across three
biogeographical provinces of the south-eastern Pacific: the case of the marine gastropod Concholepas concholepas. Journal of Biogeography 36, 969-981.
Cardinal A (1964) Etude sur les Ectocarpacées de la Manche. Beih. Nova Hedwigia. 15, 1-86. Cariou M, Duret L, Charlat S (2013) Is RAD-seq suitable for phylogenetic inference? An in
silico assessment and optimization. Ecology and Evolution 3, 846-852. Carstens BC, Dewey TA (2010) Species delimitation using a combined coalescent and
information-theoretic approach: an example from North American Myotis bats. Systematic Biology, syq024.
Carstens BC, Pelletier TA, Reid NM, Satler JD (2013a) How to fail at species delimitation.
Molecular Ecology 22, 4369-4383. Carstens BC, Satler JD (2013b) The carnivorous plant described as Sarracenia alata contains
two cryptic species. Biological Journal of the Linnean Society 109, 737-746. Catchen JM, Amores A, Hohenlohe P, Cresko W, Postlethwait JH (2011) Stacks: building
and genotyping loci de novo from short-read sequences. G3: Genes, Genomes, Genetics 1, 171-182.
Catchen J, Hohenlohe PA, Bassham S, Amores A, Cresko WA (2013) Stacks: an analysis
tool set for population genomics. Molecular Ecology 22, 3124-3140. Cathey JC, Bickham JW, Patton JC (1998) Introgressive hybridization and nonconcordant
evolutionary history of maternal and paternal lineages in North American deer. Evolution 52, 1224-1229.
Charrier B, Coelho SM, Le Bail A, et al. (2008) Development and physiology of the brown
alga Ectocarpus siliculosus: two centuries of research. New Phytologist 177, 319-332. Choi SC, Hey J (2011) Joint inference of population assignment and demographic history.
Genetics 189, 561-577.
170
Cock JM, Sterck L, Rouzé P, et al. (2010a) The Ectocarpus genome and the independent evolution of multicellularity in brown algae. Nature 465, 617-621.
Cock JM, Coelho SM, Brownlee C, Taylor AR (2010b) The Ectocarpus genome sequence:
insights into brown algal biology and the evolutionary diversity of the eukaryotes. New Phytologist 188, 1-4.
Cock JM, Coelho SM (2011) Algal models in plant biology. Journal of Experimental Botany
62, 2425-2430. Cock JM, Godfroy O, Macaisne N, et al. (2014) Evolution and regulation of complex life
cycles: a brown algal perspective. Current opinion in plant biology 17, 1-6. Coelho SM, Peters AF, Charrier B, et al. (2007) Complex life cycles of multicellular
eukaryotes: new approaches based on the use of model organisms. Gene 406, 152-170.
Coelho SM, Godfroy O, Arun A, et al. (2011) OUROBOROS is a master regulator of the
gametophyte to sporophyte life cycle transition in the brown alga Ectocarpus. Proceedings of the National Academy of Sciences 108, 11518-11523.
Coelho SM, Scornet D, Rousvoal S, Peters N, et al. (2012). How to cultivate Ectocarpus.
Cold Spring Harbor Protocols 2,258-261. Coghill LM, Hulsey CD, Chaves-Campos J, et al. (2014) Next generation phylogeography of
cave and surface Astyanax mexicanus. Molecular Phylogenetics and Evolution 79, 368-374.
Cornils A, Held C (2014) Evidence of cryptic and pseudocryptic speciation in the
Paracalanus parvus species complex (Crustacea, Copepoda, Calanoida). Frontiers in Zoology 11, 19.
Couceiro L, Le Gac M, Hunsperger HM, et al. (2015) Evolution and maintenance of haploid–
diploid life cycles in natural populations: The case of the marine brown alga Ectocarpus. Evolution 69, 1808-1822.
Coyer JA, Smith GJ, Andersen RA (2001) Evolution of Macrocystis spp. (Phaeophyceae) as
determined by ITS1 and ITS2 sequences. Journal of Phycology 37, 574-585. Coyer J, Peters A, Hoarau G, Stam W, Olsen J (2002) Hybridization of the marine seaweeds,
Fucus serratus and Fucus evanescens (Heterokontophyta: Phaeophyceae) in a 100-year-old zone of secondary contact. Proceedings of the Royal Society of London B: Biological Sciences 269, 1829-1834.
Coyer JA, Hoarau G, Oudot-Le Secq M-P, Stam WT, Olsen JL (2006) A mtDNA-based
phylogeny of the brown algal genus Fucus (Heterokontophyta; Phaeophyta). Molecular Phylogenetics and Evolution 39, 209-222.
Coyer J, Hoarau G, Stam W, Olsen J (2007) Hybridization and introgression in a mixed
population of the intertidal seaweeds Fucus evanescens and F. serratus. Journal of

171
Evolutionary Biology 20, 2322-2333. Coyer J, Hoarau G, Costa J, et al. (2011) Evolution and diversification within the intertidal
brown macroalgae Fucus spiralis/F. vesiculosus species complex in the North Atlantic. Molecular Phylogenetics and Evolution 58, 283-296.
Coyne JA, Orr HA (1998) The evolutionary genetics of speciation. Philosophical
Transactions of the Royal Society B: Biological Sciences 353, 287-305. Coyne JA, Orr HA (2004) Speciation Sinauer Associates Sunderland, MA. Cruaud A, Gautier M, Galan M, et al. (2014) Empirical assessment of RAD sequencing for
interspecific phylogeny. Molecular Biology and Evolution 31, 1272-1274. Darriba D, Taboada GL, Doallo R, Posada D (2012) jModelTest 2: more models, new
heuristics and parallel computing. Nature methods 9, 772-772. Davey JW, Blaxter ML (2010) RADSeq: next-generation population genetics. Briefings in
Functional Genomics 9, 416-423. Davey JW, Hohenlohe PA, Etter PD, et al. (2011) Genome-wide genetic marker discovery
and genotyping using next-generation sequencing. Nature Reviews Genetics 12, 499-510.
De Queiroz K (1998) The general lineage concept of species, species criteria, and the process
of speciation a conceptual unification and terminological recommendations. In: Endless Forms: Species and Speciation, pp. 57-75, Oxford University Press, Oxford.
De Queiroz K (1999) The General Lineage Concept of Species and the Defining Properties of
the Species. Species: New Interdisciplinary Essays. Cambridge, Massachusetts: MIT Press. In: Species: New Interdisciplinary Essays, pp. 49-89, MIT Press, Cambridge, Massachusetts.
De Queiroz K (2007) Species concepts and species delimitation. Systematic Biology 56, 879-
886. Destombe C, Valero M, Guillemin ML (2010) Delineation of two sibling red algal species,
Gracilaria gracilis and Gracilaria dura (Gracilariales, Rhodophyta), using multiple dna markers: resurrection of the species G. dura previously described in the northern atlantic 200 years ago1. Journal of Phycology 46, 720-727.
DiBattista JD, Rocha LA, Craig MT, Feldheim KA, Bowen BW (2012) Phylogeography of
two closely related Indo-Pacific butterflyfishes reveals divergent evolutionary histories and discordant results from mtDNA and microsatellites. Journal of Heredity 103, 617-629.
Dillwyn LW (1809) British Confervæ: Or, Colored Figures and Descriptions of the British
Plants Referred by Botanists to the Genus Conferva W. Phillips. Dobzhansky T, Dobzhansky TG (1937) Genetics and the Origin of Species. Columbia
172
University Press, Columbia. Dorken ME, Eckert CG (2001) Severely reduced sexual reproduction in northern populations
of a clonal plant, Decodon verticillatus Lythraceae). Journal of Ecology 89, 339-350. Dover G (1994) Concerted evolution, molecular drive and natural selection. Current Biology
4, 1165-1166. Drummond AJ, Suchard MA, Xie D, Rambaut A (2012) Bayesian phylogenetics with
BEAUti and the BEAST 1.7. Molecular Biology and Evolution 29, 1969-1973. Dupuis JR, Roe AD, Sperling FA (2012) Multi-locus species delimitation in closely related
animals and fungi: one marker is not enough. Molecular Ecology 21, 4422-4436. Eaton DA, Ree RH (2013) Inferring phylogeny and introgression using RADseq data: an
example from flowering plants (Pedicularis: Orobanchaceae). Systematic Biology 62, 689-706.
Eaton DA (2014) PyRAD: assembly of de novo RADseq loci for phylogenetic analyses.
Bioinformatics, btu121. Ellstrand NC, Whitkus R, Rieseberg LH (1996) Distribution of spontaneous plant hybrids.
Proceedings of the National Academy of Sciences 93, 5090-5093. Engel C, Daguin C, Serrao E (2005) Genetic entities and mating system in hermaphroditic
Fucus spiralis and its close dioecious relative F. vesiculosus (Fucaceae, Phaeophyceae). Molecular Ecology 14, 2033-2046.
Escudero M, Eaton DA, Hahn M, Hipp AL (2014) Genotyping-by-sequencing as a tool to
infer phylogeny and ancestral hybridization: A case study in Carex (Cyperaceae). Molecular Phylogenetics and Evolution 79, 359-367.
Evanno G, Regnaut S, Goudet J (2005) Detecting the number of clusters of individuals using
the software STRUCTURE: a simulation study. Molecular Ecology 14, 2611-2620. Excoffier L, Smouse PE, Quattro JM (1992) Analysis of molecular variance inferred from
metric distances among DNA haplotypes: application to human mitochondrial DNA restriction data. Genetics 131, 479-491.
Excoffier L, Lischer HE (2010) Arlequin suite ver 3.5: a new series of programs to perform
population genetics analyses under Linux and Windows. Molecular Ecology Resources 10, 564-567.
Famá P, Olsen JL, Stam WT, Procaccini G (2000) High levels of intra-and inter-individual
polymorphism in the rDNA ITS1 of Caulerpa racemosa (Chlorophyta). European Journal of Phycology 35, 349-356.
Feder J, Flaxman S, Egan S, Nosil P (2013a) Hybridization and the build-up of genomic
divergence during speciation. Journal of Evolutionary Biology 26, 261-266.
173
Feder JL, Flaxman SM, Egan SP, Comeault AA, Nosil P (2013b) Geographic mode of speciation and genomic divergence. Annual Review of Ecology, Evolution, and Systematics 44, 73-97.
Fehrer J, Gemeinholzer B, Chrtek J, Bräutigam S (2007) Incongruent plastid and nuclear
DNA phylogenies reveal ancient intergeneric hybridization in Pilosella hawkweeds (Hieracium, Cichorieae, Asteraceae). Molecular Phylogenetics and Evolution 42, 347-361.
Felsenstein J (1992) Phylogenies from restriction sites: A maximum-likelihood approach.
Evolution 46, 159-173. Fitzpatrick B, Fordyce J, Gavrilets S (2009) Pattern, process and geographic modes of
speciation. Journal of Evolutionary Biology 22, 2342-2347. Fraley C, Raftery AE (2006) MCLUST version 3: an R package for normal mixture modeling
and model-based clustering. DTIC Document. Franzke A, Mummenhoff K (1999) Recent hybrid speciation in Cardamine (Brassicaceae)–
conversion of nuclear ribosomal ITS sequences in statu nascendi. Theoretical and Applied Genetics 98, 831-834.
Fraser CI, McGaughran A, Chuah A, Waters JM (2016) The importance of replicating
genomic analyses to verify phylogenetic signal for recently-evolved lineages. Molecular Ecology 15, 3683-3695.
Gagnaire PA, Pavey SA, Normandeau E, Bernatchez L (2013) The genetic architecture of
reproductive isolation during speciation-with-gene-flow in lake whitefish species pairs assessed by rad sequencing. Evolution 67, 2483-2497.
Galindo J, Grahame J, Butlin R (2010) An EST-based genome scan using 454 sequencing in
the marine snail Littorina saxatilis. Journal of Evolutionary Biology 23, 2004-2016. Geoffroy A, Mauger S, De Jode A, Le Gall L, Destombe C (2015) Molecular evidence for
the coexistence of two sibling species in Pylaiella littoralis (Ectocarpales, Phaeophyceae) along the Brittany coast. Journal of Phycology 51, 480-489.
Giraud T, Refrégier G, Le Gac M, de Vienne DM, Hood ME (2008) Speciation in fungi.
Fungal Genetics and Biology 45, 791-802. Goldstein PZ, DeSalle R (2011) Integrating DNA barcode data and taxonomic practice:
determination, discovery, and description. Bioessays 33, 135-147. Gourbiere S, Mallet J (2010) Are species real? The shape of the species boundary with
exponential failure, reinforcement, and the “missing snowball”. Evolution 64, 1-24. Guillemin M-L, Valero M, Faugeron S, Nelson W, Destombe C (2014) Tracing the trans-
Pacific evolutionary history of a domesticated seaweed (Gracilaria chilensis) with archaeological and genetic data. PLoS One 9, e114039.
174
Guillemin M-L, Valero M, Tellier F, et al. (2016a) Phylogeography of Seaweeds in the South East Pacific: Complex Evolutionary Processes Along a Latitudinal Gradient. In: Seaweed Phylogeography, pp. 251-277. Springer, Berlin.
Guillemin ML, Valero M, Morales Collio K, et al. (2016b) Microsatellite markers and
cytoplasmic sequences reveal contrasting pattern of spatial genetic structure in the red algae species complex Mazzaella laminarioides. Journal of Phycology 52, 806-816.
Guillemin M-L, Contreras-Porcia L, Ramírez ME, et al. (2016c) The bladed Bangiales
(Rhodophyta) of the South Eastern Pacific: Molecular species delimitation reveals extensive diversity. Molecular Phylogenetics and Evolution 94, 814-826
Guillot G, Mortier F, Estoup A (2005) GENELAND: a computer package for landscape
genetics. Molecular Ecology Notes 5, 712-715. Guillot G, Renaud S, Ledevin R, Michaux J, Claude J (2012) A unifying model for the
analysis of phenotypic, genetic, and geographic data. Systematic Biology 61, 897-911. Hajibabaei M, Singer GA, Hebert PD, Hickey DA (2007) DNA barcoding: how it
complements taxonomy, molecular phylogenetics and population genetics. TRENDS in Genetics 23, 167-172.
Haldane JB (1922) Sex ratio and unisexual sterility in hybrid animals. Journal of Genetics
12, 101-109. Hamel G (1931-1939) Phéophycées de France. Wolf, Paris, XLVII + 431 pp., 9 plates. Hausdorf B, Hennig C (2010) Species delimitation using dominant and codominant
multilocus markers. Systematic Biology 59, 491-503. Haye PA, Segovia NI, Muñoz-Herrera NC, et al. (2014) Phylogeographic structure in benthic
marine invertebrates of the southeast Pacific coast of Chile with differing dispersal potential. PLoS One 9, e88613.
Hebert PD, Cywinska A, Ball SL (2003) Biological identifications through DNA barcodes.
Proceedings of the Royal Society of London B: Biological Sciences 270, 313-321. Hebert PD, Stoeckle MY, Zemlak TS, Francis CM (2004) Identification of birds through
DNA barcodes. PLoS Biol 2, e312. Hedtke SM, Townsend TM, Hillis DM (2006) Resolution of phylogenetic conflict in large
data sets by increased taxon sampling. Systematic Biology 55, 522-529. Heesch S, Cho GY, Peters AF, et al. (2010) A sequence-tagged genetic map for the brown
alga Ectocarpus siliculosus provides large-scale assembly of the genome sequence. New Phytologist 188, 42-51.
Heliconius Genome Consortium (2012) Butterfly genome reveals promiscuous exchange of
mimicry adaptations among species. Nature 487, 94-98.
175
Hermann K, Klahre U, Moser M, et al. (2013) Tight genetic linkage of prezygotic barrier loci creates a multifunctional speciation island in Petunia. Current Biology 23, 873-877.
Herrera S, Watanabe H, Shank TM (2015) Evolutionary and biogeographical patterns of
barnacles from deep-sea hydrothermal vents. Molecular Ecology 24, 673-689. Hey J, Nielsen R (2004) Multilocus methods for estimating population sizes, migration rates
and divergence time, with applications to the divergence of Drosophila pseudoobscura and D. persimilis. Genetics 167, 747-760.
Hillis DM, Pollock DD, McGuire JA, Zwickl DJ (2003) Is sparse taxon sampling a problem
for phylogenetic inference? Systematic Biology 52, 124. Hind KR, Saunders GW (2013) Molecular markers from three organellar genomes unravel
complex taxonomic relationships within the coralline algal genus Chiharaea (Corallinales, Rhodophyta). Molecular Phylogenetics and Evolution 67, 529-540.
Hipp AL, Eaton DA, Cavender-Bares J, et al. (2014) A framework phylogeny of the
American oak clade based on sequenced RAD data. PLoS One 9, e93975. Hoarau G, Coyer JA, Giesbers M, Jüterbock A, Olsen JL (2015) Pre-zygotic isolation in the
macroalgal genus Fucus from four contact zones spanning 100–10 000 years: a tale of reinforcement? Royal Society Open Science 2, 140538.
Hou Y, Nowak MD, Mirré V, et al. (2015) Thousands of RAD-seq loci fully resolve the
phylogeny of the highly disjunct arctic-alpine genus Diapensia (Diapensiaceae). PLoS One 10, e0140175.
Huelsenbeck JP, Ronquist F (2001) MRBAYES: Bayesian inference of phylogenetic trees.
Bioinformatics 17, 754-755. Huelsenbeck JP, Andolfatto P, Huelsenbeck ET (2011) Structurama: Bayesian inference of
population structure. Evolutionary Bioinformatics 7, 55. Ito H, Langenhorst T, Ogden R, Inoue-Murayama M (2015) Population genetic diversity and
hybrid detection in captive zebras. Scientific Reports 5, 13171. Jakobsson M, Rosenberg NA (2007) CLUMPP: a cluster matching and permutation program
for dealing with label switching and multimodality in analysis of population structure. Bioinformatics 23, 1801-1806.
Johannesson K (2003) Evolution in Littorina: ecology matters. Journal of Sea Research 49,
107-117. Johannesson K (2009) Inverting the null-hypothesis of speciation: a marine snail perspective.
Evolutionary Ecology, 23, 5-16. Johannesson K (2016) What can be learnt from a snail? Evolutionary applications 9, 153-
165.
176
Jombart T (2008) adegenet: a R package for the multivariate analysis of genetic markers. Bioinformatics 24, 1403-1405.
Jones JC, Fan S, Franchini P, Schartl M, Meyer A (2013) The evolutionary history of
Xiphophorus fish and their sexually selected sword: a genome-wide approach using restriction site-associated DNA sequencing. Molecular Ecology 22, 2986-3001.
Jonsson PR, Granhag L, Moschella PS, Aberg P, Hawkins SJ, Thompson RC (2006)
Interactions between wave action and grazing control the distribution of intertidal macroalgae. Ecology 87,1169–1178
Kamath RS, Fraser AG, Dong Y, et al. (2003) Systematic functional analysis of the
Caenorhabditis elegans genome using RNAi. Nature 421, 231-237. Kaul S, Koo HL, Jenkins J, et al. (2000) Analysis of the genome sequence of the flowering
plant Arabidopsis thaliana. Nature 408, 796-815. Kekkonen M, Hebert PD (2014) DNA barcode-based delineation of putative species: efficient
start for taxonomic workflows. Molecular Ecology Resources 14, 706-715. Keller I, Wagner C, Greuter L, et al. (2013) Population genomic signatures of divergent
adaptation, gene flow and hybrid speciation in the rapid radiation of Lake Victoria cichlid fishes. Molecular Ecology 22, 2848-2863.
Kim K-J, Jansen R (1994) Comparisons of phylogenetic hypotheses among different data sets
in dwarf dandelions (Krigia, Asteraceae): additional information from internal transcribed spacer sequences of nuclear ribosomal DNA. Plant Systematics and Evolution 190, 157-185.
Knowles L (2004) The burgeoning field of statistical phylogeography. Journal of
Evolutionary Biology 17, 1-10. Kogame K, Rindi F, Peters AF, Guiry MD (2015) Genetic diversity and mitochondrial
introgression in Scytosiphon lomentaria (Ectocarpales, Phaeophyceae) in the north-eastern Atlantic Ocean. Phycologia 54, 367-374.
Kohn LM (2005) Mechanisms of fungal speciation. Annual Reviews of Phytopathology 43,
279-308. Kubatko LS, Carstens BC, Knowles LL (2009) STEM: species tree estimation using
maximum likelihood for gene trees under coalescence. Bioinformatics 25, 971-973. Lafon-Placette C, Köhler C (2016) Endosperm-based postzygotic hybridization barriers:
developmental mechanisms and evolutionary drivers. Molecular Ecology 25, 2620-2629.
Lammers Y, Kremer D, Brakefield P, et al. (2013) SNP genotyping for detecting the ‘rare
allele phenomenon’in hybrid zones. Molecular Ecology Resources 13, 237-242. Lane CE, Lindstrom SC, Saunders GW (2007) A molecular assessment of northeast Pacific
177
Alaria species (Laminariales, Phaeophyceae) with reference to the utility of DNA barcoding. Molecular Phylogenetics and Evolution 44, 634-648.
Langmead B, Salzberg SL (2012) Fast gapped-read alignment with Bowtie 2. Nature
methods 9, 357-359. Lavretsky P, Peters JL, Winker K, et al. (2016) Becoming pure: identifying generational
classes of admixed individuals within lesser and greater scaup populations. Molecular Ecology 25, 661-674.
Le Bail A, Billoud B, Le Panse S, Chenivesse S, Charrier B (2011) ETOILE regulates
developmental patterning in the filamentous brown alga Ectocarpus siliculosus. The Plant Cell 23, 1666-1678.
Leaché AD, Fujita MK, Minin VN, Bouckaert RR (2014) Species delimitation using genome-
wide SNP data. Systematic Biology 63, 534-542. Lecointre G, Philippe H, Vân Lê HL, Le Guyader H (1993) Species sampling has a major
impact on phylogenetic inference. Molecular phylogenetics and evolution 2, 205-224. Leliaert F, Verbruggen H, Vanormelingen P, et al. (2014) DNA-based species delimitation in
algae. European Journal of Phycology 49, 179-196. Lemmon EM, Lemmon AR (2013) High-throughput genomic data in systematics and
phylogenetics. Annual Review of Ecology, Evolution, and Systematics 44, 99-121. Lewis PO (2001) A likelihood approach to estimating phylogeny from discrete
morphological character data. Systematic Biology 50, 913-925. Lexer C, Buerkle C, Joseph J, Heinze B, Fay M (2007) Admixture in European Populus
hybrid zones makes feasible the mapping of loci that contribute to reproductive isolation and trait differences. Heredity 98, 74-84.
Lexer C, Mangili S, Bossolini E, et al. (2013) ‘Next generation biogeography: towards
understanding the drivers of species diversification and persistence. Journal of Biogeography 40, 1013-1022.
Li H, Handsaker B, Wysoker A, et al. (2009) The sequence alignment/map format and
SAMtools. Bioinformatics 25, 2078-2079. Liao P-C, Shih H-C, Yen T-B, et al. (2010) Molecular evaluation of interspecific hybrids
between Acer albopurpurascens and A. buergerianum var. formosanum. Botanical Studies 51, 413-420.
Librado P, Rozas J (2009) DnaSP v5: a software for comprehensive analysis of DNA
polymorphism data. Bioinformatics 25, 1451-1452. Lipinska A, Cormier A, Luthringer R, et al. (2015) Sexual dimorphism and the evolution of
sex-biased gene expression in the brown alga Ectocarpus. Molecular Biology and Evolution, msv049.
178
Liti G, Barton DB, Louis EJ (2006) Sequence diversity, reproductive isolation and species
concepts in Saccharomyces. Genetics 174, 839-850. Livingstone K, Rieseberg L (2004) Chromosomal evolution and speciation: a recombination-
based approach. New Phytologist 161, 107-112. Lu F, Lipka AE, Glaubitz J, et al. (2013) Switchgrass genomic diversity, ploidy, and
evolution: novel insights from a network-based SNP discovery protocol. PLoS Genet 9, e1003215.
Luikart G, England PR, Tallmon D, Jordan S, Taberlet P (2003) The power and promise of
population genomics: from genotyping to genome typing. Nature Reviews Genetics 4, 981-994.
Lumbsch HT, Leavitt SD (2011) Goodbye morphology? A paradigm shift in the delimitation
of species in lichenized fungi. Fungal Diversity 50, 59-72. Lyngbye HC (1819) Tentamen hydrophytologiae danicae;: continens omnia hydrophyta
cryptogama Daniae, Holsatiae, Faeroae, Islandiae, Groenlandiae hucusqve cognita, systematice disposita, descripta et iconibus illustrata, adjectis simul speciebus norvegicis Typis Schultzianis.
Mable BK, Otto SP (1998) The evolution of life cycles with haploid and diploid phases.
Bioessays 20, 453-462. Maggs CA, Castilho R, Foltz D, et al. (2008) Evaluating signatures of glacial refugia for
North Atlantic benthic marine taxa. Ecology 89, S108–S122. Maggs CA, Fletcher HL, Fewer D, et al. (2011) Speciation in red algae: members of the
Ceramiales as model organisms. Integrative and Comparative Biology 51, 492-504. Mallet J (2005a) Speciation in the 21st century. Heredity 95, 105–109 Mallet J (2005b) Hybridization as an invasion of the genome. Trends in Ecology & Evolution
20, 229-237. Mallet J (2007) Hybrid speciation. Nature 446, 279-283. Martin M (2011) Cutadapt removes adapter sequences from high-throughput sequencing
reads. EMBnet journal 17, pp. 10-12. Mayden RL (1997) A hierarchy of species concepts: the denouement in the saga of the
species problem. In: Species: The units of diversity, pp. 381-423. Chapman and Hall, London.
Mayden RL (1999) Consilience and a hierarchy of species concepts: advances toward closure
on the species puzzle. Journal of Nematology 31, 95-116. Mayr E (1942) Systematics and the origin of species, from the viewpoint of a zoologist.
179
Harvard University Press, Cambridge Massachusetts. McCluskey BM, Postlethwait JH (2015) Phylogeny of zebrafish, a “model species,” within
Danio, a “model genus”. Molecular Biology and Evolution 32, 635-652. McCormack JE, Harvey MG, Faircloth BC, et al. (2013) A phylogeny of birds based on over
1,500 loci collected by target enrichment and high-throughput sequencing. PLoS One 8, e54848.
McDevit DC, Saunders GW (2009) On the utility of DNA barcoding for species
differentiation among brown macroalgae (Phaeophyceae) including a novel extraction protocol. Phycological Research 57, 131-141.
McHugh DJ (2003) A guide to the seaweed industry. Food and Agriculture Organization of
the United Nations Rome. Miller MR, Atwood TS, Eames BF, et al. (2007a) RAD marker microarrays enable rapid
mapping of zebrafish mutations. Genome Biology 8, R105. Miller MR, Dunham JP, Amores A, Cresko WA, Johnson EA (2007b) Rapid and cost-
effective polymorphism identification and genotyping using restriction site associated DNA (RAD) markers. Genome Research 17, 240-248.
Modica MV, Puillandre N, Castelin M, Zhang Y, Holford M (2014) A good compromise:
rapid and robust species proxies for inventorying biodiversity hotspots using the Terebridae (Gastropoda: Conoidea). PLoS One 9, e102160.
Monaghan MT, Wild R, Elliot M, et al. (2009a) Accelerated species inventory on
Madagascar using coalescent-based models of species delineation. Systematic Biology 58, 298-311.
Monaghan P, Metcalfe NB, Torres R (2009b) Oxidative stress as a mediator of life history
trade-offs: mechanisms, measurements and interpretation. Ecology letters 12, 75-92. Montecinos A, Broitman BR, Faugeron S, et al. (2012) Species replacement along a linear
coastal habitat: phylogeography and speciation in the red alga Mazzaella laminarioides along the south east pacific. BMC Evolutionary Biology 12, 97.
Montecinos AE, Couceiro L, Peters AF, et al. (2016) Species delimitation and
phylogeographic analyses in the Ectocarpus subgroup siliculosi (Ectocarpales, Phaeophyceae). Journal of Phycology, doi: 10.1111/jpy.12452.
Monteiro CA, Serrão EA, Pearson GA (2012) Prezygotic barriers to hybridization in marine
broadcast spawners: reproductive timing and mating system variation. PLoS One 7, e35978.
Moyle LC (2004) Adaptation in plant speciation: evidence for the role of selection in the
evolution of isolating barriers between plant species. Rajakaruna. 4. Variation in flower size in individuals of Collinsia parviflora grown under uniform conditions. See Chapter 14. Photo credit: Elizabeth Elle, 82.
180
Müller HJ (1942) Isolating mechanisms, evolution and temperature. Biol. Symp. 6: 71-122. Müller DG (1967) Generationswechsel, kernphasenwechsel und sexualität der braunalge
Ectocarpus siliculosus im kulturversuch. Planta 75, 39-54. Müller DG (1976) Sexual isolation between Europe and an American population of
Ectocarpus siliculosus (Phaeophyta). Journal of Phycology 12, 252-254. Müller D (1977) Sexual reproduction in British Ectocarpus siliculosus (Phaeophyta). British
Phycological Journal 12, 131-136. Müller DG (1979) Genetic affinity of Ectocarpus siliculosus (Dillw.) Lyngb. from the
Mediterranean, North Atlantic and Australia. Phycologia 18, 312-318. Müller D, Gassmann G (1980) Sexual hormone specificity in Ectocarpus and Laminaria
(Phaeophyceae). Naturwissenschaften 67, 462-463. Müller DG (1988) Studies on sexual compatibility between Ectocarpus siliculosus
(Phaeophyceae) from Chile and the Mediterranean Sea. Helgoländer Meeresuntersuchungen 42, 469.
Müller D, Kawai H (1991) Sexual reproduction of Ectocarpus siliculosus (Ectocarpales,
Phaeophyceae) in Japan. Japanese journal of Phycology 39, 151-155. Müller DG, Eichenberger W (1995) Crossing experiments, lipid composition, and the species
concept in Ectocarpus siliculosus and E. fasciculatus (Pheophyceae, Ectocarpales). Journal of Phycology 31, 173-176.
Nadeau NJ, Martin SH, Kozak KM, et al. (2013) Genome-wide patterns of divergence and
gene flow across a butterfly radiation. Molecular Ecology 22, 814-826. Navarro A, Barton NH (2003) Chromosomal speciation and molecular divergence--
accelerated evolution in rearranged chromosomes. Science 300, 321-324 Nei M, Li W-H (1979) Mathematical model for studying genetic variation in terms of
restriction endonucleases. Proceedings of the National Academy of Sciences 76, 5269-5273.
Neiva J, Pearson GA, Valero M, Serrao EA (2010) Surfing the wave on a borrowed board:
range expansion and spread of introgressed organellar genomes in the seaweed Fucus ceranoides L. Molecular Ecology 19, 4812-4822.
Neiva J, Pearson GA, Valero M, Serrao EA (2012a) Drifting fronds and drifting alleles: range
dynamics, local dispersal and habitat isolation shape the population structure of the estuarine seaweed Fucus ceranoides. Journal of Biogeography 39, 1167-1178.
Neiva J, Pearson GA, Valero M, Serrão EA (2012b) Fine-scale genetic breaks driven by
historical range dynamics and ongoing density-barrier effects in the estuarine seaweed Fucus ceranoides L. BMC Evolutionary Biology 12, 78.
181
Neiva J, Serrão EA, Assis J, et al. (2016) Climate oscillations, range shifts and
phylogeographic patterns of North Atlantic Fucaceae. In: Seaweed Phylogeography, pp. 279-308. Springer, Berlin.
Niwa K, Kobiyama A (2014) Speciation in the marine crop Pyropia yezoensis (Bangiales,
Rhodophyta). Journal of Phycology 50, 897-900. Noor MA, Grams KL, Bertucci LA, Reiland J (2001) Chromosomal inversions and the
reproductive isolation of species. Proceedings of the National Academy of Sciences 98, 12084-12088.
Noor MA, Bennett SM (2009) Islands of speciation or mirages in the desert? Examining the
role of restricted recombination in maintaining species. Heredity 103, 439-444. Nosil P, Schluter D (2011) The genes underlying the process of speciation. Trends in Ecology
& Evolution 26, 160-167. Nosil P, Feder JL (2013) Genome evolution and speciation: toward quantitative descriptions
of pattern and process. Evolution 67, 2461-2467. O'Kane Jr SL, Schaal BA, Al-Shehbaz IA (1996) The origins of Arabidopsis suecica
(Brassicaceae) as indicated by nuclear rDNA sequences. Systematic Botany 21, 559-566.
O'Meara BC (2008) Using trees: Myrmecocystus phylogeny and character evolution and new
methods for investigating trait evolution and species delimitation. ProQuest. O'Meara BC (2009) New heuristic methods for joint species delimitation and species tree
inference. Systematic Biology 59, 59-73. Otte D, Endler JA (1989) Speciation and its consequences. Sinauer Assoc., Sunderland, MA. Paetkau D, Slade R, Burden M, Estoup A (2004) Genetic assignment methods for the direct,
real-time estimation of migration rate: a simulation-based exploration of accuracy and power. Molecular Ecology 13, 55-65.
Panhuis TM, Butlin R, Zuk M, Tregenza T (2001) Sexual selection and speciation. Trends in
Ecology & Evolution 16, 364-371. Pante E, Abdelkrim J, Viricel A, et al. (2015a) Use of RAD sequencing for delimiting
species. Heredity 114, 450-459. Pante E, Puillandre N, Viricel A, et al. (2015b) Species are hypotheses: avoid connectivity
assessments based on pillars of sand. Molecular Ecology 24, 525-544. Pardo C, Lopez L, Peña V, et al. (2014) A multilocus species delimitation reveals a striking
number of species of coralline algae forming maerl in the OSPAR maritime area. PLoS One 9, e104073.
182
Pardo C, Peña V, Barreiro R, Bárbara I (2015) A molecular and morphological study of Corallina sensu lato (Corallinales, Rhodophyta) in the Atlantic Iberian Peninsula. Cryptogamie Algologie 36, 31-54.
Patarnello T, Volckaert FA, Castilho R (2007) Pillars of Hercules: is the Atlantic–
Mediterranean transition a phylogeographical break? Molecular Ecology 16, 4426-4444.
Patwardhan A, Ray S, Roy A (2014) Molecular Markers in Phylogenetic Studies-A Review.
Journal of Phylogenetics & Evolutionary Biology 2, 131. Payo DA, Leliaert F, Verbruggen H, et al. (2013) Extensive cryptic species diversity and
fine-scale endemism in the marine red alga Portieria in the Philippines 280, 20122660.
Payseur BA, Rieseberg LH (2016) A genomic perspective on hybridization and speciation.
Molecular Ecology 25, 2337-2360. Peakall R, Smouse P (2012) GenAlEx 6.5: genetic analysis in Excel. Population genetic
software for teaching and research—an update. Bioinformatics 28, 2537-2539. Pereyra RT, Bergström L, Kautsky L, Johannesson K (2009) Rapid speciation in a newly
opened postglacial marine environment, the Baltic Sea. BMC Evolutionary Biology 9, 70.
Peters A, Breeman A (1993) Temperature tolerance and latitudinal range of brown algae
from temperate Pacific South America. Marine Biology 115, 143-150. Peters AF, Marie D, Scornet D, Kloareg B, Mark Cock J (2004a) Proposal of Ectocarpus
siliculosus (Ectocarpales, Phaeophyceae) as a model organism for brown algal genetics and genomics. Journal of Phycology 40, 1079-1088.
Peters AF, Scornet D, Müller DG, Kloareg B, Cock JM (2004b) Inheritance of organelles in
artificial hybrids of the isogamous multicellular chromist alga Ectocarpus siliculosus (Phaeophyceae). European Journal of Phycology 39, 235-242.
Peters AF, Van Wijk SJ, Cho GY, et al. (2010a) Reinstatement of Ectocarpus crouaniorum
Thuret in Le Jolis as a third common species of Ectocarpus (Ectocarpales, Phaeophyceae) in Western Europe, and its phenology at Roscoff, Brittany. Phycological research 58, 157-170.
Peters AF, Mann AD, Cordova CA et al. (2010b) Genetic diversity of Ectocarpus
(Ectocarpales, Phaeophyceae) in Peru and northern Chile, the area of origin of the genome-sequenced strain. New Phytologyst 188: 30–41.
Peters JL, Zhuravlev Y, Fefelov I, Logie A, Omland KE (2007) Nuclear loci and coalescent
methods support ancient hybridization as cause of mitochondrial paraphyly between gadwall and falcated duck (Anas spp.). Evolution 61, 1992-2006.
Peters AF, Couceiro L, Tsiamis K, Küpper FC, Valero M (2015) Barcoding of cryptic stages
183
of marine brown algae isolated from incubated substratum reveals high diversity in Acinetosporaceae (Ectocarpales, Phaeophyceae). Cryptogamie, Algologie 36, 3-29.
Peterson BK, Weber JN, Kay EH, Fisher HS, Hoekstra HE (2012) Double digest RADseq: an
inexpensive method for de novo SNP discovery and genotyping in model and non-model species. PLoS One 7, e37135.
Petit RJ, Excoffier L (2009) Gene flow and species delimitation. Trends in Ecology &
Evolution 24, 386-393. Pillmann A, Woolcott G, Olsen J, Stam W, King R (1997) Inter-and intraspecific genetic
variation in Caulerpa (Chlorophyta) based on nuclear rDNA ITS sequences. European Journal of Phycology 32, 379-386.
Pineda MC, López-Legentil S, Turon X (2011) The Whereabouts of an Ancient Wanderer:
Global Phylogeography of the Solitary Ascidian Styela plicata. ). PLoS One 6, e25495.
Piry S, Cornuet J (1999) GeneClass. A Program for Assignation and Exclusion Using
Molecular Markers. URLB/INRA, France. Pons J, Barraclough TG, Gomez-Zurita J, et al. (2006) Sequence-based species delimitation
for the DNA taxonomy of undescribed insects. Systematic Biology 55, 595-609. Presgraves DC, Balagopalan L, Abmayr SM, Orr HA (2003) Adaptive evolution drives
divergence of a hybrid inviability gene between two species of Drosophila. Nature 423, 715-719.
Prévot V, Jordaens K, Sonet G, Backeljau T (2013) Exploring species level taxonomy and
species delimitation methods in the facultatively self-fertilizing land snail genus Rumina (Gastropoda: Pulmonata). PLoS One 8, e60736.
Pritchard JK, Stephens M, Donnelly P (2000) Inference of population structure using
multilocus genotype data. Genetics 155, 945-959. Puillandre N, Lambert A, Brouillet S, Achaz G (2012a) ABGD, Automatic Barcode Gap
Discovery for primary species delimitation. Molecular Ecology 21, 1864-1877. Puillandre N, Modica M, Zhang Y, et al. (2012b) Large-scale species delimitation method for
hyperdiverse groups. Molecular Ecology 21, 2671-2691. Quillet M, Madjidian N, Griveau Y, et al. (1995) Mapping genetic factors controlling pollen
viability in an interspecific cross in Helianthus sect. Helianthus. Theoretical and Applied Genetics 91, 1195-1202.
Raimondi P, Reed D, Gaylord B, Washburn L (2004) Effects of Self-Fertilization in the Giant
Kelp, Macrocystis pyrifera. Ecology 85, 3267-3276. Rambaut A, Drummond AJ (2010) TreeAnnotator version 1.6.1. Available at:
http://beast.bio.ed.ac.uk/treeannotator.
184
Ramsey J, Schemske DW (1998) Pathways, mechanisms, and rates of polyploid formation in
flowering plants. Annual Review of Ecology and Systematics 29, 467-501. Rannala B, Mountain JL (1997) Detecting immigration by using multilocus genotypes.
Proceedings of the National Academy of Sciences 94, 9197-9201. Rannala B, Yang Z (2013) Improved reversible jump algorithms for Bayesian species
delimitation. Genetics 194, 245-253. Reed DC (1990) The effects of variable settlement and early competition on patterns of kelp
recruitment. Ecology 71, 776-787. Reid NM, Carstens BC (2012) Phylogenetic estimation error can decrease the accuracy of
species delimitation: a Bayesian implementation of the general mixed Yule-coalescent model. BMC Evolutionary Biology 12, 196.
Reitzel A, Herrera S, Layden M, Martindale M, Shank T (2013) Going where traditional
markers have not gone before: utility of and promise for RAD sequencing in marine invertebrate phylogeography and population genomics. Molecular Ecology 22, 2953-2970.
Rescan M (2016) Evolution of life cycles: Theoretical models and experimental evolution on
the yeast Saccharomyces cerevisiae PhD thesis, Université Pierre et marie Curie, Sorbonne Universités, Paris, France.
Rieseberg L, Arias D, Ungerer M, Linder C, Sinervo B (1996) The effects of mating design
on introgression between chromosomally divergent sunflower species. Theoretical and Applied Genetics 93, 633-644.
Rieseberg LH, Carney SE (1998) Plant hybridization. New Phytologist 140, 599-624. Rieseberg LH (2001) Chromosomal rearrangements and speciation. Trends in Ecology &
Evolution 16, 351-358. Ritchie MG (2007) Sexual selection and speciation. Annual Review of Ecology, Evolution,
and Systematics 38, 79-102. Robuchon M, Le Gall L, Mauger S, Valero M (2014) Contrasting genetic diversity patterns in
two sister kelp species co-distributed along the coast of Brittany, France. Molecular Ecology 23, 2669-2685.
Robuchon M, Valero M, Gey D, Le Gall L (2015) How does molecular-assisted
identification affect our estimation of α, β and γ biodiversity? An example from understory red seaweeds (Rhodophyta) of Laminaria kelp forests in Brittany, France. Genetica 143, 207-223.
Rokas A, Carroll SB (2005) More genes or more taxa? The relative contribution of gene
number and taxon number to phylogenetic accuracy. Molecular Biology and Evolution 22, 1337-1344.
185
Rolán-Alvarez E (2007) Sympatric speciation as a by-product of ecological adaptation in the
Galician Littorina saxatilis hybrid zone. Journal of Molluscan Studies 73, 1-10. Rosenberg NA (2004) DISTRUCT: a program for the graphical display of population
structure. Molecular Ecology Notes 4, 137-138. Rousset F (2008) genepop’007: a complete re-implementation of the genepop software for
Windows and Linux. Molecular Ecology Resources 8, 103-106. Rubin BE, Ree RH, Moreau CS (2012) Inferring phylogenies from RAD sequence data.
PLoS One 7, e33394. Rubinoff D, Holland BS (2005) Between two extremes: mitochondrial DNA is neither the
panacea nor the nemesis of phylogenetic and taxonomic inference. Systematic Biology 54, 952-961.
Russell G (1966) The genus Ectocarpus in Britain. I. The attached forms. Journal of the
Marine Biological Association of the United Kingdom 46, 267-294. Russell G (1967a) The ecology of some free-living Ectocarpaceae. Helgoländer
wissenschaftliche Meeresuntersuchungen 15, 155. Russell G (1967b) The genus Ectocarpus in Britain II. The Free-living forms. Journal of the
Marine Biological Association of the United Kingdom 47, 233-250. Russell G (1983a) Parallel growth patterns in algal epiphytes and Laminaria blades. Marine
ecology progress series. Oldendorf 13, 303-304. Russell G (1983b) Formation of an ectocarpoid epiflora on blades of Laminaria digitata.
Marine ecology progress series. Oldendorf 11, 181-187. Samadi S, Barberousse A (2006) The tree, the network, and the species. Biological Journal of
the Linnean Society 89, 509-521. Sanger F, Nicklen S, Coulson AR (1977) DNA sequencing with chain-terminating inhibitors.
Proceedings of the National Academy of Sciences 74, 5463-5467. Satler JD, Carstens BC, Hedin M (2013) Multilocus species delimitation in a complex of
morphologically conserved trapdoor spiders (Mygalomorphae, Antrodiaetidae, Aliatypus). Systematic Biology 62, 805-823.
Savoie AM, Saunders GW (2015) Evidence for the introduction of the Asian red alga
Neosiphonia japonica and its introgression with Neosiphonia harveyi (Ceramiales, Rhodophyta) in the Northwest Atlantic. Molecular Ecology 24, 5927-5937.
Schilthuizen M, Hoekstra RF, Gittenberger E (1999) Selective increase of a rare haplotype in
a land snail hybrid zone. Proceedings of the Royal Society of London B: Biological Sciences 266, 2181-2185.
186
Seehausen O (2004) Hybridization and adaptive radiation. Trends in Ecology & Evolution 19, 198-207.
Seehausen O, Terai Y, Magalhaes IS, et al. (2008) Speciation through sensory drive in
cichlid fish. Nature 455, 620-626. Seehausen O, Butlin RK, Keller I, et al. (2014) Genomics and the origin of species. Nature
Reviews Genetics 15, 176-192. Serrão EA, Alice LA, Brawley SH (1999) Evolution of the Fucaceae (Phaeophyceae) inferred
from nrDNA-ITS. Journal of Phycology 35, 382-394. Sites JW, Moritz C (1987) Chromosomal evolution and speciation revisited. Systematic
Biology 36, 153-174. Sites JW, Marshall JC (2003) Delimiting species: a Renaissance issue in systematic biology.
Trends in Ecology & Evolution 18, 462-470. Sites JW, Marshall JC (2004) Operational criteria for delimiting species. Annual Review of
Ecology, Evolution, and Systematics 35, 199-227. Smadja CM, Butlin RK (2011) A framework for comparing processes of speciation in the
presence of gene flow. Molecular Ecology 20, 5123-5140. Smith BT, Escalante P, Baños BEH, et al. (2011) The role of historical and contemporary
processes on phylogeographic structure and genetic diversity in the Northern Cardinal, Cardinalis cardinalis. BMC Evolutionary Biology 11, 1.
Spalding MD, Fox HE, Allen GR, et al. (2007) Marine ecoregions of the world: a
bioregionalization of coastal and shelf areas. BioScience 57, 573-583. Spirito F (1998) The role of chromosomal change in speciation. In: Endless forms: Species
and speciation, pp. 320-329. Oxford University Press, Oxford. Stache B (1990) Sexual compatibility and species concept in Ectocarpus siliculosus
(Ectocarpales, Phaeophyceae) from Italy, North Carolina, Chile, and New Zealand. In: Evolutionary biogeography of the marine algae of the North Atlantic, pp. 173-186. Springer.
Stache-Crain B, Müller DG, Goff LJ (1997) Molecular systematics of Ectocarpus and
Kuckuckia (Ectocarpales, Phaeophyceae) inferred from phylogenetic analyses of nuclear and plastid-encoded DNA sequences. Journal of Phycology 33, 152-168.
Stamatakis A, Hoover P, Rougemont J (2008) A rapid bootstrap algorithm for the RAxML
web servers. Systematic Biology 57, 758-771. Stamatakis A (2014) RAxML version 8: a tool for phylogenetic analysis and post-analysis of
large phylogenies. Bioinformatics 30, 1312-1313. Stebbins GL (1958) The inviability, weakness, and sterility of interspecific hybrids. Advances
187
in genetics 9, 147-215. Stebbins GL (1971) Chromosomal evolution in higher plants. Chromosomal evolution in
higher plants. Takahashi T, Nagata N, Sota T (2014) Application of RAD-based phylogenetics to complex
relationships among variously related taxa in a species flock. Molecular Phylogenetics and Evolution 80, 137-144.
Tamura K, Stecher G, Peterson D, Filipski A, Kumar S (2013) MEGA6: molecular
evolutionary genetics analysis version 6.0. Molecular Biology and Evolution 30, 2725-2729.
Thorpe RS, McGregor DP, Cumming AM, Jordan WC (1994) DNA evolution and
colonization sequence of island lizards in relation to geological history: mtDNA RFLP, cytochrome b, cytochrome oxidase, 12s rRNA sequence, and nuclear RAPD analysis. Evolution 48, 230-240.
Tronholm A, Steen F, Tyberghein L, et al. (2010) Species Delimitation, Taxonomy, and
Biogeography of Dictyota in Europe (Dictyotales, Phaeophyceae). Journal of Phycology 46, 1301-1321.
Turchetto C, Segatto ALA, Beduschi J, Bonatto SL, Freitas LB (2015) Genetic differentiation
and hybrid identification using microsatellite markers in closely related wild species. AoB Plants 7, plv084.
Turelli M, Barton NH, Coyne JA (2001) Theory and speciation. Trends in Ecology &
Evolution 16, 330-343. Turner TL, Hahn MW, Nuzhdin SV (2005) Genomic islands of speciation in Anopheles
gambiae. PLoS Biology 3, e285. Turner LM, Harr B (2014) Genome-wide mapping in a house mouse hybrid zone reveals
hybrid sterility loci and Dobzhansky-Muller interactions. Elife 3, e02504. Twyford A, Ennos R (2012) Next-generation hybridization and introgression. Heredity 108,
179-189. Vähä J-P, Primmer CR (2006) Efficiency of model-based Bayesian methods for detecting
hybrid individuals under different hybridization scenarios and with different numbers of loci. Molecular Ecology 15, 63-72.
Valero M, Richerd S, Perrot V, Destombe C (1992) Evolution of alternation of haploid and
diploid phases in life cycles. Trends in Ecology & Evolution 7, 25-29. Van Houten W, Scarlett N, Bachmann K (1993) Nuclear DNA markers of the Australian
tetraploid Microseris scapigera and its North American diploid relatives. Theoretical and Applied Genetics 87, 498-505.
Vieira C, D'hondt S, De Clerck O, Payri CE (2014) Toward an inordinate fondness for stars,
188
beetles and Lobophora? Species diversity of the genus Lobophora (Dictyotales, Phaeophyceae) in New Caledonia. Journal of Phycology 50, 1101-1119.
Viricel A, Pante E, Dabin W, Simon-Bouhet B (2014) Applicability of RAD-tag genotyping
for interfamilial comparisons: empirical data from two cetaceans. Molecular Ecology Resources 14, 597-605.
Wagner W (1987) Some questions about natural hybrids in ferns. Botanica Helvetica 97,
195-205. Wagner CE, Keller I, Wittwer S, et al. (2013) Genome-wide RAD sequence data provide
unprecedented resolution of species boundaries and relationships in the Lake Victoria cichlid adaptive radiation. Molecular Ecology 22, 787-798.
Wallace AL, Klein AS, Mathieson AC (2004) Determining the affinities of salt marsh
Fucoids using microsatellite markers: evidence of hybridization and introgression between two species of Fucus (Phaeophyta) in a Maine estuary. Journal of Phycology 40, 1013-1027.
Weir BS, Cockerham CC (1984) Estimating F-statistics for the analysis of population
structure. Evolution 38, 1358-1370. Wendel JF, Schnabel A, Seelanan T (1995) Bidirectional interlocus concerted evolution
following allopolyploid speciation in cotton (Gossypium). Proceedings of the National Academy of Sciences 92, 280-284.
Wendel JF, Doyle JJ (1998) Phylogenetic incongruence: window into genome history and
molecular evolution. In: Molecular systematics of plants II, pp. 265-296. Springer. Wiens JJ, Penkrot TA (2002) Delimiting species using DNA and morphological variation and
discordant species limits in spiny lizards (Sceloporus). Systematic Biology 51, 69-91. Wu C-I, Ting C-T (2004) Genes and speciation. Nature Reviews Genetics 5, 114-122. Yamashita T, Rhoads DD (2013) Species delimitation and morphological divergence in the
scorpion Centruroides vittatus (Say, 1821): insights from phylogeography. PLoS One 8, e68282.
Yang Z, Rannala B (2010) Bayesian species delimitation using multilocus sequence data.
Proceedings of the National Academy of Sciences 107, 9264-9269. Yu Y, Than C, Degnan JH, Nakhleh L (2011) Coalescent histories on phylogenetic networks
and detection of hybridization despite incomplete lineage sorting. Systematic Biology 60, 138-149.
Zardi GI, Nicastro KR, Canovas F, et al. (2011) Adaptive traits are maintained on steep
selective gradients despite gene flow and hybridization in the intertidal zone. PLoS One 6, e19402.
Zhan A, Macisaac HJ, Cristescu ME (2010) Invasion genetics of the Ciona intestinalis
189
species complex: from regional endemism to global homogeneity. Molecular Ecology 19, 4678-4694.
Zhang J, Kobert K, Flouri T, Stamatakis A (2014) PEAR: a fast and accurate Illumina Paired-
End reAd mergeR. Bioinformatics 30, 614-620. Zimmer EA, Wen J (2013) Reprint of: Using nuclear gene data for plant phylogenetics:
Progress and prospects. Molecular Phylogenetics and Evolution 66, 539-550. Zuccarello GC, Schidlo N, Mcivor L, Guiry MD (2005) A molecular re-examination of
speciation in the intertidal red alga Mastocarpus stellatus (Gigartinales, Rhodophyta) in Europe. European Journal of Phycology 40, 337-344.

190
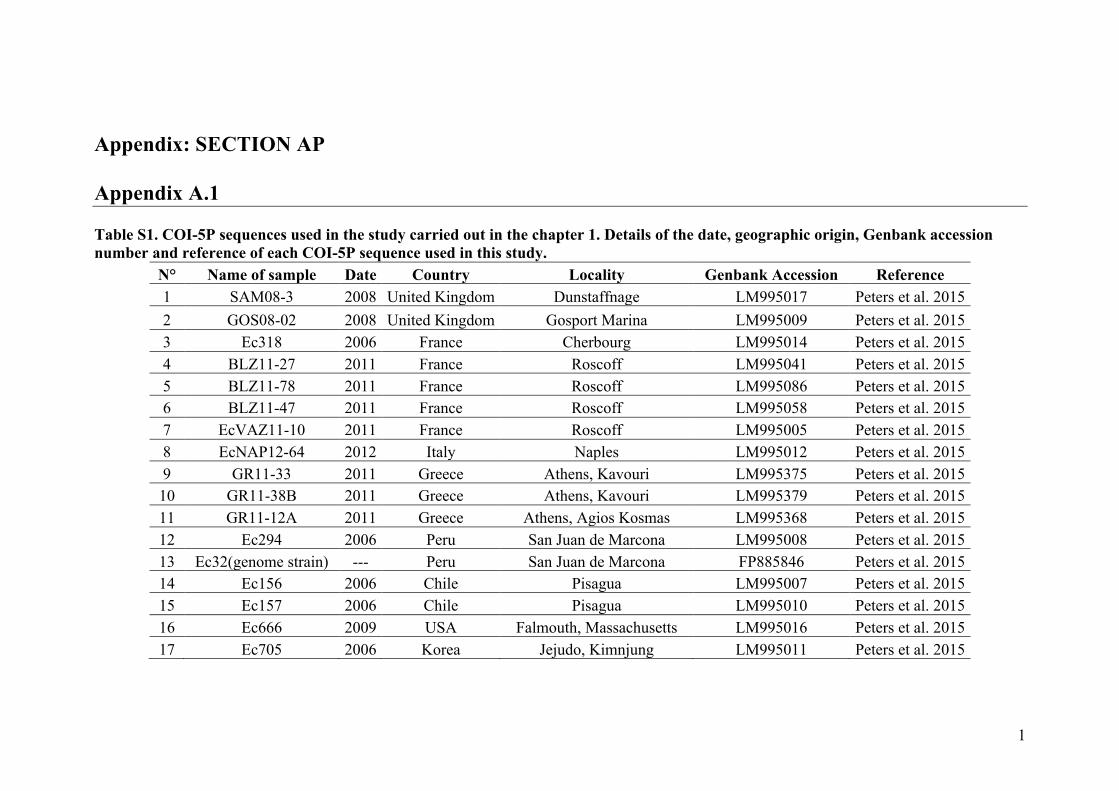
1
Appendix: SECTION AP Appendix A.1 Table S1. COI-5P sequences used in the study carried out in the chapter 1. Details of the date, geographic origin, Genbank accession number and reference of each COI-5P sequence used in this study.
N° Name of sample Date Country Locality Genbank Accession Reference 1 SAM08-3 2008 United Kingdom Dunstaffnage LM995017 Peters et al. 2015 2 GOS08-02 2008 United Kingdom Gosport Marina LM995009 Peters et al. 2015 3 Ec318 2006 France Cherbourg LM995014 Peters et al. 2015 4 BLZ11-27 2011 France Roscoff LM995041 Peters et al. 2015 5 BLZ11-78 2011 France Roscoff LM995086 Peters et al. 2015 6 BLZ11-47 2011 France Roscoff LM995058 Peters et al. 2015 7 EcVAZ11-10 2011 France Roscoff LM995005 Peters et al. 2015 8 EcNAP12-64 2012 Italy Naples LM995012 Peters et al. 2015 9 GR11-33 2011 Greece Athens, Kavouri LM995375 Peters et al. 2015 10 GR11-38B 2011 Greece Athens, Kavouri LM995379 Peters et al. 2015 11 GR11-12A 2011 Greece Athens, Agios Kosmas LM995368 Peters et al. 2015 12 Ec294 2006 Peru San Juan de Marcona LM995008 Peters et al. 2015 13 Ec32(genome strain) --- Peru San Juan de Marcona FP885846 Peters et al. 2015 14 Ec156 2006 Chile Pisagua LM995007 Peters et al. 2015 15 Ec157 2006 Chile Pisagua LM995010 Peters et al. 2015 16 Ec666 2009 USA Falmouth, Massachusetts LM995016 Peters et al. 2015 17 Ec705 2006 Korea Jejudo, Kimnjung LM995011 Peters et al. 2015
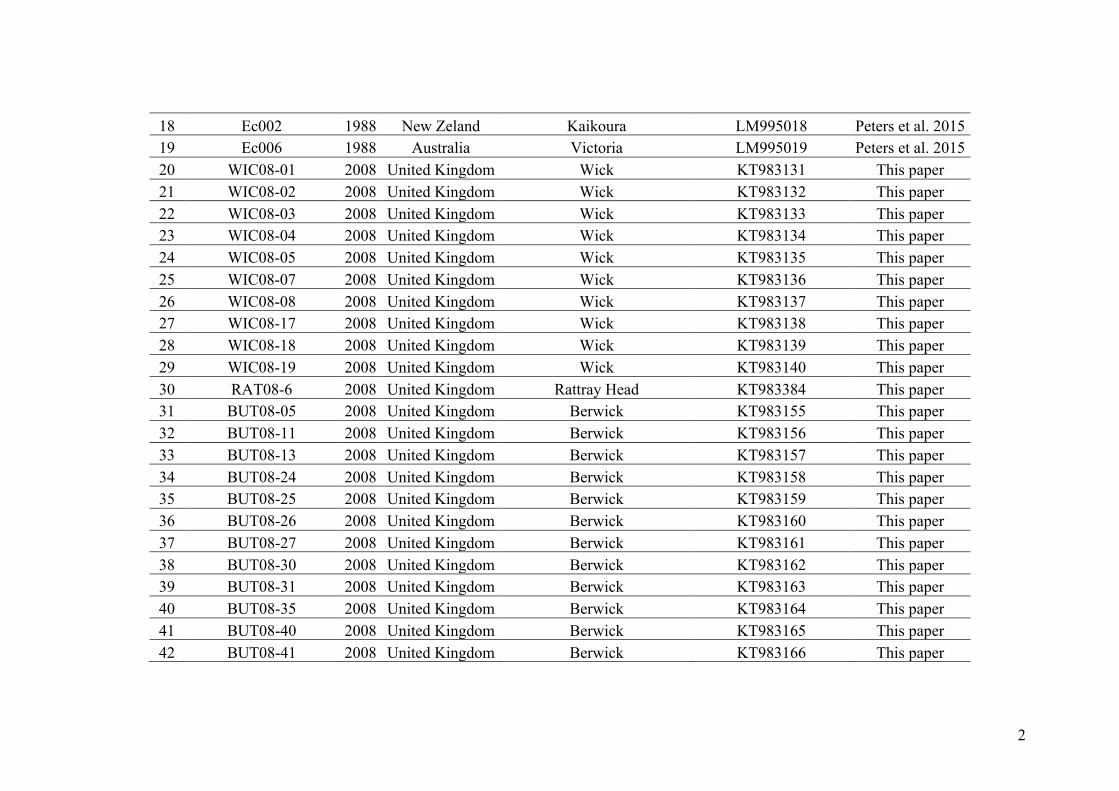
2
18 Ec002 1988 New Zeland Kaikoura LM995018 Peters et al. 2015 19 Ec006 1988 Australia Victoria LM995019 Peters et al. 2015 20 WIC08-01 2008 United Kingdom Wick KT983131 This paper 21 WIC08-02 2008 United Kingdom Wick KT983132 This paper 22 WIC08-03 2008 United Kingdom Wick KT983133 This paper 23 WIC08-04 2008 United Kingdom Wick KT983134 This paper 24 WIC08-05 2008 United Kingdom Wick KT983135 This paper 25 WIC08-07 2008 United Kingdom Wick KT983136 This paper 26 WIC08-08 2008 United Kingdom Wick KT983137 This paper 27 WIC08-17 2008 United Kingdom Wick KT983138 This paper 28 WIC08-18 2008 United Kingdom Wick KT983139 This paper 29 WIC08-19 2008 United Kingdom Wick KT983140 This paper 30 RAT08-6 2008 United Kingdom Rattray Head KT983384 This paper 31 BUT08-05 2008 United Kingdom Berwick KT983155 This paper 32 BUT08-11 2008 United Kingdom Berwick KT983156 This paper 33 BUT08-13 2008 United Kingdom Berwick KT983157 This paper 34 BUT08-24 2008 United Kingdom Berwick KT983158 This paper 35 BUT08-25 2008 United Kingdom Berwick KT983159 This paper 36 BUT08-26 2008 United Kingdom Berwick KT983160 This paper 37 BUT08-27 2008 United Kingdom Berwick KT983161 This paper 38 BUT08-30 2008 United Kingdom Berwick KT983162 This paper 39 BUT08-31 2008 United Kingdom Berwick KT983163 This paper 40 BUT08-35 2008 United Kingdom Berwick KT983164 This paper 41 BUT08-40 2008 United Kingdom Berwick KT983165 This paper 42 BUT08-41 2008 United Kingdom Berwick KT983166 This paper
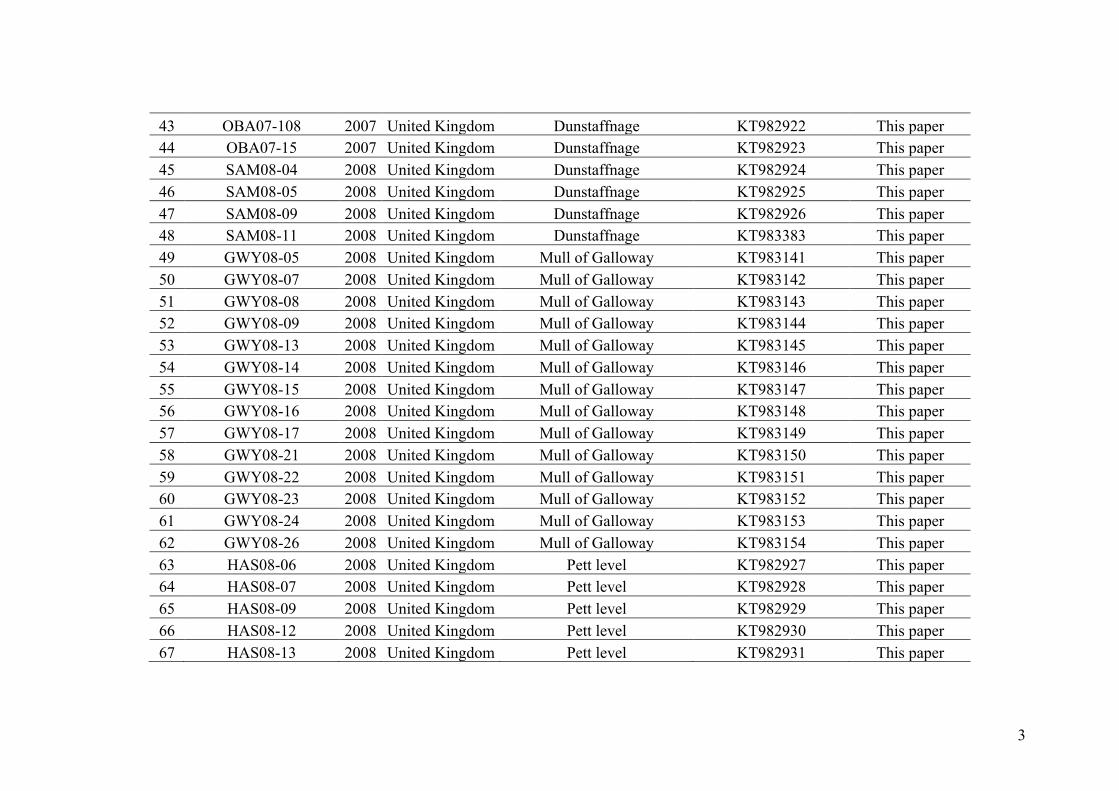
3
43 OBA07-108 2007 United Kingdom Dunstaffnage KT982922 This paper 44 OBA07-15 2007 United Kingdom Dunstaffnage KT982923 This paper 45 SAM08-04 2008 United Kingdom Dunstaffnage KT982924 This paper 46 SAM08-05 2008 United Kingdom Dunstaffnage KT982925 This paper 47 SAM08-09 2008 United Kingdom Dunstaffnage KT982926 This paper 48 SAM08-11 2008 United Kingdom Dunstaffnage KT983383 This paper 49 GWY08-05 2008 United Kingdom Mull of Galloway KT983141 This paper 50 GWY08-07 2008 United Kingdom Mull of Galloway KT983142 This paper 51 GWY08-08 2008 United Kingdom Mull of Galloway KT983143 This paper 52 GWY08-09 2008 United Kingdom Mull of Galloway KT983144 This paper 53 GWY08-13 2008 United Kingdom Mull of Galloway KT983145 This paper 54 GWY08-14 2008 United Kingdom Mull of Galloway KT983146 This paper 55 GWY08-15 2008 United Kingdom Mull of Galloway KT983147 This paper 56 GWY08-16 2008 United Kingdom Mull of Galloway KT983148 This paper 57 GWY08-17 2008 United Kingdom Mull of Galloway KT983149 This paper 58 GWY08-21 2008 United Kingdom Mull of Galloway KT983150 This paper 59 GWY08-22 2008 United Kingdom Mull of Galloway KT983151 This paper 60 GWY08-23 2008 United Kingdom Mull of Galloway KT983152 This paper 61 GWY08-24 2008 United Kingdom Mull of Galloway KT983153 This paper 62 GWY08-26 2008 United Kingdom Mull of Galloway KT983154 This paper 63 HAS08-06 2008 United Kingdom Pett level KT982927 This paper 64 HAS08-07 2008 United Kingdom Pett level KT982928 This paper 65 HAS08-09 2008 United Kingdom Pett level KT982929 This paper 66 HAS08-12 2008 United Kingdom Pett level KT982930 This paper 67 HAS08-13 2008 United Kingdom Pett level KT982931 This paper
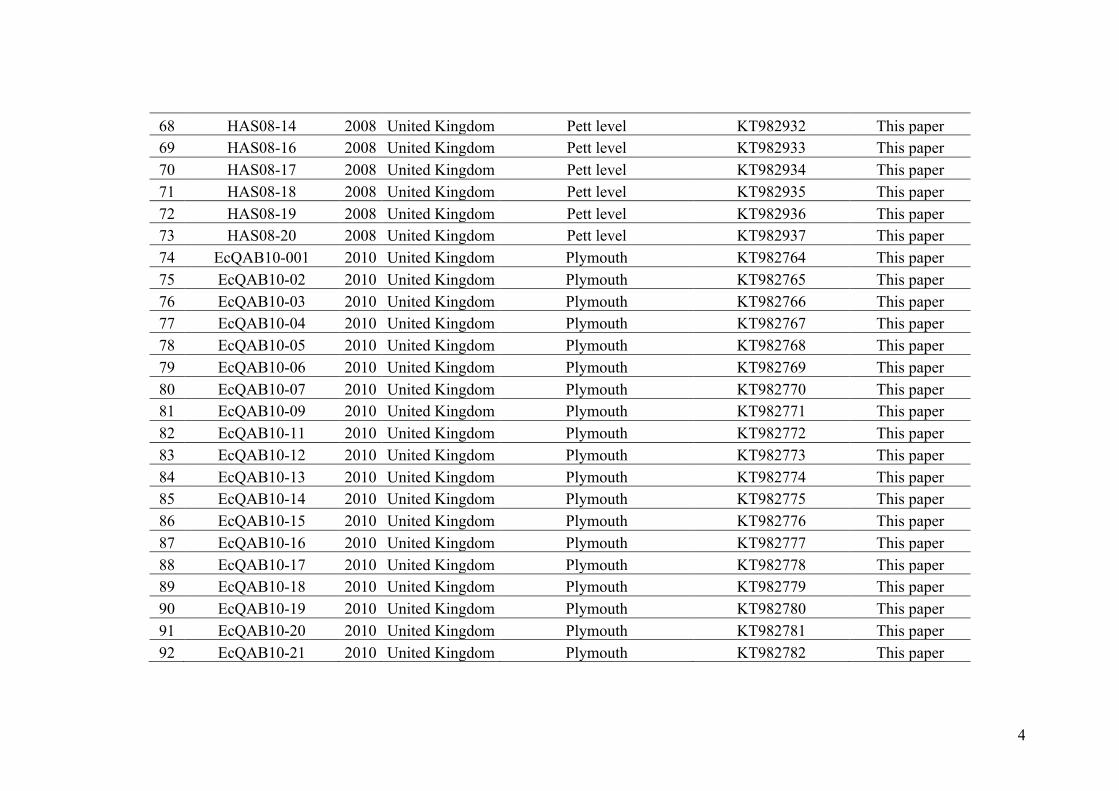
4
68 HAS08-14 2008 United Kingdom Pett level KT982932 This paper 69 HAS08-16 2008 United Kingdom Pett level KT982933 This paper 70 HAS08-17 2008 United Kingdom Pett level KT982934 This paper 71 HAS08-18 2008 United Kingdom Pett level KT982935 This paper 72 HAS08-19 2008 United Kingdom Pett level KT982936 This paper 73 HAS08-20 2008 United Kingdom Pett level KT982937 This paper 74 EcQAB10-001 2010 United Kingdom Plymouth KT982764 This paper 75 EcQAB10-02 2010 United Kingdom Plymouth KT982765 This paper 76 EcQAB10-03 2010 United Kingdom Plymouth KT982766 This paper 77 EcQAB10-04 2010 United Kingdom Plymouth KT982767 This paper 78 EcQAB10-05 2010 United Kingdom Plymouth KT982768 This paper 79 EcQAB10-06 2010 United Kingdom Plymouth KT982769 This paper 80 EcQAB10-07 2010 United Kingdom Plymouth KT982770 This paper 81 EcQAB10-09 2010 United Kingdom Plymouth KT982771 This paper 82 EcQAB10-11 2010 United Kingdom Plymouth KT982772 This paper 83 EcQAB10-12 2010 United Kingdom Plymouth KT982773 This paper 84 EcQAB10-13 2010 United Kingdom Plymouth KT982774 This paper 85 EcQAB10-14 2010 United Kingdom Plymouth KT982775 This paper 86 EcQAB10-15 2010 United Kingdom Plymouth KT982776 This paper 87 EcQAB10-16 2010 United Kingdom Plymouth KT982777 This paper 88 EcQAB10-17 2010 United Kingdom Plymouth KT982778 This paper 89 EcQAB10-18 2010 United Kingdom Plymouth KT982779 This paper 90 EcQAB10-19 2010 United Kingdom Plymouth KT982780 This paper 91 EcQAB10-20 2010 United Kingdom Plymouth KT982781 This paper 92 EcQAB10-21 2010 United Kingdom Plymouth KT982782 This paper
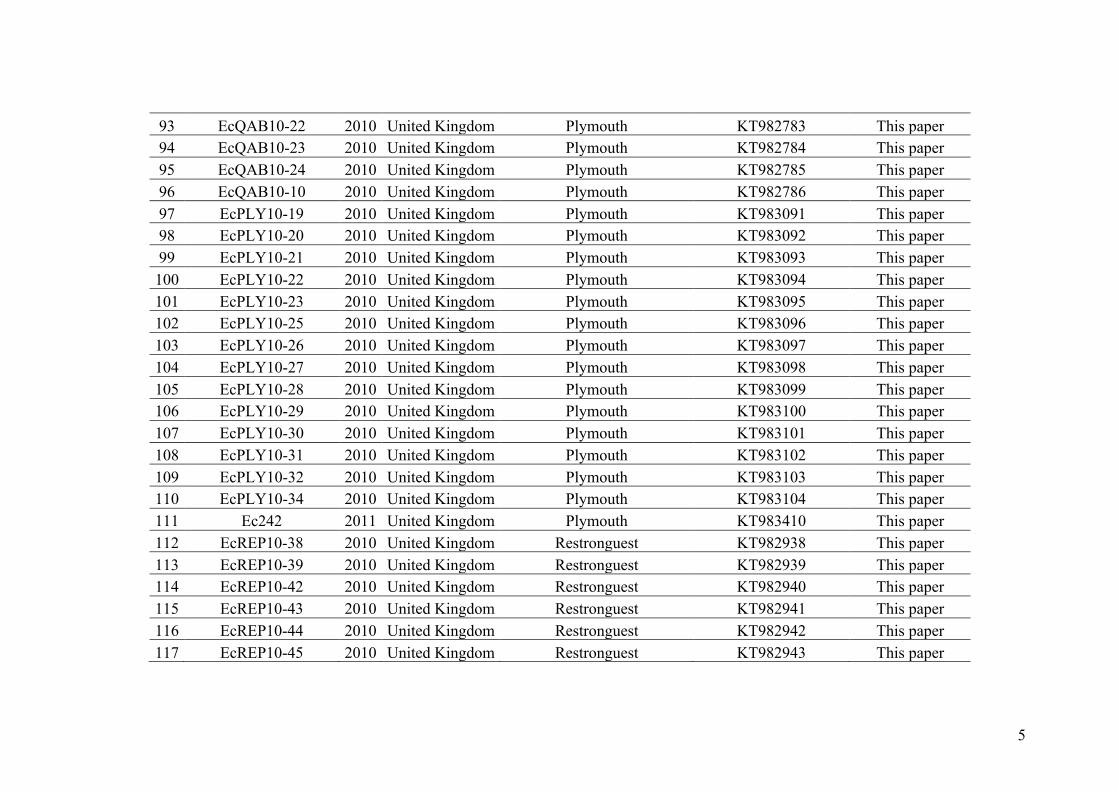
5
93 EcQAB10-22 2010 United Kingdom Plymouth KT982783 This paper 94 EcQAB10-23 2010 United Kingdom Plymouth KT982784 This paper 95 EcQAB10-24 2010 United Kingdom Plymouth KT982785 This paper 96 EcQAB10-10 2010 United Kingdom Plymouth KT982786 This paper 97 EcPLY10-19 2010 United Kingdom Plymouth KT983091 This paper 98 EcPLY10-20 2010 United Kingdom Plymouth KT983092 This paper 99 EcPLY10-21 2010 United Kingdom Plymouth KT983093 This paper 100 EcPLY10-22 2010 United Kingdom Plymouth KT983094 This paper 101 EcPLY10-23 2010 United Kingdom Plymouth KT983095 This paper 102 EcPLY10-25 2010 United Kingdom Plymouth KT983096 This paper 103 EcPLY10-26 2010 United Kingdom Plymouth KT983097 This paper 104 EcPLY10-27 2010 United Kingdom Plymouth KT983098 This paper 105 EcPLY10-28 2010 United Kingdom Plymouth KT983099 This paper 106 EcPLY10-29 2010 United Kingdom Plymouth KT983100 This paper 107 EcPLY10-30 2010 United Kingdom Plymouth KT983101 This paper 108 EcPLY10-31 2010 United Kingdom Plymouth KT983102 This paper 109 EcPLY10-32 2010 United Kingdom Plymouth KT983103 This paper 110 EcPLY10-34 2010 United Kingdom Plymouth KT983104 This paper 111 Ec242 2011 United Kingdom Plymouth KT983410 This paper 112 EcREP10-38 2010 United Kingdom Restronguest KT982938 This paper 113 EcREP10-39 2010 United Kingdom Restronguest KT982939 This paper 114 EcREP10-42 2010 United Kingdom Restronguest KT982940 This paper 115 EcREP10-43 2010 United Kingdom Restronguest KT982941 This paper 116 EcREP10-44 2010 United Kingdom Restronguest KT982942 This paper 117 EcREP10-45 2010 United Kingdom Restronguest KT982943 This paper
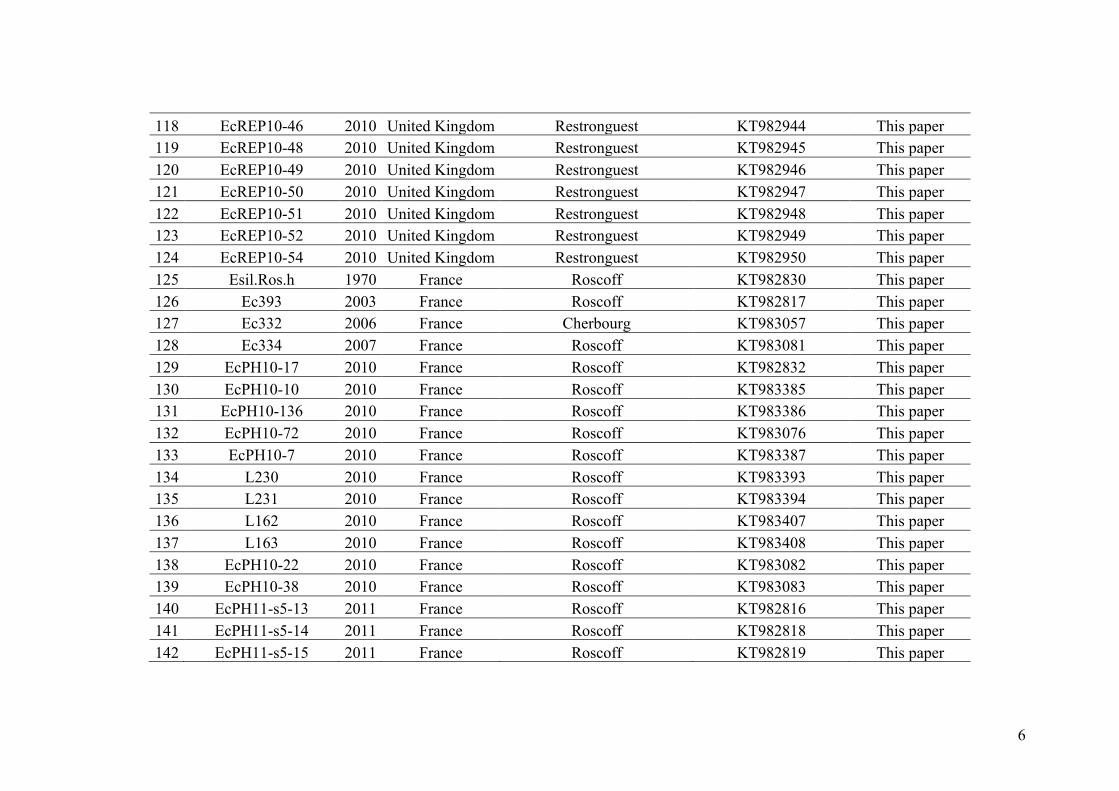
6
118 EcREP10-46 2010 United Kingdom Restronguest KT982944 This paper 119 EcREP10-48 2010 United Kingdom Restronguest KT982945 This paper 120 EcREP10-49 2010 United Kingdom Restronguest KT982946 This paper 121 EcREP10-50 2010 United Kingdom Restronguest KT982947 This paper 122 EcREP10-51 2010 United Kingdom Restronguest KT982948 This paper 123 EcREP10-52 2010 United Kingdom Restronguest KT982949 This paper 124 EcREP10-54 2010 United Kingdom Restronguest KT982950 This paper 125 Esil.Ros.h 1970 France Roscoff KT982830 This paper 126 Ec393 2003 France Roscoff KT982817 This paper 127 Ec332 2006 France Cherbourg KT983057 This paper 128 Ec334 2007 France Roscoff KT983081 This paper 129 EcPH10-17 2010 France Roscoff KT982832 This paper 130 EcPH10-10 2010 France Roscoff KT983385 This paper 131 EcPH10-136 2010 France Roscoff KT983386 This paper 132 EcPH10-72 2010 France Roscoff KT983076 This paper 133 EcPH10-7 2010 France Roscoff KT983387 This paper 134 L230 2010 France Roscoff KT983393 This paper 135 L231 2010 France Roscoff KT983394 This paper 136 L162 2010 France Roscoff KT983407 This paper 137 L163 2010 France Roscoff KT983408 This paper 138 EcPH10-22 2010 France Roscoff KT983082 This paper 139 EcPH10-38 2010 France Roscoff KT983083 This paper 140 EcPH11-s5-13 2011 France Roscoff KT982816 This paper 141 EcPH11-s5-14 2011 France Roscoff KT982818 This paper 142 EcPH11-s5-15 2011 France Roscoff KT982819 This paper
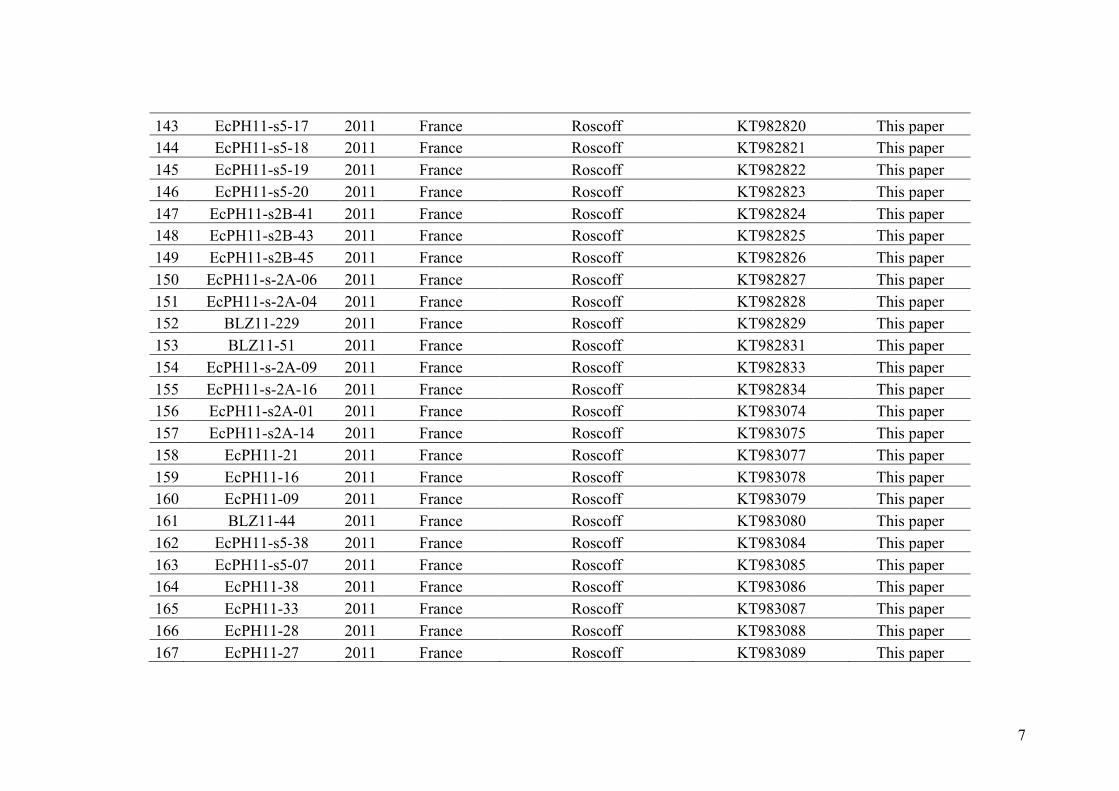
7
143 EcPH11-s5-17 2011 France Roscoff KT982820 This paper 144 EcPH11-s5-18 2011 France Roscoff KT982821 This paper 145 EcPH11-s5-19 2011 France Roscoff KT982822 This paper 146 EcPH11-s5-20 2011 France Roscoff KT982823 This paper 147 EcPH11-s2B-41 2011 France Roscoff KT982824 This paper 148 EcPH11-s2B-43 2011 France Roscoff KT982825 This paper 149 EcPH11-s2B-45 2011 France Roscoff KT982826 This paper 150 EcPH11-s-2A-06 2011 France Roscoff KT982827 This paper 151 EcPH11-s-2A-04 2011 France Roscoff KT982828 This paper 152 BLZ11-229 2011 France Roscoff KT982829 This paper 153 BLZ11-51 2011 France Roscoff KT982831 This paper 154 EcPH11-s-2A-09 2011 France Roscoff KT982833 This paper 155 EcPH11-s-2A-16 2011 France Roscoff KT982834 This paper 156 EcPH11-s2A-01 2011 France Roscoff KT983074 This paper 157 EcPH11-s2A-14 2011 France Roscoff KT983075 This paper 158 EcPH11-21 2011 France Roscoff KT983077 This paper 159 EcPH11-16 2011 France Roscoff KT983078 This paper 160 EcPH11-09 2011 France Roscoff KT983079 This paper 161 BLZ11-44 2011 France Roscoff KT983080 This paper 162 EcPH11-s5-38 2011 France Roscoff KT983084 This paper 163 EcPH11-s5-07 2011 France Roscoff KT983085 This paper 164 EcPH11-38 2011 France Roscoff KT983086 This paper 165 EcPH11-33 2011 France Roscoff KT983087 This paper 166 EcPH11-28 2011 France Roscoff KT983088 This paper 167 EcPH11-27 2011 France Roscoff KT983089 This paper
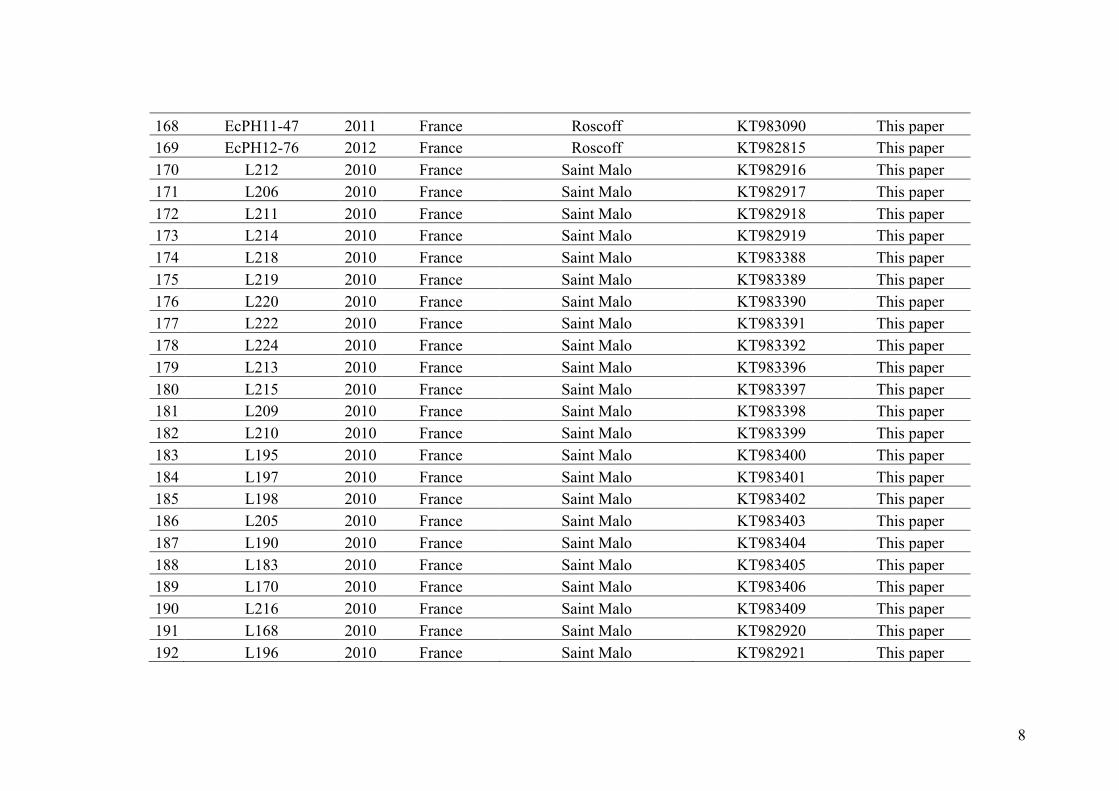
8
168 EcPH11-47 2011 France Roscoff KT983090 This paper 169 EcPH12-76 2012 France Roscoff KT982815 This paper 170 L212 2010 France Saint Malo KT982916 This paper 171 L206 2010 France Saint Malo KT982917 This paper 172 L211 2010 France Saint Malo KT982918 This paper 173 L214 2010 France Saint Malo KT982919 This paper 174 L218 2010 France Saint Malo KT983388 This paper 175 L219 2010 France Saint Malo KT983389 This paper 176 L220 2010 France Saint Malo KT983390 This paper 177 L222 2010 France Saint Malo KT983391 This paper 178 L224 2010 France Saint Malo KT983392 This paper 179 L213 2010 France Saint Malo KT983396 This paper 180 L215 2010 France Saint Malo KT983397 This paper 181 L209 2010 France Saint Malo KT983398 This paper 182 L210 2010 France Saint Malo KT983399 This paper 183 L195 2010 France Saint Malo KT983400 This paper 184 L197 2010 France Saint Malo KT983401 This paper 185 L198 2010 France Saint Malo KT983402 This paper 186 L205 2010 France Saint Malo KT983403 This paper 187 L190 2010 France Saint Malo KT983404 This paper 188 L183 2010 France Saint Malo KT983405 This paper 189 L170 2010 France Saint Malo KT983406 This paper 190 L216 2010 France Saint Malo KT983409 This paper 191 L168 2010 France Saint Malo KT982920 This paper 192 L196 2010 France Saint Malo KT982921 This paper
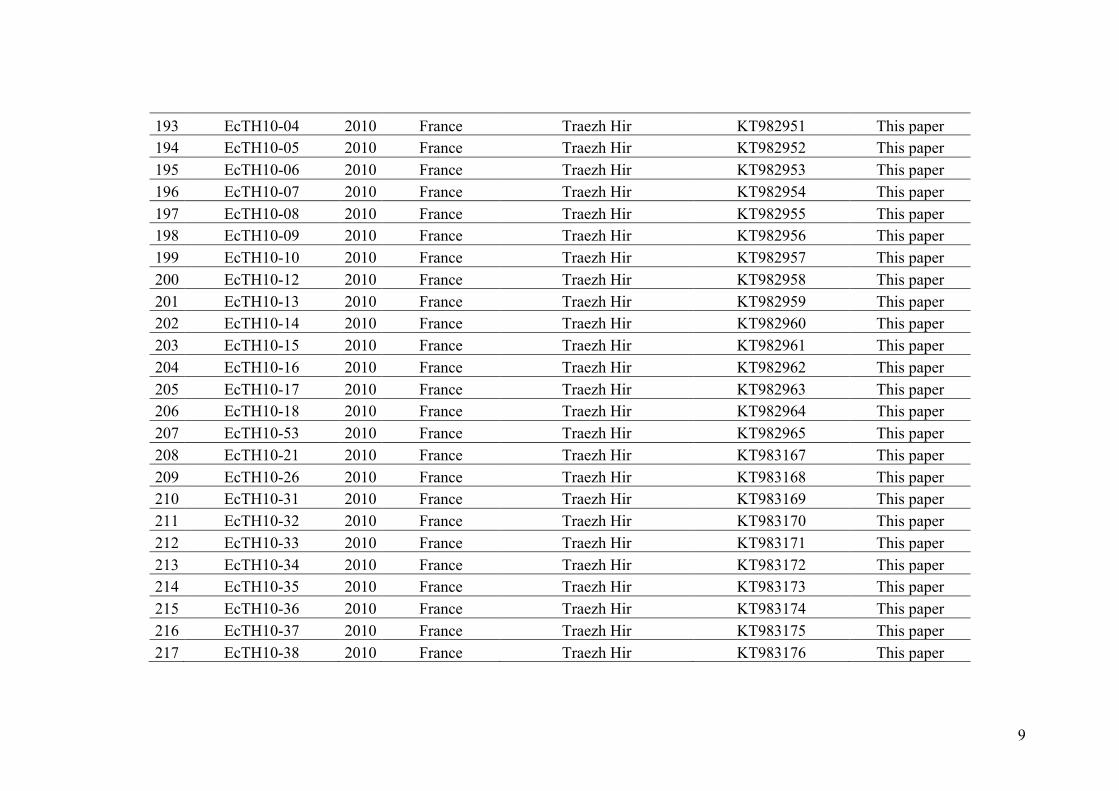
9
193 EcTH10-04 2010 France Traezh Hir KT982951 This paper 194 EcTH10-05 2010 France Traezh Hir KT982952 This paper 195 EcTH10-06 2010 France Traezh Hir KT982953 This paper 196 EcTH10-07 2010 France Traezh Hir KT982954 This paper 197 EcTH10-08 2010 France Traezh Hir KT982955 This paper 198 EcTH10-09 2010 France Traezh Hir KT982956 This paper 199 EcTH10-10 2010 France Traezh Hir KT982957 This paper 200 EcTH10-12 2010 France Traezh Hir KT982958 This paper 201 EcTH10-13 2010 France Traezh Hir KT982959 This paper 202 EcTH10-14 2010 France Traezh Hir KT982960 This paper 203 EcTH10-15 2010 France Traezh Hir KT982961 This paper 204 EcTH10-16 2010 France Traezh Hir KT982962 This paper 205 EcTH10-17 2010 France Traezh Hir KT982963 This paper 206 EcTH10-18 2010 France Traezh Hir KT982964 This paper 207 EcTH10-53 2010 France Traezh Hir KT982965 This paper 208 EcTH10-21 2010 France Traezh Hir KT983167 This paper 209 EcTH10-26 2010 France Traezh Hir KT983168 This paper 210 EcTH10-31 2010 France Traezh Hir KT983169 This paper 211 EcTH10-32 2010 France Traezh Hir KT983170 This paper 212 EcTH10-33 2010 France Traezh Hir KT983171 This paper 213 EcTH10-34 2010 France Traezh Hir KT983172 This paper 214 EcTH10-35 2010 France Traezh Hir KT983173 This paper 215 EcTH10-36 2010 France Traezh Hir KT983174 This paper 216 EcTH10-37 2010 France Traezh Hir KT983175 This paper 217 EcTH10-38 2010 France Traezh Hir KT983176 This paper
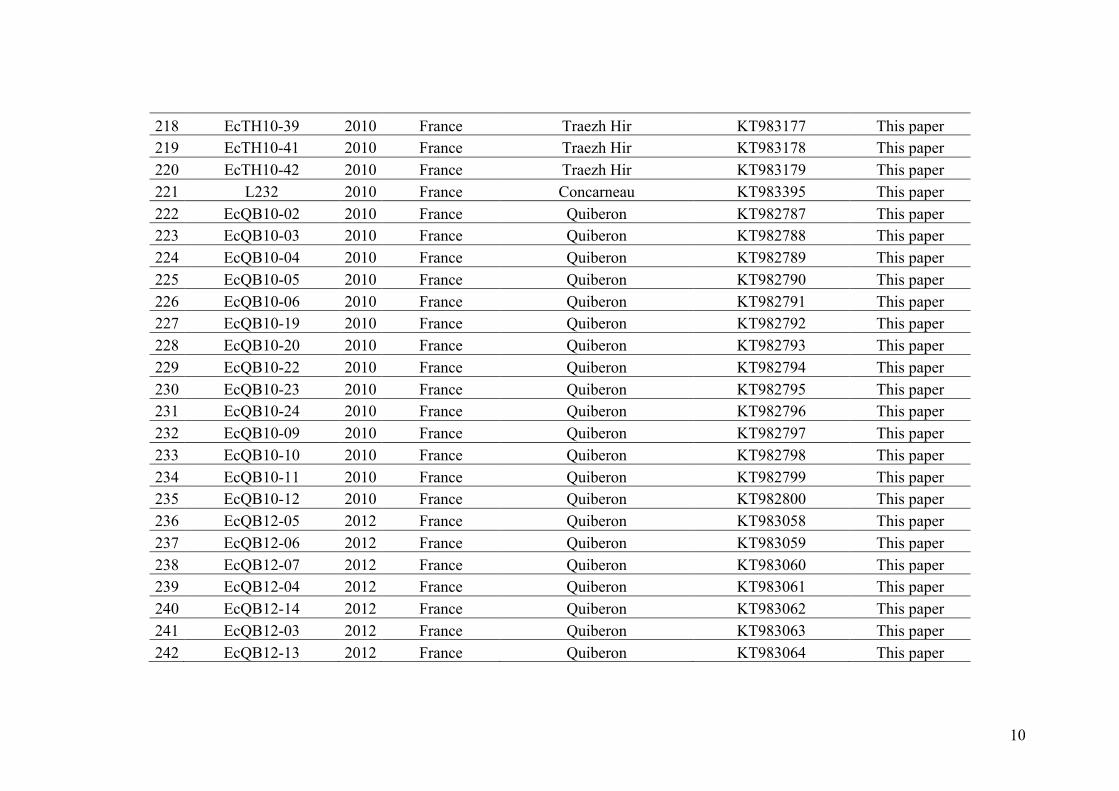
10
218 EcTH10-39 2010 France Traezh Hir KT983177 This paper 219 EcTH10-41 2010 France Traezh Hir KT983178 This paper 220 EcTH10-42 2010 France Traezh Hir KT983179 This paper 221 L232 2010 France Concarneau KT983395 This paper 222 EcQB10-02 2010 France Quiberon KT982787 This paper 223 EcQB10-03 2010 France Quiberon KT982788 This paper 224 EcQB10-04 2010 France Quiberon KT982789 This paper 225 EcQB10-05 2010 France Quiberon KT982790 This paper 226 EcQB10-06 2010 France Quiberon KT982791 This paper 227 EcQB10-19 2010 France Quiberon KT982792 This paper 228 EcQB10-20 2010 France Quiberon KT982793 This paper 229 EcQB10-22 2010 France Quiberon KT982794 This paper 230 EcQB10-23 2010 France Quiberon KT982795 This paper 231 EcQB10-24 2010 France Quiberon KT982796 This paper 232 EcQB10-09 2010 France Quiberon KT982797 This paper 233 EcQB10-10 2010 France Quiberon KT982798 This paper 234 EcQB10-11 2010 France Quiberon KT982799 This paper 235 EcQB10-12 2010 France Quiberon KT982800 This paper 236 EcQB12-05 2012 France Quiberon KT983058 This paper 237 EcQB12-06 2012 France Quiberon KT983059 This paper 238 EcQB12-07 2012 France Quiberon KT983060 This paper 239 EcQB12-04 2012 France Quiberon KT983061 This paper 240 EcQB12-14 2012 France Quiberon KT983062 This paper 241 EcQB12-03 2012 France Quiberon KT983063 This paper 242 EcQB12-13 2012 France Quiberon KT983064 This paper
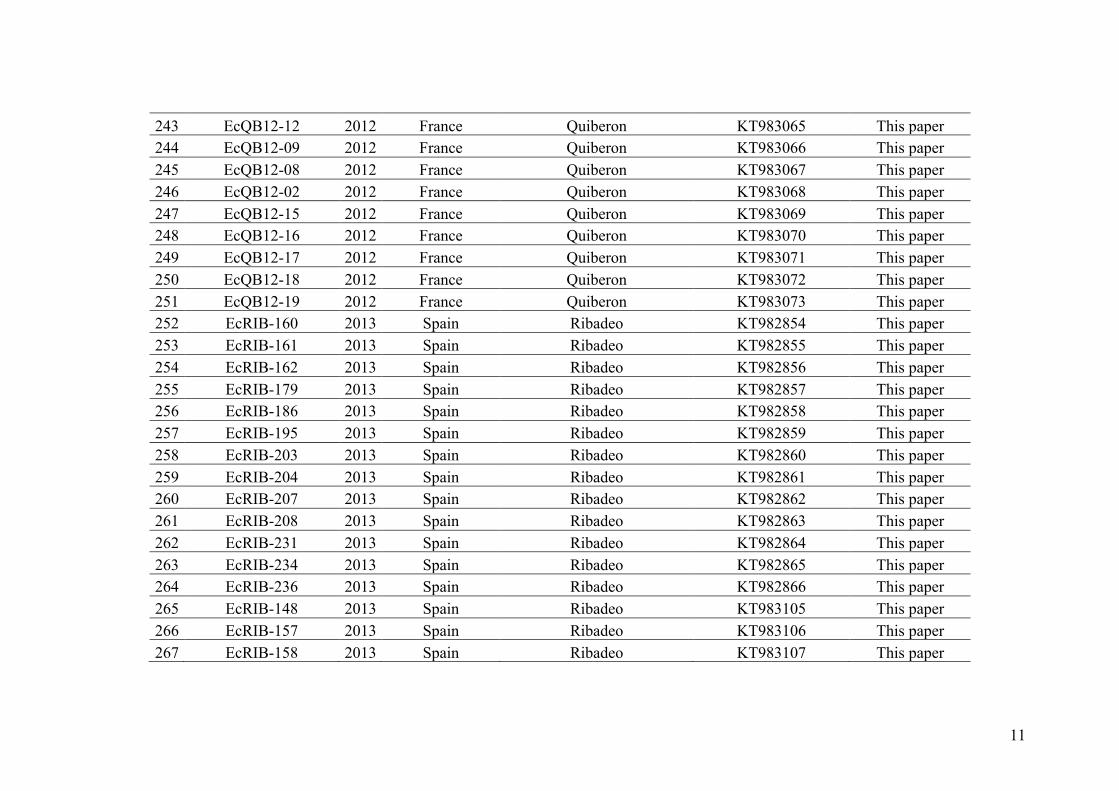
11
243 EcQB12-12 2012 France Quiberon KT983065 This paper 244 EcQB12-09 2012 France Quiberon KT983066 This paper 245 EcQB12-08 2012 France Quiberon KT983067 This paper 246 EcQB12-02 2012 France Quiberon KT983068 This paper 247 EcQB12-15 2012 France Quiberon KT983069 This paper 248 EcQB12-16 2012 France Quiberon KT983070 This paper 249 EcQB12-17 2012 France Quiberon KT983071 This paper 250 EcQB12-18 2012 France Quiberon KT983072 This paper 251 EcQB12-19 2012 France Quiberon KT983073 This paper 252 EcRIB-160 2013 Spain Ribadeo KT982854 This paper 253 EcRIB-161 2013 Spain Ribadeo KT982855 This paper 254 EcRIB-162 2013 Spain Ribadeo KT982856 This paper 255 EcRIB-179 2013 Spain Ribadeo KT982857 This paper 256 EcRIB-186 2013 Spain Ribadeo KT982858 This paper 257 EcRIB-195 2013 Spain Ribadeo KT982859 This paper 258 EcRIB-203 2013 Spain Ribadeo KT982860 This paper 259 EcRIB-204 2013 Spain Ribadeo KT982861 This paper 260 EcRIB-207 2013 Spain Ribadeo KT982862 This paper 261 EcRIB-208 2013 Spain Ribadeo KT982863 This paper 262 EcRIB-231 2013 Spain Ribadeo KT982864 This paper 263 EcRIB-234 2013 Spain Ribadeo KT982865 This paper 264 EcRIB-236 2013 Spain Ribadeo KT982866 This paper 265 EcRIB-148 2013 Spain Ribadeo KT983105 This paper 266 EcRIB-157 2013 Spain Ribadeo KT983106 This paper 267 EcRIB-158 2013 Spain Ribadeo KT983107 This paper
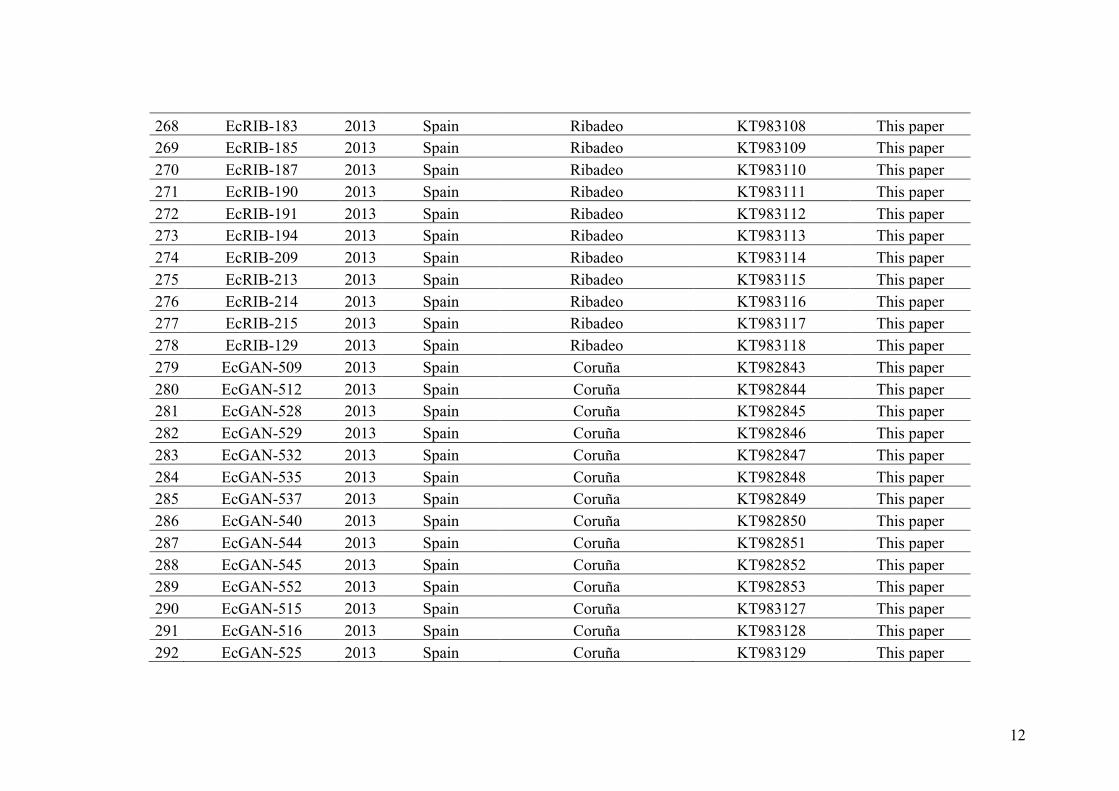
12
268 EcRIB-183 2013 Spain Ribadeo KT983108 This paper 269 EcRIB-185 2013 Spain Ribadeo KT983109 This paper 270 EcRIB-187 2013 Spain Ribadeo KT983110 This paper 271 EcRIB-190 2013 Spain Ribadeo KT983111 This paper 272 EcRIB-191 2013 Spain Ribadeo KT983112 This paper 273 EcRIB-194 2013 Spain Ribadeo KT983113 This paper 274 EcRIB-209 2013 Spain Ribadeo KT983114 This paper 275 EcRIB-213 2013 Spain Ribadeo KT983115 This paper 276 EcRIB-214 2013 Spain Ribadeo KT983116 This paper 277 EcRIB-215 2013 Spain Ribadeo KT983117 This paper 278 EcRIB-129 2013 Spain Ribadeo KT983118 This paper 279 EcGAN-509 2013 Spain Coruña KT982843 This paper 280 EcGAN-512 2013 Spain Coruña KT982844 This paper 281 EcGAN-528 2013 Spain Coruña KT982845 This paper 282 EcGAN-529 2013 Spain Coruña KT982846 This paper 283 EcGAN-532 2013 Spain Coruña KT982847 This paper 284 EcGAN-535 2013 Spain Coruña KT982848 This paper 285 EcGAN-537 2013 Spain Coruña KT982849 This paper 286 EcGAN-540 2013 Spain Coruña KT982850 This paper 287 EcGAN-544 2013 Spain Coruña KT982851 This paper 288 EcGAN-545 2013 Spain Coruña KT982852 This paper 289 EcGAN-552 2013 Spain Coruña KT982853 This paper 290 EcGAN-515 2013 Spain Coruña KT983127 This paper 291 EcGAN-516 2013 Spain Coruña KT983128 This paper 292 EcGAN-525 2013 Spain Coruña KT983129 This paper

13
293 EcLOU-57 2013 Spain Coruña KT982840 This paper 294 EcLOU-71 2013 Spain Coruña KT982841 This paper 295 EcLOU-98 2013 Spain Coruña KT982842 This paper 296 EcLOU-102 2013 Spain Coruña KT983119 This paper 297 EcLOU-371 2013 Spain Coruña KT983120 This paper 298 EcLOU-391 2013 Spain Coruña KT983121 This paper 299 EcLOU-393 2013 Spain Coruña KT983122 This paper 300 EcLOU-394 2013 Spain Coruña KT983123 This paper 301 EcLOU-412 2013 Spain Coruña KT983124 This paper 302 EcLOU-413 2013 Spain Coruña KT983125 This paper 303 EcLOU-418 2013 Spain Coruña KT983126 This paper 304 EcLOU-454 2013 Spain Coruña KT983130 This paper 305 EcRIA-119 2013 Spain Ría de Arosa KT983180 This paper 306 EcRIA-120 2013 Spain Ría de Arosa KT983181 This paper 307 EcRIA-121 2013 Spain Ría de Arosa KT983182 This paper 308 EcRIA-279 2013 Spain Ría de Arosa KT983183 This paper 309 EcRIA-297 2013 Spain Ría de Arosa KT983184 This paper 310 EcRIA-298 2013 Spain Ría de Arosa KT983185 This paper 311 EcRIA-307 2013 Spain Ría de Arosa KT983186 This paper 312 EcRIA-308 2013 Spain Ría de Arosa KT983187 This paper 313 EcPOV-03 2013 Portugal Viana do Castelo KT982835 This paper 314 EcPOV-10 2013 Portugal Viana do Castelo KT982836 This paper 315 EcPOV-11 2013 Portugal Viana do Castelo KT982837 This paper 316 EcPOV-554 2013 Portugal Viana do Castelo KT982839 This paper 317 EcPOV-16 2013 Portugal Viana do Castelo KT983193 This paper
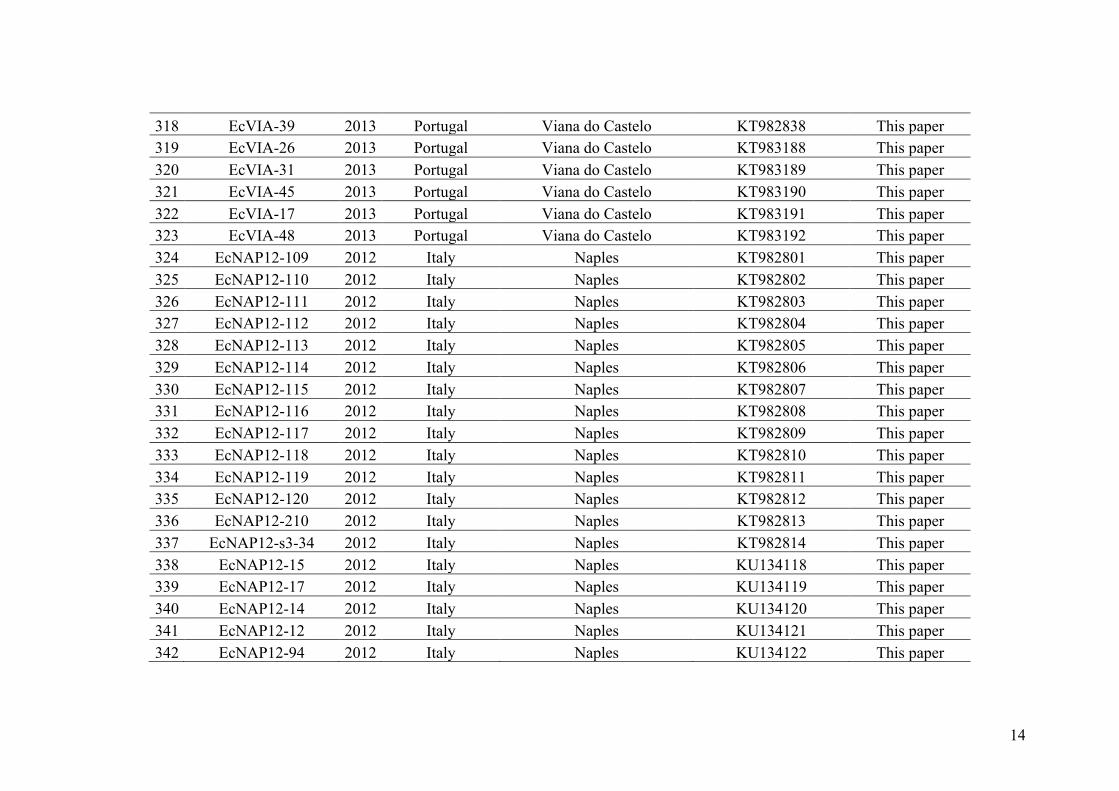
14
318 EcVIA-39 2013 Portugal Viana do Castelo KT982838 This paper 319 EcVIA-26 2013 Portugal Viana do Castelo KT983188 This paper 320 EcVIA-31 2013 Portugal Viana do Castelo KT983189 This paper 321 EcVIA-45 2013 Portugal Viana do Castelo KT983190 This paper 322 EcVIA-17 2013 Portugal Viana do Castelo KT983191 This paper 323 EcVIA-48 2013 Portugal Viana do Castelo KT983192 This paper 324 EcNAP12-109 2012 Italy Naples KT982801 This paper 325 EcNAP12-110 2012 Italy Naples KT982802 This paper 326 EcNAP12-111 2012 Italy Naples KT982803 This paper 327 EcNAP12-112 2012 Italy Naples KT982804 This paper 328 EcNAP12-113 2012 Italy Naples KT982805 This paper 329 EcNAP12-114 2012 Italy Naples KT982806 This paper 330 EcNAP12-115 2012 Italy Naples KT982807 This paper 331 EcNAP12-116 2012 Italy Naples KT982808 This paper 332 EcNAP12-117 2012 Italy Naples KT982809 This paper 333 EcNAP12-118 2012 Italy Naples KT982810 This paper 334 EcNAP12-119 2012 Italy Naples KT982811 This paper 335 EcNAP12-120 2012 Italy Naples KT982812 This paper 336 EcNAP12-210 2012 Italy Naples KT982813 This paper 337 EcNAP12-s3-34 2012 Italy Naples KT982814 This paper 338 EcNAP12-15 2012 Italy Naples KU134118 This paper 339 EcNAP12-17 2012 Italy Naples KU134119 This paper 340 EcNAP12-14 2012 Italy Naples KU134120 This paper 341 EcNAP12-12 2012 Italy Naples KU134121 This paper 342 EcNAP12-94 2012 Italy Naples KU134122 This paper
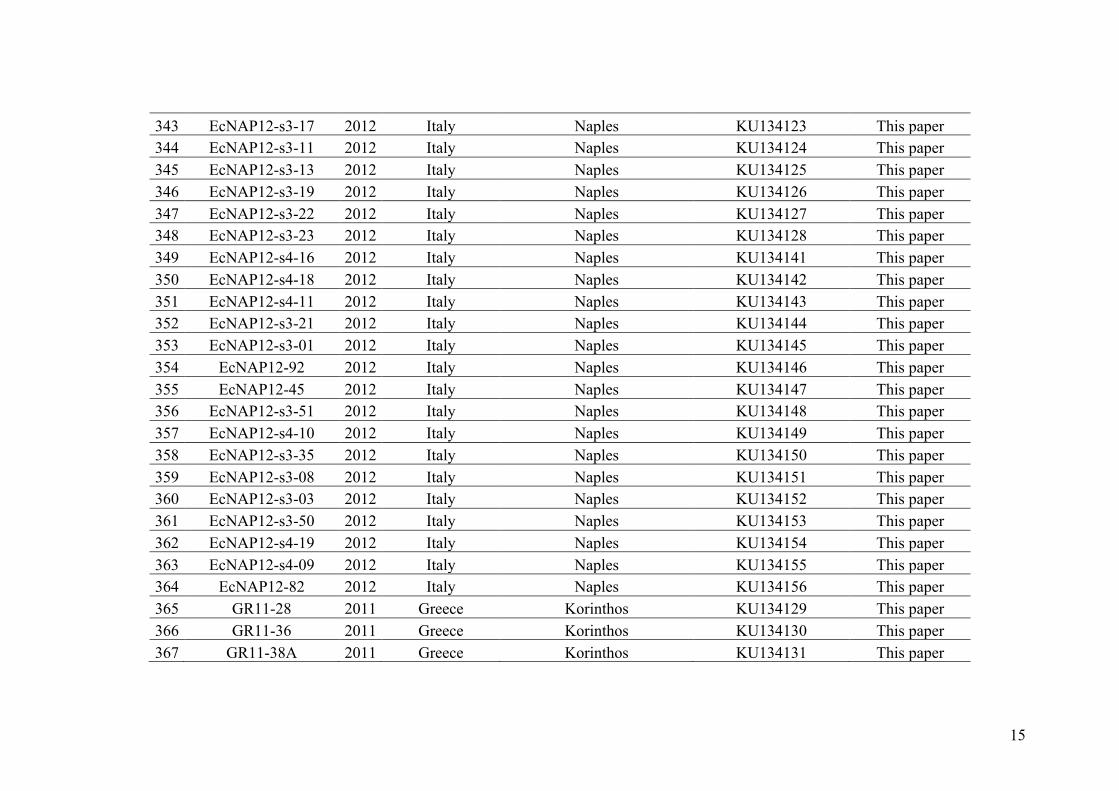
15
343 EcNAP12-s3-17 2012 Italy Naples KU134123 This paper 344 EcNAP12-s3-11 2012 Italy Naples KU134124 This paper 345 EcNAP12-s3-13 2012 Italy Naples KU134125 This paper 346 EcNAP12-s3-19 2012 Italy Naples KU134126 This paper 347 EcNAP12-s3-22 2012 Italy Naples KU134127 This paper 348 EcNAP12-s3-23 2012 Italy Naples KU134128 This paper 349 EcNAP12-s4-16 2012 Italy Naples KU134141 This paper 350 EcNAP12-s4-18 2012 Italy Naples KU134142 This paper 351 EcNAP12-s4-11 2012 Italy Naples KU134143 This paper 352 EcNAP12-s3-21 2012 Italy Naples KU134144 This paper 353 EcNAP12-s3-01 2012 Italy Naples KU134145 This paper 354 EcNAP12-92 2012 Italy Naples KU134146 This paper 355 EcNAP12-45 2012 Italy Naples KU134147 This paper 356 EcNAP12-s3-51 2012 Italy Naples KU134148 This paper 357 EcNAP12-s4-10 2012 Italy Naples KU134149 This paper 358 EcNAP12-s3-35 2012 Italy Naples KU134150 This paper 359 EcNAP12-s3-08 2012 Italy Naples KU134151 This paper 360 EcNAP12-s3-03 2012 Italy Naples KU134152 This paper 361 EcNAP12-s3-50 2012 Italy Naples KU134153 This paper 362 EcNAP12-s4-19 2012 Italy Naples KU134154 This paper 363 EcNAP12-s4-09 2012 Italy Naples KU134155 This paper 364 EcNAP12-82 2012 Italy Naples KU134156 This paper 365 GR11-28 2011 Greece Korinthos KU134129 This paper 366 GR11-36 2011 Greece Korinthos KU134130 This paper 367 GR11-38A 2011 Greece Korinthos KU134131 This paper
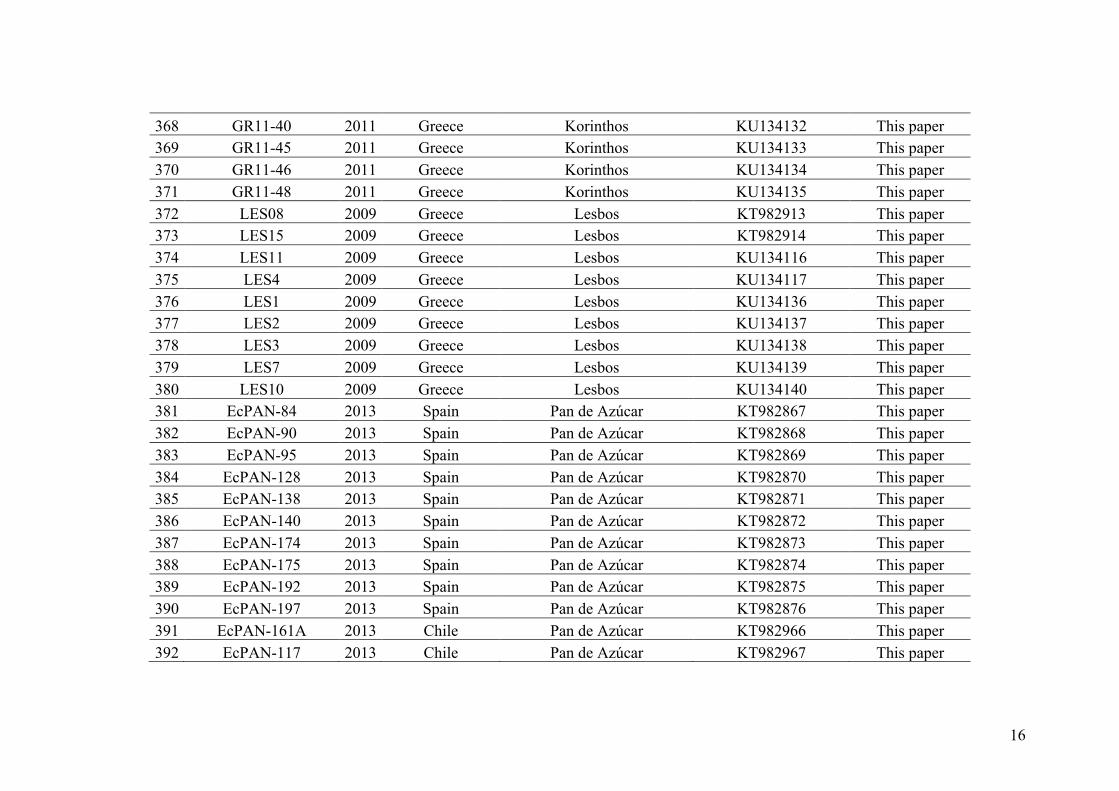
16
368 GR11-40 2011 Greece Korinthos KU134132 This paper 369 GR11-45 2011 Greece Korinthos KU134133 This paper 370 GR11-46 2011 Greece Korinthos KU134134 This paper 371 GR11-48 2011 Greece Korinthos KU134135 This paper 372 LES08 2009 Greece Lesbos KT982913 This paper 373 LES15 2009 Greece Lesbos KT982914 This paper 374 LES11 2009 Greece Lesbos KU134116 This paper 375 LES4 2009 Greece Lesbos KU134117 This paper 376 LES1 2009 Greece Lesbos KU134136 This paper 377 LES2 2009 Greece Lesbos KU134137 This paper 378 LES3 2009 Greece Lesbos KU134138 This paper 379 LES7 2009 Greece Lesbos KU134139 This paper 380 LES10 2009 Greece Lesbos KU134140 This paper 381 EcPAN-84 2013 Spain Pan de Azúcar KT982867 This paper 382 EcPAN-90 2013 Spain Pan de Azúcar KT982868 This paper 383 EcPAN-95 2013 Spain Pan de Azúcar KT982869 This paper 384 EcPAN-128 2013 Spain Pan de Azúcar KT982870 This paper 385 EcPAN-138 2013 Spain Pan de Azúcar KT982871 This paper 386 EcPAN-140 2013 Spain Pan de Azúcar KT982872 This paper 387 EcPAN-174 2013 Spain Pan de Azúcar KT982873 This paper 388 EcPAN-175 2013 Spain Pan de Azúcar KT982874 This paper 389 EcPAN-192 2013 Spain Pan de Azúcar KT982875 This paper 390 EcPAN-197 2013 Spain Pan de Azúcar KT982876 This paper 391 EcPAN-161A 2013 Chile Pan de Azúcar KT982966 This paper 392 EcPAN-117 2013 Chile Pan de Azúcar KT982967 This paper
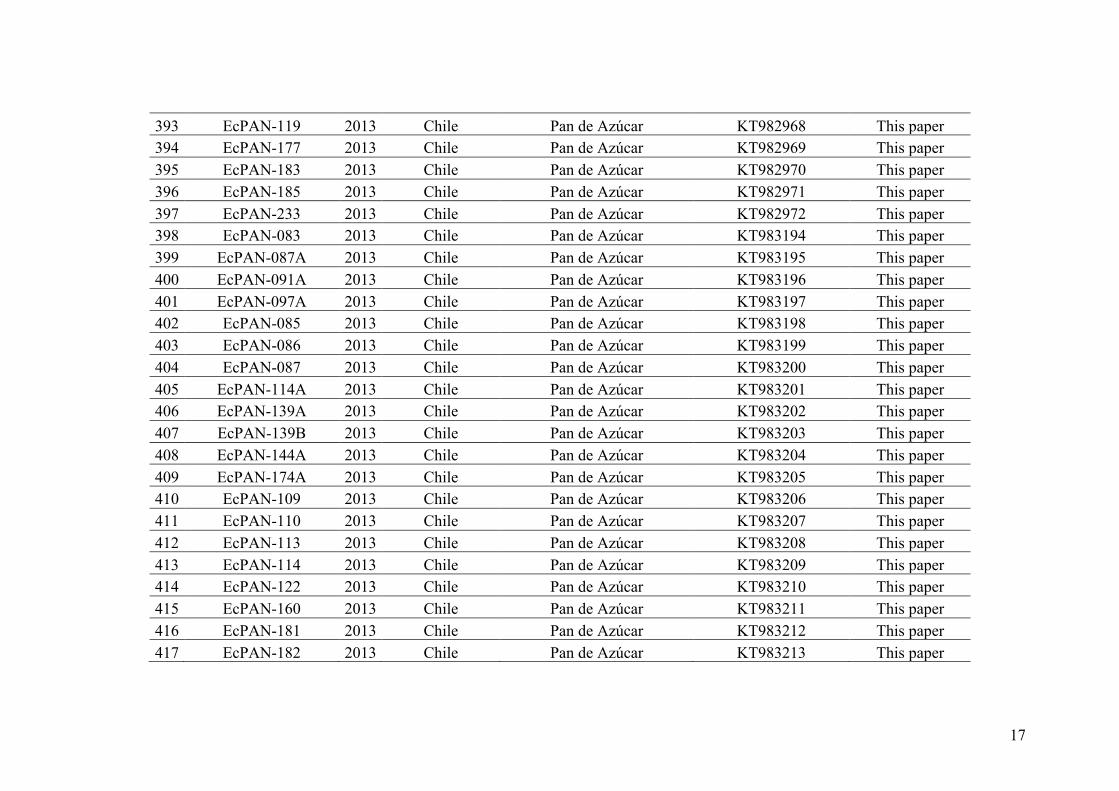
17
393 EcPAN-119 2013 Chile Pan de Azúcar KT982968 This paper 394 EcPAN-177 2013 Chile Pan de Azúcar KT982969 This paper 395 EcPAN-183 2013 Chile Pan de Azúcar KT982970 This paper 396 EcPAN-185 2013 Chile Pan de Azúcar KT982971 This paper 397 EcPAN-233 2013 Chile Pan de Azúcar KT982972 This paper 398 EcPAN-083 2013 Chile Pan de Azúcar KT983194 This paper 399 EcPAN-087A 2013 Chile Pan de Azúcar KT983195 This paper 400 EcPAN-091A 2013 Chile Pan de Azúcar KT983196 This paper 401 EcPAN-097A 2013 Chile Pan de Azúcar KT983197 This paper 402 EcPAN-085 2013 Chile Pan de Azúcar KT983198 This paper 403 EcPAN-086 2013 Chile Pan de Azúcar KT983199 This paper 404 EcPAN-087 2013 Chile Pan de Azúcar KT983200 This paper 405 EcPAN-114A 2013 Chile Pan de Azúcar KT983201 This paper 406 EcPAN-139A 2013 Chile Pan de Azúcar KT983202 This paper 407 EcPAN-139B 2013 Chile Pan de Azúcar KT983203 This paper 408 EcPAN-144A 2013 Chile Pan de Azúcar KT983204 This paper 409 EcPAN-174A 2013 Chile Pan de Azúcar KT983205 This paper 410 EcPAN-109 2013 Chile Pan de Azúcar KT983206 This paper 411 EcPAN-110 2013 Chile Pan de Azúcar KT983207 This paper 412 EcPAN-113 2013 Chile Pan de Azúcar KT983208 This paper 413 EcPAN-114 2013 Chile Pan de Azúcar KT983209 This paper 414 EcPAN-122 2013 Chile Pan de Azúcar KT983210 This paper 415 EcPAN-160 2013 Chile Pan de Azúcar KT983211 This paper 416 EcPAN-181 2013 Chile Pan de Azúcar KT983212 This paper 417 EcPAN-182 2013 Chile Pan de Azúcar KT983213 This paper
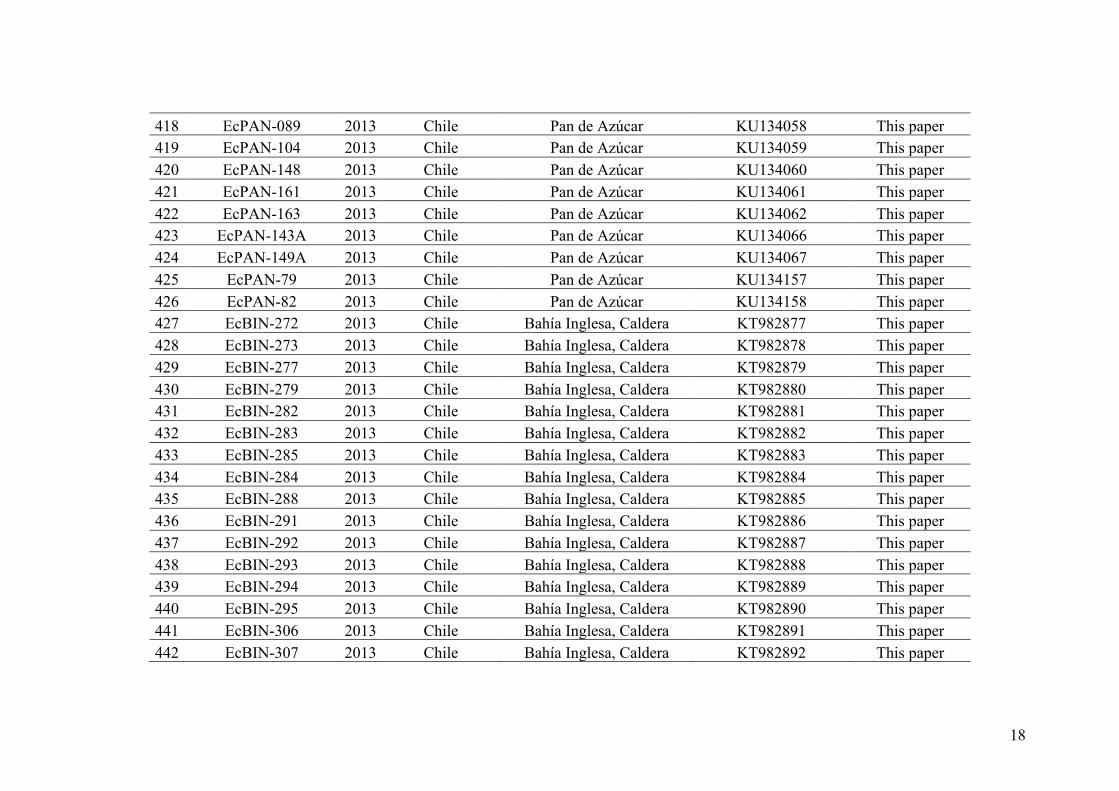
18
418 EcPAN-089 2013 Chile Pan de Azúcar KU134058 This paper 419 EcPAN-104 2013 Chile Pan de Azúcar KU134059 This paper 420 EcPAN-148 2013 Chile Pan de Azúcar KU134060 This paper 421 EcPAN-161 2013 Chile Pan de Azúcar KU134061 This paper 422 EcPAN-163 2013 Chile Pan de Azúcar KU134062 This paper 423 EcPAN-143A 2013 Chile Pan de Azúcar KU134066 This paper 424 EcPAN-149A 2013 Chile Pan de Azúcar KU134067 This paper 425 EcPAN-79 2013 Chile Pan de Azúcar KU134157 This paper 426 EcPAN-82 2013 Chile Pan de Azúcar KU134158 This paper 427 EcBIN-272 2013 Chile Bahía Inglesa, Caldera KT982877 This paper 428 EcBIN-273 2013 Chile Bahía Inglesa, Caldera KT982878 This paper 429 EcBIN-277 2013 Chile Bahía Inglesa, Caldera KT982879 This paper 430 EcBIN-279 2013 Chile Bahía Inglesa, Caldera KT982880 This paper 431 EcBIN-282 2013 Chile Bahía Inglesa, Caldera KT982881 This paper 432 EcBIN-283 2013 Chile Bahía Inglesa, Caldera KT982882 This paper 433 EcBIN-285 2013 Chile Bahía Inglesa, Caldera KT982883 This paper 434 EcBIN-284 2013 Chile Bahía Inglesa, Caldera KT982884 This paper 435 EcBIN-288 2013 Chile Bahía Inglesa, Caldera KT982885 This paper 436 EcBIN-291 2013 Chile Bahía Inglesa, Caldera KT982886 This paper 437 EcBIN-292 2013 Chile Bahía Inglesa, Caldera KT982887 This paper 438 EcBIN-293 2013 Chile Bahía Inglesa, Caldera KT982888 This paper 439 EcBIN-294 2013 Chile Bahía Inglesa, Caldera KT982889 This paper 440 EcBIN-295 2013 Chile Bahía Inglesa, Caldera KT982890 This paper 441 EcBIN-306 2013 Chile Bahía Inglesa, Caldera KT982891 This paper 442 EcBIN-307 2013 Chile Bahía Inglesa, Caldera KT982892 This paper
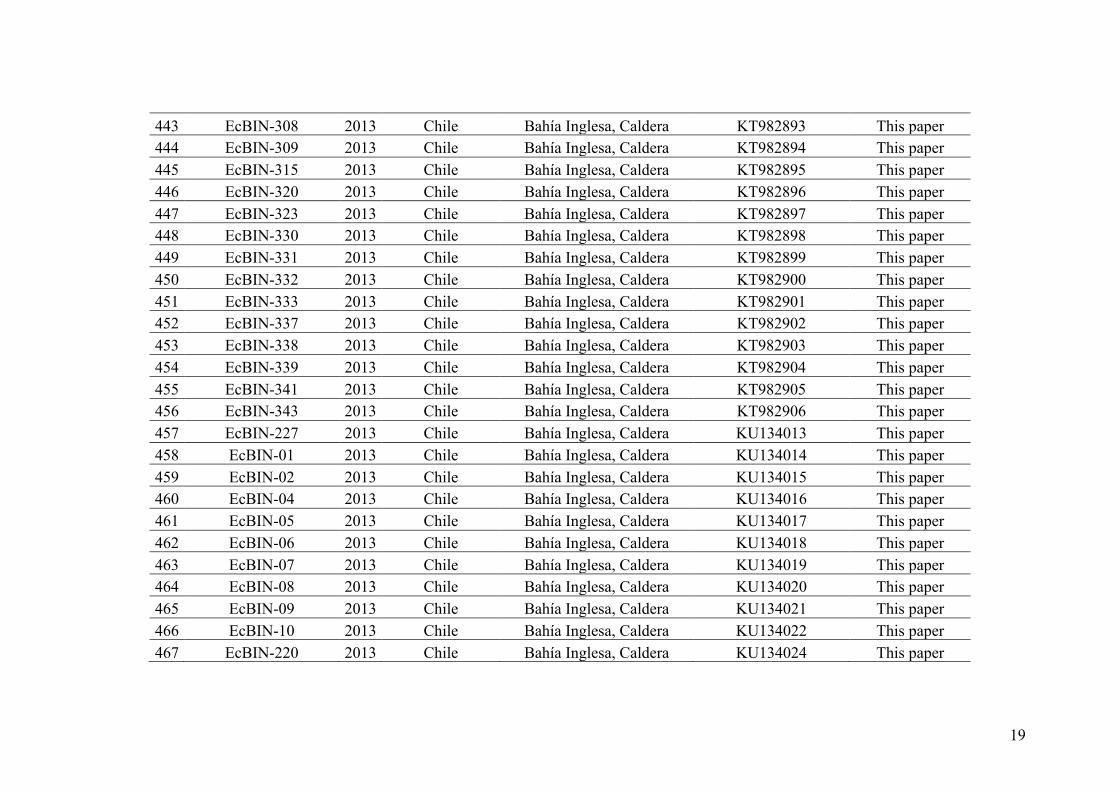
19
443 EcBIN-308 2013 Chile Bahía Inglesa, Caldera KT982893 This paper 444 EcBIN-309 2013 Chile Bahía Inglesa, Caldera KT982894 This paper 445 EcBIN-315 2013 Chile Bahía Inglesa, Caldera KT982895 This paper 446 EcBIN-320 2013 Chile Bahía Inglesa, Caldera KT982896 This paper 447 EcBIN-323 2013 Chile Bahía Inglesa, Caldera KT982897 This paper 448 EcBIN-330 2013 Chile Bahía Inglesa, Caldera KT982898 This paper 449 EcBIN-331 2013 Chile Bahía Inglesa, Caldera KT982899 This paper 450 EcBIN-332 2013 Chile Bahía Inglesa, Caldera KT982900 This paper 451 EcBIN-333 2013 Chile Bahía Inglesa, Caldera KT982901 This paper 452 EcBIN-337 2013 Chile Bahía Inglesa, Caldera KT982902 This paper 453 EcBIN-338 2013 Chile Bahía Inglesa, Caldera KT982903 This paper 454 EcBIN-339 2013 Chile Bahía Inglesa, Caldera KT982904 This paper 455 EcBIN-341 2013 Chile Bahía Inglesa, Caldera KT982905 This paper 456 EcBIN-343 2013 Chile Bahía Inglesa, Caldera KT982906 This paper 457 EcBIN-227 2013 Chile Bahía Inglesa, Caldera KU134013 This paper 458 EcBIN-01 2013 Chile Bahía Inglesa, Caldera KU134014 This paper 459 EcBIN-02 2013 Chile Bahía Inglesa, Caldera KU134015 This paper 460 EcBIN-04 2013 Chile Bahía Inglesa, Caldera KU134016 This paper 461 EcBIN-05 2013 Chile Bahía Inglesa, Caldera KU134017 This paper 462 EcBIN-06 2013 Chile Bahía Inglesa, Caldera KU134018 This paper 463 EcBIN-07 2013 Chile Bahía Inglesa, Caldera KU134019 This paper 464 EcBIN-08 2013 Chile Bahía Inglesa, Caldera KU134020 This paper 465 EcBIN-09 2013 Chile Bahía Inglesa, Caldera KU134021 This paper 466 EcBIN-10 2013 Chile Bahía Inglesa, Caldera KU134022 This paper 467 EcBIN-220 2013 Chile Bahía Inglesa, Caldera KU134024 This paper
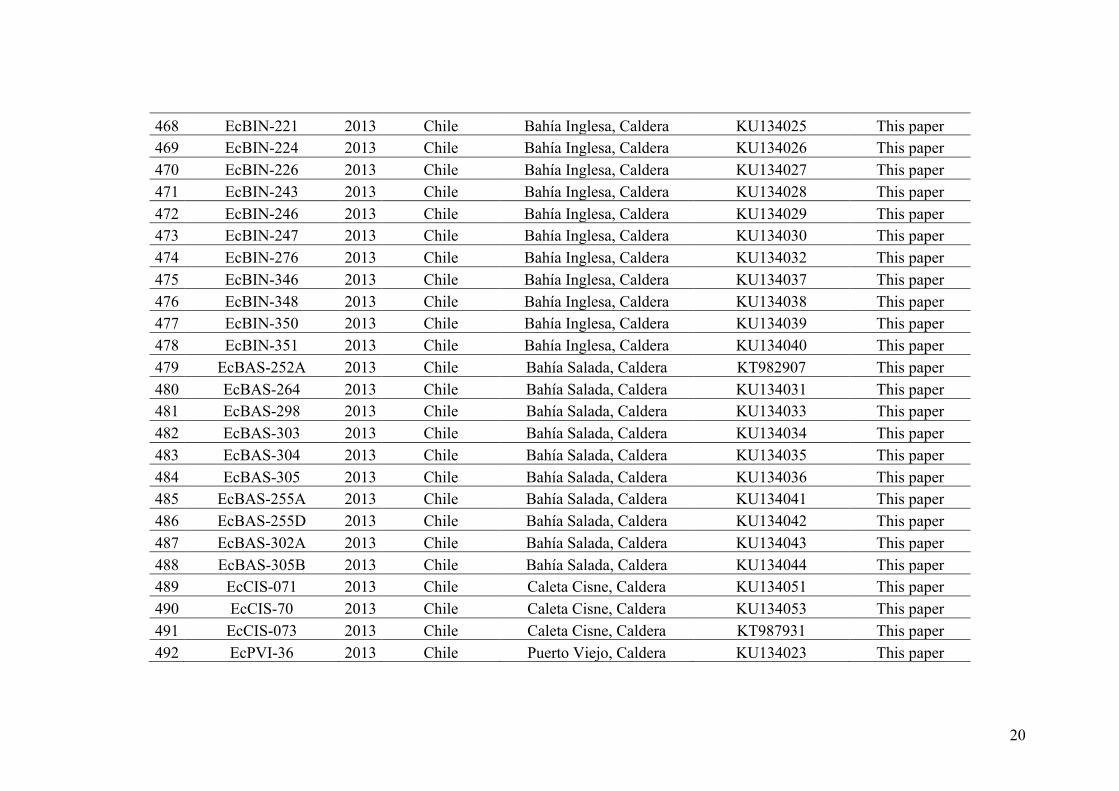
20
468 EcBIN-221 2013 Chile Bahía Inglesa, Caldera KU134025 This paper 469 EcBIN-224 2013 Chile Bahía Inglesa, Caldera KU134026 This paper 470 EcBIN-226 2013 Chile Bahía Inglesa, Caldera KU134027 This paper 471 EcBIN-243 2013 Chile Bahía Inglesa, Caldera KU134028 This paper 472 EcBIN-246 2013 Chile Bahía Inglesa, Caldera KU134029 This paper 473 EcBIN-247 2013 Chile Bahía Inglesa, Caldera KU134030 This paper 474 EcBIN-276 2013 Chile Bahía Inglesa, Caldera KU134032 This paper 475 EcBIN-346 2013 Chile Bahía Inglesa, Caldera KU134037 This paper 476 EcBIN-348 2013 Chile Bahía Inglesa, Caldera KU134038 This paper 477 EcBIN-350 2013 Chile Bahía Inglesa, Caldera KU134039 This paper 478 EcBIN-351 2013 Chile Bahía Inglesa, Caldera KU134040 This paper 479 EcBAS-252A 2013 Chile Bahía Salada, Caldera KT982907 This paper 480 EcBAS-264 2013 Chile Bahía Salada, Caldera KU134031 This paper 481 EcBAS-298 2013 Chile Bahía Salada, Caldera KU134033 This paper 482 EcBAS-303 2013 Chile Bahía Salada, Caldera KU134034 This paper 483 EcBAS-304 2013 Chile Bahía Salada, Caldera KU134035 This paper 484 EcBAS-305 2013 Chile Bahía Salada, Caldera KU134036 This paper 485 EcBAS-255A 2013 Chile Bahía Salada, Caldera KU134041 This paper 486 EcBAS-255D 2013 Chile Bahía Salada, Caldera KU134042 This paper 487 EcBAS-302A 2013 Chile Bahía Salada, Caldera KU134043 This paper 488 EcBAS-305B 2013 Chile Bahía Salada, Caldera KU134044 This paper 489 EcCIS-071 2013 Chile Caleta Cisne, Caldera KU134051 This paper 490 EcCIS-70 2013 Chile Caleta Cisne, Caldera KU134053 This paper 491 EcCIS-073 2013 Chile Caleta Cisne, Caldera KT987931 This paper 492 EcPVI-36 2013 Chile Puerto Viejo, Caldera KU134023 This paper
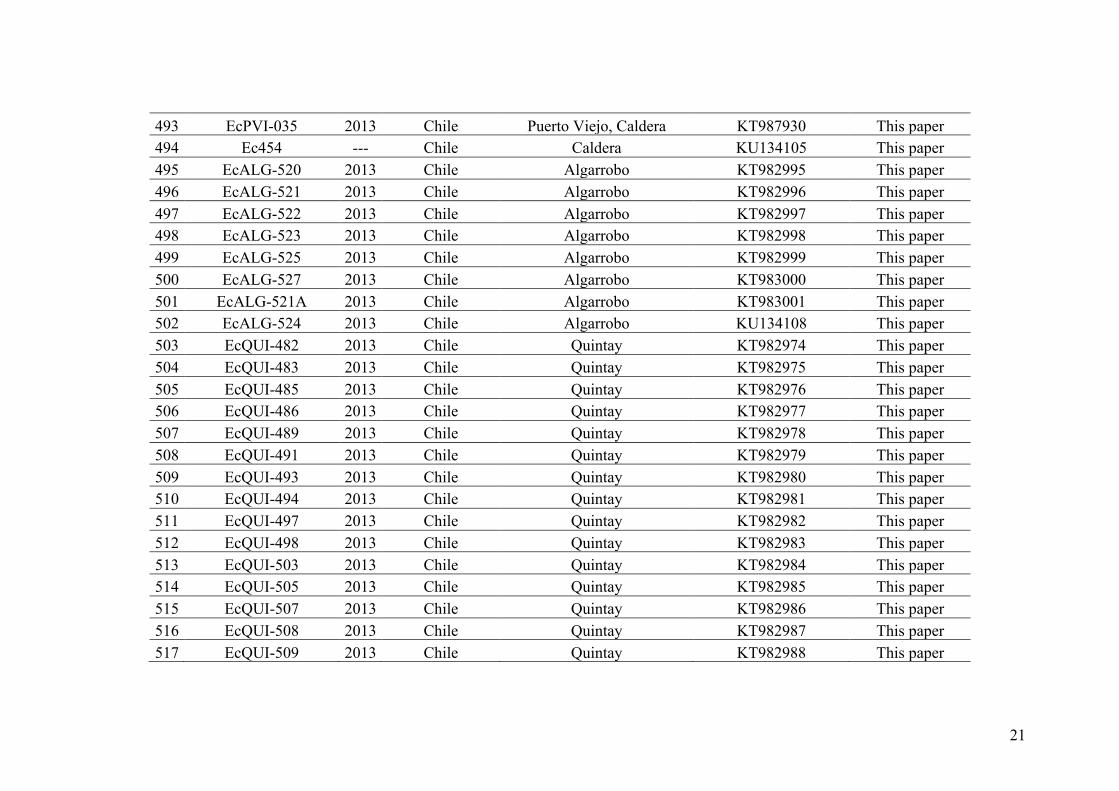
21
493 EcPVI-035 2013 Chile Puerto Viejo, Caldera KT987930 This paper 494 Ec454 --- Chile Caldera KU134105 This paper 495 EcALG-520 2013 Chile Algarrobo KT982995 This paper 496 EcALG-521 2013 Chile Algarrobo KT982996 This paper 497 EcALG-522 2013 Chile Algarrobo KT982997 This paper 498 EcALG-523 2013 Chile Algarrobo KT982998 This paper 499 EcALG-525 2013 Chile Algarrobo KT982999 This paper 500 EcALG-527 2013 Chile Algarrobo KT983000 This paper 501 EcALG-521A 2013 Chile Algarrobo KT983001 This paper 502 EcALG-524 2013 Chile Algarrobo KU134108 This paper 503 EcQUI-482 2013 Chile Quintay KT982974 This paper 504 EcQUI-483 2013 Chile Quintay KT982975 This paper 505 EcQUI-485 2013 Chile Quintay KT982976 This paper 506 EcQUI-486 2013 Chile Quintay KT982977 This paper 507 EcQUI-489 2013 Chile Quintay KT982978 This paper 508 EcQUI-491 2013 Chile Quintay KT982979 This paper 509 EcQUI-493 2013 Chile Quintay KT982980 This paper 510 EcQUI-494 2013 Chile Quintay KT982981 This paper 511 EcQUI-497 2013 Chile Quintay KT982982 This paper 512 EcQUI-498 2013 Chile Quintay KT982983 This paper 513 EcQUI-503 2013 Chile Quintay KT982984 This paper 514 EcQUI-505 2013 Chile Quintay KT982985 This paper 515 EcQUI-507 2013 Chile Quintay KT982986 This paper 516 EcQUI-508 2013 Chile Quintay KT982987 This paper 517 EcQUI-509 2013 Chile Quintay KT982988 This paper
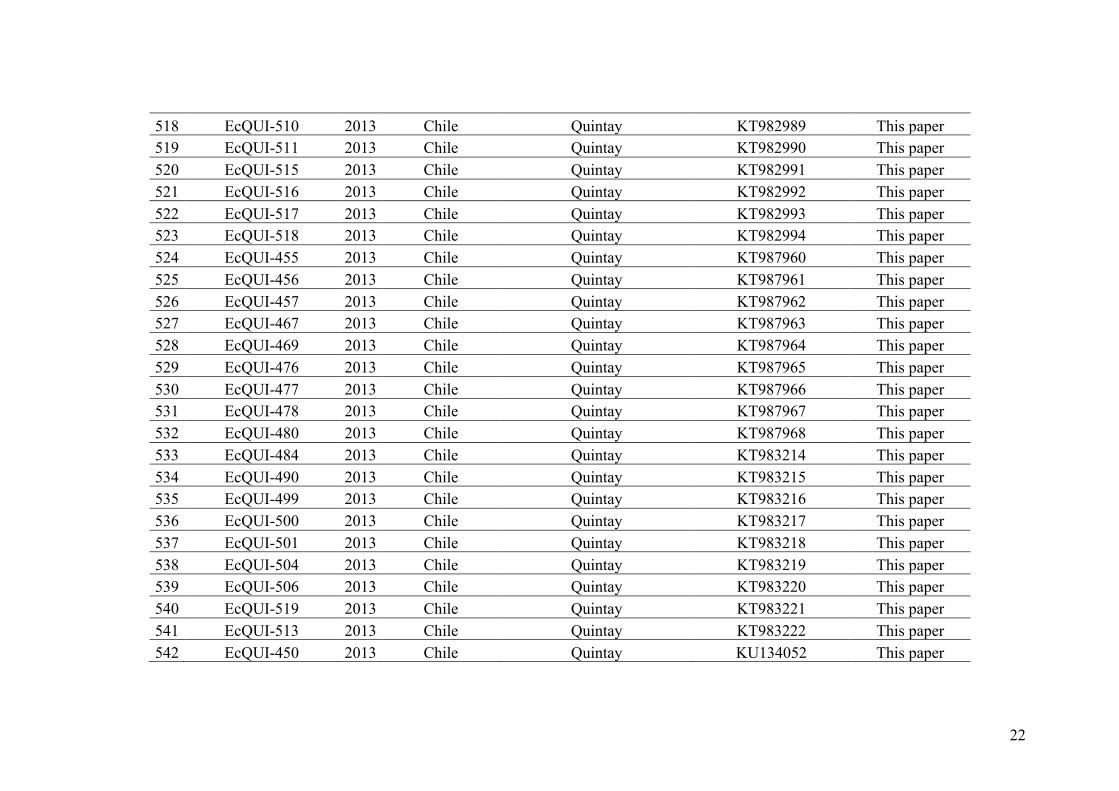
22
518 EcQUI-510 2013 Chile Quintay KT982989 This paper 519 EcQUI-511 2013 Chile Quintay KT982990 This paper 520 EcQUI-515 2013 Chile Quintay KT982991 This paper 521 EcQUI-516 2013 Chile Quintay KT982992 This paper 522 EcQUI-517 2013 Chile Quintay KT982993 This paper 523 EcQUI-518 2013 Chile Quintay KT982994 This paper 524 EcQUI-455 2013 Chile Quintay KT987960 This paper 525 EcQUI-456 2013 Chile Quintay KT987961 This paper 526 EcQUI-457 2013 Chile Quintay KT987962 This paper 527 EcQUI-467 2013 Chile Quintay KT987963 This paper 528 EcQUI-469 2013 Chile Quintay KT987964 This paper 529 EcQUI-476 2013 Chile Quintay KT987965 This paper 530 EcQUI-477 2013 Chile Quintay KT987966 This paper 531 EcQUI-478 2013 Chile Quintay KT987967 This paper 532 EcQUI-480 2013 Chile Quintay KT987968 This paper 533 EcQUI-484 2013 Chile Quintay KT983214 This paper 534 EcQUI-490 2013 Chile Quintay KT983215 This paper 535 EcQUI-499 2013 Chile Quintay KT983216 This paper 536 EcQUI-500 2013 Chile Quintay KT983217 This paper 537 EcQUI-501 2013 Chile Quintay KT983218 This paper 538 EcQUI-504 2013 Chile Quintay KT983219 This paper 539 EcQUI-506 2013 Chile Quintay KT983220 This paper 540 EcQUI-519 2013 Chile Quintay KT983221 This paper 541 EcQUI-513 2013 Chile Quintay KT983222 This paper 542 EcQUI-450 2013 Chile Quintay KU134052 This paper
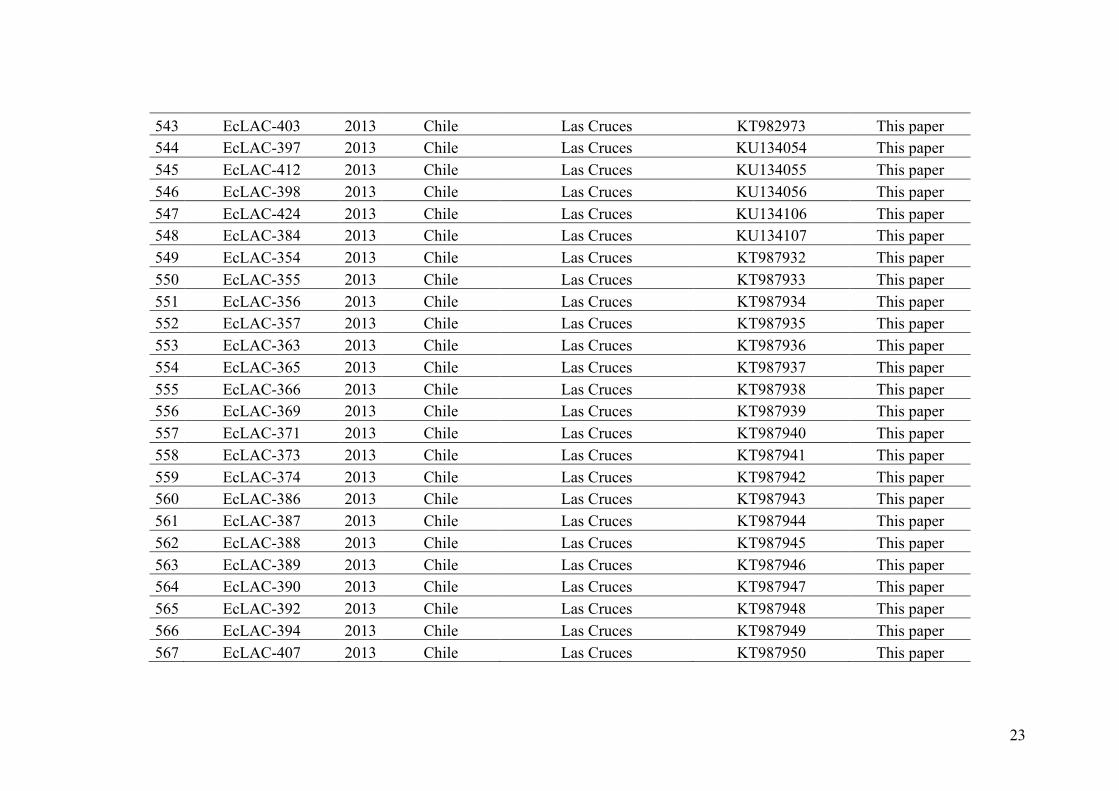
23
543 EcLAC-403 2013 Chile Las Cruces KT982973 This paper 544 EcLAC-397 2013 Chile Las Cruces KU134054 This paper 545 EcLAC-412 2013 Chile Las Cruces KU134055 This paper 546 EcLAC-398 2013 Chile Las Cruces KU134056 This paper 547 EcLAC-424 2013 Chile Las Cruces KU134106 This paper 548 EcLAC-384 2013 Chile Las Cruces KU134107 This paper 549 EcLAC-354 2013 Chile Las Cruces KT987932 This paper 550 EcLAC-355 2013 Chile Las Cruces KT987933 This paper 551 EcLAC-356 2013 Chile Las Cruces KT987934 This paper 552 EcLAC-357 2013 Chile Las Cruces KT987935 This paper 553 EcLAC-363 2013 Chile Las Cruces KT987936 This paper 554 EcLAC-365 2013 Chile Las Cruces KT987937 This paper 555 EcLAC-366 2013 Chile Las Cruces KT987938 This paper 556 EcLAC-369 2013 Chile Las Cruces KT987939 This paper 557 EcLAC-371 2013 Chile Las Cruces KT987940 This paper 558 EcLAC-373 2013 Chile Las Cruces KT987941 This paper 559 EcLAC-374 2013 Chile Las Cruces KT987942 This paper 560 EcLAC-386 2013 Chile Las Cruces KT987943 This paper 561 EcLAC-387 2013 Chile Las Cruces KT987944 This paper 562 EcLAC-388 2013 Chile Las Cruces KT987945 This paper 563 EcLAC-389 2013 Chile Las Cruces KT987946 This paper 564 EcLAC-390 2013 Chile Las Cruces KT987947 This paper 565 EcLAC-392 2013 Chile Las Cruces KT987948 This paper 566 EcLAC-394 2013 Chile Las Cruces KT987949 This paper 567 EcLAC-407 2013 Chile Las Cruces KT987950 This paper
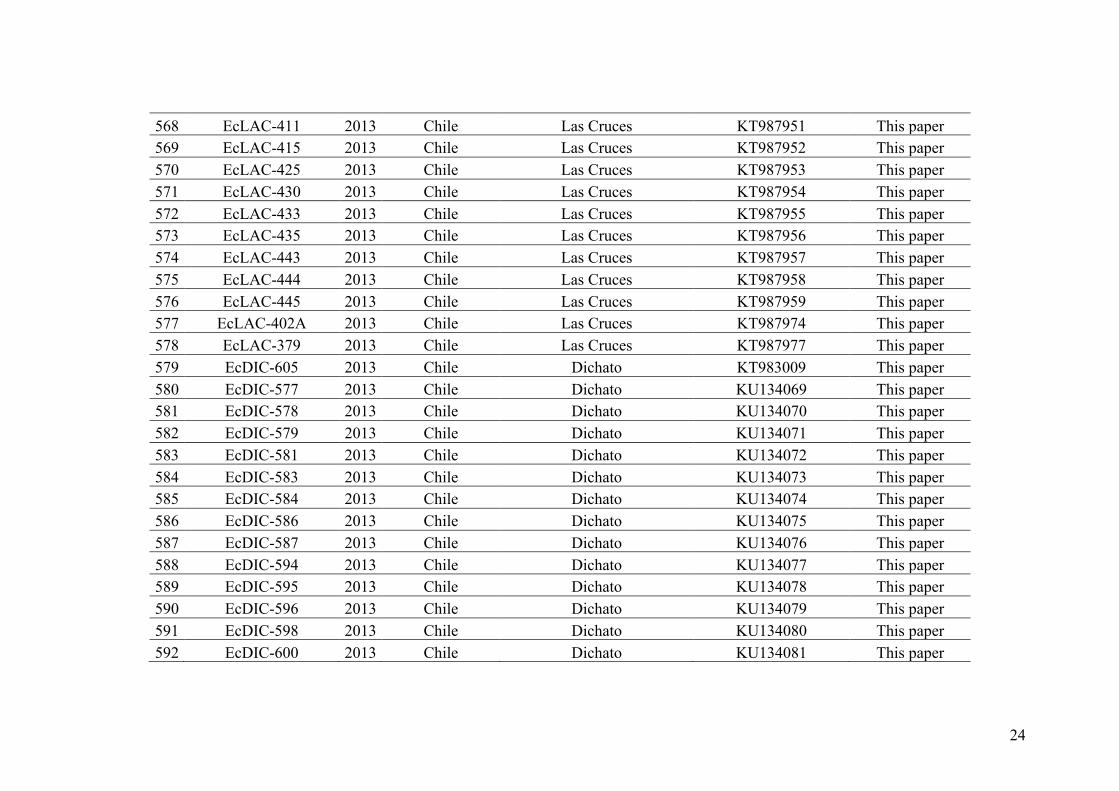
24
568 EcLAC-411 2013 Chile Las Cruces KT987951 This paper 569 EcLAC-415 2013 Chile Las Cruces KT987952 This paper 570 EcLAC-425 2013 Chile Las Cruces KT987953 This paper 571 EcLAC-430 2013 Chile Las Cruces KT987954 This paper 572 EcLAC-433 2013 Chile Las Cruces KT987955 This paper 573 EcLAC-435 2013 Chile Las Cruces KT987956 This paper 574 EcLAC-443 2013 Chile Las Cruces KT987957 This paper 575 EcLAC-444 2013 Chile Las Cruces KT987958 This paper 576 EcLAC-445 2013 Chile Las Cruces KT987959 This paper 577 EcLAC-402A 2013 Chile Las Cruces KT987974 This paper 578 EcLAC-379 2013 Chile Las Cruces KT987977 This paper 579 EcDIC-605 2013 Chile Dichato KT983009 This paper 580 EcDIC-577 2013 Chile Dichato KU134069 This paper 581 EcDIC-578 2013 Chile Dichato KU134070 This paper 582 EcDIC-579 2013 Chile Dichato KU134071 This paper 583 EcDIC-581 2013 Chile Dichato KU134072 This paper 584 EcDIC-583 2013 Chile Dichato KU134073 This paper 585 EcDIC-584 2013 Chile Dichato KU134074 This paper 586 EcDIC-586 2013 Chile Dichato KU134075 This paper 587 EcDIC-587 2013 Chile Dichato KU134076 This paper 588 EcDIC-594 2013 Chile Dichato KU134077 This paper 589 EcDIC-595 2013 Chile Dichato KU134078 This paper 590 EcDIC-596 2013 Chile Dichato KU134079 This paper 591 EcDIC-598 2013 Chile Dichato KU134080 This paper 592 EcDIC-600 2013 Chile Dichato KU134081 This paper
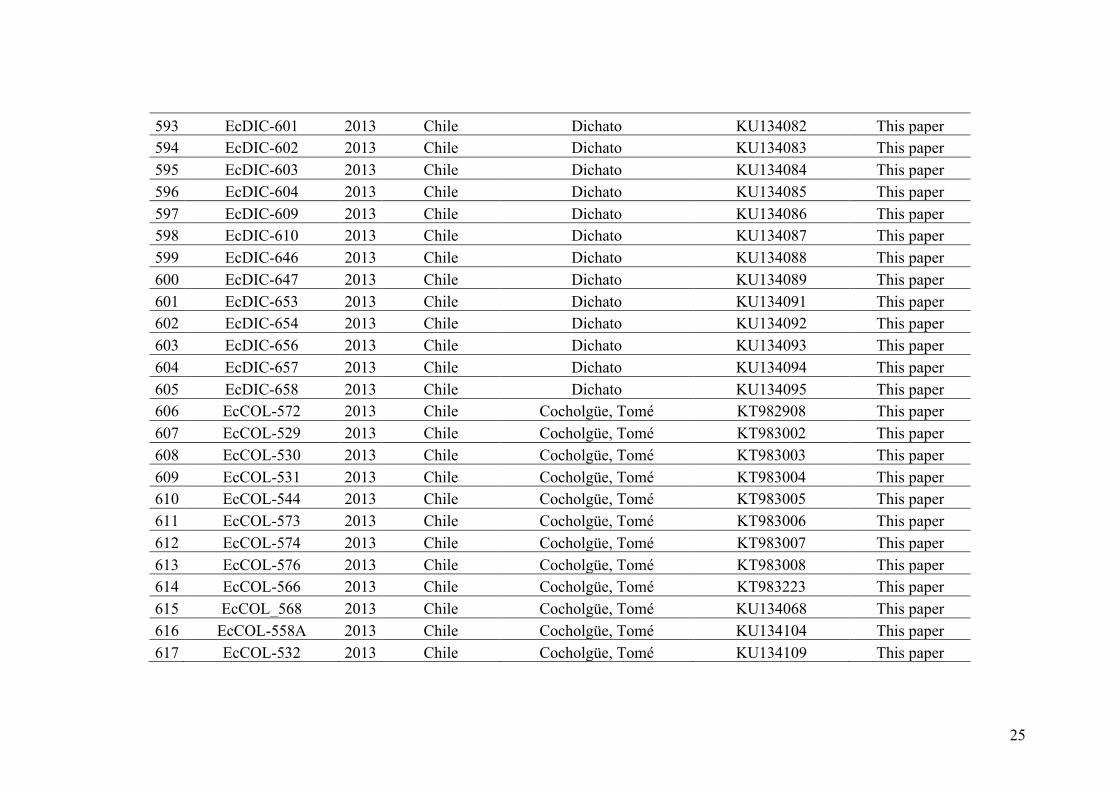
25
593 EcDIC-601 2013 Chile Dichato KU134082 This paper 594 EcDIC-602 2013 Chile Dichato KU134083 This paper 595 EcDIC-603 2013 Chile Dichato KU134084 This paper 596 EcDIC-604 2013 Chile Dichato KU134085 This paper 597 EcDIC-609 2013 Chile Dichato KU134086 This paper 598 EcDIC-610 2013 Chile Dichato KU134087 This paper 599 EcDIC-646 2013 Chile Dichato KU134088 This paper 600 EcDIC-647 2013 Chile Dichato KU134089 This paper 601 EcDIC-653 2013 Chile Dichato KU134091 This paper 602 EcDIC-654 2013 Chile Dichato KU134092 This paper 603 EcDIC-656 2013 Chile Dichato KU134093 This paper 604 EcDIC-657 2013 Chile Dichato KU134094 This paper 605 EcDIC-658 2013 Chile Dichato KU134095 This paper 606 EcCOL-572 2013 Chile Cocholgüe, Tomé KT982908 This paper 607 EcCOL-529 2013 Chile Cocholgüe, Tomé KT983002 This paper 608 EcCOL-530 2013 Chile Cocholgüe, Tomé KT983003 This paper 609 EcCOL-531 2013 Chile Cocholgüe, Tomé KT983004 This paper 610 EcCOL-544 2013 Chile Cocholgüe, Tomé KT983005 This paper 611 EcCOL-573 2013 Chile Cocholgüe, Tomé KT983006 This paper 612 EcCOL-574 2013 Chile Cocholgüe, Tomé KT983007 This paper 613 EcCOL-576 2013 Chile Cocholgüe, Tomé KT983008 This paper 614 EcCOL-566 2013 Chile Cocholgüe, Tomé KT983223 This paper 615 EcCOL_568 2013 Chile Cocholgüe, Tomé KU134068 This paper 616 EcCOL-558A 2013 Chile Cocholgüe, Tomé KU134104 This paper 617 EcCOL-532 2013 Chile Cocholgüe, Tomé KU134109 This paper
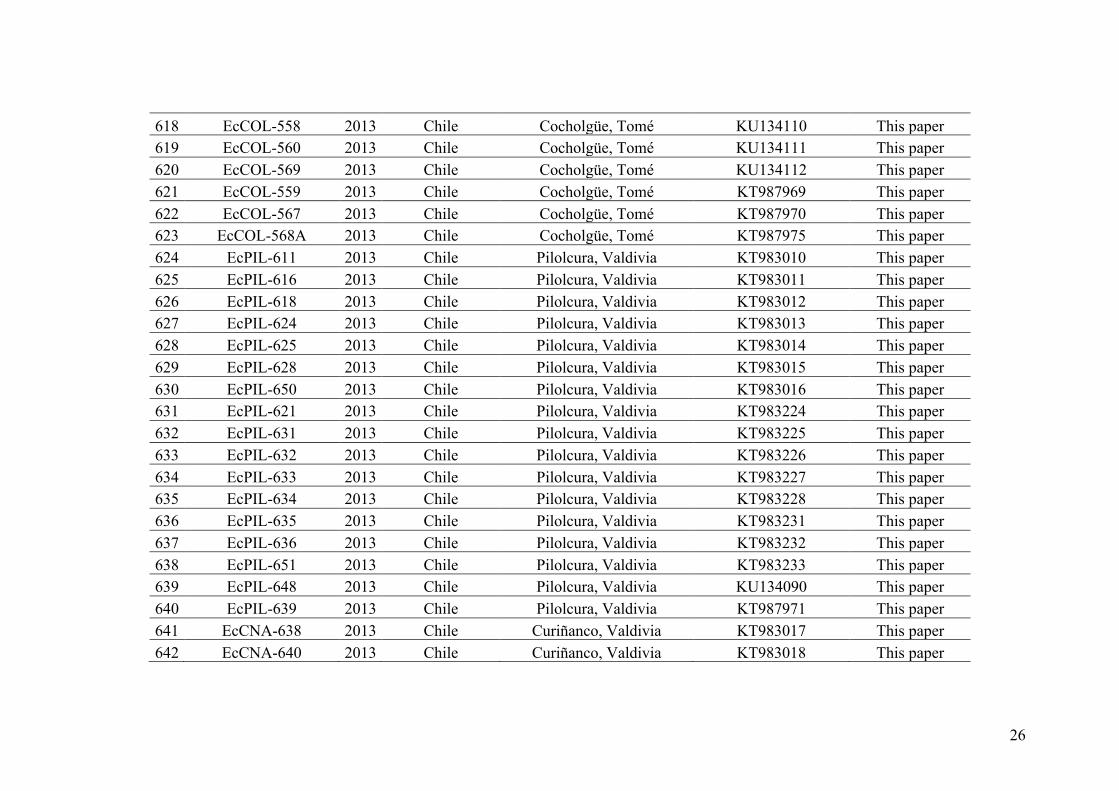
26
618 EcCOL-558 2013 Chile Cocholgüe, Tomé KU134110 This paper 619 EcCOL-560 2013 Chile Cocholgüe, Tomé KU134111 This paper 620 EcCOL-569 2013 Chile Cocholgüe, Tomé KU134112 This paper 621 EcCOL-559 2013 Chile Cocholgüe, Tomé KT987969 This paper 622 EcCOL-567 2013 Chile Cocholgüe, Tomé KT987970 This paper 623 EcCOL-568A 2013 Chile Cocholgüe, Tomé KT987975 This paper 624 EcPIL-611 2013 Chile Pilolcura, Valdivia KT983010 This paper 625 EcPIL-616 2013 Chile Pilolcura, Valdivia KT983011 This paper 626 EcPIL-618 2013 Chile Pilolcura, Valdivia KT983012 This paper 627 EcPIL-624 2013 Chile Pilolcura, Valdivia KT983013 This paper 628 EcPIL-625 2013 Chile Pilolcura, Valdivia KT983014 This paper 629 EcPIL-628 2013 Chile Pilolcura, Valdivia KT983015 This paper 630 EcPIL-650 2013 Chile Pilolcura, Valdivia KT983016 This paper 631 EcPIL-621 2013 Chile Pilolcura, Valdivia KT983224 This paper 632 EcPIL-631 2013 Chile Pilolcura, Valdivia KT983225 This paper 633 EcPIL-632 2013 Chile Pilolcura, Valdivia KT983226 This paper 634 EcPIL-633 2013 Chile Pilolcura, Valdivia KT983227 This paper 635 EcPIL-634 2013 Chile Pilolcura, Valdivia KT983228 This paper 636 EcPIL-635 2013 Chile Pilolcura, Valdivia KT983231 This paper 637 EcPIL-636 2013 Chile Pilolcura, Valdivia KT983232 This paper 638 EcPIL-651 2013 Chile Pilolcura, Valdivia KT983233 This paper 639 EcPIL-648 2013 Chile Pilolcura, Valdivia KU134090 This paper 640 EcPIL-639 2013 Chile Pilolcura, Valdivia KT987971 This paper 641 EcCNA-638 2013 Chile Curiñanco, Valdivia KT983017 This paper 642 EcCNA-640 2013 Chile Curiñanco, Valdivia KT983018 This paper
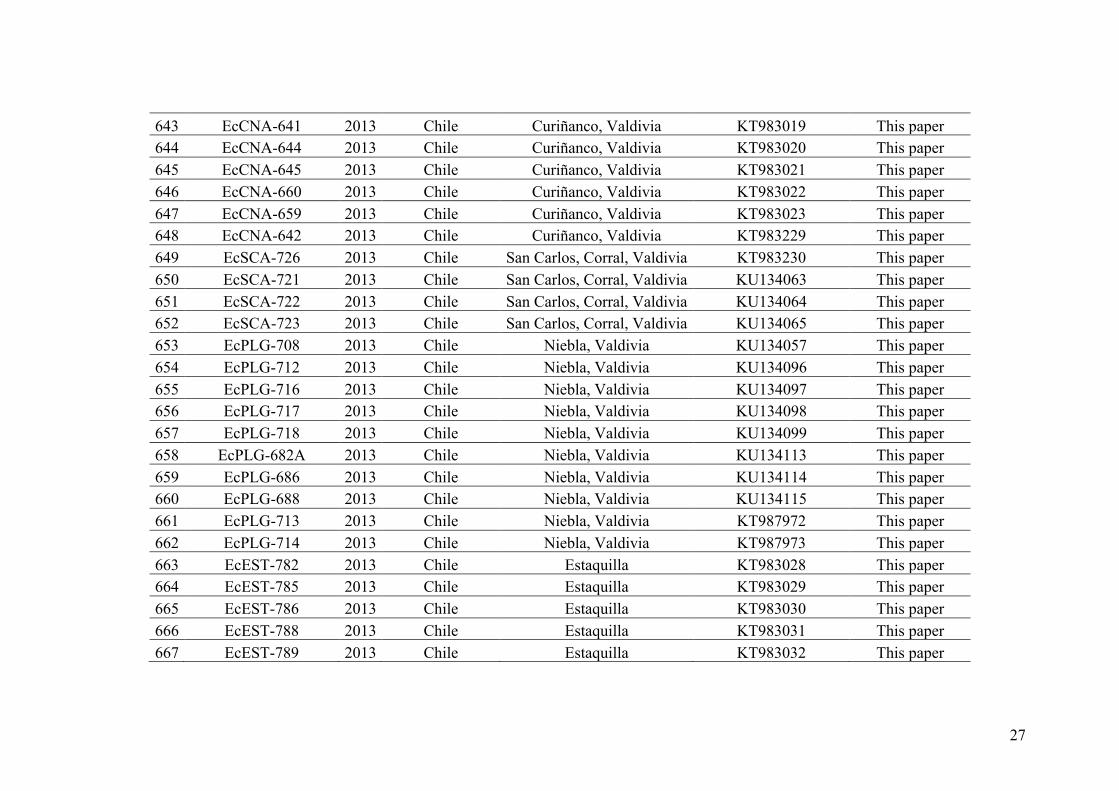
27
643 EcCNA-641 2013 Chile Curiñanco, Valdivia KT983019 This paper 644 EcCNA-644 2013 Chile Curiñanco, Valdivia KT983020 This paper 645 EcCNA-645 2013 Chile Curiñanco, Valdivia KT983021 This paper 646 EcCNA-660 2013 Chile Curiñanco, Valdivia KT983022 This paper 647 EcCNA-659 2013 Chile Curiñanco, Valdivia KT983023 This paper 648 EcCNA-642 2013 Chile Curiñanco, Valdivia KT983229 This paper 649 EcSCA-726 2013 Chile San Carlos, Corral, Valdivia KT983230 This paper 650 EcSCA-721 2013 Chile San Carlos, Corral, Valdivia KU134063 This paper 651 EcSCA-722 2013 Chile San Carlos, Corral, Valdivia KU134064 This paper 652 EcSCA-723 2013 Chile San Carlos, Corral, Valdivia KU134065 This paper 653 EcPLG-708 2013 Chile Niebla, Valdivia KU134057 This paper 654 EcPLG-712 2013 Chile Niebla, Valdivia KU134096 This paper 655 EcPLG-716 2013 Chile Niebla, Valdivia KU134097 This paper 656 EcPLG-717 2013 Chile Niebla, Valdivia KU134098 This paper 657 EcPLG-718 2013 Chile Niebla, Valdivia KU134099 This paper 658 EcPLG-682A 2013 Chile Niebla, Valdivia KU134113 This paper 659 EcPLG-686 2013 Chile Niebla, Valdivia KU134114 This paper 660 EcPLG-688 2013 Chile Niebla, Valdivia KU134115 This paper 661 EcPLG-713 2013 Chile Niebla, Valdivia KT987972 This paper 662 EcPLG-714 2013 Chile Niebla, Valdivia KT987973 This paper 663 EcEST-782 2013 Chile Estaquilla KT983028 This paper 664 EcEST-785 2013 Chile Estaquilla KT983029 This paper 665 EcEST-786 2013 Chile Estaquilla KT983030 This paper 666 EcEST-788 2013 Chile Estaquilla KT983031 This paper 667 EcEST-789 2013 Chile Estaquilla KT983032 This paper
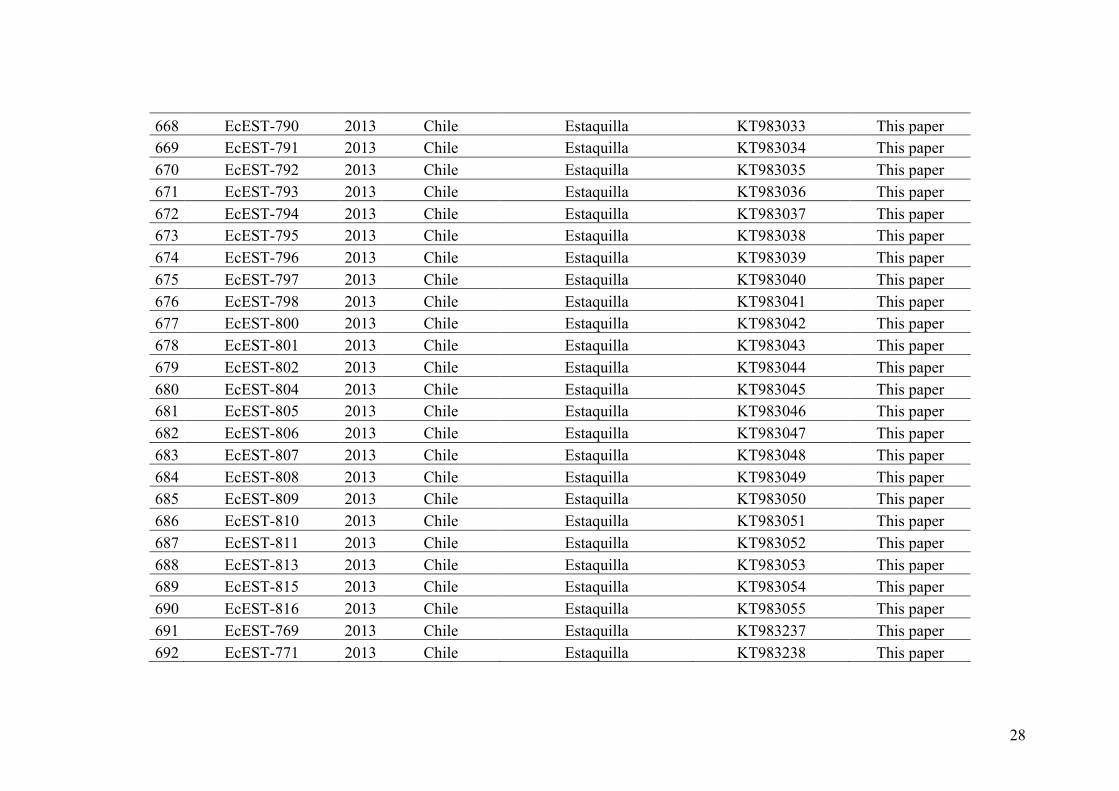
28
668 EcEST-790 2013 Chile Estaquilla KT983033 This paper 669 EcEST-791 2013 Chile Estaquilla KT983034 This paper 670 EcEST-792 2013 Chile Estaquilla KT983035 This paper 671 EcEST-793 2013 Chile Estaquilla KT983036 This paper 672 EcEST-794 2013 Chile Estaquilla KT983037 This paper 673 EcEST-795 2013 Chile Estaquilla KT983038 This paper 674 EcEST-796 2013 Chile Estaquilla KT983039 This paper 675 EcEST-797 2013 Chile Estaquilla KT983040 This paper 676 EcEST-798 2013 Chile Estaquilla KT983041 This paper 677 EcEST-800 2013 Chile Estaquilla KT983042 This paper 678 EcEST-801 2013 Chile Estaquilla KT983043 This paper 679 EcEST-802 2013 Chile Estaquilla KT983044 This paper 680 EcEST-804 2013 Chile Estaquilla KT983045 This paper 681 EcEST-805 2013 Chile Estaquilla KT983046 This paper 682 EcEST-806 2013 Chile Estaquilla KT983047 This paper 683 EcEST-807 2013 Chile Estaquilla KT983048 This paper 684 EcEST-808 2013 Chile Estaquilla KT983049 This paper 685 EcEST-809 2013 Chile Estaquilla KT983050 This paper 686 EcEST-810 2013 Chile Estaquilla KT983051 This paper 687 EcEST-811 2013 Chile Estaquilla KT983052 This paper 688 EcEST-813 2013 Chile Estaquilla KT983053 This paper 689 EcEST-815 2013 Chile Estaquilla KT983054 This paper 690 EcEST-816 2013 Chile Estaquilla KT983055 This paper 691 EcEST-769 2013 Chile Estaquilla KT983237 This paper 692 EcEST-771 2013 Chile Estaquilla KT983238 This paper
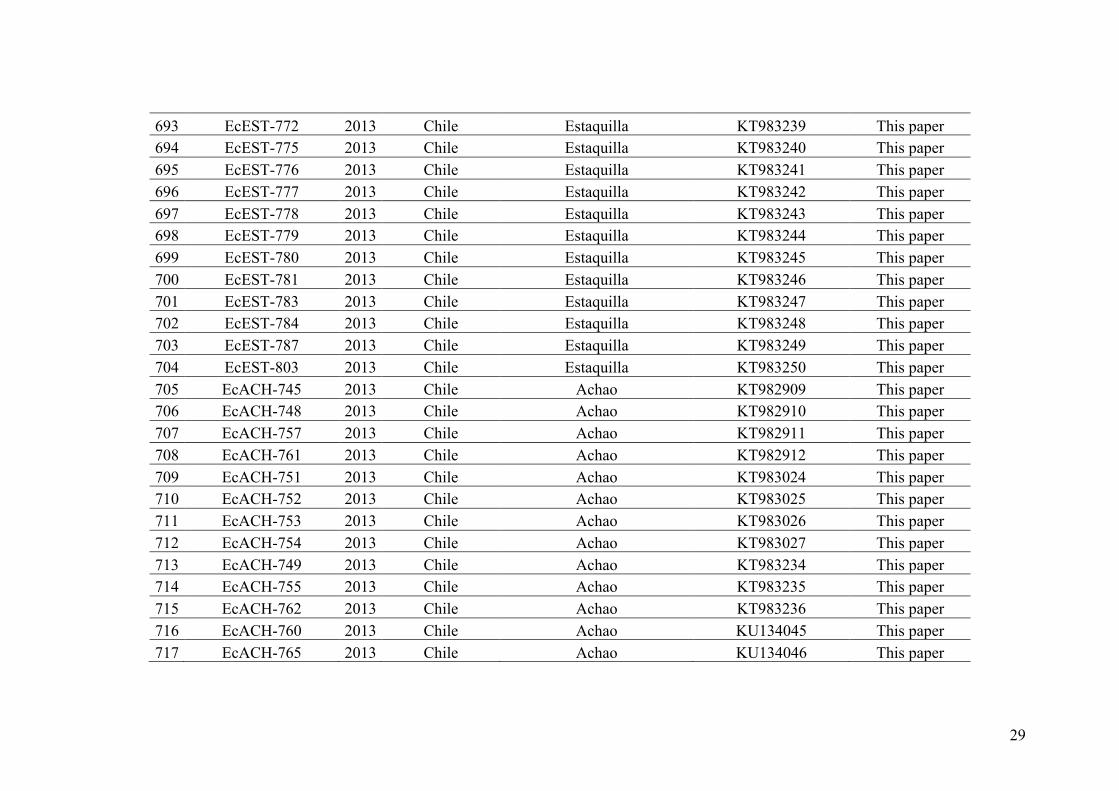
29
693 EcEST-772 2013 Chile Estaquilla KT983239 This paper 694 EcEST-775 2013 Chile Estaquilla KT983240 This paper 695 EcEST-776 2013 Chile Estaquilla KT983241 This paper 696 EcEST-777 2013 Chile Estaquilla KT983242 This paper 697 EcEST-778 2013 Chile Estaquilla KT983243 This paper 698 EcEST-779 2013 Chile Estaquilla KT983244 This paper 699 EcEST-780 2013 Chile Estaquilla KT983245 This paper 700 EcEST-781 2013 Chile Estaquilla KT983246 This paper 701 EcEST-783 2013 Chile Estaquilla KT983247 This paper 702 EcEST-784 2013 Chile Estaquilla KT983248 This paper 703 EcEST-787 2013 Chile Estaquilla KT983249 This paper 704 EcEST-803 2013 Chile Estaquilla KT983250 This paper 705 EcACH-745 2013 Chile Achao KT982909 This paper 706 EcACH-748 2013 Chile Achao KT982910 This paper 707 EcACH-757 2013 Chile Achao KT982911 This paper 708 EcACH-761 2013 Chile Achao KT982912 This paper 709 EcACH-751 2013 Chile Achao KT983024 This paper 710 EcACH-752 2013 Chile Achao KT983025 This paper 711 EcACH-753 2013 Chile Achao KT983026 This paper 712 EcACH-754 2013 Chile Achao KT983027 This paper 713 EcACH-749 2013 Chile Achao KT983234 This paper 714 EcACH-755 2013 Chile Achao KT983235 This paper 715 EcACH-762 2013 Chile Achao KT983236 This paper 716 EcACH-760 2013 Chile Achao KU134045 This paper 717 EcACH-765 2013 Chile Achao KU134046 This paper
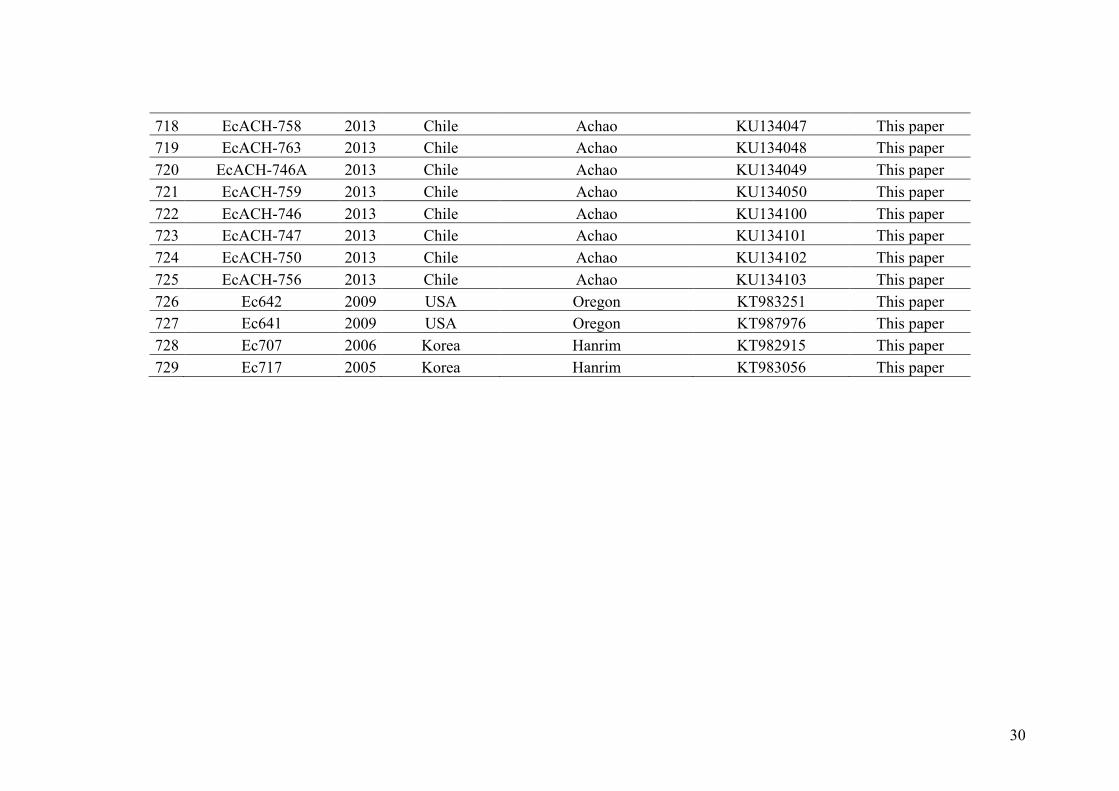
30
718 EcACH-758 2013 Chile Achao KU134047 This paper 719 EcACH-763 2013 Chile Achao KU134048 This paper 720 EcACH-746A 2013 Chile Achao KU134049 This paper 721 EcACH-759 2013 Chile Achao KU134050 This paper 722 EcACH-746 2013 Chile Achao KU134100 This paper 723 EcACH-747 2013 Chile Achao KU134101 This paper 724 EcACH-750 2013 Chile Achao KU134102 This paper 725 EcACH-756 2013 Chile Achao KU134103 This paper 726 Ec642 2009 USA Oregon KT983251 This paper 727 Ec641 2009 USA Oregon KT987976 This paper 728 Ec707 2006 Korea Hanrim KT982915 This paper 729 Ec717 2005 Korea Hanrim KT983056 This paper
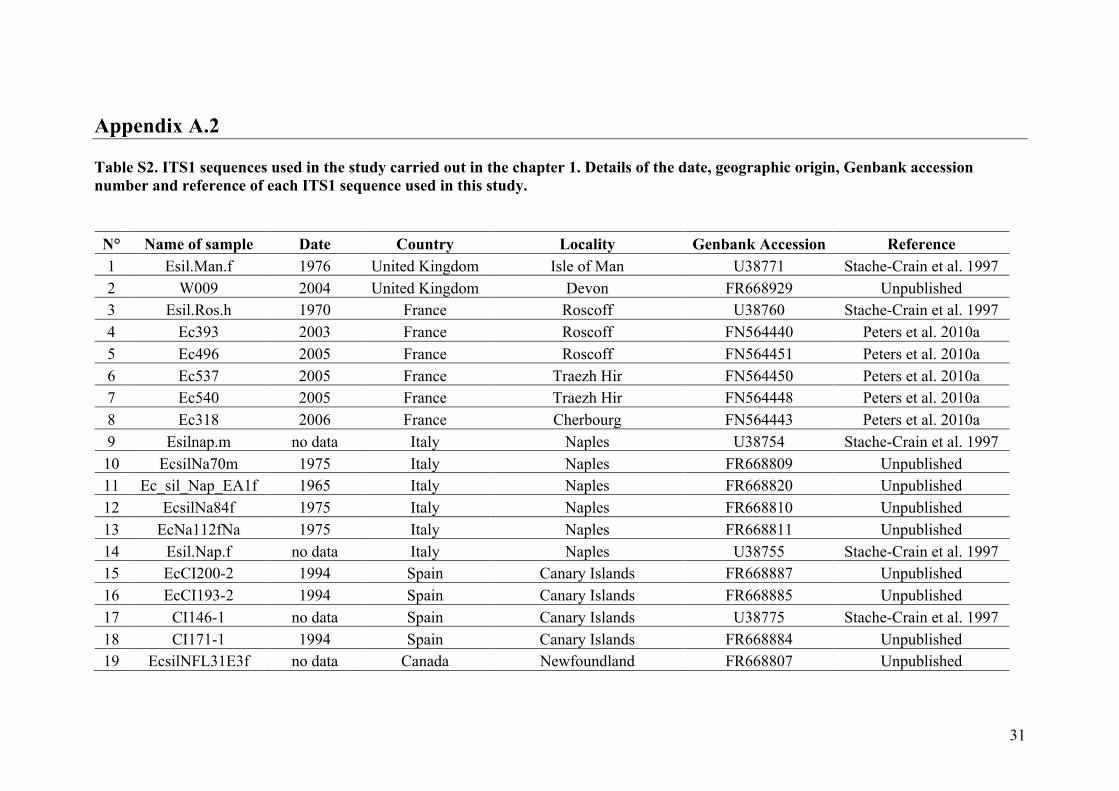
31
Appendix A.2 Table S2. ITS1 sequences used in the study carried out in the chapter 1. Details of the date, geographic origin, Genbank accession number and reference of each ITS1 sequence used in this study.
N° Name of sample Date Country Locality Genbank Accession Reference 1 Esil.Man.f 1976 United Kingdom Isle of Man U38771 Stache-Crain et al. 1997 2 W009 2004 United Kingdom Devon FR668929 Unpublished 3 Esil.Ros.h 1970 France Roscoff U38760 Stache-Crain et al. 1997 4 Ec393 2003 France Roscoff FN564440 Peters et al. 2010a 5 Ec496 2005 France Roscoff FN564451 Peters et al. 2010a 6 Ec537 2005 France Traezh Hir FN564450 Peters et al. 2010a 7 Ec540 2005 France Traezh Hir FN564448 Peters et al. 2010a 8 Ec318 2006 France Cherbourg FN564443 Peters et al. 2010a 9 Esilnap.m no data Italy Naples U38754 Stache-Crain et al. 1997 10 EcsilNa70m 1975 Italy Naples FR668809 Unpublished 11 Ec_sil_Nap_EA1f 1965 Italy Naples FR668820 Unpublished 12 EcsilNa84f 1975 Italy Naples FR668810 Unpublished 13 EcNa112fNa 1975 Italy Naples FR668811 Unpublished 14 Esil.Nap.f no data Italy Naples U38755 Stache-Crain et al. 1997 15 EcCI200-2 1994 Spain Canary Islands FR668887 Unpublished 16 EcCI193-2 1994 Spain Canary Islands FR668885 Unpublished 17 CI146-1 no data Spain Canary Islands U38775 Stache-Crain et al. 1997 18 CI171-1 1994 Spain Canary Islands FR668884 Unpublished 19 EcsilNFL31E3f no data Canada Newfoundland FR668807 Unpublished
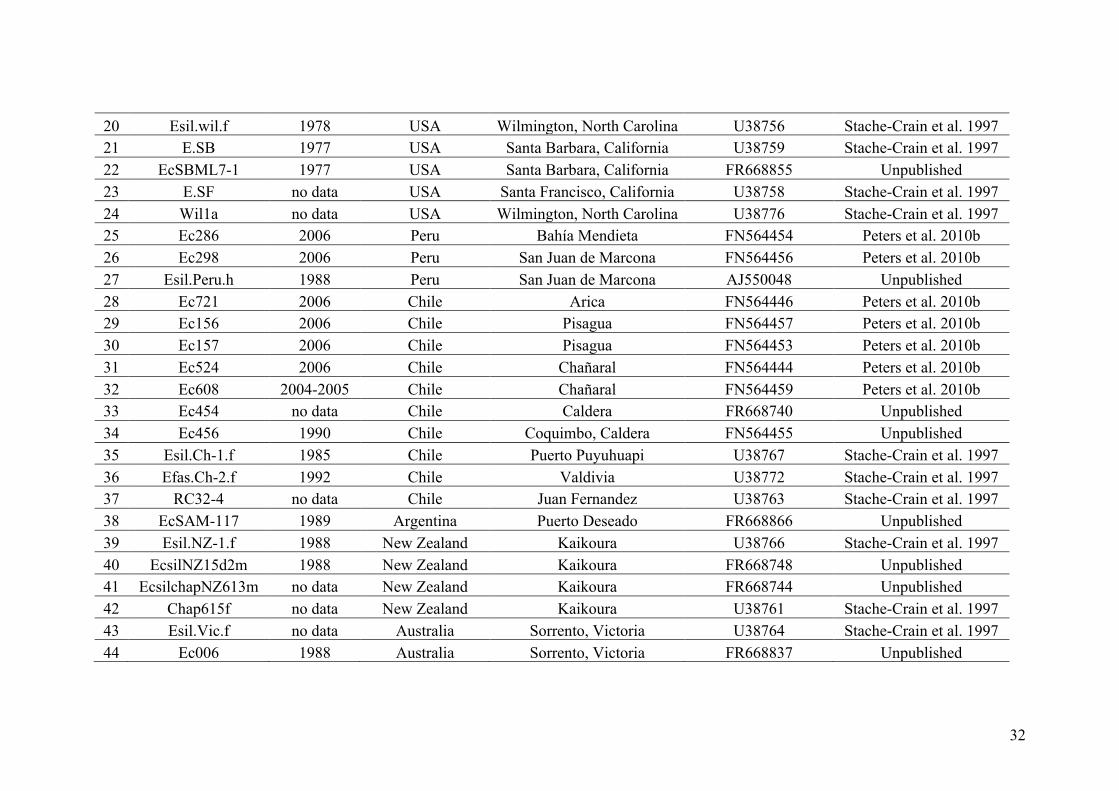
32
20 Esil.wil.f 1978 USA Wilmington, North Carolina U38756 Stache-Crain et al. 1997 21 E.SB 1977 USA Santa Barbara, California U38759 Stache-Crain et al. 1997 22 EcSBML7-1 1977 USA Santa Barbara, California FR668855 Unpublished 23 E.SF no data USA Santa Francisco, California U38758 Stache-Crain et al. 1997 24 Wil1a no data USA Wilmington, North Carolina U38776 Stache-Crain et al. 1997 25 Ec286 2006 Peru Bahía Mendieta FN564454 Peters et al. 2010b 26 Ec298 2006 Peru San Juan de Marcona FN564456 Peters et al. 2010b 27 Esil.Peru.h 1988 Peru San Juan de Marcona AJ550048 Unpublished 28 Ec721 2006 Chile Arica FN564446 Peters et al. 2010b 29 Ec156 2006 Chile Pisagua FN564457 Peters et al. 2010b 30 Ec157 2006 Chile Pisagua FN564453 Peters et al. 2010b 31 Ec524 2006 Chile Chañaral FN564444 Peters et al. 2010b 32 Ec608 2004-2005 Chile Chañaral FN564459 Peters et al. 2010b 33 Ec454 no data Chile Caldera FR668740 Unpublished 34 Ec456 1990 Chile Coquimbo, Caldera FN564455 Unpublished 35 Esil.Ch-1.f 1985 Chile Puerto Puyuhuapi U38767 Stache-Crain et al. 1997 36 Efas.Ch-2.f 1992 Chile Valdivia U38772 Stache-Crain et al. 1997 37 RC32-4 no data Chile Juan Fernandez U38763 Stache-Crain et al. 1997 38 EcSAM-117 1989 Argentina Puerto Deseado FR668866 Unpublished 39 Esil.NZ-1.f 1988 New Zealand Kaikoura U38766 Stache-Crain et al. 1997 40 EcsilNZ15d2m 1988 New Zealand Kaikoura FR668748 Unpublished 41 EcsilchapNZ613m no data New Zealand Kaikoura FR668744 Unpublished 42 Chap615f no data New Zealand Kaikoura U38761 Stache-Crain et al. 1997 43 Esil.Vic.f no data Australia Sorrento, Victoria U38764 Stache-Crain et al. 1997 44 Ec006 1988 Australia Sorrento, Victoria FR668837 Unpublished
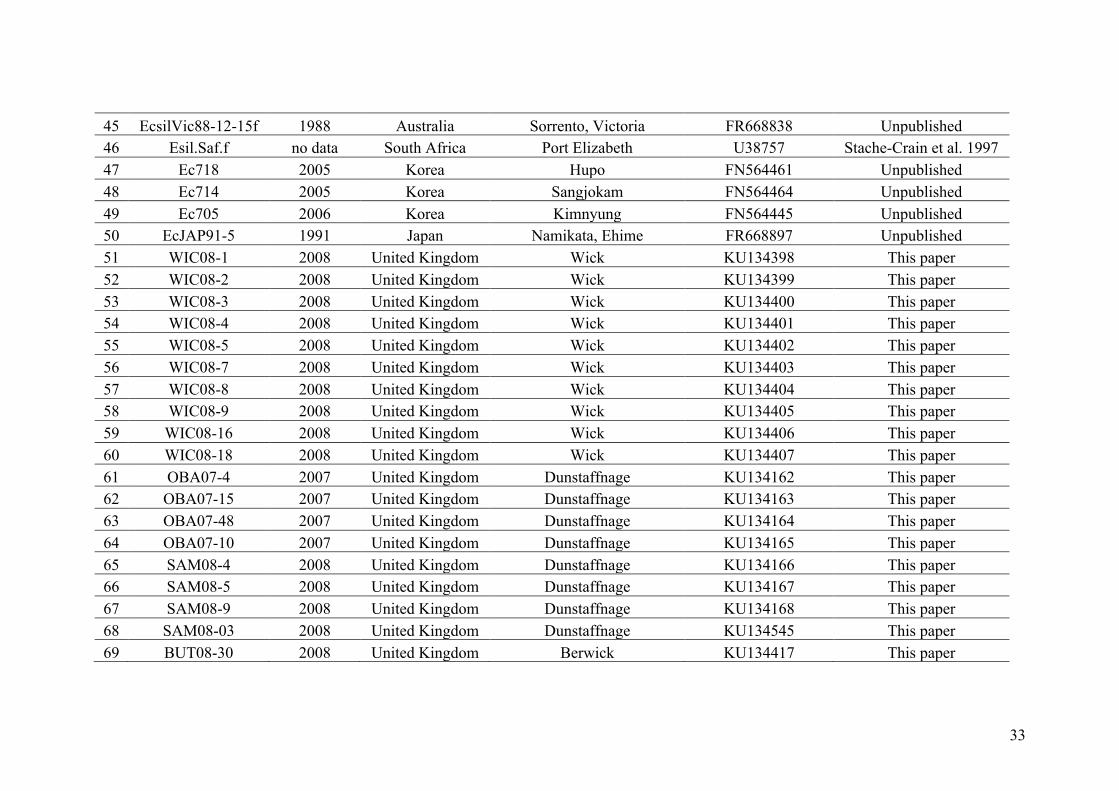
33
45 EcsilVic88-12-15f 1988 Australia Sorrento, Victoria FR668838 Unpublished 46 Esil.Saf.f no data South Africa Port Elizabeth U38757 Stache-Crain et al. 1997 47 Ec718 2005 Korea Hupo FN564461 Unpublished 48 Ec714 2005 Korea Sangjokam FN564464 Unpublished 49 Ec705 2006 Korea Kimnyung FN564445 Unpublished 50 EcJAP91-5 1991 Japan Namikata, Ehime FR668897 Unpublished 51 WIC08-1 2008 United Kingdom Wick KU134398 This paper 52 WIC08-2 2008 United Kingdom Wick KU134399 This paper 53 WIC08-3 2008 United Kingdom Wick KU134400 This paper 54 WIC08-4 2008 United Kingdom Wick KU134401 This paper 55 WIC08-5 2008 United Kingdom Wick KU134402 This paper 56 WIC08-7 2008 United Kingdom Wick KU134403 This paper 57 WIC08-8 2008 United Kingdom Wick KU134404 This paper 58 WIC08-9 2008 United Kingdom Wick KU134405 This paper 59 WIC08-16 2008 United Kingdom Wick KU134406 This paper 60 WIC08-18 2008 United Kingdom Wick KU134407 This paper 61 OBA07-4 2007 United Kingdom Dunstaffnage KU134162 This paper 62 OBA07-15 2007 United Kingdom Dunstaffnage KU134163 This paper 63 OBA07-48 2007 United Kingdom Dunstaffnage KU134164 This paper 64 OBA07-10 2007 United Kingdom Dunstaffnage KU134165 This paper 65 SAM08-4 2008 United Kingdom Dunstaffnage KU134166 This paper 66 SAM08-5 2008 United Kingdom Dunstaffnage KU134167 This paper 67 SAM08-9 2008 United Kingdom Dunstaffnage KU134168 This paper 68 SAM08-03 2008 United Kingdom Dunstaffnage KU134545 This paper 69 BUT08-30 2008 United Kingdom Berwick KU134417 This paper
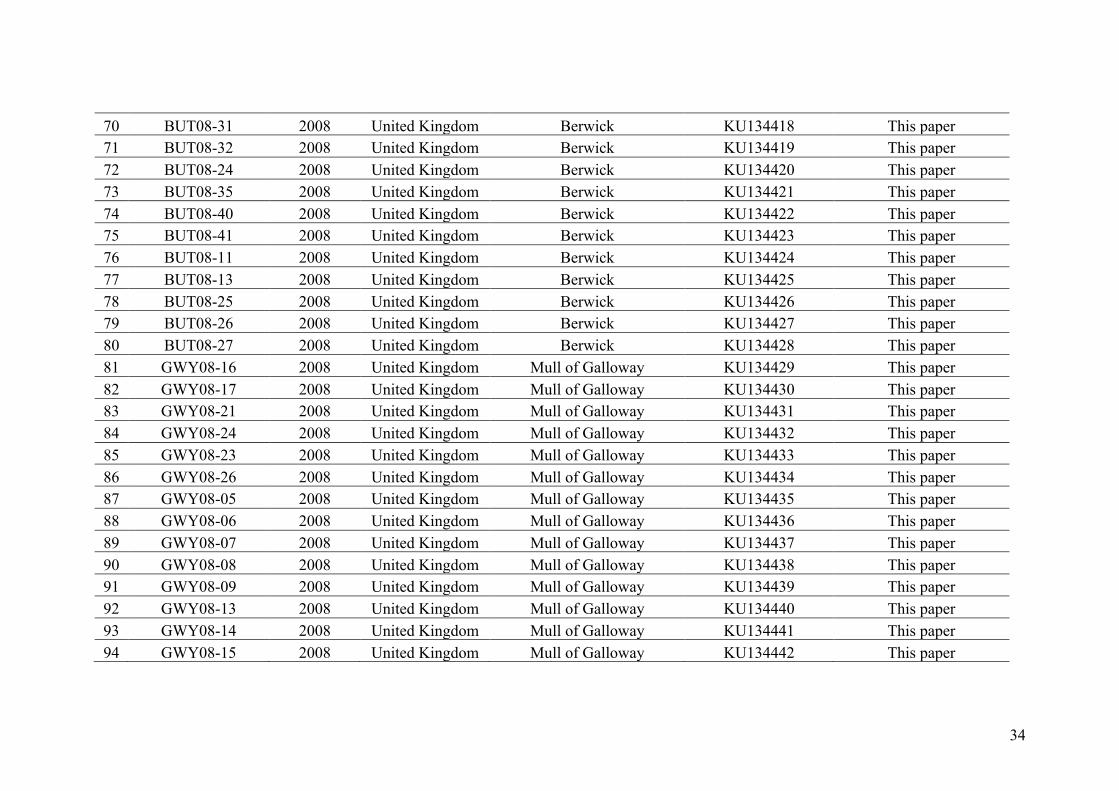
34
70 BUT08-31 2008 United Kingdom Berwick KU134418 This paper 71 BUT08-32 2008 United Kingdom Berwick KU134419 This paper 72 BUT08-24 2008 United Kingdom Berwick KU134420 This paper 73 BUT08-35 2008 United Kingdom Berwick KU134421 This paper 74 BUT08-40 2008 United Kingdom Berwick KU134422 This paper 75 BUT08-41 2008 United Kingdom Berwick KU134423 This paper 76 BUT08-11 2008 United Kingdom Berwick KU134424 This paper 77 BUT08-13 2008 United Kingdom Berwick KU134425 This paper 78 BUT08-25 2008 United Kingdom Berwick KU134426 This paper 79 BUT08-26 2008 United Kingdom Berwick KU134427 This paper 80 BUT08-27 2008 United Kingdom Berwick KU134428 This paper 81 GWY08-16 2008 United Kingdom Mull of Galloway KU134429 This paper 82 GWY08-17 2008 United Kingdom Mull of Galloway KU134430 This paper 83 GWY08-21 2008 United Kingdom Mull of Galloway KU134431 This paper 84 GWY08-24 2008 United Kingdom Mull of Galloway KU134432 This paper 85 GWY08-23 2008 United Kingdom Mull of Galloway KU134433 This paper 86 GWY08-26 2008 United Kingdom Mull of Galloway KU134434 This paper 87 GWY08-05 2008 United Kingdom Mull of Galloway KU134435 This paper 88 GWY08-06 2008 United Kingdom Mull of Galloway KU134436 This paper 89 GWY08-07 2008 United Kingdom Mull of Galloway KU134437 This paper 90 GWY08-08 2008 United Kingdom Mull of Galloway KU134438 This paper 91 GWY08-09 2008 United Kingdom Mull of Galloway KU134439 This paper 92 GWY08-13 2008 United Kingdom Mull of Galloway KU134440 This paper 93 GWY08-14 2008 United Kingdom Mull of Galloway KU134441 This paper 94 GWY08-15 2008 United Kingdom Mull of Galloway KU134442 This paper
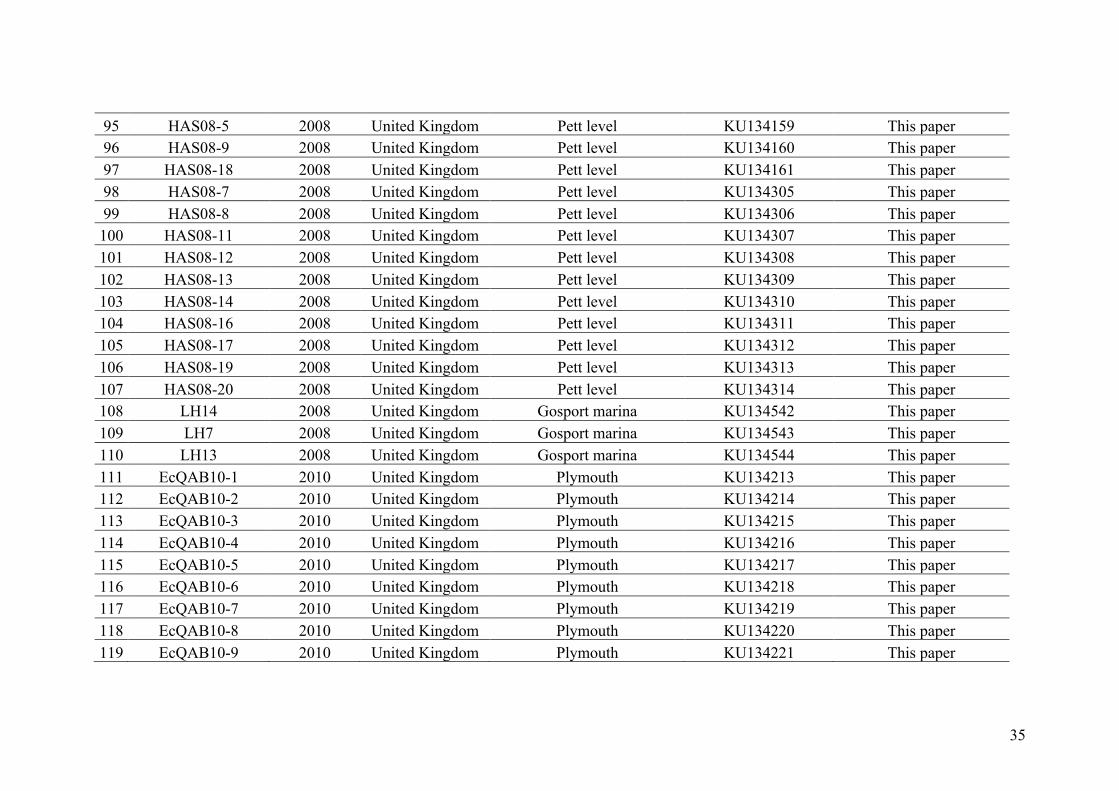
35
95 HAS08-5 2008 United Kingdom Pett level KU134159 This paper 96 HAS08-9 2008 United Kingdom Pett level KU134160 This paper 97 HAS08-18 2008 United Kingdom Pett level KU134161 This paper 98 HAS08-7 2008 United Kingdom Pett level KU134305 This paper 99 HAS08-8 2008 United Kingdom Pett level KU134306 This paper 100 HAS08-11 2008 United Kingdom Pett level KU134307 This paper 101 HAS08-12 2008 United Kingdom Pett level KU134308 This paper 102 HAS08-13 2008 United Kingdom Pett level KU134309 This paper 103 HAS08-14 2008 United Kingdom Pett level KU134310 This paper 104 HAS08-16 2008 United Kingdom Pett level KU134311 This paper 105 HAS08-17 2008 United Kingdom Pett level KU134312 This paper 106 HAS08-19 2008 United Kingdom Pett level KU134313 This paper 107 HAS08-20 2008 United Kingdom Pett level KU134314 This paper 108 LH14 2008 United Kingdom Gosport marina KU134542 This paper 109 LH7 2008 United Kingdom Gosport marina KU134543 This paper 110 LH13 2008 United Kingdom Gosport marina KU134544 This paper 111 EcQAB10-1 2010 United Kingdom Plymouth KU134213 This paper 112 EcQAB10-2 2010 United Kingdom Plymouth KU134214 This paper 113 EcQAB10-3 2010 United Kingdom Plymouth KU134215 This paper 114 EcQAB10-4 2010 United Kingdom Plymouth KU134216 This paper 115 EcQAB10-5 2010 United Kingdom Plymouth KU134217 This paper 116 EcQAB10-6 2010 United Kingdom Plymouth KU134218 This paper 117 EcQAB10-7 2010 United Kingdom Plymouth KU134219 This paper 118 EcQAB10-8 2010 United Kingdom Plymouth KU134220 This paper 119 EcQAB10-9 2010 United Kingdom Plymouth KU134221 This paper
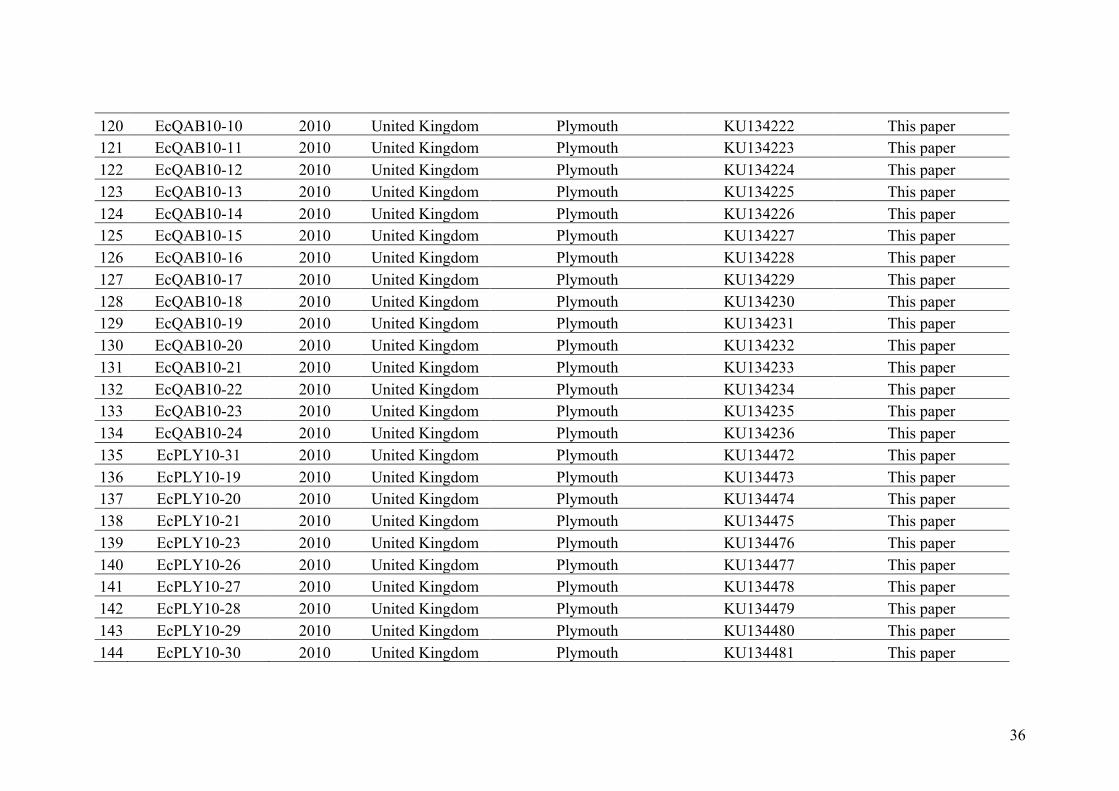
36
120 EcQAB10-10 2010 United Kingdom Plymouth KU134222 This paper 121 EcQAB10-11 2010 United Kingdom Plymouth KU134223 This paper 122 EcQAB10-12 2010 United Kingdom Plymouth KU134224 This paper 123 EcQAB10-13 2010 United Kingdom Plymouth KU134225 This paper 124 EcQAB10-14 2010 United Kingdom Plymouth KU134226 This paper 125 EcQAB10-15 2010 United Kingdom Plymouth KU134227 This paper 126 EcQAB10-16 2010 United Kingdom Plymouth KU134228 This paper 127 EcQAB10-17 2010 United Kingdom Plymouth KU134229 This paper 128 EcQAB10-18 2010 United Kingdom Plymouth KU134230 This paper 129 EcQAB10-19 2010 United Kingdom Plymouth KU134231 This paper 130 EcQAB10-20 2010 United Kingdom Plymouth KU134232 This paper 131 EcQAB10-21 2010 United Kingdom Plymouth KU134233 This paper 132 EcQAB10-22 2010 United Kingdom Plymouth KU134234 This paper 133 EcQAB10-23 2010 United Kingdom Plymouth KU134235 This paper 134 EcQAB10-24 2010 United Kingdom Plymouth KU134236 This paper 135 EcPLY10-31 2010 United Kingdom Plymouth KU134472 This paper 136 EcPLY10-19 2010 United Kingdom Plymouth KU134473 This paper 137 EcPLY10-20 2010 United Kingdom Plymouth KU134474 This paper 138 EcPLY10-21 2010 United Kingdom Plymouth KU134475 This paper 139 EcPLY10-23 2010 United Kingdom Plymouth KU134476 This paper 140 EcPLY10-26 2010 United Kingdom Plymouth KU134477 This paper 141 EcPLY10-27 2010 United Kingdom Plymouth KU134478 This paper 142 EcPLY10-28 2010 United Kingdom Plymouth KU134479 This paper 143 EcPLY10-29 2010 United Kingdom Plymouth KU134480 This paper 144 EcPLY10-30 2010 United Kingdom Plymouth KU134481 This paper
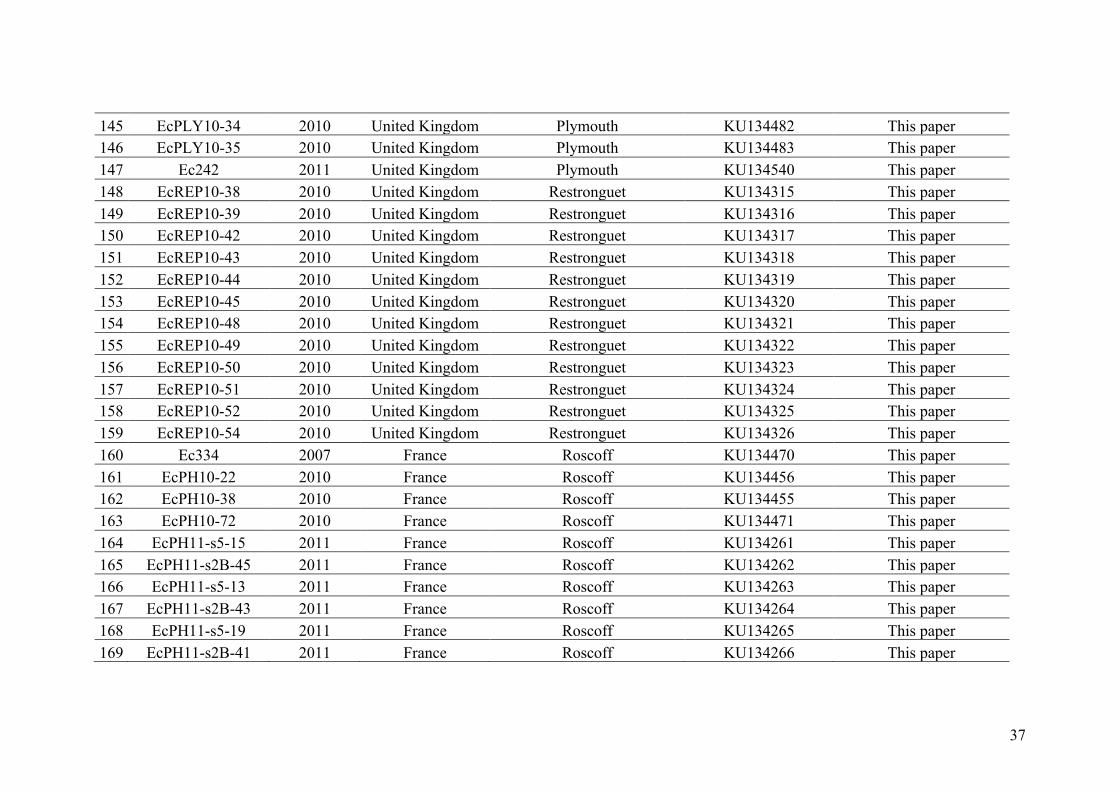
37
145 EcPLY10-34 2010 United Kingdom Plymouth KU134482 This paper 146 EcPLY10-35 2010 United Kingdom Plymouth KU134483 This paper 147 Ec242 2011 United Kingdom Plymouth KU134540 This paper 148 EcREP10-38 2010 United Kingdom Restronguet KU134315 This paper 149 EcREP10-39 2010 United Kingdom Restronguet KU134316 This paper 150 EcREP10-42 2010 United Kingdom Restronguet KU134317 This paper 151 EcREP10-43 2010 United Kingdom Restronguet KU134318 This paper 152 EcREP10-44 2010 United Kingdom Restronguet KU134319 This paper 153 EcREP10-45 2010 United Kingdom Restronguet KU134320 This paper 154 EcREP10-48 2010 United Kingdom Restronguet KU134321 This paper 155 EcREP10-49 2010 United Kingdom Restronguet KU134322 This paper 156 EcREP10-50 2010 United Kingdom Restronguet KU134323 This paper 157 EcREP10-51 2010 United Kingdom Restronguet KU134324 This paper 158 EcREP10-52 2010 United Kingdom Restronguet KU134325 This paper 159 EcREP10-54 2010 United Kingdom Restronguet KU134326 This paper 160 Ec334 2007 France Roscoff KU134470 This paper 161 EcPH10-22 2010 France Roscoff KU134456 This paper 162 EcPH10-38 2010 France Roscoff KU134455 This paper 163 EcPH10-72 2010 France Roscoff KU134471 This paper 164 EcPH11-s5-15 2011 France Roscoff KU134261 This paper 165 EcPH11-s2B-45 2011 France Roscoff KU134262 This paper 166 EcPH11-s5-13 2011 France Roscoff KU134263 This paper 167 EcPH11-s2B-43 2011 France Roscoff KU134264 This paper 168 EcPH11-s5-19 2011 France Roscoff KU134265 This paper 169 EcPH11-s2B-41 2011 France Roscoff KU134266 This paper
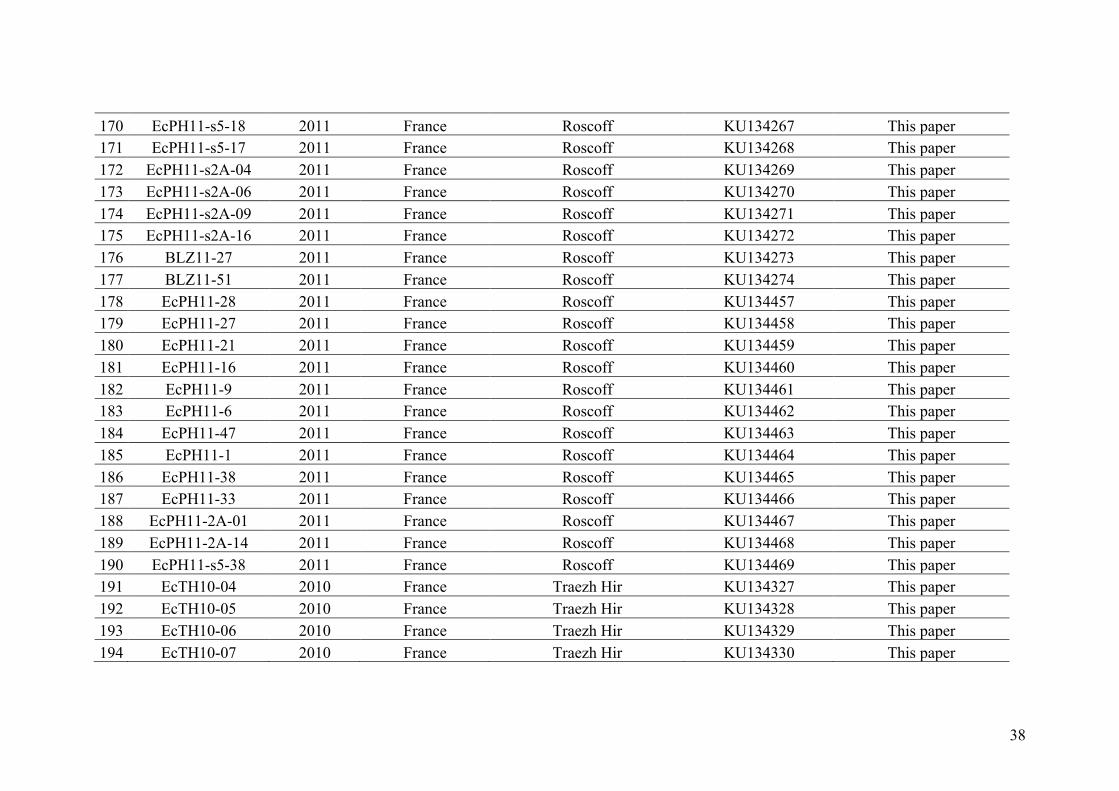
38
170 EcPH11-s5-18 2011 France Roscoff KU134267 This paper 171 EcPH11-s5-17 2011 France Roscoff KU134268 This paper 172 EcPH11-s2A-04 2011 France Roscoff KU134269 This paper 173 EcPH11-s2A-06 2011 France Roscoff KU134270 This paper 174 EcPH11-s2A-09 2011 France Roscoff KU134271 This paper 175 EcPH11-s2A-16 2011 France Roscoff KU134272 This paper 176 BLZ11-27 2011 France Roscoff KU134273 This paper 177 BLZ11-51 2011 France Roscoff KU134274 This paper 178 EcPH11-28 2011 France Roscoff KU134457 This paper 179 EcPH11-27 2011 France Roscoff KU134458 This paper 180 EcPH11-21 2011 France Roscoff KU134459 This paper 181 EcPH11-16 2011 France Roscoff KU134460 This paper 182 EcPH11-9 2011 France Roscoff KU134461 This paper 183 EcPH11-6 2011 France Roscoff KU134462 This paper 184 EcPH11-47 2011 France Roscoff KU134463 This paper 185 EcPH11-1 2011 France Roscoff KU134464 This paper 186 EcPH11-38 2011 France Roscoff KU134465 This paper 187 EcPH11-33 2011 France Roscoff KU134466 This paper 188 EcPH11-2A-01 2011 France Roscoff KU134467 This paper 189 EcPH11-2A-14 2011 France Roscoff KU134468 This paper 190 EcPH11-s5-38 2011 France Roscoff KU134469 This paper 191 EcTH10-04 2010 France Traezh Hir KU134327 This paper 192 EcTH10-05 2010 France Traezh Hir KU134328 This paper 193 EcTH10-06 2010 France Traezh Hir KU134329 This paper 194 EcTH10-07 2010 France Traezh Hir KU134330 This paper
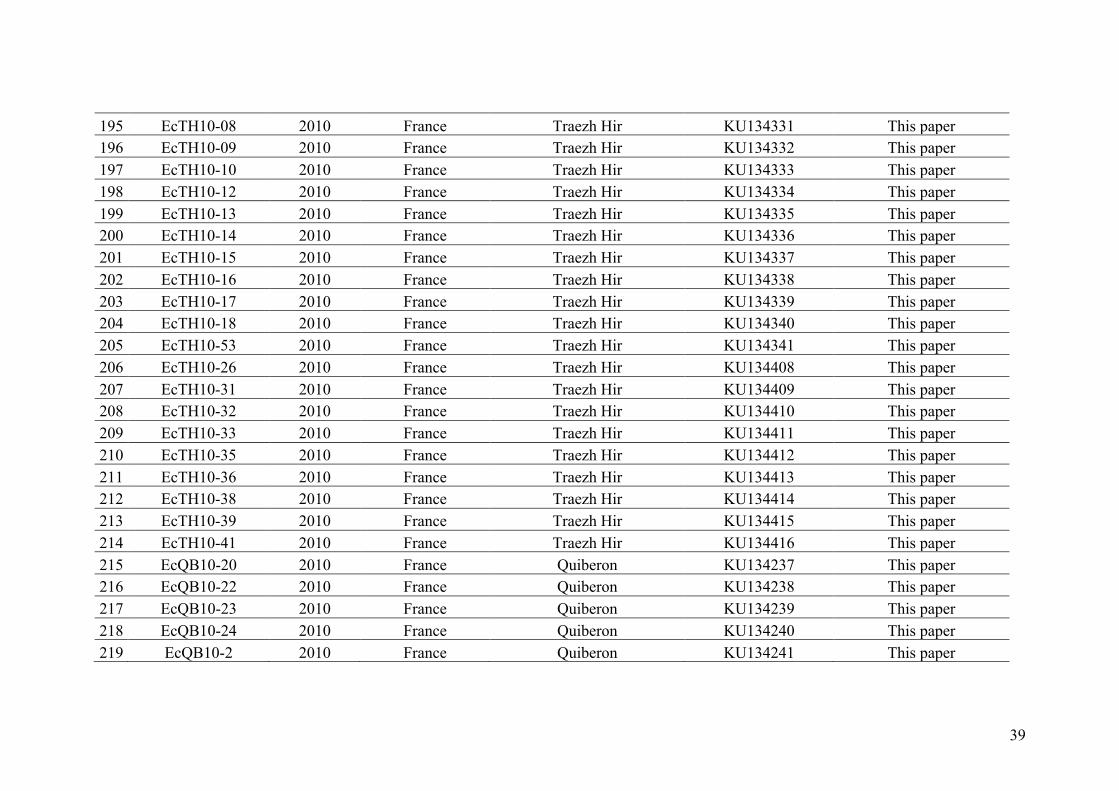
39
195 EcTH10-08 2010 France Traezh Hir KU134331 This paper 196 EcTH10-09 2010 France Traezh Hir KU134332 This paper 197 EcTH10-10 2010 France Traezh Hir KU134333 This paper 198 EcTH10-12 2010 France Traezh Hir KU134334 This paper 199 EcTH10-13 2010 France Traezh Hir KU134335 This paper 200 EcTH10-14 2010 France Traezh Hir KU134336 This paper 201 EcTH10-15 2010 France Traezh Hir KU134337 This paper 202 EcTH10-16 2010 France Traezh Hir KU134338 This paper 203 EcTH10-17 2010 France Traezh Hir KU134339 This paper 204 EcTH10-18 2010 France Traezh Hir KU134340 This paper 205 EcTH10-53 2010 France Traezh Hir KU134341 This paper 206 EcTH10-26 2010 France Traezh Hir KU134408 This paper 207 EcTH10-31 2010 France Traezh Hir KU134409 This paper 208 EcTH10-32 2010 France Traezh Hir KU134410 This paper 209 EcTH10-33 2010 France Traezh Hir KU134411 This paper 210 EcTH10-35 2010 France Traezh Hir KU134412 This paper 211 EcTH10-36 2010 France Traezh Hir KU134413 This paper 212 EcTH10-38 2010 France Traezh Hir KU134414 This paper 213 EcTH10-39 2010 France Traezh Hir KU134415 This paper 214 EcTH10-41 2010 France Traezh Hir KU134416 This paper 215 EcQB10-20 2010 France Quiberon KU134237 This paper 216 EcQB10-22 2010 France Quiberon KU134238 This paper 217 EcQB10-23 2010 France Quiberon KU134239 This paper 218 EcQB10-24 2010 France Quiberon KU134240 This paper 219 EcQB10-2 2010 France Quiberon KU134241 This paper
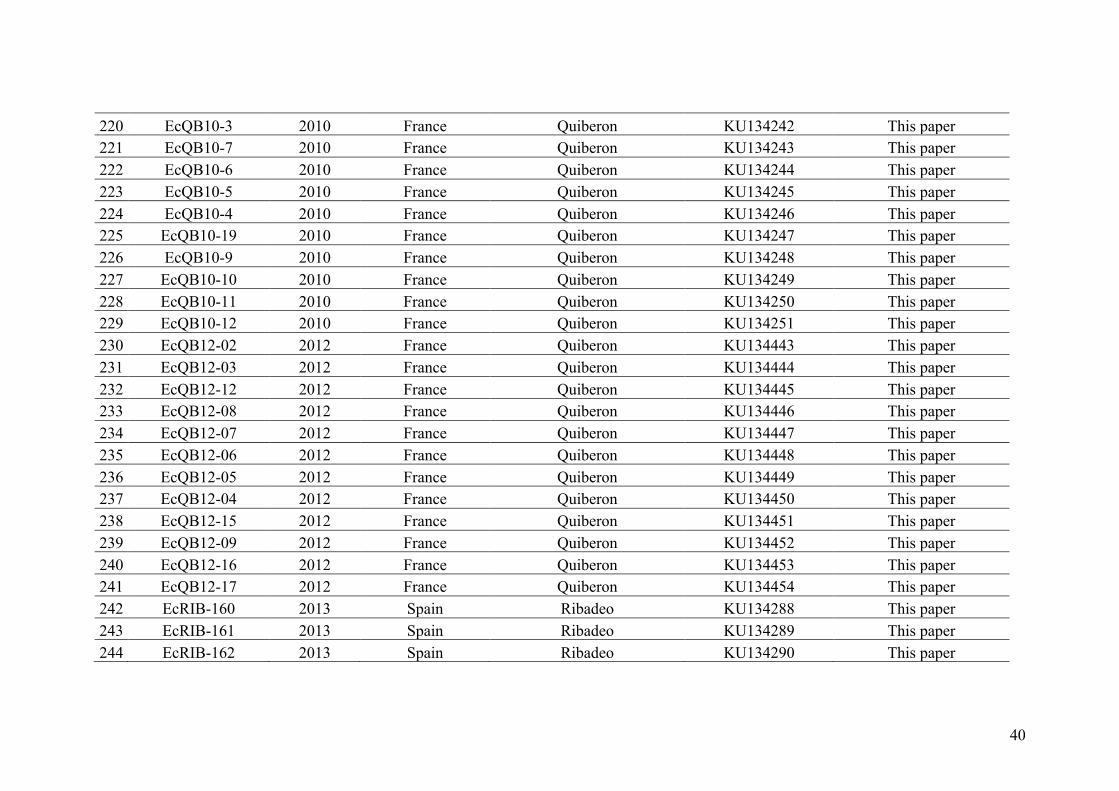
40
220 EcQB10-3 2010 France Quiberon KU134242 This paper 221 EcQB10-7 2010 France Quiberon KU134243 This paper 222 EcQB10-6 2010 France Quiberon KU134244 This paper 223 EcQB10-5 2010 France Quiberon KU134245 This paper 224 EcQB10-4 2010 France Quiberon KU134246 This paper 225 EcQB10-19 2010 France Quiberon KU134247 This paper 226 EcQB10-9 2010 France Quiberon KU134248 This paper 227 EcQB10-10 2010 France Quiberon KU134249 This paper 228 EcQB10-11 2010 France Quiberon KU134250 This paper 229 EcQB10-12 2010 France Quiberon KU134251 This paper 230 EcQB12-02 2012 France Quiberon KU134443 This paper 231 EcQB12-03 2012 France Quiberon KU134444 This paper 232 EcQB12-12 2012 France Quiberon KU134445 This paper 233 EcQB12-08 2012 France Quiberon KU134446 This paper 234 EcQB12-07 2012 France Quiberon KU134447 This paper 235 EcQB12-06 2012 France Quiberon KU134448 This paper 236 EcQB12-05 2012 France Quiberon KU134449 This paper 237 EcQB12-04 2012 France Quiberon KU134450 This paper 238 EcQB12-15 2012 France Quiberon KU134451 This paper 239 EcQB12-09 2012 France Quiberon KU134452 This paper 240 EcQB12-16 2012 France Quiberon KU134453 This paper 241 EcQB12-17 2012 France Quiberon KU134454 This paper 242 EcRIB-160 2013 Spain Ribadeo KU134288 This paper 243 EcRIB-161 2013 Spain Ribadeo KU134289 This paper 244 EcRIB-162 2013 Spain Ribadeo KU134290 This paper
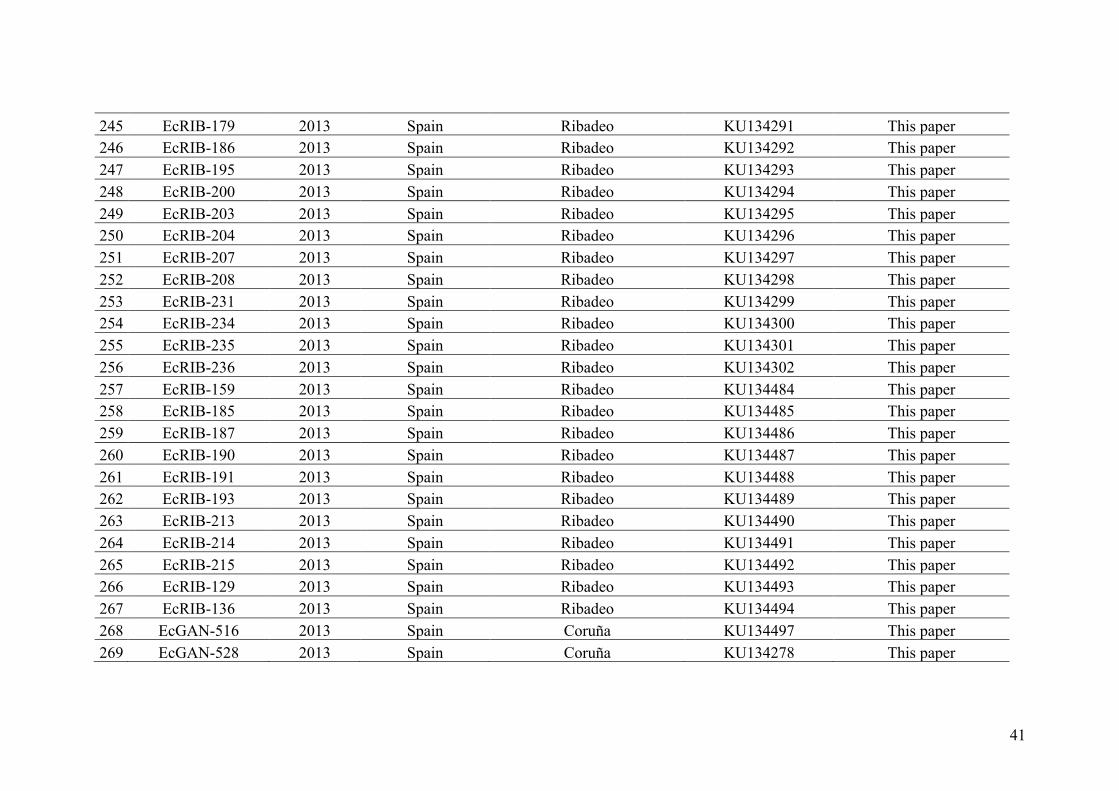
41
245 EcRIB-179 2013 Spain Ribadeo KU134291 This paper 246 EcRIB-186 2013 Spain Ribadeo KU134292 This paper 247 EcRIB-195 2013 Spain Ribadeo KU134293 This paper 248 EcRIB-200 2013 Spain Ribadeo KU134294 This paper 249 EcRIB-203 2013 Spain Ribadeo KU134295 This paper 250 EcRIB-204 2013 Spain Ribadeo KU134296 This paper 251 EcRIB-207 2013 Spain Ribadeo KU134297 This paper 252 EcRIB-208 2013 Spain Ribadeo KU134298 This paper 253 EcRIB-231 2013 Spain Ribadeo KU134299 This paper 254 EcRIB-234 2013 Spain Ribadeo KU134300 This paper 255 EcRIB-235 2013 Spain Ribadeo KU134301 This paper 256 EcRIB-236 2013 Spain Ribadeo KU134302 This paper 257 EcRIB-159 2013 Spain Ribadeo KU134484 This paper 258 EcRIB-185 2013 Spain Ribadeo KU134485 This paper 259 EcRIB-187 2013 Spain Ribadeo KU134486 This paper 260 EcRIB-190 2013 Spain Ribadeo KU134487 This paper 261 EcRIB-191 2013 Spain Ribadeo KU134488 This paper 262 EcRIB-193 2013 Spain Ribadeo KU134489 This paper 263 EcRIB-213 2013 Spain Ribadeo KU134490 This paper 264 EcRIB-214 2013 Spain Ribadeo KU134491 This paper 265 EcRIB-215 2013 Spain Ribadeo KU134492 This paper 266 EcRIB-129 2013 Spain Ribadeo KU134493 This paper 267 EcRIB-136 2013 Spain Ribadeo KU134494 This paper 268 EcGAN-516 2013 Spain Coruña KU134497 This paper 269 EcGAN-528 2013 Spain Coruña KU134278 This paper
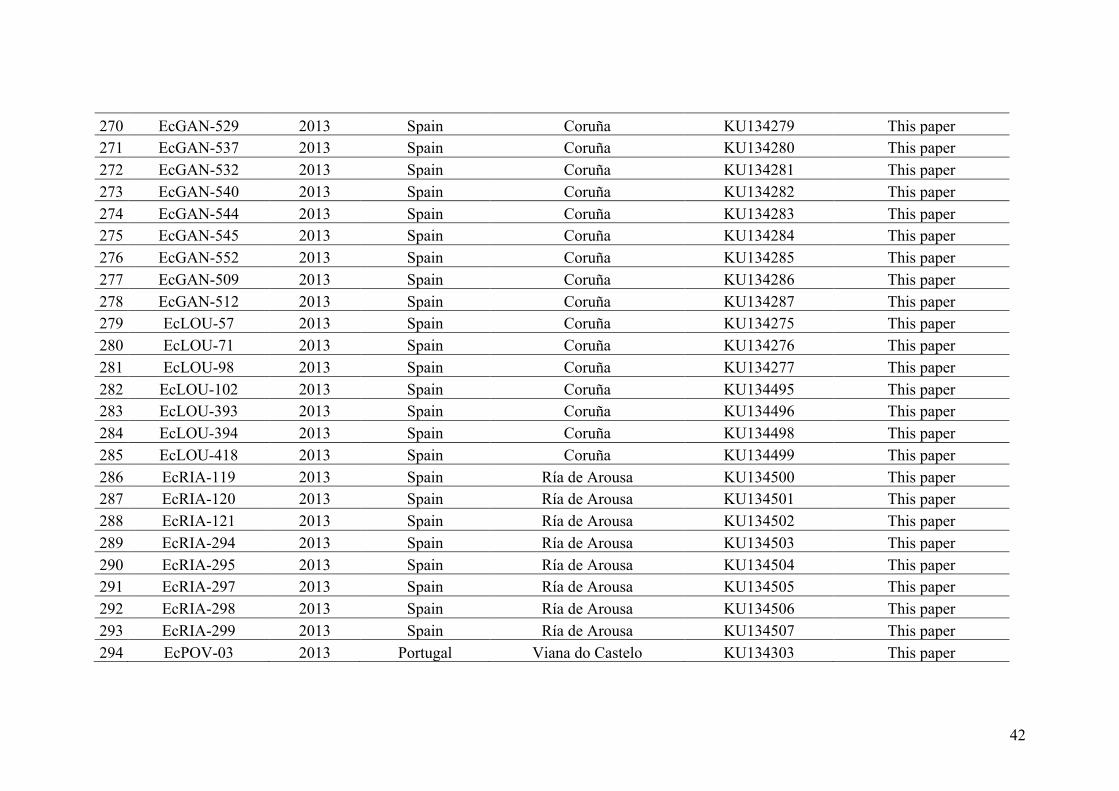
42
270 EcGAN-529 2013 Spain Coruña KU134279 This paper 271 EcGAN-537 2013 Spain Coruña KU134280 This paper 272 EcGAN-532 2013 Spain Coruña KU134281 This paper 273 EcGAN-540 2013 Spain Coruña KU134282 This paper 274 EcGAN-544 2013 Spain Coruña KU134283 This paper 275 EcGAN-545 2013 Spain Coruña KU134284 This paper 276 EcGAN-552 2013 Spain Coruña KU134285 This paper 277 EcGAN-509 2013 Spain Coruña KU134286 This paper 278 EcGAN-512 2013 Spain Coruña KU134287 This paper 279 EcLOU-57 2013 Spain Coruña KU134275 This paper 280 EcLOU-71 2013 Spain Coruña KU134276 This paper 281 EcLOU-98 2013 Spain Coruña KU134277 This paper 282 EcLOU-102 2013 Spain Coruña KU134495 This paper 283 EcLOU-393 2013 Spain Coruña KU134496 This paper 284 EcLOU-394 2013 Spain Coruña KU134498 This paper 285 EcLOU-418 2013 Spain Coruña KU134499 This paper 286 EcRIA-119 2013 Spain Ría de Arousa KU134500 This paper 287 EcRIA-120 2013 Spain Ría de Arousa KU134501 This paper 288 EcRIA-121 2013 Spain Ría de Arousa KU134502 This paper 289 EcRIA-294 2013 Spain Ría de Arousa KU134503 This paper 290 EcRIA-295 2013 Spain Ría de Arousa KU134504 This paper 291 EcRIA-297 2013 Spain Ría de Arousa KU134505 This paper 292 EcRIA-298 2013 Spain Ría de Arousa KU134506 This paper 293 EcRIA-299 2013 Spain Ría de Arousa KU134507 This paper 294 EcPOV-03 2013 Portugal Viana do Castelo KU134303 This paper
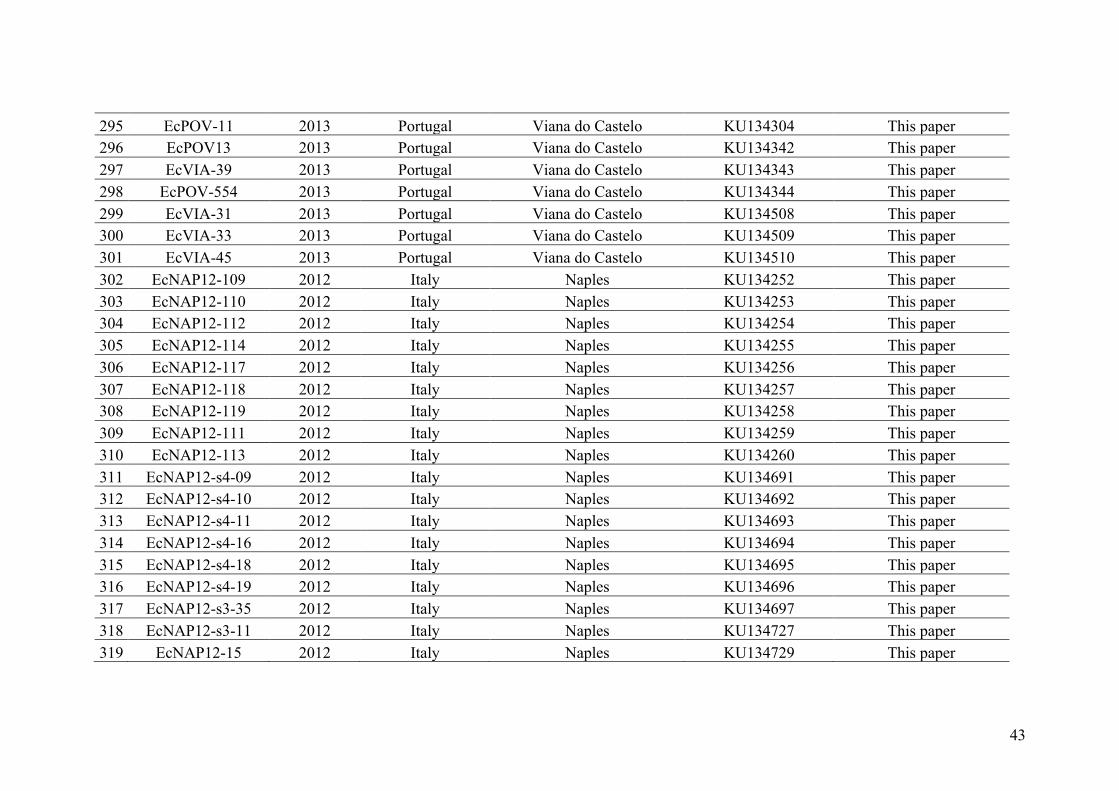
43
295 EcPOV-11 2013 Portugal Viana do Castelo KU134304 This paper 296 EcPOV13 2013 Portugal Viana do Castelo KU134342 This paper 297 EcVIA-39 2013 Portugal Viana do Castelo KU134343 This paper 298 EcPOV-554 2013 Portugal Viana do Castelo KU134344 This paper 299 EcVIA-31 2013 Portugal Viana do Castelo KU134508 This paper 300 EcVIA-33 2013 Portugal Viana do Castelo KU134509 This paper 301 EcVIA-45 2013 Portugal Viana do Castelo KU134510 This paper 302 EcNAP12-109 2012 Italy Naples KU134252 This paper 303 EcNAP12-110 2012 Italy Naples KU134253 This paper 304 EcNAP12-112 2012 Italy Naples KU134254 This paper 305 EcNAP12-114 2012 Italy Naples KU134255 This paper 306 EcNAP12-117 2012 Italy Naples KU134256 This paper 307 EcNAP12-118 2012 Italy Naples KU134257 This paper 308 EcNAP12-119 2012 Italy Naples KU134258 This paper 309 EcNAP12-111 2012 Italy Naples KU134259 This paper 310 EcNAP12-113 2012 Italy Naples KU134260 This paper 311 EcNAP12-s4-09 2012 Italy Naples KU134691 This paper 312 EcNAP12-s4-10 2012 Italy Naples KU134692 This paper 313 EcNAP12-s4-11 2012 Italy Naples KU134693 This paper 314 EcNAP12-s4-16 2012 Italy Naples KU134694 This paper 315 EcNAP12-s4-18 2012 Italy Naples KU134695 This paper 316 EcNAP12-s4-19 2012 Italy Naples KU134696 This paper 317 EcNAP12-s3-35 2012 Italy Naples KU134697 This paper 318 EcNAP12-s3-11 2012 Italy Naples KU134727 This paper 319 EcNAP12-15 2012 Italy Naples KU134729 This paper

44
320 EcNAP12-17 2012 Italy Naples KU134730 This paper 321 EcNAP12-s3-13 2012 Italy Naples KU134731 This paper 322 EcNAP12-s3-17 2012 Italy Naples KU134732 This paper 323 EcNAP12-s3-19 2012 Italy Naples KU134733 This paper 324 EcNAP12-s3-22 2012 Italy Naples KU134734 This paper 325 EcNAP12-s3-23 2012 Italy Naples KU134735 This paper 326 EcNAP12-s4-51 2012 Italy Naples KU134736 This paper 327 EcNAP12-12 2012 Italy Naples KU134737 This paper 328 EcNAP12-14 2012 Italy Naples KU134738 This paper 329 GR11-12A 2009 Greece Korinthos KU134682 This paper 330 GR11-28 2009 Greece Korinthos KU134683 This paper 331 GR11-45 2009 Greece Korinthos KU134684 This paper 332 GR11-46 2009 Greece Korinthos KU134685 This paper 333 GR11-48 2009 Greece Korinthos KU134686 This paper 334 LES10 2009 Greece Lesbos KU134681 This paper 335 LES1 2009 Greece Lesbos KU134687 This paper 336 LES2 2009 Greece Lesbos KU134688 This paper 337 LES3 2009 Greece Lesbos KU134689 This paper 338 LES7 2009 Greece Lesbos KU134690 This paper 339 Les4 2009 Greece Lesbos KU134728 This paper 340 Ec287 2006 Peru Mendieta KU134591 This paper 341 Ec279 2006 Peru Mendieta KU134623 This paper 342 Ec521 2004-2005 Chile Pan de Azúcar KU134592 This paper 343 Ec606 2005-2005 Chile Pan de Azúcar KU134345 This paper 344 EcPAN-084 2013 Chile Pan de Azúcar KU134169 This paper
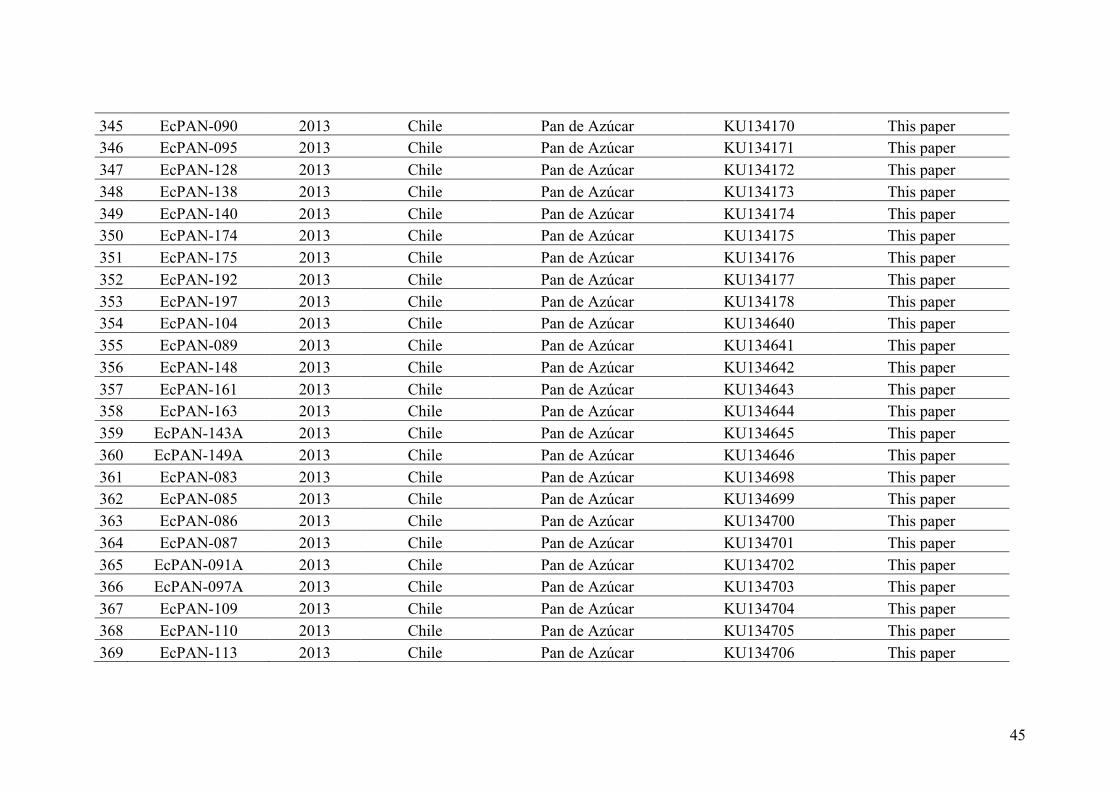
45
345 EcPAN-090 2013 Chile Pan de Azúcar KU134170 This paper 346 EcPAN-095 2013 Chile Pan de Azúcar KU134171 This paper 347 EcPAN-128 2013 Chile Pan de Azúcar KU134172 This paper 348 EcPAN-138 2013 Chile Pan de Azúcar KU134173 This paper 349 EcPAN-140 2013 Chile Pan de Azúcar KU134174 This paper 350 EcPAN-174 2013 Chile Pan de Azúcar KU134175 This paper 351 EcPAN-175 2013 Chile Pan de Azúcar KU134176 This paper 352 EcPAN-192 2013 Chile Pan de Azúcar KU134177 This paper 353 EcPAN-197 2013 Chile Pan de Azúcar KU134178 This paper 354 EcPAN-104 2013 Chile Pan de Azúcar KU134640 This paper 355 EcPAN-089 2013 Chile Pan de Azúcar KU134641 This paper 356 EcPAN-148 2013 Chile Pan de Azúcar KU134642 This paper 357 EcPAN-161 2013 Chile Pan de Azúcar KU134643 This paper 358 EcPAN-163 2013 Chile Pan de Azúcar KU134644 This paper 359 EcPAN-143A 2013 Chile Pan de Azúcar KU134645 This paper 360 EcPAN-149A 2013 Chile Pan de Azúcar KU134646 This paper 361 EcPAN-083 2013 Chile Pan de Azúcar KU134698 This paper 362 EcPAN-085 2013 Chile Pan de Azúcar KU134699 This paper 363 EcPAN-086 2013 Chile Pan de Azúcar KU134700 This paper 364 EcPAN-087 2013 Chile Pan de Azúcar KU134701 This paper 365 EcPAN-091A 2013 Chile Pan de Azúcar KU134702 This paper 366 EcPAN-097A 2013 Chile Pan de Azúcar KU134703 This paper 367 EcPAN-109 2013 Chile Pan de Azúcar KU134704 This paper 368 EcPAN-110 2013 Chile Pan de Azúcar KU134705 This paper 369 EcPAN-113 2013 Chile Pan de Azúcar KU134706 This paper
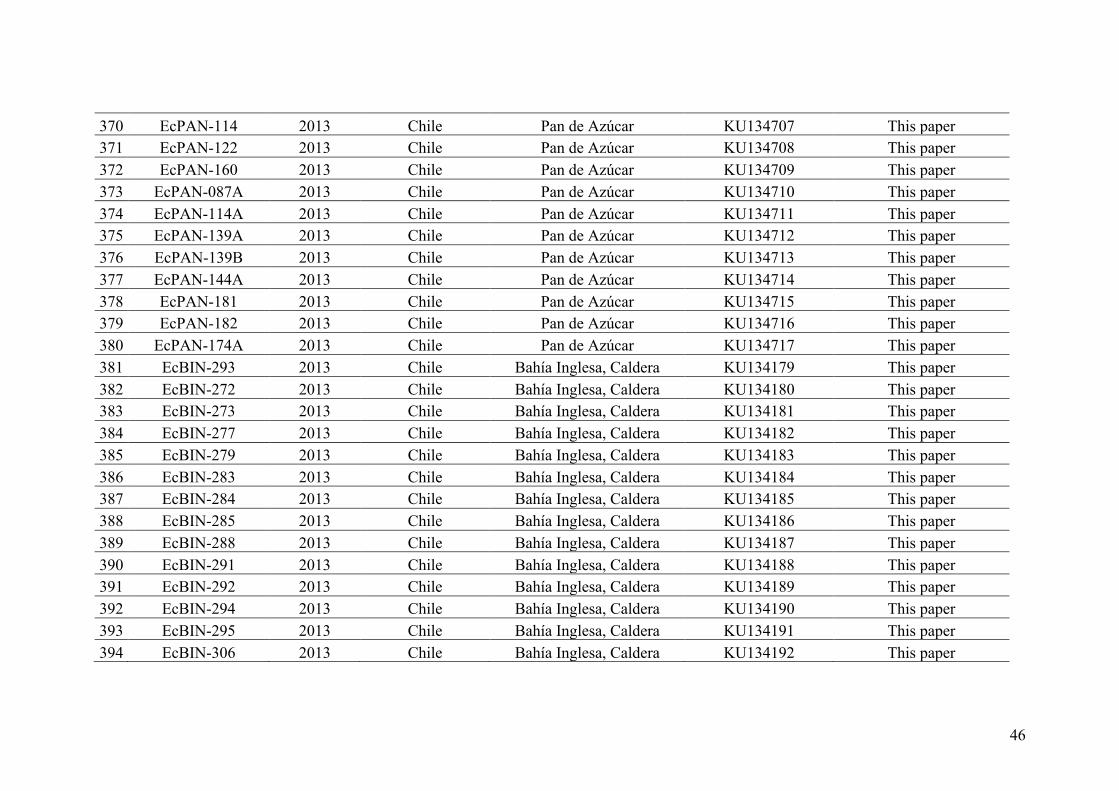
46
370 EcPAN-114 2013 Chile Pan de Azúcar KU134707 This paper 371 EcPAN-122 2013 Chile Pan de Azúcar KU134708 This paper 372 EcPAN-160 2013 Chile Pan de Azúcar KU134709 This paper 373 EcPAN-087A 2013 Chile Pan de Azúcar KU134710 This paper 374 EcPAN-114A 2013 Chile Pan de Azúcar KU134711 This paper 375 EcPAN-139A 2013 Chile Pan de Azúcar KU134712 This paper 376 EcPAN-139B 2013 Chile Pan de Azúcar KU134713 This paper 377 EcPAN-144A 2013 Chile Pan de Azúcar KU134714 This paper 378 EcPAN-181 2013 Chile Pan de Azúcar KU134715 This paper 379 EcPAN-182 2013 Chile Pan de Azúcar KU134716 This paper 380 EcPAN-174A 2013 Chile Pan de Azúcar KU134717 This paper 381 EcBIN-293 2013 Chile Bahía Inglesa, Caldera KU134179 This paper 382 EcBIN-272 2013 Chile Bahía Inglesa, Caldera KU134180 This paper 383 EcBIN-273 2013 Chile Bahía Inglesa, Caldera KU134181 This paper 384 EcBIN-277 2013 Chile Bahía Inglesa, Caldera KU134182 This paper 385 EcBIN-279 2013 Chile Bahía Inglesa, Caldera KU134183 This paper 386 EcBIN-283 2013 Chile Bahía Inglesa, Caldera KU134184 This paper 387 EcBIN-284 2013 Chile Bahía Inglesa, Caldera KU134185 This paper 388 EcBIN-285 2013 Chile Bahía Inglesa, Caldera KU134186 This paper 389 EcBIN-288 2013 Chile Bahía Inglesa, Caldera KU134187 This paper 390 EcBIN-291 2013 Chile Bahía Inglesa, Caldera KU134188 This paper 391 EcBIN-292 2013 Chile Bahía Inglesa, Caldera KU134189 This paper 392 EcBIN-294 2013 Chile Bahía Inglesa, Caldera KU134190 This paper 393 EcBIN-295 2013 Chile Bahía Inglesa, Caldera KU134191 This paper 394 EcBIN-306 2013 Chile Bahía Inglesa, Caldera KU134192 This paper
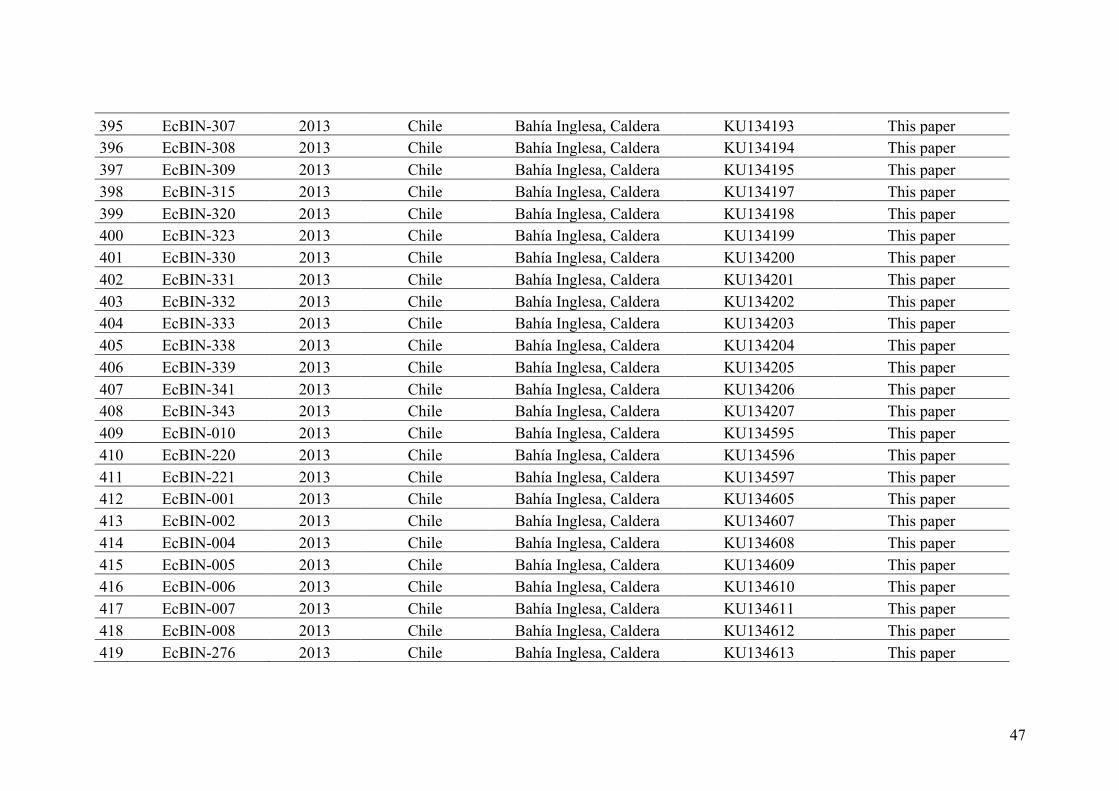
47
395 EcBIN-307 2013 Chile Bahía Inglesa, Caldera KU134193 This paper 396 EcBIN-308 2013 Chile Bahía Inglesa, Caldera KU134194 This paper 397 EcBIN-309 2013 Chile Bahía Inglesa, Caldera KU134195 This paper 398 EcBIN-315 2013 Chile Bahía Inglesa, Caldera KU134197 This paper 399 EcBIN-320 2013 Chile Bahía Inglesa, Caldera KU134198 This paper 400 EcBIN-323 2013 Chile Bahía Inglesa, Caldera KU134199 This paper 401 EcBIN-330 2013 Chile Bahía Inglesa, Caldera KU134200 This paper 402 EcBIN-331 2013 Chile Bahía Inglesa, Caldera KU134201 This paper 403 EcBIN-332 2013 Chile Bahía Inglesa, Caldera KU134202 This paper 404 EcBIN-333 2013 Chile Bahía Inglesa, Caldera KU134203 This paper 405 EcBIN-338 2013 Chile Bahía Inglesa, Caldera KU134204 This paper 406 EcBIN-339 2013 Chile Bahía Inglesa, Caldera KU134205 This paper 407 EcBIN-341 2013 Chile Bahía Inglesa, Caldera KU134206 This paper 408 EcBIN-343 2013 Chile Bahía Inglesa, Caldera KU134207 This paper 409 EcBIN-010 2013 Chile Bahía Inglesa, Caldera KU134595 This paper 410 EcBIN-220 2013 Chile Bahía Inglesa, Caldera KU134596 This paper 411 EcBIN-221 2013 Chile Bahía Inglesa, Caldera KU134597 This paper 412 EcBIN-001 2013 Chile Bahía Inglesa, Caldera KU134605 This paper 413 EcBIN-002 2013 Chile Bahía Inglesa, Caldera KU134607 This paper 414 EcBIN-004 2013 Chile Bahía Inglesa, Caldera KU134608 This paper 415 EcBIN-005 2013 Chile Bahía Inglesa, Caldera KU134609 This paper 416 EcBIN-006 2013 Chile Bahía Inglesa, Caldera KU134610 This paper 417 EcBIN-007 2013 Chile Bahía Inglesa, Caldera KU134611 This paper 418 EcBIN-008 2013 Chile Bahía Inglesa, Caldera KU134612 This paper 419 EcBIN-276 2013 Chile Bahía Inglesa, Caldera KU134613 This paper
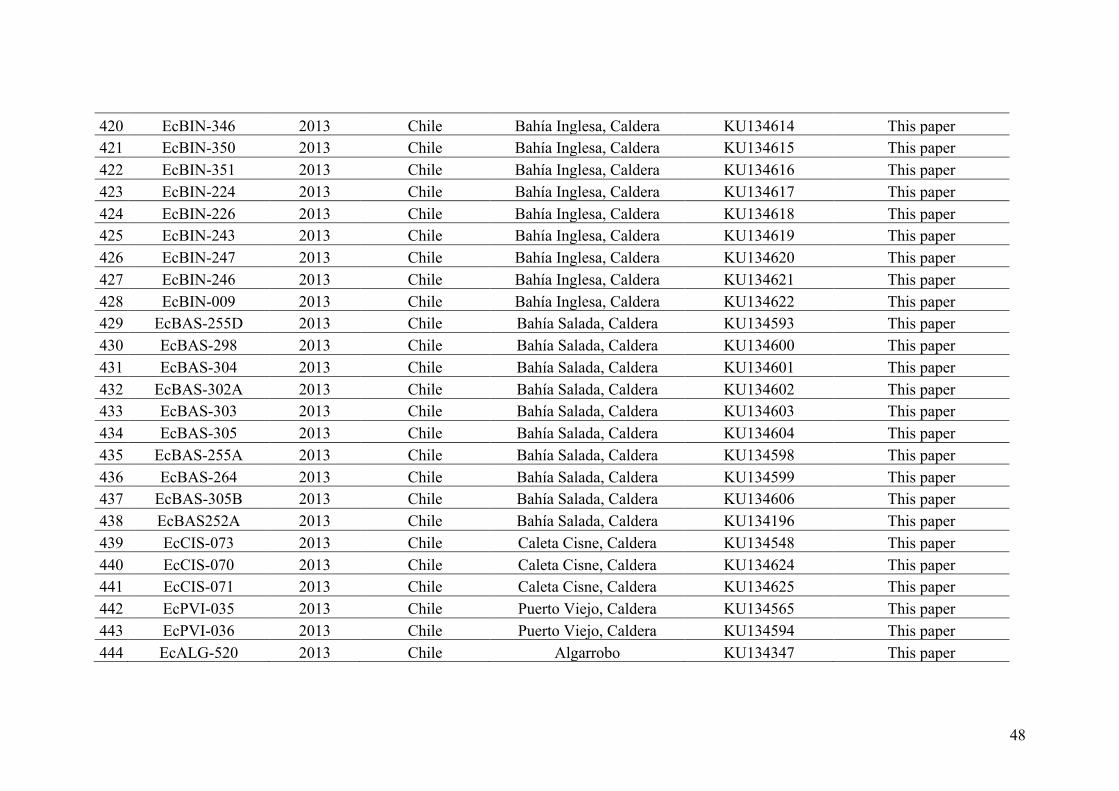
48
420 EcBIN-346 2013 Chile Bahía Inglesa, Caldera KU134614 This paper 421 EcBIN-350 2013 Chile Bahía Inglesa, Caldera KU134615 This paper 422 EcBIN-351 2013 Chile Bahía Inglesa, Caldera KU134616 This paper 423 EcBIN-224 2013 Chile Bahía Inglesa, Caldera KU134617 This paper 424 EcBIN-226 2013 Chile Bahía Inglesa, Caldera KU134618 This paper 425 EcBIN-243 2013 Chile Bahía Inglesa, Caldera KU134619 This paper 426 EcBIN-247 2013 Chile Bahía Inglesa, Caldera KU134620 This paper 427 EcBIN-246 2013 Chile Bahía Inglesa, Caldera KU134621 This paper 428 EcBIN-009 2013 Chile Bahía Inglesa, Caldera KU134622 This paper 429 EcBAS-255D 2013 Chile Bahía Salada, Caldera KU134593 This paper 430 EcBAS-298 2013 Chile Bahía Salada, Caldera KU134600 This paper 431 EcBAS-304 2013 Chile Bahía Salada, Caldera KU134601 This paper 432 EcBAS-302A 2013 Chile Bahía Salada, Caldera KU134602 This paper 433 EcBAS-303 2013 Chile Bahía Salada, Caldera KU134603 This paper 434 EcBAS-305 2013 Chile Bahía Salada, Caldera KU134604 This paper 435 EcBAS-255A 2013 Chile Bahía Salada, Caldera KU134598 This paper 436 EcBAS-264 2013 Chile Bahía Salada, Caldera KU134599 This paper 437 EcBAS-305B 2013 Chile Bahía Salada, Caldera KU134606 This paper 438 EcBAS252A 2013 Chile Bahía Salada, Caldera KU134196 This paper 439 EcCIS-073 2013 Chile Caleta Cisne, Caldera KU134548 This paper 440 EcCIS-070 2013 Chile Caleta Cisne, Caldera KU134624 This paper 441 EcCIS-071 2013 Chile Caleta Cisne, Caldera KU134625 This paper 442 EcPVI-035 2013 Chile Puerto Viejo, Caldera KU134565 This paper 443 EcPVI-036 2013 Chile Puerto Viejo, Caldera KU134594 This paper 444 EcALG-520 2013 Chile Algarrobo KU134347 This paper
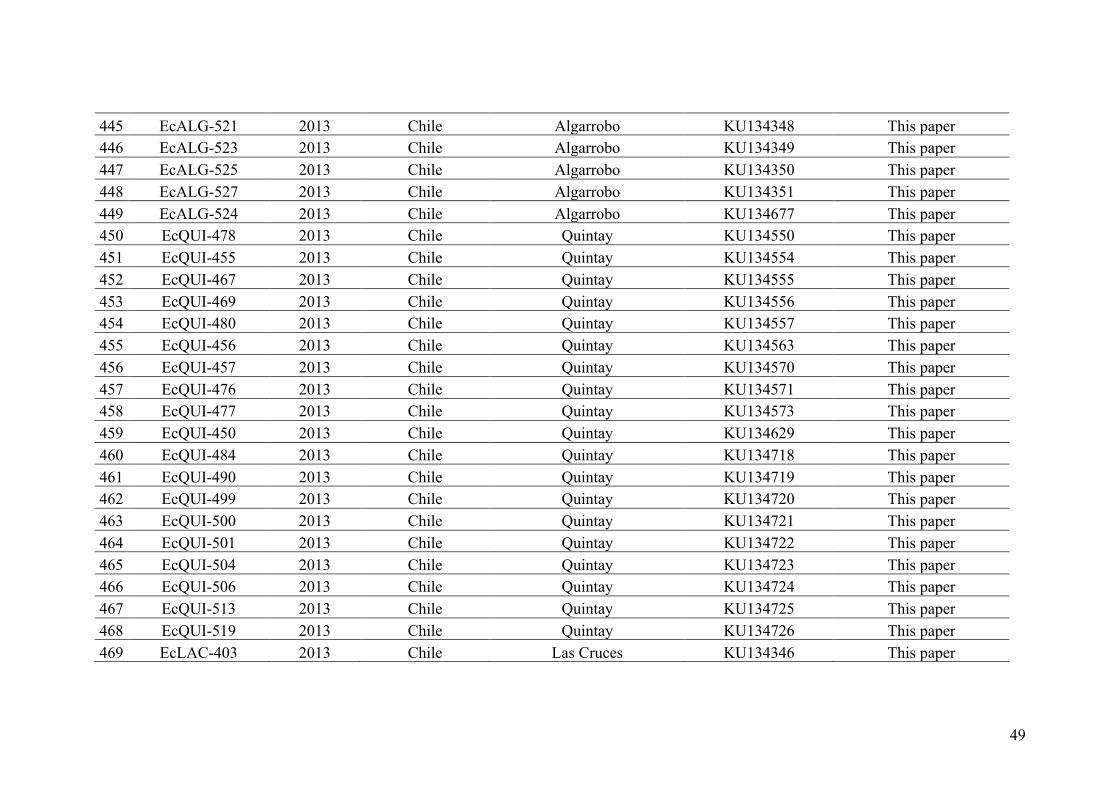
49
445 EcALG-521 2013 Chile Algarrobo KU134348 This paper 446 EcALG-523 2013 Chile Algarrobo KU134349 This paper 447 EcALG-525 2013 Chile Algarrobo KU134350 This paper 448 EcALG-527 2013 Chile Algarrobo KU134351 This paper 449 EcALG-524 2013 Chile Algarrobo KU134677 This paper 450 EcQUI-478 2013 Chile Quintay KU134550 This paper 451 EcQUI-455 2013 Chile Quintay KU134554 This paper 452 EcQUI-467 2013 Chile Quintay KU134555 This paper 453 EcQUI-469 2013 Chile Quintay KU134556 This paper 454 EcQUI-480 2013 Chile Quintay KU134557 This paper 455 EcQUI-456 2013 Chile Quintay KU134563 This paper 456 EcQUI-457 2013 Chile Quintay KU134570 This paper 457 EcQUI-476 2013 Chile Quintay KU134571 This paper 458 EcQUI-477 2013 Chile Quintay KU134573 This paper 459 EcQUI-450 2013 Chile Quintay KU134629 This paper 460 EcQUI-484 2013 Chile Quintay KU134718 This paper 461 EcQUI-490 2013 Chile Quintay KU134719 This paper 462 EcQUI-499 2013 Chile Quintay KU134720 This paper 463 EcQUI-500 2013 Chile Quintay KU134721 This paper 464 EcQUI-501 2013 Chile Quintay KU134722 This paper 465 EcQUI-504 2013 Chile Quintay KU134723 This paper 466 EcQUI-506 2013 Chile Quintay KU134724 This paper 467 EcQUI-513 2013 Chile Quintay KU134725 This paper 468 EcQUI-519 2013 Chile Quintay KU134726 This paper 469 EcLAC-403 2013 Chile Las Cruces KU134346 This paper
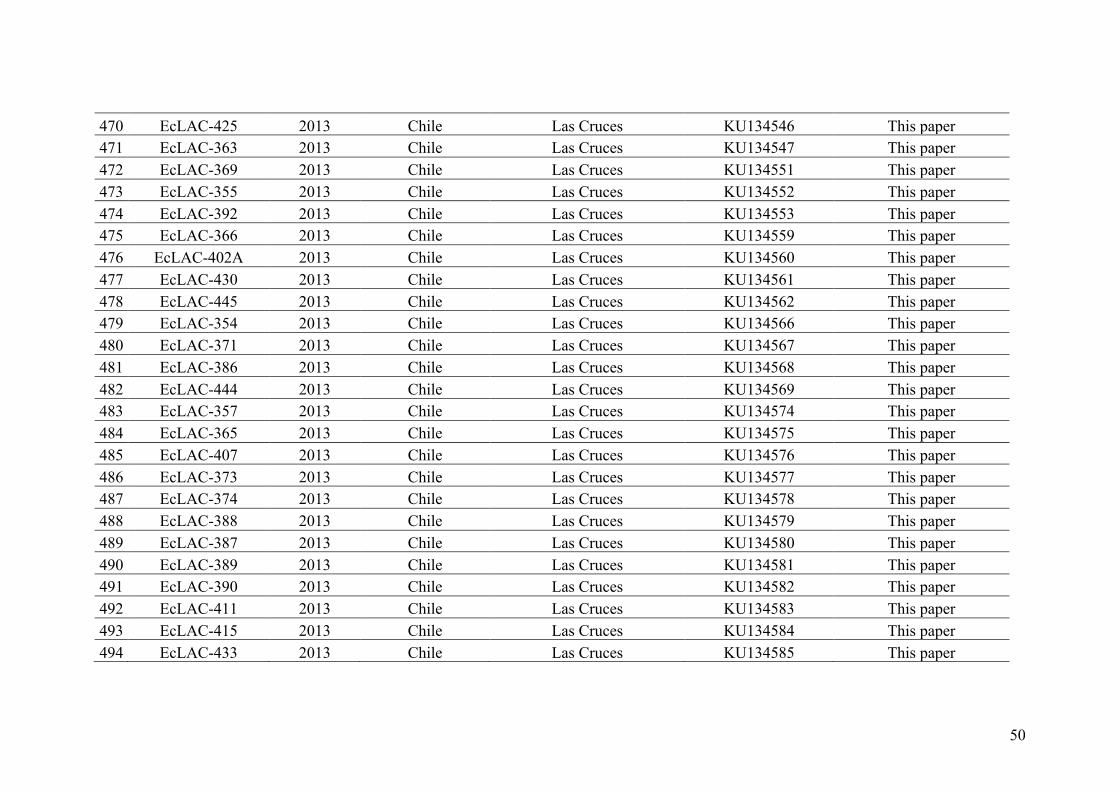
50
470 EcLAC-425 2013 Chile Las Cruces KU134546 This paper 471 EcLAC-363 2013 Chile Las Cruces KU134547 This paper 472 EcLAC-369 2013 Chile Las Cruces KU134551 This paper 473 EcLAC-355 2013 Chile Las Cruces KU134552 This paper 474 EcLAC-392 2013 Chile Las Cruces KU134553 This paper 475 EcLAC-366 2013 Chile Las Cruces KU134559 This paper 476 EcLAC-402A 2013 Chile Las Cruces KU134560 This paper 477 EcLAC-430 2013 Chile Las Cruces KU134561 This paper 478 EcLAC-445 2013 Chile Las Cruces KU134562 This paper 479 EcLAC-354 2013 Chile Las Cruces KU134566 This paper 480 EcLAC-371 2013 Chile Las Cruces KU134567 This paper 481 EcLAC-386 2013 Chile Las Cruces KU134568 This paper 482 EcLAC-444 2013 Chile Las Cruces KU134569 This paper 483 EcLAC-357 2013 Chile Las Cruces KU134574 This paper 484 EcLAC-365 2013 Chile Las Cruces KU134575 This paper 485 EcLAC-407 2013 Chile Las Cruces KU134576 This paper 486 EcLAC-373 2013 Chile Las Cruces KU134577 This paper 487 EcLAC-374 2013 Chile Las Cruces KU134578 This paper 488 EcLAC-388 2013 Chile Las Cruces KU134579 This paper 489 EcLAC-387 2013 Chile Las Cruces KU134580 This paper 490 EcLAC-389 2013 Chile Las Cruces KU134581 This paper 491 EcLAC-390 2013 Chile Las Cruces KU134582 This paper 492 EcLAC-411 2013 Chile Las Cruces KU134583 This paper 493 EcLAC-415 2013 Chile Las Cruces KU134584 This paper 494 EcLAC-433 2013 Chile Las Cruces KU134585 This paper
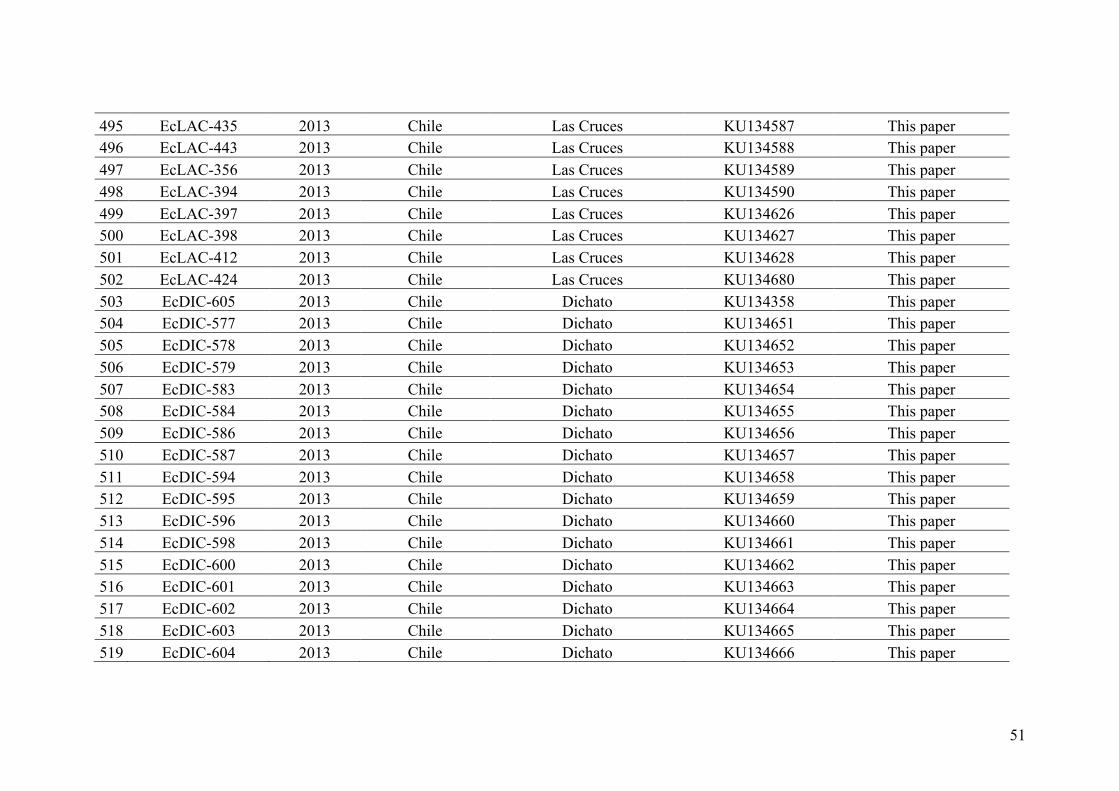
51
495 EcLAC-435 2013 Chile Las Cruces KU134587 This paper 496 EcLAC-443 2013 Chile Las Cruces KU134588 This paper 497 EcLAC-356 2013 Chile Las Cruces KU134589 This paper 498 EcLAC-394 2013 Chile Las Cruces KU134590 This paper 499 EcLAC-397 2013 Chile Las Cruces KU134626 This paper 500 EcLAC-398 2013 Chile Las Cruces KU134627 This paper 501 EcLAC-412 2013 Chile Las Cruces KU134628 This paper 502 EcLAC-424 2013 Chile Las Cruces KU134680 This paper 503 EcDIC-605 2013 Chile Dichato KU134358 This paper 504 EcDIC-577 2013 Chile Dichato KU134651 This paper 505 EcDIC-578 2013 Chile Dichato KU134652 This paper 506 EcDIC-579 2013 Chile Dichato KU134653 This paper 507 EcDIC-583 2013 Chile Dichato KU134654 This paper 508 EcDIC-584 2013 Chile Dichato KU134655 This paper 509 EcDIC-586 2013 Chile Dichato KU134656 This paper 510 EcDIC-587 2013 Chile Dichato KU134657 This paper 511 EcDIC-594 2013 Chile Dichato KU134658 This paper 512 EcDIC-595 2013 Chile Dichato KU134659 This paper 513 EcDIC-596 2013 Chile Dichato KU134660 This paper 514 EcDIC-598 2013 Chile Dichato KU134661 This paper 515 EcDIC-600 2013 Chile Dichato KU134662 This paper 516 EcDIC-601 2013 Chile Dichato KU134663 This paper 517 EcDIC-602 2013 Chile Dichato KU134664 This paper 518 EcDIC-603 2013 Chile Dichato KU134665 This paper 519 EcDIC-604 2013 Chile Dichato KU134666 This paper
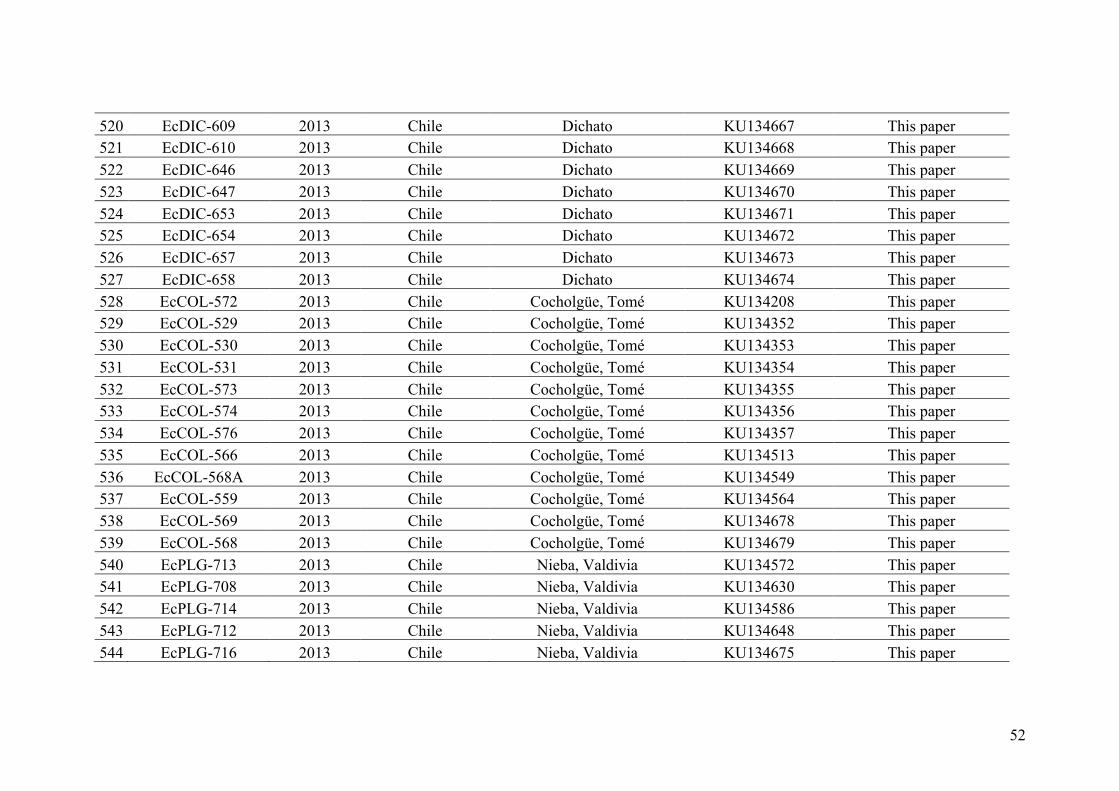
52
520 EcDIC-609 2013 Chile Dichato KU134667 This paper 521 EcDIC-610 2013 Chile Dichato KU134668 This paper 522 EcDIC-646 2013 Chile Dichato KU134669 This paper 523 EcDIC-647 2013 Chile Dichato KU134670 This paper 524 EcDIC-653 2013 Chile Dichato KU134671 This paper 525 EcDIC-654 2013 Chile Dichato KU134672 This paper 526 EcDIC-657 2013 Chile Dichato KU134673 This paper 527 EcDIC-658 2013 Chile Dichato KU134674 This paper 528 EcCOL-572 2013 Chile Cocholgüe, Tomé KU134208 This paper 529 EcCOL-529 2013 Chile Cocholgüe, Tomé KU134352 This paper 530 EcCOL-530 2013 Chile Cocholgüe, Tomé KU134353 This paper 531 EcCOL-531 2013 Chile Cocholgüe, Tomé KU134354 This paper 532 EcCOL-573 2013 Chile Cocholgüe, Tomé KU134355 This paper 533 EcCOL-574 2013 Chile Cocholgüe, Tomé KU134356 This paper 534 EcCOL-576 2013 Chile Cocholgüe, Tomé KU134357 This paper 535 EcCOL-566 2013 Chile Cocholgüe, Tomé KU134513 This paper 536 EcCOL-568A 2013 Chile Cocholgüe, Tomé KU134549 This paper 537 EcCOL-559 2013 Chile Cocholgüe, Tomé KU134564 This paper 538 EcCOL-569 2013 Chile Cocholgüe, Tomé KU134678 This paper 539 EcCOL-568 2013 Chile Cocholgüe, Tomé KU134679 This paper 540 EcPLG-713 2013 Chile Nieba, Valdivia KU134572 This paper 541 EcPLG-708 2013 Chile Nieba, Valdivia KU134630 This paper 542 EcPLG-714 2013 Chile Nieba, Valdivia KU134586 This paper 543 EcPLG-712 2013 Chile Nieba, Valdivia KU134648 This paper 544 EcPLG-716 2013 Chile Nieba, Valdivia KU134675 This paper
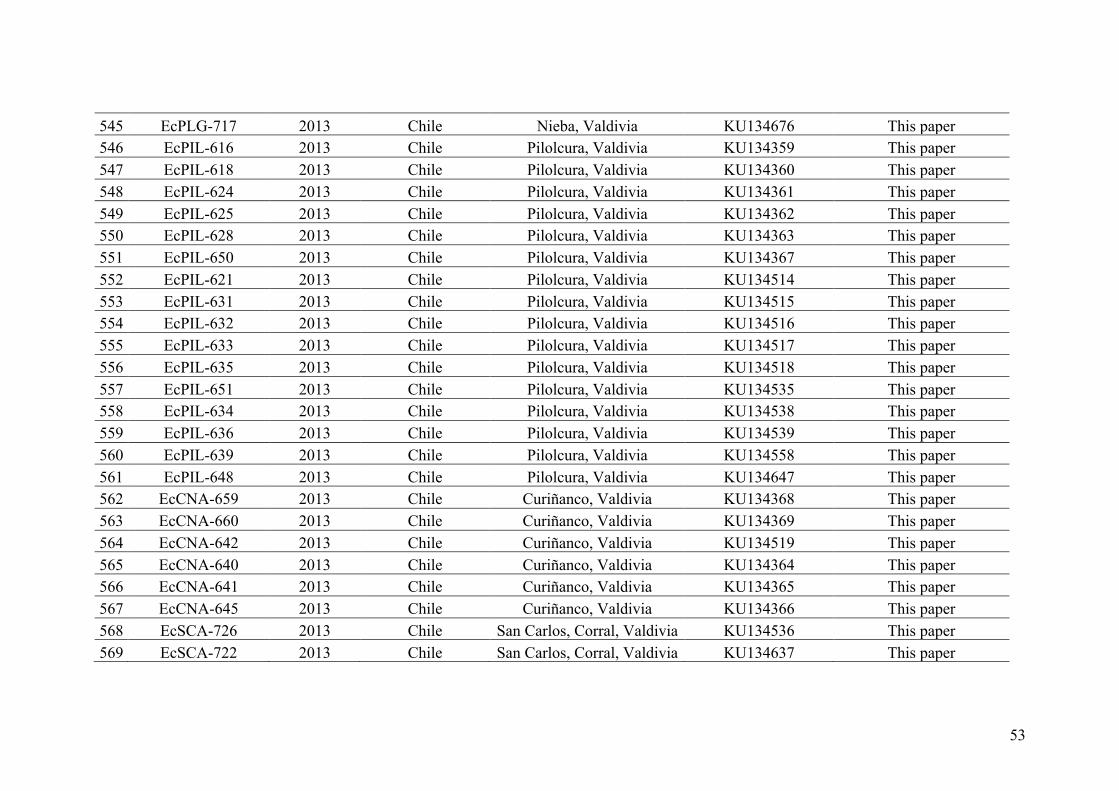
53
545 EcPLG-717 2013 Chile Nieba, Valdivia KU134676 This paper 546 EcPIL-616 2013 Chile Pilolcura, Valdivia KU134359 This paper 547 EcPIL-618 2013 Chile Pilolcura, Valdivia KU134360 This paper 548 EcPIL-624 2013 Chile Pilolcura, Valdivia KU134361 This paper 549 EcPIL-625 2013 Chile Pilolcura, Valdivia KU134362 This paper 550 EcPIL-628 2013 Chile Pilolcura, Valdivia KU134363 This paper 551 EcPIL-650 2013 Chile Pilolcura, Valdivia KU134367 This paper 552 EcPIL-621 2013 Chile Pilolcura, Valdivia KU134514 This paper 553 EcPIL-631 2013 Chile Pilolcura, Valdivia KU134515 This paper 554 EcPIL-632 2013 Chile Pilolcura, Valdivia KU134516 This paper 555 EcPIL-633 2013 Chile Pilolcura, Valdivia KU134517 This paper 556 EcPIL-635 2013 Chile Pilolcura, Valdivia KU134518 This paper 557 EcPIL-651 2013 Chile Pilolcura, Valdivia KU134535 This paper 558 EcPIL-634 2013 Chile Pilolcura, Valdivia KU134538 This paper 559 EcPIL-636 2013 Chile Pilolcura, Valdivia KU134539 This paper 560 EcPIL-639 2013 Chile Pilolcura, Valdivia KU134558 This paper 561 EcPIL-648 2013 Chile Pilolcura, Valdivia KU134647 This paper 562 EcCNA-659 2013 Chile Curiñanco, Valdivia KU134368 This paper 563 EcCNA-660 2013 Chile Curiñanco, Valdivia KU134369 This paper 564 EcCNA-642 2013 Chile Curiñanco, Valdivia KU134519 This paper 565 EcCNA-640 2013 Chile Curiñanco, Valdivia KU134364 This paper 566 EcCNA-641 2013 Chile Curiñanco, Valdivia KU134365 This paper 567 EcCNA-645 2013 Chile Curiñanco, Valdivia KU134366 This paper 568 EcSCA-726 2013 Chile San Carlos, Corral, Valdivia KU134536 This paper 569 EcSCA-722 2013 Chile San Carlos, Corral, Valdivia KU134637 This paper
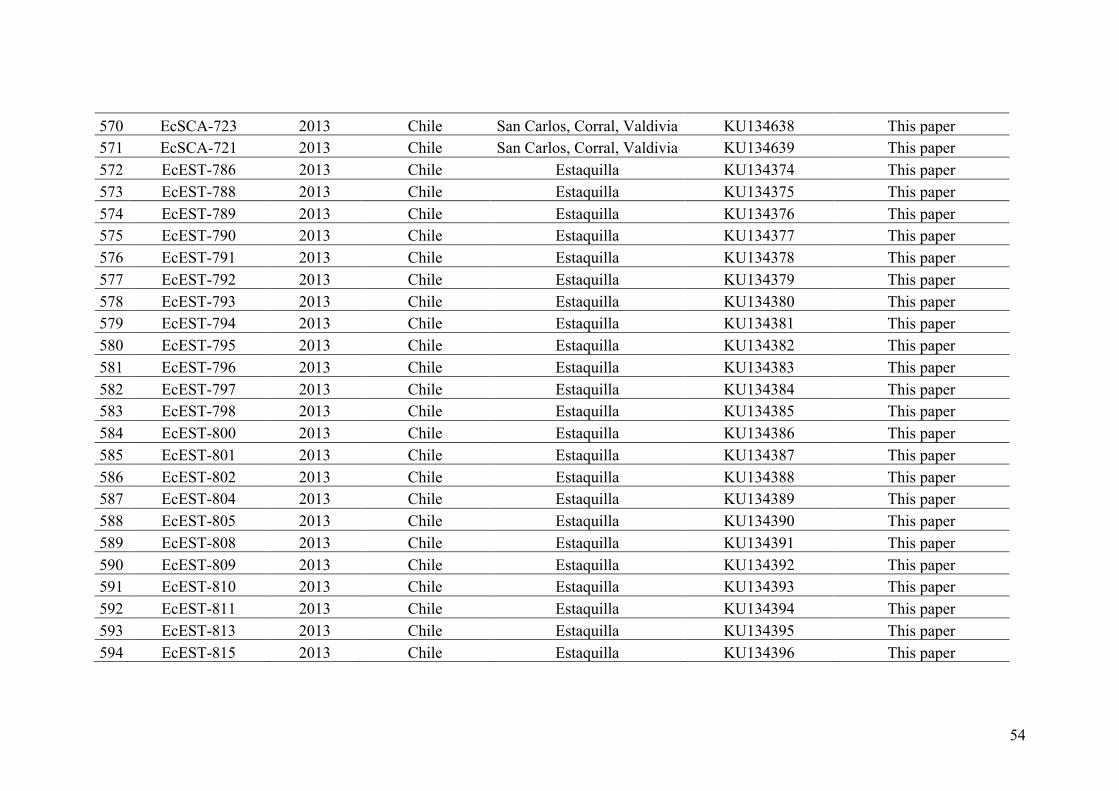
54
570 EcSCA-723 2013 Chile San Carlos, Corral, Valdivia KU134638 This paper 571 EcSCA-721 2013 Chile San Carlos, Corral, Valdivia KU134639 This paper 572 EcEST-786 2013 Chile Estaquilla KU134374 This paper 573 EcEST-788 2013 Chile Estaquilla KU134375 This paper 574 EcEST-789 2013 Chile Estaquilla KU134376 This paper 575 EcEST-790 2013 Chile Estaquilla KU134377 This paper 576 EcEST-791 2013 Chile Estaquilla KU134378 This paper 577 EcEST-792 2013 Chile Estaquilla KU134379 This paper 578 EcEST-793 2013 Chile Estaquilla KU134380 This paper 579 EcEST-794 2013 Chile Estaquilla KU134381 This paper 580 EcEST-795 2013 Chile Estaquilla KU134382 This paper 581 EcEST-796 2013 Chile Estaquilla KU134383 This paper 582 EcEST-797 2013 Chile Estaquilla KU134384 This paper 583 EcEST-798 2013 Chile Estaquilla KU134385 This paper 584 EcEST-800 2013 Chile Estaquilla KU134386 This paper 585 EcEST-801 2013 Chile Estaquilla KU134387 This paper 586 EcEST-802 2013 Chile Estaquilla KU134388 This paper 587 EcEST-804 2013 Chile Estaquilla KU134389 This paper 588 EcEST-805 2013 Chile Estaquilla KU134390 This paper 589 EcEST-808 2013 Chile Estaquilla KU134391 This paper 590 EcEST-809 2013 Chile Estaquilla KU134392 This paper 591 EcEST-810 2013 Chile Estaquilla KU134393 This paper 592 EcEST-811 2013 Chile Estaquilla KU134394 This paper 593 EcEST-813 2013 Chile Estaquilla KU134395 This paper 594 EcEST-815 2013 Chile Estaquilla KU134396 This paper
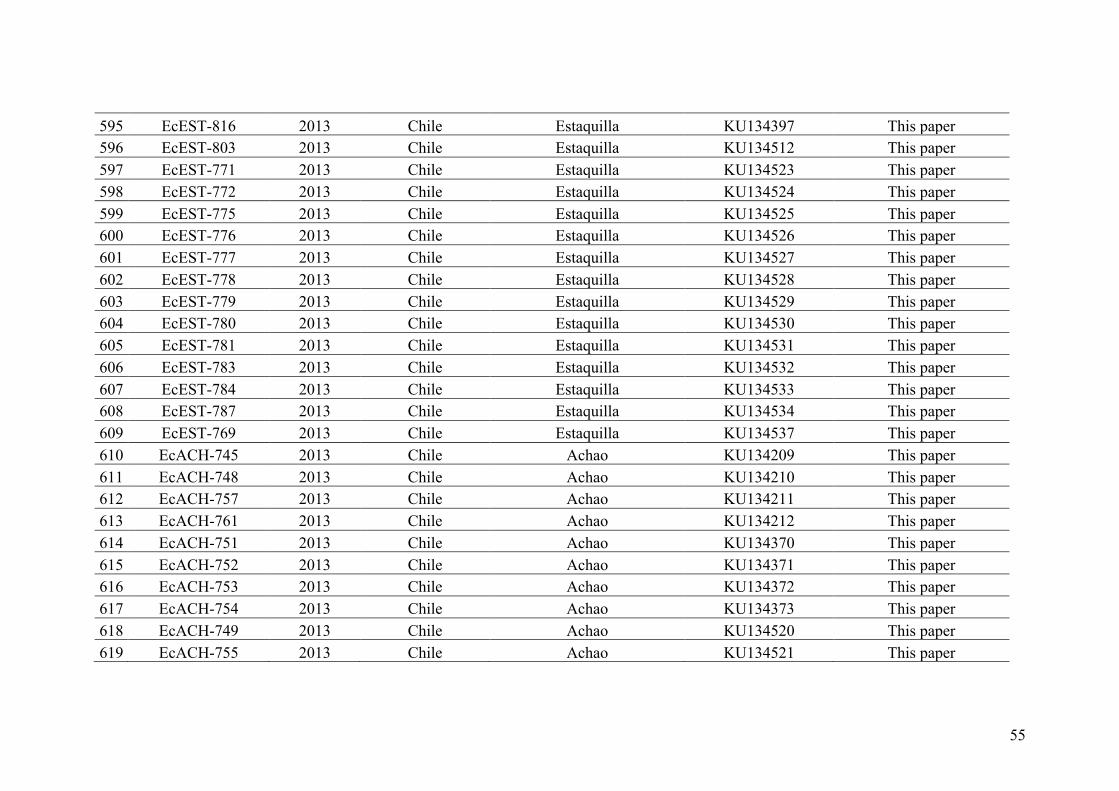
55
595 EcEST-816 2013 Chile Estaquilla KU134397 This paper 596 EcEST-803 2013 Chile Estaquilla KU134512 This paper 597 EcEST-771 2013 Chile Estaquilla KU134523 This paper 598 EcEST-772 2013 Chile Estaquilla KU134524 This paper 599 EcEST-775 2013 Chile Estaquilla KU134525 This paper 600 EcEST-776 2013 Chile Estaquilla KU134526 This paper 601 EcEST-777 2013 Chile Estaquilla KU134527 This paper 602 EcEST-778 2013 Chile Estaquilla KU134528 This paper 603 EcEST-779 2013 Chile Estaquilla KU134529 This paper 604 EcEST-780 2013 Chile Estaquilla KU134530 This paper 605 EcEST-781 2013 Chile Estaquilla KU134531 This paper 606 EcEST-783 2013 Chile Estaquilla KU134532 This paper 607 EcEST-784 2013 Chile Estaquilla KU134533 This paper 608 EcEST-787 2013 Chile Estaquilla KU134534 This paper 609 EcEST-769 2013 Chile Estaquilla KU134537 This paper 610 EcACH-745 2013 Chile Achao KU134209 This paper 611 EcACH-748 2013 Chile Achao KU134210 This paper 612 EcACH-757 2013 Chile Achao KU134211 This paper 613 EcACH-761 2013 Chile Achao KU134212 This paper 614 EcACH-751 2013 Chile Achao KU134370 This paper 615 EcACH-752 2013 Chile Achao KU134371 This paper 616 EcACH-753 2013 Chile Achao KU134372 This paper 617 EcACH-754 2013 Chile Achao KU134373 This paper 618 EcACH-749 2013 Chile Achao KU134520 This paper 619 EcACH-755 2013 Chile Achao KU134521 This paper
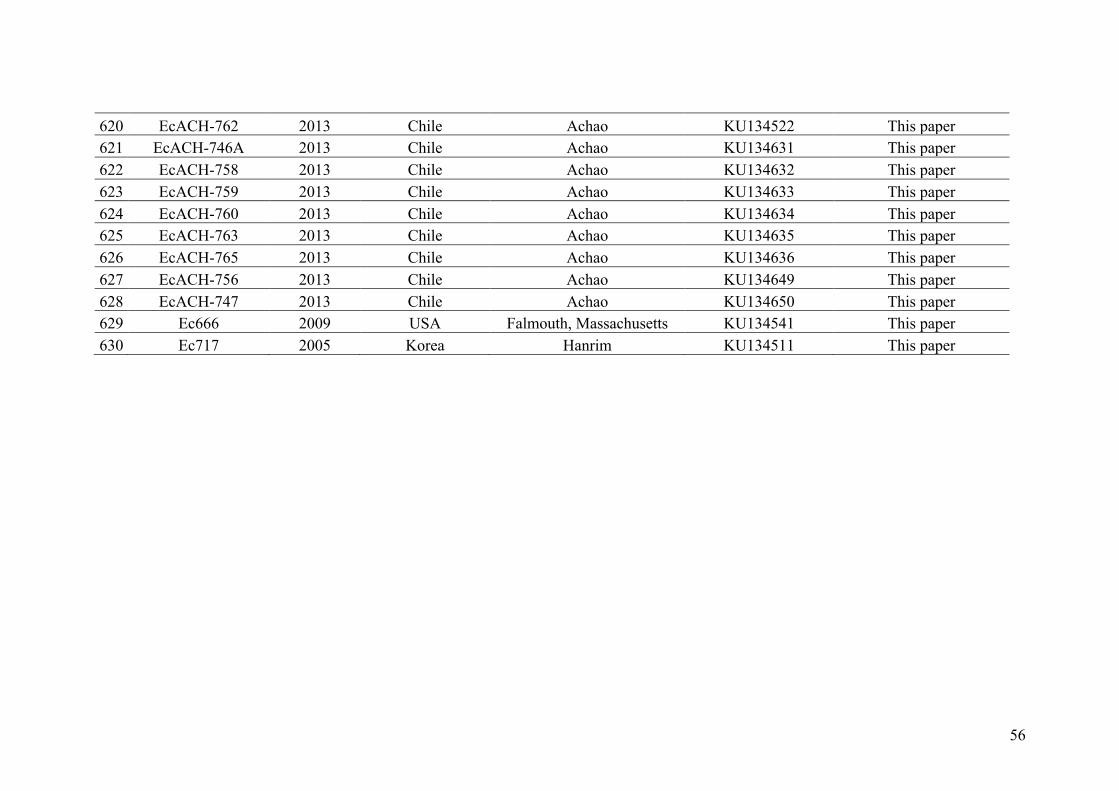
56
620 EcACH-762 2013 Chile Achao KU134522 This paper 621 EcACH-746A 2013 Chile Achao KU134631 This paper 622 EcACH-758 2013 Chile Achao KU134632 This paper 623 EcACH-759 2013 Chile Achao KU134633 This paper 624 EcACH-760 2013 Chile Achao KU134634 This paper 625 EcACH-763 2013 Chile Achao KU134635 This paper 626 EcACH-765 2013 Chile Achao KU134636 This paper 627 EcACH-756 2013 Chile Achao KU134649 This paper 628 EcACH-747 2013 Chile Achao KU134650 This paper 629 Ec666 2009 USA Falmouth, Massachusetts KU134541 This paper 630 Ec717 2005 Korea Hanrim KU134511 This paper
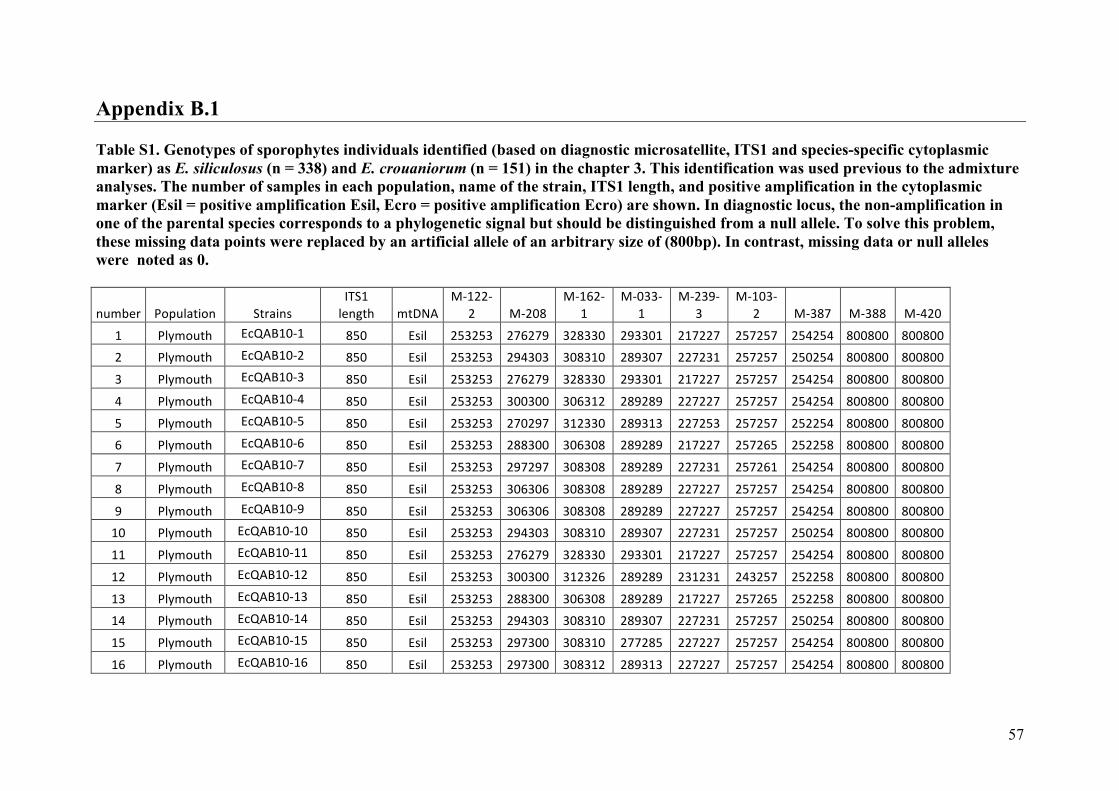
57
Appendix B.1 Table S1. Genotypes of sporophytes individuals identified (based on diagnostic microsatellite, ITS1 and species-specific cytoplasmic marker) as E. siliculosus (n = 338) and E. crouaniorum (n = 151) in the chapter 3. This identification was used previous to the admixture analyses. The number of samples in each population, name of the strain, ITS1 length, and positive amplification in the cytoplasmic marker (Esil = positive amplification Esil, Ecro = positive amplification Ecro) are shown. In diagnostic locus, the non-amplification in one of the parental species corresponds to a phylogenetic signal but should be distinguished from a null allele. To solve this problem, these missing data points were replaced by an artificial allele of an arbitrary size of (800bp). In contrast, missing data or null alleles were noted as 0.
number Population StrainsITS1length mtDNA
M-122-2 M-208
M-162-1
M-033-1
M-239-3
M-103-2 M-387 M-388 M-420
1 Plymouth EcQAB10-1 850 Esil 253253 276279 328330 293301 217227 257257 254254 800800 8008002 Plymouth EcQAB10-2 850 Esil 253253 294303 308310 289307 227231 257257 250254 800800 8008003 Plymouth EcQAB10-3 850 Esil 253253 276279 328330 293301 217227 257257 254254 800800 8008004 Plymouth EcQAB10-4 850 Esil 253253 300300 306312 289289 227227 257257 254254 800800 8008005 Plymouth EcQAB10-5 850 Esil 253253 270297 312330 289313 227253 257257 252254 800800 8008006 Plymouth EcQAB10-6 850 Esil 253253 288300 306308 289289 217227 257265 252258 800800 8008007 Plymouth EcQAB10-7 850 Esil 253253 297297 308308 289289 227231 257261 254254 800800 8008008 Plymouth EcQAB10-8 850 Esil 253253 306306 308308 289289 227227 257257 254254 800800 8008009 Plymouth EcQAB10-9 850 Esil 253253 306306 308308 289289 227227 257257 254254 800800 80080010 Plymouth EcQAB10-10 850 Esil 253253 294303 308310 289307 227231 257257 250254 800800 80080011 Plymouth EcQAB10-11 850 Esil 253253 276279 328330 293301 217227 257257 254254 800800 80080012 Plymouth EcQAB10-12 850 Esil 253253 300300 312326 289289 231231 243257 252258 800800 80080013 Plymouth EcQAB10-13 850 Esil 253253 288300 306308 289289 217227 257265 252258 800800 80080014 Plymouth EcQAB10-14 850 Esil 253253 294303 308310 289307 227231 257257 250254 800800 80080015 Plymouth EcQAB10-15 850 Esil 253253 297300 308310 277285 227227 257257 254254 800800 80080016 Plymouth EcQAB10-16 850 Esil 253253 297300 308312 289313 227227 257257 254254 800800 800800
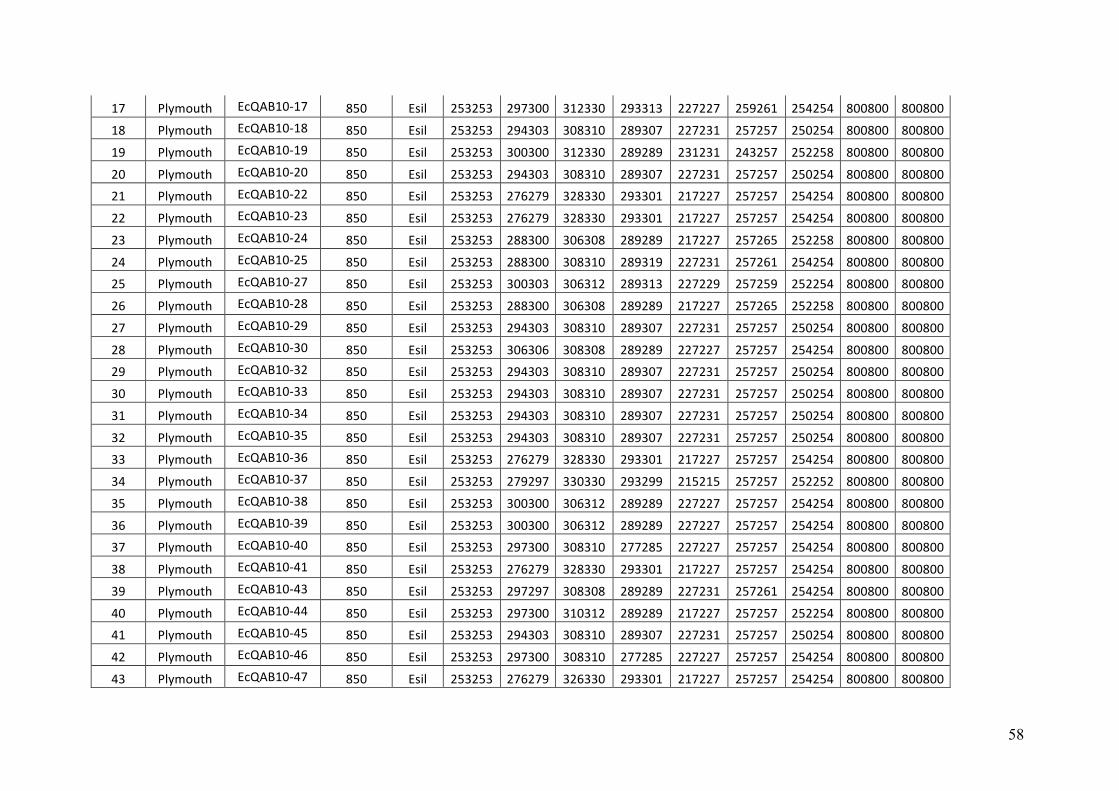
58
17 Plymouth EcQAB10-17 850 Esil 253253 297300 312330 293313 227227 259261 254254 800800 80080018 Plymouth EcQAB10-18 850 Esil 253253 294303 308310 289307 227231 257257 250254 800800 80080019 Plymouth EcQAB10-19 850 Esil 253253 300300 312330 289289 231231 243257 252258 800800 80080020 Plymouth EcQAB10-20 850 Esil 253253 294303 308310 289307 227231 257257 250254 800800 80080021 Plymouth EcQAB10-22 850 Esil 253253 276279 328330 293301 217227 257257 254254 800800 80080022 Plymouth EcQAB10-23 850 Esil 253253 276279 328330 293301 217227 257257 254254 800800 80080023 Plymouth EcQAB10-24 850 Esil 253253 288300 306308 289289 217227 257265 252258 800800 80080024 Plymouth EcQAB10-25 850 Esil 253253 288300 308310 289319 227231 257261 254254 800800 80080025 Plymouth EcQAB10-27 850 Esil 253253 300303 306312 289313 227229 257259 252254 800800 80080026 Plymouth EcQAB10-28 850 Esil 253253 288300 306308 289289 217227 257265 252258 800800 80080027 Plymouth EcQAB10-29 850 Esil 253253 294303 308310 289307 227231 257257 250254 800800 80080028 Plymouth EcQAB10-30 850 Esil 253253 306306 308308 289289 227227 257257 254254 800800 80080029 Plymouth EcQAB10-32 850 Esil 253253 294303 308310 289307 227231 257257 250254 800800 80080030 Plymouth EcQAB10-33 850 Esil 253253 294303 308310 289307 227231 257257 250254 800800 80080031 Plymouth EcQAB10-34 850 Esil 253253 294303 308310 289307 227231 257257 250254 800800 80080032 Plymouth EcQAB10-35 850 Esil 253253 294303 308310 289307 227231 257257 250254 800800 80080033 Plymouth EcQAB10-36 850 Esil 253253 276279 328330 293301 217227 257257 254254 800800 80080034 Plymouth EcQAB10-37 850 Esil 253253 279297 330330 293299 215215 257257 252252 800800 80080035 Plymouth EcQAB10-38 850 Esil 253253 300300 306312 289289 227227 257257 254254 800800 80080036 Plymouth EcQAB10-39 850 Esil 253253 300300 306312 289289 227227 257257 254254 800800 80080037 Plymouth EcQAB10-40 850 Esil 253253 297300 308310 277285 227227 257257 254254 800800 80080038 Plymouth EcQAB10-41 850 Esil 253253 276279 328330 293301 217227 257257 254254 800800 80080039 Plymouth EcQAB10-43 850 Esil 253253 297297 308308 289289 227231 257261 254254 800800 80080040 Plymouth EcQAB10-44 850 Esil 253253 297300 310312 289289 217227 257257 252254 800800 80080041 Plymouth EcQAB10-45 850 Esil 253253 294303 308310 289307 227231 257257 250254 800800 80080042 Plymouth EcQAB10-46 850 Esil 253253 297300 308310 277285 227227 257257 254254 800800 80080043 Plymouth EcQAB10-47 850 Esil 253253 276279 326330 293301 217227 257257 254254 800800 800800
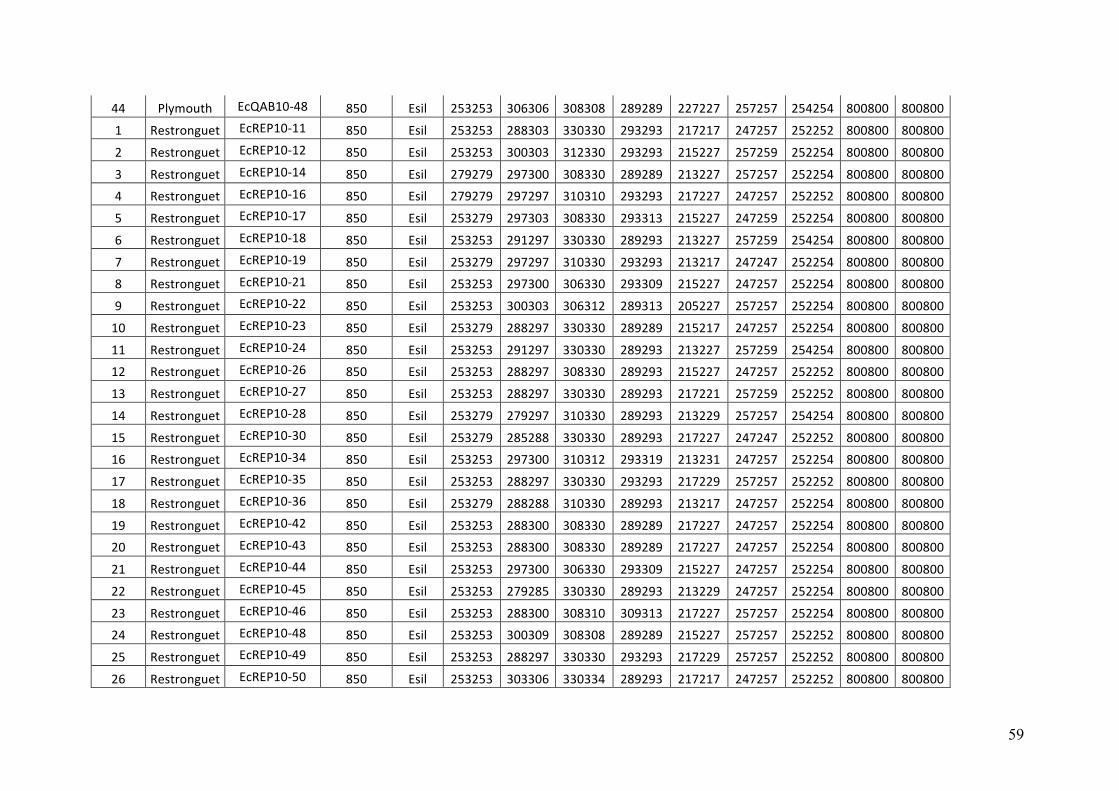
59
44 Plymouth EcQAB10-48 850 Esil 253253 306306 308308 289289 227227 257257 254254 800800 8008001 Restronguet EcREP10-11 850 Esil 253253 288303 330330 293293 217217 247257 252252 800800 8008002 Restronguet EcREP10-12 850 Esil 253253 300303 312330 293293 215227 257259 252254 800800 8008003 Restronguet EcREP10-14 850 Esil 279279 297300 308330 289289 213227 257257 252254 800800 8008004 Restronguet EcREP10-16 850 Esil 279279 297297 310310 293293 217227 247257 252252 800800 8008005 Restronguet EcREP10-17 850 Esil 253279 297303 308330 293313 215227 247259 252254 800800 8008006 Restronguet EcREP10-18 850 Esil 253253 291297 330330 289293 213227 257259 254254 800800 8008007 Restronguet EcREP10-19 850 Esil 253279 297297 310330 293293 213217 247247 252254 800800 8008008 Restronguet EcREP10-21 850 Esil 253253 297300 306330 293309 215227 247257 252254 800800 8008009 Restronguet EcREP10-22 850 Esil 253253 300303 306312 289313 205227 257257 252254 800800 80080010 Restronguet EcREP10-23 850 Esil 253279 288297 330330 289289 215217 247257 252254 800800 80080011 Restronguet EcREP10-24 850 Esil 253253 291297 330330 289293 213227 257259 254254 800800 80080012 Restronguet EcREP10-26 850 Esil 253253 288297 308330 289293 215227 247257 252252 800800 80080013 Restronguet EcREP10-27 850 Esil 253253 288297 330330 289293 217221 257259 252252 800800 80080014 Restronguet EcREP10-28 850 Esil 253279 279297 310330 289293 213229 257257 254254 800800 80080015 Restronguet EcREP10-30 850 Esil 253279 285288 330330 289293 217227 247247 252252 800800 80080016 Restronguet EcREP10-34 850 Esil 253253 297300 310312 293319 213231 247257 252254 800800 80080017 Restronguet EcREP10-35 850 Esil 253253 288297 330330 293293 217229 257257 252252 800800 80080018 Restronguet EcREP10-36 850 Esil 253279 288288 310330 289293 213217 247257 252254 800800 80080019 Restronguet EcREP10-42 850 Esil 253253 288300 308330 289289 217227 247257 252254 800800 80080020 Restronguet EcREP10-43 850 Esil 253253 288300 308330 289289 217227 247257 252254 800800 80080021 Restronguet EcREP10-44 850 Esil 253253 297300 306330 293309 215227 247257 252254 800800 80080022 Restronguet EcREP10-45 850 Esil 253253 279285 330330 289293 213229 247257 252254 800800 80080023 Restronguet EcREP10-46 850 Esil 253253 288300 308310 309313 217227 257257 252254 800800 80080024 Restronguet EcREP10-48 850 Esil 253253 300309 308308 289289 215227 257257 252252 800800 80080025 Restronguet EcREP10-49 850 Esil 253253 288297 330330 293293 217229 257257 252252 800800 80080026 Restronguet EcREP10-50 850 Esil 253253 303306 330334 289293 217217 247257 252252 800800 800800
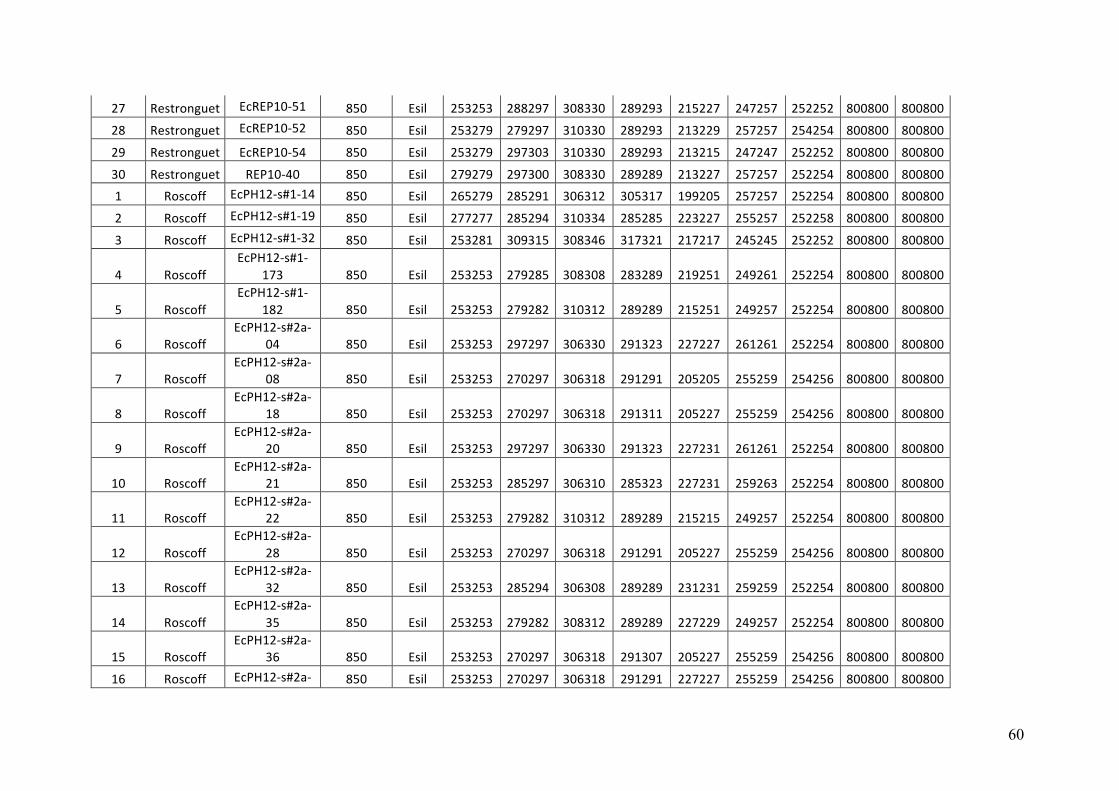
60
27 Restronguet EcREP10-51 850 Esil 253253 288297 308330 289293 215227 247257 252252 800800 80080028 Restronguet EcREP10-52 850 Esil 253279 279297 310330 289293 213229 257257 254254 800800 80080029 Restronguet EcREP10-54 850 Esil 253279 297303 310330 289293 213215 247247 252252 800800 80080030 Restronguet REP10-40 850 Esil 279279 297300 308330 289289 213227 257257 252254 800800 8008001 Roscoff EcPH12-s#1-14 850 Esil 265279 285291 306312 305317 199205 257257 252254 800800 8008002 Roscoff EcPH12-s#1-19 850 Esil 277277 285294 310334 285285 223227 255257 252258 800800 8008003 Roscoff EcPH12-s#1-32 850 Esil 253281 309315 308346 317321 217217 245245 252252 800800 800800
4 RoscoffEcPH12-s#1-
173 850 Esil 253253 279285 308308 283289 219251 249261 252254 800800 800800
5 RoscoffEcPH12-s#1-
182 850 Esil 253253 279282 310312 289289 215251 249257 252254 800800 800800
6 RoscoffEcPH12-s#2a-
04 850 Esil 253253 297297 306330 291323 227227 261261 252254 800800 800800
7 RoscoffEcPH12-s#2a-
08 850 Esil 253253 270297 306318 291291 205205 255259 254256 800800 800800
8 RoscoffEcPH12-s#2a-
18 850 Esil 253253 270297 306318 291311 205227 255259 254256 800800 800800
9 RoscoffEcPH12-s#2a-
20 850 Esil 253253 297297 306330 291323 227231 261261 252254 800800 800800
10 RoscoffEcPH12-s#2a-
21 850 Esil 253253 285297 306310 285323 227231 259263 252254 800800 800800
11 RoscoffEcPH12-s#2a-
22 850 Esil 253253 279282 310312 289289 215215 249257 252254 800800 800800
12 RoscoffEcPH12-s#2a-
28 850 Esil 253253 270297 306318 291291 205227 255259 254256 800800 800800
13 RoscoffEcPH12-s#2a-
32 850 Esil 253253 285294 306308 289289 231231 259259 252254 800800 800800
14 RoscoffEcPH12-s#2a-
35 850 Esil 253253 279282 308312 289289 227229 249257 252254 800800 800800
15 RoscoffEcPH12-s#2a-
36 850 Esil 253253 270297 306318 291307 205227 255259 254256 800800 80080016 Roscoff EcPH12-s#2a- 850 Esil 253253 270297 306318 291291 227227 255259 254256 800800 800800
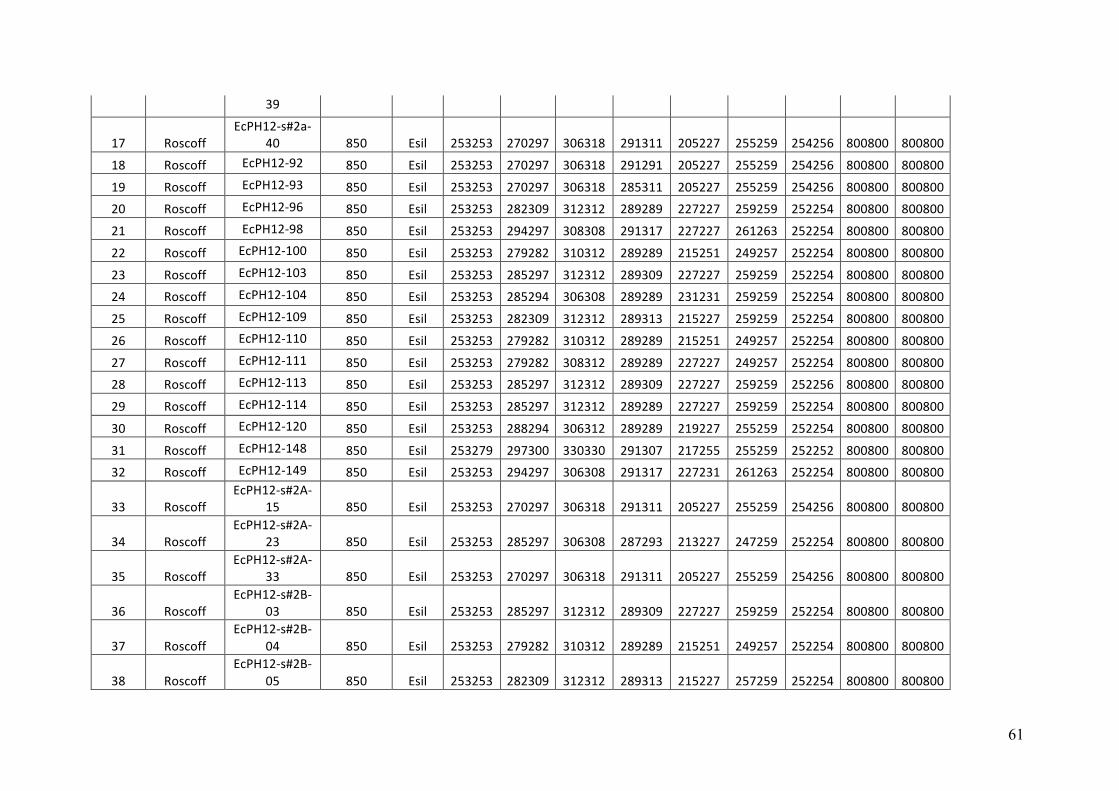
61
39
17 RoscoffEcPH12-s#2a-
40 850 Esil 253253 270297 306318 291311 205227 255259 254256 800800 80080018 Roscoff EcPH12-92 850 Esil 253253 270297 306318 291291 205227 255259 254256 800800 80080019 Roscoff EcPH12-93 850 Esil 253253 270297 306318 285311 205227 255259 254256 800800 80080020 Roscoff EcPH12-96 850 Esil 253253 282309 312312 289289 227227 259259 252254 800800 80080021 Roscoff EcPH12-98 850 Esil 253253 294297 308308 291317 227227 261263 252254 800800 80080022 Roscoff EcPH12-100 850 Esil 253253 279282 310312 289289 215251 249257 252254 800800 80080023 Roscoff EcPH12-103 850 Esil 253253 285297 312312 289309 227227 259259 252254 800800 80080024 Roscoff EcPH12-104 850 Esil 253253 285294 306308 289289 231231 259259 252254 800800 80080025 Roscoff EcPH12-109 850 Esil 253253 282309 312312 289313 215227 259259 252254 800800 80080026 Roscoff EcPH12-110 850 Esil 253253 279282 310312 289289 215251 249257 252254 800800 80080027 Roscoff EcPH12-111 850 Esil 253253 279282 308312 289289 227227 249257 252254 800800 80080028 Roscoff EcPH12-113 850 Esil 253253 285297 312312 289309 227227 259259 252256 800800 80080029 Roscoff EcPH12-114 850 Esil 253253 285297 312312 289289 227227 259259 252254 800800 80080030 Roscoff EcPH12-120 850 Esil 253253 288294 306312 289289 219227 255259 252254 800800 80080031 Roscoff EcPH12-148 850 Esil 253279 297300 330330 291307 217255 255259 252252 800800 80080032 Roscoff EcPH12-149 850 Esil 253253 294297 306308 291317 227231 261263 252254 800800 800800
33 RoscoffEcPH12-s#2A-
15 850 Esil 253253 270297 306318 291311 205227 255259 254256 800800 800800
34 RoscoffEcPH12-s#2A-
23 850 Esil 253253 285297 306308 287293 213227 247259 252254 800800 800800
35 RoscoffEcPH12-s#2A-
33 850 Esil 253253 270297 306318 291311 205227 255259 254256 800800 800800
36 RoscoffEcPH12-s#2B-
03 850 Esil 253253 285297 312312 289309 227227 259259 252254 800800 800800
37 RoscoffEcPH12-s#2B-
04 850 Esil 253253 279282 310312 289289 215251 249257 252254 800800 800800
38 RoscoffEcPH12-s#2B-
05 850 Esil 253253 282309 312312 289313 215227 257259 252254 800800 800800
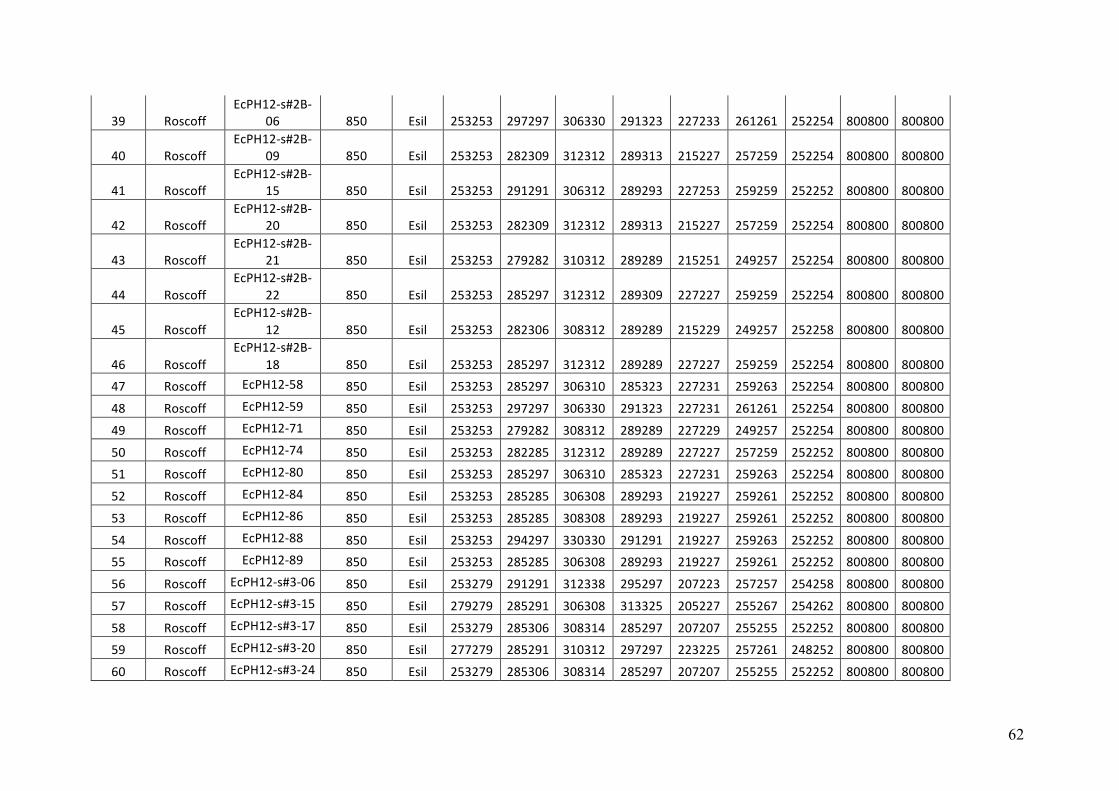
62
39 RoscoffEcPH12-s#2B-
06 850 Esil 253253 297297 306330 291323 227233 261261 252254 800800 800800
40 RoscoffEcPH12-s#2B-
09 850 Esil 253253 282309 312312 289313 215227 257259 252254 800800 800800
41 RoscoffEcPH12-s#2B-
15 850 Esil 253253 291291 306312 289293 227253 259259 252252 800800 800800
42 RoscoffEcPH12-s#2B-
20 850 Esil 253253 282309 312312 289313 215227 257259 252254 800800 800800
43 RoscoffEcPH12-s#2B-
21 850 Esil 253253 279282 310312 289289 215251 249257 252254 800800 800800
44 RoscoffEcPH12-s#2B-
22 850 Esil 253253 285297 312312 289309 227227 259259 252254 800800 800800
45 RoscoffEcPH12-s#2B-
12 850 Esil 253253 282306 308312 289289 215229 249257 252258 800800 800800
46 RoscoffEcPH12-s#2B-
18 850 Esil 253253 285297 312312 289289 227227 259259 252254 800800 80080047 Roscoff EcPH12-58 850 Esil 253253 285297 306310 285323 227231 259263 252254 800800 80080048 Roscoff EcPH12-59 850 Esil 253253 297297 306330 291323 227231 261261 252254 800800 80080049 Roscoff EcPH12-71 850 Esil 253253 279282 308312 289289 227229 249257 252254 800800 80080050 Roscoff EcPH12-74 850 Esil 253253 282285 312312 289289 227227 257259 252252 800800 80080051 Roscoff EcPH12-80 850 Esil 253253 285297 306310 285323 227231 259263 252254 800800 80080052 Roscoff EcPH12-84 850 Esil 253253 285285 306308 289293 219227 259261 252252 800800 80080053 Roscoff EcPH12-86 850 Esil 253253 285285 308308 289293 219227 259261 252252 800800 80080054 Roscoff EcPH12-88 850 Esil 253253 294297 330330 291291 219227 259263 252252 800800 80080055 Roscoff EcPH12-89 850 Esil 253253 285285 306308 289293 219227 259261 252252 800800 80080056 Roscoff EcPH12-s#3-06 850 Esil 253279 291291 312338 295297 207223 257257 254258 800800 80080057 Roscoff EcPH12-s#3-15 850 Esil 279279 285291 306308 313325 205227 255267 254262 800800 80080058 Roscoff EcPH12-s#3-17 850 Esil 253279 285306 308314 285297 207207 255255 252252 800800 80080059 Roscoff EcPH12-s#3-20 850 Esil 277279 285291 310312 297297 223225 257261 248252 800800 80080060 Roscoff EcPH12-s#3-24 850 Esil 253279 285306 308314 285297 207207 255255 252252 800800 800800
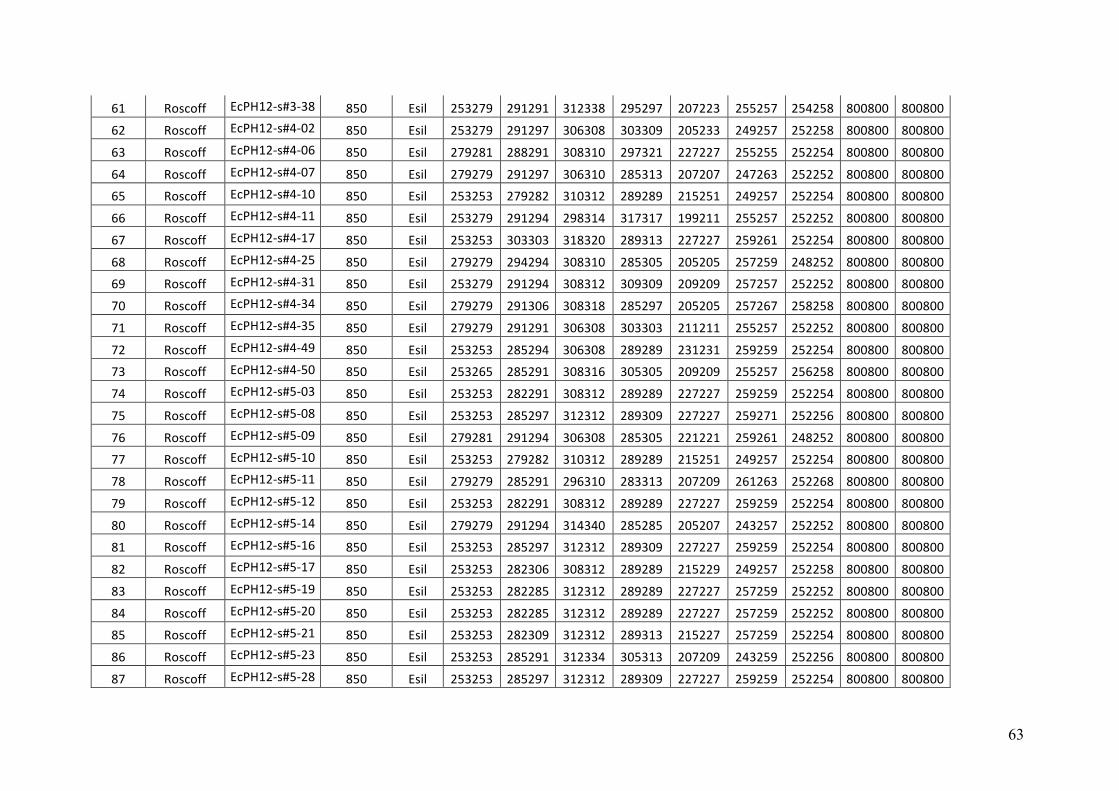
63
61 Roscoff EcPH12-s#3-38 850 Esil 253279 291291 312338 295297 207223 255257 254258 800800 80080062 Roscoff EcPH12-s#4-02 850 Esil 253279 291297 306308 303309 205233 249257 252258 800800 80080063 Roscoff EcPH12-s#4-06 850 Esil 279281 288291 308310 297321 227227 255255 252254 800800 80080064 Roscoff EcPH12-s#4-07 850 Esil 279279 291297 306310 285313 207207 247263 252252 800800 80080065 Roscoff EcPH12-s#4-10 850 Esil 253253 279282 310312 289289 215251 249257 252254 800800 80080066 Roscoff EcPH12-s#4-11 850 Esil 253279 291294 298314 317317 199211 255257 252252 800800 80080067 Roscoff EcPH12-s#4-17 850 Esil 253253 303303 318320 289313 227227 259261 252254 800800 80080068 Roscoff EcPH12-s#4-25 850 Esil 279279 294294 308310 285305 205205 257259 248252 800800 80080069 Roscoff EcPH12-s#4-31 850 Esil 253279 291294 308312 309309 209209 257257 252252 800800 80080070 Roscoff EcPH12-s#4-34 850 Esil 279279 291306 308318 285297 205205 257267 258258 800800 80080071 Roscoff EcPH12-s#4-35 850 Esil 279279 291291 306308 303303 211211 255257 252252 800800 80080072 Roscoff EcPH12-s#4-49 850 Esil 253253 285294 306308 289289 231231 259259 252254 800800 80080073 Roscoff EcPH12-s#4-50 850 Esil 253265 285291 308316 305305 209209 255257 256258 800800 80080074 Roscoff EcPH12-s#5-03 850 Esil 253253 282291 308312 289289 227227 259259 252254 800800 80080075 Roscoff EcPH12-s#5-08 850 Esil 253253 285297 312312 289309 227227 259271 252256 800800 80080076 Roscoff EcPH12-s#5-09 850 Esil 279281 291294 306308 285305 221221 259261 248252 800800 80080077 Roscoff EcPH12-s#5-10 850 Esil 253253 279282 310312 289289 215251 249257 252254 800800 80080078 Roscoff EcPH12-s#5-11 850 Esil 279279 285291 296310 283313 207209 261263 252268 800800 80080079 Roscoff EcPH12-s#5-12 850 Esil 253253 282291 308312 289289 227227 259259 252254 800800 80080080 Roscoff EcPH12-s#5-14 850 Esil 279279 291294 314340 285285 205207 243257 252252 800800 80080081 Roscoff EcPH12-s#5-16 850 Esil 253253 285297 312312 289309 227227 259259 252254 800800 80080082 Roscoff EcPH12-s#5-17 850 Esil 253253 282306 308312 289289 215229 249257 252258 800800 80080083 Roscoff EcPH12-s#5-19 850 Esil 253253 282285 312312 289289 227227 257259 252252 800800 80080084 Roscoff EcPH12-s#5-20 850 Esil 253253 282285 312312 289289 227227 257259 252252 800800 80080085 Roscoff EcPH12-s#5-21 850 Esil 253253 282309 312312 289313 215227 257259 252254 800800 80080086 Roscoff EcPH12-s#5-23 850 Esil 253253 285291 312334 305313 207209 243259 252256 800800 80080087 Roscoff EcPH12-s#5-28 850 Esil 253253 285297 312312 289309 227227 259259 252254 800800 800800
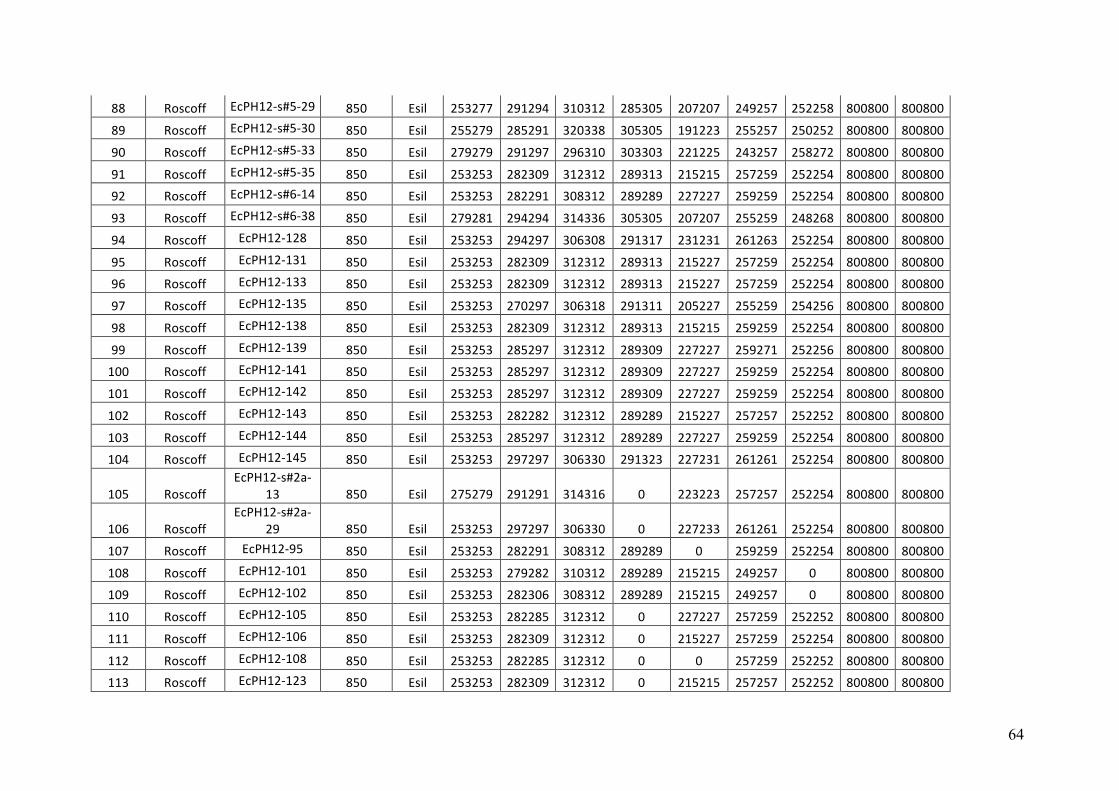
64
88 Roscoff EcPH12-s#5-29 850 Esil 253277 291294 310312 285305 207207 249257 252258 800800 80080089 Roscoff EcPH12-s#5-30 850 Esil 255279 285291 320338 305305 191223 255257 250252 800800 80080090 Roscoff EcPH12-s#5-33 850 Esil 279279 291297 296310 303303 221225 243257 258272 800800 80080091 Roscoff EcPH12-s#5-35 850 Esil 253253 282309 312312 289313 215215 257259 252254 800800 80080092 Roscoff EcPH12-s#6-14 850 Esil 253253 282291 308312 289289 227227 259259 252254 800800 80080093 Roscoff EcPH12-s#6-38 850 Esil 279281 294294 314336 305305 207207 255259 248268 800800 80080094 Roscoff EcPH12-128 850 Esil 253253 294297 306308 291317 231231 261263 252254 800800 80080095 Roscoff EcPH12-131 850 Esil 253253 282309 312312 289313 215227 257259 252254 800800 80080096 Roscoff EcPH12-133 850 Esil 253253 282309 312312 289313 215227 257259 252254 800800 80080097 Roscoff EcPH12-135 850 Esil 253253 270297 306318 291311 205227 255259 254256 800800 80080098 Roscoff EcPH12-138 850 Esil 253253 282309 312312 289313 215215 259259 252254 800800 80080099 Roscoff EcPH12-139 850 Esil 253253 285297 312312 289309 227227 259271 252256 800800 800800100 Roscoff EcPH12-141 850 Esil 253253 285297 312312 289309 227227 259259 252254 800800 800800101 Roscoff EcPH12-142 850 Esil 253253 285297 312312 289309 227227 259259 252254 800800 800800102 Roscoff EcPH12-143 850 Esil 253253 282282 312312 289289 215227 257257 252252 800800 800800103 Roscoff EcPH12-144 850 Esil 253253 285297 312312 289289 227227 259259 252254 800800 800800104 Roscoff EcPH12-145 850 Esil 253253 297297 306330 291323 227231 261261 252254 800800 800800
105 RoscoffEcPH12-s#2a-
13 850 Esil 275279 291291 314316 0 223223 257257 252254 800800 800800
106 RoscoffEcPH12-s#2a-
29 850 Esil 253253 297297 306330 0 227233 261261 252254 800800 800800107 Roscoff EcPH12-95 850 Esil 253253 282291 308312 289289 0 259259 252254 800800 800800108 Roscoff EcPH12-101 850 Esil 253253 279282 310312 289289 215215 249257 0 800800 800800109 Roscoff EcPH12-102 850 Esil 253253 282306 308312 289289 215215 249257 0 800800 800800110 Roscoff EcPH12-105 850 Esil 253253 282285 312312 0 227227 257259 252252 800800 800800111 Roscoff EcPH12-106 850 Esil 253253 282309 312312 0 215227 257259 252254 800800 800800112 Roscoff EcPH12-108 850 Esil 253253 282285 312312 0 0 257259 252252 800800 800800113 Roscoff EcPH12-123 850 Esil 253253 282309 312312 0 215215 257257 252252 800800 800800
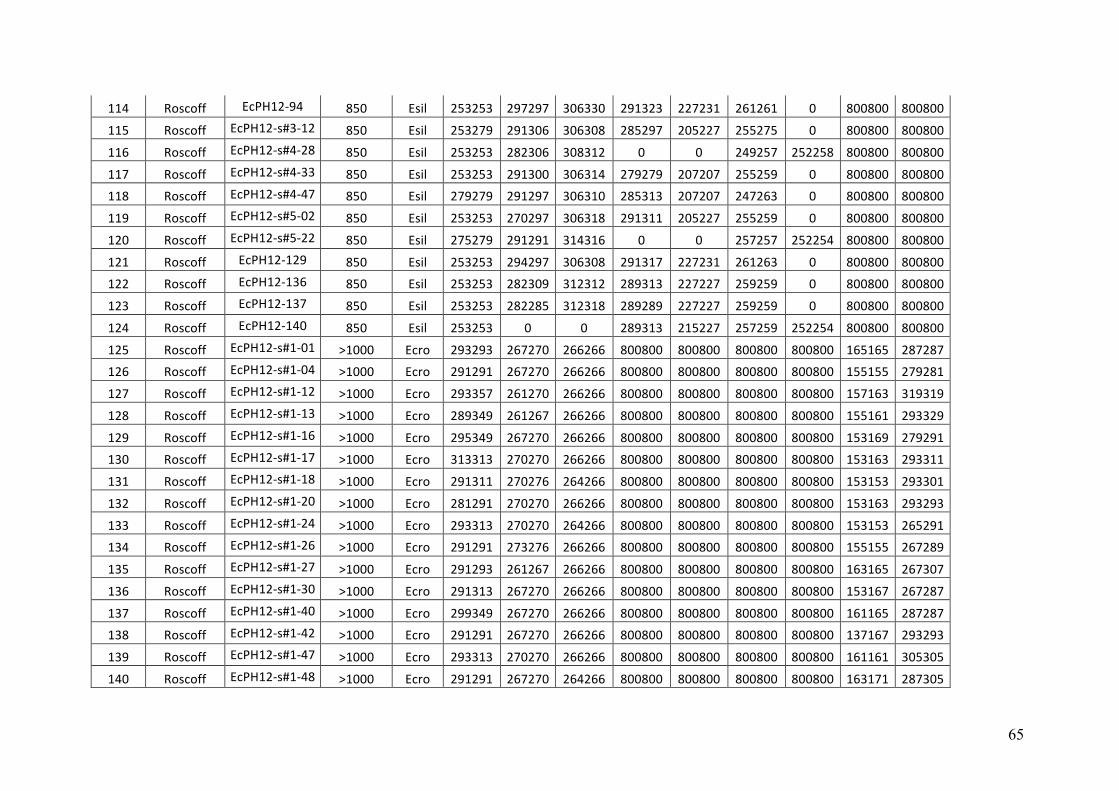
65
114 Roscoff EcPH12-94 850 Esil 253253 297297 306330 291323 227231 261261 0 800800 800800115 Roscoff EcPH12-s#3-12 850 Esil 253279 291306 306308 285297 205227 255275 0 800800 800800116 Roscoff EcPH12-s#4-28 850 Esil 253253 282306 308312 0 0 249257 252258 800800 800800117 Roscoff EcPH12-s#4-33 850 Esil 253253 291300 306314 279279 207207 255259 0 800800 800800118 Roscoff EcPH12-s#4-47 850 Esil 279279 291297 306310 285313 207207 247263 0 800800 800800119 Roscoff EcPH12-s#5-02 850 Esil 253253 270297 306318 291311 205227 255259 0 800800 800800120 Roscoff EcPH12-s#5-22 850 Esil 275279 291291 314316 0 0 257257 252254 800800 800800121 Roscoff EcPH12-129 850 Esil 253253 294297 306308 291317 227231 261263 0 800800 800800122 Roscoff EcPH12-136 850 Esil 253253 282309 312312 289313 227227 259259 0 800800 800800123 Roscoff EcPH12-137 850 Esil 253253 282285 312318 289289 227227 259259 0 800800 800800124 Roscoff EcPH12-140 850 Esil 253253 0 0 289313 215227 257259 252254 800800 800800125 Roscoff EcPH12-s#1-01 >1000 Ecro 293293 267270 266266 800800 800800 800800 800800 165165 287287126 Roscoff EcPH12-s#1-04 >1000 Ecro 291291 267270 266266 800800 800800 800800 800800 155155 279281127 Roscoff EcPH12-s#1-12 >1000 Ecro 293357 261270 266266 800800 800800 800800 800800 157163 319319128 Roscoff EcPH12-s#1-13 >1000 Ecro 289349 261267 266266 800800 800800 800800 800800 155161 293329129 Roscoff EcPH12-s#1-16 >1000 Ecro 295349 267270 266266 800800 800800 800800 800800 153169 279291130 Roscoff EcPH12-s#1-17 >1000 Ecro 313313 270270 266266 800800 800800 800800 800800 153163 293311131 Roscoff EcPH12-s#1-18 >1000 Ecro 291311 270276 264266 800800 800800 800800 800800 153153 293301132 Roscoff EcPH12-s#1-20 >1000 Ecro 281291 270270 266266 800800 800800 800800 800800 153163 293293133 Roscoff EcPH12-s#1-24 >1000 Ecro 293313 270270 264266 800800 800800 800800 800800 153153 265291134 Roscoff EcPH12-s#1-26 >1000 Ecro 291291 273276 266266 800800 800800 800800 800800 155155 267289135 Roscoff EcPH12-s#1-27 >1000 Ecro 291293 261267 266266 800800 800800 800800 800800 163165 267307136 Roscoff EcPH12-s#1-30 >1000 Ecro 291313 267270 266266 800800 800800 800800 800800 153167 267287137 Roscoff EcPH12-s#1-40 >1000 Ecro 299349 267270 266266 800800 800800 800800 800800 161165 287287138 Roscoff EcPH12-s#1-42 >1000 Ecro 291291 267270 266266 800800 800800 800800 800800 137167 293293139 Roscoff EcPH12-s#1-47 >1000 Ecro 293313 270270 266266 800800 800800 800800 800800 161161 305305140 Roscoff EcPH12-s#1-48 >1000 Ecro 291291 267270 264266 800800 800800 800800 800800 163171 287305
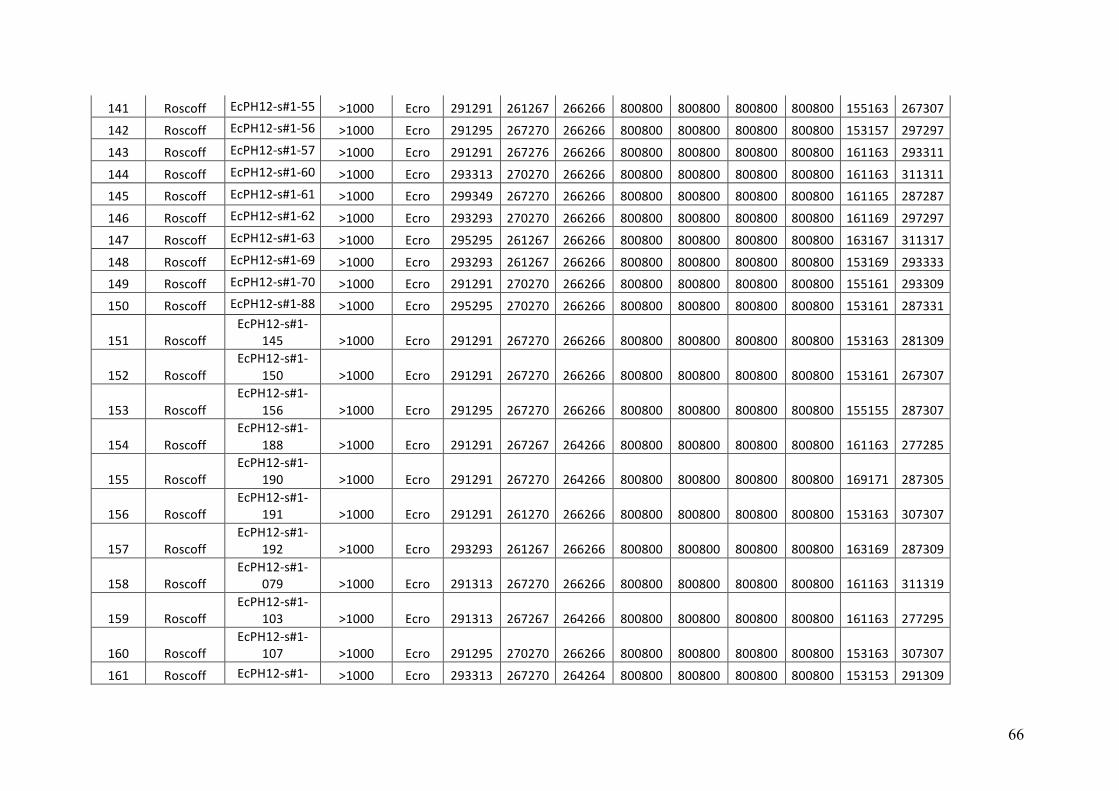
66
141 Roscoff EcPH12-s#1-55 >1000 Ecro 291291 261267 266266 800800 800800 800800 800800 155163 267307142 Roscoff EcPH12-s#1-56 >1000 Ecro 291295 267270 266266 800800 800800 800800 800800 153157 297297143 Roscoff EcPH12-s#1-57 >1000 Ecro 291291 267276 266266 800800 800800 800800 800800 161163 293311144 Roscoff EcPH12-s#1-60 >1000 Ecro 293313 270270 266266 800800 800800 800800 800800 161163 311311145 Roscoff EcPH12-s#1-61 >1000 Ecro 299349 267270 266266 800800 800800 800800 800800 161165 287287146 Roscoff EcPH12-s#1-62 >1000 Ecro 293293 270270 266266 800800 800800 800800 800800 161169 297297147 Roscoff EcPH12-s#1-63 >1000 Ecro 295295 261267 266266 800800 800800 800800 800800 163167 311317148 Roscoff EcPH12-s#1-69 >1000 Ecro 293293 261267 266266 800800 800800 800800 800800 153169 293333149 Roscoff EcPH12-s#1-70 >1000 Ecro 291291 270270 266266 800800 800800 800800 800800 155161 293309150 Roscoff EcPH12-s#1-88 >1000 Ecro 295295 270270 266266 800800 800800 800800 800800 153161 287331
151 RoscoffEcPH12-s#1-
145 >1000 Ecro 291291 267270 266266 800800 800800 800800 800800 153163 281309
152 RoscoffEcPH12-s#1-
150 >1000 Ecro 291291 267270 266266 800800 800800 800800 800800 153161 267307
153 RoscoffEcPH12-s#1-
156 >1000 Ecro 291295 267270 266266 800800 800800 800800 800800 155155 287307
154 RoscoffEcPH12-s#1-
188 >1000 Ecro 291291 267267 264266 800800 800800 800800 800800 161163 277285
155 RoscoffEcPH12-s#1-
190 >1000 Ecro 291291 267270 264266 800800 800800 800800 800800 169171 287305
156 RoscoffEcPH12-s#1-
191 >1000 Ecro 291291 261270 266266 800800 800800 800800 800800 153163 307307
157 RoscoffEcPH12-s#1-
192 >1000 Ecro 293293 261267 266266 800800 800800 800800 800800 163169 287309
158 RoscoffEcPH12-s#1-
079 >1000 Ecro 291313 267270 266266 800800 800800 800800 800800 161163 311319
159 RoscoffEcPH12-s#1-
103 >1000 Ecro 291313 267267 264266 800800 800800 800800 800800 161163 277295
160 RoscoffEcPH12-s#1-
107 >1000 Ecro 291295 270270 266266 800800 800800 800800 800800 153163 307307161 Roscoff EcPH12-s#1- >1000 Ecro 293313 267270 264264 800800 800800 800800 800800 153153 291309
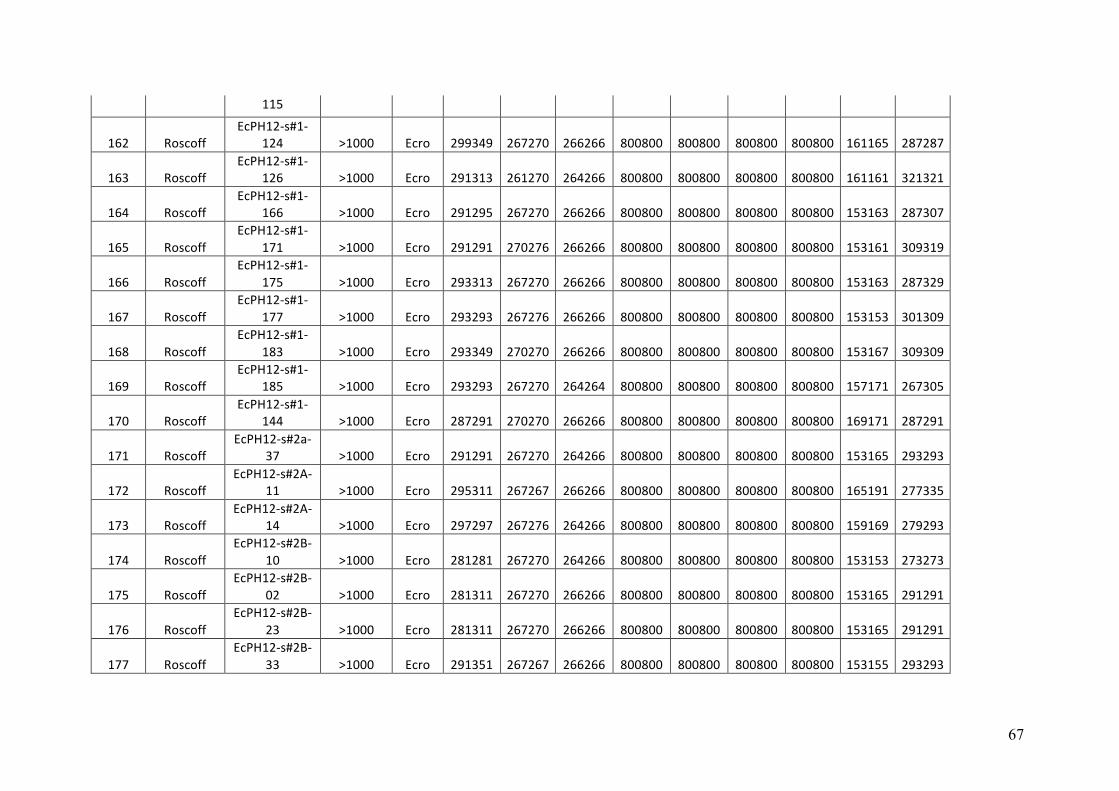
67
115
162 RoscoffEcPH12-s#1-
124 >1000 Ecro 299349 267270 266266 800800 800800 800800 800800 161165 287287
163 RoscoffEcPH12-s#1-
126 >1000 Ecro 291313 261270 264266 800800 800800 800800 800800 161161 321321
164 RoscoffEcPH12-s#1-
166 >1000 Ecro 291295 267270 266266 800800 800800 800800 800800 153163 287307
165 RoscoffEcPH12-s#1-
171 >1000 Ecro 291291 270276 266266 800800 800800 800800 800800 153161 309319
166 RoscoffEcPH12-s#1-
175 >1000 Ecro 293313 267270 266266 800800 800800 800800 800800 153163 287329
167 RoscoffEcPH12-s#1-
177 >1000 Ecro 293293 267276 266266 800800 800800 800800 800800 153153 301309
168 RoscoffEcPH12-s#1-
183 >1000 Ecro 293349 270270 266266 800800 800800 800800 800800 153167 309309
169 RoscoffEcPH12-s#1-
185 >1000 Ecro 293293 267270 264264 800800 800800 800800 800800 157171 267305
170 RoscoffEcPH12-s#1-
144 >1000 Ecro 287291 270270 266266 800800 800800 800800 800800 169171 287291
171 RoscoffEcPH12-s#2a-
37 >1000 Ecro 291291 267270 264266 800800 800800 800800 800800 153165 293293
172 RoscoffEcPH12-s#2A-
11 >1000 Ecro 295311 267267 266266 800800 800800 800800 800800 165191 277335
173 RoscoffEcPH12-s#2A-
14 >1000 Ecro 297297 267276 264266 800800 800800 800800 800800 159169 279293
174 RoscoffEcPH12-s#2B-
10 >1000 Ecro 281281 267270 264266 800800 800800 800800 800800 153153 273273
175 RoscoffEcPH12-s#2B-
02 >1000 Ecro 281311 267270 266266 800800 800800 800800 800800 153165 291291
176 RoscoffEcPH12-s#2B-
23 >1000 Ecro 281311 267270 266266 800800 800800 800800 800800 153165 291291
177 RoscoffEcPH12-s#2B-
33 >1000 Ecro 291351 267267 266266 800800 800800 800800 800800 153155 293293
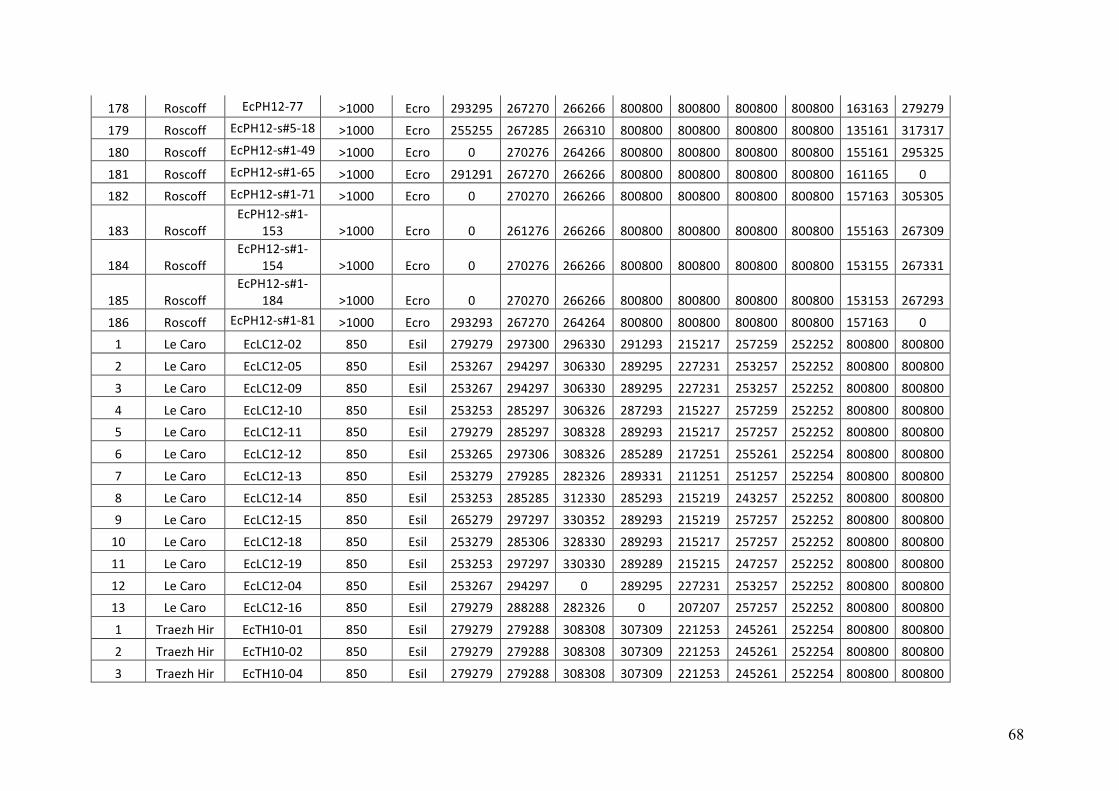
68
178 Roscoff EcPH12-77 >1000 Ecro 293295 267270 266266 800800 800800 800800 800800 163163 279279179 Roscoff EcPH12-s#5-18 >1000 Ecro 255255 267285 266310 800800 800800 800800 800800 135161 317317180 Roscoff EcPH12-s#1-49 >1000 Ecro 0 270276 264266 800800 800800 800800 800800 155161 295325181 Roscoff EcPH12-s#1-65 >1000 Ecro 291291 267270 266266 800800 800800 800800 800800 161165 0182 Roscoff EcPH12-s#1-71 >1000 Ecro 0 270270 266266 800800 800800 800800 800800 157163 305305
183 RoscoffEcPH12-s#1-
153 >1000 Ecro 0 261276 266266 800800 800800 800800 800800 155163 267309
184 RoscoffEcPH12-s#1-
154 >1000 Ecro 0 270276 266266 800800 800800 800800 800800 153155 267331
185 RoscoffEcPH12-s#1-
184 >1000 Ecro 0 270270 266266 800800 800800 800800 800800 153153 267293186 Roscoff EcPH12-s#1-81 >1000 Ecro 293293 267270 264264 800800 800800 800800 800800 157163 01 LeCaro EcLC12-02 850 Esil 279279 297300 296330 291293 215217 257259 252252 800800 8008002 LeCaro EcLC12-05 850 Esil 253267 294297 306330 289295 227231 253257 252252 800800 8008003 LeCaro EcLC12-09 850 Esil 253267 294297 306330 289295 227231 253257 252252 800800 8008004 LeCaro EcLC12-10 850 Esil 253253 285297 306326 287293 215227 257259 252252 800800 8008005 LeCaro EcLC12-11 850 Esil 279279 285297 308328 289293 215217 257257 252252 800800 8008006 LeCaro EcLC12-12 850 Esil 253265 297306 308326 285289 217251 255261 252254 800800 8008007 LeCaro EcLC12-13 850 Esil 253279 279285 282326 289331 211251 251257 252254 800800 8008008 LeCaro EcLC12-14 850 Esil 253253 285285 312330 285293 215219 243257 252252 800800 8008009 LeCaro EcLC12-15 850 Esil 265279 297297 330352 289293 215219 257257 252252 800800 80080010 LeCaro EcLC12-18 850 Esil 253279 285306 328330 289293 215217 257257 252252 800800 80080011 LeCaro EcLC12-19 850 Esil 253253 297297 330330 289289 215215 247257 252252 800800 80080012 LeCaro EcLC12-04 850 Esil 253267 294297 0 289295 227231 253257 252252 800800 80080013 LeCaro EcLC12-16 850 Esil 279279 288288 282326 0 207207 257257 252252 800800 8008001 TraezhHir EcTH10-01 850 Esil 279279 279288 308308 307309 221253 245261 252254 800800 8008002 TraezhHir EcTH10-02 850 Esil 279279 279288 308308 307309 221253 245261 252254 800800 8008003 TraezhHir EcTH10-04 850 Esil 279279 279288 308308 307309 221253 245261 252254 800800 800800
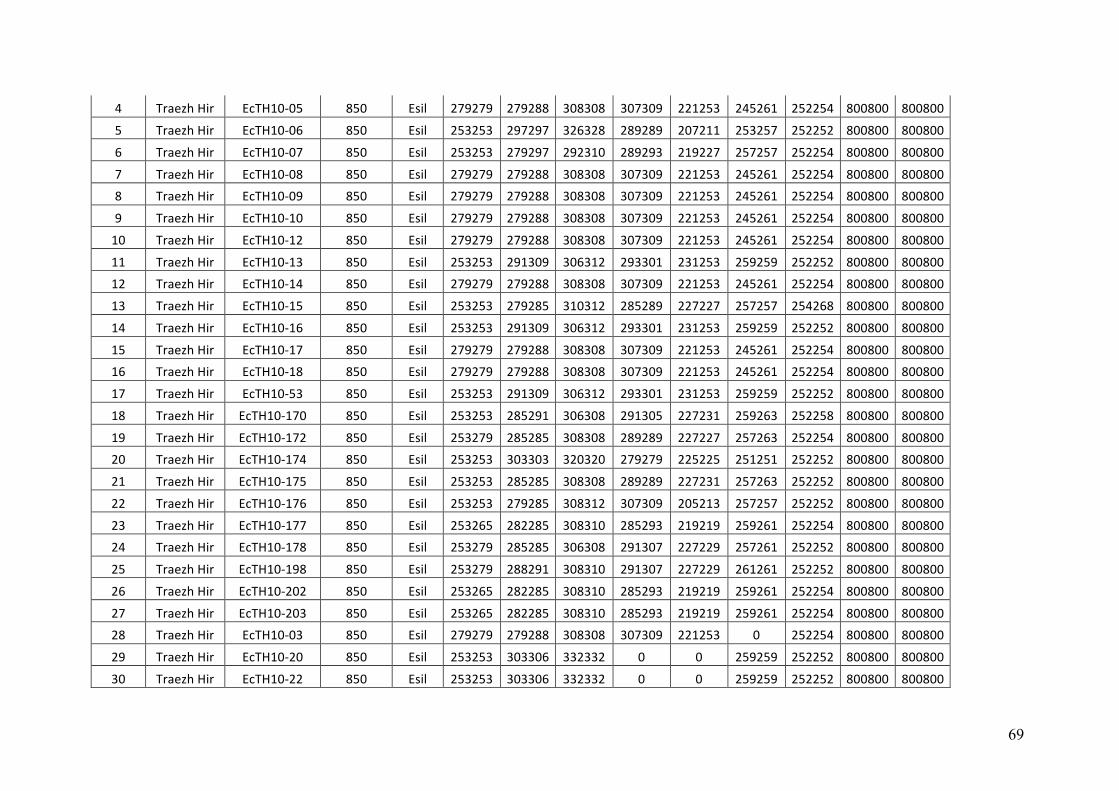
69
4 TraezhHir EcTH10-05 850 Esil 279279 279288 308308 307309 221253 245261 252254 800800 8008005 TraezhHir EcTH10-06 850 Esil 253253 297297 326328 289289 207211 253257 252252 800800 8008006 TraezhHir EcTH10-07 850 Esil 253253 279297 292310 289293 219227 257257 252254 800800 8008007 TraezhHir EcTH10-08 850 Esil 279279 279288 308308 307309 221253 245261 252254 800800 8008008 TraezhHir EcTH10-09 850 Esil 279279 279288 308308 307309 221253 245261 252254 800800 8008009 TraezhHir EcTH10-10 850 Esil 279279 279288 308308 307309 221253 245261 252254 800800 80080010 TraezhHir EcTH10-12 850 Esil 279279 279288 308308 307309 221253 245261 252254 800800 80080011 TraezhHir EcTH10-13 850 Esil 253253 291309 306312 293301 231253 259259 252252 800800 80080012 TraezhHir EcTH10-14 850 Esil 279279 279288 308308 307309 221253 245261 252254 800800 80080013 TraezhHir EcTH10-15 850 Esil 253253 279285 310312 285289 227227 257257 254268 800800 80080014 TraezhHir EcTH10-16 850 Esil 253253 291309 306312 293301 231253 259259 252252 800800 80080015 TraezhHir EcTH10-17 850 Esil 279279 279288 308308 307309 221253 245261 252254 800800 80080016 TraezhHir EcTH10-18 850 Esil 279279 279288 308308 307309 221253 245261 252254 800800 80080017 TraezhHir EcTH10-53 850 Esil 253253 291309 306312 293301 231253 259259 252252 800800 80080018 TraezhHir EcTH10-170 850 Esil 253253 285291 306308 291305 227231 259263 252258 800800 80080019 TraezhHir EcTH10-172 850 Esil 253279 285285 308308 289289 227227 257263 252254 800800 80080020 TraezhHir EcTH10-174 850 Esil 253253 303303 320320 279279 225225 251251 252252 800800 80080021 TraezhHir EcTH10-175 850 Esil 253253 285285 308308 289289 227231 257263 252252 800800 80080022 TraezhHir EcTH10-176 850 Esil 253253 279285 308312 307309 205213 257257 252252 800800 80080023 TraezhHir EcTH10-177 850 Esil 253265 282285 308310 285293 219219 259261 252254 800800 80080024 TraezhHir EcTH10-178 850 Esil 253279 285285 306308 291307 227229 257261 252252 800800 80080025 TraezhHir EcTH10-198 850 Esil 253279 288291 308310 291307 227229 261261 252252 800800 80080026 TraezhHir EcTH10-202 850 Esil 253265 282285 308310 285293 219219 259261 252254 800800 80080027 TraezhHir EcTH10-203 850 Esil 253265 282285 308310 285293 219219 259261 252254 800800 80080028 TraezhHir EcTH10-03 850 Esil 279279 279288 308308 307309 221253 0 252254 800800 80080029 TraezhHir EcTH10-20 850 Esil 253253 303306 332332 0 0 259259 252252 800800 80080030 TraezhHir EcTH10-22 850 Esil 253253 303306 332332 0 0 259259 252252 800800 800800
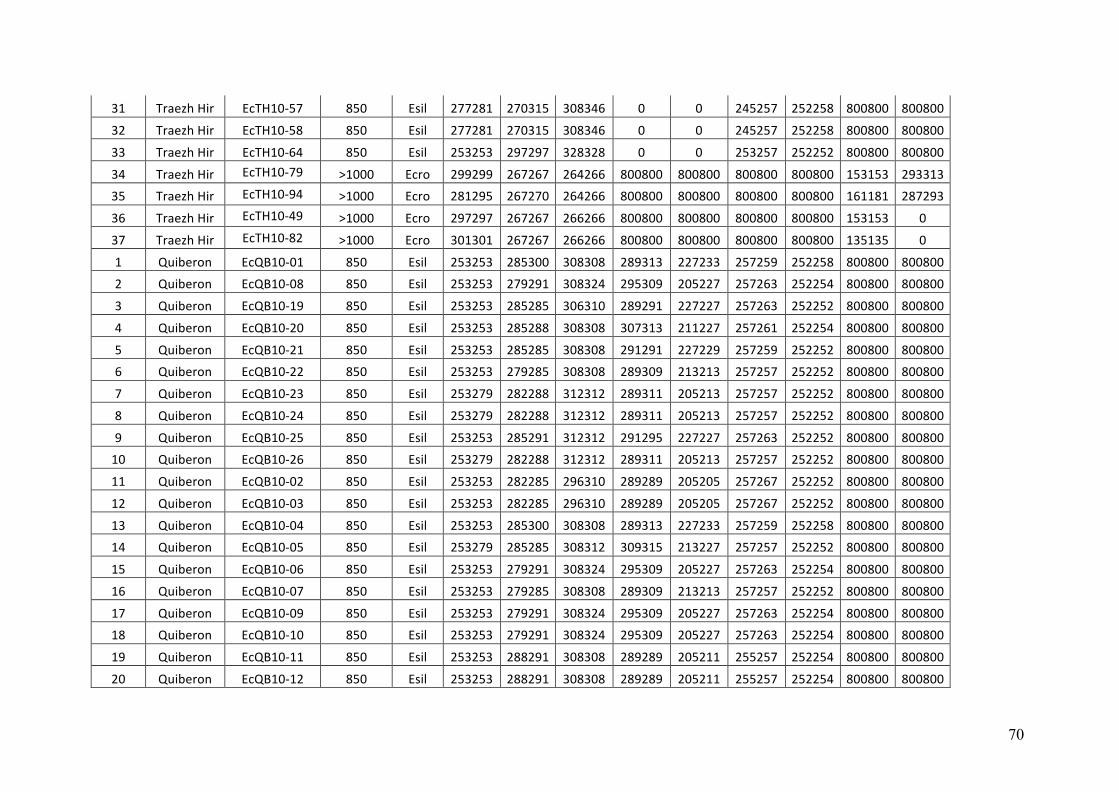
70
31 TraezhHir EcTH10-57 850 Esil 277281 270315 308346 0 0 245257 252258 800800 80080032 TraezhHir EcTH10-58 850 Esil 277281 270315 308346 0 0 245257 252258 800800 80080033 TraezhHir EcTH10-64 850 Esil 253253 297297 328328 0 0 253257 252252 800800 80080034 TraezhHir EcTH10-79 >1000 Ecro 299299 267267 264266 800800 800800 800800 800800 153153 29331335 TraezhHir EcTH10-94 >1000 Ecro 281295 267270 264266 800800 800800 800800 800800 161181 28729336 TraezhHir EcTH10-49 >1000 Ecro 297297 267267 266266 800800 800800 800800 800800 153153 037 TraezhHir EcTH10-82 >1000 Ecro 301301 267267 266266 800800 800800 800800 800800 135135 01 Quiberon EcQB10-01 850 Esil 253253 285300 308308 289313 227233 257259 252258 800800 8008002 Quiberon EcQB10-08 850 Esil 253253 279291 308324 295309 205227 257263 252254 800800 8008003 Quiberon EcQB10-19 850 Esil 253253 285285 306310 289291 227227 257263 252252 800800 8008004 Quiberon EcQB10-20 850 Esil 253253 285288 308308 307313 211227 257261 252254 800800 8008005 Quiberon EcQB10-21 850 Esil 253253 285285 308308 291291 227229 257259 252252 800800 8008006 Quiberon EcQB10-22 850 Esil 253253 279285 308308 289309 213213 257257 252252 800800 8008007 Quiberon EcQB10-23 850 Esil 253279 282288 312312 289311 205213 257257 252252 800800 8008008 Quiberon EcQB10-24 850 Esil 253279 282288 312312 289311 205213 257257 252252 800800 8008009 Quiberon EcQB10-25 850 Esil 253253 285291 312312 291295 227227 257263 252252 800800 80080010 Quiberon EcQB10-26 850 Esil 253279 282288 312312 289311 205213 257257 252252 800800 80080011 Quiberon EcQB10-02 850 Esil 253253 282285 296310 289289 205205 257267 252252 800800 80080012 Quiberon EcQB10-03 850 Esil 253253 282285 296310 289289 205205 257267 252252 800800 80080013 Quiberon EcQB10-04 850 Esil 253253 285300 308308 289313 227233 257259 252258 800800 80080014 Quiberon EcQB10-05 850 Esil 253279 285285 308312 309315 213227 257257 252252 800800 80080015 Quiberon EcQB10-06 850 Esil 253253 279291 308324 295309 205227 257263 252254 800800 80080016 Quiberon EcQB10-07 850 Esil 253253 279285 308308 289309 213213 257257 252252 800800 80080017 Quiberon EcQB10-09 850 Esil 253253 279291 308324 295309 205227 257263 252254 800800 80080018 Quiberon EcQB10-10 850 Esil 253253 279291 308324 295309 205227 257263 252254 800800 80080019 Quiberon EcQB10-11 850 Esil 253253 288291 308308 289289 205211 255257 252254 800800 80080020 Quiberon EcQB10-12 850 Esil 253253 288291 308308 289289 205211 255257 252254 800800 800800
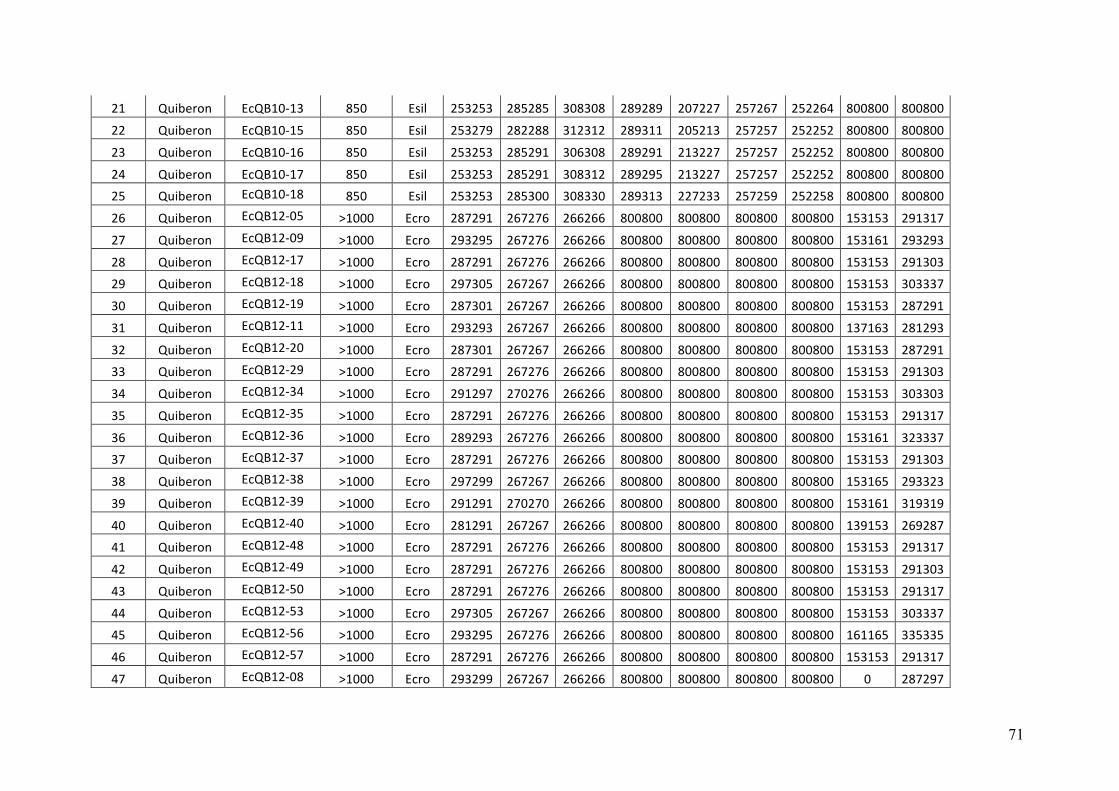
71
21 Quiberon EcQB10-13 850 Esil 253253 285285 308308 289289 207227 257267 252264 800800 80080022 Quiberon EcQB10-15 850 Esil 253279 282288 312312 289311 205213 257257 252252 800800 80080023 Quiberon EcQB10-16 850 Esil 253253 285291 306308 289291 213227 257257 252252 800800 80080024 Quiberon EcQB10-17 850 Esil 253253 285291 308312 289295 213227 257257 252252 800800 80080025 Quiberon EcQB10-18 850 Esil 253253 285300 308330 289313 227233 257259 252258 800800 80080026 Quiberon EcQB12-05 >1000 Ecro 287291 267276 266266 800800 800800 800800 800800 153153 29131727 Quiberon EcQB12-09 >1000 Ecro 293295 267276 266266 800800 800800 800800 800800 153161 29329328 Quiberon EcQB12-17 >1000 Ecro 287291 267276 266266 800800 800800 800800 800800 153153 29130329 Quiberon EcQB12-18 >1000 Ecro 297305 267267 266266 800800 800800 800800 800800 153153 30333730 Quiberon EcQB12-19 >1000 Ecro 287301 267267 266266 800800 800800 800800 800800 153153 28729131 Quiberon EcQB12-11 >1000 Ecro 293293 267267 266266 800800 800800 800800 800800 137163 28129332 Quiberon EcQB12-20 >1000 Ecro 287301 267267 266266 800800 800800 800800 800800 153153 28729133 Quiberon EcQB12-29 >1000 Ecro 287291 267276 266266 800800 800800 800800 800800 153153 29130334 Quiberon EcQB12-34 >1000 Ecro 291297 270276 266266 800800 800800 800800 800800 153153 30330335 Quiberon EcQB12-35 >1000 Ecro 287291 267276 266266 800800 800800 800800 800800 153153 29131736 Quiberon EcQB12-36 >1000 Ecro 289293 267276 266266 800800 800800 800800 800800 153161 32333737 Quiberon EcQB12-37 >1000 Ecro 287291 267276 266266 800800 800800 800800 800800 153153 29130338 Quiberon EcQB12-38 >1000 Ecro 297299 267267 266266 800800 800800 800800 800800 153165 29332339 Quiberon EcQB12-39 >1000 Ecro 291291 270270 266266 800800 800800 800800 800800 153161 31931940 Quiberon EcQB12-40 >1000 Ecro 281291 267267 266266 800800 800800 800800 800800 139153 26928741 Quiberon EcQB12-48 >1000 Ecro 287291 267276 266266 800800 800800 800800 800800 153153 29131742 Quiberon EcQB12-49 >1000 Ecro 287291 267276 266266 800800 800800 800800 800800 153153 29130343 Quiberon EcQB12-50 >1000 Ecro 287291 267276 266266 800800 800800 800800 800800 153153 29131744 Quiberon EcQB12-53 >1000 Ecro 297305 267267 266266 800800 800800 800800 800800 153153 30333745 Quiberon EcQB12-56 >1000 Ecro 293295 267276 266266 800800 800800 800800 800800 161165 33533546 Quiberon EcQB12-57 >1000 Ecro 287291 267276 266266 800800 800800 800800 800800 153153 29131747 Quiberon EcQB12-08 >1000 Ecro 293299 267267 266266 800800 800800 800800 800800 0 287297
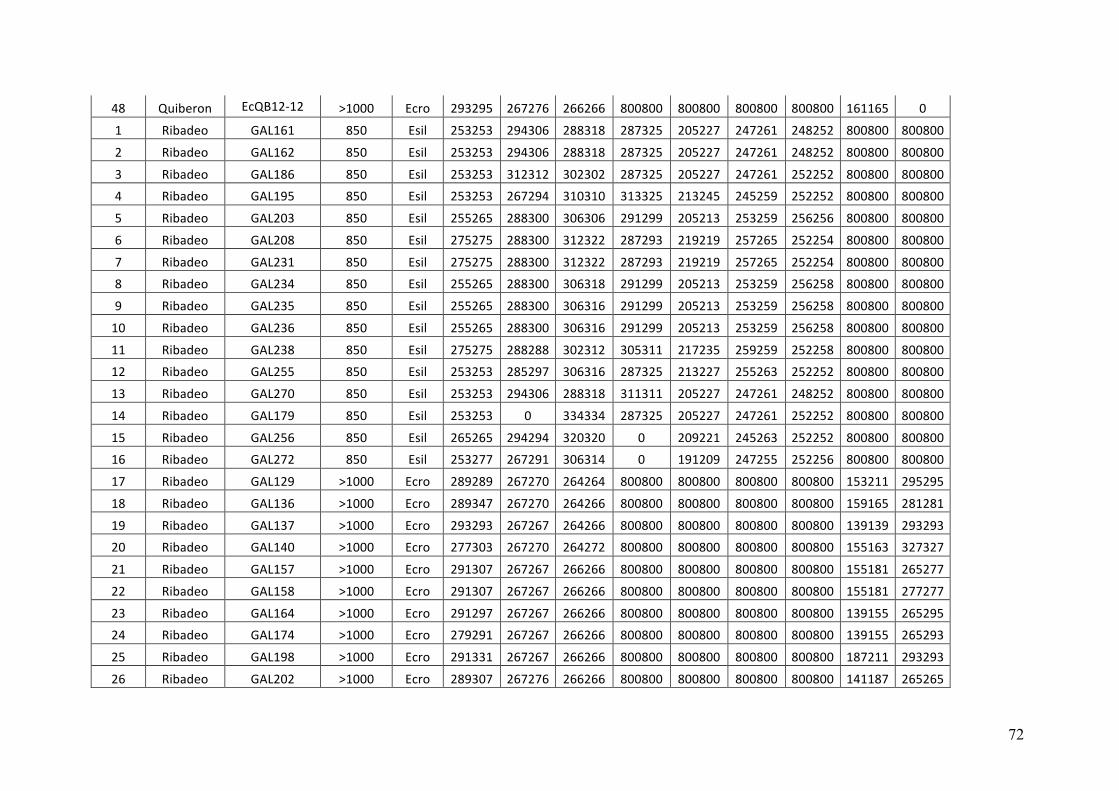
72
48 Quiberon EcQB12-12 >1000 Ecro 293295 267276 266266 800800 800800 800800 800800 161165 01 Ribadeo GAL161 850 Esil 253253 294306 288318 287325 205227 247261 248252 800800 8008002 Ribadeo GAL162 850 Esil 253253 294306 288318 287325 205227 247261 248252 800800 8008003 Ribadeo GAL186 850 Esil 253253 312312 302302 287325 205227 247261 252252 800800 8008004 Ribadeo GAL195 850 Esil 253253 267294 310310 313325 213245 245259 252252 800800 8008005 Ribadeo GAL203 850 Esil 255265 288300 306306 291299 205213 253259 256256 800800 8008006 Ribadeo GAL208 850 Esil 275275 288300 312322 287293 219219 257265 252254 800800 8008007 Ribadeo GAL231 850 Esil 275275 288300 312322 287293 219219 257265 252254 800800 8008008 Ribadeo GAL234 850 Esil 255265 288300 306318 291299 205213 253259 256258 800800 8008009 Ribadeo GAL235 850 Esil 255265 288300 306316 291299 205213 253259 256258 800800 80080010 Ribadeo GAL236 850 Esil 255265 288300 306316 291299 205213 253259 256258 800800 80080011 Ribadeo GAL238 850 Esil 275275 288288 302312 305311 217235 259259 252258 800800 80080012 Ribadeo GAL255 850 Esil 253253 285297 306316 287325 213227 255263 252252 800800 80080013 Ribadeo GAL270 850 Esil 253253 294306 288318 311311 205227 247261 248252 800800 80080014 Ribadeo GAL179 850 Esil 253253 0 334334 287325 205227 247261 252252 800800 80080015 Ribadeo GAL256 850 Esil 265265 294294 320320 0 209221 245263 252252 800800 80080016 Ribadeo GAL272 850 Esil 253277 267291 306314 0 191209 247255 252256 800800 80080017 Ribadeo GAL129 >1000 Ecro 289289 267270 264264 800800 800800 800800 800800 153211 29529518 Ribadeo GAL136 >1000 Ecro 289347 267270 264266 800800 800800 800800 800800 159165 28128119 Ribadeo GAL137 >1000 Ecro 293293 267267 264266 800800 800800 800800 800800 139139 29329320 Ribadeo GAL140 >1000 Ecro 277303 267270 264272 800800 800800 800800 800800 155163 32732721 Ribadeo GAL157 >1000 Ecro 291307 267267 266266 800800 800800 800800 800800 155181 26527722 Ribadeo GAL158 >1000 Ecro 291307 267267 266266 800800 800800 800800 800800 155181 27727723 Ribadeo GAL164 >1000 Ecro 291297 267267 266266 800800 800800 800800 800800 139155 26529524 Ribadeo GAL174 >1000 Ecro 279291 267267 266266 800800 800800 800800 800800 139155 26529325 Ribadeo GAL198 >1000 Ecro 291331 267267 266266 800800 800800 800800 800800 187211 29329326 Ribadeo GAL202 >1000 Ecro 289307 267276 266266 800800 800800 800800 800800 141187 265265
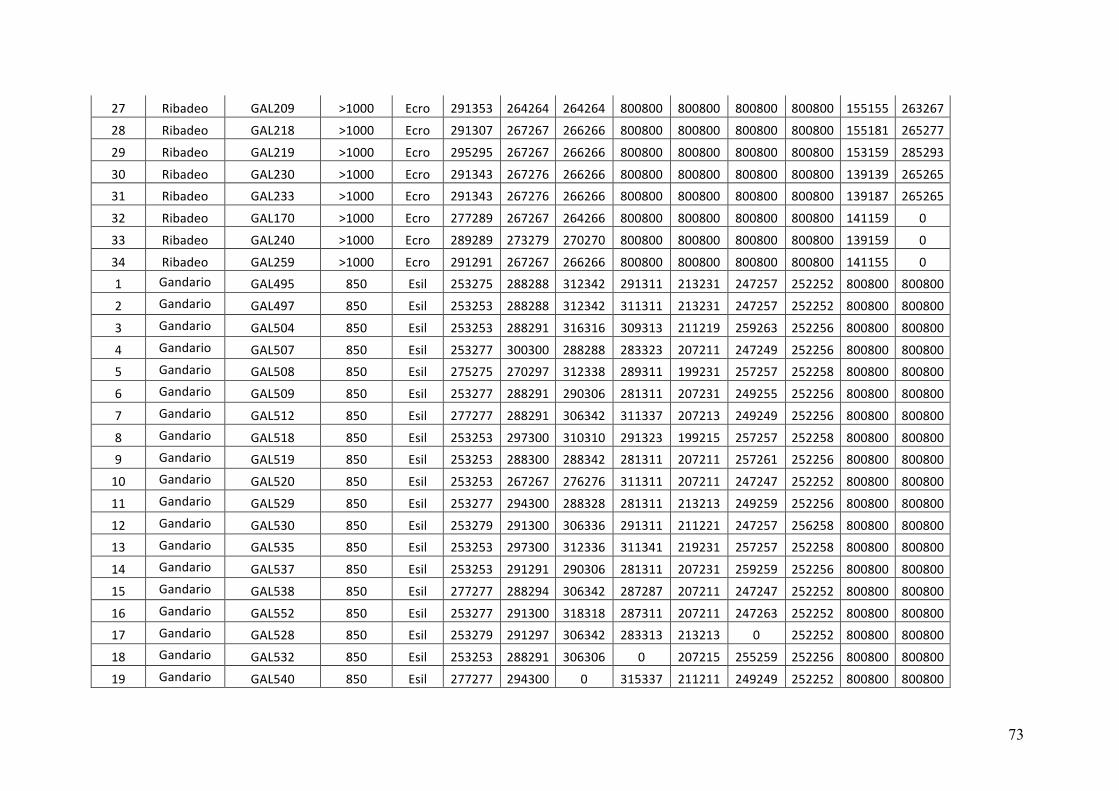
73
27 Ribadeo GAL209 >1000 Ecro 291353 264264 264264 800800 800800 800800 800800 155155 26326728 Ribadeo GAL218 >1000 Ecro 291307 267267 266266 800800 800800 800800 800800 155181 26527729 Ribadeo GAL219 >1000 Ecro 295295 267267 266266 800800 800800 800800 800800 153159 28529330 Ribadeo GAL230 >1000 Ecro 291343 267276 266266 800800 800800 800800 800800 139139 26526531 Ribadeo GAL233 >1000 Ecro 291343 267276 266266 800800 800800 800800 800800 139187 26526532 Ribadeo GAL170 >1000 Ecro 277289 267267 264266 800800 800800 800800 800800 141159 033 Ribadeo GAL240 >1000 Ecro 289289 273279 270270 800800 800800 800800 800800 139159 034 Ribadeo GAL259 >1000 Ecro 291291 267267 266266 800800 800800 800800 800800 141155 01 Gandario GAL495 850 Esil 253275 288288 312342 291311 213231 247257 252252 800800 8008002 Gandario GAL497 850 Esil 253253 288288 312342 311311 213231 247257 252252 800800 8008003 Gandario GAL504 850 Esil 253253 288291 316316 309313 211219 259263 252256 800800 8008004 Gandario GAL507 850 Esil 253277 300300 288288 283323 207211 247249 252256 800800 8008005 Gandario GAL508 850 Esil 275275 270297 312338 289311 199231 257257 252258 800800 8008006 Gandario GAL509 850 Esil 253277 288291 290306 281311 207231 249255 252256 800800 8008007 Gandario GAL512 850 Esil 277277 288291 306342 311337 207213 249249 252256 800800 8008008 Gandario GAL518 850 Esil 253253 297300 310310 291323 199215 257257 252258 800800 8008009 Gandario GAL519 850 Esil 253253 288300 288342 281311 207211 257261 252256 800800 80080010 Gandario GAL520 850 Esil 253253 267267 276276 311311 207211 247247 252252 800800 80080011 Gandario GAL529 850 Esil 253277 294300 288328 281311 213213 249259 252256 800800 80080012 Gandario GAL530 850 Esil 253279 291300 306336 291311 211221 247257 256258 800800 80080013 Gandario GAL535 850 Esil 253253 297300 312336 311341 219231 257257 252258 800800 80080014 Gandario GAL537 850 Esil 253253 291291 290306 281311 207231 259259 252256 800800 80080015 Gandario GAL538 850 Esil 277277 288294 306342 287287 207211 247247 252252 800800 80080016 Gandario GAL552 850 Esil 253277 291300 318318 287311 207211 247263 252252 800800 80080017 Gandario GAL528 850 Esil 253279 291297 306342 283313 213213 0 252252 800800 80080018 Gandario GAL532 850 Esil 253253 288291 306306 0 207215 255259 252256 800800 80080019 Gandario GAL540 850 Esil 277277 294300 0 315337 211211 249249 252252 800800 800800
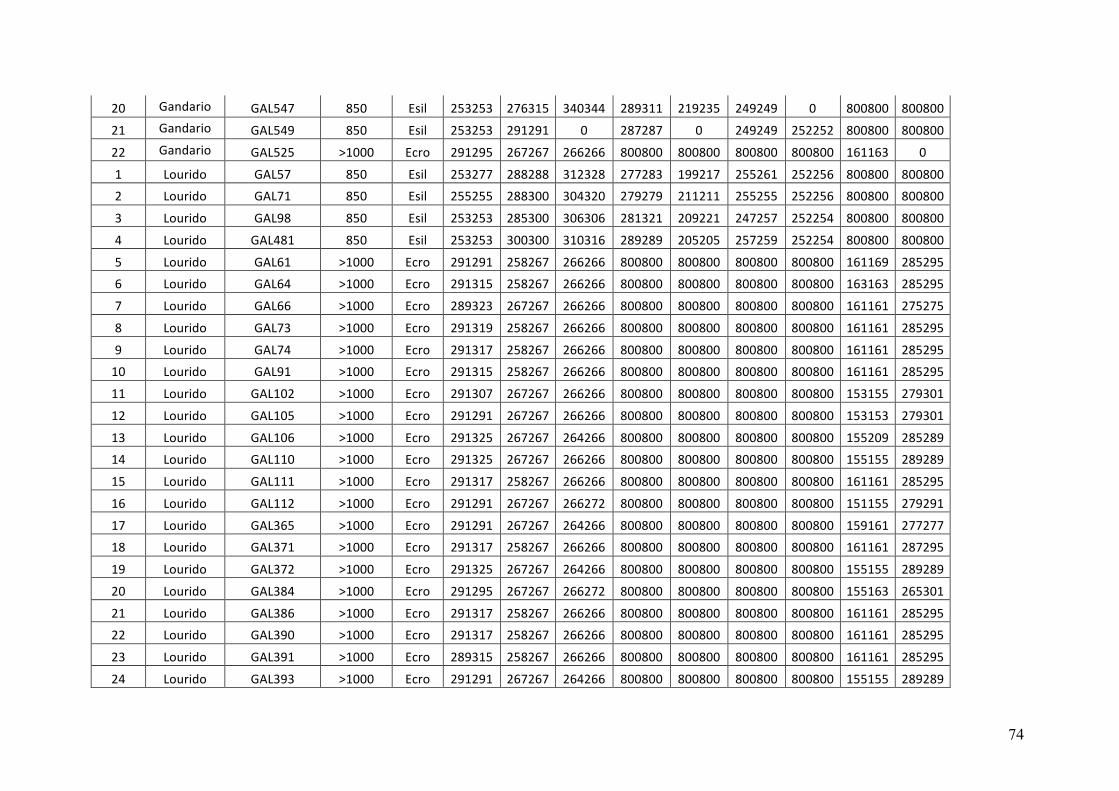
74
20 Gandario GAL547 850 Esil 253253 276315 340344 289311 219235 249249 0 800800 80080021 Gandario GAL549 850 Esil 253253 291291 0 287287 0 249249 252252 800800 80080022 Gandario GAL525 >1000 Ecro 291295 267267 266266 800800 800800 800800 800800 161163 01 Lourido GAL57 850 Esil 253277 288288 312328 277283 199217 255261 252256 800800 8008002 Lourido GAL71 850 Esil 255255 288300 304320 279279 211211 255255 252256 800800 8008003 Lourido GAL98 850 Esil 253253 285300 306306 281321 209221 247257 252254 800800 8008004 Lourido GAL481 850 Esil 253253 300300 310316 289289 205205 257259 252254 800800 8008005 Lourido GAL61 >1000 Ecro 291291 258267 266266 800800 800800 800800 800800 161169 2852956 Lourido GAL64 >1000 Ecro 291315 258267 266266 800800 800800 800800 800800 163163 2852957 Lourido GAL66 >1000 Ecro 289323 267267 266266 800800 800800 800800 800800 161161 2752758 Lourido GAL73 >1000 Ecro 291319 258267 266266 800800 800800 800800 800800 161161 2852959 Lourido GAL74 >1000 Ecro 291317 258267 266266 800800 800800 800800 800800 161161 28529510 Lourido GAL91 >1000 Ecro 291315 258267 266266 800800 800800 800800 800800 161161 28529511 Lourido GAL102 >1000 Ecro 291307 267267 266266 800800 800800 800800 800800 153155 27930112 Lourido GAL105 >1000 Ecro 291291 267267 266266 800800 800800 800800 800800 153153 27930113 Lourido GAL106 >1000 Ecro 291325 267267 264266 800800 800800 800800 800800 155209 28528914 Lourido GAL110 >1000 Ecro 291325 267267 266266 800800 800800 800800 800800 155155 28928915 Lourido GAL111 >1000 Ecro 291317 258267 266266 800800 800800 800800 800800 161161 28529516 Lourido GAL112 >1000 Ecro 291291 267267 266272 800800 800800 800800 800800 151155 27929117 Lourido GAL365 >1000 Ecro 291291 267267 264266 800800 800800 800800 800800 159161 27727718 Lourido GAL371 >1000 Ecro 291317 258267 266266 800800 800800 800800 800800 161161 28729519 Lourido GAL372 >1000 Ecro 291325 267267 264266 800800 800800 800800 800800 155155 28928920 Lourido GAL384 >1000 Ecro 291295 267267 266272 800800 800800 800800 800800 155163 26530121 Lourido GAL386 >1000 Ecro 291317 258267 266266 800800 800800 800800 800800 161161 28529522 Lourido GAL390 >1000 Ecro 291317 258267 266266 800800 800800 800800 800800 161161 28529523 Lourido GAL391 >1000 Ecro 289315 258267 266266 800800 800800 800800 800800 161161 28529524 Lourido GAL393 >1000 Ecro 291291 267267 264266 800800 800800 800800 800800 155155 289289
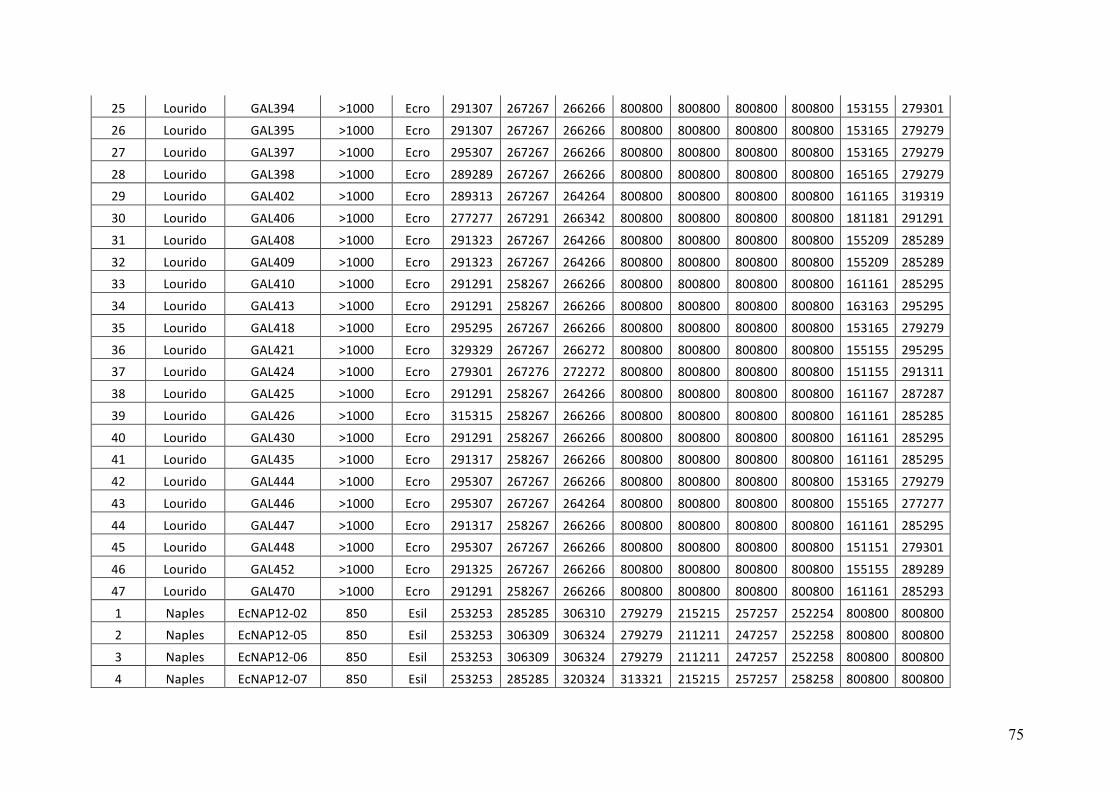
75
25 Lourido GAL394 >1000 Ecro 291307 267267 266266 800800 800800 800800 800800 153155 27930126 Lourido GAL395 >1000 Ecro 291307 267267 266266 800800 800800 800800 800800 153165 27927927 Lourido GAL397 >1000 Ecro 295307 267267 266266 800800 800800 800800 800800 153165 27927928 Lourido GAL398 >1000 Ecro 289289 267267 266266 800800 800800 800800 800800 165165 27927929 Lourido GAL402 >1000 Ecro 289313 267267 264264 800800 800800 800800 800800 161165 31931930 Lourido GAL406 >1000 Ecro 277277 267291 266342 800800 800800 800800 800800 181181 29129131 Lourido GAL408 >1000 Ecro 291323 267267 264266 800800 800800 800800 800800 155209 28528932 Lourido GAL409 >1000 Ecro 291323 267267 264266 800800 800800 800800 800800 155209 28528933 Lourido GAL410 >1000 Ecro 291291 258267 266266 800800 800800 800800 800800 161161 28529534 Lourido GAL413 >1000 Ecro 291291 258267 266266 800800 800800 800800 800800 163163 29529535 Lourido GAL418 >1000 Ecro 295295 267267 266266 800800 800800 800800 800800 153165 27927936 Lourido GAL421 >1000 Ecro 329329 267267 266272 800800 800800 800800 800800 155155 29529537 Lourido GAL424 >1000 Ecro 279301 267276 272272 800800 800800 800800 800800 151155 29131138 Lourido GAL425 >1000 Ecro 291291 258267 264266 800800 800800 800800 800800 161167 28728739 Lourido GAL426 >1000 Ecro 315315 258267 266266 800800 800800 800800 800800 161161 28528540 Lourido GAL430 >1000 Ecro 291291 258267 266266 800800 800800 800800 800800 161161 28529541 Lourido GAL435 >1000 Ecro 291317 258267 266266 800800 800800 800800 800800 161161 28529542 Lourido GAL444 >1000 Ecro 295307 267267 266266 800800 800800 800800 800800 153165 27927943 Lourido GAL446 >1000 Ecro 295307 267267 264264 800800 800800 800800 800800 155165 27727744 Lourido GAL447 >1000 Ecro 291317 258267 266266 800800 800800 800800 800800 161161 28529545 Lourido GAL448 >1000 Ecro 295307 267267 266266 800800 800800 800800 800800 151151 27930146 Lourido GAL452 >1000 Ecro 291325 267267 266266 800800 800800 800800 800800 155155 28928947 Lourido GAL470 >1000 Ecro 291291 258267 266266 800800 800800 800800 800800 161161 2852931 Naples EcNAP12-02 850 Esil 253253 285285 306310 279279 215215 257257 252254 800800 8008002 Naples EcNAP12-05 850 Esil 253253 306309 306324 279279 211211 247257 252258 800800 8008003 Naples EcNAP12-06 850 Esil 253253 306309 306324 279279 211211 247257 252258 800800 8008004 Naples EcNAP12-07 850 Esil 253253 285285 320324 313321 215215 257257 258258 800800 800800
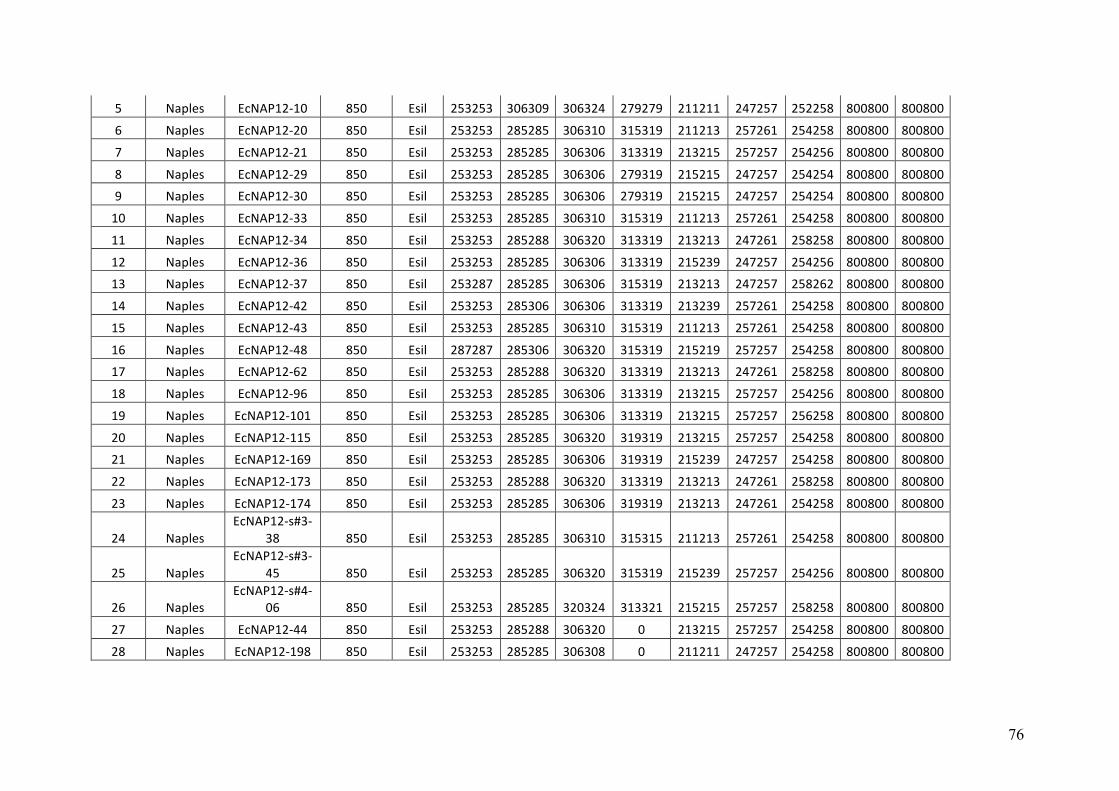
76
5 Naples EcNAP12-10 850 Esil 253253 306309 306324 279279 211211 247257 252258 800800 8008006 Naples EcNAP12-20 850 Esil 253253 285285 306310 315319 211213 257261 254258 800800 8008007 Naples EcNAP12-21 850 Esil 253253 285285 306306 313319 213215 257257 254256 800800 8008008 Naples EcNAP12-29 850 Esil 253253 285285 306306 279319 215215 247257 254254 800800 8008009 Naples EcNAP12-30 850 Esil 253253 285285 306306 279319 215215 247257 254254 800800 80080010 Naples EcNAP12-33 850 Esil 253253 285285 306310 315319 211213 257261 254258 800800 80080011 Naples EcNAP12-34 850 Esil 253253 285288 306320 313319 213213 247261 258258 800800 80080012 Naples EcNAP12-36 850 Esil 253253 285285 306306 313319 215239 247257 254256 800800 80080013 Naples EcNAP12-37 850 Esil 253287 285285 306306 315319 213213 247257 258262 800800 80080014 Naples EcNAP12-42 850 Esil 253253 285306 306306 313319 213239 257261 254258 800800 80080015 Naples EcNAP12-43 850 Esil 253253 285285 306310 315319 211213 257261 254258 800800 80080016 Naples EcNAP12-48 850 Esil 287287 285306 306320 315319 215219 257257 254258 800800 80080017 Naples EcNAP12-62 850 Esil 253253 285288 306320 313319 213213 247261 258258 800800 80080018 Naples EcNAP12-96 850 Esil 253253 285285 306306 313319 213215 257257 254256 800800 80080019 Naples EcNAP12-101 850 Esil 253253 285285 306306 313319 213215 257257 256258 800800 80080020 Naples EcNAP12-115 850 Esil 253253 285285 306320 319319 213215 257257 254258 800800 80080021 Naples EcNAP12-169 850 Esil 253253 285285 306306 319319 215239 247257 254258 800800 80080022 Naples EcNAP12-173 850 Esil 253253 285288 306320 313319 213213 247261 258258 800800 80080023 Naples EcNAP12-174 850 Esil 253253 285285 306306 319319 213213 247261 254258 800800 800800
24 NaplesEcNAP12-s#3-
38 850 Esil 253253 285285 306310 315315 211213 257261 254258 800800 800800
25 NaplesEcNAP12-s#3-
45 850 Esil 253253 285285 306320 315319 215239 257257 254256 800800 800800
26 NaplesEcNAP12-s#4-
06 850 Esil 253253 285285 320324 313321 215215 257257 258258 800800 80080027 Naples EcNAP12-44 850 Esil 253253 285288 306320 0 213215 257257 254258 800800 80080028 Naples EcNAP12-198 850 Esil 253253 285285 306308 0 211211 247257 254258 800800 800800
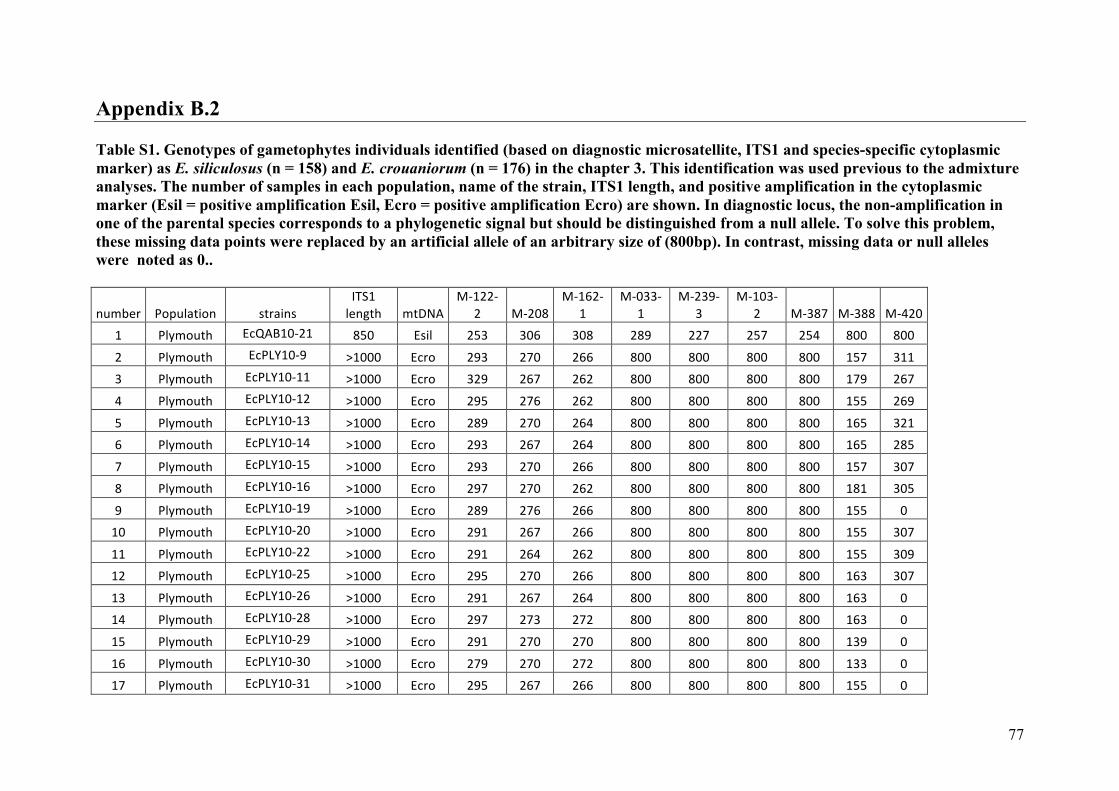
77
Appendix B.2 Table S1. Genotypes of gametophytes individuals identified (based on diagnostic microsatellite, ITS1 and species-specific cytoplasmic marker) as E. siliculosus (n = 158) and E. crouaniorum (n = 176) in the chapter 3. This identification was used previous to the admixture analyses. The number of samples in each population, name of the strain, ITS1 length, and positive amplification in the cytoplasmic marker (Esil = positive amplification Esil, Ecro = positive amplification Ecro) are shown. In diagnostic locus, the non-amplification in one of the parental species corresponds to a phylogenetic signal but should be distinguished from a null allele. To solve this problem, these missing data points were replaced by an artificial allele of an arbitrary size of (800bp). In contrast, missing data or null alleles were noted as 0..
number Population strainsITS1length mtDNA
M-122-2 M-208
M-162-1
M-033-1
M-239-3
M-103-2 M-387 M-388 M-420
1 Plymouth EcQAB10-21 850 Esil 253 306 308 289 227 257 254 800 8002 Plymouth EcPLY10-9 >1000 Ecro 293 270 266 800 800 800 800 157 3113 Plymouth EcPLY10-11 >1000 Ecro 329 267 262 800 800 800 800 179 2674 Plymouth EcPLY10-12 >1000 Ecro 295 276 262 800 800 800 800 155 2695 Plymouth EcPLY10-13 >1000 Ecro 289 270 264 800 800 800 800 165 3216 Plymouth EcPLY10-14 >1000 Ecro 293 267 264 800 800 800 800 165 2857 Plymouth EcPLY10-15 >1000 Ecro 293 270 266 800 800 800 800 157 3078 Plymouth EcPLY10-16 >1000 Ecro 297 270 262 800 800 800 800 181 3059 Plymouth EcPLY10-19 >1000 Ecro 289 276 266 800 800 800 800 155 010 Plymouth EcPLY10-20 >1000 Ecro 291 267 266 800 800 800 800 155 30711 Plymouth EcPLY10-22 >1000 Ecro 291 264 262 800 800 800 800 155 30912 Plymouth EcPLY10-25 >1000 Ecro 295 270 266 800 800 800 800 163 30713 Plymouth EcPLY10-26 >1000 Ecro 291 267 264 800 800 800 800 163 014 Plymouth EcPLY10-28 >1000 Ecro 297 273 272 800 800 800 800 163 015 Plymouth EcPLY10-29 >1000 Ecro 291 270 270 800 800 800 800 139 016 Plymouth EcPLY10-30 >1000 Ecro 279 270 272 800 800 800 800 133 017 Plymouth EcPLY10-31 >1000 Ecro 295 267 266 800 800 800 800 155 0
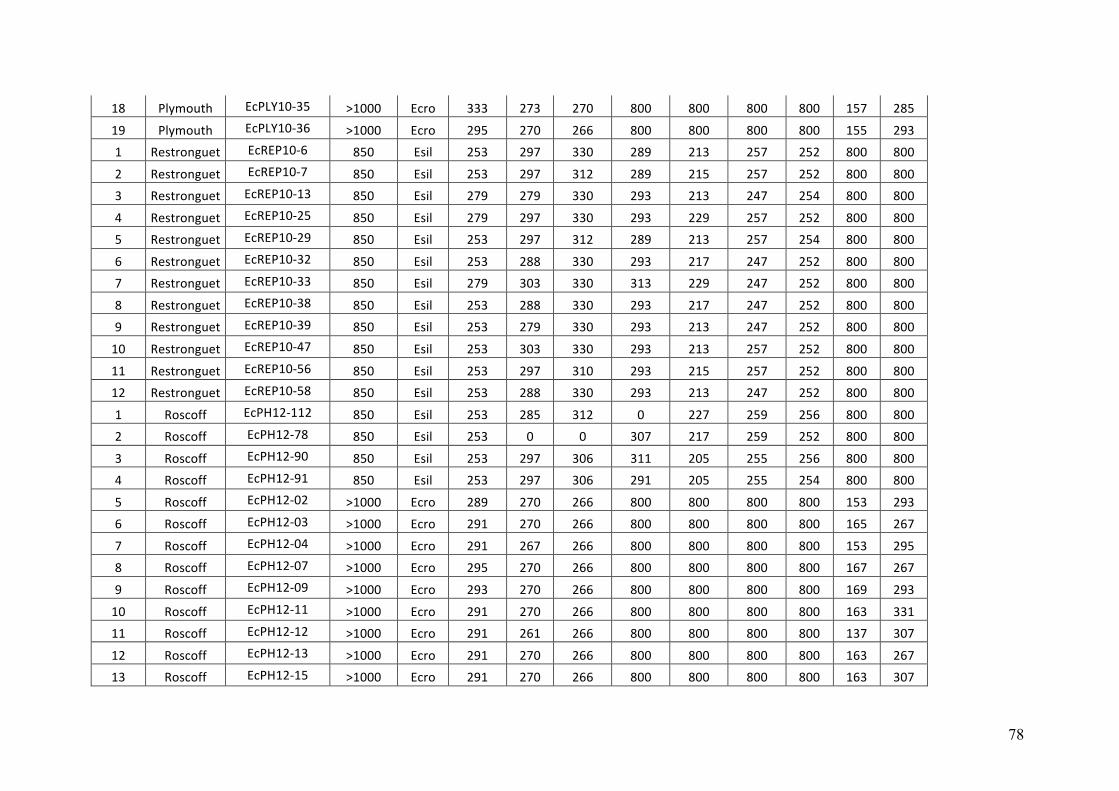
78
18 Plymouth EcPLY10-35 >1000 Ecro 333 273 270 800 800 800 800 157 28519 Plymouth EcPLY10-36 >1000 Ecro 295 270 266 800 800 800 800 155 2931 Restronguet EcREP10-6 850 Esil 253 297 330 289 213 257 252 800 8002 Restronguet EcREP10-7 850 Esil 253 297 312 289 215 257 252 800 8003 Restronguet EcREP10-13 850 Esil 279 279 330 293 213 247 254 800 8004 Restronguet EcREP10-25 850 Esil 279 297 330 293 229 257 252 800 8005 Restronguet EcREP10-29 850 Esil 253 297 312 289 213 257 254 800 8006 Restronguet EcREP10-32 850 Esil 253 288 330 293 217 247 252 800 8007 Restronguet EcREP10-33 850 Esil 279 303 330 313 229 247 252 800 8008 Restronguet EcREP10-38 850 Esil 253 288 330 293 217 247 252 800 8009 Restronguet EcREP10-39 850 Esil 253 279 330 293 213 247 252 800 80010 Restronguet EcREP10-47 850 Esil 253 303 330 293 213 257 252 800 80011 Restronguet EcREP10-56 850 Esil 253 297 310 293 215 257 252 800 80012 Restronguet EcREP10-58 850 Esil 253 288 330 293 213 247 252 800 8001 Roscoff EcPH12-112 850 Esil 253 285 312 0 227 259 256 800 8002 Roscoff EcPH12-78 850 Esil 253 0 0 307 217 259 252 800 8003 Roscoff EcPH12-90 850 Esil 253 297 306 311 205 255 256 800 8004 Roscoff EcPH12-91 850 Esil 253 297 306 291 205 255 254 800 8005 Roscoff EcPH12-02 >1000 Ecro 289 270 266 800 800 800 800 153 2936 Roscoff EcPH12-03 >1000 Ecro 291 270 266 800 800 800 800 165 2677 Roscoff EcPH12-04 >1000 Ecro 291 267 266 800 800 800 800 153 2958 Roscoff EcPH12-07 >1000 Ecro 295 270 266 800 800 800 800 167 2679 Roscoff EcPH12-09 >1000 Ecro 293 270 266 800 800 800 800 169 29310 Roscoff EcPH12-11 >1000 Ecro 291 270 266 800 800 800 800 163 33111 Roscoff EcPH12-12 >1000 Ecro 291 261 266 800 800 800 800 137 30712 Roscoff EcPH12-13 >1000 Ecro 291 270 266 800 800 800 800 163 26713 Roscoff EcPH12-15 >1000 Ecro 291 270 266 800 800 800 800 163 307
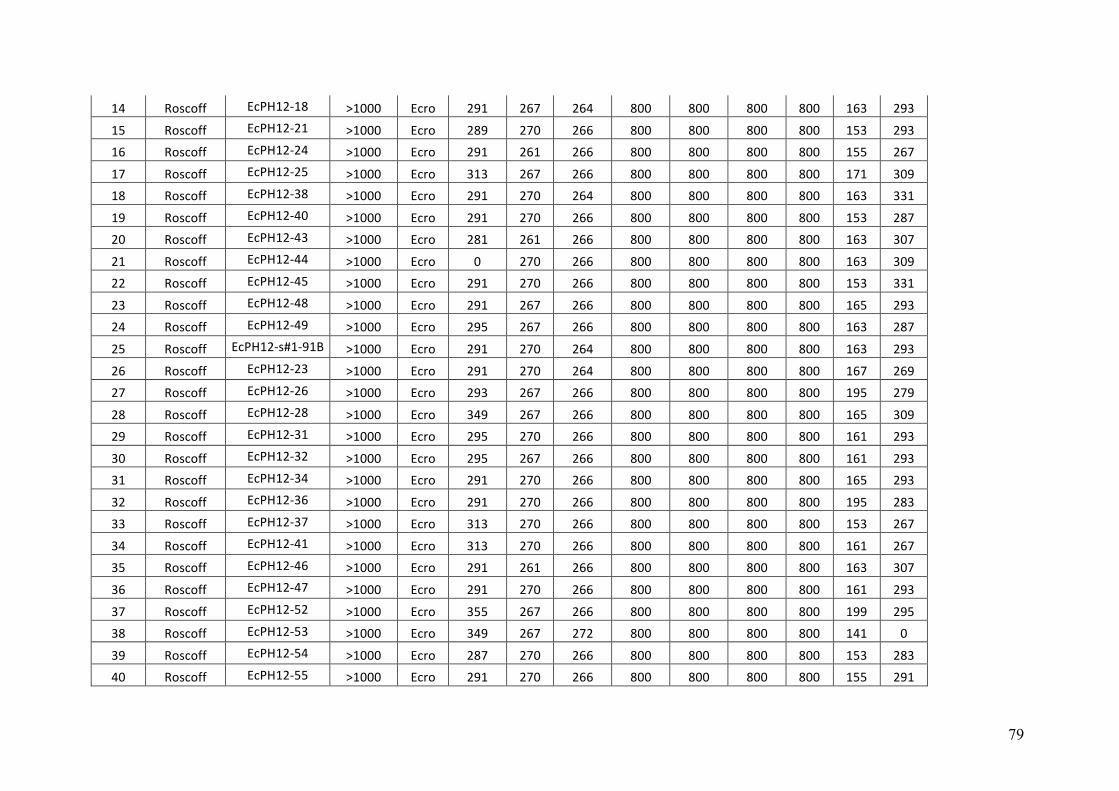
79
14 Roscoff EcPH12-18 >1000 Ecro 291 267 264 800 800 800 800 163 29315 Roscoff EcPH12-21 >1000 Ecro 289 270 266 800 800 800 800 153 29316 Roscoff EcPH12-24 >1000 Ecro 291 261 266 800 800 800 800 155 26717 Roscoff EcPH12-25 >1000 Ecro 313 267 266 800 800 800 800 171 30918 Roscoff EcPH12-38 >1000 Ecro 291 270 264 800 800 800 800 163 33119 Roscoff EcPH12-40 >1000 Ecro 291 270 266 800 800 800 800 153 28720 Roscoff EcPH12-43 >1000 Ecro 281 261 266 800 800 800 800 163 30721 Roscoff EcPH12-44 >1000 Ecro 0 270 266 800 800 800 800 163 30922 Roscoff EcPH12-45 >1000 Ecro 291 270 266 800 800 800 800 153 33123 Roscoff EcPH12-48 >1000 Ecro 291 267 266 800 800 800 800 165 29324 Roscoff EcPH12-49 >1000 Ecro 295 267 266 800 800 800 800 163 28725 Roscoff EcPH12-s#1-91B >1000 Ecro 291 270 264 800 800 800 800 163 29326 Roscoff EcPH12-23 >1000 Ecro 291 270 264 800 800 800 800 167 26927 Roscoff EcPH12-26 >1000 Ecro 293 267 266 800 800 800 800 195 27928 Roscoff EcPH12-28 >1000 Ecro 349 267 266 800 800 800 800 165 30929 Roscoff EcPH12-31 >1000 Ecro 295 270 266 800 800 800 800 161 29330 Roscoff EcPH12-32 >1000 Ecro 295 267 266 800 800 800 800 161 29331 Roscoff EcPH12-34 >1000 Ecro 291 270 266 800 800 800 800 165 29332 Roscoff EcPH12-36 >1000 Ecro 291 270 266 800 800 800 800 195 28333 Roscoff EcPH12-37 >1000 Ecro 313 270 266 800 800 800 800 153 26734 Roscoff EcPH12-41 >1000 Ecro 313 270 266 800 800 800 800 161 26735 Roscoff EcPH12-46 >1000 Ecro 291 261 266 800 800 800 800 163 30736 Roscoff EcPH12-47 >1000 Ecro 291 270 266 800 800 800 800 161 29337 Roscoff EcPH12-52 >1000 Ecro 355 267 266 800 800 800 800 199 29538 Roscoff EcPH12-53 >1000 Ecro 349 267 272 800 800 800 800 141 039 Roscoff EcPH12-54 >1000 Ecro 287 270 266 800 800 800 800 153 28340 Roscoff EcPH12-55 >1000 Ecro 291 270 266 800 800 800 800 155 291
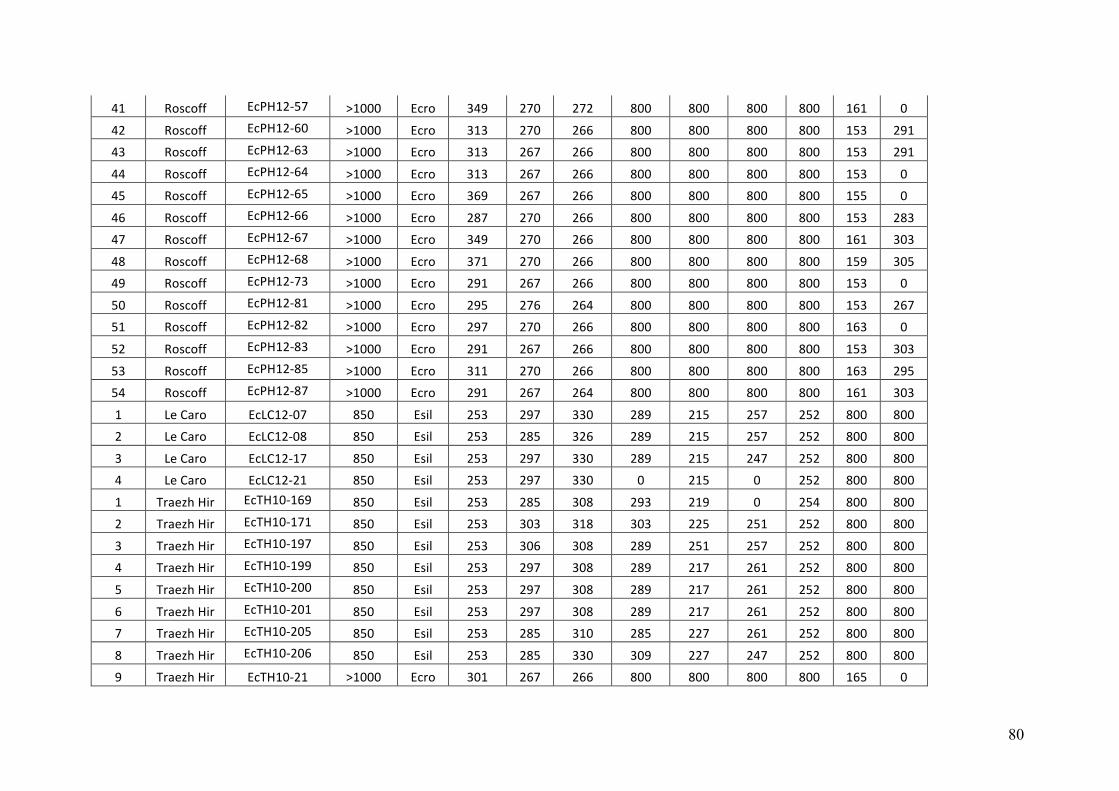
80
41 Roscoff EcPH12-57 >1000 Ecro 349 270 272 800 800 800 800 161 042 Roscoff EcPH12-60 >1000 Ecro 313 270 266 800 800 800 800 153 29143 Roscoff EcPH12-63 >1000 Ecro 313 267 266 800 800 800 800 153 29144 Roscoff EcPH12-64 >1000 Ecro 313 267 266 800 800 800 800 153 045 Roscoff EcPH12-65 >1000 Ecro 369 267 266 800 800 800 800 155 046 Roscoff EcPH12-66 >1000 Ecro 287 270 266 800 800 800 800 153 28347 Roscoff EcPH12-67 >1000 Ecro 349 270 266 800 800 800 800 161 30348 Roscoff EcPH12-68 >1000 Ecro 371 270 266 800 800 800 800 159 30549 Roscoff EcPH12-73 >1000 Ecro 291 267 266 800 800 800 800 153 050 Roscoff EcPH12-81 >1000 Ecro 295 276 264 800 800 800 800 153 26751 Roscoff EcPH12-82 >1000 Ecro 297 270 266 800 800 800 800 163 052 Roscoff EcPH12-83 >1000 Ecro 291 267 266 800 800 800 800 153 30353 Roscoff EcPH12-85 >1000 Ecro 311 270 266 800 800 800 800 163 29554 Roscoff EcPH12-87 >1000 Ecro 291 267 264 800 800 800 800 161 3031 LeCaro EcLC12-07 850 Esil 253 297 330 289 215 257 252 800 8002 LeCaro EcLC12-08 850 Esil 253 285 326 289 215 257 252 800 8003 LeCaro EcLC12-17 850 Esil 253 297 330 289 215 247 252 800 8004 LeCaro EcLC12-21 850 Esil 253 297 330 0 215 0 252 800 8001 TraezhHir EcTH10-169 850 Esil 253 285 308 293 219 0 254 800 8002 TraezhHir EcTH10-171 850 Esil 253 303 318 303 225 251 252 800 8003 TraezhHir EcTH10-197 850 Esil 253 306 308 289 251 257 252 800 8004 TraezhHir EcTH10-199 850 Esil 253 297 308 289 217 261 252 800 8005 TraezhHir EcTH10-200 850 Esil 253 297 308 289 217 261 252 800 8006 TraezhHir EcTH10-201 850 Esil 253 297 308 289 217 261 252 800 8007 TraezhHir EcTH10-205 850 Esil 253 285 310 285 227 261 252 800 8008 TraezhHir EcTH10-206 850 Esil 253 285 330 309 227 247 252 800 8009 TraezhHir EcTH10-21 >1000 Ecro 301 267 266 800 800 800 800 165 0

81
10 TraezhHir EcTH10-25 >1000 Ecro 301 270 264 800 800 800 800 163 27711 TraezhHir EcTH10-26 >1000 Ecro 281 267 266 800 800 800 800 161 27912 TraezhHir EcTH10-31 >1000 Ecro 0 267 264 800 800 800 800 163 27713 TraezhHir EcTH10-32 >1000 Ecro 291 270 266 800 800 800 800 163 27714 TraezhHir EcTH10-33 >1000 Ecro 301 270 264 800 800 800 800 153 27715 TraezhHir EcTH10-34 >1000 Ecro 301 267 264 800 800 800 800 191 016 TraezhHir EcTH10-35 >1000 Ecro 291 267 266 800 800 800 800 155 017 TraezhHir EcTH10-37 >1000 Ecro 291 267 266 800 800 800 800 153 27718 TraezhHir EcTH10-38 >1000 Ecro 0 267 266 800 800 800 800 153 27719 TraezhHir EcTH10-39 >1000 Ecro 325 267 266 800 800 800 800 0 28520 TraezhHir EcTH10-41 >1000 Ecro 289 267 264 800 800 800 800 165 29121 TraezhHir EcTH10-42 >1000 Ecro 253 270 266 800 800 800 800 153 27722 TraezhHir EcTH10-44 >1000 Ecro 349 264 266 800 800 800 800 159 32323 TraezhHir EcTH10-46 >1000 Ecro 297 270 266 800 800 800 800 153 31724 TraezhHir EcTH10-51 >1000 Ecro 337 267 266 800 800 800 800 0 28725 TraezhHir EcTH10-52 >1000 Ecro 291 276 266 800 800 800 800 165 28926 TraezhHir EcTH10-54 >1000 Ecro 0 267 266 800 800 800 800 155 27727 TraezhHir EcTH10-56 >1000 Ecro 291 264 266 800 800 800 800 0 34728 TraezhHir EcTH10-59 >1000 Ecro 301 267 266 800 800 800 800 163 28929 TraezhHir EcTH10-60 >1000 Ecro 291 270 266 800 800 800 800 195 30930 TraezhHir EcTH10-61 >1000 Ecro 327 267 266 800 800 800 800 155 28531 TraezhHir EcTH10-62 >1000 Ecro 291 267 266 800 800 800 800 155 032 TraezhHir EcTH10-63 >1000 Ecro 289 267 266 800 800 800 800 163 033 TraezhHir EcTH10-66 >1000 Ecro 337 264 266 800 800 800 800 159 034 TraezhHir EcTH10-67 >1000 Ecro 297 270 264 800 800 800 800 153 035 TraezhHir EcTH10-68 >1000 Ecro 297 267 266 800 800 800 800 153 036 TraezhHir EcTH10-69 >1000 Ecro 291 270 266 800 800 800 800 163 277
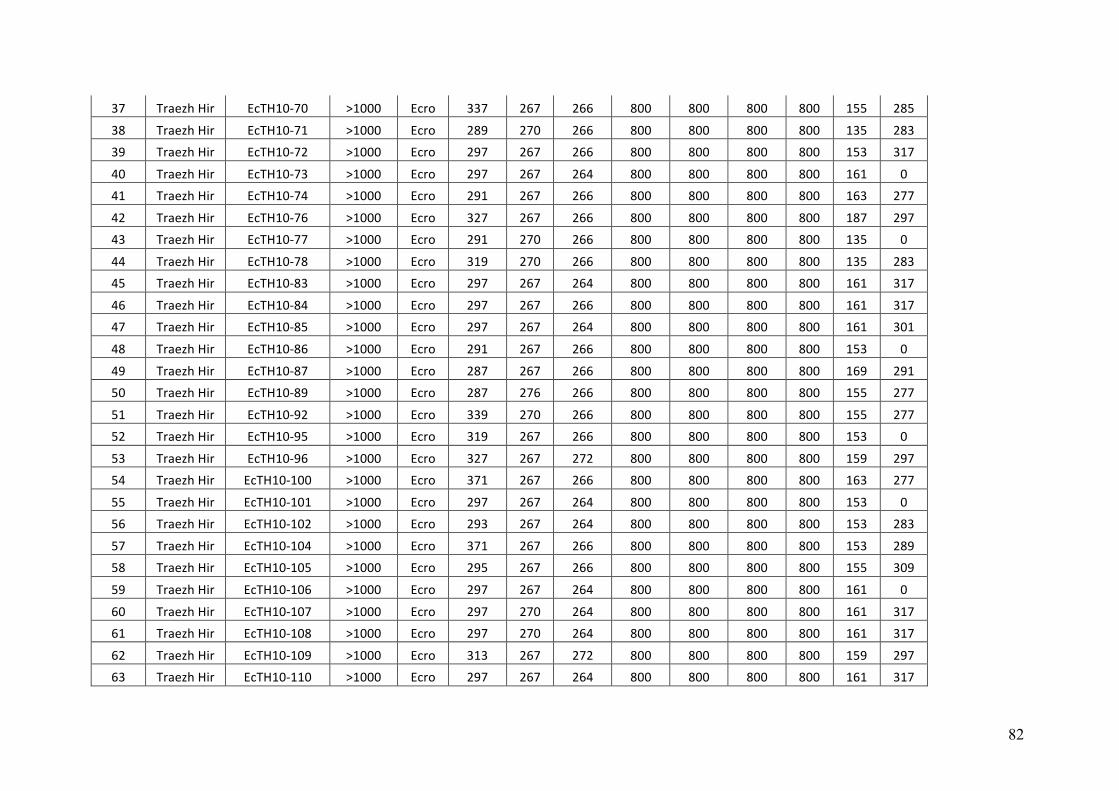
82
37 TraezhHir EcTH10-70 >1000 Ecro 337 267 266 800 800 800 800 155 28538 TraezhHir EcTH10-71 >1000 Ecro 289 270 266 800 800 800 800 135 28339 TraezhHir EcTH10-72 >1000 Ecro 297 267 266 800 800 800 800 153 31740 TraezhHir EcTH10-73 >1000 Ecro 297 267 264 800 800 800 800 161 041 TraezhHir EcTH10-74 >1000 Ecro 291 267 266 800 800 800 800 163 27742 TraezhHir EcTH10-76 >1000 Ecro 327 267 266 800 800 800 800 187 29743 TraezhHir EcTH10-77 >1000 Ecro 291 270 266 800 800 800 800 135 044 TraezhHir EcTH10-78 >1000 Ecro 319 270 266 800 800 800 800 135 28345 TraezhHir EcTH10-83 >1000 Ecro 297 267 264 800 800 800 800 161 31746 TraezhHir EcTH10-84 >1000 Ecro 297 267 266 800 800 800 800 161 31747 TraezhHir EcTH10-85 >1000 Ecro 297 267 264 800 800 800 800 161 30148 TraezhHir EcTH10-86 >1000 Ecro 291 267 266 800 800 800 800 153 049 TraezhHir EcTH10-87 >1000 Ecro 287 267 266 800 800 800 800 169 29150 TraezhHir EcTH10-89 >1000 Ecro 287 276 266 800 800 800 800 155 27751 TraezhHir EcTH10-92 >1000 Ecro 339 270 266 800 800 800 800 155 27752 TraezhHir EcTH10-95 >1000 Ecro 319 267 266 800 800 800 800 153 053 TraezhHir EcTH10-96 >1000 Ecro 327 267 272 800 800 800 800 159 29754 TraezhHir EcTH10-100 >1000 Ecro 371 267 266 800 800 800 800 163 27755 TraezhHir EcTH10-101 >1000 Ecro 297 267 264 800 800 800 800 153 056 TraezhHir EcTH10-102 >1000 Ecro 293 267 264 800 800 800 800 153 28357 TraezhHir EcTH10-104 >1000 Ecro 371 267 266 800 800 800 800 153 28958 TraezhHir EcTH10-105 >1000 Ecro 295 267 266 800 800 800 800 155 30959 TraezhHir EcTH10-106 >1000 Ecro 297 267 264 800 800 800 800 161 060 TraezhHir EcTH10-107 >1000 Ecro 297 270 264 800 800 800 800 161 31761 TraezhHir EcTH10-108 >1000 Ecro 297 270 264 800 800 800 800 161 31762 TraezhHir EcTH10-109 >1000 Ecro 313 267 272 800 800 800 800 159 29763 TraezhHir EcTH10-110 >1000 Ecro 297 267 264 800 800 800 800 161 317
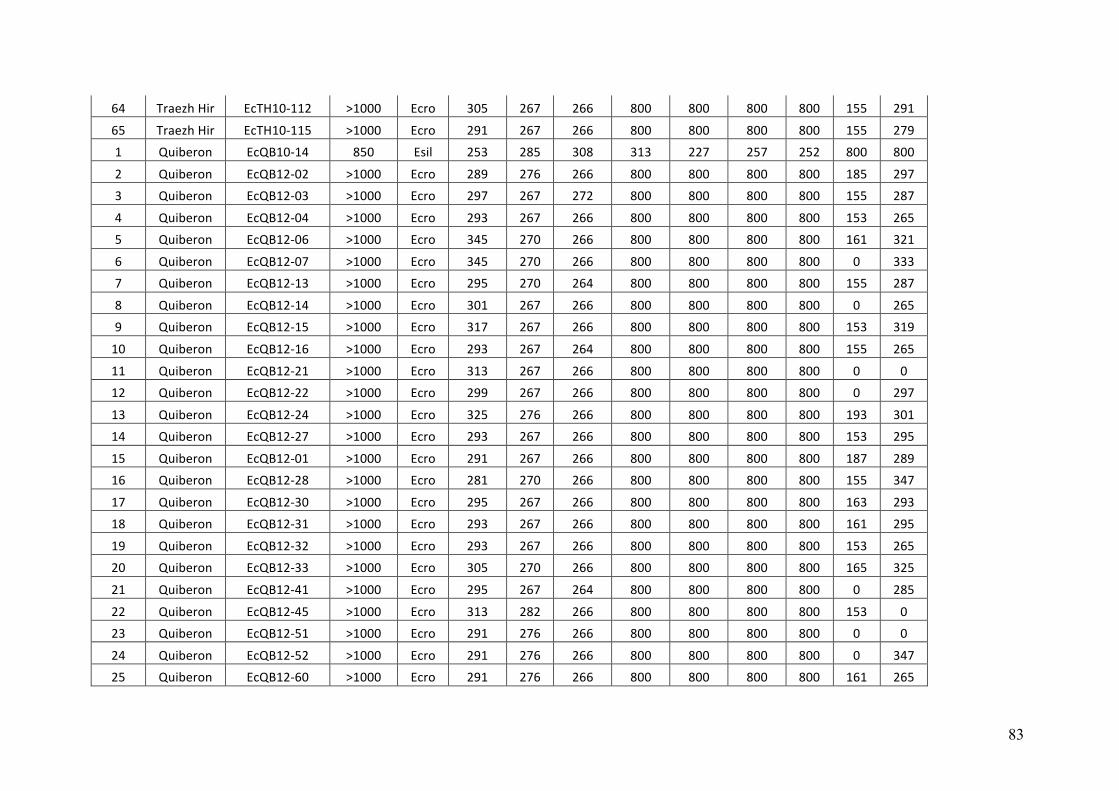
83
64 TraezhHir EcTH10-112 >1000 Ecro 305 267 266 800 800 800 800 155 29165 TraezhHir EcTH10-115 >1000 Ecro 291 267 266 800 800 800 800 155 2791 Quiberon EcQB10-14 850 Esil 253 285 308 313 227 257 252 800 8002 Quiberon EcQB12-02 >1000 Ecro 289 276 266 800 800 800 800 185 2973 Quiberon EcQB12-03 >1000 Ecro 297 267 272 800 800 800 800 155 2874 Quiberon EcQB12-04 >1000 Ecro 293 267 266 800 800 800 800 153 2655 Quiberon EcQB12-06 >1000 Ecro 345 270 266 800 800 800 800 161 3216 Quiberon EcQB12-07 >1000 Ecro 345 270 266 800 800 800 800 0 3337 Quiberon EcQB12-13 >1000 Ecro 295 270 264 800 800 800 800 155 2878 Quiberon EcQB12-14 >1000 Ecro 301 267 266 800 800 800 800 0 2659 Quiberon EcQB12-15 >1000 Ecro 317 267 266 800 800 800 800 153 31910 Quiberon EcQB12-16 >1000 Ecro 293 267 264 800 800 800 800 155 26511 Quiberon EcQB12-21 >1000 Ecro 313 267 266 800 800 800 800 0 012 Quiberon EcQB12-22 >1000 Ecro 299 267 266 800 800 800 800 0 29713 Quiberon EcQB12-24 >1000 Ecro 325 276 266 800 800 800 800 193 30114 Quiberon EcQB12-27 >1000 Ecro 293 267 266 800 800 800 800 153 29515 Quiberon EcQB12-01 >1000 Ecro 291 267 266 800 800 800 800 187 28916 Quiberon EcQB12-28 >1000 Ecro 281 270 266 800 800 800 800 155 34717 Quiberon EcQB12-30 >1000 Ecro 295 267 266 800 800 800 800 163 29318 Quiberon EcQB12-31 >1000 Ecro 293 267 266 800 800 800 800 161 29519 Quiberon EcQB12-32 >1000 Ecro 293 267 266 800 800 800 800 153 26520 Quiberon EcQB12-33 >1000 Ecro 305 270 266 800 800 800 800 165 32521 Quiberon EcQB12-41 >1000 Ecro 295 267 264 800 800 800 800 0 28522 Quiberon EcQB12-45 >1000 Ecro 313 282 266 800 800 800 800 153 023 Quiberon EcQB12-51 >1000 Ecro 291 276 266 800 800 800 800 0 024 Quiberon EcQB12-52 >1000 Ecro 291 276 266 800 800 800 800 0 34725 Quiberon EcQB12-60 >1000 Ecro 291 276 266 800 800 800 800 161 265
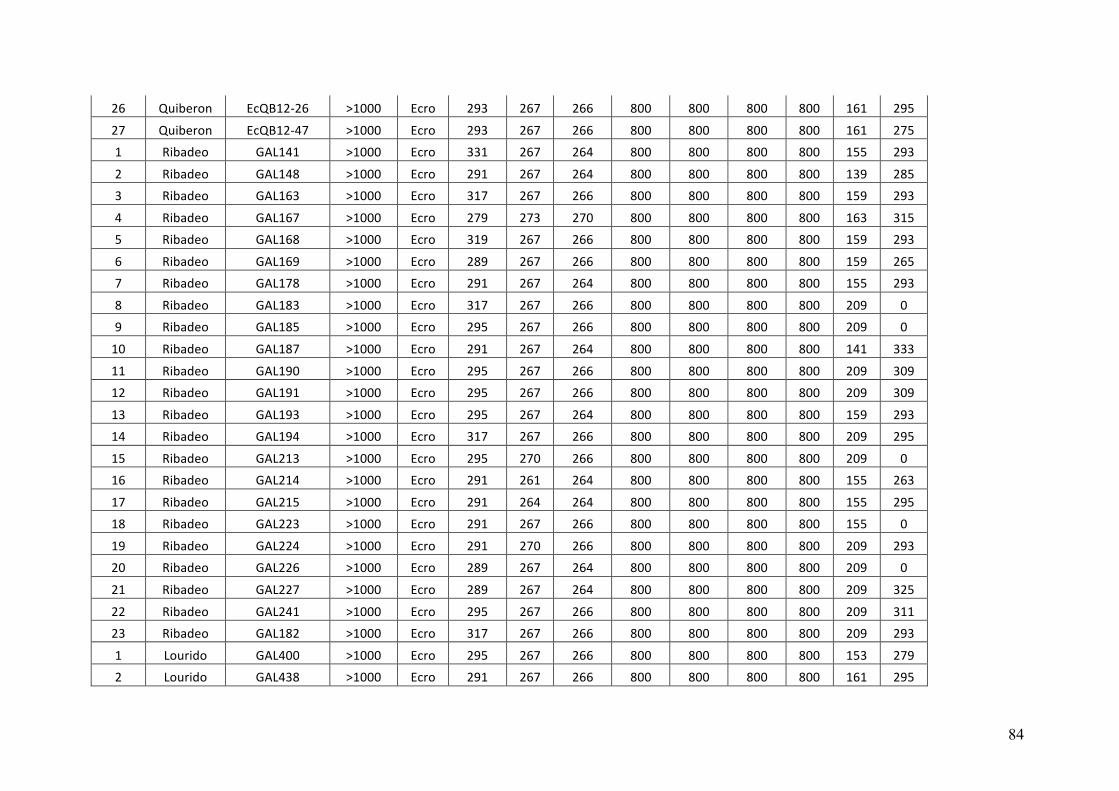
84
26 Quiberon EcQB12-26 >1000 Ecro 293 267 266 800 800 800 800 161 29527 Quiberon EcQB12-47 >1000 Ecro 293 267 266 800 800 800 800 161 2751 Ribadeo GAL141 >1000 Ecro 331 267 264 800 800 800 800 155 2932 Ribadeo GAL148 >1000 Ecro 291 267 264 800 800 800 800 139 2853 Ribadeo GAL163 >1000 Ecro 317 267 266 800 800 800 800 159 2934 Ribadeo GAL167 >1000 Ecro 279 273 270 800 800 800 800 163 3155 Ribadeo GAL168 >1000 Ecro 319 267 266 800 800 800 800 159 2936 Ribadeo GAL169 >1000 Ecro 289 267 266 800 800 800 800 159 2657 Ribadeo GAL178 >1000 Ecro 291 267 264 800 800 800 800 155 2938 Ribadeo GAL183 >1000 Ecro 317 267 266 800 800 800 800 209 09 Ribadeo GAL185 >1000 Ecro 295 267 266 800 800 800 800 209 010 Ribadeo GAL187 >1000 Ecro 291 267 264 800 800 800 800 141 33311 Ribadeo GAL190 >1000 Ecro 295 267 266 800 800 800 800 209 30912 Ribadeo GAL191 >1000 Ecro 295 267 266 800 800 800 800 209 30913 Ribadeo GAL193 >1000 Ecro 295 267 264 800 800 800 800 159 29314 Ribadeo GAL194 >1000 Ecro 317 267 266 800 800 800 800 209 29515 Ribadeo GAL213 >1000 Ecro 295 270 266 800 800 800 800 209 016 Ribadeo GAL214 >1000 Ecro 291 261 264 800 800 800 800 155 26317 Ribadeo GAL215 >1000 Ecro 291 264 264 800 800 800 800 155 29518 Ribadeo GAL223 >1000 Ecro 291 267 266 800 800 800 800 155 019 Ribadeo GAL224 >1000 Ecro 291 270 266 800 800 800 800 209 29320 Ribadeo GAL226 >1000 Ecro 289 267 264 800 800 800 800 209 021 Ribadeo GAL227 >1000 Ecro 289 267 264 800 800 800 800 209 32522 Ribadeo GAL241 >1000 Ecro 295 267 266 800 800 800 800 209 31123 Ribadeo GAL182 >1000 Ecro 317 267 266 800 800 800 800 209 2931 Lourido GAL400 >1000 Ecro 295 267 266 800 800 800 800 153 2792 Lourido GAL438 >1000 Ecro 291 267 266 800 800 800 800 161 295
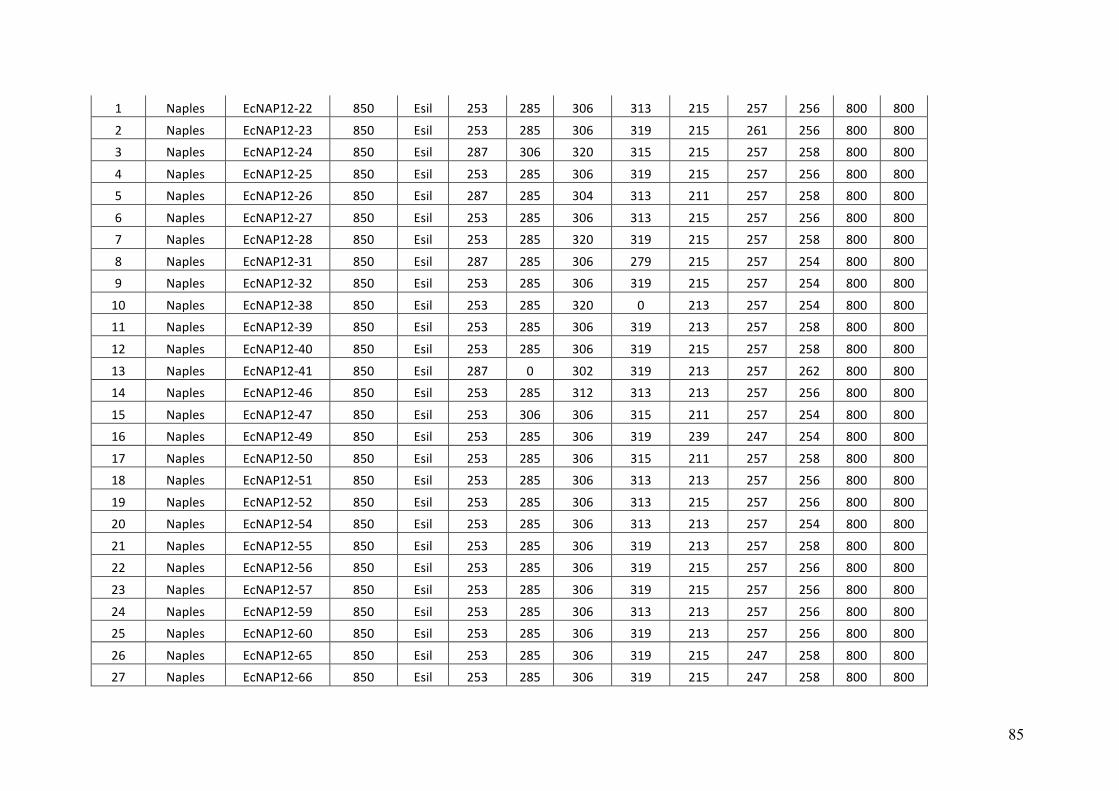
85
1 Naples EcNAP12-22 850 Esil 253 285 306 313 215 257 256 800 8002 Naples EcNAP12-23 850 Esil 253 285 306 319 215 261 256 800 8003 Naples EcNAP12-24 850 Esil 287 306 320 315 215 257 258 800 8004 Naples EcNAP12-25 850 Esil 253 285 306 319 215 257 256 800 8005 Naples EcNAP12-26 850 Esil 287 285 304 313 211 257 258 800 8006 Naples EcNAP12-27 850 Esil 253 285 306 313 215 257 256 800 8007 Naples EcNAP12-28 850 Esil 253 285 320 319 215 257 258 800 8008 Naples EcNAP12-31 850 Esil 287 285 306 279 215 257 254 800 8009 Naples EcNAP12-32 850 Esil 253 285 306 319 215 257 254 800 80010 Naples EcNAP12-38 850 Esil 253 285 320 0 213 257 254 800 80011 Naples EcNAP12-39 850 Esil 253 285 306 319 213 257 258 800 80012 Naples EcNAP12-40 850 Esil 253 285 306 319 215 257 258 800 80013 Naples EcNAP12-41 850 Esil 287 0 302 319 213 257 262 800 80014 Naples EcNAP12-46 850 Esil 253 285 312 313 213 257 256 800 80015 Naples EcNAP12-47 850 Esil 253 306 306 315 211 257 254 800 80016 Naples EcNAP12-49 850 Esil 253 285 306 319 239 247 254 800 80017 Naples EcNAP12-50 850 Esil 253 285 306 315 211 257 258 800 80018 Naples EcNAP12-51 850 Esil 253 285 306 313 213 257 256 800 80019 Naples EcNAP12-52 850 Esil 253 285 306 313 215 257 256 800 80020 Naples EcNAP12-54 850 Esil 253 285 306 313 213 257 254 800 80021 Naples EcNAP12-55 850 Esil 253 285 306 319 213 257 258 800 80022 Naples EcNAP12-56 850 Esil 253 285 306 319 215 257 256 800 80023 Naples EcNAP12-57 850 Esil 253 285 306 319 215 257 256 800 80024 Naples EcNAP12-59 850 Esil 253 285 306 313 213 257 256 800 80025 Naples EcNAP12-60 850 Esil 253 285 306 319 213 257 256 800 80026 Naples EcNAP12-65 850 Esil 253 285 306 319 215 247 258 800 80027 Naples EcNAP12-66 850 Esil 253 285 306 319 215 247 258 800 800
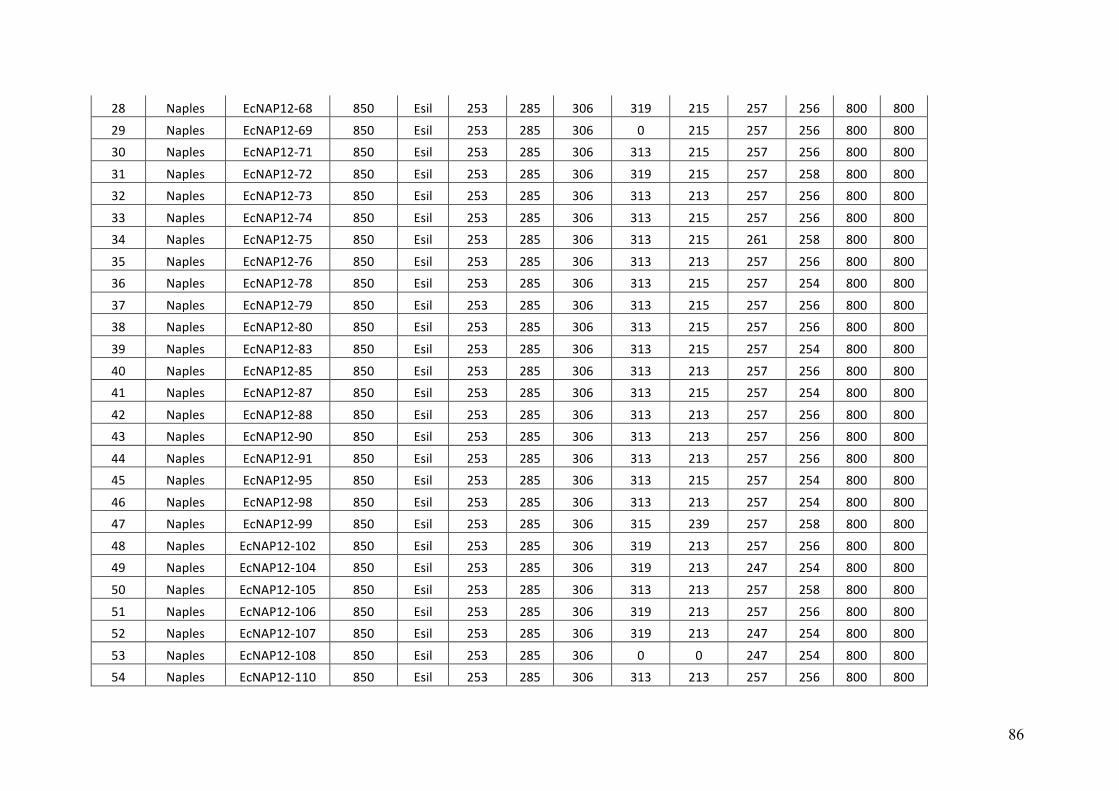
86
28 Naples EcNAP12-68 850 Esil 253 285 306 319 215 257 256 800 80029 Naples EcNAP12-69 850 Esil 253 285 306 0 215 257 256 800 80030 Naples EcNAP12-71 850 Esil 253 285 306 313 215 257 256 800 80031 Naples EcNAP12-72 850 Esil 253 285 306 319 215 257 258 800 80032 Naples EcNAP12-73 850 Esil 253 285 306 313 213 257 256 800 80033 Naples EcNAP12-74 850 Esil 253 285 306 313 215 257 256 800 80034 Naples EcNAP12-75 850 Esil 253 285 306 313 215 261 258 800 80035 Naples EcNAP12-76 850 Esil 253 285 306 313 213 257 256 800 80036 Naples EcNAP12-78 850 Esil 253 285 306 313 215 257 254 800 80037 Naples EcNAP12-79 850 Esil 253 285 306 313 215 257 256 800 80038 Naples EcNAP12-80 850 Esil 253 285 306 313 215 257 256 800 80039 Naples EcNAP12-83 850 Esil 253 285 306 313 215 257 254 800 80040 Naples EcNAP12-85 850 Esil 253 285 306 313 213 257 256 800 80041 Naples EcNAP12-87 850 Esil 253 285 306 313 215 257 254 800 80042 Naples EcNAP12-88 850 Esil 253 285 306 313 213 257 256 800 80043 Naples EcNAP12-90 850 Esil 253 285 306 313 213 257 256 800 80044 Naples EcNAP12-91 850 Esil 253 285 306 313 213 257 256 800 80045 Naples EcNAP12-95 850 Esil 253 285 306 313 215 257 254 800 80046 Naples EcNAP12-98 850 Esil 253 285 306 313 213 257 254 800 80047 Naples EcNAP12-99 850 Esil 253 285 306 315 239 257 258 800 80048 Naples EcNAP12-102 850 Esil 253 285 306 319 213 257 256 800 80049 Naples EcNAP12-104 850 Esil 253 285 306 319 213 247 254 800 80050 Naples EcNAP12-105 850 Esil 253 285 306 313 213 257 258 800 80051 Naples EcNAP12-106 850 Esil 253 285 306 319 213 257 256 800 80052 Naples EcNAP12-107 850 Esil 253 285 306 319 213 247 254 800 80053 Naples EcNAP12-108 850 Esil 253 285 306 0 0 247 254 800 80054 Naples EcNAP12-110 850 Esil 253 285 306 313 213 257 256 800 800
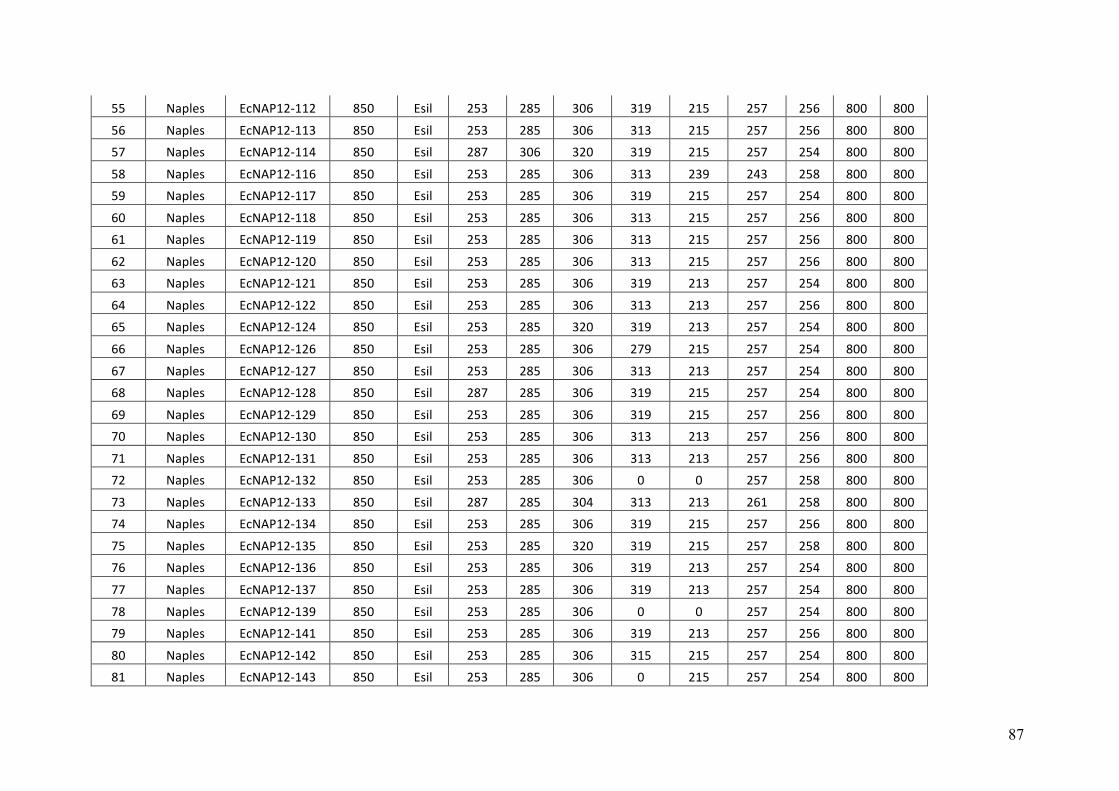
87
55 Naples EcNAP12-112 850 Esil 253 285 306 319 215 257 256 800 80056 Naples EcNAP12-113 850 Esil 253 285 306 313 215 257 256 800 80057 Naples EcNAP12-114 850 Esil 287 306 320 319 215 257 254 800 80058 Naples EcNAP12-116 850 Esil 253 285 306 313 239 243 258 800 80059 Naples EcNAP12-117 850 Esil 253 285 306 319 215 257 254 800 80060 Naples EcNAP12-118 850 Esil 253 285 306 313 215 257 256 800 80061 Naples EcNAP12-119 850 Esil 253 285 306 313 215 257 256 800 80062 Naples EcNAP12-120 850 Esil 253 285 306 313 215 257 256 800 80063 Naples EcNAP12-121 850 Esil 253 285 306 319 213 257 254 800 80064 Naples EcNAP12-122 850 Esil 253 285 306 313 213 257 256 800 80065 Naples EcNAP12-124 850 Esil 253 285 320 319 213 257 254 800 80066 Naples EcNAP12-126 850 Esil 253 285 306 279 215 257 254 800 80067 Naples EcNAP12-127 850 Esil 253 285 306 313 213 257 254 800 80068 Naples EcNAP12-128 850 Esil 287 285 306 319 215 257 254 800 80069 Naples EcNAP12-129 850 Esil 253 285 306 319 215 257 256 800 80070 Naples EcNAP12-130 850 Esil 253 285 306 313 213 257 256 800 80071 Naples EcNAP12-131 850 Esil 253 285 306 313 213 257 256 800 80072 Naples EcNAP12-132 850 Esil 253 285 306 0 0 257 258 800 80073 Naples EcNAP12-133 850 Esil 287 285 304 313 213 261 258 800 80074 Naples EcNAP12-134 850 Esil 253 285 306 319 215 257 256 800 80075 Naples EcNAP12-135 850 Esil 253 285 320 319 215 257 258 800 80076 Naples EcNAP12-136 850 Esil 253 285 306 319 213 257 254 800 80077 Naples EcNAP12-137 850 Esil 253 285 306 319 213 257 254 800 80078 Naples EcNAP12-139 850 Esil 253 285 306 0 0 257 254 800 80079 Naples EcNAP12-141 850 Esil 253 285 306 319 213 257 256 800 80080 Naples EcNAP12-142 850 Esil 253 285 306 315 215 257 254 800 80081 Naples EcNAP12-143 850 Esil 253 285 306 0 215 257 254 800 800
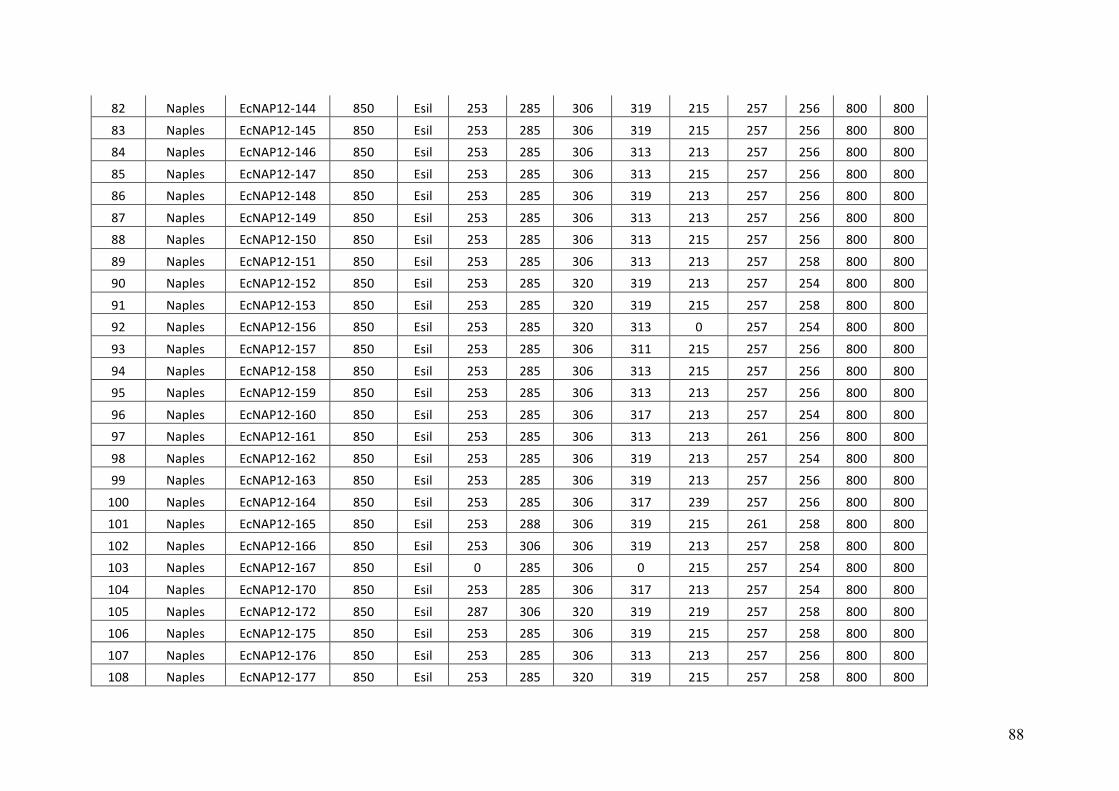
88
82 Naples EcNAP12-144 850 Esil 253 285 306 319 215 257 256 800 80083 Naples EcNAP12-145 850 Esil 253 285 306 319 215 257 256 800 80084 Naples EcNAP12-146 850 Esil 253 285 306 313 213 257 256 800 80085 Naples EcNAP12-147 850 Esil 253 285 306 313 215 257 256 800 80086 Naples EcNAP12-148 850 Esil 253 285 306 319 213 257 256 800 80087 Naples EcNAP12-149 850 Esil 253 285 306 313 213 257 256 800 80088 Naples EcNAP12-150 850 Esil 253 285 306 313 215 257 256 800 80089 Naples EcNAP12-151 850 Esil 253 285 306 313 213 257 258 800 80090 Naples EcNAP12-152 850 Esil 253 285 320 319 213 257 254 800 80091 Naples EcNAP12-153 850 Esil 253 285 320 319 215 257 258 800 80092 Naples EcNAP12-156 850 Esil 253 285 320 313 0 257 254 800 80093 Naples EcNAP12-157 850 Esil 253 285 306 311 215 257 256 800 80094 Naples EcNAP12-158 850 Esil 253 285 306 313 215 257 256 800 80095 Naples EcNAP12-159 850 Esil 253 285 306 313 213 257 256 800 80096 Naples EcNAP12-160 850 Esil 253 285 306 317 213 257 254 800 80097 Naples EcNAP12-161 850 Esil 253 285 306 313 213 261 256 800 80098 Naples EcNAP12-162 850 Esil 253 285 306 319 213 257 254 800 80099 Naples EcNAP12-163 850 Esil 253 285 306 319 213 257 256 800 800100 Naples EcNAP12-164 850 Esil 253 285 306 317 239 257 256 800 800101 Naples EcNAP12-165 850 Esil 253 288 306 319 215 261 258 800 800102 Naples EcNAP12-166 850 Esil 253 306 306 319 213 257 258 800 800103 Naples EcNAP12-167 850 Esil 0 285 306 0 215 257 254 800 800104 Naples EcNAP12-170 850 Esil 253 285 306 317 213 257 254 800 800105 Naples EcNAP12-172 850 Esil 287 306 320 319 219 257 258 800 800106 Naples EcNAP12-175 850 Esil 253 285 306 319 215 257 258 800 800107 Naples EcNAP12-176 850 Esil 253 285 306 313 213 257 256 800 800108 Naples EcNAP12-177 850 Esil 253 285 320 319 215 257 258 800 800
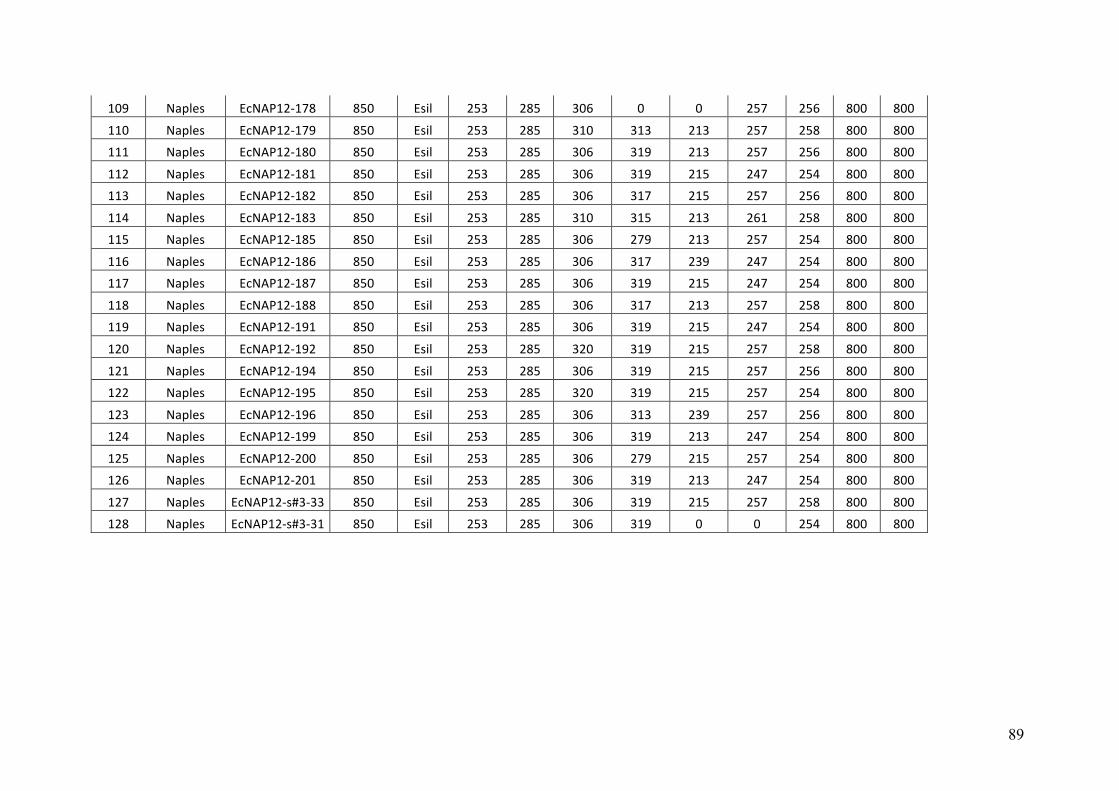
89
109 Naples EcNAP12-178 850 Esil 253 285 306 0 0 257 256 800 800110 Naples EcNAP12-179 850 Esil 253 285 310 313 213 257 258 800 800111 Naples EcNAP12-180 850 Esil 253 285 306 319 213 257 256 800 800112 Naples EcNAP12-181 850 Esil 253 285 306 319 215 247 254 800 800113 Naples EcNAP12-182 850 Esil 253 285 306 317 215 257 256 800 800114 Naples EcNAP12-183 850 Esil 253 285 310 315 213 261 258 800 800115 Naples EcNAP12-185 850 Esil 253 285 306 279 213 257 254 800 800116 Naples EcNAP12-186 850 Esil 253 285 306 317 239 247 254 800 800117 Naples EcNAP12-187 850 Esil 253 285 306 319 215 247 254 800 800118 Naples EcNAP12-188 850 Esil 253 285 306 317 213 257 258 800 800119 Naples EcNAP12-191 850 Esil 253 285 306 319 215 247 254 800 800120 Naples EcNAP12-192 850 Esil 253 285 320 319 215 257 258 800 800121 Naples EcNAP12-194 850 Esil 253 285 306 319 215 257 256 800 800122 Naples EcNAP12-195 850 Esil 253 285 320 319 215 257 254 800 800123 Naples EcNAP12-196 850 Esil 253 285 306 313 239 257 256 800 800124 Naples EcNAP12-199 850 Esil 253 285 306 319 213 247 254 800 800125 Naples EcNAP12-200 850 Esil 253 285 306 279 215 257 254 800 800126 Naples EcNAP12-201 850 Esil 253 285 306 319 213 247 254 800 800127 Naples EcNAP12-s#3-33 850 Esil 253 285 306 319 215 257 258 800 800128 Naples EcNAP12-s#3-31 850 Esil 253 285 306 319 0 0 254 800 800
The genus Ectocarpus Lyngbye (Ectocarpales, Phaeophyceae) comprises marine filamentous algae characterized by an
alternation between two independent multicellular organisms of different ploidy. The general objective of the thesis was to study
species delineation and speciation within this genus. We started clarifying the number of cryptic species using two unlinked loci
(COI-5P and ITS1) and an integrative approach associating barcode gap detection analyses with phylogenetic reconstructions. We
showed the presence of at least 15 species partitioned within a monophyletic group composed of E. crouaniorum (Ecro) and two
closely related species and a paraphyletic assemblage composed of the remaining 12 other species including E. siliculosus (Esil).
Second, Rad sequencing and phylogenomics analyses allowed to resolve the relationships within the paraphyletic assemblage. The
different species becomes well separated into two divergent clades (Ecro and Esil). A diversity of taxa with various levels of
divergence was revealed within the clade Esil and hybridization between the closest and sympatric species was suggested. Finally,
the importance of reproductive isolation among the two commonest but most divergent species Esil and Ecro was studied using
species-specific nuclear and cytoplasmic markers jointly with 9 microsatellites. We showed that meiosis acts as a strong
reproductive barrier among these two species and demonstrates that the species of the genus Ectocarpus are excellent systems to
study evolutionary consequences of hybridization and introgression for the maintenance or breakdown of species because of their
haploid diploid life cycle.
Le genre Ectocarpus Lyngbye (Ectocarpales, Phaeophyceae) regroupe des algues marines filamenteuses caractérisées par un
cycle haploïde-diploïde. L’objectif de la thèse était de délimiter les espèces et d’étudier la spéciation dans ce genre. Nous avons
commencé par clarifier le nombre d’espèces cryptiques en utilisant deux loci indépendants et une approche intégrative associant
une analyse de détection de « barcode gap » avec des reconstructions phylogénétiques. Nos résultats montrent l’existence d’au
moins 15 espèces qui se répartissent en un groupe monophylétique composé d’E. crouaniorum (Ecro) et de deux espèces proches
ainsi que d’un mélange paraphylétique composé des 12 autres espèces incluant E. siliculosus (Esil). Deuxièmement, les analyses
de séquençage Rad et de phylogénomique ont permis de résoudre les relations au sein du groupe paraphylétique. Les espèces se
regroupent maintenant en deux clades divergents (Ecro and Esil). Des niveaux de divergence variables entre espèces sont révélés
au sein du clade Esil. Des phénomènes d’hybridation entre les espèces les plus apparentées, et trouvées en sympatrie, sont
suspectés. Finalement, l’importance de l’isolement reproducteur a été étudié entre les espèces Esil et Ecro, les plus communes,
mais les plus divergentes, en utilisant des marqueurs spécifiques de chacune des espèces. Nos résultats indiquent que la méiose
agit comme une forte barrière reproductive entre ces espèces et démontrent que les espèces du genre Ectocarpus sont d’excellents
systèmes pour étudier les conséquences évolutives de l’hybridation et de l’introgression pour le maintien ou la divergence des
espèces grâce à leur cycle haploïde-diploïde.
El género Ectocarpus Lyngbye (Ectocarpales, Phaeophyceae) está formado por algas marinas filamentosas con alternancia de
generaciones en su ciclo de vida (haploide-diploide). Esta tesis tuvo por objetivo delimitar las especies dentro de este género y
estudiar los mecanismos de especiación. Nosotros empezamos clarificando el numero de especies crípticas usando dos genes no
ligados y una aproximación integrativa asociando el análisis de barcoding genético con filogenias. Los resultados mostraron la
presencia de al menos 15 especies particionadas dentro un clado monofilético compuesto de E. crouaniorum (Ecro) y dos especies
estrechamente relacionadas, y un ensamblaje parafilético incluyendo E. siliculosus (Esil) y las restantes 12 especies. Segundo,
análisis de filogenómica permitieron resolver las relaciones dentro de este ensamblaje. Las diferentes especies fueron claramente
separadas mostrando diferentes niveles de divergencia y fueron agrupadas en dos clados. Además, la posible hibridación entre
especies filogenéticamente cercanas y simpátricas fue evidenciada. Finalmente, mediante la combinación de marcadores
moleculares provenientes del núcleo y citoplasma, junto a 9 microsatélites, estudiamos la importancia del aislamiento reproductivo
entre las especies más comunes y divergentes del género (Esil y Ecro). Así, nosotros mostramos que la meiosis actúa como una
fuerte barrera reproductiva entre estas dos especies. Por último, destacamos que las especies pertenecientes al género Ectocarpus
constituyen un modelo apropiado para estudiar los procesos de hibridación e introgresión, así como la divergencia de especies
debido a su ciclo de vida haploide-diploide.


