Embed Size (px)
Citation preview
E(OLOfI(IIL mOOELLIn6
ELSEVIER Ecological Modelling 74 (1994) 287-304
Mathematical simulations of man-made microbial mixture grown on natural gas
I .R . Sp ivak , J.S. R o k e m *
Department of Applied Microbiology, Institute of Microbiology, The Hebrew University - Hadassah Medical School, P.O.B. 12272, 91120, Jerusalem, Israel
(Received 18 March 1993; accepted 24 August 1993)
Abstract
A new mathematical model was developed and used to analyze growth kinetics of transient stages of continuous cultures leading to steady states for mixed cultures of one methylotrophic bacterium and two heterotrophic bacteria. In the model the methylotrophic species was limited by oxygen and the heterotrophic species were limited either by oxygen, maximal specific growth rate or concentration of intermediate extracellular metabolites. Simulations, based on the model, were run to determine the applicability of the model. Characteristics of the species were based on data obtained from bacteria used in industrial processes. This model is based on "ecological principles" taking into consideration various interactions among the species in a linearized form of the Monod equation. The model could account for the ability of the three species to coexist with methane as the sole carbon source at different initial conditions.
Key words: Growth, microorganism; Mixed bacterium culture
I. Introduct ion
Microorganisms in nature are usually present and grow as mixed cultures (Odum, 1971) and there are also many biotechnological processes of economical interest utilizing mixed cultures (Wilkinson et al., 1974; Bailey and Ollis, 1986; Begon et al., 1986).
A mixed culture of practical interest is the bacterial association growing on natural gas, including microorganisms able to oxidize me thane for growth (Wilkin-
* Corresponding author.
0304-3800/94/$07.00 © 1994 Elsevier Science B.V. All rights reserved SSDI 0304-3800(93)E0065-B
288 I.R. Spivak, J.S. Rokem / Ecological Modelling 74 (1994) 287-304
I - - P ! . . . . . . . . . . . . . . I
. . . . . I . . . . . . . . ; )
t . . _ . p ! . . . . . . . . . . . . . .
: . . . I . . . . . . . . :
S, - - M , ::
i --- F~ ........ ! M , - - ~
- - - P ( . . . . . . . ~ ! M 3 - -
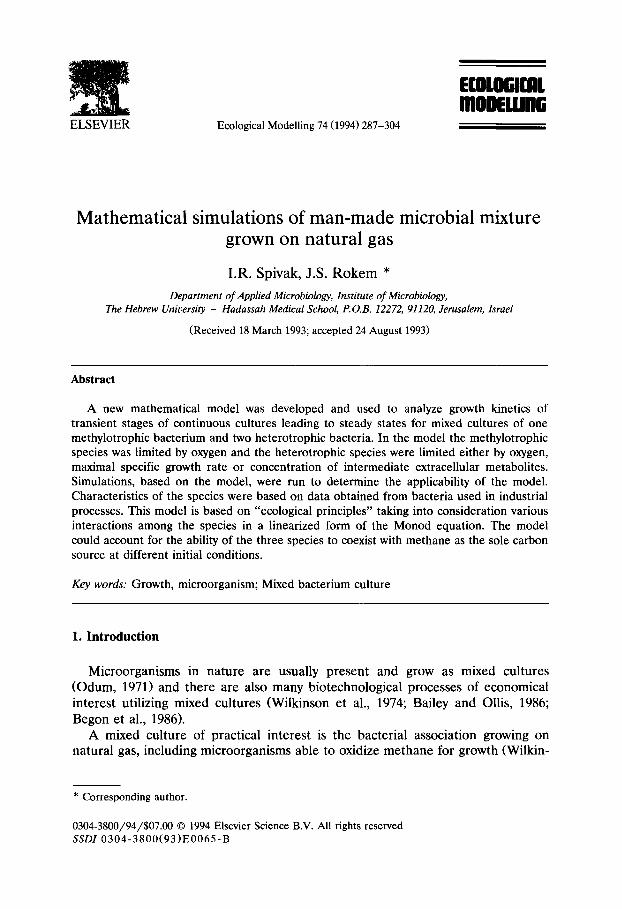
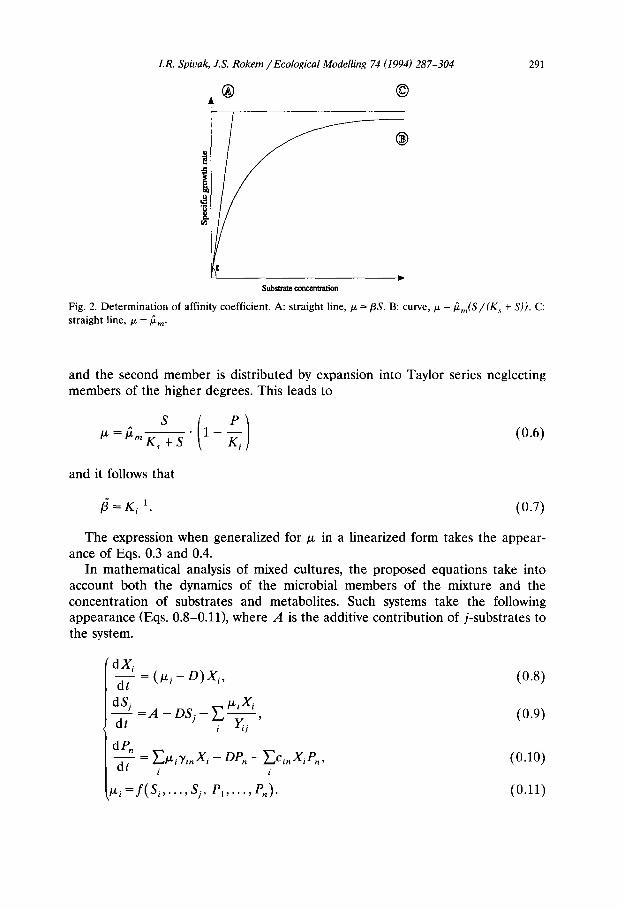
Fig. 1. Types of interactions for the methylotrophic and the two heterotrophic species. competition by external substrate; . . . . . . products of metabolism; . . . . . . inhibition; . . . . . . competi- tion for metabolites. PI: C02; P2: methanol; P3: ethanol; P4: acetate; MI: methylotroph; M2: first heterotroph; M3: second heterotroph.
son et al., 1974; Malashenko et al., 1988). Natural gas contains compounds homologous to methane. These compounds are cooxidized to longer chain alcohols and aldehydes by the methane utilizer, due to the wide substrate specificity of the enzyme methane-monooxygenase (Ivanova and Nesterov, 1988), which is the first enzyme in the oxidation pathway of methane.
Growth of methylotrophs results in accumulation of partially oxidized metabo- lites, growth inhibitory to the methane utilizer (Wilkinson et aI., 1974). Addition of non-methylotrophic (heterotrophic) bacteria, which utilize the organic compounds formed as a result of methylotrophic metabolism, avoids the detrimental effect of these metabolite on growth and the overall process. A positive interaction of this type where both cell types benefit is called mutualism (Odum, 1971), but there are also negative interactions in such a system due to the competition of the het- erotrophic bacteria for extracellular organic metabolites and the self inhibition of the methylotrophic bacterium by the same metabolite(s).
The simulations presented in this communication exemplify the interactions of the two heterotrophs, competing among themselves for extracellular metabolites (in this case ethanol and acetate) excreted by the methylotroph, when simultane- ously these metabolites are inhibitory to the methylotrophic bacterium. Two different types of metabolites were included in the model, one type is assimilated by the heterotrophic bacteria and the other type acts as an inhibitor to all members of the mixture (Fig. 1). In Fig. 1, Ma, M 2 and M 3 represent the three bacteria (Ma is the methylotrophic species and M 2 and M 3 are both heterotrophs) and P1, P2, P3 and P4 are the products of the metabolism of M~ (carbon dioxide, methanol, ethanol and acetate, respectively).
I.R. Spivak, J.S. Rokem ~Ecological Modelling 74 (1994) 287-304 289
2. Materials and methods
A mathematical model based on the work (Abrosov et al., 1982), was developed where linear approximations are used for the expressions for the specific growth rate in the interaction of different species in the population. The Runge-Kutta- Fehlberg method (Fehlberg, 1970; Conte and Boor, 1981) with step size control was used for calculations. The original program was written in Microsoft Quick Basic 4.5. The assumptions for this analysis were as follows:
1. The microbial association contains one methylotrophic bacterium and two heterotrophic bacteria. Methylococcus capsulatus and two distinct strains of Frateuria aurantia have been observed under industrial conditions (Ivanova and Nesterov, 1988). In a similar case, a mixture of Methylococcus ter- mophilus and Gluconobacter oxydans and a Bacillus sp. was isolated as described by Romanovskaya (1990).
2. The methylotrophic bacterium excreted methanol, ethanol and acetate (inter- mediate carbon containing metabolites) to the medium. This assumption is supported by earlier studies (Wilkinson et al., 1974; Ivanova and Nesterov, 1988; Malashenko et al., 1988) where these metabolites were found to be prevailing.
3. All bacteria of the mixture are inhibited by and cannot assimilate methanol, with the exception that low concentrations of methanol can be assimilated by the methylotrophic species (Malashenko et al., 1988).
4. All bacteria present in the mixture compete for the dissolved oxygen. 5. The heterotrophic bacteria compete for ethanol and acetate, and these
metabolites are interchangeable. 6. The bacteria of the mixture are all inhibited by CO2, which is also produced by
all the bacteria. This assumption together with assumption 3 allows for the analyses of self and cross inhibition simultaneously.
7. The heterotrophic bacteria differ only in their adaptability to ethanol and acetate. This assumption is most probably not representative of what really occurs in nature; however, it allows for the simplification of the theoretical analysis without misrepresenting the biology of the system.
8. Methane and minerals are available in excess. 9. The fermentor configuration allows for ideal mixing.
10. There is no wall growth or other phenomena that change the growth kinetics of the mixture.
11. The process is performed in an aqueous solution under continuous culture conditions.
2.1. Choice of term for specific growth rate to use in this model
The specific growth rate is dependent on the concentration of the limiting growth nutrient, represented by a curve of the saturation type. These dependencies have been shown to vary greatly (Monod, 1949).
290 I.R. Spivak, J.S. Rokem ~Ecological Modelling 74 (1994) 287-304
Mechanisms based on the "bottle neck" concept (Bailey and Ollis, 1986) are valid in this case, since rate of metabolism must be considered to be based on the slowest reaction occurring in the cell. In its simplest case this is described by the Monod equation, which is very close to represent actual experimental data (Hol- berg, 1982), and therefore it is useful to form mathematical models for growth of populations.
The studied system also contains negative interactions and consequently it is necessary to account for this in the Monod equation.
Even though the inhibition mechanisms might be different, it is reasonable to assume analogy of inhibition kinetics with growth-related reactions. Various ex- pressions have been suggested to accommodate for the inhibition factor using Monod kinetics (Luong, 1987), however, the Haldane equation (Eq. 0.1) (Haldane, 1965) is convenient for the subsequent linearization:
01, ( K , + S ) 1 +
According to Aiba and coworkers (1968), this can also be described as
P S eK-- 7
t x = ~ m K s + S (0.2)
by expansion into Taylor series and neglecting the members of the highest degrees. Linear approximations for the expressions of the specific growth rate in the
interaction of species in a population were described by Abrosov and coworkers (1982) as
Ix = min{/2m; ~ilS1; ~ i jS j } ' ( 1 - ~ilP1)" . . . • (1 - 13i, Pn) (0.3)
when the substrate is unique, and when the substrate is interchangeable, by
Ix = min{/2m; E j ~ i j S j ) " ( 1 - - [ 3 i l e l ) ' . . . ' ( 1 - - [ 3 i n P n ) , (0.4) J
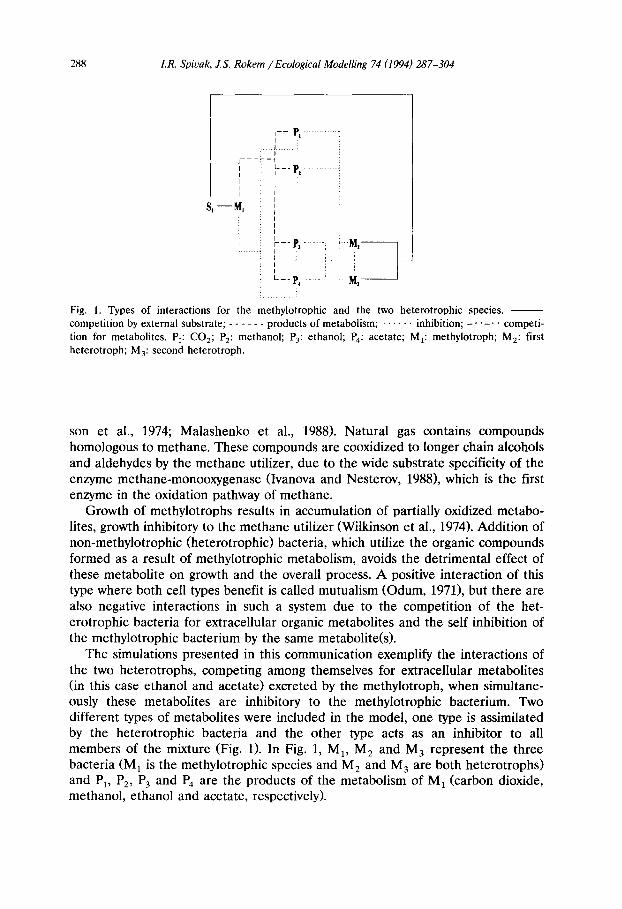
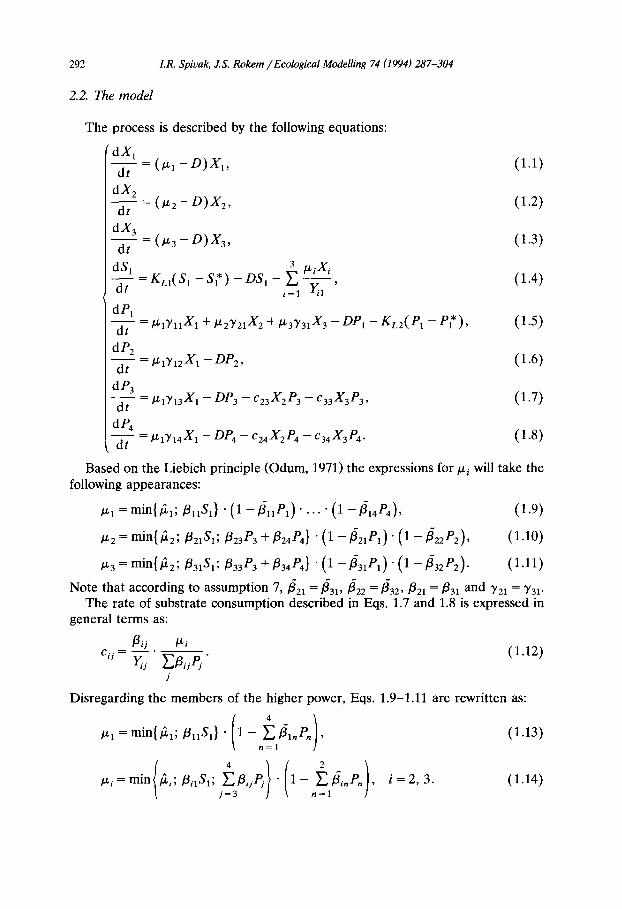
where i is microorganism number, j is substrate number, n is inhibitor number. The term /3ij is the affinity coefficient of microorganism i to substrate j,
defined as the tangent of the inclination angle a adjacent to the curve. In the Monod equation it is found at the origin, defined as t x / K s (see Fig. 2).
The coefficient of sensitivity to inhibitors, ~, can be determined in the following way:
The Haldane equation (Eq. 0.1) is rewritten
S K i Ix = ~ m - - (0.5)
K s + S K i + P
LR. Spivak, J.S. Rokem / Ecological Modelling 74 (1994) 287-304 291
® ©
® t
Substrate concen~fion
Fig. 2. Determinat ion of affinity coefficient. A: straight l ine, /z =/3S. B: curve, p~ = ~m(S/(Ks + S)). C: straight line, tz = #m"
and the second member is distributed by expansion into Taylor series neglecting members of the higher degrees. This leads to
~ = ~ " K ~ + - ~ " 1 - K i (0.6)
and it follows that
/3 = K~- 1. (0 .7)
The expression when generalized for g in a linearized form takes the appear- ance of Eqs. 0.3 and 0.4.
In mathematical analysis of mixed cultures, the proposed equations take into account both the dynamics of the microbial members of the mixture and the concentration of substrates and metabolites. Such systems take the following appearance (Eqs. 0.8-0.11), where A is the additive contribution of j-substrates to the system.
' d X i = ( / ~ , - D ) X i, (0.8)
dS i ].£iXi = A - D S j - E Yi----]- ' (0.9)
dt i
de. - ~ - = E ~ i T i . X i - D in - E C i n X i P . , (0.10)
i i
tz i = f ( S i . . . . . Sj, P, . . . . . Pn)" (0.11)
292 I.R. Spivak, J.S. Rokem / Ecological Modelling 74 (1994) 287-304
2.2. The model
The process is described by the following equations:
' d X 1 T = (P-I - D ) X 1 , (1.1)
dX: - - ~ = (/-¢2 - D ) X 2 , (1.2)
dX3 T = (Jz3 - D)X3 ' (1.3)
d S 1 3 l £ i X i -d-[- = KL'( S' - S~ ) - D S l - E Yi---7-' (1.4)
i=1
dP1 - ~ =/£13,11X1 + jLt 2"Y21X 2 + /£33 ,31X3 - DP, - KL2 (P1 - - PI*), (1.5)
dP2 = / £ 13,12 X l - DP2, (1.6)
dP3 = ]£13,13X1 - DP 3 - c 2 3 X 2 P 3 - c 3 3 X 3 P 3 , (1.7)
OP4 =/£13,14X1 - D P 4 - c 2 4 X 2 P 4 - c 3 4 X 3 P 4. (1.8)
Based on the Liebich principle (Odum, 1971) the expressions for tz i will take the following appearances:
~.£1 = min{/21;/31lS1} . ( 1 - / 3 1 1 P 1 ) • . . . • (1 - ~14P4), ( 1 . 9 )
/z2 = min{/22;/321S1;/323P3 + ~24P4}" (1 - ~21P~) • (1 - ~22P2), (1.10)
/~3 = min{/2z; fl31S1;/333P3 +/33,P4}" (1 -/~31P~) • (1 - ~32P2)- (1.11)
Note that according to assumption 7 , /321 = / 331 , / 322 = /~32 , / 321 = f131 and 3'2t = 3,31. The rate of substrate consumption described in Eqs. 1.7 and 1.8 is expressed in
general terms as:
cij = Yij Y'~flijPj " (1.12)
i
Disregarding the members of the higher power, Eqs. 1.9-1.11 are rewritten as:
tx 1 = min{121; fllaS1} • 1 - fllnP,, , (1.13) 1
/-~i = min ~i; flilS1; flo.Pj • 1 - i,P~ , i = 2, 3. (1.14) J
I.R. Spivak, J.S. Rokem / Ecological Modelling 74 (1994) 287-304 293
Note that these equations express the additive effect of the inhibitors to each organism. For/z, Eqs. 1.13 and 1.14 will hence be used.
It has been shown that the methane-utilizing methylotroph is able to utilize low concentrations of methanol (Malashenko et al., 1988). Therefore Eq. 1.6 is rewrit- ten as follows:
dP2 dt = Y121xlXI - DP2 - C l 2 S l e 2 ' (1.6.1)
and accordingly Eq. 1.12 expressed for c12 will be
~12 ]2"1 /[/~1 C12 = Y1--~2 f112P~ - Y12P----~2 " (1.6.2)
Substituting Eq. 1.6.2 in Eq. 1.6.1 we get:
£tt = Y l 2 - ~ " I ~ I X 1 - DP2" (1.6.3)
Experimentally it is difficult to determine the quantities "~12 and Y12- The expression in brackets is the "actual" rate of methanol excretion and we define it as Y12 by the use of Eq. (1.6).
3. Results
Simulations based on the above equations were run from the time of inoculation until steady state was reached. The criteria to determine the steady state condi- tions were defined as follows:
xi-xi-1 I Xi <~ e, (1.15)
where e is the relative estimate, set up as 0.1%, and X/ and Xi_ 1 a r e the given and the previous biomass value in the simulation.
The transient behavior of the three species is described by these simulation runs. The type of limitation obtained for the three bacterial species is not known beforehand. Coefficients for the characteristics of species are values taken from and close to actual industrial processes. The industrial production of single cell protein using methane as sole carbon source has been performed and actual results of this process cannot be presented. The mixed cultures obtained behaved in a similar way to the simulations presented here. In order to test the validity of the system of differential equations, simulations with different characteristics of the species were run.
Most of the simulations did not reach steady state, because the calculations were stopped when condition 1.15 was fulfilled.
294 LR. Spicak, J.S. Rokem / Ecological Modelling 74 (1994) 287-304
3.1. S imulat ion 1 - initial conditions, close to actual process
The various characteristics of the species used in the simulation are presented in Table 1 (see list of nomenclature for definitions), and the numerical values chosen are related to actual processes. The limitation type obtained for the three species is shown in Table 2.
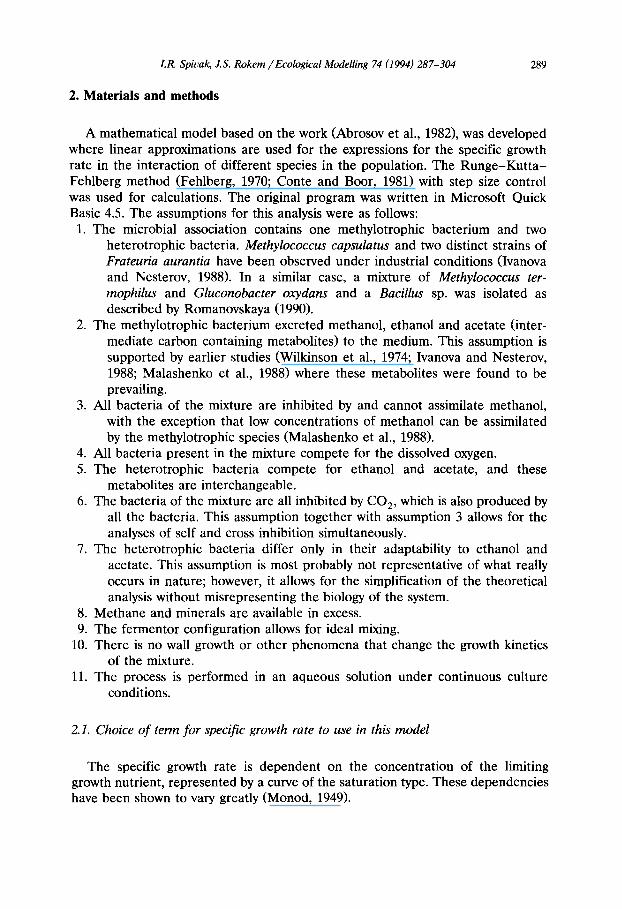
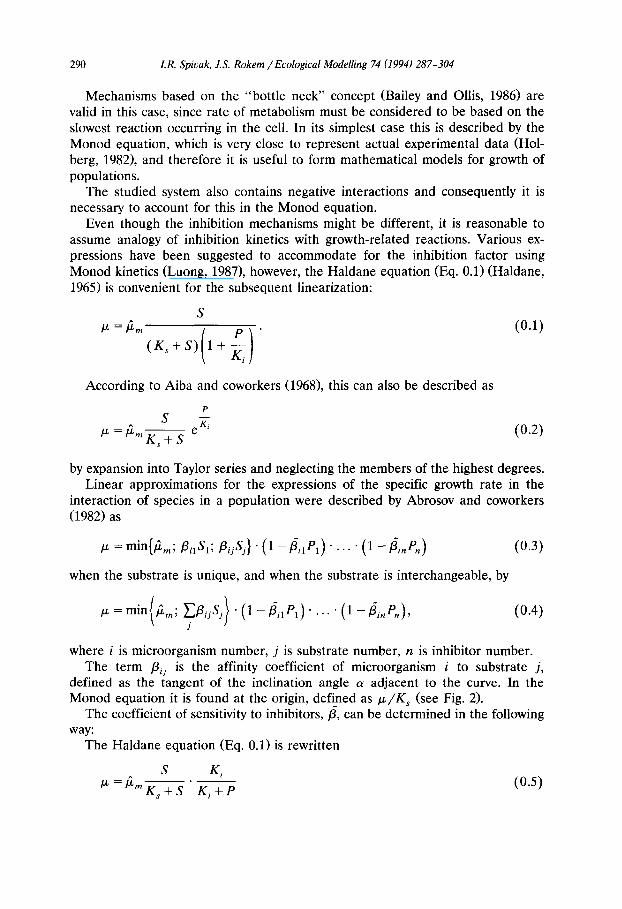
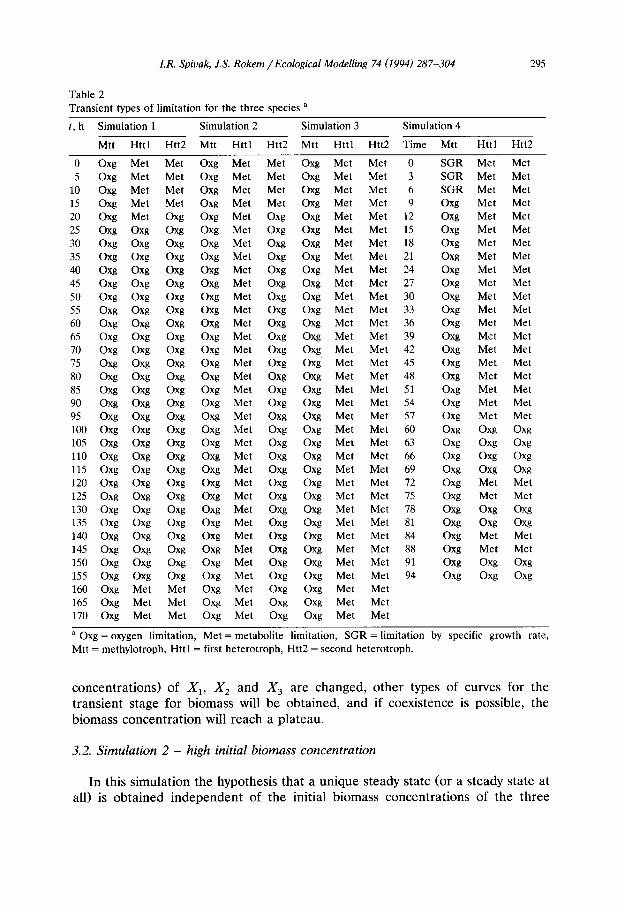
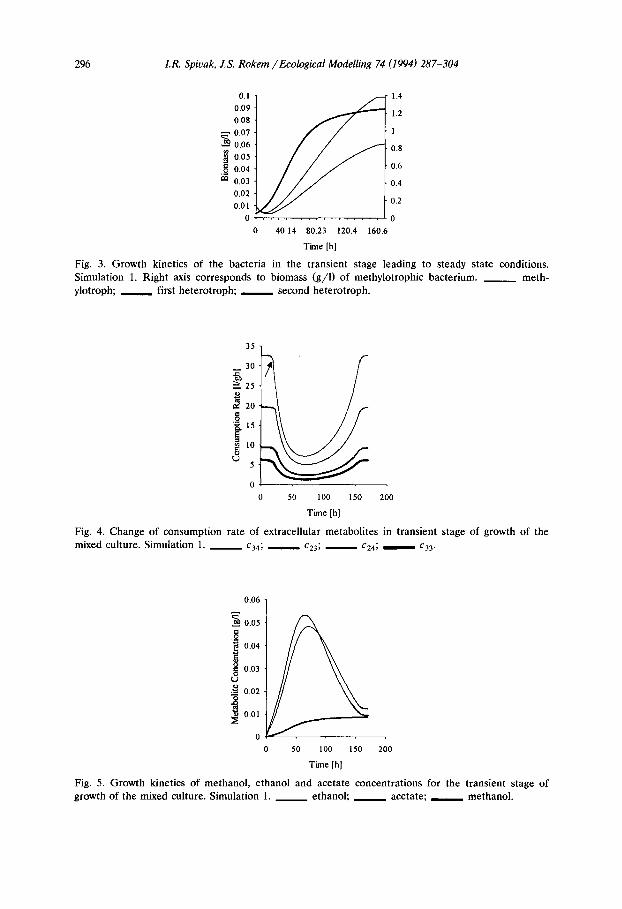
It should be noted that type of limitation for the heterotrophs changed from the initial extracellular metabolite limitation to dissolved oxygen limitation and finally before reaching steady state, limitation of the heterotrophs by extracellular metabolites was restored (Table 2). The growth kinetics of the bacteria is shown in Fig. 3 and consumption rate of extracellular metabolites is presented in Fig. 4. There are several indications for the switches in growth limitation types. The first change in limitation is characterized by change of the sign of the second derivative (point of inflection) on the graph of the growth kinetics of the three species (Fig. 3), and is seen in the inversion that occurs in the specific growth rate for the two heterotrophic species (Fig. 3). The limitation change is also seen in the change of consumption rate of the extracellular metabolites (ethanol and acetate) that occurs 15 to 20 h after inoculation (arrow, Fig. 4). Kinetics of methanol, ethanol and acetate concentration are shown in Fig. 5. Both assimilated metabolites reach an independent maximum before they are utilized by the increased heterotrophic biomass. Later the heterotrophs become metabolite limited and the curves reach plateaus (i.e. steady state).
It should be noted that in this and all following simulations we get well-known types of curves for the biomass accumulation. If initial conditions (inoculation
Table 1 Numerical values for the characteristics of the species. Units as in list of nomenclature
Simulation Simulation
1 2 3 4 1 2 3 4
K m 350 350 350 350 Kse3 0.025 0.025 0.025 0.025 KL2 350 350 350 350 Ks33 0.07 0.07 0.07 0.07 ]II 1 350 350 350 350 KS24 0.06 0.06 0.06 0.06 Y2I 0.3 0.3 0.3 0.3 KS34 0.02 0.02 0.1 0.02 Y3t 0.3 0.3 0.3 0.3 /011 500 500 500 500 $1" 0.0082 0.0082 0.0082 0.016 /012 0.5 0.5 0.03 0.5 PI* 23.32 23.32 23.32 23.32 /013 1.5 1.5 0.15 1.5 KS I1 0.0083 0.0083 0.0083 0.0083 Kt'14 1.5 1.5 0.07 1.5 Ks21 0.008 0.008 0.008 0.008 /0"21 500 500 500 500 Ks31 0.008 0.008 0.008 0.008 /022 1.2 12 12 12 /21 0.43 0.43 0.43 0.43 /031 500 500 500 500 /22 0.41 0.41 0.41 0.41 /032 1.2 12 12 12 /23 0.41 0.41 0.41 0.41 Yll 1.2 1.2 1.2 1.2 D 0.25 0.28 0.25 0.135 Y21 1.5 1.5 1.5 1.5 Y23 0.8 0.8 0.8 0.8 3'31 1.5 1.5 1.5 1.5 )I-33 0.9 0.9 0.9 0.9 3"12 0.007 0.008 0.007 0.008 Y24 0.7 0.7 0.7 0.7 3'13 0.8 0.08 0.05 0.08 Y34 0,6 0.6 0.6 0.6 3'14 1.2 0.12 0.2 0.12
LR. Spivak, J.S. Rokem / Ecological Modelling 74 (1994) 287-304
Table 2 Transient types of limitation for the three species a
295
t, h Simulation 1 Simulation 2 Simulation 3 Simulation 4
Mtt Httl Htt2 Mtt Httl Htt2 Mn Httl Htt2 Time Mtt Httl Htt2
0 Oxg Met Met Oxg Met Met Oxg Met Met 0 5 Oxg Met Met Oxg Met Met Oxg Met Met 3
10 Oxg Met Met Oxg Met Met Oxg Met Met 6 15 Oxg Met Met Oxg Met Met Oxg Met Met 9 20 Oxg Met Oxg Oxg Met Oxg Oxg Met Met 12 25 Oxg Oxg Oxg Oxg Met Oxg Oxg Met Met 15 30 Oxg Oxg Oxg Oxg Met Oxg Oxg Met Met 18 35 Oxg Oxg Oxg Oxg Met Oxg Oxg Met Met 21 40 Oxg Oxg Oxg Oxg Met Oxg Oxg Met Met 24 45 Oxg Oxg Oxg Oxg Met Oxg Oxg Met Met 27 50 Oxg Oxg Oxg Oxg Met Oxg Oxg Met Met 30 55 Oxg Oxg Oxg Oxg Met Oxg Oxg Met Met 33 60 Oxg Oxg Oxg Oxg Met Oxg Oxg Met Met 36 65 Oxg Oxg Oxg Oxg Met Oxg Oxg Met Met 39 70 Oxg Oxg Oxg Oxg Met Oxg Oxg Met Met 42 75 Oxg Oxg Oxg Oxg Met Oxg Oxg Met Met 45 80 Oxg Oxg Oxg Oxg Met Oxg Oxg Met Met 48 85 Oxg Oxg Oxg Oxg Met Oxg Oxg Met Met 51 90 Oxg Oxg Oxg Oxg Met Oxg Oxg Met Met 54 95 Oxg Oxg Oxg Oxg Met Oxg Oxg Met Met 57 100 Oxg Oxg Oxg Oxg Met Oxg Oxg Met Met 60 105 Oxg Oxg Oxg Oxg Met Oxg Oxg Met Met 63 110 Oxg Oxg Oxg Oxg Met Oxg Oxg Met Met 66 115 Oxg Oxg Oxg Oxg Met Oxg Oxg Met Met 69 120 Oxg Oxg Oxg Oxg Met Oxg Oxg Met Met 72 125 Oxg Oxg Oxg Oxg Met Oxg Oxg Met Met 75 130 Oxg Oxg Oxg Oxg Met Oxg Oxg Met Met 78 135 Oxg Oxg Oxg Oxg Met Oxg Oxg Met Met 81 140 Oxg Oxg Oxg Oxg Met Oxg Oxg Met Met 84 145 Oxg Oxg Oxg Oxg Met Oxg Oxg Met Met 88 150 Oxg Oxg Oxg Oxg Met Oxg Oxg Met Met 91 155 Oxg Oxg Oxg Oxg Met Oxg Oxg Met Met 94 160 Oxg Met Met Oxg Met Oxg Oxg Met Met 165 Oxg Met Met Oxg Met Oxg Oxg Met Met 170 Oxg Met Met Oxg Met Oxg Oxg Met Met
SGR Met Met SGR Met Met SGR Met Met Oxg Met Met Oxg Met Met Oxg Met Met Oxg Met Met Oxg Met Met Oxg Met Met Oxg Met Met Oxg Met Met Oxg Met Met Oxg Met Met Oxg Met Met Oxg Met Met Oxg Met Met Oxg Met Met Oxg Met Met Oxg Met Met Oxg Met Met Oxg Oxg Oxg Oxg Oxg Oxg Oxg Oxg Oxg Oxg Oxg Oxg Oxg Met Met Oxg Met Met Oxg Oxg Oxg Oxg Oxg Oxg Oxg Met Met Oxg Met Met Oxg Oxg Oxg Oxg Oxg Oxg
a Oxg = oxygen limitation, Met = metabolite limitation, SGR = limitation by specific growth rate, Mtt = methylotroph, Httl = first heterotroph, Htt2 = second heterotroph.
c o n c e n t r a t i o n s ) o f X 1, X 2 a n d X 3 a r e c h a n g e d , o t h e r types o f cu rves for t h e
t r a n s i e n t s t age for b i o m a s s wil l be o b t a i n e d , a n d if c o e x i s t e n c e is poss ib le , t h e
b i o m a s s c o n c e n t r a t i o n will r e a c h a p l a t e a u .
3.2. Simulation 2 - high initial biomass concentration
In th is s i m u l a t i o n t h e hypo the s i s t h a t a u n i q u e s t eady s ta te (or a s t e a d y s ta te at
all) is o b t a i n e d i n d e p e n d e n t o f t h e in i t ia l b i o m a s s c o n c e n t r a t i o n s o f t h e t h r e e
296 I.R. Spivak, J.S. Rokem / Ecological Modelling 74 (1994) 287-304
O.l 1.4 0.09 ~ 1.2 0.08
0.07 1 0.06 0.8 ~ 0.05
.o 0.04 0.6 0.03 0.4 0.02 0.01 0.2
0 0 40.14 80.23 120.4 160.6
Time [h]
Fig. 3. Growth kinetics of the bacteria in the transient stage leading to steady state conditions. Simulation 1. Right axis corresponds to biomass (g/l) of methylotrophic bacterium. ~ meth- ylotroph; first heterotroph; second heterotroph.
35
30
~25 ~. 20 "~ 15
10
5
50 100 150 200
Time [h]
Fig. 4. Change of consumption rate of extracellular metabolites in transient stage of growth of the mixed culture. Simulation 1. ~ c34; c23; cz4; ~ c33.
0.06
~-~ 0.05 ._~
0.04
g O.03
~- 0.02
"~ 0.01
50 100 150 200
Time [hi
Fig. 5. Growth kinetics of methanol, ethanol and acetate concentrations for the transient stage of growth of the mixed culture. Simulation 1. ~ ethanol; acetate; methanol.
I.R. Spivak, J.S. Rokem / Ecological Modelling 74 (1994) 287-304 297
0.6 1.4
0.5 1.2
0.4 0.8
m 0.2 0.4
0.1 0.2
0 . 0
0 25.1 50.2 75.2 100 125 151
Time [h]
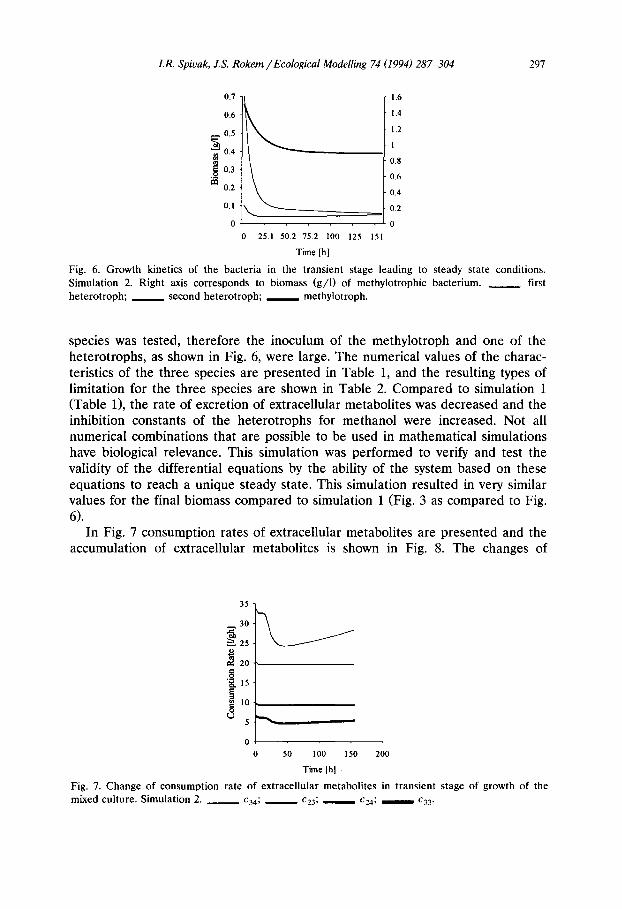
F ig . 6. Growth kinetics of the bacteria in the transient stage leading to steady state conditions. Simulation 2. Right axis corresponds to biomass (g/ l) of methylotrophic bacterium. ~ first heterotroph; second heterotroph; methylotroph.
species was tested, therefore the inoculum of the methylotroph and one of the heterotrophs, as shown in Fig. 6, were large. The numerical values of the charac- teristics of the three species are presented in Table 1, and the resulting types of limitation for the three species are shown in Table 2. Compared to simulation 1 (Table 1), the rate of excretion of extracellular metabolites was decreased and the inhibition constants of the heterotrophs for methanol were increased. Not all numerical combinations that are possible to be used in mathematical simulations have biological relevance. This simulation was performed to verify and test the validity of the differential equations by the ability of the system based on these equations to reach a unique steady state. This simulation resulted in very similar values for the final biomass compared to simulation 1 (Fig. 3 as compared to Fig. 6).
In Fig. 7 consumption rates of extracellular metabolites are presented and the accumulation of extracellular metabolites is shown in Fig. 8. The changes of
35
30
25
20
'~ 15
5
0
50 I00 150 200
Time [h]
Fig . 7. Change of consumption rate of extracellular metabolites in transient stage of growth of the mixed culture. Simulation 2. ~ £34; ~ c23~ .... c24; ~ c33.
298 LR. Spivak, J.S. Rokem / Ecological Modelling 74 (1994) 287-304
0.018
3 0.016
0.014
"~ 0.012
0.01 =
0.008
0.006
0.004 rJ
0.002
50 100 150 200
Time [h]
Fig. 8. Growth k inet ics of me thano l , e thano l and ace ta te concen t ra t ions for the t rans ien t s tage of
growth of the mixed cul ture . S imula t ion 2. _ _ e thanol ; ace ta te ; methanol .
excretion rate of the extracellular metabolites and methanol inhibition constant resulted in straight lines for consumption rate of the extracellular metabolites (Fig. 7, the first heterotroph, X2). The accumulated extracellular metabolites did not reached a plateau in this simulation (Fig. 8), i.e. their concentration never reached saturation (compare to Fig. 5).
In this simulation there is a decline in acetate concentration together with an increase in ethanol concentration. This could be explained as follows: the specific growth rate of the second heterotroph is larger than the dilution rate, simultane- ously with a high affinity for acetate, therefore acetate concentration will decline until steady state is reached or until specific growth rate will be larger than dilution rate. On the other hand, the specific growth rate of the first heterotroph is smaller than the dilution rate and its affinity for ethanol is lower and this results in the accumulation of ethanol in the medium.
The consumption rate images for simulations 1 and 2 are similar (Figs. 4 and 7, c34 and c33) indicating that the extracellular metabolites are utilized in the same manner independent of initial conditions.
3.3. Simulation 3 - change for one heterotroph in affinity for extracellular metabolites
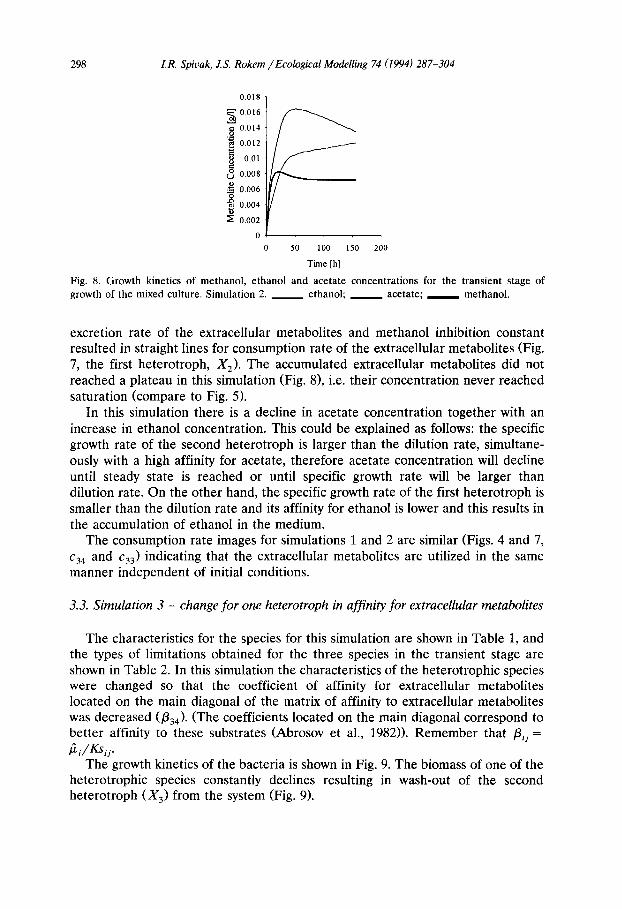
The characteristics for the species for this simulation are shown in Table 1, and the types of limitations obtained for the three species in the transient stage are shown in Table 2. In this simulation the characteristics of the heterotrophic species were changed so that the coefficient of affinity for extracellular metabolites located on the main diagonal of the matrix of affinity to extracellular metabolites was decreased (/334). (The coefficients located on the main diagonal correspond to better affinity to these substrates (Abrosov et al., 1982)). Remember that /3ij = ~i/Ksij.
The growth kinetics of the bacteria is shown in Fig. 9. The biomass of one of the heterotrophic species constantly declines resulting in wash-out of the second heterotroph (X 3) from the system (Fig. 9).
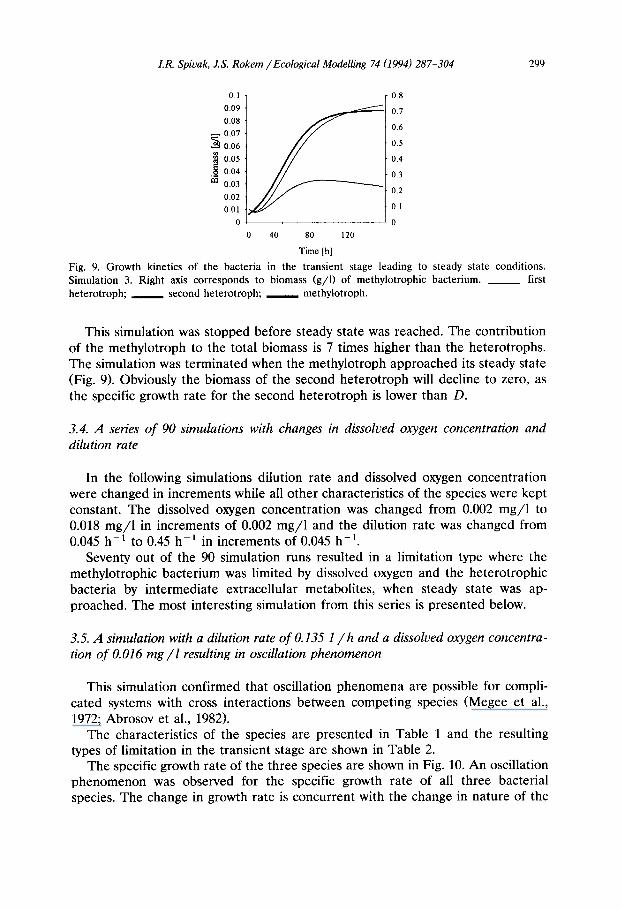
LR. Spivak, J.S. Rokem / Ecological Modelling 74 (1994) 287-304 299
0.1 0.09 0.08 0.07 ~ 0.06 0.05
o 0.04 i~ 0.03
0.02 0.01
0 0 40 80 120
Time [hi
0.8
0.7
0.6
0.5
0.4
0.3
0.2
0.1
0
Fig. 9. G r o w t h k ine t i cs o f t he b a c t e r i a in t he t r a n s i e n t s t age l e a d i n g to s t e a d y s t a t e cond i t i ons .
S imu la t i on 3. R i g h t axis c o r r e s p o n d s to b i o m a s s ( g / l ) o f m e t h y l o t r o p h i c b a c t e r i u m . ~ first
h e t e r o t r o p h ; s e c o n d h e t e r o t r o p h ; m e t h y l o t r o p h .
This simulation was stopped before steady state was reached. The contribution of the methylotroph to the total biomass is 7 times higher than the heterotrophs. The simulation was terminated when the methylotroph approached its steady state (Fig. 9). Obviously the biomass of the second heterotroph will decline to zero, as the specific growth rate for the second heterotroph is lower than D.
3.4. A series of 90 simulations with changes in dissolved oxygen concentration and dilution rate
In the following simulations dilution rate and dissolved oxygen concentration were changed in increments while all other characteristics of the species were kept constant. The dissolved oxygen concentration was changed from 0.002 mg/ l to 0.018 mg/ l in increments of 0.002 mg/1 and the dilution rate was changed from 0.045 h - t to 0.45 h-1 in increments of 0.045 h-1.
Seventy out of the 90 simulation runs resulted in a limitation type where the methylotrophic bacterium was limited by dissolved oxygen and the heterotrophic bacteria by intermediate extracellular metabolites, when steady state was ap- proached. The most interesting simulation from this series is presented below.
3.5. A simulation with a dilution rate of 0.135 1 / h and a dissolved oxygen concentra- tion of O. 016 mg / l resulting in oscillation phenomenon
This simulation confirmed that oscillation phenomena are possible for compli- cated systems with cross interactions between competing species (Megee et al., 1972; Abrosov et al., 1982).
The characteristics of the species are presented in Table 1 and the resulting types of limitation in the transient stage are shown in Table 2.
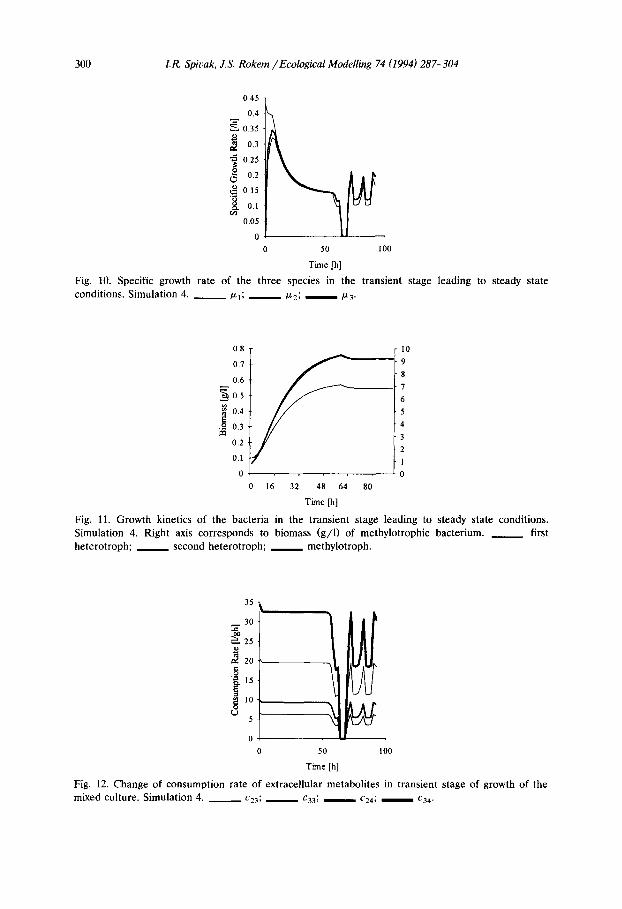
The specific growth rate of the three species are shown in Fig. 10. An oscillation phenomenon was observed for the specific growth rate of all three bacterial species. The change in growth rate is concurrent with the change in nature of the
300 I.R. Spivak, J.S. Rokem / Ecological Modelling 74 (1994) 287-304
0.45
0.4
0.35
0.3
0.25 .o 0.2
0.15
r~ 0.1 0.05
0 50 100
Time [h]
Fig. 10. Specific growth rate of the three species in the t ransient stage leading to steady state conditions. Simulation 4. ~ P-l; /x2; /z3.
0.8
0.7
0.6
~ 0.5
0.4
o 0.3
02
0.1
0
10 9 8
7 6 5 4
3 2
1
0 16 32 48 64 80
Time [h]
Fig. 11. Growth kinetics of the bacteria in the t ransient stage leading to steady state conditions. Simulation 4. Right axis corresponds to biomass ( g / l ) of methylotrophic bacterium. ~ first heterotroph; second heterotroph; methylotroph.
35
3O
25
~. 2o
"~ 15
¢..) 5
0 0 50 100
Time [h]
Fig. 12. Change of consumpt ion rate of extracellular metaboli tes in transient stage of growth of the mixed culture. Simulation 4. ~ c23; c33; c24, ~ c34-
I.R. Spivak, J.S. Rokem / Ecological Modelling 74 (1994) 287-304 301
growth limitation, from oxygen limitation to extracellular metabolite limitation. The decline to zero growth rate is caused by the inadequate supply of oxygen to the medium. By increase of the mass transfer coefficient this oxygen limitation can be avoided and the growth rate will not reach zero. The growth kinetics of the methylotrophic bacterium and the heterotrophic bacteria are shown in Fig. 11. The consumption rates of intermediate extracellular metabolites are shown in Fig. 12. There is a slight decrease in biomass in all three species that coincide with the first change in limitation type for the two heterotrophic bacteria from intermediate extracellular metabolite limitation to oxygen limitation (after 56.1 h of fermenta- tion, Fig. 11). The changes of consumption rate of intermediate extracellular metabolite concentrations observed in Fig. 12 are also a result of the change of limitation type. With no growth there is no utilization of the intermediate extracel- lular metabolites resulting in the oscillations in the specific growth rate of the two heterotrophic bacteria.
4. Discussion
Many different types of mathematical models which describe microbiological processes have been proposed. According to Tsuchiya and coworkers (1966), mathematical models of microbiological processes may be divided in two groups, so called structured and unstructured models. Structured models describe multicom- ponent systems, and unstructured models are monocomponent systems. Each kind may be further divided in lumped and distributed models. In a segregated model only "average cell approximation" (Bailey and Ollis, 1986) is used.
According to this classification (Tsuchiya et al., 1966), the studied model is of the structural unsegregated type, based on the "bottleneck" (Bailey and Ollis, 1986) concept. The multicomponents are as follows: biomass of the three species, extracellular metabolites and external source of oxygen. Contrary to other mathe- matical models for industrial processes we paid attention to interactions between the species as a primary phenomenon, and therefore it was possible to obtain conditions for species coexistence related to the various beneficial and detrimental interactions between the species ("ecological properties"). The model developed here is able to predict existence of steady states for a mixed culture grown on methane as a sole carbon source. Other models (Wilkinson et al., 1974; Ro- manovskaya et al., 1976; Drozd et al., 1980; Drozd and McCarthy, 1981) also enable coexistence of species for growth on methane as a sole carbon source, and it is a phenomenon described for a few experimental systems (Wilkinson et al., 1974; Malashenko et al., 1988). The conditions for growth found in experimental systems are in the range found to support coexistence of species in the model proposed here.
The simulations based on the proposed model showed that it is possible to obtain stable steady state points for the three different bacterial species using two external control parameters (the dissolved oxygen concentration and the dilution rate).
302 LR. Spivak, J.S. Rokem / Ecological Modelling 74 (1994) 287-304
The oscillatory behavior found in one of the 90 simulations is dependent on the initial conditions; of the 90 different dissolved oxygen concentrations and dilution rates, one combination, shown on Figs. 10 and 11, resulted in this oscillatory behavior, whereas the other 89 runs approached steady states without any oscilla- tions (results not shown).
Control with oxygen limitation is preferred, since the control of oxygen satura- tion concentration is technically easier and the cell response for changes in oxygen saturation concentration are orders of magnitude faster than response to changes of dilution rate. It is also more economical to limit cell growth by the dissolved oxygen concentration.
The dissolved oxygen concentration can be controlled by change of the rate of oxygen supply, the pressure in the fermentor or by change of agitation rate, either by themselves or in concert. Increase of pressure will influence both the dissolved oxygen and carbon dioxide concentrations; the latter has a negative effect on all the members of the mixture. Changes in agitation rate are more convenient but will have effects on, for example, the bubble size and distribution in the growth vessel as well as increased shear stress and increased energy cost.
Changes in dilution rate enables the regulation of the contribution of the various species of the mixture to the total biomass. It has been found that the dilution rate must exceed some minimal value, since at too low dilution rates there is instability resulting in cases where coexistence is not possible (Spivak and Rokem, 1995). This method also allows for the prediction of possible steady states for other microbial systems.
Generally, the model based on the principles mentioned above is able to predict the behavior of microbial systems. Note that it is valid for small quantities of substrates when the linear approximation for /z might be used.
List of nomenclature
X i (i = 1 . . . . ,3 )
/zi; 12 i (i = 1 . . . . . 3)
t "Z; ]~m D S1; Sl*
P,; P1*
KLi (i = 1, 2)
Y~i (i = 1 . . . . . 3, j = 1,3,4) /3ij (i = 1 . . . . . 3, j = 1,3,4)
bacterial biomass of methylotroph and the two heterotrophs (g I-1) specific and maximum specific growth rate of ith organism (h- 1) specific and maximum specific growth rate (h-1) dilution rate ( h - , ) dynamic and steady state concentration of oxygen in fermentation broth (g I-1) dynamic and steady state concentration of C02 in fermentation broth (g l - l ) mass transfer coefficients for oxygen and CO 2, respectively (h - l) yield of bacterium i to substrate j (g g - l ) coefficient for affinity of bacterium i to substrate j (1 g - l h - l )
I.R. Spivak, J.S. Rokem / Ecological Modelling 74 (1994) 287-304 303
~in (i = 1 . . . . , 3, n = 1, . . . , 4)
Pj ( j = 2 . . . . . 4)
cij (i = 2, 3, j = 3, 4)
Yij (i = 1 . . . . . 3, j = 1, . . . , 4)
Ksij (i = 1 . . . . , 3 , j = 1, 3, 4)
Kiln (i = 1 . . . . , 3 , j = 1 . . . . . 4)
/3 t
coefficient of sensitivity of bac t e r ium i to extracel lular metabol i t e n (1 g - l ) concen t ra t ion of methanol , e thanol , ace ta te respect ively (g 1-1) ra te of uti l ization of extracel lular metabo l i t e j by he t e ro t roph i (1 g-1 h - l ) specific rate of excret ion of extracel lular metabo l i t e j by bac t e r ium i (g g -1 ) sa tura t ion cons tant for bac t e r ium i on subst ra te j (g 1-1) inhibit ion constant for bac ter ia i to extracel lular metabol i t e n (g 1-1) inhibition constant (g 1 - t ) coefficient of sensitivity (1 g -1 ) t ime (h)
References
Abrosov, N.S., Kovrov, B.G. and Cherepanov, O.A., 1982. Ecologicheskie Mehanizmy Sosushestvo- vaniya i Vidovoy Regulatsii. Nauka, Novosibirsk (in Russian).
Aiba, S., Shoda, M. and Nagatini, M., 1968. Kinetics of product inhibition in alcohol fermentation. Biotechnol. Bioeng., 10: 845-854.
Bailey, J.E. and Ollis, D.F., 1986. Biochemical Engineering Fundamentals, 2nd edition. McGraw-Hill, New York, NY.
Begon, M., Harper, J.L. and Townsend, C.R., 1986. Ecology. Individuals, Populations and Communi- ties. Blackwell, Oxford.
Conte, S. and Boor, C., 1981. Elementary Numerical Analysis. McGraw-Hill, Singapore. Drozd, J.W. and McCarthy, P.W., 1981. Mathematical model of microbial hydrocarbon oxidation. In:
H.D. Dalton (Editor), Proceedings of the 3rd International Symposium of Microbial Growth on Cl-compounds, Sheffield, 1980. Heyden & Sons, London, pp. 360-369.
Drozd, J.W., Khosrovi, B., Downs, J., Bailey, M.I., Barnes, L.J. and Linton, J.D., 1980. Biomass production from natural gas. In: B.S. Sikyta, Z. Fencl and V. Polacek (Editors), Proceedings of the 7th International Continuous Culture Symposium, Prague, 1978. Czechoslovak Academy of Science, Prague, pp. 505-519.
Fehlberg, E., 1970. Kiassische Runge-Kutta-Formeln vierter und niedrigerer Ordnung mit Schrit- tweiten-kontrolle und ihre Anwendnung auf W~irmeleitungsprobleme. Computing, 6:61-71 (in German).
Haldane, J.B.S., 1965. Enzymes. MIT Press, Cambridge, MA. Holberg, A., 1982. On the practical identiability of microbial growth models incorporating Michaelis-
Menten type nonlinearities. Math. Biosci., 62: 23-31. Ivanova, T.N. and Nesterov, A.I., 1988. Vydelenie organicheskih ekzometabolitov razlichnymi kulturami
obligatnyh metilotrofov. Microbiologia, 57:600-623 (in Russian). Luong, J.H.T., 1987. Generalization of Monod kinetics from analyses of growth data with substrate
inhibition. Biotechnol. Bioeng., 29: 242-248. Malashenko, U.R., Sineglasov, V.M., Sinitsin, I.V. and Muchnik, F.V., 1988. Identefikatsiya parametrov
i chislennoe modelirovanie iskusstvennoy mikrobnoy populatsii rastustchey na prirodnom gase. Microbiol. J., 50:8-13 (in Russian).
Megee, R.D., Drake, J.F., Fredricson, A.G. and Tsuchiya, H.M., 1972. Studies in intermicrobial symbiosis Saccharornyces cerevisiae and Lactobacillus casei. Can. J. Microbiol., 18: 1733-1742.

304 I.R. Spivak, J.S. Rokem / Ecological Modelling 74 (1994) 287-304
Monod, J., 1949. The growth of bacterial cultures. Ann. Rev. Microbiol., 3: 371-394. Odum, H.T., 1971. Environment, Power and Society. Wiley, New York, NY. Romanovskaya, V.A., 1990. Taksonomicheskoe polosenie etanolispolzuyustchih bakteriy. Microbiol. J.,
52:53-58 (in Russian). Romanovskaya, V.A., Malashenko, Y.R., Sokolov, I.G. and Kryshtab, T.P., 1976. The competitive
inhibition of the microbial oxidation of methane by ethane. In: H.G. Schlegel, G. Gottschalk and N. Pfennig (Editors), Microbial Production and Utilization of Gases. E. Goltze, Gottingen, pp. 345-353.
Spivak, I.R. and Rokem, J.S., 1995. Analyses of possible steady states for mixed culture grown on natural gas. Ecol. Model. (in press).
Tsuchiya, H.M., Fredrikson, A.G. and Axis, R., 1966. Dynamics of microbial cell populations. Adv. Chem. Eng., 6: 125-206.
Wilkinson, T.G., Topiwala, H.H. and Hamer, G., 1974. Interactions in a mixed population growing on methane in continuous culture. Biotechnol. Bioeng., 16: 41-59.


