Embed Size (px)
Citation preview
MARYLAND ESEA FLEXIBILITY
REQUEST
February 28, 2012 REVISED May 23, 2012
Maryland State Department of Education 200 West Baltimore Street
Baltimore, MD 21201
ii
TABLE OF CONTENTS: ESEA FLEXIBILITY REQUEST
Introduction
iii
General Instructions
iv
Table of Contents
7
Cover Sheet for ESEA Flexibility Request
9
Waivers
10
Assurances 12
Consultation 14
Evaluation 27
Overview of SEA’s ESEA Flexibility Request
28
Principle 1: College- and Career-Ready Expectations for All Students
31
Principle 2: State-Developed Differentiated Recognition, Accountability, and Support
65
Principle 3: Supporting Effective Instruction and Leadership
147
Principle 4: Reducing Duplication and Unnecessary Burden
194
iii
INTRODUCTION
The U.S. Department of Education (Department) is offering each State educational agency (SEA) the opportunity to request flexibility on behalf of itself, its local educational agencies (LEAs), and its schools, in order to better focus on improving student learning and increasing the quality of instruction. This voluntary opportunity will provide educators and State and local leaders with flexibility regarding specific requirements of the No Child Left Behind Act of 2001 (NCLB) in exchange for rigorous and comprehensive State-developed plans designed to improve educational outcomes for all students, close achievement gaps, increase equity, and improve the quality of instruction. This flexibility is intended to build on and support the significant State and local reform efforts already underway in critical areas such as transitioning to college- and career-ready standards and assessments; developing systems of differentiated recognition, accountability, and support; and evaluating and supporting teacher and principal effectiveness. The Department invites interested SEAs to request this flexibility pursuant to the authority in section 9401 of the Elementary and Secondary Education Act of 1965 (ESEA), which allows the Secretary to waive, with certain exceptions, any statutory or regulatory requirement of the ESEA for an SEA that receives funds under a program authorized by the ESEA and requests a waiver. Under this flexibility, the Department would grant waivers through the 2013−2014 school year, after which time an SEA may request an extension of this flexibility.
REVIEW AND EVALUATION OF REQUESTS
The Department will use a review process that will include both external peer reviewers and staff reviewers to evaluate SEA requests for this flexibility. This review process will help ensure that each request for this flexibility approved by the Department is consistent with the principles described in the document titled ESEA Flexibility, which are designed to support State efforts to improve student academic achievement and increase the quality of instruction, and is both educationally and technically sound. Reviewers will evaluate whether and how each request for this flexibility will support a comprehensive and coherent set of improvements in the areas of standards and assessments, accountability, and teacher and principal effectiveness that will lead to improved student outcomes. Each SEA will have an opportunity, if necessary, to clarify its plans for peer and staff reviewers and to answer any questions reviewers may have. The peer reviewers will then provide comments to the Department. Taking those comments into consideration, the Secretary will make a decision regarding each SEA’s request for this flexibility. If an SEA’s request for this flexibility is not granted, reviewers and the Department will provide feedback to the SEA about the components of the SEA’s request that need additional development in order for the request to be approved.
iv
GENERAL INSTRUCTIONS
An SEA seeking approval to implement this flexibility must submit a high-quality request that addresses all aspects of the principles and waivers and, in each place where a plan is required, includes a high-quality plan. Consistent with ESEA section 9401(d)(1), the Secretary intends to grant waivers that are included in this flexibility through the end of the 2013–2014 school year. An SEA will be permitted to request an extension of the initial period of this flexibility prior to the start of the 2014–2015 school year unless this flexibility is superseded by reauthorization of the ESEA. The Department is asking SEAs to submit requests that include plans through the 2014–2015 school year in order to provide a complete picture of the SEA’s reform efforts. The Department will not accept a request that meets only some of the principles of this flexibility. High-Quality Request: A high-quality request for this flexibility is one that is comprehensive and coherent in its approach, and that clearly indicates how this flexibility will help an SEA and its LEAs improve student achievement and the quality of instruction for students. A high-quality request will (1) if an SEA has already met a principle, provide a description of how it has done so, including evidence as required; and (2) if an SEA has not yet met a principle, describe how it will meet the principle on the required timelines, including any progress to date. For example, an SEA that has not adopted minimum guidelines for local teacher and principal evaluation and support systems consistent with principle 3 by the time it submits its request for the flexibility will need to provide a plan demonstrating that it will do so by the end of the 2011–2012 school year. In each such case, an SEA’s plan must include, at a minimum, the following elements for each principle that the SEA has not yet met: 1. Key milestones and activities: Significant milestones to be achieved in order to meet a given
principle, and essential activities to be accomplished in order to reach the key milestones. The SEA should also include any essential activities that have already been completed or key milestones that have already been reached so that reviewers can understand the context for and fully evaluate the SEA’s plan to meet a given principle.
2. Detailed timeline: A specific schedule setting forth the dates on which key activities will begin
and be completed and milestones will be achieved so that the SEA can meet the principle by the required date.
3. Party or parties responsible: Identification of the SEA staff (e.g., position, title, or office) and, as
appropriate, others who will be responsible for ensuring that each key activity is accomplished. 4. Evidence: Where required, documentation to support the plan and demonstrate the SEA’s
progress in implementing the plan. This ESEA Flexibility Request indicates the specific evidence that the SEA must either include in its request or provide at a future reporting date.
5. Resources: Resources necessary to complete the key activities, including staff time and
additional funding.
6. Significant obstacles: Any major obstacles that may hinder completion of key milestones and activities (e.g., State laws that need to be changed) and a plan to overcome them.
v
Included on page 19 of this document is an example of a format for a table that an SEA may use to submit a plan that is required for any principle of this flexibility that the SEA has not already met. An SEA that elects to use this format may also supplement the table with text that provides an overview of the plan. An SEA should keep in mind the required timelines for meeting each principle and develop credible plans that allow for completion of the activities necessary to meet each principle. Although the plan for each principle will reflect that particular principle, as discussed above, an SEA should look across all plans to make sure that it puts forward a comprehensive and coherent request for this flexibility. Preparing the Request: To prepare a high-quality request, it is extremely important that an SEA refer to all of the provided resources, including the document titled ESEA Flexibility, which includes the principles, definitions, and timelines; the document titled ESEA Flexibility Review Guidance, which includes the criteria that will be used by the peer reviewers to determine if the request meets the principles of this flexibility; and the document titled ESEA Flexibility Frequently Asked Questions, which provides additional guidance for SEAs in preparing their requests. As used in this request form, the following terms have the definitions set forth in the document titled ESEA Flexibility: (1) college- and career-ready standards, (2) focus school, (3) high-quality assessment, (4) priority school, (5) reward school, (6) standards that are common to a significant number of States, (7) State network of institutions of higher education, (8) student growth, and (9) turnaround principles. Each request must include:
• A table of contents and a list of attachments, using the forms on pages 1 and 2. • The cover sheet (p. 3), waivers requested (p. 4-5), and assurances (p. 5-6). • A description of how the SEA has met the consultation requirements (p. 8). • An overview of the SEA’s request for the ESEA flexibility (p. 8). This overview is a
synopsis of the SEA’s vision of a comprehensive and coherent system to improve student achievement and the quality of instruction and will orient the peer reviewers to the SEA’s request. The overview should be about 500 words.
• Evidence and plans to meet the principles (p. 9-18). An SEA will enter narrative text in the text boxes provided, complete the required tables, and provide other required evidence. An SEA may supplement the narrative text in a text box with attachments, which will be included in an appendix. Any supplemental attachments that are included in an appendix must be referenced in the related narrative text.
Requests should not include personally identifiable information. Process for Submitting the Request: An SEA must submit a request to the Department to receive the flexibility. This request form and other pertinent documents are available on the Department’s Website at: http://www.ed.gov/esea/flexibility.
Electronic Submission: The Department strongly prefers to receive an SEA’s request for the flexibility electronically. The SEA should submit it to the following address: [email protected].
vi
Paper Submission: In the alternative, an SEA may submit the original and two copies of its request for the flexibility to the following address:
Patricia McKee, Acting Director
Student Achievement and School Accountability Programs U.S. Department of Education 400 Maryland Avenue, SW, Room 3W320 Washington, DC 20202-6132
Due to potential delays in processing mail sent through the U.S. Postal Service, SEAs are encouraged to use alternate carriers for paper submissions. REQUEST SUBMISSION DEADLINE
SEAs have multiple opportunities to submit requests for the flexibility. The submission dates are November 14, 2011, February 28, 2012, and an additional opportunity following the conclusion of the 2011–2012 school year.
TECHNICAL ASSISTANCE MEETING FOR SEAS
To assist SEAs in preparing a request and to respond to questions, the Department will host a series of Technical Assistance Meetings via webinars in September and October 2011. FOR FURTHER INFORMATION
If you have any questions, please contact the Department by e-mail at [email protected].
7
ESEA FLEXIBI LITY – REQ UEST U .S . DEPARTMENT OF EDUC ATI ON
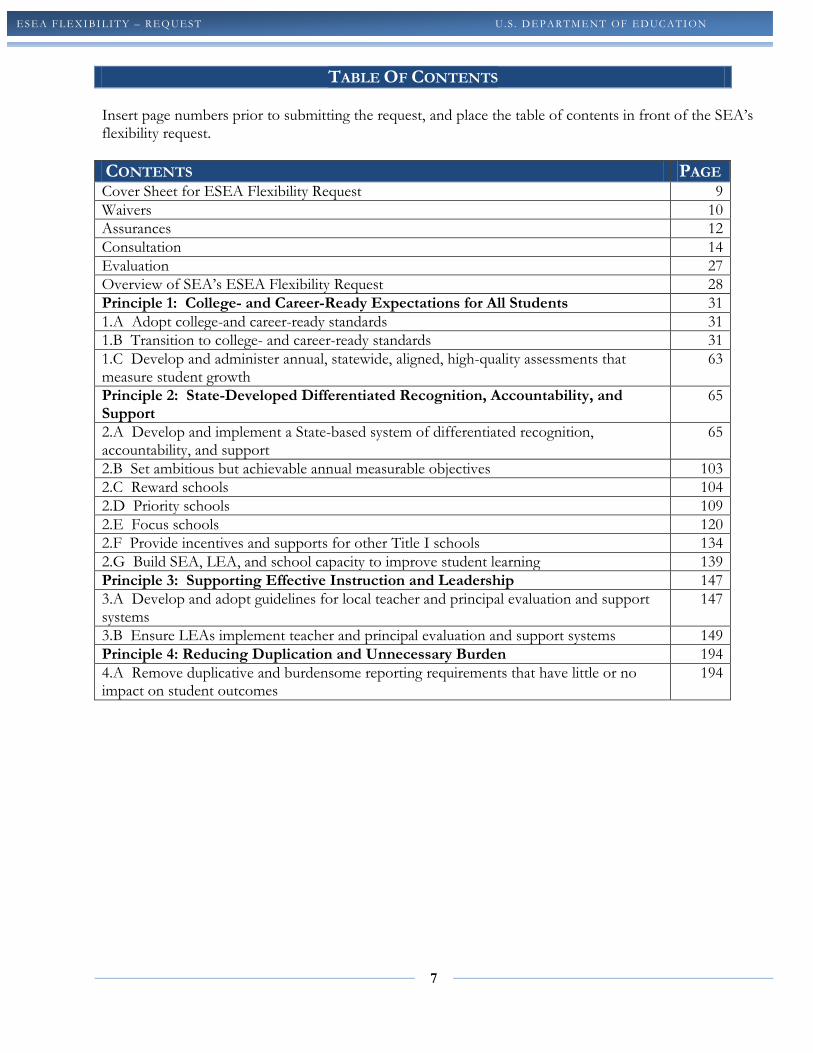
TABLE OF CONTENTS Insert page numbers prior to submitting the request, and place the table of contents in front of the SEA’s flexibility request. CONTENTS PAGE Cover Sheet for ESEA Flexibility Request 9 Waivers 10 Assurances 12 Consultation 14 Evaluation 27 Overview of SEA’s ESEA Flexibility Request 28 Principle 1: College- and Career-Ready Expectations for All Students 31 1.A Adopt college-and career-ready standards 31 1.B Transition to college- and career-ready standards 31 1.C Develop and administer annual, statewide, aligned, high-quality assessments that measure student growth
63
Principle 2: State-Developed Differentiated Recognition, Accountability, and Support
65
2.A Develop and implement a State-based system of differentiated recognition, accountability, and support
65
2.B Set ambitious but achievable annual measurable objectives 103 2.C Reward schools 104 2.D Priority schools 109 2.E Focus schools 120 2.F Provide incentives and supports for other Title I schools 134 2.G Build SEA, LEA, and school capacity to improve student learning 139 Principle 3: Supporting Effective Instruction and Leadership 147 3.A Develop and adopt guidelines for local teacher and principal evaluation and support systems
147
3.B Ensure LEAs implement teacher and principal evaluation and support systems 149 Principle 4: Reducing Duplication and Unnecessary Burden 194 4.A Remove duplicative and burdensome reporting requirements that have little or no impact on student outcomes
194
8
ESEA FLEXIBI LITY – REQ UEST U .S . DEPARTMENT OF EDUC ATI ON
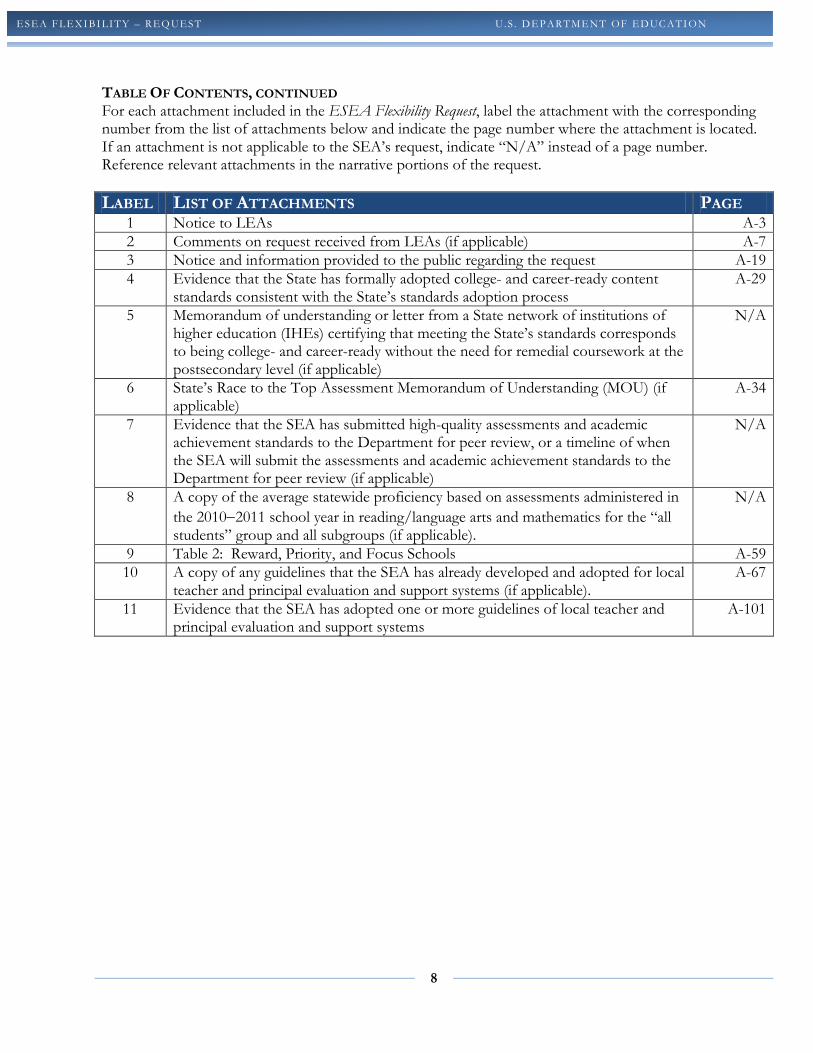
TABLE OF CONTENTS, CONTINUED For each attachment included in the ESEA Flexibility Request, label the attachment with the corresponding number from the list of attachments below and indicate the page number where the attachment is located. If an attachment is not applicable to the SEA’s request, indicate “N/A” instead of a page number. Reference relevant attachments in the narrative portions of the request. LABEL LIST OF ATTACHMENTS PAGE
1 Notice to LEAs A-3 2 Comments on request received from LEAs (if applicable) A-7 3 Notice and information provided to the public regarding the request A-19 4 Evidence that the State has formally adopted college- and career-ready content
standards consistent with the State’s standards adoption process A-29
5 Memorandum of understanding or letter from a State network of institutions of higher education (IHEs) certifying that meeting the State’s standards corresponds to being college- and career-ready without the need for remedial coursework at the postsecondary level (if applicable)
N/A
6 State’s Race to the Top Assessment Memorandum of Understanding (MOU) (if applicable)
A-34
7 Evidence that the SEA has submitted high-quality assessments and academic achievement standards to the Department for peer review, or a timeline of when the SEA will submit the assessments and academic achievement standards to the Department for peer review (if applicable)
N/A
8 A copy of the average statewide proficiency based on assessments administered in the 2010−2011 school year in reading/language arts and mathematics for the “all students” group and all subgroups (if applicable).
N/A
9 Table 2: Reward, Priority, and Focus Schools A-59 10 A copy of any guidelines that the SEA has already developed and adopted for local
teacher and principal evaluation and support systems (if applicable). A-67
11 Evidence that the SEA has adopted one or more guidelines of local teacher and principal evaluation and support systems
A-101
9
ESEA FLEXIBI LITY – REQ UEST U .S . DEPARTMENT OF EDUC ATI ON
COVER SHEET FOR ESEA FLEXIBILITY REQUEST
Legal Name of Requester: Bernard J. Sadusky, Ed.D.
Requester’s Mailing Address: Office of the Superintendent Maryland State Department of Education 200 West Baltimore Street Baltimore, MD 21201
State Contact for the ESEA Flexibility Request Name: Mary L. Gable Position and Office: Assistant State Superintendent - Division of Academic Policy Contact’s Mailing Address: Maryland State Department of Education 200 West Baltimore Street Baltimore, MD 21201 Telephone: 410-767-0473 Fax: 410-333-2275 Email address: [email protected] Chief State School Officer (Printed Name): Bernard J. Sadusky, Ed.D.
Telephone: 410-767-0462
Signature of the Chief State School Officer:
X
Date: 2-28-12
The State, through its authorized representative, agrees to meet all principles of the ESEA Flexibility.
10
ESEA FLEXIBI LITY – REQ UEST U .S . DEPARTMENT OF EDUC ATI ON
WAIVERS
By submitting this flexibility request, the SEA requests flexibility through waivers of the ten ESEA requirements listed below and their associated regulatory, administrative, and reporting requirements by checking each of the boxes below. The provisions below represent the general areas of flexibility requested; a chart appended to the document titled ESEA Flexibility Frequently Asked Questions enumerates each specific provision of which the SEA requests a waiver, which the SEA incorporates into its request by reference.
1. The requirements in ESEA section 1111(b)(2)(E)-(H) that prescribe how an SEA must establish annual measurable objectives (AMOs) for determining adequate yearly progress (AYP) to ensure that all students meet or exceed the State’s proficient level of academic achievement on the State’s assessments in reading/language arts and mathematics no later than the end of the 2013–2014 school year. The SEA requests this waiver to develop new ambitious but achievable AMOs in reading/language arts and mathematics in order to provide meaningful goals that are used to guide support and improvement efforts for the State, LEAs, schools, and student subgroups.
2. The requirements in ESEA section 1116(b) for an LEA to identify for improvement, corrective action, or restructuring, as appropriate, a Title I school that fails, for two consecutive years or more, to make AYP, and for a school so identified and its LEA to take certain improvement actions. The SEA requests this waiver so that an LEA and its Title I schools need not comply with these requirements.
3. The requirements in ESEA section 1116(c) for an SEA to identify for improvement or corrective action, as appropriate, an LEA that, for two consecutive years or more, fails to make AYP, and for an LEA so identified and its SEA to take certain improvement actions. The SEA requests this waiver so that it need not comply with these requirements with respect to its LEAs.
4. The requirements in ESEA sections 6213(b) and 6224(e) that limit participation in, and use of funds under the Small, Rural School Achievement (SRSA) and Rural and Low-Income School (RLIS) programs based on whether an LEA has made AYP and is complying with the requirements in ESEA section 1116. The SEA requests this waiver so that an LEA that receives SRSA or RLIS funds may use those funds for any authorized purpose regardless of whether the LEA makes AYP.
5. The requirement in ESEA section 1114(a)(1) that a school have a poverty percentage of 40 percent or more in order to operate a schoolwide program. The SEA requests this waiver so that an LEA may implement interventions consistent with the turnaround principles or interventions that are based on the needs of the students in the school and designed to enhance the entire educational program in a school in any of its priority and focus schools, as appropriate, even if those schools do not have a poverty percentage of 40 percent or more.
6. The requirement in ESEA section 1003(a) for an SEA to distribute funds reserved under that section only to LEAs with schools identified for improvement, corrective action, or restructuring. The SEA requests this waiver so that it may allocate section 1003(a) funds to its LEAs in order to serve any of the State’s priority and focus schools.
11
ESEA FLEXIBI LITY – REQ UEST U .S . DEPARTMENT OF EDUC ATI ON
7. The provision in ESEA section 1117(c)(2)(A) that authorizes an SEA to reserve Title I, Part A funds to reward a Title I school that (1) significantly closed the achievement gap between subgroups in the school; or (2) has exceeded AYP for two or more consecutive years. The SEA requests this waiver so that it may use funds reserved under ESEA section 1117(c)(2)(A) for any of the State’s reward schools.
8. The requirements in ESEA section 2141(a), (b), and (c) for an LEA and SEA to comply with certain requirements for improvement plans regarding highly qualified teachers. The SEA requests this waiver to allow the SEA and its LEAs to focus on developing and implementing more meaningful evaluation and support systems.
9. The limitations in ESEA section 6123 that limit the amount of funds an SEA or LEA may transfer from certain ESEA programs to other ESEA programs. The SEA requests this waiver so that it and its LEAs may transfer up to 100 percent of the funds it receives under the authorized programs among those programs and into Title I, Part A.
10. The requirements in ESEA section 1003(g)(4) and the definition of a Tier I school in Section I.A.3 of the School Improvement Grants (SIG) final requirements. The SEA requests this waiver so that it may award SIG funds to an LEA to implement one of the four SIG models in any of the State’s priority schools.
Optional Flexibility: An SEA should check the box below only if it chooses to request a waiver of the following requirements:
11. The requirements in ESEA sections 4201(b)(1)(A) and 4204(b)(2)(A) that restrict the activities provided by a community learning center under the Twenty-First Century Community Learning Centers (21st CCLC) program to activities provided only during non-school hours or periods when school is not in session (i.e., before and after school or during summer recess). The SEA requests this waiver so that 21st CCLC funds may be used to support expanded learning time during the school day in addition to activities during non-school hours or periods when school is not in session.
12. The requirements in ESEA sections 1116(a)(1)(A)-(B) and 1116(c)(1)(A) that require LEAs and SEAs to make determinations of adequate yearly progress (AYP) for schools and LEAs, respectively. The SEA requests this waiver because continuing to determine whether an LEA and its schools make AYP is inconsistent with the SEA’s State-developed differentiated recognition, accountability, and support system included in its ESEA flexibility request. The SEA and its LEAs must report on their report cards performance against the AMOs for all subgroups identified in ESEA section 1111(b)(2)(C)(v), and use performance against the AMOs to support continuous improvement in Title I schools that are not Reward schools, priority schools, or focus schools.
13. The requirements in ESEA section 1113(a)(3)-(4) and (c)(1) that require an LEA to serve eligible schools under Title I in rank order of poverty and to allocate Title I, Part A funds based on that rank ordering. The SEA requests this waiver in order to permit its LEAs to serve a Title I-eligible high school with a graduation rate below 60 percent that the SEA has identified as a priority school even if that school does not rank sufficiently high to be served.
12
ESEA FLEXIBI LITY – REQ UEST U .S . DEPARTMENT OF EDUC ATI ON
ASSURANCES By submitting this application, the SEA assures that:
1. It requests waivers of the above-referenced requirements based on its agreement to meet Principles 1 through 4 of the flexibility, as described throughout the remainder of this request.
2. It will adopt English language proficiency (ELP) standards that correspond to the State’s college- and career-ready standards, consistent with the requirement in ESEA section 3113(b)(2), and that reflect the academic language skills necessary to access and meet the new college- and career-ready standards, no later than the 2013–2014 school year. (Principle 1)
3. It will develop and administer no later than the 2014–2015 school year alternate assessments based on grade-level academic achievement standards or alternate assessments based on alternate academic achievement standards for students with the most significant cognitive disabilities that are consistent with 34 C.F.R. § 200.6(a)(2) and are aligned with the State’s college- and career-ready standards. (Principle 1)
4. It will develop and administer ELP assessments aligned with the State’s ELP standards, consistent with the requirements in ESEA sections 1111(b)(7), 3113(b)(2), and 3122(a)(3)(A)(ii). (Principle 1)
5. It will report annually to the public on college-going and college credit-accumulation rates for all students and subgroups of students in each LEA and each public high school in the State. (Principle 1)
6. If the SEA includes student achievement on assessments in addition to reading/language arts and mathematics in its differentiated recognition, accountability, and support system and uses achievement on those assessments to identify priority and focus schools, it has technical documentation, which can be made available to the Department upon request, demonstrating that the assessments are administered statewide; include all students, including by providing appropriate accommodations for English Learners and students with disabilities, as well as alternate assessments based on grade-level academic achievement standards or alternate assessments based on alternate academic achievement standards for students with the most significant cognitive disabilities, consistent with 34 C.F.R. § 200.6(a)(2); and are valid and reliable for use in the SEA’s differentiated recognition, accountability, and support system. (Principle 2)
7. It will report to the public its lists of reward schools, priority schools, and focus schools at the time the SEA is approved to implement the flexibility, and annually thereafter, it will publicly recognize its reward schools. (Principle 2)
8. Prior to submitting this request, it provided student growth data on their current students and the students they taught in the previous year to, at a minimum, teachers of reading/language arts and mathematics in grades in which the State administers assessments in those subjects in a manner that is timely and informs instructional programs, or it will do so no later the deadline required under the State Fiscal Stabilization Fund. (Principle 3)
13
ESEA FLEXIBI LITY – REQ UEST U .S . DEPARTMENT OF EDUC ATI ON
9. It will evaluate and, based on that evaluation, revise its own administrative requirements to reduce duplication and unnecessary burden on LEAs and schools. (Principle 4)
10. It has consulted with its Committee of Practitioners regarding the information set forth in its request.
11. Prior to submitting this request, it provided all LEAs with notice and a reasonable opportunity to comment on the request and has attached a copy of that notice (Attachment 1) as well as copies of any comments it received from LEAs (Attachment 2).
12. Prior to submitting this request, it provided notice and information regarding the request to the public in the manner in which the State customarily provides such notice and information to the public (e.g., by publishing a notice in the newspaper; by posting information on its website) and has attached a copy of, or link to, that notice (Attachment 3).
13. It will provide to the Department, in a timely manner, all required reports, data, and evidence regarding its progress in implementing the plans contained throughout this request.
14. It will report annually on its State report card, and will ensure that its LEAs annually report on their local report cards, for the “all students” group and for each subgroup described in ESEA section 1111(b)(2)(C)(v)(II): information on student achievement at each proficiency level; data comparing actual achievement levels to the State’s annual measurable objectives; the percentage of students not tested; performance on the other academic indicator for elementary and middle schools; and graduation rates for high schools. It will also annually report, and will ensure that its LEAs annually report, all other information and data required by ESEA section 1111(h)(1)(C) and 1111(h)(2)(B), respectively.
If the SEA selects Option A in section 3.A of its request, indicating that it has not yet developed and adopted all the guidelines for teacher and principal evaluation and support systems, it must also assure that:
15. It will submit to the Department for peer review and approval a copy of the guidelines that it will adopt by the end of the 2011–2012 school year. (Principle 3)
14
ESEA FLEXIBI LITY – REQ UEST U .S . DEPARTMENT OF EDUC ATI ON
CONSULTATION
An SEA must meaningfully engage and solicit input from diverse stakeholders and communities in the development of its request. To demonstrate that an SEA has done so, the SEA must provide an assurance that it has consulted with the State’s Committee of Practitioners regarding the information set forth in the request and provide the following:
1. A description of how the SEA meaningfully engaged and solicited input on its request from teachers and their representatives.
2. A description of how the SEA meaningfully engaged and solicited input on its request from other diverse communities, such as students, parents, community-based organizations, civil rights organizations, organizations representing students with disabilities and English Learners, business organizations, and Indian tribes.
I. Maryland Context
Maryland has 24 Local Education Agencies (LEAs) from 23 counties and Baltimore City. As of fall
2011, those 24 LEAs had 852,211 PreK–12 students (see http://www.mdreportcard.org ). Generally
speaking, Maryland divides its schools into six regions. The Baltimore Metropolitan Region has six
LEAs: Anne Arundel County, Baltimore City, Baltimore County, Carroll County, Harford County, and
Howard County. It also has the SEED School, a publicly-funded, residential boarding school featured
on May 23, 2010, on CBS News’ 60 Minutes program. The Baltimore Metropolitan Region is the
largest of the six regions. The National Capital Region includes Montgomery County and Prince
George’s County and is the second-largest region in the State. The Western Maryland Region has four
LEAs: Allegany County, Frederick County, Garrett County, and Washington County. The Upper Shore
Region has five LEAs and includes Caroline County, Cecil County, Kent County, Queen Anne’s
County, and Talbot County. The Lower Shore Region has four LEAs and includes Dorchester County,
Somerset County, Wicomico County, and Worcester County. Finally, the Southern Maryland Region is
home to three LEAs and includes Calvert County, Charles County, and St. Mary’s County.
Maryland will continue to take advantage of its relatively small number of LEAs (24) to provide
individualized support and ongoing technical assistance in carrying out the State’s goals. Dr. Bernard
Sadusky, Interim State Superintendent, meets monthly with all LEA Superintendents, and appropriate
MSDE staff meets monthly with Assistant Superintendents and curriculum content supervisors.
Maryland’s small size makes it a good investment for developing and implementing education reform,
as the State’s close relationship with all 24 Superintendents ensures constant collaboration, oversight,
assistance, rapid communications, and capacity building.
15
ESEA FLEXIBI LITY – REQ UEST U .S . DEPARTMENT OF EDUC ATI ON
II. Engaging All Stakeholders about the Flexibility Application
Maryland is quite experienced in engaging stakeholders, especially teachers, to build support for
education reforms. Maryland has a long history of bringing together education, business, foundation,
and community agencies to achieve student success, and to actively engage them in reform efforts.
Maryland utilized much of the communication plan from the State’s work on Race to the Top to ensure
engagement of all the appropriate stakeholder groups. An Executive Steering Committee coordinated
Maryland’s Race to the Top application, ensuring that all stakeholders were informed and contributing
suggestions. The committee was co-chaired by now-retired State Superintendent Nancy S. Grasmick
and James DeGraffenreidt, Jr., the president of the State Board of Education. Membership included the
Director of Policy for Governor Martin O’Malley; the presidents of the Baltimore Teachers Union
(American Federation of Teachers [AFT] affiliate) and the Maryland State Education Association
(National Education Association [NEA] affiliate); the Public School Superintendents Association of
Maryland (PSSAM), school boards, elementary principals, and secondary principals; the Maryland
Parent Teacher Association; the Maryland Business Roundtable; representatives from higher education
(State and private colleges and universities, and community colleges); and an advisor from the national
AFT.
The letters of support from most of the organizations these individuals represent, as well as from a
broad spectrum of others across the State for the Race to the Top application, confirm that Maryland is
a united community committed to systemic and sustainable improvements in its public schools. In fact,
among the many letters of support Maryland received for its Race to the Top efforts was
correspondence signed by every 2009–10 Maryland Local Teacher of the Year (including the teachers
from Montgomery County and Frederick County — the only two Local Education Agencies (LEAs)
that did not sign on to Race to the Top) and from approximately 30 former Teachers of the Year, as
well as Milken Award winners who collectively expressed their support for the Maryland reform plan.
Similarly, as Maryland began preparing the application for the ESEA flexibility, multiple efforts were
made to engage as many stakeholders as possible. Maryland held or participated in at least thirty-eight
meetings (see Appendix C-1-Consultation Evidence), representing stakeholders from all the
appropriate groups in Maryland (see Appendix C-2- Stakeholder Groups) to discuss the flexibility
16
ESEA FLEXIBI LITY – REQ UEST U .S . DEPARTMENT OF EDUC ATI ON
application process and solicit feedback on the options offered in the application.
Continuing the success of the work on Race to the Top, Maryland used many of the groups that have
been convened for Race to the Top work to gather feedback on the flexibility application. This includes
the Race to the Top Executive Advisory Meetings. This group includes LEA administrative personnel,
teachers, principals, students, parents, higher education, organizations representing students with
disabilities and English Language Learners, and business organizations.
As mentioned above, the Interim State Superintendent of School, Dr. Bernard Sadusky, holds meetings
with all 24 Local Superintendents on a monthly basis. Dr. Sadusky has discussed the flexibility
application with the superintendents in at least the last 5 meetings, beginning September 2011 through
January 2012. He solicited their views on the pros and cons of applying for the flexibility and then
about each of the components of the application. As the Maryland State Department of Education
(MSDE) staff drafted versions of each of the components, Dr. Sadusky brought them back to the
superintendents for feedback that was used to revise the models.
Similarly, Dr. Sadusky and his staff presented information about the components of flexibility and the
process of developing the application to the Maryland State Board of Education at each of its monthly
meetings (September 2011 to the present). The Board provided feedback on the decision to apply for
flexibility as well as offered feedback on the elements of the flexibility application which were
incorporated into the final application. Additionally, the State Board of Education held a special
meeting on February 13, 2012, after the public comment period ended to review and endorse the final
application.
Dr. Sadusky and his staff provided updates to the Governor and the legislative analysts explaining the
flexibility request, what the flexibility would mean to Maryland, and soliciting feedback and support
for Maryland’s application. MSDE staff have attended student council meetings, parent and community
engagement meetings, gatherings with teacher associations and meetings of advocacy groups for both
children with special needs and English Language Learners. During the public comment period, MSDE
sent a personal copy of the application to the American Civil Liberties Union (ACLU) and to the
Advocate for Children and Youth (ACY) to request their feedback. All of these meetings were in
addition to the outreach done with members of each of these groups who sit on various councils
17
ESEA FLEXIBI LITY – REQ UEST U .S . DEPARTMENT OF EDUC ATI ON
spearheaded by MSDE. Each time a member of the MSDE staff went out to these groups they offered
an explanation of the purpose of the flexibility, an update on where Maryland was in the drafting of its
application and sought feedback on any developments. All comments were collected and incorporated
into the final application (Please see Attachments 1, 2, and 3 for evidence of Maryland’s engagement
and the feedback received.)
Maryland posted a draft copy of the application, all attachments, appendices, and a link to the survey
monkey feedback tool online (1/25/12) with a message, prominently displayed on the first page of the
MSDE website. Emails were sent (1/26/12) to advocacy groups, LEAs, the Community of
Practitioners, and groups of stakeholders that had been engaged in this work to alert them to the posting
of the draft. The draft remained posted for two weeks (until 2/8/12 at noon) and all comments were
either emailed directly to MSDE staff or gathered through a survey monkey feedback site (see survey
in Attachment 3).
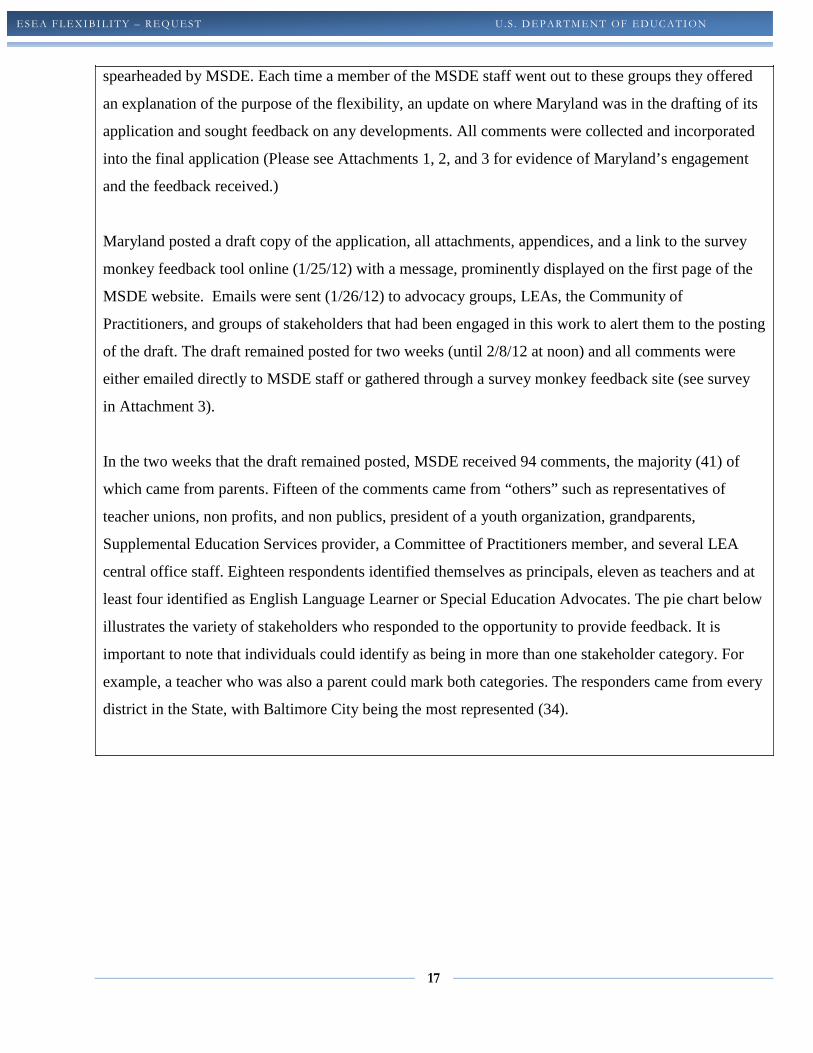
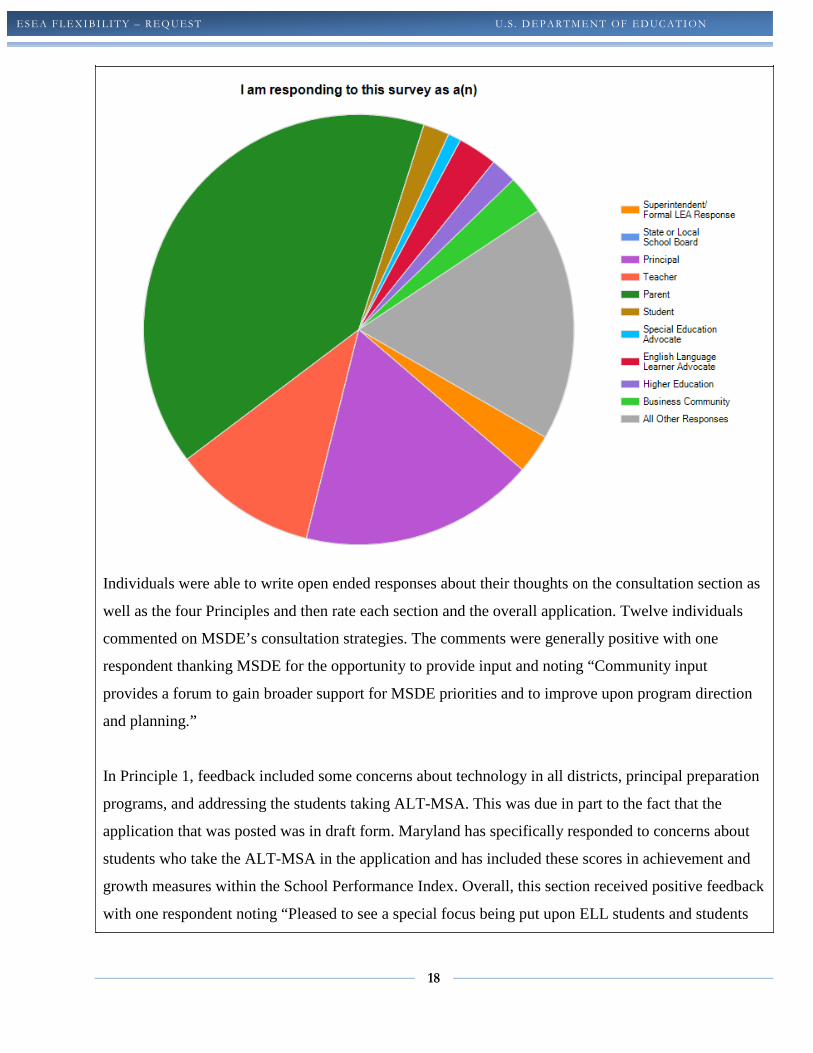
In the two weeks that the draft remained posted, MSDE received 94 comments, the majority (41) of
which came from parents. Fifteen of the comments came from “others” such as representatives of
teacher unions, non profits, and non publics, president of a youth organization, grandparents,
Supplemental Education Services provider, a Committee of Practitioners member, and several LEA
central office staff. Eighteen respondents identified themselves as principals, eleven as teachers and at
least four identified as English Language Learner or Special Education Advocates. The pie chart below
illustrates the variety of stakeholders who responded to the opportunity to provide feedback. It is
important to note that individuals could identify as being in more than one stakeholder category. For
example, a teacher who was also a parent could mark both categories. The responders came from every
district in the State, with Baltimore City being the most represented (34).
18
ESEA FLEXIBI LITY – REQ UEST U .S . DEPARTMENT OF EDUC ATI ON
Individuals were able to write open ended responses about their thoughts on the consultation section as
well as the four Principles and then rate each section and the overall application. Twelve individuals
commented on MSDE’s consultation strategies. The comments were generally positive with one
respondent thanking MSDE for the opportunity to provide input and noting “Community input
provides a forum to gain broader support for MSDE priorities and to improve upon program direction
and planning.”
In Principle 1, feedback included some concerns about technology in all districts, principal preparation
programs, and addressing the students taking ALT-MSA. This was due in part to the fact that the
application that was posted was in draft form. Maryland has specifically responded to concerns about
students who take the ALT-MSA in the application and has included these scores in achievement and
growth measures within the School Performance Index. Overall, this section received positive feedback
with one respondent noting “Pleased to see a special focus being put upon ELL students and students
19
ESEA FLEXIBI LITY – REQ UEST U .S . DEPARTMENT OF EDUC ATI ON
with disabilities.”
Eleven respondents offered feedback on Principle 2 which was relatively positive. One concern about
Maryland’s accountability system, that subgroups will not receive the appropriate amount of focus, has
been continually voiced by Special Education advocates and was mentioned in the feedback in
Principle 2. MSDE staff have been working closely with the special education and English Language
Learner communities to allay some of these concerns. Maryland preserved a strong focus on subgroup
achievement in AMOs, retained its n size of 5 to maintain strong accountability for all students, and has
proposed a reward structure that specifically rewards schools for reducing achievement gaps with all
subgroups. These decisions were made with the advice and consultation of the advocates in these areas.
In fact, one respondent noted that “We were pleased to see that MSDE will continue to require
accountability requirements and will also improve data systems that have the capacity to differentiate
between subgroups in a meaningful and useful approach.”
Feedback on Principle 3 was completed by 12 respondents. Overall, they responded that they were
pleased with the steps Maryland has been taking to redesign its teacher/principal evaluation system.
Positive comments included praise for considerations of student growth, allowing the option of a fourth
rating category, and linking evaluation with professional development. Concerns included using the
School Performance Index as part of the evaluation model, evaluating the effectiveness of the
assessments to be used, and the evaluation cycle. MSDE has responded to many of these comments in
the final application, including a clearer explanation of the School Performance Index and how it will
be used in the teacher/principal evaluation model.
There was no explanation of Principal 4, reducing duplication and unnecessary burden, at the time the
draft proposal was posted. Therefore, many of the comments were about the lack of information. At the
time of the posting, Maryland made a statement that it would evaluate and based on that evaluation,
revise its own administrative requirements to reduce duplication and unnecessary burden on LEAs and
schools. Since the posting, Maryland has explained how the Master Plan process reduces the paperwork
burden and that future meetings about this process will pay special attention to even further reduction
of duplicative reporting without jeopardizing the integrity of the accountability systems.
One concern that was raised in the feedback process came from Supplemental Education Service (SES)
20
ESEA FLEXIBI LITY – REQ UEST U .S . DEPARTMENT OF EDUC ATI ON
providers mainly from Baltimore City with additional concerns from SES providers in Baltimore
County and Prince George’s County. Because the flexibility would allow low-performing LEAs to use
the funds they had been required to reserve for SES for other uses, SES providers are concerned that
their services will be eliminated. Maryland has responded to this by clearly stating in the application
that an LEA may still choose to use its funds for SES, although it will not be required to do so.
Furthermore, Interim State Superintendent, Dr. Bernard Sadusky, met with a group of representatives
from SES providers in the State to hear their concerns and explain Maryland’s position. Still, the SES
providers encouraged parents to contact MSDE to advocate for “keeping” SES. As a result, each
section of the feedback has some comments about maintaining the current SES programs. Additionally,
MSDE received approximately 200 postcards that were pre-printed “Save SES” and approximately 20
calls from parents requesting the same.
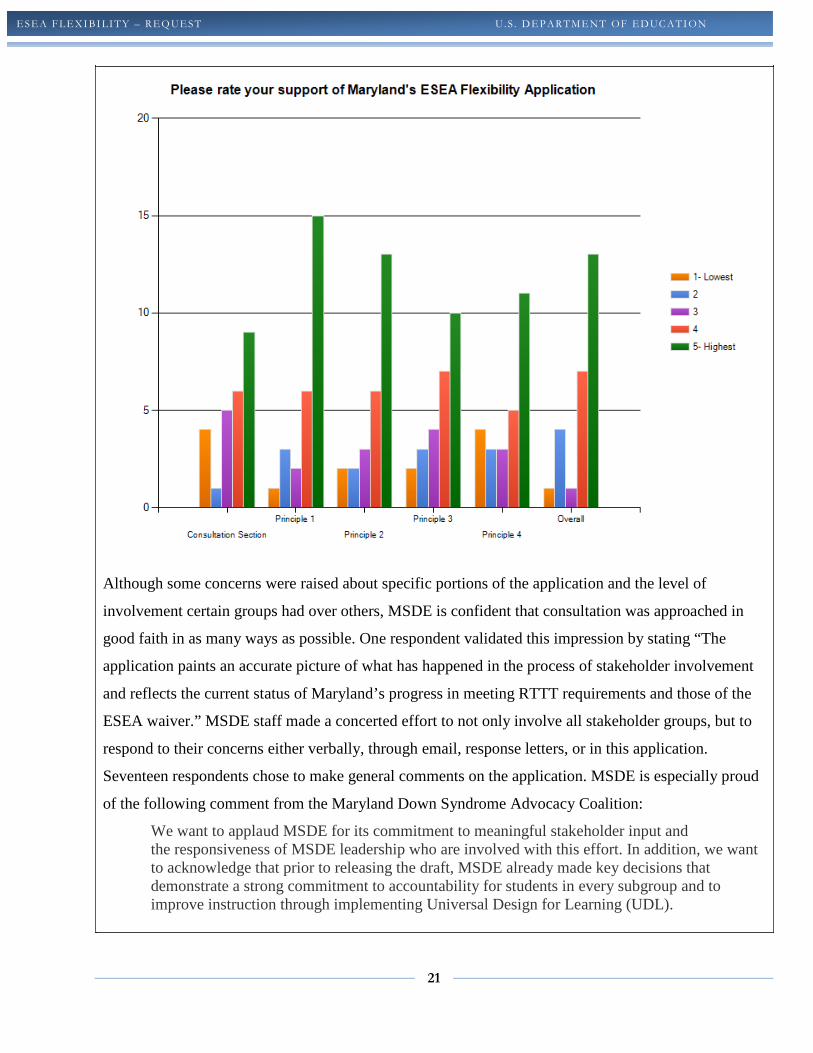
Overall, MSDE was very pleased with the feedback and stakeholder input received through the public
feedback survey. Twenty-nine of the respondents chose to rate the components of the application and
the application overall. On a 1-5 scale with 1 being the lowest and 5 the highest, the overall application
received a 4.04. A graph of the overall ratings is below:
21
ESEA FLEXIBI LITY – REQ UEST U .S . DEPARTMENT OF EDUC ATI ON
Although some concerns were raised about specific portions of the application and the level of
involvement certain groups had over others, MSDE is confident that consultation was approached in
good faith in as many ways as possible. One respondent validated this impression by stating “The
application paints an accurate picture of what has happened in the process of stakeholder involvement
and reflects the current status of Maryland’s progress in meeting RTTT requirements and those of the
ESEA waiver.” MSDE staff made a concerted effort to not only involve all stakeholder groups, but to
respond to their concerns either verbally, through email, response letters, or in this application.
Seventeen respondents chose to make general comments on the application. MSDE is especially proud
of the following comment from the Maryland Down Syndrome Advocacy Coalition:
We want to applaud MSDE for its commitment to meaningful stakeholder input and the responsiveness of MSDE leadership who are involved with this effort. In addition, we want to acknowledge that prior to releasing the draft, MSDE already made key decisions that demonstrate a strong commitment to accountability for students in every subgroup and to improve instruction through implementing Universal Design for Learning (UDL).
22
ESEA FLEXIBI LITY – REQ UEST U .S . DEPARTMENT OF EDUC ATI ON
III. Engagement around Principle #1— College- and Career-Ready Expectations for all
Students
Maryland’s work on engaging stakeholders to work on creating college- and career-ready expectations
began before the opportunity for ESEA flexibility was announced. Like many other Race to the Top
states, Maryland had already agreed to adopt the Common Core State Standards as part of its Race to
the Top application. Importantly, this decision was informed by many of the stakeholders in Maryland.
Beginning in the summer 2002, Maryland departed from a long tradition of total local curriculum
control to implement a Statewide Maryland curriculum. Maryland developed the Voluntary State
Curriculum (VSC) in the summer 2002 and took the mathematics and reading curriculums to the State
Board in June 2003. It was voluntary for LEAs to adopt the State curriculum. More than 900 educators
throughout Maryland came together to develop the curriculum in English/Language Arts, mathematics,
science, social studies, world languages, health, physical education, fine arts, and school library media,
and to develop cross-cutting expectations and tools to help content-area teachers instruct English
Language Learners (ELLs) and students with disabilities. Educators in each of the State’s 24 LEAs
were deeply engaged in developing this curriculum. In 2008 the VSC became the Maryland State
Curriculum and all 24 local districts aligned to this curriculum for the Maryland School Assessments
(MSAs) and the High School Assessments (HSAs). This experience served as a model for engaging
teachers and their representatives as Maryland adopted the Common Core State Standards in June 2010
and began development of the Maryland Common Core State Curriculum.
In both reforms, and as described below (see Principle 1), Maryland initiated meetings of cross-district,
cross-discipline, and cross-grade-level (including higher education) to come together to develop a
model curricular framework based on the Common Core State Standards. These cross area teams also
included educators with a focus on English Language Learners and Students With Disabilities (SWD).
MSDE shared the draft products iteratively with educators in each of the 24 LEAs and in higher
education for multiple rounds of feedback and redrafting until the writing teams were satisfied that the
materials were of exceptional quality. The curricula were shared with grade-level teams at the Educator
Effectiveness Academies (described more below) which MSDE conducted over the summer 2011. The
participants in these Academies were tasked with bringing the information back to their own schools
and had to develop a plan for doing so (See Principle 1 for a more complete description).
23
ESEA FLEXIBI LITY – REQ UEST U .S . DEPARTMENT OF EDUC ATI ON
State Board adoption was the culmination of months of active participation by Maryland educators and
stakeholders in the development of the standards. Three MSDE staff members provided feedback and
guidance to the Common Core State Standards Initiative during the standards development phase. Four
representatives from Maryland colleges and universities — Francis (Skip) Fennell (McDaniel College),
Denny Gulick (University of Maryland, College Park), Bernadette Sandruck (Howard Community
College), and Stephen Wilson (Johns Hopkins University) — also served on the standards development
teams or feedback teams. In addition, MSDE, the Maryland State Education Association (MSEA), local
colleges and universities, and the Maryland Business Roundtable provided extensive feedback.
To expand the base of participation, MSDE invited all 24 LEA supervisors in each of the content areas
of reading, English/Language Arts, mathematics, science, and social studies to comment, along with all
24 Local Assistant Superintendents for Instruction, the 25 higher-education representatives on the
Statewide Standards for College English Committee, and mathematics higher-education
representatives.
Twenty-three of the 24 systems (90 educators in all) were represented at regular MSDE content
briefings and feedback sessions on the Common Core State Standards. With the permission of the
Council of Chief State School Officers (CCSSO), the 24 Local Assistant Superintendents received an
overview of the draft K–12 Common Core State Standards at their February 2011 meeting and were
given the opportunity to identify concerns. Moreover, to get a head start on the next phase of
implementation, 10 Reading/English/Language Arts specialists from multiple LEAs and 14
mathematics specialists began comparing the draft Common Core State Standards to the existing
Maryland State Curriculum (see the gap analysis description in Principle 1).
Concerned about the difficulty in engaging higher education faculty and cognizant of how imperative
their involvement was to creating college-and career-ready standards, MSDE contacted the University
System of Maryland (USM) and the Maryland Higher Education Commission (MHEC) to set up a
meeting specifically to gather feedback from the higher education faculty. Two meetings were held,
one for English/Language Arts and one for mathematics, involving more than one hundred faculty and
including not just teacher educators, but English and mathematics content faculty as well. MSDE staff
from the Division of Instruction presented the draft of the curriculum frameworks for all grade levels in
both content areas. Higher Education faculty reviewed the frameworks and offered feedback that
24
ESEA FLEXIBI LITY – REQ UEST U .S . DEPARTMENT OF EDUC ATI ON
MSDE staff then incorporated into the final frameworks. MSDE also used this opportunity to explain
the Partnership for the Assessment of Readiness for College and Careers (PARCC) and the role higher
education faculty could play in that work. (Appendix C-3)
Most importantly, this collaboration created a network of practitioners from the full P-20 spectrum to
continue to work together to ensure that all students in Maryland are college- and career-ready. MSDE
has continued to offer regional meetings for all teachers, principals, students, parents, other LEA
representatives, higher education faculty, and any other interested stakeholders, to continue a dialogue
about college- and career-ready standards (Appendix C-4).
Finally, MSDE publishes a monthly update on Race to the Top that often includes information about
the progress on implementation of the Common Core State Standards and the PARCC Assessments.
MSDE also issues a document titled “Maryland Classroom” that provides ongoing updates about all
the initiatives in Maryland education. Both of these documents are published on the MSDE website and
the Maryland Classroom is distributed in limited numbers to every school in the State. The purpose of
both documents is to continue to reach out to the public and engage all stakeholders in all reform
efforts in Maryland. (Appendix C-5 and can also be found at:
http://www.marylandpublicschools.org/MSDE/programs/race_to_the_top).
IV. Engagement around Principle #2— State-Developed Differentiated Recognition,
Accountability and Support
Teachers and their representatives were also intricately involved in the development of the State
differentiated recognition, accountability, and support system. MSDE held multiple meetings to solicit
feedback from teachers and their representatives including presentations to Educators Association
representatives. The National Teacher of the Year 2010, Michelle Shearer, and the Maryland State
Teacher of the Year 2011, Joshua Parker, were both engaged directly about their thoughts and feedback
on the process.
MSDE held a stakeholder meeting for all the LEA superintendents and/or their accountability and
assessment representatives to engage them in the development of this system. Eighteen of the twenty-
four LEAs were represented. The group, which included at least six superintendents, reviewed the
requirements and options for Principle 2. They agreed that they wanted to do an Index that expressed
25
ESEA FLEXIBI LITY – REQ UEST U .S . DEPARTMENT OF EDUC ATI ON
the value Maryland places on achievement, student growth, gap closing, college- and career-readiness,
and the graduation rate. They discussed the options of super-groups, n-sizes, and which schools should
be involved. They advised the MSDE staff drafting the model to keep it simple, align it with strategic
initiatives, and base all components on presently available data, with the ability to add more as data
became available.
In addition to the above mentioned meeting, MSDE provided updates and gathered feedback at the
monthly PSSAM meetings in November and December 2011 and in January 2012. MSDE shared
progress, data, and the draft Index. The superintendents’ continuous feedback was utilized in the
development of the models.
As the components of the new model were developed, MSDE staff shared them with all of the
stakeholder groups MSDE works with as well as offering to visit all teacher education associations and
any district that wanted more explanation and input. This resulted in attendance at Special Education
Meeting, ELL Advisory Council, and an LEA Teacher Union meeting. At each meeting, staff presented
the most recent version of the new recognition, accountability and reward system, solicited input and
support and brought it back for consultation and action as appropriate. The ELL Advisory Council
recommended a differentiated approach to AYP for ELLs that links both a student’s time in an ESOL
program and current English language proficiency level (beginning, intermediate, advanced) to
expectations for achievement on State assessments. The ELL Advisory Council also felt that NCLB
was an important catalyst for transparency and accountability regarding ESOL programs and ELL
student achievement. The group cautioned that we do not want to lose ground related to this emphasis
on rigor and accountability for ELLs. Additionally, special education advocates shared emails, letters
and feedback on “n” size and discouraged the use of a super subgroup and the use of the IEP as a
multiple measure. In response to this feedback and the suggestion that Maryland keep its small
subgroup size for AYP purposes so as not to lose the focus on ELL and SWD students, MSDE is
maintaining the current “n” size of 5 and is not requesting an increase in “n” size.
To continue feeding all the input into the model, MSDE formed an internal working group of Assistant
State Superintendents, led by the Interim State Superintendent. This group included two consultants
hired by MSDE to help develop the specific metrics. Meeting on an almost bi-weekly basis, every
member of this group solicited feedback from stakeholder groups, brought it back to the authors, and
26
ESEA FLEXIBI LITY – REQ UEST U .S . DEPARTMENT OF EDUC ATI ON
was responsible for making sure all voices were heard, incorporated, and included in the final
application while also responding to the feasibility of the model options.
V. Engagement around Principle #3 — Supporting Effective Instruction and Leadership
While the broad framework of Maryland’s new educator evaluation system has been established
through State law, MSDE relied extensively on consultations, feedback, and focus-group discussions
with teachers and principals from throughout the State to begin filling in key details and next steps.
Similar to Maryland’s adoption of the Common Core State Standards, the work for this application
actually began with the Race to the Top application. Specifically, a series of 24 focus groups consisting
of 432 stakeholders — including superintendents, human resource directors, teachers, ELL and SWD
educators, representatives of teacher associations, and representatives from higher-education teacher
preparation and arts and sciences faculty — provided input on the draft framework for teacher
evaluations that was originally presented in Maryland’s Race to the Top Application. Eleven focus
groups engaged 200 principals and 30 supervisors of principals on the draft framework for principal
evaluations. Just as a similar consultative process a decade ago helped the State shift to a mandatory
curriculum (described in Principle 1) that was widely accepted and used, this outreach and consultation
on the evaluation system has helped lay a strong groundwork and broader buy-in for the new evaluation
system as Maryland shifts from a locally determined system to a Statewide framework with required
components and consistent quality, but still with local flexibility.
Additionally, Maryland established the Maryland Educator Effectiveness Council (MEEC) which
required the participation of representatives from individuals/groups such as: State Superintendent;
Members of the General Assembly; Governor’s Policy Director; State Board of Education; Local
Boards of Education; LEA Superintendents; Maryland State Education Association; Baltimore
Teachers Union; LEA Assistant Superintendents for Instruction; LEA School Business Officials; LEA
Executive Officers; Local Accountability Coordinators; LEA Human Resources Directors; Title I
coordinators; Principals; MSDE/LEA identified teachers; Institutions of Higher Education (USM
system, private colleges and community colleges); Community/Business; PTA; National Psychometric
Council; Maryland Assessment Research Center for Education Success (MARCES); and students. At
least six teachers or their representatives where required to make up the Council. The job of this
Council is to submit recommendations to the Governor, the General Assembly, and the Maryland State
Board of Education for the development of a model evaluation system for educators. The interim report
27
ESEA FLEXIBI LITY – REQ UEST U .S . DEPARTMENT OF EDUC ATI ON
of this Council, informed by the pilots (discussed below) is the basis for the Maryland model that is
included in this application.
As part of the work of the MEEC, Maryland held a series of think tank meetings that were designed
around specific content areas. In addition to content areas, there were ESOL teachers, special
educators, and Career and Technical Education (CTE) educator think tanks. The think tanks were
charged with how to define student growth for content that is not part of the content accountability
assessments and what measures would be used to then evaluate the teachers of the specific subject or
area. Some examples of feedback include: the group of ELL educators identified sample measures of
an ESOL teacher’s effectiveness, English language proficiency assessment measures, and specific ELL
“look-fors” for teacher observations and teacher portfolios; the Special Education group identified
reasonable growth measures that included pre and post measures, improvement over baselines and
growth from pre to post rather than IEPs; Science educators focused on quarterly assessments and
portfolios; finally, mathematics educators recommended that student growth be incorporated with a
focus on how pre and post tests are constructed. All recommendations were then presented to the
Maryland Educator Effectiveness Council and were considered for incorporation into the report and
pilot models.
Currently seven districts are piloting the system recommended by MEEC (see Principle 3 for more
information). The leadership teams of these pilots, which include superintendents, district staff,
principals and teachers, meet on a monthly basis and offer input and feedback into what is and is not
working and how that information can be used to make adjustments to the Statewide model that will be
piloted in the next school year. MSDE has hired three RTTT contractual employees who act as liaisons
between the pilot districts, non-pilot districts, and MSDE to ensure a continuous feedback loop of
communication and adjustment.
EVALUATION The Department encourages an SEA that receives approval to implement the flexibility to collaborate with the Department to evaluate at least one program, practice, or strategy the SEA or its LEAs implement under principle 1, 2, or 3. Upon receipt of approval of the flexibility, an interested SEA will need to nominate for evaluation a program, practice, or strategy the SEA or its LEAs will implement under
28
ESEA FLEXIBI LITY – REQ UEST U .S . DEPARTMENT OF EDUC ATI ON
principles 1, 2, or 3. The Department will work with the SEA to determine the feasibility and design of the evaluation and, if it is determined to be feasible and appropriate, will fund and conduct the evaluation in partnership with the SEA, ensuring that the implementation of the chosen program, practice, or strategy is consistent with the evaluation design.
Check here if you are interested in collaborating with the Department in this evaluation, if your request for the flexibility is approved.
OVERVIEW OF SEA’S REQUEST FOR THE ESEA FLEXIBILITY Provide an overview (about 500 words) of the SEA’s request for the flexibility that:
1. explains the SEA’s comprehensive approach to implement the waivers and principles and describes the SEA’s strategy to ensure this approach is coherent within and across the principles; and
2. describes how the implementation of the waivers and principles will enhance the SEA’s and its LEAs’ ability to increase the quality of instruction for students and improve student achievement.
Even in its fourth straight year as Education Week’s number one ranked school system in the
nation and the College Board’s number one ranking in Advanced Placement performance, the
Maryland Department of Education (MSDE) is always challenging itself to improve. MSDE’s
core values of commitment to every student, belief that all students can and must learn,
certainty that schools must help students grow, and conviction that the educator evaluation
system must be equitable are achieved through data-driven accountability systems, high
standards of excellence from teachers and principals and dynamic collaboration between Local
Education Agencies (LEAs) and MSDE. Maryland’s ambitious mission is to provide every
student with a world-class education that ensures post-graduation college- and career-readiness.
Every student must be prepared to graduate from a Maryland public school with the content
knowledge and learning skills to be successful in the future, whether post-secondary education,
job training, or an immediate career.
Maryland’s excellence in education is made possible by seamless and supportive partnerships
connecting the 24 LEAs with MSDE. Maryland continually challenges its education system to
be “world class” by providing strong State education policy, programs, and leadership. Annual
reports by every school system on student achievement are scrutinized within the framework of
State and federal standards. LEAs are required to include strategies and methodologies for
further improvement, which must be approved by the Maryland State Board of Education.
29
ESEA FLEXIBI LITY – REQ UEST U .S . DEPARTMENT OF EDUC ATI ON
Maryland educators are building a homegrown Maryland Curriculum, aligned with the
Common Core State Standards, to help students achieve the national standards. Such cutting-
edge activity is also visible in the emphasis on a Statewide technology infrastructure that links
all data elements with analytic and instructional tools to better monitor student achievement.
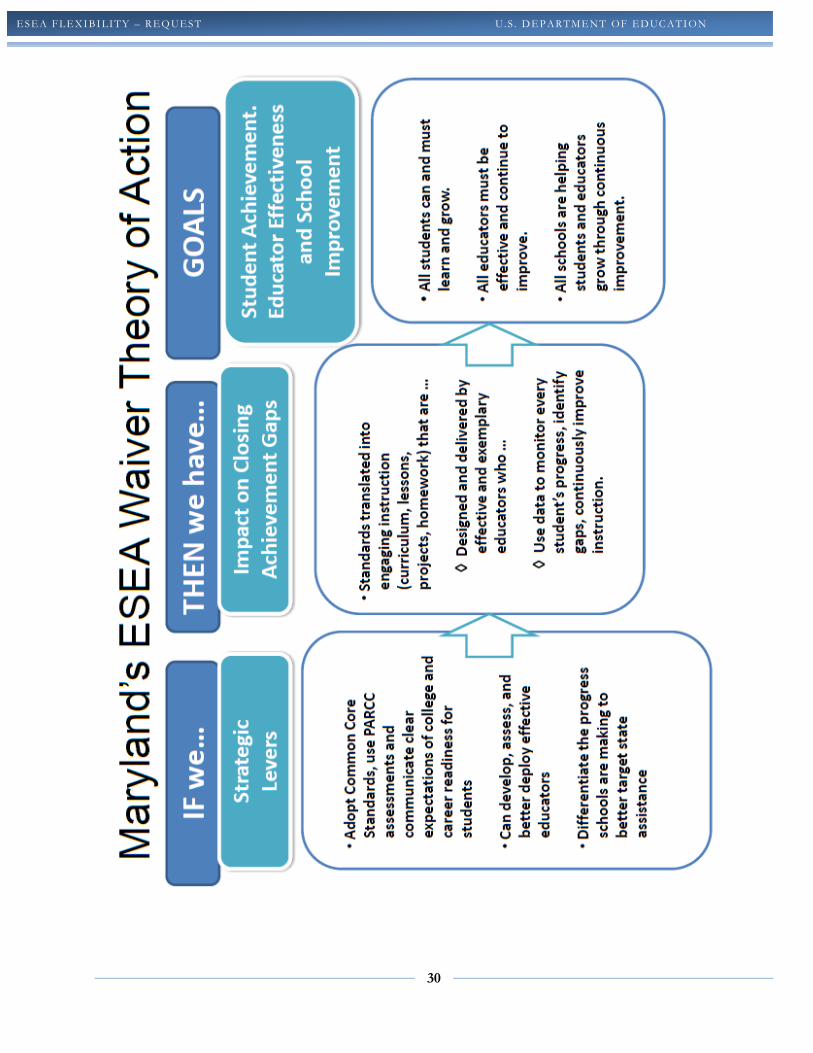
In regards to Principle 1, Maryland adopted college- and career-ready standards for all students
and signed a Memorandum of Understanding with the Partnership for Assessment of Readiness
for College and Careers (PARCC), which is focused on developing summative assessments that
will measure each student’s readiness for college and careers and will be sufficiently reliable
and valid for student and school accountability. The new Maryland CCSS Curriculum
Framework emphasizes the incorporation of Universal Design of Learning (UDL) principles.
As for Principle 2, Maryland’s approach to differentiated recognition, accountability, and
support builds upon the differentiated accountability structure that Maryland has been using for
the last four years with renewed attention to achievement, equity, growth, and attainment. For
Principle 3, Maryland is committed to taking bolder, more aggressive steps to develop an
evaluation process for teachers and principals and use that information to help develop the
strongest educator corps in the country. Finally, for Principle 4, the flexibility will help
Maryland in consolidating similar reports to reduce the burden on schools and school systems
in duplicating reports.
The implementation of the flexibility described in this ESEA flexibility request will enhance
the ability of the Maryland State Department of Education and the local school systems to
increase the quality of instruction for all students as well as improve their achievement levels.
Maryland’s dedication to accountability, support for educators, spirit of collaboration, and
insistence of excellence for all students were fundamental in helping Maryland win Race to the
Top, and will continue to guide Maryland in preparing world-class students.
30
ESEA FLEXIBI LITY – REQ UEST U .S . DEPARTMENT OF EDUC ATI ON
31
ESEA FLEXIBI LITY – REQ UEST U .S . DEPARTMENT OF EDUC ATI ON
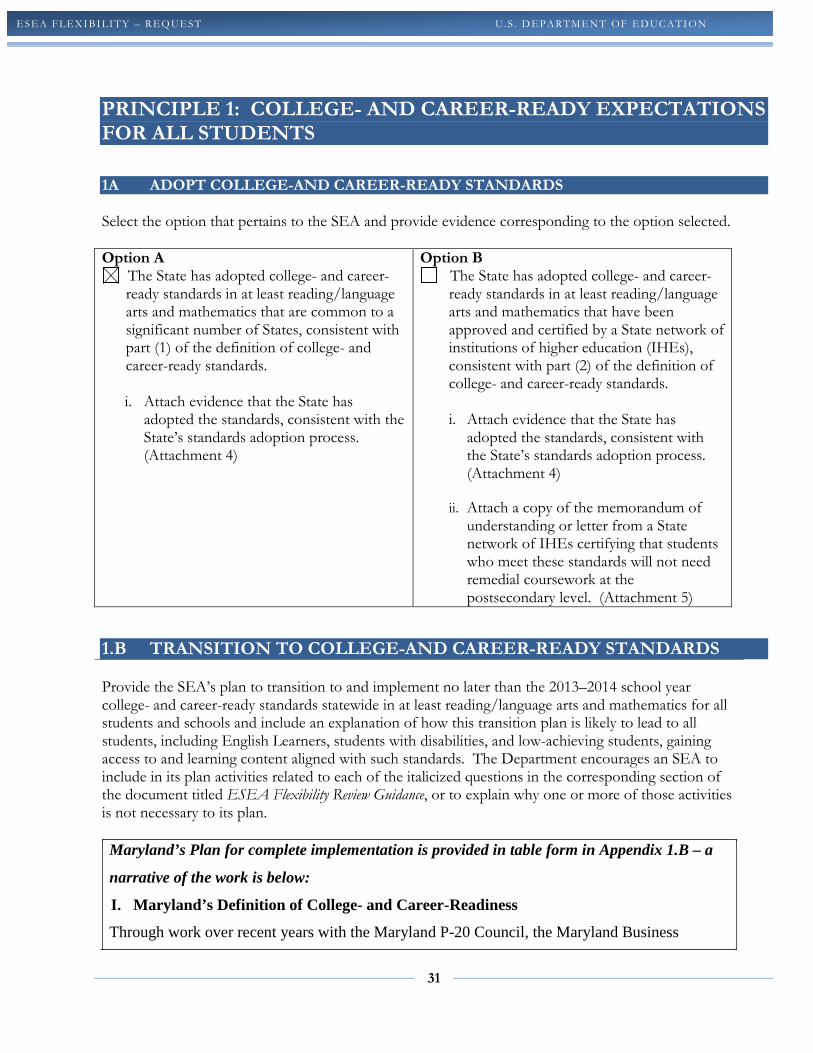
PRINCIPLE 1: COLLEGE- AND CAREER-READY EXPECTATIONS FOR ALL STUDENTS
1A ADOPT COLLEGE-AND CAREER-READY STANDARDS Select the option that pertains to the SEA and provide evidence corresponding to the option selected. Option A
The State has adopted college- and career-ready standards in at least reading/language arts and mathematics that are common to a significant number of States, consistent with part (1) of the definition of college- and career-ready standards.
i. Attach evidence that the State has
adopted the standards, consistent with the State’s standards adoption process. (Attachment 4)
Option B The State has adopted college- and career-
ready standards in at least reading/language arts and mathematics that have been approved and certified by a State network of institutions of higher education (IHEs), consistent with part (2) of the definition of college- and career-ready standards.
i. Attach evidence that the State has
adopted the standards, consistent with the State’s standards adoption process. (Attachment 4)
ii. Attach a copy of the memorandum of
understanding or letter from a State network of IHEs certifying that students who meet these standards will not need remedial coursework at the postsecondary level. (Attachment 5)
1.B TRANSITION TO COLLEGE-AND CAREER-READY STANDARDS Provide the SEA’s plan to transition to and implement no later than the 2013–2014 school year college- and career-ready standards statewide in at least reading/language arts and mathematics for all students and schools and include an explanation of how this transition plan is likely to lead to all students, including English Learners, students with disabilities, and low-achieving students, gaining access to and learning content aligned with such standards. The Department encourages an SEA to include in its plan activities related to each of the italicized questions in the corresponding section of the document titled ESEA Flexibility Review Guidance, or to explain why one or more of those activities is not necessary to its plan.
Maryland’s Plan for complete implementation is provided in table form in Appendix 1.B – a
narrative of the work is below:
I. Maryland’s Definition of College- and Career-Readiness
Through work over recent years with the Maryland P-20 Council, the Maryland Business
32
ESEA FLEXIBI LITY – REQ UEST U .S . DEPARTMENT OF EDUC ATI ON
Roundtable for Education and our 24 Local Education Agencies, MSDE has developed the
following definition for College- and Career-Readiness.
College- and career-readiness includes mastery of rigorous content knowledge and the abilities
to apply that knowledge through higher-order skills to demonstrate success in college and
careers. This includes the ability to think critically and solve problems, communicate
effectively, work collaboratively, and be self-directed in the learning process. More specifically,
a student who is college- and career-ready should:
• Be prepared to succeed in credit-bearing postsecondary introductory general education
courses or in an industry certification programs without needing remediation;
• Be competent in the Skills for Success (SFS) which can be found at
http://www.marylandpublicschools.org/NR/rdonlyres/2990BAB1-3E67-4E08-9D0E-
297014ADE008/10606/SFSFeb1998.pdf. (SFS includes learning, thinking,
communication, technology, and interpersonal skills.)
• Have identified potential career goal(s) and understand the steps to achieve them; and
• Be skilled enough in communication to seek assistance as needed, including student
financial assistance.
II. Adoption of Common Core State Standards (CCSS)
On June 1, 2009, Maryland signed the Memorandum of Agreement to participate in the
development and adoption of internationally benchmarked State standards through the Common
Core State Standards Initiative led by the National Governors Association (NGA) and the
Council of Chief State School Officers (CCSSO). This initiative now includes 45 other states,
the District of Columbia, and two U.S. territories. At that time, Governor Martin O’Malley
stated, “Maryland has a long history of high educational standards, which have helped our State
to be recognized as the number one-ranked system in the nation. At the same time, our schools
and our students must compete globally, and we must continue to raise expectations.” The
standards were adopted by the Maryland State Board of Education on June 22, 2010
(Attachment 4 is an excerpt from the minutes of that meeting- the complete minutes can be
found at: http://www.marylandpublicschools.org/NR/rdonlyres/5D922A58-42B9-420F-997F-
11CF4B13DEB4/24679/June222010.pdf ).
33
ESEA FLEXIBI LITY – REQ UEST U .S . DEPARTMENT OF EDUC ATI ON
The Common Core State Standards represent an important evolution in standards-based reform,
an area where Maryland has demonstrated leadership since the 1980s. Indeed, in 2011,
Education Week’s Quality Counts report gave the State’s standards an A ranking. Maryland has
led the nation in establishing strong academic standards and accompanying curriculum; shown
how to effectively engage hundreds of teachers, Local Education Agencies (LEAs), and
Institutions of Higher Education (IHEs) across the State in developing standards and the State
Curriculum; sought outside experts to evaluate the quality of the curriculum; and benchmarked
the State’s standards and curriculum against those used in high-performing states and countries.
Most recently (2007–08), to ensure that its standards were world class and rigorous enough to
prepare students for college and careers, Maryland aligned its high school curriculum with the
American Diploma Project’s College- and Career-Ready Benchmarks in reading,
English/Language Arts, and mathematics.
Given this track record for Maryland, the Common Core State Standards are the logical next step
in providing a set of rigorous expectations for the State’s schools to build on the work the State
has accomplished over the past two decades. The standards provide the essential foundation to
ensure that all students, including those who traditionally have not succeeded at higher levels,
have access to the challenging education opportunities that more privileged students have long
taken for granted. As described more fully below, Maryland plans to take essential steps over the
next several years to make these standards accessible to all Maryland teachers and students with
a specific focus for students with disabilities and English Language Learners by incorporating
Universal Design Learning (UDL) principles throughout the standards (Appendix 1.B).
III. Gap Analysis
After the adoption of the Common Core State Standards, MSDE’s Division of Instruction
created and shared a transition plan. The first step in the transition process was to review the
final version of the Common Core State Standards (CCSS) and compare them to Maryland’s
State Curriculum. Members of MSDE’s Division of Instruction staff invited educators from
LEAs, including ESOL teachers and Special Educators, and higher education to compare the
State Curricula in mathematics and Reading/English/Language Arts with the CCSS using the
Achieve Common Core Comparison Tool (CCCTool). The information provided by this tool
was a roadmap to guide State teams in updating the State curriculum, developing tools for
34
ESEA FLEXIBI LITY – REQ UEST U .S . DEPARTMENT OF EDUC ATI ON
Maryland educators and providing professional development. During the months of August and
September 2010, educators completed the match and rate process. This information forms the
data set and reports that curriculum revision teams used to create curricular documents and
produce and identify materials for the Online Instructional Toolkit.
Mathematics
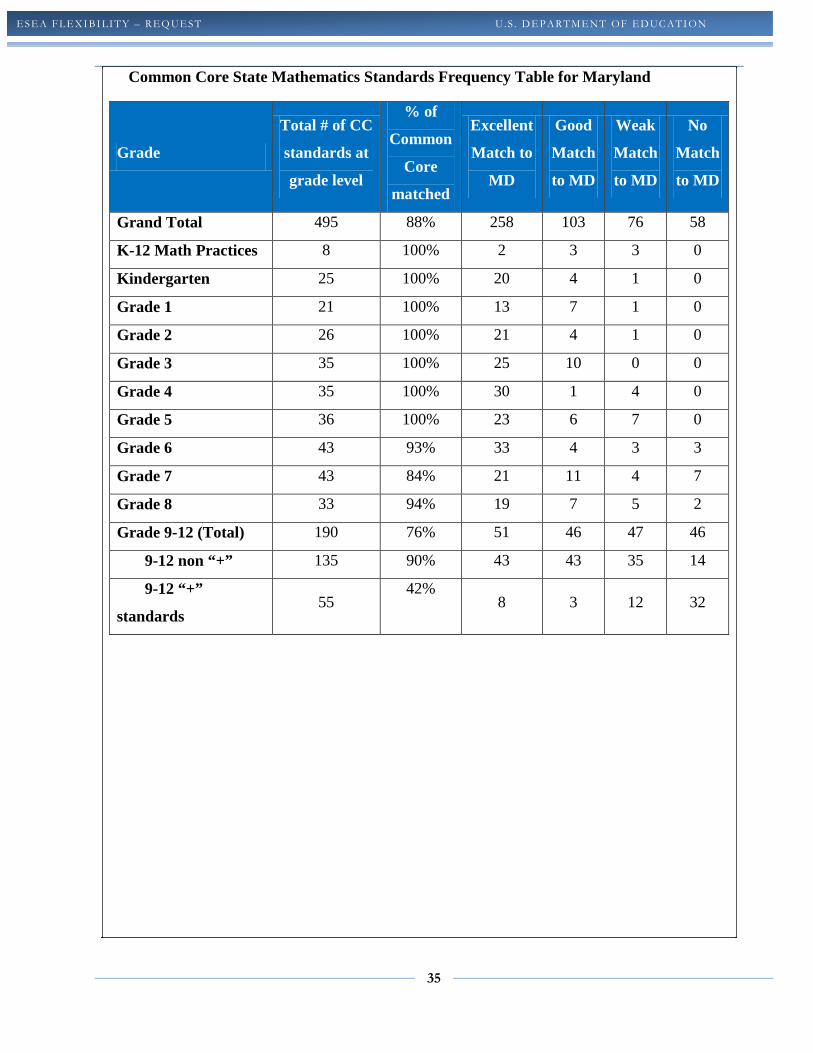
The CCCTool for mathematics indicated that 88% of the Common Core State Mathematics
Standards matched Maryland mathematics standards; there are 495 Common Core State
Mathematics Standards. The strength of the matches is categorized as excellent, good, or
weak. Twelve percent of the Common Core State Mathematics Standards had no match to
Maryland mathematics standards. The mathematics teams considered the strength of the
matched standards, as well as those standards that have no match, as they developed
curricular documents and tools. Grade level differences were reviewed and appropriate
adjustments to the Common Core State Curriculum were completed by May 2011.
Of the 495 Common Core State Mathematics Standards, 55 are “+” standards (all in grades
9 – 12). This means that these standards are not required for students to meet the College-
and Career-Readiness standards but represent additional mathematics that students should
learn in order to take advanced courses such as calculus, advanced statistics, or discrete
mathematics. These “+” standards are the weakest match between the Common Core State
Standards and Maryland mathematics standards with a 42% match. The strongest matches
occurred in grades K – 5 where the match was 100%.
Overall, Maryland teams identified the strength of the matches in mathematics:
52% (n=258) Excellent match
21% (n=103) Good match
15% (n=76) Weak match
12% (n= 58) No match
35
ESEA FLEXIBI LITY – REQ UEST U .S . DEPARTMENT OF EDUC ATI ON
Common Core State Mathematics Standards Frequency Table for Maryland
Grade
Total # of CC
standards at
grade level
% of
Common
Core
matched
Excellent
Match to
MD
Good
Match
to MD
Weak
Match
to MD
No
Match
to MD
Grand Total 495 88% 258 103 76 58
K-12 Math Practices 8 100% 2 3 3 0
Kindergarten 25 100% 20 4 1 0
Grade 1 21 100% 13 7 1 0
Grade 2 26 100% 21 4 1 0
Grade 3 35 100% 25 10 0 0
Grade 4 35 100% 30 1 4 0
Grade 5 36 100% 23 6 7 0
Grade 6 43 93% 33 4 3 3
Grade 7 43 84% 21 11 4 7
Grade 8 33 94% 19 7 5 2
Grade 9-12 (Total) 190 76% 51 46 47 46
9-12 non “+” 135 90% 43 43 35 14
9-12 “+”
standards 55
42% 8 3 12 32
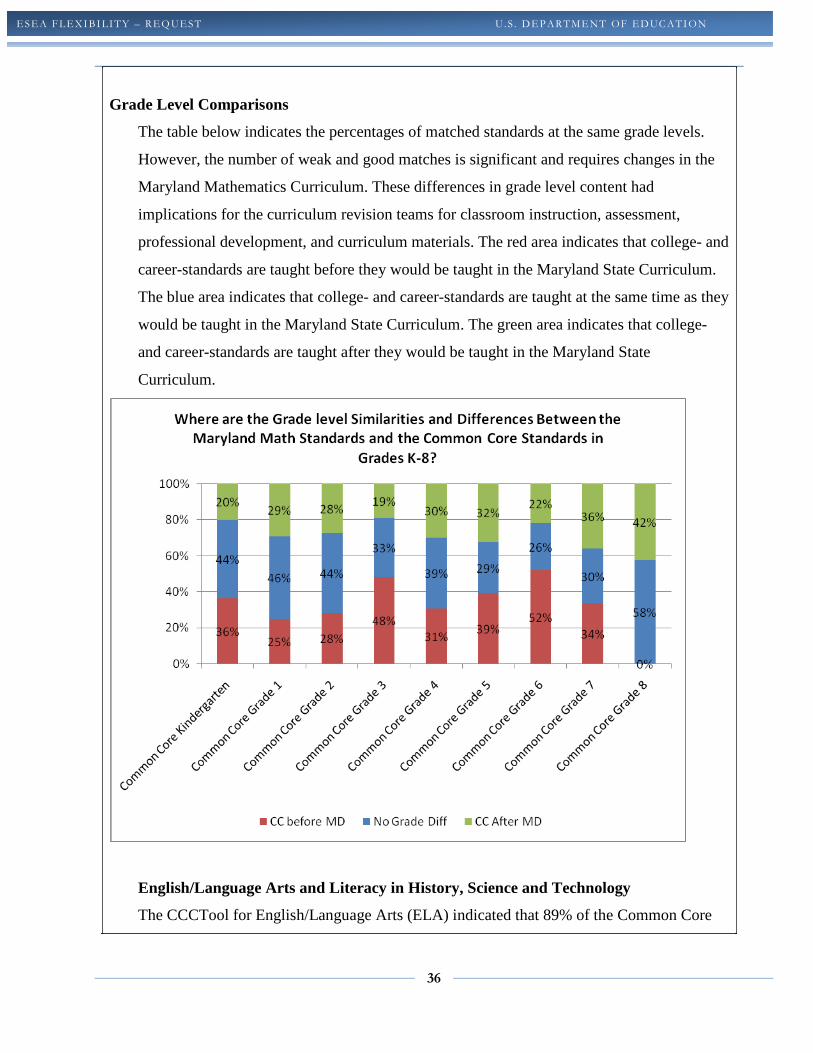
36
ESEA FLEXIBI LITY – REQ UEST U .S . DEPARTMENT OF EDUC ATI ON
Grade Level Comparisons
The table below indicates the percentages of matched standards at the same grade levels.
However, the number of weak and good matches is significant and requires changes in the
Maryland Mathematics Curriculum. These differences in grade level content had
implications for the curriculum revision teams for classroom instruction, assessment,
professional development, and curriculum materials. The red area indicates that college- and
career-standards are taught before they would be taught in the Maryland State Curriculum.
The blue area indicates that college- and career-standards are taught at the same time as they
would be taught in the Maryland State Curriculum. The green area indicates that college-
and career-standards are taught after they would be taught in the Maryland State
Curriculum.
English/Language Arts and Literacy in History, Science and Technology
The CCCTool for English/Language Arts (ELA) indicated that 89% of the Common Core
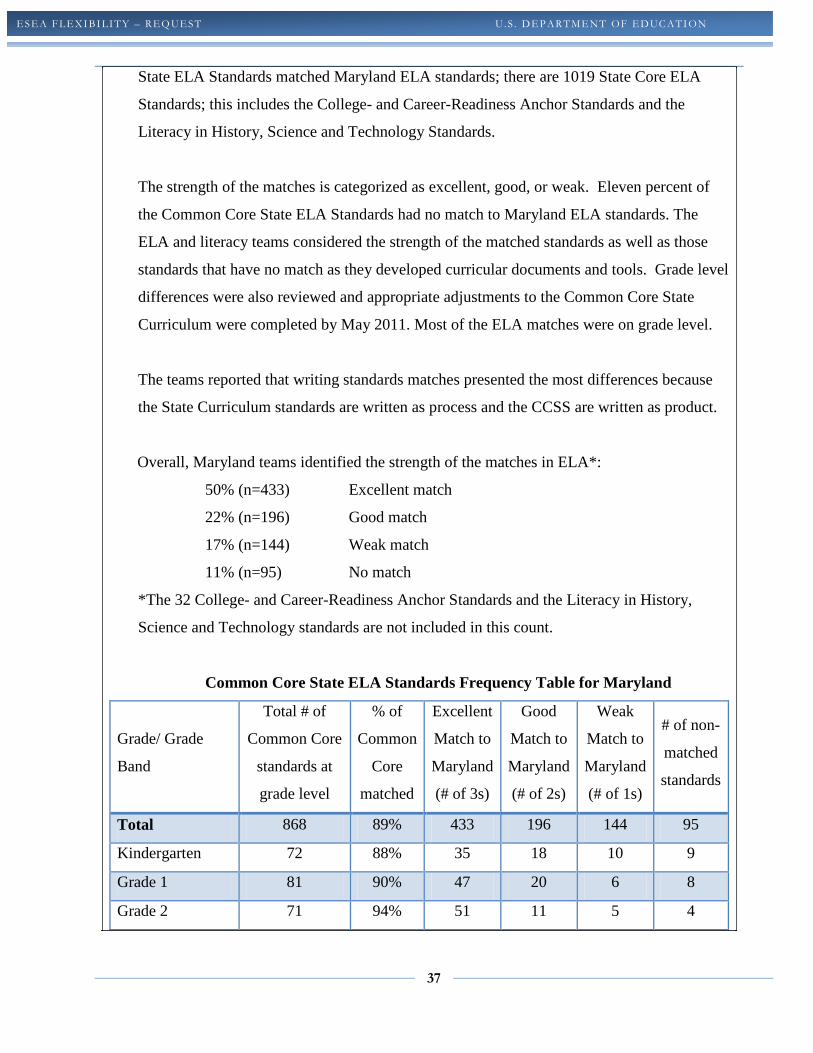
37
ESEA FLEXIBI LITY – REQ UEST U .S . DEPARTMENT OF EDUC ATI ON
State ELA Standards matched Maryland ELA standards; there are 1019 State Core ELA
Standards; this includes the College- and Career-Readiness Anchor Standards and the
Literacy in History, Science and Technology Standards.
The strength of the matches is categorized as excellent, good, or weak. Eleven percent of
the Common Core State ELA Standards had no match to Maryland ELA standards. The
ELA and literacy teams considered the strength of the matched standards as well as those
standards that have no match as they developed curricular documents and tools. Grade level
differences were also reviewed and appropriate adjustments to the Common Core State
Curriculum were completed by May 2011. Most of the ELA matches were on grade level.
The teams reported that writing standards matches presented the most differences because
the State Curriculum standards are written as process and the CCSS are written as product.
Overall, Maryland teams identified the strength of the matches in ELA*:
50% (n=433) Excellent match
22% (n=196) Good match
17% (n=144) Weak match
11% (n=95) No match
*The 32 College- and Career-Readiness Anchor Standards and the Literacy in History,
Science and Technology standards are not included in this count.
Common Core State ELA Standards Frequency Table for Maryland
Grade/ Grade
Band
Total # of
Common Core
standards at
grade level
% of
Common
Core
matched
Excellent
Match to
Maryland
(# of 3s)
Good
Match to
Maryland
(# of 2s)
Weak
Match to
Maryland
(# of 1s)
# of non-
matched
standards
Total 868 89% 433 196 144 95
Kindergarten 72 88% 35 18 10 9
Grade 1 81 90% 47 20 6 8
Grade 2 71 94% 51 11 5 4
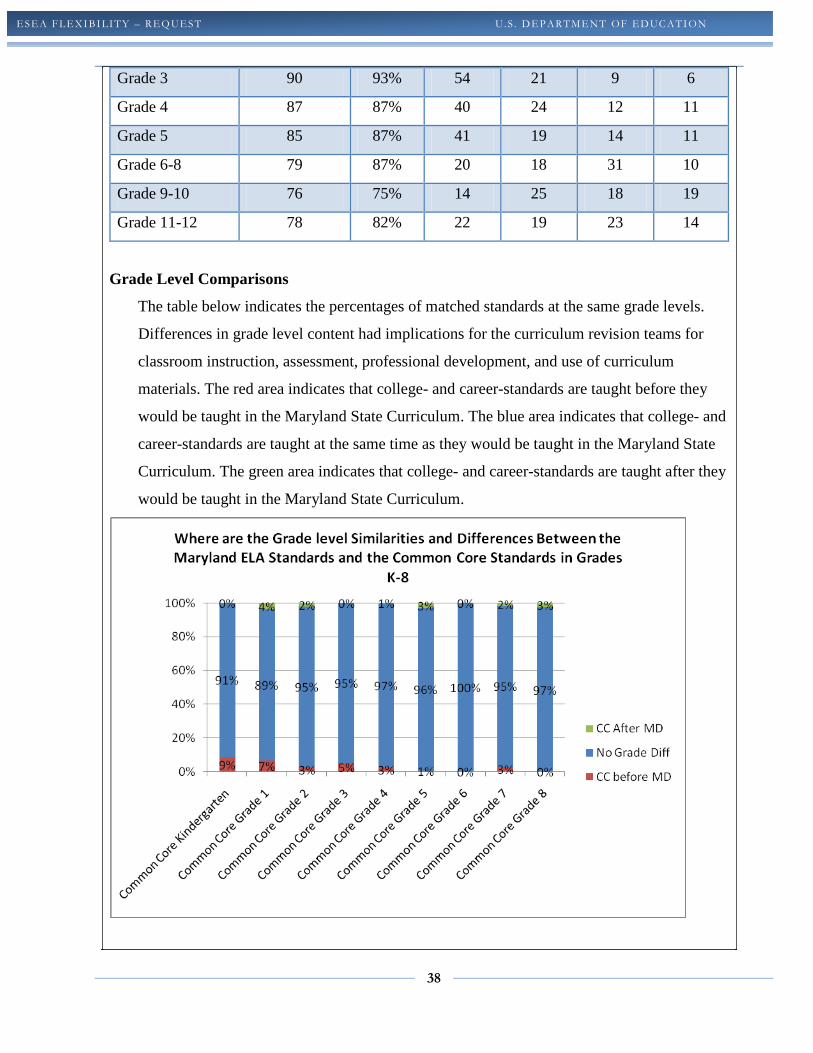
38
ESEA FLEXIBI LITY – REQ UEST U .S . DEPARTMENT OF EDUC ATI ON
Grade 3 90 93% 54 21 9 6
Grade 4 87 87% 40 24 12 11
Grade 5 85 87% 41 19 14 11
Grade 6-8 79 87% 20 18 31 10
Grade 9-10 76 75% 14 25 18 19
Grade 11-12 78 82% 22 19 23 14
Grade Level Comparisons
The table below indicates the percentages of matched standards at the same grade levels.
Differences in grade level content had implications for the curriculum revision teams for
classroom instruction, assessment, professional development, and use of curriculum
materials. The red area indicates that college- and career-standards are taught before they
would be taught in the Maryland State Curriculum. The blue area indicates that college- and
career-standards are taught at the same time as they would be taught in the Maryland State
Curriculum. The green area indicates that college- and career-standards are taught after they
would be taught in the Maryland State Curriculum.
39
ESEA FLEXIBI LITY – REQ UEST U .S . DEPARTMENT OF EDUC ATI ON
This gap analysis was presented to the State School Board in October 2010. Appendix 1.B.1
contains an excerpt from the minutes of that meeting— the complete minutes can be found at:
http://www.marylandpublicschools.org/NR/rdonlyres/5D922A58-42B9-420F-997F-
11CF4B13DEB4/27202/October262010.pdf ).
It is important to note that when teams of Maryland educators developed the Maryland Common
Core State Curriculum Frameworks (discussed below) during 2010-2011 school year, they
specifically identified the excellent matches. The Maryland Curriculum Frameworks include
each grade level standard and the “Essential Skills and Knowledge” needed to master that
standard. This information was part of the Educator Effectiveness Academy in 2011 (also
described below). Additionally, workshops on addressing the transition have targeted specific
changes that need to occur which includes addressing standards identified as a low/no match in
the CCSS gap analysis or that had a grade misalignment.
IV. Common Core State Curriculum Frameworks
Adopting the world-class expectations embodied in the Common Core State Standards is just the
first step Maryland took to ensure that all high school graduates are ready for college and
careers. The standards are an important foundation. But to meet its ultimate goal of preparing all
students for college and careers — including students traditionally not meeting standards — the
State had to find and fund more effective strategies for ensuring that these standards make their
way into every classroom. The standards had to be: (1) translated into challenging and engaging
curriculum, lesson plans, classroom projects, and homework assignments; (2) delivered by
effective instructors in schools that are managed by effective principals; and (3) supported by a
technology infrastructure and longitudinal data system that can identify achievement gaps
among students and help educators intervene in a timely way to close those gaps. Race to the
Top has allowed Maryland to re-examine every aspect of its instructional system. The
implementation strategies described below and in subsequent sections of this application will
ensure that the State closes its persistent achievement gaps and, in the process, lives up to its
commitment to transition from national leadership to world-class excellence — and not just for
the majority of students who already do well, but also for those who traditionally have lagged
behind.
40
ESEA FLEXIBI LITY – REQ UEST U .S . DEPARTMENT OF EDUC ATI ON
Aligned State Curriculum: After the Maryland State Board of Education approved the
Common Core State Standards in June 2010, Maryland began a year-long, Statewide,
participatory process to revise its curriculum to align with these new challenging standards.
Hundreds of classroom educators, including educators of ELL, SWD, and Gifted and Talented
(GTE) students, instructional coaches, LEA curriculum, assessment, and accountability leaders,
and members of the higher education community collaborated to refine and align the current
Maryland State Curriculum with the Common Core State Standards through the creation of
curriculum frameworks. The new Maryland Common Core State Curriculum Frameworks were
accepted by the Maryland State Board of Education in June 2011 — an accelerated process
made possible by the State’s previous work in this area. These frameworks are available at
www.mdk12.org.
Online Instructional Toolkit: The State curriculum frameworks, in turn, provided the starting
point for the redesign of a widely used and admired online resource for teachers: Maryland’s
current Online Instructional Toolkit found at the www.mdk12.org website. This content-rich,
instantly accessible resource bank was developed in response to teacher requests and links
instructional tools, such as curricular objectives, lesson seeds, instructional resources, and
annotated publicly released assessment items, to State standards. Maryland teachers, as well as
educators across the country, have used this website extensively. For example, in 2009, the
website had more than 16 million page views by 1,666,704 unique users. This website is now
so ingrained in the culture of Maryland teachers that when the Maryland Business Roundtable
hosted teacher focus groups in March 2010 to discuss how teachers wanted to access STEM
resources, such as instructional materials and industry externships, teachers said, “The materials
must be meta-tagged to the State curriculum and available to us like the mdk12 website.”
The items in the toolkit are provided by vendors and MSDE. The review process for vendors is
part of the Requests for Proposal that accompany each item. The model units and lessons being
developed by Maryland educators and facilitated by curriculum specialists at the Maryland State
Department of Education will be reviewed using rubrics.
It is important to note that LEAs in Maryland choose their own instructional materials.
However, information from PARCC has been shared and discussed, such as the Publishers’
41
ESEA FLEXIBI LITY – REQ UEST U .S . DEPARTMENT OF EDUC ATI ON
Criteria for ELA/Literacy, as well as the PARCC Model Content Frameworks. These
documents guide educators in criteria for choosing instructional materials. Achieve, Inc., has
also developed rubrics for OER (Open Educational Resources) that have been shared and
discussed with LEAs. At the 2011 Educator Effectiveness Academies, information on
determining text complexity was part of the English/Language Arts/Literacy sessions. This
summer (2012), more detailed information on determining text complexity will be included in
the Educator Effectiveness Academy. Through all of these options, MSDE is ensuring, where
appropriate, that textbooks and other common instructional materials are aligned with the new
standards.
Mini Academies for Local Assistant Superintendents of Instruction: As the Maryland
Common Core State Standards Curriculum frameworks were created, the local assistant
superintendents began developing a structure for the Educator Effectiveness Academies
(described below) (Appendix 1.B.2). In these Academies, school district teams began creating
their transition plans for the shift from the Maryland State Curriculum to the newly aligned
Maryland Common Core State Curriculum. Additionally, the monthly assistant superintendents’
meetings, led by the Assistant State Superintendent of the Division of Instruction, have had a
dedicated agenda item to transitioning to the Common Core State Standards, including sharing
content specific approaches, walking through exercises that can be replicated, analyzing
connections with new PARCC assessment information and PARCC content framework
information.
V. Individual School Transition Plans— Summer Educator Effectiveness Academies &
Professional Development for New Curriculum and Curriculum Resources
Educator Effectiveness Academies 2011: As part of the Race to the Top grant, MSDE
conducted 11 regional Educator Effectiveness Academies during the summer 2011. Every
school in the State sent a team which consisted of the principal, one ELA teacher, one
Mathematics teacher and one STEM teacher. More than 6,000 teachers and principals attended
these Academies. The purpose of these Academies was to assist principals and teachers to:
1. Develop knowledge of the Maryland Common Core State Curriculum Standards and
Framework;
42
ESEA FLEXIBI LITY – REQ UEST U .S . DEPARTMENT OF EDUC ATI ON
2. Develop an understanding of the relationship between Maryland's vision of STEM
and the Maryland Common Core State Curriculum Framework;
3. Provide feedback, modifications, and additions to curriculum work completed in
2010-2011;
4. Analyze the Academy content presented to identify prerequisite skills needed and
appropriate strategies for scaffolding instruction to build capacity for addressing
diverse learning needs; and
5. Create a one-year study plan that will guide school staff in delivering the Academy
content.
All schools were given a transition plan template that included how SWD and ELL educators
will be trained to support Common Core State Standard implementation, a rubric, and questions
to consider as they developed their transition plans (Appendix 1.B.3).
To support educators of Students With Disabilities and English Language Learners, additional
briefings on the content of the Educator Effectiveness Academies were held prior to the
Academies themselves. This process will continue as the Educator Effectiveness Academies
continue.
Academy Participant Responsibilities: Staff members attending the Academies with their
principal agreed to plan and organize, in collaboration with the principal, professional
development activities during the school year that would assist all staff members, including
Special Education and ELL educators, in developing a working knowledge of the Maryland
Common Core State Curriculum Framework. Members of the school team also agreed to
participate in on-line follow-up sessions. In future years, Academy outcomes will expand to
include effective use of Maryland's Instructional Improvement System as described in the Race
to the Top application. This includes information regarding new summative assessments to be
developed by the PARCC consortium, effective use of formative assessment tools, and the
Instructional Improvement System. The composition of school teams in future years will also be
determined by the principal.
Academy Format: Master teachers facilitated Academy sessions which grouped participants by
43
ESEA FLEXIBI LITY – REQ UEST U .S . DEPARTMENT OF EDUC ATI ON
content area and grade level (elementary, middle, high) in classes of approximately 25. School
principals engaged in activities in collaboration with their teachers in addition to job-alike
sessions. Time was provided for school team planning (Appendix 1.B.4).
Selection for the Master Teachers is a collaborative process between the Maryland State
Department of Education’s (MSDE) Professional Development Team in the Division of
Instruction and Maryland’s 24 Local Education Agencies. The required qualifications include a
Master’s degree or Advanced Professional Certificate; successful teaching or co-teaching in
Reading, English Language Arts, Math, or STEM related field; A thorough understanding of the
existing Maryland State Core Curriculum Frameworks; Evidence of providing professional
development at the school, district, state, and/or national level; and evidence of experience/
participation in an online environment. Preferred qualifications include 2011 Educator
Effectiveness Academy Master Teacher experience; National Board Certification, Governor’s
Academy teaching experience; Experience in adult learning theory and practice; Leadership
experience; Experience delivering content in an online environment; and participation in
curriculum development. Attached are documents that include the qualifications, the application
process, the announcement for the application, the application, and rubric (Appendix II- 1).
Candidates submit their applications to their local system coordinator and that system forwards
their top candidates to MSDE. The MSDE Professional Development Team then works with the
selected candidates on placement at the Educator Effectiveness Academy sites.
Academy Evaluation: In June 2011, an MOU was signed by MSDE and University System of
Maryland (USM) to evaluate MSDE’s Race to the Top work. The Center for Application and
Innovation Research in Education (CAIRE) is the USM organization responsible for this
program evaluation. Each year of the grant, CAIRE will: evaluate the Educator Effectiveness
Academy and related LEA transition plans; review project schedules; conduct a three-phase
evaluation – product/process, utilization, and impact— of the 54 RTTT projects; and conduct
reviews of LEA goals and initiatives.
The first round of this evaluation just began and CAIRE staff have focused specifically on the
Educator Effectiveness Academies from Summer 2011. The very preliminary results suggest a
67% response rate that indicates that there is a valuable partnership between MSDE and the
44
ESEA FLEXIBI LITY – REQ UEST U .S . DEPARTMENT OF EDUC ATI ON
LEAs in delivering this important content. MSDE is eager to continue to monitor and adjust the
future Educator Effectiveness Academies based on this evaluation.
After each summer academy, there are two on-line follow-up sessions; one is posted in the fall
and the second is posted in the spring. LEAs submit their transition plans that incorporate their
use of academy resources, including on-line follow-up opportunities. The outside evaluation
team, CAIRE will evaluate all aspects of the Educator Effectiveness Academies, including
follow-up activities. Measureable objectives include identifying the expectations of the
academies and whether expectations of the academies are met. Online professional development
will continue at the conclusion of the 2013 Summer Effectiveness Academies. There will be
twelve online courses for English Language Arts, Mathematics, and STEM. These courses will
review content that was presented at the Summer Educator Effectiveness Academies and also
provide additional resources and support to educators as they continue implementing the new
curriculum aligned to the Common Core State Standards. Educators will be assigned discreet
IDs that will enable them to schedule their online professional development. Educators who
take the academy online courses will take assessments that will be scored, and will result in
grades for each online course. Educators who successfully complete a course will receive a
certificate, and a record of their successful completion will become a part of the Educator
Information System. This system will allow Maryland to monitor the online professional
development.
Educator Effectiveness Academies 2012 and beyond: Ten more regional Educator
Effectiveness Academies will be held during the summers of both 2012 and 2013. Academy
content will be delivered on-line in 2014 and future years. Evaluation results provided by
participants after the 2011 Academies indicated that the structure and activities were highly
successful at achieving Academy outcomes. Transition plans produced by school teams to guide
professional development activities with school staff members during the 2011-2012 school year
demonstrated that Academy activities were highly engaging and focused on implementation of
the Common Core State Curriculum and Maryland’s STEM initiatives.
Outcomes for the Academy in 2012:
1. Review final version of English/Language Arts and Mathematics Frameworks,
identify changes, and introduce content literacy frameworks;
45
ESEA FLEXIBI LITY – REQ UEST U .S . DEPARTMENT OF EDUC ATI ON
2. Learn STEM standards, practices, processes and skills;
3. Develop knowledge of the format, lessons, and media resources in the
English/Language Arts, Mathematics, and STEM curriculum toolkits;
4. Practice navigating curriculum toolkits and develop applications based on curriculum
toolkit models;
5. Update participants on PARCC assessment development, design and timeline (and if
possible, engage in activities related to innovative item types); and
6. Create a school plan that will guide school staff in delivering content and curriculum
toolkit that includes special educators and ELL specialists.
Academy participant responsibilities and the Academy format will remain the same for
the 2012 sessions. The MSDE Division of Instruction (DOI) have held in the fall 2011
and will hold in the spring 2012, online follow-up sessions in the fall and spring for
school year 2011-2012 which will provide further guidance on the Common Core State
Standards and new information provided by PARCC.
In addition, staff from MSDE DOI will make periodic site visits to LEAs requesting assistance
with their system planning and/or individual school planning (Appendix 1.B.5). All content
discipline supervisory briefings facilitated by members of DOI will have dedicated agenda time
for discussing transition guidelines, and sharing system approaches, for the full implementation
of the new curriculum targeted for 2013-2014 (Appendix 1.B.6).
Supporting Principals
During the 2011 Educator Effectiveness Academies, principals attended sessions on the
Common Core State Standards with their English Language Arts, Mathematics, and STEM
teachers. They worked with their school teams to develop the transition plans for
implementation of the new standards for the 2011 – 2012 school year. All principals from all
school teams attended these academies, which is a total of 1, 490 schools. Online follow-up
sessions were provided in the fall and spring. The topics of these sessions included transition
issues and integrating Universal Design for Learning Principles into daily instruction.
46
ESEA FLEXIBI LITY – REQ UEST U .S . DEPARTMENT OF EDUC ATI ON
During the 2011-2012 school year members of the Division of Instruction have presented
overviews of the Common Core to both the Maryland Association of Elementary School
Principals and Maryland Association of Secondary School Principals.
During the 2012 Educator Effectiveness Academies, principals will attend sessions that provide
an overview of the curriculum resources that will be available to the teachers, and an
introduction to the new Curriculum Management System. They will also attend a session that
focuses specifically on the Literacy Standards for Social Studies/History, Science, and Technical
Subjects. On the final day of the Academy, the entire school team with the support of the LEA,
will develop a transition plan for the 2012 – 2013 school year. Online follow-up sessions will
occur in the fall and spring. The topics for these sessions are based on feedback from academy
participants, but a follow-up session on the use of the new Curriculum Management System will
be included. The Executive Officers’ Network (individuals in the LEAs who supervise
principals), worked with professional development specialists to create the transition documents
and accompanying activities for the 2012 Educator Effectiveness Academy.
In addition to the support provided to principals through the Educator Effectiveness Academies,
the Division of Academic Reform and Innovation (DARI) provides a variety of other learning
opportunities for principals to assist them in their role as instructional leaders. For example,
DARI is creating an Academy for School Turnaround specifically targeting the needs of
principals in the 200 schools in school improvement, corrective action, or restructuring. This
academy’s content is research-based and is focused on school turnaround strategies that have
proven successful. It will be in place for the summer 2012.
DARI also offers a Leadership Learning Series on specific topical areas that are designed to help
principals improve their knowledge and skills in a variety of areas. The Maryland Instructional
Leadership Framework serves as the foundation for all of these training experiences. Those
series include sessions on data-driven decision making, improving school culture, purposeful
observation of instruction, effective post-observation conferences, and informal observation of
instruction. The sessions have been offered to LEAs for several years, and there has been an
extremely positive response across the State.
47
ESEA FLEXIBI LITY – REQ UEST U .S . DEPARTMENT OF EDUC ATI ON
Finally, DARI is very concerned about building the pipeline to the principalship. In partnership
with LEAs, DARI has offered a series of regional learning opportunities for aspiring principals.
These too have been based on the Maryland Instructional Leadership Framework, and they are
very popular around the State. We believe that this focus on principals and those who aspire to
be principals has been one of Maryland true strengths over the years and an extremely important
factor in increasing student achievement across our State.
Pre-Service Teachers
In addition to training and supporting current teachers to adapt to the Common Core State
Standards, Maryland is working with its higher education counterparts to effectively prepare
pre-service teachers. Specifically, members of the Divisions of Instruction and Certification and
Accreditation have held workshops with IHE faculty to provide an overview of the Common
Core State Standards for English/Language Arts/Literacy and Mathematics. These workshops
were held throughout the State so that higher education faculty members could attend a regional
session. One topic addressed in these meetings was “Implications for Teacher Education.”
Additionally, the English/Language Arts/Literacy and Mathematics Teams routinely invite
members of IHEs to their unit/lesson plan development sessions, just as they were invited to the
sessions where the Maryland Common Core State Curriculum Frameworks were developed.
VI. Schools Implement Transition Plans
As mentioned above, transition planning began with the Educator Effectiveness Academies and
the assistant superintendent meetings. The thorough and deep engagement of educators in
developing and implementing the current Maryland Common Core State Curriculum
frameworks illustrates why MSDE and all LEAs will be able to thoughtfully and confidently
transition the new curriculum to align with the Common Core State Standards. To begin, MSDE
used Achieve’s Gap Analysis Tool to analyze the alignment, gaps, and inconsistencies of the
Maryland State Standards against the Common Core State Standards. As described above, this
work began on June 18, 2010, in a full-day meeting with the Assistant Superintendents for
Instruction from all 24 LEAs, who determined the magnitude of needed adjustments. The team
then mapped out a yearlong plan for accomplishing the curriculum refinement and transition; the
review included identifying where new curriculum units needed to be created and existing ones
48
ESEA FLEXIBI LITY – REQ UEST U .S . DEPARTMENT OF EDUC ATI ON
augmented (Appendix 1.B.7). It was this expedited process that allowed MSDE to present the
new Common Core State Curriculum Frameworks to the State Board of Education for approval
in June 2011.
At the same time that the State curriculum is being revised, Maryland is also working to expand
the Online Instructional Toolkit mentioned above. It consists of several elements. First, the
revised State Curriculum will be posted on the Online Instructional Toolkit website
(www.mdk12.org). Second, curricular supports, such as lesson plans, multimedia resources (e.g.,
videos), and public release summative assessment items with annotated student responses are
linked to the State Curricula. Third, the formative assessment item bank and computerized test
blueprints will be available at this site. Finally, online and face-to-face opportunities for
professional development, available from IHEs, LEAs, and MSDE, which have been reviewed
for quality, will be posted in the Online Instructional Toolkit. As described more below, tools
are also being designed using UDL principles and guidelines to assist in differentiation for
teachers of SWD, ELL and other diverse learners. In addition, MSDE staff from the Division of
Special Education and Early Intervention Services and the Division of Instruction are currently
drafting proposed regulations for the Code of Maryland Regulations (COMAR) for the use of
Universal Design of Learning (UDL) principles and guidelines in the development of curriculum
instruction and assessment for all learners.
This Toolkit is an important component of the Instructional Improvement System and is a
critical part of the transition process. As teachers access student performance data from the
longitudinal data system through the dashboard system supported by the technology
infrastructure, they will analyze current levels of student learning, develop lessons aligned to the
State Curriculum frameworks, and draw on the curricular resources described above. Teachers
can use items from the formative assessment item bank to capture quick information about levels
of student mastery or longer-term interim assessments measured at quarterly or semester points
of time. Finally, if teachers want or need professional development support in a particular
curriculum, or strategies to reach students who are not demonstrating progress they can use the
Toolkit. Teachers of ELL and SWD students may also access resources in the professional
development section of the Toolkit where these supports will be meta-tagged for alignment with
specific sections of the State Curriculum.
49
ESEA FLEXIBI LITY – REQ UEST U .S . DEPARTMENT OF EDUC ATI ON
Throughout the year, LEAs, IHEs, and other partners will identify instructional materials and
digital resources that are focused, coherent, and aligned to the Common Core State Standards
and State Curriculum frameworks. In addition, digital resources, course modules, and online
courses aligned to the Common Core State Standards will be identified and developed through
the Maryland Virtual Learning Opportunities Program.
Additional resources will be identified through Maryland’s MDK12 Digital Library. This
collaborative purchasing consortium made up of the 24 LEAs and MSDE provides a rich set of
resources and ensures equity of availability in all 24 LEAs. Partnerships with the Maryland
Business Roundtable (MBRT), Maryland Public Television (MPT), and the College Board will
give teachers easy access to quality digital instructional materials. MBRT will identify business
partners anxious to contribute their knowledge and time in Maryland classrooms, and will
provide additional instructional materials and digital resources, including links to available local,
national, and international business, industry, and military partners that are carefully evaluated
for quality and alignment. These materials will provide Maryland’s teachers with an array of
electronic resources carefully mapped to support the effective implementation of the State
Curriculum frameworks. Maryland Public Television and MSDE will conduct a technical review
of existing resources on the MPT Thinkport website, and then develop new online courses and
content resources and provide public outreach programming and public service announcements.
Maryland and the College Board have a co-funded liaison position at MSDE. Building on this
unique nine-year partnership, MSDE and the College Board will conduct a technical correlation
between the State curriculum and College Board public-domain materials, programs, and
services to ensure that all teachers and students have easy online access.
Finally, MSDE’s Division of Instruction is working with LEAs to create model units for each
subject at every grade level and are using UDL guidelines and principles within these modules
(Appendix 1.B.8). The curriculum resources include intervention and enrichment modules, on-
line courses, and multi-media resources to accelerate student learning opportunities. The model
units and lessons will include resources for enrichment and acceleration/intervention. As
curriculum resources are developed, specialists who work with students with disabilities and
English Language Learners participate in the development of the resources. All curriculum
50
ESEA FLEXIBI LITY – REQ UEST U .S . DEPARTMENT OF EDUC ATI ON
resources incorporate Universal Design for Learning principles (discussed more below).
All schools implemented their transition plans for school year 2011-2012, which were developed
based on the content provided on the Common Core State Standards, the Maryland Common
Core State Curriculum Frameworks, and presented at the Educator Effectiveness Academies.
Additionally, the plans were presented at the superintendents’ meeting (Monthly meeting of all
Local Superintendents led by the State Interim Superintendent) in December 2011 (Appendix
1.B.9) and remain a consistent agenda item for the monthly assistant superintendents’ meetings.
Members of the MSDE Division of Instruction have been making periodic site visits to LEAs
that request assistance with their system or individual school transition plans. A review of a
random sampling of these transition plans will be part of the evaluation of Maryland’s RTTT
program (Appendix 1.B.10). More specifically, MSDE, in collaboration with the University of
Maryland System, developed an evaluation process to be done by CAIRE. This process includes
a rubric for evaluating the transition plans. This rubric can be found on the www.mdk12.org
website under Educator Effectiveness Academy (and also as part of Appendix 1.B.3). The State
has provided support to the LEAs by facilitating “Transition Tools Workshops” to help LEAs
identify professional development needs.
VII. Writing new State curriculum based on CCSS and Maryland CCSS Curriculum
Framework
As mentioned above, the LEA Assistant Superintendents of Instruction met in October 2011 to
develop a timeline for the full implementation of the new Maryland Common Core State
Curriculum (Appendix 1.B.11). While the Common Core State Standards provide goals and
expectations for student learning, Maryland educators, including ELL and SWD educators, are
developing the State Curriculum that will help its students achieve the Standards. Following the
adoption of the Common Core State Standards, Maryland launched a broad-based, year-long
process to analyze the new Standards and compared the alignment of the existing State
Curriculum to the Common Core State Standards (the gap analysis described above). Using only
the “excellent” matches in each grade level, development of the new Maryland Common Core
State Curriculum Frameworks began.
This was the first iteration of the State Curriculum and was developed as a curricular framework
51
ESEA FLEXIBI LITY – REQ UEST U .S . DEPARTMENT OF EDUC ATI ON
for each separate content area (e.g., English/Language Arts, mathematics, science, social
studies). When the Maryland Common Core State Curriculum is complete it will have two main
components, the Curriculum Frameworks and the Online Curriculum Toolkit (also described
above).
The State Curriculum is the document that aligns the Maryland Content Standards and the
Maryland Assessment Program and will be available in a number of formats for teachers, central
office staff, students, parents, and the other stakeholders. The curriculum documents are
formatted so that each begins with content standards or broad, measurable statements about what
students should know and be able to do. Indicator statements provide the next level of specificity
and begin to narrow the focus for teachers. Finally, the objectives provide teachers with very
clear information about what specific learning should occur.
Hundreds of classroom educators, instructional leaders, administrators, and higher education
representatives continue to assist State officials in developing components of the new State
Curriculum based on the Common Core State Standards, and the Maryland Common Core State
Curriculum Frameworks. This is extensive and substantive professional development. As part
of this work, curriculum teams have also been identifying instructional priorities for transition.
The development of the new Maryland Common Core State Curriculum has involved extending
the Common Core State Standards down to Pre-K. Since the Common Core State Standards did
not include Pre-K, Maryland educators created standards and developed the essential skills and
knowledge to serve these students. This work will be further developed with the new federal
Race to the Top Early Learning Challenge Fund Grant (RTTT-ELC) that Maryland was recently
awarded in December 2011, along with eight other states. The program is designed to narrow
the school readiness gap for children in poverty, English Language Learners, and those with
disabilities. Maryland developed an ambitious slate of projects in its RTTT-ELC application.
These projects range from strengthening the Maryland Excellence Counts in Early Learning and
School-Age Child Care (EXCELS) rating system to revising the early learning standards to align
with the Common Core State Standards to refining the State’s assessment system for pre-school
children.
52
ESEA FLEXIBI LITY – REQ UEST U .S . DEPARTMENT OF EDUC ATI ON
In redesigning the content areas of the State Curriculum to align to Common Core State
Standards, MSDE and the LEAs will develop an interdisciplinary STEM-based curriculum.
Finally, a cross-curricular team, including educators of SWD and ELL students, will develop
curriculum frameworks for the Literacy Standards for Social Studies/History, Science, and
Technical Subjects, grades 6 – 12. The Literacy Standards are part of the Common Core State
Standards, but Maryland is still in the process of developing the frameworks which will
ultimately be incorporated into the new Maryland Common Core State Curriculum. These
frameworks will be complete by March 2012.
As the work of writing the curriculum continues, MSDE is also offering continuous
opportunities for districts to request assistance in developing their plans and helping teachers
and parents understand the new standards, frameworks, and curriculum. This includes regional
meetings and presentations by the MSDE Division of Instruction for any requesting LEA and for
higher education (Appendix 1.B.12).
Additionally, MSDE is making a concerted effort to inform parents about the new standards in a
way that helps engage them in their children’s learning. As mentioned in the consultation section
above, last spring, five regional briefings, open to the public, were held across the State to
introduce the Common Core State Standards. Members of the Division of Instruction have also
presented a session on the Common Core State Standards at the State PTA Convention held in
the summer 2011. Information on the website also provides information for parents.
VIII. Addressing the Needs of Students with Disabilities and English Language Learners
(ELL)
Maryland is developing curriculum resources, including model units and lessons that are aligned
to the Common Core State Standards. These resources are being developed by teams of
Maryland educators from across the state. In addition to identifying specific components to be
included in these models, educators are developing the resources based on the guidelines and
principles of Universal Design for Learning to ensure that all children have access to the tools
and resources needed to master the Common Core State Standards. Please see Appendix 1.B.13
for a description of the State UDL Resources and a flier that contains valuable information about
tools that have been developed to help teachers teach all students. These tools include an online
53
ESEA FLEXIBI LITY – REQ UEST U .S . DEPARTMENT OF EDUC ATI ON
version of an interactive Universal Design for Learning (UDL) resource wheel and links to the
two websites where educators can download free apps for their smart-phones. Both tools foster
incorporating UDL into instructional practice at every grade level from pre-school through
graduation.
PARCC, the consortium developing the assessments for Maryland and 23 other states, has stated
that test items will adhere to Universal Design principles, as well. PARCC is committed to
providing all students with equitable access to high-quality, 21st-century PARCC assessments.
For the assessment system as a whole, PARCC will consider how its assessments will be
accessible to all participating students, including English Language Learners (ELL) and students
with disabilities (SWD), and then include appropriate accommodations (as defined in the Notice
for Inviting Applications) for SWD and ELLs. Accessible assessments will allow all individuals
taking the assessments to participate and engage in a meaningful and appropriate manner, with
the goal being to ensure that results are valid for each and every student.
Through a combination of Universal Design principles and computer embedded supports,
PARCC intends to design an assessment system that is inclusive by considering accessibility
from the beginning of initial design through item development, field testing, and
implementation, rather than trying to retrofit the assessments for SWD and ELLs. Paper-and-
pencil assessments that have been designed without the benefit of Universal Design have
focused primarily on promoting accessibility after-the-fact resulting in the need to provide many
more accommodations and a consequent need for increased test administration resources at the
school level. Additionally, as the number of accommodations increases, so does the possibility
of implementation infidelity. While external accommodations may be needed for some students
to demonstrate what they know and can do, embedded support accessibility options and
procedures need to be addressed during design and item development to minimize the need for
accommodations during testing. Embedded accessibility supports at the item level, that do not
shift the construct being measured, become a feature of the assessment for potential use by all
children.
The PARCC assessments will also require all electronic test items and test materials to be
compliant with the Accessible Portable Item Profile (APIP) standards. This will require the
54
ESEA FLEXIBI LITY – REQ UEST U .S . DEPARTMENT OF EDUC ATI ON
provision of accessibility information for text only, graphic only, text and graphic, non-visual
audio representation of item content, and Braille representation of item content. Additional
optional accessibility information will also be required so long as the construct to be measured is
not violated. These will include audio directions, tactile graphics, American Sign Language,
signed English, alternate language(s), keyword highlighting and keyword translation.
The results will yield information in order to make valid inferences about the performance of
students with diverse characteristics, and that does not mask what students really know and can
do. To ensure that students with wide ranging learning characteristics and English proficiency
are able to demonstrate their content knowledge and skills on the common assessments, PARCC
will eliminate or minimize any features that are irrelevant to measuring Common Core State
Standards constructs. The range of complexity of the constructs measured must be such that
students are able to demonstrate their knowledge for the intended purpose of each test.
PARCC‘s Accessibility, Accommodations, and Fairness Operational and Technical Working
Groups are guided by the following key principles:
1) Minimize/eliminate features of the assessment that are irrelevant to what is being
measured and that measure the full range of complexity of the standards so that students
can more accurately demonstrate their knowledge and skills;
2) Design each component of the assessment in a manner that allows ELLs and students
with disabilities to demonstrate what they know and can do;
3) Use Universal Design for accessible assessments throughout every stage and
component of the assessment, including items/tasks, stimuli, passages, performance
tasks, graphics and performance-based tasks; and
4) Use technology for rendering all assessment components in as accessible a manner as
possible.
These guiding principles demonstrate PARCC‘s deep commitment to developing assessments
that reach the broadest range of students while maintaining comparability and measurement
accuracy.
In addition to addressing the needs of students with disabilities, Maryland is also committed to
55
ESEA FLEXIBI LITY – REQ UEST U .S . DEPARTMENT OF EDUC ATI ON
ensuring effective and appropriate instruction, support and assessments for English Language
Learners. In June 2011, the Maryland State Department of Education joined the World-Class
Instructional Design and Assessment (WIDA) Consortium that provides English language
proficiency (ELP) standards and an ELP assessment. As a result, the State is in the process of
implementing these standards and the ACCESS for ELLs® ELP assessment. The standards
encompass (1) social and instructional language; (2) the language of language arts; (3) the
language of mathematics; (4) the language of science; and (5) the language of social studies.
The focus of the standards is teaching academic language within the context of content area
instruction. Model Performance Indicators have been developed that align with the Common
Core State Curriculum across grade levels. The result of this focus on academic language in a
content context and the alignment with the Common Core State Curriculum will support English
Language Learners in accessing the college- and career-ready standards on the same schedule as
all students.
The WIDA Assessment exceeds the requirements stipulated by the No Child Left Behind
(NCLB) Act of 2001 and is used to measure and report growth in a manner consistent with the
need for fulfilling these requirements. The program generates results that serve as one criterion
to aid in determining when ELLs have attained the language proficiency needed to participate
meaningfully in content area classrooms without program support and on State academic content
tests without accommodations. Additionally, it provides districts with information that will aid
in evaluating the effectiveness of their ESL/bilingual programs, identifies the ELP levels of
students with respect to the WIDA ELP Standards' levels 1-6 and provides information that can
be used to enhance instruction and learning for ELLs.
Maryland is also working with State’s Institutions of Higher Education (IHEs) to ensure that
teacher preparation programs are incorporating strategies for teaching academic language that
aligns with the Common Core State Curriculum to ELLs. One example is a program between
MSDE and the University of Maryland Baltimore County to develop an online course for
secondary content teachers who have English Language Learners in their classrooms that
include the language acquisition process as well as effective instructional strategies that result in
the attainment of academic vocabulary and content knowledge across levels of English language
proficiency.
In addition, MSDE is issuing sub-grants to LEAs to provide incentives for English, mathematics,
56
ESEA FLEXIBI LITY – REQ UEST U .S . DEPARTMENT OF EDUC ATI ON
social studies, science, and elementary classroom teachers in low-achieving, high-minority,
high-poverty schools with a significant number of ELLs to obtain an additional certification
(endorsement) in ESOL. This project is funded by the Race to the Top grant and will last
through the 2013-2014 school year. Each LEA that participates in this project can nominate 5
applicants per year. Once selected, teachers must take courses in second language acquisition
and ESOL methodology as well as pass the required Praxis II (ESOL) examination. The
purpose of this incentive is for classroom teachers to gain an understanding of ESOL and
strategies for working with ELLs and to become dual certified in their content and ESOL, not to
prepare additional ESOL teachers. Therefore, teachers must pledge to remain in their content
area for at least 2 years after receiving the incentive.
Maryland has submitted an amendment to the Race to the Top (RTTT) Application that would
increase the funding for the ESOL Certification project in years 3 and 4 of the RTTT grant.
After 2014, LEAs may have the option to incorporate this project into their Title III proposals.
Throughout this process, Maryland colleges and universities and online universities have created
partnerships with local school systems, establishing ESOL certification models and cohorts that
will extend beyond the RTTT grant period.
VIII. Providing access to high level courses for all students, especially ELL and SpEd
Students
Maryland’s new Curriculum Management System will include extensive curriculum resources
for educators and students. Universal Design for Learning Principles are imbedded in
curriculum resources, including model units, model lessons, intervention modules, enrichment
modules, and multi-media resources. These resources are reviewed by educators with an
expertise in Special Education and ESOL. Intervention and enrichment modules will be
available to students on a learning management system that has 24 hour access.
Maryland enjoys a unique partnership with the College Board to promote access and equity –
and to increase the participation of underrepresented groups (ELL and Special Education) in
Advanced Placement courses. Two federal APIP (Advanced Placement Incentive Program)
grants have enabled Maryland to provide extensive professional development, student
57
ESEA FLEXIBI LITY – REQ UEST U .S . DEPARTMENT OF EDUC ATI ON
enrichment and support programs, and subsidized AP exam fees for income eligible students.
For the fourth consecutive year, Maryland leads the nation with the largest percentage of all
graduates earning a score of 3 or higher on one or more AP exams. Overall, 27.9 percent of the
state’s graduating seniors scored a 3 or better. The numbers of traditionally underserved
students participating and succeeding in AP are increasing:
• Maryland has nearly eliminated the equity and excellence gap in AP achievement for
the Hispanic and Latino population. Hispanics accounted for 8 percent of the
Maryland graduating class last year, 7.8 percent of the seniors who scored 3 or higher
on the AP exam were Hispanic.
• Maryland also has seen a big increase in the percentage of Black/African American
students having success on the AP assessments. A record 10.8 percent of students
receiving a grade of 3 or better in Maryland were Black/African American. That is
the third-highest percentage among states in the nation.
• The number of low-income graduates who took at least one AP exam during high
school has nearly tripled over the past five years – from 1,563 in the class of 2006 to
4,581 last year.
• Maryland placed second to Florida in the total percentage of seniors completing an
AP exam (46.4 percent to Florida’s 47.4). That compares to 32.5 percent from the
class of 2006 – just five years earlier – demonstrating the growth, and successful
strategies, of Maryland’s AP program.
• The program also has provided ongoing professional development to teachers, school
counselors, and administrators. The effort has paid enormous dividends: all 24
Maryland school systems have at least 20 percent participation rate among high
school seniors, and 16 districts have 30 percent or greater.
• Also, Maryland leads the nation with the largest percentage of all graduates taking
AP exams in the mathematics and science disciplines—18 percent and 17.8 percent
of the graduating class, respectively.
X. Full Implementation of the CCSS through the Maryland Common Core State
Curriculum
58
ESEA FLEXIBI LITY – REQ UEST U .S . DEPARTMENT OF EDUC ATI ON
Maryland is on track to fully implement the Common Core State Standards integrated into the
new Maryland Common Core State Curriculum by school year 2013-2014. All of the work
described above has positioned Maryland to transition to the new curriculum a year before the
new assessments begin (although Maryland has agreed to field test some of the assessments).
XI. Maryland participation in the ACHIEVE led Partnership for the Assessment of
Readiness for College and Careers (PARCC)
Maryland has signed a MOU with PARCC, an assessment consortium facilitated by Achieve
(Attachment 6). Twenty-four states are in this College- and Career-Readiness consortium, which
is focused on summative assessments that will measure each student’s readiness for college and
careers and will be sufficiently reliable and valid for student and school accountability. The
member states currently include Alabama, Arizona, Arkansas, Colorado, District of Columbia,
Florida, Georgia, Illinois, Indiana, Kentucky, Louisiana, Maryland, Massachusetts, Mississippi,
New Hampshire, New Jersey, New York, North Dakota, Ohio, Oklahoma, Pennsylvania, Rhode
Island, South Carolina, and Tennessee.
As a governing state in this consortium, MSDE staff members are actively engaged in the design
and development of the assessments. For example, staff members participate in weekly planning
calls with the PARCC consortium and staff from the Division of Instruction and Division of
Assessment, Accountability and Data Systems, participate in the consortium’s design team. In
addition, Maryland is fully committed to engaging IHE staff in the development of a new
generation of assessments that fully certify students as college- and career-ready.
Maryland believes that partnering with other states offers multiple benefits: an ability to measure
the full range of college- and career-readiness skills, generate comparable student achievement
results across states, increase assessment quality, and decrease costs. Several aspects of the
PARCC consortium make it an ideal fit for Maryland:
• The design principles of the consortium align with Maryland’s vision for an
innovative assessment system that enhances classroom instruction and ensures that
students become college- and career-ready. In particular, the consortium will measure
the full depth, breadth, and rigor of the Common Core State Standards and include
assessments given in high school that will measure college- and career-readiness. In
59
ESEA FLEXIBI LITY – REQ UEST U .S . DEPARTMENT OF EDUC ATI ON
fact, Maryland is encouraging the consortium to develop college- and career-ready
anchor assessments in advanced English/Language Arts and mathematics courses and
to set a college- and career-ready cut score that will be comparable across state lines.
• The consortium approaches assessment design comprehensively, seeking an aligned
system of summative, interim, and formative assessments. The design for each type
of assessment will be closely aligned and occur concurrently, with significant
collaboration among consortium partners.
• A rapid transition is especially important to Maryland. With the formal adoption of
the Common Core State Standards by the State Board of Education in June 2010,
educators spent the 2010–11 school year revising the State’s curriculum in
reading/language arts, mathematics, and STEM to align with the Common Core State
Standards. This curriculum framework development was completed by June 2011,
and educators working in every school in Maryland will have been trained on the
reading/language arts, mathematics, and STEM curriculum by 2013. The PARCC
Consortium plans for its summative assessments to be operational no later than
spring 2015 and sooner if possible.
• The consortium is committed to developing common summative assessments that are
high quality, scalable within a short time, and designed for multiple purposes,
including assessing student performance in high school; evaluating school and
district performance disaggregated by subgroups of ethnicity, income, and special-
needs populations; and determining educator effectiveness by isolating student-
learning gains.
• The consortium plans to infuse technically sound innovations in measurement,
including online administration (in addition to traditional paper-and-pencil
assessment); use of artificial intelligence for scoring certain constructed-response
items; a richer range of constructed-response item types that can measure various
cognitive skills; and greater teacher involvement in item development. In addition, the
consortium will explore computer-adaptive testing that can diagnose how well
students are meeting the Common Core State Standards and adjust, in real time, the
rigor and content of the items presented to students based on students’ previous
responses. Maryland has piloted the use of artificial intelligence systems in scoring
constructed responses. The State hopes each consortium will fully implement the
60
ESEA FLEXIBI LITY – REQ UEST U .S . DEPARTMENT OF EDUC ATI ON
goals and recommendations contained in the 2010 draft of the National Educational
Technology Plan.
In transitioning to a new system of high-quality assessments, Maryland builds on an impressive
legacy of leadership. In the 1980s, Maryland was one of the first states to require students to
pass a Statewide minimum competency test, the Maryland Functional Test, as one condition of
earning a high school diploma. In the 1990s, the Maryland School Performance Assessment
Program (MSPAP) pioneered the use of performance-assessment tasks to foster students’
problem-solving, critical-thinking, and writing skills. This first iteration of performance
assessments provided excellent school-level data, which gives Maryland a valuable head start in
developing the kinds of multiple measures of performance that provide a more balanced and
comprehensive view of achievement. The current criterion-referenced Maryland School
Assessments (MSA), begun in 2003, provide even more useful student-level data that have
helped to drive improvements at the classroom level and reduced achievement gaps.
Maryland’s transition plan for the implementation of a new assessment system links seamlessly
to professional development initiatives for teachers designed to assist movement from the
Maryland State Curriculum to the Common Core State Standards (see above). Maryland’s
teachers have benefited in the past decade from the existence of a very transparent assessment
system supported by the Online Instructional Toolkit on www.mdk12.org. Statewide, teachers
already understand the State curriculum and assessment parameters that guide accountability
testing. Maryland’s transition plan to new assessments will build on this existing knowledge
base and assist teachers and administrators in understanding changes in the assessment system.
Maryland’s past experience transitioning to and implementing the MSPAP provides an
experience base across the State that increases the likelihood that teachers can effectively use the
results of performance-assessment tasks to improve instruction. Maryland’s current assessment
system already allows schools to administer tests on the computer, and the State has piloted the
use of artificial intelligence systems in scoring constructed responses. The new generation of
assessments will be delivered primarily on a technology platform. A purposeful, Statewide plan
will assist for all schools to migrate from paper-and-pencil assessments to technology-delivered
assessment practices. A Statewide cadre of technology-savvy teachers will ensure there are
61
ESEA FLEXIBI LITY – REQ UEST U .S . DEPARTMENT OF EDUC ATI ON
educators in every school who can build capacity among staff for effective use of technology in
assessment practices.
Maryland’s transition plan first ensures that its existing assessment system remains fully
operational until new assessments are implemented. Since full implementation of the new
assessment system will occur no later than the 2014–15 school year, the Maryland State Board
of Education is reviewing the issue of whether the current assessment system needs to be
changed in order to ease the transition to the new assessments. They are expected to make a
decision in spring 2012.
Upon passage of the Maryland Governor’s proposed budget, the last administration of the Mod-
MSA in reading and mathematics for grades 3 through 8 will be March 2012. Therefore,
Maryland is beginning the transition for the students taking the 2% Mod-MSA in the spring
2012.
Plans for transition are clearly defined in the Memo from Dr. Bernard Sadusky to the Local
Superintendents of Schools dated March 2, 2012 (Appendix II- 2); the Maryland State
Department of Education (MSDE) Transition Plan for 2% Mod-MSA Students to the Regular
MSA School Year 2012-2013 (Appendix II-3); and the Elimination of Modified Maryland
School Assessment Questions and Answers Draft Document (note that the Q and A document is
still in draft form) (Appendix II-4).Maryland will continue to engage stakeholders to provide
input to the multistate consortia and will keep stakeholders up to date as important design
decisions are made. Participation of MSDE and LEA content specialists in the assessment design
work conducted by multistate consortia will ensure this engagement takes place, and monthly
updates to the LEA Superintendents and Assistant Superintendents for Instruction ensure
ongoing communication with LEA leadership. Participation by Maryland teachers in the
construction of assessment items increases engagement and ownership. In addition, Maryland
will support teachers’ transitions to new assessments by keeping them fully informed at all
stages of assessment design, with particular attention to those areas where the design of new
assessments differs from past practice (e.g., computer-adaptive designs).
Maryland believes that student learning advances when student achievement data in various
62
ESEA FLEXIBI LITY – REQ UEST U .S . DEPARTMENT OF EDUC ATI ON
forms inform teachers’ decisions regarding lesson planning and choice of instructional materials.
Teachers and administrators will reap the greatest benefit in transitioning to new State
summative assessments through their involvement in developing formative assessments.
Maryland’s plan for developing formative assessments that are aligned with the new summative
assessments involves building on existing expertise in the State, including work underway with
Response to Intervention and Classroom Focused Improvement Program models, where several
LEAs already employ a rich array of formative and interim assessment tools. Initial work has
involved creating an item bank constructed from these existing tools including tools specifically
designed for ELL and SWD students. This bank will be expanded based on the ongoing
assessment development work of the State’s consortium partners. Teachers will use high-quality
formative assessments that provide Maryland’s teachers with real-time data as part of the
Instructional Improvement System being implemented through Maryland’s Race to the Top
Grant. Effective use of formative assessment results to guide instructional decision making will
be a major component of face-to-face and online professional development offerings.
Finally, the development and implementation of a new assessment system is meaningless unless
that system validly and reliably measures the readiness of students to succeed in college and
careers. Thus, a critical transition activity is the active collaboration of MSDE and Maryland’s
IHE community at all stages of the development of formative, interim, and summative
assessment tools. Importantly, to ensure that assessments are fully aligned with the college
admissions requirements and employers’ hiring criteria, Maryland’s higher education faculty
have been participating extensively in the multistate consortia’s activities, including blueprint
design, item development, piloting, field testing, operational administration, range finding,
scoring, and reporting. In the process, Maryland is fully implementing a key recommendation
from the Governor’s College Success Task Force: “Partner with Maryland P–20 discipline-based
groups to ensure that the high school assessments of the Common Core State Curriculum build
on the rigor of K–8 assessments and serve as college-readiness tests for all students.” To this
end, Maryland secured letters of intent from all IHEs, including those with Special Education
programs, to participate in the assessment consortium development of high school summative
assessments in Reading/English/Language Arts and mathematics, and to implement policies that
place students who meet the consortium-adopted achievement standards for each assessment
into credit-bearing college courses. This collaborative work will be reported regularly to
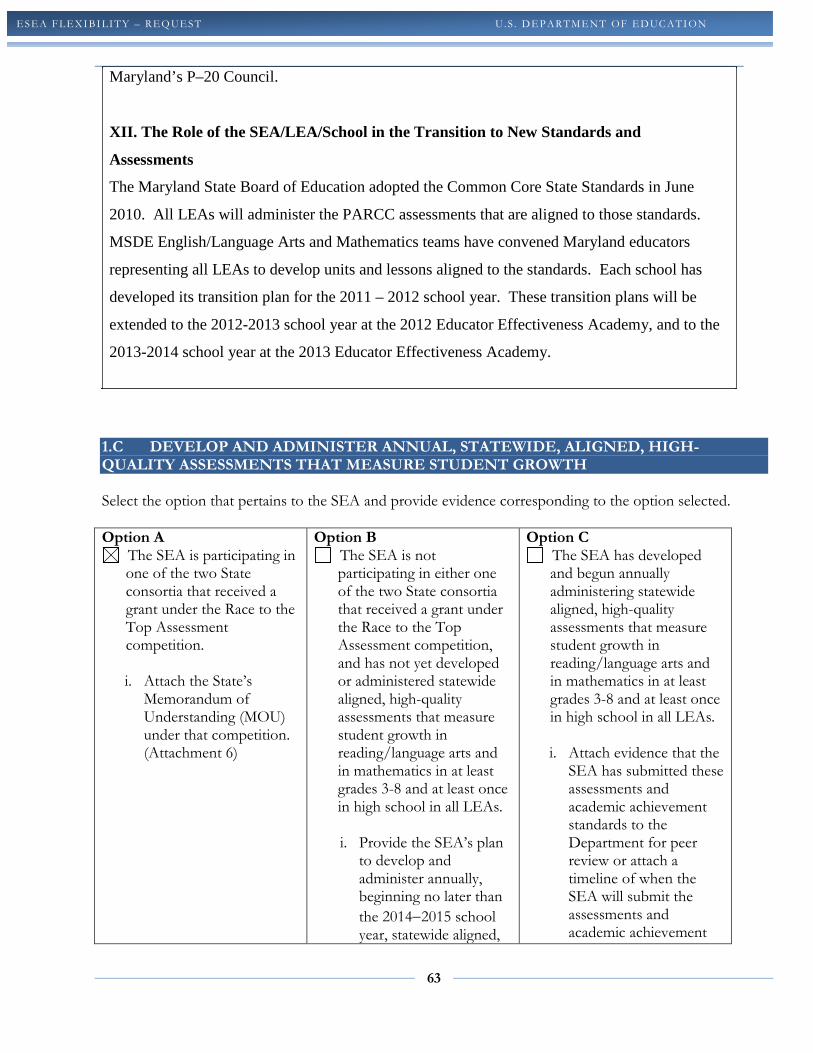
63
ESEA FLEXIBI LITY – REQ UEST U .S . DEPARTMENT OF EDUC ATI ON
Maryland’s P–20 Council.
XII. The Role of the SEA/LEA/School in the Transition to New Standards and
Assessments
The Maryland State Board of Education adopted the Common Core State Standards in June
2010. All LEAs will administer the PARCC assessments that are aligned to those standards.
MSDE English/Language Arts and Mathematics teams have convened Maryland educators
representing all LEAs to develop units and lessons aligned to the standards. Each school has
developed its transition plan for the 2011 – 2012 school year. These transition plans will be
extended to the 2012-2013 school year at the 2012 Educator Effectiveness Academy, and to the
2013-2014 school year at the 2013 Educator Effectiveness Academy.
1.C DEVELOP AND ADMINISTER ANNUAL, STATEWIDE, ALIGNED, HIGH-QUALITY ASSESSMENTS THAT MEASURE STUDENT GROWTH Select the option that pertains to the SEA and provide evidence corresponding to the option selected. Option A
The SEA is participating in one of the two State consortia that received a grant under the Race to the Top Assessment competition.
i. Attach the State’s
Memorandum of Understanding (MOU) under that competition. (Attachment 6)
Option B The SEA is not participating in either one of the two State consortia that received a grant under the Race to the Top Assessment competition, and has not yet developed or administered statewide aligned, high-quality assessments that measure student growth in reading/language arts and in mathematics in at least grades 3-8 and at least once in high school in all LEAs.
i. Provide the SEA’s plan
to develop and administer annually, beginning no later than the 2014−2015 school year, statewide aligned,
Option C The SEA has developed and begun annually administering statewide aligned, high-quality assessments that measure student growth in reading/language arts and in mathematics in at least grades 3-8 and at least once in high school in all LEAs.
i. Attach evidence that the
SEA has submitted these assessments and academic achievement standards to the Department for peer review or attach a timeline of when the SEA will submit the assessments and academic achievement
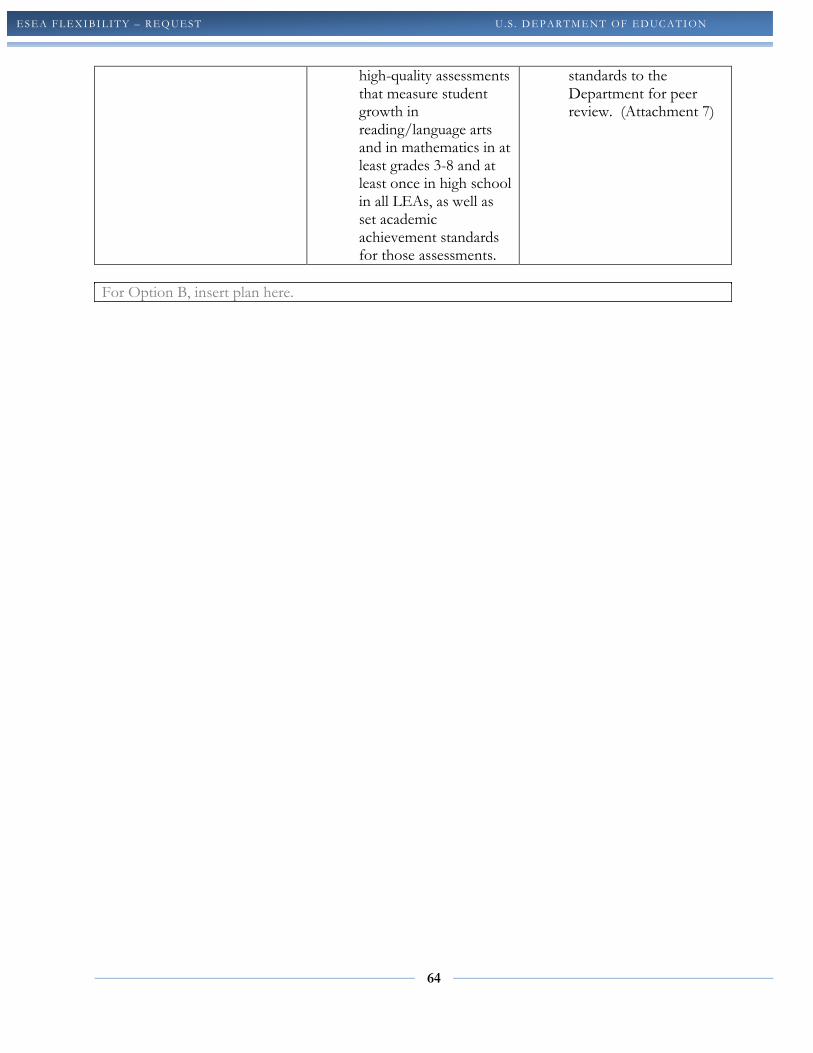
64
ESEA FLEXIBI LITY – REQ UEST U .S . DEPARTMENT OF EDUC ATI ON
high-quality assessments that measure student growth in reading/language arts and in mathematics in at least grades 3-8 and at least once in high school in all LEAs, as well as set academic achievement standards for those assessments.
standards to the Department for peer review. (Attachment 7)
For Option B, insert plan here.
65
ESEA FLEXIBI LITY – REQ UEST U .S . DEPARTMENT OF EDUC ATI ON
PRINCIPLE 2: STATE-DEVELOPED DIFFERENTIATED RECOGNITION, ACCOUNTABILITY, AND SUPPORT
2.A DEVELOP AND IMPLEMENT A STATE-BASED SYSTEM OF DIFFERENTIATED RECOGNITION, ACCOUNTABILITY, AND SUPPORT
2.A.i Provide a description of the SEA’s differentiated recognition, accountability, and support
system that includes all the components listed in Principle 2, the SEA’s plan for implementation of the differentiated recognition, accountability, and support system no later than the 2012–2013 school year, and an explanation of how the SEA’s differentiated recognition, accountability, and support system is designed to improve student achievement and school performance, close achievement gaps, and increase the quality of instruction for students.
Maryland’s flexibility proposal permits the State to build on more than two decades of experience with
school accountability using systematic enhancements benefitting from an array of technical and policy
improvements that continue to evolve. The current flexibility proposal is based on the best
accountability tools available to Maryland and now encompasses a broader palate of indicators of
school progress. However, the proposal anticipates the continuing evolution of school accountability
over the coming years as the State implements PARCC assessments and makes further strides in both
policy and data development. As additional tools become available to Maryland, Maryland plans to
continue to evolve the proposed accountability plan to take advantage of tools currently in development
and to work toward better reflecting the societal values that Marylanders express regarding their
schools.
The Adequate Yearly Progress measures and school report cards of the past decade of No Child Left
Behind are increasingly becoming outdated as developments on the research front avail educators with
better tools and strategies. The grid of measures mandated by No Child Left Behind may have
reflected the state of the art in 2002, but educators now recognize that AYP could tell only a very
limited story of achievement for each school. However, through a decade of hard work, leaders have
increasingly seen the value of expanding accountability mechanisms to encompass better real-time
feedback via the analyses of data features, particularly within student growth and subgroup
performance gap data.
The ongoing dialogue in Maryland over the past decade has involved a rich exchange among advocates
66
ESEA FLEXIBI LITY – REQ UEST U .S . DEPARTMENT OF EDUC ATI ON
for students, teachers, and school and school system leaders. By the time the ESEA Flexibility
guidance was released by the United States Department of Education, Maryland State leaders had a
strong sense of what the educational community and the community at large valued about schools.
Through the two-decade school accountability experience in Maryland, school leaders have found the
community to be a steadfast partner in the struggle to improve our schools. Unfortunately, the inherent
design of No Child Left Behind, with its idealistic drive for one-hundred-percent proficiency by 2014
had the net effect of diluting State and local efforts to improve Maryland’s most critically ineffective
schools. ESEA Flexibility permits Maryland to reset its focus on the lowest-performing schools and to
support those efforts vigorously, with a drive toward rigorous, but more realistic goals.
In Maryland and elsewhere in the nation, the dialogue on schools has become focused more sharply on
ensuring that the learning trajectory for every student is aimed more accurately toward college and
career goals. Consequently, Maryland invites the opportunity provided by the flexibility guidance to
include a focus on that trajectory from preK through the post-secondary experience. It is for this reason
that Maryland stakeholders invited the opportunity to recast the school accountability system to begin
taking the pulse on College- and Career-Readiness. The initial readiness measures proposed by
Maryland are carefully chosen to be ones that are useful in gauging the programmatic trajectory of all
high schools and all students in those schools. This shift can now provide a catalytic opportunity for
both SEAs and LEAs to begin looking at their own work with high schools and their own even deeper
measures of high school programs. Maryland was cautioned by advisors to ensure that the array of
components in its accountability measures was limited to those most reflective of the education
community’s values and not overload the array with too many discrete measures. Overly robust arrays
of school performance often provide too many compensatory opportunities for schools, ultimately
permitting schools to hide their challenges in favor of their image. School improvement work must be
based on honest reporting and an open understanding of the root causes of failure.
Maryland also approached the data array for its accountability system with an eye toward elegance,
credibility, and validity. The past decade of school improvement work has provided a good
opportunity to build strong accountability systems at the State level. However, many more additional
opportunities lie ahead for states to begin capturing even more meaningful data and analytical tools.
College- and career-readiness measures will evolve to take advantage of data from nationally used
programs such as that generated by Advanced Placement and International Baccalaureate programs.
67
ESEA FLEXIBI LITY – REQ UEST U .S . DEPARTMENT OF EDUC ATI ON
Because the accountability program is meant to gauge student performance and readiness and not
school policies, some work will lie ahead for Maryland to identify ways to incorporate some of the
most meaningful data as the accountability system further evolves.
Over the past two decades, work with low-performing schools has been based on relatively limited
comparative snapshots of school data. School leaders analyzed their performance against LEA and
SEA results in any given year and watched their trend lines over time. Maryland’s flexibility proposal
will provide leaders with better tools to gauge how schools are addressing the needs of subgroups as
well as individual students. The data array will permit leaders to examine how well students are
progressing year-to-year. The system will permit leaders to probe further into data to locate the most
egregious student performance gaps among subgroups. Both student growth and subgroup gaps data in
isolation are of very limited value unless viewed comparatively.The Maryland School Performance
Index will be rolled out as part of Maryland’s recasting of its accountability system. The annual
tracking of a school’s aggregated and subgroup performance will continue as reported via
www.MDReportCard.org at the school, school system, and state level. The data will be informative to
the school improvement progress, particularly as it relates to the Annual Measurable Objectives as
calculated using Option A and will assure full disclosure of the year-to-year performance of every
Maryland school. However, the Maryland School Performance Index will use the Report Card data
and/or derivatives of that data for the purpose of painting a clear picture of every school’s performance
on a comparative scale in relation to the school’s movement toward the reduction of student non-
proficiency within six years.
Maryland has multiple effective channels to communicate and explain the new accountability system
and Index. Currently, Maryland is undergoing a redesign of the MarylandReportCard.org website,
which will include in depth information of the new reporting system. The website has consistently been
the primary source of individual school, system and State accountability data. Screen shots of the initial
stage of the preliminary design are attached (Please see Appendix II-5). There are regular monthly
meetings with Local School System Superintendents and Assistant Superintendents for Instruction, as
well as regular meetings with Local Accountability Coordinators and Public Information Officers.
Maryland has various regular publications that are widely disseminated to system-level and school-
based staff and other stakeholders that will address the change. MSDE staff also plan on producing a
68
ESEA FLEXIBI LITY – REQ UEST U .S . DEPARTMENT OF EDUC ATI ON
video that will be promoted to a wide variety of audiences and available on the Maryland
website. MSDE will work with Maryland State PTA so that parents can be updated during their regular
communication channels and also during their annual statewide convention held in July. Information
will also be provided through a Parent's Guide publication that will be widely distributed. MSDE will
also work with the Maryland Association of Student Councils to provide information directly to
students. Finally, Maryland will utilize a wide variety of media outlets to update the general public.
Additionally, webinars are being developed that describe the calculations for Priority, Focus and
Reward schools; Option A AMOs; and the school index. Webinars will be presented to Local
Accountability Coordinators, Title I Coordinators and Directors of Special Education. Design and
development work with Maryland’s vendor for the public website (mdreportcard.org) began for the
presentation of the Maryland School Performance Index. Maryland plans to calculate the school
index utilizing the 2011-2012 assessment and accountability data for publication in August 2012.
The Index mirrors recent work performed in many other states on similar indices, but it is uniquely a
Maryland tool. The Index is the result of work the State has done to dialogue with advocates, leaders,
and stakeholders over many months on the future of accountability in Maryland. While Maryland
conducted dozens of formal briefings and exchanges with key stakeholders over five months,
Maryland’s unique geographic and political structure has been conducive for the ongoing dialogue on
school accountability for some years. The State Superintendent and key staff meets ten to twelve times
per year with the State’s twenty-four local superintendents on critical policy issues, for which school
accountability has been an ever-present part of the discussions. Further, Maryland State Department of
Education technical, program, and policy staff meet nearly as often with their local counterparts to
assure coherence across local school systems and to ensure effective implementation of new policies
and programs. All were engaged in dialogues and briefings with these groups in the five months during
which the current proposal was developed. Numerous additional meetings were held with teachers,
parents, higher education officials, business leaders, and advocates to broaden the dialogue. The
ultimate shape and structure of the Index is a direct result of those dialogues.
The discussions often probed routine implementation issues for both State and local staff as well as the
data requirements. It also became clear that the State would ultimately need to limit the number of
Index components to ones that were meaningful to schools and at the same time would meet the highest
tests of integrity. While the mechanisms and structures for measurement were probed, a significant
69
ESEA FLEXIBI LITY – REQ UEST U .S . DEPARTMENT OF EDUC ATI ON
amount of attention was given to the core values that stakeholders held regarding their schools. The
core values emerging from those discussions were not unlike those held in other states, but they helped
assure that the Index would be rooted in things that most mattered to Marylanders.
The Core Values were articulated in numerous ways, but they ultimately came down to a recognition
that schools needed to assure that every student in every school was served well. That meant that at the
end of the school year, every student would have progressed at least one year in critical content
knowledge and skills. It also meant that no student subgroup would fall behind due to the lack of
attention of school leaders to student and/or community problems and needs. The Core Values, in the
end, centered around the deeply held belief of so many stakeholders that graduates should graduate on
time and be prepared to pursue their life dreams.
By cross-referencing the Core Values strongly articulated by the community and stakeholders as well
as educators against the data and data tools currently available in Maryland, the concept of the
Maryland School Performance Index was born. A need for simplicity and elegance for both
implementation and communication reasons formed the basis for the skeleton structure of the Index
with three distinct Core Values areas for each of the elementary, middle school, and high school levels.
The elementary and middle school Index looks at Student Achievement, Growth, and Gaps while the
high school Index substitutes College- and Career-Readiness for Growth. At some time in the future,
student growth may be incorporated into the high school Index, but the State’s data advisors suggested
that the current assessment programs at the high school and middle school levels had administrative
and timing issues that might confound the production of a high school growth measure and compromise
the value of the Index measure. Further study or assessment changes in future years might facilitate the
introduction of growth into the high school Index.
In February 2012, Maryland conducted standard setting for the Index using a modified Delphi model
similar to the approach used in Maryland over the past two decades for standard setting for
assessments, performance reports, graduation rates, and other accountability measures. Approximately
25 stakeholders were invited to participate in the process from local superintendents of both large and
small school systems to parent and teacher representatives, local school data technical experts, business
representatives, school principals, and advocates for groups such as students with disabilities and
students who are English Language Learners. The participants were provided an orientation on the
70
ESEA FLEXIBI LITY – REQ UEST U .S . DEPARTMENT OF EDUC ATI ON
ESEA Flexibility proposal for Maryland and the role the Index will play in the State’s school
accountability system. The data elements were defined and articulated so that participants would
understand both the values and limitations of the measurements included in the Index. However,
participants were asked to recognize their own values as they related to schools and to work as a group
toward consensus on the weights to be applied to each of the Core Value areas in the Index and the
components of each.
By identifying the median position of each participant on each consensus round, standards-setting
leaders produced a complete record of proceedings for sharing with the Interim State Superintendent of
Schools. Following the State Superintendent’s review of the recommendations of the standards-setting
group, the State Superintendent produced a set of recommendations for the State Board of Education
for inclusion in the ESEA Flexibility application for Maryland. On February 13 and again on February
28, the State Board examined and agreed to the Core Values Areas, their weights, and the weights of
their components as reflected in this application.
Annual Measurable Objectives
The proposal begins by incorporating the opportunity under Option A in the Flexibility Guidance to
reset Annual Measurable Objectives (AMOs) for the coming six years on a trajectory toward 2017, the
time by which each individual school is expected to reduce its percent of non-proficient students for
each of its subgroups and overall by half. The reconfiguration of annual targets and the 2017 goal itself
will be instrumental in driving school improvement work for all schools, all students, and all
subgroups. The AMOs will be calculated for each school for the “all students” category and for all of
the subgroups. The subgroup level AMO in the LEA will be used for any subgroup or “all students”
with a 90% or higher baseline. Please see below for the 2010-11 State data (this will not be referred to
as an AYP Report in the future) — these AMOs represent the State level AMOs collapsed for all grades
K-12. Further, the progress of each school toward the Statewide targets provide valuable information
over time on the effectiveness of instructional strategies, the inherent needs of the students and the
extent to which the school is fulfilling those needs. Participation will continue to be calculated and
included with a 95% AMO for participation.
Maryland will reinforce its expectation that all students participate in assessments by including the non-
participants in the Option A Achievement AMOs at the Basic proficiency.
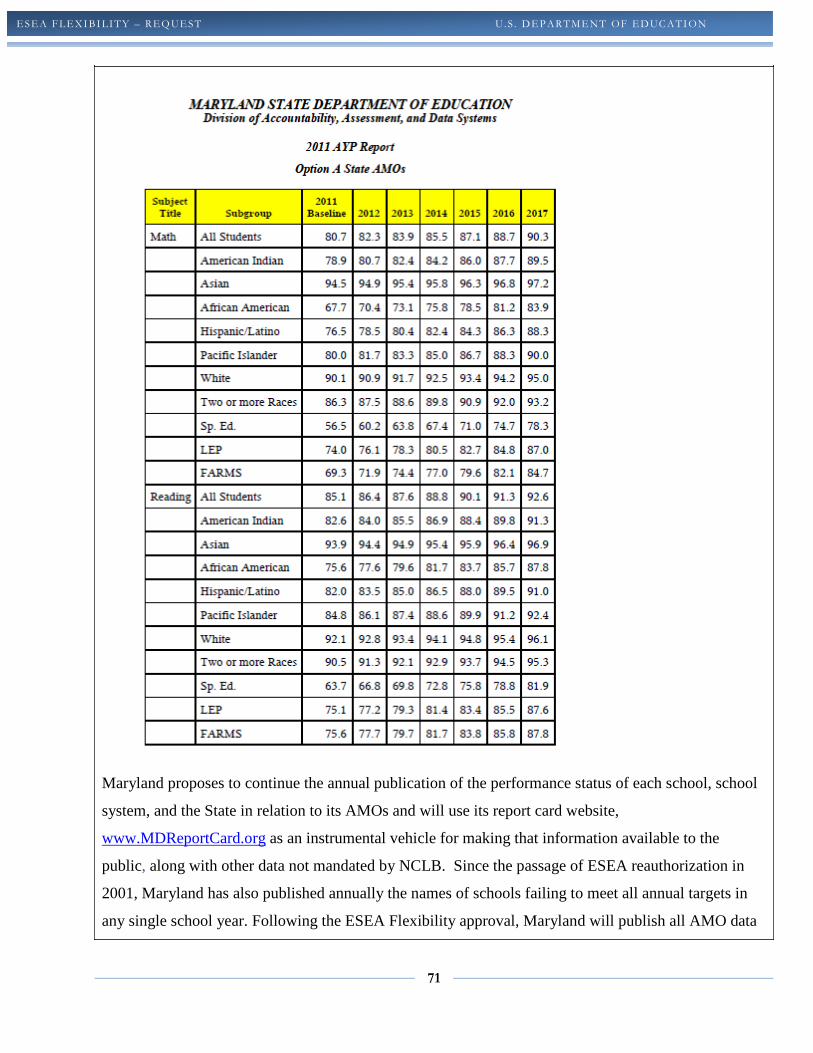
71
ESEA FLEXIBI LITY – REQ UEST U .S . DEPARTMENT OF EDUC ATI ON
Maryland proposes to continue the annual publication of the performance status of each school, school
system, and the State in relation to its AMOs and will use its report card website,
www.MDReportCard.org as an instrumental vehicle for making that information available to the
public, along with other data not mandated by NCLB. Since the passage of ESEA reauthorization in
2001, Maryland has also published annually the names of schools failing to meet all annual targets in
any single school year. Following the ESEA Flexibility approval, Maryland will publish all AMO data
72
ESEA FLEXIBI LITY – REQ UEST U .S . DEPARTMENT OF EDUC ATI ON
for the “all students” category and for each individual subgroup for each school. However, Maryland is
requesting a waiver of the requirement for identifying schools based on AYP status since the proposal
reconfigures accountability to a more accurate methodology, based on the flexibility provided in the
Flexibility Guidance.
Maryland School Performance Index
Maryland’s collaboration with its partners—parents, educators, legislators, business, and the general
public—has produced consensus on a set of Core Values that will drive the identification of schools for
intervention and similarly the recognition of schools making exceptional progress and achieving at high
levels. Selected components and derivatives from the traditional Adequate Yearly Progress data set
will be incorporated into a school appraisal instrument that more comprehensively reflects the Core
Values Marylanders have regarding their schools.
The identified Core Values begin with student performance. Certainly, the goal and purpose of each
Maryland school is to assure that students receive the best education possible and can demonstrate the
acquisition of the skills and knowledge they have acquired. Maryland assessments, built under the
requirements of the Elementary and Secondary Education Act continue to be the benchmarks by which
student performance is measured, with proficiency standards (advanced, proficient, basic). These
assessments provide an accurate measure of student achievement in critical grade level mathematics
and reading/English content. This information contributes directly to the current AYP data set posted
for each school and subgroup. The data related to AMO progress for schools will essentially be the
same information feeding into the Core Values measurements. Core Values data is principally
concerned with the distance a school is from each of its annual performance targets as determined by
Option A. It should be noted that the Index will be revised as MSA and HSA are replaced by PARCC
Assessments and other measures are developed with the implementation of the Longitudinal Data
System.
Ultimately, the Standard Setting Committee on February 8th made recommendations for the value of
achievement. If all students are achieving at high levels, then the performance of the school is deemed
acceptable and the school assessed as successfully achieving its targets and goals. However, within
every school, the spectrum of student performance mirrors an array of student social, developmental,
and medical conditions. Standards are set to represent the minimal expectations all students will need
73
ESEA FLEXIBI LITY – REQ UEST U .S . DEPARTMENT OF EDUC ATI ON
to meet if they are to be prepared adequately for the next school year’s academic challenges and to
eventually be college- and career-ready.
Particularly for students receiving special services (English Language Learners, students with
disabilities, and students living in poverty as measured via the Free and Reduced Price Meals Program)
and for some students in some traditionally low-performing racial subgroups, the assessment standards
and thus the annual performance targets may be challenging to achieve. Consequently, the school’s
instructional program must include features designed for the primary purpose of accelerating the year-
to-year performance growth of low-performing students so that the annual targets are achieved assuring
the student can be ready for college or career upon graduation.
Through the MD IDEA scorecard, State and district leaders can compare schools, regions and district
performance of all students, including students with disabilities. At the local level, school leaders can
analyze local school data to improve school performance and access online professional development to
support data analysis and data informed decision making. In addition, schools can monitor fidelity of
implementation of targeted interventions and student performance. The Maryland State Department of
Education, Division of Special Education/Early Intervention Services has a newly launched web portal
located at http://marylandlearninglinks.org. This dynamic site has many interactive features and
resources for educators and families related to special education and early intervention services in
Maryland. The site is constantly being updated and enhanced with new resources and current
information. The Maryland Learning Links (MLL) contains multiple channels and among them are the
Teaching All Students, Professional Practice, and Leadership channels. The Teaching All Students
channel contains multiple methods of presenting information about research-based practices such as
Universal Design for Learning and Differentiated Instruction. There are media clips, enhanced
podcasts, narrative information, professional development segments, articles, interactive practice
activities, and links to learn more that can all be used to support professional development and growth
for addressing the needs of diverse learners. The Professional Practice channel has information that can
support a teacher in developing their own professional growth plan throughout their career that will
enhance their skills in meeting diverse student needs. There is also media and information about
mentoring. The Leadership channel was developed to support leaders and school administrators who
are the instructional leaders that lay the foundation for establishing a collaborative school culture in
order to promote high levels of achievement for all students.
74
ESEA FLEXIBI LITY – REQ UEST U .S . DEPARTMENT OF EDUC ATI ON
School improvement is by definition a long term but constantly changing process. Good planning
based on the analyses of targeted data should keep the necessary changes to a minimum. Any change
should be directly driven by the changing needs of the students and often takes several years to
institutionalize. Meanwhile, students who are not performing at the standards levels often need
extraordinary intervention to fuel their performance acceleration, regardless of the overall condition of
the school. Recognizing that greater incentive and accountability is needed to assure that kind of
acceleration, Maryland constituents indicated a need for direct measurements of the acceleration of
individual student performance and for the closing of gaps for student subgroups. Consequently, the
proposed Maryland School Performance Index incorporates two additional related, but separate Core
Values—Gap Closing and Annual Individual Student Growth. The Standard Setting Committee made
further recommendations for the weights of gap and growth.
A fourth Core Value is College- and Career-Readiness. While no satisfactory elementary or middle
school measures currently exist, several existing high school measures permit a reasonably satisfactory
assessment of the measure. Maryland looks forward to the addition of further elements as the data
become available with the development of the Longitudinal Data System and as Maryland administers
the PARCC assessments. Additionally, Maryland will continue to revise the School Performance Index
as the data components are analyzed and reviewed. Since the Standard Setting process was conducted
on February 8, 2012, as discussed below, Maryland will need to review the data runs and will submit
any revisions to USDE prior to implementation.
Ultimately, the Index will be used to group schools with similar challenges so that targeted supports
and resources can be offered by both the State Education Agency (SEA) and the Local Education
Agency (LEA).
Maryland School Performance Index Components Theory of Action
The premise of an Index is that schools are evaluated on a continuous scale based on variables
Maryland State Department of Education deems important indicators of adequacy: Achievement,
Growth, College- and Career-Readiness, and Reducing Gaps. A proportional index measures the
location of a school relative to a target (O/T) where O is the observed value and T is the target.
75
ESEA FLEXIBI LITY – REQ UEST U .S . DEPARTMENT OF EDUC ATI ON
Proportions less than one indicate the observed performance is less than the target. Proportions one or
greater indicate the observed performance is greater than or equal to the target. The measure is
continuous in that the value conveys how far above or below the target the observed result falls. The
index for the sample has a minimum value of 0 and a theoretical value greater than 1. The index can be
rescaled by multiplying the index value by the maximum value of the desired scale. For example, to
convert the values to a 100-point scale, multiply the index value by 100.
To simplify matters, targets for each component of the Index were created using the logic of Option A:
a 50% reduction by 2017 in students at basic, not graduating, etc. Annual targets were set according to
Option A as well. The amount of improvement needed to reach the 2017 target is equally distributed
across 6 years.
Unlike the discreet model used for AYP decisions (Met or Not Met), combining values within and
between categories results in a composite Index that is compensatory where a low value on one
component can be balanced by a high value on another component. It is possible that a school not
meeting the AYP criteria could have a relatively higher composite Index value and very likely be
judged as adequate. Unlike the AYP model in which all components are equally weighted, each of the
components and categories comprising the Index can be differentially weighted based on their
perceived importance in assessing overall school performance.
Under No Child Left Behind, a school could achieve Adequate Yearly Progress only if each of the
groups and subgroup performance levels met or exceeded the same Annual Measurable Objective.
Consequently, the school failing to achieve the AMO for one of the subject areas for one of the
subgroups would necessarily fail to achieve AYP for the year and failing to meet AMOs for two
consecutive years would result in the school entering school improvement. An examination of schools
not achieving AYP then produces a mixture of schools and consequently helps little in appraising a
school’s overall performance. The compensatory nature of the Index reveals better how the school is
performing and incorporates vitally important information about improvement and growth in addition
to achievement. (The draft of the Index is below with full size copies in Appendix 2.A)
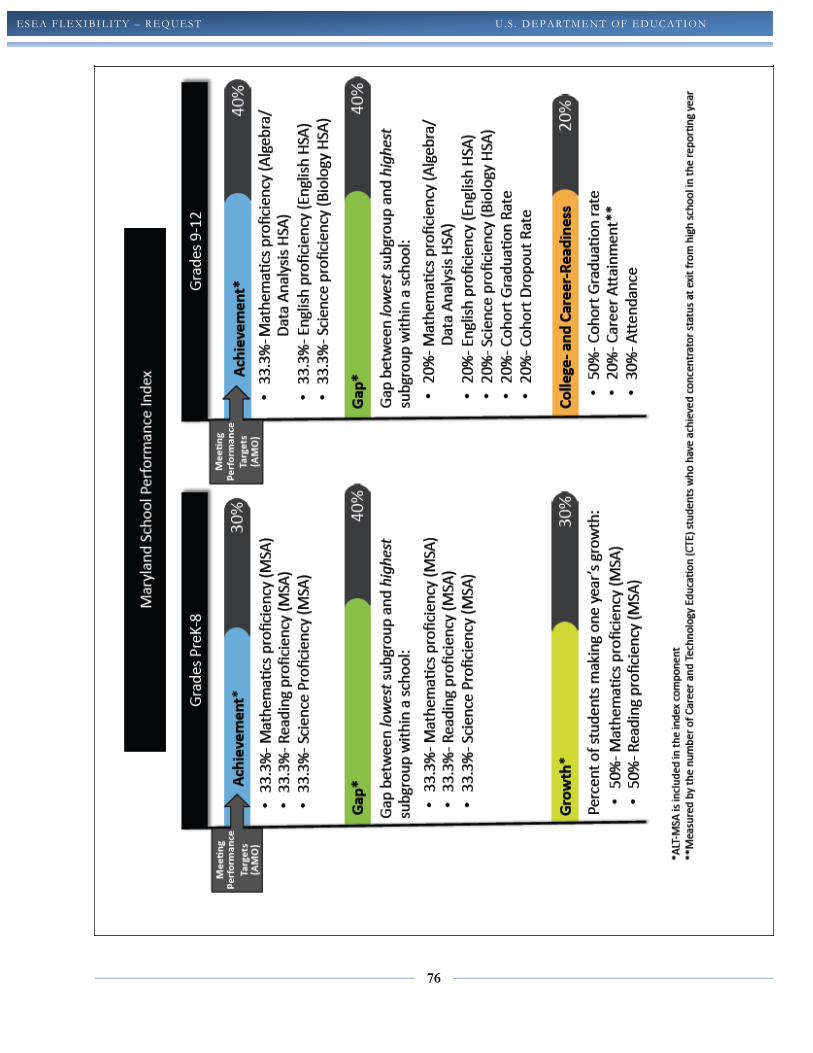
76
ESEA FLEXIBI LITY – REQ UEST U .S . DEPARTMENT OF EDUC ATI ON
77
ESEA FLEXIBI LITY – REQ UEST U .S . DEPARTMENT OF EDUC ATI ON
Core Value Definitions
The Core Values related to the Maryland School Performance Index include the following:
Achievement (elementary, middle, and high school) based on percentage of the “all students” group
scoring proficient or advanced on the Maryland School Assessments (MSA) (which includes and will
continue to include student performance on the Alt-MSA) in Mathematics, Reading, and Science for
Elementary Schools, Middle Schools, and on the High School Assessments in Algebra, Biology, and
English. Non-participants will be included at basic proficiency to reinforce Maryland’s expectation that
all students participate in the assessments.
Growth (elementary and middle) or Annual Individual Student Performance Growth is based on the
percentage of the “all students” group and in specific subgroups demonstrating growth in performance
over the previous year. Annual targets set for each content area separately are based on the percent of
students that would yield a 50% reduction in the percentage of students by 2017 demonstrating less
than one year’s growth from the prior year for the “all students” group.
Gap Reduction (elementary, middle, and high school) is defined as a decrease in the performance gap
between the highest- and lowest-performing subgroups. The calculations include an adjustment for
reductions resulting from declines in performance of highest-performing subgroup.
College- and Career-Readiness for high schools includes cohort graduation rate, attendance, and
career attainment. Maryland’s School Performance Index (Grades 9-12) includes College- and Career-
Readiness Indicators because they are important early predictors of whether a student will be positioned
for successful first steps in college and a career. In the first iteration of the Index, only indicators for
which there are established data elements are included. These indicators will be adjusted/replaced as
the Index is refined and expanded with the assistance of the Maryland Longitudinal Data Systems
(LDS). (Note: Once Maryland’s LDS is fully operational, the Career Attainment metric for the School
Performance Index can be replaced by the percentage of graduates achieving program completion status
or the percentage of graduates earning industry certifications.) While these indicators are less than
perfect, each can be viewed as a predictor of college and career success. Moreover, they currently
constitute the measures for which reliable data is available. Over time, it is expected that more
measures, such as International Baccalaureate and Advanced Placement metrics, will be added with the
78
ESEA FLEXIBI LITY – REQ UEST U .S . DEPARTMENT OF EDUC ATI ON
Longitudinal Data System (LDS).
Cohort Graduation Rate and Definition
Maryland began using the cohort graduation rate for accountability in 2011, one year ahead of the
requirement for all states due to State Legislation. Maryland has previously used and continues to
report the Leaver Graduation Rate. The Leaver Graduation Rate is 87.0% for 2011, up from 85.2% in
2007, demonstrating continuing growth in overall graduation rate for all Maryland students. The goal
and respective targets for both 4-year and 5-year cohort graduation rate for the “all students” group
were established in February 2011 and approved by the State Board. For 2012, all states must report
cohort graduation rate for the “all students” group and for each subgroup.
Through the Standard Setting process, a group of stakeholders recommended that the cohort graduation
goal be 95% in 2020 (submitted and approved by USDE in Maryland’s Consolidated State Application
in 2011). Based on data analysis it is clear that there are subgroups that continue to struggle with
graduation and a number of subgroups have far greater distances to improve and reach this 95% 2020
goal than others.
To ensure that Maryland’s process and targets are both rigorous and attainable, Maryland has calculated
the targets for subgroups utilizing the target approved by USDE in 2011 and adapting the “Option A”
for assessment AMOs as provided in the ESEA Flexibility Application. The procedure is: Set annual
equal increments toward the goal of reducing by half the percentage of students in each subgroup who
are not meeting the 95% in 2020 graduation goal, as approved by USDE, within nine years (number of
years between the present and 2020). By using option A to reach a grad rate using a goal of 95% by
2020, we want to reduce the percentage of non grads by 50% (one-half) in relation to the 95% goal
based on the base year. The formula for gain per year is as follows:
Gain per year = (((0.95 – (0.95 – baseline grad rate)/2) – baseline grad rate) / 9)
The formula above is used for the 4-year and 5- year cohort graduation rate.
State Graduation targets by subgroup are provided below. The first table is the 4-year cohort graduation
data and the second table is the 5-year cohort graduation data.
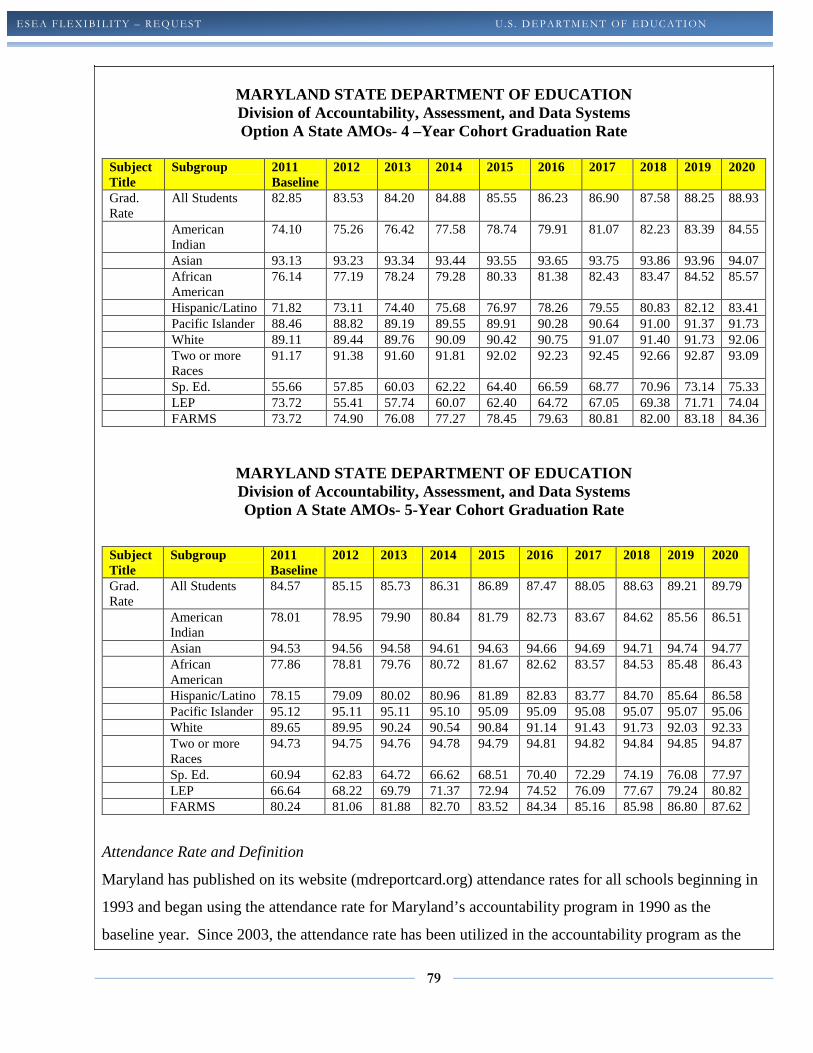
79
ESEA FLEXIBI LITY – REQ UEST U .S . DEPARTMENT OF EDUC ATI ON
MARYLAND STATE DEPARTMENT OF EDUCATION Division of Accountability, Assessment, and Data Systems Option A State AMOs- 4 –Year Cohort Graduation Rate
Subject Title
Subgroup 2011 Baseline
2012 2013 2014 2015 2016 2017 2018 2019 2020
Grad. Rate
All Students 82.85 83.53 84.20 84.88 85.55 86.23 86.90 87.58 88.25 88.93
American Indian
74.10 75.26 76.42 77.58 78.74 79.91 81.07 82.23 83.39 84.55
Asian 93.13 93.23 93.34 93.44 93.55 93.65 93.75 93.86 93.96 94.07 African
American 76.14 77.19 78.24 79.28 80.33 81.38 82.43 83.47 84.52 85.57
Hispanic/Latino 71.82 73.11 74.40 75.68 76.97 78.26 79.55 80.83 82.12 83.41 Pacific Islander 88.46 88.82 89.19 89.55 89.91 90.28 90.64 91.00 91.37 91.73 White 89.11 89.44 89.76 90.09 90.42 90.75 91.07 91.40 91.73 92.06 Two or more
Races 91.17 91.38 91.60 91.81 92.02 92.23 92.45 92.66 92.87 93.09
Sp. Ed. 55.66 57.85 60.03 62.22 64.40 66.59 68.77 70.96 73.14 75.33 LEP 73.72 55.41 57.74 60.07 62.40 64.72 67.05 69.38 71.71 74.04 FARMS 73.72 74.90 76.08 77.27 78.45 79.63 80.81 82.00 83.18 84.36
MARYLAND STATE DEPARTMENT OF EDUCATION Division of Accountability, Assessment, and Data Systems Option A State AMOs- 5-Year Cohort Graduation Rate
Subject Title
Subgroup 2011 Baseline
2012 2013 2014 2015 2016 2017 2018 2019 2020
Grad. Rate
All Students 84.57 85.15 85.73 86.31 86.89 87.47 88.05 88.63 89.21 89.79
American Indian
78.01 78.95 79.90 80.84 81.79 82.73 83.67 84.62 85.56 86.51
Asian 94.53 94.56 94.58 94.61 94.63 94.66 94.69 94.71 94.74 94.77 African
American 77.86 78.81 79.76 80.72 81.67 82.62 83.57 84.53 85.48 86.43
Hispanic/Latino 78.15 79.09 80.02 80.96 81.89 82.83 83.77 84.70 85.64 86.58 Pacific Islander 95.12 95.11 95.11 95.10 95.09 95.09 95.08 95.07 95.07 95.06 White 89.65 89.95 90.24 90.54 90.84 91.14 91.43 91.73 92.03 92.33 Two or more
Races 94.73 94.75 94.76 94.78 94.79 94.81 94.82 94.84 94.85 94.87
Sp. Ed. 60.94 62.83 64.72 66.62 68.51 70.40 72.29 74.19 76.08 77.97 LEP 66.64 68.22 69.79 71.37 72.94 74.52 76.09 77.67 79.24 80.82 FARMS 80.24 81.06 81.88 82.70 83.52 84.34 85.16 85.98 86.80 87.62
Attendance Rate and Definition
Maryland has published on its website (mdreportcard.org) attendance rates for all schools beginning in
1993 and began using the attendance rate for Maryland’s accountability program in 1990 as the
baseline year. Since 2003, the attendance rate has been utilized in the accountability program as the
80
ESEA FLEXIBI LITY – REQ UEST U .S . DEPARTMENT OF EDUC ATI ON
other academic indicator for elementary and middle schools The Attendance Rate for high schools in
2011 is 92.3%, up from the 1993 attendance rate of 90.6%.
Through a Standard Setting process, a group of stakeholders recommended that the attendance rate
target be 94% which has been part of the Accountability Workbook since 2003.
To ensure that Maryland’s process and targets are both rigorous and attainable, Maryland has calculated
the targets for high schools utilizing the 94% goal using the “Option A” procedures for the attendance
AMOs as provided in the ESEA Flexibility Application. The procedure is: Set annual equal increments
toward the goal of reducing by half the percentage of students in each subgroup who are not meeting
the 94% in 2017 attendance rate goal within six years. By using option A to reach an attendance rate
using a goal of 94% by 2017, we want to reduce the percentage of absentees by 50% (one-half) in
relation to the 94% goal based on the base year. The formula for gain per year is as follows:
Gain per year = (((0.94 – (0.94 – baseline attendance rate)/2) – baseline attendance rate) / 6)
Career Attainment Definition
Maryland gives students the option of earning a standard high school diploma with a career
concentration if they complete a State-approved career and technology education (CTE) program of
study. The Career Attainment rate represents the percentage of graduating students who attained
advanced standing in a State-approved CTE program of study, i.e. enrollment in the “concentrator” or
third course in the program sequence. (Note: CTE Concentrator data are included in Maryland’s CTE
Accountability System and are part of the data reported annually to the USDE.) CTE programs of study
provide students with academic and technical knowledge and skills, include a work-based learning
component, and culminate in an industry certification and/or early college credit.
Standard Setting
On February 8, MSDE invited 25 representatives of Maryland’s Statewide pre-K through 12 school
community to participate in a standard setting discussion on the new Maryland School Performance
Index. The group was identified to represent both school and school system leadership from among the
State’s twenty-four school systems as well parents and advocates for teachers and students. Groups
such as the Maryland State Educators Association (the NEA affiliate for Maryland) and the Baltimore
Teachers Union (the AFT affiliate) were invited to be at the table as well as advocates for students with
disabilities, Title I students, and ELL students. The Maryland State Department of Education provided
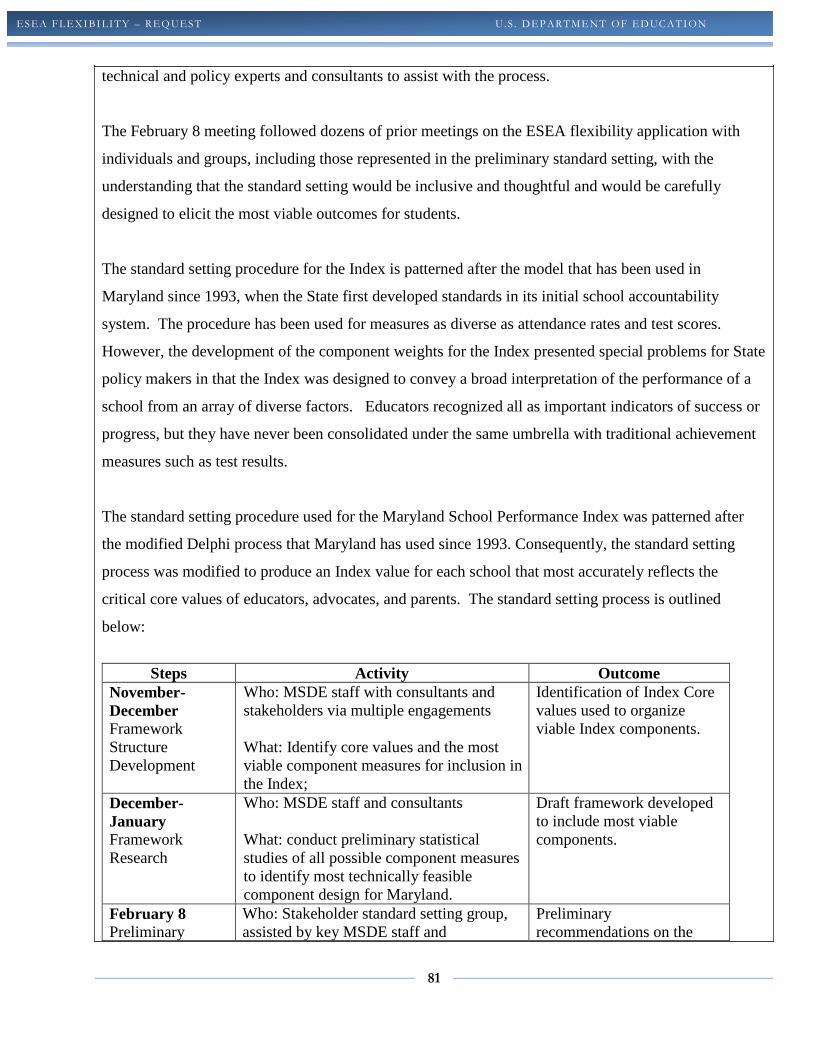
81
ESEA FLEXIBI LITY – REQ UEST U .S . DEPARTMENT OF EDUC ATI ON
technical and policy experts and consultants to assist with the process.
The February 8 meeting followed dozens of prior meetings on the ESEA flexibility application with
individuals and groups, including those represented in the preliminary standard setting, with the
understanding that the standard setting would be inclusive and thoughtful and would be carefully
designed to elicit the most viable outcomes for students.
The standard setting procedure for the Index is patterned after the model that has been used in
Maryland since 1993, when the State first developed standards in its initial school accountability
system. The procedure has been used for measures as diverse as attendance rates and test scores.
However, the development of the component weights for the Index presented special problems for State
policy makers in that the Index was designed to convey a broad interpretation of the performance of a
school from an array of diverse factors. Educators recognized all as important indicators of success or
progress, but they have never been consolidated under the same umbrella with traditional achievement
measures such as test results.
The standard setting procedure used for the Maryland School Performance Index was patterned after
the modified Delphi process that Maryland has used since 1993. Consequently, the standard setting
process was modified to produce an Index value for each school that most accurately reflects the
critical core values of educators, advocates, and parents. The standard setting process is outlined
below:
Steps Activity Outcome
November-December Framework Structure Development
Who: MSDE staff with consultants and stakeholders via multiple engagements What: Identify core values and the most viable component measures for inclusion in the Index;
Identification of Index Core values used to organize viable Index components.
December-January Framework Research
Who: MSDE staff and consultants What: conduct preliminary statistical studies of all possible component measures to identify most technically feasible component design for Maryland.
Draft framework developed to include most viable components.
February 8 Preliminary
Who: Stakeholder standard setting group, assisted by key MSDE staff and
Preliminary recommendations on the

82
ESEA FLEXIBI LITY – REQ UEST U .S . DEPARTMENT OF EDUC ATI ON
Determination of Index Weights
consultants. What: Study the Draft Index framework and the outcome of MSDE studies of component viability and determine alignment with core values.
weighting of components for the Index.
February 10 State Superintendent Review
Who: State Superintendent of Schools and appropriate MSDE staff What: Review the preliminary recommendations of the Stakeholder standard setting group
Recommendation of Index framework and component weights for State Board of Education
February 13 State Board Action
Who: State Board of Education What: Considers the recommendations of the State Superintendent of Schools on the School Performance Index framework for action.
The determination of the Index component weights for submission to USDE February 28 in the ESEA waiver application.
February 28 USDE Review
Who: USDE staff and experts What: Review of the complete Maryland ESEA waiver application
Approval/recommendations or both for Maryland on the implementation of the ESEA waiver plan.
March-May Further Technical Studies
Who: MSDE staff and consultants What: Conduct statistical studies of the draft framework and fine-tune the implementation steps necessary.
Studies based on the design to identify possible adjustments necessary to assure the Index functions as intended.
April-May Second Standard Setting Process
Who: MSDE staff and consultants What: Review data on the Index to determine cuts of schools.
Determination of schools in each of 5 strands as described in process.
February 8 Standard Setting Procedure
Development of Standards Recommendations:
HIGH SCHOOL STANDARDS
1. Relative weights for three core values areas (Achievement, Gaps, College- and Career-
Ready.
a. Develop an understanding of the terms used for components:
i. Core Values Areas
ii. Components
iii. Recommendations
b. Conduct table discussions on the core value areas and how these areas might help paint a

83
ESEA FLEXIBI LITY – REQ UEST U .S . DEPARTMENT OF EDUC ATI ON
good picture of a school’s performance.
c. Conduct consensus vote on the possible relative weights of the core values areas.
d. Discussion of the preliminary vote and range of votes.
e. Second table discussion on the weighting
f. Conduct second consensus vote on the possible relative weights of the core values areas.
g. Sharing of the outcome of vote 2, with explanation of the range of votes.
2. Relative weights for High School Achievement (English, Mathematics, Science)
a. Develop an understanding of the terms used for the achievement components.
i. English (English HSA)
ii. Mathematics (Algebra/Data Analysis HSA)
iii. Science (Biology HSA)
b. Conduct table discussion on the Achievement components and how these areas might
help paint a good picture of a school’s performance.
c. Conduct consensus vote on the possible relative weights of the Achievement
components.
d. Discussion of the consensus vote and range of votes.
e. Second table discussion on the Achievement weighting
f. Conduct second consensus vote on the possible relative Achievement component
weights.
g. Sharing of the outcome of vote 2, with explanation of the range of votes.
3. Relative weights for High School Gaps components. The Gaps components consist of the
gaps for each of the five measures between the school’s highest- and lowest-performing
group.
a. Develop an understanding of the terms used for the Gaps components.
i. English (English HSA)
ii. Mathematics (Algebra/Data Analysis HSA)
iii. Science (Biology HSA)
iv. Cohort Graduation Rate
v. Cohort Dropout Rate
b. Conduct table discussion on the Gaps components and how these areas might help paint

84
ESEA FLEXIBI LITY – REQ UEST U .S . DEPARTMENT OF EDUC ATI ON
a good picture of a school’s performance.
c. Conduct consensus vote on the possible relative weights of the Gaps components.
d. Discussion of the consensus vote and range of votes.
e. Second table discussion on the Gaps weighting
f. Conduct second consensus vote on the possible relative Gaps component weights.
g. Sharing of the outcome of vote 2, with explanation of the range of votes.
4. Relative weights for High School College- and Career-Ready
a. Develop an understanding of the terms used for the College- and Career-Ready
components.
i. Cohort Graduation Rate
ii. Career Attainment
iii. Attendance
b. Conduct table discussion on the College- and Career-Ready components and how these
components might help paint a good picture of a school’s performance.
c. Conduct consensus vote on the possible relative weights of the College- and Career-
Ready components.
d. Discussion of the consensus vote and range of votes.
e. Second table discussion on the College- and Career-Ready weighting
f. Conduct second consensus vote on the possible relative College- and Career-Ready
component weights.
g. Sharing of the outcome of vote 2, with explanation of the range of votes.
ELEMENTARY AND MIDDLE SCHOOL STANDARDS
1. Relative weights for Elementary and Middle School Core Values Areas
(Achievement, Growth, Gaps)
a. Review the terms used for components:
i. Core Values Areas
ii. Components
iii. Recommendations
b. Conduct table discussion on the Elementary and Middle School core values areas and
how these areas might help paint a good picture of a school’s performance.

85
ESEA FLEXIBI LITY – REQ UEST U .S . DEPARTMENT OF EDUC ATI ON
c. Conduct consensus vote on the possible relative weights of the core values areas.
d. Discussion of the consensus vote and range of votes.
e. Second table discussion on the weighting
f. Conduct second consensus vote on the possible relative weights of the core values areas.
g. Sharing of the outcome of vote 2, with explanation of the range of votes.
2. Relative weights for Elementary/Middle School Achievement (Reading, Mathematics,
Science)
a. Develop an understanding of the terms used for the achievement components.
i. Reading (Reading MSA)
ii. Mathematics (Mathematics MSA)
iii. Science (Science MSA)
b. Conduct table discussion on the Achievement components and how these components
might help paint a good picture of a school’s performance. Discuss whether the
elementary and middle school achievement weighting should different from high school
achievement
c. Conduct preliminary vote on the possible relative weights of the Achievement
components.
d. Discussion of the preliminary vote and range of votes.
e. Second table discussion on the Achievement weighting (if necessary)
f. Conduct second vote on the possible relative Achievement component weights (if
necessary).
g. Sharing of the outcome of vote 2, if necessary, with explanation of the range of votes.
3. Relative weights for Elementary/Middle School Gaps components. The Gaps components
come from the gaps between the highest- and lowest-performing subgroups within the school.
a. Develop an understanding of the terms used for the Gaps components.
i. Reading (Reading MSA)
ii. Mathematics (Mathematics MSA)
iii. Science (Science MSA)
b. Conduct table discussion on the Gaps components and how these components might
help paint a good picture of a school’s performance. Discuss whether the weighting
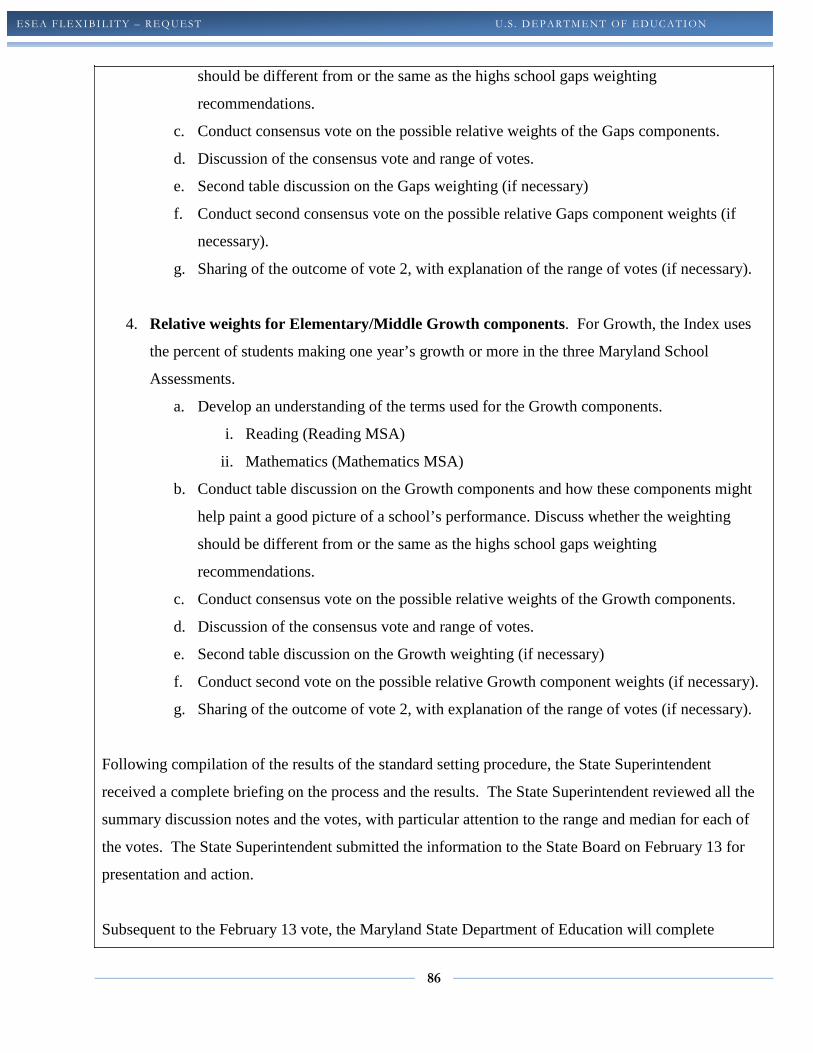
86
ESEA FLEXIBI LITY – REQ UEST U .S . DEPARTMENT OF EDUC ATI ON
should be different from or the same as the highs school gaps weighting
recommendations.
c. Conduct consensus vote on the possible relative weights of the Gaps components.
d. Discussion of the consensus vote and range of votes.
e. Second table discussion on the Gaps weighting (if necessary)
f. Conduct second consensus vote on the possible relative Gaps component weights (if
necessary).
g. Sharing of the outcome of vote 2, with explanation of the range of votes (if necessary).
4. Relative weights for Elementary/Middle Growth components. For Growth, the Index uses
the percent of students making one year’s growth or more in the three Maryland School
Assessments.
a. Develop an understanding of the terms used for the Growth components.
i. Reading (Reading MSA)
ii. Mathematics (Mathematics MSA)
b. Conduct table discussion on the Growth components and how these components might
help paint a good picture of a school’s performance. Discuss whether the weighting
should be different from or the same as the highs school gaps weighting
recommendations.
c. Conduct consensus vote on the possible relative weights of the Growth components.
d. Discussion of the consensus vote and range of votes.
e. Second table discussion on the Growth weighting (if necessary)
f. Conduct second vote on the possible relative Growth component weights (if necessary).
g. Sharing of the outcome of vote 2, with explanation of the range of votes (if necessary).
Following compilation of the results of the standard setting procedure, the State Superintendent
received a complete briefing on the process and the results. The State Superintendent reviewed all the
summary discussion notes and the votes, with particular attention to the range and median for each of
the votes. The State Superintendent submitted the information to the State Board on February 13 for
presentation and action.
Subsequent to the February 13 vote, the Maryland State Department of Education will complete
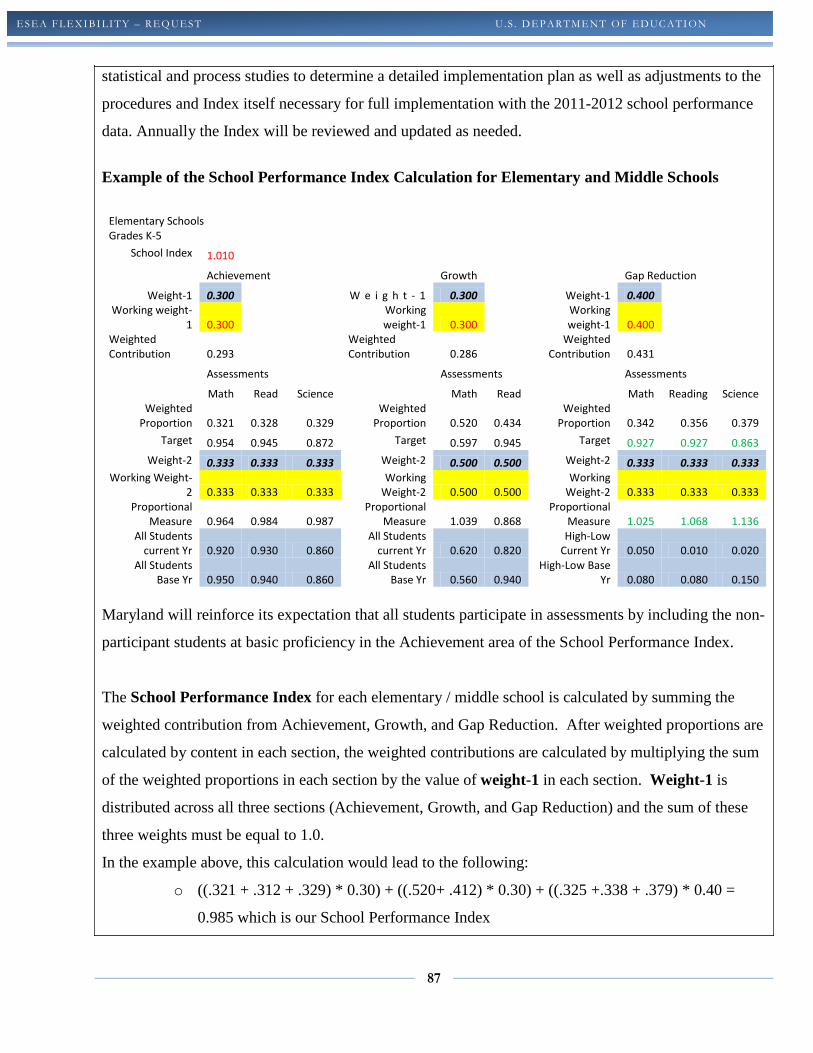
87
ESEA FLEXIBI LITY – REQ UEST U .S . DEPARTMENT OF EDUC ATI ON
statistical and process studies to determine a detailed implementation plan as well as adjustments to the
procedures and Index itself necessary for full implementation with the 2011-2012 school performance
data. Annually the Index will be reviewed and updated as needed.
Example of the School Performance Index Calculation for Elementary and Middle Schools
Elementary Schools Grades K-5
School Index 1.010
Achievement
Growth
Gap Reduction
Weight-1 0.300
W e i g h t - 1 0.300
Weight-1 0.400 Working weight-
1 0.300
Working weight-1 0.300
Working weight-1 0.400
Weighted Contribution 0.293
Weighted Contribution 0.286
Weighted Contribution 0.431
Assessments
Assessments
Assessments
Math Read Science
Math Read
Math Reading Science
Weighted Proportion 0.321 0.328 0.329
Weighted Proportion 0.520 0.434
Weighted Proportion 0.342 0.356 0.379
Target 0.954 0.945 0.872 Target 0.597 0.945 Target 0.927 0.927 0.863
Weight-2 0.333 0.333 0.333 Weight-2 0.500 0.500 Weight-2 0.333 0.333 0.333 Working Weight-
2 0.333 0.333 0.333 Working
Weight-2 0.500 0.500 Working
Weight-2 0.333 0.333 0.333 Proportional
Measure 0.964 0.984 0.987 Proportional
Measure 1.039 0.868 Proportional
Measure 1.025 1.068 1.136 All Students
current Yr 0.920 0.930 0.860 All Students
current Yr 0.620 0.820 High-Low
Current Yr 0.050 0.010 0.020 All Students
Base Yr 0.950 0.940 0.860 All Students
Base Yr 0.560 0.940 High-Low Base
Yr 0.080 0.080 0.150
Maryland will reinforce its expectation that all students participate in assessments by including the non-
participant students at basic proficiency in the Achievement area of the School Performance Index.
The School Performance Index for each elementary / middle school is calculated by summing the
weighted contribution from Achievement, Growth, and Gap Reduction. After weighted proportions are
calculated by content in each section, the weighted contributions are calculated by multiplying the sum
of the weighted proportions in each section by the value of weight-1 in each section. Weight-1 is
distributed across all three sections (Achievement, Growth, and Gap Reduction) and the sum of these
three weights must be equal to 1.0.
In the example above, this calculation would lead to the following:
o ((.321 + .312 + .329) * 0.30) + ((.520+ .412) * 0.30) + ((.325 +.338 + .379) * 0.40 =
0.985 which is our School Performance Index

88
ESEA FLEXIBI LITY – REQ UEST U .S . DEPARTMENT OF EDUC ATI ON
On the next page is a brief description of each section that leads up to how the weighted proportions
are calculated in that section.
Note: This is a sample with sample given weights. Final weights were decided through the standard
setting process that included a representative group of stakeholders on February 8, 2012.
School Achievement
Achievement is based on the percentage of the students in the “all students” group scoring proficient or
advanced in Mathematics, Reading, and Science for each elementary and middle school. The
performance percent for each school and content (values highlighted in blue in the achievement
section) is the combined result of all three elementary / middle test types (Alt-MSA, Mod-MSA, and
MSA) and is calculated for the current and baseline (prior) school year.
School Growth
Growth is based on the percentage of students in the “all students” group demonstrating growth in
Mathematics or Reading performance over the previous year for each elementary and middle school.
The growth percent for each school and content (values highlighted in blue in the growth section) is the
combined result of all three elementary / middle test types (Alt-MSA, Mod-MSA, and MSA) and is
calculated for the current and baseline (prior) school year.
The following steps are taken to determine the growth percentage by content:
• Determine a student’s scale score cut for the current and prior school year. The scale score cut
is derived from a standardized table and ranges from 1 to 9 with 9 being the highest. Each
proficiency level is broken into three ranges:
o 1 - 3 for basic scale scores
o 4 - 6 for proficient scale scores
o 7 - 9 for advanced scale scores.
• Determine a student’s growth score by subtracting the prior year scale score cut from the current
year scale score cut. The growth score ranges from -8 to 8 with 8 being the highest.
• For a growth score to be calculated for a student, the student must have matching test types in
both the prior and current school year, and the student’s grade must progress by a one grade
increment (i.e. if a student was in grade 3 in the prior year then they must be in grade 4 in the

89
ESEA FLEXIBI LITY – REQ UEST U .S . DEPARTMENT OF EDUC ATI ON
current year).
• The student will then be placed into one of the following three categories based on their growth
score
o Decline: Growth Score: -8 to -1
o Same: Growth Score: 0
o Improve: Growth Score: 1 to 8
• Sum the students by school and content for the same and improve categories, which become the
number of students demonstrating growth.
• Sum the students by school and content for the decline, same, and improve categories, which
becomes the number of test takers.
• The growth percent by content is then the number of students demonstrating growth divided by
the number of test takers.
• The current year growth percent is determined by looking at changes from SY2010-11 to
SY2011-12. The baseline year growth percent is determined by looking at changes from
SY2009-10 to SY2010-11.
School Gap Reduction
Gap reduction is based on a gap score that is calculated for each school which shows the gap between
the highest-achieving subgroup and the lowest-achieving subgroup in Mathematics, Reading, and
Science for each elementary and middle school. The gap percent for each school and content (values
highlighted in blue in the gap reduction section) is the combined result of all three elementary / middle
test types (Alt-MSA, Mod-MSA, and MSA) and is calculated for the current and baseline (prior) school
year.
The following steps are taken to determine the gap score by content:
• The subgroups here are defined as the seven racial categories along with special education,
limited English proficiency, and free and reduced meal status.
• For each school, the above subgroups are evaluated by content and the highest- and lowest-
achieving subgroups (based on the percentage of the students in the “all students” group scoring
proficient or advanced) are flagged for both the current and baseline years (SY2010-11 and
SY2011-12). Note that a minimum n of 5 test takers was used per content and subgroup, so any
subgroups under that were eliminated from the process. A content-specific gap score is then

90
ESEA FLEXIBI LITY – REQ UEST U .S . DEPARTMENT OF EDUC ATI ON
calculated as the percentage of all students scoring proficient or advanced in the highest-
achieving subgroup minus the percentage of all students scoring proficient or advanced in the
lowest-achieving subgroup. Since these gap scores are year-specific, there was no requirement
that the subgroup had to exist in both years.
• To help ensure that gap reductions reflect improved performance of the lowest-performing
subgroup and not a decline in the performance of the highest-performing subgroup, the percent
proficient value used to calculate the gap for the highest-performing subgroup was the larger of
the prior and current year.
Calculating the Weighted Proportions
The weighted proportion calculation is similar across all three sections. The only difference is in the
formula used for the proportional measure and target calculations for gap reduction. Also, growth only
looks at Mathematics and Reading whereas achievement and gap reduction look at all three contents.
You can follow along by using the example in the beginning of this section.
• Weight-2 is distributed across the contents independently within each section; the sum of the
weights in the section must be equal to 1.0.
• Target is calculated by taking a school’s percentage for the baseline school year and
determining annual equal increments toward a goal of reducing by half the percentage of
students who are not proficient within six years. The target is calculated separately by content
within a school. The targets were computed with the convention that larger values are
indicative of higher performance levels. Annual targets represent the annual increase in
performance required to achieve a 50% reduction in the number of students not meeting the
desired outcome by 2017. For the Achievement, Growth, Cohort Graduation Rate, and CTE
Concentrators measures the targets are computed as:
All Students Base Yr + (((1 - ((1 - All Students Base Yr) / 2)) - All Students Base Yr) / 6) For Gap reduction and Cohort Dropout Rate, where larger values are indicative of lower (less
desirable) performance level, calculations were based on the complements (1-Gap and 1-Cohort
Dropout Rate) for consistency.
• Proportional Measure is a school’s percentage for the current year divided by the target for
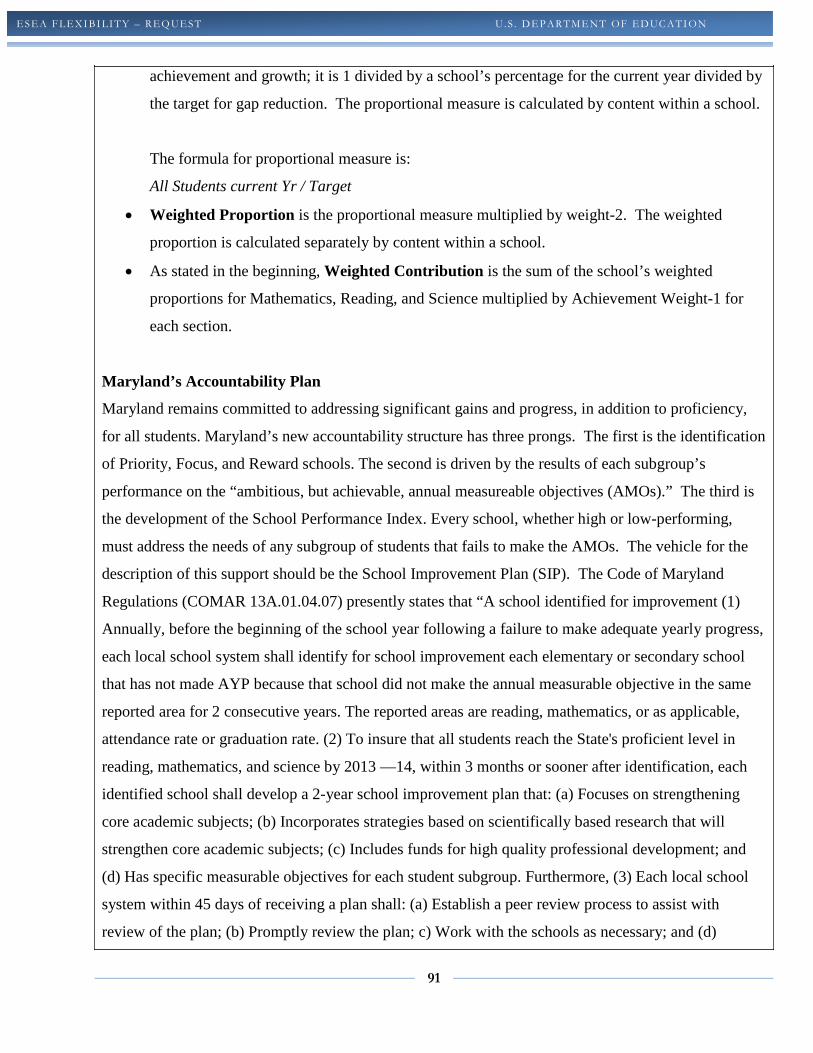
91
ESEA FLEXIBI LITY – REQ UEST U .S . DEPARTMENT OF EDUC ATI ON
achievement and growth; it is 1 divided by a school’s percentage for the current year divided by
the target for gap reduction. The proportional measure is calculated by content within a school.
The formula for proportional measure is:
All Students current Yr / Target
• Weighted Proportion is the proportional measure multiplied by weight-2. The weighted
proportion is calculated separately by content within a school.
• As stated in the beginning, Weighted Contribution is the sum of the school’s weighted
proportions for Mathematics, Reading, and Science multiplied by Achievement Weight-1 for
each section.
Maryland’s Accountability Plan
Maryland remains committed to addressing significant gains and progress, in addition to proficiency,
for all students. Maryland’s new accountability structure has three prongs. The first is the identification
of Priority, Focus, and Reward schools. The second is driven by the results of each subgroup’s
performance on the “ambitious, but achievable, annual measureable objectives (AMOs).” The third is
the development of the School Performance Index. Every school, whether high or low-performing,
must address the needs of any subgroup of students that fails to make the AMOs. The vehicle for the
description of this support should be the School Improvement Plan (SIP). The Code of Maryland
Regulations (COMAR 13A.01.04.07) presently states that “A school identified for improvement (1)
Annually, before the beginning of the school year following a failure to make adequate yearly progress,
each local school system shall identify for school improvement each elementary or secondary school
that has not made AYP because that school did not make the annual measurable objective in the same
reported area for 2 consecutive years. The reported areas are reading, mathematics, or as applicable,
attendance rate or graduation rate. (2) To insure that all students reach the State's proficient level in
reading, mathematics, and science by 2013 —14, within 3 months or sooner after identification, each
identified school shall develop a 2-year school improvement plan that: (a) Focuses on strengthening
core academic subjects; (b) Incorporates strategies based on scientifically based research that will
strengthen core academic subjects; (c) Includes funds for high quality professional development; and
(d) Has specific measurable objectives for each student subgroup. Furthermore, (3) Each local school
system within 45 days of receiving a plan shall: (a) Establish a peer review process to assist with
review of the plan; (b) Promptly review the plan; c) Work with the schools as necessary; and (d)
92
ESEA FLEXIBI LITY – REQ UEST U .S . DEPARTMENT OF EDUC ATI ON
Approve the school plan if the plan meets the requirements of all applicable federal and State laws and
regulations.” This COMAR regulation will be reviewed and revised as necessary.
Once the data has been reported and analyzed and the support is in place, the school’s efforts for
improvement should address any subgroup needs and allow the school to track the improvement efforts
by subgroup as well as intervention. Most all schools in Maryland currently use a very robust school
improvement plan process and may be best served by continuing along a path for improvement that is
already in place. If all school data is being considered and the current direction for the school indicates
that all targets are being met and the school continues to improve then no change should be made just
for this process. However, if the school and/or LEA examine the data and come to a new analysis for
change then this process can be an opportune moment to implement necessary changes. The format for
school improvement plans will not be specified by MSDE. However, it will be expected that all
schools have a SIP which is available to the public. Priority schools will be required to incorporate the
seven turnaround principles into the SIP or adopt one of the four USDE approved 1003(g) SIG models.
School Improvement Plans:
Master Plans are the umbrella for monitoring and accountability of LEAs as they implement support to
Priority and Focus Schools and School Improvement Planning. MSDE is currently revising the
guidance document for the 2012 Master Plan to prompt LEAs with Priority and/or Focus Schools to
describe their overall approach and the challenges and successes that they may be having. In the case
of challenges, LEAs will be expected to explain how they plan to alter direction to address the
deficiencies. As with all other aspects of Master Planning, the explanations will be data-driven.
For School Improvement Plans (SIP), Maryland has chosen to create a reporting mechanism by Strand
that will be included as part of the Master Plan for ALL LEAs. The description of this graduated
reporting can be found in Maryland’s ESEA Flexibility Proposal (see pages 86-90) in the final
paragraph of each Strand.
Please note: Maryland does not have separate “district plans”. LEAs district specific plans are part of
the Master Plan each district completes.
Building District Capacity
93
ESEA FLEXIBI LITY – REQ UEST U .S . DEPARTMENT OF EDUC ATI ON
The structure of Maryland, with only 24 school districts, is very conducive to a collegial process.
Maryland’s state Superintendent meets monthly with the 24 LEA superintendents. These meetings are
extremely important to all involved for problem solving, in depth discussion of major issues and as an
essential communication tool throughout the state. In addition to these meetings, the Assistant
Superintendents for Instruction meet monthly with the Assistant State Superintendent for Instruction.
Other liaisons meet regularly to discuss all initiatives that require LEA and state action. Maryland
works as a community with a clear goal of high achievement for all students through the cooperation of
families, teachers, administrators and students.
MSDE and the local school systems use these regular meetings to examine both State and local issues
and impending policy changes to ensure local school systems and the State work in concert on
implementation. Further, with only 24 school systems within a geographically close proximity,
technical exchanges on an ad hoc basis are frequently scheduled both with individual school systems
and with clusters of systems with similar issues.
As described above, once standard setting is complete for the School Performance Index, a scale will be
created from 0-1+. For directing support and interventions to schools with similar conditions, the scale
will be broken into five strands with Strand 1 the highest-performing and Strand 5 the lowest.
Although schools will, as always, have very unique profiles, MSDE will group the schools based on a
measure of the magnitude of the issues these schools face. Thus, if a school falls into Strand 5, it joins
other schools with pervasive, school-wide, systemic problems. Schools in Strand 1 are meeting the
challenges brought to school by their students. This is not to say that schools in Strand 1 cannot
achieve more but that the schools overall and by subgroup are meeting and exceeding the academic
standards currently set for the school. This Strand categorization allows the SEA and LEA to
differentiate resources to schools by magnitude of need while precise diagnosis occurs at the school.
STRAND 1
If schools fall into Strand 1, the schools usually meet and exceed the academic standards for all
students. Although, it will be possible to be in the top Strand and still miss the AMOs for one
subgroup, most of the Reward Schools identified below will fall into Strand 1. Schools that score in
this Strand may have met the minimum standards set by the State for closing the achievement gaps but

94
ESEA FLEXIBI LITY – REQ UEST U .S . DEPARTMENT OF EDUC ATI ON
will, through development of the School Improvement Plan, set higher standards. Additionally, schools
will examine the data they have that indicate any need whether academic, physical, emotional or
cultural and develop intervention plans which will be monitored.
Since data for the School Performance Index will be published annually, to maintain the status of a
Strand I school, focused and intense interventions for students not showing growth will be necessary.
Although the Maryland School Assessments (MSAs) are meant to assess the most important academic
content instructed in all Maryland classrooms, teachers/leaders understand that they are responsible for
the whole child. That means that at times Social Studies activities, tools to keep students organized or
addressing intense personal needs will intervene and be partnered with the ongoing support for the
content of Science, English/Language Arts and Mathematics.
Support to these schools beyond the SIP may take different forms. The school should be able to
identify the professional development and training that can lead to additional improvement in
achievement. The LEA may provide this resource or schools may leverage other sources of funding to
seek training beyond the current staff within the LEA.
Monitoring for these schools on the part of the LEA is left totally to the LEA and its theory of action.
MSDE will intervene in a very small way. Each year a random sample of 1-3% of the schools in
Strand I will submit their School Improvement Plans for review by LEA experts. The LEA
Superintendent will report on the examination of these plans through the Master Plan process and
assure that any omissions or inadequacies will be addressed in these and all other SIPs. This will allow
MSDE to have insight into the School Improvement Plan process from the school’s perspective and the
school will receive feedback that will assist with the continued improvement of the school’s ability to
diagnose and prescribe interventions.
STRAND 2
When schools are categorized as Strand 2 they are expected to be among the top 50% of schools in the
State. The successes and challenges in this Strand will be varied. Schools may excel at Mathematics
but lag in reading or the reverse. In this case, the balance of Achievement, Growth, Gap Reduction and
College- and Career-Ready Goals can yield relatively high-performing schools with targeted needs that,
when addressed, could lead them to enter Strand I. Schools in this Strand could also be struggling to
95
ESEA FLEXIBI LITY – REQ UEST U .S . DEPARTMENT OF EDUC ATI ON
stay in Strand 2.
More than one area of need may drive the school to focus on one and then another intervention
sequentially or consider a quasi-systemic plan that would embrace all of the needs at once. The SIP
process will again ensure that each subgroup is addressed and identified needs drive professional
development for teachers and appropriate interventions for the students. MSDE will dictate no specific
support for schools in Strand 2. However, it is expected that LEAs will take particular interest in the
needs in these schools. Although an individual school’s assessment of data is recommended for
sustained improvement, it will additionally serve as an excellent source for the LEA to determine
system-wide professional development.
State monitoring for Strand 2 schools will be identical to the random inspection of SIPs as described for
Strand 1, with a larger sample of 4-5%. MSDE will also require the LEA with Strand 2 schools to
describe in the annual Master Plan Update the overall process for addressing the production of useful,
focused SIPs; the commonalities discovered through this analyses and syntheses of data; and the
system-wide professional development plan that emerges from that work. There will be specific
language in the Master Plan guidance developed by the BTE External Advisory Panel.
STRAND 3
Strand 3 schools bring the same variety as Strand 2 but an increase in the intensity of needs identified
by the School Improvement Process. Schools in Strand 3 may have multiple subgroups struggling to
achieve standards or may have intensive, pervasive problems for one very low-performing subgroup.
More often than for schools in Strand 2, LEAs and schools may determine the need for a systemic
solution rather than or in addition to continued support to individual subgroups. Title I schools that fall
in this Strand will be eligible to apply for 1003(a) School Improvement Grant funds to support the
direction toward improvement detailed in the SIP.
LEAs are directed to oversee the School Improvement Process for Strand 3 schools. Many
configurations may be used for the delivery of professional development or training but LEAs must be
closely in touch with these schools and regularly checking on progress. Additionally, LEAs will have a
section of the Master Plan to address Strand 3 activities separately. Commonalities of the school
concerns should be addressed. Successes and challenges will be addressed through monitoring

96
ESEA FLEXIBI LITY – REQ UEST U .S . DEPARTMENT OF EDUC ATI ON
questions developed by the BTE External Advisory Panel.
STRAND 4
Strand 4 schools are those with serious needs. These schools fall in the close to the bottom of
achievement for schools in the State. They are not identified as falling into the very bottom but they
are near that point. Rarely will these schools have focused problems with one specific subgroup. Most
often, a systemic change will be necessary to address all instruction as well as those ancillary supports,
like classroom management training, that can prevent other problems from interfering with instruction.
Support for the improvement of instruction, the replacement or the retraining of the leadership staff,
and intensified outreach to families to become involved with their child’s school should be addressed
by all schools in this strand and always with LEA oversight. LEAs should look carefully to the existing
supports in the schools to determine effectiveness of the current path to improvement. Schools with
serious needs require the attention and support of the whole community and Strand 4 schools must have
intentional activities to create community involvement.
For monitoring, LEAs must include in their Master Plan Update, the process that is used to assure that
each Strand 4 school has the most effective school improvement plan possible. Additionally, specific
guiding questions will ask for a description of any differentiation of supports to these schools with very
low scores on the School Performance Index. It is possible for Focus schools to fall into this strand.
When this occurs, certain Title I Focus schools will be eligible to apply for 1003(a) school
improvement funds to support the path for improvement stated in their school improvement plans.
STRAND 5
The lowest-achieving schools in the State will fall into Strand 5. It is probable that all Priority Schools
will fall in this category but there will be others, not receiving Title I services, that will present with
serious, school-wide issues that require additional, differentiated services from the LEA. These schools
are also going to present the most need from the student services. These schools will typically be of
higher poverty, more diverse and in communities of need.
Required supports for Strand 5 schools that are not Title I are described in Section 2.G. Those Title I
schools in this Strand will either be Priority, Focus or another low-performing Title I school so each
97
ESEA FLEXIBI LITY – REQ UEST U .S . DEPARTMENT OF EDUC ATI ON
category will afford access to additional school improvement dollars. All schools, Title I or non-Title I
schools should receive differentiated support from the LEA.
Monitoring of these schools will be covered by the LEA and MSDE if they are Priority or Focus. The
other schools will be required to provide assurances within the Master Plan to the State Superintendent
of Schools that all required interventions, reporting, and monitoring are being supplied by the LEA.
Maryland will identify schools in each strand in early May 2012. Simulations of the school index
utilizing the AYP data from 2010 for the baseline year and 2011 for the current year have been
calculated (Please see the School Index Excel File attached. Because of its large size, the Excel
Spreadsheet document is attached electronically to this application and cannot be included as part of the
appendix). A full analysis of the ranking of the schools has not been completed. The first step in this
process was the running of the data that took place with the submission of the ESEA Flexibility
Proposal in February 2012. Maryland is now analyzing those data runs, which were based on 2010 and
2011 data, to determine cut points for each strand. The final identification of schools will then be run
using 2011-2012 data. This ranking will be completed in May 2012.
FIXED STANDARDS
Detailed in other sections of this document is the description of how schools may exit the categories of
Priority and Focus. Because that is an important concept within Maryland’s support and incentives to
schools, MSDE will take the following steps to make this a demanding, attainable goal. Upon analysis
of the data from the Index, cut scores will be established to differentiate strands. Following the
identification of the cut scores, the number of schools in each strand will be identified for the school
year 2012-2013. After that first year, the SPI scale will be held constant so that, should an SPI of .73,
for example, be necessary to move a school from Strand 3 to Strand 2 in 2013, it will also be necessary
in 2015 should this flexibility continue.
This allows the school to continue to work toward AMOs that will change each year, moving the
standard higher but allows the school to have a fixed standard to target. To exit improvement schools
must move upward at least two Strands. This standard is not moveable such that an increased
performance would be necessary to keep schools in their current Strand. The stability in the standard
not only allows schools to exit Priority and Focus status but provides an incentive for all schools to
98
ESEA FLEXIBI LITY – REQ UEST U .S . DEPARTMENT OF EDUC ATI ON
improve.
The chart below describes an overview of supports and monitoring for Maryland’s School Performance
Index.
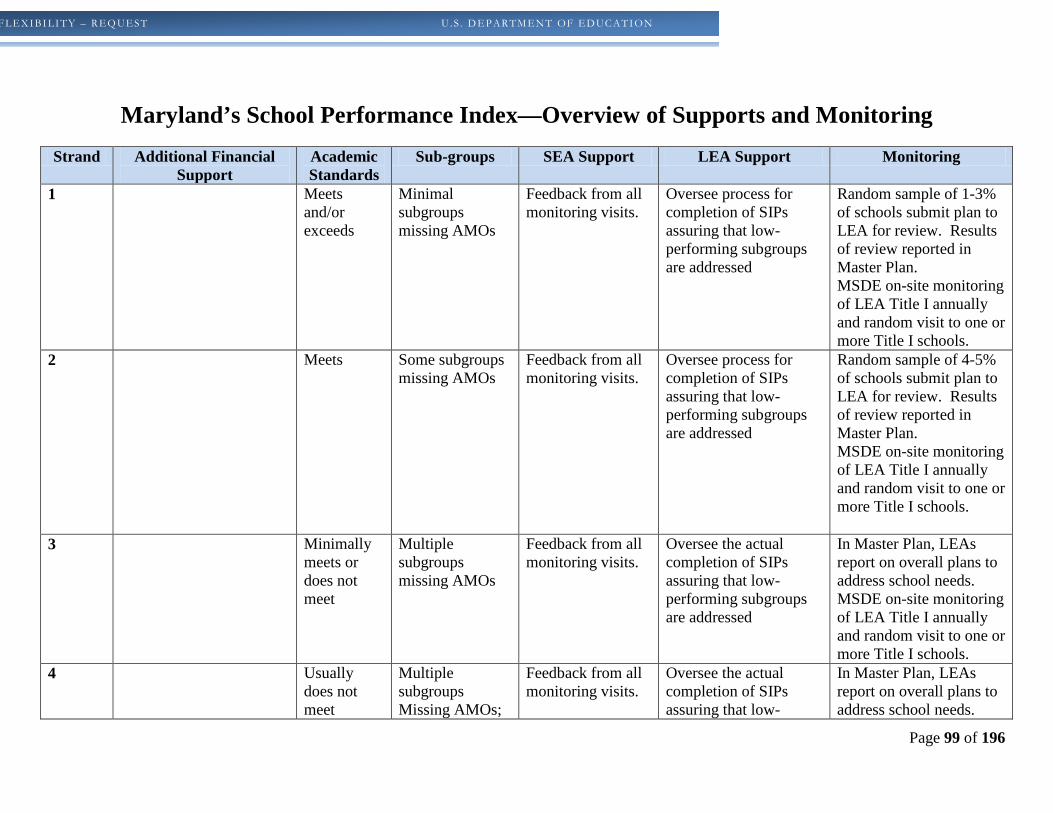
Page 99 of 196
FLEXIBI LITY – REQ UEST U .S . DEPARTMENT OF EDUC ATI ON
Maryland’s School Performance Index—Overview of Supports and Monitoring Strand Additional Financial
Support Academic Standards
Sub-groups SEA Support LEA Support Monitoring
1 Meets and/or exceeds
Minimal subgroups missing AMOs
Feedback from all monitoring visits.
Oversee process for completion of SIPs assuring that low-performing subgroups are addressed
Random sample of 1-3% of schools submit plan to LEA for review. Results of review reported in Master Plan. MSDE on-site monitoring of LEA Title I annually and random visit to one or more Title I schools.
2 Meets Some subgroups missing AMOs
Feedback from all monitoring visits.
Oversee process for completion of SIPs assuring that low-performing subgroups are addressed
Random sample of 4-5% of schools submit plan to LEA for review. Results of review reported in Master Plan. MSDE on-site monitoring of LEA Title I annually and random visit to one or more Title I schools.
3 Minimally meets or does not meet
Multiple subgroups missing AMOs
Feedback from all monitoring visits.
Oversee the actual completion of SIPs assuring that low-performing subgroups are addressed
In Master Plan, LEAs report on overall plans to address school needs. MSDE on-site monitoring of LEA Title I annually and random visit to one or more Title I schools.
4 Usually does not meet
Multiple subgroups Missing AMOs;
Feedback from all monitoring visits.
Oversee the actual completion of SIPs assuring that low-
In Master Plan, LEAs report on overall plans to address school needs.
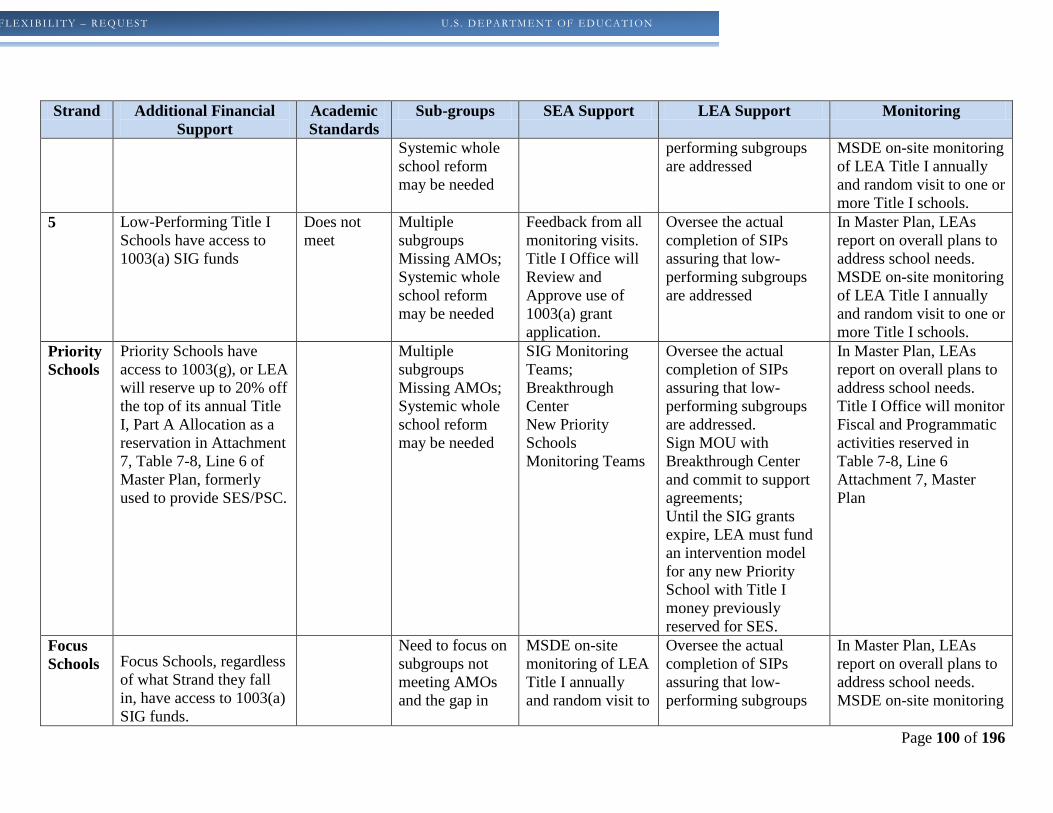
Page 100 of 196
FLEXIBI LITY – REQ UEST U .S . DEPARTMENT OF EDUC ATI ON
Strand Additional Financial Support
Academic Standards
Sub-groups SEA Support LEA Support Monitoring
Systemic whole school reform may be needed
performing subgroups are addressed
MSDE on-site monitoring of LEA Title I annually and random visit to one or more Title I schools.
5 Low-Performing Title I Schools have access to 1003(a) SIG funds
Does not meet
Multiple subgroups Missing AMOs; Systemic whole school reform may be needed
Feedback from all monitoring visits. Title I Office will Review and Approve use of 1003(a) grant application.
Oversee the actual completion of SIPs assuring that low-performing subgroups are addressed
In Master Plan, LEAs report on overall plans to address school needs. MSDE on-site monitoring of LEA Title I annually and random visit to one or more Title I schools.
Priority Schools
Priority Schools have access to 1003(g), or LEA will reserve up to 20% off the top of its annual Title I, Part A Allocation as a reservation in Attachment 7, Table 7-8, Line 6 of Master Plan, formerly used to provide SES/PSC.
Multiple subgroups Missing AMOs; Systemic whole school reform may be needed
SIG Monitoring Teams; Breakthrough Center New Priority Schools Monitoring Teams
Oversee the actual completion of SIPs assuring that low-performing subgroups are addressed. Sign MOU with Breakthrough Center and commit to support agreements; Until the SIG grants expire, LEA must fund an intervention model for any new Priority School with Title I money previously reserved for SES.
In Master Plan, LEAs report on overall plans to address school needs. Title I Office will monitor Fiscal and Programmatic activities reserved in Table 7-8, Line 6 Attachment 7, Master Plan
Focus Schools Focus Schools, regardless
of what Strand they fall in, have access to 1003(a) SIG funds.
Need to focus on subgroups not meeting AMOs and the gap in
MSDE on-site monitoring of LEA Title I annually and random visit to
Oversee the actual completion of SIPs assuring that low-performing subgroups
In Master Plan, LEAs report on overall plans to address school needs. MSDE on-site monitoring
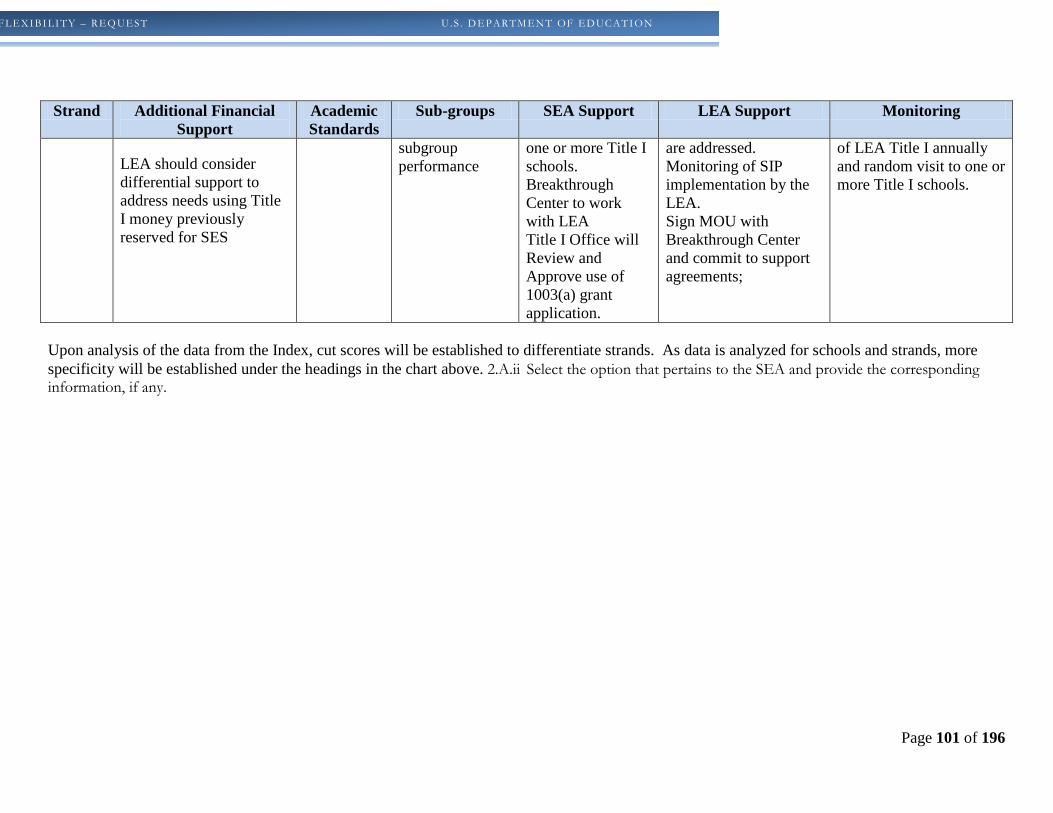
Page 101 of 196
FLEXIBI LITY – REQ UEST U .S . DEPARTMENT OF EDUC ATI ON
Strand Additional Financial Support
Academic Standards
Sub-groups SEA Support LEA Support Monitoring
LEA should consider differential support to address needs using Title I money previously reserved for SES
subgroup performance
one or more Title I schools. Breakthrough Center to work with LEA Title I Office will Review and Approve use of 1003(a) grant application.
are addressed. Monitoring of SIP implementation by the LEA. Sign MOU with Breakthrough Center and commit to support agreements;
of LEA Title I annually and random visit to one or more Title I schools.
Upon analysis of the data from the Index, cut scores will be established to differentiate strands. As data is analyzed for schools and strands, more specificity will be established under the headings in the chart above. 2.A.ii Select the option that pertains to the SEA and provide the corresponding information, if any.
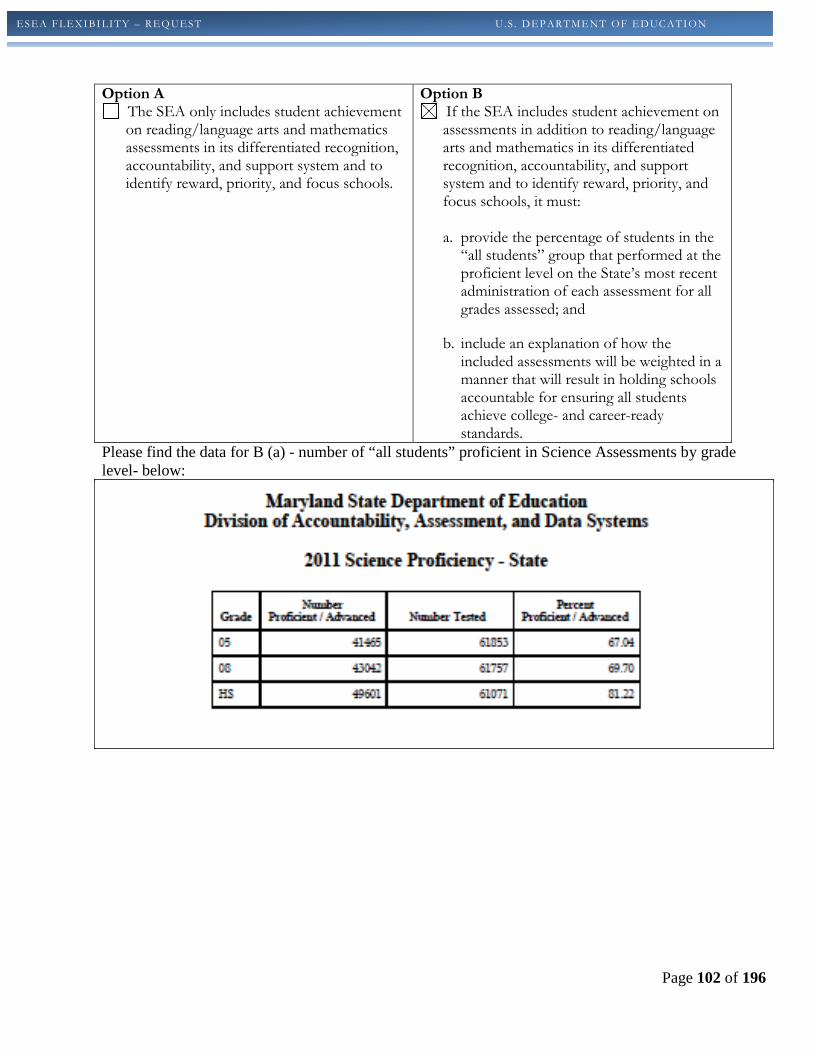
Page 102 of 196
ESEA FLEXIBI LITY – REQ UEST U .S . DEPARTMENT OF EDUC ATI ON
Option A
The SEA only includes student achievement on reading/language arts and mathematics assessments in its differentiated recognition, accountability, and support system and to identify reward, priority, and focus schools.
Option B If the SEA includes student achievement on assessments in addition to reading/language arts and mathematics in its differentiated recognition, accountability, and support system and to identify reward, priority, and focus schools, it must:
a. provide the percentage of students in the
“all students” group that performed at the proficient level on the State’s most recent administration of each assessment for all grades assessed; and
b. include an explanation of how the
included assessments will be weighted in a manner that will result in holding schools accountable for ensuring all students achieve college- and career-ready standards.
Please find the data for B (a) - number of “all students” proficient in Science Assessments by grade level- below:
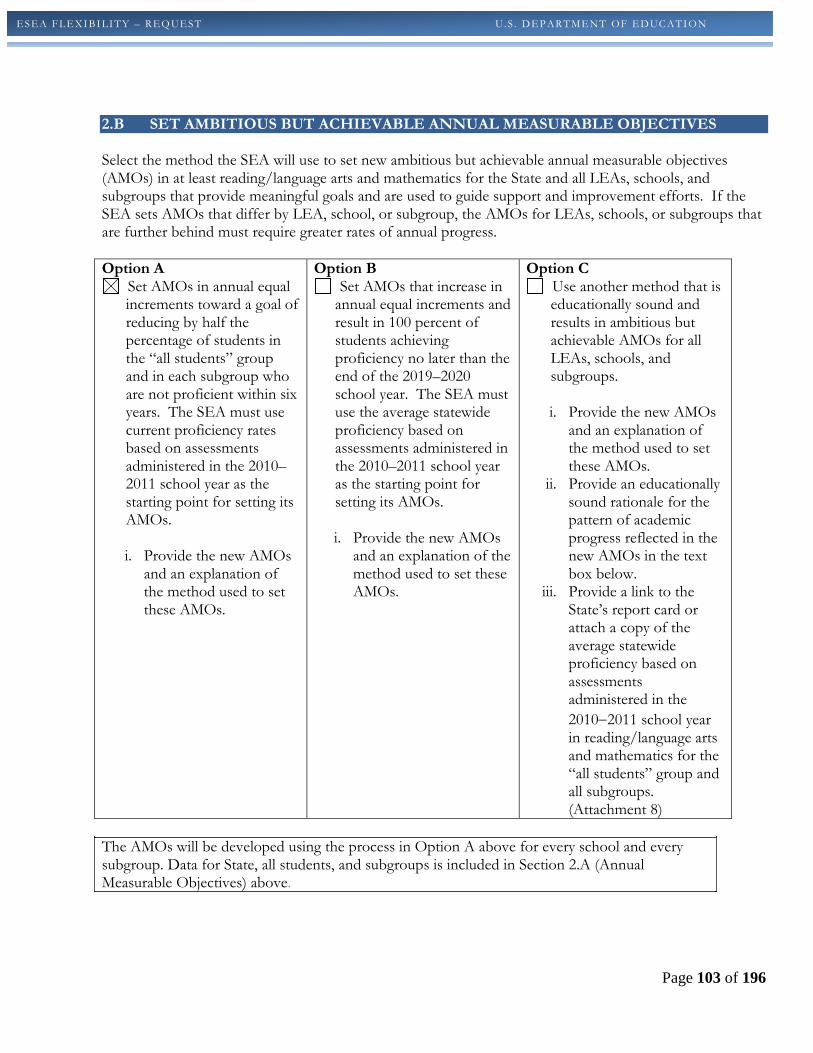
Page 103 of 196
ESEA FLEXIBI LITY – REQ UEST U .S . DEPARTMENT OF EDUC ATI ON
2.B SET AMBITIOUS BUT ACHIEVABLE ANNUAL MEASURABLE OBJECTIVES Select the method the SEA will use to set new ambitious but achievable annual measurable objectives (AMOs) in at least reading/language arts and mathematics for the State and all LEAs, schools, and subgroups that provide meaningful goals and are used to guide support and improvement efforts. If the SEA sets AMOs that differ by LEA, school, or subgroup, the AMOs for LEAs, schools, or subgroups that are further behind must require greater rates of annual progress. Option A
Set AMOs in annual equal increments toward a goal of reducing by half the percentage of students in the “all students” group and in each subgroup who are not proficient within six years. The SEA must use current proficiency rates based on assessments administered in the 2010–2011 school year as the starting point for setting its AMOs.
i. Provide the new AMOs
and an explanation of the method used to set these AMOs.
Option B Set AMOs that increase in annual equal increments and result in 100 percent of students achieving proficiency no later than the end of the 2019–2020 school year. The SEA must use the average statewide proficiency based on assessments administered in the 2010–2011 school year as the starting point for setting its AMOs.
i. Provide the new AMOs
and an explanation of the method used to set these AMOs.
Option C Use another method that is educationally sound and results in ambitious but achievable AMOs for all LEAs, schools, and subgroups.
i. Provide the new AMOs
and an explanation of the method used to set these AMOs.
ii. Provide an educationally sound rationale for the pattern of academic progress reflected in the new AMOs in the text box below.
iii. Provide a link to the State’s report card or attach a copy of the average statewide proficiency based on assessments administered in the 2010−2011 school year in reading/language arts and mathematics for the “all students” group and all subgroups. (Attachment 8)
The AMOs will be developed using the process in Option A above for every school and every subgroup. Data for State, all students, and subgroups is included in Section 2.A (Annual Measurable Objectives) above.
Page 104 of 196
ESEA FLEXIBI LITY – REQ UEST U .S . DEPARTMENT OF EDUC ATI ON
2.C REWARD SCHOOLS 2.C.i Describe the SEA’s methodology for identifying highest-performing and high-progress schools as reward schools. If the SEA’s methodology is not based on the definition of reward schools in ESEA Flexibility (but instead, e.g. based on school grades or ratings that take into account a number of factors), the SEA should also demonstrate that the list provided in Table 2 is consistent with the definition, per the Department’s “Demonstrating that an SEA’s Lists of Schools meet ESEA Flexibility Definitions” guidance. Title I schools are identified because of the enormous challenge that poverty brings for
families, students and schools. Students and families are steeped in the basic needs for
employment, food and shelter. These needs and those additional ones of health care, mental
health care and childcare come into the schools with the children. Education is one of the keys
to overcoming poverty and the devastating effects it is having on our state’s youth. Because of
this basic reason for the existence of Title I, Maryland seeks to reward all schools that are high
achieving but to offer an additional recognition for those schools that do this with additional
challenges. As will all aspects of this application, the definitions and recognitions of Reward
Schools were shared with LEAs and all comments were taken into consideration.
One of the most effective aspects of NCLB has been the increased attention to subgroups. In
Maryland, the most frequently low-performing subgroup is the students with disabilities
subgroup. This is, at times, due to their disability. The English Language Learner subgroup
also struggles with low performance. For these students, the language barrier can affect their
academic progress. Maryland remains concerned for the struggle of students in other cultural
and racial subgroups. By requiring Reward schools to keep the achievement gap between “all
students” and any lower performing subgroup at or below 10%, Maryland keeps the spotlight
on students with disabilities, students with cultural and language barriers, and on other
subgroups facing challenges. This allows schools, parents and advocates to have a clearer
picture of performance and need.
The methodology will have multiple steps. First, any Title I school will be designated a
Highest Performing Reward School if the school has met AYP for “all students” and all
subgroups for two consecutive years AND has a 10% or less gap between the performance of
“all students” and that of any lower performing subgroup.
Page 105 of 196
ESEA FLEXIBI LITY – REQ UEST U .S . DEPARTMENT OF EDUC ATI ON
Of the identified Highest Performing Reward Schools, those that additionally appear in the top
10% of Title I schools showing the most improvement in performance between the 2007 MSA
and the 2011 MSA will be designated Distinguished Highest Performing Reward Schools.
If a Highest Performing Reward School has additionally improved its “all students”
performance by at least eighteen percentage points between the 2007 MSA and the 2011
MSA, AND have 50% or more economically disadvantaged students it will be designated as a
Superlative Highest Performing Reward School.
The second category of Reward schools will be those that have shown significant
improvement in performance but may not have yet reached the current mark for Adequate
Yearly Progress. These schools must have made at least a gain of eighteen percentage points
between the 2007 MSA and the 2011 MSA for “all students” and have a 10% or less gap
between the performance of “all students” and that of any lower performing subgroup. These
schools will be designated as Highest Progress Reward Schools.
Maryland’s Highest Performing Reward Schools will receive additional endorsements for
additional accomplishments in progress and with high poverty. The Highest Progress schools
will have made significant improvement for all students over the past five years. In both cases
these schools have met and exceeded very high standards.
This method will apply only to this initial year of recognition. After the 2012-2013 school
year, Reward Schools will also be expected to achieve one of the top two categories on the
newly developed School Index for two consecutive years.
2.C.ii Provide the SEA’s list of reward schools in Table 2.
The 30 schools to be recognized in all four categories of reward are attached in Table 2.

Page 106 of 196
ESEA FLEXIBI LITY – REQ UEST U .S . DEPARTMENT OF EDUC ATI ON
2.C.iii Describe how the SEA will publicly recognize and, if possible, reward highest-performing and high-progress schools.
Maryland will recognize all Title I Highest Performing Reward Schools and the Highest
Progress Reward Schools by sending out a Maryland State Department of Education press
release listing all schools in this category and actively promoting the announcement with
Statewide media. The State will provide a Special Certificate of Recognition that applauds
their accomplishment. Schools in this category will also be encouraged to celebrate their
success and prominently display the certificate in a highly visible location in the school. The
State will also provide a template for local school systems and encourage them to release their
own press announcement and work with their own local media to highlight their successful
schools. All information will be prominently displayed on the MSDE website.
In addition to the State and local media recognition detailed above, Title I Distinguished
Highest Performing Reward Schools will receive a Special Plaque of Recognition that
applauds the accomplishment. Schools in this category will also be encouraged to celebrate
their success and display the plaque in a highly visible location in the school. n.
In addition to the recognition detailed above, the Superlative Highest Performing Reward
Schools will also be recognized by the State Board of Education and the Governor’s Office at
a State Board meeting. In addition, the State Superintendent and other State dignitaries will
visit every school to applaud success and highlight best practices. A special publication and a
video highlighting Best Practices in every Superlative Highest Performing Reward School
will be produced and shared with other schools throughout the State. Finally, the Superlative
Highest Performing Reward Schools will be featured and afforded the opportunity to present
their Best Practices at our yearly Title I administrative meetings.
Additionally, all LEAs will be encouraged to identify strategies to recognize these schools
within their local districts in addition to the Statewide recognition. Maryland is also exploring
ways to expand its very prestigious Blue Ribbon Schools of Excellence Program to an
Honorable Mention Blue Ribbon Schools Program that would encompass Reward Schools that
have made exemplary progress for all students. These schools would be recognized, honored,
and rewarded in a program that could lead them to Maryland and National Blue Ribbon
Page 107 of 196
ESEA FLEXIBI LITY – REQ UEST U .S . DEPARTMENT OF EDUC ATI ON
School status.
It should be noted that it is a result of the input of the LEA Superintendents that there are
multiple categories of reward schools. Additionally, LEAs will be expected to recognize these
schools as well.
The table below displays the types of Reward Schools and their recognition.
See Appendix II-6 for the full ranking of the Reward Schools
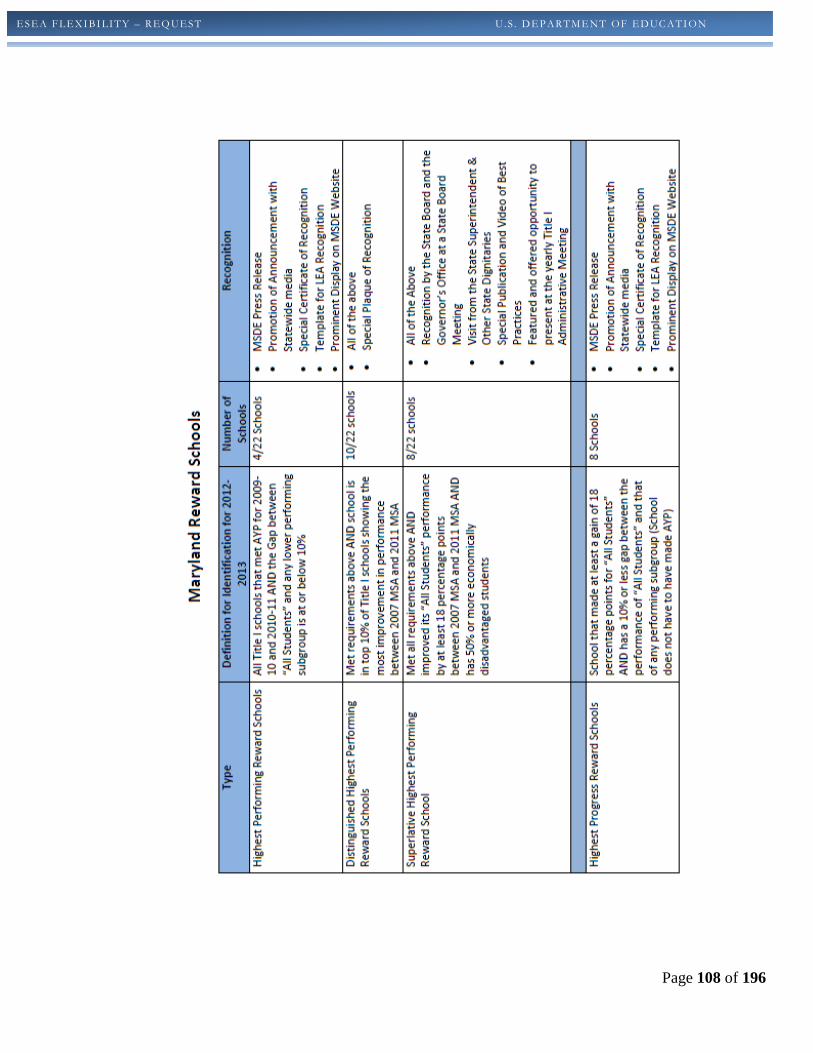
Page 108 of 196
ESEA FLEXIBI LITY – REQ UEST U .S . DEPARTMENT OF EDUC ATI ON
Page 109 of 196
ESEA FLEXIBI LITY – REQ UEST U .S . DEPARTMENT OF EDUC ATI ON
2.D PRIORITY SCHOOLS 2.D.i Describe the SEA’s methodology for identifying a number of lowest-performing schools equal to at least five percent of the State’s Title I schools as priority schools. If the SEA’s methodology is not based on the definition of reward schools in ESEA Flexibility (but instead, e.g. based on school grades or ratings that take into account a number of factors), the SEA should also demonstrate that the list provided in Table 2 is consistent with the definition, per the Department’s “Demonstrating that an SEA’s Lists of Schools meet ESEA Flexibility Definitions” guidance. Maryland views Priority Schools as not only those schools with the most obvious need and
challenge but as test cases for the interventions and support brought by the federal dollars and
direction; the State vision and policy; the district attention and resources; and the school’s
dedication to change. Maryland is coordinating enormous resources and efforts across all
levels of government in a way that is unprecedented in recent times to make real differences in
schools that have struggled for years under the challenges of low expectations and high
poverty and all of the additional baggage that brings. Maryland is ready to meet this challenge
and believes that there is a structure in place with Section 1003(g) School Improvement Grant
(SIG) Schools that can be extended to the additional schools that we will need to identify as
Priority. Maryland will use the same definition of Persistently Lowest-Performing Schools to
identify Priority schools as it used to identify “Tier I” 2010 SIG schools.
2010 Definition of Persistently Lowest-Performing Schools
Maryland defines “persistently lowest-performing Tier I schools” as those Title I schools
(elementary school grade levels Pre-K through five, and middle school grade levels 6-8, and
combination schools, PreK-8 at the LEA’s discretion) that are the five lowest-achieving (or
five percent) of all Title I schools in improvement, corrective action, or restructuring in the
State.
Based on the 2010 Spring administration of the Maryland School Assessment, Maryland
identified 76 operating Title I schools in improvement, corrective action or restructuring for
school year 2010-2011. The five identified Title I schools have not met performance
standards in combined reading and mathematics in the “all students” subgroup for the full
academic year 2009-2010. There are 4 Title I high schools (grades 9-12 or combination K-12)
in Maryland. No combination high schools have a graduation rate of 60% or less. The process
Page 110 of 196
ESEA FLEXIBI LITY – REQ UEST U .S . DEPARTMENT OF EDUC ATI ON
below was used to identify Tier I schools.
Annual Performance Ranking
1. School’s AYP Proficiency calculated based on all assessed grades
2. Schools Annual Measurable Objective (AMO) based on all assessed grades
3. Ranking for Reading and Mathematics are calculated separately by subtracting
the AMO from the AYP Proficiency
4. Reading and Mathematics Rankings are summed to calculate the School’s
annual Overall Performance Rank
Annual Performance Rank = (AYP % proficient for Reading – AMO for Reading) + (AYP
% proficient for Mathematics – AMO for Mathematics)
• Overall Rank – is the School’s Annual Performance Rank summed for 2008 through
2010
• Overall Average Rank - is the School’s Annual Performance Ranks averaged based
on the summed Annual Performance Ranks for 2008 through 2010
• Overall Weighted Rank – is the School’s Annual Performance Rank weighted for
each school year
1. 2008 Performance Rank multiplied by a weight of 1.0
2. 2009 Performance Rank multiplied by a weight of 1.0
3. 2010 Performance Rank multiplied by a weight of 1.25
4. Sum the weighted Performance Ranks for 2009 through 2010
5. Divide the sum of the Performance Ranks by the sum of the weights, which is
3.25 when a Performance Rank is present for all three school years
Graduation Rate Criteria:
Graduation Rate
o Graduation Rate is less than 60% for the past 3 school years
o School must be Title I eligible
o School measured for AYP
Notes:
o Schools that did not have three years of AYP data were excluded from Tier I
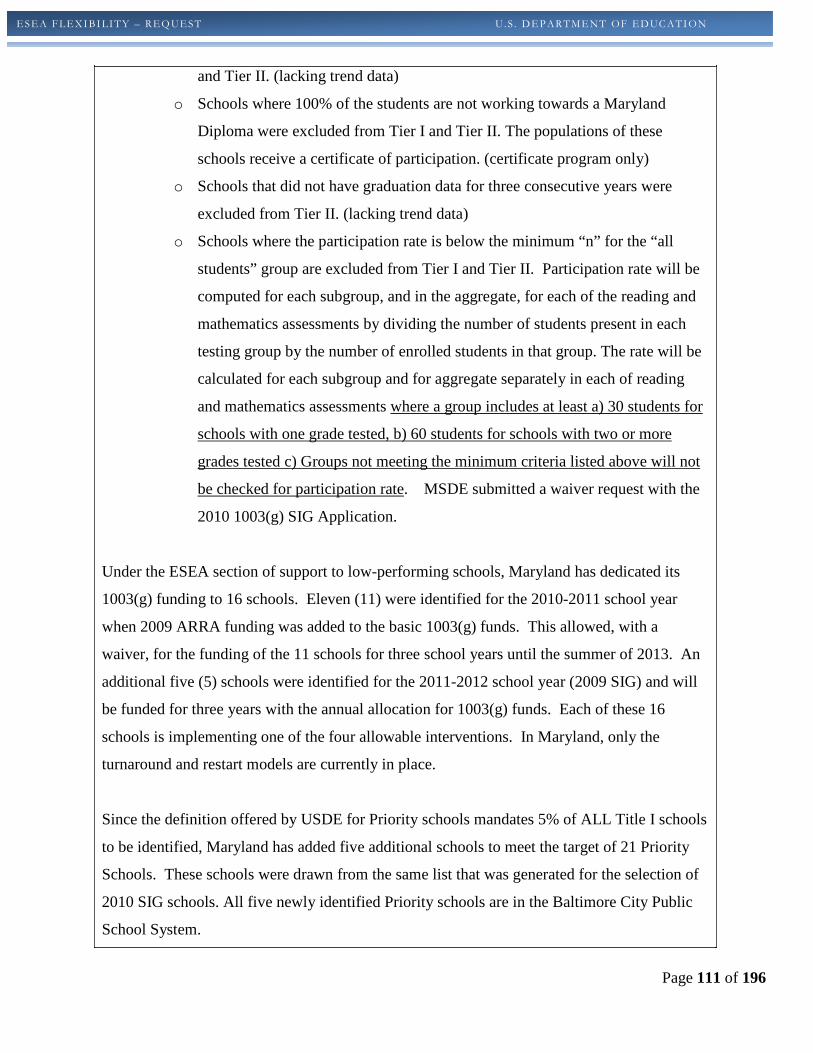
Page 111 of 196
ESEA FLEXIBI LITY – REQ UEST U .S . DEPARTMENT OF EDUC ATI ON
and Tier II. (lacking trend data)
o Schools where 100% of the students are not working towards a Maryland
Diploma were excluded from Tier I and Tier II. The populations of these
schools receive a certificate of participation. (certificate program only)
o Schools that did not have graduation data for three consecutive years were
excluded from Tier II. (lacking trend data)
o Schools where the participation rate is below the minimum “n” for the “all
students” group are excluded from Tier I and Tier II. Participation rate will be
computed for each subgroup, and in the aggregate, for each of the reading and
mathematics assessments by dividing the number of students present in each
testing group by the number of enrolled students in that group. The rate will be
calculated for each subgroup and for aggregate separately in each of reading
and mathematics assessments where a group includes at least a) 30 students for
schools with one grade tested, b) 60 students for schools with two or more
grades tested c) Groups not meeting the minimum criteria listed above will not
be checked for participation rate. MSDE submitted a waiver request with the
2010 1003(g) SIG Application.
Under the ESEA section of support to low-performing schools, Maryland has dedicated its
1003(g) funding to 16 schools. Eleven (11) were identified for the 2010-2011 school year
when 2009 ARRA funding was added to the basic 1003(g) funds. This allowed, with a
waiver, for the funding of the 11 schools for three school years until the summer of 2013. An
additional five (5) schools were identified for the 2011-2012 school year (2009 SIG) and will
be funded for three years with the annual allocation for 1003(g) funds. Each of these 16
schools is implementing one of the four allowable interventions. In Maryland, only the
turnaround and restart models are currently in place.
Since the definition offered by USDE for Priority schools mandates 5% of ALL Title I schools
to be identified, Maryland has added five additional schools to meet the target of 21 Priority
Schools. These schools were drawn from the same list that was generated for the selection of
2010 SIG schools. All five newly identified Priority schools are in the Baltimore City Public
School System.
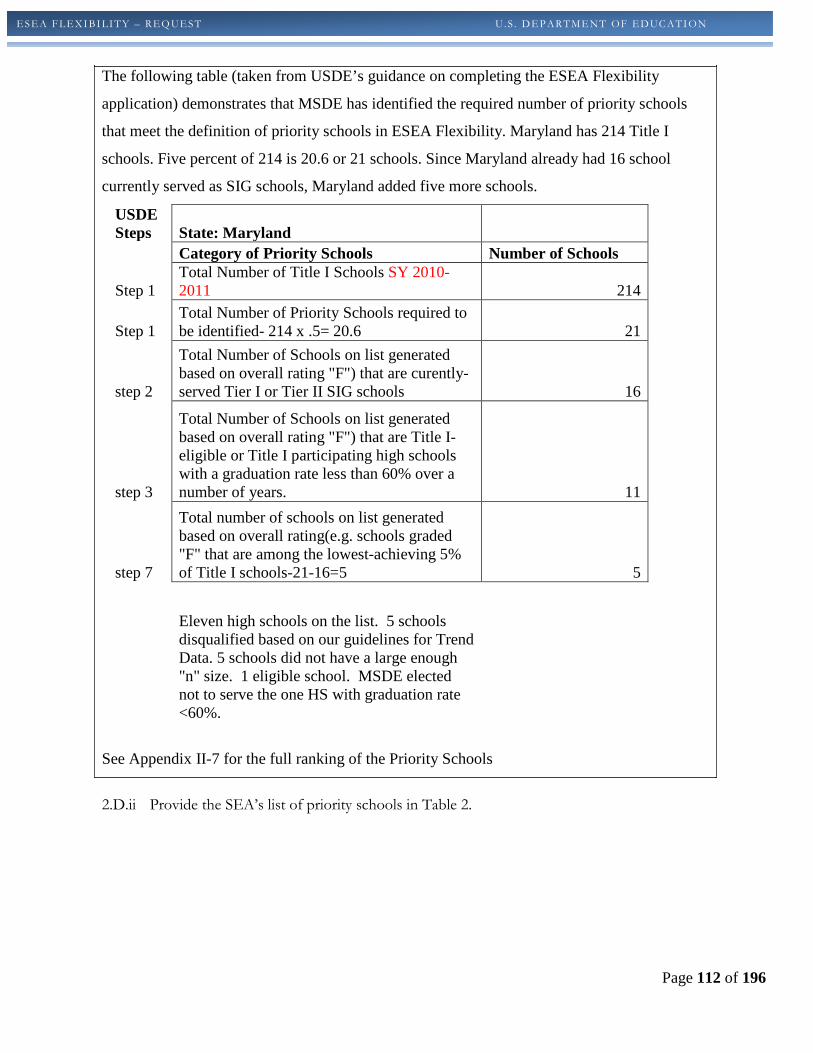
Page 112 of 196
ESEA FLEXIBI LITY – REQ UEST U .S . DEPARTMENT OF EDUC ATI ON
The following table (taken from USDE’s guidance on completing the ESEA Flexibility
application) demonstrates that MSDE has identified the required number of priority schools
that meet the definition of priority schools in ESEA Flexibility. Maryland has 214 Title I
schools. Five percent of 214 is 20.6 or 21 schools. Since Maryland already had 16 school
currently served as SIG schools, Maryland added five more schools.
USDE Steps State: Maryland
Category of Priority Schools Number of Schools
Step 1 Total Number of Title I Schools SY 2010-2011 214
Step 1 Total Number of Priority Schools required to be identified- 214 x .5= 20.6 21
step 2
Total Number of Schools on list generated based on overall rating "F") that are curently-served Tier I or Tier II SIG schools 16
step 3
Total Number of Schools on list generated based on overall rating "F") that are Title I-eligible or Title I participating high schools with a graduation rate less than 60% over a number of years. 11
step 7
Total number of schools on list generated based on overall rating(e.g. schools graded "F" that are among the lowest-achieving 5% of Title I schools-21-16=5 5
Eleven high schools on the list. 5 schools disqualified based on our guidelines for Trend Data. 5 schools did not have a large enough "n" size. 1 eligible school. MSDE elected not to serve the one HS with graduation rate <60%.
See Appendix II-7 for the full ranking of the Priority Schools
2.D.ii Provide the SEA’s list of priority schools in Table 2.
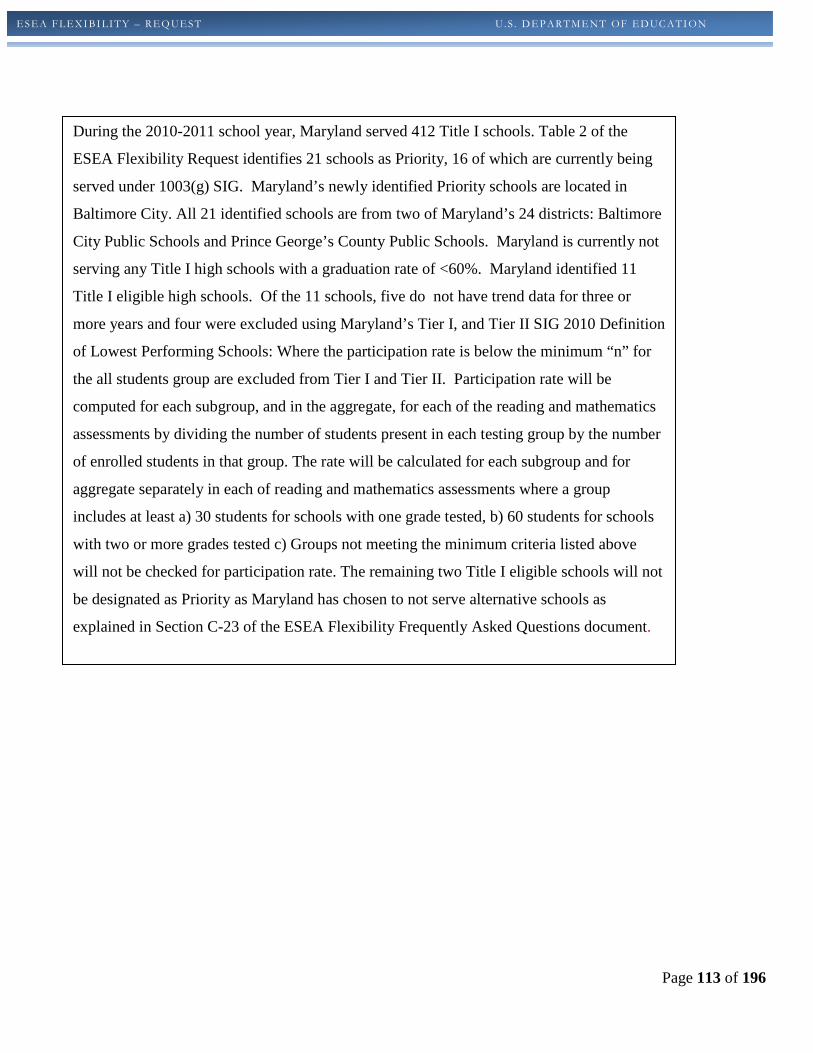
Page 113 of 196
ESEA FLEXIBI LITY – REQ UEST U .S . DEPARTMENT OF EDUC ATI ON
During the 2010-2011 school year, Maryland served 412 Title I schools. Table 2 of the
ESEA Flexibility Request identifies 21 schools as Priority, 16 of which are currently being
served under 1003(g) SIG. Maryland’s newly identified Priority schools are located in
Baltimore City. All 21 identified schools are from two of Maryland’s 24 districts: Baltimore
City Public Schools and Prince George’s County Public Schools. Maryland is currently not
serving any Title I high schools with a graduation rate of <60%. Maryland identified 11
Title I eligible high schools. Of the 11 schools, five do not have trend data for three or
more years and four were excluded using Maryland’s Tier I, and Tier II SIG 2010 Definition
of Lowest Performing Schools: Where the participation rate is below the minimum “n” for
the all students group are excluded from Tier I and Tier II. Participation rate will be
computed for each subgroup, and in the aggregate, for each of the reading and mathematics
assessments by dividing the number of students present in each testing group by the number
of enrolled students in that group. The rate will be calculated for each subgroup and for
aggregate separately in each of reading and mathematics assessments where a group
includes at least a) 30 students for schools with one grade tested, b) 60 students for schools
with two or more grades tested c) Groups not meeting the minimum criteria listed above
will not be checked for participation rate. The remaining two Title I eligible schools will not
be designated as Priority as Maryland has chosen to not serve alternative schools as
explained in Section C-23 of the ESEA Flexibility Frequently Asked Questions document.
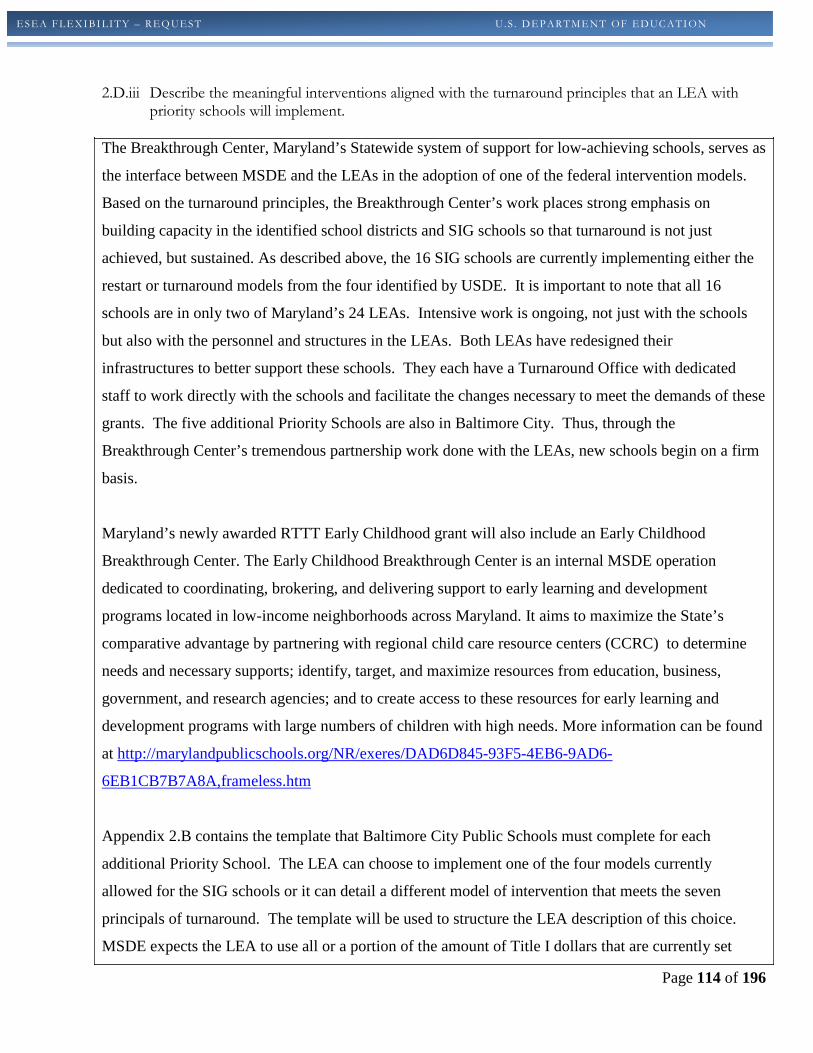
Page 114 of 196
ESEA FLEXIBI LITY – REQ UEST U .S . DEPARTMENT OF EDUC ATI ON
2.D.iii Describe the meaningful interventions aligned with the turnaround principles that an LEA with
priority schools will implement. The Breakthrough Center, Maryland’s Statewide system of support for low-achieving schools, serves as
the interface between MSDE and the LEAs in the adoption of one of the federal intervention models.
Based on the turnaround principles, the Breakthrough Center’s work places strong emphasis on
building capacity in the identified school districts and SIG schools so that turnaround is not just
achieved, but sustained. As described above, the 16 SIG schools are currently implementing either the
restart or turnaround models from the four identified by USDE. It is important to note that all 16
schools are in only two of Maryland’s 24 LEAs. Intensive work is ongoing, not just with the schools
but also with the personnel and structures in the LEAs. Both LEAs have redesigned their
infrastructures to better support these schools. They each have a Turnaround Office with dedicated
staff to work directly with the schools and facilitate the changes necessary to meet the demands of these
grants. The five additional Priority Schools are also in Baltimore City. Thus, through the
Breakthrough Center’s tremendous partnership work done with the LEAs, new schools begin on a firm
basis.
Maryland’s newly awarded RTTT Early Childhood grant will also include an Early Childhood
Breakthrough Center. The Early Childhood Breakthrough Center is an internal MSDE operation
dedicated to coordinating, brokering, and delivering support to early learning and development
programs located in low-income neighborhoods across Maryland. It aims to maximize the State’s
comparative advantage by partnering with regional child care resource centers (CCRC) to determine
needs and necessary supports; identify, target, and maximize resources from education, business,
government, and research agencies; and to create access to these resources for early learning and
development programs with large numbers of children with high needs. More information can be found
at http://marylandpublicschools.org/NR/exeres/DAD6D845-93F5-4EB6-9AD6-
6EB1CB7B7A8A,frameless.htm
Appendix 2.B contains the template that Baltimore City Public Schools must complete for each
additional Priority School. The LEA can choose to implement one of the four models currently
allowed for the SIG schools or it can detail a different model of intervention that meets the seven
principals of turnaround. The template will be used to structure the LEA description of this choice.
MSDE expects the LEA to use all or a portion of the amount of Title I dollars that are currently set
Page 115 of 196
ESEA FLEXIBI LITY – REQ UEST U .S . DEPARTMENT OF EDUC ATI ON
aside for Supplemental Education Services (SES) and Parental Choice to provide between $50,000 and
$2 million per school per year for the next three years in order to implement the chosen intervention. In
2011-2012, Baltimore City Public Schools reserved $6,954,799 for Supplemental Educational Services
and Public School Choice. MSDE believes this amount, coupled with its regular Title I A funds, will
allow the five Priority schools to implement a model or interventions sufficient to address the needs of
its schools and students. It should be noted that the LEA may choose to continue to work with SES
providers to support these schools and may choose to allocate Title I or other funding sources to hire
SES providers to support these schools.
Appendix 2.B contains the Priority Schools Template that Maryland will require each newly identified
Priority school to complete. The LEA and/or school can opt to implement one of the four USDE
approved turnaround models or can develop their own models for intervention that meet the seven
principals of turnaround. The template will be used to structure and ensure that all turnaround
principles below have been addressed.
1. Providing strong leadership
2. Ensuring that teachers are effective and able to improve instruction
3. Redesigning the school day, week, or year to include additional time for student learning and
support
4. Strengthening the school’s instructional program
5. Using data to inform instruction for continuous improvement
6. Establishing a school environment that improves school safety and discipline
7. Providing ongoing mechanisms for family and community engagement
The MSDE applications and templates (for Priority and Focus schools) will be placed online on the
Title I website. These templates will be accessible electronically, can be completed electronically and
submitted to MSDE. Hard copies of signed assurances and budgets are submitted to MSDE with their
applications and templates.
Financial Resources
MSDE expects each LEA with Priority schools to set aside and use all or a portion of the amount of
Title I, Part A dollars that they would set aside for Supplemental Education Services (SES) and Public
School Choice to implement their chosen interventions. Each school is eligible to receive between
Page 116 of 196
ESEA FLEXIBI LITY – REQ UEST U .S . DEPARTMENT OF EDUC ATI ON
$50,000 and $2 million per school, per year for the next three years to implement the chosen
interventions in order to make substantial student progress towards meeting Maryland’s performance
targets by 2017.
Maryland understands that under ESEA section 9401(a)(5), the U.S. Secretary of Education may not
waive any statutory or regulatory requirement related to the equitable participation of private school
students, teachers, and families. As such, Maryland has and will continue to expect LEAs to engage in
timely and meaningful consultation before making any decision that affects the opportunities of eligible
private school children, teachers, and other educational personnel, if applicable, to participate in the
programs affected by the transfer of funds, and provide private school students and teachers equitable
services under the program to which the funds are transferred (if applicable) based on the total amount
of funds available to each program after the transfer. Maryland consulted with private school
stakeholders on February 7, 2012.
Should an LEA transfer funds from Title II, Part A, Section 9501 (b)(3)(B) the LEA is required to
provide, at a minimum, equitable services to private school teachers based on an amount of the LEA’s
allocation under Title II, Part A, that is not less than the aggregate amount of FY2001 funds that an
LEA used for professional development under the Eisenhower and Class Size Reduction Program.
2.D.iv Provide the timeline the SEA will use to ensure that its LEAs that have one or more priority
schools implement meaningful interventions aligned with the turnaround principles in each priority school no later than the 2014–2015 school year and provide a justification for the SEA’s choice of timeline.
Because of the existing infrastructure for the current 16 SIG schools, Maryland expects the
LEAs to commence pre-implementation activities beginning July 2012 with full
implementation of the plan beginning July 1, 2013. This allows for a full year of planning
(assuming approval of the flexibility package by the end of May 2012) to slowly introduce
those programs or policies that will be in full effect beginning July 2013. The Priority
Schools will use the Maryland Priority Schools Intervention Template or Adopt one of the
four USDE approved SIG models. An LEA may use up to 20% of the federal FY 2012 Title
I, Part A funds in its Priority schools. An LEA may reserve from $50, 000- $2, 000,000 per
school from this reservation annually to implement its schools’ plans. The list of the Priority
schools will be refreshed after the three-year period.
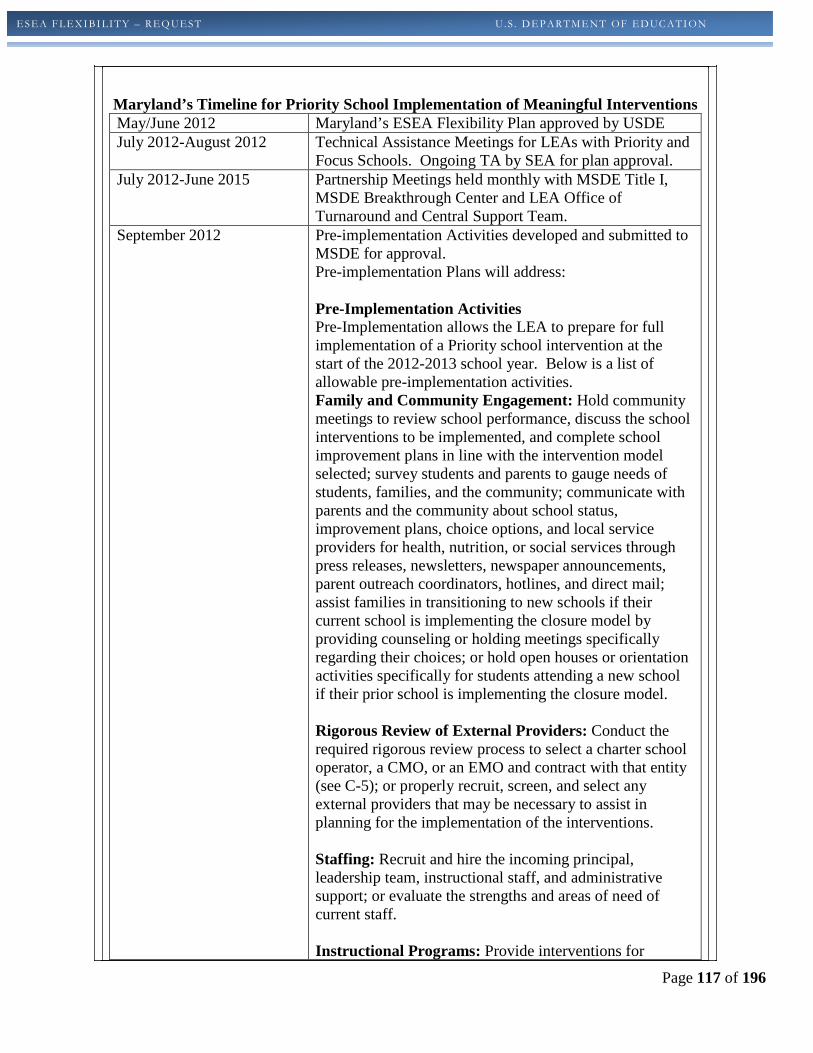
Page 117 of 196
ESEA FLEXIBI LITY – REQ UEST U .S . DEPARTMENT OF EDUC ATI ON
Maryland’s Timeline for Priority School Implementation of Meaningful Interventions May/June 2012 Maryland’s ESEA Flexibility Plan approved by USDE July 2012-August 2012 Technical Assistance Meetings for LEAs with Priority and
Focus Schools. Ongoing TA by SEA for plan approval. July 2012-June 2015 Partnership Meetings held monthly with MSDE Title I,
MSDE Breakthrough Center and LEA Office of Turnaround and Central Support Team.
September 2012 Pre-implementation Activities developed and submitted to MSDE for approval. Pre-implementation Plans will address: Pre-Implementation Activities Pre-Implementation allows the LEA to prepare for full implementation of a Priority school intervention at the start of the 2012-2013 school year. Below is a list of allowable pre-implementation activities. Family and Community Engagement: Hold community meetings to review school performance, discuss the school interventions to be implemented, and complete school improvement plans in line with the intervention model selected; survey students and parents to gauge needs of students, families, and the community; communicate with parents and the community about school status, improvement plans, choice options, and local service providers for health, nutrition, or social services through press releases, newsletters, newspaper announcements, parent outreach coordinators, hotlines, and direct mail; assist families in transitioning to new schools if their current school is implementing the closure model by providing counseling or holding meetings specifically regarding their choices; or hold open houses or orientation activities specifically for students attending a new school if their prior school is implementing the closure model.
Rigorous Review of External Providers: Conduct the required rigorous review process to select a charter school operator, a CMO, or an EMO and contract with that entity (see C-5); or properly recruit, screen, and select any external providers that may be necessary to assist in planning for the implementation of the interventions.
Staffing: Recruit and hire the incoming principal, leadership team, instructional staff, and administrative support; or evaluate the strengths and areas of need of current staff. Instructional Programs: Provide interventions for
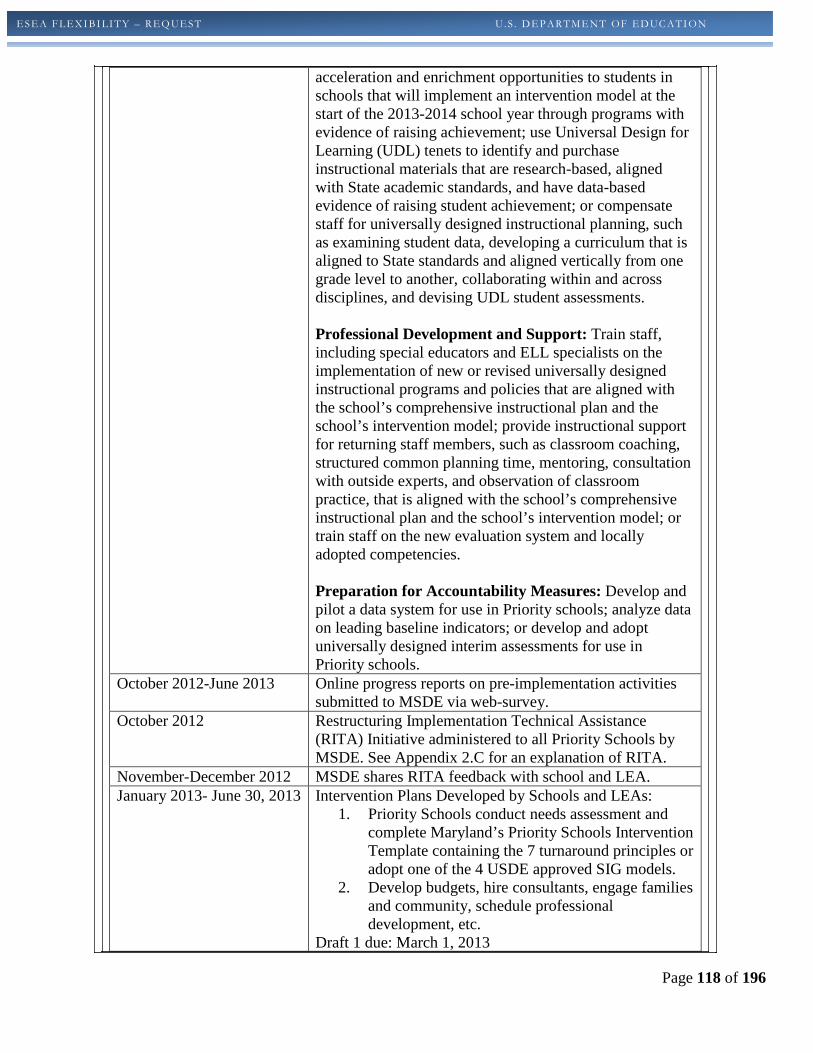
Page 118 of 196
ESEA FLEXIBI LITY – REQ UEST U .S . DEPARTMENT OF EDUC ATI ON
acceleration and enrichment opportunities to students in schools that will implement an intervention model at the start of the 2013-2014 school year through programs with evidence of raising achievement; use Universal Design for Learning (UDL) tenets to identify and purchase instructional materials that are research-based, aligned with State academic standards, and have data-based evidence of raising student achievement; or compensate staff for universally designed instructional planning, such as examining student data, developing a curriculum that is aligned to State standards and aligned vertically from one grade level to another, collaborating within and across disciplines, and devising UDL student assessments.
Professional Development and Support: Train staff, including special educators and ELL specialists on the implementation of new or revised universally designed instructional programs and policies that are aligned with the school’s comprehensive instructional plan and the school’s intervention model; provide instructional support for returning staff members, such as classroom coaching, structured common planning time, mentoring, consultation with outside experts, and observation of classroom practice, that is aligned with the school’s comprehensive instructional plan and the school’s intervention model; or train staff on the new evaluation system and locally adopted competencies.
Preparation for Accountability Measures: Develop and pilot a data system for use in Priority schools; analyze data on leading baseline indicators; or develop and adopt universally designed interim assessments for use in Priority schools.
October 2012-June 2013 Online progress reports on pre-implementation activities submitted to MSDE via web-survey.
October 2012 Restructuring Implementation Technical Assistance (RITA) Initiative administered to all Priority Schools by MSDE. See Appendix 2.C for an explanation of RITA.
November-December 2012 MSDE shares RITA feedback with school and LEA. January 2013- June 30, 2013 Intervention Plans Developed by Schools and LEAs:
1. Priority Schools conduct needs assessment and complete Maryland’s Priority Schools Intervention Template containing the 7 turnaround principles or adopt one of the 4 USDE approved SIG models.
2. Develop budgets, hire consultants, engage families and community, schedule professional development, etc.
Draft 1 due: March 1, 2013

Page 119 of 196
ESEA FLEXIBI LITY – REQ UEST U .S . DEPARTMENT OF EDUC ATI ON
Draft 2 due: April 15, 2013 Final Submission due: May 30, 2013
February 2013 MSDE onsite monitoring of pre-implementation activities. MSDE shares monitoring feedback during the monthly technical assistance Partnership Meeting in March 2013. Monitoring tool will be customized for each school.
July 1, 2013- June 30, 2014 Full Implementation of approved Priority School Implementation plan.
July 1, 2013- June 30, 2014 MSDE onsite Monitoring of the Approved Priority School Implementation Plan September/October 2013 February/March 2014 May/June 2014 Monitoring tools will be customized to each approved Priority School plan and budgets.
July 1, 2014 MSDE and LEA review of Performance Data and revise plans based on data.
July 1, 2014- June 30, 2015 MSDE onsite Monitoring of the Approved Priority School Implementation Plan September/October 2014 February/March 2015 May/June 2015 Monitoring tools will be customized to each approved Priority School plan and budgets.
July 1, 2015 MSDE and LEA review of Performance Data and revise plans based on data.
2.D.v Provide the criteria the SEA will use to determine when a school that is making significant progress in improving student achievement exits priority status and a justification for the criteria selected.
The sustained support to Priority Schools is designed to fundamentally alter their current
direction or performance. Because of this and the discussion in Section 2.A.i., a Priority school
will exit Priority status when it demonstrates that it is making significant progress in
improving student achievement on the Maryland State Assessment. A Priority school must
advance two (2) strands or more on the Maryland School Performance Index or fall within
Strand 2 on the School Performance Index. Should Maryland identify Title I high schools or
Title I eligible high schools in the future, an additional exit component would include a
graduation rate of 70% or above for two consecutive years.
Page 120 of 196
ESEA FLEXIBI LITY – REQ UEST U .S . DEPARTMENT OF EDUC ATI ON
Maryland has implemented a process to provide direct support to LEAs with SIG Schools in
Tier I and Tier II as well as RTTT feeder schools. Maryland’s position is to work with the
LEA on a regular basis to insure there is improvement in these lowest performing schools.
This process includes monthly internal MSDE meetings via the Breakthrough Center. One
key feature of the Breakthrough Center calls for MSDE to convene a cross functional team
comprised of experts within the Department from Title I and Divisions of Instruction, Student,
Family and School Support, Career and Technology Education, etc. The cross functional team
is charged with providing direct support to schools and LEAs by brokering services or
providing direct services related to academics, scheduling, safe schools, leadership, data and
professional development among others. The cross functional team meets monthly. In
addition, MSDE’s Breakthrough Center staff and Title I staff meet monthly with the LEA
Turnaround offices to discuss services and interventions and assist with implementation.
LEAs are required to submit quarterly data to MSDE. MSDE analyzes the data and provides
feedback and strategies that the LEA may implement.
2.E FOCUS SCHOOLS 2.E.i Describe the SEA’s methodology for identifying a number of low-performing schools equal to at least 10 percent of the State’s Title I schools as “focus schools.” If the SEA’s methodology is not based on the definition of focus schools in ESEA Flexibility (but instead, e.g. based on school grades or ratings that take into account a number of factors), the SEA should also demonstrate that the list provided in Table 2 is consistent with the definition, per the Department’s “Demonstrating that an SEA’s Lists of Schools meet ESEA Flexibility Definitions” guidance. Maryland has a history of identifying Focus schools under the piloted Differentiated
Accountability structure. These are schools that do not require a school-wide, systemic change
but rather need to focus on the services to only one or two subgroups. Because performance in
the other subgroups and at the “all students” level are maintaining and improving, the low
achievement of one subgroup contributes to the overall gap within the school, the LEA and the
SEA.
Analysis: In order to be considered for this analysis, a school had to be a Title I school in 2011
and had to have been measured for AYP for Reading and Mathematics in both 2010 and 2011
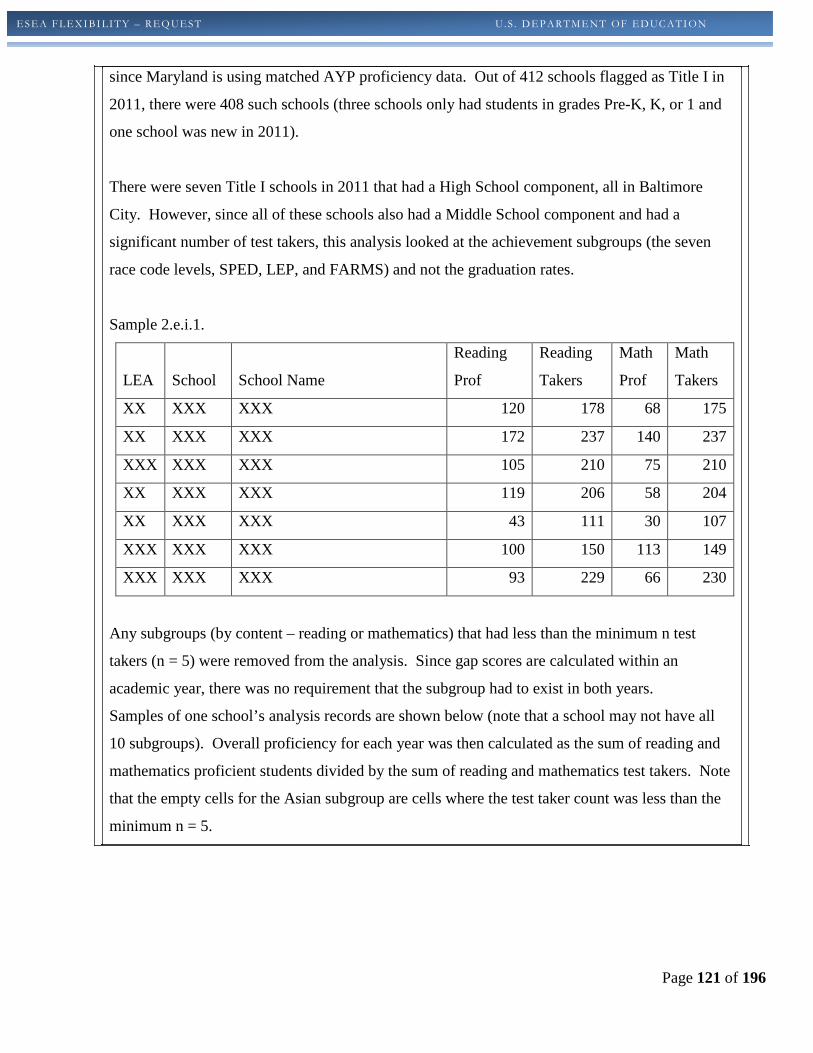
Page 121 of 196
ESEA FLEXIBI LITY – REQ UEST U .S . DEPARTMENT OF EDUC ATI ON
since Maryland is using matched AYP proficiency data. Out of 412 schools flagged as Title I in
2011, there were 408 such schools (three schools only had students in grades Pre-K, K, or 1 and
one school was new in 2011).
There were seven Title I schools in 2011 that had a High School component, all in Baltimore
City. However, since all of these schools also had a Middle School component and had a
significant number of test takers, this analysis looked at the achievement subgroups (the seven
race code levels, SPED, LEP, and FARMS) and not the graduation rates.
Sample 2.e.i.1.
LEA School School Name
Reading
Prof
Reading
Takers
Math
Prof
Math
Takers
XX XXX XXX 120 178 68 175
XX XXX XXX 172 237 140 237
XXX XXX XXX 105 210 75 210
XX XXX XXX 119 206 58 204
XX XXX XXX 43 111 30 107
XXX XXX XXX 100 150 113 149
XXX XXX XXX 93 229 66 230
Any subgroups (by content – reading or mathematics) that had less than the minimum n test
takers (n = 5) were removed from the analysis. Since gap scores are calculated within an
academic year, there was no requirement that the subgroup had to exist in both years.
Samples of one school’s analysis records are shown below (note that a school may not have all
10 subgroups). Overall proficiency for each year was then calculated as the sum of reading and
mathematics proficient students divided by the sum of reading and mathematics test takers. Note
that the empty cells for the Asian subgroup are cells where the test taker count was less than the
minimum n = 5.
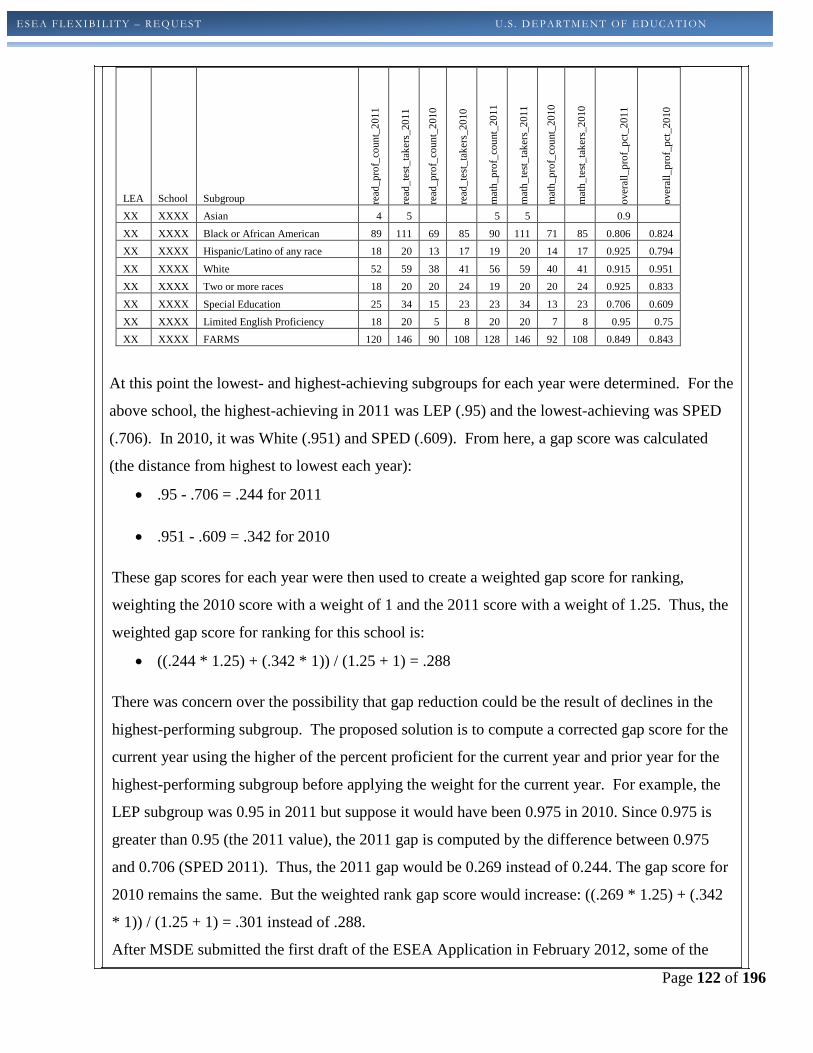
Page 122 of 196
ESEA FLEXIBI LITY – REQ UEST U .S . DEPARTMENT OF EDUC ATI ON
LEA School Subgroup read
_pro
f_co
unt_
2011
read
_tes
t_ta
kers
_201
1
read
_pro
f_co
unt_
2010
read
_tes
t_ta
kers
_201
0
mat
h_pr
of_c
ount
_201
1
mat
h_te
st_ta
kers
_201
1
mat
h_pr
of_c
ount
_201
0
mat
h_te
st_ta
kers
_201
0
over
all_
prof
_pct
_201
1
over
all_
prof
_pct
_201
0
XX XXXX Asian 4 5
5 5
0.9 XX XXXX Black or African American 89 111 69 85 90 111 71 85 0.806 0.824
XX XXXX Hispanic/Latino of any race 18 20 13 17 19 20 14 17 0.925 0.794
XX XXXX White 52 59 38 41 56 59 40 41 0.915 0.951 XX XXXX Two or more races 18 20 20 24 19 20 20 24 0.925 0.833
XX XXXX Special Education 25 34 15 23 23 34 13 23 0.706 0.609 XX XXXX Limited English Proficiency 18 20 5 8 20 20 7 8 0.95 0.75 XX XXXX FARMS 120 146 90 108 128 146 92 108 0.849 0.843
At this point the lowest- and highest-achieving subgroups for each year were determined. For the
above school, the highest-achieving in 2011 was LEP (.95) and the lowest-achieving was SPED
(.706). In 2010, it was White (.951) and SPED (.609). From here, a gap score was calculated
(the distance from highest to lowest each year):
• .95 - .706 = .244 for 2011
• .951 - .609 = .342 for 2010
These gap scores for each year were then used to create a weighted gap score for ranking,
weighting the 2010 score with a weight of 1 and the 2011 score with a weight of 1.25. Thus, the
weighted gap score for ranking for this school is:
• ((.244 * 1.25) + (.342 * 1)) / (1.25 + 1) = .288
There was concern over the possibility that gap reduction could be the result of declines in the
highest-performing subgroup. The proposed solution is to compute a corrected gap score for the
current year using the higher of the percent proficient for the current year and prior year for the
highest-performing subgroup before applying the weight for the current year. For example, the
LEP subgroup was 0.95 in 2011 but suppose it would have been 0.975 in 2010. Since 0.975 is
greater than 0.95 (the 2011 value), the 2011 gap is computed by the difference between 0.975
and 0.706 (SPED 2011). Thus, the 2011 gap would be 0.269 instead of 0.244. The gap score for
2010 remains the same. But the weighted rank gap score would increase: ((.269 * 1.25) + (.342
* 1)) / (1.25 + 1) = .301 instead of .288.
After MSDE submitted the first draft of the ESEA Application in February 2012, some of the
Page 123 of 196
ESEA FLEXIBI LITY – REQ UEST U .S . DEPARTMENT OF EDUC ATI ON
LEAs alerted MSDE that a few schools on the focus list were no longer Title I schools. In this
submission (May 2012), Maryland revised the list indicating the schools that were no longer
Title I. This is labeled in the first column of the full ranking of the Focus Schools found in
Appendix II-8.
2.E.ii Provide the SEA’s list of focus schools in Table 2. 2.E.iii Describe the process and timeline the SEA will use to ensure that its LEAs that have one or more
focus schools will identify the specific needs of the SEA’s focus schools and their students and provide examples of and justifications for the interventions focus schools will be required to implement to improve the performance of students who are the furthest behind.
Maryland’s experience with schools that have performance deficits in only one or two
subgroups, through the Restructuring Planning and Implementation phases under No Child
Left Behind is that examining the needs and resources dedicated to the low-performing
subgroup often reveals work necessary to turnaround the low performance. MSDE currently
distributes the school improvement dollars provided through 1003(a) funding to all Title I
schools in improvement. In SY 2011-2012, 150 Title I schools were in improvement. To
apply for these funds a school or LEA must complete an application that details its Priority
needs and the interventions the school will put in place to address the identified needs.
Maryland proposes to use the same process for identifying the needs in Focus Schools and for
ensuring that these schools have a viable plan for improvement. MSDE will ask that each
LEA, after funding any Priority Schools, use up to the current amount used for SES or Choice
to support the work necessary in these schools. After that, MSDE will target these 41 schools
for a differentiated amount of the 1003(a) funds (Appendix 2.D). Maryland’s 1003(a) funds
are currently used for 150 Title I schools in improvement. At the time this application was
submitted, Maryland does not have any Title I high schools with a graduation rate less than 60
percent. With a differentiation that weights support to Focus schools, LEAs and schools will
be able to craft effective interventions to address specific needs, describe them in the
application for 1003(a) funds and implement them under the direction and monitoring of the
SEA and the LEAs. Maryland will use 1003(a) funds to provide base funding of $30,000 +
(enrollment x $50.00 PPA) for each Focus school. These funds, coupled with the schools’
regular Title I, Part A allocations will provide adequate resources to address the schools’
needs. The difference will be the availability of additional dollars and support from The
Breakthrough Center. See Appendix 2.E for a fuller explanation of Maryland’s Breakthrough
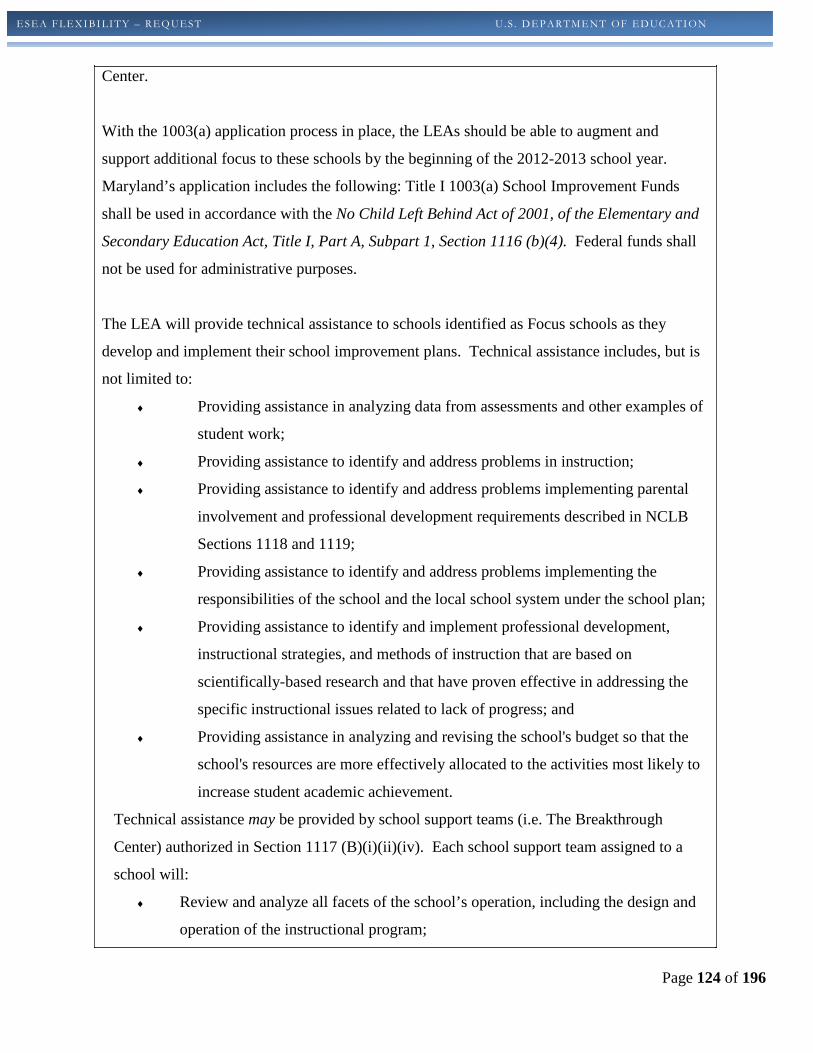
Page 124 of 196
ESEA FLEXIBI LITY – REQ UEST U .S . DEPARTMENT OF EDUC ATI ON
Center.
With the 1003(a) application process in place, the LEAs should be able to augment and
support additional focus to these schools by the beginning of the 2012-2013 school year.
Maryland’s application includes the following: Title I 1003(a) School Improvement Funds
shall be used in accordance with the No Child Left Behind Act of 2001, of the Elementary and
Secondary Education Act, Title I, Part A, Subpart 1, Section 1116 (b)(4). Federal funds shall
not be used for administrative purposes.
The LEA will provide technical assistance to schools identified as Focus schools as they
develop and implement their school improvement plans. Technical assistance includes, but is
not limited to:
♦ Providing assistance in analyzing data from assessments and other examples of
student work;
♦ Providing assistance to identify and address problems in instruction;
♦ Providing assistance to identify and address problems implementing parental
involvement and professional development requirements described in NCLB
Sections 1118 and 1119;
♦ Providing assistance to identify and address problems implementing the
responsibilities of the school and the local school system under the school plan;
♦ Providing assistance to identify and implement professional development,
instructional strategies, and methods of instruction that are based on
scientifically-based research and that have proven effective in addressing the
specific instructional issues related to lack of progress; and
♦ Providing assistance in analyzing and revising the school's budget so that the
school's resources are more effectively allocated to the activities most likely to
increase student academic achievement.
Technical assistance may be provided by school support teams (i.e. The Breakthrough
Center) authorized in Section 1117 (B)(i)(ii)(iv). Each school support team assigned to a
school will:
♦ Review and analyze all facets of the school’s operation, including the design and
operation of the instructional program;

Page 125 of 196
ESEA FLEXIBI LITY – REQ UEST U .S . DEPARTMENT OF EDUC ATI ON
♦ Assist the school in developing recommendations for improving student
performance in the school;
♦ Collaborate with parents and school staff and the local educational agency in the
design, implementation, and monitoring of a plan that can reasonably be expected
to improve student performance and help the school meet its goals for
improvement; and
♦ Make additional recommendations as the school implements that plan.
Each school receiving funds under 1003(a) must complete a needs assessment. Schools will
summarize the results of the data analysis, including the data sources, used to identify the
Priority need(s). The Required Strategies are described below. Each school will select one or
more strategies that will meet the Priority identified need(s).
• Schools will coordinate with the LEA to develop a professional development plan that
is designed to build the capacity of the school staff and is informed by student
achievement and outcome-related measures.
Each school will work with the LEA to create a professional development plan that
takes into consideration the various needs of the instructional staff. The plan must be
systemic in behavior-changing approaches that foster collaboration and increase
teacher knowledge of best practices. The plan must:
• Include instructional teams that meet regularly to examine student work,
collaborate on lesson design, and implement instruction based on proven
effective strategies;
• Align with the Maryland Professional Development Standards for Staff
Development that focus on context, process, and content standards:
(http://www.marylandpublicschools.org/MSDE/divisions/instruction/prof_standards);
and
• Provide time for all staff to collaborate and plan strategy implementation.
• Schools will target research-based strategies to change instructional practice in order to
address the academic achievement gaps and other challenges that led to the school not
making the AMOs.

Page 126 of 196
ESEA FLEXIBI LITY – REQ UEST U .S . DEPARTMENT OF EDUC ATI ON
• Each school will develop a plan that clearly identifies the expected outcomes for
students. Plans will include but not be limited to data retreats, professional learning
communities, and continual self-monitoring of individually targeted student progress.
Additionally, each school will explore tools that identify the local alignment of
curricula, curriculum mapping, or other tools that align with Maryland’s State
Curriculum. This will provide the school with research-based data to focus on the
curriculum areas that need improvement. From the curriculum gap analysis, the school
will need to write strategies that support these efforts. The school and the district must
approach educating targeted students using progress-monitoring instruments, data
analysis, collaborative decision-making, tiered and/or differentiated instruction,
parental involvement, and access to a standards-aligned core curriculum.
• Schools may create partnerships among external entities to obtain technical assistance,
professional development, and management advice. Grantees are encouraged to create
partnerships that can be cultivated to leverage assistance in meeting the individual
needs of each school.
• Schools may consider strengthening the parental involvement component of the school
improvement plan and may work with other technical assistance providers to provide
opportunities for parents to become more involved in the educational process.
• Schools may implement other strategies determined by the school district, as
appropriate, for which data indicate the strategy is likely to result in improved teaching
and learning. Schools will be required to plan for collecting, analyzing, and
interpreting individualized student data in order to adjust the daily instruction to
promote student outcomes.
Additionally, the MSDE Division of Special Education and Early Intervention Services
(DSE/EIS) has a compiled list of reading and math interventions (Appendix 2.F) currently
based in local school systems to support achievement of children with disabilities that we
could provide you upon request if you think it would enhance this section. This document was
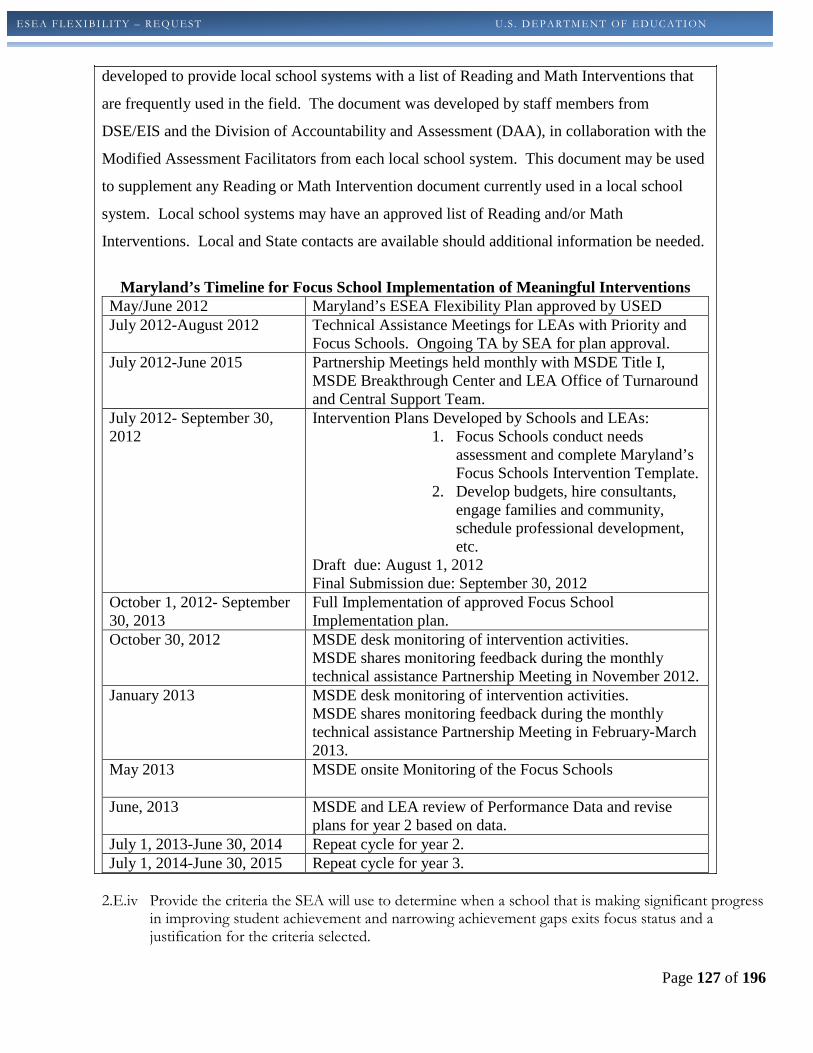
Page 127 of 196
ESEA FLEXIBI LITY – REQ UEST U .S . DEPARTMENT OF EDUC ATI ON
developed to provide local school systems with a list of Reading and Math Interventions that
are frequently used in the field. The document was developed by staff members from
DSE/EIS and the Division of Accountability and Assessment (DAA), in collaboration with the
Modified Assessment Facilitators from each local school system. This document may be used
to supplement any Reading or Math Intervention document currently used in a local school
system. Local school systems may have an approved list of Reading and/or Math
Interventions. Local and State contacts are available should additional information be needed.
Maryland’s Timeline for Focus School Implementation of Meaningful Interventions
May/June 2012 Maryland’s ESEA Flexibility Plan approved by USED July 2012-August 2012 Technical Assistance Meetings for LEAs with Priority and
Focus Schools. Ongoing TA by SEA for plan approval. July 2012-June 2015 Partnership Meetings held monthly with MSDE Title I,
MSDE Breakthrough Center and LEA Office of Turnaround and Central Support Team.
July 2012- September 30, 2012
Intervention Plans Developed by Schools and LEAs: 1. Focus Schools conduct needs
assessment and complete Maryland’s Focus Schools Intervention Template.
2. Develop budgets, hire consultants, engage families and community, schedule professional development, etc.
Draft due: August 1, 2012 Final Submission due: September 30, 2012
October 1, 2012- September 30, 2013
Full Implementation of approved Focus School Implementation plan.
October 30, 2012 MSDE desk monitoring of intervention activities. MSDE shares monitoring feedback during the monthly technical assistance Partnership Meeting in November 2012.
January 2013 MSDE desk monitoring of intervention activities. MSDE shares monitoring feedback during the monthly technical assistance Partnership Meeting in February-March 2013.
May 2013 MSDE onsite Monitoring of the Focus Schools
June, 2013 MSDE and LEA review of Performance Data and revise plans for year 2 based on data.
July 1, 2013-June 30, 2014 Repeat cycle for year 2. July 1, 2014-June 30, 2015 Repeat cycle for year 3.
2.E.iv Provide the criteria the SEA will use to determine when a school that is making significant progress
in improving student achievement and narrowing achievement gaps exits focus status and a justification for the criteria selected.

Page 128 of 196
ESEA FLEXIBI LITY – REQ UEST U .S . DEPARTMENT OF EDUC ATI ON
The support to Focus Schools is designed to address poor performance in targeted subgroups.
Because of this and the discussion in Section 2.A.i., a Focus school will exit Focus status
when it (1) demonstrates that it is making progress in improving student achievement on the
Maryland State Assessment in the area(s) that caused that status originally, (2) advance two
(2) Strands or fall within Strand 2 on the Maryland School Performance Index to exit this
designation. For a school to exit Focus status, the school must no longer be in the top 10% of
schools with a gap. Rather than create a broad goal of just “making progress”, the gap must in
fact be reduced to exit Focus status.
Maryland is currently not serving any Title I high schools with a graduation rate of <60%.
Should Maryland identify Title I high schools as Focus schools in the future, an additional exit
component would include a graduation rate of 70% or above for two (2) or more consecutive
years.
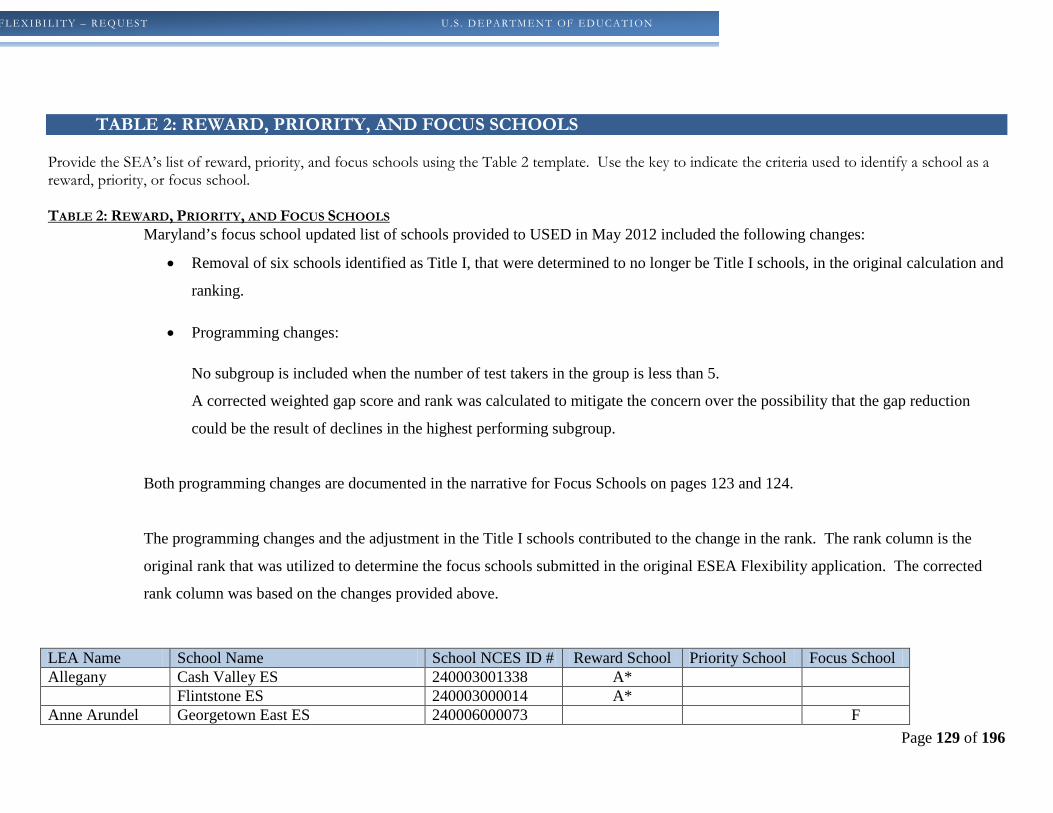
Page 129 of 196
FLEXIBI LITY – REQ UEST U .S . DEPARTMENT OF EDUC ATI ON
TABLE 2: REWARD, PRIORITY, AND FOCUS SCHOOLS Provide the SEA’s list of reward, priority, and focus schools using the Table 2 template. Use the key to indicate the criteria used to identify a school as a reward, priority, or focus school. TABLE 2: REWARD, PRIORITY, AND FOCUS SCHOOLS
Maryland’s focus school updated list of schools provided to USED in May 2012 included the following changes:
• Removal of six schools identified as Title I, that were determined to no longer be Title I schools, in the original calculation and
ranking.
• Programming changes:
No subgroup is included when the number of test takers in the group is less than 5.
A corrected weighted gap score and rank was calculated to mitigate the concern over the possibility that the gap reduction
could be the result of declines in the highest performing subgroup.
Both programming changes are documented in the narrative for Focus Schools on pages 123 and 124.
The programming changes and the adjustment in the Title I schools contributed to the change in the rank. The rank column is the
original rank that was utilized to determine the focus schools submitted in the original ESEA Flexibility application. The corrected
rank column was based on the changes provided above.
LEA Name School Name School NCES ID # Reward School Priority School Focus School Allegany Cash Valley ES 240003001338 A* Flintstone ES 240003000014 A* Anne Arundel Georgetown East ES 240006000073 F
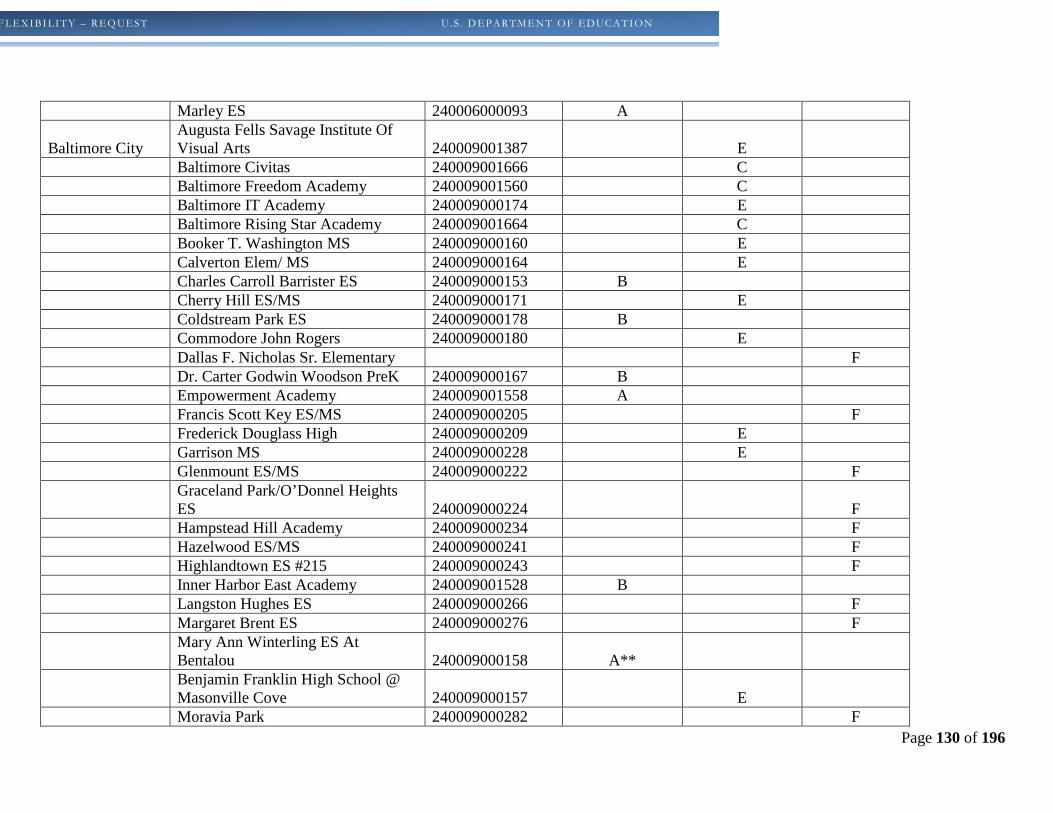
Page 130 of 196
FLEXIBI LITY – REQ UEST U .S . DEPARTMENT OF EDUC ATI ON
Marley ES 240006000093 A
Baltimore City Augusta Fells Savage Institute Of Visual Arts 240009001387 E
Baltimore Civitas 240009001666 C Baltimore Freedom Academy 240009001560 C Baltimore IT Academy 240009000174 E Baltimore Rising Star Academy 240009001664 C Booker T. Washington MS 240009000160 E Calverton Elem/ MS 240009000164 E Charles Carroll Barrister ES 240009000153 B Cherry Hill ES/MS 240009000171 E Coldstream Park ES 240009000178 B Commodore John Rogers 240009000180 E Dallas F. Nicholas Sr. Elementary F Dr. Carter Godwin Woodson PreK 240009000167 B Empowerment Academy 240009001558 A Francis Scott Key ES/MS 240009000205 F Frederick Douglass High 240009000209 E Garrison MS 240009000228 E Glenmount ES/MS 240009000222 F Graceland Park/O’Donnel Heights
ES 240009000224 F Hampstead Hill Academy 240009000234 F Hazelwood ES/MS 240009000241 F Highlandtown ES #215 240009000243 F Inner Harbor East Academy 240009001528 B Langston Hughes ES 240009000266 F Margaret Brent ES 240009000276 F Mary Ann Winterling ES At
Bentalou 240009000158 A** Benjamin Franklin High School @
Masonville Cove 240009000157 E Moravia Park 240009000282 F
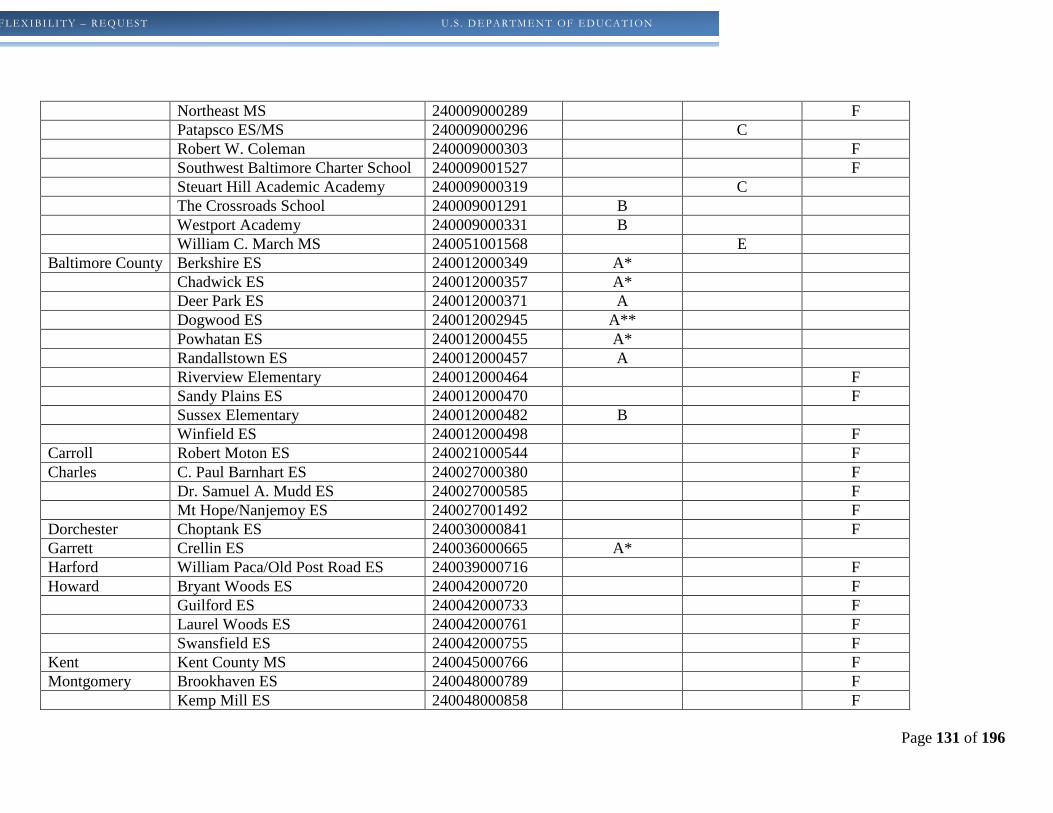
Page 131 of 196
FLEXIBI LITY – REQ UEST U .S . DEPARTMENT OF EDUC ATI ON
Northeast MS 240009000289 F Patapsco ES/MS 240009000296 C Robert W. Coleman 240009000303 F Southwest Baltimore Charter School 240009001527 F Steuart Hill Academic Academy 240009000319 C The Crossroads School 240009001291 B Westport Academy 240009000331 B William C. March MS 240051001568 E Baltimore County Berkshire ES 240012000349 A* Chadwick ES 240012000357 A* Deer Park ES 240012000371 A Dogwood ES 240012002945 A** Powhatan ES 240012000455 A* Randallstown ES 240012000457 A Riverview Elementary 240012000464 F Sandy Plains ES 240012000470 F Sussex Elementary 240012000482 B Winfield ES 240012000498 F Carroll Robert Moton ES 240021000544 F Charles C. Paul Barnhart ES 240027000380 F Dr. Samuel A. Mudd ES 240027000585 F Mt Hope/Nanjemoy ES 240027001492 F Dorchester Choptank ES 240030000841 F Garrett Crellin ES 240036000665 A* Harford William Paca/Old Post Road ES 240039000716 F Howard Bryant Woods ES 240042000720 F Guilford ES 240042000733 F Laurel Woods ES 240042000761 F Swansfield ES 240042000755 F Kent Kent County MS 240045000766 F Montgomery Brookhaven ES 240048000789 F Kemp Mill ES 240048000858 F
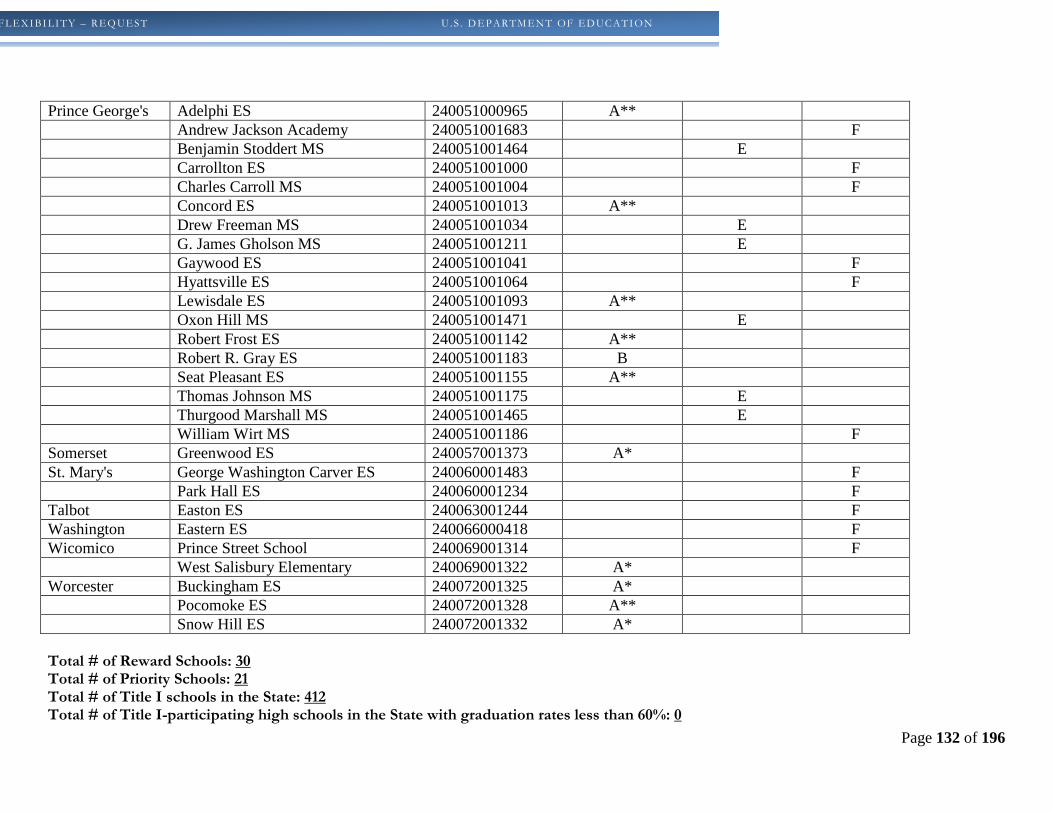
Page 132 of 196
FLEXIBI LITY – REQ UEST U .S . DEPARTMENT OF EDUC ATI ON
Prince George's Adelphi ES 240051000965 A** Andrew Jackson Academy 240051001683 F Benjamin Stoddert MS 240051001464 E Carrollton ES 240051001000 F Charles Carroll MS 240051001004 F Concord ES 240051001013 A** Drew Freeman MS 240051001034 E G. James Gholson MS 240051001211 E Gaywood ES 240051001041 F Hyattsville ES 240051001064 F Lewisdale ES 240051001093 A** Oxon Hill MS 240051001471 E Robert Frost ES 240051001142 A** Robert R. Gray ES 240051001183 B Seat Pleasant ES 240051001155 A** Thomas Johnson MS 240051001175 E Thurgood Marshall MS 240051001465 E William Wirt MS 240051001186 F Somerset Greenwood ES 240057001373 A* St. Mary's George Washington Carver ES 240060001483 F Park Hall ES 240060001234 F Talbot Easton ES 240063001244 F Washington Eastern ES 240066000418 F Wicomico Prince Street School 240069001314 F West Salisbury Elementary 240069001322 A* Worcester Buckingham ES 240072001325 A* Pocomoke ES 240072001328 A** Snow Hill ES 240072001332 A* Total # of Reward Schools: 30 Total # of Priority Schools: 21 Total # of Title I schools in the State: 412 Total # of Title I-participating high schools in the State with graduation rates less than 60%: 0

Page 133 of 196
FLEXIBI LITY – REQ UEST U .S . DEPARTMENT OF EDUC ATI ON
Key Reward School Criteria: A. Highest-performing school (See definition below) B. High-progress school (See definition below)
Highest Performing Title I Reward Schools- A (4) 1. Title I School making AYP or AMOs foe the "all students" group and all subgroups 2. Highest absolute performance over 2 years for the " all students" group and for all subgroups 3. If applicable be among Title I high schools with graduation rates greater than 60% 4. Not have significant achievement gaps across subgroups that are not closing Distinguished Highest Performing Title I Reward Schools - A*(10) 1. Title I School making AYP or AMOs foe the "all students" group and all subgroups 2. Highest absolute performance over 2 years for the " all students" group and for all subgroups 3. If applicable be among Title I high schools with graduation rates greater than 60% 4. Not have significant achievement gaps across subgroups that are not closing 5. Be among the top ten percent of Title I schools in the State in improving the performance of the "all students" group over 5 years or be among the Title I high schools in the state making the most progress in increasing graduation rates. Superlative Highest Performing Title I Reward Schools -A** (8) 1. Title I School making AYP or AMOs foe the "all students" group and all subgroups 2. Highest absolute performance over 2 years for the " all students" group and for all subgroups 3. If applicable be among Title I high schools with graduation rates greater than 60% 4. Not have significant achievement gaps across subgroups that are not closing 5. Be among the top ten percent of Title I schools in the State in improving the performance of the "all students" group by at least 18 percentage points over 5 years or be among the Title I high schools in the state making the most progress in increasing graduation rates. 6. Have a FARMs rate of 50% or higher.
High Progress Title I Schools-B (8) 1. Title I school among the top 10% of Title I schools in the State in improving the performance of the "all students" group over 5 years. 2. A Title I high school making the most progress in increasing graduation rates. 3. No significant achievement gaps across subgroups that are not closing. Note: In Maryland, Increased gap closure by 18% points or more
Priority School Criteria: C. Among the lowest five percent of Title I schools in the State based on the
proficiency and lack of progress of the “all students” group D-1. Title I-participating high school with graduation rate less than 60%
over a number of years D-2. Title I-eligible high school with graduation rate less than 60% over a number of years E. Tier I or Tier II SIG school implementing a school intervention model
Focus School Criteria:
F. Has the largest within-school gaps between the highest-achieving subgroup(s) and the lowest-achieving subgroup(s) or, at the high school level, has the largest within-school gaps in the graduation rate
G. Has a subgroup or subgroups with low achievement or, at the high school level, a low graduation rate
H. A Title I-participating high school with graduation rate less than 60% over a number of years that is not identified as a priority school
Page 134 of 196
ESEA FLEXIBI LITY – REQ UEST U .S . DEPARTMENT OF EDUC ATI ON
2.F PROVIDE INCENTIVES AND SUPPORTS FOR OTHER TITLE 1 SCHOOLS 2.F Describe how the SEA’s differentiated recognition, accountability, and support system will
provide incentives and supports to ensure continuous improvement in other Title I schools that, based on the SEA’s new AMOs and other measures, are not making progress in improving student achievement and narrowing achievement gaps, and an explanation of how these incentives and supports are likely to improve student achievement and school performance, close achievement gaps, and increase the quality of instruction for students.
With the Maryland plan of differentiated recognition, accountability, and support system
described above, Maryland will provide the incentives for excellent and improved performance
by publically recognizing Reward Schools and all additional endorsement schools. The
Breakthrough Center is the leading edge of Maryland’s school turnaround work. The Center
gives high visibility and priority to support dramatic improvement in the Priority Schools and in
LEAs that have Focus Schools.
Priority Schools will each implement full interventions that include all of the seven principles of
turnaround, either through adoption of one of the current four interventions available to SIG
schools or through the crafting of a unique intervention for one of the newly identified Priority
Schools. The interventions will be funded by the money made available by the removal of the
requirements for SES and Choice and the current SIG grants. Focus Schools will receive
increased fiscal support for programs under the differentiated 1003(a) plans and LEAs that have
Focus Schools will receive differentiated support from The Breakthrough Center.
Maryland has a long history of support to low-performing schools. This application allows
LEAs and schools to shed some of the debilitating aspects of NCLB and focus improvement on
fiscal and human capital support to fewer schools with more emphasis. The State’s performance
nationally, Education Week’s identification as #1 for the fourth year in a row, is not based on
relying on high-performing school success but on constantly building the infrastructure and
resources for our lowest-performing schools and for those that have very targeted needs. To
maintain this position, Maryland and its 24 schools systems rely on close communications,
shared vision planning, responsible allocation of resources, and an enormous pool of talented
educators that are dedicated to constant, sustained improvement.
Page 135 of 196
ESEA FLEXIBI LITY – REQ UEST U .S . DEPARTMENT OF EDUC ATI ON
Maryland will annually assess school and student performance using Annual Measurable
Objectives as described in Option A and Maryland’s School Performance Index. A new list of
schools will be generated annually based on school performance. If a Title I school (that is not a
Focus or Priority school) should fail to meet an Annual Measurable Objective (AMO) for any
subgroup, including the “all students” group, the school shall be required to submit a school
improvement plan to its Local Education Agency (LEA) that describes the strategies the school
will use to improve achievement in the specific subgroup. Both MSDE and the LEA will provide
technical assistance in developing and implementing the appropriate strategies.
Maryland will annually assess school and student performance of all schools, including those not
identified as Priority or Focus schools, using Annual Measurable Objectives as described in
Option A and Maryland’s Performance Index. A new list of schools will be generated annually
based on school performance. Support to Title I schools, (not identified as Priority or Focus
schools) that have not made the AMOs in all subgroups will be identified for support and will be
eligible for Title I 1003(a) funds.
With a differentiation that weights support to Focus schools, LEAs and schools will be able to
craft effective interventions to address specific needs, describe them in the application for
1003(a) funds and implement them under the direction and monitoring of the LEAs through the
Annual Master Plan Update. Maryland will use 1003(a) funds to provide base funding of
$20,000 + (enrollment x $30.00 PPA) for each Title I school that is not making progress in
improving student achievement and narrowing achievement gaps (Appendix 2.G). These funds,
coupled with the schools’ regular Title I, Part A allocation will provide adequate resources to
address the schools’ needs. The Maryland State Department of Education’s Title I Office will
be available to provide technical support and monitoring of all fiscal and programmatic aspects
associated with the use of 1003(a) funds in these schools. Maryland will perform an onsite
monitoring of LEAs annually and randomly select 1-5 schools from each LEA to monitor onsite
annually.
With the 1003(a) application process in place, the LEAs should be able to augment and support
Page 136 of 196
ESEA FLEXIBI LITY – REQ UEST U .S . DEPARTMENT OF EDUC ATI ON
additional focus to these schools by the beginning of the 2012-2013 school year. Maryland’s
application includes the following: Title I 1003(a) School Improvement Funds shall be used in
accordance with the No Child Left Behind Act of 2001, of the Elementary and Secondary
Education Act, Title I, Part A, Subpart 1, Section 1116 (b)(4). These Federal funds shall not be
used for administrative purposes.
With approval, Maryland plans to use 1003(a) School Improvement funds to help Title I schools
that are not Focus or Priority schools but which require intervention based on the failure to meet
AMOs in any subgroup. Maryland is aware that this use of 1003(a) funds is not a part of Waiver
#6 in the ESEA Flexibility Request. However, Maryland requests the ability to use the funds in
this way because all Title I schools that have been in improvement had access to these funds
before the flexibility process. Maryland feels it would be unfair and detrimental to these schools
to remove all the 1003(a) funding, Maryland requests reducing the amount while still offering
some support, these schools will have the opportunity to adjust to the decrease in funding and
begin to find other funding streams for the necessary resources.
The LEA will provide technical assistance to Title I schools that have not met the AMOs or have
large gaps in achievement as they develop and implement their school improvement plans.
Technical assistance includes, but is not limited to:
♦ Providing assistance in analyzing data from assessments and other examples of
student work;
♦ Providing assistance to identify and address problems in instruction;
♦ Providing assistance to identify and address problems implementing parental
involvement and professional development requirements described in NCLB
Sections 1118 and 1119;
♦ Providing assistance to identify and address problems implementing the
responsibilities of the school and the local school system under the school plan;
♦ Providing assistance to identify and implement professional development,
instructional strategies, and methods of instruction that are based on scientifically-
based research and that have proven effective in addressing the specific
instructional issues; and

Page 137 of 196
ESEA FLEXIBI LITY – REQ UEST U .S . DEPARTMENT OF EDUC ATI ON
♦ Providing assistance in analyzing and revising the school's budget so that the
school's resources are more effectively allocated to the activities most likely to
increase student academic achievement and remove the school from school
improvement status.
Technical assistance may be provided by school support teams upon request, (i.e. The
Breakthrough Center) authorized in Section 1117 (B)(i)(ii)(iv). Each school support team
assigned to a school will:
♦ Review and analyze all facets of the school’s operation, including the design and
operation of the instructional program;
♦ Assist the school in developing recommendations for improving student
performance in the school;
♦ Collaborate with parents and school staff and the local educational agency in the
design, implementation, and monitoring of a plan that can reasonably be expected to
improve student performance and help the school meet its goals for improvement;
and
♦ Make additional recommendations as the school implements that plan.
Each school receiving funds under 1003(a) must complete a needs assessment. Schools will
summarize the results of the data analysis, including the data sources, used to identify the
priority need(s). The Required Strategies are described below. Each school will select one or
more strategies that will meet the priority identified need(s).
• Schools will coordinate with the LEA to develop a professional development plan that is
designed to build the capacity of the school staff and is informed by student achievement
and outcome-related measures. Each school will work with the LEA to create a
professional development plan that takes into consideration the various needs of the
instructional staff. The plan must be systemic in behavior-changing approaches that foster
collaboration and increase teacher knowledge of best practices. The plan must:
• Include instructional teams that meet regularly to examine student work,
collaborate on lesson design, and implement instruction based on proven effective
strategies;
• Align with the Maryland Professional Development Standards for Staff

Page 138 of 196
ESEA FLEXIBI LITY – REQ UEST U .S . DEPARTMENT OF EDUC ATI ON
Development that focus on context, process, and content standards:
(http://www.marylandpublicschools.org/MSDE/divisions/instruction/prof_standards );
and
• Provide time for all staff to collaborate and plan strategy implementation.
• Schools will target research-based strategies to change instructional practice in order to
address the academic achievement challenges that led to the school not making the
AMOs.
• Each school will develop a plan that clearly identifies the expected outcomes for students.
Plans will include but not be limited to data retreats, professional learning communities,
and continual self-monitoring of individually targeted student progress.
Additionally, each school will explore tools that identify the local alignment of curricula,
curriculum mapping, or other tools that align with Maryland’s State Curriculum. This
will provide the school with research-based data to focus on the curriculum areas that
need improvement. From the curriculum gap analysis, the school will need to write
strategies that support these efforts. The school and the district must approach educating
targeted students using progress-monitoring instruments, data analysis, collaborative
decision-making, tiered and/or differentiated instruction, parental involvement, and
access to a standards-aligned core curriculum.
• Schools may create partnerships among external entities to obtain technical assistance,
professional development, and management advice. Grantees are encouraged to create
partnerships that can be cultivated to leverage assistance in meeting the individual needs
of each school.
• Schools may consider strengthening the parental involvement component of the school
improvement plan and may work with other technical assistance providers to provide
opportunities for parents to become more involved in the educational process.
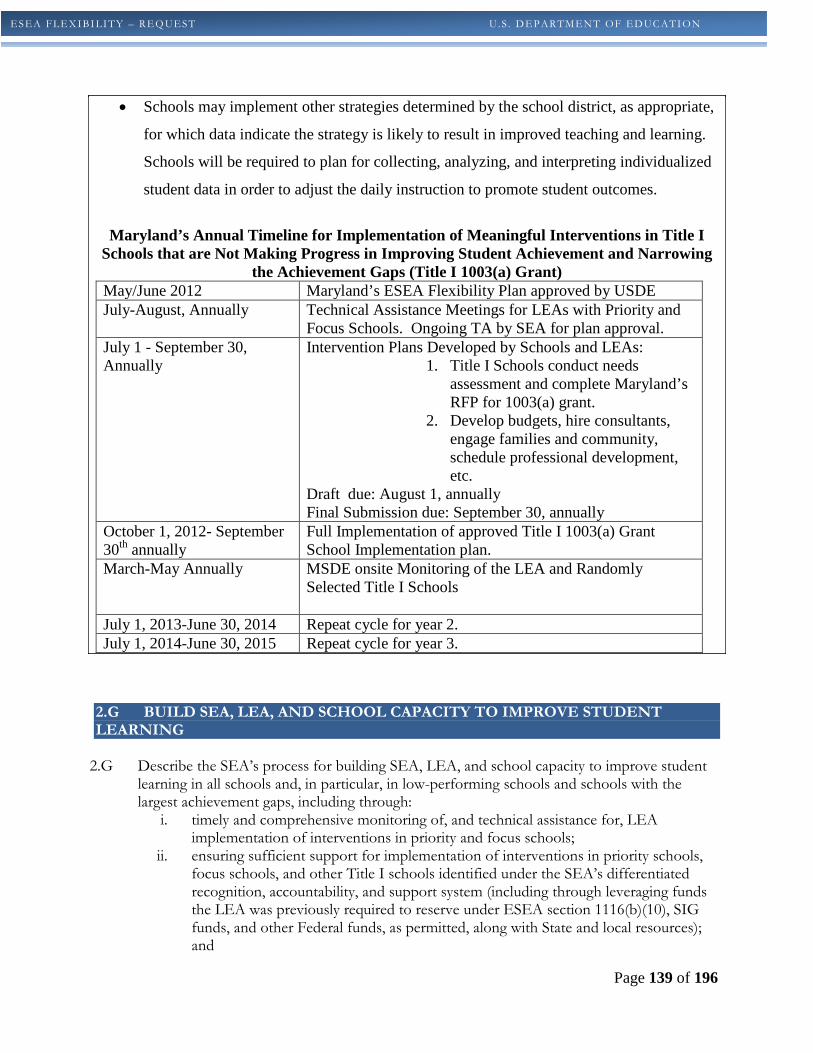
Page 139 of 196
ESEA FLEXIBI LITY – REQ UEST U .S . DEPARTMENT OF EDUC ATI ON
• Schools may implement other strategies determined by the school district, as appropriate,
for which data indicate the strategy is likely to result in improved teaching and learning.
Schools will be required to plan for collecting, analyzing, and interpreting individualized
student data in order to adjust the daily instruction to promote student outcomes.
Maryland’s Annual Timeline for Implementation of Meaningful Interventions in Title I
Schools that are Not Making Progress in Improving Student Achievement and Narrowing the Achievement Gaps (Title I 1003(a) Grant)
May/June 2012 Maryland’s ESEA Flexibility Plan approved by USDE July-August, Annually Technical Assistance Meetings for LEAs with Priority and
Focus Schools. Ongoing TA by SEA for plan approval. July 1 - September 30, Annually
Intervention Plans Developed by Schools and LEAs: 1. Title I Schools conduct needs
assessment and complete Maryland’s RFP for 1003(a) grant.
2. Develop budgets, hire consultants, engage families and community, schedule professional development, etc.
Draft due: August 1, annually Final Submission due: September 30, annually
October 1, 2012- September 30th annually
Full Implementation of approved Title I 1003(a) Grant School Implementation plan.
March-May Annually MSDE onsite Monitoring of the LEA and Randomly Selected Title I Schools
July 1, 2013-June 30, 2014 Repeat cycle for year 2. July 1, 2014-June 30, 2015 Repeat cycle for year 3.
2.G BUILD SEA, LEA, AND SCHOOL CAPACITY TO IMPROVE STUDENT LEARNING
2.G Describe the SEA’s process for building SEA, LEA, and school capacity to improve student
learning in all schools and, in particular, in low-performing schools and schools with the largest achievement gaps, including through:
i. timely and comprehensive monitoring of, and technical assistance for, LEA implementation of interventions in priority and focus schools;
ii. ensuring sufficient support for implementation of interventions in priority schools, focus schools, and other Title I schools identified under the SEA’s differentiated recognition, accountability, and support system (including through leveraging funds the LEA was previously required to reserve under ESEA section 1116(b)(10), SIG funds, and other Federal funds, as permitted, along with State and local resources); and
Page 140 of 196
ESEA FLEXIBI LITY – REQ UEST U .S . DEPARTMENT OF EDUC ATI ON
iii. holding LEAs accountable for improving school and student performance, particularly for turning around their priority schools.
Explain how this process is likely to succeed in improving SEA, LEA, and school capacity.
2.G.i Maryland has distinguished itself with its overall monitoring of performance and
standard attainment for all 24 LEAs. Since 2003, the Maryland General Assembly has
required all 24 LEAs to submit a Master Plan detailing strategies for meeting ESEA and
Maryland education goals. Data for each standard or program is tracked and each year, in an
Update to the Master Plan, each LEA must describe the progress to date. If the data indicates
success, an explanation for what the LEA believes has worked is included. If the LEA is not
making adequate progress on any standard, it must detail what steps will be taken to correct
the course. The Master Plan guidance documents officially called the Bridge to Excellence
Guidance Document Part I can be found at
http://docushare.msde.state.md.us/docushare/dsweb/Get/Document-
147467/BTE%20RTTT%20Guidance%202011_6_20_11.docx . The Guidance Part 2 (Federal
Grant Applications and Other State Reporting Requirements can be found at
http://docushare.msde.state.md.us/docushare/dsweb/Get/Document-
146666/BTE%20Guidance%20Part%202%20FINAL_6-20-11.docx
The existence of the Master Plan offers an ideal vehicle for monitoring progress by LEAs with
their Focus and Priority Schools. Maryland has used this process to incorporate ARRA
spending and activities and RTT Scopes of Work for each participating LEA.
The Master Plan clearly includes fiscal reporting, however, Title I monitoring of expenditures
of federal dollars will offer more targeted, more detailed inspection of the spending in Focus
and Priority Schools. The monitoring of the specific programs in each school is described
below.
Maryland’s monitoring and support for SIG schools has been cited as a model for the nation.
In fact, staff that developed this process was asked to present to the newly formed School
Improvement office at USDE. For Priority Schools this process will continue for SIG schools
and be developed in a commensurate way for the newly identified schools. This oversight
Page 141 of 196
ESEA FLEXIBI LITY – REQ UEST U .S . DEPARTMENT OF EDUC ATI ON
includes three visits a year that require SIG teams to closely inspect any indicators that have
been provided since the last visit so that targeted questions can be posed to the school and
LEA staff at a face-to-face meeting. The follow up to each visit includes a written report with
recommendations for the school and/or LEA with a recommended timeline for meeting the
recommendations.
Maryland does not maintain an approved list of outside providers. Each LEA that chooses to
contract with an outside provider, such as a charter management organization (CMO) or an
education management organization (EMO), must utilize a rigorous review process which
follows state and local procurement laws. The LEA must have conducted a comprehensive
needs assessment to ensure the Request for Proposals (RFP) contains an accurate description
of the services and programs that meet the needs of the school(s) to be served and that are
aligned to the Turnaround Principles. Each LEA must demonstrate, in their application, that
the selected provider is able to address the identified needs of the school. In addition, the LEA
must submit to MSDE, the steps it completed with regard to recruiting, screening and selecting
an external provider to ensure quality. The LEA must also describe how relevant
stakeholders, including administrators, teachers, and their respective unions (as appropriate),
parents, students and/or members of the community were consulted during the needs
assessment, intervention selection and design process to serve its Priority schools. MSDE will
monitor both the providers and the LEA according to the previously stated timelines as other
Priority schools not working with an external provider(s).
As referenced above in section 2.G.i., the 5% lowest-achieving non-Title I schools will also
undergo periodic monitoring which will be focused on teachers’ individual professional
development plans. Each teacher will be required at the beginning of each school year to
develop a Professional Growth Plan that is based on the teachers’ needs in addressing student
achievement gaps. The required components of the plan will be, but not limited to, the Type
of Learning Experience, Description of Relevance to School, System, and SEA goals, Timing
of Experiences, and Expected Impact on Student Learning. These plans must be approved by
the principal and kept on file for periodic review by the LEA and SEA. A mid-year update on
the plan must include a section describing ongoing growth opportunities and connecting those
Page 142 of 196
ESEA FLEXIBI LITY – REQ UEST U .S . DEPARTMENT OF EDUC ATI ON
to specific interventions needed for the teachers’ students. Technical assistance both online
and face to face will have a focus on assisting the teacher in identifying appropriate learning
experiences within the parameters of the stated teachers’ goals.
2.G.ii Through the Breakthrough Center’s partnerships, Maryland has established a close,
constructive relationship with its LEAs. Regular meetings are held with the two LEAs that
include the Priority Schools; SEA and LEA Superintendent, SEA and LEA Assistant
Superintendents for Instruction, and the SEA Breakthrough Center and LEA School
Turnaround staff. At the monthly Breakthrough Center meetings with the two LEAs, the
Priority Schools and their progress are always agenda items and receive special attention. As
described earlier, ongoing work for the SIG schools includes clear needs assessment and a
detailed list of recommendations for each school and for the LEA for each school. The work
already underway will support the addition of five more schools. The new Turnaround Offices
in each LEA have staff dedicated to support for SIG schools and MSDE has provided direction
for diversion of funding from SES and Choice funds to provide the resources to augment
supports as needed for the new schools. Maryland is a small community and takes very
seriously the admonition to improve.
Focus Schools
The Breakthrough Center will collaborate with the LEAs that have Focus schools to assess
needs, streamline and differentiate the services and supports consistent with school capacity
and need, and develop structures and strategies to build and sustain their capacity to improve
and successfully turnaround their pattern of underperformance.
The SEA will hold the system accountable for providing assistance to its principals of the 5%
lowest-performing non-Title I schools in the system through a process that both mirrors and
supports the teachers’ professional growth plans. Each LEA will submit prior to November 1
of each school year the Professional Growth Plan (PGP) for each principal in these identified
schools. The PGP will include, but not be limited to, the School, Principal, Date of
Conference with Executive Officer, Targeted Growth Experiences for the year, Connection of
Experience to Identified Student Achievement Needs, and Expected Outcomes. Mid-year

Page 143 of 196
ESEA FLEXIBI LITY – REQ UEST U .S . DEPARTMENT OF EDUC ATI ON
corrections based on emerging student and teacher needs will be made and on file for periodic
review by the LEA Executive Officer and SEA staff.
2.G.iii Funding for each of the Priority and Focus Schools as well as those Title I schools that
are also low-performing but do not fall into the new categorization of schools has been
explained within the description of support to each category. In Summary,
1. Priority Schools must be funded with SIG grants (already) in place or with $50,000 to
$2 million dollars per year per school for the next three years from funds leveraged
from dollars currently required under ESEA section 1116 (b)(10). These funds must
be sufficient to implement the Turnaround plans designed to address the needs
identified by the school and LEA.
2. Focus Schools will receive a differentiated amount of the 1003(a) funding based on
their completion of an approved application. This process is currently in use and has
proven a valid vehicle for delivery of targeted funds. LEAs and schools must cite
needs assessments that document that the needs that will be addressed with these funds
are the ones that are contributing to the achievement gaps in the school.
a. Maryland will follow the implementation of strategies identified by the LEA and
the progress of the Focus Schools in the 2012-2013 school year. Should progress
towards improvement not be made with the Focus Schools in the first year, MSDE
will require the LEA to set aside some amount of funds (could be $50,000 per
school) in the 2013-2014 school year to support instructional strategies for each of
the Focus Schools.
3. Other low-performing Title I schools will receive the balance of 1003(a) funds upon
completion of the application that specifies the particular needs of the school and
approval by MSDE teams of specialists. The schools will be encouraged to use their
own Title I, Part A funding for staff development to address these needs as well.
SEA support for the development of the teacher and principal Professional Growth Plan (PGP)
will be twofold. The major responsibility will be (a) to provide ongoing opportunities for
professional growth in both online and face-to-face experiences and (b) periodic reviews and
Page 144 of 196
ESEA FLEXIBI LITY – REQ UEST U .S . DEPARTMENT OF EDUC ATI ON
discussions that are focused on classroom and school application of skills and content that
constituted the learning experiences. With the advent of a new universally designed Maryland
curriculum in all disciplines, support for teachers to learn, teach, and assess these new
curricula will be a major outcome of the growth experiences. For principals, ongoing
observation and effective feedback in the context of a new State curriculum will be a major
focus, thus, placing teachers and principals on a parallel track for improvement and school
reform.
LEA Accountability and MSDE’s Authority
Maryland has no clear legal mandate to intervene directly in chronically low-performing
schools. The Maryland State Department of Education operates from both state statute and an
extensive array of regulations set by the State Board of Education. Maryland law currently
has no direct authority for intervention. However, with more than two decades of school
accountability in place, intervention work in low performing schools through NCLB and
ESEA have been generally successful without a legal expectation for State takeovers.
The unique structure of Maryland’s education system, with only 24 school jurisdictional level
districts, is very conducive to cooperative work with local school systems, both independently
and occasionally in clusters. Maryland’s State Superintendent meets monthly with the 24
LEA superintendents and regularly with individual local superintendents—particularly with
those attempting to resolve local performance issues. These unique collegial exchanges
typically are intimate and provide an opportunity for very frank and honest exchange on
issues.
In addition to these meetings, the Assistant Superintendents for Instruction meet monthly and
these meetings provide an important opportunity to explore and resolve the more specific
issues related to policy implementations since these local leaders are most often the
individuals charged with the day-to-day implementation of LEA and state action. Because
these staff members are charged with the operational work, their briefings most often take on
the quality of work sessions.
Page 145 of 196
ESEA FLEXIBI LITY – REQ UEST U .S . DEPARTMENT OF EDUC ATI ON
The Master Plan is also a very critical means for accountability for LEAs. If a local Master
Plan, after a rigorous review, is deemed “not approvable” there is legal authority supporting
the withholding of future funding. A great deal of work goes into the process to make the
Master Plans fully “approvable,” but Maryland State Department of Education is positioned to
take even stronger action if necessary. In the past, Local Superintendent have been asked to
meet with MSDE staff to explain the course of action outlined in the Master Plans, and local
superintendents were often asked by MSDE to strengthen and rework plans when responses
were not strong enough. These unique tools have served to provide good technical exchanges
for local school systems and have set a standard for local policies that prevents token
responses to the plight of low performing schools.
Maryland’s Theory of Action for Principle 2
In summary, Maryland’s overall theory of action regarding differentiated recognition,
accountability, and support is based on a fundamental belief that all schools and all subgroups
can improve. Through methods that have been described, Maryland endeavors to recognize
accomplishments where appropriate, identify schools that are in need of assistance, and provide
support as needed. Maryland believes that such support includes one-on-one assistance with
classroom teachers in the most challenging schools, direct involvement with principals of those
schools, and building the capacity of the LEA to sustain the improvement effort beyond the time
of MSDE’s involvement. The Breakthrough Center serves as the vehicle to coordinate these
services, and its work is informed by an internal cross-functional team with representatives of
various divisions throughout MSDE that meet regularly to provide direction and coherence to the
effort.
The theory of change is described in a PowerPoint presentation which is included as Appendix
II-9. The graphics in this Power Point were developed to illustrate how the State works directly
with LEAs and schools identified as the lowest performing SIG schools. MSDE will continue to
follow this protocol as school support is expanded to include Priority schools. Focus schools
will be organized into networks whereby the state will be able to cluster schools according to
region and specific needs. MSDE is in the planning phase and has scheduled an internal meeting

Page 146 of 196
ESEA FLEXIBI LITY – REQ UEST U .S . DEPARTMENT OF EDUC ATI ON
in May. Focus Schools will also fall under the Breakthrough Center umbrella. The first LEA
Focus schools network meeting will be scheduled in May and will include both Title I directors
and other high level LEA administrators such as assistant superintendents and supervisors.
The following graphic illustrates Maryland’s Theory of Action:
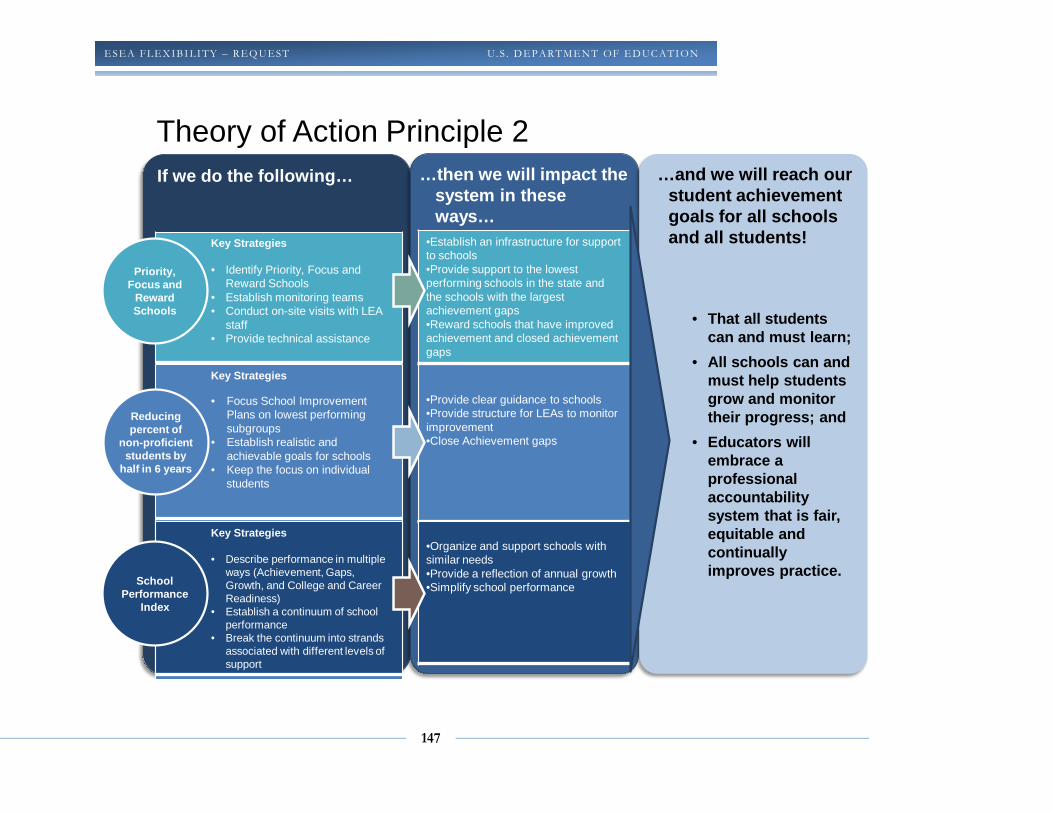
147
ESEA FLEXIBI LITY – REQ UEST U .S . DEPARTMENT OF EDUC ATION
If we do the following…
Key Strategies
• Focus School Improvement Plans on lowest performing subgroups
• Establish realistic and achievable goals for schools
• Keep the focus on individual students
Key Strategies
• Describe performance in multiple ways (Achievement, Gaps, Growth, and College and Career Readiness)
• Establish a continuum of school performance
• Break the continuum into strands associated with different levels of support
Reducing percent of
non-proficient students by
half in 6 years
School Performance
Index
Key Strategies
• Identify Priority, Focus and Reward Schools
• Establish monitoring teams• Conduct on-site visits with LEA
staff • Provide technical assistance
Priority, Focus and
Reward Schools
Theory of Action Principle 2 …then we will impact the
system in these ways…
•Provide clear guidance to schools•Provide structure for LEAs to monitor improvement•Close Achievement gaps
•Organize and support schools with similar needs•Provide a reflection of annual growth•Simplify school performance
•Establish an infrastructure for support to schools •Provide support to the lowest performing schools in the state and the schools with the largest achievement gaps•Reward schools that have improved achievement and closed achievement gaps
…and we will reach our student achievement goals for all schools and all students!
• That all students can and must learn;
• All schools can and must help students grow and monitor their progress; and
• Educators will embrace a professional accountability system that is fair, equitable and continually improves practice.
148
ESEA FLEXIBI LITY – REQ UEST U .S . DEPARTMENT OF EDUC ATION
PRINCIPLE 3: SUPPORTING EFFECTIVE INSTRUCTION AND LEADERSHIP
3.A DEVELOP AND ADOPT GUIDELINES FOR LOCAL TEACHER AND PRINCIPAL EVALUATION AND SUPPORT SYSTEMS Select the option that pertains to the SEA and provide the corresponding description and evidence, as appropriate, for the option selected. Option A
If the SEA has not already developed and adopted all of the guidelines consistent with Principle 3, provide:
i. the SEA’s plan to develop and adopt
guidelines for local teacher and principal evaluation and support systems by the end of the 2011–2012 school year;
ii. a description of the process the SEA will use
to involve teachers and principals in the development of these guidelines; and
iii. an assurance that the SEA will submit to the
Department a copy of the guidelines that it will adopt by the end of the 2011–2012 school year (see Assurance 14).
Option B If the SEA has developed and adopted all of the guidelines consistent with Principle 3, provide:
i. a copy of the guidelines the SEA has adopted
(Attachment 10) and an explanation of how these guidelines are likely to lead to the development of evaluation and support systems that improve student achievement and the quality of instruction for students;
ii. evidence of the adoption of the guidelines
(Attachment 11); and
iii. a description of the process the SEA used to involve teachers and principals in the development of these guidelines.
The graphic below is Maryland’s Theory of Action for Teacher/Principal Evaluation
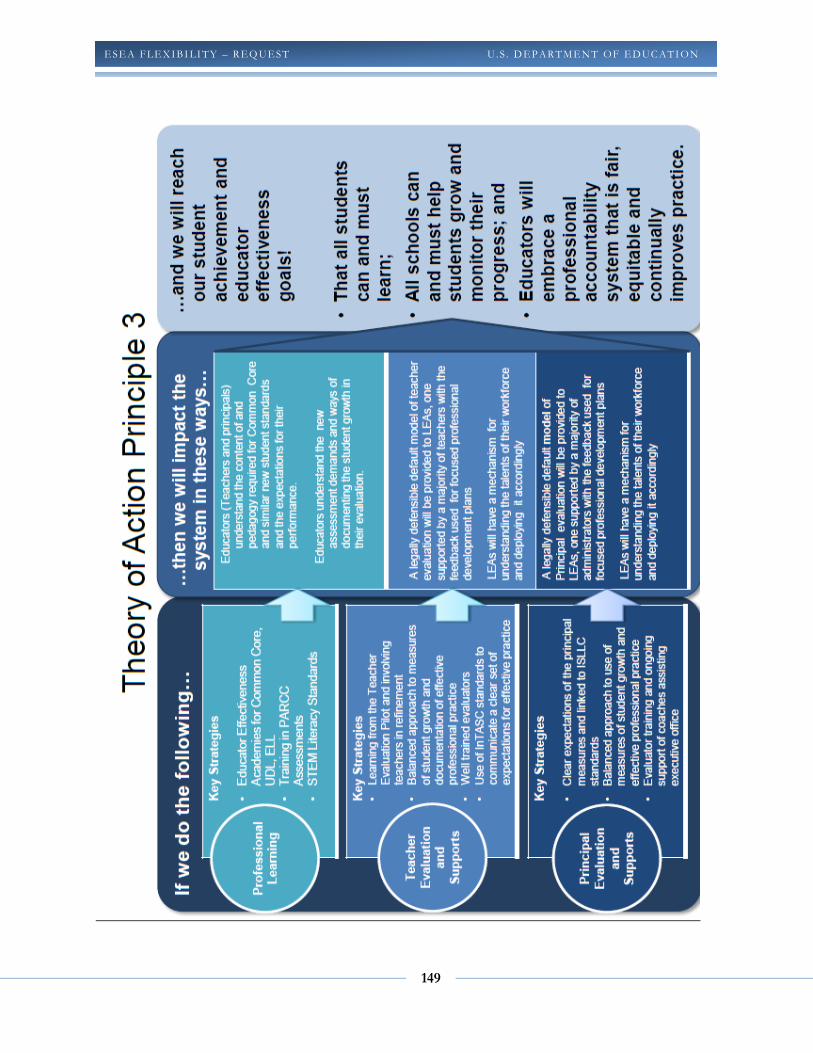
149
ESEA FLEXIBI LITY – REQ UEST U .S . DEPARTMENT OF EDUC ATION
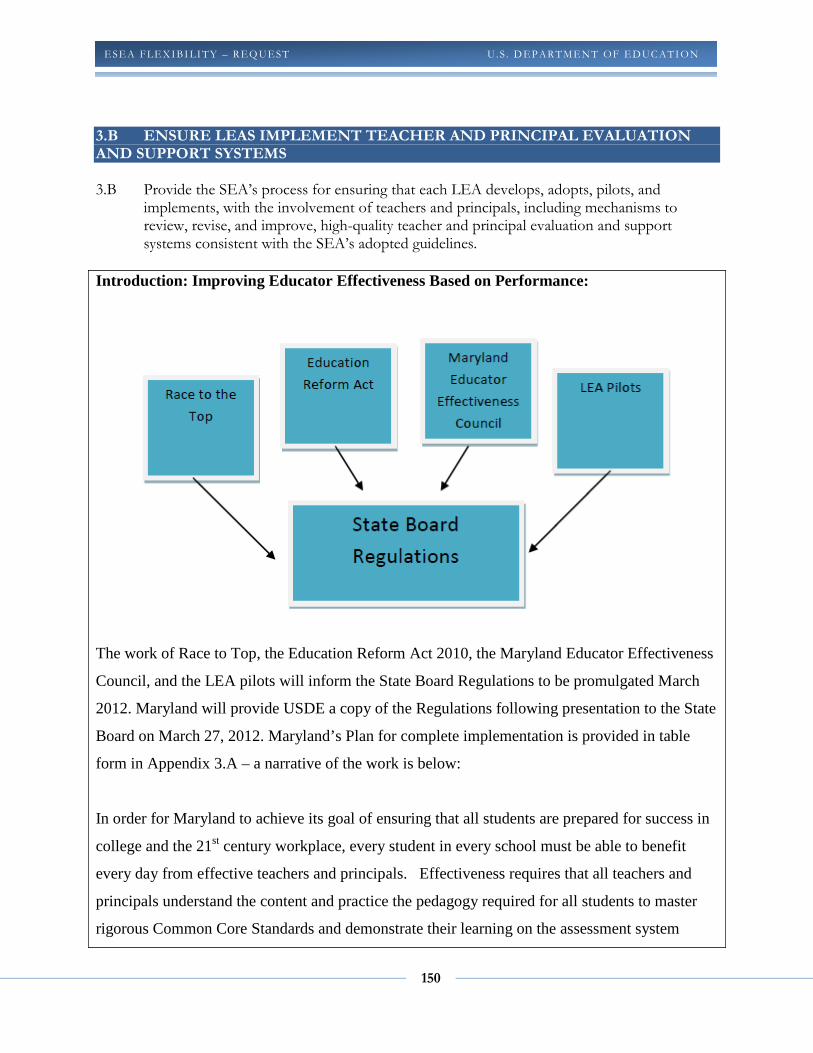
150
ESEA FLEXIBI LITY – REQ UEST U .S . DEPARTMENT OF EDUC ATION
3.B ENSURE LEAS IMPLEMENT TEACHER AND PRINCIPAL EVALUATION AND SUPPORT SYSTEMS 3.B Provide the SEA’s process for ensuring that each LEA develops, adopts, pilots, and
implements, with the involvement of teachers and principals, including mechanisms to review, revise, and improve, high-quality teacher and principal evaluation and support systems consistent with the SEA’s adopted guidelines.
Introduction: Improving Educator Effectiveness Based on Performance:
The work of Race to Top, the Education Reform Act 2010, the Maryland Educator Effectiveness
Council, and the LEA pilots will inform the State Board Regulations to be promulgated March
2012. Maryland will provide USDE a copy of the Regulations following presentation to the State
Board on March 27, 2012. Maryland’s Plan for complete implementation is provided in table
form in Appendix 3.A – a narrative of the work is below:
In order for Maryland to achieve its goal of ensuring that all students are prepared for success in
college and the 21st century workplace, every student in every school must be able to benefit
every day from effective teachers and principals. Effectiveness requires that all teachers and
principals understand the content and practice the pedagogy required for all students to master
rigorous Common Core Standards and demonstrate their learning on the assessment system
151
ESEA FLEXIBI LITY – REQ UEST U .S . DEPARTMENT OF EDUC ATION
under development. The strategy set out in the ESEA Flexibility Proposal is designed to
improve and maintain educator effectiveness through (1) clearly articulated curriculum standards
and expectations for student learning, (2) high-quality professional development focused on the
delivery of rigorous instruction, (3) ongoing access to an array of instructional resources and
supports, and (4) an evaluation system which holds teachers and principals accountable for both
effective professional practice and student learning and growth. The professional practice
components of the teacher and principal evaluation models are aligned with Maryland’s
research-supported beliefs about effective leadership and instruction and will provide valuable
feedback to improve performance. The student growth components reflect Maryland’s
commitment to the use of multiple measures, the focus on student growth and change under the
direction of the teacher and independent of the student’s entering status, the use of multiple
measures, and an acknowledgement of shared accountability, represented by the Maryland
School Performance Index.
Maryland’s goals are to improve the performance of all students and close the achievement gap.
Maryland strongly believes that the way to accomplish this goal is through thorough, effective,
meaningful and consistent professional development. Maryland firmly believes that professional
development is the foundation of all aspects of education and is effective in improving
instruction, understanding curriculum, learning to work with data, and the other many
components that make a strong and effective education system. In addition, the strong Core
Values expressed by Marylanders, around achievement, growth, achievement gaps and college-
and career-readiness, which were incorporated into the Maryland School Performance Index
indicate that the goals of the State and its citizens are well aligned.
Maryland’s Race to the Top Application
If Maryland is going to ensure that all students are college- and career-ready, every school —
especially those where students need the most support — must have teachers and principals who
are effective at increasing student achievement. Although Maryland has worked diligently and
successfully over the past decade to increase the number of Maryland teachers designated as
Highly Qualified under federal definitions, State leaders also understand that this measurement is
imprecise and considers only inputs into good teaching and not actual performance. Maryland is
152
ESEA FLEXIBI LITY – REQ UEST U .S . DEPARTMENT OF EDUC ATION
committed to taking bolder, more aggressive steps to develop an evaluation process for teachers
and principals and using that information to help develop the strongest educator corps in the
country.
Signaling its serious commitment to this new approach, when Maryland submitted its Race to the
Top (RTTT) Application in May 2010, a revision of the teacher and principal evaluation system
was central to the work Maryland agreed to do. The application offered guidelines (Attachment
10) for a new system to be piloted in seven school districts in 2011-2012 and fully implemented
Statewide by school year 2012-2013. The dates for full implementation were later revised
through an amendment that was submitted to and approved by USDE to 2013-2014; one year
before the ESEA flexibility requirements call for full implementation. The application outlined
the plan for pilots in seven districts to build the new model in a collective fashion. The
application was signed by the Governor and the President of the Maryland State Board of
Education (Attachment 11).
Education Reform Act of 2010
Maryland has already adopted needed policies to anchor and guide next steps. Signed by
Governor O’Malley on May 3, 2010, the Education Reform Act of 2010 created a new
expectation for Maryland educators: To be effective, teachers and principals must show they can
successfully improve student learning. The law established that changes in student growth will
become a significant factor in the evaluation of teachers and principals (see Appendix 3-B). This
legislation created the foundation for a new evaluation system that will more consistently and
fairly identify, support, and reward educators who are effective; and identify, develop, or exit
those who are ineffective.
Supporting the transition to this new system, the General Assembly also extended the timeline
for granting tenure from two years to three years, allowing new teachers to receive both the
support and oversight they need in their early years to become effective or leave the profession.
Comprehensive Teacher Induction Program
The State Board of Education developed Code of Maryland Regulations (COMAR) 13A.07.00-
153
ESEA FLEXIBI LITY – REQ UEST U .S . DEPARTMENT OF EDUC ATION
.09 that calls for a Comprehensive Teacher Induction Program. The purpose of the regulation is
to provide guidance for local school systems to establish a high quality induction program that
addresses critical professional learning needs of new teachers, improves instructional quality and
helps inductees achieve success in their initial assignments, resulting in improved student
learning and high retention in the profession. The induction program that each local school
system designs shall reflect coherence in structure and consistency in focus to ensure an
integrated, seamless system of support. Recognizing that “one-size-fits-all” induction programs
do not meet the needs of new teachers, this regulation establishes the components of an induction
program, allowing local school systems to build on their current programs. More information can
be found at http://www.dsd.state.md.us/comar/SubtitleSearch.aspx?search=13A.07.01.
Maryland Educator Effectiveness Council
To help guide the design and refinement of the pilots and resolve outstanding issues, the
Governor created, through an Executive Order in June 2010, the Maryland Educator
Effectiveness Council (MEEC) (Appendix 3-C). Membership of this Council and stakeholders
that support the work of this council are broad-based and include representation from
individuals/groups such as: State Superintendent; Members of the General Assembly;
Governor’s Policy Director; State Board of Education; Local Boards of Education; LEA
Superintendents; Maryland State Education Association; Baltimore Teachers Union; LEA
Assistant Superintendents for Instruction; LEA School Business Officials; LEA Executive
Officers; Local Accountability Coordinators; LEA Human Resources Directors; Title I
coordinators; Principals; MSDE/LEA identified teachers; Institutions of Higher Education
(University System of Maryland (USM) system, private colleges and community colleges);
Community/Business; PTA; National Psychometric Council; Maryland Assessment Research
Center for Education Success (MARCES); and students. The council is chaired by the Maryland
State Superintendent and Maryland State Educators Association Vice President. The specific
membership of the Maryland Council for Educator Effectiveness can be found at
http://www.marylandpublicschools.org/MSDE/programs/race_to_the_top/eecm.
The Maryland Educator Effectiveness Council was charged with submitting recommendations
for the development of the model evaluation system that was legislatively mandated by the
154
ESEA FLEXIBI LITY – REQ UEST U .S . DEPARTMENT OF EDUC ATION
Education Reform Act. The recommendations must include a definition for effective teachers
and principals, a definition for highly effective teachers and principals, an explanation of the
relationship between the student learning component of educator evaluations and the other
components of the evaluations.
The Council met 17 times from August 2010 to June 2011 and continues to monitor the progress
of the pilot programs being conducted in seven LEAs (described below) with the intention to
provide recommendations to the Governor, State Board of Education, and State Superintendent.
Once these recommendations, informed by the pilots, are made, procedures and policies will be
developed to address the following areas:
• Appropriate levels of student growth for a teacher or principal to be rated Effective
or Highly Effective; Maryland believes that to be rated Effective, a teacher or
principal must show appropriate levels of growth among their students to help them
successfully transition and progress from grade to grade; to be rated Highly
Effective, a teacher or principal must show exceptional talent in increasing student
growth well beyond one grade level in one year or exceptional success educating
high-poverty, minority, English Language Learners (ELL), Students with
Disabilities (SWD), or other high-needs students;
• Definition of Ineffective for a teacher or principal receiving an Ineffective rating,
including what supports should be offered and what additional evaluations are
needed;
• Whether an additional rating category (e.g., “Developing,” for educators whose
performance falls between Ineffective and Effective) beyond the minimum three
categories established in State Board of Education regulations is needed;
• Model scoring rubrics for classroom observations of teachers that measure the four
other domains and are based on best practices, such as the Charlotte Danielson
Framework for Teacher Performance Assessment System;
• Model scoring rubrics for measuring the eight outcomes of the Maryland
Instructional Leadership Framework (See Appendix 3-D );
• Matrix for determining how different rating criteria received in any individual domain
155
ESEA FLEXIBI LITY – REQ UEST U .S . DEPARTMENT OF EDUC ATION
combine to form an overall summative rating for the teacher or principal;
• Reviews of current LEA evaluation tools, protocols, and processes to determine
potential applicability to other counties; and
• Propose revisions to Maryland Teaching Standards to reflect current INTASC
standards research, best practices, the new evaluation system, and to inform teacher
preparation and professional development.
In April 2012, the Governor signed a new Executive Order extending the life of the Council
through December 2013 to continue to monitor the pilots and the statewide field testing. The new
order can be found in Appendix II- 10.
Race to the Top Amendment
As the Council began its work, it became evident that it needed more time to complete its charge
than originally conceived. As such, the Council requested of the Governor an extension to the
original timeline (December 2010) to June 2011 to present its recommendations for the new
model system (Appendix 3.E). Built into this revised timeline is a professional development
component for teachers and principals. The new timeline also provides for a 24 month (SY
2011-2012 and SY 2012-2013) pilot project for the new Statewide system of evaluation instead
of the original 18 month (second semester of SY 2010-2011 and SY 2011-2012) pilot.
Upon further reflection, the Council became concerned about moving too quickly from a pilot
evaluation system being conducted in 7 Local Education Agencies (LEAs) to Statewide
implementation without further time provided to the remaining school systems to also develop
and pilot their own local evaluation systems in order to seek solutions to unforeseen obstacles
and provide high quality professional development. Accordingly, the Council endorsed a
proposal from Dr. Nancy Grasmick (Former State Superintendent of Schools) that the Maryland
State Department of Education (MSDE) should request an amendment from the United States
Department of Education (USDE) to allow an additional year before implementing the Statewide
system of evaluation. This is an operational timeline amendment that changed when the new
system would be State mandated. That amendment was submitted to USDE on April 22, 2011,
and was approved on June 17, 2011. The timeline below describes the relationship between and
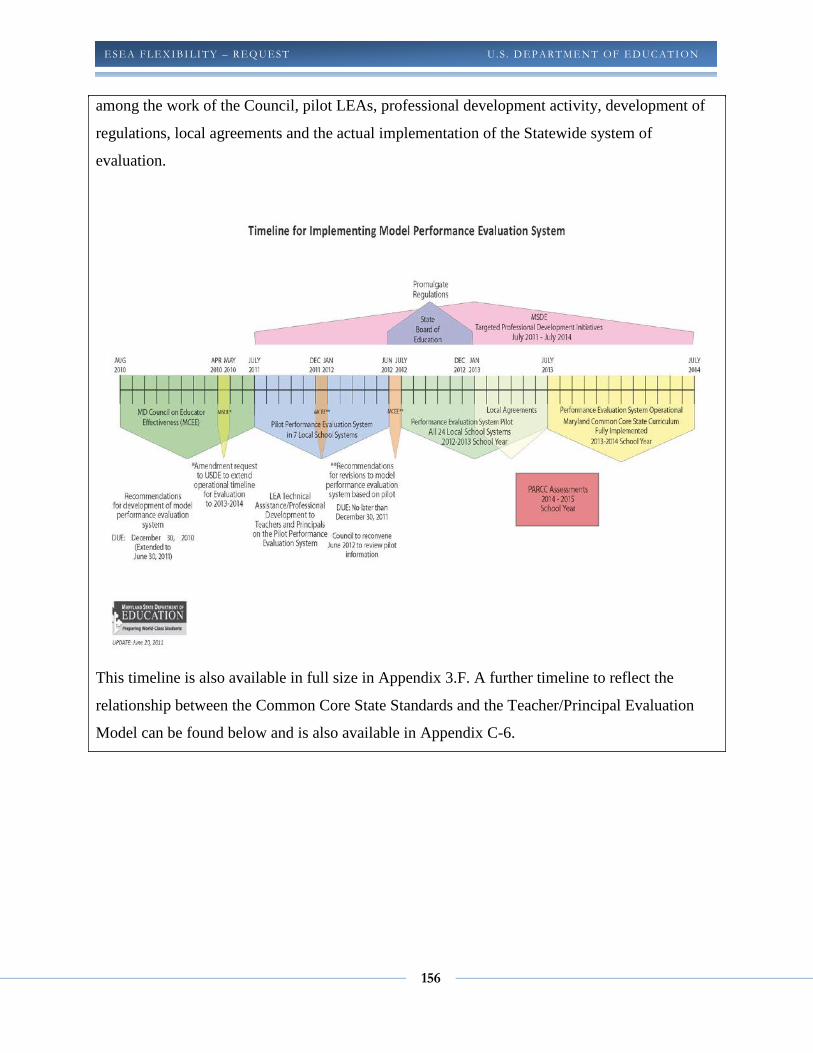
156
ESEA FLEXIBI LITY – REQ UEST U .S . DEPARTMENT OF EDUC ATION
among the work of the Council, pilot LEAs, professional development activity, development of
regulations, local agreements and the actual implementation of the Statewide system of
evaluation.
This timeline is also available in full size in Appendix 3.F. A further timeline to reflect the
relationship between the Common Core State Standards and the Teacher/Principal Evaluation
Model can be found below and is also available in Appendix C-6.
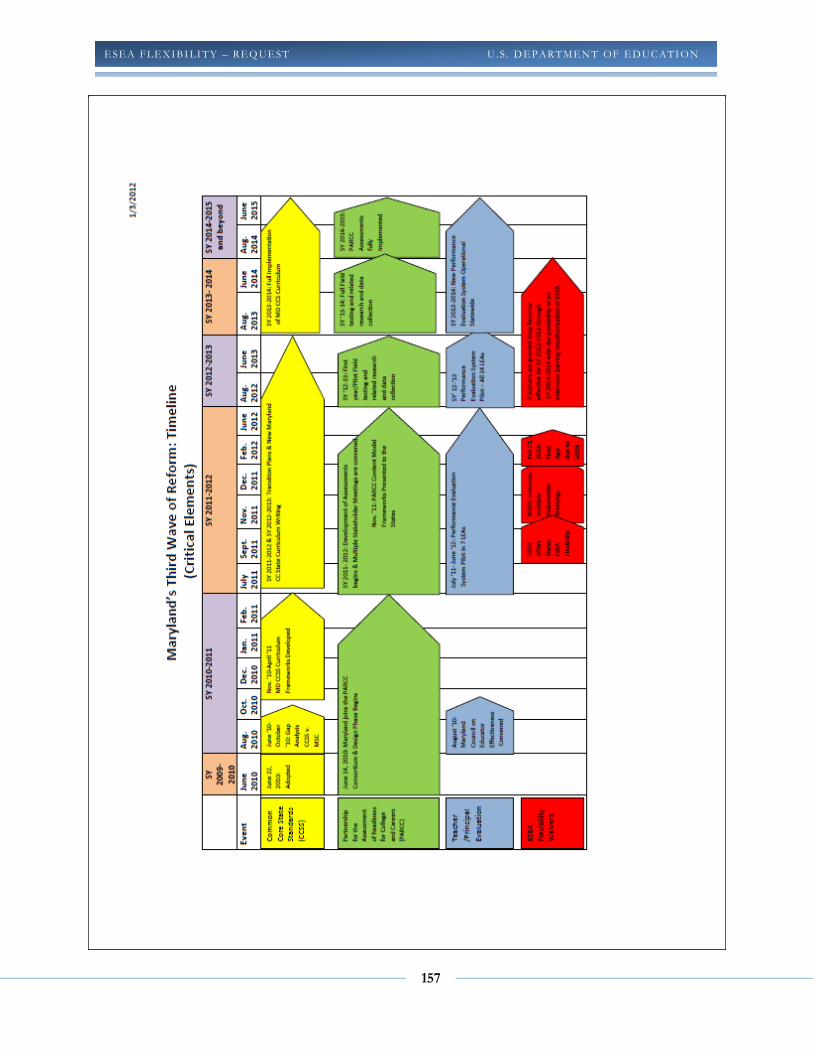
157
ESEA FLEXIBI LITY – REQ UEST U .S . DEPARTMENT OF EDUC ATION
158
ESEA FLEXIBI LITY – REQ UEST U .S . DEPARTMENT OF EDUC ATION
MEEC Interim Report- Framework: Evaluation of Teachers and Principals
In June 2011, after meeting 17 times beginning August 2010, the MEEC offered an interim
report to the Governor on their progress to date. The report “Maryland Council for Educator
Effectiveness Initial Recommendations Statewide Educator Evaluation System”, offered a
framework for the model of evaluation of teachers and principals.
After several discussions at Council meetings about the suggested components of an effective yet
flexible Statewide evaluation system, the Council endorsed two separate frameworks and
definitions that accompany those frameworks (below). The first framework lays out graphically
the components of a model for teacher evaluation in Maryland. The framework has at its core a
professional development component. It includes four qualitative measures (planning and
preparation; instruction; classroom environment; and professional responsibilities). The
framework also allows for the inclusion of other local priorities in addition to the four qualitative
measures to take into account other areas for which LEAs wish to hold teachers responsible.
This component of the evaluation is 50%. The other 50% is the student growth component. It
provides for consideration of complexity factors (see definition below) recognized by the LEA.
The framework yields a decision-making process based on performance standards. Once again,
professional development is included, with the caveat that such professional development is
important for all teachers, not just those who are rated ineffective. Continuous improvement is
the key to sustainable change.
The principal framework is similar to the first in design, but does have different components
because of the nature of the job of a principal. Once again, at its core is professional
development. For the qualitative measures, the framework includes specifically the eight
outcomes in the Maryland Instructional Leadership Framework. As with the teacher
framework, the principal framework yields a decision-making process based on performance
standards. Targeted professional development is provided based on needs identified in the
evaluation. Similar to the teacher professional development, such assistance for principals is
intended for all principals, since the model is based on the premise that all principals can
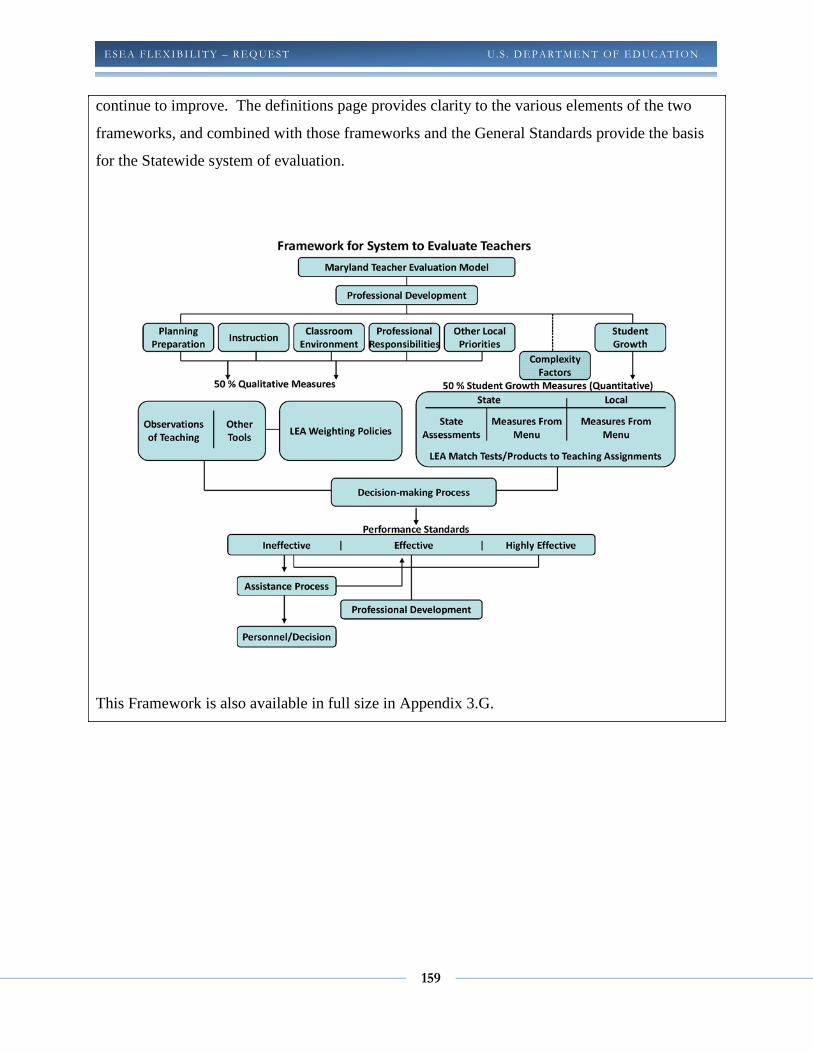
159
ESEA FLEXIBI LITY – REQ UEST U .S . DEPARTMENT OF EDUC ATION
continue to improve. The definitions page provides clarity to the various elements of the two
frameworks, and combined with those frameworks and the General Standards provide the basis
for the Statewide system of evaluation.
This Framework is also available in full size in Appendix 3.G.
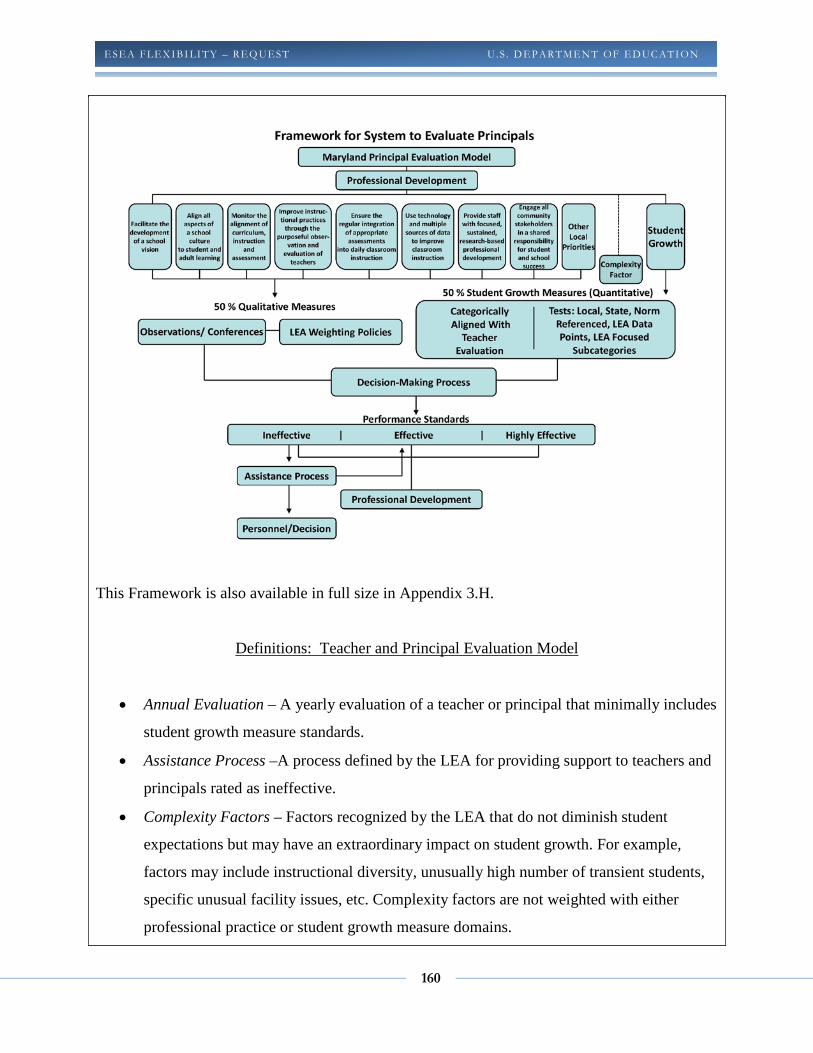
160
ESEA FLEXIBI LITY – REQ UEST U .S . DEPARTMENT OF EDUC ATION
This Framework is also available in full size in Appendix 3.H.
Definitions: Teacher and Principal Evaluation Model
• Annual Evaluation – A yearly evaluation of a teacher or principal that minimally includes
student growth measure standards.
• Assistance Process –A process defined by the LEA for providing support to teachers and
principals rated as ineffective.
• Complexity Factors – Factors recognized by the LEA that do not diminish student
expectations but may have an extraordinary impact on student growth. For example,
factors may include instructional diversity, unusually high number of transient students,
specific unusual facility issues, etc. Complexity factors are not weighted with either
professional practice or student growth measure domains.
161
ESEA FLEXIBI LITY – REQ UEST U .S . DEPARTMENT OF EDUC ATION
• Decision Making Process – The process by which an LEA utilizes the data, both
qualitative and quantitative, for determining a teacher’s or principal’s level of
performance and targeted professional development.
• LEA Match Test/Products to Teaching Assignments – Assessments, selected by the LEA
for grade level or content area teachers from the menu of multiple measures, which align
with a teacher’s assignment.
• LEA Weighting Policies – Policies set by each LEA indicating the percentage the LEA
will assign to each of the qualitative measures. Qualitative measures account for 50% of
the total evaluation.
• Measures From Menu – The list of options that were part of the report of the Maryland
Council for Educator Effectiveness that may be used to measure student growth (see table
below). The list is not meant to be exhaustive, but to offer suggestions.
• Mentoring – Ongoing support provided to teachers and/or principals by a cadre of
mentors trained by the LEA to provide teachers and/or principals with the knowledge and
skills necessary to be successful in their classroom and schools and enable them to stay in
the profession. Mentoring should be focused, systematic, ongoing, high quality, geared to
the needs of the employee being mentored, include observations, and include feedback.
• Observations of Leadership – The process by which a trained evaluator has formally
observed the qualitative measures of instructional and administrative leadership for each
principal being evaluated.
• Observations of Teaching – The process by which a trained evaluator has formally
observed the qualitative measures of teaching for each teacher being evaluated.
• Other Tools – Qualitative data collection tools in the classroom and school that produce
sufficient data from which a teacher or principal may be evaluated on all or part of the
domains of the teacher and/or principal evaluation model.
• Performance Standards – Levels of teacher or principal performance resulting in a final
rating of ineffective, effective, or highly effective on the individual’s evaluation.
• Professional Development – The training a teacher and/or principal receives relative to
the teacher’s and/or principal’s level of performance. It should be research-based, high
quality, timely, and relevant.
162
ESEA FLEXIBI LITY – REQ UEST U .S . DEPARTMENT OF EDUC ATION
• Qualitative Measures (Teacher) – Observable measures and evidence, accounting for
50% of a teacher’s evaluation, which must include the following domains:
planning/preparation, instruction, classroom environment, professional responsibilities,
and other local priorities if appropriate.
• Qualitative Measures (Principal) – Observable measures and evidence, accounting for
50% of a principal’s evaluation, which must include: school vision, school culture,
alignment of curriculum, instruction and assessments, instructional practices, appropriate
assessments, technology and multiple sources of data, professional development,
engagement of community stakeholders, and other local priorities if appropriate.
• Quantitative Measures – Data specific measure which results from students’ performance
on approved State or LEA multiple measures of student performance.
• State Assessments – State assessments as required by state or federal laws and/or
regulations.
• Student Growth Measures – Multiple measures of student academic and affective
outcomes directly related to the teacher or principal. These measures account for 50% of
a teacher’s or principal’s evaluation.
Menu of Sample Growth Measures
This table of options was part of the June 2011 Interim Report of the Maryland Council for
Educator Effectiveness. It is not meant to be a comprehensive menu.
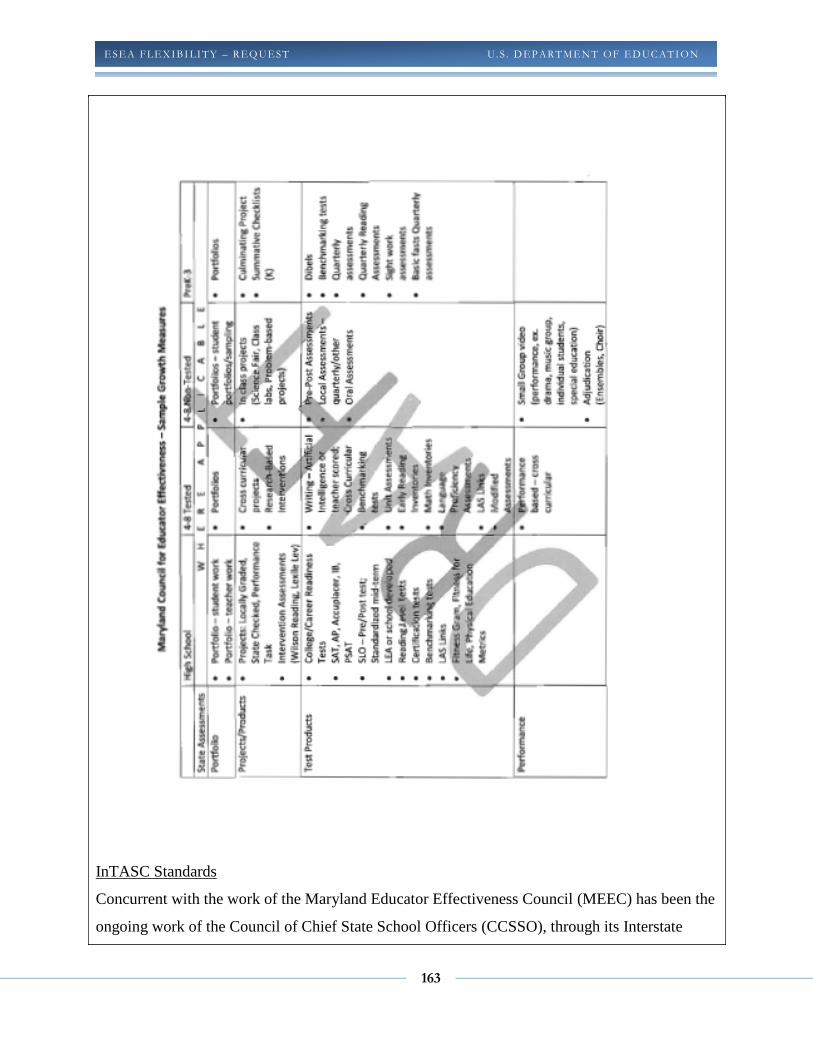
163
ESEA FLEXIBI LITY – REQ UEST U .S . DEPARTMENT OF EDUC ATION
InTASC Standards
Concurrent with the work of the Maryland Educator Effectiveness Council (MEEC) has been the
ongoing work of the Council of Chief State School Officers (CCSSO), through its Interstate
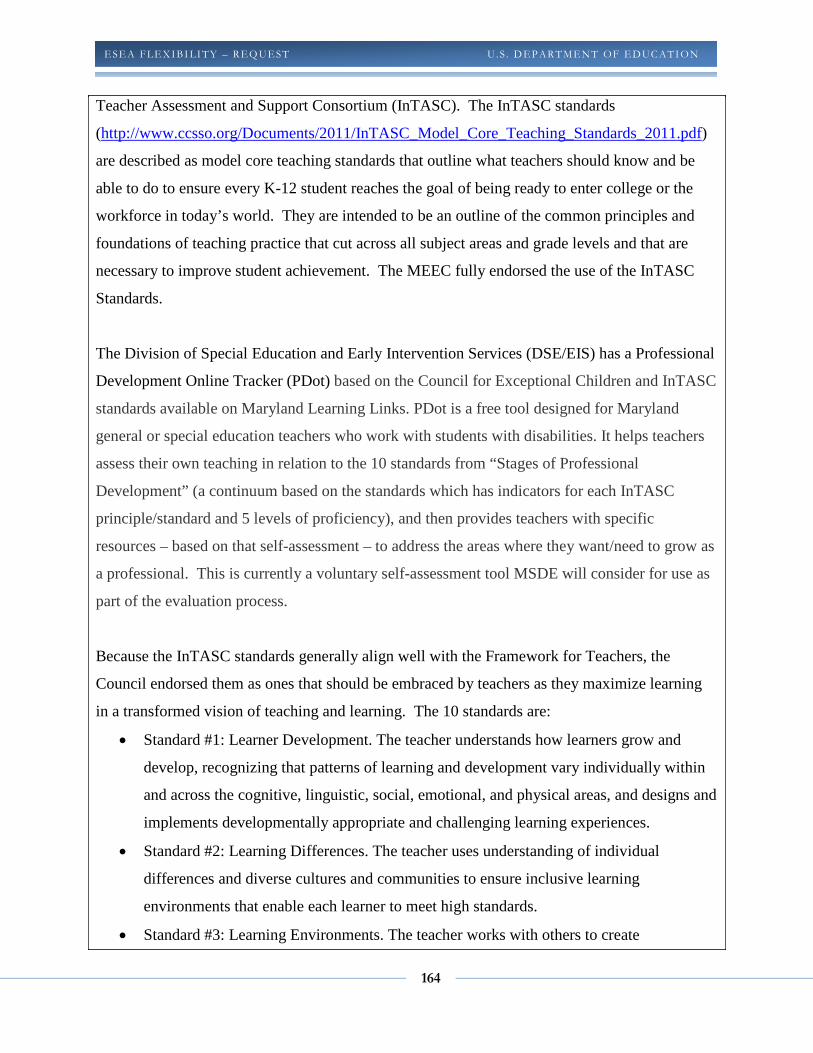
164
ESEA FLEXIBI LITY – REQ UEST U .S . DEPARTMENT OF EDUC ATION
Teacher Assessment and Support Consortium (InTASC). The InTASC standards
(http://www.ccsso.org/Documents/2011/InTASC_Model_Core_Teaching_Standards_2011.pdf)
are described as model core teaching standards that outline what teachers should know and be
able to do to ensure every K-12 student reaches the goal of being ready to enter college or the
workforce in today’s world. They are intended to be an outline of the common principles and
foundations of teaching practice that cut across all subject areas and grade levels and that are
necessary to improve student achievement. The MEEC fully endorsed the use of the InTASC
Standards.
The Division of Special Education and Early Intervention Services (DSE/EIS) has a Professional
Development Online Tracker (PDot) based on the Council for Exceptional Children and InTASC
standards available on Maryland Learning Links. PDot is a free tool designed for Maryland
general or special education teachers who work with students with disabilities. It helps teachers
assess their own teaching in relation to the 10 standards from “Stages of Professional
Development” (a continuum based on the standards which has indicators for each InTASC
principle/standard and 5 levels of proficiency), and then provides teachers with specific
resources – based on that self-assessment – to address the areas where they want/need to grow as
a professional. This is currently a voluntary self-assessment tool MSDE will consider for use as
part of the evaluation process.
Because the InTASC standards generally align well with the Framework for Teachers, the
Council endorsed them as ones that should be embraced by teachers as they maximize learning
in a transformed vision of teaching and learning. The 10 standards are:
• Standard #1: Learner Development. The teacher understands how learners grow and
develop, recognizing that patterns of learning and development vary individually within
and across the cognitive, linguistic, social, emotional, and physical areas, and designs and
implements developmentally appropriate and challenging learning experiences.
• Standard #2: Learning Differences. The teacher uses understanding of individual
differences and diverse cultures and communities to ensure inclusive learning
environments that enable each learner to meet high standards.
• Standard #3: Learning Environments. The teacher works with others to create

165
ESEA FLEXIBI LITY – REQ UEST U .S . DEPARTMENT OF EDUC ATION
environments that support individual and collaborative learning, and that encourage
positive social interaction, active engagement in learning, and self motivation.
• Standard #4: Content Knowledge. The teacher understands the central concepts, tools of
inquiry, and structures of the discipline(s) he or she teaches and creates learning
experiences that make the discipline accessible and meaningful for learners to assure
mastery of the content.
• Standard #5: Application of Content. The teacher understands how to connect concepts
and use differing perspectives to engage learners in critical thinking, creativity, and
collaborative problem solving related to authentic local and global issues.
• Standard #6: Assessment. The teacher understands and uses multiple methods of
assessment to engage learners in their own growth, to monitor learner progress, and to
guide the teacher’s and learner’s decision making.
• Standard #7: Planning for Instruction. The teacher plans instruction that supports every
student in meeting rigorous learning goals by drawing upon knowledge of content areas,
curriculum, cross-disciplinary skills, and pedagogy, as well as knowledge of learners and
the community context.
• Standard #8: Instructional Strategies. The teacher understands and uses a variety of
instructional strategies to encourage learners to develop deep understanding of content
areas and their connections, and to build skills to apply knowledge in meaningful ways.
• Standard #9: Professional Learning and Ethical Practice. The teacher engages in ongoing
professional learning and uses evidence to continually evaluate his/her practice,
particularly the effects of his/her choices and actions on others (learners, families, other
professionals, and the community), and adapts practice to meet the needs of each learner.
• Standard #10: Leadership and Collaboration. The teacher seeks appropriate leadership
roles and opportunities to take responsibility for student learning, to collaborate with
learners, families, colleagues, other school professionals, and community members to
ensure learner growth, and to advance the profession.
Pilot Teacher Evaluation Programs
Maryland’s goal is to ensure the majority of teachers and principals in its public schools are not
only evaluated as being effective, but are effective. A lynchpin in the State’s overall strategy for
166
ESEA FLEXIBI LITY – REQ UEST U .S . DEPARTMENT OF EDUC ATION
creating a truly world-class education system, this new evaluation system will: (1) collect
information about how every educator impacts student growth and achievement; (2) count
student achievement growth as the single most significant factor, accounting for 50 percent, of
the evaluation of teachers and principals; (3) combine information about student learning with
high-quality, more consistent observations of teachers’ and principals’ skills, knowledge, and
leadership by better-trained supervisors; (4) empower schools to better support educators and
strengthen their practices, compensate exceptional teachers and principals, and remove those
who clearly are ineffective; and (5) help Maryland identify and deploy the best teachers and
principals to the neediest schools.
Student Growth Measures
The State Board of Education specified that student-learning gains should comprise 50 percent of
the evaluation. Currently, Maryland is in the pilot phase with the seven pilot school districts that
will result in Statewide pilot in 2012-2013 and then full implementation of this new standard by
the 2013–14 school year.
Clear approaches to measuring student growth (intermediate strategy and long-term strategy):
State leaders recognize that using student growth data in teacher and principal evaluations
requires thoughtful planning and engagement among key stakeholders and psychometrically
valid instruments and analytics. Compounding the challenge, Maryland (like many other states)
is implementing its new educator evaluation system even as it plans to convert to a new student
assessment system that measures Common Core State Standards and will be developed jointly
with other states. These new assessments will be specifically designed to measure growth with
summative assessments. MSDE envisions a system of growth measures that are flexible to
accommodate various types of growth data, and will provide alert data for students not making
progress during the school year.
MSDE will calculate the progress each school makes in closing overall achievement gaps as
measured by the Maryland State Assessment (MSA) for elementary and middle schools and in
end-of-course exams in algebra, biology, and English (as measured by the end-of-course High
School Assessments for high school. MSDE has determined that virtually every school has an
167
ESEA FLEXIBI LITY – REQ UEST U .S . DEPARTMENT OF EDUC ATION
achievement gap for at least one group of students (e.g., low-income, minority, special
education); this measure reinforces the need to ensure educators are helping students make
sufficient growth to close these gaps. Again, the State’s experience developing and using these
types of indices began with the Maryland School Performance Assessment Program (MSPAP)
results which gives MSDE existing capacity and expertise to make these school-based
calculations.
The rubric (below) was developed by the Assessment and Accountability Comprehensive Center
and has been adapted for specific application in Maryland. Pilot districts received this rubric
as an example of criteria that could be used to evaluate the suitability of student growth measures
in a teacher evaluation system. While it is acknowledged that many existing measures may not
meet all of the criteria, the rubric can help districts select the measures that are most appropriate
for initial implementation and offer guidance on how the measures can be improved.
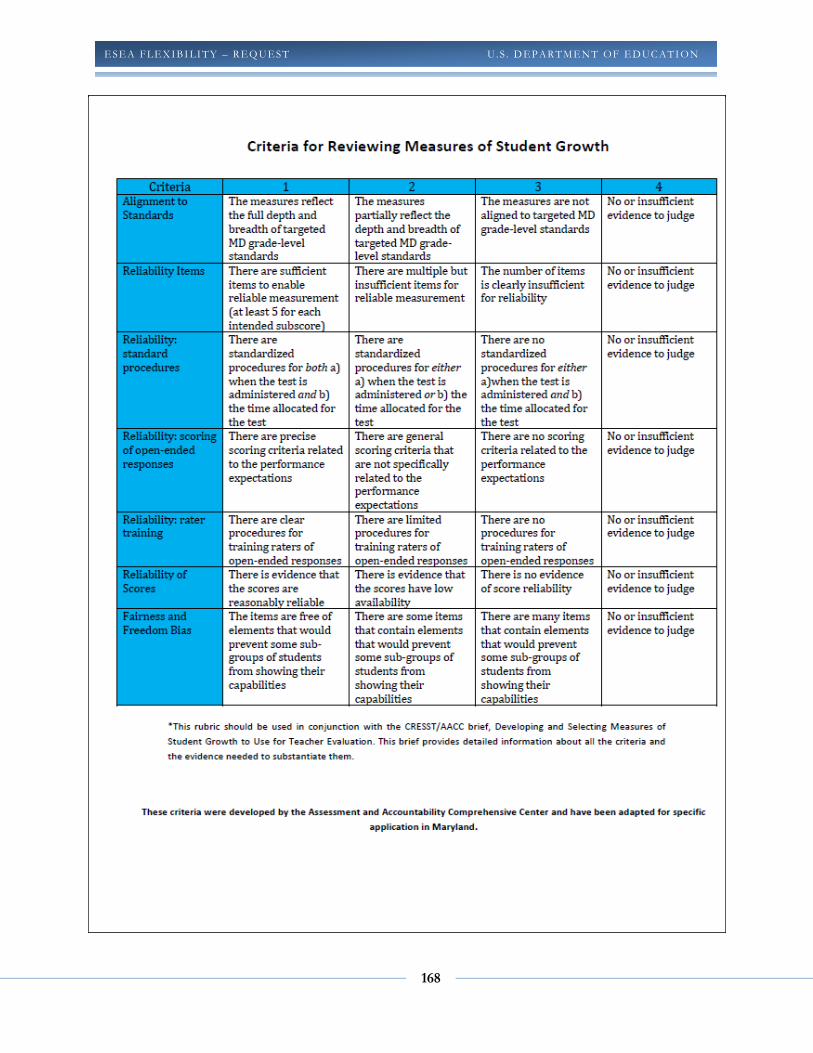
168
ESEA FLEXIBI LITY – REQ UEST U .S . DEPARTMENT OF EDUC ATION
169
ESEA FLEXIBI LITY – REQ UEST U .S . DEPARTMENT OF EDUC ATION
Piloting and refining the growth measures (2011–13): Measures of student growth began being
piloted in September 2011 and will continue to be refined through the 2011-2012 and 2012-2013
school years. Maryland is working in close partnership with seven pilot school districts
throughout the State: Baltimore City, Baltimore County, Charles County, Kent County,
Prince George’s County, Queen Anne’s County, and St. Mary’s County. Importantly, three
of these districts (Baltimore City, Baltimore County, and Prince George’s County)
disproportionally serve the majority of low-income students in Maryland — ensuring that the
new evaluation system can accelerate improvement in schools serving the State’s neediest
students and efforts to equitably distribute effective teachers and principals. The pilot LEAs
presently consist of eighty-three schools, nine hundred and thirty-four teachers, and forty-eight
principals. It is representative of multiple school levels, grade levels, team levels, and subject
levels; with consideration given to both assessed and non-assessed area educators. Models range
from systems identifying a selection of educators across all schools to systems identifying full
cohorts of educators within select schools. To varying degrees, six districts are conducting
complementary pilot evaluation processes with principals and or assistant principals. Most are
using a variation of existing or recently created evaluation tools to facilitate the validation of the
Professional Practice portion of Educator Effectiveness. The seven Pilot LEAs recognize that
the “experimental” design of the model allows for unique measures and accomplishments
associated with the interests and limitations of each district and that it has the potential to create
a valuable collection of evaluative evidence.
The seven LEAs’ experiences over the two-year pilot are also helping to inform any needed
course corrections before the system is piloted in all schools throughout the State in the 2012-13
school year and then implemented completely in school year 2013-2014. MSDE and the
Maryland Educator Effectiveness Council will collaborate with the pilot districts to gather
information and lessons learned to inform the Statewide scale-up.
The seven pilot districts meet with MSDE on a monthly basis to update MSDE and one another
on successes and challenges and to make recommendations for revisions to the models. These
meetings allow the districts to share with one another, learn from one another, request support
170
ESEA FLEXIBI LITY – REQ UEST U .S . DEPARTMENT OF EDUC ATION
from MSDE and maintain the collaborative approach with which the new evaluation system is
being developed.
With the goal of testing and refining the rubrics and measures, the student-growth portion of
evaluations during this pilot cycle will be “no fault” without high stakes or consequences
attached. However, as part of Race to the Top, participating teachers and principals in the lowest-
performing schools are part of an incentive project. Those identified by their local school
systems because of their exceptional impact on student growth will qualify for locally negotiated
incentives for working in high-poverty/high-minority schools. In the interest of fairness during
the pilot period, the participating LEAs will use their current evaluation system.
Two Race to the Top (RTTT) projects support the Student Growth portion of the
Teacher/Principal Evaluation model. Project # 28/47 - Develop and Implement a Statistical
Model to Measure Student Growth supports Maryland educational reform initiatives by
developing and implementing a student growth model so student performance outcome measures
may be used in educator effectiveness evaluations. This project assessed the strengths and
limitations of various valued added growth models in Year 1. In the current year, Year 2, the
SEA team has tested the Colorado growth model as a key student growth measure and
distributed the data to seven LEAs for use in a no-fault teacher effectiveness pilot. Based on
preliminary direction of the LEA pilots, MSDE is consolidating the best practices of the LEAs in
order to develop a multi-component State student growth measurement system.
Accomplishments that show evidence of meeting goals/activities and making progress include:
(1) Preparation of initial requirements document for student growth index method; (2) Design of
approach using value matrices for non-tested areas to create student growth index; (3) Design of
State level computation for the combined local plus State multi-component growth measure; (4)
Installation of the Colorado system with associated data structures to capture and store student
growth percentile data from the system, and process of student data for grades 3-8 from years
2007-2011; (5) Development of proof-of-concept dashboards showing aggregation and drill
down dis-aggregation of growth data from the State to LEA to school to subgroups; (6)
Completion of system technical architecture to productionalize the system and integrated the data
171
ESEA FLEXIBI LITY – REQ UEST U .S . DEPARTMENT OF EDUC ATION
with teacher effectiveness data to create a single teacher effectiveness measure; (7) Initiation of
assessment of short-comings with Colorado models and identification of solutions to improve the
measure with the National Psychometric Council; and (8) Initiation of new procurement for
psychometric consulting support to facilitate the development of a full student growth
measurement system.
The second project, Project # 29/48 - Develop and Implement an Educator Evaluation System
develops and implements an educator evaluation system that allows LEAs that do not have a
system, to implement a system of fair evaluations that use student performance measures and
professional performance measures for administrators and teachers. Year 2 activities include
identifying the best administrator and teacher performance measurement practices, tools and
methods in Maryland LEAs, procure an educator effectiveness system, and initiate a pilot it in
one or more LEAs.
Accomplishments that show evidence of meeting goals/activities and making progress include
(1) Survey of LEAs for teacher evaluation tools and procedures; (2) Preparation of strategy and
initial requirements document for educator effectiveness measures and a system; (3) Creation of
LEA collaboration team to review and participate in the selection of administrator and teacher
effectiveness tools and methods; (4) Design of State level computation system to combined local
plus State multi-component educator effectiveness measures with student growth measures; (5)
Design of a portfolio method for teachers and initiation of a single-LEA pilot; and (6) Matrix that
shows the initial identification of administrator rating tools and procedures, teacher rating tools
and procedures, and training packages that can meet State LEA needs.
Rigorous, Transparent, Fair Evaluations
The pilot process — and MSDE’s close partnership with the seven school districts to refine the
new framework — is an important step to ensuring the fairness, reliability, and rigor of the new
system and to identify and work out any problems before the evaluation models are piloted
Statewide in 2012 and then implemented Statewide in 2013. Importantly, MSDE and its partner
school districts will study the impacts and validity of the new evaluation system by examining
key questions, such as: Do ratings of teachers and principals under the new system match what
172
ESEA FLEXIBI LITY – REQ UEST U .S . DEPARTMENT OF EDUC ATION
principals and administrators had expected? Are teachers and principals receiving overall ratings
of Effective or better in numbers that are the same, fewer, or more that had been previously rated
Satisfactory?
Annual Evaluations that Provide Constructive Feedback-
Maryland’s goal is to ensure that all of the teachers and principals in its schools truly are
effective. Data and anecdotal reports suggest that nearly every educator today is rated
Satisfactory — which is not the same as knowing whether principals or teachers actually are
effective at improving student learning, the most important component of their jobs. For
Maryland to achieve its aspiration of having every principal and teacher become Effective or
Highly Effective, the State needs to ensure that evaluations happen regularly and that supervisors
not only are able to conduct evaluations capably and fairly but also understand how to use the
results to provide useful feedback and target appropriate support to those they are evaluating.
Maryland now mandates that all teachers and principals will be required to have annual
evaluations on student growth. Under the current system, tenured teachers are evaluated every
other year; under the new system, all school districts must follow these guidelines:
• Every teacher and principal shall be evaluated at least once annually.
• Each annual evaluation of a principal shall include all of the components of the
evaluation system (student growth, the eight leadership outcomes, and locally-
decided priorities).
MSDE will review the Code of Maryland Regulations (COMAR) to address this issue. In the
proposed regulation to be submitted to the State Board on March 27, 2012, the annual
evaluation process will be that teachers and principals shall be evaluated at least once annually
on a three year evaluation cycle, in the following ways: (1) tenured teachers shall be evaluated
on both professional practice and student growth in the first year of the evaluation cycle. If in
the first year of the evaluation cycle a tenured teacher is determined to be highly effective or
effective then in the second year of the evaluation cycle, the tenured teacher shall be evaluated
using the professional practice rating from the previous year and student growth based on the
most recent available data. If in the second year of the evaluation cycle a tenured teacher is
173
ESEA FLEXIBI LITY – REQ UEST U .S . DEPARTMENT OF EDUC ATION
determined to be highly effective or effective, then in the third year of the evaluation cycle, the
tenured teacher shall be evaluated using the professional practice rating from the previous year
and student growth based on the most recent available data. In the fourth year of the evaluation
cycle conducted under these regulations, tenured teachers shall be evaluated on both
professional practice and student growth. The cycle will continue as described above. In any
year, a principal may determine or a teacher may request that the evaluation be based on a new
review of professional practice along with student growth. (2) All non-tenured teachers and all
teachers rated as ineffective shall be evaluated annually on professional practice and student
growth. (3) Every principal shall be evaluated at least once annually based on all of the
components set of the evaluation.
Whenever student growth demonstrates a failure on the part of the teacher or principal to meet
targets and earn a rating of Effective, it will trigger additional evaluation of the teacher’s or
principal’s performance and a determination of what intervention and/or supports may be
necessary.
Because a high-quality, consistent, Statewide system for evaluating teacher and principal
effectiveness has never existed before in Maryland — and because student learning data in
particular have not regularly been used by all LEAs in evaluations — Maryland will invest in
significant technical assistance to support school districts, and especially those education leaders
who supervise teachers and principals, in making the transition.
In Maryland, principal evaluations are performed by a designated executive officer in each LEA,
so assistance and support easily can be targeted to the right individuals. In order to determine the
kind of assistance that executive officers feel that they need, the Division of Academic Reform
and Innovation will be conducting a needs assessment session at the February 2012 executive
officers meeting to help drive the design of the professional development. This training in staff
evaluations will be designed during spring 2012; regional trainers will be hired to support the 58
executive officers, and support will be offered to every LEA beginning in 2012. Executive
officers will help teach principals to evaluate teachers using the new teacher evaluation system;
they also will receive continued professional development and support to enable them to improve
174
ESEA FLEXIBI LITY – REQ UEST U .S . DEPARTMENT OF EDUC ATION
the oversight, coaching, and annual evaluation of principals. Executive officers and principals
also will receive training in the use of evaluations for promotion, incentives, and removal.
MSDE Teacher/Principal Evaluation Committee
In addition to the MEEC, MSDE established an internal stakeholder group to discuss and
monitor the progress of the Teacher/Principal Evaluation Model. This group consists of Cross-
Divisional Assistant State Superintendents, State Directors, and State Specialists and is led by
the Interim State Superintendent. The focus is on how MSDE can assist the non-pilot districts as
they develop their own systems, the seven pilot districts as they continue to experiment and test
their models, while also refining the Maryland default model as needed.
This group meets monthly and always one week before the pilots meet. Their main task is to
write a report that will help inform the Statewide pilot in 2012-2013 including incorporating
lessons learned from the seven pilot districts and designing a Statewide default model. The report
will include guidance on the teacher and principal evaluation frameworks, the multiple measures,
work and learnings from the pilots, annual evaluation cycles, professional development,
dashboards, attributions, certification and training of principals/evaluators, and partnering with
the unions.
Teacher Evaluation System: (State Default Model)
Following the initial work of the Council, the internal MSDE Teacher/Principal Evaluation
Committee, representatives of MSDE and MSEA Committee, the pilot group and the ESEA
Flexibility committee, with input from local superintendents and other stakeholders developed a
draft Teacher and Principal State Default Evaluation Model. These models will be shared with
the Educator Effectiveness Council.
Local school systems in working with their local unions are encouraged to develop the Teacher
Evaluation model that is aligned with the State framework as defined in the report of the
Council for Educator Effectiveness and as described above. In the event that the LEA and their
union do not agree on a local model, the LEA must adopt the State Default model for Teacher
Evaluation. Maryland continues to work on finalizing the State Teacher Evaluation Model and
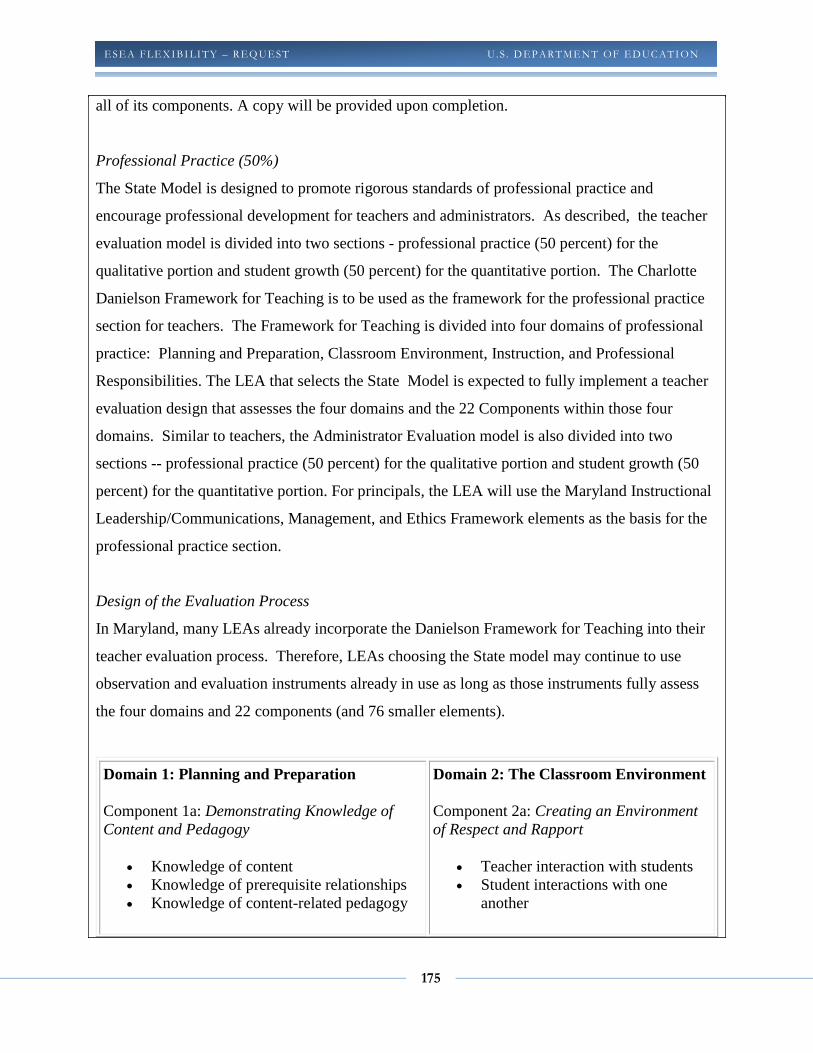
175
ESEA FLEXIBI LITY – REQ UEST U .S . DEPARTMENT OF EDUC ATION
all of its components. A copy will be provided upon completion.
Professional Practice (50%)
The State Model is designed to promote rigorous standards of professional practice and
encourage professional development for teachers and administrators. As described, the teacher
evaluation model is divided into two sections - professional practice (50 percent) for the
qualitative portion and student growth (50 percent) for the quantitative portion. The Charlotte
Danielson Framework for Teaching is to be used as the framework for the professional practice
section for teachers. The Framework for Teaching is divided into four domains of professional
practice: Planning and Preparation, Classroom Environment, Instruction, and Professional
Responsibilities. The LEA that selects the State Model is expected to fully implement a teacher
evaluation design that assesses the four domains and the 22 Components within those four
domains. Similar to teachers, the Administrator Evaluation model is also divided into two
sections -- professional practice (50 percent) for the qualitative portion and student growth (50
percent) for the quantitative portion. For principals, the LEA will use the Maryland Instructional
Leadership/Communications, Management, and Ethics Framework elements as the basis for the
professional practice section.
Design of the Evaluation Process
In Maryland, many LEAs already incorporate the Danielson Framework for Teaching into their
teacher evaluation process. Therefore, LEAs choosing the State model may continue to use
observation and evaluation instruments already in use as long as those instruments fully assess
the four domains and 22 components (and 76 smaller elements).
Domain 1: Planning and Preparation
Component 1a: Demonstrating Knowledge of Content and Pedagogy
• Knowledge of content • Knowledge of prerequisite relationships • Knowledge of content-related pedagogy
Domain 2: The Classroom Environment
Component 2a: Creating an Environment of Respect and Rapport
• Teacher interaction with students • Student interactions with one
another
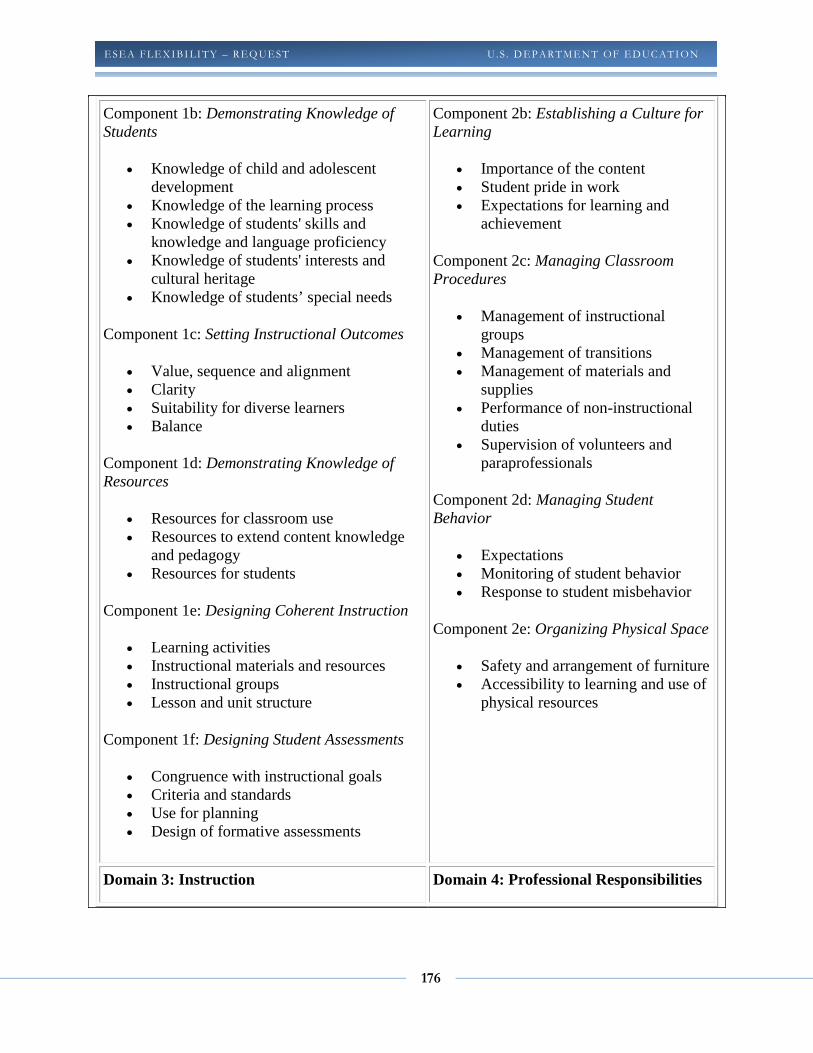
176
ESEA FLEXIBI LITY – REQ UEST U .S . DEPARTMENT OF EDUC ATION
Component 1b: Demonstrating Knowledge of Students
• Knowledge of child and adolescent development
• Knowledge of the learning process • Knowledge of students' skills and
knowledge and language proficiency • Knowledge of students' interests and
cultural heritage • Knowledge of students’ special needs
Component 1c: Setting Instructional Outcomes
• Value, sequence and alignment • Clarity • Suitability for diverse learners • Balance
Component 1d: Demonstrating Knowledge of Resources
• Resources for classroom use • Resources to extend content knowledge
and pedagogy • Resources for students
Component 1e: Designing Coherent Instruction
• Learning activities • Instructional materials and resources • Instructional groups • Lesson and unit structure
Component 1f: Designing Student Assessments
• Congruence with instructional goals • Criteria and standards • Use for planning • Design of formative assessments
Component 2b: Establishing a Culture for Learning
• Importance of the content • Student pride in work • Expectations for learning and
achievement
Component 2c: Managing Classroom Procedures
• Management of instructional groups
• Management of transitions • Management of materials and
supplies • Performance of non-instructional
duties • Supervision of volunteers and
paraprofessionals
Component 2d: Managing Student Behavior
• Expectations • Monitoring of student behavior • Response to student misbehavior
Component 2e: Organizing Physical Space
• Safety and arrangement of furniture • Accessibility to learning and use of
physical resources
Domain 3: Instruction Domain 4: Professional Responsibilities
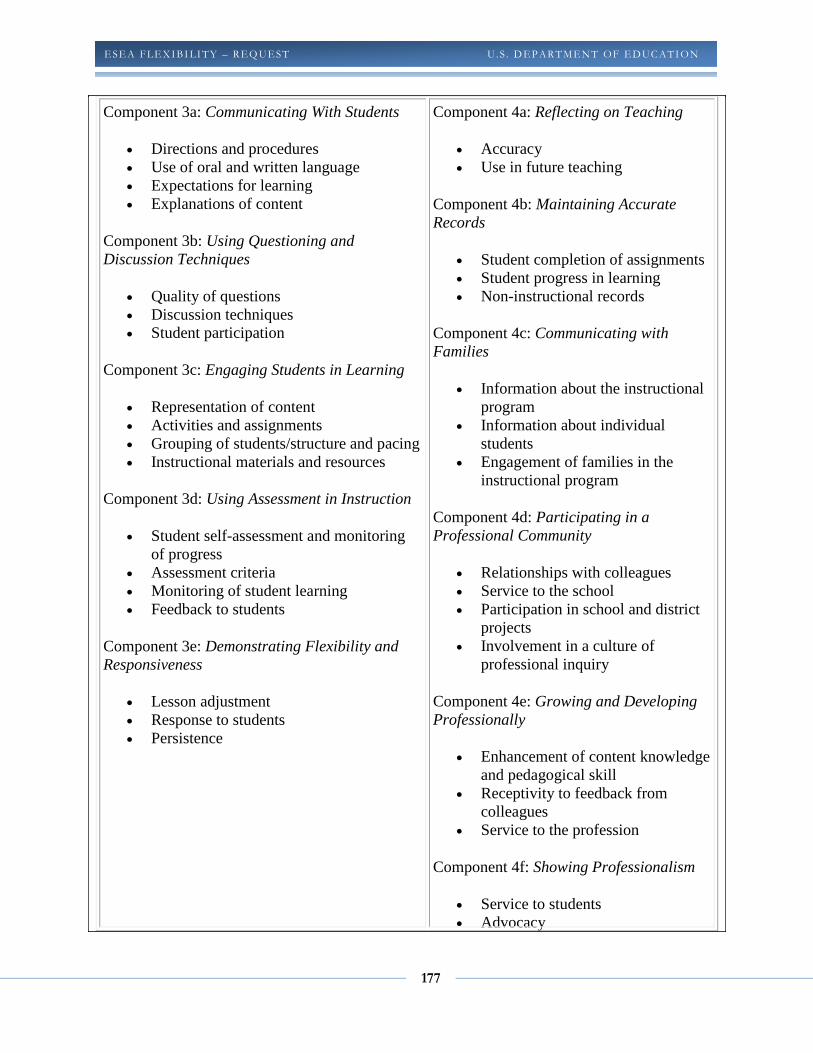
177
ESEA FLEXIBI LITY – REQ UEST U .S . DEPARTMENT OF EDUC ATION
Component 3a: Communicating With Students
• Directions and procedures • Use of oral and written language • Expectations for learning • Explanations of content
Component 3b: Using Questioning and Discussion Techniques
• Quality of questions • Discussion techniques • Student participation
Component 3c: Engaging Students in Learning
• Representation of content • Activities and assignments • Grouping of students/structure and pacing • Instructional materials and resources
Component 3d: Using Assessment in Instruction
• Student self-assessment and monitoring of progress
• Assessment criteria • Monitoring of student learning • Feedback to students
Component 3e: Demonstrating Flexibility and Responsiveness
• Lesson adjustment • Response to students • Persistence
Component 4a: Reflecting on Teaching
• Accuracy • Use in future teaching
Component 4b: Maintaining Accurate Records
• Student completion of assignments • Student progress in learning • Non-instructional records
Component 4c: Communicating with Families
• Information about the instructional program
• Information about individual students
• Engagement of families in the instructional program
Component 4d: Participating in a Professional Community
• Relationships with colleagues • Service to the school • Participation in school and district
projects • Involvement in a culture of
professional inquiry
Component 4e: Growing and Developing Professionally
• Enhancement of content knowledge and pedagogical skill
• Receptivity to feedback from colleagues
• Service to the profession
Component 4f: Showing Professionalism
• Service to students • Advocacy
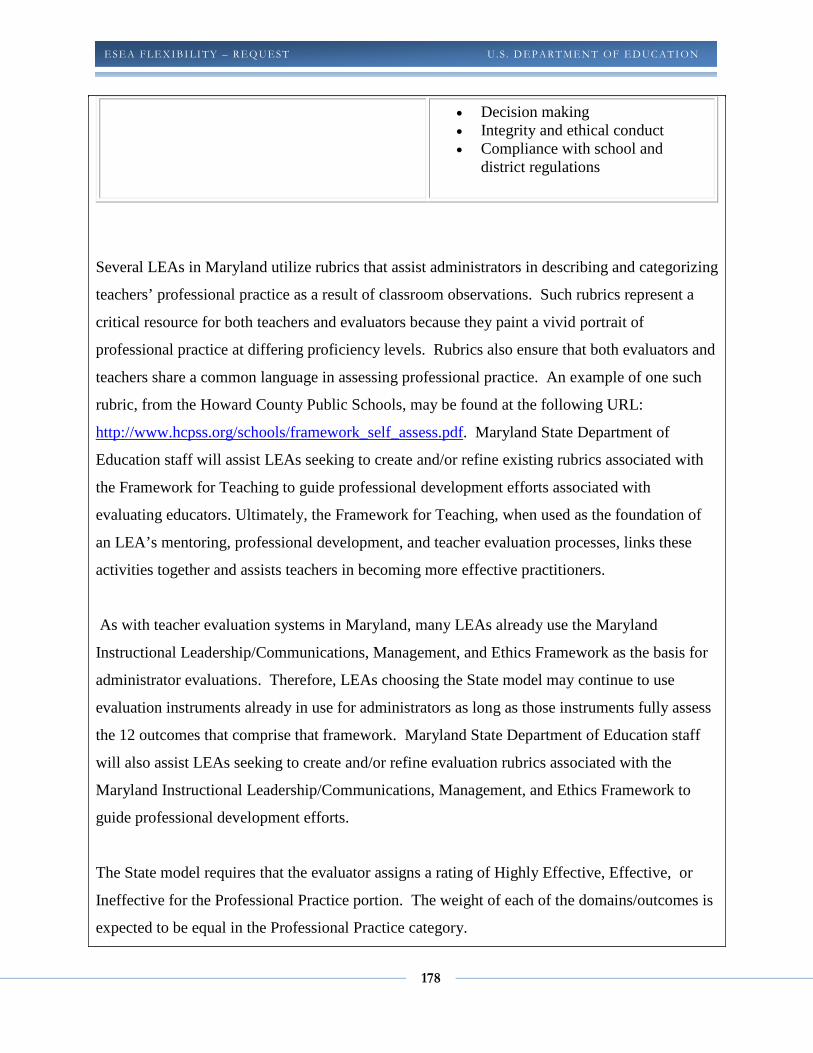
178
ESEA FLEXIBI LITY – REQ UEST U .S . DEPARTMENT OF EDUC ATION
• Decision making • Integrity and ethical conduct • Compliance with school and
district regulations
Several LEAs in Maryland utilize rubrics that assist administrators in describing and categorizing
teachers’ professional practice as a result of classroom observations. Such rubrics represent a
critical resource for both teachers and evaluators because they paint a vivid portrait of
professional practice at differing proficiency levels. Rubrics also ensure that both evaluators and
teachers share a common language in assessing professional practice. An example of one such
rubric, from the Howard County Public Schools, may be found at the following URL:
http://www.hcpss.org/schools/framework_self_assess.pdf. Maryland State Department of
Education staff will assist LEAs seeking to create and/or refine existing rubrics associated with
the Framework for Teaching to guide professional development efforts associated with
evaluating educators. Ultimately, the Framework for Teaching, when used as the foundation of
an LEA’s mentoring, professional development, and teacher evaluation processes, links these
activities together and assists teachers in becoming more effective practitioners.
As with teacher evaluation systems in Maryland, many LEAs already use the Maryland
Instructional Leadership/Communications, Management, and Ethics Framework as the basis for
administrator evaluations. Therefore, LEAs choosing the State model may continue to use
evaluation instruments already in use for administrators as long as those instruments fully assess
the 12 outcomes that comprise that framework. Maryland State Department of Education staff
will also assist LEAs seeking to create and/or refine evaluation rubrics associated with the
Maryland Instructional Leadership/Communications, Management, and Ethics Framework to
guide professional development efforts.
The State model requires that the evaluator assigns a rating of Highly Effective, Effective, or
Ineffective for the Professional Practice portion. The weight of each of the domains/outcomes is
expected to be equal in the Professional Practice category.
179
ESEA FLEXIBI LITY – REQ UEST U .S . DEPARTMENT OF EDUC ATION
Professional Development
Extensive materials, including videos, webinars and on-line materials are available to support the
implementation of these models of evaluation of professional practice. The LEA is encouraged
to utilize Title II, Part A federal funds along with local funds to provide necessary professional
development and to support these initiatives.
Depending on the continuation of federal Title II, Part A funding, grants to local school systems
will include priority for professional learning experiences for teachers and school leaders that are
directly aligned with the qualitative components of the teacher/principal evaluation system. The
focus of professional development for principals regarding the qualitative components will
include outcomes and evidences of practice as delineated in the Maryland Instructional
Leadership/Communications, Management, and Ethics Framework. The focus for the qualitative
components of professional practice for teachers will include the Charlotte Danielson
Framework for Teaching or other locally chosen qualitative framework.
The teacher toolkit portal, developed as part of the Race to the Top grant, represents a significant
professional development resource in support of educator evaluation. The Toolkit will provide
educators with access to a variety of online and face-to-face professional development, tools that
will help them plan their individual professional development plans along with opportunities to
collaborate online. It will provide a user friendly resource for teachers and principals to tap
professional development resources linked to the Common Core State Curriculum, multiple
dashboards for student, teacher and principal performance and teacher and principal evaluation
systems.
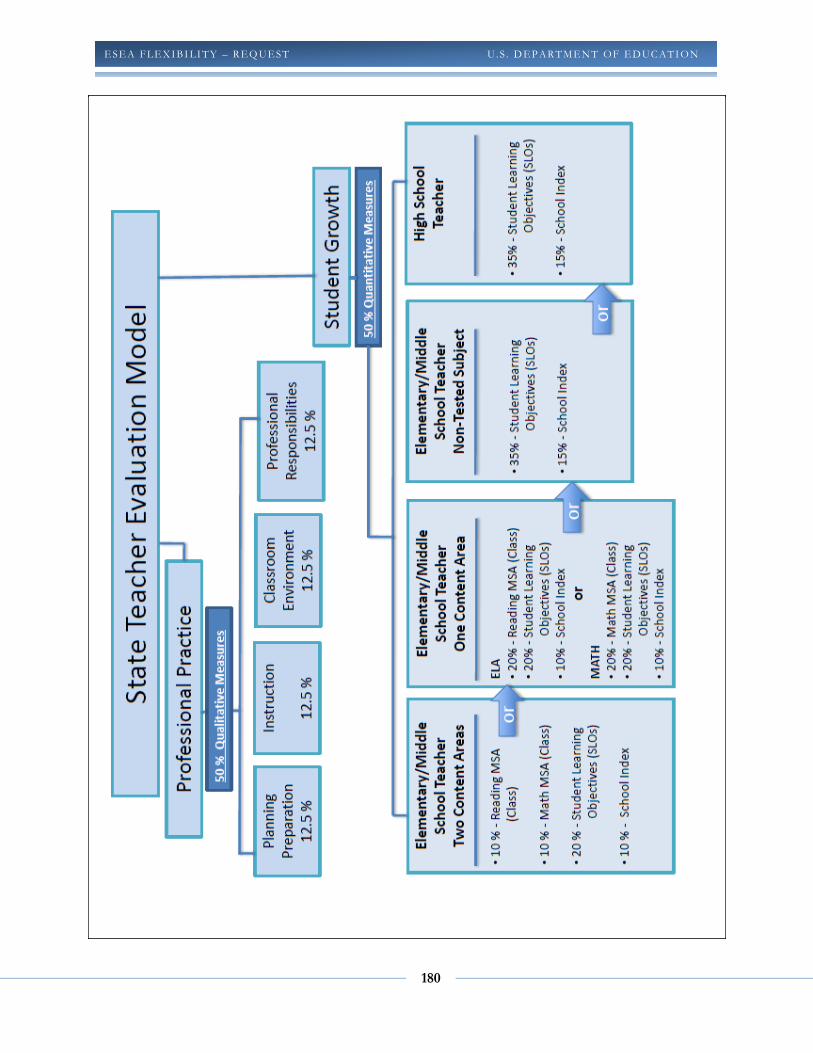
180
ESEA FLEXIBI LITY – REQ UEST U .S . DEPARTMENT OF EDUC ATION
181
ESEA FLEXIBI LITY – REQ UEST U .S . DEPARTMENT OF EDUC ATION
Student Growth (50%)
Student growth will be determined based on the courses and grade levels a teacher teaches. The
State model incorporates the use of the Maryland School Performance Index (described in
Principle 2) and Student Learning Objectives (SLOs) (defined more clearly below) to define
student growth for the evaluation. Wherever a Statewide assessment exists; it must be used as
one of the multiple measures (per Race to the Top). State assessments, if available, will be
combined with SLOs and MSDE’s approval to yield ratings of Highly Effective, Effective, or
Ineffective. The evaluator rates the teacher/principal as Highly Effective, Effective, or
Ineffective on the student growth rubric. The metrics that serve as the basis of the evaluation are
below.
• For elementary and middle school teachers who teach more than one subject (Option A),
the student growth would be calculated by combining the aggregate of 10% of the class
reading scores on the Maryland State Assessment (MSA), 10% of the class mathematics
scores, 20% of the SLOs and then the remaining 10% comes from the School
Performance Index.
• For elementary and middle school teachers who only teach one subject (Option B), the
score would still be calculated using 20% from SLOs and 10% from the School
Performance Index, however, the final 20% would be calculated from the Class scores of
the appropriate subject (Mathematics or English/Language Arts).
• For elementary or middle school teachers who teach in a non-tested content area, their
student growth rating would be determined by the SLOs (35%) and the School
Performance Index rating (15%).
• High school teachers would derive their student growth rating the same way as non-tested
content area teachers. Thirty-five percent comes from their SLOs and 15% from the
School Performance Index.
These metrics are also displayed graphically in Appendix 3.I. It is important to note that MSDE
is in the process of defining options and strategies for co-teachers in one content all day, self
contained special educators like those teaching multiple subjects, and support for special
educators in the non-tested areas.
MSDE is finalizing the method of calculation of growth for the Maryland School Assessment.
182
ESEA FLEXIBI LITY – REQ UEST U .S . DEPARTMENT OF EDUC ATION
The Assistant State Superintendent for Assessment, Accountability, and Data Systems is meeting
with the Psychometric Council on February 23, 2012 to review the use of student growth
percentiles and the Value Matrix. A recommendation will be brought to the Core Team which
includes the Interim State Superintendent for approval. Standard setting will be conducted on the
teacher evaluation model to determine the process for arriving at the final evaluation based on
the inputs as described above. MSDE will update the model with any revisions as needed. The
results of the standard setting process and other revisions to the teacher and principal evaluation
will be made available upon completion.
Overall Evaluation
The intersection of the Professional Practice rating (50%) and the Student Growth rating (50%)
will result in the final evaluation of the teacher/principal.
Student Learning Objectives (SLOs)
The use of Student Learning Objectives (SLOs) is planned to be an integral part of the teacher
and principal evaluation process. A student learning objective is a long term academic goal for a
group or class of students. SLOs are specific and measurable, based on available prior student
learning data, and aligned to State standards, as well as any school and LEA priorities. SLOs
should represent the most important learning during the interval of instruction. Objectives may
be based on progress or mastery.
SLOs are a solution that can work for all teachers, make a difference in instruction and student
outcomes and will support the transition to Common Core State Standards and assessments.
SLOs are also helpful in framing the conversations about school improvement and closing the
achievement gap.
Student Learning Objectives are not new in Maryland. Today in schools across the State groups
of teachers review formative and summative assessments with principals and other school
leadership and make instructional decisions based on past and current data and student work.
Maryland currently sees teachers conducting teacher research to solve real problems in their
classrooms and basing their instructional decisions on data they collect.
183
ESEA FLEXIBI LITY – REQ UEST U .S . DEPARTMENT OF EDUC ATION
In trying to assure quality and clarity Maryland has asked for technical assistance from USDE
from the Race to the Top Reform Support Network to capture best practices, models and
strategies from Massachusetts, Colorado, Austin TX, and New York. Maryland has also
contacted colleagues in Rhode Island who have had SLOs in use to find out what lessons they
have learned this year. See Appendix 3.J for the SLO Report for Maryland from the Race to the
Top Reform Support Network.
Maryland has an Ad Hoc committee in place that is currently reviewing in-State and out of state
models that could be adopted for the State model. Maryland is preparing an informational
document on SLOs which will include a general overview of SLOs and the rationale for using
them in Maryland’s Educator Evaluation System, a more in-depth detailed explanation of how
SLOs will be used in Maryland, and the explicit connection between SLOs and professional
practice. In addition Maryland will provide resources and information for all educators on
developing SLOs that address the specific needs of all subgroups.
Maryland is committed to making SLOs a focus for evaluating all teachers, but most especially
to address teachers who teach in areas that are not tested. The SLO process adds key strengths to
an evaluation system, including: providing a model for differentiating teacher effectiveness;
establishing a vehicle for improving teaching based on data on student performance and growth;
bringing more science to the art of teaching; linking teacher effectiveness to principal
effectiveness; connecting evaluation directly to student learning, while respecting teacher
professionalism; and enabling teachers and principals to become more systematic and strategic in
their instructional decisions to improve the quality of the outcome.
Principal Evaluation System: (State Default Model)
Simultaneous to the development of the teacher evaluation model, MSDE and its stakeholders
have been working on a State default model for the principal evaluation system. Similar to the
teacher evaluation model, the principal model will be based 50% on growth measures and 50%
on Professional Practice Measures.

184
ESEA FLEXIBI LITY – REQ UEST U .S . DEPARTMENT OF EDUC ATION
Growth Measures for Principals (50%)
Cognizant of the fact that growth is and should be measured differently for principals of different
types and level of schools; MSDE developed a model that is differentiated based on the type of
school a principal leads (see the table below). For elementary and middle school principals,
growth will be defined 20% by Student Learning Objectives (SLOs). Similar to the teacher
model, these will be developed collaboratively by the principal and the evaluator before the start
of the school year and will be based on overall student performance within the school. MSA
school-wide reading and mathematics scores will each make up another 10% of this component.
The final 10% will be decided based on the Maryland School Performance Index discussed in
Principle 2. Since high school principals do not have MSA scores, their growth measures will be
based 30% on SLOs and 20% on the Maryland School Performance Index. Finally, principals of
Special Education Centers, a PreK-2 school or any of the other types of schools in the State will
calculate their growth measure with 35% from SLOs and 15% from the Maryland School
Performance Index.
Growth Measures for Principals (50%)
Professional Practice Measures for Principals (50%)
Professional practice measures for principals will make up the remaining 50% of the evaluation.
These measures will have two main components: Providing effective instructional leadership and
providing a safe, orderly, and supportive learning environment. Recognizing the important role
principals play as instructional leaders, this first component will consist of facilitating the
development of a school vision; aligning all aspects of a school culture to student and adult
learning; monitoring the alignment of curriculum, instruction, and assessment; improving
instructional practices through purposeful observation and evaluation of teachers; ensuring the
Elementary/Middle Principals
High School Principals Other Principals (e.g., Special Centers, PreK-2)
Student Learning Objectives: 20%
Student Learning Objectives: 30%
Student Learning Objectives: 35%
MSA Reading:10% Index: 20% Index: 15% MSA Mathematics: 10% Index: 10%
185
ESEA FLEXIBI LITY – REQ UEST U .S . DEPARTMENT OF EDUC ATION
regular integration of appropriate assessments into daily classroom instruction; using technology
and multiple sources of data to improve classroom instruction; providing staff with focused,
sustained, research-based professional development; and engaging all community stakeholders in
a shared responsibility for student and school success.
The second professional practice measure involves providing a safe, orderly, and supportive
learning environment. This is measured by whether a principal manages and administers the
school operations and budget in an effective and efficient manner; communicates effectively in a
variety of situations and circumstances with diverse audiences; understands, responds to, and
helps influence the political, social, economic, legal, and cultural context of the school
community; and promotes the success of every student and teacher by acting within a framework
of integrity, fairness, and ethics.
MSDE is developing a series of “Look-fors” for each of the above metrics either by using the
evidences in practice in the Maryland Instructional Leadership Framework or the knowledge,
dispositions, and performances in the ISLLC Standards.
For the most recent version of the Principal Default Model, please see Appendix 3.K.
Internal Support Mechanisms and Non-Pilot Districts
A variety of technical assistance has been provided to the pilot LEAs in support of their work,
mostly through the RTTT funds. Individual visitations have been conducted to each LEA along
with combined monthly progress and informational sharing meetings. Electronic networks have
been established to facilitate communications, to maintain a reference resource, and to conduct
topical Webinar sessions. Teleconferencing has occurred with MSDE and USDE to report
progress and to identify immediate and longer range needs for State and national assistance. A
second round of visits took place in January 2012 along with a meeting that included a topically
driven action agenda.
In preparation for the second year Statewide pilot, the other seventeen LEAs have accepted the
invitation to participate in less formal processes to inform and instruct them of the work that is
occurring. Upon request, visitations and conversations have been conducted to thirteen of the
186
ESEA FLEXIBI LITY – REQ UEST U .S . DEPARTMENT OF EDUC ATION
non-pilot LEAs; with two more scheduled. The purpose of such briefings was to obtain a sense
of what the non-pilot LEAs may be presently doing with the Educator Effectiveness Initiative,
what they may be planning, and how MSDE might be of technical assistance concurrent to the
seven pilot LEA initiative. Points of contact indicate that the non-pilot LEAs are independently
pursuing a number of approaches to crafting a local method for measuring educator
effectiveness. The non-pilot LEAs, not unlike their pilot counterparts, are at varying points in
their efforts to quantify educator effectiveness. Some are taking full advantage of this year to
pursue conversations with their stakeholder groups; realigning local evaluation instruments and
initiating discussions about the means for quantifying student growth. Others, equally
complying with this year’s expectations, are taking the time to converse and consider options
while awaiting the outcomes of the seven pilot LEAs.
Both pilot and non-pilot LEAs are committed to the spirit and the intent of the Educator
Effectiveness initiative and a positive and productive dynamic is being evidenced between
administrative and association personnel.
New Regulations
As mentioned above, new regulations have been developed and were presented to the State
Board of Education on March 27, 2012. A copy of these regulations can be found in Appendix
II- 11. These regulations address much of what has been and is being learned by the pilots. The
regulations will be posted in the State Register for 40 days of public comment in mid-May. It is
expected that the regulations will come back to the State Board in July 2012 for any revisions
and/or action. The State Superintendent and MSDE will rely heavily on the Maryland Educator
Effectiveness Council to identify and develop further recommendations for the framework as
needed. The Council will continue to meet throughout the pilots to provide input and advice on
these additional issues:
• Guide MSDE’s evaluation and research questions throughout the two-year pilot of the
new system (one year with 7 districts and one year statewide); and
• Identify by April 2012 corrections and adjustments to the overall design of the State
evaluation system — including the guidelines, tools, and measures — before the
system is piloted statewide in fall 2012.
187
ESEA FLEXIBI LITY – REQ UEST U .S . DEPARTMENT OF EDUC ATION
Further adjustments to the evaluation system and specific consequences for those rated
Ineffective under the new system still need to be enacted into policy in 2012 (and 2013 if
additional corrections are needed). It is important to understand that members of the State Board
of Education — who are appointed by the Governor — have sole authority within the limits of
the law to act on these issues. Maryland leaders are appropriately taking the needed time to seek
input from stakeholders to refine and perfect the new evaluation system — and not simply
postponing difficult decisions to a distant date or to an uncertain future. The action of
Maryland’s General Assembly — combined with the State Board’s broad powers to “determine
the elementary and secondary educational policies of this State” and to do so by regulations that
have the “force of law” and apply to all school systems (Annotated Code of Maryland, §2-
205(b)(1) and§2-205(c)) — ensure Maryland will take action and enact all aspects of the plan
outlined above, after conferring closely with stakeholders.
Towards Full Implementation: Refining the Evaluation System and Involving Teachers
and Principals:
As part of annual evaluations, school districts will have flexibility to determine how these
domains are assessed. They also have the flexibility to suggest additional measures for this 50
percent that reflect unique priorities of their communities. Similar to the non-growth measure
component of the teacher evaluation, LEAs will have flexibility in their principal evaluations to
determine how best to assess these outcomes, which must be done annually. In addition, LEAs
may add attributes of principal leadership (e.g., school-management skills) to these eight
outcomes that reflect local priorities. LEAs must work within the framework as described for
teachers and principals, must include multiple measures and must have annual evaluations.
Initially each LEA will submit their evaluation model to MSDE for review and approval. In
future years as part of the annual Master Plan update process, MSDE will review each LEA’s
evaluation framework and exert quality control as needed. Maryland tracks performances at the
district level through the Bridge to Excellence program, which requires local school systems to
develop and implement a comprehensive master plan, updated annually, as part of receiving
increased State funding. Because the Master Plan is reviewed annually by MSDE and LEA staff

188
ESEA FLEXIBI LITY – REQ UEST U .S . DEPARTMENT OF EDUC ATION
to ensure that students, schools, and districts are making sufficient progress toward performance
goals, the process serves as an important, high-profile accountability tool in Maryland.
The new Maryland Teacher/Principal Evaluation System will be operational Statewide in
September 2013. All twenty-four LEAs will be mandated to participate in the new
collaboratively developed system. All revisions to the model will be available.
Update:
Maryland’s work on redesigning its Teacher/Principal Evaluation System has been a critical
component of Maryland’s Third Wave of Education Reform. Please see Appendix II-12 for a
timeline of this work. Maryland currently has 7 LEAs piloting different elements of a
Teacher/Principal Evaluation model. The information and learnings from these pilots will inform
the recommendations for the statewide field test of new Teacher/Principal Evaluation Models by
all 24 LEAs in 2012-2013. Maryland has developed a default model for districts that are unable
to mutually agree with their bargaining unit on an LEA model.
MSDE has also created the Maryland Teacher/Principal Evaluation Guidebook, an
implementation guide to assist LEAs in implementing the new Teacher/Principal Evaluation
System in the 2012-2013 school year field test. This guidebook can be found at:
http://www.marylandpublicschools.org/MSDE/programs/race_to_the_top/tpeg. Revisions will be
made to the Guidebook following the field test and will be distributed for the 2013-2014 full
implementation.
The Maryland State Evaluation Default Model will be piloted during the statewide field testing
in 2012-2013 by Anne Arundel County Public Schools (AACPS). AACPS is a mid size LEA
with a diverse school population which includes Annapolis, the State capital. The components of
the 50% student growth portion include MSA results by class, the Maryland School Performance
Index, and Student Learning Objectives (SLOs). In addition to AACPS, Calvert and Somerset
County LEAs are also field testing the State Model. These are two smaller counties and should
provide more varied data on the State Model
189
ESEA FLEXIBI LITY – REQ UEST U .S . DEPARTMENT OF EDUC ATION
Because Maryland decided that SLOs would be a part of the default model, MSDE is prepared to
offer professional development on developing and measuring SLOs. Maryland requested
technical assistance from USDE to learn how SLOs have been used in the educator evaluation
systems across the country. This information has been shared with superintendents and other
school system leaders as well as with the Maryland State Educators Association [MSEA] a local
arm of NEA. Of the 24 school systems in the state, 23 are MSEA members.
Additionally, MSDE recently sent a team to Charlotte-Mecklenburg, NC, where Student
Learning Objectives have been used to measure student outcomes as part of a TIF grant for five
years. The team met with Dr. Susan Norwood, Executive Director of the grant. The team also
met with teachers and principals to find out from practitioners how effective the SLOs are in
increasing student achievement. The team is composed of cross divisional personnel who will
implement the professional development model for school systems using SLOs next year and for
the Maryland State Teacher and Principal Evaluation System. Team members were chosen
because of their ability to plan and conduct professional development for LEA pilot programs
and also to impact specific stakeholder groups as well.
The SLO team includes a former LEA superintendent, who will communicate directly with
superintendents, a program approval specialist who will connect with teacher and principals
preparation programs, a Title I specialist who will communicate with Focus and Priority Title I
schools and a Career and Technology specialist who will work with LEA supervisors of these
programs to assure effective implementation of SLOs for this diverse population. Dr. Megan
Dolan, Mid- Atlantic Comprehensive Center, also is a part of the team and has provided valuable
research and contact from across the country.
MSDE is creating a full Professional Development Plan and Timeline for SLOs, Charlotte,
Danielson, the School Performance Index, etc. Members of the SLO team already created the
following Professional Development Plan for SLOs:
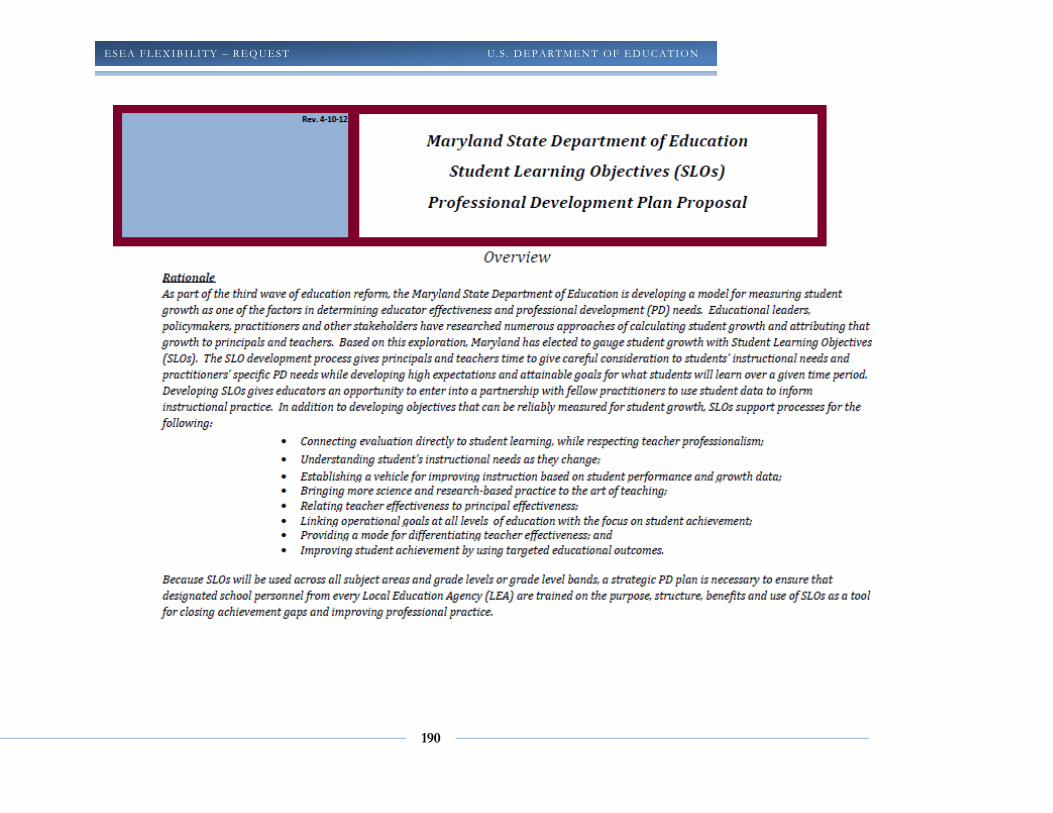
190
ESEA FLEXIBI LITY – REQ UEST U .S . DEPARTMENT OF EDUC ATION
191
ESEA FLEXIBI LITY – REQ UEST U .S . DEPARTMENT OF EDUC ATION
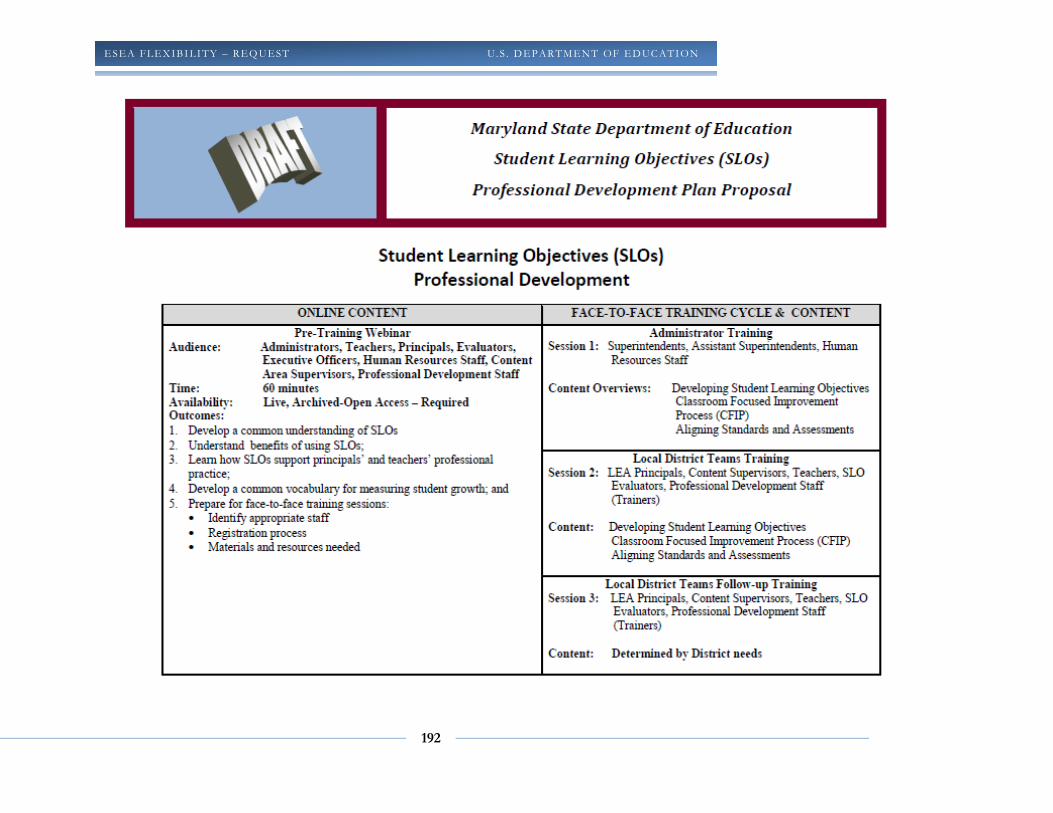
192
ESEA FLEXIBI LITY – REQ UEST U .S . DEPARTMENT OF EDUC ATION
193
ESEA FLEXIBI LITY – REQ UEST U .S . DEPARTMENT OF EDUC ATION
Finally, Maryland has a project in its Race to the Top application that is directly tied to the
training of school and district staff. Project 40/15 was originally designed for the training of
executive officers in the teacher and principal evaluation system that was to be developed. Its
scope has since been expanded. Maryland has hired a Center Coordinator for this project, and is
in the process of hiring two regional trainers. The Center Coordinator has travelled to each of
our 24 LEAs to ascertain their professional development needs. MSDE also conducted a session
at the February convening of executive officers to determine what needs they felt they had. The
Center Coordinator and the two regional trainers will work with an outside vendor to design
appropriate professional development sessions based on the needs assessments Maryland has
conducted. They will then deliver those professional development sessions in regional forums
to executive officers. They will also deliver sessions for principals. Because of Maryland’s size
as a State and our resultant ability to get to each LEA within a three-hour drive, we also intend to
offer sessions for individual LEAs as needed. Maryland feels fortunate to have funds for this
effort as a result of our Race to the Top grant. We believe that this effort combined with other
efforts described herein will provide us the opportunity to reach deeply into each LEA and
support them in a way that they consider most important.
Additionally, as part of the plan that each LEA must submit for approval of their
Teacher/Principal Evaluation model, the LEA must describe how they will provide professional
development on the model to teachers and principals.
Validation Maryland is committed to continual improvement and will apply that commitment to
Teacher/Principal evaluation process. The seven pilots (2011-2012), statewide field testing
(2012-2013), Maryland Teacher/Principal Evaluation Guidebook, and MSDE’s intention to
continually review and revise the system and the models are indicative of the importance
Maryland places on an effective Teacher/Principal Evaluation model.
Maryland principals will assist in the validation process of the new evaluation system for
teachers. Likewise, the feedback from executive officers will also validate the new evaluation
194
ESEA FLEXIBI LITY – REQ UEST U .S . DEPARTMENT OF EDUC ATION
process for principals. Essentially, Maryland will utilize feedback from those who are in a
supervisory role, as they are best positioned, to confirm that the ratings assigned to those whom
they evaluate in the new evaluation system appear reasonable based on past practice. Certainly
Maryland will use data to assist in this effort as well, but expert professional judgment will be
invaluable as Maryland enters this new territory.
Finally, Maryland hired a retired Superintendent as part of the Race to the Top project to work
specifically on Teacher/Principal Evaluation. She is the liaison between MSDE and the LEA
Superintendents to assist in the transition to the new system. Her position also facilitates
increased communication, support, and understanding between MSDE and its LEAs.
Information concerning the operation and effects of the pilots is currently being gathered. An
end of year report was designed by representatives from inter-divisional MSDE offices with
responsibility for teacher evaluation, professional development, accountability and assessment,
and policy to elicit information about the focus of each pilot, the evaluation cycle observed, the
measures used for student growth and professional practice, and a general reflection on the
process and product including lessons learned. This information will be analyzed, interpreted,
shared with stakeholders, and used to guide improvement. Goals and requirements are being
established for the field test. The tools to gather this information will be developed and
distributed to all LEAs participating in the field test with a timeline for submission.
195
ESEA FLEXIBI LITY – REQ UEST U .S . DEPARTMENT OF EDUC ATION
PRINCIPLE 4: REDUCING DUPLICATION AND UNNECESSARY BURDEN
4. A REMOVE DUPLICATIVE AND BURDENSOME REPORTING REQUIREMENTS THAT HAVE LITTLE OR NO IMPACT ON STUDENT OUTCOMES
Maryland has a long history of consolidating and reducing reporting. Beginning in the early
1990’s, MSDE produced the School Accountability Funding for Excellence reporting
compendium of all Federal Programs. This not only reduced the explanatory work necessary for
each program but it also forced more coherence between programs, thus bringing more
efficiency to the work.
Efficiency is the key, not just reduction of paperwork. Maryland’s programs must run smoothly
and with great attention to fiscal responsibility. Because of this premise and the understanding
from the Maryland General Assembly about the need to consolidate plans, MSDE embarked, in
2003, on the Master Planning Process. Master Plans consist of the ESEA goals, Race to the Top
goals, and additional State goals. With each goal there is an explanation of milestones; tracking
and analyses of data against these milestones; an evaluation of the successes and challenges; and
then a clear path forward to attaining each and every goal including the resource allocation. The
original five-year plans are updated annually leading to a constant adjustment of programs and
policies that drive excellent schooling in each of the LEAs.
The Guidance document for each year’s Master Plan is created with the assistance of an External
Advisory Panel. MSDE staff begin meeting with this Panel in February of each year to bring
forward any changes to laws, regulations or policies that have occurred since the last Update.
This Panel consists of LEA Superintendents, LEA data experts, LEA Assistant Superintendents
for Instruction, policy specialists and a variety of MSDE staff that have program responsibilities.
This group is forthright and demanding but able to keep the big picture of consolidation in sight.
Because each member has responsibilities for producing the Master Plan for their respective
LEA, the members are vigilant regarding redundancy and unnecessary additions to the plans. As

196
ESEA FLEXIBI LITY – REQ UEST U .S . DEPARTMENT OF EDUC ATION
the External Advisory Panel meets beginning February 2012 and prepares for the next Master
Plan Update, MSDE will ask the Panel to pay particular attention to Principle 4: “Reducing
Duplication and Unnecessary Burden”.
The annual Master Plan Guidance is distributed in early spring each year with preloaded data
from previous years. As soon as the current year’s data is available it is provided so that all
LEAs work with approved, MSDE data. The planning and writing happens throughout the
summer with the formulaic Federal Grant portions due in August and the complete Master Plan
due in October. The August submissions are reviewed by specialists in the program and the
complete Master Plan is reviewed by panels of experts from both MSDE and the LEAs. This
panel work allows for another feedback loop not only to assure that LEAs have viable, realistic
goals and plans to meet them but that MSDE uses the most efficient process to gather this
information.
Final Master Plan Updates are approved by the Superintendent based on the recommendation of
the panel. A summary of the plans is then presented to the State Board of Education, the
Governor and the leaders of the Maryland General Assembly. The local Master Plans are used
by the LEAs to inform the funding agents in their districts and to report to the public the progress
they are making and their commitment to continue to address disparities. These multiple uses
are yet another example of how this process reduces paperwork because without it each of the
LEAs would have to prepare and each of the constituencies above would have to receive and
review a separate report.
Reviewers will find references to Master Plan reporting throughout this application. With nine
years of experience with this process MSDE has learned the power and the efficiency of one
vehicle for describing the direction of schooling in Maryland.
MSDE will continue to look for additional ways to reduce paperwork. Again, this reduction will
always be for the betterment of the program, not just so that paperwork is reduced.
A-1
MARYLAND
ESEA FLEXIBILITY ATTACHMENTS
February 28, 2012
Maryland State Department of Education
200 West Baltimore Street
Baltimore, MD 21201
A-2
LABEL LIST OF ATTACHMENTS PAGE
1 Notice to LEAs A-3
2 Comments on request received from LEAs (if applicable) A-7
3 Notice and information provided to the public regarding the request A-19
4 Evidence that the State has formally adopted college- and career-ready content standards consistent with the State’s standards adoption process
A-29
5 Memorandum of understanding or letter from a State network of institutions of higher education (IHEs) certifying that meeting the State’s standards corresponds to being college- and career-ready without the need for remedial coursework at the postsecondary level (if applicable)
N/A
6 State’s Race to the Top Assessment Memorandum of Understanding (MOU) (if applicable)
A-34
7 Evidence that the SEA has submitted high-quality assessments and academic achievement standards to the Department for peer review, or a timeline of when the SEA will submit the assessments and academic achievement standards to the Department for peer review (if applicable)
N/A
8 A copy of the average statewide proficiency based on assessments administered in the 2010−2011 school year in reading/language arts and mathematics for the “all students” group and all subgroups (if applicable).
N/A
9 Table 2: Reward, Priority, and Focus Schools A-59
10 A copy of any guidelines that the SEA has already developed and adopted for local teacher and principal evaluation and support systems (if applicable).
A-67
11 Evidence that the SEA has adopted one or more guidelines of local teacher and principal evaluation and support systems
A-101
A-3
Attachment 1: Notice to Local Education Agencies (LEAs)
A-4
Email to Superintendents about Stakeholder Meeting From: Betty Mack On Behalf Of Bernard Sadusky Sent: Wednesday, November 02, 2011 11:25 AM To: MD Superintendents Cc: Mary Gable; Cindy Schaefer; Debbie Drankiewicz; Betty Mack Subject: ESEA Flexibility
Dear Colleagues:
As discussed on Friday, October 28, 2011 at the Superintendent's Retreat, an ESEA Flexibility Meeting will be held to review options, discuss and provide recommendations related to the U.S. Department of Education ESEA Flexibility Application. The meeting will be Tuesday, November 29, 2011 from 1:00 to 4:00 PM at the Maryland State Department of Education in the State Board Room on the 7th floor. You are invited to participate in this discussion or send a representative.
Please let Mary Gable know by November 9 via email ([email protected]) or telephone (410-767-0473) of the name, position and email of your nominee to this workgroup.
Thank you!
Bernie
Bernard J. Sadusky, Ed.D Interim State Superintendent of Schools Maryland State Department of Education 200 West Baltimore Street Baltimore, Maryland 21201 410-767-0462 [email protected]
A-5
Email to Superintendents for Feedback From: Bernard Sadusky Sent: Thursday, January 26, 2012 3:35 PM To: MD Superintendents Subject: ESEA Flexibility Memo
Colleagues,
We have had lengthy discussions on this topic during the past several months as we develop our February 21 submission. I appreciate the feedback we have already received during our multiple meetings. Please know that a great deal of time and effort has gone into addressing your concerns and issues.
Maryland’s Draft ESEA Flexibility Application has now been posted on our website for public comment. We will have this item on our PSSAM meeting agenda for February 3 and we will review the application and the critical elements with you and will allow sufficient time for your input.
As part of the application process, we are soliciting comments on the contents of the application from the various stakeholders via a feedback survey that has also been posted on our website. Please know that although the survey is the preferred method of providing comment, your feedback would be greatly appreciated through other channels (letter, email, etc.) or can be a part of our discussion on February 3. Deadline for submission of all feedback is February 8. All comments will be taken into consideration before the final application is submitted to USDE on February 21.
A formal memo providing specifics and links to the application and survey is attached. Please feel free to share this memo with others as you deem appropriate.
Thank you for your continued support as we work together on this important opportunity to recommend improvements to our accountability system.
Bernie
Links are listed below:
Application: http://marylandpublicschools.org/MSDE/programs/esea/ESEA
Survey: https://www.surveymonkey.com/s/MarylandESEAFlexibilityDRAFTApplication
A-6
A-7
Attachment 2: Comments on Request Received from Local Education
Agencies (LEAs)

A-8
MEMO
To: Mary Gable, Maryland State Department of Education
From: Heather Nolan, Office of Achievement and Accountability
Date: February 8, 2012
Re: City Schools’ Comments on MSDE ESEA Flexibility Proposal
CC: Jennifer Bell-Ellwanger, Chief Accountability Officer
Summary
We appreciate the opportunity to provide comments to MSDE’s ESEA Flexibility Proposal. Below you will find a compilation of City Schools’ comments on the components of the MSDE ESEA Flexibility Proposal. Please contact Heather Nolan at [email protected] if you have any questions.
Feedback on Principles
1) Consultation (Rating: 4): The application detailed how all stakeholder groups were engaged in the process. MSDE should consider adding documentation to support feedback from stakeholder groups.
2) Principle 1: College- and Career-Ready Expectations for All students (Rating: 3) • MSDE provides details on its adoption of Common Core State Standards and the gap analysis it
completed to compare the difference between the Common Core and the state’s current standards. • MSDE states its progress in developing online toolkits and guidance to support the transition of LEAs
to the Common Core. • There is a lack of information on what MSDE sees as the role of the LEA to ramp up the work on
setting College- and Career-Ready Expectations for all students. • There is a lack of information and clarity regarding assessing accommodations/supports for students
with disabilities and students who are English language learners. • It is unclear how Maryland will determine college ready standards based on actual data and analyses
from higher education institutions and LEAs. • Very little information included on how the MSDE and LEAs are to get their technological
infrastructures ready to roll out the Common Core standards and assessments. • There is a recommendation that there should be more of an engagement with HCBU’s, community
and technical college and trade schools in the discussion.
A-9
3) Principle 2: State-Developed Differentiated Recognition, Accountability, and Support (Rating: 2) • The Application proposes a more realistic goal of reducing by half the number of students who are
not proficient by 2017, to replace the unrealistic goal of all students proficient by 2014. • The Application proposes a more realistic goal of reducing by half the number of students who are
not proficient by 2017, to replace the unrealistic goal of all students proficient by 2014. • MSDE proposes to revise its accountability system to include traditional AYP achievement
components in addition to school progress measures related to closing the achievement gap for subgroups, student level growth from year to year, and improvements in college and career readiness for high school students.
a. The proposed School Performance Index (SPI) and associated formulas are specific, understandable, and unambiguous.
b. It extends the viewpoint on student performance to accommodate the notion of growth, and promotes the use of multiple quantitative measures, and promotes the use of multiple quantitative measures.
c. It acknowledges and builds on the contribution of NCLB accountability with respect to attention on subgroups and gap-closing.
• The proposal does nothing to answer criticisms of NCLB accountability that it promoted “narrowing of the curriculum” by focusing on a narrow range of subjects. By choosing Option A, rather than exploring the opportunities provided by the greater flexibility of Option C, this seems to perpetuate that problem.
• In addition, by choosing Option A rather than Option C, the State decided not to explore imaginative or innovative alternatives, such as a role for qualitative inspections, portfolio assessments, or other forms of “rich” description of what is going on in schools. However, this may be a prudent and practical path to take given current economic realities and the transitional state we find ourselves in prior to the introduction of PARCC assessments and the Common Core Standards.
• The particular growth model promoted in the Application is the least sophisticated among several alternatives currently under development in the state, including Student Growth Percentiles and a Value Added Model. As such, this Application represents a missed opportunity to seek greater integration with the new evaluation systems for teachers, schools, and school leaders being developed at both SEA and LEA levels under Race to the Top. In particular, this is a missed opportunity to align with the key performance indicators in these latter systems.
• MSDE’s definition of “growth” (page 55) seems simplistic and incomplete as it seems to make unrealistic (and unacknowledged) assumptions that the state assessment performance categories are equal-sized and are measured with equal precision across the entire scale score ranges. It ignores growth within performance categories. It seems to makes unrealistic (and unacknowledged) assumptions that the state assessment performance categories are equal-sized and are measured with equal precision across the entire scale score ranges. On the positive side, it does acknowledge the difficulties inherent in defining “one year’s growth.”
• MSDE remains silent on the issue of eligibility rules for including a student in a school’s measures based on length of enrollment. There is a greater potential for distortion from increased student attrition because of the introduction of longitudinal “growth” indicators. It is both a fairness issue, and a caution against allowing more students to fall “off the books.”
• The discussion about applying weights to create a composite index seems to rely on an assumption that the various components are measured on naturally similar scales, or can be re-scaled to fall on a common scale. But re-scaling doesn’t solve the problem if the scores have dissimilar distributions. The scores with larger variances will have a disproportionate impact on the final composite, and the original weighting intentions may be subverted. This phenomenon is termed “effective weighting”, and there should be an explicit plan to deal with it.
4) Principle 3: Supporting Effective Instruction and Leadership (Rating: 2)
A-10
• In this proposal, MSDE provides a comprehensive summary of the timeline for implementing a teacher and school leader evaluation system for SY 2013-2014 and beyond.
• MSDE is relying heavily on the feedback from the pilot school districts (e.g., City Schools) to inform their development of the state-wide evaluation system.
• As shared at the monthly MSDE Educator Effectiveness meetings, City Schools continues to raise questions regarding: roster verification of students and teachers to ensure data integrity, alignment of courses to tested subjects, incorporation of factors related to student mobility and shared teaching assignments and regrouping. City Schools continues to wrestle with questions related to the design of the teacher evaluation system and would greatly appreciate guidance from the state.
5) Principle 4: Reducing Duplication and Unnecessary Burden (Rating: 3) • Appreciate the creation of breakthrough centers and zones to serve as models to accelerate
achievement in low performing schools. • Outstanding questions include: what is the ‘real time’ element surrounding the processes and
procedures identified; will funds and resources be available for implementation; what technological infrastructures and systems will be available to upload and report data?
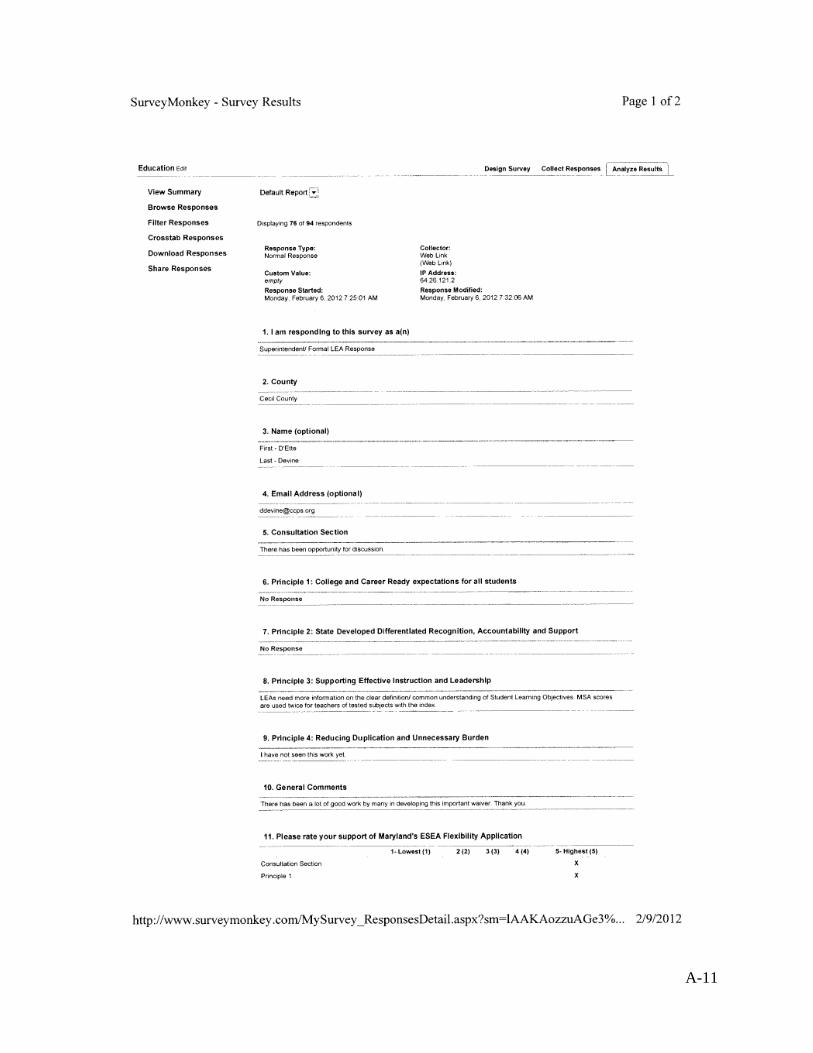
A-11
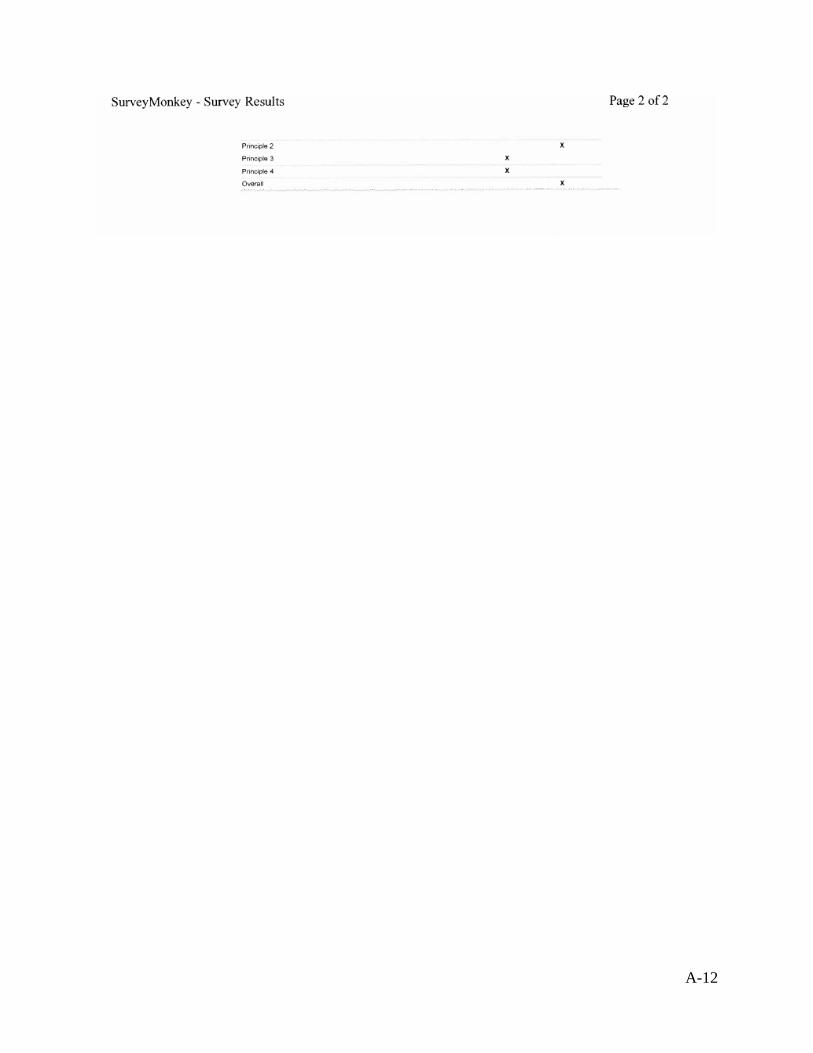
A-12
A-13
A-14

A-15
From: Karen B. Salmon [mailto:[email protected]] Sent: Tuesday, February 07, 2012 4:06 PM To: Mary Gable Subject: Waiver Comments
Hi Mary, Here is our feedback on the waiver application:
• Page 57 - In the formula, I think that the number .200 should not be included. We could find all of the other numbers in the table but could not locate the .200.
At the bottom of the page Mod-MSA is referred to. If the Mod assessments are eliminated, will we return to an appeal process? If so, does this need to be mentioned?
• Page 59 - Second bullet: no mention is made of the confidence interval - what happens to it?
• Page 70 - Notes that Financial Resource target date is 2017, which does not align with school implementation timeline.
• Page 101 - Maryland will invest in significant assistance to support school districts, and especially those education leaders who supervise teachers and principals, in making the transition. When? How? Does this need to be more specific?
• Page 101 - All teachers will be evaluated annually. This changes COMAR. Now COMAR states at least every other year.
Hope this is helpful! Karen Karen B. Salmon, Ph.D. Superintendent of Schools Talbot County Public Schools 12 Magnolia Street Easton, MD 21601 410-822-0330 NOTICE: Pursuant to Talbot County Public Schools (TCPS) policy and administrative procedures, the intended use of this e-mail system is for TCPS business. All users are cautioned that all messages sent and received through this system are subject to the Freedom of Information Act and Maryland public disclosure laws, and may be reviewed at any time by TCPS. There should be no expectation of privacy. The contents of this email and any attachments are intended solely for the use of the named addressee(s) and may contain confidential and/or legally privileged information. Any unauthorized use, copying disclosure, forwarding, or distribution of the contents of this e-mail is strictly prohibited by the sender and may be unlawful.
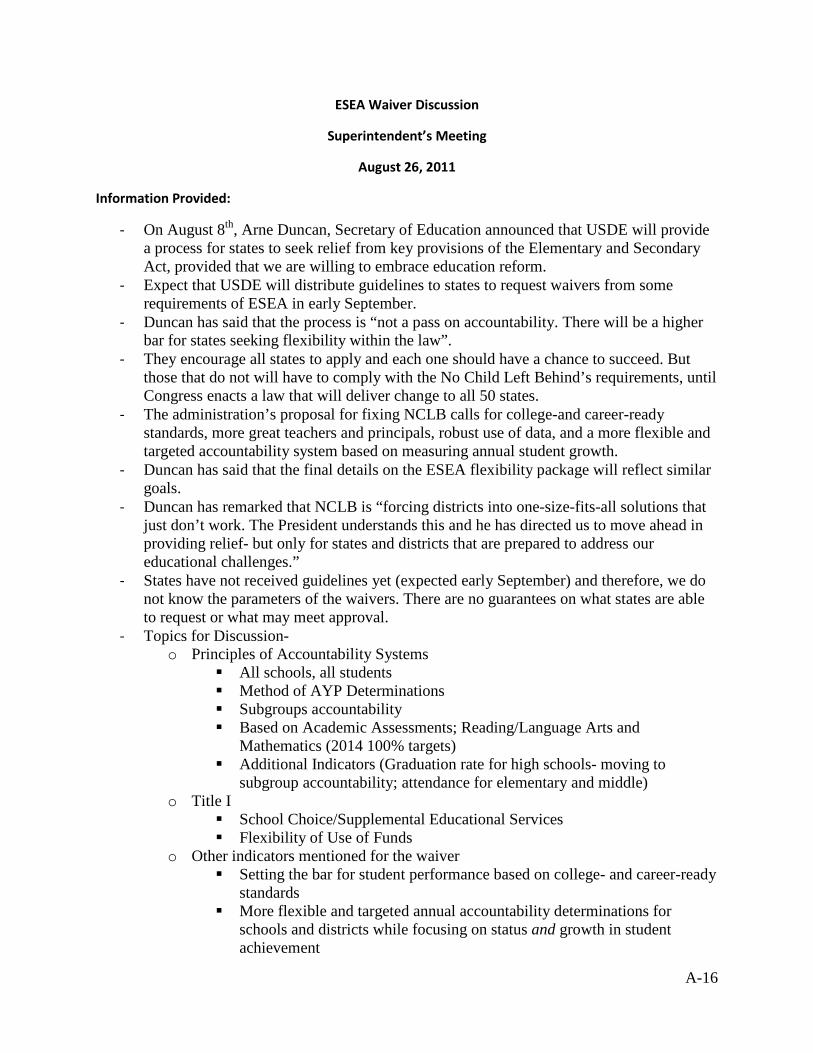
A-16
ESEA Waiver Discussion
Superintendent’s Meeting
August 26, 2011
Information Provided:
- On August 8th, Arne Duncan, Secretary of Education announced that USDE will provide a process for states to seek relief from key provisions of the Elementary and Secondary Act, provided that we are willing to embrace education reform.
- Expect that USDE will distribute guidelines to states to request waivers from some requirements of ESEA in early September.
- Duncan has said that the process is “not a pass on accountability. There will be a higher bar for states seeking flexibility within the law”.
- They encourage all states to apply and each one should have a chance to succeed. But those that do not will have to comply with the No Child Left Behind’s requirements, until Congress enacts a law that will deliver change to all 50 states.
- The administration’s proposal for fixing NCLB calls for college-and career-ready standards, more great teachers and principals, robust use of data, and a more flexible and targeted accountability system based on measuring annual student growth.
- Duncan has said that the final details on the ESEA flexibility package will reflect similar goals.
- Duncan has remarked that NCLB is “forcing districts into one-size-fits-all solutions that just don’t work. The President understands this and he has directed us to move ahead in providing relief- but only for states and districts that are prepared to address our educational challenges.”
- States have not received guidelines yet (expected early September) and therefore, we do not know the parameters of the waivers. There are no guarantees on what states are able to request or what may meet approval.
- Topics for Discussion- o Principles of Accountability Systems
All schools, all students Method of AYP Determinations Subgroups accountability Based on Academic Assessments; Reading/Language Arts and
Mathematics (2014 100% targets) Additional Indicators (Graduation rate for high schools- moving to
subgroup accountability; attendance for elementary and middle) o Title I
School Choice/Supplemental Educational Services Flexibility of Use of Funds
o Other indicators mentioned for the waiver Setting the bar for student performance based on college- and career-ready
standards More flexible and targeted annual accountability determinations for
schools and districts while focusing on status and growth in student achievement
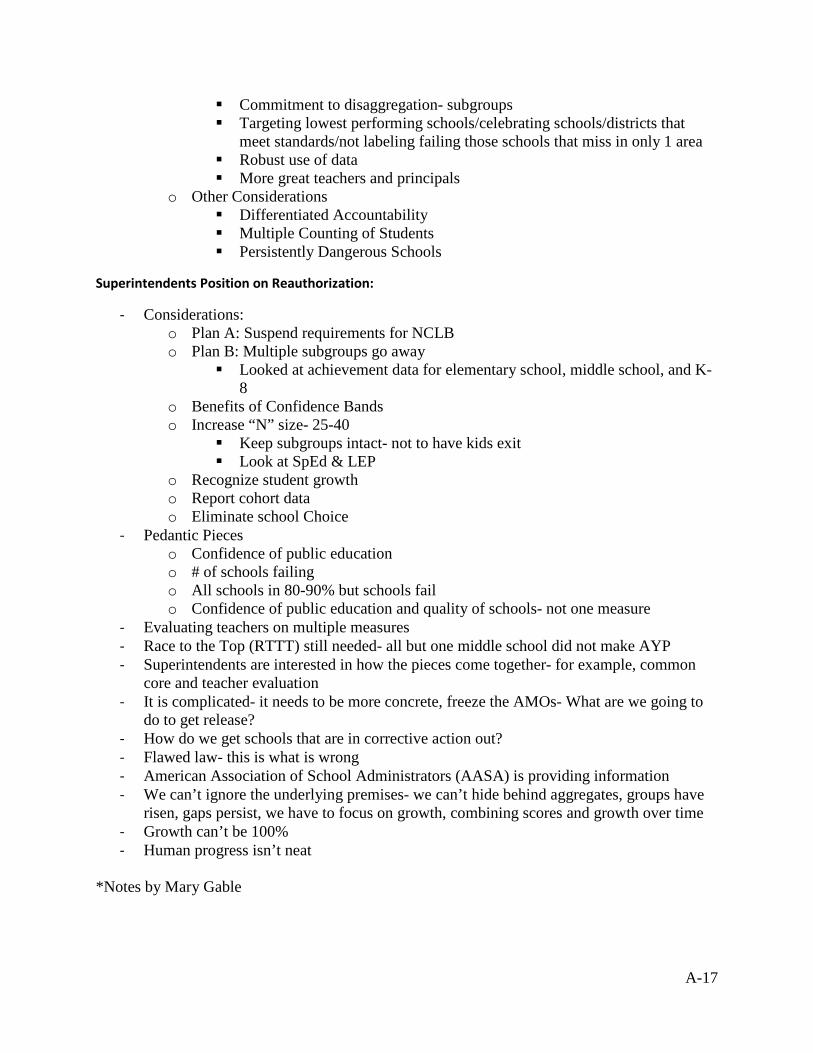
A-17
Commitment to disaggregation- subgroups Targeting lowest performing schools/celebrating schools/districts that
meet standards/not labeling failing those schools that miss in only 1 area Robust use of data More great teachers and principals
o Other Considerations Differentiated Accountability Multiple Counting of Students Persistently Dangerous Schools
Superintendents Position on Reauthorization:
- Considerations: o Plan A: Suspend requirements for NCLB o Plan B: Multiple subgroups go away
Looked at achievement data for elementary school, middle school, and K-8
o Benefits of Confidence Bands o Increase “N” size- 25-40
Keep subgroups intact- not to have kids exit Look at SpEd & LEP
o Recognize student growth o Report cohort data o Eliminate school Choice
- Pedantic Pieces o Confidence of public education o # of schools failing o All schools in 80-90% but schools fail o Confidence of public education and quality of schools- not one measure
- Evaluating teachers on multiple measures - Race to the Top (RTTT) still needed- all but one middle school did not make AYP - Superintendents are interested in how the pieces come together- for example, common
core and teacher evaluation - It is complicated- it needs to be more concrete, freeze the AMOs- What are we going to
do to get release? - How do we get schools that are in corrective action out? - Flawed law- this is what is wrong - American Association of School Administrators (AASA) is providing information - We can’t ignore the underlying premises- we can’t hide behind aggregates, groups have
risen, gaps persist, we have to focus on growth, combining scores and growth over time - Growth can’t be 100% - Human progress isn’t neat
*Notes by Mary Gable
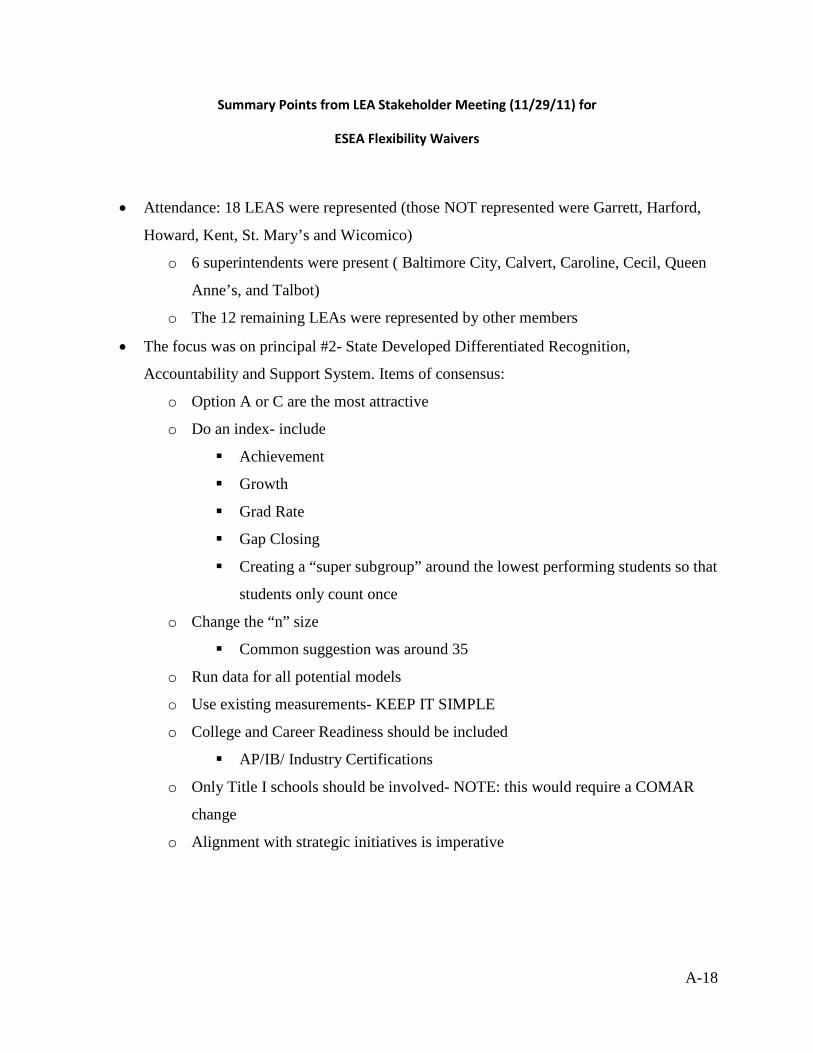
A-18
Summary Points from LEA Stakeholder Meeting (11/29/11) for
ESEA Flexibility Waivers
• Attendance: 18 LEAS were represented (those NOT represented were Garrett, Harford,
Howard, Kent, St. Mary’s and Wicomico)
o 6 superintendents were present ( Baltimore City, Calvert, Caroline, Cecil, Queen
Anne’s, and Talbot)
o The 12 remaining LEAs were represented by other members
• The focus was on principal #2- State Developed Differentiated Recognition,
Accountability and Support System. Items of consensus:
o Option A or C are the most attractive
o Do an index- include
Achievement
Growth
Grad Rate
Gap Closing
Creating a “super subgroup” around the lowest performing students so that
students only count once
o Change the “n” size
Common suggestion was around 35
o Run data for all potential models
o Use existing measurements- KEEP IT SIMPLE
o College and Career Readiness should be included
AP/IB/ Industry Certifications
o Only Title I schools should be involved- NOTE: this would require a COMAR
change
o Alignment with strategic initiatives is imperative
A-19
Attachment 3: Notice and Information Provided to the Public Regarding the
Request
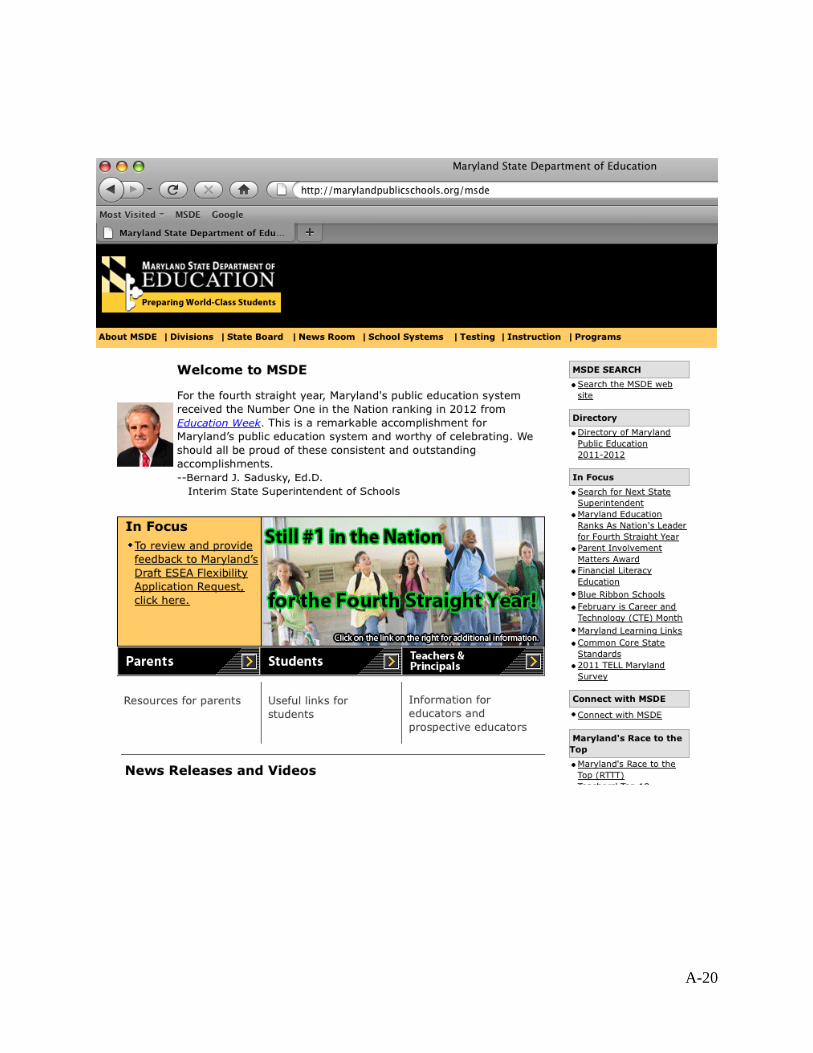
A-20
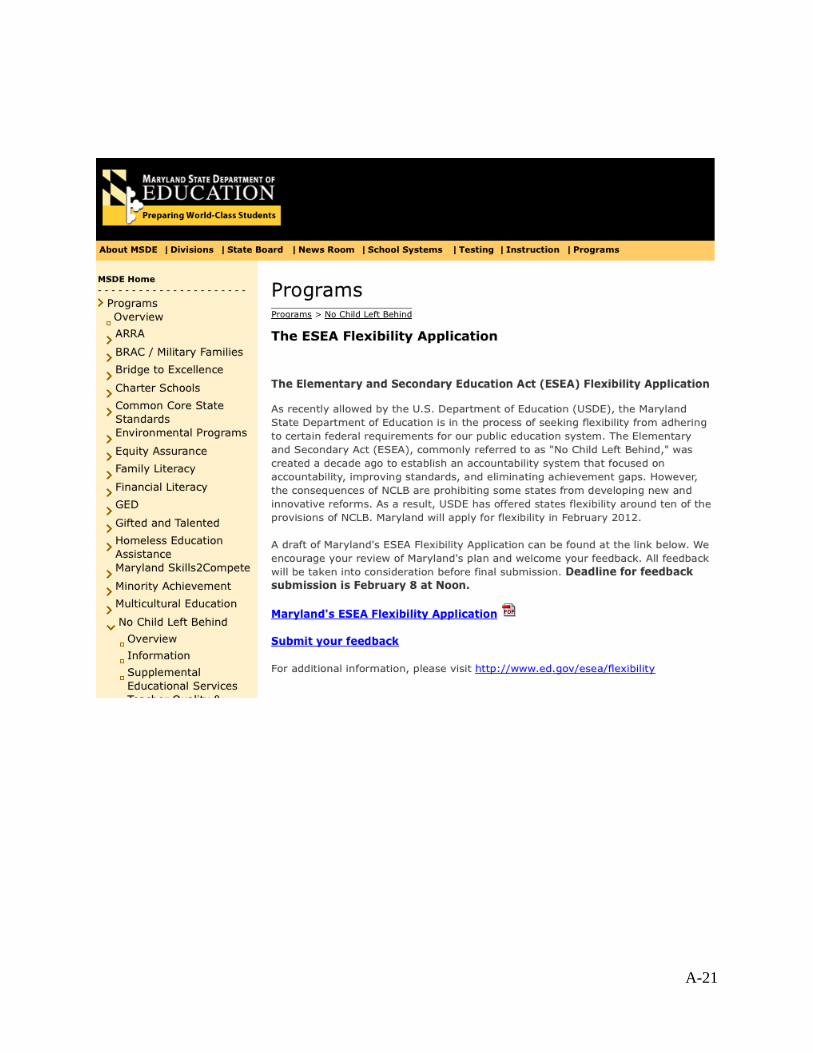
A-21
A-22
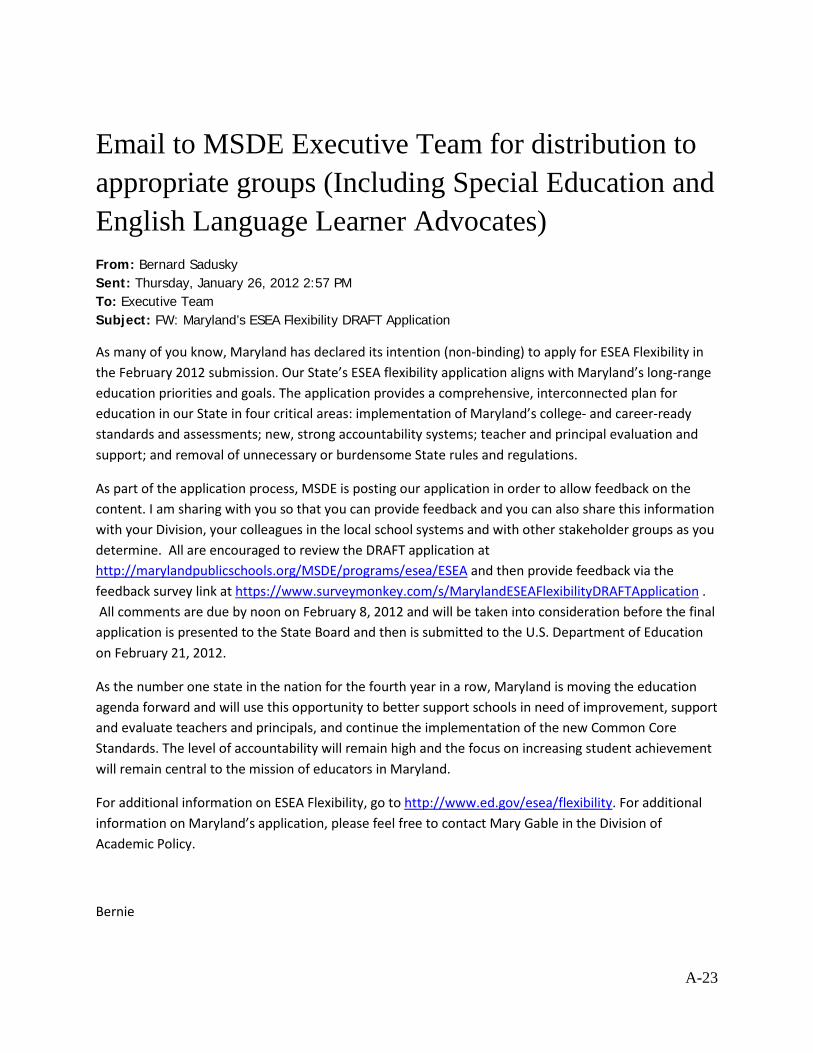
A-23
Email to MSDE Executive Team for distribution to appropriate groups (Including Special Education and English Language Learner Advocates) From: Bernard Sadusky Sent: Thursday, January 26, 2012 2:57 PM To: Executive Team Subject: FW: Maryland’s ESEA Flexibility DRAFT Application
As many of you know, Maryland has declared its intention (non-binding) to apply for ESEA Flexibility in the February 2012 submission. Our State’s ESEA flexibility application aligns with Maryland’s long-range education priorities and goals. The application provides a comprehensive, interconnected plan for education in our State in four critical areas: implementation of Maryland’s college- and career-ready standards and assessments; new, strong accountability systems; teacher and principal evaluation and support; and removal of unnecessary or burdensome State rules and regulations.
As part of the application process, MSDE is posting our application in order to allow feedback on the content. I am sharing with you so that you can provide feedback and you can also share this information with your Division, your colleagues in the local school systems and with other stakeholder groups as you determine. All are encouraged to review the DRAFT application at http://marylandpublicschools.org/MSDE/programs/esea/ESEA and then provide feedback via the feedback survey link at https://www.surveymonkey.com/s/MarylandESEAFlexibilityDRAFTApplication . All comments are due by noon on February 8, 2012 and will be taken into consideration before the final application is presented to the State Board and then is submitted to the U.S. Department of Education on February 21, 2012.
As the number one state in the nation for the fourth year in a row, Maryland is moving the education agenda forward and will use this opportunity to better support schools in need of improvement, support and evaluate teachers and principals, and continue the implementation of the new Common Core Standards. The level of accountability will remain high and the focus on increasing student achievement will remain central to the mission of educators in Maryland.
For additional information on ESEA Flexibility, go to http://www.ed.gov/esea/flexibility. For additional information on Maryland’s application, please feel free to contact Mary Gable in the Division of Academic Policy.
Bernie
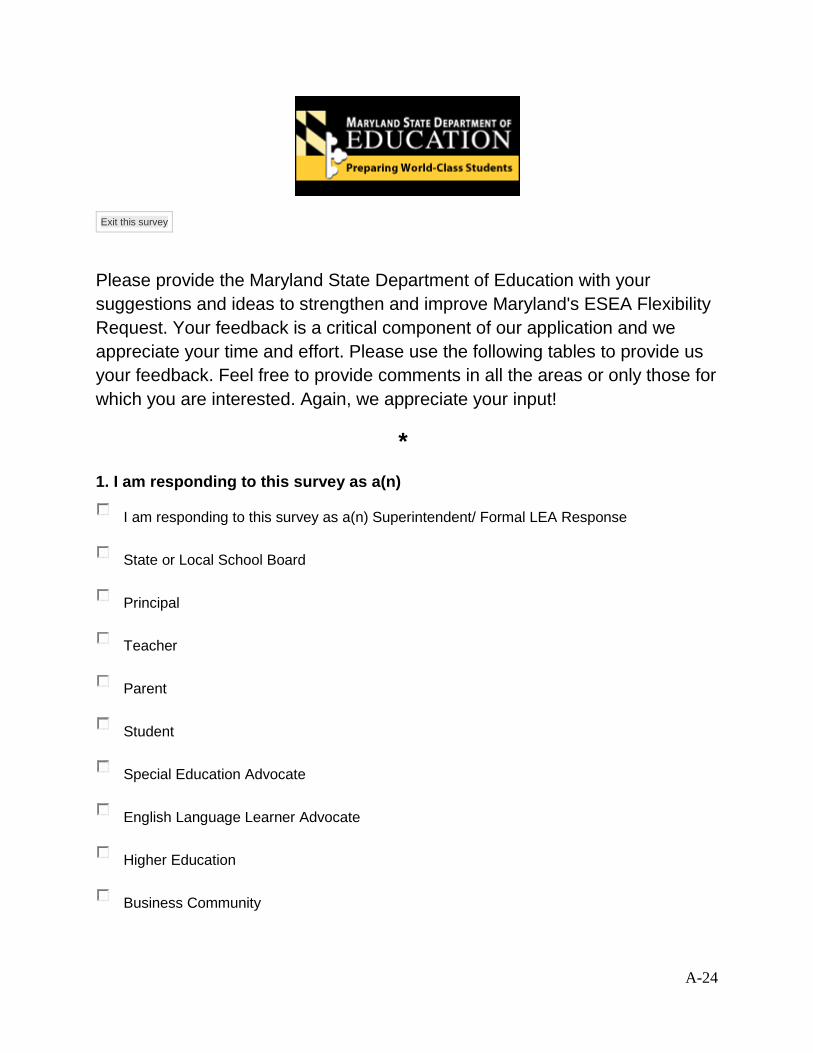
A-24
Exit this survey
Please provide the Maryland State Department of Education with your suggestions and ideas to strengthen and improve Maryland's ESEA Flexibility Request. Your feedback is a critical component of our application and we appreciate your time and effort. Please use the following tables to provide us your feedback. Feel free to provide comments in all the areas or only those for which you are interested. Again, we appreciate your input!
* 1. I am responding to this survey as a(n)
I am responding to this survey as a(n) Superintendent/ Formal LEA Response
State or Local School Board
Principal
Teacher
Parent
Student
Special Education Advocate
English Language Learner Advocate
Higher Education
Business Community
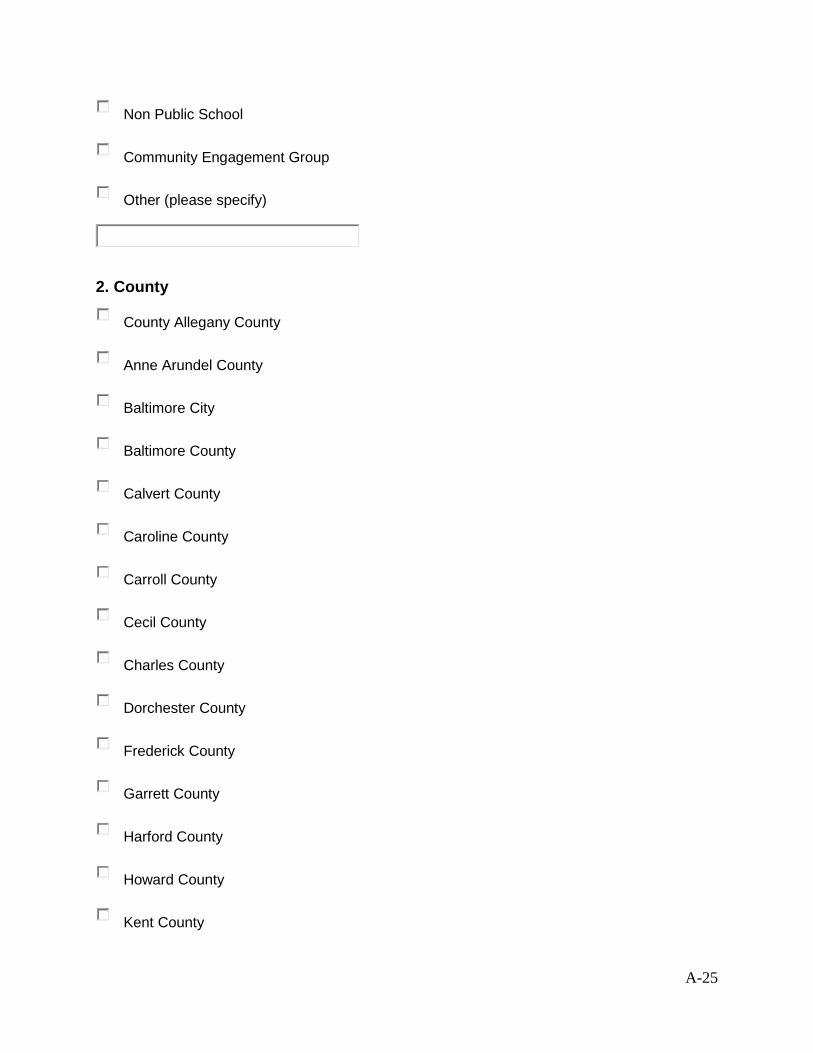
A-25
Non Public School
Community Engagement Group
Other (please specify)
2. County
County Allegany County
Anne Arundel County
Baltimore City
Baltimore County
Calvert County
Caroline County
Carroll County
Cecil County
Charles County
Dorchester County
Frederick County
Garrett County
Harford County
Howard County
Kent County
A-26
Montgomery County
Prince George's County
Queen Anne's County
St. Mary's County
Somerset County
Talbot County
Washington County
Wicomico County
Worcester County
Not in Maryland
3. Name (optional) Name (optional) First
Last
4. Email Address (optional)
Email Address (optional)
Next
Powered by SurveyMonkey Create your own free online survey now!
A-27
Exit this survey
Maryland's ESEA Flexibility Application Feedback Please submit your feedback, comments, and suggestions in the boxes below the corresponding heading.(Note: Comment boxes expand)
5. Consultation Section
Consultation Section
6. Principle 1: College and Career Ready expectations for all students
Principle 1: College and Career Ready expectations for all students
7. Principle 2: State Developed Differentiated Recognition, Accountability and Support
Principle 2: State Developed Differentiated Recognition, Accountability and Support
8. Principle 3: Supporting Effective Instruction and Leadership
Principle 3: Supporting Effective Instruction and Leadership
A-28
9. Principle 4: Reducing Duplication and Unnecessary Burden
Principle 4: Reducing Duplication and Unnecessary Burden
10. General Comments
General Comments
11. Please rate your support of Maryland's ESEA Flexibility Application
1- Lowest 2 3 4 5- Highest
Consultation Section
Consultation Section 1-
Lowest
Consultation Section 2
Consultation Section 3
Consultation Section 4
Consultation Section 5- Highest
Principle 1 Principle 1 1- Lowest
Principle 1 2
Principle 1 3
Principle 1 4
Principle 1 5- Highest
Principle 2 Principle 2 1- Lowest
Principle 2 2
Principle 2 3
Principle 2 4
Principle 2 5- Highest
Principle 3 Principle 3 1- Lowest
Principle 3 2
Principle 3 3
Principle 3 4
Principle 3 5- Highest
Principle 4 Principle 4 1- Lowest
Principle 4 2
Principle 4 3
Principle 4 4
Principle 4 5- Highest
Overall Overall 1- Lowest Overall 2 Overall 3 Overall 4 Overall 5-
Highest
Prev Next
Powered by SurveyMonkey
Create your own free online survey now!
A-29
Attachment 4: Evidence that the State has Formally Adopted College-and Career- Ready Content Standards
Consistent with the State’s Standard Adoption Process
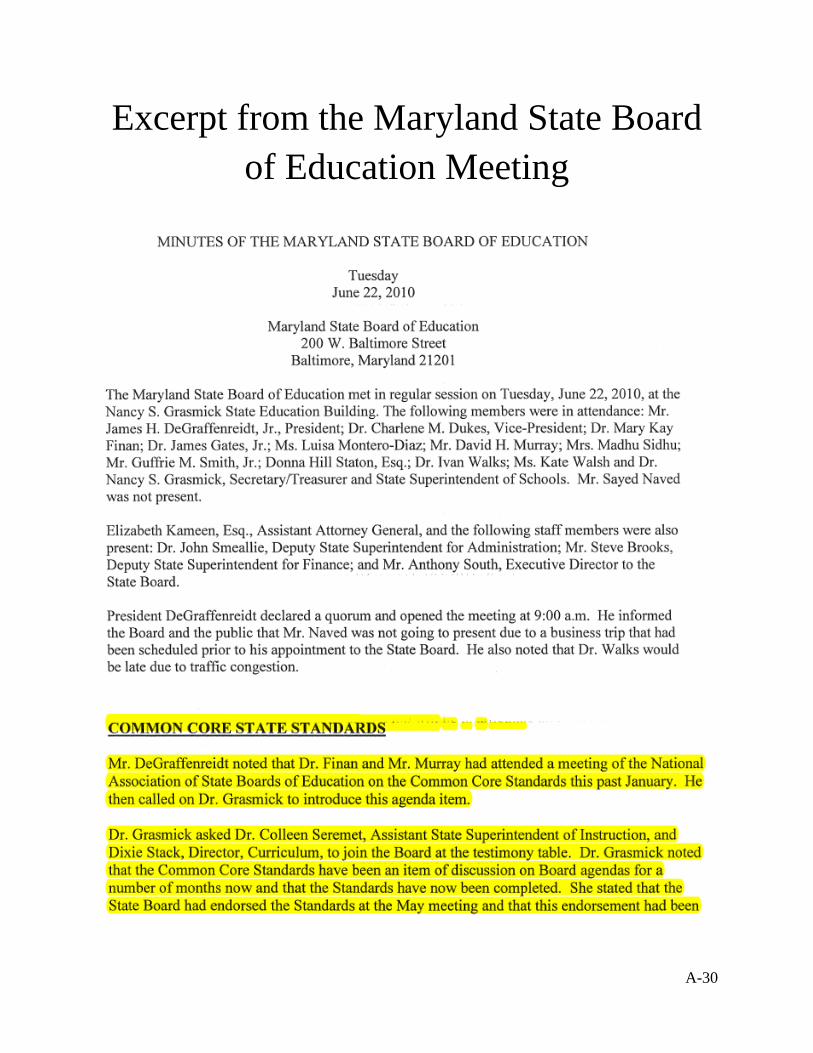
A-30
Excerpt from the Maryland State Board of Education Meeting
A-31
A-32
To see the press release, please go to: http://www.marylandpublicschools.org/NR/exeres/BA437608-FEFA-4CB9-ABF9-16E12C08229E,frameless.htm?Year=2010&Month=6&WBCMODE=PresentationUnpub%25%25%>
To see the full minutes, please go to: http://www.marylandpublicschools.org/MSDE/stateboard/2011_mc.htm
A-33
Attachment 5: Memorandum Of Understanding or Letter From a State
Network of Institutions of Higher Education (IHEs) Certifying that
Meeting the State’s Standards Corresponds to Being College- And Career-Ready Without the Need for
Remedial Coursework at the Postsecondary Level
THIS IS NOT APPLICABLE TO MARYLAND
A-34
Attachment 6: State’s Race to the Top Assessment Memorandum of
Understanding (MOU)
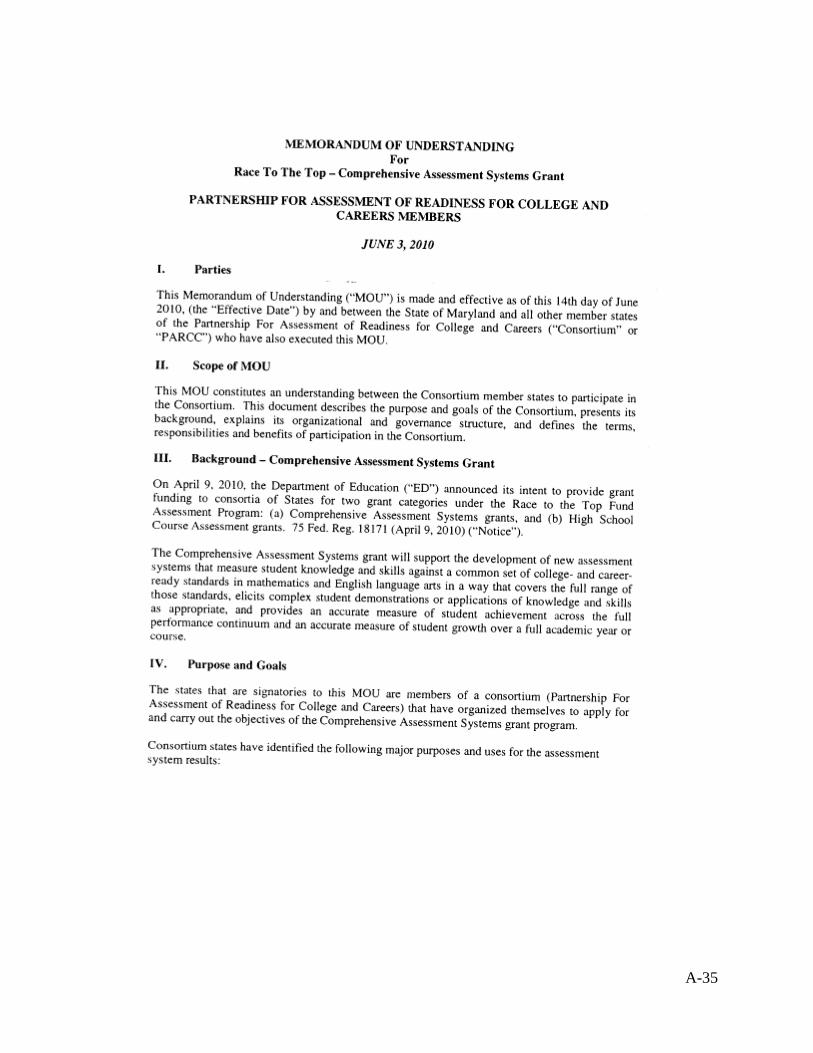
A-35
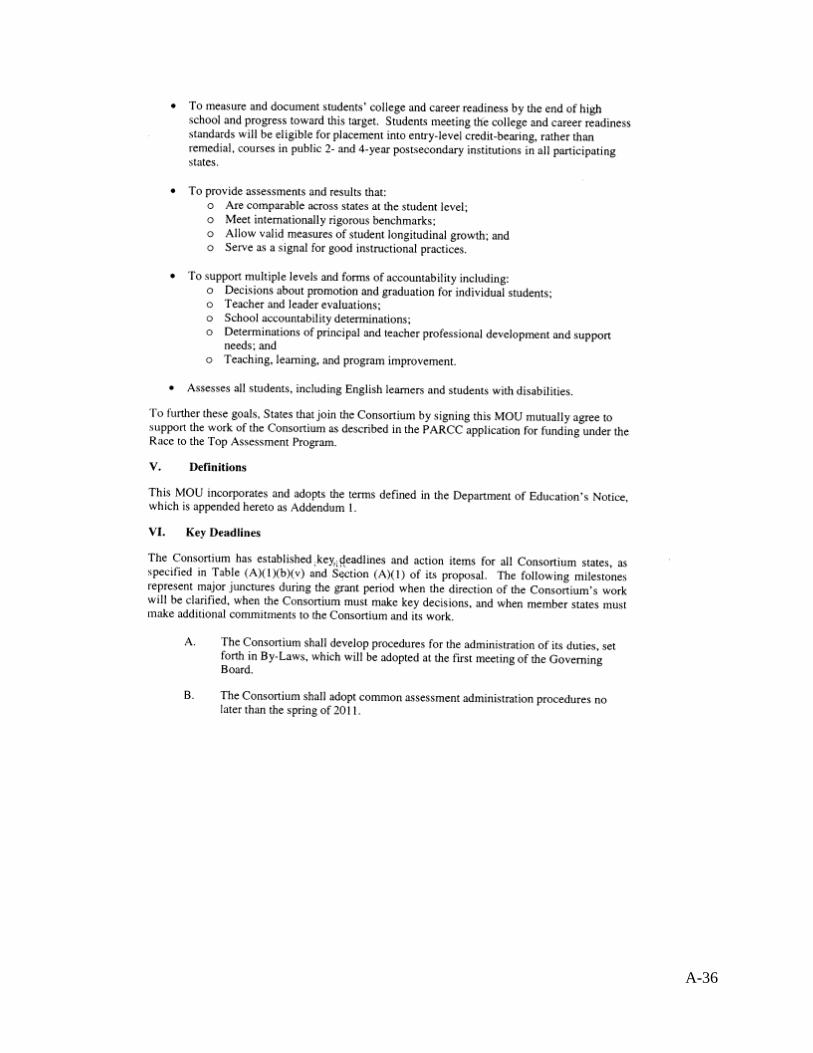
A-36
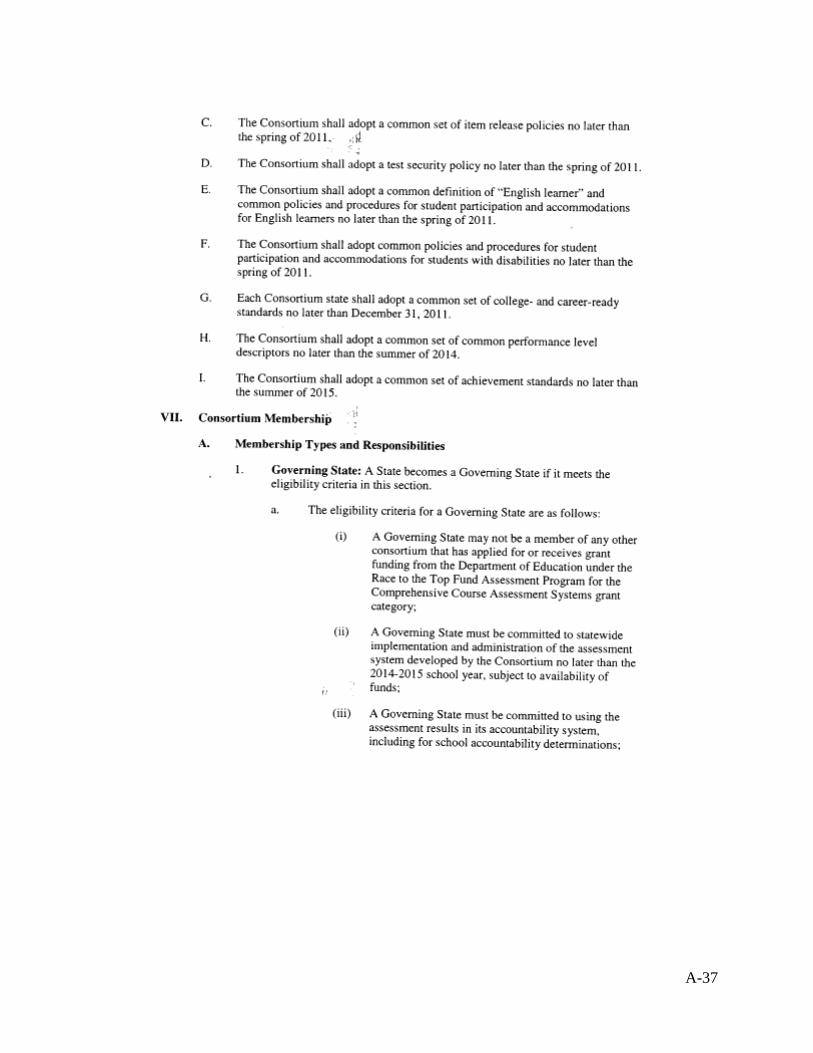
A-37
A-38
A-39
A-40
A-41
A-42
A-43
A-44
A-45
A-46
A-47
A-48
A-49
A-50
A-51
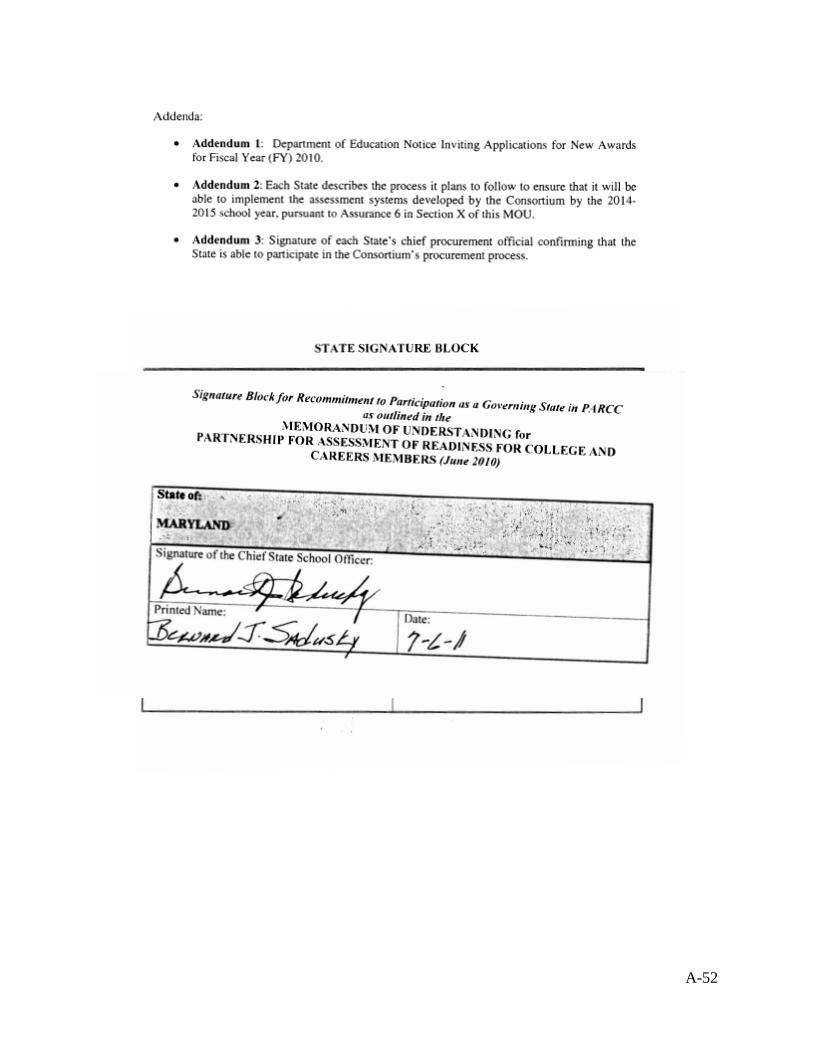
A-52
A-53
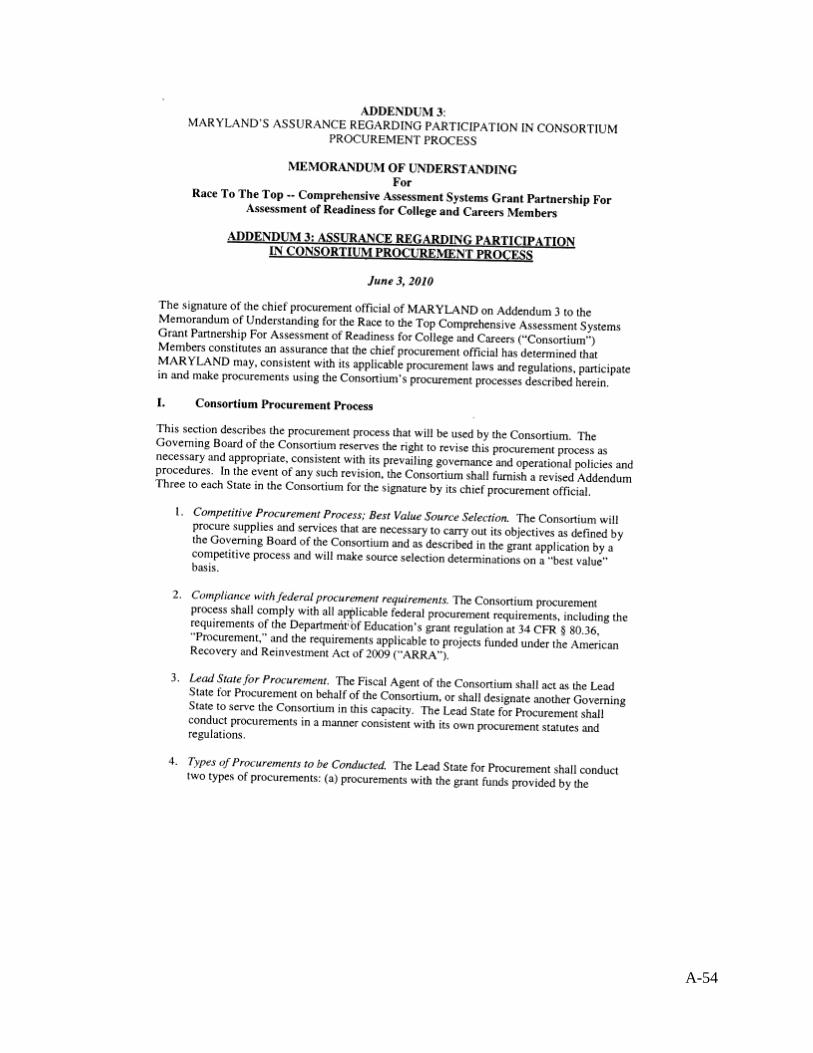
A-54
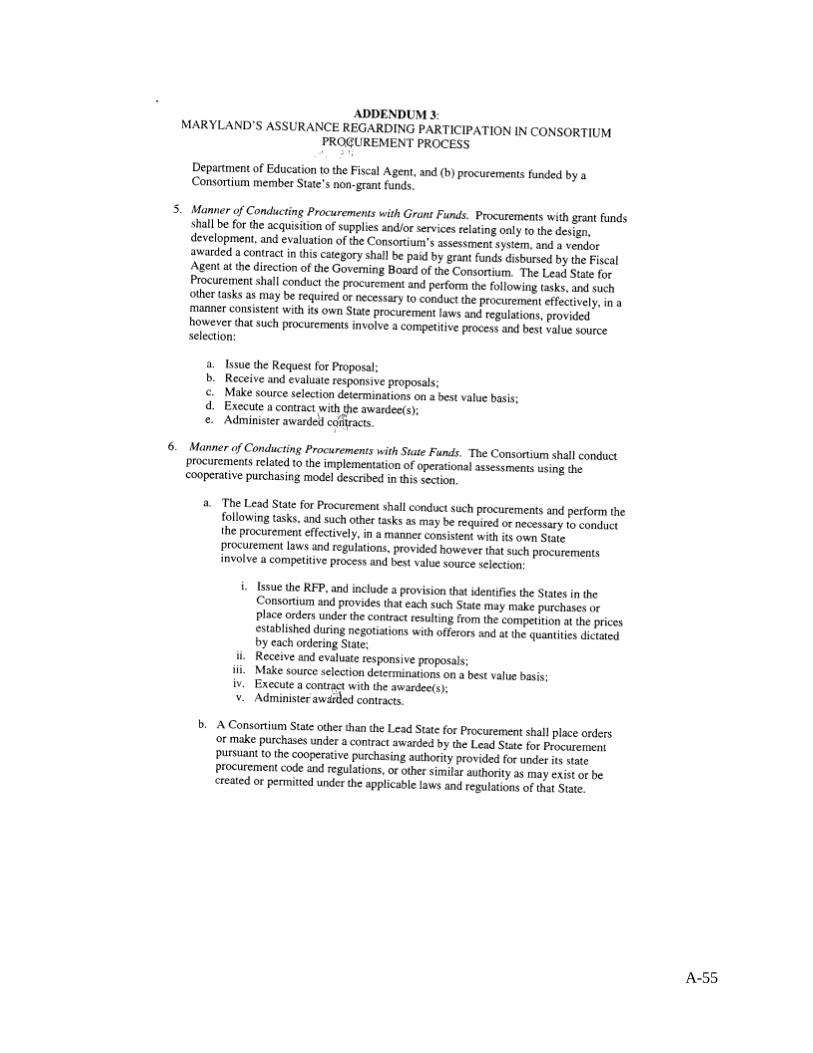
A-55
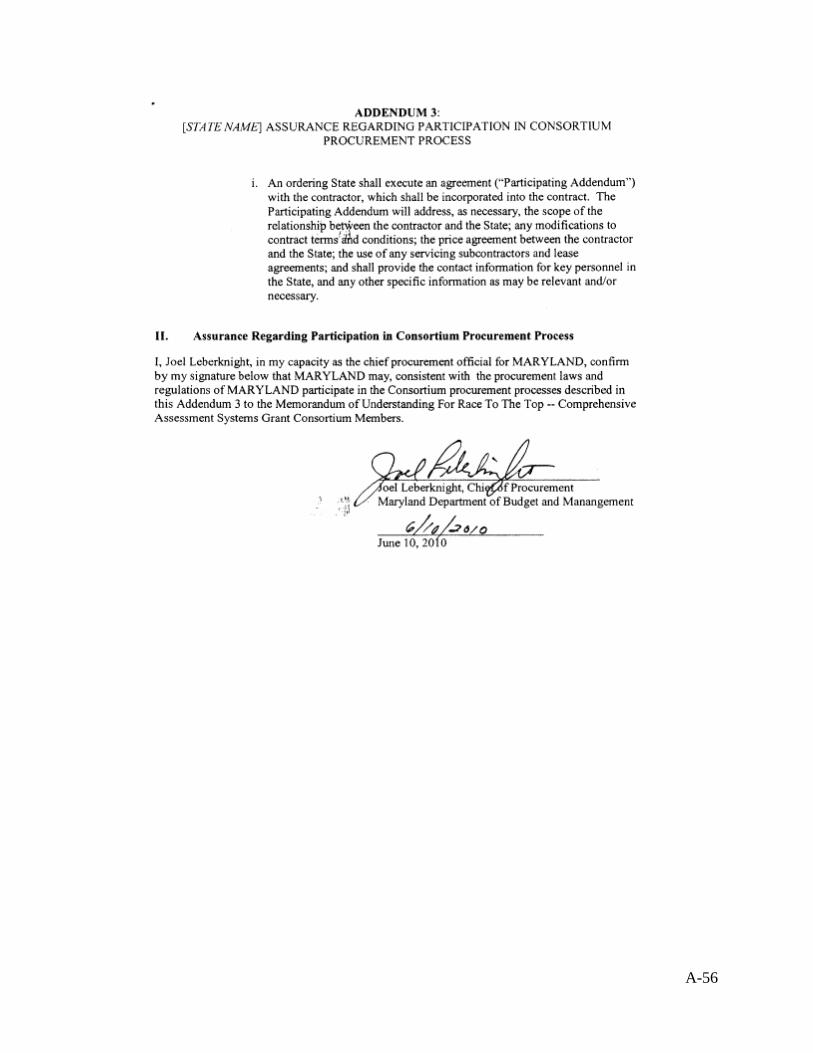
A-56
A-57
Attachment 7: Evidence that SEA has Submitted High-Quality Assessments
and Academic Achievement Standards to the Department for Peer Review, or a
Timeline of When the SEA will Submit the Assessments and Academic Achievement Standards to the Department for Peer Review
THIS IS NOT APPLICABLE TO MARYLAND
A-58
Attachment 8: A Copy of the Average Statewide Proficiency Based on
Assessments Administered in the 2010-2011 School Year in Reading/Language Arts and Mathematics for “All Students”
Group and All Subgroups
THIS IS NOT APPLICABLE TO MARYLAND
A-59
Attachment 9: Table 2: Reward, Priority, and Focus Schools
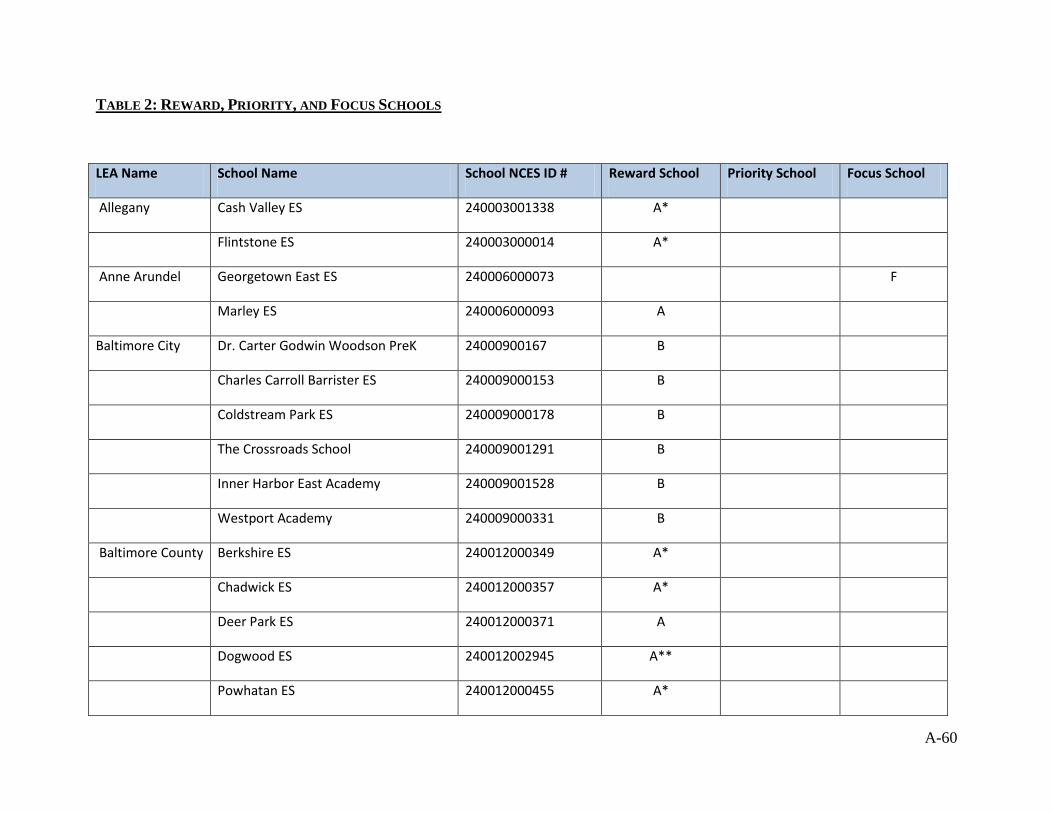
A-60
TABLE 2: REWARD, PRIORITY, AND FOCUS SCHOOLS
LEA Name School Name School NCES ID # Reward School Priority School Focus School
Allegany Cash Valley ES 240003001338 A*
Flintstone ES 240003000014 A*
Anne Arundel Georgetown East ES 240006000073 F
Marley ES 240006000093 A
Baltimore City Dr. Carter Godwin Woodson PreK 24000900167 B
Charles Carroll Barrister ES 240009000153 B
Coldstream Park ES 240009000178 B
The Crossroads School 240009001291 B
Inner Harbor East Academy 240009001528 B
Westport Academy 240009000331 B
Baltimore County Berkshire ES 240012000349 A*
Chadwick ES 240012000357 A*
Deer Park ES 240012000371 A
Dogwood ES 240012002945 A**
Powhatan ES 240012000455 A*
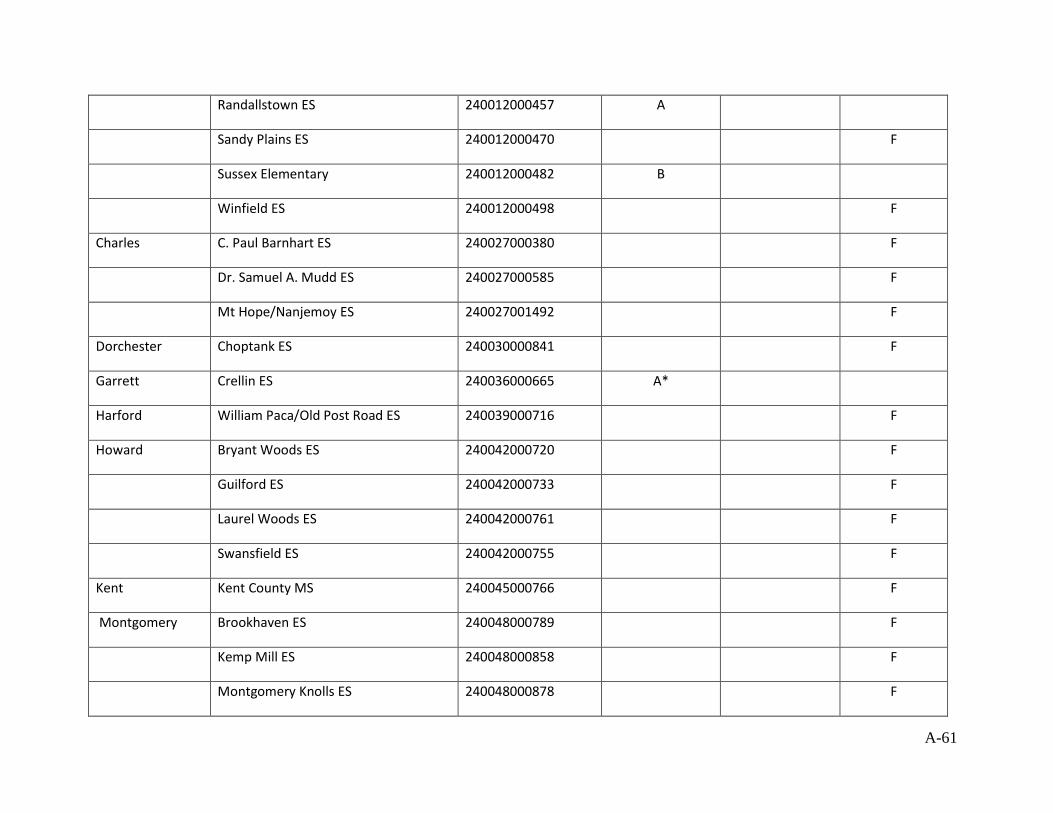
A-61
Randallstown ES 240012000457 A
Sandy Plains ES 240012000470 F
Sussex Elementary 240012000482 B
Winfield ES 240012000498 F
Charles C. Paul Barnhart ES 240027000380 F
Dr. Samuel A. Mudd ES 240027000585 F
Mt Hope/Nanjemoy ES 240027001492 F
Dorchester Choptank ES 240030000841 F
Garrett Crellin ES 240036000665 A*
Harford William Paca/Old Post Road ES 240039000716 F
Howard Bryant Woods ES 240042000720 F
Guilford ES 240042000733 F
Laurel Woods ES 240042000761 F
Swansfield ES 240042000755 F
Kent Kent County MS 240045000766 F
Montgomery Brookhaven ES 240048000789 F
Kemp Mill ES 240048000858 F
Montgomery Knolls ES 240048000878 F
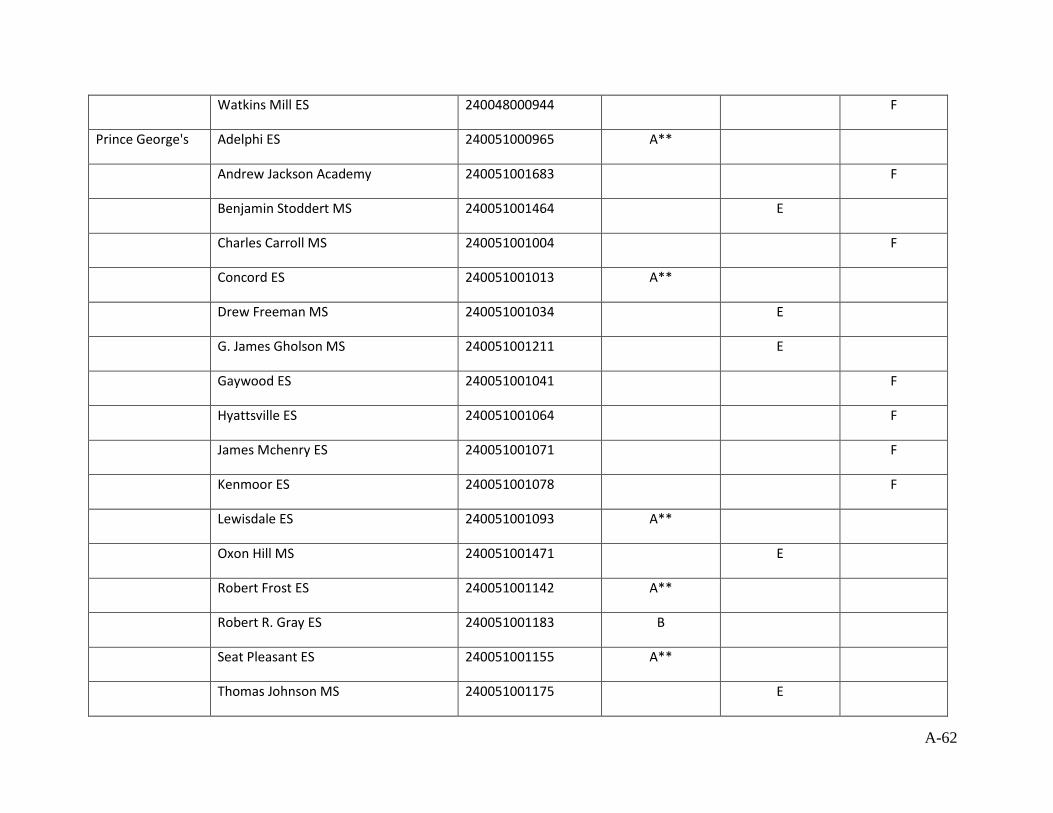
A-62
Watkins Mill ES 240048000944 F
Prince George's Adelphi ES 240051000965 A**
Andrew Jackson Academy 240051001683 F
Benjamin Stoddert MS 240051001464 E
Charles Carroll MS 240051001004 F
Concord ES 240051001013 A**
Drew Freeman MS 240051001034 E
G. James Gholson MS 240051001211 E
Gaywood ES 240051001041 F
Hyattsville ES 240051001064 F
James Mchenry ES 240051001071 F
Kenmoor ES 240051001078 F
Lewisdale ES 240051001093 A**
Oxon Hill MS 240051001471 E
Robert Frost ES 240051001142 A**
Robert R. Gray ES 240051001183 B
Seat Pleasant ES 240051001155 A**
Thomas Johnson MS 240051001175 E
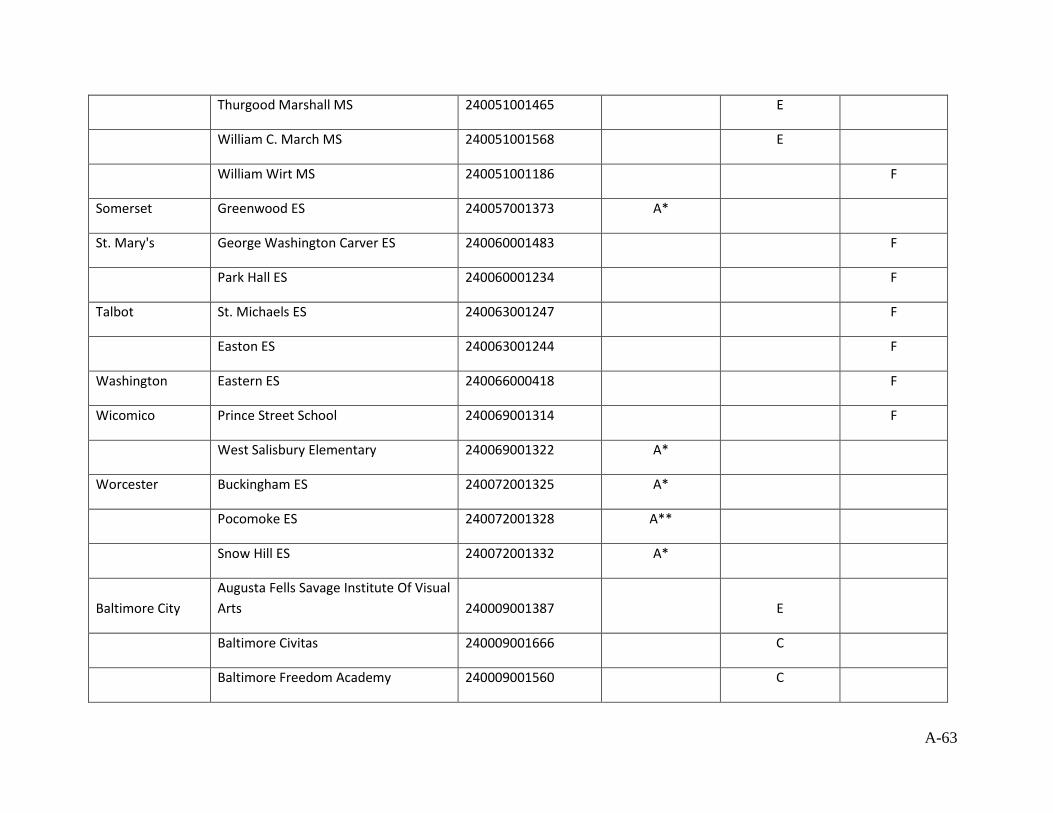
A-63
Thurgood Marshall MS 240051001465 E
William C. March MS 240051001568 E
William Wirt MS 240051001186 F
Somerset Greenwood ES 240057001373 A*
St. Mary's George Washington Carver ES 240060001483 F
Park Hall ES 240060001234 F
Talbot St. Michaels ES 240063001247 F
Easton ES 240063001244 F
Washington Eastern ES 240066000418 F
Wicomico Prince Street School 240069001314 F
West Salisbury Elementary 240069001322 A*
Worcester Buckingham ES 240072001325 A*
Pocomoke ES 240072001328 A**
Snow Hill ES 240072001332 A*
Baltimore City Augusta Fells Savage Institute Of Visual Arts 240009001387 E
Baltimore Civitas 240009001666 C
Baltimore Freedom Academy 240009001560 C
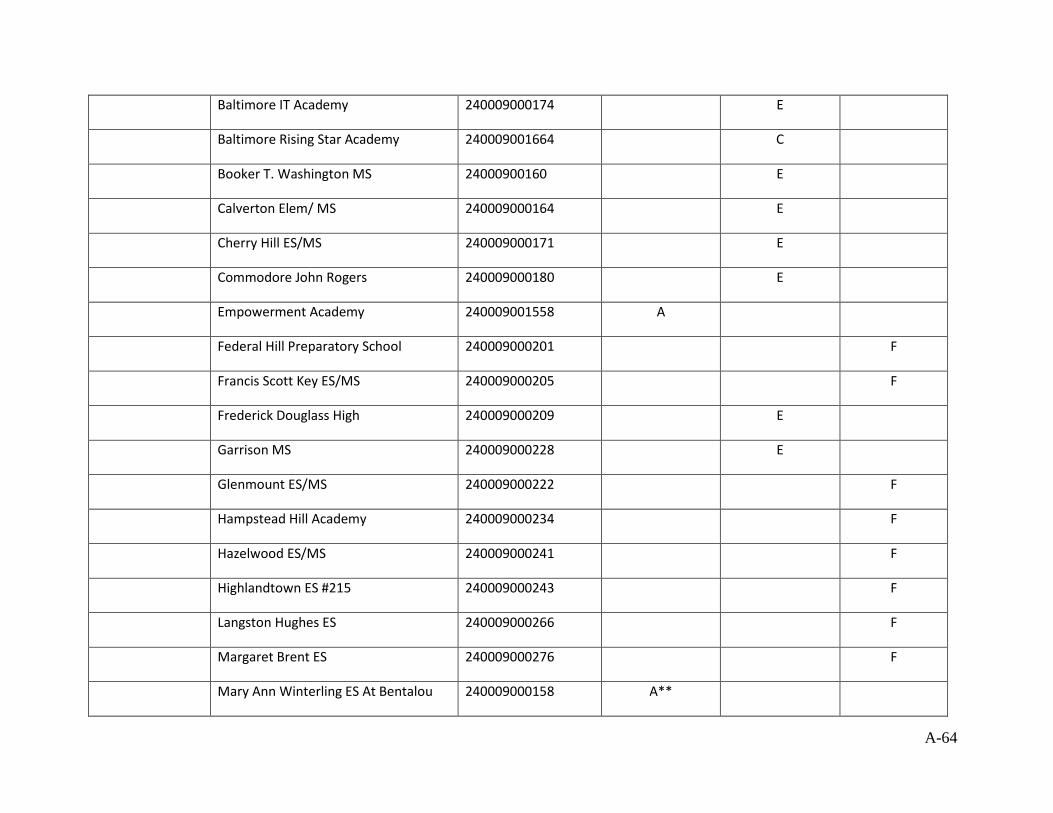
A-64
Baltimore IT Academy 240009000174 E
Baltimore Rising Star Academy 240009001664 C
Booker T. Washington MS 24000900160 E
Calverton Elem/ MS 240009000164 E
Cherry Hill ES/MS 240009000171 E
Commodore John Rogers 240009000180 E
Empowerment Academy 240009001558 A
Federal Hill Preparatory School 240009000201 F
Francis Scott Key ES/MS 240009000205 F
Frederick Douglass High 240009000209 E
Garrison MS 240009000228 E
Glenmount ES/MS 240009000222 F
Hampstead Hill Academy 240009000234 F
Hazelwood ES/MS 240009000241 F
Highlandtown ES #215 240009000243 F
Langston Hughes ES 240009000266 F
Margaret Brent ES 240009000276 F
Mary Ann Winterling ES At Bentalou 240009000158 A**
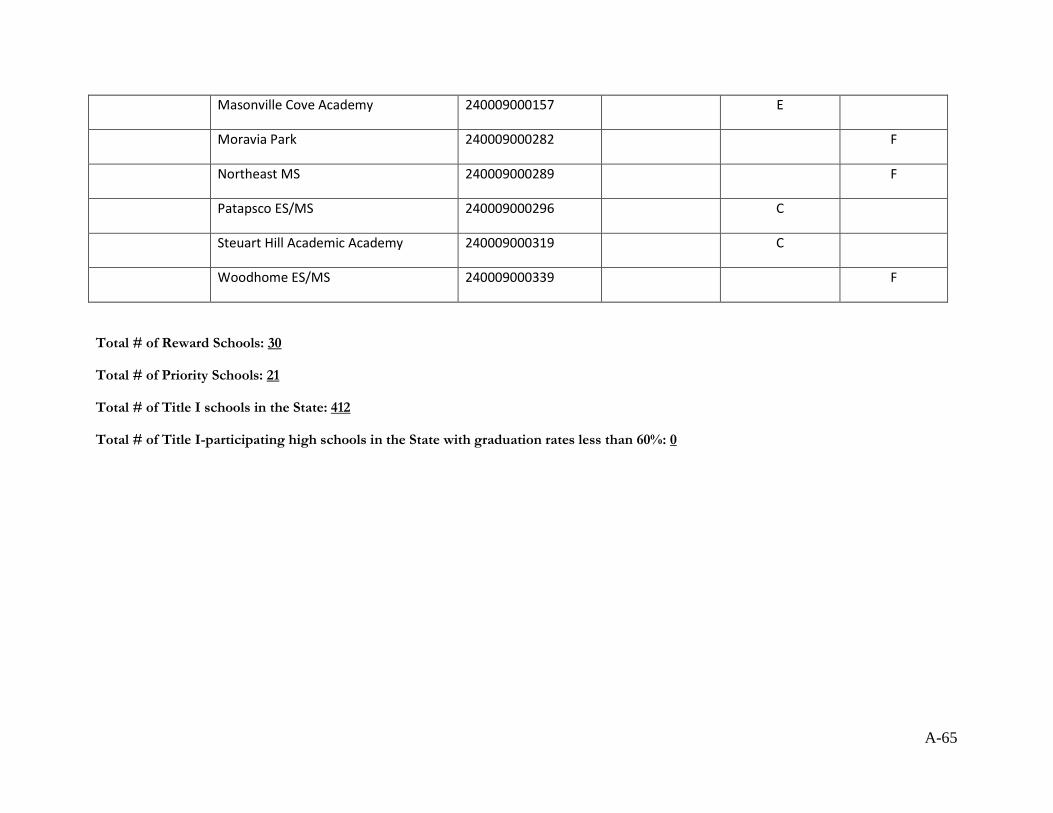
A-65
Masonville Cove Academy 240009000157 E
Moravia Park 240009000282 F
Northeast MS 240009000289 F
Patapsco ES/MS 240009000296 C
Steuart Hill Academic Academy 240009000319 C
Woodhome ES/MS 240009000339 F
Total # of Reward Schools: 30
Total # of Priority Schools: 21
Total # of Title I schools in the State: 412
Total # of Title I-participating high schools in the State with graduation rates less than 60%: 0

A-66
Reward School Criteria:
A. Highest-performing school (See definition below) B. High-progress school (See definition below)
Highest Performing Title I Reward Schools- A (4)
1. Title I School making AYP or AMOs foe the "all students" group and all subgroups
2. Highest absolute performance over 2 years for the " all students" group and for all subgroups
3. If applicable be among Title I high schools with graduation rates greater than 60%
4. Not have significant achievement gaps across subgroups that are not closing
Distinguished Highest Performing Title I Reward Schools - A*(10)
1. Title I School making AYP or AMOs foe the "all students" group and all subgroups
2. Highest absolute performance over 2 years for the " all students" group and for all subgroups
3. If applicable be among Title I high schools with graduation rates greater than 60%
4. Not have significant achievement gaps across subgroups that are not closing
5. Be among the top ten percent of Title I schools in the State in improving the performance of the "all students" group over 5 years or be among the Title I high schools in the state making the most progress in increasing graduation rates.
Superlative Highest Performing Title I Reward Schools -A** (8)
1. Title I School making AYP or AMOs foe the "all students" group and all subgroups
2. Highest absolute performance over 2 years for the " all students" group and
High Progress Title I Schools-B (8)
1. Title I school among the top 10% of Title I schools in the State in improving the performance of the "all students" group over 5 years.
2. A Title I high school making the most progress in increasing graduation rates.
3. No significant achievement gaps across subgroups that are not closing.
Note: In Maryland, Increased gap closure by 18% points or more
Priority School Criteria:
C. Among the lowest five percent of Title I schools in the State based on the proficiency and lack of progress of the “all students” group
D-1. Title I-participating high school with graduation rate less than 60%
over a number of years
D-2. Title I-eligible high school with graduation rate less than 60% over a number of years
E. Tier I or Tier II SIG school implementing a school intervention model
Focus School Criteria:
F. Has the largest within-school gaps between the highest-achieving subgroup(s) and the lowest-achieving subgroup(s) or, at the high school level, has the largest within-school gaps in the graduation rate
G. Has a subgroup or subgroups with low achievement or, at the high school level, a low graduation rate
H. A Title I-participating high school with graduation rate less than 60% over a number of years that is not identified as a priority school
Key
A-67
Attachment 10: A Copy of any Guidelines that the SEA has Already
Developed and Adopted for Local Teacher and Principal Evaluation and
Support Systems
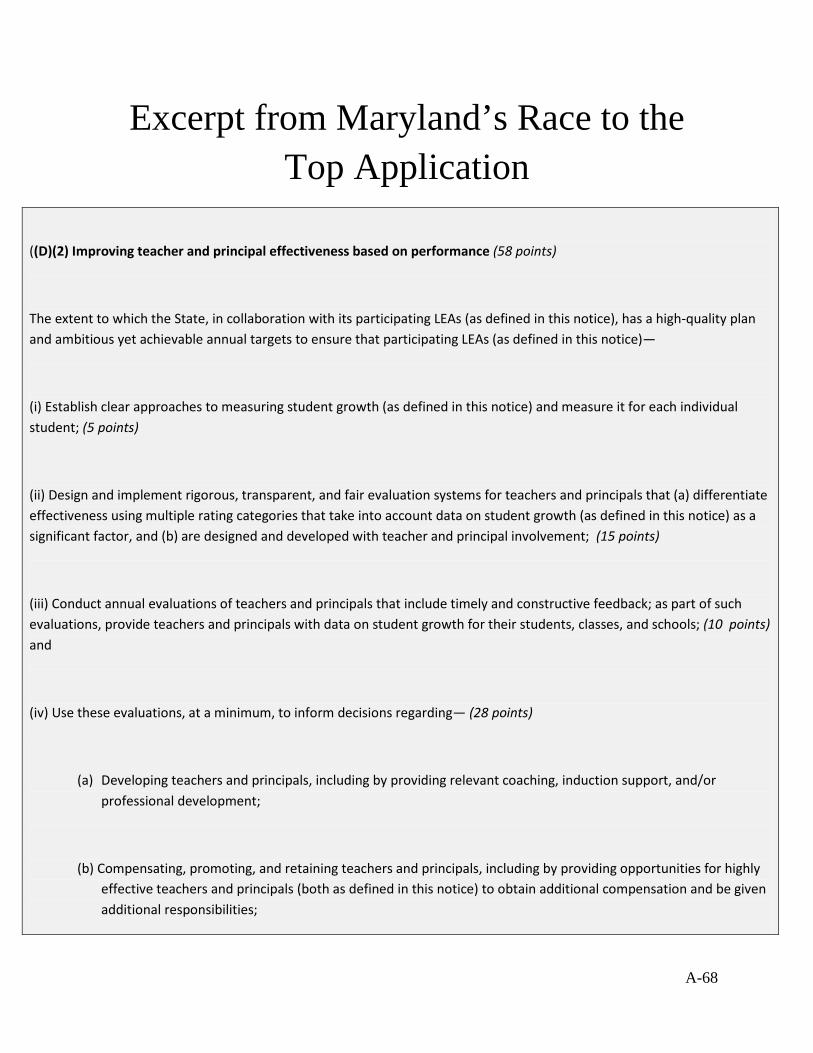
A-68
Excerpt from Maryland’s Race to the Top Application
((D)(2) Improving teacher and principal effectiveness based on performance (58 points)
The extent to which the State, in collaboration with its participating LEAs (as defined in this notice), has a high-quality plan and ambitious yet achievable annual targets to ensure that participating LEAs (as defined in this notice)—
(i) Establish clear approaches to measuring student growth (as defined in this notice) and measure it for each individual student; (5 points)
(ii) Design and implement rigorous, transparent, and fair evaluation systems for teachers and principals that (a) differentiate effectiveness using multiple rating categories that take into account data on student growth (as defined in this notice) as a significant factor, and (b) are designed and developed with teacher and principal involvement; (15 points)
(iii) Conduct annual evaluations of teachers and principals that include timely and constructive feedback; as part of such evaluations, provide teachers and principals with data on student growth for their students, classes, and schools; (10 points) and
(iv) Use these evaluations, at a minimum, to inform decisions regarding— (28 points)
(a) Developing teachers and principals, including by providing relevant coaching, induction support, and/or professional development;
(b) Compensating, promoting, and retaining teachers and principals, including by providing opportunities for highly effective teachers and principals (both as defined in this notice) to obtain additional compensation and be given additional responsibilities;
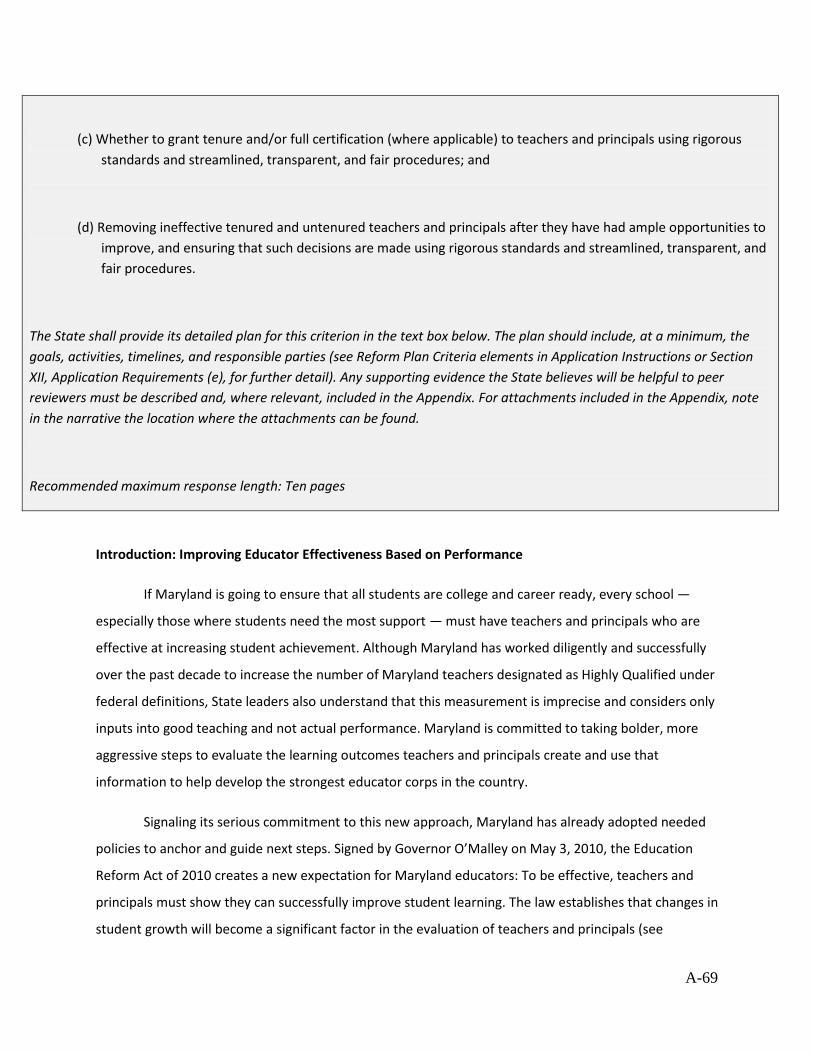
A-69
(c) Whether to grant tenure and/or full certification (where applicable) to teachers and principals using rigorous standards and streamlined, transparent, and fair procedures; and
(d) Removing ineffective tenured and untenured teachers and principals after they have had ample opportunities to improve, and ensuring that such decisions are made using rigorous standards and streamlined, transparent, and fair procedures.
The State shall provide its detailed plan for this criterion in the text box below. The plan should include, at a minimum, the goals, activities, timelines, and responsible parties (see Reform Plan Criteria elements in Application Instructions or Section XII, Application Requirements (e), for further detail). Any supporting evidence the State believes will be helpful to peer reviewers must be described and, where relevant, included in the Appendix. For attachments included in the Appendix, note in the narrative the location where the attachments can be found.
Recommended maximum response length: Ten pages
Introduction: Improving Educator Effectiveness Based on Performance
If Maryland is going to ensure that all students are college and career ready, every school —
especially those where students need the most support — must have teachers and principals who are
effective at increasing student achievement. Although Maryland has worked diligently and successfully
over the past decade to increase the number of Maryland teachers designated as Highly Qualified under
federal definitions, State leaders also understand that this measurement is imprecise and considers only
inputs into good teaching and not actual performance. Maryland is committed to taking bolder, more
aggressive steps to evaluate the learning outcomes teachers and principals create and use that
information to help develop the strongest educator corps in the country.
Signaling its serious commitment to this new approach, Maryland has already adopted needed
policies to anchor and guide next steps. Signed by Governor O’Malley on May 3, 2010, the Education
Reform Act of 2010 creates a new expectation for Maryland educators: To be effective, teachers and
principals must show they can successfully improve student learning. The law establishes that changes in
student growth will become a significant factor in the evaluation of teachers and principals (see
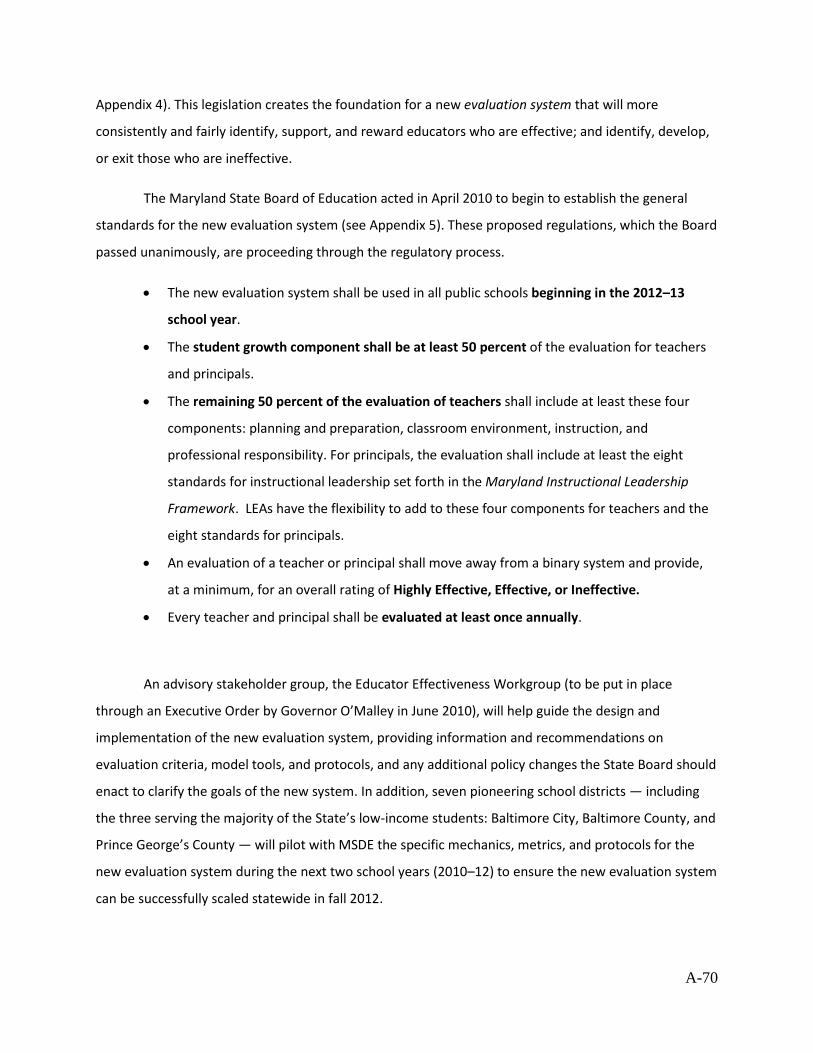
A-70
Appendix 4). This legislation creates the foundation for a new evaluation system that will more
consistently and fairly identify, support, and reward educators who are effective; and identify, develop,
or exit those who are ineffective.
The Maryland State Board of Education acted in April 2010 to begin to establish the general
standards for the new evaluation system (see Appendix 5). These proposed regulations, which the Board
passed unanimously, are proceeding through the regulatory process.
• The new evaluation system shall be used in all public schools beginning in the 2012–13
school year.
• The student growth component shall be at least 50 percent of the evaluation for teachers
and principals.
• The remaining 50 percent of the evaluation of teachers shall include at least these four
components: planning and preparation, classroom environment, instruction, and
professional responsibility. For principals, the evaluation shall include at least the eight
standards for instructional leadership set forth in the Maryland Instructional Leadership
Framework. LEAs have the flexibility to add to these four components for teachers and the
eight standards for principals.
• An evaluation of a teacher or principal shall move away from a binary system and provide,
at a minimum, for an overall rating of Highly Effective, Effective, or Ineffective.
• Every teacher and principal shall be evaluated at least once annually.
An advisory stakeholder group, the Educator Effectiveness Workgroup (to be put in place
through an Executive Order by Governor O’Malley in June 2010), will help guide the design and
implementation of the new evaluation system, providing information and recommendations on
evaluation criteria, model tools, and protocols, and any additional policy changes the State Board should
enact to clarify the goals of the new system. In addition, seven pioneering school districts — including
the three serving the majority of the State’s low-income students: Baltimore City, Baltimore County, and
Prince George’s County — will pilot with MSDE the specific mechanics, metrics, and protocols for the
new evaluation system during the next two school years (2010–12) to ensure the new evaluation system
can be successfully scaled statewide in fall 2012.
A-71
Supporting the transition to this new system, the General Assembly also extended the timeline
for granting tenure from two years to three years, allowing new teachers to receive both the support
and oversight they need in their early years to become effective or leave the profession. The new State
Board regulations (see Appendix 30), passed unanimously in April 2010, complement this change by
creating a comprehensive induction and mentoring system for all teachers during their initial three years
in the classroom as well (described in more detail in Section (D)(5)). Those regulations are proceeding
through the regulatory review process.
Maryland’s goal is to ensure the majority of teachers and principals in its public schools are not
only evaluated as being effective, but are effective. A lynchpin in the State’s overall strategy for creating
a truly world-class education system, this new evaluation system will: (1) collect information about how
every educator actually impacts student growth and achievement; (2) count student achievement
growth as the single most significant factor, accounting for 50 percent, of the evaluation of teachers and
principals; (3) combine information about student learning with high-quality, more consistent
observations of teachers’ and principals’ skills, knowledge, and leadership by better-trained supervisors;
(4) empower schools to better support educators and strengthen their practices, compensate
exceptional teachers and principals, and remove those who clearly are ineffective; and (5) help
Maryland identify and deploy the best teachers and principals to the neediest schools. These changes —
and timelines for implementing them — are described in more detail below throughout section (D)(2).
Section (D)(2)(i): Student Growth Measures
As noted in the introduction, in April 2010 the Maryland State Board of Education passed
proposed regulations that are now going through the regulatory process. These regulations specify that
student-learning gains should comprise 50 percent of the evaluation. There will be a pilot phase with
the seven pilot school districts that will result in statewide implementation of this new standard by the
2012–13 school year.
Clear approaches to measuring student growth (intermediate strategy and long-term strategy): State
leaders recognize that using student growth data in teacher and principal evaluations requires
thoughtful planning and engagement among key stakeholders and psychometrically valid instruments
A-72
and analytics. Compounding the challenge, Maryland (like many other states) is implementing its new
educator evaluation system even as it plans to convert to a new student assessment system that
measures Common Core State Standards and will be developed jointly with other states. These new
assessments will be specifically designed to measure growth with summative assessments. MSDE
envisions a system of growth measures that are flexible to accommodate various types of growth data,
and — as detailed in Section (B)(2)(i) — will provide alert data for students not making progress during
the school year.
However, until the new Common Core assessments are in place (expected by 2014) and can be
validated for use in evaluations and personnel decisions, Maryland will incorporate other assessments of
student learning into its new educator evaluation system. With an urgency and imperative to act,
Maryland leaders will implement the new system by the 2012–13 using these existing measures of
student growth until the evaluation system can be successfully transitioned to Common Core-based
assessments (how these growth measures will be factored into evaluations is explained later in Section
(D)(2)(ii)).
1. For teachers of mathematics and reading in grades 3–8, MSDE will adjust scaling of the
existing Maryland School Assessment (MSA) to allow calculations assessing individual
student growth — from a baseline to at least one other point in time — to be performed.
MSDE is designing these technical changes in close consultation with its National
Psychometric Council, a group of nationally recognized psychometric experts who provide
external validation of Maryland’s assessment processes. The Council has already determined
several potential calculations are feasible using the MSA.
2. For all other teachers, to generate student growth information, MSDE will seek to identify
objective pre- and post-tests that are comparable across classrooms and appropriate for
each grade and subject already in use by school districts throughout the State. In designing a
framework for the new educator evaluation system, MDSE has been engaged in extensive
conversations with school-district leaders, principals, and teachers throughout the past six
months and is reasonably confident it can identify appropriate assessments for this purpose.
The State’s National Psychometric Council has drawn up criteria to help guide the selection,
review, and approval of these assessments.
3. For principals (and as a fallback for teachers in any grade or subject for which appropriate
assessments for calculating individual student-learning growth are not found to be
A-73
available), MSDE will aggregate student growth gains — from a baseline to at least one
other point in time — for the entire school in mathematics, reading, and science (as
measured by MSA for elementary and middle schools) and in algebra, biology, English, and
government (as measured by the end-of-course High School Assessments for high schools).
4. In addition, MSDE will calculate a combined index reflecting the gains a team of teachers
collectively contributes to student growth — from a baseline to at least one other point in
time — using MSA performance gains in mathematics, reading, and science. Maryland
values the collaborative, collective work of teams of teachers, such as co-teaching teams for
students with disabilities and English Language Learners, or grade or content teams who
flexibly group students based on individual student learning needs and individual teacher
strengths. This measure also will signal the importance of all school faculty focusing on
literacy and numeracy, regardless of the subject they teach. For purposes of this calculation,
a “team” could be defined as groups of teachers supporting students in a particular content
area (e.g., co-teaching by content and special education teachers), all teachers at a certain
grade-level (in elementary and middle schools), or all teachers in a department (in high
schools). The National Psychometric Council and national experts, in conjunction with the
Educator Effectiveness Workgroup (a stakeholder group that will advise on implementation;
its charge and members are described below in Section (D)(2)(ii)), will determine the
calculations to be used. The State’s prior accountability program (based on the Maryland
School Performance Assessment Program or MSPAP that was used from 1993 to 2002)
measured school performance rather than individual student performance, so Maryland has
strong history with and existing capacity to perform and use these calculations for
accountability.
5. Finally, MSDE will calculate the progress each school makes in closing overall achievement
gaps as measured by MSA for elementary and middle schools and in end-of-course exams in
algebra, biology, English, and government (as measured by the end-of-course High School
Assessments for high schools. As described more fully in Section (A)(3)(ii)(b), MSDE has
determined that virtually every school has an achievement gap for at least one group of
students (e.g., low-income, minority, special education); this measure reinforces the need to
ensure educators are helping students make sufficient growth to close these gaps. Again,
the State’s experience developing and using these types of indices using MSPAP results gives
MSDE existing capacity and expertise to make these school-based calculations.
A-74
Piloting and refining the growth measures (2010–12): These five measures of student growth will be
piloted and refined as needed beginning in January 2011 and for the following 18 months, working in
close partnership with seven pilot school districts throughout the State: Baltimore City, Baltimore
County, Charles County, Kent County, Prince George’s County, Queen Anne’s County, and St. Mary’s
County. Importantly, three of these districts (Baltimore City, Baltimore County, and Prince George’s
County) disproportionally serve the majority of low-income students in Maryland — ensuring that the
new evaluation system can accelerate improvement in schools serving the State’s neediest students and
efforts to equitably distribute effective teachers and principals. The seven LEAs’ experiences over the
two-year pilot also will help inform any needed course corrections before the system is used in all
schools throughout the State beginning in the 2012-13 school year. MSDE and the Educator
Effectiveness Workgroup will collaborate with the pilot districts to gather information and lessons
learned to inform the statewide scale-up.
MSDE and the seven districts will pilot the use of student-learning measures, data systems, and
evaluation instruments. To address the need for objective assessments of student learning not
measured by MSA, MSDE and its National Psychometric Council will begin its ongoing screening process
to select additional student-learning measures already in use throughout Maryland that meet the
criteria for calculating student growth.
Section (D)(2)(ii): Rigorous, Transparent, Fair Evaluations
While the broad framework of Maryland’s new educator evaluation system has been
established through State law and a regulation proposed by the State Board that is now working its way
through the regulatory process, MSDE has relied extensively on consultations, feedback, and focus-
group discussions with teachers and principals from throughout the State to begin filling in key details
and next steps. Specifically, a series of 24 focus groups consisting of 432 stakeholders — including
superintendents, human resource directors, teachers, representatives of teacher associations, and
representatives from higher-education teacher preparation and arts and sciences faculty — provided
input on the draft framework for teacher evaluations (see Appendix 31). Eleven focus groups engaged
200 principals and 30 supervisors of principals on the draft framework for principal evaluations. Much as
a similar consultative process a decade ago helped the State shift to a mandatory curriculum that was
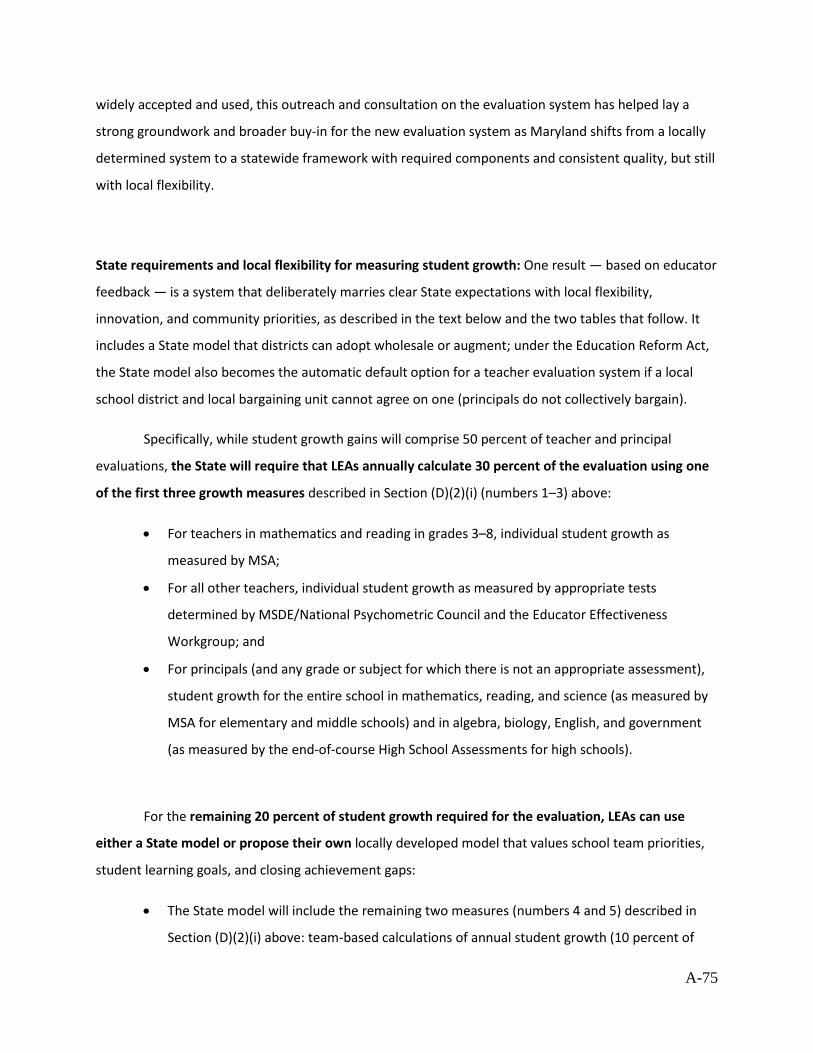
A-75
widely accepted and used, this outreach and consultation on the evaluation system has helped lay a
strong groundwork and broader buy-in for the new evaluation system as Maryland shifts from a locally
determined system to a statewide framework with required components and consistent quality, but still
with local flexibility.
State requirements and local flexibility for measuring student growth: One result — based on educator
feedback — is a system that deliberately marries clear State expectations with local flexibility,
innovation, and community priorities, as described in the text below and the two tables that follow. It
includes a State model that districts can adopt wholesale or augment; under the Education Reform Act,
the State model also becomes the automatic default option for a teacher evaluation system if a local
school district and local bargaining unit cannot agree on one (principals do not collectively bargain).
Specifically, while student growth gains will comprise 50 percent of teacher and principal
evaluations, the State will require that LEAs annually calculate 30 percent of the evaluation using one
of the first three growth measures described in Section (D)(2)(i) (numbers 1–3) above:
• For teachers in mathematics and reading in grades 3–8, individual student growth as
measured by MSA;
• For all other teachers, individual student growth as measured by appropriate tests
determined by MSDE/National Psychometric Council and the Educator Effectiveness
Workgroup; and
• For principals (and any grade or subject for which there is not an appropriate assessment),
student growth for the entire school in mathematics, reading, and science (as measured by
MSA for elementary and middle schools) and in algebra, biology, English, and government
(as measured by the end-of-course High School Assessments for high schools).
For the remaining 20 percent of student growth required for the evaluation, LEAs can use
either a State model or propose their own locally developed model that values school team priorities,
student learning goals, and closing achievement gaps:
• The State model will include the remaining two measures (numbers 4 and 5) described in
Section (D)(2)(i) above: team-based calculations of annual student growth (10 percent of
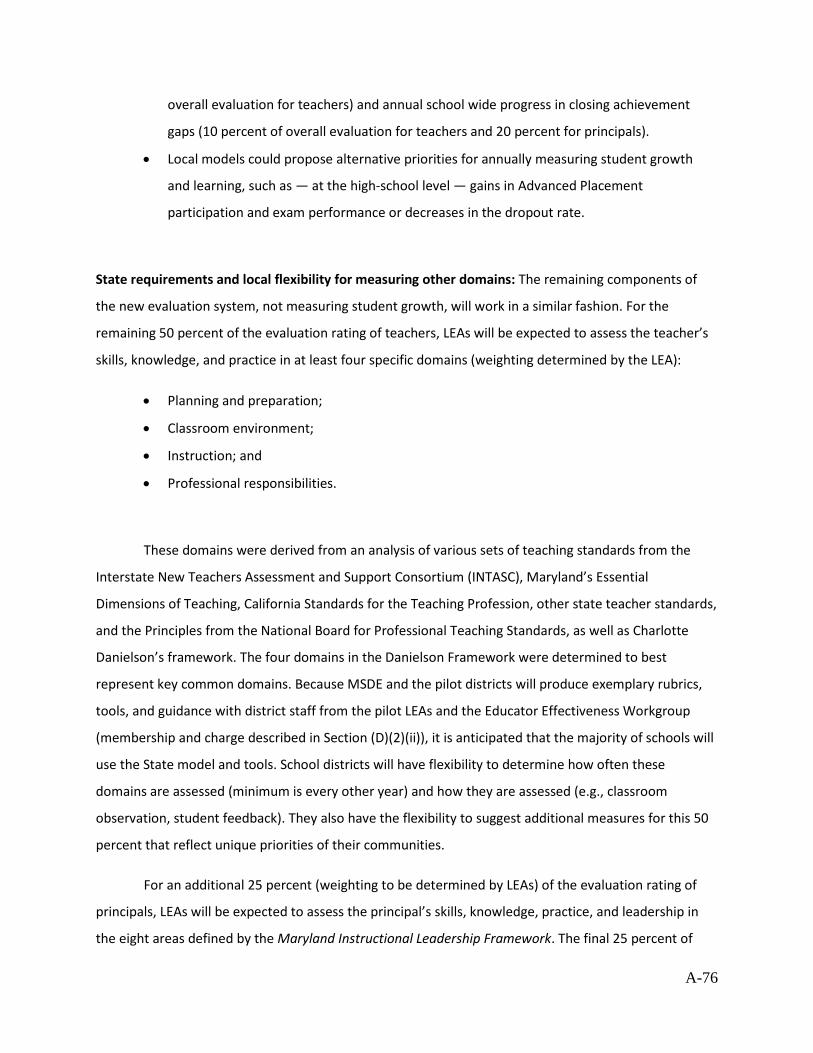
A-76
overall evaluation for teachers) and annual school wide progress in closing achievement
gaps (10 percent of overall evaluation for teachers and 20 percent for principals).
• Local models could propose alternative priorities for annually measuring student growth
and learning, such as — at the high-school level — gains in Advanced Placement
participation and exam performance or decreases in the dropout rate.
State requirements and local flexibility for measuring other domains: The remaining components of
the new evaluation system, not measuring student growth, will work in a similar fashion. For the
remaining 50 percent of the evaluation rating of teachers, LEAs will be expected to assess the teacher’s
skills, knowledge, and practice in at least four specific domains (weighting determined by the LEA):
• Planning and preparation;
• Classroom environment;
• Instruction; and
• Professional responsibilities.
These domains were derived from an analysis of various sets of teaching standards from the
Interstate New Teachers Assessment and Support Consortium (INTASC), Maryland’s Essential
Dimensions of Teaching, California Standards for the Teaching Profession, other state teacher standards,
and the Principles from the National Board for Professional Teaching Standards, as well as Charlotte
Danielson’s framework. The four domains in the Danielson Framework were determined to best
represent key common domains. Because MSDE and the pilot districts will produce exemplary rubrics,
tools, and guidance with district staff from the pilot LEAs and the Educator Effectiveness Workgroup
(membership and charge described in Section (D)(2)(ii)), it is anticipated that the majority of schools will
use the State model and tools. School districts will have flexibility to determine how often these
domains are assessed (minimum is every other year) and how they are assessed (e.g., classroom
observation, student feedback). They also have the flexibility to suggest additional measures for this 50
percent that reflect unique priorities of their communities.
For an additional 25 percent (weighting to be determined by LEAs) of the evaluation rating of
principals, LEAs will be expected to assess the principal’s skills, knowledge, practice, and leadership in
the eight areas defined by the Maryland Instructional Leadership Framework. The final 25 percent of
A-77
principals’ evaluations will be at the discretion of the LEAs. Endorsed by the State Board of Education in
2005, the Framework is a set of eight rigorous and well-researched outcomes expected of principals as
they provide leadership in their schools in the following ways:
• Facilitate the development of a school vision;
• Align all aspects of a school culture to student and adult learning;
• Monitor the alignment of curriculum, instruction, and assessment;
• Improve instructional practice through the purposeful observation and evaluation of
teachers;
• Ensure the regular integration of appropriate assessments into daily classroom instruction;
• Use technology and multiple sources of data to improve classroom instruction;
• Provide staff with focused, sustained, research-based professional development; and
• Engage all community stakeholders in a shared responsibility for student and school success.
Originally adopted as a means of informing best practices in preparation programs and
professional development of principals, the Framework is now used widely and referenced throughout
the State.
Similar to the non-growth measure component of the teacher evaluation, LEAs will have
flexibility in their principal evaluations to determine how best to assess these outcomes, which must be
done annually. In addition, LEAs may add attributes of principal leadership (e.g., school-management
skills) to these eight outcomes that reflect local priorities.
As part of the annual Master Plan update process, MSDE will review each LEA’s evaluation
framework and exert quality control as needed. As described in Section (A)(2)(i), Maryland tracks
performances at the district level through the Bridge to Excellence program, which requires local school
systems to develop and implement a comprehensive master plan, updated annually, as part of receiving
increased State funding. Because the Master Plan is reviewed annually by MSDE and LEA staff to ensure
that students, schools, and districts are making sufficient progress toward performance goals, the
process serves as an important, high-profile accountability tool in Maryland.
Student growth and teacher evaluation design: For teachers, the new evaluation system includes these
factors:
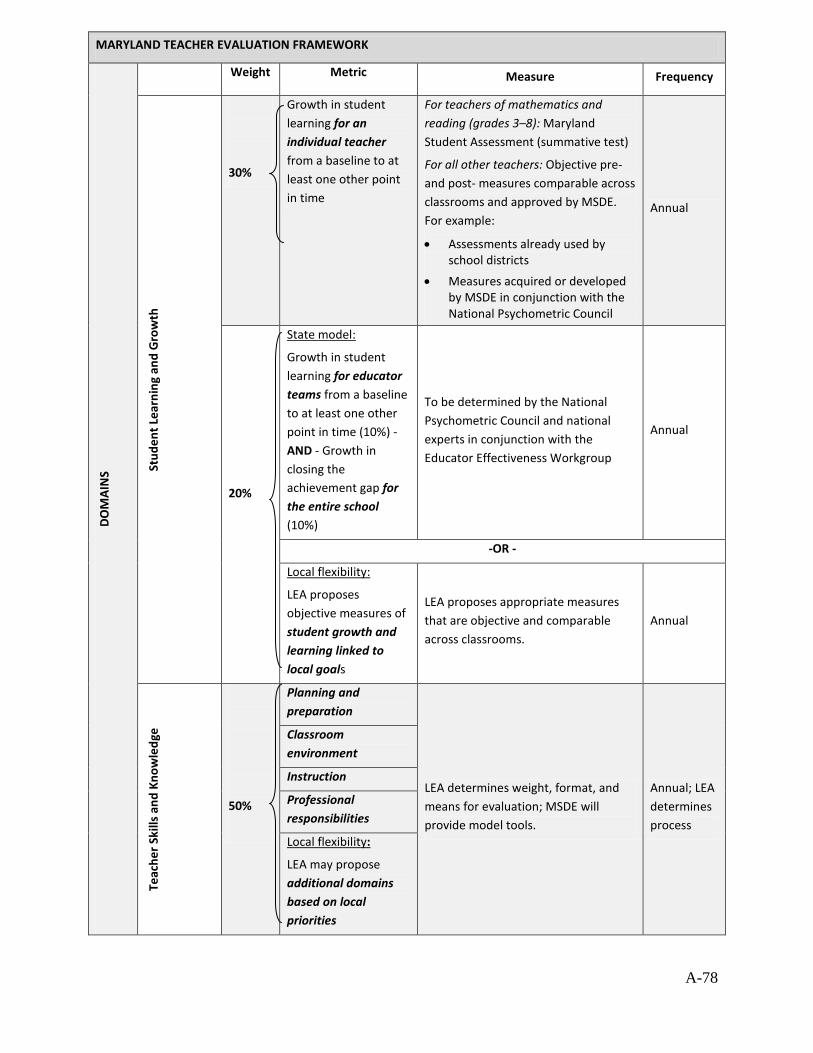
A-78
MARYLAND TEACHER EVALUATION FRAMEWORK
DO
MA
INS
Weight Metric Measure Frequency
Stud
ent
Lear
ning
and
Gro
wth
30%
Growth in student learning for an individual teacher from a baseline to at least one other point in time
For teachers of mathematics and reading (grades 3–8): Maryland Student Assessment (summative test)
For all other teachers: Objective pre-and post- measures comparable across classrooms and approved by MSDE. For example:
• Assessments already used by school districts
• Measures acquired or developed by MSDE in conjunction with the National Psychometric Council
Annual
20%
State model:
Growth in student learning for educator teams from a baseline to at least one other point in time (10%) - AND - Growth in closing the achievement gap for the entire school (10%)
To be determined by the National Psychometric Council and national experts in conjunction with the Educator Effectiveness Workgroup
Annual
-OR -
Local flexibility:
LEA proposes objective measures of student growth and learning linked to local goals
LEA proposes appropriate measures that are objective and comparable across classrooms.
Annual
Teac
her
Skill
s an
d Kn
owle
dge
50%
Planning and preparation
LEA determines weight, format, and means for evaluation; MSDE will provide model tools.
Annual; LEA determines process
Classroom environment
Instruction
Professional responsibilities
Local flexibility:
LEA may propose additional domains based on local priorities
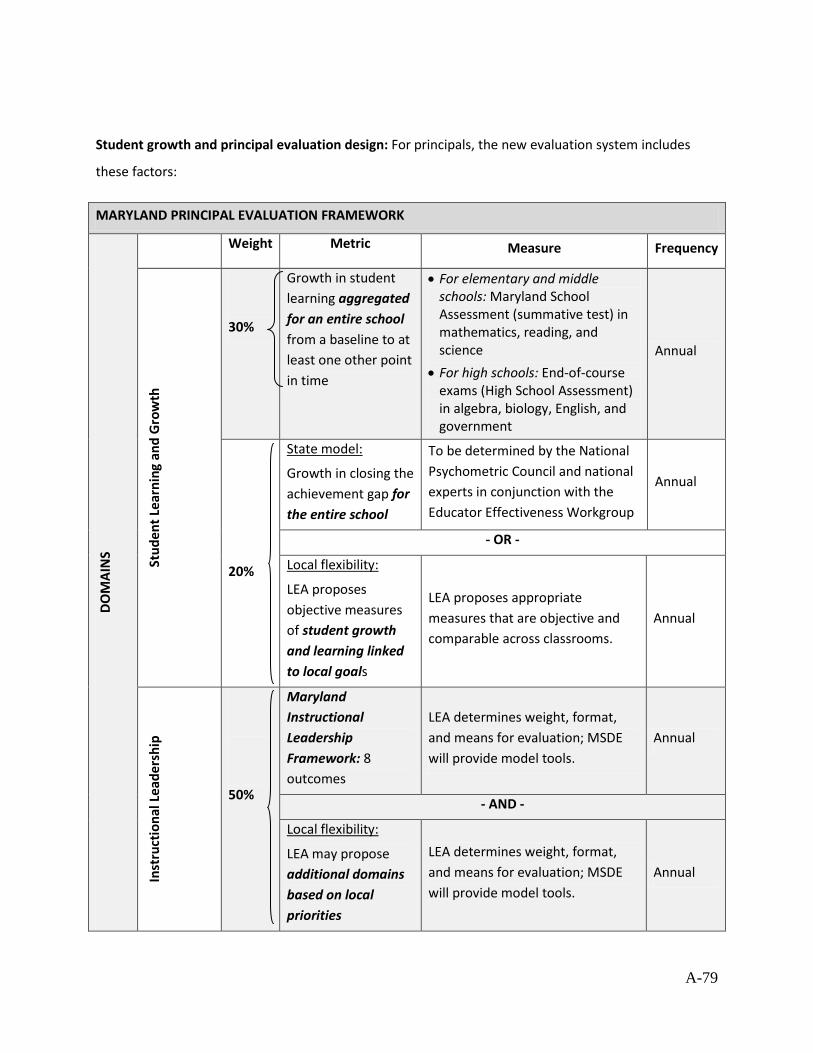
A-79
Student growth and principal evaluation design: For principals, the new evaluation system includes
these factors:
MARYLAND PRINCIPAL EVALUATION FRAMEWORK
DO
MA
INS
Weight Metric Measure Frequency
Stud
ent
Lear
ning
and
Gro
wth
30%
Growth in student learning aggregated for an entire school from a baseline to at least one other point in time
• For elementary and middle schools: Maryland School Assessment (summative test) in mathematics, reading, and science
• For high schools: End-of-course exams (High School Assessment) in algebra, biology, English, and government
Annual
20%
State model:
Growth in closing the achievement gap for the entire school
To be determined by the National Psychometric Council and national experts in conjunction with the Educator Effectiveness Workgroup
Annual
- OR -
Local flexibility:
LEA proposes objective measures of student growth and learning linked to local goals
LEA proposes appropriate measures that are objective and comparable across classrooms.
Annual
Inst
ruct
iona
l Lea
ders
hip
50%
Maryland Instructional Leadership Framework: 8 outcomes
LEA determines weight, format, and means for evaluation; MSDE will provide model tools.
Annual
- AND -
Local flexibility:
LEA may propose additional domains based on local priorities
LEA determines weight, format, and means for evaluation; MSDE will provide model tools.
Annual
A-80
Multiple rating categories to differentiate effectiveness: In addition to proposing the categories and framework for the new educator evaluation system in April 2010, the State Board of Education also included in the new regulation a minimum of three rating criteria (in place of the current two for teachers and principals): Highly Effective, Effective, and Ineffective (see Appendix 5). Between now and December 2010, MSDE will work with the Educator Effectiveness Workgroup to determine if additional rating criteria would be constructive and, if so, propose these changes to the State Board for adoption in 2011.
Maryland believes that to be rated Effective, a teacher or principal must show appropriate levels
of growth among their students to help them successfully transition and progress from grade to grade.
Further, to be rated Highly Effective, a teacher or principal must show exceptional talent in increasing
student growth well beyond one grade level in one year, or exceptional success in educating high-
poverty, minority, ELL, or other high-needs students.
Teachers and principals who do not meet at least the Effective standard on the student-
growth portion of their evaluations cannot be rated Effective overall and will thus be deemed
Ineffective. In other words, an educator in Maryland cannot be rated Effective or better unless he/she
has demonstrated satisfactory levels of student growth.
The required amount of growth to receive a rating of Effective or Highly Effective will be
determined by the State Board during the 2011–13 pilot/refinement phase and in consultation with the
Educator Effectiveness Workgroup (as described in more detail below).
Next Steps: Refining the Evaluation System and Involving Teachers and Principals
Although Maryland has made rapid and substantial progress in a short period to dramatically
overhaul its evaluation of public school teachers and principals — demonstrating clearly its commitment
to do what it takes to ensure great teachers and leaders in every school — essential details still need to
be resolved and studied.
In particular, several aspects of the new evaluation system cannot be completed until the 2011–
13 pilot is underway and they are field tested, including:
• The validity of different student growth measures in calculating student growth;
• Appropriate student growth needed to be rated Effective or Highly Effective;
A-81
• Model teacher- and principal-evaluation tools and rubrics that meet the needs of principals,
executive officers, and schools; and
• Protocols for conducting annual evaluations
Thus, the pilot process — and MSDE’s close partnership with seven school districts to refine the
new framework — is an important step to ensuring the fairness, reliability, and rigor of the new system
and to identify and work out any problems before the system is implemented statewide in 2012.
Importantly, MSDE and its partner school districts will study the impacts and validity of the new
evaluation system by examining key questions, such as: Do ratings of teachers and principals under the
new system match what principals and administrators had expected? Are teachers and principals
receiving overall ratings of Effective or better in numbers that are the same, fewer, or more that had
been previously rated Satisfactory?
With the goal of testing and refining the rubrics and measures, the student-growth portion of
evaluations during this pilot cycle will be “no fault” without high stakes or consequences attached,
although teachers and principals rated Highly Effective during the pilot because of their exceptional
impact on student growth will qualify for locally negotiated incentives described in Section (D)(3) for
working in high-poverty/high-minority schools. In the interest of fairness during the pilot period, the
participating LEAs will use both their current evaluation system and the one developed specifically for
the pilot. Therefore, for purposes of determining tenure, needed supports, or the need to terminate or
non-renew the teacher’s contract during the two-year pilot, teachers and principals will continue to be
evaluated using present LEA evaluation systems, not the pilot system being tested.
To help guide the design and refinement of the pilots and resolve outstanding issues, the
Governor is creating through an Executive Order in June 2010, the Educator Effectiveness Workgroup.
Membership of this Workgroup will be broad-based and will include representation from
individuals/groups such as: State Superintendent; Members of the General Assembly; Governor’s Policy
Director; State Board of Education; Local Boards of Education; LEA Superintendents; Maryland State
Education Association; Baltimore Teachers Union; LEA Assistant Superintendents for Instruction; LEA
School Business Officials; LEA Executive Officers; Local Accountability Coordinators; LEA Human
Resources Directors; Title I coordinators; Principals; MSDE/LEA identified teachers; Institutions of Higher
Education (USM system, private colleges and community colleges); Community/Business; PTA; National
A-82
Psychometric Council; Maryland Assessment Research Center for Education Success (MARCES); and
students
The Workgroup will be asked to make recommendations to the Governor, State Board of
Education, and State Superintendent by December 2010 so the recommendations can be ready for
piloting in the seven LEAs by spring 2011 and the State Board of Education can enact any new policies
needed in early 2011 in these areas:
• Appropriate levels of student growth for a teacher or principal to be rated Effective or
Highly Effective; Maryland believes that to be rated Effective, a teacher or principal must
show appropriate levels of growth among their students to help them successfully transition
and progress from grade to grade; to be rated Highly Effective, a teacher or principal must
show exceptional talent in increasing student growth well beyond one grade level in one
year or exceptional success educating high-poverty, minority, ELL, or other high-needs
students (and the Workgroup will help translate these value statements into specific
psychometric measures);
• Definition of Ineffective for a teacher or principal of receiving an Ineffective rating, including
what supports should be offered and what additional evaluations are needed;
• Whether an additional rating category (e.g., “Developing,” for educators whose
performance falls between Ineffective and Effective) beyond the minimum three categories
established in State Board of Education regulations is needed;
• Model scoring rubrics for classroom observations of teachers that measure the four other
domains and are based on best practices, such as the Danielson framework;
• Model scoring rubrics for measuring the eight outcomes of the Maryland Instructional
Leadership Framework;
• Matrix for determining how different rating criteria received in any individual domain
combine to form an overall summative rating for the teacher or principal while ensuring, as
noted above, that no principals or teachers can be rated Effective unless their students
achieve the appropriate level of growth;
• Advice to MSDE (in consultation with the National Psychometric Council) on the feasibility of
specific LEA-developed or LEA-purchased tests to generate objective student growth data
for teachers in grades or subjects not assessed by the State summative assessment;
A-83
• Reviews of current LEA evaluation tools, protocols, and processes, including Montgomery
County’s Peer Assistance and Review System, to determine potential applicability to other
counties; and
• Propose revisions to Maryland Teaching Standards to reflect current research, best
practices, the new evaluation system, and to inform teacher preparation and professional
development (described in Section (D)(5)).
As part of its April 2010 proposed regulations for the new evaluation system, the State Board of
Education is directing MSDE to present any additional regulations needed to guide the implementation
of the system statewide by January 2011 — and the State superintendent and MSDE will rely heavily on
the Educator Effectiveness Workgroup to identify and develop any further policies needed. The
Workgroup will continue to meet throughout the pilot to provide input and advice on these additional
issues:
• Guide MSDE’s evaluation and research questions throughout the two-year pilot of the new
system; and
• Identify by December 2011 corrections and adjustments to the overall design of the State
evaluation system — including the guidelines, tools, and measures — before the system is
mandated for statewide use in fall 2012.
Further adjustments to the evaluation system and specific consequences for those rated
Ineffective under the new system still need to be enacted into policy in 2011 (and 2012 if additional
corrections are needed). It is important to understand that members of the State Board of Education —
who are appointed by the Governor — have sole authority within the limits of the law to act on these
issues. Over the next six months (to December 2010), Maryland leaders are appropriately taking the
needed time to seek input from stakeholders to refine and perfect the new evaluation system — and
not simply postponing difficult decisions to a distant date or to an uncertain future. The action of
Maryland’s General Assembly — combined with the State Board’s broad powers to “determine the
elementary and secondary educational policies of this State” and to do so by regulations that have the
“force of law” and apply to all school systems (Annotated Code of Maryland, §2-205(b)(1) and§2-205(c))
A-84
— ensure Maryland will take action and enact all aspects of the plan outlined above, after conferring
closely with stakeholders.
Section (D)(2)(iii): Annual Evaluations that Provide Timely and Constructive Feedback
As stated above, Maryland’s goal is to ensure nearly all of the teachers and principals in its
schools are not just rated Effective (or better) but truly are effective. Data and anecdotal reports suggest
that nearly every educator today is rated Satisfactory — which is not the same as knowing whether
principals or teachers actually are effective at improving student learning, the most important
component of their jobs. For Maryland to achieve its aspiration of having nearly every principal and
teacher become Effective (or even Highly Effective), the State needs to ensure that evaluations happen
regularly and that supervisors not only are able to conduct evaluations capably and fairly but also
understand how to use the results to provide useful feedback and target appropriate support to those
they are evaluating.
As part of its April 2010 proposed regulations for the new evaluation system, the State Board of
Education agreed that — beginning in the 2012 school year — all teachers and principals will be required
to have annual evaluations on student growth (see Appendix 5). Under the current system, tenured
teachers are evaluated every other year; under the new system, all school districts must follow these
guidelines:
• Every teacher and principal shall be evaluated at least once annually.
• Each annual evaluation of a principal shall include all of the components of the evaluation
system (student growth, the eight leadership outcomes, and locally-decided priorities).
Whenever student growth demonstrates a failure on the part of the teacher or principal to meet
targets and earn a rating of Effective, it will trigger additional evaluation of the teacher’s or principal’s
performance and a determination of what intervention and/or supports may be necessary.
Because a high-quality, consistent, statewide system for evaluating teacher and principal
effectiveness has never existed before in Maryland — and because student learning data in particular
have not regularly been used by all LEAs in evaluations — Maryland will invest in significant technical
assistance to support school districts, and especially those education leaders who supervise teachers
and principals, in making the transition.
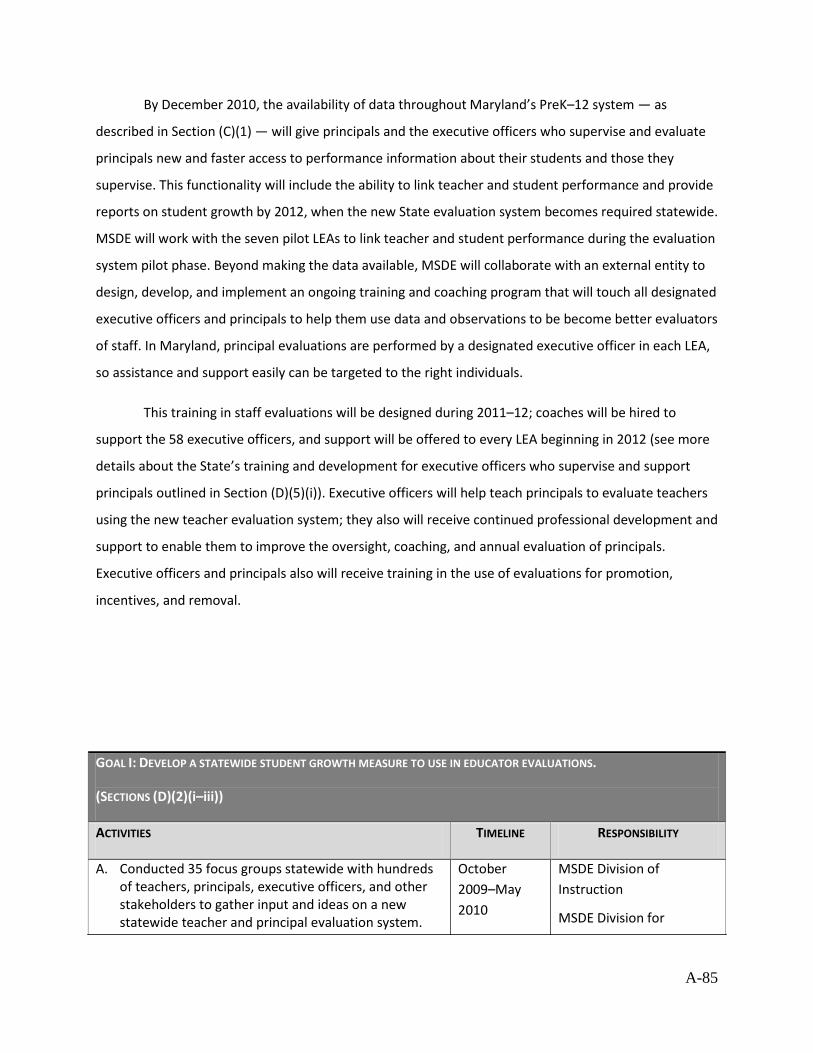
A-85
By December 2010, the availability of data throughout Maryland’s PreK–12 system — as
described in Section (C)(1) — will give principals and the executive officers who supervise and evaluate
principals new and faster access to performance information about their students and those they
supervise. This functionality will include the ability to link teacher and student performance and provide
reports on student growth by 2012, when the new State evaluation system becomes required statewide.
MSDE will work with the seven pilot LEAs to link teacher and student performance during the evaluation
system pilot phase. Beyond making the data available, MSDE will collaborate with an external entity to
design, develop, and implement an ongoing training and coaching program that will touch all designated
executive officers and principals to help them use data and observations to be become better evaluators
of staff. In Maryland, principal evaluations are performed by a designated executive officer in each LEA,
so assistance and support easily can be targeted to the right individuals.
This training in staff evaluations will be designed during 2011–12; coaches will be hired to
support the 58 executive officers, and support will be offered to every LEA beginning in 2012 (see more
details about the State’s training and development for executive officers who supervise and support
principals outlined in Section (D)(5)(i)). Executive officers will help teach principals to evaluate teachers
using the new teacher evaluation system; they also will receive continued professional development and
support to enable them to improve the oversight, coaching, and annual evaluation of principals.
Executive officers and principals also will receive training in the use of evaluations for promotion,
incentives, and removal.
GOAL I: DEVELOP A STATEWIDE STUDENT GROWTH MEASURE TO USE IN EDUCATOR EVALUATIONS.
(SECTIONS (D)(2)(i–iii))
ACTIVITIES TIMELINE RESPONSIBILITY
A. Conducted 35 focus groups statewide with hundreds of teachers, principals, executive officers, and other stakeholders to gather input and ideas on a new statewide teacher and principal evaluation system.
October 2009–May 2010
MSDE Division of Instruction
MSDE Division for
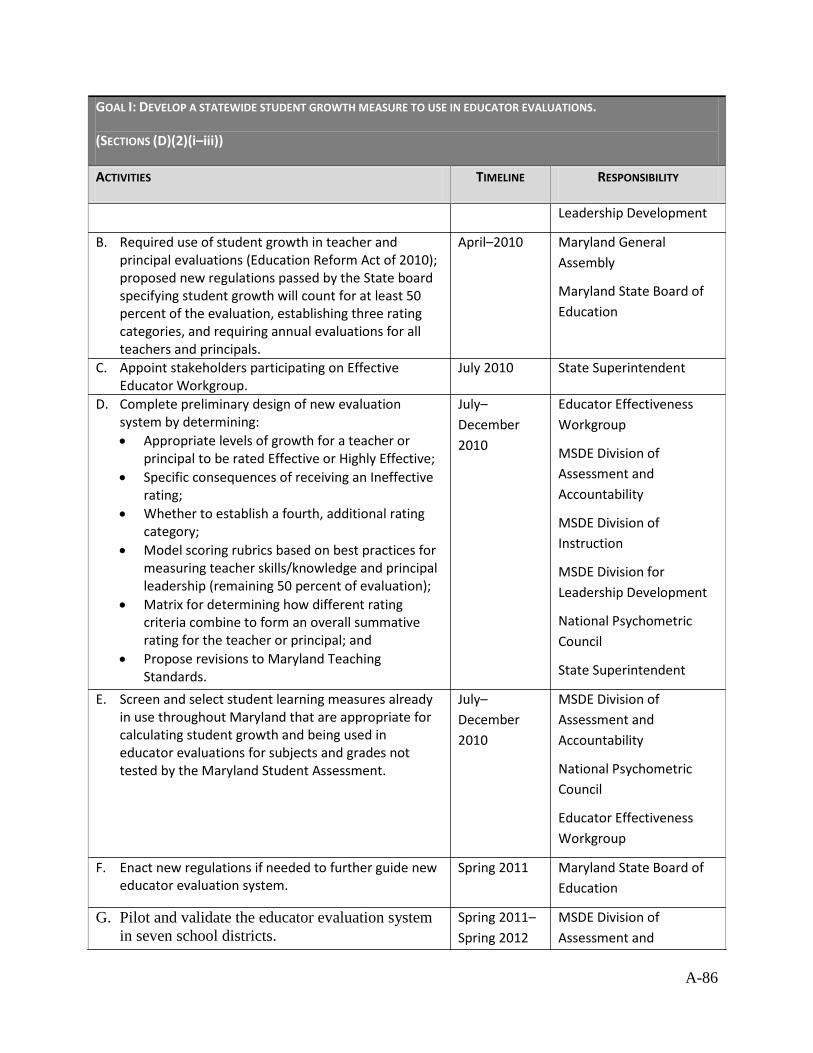
A-86
GOAL I: DEVELOP A STATEWIDE STUDENT GROWTH MEASURE TO USE IN EDUCATOR EVALUATIONS.
(SECTIONS (D)(2)(i–iii))
ACTIVITIES TIMELINE RESPONSIBILITY
Leadership Development
B. Required use of student growth in teacher and principal evaluations (Education Reform Act of 2010); proposed new regulations passed by the State board specifying student growth will count for at least 50 percent of the evaluation, establishing three rating categories, and requiring annual evaluations for all teachers and principals.
April–2010 Maryland General Assembly
Maryland State Board of Education
C. Appoint stakeholders participating on Effective Educator Workgroup.
July 2010 State Superintendent
D. Complete preliminary design of new evaluation system by determining: • Appropriate levels of growth for a teacher or
principal to be rated Effective or Highly Effective; • Specific consequences of receiving an Ineffective
rating; • Whether to establish a fourth, additional rating
category; • Model scoring rubrics based on best practices for
measuring teacher skills/knowledge and principal leadership (remaining 50 percent of evaluation);
• Matrix for determining how different rating criteria combine to form an overall summative rating for the teacher or principal; and
• Propose revisions to Maryland Teaching Standards.
July–December 2010
Educator Effectiveness Workgroup
MSDE Division of Assessment and Accountability
MSDE Division of Instruction
MSDE Division for Leadership Development
National Psychometric Council
State Superintendent
E. Screen and select student learning measures already in use throughout Maryland that are appropriate for calculating student growth and being used in educator evaluations for subjects and grades not tested by the Maryland Student Assessment.
July–December 2010
MSDE Division of Assessment and Accountability
National Psychometric Council
Educator Effectiveness Workgroup
F. Enact new regulations if needed to further guide new educator evaluation system.
Spring 2011 Maryland State Board of Education
G. Pilot and validate the educator evaluation system in seven school districts.
Spring 2011–Spring 2012
MSDE Division of Assessment and
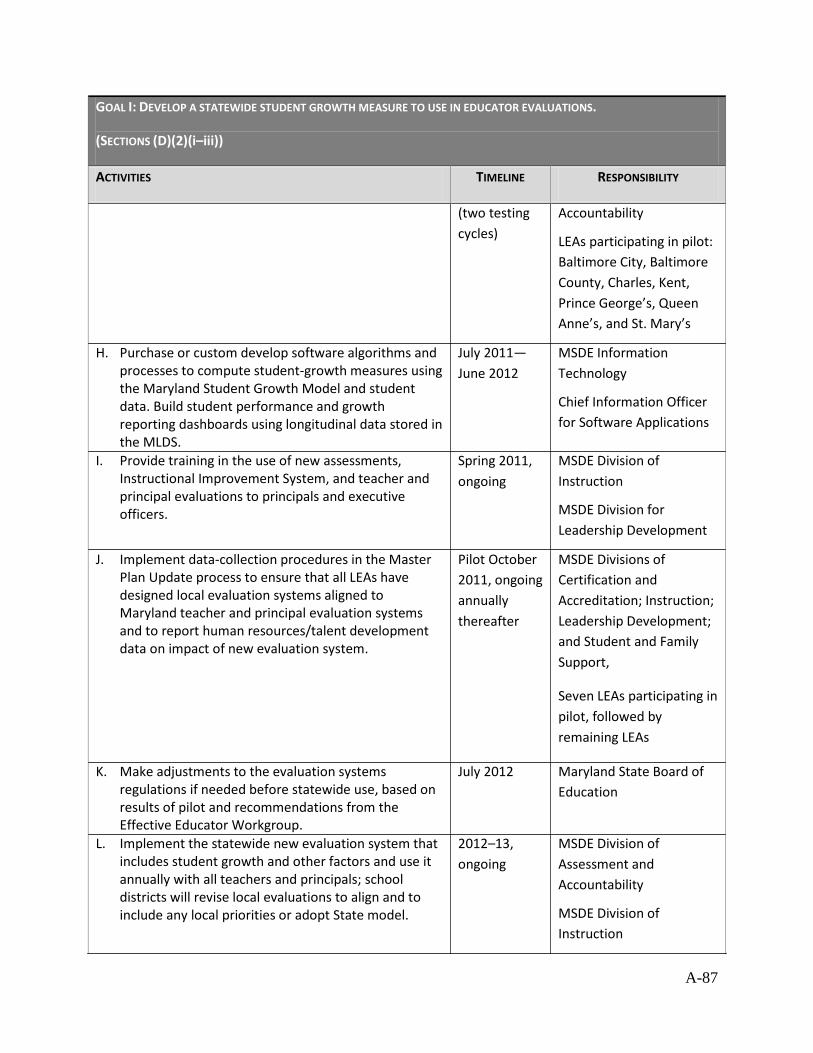
A-87
GOAL I: DEVELOP A STATEWIDE STUDENT GROWTH MEASURE TO USE IN EDUCATOR EVALUATIONS.
(SECTIONS (D)(2)(i–iii))
ACTIVITIES TIMELINE RESPONSIBILITY
(two testing cycles)
Accountability
LEAs participating in pilot: Baltimore City, Baltimore County, Charles, Kent, Prince George’s, Queen Anne’s, and St. Mary’s
H. Purchase or custom develop software algorithms and processes to compute student-growth measures using the Maryland Student Growth Model and student data. Build student performance and growth reporting dashboards using longitudinal data stored in the MLDS.
July 2011—June 2012
MSDE Information Technology
Chief Information Officer for Software Applications
I. Provide training in the use of new assessments, Instructional Improvement System, and teacher and principal evaluations to principals and executive officers.
Spring 2011, ongoing
MSDE Division of Instruction
MSDE Division for Leadership Development
J. Implement data-collection procedures in the Master Plan Update process to ensure that all LEAs have designed local evaluation systems aligned to Maryland teacher and principal evaluation systems and to report human resources/talent development data on impact of new evaluation system.
Pilot October 2011, ongoing annually thereafter
MSDE Divisions of Certification and Accreditation; Instruction; Leadership Development; and Student and Family Support,
Seven LEAs participating in pilot, followed by remaining LEAs
K. Make adjustments to the evaluation systems regulations if needed before statewide use, based on results of pilot and recommendations from the Effective Educator Workgroup.
July 2012 Maryland State Board of Education
L. Implement the statewide new evaluation system that includes student growth and other factors and use it annually with all teachers and principals; school districts will revise local evaluations to align and to include any local priorities or adopt State model.
2012–13, ongoing
MSDE Division of Assessment and Accountability
MSDE Division of Instruction

A-88
GOAL I: DEVELOP A STATEWIDE STUDENT GROWTH MEASURE TO USE IN EDUCATOR EVALUATIONS.
(SECTIONS (D)(2)(i–iii))
ACTIVITIES TIMELINE RESPONSIBILITY
MSDE Division for Leadership Development
All 24 LEAs
M. Begin reporting statewide teacher and principal evaluation data, methods, and procedures on MSDE’s educator web portal.
2012–13, ongoing
MSDE Division of Assessment and Accountability
N. Test and validate new (Common Core) assessments for measuring student growth in new educator evaluation system.
2014–16 Maryland’s National Psychometric Council
MSDE Division of Assessment and Accountability
MSDE Division of Instruction
MSDE Division for Leadership Development
LEAs
O. Begin using Common Core assessment data to inform teacher and principal evaluations; upgrade data systems and performance and accountability dashboards with new assessments for use in teacher and principal evaluations and Instructional Improvement System.
2016–17, ongoing
MSDE Division of Assessment and Accountability
MSDE Information Technology staff
Applications Chief Information Officer
All 24 LEAs
Section (D)(2)(iv): Using Evaluations for Professional Development, Compensation, Tenure,
Promotion, and Removal
A-89
Section (D)(2)(iv)(a): Use Evaluations to Inform Decisions Regarding Developing Teachers and
Principals
The 2009 Teaching, Empowering, Leading, and Learning Maryland Survey (TELL) provides
information from new teachers on their perceptions of induction and mentoring services. In addition,
the Professional Development Advisory Council, the Governor’s STEM Task Force, and the Teacher
Shortage Task Force reports all recommended ensuring quality induction and mentoring programs. For
new teachers, the State Board adopted regulations in April 2010 that guide a comprehensive and
rigorous approach for providing all new/non-tenured teachers with consistently high-quality support
(see Appendix 30). The regulations are proceeding through the final regulatory review process. The new
induction program requirements — which include ensuring that teachers receive top-notch support
throughout their entire three-year probationary status period — replace the patchwork of uneven
induction programs currently operated by school districts. The new requirements are effective with the
start of the 2010–11 school year and LEAs must be fully compliant with all program components by July
2011. These regulations direct LEAs to provide a mentor, regularly scheduled opportunities for new
teachers to co-teach or observe classrooms, target professional development and match it to each
teacher’s needs, and conduct regular formative reviews and classroom observations. Importantly, new
teachers who are rated Ineffective will receive more intensive support and frequent evaluations and
feedback.
As Maryland’s new teacher evaluation system is operational — with its improved measures of
teacher effectiveness — the new Maryland induction program will be an ideal platform, not just for
ensuring that new teachers get support that can make them more successful, but also for identifying
Highly Effective teachers who might become mentors. Moreover, as Maryland shifts to a more
performance-based certification system for all teachers — as described in Section (D)(2)(iv)(c) — veteran
teachers will be expected to develop detailed professional development plans linked to specific needs
identified in their annual evaluations. As teachers seek recertification every five years, they will need to
demonstrate their performance as an Effective teacher and show they have met the goals in their
targeted professional development plan in order to be re-licensed.
In addition, many new principals would benefit greatly from a qualified mentor. However,
because Maryland has no qualifying or certifying program for principal mentors, the quality of mentor
programs and skills of principal mentors varies greatly across the State. In response, in August 2010,
MSDE will present to the State Board a regulation outlining State standards for principal mentor
A-90
programs. Also, in collaboration with an institution of higher education (IHE), Maryland will develop a
principal mentor-certificating program that will be based on the leadership standards in the Maryland
Instructional Leadership Framework. Planning for the certificating program will begin in fall 2010, and
implementation will begin as early as 2011. Over time, the new teacher and principal evaluation results
will help inform the support and professional development that all educators receive — so all learn and
grow to become more effective — in these ways:
• Beginning in 2011, Maryland will ensure that the 1,800 professional
development/data/content coaches it has identified across all LEAs are receiving intensive
training over three years on the emerging Common Core State Curriculum, new
assessments, the Instructional Improvement System, and the Online Instructional Toolkit
the State is developing (see Section (B)(3)). This existing cadre of coaches will be expanded
to include teacher leaders to ensure every school has a reading, mathematics, and STEM
coach/lead teacher.
• Beginning in 2012, as the new evaluation system becomes a statewide requirement,
intensive and ongoing training of and support for every principal and executive officer will
help ensure that all supervisors understand their roles, the role of evaluation, and the ways
to use evaluation results to tailor professional development needs and support teachers in
identifying and implementing individualized professional development goals and plans. This
training will include a focus on linking evaluation results and individual teacher needs to the
best professional development activities (as described in more detail in Section (D)(5)(i)).
Research suggests that, when principals are well trained, their assessments of teachers
become one of the best predictors of future student achievement (Jacob and Lefgren, The
persistence of teacher-induced learning gains, NBER working paper, June 2008)
• By 2014, Maryland will create online options that allow individual teachers and principals to
select professional learning opportunities that meet their individual needs, as identified in
the teacher and principal evaluation systems. Using technology to help teachers and
principals make these links and providing professional development online will allow a truly
individualized approach to professional development (as described in more detail in Section
(D)(5)(i)).
A-91
Section (D)(2)(iv)(b): Use Evaluations to Inform Decisions Regarding Compensation and Promotion of
Teachers and Principals
Maryland leaders at both the State and local levels are committed to transitioning to
compensation systems for educators that better reward performance and signal the premium value the
State places on those who are exceptional at their jobs. As described in detail in Section (D)(3)(i), the
Education Reform Act of 2010 allows teachers and principals designated as Highly Effective to receive
special, locally-negotiated financial incentives to work in low-achieving schools — thus connecting the
new educator evaluation system to compensation decisions and to the State’s need to distribute its
most talented teachers and principals more equitably. In addition, the State is setting aside grant money
in order to fund locally negotiated incentives for highly effective STEM teachers and teachers of English
Language Learners more generously. Teachers and principals in the seven school districts piloting the
new evaluation system beginning in January 2011 and for the following 18 months and who are rated
Highly Effective will be eligible for these incentives as soon as the end of the 2010–11 school year.
However, all participating LEAs, consistent with locally negotiated collective bargaining
agreements, will use their Race to the Top funding to experiment with new compensation models that
provide differentiated compensation to Effective or Highly Effective teachers and principals, especially
subject areas where shortages exist and Maryland especially needs strong teachers: STEM fields and
world languages. To support and accelerate their efforts, beginning in September 2010 MSDE will
convene superintendents, human resources officers, and local union leaders from five Maryland school
districts that have developed new compensation models and incentives and thus can serve as examples
to others. Among these five school districts is the Prince George’s County school district, which has
begun piloting a robust teacher effectiveness initiative to overhaul teacher recruitment, evaluation,
development, retention, and dismissal processes. The school district’s plans are so well considered that
it was among 10 finalist school districts in a highly competitive national application process to win
support from the Bill & Melinda Gates Foundation for this sort of comprehensive talent-development
system. Anne Arundel, Montgomery, Queen Anne’s, and Washington Counties round out Maryland
districts that have implemented new, differentiated compensation systems for teachers and principals.
Maryland will direct a portion of its Race to the Top funds — and will expect participating LEAs to do so
as well — to invest more in the success and refinement of these five models.
By January 2011, an advisory group of leaders from these five school districts — called the
Performance Compensation Workgroup — will pool lessons and ideas from their individual efforts to
A-92
develop a model compensation system that can be presented to their peer school districts; the model
will propose ways of compensating teachers differently based on performance/evaluation results,
career points and leadership roles, and subject areas. The model also will propose differentiated pay
approaches for principals based on performance evaluation results. In turn, MSDE staff will provide
guidance and technical support in assisting each of the remaining 19 systems in navigating the political
and technical challenges needed to implement new compensation plans that meet their unique needs.
Finally, as part of the revamped teacher certificate structure now being developed for adoption
in 2011 — described in Section (D)(2)(iv)(c) — special promotion and locally negotiated compensation
opportunities will be developed for those evaluated as Highly Effective and interested in pursuing
additional responsibilities or professional growth opportunities, including roles as new-teacher mentors,
peer reviewers and coaches, and resource teachers. Participating LEAs will be encouraged to direct local
dollars, including tuition reimbursement, to support teachers in meeting the goals outlined in their
professional-development plans and required for recertification and teacher leader certification.
Section (D)(2)(iv)(c): Use Evaluations to Inform Decisions Regarding Granting Tenure and Certification
to Teachers and Principals
The Education Reform Act of 2010 changed the probationary period for teachers to achieve
tenure from two to three years. Non-tenured teachers who are struggling will be assigned a mentor and
given access to additional professional development opportunities. Novice teachers must achieve a
rating of Effective by their third year of teaching or their contract will not be renewed. In addition, after
appropriate support, school districts have the right to non-renew the contract of a novice teacher at any
point during the first three years and do not need to wait until this third year.
Maryland’s goals for new-teacher induction include to provide all new teachers the support they
need to learn to be effective in the classroom, to assess whether each new teacher has the skills and
knowledge to succeed in the profession long term, and to ensure the decision to offer tenure is made
with this consideration in mind. As described earlier in Section (D)(2)(iii), training will be provided for
executive officers and principals in their supervisory duties to make these goals a reality in Maryland
schools. Training for mentors and Induction Program Coordinators is described in Section (D)(5)(i).
A-93
Under Maryland law, principals have never had a right to tenure and can be dismissed from the
position whenever they demonstrate a pattern of ineffective performance. Maryland is expanding its
promising Aspiring Principals Institute to serve all regions of the State and will institute new mentoring
guidelines resulting in a principal mentor certificate to be implemented in fall 2010 (see details in
Section (D)(5)) to help ensure that new principals receive deeper support to be effective in meeting the
expectations of the State’s new principal evaluation system.
In addition to changing policies and programs that can improve induction and help school
systems make smarter decisions about tenure, Maryland is well under way to restructuring the current
certificate system to a three-tiered, performance-based structure. In March 2010, the State Board
convened a workgroup composed of State Board of Education members, LEA human resource and
certification directors, and higher-education representatives to begin the regulatory process connecting
teacher effectiveness to certification. Maryland’s revised structure will align tenure with a teacher’s
evaluation rating as Effective in order to achieve certification status. This certificate structure will be
implemented by July 2013, recognizing that the new statewide evaluation systems for teachers and
principals will become effective during the 2012–13 school year. Tier 1 will be an initial license granted
to novice teachers for three years. New teachers who are not rated Effective by the end of three years
will not earn tenure and therefore will not receive a continuing certification for teaching. Tier 2 will
represent a certificate granted when teachers achieve tenure and will be valid for five years.
As part of receiving Tier 2 certification, teachers will create and implement a professional
development plan with specific professional growth outcomes. To receive continuing Tier 2 certification
every five years, teachers and principals will need to be consistently rated at least Effective under the
new teacher and principal evaluation systems and will need to show mastery in achieving their
professional development outcomes. Tier 3 will be optional; eligibility for this certificate may include
graduate study, advanced degrees, or MSDE-approved national certifications, such as the Administrator
III certification that is being developed by the National Board for Professional Teaching Standards.
This proposed certification redesign plan, currently under consideration by a design workgroup
that includes representatives from LEA human resource officers, the Maryland State Board of Education,
institutions of higher education, and MSDE, moves the focus of certification from accumulating credits
and advanced degrees to evidence of educator effectiveness.
A-94
Section (D)(2)(iv)(d): Use Evaluations to Inform Decisions Regarding Removing Ineffective Teachers
and Principals
As part of Maryland’s proposed new teacher and principal evaluation system, educators who do
not meet at least the Effective standard on the student growth portion of their evaluations cannot be
rated Effective overall and will thus be deemed Ineffective. Participating LEAs will use the new teacher
and principal evaluation system as the basis for decisions about removal of Ineffective principals and
Ineffective tenured and non-tenured teachers after they have had ample support and opportunities for
improvement. Processes for removing ineffective teachers and principals will include:
• Additional supports: After the first year of being rated Ineffective, non-tenured/novice
teachers receive additional supports and extra coaching, feedback, and evaluations.
• Focused professional development: After the first year of being rated Ineffective, principals
and tenured teachers modify their professional development plans in conjunction with their
supervisor and identify clear improvement goals and specific ways and opportunities for
improving their effectiveness, based on problems identified by their evaluation. They also
receive additional supports, observations, and feedback throughout the year, and a formal
year-end annual evaluation.
• Non-renewal of non-tenured teachers’ contracts: If a non-tenured teacher cannot
achieve a rating of Effective within three years, the teacher’s contract will not be
renewed. In addition, after providing appropriate support, school districts have the
right to non-renew a novice teacher’s contract at any point during the first three years
and do not need to wait until this third year.
• Termination/removal of tenured teachers: After being rated Ineffective for two
years, tenured teachers either are removed or transitioned to a second-class certificate
— which freezes their movement on the salary schedule — and enter into a specific
performance-improvement plan with their supervisor. Consistent with local
bargaining agreements; a tenured teacher rated Ineffective for a third year in a row
will be terminated.
• Termination/removal of principals: Although principals in Maryland do not have tenure, the
process will be similar: Principals who are not rated Effective will move into a performance-
improvement plan with their supervisor. Principals can be removed from their positions at
the will of the LEA Superintendent.
A-95
The State Board of Education already has signaled its intention to begin in January 2011 any
needed regulatory process to connect teacher and principal ineffectiveness and removal. With broad
powers delegated to it by the General Assembly, the State Board of Education has the authority to act
on these issues.
Until the State Board enacts new policies guiding the removal of Ineffective teachers and
principals early next year and the new evaluation system goes statewide in 2012, participating LEAs in
the interim will prohibit teachers with a second-class certificate — meaning their performance has been
unsatisfactory for two consecutive years -- and principals rated unsatisfactory for two consecutive years
from filling vacancies in a persistently low-achieving school. While no child should be in a classroom with
an Ineffective educator — and, over the next few years, the new evaluation system will better ensure
that is the case — Maryland leaders recognize that the most vulnerable students absolutely need the
best educators supporting them and have committed to take this immediate, urgent step to make sure
that is the case.
In addition to these eventual policy changes in early 2011, Maryland is committed to greater
transparency about the quality and effectiveness of its educator workforce. State leaders believe that
data — regularly presented to policymakers, school leaders, and the public — can be an important tool
for ensuring the new educator evaluation system accomplishes its goal of dramatically improving
student learning. To ensure quality, equity, and fairness of the educator evaluation systems, LEAs will
report to MSDE annually on evaluations in their Master Plan update, as required by Maryland’s Bridge to
Excellence legislation (see Section (A)(2)(i). These annual reports will include information on how LEAs
are measuring each domain and how teacher and principal evaluations are informing decisions
concerning induction, retention, removal, promotion, awarding of tenure, and professional
development. Additionally, MSDE will maintain a public web site to report each year the percentage of
teachers and principals — by school (for teachers) and by system (for teachers and principals) — who
are rated Ineffective, Effective, or Highly Effective; the percentage of teachers and principals retained
each year; the percentage of novice teachers achieving tenure status; and the percentage of teachers
and principals who have been continually rated Ineffective and are exiting the system. LEAs will be
expected to maintain a public web site to report aggregated teacher and principal evaluation data,
methods, and procedures (as described in Section (C)(2)).
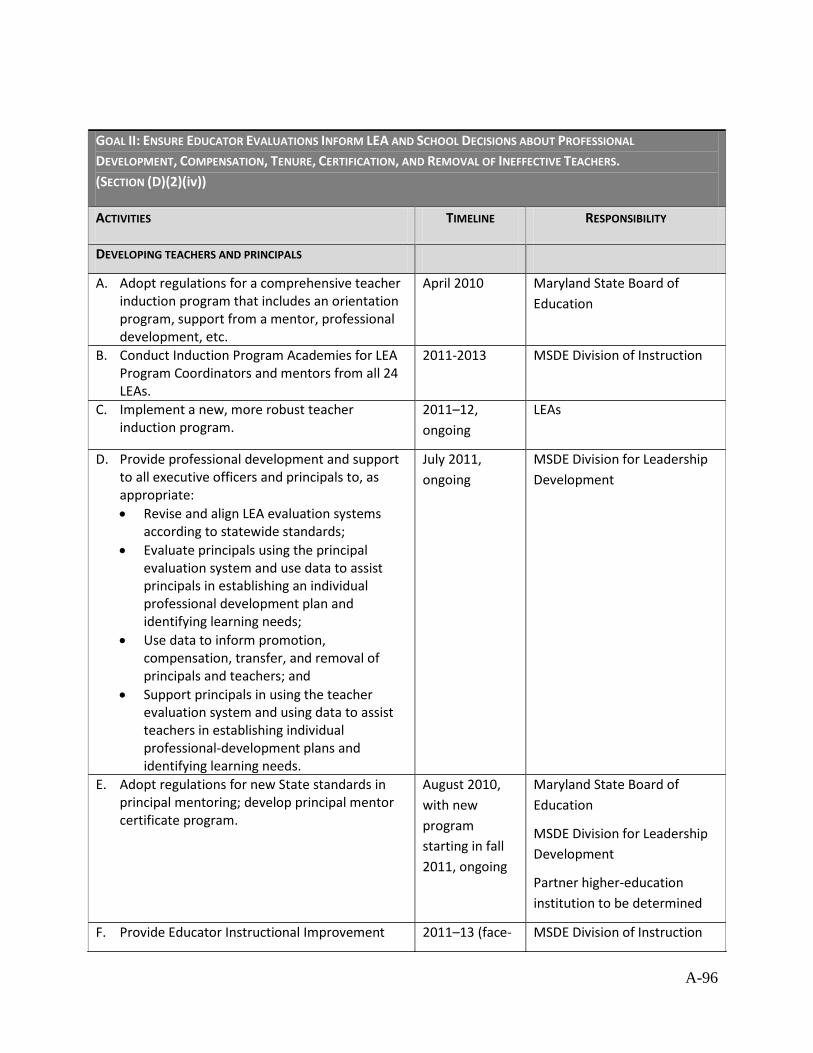
A-96
GOAL II: ENSURE EDUCATOR EVALUATIONS INFORM LEA AND SCHOOL DECISIONS ABOUT PROFESSIONAL
DEVELOPMENT, COMPENSATION, TENURE, CERTIFICATION, AND REMOVAL OF INEFFECTIVE TEACHERS. (SECTION (D)(2)(iv))
ACTIVITIES TIMELINE RESPONSIBILITY
DEVELOPING TEACHERS AND PRINCIPALS
A. Adopt regulations for a comprehensive teacher induction program that includes an orientation program, support from a mentor, professional development, etc.
April 2010 Maryland State Board of Education
B. Conduct Induction Program Academies for LEA Program Coordinators and mentors from all 24 LEAs.
2011-2013 MSDE Division of Instruction
C. Implement a new, more robust teacher induction program.
2011–12, ongoing
LEAs
D. Provide professional development and support to all executive officers and principals to, as appropriate: • Revise and align LEA evaluation systems
according to statewide standards; • Evaluate principals using the principal
evaluation system and use data to assist principals in establishing an individual professional development plan and identifying learning needs;
• Use data to inform promotion, compensation, transfer, and removal of principals and teachers; and
• Support principals in using the teacher evaluation system and using data to assist teachers in establishing individual professional-development plans and identifying learning needs.
July 2011, ongoing
MSDE Division for Leadership Development
E. Adopt regulations for new State standards in principal mentoring; develop principal mentor certificate program.
August 2010, with new program starting in fall 2011, ongoing
Maryland State Board of Education
MSDE Division for Leadership Development
Partner higher-education institution to be determined
F. Provide Educator Instructional Improvement 2011–13 (face- MSDE Division of Instruction
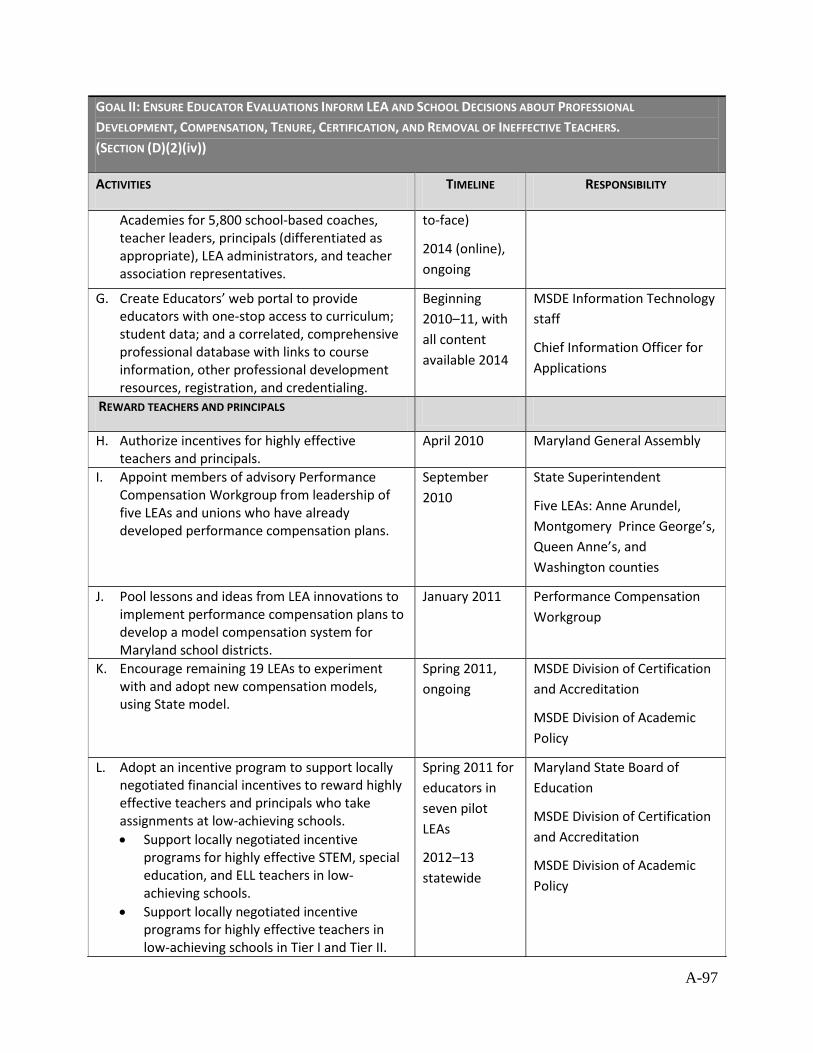
A-97
GOAL II: ENSURE EDUCATOR EVALUATIONS INFORM LEA AND SCHOOL DECISIONS ABOUT PROFESSIONAL
DEVELOPMENT, COMPENSATION, TENURE, CERTIFICATION, AND REMOVAL OF INEFFECTIVE TEACHERS. (SECTION (D)(2)(iv))
ACTIVITIES TIMELINE RESPONSIBILITY
Academies for 5,800 school-based coaches, teacher leaders, principals (differentiated as appropriate), LEA administrators, and teacher association representatives.
to-face)
2014 (online), ongoing
G. Create Educators’ web portal to provide educators with one-stop access to curriculum; student data; and a correlated, comprehensive professional database with links to course information, other professional development resources, registration, and credentialing.
Beginning 2010–11, with all content available 2014
MSDE Information Technology staff
Chief Information Officer for Applications
REWARD TEACHERS AND PRINCIPALS
H. Authorize incentives for highly effective teachers and principals.
April 2010 Maryland General Assembly
I. Appoint members of advisory Performance Compensation Workgroup from leadership of five LEAs and unions who have already developed performance compensation plans.
September 2010
State Superintendent
Five LEAs: Anne Arundel, Montgomery Prince George’s, Queen Anne’s, and Washington counties
J. Pool lessons and ideas from LEA innovations to implement performance compensation plans to develop a model compensation system for Maryland school districts.
January 2011 Performance Compensation Workgroup
K. Encourage remaining 19 LEAs to experiment with and adopt new compensation models, using State model.
Spring 2011, ongoing
MSDE Division of Certification and Accreditation
MSDE Division of Academic Policy
L. Adopt an incentive program to support locally negotiated financial incentives to reward highly effective teachers and principals who take assignments at low-achieving schools. • Support locally negotiated incentive
programs for highly effective STEM, special education, and ELL teachers in low-achieving schools.
• Support locally negotiated incentive programs for highly effective teachers in low-achieving schools in Tier I and Tier II.
Spring 2011 for educators in seven pilot LEAs
2012–13 statewide
Maryland State Board of Education
MSDE Division of Certification and Accreditation
MSDE Division of Academic Policy
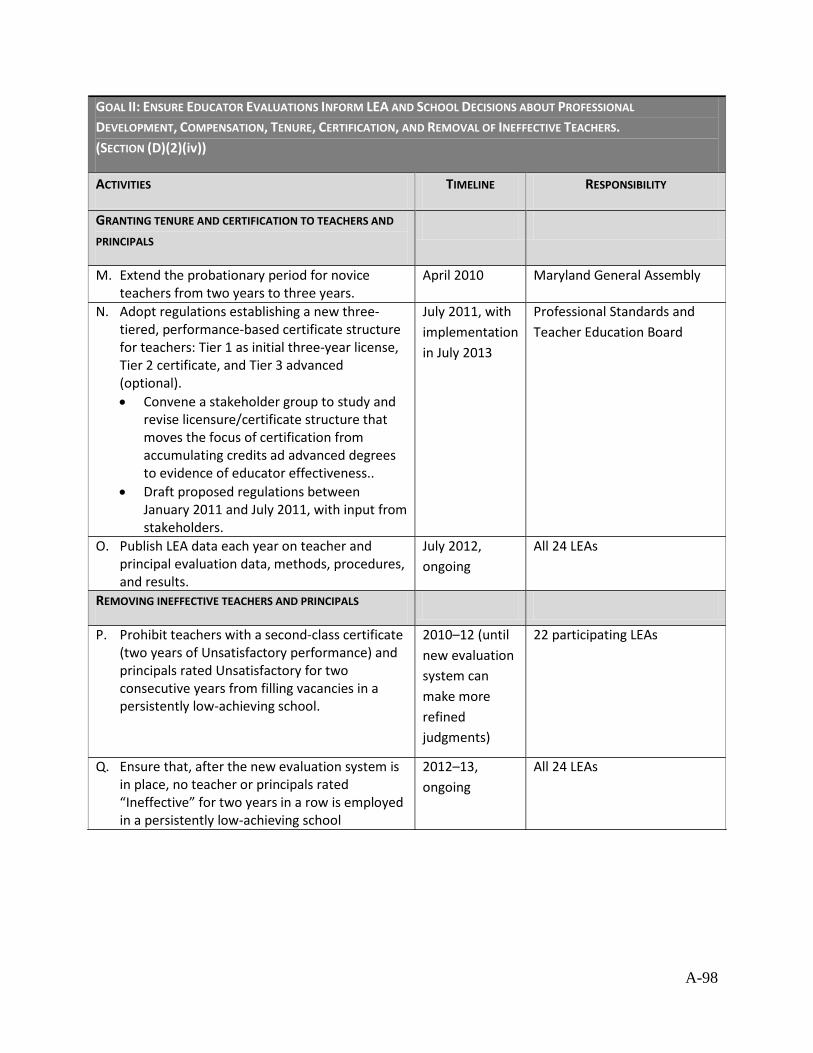
A-98
GOAL II: ENSURE EDUCATOR EVALUATIONS INFORM LEA AND SCHOOL DECISIONS ABOUT PROFESSIONAL
DEVELOPMENT, COMPENSATION, TENURE, CERTIFICATION, AND REMOVAL OF INEFFECTIVE TEACHERS. (SECTION (D)(2)(iv))
ACTIVITIES TIMELINE RESPONSIBILITY
GRANTING TENURE AND CERTIFICATION TO TEACHERS AND
PRINCIPALS
M. Extend the probationary period for novice teachers from two years to three years.
April 2010 Maryland General Assembly
N. Adopt regulations establishing a new three-tiered, performance-based certificate structure for teachers: Tier 1 as initial three-year license, Tier 2 certificate, and Tier 3 advanced (optional). • Convene a stakeholder group to study and
revise licensure/certificate structure that moves the focus of certification from accumulating credits ad advanced degrees to evidence of educator effectiveness..
• Draft proposed regulations between January 2011 and July 2011, with input from stakeholders.
July 2011, with implementation in July 2013
Professional Standards and Teacher Education Board
O. Publish LEA data each year on teacher and principal evaluation data, methods, procedures, and results.
July 2012, ongoing
All 24 LEAs
REMOVING INEFFECTIVE TEACHERS AND PRINCIPALS
P. Prohibit teachers with a second-class certificate (two years of Unsatisfactory performance) and principals rated Unsatisfactory for two consecutive years from filling vacancies in a persistently low-achieving school.
2010–12 (until new evaluation system can make more refined judgments)
22 participating LEAs
Q. Ensure that, after the new evaluation system is in place, no teacher or principals rated “Ineffective” for two years in a row is employed in a persistently low-achieving school
2012–13, ongoing
All 24 LEAs
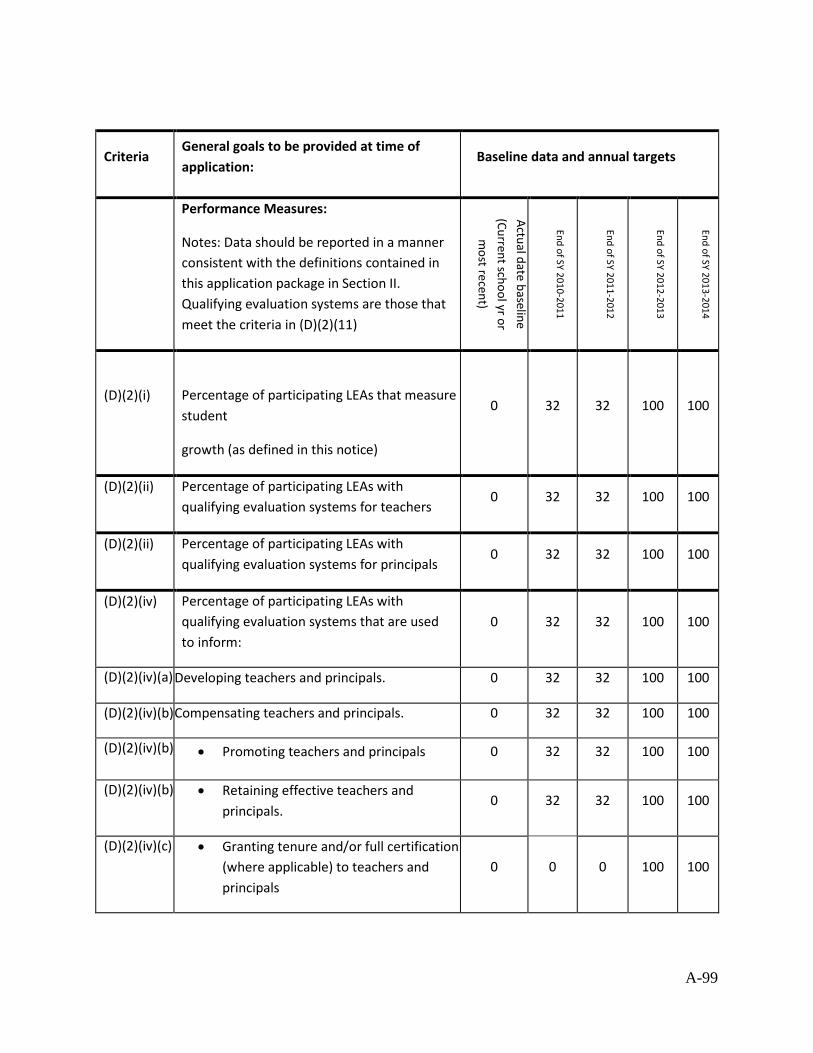
A-99
Criteria General goals to be provided at time of application:
Baseline data and annual targets
Performance Measures:
Notes: Data should be reported in a manner consistent with the definitions contained in this application package in Section II. Qualifying evaluation systems are those that meet the criteria in (D)(2)(11)
Actual date baseline
(Current school yr or
most recent)
End of SY 2010-2011
End of SY 2011-2012
End of SY 2012-2013
End of SY 2013-2014
(D)(2)(i)
Percentage of participating LEAs that measure student
growth (as defined in this notice)
0 32 32 100 100
(D)(2)(ii) Percentage of participating LEAs with qualifying evaluation systems for teachers
0 32 32 100 100
(D)(2)(ii) Percentage of participating LEAs with qualifying evaluation systems for principals
0 32 32 100 100
(D)(2)(iv) Percentage of participating LEAs with qualifying evaluation systems that are used to inform:
0 32 32 100 100
(D)(2)(iv)(a) Developing teachers and principals. 0 32 32 100 100
(D)(2)(iv)(b) Compensating teachers and principals. 0 32 32 100 100
(D)(2)(iv)(b) • Promoting teachers and principals 0 32 32 100 100
(D)(2)(iv)(b) • Retaining effective teachers and principals.
0 32 32 100 100
(D)(2)(iv)(c) • Granting tenure and/or full certification (where applicable) to teachers and principals
0 0 0 100 100
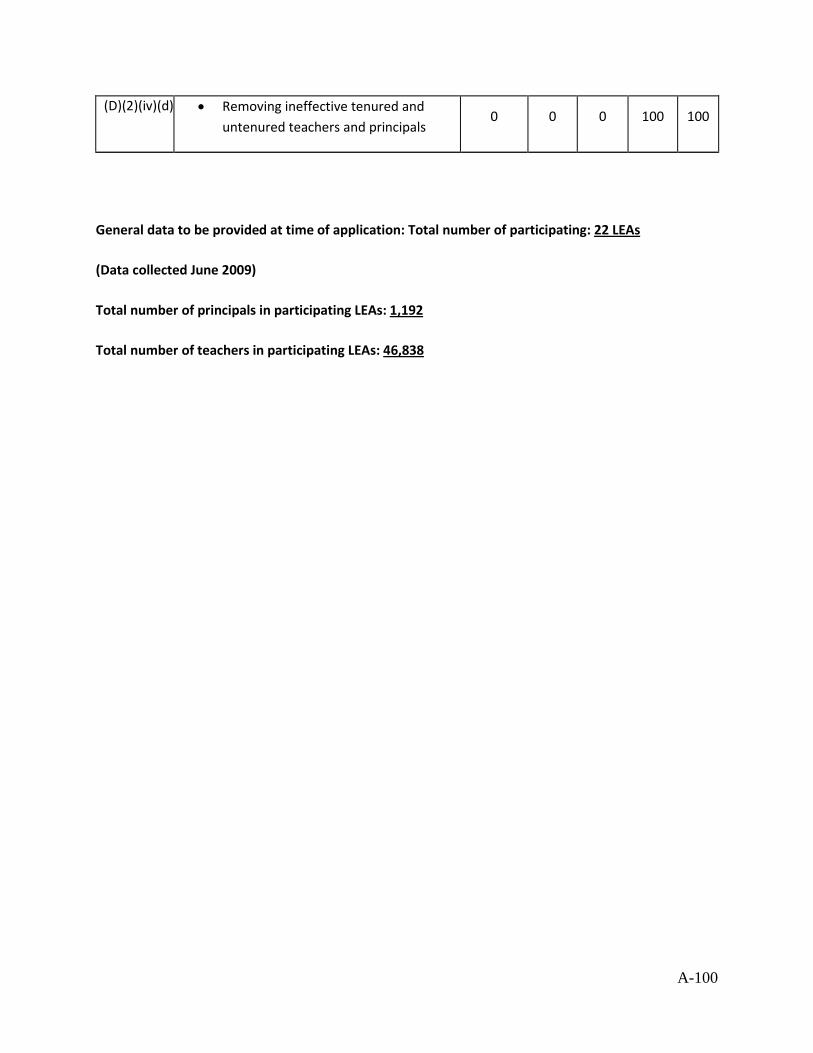
A-100
(D)(2)(iv)(d) • Removing ineffective tenured and untenured teachers and principals
0 0 0 100 100
General data to be provided at time of application: Total number of participating: 22 LEAs
(Data collected June 2009)
Total number of principals in participating LEAs: 1,192
Total number of teachers in participating LEAs: 46,838
A-101
Attachment 11: Evidence that the SEA has Adopted One or More Guidelines of Local Teacher and Principal Evaluation
and Support Systems
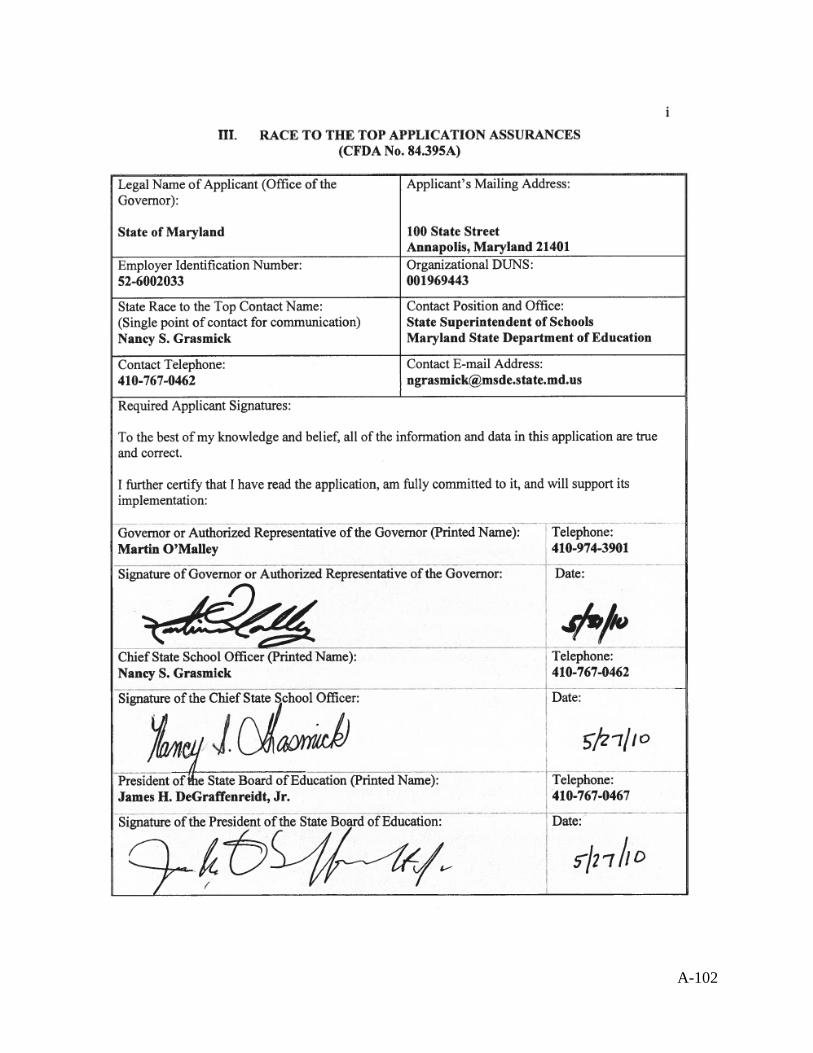
A-102
Appendix- page 1
MARYLAND
ESEA FLEXIBILITY APPENDICES
February 28, 2012
Maryland State Department of Education
200 West Baltimore Street
Baltimore, MD 21201
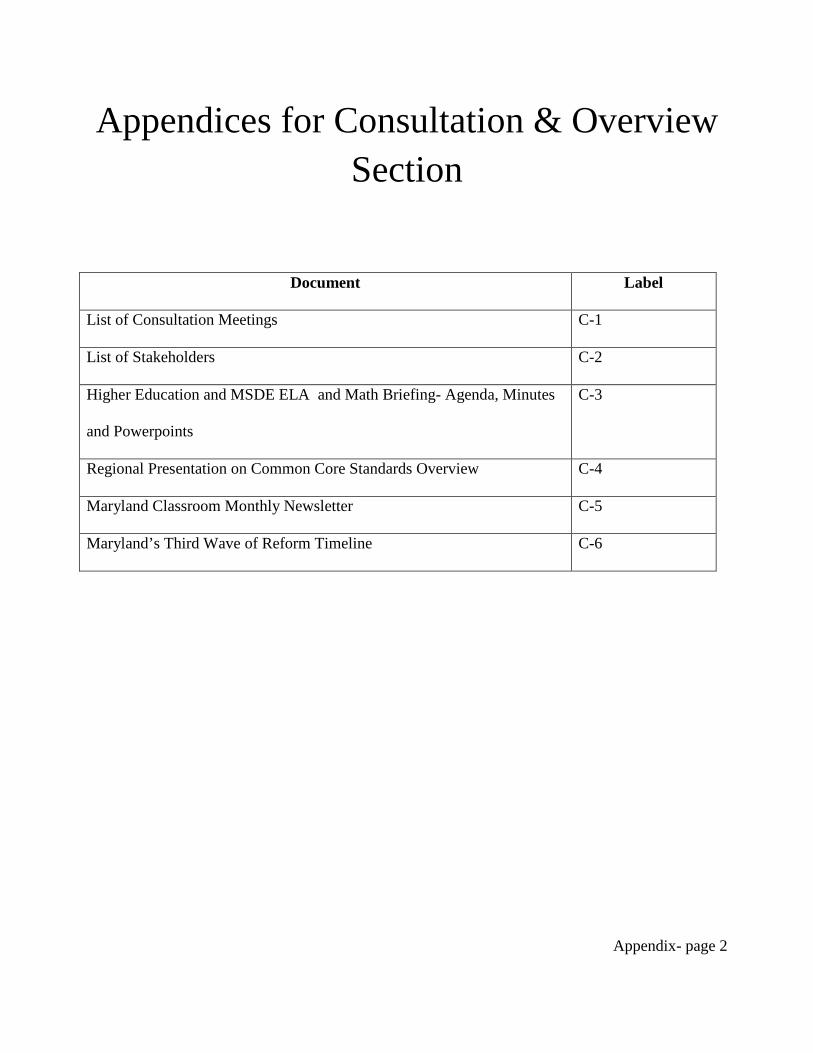
Appendix- page 2
Appendices for Consultation & Overview Section
Document Label
List of Consultation Meetings C-1
List of Stakeholders C-2
Higher Education and MSDE ELA and Math Briefing- Agenda, Minutes
and Powerpoints
C-3
Regional Presentation on Common Core Standards Overview C-4
Maryland Classroom Monthly Newsletter C-5
Maryland’s Third Wave of Reform Timeline C-6

Appendix- page 3
Appendix C-1: List of Consultation Meetings
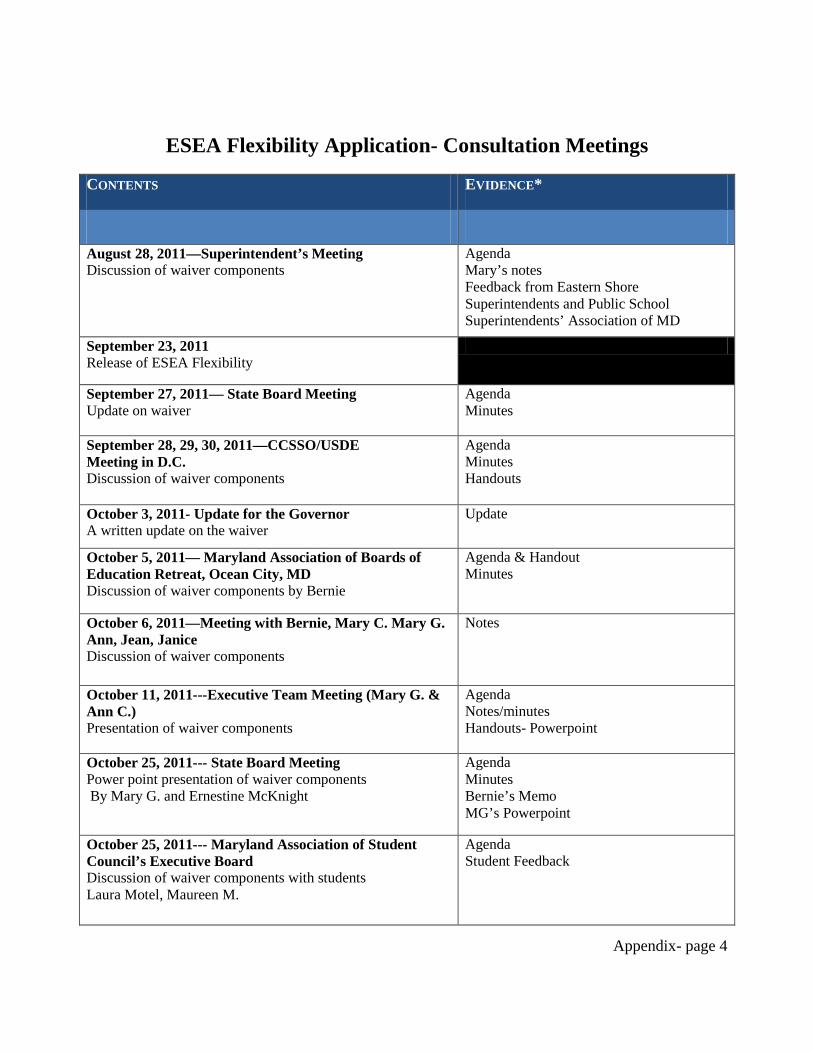
Appendix- page 4
ESEA Flexibility Application- Consultation Meetings
CONTENTS EVIDENCE*
August 28, 2011—Superintendent’s Meeting Discussion of waiver components
Agenda Mary’s notes Feedback from Eastern Shore Superintendents and Public School Superintendents’ Association of MD
September 23, 2011 Release of ESEA Flexibility
September 27, 2011— State Board Meeting Update on waiver
Agenda Minutes
September 28, 29, 30, 2011—CCSSO/USDE Meeting in D.C. Discussion of waiver components
Agenda Minutes Handouts
October 3, 2011- Update for the Governor A written update on the waiver
Update
October 5, 2011— Maryland Association of Boards of Education Retreat, Ocean City, MD Discussion of waiver components by Bernie
Agenda & Handout Minutes
October 6, 2011—Meeting with Bernie, Mary C. Mary G. Ann, Jean, Janice Discussion of waiver components
Notes
October 11, 2011---Executive Team Meeting (Mary G. & Ann C.) Presentation of waiver components
Agenda Notes/minutes Handouts- Powerpoint
October 25, 2011--- State Board Meeting Power point presentation of waiver components By Mary G. and Ernestine McKnight
Agenda Minutes Bernie’s Memo MG’s Powerpoint
October 25, 2011--- Maryland Association of Student Council’s Executive Board Discussion of waiver components with students Laura Motel, Maureen M.
Agenda Student Feedback
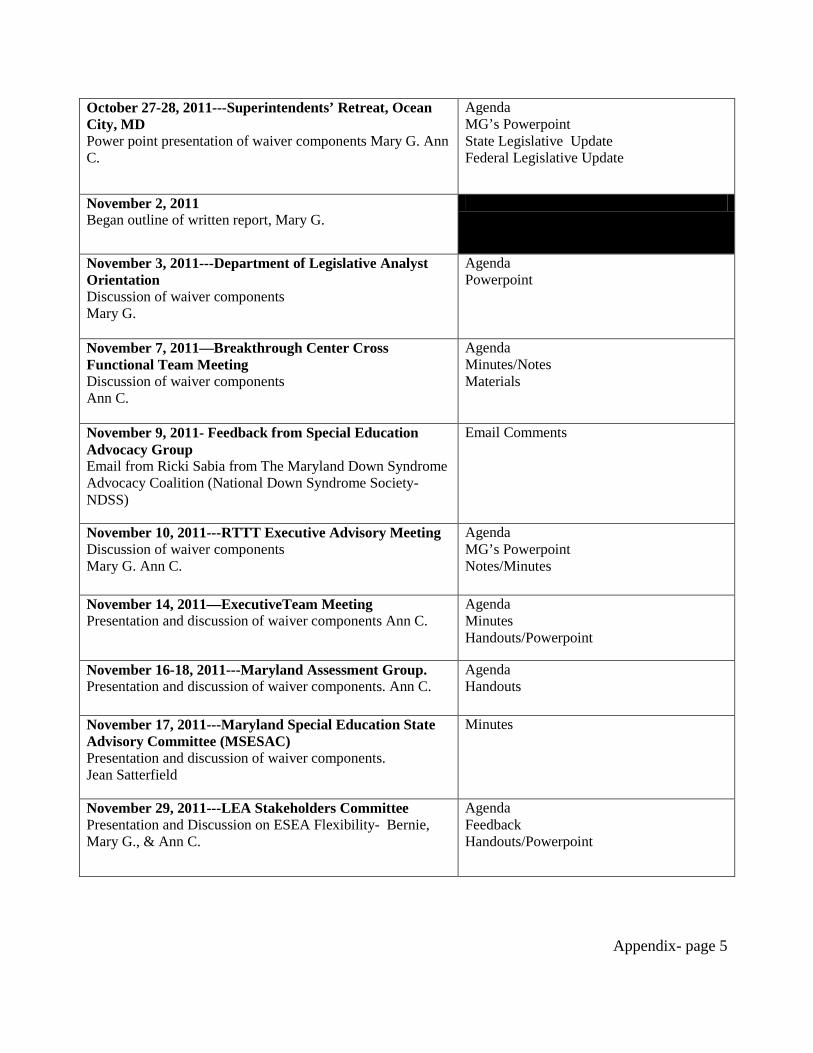
Appendix- page 5
October 27-28, 2011---Superintendents’ Retreat, Ocean City, MD Power point presentation of waiver components Mary G. Ann C.
Agenda MG’s Powerpoint State Legislative Update Federal Legislative Update
November 2, 2011 Began outline of written report, Mary G.
November 3, 2011---Department of Legislative Analyst Orientation Discussion of waiver components Mary G.
Agenda Powerpoint
November 7, 2011—Breakthrough Center Cross Functional Team Meeting Discussion of waiver components Ann C.
Agenda Minutes/Notes Materials
November 9, 2011- Feedback from Special Education Advocacy Group Email from Ricki Sabia from The Maryland Down Syndrome Advocacy Coalition (National Down Syndrome Society- NDSS)
Email Comments
November 10, 2011---RTTT Executive Advisory Meeting Discussion of waiver components Mary G. Ann C.
Agenda MG’s Powerpoint Notes/Minutes
November 14, 2011—ExecutiveTeam Meeting Presentation and discussion of waiver components Ann C.
Agenda Minutes Handouts/Powerpoint
November 16-18, 2011---Maryland Assessment Group. Presentation and discussion of waiver components. Ann C.
Agenda Handouts
November 17, 2011---Maryland Special Education State Advisory Committee (MSESAC) Presentation and discussion of waiver components. Jean Satterfield
Minutes
November 29, 2011---LEA Stakeholders Committee Presentation and Discussion on ESEA Flexibility- Bernie, Mary G., & Ann C.
Agenda Feedback Handouts/Powerpoint
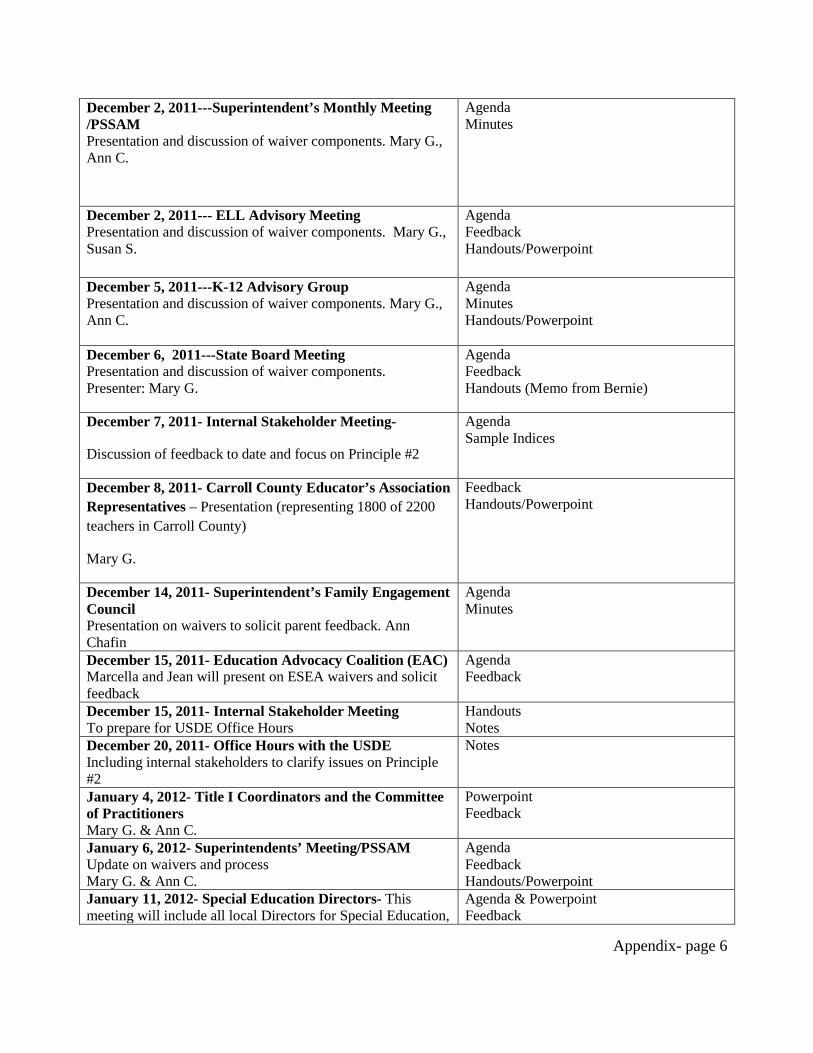
Appendix- page 6
December 2, 2011---Superintendent’s Monthly Meeting /PSSAM Presentation and discussion of waiver components. Mary G., Ann C.
Agenda Minutes
December 2, 2011--- ELL Advisory Meeting Presentation and discussion of waiver components. Mary G., Susan S.
Agenda Feedback Handouts/Powerpoint
December 5, 2011---K-12 Advisory Group Presentation and discussion of waiver components. Mary G., Ann C.
Agenda Minutes Handouts/Powerpoint
December 6, 2011---State Board Meeting Presentation and discussion of waiver components. Presenter: Mary G.
Agenda Feedback Handouts (Memo from Bernie)
December 7, 2011- Internal Stakeholder Meeting-
Discussion of feedback to date and focus on Principle #2
Agenda Sample Indices
December 8, 2011- Carroll County Educator’s Association Representatives – Presentation (representing 1800 of 2200 teachers in Carroll County)
Mary G.
Feedback Handouts/Powerpoint
December 14, 2011- Superintendent’s Family Engagement Council Presentation on waivers to solicit parent feedback. Ann Chafin
Agenda Minutes
December 15, 2011- Education Advocacy Coalition (EAC) Marcella and Jean will present on ESEA waivers and solicit feedback
Agenda Feedback
December 15, 2011- Internal Stakeholder Meeting To prepare for USDE Office Hours
Handouts Notes
December 20, 2011- Office Hours with the USDE Including internal stakeholders to clarify issues on Principle #2
Notes
January 4, 2012- Title I Coordinators and the Committee of Practitioners Mary G. & Ann C.
Powerpoint Feedback
January 6, 2012- Superintendents’ Meeting/PSSAM Update on waivers and process Mary G. & Ann C.
Agenda Feedback Handouts/Powerpoint
January 11, 2012- Special Education Directors- This meeting will include all local Directors for Special Education,
Agenda & Powerpoint Feedback

Appendix- page 7
Directors for Infants and Toddlers, and the Preschool Coordinators Presentation on the waiver components to date Mary G. & Ann C.
January 19, 2012- ESEA Flexibility Forum for Special Education Advocates- Mary G., Ann C. and Marcella F. presented and collected feedback from the Special Education Advocates
Agenda & Powerpoint Sign in Sheet Feedback
January 20, 2012- Assistant Superintendents Meeting Update on the waivers and process Mary G. & Ann C.
Agenda & Powerpoint Feedback
January 24, 2012- State Board Meeting Presentation on waiver application and request for approval Bernie S., Mary G., & Ann C.
Agenda, Memo, Powerpoint Minutes
January 25, 2012 Maryland Draft Application Posted for Public Comment
February 7, 2012- State Superintendents Non-Public Meeting
Agenda
February 8, 2012- Standard Setting Standard Setting for the School Index
Agenda Feedback
February 13, 2012- State Board Meeting To endorse the application
Agenda Minutes
February 24, 2012- State Superintendents Meeting Agenda
February 28, 2012- State Board Meeting Agenda Feedback Letters:
- Education Advocacy Coalition - SESAC - CCSSO Feedback - Archdiocese Letter - MDAC Letter - Down Syndrome Coalition - SES Representatives
*Agendas, powerpoints/handouts, and minutes/notes are available as evidence of all meetings upon request.
Appendix- page 8
Appendix C-2: List of Stakeholders
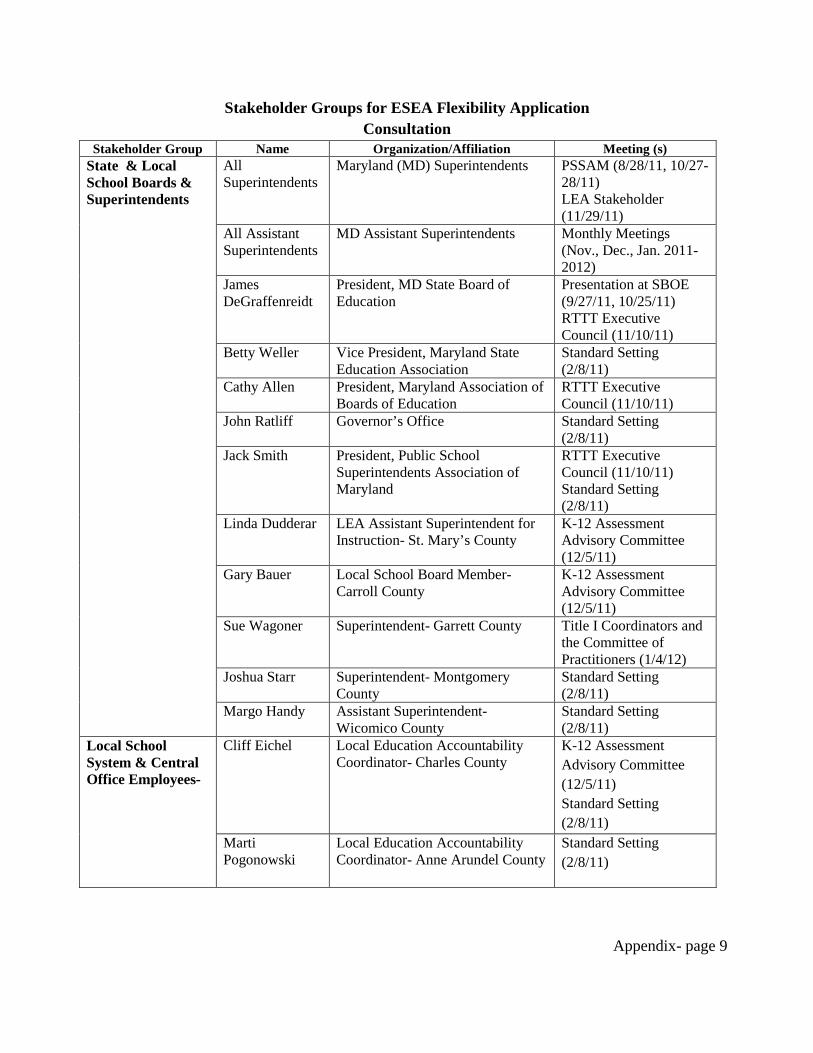
Appendix- page 9
Stakeholder Groups for ESEA Flexibility Application Consultation
Stakeholder Group Name Organization/Affiliation Meeting (s) State & Local School Boards & Superintendents
All Superintendents
Maryland (MD) Superintendents PSSAM (8/28/11, 10/27-28/11) LEA Stakeholder (11/29/11)
All Assistant Superintendents
MD Assistant Superintendents Monthly Meetings (Nov., Dec., Jan. 2011-2012)
James DeGraffenreidt
President, MD State Board of Education
Presentation at SBOE (9/27/11, 10/25/11) RTTT Executive Council (11/10/11)
Betty Weller Vice President, Maryland State Education Association
Standard Setting (2/8/11)
Cathy Allen President, Maryland Association of Boards of Education
RTTT Executive Council (11/10/11)
John Ratliff Governor’s Office Standard Setting (2/8/11)
Jack Smith President, Public School Superintendents Association of Maryland
RTTT Executive Council (11/10/11) Standard Setting (2/8/11)
Linda Dudderar LEA Assistant Superintendent for Instruction- St. Mary’s County
K-12 Assessment Advisory Committee (12/5/11)
Gary Bauer Local School Board Member- Carroll County
K-12 Assessment Advisory Committee (12/5/11)
Sue Wagoner Superintendent- Garrett County Title I Coordinators and the Committee of Practitioners (1/4/12)
Joshua Starr Superintendent- Montgomery County
Standard Setting (2/8/11)
Margo Handy Assistant Superintendent- Wicomico County
Standard Setting (2/8/11)
Local School System & Central Office Employees-
Cliff Eichel Local Education Accountability Coordinator- Charles County
K-12 Assessment Advisory Committee (12/5/11) Standard Setting (2/8/11)
Marti Pogonowski
Local Education Accountability Coordinator- Anne Arundel County
Standard Setting (2/8/11)
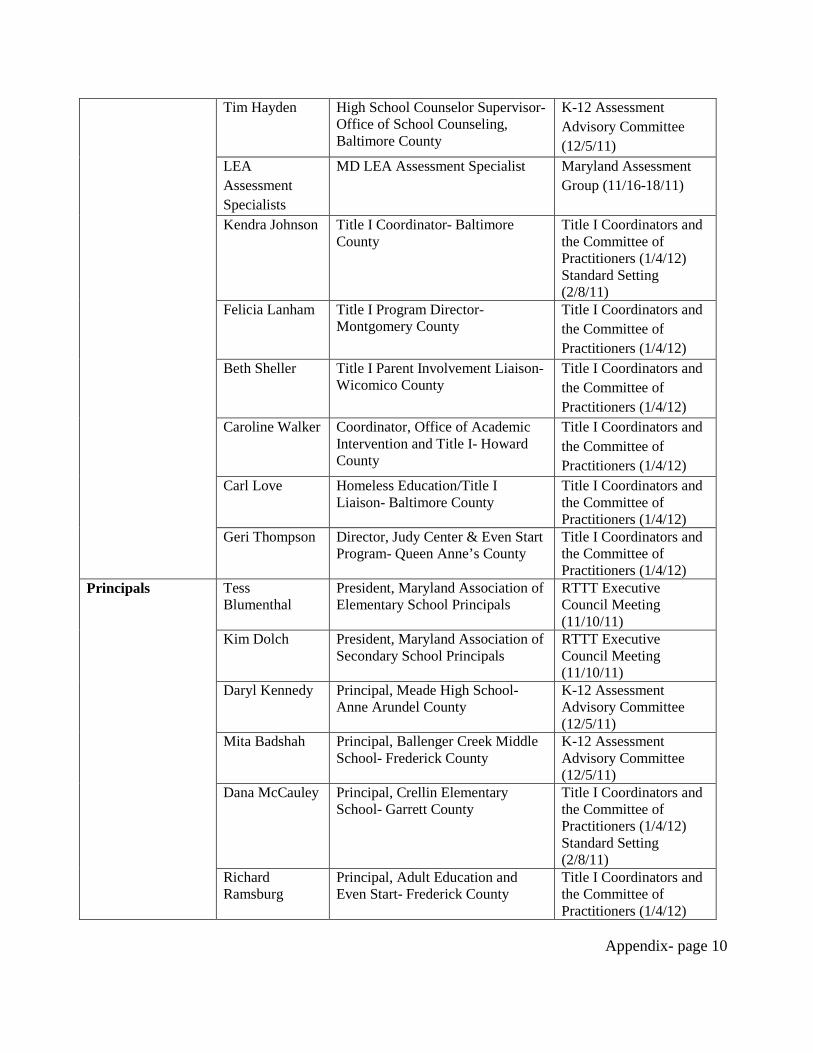
Appendix- page 10
Tim Hayden High School Counselor Supervisor- Office of School Counseling, Baltimore County
K-12 Assessment Advisory Committee (12/5/11)
LEA Assessment Specialists
MD LEA Assessment Specialist Maryland Assessment Group (11/16-18/11)
Kendra Johnson Title I Coordinator- Baltimore County
Title I Coordinators and the Committee of Practitioners (1/4/12) Standard Setting (2/8/11)
Felicia Lanham Title I Program Director- Montgomery County
Title I Coordinators and the Committee of Practitioners (1/4/12)
Beth Sheller Title I Parent Involvement Liaison- Wicomico County
Title I Coordinators and the Committee of Practitioners (1/4/12)
Caroline Walker Coordinator, Office of Academic Intervention and Title I- Howard County
Title I Coordinators and the Committee of Practitioners (1/4/12)
Carl Love Homeless Education/Title I Liaison- Baltimore County
Title I Coordinators and the Committee of Practitioners (1/4/12)
Geri Thompson Director, Judy Center & Even Start Program- Queen Anne’s County
Title I Coordinators and the Committee of Practitioners (1/4/12)
Principals
Tess Blumenthal
President, Maryland Association of Elementary School Principals
RTTT Executive Council Meeting (11/10/11)
Kim Dolch President, Maryland Association of Secondary School Principals
RTTT Executive Council Meeting (11/10/11)
Daryl Kennedy Principal, Meade High School- Anne Arundel County
K-12 Assessment Advisory Committee (12/5/11)
Mita Badshah Principal, Ballenger Creek Middle School- Frederick County
K-12 Assessment Advisory Committee (12/5/11)
Dana McCauley Principal, Crellin Elementary School- Garrett County
Title I Coordinators and the Committee of Practitioners (1/4/12) Standard Setting (2/8/11)
Richard Ramsburg
Principal, Adult Education and Even Start- Frederick County
Title I Coordinators and the Committee of Practitioners (1/4/12)
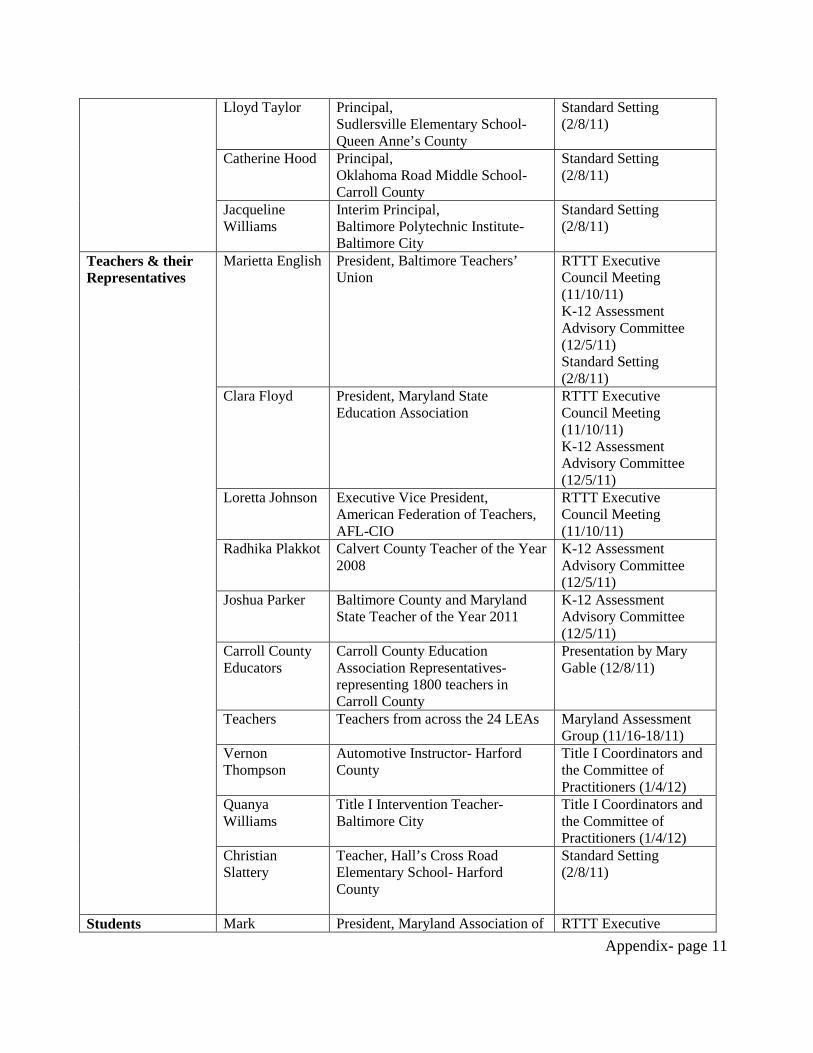
Appendix- page 11
Lloyd Taylor Principal, Sudlersville Elementary School- Queen Anne’s County
Standard Setting (2/8/11)
Catherine Hood Principal, Oklahoma Road Middle School- Carroll County
Standard Setting (2/8/11)
Jacqueline Williams
Interim Principal, Baltimore Polytechnic Institute- Baltimore City
Standard Setting (2/8/11)
Teachers & their Representatives
Marietta English President, Baltimore Teachers’ Union
RTTT Executive Council Meeting (11/10/11) K-12 Assessment Advisory Committee (12/5/11) Standard Setting (2/8/11)
Clara Floyd President, Maryland State Education Association
RTTT Executive Council Meeting (11/10/11) K-12 Assessment Advisory Committee (12/5/11)
Loretta Johnson Executive Vice President, American Federation of Teachers, AFL-CIO
RTTT Executive Council Meeting (11/10/11)
Radhika Plakkot Calvert County Teacher of the Year 2008
K-12 Assessment Advisory Committee (12/5/11)
Joshua Parker Baltimore County and Maryland State Teacher of the Year 2011
K-12 Assessment Advisory Committee (12/5/11)
Carroll County Educators
Carroll County Education Association Representatives- representing 1800 teachers in Carroll County
Presentation by Mary Gable (12/8/11)
Teachers Teachers from across the 24 LEAs Maryland Assessment Group (11/16-18/11)
Vernon Thompson
Automotive Instructor- Harford County
Title I Coordinators and the Committee of Practitioners (1/4/12)
Quanya Williams
Title I Intervention Teacher- Baltimore City
Title I Coordinators and the Committee of Practitioners (1/4/12)
Christian Slattery
Teacher, Hall’s Cross Road Elementary School- Harford County
Standard Setting (2/8/11)
Students Mark President, Maryland Association of RTTT Executive
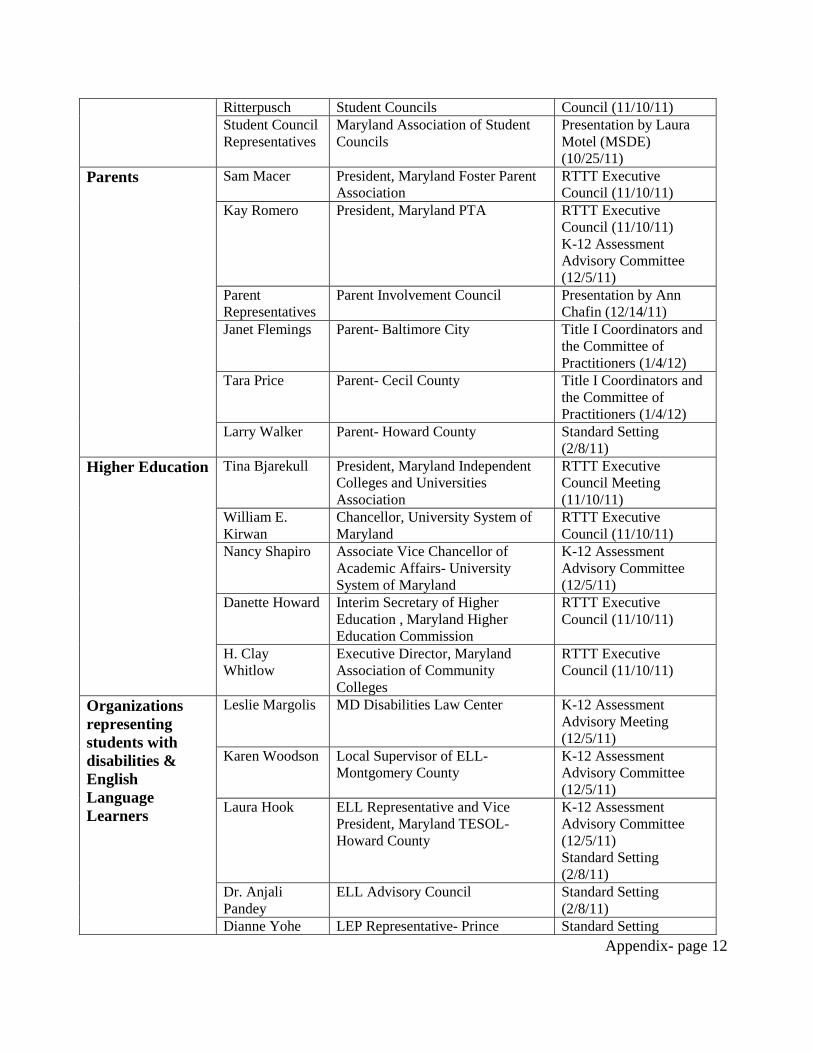
Appendix- page 12
Ritterpusch Student Councils Council (11/10/11) Student Council Representatives
Maryland Association of Student Councils
Presentation by Laura Motel (MSDE) (10/25/11)
Parents Sam Macer President, Maryland Foster Parent Association
RTTT Executive Council (11/10/11)
Kay Romero President, Maryland PTA RTTT Executive Council (11/10/11) K-12 Assessment Advisory Committee (12/5/11)
Parent Representatives
Parent Involvement Council Presentation by Ann Chafin (12/14/11)
Janet Flemings Parent- Baltimore City Title I Coordinators and the Committee of Practitioners (1/4/12)
Tara Price Parent- Cecil County Title I Coordinators and the Committee of Practitioners (1/4/12)
Larry Walker Parent- Howard County Standard Setting (2/8/11)
Higher Education Tina Bjarekull President, Maryland Independent Colleges and Universities Association
RTTT Executive Council Meeting (11/10/11)
William E. Kirwan
Chancellor, University System of Maryland
RTTT Executive Council (11/10/11)
Nancy Shapiro Associate Vice Chancellor of Academic Affairs- University System of Maryland
K-12 Assessment Advisory Committee (12/5/11)
Danette Howard Interim Secretary of Higher Education , Maryland Higher Education Commission
RTTT Executive Council (11/10/11)
H. Clay Whitlow
Executive Director, Maryland Association of Community Colleges
RTTT Executive Council (11/10/11)
Organizations representing students with disabilities & English Language Learners
Leslie Margolis MD Disabilities Law Center K-12 Assessment Advisory Meeting (12/5/11)
Karen Woodson Local Supervisor of ELL- Montgomery County
K-12 Assessment Advisory Committee (12/5/11)
Laura Hook ELL Representative and Vice President, Maryland TESOL- Howard County
K-12 Assessment Advisory Committee (12/5/11) Standard Setting (2/8/11)
Dr. Anjali Pandey
ELL Advisory Council Standard Setting (2/8/11)
Dianne Yohe LEP Representative- Prince Standard Setting
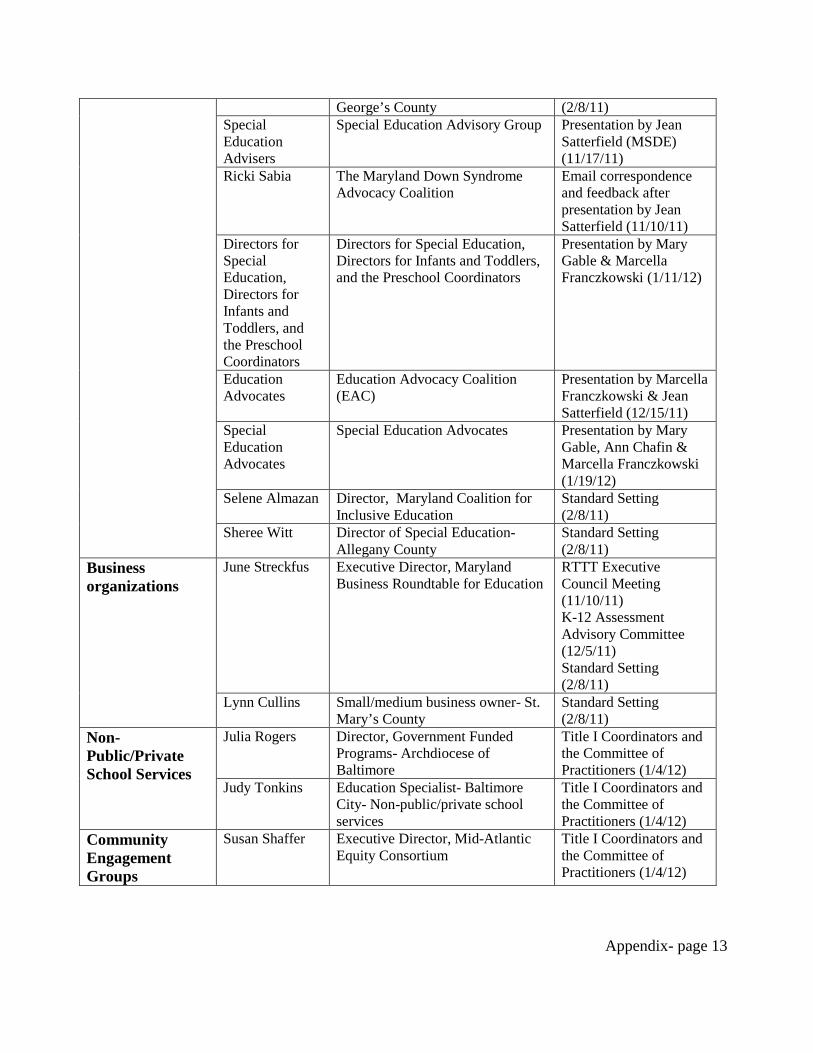
Appendix- page 13
George’s County (2/8/11) Special Education Advisers
Special Education Advisory Group Presentation by Jean Satterfield (MSDE) (11/17/11)
Ricki Sabia The Maryland Down Syndrome Advocacy Coalition
Email correspondence and feedback after presentation by Jean Satterfield (11/10/11)
Directors for Special Education, Directors for Infants and Toddlers, and the Preschool Coordinators
Directors for Special Education, Directors for Infants and Toddlers, and the Preschool Coordinators
Presentation by Mary Gable & Marcella Franczkowski (1/11/12)
Education Advocates
Education Advocacy Coalition (EAC)
Presentation by Marcella Franczkowski & Jean Satterfield (12/15/11)
Special Education Advocates
Special Education Advocates Presentation by Mary Gable, Ann Chafin & Marcella Franczkowski (1/19/12)
Selene Almazan Director, Maryland Coalition for Inclusive Education
Standard Setting (2/8/11)
Sheree Witt Director of Special Education- Allegany County
Standard Setting (2/8/11)
Business organizations
June Streckfus Executive Director, Maryland Business Roundtable for Education
RTTT Executive Council Meeting (11/10/11) K-12 Assessment Advisory Committee (12/5/11) Standard Setting (2/8/11)
Lynn Cullins Small/medium business owner- St. Mary’s County
Standard Setting (2/8/11)
Non-Public/Private School Services
Julia Rogers Director, Government Funded Programs- Archdiocese of Baltimore
Title I Coordinators and the Committee of Practitioners (1/4/12)
Judy Tonkins Education Specialist- Baltimore City- Non-public/private school services
Title I Coordinators and the Committee of Practitioners (1/4/12)
Community Engagement Groups
Susan Shaffer Executive Director, Mid-Atlantic Equity Consortium
Title I Coordinators and the Committee of Practitioners (1/4/12)
Appendix- page 14
Appendix C-3: Higher Education and MSDE ELA and Math Briefing- Agenda,
Minutes and Powerpoints
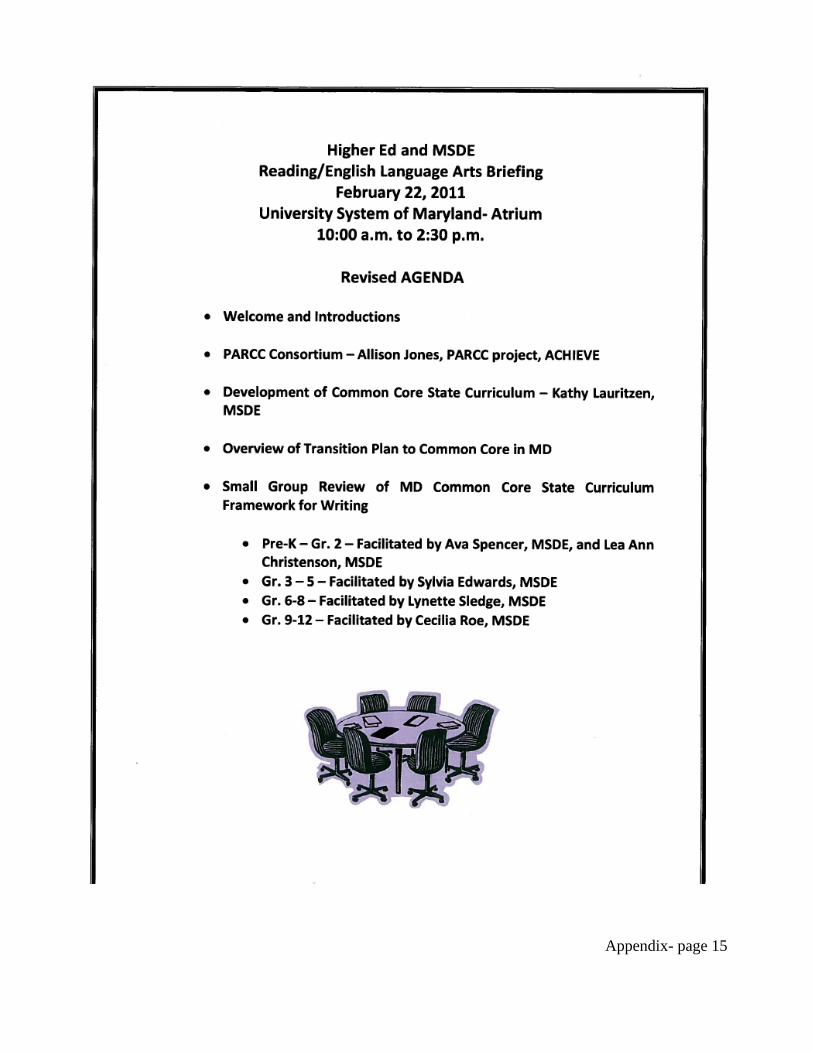
Appendix- page 15

Appendix- page 16

Appendix- page 17
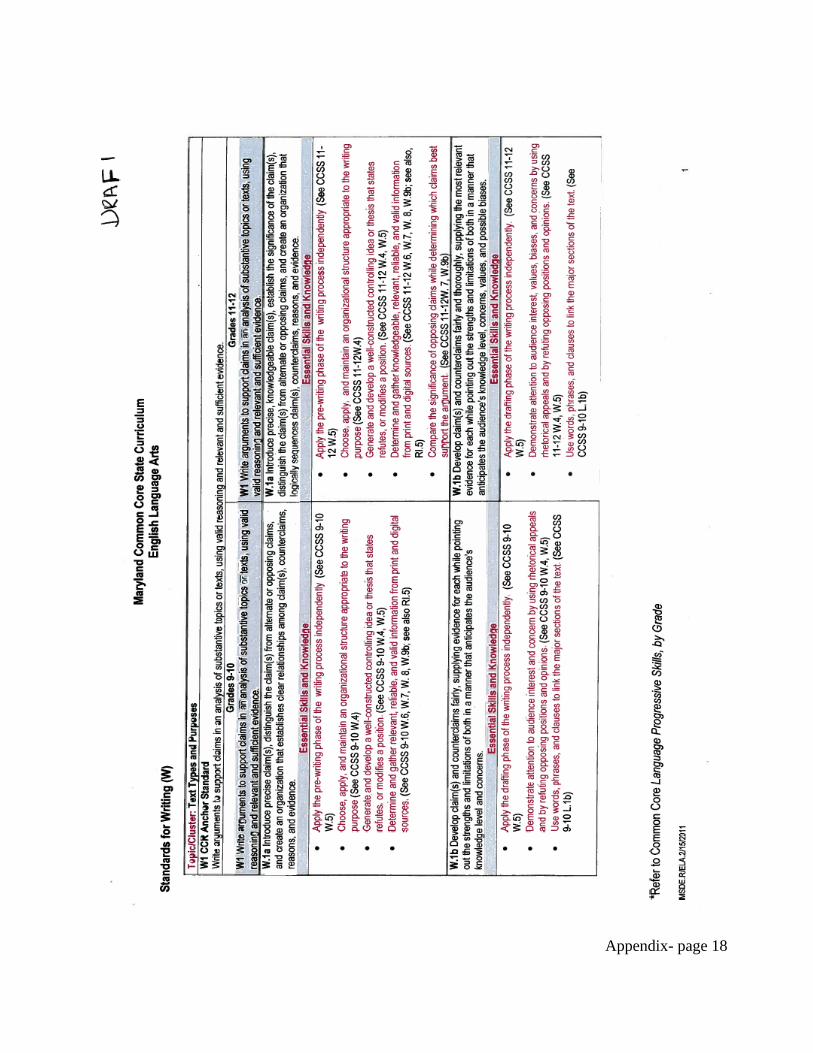
Appendix- page 18
Appendix- page 19
MSDE/Higher Ed English Language Arts Higher Ed Meeting
February 22, 2011
Introductions
- In CA, they plan how many jail cells they will build based on how many children are not reading by third grade
Allison Jones- Achieve – Partnership for the Assessment of Readiness for College and Careers (PARCC)
- “If we cannot learn wisdom from experience it is hard to say where it will be found” George Washington
- Close to 48 states and DC that have adopted the CCS, was developed by the states, not the federal government- supported by the governors who wanted to move it forward
- What students are expected to know in high school is not what we in higher education expect them to know- the CCS will create a common set of expectations for what students should know when graduating high school and entering college
- Effort between CCS and higher education- we are aligning the common core with the higher ed expectations
- CCS has a clear mission statement- to provide a consistent clear understanding of what students are expected to learn , designed to be relevant to the real world, to reflect the knowledge and skills our students will need to be competitive globally and nationally- types of skills employers want- are ability of students to think analytically, critically, synthesize, - for students to be fully prepared
- In terms of its engagement, PARCC initiative – one of two consortia funded, state of MD is a governing state (13 of 25) that are committed to this effort- to pilot the assessments and accept a college readiness indicator students will get as part of this process- much of what is done today will roll into the process of developing the assessments
- The Assessment design is a “through course model”- students will be assessed on a quarterly basis and will be in grades 3-11- ideally, trying to define what this means, not formative, but summative- will be computer based so teachers get data back in 5 days to know effectively teachers are teaching the material and how effectively students are learning the material and hopefully will have supports along the way
- Higher education has made a major commitment- over 200 Higher Ed reps that signed a letter of intent last spring in support of the RTT grant and the PARCC grant- represents over 1000 IHES- an agreement nationally from 25 states that says that if in fact the college readiness score is developed with higher education, (likely to be 11th grade), an indication of whether student is college ready – it will exempt you from entry into the first year credit-
Appendix- page 20
bearing courses (not admission or does NOT replace existing placement tests used to place students in advanced courses).
- Role of higher education is to work closely with K-12 and be engaged in that work - Last week, some higher Ed faculty from our state met with K-12 faculty from our state to
talk about what skills are most important for students to be college ready- one of the outcomes was that K-12 faculty and Higher Ed faculty didn’t necessarily have the same assumptions
- What are the most important skills to be assessed effectively to define college readiness? - The college readiness from perspective of SAT is 500 on ELA, it is 65% chance of earning
B or better in first credit bearing courses, ACT: ELA score 18, means 50 % will score B or higher in first credit bearing course
o Range of PARCC states- SAT: 400-600; ACT: 16-21- so students who are remedial in one state are fully proficient in another and vice versa- one of the things that common core is doing is creating a common definition of college readiness because the college ready cut score will be acceptable across all states, not just across institutions within a state
- This is the purview of the faculty- this is not the decision of the president- it is the faculty in the classrooms, if faculty don’t understand the common core and don’t participate in the definition of college readiness, then it won’t work
- There is an Higher Education Advisory Committee- There are representatives from participating states and governing states, representatives from SHEOO, - it is a broad based group that will provide guidance to the overarching executive committee
- A high school diploma is no longer enough, 83% of the nation’s jobs require some postsecondary training
- “To encourage literature and the arts is a duty which every good citizen owes to its country” George Washington
- Timetable for defining college readiness- o Assessment for K-12 had to be in place and administered in 2014-2015; we can’t
develop the college ready definition until we have some experience with the students responses- states (including MD) will begin piloting this after development
o Working on putting together tools to help assist the development of curricula aligned with the common core standards
- Only 15% of 90% of 11th graders who took a college readiness exam in CA where college ready two years ago- jumped to 21% last year
- Question about NCTE – NCTE was at table for development of common core, but so far not in development of the PARCC assessments
- Challenge- looking for an artificial component for scoring, doesn’t exist yet, but looking for it to be developed

Appendix- page 21
Kathy Lauritzen- MSDE- Presentation MD Common Core State Standards Initiative (Powerpoint also attached)
- Working hard on the K-12 piece to prepare students for higher education - In Spring of 2009- the standards were put out for comment- in June of 2010 final draft was
released with updates from the comment period. In June MD State Board voted to adopt the standards- states could add 15% more to them, MD did not feel it necessary, only added Pre-K
- Four Strands; K-12- Reading, Writing, Speaking & Listening, Language- in Reading- Literature, Informational Text, and Foundational Skills K-5
- Common core is organized around standards that are called college and career ready anchor standards for each of the 4 strands- there are 10 standards in reading and are applied in the 3 subgroups of reading (with the exception of the Foundational Skills category for grades K-5), 10 for writing, 6 for speaking and listening and 6 for language
o The anchor standards are broken down by grade- what part of it is appropriate for each grade level teacher to develop- so there are grade specific standards as well (which we will look at today)
o In grades 6-12 there are additional standards that relate back to the same college and career ready standards- in reading the same 10 standards are applied to reading in literacy in history/social studies and literacy in science and technical subjects; the 10 writing standards are applied in the literacy in history/social studies and science and technical subjects
- In the fall, there was a gap analysis- the board adopted in June, MSDE had to run a detailed gap analysis- over the summer brought in teachers and looked at CCS and existing state curriculum and looked at how they matched up, round 2 was to bring in higher Ed folks and have them rate the match and the third round was to the supervisors and had them look at that matching
o Overall in ELA there was an 89% match of excellent, good, and weak o 50% matched at the excellent level o Lowest percent of excellent matches were in middle and high school o Crosswalk will include only excellent matches o Grade matches o Areas of concern: writing (because not assessed in our current curriculum),
complexity of text, rigor o Timeline: Late summer, early fall 2010 o So rewriting the curriculum
- MD Common Core State Curriculum Framework- Common Core State Standards are not a curriculum because a curriculum has to help teachers identify essential skills and knowledge – MSDE did this by bringing educators together and then they identified by educators and woven into framework document

Appendix- page 22
o Timeline: develop and share completed framework document in May; present to State Board of Education in June; Present for feedback at Educator Effectiveness Academies this summer (using RTT funds to bring faculty from every school (opportunity for 5800 teachers and administrators to offer feedback) for the next 3 summers- every school will send an administrator, an ELA person, a Math person and a STEM person); Revisions made based on Academy feedback
o Started with writing because it is not assessed and is important for concerns about college and career ready- that is the piece to be shared today
- Toolkit: o Clarification documents, where necessary o Lesson seeds o Model lessons o Model units o Formative assessments o Identification of text passages o Intervention/extensions o Timeline:
Inventory of current toolkit this year Development of toolkit over next three years (will work with teachers to do
this and invite higher Ed faculty to participate as well) - Collaboration- PARCC consortium that Allison Jones presented
o PARCC is also building a toolkit as well and MD will work with them during development
- Tasks for today: o Look at the DRAFT frameworks in writing- they are to be returned because they will
change as feedback is fed into the document o Divide into groups o Review the MD Common Core State Curriculum Framework document for Writing o Discuss the essential skills and knowledge section under each of the common core
standards Make suggestions for revisions (clarity, additions, deletions, etc.) Check flow from grade band to grade band (pre-K, 3-5,6-8, and 9-12) Toolkit ideas (terms, clarifications, resources)
- Kathy’s email: [email protected]
*At this point in the meeting we split into working groups- one group looked at the High school Framework, one at the 6-8 framework, one at the 3-5 framework, and one at the pre-school framework- There was also an electronic group that talked a bit about the high school framework, but couldn’t offer feedback because the document was unavailable electronically)*

Appendix- page 23
Electronic group (FSU (Charles Ewers, Ralph Brewer, and Beth Holmberg), CSU (Elaine Sykes), Garrett College (Phil Rivera), and Salisbury (Nancy Michelson and Lucy Morrison)
- Standards for Writing (W)- facilitated by Kathy Lauritzen - The document will be made public in May/June
o There were concerns that this doesn’t allow enough feedback from the electronically participating folks- Kathy asked folks to email her and she will speak to her supervisors about contributing on a small scale for more feedback
o Suggestion a reading list for 9th graders to align with college o There is a concern that there is not writing being taught in high school- there are not
forms of writing, but just one research paper a year – This feedback will be given to both the curriculum folks and the assessment folks (it is a notion that was echoed across faculty and institutions)
o Accreditation is anchored in reading and writing outcomes- students must write a statement of purpose for college admissions
High School Group- 15 people in the group
- Two sets of standards: Grades 9/10 and Grades 11/12. The grade levels are taken together,
with the expectation that students reach standards at the end of a two year period.
- W1 Standard
- Q: Why is the word “independent” only used in the writing process expectation—should it
be the “stem” component of each of the standards?
- Q: There appears to be confusion between the use of “claim” and “thesis” that could lead
students to misunderstand. Claim is the term that is used in argument and rhetoric.
- Q: Although sources are mentioned, there appears to be no mention of documentation of
sources
- Q: Should the term “academic vocabulary” be balanced by references to “standard
English?” Can we change “academically appropriate” to “discipline specific?”
- Q: How should we react to the fact that there is no real difference between 9/10 and 11/12
standards?
- A: It may be a difference in mastery level.
- Comment: the document does not make a distinction between mastery and competency.
- Q: Why is writing process mentioned throughout—shouldn’t they have it down by 11/12?
- A: Teachers insisted on it.

Appendix- page 24
- Q: Where does vocabulary building come in?
- A: in Language
- Comment: Vocabulary development is a huge weakness for students in developmental reading and writing courses.
- W2 Standard
- Q: Students don’t understand that even paraphrases need to be cited. Where is citation form taught in High School?
- Q: Can you add accuracy to the list onW2a bullet 3?
- Q: Add “connotative language” to W2b
- Q: Acceptable usage is different for different rhetorical situations. Can you change “acceptable” to “suitable?”
- Q: Where is summarizing, paraphrasing?
- A: Elementary standards, but also should be cross referenced with media, library, reading and language.
- W3 Standard
- Q: Is memorization (poems, plays) a part of the standards?
- A: No
- Q: Where do they learn language, style, tone, voice, mood?
- Q It appears that the sequence of the standards is not correct. There is no narrative writing
mentioned—does that occur elsewhere?
- Use correct sentences rather than complete, which is too narrow. Need to include other
matters of syntax, such as confusing prediction.
- Library-media people will evaluate terminology- ideas related to their discipline
- W7 Standard
- Too much information
- W8 Standard
- No mention of assessment in red.
- Need to include that wording- put it in 3rd bullet
Appendix- page 25
- W9 Standard
- Add- demonstrate understanding of propaganda, bias, and logical fallacies
- Many questions about how the Common Core Standards will be implemented
- Need to add action and passive voice somewhere
- W9a Standard
- grade-level print- questions about definition of this term
- How do we ensure that students are using grade level information when doing research?
This is really a Reading standard and applying it to grade level text that is chosen for them
- Also need to include “without plagiarism”
- Add bullet- students should understand what constitutes plagiarism- “Demonstrate
understanding that paraphrases, summaries, and quotations must be cited”
- Add “in an ethical manner” to the end of 2nd bullet
6-8 Grade Group
Comments and Observations
• Plagiarism is difficult for college level students to understand fully. How is academic
honesty presented and supported?
• Wish to see reading standards discussed among college faculties.
• How might secondary schools support positive reading habits?
• A need for professional development among groups within higher ed faculty to determine
what skills students should be expected to bring to higher ed experience
• Offer more focused explanation for relationship between reading materials being connected
to writing expectations
• Suggest a more forceful focus upon audience in writing process
• Concern about the degree of technology expertise expected of students
3-5 Grade Band- General Comments and Observations:
Appendix- page 26
° Concern that instruction in the concepts of paragraph and topic sentence was not clearly
articulated; the expectation is there but not specificity about when students will receive
instruction
° Suggestion to clarify length of writing assignments. How much can a 3rd, 4th, and 5th grader
be expected to do well?
° Attention to plagiarism should be clear at all levels. Avoid giving assignments where
students can simply cut and paste.
° Clarify and be consistent about when students move from “guidance and support” to
“support” to “independent application” of the writing process.
° Some terminology may require footnoting, e.g., thesis, academic vocabulary.
° Check to correct any unintentional dropping off of rigor from grade to grade.
° Concern over CCSS expectations for level of keyboarding skills and stamina for younger
students.
° Suggestion to revisit framework formatting to make sure the framework is easily accessible
to teachers, e.g., perhaps more bullets
PreK – Grade 2 Group
This group looked at the preK-2nd grade materials. Here are some highlights of questions/concerns
they had:
Overall, the group was productive. They did not see clear reference to the introduction of primary
vs. secondary documents; understanding how to identify and write fiction vs. non-fiction;
understanding how to write poetry or drama. In addition, while they understood that that UDL is
inferred or understood, they did not want ELLs or children eligible for special education or ELLs
with disabilities to get lost in the shuffle. Therefore, in the Toolkit section they offered a
recommendation that Assistive Technology be considered at all grade levels, including, but not
limited to, voice-synthesized software (such as Kurzweil), voice-activated software (e.g., Dragon
Naturally Speaking), spell checkers (e.g., Franklin spell checkers), and webdesign/outline software
(e.g., Kidspiration or Inspiration). In addition, they discussed the idea of including the use of

Appendix- page 27
sequencing materials such as comic strips (starting with nonverbal comics to more complex verbal
comics) and/or story sequencing cards to introduce sequencing to children.
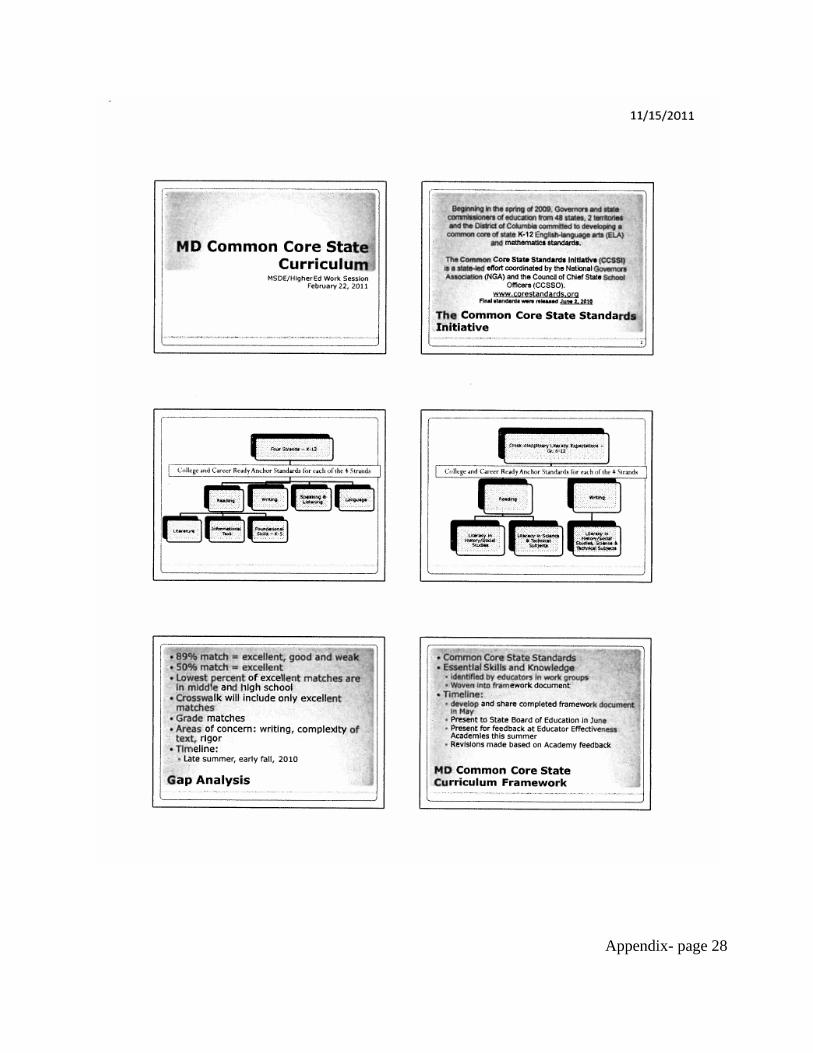
Appendix- page 28
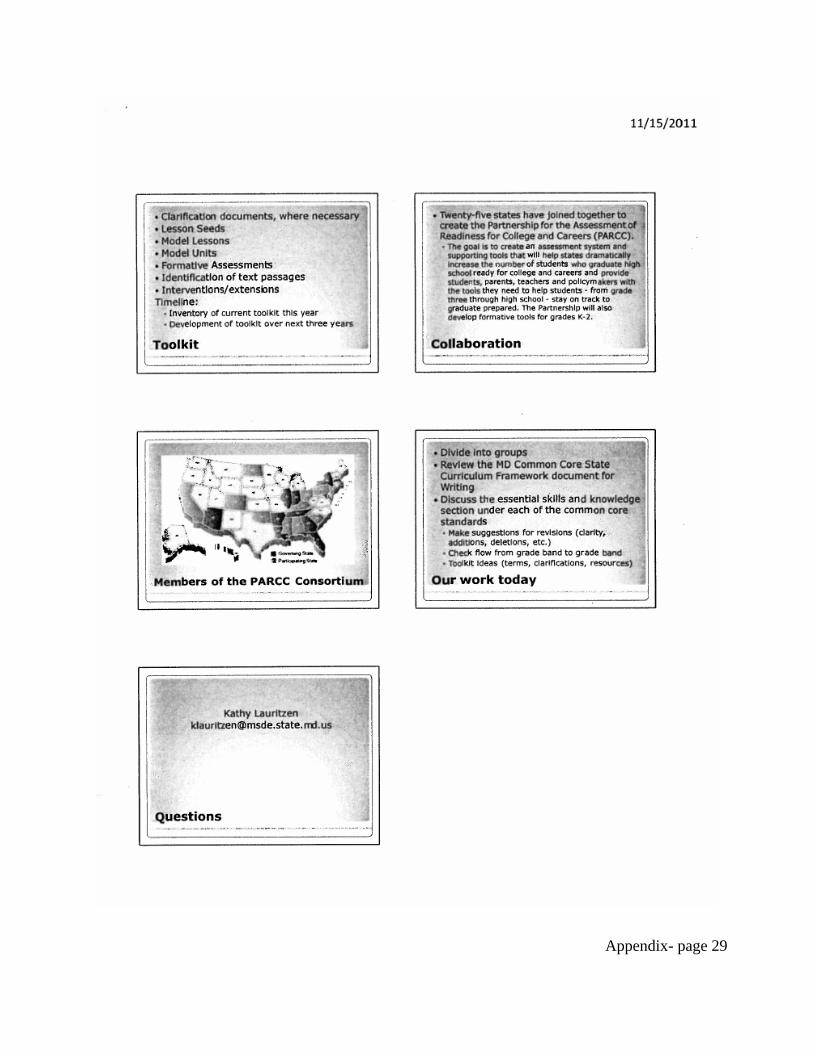
Appendix- page 29

Appendix- page 30
Higher Education Review of Maryland
Common Core State Curriculum Frameworks
MATH
April 21, 2011
Tentative Agenda
10:00 a.m. Welcome and Introductions
PARCC Update
Common Core State Standards: Overview of the Maryland Plan
General Overview of Format
Lunch
Debriefing
• Next Steps
• Educator Effectiveness Academies
2:30 p.m. Evaluation and Thank you

Appendix- page 31
Math Faculty Common Core Framework Meeting
April 21, 2011
Welcome from Chancellor Kirwan- Thanking the faculty gathered here for their involvement in this
very important work. Kirwan emphasized that the real problem in math education is the gap
between high school and college.
Allison Jones- from Achieve, Senior Fellow working on the PARCC (Partnership for the
Assessment of Readiness for Colleges and Careers) Consortium
The common core standard initiative was initiated by the Governors and CEOs and was adopted by
44 states- this was a bottoms up approach
States currently use varying methods to define and measure college readiness- there is no common
measure within or across states to define college readiness
Most colleges and universities use a score even lower than ACT set their college ready score- the
challenge is that every institution has a different definition and different expectations of core
competencies
The PARCC initiative challenge is to develop a common definition of college readiness that will be
fully acceptable to all colleges and universities in the PARCC states
What students are expected to know, as measured by assessments in High School do not equate
with what postsecondary institutions feel students need to know
PARCC (through Achieve) received $170 million dollars from Race to the Top funds (Smarter
Balance was the other consortium)
Maryland is a governing state in this consortium- only participating in this consortium, agreed to
pilot the assessments and will implement the assessments in 2014-2015
Goal- to create a “through course assessment”- students will be tested at 25%, 50%, 75% and the
final exam- weighting of these tests have not been decided, but it will provide immediate feedback
to the students and teachers that will give an opportunity to provide additional resources where and
when needed
This is an accountability model- the K-12 community felt that this was important- to measure
students, teachers, schools, districts, etc.- Smarter Balance is not an accountability model

Appendix- page 32
Through Course #4- research papers and other types of in depth assessments that will augment the
other through course assessments, students will be expected to build on the knowledge and use it in
a way besides an exam
Timeline- Assessment has to be rolled out by 2014-2015
Key mathematics focus group- met on April 11, 2011
Included 5, four-year math faculty; 4, two-year faculty, and 2, K-12 and 1 HE
Objective- to engage higher education faculty and leaders in the process of designing the high
school assessment to ensure its allows for the certification of college readiness; to identify the
options for certifying college readiness for students who take college readiness test before the 11th
grade
Looked at the key competencies (domains)- what are they in each course to ensure college
readiness? And what are the competencies in geometry that higher education faculty value and want
to be sure are measured?
When to assess? Looking at using 3rd exam of the year- Non routine tasks that require “securely
held knowledge”
College Readiness Score that hasn’t been decided on yet, but would measure depth and breadth-
will be evidence based and then the validity of the college readiness assessment
Scoring ranges- college ready, conditionally college ready and not college ready- we want to
encourage students to take more math, but won’t require it because that is the purview of the state
83% of the nation’s jobs require some postsecondary education or training
Questions:
Will the testing environment also be considered? Students should have the same testing
environment throughout K-12 that they use for taking the college readiness exam?
A: Yes, this is part of the work- all the exams will be electronic
Will the exam be constructed in a way that does not allow teachers to “teach to the test”?
A: We do not know yet- in English it is unlikely, but for Math, we do not know yet
Is this actually a placement test? Placement tests usually tell levels of where they place into…
A: This is not a placement test, but an indication of whether a student will need remediation- it is an
indication that they have mastered college readiness and skills – it is to place them into the first
level credit bearing course- it is an early warning system for the students

Appendix- page 33
Is it feasible that a university can withhold admission to a student who does not pass the test or is
not defined as “college ready”?
That is an individual state and institution decision- this will not be a standard across PARCC or that
will come from Achieve – this is a public policy issue that requires a lot of discussion
Donna Watts, Maryland State Department of Education-
Refer to the slides from MSDE
Will be showing the draft forms of the frameworks and faculty will have the opportunity to provide
feedback on the frameworks
MSDE staff discussed 3rd grade standards, 7th grade standards, and high school standards
Green means a prior standard, red is what MSDE added – Essential Skills and Knowledge, black is
common core (no wording changes), blue is a link to clarification or glossary
MSDE needs help in unpacking these standards and for faculty to really think about what a student
needs to be successful
The eight points located in a box on the right side are critical (Habits of Min
The HS documents are very similar to the elementary and middle school standards, but more detail
is provided via Units (note description of document on slides…provides detail of what’s included in
the High School Framework document)
Faculty split into groups to review the Framework
Debriefing
What positive comments would you like to share?
What suggestions do you have?
How will this impact the content of your courses and the expectations for your future teachers?
Someone needs to look at how language is being used from grade level to grade level
o That everyone should have access to the toolkits- including parental and family support for the electronic resources
o Being at a community college, it will be longer before prepared students get to us- we need to have more diverse opportunities for first year students- more sections for those still in remediation and those who have come through this more successful program- will require a wide spectrum
o When will the assessment begin? 2014-2015- Will they have a remediation course available immediately to help those not ready?- We don’t know that yet- we are working on the transition plan from the state curriculum to the new Common Core
Appendix- page 34
Standards Curriculum – states are still bound by NCLB so this is all under discussion in terms of the transition plan
o In smaller counties, great documents, with good comparisons will really make the difference- the more specific the better (here is where you are now, here is what is new, and here is the difference)
o The new standards are exciting- more based on conceptual standards than we have seen before- this will benefit those who are becoming teachers as well because they will be taught in this way- we will see a whole new group who will learn conceptually and will then teach conceptually
o Parallel standards need to be identified from grade to grade and course to course o Inclusion of modeling is very important- so anywhere that the curriculum can
incorporate modeling is useful - What did you learn about the Common Core State Standards and/or the Frameworks that
was new or surprised you? o Frameworks are striving to provide details. o Statistics is introduced at a much earlier grade. o This is the math we used to do in our schools. o Algebra I is more rigorous than the Algebra I currently being taught in schools. o There is inconsistency in the documents across the grade levels.
- What, if anything, concerns you about the Common Core State Standards and/or the
Frameworks? o Frameworks are inconsistent in the details they provide and the voice used. o Skills and Knowledge terminology is confusing and mis-leading. o Many factors which will impact success are out of our/teacher control. o We have been giving credit to students who are doing little more than putting their
name to the paper. o Supports are needed for who are currently having difficulty in mathematics. o The transition plan is concerning.
- What suggestions do you have that would ease the transition to the Maryland Common Core State Curriculum?
o Individual support and personal contact is needed for the teacher, the parent and the student.
o Professional development will need to go to a higher level if we expect success with these standards.
o Videos would be helpful as we move forward. o Common planning time would allow teachers to work together as they implement the
standards.
Next Steps:
Appendix- page 35
- Frameworks edited based upon the feedback from reviews and information gained from PARCC
o Reviews will continue throughout the summer at the Educator Effectiveness Academies
- Frameworks presented to the State Board of Education for acceptance in June 2011 o Finalized in June 2012
- Curriculum Writing Continues o Curriculum includes frameworks and toolkit
- Educator Effectiveness Academies o 2011-2014 Professional Development for 6, 000- there will be 11 academies o First group starts this summer- 3 day academies- coming from all local LEAs- each
school will send a team (a principal, a math teacher, an ELA teacher, and a STEM teacher)
o Master teachers will facilitate an represent each LSS o MSDE opportunity to obtain feedback on Frameworks o Take away- meaningful understanding of the frameworks and the MD CCS
curriculum and expertise to share within their school systems to impact faculty and students
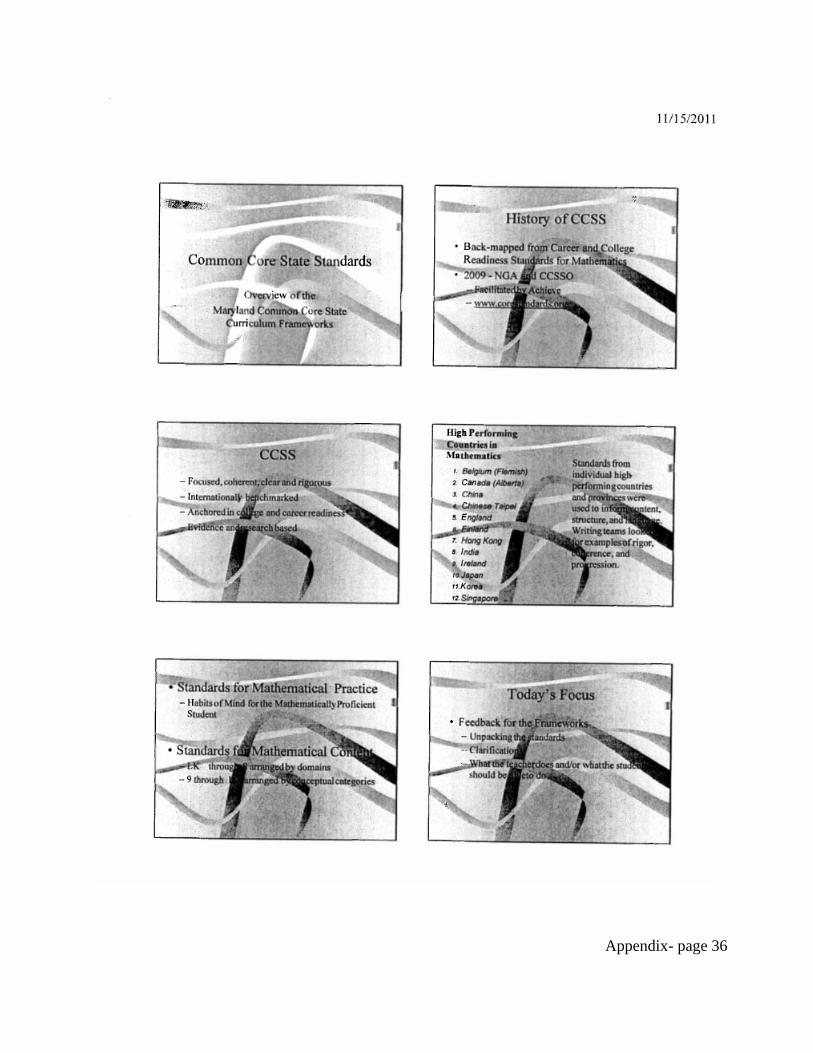
Appendix- page 36
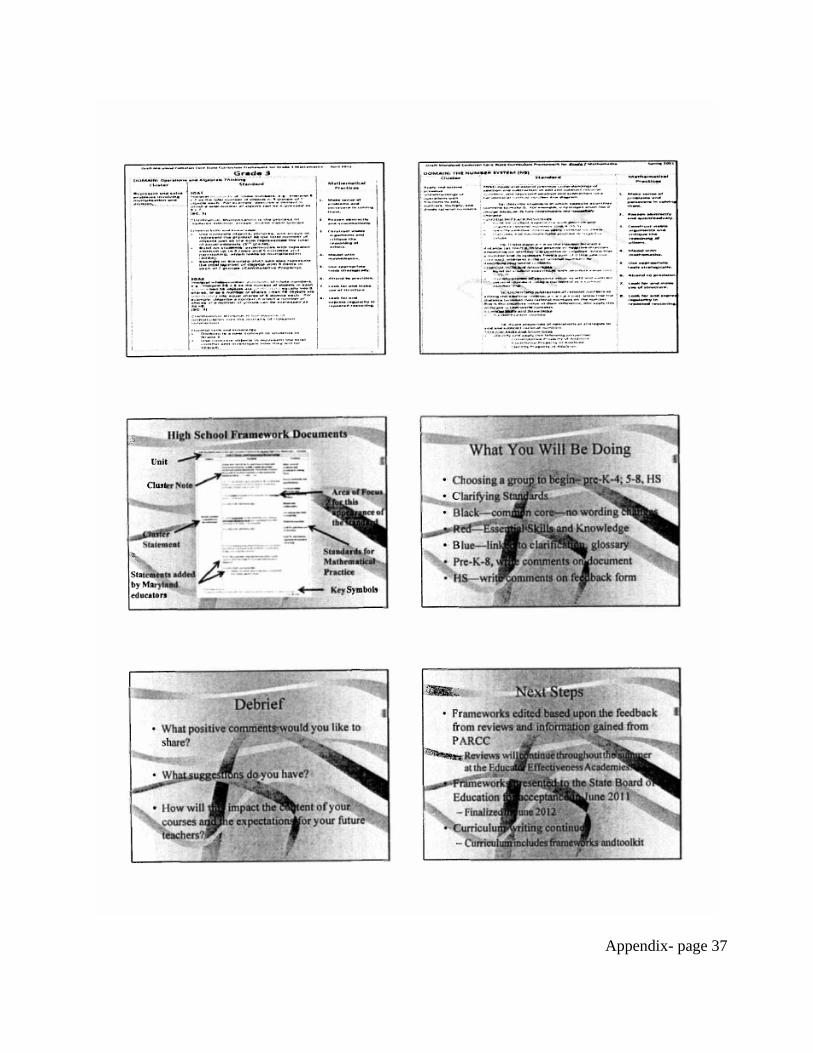
Appendix- page 37
Appendix- page 38
Appendix- page 39
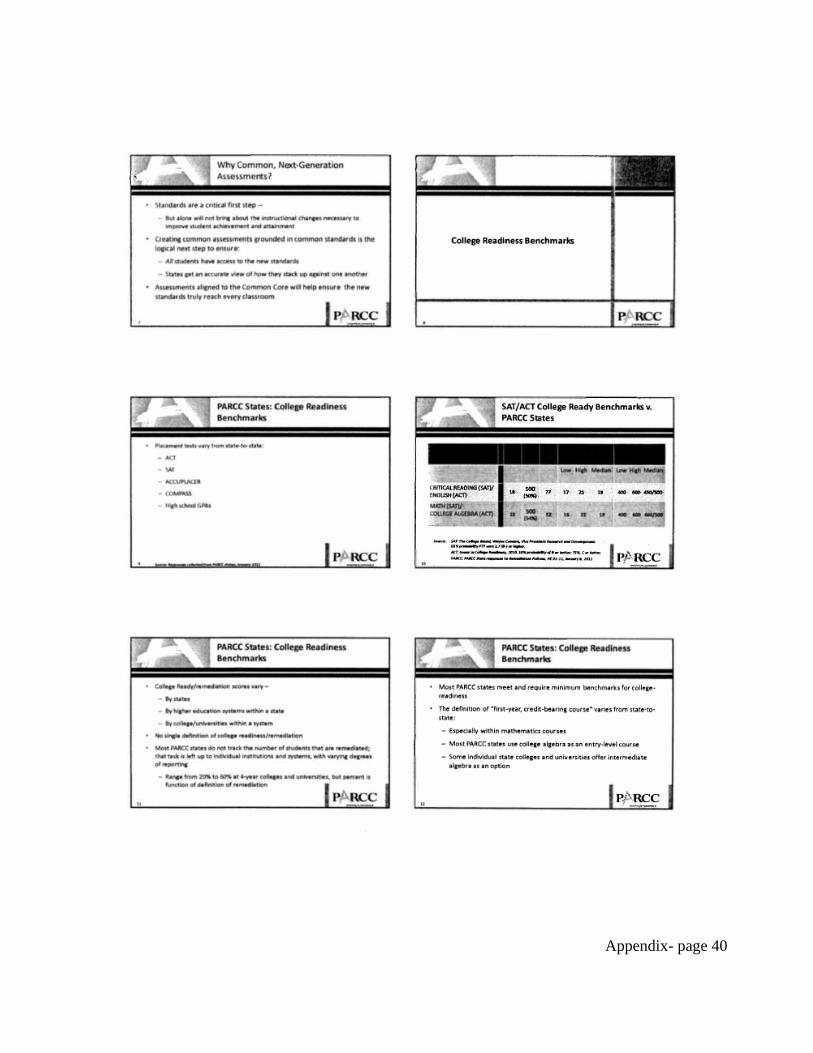
Appendix- page 40
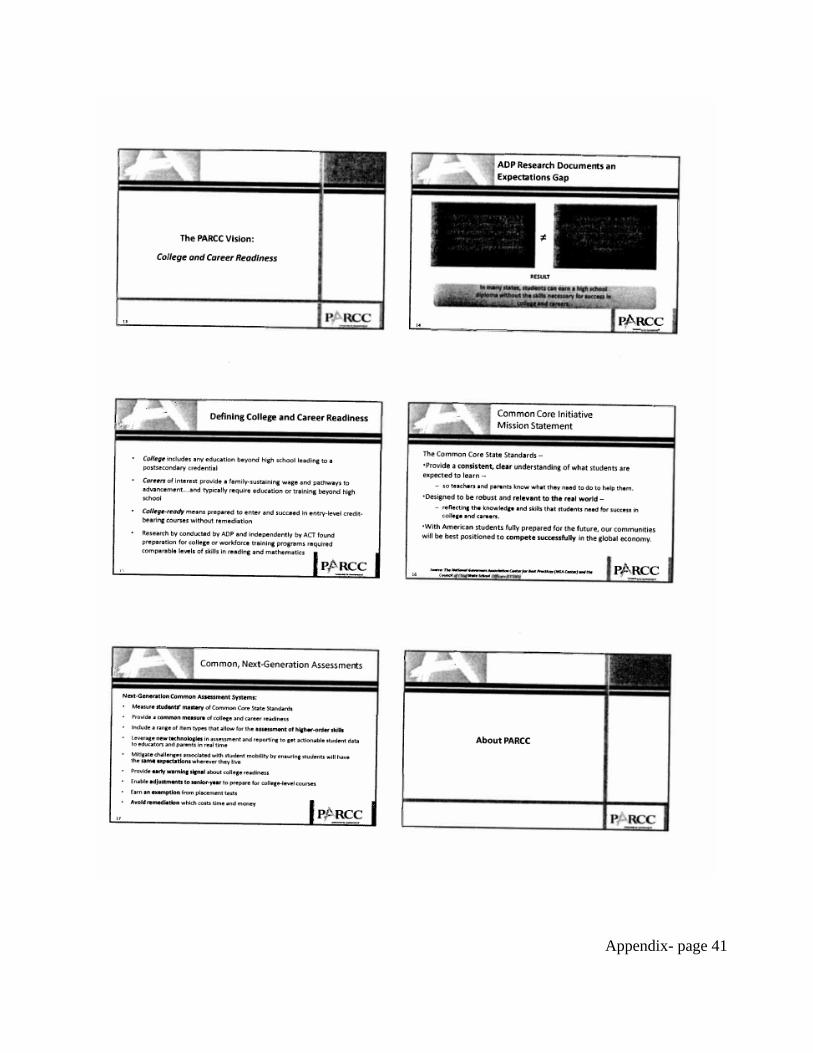
Appendix- page 41
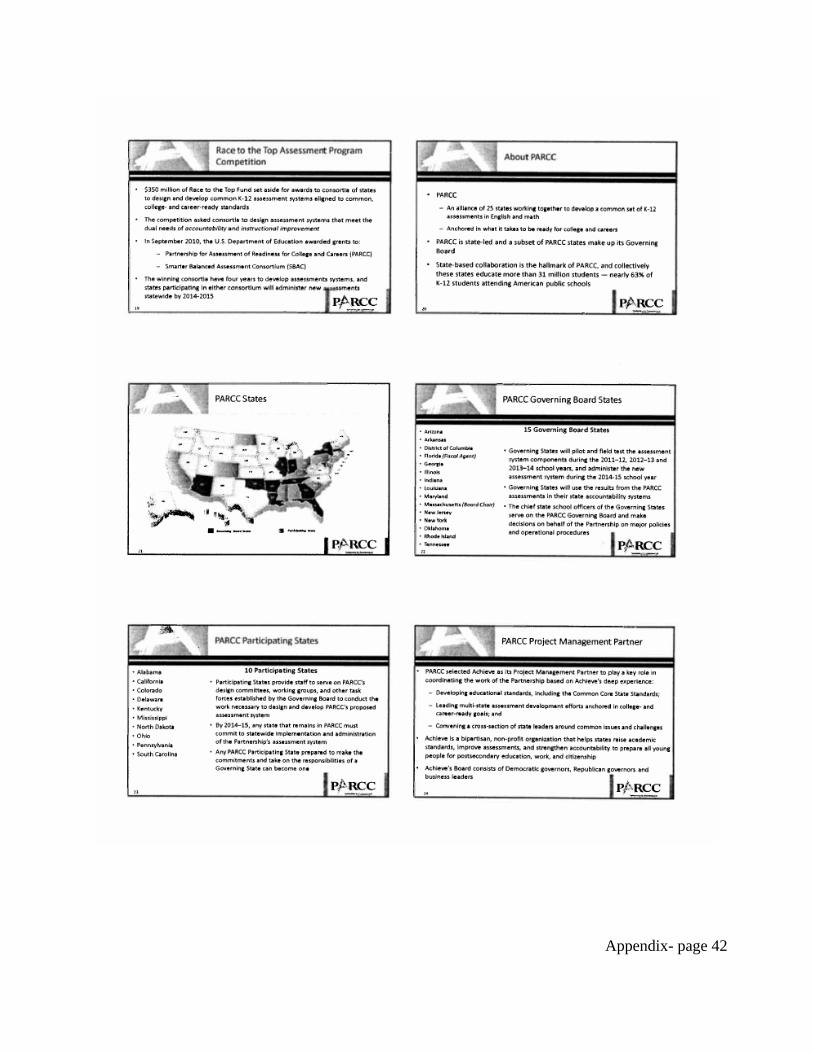
Appendix- page 42
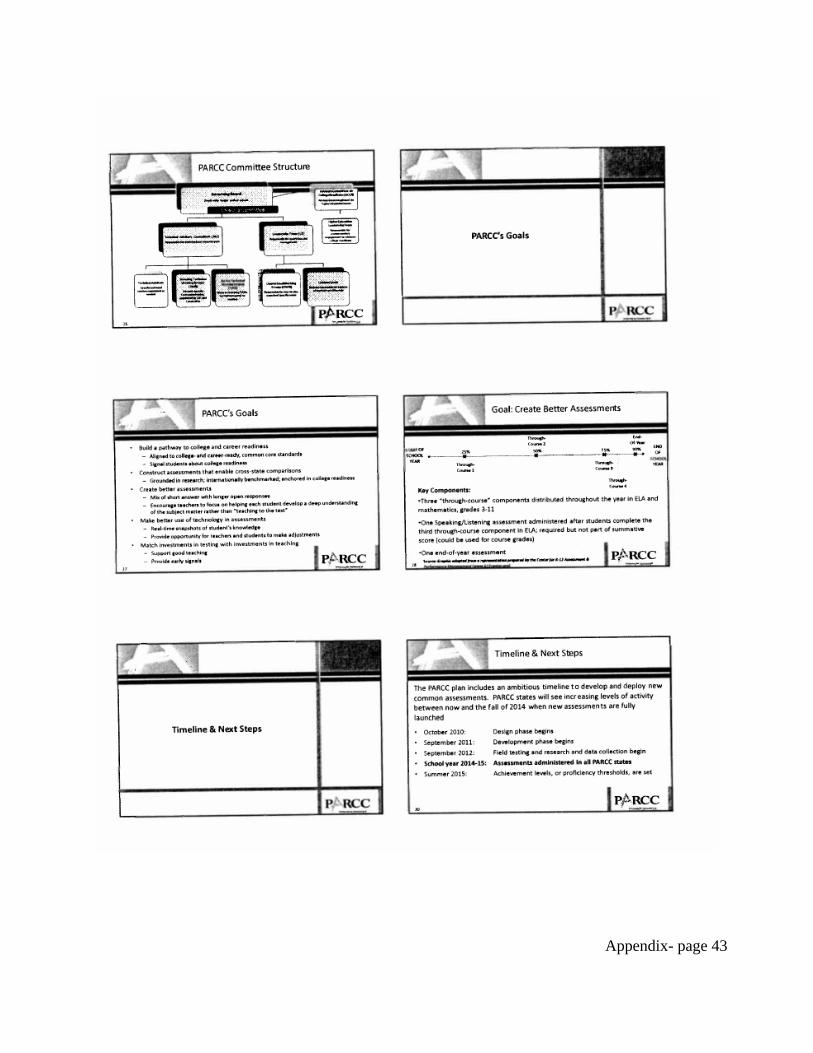
Appendix- page 43
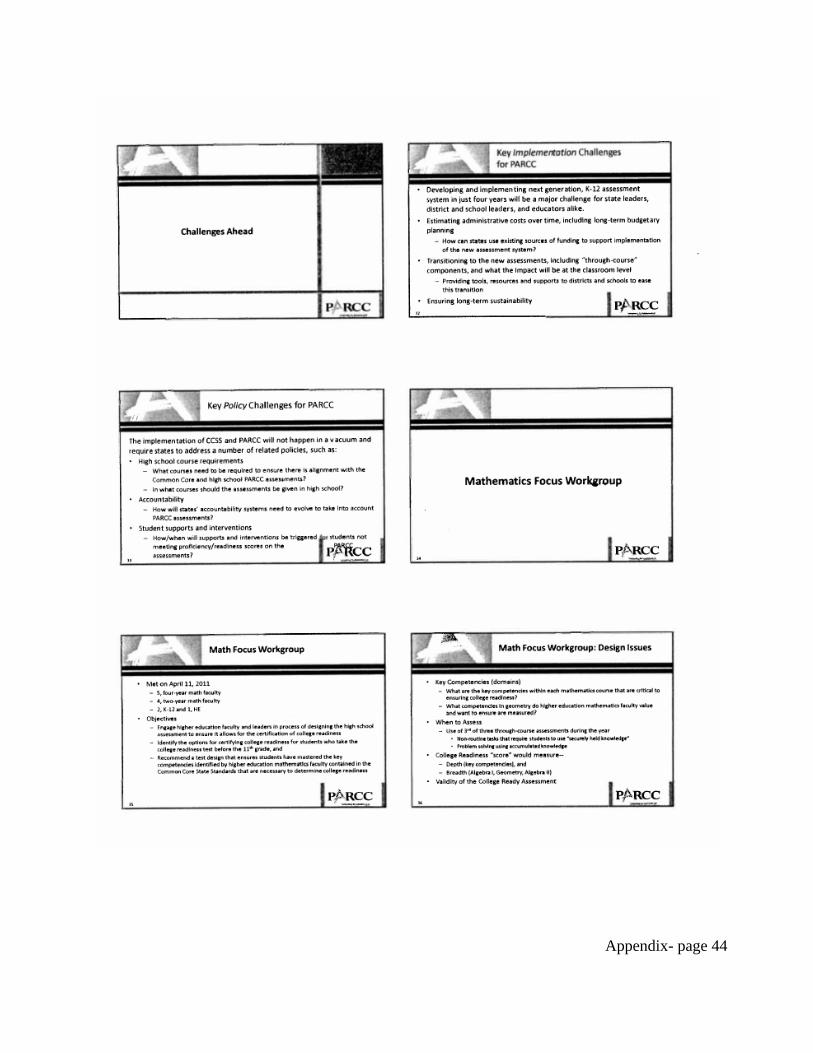
Appendix- page 44
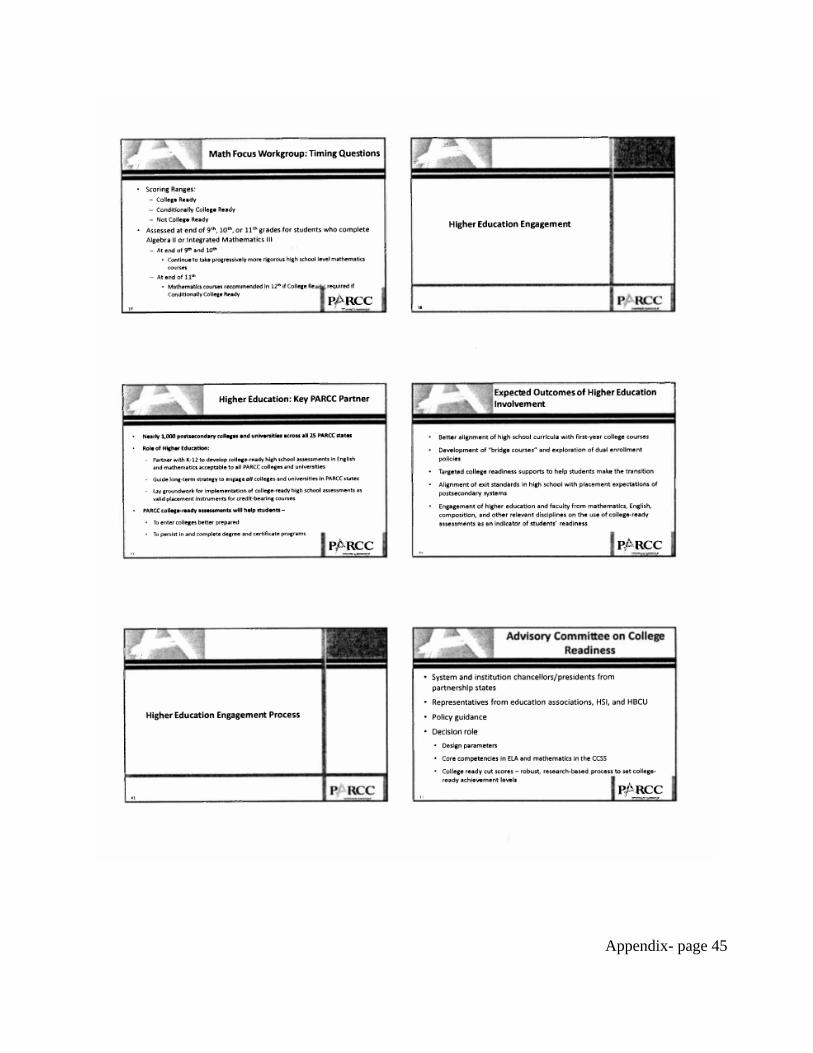
Appendix- page 45
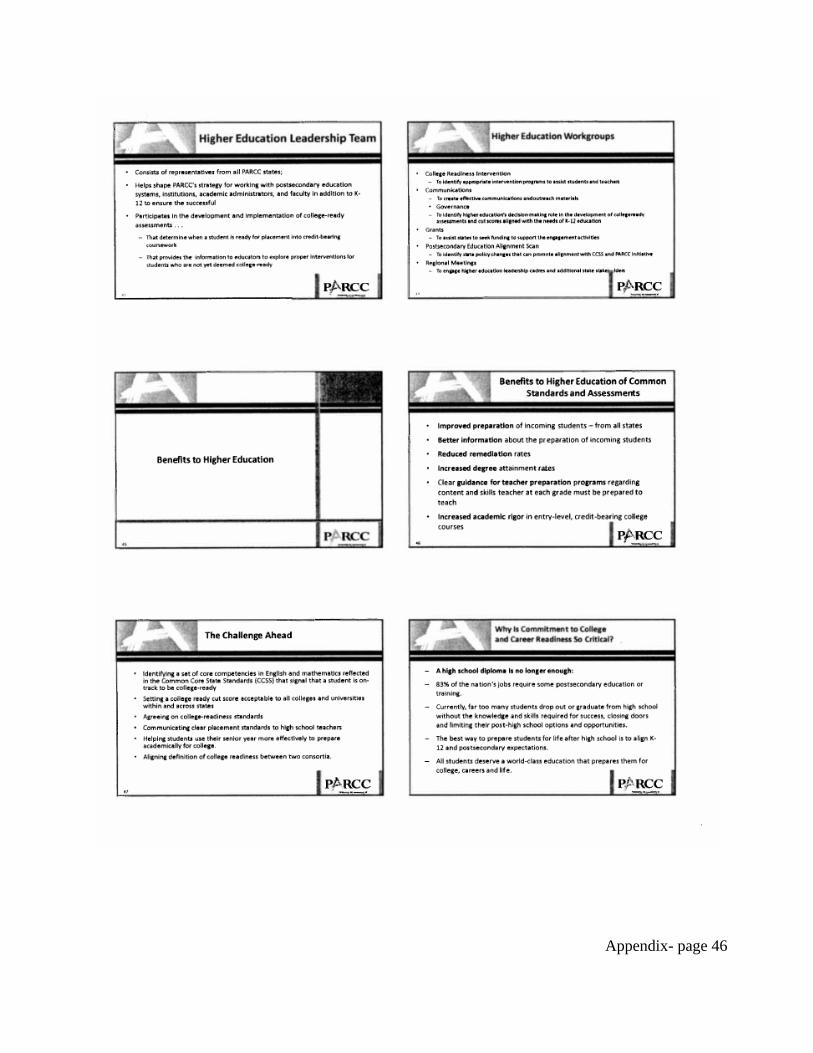
Appendix- page 46

Appendix- page 47
PARCC Higher Education Fact Sheet
ABOUT PARCC
• The Partnership for the Assessment of Readiness for College and Careers (PARCC) is a group of 25 states committed to building a next-generation assessment system for grades three through high school based upon the Common Core State Standards (CCSS). This assessment system will culminate in assessments that indicate whether students are prepared for entry-level, credit-bearing college courses. As such, higher education will play a significant role in shaping these assessments.
• K-12 leaders and higher education system and institutional leaders in PARCC states have agreed to collaborate on the development of college-ready assessments given in high school that can be used to signal whether students have acquired the prerequisite knowledge and skills for entry-level credit-bearing postsecondary courses. Teachers, parents, and students will know whether or not students are college ready by the end of high school, and, critically, whether they are “on-track” to college readiness in earlier grades. The new assessments will be ready for field-testing in 2012-2013 and for full statewide administration by the 2014 ‐2015 school year.
• The 13 governing states that will guide PARCC’s work include: Arizona, Arkansas, the District of Columbia, Florida, Georgia, Illinois, Indiana, Louisiana, Maryland, Massachusetts, New York, Rhode Island and Tennessee. Florida will serve as PARCC's fiscal agent state, and Massachusetts Commissioner of Elementary and Secondary Education Mitchell Chester will serve as the first chair of PARCC’s Governing Board. Additionally, Participating States in PARCC include: Alabama, Delaware, California, Colorado, Kentucky, Mississippi, New Jersey, North Dakota, Ohio, Oklahoma, Pennsylvania, and South Carolina. Altogether, PARCC states educate more than 31 million public K‐12 students in the U.S.
• PARCC includes most of the largest states in the country as well as those that have been leaders in education reform. In fact, 10 of the 12 state Race to the Top grant winners are PARCC states.
• PARCC selected Achieve to play a key role in coordinating the work of the Partnership, leveraging the organization’s deep experience in developing educational standards, including helping develop the CCSS, and its experience leading multi-state assessment development efforts anchored in college- and career-readiness.
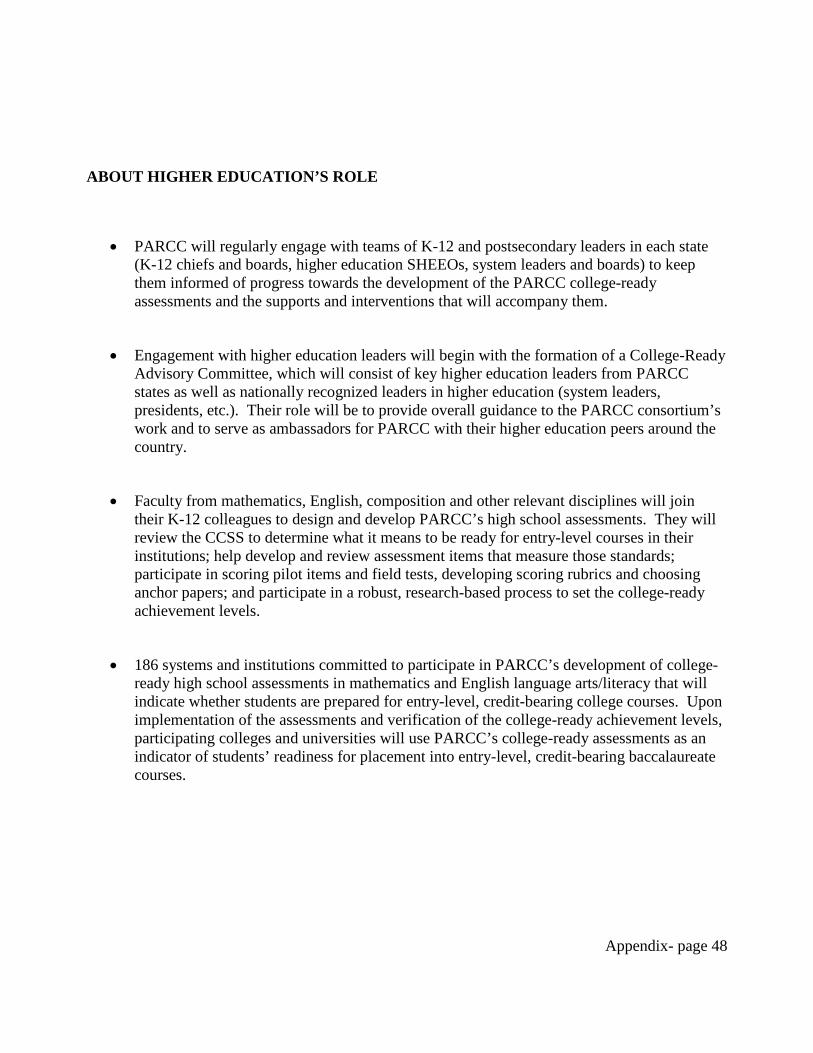
Appendix- page 48
ABOUT HIGHER EDUCATION’S ROLE
• PARCC will regularly engage with teams of K-12 and postsecondary leaders in each state (K-12 chiefs and boards, higher education SHEEOs, system leaders and boards) to keep them informed of progress towards the development of the PARCC college-ready assessments and the supports and interventions that will accompany them.
• Engagement with higher education leaders will begin with the formation of a College-Ready Advisory Committee, which will consist of key higher education leaders from PARCC states as well as nationally recognized leaders in higher education (system leaders, presidents, etc.). Their role will be to provide overall guidance to the PARCC consortium’s work and to serve as ambassadors for PARCC with their higher education peers around the country.
• Faculty from mathematics, English, composition and other relevant disciplines will join their K-12 colleagues to design and develop PARCC’s high school assessments. They will review the CCSS to determine what it means to be ready for entry-level courses in their institutions; help develop and review assessment items that measure those standards; participate in scoring pilot items and field tests, developing scoring rubrics and choosing anchor papers; and participate in a robust, research-based process to set the college-ready achievement levels.
• 186 systems and institutions committed to participate in PARCC’s development of college-ready high school assessments in mathematics and English language arts/literacy that will indicate whether students are prepared for entry-level, credit-bearing college courses. Upon implementation of the assessments and verification of the college-ready achievement levels, participating colleges and universities will use PARCC’s college-ready assessments as an indicator of students’ readiness for placement into entry-level, credit-bearing baccalaureate courses.
Appendix- page 49
Partnership for the Assessment of Readiness for College and Careers (PARCC)
Update March 2, 2011
ABOUT PARCC
The Partnership for the Assessment of Readiness for College and Careers (PARCC) is a group of 25 states1 committed to building a next-generation assessment system for elementary and secondary schools that is based upon the Common Core State Standards (CCSS). Of the twenty-five states, thirteen are part of the Governing Board which make the strongest commitment to PARCC and its activities and therefore have the most decision making authority. Maryland is one of the thirteen Governing States. The chief state school officers of the Governing States serve on the PARCC Governing Board and make decisions on behalf of the Partnership on major policies and operational procedures. Additionally, Dr. Nancy S. Grasmick serves on a six-member steering committee that advises Achieve on planning issues and implementation.
PARCC selected Achieve to play a key role in coordinating the work of the Partnership, leveraging the organization’s deep experience in developing educational standards, including helping develop the CCSS, and its experience leading multi-state assessment development efforts anchored in college- and career-readiness.
Maryland Role
As a Governing State, Maryland has representatives on the PARCC Leadership Team. Maryland’s K-12 Leadership Team is led by Leslie Wilson, Assistant State Superintendent for the Division of Accountability, Assessment and Data Systems, and Janet Bagsby, Chief of Assessment and Planning at the Maryland State at the Department of Education (MSDE). The Higher Education Leadership Team is led by Nancy Shapiro, Associate Vice Chancellor of Academic Affairs and Special Assistant to the Chancellor on P-20 Issues at the University System of Maryland (USM).
1 The 25 Participating States and Governing States (those in bold are governing states)are: Alabama, Arizona, Arkansas, California, Colorado, Delaware, District of Columbia, Florida, Georgia, Illinois, Indiana, Kentucky, Louisiana, Maryland, Massachusetts, Mississippi, New Jersey, New York, North Dakota, Ohio, Oklahoma, Pennsylvania, Rhode Island, South Carolina and Tennessee Florida will serve as PARCC's fiscal agent state, and Massachusetts Commissioner of Elementary and Secondary Education Mitchell Chester will serve as the first chair of PARCC’s Governing Board. Altogether, PARCC states educate more than 31 million public K ‐12 students in the U.S.
Appendix- page 50
The project manager for the involvement in higher education in PARCC is Danielle Susskind, also at USM.
K-12 leaders and higher education system and institutional leaders in PARCC states have agreed to
collaborate on the development of college-ready assessments given in high school that can be used
to signal whether students have acquired the prerequisite knowledge and skills for entry-level
credit-bearing postsecondary courses without remediation. The new assessments will be piloted in
2011-2012, field-tested in 2012-2013 and 2013-2014 and be fully implemented in the 2014‐2015
school year.
Recent Activities • On February 16th, 17th, and 18th the MD PARCC leadership team attended the initial PARCC
Higher Education and K-12 Engagement Meeting for Aligning College Readiness Expectations in Orlando, Florida. The MSDE leaders brought a high school English content specialist and a high school mathematics content specialist. The higher education leader brought the chair of the Statewide English Standards Committee, a professor from a community college and the chair of the Statewide Math Standards Committee, a professor at a four year institution. The high school content leads from all 25 states met with the faculty in the same discipline to discuss what each of their expectations were for college readiness set forth in the CCSS and identifying which of those standards are the most important to measure on PARCC’s assessments.
• The teams also discussed the priority purposes that are to be addressed by the PARCC high school assessments and to determine the implications of those priority purposes on the design of the assessments (e.g. end-of-course, end-of-year) and what additional information faculty will need beyond the college readiness score to determine that students are prepared for entry-level, credit-bearing college courses when they arrive at postsecondary institutions.
• Achieve is currently summarizing the various conversations and responses around these questions.
• On February 22, 2011, the Coordinator of English/Language Arts in the Department of Instruction at MSDE and her team presented the draft writing curriculum framework that has been developed in alignment with the new Common Core Standards to approximately 50 higher education faculty members from all over the state of Maryland. The faculty represented two and four year, private and public institutions. This meeting was hosted and facilitated by USM. The MSDE team explained how the framework was based on the standards and solicited feedback from the faculty on whether the essential skills and knowledge that K-12 teachers had suggested students needed to know and have to meet a standard were the right ones. Faculty offered suggestions, edits and additions to the framework that MSDE will feed into the next draft of the curriculum framework.
• On April 22nd, 2011, the Coordinator of Math in the Department of Instruction will hold the same meeting for Math faculty from all over the state in collaboration with USM. To date,
Appendix- page 51
approximately 80 faculty members have been invited to participate and offer feedback on the draft math curriculum framework.
• Maryland and all Governing States were invited to nominate three (3) higher education representatives to serve on PARCC’s Advisory Committee on College Readiness (ACCR). The nominees were jointly recommended by Dr. William (Brit) Kirwan and Dr. Nancy Grasmick. The committee will work with the PARCC Governing Board to shape the consortium’s strategy for working with higher education systems, institutions, and K-12 to ensure the successful development of college readiness assessments that will be accepted as an indicator of readiness for first-year, credit bearing courses by all colleges and universities across PARCC consortium states. The selection of the final committee representatives will be made by the PARCC Governing Board.
Appendix- page 52
Appendix C-4: Regional Presentation on Common Core Standards Overview

Appendix- page 53
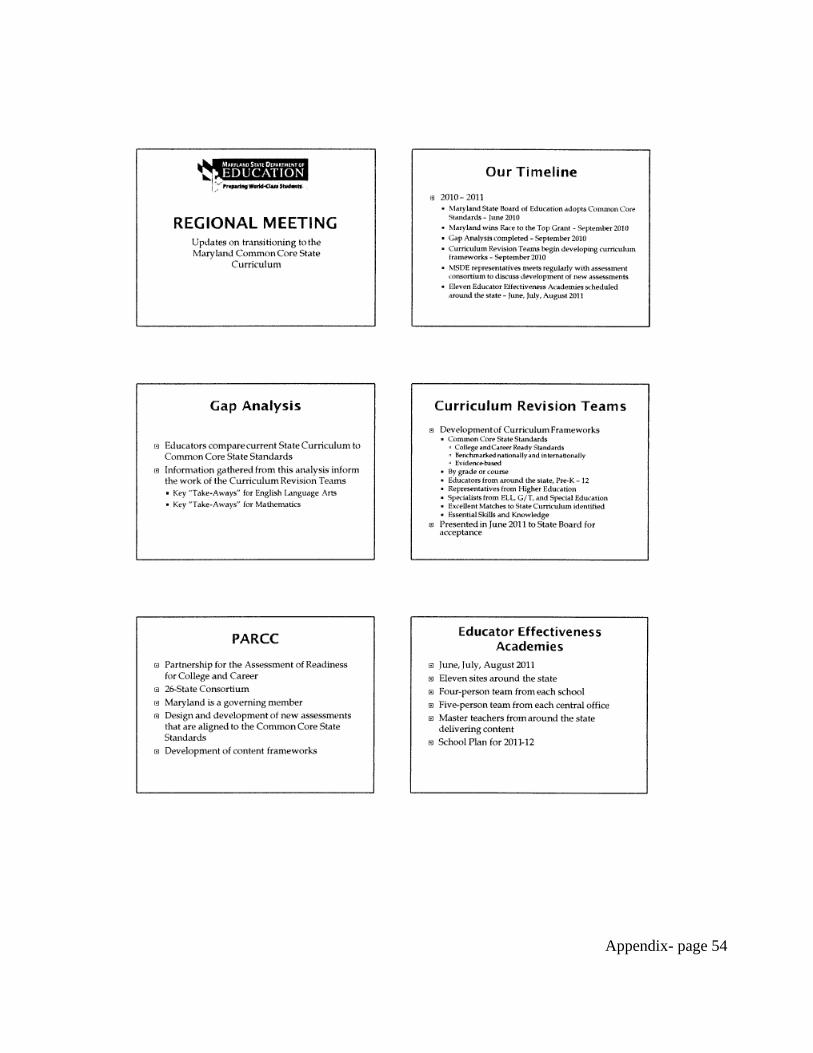
Appendix- page 54
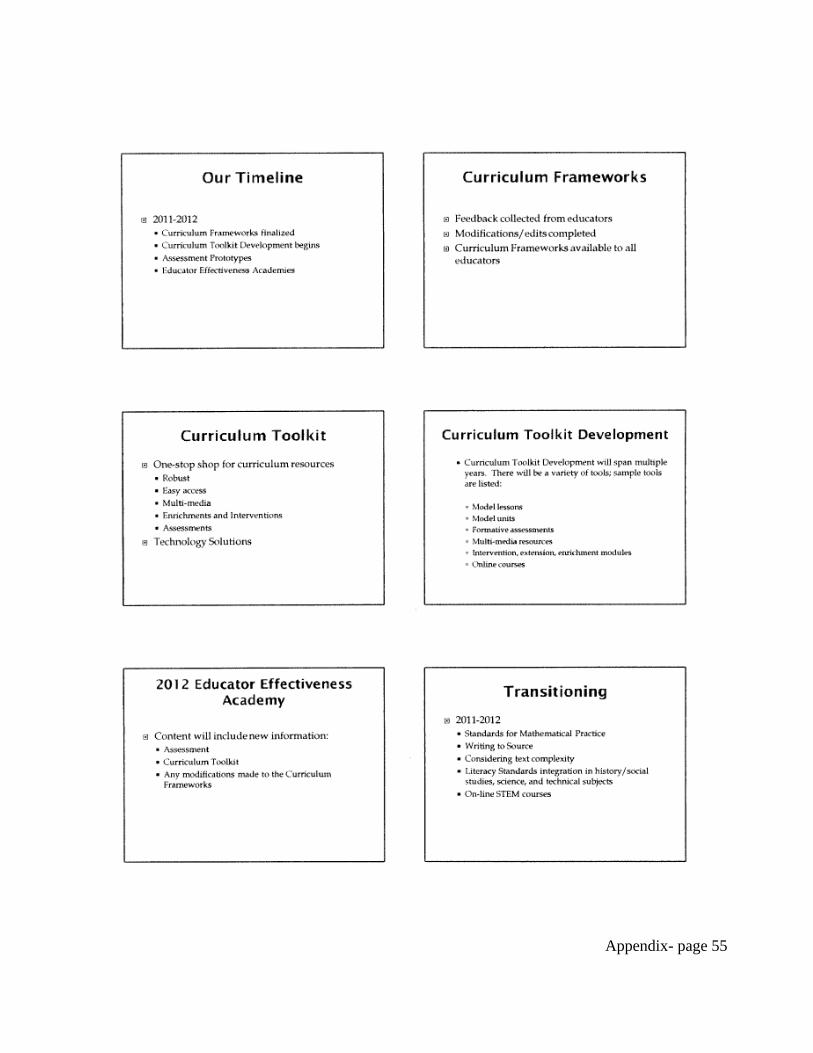
Appendix- page 55
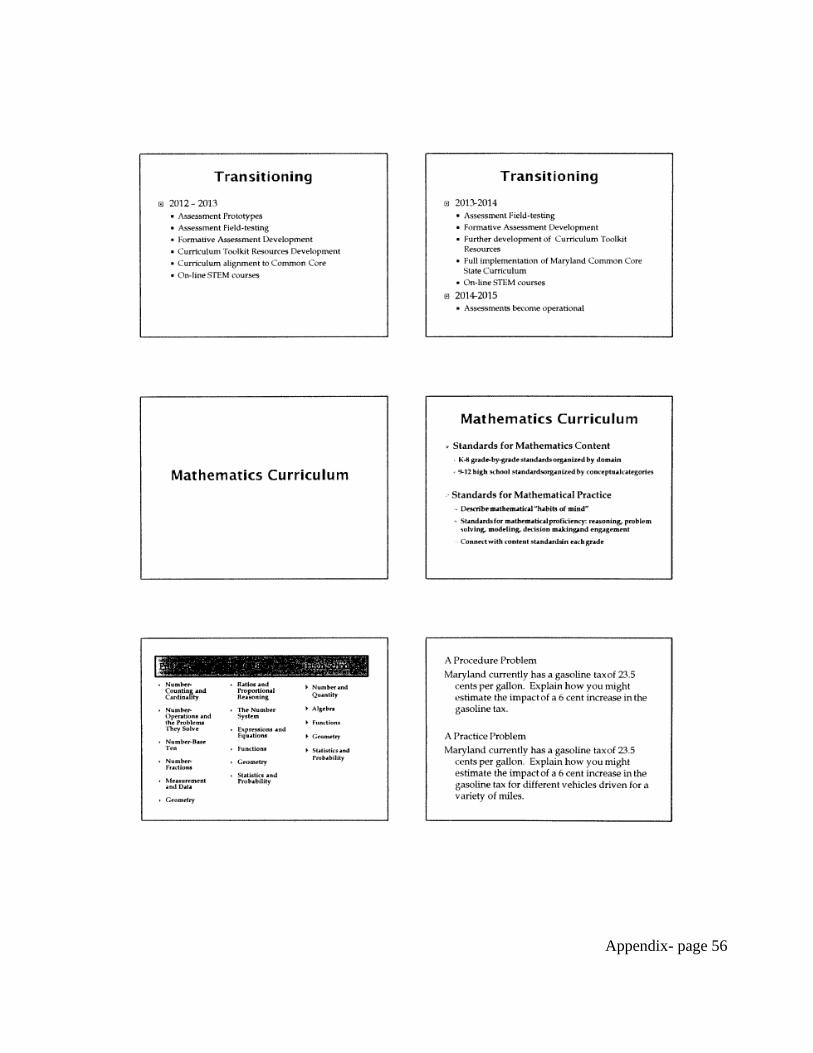
Appendix- page 56
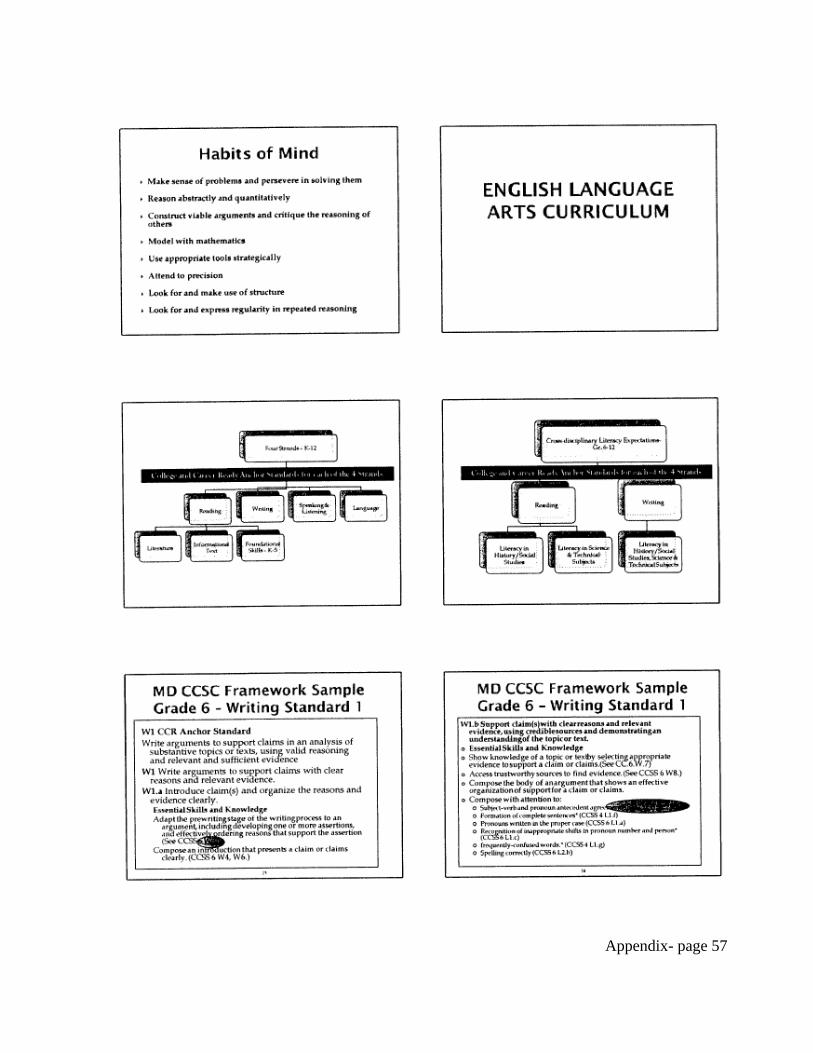
Appendix- page 57
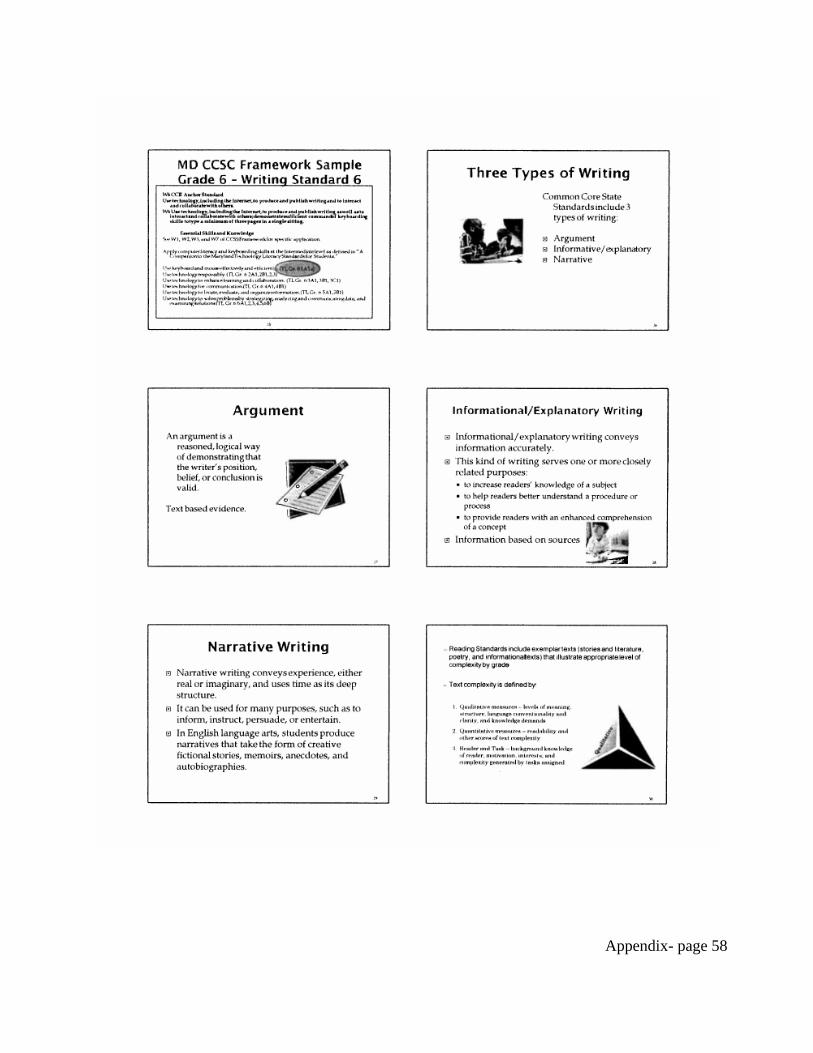
Appendix- page 58
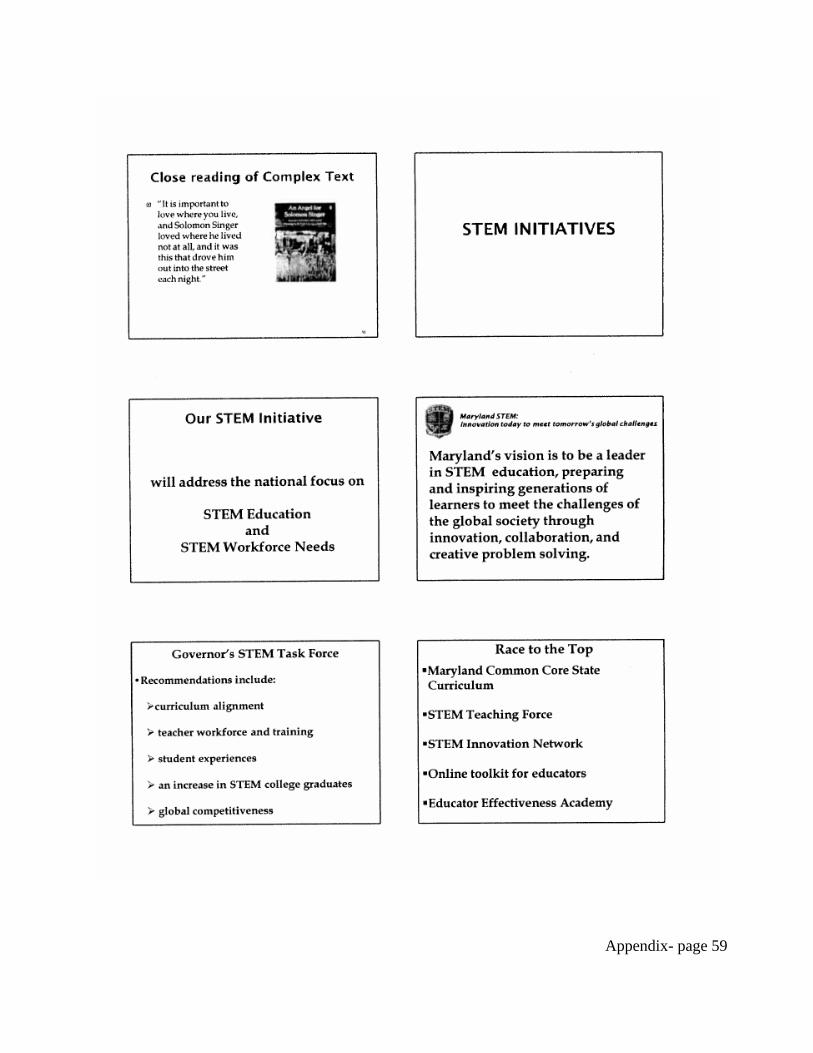
Appendix- page 59
Appendix- page 60

Appendix- page 61
Appendix C-5: Maryland Classroom Monthly Newsletter
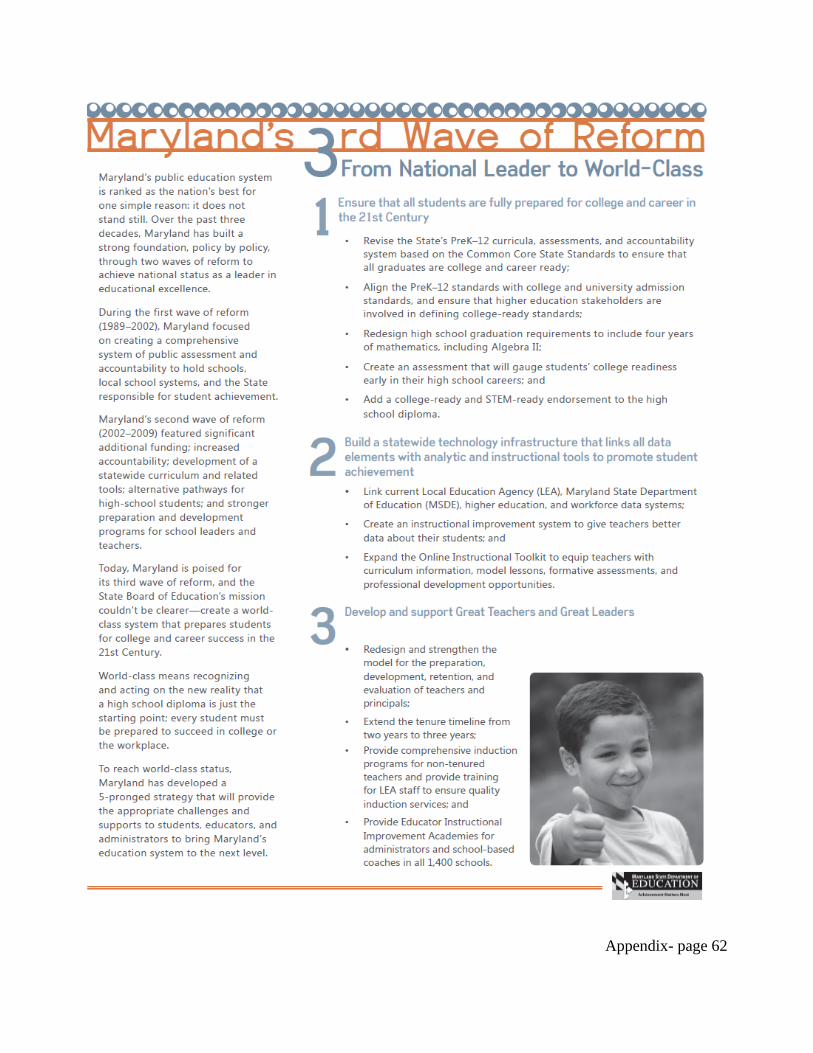
Appendix- page 62

Appendix- page 63

Appendix- page 64

Appendix- page 65
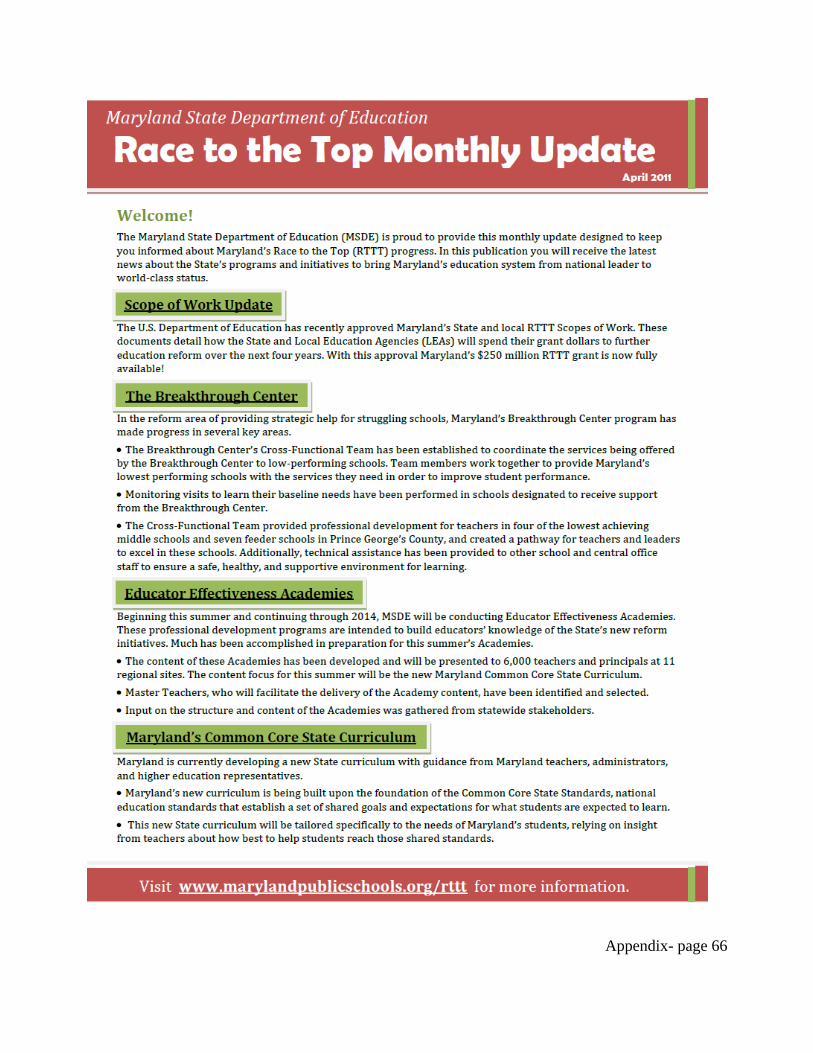
Appendix- page 66

Appendix- page 67

Appendix- page 68

Appendix- page 69

Appendix- page 70
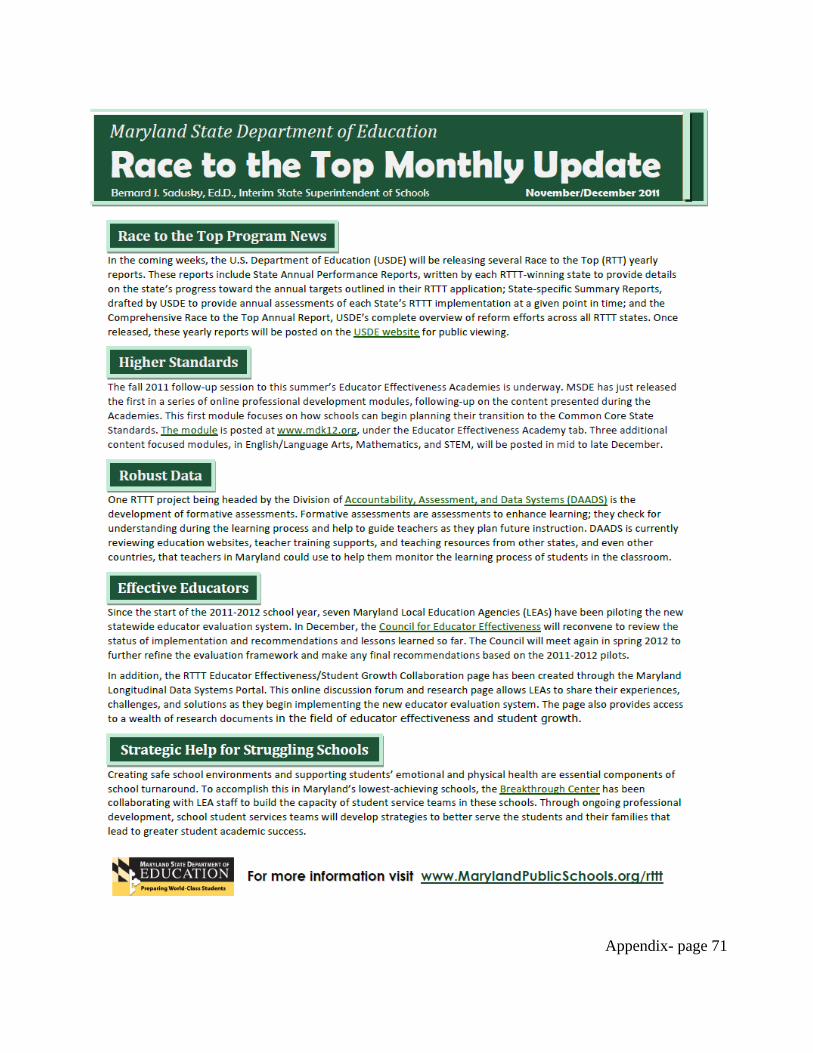
Appendix- page 71
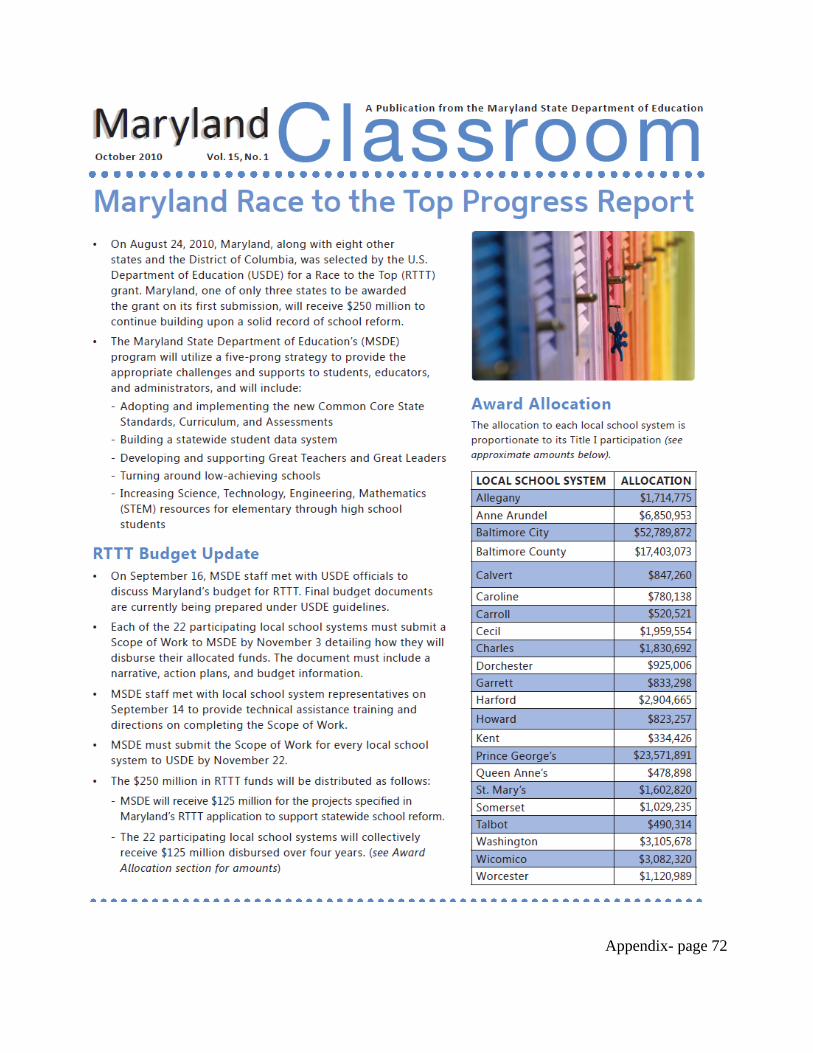
Appendix- page 72
Appendix- page 73
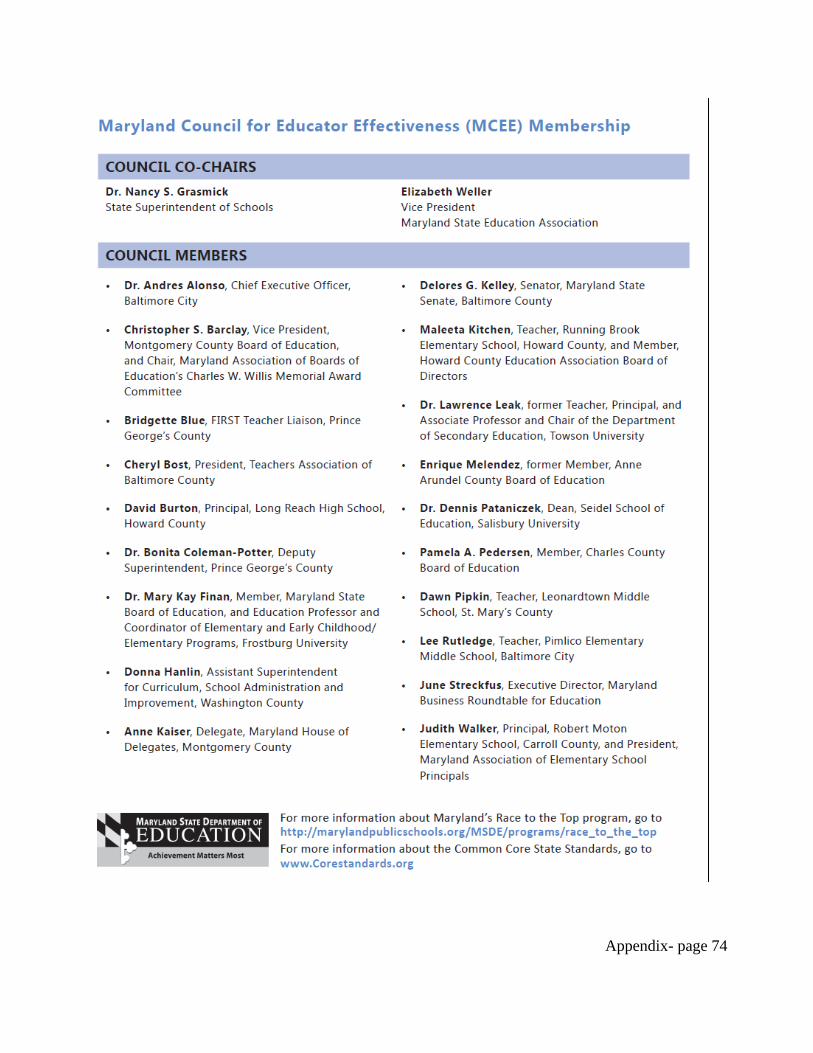
Appendix- page 74
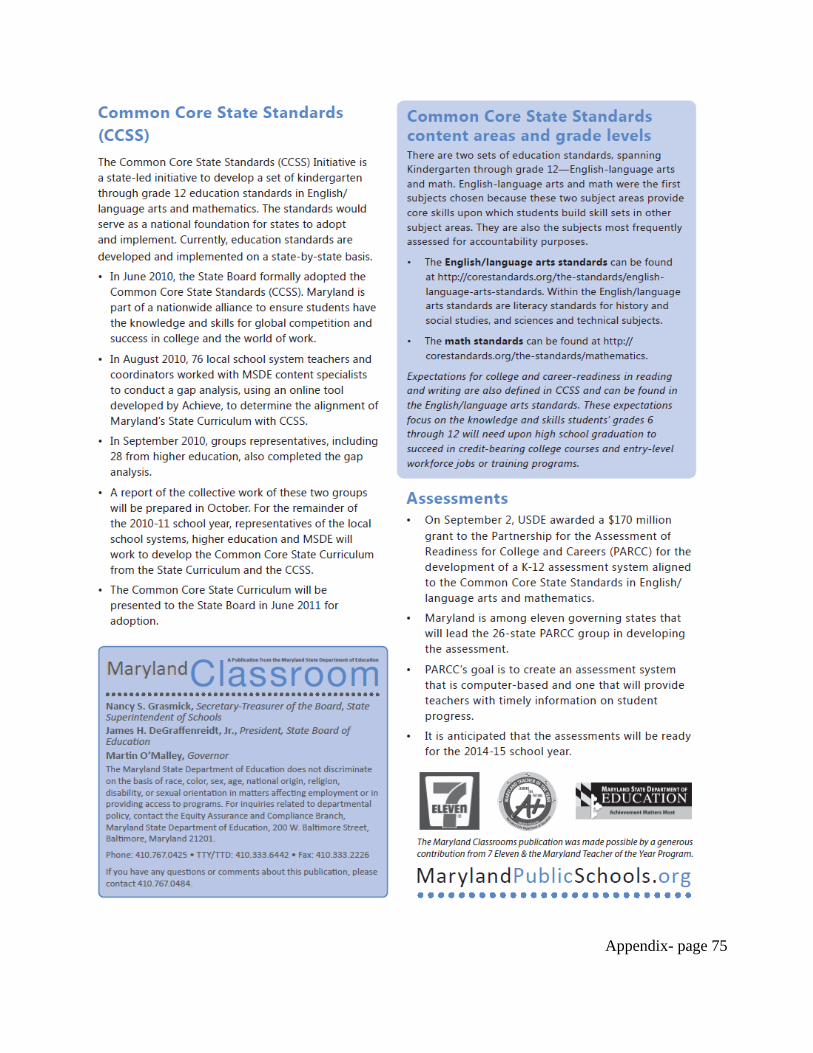
Appendix- page 75
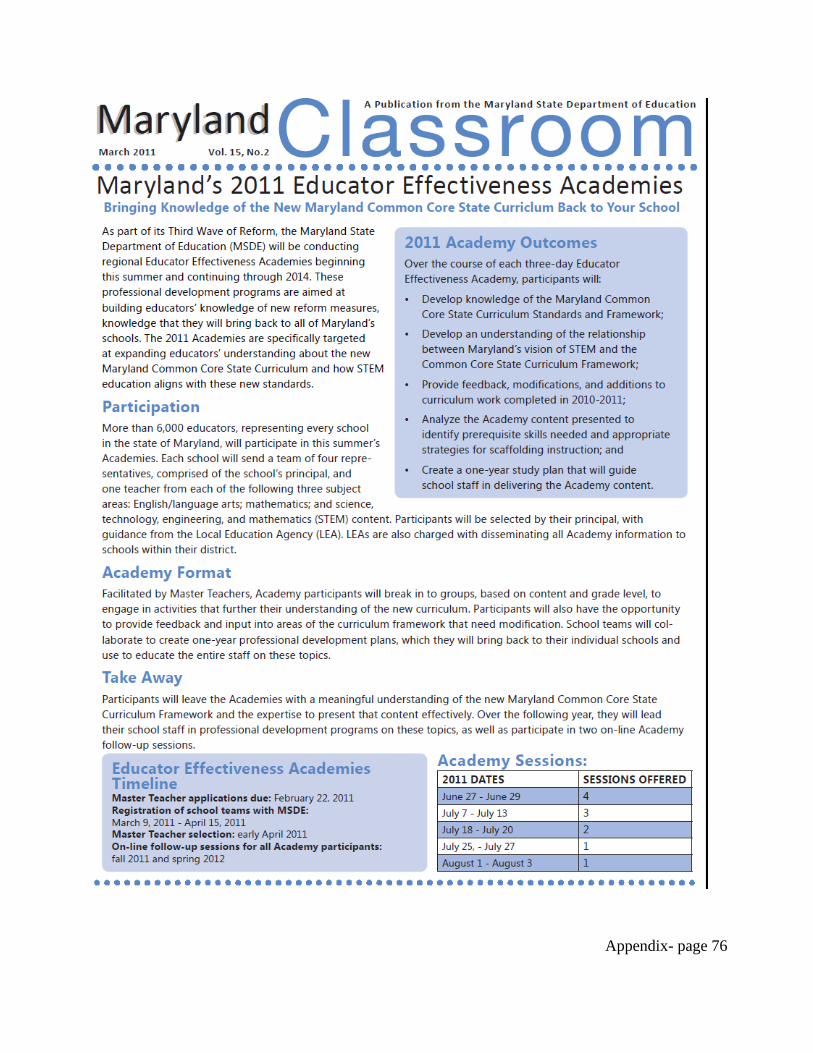
Appendix- page 76
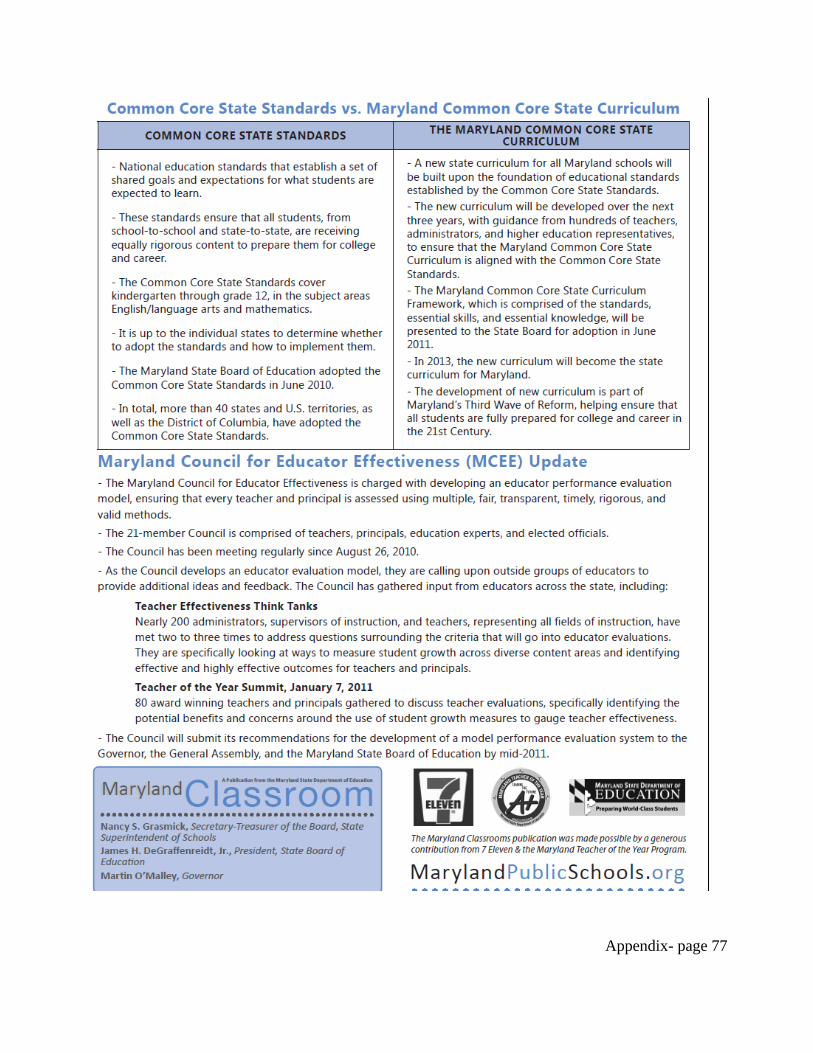
Appendix- page 77

Appendix- page 78

Appendix- page 79

Appendix- page 80

Appendix- page 81

Appendix- page 82

Appendix- page 83

Appendix- page 84

Appendix- page 85
Appendix- page 86
Appendix C-6: Maryland 3rd Wave of Reform Timeline
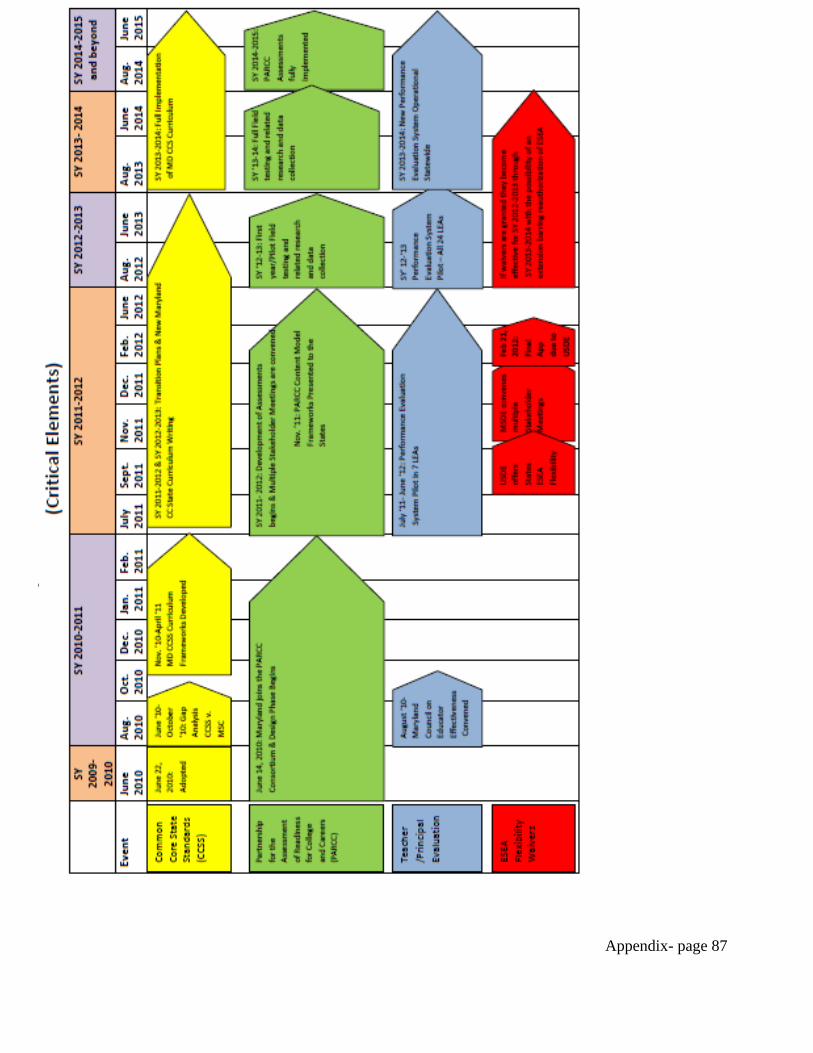
Appendix- page 87
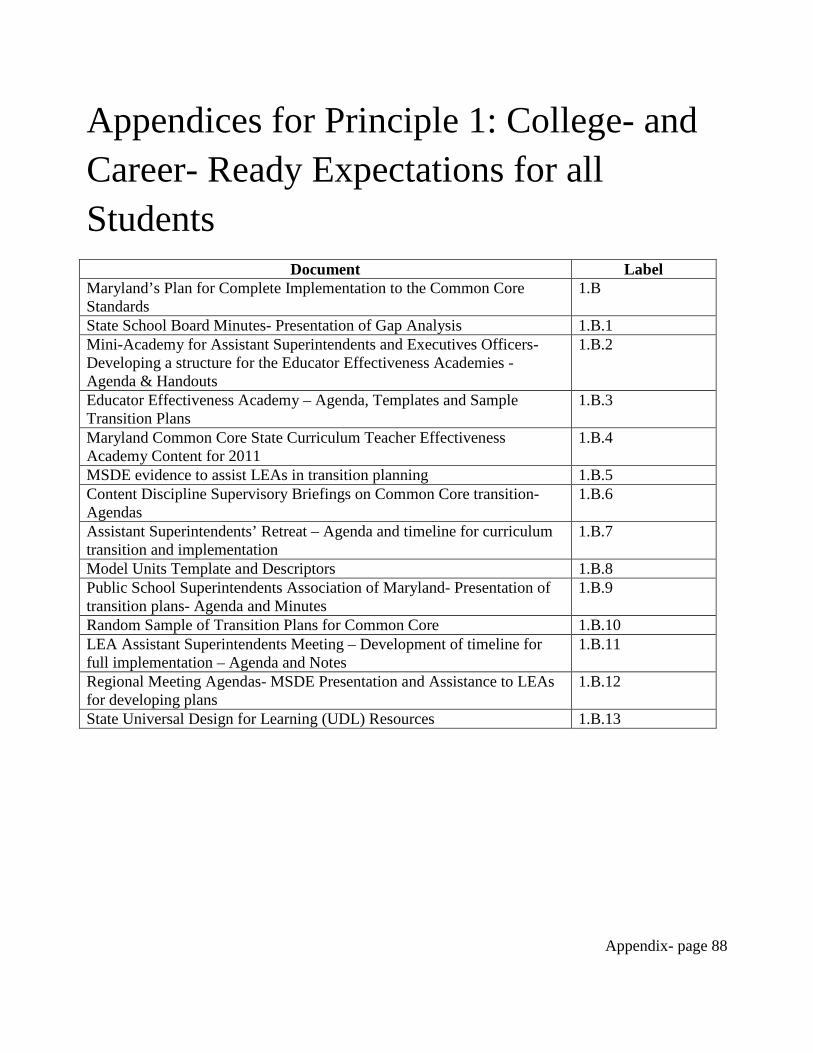
Appendix- page 88
Appendices for Principle 1: College- and Career- Ready Expectations for all Students
Document Label Maryland’s Plan for Complete Implementation to the Common Core Standards
1.B
State School Board Minutes- Presentation of Gap Analysis 1.B.1 Mini-Academy for Assistant Superintendents and Executives Officers- Developing a structure for the Educator Effectiveness Academies - Agenda & Handouts
1.B.2
Educator Effectiveness Academy – Agenda, Templates and Sample Transition Plans
1.B.3
Maryland Common Core State Curriculum Teacher Effectiveness Academy Content for 2011
1.B.4
MSDE evidence to assist LEAs in transition planning 1.B.5 Content Discipline Supervisory Briefings on Common Core transition- Agendas
1.B.6
Assistant Superintendents’ Retreat – Agenda and timeline for curriculum transition and implementation
1.B.7
Model Units Template and Descriptors 1.B.8 Public School Superintendents Association of Maryland- Presentation of transition plans- Agenda and Minutes
1.B.9
Random Sample of Transition Plans for Common Core 1.B.10 LEA Assistant Superintendents Meeting – Development of timeline for full implementation – Agenda and Notes
1.B.11
Regional Meeting Agendas- MSDE Presentation and Assistance to LEAs for developing plans
1.B.12
State Universal Design for Learning (UDL) Resources 1.B.13
Appendix- page 89
Appendix 1.B: Maryland’s Plan for Complete Implementation of the Common
Core Standards
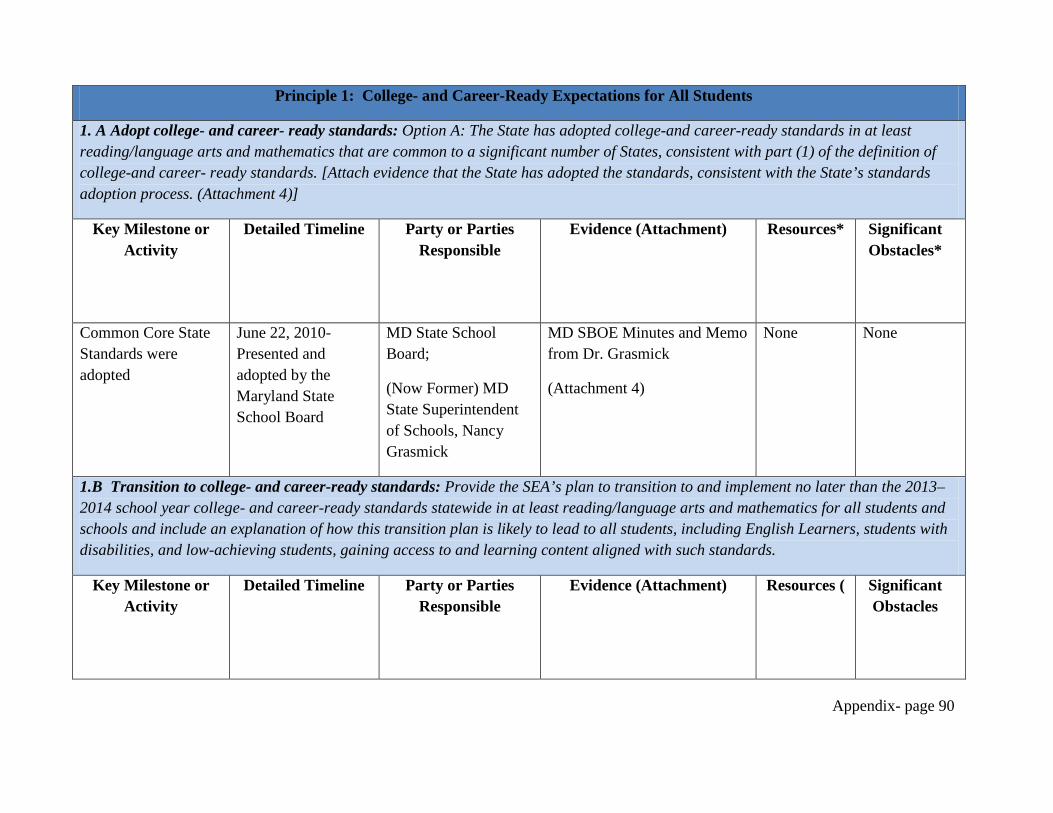
Appendix- page 90
Principle 1: College- and Career-Ready Expectations for All Students
1. A Adopt college- and career- ready standards: Option A: The State has adopted college-and career-ready standards in at least reading/language arts and mathematics that are common to a significant number of States, consistent with part (1) of the definition of college-and career- ready standards. [Attach evidence that the State has adopted the standards, consistent with the State’s standards adoption process. (Attachment 4)]
Key Milestone or Activity
Detailed Timeline Party or Parties Responsible
Evidence (Attachment)
Resources* Significant Obstacles*
Common Core State Standards were adopted
June 22, 2010- Presented and adopted by the Maryland State School Board
MD State School Board;
(Now Former) MD State Superintendent of Schools, Nancy Grasmick
MD SBOE Minutes and Memo from Dr. Grasmick
(Attachment 4)
None None
1.B Transition to college- and career-ready standards: Provide the SEA’s plan to transition to and implement no later than the 2013–2014 school year college- and career-ready standards statewide in at least reading/language arts and mathematics for all students and schools and include an explanation of how this transition plan is likely to lead to all students, including English Learners, students with disabilities, and low-achieving students, gaining access to and learning content aligned with such standards.
Key Milestone or Activity
Detailed Timeline Party or Parties Responsible
Evidence (Attachment)
Resources ( Significant Obstacles
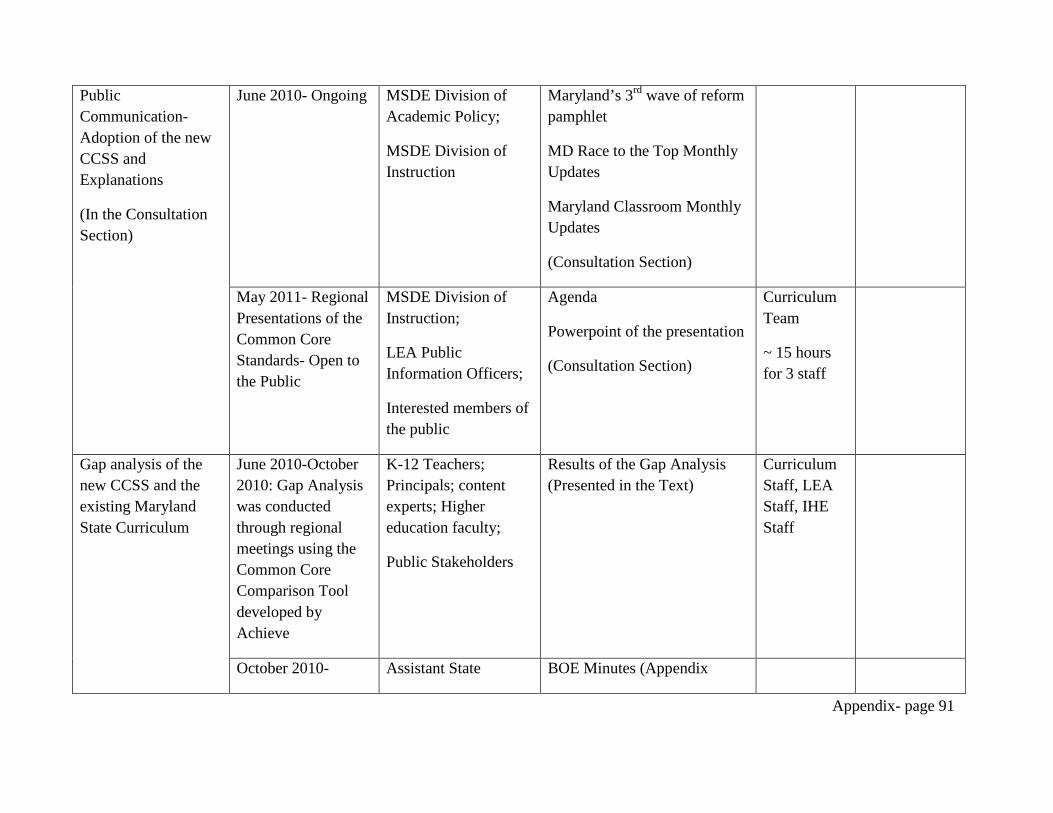
Appendix- page 91
Public Communication- Adoption of the new CCSS and Explanations
(In the Consultation Section)
June 2010- Ongoing MSDE Division of Academic Policy;
MSDE Division of Instruction
Maryland’s 3rd wave of reform pamphlet
MD Race to the Top Monthly Updates
Maryland Classroom Monthly Updates
(Consultation Section)
May 2011- Regional Presentations of the Common Core Standards- Open to the Public
MSDE Division of Instruction;
LEA Public Information Officers;
Interested members of the public
Agenda
Powerpoint of the presentation
(Consultation Section)
Curriculum Team
~ 15 hours for 3 staff
Gap analysis of the new CCSS and the existing Maryland State Curriculum
June 2010-October 2010: Gap Analysis was conducted through regional meetings using the Common Core Comparison Tool developed by Achieve
K-12 Teachers; Principals; content experts; Higher education faculty;
Public Stakeholders
Results of the Gap Analysis (Presented in the Text)
Curriculum Staff, LEA Staff, IHE Staff
October 2010- Assistant State BOE Minutes (Appendix
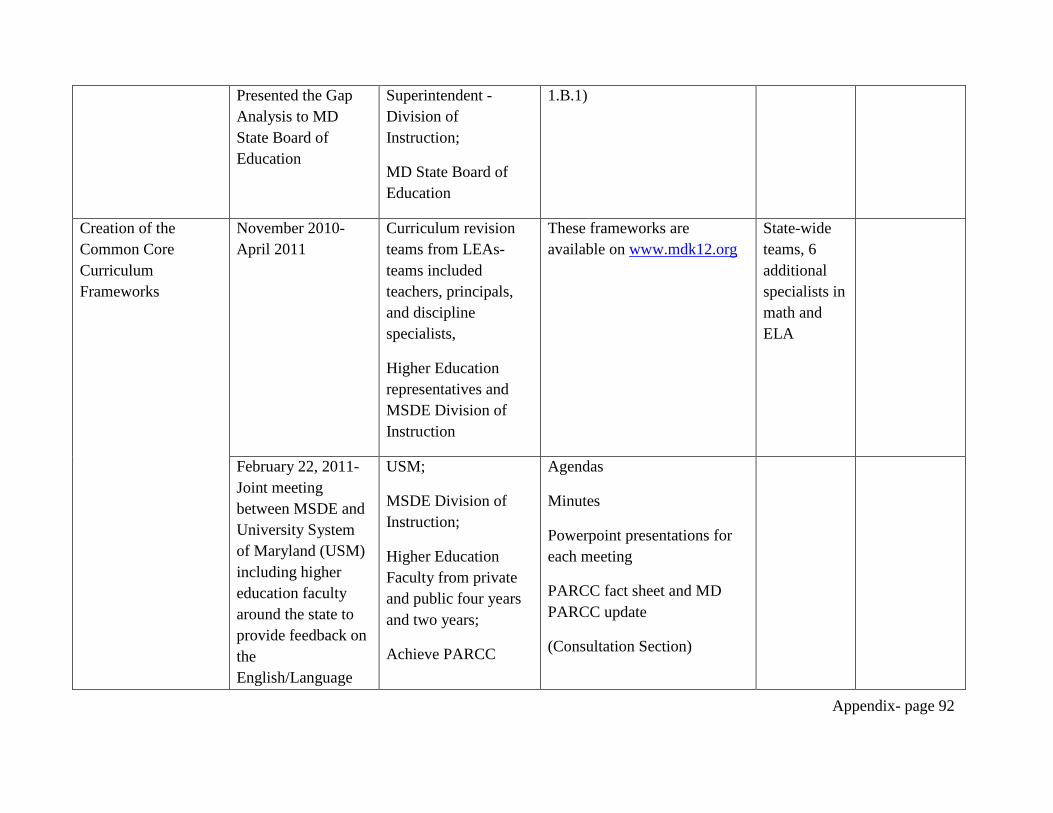
Appendix- page 92
Presented the Gap Analysis to MD State Board of Education
Superintendent -Division of Instruction;
MD State Board of Education
1.B.1)
Creation of the Common Core Curriculum Frameworks
November 2010-April 2011
Curriculum revision teams from LEAs- teams included teachers, principals, and discipline specialists,
Higher Education representatives and MSDE Division of Instruction
These frameworks are available on www.mdk12.org
State-wide teams, 6 additional specialists in math and ELA
February 22, 2011- Joint meeting between MSDE and University System of Maryland (USM) including higher education faculty around the state to provide feedback on the English/Language
USM;
MSDE Division of Instruction;
Higher Education Faculty from private and public four years and two years;
Achieve PARCC
Agendas
Minutes
Powerpoint presentations for each meeting
PARCC fact sheet and MD PARCC update
(Consultation Section)
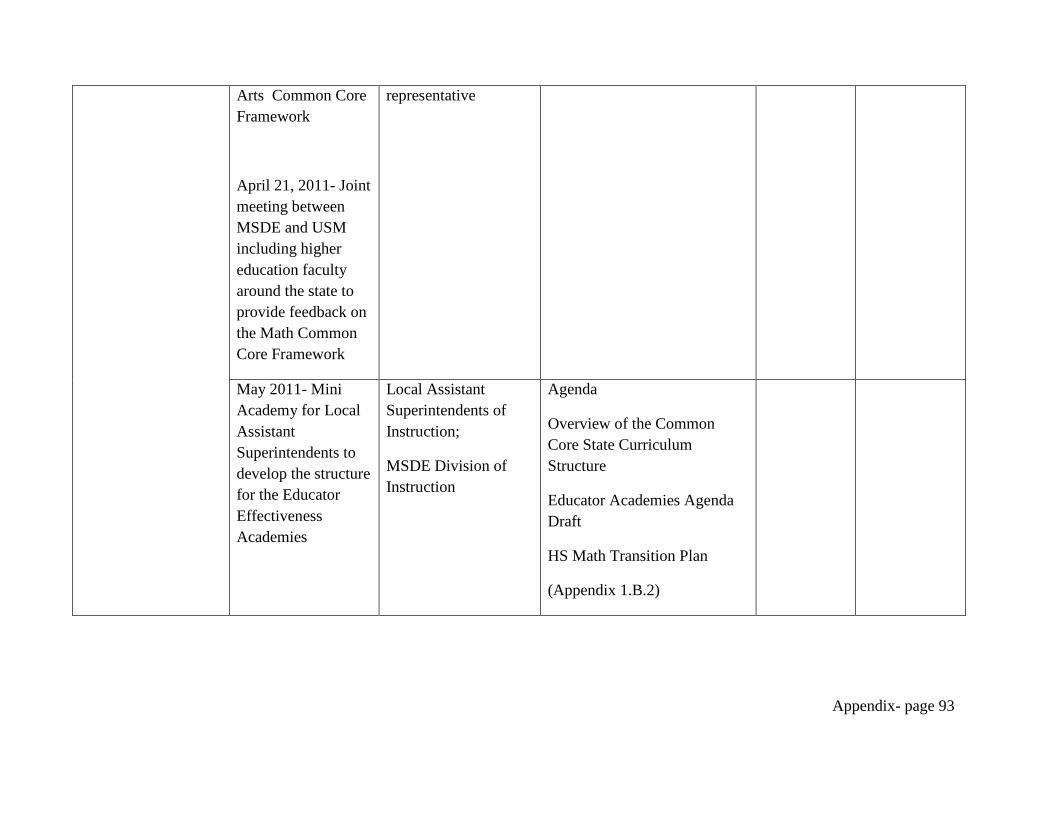
Appendix- page 93
Arts Common Core Framework
April 21, 2011- Joint meeting between MSDE and USM including higher education faculty around the state to provide feedback on the Math Common Core Framework
representative
May 2011- Mini Academy for Local Assistant Superintendents to develop the structure for the Educator Effectiveness Academies
Local Assistant Superintendents of Instruction;
MSDE Division of Instruction
Agenda
Overview of the Common Core State Curriculum Structure
Educator Academies Agenda Draft
HS Math Transition Plan
(Appendix 1.B.2)
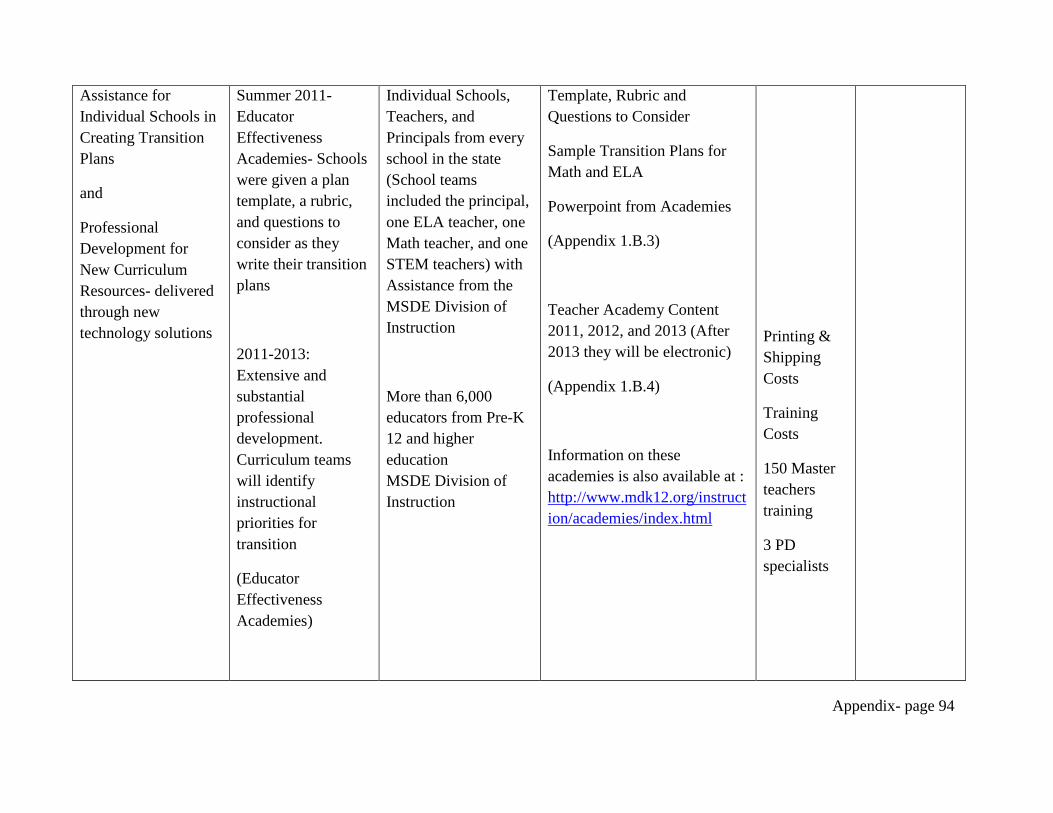
Appendix- page 94
Assistance for Individual Schools in Creating Transition Plans
and
Professional Development for New Curriculum Resources- delivered through new technology solutions
Summer 2011- Educator Effectiveness Academies- Schools were given a plan template, a rubric, and questions to consider as they write their transition plans
2011-2013: Extensive and substantial professional development. Curriculum teams will identify instructional priorities for transition
(Educator Effectiveness Academies)
Individual Schools, Teachers, and Principals from every school in the state (School teams included the principal, one ELA teacher, one Math teacher, and one STEM teachers) with Assistance from the MSDE Division of Instruction
More than 6,000 educators from Pre-K 12 and higher education MSDE Division of Instruction
Template, Rubric and Questions to Consider
Sample Transition Plans for Math and ELA
Powerpoint from Academies
(Appendix 1.B.3)
Teacher Academy Content 2011, 2012, and 2013 (After 2013 they will be electronic)
(Appendix 1.B.4)
Information on these academies is also available at : http://www.mdk12.org/instruction/academies/index.html
Printing & Shipping Costs
Training Costs
150 Master teachers training
3 PD specialists
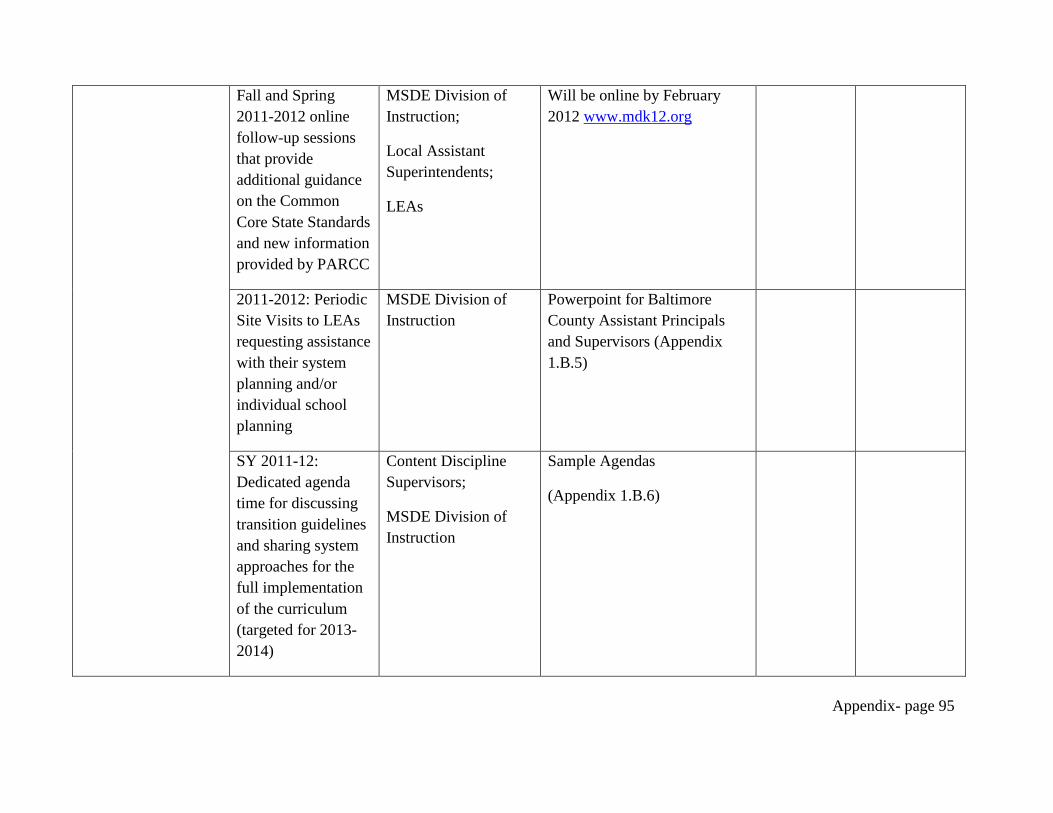
Appendix- page 95
Fall and Spring 2011-2012 online follow-up sessions that provide additional guidance on the Common Core State Standards and new information provided by PARCC
MSDE Division of Instruction;
Local Assistant Superintendents;
LEAs
Will be online by February 2012 www.mdk12.org
2011-2012: Periodic Site Visits to LEAs requesting assistance with their system planning and/or individual school planning
MSDE Division of Instruction
Powerpoint for Baltimore County Assistant Principals and Supervisors (Appendix 1.B.5)
SY 2011-12: Dedicated agenda time for discussing transition guidelines and sharing system approaches for the full implementation of the curriculum (targeted for 2013-2014)
Content Discipline Supervisors;
MSDE Division of Instruction
Sample Agendas
(Appendix 1.B.6)
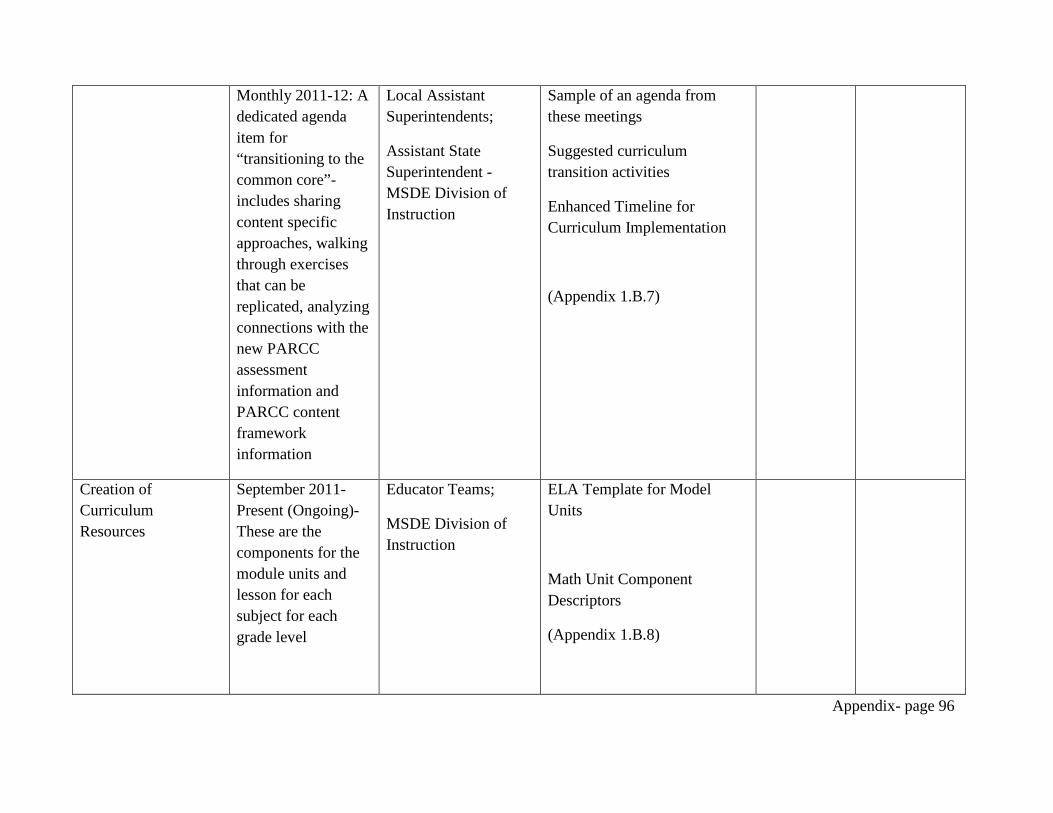
Appendix- page 96
Monthly 2011-12: A dedicated agenda item for “transitioning to the common core”- includes sharing content specific approaches, walking through exercises that can be replicated, analyzing connections with the new PARCC assessment information and PARCC content framework information
Local Assistant Superintendents;
Assistant State Superintendent - MSDE Division of Instruction
Sample of an agenda from these meetings
Suggested curriculum transition activities
Enhanced Timeline for Curriculum Implementation
(Appendix 1.B.7)
Creation of Curriculum Resources
September 2011-Present (Ongoing)- These are the components for the module units and lesson for each subject for each grade level
Educator Teams;
MSDE Division of Instruction
ELA Template for Model Units
Math Unit Component Descriptors
(Appendix 1.B.8)
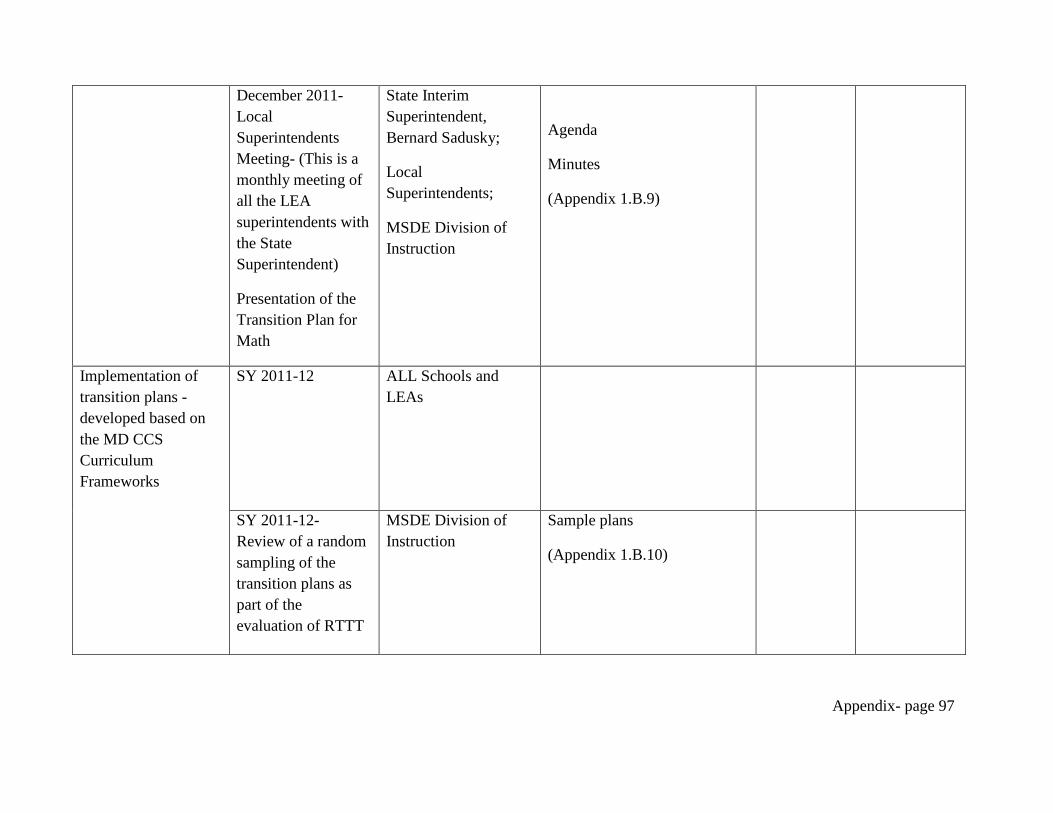
Appendix- page 97
December 2011- Local Superintendents Meeting- (This is a monthly meeting of all the LEA superintendents with the State Superintendent)
Presentation of the Transition Plan for Math
State Interim Superintendent, Bernard Sadusky;
Local Superintendents;
MSDE Division of Instruction
Agenda
Minutes
(Appendix 1.B.9)
Implementation of transition plans -developed based on the MD CCS Curriculum Frameworks
SY 2011-12 ALL Schools and LEAs
SY 2011-12- Review of a random sampling of the transition plans as part of the evaluation of RTTT
MSDE Division of Instruction
Sample plans
(Appendix 1.B.10)
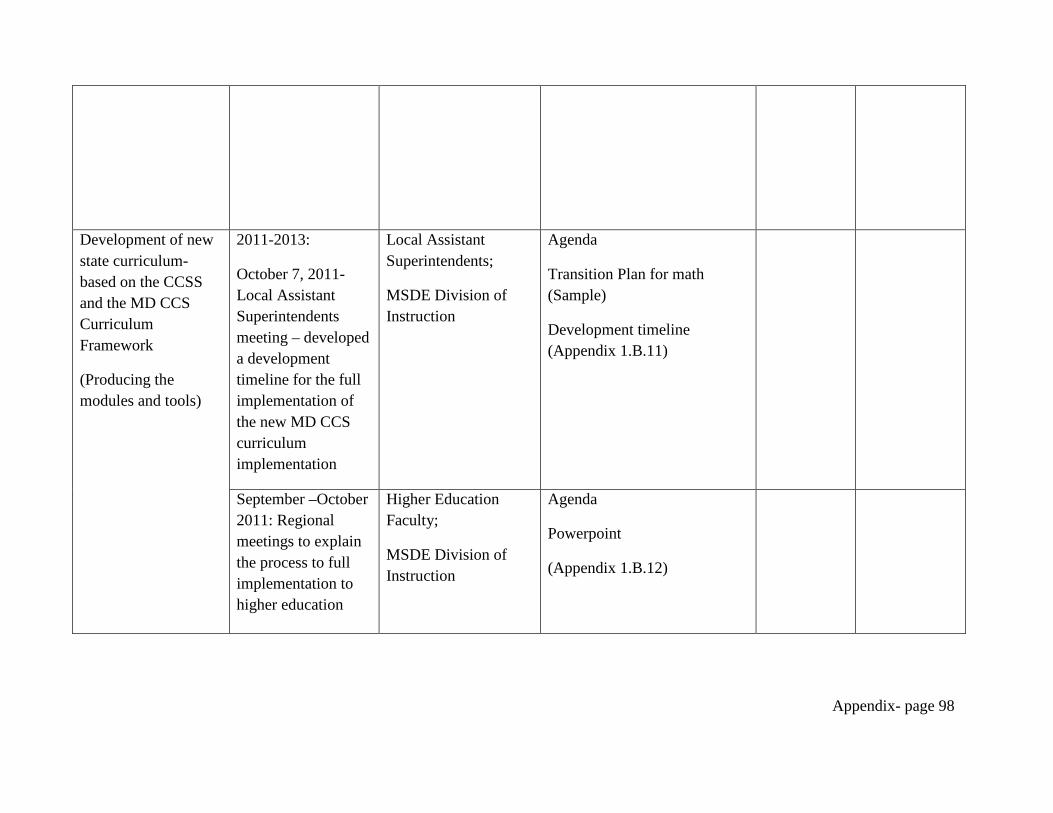
Appendix- page 98
Development of new state curriculum-based on the CCSS and the MD CCS Curriculum Framework
(Producing the modules and tools)
2011-2013:
October 7, 2011- Local Assistant Superintendents meeting – developed a development timeline for the full implementation of the new MD CCS curriculum implementation
Local Assistant Superintendents;
MSDE Division of Instruction
Agenda
Transition Plan for math (Sample)
Development timeline (Appendix 1.B.11)
September –October 2011: Regional meetings to explain the process to full implementation to higher education
Higher Education Faculty;
MSDE Division of Instruction
Agenda
Powerpoint
(Appendix 1.B.12)
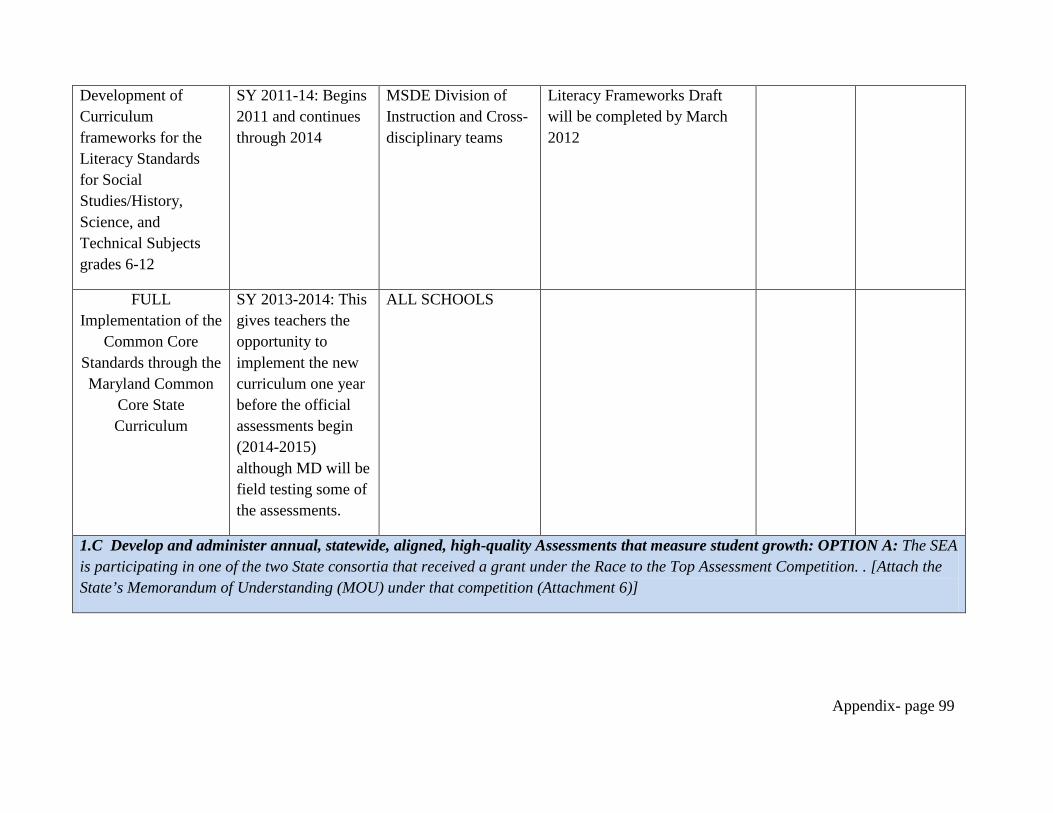
Appendix- page 99
Development of Curriculum frameworks for the Literacy Standards for Social Studies/History, Science, and Technical Subjects grades 6-12
SY 2011-14: Begins 2011 and continues through 2014
MSDE Division of Instruction and Cross-disciplinary teams
Literacy Frameworks Draft will be completed by March 2012
FULL Implementation of the
Common Core Standards through the Maryland Common
Core State Curriculum
SY 2013-2014: This gives teachers the opportunity to implement the new curriculum one year before the official assessments begin (2014-2015) although MD will be field testing some of the assessments.
ALL SCHOOLS
1.C Develop and administer annual, statewide, aligned, high-quality Assessments that measure student growth: OPTION A: The SEA is participating in one of the two State consortia that received a grant under the Race to the Top Assessment Competition. . [Attach the State’s Memorandum of Understanding (MOU) under that competition (Attachment 6)]
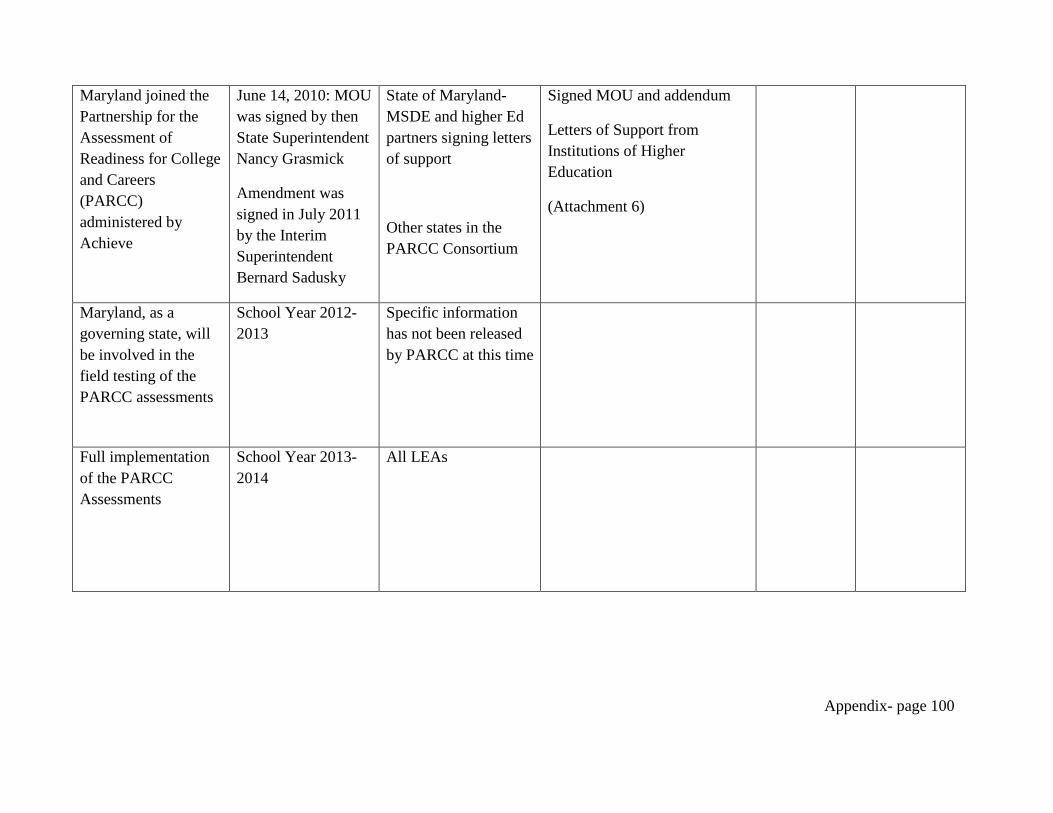
Appendix- page 100
Maryland joined the Partnership for the Assessment of Readiness for College and Careers (PARCC) administered by Achieve
June 14, 2010: MOU was signed by then State Superintendent Nancy Grasmick
Amendment was signed in July 2011 by the Interim Superintendent Bernard Sadusky
State of Maryland- MSDE and higher Ed partners signing letters of support
Other states in the PARCC Consortium
Signed MOU and addendum
Letters of Support from Institutions of Higher Education
(Attachment 6)
Maryland, as a governing state, will be involved in the field testing of the PARCC assessments
School Year 2012-2013
Specific information has not been released by PARCC at this time
Full implementation of the PARCC Assessments
School Year 2013-2014
All LEAs
Appendix- page 101
Appendix 1.B.1: State School Board Minutes - Presentation of Gap Analysis
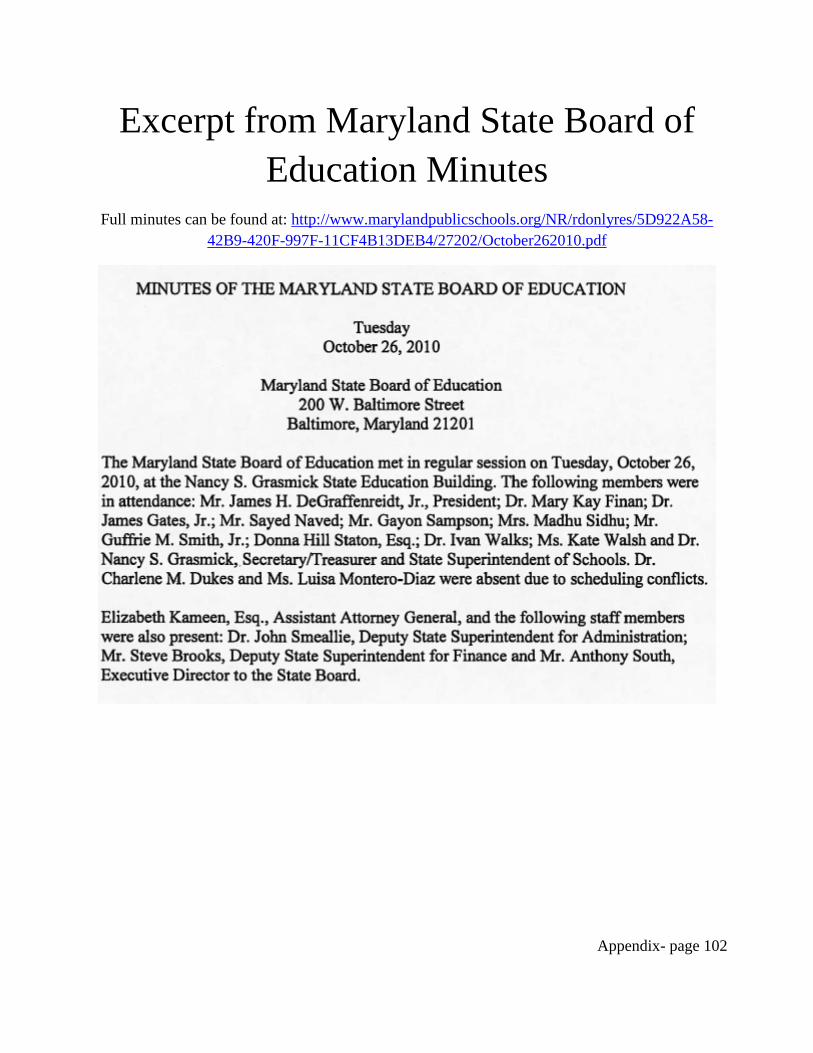
Appendix- page 102
Excerpt from Maryland State Board of Education Minutes
Full minutes can be found at: http://www.marylandpublicschools.org/NR/rdonlyres/5D922A58-42B9-420F-997F-11CF4B13DEB4/27202/October262010.pdf
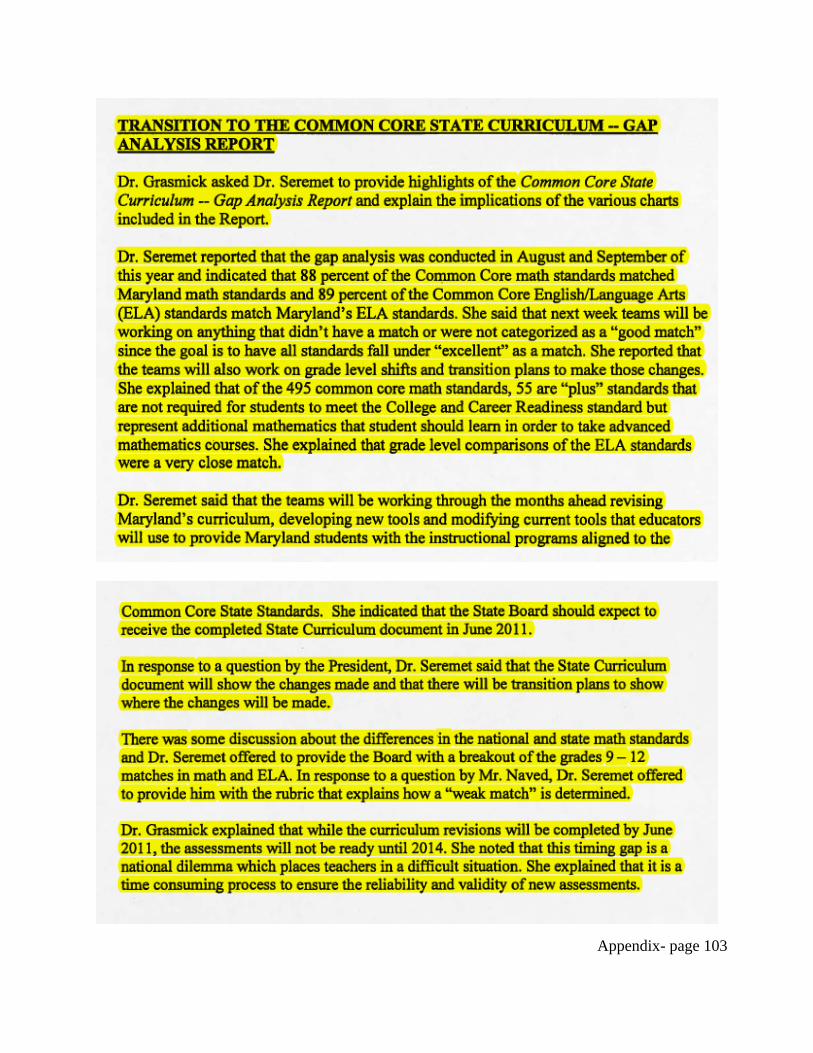
Appendix- page 103
Appendix- page 104
Appendix 1.B.2: Mini-Academy for Assistant Superintendents and Executives Officers - Developing a Structure for the
Educator Effectiveness Academies - Agenda & Handouts
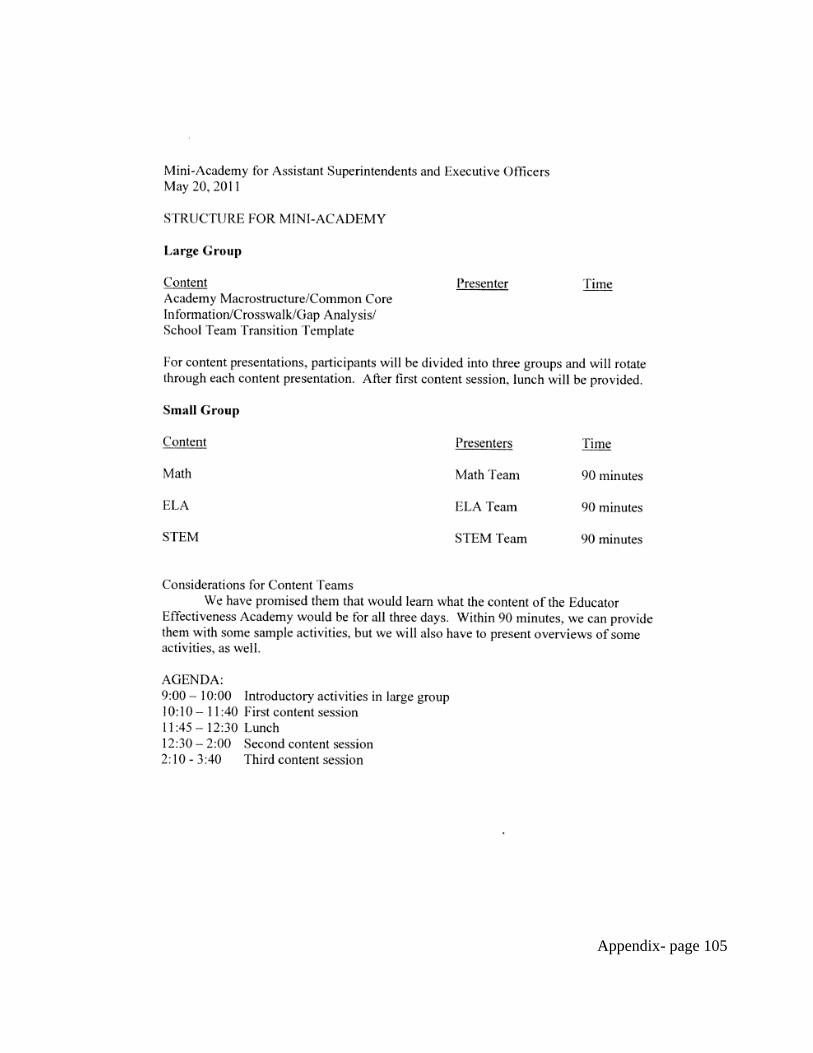
Appendix- page 105
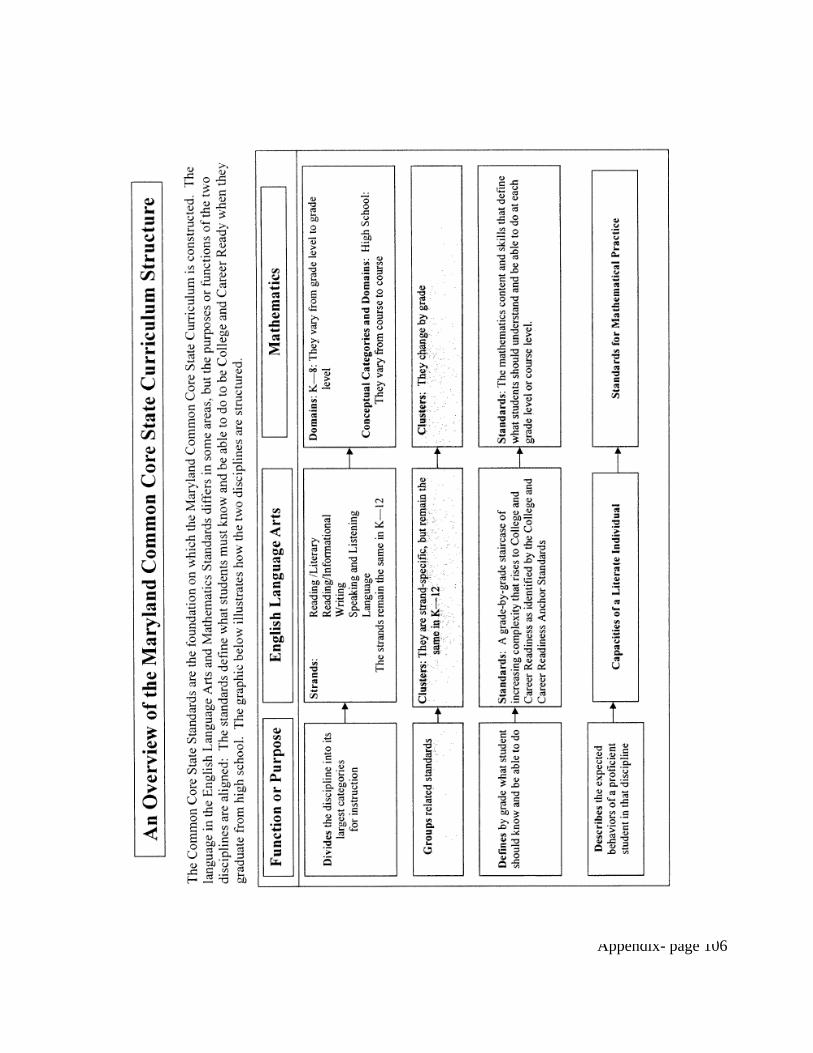
Appendix- page 106
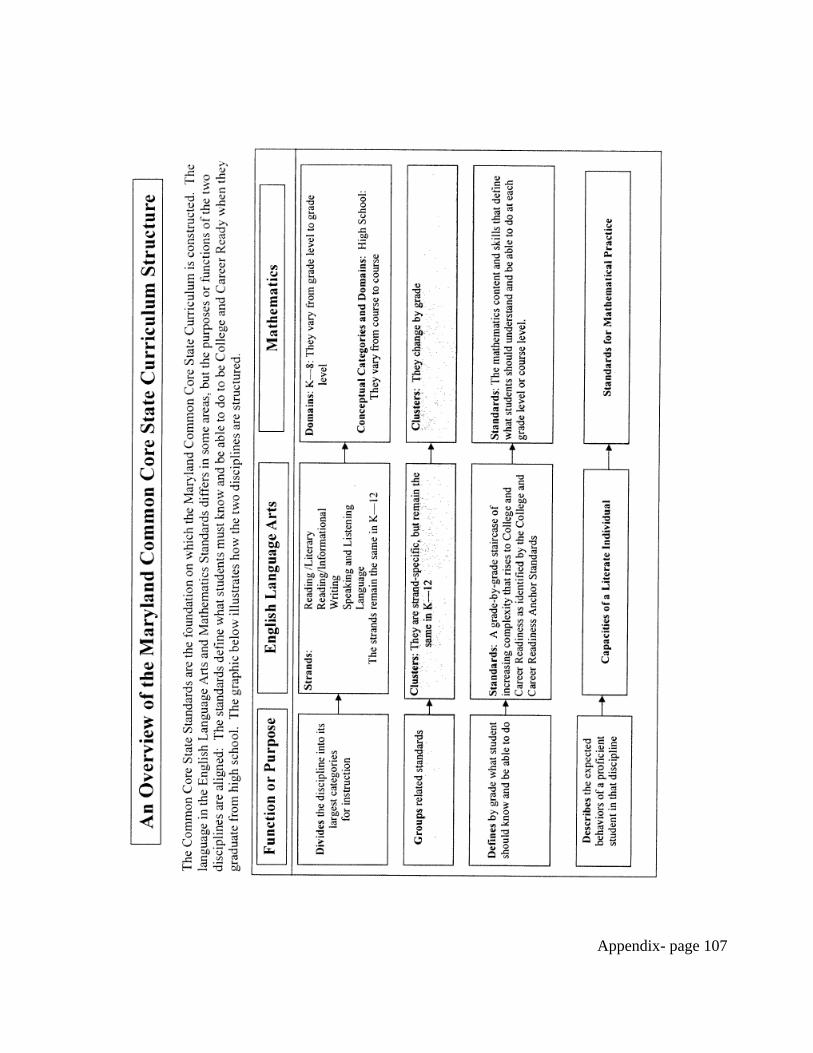
Appendix- page 107
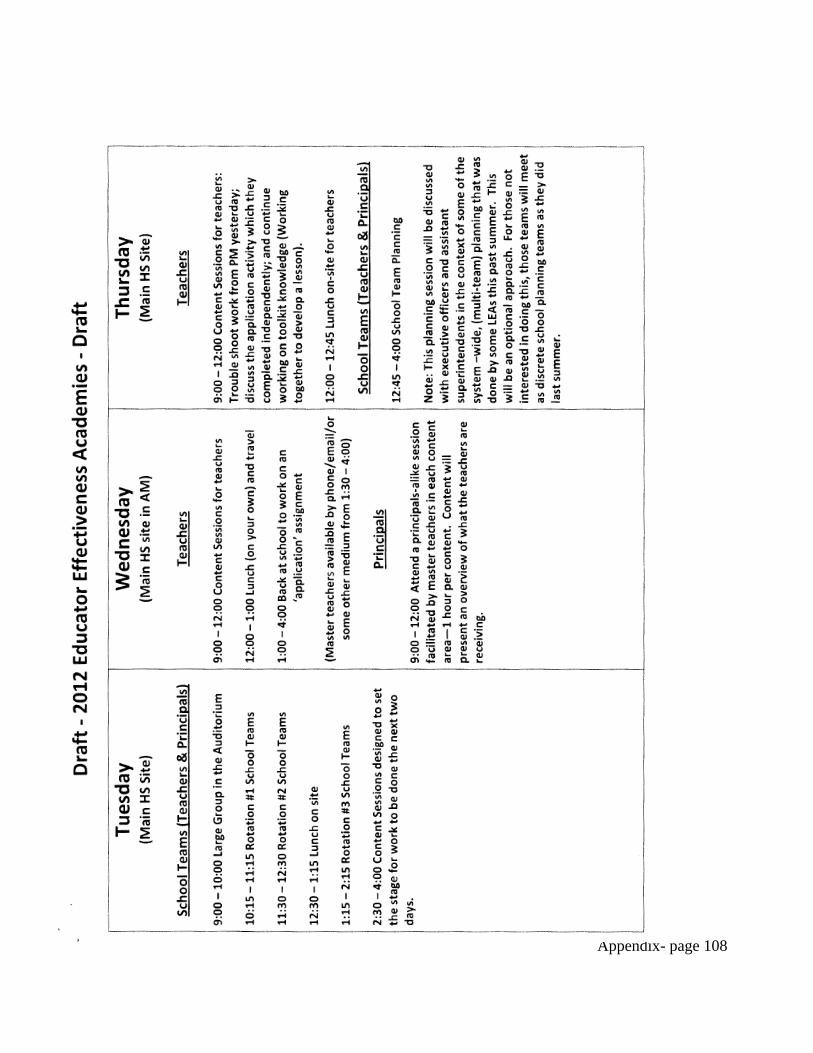
Appendix- page 108
Appendix- page 109
Appendix 1.B.3: Educator Effectiveness Academy - Agenda, Templates and
Sample Transition Plans
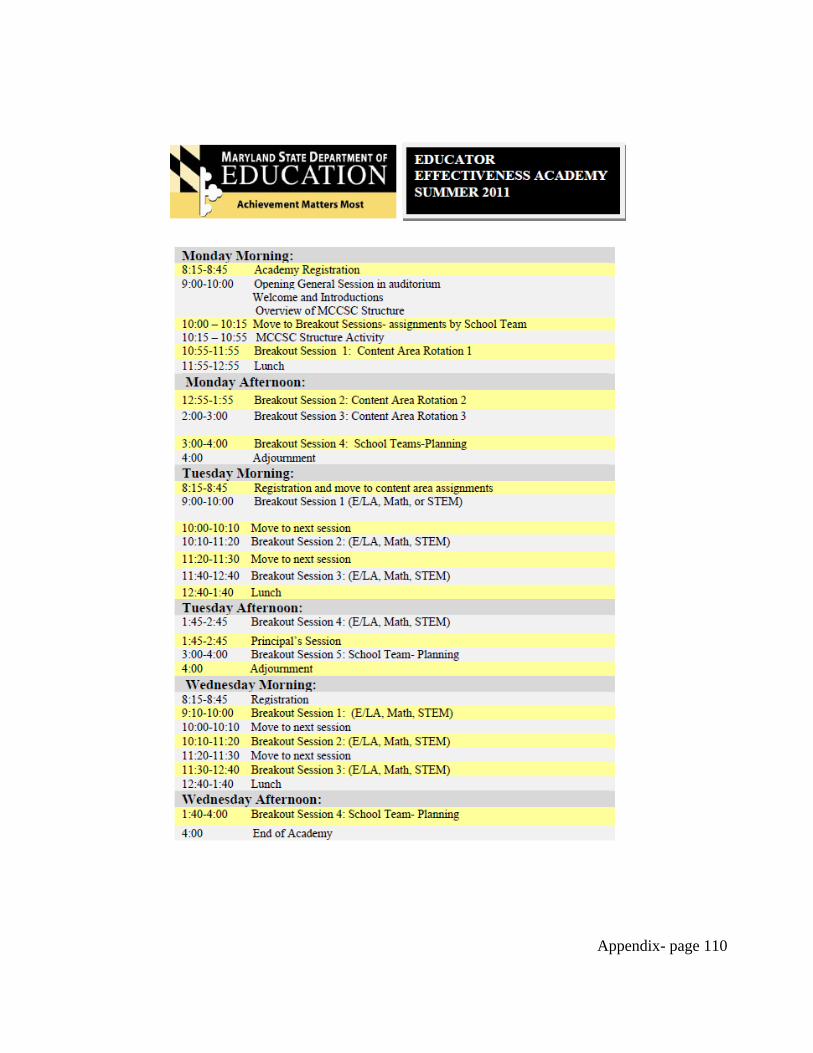
Appendix- page 110
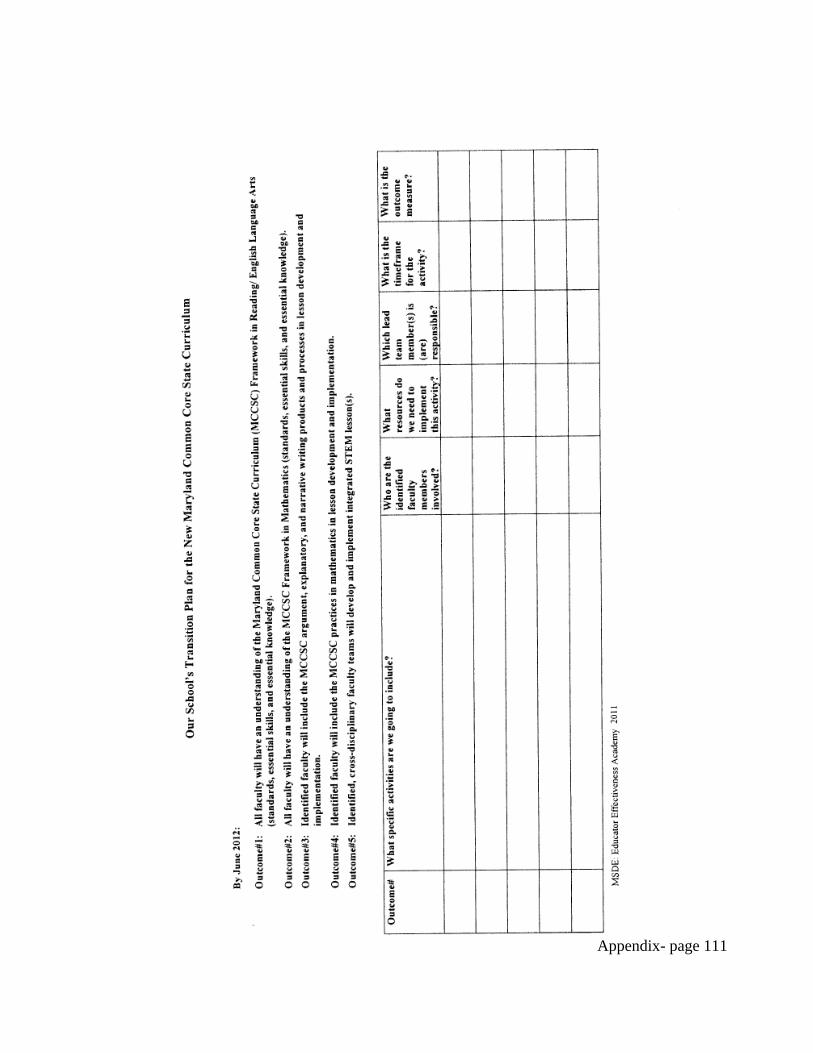
Appendix- page 111
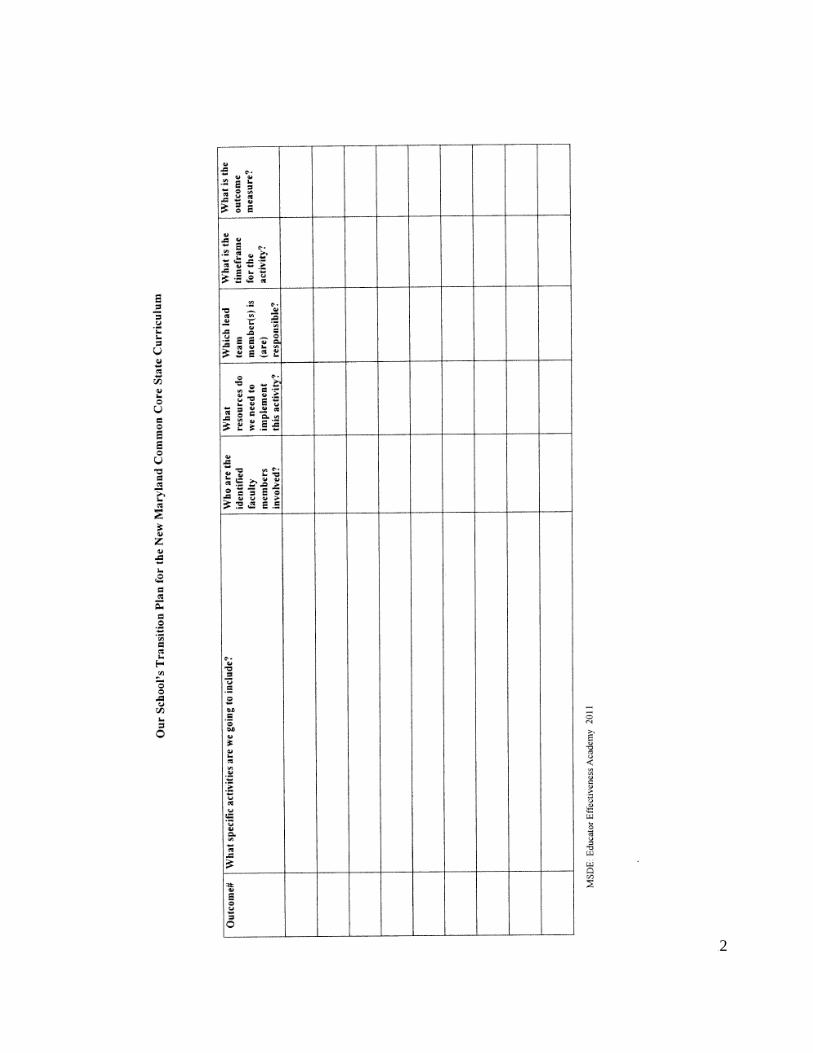
Appendix- page 112

Appendix- page 113
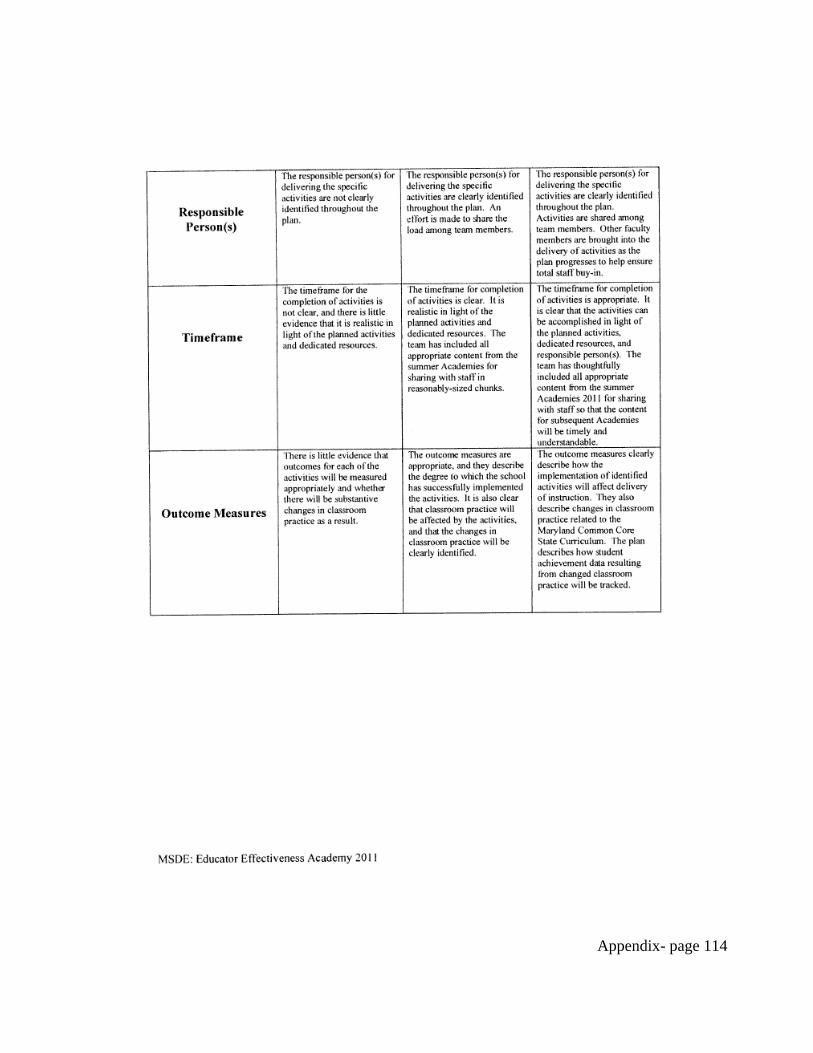
Appendix- page 114

Appendix- page 115

Appendix- page 116
Appendix 1.B.4: Maryland Common Core State Curriculum Teacher Effectiveness
Academy Content for 2011
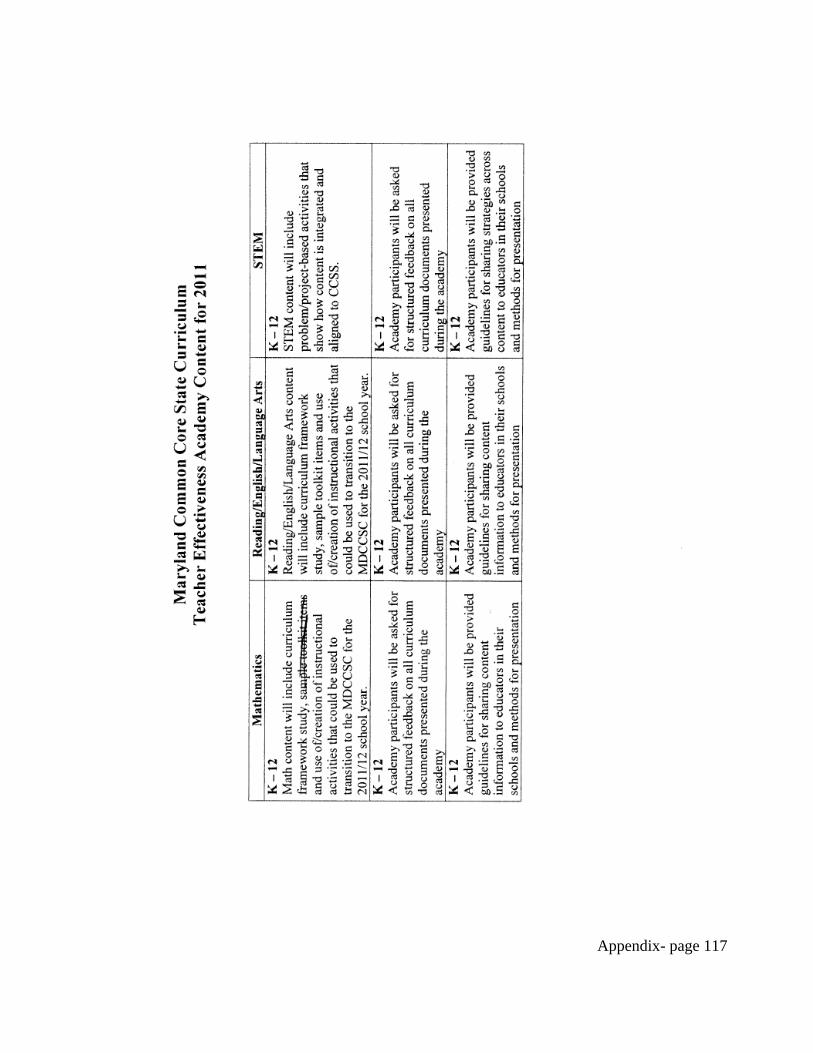
Appendix- page 117
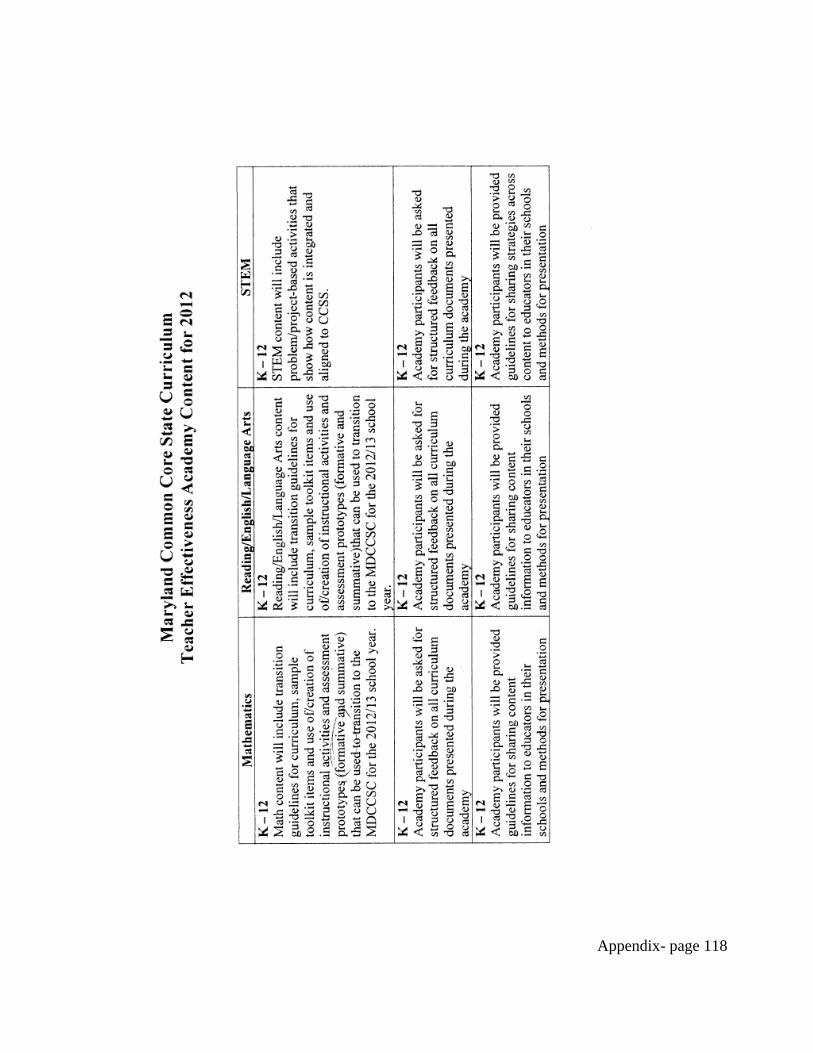
Appendix- page 118
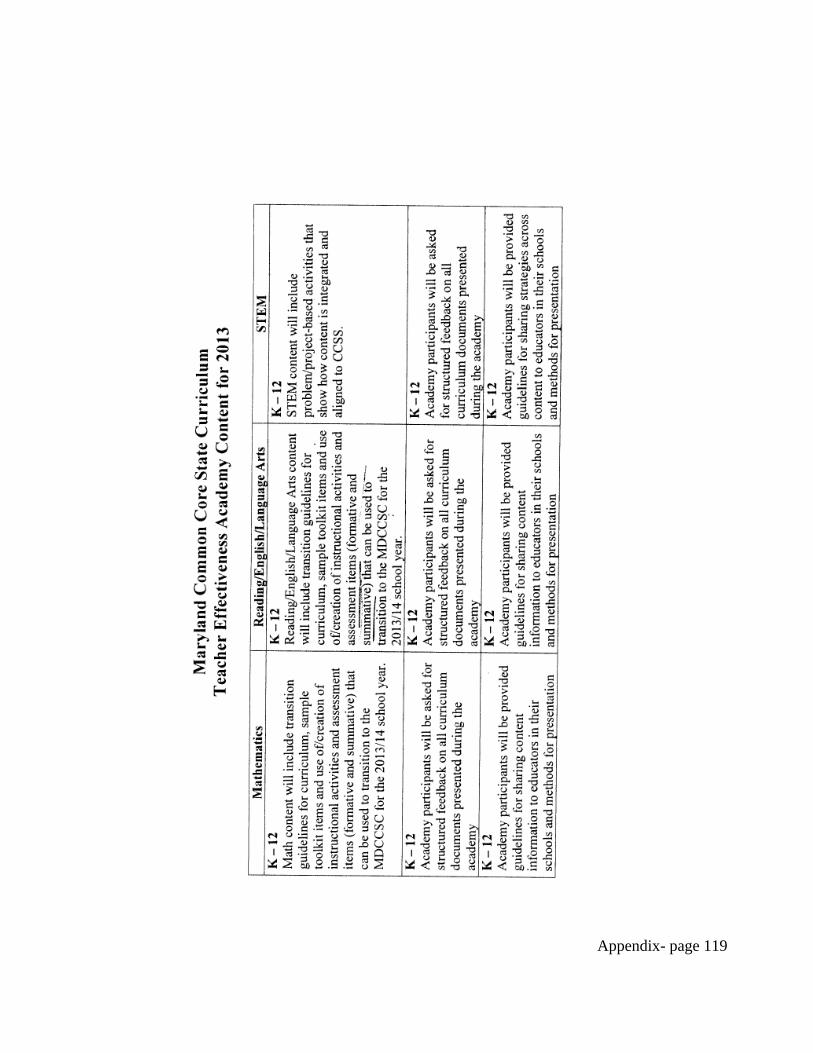
Appendix- page 119
Appendix- page 120

Appendix- page 121

Appendix- page 122
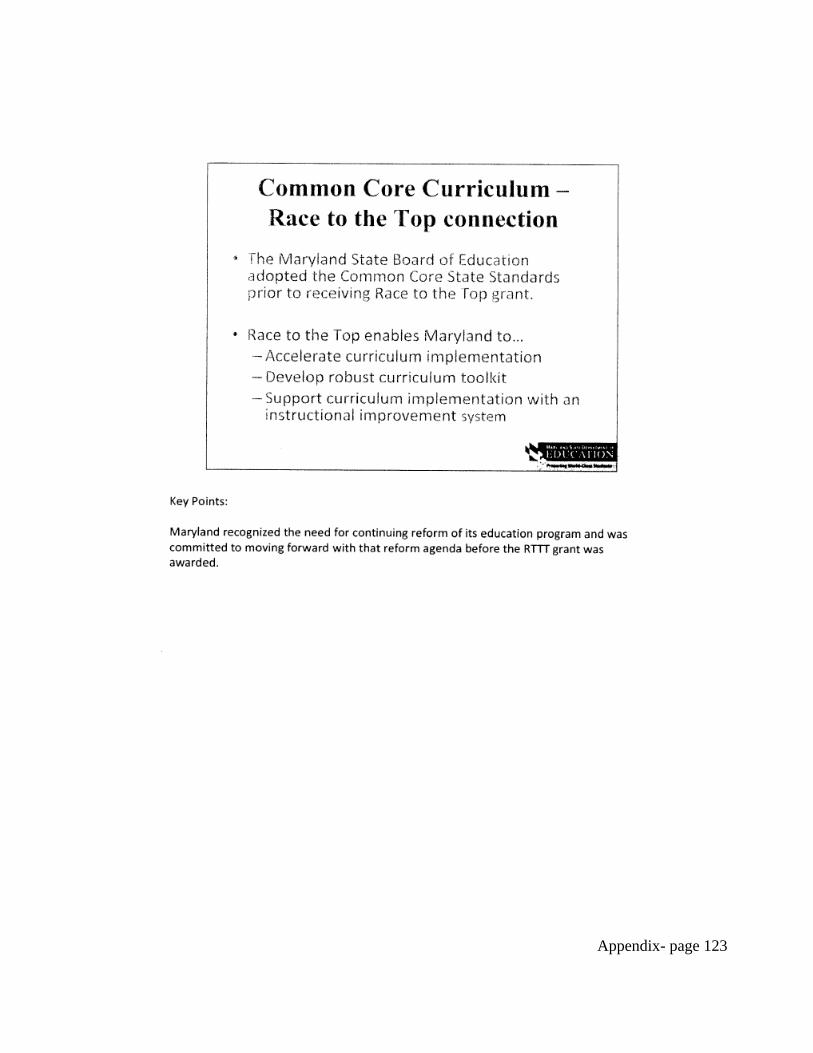
Appendix- page 123
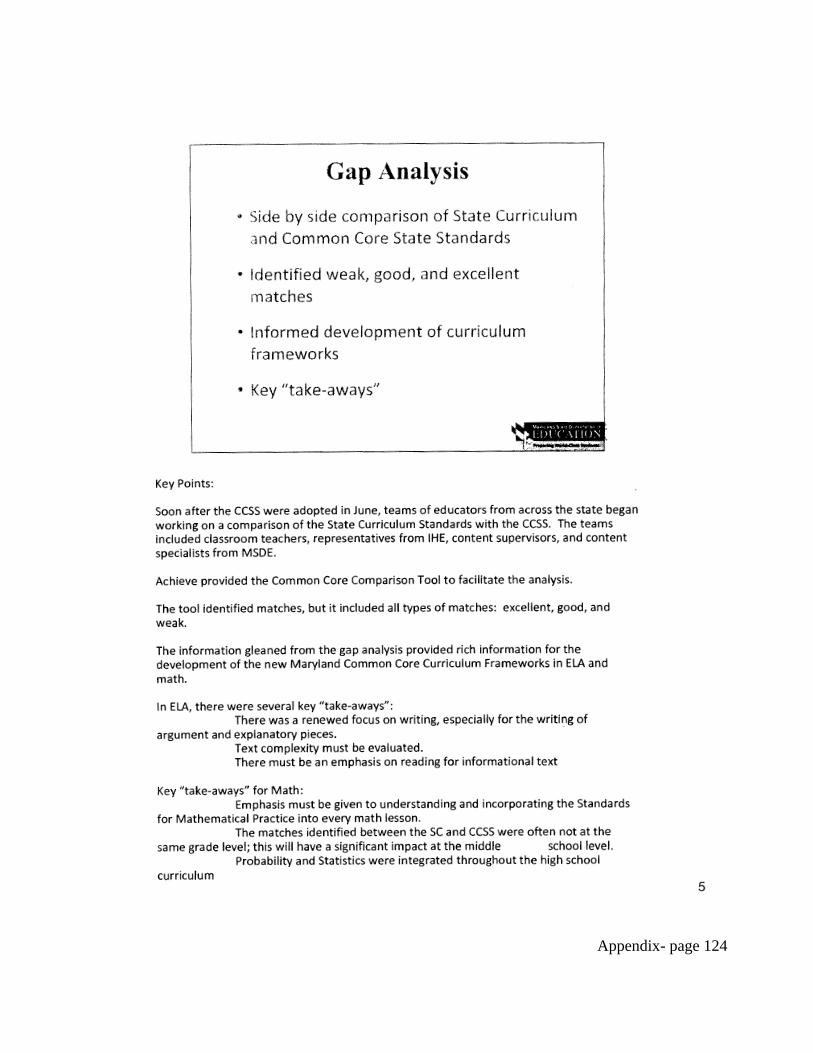
Appendix- page 124
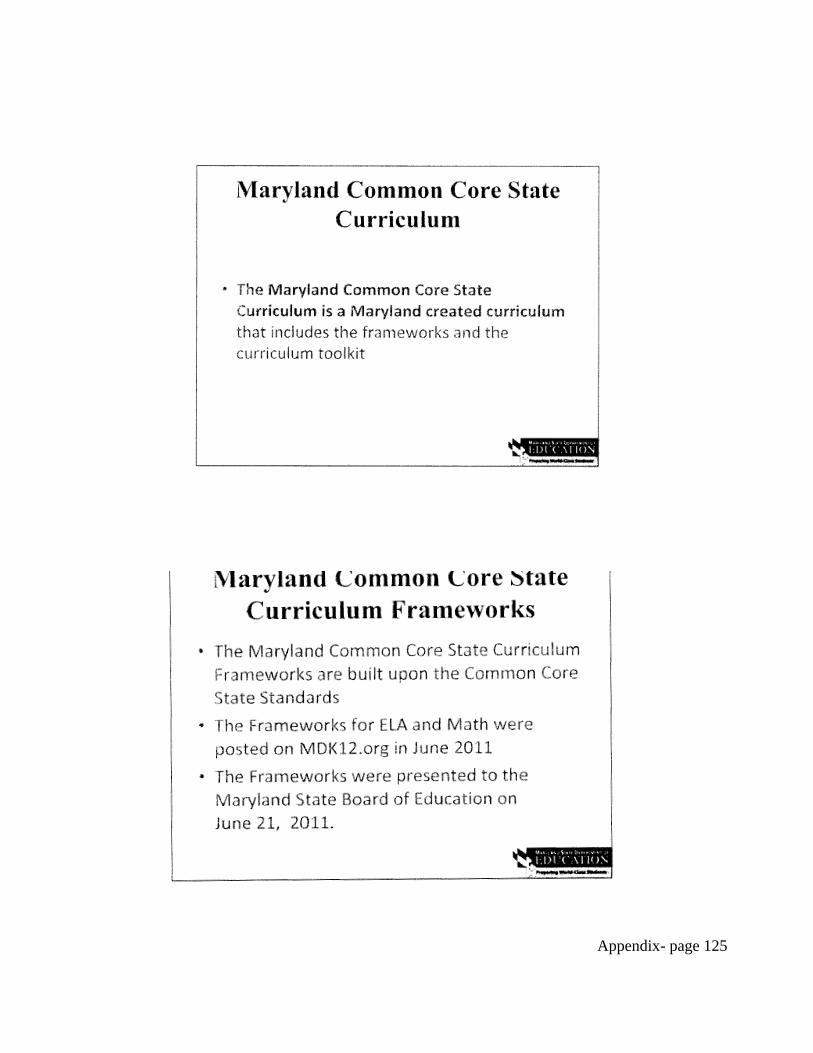
Appendix- page 125
Appendix- page 126

Appendix- page 127

Appendix- page 128

Appendix- page 129

Appendix- page 130
Appendix- page 131
Appendix- page 132
Appendix- page 133

Appendix- page 134
Appendix- page 135
Appendix- page 136
Appendix 1.B.5: MSDE Evidence to Assist LEAs in Transition Planning
Appendix- page 137
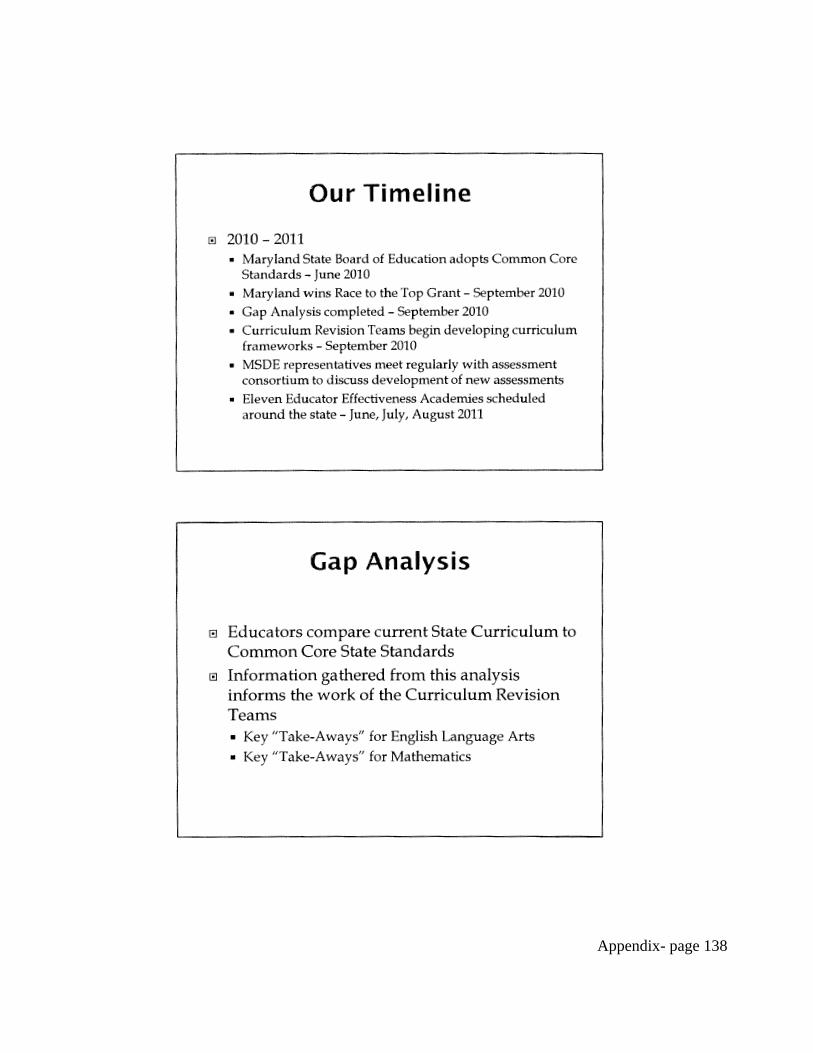
Appendix- page 138

Appendix- page 139
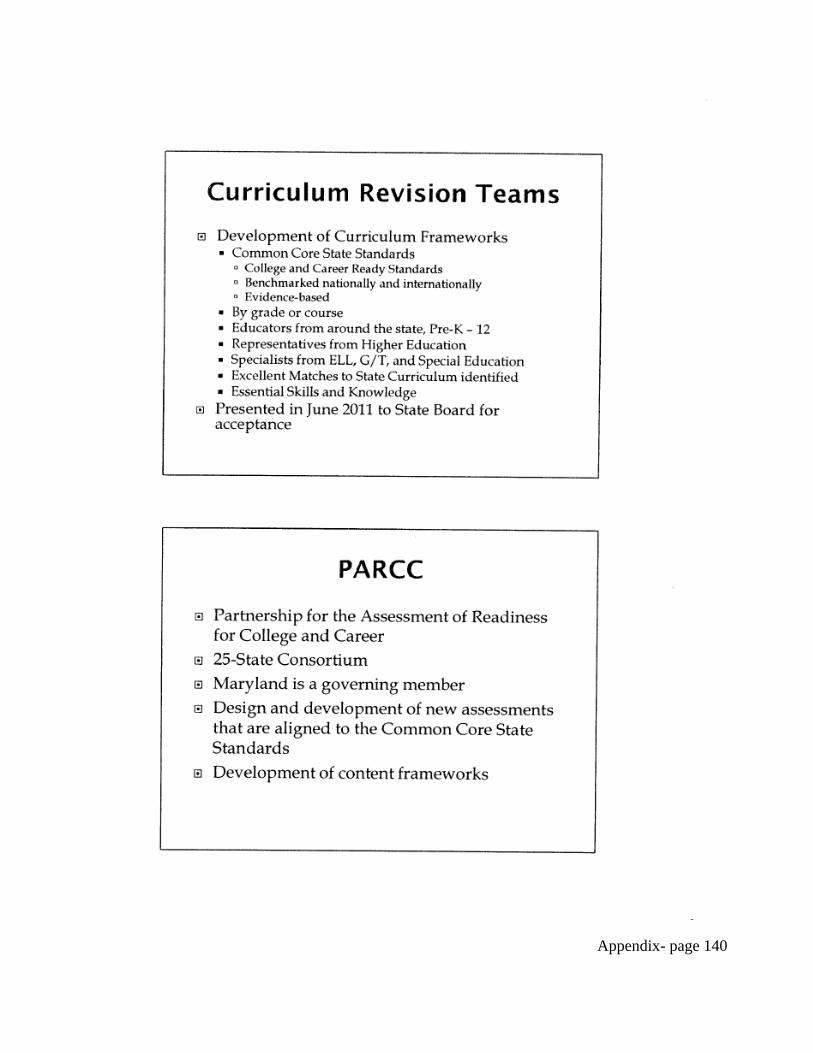
Appendix- page 140
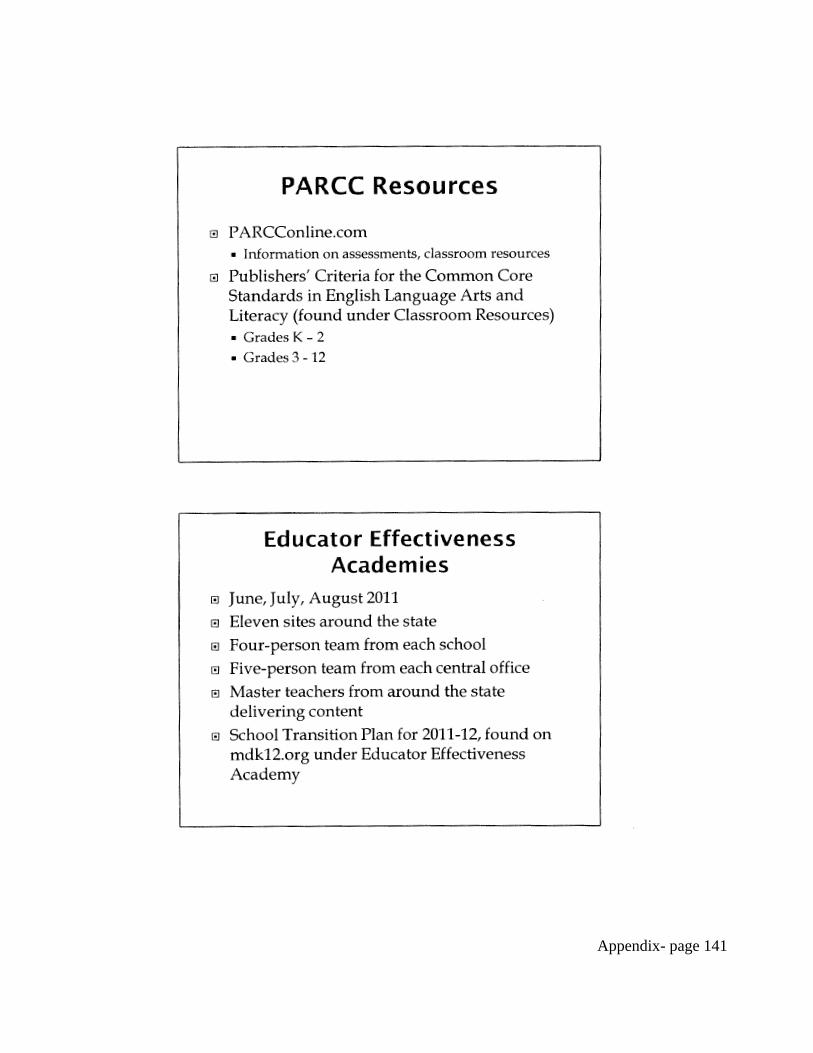
Appendix- page 141
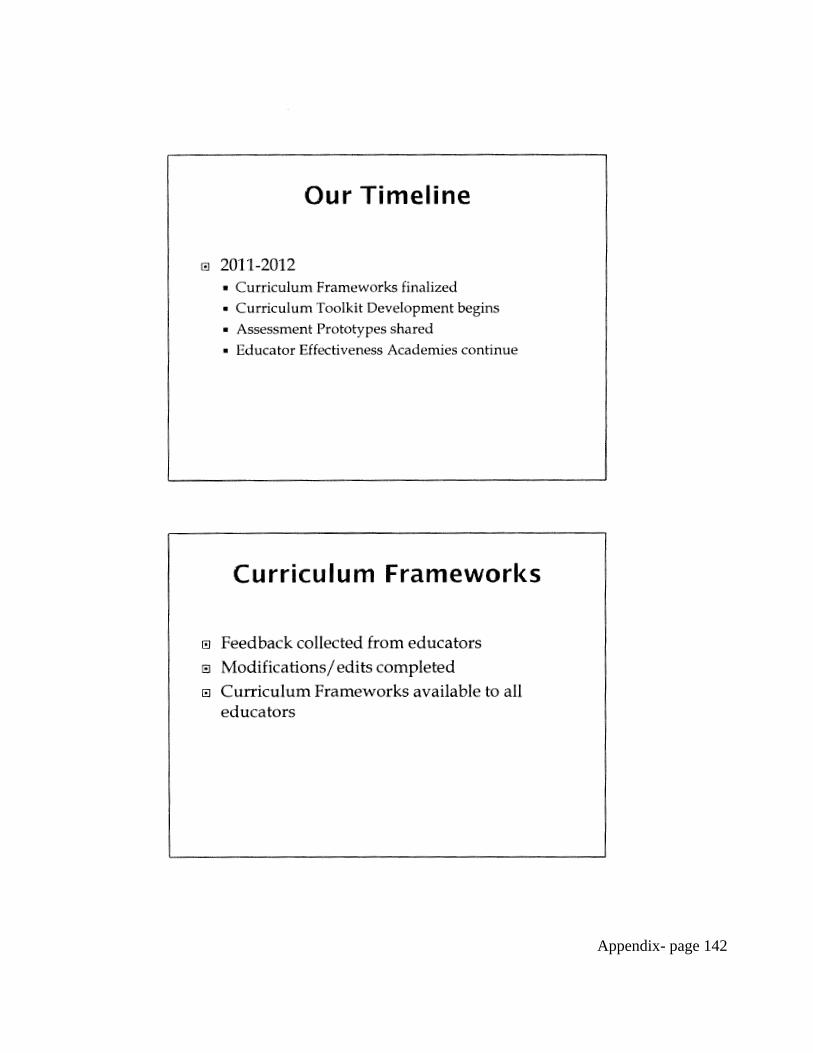
Appendix- page 142
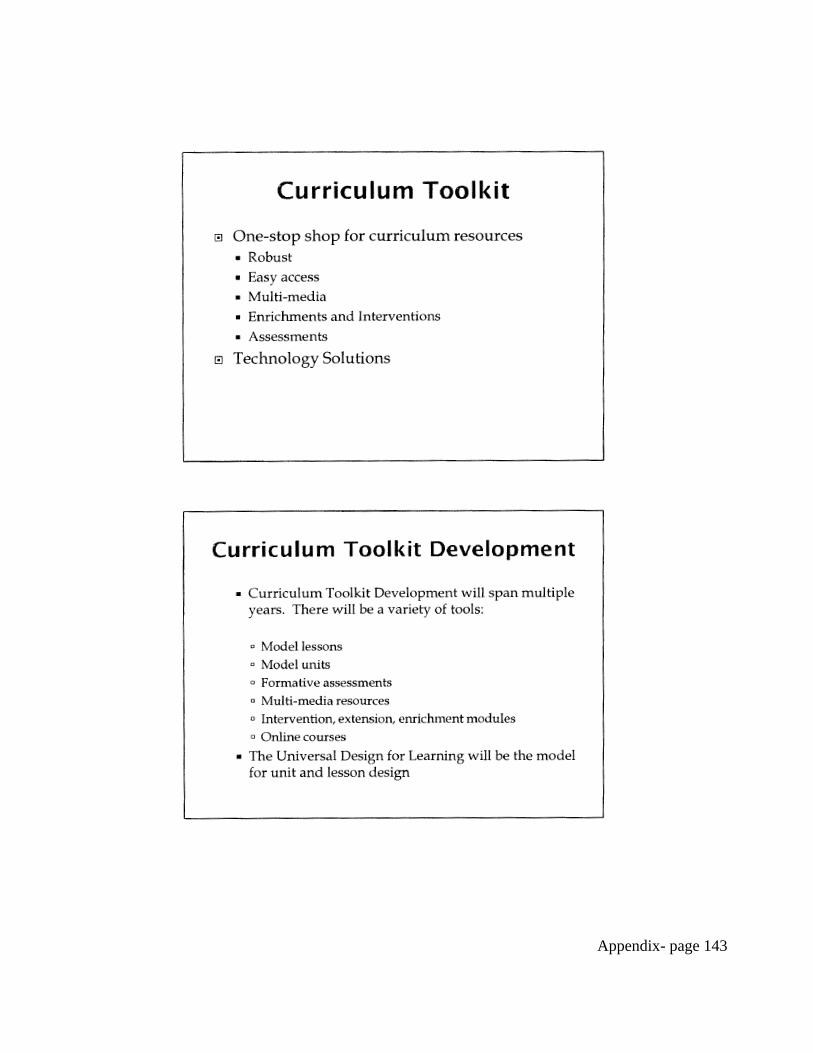
Appendix- page 143
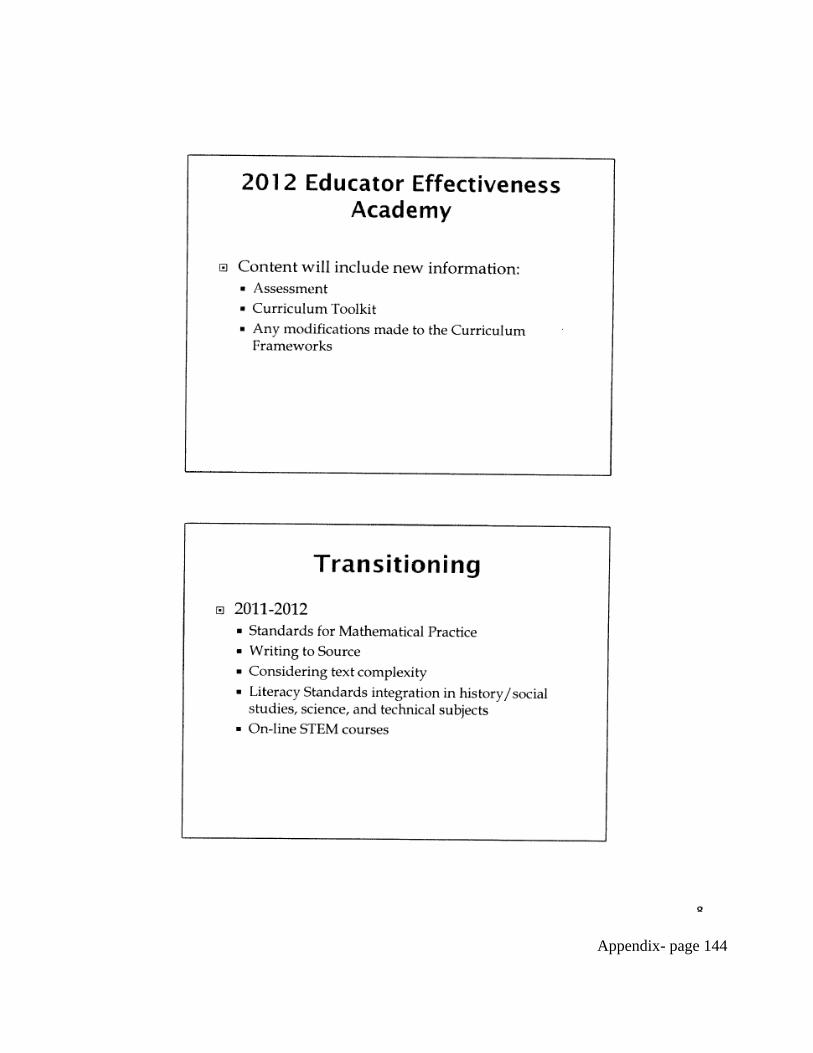
Appendix- page 144
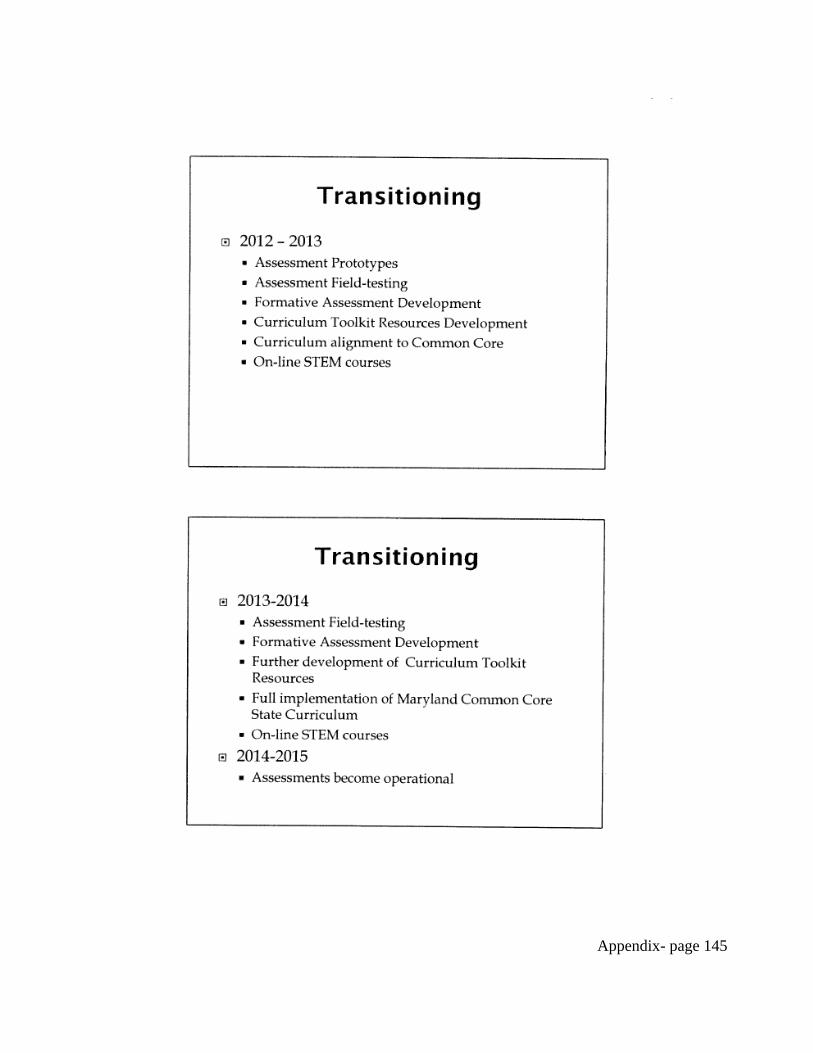
Appendix- page 145
Appendix- page 146
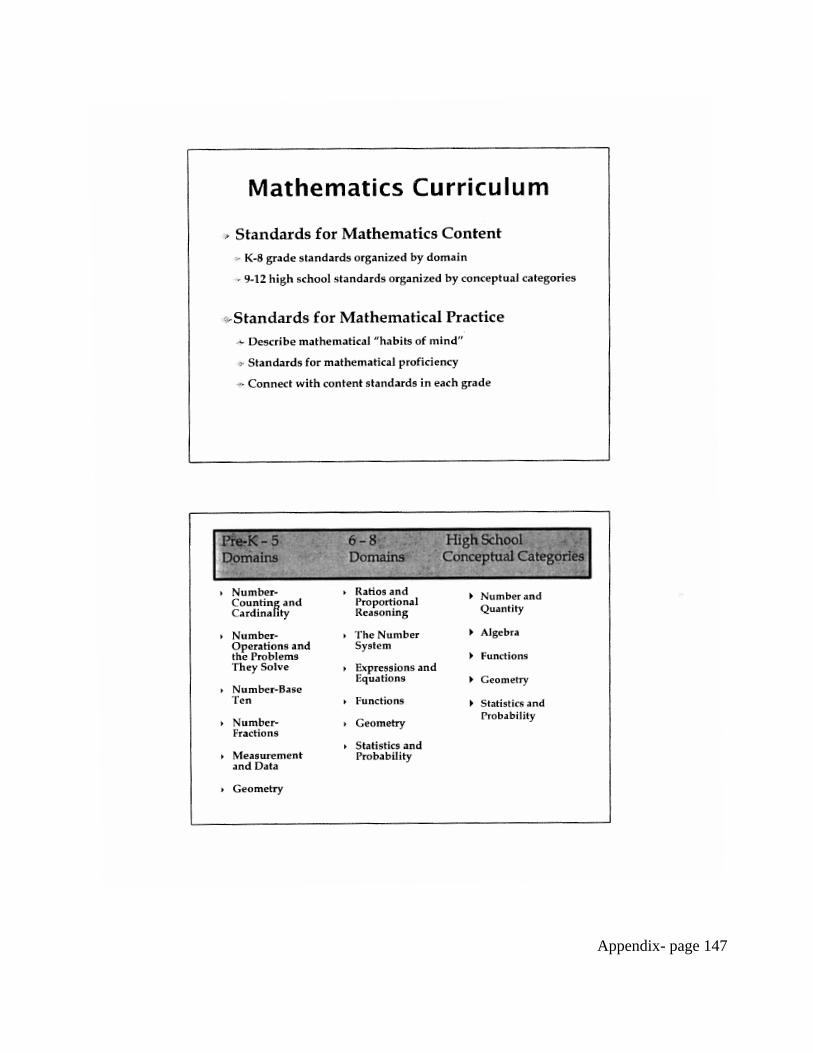
Appendix- page 147
Appendix- page 148

Appendix- page 149

Appendix- page 150
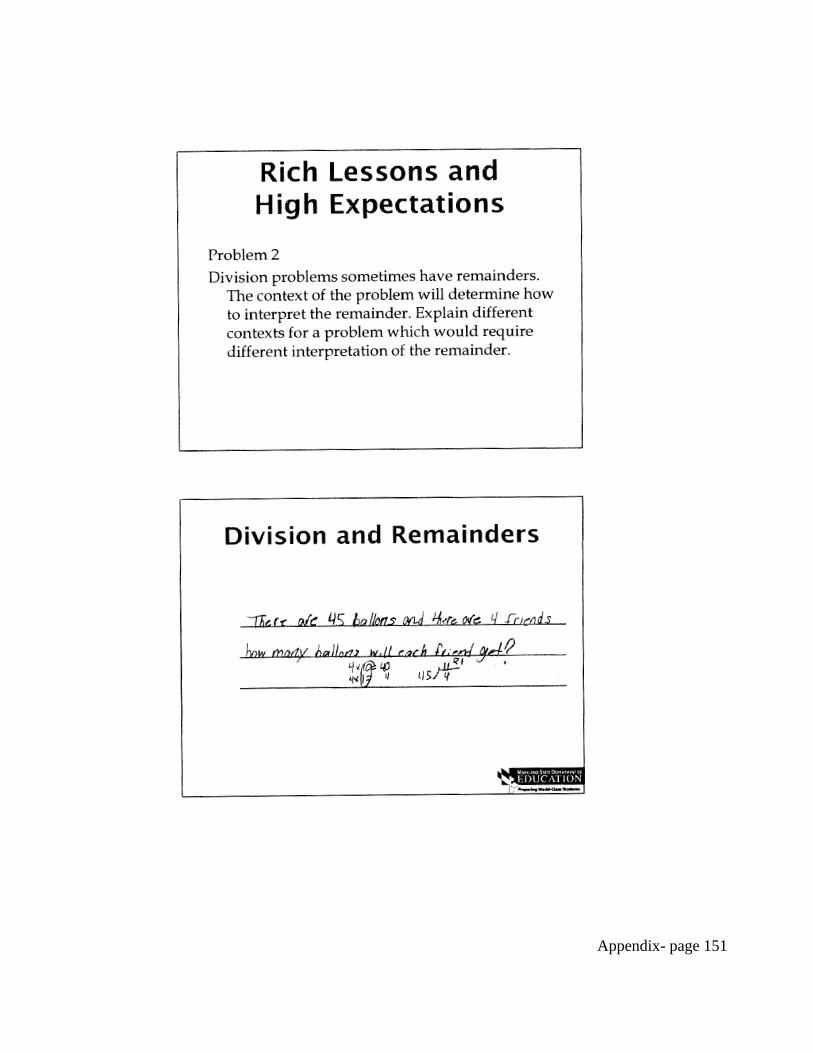
Appendix- page 151

Appendix- page 152
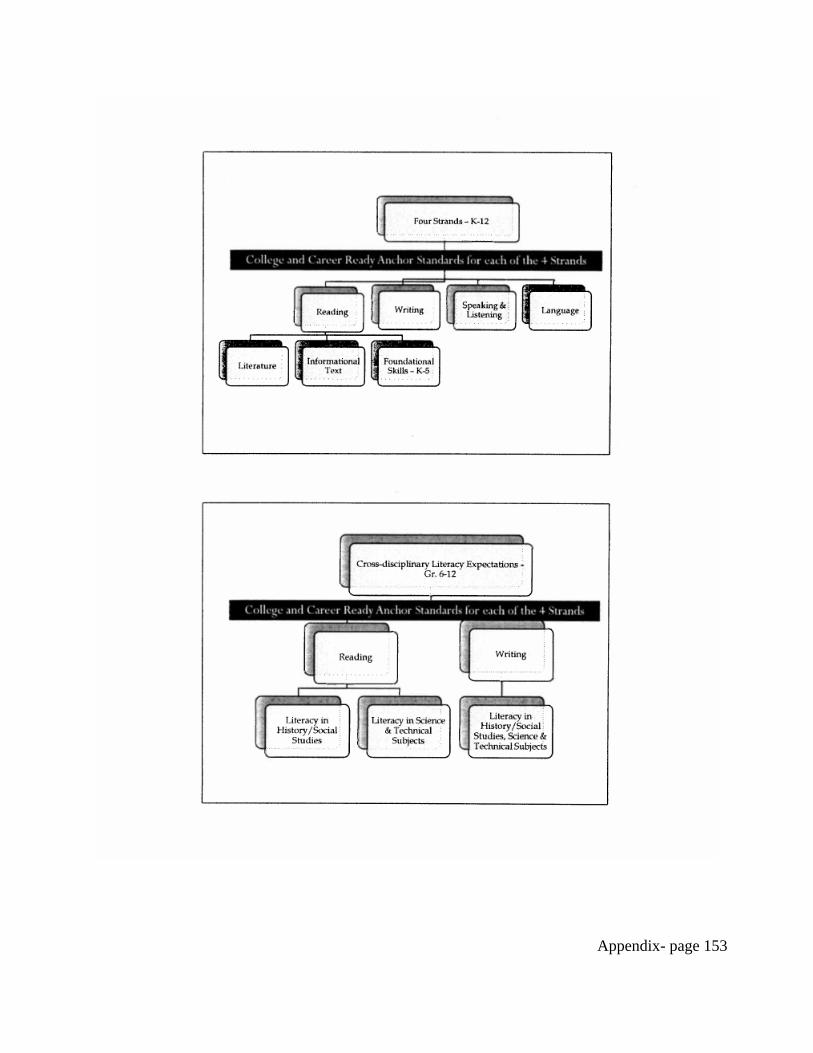
Appendix- page 153
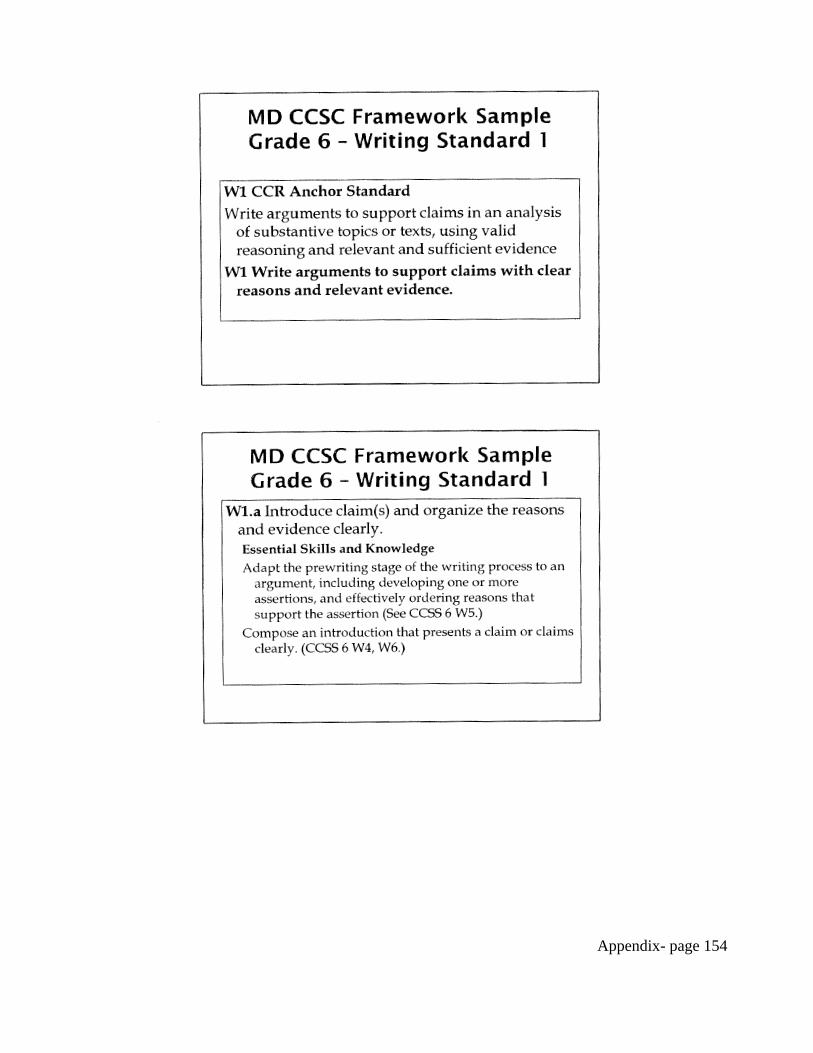
Appendix- page 154

Appendix- page 155
Appendix- page 156

Appendix- page 157
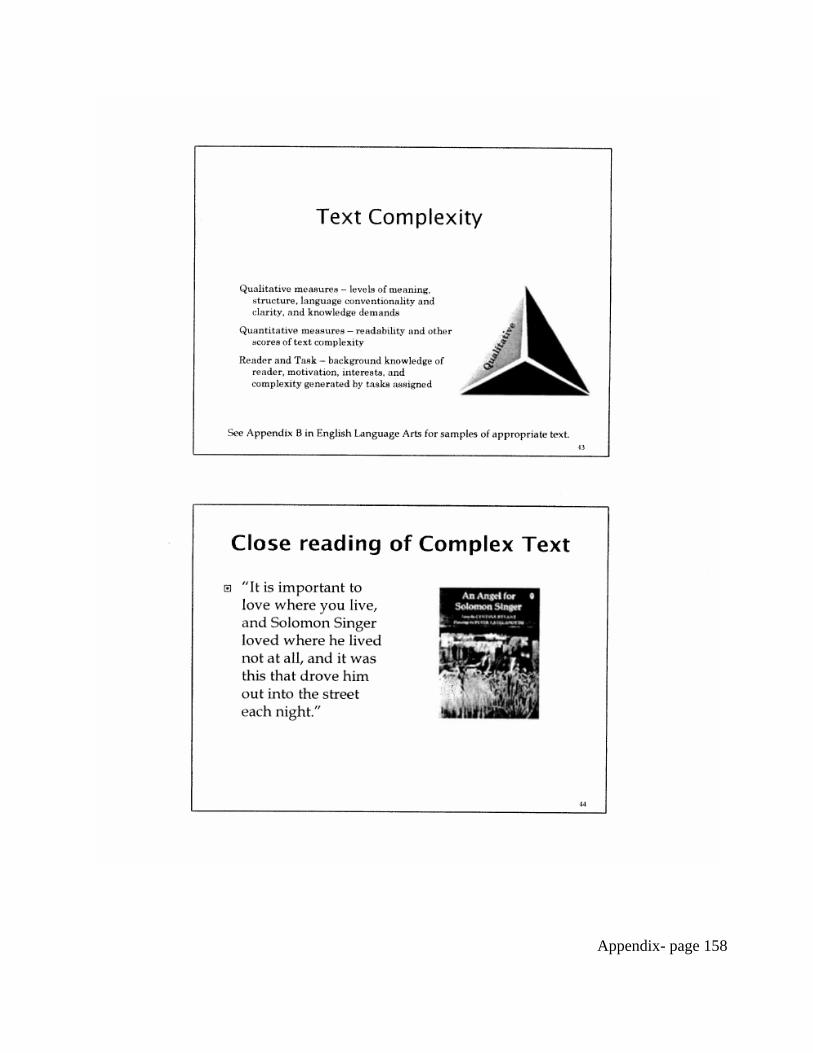
Appendix- page 158
Appendix- page 159
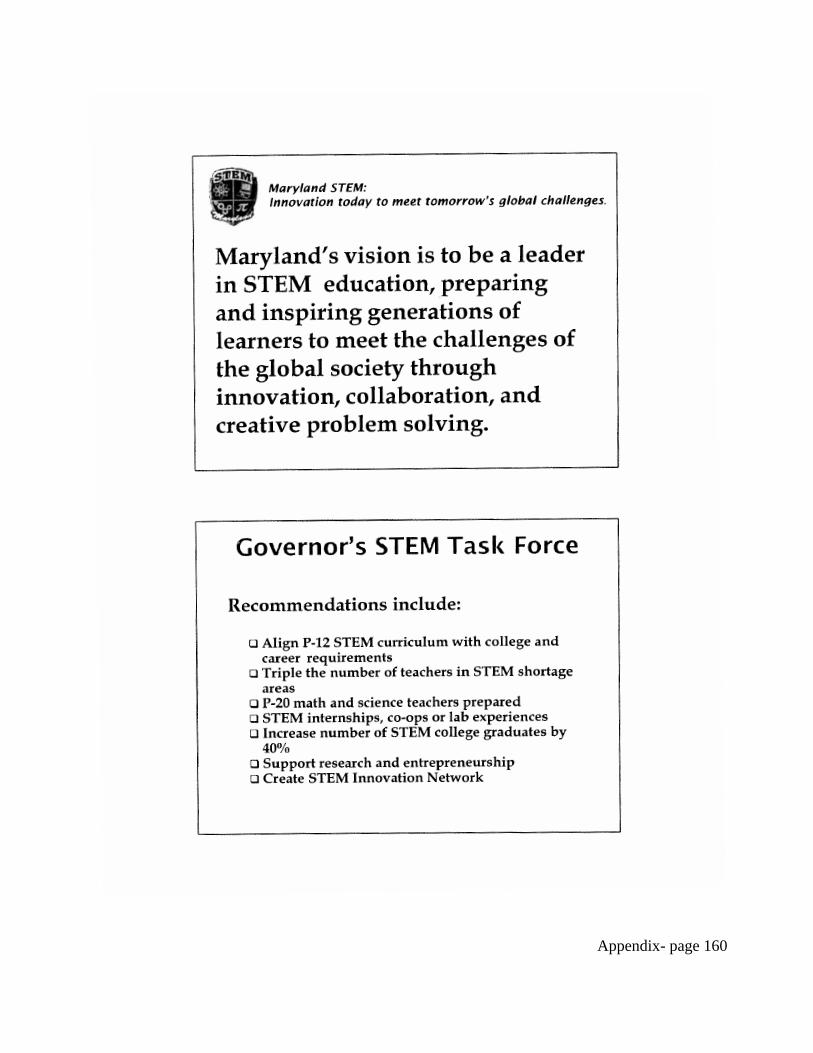
Appendix- page 160
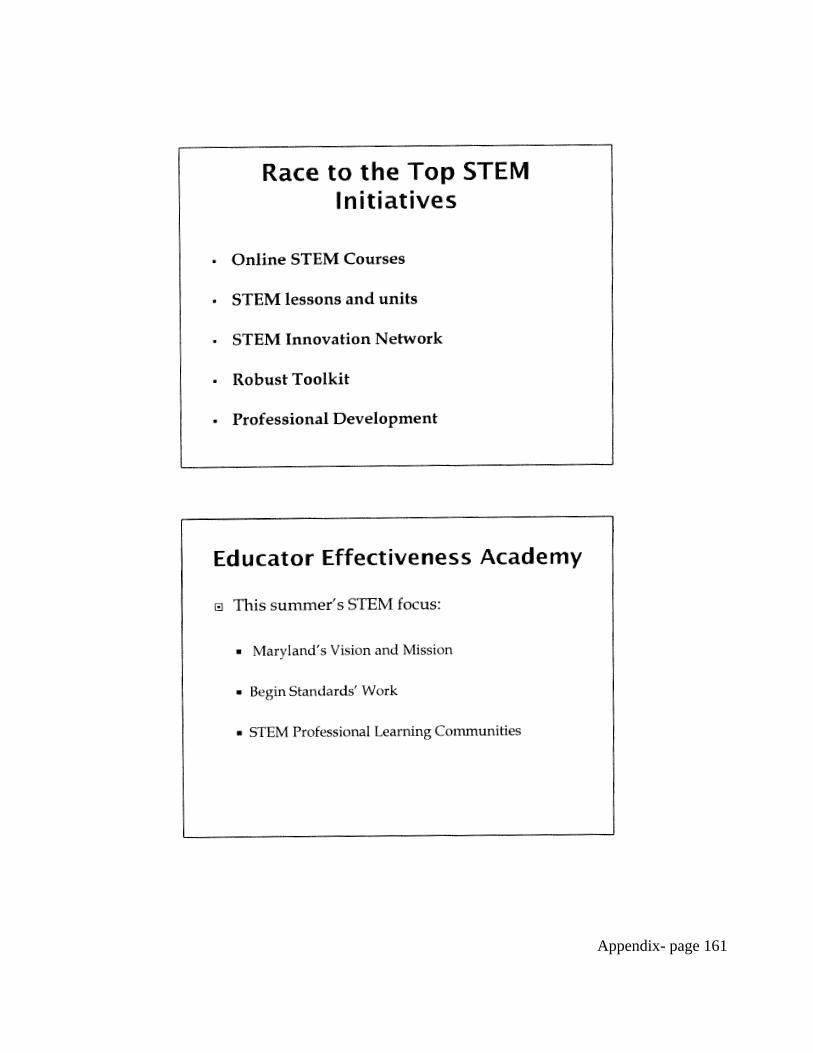
Appendix- page 161
Appendix- page 162
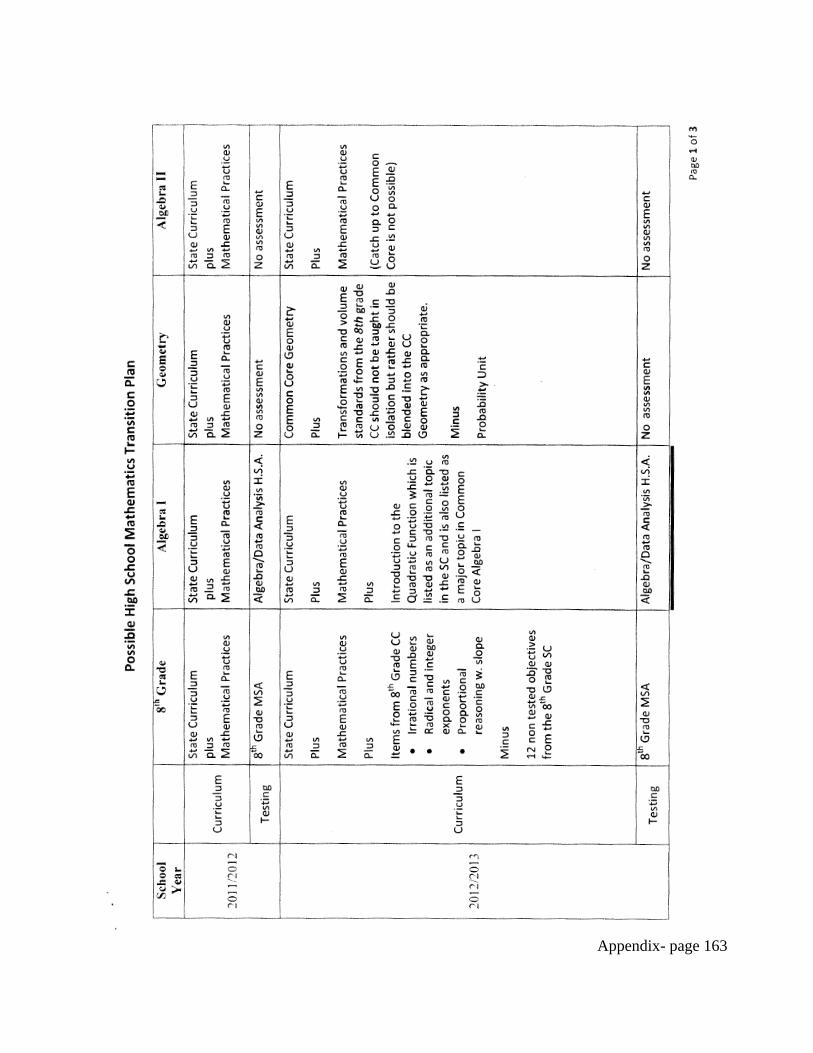
Appendix- page 163
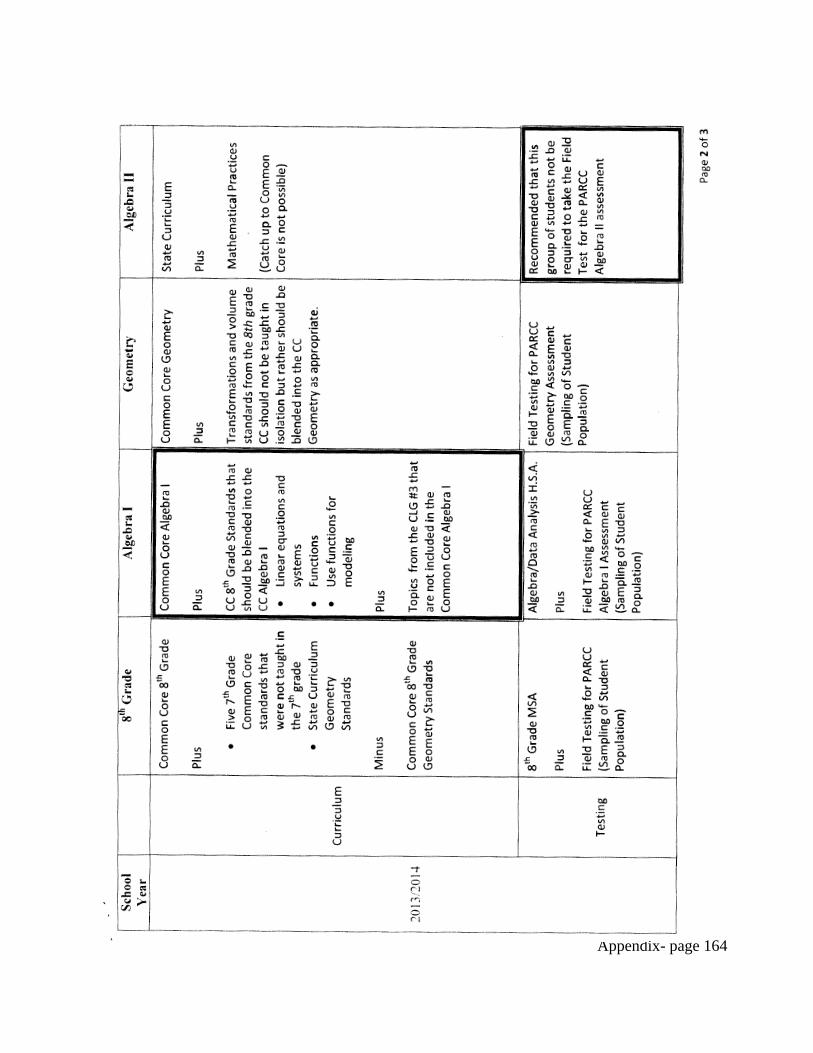
Appendix- page 164
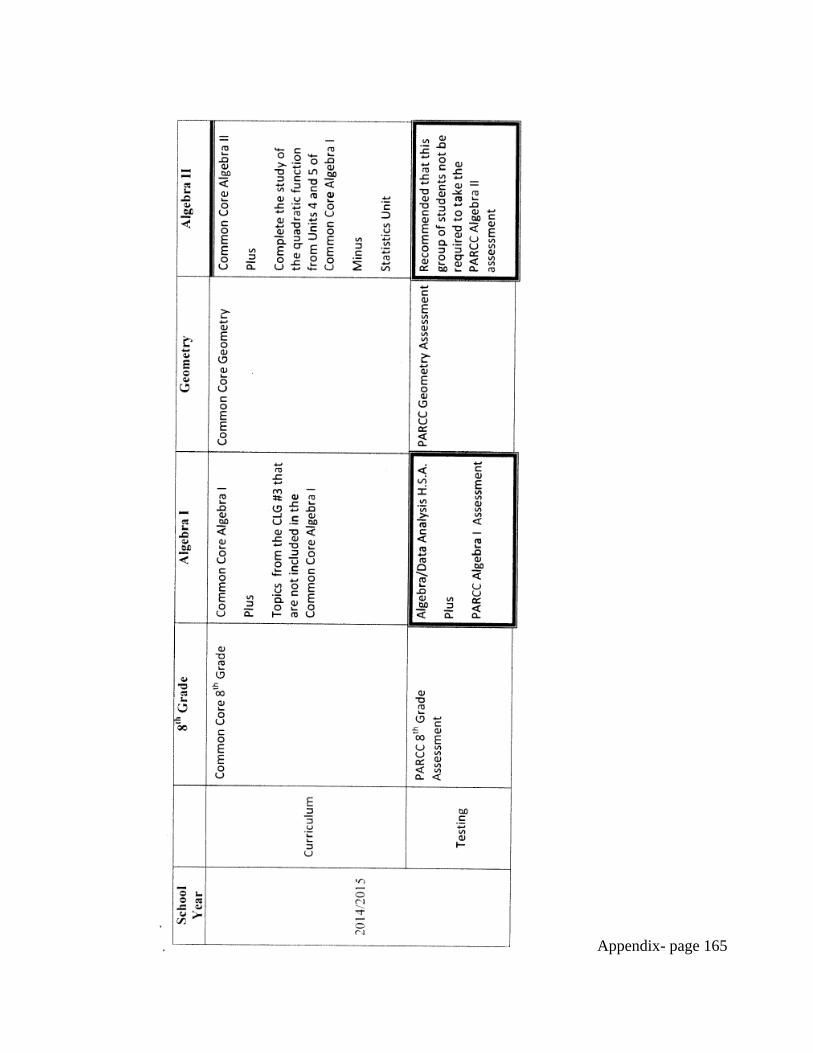
Appendix- page 165
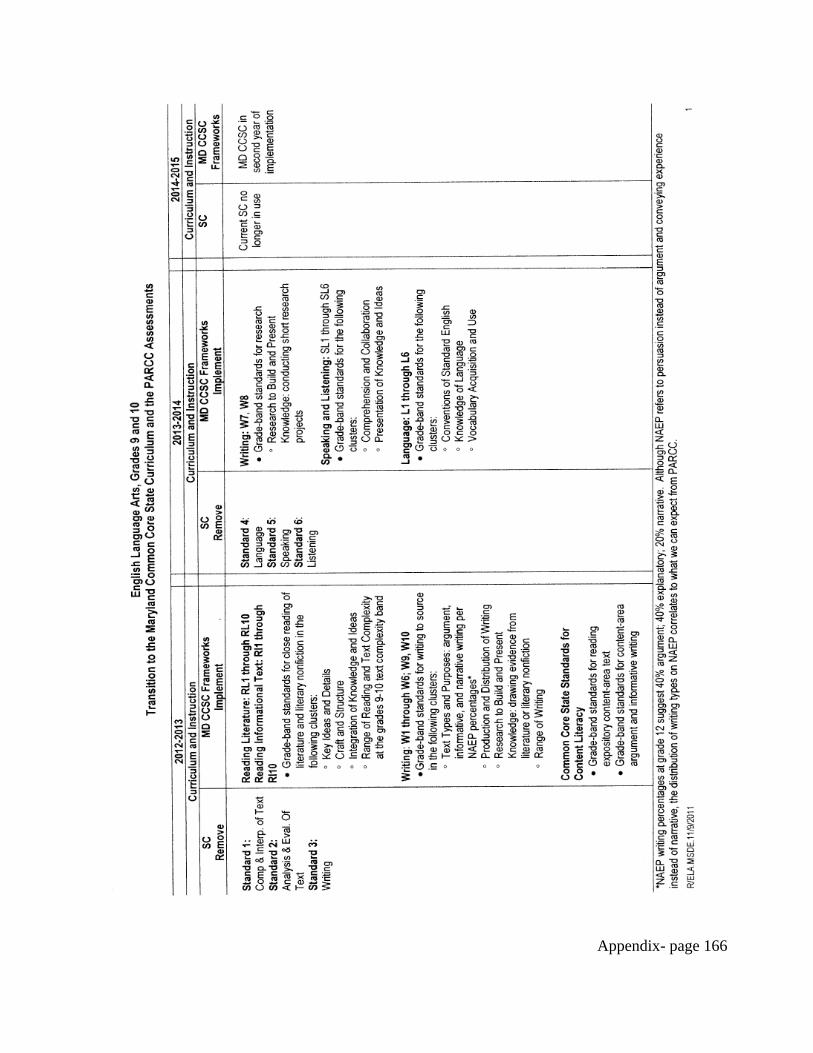
Appendix- page 166
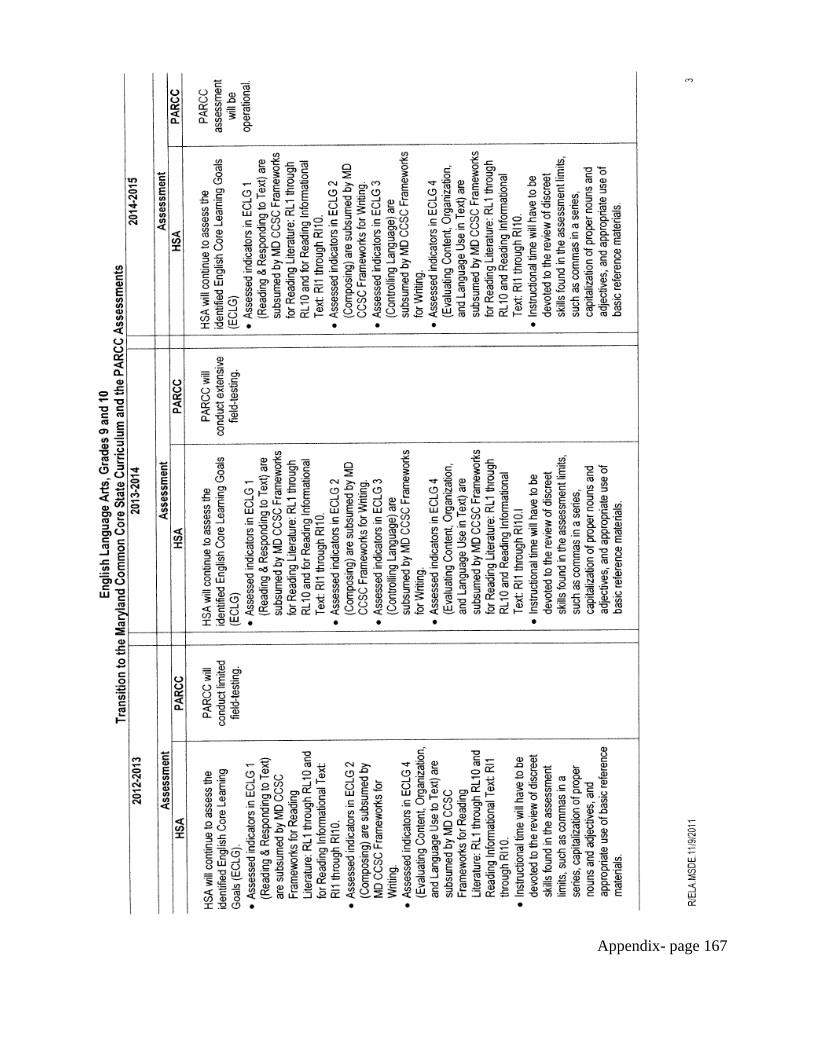
Appendix- page 167
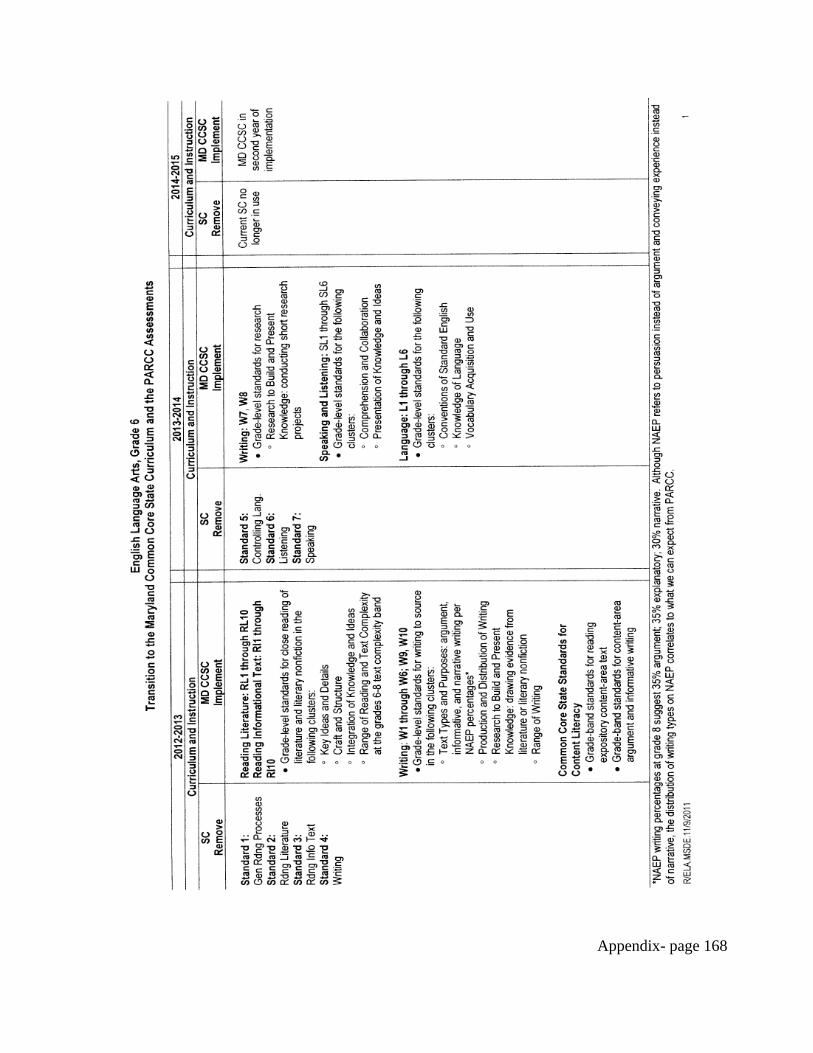
Appendix- page 168
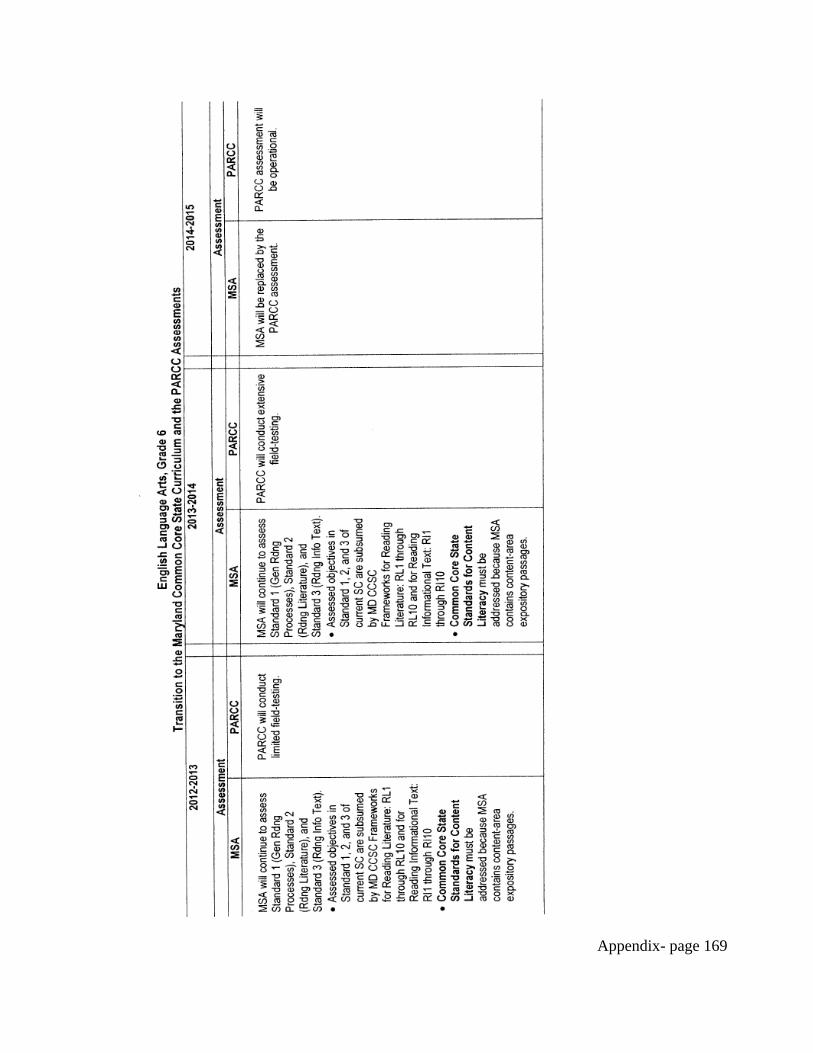
Appendix- page 169
Appendix- page 170
Appendix 1.B.6: Content Discipline Supervisory Briefings on Common Core
Transition - Agendas

Appendix- page 171
Reading/English Language Arts Briefing January 7, 2011
Carver Staff Development Center 9:00 a.m. to 3:00 p.m.
AGENDA
9:00 – Welcome and Introductions – Kathy Lauritzen, R/ELA Specialist
9:10 – Updates
• Status of Transition Plan to Common Core - Judy Jenkins, MSDE, Director of Curriculum
• Educator Effectiveness Academies, Summer 2011 – Scott Pfeifer, MSDE, Director of Assessment
• PARCC– Sylvia Edwards, R/ELA Specialist • Middle School Magazine – Lynette Sledge, R/ELA Specialist • January Reading Month, Susan Frank, SoMIRAC • Development of Common Core State Curriculum – R/ELA Team
10:30 – Form teams for Common Core State Curriculum review
11:45 – Lunch (on your own)
12:45 - Continuation of group work
2:45 – Status of work and evaluations
3:00 - Dismissal
MSDE/MSSA Briefing Lathrop E. Smith
Environmental Education Center 5110 Meadowside Lane

Appendix- page 172
Rockville, MD 20855
March 29, 2011
Working Agenda: The Impact of RT3 on Science in Maryland
Outcomes
Participants will:
gather information and discuss current initiatives underway in the MSDE Science Office: New Science Standards Framework and Standards Development CCSSO SCASS (State Collaborative on Assessment and Student Standards) Educator Effectiveness: Think Tanks and Summer Academies Environmental Education (Literacy)
gather information on current MSSA and MAST initiatives receive input on FAQ’s regarding Teacher of the Year from the current Maryland TOY
Time Room Event
8:30 White Oak Hall Registration & Coffee
9:00 White Oak Hall Welcome/ Introductions
MSDE Updates
HSA, Bridge Projects, MSA, Alt-MSA, BGA, Online Biology Course New Science Standards Framework and Standards Development : Mary
Thurlow CCSSO SCASS (State Collaborative on Assessment and Student
Standards) : George Morse
Educator Effectiveness: Think Tanks and Summer Academies : Mary Thurlow
Common Core - Mathematics & RELA: Judy Jenkins Environmental Education (Literacy) : Gary Hedges
11:30 Break
11:45 White Oak Hall
Keynote Address: FAQ’s regarding Teacher of the Year
Michelle Shearer, current Maryland TOY; National Finalist
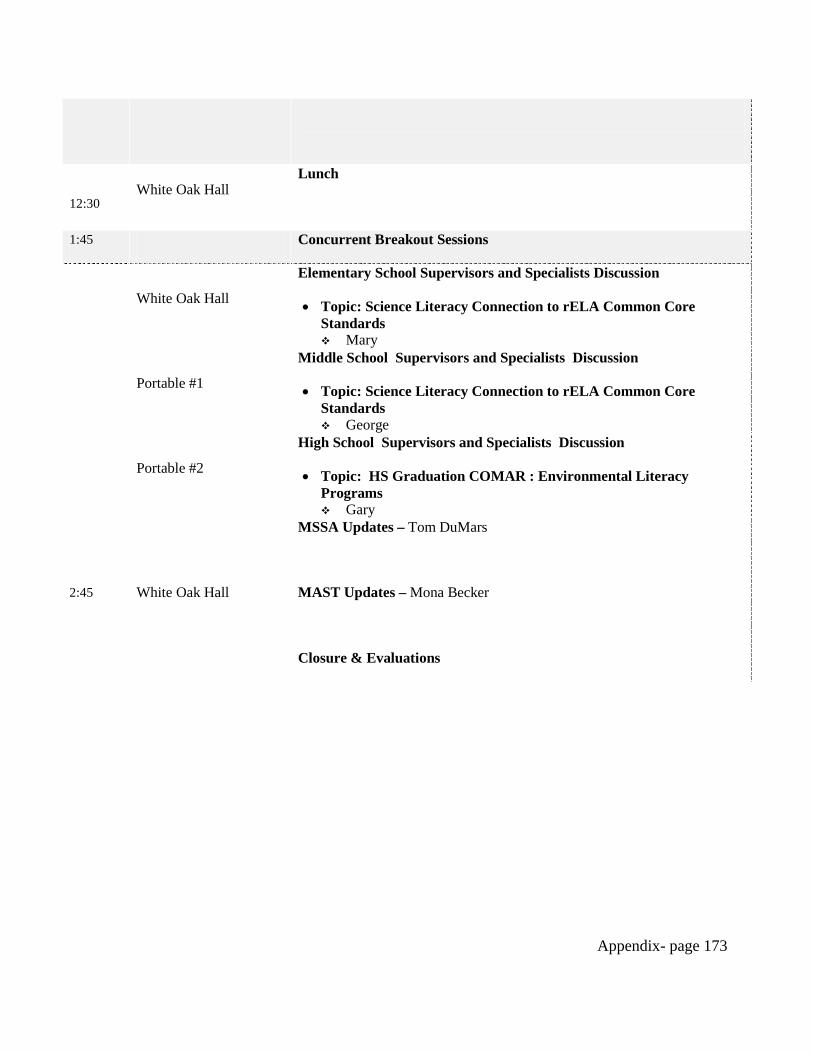
Appendix- page 173
12:30 White Oak Hall
Lunch
1:45 Concurrent Breakout Sessions
White Oak Hall
Elementary School Supervisors and Specialists Discussion
• Topic: Science Literacy Connection to rELA Common Core Standards Mary
Portable #1
Middle School Supervisors and Specialists Discussion
• Topic: Science Literacy Connection to rELA Common Core Standards George
Portable #2
High School Supervisors and Specialists Discussion
• Topic: HS Graduation COMAR : Environmental Literacy Programs Gary
2:45 White Oak Hall
MSSA Updates – Tom DuMars
MAST Updates – Mona Becker
Closure & Evaluations

Appendix- page 174
MATH
Draft Briefing Agenda – Version #3
October 20, 2011 at Howard County Conservatory
Remember – no handouts. We will need to send email files on October 17th. Will they be pdf files?? Or Word?? Yellow are files to be sent to Kim on the morning of Oct17.
Green – needs a decision/attention
Time What -Agenda Who will lead?
7:30 Set up
8:00
8:30
Sign –In, Coffee and Chat
No folders– so only sign in
Need sticky name tags with pre assigned groups
Need tent cards to label tables for groups
Debby &
Karen
Follow-up with Kim
8:30 Welcome and Announcements
• Introduction of self and other guests o Available Contractual Position
• Who - this is your first briefing? Who coming less than 5 years --- less than 3 years. Who has been coming 20+ years – Nelson retired
• Time at table to introduce yourself and your roll in system – get to know each other so we can learn from one another and not reinvent the wheel – much easier to contact someone you have met then contact them cold
• Introduction of Houghton Mifflin by Bonnie Ennis • Review efiles they should have
o Dates to remember o Contact list
• Plan for the Day
Donna
8:55 Curriculum Development – 2 or 3 year plan
• What are we doing 11-12 then 12-13 then 13-14? • Sample lesson will be shared in December • Introduce what they will hear next and what is expected of
them
Karen

Appendix- page 175
• Transition to specialists for Unit format
9:00
9:30
9:30
10:00
Unit Plan Format Discussion
• Elementary, Middle School, Alg I Sample o 10 minutes each – do not repeat concerns/issues
• Our elements – what works, what needs more, what is missing
• Capture their thoughts on feedback form – one for elem, middle high school – in color
• Please create a color coded feedback form – Deby, Sara, Bette – we will print(20 each)and take
Bette for elem
Sara for middle
Debby for HS
10:00
10:15
Transition Plan
• Presented to Asst Sups and to Sups at end of Oct • Comments • Donna comments – no middle or elem plan – we are
discussing but haven’t shared with asst sups; happening at the leadership level
Linda
10:15 Break
10:30
11:00
Educator Effectiveness Academy
• Debriefing from 2011 • Plans for Fall Follow-up of 2011 • Thoughts for Summer 2012
o Structure and Content
Donna and Cassandra
11:00
11:15
IPC Conference for High School Students/Teachers
Johns Hopkins Applied Lab
Jackie Akinpelu
11:15
11:45
Houghton Mifflin presentation Bonnie Ennis
11:45 Lunch

Appendix- page 176
12:30
12:30
1:15
STEM Update with Donna Clem
• Stem Standards/definition • STEM Advisory • STEM units/Lesson • Please spread among tables during feedback, Donna would
like specialist to facilitate table discussions
Donna C
And Staff
1:15
1:30
Other RTTT Projects • Intervention/Enrichment – briefly what has been identified for
RFP • PD modules • MPTV Projects - all 3
Marci
1:30
3:00
Sharing session – sit by level elementary, middle , hs – realize some of you are here alone so chose a group and you will benefit from hearing the large group sharing
• MD Common Core Learning Community o Bill Barnes o Small group – participant feedback, your personal
next steps, and next steps for your system • What are systems doing with PreK-2 implementation?
o Howard - Kay and John S o Wicomico – Bonnie Ennis
• What are the system-wide efforts to support the EEA? o Washington Elem – Kara reed??? o Baltimore County – Cindy for Elem and Maria for
Secondary • What concerns you???
Donna
3:00 Evaluation and Adjourn

Appendix- page 177
Fall Social Studies Briefing George Washington’s Mount Vernon Estate
Ann Pamela Cunningham Building Monday, September 26, 2011
Participants will gain information about:
George Washington, Mount Vernon Partnership & Initiatives Update Race to the Top and Common Core Social Studies Advisory Council Updates on all recent MSDE, Social Studies projects
9:00 Continental Breakfast
9:30 Welcome James C. Rees, President and
CEO
9:45 Common Core and Social Studies Marcie Taylor-Thoma
10:00 Financial Literacy Donna Olszewski
10:15 Environmental Literacy Kevin Jenkins
10:30 Social Studies Advisory Council Scott McComb
11:00 Exploration of the Donald W. Reynolds Education Nancy Hayward
Center and Museum
12:15 Working Lunch (George Washington Leadership Lesson for Elementary
School)
1:15 Mansion and Outbuildings Tour Tour Interpreters

Appendix- page 178
2:30 Debriefing
Thanks to George Washington’s Mount Vernon Estate, Museum, and Gardens for sponsoring this
event.
Appendix- page 179
Appendix B.7: Assistant Superintendents’ Retreat – Agenda and Timeline for
Curriculum Transition and Implementation

Appendix- page 180
Appendix- page 181
Appendix- page 182
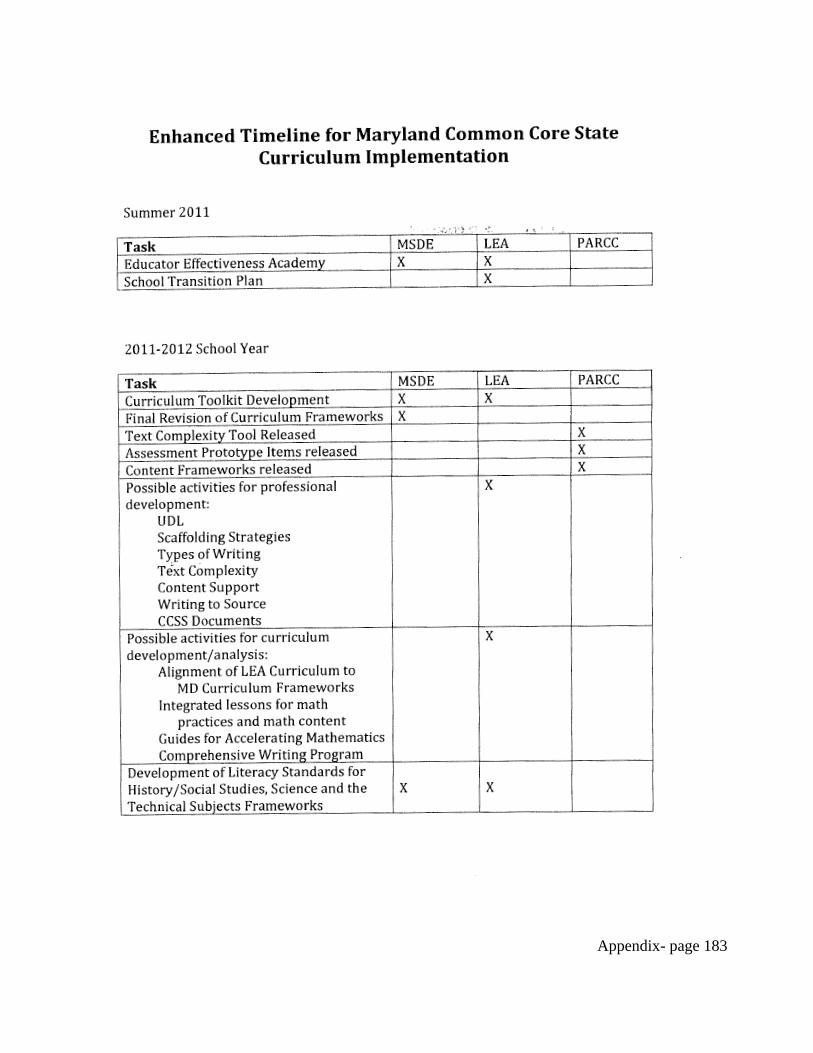
Appendix- page 183
Appendix- page 184
Appendix 1.B.8: Model Units Template and Descriptors

Appendix- page 185
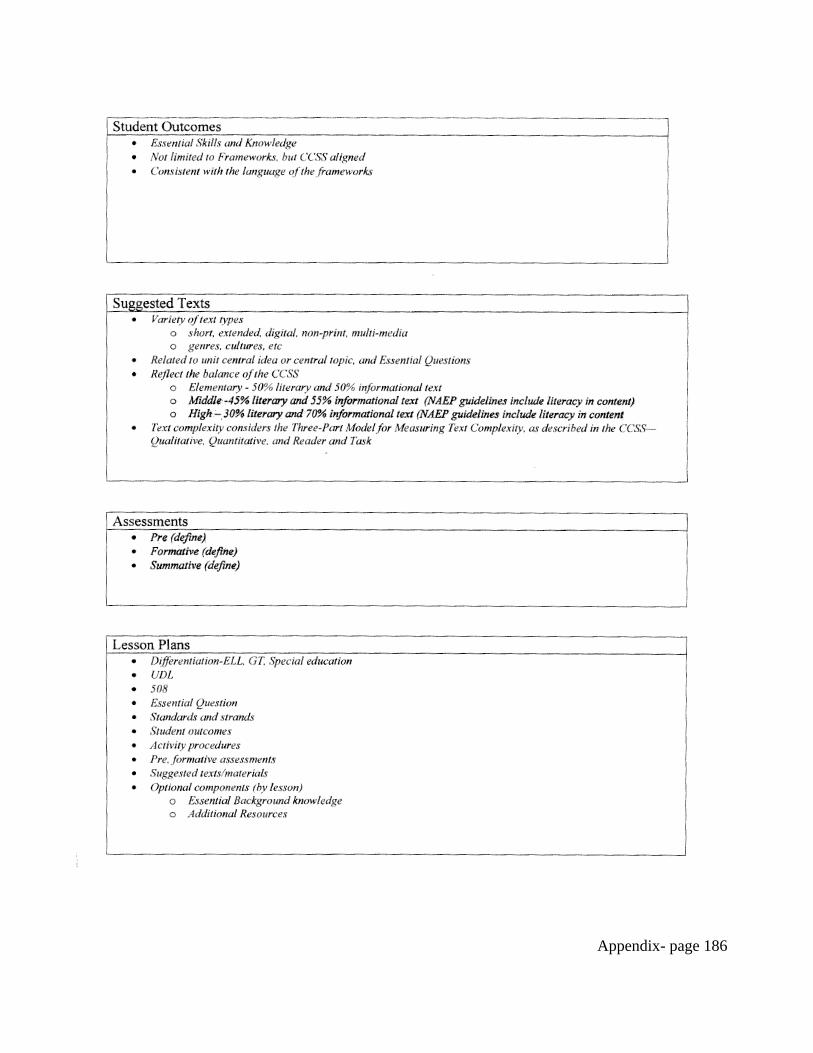
Appendix- page 186
Appendix- page 187
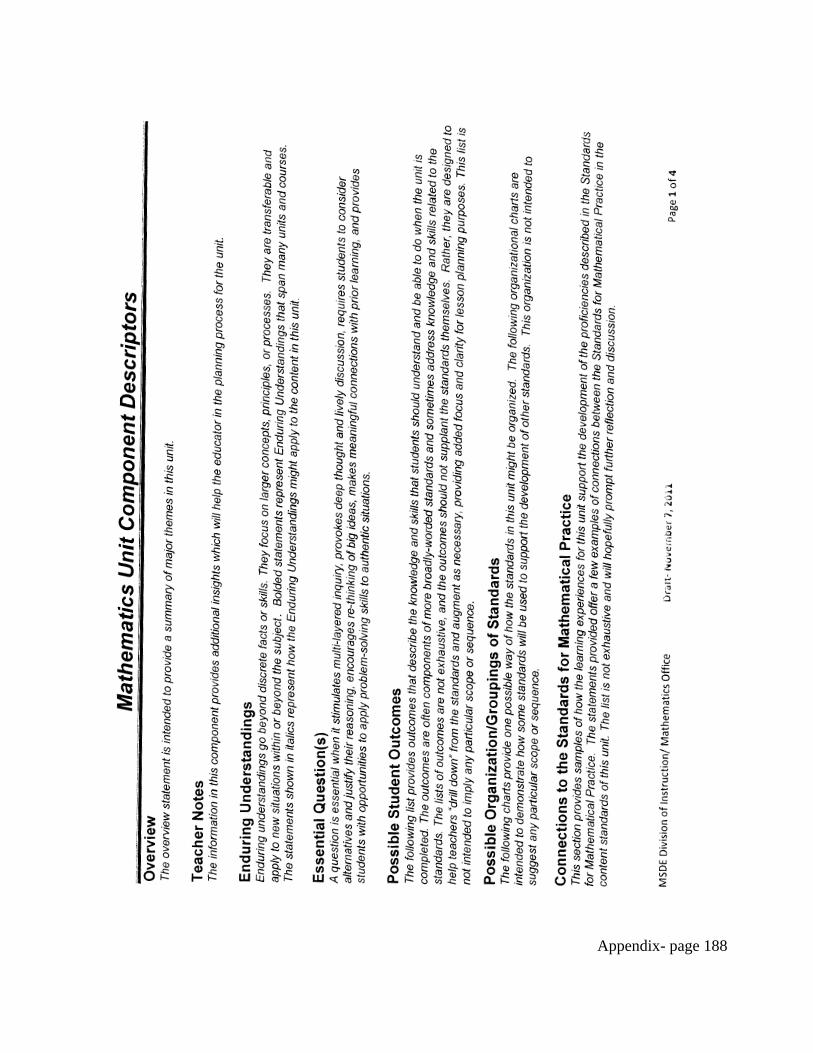
Appendix- page 188
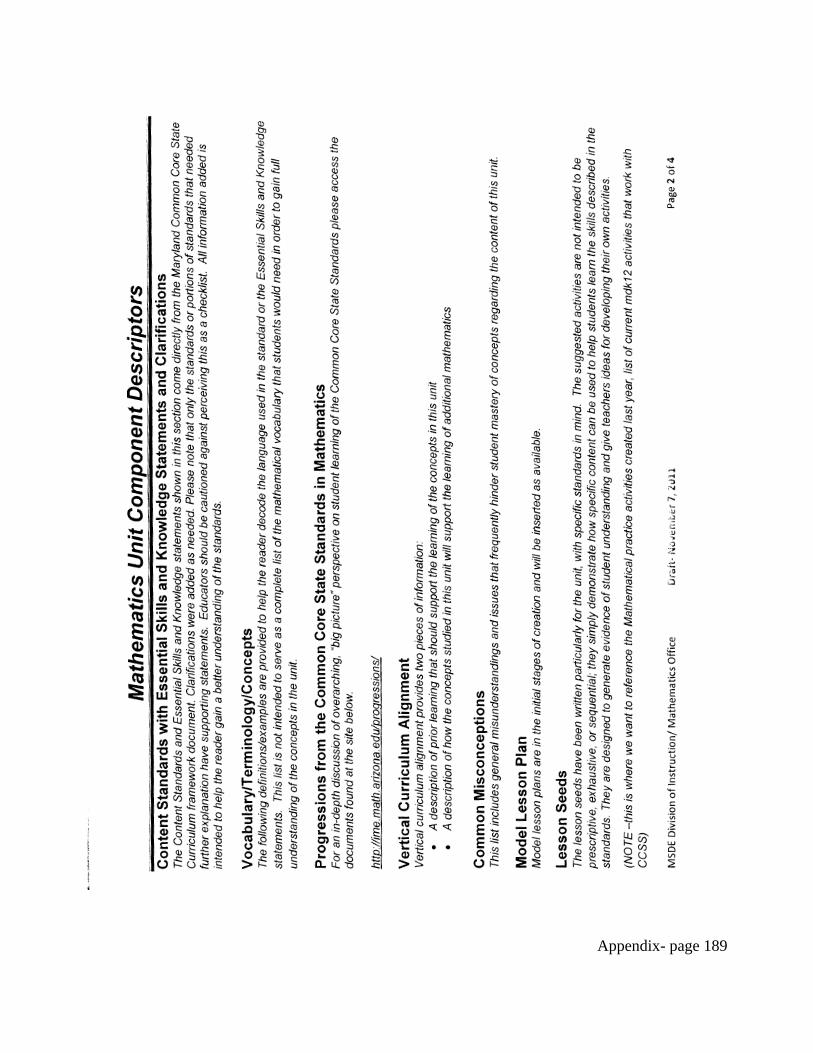
Appendix- page 189
Appendix- page 190
Appendix- page 191
Appendix- page 192
Appendix 1.B.9: Public School Superintendents Association of Maryland
- Presentation of Transition Plans - Agenda and Minutes
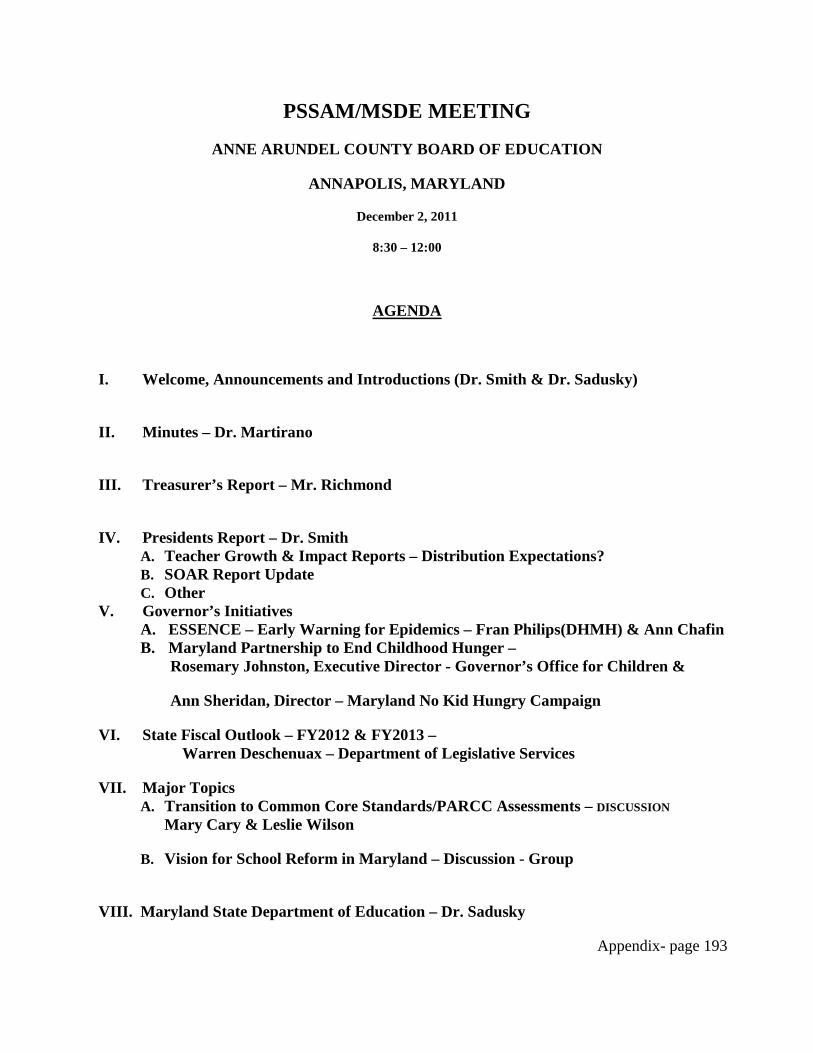
Appendix- page 193
PSSAM/MSDE MEETING
ANNE ARUNDEL COUNTY BOARD OF EDUCATION
ANNAPOLIS, MARYLAND
December 2, 2011
8:30 – 12:00
AGENDA
I. Welcome, Announcements and Introductions (Dr. Smith & Dr. Sadusky)
II. Minutes – Dr. Martirano
III. Treasurer’s Report – Mr. Richmond
IV. Presidents Report – Dr. Smith A. Teacher Growth & Impact Reports – Distribution Expectations? B. SOAR Report Update C. Other
V. Governor’s Initiatives A. ESSENCE – Early Warning for Epidemics – Fran Philips(DHMH) & Ann Chafin B. Maryland Partnership to End Childhood Hunger –
Rosemary Johnston, Executive Director - Governor’s Office for Children &
Ann Sheridan, Director – Maryland No Kid Hungry Campaign
VI. State Fiscal Outlook – FY2012 & FY2013 – Warren Deschenuax – Department of Legislative Services
VII. Major Topics A. Transition to Common Core Standards/PARCC Assessments – DISCUSSION
Mary Cary & Leslie Wilson
B. Vision for School Reform in Maryland – Discussion - Group
VIII. Maryland State Department of Education – Dr. Sadusky

Appendix- page 194
A. NCLB Waiver Update – Mary Gable B. Common Core Math Alignment – Linda Kaniecki C. Special Education – Marcella Franczkowski
IX. Executive Director’s Report A. Legislation Update B. Budget Outlook
1. Federal 2. State 3. Local
C. Other
X. Roundtable A. Maryland Scholars Program – MBRT- Dr. Salmon B. NAACP Complaint-St Mary’s County – COMAR13A.07.05.01 – Dr. Martirano C. RTTT-Early Learning Challenge Briefing – Dr. Wagner D. MPSSAA – Handbook Revision Recommendation – Mr. Guthrie E. Master Plan – Dr. Andes F. Other
XI. Adjourn
NEXT MEETING:
THURSDAY, JANUARY 6, 2012 8:30 A.M.
ANNE ARUNDEL COUNTY BOARD OF EDUCATION
Appendix- page 195
PSSAM/MSDE Anne Arundel County Board of Education -Annapolis, Maryland
December 2, 2011
8:30 a.m. – 12:00 p.m.
AGENDA
I. Welcome, Announcements and Introductions - Dr. Smith & Dr. Sadusky
II. Secretary’s Report/Minutes – Dr. Martirano
A motion to accept the minutes from the October 28, 2011 meeting was seconded and passed.
III. Treasurer’s Report - Mr. Richmond
A motion to accept the treasurer’s report was seconded and passed.
IV. President’s Report- Dr. Smith – A. Teacher Growth & Impact Report – Distribution Expectation?
Reports will be distributed to each LAC and with an email to Superintendents for notification of distribution. FAQ sheet was presented.
B. SOAR Report Update: As tied to remediation for colleges
V. Governor’s Initiatives A. ESSENCE-Early Warning for Epidemic-Fran Phillips (DHMH) and Ann Chafin
Power Point distributed. This is a syndrome surveillance system for the early notification of community based epidemics. OPPOSITION voiced to this implementation.
Appendix- page 196
B. Maryland Partnership to End Childhood Hunger- Rosemary Johnston, Executive Director- Governor’s Office for Children and Ann Sheridan, Director- Maryland No Kid Hungry Campaign. Notebook distributed to all Superintendent with Power Point included. Main focus is to establish breakfast programs in all schools across the state of Maryland.
VI. State Fiscal Outlook- FY 2012 & 2013- Warren Deschenuax- Department of Legislative Services. A very comprehensive report was delivered. Please refer to the handout (State Fiscal Outlook, December 2, 2011) which contains copious amounts of information that should be shared with your BOE and your BOCC.
VII. Major Topics A. Transition to Common Core Standards/PARCC Assessments- Discussion -
Mary Cary and Leslie Wilson. PARCC and curriculum work at the MSDE go hand in hand. Next phase is the development of the model units and lessons guided by the curriculum framework from PARCC. Two model units are being created for every grade level in math and reading language arts and each contains two lessons in each unit. The model units selected were based upon the gap analysis of the current curriculum. Superintendents are encouraged to funnel information about the Common Core Standards/PARCC Assessments to Carl in preparation for the January 6th meeting. Carl will develop a survey that will assist in the gathering information that will help frame the discussion.
B. Vision for School Reform in Maryland – Discussion - Group
VIII. Maryland State Department of Education- Dr. Sadusky A. NCLB Waiver Update – Mary Gable provided an excellent summary document of
math graduation credits for each LEA. An update of the NCLB waiver process was presented as a way remedy the current AYP requirement. The consensus was to use Option A. {Definition for Option A: The SEA would set AMOs in annual equal increments toward a goal of reducing by half the percentage of students in the “all students” group and in each subgroup who are not proficient within six years. The SEA must use current proficiency rates based on assessments administered in the 2010-2011 school year as the starting point for setting its AMOs.} The deadline for the submission of the MSDE waiver process is February 21, 2012. This will be discussed further at the next PSSAM meeting in January.
B. Common Core Math Alignment- Linda Kaniecki provided a overview of the possible high school mathematics transition plan. The alignment charts depicted the math sequence across the 3 year development and transition process. The charts are excellent.
Appendix- page 197
IX. Executive Director’s Report – Dr. Roberts A. Legislative Update: additional information will be sent via email B. Labor Relations Board – Harford Decision Update provided by Rob Tomback.
Several issues being discussed that HCEA claims that Harford County bargained in bad faith and entered in renegotiations in bad faith. The County Executive is using $32 million of fund balance to provide one-time $1250 bonus to all county employees including school system staff. Hearing before the PSLRB on December 16th. Two issues are jurisdiction and the interpretation of the legislation.
C. March 1st: Annual recognition of superintendent retirees in Annapolis. Location to be announced.
D. CEASOM: Call for proposals for Common Ground 2012 Conference E. Other
X. Roundtable A. Maryland Scholars Program – MBRT – Dr. Salmon B. NAACP Complaint – St. Mary’s County – COMAR 13A.07.05.01 – Dr.
Martirano: Handout distributed. Please read C. RTTT – Early Learning Challenge Briefing – Dr. Wagner D. MPSSAA – Handbook Revision Recommendation – Dr. Guthrie E. Master Plan – Dr. Andes F. Other
XI. Adjournment at 12:25
NEXT MEETING:
FRIDAY, JANUARY 6, 2012
ANNE ARUNDEL COUNTY BOARD OF EDUCATION

Appendix- page 198
Appendix 1.B.10: Random Sample of Transition Plans for Common Core
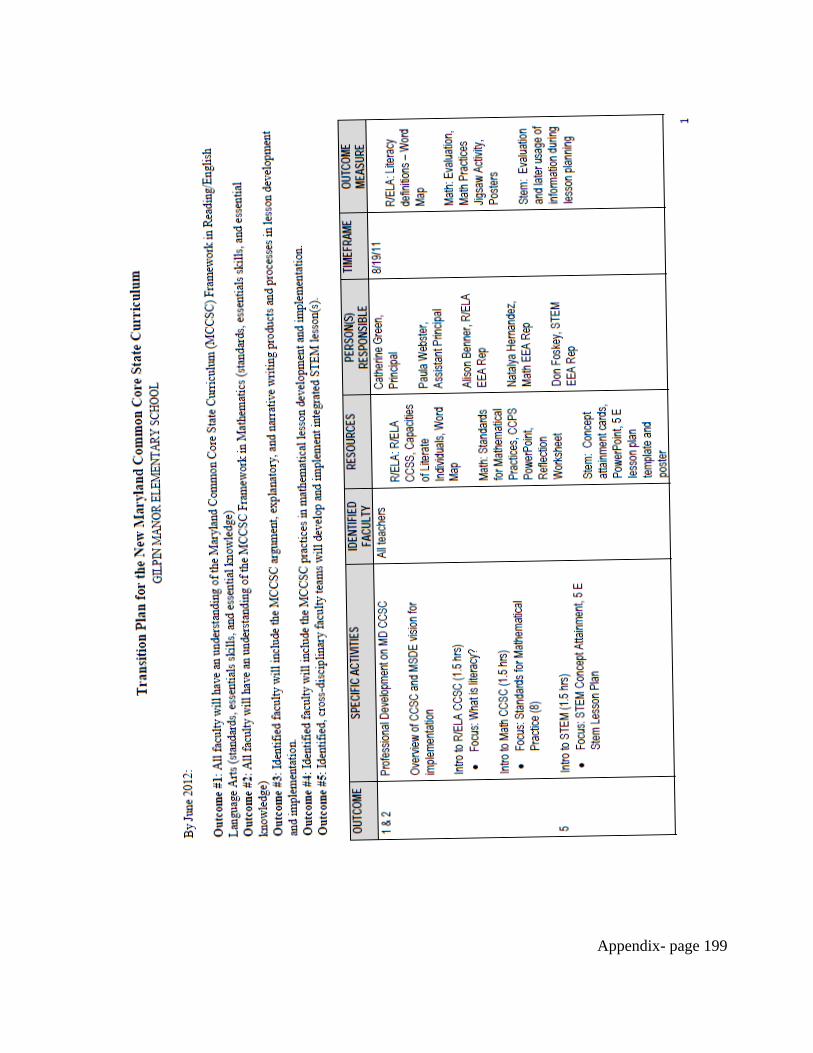
Appendix- page 199
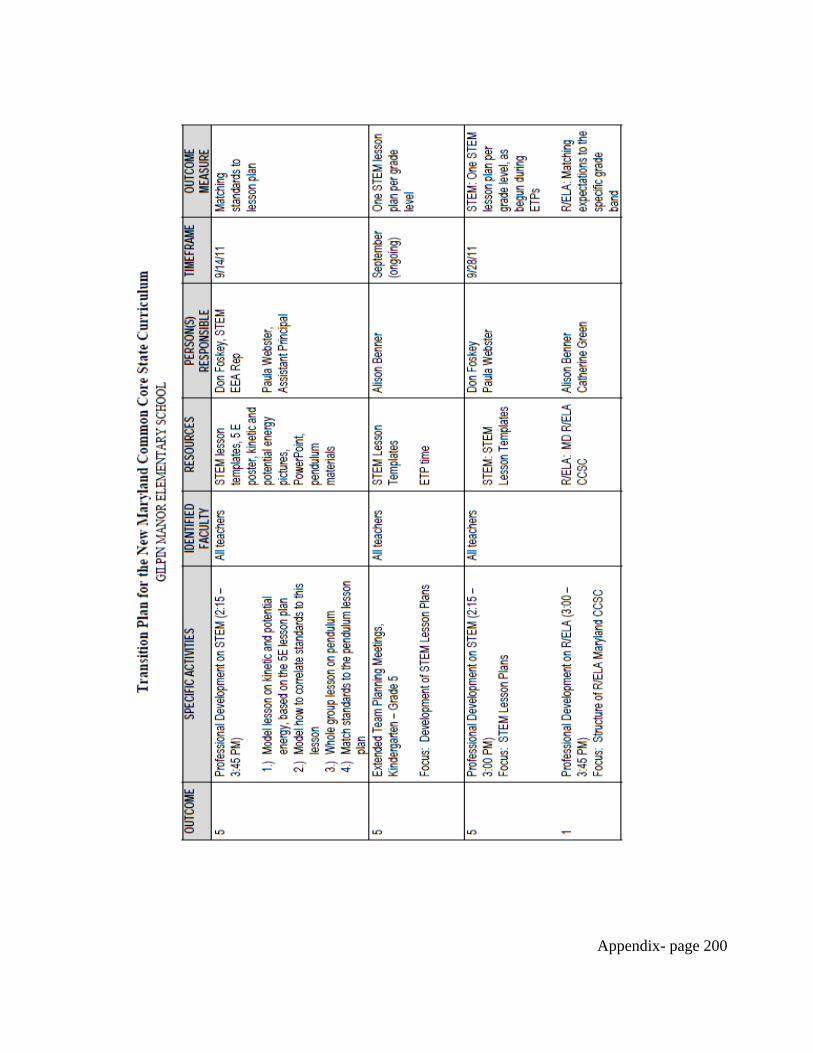
Appendix- page 200
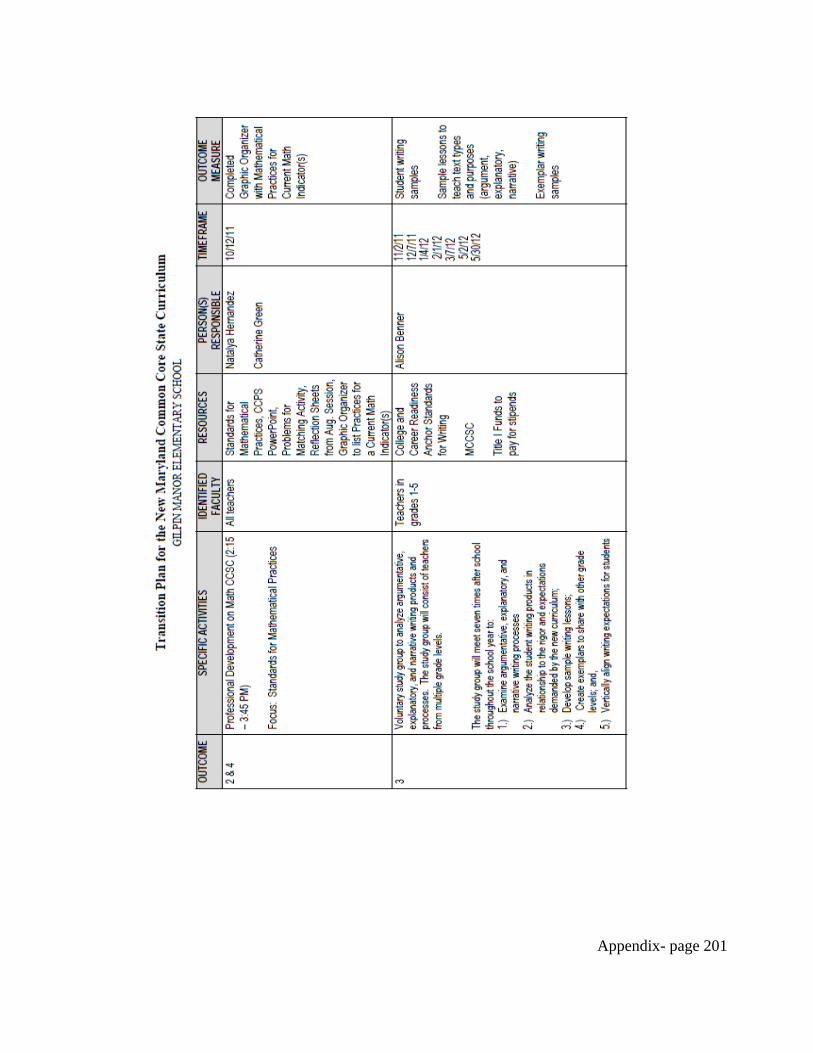
Appendix- page 201
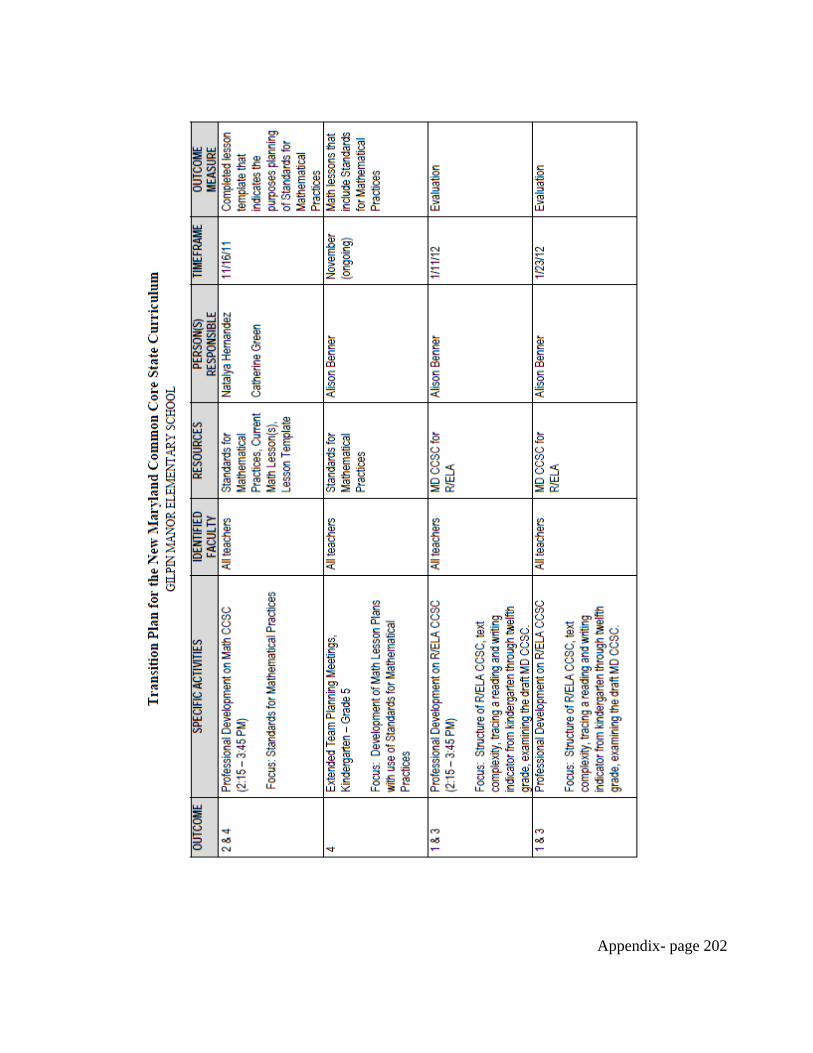
Appendix- page 202
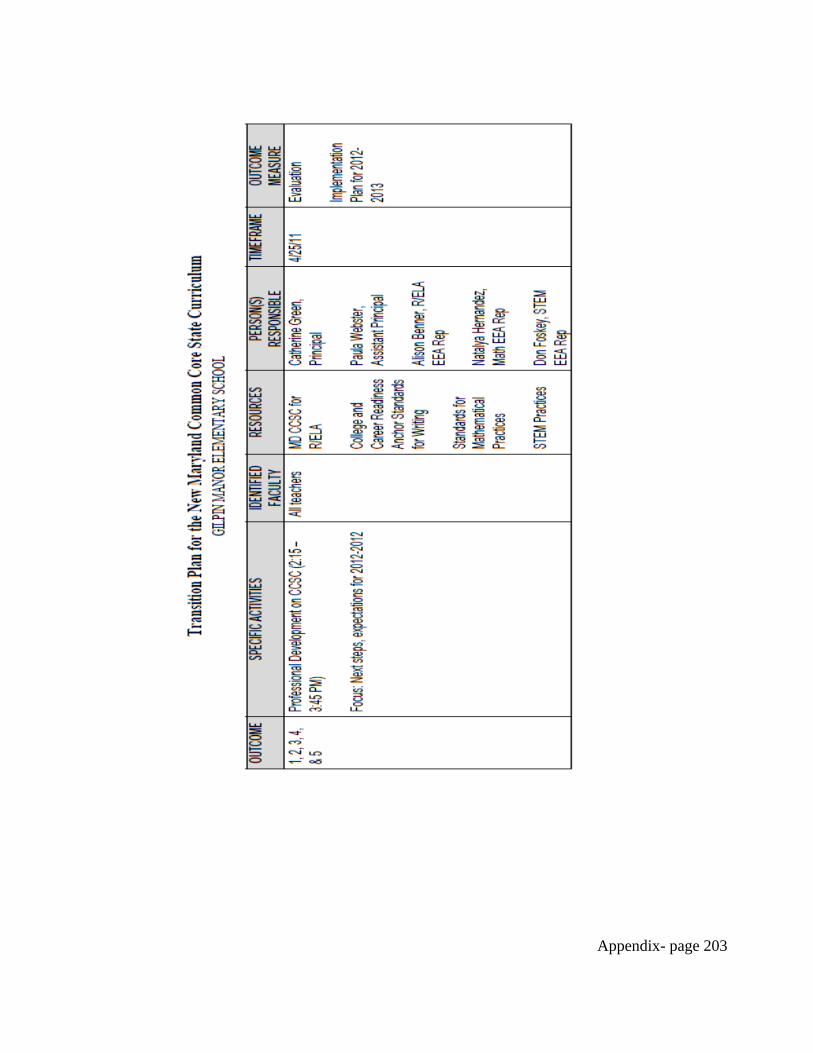
Appendix- page 203
Appendix- page 204
Appendix 1.B.11: LEA Assistant Superintendents Meeting - Development
of Timeline for Full Implementation - Agenda and Notes
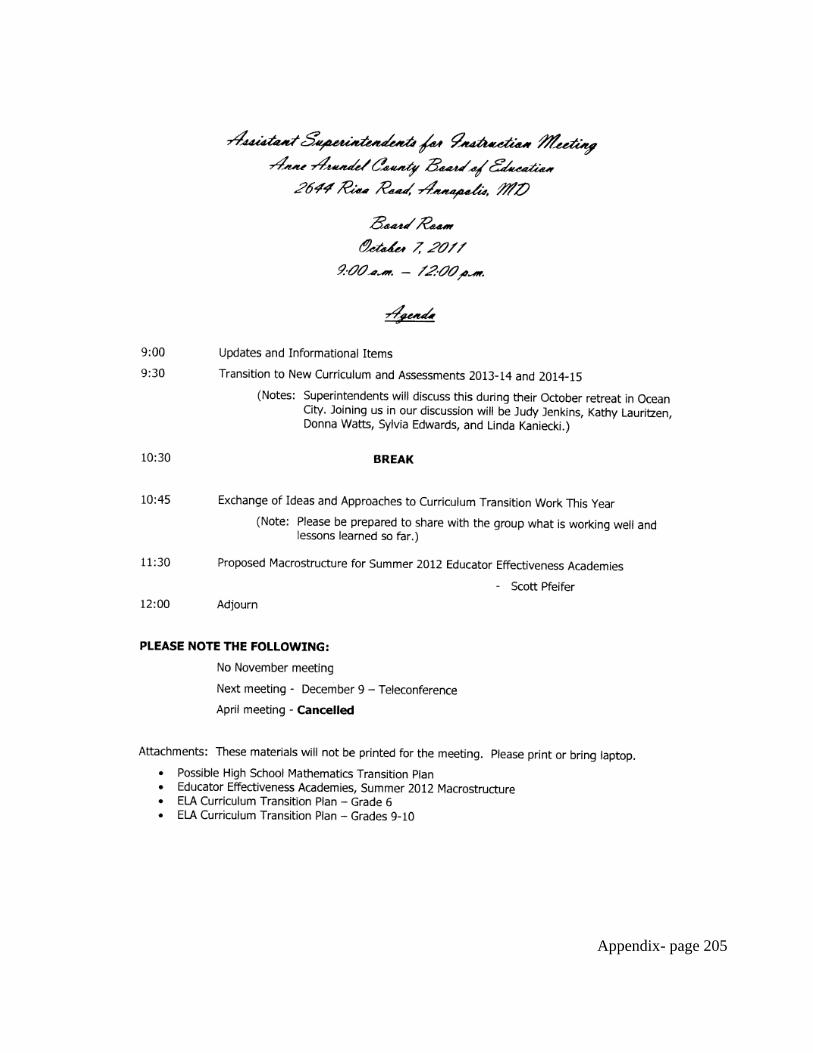
Appendix- page 205
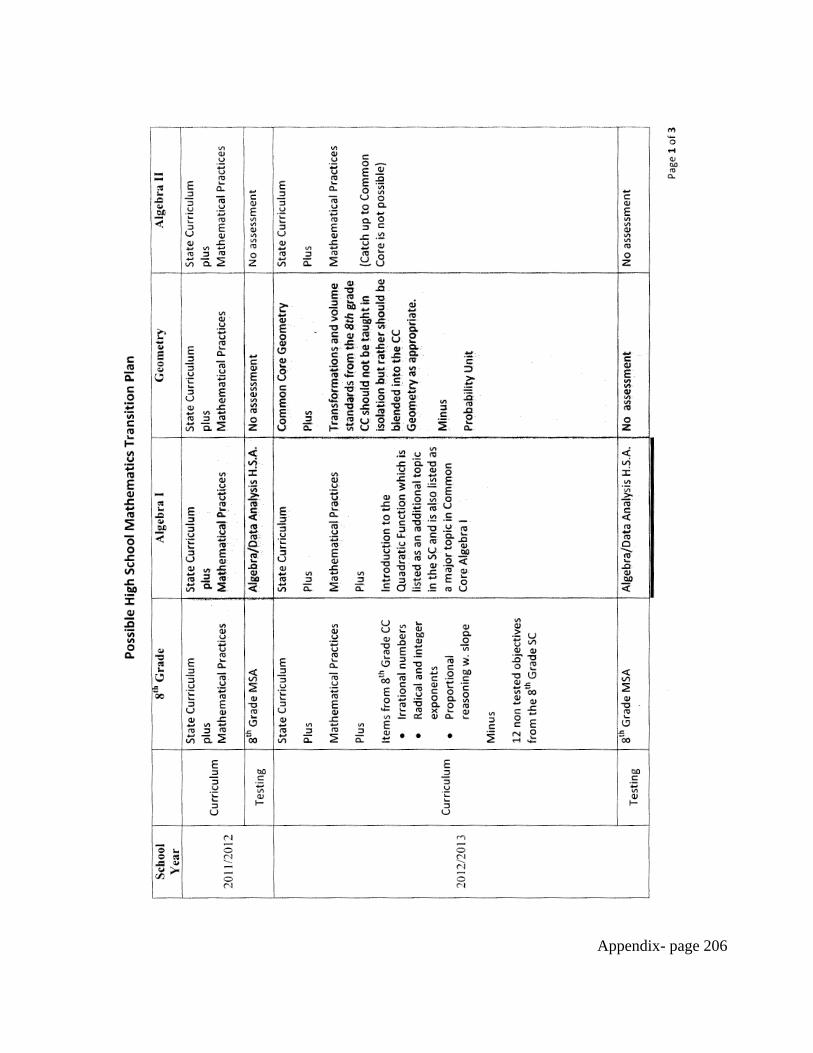
Appendix- page 206
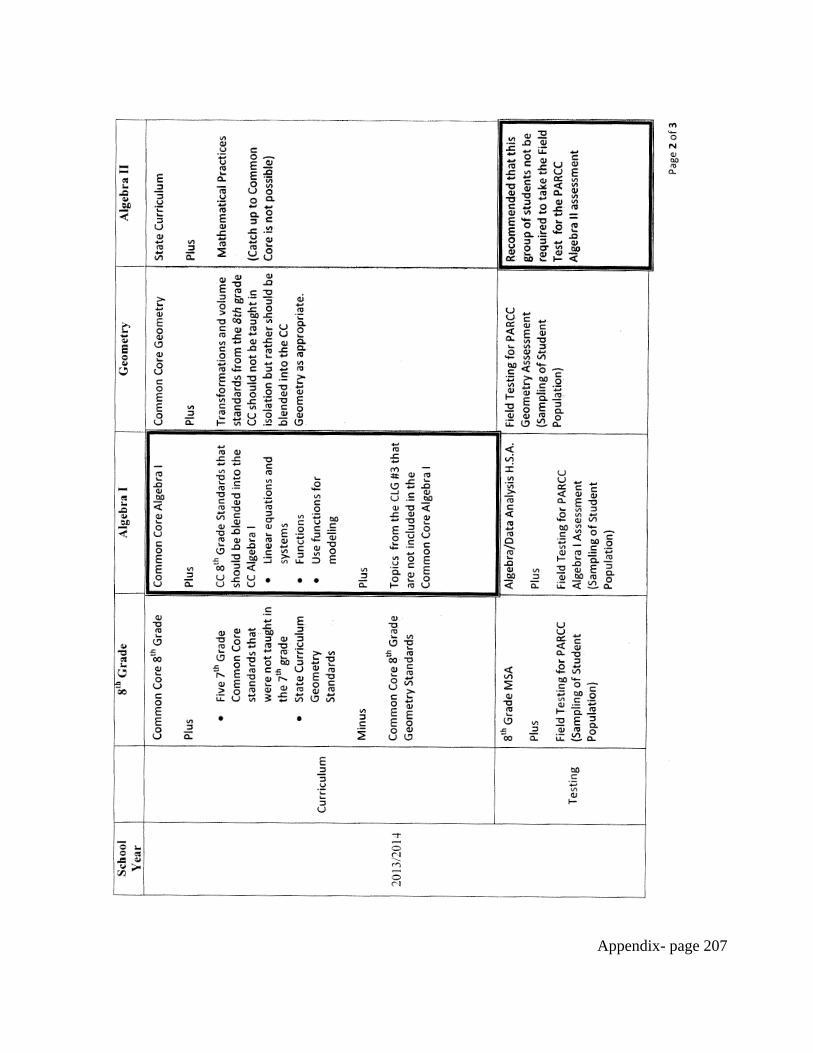
Appendix- page 207
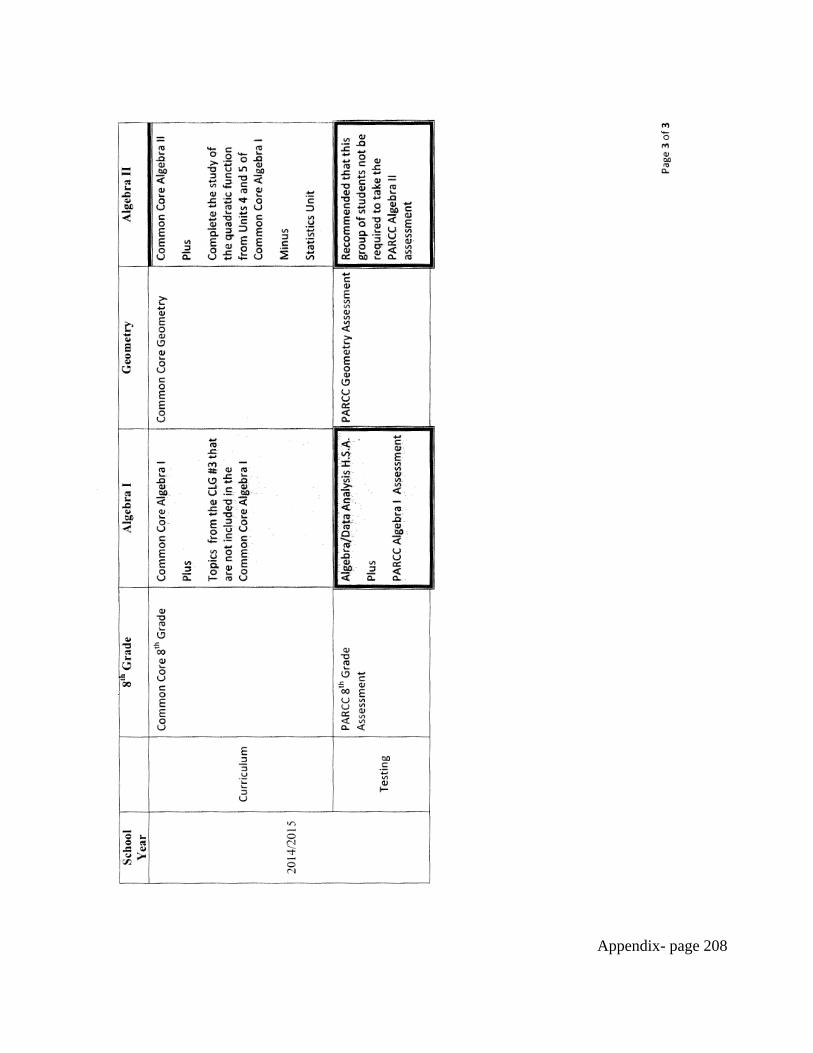
Appendix- page 208
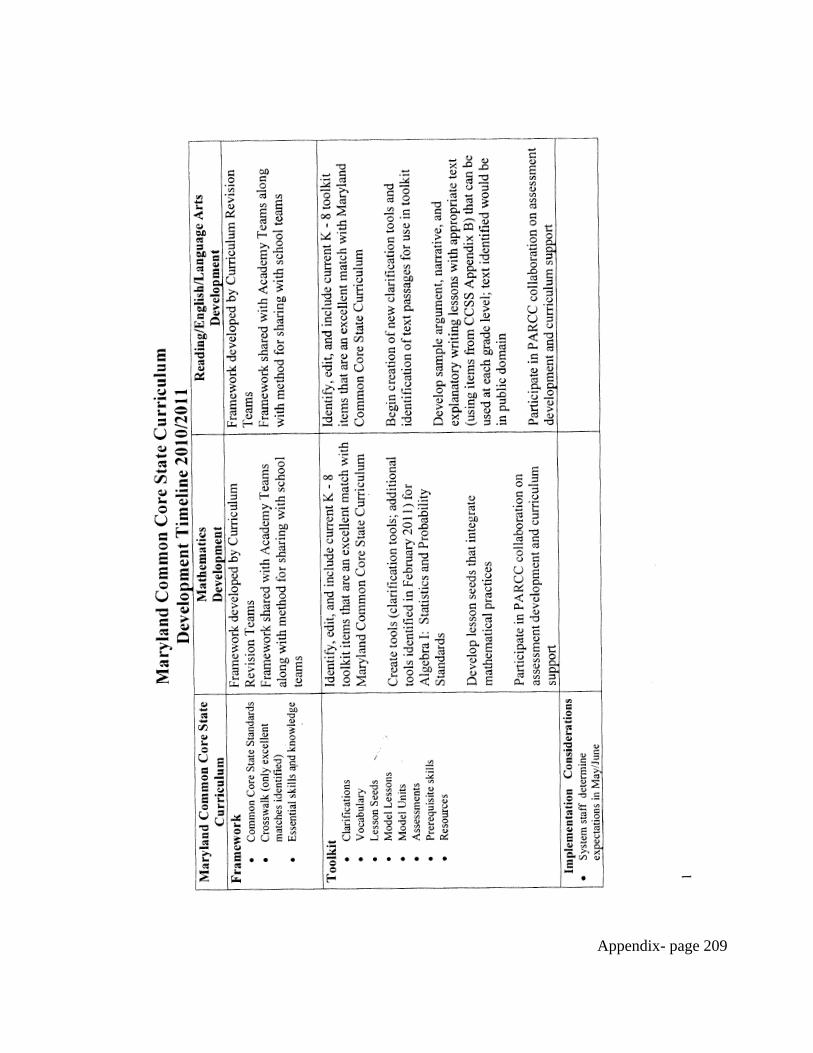
Appendix- page 209
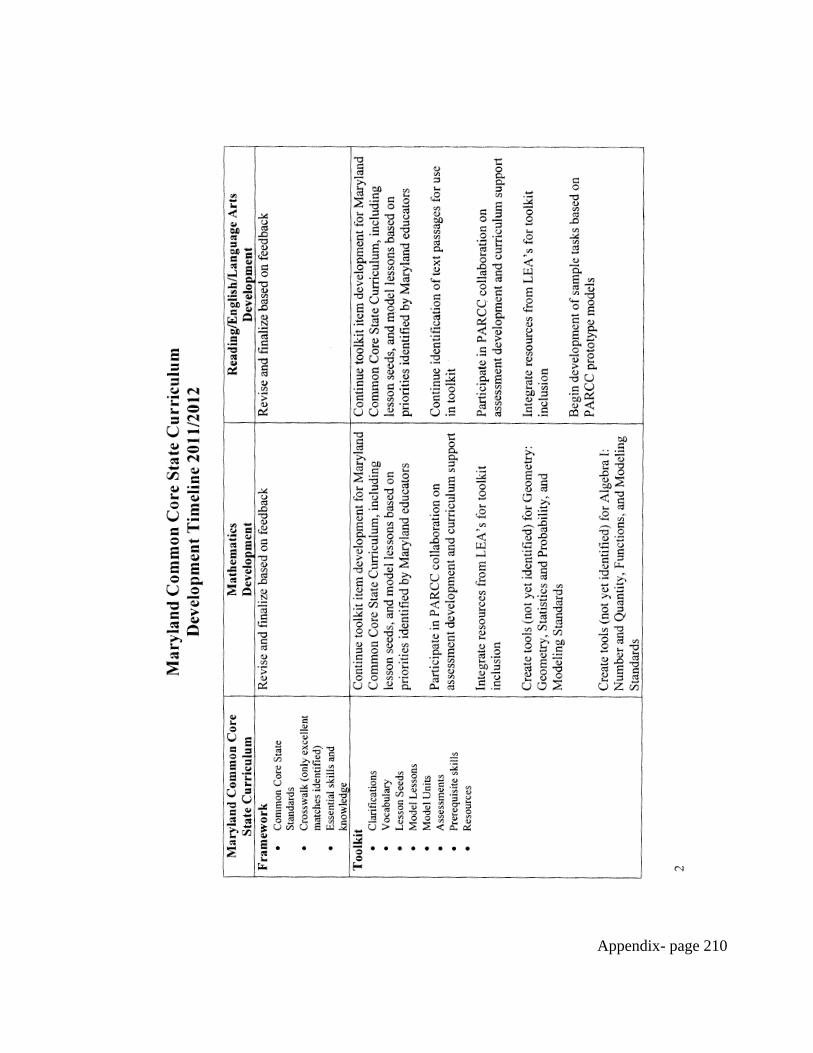
Appendix- page 210
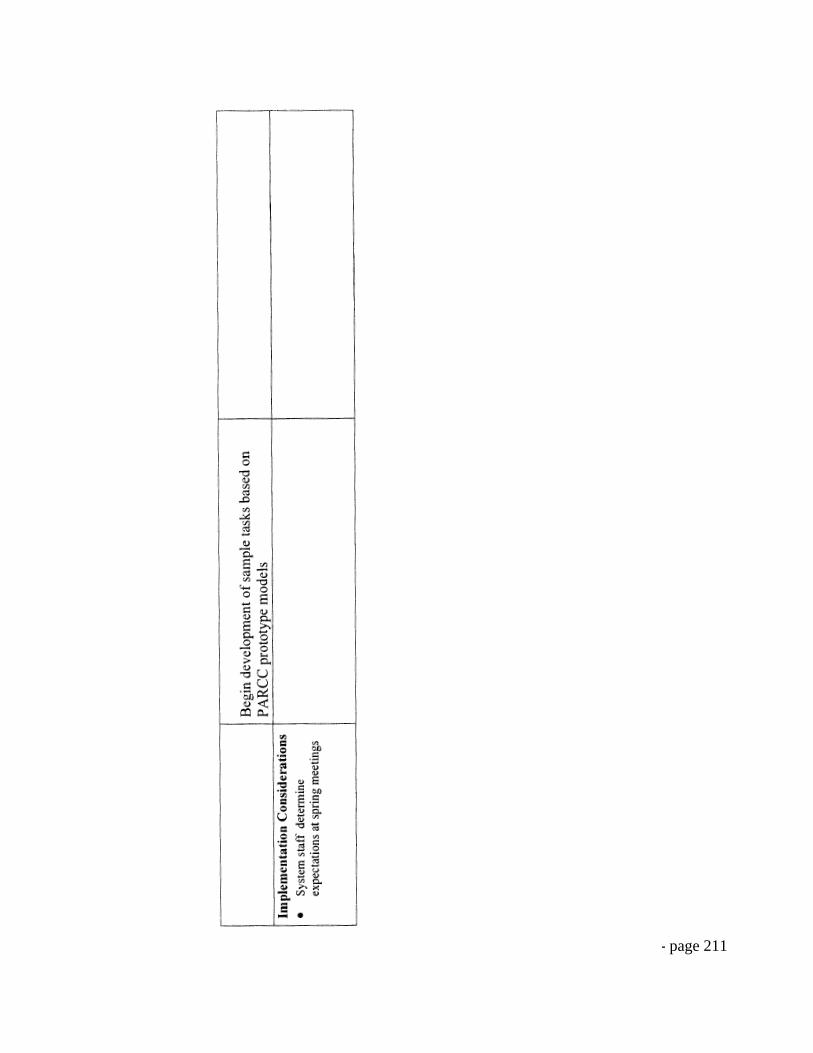
Appendix- page 211
Appendix- page 212
Appendix 1.B.12: Regional Meeting Agendas - MSDE Presentation and
Assistance to LEAs for Developing Plans
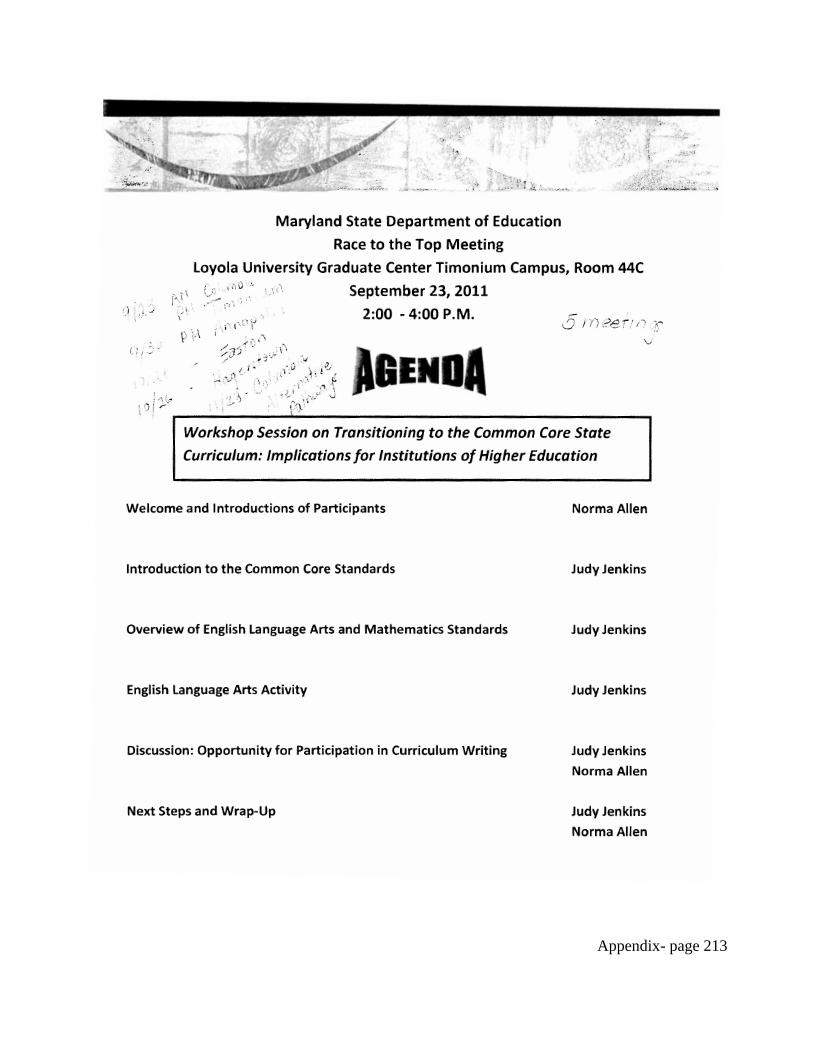
Appendix- page 213
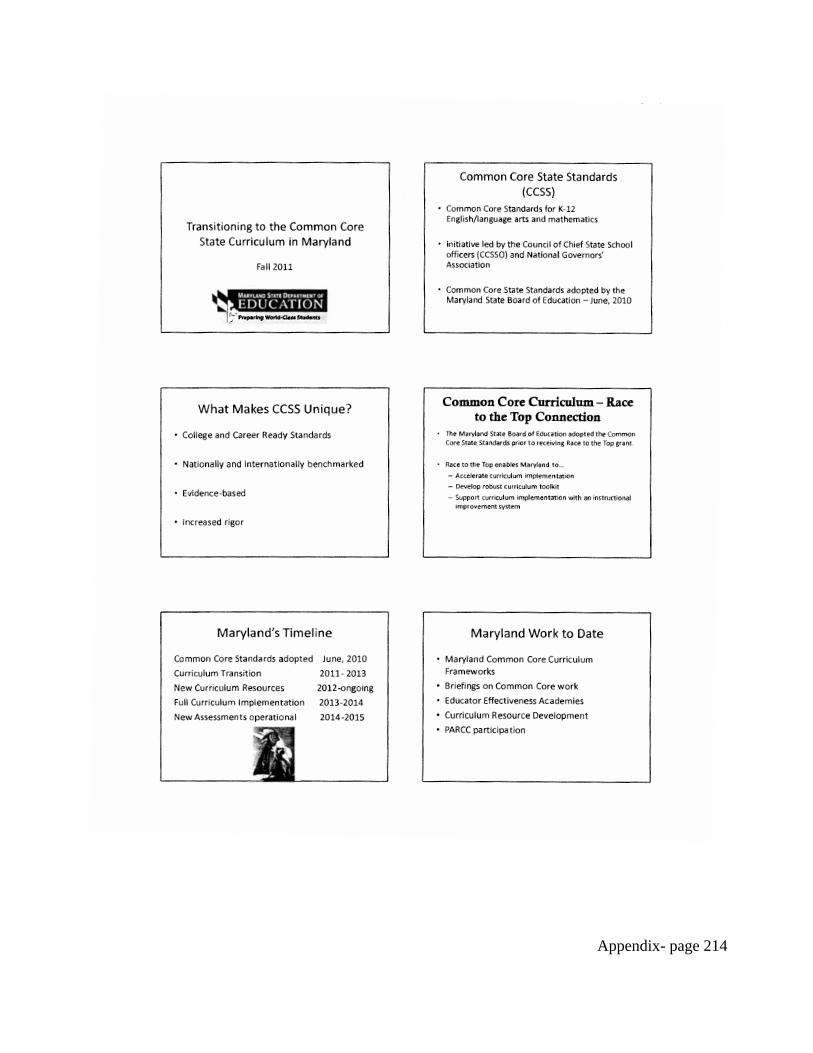
Appendix- page 214
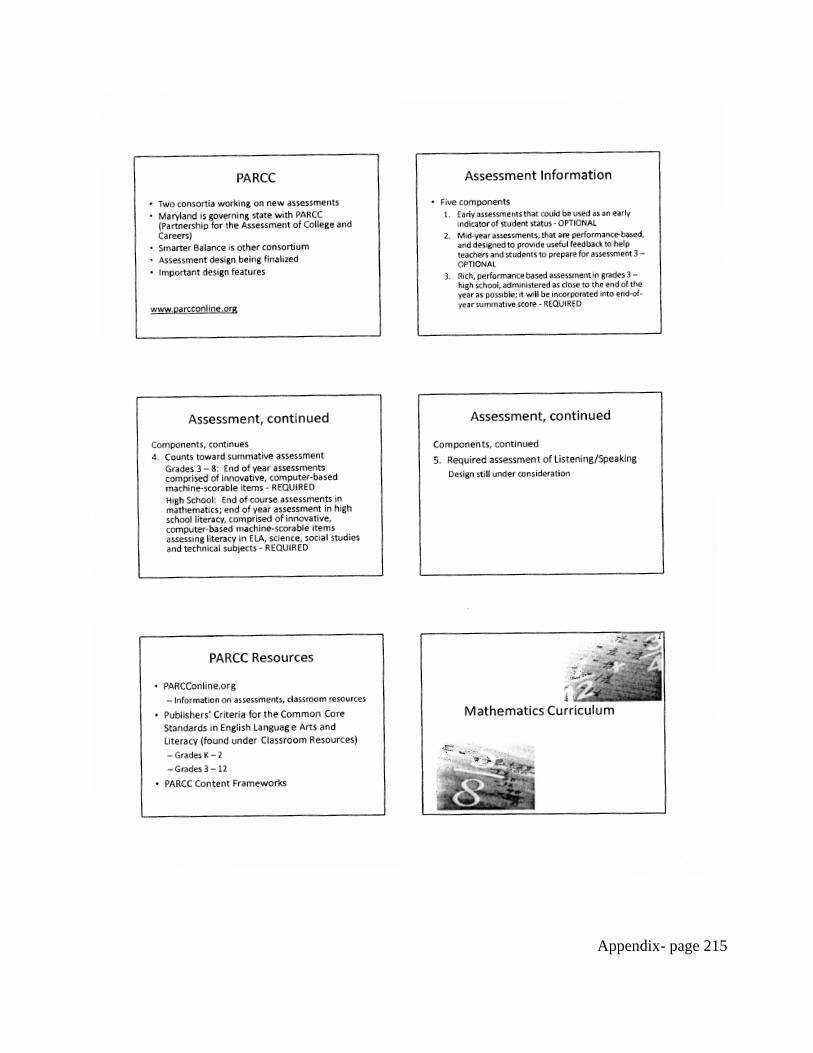
Appendix- page 215
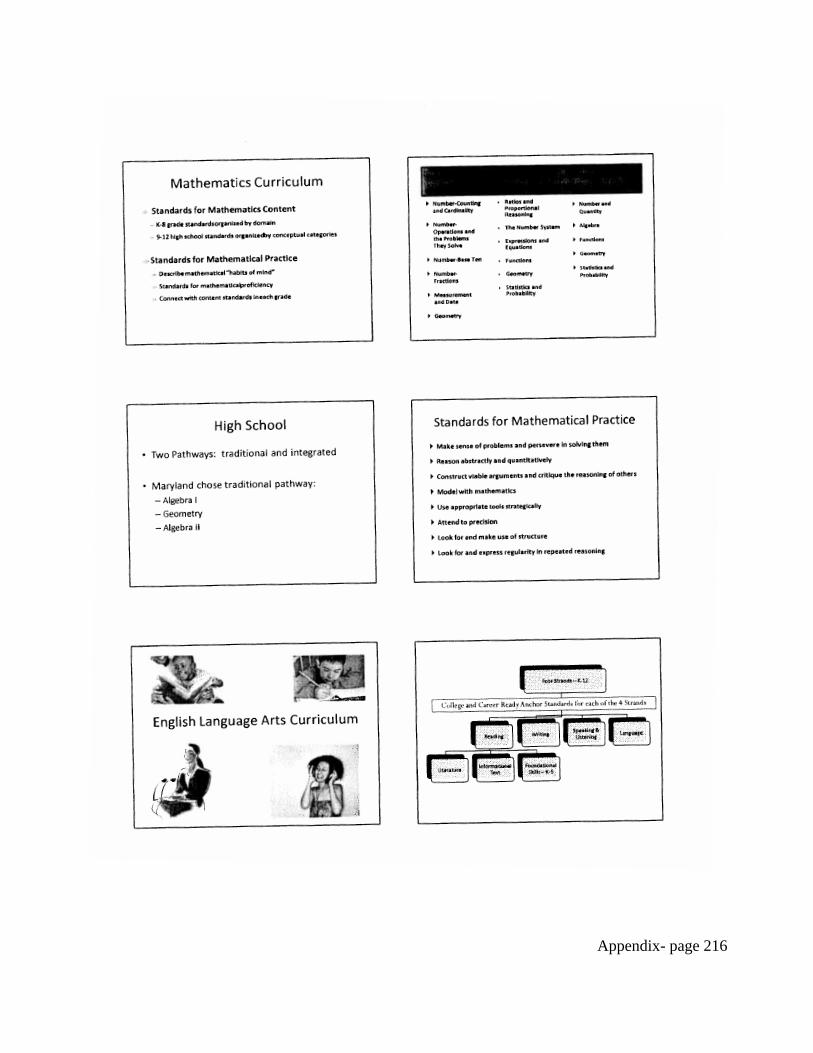
Appendix- page 216
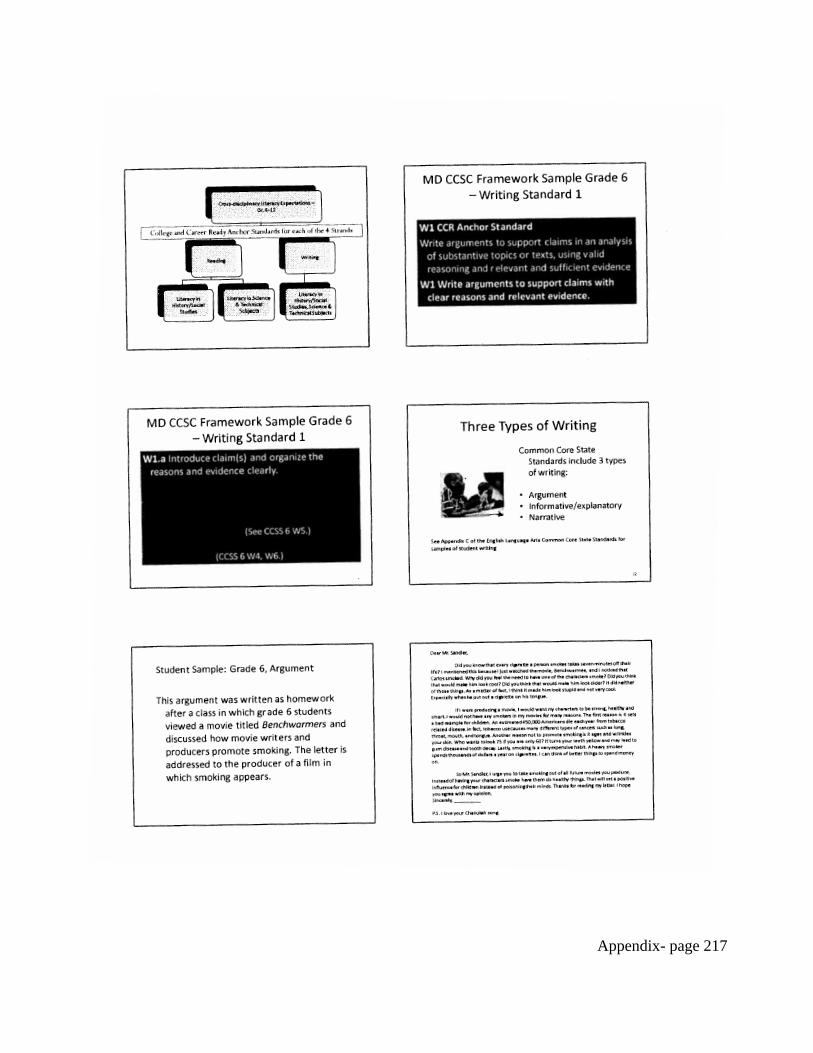
Appendix- page 217
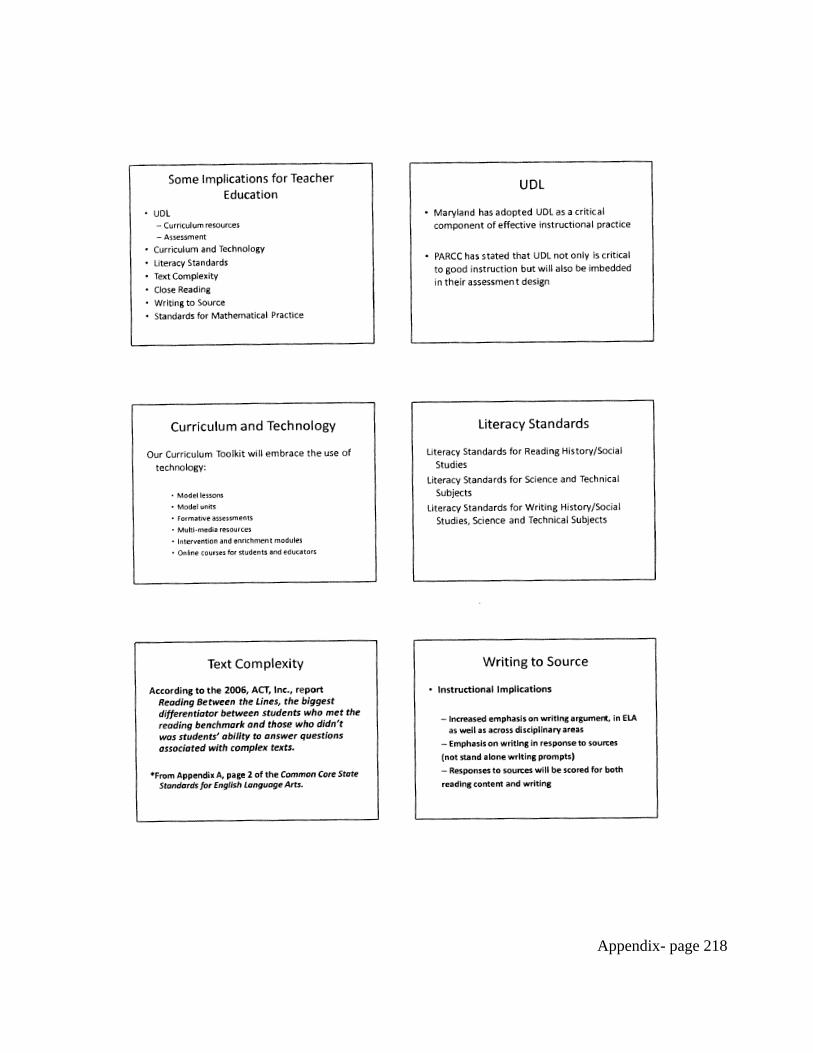
Appendix- page 218
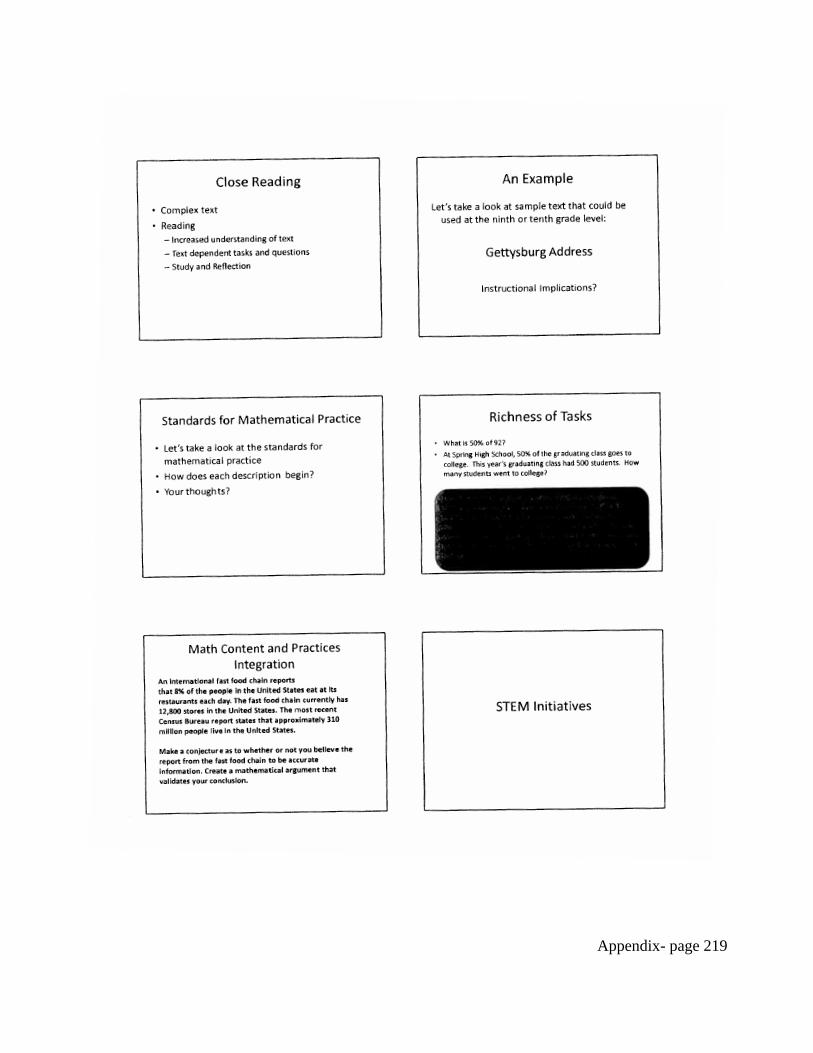
Appendix- page 219
Appendix- page 220
Appendix- page 221
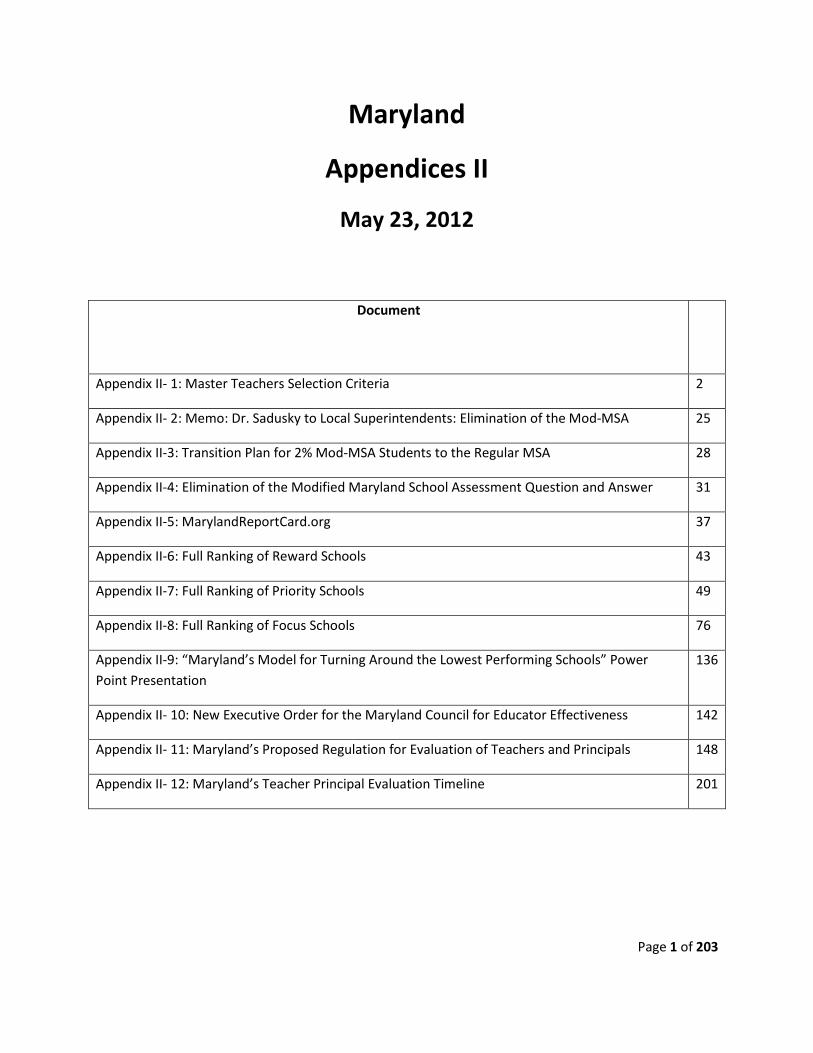
Page 1 of 203
Maryland
Appendices II
May 23, 2012
Document
Appendix II- 1: Master Teachers Selection Criteria 2
Appendix II- 2: Memo: Dr. Sadusky to Local Superintendents: Elimination of the Mod-MSA 25
Appendix II-3: Transition Plan for 2% Mod-MSA Students to the Regular MSA 28
Appendix II-4: Elimination of the Modified Maryland School Assessment Question and Answer 31
Appendix II-5: MarylandReportCard.org 37
Appendix II-6: Full Ranking of Reward Schools 43
Appendix II-7: Full Ranking of Priority Schools 49
Appendix II-8: Full Ranking of Focus Schools 76
Appendix II-9: “Maryland’s Model for Turning Around the Lowest Performing Schools” Power Point Presentation
136
Appendix II- 10: New Executive Order for the Maryland Council for Educator Effectiveness 142
Appendix II- 11: Maryland’s Proposed Regulation for Evaluation of Teachers and Principals 148
Appendix II- 12: Maryland’s Teacher Principal Evaluation Timeline 201
Page 2 of 203
APPENDIX
II-1: MASTER TEACHERS
SELECTION CRITERIA
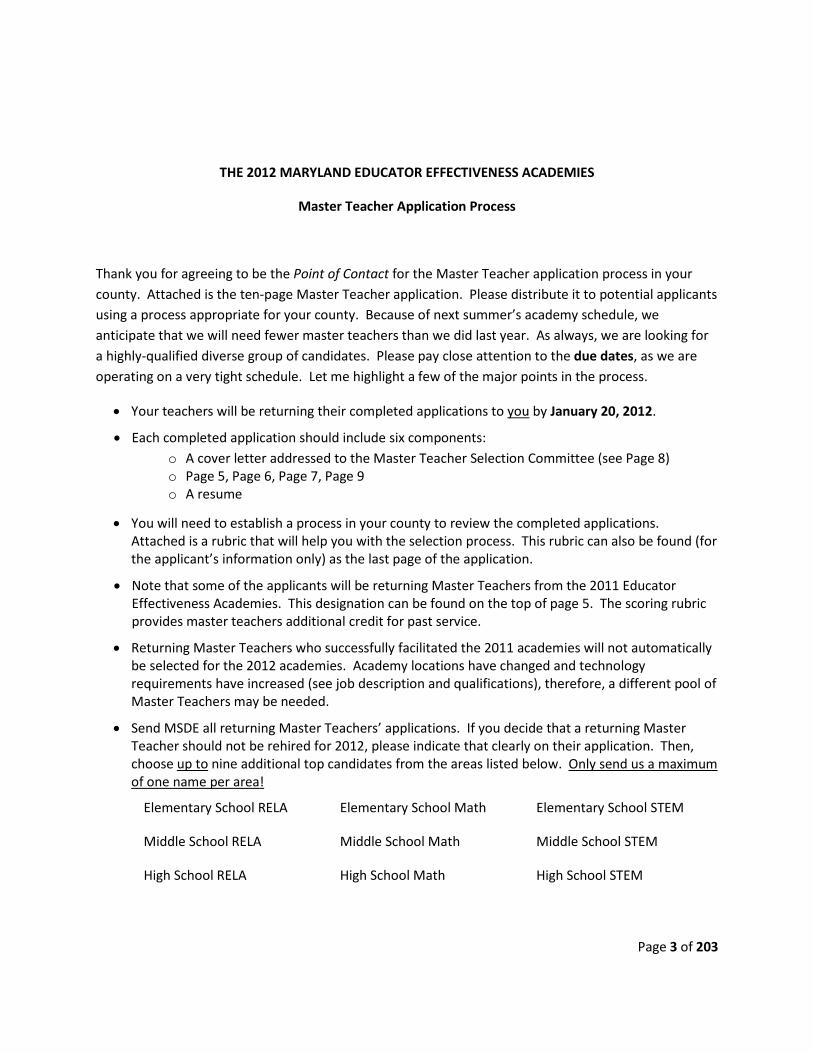
Page 3 of 203
THE 2012 MARYLAND EDUCATOR EFFECTIVENESS ACADEMIES
Master Teacher Application Process
Thank you for agreeing to be the Point of Contact for the Master Teacher application process in your county. Attached is the ten-page Master Teacher application. Please distribute it to potential applicants using a process appropriate for your county. Because of next summer’s academy schedule, we anticipate that we will need fewer master teachers than we did last year. As always, we are looking for a highly-qualified diverse group of candidates. Please pay close attention to the due dates, as we are operating on a very tight schedule. Let me highlight a few of the major points in the process.
• Your teachers will be returning their completed applications to you by January 20, 2012.
• Each completed application should include six components: o A cover letter addressed to the Master Teacher Selection Committee (see Page 8) o Page 5, Page 6, Page 7, Page 9 o A resume
• You will need to establish a process in your county to review the completed applications. Attached is a rubric that will help you with the selection process. This rubric can also be found (for the applicant’s information only) as the last page of the application.
• Note that some of the applicants will be returning Master Teachers from the 2011 Educator Effectiveness Academies. This designation can be found on the top of page 5. The scoring rubric provides master teachers additional credit for past service.
• Returning Master Teachers who successfully facilitated the 2011 academies will not automatically be selected for the 2012 academies. Academy locations have changed and technology requirements have increased (see job description and qualifications), therefore, a different pool of Master Teachers may be needed.
• Send MSDE all returning Master Teachers’ applications. If you decide that a returning Master Teacher should not be rehired for 2012, please indicate that clearly on their application. Then, choose up to nine additional top candidates from the areas listed below. Only send us a maximum of one name per area!
Elementary School RELA Elementary School Math Elementary School STEM
Middle School RELA Middle School Math Middle School STEM
High School RELA High School Math High School STEM
Page 4 of 203
Mail the completed applications (all six components) to us by February 15, 2012. Mail all applications to the address below.
Let me know if you have any questions. You may also contact Rick Marquart (410-767-0527) or Cassandra Smith (410-767-0871) if you need additional information. Thank you!
Sincerely,
Scott Pfeifer
Director of Instructional Assessment and Professional Development
Maryland State Department of Education
200 West Baltimore Street
Baltimore, MD 21202
410-767-0574

Page 5 of 203
THE 2012 MARYLAND EDUCATOR EFFECTIVENESS ACADEMY (EEA)
For Reading, English Language Arts, Mathematics, STEM and School Principals
ANNOUNCEMENT – Master Teacher Application
The Maryland State Department of Education (MSDE) in partnership with your school system invites you to consider becoming a Master Teacher for the 2012 Educator Effectiveness Academies for Reading, English Language Arts, Mathematics, or Science, Technology, Engineering and Mathematics (STEM). During the summer 2012, ten regional Educator Effectiveness Academies will be held throughout Maryland. Master teachers will be selected to facilitate the professional development for a minimum of two regional academies. These academies will include teams of teachers and principals from every school in Maryland. Academies for summer 2012 will focus on reviewing model units and lessons from the first part of the instructional toolkit. Early PARCC assessment information will be available for use during the academies. The proposed outcomes for the 2012 summer academies are as follows:
• Review final version of English/Language Arts and Mathematics Frameworks, identify changes, and introduce content literacy frameworks.
• Learn STEM standards, practices, processes and skills. • Develop knowledge of the format, lessons, and media resources in the English/Language Arts,
Mathematics and STEM curriculum toolkits. • Practice navigating curriculum toolkits and develop applications based on curriculum toolkit
models. • Update participants on PARCC assessment development, design and timeline. • Create a school plan that will guide school staff in delivering content and the curriculum toolkit.
Please review the enclosed information to determine if you are interested in one of these positions and if you meet the qualifications. If you are interested, please submit the required components of the application outlined on the checklist on page 9 by January 20, 2012 to the designated Point of Contact (POC) for Master Teachers in your county:
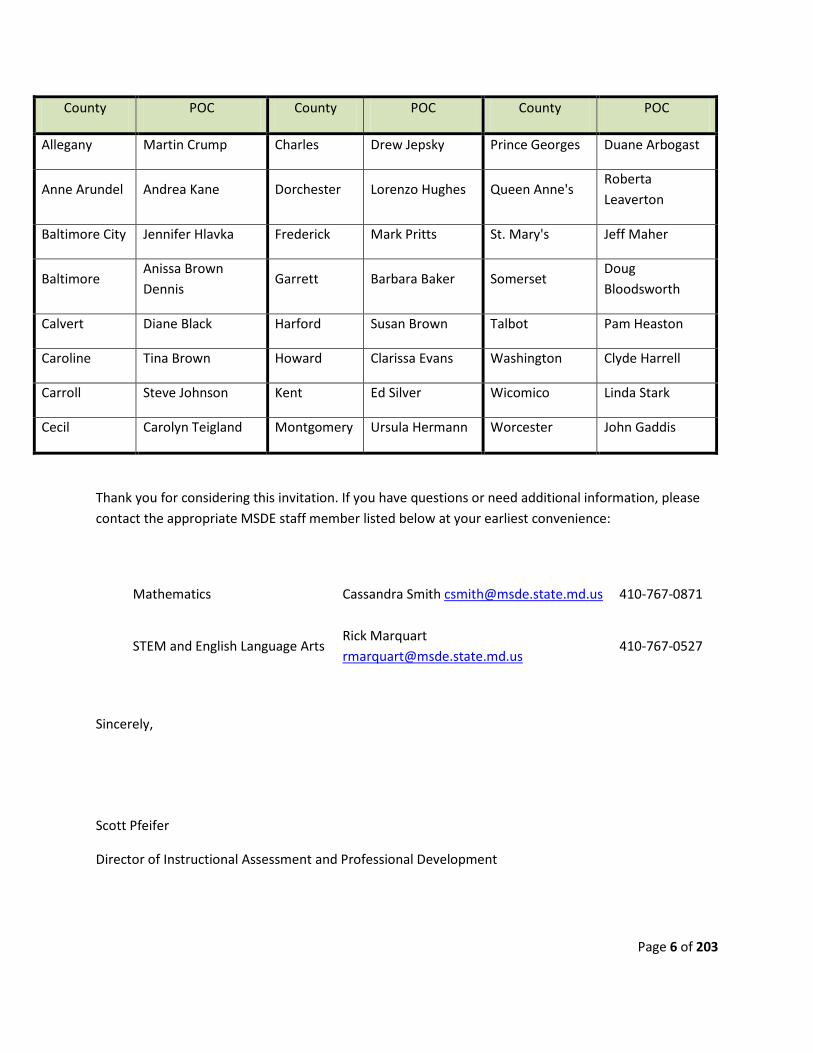
Page 6 of 203
County POC County POC County POC
Allegany Martin Crump Charles Drew Jepsky Prince Georges Duane Arbogast
Anne Arundel Andrea Kane Dorchester Lorenzo Hughes Queen Anne's Roberta Leaverton
Baltimore City Jennifer Hlavka Frederick Mark Pritts St. Mary's Jeff Maher
Baltimore Anissa Brown Dennis
Garrett Barbara Baker Somerset Doug Bloodsworth
Calvert Diane Black Harford Susan Brown Talbot Pam Heaston
Caroline Tina Brown Howard Clarissa Evans Washington Clyde Harrell
Carroll Steve Johnson Kent Ed Silver Wicomico Linda Stark
Cecil Carolyn Teigland Montgomery Ursula Hermann Worcester John Gaddis
Thank you for considering this invitation. If you have questions or need additional information, please contact the appropriate MSDE staff member listed below at your earliest convenience:
Mathematics Cassandra Smith [email protected] 410-767-0871
STEM and English Language Arts Rick Marquart [email protected]
410-767-0527
Sincerely,
Scott Pfeifer
Director of Instructional Assessment and Professional Development

Page 7 of 203
THE 2012 MARYLAND EDUCATOR EFFECTIVENESS ACADEMY (EEA)
For Reading, English Language Arts, Mathematics, STEM and School Principals
MASTER TEACHER INFORMATION
Job Description
To be eligible for a master teacher position for the summer of 2012, you must be able to:
• Attend all three full-day training sessions
o Monday, April 30 9:00 - 4:00 @ Stevenson Univ. (Owings Mills Campus) (substitute funded by MSDE)
o Thursday, May 24 9:00 - 4:00 @ Stevenson Univ. (Owings Mills Campus) (substitute funded by MSDE)
o Saturday, June 9 9:00 - 4:00 @ Stevenson Univ. (Owings Mills Campus) (stipend provided)
• Facilitate a minimum of two 3-day academies (Tuesday-Thursday) • Attend appropriate “rehearsal day” training at the academy site (Monday prior to the academy) • Attend one of the five regional debriefing sessions in the fall (5:00 PM - 8:00 PM) • Assist in supporting a professional learning community among Reading/English Language Arts,
Math, or STEM teachers in Maryland • Secure the use of a laptop and projector from your LEA
Required Qualifications
• Master’s degree or Advanced Professional Certificate • Successful teaching or co-teaching in Reading, English Language Arts, Mathematics, or STEM
related field • Thorough understanding of the existing Maryland State Core Curriculum Frameworks • Evidence of providing professional development at the school, district, state, and/or national
level • Evidence of experience/participation in an online environment
Preferred Qualifications
• National Board certification • Governor’s Academy teaching experience • Experience in adult learning theory and practice • Leadership experience • Experience delivering content in an online environment

Page 8 of 203
• Participation in curriculum development
Salary Information
• Master teachers will receive a daily stipend of $400 for the June 9, 2012 Saturday training. • Master teachers will receive a $200 stipend for the June, 2012 half -day personal planning
session. • Master teachers will receive a $200 stipend for the fall evening debriefing session. • Master teachers will receive a $1600 stipend (Monday-Thursday) for training and facilitation of
each academy. • LEAs will receive reimbursement for substitutes so that the master teachers may attend the
required April 30, 2012 and May 24, 2012 full-day trainings at Stevenson University in Owings Mills.
• Master teachers will be reimbursed (by their counties) for travel and lodging expenses for up to an average of $300 per academy. MSDE will reimburse each county for up to an average of $300 per master teacher per academy. Reimbursements for trainings are included in this amount.
• If you are under contract (i.e. 12-month employee) with your LEA during the academies or during the training sessions, you are not eligible to receive a stipend.
• Master Teachers will receive a $400 stipend for facilitating each “principals only” session on Tuesdays.
• Master teachers will be reimbursed (for expenses) for up to an additional average of $100 for each “principals only” session on Tuesdays.

Page 9 of 203
THE 2012 MARYLAND EDUCATOR EFFECTIVENESS ACADEMY
For Reading, English Language Arts, Mathematics, STEM and School Principals
Master Teacher Special “Principal’s Only” Assignment
The proposed agenda (below) for this summer’s academies includes special sessions on Tuesday afternoon for principals only. Master teachers who are assigned to facilitate these sessions will work only Tuesday of that week. Master Teachers will receive a full-day stipend for the session and will be reimbursed for expenses. The Master Teacher will use Tuesday morning to set-up their classroom and prepare/plan for the afternoon special sessions. All Master Teachers will be trained, during the regular training sessions, to facilitate the “principals only” sessions as well. If you apply to facilitate these special sessions, you still must be available to facilitate at least two full-academy sessions on different dates.
Educator Effectiveness Academies (Proposed Agenda) - 2012
Tuesday (teachers and principals)
8:15 – 8:50 Registration and Networking
9:00 – 9:30 Large Group in Auditorium
9:40 – 10:25 Rotation #1 in School Teams (teachers and principals)
10:35 – 11:20 Rotation #2 in School Teams (teachers and principals)
11:30 – 12:15 Rotation #3 in School Teams (teachers and principals)
12:15 – 1:00 Lunch (on-site in cafeteria)
Afternoon Sessions
Teachers Principals
1:10 – 4:00 Content Sessions for Teachers 1:10 – 2:00 Rotation #1
2:10 – 3:00 Rotation #2

Page 10 of 203
3:10 – 4:00 Rotation #3
Wednesday (teachers only)
9:00 – 12:00 Content Sessions for Teachers
12:00 – 1:00 Lunch (on your own) and Travel
1:00 – 4:00
Teachers Return to their Schools or Appropriate Site*
Teachers will complete a project that requires them to apply the information shared
to this point in the academy. Master teachers will be available to support teachers working on their application project through the use of a virtual tool such as Elluminate.
Thursday (teachers am, teachers and principals pm)
9:00 – 12:00 Content Sessions for Teachers
12:00 – 12:45 Lunch (on-site in cafeteria) Principals Join Teachers
1:00 – 4:00 School Teams and LEA-facilitated Planning Meetings**
*Teachers travelling more than 40 miles to return to their home school have the option to work at the Academy site at a computer workstation. The principal will coordinate this for each school team, forwarding this information to MSDE staff members who will coordinate this with the host school systems.
**LEAs are asked to facilitate the transition planning of their school teams on Thursday afternoon. MSDE will host a “Systemic Planning Team” workshop on March 20 (snow date March 23) to assist LEAs in the designing and planning of this activity.
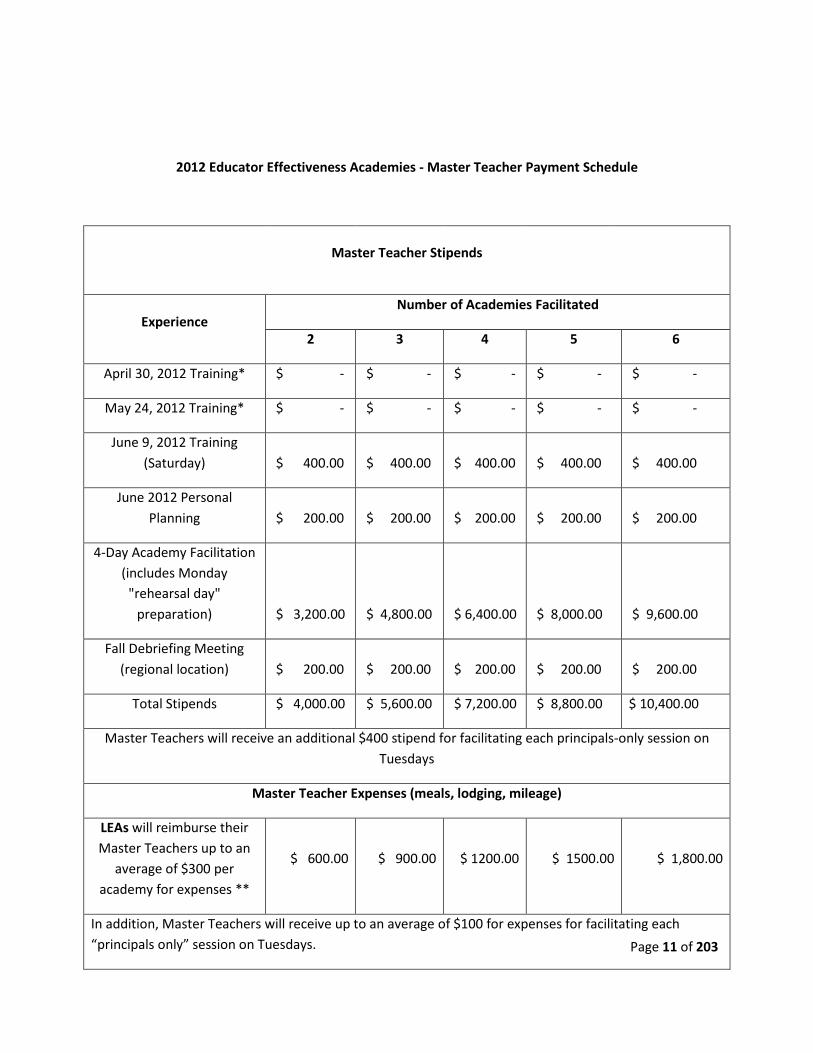
Page 11 of 203
2012 Educator Effectiveness Academies - Master Teacher Payment Schedule
Master Teacher Stipends
Experience Number of Academies Facilitated
2 3 4 5 6
April 30, 2012 Training* $ - $ - $ - $ - $ -
May 24, 2012 Training* $ - $ - $ - $ - $ -
June 9, 2012 Training (Saturday) $ 400.00 $ 400.00 $ 400.00 $ 400.00 $ 400.00
June 2012 Personal Planning $ 200.00 $ 200.00 $ 200.00 $ 200.00 $ 200.00
4-Day Academy Facilitation (includes Monday
"rehearsal day" preparation) $ 3,200.00 $ 4,800.00 $ 6,400.00 $ 8,000.00 $ 9,600.00
Fall Debriefing Meeting (regional location) $ 200.00 $ 200.00 $ 200.00 $ 200.00 $ 200.00
Total Stipends $ 4,000.00 $ 5,600.00 $ 7,200.00 $ 8,800.00 $ 10,400.00
Master Teachers will receive an additional $400 stipend for facilitating each principals-only session on Tuesdays
Master Teacher Expenses (meals, lodging, mileage)
LEAs will reimburse their Master Teachers up to an
average of $300 per academy for expenses **
$ 600.00 $ 900.00 $ 1200.00 $ 1500.00 $ 1,800.00
In addition, Master Teachers will receive up to an average of $100 for expenses for facilitating each “principals only” session on Tuesdays.
Page 12 of 203
Example: a Master Teacher who facilitates two “full” academies and one “principals only” session will receive up to a total of $700 from their county to cover expenses for the entire EEA experience; including the trainings.
*substitute funding will be provided to the LEAs
**this process is a change from the 2011 academies; master teachers will now only submit expense reports to their county. Their county will receive funds from MSDE to cover these costs.
Note: If you are under contract (i.e. 12-month employees) with your LEA during the academies or during the training sessions, you are not eligible to receive a stipend.

Page 13 of 203
MASTER TEACHER APPLICATION
Were you employed as an MSDE Master Teacher during the summer of 2011? YES □ NO □
If yes, what level and content area? Elementary Middle High
(circle level and content area)
RELA Math STEM
Please complete the information below and return it with all required information from the checklist on or before January 20, 2012 the Designated Point of Contact for Master Teachers in your county.
PLEASE TYPE OR PRINT LEGIBLY
Name
Address
City, State, Zip
Home Phone
Cell Phone
Primary Email Address (will be used for all communication)
School/Office Name
School/Office Address

Page 14 of 203
City, Zip
School/Office Phone
Check all appropriate boxes below that pertain to your current position.
Department chair / team leader Lead / master teacher
School-based resource teacher Intervention teacher
Elementary school teacher ELL / ESOL teacher
Middle school teacher Special education teacher
High school teacher Other ___________________________
Central office resource teacher / specialist
THE 2012 MARYLAND EDUCATOR EFFECTIVENESS ACADEMY
For Reading, English Language Arts, Mathematics, STEM and School Principals
Check (√) the content area that you are applying for. Only check one area.
□ Reading/English Language Arts
□ Mathematics
□ STEM (Science, Technology, Math, Engineering)

Page 15 of 203
Check (√) the level you are applying for. Only check one level.
□ Elementary
□ Middle
□ High
Check all appropriate 4-Day academies and Principals-only Tuesday sessions indicating your availability. You may check more than one academy for the same date, indicating that you would be willing to work either academy. You must, however, be available to work at least two full academies on different dates. You may check full 4-Day academies and Principals-only sessions for the same dates, indicating that you are available to do either. Greater availability increases the likelihood that you will be selected as a master teacher.
DATES
(includes Monday
rehearsal and planning day)
ACADEMY SITE
(county) HIGH SCHOOL
CHECK (√) EACH ACADEMY THAT YOU ARE AVAILABLE TO
FACILITATE
Full 4-Day Academy
Principals-Only Tuesday Session
6/18 - 6/21 Howard Marriott’s Ridge
6/25 - 6/28 Baltimore City Heritage
6/25 - 6/28 Charles North Point
7/9 - 7/12 Dorchester Cambridge-South Dorchester
7/9 - 7/12 Prince George’s Dr. Henry A. Wise
7/16 - 7/19 Anne Arundel Arundel
7/16 - 7/19 Harford C. Milton Wright
7/23 - 7/26 Baltimore County Chesapeake
7/23 - 7/26 Washington South Hagerstown
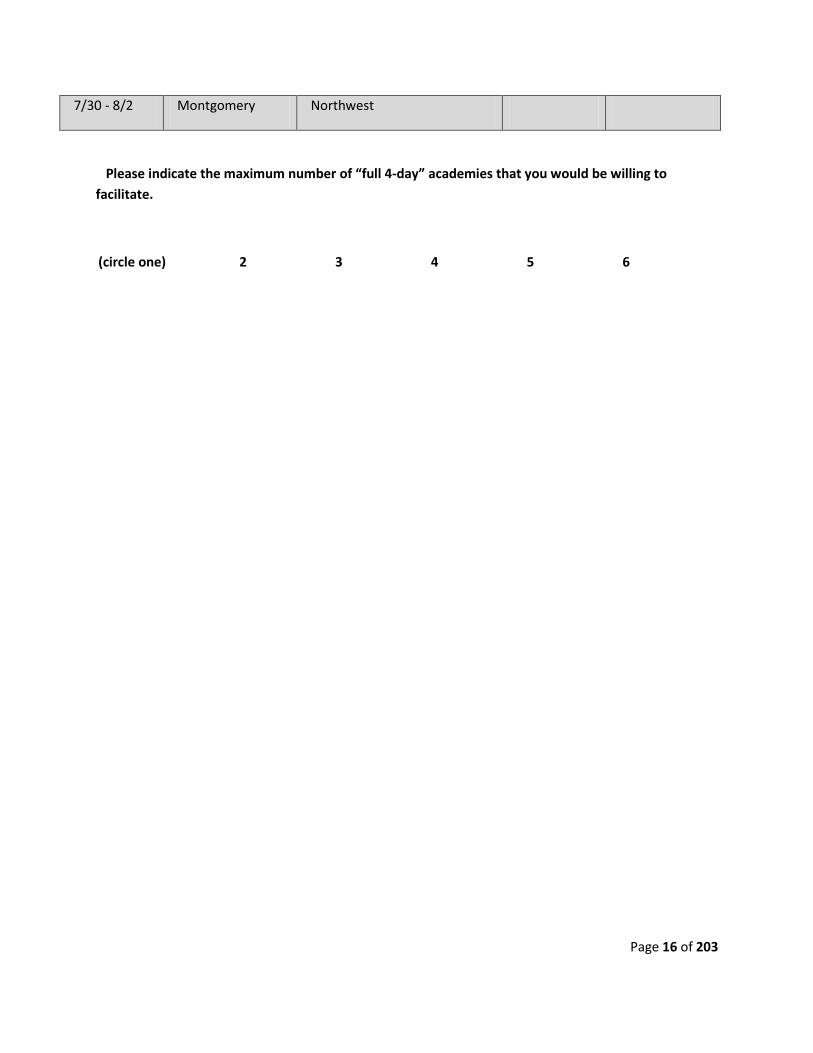
Page 16 of 203
7/30 - 8/2 Montgomery Northwest
Please indicate the maximum number of “full 4-day” academies that you would be willing to facilitate.
(circle one) 2 3 4 5 6

Page 17 of 203
THE 2012 MARYLAND EDUCATOR EFFECTIVENESS ACADEMY
For Reading, English Language Arts, Mathematics, STEM and School Principals
_________________________________________
(Applicant’s Name)
Principal’s / Immediate Supervisor’s Endorsement
I, ____________________________, based on the qualifications and job description stated below, support the candidate named above to serve as a Master Teacher for the 2012 Educator Effectiveness Academy for English Language Arts, Mathematics, or STEM.
___________________________ ___________________________ ___________
Signature Title Date
Job Description
To be eligible for a master teacher position for the summer of 2012, you must be able to:
• Attend all three full-day training sessions
o Monday, April 30 9:00 - 4:00 @ Stevenson Univ. (Owings Mills Campus) (substitute funded by MSDE)
o Thursday, May 24 9:00 - 4:00 @ Stevenson Univ. (Owings Mills Campus) (substitute funded by MSDE)
o Saturday, June 9 9:00 - 4:00 @ Stevenson Univ. (Owings Mills Campus) (stipend provided)
• Facilitate a minimum of two 3-day academies (Tuesday-Thursday) • Attend appropriate “rehearsal day” training at the academy site (Monday prior to the academy)

Page 18 of 203
• Attend one of the five regional debriefing sessions in the fall (5:00 PM - 8:00 PM) • Assist in supporting a professional learning community among Reading/English Language Arts,
Math, or STEM teachers in Maryland • Secure the use of a laptop and projector from your LEA
Required Qualifications
• Master’s degree or Advanced Professional Certificate • Successful teaching or co-teaching in Reading, English Language Arts, Mathematics, or STEM
related field • Thorough understanding of the existing Maryland State Core Curriculum Frameworks. • Evidence of providing professional development at the school, district, state, and/or national
level • Evidence of experience/participation in an online environment
Preferred Qualifications
• National Board certification • Governor’s Academy teaching experience • Experience in adult learning theory and practice • Leadership experience • Experience delivering content in an online environment • Participation in curriculum development

Page 19 of 203
THE 2012 MARYLAND EDUCATOR EFFECTIVENESSACADEMY
For Reading, English Language Arts, Mathematics, STEM and School Principals
Please respond to the following prompts in your cover letter:
#1 – For New Applicants Only
• How will the implementation of the Maryland Common Core State Curriculum impact student learning?
• Describe your recent professional development experiences presenting to adult learners. What are your greatest strengths? Explain a challenge you have encountered and how you overcame it.
• Describe how you utilize technology to facilitate learning. Be specific in describing your experience using an online learning environment.
• Please describe your professional development experience or involvement related to the 2011 Educator Effectiveness Academies in your school or district.
Please limit your response to 2 pages.
#2 – For 2011 Master Teachers Only
Page 20 of 203
• Please explain how your experience as a master teacher at the Educator Effectiveness Academies influenced your work with students and teachers.
• Please describe how your school and/or school system tapped your experience as a master teacher since the summer academies ended.
• Describe how you utilize technology to facilitate learning. Be specific in describing your experience using an online learning environment.
• Please describe any feedback you received from participants and/or MSDE staff during or after the summer academies and how this feedback has influenced your professional practice.
Please limit your response to 2 pages.

Page 21 of 203
THE 2012 MARYLAND EDUCATOR EFFECTIVENESSACADEMY
For Reading, English Language Arts, Mathematics, STEM and School Principals
Application checklist:
Completed application (pages 5 and 6)
Résumé (including personal contact information, degree(s), certifications, teaching experience, professional organizations, publications, awards)
Principal’s or immediate Supervisor’s endorsement (page 7)
Cover letter addressed to the Master Teacher Selection Committee (details on page 8)
I certify that all information contained in this application is current and accurate. (page 9)
____________________________________ _______________
(Applicant’s Signature) (Date)
____________________________________

Page 22 of 203
(Applicant’s Name, Please Print)
Reminder: Applications should be sent to the Point of Contact (POC) for your local school system. The names of the POCs are listed on page 1 of this application. Applications must be received by January 20, 2012 to be considered. Decisions will be made in late February.
Page 10 of this packet is the optional scoring rubric that each county may use as they review the applications. This is for your information only.

Page 23 of 203
THE 2011 MARYLAND EDUCATOR EFFECTIVENESSACADEMY
For Reading, English Language Arts, Math, STEM and School Principals
Application Scoring Rubric – For LEA use only.
Name __________________________________________
Level: (circle one only) Elementary Middle High
Content: (circle one only) RELA Math STEM
Required Qualifications
(√) if the required qualification
has been met
Attributes
Master’s degree or Advanced Professional Certificate
Successful teaching or co-teaching in Reading, English Language Arts, Math or STEM related field
Thorough understanding of the existing Maryland State Core Curriculum Frameworks
Evidence of providing professional development at the school, district, state, and/or national level
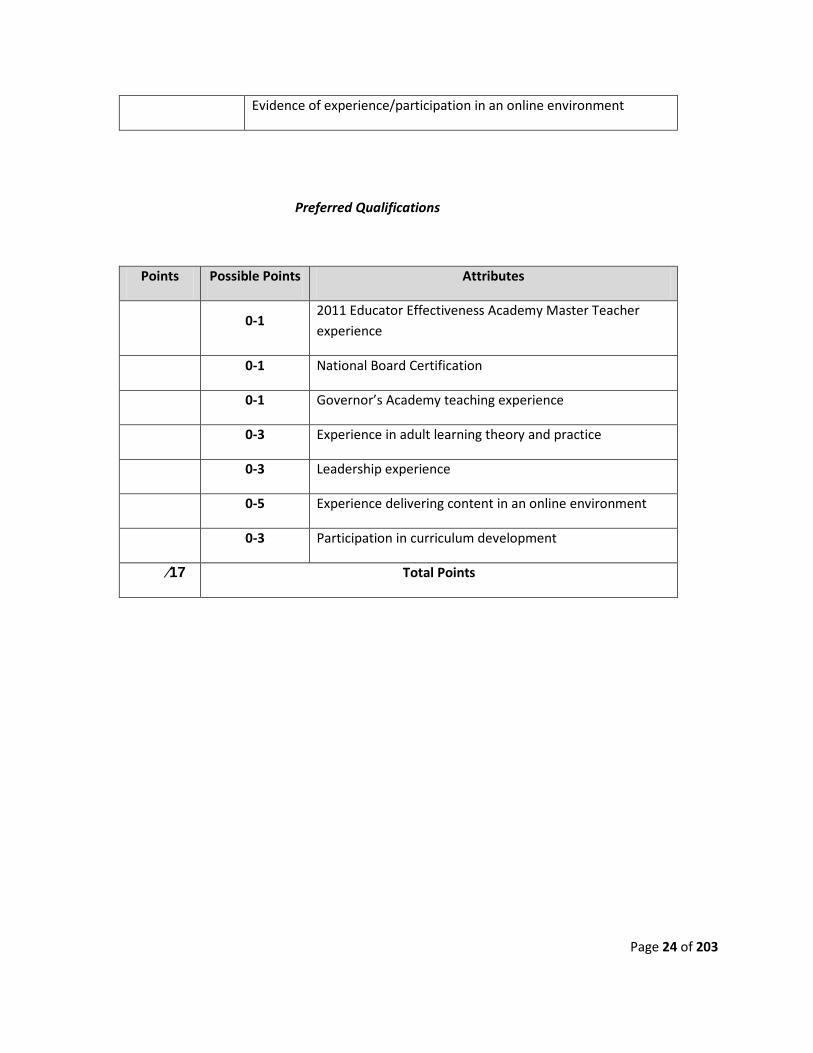
Page 24 of 203
Evidence of experience/participation in an online environment
Preferred Qualifications
Points Possible Points Attributes
0-1
2011 Educator Effectiveness Academy Master Teacher experience
0-1 National Board Certification
0-1 Governor’s Academy teaching experience
0-3 Experience in adult learning theory and practice
0-3 Leadership experience
0-5 Experience delivering content in an online environment
0-3 Participation in curriculum development
∕17 Total Points
Page 25 of 203
APPENDIX II-2: MEMO FROM DR.
SADUSKY TO LOCAL
SUPERINTENDENTS: ELIMINATION
OF THE MOD-MSA
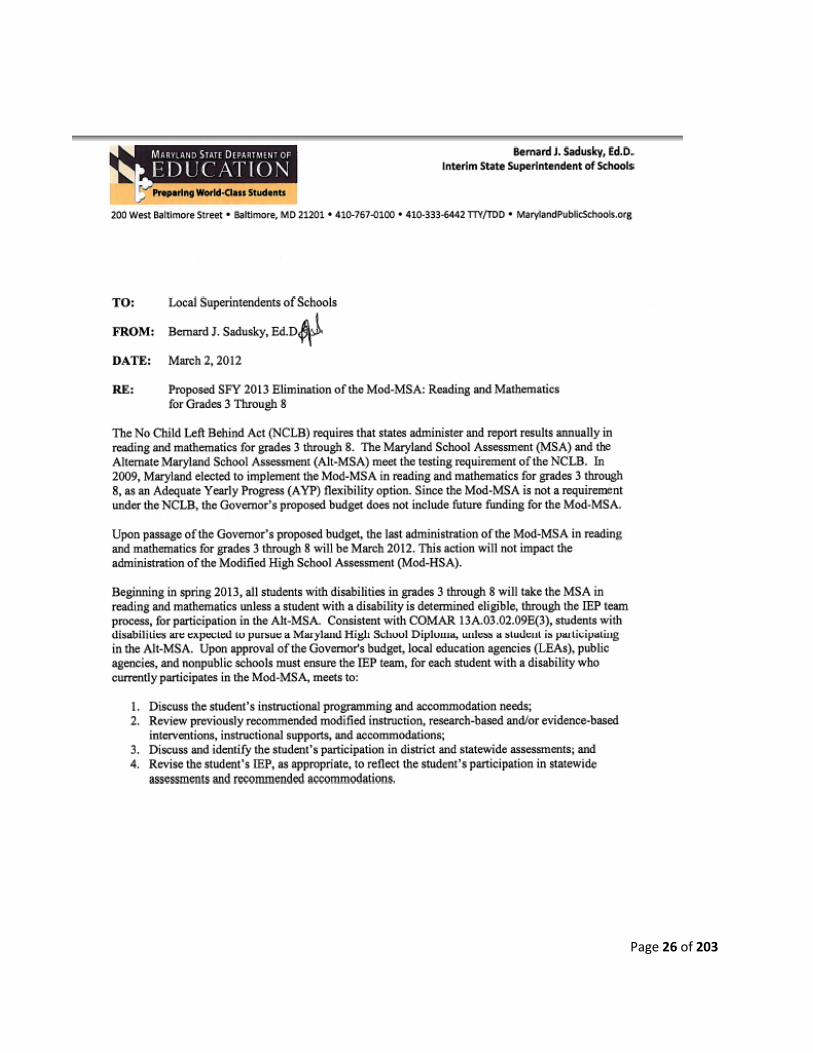
Page 26 of 203
Page 27 of 203
Page 28 of 203
APPENDIX II-3: TRANSITION PLAN
FOR 2% MOD-MSA STUDENTS TO
THE REGULAR MSA
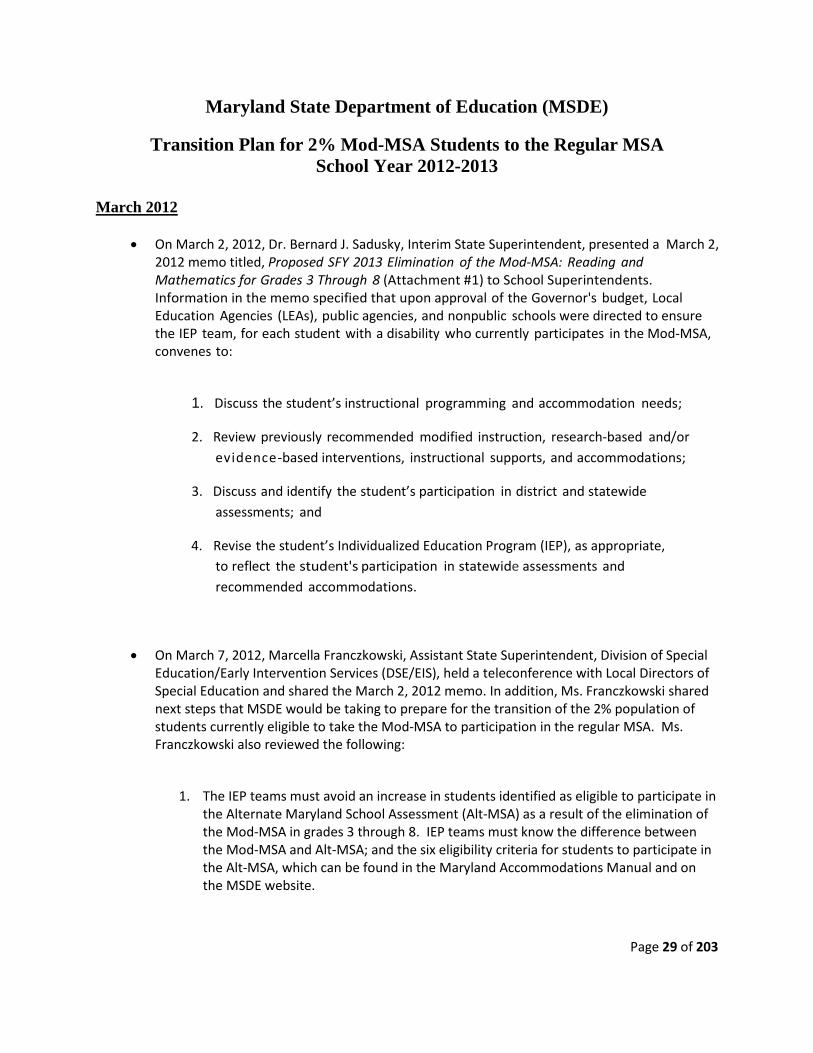
Page 29 of 203
Maryland State Department of Education (MSDE)
Transition Plan for 2% Mod-MSA Students to the Regular MSA School Year 2012-2013
March 2012
• On March 2, 2012, Dr. Bernard J. Sadusky, Interim State Superintendent, presented a March 2, 2012 memo titled, Proposed SFY 2013 Elimination of the Mod-MSA: Reading and Mathematics for Grades 3 Through 8 (Attachment #1) to School Superintendents. Information in the memo specified that upon approval of the Governor's budget, Local Education Agencies (LEAs), public agencies, and nonpublic schools were directed to ensure the IEP team, for each student with a disability who currently participates in the Mod-MSA, convenes to:
1. Discuss the student’s instructional programming and accommodation needs;
2. Review previously recommended modified instruction, research-based and/or evidence-based interventions, instructional supports, and accommodations;
3. Discuss and identify the student’s participation in district and statewide assessments; and
4. Revise the student’s Individualized Education Program (IEP), as appropriate, to reflect the student's participation in statewide assessments and recommended accommodations.
• On March 7, 2012, Marcella Franczkowski, Assistant State Superintendent, Division of Special Education/Early Intervention Services (DSE/EIS), held a teleconference with Local Directors of Special Education and shared the March 2, 2012 memo. In addition, Ms. Franczkowski shared next steps that MSDE would be taking to prepare for the transition of the 2% population of students currently eligible to take the Mod-MSA to participation in the regular MSA. Ms. Franczkowski also reviewed the following:
1. The IEP teams must avoid an increase in students identified as eligible to participate in the Alternate Maryland School Assessment (Alt-MSA) as a result of the elimination of the Mod-MSA in grades 3 through 8. IEP teams must know the difference between the Mod-MSA and Alt-MSA; and the six eligibility criteria for students to participate in the Alt-MSA, which can be found in the Maryland Accommodations Manual and on the MSDE website.
Page 30 of 203
2. Students will need to be prepared for the transition from accessing an online assessment to completing a paper and pencil assessment. Mod-MSA has only selected responses; MSA has selected responses, Brief Constructed Responses (BCRs), and Extended Constructed Responses (ECRs). There will be additional technical assistance to local school systems related to preparing students to take an assessment containing BCRs and ECRs.
April 2012
• Maryland's Online IEP form and format, effective July 1, 2012, will reflect, as appropriate, the removal of the current Mod-MSA language. The MSDE will provide resource materials for dissemination to appropriate staff by the end of April 2012.
• Currently developing a question and answer (Q & A) document (Attachment #2) addressing the elimination of the Mod-MSA. The document will be disseminated to local school systems, nonpublic schools, and parents by April 30, 2012 (Attachment 3 Draft information).
May 2012
• Each local school system appoints a Mod-MSA Facilitator to serve as a liaison between the MSDE and the local school system. The name of this facilitator will now change to Assessment Facilitator for Students with Disabilities. The Facilitators will continue monthly meetings with the MSDE and will continue to receive technical assistance and support in the transition of the 2% students from the Mod-MSA to the regular MSA. In addition, the Facilitators will continue to receive professional development on a variety of topics related to student participation in Maryland assessments. A meeting with the Facilitators will be scheduled in May 2012, for the purpose of discussing the transition and to provide technical assistance as requested to each local school system.
June 2012
• Maryland’s Accommodations Manual (MAM) updates, effective June 2012, will reflect the removal of the current Mod-MSA language. The MSDE will release the new MAM and provide training to local school systems on June 8, 2012 and June 11, 2012. The nonpublic schools will be trained on June 18, and June 19, 2012.
Page 31 of 203
APPENDIX II-4: ELIMINATION OF
THE MODIFIED MARYLAND
SCHOOL ASSESSMENT QUESTION
AND ANSWER
Page 32 of 203
ELIMINATION OF MODIFIED MARYLAND SCHOOL ASSESSMENT (DRAFT)
1. Has the administration of the Modified Maryland School Assessment (Mod-MSA) been
eliminated? MSDE Response: Yes. The last administration of the Mod-MSA in reading and mathematics for students enrolled in grades 3 through 8 was administered in March 2012.
2. Why is the Mod-MSA being eliminated? MSDE Response: Since the Mod-MSA is not a requirement under the NCLB, the Governor’s proposed budget does not include future funding for the Mod-MSA. During the 2014 -2015 school year, Maryland will be implementing the Partnership of Assessment for Readiness for College and Career (PARCC) assessment for all students. The Maryland State Department of Education (MSDE) is beginning the transition to these assessments to increase students’ awareness of readiness and competency to participate in regular State assessments. In addition, the PARCC assessments will focus on the rigor and skills required for the 21st century.
3. What does PARCC stand for? MSDE Response: PARCC stands for Partnership for Assessment of Readiness for College and Careers. The PARCC is a consortium of 24 states working together to develop a common set of K-12 assessments in English and mathematics. These new Kindergarten through grade 12 assessments, will foster a pathway to college and career readinesses by the end of high school, denotes students’ progress toward this goal from grade 3 through grade 12, and provides teachers with timely information to adjust instruction, if required, and provide student support.
4. What are students’ assessment options? MSDE Response: The Maryland Assessment Program includes the Maryland School Assessment (MSA), the Alternate Maryland School Assessment (Alt-MSA), and the High School Assessment (HSA). In addition, the Modified High School Assessment (Mod-HSA) will continue to be an assessment instrument. The student’s IEP Team, which includes the parent, will make the recommendation for each student’s participation in the appropriate assessment measure based on the individual needs of the student.
Page 33 of 203
5. Will each student continue to receive modified instruction, interventions and other instructional supports? MSDE Response: Yes. A student will continue to receive modified instruction, research-based and/or evidenced-based interventions, and instructional supports as recommended and documented in his/her IEP. There is a continued expectation to ensure that each student receives all required supports to be successful in the classroom.
6. Will the new State assessment consider supports and modifications in the assessment? MSDE Response: PARCC is committed to providing all students with equitable access to high-quality, 21st century assessments, and attending to the unique assessment needs of students with disabilities and English learners (ELLs). From the initial design stages, PARCC will consider how its assessments will be accessible to all participating students, including students with disabilities and ELLs. Accessible assessments will allow all individuals taking the assessments to participate and engage in a meaningful and appropriate manner, with the goal of ensuring that results are valid for every student. The PARCC assessment system will increase access to all participating students by adhering to Universal Design for Learning principles and embedding supports from the initial stages of item development.
7. How will the elimination of the Mod-MSA for students enrolled in grades 3-8 affect students? MSDE Response: The elimination of the Mod-MSA will not have an instructional or educational impact on students’ educational progress. Each student with a disability will continue to receive the same quality instruction and supports during instruction and assessment as outlined in his/her IEP.
8. Will students be able to get the same accommodations on the regular MSA as they received on the Mod-MSA? MSDE Response: Yes. The accommodation(s) identified by a student’s IEP Team, which includes the parent, is/are documented in the student’s IEP and must be provided for all State assessments.
9. Will the elimination of the Mod-MSA affect a student’s graduation requirement? MSDE Response: No. The elimination of the Mod-MSA will not affect a student’s graduation requirement. A student with a disability will continue to take the regular assessment, with the provision of accommodations, as recommended by his or her IEP Team. In addition, the High School Assessments (HSA) and Modified High School Assessments (Mod-HSA) will continue to be administered. Once the PARCC assessments are implemented, students will continue to work toward pursuing a Maryland High School Diploma.
10. Is the Mod-MSA required by No Child Left Behind (NCLB)?
Page 34 of 203
MSDE Response: No. The Mod-MSA is not required by No Child Left Behind (NCLB). In 2009, Maryland elected to implement the Mod-MSA in reading and mathematics for grades 3 through 8, as an Annual Yearly Progress (AYP) flexibility option.
11. Will the elimination of the Mod-MSA have an impact on Adequate Yearly Progress (AYP)? MSDE Response: Adequate Yearly Progress is being discontinued beginning this school year (2011-2012) contingent upon Maryland's Elementary and Secondary Education Act (ESEA) Flexibility application being approved by the United States Department of Education (USED). The Mod-MSA will be removed in the 2012-2013 school year and adjusted Annual Measurable Objectives (AMOs) will be calculated that do not include the Mod-MSA for grades 3 through 8. The AMOs will be calculated for each school for the "all students" category and for all of the subgroups. The subgroup level AMO in the LEA will be used for any subgroup or "all students" with a 90% or higher baseline. Participation will continue to be calculated and included with a 95% AMO for participation. The subgroup achievement in AMOs retained a number (n) size of 5 to maintain strong accountability for all students.
12. Since the Mod-MSA is eliminated, why is the Mod-HSA not being eliminated? MSDE Response: The Mod-HSA is an end-of-course assessment, which fulfills both the State graduation requirements and the NCLB. The Mod-HSA will continue to be offered until the implementation of the PARCC assessment which takes place in 2014-2015.
13. Does an IEP Team meeting need to be held for each student who was identified to participate in the Mod-MSA? MSDE Response: Yes. The IEP Team must reconvene for each student who was found eligible to participate in the Mod-MSA. Each IEP Team must reconvene to select another assessment option for each student. All local education agencies (LEAs), public agencies, and nonpublic schools must ensure the IEP team, for each student with a disability who currently participates in the Mod-MSA, meets to:
1. Discuss the student’s instructional programming and accommodation needs;
2. Review previously recommended modified instruction, research-based
and/or evidence-based interventions, instructional supports, and accommodations;
3. Discuss and identify the student’s participation in district and statewide
assessments; and
4. Revise the student’s Individualized Education Plan (IEP), as appropriate,
Page 35 of 203
to reflect the student's participation in statewide assessments and recommended accommodations
14. What is the timeline for IEP Teams to reconvene to reconsider the IEP Team’s recommendation for each student who was identified as eligible to participate in Mod-MSA? MSDE Response: The timeline for IEP Teams to reconvene can be consistent with the student’s annual IEP process timeline. However, the IEP team must reconvene prior to the beginning of the next State assessment administration window. All IEP Team recommended modifications must be documented in the student’s IEP for instruction and assessment purposes.
15. How do I prepare my students for the MSA that has Brief Constructive Responses (BCRs) and Extended Constructive Responses (ECRs) and longer questions that are on the MSA? MSDE Response: Preparation for the MSA should mirror preparation for any other assessment. The www.mdk12.org website provides teachers and parents with public release test items and answer keys. The public release items provide students with an opportunity to respond to similar test items that he or she will encounter during testing. In addition, students are able to become familiar with the format of the test as well as the directions they will receive from test examiners during testing. Teachers must continue to teach grade-level content standards, provide accommodations and supplementary aid and services during instruction to assist students to access grade level content and participate in rigorous instructional activities. ADD THE RACE STRATEGY ADD MORE INFORMATION FROM MDK12 WEBSITE and FROM CONTENT STAFF
16. Are there professional development opportunities to improve best practices of accommodations to provide students with optimal testing experience? MSDE Response: Each local school system may provide professional develop opportunities to improve best practices for the use of accommodations. Educators should check with their local school system special education office to identify professional development opportunities that are available.
17. Should local school systems that have developed modified benchmarks assessments continue to develop and administer them? MSDE Response: Local school systems should decide if any modified benchmark assessments should continue. In order for the student to be prepared for the MSA, and the upcoming PARCC assessment, teachers must teach grade-level content standards, aligned with the format of the assessment, with accommodations and supplementary aid and services. To ensure students are instructed and are familiar with the format of
Page 36 of 203
the assessment, will assist them to successfully access grade level content standards, and participate in instructional activities and assessment.
18. Who should I contact if I have questions about the elimination of the Mod-MSA? MSDE Response: If there are questions regarding the elimination of the Mod-MSA, you may contact your child’s principal or the special education office in your local school system.
19. What resources are available for teachers to learn more about the PARCC assessment, and timeline for the new assessments? MSDE Response: Teachers may learn more about the PARCC assessment on the PARCC website, www.parcconline.org . The website provides information about the PARCC assessment design for kindergarten through high school. As information becomes available about the PARCC assessments, it will be posted on the website to ensure that teachers, parents and students are kept updated throughout the process.
20. Who can a parent contact if they have questions or concerns regarding the elimination of the Mod-MSA?
MSDE Response: Parents, who have questions or concerns about their child’s participate in the State assessment program, should first speak to their child’s classroom teacher, school testing coordinator and, then your child’s school principal. If you need further assistance, you can speak to your Modified Facilitator at the district level or the Local Accountability Coordinator (LAC). You can also contact MSDE directly and speak to the Program Manager for the Modified Assessment in the Division of Accountability and Assessment or the Modified Assessment Specialist for Alternate Assessments in the Division of Special Education/Early Intervention Services for any assistance with the State assessment programs.
Page 37 of 203
APPENDIX II-5: DRAFT
MARYLANDREPORTCARD.ORG
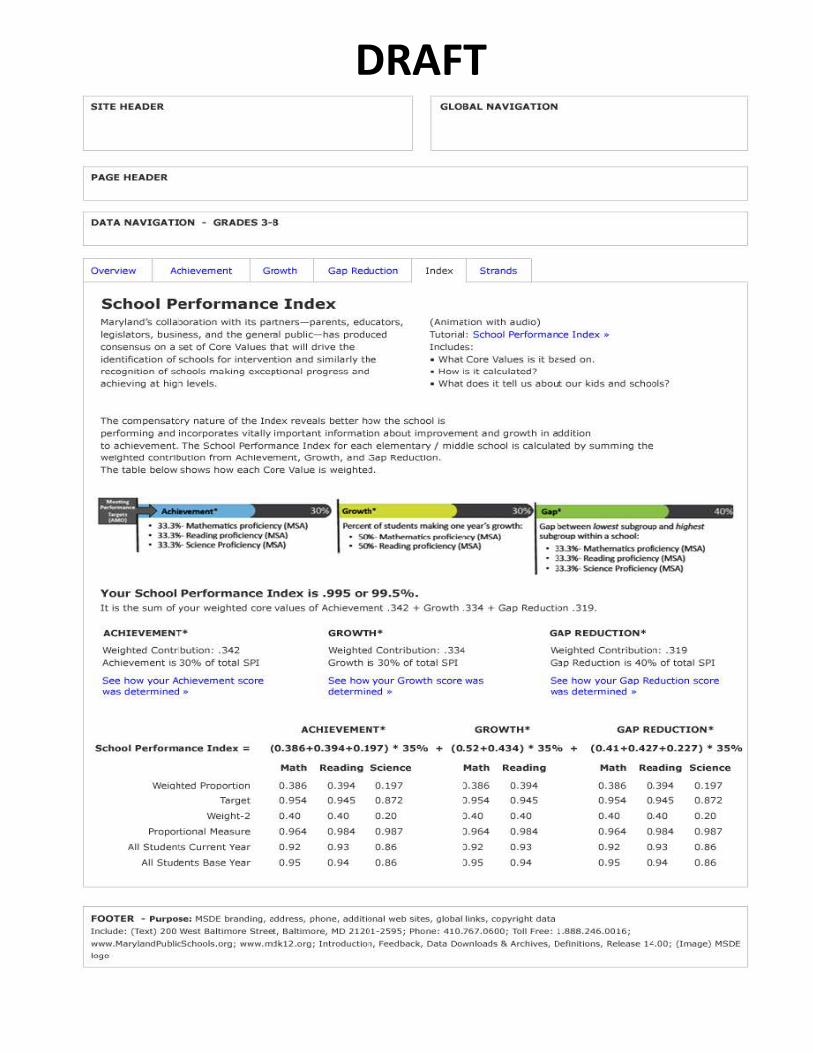
Page 38 of 203
DRAFT
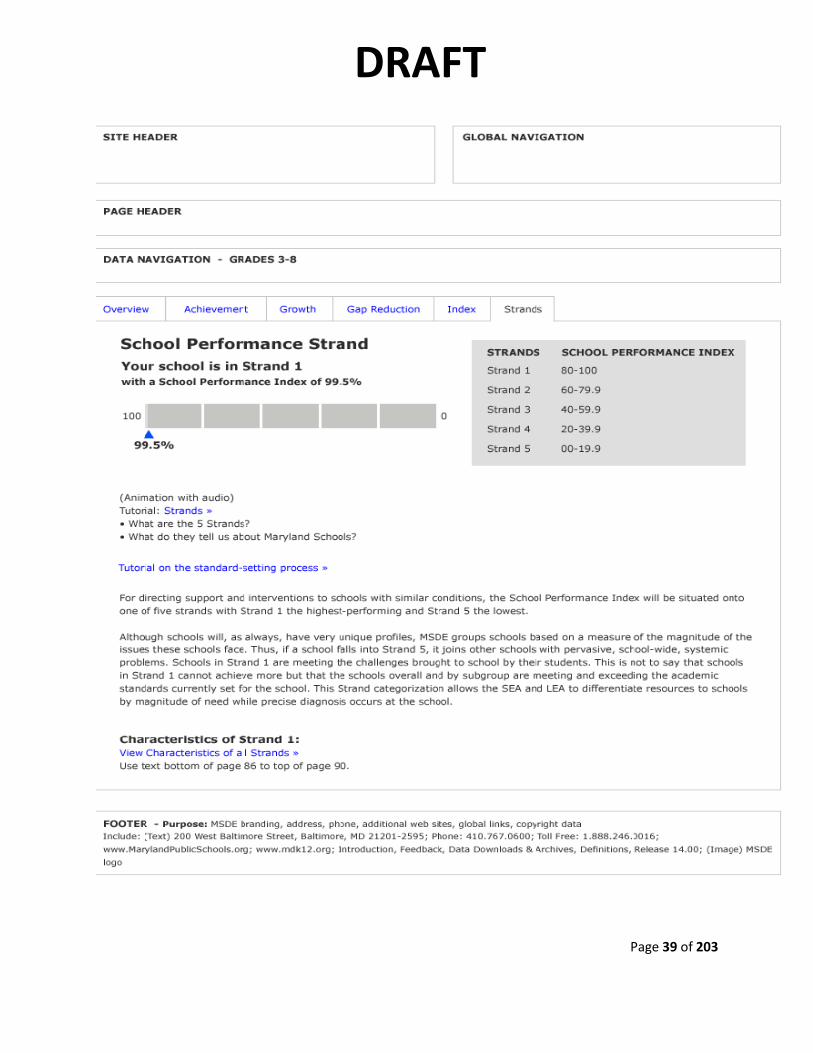
Page 39 of 203
DRAFT
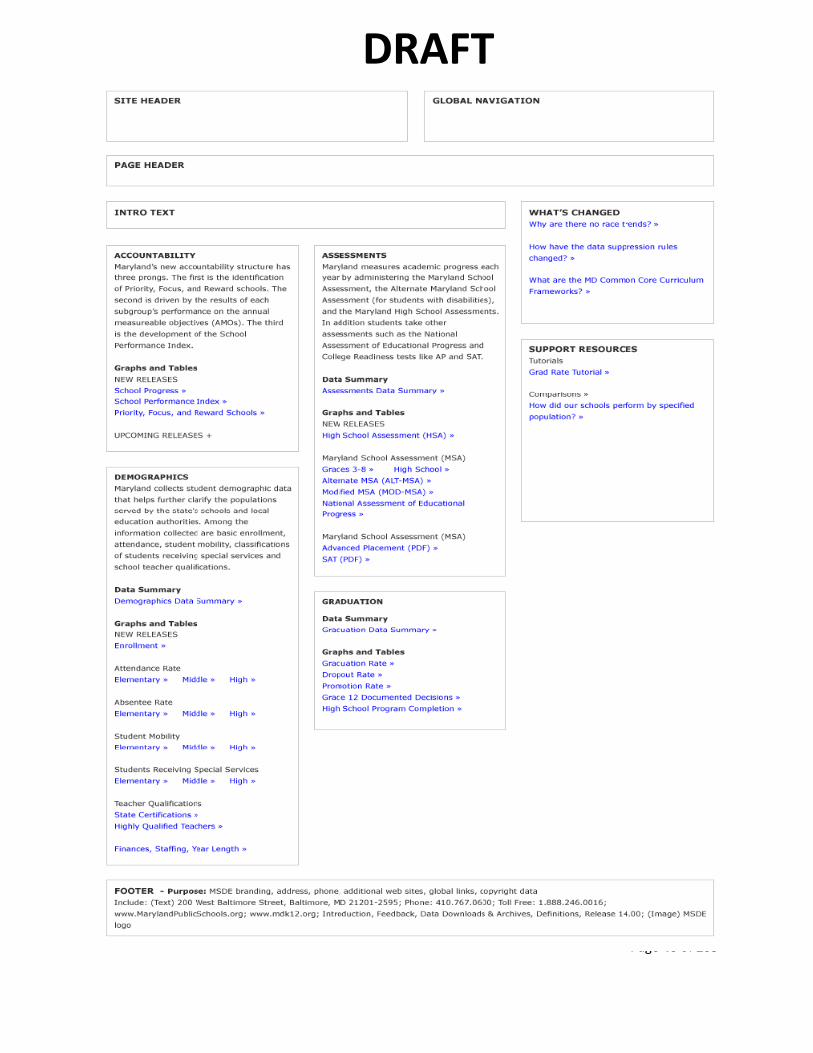
Page 40 of 203
DRAFT
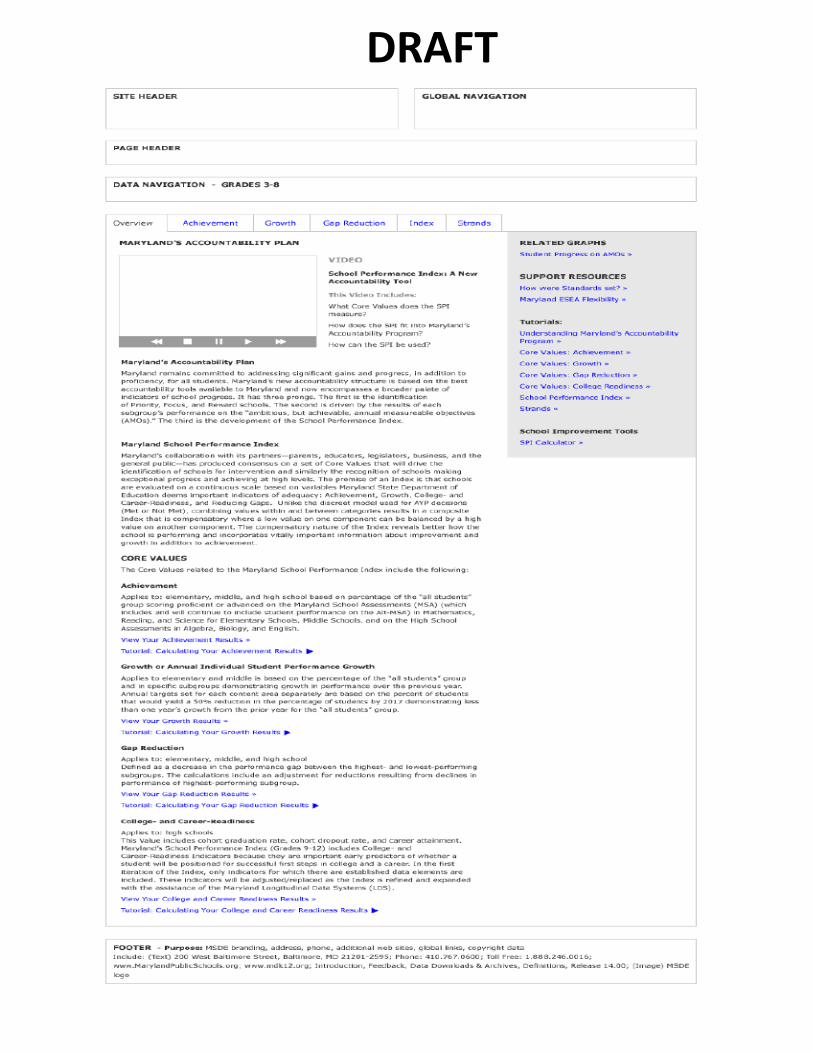
Page 41 of 203
DRAFT
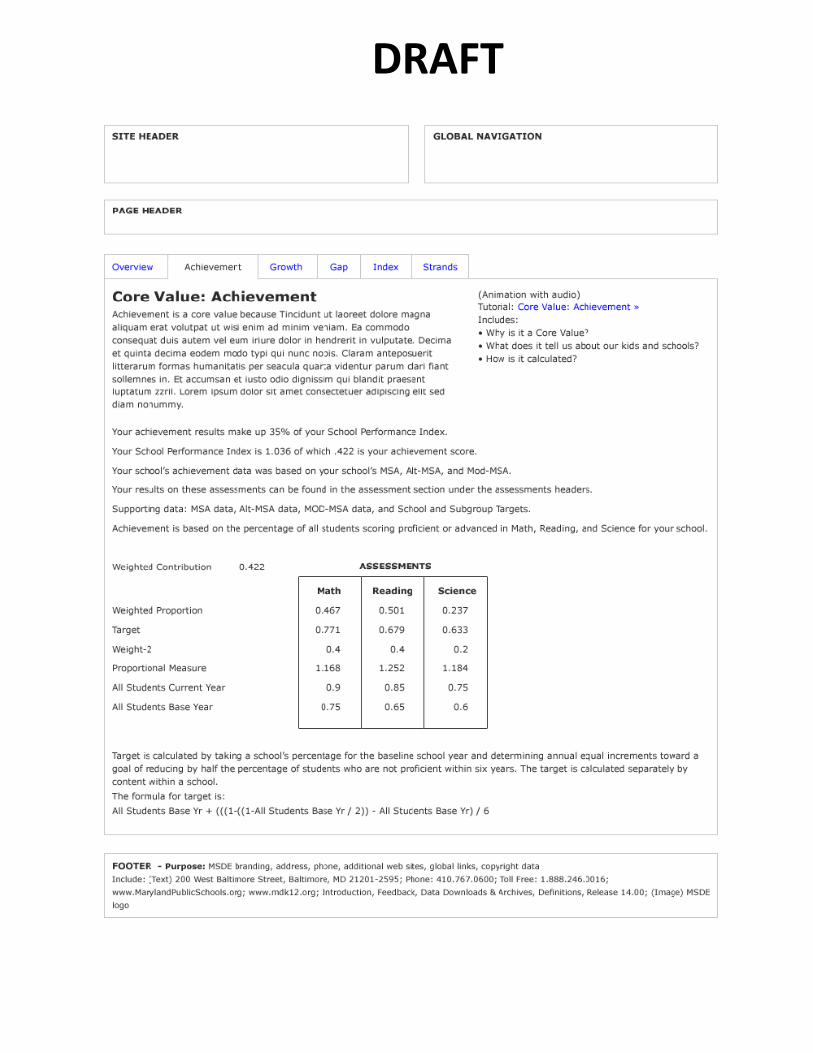
Page 42 of 203
DRAFT
Page 43 of 203
APPENDIX II- 6: FULL RANKING OF
REWARD SCHOOLS
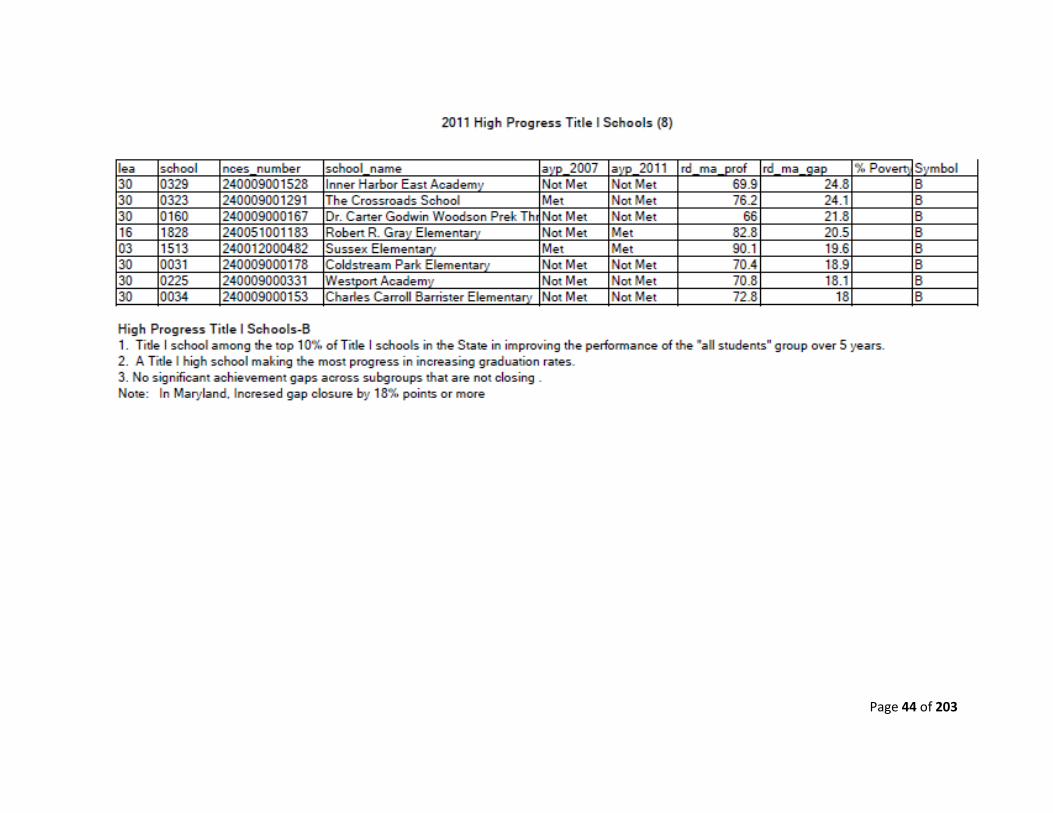
Page 44 of 203
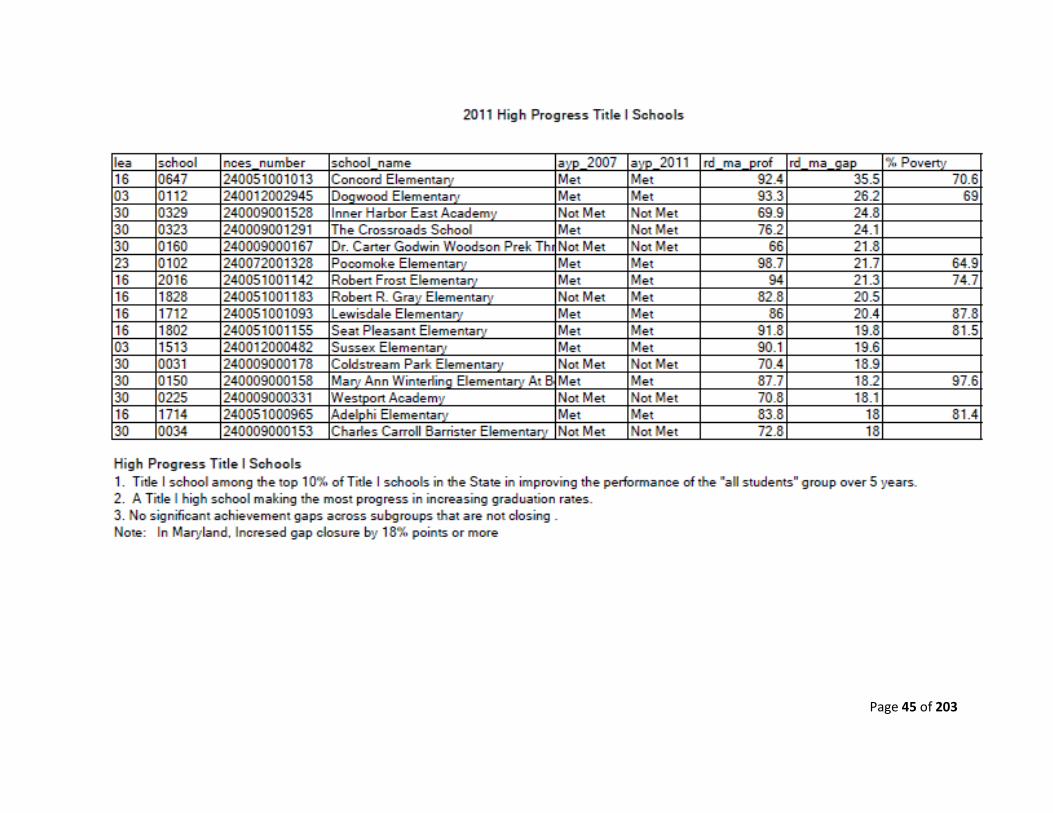
Page 45 of 203
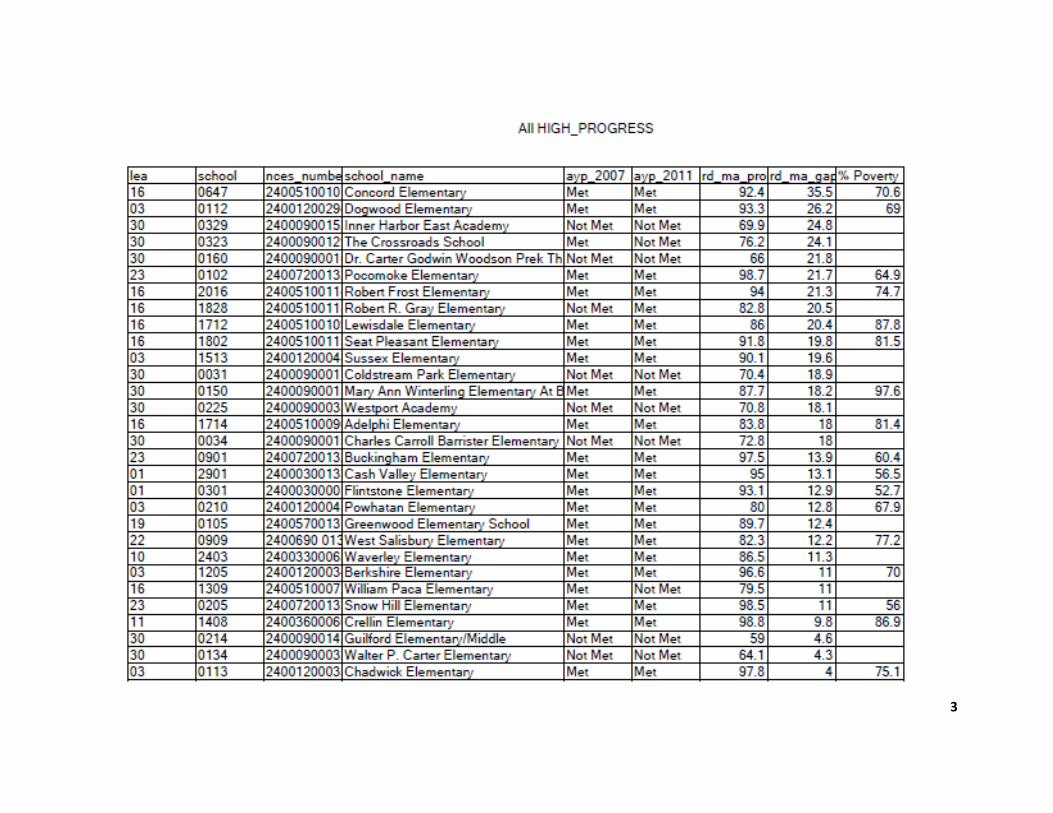
Page 46 of 203
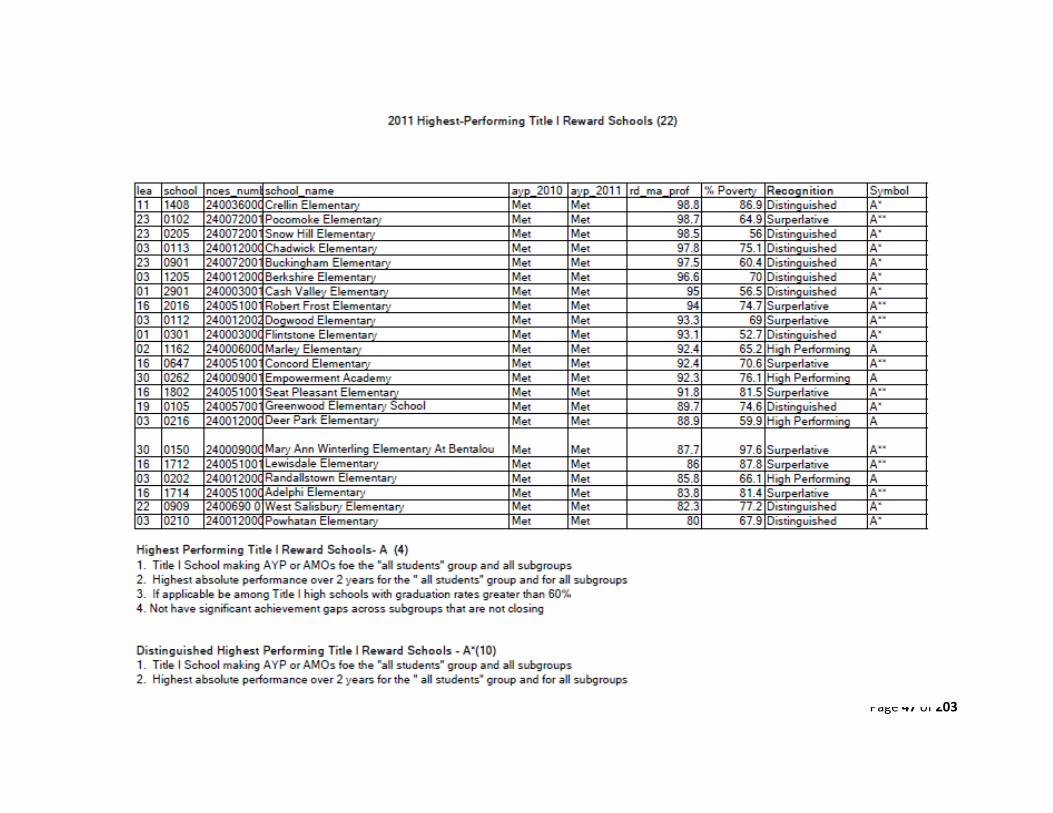
Page 47 of 203
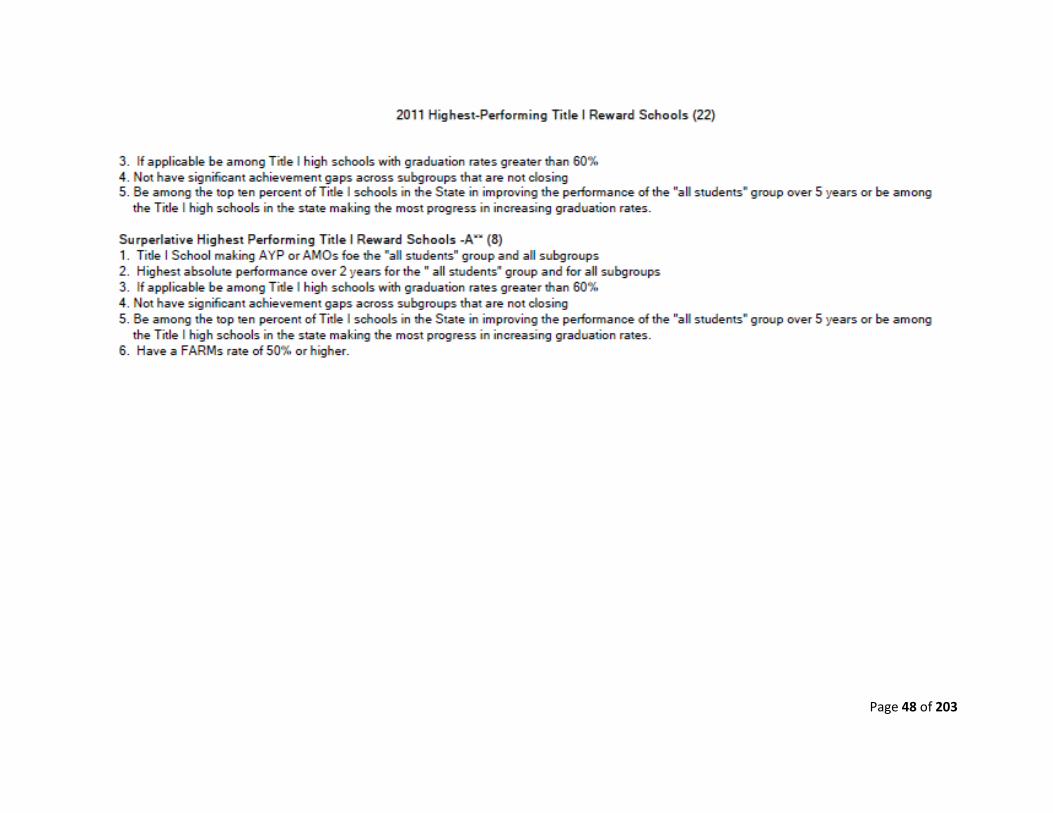
Page 48 of 203

Page 49 of 203
APPENDIX II- 7: FULL RANKING OF
PRIORITY SCHOOLS
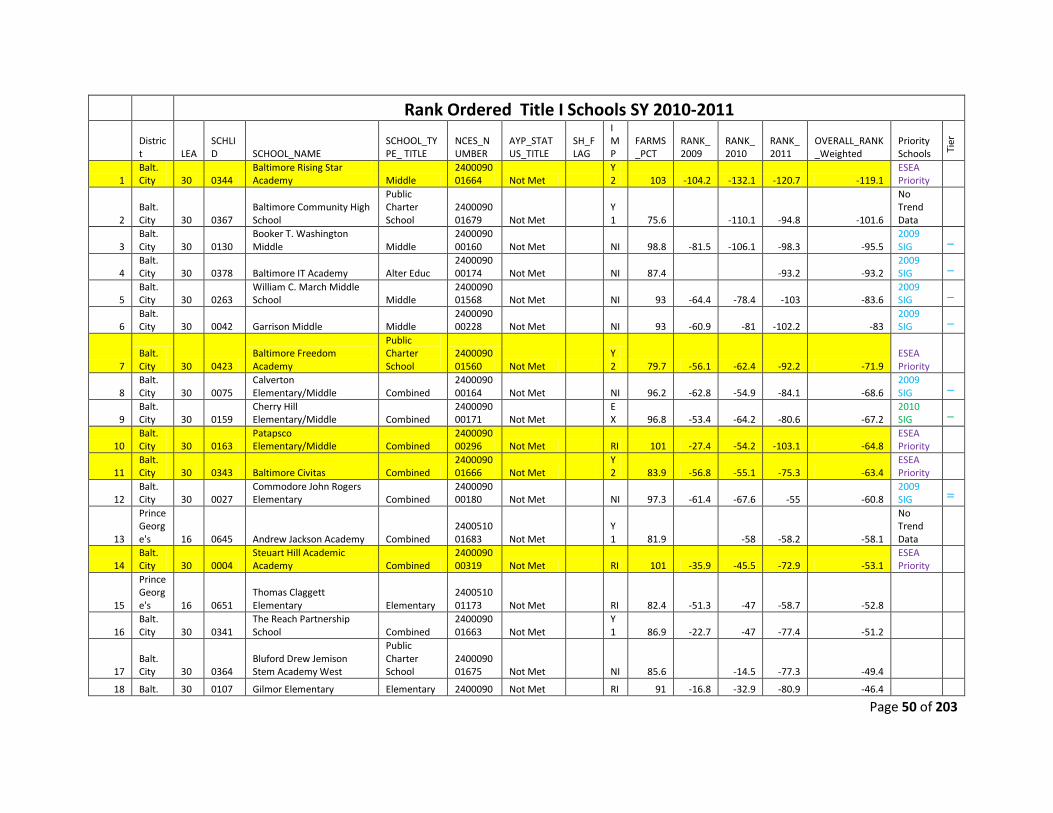
Page 50 of 203
Rank Ordered Title I Schools SY 2010-2011
District LEA
SCHLID SCHOOL_NAME
SCHOOL_TYPE_ TITLE
NCES_NUMBER
AYP_STATUS_TITLE
SH_FLAG
IMP
FARMS_PCT
RANK_2009
RANK_2010
RANK_2011
OVERALL_RANK_Weighted
Priority Schools
Ti
er
1 Balt. City 30 0344
Baltimore Rising Star Academy Middle
240009001664 Not Met
Y2 103 -104.2 -132.1 -120.7 -119.1
ESEA Priority
2 Balt. City 30 0367
Baltimore Community High School
Public Charter School
240009001679 Not Met
Y1 75.6 -110.1 -94.8 -101.6
No Trend Data
3 Balt. City 30 0130
Booker T. Washington Middle Middle
240009000160 Not Met NI 98.8 -81.5 -106.1 -98.3 -95.5
2009 SIG
I
4 Balt. City 30 0378 Baltimore IT Academy Alter Educ
240009000174 Not Met NI 87.4 -93.2 -93.2
2009 SIG
I
5 Balt. City 30 0263
William C. March Middle School Middle
240009001568 Not Met NI 93 -64.4 -78.4 -103 -83.6
2009 SIG
I
6 Balt. City 30 0042 Garrison Middle Middle
240009000228 Not Met NI 93 -60.9 -81 -102.2 -83
2009 SIG
I
7 Balt. City 30 0423
Baltimore Freedom Academy
Public Charter School
240009001560 Not Met
Y2 79.7 -56.1 -62.4 -92.2 -71.9
ESEA Priority
8 Balt. City 30 0075
Calverton Elementary/Middle Combined
240009000164 Not Met NI 96.2 -62.8 -54.9 -84.1 -68.6
2009 SIG
I
9 Balt. City 30 0159
Cherry Hill Elementary/Middle Combined
240009000171 Not Met
EX 96.8 -53.4 -64.2 -80.6 -67.2
2010 SIG
I
10 Balt. City 30 0163
Patapsco Elementary/Middle Combined
240009000296 Not Met RI 101 -27.4 -54.2 -103.1 -64.8
ESEA Priority
11 Balt. City 30 0343 Baltimore Civitas Combined
240009001666 Not Met
Y2 83.9 -56.8 -55.1 -75.3 -63.4
ESEA Priority
12 Balt. City 30 0027
Commodore John Rogers Elementary Combined
240009000180 Not Met NI 97.3 -61.4 -67.6 -55 -60.8
2009 SIG
II
13
Prince George's 16 0645 Andrew Jackson Academy Combined
240051001683 Not Met
Y1 81.9 -58 -58.2 -58.1
No Trend Data
14 Balt. City 30 0004
Steuart Hill Academic Academy Combined
240009000319 Not Met RI 101 -35.9 -45.5 -72.9 -53.1
ESEA Priority
15
Prince George's 16 0651
Thomas Claggett Elementary Elementary
240051001173 Not Met RI 82.4 -51.3 -47 -58.7 -52.8
16 Balt. City 30 0341
The Reach Partnership School Combined
240009001663 Not Met
Y1 86.9 -22.7 -47 -77.4 -51.2
17 Balt. City 30 0364
Bluford Drew Jemison Stem Academy West
Public Charter School
240009001675 Not Met NI 85.6 -14.5 -77.3 -49.4
18 Balt. 30 0107 Gilmor Elementary Elementary 2400090 Not Met RI 91 -16.8 -32.9 -80.9 -46.4
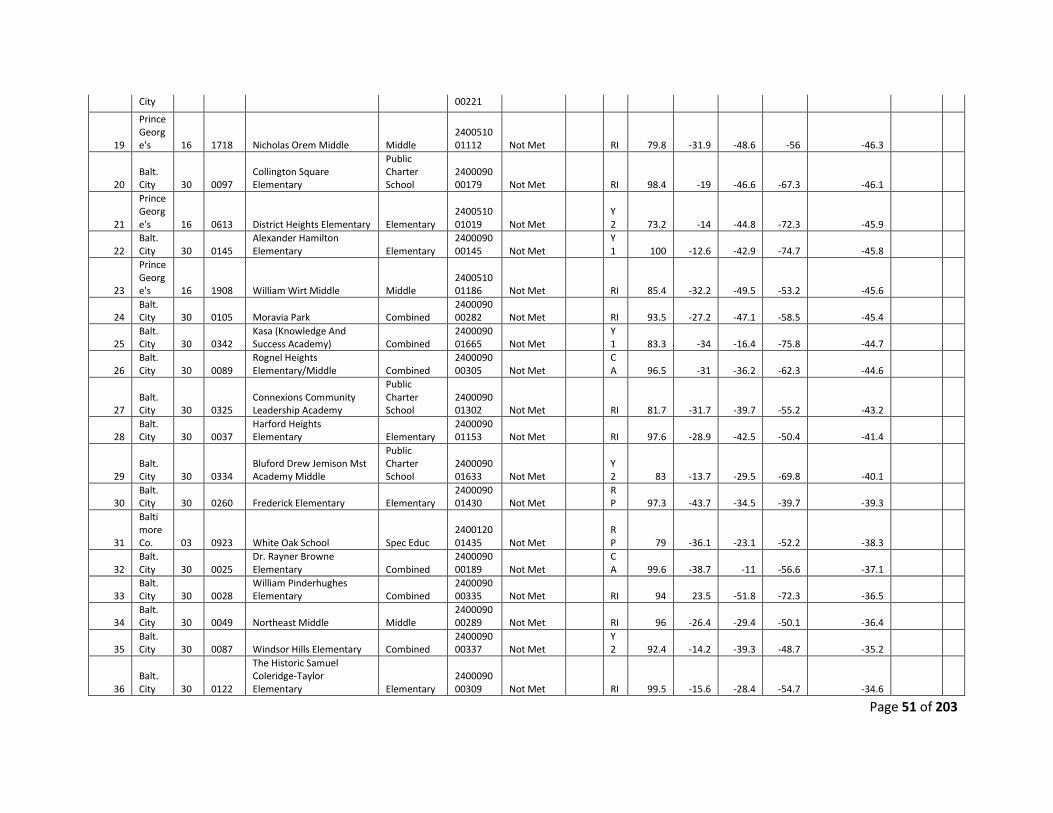
Page 51 of 203
City 00221
19
Prince George's 16 1718 Nicholas Orem Middle Middle
240051001112 Not Met RI 79.8 -31.9 -48.6 -56 -46.3
20 Balt. City 30 0097
Collington Square Elementary
Public Charter School
240009000179 Not Met RI 98.4 -19 -46.6 -67.3 -46.1
21
Prince George's 16 0613 District Heights Elementary Elementary
240051001019 Not Met
Y2 73.2 -14 -44.8 -72.3 -45.9
22 Balt. City 30 0145
Alexander Hamilton Elementary Elementary
240009000145 Not Met
Y1 100 -12.6 -42.9 -74.7 -45.8
23
Prince George's 16 1908 William Wirt Middle Middle
240051001186 Not Met RI 85.4 -32.2 -49.5 -53.2 -45.6
24 Balt. City 30 0105 Moravia Park Combined
240009000282 Not Met RI 93.5 -27.2 -47.1 -58.5 -45.4
25 Balt. City 30 0342
Kasa (Knowledge And Success Academy) Combined
240009001665 Not Met
Y1 83.3 -34 -16.4 -75.8 -44.7
26 Balt. City 30 0089
Rognel Heights Elementary/Middle Combined
240009000305 Not Met
CA 96.5 -31 -36.2 -62.3 -44.6
27 Balt. City 30 0325
Connexions Community Leadership Academy
Public Charter School
240009001302 Not Met RI 81.7 -31.7 -39.7 -55.2 -43.2
28 Balt. City 30 0037
Harford Heights Elementary Elementary
240009001153 Not Met RI 97.6 -28.9 -42.5 -50.4 -41.4
29 Balt. City 30 0334
Bluford Drew Jemison Mst Academy Middle
Public Charter School
240009001633 Not Met
Y2 83 -13.7 -29.5 -69.8 -40.1
30 Balt. City 30 0260 Frederick Elementary Elementary
240009001430 Not Met
RP 97.3 -43.7 -34.5 -39.7 -39.3
31
Baltimore Co. 03 0923 White Oak School Spec Educ
240012001435 Not Met
RP 79 -36.1 -23.1 -52.2 -38.3
32 Balt. City 30 0025
Dr. Rayner Browne Elementary Combined
240009000189 Not Met
CA 99.6 -38.7 -11 -56.6 -37.1
33 Balt. City 30 0028
William Pinderhughes Elementary Combined
240009000335 Not Met RI 94 23.5 -51.8 -72.3 -36.5
34 Balt. City 30 0049 Northeast Middle Middle
240009000289 Not Met RI 96 -26.4 -29.4 -50.1 -36.4
35 Balt. City 30 0087 Windsor Hills Elementary Combined
240009000337 Not Met
Y2 92.4 -14.2 -39.3 -48.7 -35.2
36 Balt. City 30 0122
The Historic Samuel Coleridge-Taylor Elementary Elementary
240009000309 Not Met RI 99.5 -15.6 -28.4 -54.7 -34.6
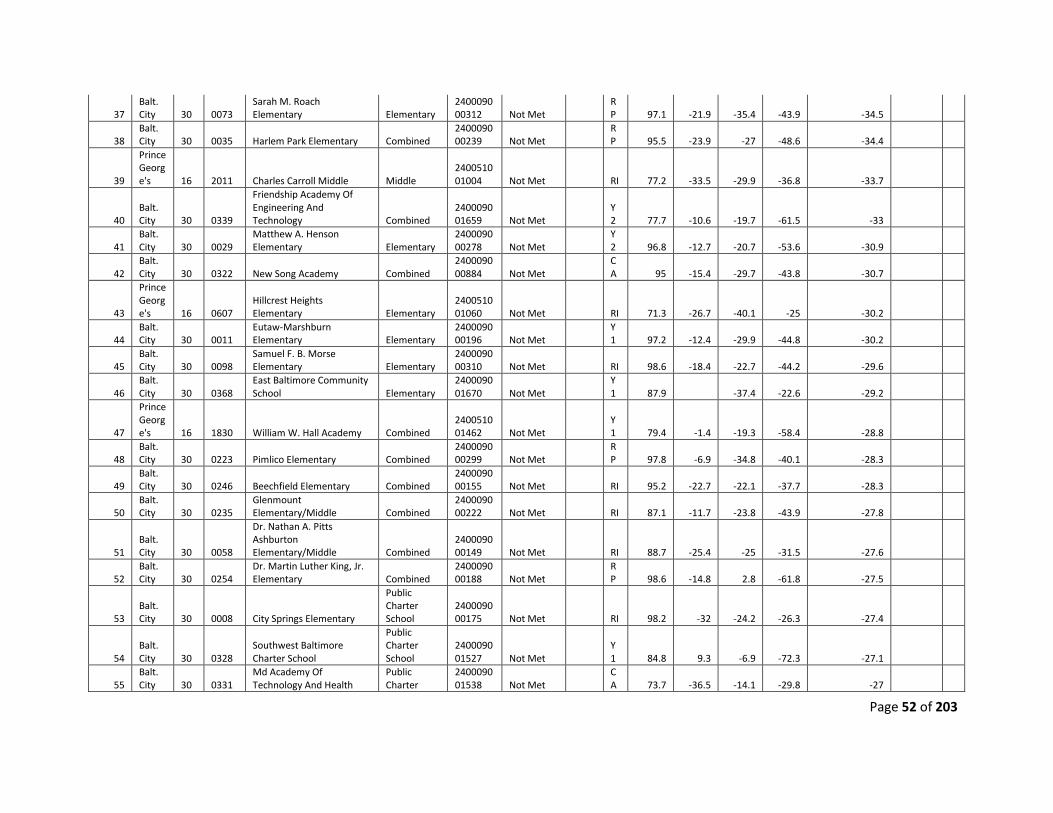
Page 52 of 203
37 Balt. City 30 0073
Sarah M. Roach Elementary Elementary
240009000312 Not Met
RP 97.1 -21.9 -35.4 -43.9 -34.5
38 Balt. City 30 0035 Harlem Park Elementary Combined
240009000239 Not Met
RP 95.5 -23.9 -27 -48.6 -34.4
39
Prince George's 16 2011 Charles Carroll Middle Middle
240051001004 Not Met RI 77.2 -33.5 -29.9 -36.8 -33.7
40 Balt. City 30 0339
Friendship Academy Of Engineering And Technology Combined
240009001659 Not Met
Y2 77.7 -10.6 -19.7 -61.5 -33
41 Balt. City 30 0029
Matthew A. Henson Elementary Elementary
240009000278 Not Met
Y2 96.8 -12.7 -20.7 -53.6 -30.9
42 Balt. City 30 0322 New Song Academy Combined
240009000884 Not Met
CA 95 -15.4 -29.7 -43.8 -30.7
43
Prince George's 16 0607
Hillcrest Heights Elementary Elementary
240051001060 Not Met RI 71.3 -26.7 -40.1 -25 -30.2
44 Balt. City 30 0011
Eutaw-Marshburn Elementary Elementary
240009000196 Not Met
Y1 97.2 -12.4 -29.9 -44.8 -30.2
45 Balt. City 30 0098
Samuel F. B. Morse Elementary Elementary
240009000310 Not Met RI 98.6 -18.4 -22.7 -44.2 -29.6
46 Balt. City 30 0368
East Baltimore Community School Elementary
240009001670 Not Met
Y1 87.9 -37.4 -22.6 -29.2
47
Prince George's 16 1830 William W. Hall Academy Combined
240051001462 Not Met
Y1 79.4 -1.4 -19.3 -58.4 -28.8
48 Balt. City 30 0223 Pimlico Elementary Combined
240009000299 Not Met
RP 97.8 -6.9 -34.8 -40.1 -28.3
49 Balt. City 30 0246 Beechfield Elementary Combined
240009000155 Not Met RI 95.2 -22.7 -22.1 -37.7 -28.3
50 Balt. City 30 0235
Glenmount Elementary/Middle Combined
240009000222 Not Met RI 87.1 -11.7 -23.8 -43.9 -27.8
51 Balt. City 30 0058
Dr. Nathan A. Pitts Ashburton Elementary/Middle Combined
240009000149 Not Met RI 88.7 -25.4 -25 -31.5 -27.6
52 Balt. City 30 0254
Dr. Martin Luther King, Jr. Elementary Combined
240009000188 Not Met
RP 98.6 -14.8 2.8 -61.8 -27.5
53 Balt. City 30 0008 City Springs Elementary
Public Charter School
240009000175 Not Met RI 98.2 -32 -24.2 -26.3 -27.4
54 Balt. City 30 0328
Southwest Baltimore Charter School
Public Charter School
240009001527 Not Met
Y1 84.8 9.3 -6.9 -72.3 -27.1
55 Balt. City 30 0331
Md Academy Of Technology And Health
Public Charter
240009001538 Not Met
CA 73.7 -36.5 -14.1 -29.8 -27
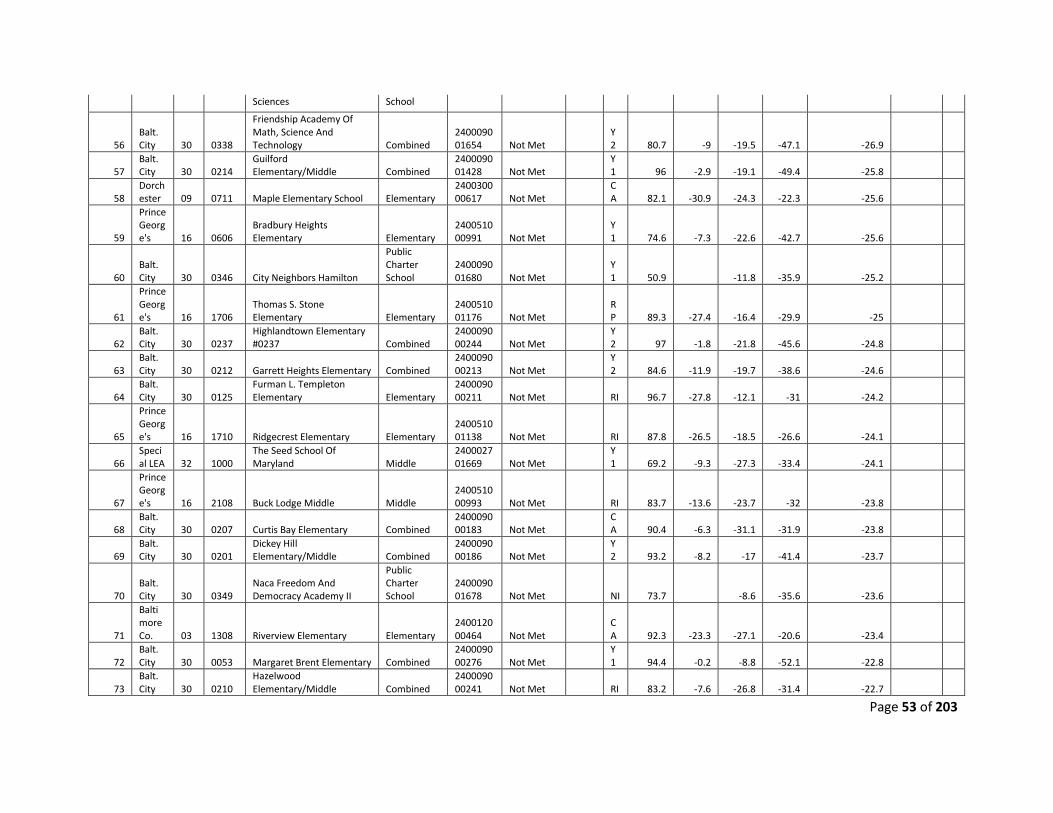
Page 53 of 203
Sciences School
56 Balt. City 30 0338
Friendship Academy Of Math, Science And Technology Combined
240009001654 Not Met
Y2 80.7 -9 -19.5 -47.1 -26.9
57 Balt. City 30 0214
Guilford Elementary/Middle Combined
240009001428 Not Met
Y1 96 -2.9 -19.1 -49.4 -25.8
58 Dorchester 09 0711 Maple Elementary School Elementary
240030000617 Not Met
CA 82.1 -30.9 -24.3 -22.3 -25.6
59
Prince George's 16 0606
Bradbury Heights Elementary Elementary
240051000991 Not Met
Y1 74.6 -7.3 -22.6 -42.7 -25.6
60 Balt. City 30 0346 City Neighbors Hamilton
Public Charter School
240009001680 Not Met
Y1 50.9 -11.8 -35.9 -25.2
61
Prince George's 16 1706
Thomas S. Stone Elementary Elementary
240051001176 Not Met
RP 89.3 -27.4 -16.4 -29.9 -25
62 Balt. City 30 0237
Highlandtown Elementary #0237 Combined
240009000244 Not Met
Y2 97 -1.8 -21.8 -45.6 -24.8
63 Balt. City 30 0212 Garrett Heights Elementary Combined
240009000213 Not Met
Y2 84.6 -11.9 -19.7 -38.6 -24.6
64 Balt. City 30 0125
Furman L. Templeton Elementary Elementary
240009000211 Not Met RI 96.7 -27.8 -12.1 -31 -24.2
65
Prince George's 16 1710 Ridgecrest Elementary Elementary
240051001138 Not Met RI 87.8 -26.5 -18.5 -26.6 -24.1
66 Special LEA 32 1000
The Seed School Of Maryland Middle
240002701669 Not Met
Y1 69.2 -9.3 -27.3 -33.4 -24.1
67
Prince George's 16 2108 Buck Lodge Middle Middle
240051000993 Not Met RI 83.7 -13.6 -23.7 -32 -23.8
68 Balt. City 30 0207 Curtis Bay Elementary Combined
240009000183 Not Met
CA 90.4 -6.3 -31.1 -31.9 -23.8
69 Balt. City 30 0201
Dickey Hill Elementary/Middle Combined
240009000186 Not Met
Y2 93.2 -8.2 -17 -41.4 -23.7
70 Balt. City 30 0349
Naca Freedom And Democracy Academy II
Public Charter School
240009001678 Not Met NI 73.7 -8.6 -35.6 -23.6
71
Baltimore Co. 03 1308 Riverview Elementary Elementary
240012000464 Not Met
CA 92.3 -23.3 -27.1 -20.6 -23.4
72 Balt. City 30 0053 Margaret Brent Elementary Combined
240009000276 Not Met
Y1 94.4 -0.2 -8.8 -52.1 -22.8
73 Balt. City 30 0210
Hazelwood Elementary/Middle Combined
240009000241 Not Met RI 83.2 -7.6 -26.8 -31.4 -22.7
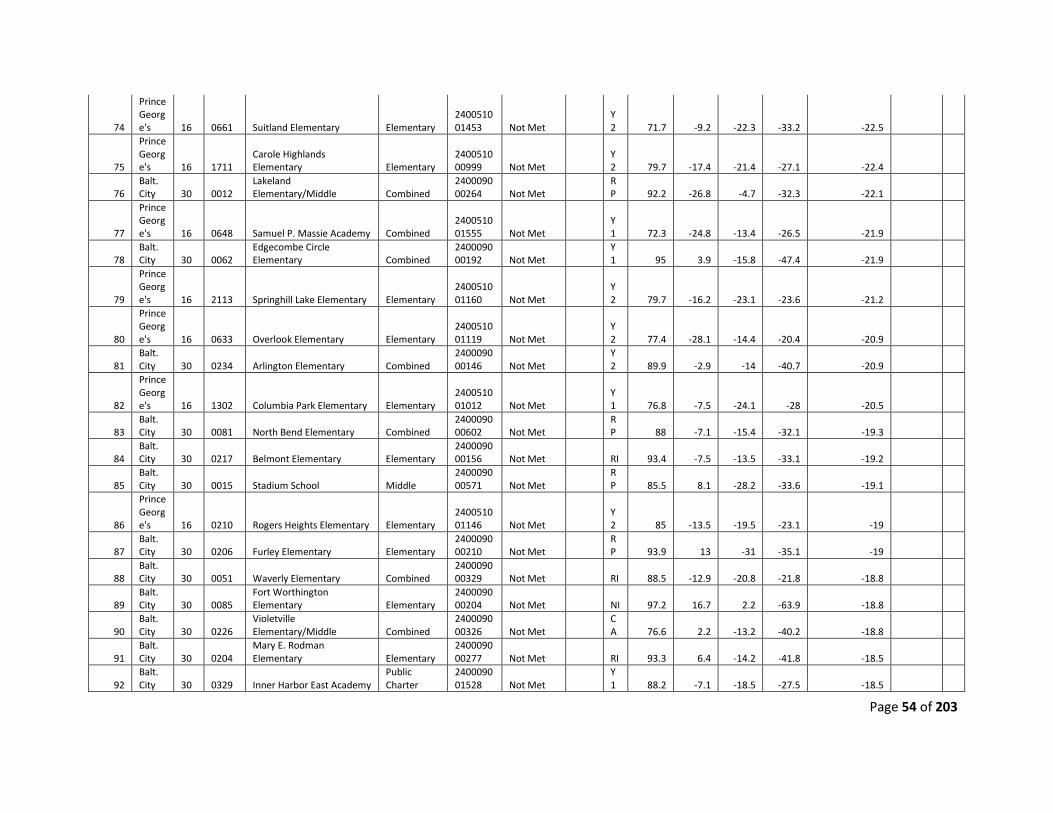
Page 54 of 203
74
Prince George's 16 0661 Suitland Elementary Elementary
240051001453 Not Met
Y2 71.7 -9.2 -22.3 -33.2 -22.5
75
Prince George's 16 1711
Carole Highlands Elementary Elementary
240051000999 Not Met
Y2 79.7 -17.4 -21.4 -27.1 -22.4
76 Balt. City 30 0012
Lakeland Elementary/Middle Combined
240009000264 Not Met
RP 92.2 -26.8 -4.7 -32.3 -22.1
77
Prince George's 16 0648 Samuel P. Massie Academy Combined
240051001555 Not Met
Y1 72.3 -24.8 -13.4 -26.5 -21.9
78 Balt. City 30 0062
Edgecombe Circle Elementary Combined
240009000192 Not Met
Y1 95 3.9 -15.8 -47.4 -21.9
79
Prince George's 16 2113 Springhill Lake Elementary Elementary
240051001160 Not Met
Y2 79.7 -16.2 -23.1 -23.6 -21.2
80
Prince George's 16 0633 Overlook Elementary Elementary
240051001119 Not Met
Y2 77.4 -28.1 -14.4 -20.4 -20.9
81 Balt. City 30 0234 Arlington Elementary Combined
240009000146 Not Met
Y2 89.9 -2.9 -14 -40.7 -20.9
82
Prince George's 16 1302 Columbia Park Elementary Elementary
240051001012 Not Met
Y1 76.8 -7.5 -24.1 -28 -20.5
83 Balt. City 30 0081 North Bend Elementary Combined
240009000602 Not Met
RP 88 -7.1 -15.4 -32.1 -19.3
84 Balt. City 30 0217 Belmont Elementary Elementary
240009000156 Not Met RI 93.4 -7.5 -13.5 -33.1 -19.2
85 Balt. City 30 0015 Stadium School Middle
240009000571 Not Met
RP 85.5 8.1 -28.2 -33.6 -19.1
86
Prince George's 16 0210 Rogers Heights Elementary Elementary
240051001146 Not Met
Y2 85 -13.5 -19.5 -23.1 -19
87 Balt. City 30 0206 Furley Elementary Elementary
240009000210 Not Met
RP 93.9 13 -31 -35.1 -19
88 Balt. City 30 0051 Waverly Elementary Combined
240009000329 Not Met RI 88.5 -12.9 -20.8 -21.8 -18.8
89 Balt. City 30 0085
Fort Worthington Elementary Elementary
240009000204 Not Met NI 97.2 16.7 2.2 -63.9 -18.8
90 Balt. City 30 0226
Violetville Elementary/Middle Combined
240009000326 Not Met
CA 76.6 2.2 -13.2 -40.2 -18.8
91 Balt. City 30 0204
Mary E. Rodman Elementary Elementary
240009000277 Not Met RI 93.3 6.4 -14.2 -41.8 -18.5
92 Balt. City 30 0329 Inner Harbor East Academy
Public Charter
240009001528 Not Met
Y1 88.2 -7.1 -18.5 -27.5 -18.5
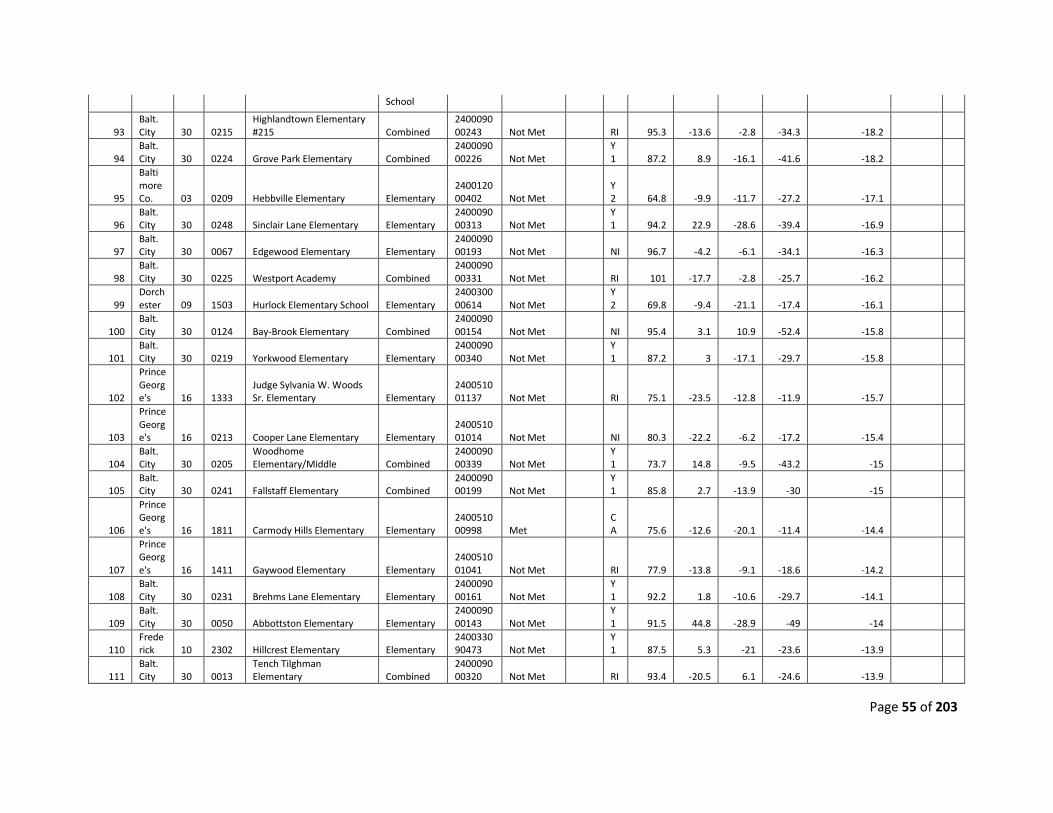
Page 55 of 203
School
93 Balt. City 30 0215
Highlandtown Elementary #215 Combined
240009000243 Not Met RI 95.3 -13.6 -2.8 -34.3 -18.2
94 Balt. City 30 0224 Grove Park Elementary Combined
240009000226 Not Met
Y1 87.2 8.9 -16.1 -41.6 -18.2
95
Baltimore Co. 03 0209 Hebbville Elementary Elementary
240012000402 Not Met
Y2 64.8 -9.9 -11.7 -27.2 -17.1
96 Balt. City 30 0248 Sinclair Lane Elementary Elementary
240009000313 Not Met
Y1 94.2 22.9 -28.6 -39.4 -16.9
97 Balt. City 30 0067 Edgewood Elementary Elementary
240009000193 Not Met NI 96.7 -4.2 -6.1 -34.1 -16.3
98 Balt. City 30 0225 Westport Academy Combined
240009000331 Not Met RI 101 -17.7 -2.8 -25.7 -16.2
99 Dorchester 09 1503 Hurlock Elementary School Elementary
240030000614 Not Met
Y2 69.8 -9.4 -21.1 -17.4 -16.1
100 Balt. City 30 0124 Bay-Brook Elementary Combined
240009000154 Not Met NI 95.4 3.1 10.9 -52.4 -15.8
101 Balt. City 30 0219 Yorkwood Elementary Elementary
240009000340 Not Met
Y1 87.2 3 -17.1 -29.7 -15.8
102
Prince George's 16 1333
Judge Sylvania W. Woods Sr. Elementary Elementary
240051001137 Not Met RI 75.1 -23.5 -12.8 -11.9 -15.7
103
Prince George's 16 0213 Cooper Lane Elementary Elementary
240051001014 Not Met NI 80.3 -22.2 -6.2 -17.2 -15.4
104 Balt. City 30 0205
Woodhome Elementary/Middle Combined
240009000339 Not Met
Y1 73.7 14.8 -9.5 -43.2 -15
105 Balt. City 30 0241 Fallstaff Elementary Combined
240009000199 Not Met
Y1 85.8 2.7 -13.9 -30 -15
106
Prince George's 16 1811 Carmody Hills Elementary Elementary
240051000998 Met
CA 75.6 -12.6 -20.1 -11.4 -14.4
107
Prince George's 16 1411 Gaywood Elementary Elementary
240051001041 Not Met RI 77.9 -13.8 -9.1 -18.6 -14.2
108 Balt. City 30 0231 Brehms Lane Elementary Elementary
240009000161 Not Met
Y1 92.2 1.8 -10.6 -29.7 -14.1
109 Balt. City 30 0050 Abbottston Elementary Elementary
240009000143 Not Met
Y1 91.5 44.8 -28.9 -49 -14
110 Frederick 10 2302 Hillcrest Elementary Elementary
240033090473 Not Met
Y1 87.5 5.3 -21 -23.6 -13.9
111 Balt. City 30 0013
Tench Tilghman Elementary Combined
240009000320 Not Met RI 93.4 -20.5 6.1 -24.6 -13.9
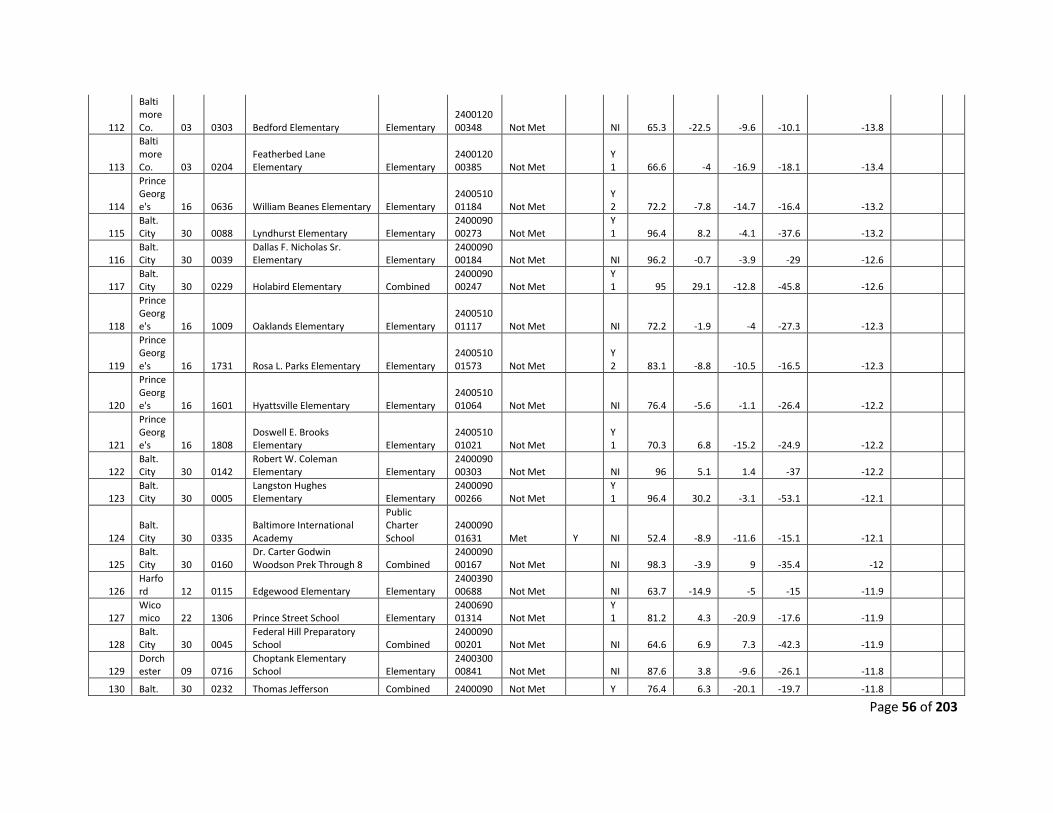
Page 56 of 203
112
Baltimore Co. 03 0303 Bedford Elementary Elementary
240012000348 Not Met NI 65.3 -22.5 -9.6 -10.1 -13.8
113
Baltimore Co. 03 0204
Featherbed Lane Elementary Elementary
240012000385 Not Met
Y1 66.6 -4 -16.9 -18.1 -13.4
114
Prince George's 16 0636 William Beanes Elementary Elementary
240051001184 Not Met
Y2 72.2 -7.8 -14.7 -16.4 -13.2
115 Balt. City 30 0088 Lyndhurst Elementary Elementary
240009000273 Not Met
Y1 96.4 8.2 -4.1 -37.6 -13.2
116 Balt. City 30 0039
Dallas F. Nicholas Sr. Elementary Elementary
240009000184 Not Met NI 96.2 -0.7 -3.9 -29 -12.6
117 Balt. City 30 0229 Holabird Elementary Combined
240009000247 Not Met
Y1 95 29.1 -12.8 -45.8 -12.6
118
Prince George's 16 1009 Oaklands Elementary Elementary
240051001117 Not Met NI 72.2 -1.9 -4 -27.3 -12.3
119
Prince George's 16 1731 Rosa L. Parks Elementary Elementary
240051001573 Not Met
Y2 83.1 -8.8 -10.5 -16.5 -12.3
120
Prince George's 16 1601 Hyattsville Elementary Elementary
240051001064 Not Met NI 76.4 -5.6 -1.1 -26.4 -12.2
121
Prince George's 16 1808
Doswell E. Brooks Elementary Elementary
240051001021 Not Met
Y1 70.3 6.8 -15.2 -24.9 -12.2
122 Balt. City 30 0142
Robert W. Coleman Elementary Elementary
240009000303 Not Met NI 96 5.1 1.4 -37 -12.2
123 Balt. City 30 0005
Langston Hughes Elementary Elementary
240009000266 Not Met
Y1 96.4 30.2 -3.1 -53.1 -12.1
124 Balt. City 30 0335
Baltimore International Academy
Public Charter School
240009001631 Met Y NI 52.4 -8.9 -11.6 -15.1 -12.1
125 Balt. City 30 0160
Dr. Carter Godwin Woodson Prek Through 8 Combined
240009000167 Not Met NI 98.3 -3.9 9 -35.4 -12
126 Harford 12 0115 Edgewood Elementary Elementary
240039000688 Not Met NI 63.7 -14.9 -5 -15 -11.9
127 Wicomico 22 1306 Prince Street School Elementary
240069001314 Not Met
Y1 81.2 4.3 -20.9 -17.6 -11.9
128 Balt. City 30 0045
Federal Hill Preparatory School Combined
240009000201 Not Met NI 64.6 6.9 7.3 -42.3 -11.9
129 Dorchester 09 0716
Choptank Elementary School Elementary
240030000841 Not Met NI 87.6 3.8 -9.6 -26.1 -11.8
130 Balt. 30 0232 Thomas Jefferson Combined 2400090 Not Met Y 76.4 6.3 -20.1 -19.7 -11.8
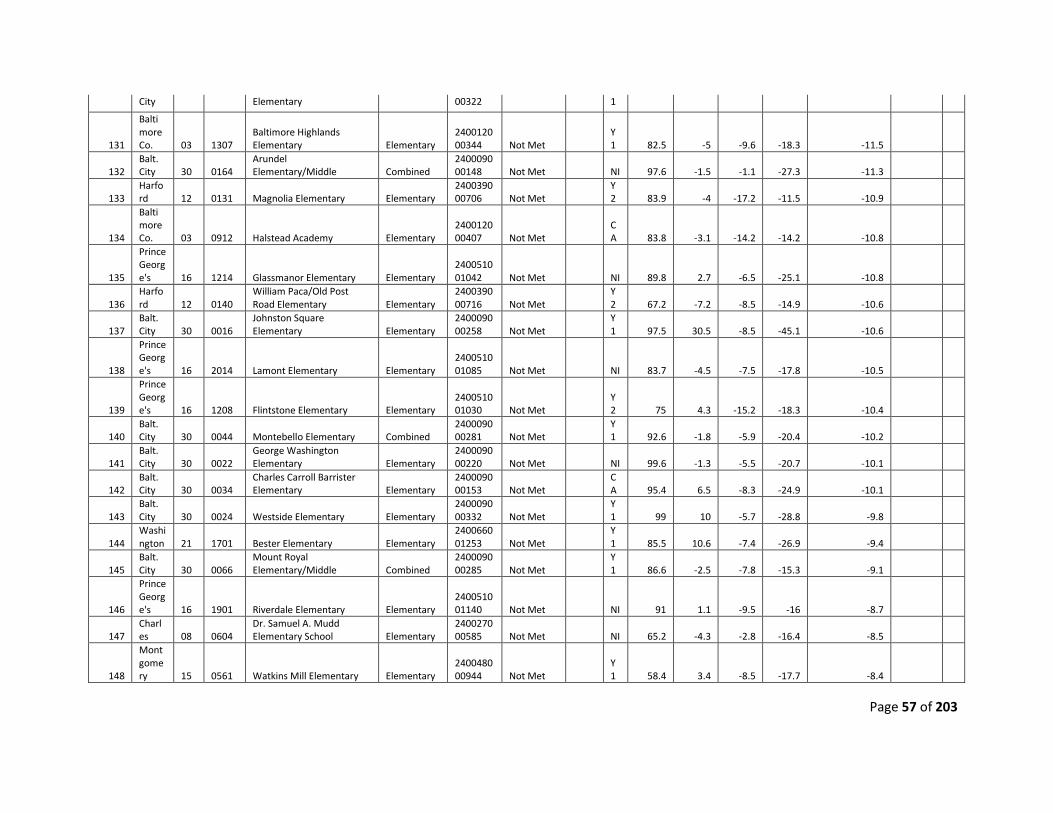
Page 57 of 203
City Elementary 00322 1
131
Baltimore Co. 03 1307
Baltimore Highlands Elementary Elementary
240012000344 Not Met
Y1 82.5 -5 -9.6 -18.3 -11.5
132 Balt. City 30 0164
Arundel Elementary/Middle Combined
240009000148 Not Met NI 97.6 -1.5 -1.1 -27.3 -11.3
133 Harford 12 0131 Magnolia Elementary Elementary
240039000706 Not Met
Y2 83.9 -4 -17.2 -11.5 -10.9
134
Baltimore Co. 03 0912 Halstead Academy Elementary
240012000407 Not Met
CA 83.8 -3.1 -14.2 -14.2 -10.8
135
Prince George's 16 1214 Glassmanor Elementary Elementary
240051001042 Not Met NI 89.8 2.7 -6.5 -25.1 -10.8
136 Harford 12 0140
William Paca/Old Post Road Elementary Elementary
240039000716 Not Met
Y2 67.2 -7.2 -8.5 -14.9 -10.6
137 Balt. City 30 0016
Johnston Square Elementary Elementary
240009000258 Not Met
Y1 97.5 30.5 -8.5 -45.1 -10.6
138
Prince George's 16 2014 Lamont Elementary Elementary
240051001085 Not Met NI 83.7 -4.5 -7.5 -17.8 -10.5
139
Prince George's 16 1208 Flintstone Elementary Elementary
240051001030 Not Met
Y2 75 4.3 -15.2 -18.3 -10.4
140 Balt. City 30 0044 Montebello Elementary Combined
240009000281 Not Met
Y1 92.6 -1.8 -5.9 -20.4 -10.2
141 Balt. City 30 0022
George Washington Elementary Elementary
240009000220 Not Met NI 99.6 -1.3 -5.5 -20.7 -10.1
142 Balt. City 30 0034
Charles Carroll Barrister Elementary Elementary
240009000153 Not Met
CA 95.4 6.5 -8.3 -24.9 -10.1
143 Balt. City 30 0024 Westside Elementary Elementary
240009000332 Not Met
Y1 99 10 -5.7 -28.8 -9.8
144 Washington 21 1701 Bester Elementary Elementary
240066001253 Not Met
Y1 85.5 10.6 -7.4 -26.9 -9.4
145 Balt. City 30 0066
Mount Royal Elementary/Middle Combined
240009000285 Not Met
Y1 86.6 -2.5 -7.8 -15.3 -9.1
146
Prince George's 16 1901 Riverdale Elementary Elementary
240051001140 Not Met NI 91 1.1 -9.5 -16 -8.7
147 Charles 08 0604
Dr. Samuel A. Mudd Elementary School Elementary
240027000585 Not Met NI 65.2 -4.3 -2.8 -16.4 -8.5
148
Montgomery 15 0561 Watkins Mill Elementary Elementary
240048000944 Not Met
Y1 58.4 3.4 -8.5 -17.7 -8.4
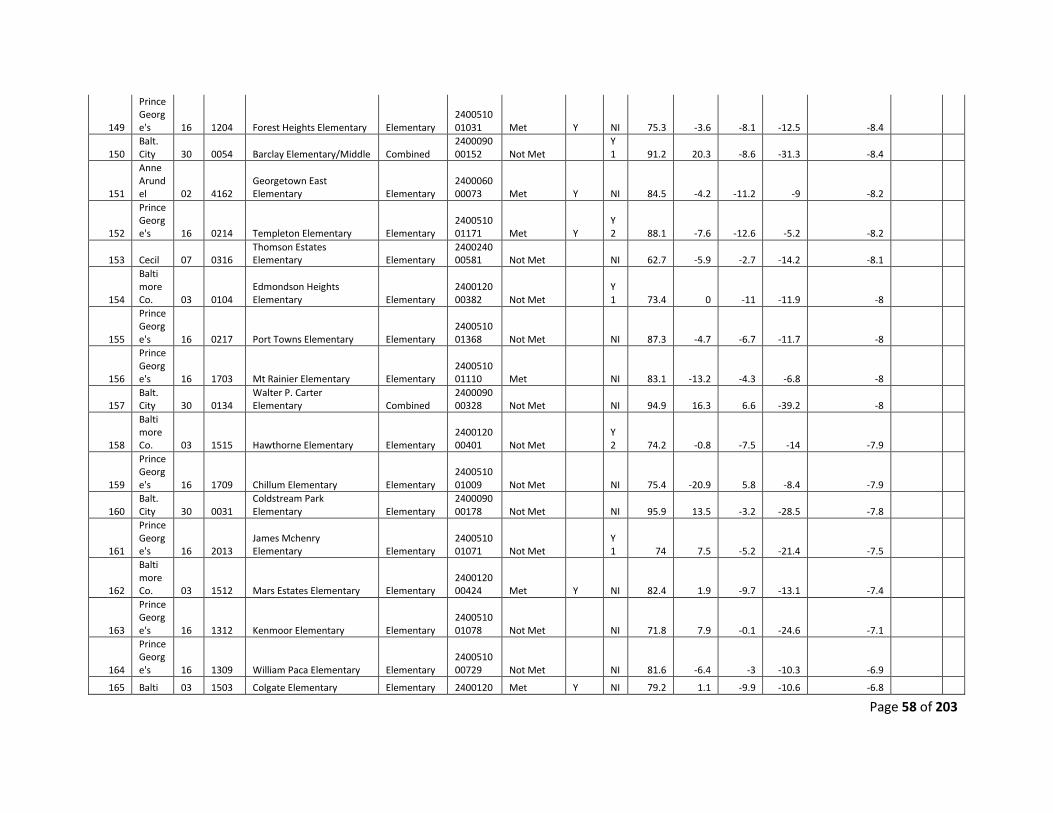
Page 58 of 203
149
Prince George's 16 1204 Forest Heights Elementary Elementary
240051001031 Met Y NI 75.3 -3.6 -8.1 -12.5 -8.4
150 Balt. City 30 0054 Barclay Elementary/Middle Combined
240009000152 Not Met
Y1 91.2 20.3 -8.6 -31.3 -8.4
151
Anne Arundel 02 4162
Georgetown East Elementary Elementary
240006000073 Met Y NI 84.5 -4.2 -11.2 -9 -8.2
152
Prince George's 16 0214 Templeton Elementary Elementary
240051001171 Met Y
Y2 88.1 -7.6 -12.6 -5.2 -8.2
153 Cecil 07 0316 Thomson Estates Elementary Elementary
240024000581 Not Met NI 62.7 -5.9 -2.7 -14.2 -8.1
154
Baltimore Co. 03 0104
Edmondson Heights Elementary Elementary
240012000382 Not Met
Y1 73.4 0 -11 -11.9 -8
155
Prince George's 16 0217 Port Towns Elementary Elementary
240051001368 Not Met NI 87.3 -4.7 -6.7 -11.7 -8
156
Prince George's 16 1703 Mt Rainier Elementary Elementary
240051001110 Met NI 83.1 -13.2 -4.3 -6.8 -8
157 Balt. City 30 0134
Walter P. Carter Elementary Combined
240009000328 Not Met NI 94.9 16.3 6.6 -39.2 -8
158
Baltimore Co. 03 1515 Hawthorne Elementary Elementary
240012000401 Not Met
Y2 74.2 -0.8 -7.5 -14 -7.9
159
Prince George's 16 1709 Chillum Elementary Elementary
240051001009 Not Met NI 75.4 -20.9 5.8 -8.4 -7.9
160 Balt. City 30 0031
Coldstream Park Elementary Elementary
240009000178 Not Met NI 95.9 13.5 -3.2 -28.5 -7.8
161
Prince George's 16 2013
James Mchenry Elementary Elementary
240051001071 Not Met
Y1 74 7.5 -5.2 -21.4 -7.5
162
Baltimore Co. 03 1512 Mars Estates Elementary Elementary
240012000424 Met Y NI 82.4 1.9 -9.7 -13.1 -7.4
163
Prince George's 16 1312 Kenmoor Elementary Elementary
240051001078 Not Met NI 71.8 7.9 -0.1 -24.6 -7.1
164
Prince George's 16 1309 William Paca Elementary Elementary
240051000729 Not Met NI 81.6 -6.4 -3 -10.3 -6.9
165 Balti 03 1503 Colgate Elementary Elementary 2400120 Met Y NI 79.2 1.1 -9.9 -10.6 -6.8
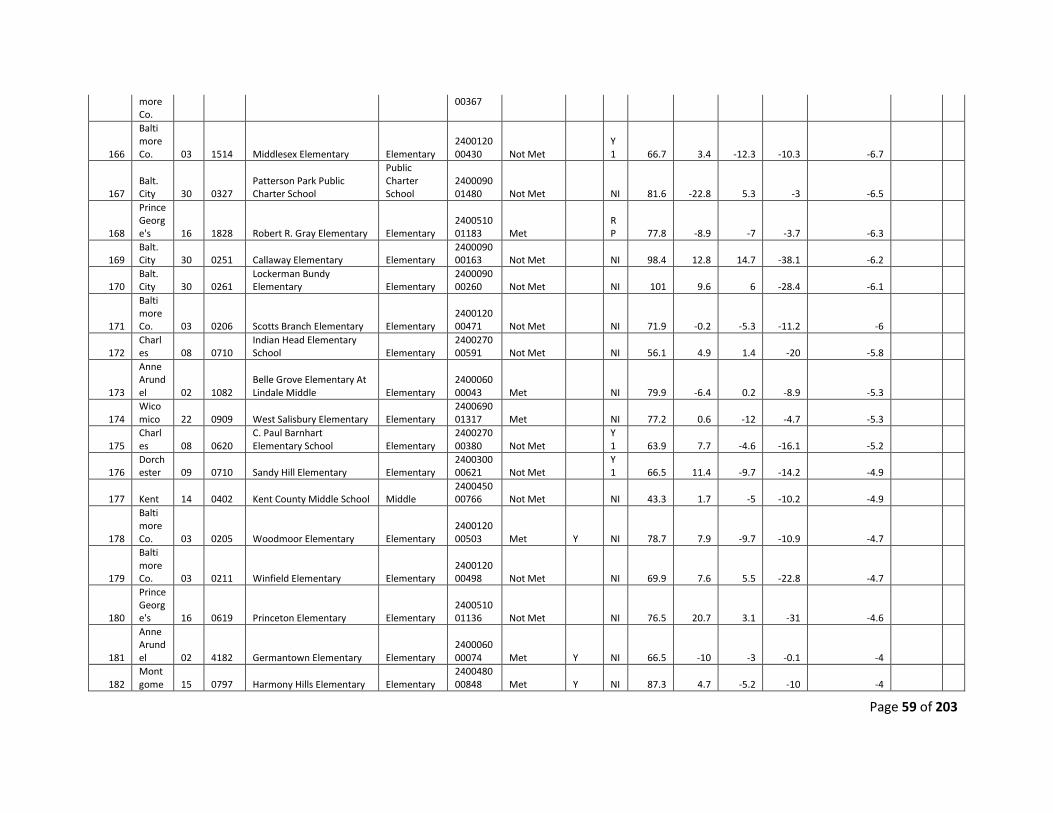
Page 59 of 203
more Co.
00367
166
Baltimore Co. 03 1514 Middlesex Elementary Elementary
240012000430 Not Met
Y1 66.7 3.4 -12.3 -10.3 -6.7
167 Balt. City 30 0327
Patterson Park Public Charter School
Public Charter School
240009001480 Not Met NI 81.6 -22.8 5.3 -3 -6.5
168
Prince George's 16 1828 Robert R. Gray Elementary Elementary
240051001183 Met
RP 77.8 -8.9 -7 -3.7 -6.3
169 Balt. City 30 0251 Callaway Elementary Elementary
240009000163 Not Met NI 98.4 12.8 14.7 -38.1 -6.2
170 Balt. City 30 0261
Lockerman Bundy Elementary Elementary
240009000260 Not Met NI 101 9.6 6 -28.4 -6.1
171
Baltimore Co. 03 0206 Scotts Branch Elementary Elementary
240012000471 Not Met NI 71.9 -0.2 -5.3 -11.2 -6
172 Charles 08 0710
Indian Head Elementary School Elementary
240027000591 Not Met NI 56.1 4.9 1.4 -20 -5.8
173
Anne Arundel 02 1082
Belle Grove Elementary At Lindale Middle Elementary
240006000043 Met NI 79.9 -6.4 0.2 -8.9 -5.3
174 Wicomico 22 0909 West Salisbury Elementary Elementary
240069001317 Met NI 77.2 0.6 -12 -4.7 -5.3
175 Charles 08 0620
C. Paul Barnhart Elementary School Elementary
240027000380 Not Met
Y1 63.9 7.7 -4.6 -16.1 -5.2
176 Dorchester 09 0710 Sandy Hill Elementary Elementary
240030000621 Not Met
Y1 66.5 11.4 -9.7 -14.2 -4.9
177 Kent 14 0402 Kent County Middle School Middle 240045000766 Not Met NI 43.3 1.7 -5 -10.2 -4.9
178
Baltimore Co. 03 0205 Woodmoor Elementary Elementary
240012000503 Met Y NI 78.7 7.9 -9.7 -10.9 -4.7
179
Baltimore Co. 03 0211 Winfield Elementary Elementary
240012000498 Not Met NI 69.9 7.6 5.5 -22.8 -4.7
180
Prince George's 16 0619 Princeton Elementary Elementary
240051001136 Not Met NI 76.5 20.7 3.1 -31 -4.6
181
Anne Arundel 02 4182 Germantown Elementary Elementary
240006000074 Met Y NI 66.5 -10 -3 -0.1 -4
182 Montgome 15 0797 Harmony Hills Elementary Elementary
240048000848 Met Y NI 87.3 4.7 -5.2 -10 -4
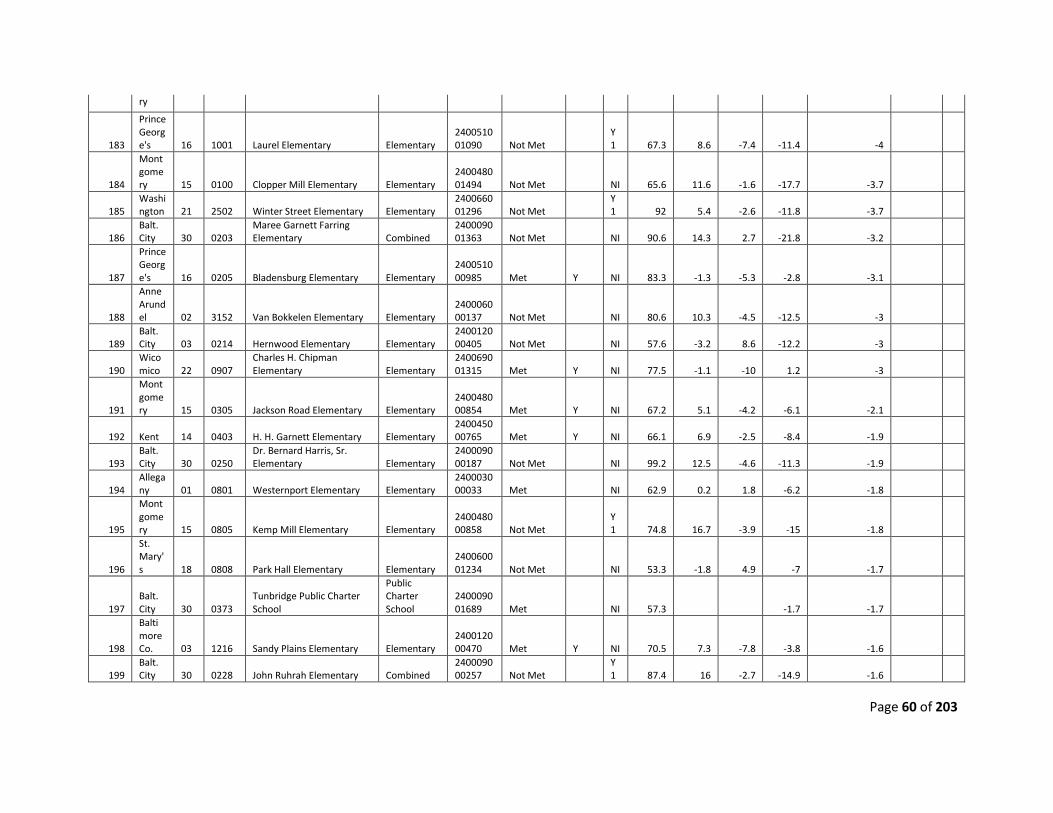
Page 60 of 203
ry
183
Prince George's 16 1001 Laurel Elementary Elementary
240051001090 Not Met
Y1 67.3 8.6 -7.4 -11.4 -4
184
Montgomery 15 0100 Clopper Mill Elementary Elementary
240048001494 Not Met NI 65.6 11.6 -1.6 -17.7 -3.7
185 Washington 21 2502 Winter Street Elementary Elementary
240066001296 Not Met
Y1 92 5.4 -2.6 -11.8 -3.7
186 Balt. City 30 0203
Maree Garnett Farring Elementary Combined
240009001363 Not Met NI 90.6 14.3 2.7 -21.8 -3.2
187
Prince George's 16 0205 Bladensburg Elementary Elementary
240051000985 Met Y NI 83.3 -1.3 -5.3 -2.8 -3.1
188
Anne Arundel 02 3152 Van Bokkelen Elementary Elementary
240006000137 Not Met NI 80.6 10.3 -4.5 -12.5 -3
189 Balt. City 03 0214 Hernwood Elementary Elementary
240012000405 Not Met NI 57.6 -3.2 8.6 -12.2 -3
190 Wicomico 22 0907
Charles H. Chipman Elementary Elementary
240069001315 Met Y NI 77.5 -1.1 -10 1.2 -3
191
Montgomery 15 0305 Jackson Road Elementary Elementary
240048000854 Met Y NI 67.2 5.1 -4.2 -6.1 -2.1
192 Kent 14 0403 H. H. Garnett Elementary Elementary 240045000765 Met Y NI 66.1 6.9 -2.5 -8.4 -1.9
193 Balt. City 30 0250
Dr. Bernard Harris, Sr. Elementary Elementary
240009000187 Not Met NI 99.2 12.5 -4.6 -11.3 -1.9
194 Allegany 01 0801 Westernport Elementary Elementary
240003000033 Met NI 62.9 0.2 1.8 -6.2 -1.8
195
Montgomery 15 0805 Kemp Mill Elementary Elementary
240048000858 Not Met
Y1 74.8 16.7 -3.9 -15 -1.8
196
St. Mary's 18 0808 Park Hall Elementary Elementary
240060001234 Not Met NI 53.3 -1.8 4.9 -7 -1.7
197 Balt. City 30 0373
Tunbridge Public Charter School
Public Charter School
240009001689 Met NI 57.3 -1.7 -1.7
198
Baltimore Co. 03 1216 Sandy Plains Elementary Elementary
240012000470 Met Y NI 70.5 7.3 -7.8 -3.8 -1.6
199 Balt. City 30 0228 John Ruhrah Elementary Combined
240009000257 Not Met
Y1 87.4 16 -2.7 -14.9 -1.6
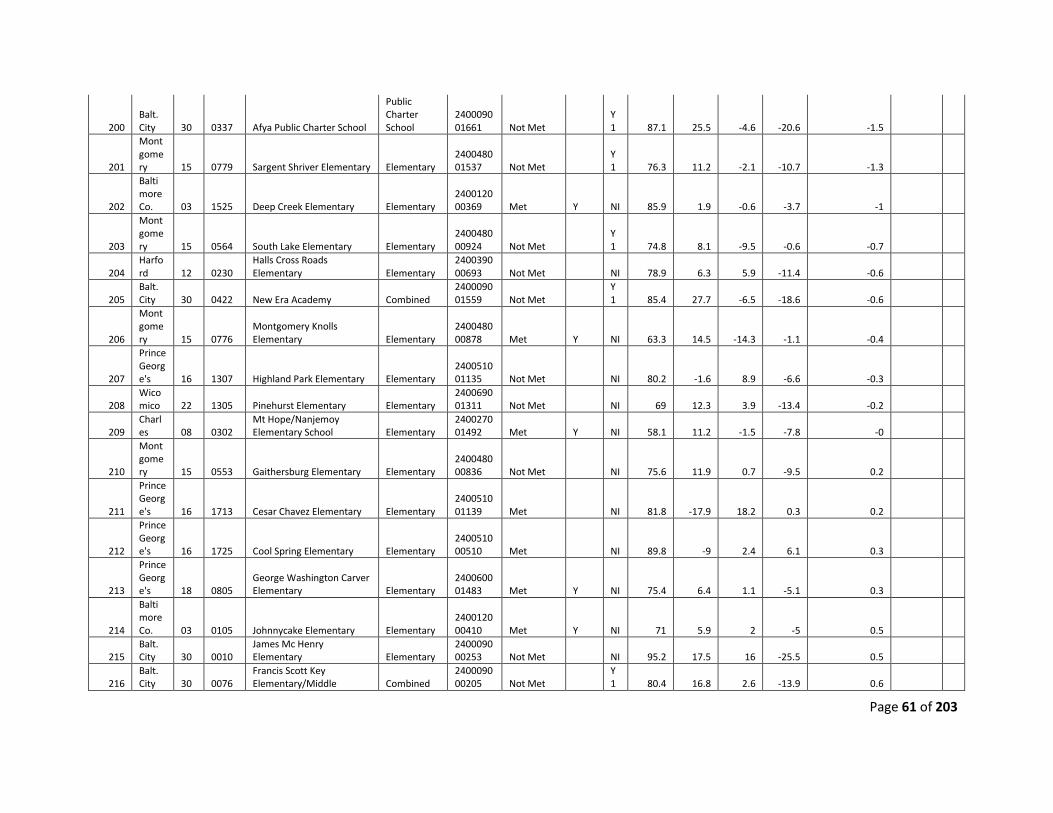
Page 61 of 203
200 Balt. City 30 0337 Afya Public Charter School
Public Charter School
240009001661 Not Met
Y1 87.1 25.5 -4.6 -20.6 -1.5
201
Montgomery 15 0779 Sargent Shriver Elementary Elementary
240048001537 Not Met
Y1 76.3 11.2 -2.1 -10.7 -1.3
202
Baltimore Co. 03 1525 Deep Creek Elementary Elementary
240012000369 Met Y NI 85.9 1.9 -0.6 -3.7 -1
203
Montgomery 15 0564 South Lake Elementary Elementary
240048000924 Not Met
Y1 74.8 8.1 -9.5 -0.6 -0.7
204 Harford 12 0230
Halls Cross Roads Elementary Elementary
240039000693 Not Met NI 78.9 6.3 5.9 -11.4 -0.6
205 Balt. City 30 0422 New Era Academy Combined
240009001559 Not Met
Y1 85.4 27.7 -6.5 -18.6 -0.6
206
Montgomery 15 0776
Montgomery Knolls Elementary Elementary
240048000878 Met Y NI 63.3 14.5 -14.3 -1.1 -0.4
207
Prince George's 16 1307 Highland Park Elementary Elementary
240051001135 Not Met NI 80.2 -1.6 8.9 -6.6 -0.3
208 Wicomico 22 1305 Pinehurst Elementary Elementary
240069001311 Not Met NI 69 12.3 3.9 -13.4 -0.2
209 Charles 08 0302
Mt Hope/Nanjemoy Elementary School Elementary
240027001492 Met Y NI 58.1 11.2 -1.5 -7.8 -0
210
Montgomery 15 0553 Gaithersburg Elementary Elementary
240048000836 Not Met NI 75.6 11.9 0.7 -9.5 0.2
211
Prince George's 16 1713 Cesar Chavez Elementary Elementary
240051001139 Met NI 81.8 -17.9 18.2 0.3 0.2
212
Prince George's 16 1725 Cool Spring Elementary Elementary
240051000510 Met NI 89.8 -9 2.4 6.1 0.3
213
Prince George's 18 0805
George Washington Carver Elementary Elementary
240060001483 Met Y NI 75.4 6.4 1.1 -5.1 0.3
214
Baltimore Co. 03 0105 Johnnycake Elementary Elementary
240012000410 Met Y NI 71 5.9 2 -5 0.5
215 Balt. City 30 0010
James Mc Henry Elementary Elementary
240009000253 Not Met NI 95.2 17.5 16 -25.5 0.5
216 Balt. City 30 0076
Francis Scott Key Elementary/Middle Combined
240009000205 Not Met
Y1 80.4 16.8 2.6 -13.9 0.6
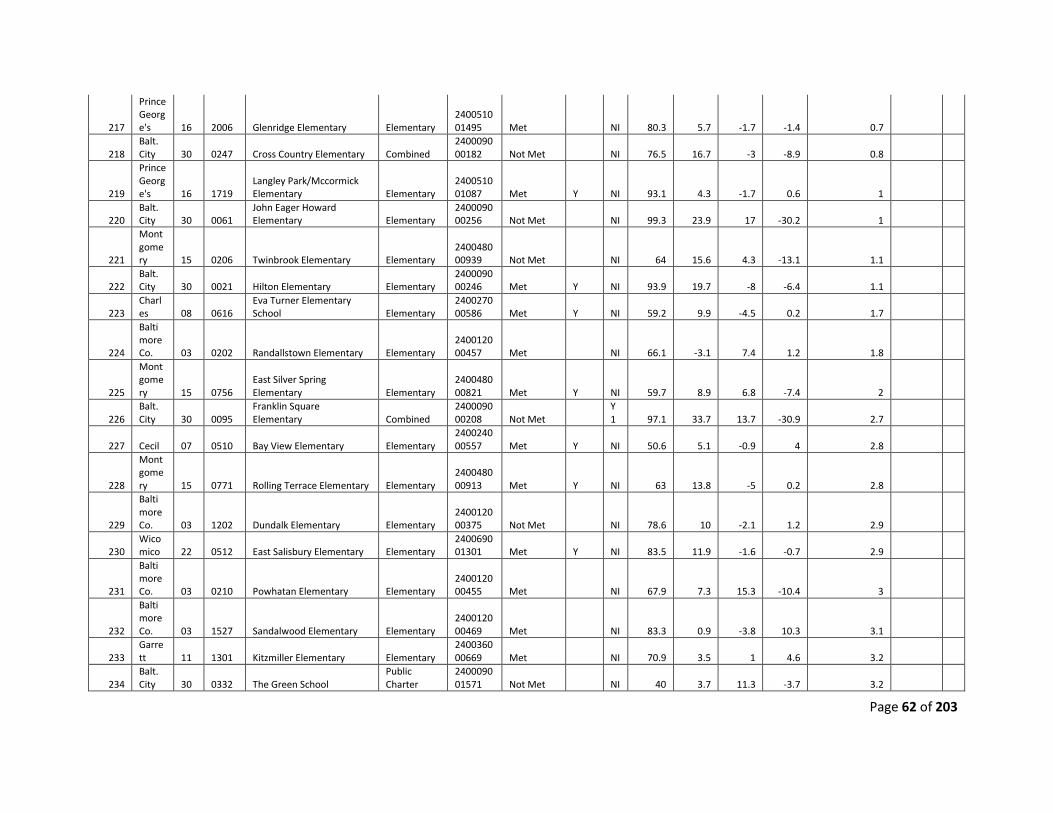
Page 62 of 203
217
Prince George's 16 2006 Glenridge Elementary Elementary
240051001495 Met NI 80.3 5.7 -1.7 -1.4 0.7
218 Balt. City 30 0247 Cross Country Elementary Combined
240009000182 Not Met NI 76.5 16.7 -3 -8.9 0.8
219
Prince George's 16 1719
Langley Park/Mccormick Elementary Elementary
240051001087 Met Y NI 93.1 4.3 -1.7 0.6 1
220 Balt. City 30 0061
John Eager Howard Elementary Elementary
240009000256 Not Met NI 99.3 23.9 17 -30.2 1
221
Montgomery 15 0206 Twinbrook Elementary Elementary
240048000939 Not Met NI 64 15.6 4.3 -13.1 1.1
222 Balt. City 30 0021 Hilton Elementary Elementary
240009000246 Met Y NI 93.9 19.7 -8 -6.4 1.1
223 Charles 08 0616
Eva Turner Elementary School Elementary
240027000586 Met Y NI 59.2 9.9 -4.5 0.2 1.7
224
Baltimore Co. 03 0202 Randallstown Elementary Elementary
240012000457 Met NI 66.1 -3.1 7.4 1.2 1.8
225
Montgomery 15 0756
East Silver Spring Elementary Elementary
240048000821 Met Y NI 59.7 8.9 6.8 -7.4 2
226 Balt. City 30 0095
Franklin Square Elementary Combined
240009000208 Not Met
Y1 97.1 33.7 13.7 -30.9 2.7
227 Cecil 07 0510 Bay View Elementary Elementary 240024000557 Met Y NI 50.6 5.1 -0.9 4 2.8
228
Montgomery 15 0771 Rolling Terrace Elementary Elementary
240048000913 Met Y NI 63 13.8 -5 0.2 2.8
229
Baltimore Co. 03 1202 Dundalk Elementary Elementary
240012000375 Not Met NI 78.6 10 -2.1 1.2 2.9
230 Wicomico 22 0512 East Salisbury Elementary Elementary
240069001301 Met Y NI 83.5 11.9 -1.6 -0.7 2.9
231
Baltimore Co. 03 0210 Powhatan Elementary Elementary
240012000455 Met NI 67.9 7.3 15.3 -10.4 3
232
Baltimore Co. 03 1527 Sandalwood Elementary Elementary
240012000469 Met NI 83.3 0.9 -3.8 10.3 3.1
233 Garrett 11 1301 Kitzmiller Elementary Elementary
240036000669 Met NI 70.9 3.5 1 4.6 3.2
234 Balt. City 30 0332 The Green School
Public Charter
240009001571 Not Met NI 40 3.7 11.3 -3.7 3.2
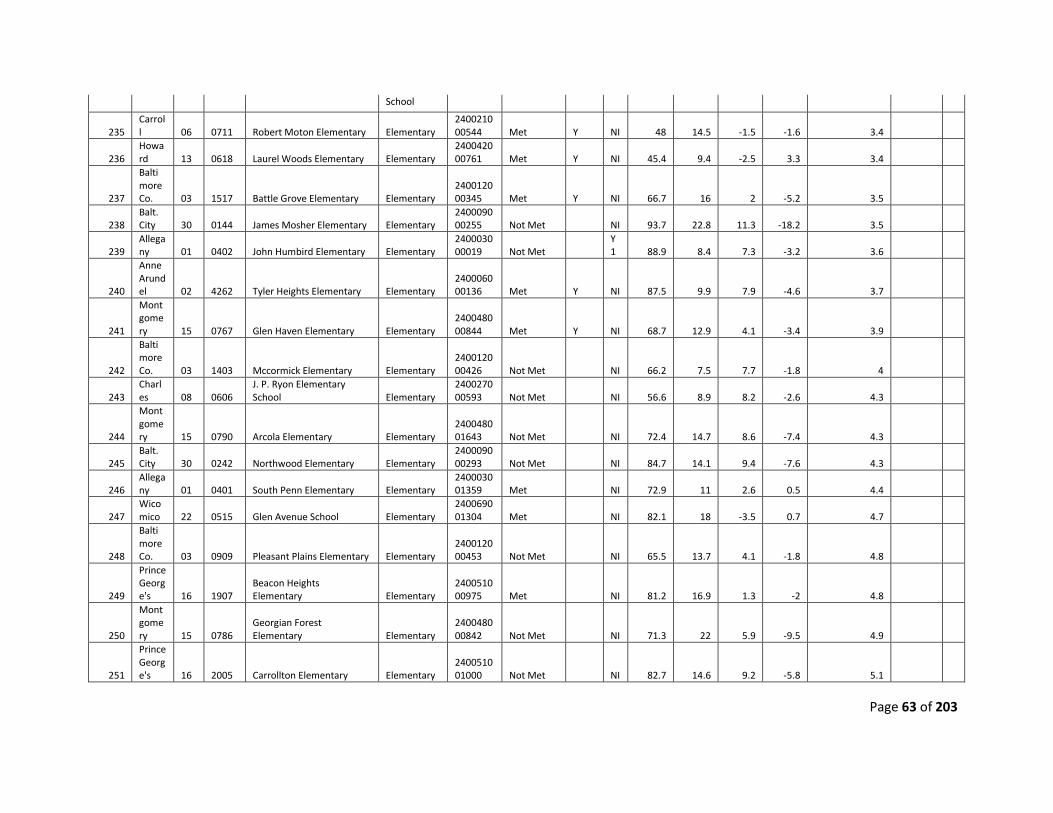
Page 63 of 203
School
235 Carroll 06 0711 Robert Moton Elementary Elementary
240021000544 Met Y NI 48 14.5 -1.5 -1.6 3.4
236 Howard 13 0618 Laurel Woods Elementary Elementary
240042000761 Met Y NI 45.4 9.4 -2.5 3.3 3.4
237
Baltimore Co. 03 1517 Battle Grove Elementary Elementary
240012000345 Met Y NI 66.7 16 2 -5.2 3.5
238 Balt. City 30 0144 James Mosher Elementary Elementary
240009000255 Not Met NI 93.7 22.8 11.3 -18.2 3.5
239 Allegany 01 0402 John Humbird Elementary Elementary
240003000019 Not Met
Y1 88.9 8.4 7.3 -3.2 3.6
240
Anne Arundel 02 4262 Tyler Heights Elementary Elementary
240006000136 Met Y NI 87.5 9.9 7.9 -4.6 3.7
241
Montgomery 15 0767 Glen Haven Elementary Elementary
240048000844 Met Y NI 68.7 12.9 4.1 -3.4 3.9
242
Baltimore Co. 03 1403 Mccormick Elementary Elementary
240012000426 Not Met NI 66.2 7.5 7.7 -1.8 4
243 Charles 08 0606
J. P. Ryon Elementary School Elementary
240027000593 Not Met NI 56.6 8.9 8.2 -2.6 4.3
244
Montgomery 15 0790 Arcola Elementary Elementary
240048001643 Not Met NI 72.4 14.7 8.6 -7.4 4.3
245 Balt. City 30 0242 Northwood Elementary Elementary
240009000293 Not Met NI 84.7 14.1 9.4 -7.6 4.3
246 Allegany 01 0401 South Penn Elementary Elementary
240003001359 Met NI 72.9 11 2.6 0.5 4.4
247 Wicomico 22 0515 Glen Avenue School Elementary
240069001304 Met NI 82.1 18 -3.5 0.7 4.7
248
Baltimore Co. 03 0909 Pleasant Plains Elementary Elementary
240012000453 Not Met NI 65.5 13.7 4.1 -1.8 4.8
249
Prince George's 16 1907
Beacon Heights Elementary Elementary
240051000975 Met NI 81.2 16.9 1.3 -2 4.8
250
Montgomery 15 0786
Georgian Forest Elementary Elementary
240048000842 Not Met NI 71.3 22 5.9 -9.5 4.9
251
Prince George's 16 2005 Carrollton Elementary Elementary
240051001000 Not Met NI 82.7 14.6 9.2 -5.8 5.1
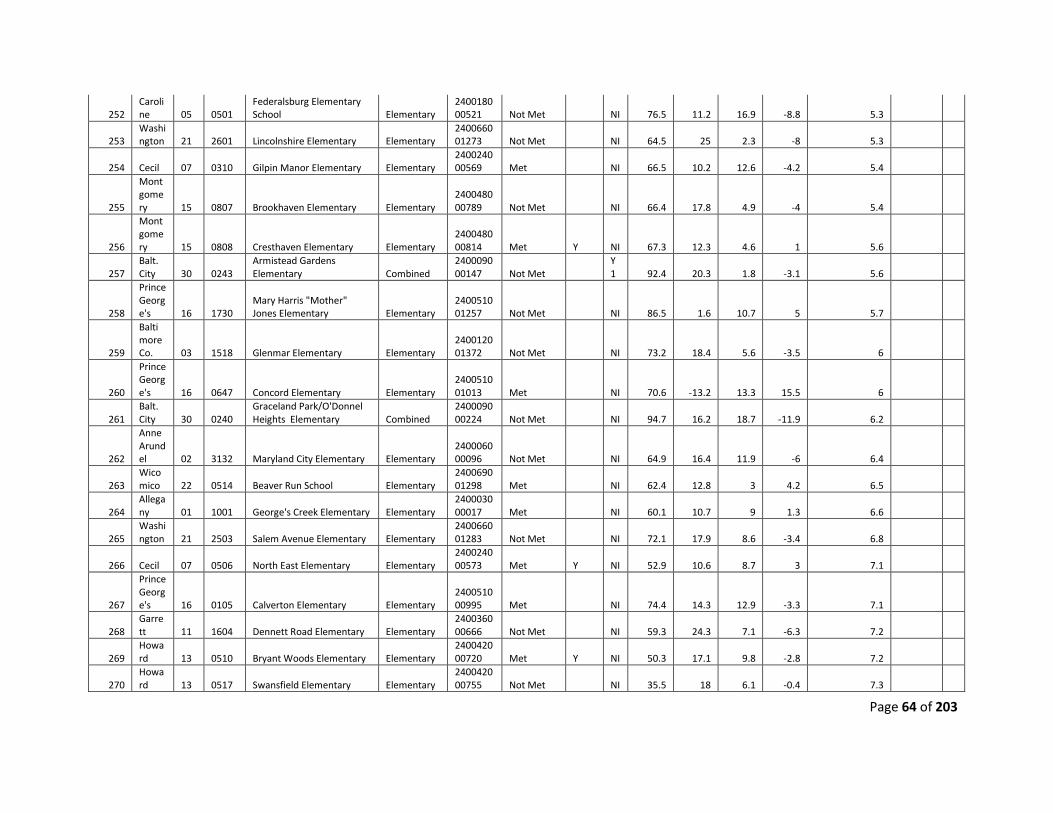
Page 64 of 203
252 Caroline 05 0501
Federalsburg Elementary School Elementary
240018000521 Not Met NI 76.5 11.2 16.9 -8.8 5.3
253 Washington 21 2601 Lincolnshire Elementary Elementary
240066001273 Not Met NI 64.5 25 2.3 -8 5.3
254 Cecil 07 0310 Gilpin Manor Elementary Elementary 240024000569 Met NI 66.5 10.2 12.6 -4.2 5.4
255
Montgomery 15 0807 Brookhaven Elementary Elementary
240048000789 Not Met NI 66.4 17.8 4.9 -4 5.4
256
Montgomery 15 0808 Cresthaven Elementary Elementary
240048000814 Met Y NI 67.3 12.3 4.6 1 5.6
257 Balt. City 30 0243
Armistead Gardens Elementary Combined
240009000147 Not Met
Y1 92.4 20.3 1.8 -3.1 5.6
258
Prince George's 16 1730
Mary Harris "Mother" Jones Elementary Elementary
240051001257 Not Met NI 86.5 1.6 10.7 5 5.7
259
Baltimore Co. 03 1518 Glenmar Elementary Elementary
240012001372 Not Met NI 73.2 18.4 5.6 -3.5 6
260
Prince George's 16 0647 Concord Elementary Elementary
240051001013 Met NI 70.6 -13.2 13.3 15.5 6
261 Balt. City 30 0240
Graceland Park/O'Donnel Heights Elementary Combined
240009000224 Not Met NI 94.7 16.2 18.7 -11.9 6.2
262
Anne Arundel 02 3132 Maryland City Elementary Elementary
240006000096 Not Met NI 64.9 16.4 11.9 -6 6.4
263 Wicomico 22 0514 Beaver Run School Elementary
240069001298 Met NI 62.4 12.8 3 4.2 6.5
264 Allegany 01 1001 George's Creek Elementary Elementary
240003000017 Met NI 60.1 10.7 9 1.3 6.6
265 Washington 21 2503 Salem Avenue Elementary Elementary
240066001283 Not Met NI 72.1 17.9 8.6 -3.4 6.8
266 Cecil 07 0506 North East Elementary Elementary 240024000573 Met Y NI 52.9 10.6 8.7 3 7.1
267
Prince George's 16 0105 Calverton Elementary Elementary
240051000995 Met NI 74.4 14.3 12.9 -3.3 7.1
268 Garrett 11 1604 Dennett Road Elementary Elementary
240036000666 Not Met NI 59.3 24.3 7.1 -6.3 7.2
269 Howard 13 0510 Bryant Woods Elementary Elementary
240042000720 Met Y NI 50.3 17.1 9.8 -2.8 7.2
270 Howard 13 0517 Swansfield Elementary Elementary
240042000755 Not Met NI 35.5 18 6.1 -0.4 7.3
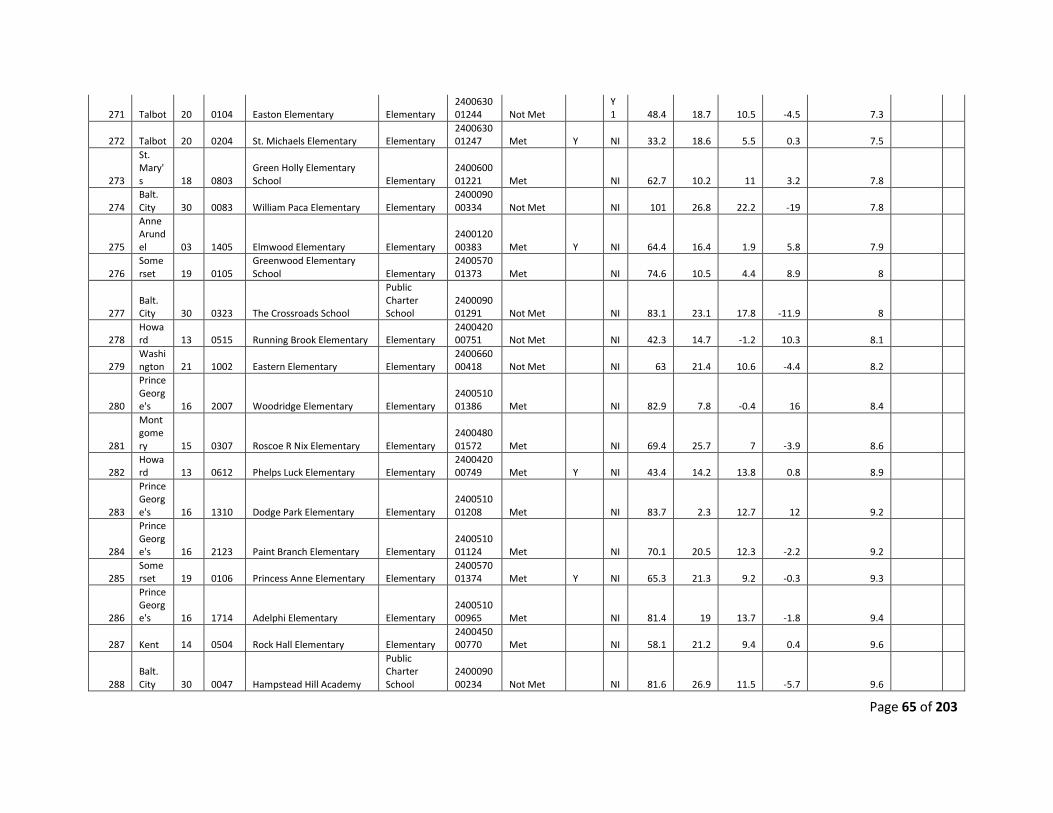
Page 65 of 203
271 Talbot 20 0104 Easton Elementary Elementary 240063001244 Not Met
Y1 48.4 18.7 10.5 -4.5 7.3
272 Talbot 20 0204 St. Michaels Elementary Elementary 240063001247 Met Y NI 33.2 18.6 5.5 0.3 7.5
273
St. Mary's 18 0803
Green Holly Elementary School Elementary
240060001221 Met NI 62.7 10.2 11 3.2 7.8
274 Balt. City 30 0083 William Paca Elementary Elementary
240009000334 Not Met NI 101 26.8 22.2 -19 7.8
275
Anne Arundel 03 1405 Elmwood Elementary Elementary
240012000383 Met Y NI 64.4 16.4 1.9 5.8 7.9
276 Somerset 19 0105
Greenwood Elementary School Elementary
240057001373 Met NI 74.6 10.5 4.4 8.9 8
277 Balt. City 30 0323 The Crossroads School
Public Charter School
240009001291 Not Met NI 83.1 23.1 17.8 -11.9 8
278 Howard 13 0515 Running Brook Elementary Elementary
240042000751 Not Met NI 42.3 14.7 -1.2 10.3 8.1
279 Washington 21 1002 Eastern Elementary Elementary
240066000418 Not Met NI 63 21.4 10.6 -4.4 8.2
280
Prince George's 16 2007 Woodridge Elementary Elementary
240051001386 Met NI 82.9 7.8 -0.4 16 8.4
281
Montgomery 15 0307 Roscoe R Nix Elementary Elementary
240048001572 Met NI 69.4 25.7 7 -3.9 8.6
282 Howard 13 0612 Phelps Luck Elementary Elementary
240042000749 Met Y NI 43.4 14.2 13.8 0.8 8.9
283
Prince George's 16 1310 Dodge Park Elementary Elementary
240051001208 Met NI 83.7 2.3 12.7 12 9.2
284
Prince George's 16 2123 Paint Branch Elementary Elementary
240051001124 Met NI 70.1 20.5 12.3 -2.2 9.2
285 Somerset 19 0106 Princess Anne Elementary Elementary
240057001374 Met Y NI 65.3 21.3 9.2 -0.3 9.3
286
Prince George's 16 1714 Adelphi Elementary Elementary
240051000965 Met NI 81.4 19 13.7 -1.8 9.4
287 Kent 14 0504 Rock Hall Elementary Elementary 240045000770 Met NI 58.1 21.2 9.4 0.4 9.6
288 Balt. City 30 0047 Hampstead Hill Academy
Public Charter School
240009000234 Not Met NI 81.6 26.9 11.5 -5.7 9.6
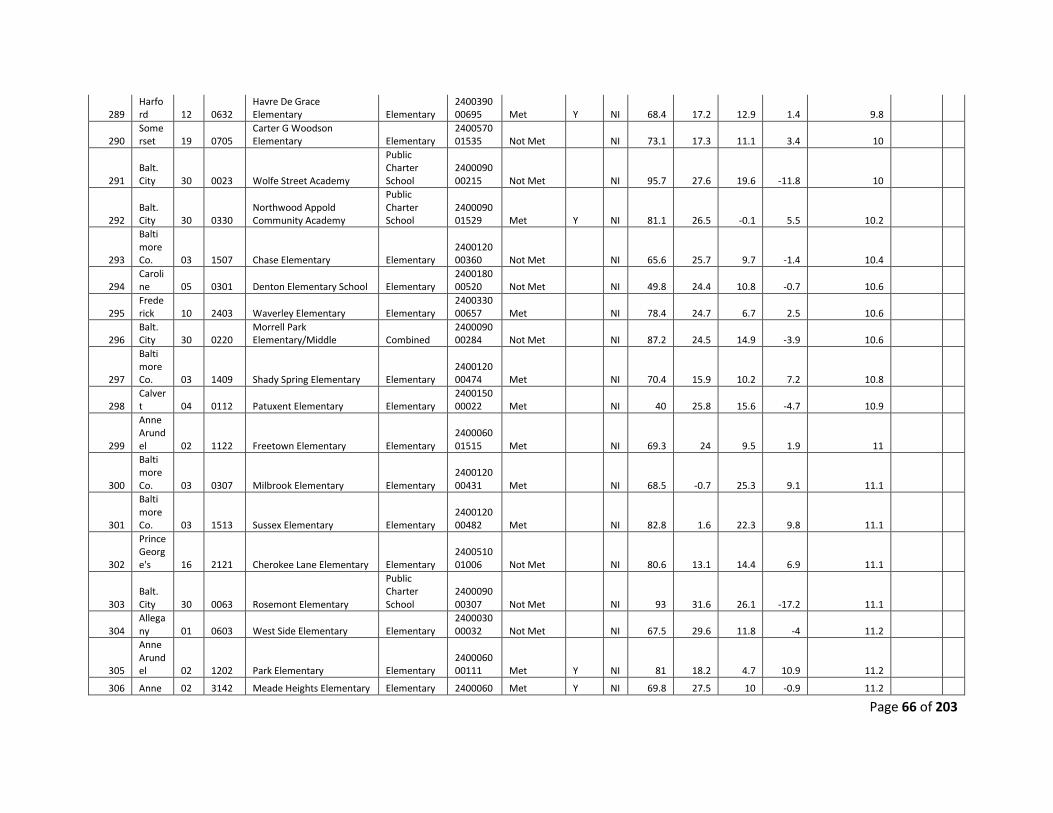
Page 66 of 203
289 Harford 12 0632
Havre De Grace Elementary Elementary
240039000695 Met Y NI 68.4 17.2 12.9 1.4 9.8
290 Somerset 19 0705
Carter G Woodson Elementary Elementary
240057001535 Not Met NI 73.1 17.3 11.1 3.4 10
291 Balt. City 30 0023 Wolfe Street Academy
Public Charter School
240009000215 Not Met NI 95.7 27.6 19.6 -11.8 10
292 Balt. City 30 0330
Northwood Appold Community Academy
Public Charter School
240009001529 Met Y NI 81.1 26.5 -0.1 5.5 10.2
293
Baltimore Co. 03 1507 Chase Elementary Elementary
240012000360 Not Met NI 65.6 25.7 9.7 -1.4 10.4
294 Caroline 05 0301 Denton Elementary School Elementary
240018000520 Not Met NI 49.8 24.4 10.8 -0.7 10.6
295 Frederick 10 2403 Waverley Elementary Elementary
240033000657 Met NI 78.4 24.7 6.7 2.5 10.6
296 Balt. City 30 0220
Morrell Park Elementary/Middle Combined
240009000284 Not Met NI 87.2 24.5 14.9 -3.9 10.6
297
Baltimore Co. 03 1409 Shady Spring Elementary Elementary
240012000474 Met NI 70.4 15.9 10.2 7.2 10.8
298 Calvert 04 0112 Patuxent Elementary Elementary
240015000022 Met NI 40 25.8 15.6 -4.7 10.9
299
Anne Arundel 02 1122 Freetown Elementary Elementary
240006001515 Met NI 69.3 24 9.5 1.9 11
300
Baltimore Co. 03 0307 Milbrook Elementary Elementary
240012000431 Met NI 68.5 -0.7 25.3 9.1 11.1
301
Baltimore Co. 03 1513 Sussex Elementary Elementary
240012000482 Met NI 82.8 1.6 22.3 9.8 11.1
302
Prince George's 16 2121 Cherokee Lane Elementary Elementary
240051001006 Not Met NI 80.6 13.1 14.4 6.9 11.1
303 Balt. City 30 0063 Rosemont Elementary
Public Charter School
240009000307 Not Met NI 93 31.6 26.1 -17.2 11.1
304 Allegany 01 0603 West Side Elementary Elementary
240003000032 Not Met NI 67.5 29.6 11.8 -4 11.2
305
Anne Arundel 02 1202 Park Elementary Elementary
240006000111 Met Y NI 81 18.2 4.7 10.9 11.2
306 Anne 02 3142 Meade Heights Elementary Elementary 2400060 Met Y NI 69.8 27.5 10 -0.9 11.2
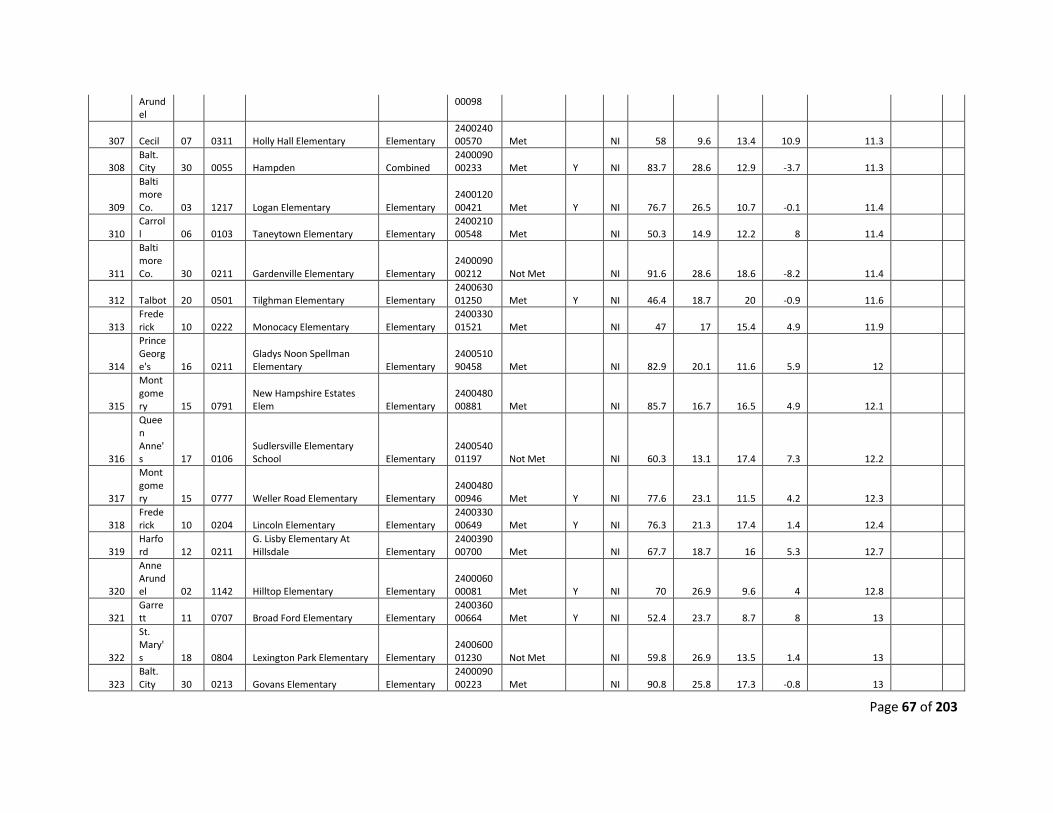
Page 67 of 203
Arundel
00098
307 Cecil 07 0311 Holly Hall Elementary Elementary 240024000570 Met NI 58 9.6 13.4 10.9 11.3
308 Balt. City 30 0055 Hampden Combined
240009000233 Met Y NI 83.7 28.6 12.9 -3.7 11.3
309
Baltimore Co. 03 1217 Logan Elementary Elementary
240012000421 Met Y NI 76.7 26.5 10.7 -0.1 11.4
310 Carroll 06 0103 Taneytown Elementary Elementary
240021000548 Met NI 50.3 14.9 12.2 8 11.4
311
Baltimore Co. 30 0211 Gardenville Elementary Elementary
240009000212 Not Met NI 91.6 28.6 18.6 -8.2 11.4
312 Talbot 20 0501 Tilghman Elementary Elementary 240063001250 Met Y NI 46.4 18.7 20 -0.9 11.6
313 Frederick 10 0222 Monocacy Elementary Elementary
240033001521 Met NI 47 17 15.4 4.9 11.9
314
Prince George's 16 0211
Gladys Noon Spellman Elementary Elementary
240051090458 Met NI 82.9 20.1 11.6 5.9 12
315
Montgomery 15 0791
New Hampshire Estates Elem Elementary
240048000881 Met NI 85.7 16.7 16.5 4.9 12.1
316
Queen Anne's 17 0106
Sudlersville Elementary School Elementary
240054001197 Not Met NI 60.3 13.1 17.4 7.3 12.2
317
Montgomery 15 0777 Weller Road Elementary Elementary
240048000946 Met Y NI 77.6 23.1 11.5 4.2 12.3
318 Frederick 10 0204 Lincoln Elementary Elementary
240033000649 Met Y NI 76.3 21.3 17.4 1.4 12.4
319 Harford 12 0211
G. Lisby Elementary At Hillsdale Elementary
240039000700 Met NI 67.7 18.7 16 5.3 12.7
320
Anne Arundel 02 1142 Hilltop Elementary Elementary
240006000081 Met Y NI 70 26.9 9.6 4 12.8
321 Garrett 11 0707 Broad Ford Elementary Elementary
240036000664 Met Y NI 52.4 23.7 8.7 8 13
322
St. Mary's 18 0804 Lexington Park Elementary Elementary
240060001230 Not Met NI 59.8 26.9 13.5 1.4 13
323 Balt. City 30 0213 Govans Elementary Elementary
240009000223 Met NI 90.8 25.8 17.3 -0.8 13
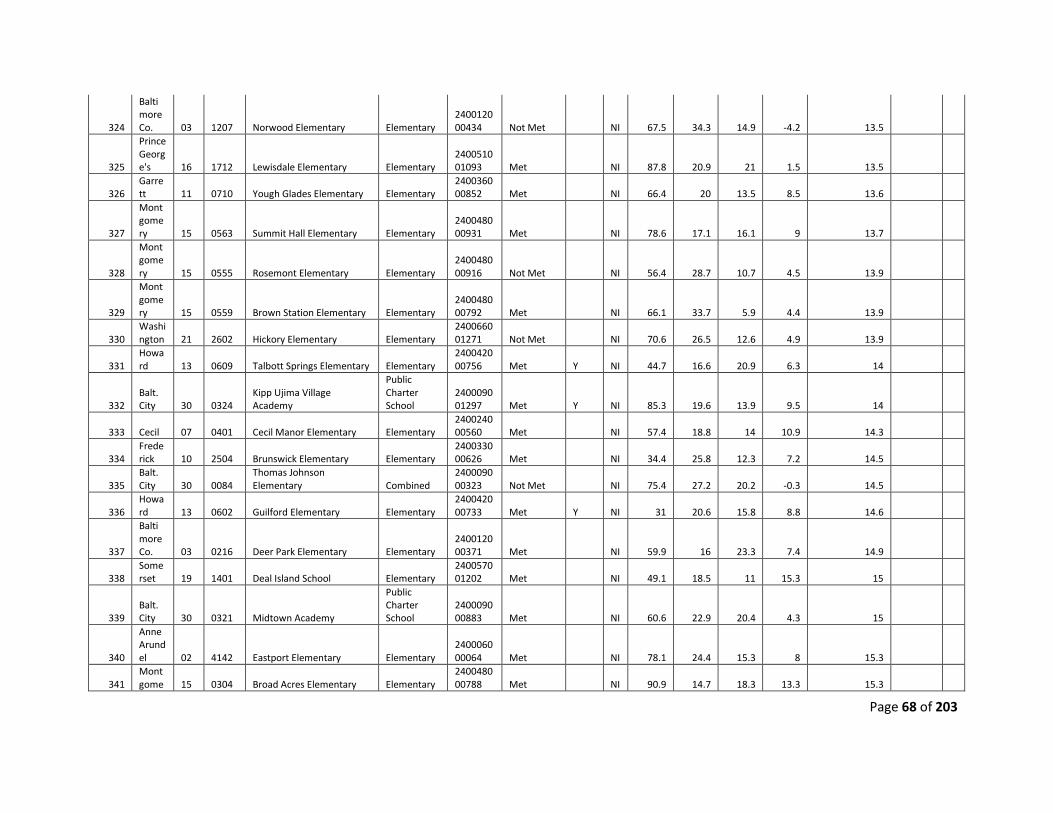
Page 68 of 203
324
Baltimore Co. 03 1207 Norwood Elementary Elementary
240012000434 Not Met NI 67.5 34.3 14.9 -4.2 13.5
325
Prince George's 16 1712 Lewisdale Elementary Elementary
240051001093 Met NI 87.8 20.9 21 1.5 13.5
326 Garrett 11 0710 Yough Glades Elementary Elementary
240036000852 Met NI 66.4 20 13.5 8.5 13.6
327
Montgomery 15 0563 Summit Hall Elementary Elementary
240048000931 Met NI 78.6 17.1 16.1 9 13.7
328
Montgomery 15 0555 Rosemont Elementary Elementary
240048000916 Not Met NI 56.4 28.7 10.7 4.5 13.9
329
Montgomery 15 0559 Brown Station Elementary Elementary
240048000792 Met NI 66.1 33.7 5.9 4.4 13.9
330 Washington 21 2602 Hickory Elementary Elementary
240066001271 Not Met NI 70.6 26.5 12.6 4.9 13.9
331 Howard 13 0609 Talbott Springs Elementary Elementary
240042000756 Met Y NI 44.7 16.6 20.9 6.3 14
332 Balt. City 30 0324
Kipp Ujima Village Academy
Public Charter School
240009001297 Met Y NI 85.3 19.6 13.9 9.5 14
333 Cecil 07 0401 Cecil Manor Elementary Elementary 240024000560 Met NI 57.4 18.8 14 10.9 14.3
334 Frederick 10 2504 Brunswick Elementary Elementary
240033000626 Met NI 34.4 25.8 12.3 7.2 14.5
335 Balt. City 30 0084
Thomas Johnson Elementary Combined
240009000323 Not Met NI 75.4 27.2 20.2 -0.3 14.5
336 Howard 13 0602 Guilford Elementary Elementary
240042000733 Met Y NI 31 20.6 15.8 8.8 14.6
337
Baltimore Co. 03 0216 Deer Park Elementary Elementary
240012000371 Met NI 59.9 16 23.3 7.4 14.9
338 Somerset 19 1401 Deal Island School Elementary
240057001202 Met NI 49.1 18.5 11 15.3 15
339 Balt. City 30 0321 Midtown Academy
Public Charter School
240009000883 Met NI 60.6 22.9 20.4 4.3 15
340
Anne Arundel 02 4142 Eastport Elementary Elementary
240006000064 Met NI 78.1 24.4 15.3 8 15.3
341 Montgome 15 0304 Broad Acres Elementary Elementary
240048000788 Met NI 90.9 14.7 18.3 13.3 15.3
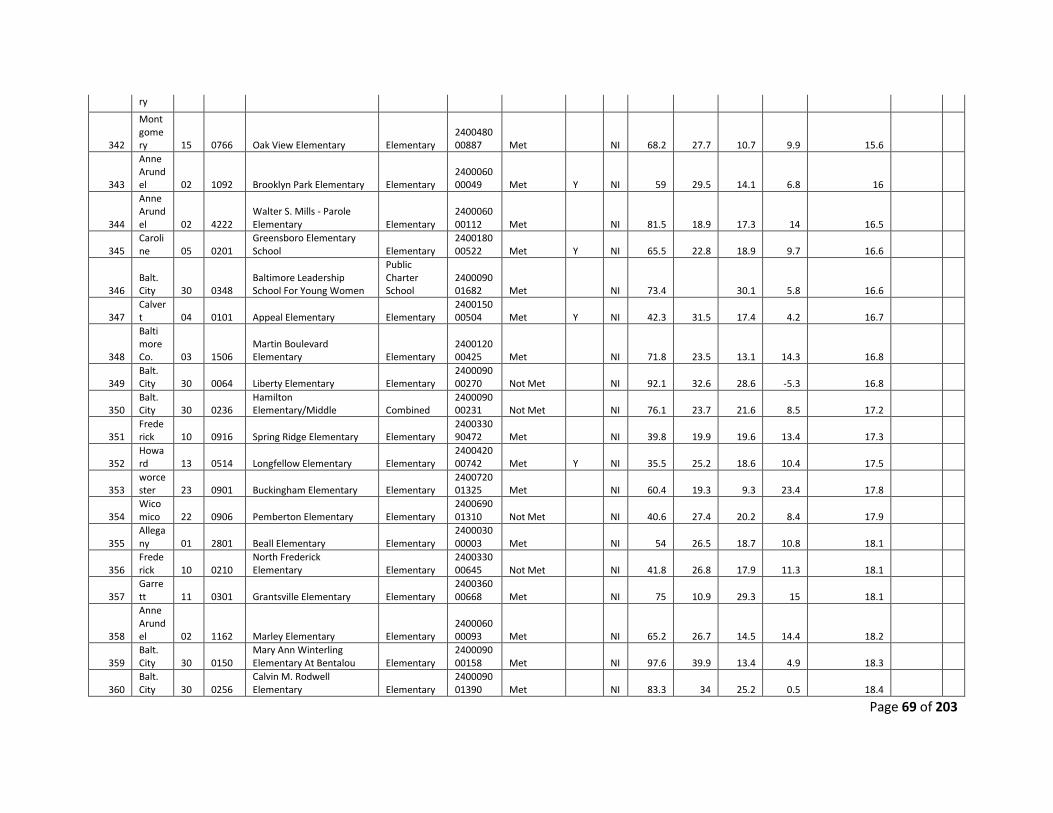
Page 69 of 203
ry
342
Montgomery 15 0766 Oak View Elementary Elementary
240048000887 Met NI 68.2 27.7 10.7 9.9 15.6
343
Anne Arundel 02 1092 Brooklyn Park Elementary Elementary
240006000049 Met Y NI 59 29.5 14.1 6.8 16
344
Anne Arundel 02 4222
Walter S. Mills - Parole Elementary Elementary
240006000112 Met NI 81.5 18.9 17.3 14 16.5
345 Caroline 05 0201
Greensboro Elementary School Elementary
240018000522 Met Y NI 65.5 22.8 18.9 9.7 16.6
346 Balt. City 30 0348
Baltimore Leadership School For Young Women
Public Charter School
240009001682 Met NI 73.4 30.1 5.8 16.6
347 Calvert 04 0101 Appeal Elementary Elementary
240015000504 Met Y NI 42.3 31.5 17.4 4.2 16.7
348
Baltimore Co. 03 1506
Martin Boulevard Elementary Elementary
240012000425 Met NI 71.8 23.5 13.1 14.3 16.8
349 Balt. City 30 0064 Liberty Elementary Elementary
240009000270 Not Met NI 92.1 32.6 28.6 -5.3 16.8
350 Balt. City 30 0236
Hamilton Elementary/Middle Combined
240009000231 Not Met NI 76.1 23.7 21.6 8.5 17.2
351 Frederick 10 0916 Spring Ridge Elementary Elementary
240033090472 Met NI 39.8 19.9 19.6 13.4 17.3
352 Howard 13 0514 Longfellow Elementary Elementary
240042000742 Met Y NI 35.5 25.2 18.6 10.4 17.5
353 worcester 23 0901 Buckingham Elementary Elementary
240072001325 Met NI 60.4 19.3 9.3 23.4 17.8
354 Wicomico 22 0906 Pemberton Elementary Elementary
240069001310 Not Met NI 40.6 27.4 20.2 8.4 17.9
355 Allegany 01 2801 Beall Elementary Elementary
240003000003 Met NI 54 26.5 18.7 10.8 18.1
356 Frederick 10 0210
North Frederick Elementary Elementary
240033000645 Not Met NI 41.8 26.8 17.9 11.3 18.1
357 Garrett 11 0301 Grantsville Elementary Elementary
240036000668 Met NI 75 10.9 29.3 15 18.1
358
Anne Arundel 02 1162 Marley Elementary Elementary
240006000093 Met NI 65.2 26.7 14.5 14.4 18.2
359 Balt. City 30 0150
Mary Ann Winterling Elementary At Bentalou Elementary
240009000158 Met NI 97.6 39.9 13.4 4.9 18.3
360 Balt. City 30 0256
Calvin M. Rodwell Elementary Elementary
240009001390 Met NI 83.3 34 25.2 0.5 18.4
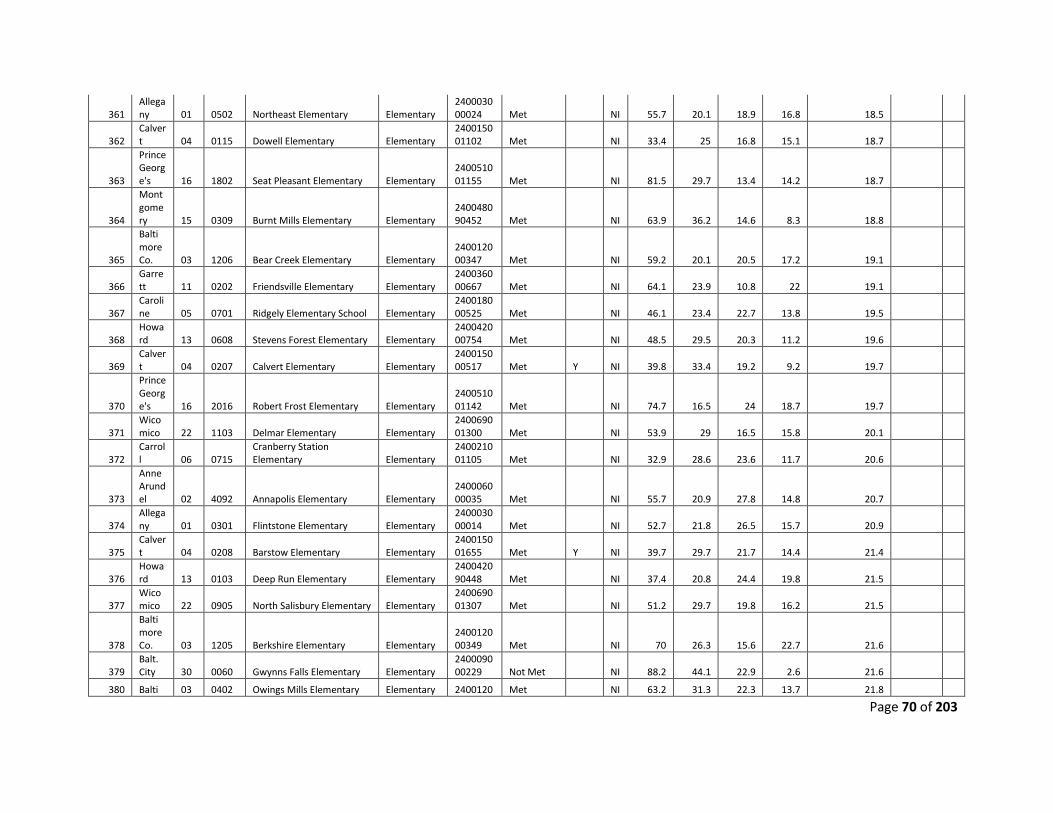
Page 70 of 203
361 Allegany 01 0502 Northeast Elementary Elementary
240003000024 Met NI 55.7 20.1 18.9 16.8 18.5
362 Calvert 04 0115 Dowell Elementary Elementary
240015001102 Met NI 33.4 25 16.8 15.1 18.7
363
Prince George's 16 1802 Seat Pleasant Elementary Elementary
240051001155 Met NI 81.5 29.7 13.4 14.2 18.7
364
Montgomery 15 0309 Burnt Mills Elementary Elementary
240048090452 Met NI 63.9 36.2 14.6 8.3 18.8
365
Baltimore Co. 03 1206 Bear Creek Elementary Elementary
240012000347 Met NI 59.2 20.1 20.5 17.2 19.1
366 Garrett 11 0202 Friendsville Elementary Elementary
240036000667 Met NI 64.1 23.9 10.8 22 19.1
367 Caroline 05 0701 Ridgely Elementary School Elementary
240018000525 Met NI 46.1 23.4 22.7 13.8 19.5
368 Howard 13 0608 Stevens Forest Elementary Elementary
240042000754 Met NI 48.5 29.5 20.3 11.2 19.6
369 Calvert 04 0207 Calvert Elementary Elementary
240015000517 Met Y NI 39.8 33.4 19.2 9.2 19.7
370
Prince George's 16 2016 Robert Frost Elementary Elementary
240051001142 Met NI 74.7 16.5 24 18.7 19.7
371 Wicomico 22 1103 Delmar Elementary Elementary
240069001300 Met NI 53.9 29 16.5 15.8 20.1
372 Carroll 06 0715
Cranberry Station Elementary Elementary
240021001105 Met NI 32.9 28.6 23.6 11.7 20.6
373
Anne Arundel 02 4092 Annapolis Elementary Elementary
240006000035 Met NI 55.7 20.9 27.8 14.8 20.7
374 Allegany 01 0301 Flintstone Elementary Elementary
240003000014 Met NI 52.7 21.8 26.5 15.7 20.9
375 Calvert 04 0208 Barstow Elementary Elementary
240015001655 Met Y NI 39.7 29.7 21.7 14.4 21.4
376 Howard 13 0103 Deep Run Elementary Elementary
240042090448 Met NI 37.4 20.8 24.4 19.8 21.5
377 Wicomico 22 0905 North Salisbury Elementary Elementary
240069001307 Met NI 51.2 29.7 19.8 16.2 21.5
378
Baltimore Co. 03 1205 Berkshire Elementary Elementary
240012000349 Met NI 70 26.3 15.6 22.7 21.6
379 Balt. City 30 0060 Gwynns Falls Elementary Elementary
240009000229 Not Met NI 88.2 44.1 22.9 2.6 21.6
380 Balti 03 0402 Owings Mills Elementary Elementary 2400120 Met NI 63.2 31.3 22.3 13.7 21.8
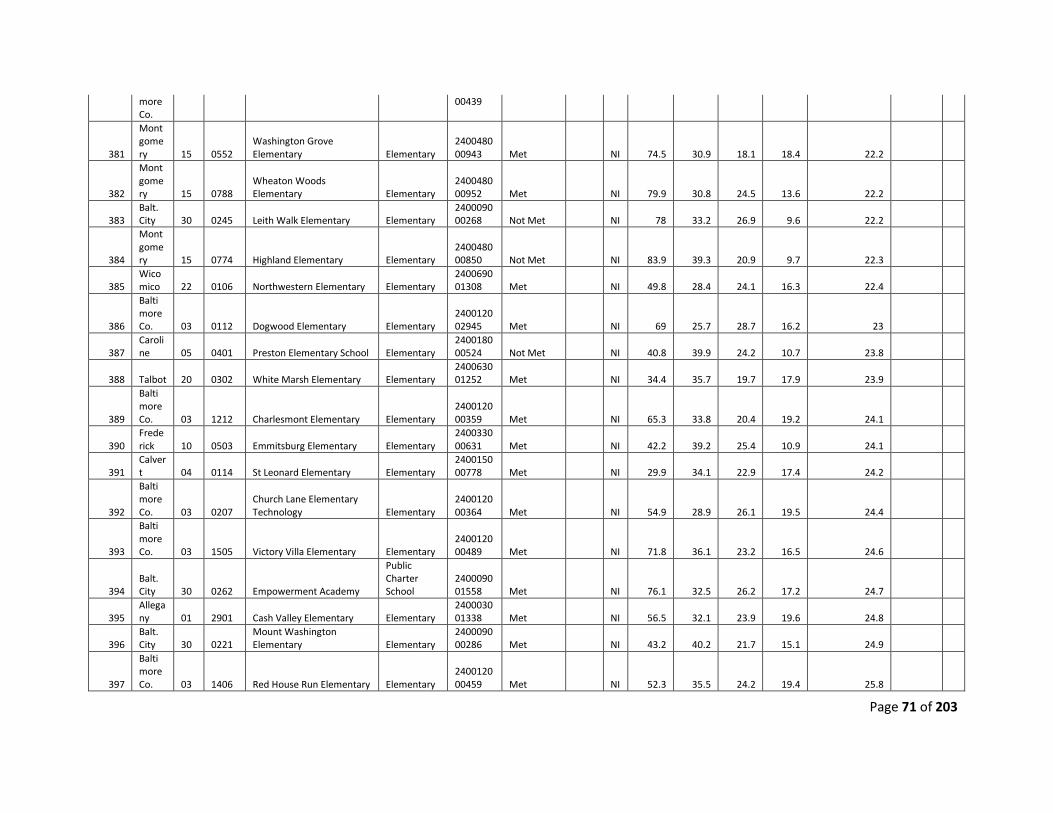
Page 71 of 203
more Co.
00439
381
Montgomery 15 0552
Washington Grove Elementary Elementary
240048000943 Met NI 74.5 30.9 18.1 18.4 22.2
382
Montgomery 15 0788
Wheaton Woods Elementary Elementary
240048000952 Met NI 79.9 30.8 24.5 13.6 22.2
383 Balt. City 30 0245 Leith Walk Elementary Elementary
240009000268 Not Met NI 78 33.2 26.9 9.6 22.2
384
Montgomery 15 0774 Highland Elementary Elementary
240048000850 Not Met NI 83.9 39.3 20.9 9.7 22.3
385 Wicomico 22 0106 Northwestern Elementary Elementary
240069001308 Met NI 49.8 28.4 24.1 16.3 22.4
386
Baltimore Co. 03 0112 Dogwood Elementary Elementary
240012002945 Met NI 69 25.7 28.7 16.2 23
387 Caroline 05 0401 Preston Elementary School Elementary
240018000524 Not Met NI 40.8 39.9 24.2 10.7 23.8
388 Talbot 20 0302 White Marsh Elementary Elementary 240063001252 Met NI 34.4 35.7 19.7 17.9 23.9
389
Baltimore Co. 03 1212 Charlesmont Elementary Elementary
240012000359 Met NI 65.3 33.8 20.4 19.2 24.1
390 Frederick 10 0503 Emmitsburg Elementary Elementary
240033000631 Met NI 42.2 39.2 25.4 10.9 24.1
391 Calvert 04 0114 St Leonard Elementary Elementary
240015000778 Met NI 29.9 34.1 22.9 17.4 24.2
392
Baltimore Co. 03 0207
Church Lane Elementary Technology Elementary
240012000364 Met NI 54.9 28.9 26.1 19.5 24.4
393
Baltimore Co. 03 1505 Victory Villa Elementary Elementary
240012000489 Met NI 71.8 36.1 23.2 16.5 24.6
394 Balt. City 30 0262 Empowerment Academy
Public Charter School
240009001558 Met NI 76.1 32.5 26.2 17.2 24.7
395 Allegany 01 2901 Cash Valley Elementary Elementary
240003001338 Met NI 56.5 32.1 23.9 19.6 24.8
396 Balt. City 30 0221
Mount Washington Elementary Elementary
240009000286 Met NI 43.2 40.2 21.7 15.1 24.9
397
Baltimore Co. 03 1406 Red House Run Elementary Elementary
240012000459 Met NI 52.3 35.5 24.2 19.4 25.8
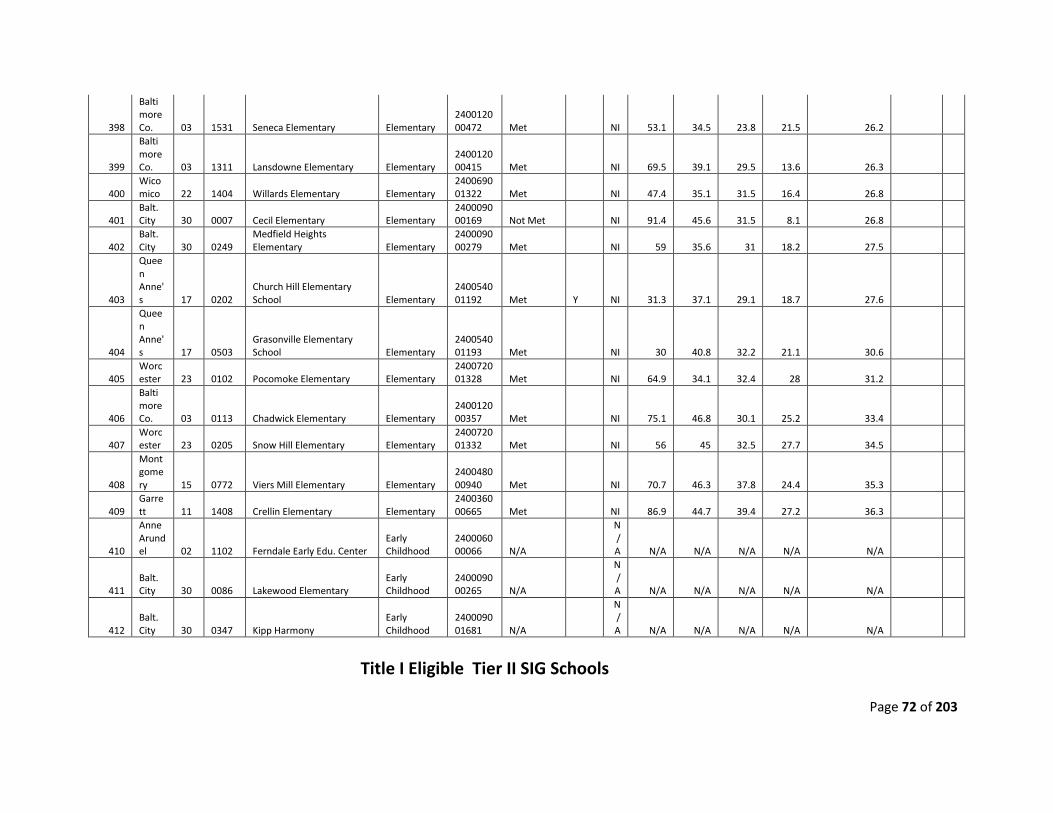
Page 72 of 203
398
Baltimore Co. 03 1531 Seneca Elementary Elementary
240012000472 Met NI 53.1 34.5 23.8 21.5 26.2
399
Baltimore Co. 03 1311 Lansdowne Elementary Elementary
240012000415 Met NI 69.5 39.1 29.5 13.6 26.3
400 Wicomico 22 1404 Willards Elementary Elementary
240069001322 Met NI 47.4 35.1 31.5 16.4 26.8
401 Balt. City 30 0007 Cecil Elementary Elementary
240009000169 Not Met NI 91.4 45.6 31.5 8.1 26.8
402 Balt. City 30 0249
Medfield Heights Elementary Elementary
240009000279 Met NI 59 35.6 31 18.2 27.5
403
Queen Anne's 17 0202
Church Hill Elementary School Elementary
240054001192 Met Y NI 31.3 37.1 29.1 18.7 27.6
404
Queen Anne's 17 0503
Grasonville Elementary School Elementary
240054001193 Met NI 30 40.8 32.2 21.1 30.6
405 Worcester 23 0102 Pocomoke Elementary Elementary
240072001328 Met NI 64.9 34.1 32.4 28 31.2
406
Baltimore Co. 03 0113 Chadwick Elementary Elementary
240012000357 Met NI 75.1 46.8 30.1 25.2 33.4
407 Worcester 23 0205 Snow Hill Elementary Elementary
240072001332 Met NI 56 45 32.5 27.7 34.5
408
Montgomery 15 0772 Viers Mill Elementary Elementary
240048000940 Met NI 70.7 46.3 37.8 24.4 35.3
409 Garrett 11 1408 Crellin Elementary Elementary
240036000665 Met NI 86.9 44.7 39.4 27.2 36.3
410
Anne Arundel 02 1102 Ferndale Early Edu. Center
Early Childhood
240006000066 N/A
N/A N/A N/A N/A N/A N/A
411 Balt. City 30 0086 Lakewood Elementary
Early Childhood
240009000265 N/A
N/A N/A N/A N/A N/A N/A
412 Balt. City 30 0347 Kipp Harmony
Early Childhood
240009001681 N/A
N/A N/A N/A N/A N/A N/A
Title I Eligible Tier II SIG Schools
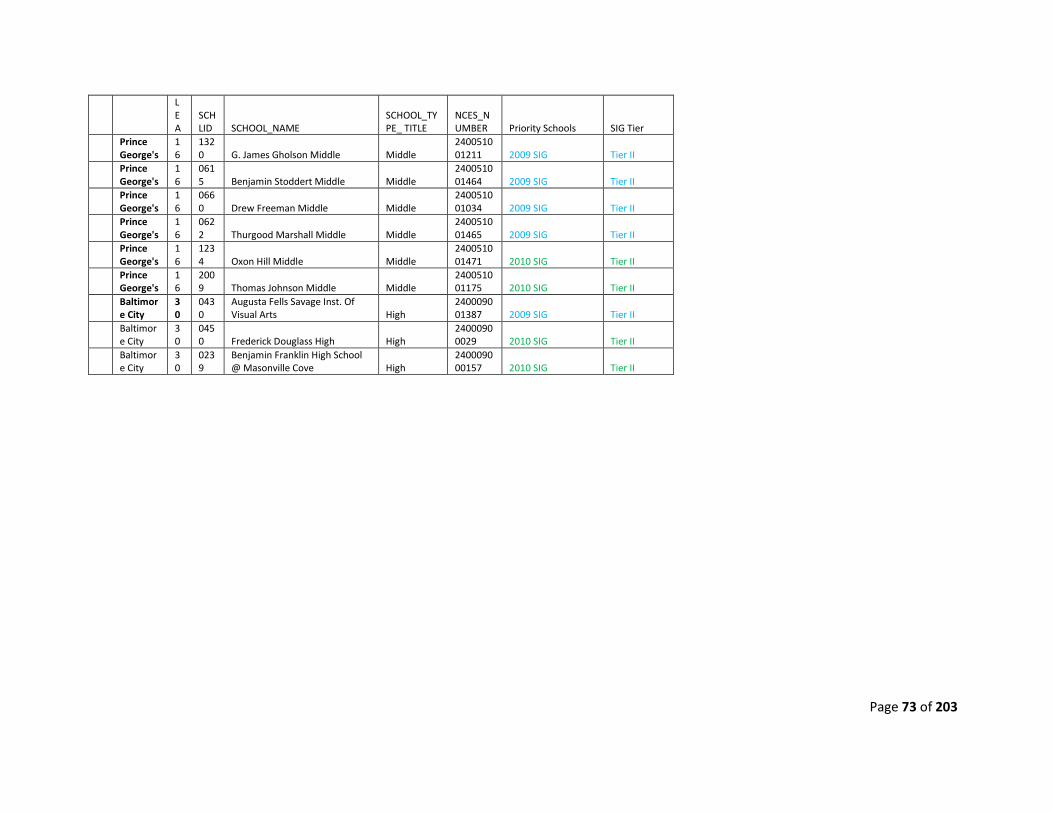
Page 73 of 203
LEA
SCHLID SCHOOL_NAME
SCHOOL_TYPE_ TITLE
NCES_NUMBER Priority Schools SIG Tier
Prince George's
16
1320 G. James Gholson Middle Middle
240051001211 2009 SIG Tier II
Prince George's
16
0615 Benjamin Stoddert Middle Middle
240051001464 2009 SIG Tier II
Prince George's
16
0660 Drew Freeman Middle Middle
240051001034 2009 SIG Tier II
Prince George's
16
0622 Thurgood Marshall Middle Middle
240051001465 2009 SIG Tier II
Prince George's
16
1234 Oxon Hill Middle Middle
240051001471 2010 SIG Tier II
Prince George's
16
2009 Thomas Johnson Middle Middle
240051001175 2010 SIG Tier II
Baltimore City
30
0430
Augusta Fells Savage Inst. Of Visual Arts High
240009001387 2009 SIG Tier II
Baltimore City
30
0450 Frederick Douglass High High
24000900029 2010 SIG Tier II
Baltimore City
30
0239
Benjamin Franklin High School @ Masonville Cove High
240009000157 2010 SIG Tier II
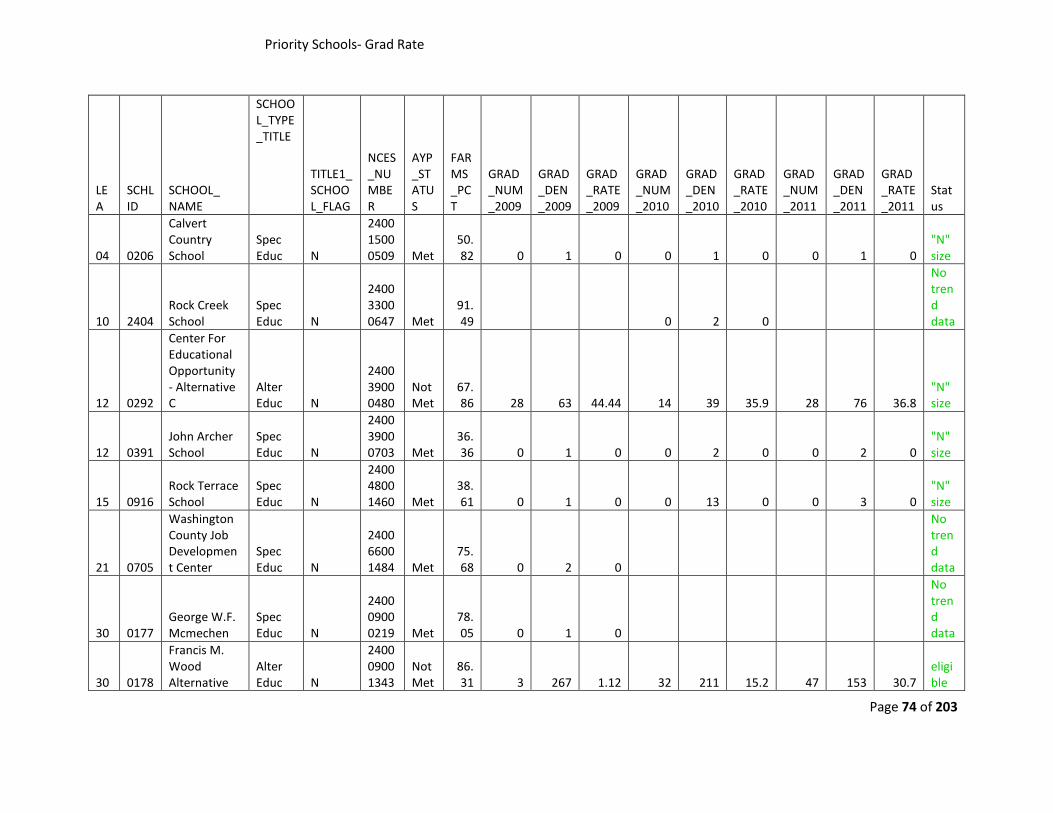
Page 74 of 203
LEA
SCHLID
SCHOOL_ NAME
SCHOOL_TYPE_TITLE
TITLE1_SCHOOL_FLAG
NCES_NUMBER
AYP_STATUS
FARMS_PCT
GRAD_NUM_2009
GRAD_DEN_2009
GRAD_RATE_2009
GRAD_NUM_2010
GRAD_DEN_2010
GRAD_RATE_2010
GRAD_NUM_2011
GRAD_DEN_2011
GRAD_RATE_2011
Status
04 0206
Calvert Country School
Spec Educ N
240015000509 Met
50.82 0 1 0 0 1 0 0 1 0
"N" size
10 2404 Rock Creek School
Spec Educ N
240033000647 Met
91.49 0 2 0
No trend data
12 0292
Center For Educational Opportunity - Alternative C
Alter Educ N
240039000480
Not Met
67.86 28 63 44.44 14 39 35.9 28 76 36.8
"N" size
12 0391 John Archer School
Spec Educ N
240039000703 Met
36.36 0 1 0 0 2 0 0 2 0
"N" size
15 0916 Rock Terrace School
Spec Educ N
240048001460 Met
38.61 0 1 0 0 13 0 0 3 0
"N" size
21 0705
Washington County Job Development Center
Spec Educ N
240066001484 Met
75.68 0 2 0
No trend data
30 0177 George W.F. Mcmechen
Spec Educ N
240009000219 Met
78.05 0 1 0
No trend data
30 0178
Francis M. Wood Alternative
Alter Educ N
240009001343
Not Met
86.31 3 267 1.12 32 211 15.2 47 153 30.7
eligible
Priority Schools- Grad Rate
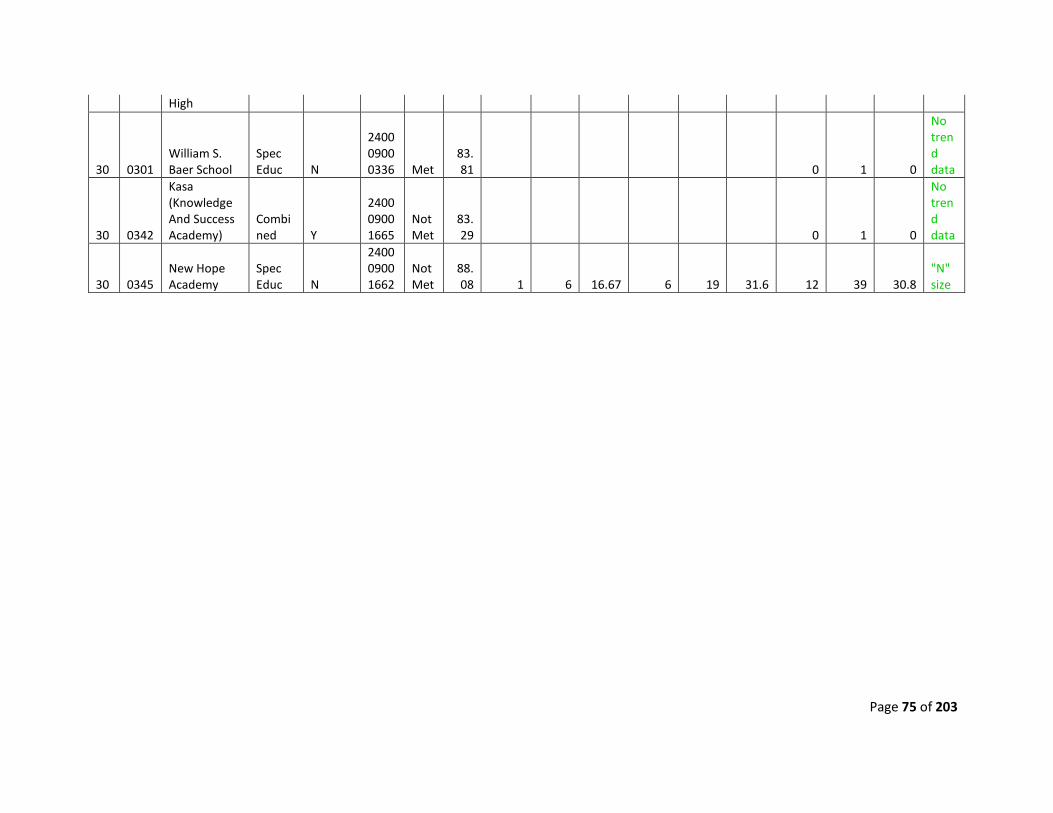
Page 75 of 203
High
30 0301 William S. Baer School
Spec Educ N
240009000336 Met
83.81 0 1 0
No trend data
30 0342
Kasa (Knowledge And Success Academy)
Combined Y
240009001665
Not Met
83.29 0 1 0
No trend data
30 0345 New Hope Academy
Spec Educ N
240009001662
Not Met
88.08 1 6 16.67 6 19 31.6 12 39 30.8
"N" size
Page 76 of 203
APPENDIX II- 8: FULL RANKING OF
FOCUS SCHOOLS
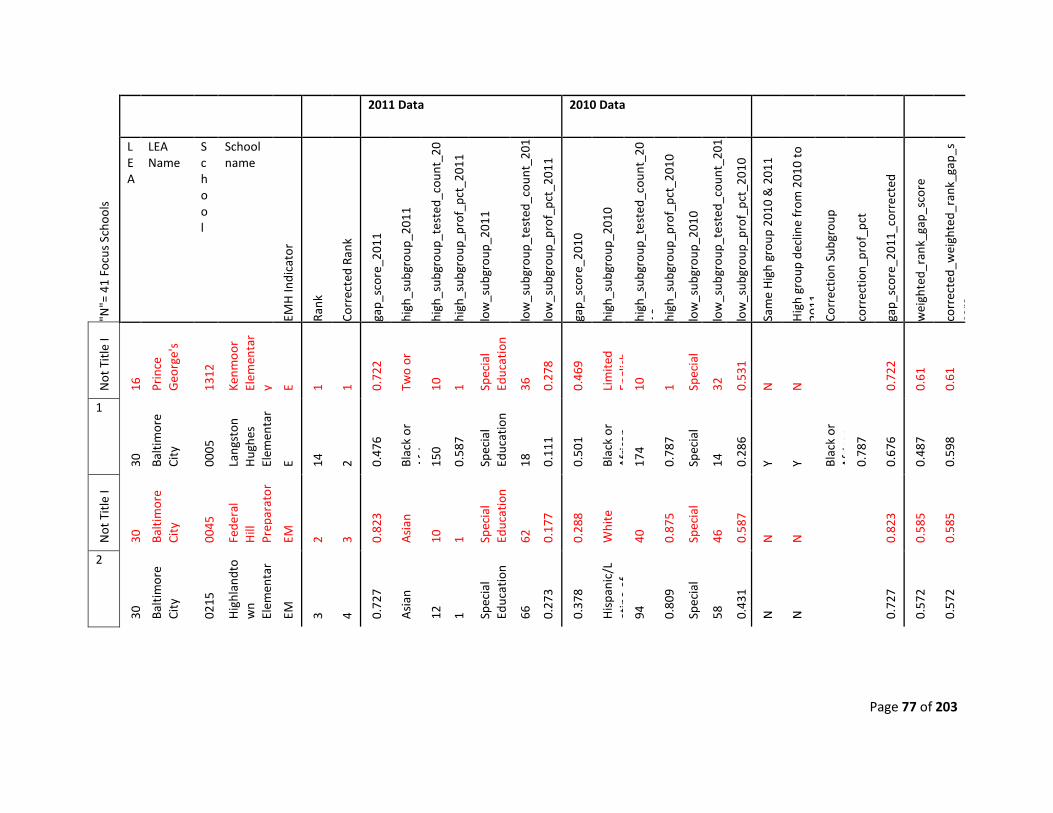
Page 77 of 203
2011 Data 2010 Data
"N"=
41
Focu
s Sc
hool
s
LEA
LEA Name
School
School name
EMH
Indi
cato
r
Rank
Corr
ecte
d Ra
nk
gap_
scor
e_20
11
high
_sub
grou
p_20
11
high
_sub
grou
p_te
sted
_cou
nt_2
0
high
_sub
grou
p_pr
of_p
ct_2
011
low
_sub
grou
p_20
11
low
_sub
grou
p_te
sted
_cou
nt_2
01 low
_sub
grou
p_pr
of_p
ct_2
011
gap_
scor
e_20
10
high
_sub
grou
p_20
10
high
_sub
grou
p_te
sted
_cou
nt_2
010
hi
gh_s
ubgr
oup_
prof
_pct
_201
0
low
_sub
grou
p_20
10
low
_sub
grou
p_te
sted
_cou
nt_2
01 low
_sub
grou
p_pr
of_p
ct_2
010
Sam
e H
igh
grou
p 20
10 &
201
1
Hig
h gr
oup
decl
ine
from
201
0 to
20
11
Corr
ectio
n Su
bgro
up
corr
ectio
n_pr
of_p
ct
gap_
scor
e_20
11_c
orre
cted
wei
ghte
d_ra
nk_g
ap_s
core
corr
ecte
d_w
eigh
ted_
rank
_gap
_sco
re
Not
Titl
e I
16
Prin
ce
Geo
rge'
s
1312
Kenm
oor
Elem
enta
ry E 1 1 0.
722
Two
or
10
1 Spec
ial
Educ
atio
n
36
0.27
8
0.46
9
Lim
ited
Engl
ish
10
1 Spec
ial
32
0.53
1
N
N
0.72
2
0.61
0.61
1
30
Balti
mor
e Ci
ty
0005
Lang
ston
H
ughe
s El
emen
tar
E 14
2 0.47
6
Blac
k or
A
fi
150
0.58
7
Spec
ial
Educ
atio
n
18
0.11
1
0.50
1
Blac
k or
A
fric
an
17
4
0.78
7
Spec
ial
14
0.28
6
Y Y Blac
k or
A
fric
an
0.
787
0.67
6
0.48
7
0.59
8
Not
Titl
e I
30
Balti
mor
e Ci
ty
0045
Fede
ral
Hill
Pr
epar
ator
EM
2 3 0.82
3
Asi
an
10
1 Spec
ial
Educ
atio
n
62
0.17
7
0.28
8
Whi
te
40
0.87
5
Spec
ial
46
0.58
7
N
N
0.82
3
0.58
5
0.58
5
2
30
Balti
mor
e Ci
ty
0215
Hig
hlan
dto
wn
Elem
enta
r
EM
3 4 0.72
7
Asi
an
12
1 Spec
ial
Educ
atio
n
66
0.27
3
0.37
8
His
pani
c/L
atin
o of
94
0.80
9
Spec
ial
58
0.43
1
N
N
0.72
7
0.57
2
0.57
2
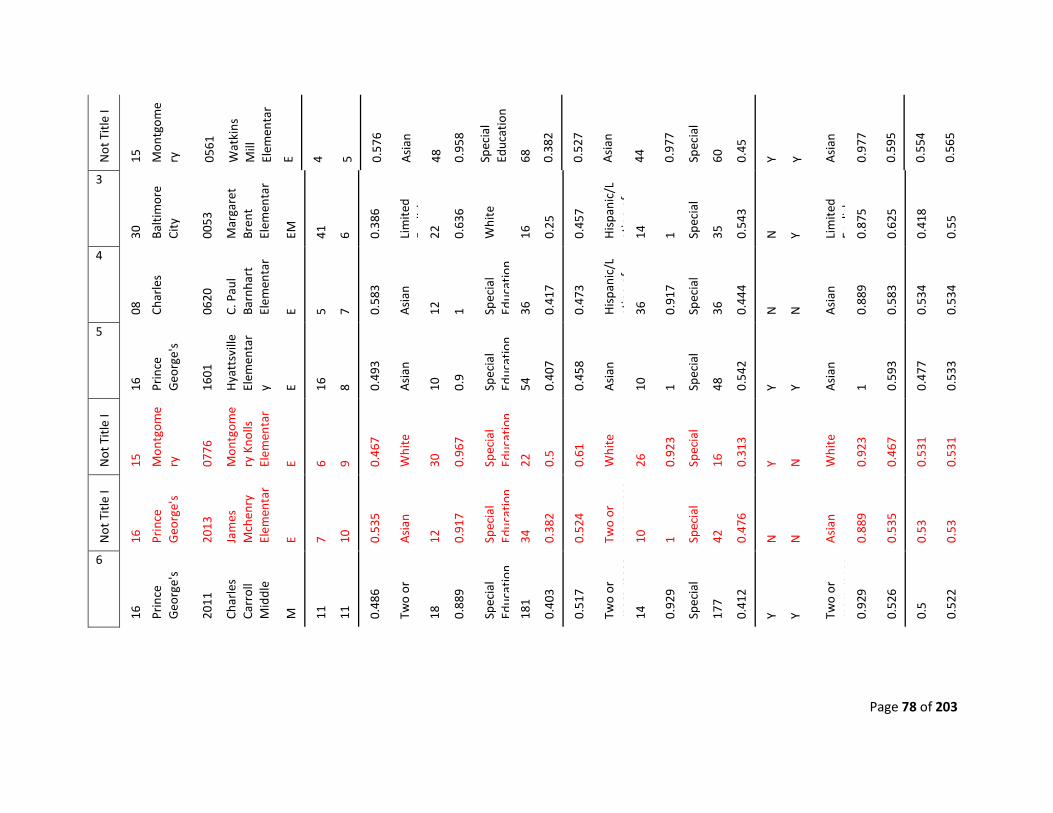
Page 78 of 203
Not
Titl
e I
15
Mon
tgom
ery
0561
Wat
kins
M
ill
Elem
enta
r E 4 5 0.57
6
Asi
an
48
0.95
8
Spec
ial
Educ
atio
n
68
0.38
2
0.52
7
Asi
an
44
0.97
7
Spec
ial
60
0.45
Y Y Asi
an
0.97
7
0.59
5
0.55
4
0.56
5
3
30
Balti
mor
e Ci
ty
0053
Mar
gare
t Br
ent
Elem
enta
r EM
41
6 0.38
6
Lim
ited
Eli
h
22
0.63
6
Whi
te
16
0.25
0.45
7
His
pani
c/L
atin
o of
14
1 Spec
ial
35
0.54
3
N
Y Lim
ited
Engl
ish
0.
875
0.62
5
0.41
8
0.55
4
08
Char
les
0620
C. P
aul
Barn
hart
El
emen
tar
E 5 7 0.58
3
Asi
an
12
1 Spec
ial
Educ
atio
n
36
0.41
7
0.47
3
His
pani
c/L
atin
o of
36
0.91
7
Spec
ial
36
0.44
4
N
N
Asi
an
0.88
9
0.58
3
0.53
4
0.53
4
5
16
Prin
ce
Geo
rge'
s
1601
Hya
ttsv
ille
Elem
enta
ry E 16
8 0.49
3
Asi
an
10
0.9
Spec
ial
Educ
atio
n
54
0.40
7
0.45
8
Asi
an
10
1 Spec
ial
48
0.54
2
Y Y Asi
an
1 0.59
3
0.47
7
0.53
3
Not
Titl
e I
15
Mon
tgom
ery
0776
Mon
tgom
ery
Kno
lls
Elem
enta
r E 6 9 0.46
7
Whi
te
30
0.96
7
Spec
ial
Educ
atio
n
22
0.5
0.61
Whi
te
26
0.92
3
Spec
ial
16
0.31
3
Y N
Whi
te
0.92
3
0.46
7
0.53
1
0.53
1
Not
Titl
e I
16
Prin
ce
Geo
rge'
s
2013
Jam
es
Mch
enry
El
emen
tar
E 7 10
0.53
5
Asi
an
12
0.91
7
Spec
ial
Educ
atio
n
34
0.38
2
0.52
4
Two
or
mor
e ra
ces
10
1 Spec
ial
42
0.47
6
N
N
Asi
an
0.88
9
0.53
5
0.53
0.53
6
16
Prin
ce
Geo
rge'
s
2011
Char
les
Carr
oll
Mid
dle
M
11
11
0.48
6
Two
or
18
0.88
9
Spec
ial
Educ
atio
n
181
0.40
3
0.51
7
Two
or
mor
e ra
ces
14
0.92
9
Spec
ial
17
7
0.41
2
Y Y Two
or
mor
e ra
ces
0.92
9
0.52
6
0.5
0.52
2
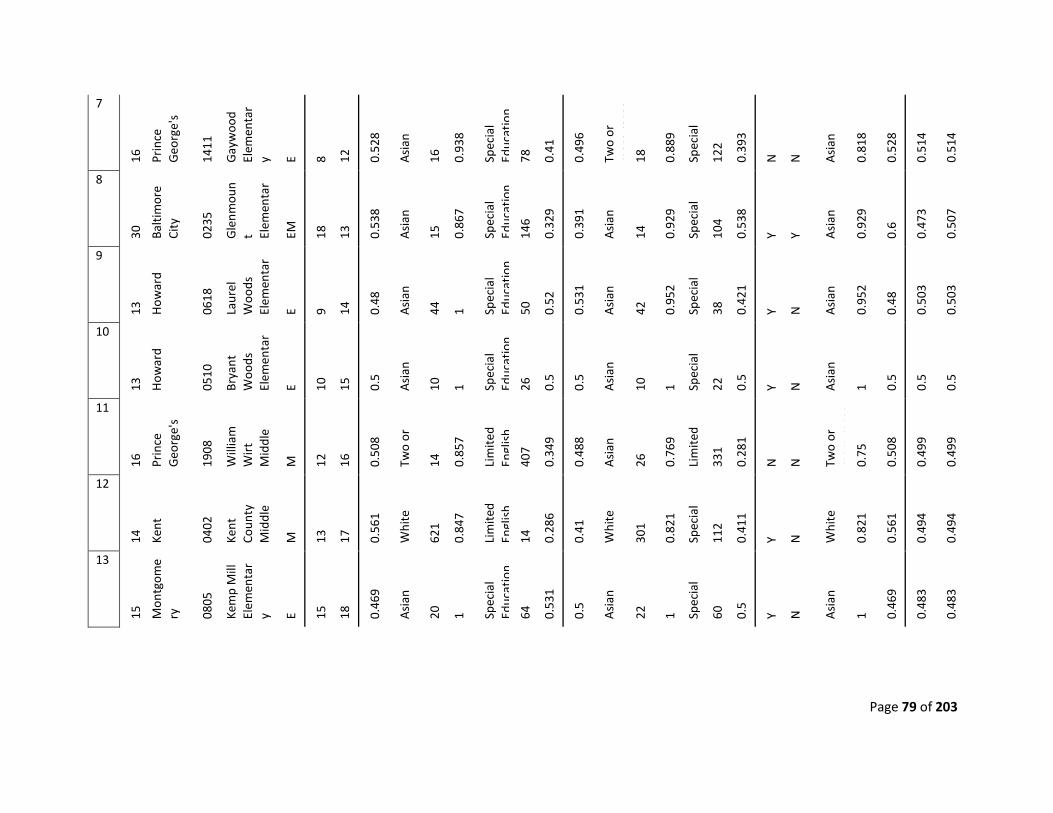
Page 79 of 203
7
16
Prin
ce
Geo
rge'
s
1411
Gay
woo
d El
emen
tar
y E 8 12
0.52
8
Asi
an
16
0.93
8
Spec
ial
Educ
atio
n
78
0.41
0.49
6
Two
or
mor
e ra
ces
18
0.88
9
Spec
ial
12
2
0.39
3
N
N
Asi
an
0.81
8
0.52
8
0.51
4
0.51
4
8
30
Balti
mor
e Ci
ty
0235
Gle
nmou
nt El
emen
tar
EM
18
13
0.53
8
Asi
an
15
0.86
7
Spec
ial
Educ
atio
n
146
0.32
9
0.39
1
Asi
an
14
0.92
9
Spec
ial
10
4
0.53
8
Y Y Asi
an
0.92
9
0.6
0.47
3
0.50
7
9
13
How
ard
0618
Laur
el
Woo
ds
Elem
enta
r E 9 14
0.48
Asi
an
44
1 Spec
ial
Educ
atio
n
50
0.52
0.53
1
Asi
an
42
0.95
2
Spec
ial
38
0.42
1
Y N
Asi
an
0.95
2
0.48
0.50
3
0.50
3
10
13
How
ard
0510
Brya
nt
Woo
ds
Elem
enta
r E 10
15
0.5
Asi
an
10
1 Spec
ial
Educ
atio
n
26
0.5
0.5
Asi
an
10
1 Spec
ial
22
0.5
Y N
Asi
an
1 0.5
0.5
0.5
11
16
Prin
ce
Geo
rge'
s
1908
Will
iam
W
irt
Mid
dle
M
12
16
0.50
8
Two
or
14
0.85
7
Lim
ited
Engl
ish
40
7
0.34
9
0.48
8
Asi
an
26
0.76
9
Lim
ited
33
1
0.28
1
N
N
Two
or
mor
e ra
ces
0.75
0.50
8
0.49
9
0.49
9
12
14
Kent
0402
Kent
Co
unty
M
iddl
e M
13
17
0.56
1
Whi
te
621
0.84
7
Lim
ited
Engl
ish
14
0.28
6
0.41
Whi
te
301
0.82
1
Spec
ial
11
2
0.41
1
Y N
Whi
te
0.82
1
0.56
1
0.49
4
0.49
4
13
15
Mon
tgom
ery
0805
Kem
p M
ill
Elem
enta
ry E 15
18
0.46
9
Asi
an
20
1 Spec
ial
Educ
atio
n
64
0.53
1
0.5
Asi
an
22
1 Spec
ial
60
0.5
Y N
Asi
an
1 0.46
9
0.48
3
0.48
3
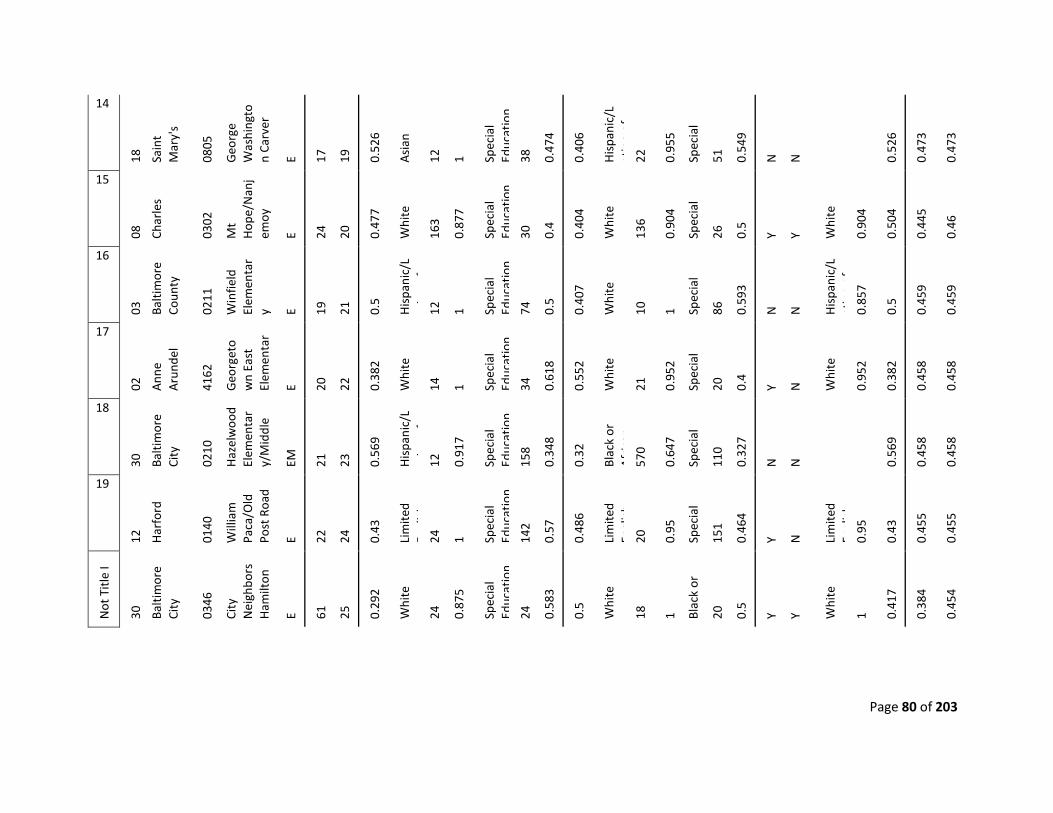
Page 80 of 203
14
18
Sain
t M
ary'
s
0805
Geo
rge
Was
hing
ton
Carv
er
E 17
19
0.52
6
Asi
an
12
1 Spec
ial
Educ
atio
n
38
0.47
4
0.40
6
His
pani
c/L
atin
o of
22
0.95
5
Spec
ial
51
0.54
9
N
N
0.52
6
0.47
3
0.47
3
15
08
Char
les
0302
Mt
Hop
e/N
anj
emoy
E 24
20
0.47
7
Whi
te
163
0.87
7
Spec
ial
Educ
atio
n
30
0.4
0.40
4
Whi
te
136
0.90
4
Spec
ial
26
0.5
Y Y Whi
te
0.90
4
0.50
4
0.44
5
0.46
16
03
Balti
mor
e Co
unty
0211
Win
field
El
emen
tar
y E 19
21
0.5
His
pani
c/L
ti
f
12
1 Spec
ial
Educ
atio
n
74
0.5
0.40
7
Whi
te
10
1 Spec
ial
86
0.59
3
N
N
His
pani
c/L
atin
o of
0.
857
0.5
0.45
9
0.45
9
17
02
Ann
e A
rund
el
4162
Geo
rget
ow
n Ea
st
Elem
enta
r E 20
22
0.38
2
Whi
te
14
1 Spec
ial
Educ
atio
n
34
0.61
8
0.55
2
Whi
te
21
0.95
2
Spec
ial
20
0.4
Y N
Whi
te
0.95
2
0.38
2
0.45
8
0.45
8
18
30
Balti
mor
e Ci
ty
0210
Haz
elw
ood
Elem
enta
ry/
Mid
dle
EM
21
23
0.56
9
His
pani
c/L
ti
f
12
0.91
7
Spec
ial
Educ
atio
n
158
0.34
8
0.32
Blac
k or
A
fric
an
57
0
0.64
7
Spec
ial
11
0
0.32
7
N
N
0.56
9
0.45
8
0.45
8
19
12
Har
ford
0140
Will
iam
Pa
ca/O
ld
Post
Roa
d
E 22
24
0.43
Lim
ited
Eli
h
24
1 Spec
ial
Educ
atio
n
142
0.57
0.48
6
Lim
ited
Engl
ish
20
0.95
Spec
ial
15
1
0.46
4
Y N
Lim
ited
Engl
ish
0.
95
0.43
0.45
5
0.45
5
Not
Titl
e I
30
Balti
mor
e Ci
ty
0346
City
N
eigh
bors
H
amilt
on
E 61
25
0.29
2
Whi
te
24
0.87
5
Spec
ial
Educ
atio
n
24
0.58
3
0.5
Whi
te
18
1 Blac
k or
20
0.5
Y Y Whi
te
1 0.41
7
0.38
4
0.45
4
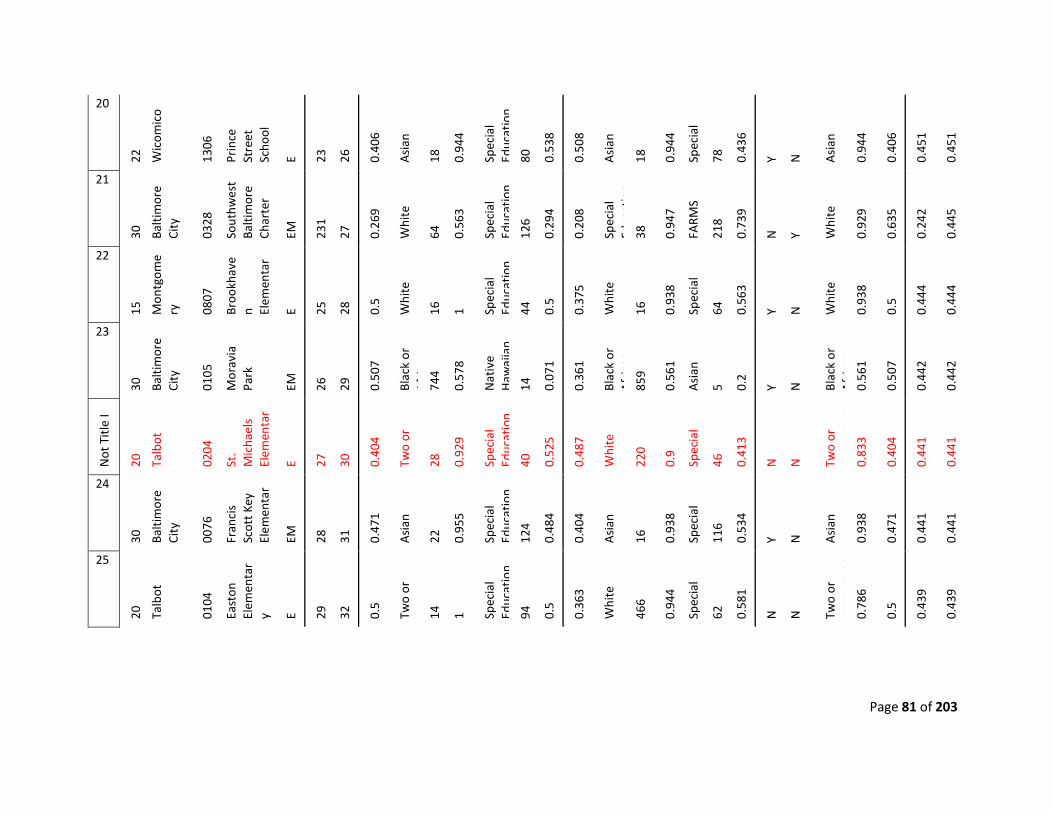
Page 81 of 203
20
22
Wic
omic
o
1306
Prin
ce
Stre
et
Scho
ol
E 23
26
0.40
6
Asi
an
18
0.94
4
Spec
ial
Educ
atio
n
80
0.53
8
0.50
8
Asi
an
18
0.94
4
Spec
ial
78
0.43
6
Y N
Asi
an
0.94
4
0.40
6
0.45
1
0.45
1
21
30
Balti
mor
e Ci
ty
0328
Sout
hwes
t Ba
ltim
ore
Char
ter
EM
231
27
0.26
9
Whi
te
64
0.56
3
Spec
ial
Educ
atio
n
126
0.29
4
0.20
8
Spec
ial
Educ
atio
n 38
0.94
7
FARM
S
218
0.73
9
N
Y Whi
te
0.92
9
0.63
5
0.24
2
0.44
5
22
15
Mon
tgom
ery
0807
Broo
khav
en El
emen
tar
E 25
28
0.5
Whi
te
16
1 Spec
ial
Educ
atio
n
44
0.5
0.37
5
Whi
te
16
0.93
8
Spec
ial
64
0.56
3
Y N
Whi
te
0.93
8
0.5
0.44
4
0.44
4
23
30
Balti
mor
e Ci
ty
0105
Mor
avia
Pa
rk
EM
26
29
0.50
7
Blac
k or
A
fi
744
0.57
8
Nat
ive
Haw
aiia
n
14
0.07
1
0.36
1
Blac
k or
A
fric
an
85
9
0.56
1
Asi
an
5 0.2
Y N
Blac
k or
A
fric
an
0.
561
0.50
7
0.44
2
0.44
2
Not
Titl
e I
20
Talb
ot
0204
St.
Mic
hael
s El
emen
tar
E 27
30
0.40
4
Two
or
28
0.92
9
Spec
ial
Educ
atio
n
40
0.52
5
0.48
7
Whi
te
220
0.9
Spec
ial
46
0.41
3
N
N
Two
or
mor
e ra
ces
0.83
3
0.40
4
0.44
1
0.44
1
24
30
Balti
mor
e Ci
ty
0076
Fran
cis
Scot
t Key
El
emen
tar
EM
28
31
0.47
1
Asi
an
22
0.95
5
Spec
ial
Educ
atio
n
124
0.48
4
0.40
4
Asi
an
16
0.93
8
Spec
ial
11
6
0.53
4
Y N
Asi
an
0.93
8
0.47
1
0.44
1
0.44
1
25
20
Talb
ot
0104
East
on
Elem
enta
ry E 29
32
0.5
Two
or
14
1 Spec
ial
Educ
atio
n
94
0.5
0.36
3
Whi
te
466
0.94
4
Spec
ial
62
0.58
1
N
N
Two
or
mor
e ra
ces
0.78
6
0.5
0.43
9
0.43
9
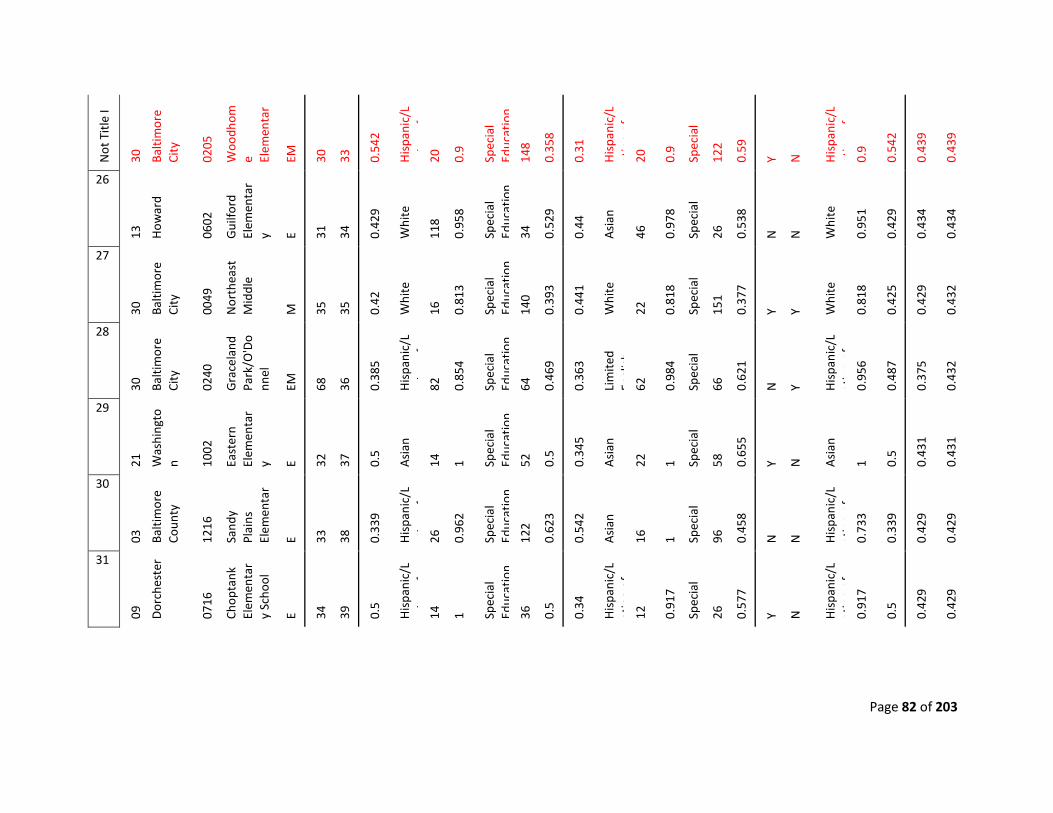
Page 82 of 203
Not
Titl
e I
30
Balti
mor
e Ci
ty
0205
Woo
dhom
e Elem
enta
r EM
30
33
0.54
2
His
pani
c/L
ti
f
20
0.9
Spec
ial
Educ
atio
n
148
0.35
8
0.31
His
pani
c/L
atin
o of
20
0.9
Spec
ial
12
2
0.59
Y N
His
pani
c/L
atin
o of
0.
9
0.54
2
0.43
9
0.43
9
26
13
How
ard
0602
Gui
lford
El
emen
tar
y E 31
34
0.42
9
Whi
te
118
0.95
8
Spec
ial
Educ
atio
n
34
0.52
9
0.44
Asi
an
46
0.97
8
Spec
ial
26
0.53
8
N
N
Whi
te
0.95
1
0.42
9
0.43
4
0.43
4
27
30
Balti
mor
e Ci
ty
0049
Nor
thea
st
Mid
dle
M
35
35
0.42
Whi
te
16
0.81
3
Spec
ial
Educ
atio
n
140
0.39
3
0.44
1
Whi
te
22
0.81
8
Spec
ial
15
1
0.37
7
Y Y Whi
te
0.81
8
0.42
5
0.42
9
0.43
2
28
30
Balti
mor
e Ci
ty
0240
Gra
cela
nd
Park
/O'D
onn
el
EM
68
36
0.38
5
His
pani
c/L
ti
f
82
0.85
4
Spec
ial
Educ
atio
n
64
0.46
9
0.36
3
Lim
ited
Engl
ish
62
0.98
4
Spec
ial
66
0.62
1
N
Y His
pani
c/L
atin
o of
0.
956
0.48
7
0.37
5
0.43
2
29
21
Was
hing
ton 10
02
East
ern
Elem
enta
ry E 32
37
0.5
Asi
an
14
1 Spec
ial
Educ
atio
n
52
0.5
0.34
5
Asi
an
22
1 Spec
ial
58
0.65
5
Y N
Asi
an
1 0.5
0.43
1
0.43
1
30
03
Balti
mor
e Co
unty
1216
Sand
y Pl
ains
El
emen
tar
E 33
38
0.33
9
His
pani
c/L
ti
f
26
0.96
2
Spec
ial
Educ
atio
n
122
0.62
3
0.54
2
Asi
an
16
1 Spec
ial
96
0.45
8
N
N
His
pani
c/L
atin
o of
0.
733
0.33
9
0.42
9
0.42
9
31
09
Dor
ches
ter
0716
Chop
tank
El
emen
tar
y Sc
hool
E 34
39
0.5
His
pani
c/L
ti
f
14
1 Spec
ial
Educ
atio
n
36
0.5
0.34
His
pani
c/L
atin
o of
12
0.91
7
Spec
ial
26
0.57
7
Y N
His
pani
c/L
atin
o of
0.
917
0.5
0.42
9
0.42
9
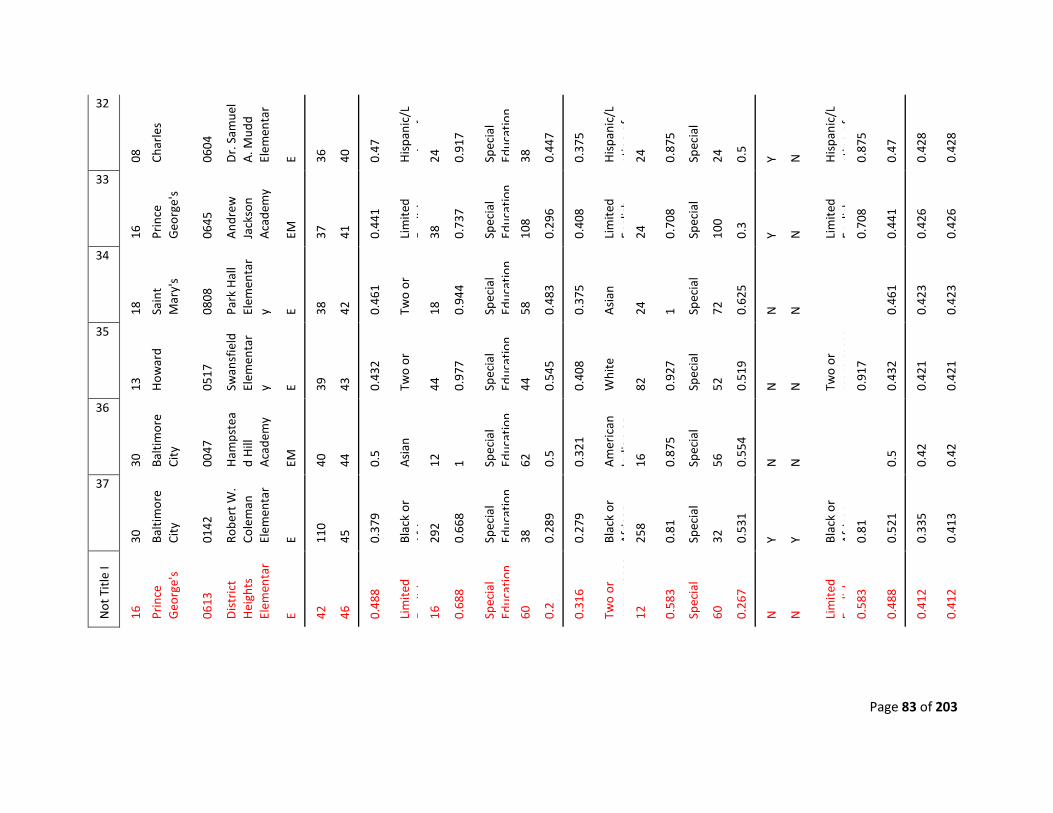
Page 83 of 203
32
08
Char
les
0604
Dr.
Sam
uel
A. M
udd
Elem
enta
r
E 36
40
0.47
His
pani
c/L
ti
f
24
0.91
7
Spec
ial
Educ
atio
n
38
0.44
7
0.37
5
His
pani
c/L
atin
o of
24
0.87
5
Spec
ial
24
0.5
Y N
His
pani
c/L
atin
o of
0.
875
0.47
0.42
8
0.42
8
33
16
Prin
ce
Geo
rge'
s
0645
And
rew
Ja
ckso
n A
cade
my
EM
37
41
0.44
1
Lim
ited
Eli
h
38
0.73
7
Spec
ial
Educ
atio
n
108
0.29
6
0.40
8
Lim
ited
Engl
ish
24
0.70
8
Spec
ial
10
0
0.3
Y N
Lim
ited
Engl
ish
0.
708
0.44
1
0.42
6
0.42
6
34
18
Sain
t M
ary'
s
0808
Park
Hal
l El
emen
tar
y E 38
42
0.46
1
Two
or
18
0.94
4
Spec
ial
Educ
atio
n
58
0.48
3
0.37
5
Asi
an
24
1 Spec
ial
72
0.62
5
N
N
0.46
1
0.42
3
0.42
3
35
13
How
ard
0517
Swan
sfie
ld
Elem
enta
ry E 39
43
0.43
2
Two
or
44
0.97
7
Spec
ial
Educ
atio
n
44
0.54
5
0.40
8
Whi
te
82
0.92
7
Spec
ial
52
0.51
9
N
N
Two
or
mor
e ra
ces
0.91
7
0.43
2
0.42
1
0.42
1
36
30
Balti
mor
e Ci
ty
0047
Ham
pste
ad
Hill
A
cade
my
EM
40
44
0.5
Asi
an
12
1 Spec
ial
Educ
atio
n
62
0.5
0.32
1
Am
eric
an
Indi
an o
r
16
0.87
5
Spec
ial
56
0.55
4
N
N
0.5
0.42
0.42
37
30
Balti
mor
e Ci
ty
0142
Robe
rt W
. Co
lem
an
Elem
enta
r E 11
0
45
0.37
9
Blac
k or
A
fi
292
0.66
8
Spec
ial
Educ
atio
n
38
0.28
9
0.27
9
Blac
k or
A
fric
an
25
8
0.81
Spec
ial
32
0.53
1
Y Y Blac
k or
A
fric
an
0.
81
0.52
1
0.33
5
0.41
3
Not
Titl
e I
16
Prin
ce
Geo
rge'
s
0613
Dis
tric
t H
eigh
ts
Elem
enta
r E 42
46
0.48
8
Lim
ited
Eli
h
16
0.68
8
Spec
ial
Educ
atio
n
60
0.2
0.31
6
Two
or
mor
e ra
ces
12
0.58
3
Spec
ial
60
0.26
7
N
N
Lim
ited
Engl
ish
0.
583
0.48
8
0.41
2
0.41
2
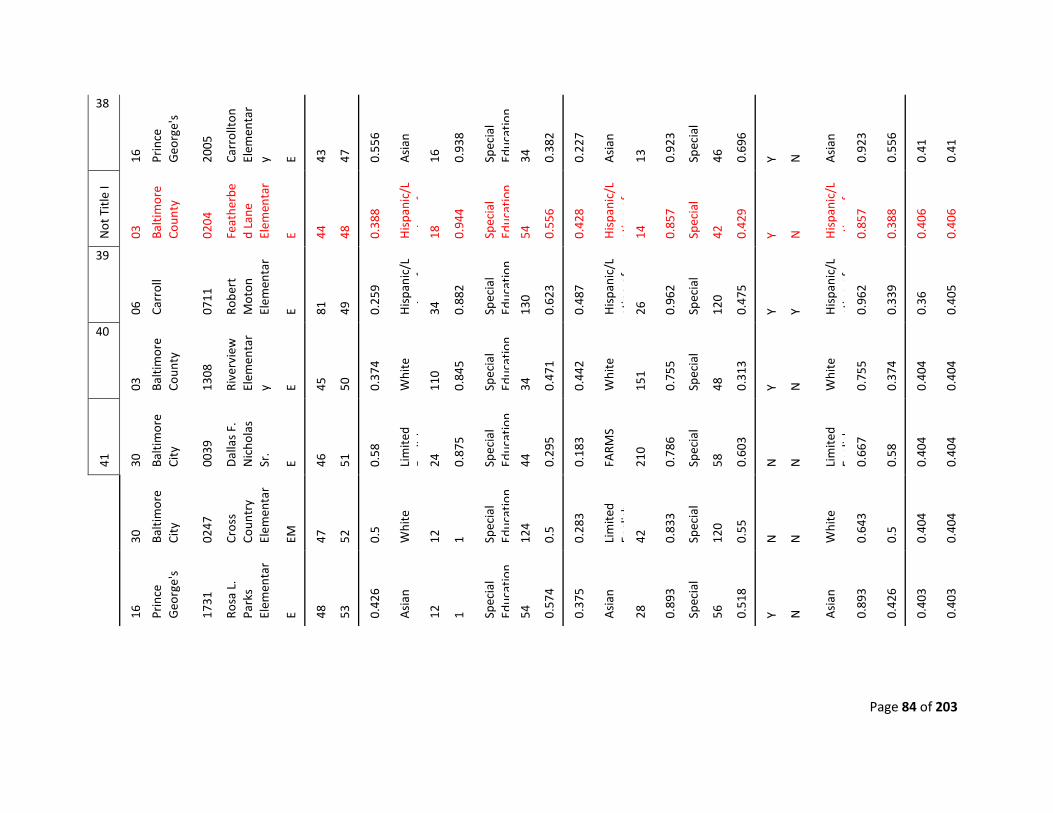
Page 84 of 203
38
16
Prin
ce
Geo
rge'
s
2005
Carr
ollto
n El
emen
tar
y E 43
47
0.55
6
Asi
an
16
0.93
8
Spec
ial
Educ
atio
n
34
0.38
2
0.22
7
Asi
an
13
0.92
3
Spec
ial
46
0.69
6
Y N
Asi
an
0.92
3
0.55
6
0.41
0.41
Not
Titl
e I
03
Balti
mor
e Co
unty
0204
Feat
herb
ed
Lane
El
emen
tar
E 44
48
0.38
8
His
pani
c/L
ti
f
18
0.94
4
Spec
ial
Educ
atio
n
54
0.55
6
0.42
8
His
pani
c/L
atin
o of
14
0.85
7
Spec
ial
42
0.42
9
Y N
His
pani
c/L
atin
o of
0.
857
0.38
8
0.40
6
0.40
6
39
06
Carr
oll
0711
Robe
rt
Mot
on
Elem
enta
r E 81
49
0.25
9
His
pani
c/L
ti
f
34
0.88
2
Spec
ial
Educ
atio
n
130
0.62
3
0.48
7
His
pani
c/L
atin
o of
26
0.96
2
Spec
ial
12
0
0.47
5
Y Y His
pani
c/L
atin
o of
0.
962
0.33
9
0.36
0.40
5
40
03
Balti
mor
e Co
unty
1308
Rive
rvie
w
Elem
enta
ry E 45
50
0.37
4
Whi
te
110
0.84
5
Spec
ial
Educ
atio
n
34
0.47
1
0.44
2
Whi
te
151
0.75
5
Spec
ial
48
0.31
3
Y N
Whi
te
0.75
5
0.37
4
0.40
4
0.40
4
41
30
Balti
mor
e Ci
ty
0039
Dal
las
F.
Nic
hola
s Sr
. E 46
51
0.58
Lim
ited
Eli
h
24
0.87
5
Spec
ial
Educ
atio
n
44
0.29
5
0.18
3
FARM
S
210
0.78
6
Spec
ial
58
0.60
3
N
N
Lim
ited
Engl
ish
0.
667
0.58
0.40
4
0.40
4
30
Balti
mor
e Ci
ty
0247
Cros
s Co
untr
y El
emen
tar
EM
47
52
0.5
Whi
te
12
1 Spec
ial
Educ
atio
n
124
0.5
0.28
3
Lim
ited
Engl
ish
42
0.83
3
Spec
ial
12
0
0.55
N
N
Whi
te
0.64
3
0.5
0.40
4
0.40
4
16
Prin
ce
Geo
rge'
s
1731
Rosa
L.
Park
s El
emen
tar
E 48
53
0.42
6
Asi
an
12
1 Spec
ial
Educ
atio
n
54
0.57
4
0.37
5
Asi
an
28
0.89
3
Spec
ial
56
0.51
8
Y N
Asi
an
0.89
3
0.42
6
0.40
3
0.40
3
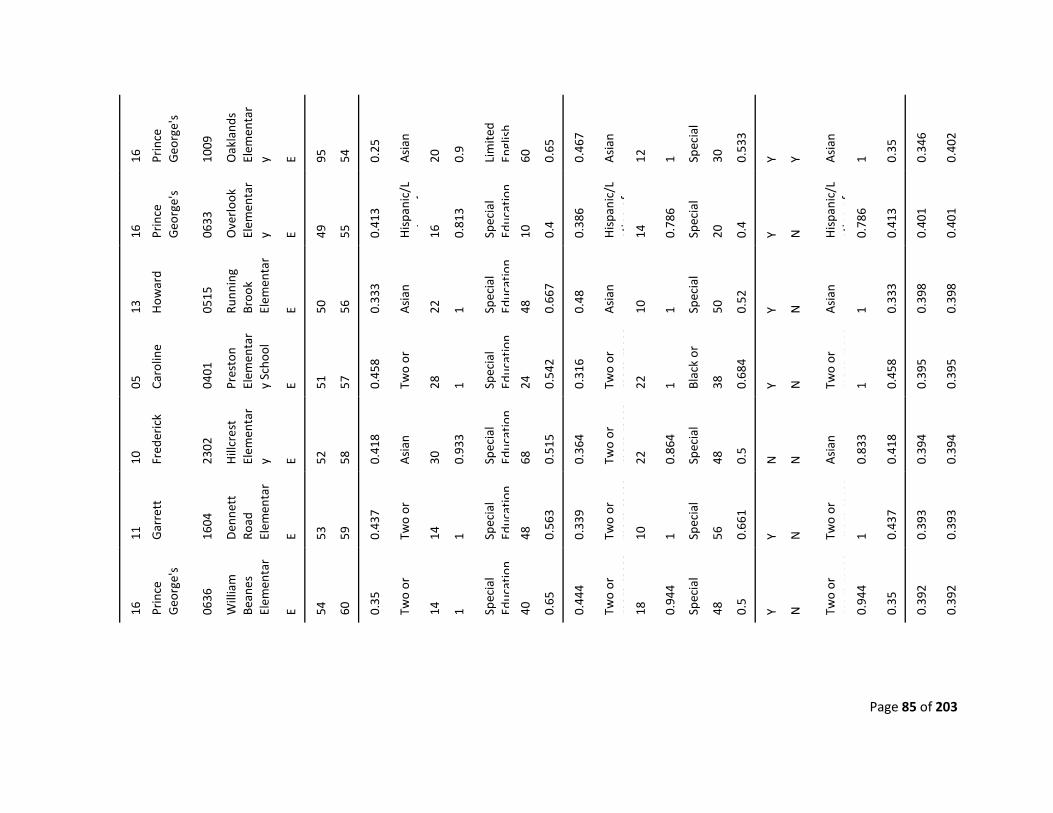
Page 85 of 203
16
Prin
ce
Geo
rge'
s
1009
Oak
land
s El
emen
tar
y E 95
54
0.25
Asi
an
20
0.9
Lim
ited
Engl
ish
60
0.65
0.46
7
Asi
an
12
1 Spec
ial
30
0.53
3
Y Y Asi
an
1 0.35
0.34
6
0.40
2
16
Prin
ce
Geo
rge'
s
0633
Ove
rloo
k El
emen
tar
y E 49
55
0.41
3
His
pani
c/L
ti
f
16
0.81
3
Spec
ial
Educ
atio
n
10
0.4
0.38
6
His
pani
c/L
atin
o of
14
0.78
6
Spec
ial
20
0.4
Y N
His
pani
c/L
atin
o of
0.
786
0.41
3
0.40
1
0.40
1
13
How
ard
0515
Runn
ing
Broo
k El
emen
tar
E 50
56
0.33
3
Asi
an
22
1 Spec
ial
Educ
atio
n
48
0.66
7
0.48
Asi
an
10
1 Spec
ial
50
0.52
Y N
Asi
an
1 0.33
3
0.39
8
0.39
8
05
Caro
line
0401
Pres
ton
Elem
enta
ry
Scho
ol
E 51
57
0.45
8
Two
or
28
1 Spec
ial
Educ
atio
n
24
0.54
2
0.31
6
Two
or
mor
e ra
ces
22
1 Blac
k or
38
0.68
4
Y N
Two
or
mor
e ra
ces
1 0.45
8
0.39
5
0.39
5
10
Fred
eric
k
2302
Hill
cres
t El
emen
tar
y E 52
58
0.41
8
Asi
an
30
0.93
3
Spec
ial
Educ
atio
n
68
0.51
5
0.36
4
Two
or
mor
e ra
ces
22
0.86
4
Spec
ial
48
0.5
N
N
Asi
an
0.83
3
0.41
8
0.39
4
0.39
4
11
Gar
rett
1604
Den
nett
Ro
ad
Elem
enta
r E 53
59
0.43
7
Two
or
14
1 Spec
ial
Educ
atio
n
48
0.56
3
0.33
9
Two
or
mor
e ra
ces
10
1 Spec
ial
56
0.66
1
Y N
Two
or
mor
e ra
ces
1 0.43
7
0.39
3
0.39
3
16
Prin
ce
Geo
rge'
s
0636
Will
iam
Be
anes
El
emen
tar
E 54
60
0.35
Two
or
14
1 Spec
ial
Educ
atio
n
40
0.65
0.44
4
Two
or
mor
e ra
ces
18
0.94
4
Spec
ial
48
0.5
Y N
Two
or
mor
e ra
ces
0.94
4
0.35
0.39
2
0.39
2
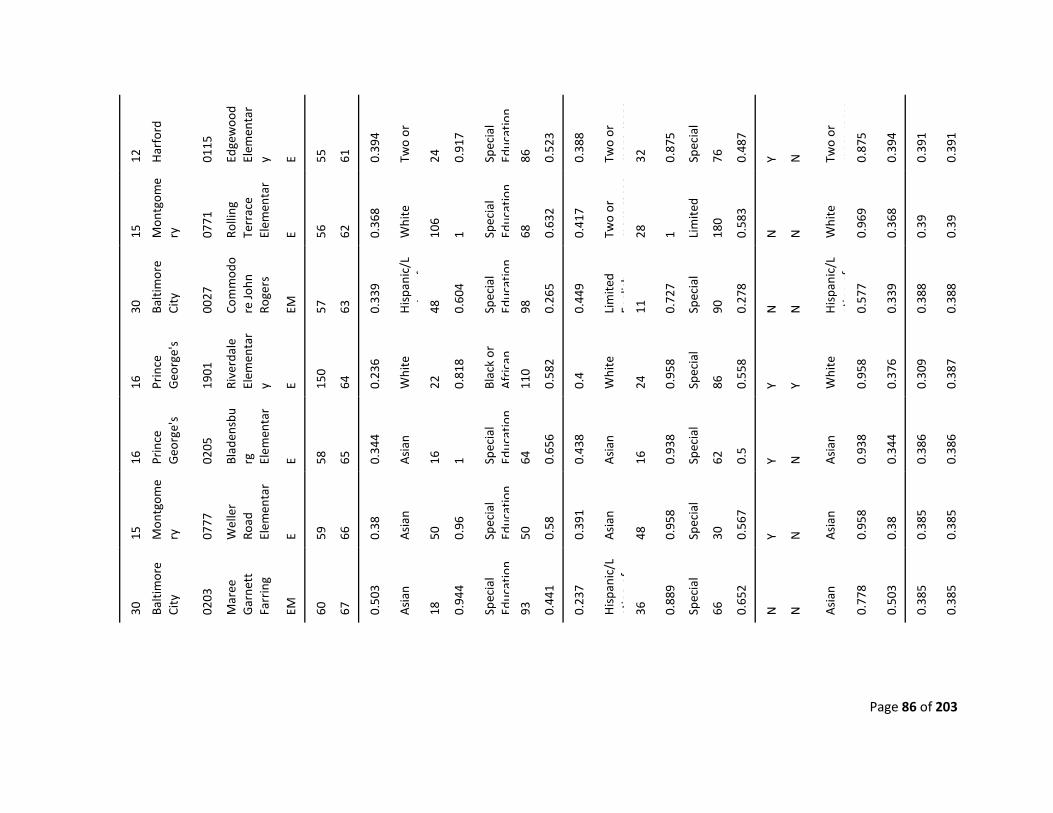
Page 86 of 203
12
Har
ford
0115
Edge
woo
d El
emen
tar
y E 55
61
0.39
4
Two
or
24
0.91
7
Spec
ial
Educ
atio
n
86
0.52
3
0.38
8
Two
or
mor
e ra
ces
32
0.87
5
Spec
ial
76
0.48
7
Y N
Two
or
mor
e ra
ces
0.87
5
0.39
4
0.39
1
0.39
1
15
Mon
tgom
ery
0771
Rolli
ng
Terr
ace
Elem
enta
r E 56
62
0.36
8
Whi
te
106
1 Spec
ial
Educ
atio
n
68
0.63
2
0.41
7
Two
or
mor
e ra
ces
28
1 Lim
ited
18
0
0.58
3
N
N
Whi
te
0.96
9
0.36
8
0.39
0.39
30
Balti
mor
e Ci
ty
0027
Com
mod
ore
John
Ro
gers
EM
57
63
0.33
9
His
pani
c/L
ti
f
48
0.60
4
Spec
ial
Educ
atio
n
98
0.26
5
0.44
9
Lim
ited
Engl
ish
11
0.72
7
Spec
ial
90
0.27
8
N
N
His
pani
c/L
atin
o of
0.
577
0.33
9
0.38
8
0.38
8
16
Prin
ce
Geo
rge'
s
1901
Rive
rdal
e El
emen
tar
y E 150
64
0.23
6
Whi
te
22
0.81
8
Blac
k or
A
fric
an
11
0
0.58
2
0.4
Whi
te
24
0.95
8
Spec
ial
86
0.55
8
Y Y Whi
te
0.95
8
0.37
6
0.30
9
0.38
7
16
Prin
ce
Geo
rge'
s
0205
Blad
ensb
urg
El
emen
tar
E 58
65
0.34
4
Asi
an
16
1 Spec
ial
Educ
atio
n
64
0.65
6
0.43
8
Asi
an
16
0.93
8
Spec
ial
62
0.5
Y N
Asi
an
0.93
8
0.34
4
0.38
6
0.38
6
15
Mon
tgom
ery
0777
Wel
ler
Road
El
emen
tar
E 59
66
0.38
Asi
an
50
0.96
Spec
ial
Educ
atio
n
50
0.58
0.39
1
Asi
an
48
0.95
8
Spec
ial
30
0.56
7
Y N
Asi
an
0.95
8
0.38
0.38
5
0.38
5
30
Balti
mor
e Ci
ty
0203
Mar
ee
Gar
nett
Fa
rrin
g
EM
60
67
0.50
3
Asi
an
18
0.94
4
Spec
ial
Educ
atio
n
93
0.44
1
0.23
7
His
pani
c/L
atin
o of
36
0.88
9
Spec
ial
66
0.65
2
N
N
Asi
an
0.77
8
0.50
3
0.38
5
0.38
5
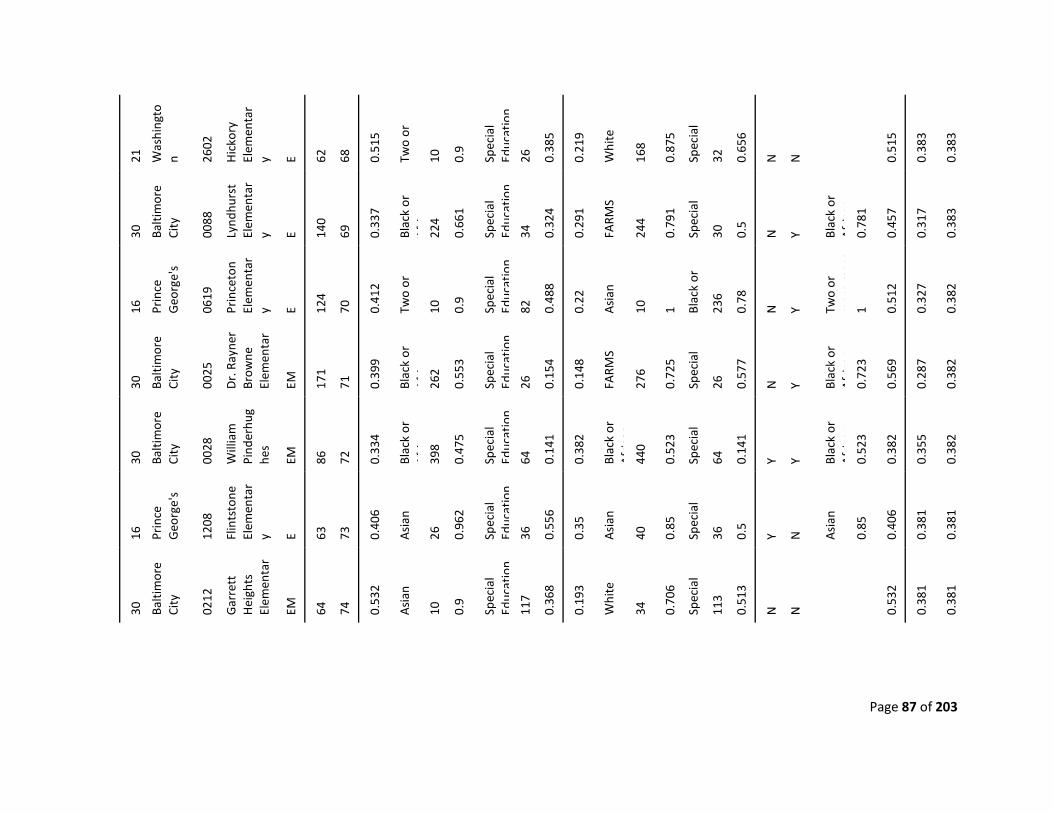
Page 87 of 203
21
Was
hing
ton 26
02
Hic
kory
El
emen
tar
y E 62
68
0.51
5
Two
or
10
0.9
Spec
ial
Educ
atio
n
26
0.38
5
0.21
9
Whi
te
168
0.87
5
Spec
ial
32
0.65
6
N
N
0.51
5
0.38
3
0.38
3
30
Balti
mor
e Ci
ty
0088
Lynd
hurs
t El
emen
tar
y E 140
69
0.33
7
Blac
k or
A
fi
224
0.66
1
Spec
ial
Educ
atio
n
34
0.32
4
0.29
1
FARM
S
244
0.79
1
Spec
ial
30
0.5
N
Y Blac
k or
A
fric
an
0.
781
0.45
7
0.31
7
0.38
3
16
Prin
ce
Geo
rge'
s
0619
Prin
ceto
n El
emen
tar
y E 124
70
0.41
2
Two
or
10
0.9
Spec
ial
Educ
atio
n
82
0.48
8
0.22
Asi
an
10
1 Blac
k or
236
0.78
N
Y Two
or
mor
e ra
ces
1 0.51
2
0.32
7
0.38
2
30
Balti
mor
e Ci
ty
0025
Dr.
Ray
ner
Brow
ne
Elem
enta
r EM
171
71
0.39
9
Blac
k or
A
fi
262
0.55
3
Spec
ial
Educ
atio
n
26
0.15
4
0.14
8
FARM
S
276
0.72
5
Spec
ial
26
0.57
7
N
Y Blac
k or
A
fric
an
0.
723
0.56
9
0.28
7
0.38
2
30
Balti
mor
e Ci
ty
0028
Will
iam
Pi
nder
hug
hes EM
86
72
0.33
4
Blac
k or
A
fi
398
0.47
5
Spec
ial
Educ
atio
n
64
0.14
1
0.38
2
Blac
k or
A
fric
an
44
0
0.52
3
Spec
ial
64
0.14
1
Y Y Blac
k or
A
fric
an
0.
523
0.38
2
0.35
5
0.38
2
16
Prin
ce
Geo
rge'
s
1208
Flin
tsto
ne
Elem
enta
ry E 63
73
0.40
6
Asi
an
26
0.96
2
Spec
ial
Educ
atio
n
36
0.55
6
0.35
Asi
an
40
0.85
Spec
ial
36
0.5
Y N
Asi
an
0.85
0.40
6
0.38
1
0.38
1
30
Balti
mor
e Ci
ty
0212
Gar
rett
H
eigh
ts
Elem
enta
r EM
64
74
0.53
2
Asi
an
10
0.9
Spec
ial
Educ
atio
n
117
0.36
8
0.19
3
Whi
te
34
0.70
6
Spec
ial
11
3
0.51
3
N
N
0.53
2
0.38
1
0.38
1
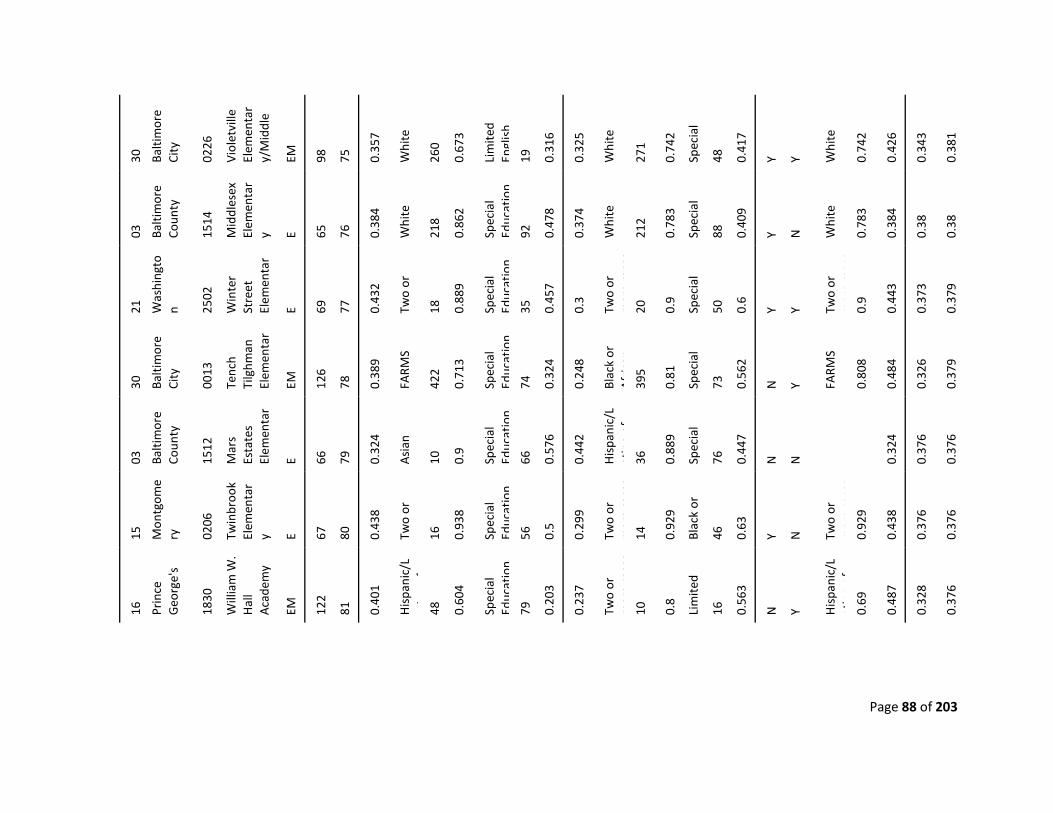
Page 88 of 203
30
Balti
mor
e Ci
ty
0226
Viol
etvi
lle
Elem
enta
ry/
Mid
dle
EM
98
75
0.35
7
Whi
te
260
0.67
3
Lim
ited
Engl
ish
19
0.31
6
0.32
5
Whi
te
271
0.74
2
Spec
ial
48
0.41
7
Y Y Whi
te
0.74
2
0.42
6
0.34
3
0.38
1
03
Balti
mor
e Co
unty
1514
Mid
dles
ex
Elem
enta
ry E 65
76
0.38
4
Whi
te
218
0.86
2
Spec
ial
Educ
atio
n
92
0.47
8
0.37
4
Whi
te
212
0.78
3
Spec
ial
88
0.40
9
Y N
Whi
te
0.78
3
0.38
4
0.38
0.38
21
Was
hing
ton 25
02
Win
ter
Stre
et
Elem
enta
r E 69
77
0.43
2
Two
or
18
0.88
9
Spec
ial
Educ
atio
n
35
0.45
7
0.3
Two
or
mor
e ra
ces
20
0.9
Spec
ial
50
0.6
Y Y Two
or
mor
e ra
ces
0.9
0.44
3
0.37
3
0.37
9
30
Balti
mor
e Ci
ty
0013
Tenc
h Ti
lghm
an
Elem
enta
r EM
126
78
0.38
9
FARM
S
422
0.71
3
Spec
ial
Educ
atio
n
74
0.32
4
0.24
8
Blac
k or
A
fric
an
39
5
0.81
Spec
ial
73
0.56
2
N
Y FARM
S
0.80
8
0.48
4
0.32
6
0.37
9
03
Balti
mor
e Co
unty
1512
Mar
s Es
tate
s El
emen
tar
E 66
79
0.32
4
Asi
an
10
0.9
Spec
ial
Educ
atio
n
66
0.57
6
0.44
2
His
pani
c/L
atin
o of
36
0.88
9
Spec
ial
76
0.44
7
N
N
0.32
4
0.37
6
0.37
6
15
Mon
tgom
ery
0206
Twin
broo
k El
emen
tar
y E 67
80
0.43
8
Two
or
16
0.93
8
Spec
ial
Educ
atio
n
56
0.5
0.29
9
Two
or
mor
e ra
ces
14
0.92
9
Blac
k or
46
0.63
Y N
Two
or
mor
e ra
ces
0.92
9
0.43
8
0.37
6
0.37
6
16
Prin
ce
Geo
rge'
s
1830
Will
iam
W.
Hal
l A
cade
my
EM
122
81
0.40
1
His
pani
c/L
ti
f
48
0.60
4
Spec
ial
Educ
atio
n
79
0.20
3
0.23
7
Two
or
mor
e ra
ces
10
0.8
Lim
ited
16
0.56
3
N
Y His
pani
c/L
atin
o of
0.
69
0.48
7
0.32
8
0.37
6
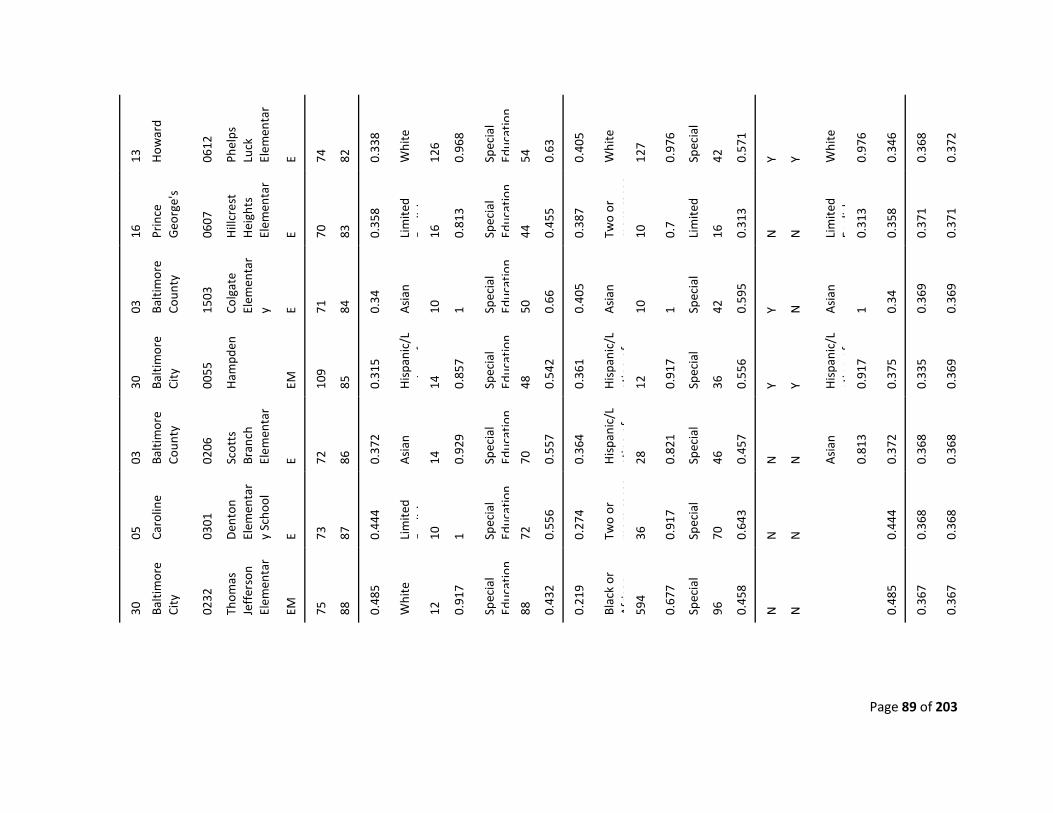
Page 89 of 203
13
How
ard
0612
Phel
ps
Luck
El
emen
tar
E 74
82
0.33
8
Whi
te
126
0.96
8
Spec
ial
Educ
atio
n
54
0.63
0.40
5
Whi
te
127
0.97
6
Spec
ial
42
0.57
1
Y Y Whi
te
0.97
6
0.34
6
0.36
8
0.37
2
16
Prin
ce
Geo
rge'
s
0607
Hill
cres
t H
eigh
ts
Elem
enta
r E 70
83
0.35
8
Lim
ited
Eli
h
16
0.81
3
Spec
ial
Educ
atio
n
44
0.45
5
0.38
7
Two
or
mor
e ra
ces
10
0.7
Lim
ited
16
0.31
3
N
N
Lim
ited
Engl
ish
0.
313
0.35
8
0.37
1
0.37
1
03
Balti
mor
e Co
unty
1503
Colg
ate
Elem
enta
ry E 71
84
0.34
Asi
an
10
1 Spec
ial
Educ
atio
n
50
0.66
0.40
5
Asi
an
10
1 Spec
ial
42
0.59
5
Y N
Asi
an
1 0.34
0.36
9
0.36
9
30
Balti
mor
e Ci
ty
0055
Ham
pden
EM
109
85
0.31
5
His
pani
c/L
ti
f
14
0.85
7
Spec
ial
Educ
atio
n
48
0.54
2
0.36
1
His
pani
c/L
atin
o of
12
0.91
7
Spec
ial
36
0.55
6
Y Y His
pani
c/L
atin
o of
0.
917
0.37
5
0.33
5
0.36
9
03
Balti
mor
e Co
unty
0206
Scot
ts
Bran
ch
Elem
enta
r E 72
86
0.37
2
Asi
an
14
0.92
9
Spec
ial
Educ
atio
n
70
0.55
7
0.36
4
His
pani
c/L
atin
o of
28
0.82
1
Spec
ial
46
0.45
7
N
N
Asi
an
0.81
3
0.37
2
0.36
8
0.36
8
05
Caro
line
0301
Den
ton
Elem
enta
ry
Scho
ol
E 73
87
0.44
4
Lim
ited
Eli
h
10
1 Spec
ial
Educ
atio
n
72
0.55
6
0.27
4
Two
or
mor
e ra
ces
36
0.91
7
Spec
ial
70
0.64
3
N
N
0.44
4
0.36
8
0.36
8
30
Balti
mor
e Ci
ty
0232
Thom
as
Jeff
erso
n El
emen
tar
EM
75
88
0.48
5
Whi
te
12
0.91
7
Spec
ial
Educ
atio
n
88
0.43
2
0.21
9
Blac
k or
A
fric
an
59
4
0.67
7
Spec
ial
96
0.45
8
N
N
0.48
5
0.36
7
0.36
7
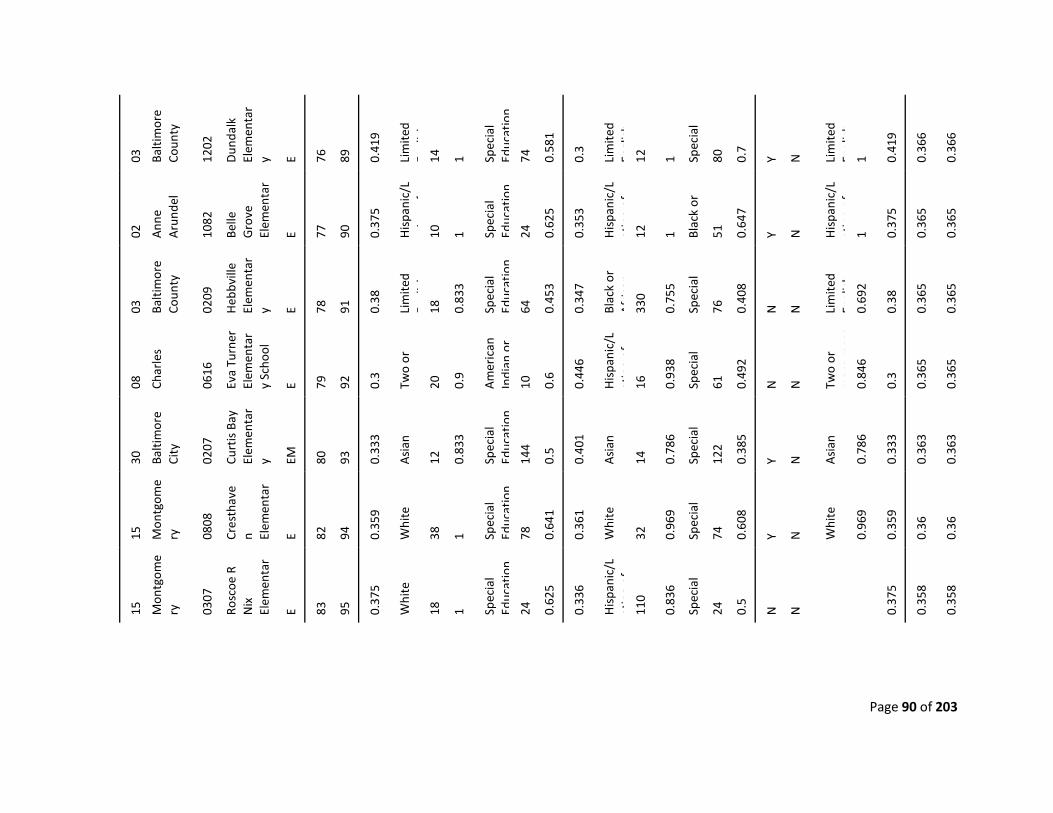
Page 90 of 203
03
Balti
mor
e Co
unty
1202
Dun
dalk
El
emen
tar
y E 76
89
0.41
9
Lim
ited
Eli
h
14
1 Spec
ial
Educ
atio
n
74
0.58
1
0.3
Lim
ited
Engl
ish
12
1 Spec
ial
80
0.7
Y N
Lim
ited
Engl
ish
1 0.
419
0.36
6
0.36
6
02
Ann
e A
rund
el
1082
Belle
G
rove
El
emen
tar
E 77
90
0.37
5
His
pani
c/L
ti
f
10
1 Spec
ial
Educ
atio
n
24
0.62
5
0.35
3
His
pani
c/L
atin
o of
12
1 Blac
k or
51
0.64
7
Y N
His
pani
c/L
atin
o of
1 0.
375
0.36
5
0.36
5
03
Balti
mor
e Co
unty
0209
Heb
bvill
e El
emen
tar
y E 78
91
0.38
Lim
ited
Eli
h
18
0.83
3
Spec
ial
Educ
atio
n
64
0.45
3
0.34
7
Blac
k or
A
fric
an
33
0
0.75
5
Spec
ial
76
0.40
8
N
N
Lim
ited
Engl
ish
0.
692
0.38
0.36
5
0.36
5
08
Char
les
0616
Eva
Turn
er
Elem
enta
ry
Scho
ol
E 79
92
0.3
Two
or
20
0.9
Am
eric
an
Indi
an o
r
10
0.6
0.44
6
His
pani
c/L
atin
o of
16
0.93
8
Spec
ial
61
0.49
2
N
N
Two
or
mor
e ra
ces
0.84
6
0.3
0.36
5
0.36
5
30
Balti
mor
e Ci
ty
0207
Curt
is B
ay
Elem
enta
ry EM
80
93
0.33
3
Asi
an
12
0.83
3
Spec
ial
Educ
atio
n
144
0.5
0.40
1
Asi
an
14
0.78
6
Spec
ial
12
2
0.38
5
Y N
Asi
an
0.78
6
0.33
3
0.36
3
0.36
3
15
Mon
tgom
ery
0808
Cres
thav
en El
emen
tar
E 82
94
0.35
9
Whi
te
38
1 Spec
ial
Educ
atio
n
78
0.64
1
0.36
1
Whi
te
32
0.96
9
Spec
ial
74
0.60
8
Y N
Whi
te
0.96
9
0.35
9
0.36
0.36
15
Mon
tgom
ery
0307
Rosc
oe R
N
ix
Elem
enta
r E 83
95
0.37
5
Whi
te
18
1 Spec
ial
Educ
atio
n
24
0.62
5
0.33
6
His
pani
c/L
atin
o of
11
0
0.83
6
Spec
ial
24
0.5
N
N
0.37
5
0.35
8
0.35
8
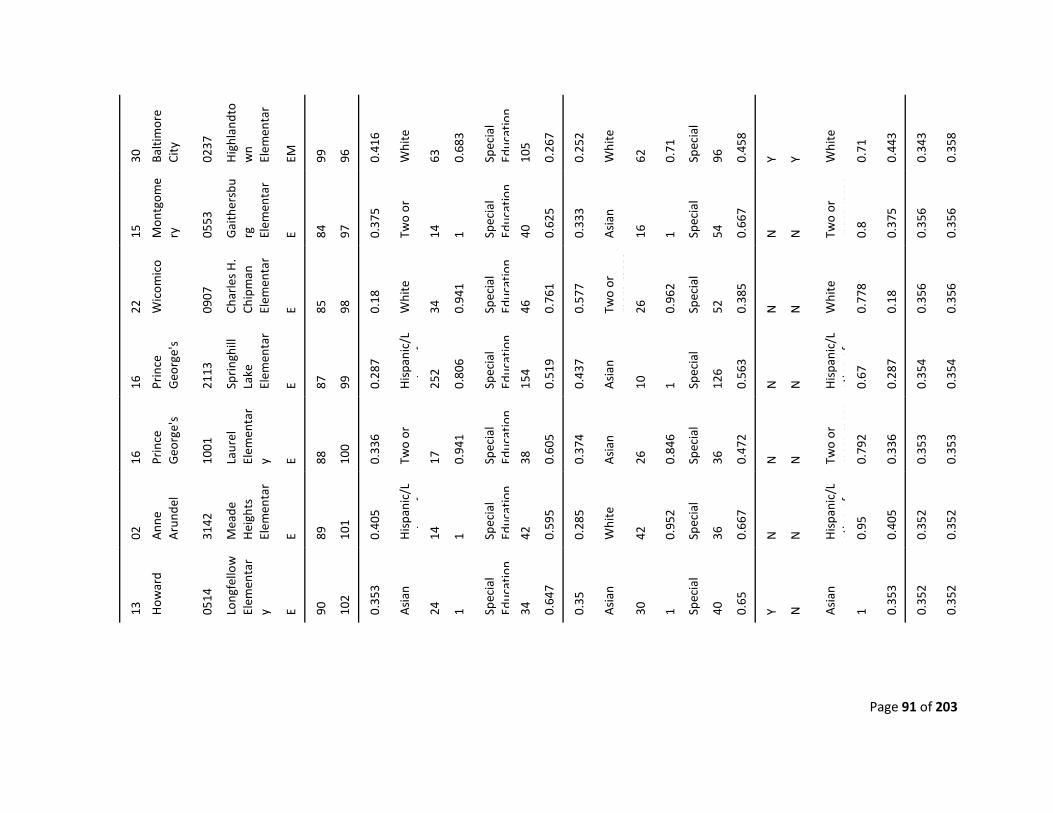
Page 91 of 203
30
Balti
mor
e Ci
ty
0237
Hig
hlan
dto
wn
Elem
enta
r
EM
99
96
0.41
6
Whi
te
63
0.68
3
Spec
ial
Educ
atio
n
105
0.26
7
0.25
2
Whi
te
62
0.71
Spec
ial
96
0.45
8
Y Y Whi
te
0.71
0.44
3
0.34
3
0.35
8
15
Mon
tgom
ery
0553
Gai
ther
sbu
rg
Elem
enta
r E 84
97
0.37
5
Two
or
14
1 Spec
ial
Educ
atio
n
40
0.62
5
0.33
3
Asi
an
16
1 Spec
ial
54
0.66
7
N
N
Two
or
mor
e ra
ces
0.8
0.37
5
0.35
6
0.35
6
22
Wic
omic
o
0907
Char
les
H.
Chip
man
El
emen
tar
E 85
98
0.18
Whi
te
34
0.94
1
Spec
ial
Educ
atio
n
46
0.76
1
0.57
7
Two
or
mor
e ra
ces
26
0.96
2
Spec
ial
52
0.38
5
N
N
Whi
te
0.77
8
0.18
0.35
6
0.35
6
16
Prin
ce
Geo
rge'
s
2113
Spri
nghi
ll La
ke
Elem
enta
r E 87
99
0.28
7
His
pani
c/L
ti
f
25
2
0.80
6
Spec
ial
Educ
atio
n
154
0.51
9
0.43
7
Asi
an
10
1 Spec
ial
12
6
0.56
3
N
N
His
pani
c/L
atin
o of
0.
67
0.28
7
0.35
4
0.35
4
16
Prin
ce
Geo
rge'
s
1001
Laur
el
Elem
enta
ry E 88
100
0.33
6
Two
or
17
0.94
1
Spec
ial
Educ
atio
n
38
0.60
5
0.37
4
Asi
an
26
0.84
6
Spec
ial
36
0.47
2
N
N
Two
or
mor
e ra
ces
0.79
2
0.33
6
0.35
3
0.35
3
02
Ann
e A
rund
el
3142
Mea
de
Hei
ghts
El
emen
tar
E 89
101
0.40
5
His
pani
c/L
ti
f
14
1 Spec
ial
Educ
atio
n
42
0.59
5
0.28
5
Whi
te
42
0.95
2
Spec
ial
36
0.66
7
N
N
His
pani
c/L
atin
o of
0.
95
0.40
5
0.35
2
0.35
2
13
How
ard
0514
Long
fello
w
Elem
enta
ry E 90
102
0.35
3
Asi
an
24
1 Spec
ial
Educ
atio
n
34
0.64
7
0.35
Asi
an
30
1 Spec
ial
40
0.65
Y N
Asi
an
1 0.35
3
0.35
2
0.35
2
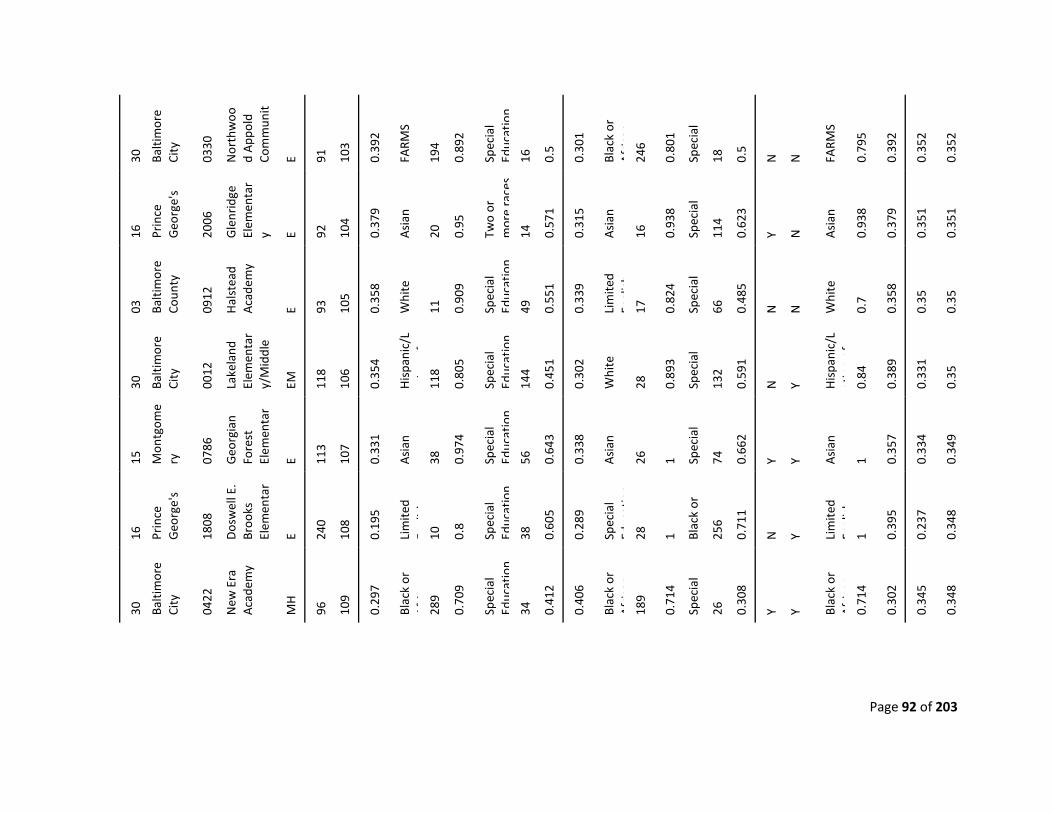
Page 92 of 203
30
Balti
mor
e Ci
ty
0330
Nor
thw
ood
App
old
Com
mun
it
E 91
103
0.39
2
FARM
S
194
0.89
2
Spec
ial
Educ
atio
n
16
0.5
0.30
1
Blac
k or
A
fric
an
24
6
0.80
1
Spec
ial
18
0.5
N
N
FARM
S
0.79
5
0.39
2
0.35
2
0.35
2
16
Prin
ce
Geo
rge'
s
2006
Gle
nrid
ge
Elem
enta
ry E 92
104
0.37
9
Asi
an
20
0.95
Two
or
mor
e ra
ces
14
0.57
1
0.31
5
Asi
an
16
0.93
8
Spec
ial
11
4
0.62
3
Y N
Asi
an
0.93
8
0.37
9
0.35
1
0.35
1
03
Balti
mor
e Co
unty
0912
Hal
stea
d A
cade
my
E 93
105
0.35
8
Whi
te
11
0.90
9
Spec
ial
Educ
atio
n
49
0.55
1
0.33
9
Lim
ited
Engl
ish
17
0.82
4
Spec
ial
66
0.48
5
N
N
Whi
te
0.7
0.35
8
0.35
0.35
30
Balti
mor
e Ci
ty
0012
Lake
land
El
emen
tar
y/M
iddl
e
EM
118
106
0.35
4
His
pani
c/L
ti
f
11
8
0.80
5
Spec
ial
Educ
atio
n
144
0.45
1
0.30
2
Whi
te
28
0.89
3
Spec
ial
13
2
0.59
1
N
Y His
pani
c/L
atin
o of
0.
84
0.38
9
0.33
1
0.35
15
Mon
tgom
ery
0786
Geo
rgia
n Fo
rest
El
emen
tar
E 113
107
0.33
1
Asi
an
38
0.97
4
Spec
ial
Educ
atio
n
56
0.64
3
0.33
8
Asi
an
26
1 Spec
ial
74
0.66
2
Y Y Asi
an
1 0.35
7
0.33
4
0.34
9
16
Prin
ce
Geo
rge'
s
1808
Dos
wel
l E.
Broo
ks
Elem
enta
r E 24
0
108
0.19
5
Lim
ited
Eli
h
10
0.8
Spec
ial
Educ
atio
n
38
0.60
5
0.28
9
Spec
ial
Educ
atio
n 28
1 Blac
k or
256
0.71
1
N
Y Lim
ited
Engl
ish
1 0.
395
0.23
7
0.34
8
30
Balti
mor
e Ci
ty
0422
New
Era
A
cade
my
MH
96
109
0.29
7
Blac
k or
A
fi
289
0.70
9
Spec
ial
Educ
atio
n
34
0.41
2
0.40
6
Blac
k or
A
fric
an
18
9
0.71
4
Spec
ial
26
0.30
8
Y Y Blac
k or
A
fric
an
0.
714
0.30
2
0.34
5
0.34
8
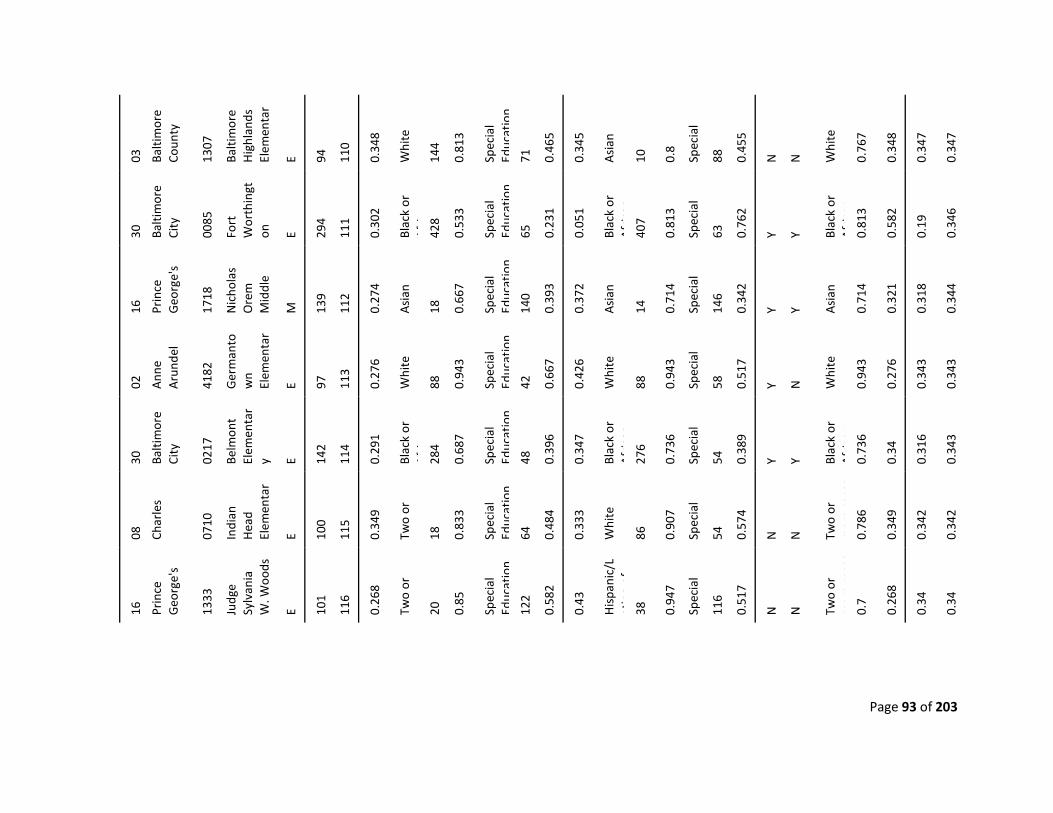
Page 93 of 203
03
Balti
mor
e Co
unty
1307
Balti
mor
e H
ighl
ands
El
emen
tar
E 94
110
0.34
8
Whi
te
144
0.81
3
Spec
ial
Educ
atio
n
71
0.46
5
0.34
5
Asi
an
10
0.8
Spec
ial
88
0.45
5
N
N
Whi
te
0.76
7
0.34
8
0.34
7
0.34
7
30
Balti
mor
e Ci
ty
0085
Fort
W
orth
ingt
on
E 294
111
0.30
2
Blac
k or
A
fi
428
0.53
3
Spec
ial
Educ
atio
n
65
0.23
1
0.05
1
Blac
k or
A
fric
an
40
7
0.81
3
Spec
ial
63
0.76
2
Y Y Blac
k or
A
fric
an
0.
813
0.58
2
0.19
0.34
6
16
Prin
ce
Geo
rge'
s
1718
Nic
hola
s O
rem
M
iddl
e
M
139
112
0.27
4
Asi
an
18
0.66
7
Spec
ial
Educ
atio
n
140
0.39
3
0.37
2
Asi
an
14
0.71
4
Spec
ial
14
6
0.34
2
Y Y Asi
an
0.71
4
0.32
1
0.31
8
0.34
4
02
Ann
e A
rund
el
4182
Ger
man
tow
n El
emen
tar
E 97
113
0.27
6
Whi
te
88
0.94
3
Spec
ial
Educ
atio
n
42
0.66
7
0.42
6
Whi
te
88
0.94
3
Spec
ial
58
0.51
7
Y N
Whi
te
0.94
3
0.27
6
0.34
3
0.34
3
30
Balti
mor
e Ci
ty
0217
Belm
ont
Elem
enta
ry E 14
2
114
0.29
1
Blac
k or
A
fi
284
0.68
7
Spec
ial
Educ
atio
n
48
0.39
6
0.34
7
Blac
k or
A
fric
an
27
6
0.73
6
Spec
ial
54
0.38
9
Y Y Blac
k or
A
fric
an
0.
736
0.34
0.31
6
0.34
3
08
Char
les
0710
Indi
an
Hea
d El
emen
tar
E 100
115
0.34
9
Two
or
18
0.83
3
Spec
ial
Educ
atio
n
64
0.48
4
0.33
3
Whi
te
86
0.90
7
Spec
ial
54
0.57
4
N
N
Two
or
mor
e ra
ces
0.78
6
0.34
9
0.34
2
0.34
2
16
Prin
ce
Geo
rge'
s
1333
Judg
e Sy
lvan
ia
W. W
oods
E 101
116
0.26
8
Two
or
20
0.85
Spec
ial
Educ
atio
n
122
0.58
2
0.43
His
pani
c/L
atin
o of
38
0.94
7
Spec
ial
11
6
0.51
7
N
N
Two
or
mor
e ra
ces
0.7
0.26
8
0.34
0.34
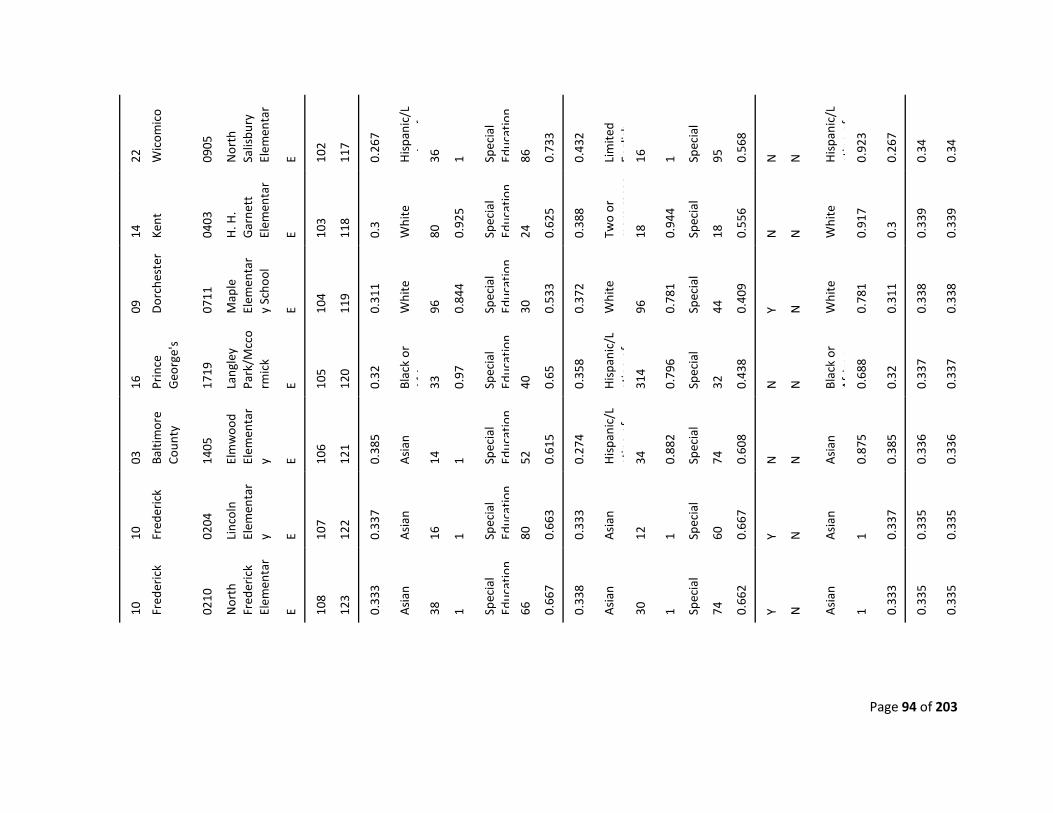
Page 94 of 203
22
Wic
omic
o
0905
Nor
th
Salis
bury
El
emen
tar
E 102
117
0.26
7
His
pani
c/L
ti
f
36
1 Spec
ial
Educ
atio
n
86
0.73
3
0.43
2
Lim
ited
Engl
ish
16
1 Spec
ial
95
0.56
8
N
N
His
pani
c/L
atin
o of
0.
923
0.26
7
0.34
0.34
14
Kent
0403
H. H
. G
arne
tt
Elem
enta
r E 10
3
118
0.3
Whi
te
80
0.92
5
Spec
ial
Educ
atio
n
24
0.62
5
0.38
8
Two
or
mor
e ra
ces
18
0.94
4
Spec
ial
18
0.55
6
N
N
Whi
te
0.91
7
0.3
0.33
9
0.33
9
09
Dor
ches
ter
0711
Map
le
Elem
enta
ry
Scho
ol
E 104
119
0.31
1
Whi
te
96
0.84
4
Spec
ial
Educ
atio
n
30
0.53
3
0.37
2
Whi
te
96
0.78
1
Spec
ial
44
0.40
9
Y N
Whi
te
0.78
1
0.31
1
0.33
8
0.33
8
16
Prin
ce
Geo
rge'
s
1719
Lang
ley
Park
/Mcc
orm
ick
E 105
120
0.32
Blac
k or
A
fi
33
0.97
Spec
ial
Educ
atio
n
40
0.65
0.35
8
His
pani
c/L
atin
o of
31
4
0.79
6
Spec
ial
32
0.43
8
N
N
Blac
k or
A
fric
an
0.
688
0.32
0.33
7
0.33
7
03
Balti
mor
e Co
unty
1405
Elm
woo
d El
emen
tar
y E 106
121
0.38
5
Asi
an
14
1 Spec
ial
Educ
atio
n
52
0.61
5
0.27
4
His
pani
c/L
atin
o of
34
0.88
2
Spec
ial
74
0.60
8
N
N
Asi
an
0.87
5
0.38
5
0.33
6
0.33
6
10
Fred
eric
k
0204
Linc
oln
Elem
enta
ry E 10
7
122
0.33
7
Asi
an
16
1 Spec
ial
Educ
atio
n
80
0.66
3
0.33
3
Asi
an
12
1 Spec
ial
60
0.66
7
Y N
Asi
an
1 0.33
7
0.33
5
0.33
5
10
Fred
eric
k
0210
Nor
th
Fred
eric
k El
emen
tar
E 108
123
0.33
3
Asi
an
38
1 Spec
ial
Educ
atio
n
66
0.66
7
0.33
8
Asi
an
30
1 Spec
ial
74
0.66
2
Y N
Asi
an
1 0.33
3
0.33
5
0.33
5
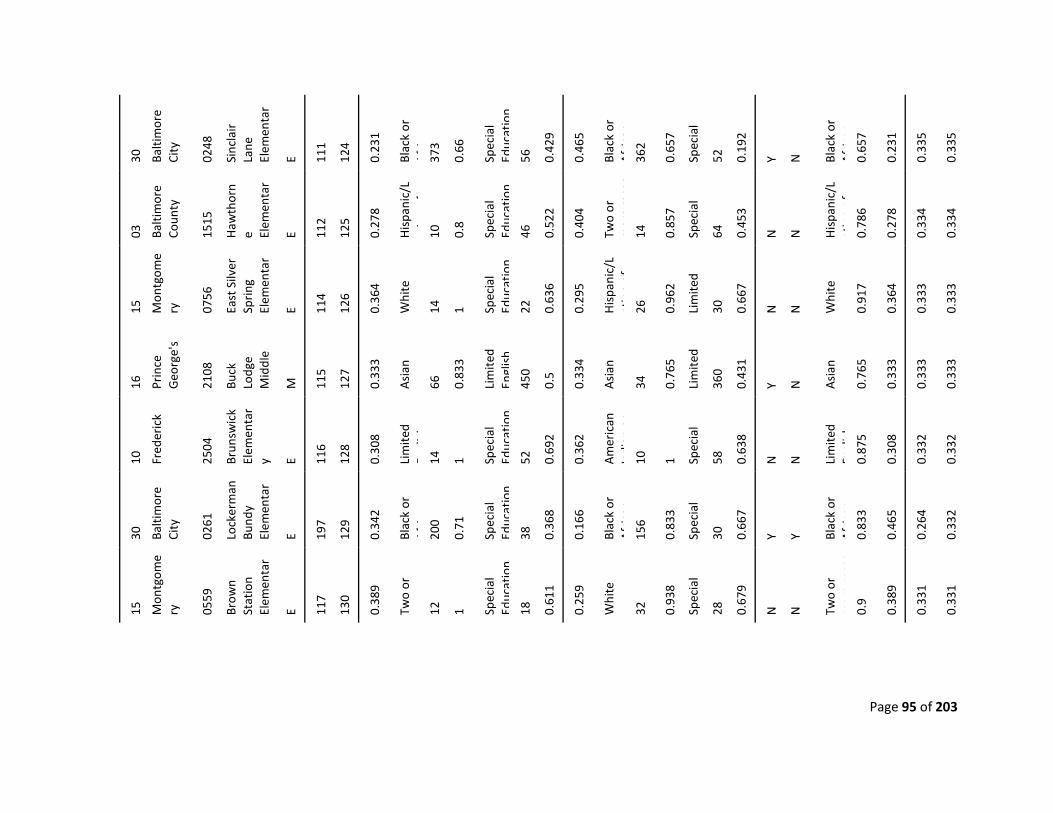
Page 95 of 203
30
Balti
mor
e Ci
ty
0248
Sinc
lair
La
ne
Elem
enta
r E 11
1
124
0.23
1
Blac
k or
A
fi
373
0.66
Spec
ial
Educ
atio
n
56
0.42
9
0.46
5
Blac
k or
A
fric
an
36
2
0.65
7
Spec
ial
52
0.19
2
Y N
Blac
k or
A
fric
an
0.
657
0.23
1
0.33
5
0.33
5
03
Balti
mor
e Co
unty
1515
Haw
thor
ne El
emen
tar
E 112
125
0.27
8
His
pani
c/L
ti
f
10
0.8
Spec
ial
Educ
atio
n
46
0.52
2
0.40
4
Two
or
mor
e ra
ces
14
0.85
7
Spec
ial
64
0.45
3
N
N
His
pani
c/L
atin
o of
0.
786
0.27
8
0.33
4
0.33
4
15
Mon
tgom
ery
0756
East
Silv
er
Spri
ng
Elem
enta
r E 11
4
126
0.36
4
Whi
te
14
1 Spec
ial
Educ
atio
n
22
0.63
6
0.29
5
His
pani
c/L
atin
o of
26
0.96
2
Lim
ited
30
0.66
7
N
N
Whi
te
0.91
7
0.36
4
0.33
3
0.33
3
16
Prin
ce
Geo
rge'
s
2108
Buck
Lo
dge
Mid
dle
M
115
127
0.33
3
Asi
an
66
0.83
3
Lim
ited
Engl
ish
45
0
0.5
0.33
4
Asi
an
34
0.76
5
Lim
ited
36
0
0.43
1
Y N
Asi
an
0.76
5
0.33
3
0.33
3
0.33
3
10
Fred
eric
k
2504
Brun
swic
k El
emen
tar
y E 116
128
0.30
8
Lim
ited
Eli
h
14
1 Spec
ial
Educ
atio
n
52
0.69
2
0.36
2
Am
eric
an
Indi
an o
r
10
1 Spec
ial
58
0.63
8
N
N
Lim
ited
Engl
ish
0.
875
0.30
8
0.33
2
0.33
2
30
Balti
mor
e Ci
ty
0261
Lock
erm
an
Bund
y El
emen
tar
E 197
129
0.34
2
Blac
k or
A
fi
200
0.71
Spec
ial
Educ
atio
n
38
0.36
8
0.16
6
Blac
k or
A
fric
an
15
6
0.83
3
Spec
ial
30
0.66
7
Y Y Blac
k or
A
fric
an
0.
833
0.46
5
0.26
4
0.33
2
15
Mon
tgom
ery
0559
Brow
n St
atio
n El
emen
tar
E 117
130
0.38
9
Two
or
12
1 Spec
ial
Educ
atio
n
18
0.61
1
0.25
9
Whi
te
32
0.93
8
Spec
ial
28
0.67
9
N
N
Two
or
mor
e ra
ces
0.9
0.38
9
0.33
1
0.33
1
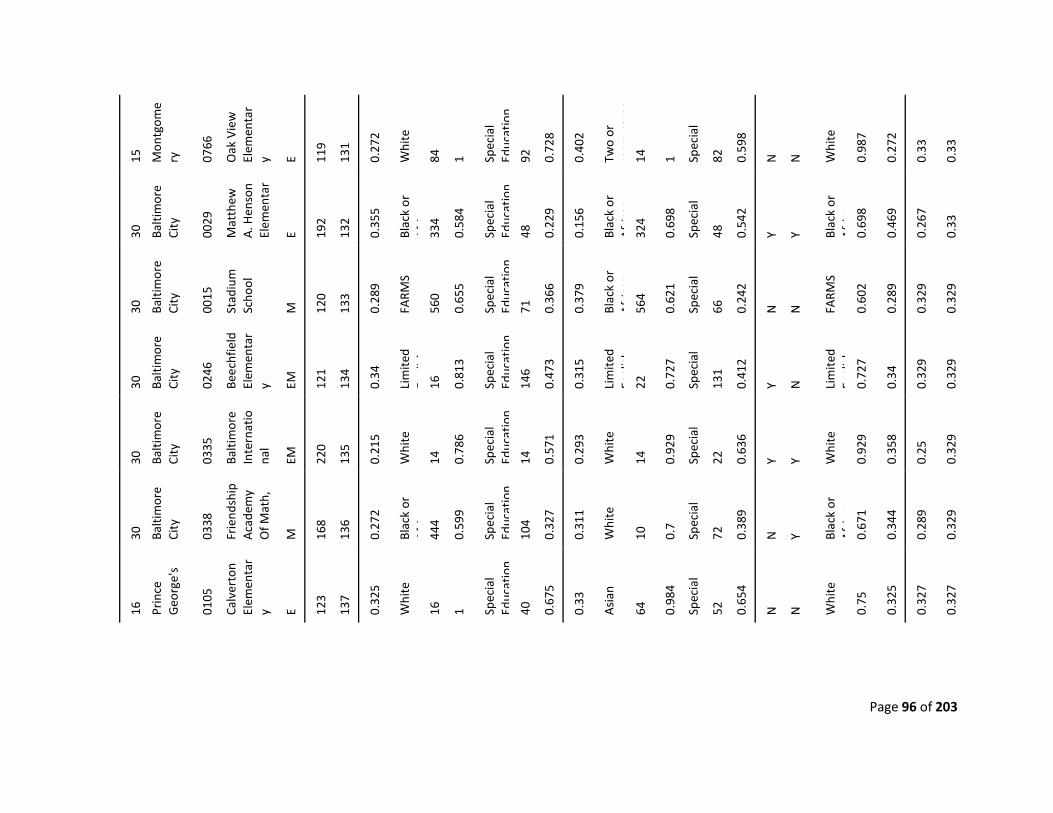
Page 96 of 203
15
Mon
tgom
ery
0766
Oak
Vie
w
Elem
enta
ry E 11
9
131
0.27
2
Whi
te
84
1 Spec
ial
Educ
atio
n
92
0.72
8
0.40
2
Two
or
mor
e ra
ces
14
1 Spec
ial
82
0.59
8
N
N
Whi
te
0.98
7
0.27
2
0.33
0.33
30
Balti
mor
e Ci
ty
0029
Mat
thew
A
. Hen
son
Elem
enta
r E 19
2
132
0.35
5
Blac
k or
A
fi
334
0.58
4
Spec
ial
Educ
atio
n
48
0.22
9
0.15
6
Blac
k or
A
fric
an
32
4
0.69
8
Spec
ial
48
0.54
2
Y Y Blac
k or
A
fric
an
0.
698
0.46
9
0.26
7
0.33
30
Balti
mor
e Ci
ty
0015
Stad
ium
Sc
hool
M
120
133
0.28
9
FARM
S
560
0.65
5
Spec
ial
Educ
atio
n
71
0.36
6
0.37
9
Blac
k or
A
fric
an
56
4
0.62
1
Spec
ial
66
0.24
2
N
N
FARM
S
0.60
2
0.28
9
0.32
9
0.32
9
30
Balti
mor
e Ci
ty
0246
Beec
hfie
ld
Elem
enta
ry EM
121
134
0.34
Lim
ited
Eli
h
16
0.81
3
Spec
ial
Educ
atio
n
146
0.47
3
0.31
5
Lim
ited
Engl
ish
22
0.72
7
Spec
ial
13
1
0.41
2
Y N
Lim
ited
Engl
ish
0.
727
0.34
0.32
9
0.32
9
30
Balti
mor
e Ci
ty
0335
Balti
mor
e In
tern
atio
nal
EM
220
135
0.21
5
Whi
te
14
0.78
6
Spec
ial
Educ
atio
n
14
0.57
1
0.29
3
Whi
te
14
0.92
9
Spec
ial
22
0.63
6
Y Y Whi
te
0.92
9
0.35
8
0.25
0.32
9
30
Balti
mor
e Ci
ty
0338
Frie
ndsh
ip
Aca
dem
y O
f Mat
h,
M
168
136
0.27
2
Blac
k or
A
fi
444
0.59
9
Spec
ial
Educ
atio
n
104
0.32
7
0.31
1
Whi
te
10
0.7
Spec
ial
72
0.38
9
N
Y Blac
k or
A
fric
an
0.
671
0.34
4
0.28
9
0.32
9
16
Prin
ce
Geo
rge'
s
0105
Calv
erto
n El
emen
tar
y E 123
137
0.32
5
Whi
te
16
1 Spec
ial
Educ
atio
n
40
0.67
5
0.33
Asi
an
64
0.98
4
Spec
ial
52
0.65
4
N
N
Whi
te
0.75
0.32
5
0.32
7
0.32
7
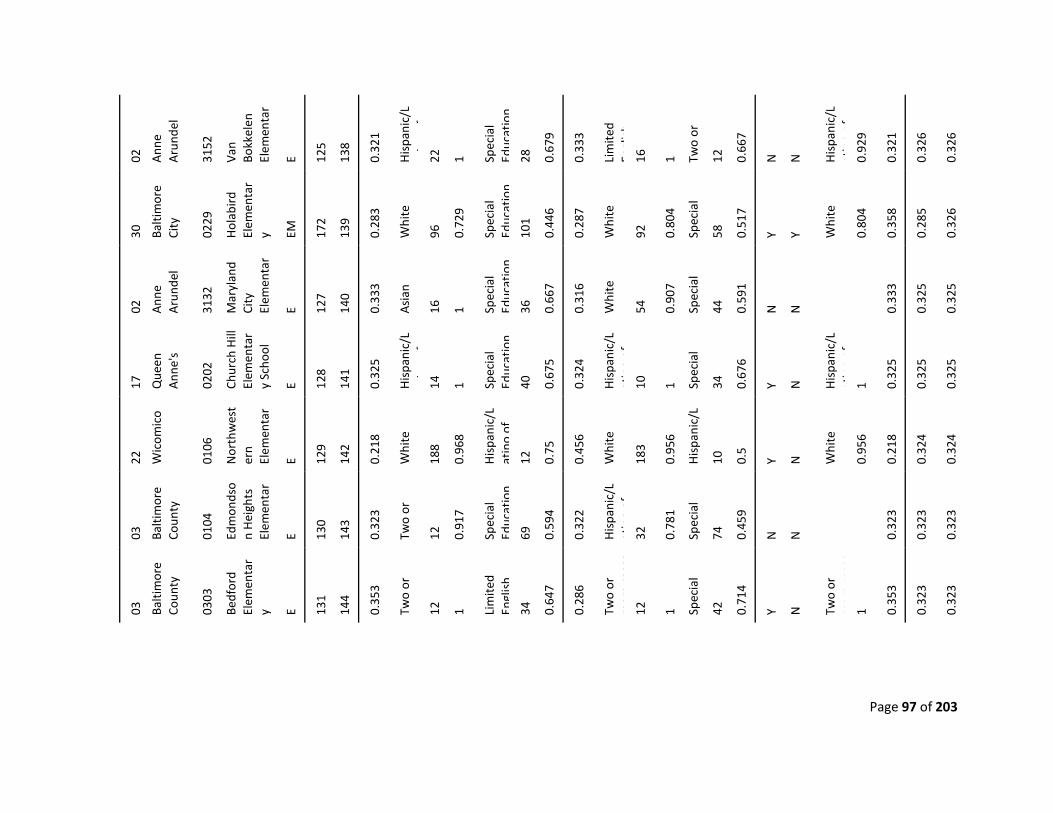
Page 97 of 203
02
Ann
e A
rund
el
3152
Van
Bokk
elen
El
emen
tar
E 125
138
0.32
1
His
pani
c/L
ti
f
22
1 Spec
ial
Educ
atio
n
28
0.67
9
0.33
3
Lim
ited
Engl
ish
16
1 Two
or
12
0.66
7
N
N
His
pani
c/L
atin
o of
0.
929
0.32
1
0.32
6
0.32
6
30
Balti
mor
e Ci
ty
0229
Hol
abir
d El
emen
tar
y EM
172
139
0.28
3
Whi
te
96
0.72
9
Spec
ial
Educ
atio
n
101
0.44
6
0.28
7
Whi
te
92
0.80
4
Spec
ial
58
0.51
7
Y Y Whi
te
0.80
4
0.35
8
0.28
5
0.32
6
02
Ann
e A
rund
el
3132
Mar
ylan
d Ci
ty
Elem
enta
r E 12
7
140
0.33
3
Asi
an
16
1 Spec
ial
Educ
atio
n
36
0.66
7
0.31
6
Whi
te
54
0.90
7
Spec
ial
44
0.59
1
N
N
0.33
3
0.32
5
0.32
5
17
Que
en
Ann
e's
0202
Chur
ch H
ill
Elem
enta
ry
Scho
ol
E 128
141
0.32
5
His
pani
c/L
ti
f
14
1 Spec
ial
Educ
atio
n
40
0.67
5
0.32
4
His
pani
c/L
atin
o of
10
1 Spec
ial
34
0.67
6
Y N
His
pani
c/L
atin
o of
1 0.
325
0.32
5
0.32
5
22
Wic
omic
o
0106
Nor
thw
est
ern
Elem
enta
r E 12
9
142
0.21
8
Whi
te
188
0.96
8
His
pani
c/L
atin
o of
12
0.75
0.45
6
Whi
te
183
0.95
6
His
pani
c/L
10
0.5
Y N
Whi
te
0.95
6
0.21
8
0.32
4
0.32
4
03
Balti
mor
e Co
unty
0104
Edm
onds
on
Hei
ghts
El
emen
tar
E 130
143
0.32
3
Two
or
12
0.91
7
Spec
ial
Educ
atio
n
69
0.59
4
0.32
2
His
pani
c/L
atin
o of
32
0.78
1
Spec
ial
74
0.45
9
N
N
0.32
3
0.32
3
0.32
3
03
Balti
mor
e Co
unty
0303
Bedf
ord
Elem
enta
ry E 13
1
144
0.35
3
Two
or
12
1 Lim
ited
Engl
ish
34
0.64
7
0.28
6
Two
or
mor
e ra
ces
12
1 Spec
ial
42
0.71
4
Y N
Two
or
mor
e ra
ces
1 0.35
3
0.32
3
0.32
3
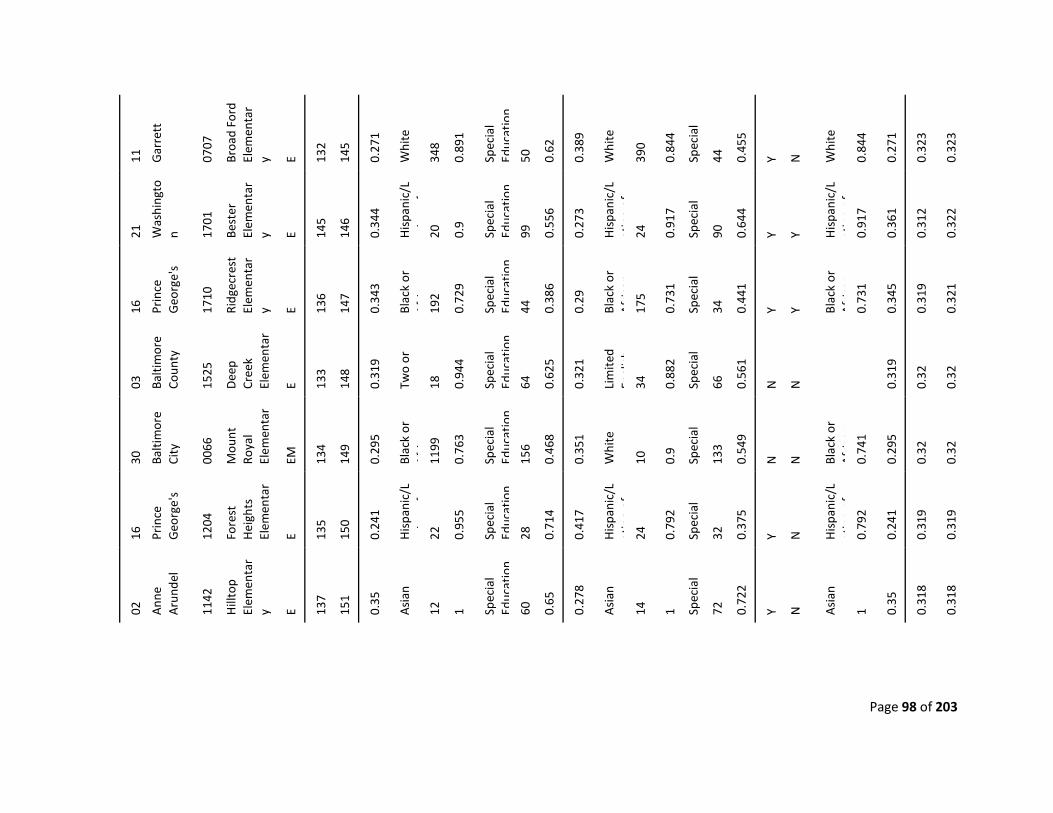
Page 98 of 203
11
Gar
rett
0707
Broa
d Fo
rd
Elem
enta
ry E 13
2
145
0.27
1
Whi
te
348
0.89
1
Spec
ial
Educ
atio
n
50
0.62
0.38
9
Whi
te
390
0.84
4
Spec
ial
44
0.45
5
Y N
Whi
te
0.84
4
0.27
1
0.32
3
0.32
3
21
Was
hing
ton 17
01
Best
er
Elem
enta
ry E 14
5
146
0.34
4
His
pani
c/L
ti
f
20
0.9
Spec
ial
Educ
atio
n
99
0.55
6
0.27
3
His
pani
c/L
atin
o of
24
0.91
7
Spec
ial
90
0.64
4
Y Y His
pani
c/L
atin
o of
0.
917
0.36
1
0.31
2
0.32
2
16
Prin
ce
Geo
rge'
s
1710
Ridg
ecre
st
Elem
enta
ry E 13
6
147
0.34
3
Blac
k or
A
fi
192
0.72
9
Spec
ial
Educ
atio
n
44
0.38
6
0.29
Blac
k or
A
fric
an
17
5
0.73
1
Spec
ial
34
0.44
1
Y Y Blac
k or
A
fric
an
0.
731
0.34
5
0.31
9
0.32
1
03
Balti
mor
e Co
unty
1525
Dee
p Cr
eek
Elem
enta
r E 13
3
148
0.31
9
Two
or
18
0.94
4
Spec
ial
Educ
atio
n
64
0.62
5
0.32
1
Lim
ited
Engl
ish
34
0.88
2
Spec
ial
66
0.56
1
N
N
0.31
9
0.32
0.32
30
Balti
mor
e Ci
ty
0066
Mou
nt
Roya
l El
emen
tar
EM
134
149
0.29
5
Blac
k or
A
fi
1199
0.76
3
Spec
ial
Educ
atio
n
156
0.46
8
0.35
1
Whi
te
10
0.9
Spec
ial
13
3
0.54
9
N
N
Blac
k or
A
fric
an
0.
741
0.29
5
0.32
0.32
16
Prin
ce
Geo
rge'
s
1204
Fore
st
Hei
ghts
El
emen
tar
E 135
150
0.24
1
His
pani
c/L
ti
f
22
0.95
5
Spec
ial
Educ
atio
n
28
0.71
4
0.41
7
His
pani
c/L
atin
o of
24
0.79
2
Spec
ial
32
0.37
5
Y N
His
pani
c/L
atin
o of
0.
792
0.24
1
0.31
9
0.31
9
02
Ann
e A
rund
el
1142
Hill
top
Elem
enta
ry E 13
7
151
0.35
Asi
an
12
1 Spec
ial
Educ
atio
n
60
0.65
0.27
8
Asi
an
14
1 Spec
ial
72
0.72
2
Y N
Asi
an
1 0.35
0.31
8
0.31
8
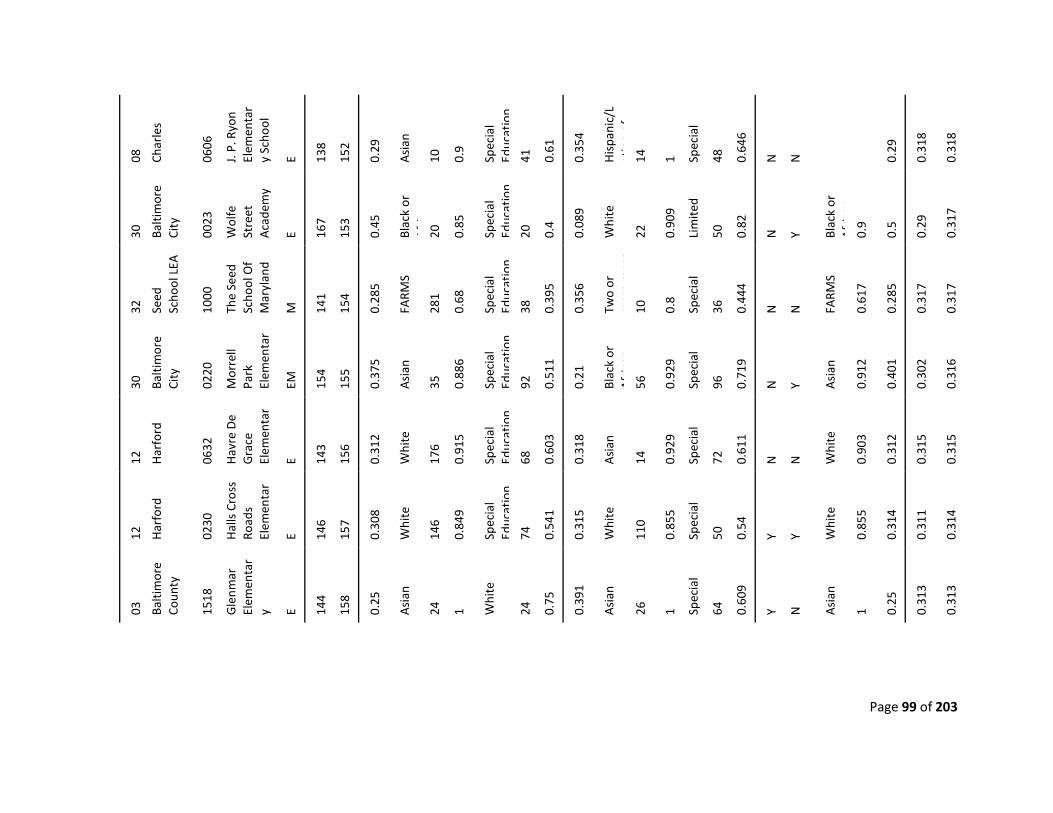
Page 99 of 203
08
Char
les
0606
J. P.
Ryo
n El
emen
tar
y Sc
hool
E 138
152
0.29
Asi
an
10
0.9
Spec
ial
Educ
atio
n
41
0.61
0.35
4
His
pani
c/L
atin
o of
14
1 Spec
ial
48
0.64
6
N
N
0.29
0.31
8
0.31
8
30
Balti
mor
e Ci
ty
0023
Wol
fe
Stre
et
Aca
dem
y
E 167
153
0.45
Blac
k or
A
fi
20
0.85
Spec
ial
Educ
atio
n
20
0.4
0.08
9
Whi
te
22
0.90
9
Lim
ited
50
0.82
N
Y Blac
k or
A
fric
an
0.
9
0.5
0.29
0.31
7
32
Seed
Sc
hool
LEA
1000
The
Seed
Sc
hool
Of
Mar
ylan
d
M
141
154
0.28
5
FARM
S
281
0.68
Spec
ial
Educ
atio
n
38
0.39
5
0.35
6
Two
or
mor
e ra
ces
10
0.8
Spec
ial
36
0.44
4
N
N
FARM
S
0.61
7
0.28
5
0.31
7
0.31
7
30
Balti
mor
e Ci
ty
0220
Mor
rell
Park
El
emen
tar
EM
154
155
0.37
5
Asi
an
35
0.88
6
Spec
ial
Educ
atio
n
92
0.51
1
0.21
Blac
k or
A
fric
an
56
0.92
9
Spec
ial
96
0.71
9
N
Y Asi
an
0.91
2
0.40
1
0.30
2
0.31
6
12
Har
ford
0632
Hav
re D
e G
race
El
emen
tar
E 143
156
0.31
2
Whi
te
176
0.91
5
Spec
ial
Educ
atio
n
68
0.60
3
0.31
8
Asi
an
14
0.92
9
Spec
ial
72
0.61
1
N
N
Whi
te
0.90
3
0.31
2
0.31
5
0.31
5
12
Har
ford
0230
Hal
ls C
ross
Ro
ads
Elem
enta
r E 14
6
157
0.30
8
Whi
te
146
0.84
9
Spec
ial
Educ
atio
n
74
0.54
1
0.31
5
Whi
te
110
0.85
5
Spec
ial
50
0.54
Y Y Whi
te
0.85
5
0.31
4
0.31
1
0.31
4
03
Balti
mor
e Co
unty
1518
Gle
nmar
El
emen
tar
y E 144
158
0.25
Asi
an
24
1 Whi
te
24
0.75
0.39
1
Asi
an
26
1 Spec
ial
64
0.60
9
Y N
Asi
an
1 0.25
0.31
3
0.31
3
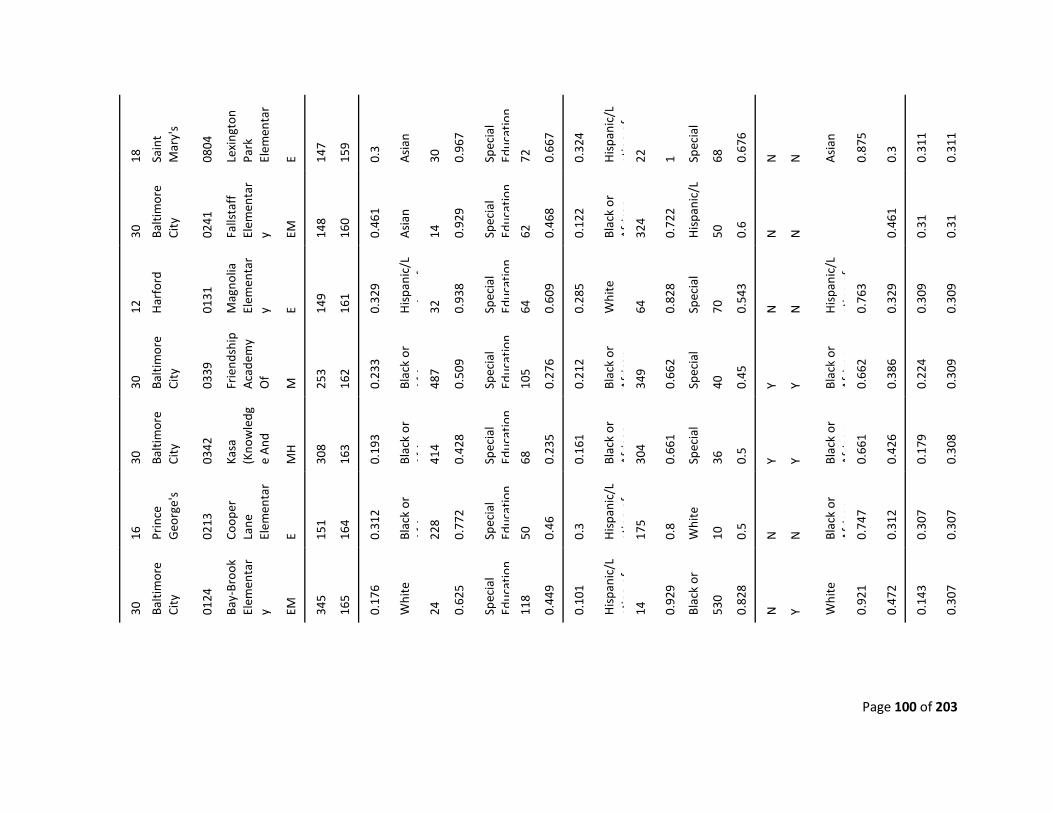
Page 100 of 203
18
Sain
t M
ary'
s
0804
Lexi
ngto
n Pa
rk
Elem
enta
r E 14
7
159
0.3
Asi
an
30
0.96
7
Spec
ial
Educ
atio
n
72
0.66
7
0.32
4
His
pani
c/L
atin
o of
22
1 Spec
ial
68
0.67
6
N
N
Asi
an
0.87
5
0.3
0.31
1
0.31
1
30
Balti
mor
e Ci
ty
0241
Falls
taff
El
emen
tar
y EM
148
160
0.46
1
Asi
an
14
0.92
9
Spec
ial
Educ
atio
n
62
0.46
8
0.12
2
Blac
k or
A
fric
an
32
4
0.72
2
His
pani
c/L
50
0.6
N
N
0.46
1
0.31
0.31
12
Har
ford
0131
Mag
nolia
El
emen
tar
y E 149
161
0.32
9
His
pani
c/L
ti
f
32
0.93
8
Spec
ial
Educ
atio
n
64
0.60
9
0.28
5
Whi
te
64
0.82
8
Spec
ial
70
0.54
3
N
N
His
pani
c/L
atin
o of
0.
763
0.32
9
0.30
9
0.30
9
30
Balti
mor
e Ci
ty
0339
Frie
ndsh
ip
Aca
dem
y O
f
M
253
162
0.23
3
Blac
k or
A
fi
487
0.50
9
Spec
ial
Educ
atio
n
105
0.27
6
0.21
2
Blac
k or
A
fric
an
34
9
0.66
2
Spec
ial
40
0.45
Y Y Blac
k or
A
fric
an
0.
662
0.38
6
0.22
4
0.30
9
30
Balti
mor
e Ci
ty
0342
Kasa
(K
now
ledg
e A
nd
MH
308
163
0.19
3
Blac
k or
A
fi
414
0.42
8
Spec
ial
Educ
atio
n
68
0.23
5
0.16
1
Blac
k or
A
fric
an
30
4
0.66
1
Spec
ial
36
0.5
Y Y Blac
k or
A
fric
an
0.
661
0.42
6
0.17
9
0.30
8
16
Prin
ce
Geo
rge'
s
0213
Coop
er
Lane
El
emen
tar
E 151
164
0.31
2
Blac
k or
A
fi
228
0.77
2
Spec
ial
Educ
atio
n
50
0.46
0.3
His
pani
c/L
atin
o of
17
5
0.8
Whi
te
10
0.5
N
N
Blac
k or
A
fric
an
0.
747
0.31
2
0.30
7
0.30
7
30
Balti
mor
e Ci
ty
0124
Bay-
Broo
k El
emen
tar
y EM
345
165
0.17
6
Whi
te
24
0.62
5
Spec
ial
Educ
atio
n
118
0.44
9
0.10
1
His
pani
c/L
atin
o of
14
0.92
9
Blac
k or
530
0.82
8
N
Y Whi
te
0.92
1
0.47
2
0.14
3
0.30
7
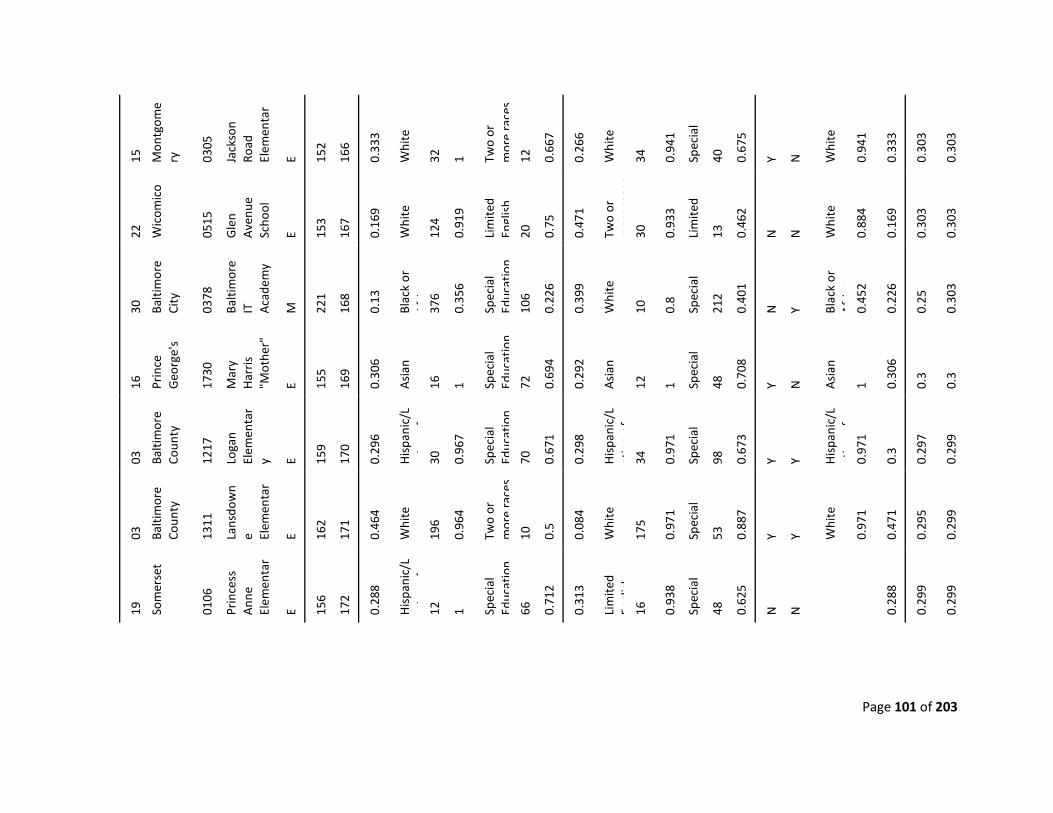
Page 101 of 203
15
Mon
tgom
ery
0305
Jack
son
Road
El
emen
tar
E 152
166
0.33
3
Whi
te
32
1 Two
or
mor
e ra
ces
12
0.66
7
0.26
6
Whi
te
34
0.94
1
Spec
ial
40
0.67
5
Y N
Whi
te
0.94
1
0.33
3
0.30
3
0.30
3
22
Wic
omic
o
0515
Gle
n A
venu
e Sc
hool
E 153
167
0.16
9
Whi
te
124
0.91
9
Lim
ited
Engl
ish
20
0.75
0.47
1
Two
or
mor
e ra
ces
30
0.93
3
Lim
ited
13
0.46
2
N
N
Whi
te
0.88
4
0.16
9
0.30
3
0.30
3
30
Balti
mor
e Ci
ty
0378
Balti
mor
e IT
A
cade
my
M
221
168
0.13
Blac
k or
A
fi
376
0.35
6
Spec
ial
Educ
atio
n
106
0.22
6
0.39
9
Whi
te
10
0.8
Spec
ial
21
2
0.40
1
N
Y Blac
k or
A
fric
an
0.
452
0.22
6
0.25
0.30
3
16
Prin
ce
Geo
rge'
s
1730
Mar
y H
arri
s "M
othe
r"
E 155
169
0.30
6
Asi
an
16
1 Spec
ial
Educ
atio
n
72
0.69
4
0.29
2
Asi
an
12
1 Spec
ial
48
0.70
8
Y N
Asi
an
1 0.30
6
0.3
0.3
03
Balti
mor
e Co
unty
1217
Loga
n El
emen
tar
y E 159
170
0.29
6
His
pani
c/L
ti
f
30
0.96
7
Spec
ial
Educ
atio
n
70
0.67
1
0.29
8
His
pani
c/L
atin
o of
34
0.97
1
Spec
ial
98
0.67
3
Y Y His
pani
c/L
atin
o of
0.
971
0.3
0.29
7
0.29
9
03
Balti
mor
e Co
unty
1311
Lans
dow
ne El
emen
tar
E 162
171
0.46
4
Whi
te
196
0.96
4
Two
or
mor
e ra
ces
10
0.5
0.08
4
Whi
te
175
0.97
1
Spec
ial
53
0.88
7
Y Y Whi
te
0.97
1
0.47
1
0.29
5
0.29
9
19
Som
erse
t
0106
Prin
cess
A
nne
Elem
enta
r E 15
6
172
0.28
8
His
pani
c/L
ti
f
12
1 Spec
ial
Educ
atio
n
66
0.71
2
0.31
3
Lim
ited
Engl
ish
16
0.93
8
Spec
ial
48
0.62
5
N
N
0.28
8
0.29
9
0.29
9
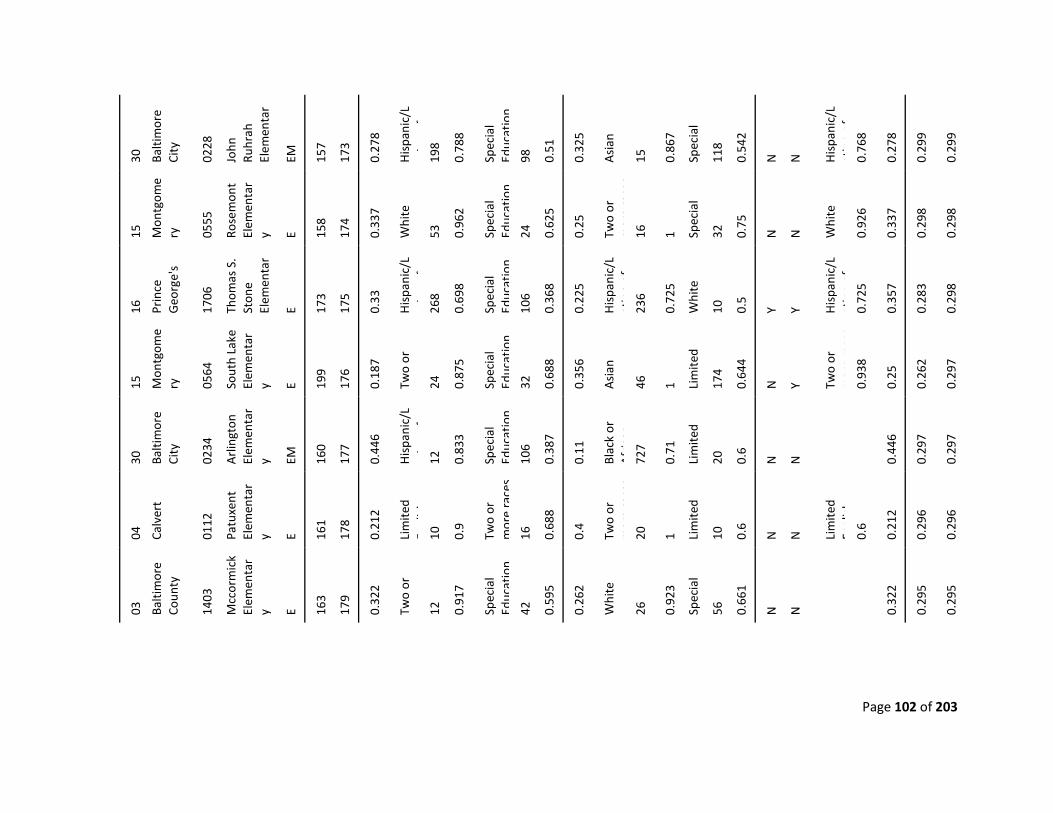
Page 102 of 203
30
Balti
mor
e Ci
ty
0228
John
Ru
hrah
El
emen
tar
EM
157
173
0.27
8
His
pani
c/L
ti
f
19
8
0.78
8
Spec
ial
Educ
atio
n
98
0.51
0.32
5
Asi
an
15
0.86
7
Spec
ial
11
8
0.54
2
N
N
His
pani
c/L
atin
o of
0.
768
0.27
8
0.29
9
0.29
9
15
Mon
tgom
ery
0555
Rose
mon
t El
emen
tar
y E 158
174
0.33
7
Whi
te
53
0.96
2
Spec
ial
Educ
atio
n
24
0.62
5
0.25
Two
or
mor
e ra
ces
16
1 Spec
ial
32
0.75
N
N
Whi
te
0.92
6
0.33
7
0.29
8
0.29
8
16
Prin
ce
Geo
rge'
s
1706
Thom
as S
. St
one
Elem
enta
r E 17
3
175
0.33
His
pani
c/L
ti
f
26
8
0.69
8
Spec
ial
Educ
atio
n
106
0.36
8
0.22
5
His
pani
c/L
atin
o of
23
6
0.72
5
Whi
te
10
0.5
Y Y His
pani
c/L
atin
o of
0.
725
0.35
7
0.28
3
0.29
8
15
Mon
tgom
ery
0564
Sout
h La
ke
Elem
enta
ry E 19
9
176
0.18
7
Two
or
24
0.87
5
Spec
ial
Educ
atio
n
32
0.68
8
0.35
6
Asi
an
46
1 Lim
ited
17
4
0.64
4
N
Y Two
or
mor
e ra
ces
0.93
8
0.25
0.26
2
0.29
7
30
Balti
mor
e Ci
ty
0234
Arl
ingt
on
Elem
enta
ry EM
160
177
0.44
6
His
pani
c/L
ti
f
12
0.83
3
Spec
ial
Educ
atio
n
106
0.38
7
0.11
Blac
k or
A
fric
an
72
7
0.71
Lim
ited
20
0.6
N
N
0.44
6
0.29
7
0.29
7
04
Calv
ert
0112
Patu
xent
El
emen
tar
y E 161
178
0.21
2
Lim
ited
Eli
h
10
0.9
Two
or
mor
e ra
ces
16
0.68
8
0.4
Two
or
mor
e ra
ces
20
1 Lim
ited
10
0.6
N
N
Lim
ited
Engl
ish
0.
6
0.21
2
0.29
6
0.29
6
03
Balti
mor
e Co
unty
1403
Mcc
orm
ick
Elem
enta
ry E 16
3
179
0.32
2
Two
or
12
0.91
7
Spec
ial
Educ
atio
n
42
0.59
5
0.26
2
Whi
te
26
0.92
3
Spec
ial
56
0.66
1
N
N
0.32
2
0.29
5
0.29
5
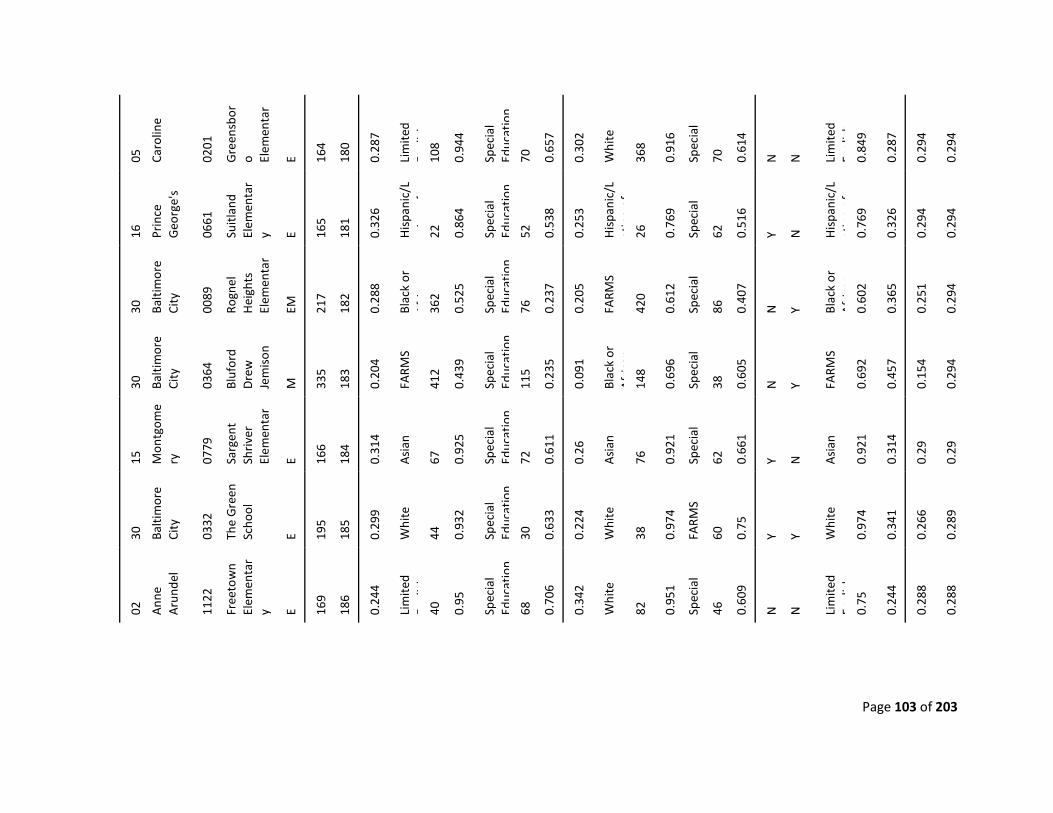
Page 103 of 203
05
Caro
line
0201
Gre
ensb
oro El
emen
tar
E 164
180
0.28
7
Lim
ited
Eli
h
108
0.94
4
Spec
ial
Educ
atio
n
70
0.65
7
0.30
2
Whi
te
368
0.91
6
Spec
ial
70
0.61
4
N
N
Lim
ited
Engl
ish
0.
849
0.28
7
0.29
4
0.29
4
16
Prin
ce
Geo
rge'
s
0661
Suitl
and
Elem
enta
ry E 16
5
181
0.32
6
His
pani
c/L
ti
f
22
0.86
4
Spec
ial
Educ
atio
n
52
0.53
8
0.25
3
His
pani
c/L
atin
o of
26
0.76
9
Spec
ial
62
0.51
6
Y N
His
pani
c/L
atin
o of
0.
769
0.32
6
0.29
4
0.29
4
30
Balti
mor
e Ci
ty
0089
Rogn
el
Hei
ghts
El
emen
tar
EM
217
182
0.28
8
Blac
k or
A
fi
362
0.52
5
Spec
ial
Educ
atio
n
76
0.23
7
0.20
5
FARM
S
420
0.61
2
Spec
ial
86
0.40
7
N
Y Blac
k or
A
fric
an
0.
602
0.36
5
0.25
1
0.29
4
30
Balti
mor
e Ci
ty
0364
Bluf
ord
Dre
w
Jem
ison
M
335
183
0.20
4
FARM
S
412
0.43
9
Spec
ial
Educ
atio
n
115
0.23
5
0.09
1
Blac
k or
A
fric
an
14
8
0.69
6
Spec
ial
38
0.60
5
N
Y FARM
S
0.69
2
0.45
7
0.15
4
0.29
4
15
Mon
tgom
ery
0779
Sarg
ent
Shri
ver
Elem
enta
r E 16
6
184
0.31
4
Asi
an
67
0.92
5
Spec
ial
Educ
atio
n
72
0.61
1
0.26
Asi
an
76
0.92
1
Spec
ial
62
0.66
1
Y N
Asi
an
0.92
1
0.31
4
0.29
0.29
30
Balti
mor
e Ci
ty
0332
The
Gre
en
Scho
ol
E 195
185
0.29
9
Whi
te
44
0.93
2
Spec
ial
Educ
atio
n
30
0.63
3
0.22
4
Whi
te
38
0.97
4
FARM
S
60
0.75
Y Y Whi
te
0.97
4
0.34
1
0.26
6
0.28
9
02
Ann
e A
rund
el
1122
Free
tow
n El
emen
tar
y E 169
186
0.24
4
Lim
ited
Eli
h
40
0.95
Spec
ial
Educ
atio
n
68
0.70
6
0.34
2
Whi
te
82
0.95
1
Spec
ial
46
0.60
9
N
N
Lim
ited
Engl
ish
0.
75
0.24
4
0.28
8
0.28
8
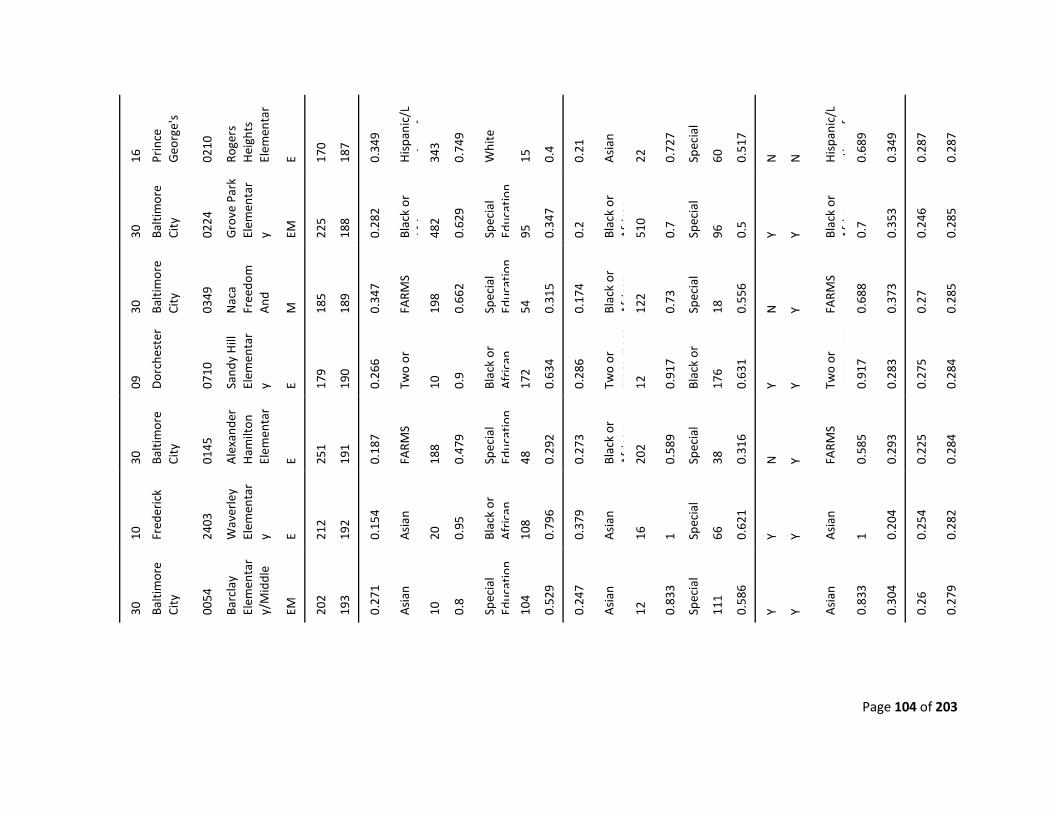
Page 104 of 203
16
Prin
ce
Geo
rge'
s
0210
Roge
rs
Hei
ghts
El
emen
tar
E 170
187
0.34
9
His
pani
c/L
ti
f
34
3
0.74
9
Whi
te
15
0.4
0.21
Asi
an
22
0.72
7
Spec
ial
60
0.51
7
N
N
His
pani
c/L
atin
o of
0.
689
0.34
9
0.28
7
0.28
7
30
Balti
mor
e Ci
ty
0224
Gro
ve P
ark
Elem
enta
ry EM
225
188
0.28
2
Blac
k or
A
fi
482
0.62
9
Spec
ial
Educ
atio
n
95
0.34
7
0.2
Blac
k or
A
fric
an
51
0
0.7
Spec
ial
96
0.5
Y Y Blac
k or
A
fric
an
0.
7
0.35
3
0.24
6
0.28
5
30
Balti
mor
e Ci
ty
0349
Nac
a Fr
eedo
m
And
M
185
189
0.34
7
FARM
S
198
0.66
2
Spec
ial
Educ
atio
n
54
0.31
5
0.17
4
Blac
k or
A
fric
an
12
2
0.73
Spec
ial
18
0.55
6
N
Y FARM
S
0.68
8
0.37
3
0.27
0.28
5
09
Dor
ches
ter
0710
Sand
y H
ill
Elem
enta
ry E 17
9
190
0.26
6
Two
or
10
0.9
Blac
k or
A
fric
an
17
2
0.63
4
0.28
6
Two
or
mor
e ra
ces
12
0.91
7
Blac
k or
176
0.63
1
Y Y Two
or
mor
e ra
ces
0.91
7
0.28
3
0.27
5
0.28
4
30
Balti
mor
e Ci
ty
0145
Ale
xand
er
Ham
ilton
El
emen
tar
E 251
191
0.18
7
FARM
S
188
0.47
9
Spec
ial
Educ
atio
n
48
0.29
2
0.27
3
Blac
k or
A
fric
an
20
2
0.58
9
Spec
ial
38
0.31
6
N
Y FARM
S
0.58
5
0.29
3
0.22
5
0.28
4
10
Fred
eric
k
2403
Wav
erle
y El
emen
tar
y E 212
192
0.15
4
Asi
an
20
0.95
Blac
k or
A
fric
an
10
8
0.79
6
0.37
9
Asi
an
16
1 Spec
ial
66
0.62
1
Y Y Asi
an
1 0.20
4
0.25
4
0.28
2
30
Balti
mor
e Ci
ty
0054
Barc
lay
Elem
enta
ry/
Mid
dle
EM
202
193
0.27
1
Asi
an
10
0.8
Spec
ial
Educ
atio
n
104
0.52
9
0.24
7
Asi
an
12
0.83
3
Spec
ial
11
1
0.58
6
Y Y Asi
an
0.83
3
0.30
4
0.26
0.27
9
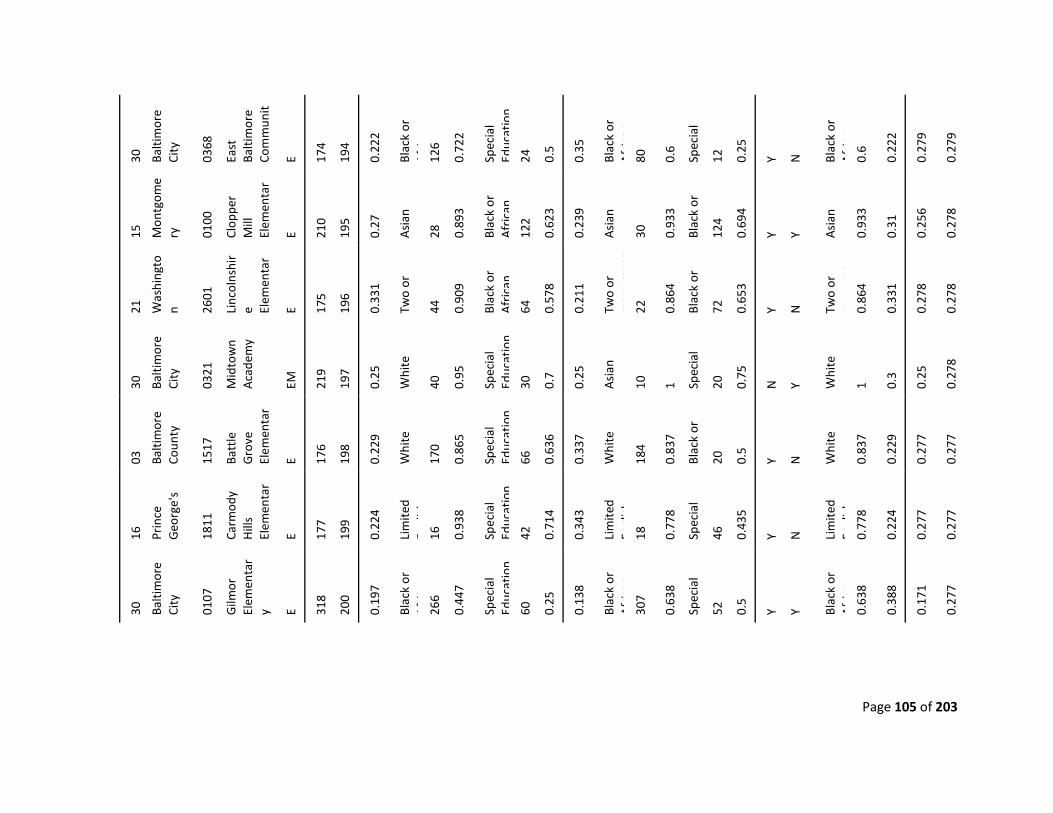
Page 105 of 203
30
Balti
mor
e Ci
ty
0368
East
Ba
ltim
ore
Com
mun
it
E 17
4
194
0.22
2
Blac
k or
A
fi
126
0.72
2
Spec
ial
Educ
atio
n
24
0.5
0.35
Blac
k or
A
fric
an
80
0.6
Spec
ial
12
0.25
Y N
Blac
k or
A
fric
an
0.
6
0.22
2
0.27
9
0.27
9
15
Mon
tgom
ery
0100
Clop
per
Mill
El
emen
tar
E 210
195
0.27
Asi
an
28
0.89
3
Blac
k or
A
fric
an
12
2
0.62
3
0.23
9
Asi
an
30
0.93
3
Blac
k or
124
0.69
4
Y Y Asi
an
0.93
3
0.31
0.25
6
0.27
8
21
Was
hing
ton 26
01
Linc
olns
hir
e Elem
enta
r E 17
5
196
0.33
1
Two
or
44
0.90
9
Blac
k or
A
fric
an
64
0.57
8
0.21
1
Two
or
mor
e ra
ces
22
0.86
4
Blac
k or
72
0.65
3
Y N
Two
or
mor
e ra
ces
0.86
4
0.33
1
0.27
8
0.27
8
30
Balti
mor
e Ci
ty
0321
Mid
tow
n A
cade
my
EM
219
197
0.25
Whi
te
40
0.95
Spec
ial
Educ
atio
n
30
0.7
0.25
Asi
an
10
1 Spec
ial
20
0.75
N
Y Whi
te
1 0.3
0.25
0.27
8
03
Balti
mor
e Co
unty
1517
Batt
le
Gro
ve
Elem
enta
r E 17
6
198
0.22
9
Whi
te
170
0.86
5
Spec
ial
Educ
atio
n
66
0.63
6
0.33
7
Whi
te
184
0.83
7
Blac
k or
20
0.5
Y N
Whi
te
0.83
7
0.22
9
0.27
7
0.27
7
16
Prin
ce
Geo
rge'
s
1811
Carm
ody
Hill
s El
emen
tar
E 177
199
0.22
4
Lim
ited
Eli
h
16
0.93
8
Spec
ial
Educ
atio
n
42
0.71
4
0.34
3
Lim
ited
Engl
ish
18
0.77
8
Spec
ial
46
0.43
5
Y N
Lim
ited
Engl
ish
0.
778
0.22
4
0.27
7
0.27
7
30
Balti
mor
e Ci
ty
0107
Gilm
or
Elem
enta
ry E 31
8
200
0.19
7
Blac
k or
A
fi
266
0.44
7
Spec
ial
Educ
atio
n
60
0.25
0.13
8
Blac
k or
A
fric
an
30
7
0.63
8
Spec
ial
52
0.5
Y Y Blac
k or
A
fric
an
0.
638
0.38
8
0.17
1
0.27
7
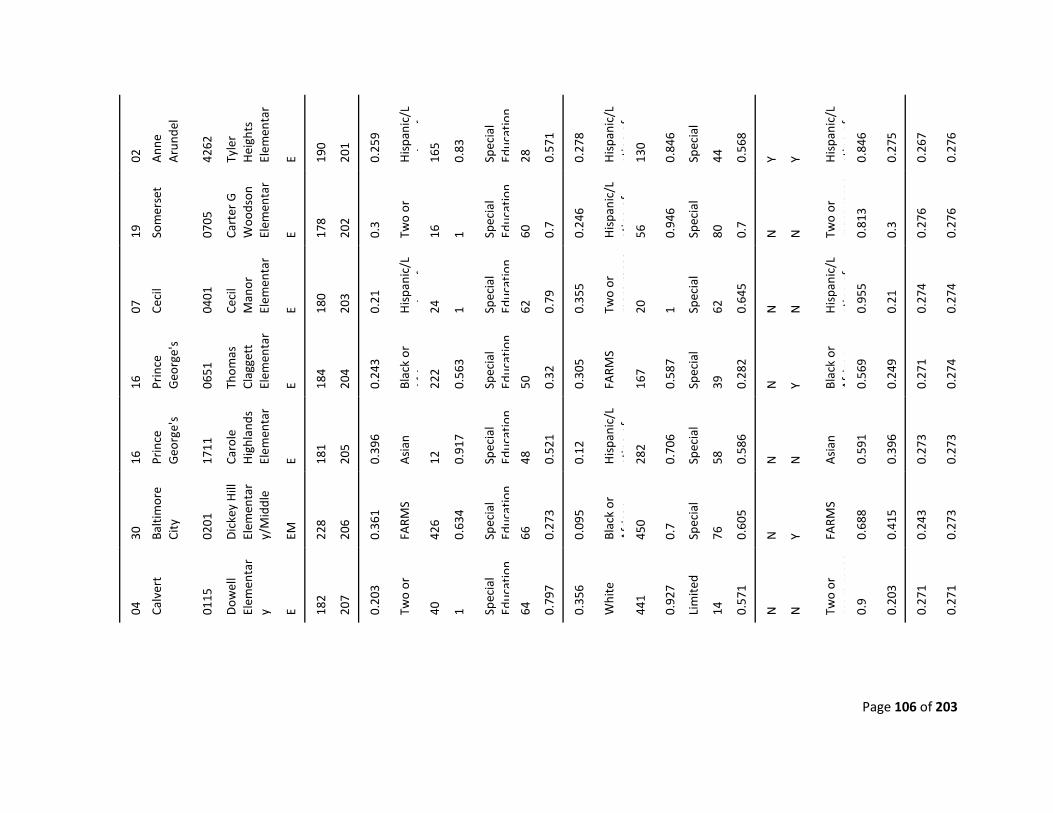
Page 106 of 203
02
Ann
e A
rund
el
4262
Tyle
r H
eigh
ts
Elem
enta
r E 19
0
201
0.25
9
His
pani
c/L
ti
f
16
5
0.83
Spec
ial
Educ
atio
n
28
0.57
1
0.27
8
His
pani
c/L
atin
o of
13
0
0.84
6
Spec
ial
44
0.56
8
Y Y His
pani
c/L
atin
o of
0.
846
0.27
5
0.26
7
0.27
6
19
Som
erse
t
0705
Cart
er G
W
oods
on
Elem
enta
r E 17
8
202
0.3
Two
or
16
1 Spec
ial
Educ
atio
n
60
0.7
0.24
6
His
pani
c/L
atin
o of
56
0.94
6
Spec
ial
80
0.7
N
N
Two
or
mor
e ra
ces
0.81
3
0.3
0.27
6
0.27
6
07
Ceci
l
0401
Ceci
l M
anor
El
emen
tar
E 180
203
0.21
His
pani
c/L
ti
f
24
1 Spec
ial
Educ
atio
n
62
0.79
0.35
5
Two
or
mor
e ra
ces
20
1 Spec
ial
62
0.64
5
N
N
His
pani
c/L
atin
o of
0.
955
0.21
0.27
4
0.27
4
16
Prin
ce
Geo
rge'
s
0651
Thom
as
Clag
gett
El
emen
tar
E 184
204
0.24
3
Blac
k or
A
fi
222
0.56
3
Spec
ial
Educ
atio
n
50
0.32
0.30
5
FARM
S
167
0.58
7
Spec
ial
39
0.28
2
N
Y Blac
k or
A
fric
an
0.
569
0.24
9
0.27
1
0.27
4
16
Prin
ce
Geo
rge'
s
1711
Caro
le
Hig
hlan
ds
Elem
enta
r E 18
1
205
0.39
6
Asi
an
12
0.91
7
Spec
ial
Educ
atio
n
48
0.52
1
0.12
His
pani
c/L
atin
o of
28
2
0.70
6
Spec
ial
58
0.58
6
N
N
Asi
an
0.59
1
0.39
6
0.27
3
0.27
3
30
Balti
mor
e Ci
ty
0201
Dic
key
Hill
El
emen
tar
y/M
iddl
e
EM
228
206
0.36
1
FARM
S
426
0.63
4
Spec
ial
Educ
atio
n
66
0.27
3
0.09
5
Blac
k or
A
fric
an
45
0
0.7
Spec
ial
76
0.60
5
N
Y FARM
S
0.68
8
0.41
5
0.24
3
0.27
3
04
Calv
ert
0115
Dow
ell
Elem
enta
ry E 18
2
207
0.20
3
Two
or
40
1 Spec
ial
Educ
atio
n
64
0.79
7
0.35
6
Whi
te
441
0.92
7
Lim
ited
14
0.57
1
N
N
Two
or
mor
e ra
ces
0.9
0.20
3
0.27
1
0.27
1
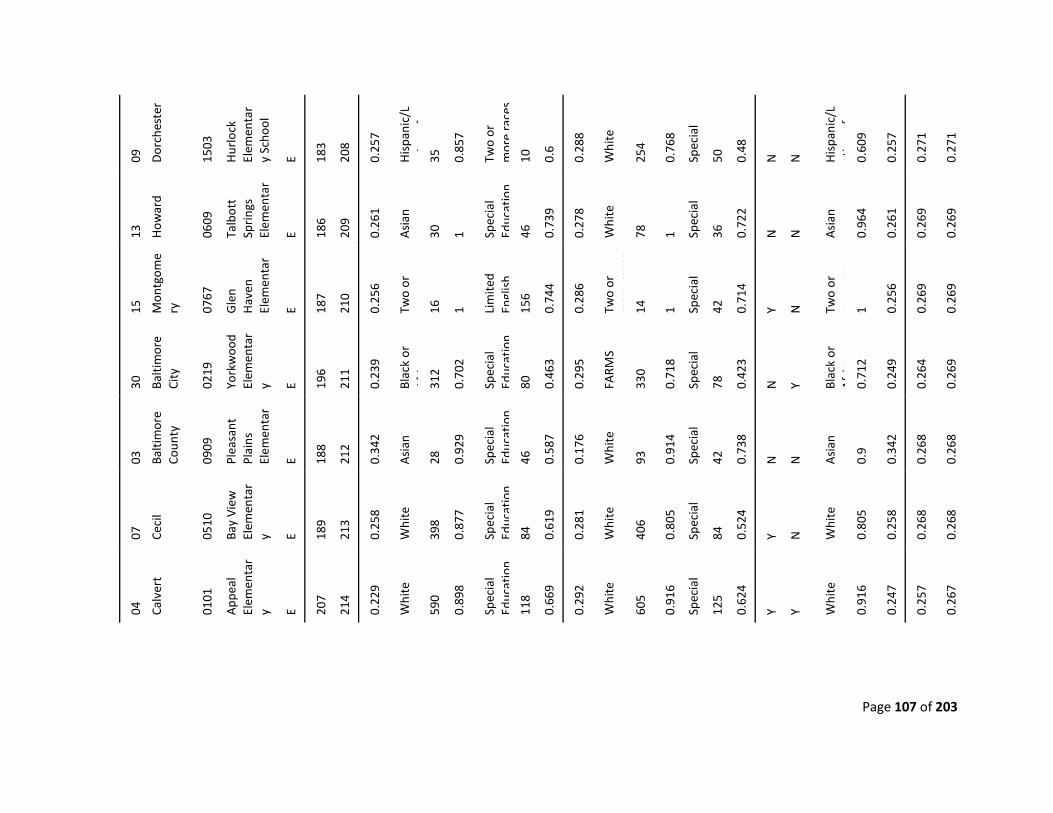
Page 107 of 203
09
Dor
ches
ter
1503
Hur
lock
El
emen
tar
y Sc
hool
E 183
208
0.25
7
His
pani
c/L
ti
f
35
0.85
7
Two
or
mor
e ra
ces
10
0.6
0.28
8
Whi
te
254
0.76
8
Spec
ial
50
0.48
N
N
His
pani
c/L
atin
o of
0.
609
0.25
7
0.27
1
0.27
1
13
How
ard
0609
Talb
ott
Spri
ngs
Elem
enta
r E 18
6
209
0.26
1
Asi
an
30
1 Spec
ial
Educ
atio
n
46
0.73
9
0.27
8
Whi
te
78
1 Spec
ial
36
0.72
2
N
N
Asi
an
0.96
4
0.26
1
0.26
9
0.26
9
15
Mon
tgom
ery
0767
Gle
n H
aven
El
emen
tar
E 187
210
0.25
6
Two
or
16
1 Lim
ited
Engl
ish
15
6
0.74
4
0.28
6
Two
or
mor
e ra
ces
14
1 Spec
ial
42
0.71
4
Y N
Two
or
mor
e ra
ces
1 0.25
6
0.26
9
0.26
9
30
Balti
mor
e Ci
ty
0219
York
woo
d El
emen
tar
y E 196
211
0.23
9
Blac
k or
A
fi
312
0.70
2
Spec
ial
Educ
atio
n
80
0.46
3
0.29
5
FARM
S
330
0.71
8
Spec
ial
78
0.42
3
N
Y Blac
k or
A
fric
an
0.
712
0.24
9
0.26
4
0.26
9
03
Balti
mor
e Co
unty
0909
Plea
sant
Pl
ains
El
emen
tar
E 188
212
0.34
2
Asi
an
28
0.92
9
Spec
ial
Educ
atio
n
46
0.58
7
0.17
6
Whi
te
93
0.91
4
Spec
ial
42
0.73
8
N
N
Asi
an
0.9
0.34
2
0.26
8
0.26
8
07
Ceci
l
0510
Bay
View
El
emen
tar
y E 189
213
0.25
8
Whi
te
398
0.87
7
Spec
ial
Educ
atio
n
84
0.61
9
0.28
1
Whi
te
406
0.80
5
Spec
ial
84
0.52
4
Y N
Whi
te
0.80
5
0.25
8
0.26
8
0.26
8
04
Calv
ert
0101
App
eal
Elem
enta
ry E 20
7
214
0.22
9
Whi
te
590
0.89
8
Spec
ial
Educ
atio
n
118
0.66
9
0.29
2
Whi
te
605
0.91
6
Spec
ial
12
5
0.62
4
Y Y Whi
te
0.91
6
0.24
7
0.25
7
0.26
7
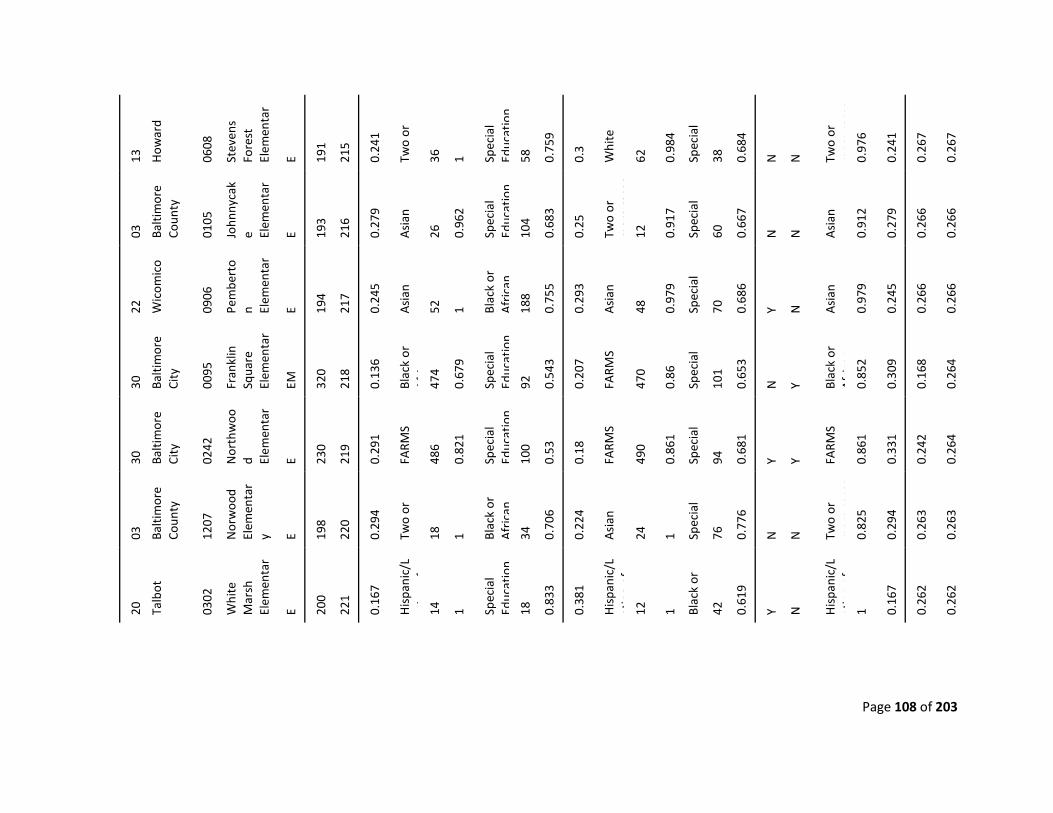
Page 108 of 203
13
How
ard
0608
Stev
ens
Fore
st
Elem
enta
r E 19
1
215
0.24
1
Two
or
36
1 Spec
ial
Educ
atio
n
58
0.75
9
0.3
Whi
te
62
0.98
4
Spec
ial
38
0.68
4
N
N
Two
or
mor
e ra
ces
0.97
6
0.24
1
0.26
7
0.26
7
03
Balti
mor
e Co
unty
0105
John
nyca
ke El
emen
tar
E 193
216
0.27
9
Asi
an
26
0.96
2
Spec
ial
Educ
atio
n
104
0.68
3
0.25
Two
or
mor
e ra
ces
12
0.91
7
Spec
ial
60
0.66
7
N
N
Asi
an
0.91
2
0.27
9
0.26
6
0.26
6
22
Wic
omic
o
0906
Pem
bert
on El
emen
tar
E 194
217
0.24
5
Asi
an
52
1 Blac
k or
A
fric
an
18
8
0.75
5
0.29
3
Asi
an
48
0.97
9
Spec
ial
70
0.68
6
Y N
Asi
an
0.97
9
0.24
5
0.26
6
0.26
6
30
Balti
mor
e Ci
ty
0095
Fran
klin
Sq
uare
El
emen
tar
EM
320
218
0.13
6
Blac
k or
A
fi
474
0.67
9
Spec
ial
Educ
atio
n
92
0.54
3
0.20
7
FARM
S
470
0.86
Spec
ial
10
1
0.65
3
N
Y Blac
k or
A
fric
an
0.
852
0.30
9
0.16
8
0.26
4
30
Balti
mor
e Ci
ty
0242
Nor
thw
ood El
emen
tar
E 230
219
0.29
1
FARM
S
486
0.82
1
Spec
ial
Educ
atio
n
100
0.53
0.18
FARM
S
490
0.86
1
Spec
ial
94
0.68
1
Y Y FARM
S
0.86
1
0.33
1
0.24
2
0.26
4
03
Balti
mor
e Co
unty
1207
Nor
woo
d El
emen
tar
y E 198
220
0.29
4
Two
or
18
1 Blac
k or
A
fric
an
34
0.70
6
0.22
4
Asi
an
24
1 Spec
ial
76
0.77
6
N
N
Two
or
mor
e ra
ces
0.82
5
0.29
4
0.26
3
0.26
3
20
Talb
ot
0302
Whi
te
Mar
sh
Elem
enta
r E 20
0
221
0.16
7
His
pani
c/L
ti
f
14
1 Spec
ial
Educ
atio
n
18
0.83
3
0.38
1
His
pani
c/L
atin
o of
12
1 Blac
k or
42
0.61
9
Y N
His
pani
c/L
atin
o of
1 0.
167
0.26
2
0.26
2
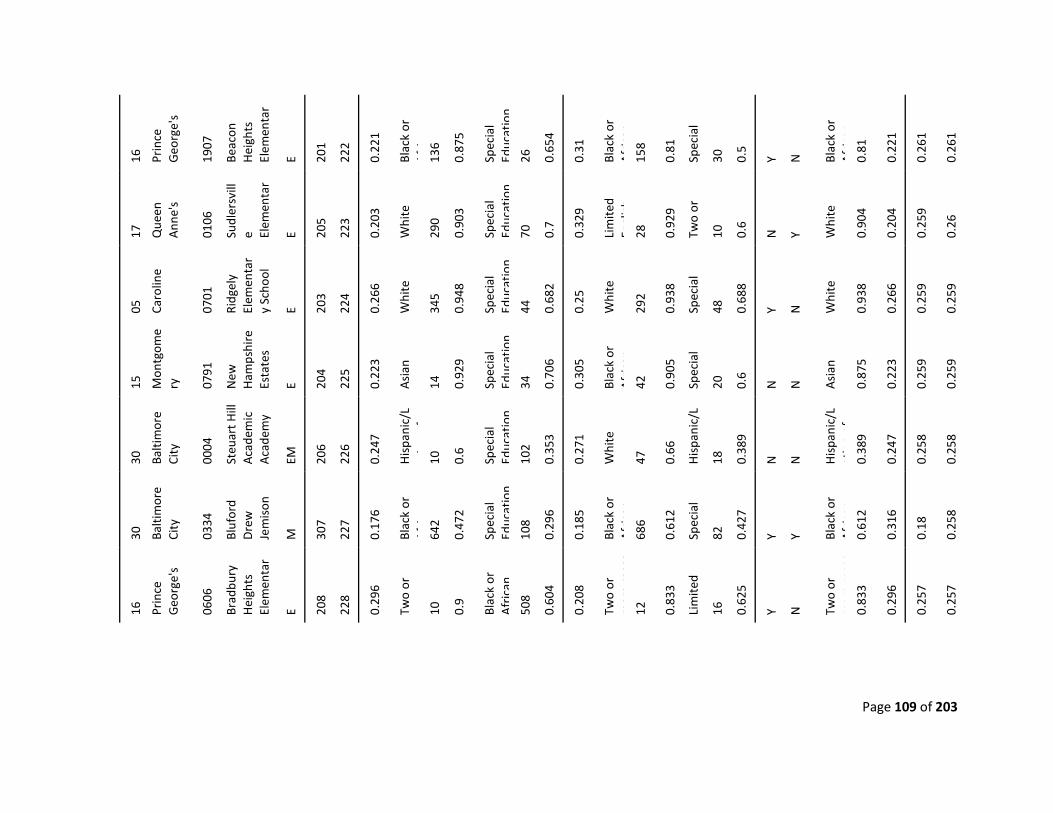
Page 109 of 203
16
Prin
ce
Geo
rge'
s
1907
Beac
on
Hei
ghts
El
emen
tar
E 201
222
0.22
1
Blac
k or
A
fi
136
0.87
5
Spec
ial
Educ
atio
n
26
0.65
4
0.31
Blac
k or
A
fric
an
15
8
0.81
Spec
ial
30
0.5
Y N
Blac
k or
A
fric
an
0.
81
0.22
1
0.26
1
0.26
1
17
Que
en
Ann
e's
0106
Sudl
ersv
ille El
emen
tar
E 205
223
0.20
3
Whi
te
290
0.90
3
Spec
ial
Educ
atio
n
70
0.7
0.32
9
Lim
ited
Engl
ish
28
0.92
9
Two
or
10
0.6
N
Y Whi
te
0.90
4
0.20
4
0.25
9
0.26
05
Caro
line
0701
Ridg
ely
Elem
enta
ry
Scho
ol
E 203
224
0.26
6
Whi
te
345
0.94
8
Spec
ial
Educ
atio
n
44
0.68
2
0.25
Whi
te
292
0.93
8
Spec
ial
48
0.68
8
Y N
Whi
te
0.93
8
0.26
6
0.25
9
0.25
9
15
Mon
tgom
ery
0791
New
H
amps
hire
Es
tate
s E 20
4
225
0.22
3
Asi
an
14
0.92
9
Spec
ial
Educ
atio
n
34
0.70
6
0.30
5
Blac
k or
A
fric
an
42
0.90
5
Spec
ial
20
0.6
N
N
Asi
an
0.87
5
0.22
3
0.25
9
0.25
9
30
Balti
mor
e Ci
ty
0004
Steu
art H
ill
Aca
dem
ic
Aca
dem
y
EM
206
226
0.24
7
His
pani
c/L
ti
f
10
0.6
Spec
ial
Educ
atio
n
102
0.35
3
0.27
1
Whi
te
47
0.66
His
pani
c/L
18
0.38
9
N
N
His
pani
c/L
atin
o of
0.
389
0.24
7
0.25
8
0.25
8
30
Balti
mor
e Ci
ty
0334
Bluf
ord
Dre
w
Jem
ison
M
307
227
0.17
6
Blac
k or
A
fi
642
0.47
2
Spec
ial
Educ
atio
n
108
0.29
6
0.18
5
Blac
k or
A
fric
an
68
6
0.61
2
Spec
ial
82
0.42
7
Y Y Blac
k or
A
fric
an
0.
612
0.31
6
0.18
0.25
8
16
Prin
ce
Geo
rge'
s
0606
Brad
bury
H
eigh
ts
Elem
enta
r E 20
8
228
0.29
6
Two
or
10
0.9
Blac
k or
A
fric
an
50
8
0.60
4
0.20
8
Two
or
mor
e ra
ces
12
0.83
3
Lim
ited
16
0.62
5
Y N
Two
or
mor
e ra
ces
0.83
3
0.29
6
0.25
7
0.25
7
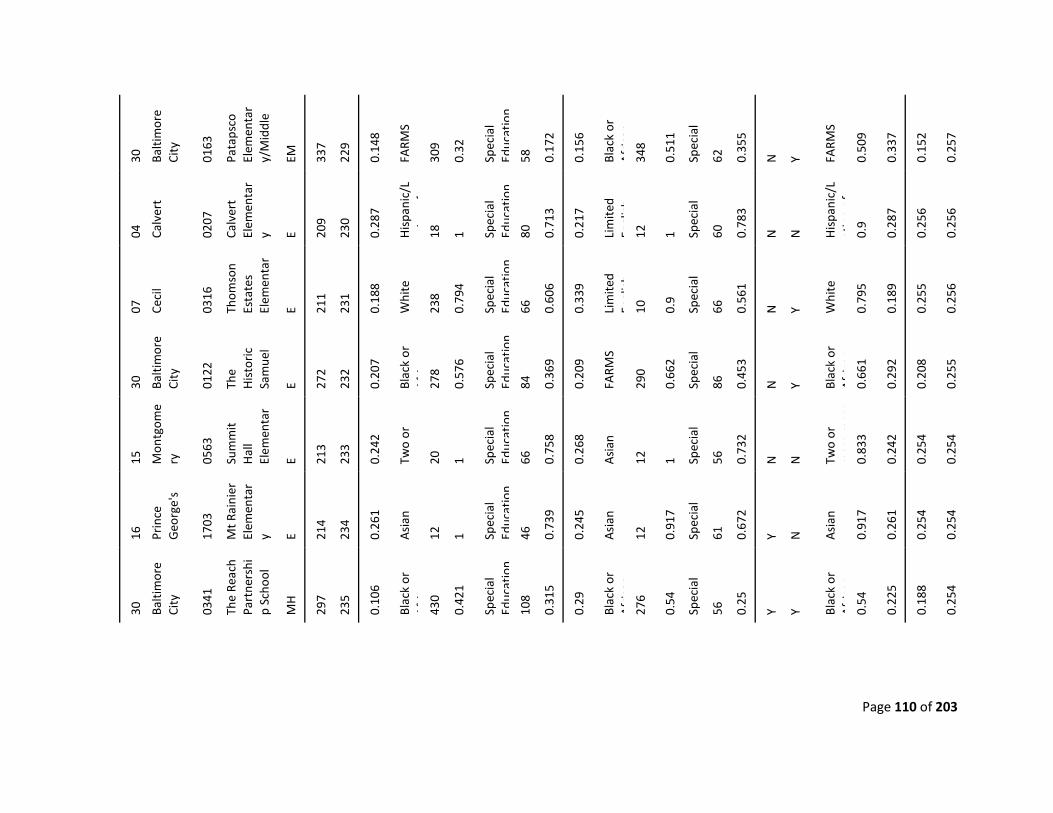
Page 110 of 203
30
Balti
mor
e Ci
ty
0163
Pata
psco
El
emen
tar
y/M
iddl
e
EM
337
229
0.14
8
FARM
S
309
0.32
Spec
ial
Educ
atio
n
58
0.17
2
0.15
6
Blac
k or
A
fric
an
34
8
0.51
1
Spec
ial
62
0.35
5
N
Y FARM
S
0.50
9
0.33
7
0.15
2
0.25
7
04
Calv
ert
0207
Calv
ert
Elem
enta
ry E 20
9
230
0.28
7
His
pani
c/L
ti
f
18
1 Spec
ial
Educ
atio
n
80
0.71
3
0.21
7
Lim
ited
Engl
ish
12
1 Spec
ial
60
0.78
3
N
N
His
pani
c/L
atin
o of
0.
9
0.28
7
0.25
6
0.25
6
07
Ceci
l
0316
Thom
son
Esta
tes
Elem
enta
r E 21
1
231
0.18
8
Whi
te
238
0.79
4
Spec
ial
Educ
atio
n
66
0.60
6
0.33
9
Lim
ited
Engl
ish
10
0.9
Spec
ial
66
0.56
1
N
Y Whi
te
0.79
5
0.18
9
0.25
5
0.25
6
30
Balti
mor
e Ci
ty
0122
The
His
tori
c Sa
mue
l
E 272
232
0.20
7
Blac
k or
A
fi
278
0.57
6
Spec
ial
Educ
atio
n
84
0.36
9
0.20
9
FARM
S
290
0.66
2
Spec
ial
86
0.45
3
N
Y Blac
k or
A
fric
an
0.
661
0.29
2
0.20
8
0.25
5
15
Mon
tgom
ery
0563
Sum
mit
Hal
l El
emen
tar
E 213
233
0.24
2
Two
or
20
1 Spec
ial
Educ
atio
n
66
0.75
8
0.26
8
Asi
an
12
1 Spec
ial
56
0.73
2
N
N
Two
or
mor
e ra
ces
0.83
3
0.24
2
0.25
4
0.25
4
16
Prin
ce
Geo
rge'
s
1703
Mt R
aini
er
Elem
enta
ry E 21
4
234
0.26
1
Asi
an
12
1 Spec
ial
Educ
atio
n
46
0.73
9
0.24
5
Asi
an
12
0.91
7
Spec
ial
61
0.67
2
Y N
Asi
an
0.91
7
0.26
1
0.25
4
0.25
4
30
Balti
mor
e Ci
ty
0341
The
Reac
h Pa
rtne
rshi
p Sc
hool
MH
297
235
0.10
6
Blac
k or
A
fi
430
0.42
1
Spec
ial
Educ
atio
n
108
0.31
5
0.29
Blac
k or
A
fric
an
27
6
0.54
Spec
ial
56
0.25
Y Y Blac
k or
A
fric
an
0.
54
0.22
5
0.18
8
0.25
4
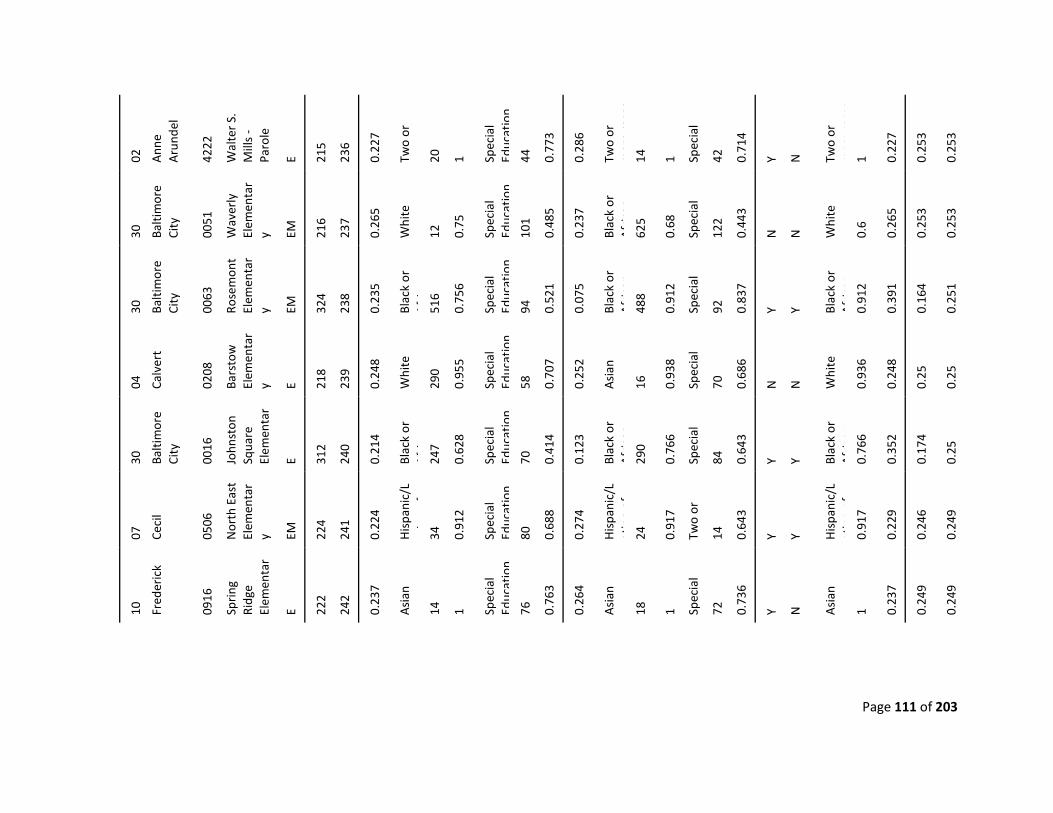
Page 111 of 203
02
Ann
e A
rund
el
4222
Wal
ter
S.
Mill
s -
Paro
le
E 215
236
0.22
7
Two
or
20
1 Spec
ial
Educ
atio
n
44
0.77
3
0.28
6
Two
or
mor
e ra
ces
14
1 Spec
ial
42
0.71
4
Y N
Two
or
mor
e ra
ces
1 0.22
7
0.25
3
0.25
3
30
Balti
mor
e Ci
ty
0051
Wav
erly
El
emen
tar
y EM
216
237
0.26
5
Whi
te
12
0.75
Spec
ial
Educ
atio
n
101
0.48
5
0.23
7
Blac
k or
A
fric
an
62
5
0.68
Spec
ial
12
2
0.44
3
N
N
Whi
te
0.6
0.26
5
0.25
3
0.25
3
30
Balti
mor
e Ci
ty
0063
Rose
mon
t El
emen
tar
y EM
324
238
0.23
5
Blac
k or
A
fi
516
0.75
6
Spec
ial
Educ
atio
n
94
0.52
1
0.07
5
Blac
k or
A
fric
an
48
8
0.91
2
Spec
ial
92
0.83
7
Y Y Blac
k or
A
fric
an
0.
912
0.39
1
0.16
4
0.25
1
04
Calv
ert
0208
Bars
tow
El
emen
tar
y E 218
239
0.24
8
Whi
te
290
0.95
5
Spec
ial
Educ
atio
n
58
0.70
7
0.25
2
Asi
an
16
0.93
8
Spec
ial
70
0.68
6
N
N
Whi
te
0.93
6
0.24
8
0.25
0.25
30
Balti
mor
e Ci
ty
0016
John
ston
Sq
uare
El
emen
tar
E 312
240
0.21
4
Blac
k or
A
fi
247
0.62
8
Spec
ial
Educ
atio
n
70
0.41
4
0.12
3
Blac
k or
A
fric
an
29
0
0.76
6
Spec
ial
84
0.64
3
Y Y Blac
k or
A
fric
an
0.
766
0.35
2
0.17
4
0.25
07
Ceci
l
0506
Nor
th E
ast
Elem
enta
ry EM
224
241
0.22
4
His
pani
c/L
ti
f
34
0.91
2
Spec
ial
Educ
atio
n
80
0.68
8
0.27
4
His
pani
c/L
atin
o of
24
0.91
7
Two
or
14
0.64
3
Y Y His
pani
c/L
atin
o of
0.
917
0.22
9
0.24
6
0.24
9
10
Fred
eric
k
0916
Spri
ng
Ridg
e El
emen
tar
E 222
242
0.23
7
Asi
an
14
1 Spec
ial
Educ
atio
n
76
0.76
3
0.26
4
Asi
an
18
1 Spec
ial
72
0.73
6
Y N
Asi
an
1 0.23
7
0.24
9
0.24
9

Page 112 of 203
16
Prin
ce
Geo
rge'
s
1307
Hig
hlan
d Pa
rk
Elem
enta
r E 24
6
243
0.39
1
Blac
k or
A
fi
130
0.80
8
Spec
ial
Educ
atio
n
12
0.41
7
0.03
6
Blac
k or
A
fric
an
15
2
0.83
6
Spec
ial
10
0.8
Y Y Blac
k or
A
fric
an
0.
836
0.41
9
0.23
3
0.24
9
03
Balti
mor
e Co
unty
1409
Shad
y Sp
ring
El
emen
tar
E 223
244
0.18
Two
or
28
0.96
4
Spec
ial
Educ
atio
n
51
0.78
4
0.33
1
Whi
te
74
0.91
9
Spec
ial
68
0.58
8
N
N
Two
or
mor
e ra
ces
0.82
4
0.18
0.24
7
0.24
7
30
Balti
mor
e Ci
ty
0061
John
Eag
er
How
ard
Elem
enta
r E 35
5
245
0.21
9
Blac
k or
A
fi
140
0.69
3
Spec
ial
Educ
atio
n
38
0.47
4
0.01
9
Blac
k or
A
fric
an
11
4
0.90
4
Spec
ial
26
0.88
5
Y Y Blac
k or
A
fric
an
0.
904
0.43
0.13
0.24
7
20
Talb
ot
0501
Tilg
hman
El
emen
tar
y E 264
246
0.26
1
Whi
te
64
0.84
4
Spec
ial
Educ
atio
n
12
0.58
3
0.15
3
Whi
te
72
0.90
3
Spec
ial
16
0.75
Y Y Whi
te
0.90
3
0.32
0.21
3
0.24
6
15
Mon
tgom
ery
0552
Was
hing
ton
Gro
ve
Elem
enta
r E 22
6
247
0.15
9
Asi
an
38
1 Spec
ial
Educ
atio
n
44
0.84
1
0.35
3
Whi
te
32
1 Spec
ial
34
0.64
7
N
N
Asi
an
0.95
7
0.15
9
0.24
5
0.24
5
30
Balti
mor
e Ci
ty
0263
Will
iam
C.
Mar
ch
Mid
dle
M
273
248
0.18
9
Blac
k or
A
fi
564
0.30
1
Spec
ial
Educ
atio
n
170
0.11
2
0.23
1
FARM
S
707
0.37
3
Spec
ial
22
5
0.14
2
N
Y Blac
k or
A
fric
an
0.
369
0.25
7
0.20
8
0.24
5
02
Ann
e A
rund
el
1202
Park
El
emen
tar
y E 227
249
0.22
5
His
pani
c/L
ti
f
40
0.95
Spec
ial
Educ
atio
n
40
0.72
5
0.26
5
His
pani
c/L
atin
o of
36
0.86
1
Spec
ial
52
0.59
6
Y N
His
pani
c/L
atin
o of
0.
861
0.22
5
0.24
3
0.24
3
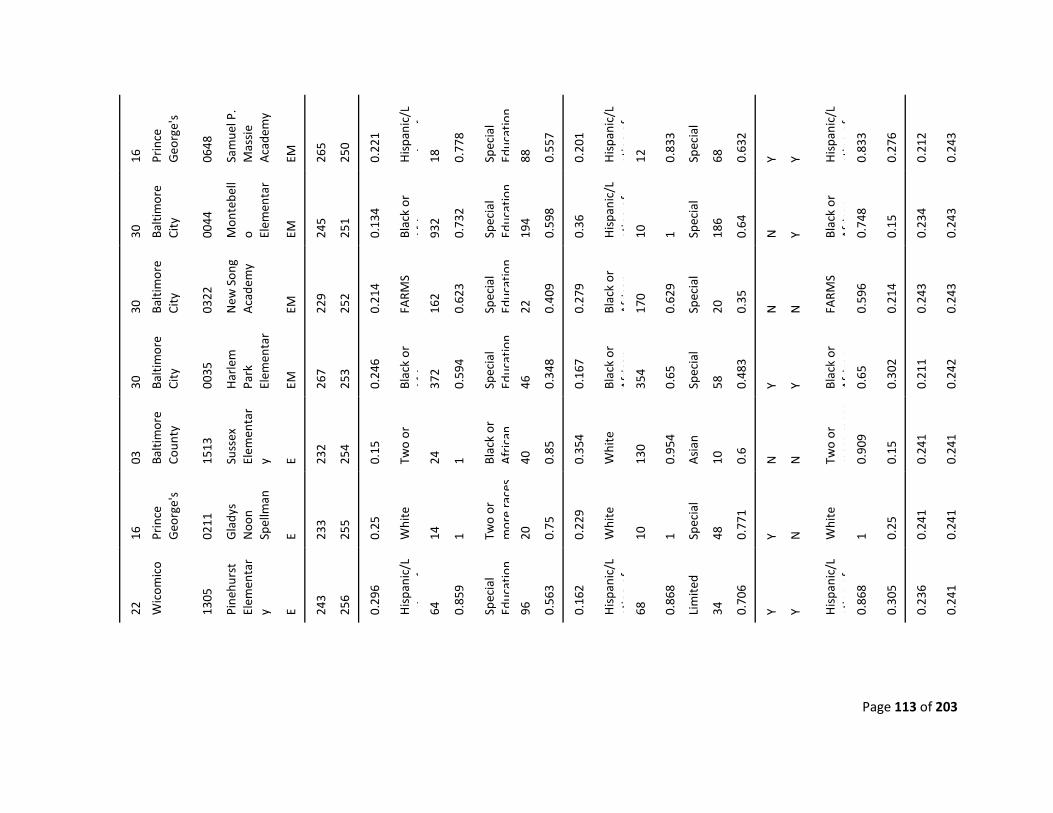
Page 113 of 203
16
Prin
ce
Geo
rge'
s
0648
Sam
uel P
. M
assi
e A
cade
my
EM
265
250
0.22
1
His
pani
c/L
ti
f
18
0.77
8
Spec
ial
Educ
atio
n
88
0.55
7
0.20
1
His
pani
c/L
atin
o of
12
0.83
3
Spec
ial
68
0.63
2
Y Y His
pani
c/L
atin
o of
0.
833
0.27
6
0.21
2
0.24
3
30
Balti
mor
e Ci
ty
0044
Mon
tebe
llo El
emen
tar
EM
245
251
0.13
4
Blac
k or
A
fi
932
0.73
2
Spec
ial
Educ
atio
n
194
0.59
8
0.36
His
pani
c/L
atin
o of
10
1 Spec
ial
18
6
0.64
N
Y Blac
k or
A
fric
an
0.
748
0.15
0.23
4
0.24
3
30
Balti
mor
e Ci
ty
0322
New
Son
g A
cade
my
EM
229
252
0.21
4
FARM
S
162
0.62
3
Spec
ial
Educ
atio
n
22
0.40
9
0.27
9
Blac
k or
A
fric
an
17
0
0.62
9
Spec
ial
20
0.35
N
N
FARM
S
0.59
6
0.21
4
0.24
3
0.24
3
30
Balti
mor
e Ci
ty
0035
Har
lem
Pa
rk
Elem
enta
r EM
267
253
0.24
6
Blac
k or
A
fi
372
0.59
4
Spec
ial
Educ
atio
n
46
0.34
8
0.16
7
Blac
k or
A
fric
an
35
4
0.65
Spec
ial
58
0.48
3
Y Y Blac
k or
A
fric
an
0.
65
0.30
2
0.21
1
0.24
2
03
Balti
mor
e Co
unty
1513
Suss
ex
Elem
enta
ry E 23
2
254
0.15
Two
or
24
1 Blac
k or
A
fric
an
40
0.85
0.35
4
Whi
te
130
0.95
4
Asi
an
10
0.6
N
N
Two
or
mor
e ra
ces
0.90
9
0.15
0.24
1
0.24
1
16
Prin
ce
Geo
rge'
s
0211
Gla
dys
Noo
n Sp
ellm
an
E 233
255
0.25
Whi
te
14
1 Two
or
mor
e ra
ces
20
0.75
0.22
9
Whi
te
10
1 Spec
ial
48
0.77
1
Y N
Whi
te
1 0.25
0.24
1
0.24
1
22
Wic
omic
o
1305
Pine
hurs
t El
emen
tar
y E 243
256
0.29
6
His
pani
c/L
ti
f
64
0.85
9
Spec
ial
Educ
atio
n
96
0.56
3
0.16
2
His
pani
c/L
atin
o of
68
0.86
8
Lim
ited
34
0.70
6
Y Y His
pani
c/L
atin
o of
0.
868
0.30
5
0.23
6
0.24
1
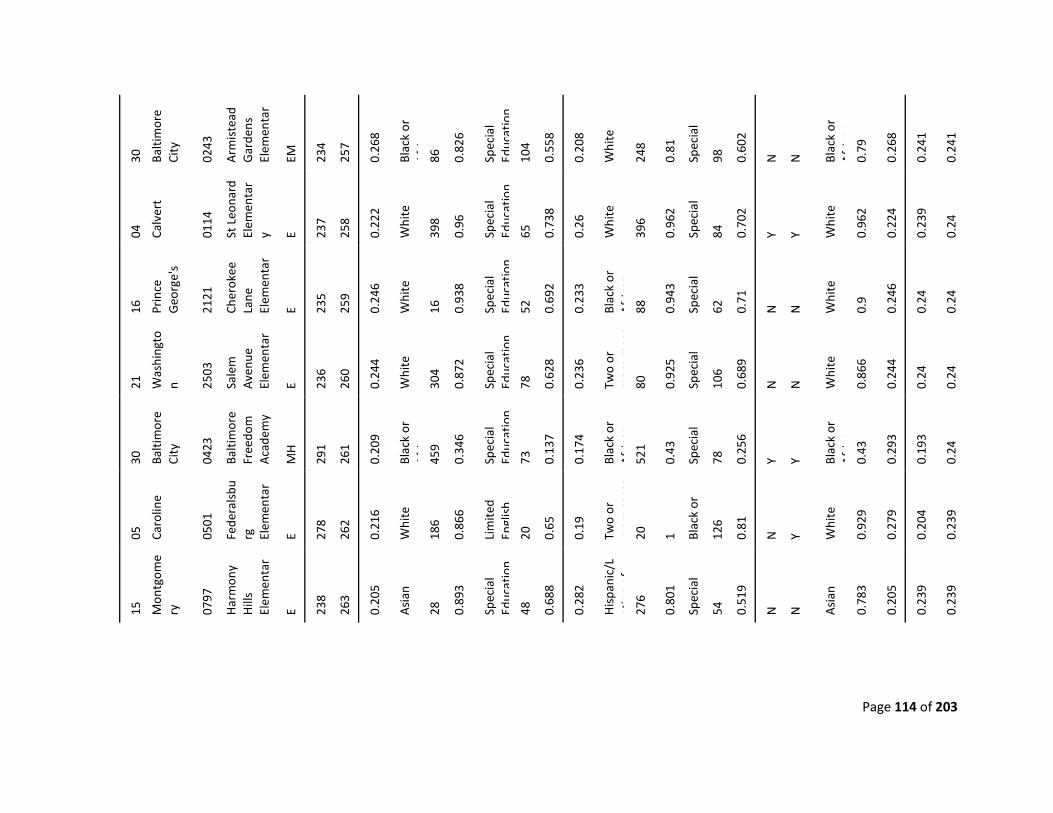
Page 114 of 203
30
Balti
mor
e Ci
ty
0243
Arm
iste
ad
Gar
dens
El
emen
tar
EM
234
257
0.26
8
Blac
k or
A
fi
86
0.82
6
Spec
ial
Educ
atio
n
104
0.55
8
0.20
8
Whi
te
248
0.81
Spec
ial
98
0.60
2
N
N
Blac
k or
A
fric
an
0.
79
0.26
8
0.24
1
0.24
1
04
Calv
ert
0114
St L
eona
rd
Elem
enta
ry E 23
7
258
0.22
2
Whi
te
398
0.96
Spec
ial
Educ
atio
n
65
0.73
8
0.26
Whi
te
396
0.96
2
Spec
ial
84
0.70
2
Y Y Whi
te
0.96
2
0.22
4
0.23
9
0.24
16
Prin
ce
Geo
rge'
s
2121
Cher
okee
La
ne
Elem
enta
r E 23
5
259
0.24
6
Whi
te
16
0.93
8
Spec
ial
Educ
atio
n
52
0.69
2
0.23
3
Blac
k or
A
fric
an
88
0.94
3
Spec
ial
62
0.71
N
N
Whi
te
0.9
0.24
6
0.24
0.24
21
Was
hing
ton 25
03
Sale
m
Ave
nue
Elem
enta
r E 23
6
260
0.24
4
Whi
te
304
0.87
2
Spec
ial
Educ
atio
n
78
0.62
8
0.23
6
Two
or
mor
e ra
ces
80
0.92
5
Spec
ial
10
6
0.68
9
N
N
Whi
te
0.86
6
0.24
4
0.24
0.24
30
Balti
mor
e Ci
ty
0423
Balti
mor
e Fr
eedo
m
Aca
dem
y
MH
291
261
0.20
9
Blac
k or
A
fi
459
0.34
6
Spec
ial
Educ
atio
n
73
0.13
7
0.17
4
Blac
k or
A
fric
an
52
1
0.43
Spec
ial
78
0.25
6
Y Y Blac
k or
A
fric
an
0.
43
0.29
3
0.19
3
0.24
05
Caro
line
0501
Fede
rals
burg
El
emen
tar
E 278
262
0.21
6
Whi
te
186
0.86
6
Lim
ited
Engl
ish
20
0.65
0.19
Two
or
mor
e ra
ces
20
1 Blac
k or
126
0.81
N
Y Whi
te
0.92
9
0.27
9
0.20
4
0.23
9
15
Mon
tgom
ery
0797
Har
mon
y H
ills
Elem
enta
r E 23
8
263
0.20
5
Asi
an
28
0.89
3
Spec
ial
Educ
atio
n
48
0.68
8
0.28
2
His
pani
c/L
atin
o of
27
6
0.80
1
Spec
ial
54
0.51
9
N
N
Asi
an
0.78
3
0.20
5
0.23
9
0.23
9
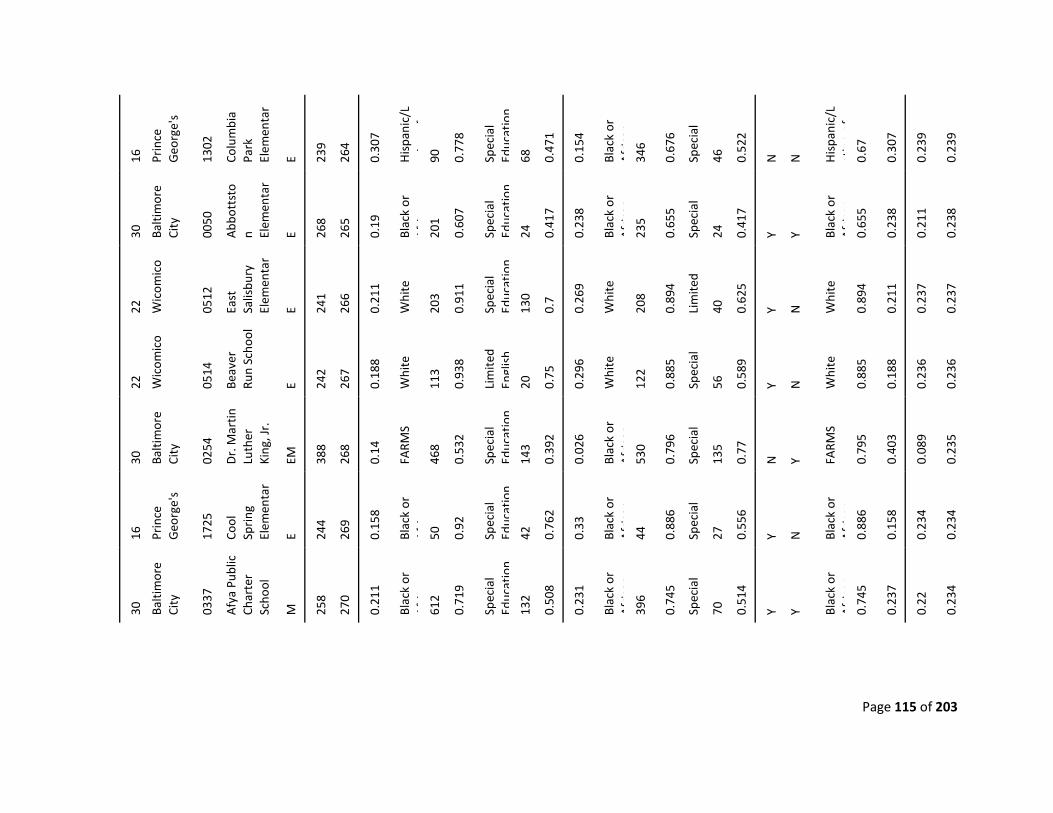
Page 115 of 203
16
Prin
ce
Geo
rge'
s
1302
Colu
mbi
a Pa
rk
Elem
enta
r E 23
9
264
0.30
7
His
pani
c/L
ti
f
90
0.77
8
Spec
ial
Educ
atio
n
68
0.47
1
0.15
4
Blac
k or
A
fric
an
34
6
0.67
6
Spec
ial
46
0.52
2
N
N
His
pani
c/L
atin
o of
0.
67
0.30
7
0.23
9
0.23
9
30
Balti
mor
e Ci
ty
0050
Abb
otts
ton El
emen
tar
E 268
265
0.19
Blac
k or
A
fi
201
0.60
7
Spec
ial
Educ
atio
n
24
0.41
7
0.23
8
Blac
k or
A
fric
an
23
5
0.65
5
Spec
ial
24
0.41
7
Y Y Blac
k or
A
fric
an
0.
655
0.23
8
0.21
1
0.23
8
22
Wic
omic
o
0512
East
Sa
lisbu
ry
Elem
enta
r E 24
1
266
0.21
1
Whi
te
203
0.91
1
Spec
ial
Educ
atio
n
130
0.7
0.26
9
Whi
te
208
0.89
4
Lim
ited
40
0.62
5
Y N
Whi
te
0.89
4
0.21
1
0.23
7
0.23
7
22
Wic
omic
o
0514
Beav
er
Run
Scho
ol
E 242
267
0.18
8
Whi
te
113
0.93
8
Lim
ited
Engl
ish
20
0.75
0.29
6
Whi
te
122
0.88
5
Spec
ial
56
0.58
9
Y N
Whi
te
0.88
5
0.18
8
0.23
6
0.23
6
30
Balti
mor
e Ci
ty
0254
Dr.
Mar
tin
Luth
er
King
, Jr.
EM
388
268
0.14
FARM
S
468
0.53
2
Spec
ial
Educ
atio
n
143
0.39
2
0.02
6
Blac
k or
A
fric
an
53
0
0.79
6
Spec
ial
13
5
0.77
N
Y FARM
S
0.79
5
0.40
3
0.08
9
0.23
5
16
Prin
ce
Geo
rge'
s
1725
Cool
Sp
ring
El
emen
tar
E 244
269
0.15
8
Blac
k or
A
fi
50
0.92
Spec
ial
Educ
atio
n
42
0.76
2
0.33
Blac
k or
A
fric
an
44
0.88
6
Spec
ial
27
0.55
6
Y N
Blac
k or
A
fric
an
0.
886
0.15
8
0.23
4
0.23
4
30
Balti
mor
e Ci
ty
0337
Afy
a Pu
blic
Ch
arte
r Sc
hool
M
258
270
0.21
1
Blac
k or
A
fi
612
0.71
9
Spec
ial
Educ
atio
n
132
0.50
8
0.23
1
Blac
k or
A
fric
an
39
6
0.74
5
Spec
ial
70
0.51
4
Y Y Blac
k or
A
fric
an
0.
745
0.23
7
0.22
0.23
4
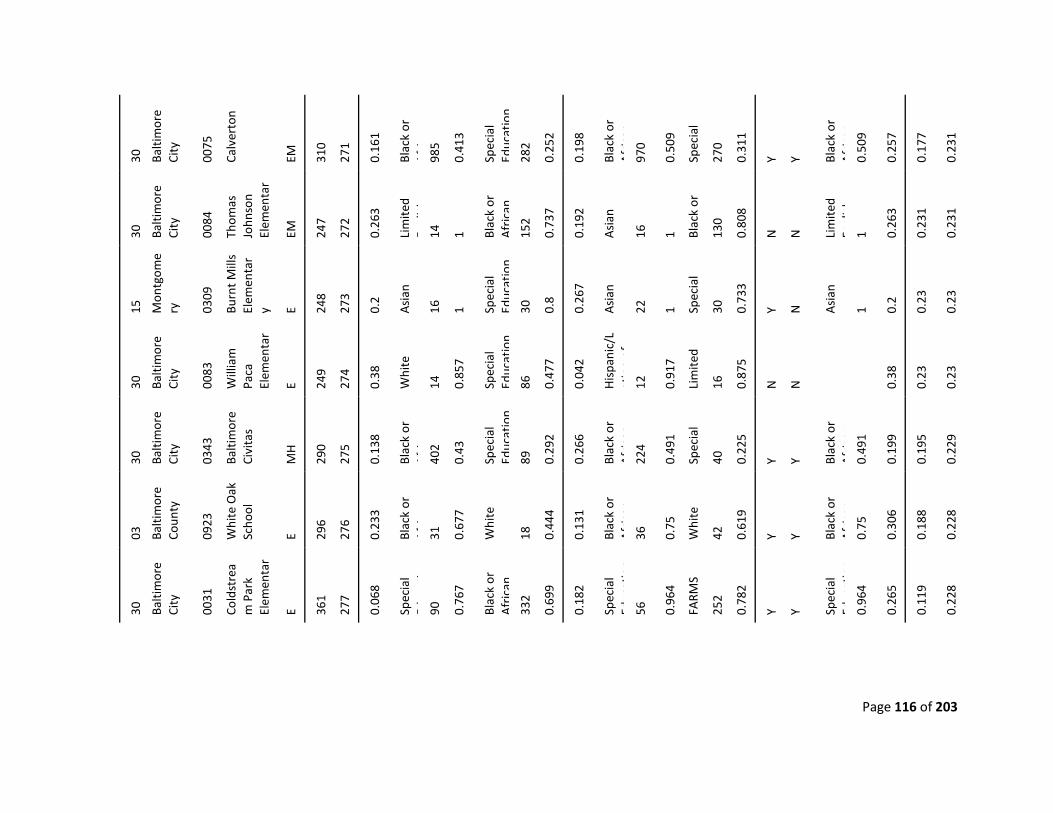
Page 116 of 203
30
Balti
mor
e Ci
ty
0075
Calv
erto
n
EM
310
271
0.16
1
Blac
k or
A
fi
985
0.41
3
Spec
ial
Educ
atio
n
282
0.25
2
0.19
8
Blac
k or
A
fric
an
97
0
0.50
9
Spec
ial
27
0
0.31
1
Y Y Blac
k or
A
fric
an
0.
509
0.25
7
0.17
7
0.23
1
30
Balti
mor
e Ci
ty
0084
Thom
as
John
son
Elem
enta
r EM
247
272
0.26
3
Lim
ited
Eli
h
14
1 Blac
k or
A
fric
an
15
2
0.73
7
0.19
2
Asi
an
16
1 Blac
k or
130
0.80
8
N
N
Lim
ited
Engl
ish
1 0.
263
0.23
1
0.23
1
15
Mon
tgom
ery
0309
Burn
t Mill
s El
emen
tar
y E 248
273
0.2
Asi
an
16
1 Spec
ial
Educ
atio
n
30
0.8
0.26
7
Asi
an
22
1 Spec
ial
30
0.73
3
Y N
Asi
an
1 0.2
0.23
0.23
30
Balti
mor
e Ci
ty
0083
Will
iam
Pa
ca
Elem
enta
r E 24
9
274
0.38
Whi
te
14
0.85
7
Spec
ial
Educ
atio
n
86
0.47
7
0.04
2
His
pani
c/L
atin
o of
12
0.91
7
Lim
ited
16
0.87
5
N
N
0.38
0.23
0.23
30
Balti
mor
e Ci
ty
0343
Balti
mor
e Ci
vita
s
MH
290
275
0.13
8
Blac
k or
A
fi
402
0.43
Spec
ial
Educ
atio
n
89
0.29
2
0.26
6
Blac
k or
A
fric
an
22
4
0.49
1
Spec
ial
40
0.22
5
Y Y Blac
k or
A
fric
an
0.
491
0.19
9
0.19
5
0.22
9
03
Balti
mor
e Co
unty
0923
Whi
te O
ak
Scho
ol
E 296
276
0.23
3
Blac
k or
A
fi
31
0.67
7
Whi
te
18
0.44
4
0.13
1
Blac
k or
A
fric
an
36
0.75
Whi
te
42
0.61
9
Y Y Blac
k or
A
fric
an
0.
75
0.30
6
0.18
8
0.22
8
30
Balti
mor
e Ci
ty
0031
Cold
stre
am
Par
k El
emen
tar
E 361
277
0.06
8
Spec
ial
Edti
90
0.76
7
Blac
k or
A
fric
an
33
2
0.69
9
0.18
2
Spec
ial
Educ
atio
n 56
0.96
4
FARM
S
252
0.78
2
Y Y Spec
ial
Educ
atio
n 0.
964
0.26
5
0.11
9
0.22
8
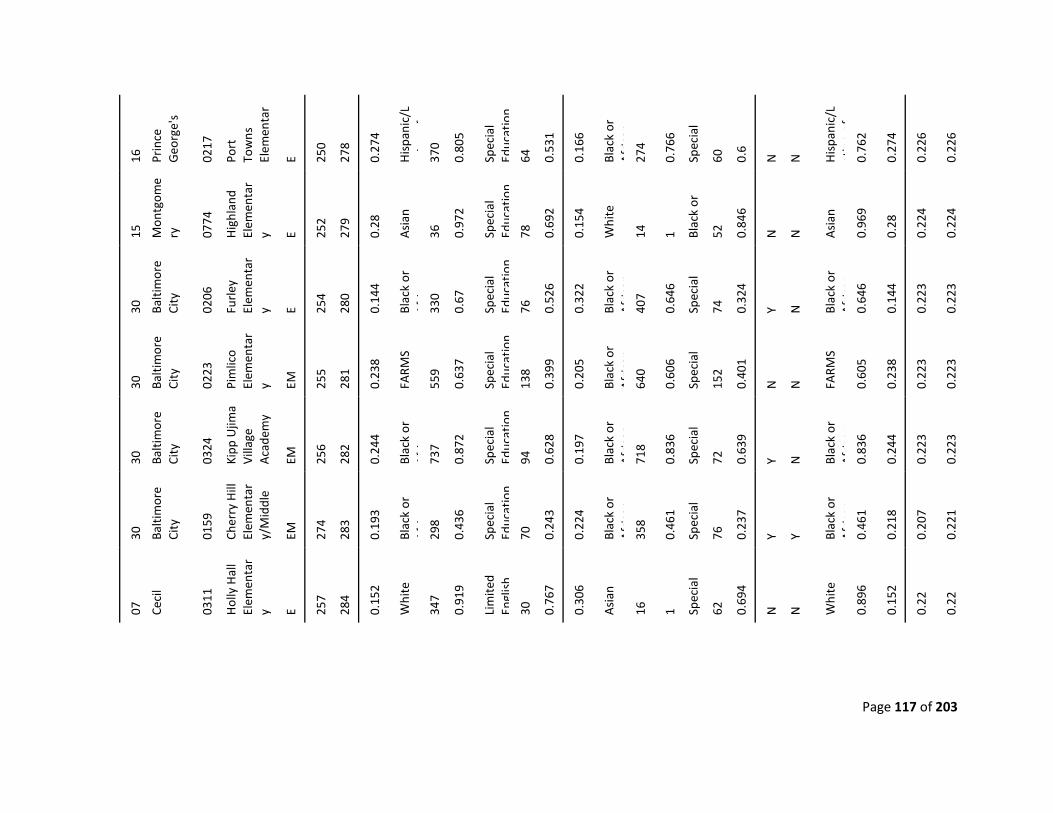
Page 117 of 203
16
Prin
ce
Geo
rge'
s
0217
Port
To
wns
El
emen
tar
E 250
278
0.27
4
His
pani
c/L
ti
f
37
0
0.80
5
Spec
ial
Educ
atio
n
64
0.53
1
0.16
6
Blac
k or
A
fric
an
27
4
0.76
6
Spec
ial
60
0.6
N
N
His
pani
c/L
atin
o of
0.
762
0.27
4
0.22
6
0.22
6
15
Mon
tgom
ery
0774
Hig
hlan
d El
emen
tar
y E 252
279
0.28
Asi
an
36
0.97
2
Spec
ial
Educ
atio
n
78
0.69
2
0.15
4
Whi
te
14
1 Blac
k or
52
0.84
6
N
N
Asi
an
0.96
9
0.28
0.22
4
0.22
4
30
Balti
mor
e Ci
ty
0206
Furl
ey
Elem
enta
ry E 25
4
280
0.14
4
Blac
k or
A
fi
330
0.67
Spec
ial
Educ
atio
n
76
0.52
6
0.32
2
Blac
k or
A
fric
an
40
7
0.64
6
Spec
ial
74
0.32
4
Y N
Blac
k or
A
fric
an
0.
646
0.14
4
0.22
3
0.22
3
30
Balti
mor
e Ci
ty
0223
Pim
lico
Elem
enta
ry EM
255
281
0.23
8
FARM
S
559
0.63
7
Spec
ial
Educ
atio
n
138
0.39
9
0.20
5
Blac
k or
A
fric
an
64
0
0.60
6
Spec
ial
15
2
0.40
1
N
N
FARM
S
0.60
5
0.23
8
0.22
3
0.22
3
30
Balti
mor
e Ci
ty
0324
Kipp
Ujim
a Vi
llage
A
cade
my
EM
256
282
0.24
4
Blac
k or
A
fi
737
0.87
2
Spec
ial
Educ
atio
n
94
0.62
8
0.19
7
Blac
k or
A
fric
an
71
8
0.83
6
Spec
ial
72
0.63
9
Y N
Blac
k or
A
fric
an
0.
836
0.24
4
0.22
3
0.22
3
30
Balti
mor
e Ci
ty
0159
Cher
ry H
ill
Elem
enta
ry/
Mid
dle
EM
274
283
0.19
3
Blac
k or
A
fi
298
0.43
6
Spec
ial
Educ
atio
n
70
0.24
3
0.22
4
Blac
k or
A
fric
an
35
8
0.46
1
Spec
ial
76
0.23
7
Y Y Blac
k or
A
fric
an
0.
461
0.21
8
0.20
7
0.22
1
07
Ceci
l
0311
Hol
ly H
all
Elem
enta
ry E 25
7
284
0.15
2
Whi
te
347
0.91
9
Lim
ited
Engl
ish
30
0.76
7
0.30
6
Asi
an
16
1 Spec
ial
62
0.69
4
N
N
Whi
te
0.89
6
0.15
2
0.22
0.22
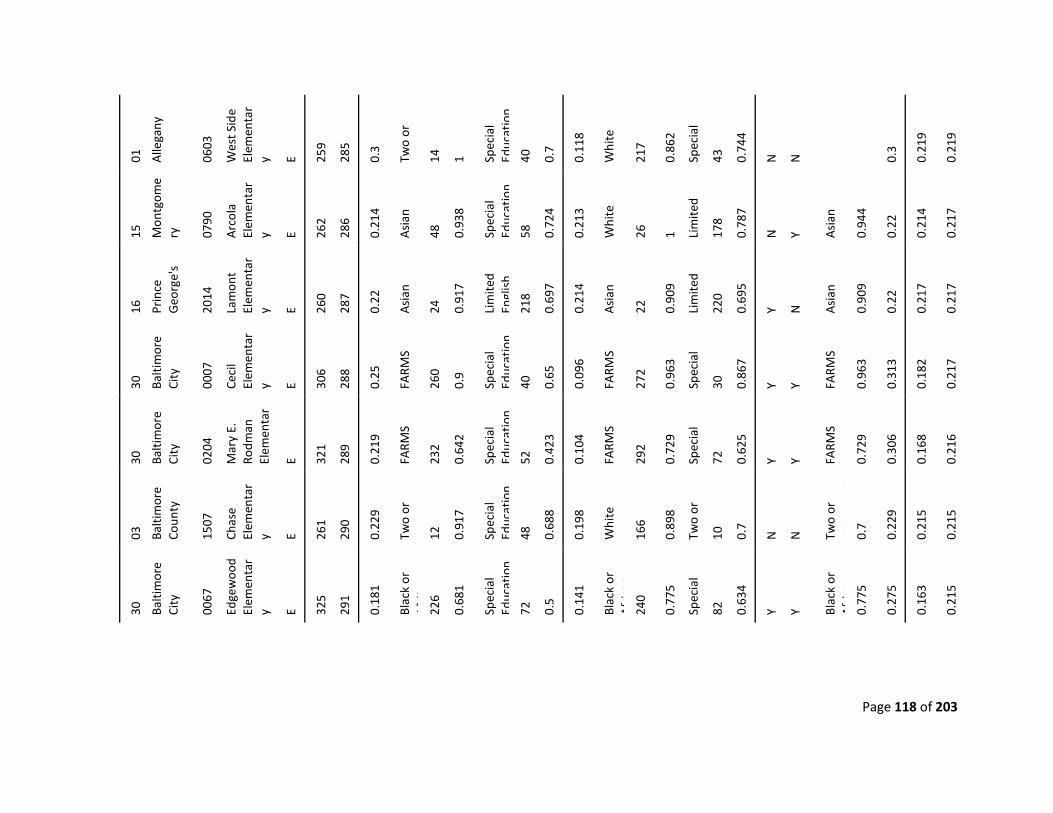
Page 118 of 203
01
Alle
gany
0603
Wes
t Sid
e El
emen
tar
y E 259
285
0.3
Two
or
14
1 Spec
ial
Educ
atio
n
40
0.7
0.11
8
Whi
te
217
0.86
2
Spec
ial
43
0.74
4
N
N
0.3
0.21
9
0.21
9
15
Mon
tgom
ery
0790
Arc
ola
Elem
enta
ry E 26
2
286
0.21
4
Asi
an
48
0.93
8
Spec
ial
Educ
atio
n
58
0.72
4
0.21
3
Whi
te
26
1 Lim
ited
17
8
0.78
7
N
Y Asi
an
0.94
4
0.22
0.21
4
0.21
7
16
Prin
ce
Geo
rge'
s
2014
Lam
ont
Elem
enta
ry E 26
0
287
0.22
Asi
an
24
0.91
7
Lim
ited
Engl
ish
21
8
0.69
7
0.21
4
Asi
an
22
0.90
9
Lim
ited
22
0
0.69
5
Y N
Asi
an
0.90
9
0.22
0.21
7
0.21
7
30
Balti
mor
e Ci
ty
0007
Ceci
l El
emen
tar
y E 306
288
0.25
FARM
S
260
0.9
Spec
ial
Educ
atio
n
40
0.65
0.09
6
FARM
S
272
0.96
3
Spec
ial
30
0.86
7
Y Y FARM
S
0.96
3
0.31
3
0.18
2
0.21
7
30
Balti
mor
e Ci
ty
0204
Mar
y E.
Ro
dman
El
emen
tar
E 321
289
0.21
9
FARM
S
232
0.64
2
Spec
ial
Educ
atio
n
52
0.42
3
0.10
4
FARM
S
292
0.72
9
Spec
ial
72
0.62
5
Y Y FARM
S
0.72
9
0.30
6
0.16
8
0.21
6
03
Balti
mor
e Co
unty
1507
Chas
e El
emen
tar
y E 261
290
0.22
9
Two
or
12
0.91
7
Spec
ial
Educ
atio
n
48
0.68
8
0.19
8
Whi
te
166
0.89
8
Two
or
10
0.7
N
N
Two
or
mor
e ra
ces
0.7
0.22
9
0.21
5
0.21
5
30
Balti
mor
e Ci
ty
0067
Edge
woo
d El
emen
tar
y E 325
291
0.18
1
Blac
k or
A
fi
226
0.68
1
Spec
ial
Educ
atio
n
72
0.5
0.14
1
Blac
k or
A
fric
an
24
0
0.77
5
Spec
ial
82
0.63
4
Y Y Blac
k or
A
fric
an
0.
775
0.27
5
0.16
3
0.21
5
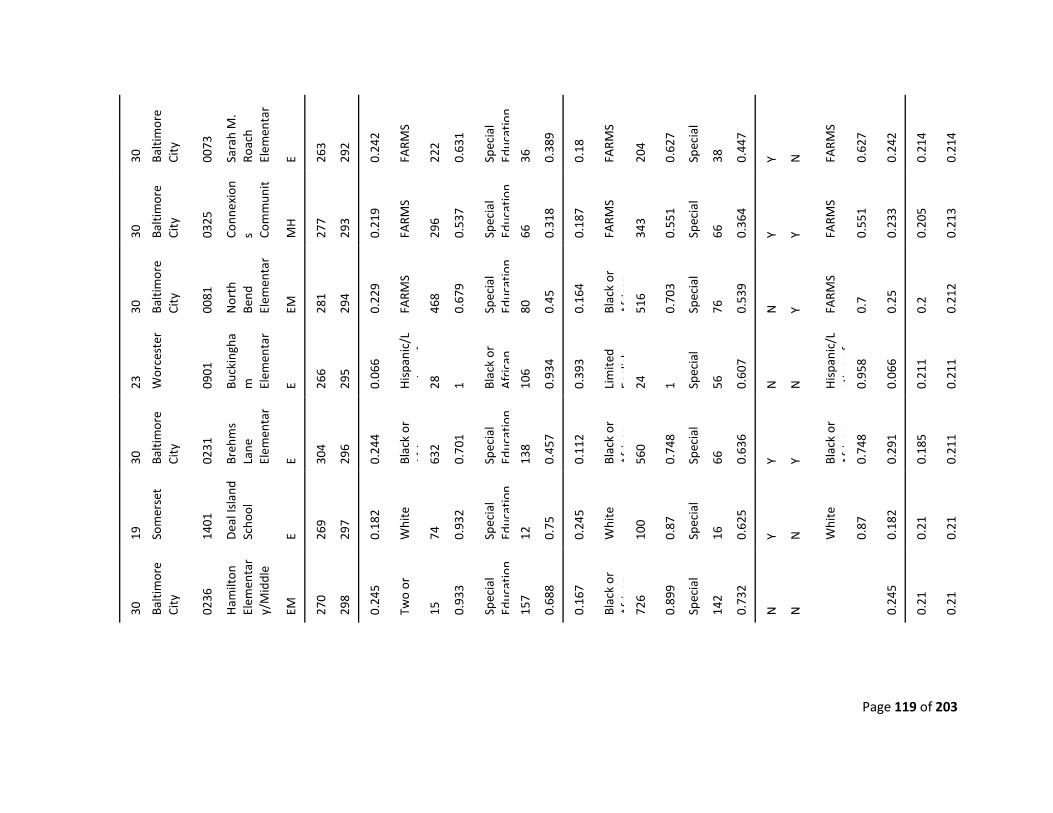
Page 119 of 203
30
Balti
mor
e Ci
ty
0073
Sara
h M
. Ro
ach
Elem
enta
r E 26
3
292
0.24
2
FARM
S
222
0.63
1
Spec
ial
Educ
atio
n
36
0.38
9
0.18
FARM
S
204
0.62
7
Spec
ial
38
0.44
7
Y N
FARM
S
0.62
7
0.24
2
0.21
4
0.21
4
30
Balti
mor
e Ci
ty
0325
Conn
exio
ns Co
mm
unit
MH
277
293
0.21
9
FARM
S
296
0.53
7
Spec
ial
Educ
atio
n
66
0.31
8
0.18
7
FARM
S
343
0.55
1
Spec
ial
66
0.36
4
Y Y FARM
S
0.55
1
0.23
3
0.20
5
0.21
3
30
Balti
mor
e Ci
ty
0081
Nor
th
Bend
El
emen
tar
EM
281
294
0.22
9
FARM
S
468
0.67
9
Spec
ial
Educ
atio
n
80
0.45
0.16
4
Blac
k or
A
fric
an
51
6
0.70
3
Spec
ial
76
0.53
9
N
Y FARM
S
0.7
0.25
0.2
0.21
2
23
Wor
cest
er
0901
Buck
ingh
am
El
emen
tar
E 266
295
0.06
6
His
pani
c/L
ti
f
28
1 Blac
k or
A
fric
an
10
6
0.93
4
0.39
3
Lim
ited
Engl
ish
24
1 Spec
ial
56
0.60
7
N
N
His
pani
c/L
atin
o of
0.
958
0.06
6
0.21
1
0.21
1
30
Balti
mor
e Ci
ty
0231
Breh
ms
Lane
El
emen
tar
E 304
296
0.24
4
Blac
k or
A
fi
632
0.70
1
Spec
ial
Educ
atio
n
138
0.45
7
0.11
2
Blac
k or
A
fric
an
56
0
0.74
8
Spec
ial
66
0.63
6
Y Y Blac
k or
A
fric
an
0.
748
0.29
1
0.18
5
0.21
1
19
Som
erse
t
1401
Dea
l Isl
and
Scho
ol
E 269
297
0.18
2
Whi
te
74
0.93
2
Spec
ial
Educ
atio
n
12
0.75
0.24
5
Whi
te
100
0.87
Spec
ial
16
0.62
5
Y N
Whi
te
0.87
0.18
2
0.21
0.21
30
Balti
mor
e Ci
ty
0236
Ham
ilton
El
emen
tar
y/M
iddl
e
EM
270
298
0.24
5
Two
or
15
0.93
3
Spec
ial
Educ
atio
n
157
0.68
8
0.16
7
Blac
k or
A
fric
an
72
6
0.89
9
Spec
ial
14
2
0.73
2
N
N
0.24
5
0.21
0.21
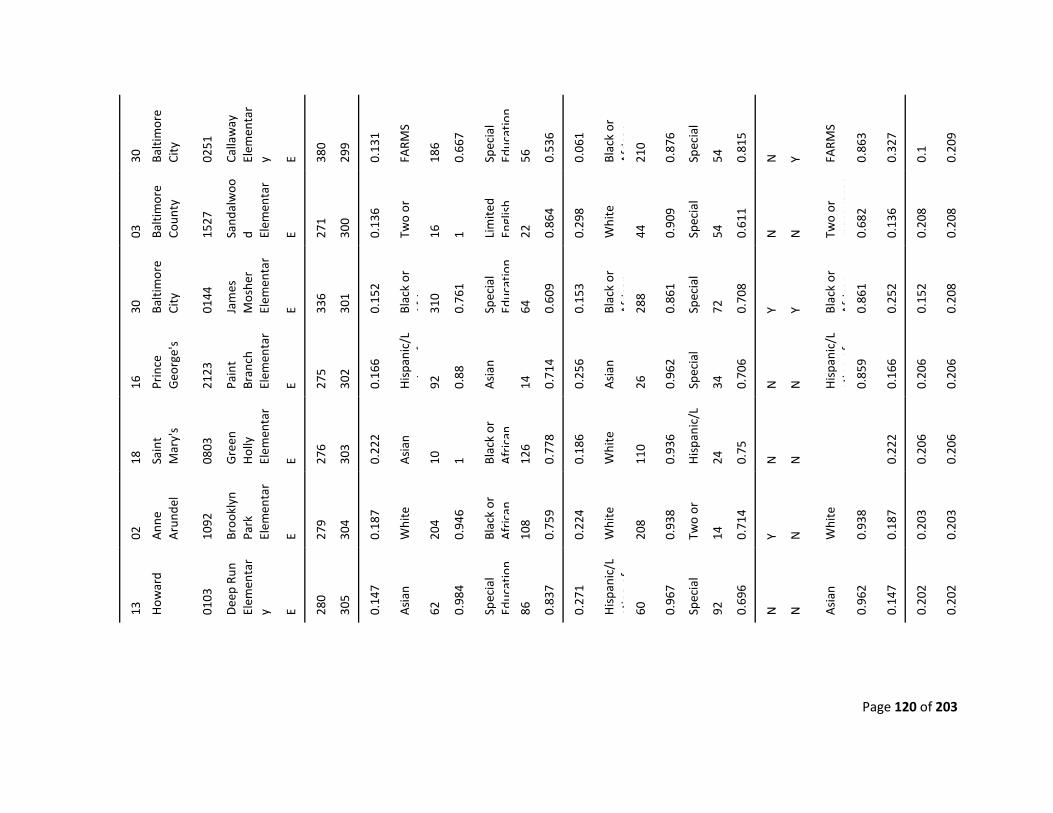
Page 120 of 203
30
Balti
mor
e Ci
ty
0251
Calla
way
El
emen
tar
y E 380
299
0.13
1
FARM
S
186
0.66
7
Spec
ial
Educ
atio
n
56
0.53
6
0.06
1
Blac
k or
A
fric
an
21
0
0.87
6
Spec
ial
54
0.81
5
N
Y FARM
S
0.86
3
0.32
7
0.1
0.20
9
03
Balti
mor
e Co
unty
1527
Sand
alw
ood El
emen
tar
E 271
300
0.13
6
Two
or
16
1 Lim
ited
Engl
ish
22
0.86
4
0.29
8
Whi
te
44
0.90
9
Spec
ial
54
0.61
1
N
N
Two
or
mor
e ra
ces
0.68
2
0.13
6
0.20
8
0.20
8
30
Balti
mor
e Ci
ty
0144
Jam
es
Mos
her
Elem
enta
r E 33
6
301
0.15
2
Blac
k or
A
fi
310
0.76
1
Spec
ial
Educ
atio
n
64
0.60
9
0.15
3
Blac
k or
A
fric
an
28
8
0.86
1
Spec
ial
72
0.70
8
Y Y Blac
k or
A
fric
an
0.
861
0.25
2
0.15
2
0.20
8
16
Prin
ce
Geo
rge'
s
2123
Pain
t Br
anch
El
emen
tar
E 275
302
0.16
6
His
pani
c/L
ti
f
92
0.88
Asi
an
14
0.71
4
0.25
6
Asi
an
26
0.96
2
Spec
ial
34
0.70
6
N
N
His
pani
c/L
atin
o of
0.
859
0.16
6
0.20
6
0.20
6
18
Sain
t M
ary'
s
0803
Gre
en
Hol
ly
Elem
enta
r
E 27
6
303
0.22
2
Asi
an
10
1 Blac
k or
A
fric
an
12
6
0.77
8
0.18
6
Whi
te
110
0.93
6
His
pani
c/L
24
0.75
N
N
0.22
2
0.20
6
0.20
6
02
Ann
e A
rund
el
1092
Broo
klyn
Pa
rk
Elem
enta
r E 27
9
304
0.18
7
Whi
te
204
0.94
6
Blac
k or
A
fric
an
10
8
0.75
9
0.22
4
Whi
te
208
0.93
8
Two
or
14
0.71
4
Y N
Whi
te
0.93
8
0.18
7
0.20
3
0.20
3
13
How
ard
0103
Dee
p Ru
n El
emen
tar
y E 280
305
0.14
7
Asi
an
62
0.98
4
Spec
ial
Educ
atio
n
86
0.83
7
0.27
1
His
pani
c/L
atin
o of
60
0.96
7
Spec
ial
92
0.69
6
N
N
Asi
an
0.96
2
0.14
7
0.20
2
0.20
2
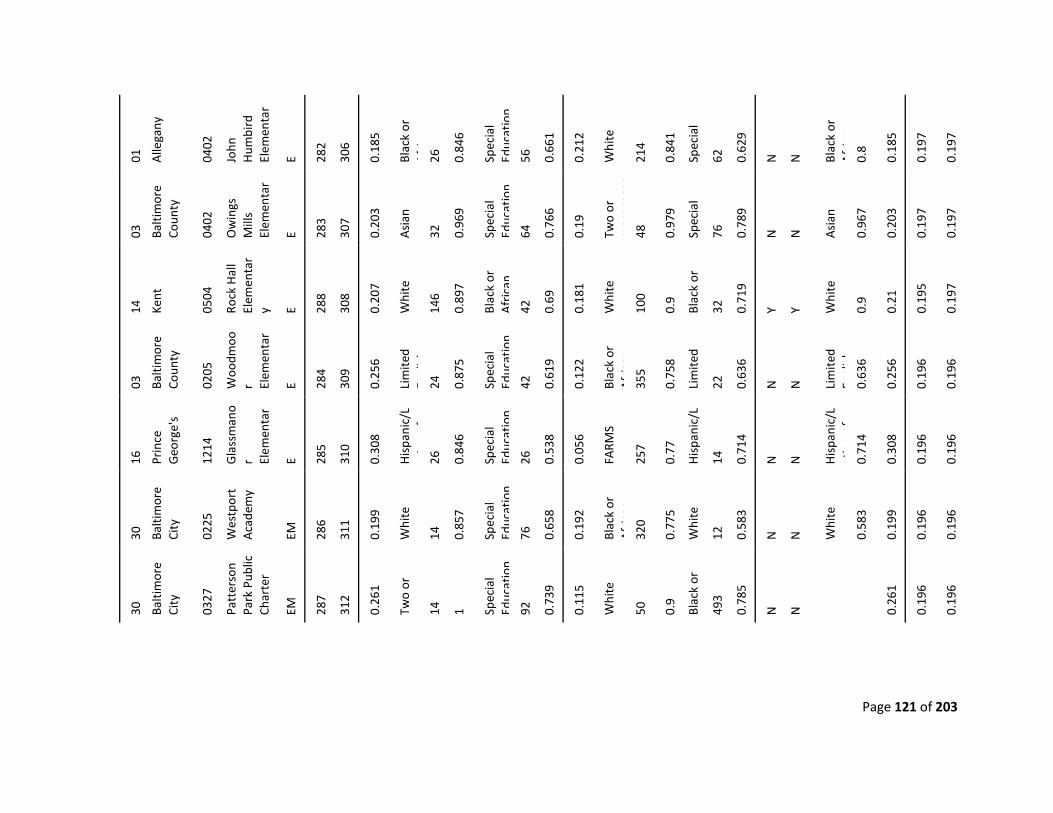
Page 121 of 203
01
Alle
gany
0402
John
H
umbi
rd
Elem
enta
r E 28
2
306
0.18
5
Blac
k or
A
fi
26
0.84
6
Spec
ial
Educ
atio
n
56
0.66
1
0.21
2
Whi
te
214
0.84
1
Spec
ial
62
0.62
9
N
N
Blac
k or
A
fric
an
0.
8
0.18
5
0.19
7
0.19
7
03
Balti
mor
e Co
unty
0402
Ow
ings
M
ills
Elem
enta
r E 28
3
307
0.20
3
Asi
an
32
0.96
9
Spec
ial
Educ
atio
n
64
0.76
6
0.19
Two
or
mor
e ra
ces
48
0.97
9
Spec
ial
76
0.78
9
N
N
Asi
an
0.96
7
0.20
3
0.19
7
0.19
7
14
Kent
0504
Rock
Hal
l El
emen
tar
y E 288
308
0.20
7
Whi
te
146
0.89
7
Blac
k or
A
fric
an
42
0.69
0.18
1
Whi
te
100
0.9
Blac
k or
32
0.71
9
Y Y Whi
te
0.9
0.21
0.19
5
0.19
7
03
Balti
mor
e Co
unty
0205
Woo
dmoo
r Elem
enta
r E 28
4
309
0.25
6
Lim
ited
Eli
h
24
0.87
5
Spec
ial
Educ
atio
n
42
0.61
9
0.12
2
Blac
k or
A
fric
an
35
5
0.75
8
Lim
ited
22
0.63
6
N
N
Lim
ited
Engl
ish
0.
636
0.25
6
0.19
6
0.19
6
16
Prin
ce
Geo
rge'
s
1214
Gla
ssm
ano
r Elem
enta
r E 28
5
310
0.30
8
His
pani
c/L
ti
f
26
0.84
6
Spec
ial
Educ
atio
n
26
0.53
8
0.05
6
FARM
S
257
0.77
His
pani
c/L
14
0.71
4
N
N
His
pani
c/L
atin
o of
0.
714
0.30
8
0.19
6
0.19
6
30
Balti
mor
e Ci
ty
0225
Wes
tpor
t A
cade
my
EM
286
311
0.19
9
Whi
te
14
0.85
7
Spec
ial
Educ
atio
n
76
0.65
8
0.19
2
Blac
k or
A
fric
an
32
0
0.77
5
Whi
te
12
0.58
3
N
N
Whi
te
0.58
3
0.19
9
0.19
6
0.19
6
30
Balti
mor
e Ci
ty
0327
Patt
erso
n Pa
rk P
ublic
Ch
arte
r EM
287
312
0.26
1
Two
or
14
1 Spec
ial
Educ
atio
n
92
0.73
9
0.11
5
Whi
te
50
0.9
Blac
k or
493
0.78
5
N
N
0.26
1
0.19
6
0.19
6
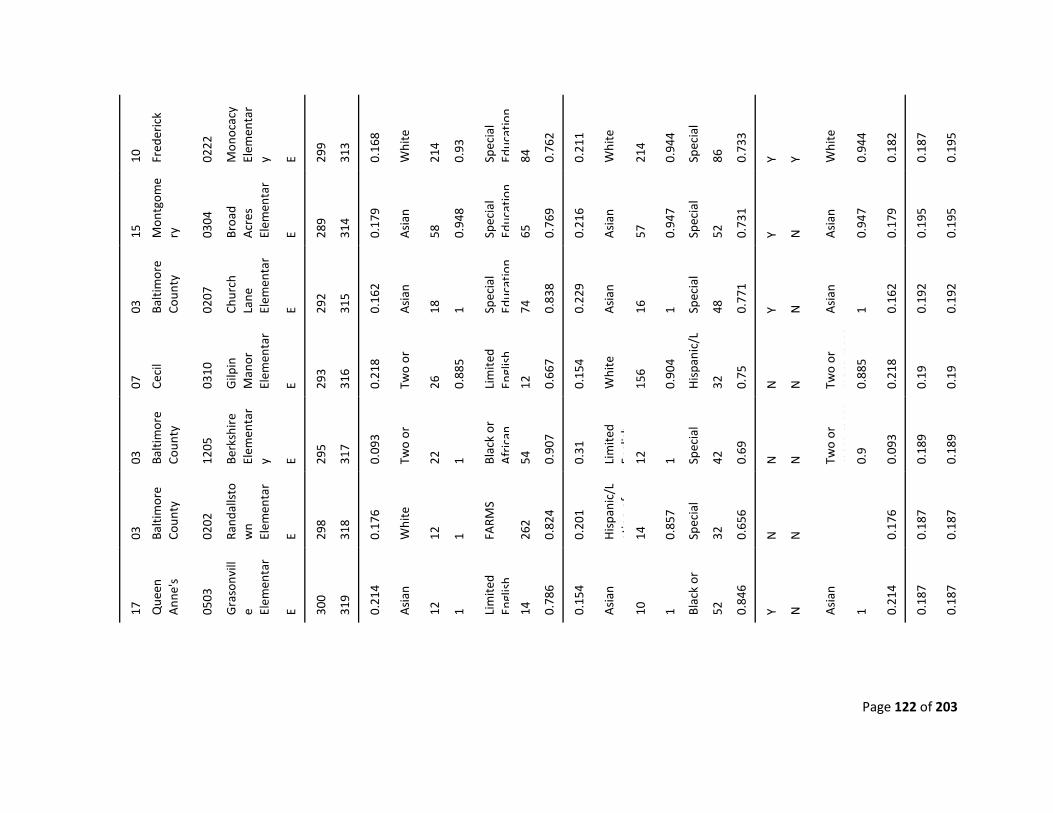
Page 122 of 203
10
Fred
eric
k
0222
Mon
ocac
y El
emen
tar
y E 299
313
0.16
8
Whi
te
214
0.93
Spec
ial
Educ
atio
n
84
0.76
2
0.21
1
Whi
te
214
0.94
4
Spec
ial
86
0.73
3
Y Y Whi
te
0.94
4
0.18
2
0.18
7
0.19
5
15
Mon
tgom
ery
0304
Broa
d A
cres
El
emen
tar
E 289
314
0.17
9
Asi
an
58
0.94
8
Spec
ial
Educ
atio
n
65
0.76
9
0.21
6
Asi
an
57
0.94
7
Spec
ial
52
0.73
1
Y N
Asi
an
0.94
7
0.17
9
0.19
5
0.19
5
03
Balti
mor
e Co
unty
0207
Chur
ch
Lane
El
emen
tar
E 292
315
0.16
2
Asi
an
18
1 Spec
ial
Educ
atio
n
74
0.83
8
0.22
9
Asi
an
16
1 Spec
ial
48
0.77
1
Y N
Asi
an
1 0.16
2
0.19
2
0.19
2
07
Ceci
l
0310
Gilp
in
Man
or
Elem
enta
r E 29
3
316
0.21
8
Two
or
26
0.88
5
Lim
ited
Engl
ish
12
0.66
7
0.15
4
Whi
te
156
0.90
4
His
pani
c/L
32
0.75
N
N
Two
or
mor
e ra
ces
0.88
5
0.21
8
0.19
0.19
03
Balti
mor
e Co
unty
1205
Berk
shir
e El
emen
tar
y E 295
317
0.09
3
Two
or
22
1 Blac
k or
A
fric
an
54
0.90
7
0.31
Lim
ited
Engl
ish
12
1 Spec
ial
42
0.69
N
N
Two
or
mor
e ra
ces
0.9
0.09
3
0.18
9
0.18
9
03
Balti
mor
e Co
unty
0202
Rand
alls
tow
n El
emen
tar
E 298
318
0.17
6
Whi
te
12
1 FARM
S
262
0.82
4
0.20
1
His
pani
c/L
atin
o of
14
0.85
7
Spec
ial
32
0.65
6
N
N
0.17
6
0.18
7
0.18
7
17
Que
en
Ann
e's
0503
Gra
sonv
ille El
emen
tar
E 300
319
0.21
4
Asi
an
12
1 Lim
ited
Engl
ish
14
0.78
6
0.15
4
Asi
an
10
1 Blac
k or
52
0.84
6
Y N
Asi
an
1 0.21
4
0.18
7
0.18
7
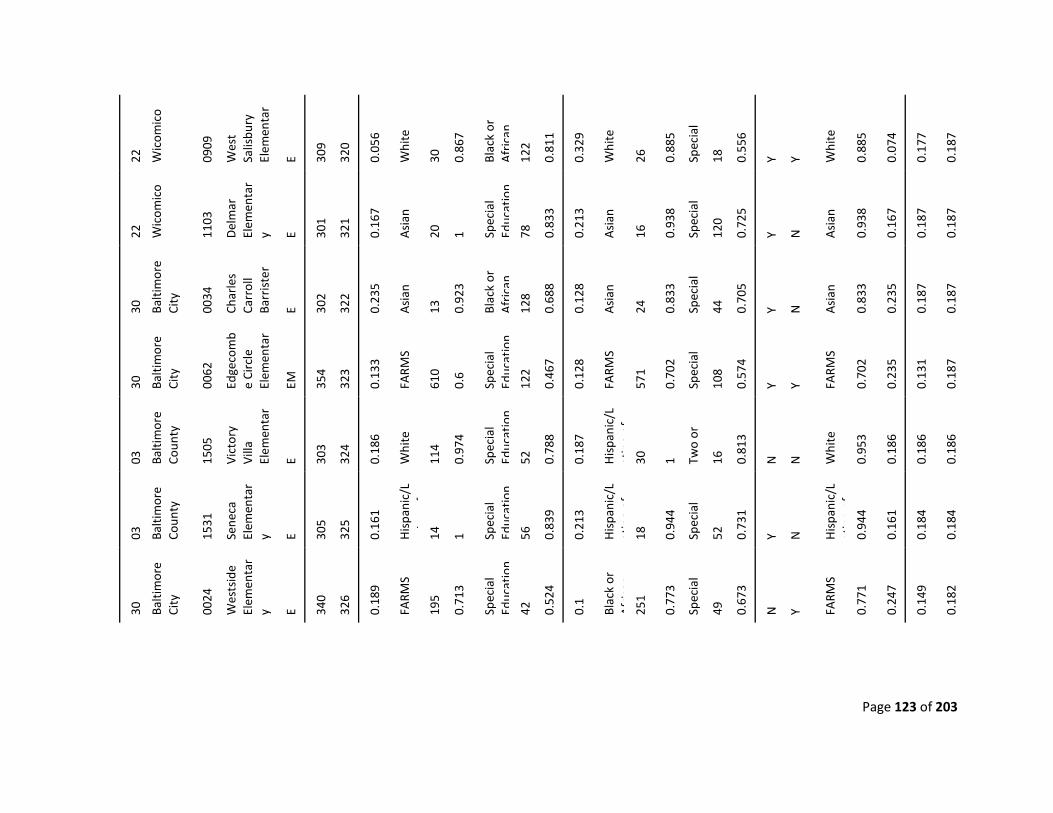
Page 123 of 203
22
Wic
omic
o
0909
Wes
t Sa
lisbu
ry
Elem
enta
r E 30
9
320
0.05
6
Whi
te
30
0.86
7
Blac
k or
A
fric
an
12
2
0.81
1
0.32
9
Whi
te
26
0.88
5
Spec
ial
18
0.55
6
Y Y Whi
te
0.88
5
0.07
4
0.17
7
0.18
7
22
Wic
omic
o
1103
Del
mar
El
emen
tar
y E 301
321
0.16
7
Asi
an
20
1 Spec
ial
Educ
atio
n
78
0.83
3
0.21
3
Asi
an
16
0.93
8
Spec
ial
12
0
0.72
5
Y N
Asi
an
0.93
8
0.16
7
0.18
7
0.18
7
30
Balti
mor
e Ci
ty
0034
Char
les
Carr
oll
Barr
iste
r
E 302
322
0.23
5
Asi
an
13
0.92
3
Blac
k or
A
fric
an
12
8
0.68
8
0.12
8
Asi
an
24
0.83
3
Spec
ial
44
0.70
5
Y N
Asi
an
0.83
3
0.23
5
0.18
7
0.18
7
30
Balti
mor
e Ci
ty
0062
Edge
com
be
Circ
le
Elem
enta
r EM
354
323
0.13
3
FARM
S
610
0.6
Spec
ial
Educ
atio
n
122
0.46
7
0.12
8
FARM
S
571
0.70
2
Spec
ial
10
8
0.57
4
Y Y FARM
S
0.70
2
0.23
5
0.13
1
0.18
7
03
Balti
mor
e Co
unty
1505
Vict
ory
Villa
El
emen
tar
E 303
324
0.18
6
Whi
te
114
0.97
4
Spec
ial
Educ
atio
n
52
0.78
8
0.18
7
His
pani
c/L
atin
o of
30
1 Two
or
16
0.81
3
N
N
Whi
te
0.95
3
0.18
6
0.18
6
0.18
6
03
Balti
mor
e Co
unty
1531
Sene
ca
Elem
enta
ry E 30
5
325
0.16
1
His
pani
c/L
ti
f
14
1 Spec
ial
Educ
atio
n
56
0.83
9
0.21
3
His
pani
c/L
atin
o of
18
0.94
4
Spec
ial
52
0.73
1
Y N
His
pani
c/L
atin
o of
0.
944
0.16
1
0.18
4
0.18
4
30
Balti
mor
e Ci
ty
0024
Wes
tsid
e El
emen
tar
y E 340
326
0.18
9
FARM
S
195
0.71
3
Spec
ial
Educ
atio
n
42
0.52
4
0.1
Blac
k or
A
fric
an
25
1
0.77
3
Spec
ial
49
0.67
3
N
Y FARM
S
0.77
1
0.24
7
0.14
9
0.18
2
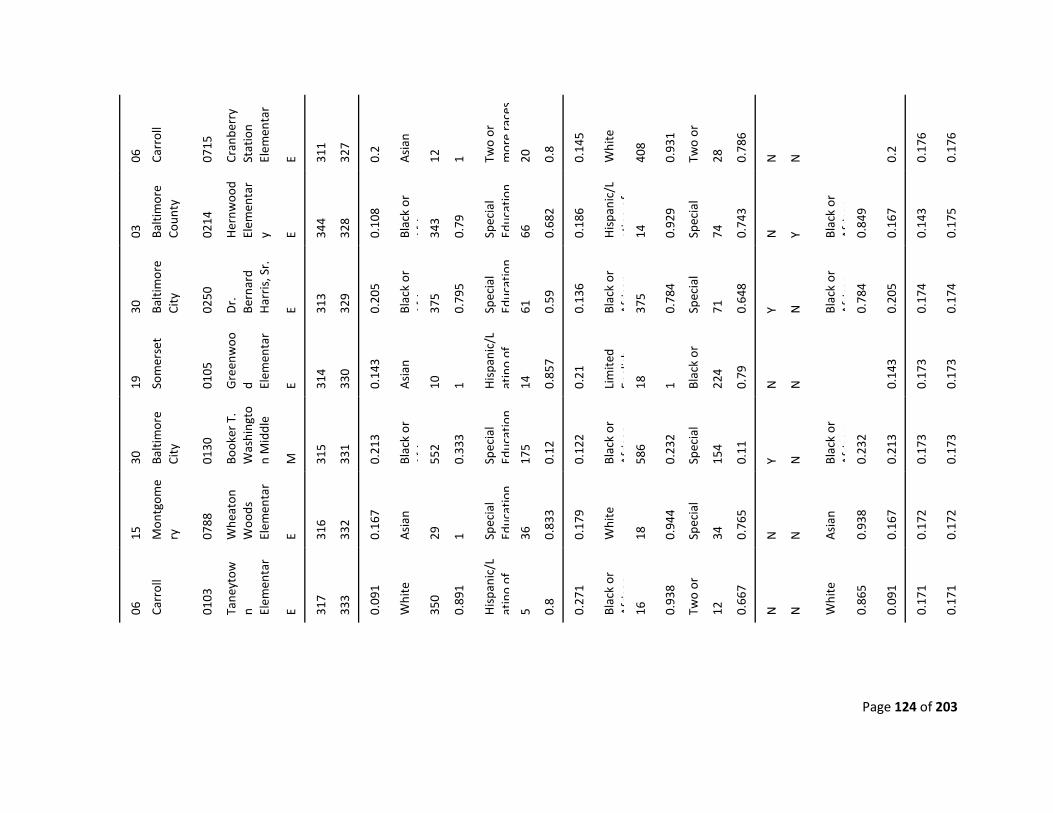
Page 124 of 203
06
Carr
oll
0715
Cran
berr
y St
atio
n El
emen
tar
E 311
327
0.2
Asi
an
12
1 Two
or
mor
e ra
ces
20
0.8
0.14
5
Whi
te
408
0.93
1
Two
or
28
0.78
6
N
N
0.2
0.17
6
0.17
6
03
Balti
mor
e Co
unty
0214
Her
nwoo
d El
emen
tar
y E 344
328
0.10
8
Blac
k or
A
fi
343
0.79
Spec
ial
Educ
atio
n
66
0.68
2
0.18
6
His
pani
c/L
atin
o of
14
0.92
9
Spec
ial
74
0.74
3
N
Y Blac
k or
A
fric
an
0.
849
0.16
7
0.14
3
0.17
5
30
Balti
mor
e Ci
ty
0250
Dr.
Be
rnar
d H
arri
s, S
r.
E 313
329
0.20
5
Blac
k or
A
fi
375
0.79
5
Spec
ial
Educ
atio
n
61
0.59
0.13
6
Blac
k or
A
fric
an
37
5
0.78
4
Spec
ial
71
0.64
8
Y N
Blac
k or
A
fric
an
0.
784
0.20
5
0.17
4
0.17
4
19
Som
erse
t
0105
Gre
enw
ood El
emen
tar
E 314
330
0.14
3
Asi
an
10
1 His
pani
c/L
atin
o of
14
0.85
7
0.21
Lim
ited
Engl
ish
18
1 Blac
k or
224
0.79
N
N
0.14
3
0.17
3
0.17
3
30
Balti
mor
e Ci
ty
0130
Book
er T
. W
ashi
ngto
n M
iddl
e
M
315
331
0.21
3
Blac
k or
A
fi
552
0.33
3
Spec
ial
Educ
atio
n
175
0.12
0.12
2
Blac
k or
A
fric
an
58
6
0.23
2
Spec
ial
15
4
0.11
Y N
Blac
k or
A
fric
an
0.
232
0.21
3
0.17
3
0.17
3
15
Mon
tgom
ery
0788
Whe
aton
W
oods
El
emen
tar
E 316
332
0.16
7
Asi
an
29
1 Spec
ial
Educ
atio
n
36
0.83
3
0.17
9
Whi
te
18
0.94
4
Spec
ial
34
0.76
5
N
N
Asi
an
0.93
8
0.16
7
0.17
2
0.17
2
06
Carr
oll
0103
Tane
ytow
n Elem
enta
r E 31
7
333
0.09
1
Whi
te
350
0.89
1
His
pani
c/L
atin
o of
5 0.
8
0.27
1
Blac
k or
A
fric
an
16
0.93
8
Two
or
12
0.66
7
N
N
Whi
te
0.86
5
0.09
1
0.17
1
0.17
1
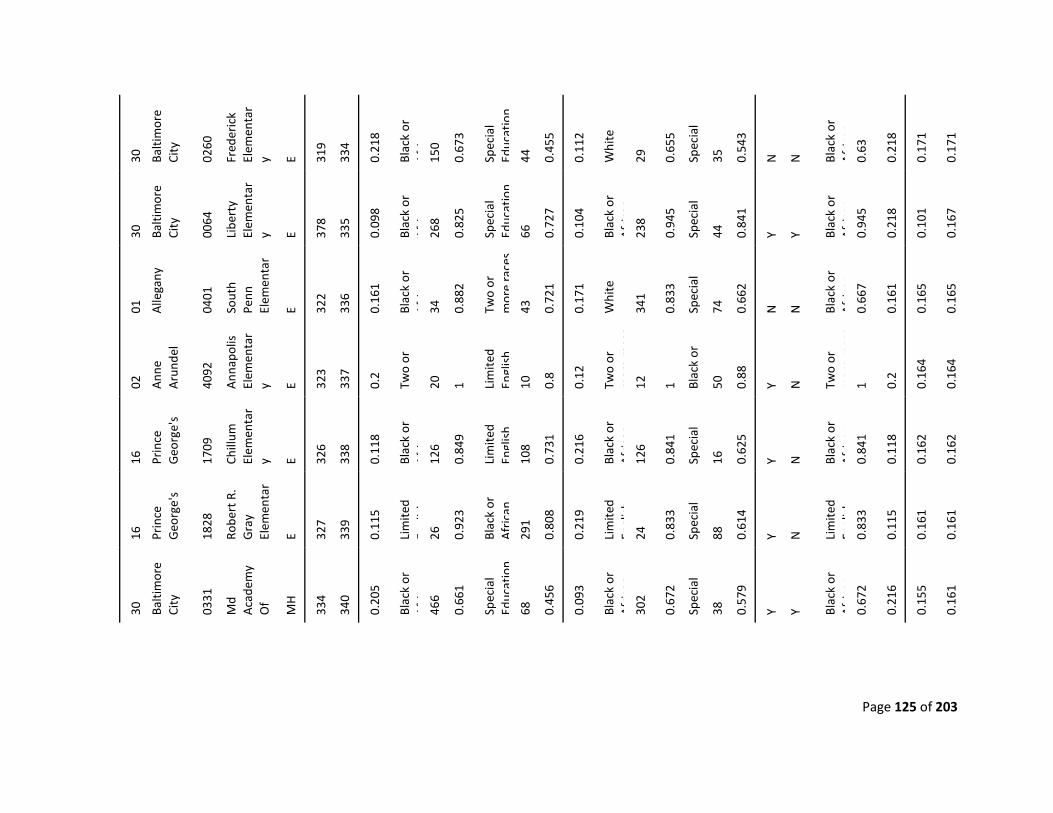
Page 125 of 203
30
Balti
mor
e Ci
ty
0260
Fred
eric
k El
emen
tar
y E 319
334
0.21
8
Blac
k or
A
fi
150
0.67
3
Spec
ial
Educ
atio
n
44
0.45
5
0.11
2
Whi
te
29
0.65
5
Spec
ial
35
0.54
3
N
N
Blac
k or
A
fric
an
0.
63
0.21
8
0.17
1
0.17
1
30
Balti
mor
e Ci
ty
0064
Libe
rty
Elem
enta
ry E 37
8
335
0.09
8
Blac
k or
A
fi
268
0.82
5
Spec
ial
Educ
atio
n
66
0.72
7
0.10
4
Blac
k or
A
fric
an
23
8
0.94
5
Spec
ial
44
0.84
1
Y Y Blac
k or
A
fric
an
0.
945
0.21
8
0.10
1
0.16
7
01
Alle
gany
0401
Sout
h Pe
nn
Elem
enta
r E 32
2
336
0.16
1
Blac
k or
A
fi
34
0.88
2
Two
or
mor
e ra
ces
43
0.72
1
0.17
1
Whi
te
341
0.83
3
Spec
ial
74
0.66
2
N
N
Blac
k or
A
fric
an
0.
667
0.16
1
0.16
5
0.16
5
02
Ann
e A
rund
el
4092
Ann
apol
is
Elem
enta
ry E 32
3
337
0.2
Two
or
20
1 Lim
ited
Engl
ish
10
0.8
0.12
Two
or
mor
e ra
ces
12
1 Blac
k or
50
0.88
Y N
Two
or
mor
e ra
ces
1 0.2
0.16
4
0.16
4
16
Prin
ce
Geo
rge'
s
1709
Chill
um
Elem
enta
ry E 32
6
338
0.11
8
Blac
k or
A
fi
126
0.84
9
Lim
ited
Engl
ish
10
8
0.73
1
0.21
6
Blac
k or
A
fric
an
12
6
0.84
1
Spec
ial
16
0.62
5
Y N
Blac
k or
A
fric
an
0.
841
0.11
8
0.16
2
0.16
2
16
Prin
ce
Geo
rge'
s
1828
Robe
rt R
. G
ray
Elem
enta
r E 32
7
339
0.11
5
Lim
ited
Eli
h
26
0.92
3
Blac
k or
A
fric
an
29
1
0.80
8
0.21
9
Lim
ited
Engl
ish
24
0.83
3
Spec
ial
88
0.61
4
Y N
Lim
ited
Engl
ish
0.
833
0.11
5
0.16
1
0.16
1
30
Balti
mor
e Ci
ty
0331
Md
Aca
dem
y O
f
MH
334
340
0.20
5
Blac
k or
A
fi
466
0.66
1
Spec
ial
Educ
atio
n
68
0.45
6
0.09
3
Blac
k or
A
fric
an
30
2
0.67
2
Spec
ial
38
0.57
9
Y Y Blac
k or
A
fric
an
0.
672
0.21
6
0.15
5
0.16
1
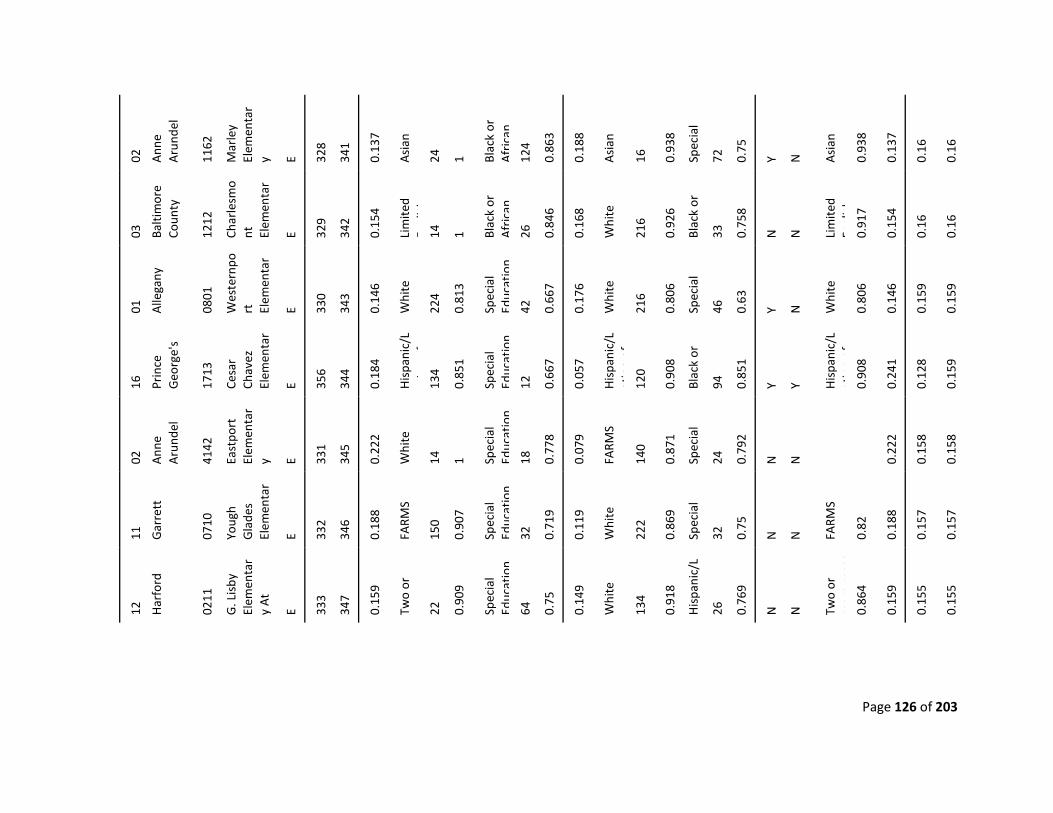
Page 126 of 203
02
Ann
e A
rund
el
1162
Mar
ley
Elem
enta
ry E 32
8
341
0.13
7
Asi
an
24
1 Blac
k or
A
fric
an
12
4
0.86
3
0.18
8
Asi
an
16
0.93
8
Spec
ial
72
0.75
Y N
Asi
an
0.93
8
0.13
7
0.16
0.16
03
Balti
mor
e Co
unty
1212
Char
lesm
ont
El
emen
tar
E 329
342
0.15
4
Lim
ited
Eli
h
14
1 Blac
k or
A
fric
an
26
0.84
6
0.16
8
Whi
te
216
0.92
6
Blac
k or
33
0.75
8
N
N
Lim
ited
Engl
ish
0.
917
0.15
4
0.16
0.16
01
Alle
gany
0801
Wes
tern
port
El
emen
tar
E 330
343
0.14
6
Whi
te
224
0.81
3
Spec
ial
Educ
atio
n
42
0.66
7
0.17
6
Whi
te
216
0.80
6
Spec
ial
46
0.63
Y N
Whi
te
0.80
6
0.14
6
0.15
9
0.15
9
16
Prin
ce
Geo
rge'
s
1713
Cesa
r Ch
avez
El
emen
tar
E 356
344
0.18
4
His
pani
c/L
ti
f
13
4
0.85
1
Spec
ial
Educ
atio
n
12
0.66
7
0.05
7
His
pani
c/L
atin
o of
12
0
0.90
8
Blac
k or
94
0.85
1
Y Y His
pani
c/L
atin
o of
0.
908
0.24
1
0.12
8
0.15
9
02
Ann
e A
rund
el
4142
East
port
El
emen
tar
y E 331
345
0.22
2
Whi
te
14
1 Spec
ial
Educ
atio
n
18
0.77
8
0.07
9
FARM
S
140
0.87
1
Spec
ial
24
0.79
2
N
N
0.22
2
0.15
8
0.15
8
11
Gar
rett
0710
Youg
h G
lade
s El
emen
tar
E 332
346
0.18
8
FARM
S
150
0.90
7
Spec
ial
Educ
atio
n
32
0.71
9
0.11
9
Whi
te
222
0.86
9
Spec
ial
32
0.75
N
N
FARM
S
0.82
0.18
8
0.15
7
0.15
7
12
Har
ford
0211
G. L
isby
El
emen
tar
y A
t
E 333
347
0.15
9
Two
or
22
0.90
9
Spec
ial
Educ
atio
n
64
0.75
0.14
9
Whi
te
134
0.91
8
His
pani
c/L
26
0.76
9
N
N
Two
or
mor
e ra
ces
0.86
4
0.15
9
0.15
5
0.15
5
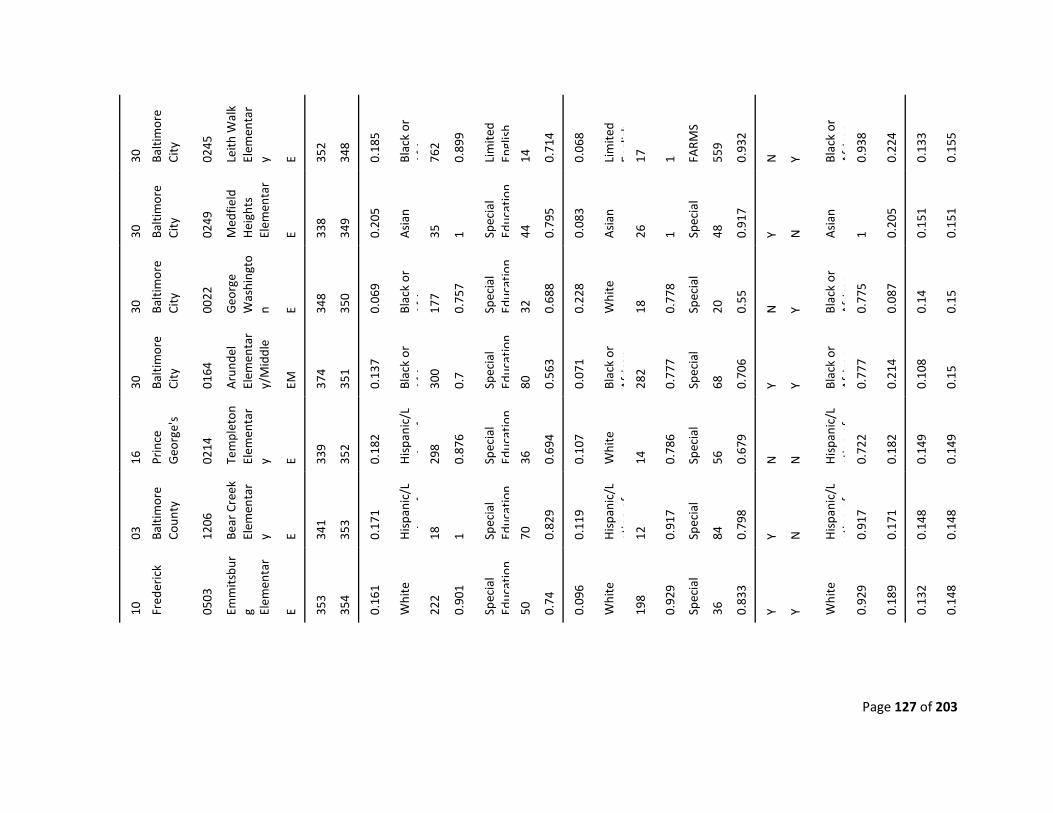
Page 127 of 203
30
Balti
mor
e Ci
ty
0245
Leith
Wal
k El
emen
tar
y E 352
348
0.18
5
Blac
k or
A
fi
762
0.89
9
Lim
ited
Engl
ish
14
0.71
4
0.06
8
Lim
ited
Engl
ish
17
1 FARM
S
559
0.93
2
N
Y Blac
k or
A
fric
an
0.
938
0.22
4
0.13
3
0.15
5
30
Balti
mor
e Ci
ty
0249
Med
field
H
eigh
ts
Elem
enta
r E 33
8
349
0.20
5
Asi
an
35
1 Spec
ial
Educ
atio
n
44
0.79
5
0.08
3
Asi
an
26
1 Spec
ial
48
0.91
7
Y N
Asi
an
1 0.20
5
0.15
1
0.15
1
30
Balti
mor
e Ci
ty
0022
Geo
rge
Was
hing
ton E 34
8
350
0.06
9
Blac
k or
A
fi
177
0.75
7
Spec
ial
Educ
atio
n
32
0.68
8
0.22
8
Whi
te
18
0.77
8
Spec
ial
20
0.55
N
Y Blac
k or
A
fric
an
0.
775
0.08
7
0.14
0.15
30
Balti
mor
e Ci
ty
0164
Aru
ndel
El
emen
tar
y/M
iddl
e
EM
374
351
0.13
7
Blac
k or
A
fi
300
0.7
Spec
ial
Educ
atio
n
80
0.56
3
0.07
1
Blac
k or
A
fric
an
28
2
0.77
7
Spec
ial
68
0.70
6
Y Y Blac
k or
A
fric
an
0.
777
0.21
4
0.10
8
0.15
16
Prin
ce
Geo
rge'
s
0214
Tem
plet
on
Elem
enta
ry E 33
9
352
0.18
2
His
pani
c/L
ti
f
29
8
0.87
6
Spec
ial
Educ
atio
n
36
0.69
4
0.10
7
Whi
te
14
0.78
6
Spec
ial
56
0.67
9
N
N
His
pani
c/L
atin
o of
0.
722
0.18
2
0.14
9
0.14
9
03
Balti
mor
e Co
unty
1206
Bear
Cre
ek
Elem
enta
ry E 34
1
353
0.17
1
His
pani
c/L
ti
f
18
1 Spec
ial
Educ
atio
n
70
0.82
9
0.11
9
His
pani
c/L
atin
o of
12
0.91
7
Spec
ial
84
0.79
8
Y N
His
pani
c/L
atin
o of
0.
917
0.17
1
0.14
8
0.14
8
10
Fred
eric
k
0503
Emm
itsbu
rg El
emen
tar
E 353
354
0.16
1
Whi
te
222
0.90
1
Spec
ial
Educ
atio
n
50
0.74
0.09
6
Whi
te
198
0.92
9
Spec
ial
36
0.83
3
Y Y Whi
te
0.92
9
0.18
9
0.13
2
0.14
8
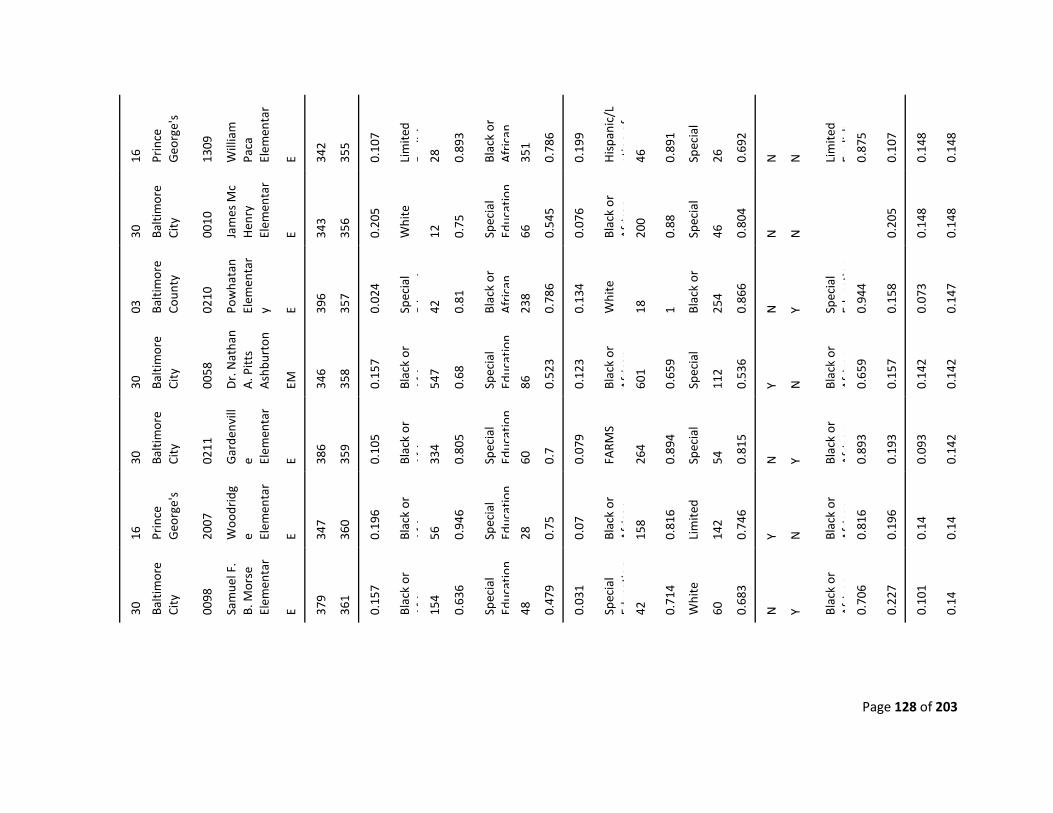
Page 128 of 203
16
Prin
ce
Geo
rge'
s
1309
Will
iam
Pa
ca
Elem
enta
r E 34
2
355
0.10
7
Lim
ited
Eli
h
28
0.89
3
Blac
k or
A
fric
an
35
1
0.78
6
0.19
9
His
pani
c/L
atin
o of
46
0.89
1
Spec
ial
26
0.69
2
N
N
Lim
ited
Engl
ish
0.
875
0.10
7
0.14
8
0.14
8
30
Balti
mor
e Ci
ty
0010
Jam
es M
c H
enry
El
emen
tar
E 343
356
0.20
5
Whi
te
12
0.75
Spec
ial
Educ
atio
n
66
0.54
5
0.07
6
Blac
k or
A
fric
an
20
0
0.88
Spec
ial
46
0.80
4
N
N
0.20
5
0.14
8
0.14
8
03
Balti
mor
e Co
unty
0210
Pow
hata
n El
emen
tar
y E 396
357
0.02
4
Spec
ial
Edti
42
0.81
Blac
k or
A
fric
an
23
8
0.78
6
0.13
4
Whi
te
18
1 Blac
k or
254
0.86
6
N
Y Spec
ial
Educ
atio
n 0.
944
0.15
8
0.07
3
0.14
7
30
Balti
mor
e Ci
ty
0058
Dr.
Nat
han
A. P
itts
Ash
burt
on
EM
346
358
0.15
7
Blac
k or
A
fi
547
0.68
Spec
ial
Educ
atio
n
86
0.52
3
0.12
3
Blac
k or
A
fric
an
60
1
0.65
9
Spec
ial
11
2
0.53
6
Y N
Blac
k or
A
fric
an
0.
659
0.15
7
0.14
2
0.14
2
30
Balti
mor
e Ci
ty
0211
Gar
denv
ille El
emen
tar
E 386
359
0.10
5
Blac
k or
A
fi
334
0.80
5
Spec
ial
Educ
atio
n
60
0.7
0.07
9
FARM
S
264
0.89
4
Spec
ial
54
0.81
5
N
Y Blac
k or
A
fric
an
0.
893
0.19
3
0.09
3
0.14
2
16
Prin
ce
Geo
rge'
s
2007
Woo
drid
ge El
emen
tar
E 347
360
0.19
6
Blac
k or
A
fi
56
0.94
6
Spec
ial
Educ
atio
n
28
0.75
0.07
Blac
k or
A
fric
an
15
8
0.81
6
Lim
ited
14
2
0.74
6
Y N
Blac
k or
A
fric
an
0.
816
0.19
6
0.14
0.14
30
Balti
mor
e Ci
ty
0098
Sam
uel F
. B.
Mor
se
Elem
enta
r E 37
9
361
0.15
7
Blac
k or
A
fi
154
0.63
6
Spec
ial
Educ
atio
n
48
0.47
9
0.03
1
Spec
ial
Educ
atio
n 42
0.71
4
Whi
te
60
0.68
3
N
Y Blac
k or
A
fric
an
0.
706
0.22
7
0.10
1
0.14
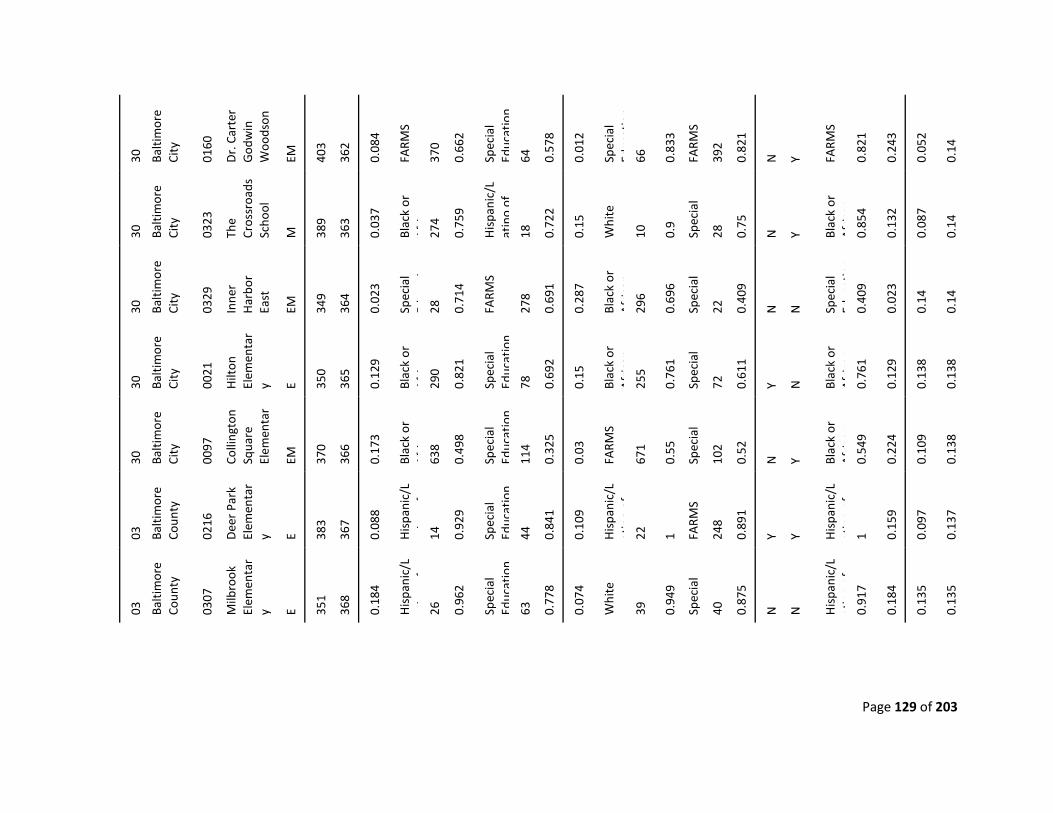
Page 129 of 203
30
Balti
mor
e Ci
ty
0160
Dr.
Car
ter
God
win
W
oods
on
EM
403
362
0.08
4
FARM
S
370
0.66
2
Spec
ial
Educ
atio
n
64
0.57
8
0.01
2
Spec
ial
Educ
atio
n 66
0.83
3
FARM
S
392
0.82
1
N
Y FARM
S
0.82
1
0.24
3
0.05
2
0.14
30
Balti
mor
e Ci
ty
0323
The
Cros
sroa
ds
Scho
ol
M
389
363
0.03
7
Blac
k or
A
fi
274
0.75
9
His
pani
c/L
atin
o of
18
0.72
2
0.15
Whi
te
10
0.9
Spec
ial
28
0.75
N
Y Blac
k or
A
fric
an
0.
854
0.13
2
0.08
7
0.14
30
Balti
mor
e Ci
ty
0329
Inne
r H
arbo
r Ea
st
EM
349
364
0.02
3
Spec
ial
Edti
28
0.71
4
FARM
S
278
0.69
1
0.28
7
Blac
k or
A
fric
an
29
6
0.69
6
Spec
ial
22
0.40
9
N
N
Spec
ial
Educ
atio
n 0.
409
0.02
3
0.14
0.14
30
Balti
mor
e Ci
ty
0021
Hilt
on
Elem
enta
ry E 35
0
365
0.12
9
Blac
k or
A
fi
290
0.82
1
Spec
ial
Educ
atio
n
78
0.69
2
0.15
Blac
k or
A
fric
an
25
5
0.76
1
Spec
ial
72
0.61
1
Y N
Blac
k or
A
fric
an
0.
761
0.12
9
0.13
8
0.13
8
30
Balti
mor
e Ci
ty
0097
Colli
ngto
n Sq
uare
El
emen
tar
EM
370
366
0.17
3
Blac
k or
A
fi
638
0.49
8
Spec
ial
Educ
atio
n
114
0.32
5
0.03
FARM
S
671
0.55
Spec
ial
10
2
0.52
N
Y Blac
k or
A
fric
an
0.
549
0.22
4
0.10
9
0.13
8
03
Balti
mor
e Co
unty
0216
Dee
r Pa
rk
Elem
enta
ry E 38
3
367
0.08
8
His
pani
c/L
ti
f
14
0.92
9
Spec
ial
Educ
atio
n
44
0.84
1
0.10
9
His
pani
c/L
atin
o of
22
1 FARM
S
248
0.89
1
Y Y His
pani
c/L
atin
o of
1 0.
159
0.09
7
0.13
7
03
Balti
mor
e Co
unty
0307
Milb
rook
El
emen
tar
y E 351
368
0.18
4
His
pani
c/L
ti
f
26
0.96
2
Spec
ial
Educ
atio
n
63
0.77
8
0.07
4
Whi
te
39
0.94
9
Spec
ial
40
0.87
5
N
N
His
pani
c/L
atin
o of
0.
917
0.18
4
0.13
5
0.13
5
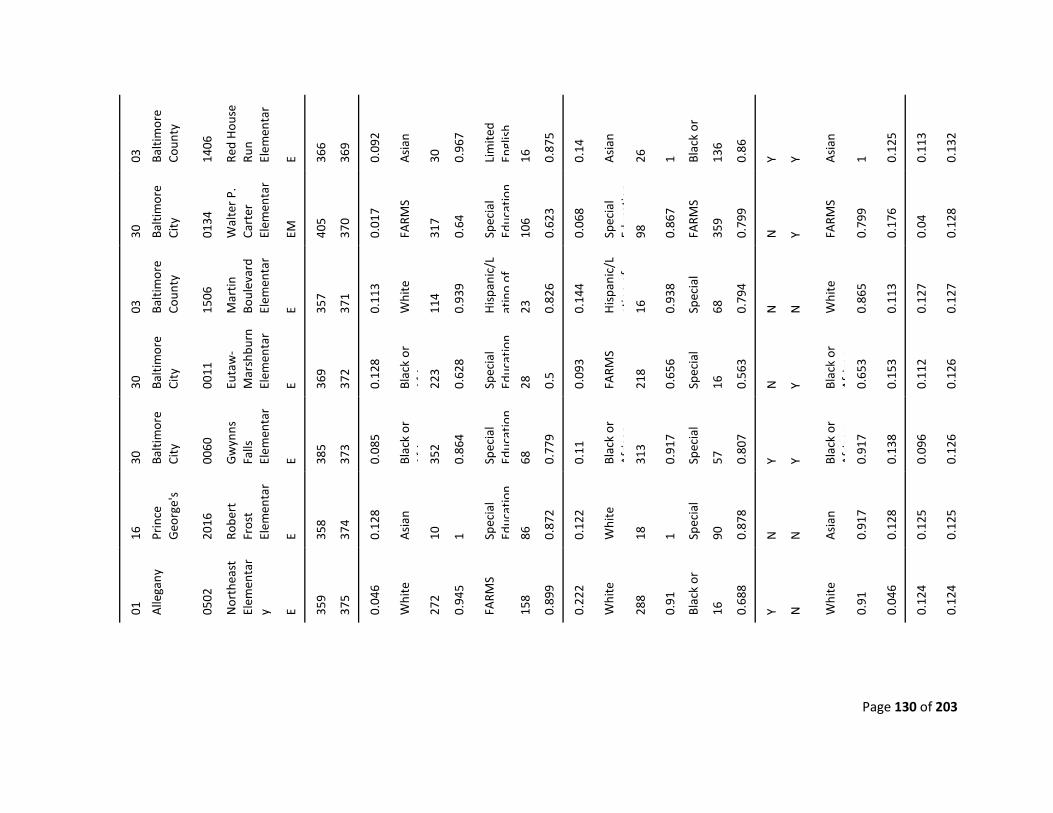
Page 130 of 203
03
Balti
mor
e Co
unty
1406
Red
Hou
se
Run
Elem
enta
r E 36
6
369
0.09
2
Asi
an
30
0.96
7
Lim
ited
Engl
ish
16
0.87
5
0.14
Asi
an
26
1 Blac
k or
136
0.86
Y Y Asi
an
1 0.12
5
0.11
3
0.13
2
30
Balti
mor
e Ci
ty
0134
Wal
ter
P.
Cart
er
Elem
enta
r EM
405
370
0.01
7
FARM
S
317
0.64
Spec
ial
Educ
atio
n
106
0.62
3
0.06
8
Spec
ial
Educ
atio
n 98
0.86
7
FARM
S
359
0.79
9
N
Y FARM
S
0.79
9
0.17
6
0.04
0.12
8
03
Balti
mor
e Co
unty
1506
Mar
tin
Boul
evar
d El
emen
tar
E 357
371
0.11
3
Whi
te
114
0.93
9
His
pani
c/L
atin
o of
23
0.82
6
0.14
4
His
pani
c/L
atin
o of
16
0.93
8
Spec
ial
68
0.79
4
N
N
Whi
te
0.86
5
0.11
3
0.12
7
0.12
7
30
Balti
mor
e Ci
ty
0011
Euta
w-
Mar
shbu
rn
Elem
enta
r E 36
9
372
0.12
8
Blac
k or
A
fi
223
0.62
8
Spec
ial
Educ
atio
n
28
0.5
0.09
3
FARM
S
218
0.65
6
Spec
ial
16
0.56
3
N
Y Blac
k or
A
fric
an
0.
653
0.15
3
0.11
2
0.12
6
30
Balti
mor
e Ci
ty
0060
Gw
ynns
Fa
lls
Elem
enta
r E 38
5
373
0.08
5
Blac
k or
A
fi
352
0.86
4
Spec
ial
Educ
atio
n
68
0.77
9
0.11
Blac
k or
A
fric
an
31
3
0.91
7
Spec
ial
57
0.80
7
Y Y Blac
k or
A
fric
an
0.
917
0.13
8
0.09
6
0.12
6
16
Prin
ce
Geo
rge'
s
2016
Robe
rt
Fros
t El
emen
tar
E 358
374
0.12
8
Asi
an
10
1 Spec
ial
Educ
atio
n
86
0.87
2
0.12
2
Whi
te
18
1 Spec
ial
90
0.87
8
N
N
Asi
an
0.91
7
0.12
8
0.12
5
0.12
5
01
Alle
gany
0502
Nor
thea
st
Elem
enta
ry E 35
9
375
0.04
6
Whi
te
272
0.94
5
FARM
S
158
0.89
9
0.22
2
Whi
te
288
0.91
Blac
k or
16
0.68
8
Y N
Whi
te
0.91
0.04
6
0.12
4
0.12
4
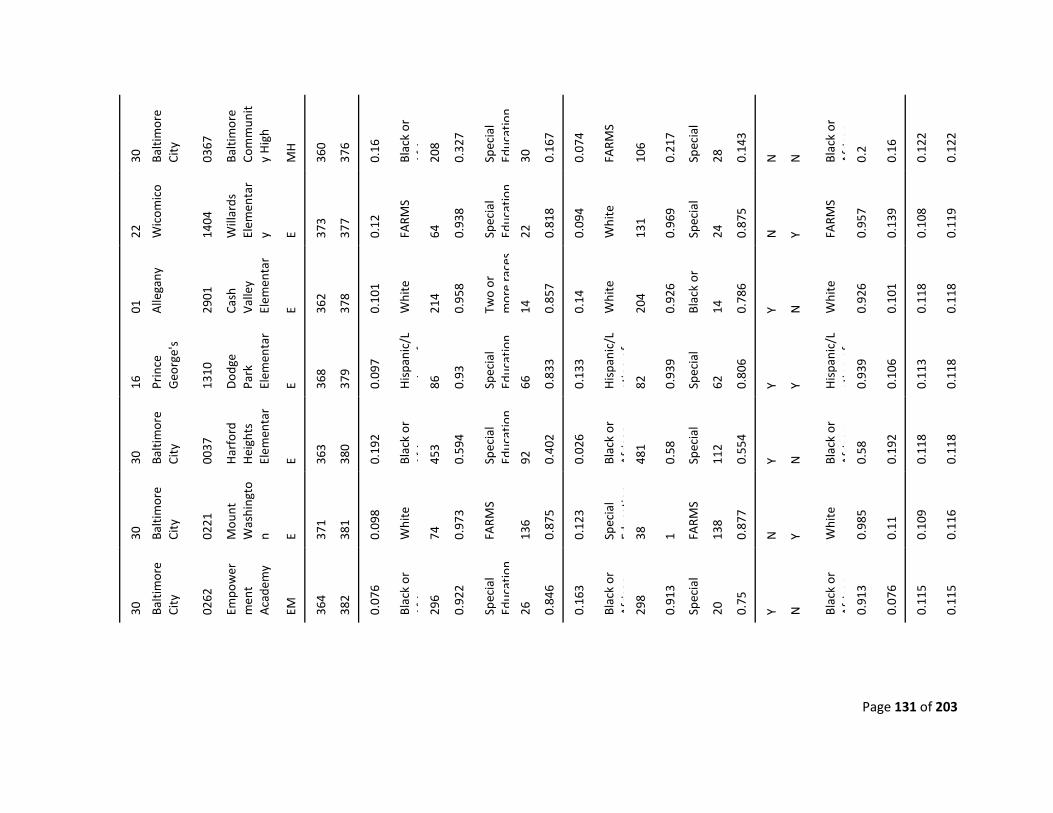
Page 131 of 203
30
Balti
mor
e Ci
ty
0367
Balti
mor
e Co
mm
unit
y H
igh
M
H
360
376
0.16
Blac
k or
A
fi
208
0.32
7
Spec
ial
Educ
atio
n
30
0.16
7
0.07
4
FARM
S
106
0.21
7
Spec
ial
28
0.14
3
N
N
Blac
k or
A
fric
an
0.
2
0.16
0.12
2
0.12
2
22
Wic
omic
o
1404
Will
ards
El
emen
tar
y E 373
377
0.12
FARM
S
64
0.93
8
Spec
ial
Educ
atio
n
22
0.81
8
0.09
4
Whi
te
131
0.96
9
Spec
ial
24
0.87
5
N
Y FARM
S
0.95
7
0.13
9
0.10
8
0.11
9
01
Alle
gany
2901
Cash
Va
lley
Elem
enta
r E 36
2
378
0.10
1
Whi
te
214
0.95
8
Two
or
mor
e ra
ces
14
0.85
7
0.14
Whi
te
204
0.92
6
Blac
k or
14
0.78
6
Y N
Whi
te
0.92
6
0.10
1
0.11
8
0.11
8
16
Prin
ce
Geo
rge'
s
1310
Dod
ge
Park
El
emen
tar
E 368
379
0.09
7
His
pani
c/L
ti
f
86
0.93
Spec
ial
Educ
atio
n
66
0.83
3
0.13
3
His
pani
c/L
atin
o of
82
0.93
9
Spec
ial
62
0.80
6
Y Y His
pani
c/L
atin
o of
0.
939
0.10
6
0.11
3
0.11
8
30
Balti
mor
e Ci
ty
0037
Har
ford
H
eigh
ts
Elem
enta
r E 36
3
380
0.19
2
Blac
k or
A
fi
453
0.59
4
Spec
ial
Educ
atio
n
92
0.40
2
0.02
6
Blac
k or
A
fric
an
48
1
0.58
Spec
ial
11
2
0.55
4
Y N
Blac
k or
A
fric
an
0.
58
0.19
2
0.11
8
0.11
8
30
Balti
mor
e Ci
ty
0221
Mou
nt
Was
hing
ton E 37
1
381
0.09
8
Whi
te
74
0.97
3
FARM
S
136
0.87
5
0.12
3
Spec
ial
Educ
atio
n 38
1 FARM
S
138
0.87
7
N
Y Whi
te
0.98
5
0.11
0.10
9
0.11
6
30
Balti
mor
e Ci
ty
0262
Empo
wer
men
t A
cade
my
EM
364
382
0.07
6
Blac
k or
A
fi
296
0.92
2
Spec
ial
Educ
atio
n
26
0.84
6
0.16
3
Blac
k or
A
fric
an
29
8
0.91
3
Spec
ial
20
0.75
Y N
Blac
k or
A
fric
an
0.
913
0.07
6
0.11
5
0.11
5
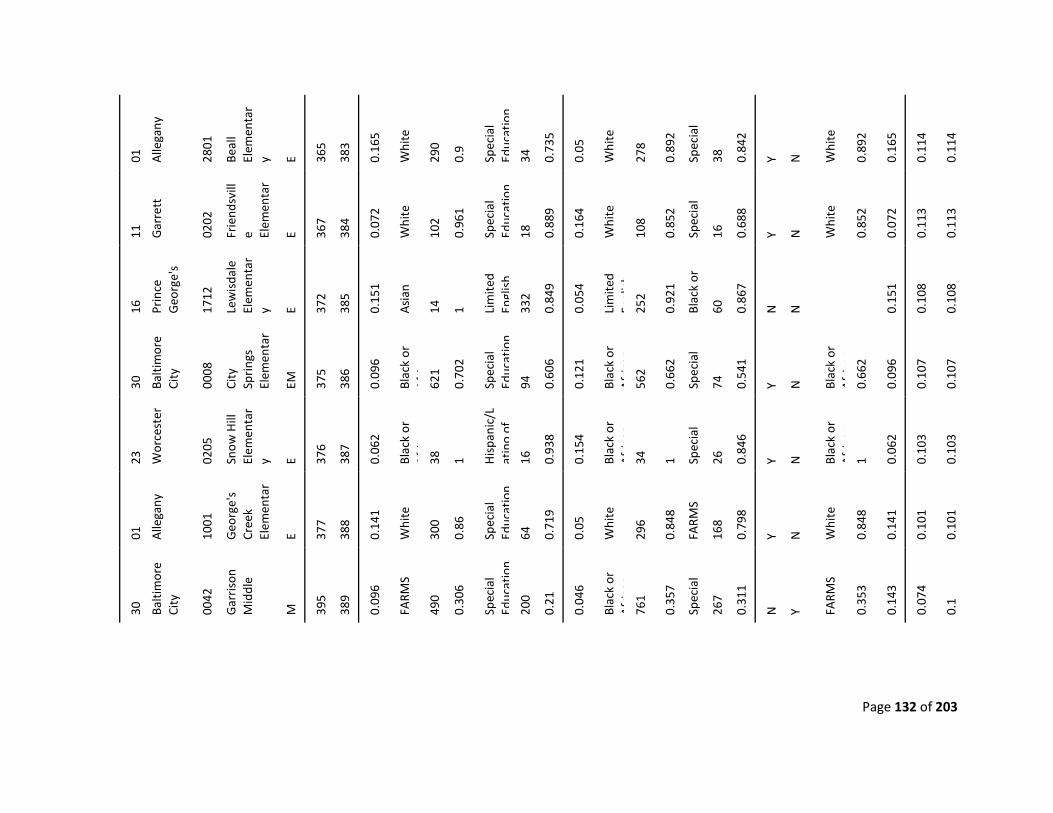
Page 132 of 203
01
Alle
gany
2801
Beal
l El
emen
tar
y E 365
383
0.16
5
Whi
te
290
0.9
Spec
ial
Educ
atio
n
34
0.73
5
0.05
Whi
te
278
0.89
2
Spec
ial
38
0.84
2
Y N
Whi
te
0.89
2
0.16
5
0.11
4
0.11
4
11
Gar
rett
0202
Frie
ndsv
ille El
emen
tar
E 367
384
0.07
2
Whi
te
102
0.96
1
Spec
ial
Educ
atio
n
18
0.88
9
0.16
4
Whi
te
108
0.85
2
Spec
ial
16
0.68
8
Y N
Whi
te
0.85
2
0.07
2
0.11
3
0.11
3
16
Prin
ce
Geo
rge'
s
1712
Lew
isda
le
Elem
enta
ry E 37
2
385
0.15
1
Asi
an
14
1 Lim
ited
Engl
ish
33
2
0.84
9
0.05
4
Lim
ited
Engl
ish
25
2
0.92
1
Blac
k or
60
0.86
7
N
N
0.15
1
0.10
8
0.10
8
30
Balti
mor
e Ci
ty
0008
City
Sp
ring
s El
emen
tar
EM
375
386
0.09
6
Blac
k or
A
fi
621
0.70
2
Spec
ial
Educ
atio
n
94
0.60
6
0.12
1
Blac
k or
A
fric
an
56
2
0.66
2
Spec
ial
74
0.54
1
Y N
Blac
k or
A
fric
an
0.
662
0.09
6
0.10
7
0.10
7
23
Wor
cest
er
0205
Snow
Hill
El
emen
tar
y E 376
387
0.06
2
Blac
k or
A
fi
38
1 His
pani
c/L
atin
o of
16
0.93
8
0.15
4
Blac
k or
A
fric
an
34
1 Spec
ial
26
0.84
6
Y N
Blac
k or
A
fric
an
1 0.
062
0.10
3
0.10
3
01
Alle
gany
1001
Geo
rge'
s Cr
eek
Elem
enta
r E 37
7
388
0.14
1
Whi
te
300
0.86
Spec
ial
Educ
atio
n
64
0.71
9
0.05
Whi
te
296
0.84
8
FARM
S
168
0.79
8
Y N
Whi
te
0.84
8
0.14
1
0.10
1
0.10
1
30
Balti
mor
e Ci
ty
0042
Gar
riso
n M
iddl
e
M
395
389
0.09
6
FARM
S
490
0.30
6
Spec
ial
Educ
atio
n
200
0.21
0.04
6
Blac
k or
A
fric
an
76
1
0.35
7
Spec
ial
26
7
0.31
1
N
Y FARM
S
0.35
3
0.14
3
0.07
4
0.1
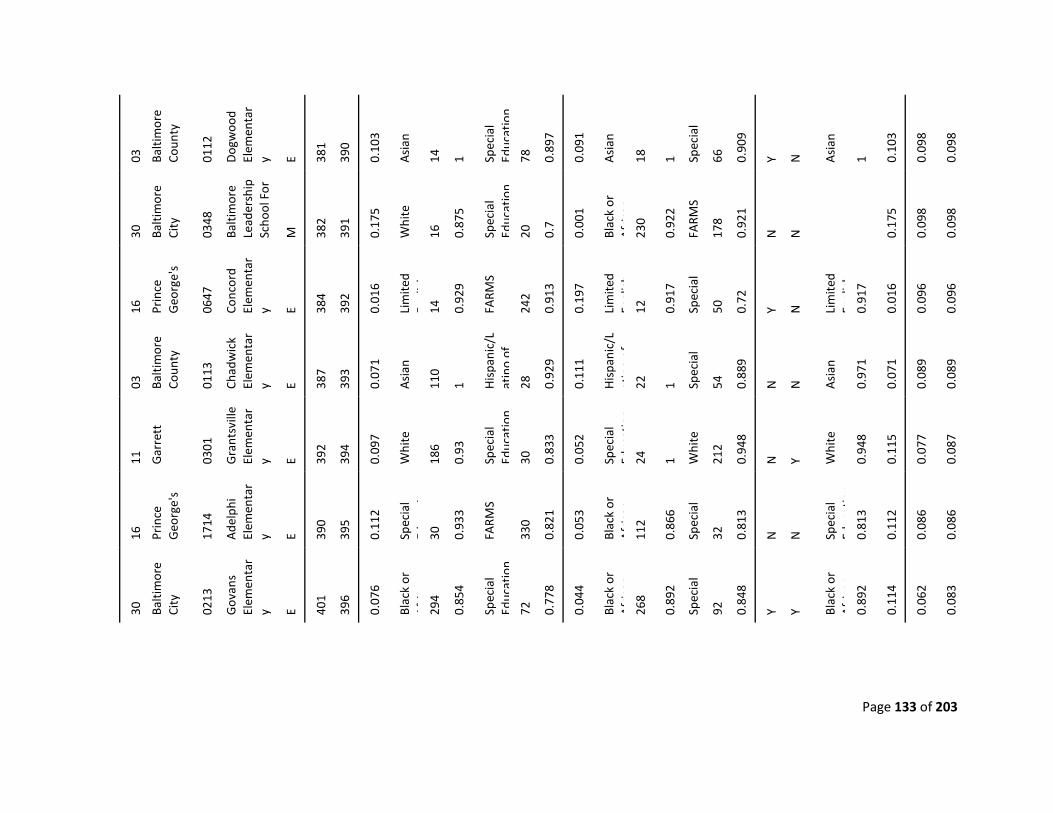
Page 133 of 203
03
Balti
mor
e Co
unty
0112
Dog
woo
d El
emen
tar
y E 381
390
0.10
3
Asi
an
14
1 Spec
ial
Educ
atio
n
78
0.89
7
0.09
1
Asi
an
18
1 Spec
ial
66
0.90
9
Y N
Asi
an
1 0.10
3
0.09
8
0.09
8
30
Balti
mor
e Ci
ty
0348
Balti
mor
e Le
ader
ship
Sc
hool
For
M
382
391
0.17
5
Whi
te
16
0.87
5
Spec
ial
Educ
atio
n
20
0.7
0.00
1
Blac
k or
A
fric
an
23
0
0.92
2
FARM
S
178
0.92
1
N
N
0.17
5
0.09
8
0.09
8
16
Prin
ce
Geo
rge'
s
0647
Conc
ord
Elem
enta
ry E 38
4
392
0.01
6
Lim
ited
Eli
h
14
0.92
9
FARM
S
242
0.91
3
0.19
7
Lim
ited
Engl
ish
12
0.91
7
Spec
ial
50
0.72
Y N
Lim
ited
Engl
ish
0.
917
0.01
6
0.09
6
0.09
6
03
Balti
mor
e Co
unty
0113
Chad
wic
k El
emen
tar
y E 387
393
0.07
1
Asi
an
110
1 His
pani
c/L
atin
o of
28
0.92
9
0.11
1
His
pani
c/L
atin
o of
22
1 Spec
ial
54
0.88
9
N
N
Asi
an
0.97
1
0.07
1
0.08
9
0.08
9
11
Gar
rett
0301
Gra
ntsv
ille
Elem
enta
ry E 39
2
394
0.09
7
Whi
te
186
0.93
Spec
ial
Educ
atio
n
30
0.83
3
0.05
2
Spec
ial
Educ
atio
n 24
1 Whi
te
212
0.94
8
N
Y Whi
te
0.94
8
0.11
5
0.07
7
0.08
7
16
Prin
ce
Geo
rge'
s
1714
Ade
lphi
El
emen
tar
y E 390
395
0.11
2
Spec
ial
Edti
30
0.93
3
FARM
S
330
0.82
1
0.05
3
Blac
k or
A
fric
an
11
2
0.86
6
Spec
ial
32
0.81
3
N
N
Spec
ial
Educ
atio
n 0.
813
0.11
2
0.08
6
0.08
6
30
Balti
mor
e Ci
ty
0213
Gov
ans
Elem
enta
ry E 40
1
396
0.07
6
Blac
k or
A
fi
294
0.85
4
Spec
ial
Educ
atio
n
72
0.77
8
0.04
4
Blac
k or
A
fric
an
26
8
0.89
2
Spec
ial
92
0.84
8
Y Y Blac
k or
A
fric
an
0.
892
0.11
4
0.06
2
0.08
3
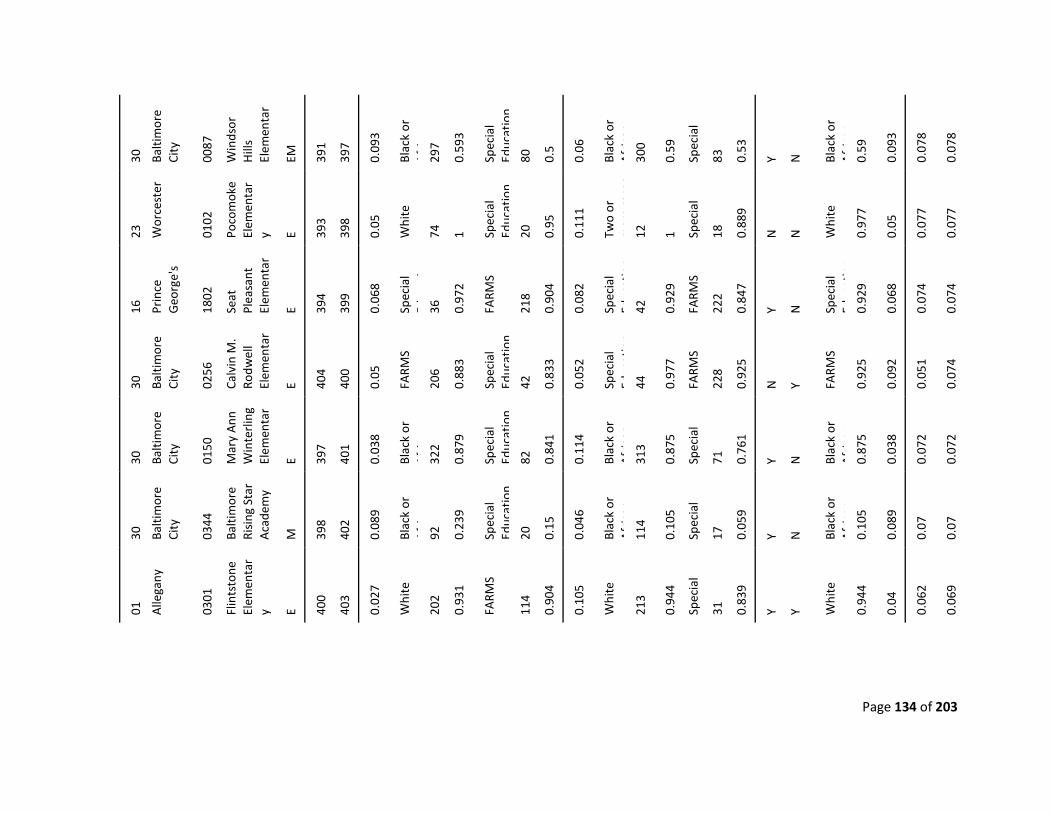
Page 134 of 203
30
Balti
mor
e Ci
ty
0087
Win
dsor
H
ills
Elem
enta
r EM
391
397
0.09
3
Blac
k or
A
fi
297
0.59
3
Spec
ial
Educ
atio
n
80
0.5
0.06
Blac
k or
A
fric
an
30
0
0.59
Spec
ial
83
0.53
Y N
Blac
k or
A
fric
an
0.
59
0.09
3
0.07
8
0.07
8
23
Wor
cest
er
0102
Poco
mok
e El
emen
tar
y E 393
398
0.05
Whi
te
74
1 Spec
ial
Educ
atio
n
20
0.95
0.11
1
Two
or
mor
e ra
ces
12
1 Spec
ial
18
0.88
9
N
N
Whi
te
0.97
7
0.05
0.07
7
0.07
7
16
Prin
ce
Geo
rge'
s
1802
Seat
Pl
easa
nt
Elem
enta
r E 39
4
399
0.06
8
Spec
ial
Edti
36
0.97
2
FARM
S
218
0.90
4
0.08
2
Spec
ial
Educ
atio
n 42
0.92
9
FARM
S
222
0.84
7
Y N
Spec
ial
Educ
atio
n 0.
929
0.06
8
0.07
4
0.07
4
30
Balti
mor
e Ci
ty
0256
Calv
in M
. Ro
dwel
l El
emen
tar
E 404
400
0.05
FARM
S
206
0.88
3
Spec
ial
Educ
atio
n
42
0.83
3
0.05
2
Spec
ial
Educ
atio
n 44
0.97
7
FARM
S
228
0.92
5
N
Y FARM
S
0.92
5
0.09
2
0.05
1
0.07
4
30
Balti
mor
e Ci
ty
0150
Mar
y A
nn
Win
terl
ing
Elem
enta
r
E 397
401
0.03
8
Blac
k or
A
fi
322
0.87
9
Spec
ial
Educ
atio
n
82
0.84
1
0.11
4
Blac
k or
A
fric
an
31
3
0.87
5
Spec
ial
71
0.76
1
Y N
Blac
k or
A
fric
an
0.
875
0.03
8
0.07
2
0.07
2
30
Balti
mor
e Ci
ty
0344
Balti
mor
e Ri
sing
Sta
r A
cade
my
M
398
402
0.08
9
Blac
k or
A
fi
92
0.23
9
Spec
ial
Educ
atio
n
20
0.15
0.04
6
Blac
k or
A
fric
an
11
4
0.10
5
Spec
ial
17
0.05
9
Y N
Blac
k or
A
fric
an
0.
105
0.08
9
0.07
0.07
01
Alle
gany
0301
Flin
tsto
ne
Elem
enta
ry E 40
0
403
0.02
7
Whi
te
202
0.93
1
FARM
S
114
0.90
4
0.10
5
Whi
te
213
0.94
4
Spec
ial
31
0.83
9
Y Y Whi
te
0.94
4
0.04
0.06
2
0.06
9
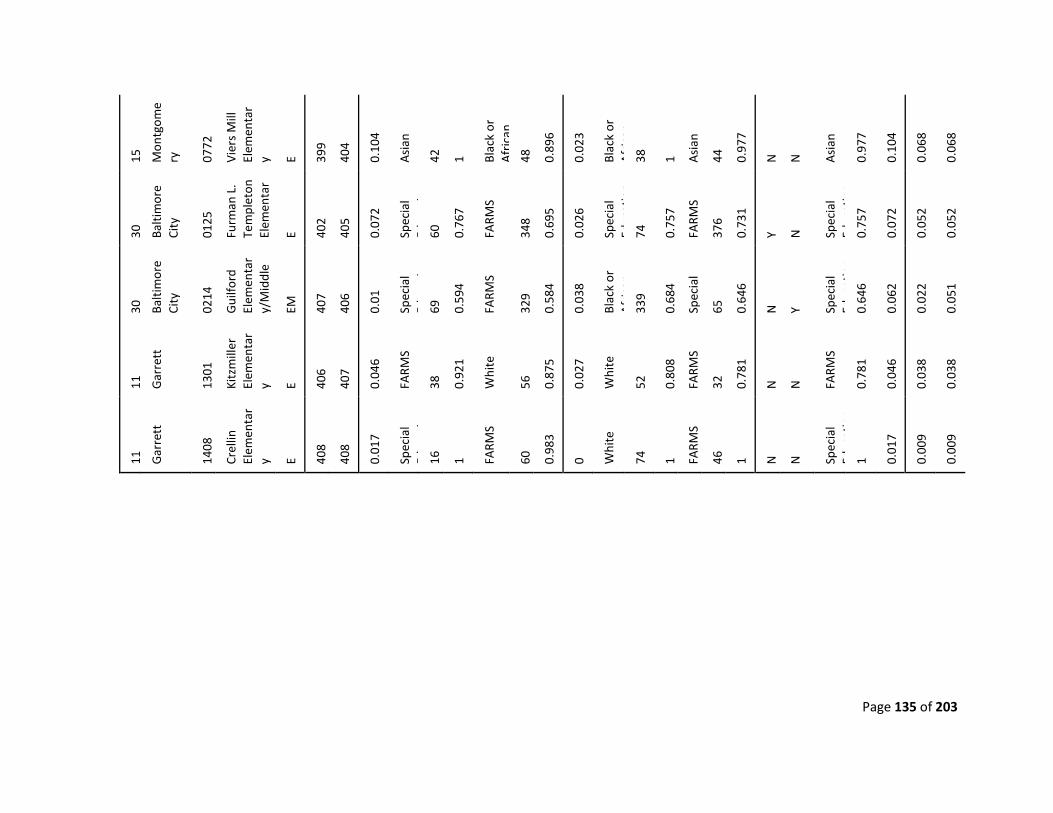
Page 135 of 203
15
Mon
tgom
ery
0772
Vier
s M
ill
Elem
enta
ry E 39
9
404
0.10
4
Asi
an
42
1 Blac
k or
A
fric
an
48
0.89
6
0.02
3
Blac
k or
A
fric
an
38
1 Asi
an
44
0.97
7
N
N
Asi
an
0.97
7
0.10
4
0.06
8
0.06
8
30
Balti
mor
e Ci
ty
0125
Furm
an L
. Te
mpl
eton
El
emen
tar
E 402
405
0.07
2
Spec
ial
Edti
60
0.76
7
FARM
S
348
0.69
5
0.02
6
Spec
ial
Educ
atio
n 74
0.75
7
FARM
S
376
0.73
1
Y N
Spec
ial
Educ
atio
n 0.
757
0.07
2
0.05
2
0.05
2
30
Balti
mor
e Ci
ty
0214
Gui
lford
El
emen
tar
y/M
iddl
e
EM
407
406
0.01
Spec
ial
Edti
69
0.59
4
FARM
S
329
0.58
4
0.03
8
Blac
k or
A
fric
an
33
9
0.68
4
Spec
ial
65
0.64
6
N
Y Spec
ial
Educ
atio
n 0.
646
0.06
2
0.02
2
0.05
1
11
Gar
rett
1301
Kitz
mill
er
Elem
enta
ry E 40
6
407
0.04
6
FARM
S
38
0.92
1
Whi
te
56
0.87
5
0.02
7
Whi
te
52
0.80
8
FARM
S
32
0.78
1
N
N
FARM
S
0.78
1
0.04
6
0.03
8
0.03
8
11
Gar
rett
1408
Crel
lin
Elem
enta
ry E 40
8
408
0.01
7
Spec
ial
Edti
16
1 FARM
S
60
0.98
3
0 Whi
te
74
1 FARM
S
46
1 N
N
Spec
ial
Educ
atio
n 1 0.
017
0.00
9
0.00
9
Page 136 of 203
APPENDIX II-9: “MARYLAND’S
MODEL FOR TURNING AROUND THE
LOWEST PERFORMING SCHOOLS”
POWERPOINT PRESENTATION
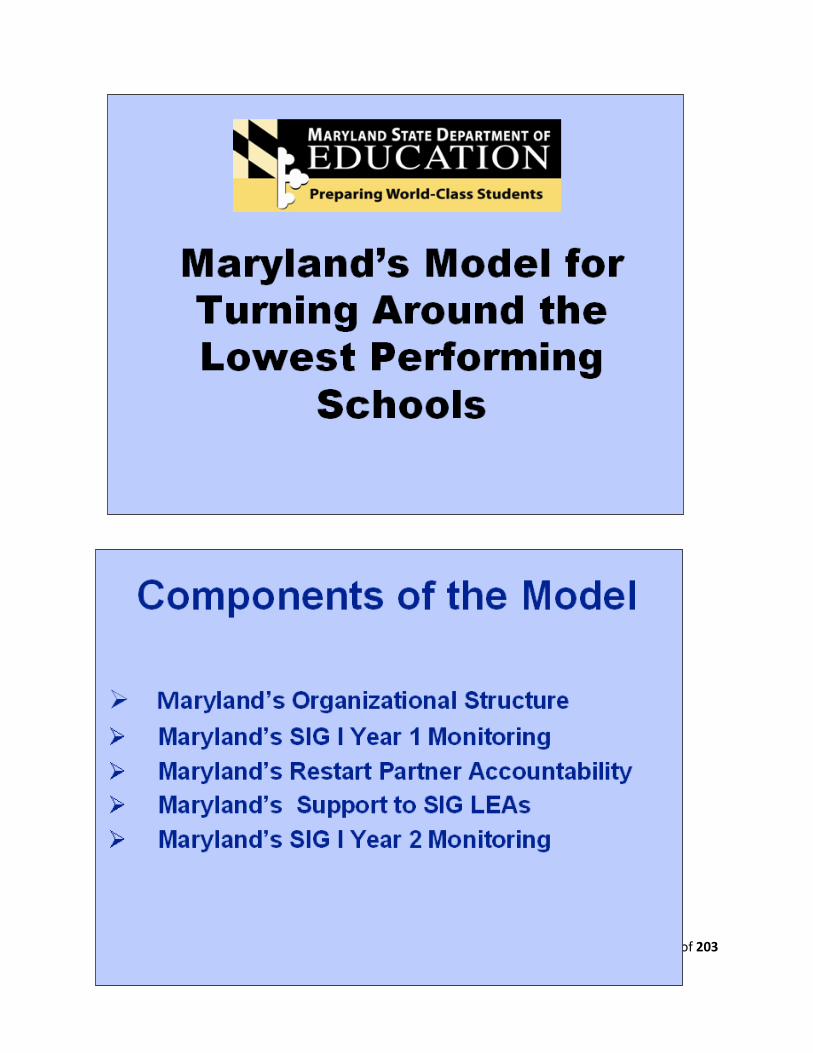
Page 137 of 203
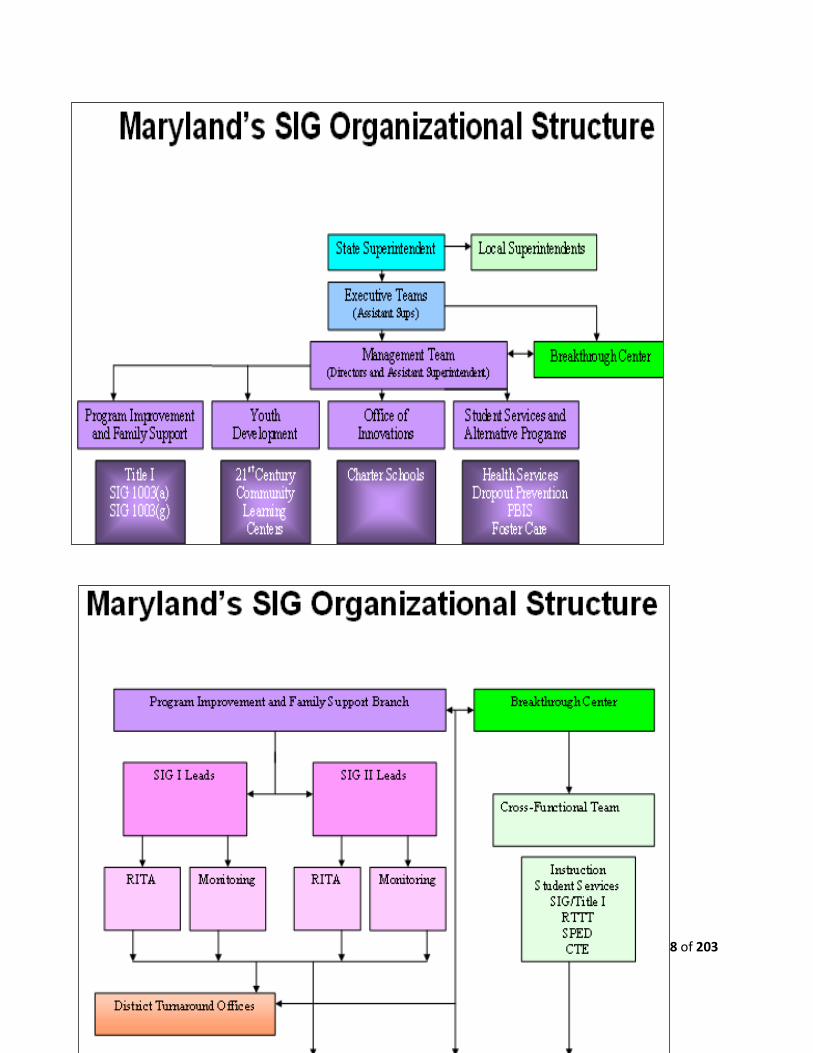
Page 138 of 203
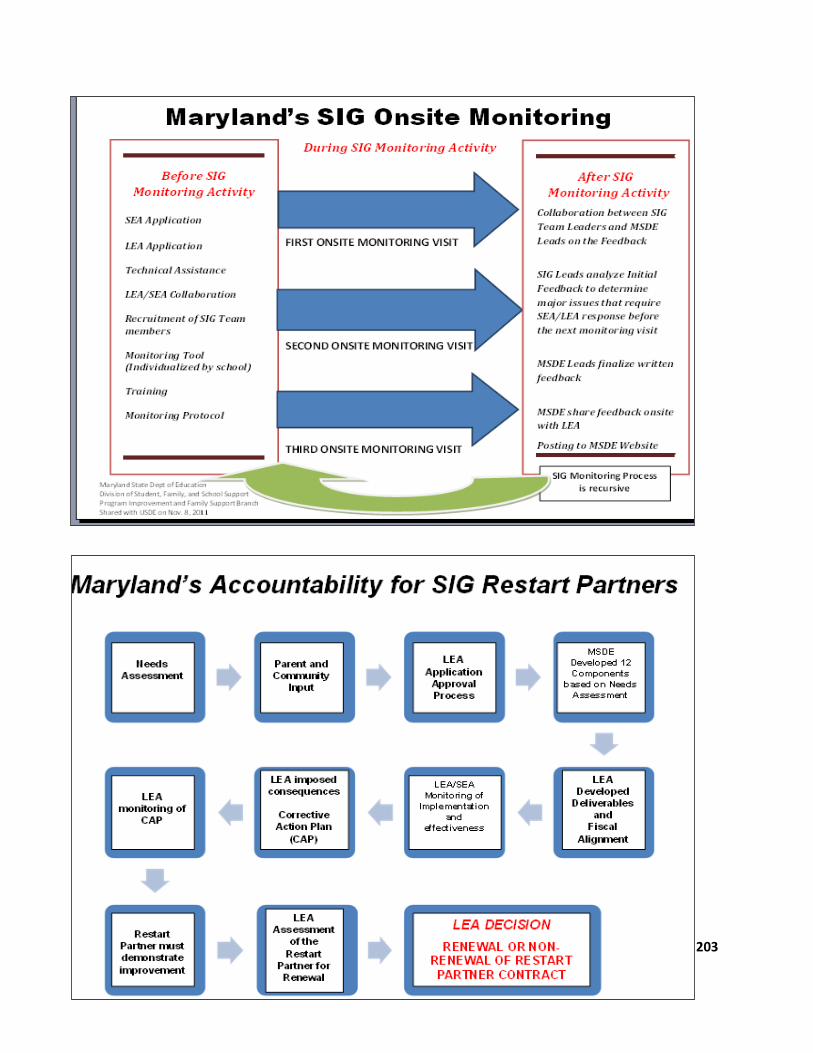
Page 139 of 203
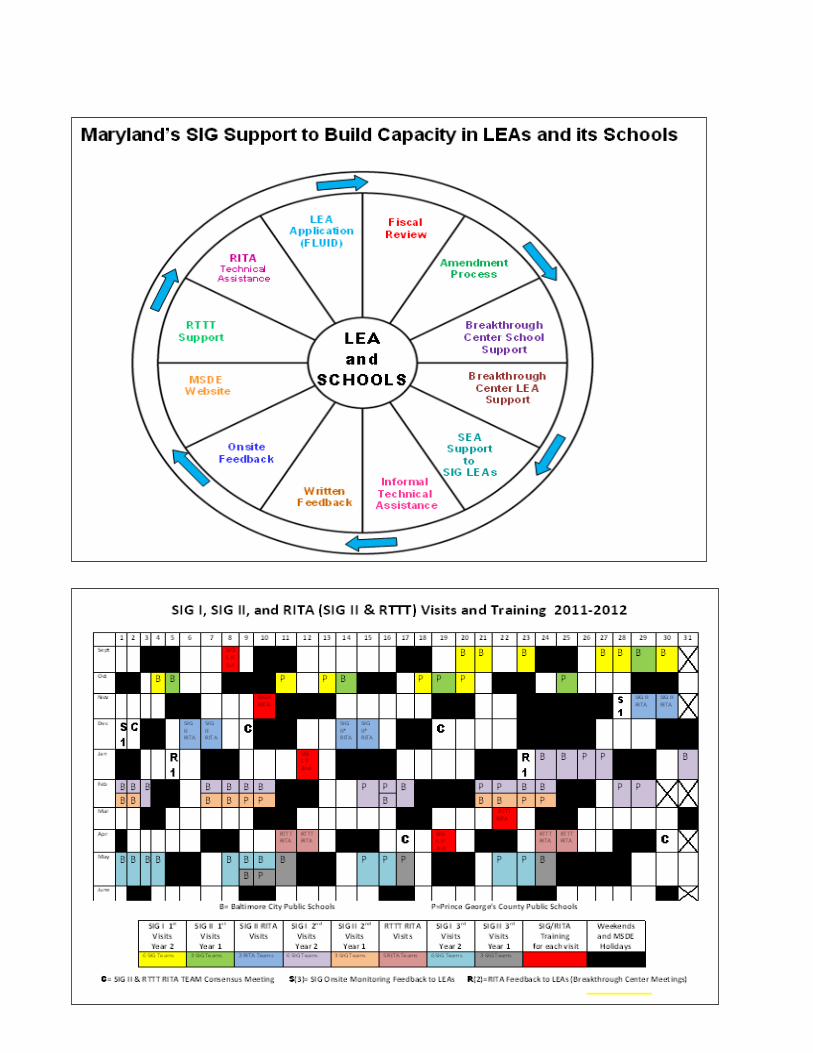
Page 140 of 203

Page 141 of 203
Page 142 of 203
APPENDIX II-10: NEW EXECUTIVE ORDER FOR THE MARYLAND
COUNCIL FOR EDUCATOR EFFECTIVENESS
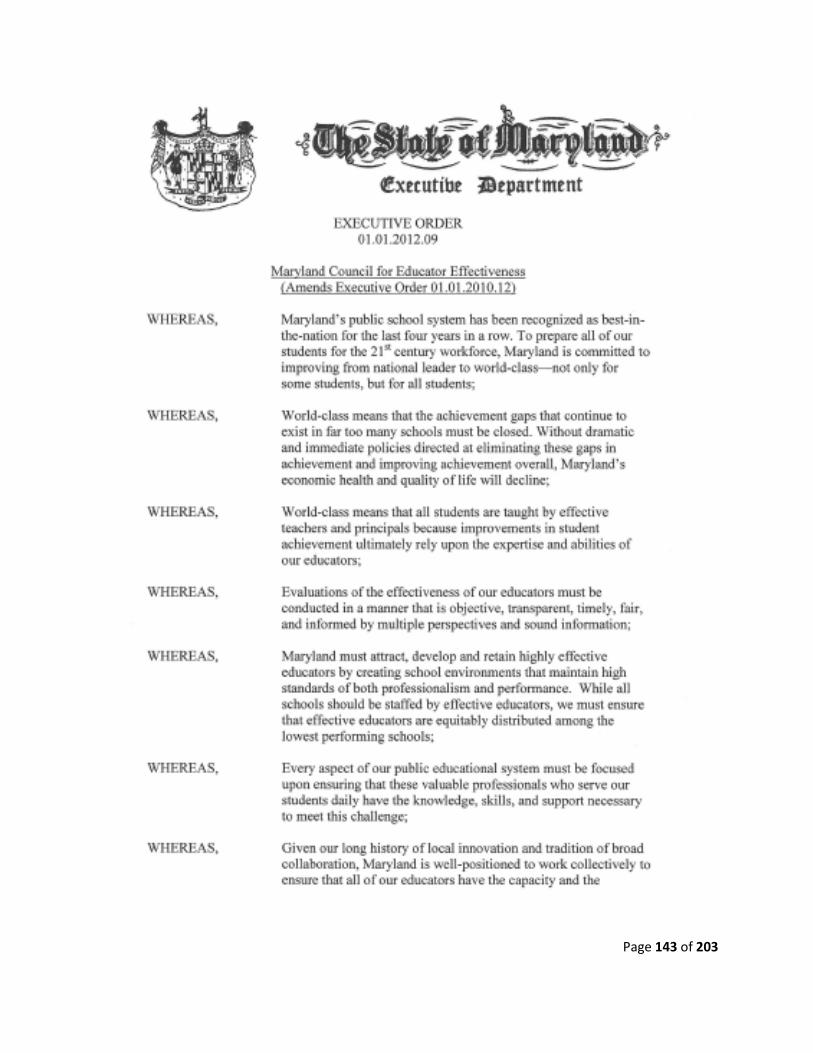
Page 143 of 203

Page 144 of 203

Page 145 of 203
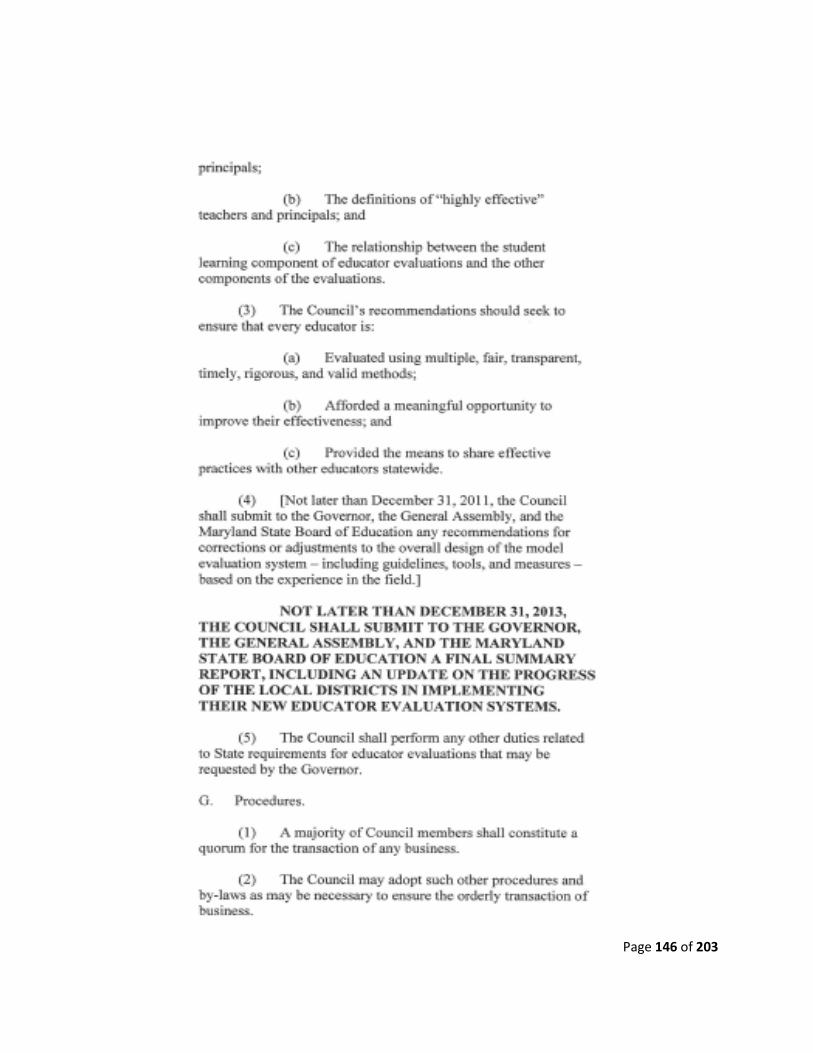
Page 146 of 203
Page 147 of 203
Page 148 of 203
APPENDIX II-11: MARYLAND’S PROPOSED REGULATION FOR
EVALUATION OF TEACHERS AND PRINCIPALS

Page 149 of 203
Title 13A STATE BOARD OF EDUCATION Subtitle 07 SCHOOL PERSONNEL
Chapter 04-1 Evaluation of Teachers and Principals Authority: Education Article, §§2-205(b) and (g), and 6-202; Annotated Code of Maryland
.01 Applicability. A. Effective in school year 2013-14, the minimum general standards set forth in Regulation
.04A of this chapter shall apply to evaluations of all teachers and principals. B. In addition, all local education agencies (LEAs) that signed on to the Race to the Top
(RTTT) application, must comply with the criteria set forth in Regulation .05B(1)(a) of this chapter. .02 Definitions.
A. In this chapter, the following terms have the meanings indicated. B. Terms Defined.
(1) "Evaluation" means an appraisal of professional performance for a school year based on written criteria and procedures that result in a written evaluation report.
(2) “Teacher” means any individual certificated under COMAR 13A.12.02 as a teacher and who delivers instruction and is responsible for a student or group of students’ academic progress in a Pre-K-12 public school setting, subject to local school system interpretation. Teacher may include an individual certificated by the Maryland State Department of Education (MSDE) under COMAR 13A.12.03. if the individual delivers instruction, and is responsible for a group of students’ academic progress in a Pre-K-12 public school setting, subject to local school system interpretation.
(3) “Principal” means an individual who serves in the position as a principal and who is certificated under COMAR 13A.12.04.04 or certificated as a resident principal under COMAR 13A.12.04.05.
(4) “Student Growth” means student progress assessed by multiple measures and from a clearly articulated baseline to one or more points in time. .03 Incorporation by Reference.
The Maryland Instructional Leadership Framework, February 2005, is incorporated by reference. .04 Local Education Agency Evaluation System.
An evaluation system for teachers and principals developed by an LEA in mutual agreement with the exclusive employee representative shall include General Standards and Performance Evaluation Criteria.
A. General Standards. (1) Classroom observations of teachers’ professional practice, which shall be conducted by
certificated individuals who have completed training that includes identification of teaching behaviors that result in student growth. Classroom observations shall play a role in the evaluation system, at minimum, in the following ways:
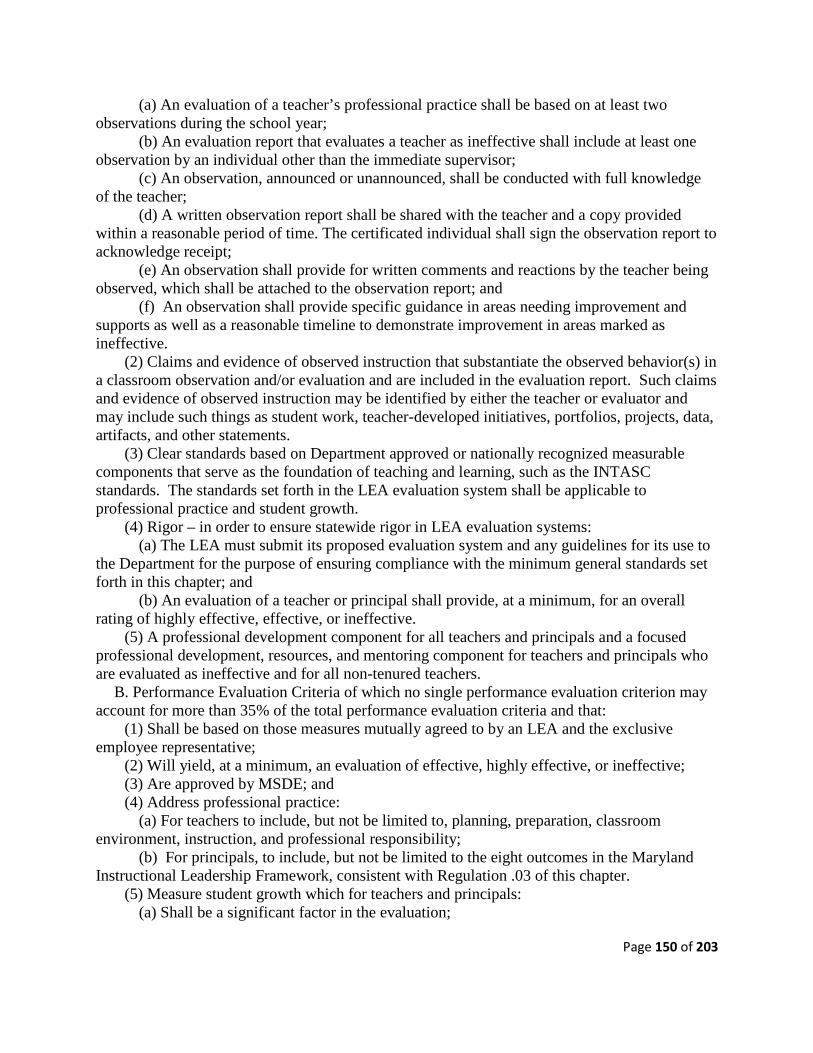
Page 150 of 203
(a) An evaluation of a teacher’s professional practice shall be based on at least two observations during the school year;
(b) An evaluation report that evaluates a teacher as ineffective shall include at least one observation by an individual other than the immediate supervisor;
(c) An observation, announced or unannounced, shall be conducted with full knowledge of the teacher;
(d) A written observation report shall be shared with the teacher and a copy provided within a reasonable period of time. The certificated individual shall sign the observation report to acknowledge receipt;
(e) An observation shall provide for written comments and reactions by the teacher being observed, which shall be attached to the observation report; and
(f) An observation shall provide specific guidance in areas needing improvement and supports as well as a reasonable timeline to demonstrate improvement in areas marked as ineffective.
(2) Claims and evidence of observed instruction that substantiate the observed behavior(s) in a classroom observation and/or evaluation and are included in the evaluation report. Such claims and evidence of observed instruction may be identified by either the teacher or evaluator and may include such things as student work, teacher-developed initiatives, portfolios, projects, data, artifacts, and other statements.
(3) Clear standards based on Department approved or nationally recognized measurable components that serve as the foundation of teaching and learning, such as the INTASC standards. The standards set forth in the LEA evaluation system shall be applicable to professional practice and student growth.
(4) Rigor – in order to ensure statewide rigor in LEA evaluation systems: (a) The LEA must submit its proposed evaluation system and any guidelines for its use to
the Department for the purpose of ensuring compliance with the minimum general standards set forth in this chapter; and
(b) An evaluation of a teacher or principal shall provide, at a minimum, for an overall rating of highly effective, effective, or ineffective.
(5) A professional development component for all teachers and principals and a focused professional development, resources, and mentoring component for teachers and principals who are evaluated as ineffective and for all non-tenured teachers.
B. Performance Evaluation Criteria of which no single performance evaluation criterion may account for more than 35% of the total performance evaluation criteria and that:
(1) Shall be based on those measures mutually agreed to by an LEA and the exclusive employee representative;
(2) Will yield, at a minimum, an evaluation of effective, highly effective, or ineffective; (3) Are approved by MSDE; and (4) Address professional practice:
(a) For teachers to include, but not be limited to, planning, preparation, classroom environment, instruction, and professional responsibility;
(b) For principals, to include, but not be limited to the eight outcomes in the Maryland Instructional Leadership Framework, consistent with Regulation .03 of this chapter.
(5) Measure student growth which for teachers and principals: (a) Shall be a significant factor in the evaluation;
Page 151 of 203
(b) Shall be based on multiple measures; and (c) Shall not be based solely on an existing or newly created examination or assessment.
.05 Model State Performance Evaluation Criteria.
A. If the LEA and the exclusive employee representative do not reach agreement on an LEA Evaluation System, the Model State Performance Evaluation Criteria shall be adopted by the LEA.
B. The Model State Performance Evaluation Criteria includes: (1) Model performance evaluation criteria for student growth that:
(a) Shall count for 50% of a teacher’s or principal’s evaluation. (b) Shall not be based solely on an existing or newly created examination or assessment; (c) Shall be based on multiple measures as follows:
(i) For elementary and middle school teachers providing instruction in state-assessed grades and content, aggregate class growth scores for state-assessed content area(s) being taught; student learning objectives in content areas being taught; and the school-wide index.
(ii) For elementary and middle school teachers providing instruction in non-state-assessed grades and content, student learning objectives in content area(s) being taught and the school-wide index.
(iii) For high school teachers, student learning objectives in content area(s) being taught and the school-wide index.
(iv) For elementary and middle school principals, student learning objectives, aggregate school-wide growth scores in state-assessed content areas, and the school-wide index.
(v) For high school principals, student learning objectives and the school-wide index. (vi) For principals of other types of schools, student learning objectives and the school-
wide index. (2) Model performance evaluation criteria for professional practice that:
(a) Shall count for 50% of a teacher’s and principal’s evaluation. (b) For teachers, shall include, but not be limited to, planning and preparation; classroom
environment; instruction; and professional responsibility. (c) For principals, shall include, but not be limited to, the eight outcomes in The Maryland
Instructional Leadership Framework, consistent with Regulation .03 of this chapter, and other outcomes based on Interstate School Leaders and Licensure Consortium (ISLLC). .06 Evaluation Cycle.
A. On a three year evaluation cycle, teachers and principals shall be evaluated at least once annually in the following ways:
(1) Tenured Teachers. (a) In the first year of the evaluation cycle conducted under these regulations, tenured
teachers shall be evaluated on both professional practice and student growth. (b) If in the first year of the evaluation cycle a tenured teacher is determined to be highly
effective or effective then in the second year of the evaluation cycle, the tenured teacher shall be evaluated using the professional practice rating from the previous year and student growth based on the most recent available data.
(c) If in the second year of the evaluation cycle a tenured teacher is determined to be highly effective or effective, then in the third year of the evaluation cycle, the tenured teacher
Page 152 of 203
shall be evaluated using the professional practice rating from the previous year and student growth based on the most recent available data.
(d) At the beginning of the fourth year, the evaluation cycle shall begin again as described in (a) through (c) of this Regulation.
(e) In any year, a principal may determine or a teacher may request that the evaluation be based on a new review of professional practice along with student growth.
(2) Non-tenured Teachers and Teachers Rated as Ineffective. (a) All non-tenured teachers and all teachers rated as ineffective shall be evaluated
annually on professional practice and student growth. (3) Principals.
(a) Every principal shall be evaluated at least once annually based on all of the components set forth in the applicable sections of Regulations .04 and .05 of this chapter. .07 Evaluation Report.
A. The evaluation report shall be shared with the certificated individual who is the subject of the evaluation.
B. The certificated individual shall receive a copy of and sign the evaluation report. C. The signature of the certificated individual does not necessarily indicate agreement with the
evaluation report. D. An evaluation report shall provide for written comments and reactions by the individual
being evaluated, which shall be attached to the evaluation report. .08 Appeal of an Evaluation.
A. In the event of an overall rating of ineffective, the local school system shall, at a minimum, provide certificated individuals with an opportunity to appeal in accordance with Education Article, §4-205(c)(4), Annotated Code of Maryland.
B. If an observation report is a component of an ineffective evaluation, the observation report may be appealed along with the ineffective evaluation.
C. The burden of proof is on the certificated individual appealing an overall rating of ineffective to show that the rating was arbitrary, unreasonable, illegal, or not in compliance with the adopted evaluation system of the LEA. .09 Review.
This chapter shall be in effect until September 30, 2014, at which time it shall automatically sunset, subject to review and re-promulgation by the State Board.
Page 153 of 203
Incorporation by Reference: Maryland Instructional Leadership Framework
Maryland Instructional Leadership
Framework Adopted by the Maryland State Board of Education
February 2005
Division for Leadership Development 200 West Baltimore Street
Baltimore, MD 21201 410-767-0368
Page 154 of 203
Maryland State Board of Education Dr. Edward L. Root, President Mr. Dunbar Brooks, Vice President Dr. Lelia T. Allen Ms. Jo Ann T. Bell Mr. J. Henry Butta Ms. Beverly A. Cooper Mr. Calvin D. Disney The Rev. Clarence A. Hawkins Dr. Karabelle Pizzigati Dr. Maria C. Torres-Queral Mr. David F. Tufaro Mr. Brian A. Williamson, Student Member Dr. Nancy S. Grasmick, Secretary-Treasurer and State Superintendent of Schools Ms. Mary Cary Assistant State Superintendent Division for Leadership Development The Maryland State Department of Education does not discriminate on the basis of race, color, sex, age, national origin, religion, or disability in matters affecting employment or in providing access to programs. For inquiries related to departmental policy, please contact: Equity Assurance and Compliance Branch Maryland State Department of Education 200 West Baltimore Street Baltimore, Maryland 21201-2595 Voice: 410-767-0433 Fax: 410-767-0431 TTY/TDD: 410-333-3045
Page 155 of 203
Maryland Instructional Leadership Framework Table of Contents Introduction 1 Philosophical Basis 2 Purposes 3 Foundation Documents 4 The Research/Document Matrix 7 Maryland Instructional Leadership Framework 9 Bibliography 13 Section I: Every Child Achieving: A Plan for Meeting the Needs of the Individual Learner 14 Section II: Maryland Task Force Report on the Principalship 30 Section III: Achievement Matters Most — Leadership Task Group 35 Section IV: Mid-continent Research for Education and Learning (McREL) 36 Section V: Breaking Ranks II: Strategies for Leading High School Reform 42 i
Page 156 of 203
1
Maryland Instructional Leadership Framework Introduction The Division for Leadership Development at the Maryland State Department of Education was created by Dr. Nancy S. Grasmick, State Superintendent of Schools, in the summer of 2000. The mission of the Division for Leadership Development is to build the instructional leadership capacity of present and potential school leaders in the content and skills needed to increase student achievement. During the past four years, the division has been responsible for providing professional growth opportunities for principals around the state, serving as the voice for principals in policy discussions, and advocating for principals in their roles as instructional leaders. As the work of this division has evolved, it has become apparent that the next step in leadership development requires the creation of a framework for instructional leadership that will drive principal preparation programs in higher education, professional development, and policy initiatives. Beginning in the summer of 2004, this draft of the Maryland Instructional Leadership Framework, created by the Division for Leadership Development, was shared with a wide variety of stakeholders in order to gain feedback, support, and commitment. The Maryland Instructional Leadership Framework describes outcomes expected of Maryland principals as they provide instructional leadership for their schools. For each outcome identified, there are evidences in practice that delineate the minimum of what we expect principals to know and be able to do if the respective leadership outcome is to be realized. The framework is not intended to include all of the various responsibilities of a quality principal. For instance, it does not speak to management
Page 157 of 203
2 responsibilities, legal issues, integrity, and ethical decision-making that are so very important to the principalship. These critical skill sets for leaders are part of the ongoing leadership development work planned and implemented by local system staff who design these learning opportunities around administrative processes and procedures endemic to the particular system. The Framework focuses, instead, on the content knowledge needed for school principals to be the leader of teaching-learning in the school. It represents the most commonly accepted instructional leadership responsibilities according to respected practitioners, researchers, and theorists in the field of instructional leadership and continuous improvement. It also provides a foundation for the alignment of professional development opportunities offered at the state and local levels as well as coursework offered at institutions of higher education. Philosophical Basis The philosophical basis for the Maryland Instructional Leadership Framework is found in three seminal Maryland State Department of Education (MSDE) documents and the research that serves as the foundation for those documents. The first is Every Child Achieving: A Plan for Meeting the Needs of the Individual Learner (adopted by the Maryland State Board of Education in 1999). This extremely important report was a response to the expressed concern of members of the Maryland State Board of Education that the State needed to have a plan in place to intervene on behalf of students not performing to expectations. One component of Every Child Achieving addressed the responsibility of principals and the skills they need to lead that effort.
Page 158 of 203
3 The second document is the Maryland Task Force Report on the Principalship (adopted by the Maryland State Board of Education in 2000). This report was in response to a statewide concern regarding the lack of a sufficient number of quality candidates for the principalship, particularly in light of significant numbers of current administrators eligible for retirement. It spoke directly about the need to redefine the role of the principal as instructional leader. The final seminal document is Achievement Matters Most: A Report of the Visionary Panel for Better Schools (adopted by the Maryland State Board of Education in 2002). This report, commissioned by Maryland State Superintendent Nancy S. Grasmick, addressed the need to look ahead to the next ten years of school reform in Maryland. It, too, emphasized the need for principals to be instructional leaders in their schools. Purposes The Maryland Instructional Leadership Framework will: � Drive the instructional leadership curriculum of the Division for Leadership Development, MSDE; � Guide instructional leadership professional development for veteran, new, and potential school leaders; � Serve as a catalyst for the alignment of professional development for Executive Officers (those who supervise and evaluate principals as defined in Code of Maryland Regulations [COMAR] 13A.01.04.02B); � Provide a self-assessment/reflective practice tool for principals and potential school leaders; � Promote dialogue in districts around matters of instructional leadership;
Page 159 of 203
4 � Be referenced in policy through the Code of Maryland Regulations; � Influence future policy decisions about the principalship; � Be incorporated into a part of the program approval process used by institutions of higher education to guide their principal preparation programs; and � Serve as the Maryland-specific evidence in practice for the instructional leadership component of the Interstate School Leaders Licensure Consortium (ISLLC) Standards. Foundation Documents The foundation documents for the Framework are relevant and noteworthy national reports, research in the field, input from various stakeholders, as well as the best thinking of the Division for Leadership Development, MSDE. These documents include: 1. Maryland Instructional Leadership Development Program, Division for Leadership Development (DLD) – This brochure describes the vision and purpose for the work of the DLD. It also describes what effective instructional leaders should know and be able to do. It includes a description of an array of delivery systems for principal training and advocacy. This brochure represents the thinking of MSDE staff and stakeholder groups based on research and literature in the field. 2. Mid-continent Research for Education and Learning (McREL) – This 2003 working paper details the outcomes of a meta-analysis of 30 years of research on the relationship between principal leadership practices and student achievement. It describes
Page 160 of 203
5 twenty-one leadership responsibilities that are significantly associated with student achievement. 3. Southern Regional Education Board (SREB) – In 2004, this organization produced a variety of research-based materials on leadership, including a series of modules designed to engage leaders in solving real school problems. The fourteen-module curriculum is intended to help guide the redesign of state academies and higher education preparation programs to assist principals and school teams with instructional leadership issues. 4. National Staff Development Council (NSDC), Moving NSDC’s Staff Development Standards into Practice: Innovation Configurations – This document presents the twelve revised NSDC standards for staff development along with innovation configuration maps that identify and describe the phases of implementation of the standards. 5. National Association of Secondary School Principals, Breaking Ranks II (BR II) – This widely acclaimed 2004 report provides strategies and a template for leading high school reform. It includes thirty-one core recommendations divided into three broad categories: Collaborative Leadership and Professional Learning Communities; Personalization and the School Environment; and Curriculum, Instruction, and Assessment. 6. National Middle School Association (NMSA), This We Believe: Successful Schools for Young Adolescents – This 2003 position
Page 161 of 203
6 paper embodies the educational ideas that comprise the middle school concept, as well as the conditions that make effective middle level schools. It includes six components that successful middle schools should provide for middle level learners. The Call to Action in this document provides specific charges to principals and the behaviors they must exhibit in order to create effective middle schools. 7. National Association of Elementary School Principals (NAESP), Leading Learning Communities, Standards for What Principals Should Know and Be Able to Do – This 2002 NAESP document describes what NAESP believes is the new thinking about school leadership that is required for improving schools. The six standards were derived from a year-long collaborative process with principals. 8. Interstate School Leaders Licensure Consortium (ISLLC) – This Consortium was established in 1994, under the guidance of the Council of Chief State School Officers, and is composed of 32 education agencies and 13 education administrative associations that established an education policy framework for school leadership. The intent of this document is to raise the bar for school leaders who enter and continue in the profession and to reshape concepts of educational leadership. 9. National Policy Board for Educational Administration, Education Leadership Constituent Council (ELCC), Standards for Advanced Programs in Educational Leadership – Revised in 2002, the ELCC standards represent a combination of the ISLLC standards and
Page 162 of 203
7 the former ELCC guidelines. The rationale for combining these documents was that many institutions of higher education felt that addressing both sets of guidelines in their principal preparation programs was too burdensome. Underlying these standards is the notion that the central responsibility of leadership is to improve teaching and learning. The Research/Document Matrix The matrix is a visual representation of the cross match between the foundation documents and the Maryland Instructional Leadership Framework. In reviewing the matrix, the reader is advised to look first at the instructional leadership outcomes in the left column. These are outcomes that appear repeatedly in the foundation documents. They are not intended to be in priority order. The subsequent columns each represent a particular document. If a “Yes” appears in a box in one of the columns, then that outcome was found in that particular document. It should be pointed out that the language of the outcomes was not always exactly the same since it came from different authors. That fact required the exercise of professional judgment by readers based on the language that did appear and supporting descriptions of that language.
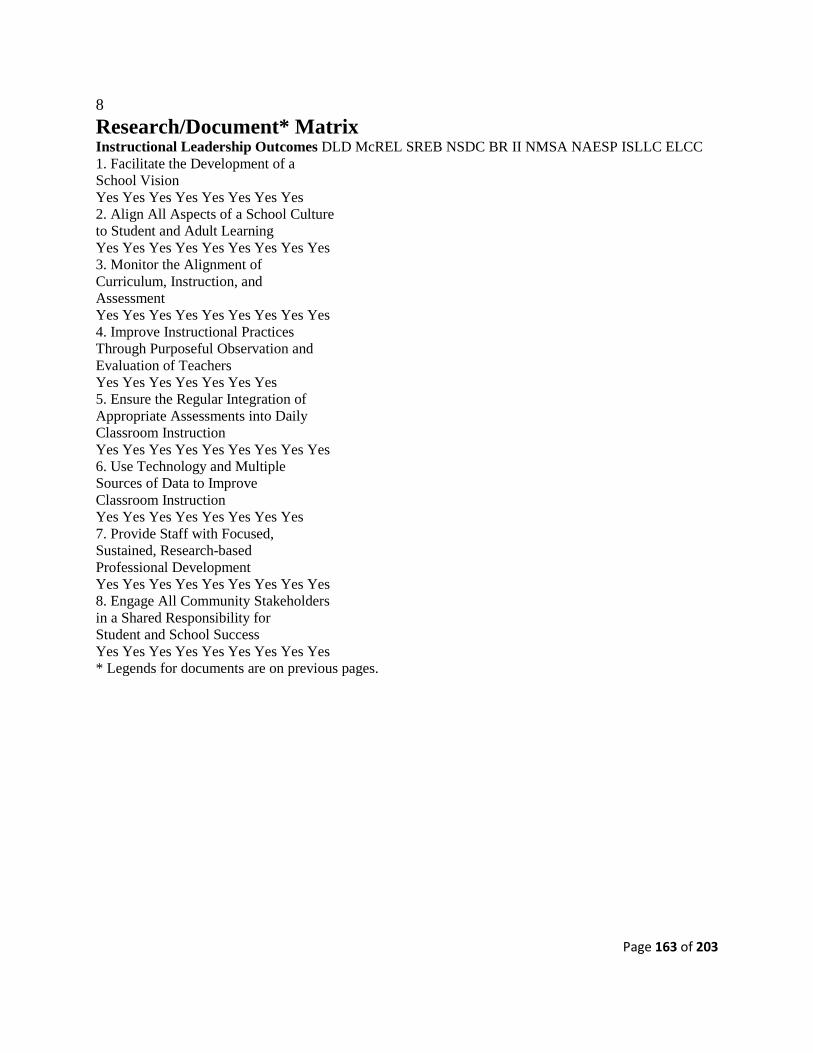
Page 163 of 203
8 Research/Document* Matrix Instructional Leadership Outcomes DLD McREL SREB NSDC BR II NMSA NAESP ISLLC ELCC 1. Facilitate the Development of a School Vision Yes Yes Yes Yes Yes Yes Yes Yes 2. Align All Aspects of a School Culture to Student and Adult Learning Yes Yes Yes Yes Yes Yes Yes Yes Yes 3. Monitor the Alignment of Curriculum, Instruction, and Assessment Yes Yes Yes Yes Yes Yes Yes Yes Yes 4. Improve Instructional Practices Through Purposeful Observation and Evaluation of Teachers Yes Yes Yes Yes Yes Yes Yes 5. Ensure the Regular Integration of Appropriate Assessments into Daily Classroom Instruction Yes Yes Yes Yes Yes Yes Yes Yes Yes 6. Use Technology and Multiple Sources of Data to Improve Classroom Instruction Yes Yes Yes Yes Yes Yes Yes Yes 7. Provide Staff with Focused, Sustained, Research-based Professional Development Yes Yes Yes Yes Yes Yes Yes Yes Yes 8. Engage All Community Stakeholders in a Shared Responsibility for Student and School Success Yes Yes Yes Yes Yes Yes Yes Yes Yes * Legends for documents are on previous pages.
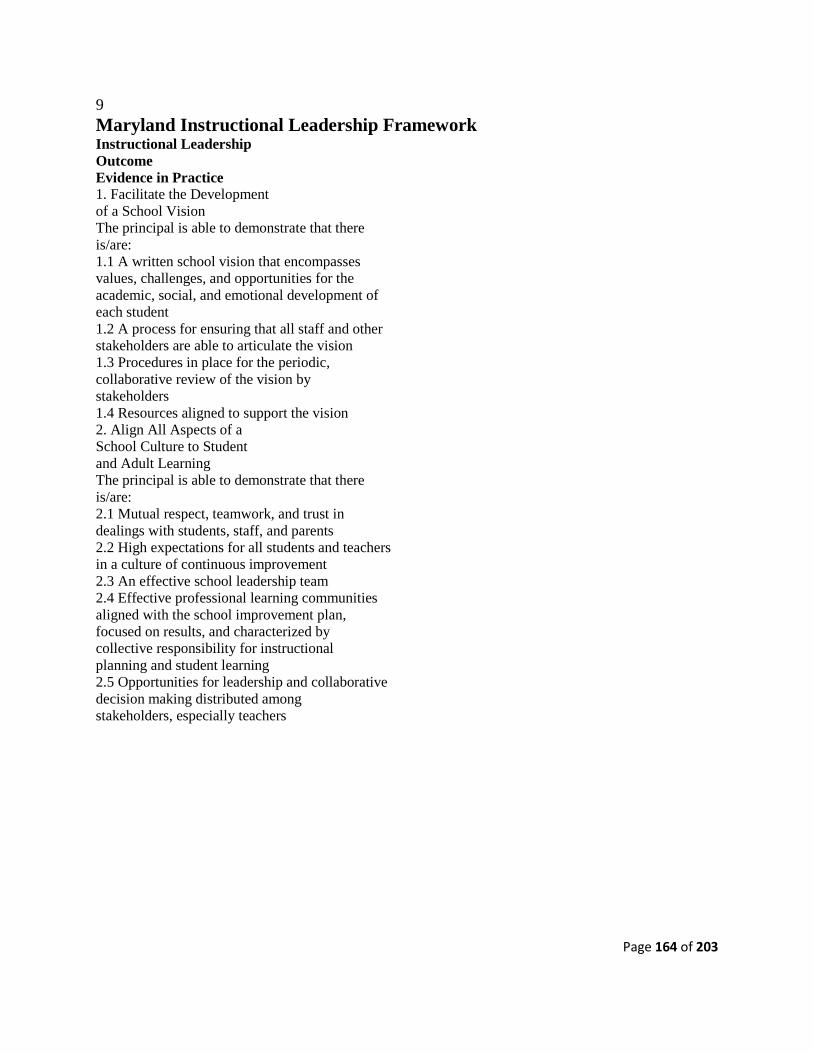
Page 164 of 203
9 Maryland Instructional Leadership Framework Instructional Leadership Outcome Evidence in Practice 1. Facilitate the Development of a School Vision The principal is able to demonstrate that there is/are: 1.1 A written school vision that encompasses values, challenges, and opportunities for the academic, social, and emotional development of each student 1.2 A process for ensuring that all staff and other stakeholders are able to articulate the vision 1.3 Procedures in place for the periodic, collaborative review of the vision by stakeholders 1.4 Resources aligned to support the vision 2. Align All Aspects of a School Culture to Student and Adult Learning The principal is able to demonstrate that there is/are: 2.1 Mutual respect, teamwork, and trust in dealings with students, staff, and parents 2.2 High expectations for all students and teachers in a culture of continuous improvement 2.3 An effective school leadership team 2.4 Effective professional learning communities aligned with the school improvement plan, focused on results, and characterized by collective responsibility for instructional planning and student learning 2.5 Opportunities for leadership and collaborative decision making distributed among stakeholders, especially teachers
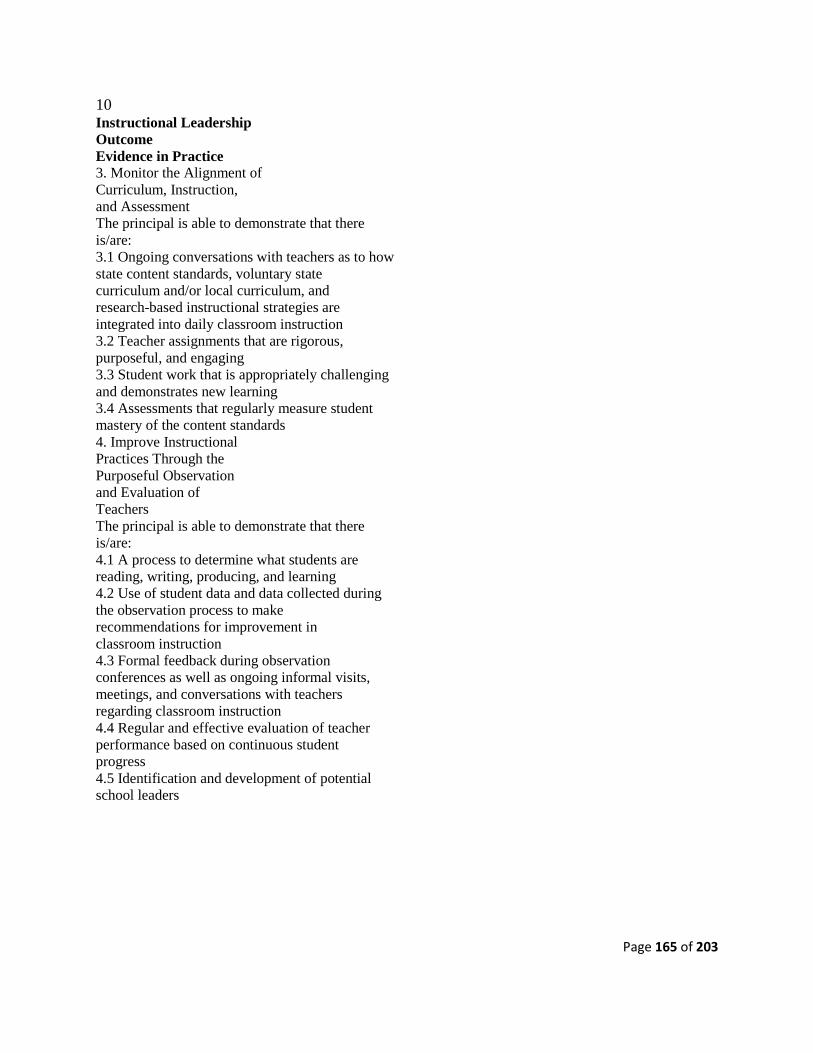
Page 165 of 203
10 Instructional Leadership Outcome Evidence in Practice 3. Monitor the Alignment of Curriculum, Instruction, and Assessment The principal is able to demonstrate that there is/are: 3.1 Ongoing conversations with teachers as to how state content standards, voluntary state curriculum and/or local curriculum, and research-based instructional strategies are integrated into daily classroom instruction 3.2 Teacher assignments that are rigorous, purposeful, and engaging 3.3 Student work that is appropriately challenging and demonstrates new learning 3.4 Assessments that regularly measure student mastery of the content standards 4. Improve Instructional Practices Through the Purposeful Observation and Evaluation of Teachers The principal is able to demonstrate that there is/are: 4.1 A process to determine what students are reading, writing, producing, and learning 4.2 Use of student data and data collected during the observation process to make recommendations for improvement in classroom instruction 4.3 Formal feedback during observation conferences as well as ongoing informal visits, meetings, and conversations with teachers regarding classroom instruction 4.4 Regular and effective evaluation of teacher performance based on continuous student progress 4.5 Identification and development of potential school leaders
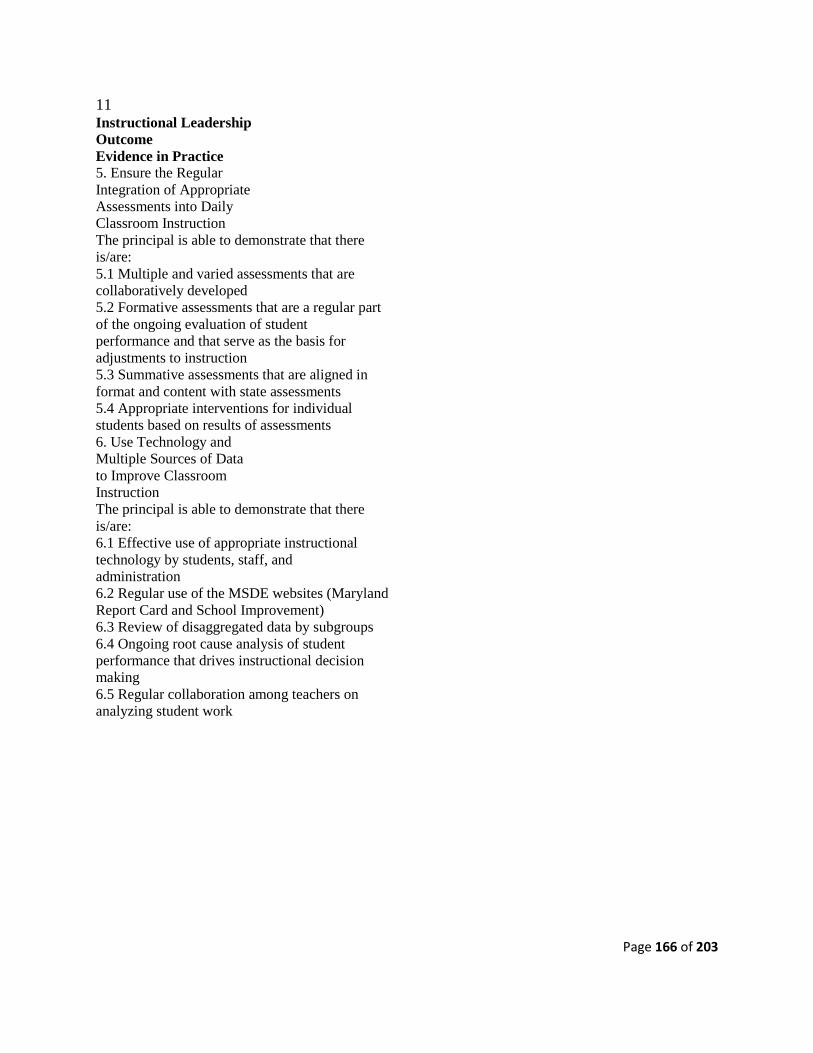
Page 166 of 203
11 Instructional Leadership Outcome Evidence in Practice 5. Ensure the Regular Integration of Appropriate Assessments into Daily Classroom Instruction The principal is able to demonstrate that there is/are: 5.1 Multiple and varied assessments that are collaboratively developed 5.2 Formative assessments that are a regular part of the ongoing evaluation of student performance and that serve as the basis for adjustments to instruction 5.3 Summative assessments that are aligned in format and content with state assessments 5.4 Appropriate interventions for individual students based on results of assessments 6. Use Technology and Multiple Sources of Data to Improve Classroom Instruction The principal is able to demonstrate that there is/are: 6.1 Effective use of appropriate instructional technology by students, staff, and administration 6.2 Regular use of the MSDE websites (Maryland Report Card and School Improvement) 6.3 Review of disaggregated data by subgroups 6.4 Ongoing root cause analysis of student performance that drives instructional decision making 6.5 Regular collaboration among teachers on analyzing student work
Page 167 of 203
12 Instructional Leadership Outcome Evidence in Practice 7. Provide Staff with Focused, Sustained, Research-based Professional Development The principal is able to demonstrate that there is/are: 7.1 Results-oriented professional development that is aligned with identified curricular, instructional, and assessment needs and is connected to school improvement goals 7.2 Opportunities for teachers to engage in collaborative planning and critical reflection during the regular school day (job-embedded) 7.3 Differentiated professional development according to career stages, needs of staff, and student performance 7.4 Personal involvement in professional development activities 7.5 Professional development aligned with the Maryland Teacher Professional Development Standards 8. Engage All Community Stakeholders in a Shared Responsibility for Student and School Success The principal is able to demonstrate that there is/are: 8.1 Parents and caregivers welcomed in the school, encouraged to participate, and given information and materials to help their children learn 8.2 Parents and caregivers who are active members of the school improvement process 8.3 Community stakeholders and school partners who readily participate in school life
Page 168 of 203
13 BIBLIOGRAPHY This bibliography includes references from the seminal reports that served as the philosophical base for the Maryland Instructional Leadership Framework: • Every Child Achieving: A Plan for Meeting the Needs of the Individual Learner (1999); • The Maryland Task Force Report on the Principalship (2000); and • Achievement Matters Most: A Report of the Visionary Panel for Better Schools (2002). The bibliography also includes references, where available, from the nine organizations whose work is cited in the Matrix: • Maryland Instructional Leadership Development Program, Division for Leadership Development (DLD), Maryland State Department of Education; • Mid-continent Research for Education and Learning (McREL); • Southern Regional Education Board (SREB); • National Staff Development Council (NSDC), Moving NSDC’s Staff Development Standards into Practice: Innovation Configurations • National Association of Secondary School Principals, Breaking Ranks II (BR II); • National Middle School Association (NMSA), This We Believe: Successful Schools for Young Adolescents; • National Association of Elementary School Principals (NAESP), Leading Learning Communities, Standards for What Principals Should Know and Be Able to Do; • Interstate School Leaders Licensure Consortium (ISLLC); and • National Policy Board for Educational Administration, Education Leadership Constituent Council (ELCC), Standards for Advanced Programs in Educational Leadership.
Page 169 of 203
14 Section I: Every Child Achieving: A Plan for Meeting the Needs of the Individual Learner Adelman, H.S. (1996). Restructuring education support services: Toward the concept of an enabling component. Kent, OH: American School Health Association. Adelman, H.S., & Taylor, L. (1997). Addressing barriers to learning: Beyond schoollinked services and full service schools. American Journal of Orthopsychiatry 67, 408-421. Adults as mentors. (1994). Education reforms and students at risk: A review of the current state of the art [On-line]. Available: www.ed.gov/pubs/EdReformStudies/EdReforms/chap8e.html American Association of University Women Educational Foundation. (1998). Gender gaps: Where schools still fail our children. Washington, DC: American Association of University Women Educational Foundation. American Federation of Teachers. (1997) Making standards matter. Washington, DC: American Federation of Teachers. Anderson, L.W., & Pellicor, L.O. (1990). Synthesis of research on compensatory and remedial education. Educational Leadership 48 (1), 10-16. Anderson, M.E. (1991). Principals: How to train, recruit, select, induct, and evaluate leaders for America’s schools. University of Oregon: ERIC Clearinghouse on Educational Management. Annie E. Casey Foundation. (1999). Kids Count data book: State profiles of child wellbeing. Baltimore, MD: Annie E. Casey Foundation. Arnette, J.L., & Walsleben, M.C. (1998). Combating fear and restoring safety in schools. Washington, DC: Office of Juvenile Justice and Delinquency Prevention. Baker, E.L. (1996). Report on the Content Area Performance Assessments (CAPA): A collaboration among Hawaii Dept. of Education, the Center for Research on Evaluation Standards and Student Testing, and the Teachers and Children of Hawaii. Baltimore, MD: Baltimore County Public School System. Baltimore County Public Schools, Department of Professional Development. (1998). Teacher mentor program: A report to the SAFE committee. Baltimore, MD: Baltimore County Public Schools. Barnet, A.B., & Barnet, R.J. (1998). The youngest minds. New York, NY: Simon & Schuster. Barton, P.E., Coley, R.J., & Wenglinsky, H. (1998). Order in the classroom: Violence, discipline, and student achievement. Princeton, NJ: Educational Testing Service Policy Information Center. Bender, D.S., Giovanis, G., & Mazzoni, M. (1994). After school tutoring. Cincinnati, OH: Paper presented at the National Middle School Association 1994 Conference. Berrueta-Clement, J.R., Barnett, W.S., Epstein, A.S., Schweinhart, L.J., & Weikert, D.P. (1984). Changed lives. Ypsilanti, MI: High/Scope.
Page 170 of 203
15 Board of Education of the City of New York. (1998). A guide for New York City’s universal PreK advisory boards. New York, NY: Board of Education of the City of New York. Boston Public Schools (1998). High school restructuring. Boston, MA: Boston Public Schools. Bottoms, G. (1998). Things that matter most in improving student learning. Atlanta, GA: Southern Regional Education Board. Bottoms, S., & Cobbs, M. (1995). Good news, bad news and actions for helping students complete a challenging program of study (Research Brief no. 13). Atlanta, GA: Southern Regional Education Board. Boyer, E. (1991). Ready to learn: A mandate for the nation. Princeton, NJ: Carnegie Foundation for the Advancement of Teaching. Brooks, J., & Brooks, M. (1993). The case for constructivist classrooms. Alexandria, VA: Association for Supervision and Curriculum Development. Brooks, R. (1998). Self-worth, resilience, and hope: The search for islands of competence. Covington, LA: Center for Development and Learning. Available: http://www.cdl.org/self-worth.html Brush, L., Deich, S., Traylor, K., & Pindus, N. (1995). Options for full-day services for children participating in Head Start. Washington, DC: Pelavin Research Institute and The Urban Institute. Bryant, D.M., Peisner-Feinberg, E., & Clifford, R. (1993). Evaluation of public school programs in North Carolina. Chapel Hill, NC: University of North Carolina, Frank Porter Graham Center. Bryk, A.S., Rollow, S.G., & Pinnell, G.S. (1996). Urban school development: Literacy as a lever for change. Educational Policy 10 (2), 172-201. Bureau of Labor Statistics. (1998). 1996-1997 Occupational outlook handbook [Online]. Available: http://www.bls.gov/oco/ocosoo7.htm Caine, R.N., & Caine, G. (1991). Teaching and the human brain. Alexandria, VA: Association of Supervision and Curriculum Development. Canaday, R.L., & Rettig, M.D. (1995). Block scheduling: A catalyst for change in high schools. Princeton, NJ: Eye on Education. Carbo, M. (1995). Educating everybody’s children: Diverse teaching strategies for diverse learners. Alexandria, VA: Association for Supervision and Curriculum Development. Carroll, J.M. (1994). Organizing time to support learning. The School Administrator 51 (3), 26-28. Casper, L.M. (1996). Who’s minding our preschoolers? Washington, DC: Bureau of the Census, Current Population Reports. Center for the Child Care Workforce. (1998). Worthy work, unlivable wages: The national child care staffing study. Washington, DC: Center for the Child Care Workforce.
Page 171 of 203
16 Child Care Administration annual report. (1992). Baltimore, MD: Department of Human Resources/Child Care Administration. Children's Defense Fund. (1990). State of America’s children: Yearbook 1990. Washington, DC: Children's Defense Fund. Children's Defense Fund. (1997). State of America’s children: Yearbook 1997. Washington, DC: Children's Defense Fund. Children's Defense Fund. (1998a). Children in the states/1998 Maryland profile [Online]. Washington, DC: Children's Defense Fund. Available: http://www.childrensdefense.org/states/data_md.html Children's Defense Fund. (1998b). State of America’s children: Yearbook 1998. Washington, DC: Children's Defense Fund. Children's Defense Fund. (1999). Helping parents work and children learn [On-line[. Washington, DC: Children's Defense Fund. Available: http://www.childrensdefense.org/childcare/cc_facts.html Cody, W.S. (1996). Operational guidelines for extended school services. Frankfort, KY: Kentucky Department of Education. Cohen, P.A., Kulik, J.A., & Kulik, C.C. (1982). Educational outcomes of tutoring: A meta-analysis of findings. American Educational Research Journal 19 (2), 237- 248. Cole, R.W. (Ed). (1995). Educating everybody’s children: Diverse teaching strategies for diverse learners. Alexandria, VA: Association for Supervision and Curriculum Development. Coleman, J.S. (1987). Families and schools. Educational Researcher 16 (6), 32-38. Commission on Chapter One. (1992). Making schools work for children in poverty. Washington, DC: American Association for Higher Education. The Consortium on Renewing Education. (1998). 20/20 vision: A strategy for doubling America’s academic achievement by the year 2020. Nashville, TN: Vanderbilt University, Peabody Center for Education Policy. Cost, Quality and Child Outcomes Study Team. (1995). Cost, quality, and child outcomes in child care centers. Denver, CO: University of Colorado at Denver, Department of Economics. Council of Chief State School Officers. (1990). Voices from effective schools: Elements of improved schools serving at-risk students and how state agencies can support more local school improvement [On-line]. Washington, DC: Council of Chief State School Officers. Available: www.ccsso.org/voicepol.html Cryan, J.R., Sheehan, R., Wiechel, J., & Bandy-Hedden, I.G. (1992). Success outcomes of full-day kindergarten: More positive behavior and achievement in the years after. Early Childhood Research Quarterly 7, 187-203. Danielson, C. (1996). Enhancing professional practice: A framework for teaching. Alexandria, VA: Association for Supervision and Curriculum Development.
Page 172 of 203
17 Darling-Hammond, L., & Ball, D.L. (1998). Teaching for high standards: What policymakers need to know and be able to do. Philadelphia, PA: Consortium for Policy Research in Education. Dauber, S., & Epstein, J. (1993). Parent attitudes and practices of involvement in inner-city elementary and middle schools. In N. Chavkin (Ed.), Families and schools in a pluralistic society. Albany, NY: State University of New York Press. Deming, W.E. (1986). Out of the crisis. Cambridge, MA: Massachusetts Institute of Technology. DeVries, K.E., & Cohn, C.A. (1998). Wrestling with retention. The School Administrator 55 (7), 24-26. Dickinson, D.K., Cote, L., & Smith, M.W. (1993). Learning vocabulary in preschool: Social and discourse contexts affecting vocabulary growth. In Collette Daiute (Ed.), The Development of Literacy through Social Interaction. San Francisco, CA: Jossey-Bass. Doll, B., & Lyon, M.A. (1998). Risk and resilience: Implications for the delivery of educational and mental health schools. School Psychology Review 27 (3), 15-20. Doud, J.L., & Keller, E.P. (1998). The K-8 principal in 1998. Principal 78 (1), 5-12. Drake, S. (1993). Planning integrated curriculum: The call to adventure. Alexandria, VA: Association for Supervision and Curriculum Development. Edmonds, R. (1979). Some schools work and more can. Social Policy 9, 28-32. EdSource. (1998). California’s school principals: At the center of school improvement efforts. Palo Alto, CA: EdSource. Education Commission of the States. (1996). The ABCs of investing in student performance (ECS Publication No. SI-96-9). Denver, CO: Education Commission of the States. Education Commission of the States Information Clearinghouse. (1997). When students get behind (Clearinghouse Notes). Denver, CO: Education Commission of the States. Education Commission of the States Information Clearinghouse. (1998). Extended day programs. Denver, CO: Education Commission of the States. The Education Trust. (1999). Dispelling the myth: High poverty schools exceeding expectations. Washington, DC: The Education Trust, Inc. Education Research Service. (1997). Ten promising programs for educating all children: Evidence of impact. Arlington, VA: Educational Research Services. Educational Research Service. (1998). Is there a shortage of qualified candidates for openings in the principalship: An exploratory study. Arlington, VA: Educational Research Services. Entwisle, D.R., & Alexander, K.L. (1992). Summer setback: Race, poverty, school composition, and mathematics achievement in the first two years of school. American Sociological Review 57 (1), 72-84.

Page 173 of 203
18 Epstein, J. (1991). Effects on student achievement of teachers’ practices of parental involvement. Advances in Reading/Language Research 5, 261-276. Epstein, J., Coates, L., Salinas, K.C., Sanders, M., & Simon, B.S. (1997). School, family, and community partnerships: Your action handbook. Thousand Oaks, CA: Corwin Press, Inc. Ferguson, R.F. (1997). Paying for public education: New evidence of how and why money matters. Harvard Journal on Legislation 28, 465-498. Fine, M., & Somerville, J.I. (Eds.). (1998). Small schools big imaginations. Chicago, IL: Cross City Campaign for Urban School Reform. Finn, J.D. (1989). Withdrawing from School. Review of Educational Research 59 (2), 117-142. Finn, J.D. (1995). Class size: What does research tell us? (Spotlight on Student Success series, No. 207). Philadelphia, PA: Temple University for Research in Human Development and Education. Finn, J.D. (1999). Full day kindergarten: Answers with questions [On-line]. (Spotlight on Student Success series, No. 210). Philadelphia, PA: Temple University for Research in Human Development and Education. Available: http://www.temple.edu/LSSspot210.htm Frederick County Public Schools. (1997). Frederick County early childhood education pilot project. Frederick, MD: Frederick County Public Schools. Funkhouser, J., et al. (1995). Extending learning time for disadvantaged students. Washington, DC: Policies Studies Associates, Inc. Galinsky, E., Howes, C., Kontos, S., & Shinn, M. (1994). The study of children in family child care and relative care. New York, NY: Families and Work Institute. Gardner, H. (1991). Frames of mind: The theory of multiple intelligences. New York, NY: Basic Books. Georgia Department of Education, Office of School Readiness. (1998). Georgia pre-K program replication handbook [On-line]. Atlanta, GA: Office of School Readiness. Available: http://www.osr.state.ga.us/whatisprek.html Glass, G.V., & Smith, M.L. (1978). Meta-analysis of research on the relationship of class size and achievement. San Francisco, CA: Far West Laboratory for Educational Research and Development. Goldhaber, D.D., & Brewer, D.J. (1997). Evaluating the effect of teacher degree level on educational performance. In William J. Fowler, Jr. (Ed.), Developments in School Finance: Fiscal Proceedings from the Annual MCES State Data Conference, July 1996. Washington, DC: National Center for Education Statistics. Gomby, D.S., Larner, M.B., Stevenson, J.D., Lewit, E.M., & Behrman, M.D. (1995). The future of children: Long-term outcomes of early childhood programs. Los Altos, CA: Center for the Future of Children, David and Lucille Packard Foundation. Goodlad, J. (1984). A place called school: Prospects for the future. New York, NY: McGraw-Hill.
Page 174 of 203
19 Governor’s Commission on School Performance. (1989). The Report of the Governor’s Commission on School Performance. Annapolis, MD: Governor’s Commission on School Performance. Gray, S.W., Ramsey, B.K., & Klaus, R.A. (1982). From 3 to 20: The early training project. Baltimore, MD: University Park Press. Gullo, D.F. (1990). The changing family context: Implications for the development of all-day kindergarten. Young Children 45 (3), 35-39. Gustad, J. (1992). Tutoring for at-risk students. Oregon School Study Council Bulletin 36, 3. Harkreader, S., & Weathersby, J. (1998). Staff development and student achievement: Making the connection in Georgia schools. Atlanta, GA: Council for School Performance. Available: http://archweb.gsu.edu/csp Harvard Family Research Project. (1995). Raising our future: Families, schools, and communities joining together. Cambridge, MA: Harvard Family Research Project. Harvard Family Research Project. (1997). New skills for new schools: Preparing teachers in family involvement. Cambridge, MA: Harvard Family Research Project. Haycock, K. (1998). Good teaching matters . . . a lot. Thinking K-16 3 (2), 1-14. Herman, R., & Stringfield, S. (1997). Ten promising programs for educating all children: Evidence of impact. Arlington, VA: Educational Research Service. Hollin, E.R. (1993). Assessing teacher competence for diverse populations. Theory into Practice 32 (1), 93-99. Horowitz, S.B., & Boardman, S.K. (1995). The role of mediation and conflict resolution in creating safe learning environments. Thresholds in Education 21 (2), 43-50. Illig, D.C. (1996). Reducing class size: A review of the literature and options for consideration [On-line]. Paper presented to California State Senator Lucy Killea. Available: www.library.ca.gov Ingersoll, R. (1998). Percentage of classes taught by teachers lacking a major in field. Unpublished manuscript, University of Georgia. International Association for the Evaluation of Educational Achievement. (1998). Third international mathematics and science study (TIMSS). Boston, MA: Boston College. International Reading Association and National Association for the Education of Young Children. (1998). Learning to read and write: Developmentally appropriate practices for young children. The Reading Teacher 52 (2), 193-214. Interstate School Leaders Licensure Consortium. (1996). Standards for school leaders. Washington, DC: Council of Chief State School Officers. Jensen, E. (1998). Teaching with the brain in mind. Alexandria, VA: Association of Supervision and Curriculum Development.
Page 175 of 203
20 Jordan, H., Mendro, R., & Weerasinghe, D. (1997, July). Teacher effects on longitudinal student achievement: A report on research in progress. Paper presented at the annual CREATE meeting, Indianapolis, IN. Joyce, B., & Showers, B. (1988). Student achievement through staff development. White Plains, NY: Longman Press. Joyce, B., Weil, M., & Showers, B. (1993). Models of teaching. Boston, MA: Allyn and Bacon. Kagan, S.L., & Cohen, N.E. (1997). Not by chance: Creating an early care and education system for America’s children. New Haven, CT: Yale University, The Bush Center in Child Development and Social Policy. Kane, M.B., Khatti, N., Reeve, A.L., & Adamson, R.J. (1997). Assessment of student performance: Studies of education reform [On-line]. Washington, DC: Office of Educational Research and Improvement. Available: http://www.ed.gov/pubs/SER/ASP/stude.html Karoly, L.A., Grenwood, S.M.S., Everingham, J., Hoube, M.R., Kilburn, C.P., Rydell, M.R., & Sanders, J.R. (1998). Investing in our children: What we know and don’t know about the costs and benefits of early childhood interventions (Report no. MR-898-TCWF). Santa Monica, CA: RAND Corp. Kauffman, J.M., & Burback, H.J. (1997). On creating a climate of classroom civility. Phi Delta Kappan 79 (4), 320-325. Kelly, K. (1999). Retention vs. social promotion: Schools search for alternatives. Harvard Education Letter 15 (1). Kiserling, K. (1995). A comparative study of life in first-grade classrooms of 1:14 and 1:23 teacher/pupil ratios. Ed.D. Dissertation. University of North Carolina, Greensboro. Kontos, S., & Wilcox-Herzog, A. (1997). Teachers’ interactions with children: Why are they so important? Young Children 52 (2), 4-12. Lazar, I., & Williams, R.B. (1982). Lasting effects of early education. Monographs of the Society for Research in Child Development 47, (195), 2-3. Lee, V.E., Smith, J.B., & Croninger, R.G. (1995). Another look at high school restructuring. Issues in Restructuring Schools 9, 1-10. Leithwood, K., Jantzi, D., & Steinbach, R. (1999). Changing leadership for changing times. Philadelphia, PA: Open University Press. Levinson, L., & Stonehill, R. (1997). Tried and true: Tested ideas for teaching and learning from the regional education laboratories. Washington, DC: U.S. Department of Education, Office of Educational Research and Improvement. Lezotte, L. (1993). Correlates of effective schools. Paper presented at the Maryland Educators Conference, Baltimore, MD. Lezotte, L.W. (1986), April) School effectiveness: Reflections and future directions. Paper presented at the annual meeting of the American Educational Reseach Association, San Francisco, CA.
Page 176 of 203
21 Lieberman, A. (1995). The work of restructuring schools: Building from the ground up. New York, NY: Teachers College Press. Loucks-Horsley, S. (1995). Professional development and the learner-centered school. Theory into Practice 34 (4), 265-271. MacIver, D.J. (1991). Helping students who fall behind: Remedial activities in the middle grades (Report no. 22). Baltimore, MD: Center for Research on Effective Schooling for Disadvantaged Students. Marazano, R., Pickering, D., Arredondo, D., Blackburn, G., Brandt, R., & Moffett, C. (1992). Dimensions of thinking. Alexandria, VA: Association for Supervision and Curriculum Development. Martin, W.J., & Willower, D.J. (1981). The managerial behavior of high school principals. Educational Administrator Quarterly 17, 69-90. Marx, E., Wooley, S., & Northrop, D. (Eds.). (1998). Health is academic. New York, NY: Columbia University. Maryland Association of Secondary School Principals (MASSP) (in press). MASSP Study: State of the secondary principalship in Maryland. MASSP, Administrator Shortage Committee. Maryland Business Roundtable for Education. (1996). Recommendations of strategic directions for professional development in Maryland’s public schools 1996-2000. Baltimore, MD: Maryland Business Roundtable for Education. Maryland Business Roundtable for Education, Ready at Five Partnership. (1996). Starting Points in Maryland. Baltimore, MD: Ready at Five Partnership. Maryland Child Care Resource Network. (1998). Child care demographics. Baltimore, MD: Maryland Committee for Children. Maryland Commission on the Early Learning Years. (1994). Laying the foundation for school success: Recommendations for improving early learning programs. Baltimore, MD: Maryland Commission on the Early Learning Years. Maryland Committee for Children. (1993). A new beginning: A blueprint for a career development and training plan for Maryland’s child care professionals. Baltimore, MD: Maryland Committee for Children. Maryland Committee for Children. (1997). Public policy priorities 1997-1998. Baltimore, MD: Maryland Committee for Children. Maryland Committee for Children. (1998). Public policy priorities 1998-1999. Baltimore, MD: Maryland Committee for Children. Maryland Committee for Children. (1999). Interview with Anna Griffith, Director of LOCATE. November 1, 1999. Baltimore, MD. Maryland Department of Human Resources, Child Care Administration. (1998). Regulated child care [On-line]. Baltimore, MD: Maryland Department of Human Resources, Child Care Administration. Available: http://www.dhr.state.md.us/cca/cca-reg.htm Maryland Education Commission. (1997). On board early project evaluation. Baltimore, MD: Maryland Education Commission.
Page 177 of 203
22 Maryland Higher Education Commission. (1995). Teacher education task force report. Annapolis, MD: Maryland Higher Education Commission. Maryland kids count fact book [On-line]. (1995). Baltimore, MD: Advocates for Children and Youth. Available: http://ww2.med.jhu.edu/schsc/kids/method.htm Maryland State Department of Education. (1990). Maryland learning outcomes. Baltimore, MD: Maryland State Department of Education. Maryland State Department of Education. (1994). Your child goes to school. Baltimore, MD: Maryland State Department of Education. Maryland State Department of Education. (1998a). Maryland model for school readiness: Fact sheet 39 [On-line]. Baltimore, MD: Maryland State Department of Education. Available: http://www.mdk12.org/practices/benchmark/MMSR/MMSRFA1.html Maryland State Department of Education. (1998b). Minority achievement in Maryland: The state of the state. Baltimore, MD: Maryland State Department of Education, Multicultural Advisory Council. Maryland State Department of Education. (1998c). State of innovation: The Maryland plan for technology in education 1999-2003. Baltimore, MD: Maryland Business Roundtable for Education Committee on Technology in Education. Maryland State Department of Education. (1998d). Strategic plan: 1998-2003. Baltimore, MD: Maryland State Department of Education. Maryland State Department of Education. (1998e). Web of success: Fifteen improving schools in Maryland. Baltimore, MD: Maryland State Department of Education. Maryland State Department of Education. (1999a). Decision Support System. Baltimore, MD: Maryland State Department of Education. Available: www.mdk12.org Maryland State Department of Education. (1999b). High school core learning goals. Baltimore, MD: Maryland State Department of Education. Maryland State Department of Education. (1999c). Maryland content standards. Baltimore, MD: Maryland State Department of Education. Maryland State Department of Education. (1999d). School accountability funding for excellence: Guidelines for developing the SAFE comprehensive plan and funding application (1999-2000). Baltimore, MD: Maryland State Department of Education. Maryland State Department of Education, Division of Instruction and Staff Development. (1998a). All-day kindergarten survey SY 97-98. Baltimore, MD: Maryland State Department of Education. Maryland State Department of Education, Division of Instruction and Staff Development. (1998b). Early identification and intervention program summary SY 97-98 for PreK-G3. Baltimore, MD: Maryland State Department of Education. Maryland State Department of Education, Division of Instruction and Staff Development (1998c). Standards for implementing quality early learning programs. Baltimore, MD: Maryland State Department of Education.
Page 178 of 203
23 Maryland State Department of Education, Division of Planning, Results, and Information Management. (1998a). The fact book: 1997-1998. Baltimore, MD: Maryland State Department of Education. Maryland State Department of Education. (1998b). Maryland teacher staffing report: 1998-2000. Baltimore, MD: Maryland State Department of Education. Maryland State Department of Education, Division of Planning, Results, and Information Management (1998c). Prekindergarten enrollment SY 97-98. Baltimore, MD: Maryland State Department of Education. Maryland State Department of Education, Division of Special Education/Early Intervention. (1999). 12-1-98 part C data overview. Baltimore, MD: Maryland State Department of Education. Maynes, B., McIntosh, G., & Mappin, D. (1996). Computer-based simulations of the school principalship: Preparation for professional practice. Educational Administration Quarterly 32 (4), 579-594. McCart, L., & Stief, E. (1996). Creating collaborative frameworks for school readiness. Washington, DC: National Governor’s Association. McLaughlin, M., & Talbert, J. (1993). Contexts that matter for teaching and learning. Stanford, CA: Stanford University, Center for Research on the Context of Secondary School Teaching. Metropolitan Educational Research Consortium. (1998). Students who defy the odds: A study of resilient at-risk students (Research Brief 18). Richmond, VA: Metropolitan Educational Research Consortium. Middle school promotion and accountability standards [On-line]. (1998). Kennewick, WA: Kennewick School District. Available: http//www.nwrel.org/psc/bestofnw/singleprac.asp/id=114 Mosteller, F. (1995). The Tennessee study of class size in the early school grades. Critical Issues for Children and Youth 5 (2), 113-27. Murphy, J. (1992). The landscape of leadership preparation: Reframing the education of school administrators. Newbury Park, CA: Corwin Press, Inc. Muse, I., & Thomas, G.J. (1991). The rural principal: Select the best. Journal of Rural and Small Schools 4 (3), 32-37. National Association for the Education of Young Children. (1996). Guidelines for preparation of early childhood professionals. Washington, DC: National Association for the Education of Young Children. National Association for the Education of Young Children. (1998). Accreditation criteria. Washington, DC: National Association for the Education of Young Children. National Association of Secondary School Principals. (1996). Breaking ranks: Changing an American institution. Reston, VA: National Association of Secondary School Principals.
Page 179 of 203
24 National Association of State Boards of Education (NASBE). (1999). Social promotion and retention of students: Policy update. Alexandria, VA: National Association of State Boards of Education. National Center for Education Statistics. (1997). School and staffing in the United States. A statistical profile 1993-1994 (NCES 96-124). Washington, DC: U.S. Department of Education. National Commission on Teaching and America’s Future. (1996a). Statistics on teaching in America. New York, NY: Columbia University, Teachers College. Available: http://www.tc.columbia.edu/~teachcomm/fact2.htm National Commission on Teaching and America’s Future. (1996b). What matters most: Teaching for America’s future. New York, NY: National Commission on Teaching and America’s Future. National Education Commission on Time and Learning. (1994). Prisoners of time. Washington, DC: U.S. Government Printing Office. National Education Goals Panel. (1996). National education goals report. Washington, DC: United States Department of Education. National Education Goals Panel. (1998). Promising practices: progress toward the goals. Washington, DC: United States Department of Education. National Governor’s Association, Center for Best Practices. (1998). Maryland child care resource network [On-line]. Washington, DC: National Governor’s Association. Available: http://www.nga.org/Pubs/IssueBriefs/1998/980223Childcare.asp National Institute on Out-of-School Time. (1997). Fact sheet on school-age children’s out of school time. Wellesley, MA: Wellesley College, Center for Research on Women. National Partnership for Excellence and Accountability in Teaching. (1998). Improving professional development: 8 research-based principles. Washington, DC: National Partnership for Excellence and Accountability in Teaching. Available: www.npeat.org National PTA. (1998). National standards for parent/family involvement programs. Chicago, IL: National PTA. National Staff Development Council. (1995). Standards for staff development: High school edition. Oxford, OH: National Staff Development Council. Natriello, G. (1998). Failing grades for retention. The School Administrator 55 (7), 14- 17. Nettles, S. (1991). Community involvement and disadvantaged students: A review. Review of Educational Research 61 (3), 379-406. Neuman, S.B. (1996). Evaluation of the Books Aloud project: Report to the William Penn Foundation. Philadelphia, PA: Temple University. New Jersey Department of Education. (1997). Abbot schools: Report to the legislature on the progress of Abbot school districts [On-line]. Trenton, NJ: New Jersey Department of Education. Available: http://www.state.nj.us/njded/genfo/abbreport.html
Page 180 of 203
25 Newman, F.M., & Welgage, G.G. (1995). Successful school restructuring: A report to the public and educators. Madison, WI: University of Wisconsin-Madison, Center on Organization and Restructuring of Schools. North Carolina State Department of Public Instruction. (1998). Planning the comprehensive concept. Raleigh, NC: Division of Support Programs. North Central Regional Educational Laboratory. (1998). Oakbrook, IL: U.S. Department of Education. Available: http://www.ncrel.org/cscd/newlead/lead52/52sizer.htm Northwest Regional Educational Laboratory. (1998). Catalogue of school reform models (1st ed.). Portland, OR: U.S. Department of Education. Office of School Readiness. (n.d.) Georgia pre-kindergarten program replication handbook. Atlanta, GA: Office of School Readiness. O’Neil, J. (1994). Aiming for new outcomes: The promise and the reality. Educational Leadership 51 (6), 6-10. Oxley, D. (1993). Organizing schools into smaller units: A planning guide. Philadelphia, PA: Temple University, Center for Research in Human Development and Education. Peak, L. (1996). Pursuing excellence. Washington, DC: U.S. Department of Education, Office of Research and Improvement. Peisner-Feinberg, E.S., Burdinal, M.R., Clifford, R., Yazejian, N., Clukin, M.L., Zelazo, J., Howes, C., Byler, P. Kagan, S.L., & Rustici, J. (1999). The children of the cost, quality, and outcomes study go to school. Chapel Hill, NC: University of North Carolina. Perkins, D. (1992). Smart schools. New York, NY: Free Press. Phillips, G.W., & Adcock, E.P. (1996, April). Practical applications of HLM to district evaluations. Paper presented at the meeting of the American Educational Research Association, New York. Phipo, C. (1998). Getting out of the box. Phi Delta Kappan 79 (9), 645-646. Pisapia, J., & Westfall, A. (1994a). Developing resilient schools and resilient students (Research Brief 19). Richmond, VA: Metropolitan Educational Research Consortium. Pisapia, J., & Westfall, A. (1994b). Students who defy the odds: A study of resilient atrisk students (Research Brief 18). Richmond, VA: Metropolitan Educational Research Consortium. Poersch, N.O., & Blank, H. (1996). Working together for children: Head Start and child care partnerships. Washington, DC: Children’s Defense Fund. Poland, S. (1998). School violence: Lessons learned. Paper presented at the Safe School Conference, Baltimore, MD. Price, H.B. (1993). Teacher professional development: It’s about time. Education Week 12, 32.
Page 181 of 203
26 Ready at Five Partnership. (1996). Starting points in Maryland: Building collaboration to promote school readiness in young children. Baltimore, MD: Ready at Five Partnership. Ready at Five Partnership. (1997). Community investment strategies for young children. Baltimore, MD: Ready at Five Partnership. Resnick, M.D., Bearman, P.S., Blum, R.W., Bauman, K.E., Harris, K.M., Jones, J., Tabor, J., Beuhring, T., Sieving, R.E., Shew, M., Ireland, M., Bearinger, L.H., & Udry, J.R. (1997). Protecting adolescents from harm: Findings from the national longitudinal study of adolescent health. Journal of the American Medical Association 278 (10) 41-50. Reville, S.P. (1999, May 5). Breaking out of the prison of time. Education Week 18 (34), 36. Reynolds, A., & Mavrogenes, N. (1993). Schools, families, and children. Chicago, IL: Chicago Public Schools. Reynolds, M.C. (1997). 20/20 analysis manual. Philadelphia, PA: Temple University, Center for Research in Human Development and Education. Rice, J.K. (1997, March). Explaining the negative impact of the transition from middle to high school on student performance in mathematics and science: An examination of school discontinuity and student background variables. Paper presented at the annual meeting of the American Education Research Association, Chicago, IL. Riley, R.W. (1998, September). Remarks as prepared for delivery at the Early Childhood Conference, Atlanta GA. Available: http://www.ed.gov/Speeches/980911.html Robinson, G.E. (1990). Synthesis of research on effects of class size. Educational Leadership, 47 (7), 80-90. Rossi, R., & Montgomery, A. (Eds.). (1994) Educational reform and students at risk: A review of the current state of the art [On-line]. Available: http://www.ed.gov/pubs/EdReformStudies/EdReforms/title.html Sanders, W.L., & Horn, S. (1994). The Tennessee value-added assessment system (TVAAS): Mixed-model methodology in educational assessment. Journal of Personnel Evaluation in Education 8, 299-311. Sanders, W.L., & Rivers, J.C. (1996). Cumulative and residual effects of teachers on future students’ academic achievement. Knoxville, TN: University of Tennessee, Value-Added Research and Assessment Center. Sarason, S. (1991). The predictable failure of education reform. San Francisco, CA: Jossey-Bass. Schiller, J., & Saltrick, D. (1997). Testing for teaching. The School Administrator 54 (11), 6-9. Schwartz, W. (1996). An overview of strategies to reduce school violence (ERIC Digest, vol. 115). Washington, DC: ERIC Clearinghouse on Urban Education. Schweinhart, L.J., & Weikert, D.P. (1985). Evidence that good early childhood programs work. Phi Delta Kappan 66, 545-563.
Page 182 of 203
27 Simich-Dudgeon, C. (1993). Increasing student achievement through teacher knowledge about parent involvement. In M. Chavkin (Ed.), Families and schools in a pluralistic society. Albany, NY: State University of New York Press. Slavin, R.E., Karweit, N.L., & Madden, N.A. (1980). Effective programs for students at risk. Boston, MA: Allyn and Bacon. Slavin, R.E., Karweit, N.L., & Wasik, B.A. (1991). Preventing early school failure: What works? (Report no. 26). Baltimore, MD: Johns Hopkins Center for Research on Effective Schooling for Disadvantaged Students. Snow, C., Burns, M.S., & Griffin, P. (Eds.). (1998). Preventing reading difficulties in young children. Washington, DC: National Academy Press. Snow, C., & Tabors, P. (1996). Intergenerational transfer of literacy. In L.A. Benjamin & J. Lord (Eds.), Family literacy: Directions in research and implications for practice. Washington, DC: U.S. Department of Education, Office of Educational Research and Improvement. Southern Regional Education Board. (1999). Prekindergarten and parent support programs. Atlanta, GA: Southern Regional Education Board. Sparks, D., & Hirsh, S. (1997). A new vision for staff development. Alexandria, VA: Association for Supervision and Curriculum Development. State student promotion/retention policies. (1999). Education Commission of the States Clearinghouse Notes. Denver, CO: Education Commission of the States. Stephens, R.D. (1998). Safe schools: A handbook for violence prevention. Bloomington, IN: National Education Service. Stratham, D.S., & Torell, C.R. (n.d.). Computers in the classroom: The impact on student learning (Spotlight on Student Success Series, no. 206). Philadelphia, PA: Mid-Atlantic Regional Education Laboratory. Stringfield, S., & Herman, R. (1997) Research on effective instruction for at-risk students: Implications for the St. Louis public schools. Journal of Negro Education 66 (3), 258-288. Stringfield, S., & Herman, R. (1998). Scaling up school restructuring in multicultural, multilingual contexts: Early observations from Sunland County. Education and Urban Society 30 (3), 326-358. Stringfield, S., & Teddlie, C. (1991). Observers as predictors of schools’ multiyear outlier status on achievement tests. Elementary School Journal 91 (4), 357-376. Swap, S. (1993). Developing home-school partnerships: From concepts to practice. New York, NY: Columbia University, Teachers College Press. Swick, K.J., Anderson, L., Seaman, M., Lennox, M., Martin, K., & Sheng, W.B. (1993). Final report: Target 2000 parent education program evaluation. Columbia, SC: University of South Carolina. Thompson, H. (1993). Quality education program/Mississippi: Program evaluation panel report. Corona, CA: Quality Education Project.
Page 183 of 203
28 Tucker, M.S., & Codding, J.B. (1998). Education and the demands of democracy in the next millennium. In D.D. Marsh (Ed.), 1999 ASCD Yearbook. Alexandria, VA: Association of Supervision and Curriculum Development. University of Kentucky/University of Louisville Joint Center for the Study of Education Policy. (1996). 1996 Review of research on the Kentucky education reform act. Frankfort, KY: Kentucky Institute for Educational Research. U.S. Department of Education. (1998). Early warning, timely response: A guide to safe schools. Washington, DC: U.S. Department of Education. U.S. Department of Education, Joint Dissemination and Review Panel. (1992). Metra 1992 catalogue. Salt Lake City, UT: U.S. Department of Education. U.S. Department of Education, National Center for Education Statistics. (1995). 1995 national household education survey. Washington, DC: U.S. Department of Education, National Center for Education Statistics. U.S. Department of Education, National Center for Education Statistics. (1996a). Child care and early education program participation of infants, toddlers, and preschoolers. Washington, DC: U.S. Department of Education, National Center for Education Statistics. U.S. Department of Education, National Center for Education Statistics. (1996b). Schools and staffing in the United States: A statistical profile 1993-1994 (NCES 96-124). Washington, DC: U.S. Department of Education. U.S. Department of Health and Human Services. (1999). Report on Head Start administration for children and families: Region III. Philadelphia, PA: U.S. Department of Health and Human Services. U.S. Department of Health and Human Services, Administration for Children and Families. (1996). Improving the quality of the Head Start program: New performance standards [On-line]. Washington, DC: U.S. Department of Health and Human Services, Administration for Children and Families. Available: http://www2.acf.dhhs.gov/programs/hsb/html/new_standards.html U.S. General Accounting Office. 91995). Early childhood centers: Services to prepare children for school often limited (GAO/HEHS-95-21). Washington, DC: General Accounting Office. Viadero, D. (1998). Research Notes. Education Week 18 (11) [On-line]. Available: http://www.edweek.com/ew/current/llrcol.h18 Wang, M., Reynolds, M.C., & Walberg, H.J. (1994). What influences learning? A content analysis of review of literature. Journal of Educational Research 65 (4), 12-17. Wang, M.C. (1994). What helps students learn. Educational leadership 56 (4), 75-79. Wang, M.C. (1997). The community for learning program: Evidence of success. Philadelphia, PA: Temple University, Center for Research. Wang, M.C., Haertel, G.D., & Walberg, H.J. (1990). What influences learning? A content analysis of review of literature. Journal of Educational Research 84 (3), 30-43.
Page 184 of 203
29 Wang, M.C., Haertel, G.D., & Walberg, H.J. (1997) What do we know: Widely implemented school improvement programs (Laboratory for Student Success Report). Philadelphia: Temple University. Wasik, B.A. (1997). Report 14: Volunteer tutoring programs: A review of research on achievement outcomes [On-line]. Available: www.csos.jhu.edu/crespar/CRESPAR%20Reports/report14entire.htm Watchke, G. (1998). Pupil assessment in grades 4-12 (Budget Brief 98-4 from the Wisconsin Legislative Reference Bureau). Madison, WI: Wisconsin Legislative Reference Bureau. Wheelock, A. (1998). Extra help and support to meet standards and prevent retention [On-line]. In website for Consortium for Equity in Standards and Testing, Spotlight Issues: Social Promotion and Grade Retention, Part II. Boston, MA: Boston College School of Education, Center for the Study of Testing, Evaluation, and Education Policy. Available: http://www.csteep.bc.edu/ctest Whitebook, M., Howes, C., & Phillips, D. (1996). Who cares? Child care teachers and the quality of care in America: National child care staffing study. Washington, DC: National Center for Early Childhood Workforce. Winfield, L.F. (1994). Developing resilience in urban youth [On-line]. Oak Brook, IL: North Central Regional Educational Laboratory, Urban Education Program. Available: http://www.ousd.k12.ca.us/netday/links/partnerships/le0win.htm Winters, W.L. (1995). A review of recent studies relating to the achievement of students enrolled in year-round education programs. San Diego, CA: The National Association for Year-Round Education. Zeichner, K. (1992). Educating teachers for cultural diversity. East Lansing, MI: National Center on Teacher Learning.
Page 185 of 203
30 Section II: Maryland Task Force on the Principalship Academy for Educational Leadership. (1998). Leadership Development Framework. Baltimore, MD: Baltimore City Public Schools/Greater Baltimore Committee, Department of Professional Development. Arthur Andersen. (1997). Annual report on the Jersey City and Paterson public schools (prepared for the New Jersey Legislature Joint Committee on the Public Schools). Baltimore City Public Schools, & Johns Hopkins University. (1998). Responses to needs assessment of new principals. Baltimore, MD: Baltimore City Public Schools and Johns Hopkins University, Graduate Division of Education. Baltimore County Public Schools. (1991). Appraisal of School-based Administrators. Towson, MD: Baltimore County Public Schools. Baltimore County Public Schools. (1998?). Educational Leadership Training & Development Program. Towson, MD: Baltimore County Public Schools, Department of Professional Development. Barron, D.J., Becker, H.P., & Pipkin, J.H. (1999). Report on the state of the secondary principalship. Maryland Association of Secondary School Principals. Barth, R. (1990). Improving schools from within. San Francisco, CA: Jossey-Bass. Bellanca, J. (1995). Designing professional development for change. Arlington Heights, IL: SkyLight Publishing. Brookover, W., & Lesotte, L. (1977). Changes in school characteristics coincident with changes in student achievement. East Lansing, MI: State University Press. Cawelti, G. (1987). Why instructional leaders are scarce. Educational Leadership (September 1987):3. Cecil County Public Schools. (1999). A&S salary comparisons. Cecil County Public Schools, Human Resources Office. Corderio, P. (1994). The principal’s role in curricular leadership and program development. In L.W. Hughes (Ed.) The principal as leader (161-183). Upper Saddle River, NJ: Merrill/Prentice Hall. Council of Chief State School Officers. (1996). Interstate School Leaders Licensure Consortium: Standards for school leaders. Washington, DC: Council of Chief State School Officers. Crum, G.J., Garrett, E., Guerra, M.M., & Loredo, R. (2000). Developing and sharpening principals’ leadership skills. Presented at the national Association of Secondary School Principals’ 84th Annual Convention, February 7, 2000. Daley, B. (1999). Principal shortage looms for school districts. The Boston Globe. (June 22, 1999). Drake, T.L., & Roe, W.H. (1994). The principalship (4th edition). New York, NY: Macmillan College Publishing Company. Duke, D. (1993). Removing barriers to professional growth. Phi Delta Kappan 74(9):702-4.
Page 186 of 203
31 Edmonds, R. (1979). Effective schools for the urban poor. Educational Leadership. 37(4):15-24. Educational Research Service. (1998). Is there a shortage of qualified candidates for openings in the principalship? An exploratory study. Arlington, VA: Educational Research Service. Educational Research Service, National Association of Elementary School Principals & National Association of Secondary School Principals. (2000). The principal, keystone of a high-achieving school: Attracting and keeping the leaders we need. Arlington, VA: Educational Research Service. Favaro, P. (1996). Workplace stress survey: Senior administration report. Peel Board of Education. Flanary, R., & Reed, P. (1999). Succession planning: Meeting the challenge of administrator shortages. Presented to the American Association of School Personnel Administrators, June 1999k, Arlington, VA. Fullan, M. (1997). What’s worth fighting for in the principalship? New York, NY: Teachers College Press. Goldring, E., & Rallis, S. (1993). Principals of dynamic schools: Taking charge of change. Newbury Park, CA: Corwin Press. Goodlad, J. (1984). A place called school: Prospects for the future. New York, NY: McGraw Hill. Hallinger, P., Bickman, L., & Davis, K. (1996) School context, principal leadership and student reading achievement. The Elementary School Journal, 96(5):527-549. Hallinger, P., & Murphy, J.F. (1986). The social context of effective schools. American Journal of Education (May 1986):328-355. Harkreader, S., & Weathersby, J. (1998). Staff development and student achievement: Making the connection in Georgia schools. Atlanta, GA: Council for School Performance. Available: http://archweb.gsu.edu/csp Herzberg, F., Mausner, B., & Snyderman, B. (1959). The motivation to work, 2nd edition. New York, NY: Wiley. Hickey, M. (1996). Have we cleared the plate? Ellicott City, MD: Howard County Public Schools. Keller, B. (1998). Principal matters. Education Week (November 11, 1998):25-27. Lashway, L. (Retrieved January 2000). Trends and Issues: Role of the school leader. ERIC Clearinghouse on Educational Management, College of Education, University of Oregon. Available: http://www.eric.uoregon.edu/trends_issues/rolelead/index.html Lashway, L. (Retrieved January 2000). Trends and issues: Training of school administrators. ERIC Clearinghouse on Educational Management, College of Education, University of Oregon. Available: http://www.eric.uoregon.edu/issues/training/index.html Leithwood, K. (1994). Leadership for school restructuring. Educational Administration Quarterly (November 1994): 498-518.
Page 187 of 203
32 Lewis, A.C. (1993). Changing the odds: Middle school reform in progress 1991-1993. New York, NY: The Edna McConnell Clark Foundation. Lyons, J.E. (1999). How school principals perceive their roles, rewards, and challenges. ERS Spectrum (Winter 1999): 18-23. McAdams, R.P. (1998). Who’ll run the schools? The American School Board Journal (August 1998):37-39. Maryland Business Roundtable for Education. (1996). Recommendations for strategic directions for professional development in Maryland’s public schools: 1996-2000. Baltimore, MD: Maryland Business Roundtable for Education, Committee on Professional Development. Maryland State Department of Education. (1999). Every child Achieving: A plan for meeting the needs of the individual learner. Baltimore, MD: Maryland State Department of Education. Massachusetts Elementary School Principals’ Association. (2000). In-District Programs. Available: http://www.mespa.org/in_dist.html Massachusetts Elementary School Principals’ Association. (2000). Principal Certification Program. Available: http://www.mespa.org/cert.html Mawhinney, H.B. (1999). Challenges in educational leadership practice, preparation and research. Presented to the Faculty of Education, Simon Fraser University, Burnaby, B.C. Mertz, N.T. (1999). Through their own eyes: Principals look at their jobs. In F.K. Kochan, B.L. Jackson & D.L. Duke (Eds.). A thousand voices from the firing line; A study of educational leaders, their jobs, their preparation, and the problems they face. (15-28). Columbia, MO: UCEA. Mizell, H. (1995). Looking for leaders. Presented at the Reform Connection, a conference of school systems and other organizations involved in middle school reform. Mizell, H. (1994). The new principal. Presented at The Middle School Principals Institute, Louisville, KY, July 14-15, 1994. Mohr, N. (1998). Creating effective study groups for principals. Educational Leadership 55(7):41-44. Murphy, J. (1992). The landscape of leadership preparation: Reframing the education of school administrators. Newbury Park, CA: Corwin Press, Inc. Murphy, J. (1994). Transformational change and the evolving role of the principal: Early empirical evidence. In J. Murphy & K. Seashore Louis (Eds.). Reshaping the principalship: Insights from the transformational change efforts. (20-54). Newbury Park, CA: Corwin Press, Inc. Muse, I., & Thomas, G.J. (1991). The rural principal: Select the best. Journal of Rural and Small Schools 4(3):32-77. National Association of State Boards of Education. (1999). Principals of change: What principals need to lead schools of excellence. Alexandria, VA: National Association of State Boards of Education.
Page 188 of 203
33 National Staff Development Council. (1995). Standards for staff development: High school edition. Oxford, OH: National Staff Development Council. New England School Development Council. (1988). Administrative shortage in New England: The evidence, the causes, the recommendations. Sudbury, MA: New England School Development Council. Odden, A. (1995). Educational leadership for America’s schools. New York, NY: McGraw Hill. Olson, L. (2000a). New thinking on what makes a leader. Education Week (January 19, 2000):1, 14-15. Olson, L. (2000b). Policy focus converges on leadership. Education Week (January 12, 2000):15-17. O’Neil, J. (1995). On schools as learning organizations: A conversation with Peter Senge. Educational Leadership 52(7):20-23. Overholser, G. (2000). Free the principal. The Washington Post. (May 13, 2000). Pellicer, L.O., et al. (1988). High school leaders and their schools — Volume I: A national profile. Reston, VA: National Association of Secondary School Principals. Perlstein, L. (2000). Wanted: A few good principals. The Washington Post. Principals’ Assessment and Development Center. (1999). Professional development offerings description. Edinburg, TX: Principals’ Assessment and Development Center, Region One Education Service Center. Richardson, J. (1999). Principals are “head learners” at successful schools. NSDC Results (February 1999). Oxford, OH: National Staff Development Council. Sanders, A.S. (1987). Maryland’s MPDA: The Maryland Professional Development Academy and its odyssey in comprehensive training. In Joseph Murphy & Philip Hallinger (Eds.) Approaches to administrative training in education. (99-114). Albany, NY: State University of New York Press. Senge, P., Kliener, A., & Roberts, C., et al. (1994). The fifth discipline fieldbook : Strategies and tools for building a learning organization. New York, NY: Doubleday. Sergiovanni, T. (1992). Moral leadership: Getting to the heart of school improvement. San Francisco, CA: Jossey-Bass. Sergiovanni, T. (1991). The principalship: A reflective practice perspective, 3rd edition. Boston, MA: Allyn & Bacon. Southern Regional Education Board. (1986). Effective school principals: A proposal for joint action by higher education, states, and school districts. Atlanta, GA: Southern Regional Education Board, Commission for Educational Quality. Sparks, D., & Hirsh, S. (1997). A new vision for staff development. Alexandria, VA: Association for Supervision and Curriculum Development. Speck, M. (1999). The principalship: Building a learning community. Upper Saddle River, NJ: Prentice Hall.

Page 189 of 203
34 Stringfield, S., & Herman, R. (1997). Research on effective instruction for at-risk students: Implications for the St. Louis public schools. Journal of Negro Education 66(3):258-288. U.S. Department of Education. (1999). School leadership: Principals at the center. Transcript of a Satellite Town Meeting (June 15, 1999).
Page 190 of 203
35 Section III: Achievement Matters Most — Leadership Task Group Bottoms, G. and O’Neill, K. Preparing a New Breed of School Principals: It’s Time for Action. Atlanta, GA, Southern Regional Educational Board, April, 2001. Elmore, Richard F. Building a New Structure for School Leadership. Washington, DC, The Albert Shanker Institute, Winter, 2000. Governor’s Commission on School Performance. Report. Annapolis, MD, August, 1989. Hoachlander, G., Alt, M., Beltranena, R. Leading School Improvement: What Research Says, Atlanta, GA, Southern Regional Education Board, March, 2001. McCay, E. Influences on Change: Supporting Ongoing Development for Mid-career Principals. Paper presented at the Annual Meeting of the American Educational Research Association, Montreal, Canada, April 19-23, 1999. Maryland Task Force on the Principalship. Report. Maryland State Department of Education, Baltimore, MD, September, 2000. National Association of Elementary School Principals. Leading Learning Communities: Standards for What Principals Should Know and Be Able to Do. Alexandria, VA, 2001. Senge, Peter M. The Fifth Discipline: The Art and Practice of the Learning Organization. New York, Doubleday, 1990.
Page 191 of 203
36 Section IV: Mid-continent Research for Education and Learning (McREL) Beckard, R. & Pritchard, W. (1992). Changing the essence: The art of creating and leading fundamental change in organizations. San Francisco: Jossey-Bass. Bridges, W. (1991). Managing transitions: Making the most of change. Reading, MA: Addison-Wesley. Elmore, R. (2003) Knowing the right thing to do: School improvement and performancebased accountability. Washington, DC: NGA Center for Best Practices. Fullan, M.G. (1993). Change forces: Probing the depths of educational reform. Bristol, PA: Falmer Press. Heifetz, R. (1994). Leadership without easy answers. Cambridge, MA: Belknap Press. Hesslebein, F. & Johnston, R. (Eds.). (2002). On leading change: A leader to leader guide. San Francisco: Jossey-Bass. Marzano, R.J. (2000). A new era of school reform : Going where the research takes us. Aurora, CO: Mid-continent Research for Education and Learning. Marzano, R.J., Gaddy, B.B. & Dean, C. (2000). What works in classroom instruction. Aurora, CO: Mid-continent Research for Education and Learning. Marzano, R.J. (2003). What works in schools : Translating research into action. Alexandria, VA: Association for Supervision and Curriculum Development. Nadler, D.A., Shaw, R.B., Walton, A.E., & Associates. (1994). Discontinuous change. SanFrancisco, CA: Jossey-Bass. Rogers, E. (1995). Diffusion of Innovations. New York, NY: The Free Press. Reports on the 70 Studies Included in the McREL Leadership Meta-Analysis Andrews, R.L., & Soder, R. (1987, March). Principal Leadership an student achievement. Educational leadership, 44(6), 9-11. Ayres, R.E. (1984). The relationship between principal effectiveness and student achievement. Unpublished doctoral dissertation, University of Missouri, Columbia. Balcerek, E.B. (2000, May). Principals’ effective leadership practice in high performing and inadequately performing schools. Unpublished doctoral dissertation, University of Tennessee, Knoxville. Bedford, W.P., Jr. (1987). Components of school climate and student achievement in Georgia middle schools. Unpublished doctoral dissertation, University of Georgia. Benoit, J.D. (1990). Relationships between principal and teacher perceptions of principal instructional management and student achievement in selected Texas school districts with an emphasis on an index of effectiveness (school effectiveness). Unpublished doctoral dissertation, New Mexico State University.
Page 192 of 203
37 Berry, F.A. (1983). Perceived leadership behavior of school principals in selected California public elementary schools with a high Hispanic student population and high or low sixth grade reading achievement scores. Unpublished doctoral dissertation, University of the Pacific, Stockton, CA. Blank, R.K. (1987). The role of principal as leader: Analysis of variation in leadership of urban high schools. Journal of Educational Research, 81(2), 69-80. Braughton, R.D., & Riley, J.D. (1991, May). The relationship between principals’ knowledge of reading process and elementary school reading achievement. (ERIC Document Reproduction Service No. ED341952). Brookover, W.B., Schweitzer, J.H., Schneider, J.M., Beady, C.H., Flood, P.K., & Wisenbaker, J.M. (1978, Spring). Elementary school social climate and school achievement. American Educational Research Journal, 15(2), 301-318. Brooks, F.K. (1986). Relationships between school effectiveness and the perceptions of teachers on leadership effectiveness and school climate. Unpublished doctoral dissertation, Memphis State University. Cantu, M.M.I. (1994, May). A study of principal instructional leadership behaviors manifested in successful and not successful urban elementary schools. Unpublished doctoral dissertation, University of Texas at Austin. Combs, M.W. (1982). Perceptions of principal leadership behaviors related to the reading program in elementary schools with high and low student achievement. Unpublished doctoral dissertation, University of Florida. Crawford, J., & Watson, P.J. (1985, February). Schools make a difference: Within and between-school effects. Journal of Research and Evaluation of the Oklahoma City Public Schools, 15(8), 1-98. Crawford, J., Kimball, G., & Watson, P. (1985, March). Causal modeling of school effects on achievement. Paper presented at the annual meeting of the American Educational Research Association, Chicago, IL. Czaja, M.D. (1985). The relationship of selected principals’ motive patterns to school climate and school climate to effectiveness. Unpublished doctoral dissertation, University of Texas at Austin. Dixon, A.E., Jr. (1981). the relationship of elementary principal leadership performance to reading achievement of students in two counties in California. Unpublished doctoral dissertation, University of San Francisco. Duggan, J.P. (1984). The impact of differing principal supervisory communication styles on teacher and student outcomes (consensus, achievement, leadership). Unpublished doctoral dissertation, Rutgers the State University of New Jersey, New Brunswick. Durr, M.T. (1986). The effects of teachers’ perceptions of principal performance on student cognitive gains. Unpublished doctoral dissertation, Indiana University. Edwards, P.I., Jr. (1984). Perceived leadership behaviors and demographic characteristics of principals as they relate to student reading achievement in elementary schools. Unpublished doctoral dissertation, University of South Florida.
Page 193 of 203
38 Erpelding, C.J. (1999). School vision, teacher autonomy, school climate, and student achievement in elementary schools. Unpublished doctoral dissertation, University of Northern Iowa. Ewing, T.M. (2001, December). Accountable leadership: The relationship of principal leadership style and student achievement in urban elementary schools. Unpublished doctoral dissertation, Northern Illinois University, Dekalb. Finklea, C.W. (1997). Principal leadership style and the effective school (secondary school principals). Unpublished doctoral dissertation, University of South Carolina. Floyd, J.E. (1999). An investigation of the leadership style of principals and its relation to teachers’ perceptions of school mission and student achievement. Unpublished doctoral dissertation, North Carolina State University, Raleigh. Freeman, E. (1987). The relationship between school effectiveness and elementary school principals’ behaviors. Unpublished doctoral dissertation, University of Washington. Friedkin, N.E., & Slater, M.R. (1994, April). School leadership and performance: A social network approach. Sociology of Education, 67, 139-157. Gentile, M. (1997). The relationship between middle school teachers’ perceptions of school climate and reading and mathematics achievement. Unpublished doctoral dissertation, Widener University, Chester, PA. Gray, C.S. (2001, August). Involvement of the principal in elementary school reading programs in the Mississippi region. Unpublished doctoral dissertation, Mississippi State University. Griffin, G.D. (1996). An examination of factors contributing to exemplary schools in an urban public school district in the Midwest (urban education). Unpublished doctoral dissertation, Western Michigan University. Hallinger, P., Bickman, L., & Davis, K. (1996, May). School context, principal leadership, and student reading achievement. The Elementary School Journal, 96(5), 527-549. Hauser, B.B. (2001). A comparison of principal perceiver themes between highly successful and less successful principals in a selection of public elementary schools in Kentucky. Unpublished doctoral dissertation, University of Kentucky, Lexington. Heck, R.H., & Marcoulides, G.A. (1990). Examining contextual differences in the development of instructional leadership and school achievement. The Urban Review, 22(4), 247-265. Heck, R.H., Larsen, T.J., & Marcoulides, G.A. (1990, May). Instructional leadership and school achievement validation of a causal model. Educational Administration Quarterly, 26(2), 94-125. Hedges, B.J. (1998). Transformational and transactional leadership and the school principal: An analysis of Catholic K-8 school principals (Catholic schools). Unpublished doctoral dissertation, University of Maryland, College Park.
Page 194 of 203
39 Hopkins-Layton, J.K. (1980). The relationships between student achievement and the characteristics of perceived leadership behavior and teacher morale in minority, low socio-economic, and urban schools. Unpublished doctoral dissertation, University of Houston. Hurwitz, N.F. (2001). The effects of elementary school principal instructional leadership on reading achievement in effective versus ineffective schools. Unpublished doctoral dissertation, St. John’s University, Jamaica, NY. Jackson, S.A.C. (1982). Instructional leadership behaviors that characterize schools that are effective for low socioeconomic urban black students. Unpublished doctoral dissertation, Catholic University of America, Washington, DC. Jones, P.A. (1987, May). The relationship between principal behavior and student achievement in Canadian secondary schools. Unpublished doctoral dissertation, Stanford University. Jun, Sung-Yun. (1981). Principal leadership, teacher job satisfaction and student achievement in selected Korean elementary schools. Unpublished doctoral dissertation, Florida State University. Knab, D.K. (1998). Comparison of the leadership practices of principals of blue ribbon schools with principals of randomly selected schools. Unpublished doctoral dissertation, The American University. Kolakowski, R.E.L. (2000). Instructional leadership and home-school relations in highand low-performing schools — SBM team perceptions. Unpublished doctoral dissertation, University of Maryland, College Park. Krug, Frances S. (1986, May). The relationship between the instructional management behavior of elementary school principals and student achievement. Unpublished doctoral dissertation, University of San Francisco. LaFontaine, V.T.C. (1995). Implementation of effective schools correlates by Bureau of Indian Affairs Elementary Pilot Schools : Staff perceptions and achievement scores (Native Americans). Unpublished doctoral dissertation, the University of North Dakota. Larsen, T.J. (1984). Identification of instructional leadership behaviors and the impact of their implementation on academic achievement (Effective Schools, High Achieving Schools; Los Angeles County, California). Unpublished doctoral dissertation, University of Colorado at Boulder. Lee, C.M. (2001). Teacher perceptions of factors impacting on student achievement in effective and less effective urban elementary schools. Unpublished doctoral dissertation, Wayne State University, Detroit, MI. Lewis, L.W., Jr. (1983). Relationship between principals’ leadership style and achievement scores of third-grade students from low-income families. Unpublished doctoral dissertation, Duke University, Durham, NC. Madison, T., Jr. (1988). A correlational study of the leadership behavior of school principals and the reading achievement of sixth grade students from the low and upper social classes. Unpublished doctoral dissertation, Georgia State University.
Page 195 of 203
40 McCord, H.C. (1982). Title I school principals’ characteristics and behaviors and their relationship to student reading achievement. Unpublished doctoral dissertation, Northern Illinois University, Dekalb. McMahon-Dumas, C.E. (1981). An investigation of the leadership styles and effectiveness dimensions of principals, and their relationship with reading gain scores of students in the Washington, DC public schools. Unpublished doctoral dissertation, George Washington University, Washington, DC. Meek, J.P. (1999). Relationship between principal instructional leadership and student achievement outcomes in North Carolina public elementary schools. Unpublished doctoral dissertation, North Carolina State University, Raleigh. Morey, M. (1996). The relationships among student science achievement, elementary science teaching efficacy, and school climate (public schools). Illinois State University. Norvell, C.A. (1984). Characteristics of perceived leadership, job satisfaction, and central life interests in high-achieving, low- achieving, and improving Chapter I Schools (Los Angeles, California). Unpublished doctoral dissertation, University of California, Los Angeles. O’Day, K.A. (1984). The relationship between principal and teacher perceptions of principal instructional management behavior and student achievement. Unpublished doctoral dissertation, Northern Illinois University. Pounder, D.G., & Ogawa, R.T. (1995,November). Leadership as an organization-wide phenomenon: Its impact on school performance. Educational Administration Quarterly, 31(4), 564-588. Prouty, R.S. (1987). Mathematics achievement and self-esteem at secondary schools in Zaire: The effects of principals’ emphasis on instructional leadership. Unpublished doctoral dissertation, Michigan State University. Reed, D.E. (1987). Organizational characteristics, principal leadership behavior and teacher job satisfaction: An investigation of the effects on student achievement. Unpublished doctoral dissertation, University of Rochester. Rigell, C.D. (1999, May). Leadership behaviors of principals and student achievement. Unpublished doctoral dissertation, University of Tennessee, Knoxville. Ruzicska, J.K. (1989). The relationships among principals’ sense of efficacy, instructional leadership, and student achievement. Unpublished doctoral dissertation, University of San Francisco. Skilling, W.C. (1992). a study of the relationship between middle school principal leadership behavior and seventh-grade student reading achievement. Unpublished doctoral dissertation, Michigan State University. Skrapits, V.A. (1986). School leadership, interpersonal communication, teacher satisfaction, and student achievement. Unpublished doctoral dissertation, Fordham University, Bronx, NY. Smith, C.L. (1995). Secondary principals: A study of relationships, leadership styles, and student achievement. Unpublished doctoral dissertation, Wayne State University, Detroit, MI.
Page 196 of 203
41 Smith, W.F., & Andrews, R.L. (1989). Instructional leadership: How principals make a difference. Alexandria, VA: Association of Supervision and Curriculum Development. Soltis, G.J. (1987). The relationship of a principal’s leadership style in decision patterns to teacher perception of building leadership an to student learning. Unpublished doctoral dissertation, Temple University, Philadelphia, PA. Spirito, J.P. (1990). The instructional leadership behaviors of principals in middle schools in California and the impact of their implementation on academic achievement (effective schools). Unpublished doctoral dissertation, University of La Verne, Bakersfield, CA. Standley, N.L. (1985). Administrative style and student achievement: A correlational study. Unpublished doctoral dissertation, Washington State University, Pullman. Thomas, M.D. (1997). The relationship of teachers’ perceptions of instructional leadership behaviors of principals in Virginia to student achievement levels. Unpublished doctoral dissertation, Wilmington College, DE. Traufler, V.J. (1992). The relationship between student achievement and individual correlates of effective schools in selected schools of South Carolina. University of South Carolina. Van Zanten, R.C. (1988). Leadership style of principals in effective urban elementary schools. Unpublished doctoral dissertation, Seton Hall University, South Orange, NJ. Vernotica, G.J. (1988). Principal goal clarity and interaction behaviors on teacher and student outcomes in the elementary public schools of Newark, New Jersey. Unpublished doctoral dissertation, Seton Hall University, South Orange, NJ. Verona, G.S. (2001, May. The influence of principal transformational leadership style on high school proficiency test results in New Jersey comprehensive and vocationaltechnical high schools. Unpublished doctoral dissertation, Rutgers University, New Brunswick, NJ. Walton, L.E. (1990). The relationship of teachers’ perceptions of school climate and principal competencies with the third-grade Georgia Criterion Referenced Test scores in rural Georgia elementary schools (rural schools). Unpublished doctoral dissertation, Georgia State University. Wolfson, E. (1980). An investigation of the relationship between elementary principals’ leadership styles and reading achievement of third and sixth grade students. Unpublished doctoral dissertation, Hofstra University, Hempstead, NY. Young, L.S. (2001, December). Measuring the effects of principal leadership adaptability on elementary school performance indicators: A quasi-experimental design. Unpublished doctoral dissertation, Texas A & M University-Commerce.
Page 197 of 203
42 Section V: Breaking Ranks II: Strategies for Leading High School Reform Adelman, C. (1999). Answers in the toolbox: Academic intensity, attendance patterns, and bachelor’s degree attainment. Washington, DC: U.S. Department of Education, Office of Educational Research and Improvement. Boyer, E.L. (1983). High school: A report on secondary education in America. The Carnegie Foundation for the Advancement of Teaching. New York, NY: Harper & Row. Camblin, S.J., Bullatt, Y., & Klopott, S. (2003). Strategies for success: Six stories of increasing college access. Boston, MA: Pathways to College Network. Carnegie Council on Adolescent Development. (1989). Turning points: Preparing American youth for the 21st century. Washington, DC: Author. Clarke, J.H. (2003). Changing systems to personalize learning: Introduction to the personalization workshops. Providence, RI: Education Alliance at Brown University. Clarke, J.H., & Frazer, E. (2003). Making learning personal: Educational practices that work. In J. DiMartino, J. Clarke, & D. Wolk (Eds.), Personalized learning: Preparing high school students to create their futures (pp. 174-193). Lanham, MD: Scarecrow Press. Collins, D. (1998). Achieving your vision of professional development: How to assess your needs and get what you want. Greensboro, NC: SERVE. Cotton, K. (2004). New small learning communities: Findings from recent literature. Reston, VA: National Association of Secondary School Principals. Dalziel, M.M., & Schoonover, S.C. (1988). Changing ways: A practical tool for implementing change within organizations. New York: Amacom. Darling-Hammond, L., Ancess, J., & Ort, S.W. (2002, Fall). Reinventing high school: Outcomes of the Coalition Campus Schools project. American Educational Research Journal, 39(3), 639-73). DiMartino, J., Clarke, J., & Wolk, D. (Eds.). Personalized learning: Preparing high school students to create their futures. Lanham, MD: Scarecrow Press. Fullan, M.G. (with S. Stiegelbauer). (1991). The new meaning of educational change. New York, NY: Teachers College Press. Gainey, D.D., & Webb, L.D. (1998). The education leader’s role in change: How to proceed. Reston, VA: National Association of Secondary School Principals. Lachat, M.A. (2002). Putting student performance data at the center of school reform. In J. DiMartino, J. Clarke, & D. Wolk (Eds.), Personalized learning: Preparing high school students to create their futures (pp. 210-228). Lanham, MD: Scarecrow Press. Lee, V.E., Smith, J.B., & Croninger, R.G. (1995, Fall). Another look at high school restructuring: More evidence that it improves student achievement and more insight into why. Issues in Restructuring Schools, 9, 1-10.
Page 198 of 203
43 Maine Commission on Secondary Education. (1998). Promising futures: A call to improve learning for Maine’s secondary students. Augusta, ME: Maine Department of Education. Marnik, G. (1997). A glimpse at today’s high schools. Presented at Successful Transitions conference by the College of Education and Human Development, University of Maine, Orono. National Association of Secondary School Principals. (1996). Breaking ranks: Changing an American institution. Reston, VA: Author. National Association of Secondary School Principals. (1998). Breaking ranks leadership: A development program for school teams. Reston, VA: Author. National Association of Secondary School Principals. (1999). Using data for school improvement. Reston, VA: Author. National Association of Secondary School Principals. (2002). What the research shows: Breaking ranks in action. Reston, VA: Author. National Commission on Excellence in Education. (1983). A nation at risk : The imperative for educational reform. Washington, DC: U.S. Government Printing Office. National Education Commission on Time and Learning. (1994). Prisoners of time. DC: U.S. Government Printing Office. North Central Regional Educational Laboratory. (2003, Spring). Notes and Reflections, 4. Retrieved January 13, 2004, from www.ncrel.org/info/notes/spring03/index.html Osofsky, D., Sinner, G., & Wolk, D. (2003). Changing systems to personalize learning: The power of advisories. Providence, RI: Education Alliance at Brown University. Painter, B., Lucas, S., Wooderson, M., & Valentine, J. (2000). The use of teams in school improvement processes. Reston,, VA: National Association of Secondary School Principals. Painter, B., & Valentine, J. (1999). Engaging teachers in the school improvement process. Reston, VA: National Association of Secondary School Principals. Painter, B., & Valentine, J. (2002). Instructional Practices Inventory. Columbia, MO: Middle Level Leadership Center. Quinn, D., Greunert, S., & Valentine, J. (1999). Using data for school improvement. Reston, VA: National Association of Secondary School Principals. Reeves, D. (2001). 101 Questions and answers about standards, assessment, and accountability. Denver, CO: Advanced Learning Centers. Schlechty, P. (1990). Schools for the 21st century. San Francisco, CA: Jossey-Bass. Sizer, T.R. (1984). Horace’s compromise: The dilemma of the American high school. Boston, MA: Houghton Mifflin. Sparks, D., & Hirsh, S. (1997). A new vision for staff development. Alexandria, VA: Association for Supervision and Curriculum Development.
Page 199 of 203
44 Sparks, D., & Loucks-Horsley, S. (1989). Five models of staff development for teachers. Journal of Staff Development, 4, 40-57. Sullivan, C. (2004). College readiness for all: A framework for action. Boston, MA: Pathways to College Network. Vermont High School Task Force. (2002). High schools on the move: Renewing Vermont’s commitment to quality secondary education. Montpelier, VT: Vermont Department of Education. Webb, L.D., & Berkbuegler, R. (1998). Personal learning plans for educators. Reston, VA: National Association of Secondary school Principals. Webb, L.D., & Norton, F.S. (1999). Human Resources Administration: Personnel Needs and Issues in Personnel Administration (3rd ed.). New York, NY: Prentice Hall. Westerberg, T., & Webb, L.D. (1997). Providing focus and direction through essential learnings. Reston, VA: National Association of Secondary School Principals.
Page 200 of 203
ACKNOWLEDGEMENTS The Maryland State Department of Education gratefully acknowledges the support and assistance of the following groups and individuals whose advice was invaluable in the development of the Maryland Instructional Leadership Framework. Primary Authors: • Ms. Mary Cary, Assistant State Superintendent, Division for Leadership Development • Dr. Jim Foran, Executive Director, High School and Postsecondary Initiatives, Division for Leadership Development Division for Leadership Development Staff: • Ms. Debbie Drown, Director of Elementary School Initiatives • Ms. Bronda Mills, Director of Middle School Initiatives • Ms. Dori Novak, Director of Leadership Alignment Initiatives • Ms. Mary Bea Preston, Director of Professional Development Grant Initiatives Individuals: • Mr. Ed Cozzolino, Distinguished Principal Fellow • Mr. Paul Dunford, Distinguished Principal Fellow • Mr. Stephen O. Gibson, Distinguished Principal Fellow • Dr. Clarence Golden, Frostburg State University • Dr. Michael Hickey, Towson University • Dr. James McGowan, Johns Hopkins University • Ms. Mary Minter, Distinguished Principal Fellow Executive Boards of the Following Organizations: • Maryland Association of Elementary School Principals • Maryland Association of Secondary School Principals • Maryland Council of Staff Developers • Maryland Parent-Teacher Association • Maryland State Teachers Association Key Educational Groups: • Maryland Superintendents • Executive Officers • College and University Deans, Coordinators, and Directors of Educational Administration Programs • Assistant Superintendents of Instruction • K-16 Highly Qualified Administrator Committee • K-12 Principals’ Advisory Council • Directors and Coordinators of Career and Technology Programs • Workgroup of the Maryland Partnership for Teaching and Learning K-16 • Principals Certification Review Committee • Maryland Teacher Mentor Program Network Participants in the Following Events: • Maryland Principals’ Academy, 2004 • High Schools That Work/Making Middle Grades Work Conference, 2004 • Maryland Association of Secondary School Principals’ Assistant Principal Conference, 2004 Special acknowledgement to Ms. Betty Fisher, Executive Associate, Division for Leadership Development, whose technology and editing expertise was invaluable to this publication.
Page 201 of 203
APPENDIX II-12: MARYLAND’S
TEACHER PRINCIPAL EVALUATION
TIMELINE
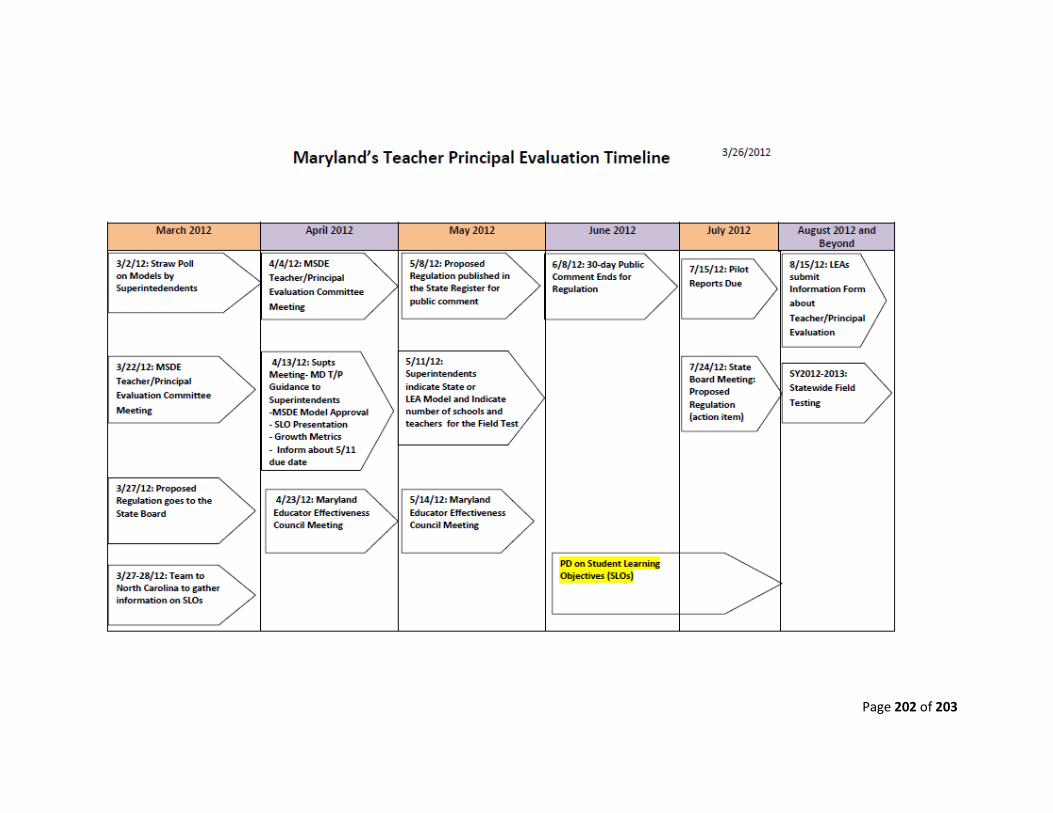
Page 202 of 203

Page 203 of 203


