Embed Size (px)
Citation preview
Long-Term Relationships between Synaptic Tenacity,Synaptic Remodeling, and Network ActivityAmir Minerbi1,2,3, Roni Kahana1,2,3, Larissa Goldfeld1,2,3, Maya Kaufman1,2,3, Shimon Marom1,2, Noam E.
Ziv1,2,3*
1 Department of Physiology and Biophysics, Technion Faculty of Medicine, Haifa, Israel, 2 Network Biology Research Laboratories, Lorry Lokey Interdisciplinary Center for
Life Sciences and Engineering, Haifa, Israel, 3 The Rappaport Family Institute for Research in the Medical Sciences, Haifa, Israel
Abstract
Synaptic plasticity is widely believed to constitute a key mechanism for modifying functional properties of neuronalnetworks. This belief implicitly implies, however, that synapses, when not driven to change their characteristics byphysiologically relevant stimuli, will maintain these characteristics over time. How tenacious are synapses over behaviorallyrelevant time scales? To begin to address this question, we developed a system for continuously imaging the structuraldynamics of individual synapses over many days, while recording network activity in the same preparations. We found thatin spontaneously active networks, distributions of synaptic sizes were generally stable over days. Following individualsynapses revealed, however, that the apparently static distributions were actually steady states of synapses exhibitingcontinual and extensive remodeling. In active networks, large synapses tended to grow smaller, whereas small synapsestended to grow larger, mainly during periods of particularly synchronous activity. Suppression of network activity onlymildly affected the magnitude of synaptic remodeling, but dependence on synaptic size was lost, leading to the broadeningof synaptic size distributions and increases in mean synaptic size. From the perspective of individual neurons, activity drovechanges in the relative sizes of their excitatory inputs, but such changes continued, albeit at lower rates, even when networkactivity was blocked. Our findings show that activity strongly drives synaptic remodeling, but they also show that significantremodeling occurs spontaneously. Whereas such spontaneous remodeling provides an explanation for ‘‘synaptichomeostasis’’ like processes, it also raises significant questions concerning the reliability of individual synapses as sitesfor persistently modifying network function.
Citation: Minerbi A, Kahana R, Goldfeld L, Kaufman M, Marom S, et al. (2009) Long-Term Relationships between Synaptic Tenacity, Synaptic Remodeling, andNetwork Activity. PLoS Biol 7(6): e1000136. doi:10.1371/journal.pbio.1000136
Academic Editor: Charles F. Stevens, Salk Institute for Biological Studies, United States of America
Received December 22, 2008; Accepted May 13, 2009; Published June 23, 2009
Copyright: � 2009 Minerbi et al. This is an open-access article distributed under the terms of the Creative Commons Attribution License, which permitsunrestricted use, distribution, and reproduction in any medium, provided the original author and source are credited.
Funding: This work was supported by grants from the Israel Science Foundation (526/01), the United States Israel Binational Science Foundation (2003176), andthe Minerva Foundation. The funders had no role in study design, data collection and analysis, decision to publish, or preparation of the manuscript.
Competing Interests: The authors have declared that no competing interests exist.
Abbreviations: CLSM, confocal laser scanning microscope; MEA, multielectrode array; PSD, postsynaptic density.
* E-mail: [email protected]
Introduction
Synapses are widely believed to constitute key loci for modifying
the functional properties of neuronal networks, possibly providing
the basis for phenomena collectively referred to as learning and
memory [1,2]. Indeed, an overwhelming body of literature supports
the notion that synapses are ‘‘plastic’’, that is, change their
functional characteristics in response to specific activation patterns.
The hypothesis that activity-dependent changes to synaptic
characteristics constitutes a key mechanism for modifying neuronal
network function also implies, however, that synapses, when not
driven to change their characteristics by physiologically relevant
stimuli, should retain these characteristics over time. Otherwise,
physiologically relevant modifications to network function would be
gradually lost due to stochastic, spurious changes or spontaneous
drift. Thus, it might be expected that the capacity of synapses for
directed change—synaptic plasticity—should be accompanied by a
tendency to retain their characteristics at all other times, a
phenomenon we will refer to here as ‘‘synaptic tenacity’’.
The advent of molecular imaging techniques and the ability to
study the molecular dynamics of specific molecules are gradually
leading to the realization that synapses are not static, rigid
structures; rather, they are made of multimolecular protein
ensembles that exhibit significant dynamics at time scales of
seconds to hours. Such dynamics include the recruitment and
dispersal of regulatory constituents, lateral diffusion, endocytosis
and exocytosis of postsynaptic neurotransmitter receptors, cyto-
skeletal dynamics and spine ‘‘morphing’’, loss, incorporation, and
turnover of scaffold molecules, and the interchange of synaptic
molecules, multimolecular complexes, and synaptic vesicles among
neighboring synapses (reviewed in [3–11]). When considering the
bewildering dynamics exhibited by synaptic molecules, it becomes
apparent that the long-term tenacity of synaptic structure and, by
extension, synaptic function is not at all an obvious outcome. Yet
to date, very little is known on the long-term tenacity of individual
synapses [12].
Despite the molecular dynamics of synaptic constituents, most
central nervous system (CNS) synapses appear to be quite
persistent, although some degree of synapse formation and
elimination is observed, depending on brain region, type of
synapse, animal age, and imaging techniques [13–20] (reviewed in
[8,21]). Interestingly, however, even persistent synapses, when
PLoS Biology | www.plosbiology.org 1 June 2009 | Volume 7 | Issue 6 | e1000136
examined over long time scales (days), seem to exhibit considerable
morphological changes (for example, [14,15,17,22,23]; see also
[18]). In most of these studies, it was surmised that the observed
changes in synaptic morphology represented structural manifesta-
tions of synaptic plasticity processes.
In most of the aforementioned studies, synapses were visualized
by means of volume-filling fluorescent dyes (mainly enhanced
green fluorescent protein [EGFP] or its spectral variants) and
identified on the basis of typical pre- and postsynaptic morpho-
logical features (i.e., axonal varicosities and dendritic spines,
respectively), whereas functionally relevant reporters, such as
synaptic vesicle, postsynaptic receptor, active zone, or postsynaptic
density (PSD) molecules were rarely used. Furthermore, even
though manipulations aimed at altering network activity were
performed in some of these studies, actual network activity was not
recorded. Thus, the actual relationships between synaptic tenacity,
synaptic remodeling, and network activity over these long time
scales remained unknown.
To evaluate the tenacity of individual synaptic structures over
behaviorally relevant time scales and differentiate between
activity-dependent and activity independent-synaptic remodeling,
an experimental system is needed in which both structural
dynamics of individual synapses and electrical activity can be
monitored continuously and simultaneously at sufficiently high
temporal resolutions for very long periods. At present, this is an
extremely challenging requirement, in particular where in vivo
studies are concerned. We therefore developed a novel system,
based on networks of rat cortical neurons in primary culture, that
allowed us to continuously follow and record the structural
dynamics of individual PSDs over time scales of minutes to weeks
while concomitantly recording (and manipulating) network activity
in the same preparations. We find that the vast majority of PSDs
in this preparation undergo significant, continuous remodeling
over time scales of many hours and days. The direction and extent
of PSD remodeling are strongly affected by network activity levels,
but remodeling does not cease upon suppression or elimination of
activity. Our findings, described below, thus indicate that the
tenacity exhibited by individual synapses over time scales of days is
rather limited and may indicate that structural (and by extension,
functional) properties of individual synapses experience significant
drift over long durations.
Results
Long-Term Time-Lapse Imaging of PostsynapticStructures with Concomitant Recording of NetworkActivity
In order to examine the tenacity of individual synapses, a system
was needed that would allow us to record the structural dynamics
of individual synaptic structures while concomitantly recording
network activity in the same preparations and to do so
continuously for many days. The experimental system we
developed for this purpose was based on primary cultures of
cortical neurons obtained from neonatal rats and plated on
substrate-integrated multielectrode array (MEA) dishes [24–27].
To allow for the use of high numerical aperture oil-immersion
objectives (that typically have short working distances), we used
special MEA dishes made of very thin glass (180 mm) that are
ideally suited for high-resolution imaging. Each dish contained 59
electrodes arranged in an 868 grid with interelectrode distances of
200 mm. Although the flat 30-mm diameter electrodes were
opaque, the leads were transparent, resulting in minimal optical
obstructions in the imaged regions (Figure 1A).
PSDs were visualized by expressing an EGFP-tagged variant of
the PSD molecule PSD-95 (PSD-95:GFP). PSD-95 [28,29] is a
major postsynaptic scaffold protein that is thought to cluster
postsynaptic NMDA receptors at postsynaptic sites. Most
importantly, PSD-95, through interactions with transmembrane
AMPA receptor regulatory proteins (such as stargazin) is believed
to dictate the number of AMPA receptors found within the
postsynaptic membrane (reviewed in [30]; see also [31–33]).
Fluorescently tagged PSD-95 was used previously to study
excitatory synapse formation (for example, [22,34–39]), PSD
turnover (for example, [40–42]), and PSD remodeling [22,43], and
was shown to faithfully represent PSD architectural rearrange-
ments [43]. The particular EGFP-fusion protein used here was
characterized extensively [35,44]; When expressed in cultured
hippocampal neurons, it was shown to localize correctly to
postsynaptic structures associated with functional presynaptic sites,
colocalize with the AMPA receptor subunit GluR1, and only
negligibly affect gross synaptic characteristics [35]. In the current
study, we used a third-generation lentiviral expression system [45]
to express this fusion protein after an extensive series of
preliminary experiments showed that this method was greatly
preferable over more common transfection methods (calcium
phosphate, cationic lipids, and electroporation): Lentivirus-based
expression was easily titratable, resulted in low and constant
expression levels, and importantly, unlike the aforementioned
transfection methods, did not affect network activity properties or
reduce cell numbers. Transduction was performed on day 5 in
vitro leading to PSD-95:GFP expression in a small (10 to 50)
number of neurons in each dish (and, occasionally, in nonneuronal
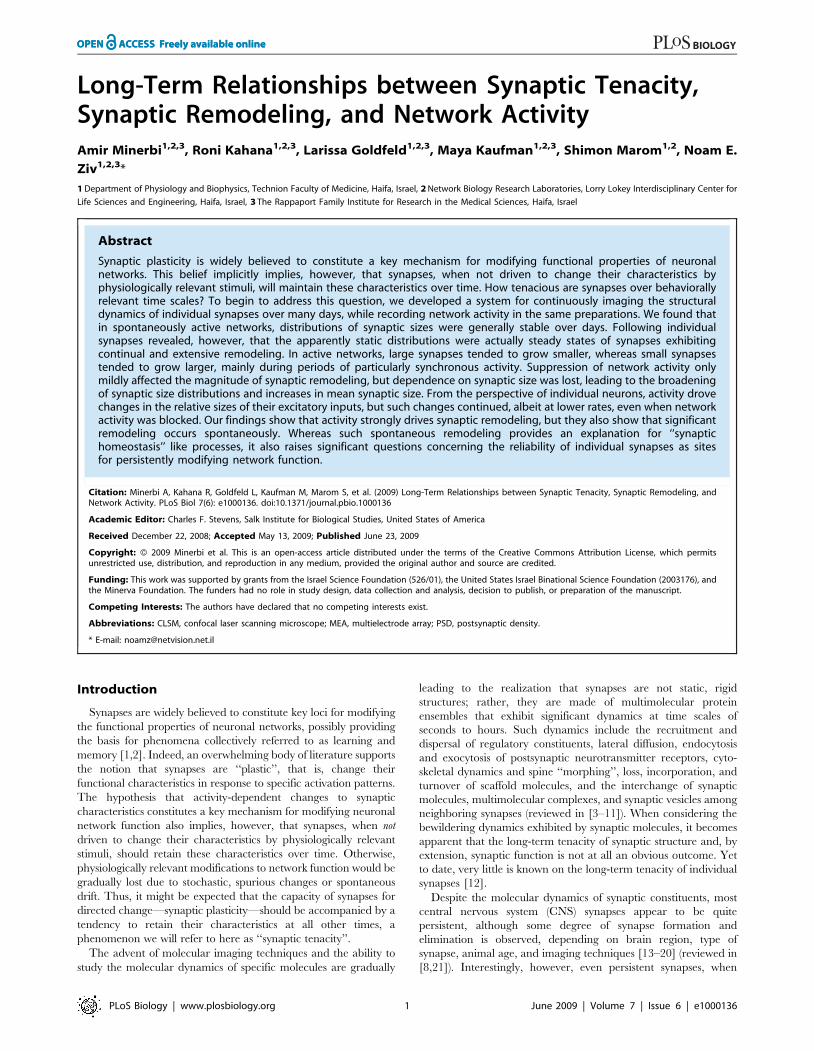
cells). As shown in Figure 1, PSD-95:GFP assumed a punctate
appearance, with the puncta commonly located at the tips of
dendritic spines.
To allow for long-term (many days) combined optical/
electrophysiological recordings from these preparations, a com-
mercial MEA headstage/amplifier was installed on a custom-built
confocal laser scanning (inverted) microscope (CLSM) equipped
with a robotic XYZ stage. In each experiment, the MEA dish was
covered with a custom-built cap and placed in the headstage/
Author Summary
Neurons communicate via synapses, and it is believed thatactivity-dependent modifications to synaptic connec-tions—synaptic plasticity—is a fundamental mechanismfor stably altering the function of neuronal networks. Thisbelief implies that synapses, when not driven to changetheir properties by physiologically relevant stimuli, shouldpreserve their individual properties over time. Otherwise,physiologically relevant modifications to network functionwould be gradually lost or become inseparable fromstochastically occurring changes in the network. So dosynapses actually preserve their properties over behavior-ally relevant time scales? To begin to address this question,we examined the structural dynamics of individualpostsynaptic densities for several days, while recordingand manipulating network activity levels in the samenetworks. We found that as expected in highly activenetworks, individual synapses undergo continual andextensive remodeling over time scales of many hours todays. However, we also observed, that synaptic remodel-ing continues at very significant rates even when networkactivity is completely blocked. Our findings thus indicatethat the capacity of synapses to preserve their specificproperties might be more limited than previously thought,raising intriguing questions about the long-term reliabilityof individual synapses.
Long-Term Synaptic Tenacity
PLoS Biology | www.plosbiology.org 2 June 2009 | Volume 7 | Issue 6 | e1000136
amplifier connected to the CLSM’s robotic stage. The MEA dish
and oil-immersion objective were heated to 37uC, and a sterile
mixture of 5% CO2, 95% air was streamed into the MEA dish. An
ultraslow perfusion system was used to exchange the media at very
low rates (two volumes per day). Images were collected
automatically at 30-min intervals from four to 12 fields of view
(or sites; ,95670 mm in size), with each site representing a portion
of the dendritic arbor of a different neuron (Figure 1). Seven to 26
Z-sections were collected at each site, beginning at a predeter-
mined offset above the upper glass surface. To correct for focal
drift, the focal plane of the upper glass surface was located
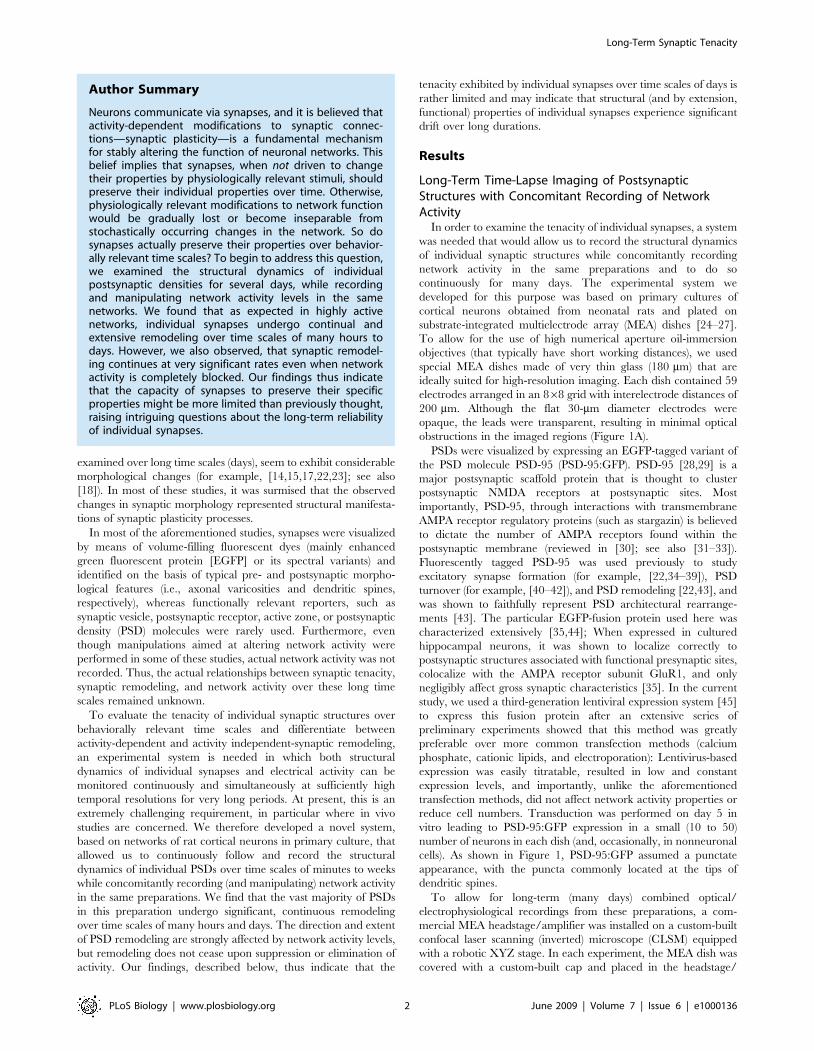
automatically before collecting each image stack [35]. Network
activity in the imaged networks was recorded from all 59
(extracellular) embedded electrodes (Figure 2). For each electrode,
waveforms of individual action potentials were stored digitally and
then converted into series of discrete events (Figure 2D). Under
these conditions, preparations were routinely maintained on the
microscope stage, recorded from and imaged continuously for
many days and even weeks (Figure 1C and 1D).
The synaptic identity of PSD-95:GFP puncta was verified by
labeling active presynaptic compartments in live neurons with
fluorescent antibodies against the lumenal domain of the synaptic
vesicle protein synaptotagmin-1 ([46]; see Materials and Methods
for further details). As shown in Figure S1, .80% of PSD-95:GFP
puncta were juxtaposed against functional synaptic vesicle
recycling sites, in good agreement with prior measurements
performed in cultured hippocampal neurons using the styryl dye
FM 4–64 (83%; [35]). The high degree of colocalization along
with the fact that labeling was based entirely on spontaneous
activity strongly indicates that most PSD-95:GFP puncta represent
Figure 1. Long-term imaging of postsynaptic sites. (A) Rat cortical neurons growing on a thin-glass MEA dish. Two electrodes (opaque circlesat the bottom of the image) and their transparent leads are visible. The yellow arrowhead indicates the neuron shown in (B). (B) A single neuronexpressing PSD-95:GFP (yellow arrowhead) in the same field of view as (A). Fluorescent puncta represent postsynaptic sites formed on dendriticspines and shafts. On rare occasions, other cell types (a microglia cell in this image) also expressed the fluorescent protein (asterisk and inset). Thepositions of the two electrodes shown in (A) are denoted as yellow dotted-line circles. (C) A 5-d time-lapse series (30-min intervals, or 48 images/day)of the region enclosed in a yellow rectangle in (B) (only a small subset of the data is shown here). (D) Magnification of region enclosed in yellowrectangle in (C), demonstrating the actual temporal and spatial resolution of imaging data collected in these experiments. All images in (B–D) aremaximal intensity projections of 14 images collected at 14 focal planes spaced 0.8 mm apart. Inset in (B) includes only the two bottommost sections.Bars in (A and B) indicate 50 mm; in (C), 10 mm; and in (D), 3 mm.doi:10.1371/journal.pbio.1000136.g001
Long-Term Synaptic Tenacity
PLoS Biology | www.plosbiology.org 3 June 2009 | Volume 7 | Issue 6 | e1000136
bona fide glutamatergic synapses that are activated by spontane-
ous network activity.
MEA dishes allowed us to sample network activity from 59
locations in the network, but due to the presence of multiple
neurons near each electrode, the identity of neurons from which
activity was recorded remained obscure. Furthermore, due to the
random nature of lentiviral infection, neurons expressing PSD-
95:GFP were not necessarily located over any particular electrode.
It was thus necessary to verify that the activity recorded through
the electrodes faithfully represented the activity of those neurons
expressing PSD-95:GFP and followed by time-lapse microscopy.
To that end, we took advantage of the fact that most activity in
networks of dissociated cortical neurons occurs in the form of
synchronized bursts (for example, [25,27,47–49]; see also
Figure 2A–2C). By using fluorescent calcium indicators and
synchronized MEA recordings, we found that practically all
Figure 2. MEA-based recordings of spontaneous activity in cultures of cortical neurons. (A) Continuous extracellular recordings from fiveof the 59 electrodes in a MEA dish. Network activity exhibits some sporadic firing but mainly synchronous bursts. (B and C) A segment of a recordingat higher resolution showing (B) trains of action potentials, and (C) individual action potentials. (D) Raster plots of action potentials recorded from 59electrodes. Each action potential event is denoted as a single dot. The bottom row (red) corresponds to the raw data trace shown in (B).doi:10.1371/journal.pbio.1000136.g002
Long-Term Synaptic Tenacity
PLoS Biology | www.plosbiology.org 4 June 2009 | Volume 7 | Issue 6 | e1000136
network bursts were time-locked to calcium transients measured
by line scanning in the somata of PSD-95:GFP-expressing neurons
(Figure S2; 27 neurons, four separate experiments). These
experiments strongly indicate that the characteristics of network
activity recorded through the MEA faithfully represent, at least to
a first approximation, the activity of PSD-95:GFP-expressing
neurons. Furthermore, the tight correlation between network
bursts and calcium transients suggests that these neurons respond
well to excitatory synapse activation, implying that PSD-95:GFP
expression does not severely impair glutamatergic synapse
functionality.
In summary, the system described here allowed us to follow
structural dynamics of individual and functional glutamatergic
synapses at relatively high temporal resolutions and over many
days while concomitantly recording network activity in the same
preparations.
Spontaneous Changes in Network Activity, PSD Number,and PSD Size
We initially set out to the examine the long-term stability of
PSD-95:GFP puncta under baseline conditions, that is, without
experimentally manipulating network activity. To that end, we
used preparations maintained in culture for at least 17 d. At this
stage, networks of rat cortical neurons are considered to be
relatively mature, and beyond the phase of extensive dendrite
extension and synapse formation. The preparations were mounted
on the CLSM and followed by combined time-lapse imaging and
electrophysiological recordings as described above. At the end of
each experiment, spike counts per electrode were extracted from
the electrophysiological recordings, and the numbers of PSD-
95:GFP puncta and their respective fluorescence intensities were
extracted from maximal intensity projections of Z-stacks for each
time point and each site (see Materials and Methods).
These experiments resulted in two highly consistent observa-
tions. The first concerns network activity. As noted above, cultured
networks of dissociated cortical neurons typically develop complex
patterns of spontaneous activity composed of asynchronous action
potentials and synchronized bursts (Figure 2A–2C). These forms of
activity were observed here as well, as soon as recording was
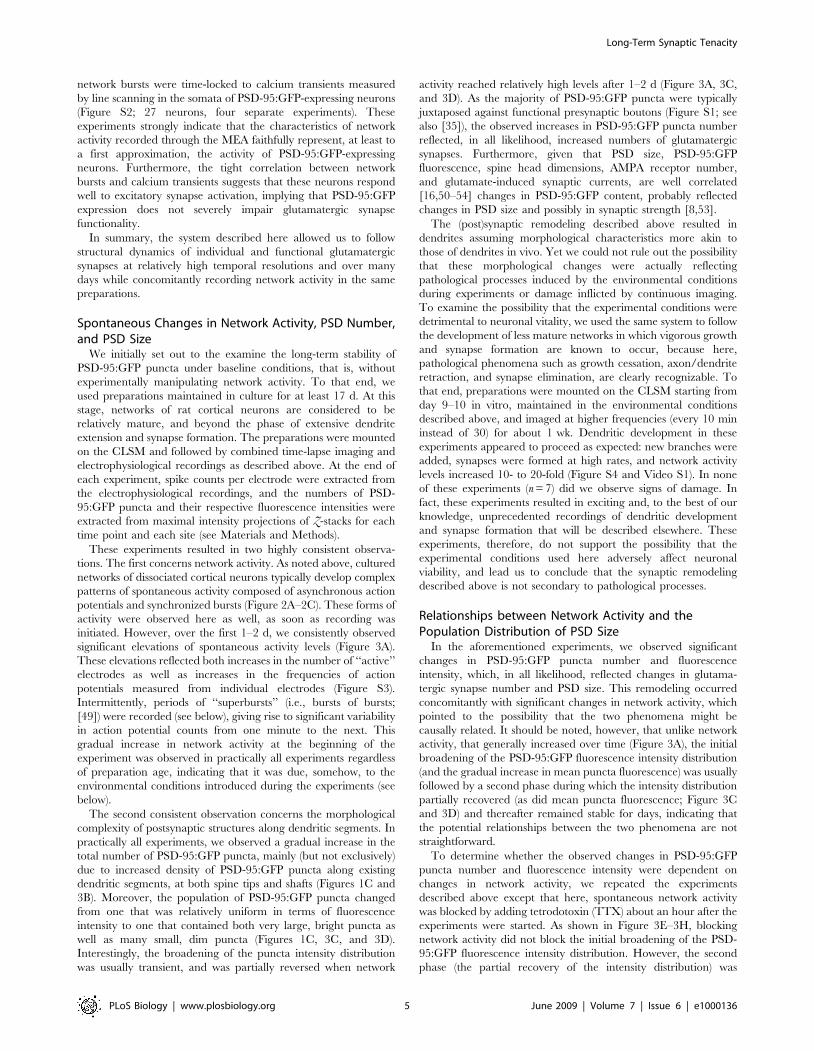
initiated. However, over the first 1–2 d, we consistently observed
significant elevations of spontaneous activity levels (Figure 3A).
These elevations reflected both increases in the number of ‘‘active’’
electrodes as well as increases in the frequencies of action
potentials measured from individual electrodes (Figure S3).
Intermittently, periods of ‘‘superbursts’’ (i.e., bursts of bursts;
[49]) were recorded (see below), giving rise to significant variability
in action potential counts from one minute to the next. This
gradual increase in network activity at the beginning of the
experiment was observed in practically all experiments regardless
of preparation age, indicating that it was due, somehow, to the
environmental conditions introduced during the experiments (see
below).
The second consistent observation concerns the morphological
complexity of postsynaptic structures along dendritic segments. In
practically all experiments, we observed a gradual increase in the
total number of PSD-95:GFP puncta, mainly (but not exclusively)
due to increased density of PSD-95:GFP puncta along existing
dendritic segments, at both spine tips and shafts (Figures 1C and
3B). Moreover, the population of PSD-95:GFP puncta changed
from one that was relatively uniform in terms of fluorescence
intensity to one that contained both very large, bright puncta as
well as many small, dim puncta (Figures 1C, 3C, and 3D).
Interestingly, the broadening of the puncta intensity distribution
was usually transient, and was partially reversed when network
activity reached relatively high levels after 1–2 d (Figure 3A, 3C,
and 3D). As the majority of PSD-95:GFP puncta were typically
juxtaposed against functional presynaptic boutons (Figure S1; see
also [35]), the observed increases in PSD-95:GFP puncta number
reflected, in all likelihood, increased numbers of glutamatergic
synapses. Furthermore, given that PSD size, PSD-95:GFP
fluorescence, spine head dimensions, AMPA receptor number,
and glutamate-induced synaptic currents, are well correlated
[16,50–54] changes in PSD-95:GFP content, probably reflected
changes in PSD size and possibly in synaptic strength [8,53].
The (post)synaptic remodeling described above resulted in
dendrites assuming morphological characteristics more akin to
those of dendrites in vivo. Yet we could not rule out the possibility
that these morphological changes were actually reflecting
pathological processes induced by the environmental conditions
during experiments or damage inflicted by continuous imaging.
To examine the possibility that the experimental conditions were
detrimental to neuronal vitality, we used the same system to follow
the development of less mature networks in which vigorous growth
and synapse formation are known to occur, because here,
pathological phenomena such as growth cessation, axon/dendrite
retraction, and synapse elimination, are clearly recognizable. To
that end, preparations were mounted on the CLSM starting from
day 9–10 in vitro, maintained in the environmental conditions
described above, and imaged at higher frequencies (every 10 min
instead of 30) for about 1 wk. Dendritic development in these
experiments appeared to proceed as expected: new branches were
added, synapses were formed at high rates, and network activity
levels increased 10- to 20-fold (Figure S4 and Video S1). In none
of these experiments (n = 7) did we observe signs of damage. In
fact, these experiments resulted in exciting and, to the best of our
knowledge, unprecedented recordings of dendritic development
and synapse formation that will be described elsewhere. These
experiments, therefore, do not support the possibility that the
experimental conditions used here adversely affect neuronal
viability, and lead us to conclude that the synaptic remodeling
described above is not secondary to pathological processes.
Relationships between Network Activity and thePopulation Distribution of PSD Size
In the aforementioned experiments, we observed significant
changes in PSD-95:GFP puncta number and fluorescence
intensity, which, in all likelihood, reflected changes in glutama-
tergic synapse number and PSD size. This remodeling occurred
concomitantly with significant changes in network activity, which
pointed to the possibility that the two phenomena might be
causally related. It should be noted, however, that unlike network
activity, that generally increased over time (Figure 3A), the initial
broadening of the PSD-95:GFP fluorescence intensity distribution
(and the gradual increase in mean puncta fluorescence) was usually
followed by a second phase during which the intensity distribution
partially recovered (as did mean puncta fluorescence; Figure 3C
and 3D) and thereafter remained stable for days, indicating that
the potential relationships between the two phenomena are not
straightforward.
To determine whether the observed changes in PSD-95:GFP
puncta number and fluorescence intensity were dependent on
changes in network activity, we repeated the experiments
described above except that here, spontaneous network activity
was blocked by adding tetrodotoxin (TTX) about an hour after the
experiments were started. As shown in Figure 3E–3H, blocking
network activity did not block the initial broadening of the PSD-
95:GFP fluorescence intensity distribution. However, the second
phase (the partial recovery of the intensity distribution) was
Long-Term Synaptic Tenacity
PLoS Biology | www.plosbiology.org 5 June 2009 | Volume 7 | Issue 6 | e1000136
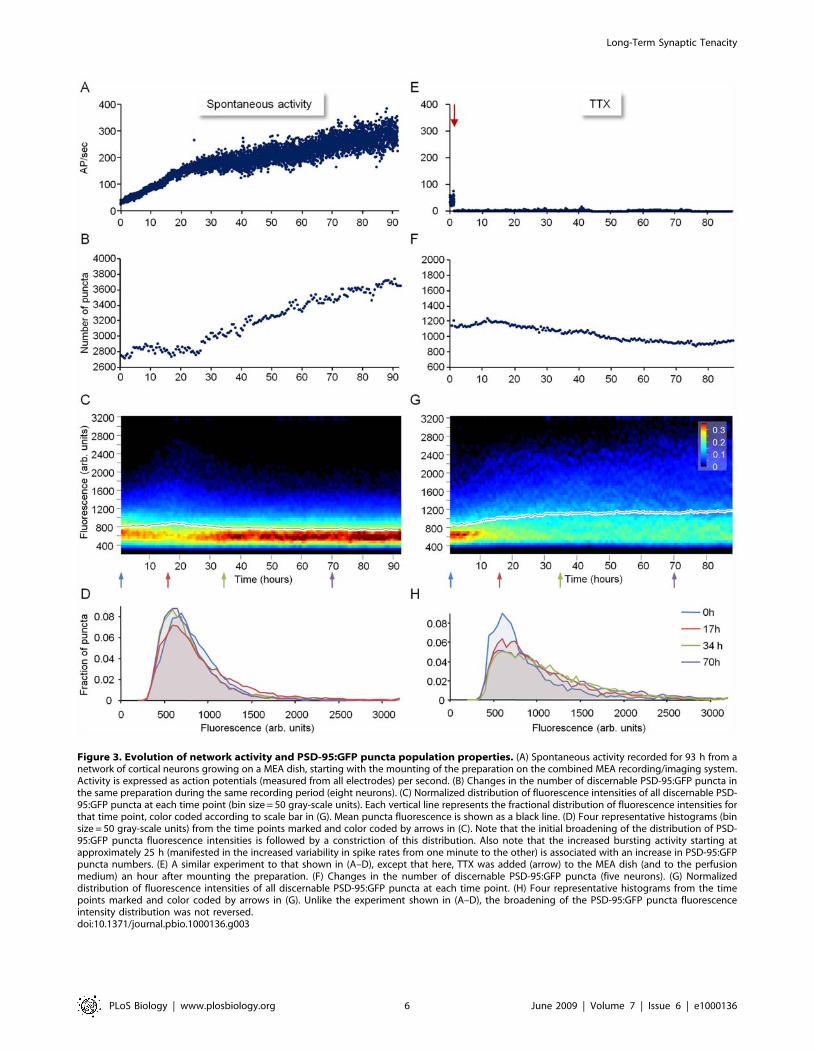
Figure 3. Evolution of network activity and PSD-95:GFP puncta population properties. (A) Spontaneous activity recorded for 93 h from anetwork of cortical neurons growing on a MEA dish, starting with the mounting of the preparation on the combined MEA recording/imaging system.Activity is expressed as action potentials (measured from all electrodes) per second. (B) Changes in the number of discernable PSD-95:GFP puncta inthe same preparation during the same recording period (eight neurons). (C) Normalized distribution of fluorescence intensities of all discernable PSD-95:GFP puncta at each time point (bin size = 50 gray-scale units). Each vertical line represents the fractional distribution of fluorescence intensities forthat time point, color coded according to scale bar in (G). Mean puncta fluorescence is shown as a black line. (D) Four representative histograms (binsize = 50 gray-scale units) from the time points marked and color coded by arrows in (C). Note that the initial broadening of the distribution of PSD-95:GFP puncta fluorescence intensities is followed by a constriction of this distribution. Also note that the increased bursting activity starting atapproximately 25 h (manifested in the increased variability in spike rates from one minute to the other) is associated with an increase in PSD-95:GFPpuncta numbers. (E) A similar experiment to that shown in (A–D), except that here, TTX was added (arrow) to the MEA dish (and to the perfusionmedium) an hour after mounting the preparation. (F) Changes in the number of discernable PSD-95:GFP puncta (five neurons). (G) Normalizeddistribution of fluorescence intensities of all discernable PSD-95:GFP puncta at each time point. (H) Four representative histograms from the timepoints marked and color coded by arrows in (G). Unlike the experiment shown in (A–D), the broadening of the PSD-95:GFP puncta fluorescenceintensity distribution was not reversed.doi:10.1371/journal.pbio.1000136.g003
Long-Term Synaptic Tenacity
PLoS Biology | www.plosbiology.org 6 June 2009 | Volume 7 | Issue 6 | e1000136
completely lost. Instead, the distributions of PSD-95:GFP puncta
fluorescence intensities continued to broaden, and mean puncta
fluorescence continued to increase (Figure 3G and 3H). In
addition, the number of puncta did not increase over time, and
in fact, gradual decreases in puncta numbers were observed
(Figure 3F).
These experiments indicate that the initial broadening of PSD-
95:GFP puncta fluorescence intensity distribution is not driven by
activity. Rather, it seems to be driven by the exposure to
environmental conditions during experiments. Given that ambient
temperature and atmospheric conditions were identical to those in
the incubators in which preparations were maintained, the most
likely ‘‘culprit’’ is the slow perfusion. Indeed, these phenomena are
not observed if perfusion is not applied (unpublished data). On the
other hand, in the absence of perfusion, the long-term viability of
these preparations was drastically impaired. Interestingly, media
turnover rates (,0.15%/min) were one to two orders of
magnitudes lower than cerebrospinal fluid (CSF) turnover rates
in the intact rat brain (1% to 16%/min; [55]), indicating that
perfusion rates were not excessively high.
In contrast to the initial broadening of PSD-95:GFP fluores-
cence intensity distributions, the subsequent constriction of
fluorescence intensity distributions was clearly dependent on
network activity. This dependence indicates that an increase in
activity levels is associated with a reduction in mean PSD size.
This finding is consistent with the concept of ‘‘synaptic scaling’’
[56–58], that is, the adjustment of synaptic strength to match
neuronal activation levels. Interestingly, following the initial
broadening and subsequent constriction, PSD-95:GFP puncta
fluorescence intensity distributions remained relatively stable as
long as activity levels did not change significantly (as exemplified in
Figure 3C). These observations are consistent with the possibility
that PSD size is generally stable, with changes in activity followed
by uniform and gradual scaling of PSD size (multiplication by a
scalar, for example). However, as shown next, this does not seem
to be the case.
Relationships between Network Activity and theRemodeling of Individual Postsynaptic Structures
The analysis described so far indicates that PSD size distribution
remains rather stable as long as activity levels are not drastically
altered. However, this analysis was performed at the population
level, and thus did not provide information on the long-term
stability of individual PSD sizes. To quantify the stability of
individual PSDs, we developed software for tracking identified
PSD-95:GFP puncta in long time series of image stacks, and used
it to quantify the fluorescence of individual PSD-95:GFP puncta at
a temporal resolution of 30 min over several days. Although PSD-
95:GFP puncta were relatively stable over time scales of several
hours, some puncta exhibited considerable dynamics (lateral
movements, merging, and splitting) as previously described
[22,35,36]. We therefore limited our analysis to PSD-95:GFP
that could be identified and tracked reliably throughout the
experiments, excluding puncta that became obscured by, merged
with, or split from other puncta, but not excluding puncta that
simply appeared or disappeared during the experiments. The
fluorescence of all tracked puncta at all time points was then
measured, and these data were compared to network activity
during the same period.
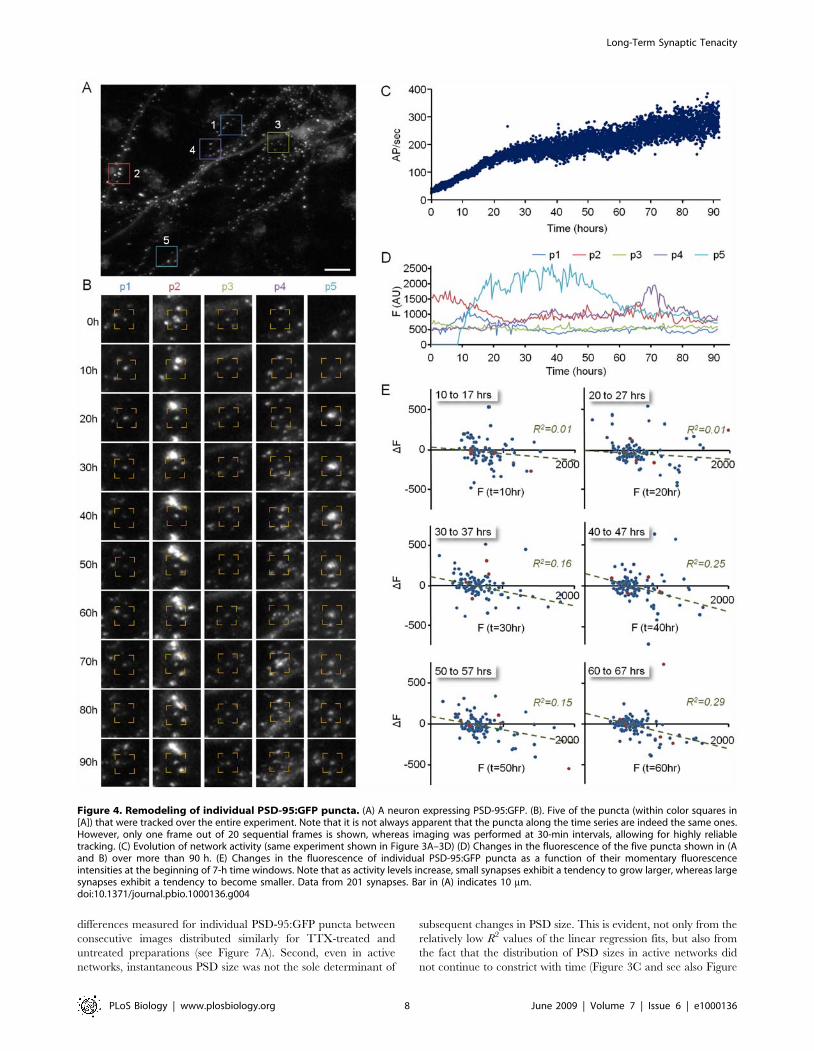
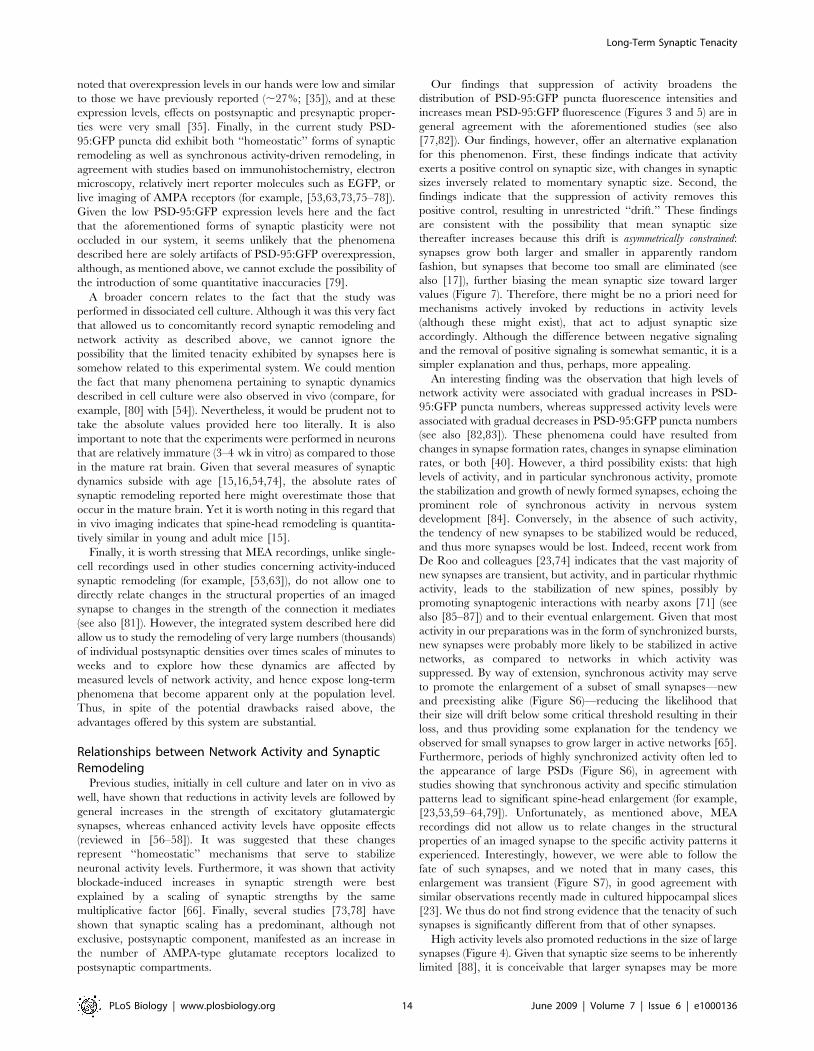
Figure 4 shows such an analysis performed for one neuron of the
experiment of Figure 3A–3D. Five (out of ,200) puncta tracked
over the entire experiment are shown in Figure 4B. Note that it is
not always apparent that the puncta shown in each time series are
indeed the same ones. However, only one frame out of 20
sequential frames is shown in this figure (10-h intervals), whereas
imaging was performed at 30-min intervals, allowing for very
reliable tracking of discernable objects (see also Figure 1D).
Plotting the fluorescence of these five puncta over .90 h
(Figure 4D) revealed that some puncta exhibited significant
changes in their fluorescence over this period, whereas the
fluorescence of others was more stable. Yet, when the fluorescence
of all tracked puncta is rendered for long stretches of time (days),
the instability of individual PSD-95:GFP puncta becomes
strikingly apparent (Video S2). These observations indicate that
the seemingly static size distributions of Figure 3 are, in fact,
population steady states, with individual synapses within this
population undergoing continual and extensive remodeling.
To examine the dependence of changes in PSD size on initial
PSD size, changes in the fluorescence of individually tracked
puncta at the end of consecutive, 7-h time windows, were plotted
as a function of their fluorescence at the beginning of each time
window. To minimize the effects of short-term fluctuations, data
were first ‘‘smoothed’’ with a five–time point (2-h) kernel. As
shown in Figure 4E, significant changes in puncta fluorescence
over time were observed for all puncta, regardless of their initial
size. Interestingly, however, as activity levels increased, a
relationship developed between initial puncta fluorescence and
subsequent changes in fluorescence: Bright puncta tended to
become dimmer, whereas very dim puncta tended to become
brighter, as if activity was driving the convergence of PSD sizes to
some optimal value. These relationships could be approximated
reasonably well by linear regression fits to the data. In should be
noted, however that the R2 values of these linear fits were not very
high, suggesting that the direction and magnitude of PSD size
change were only partially determined by their instantaneous size.
To further examine the dependence of the aforementioned
relationship on network activity, identical experiments were
performed in which spontaneous network activity was blocked
abruptly by adding TTX 40 to 70 h after the experiments were
started. Significant changes in puncta fluorescence over time were
still observed in the presence of TTX, and such changes were
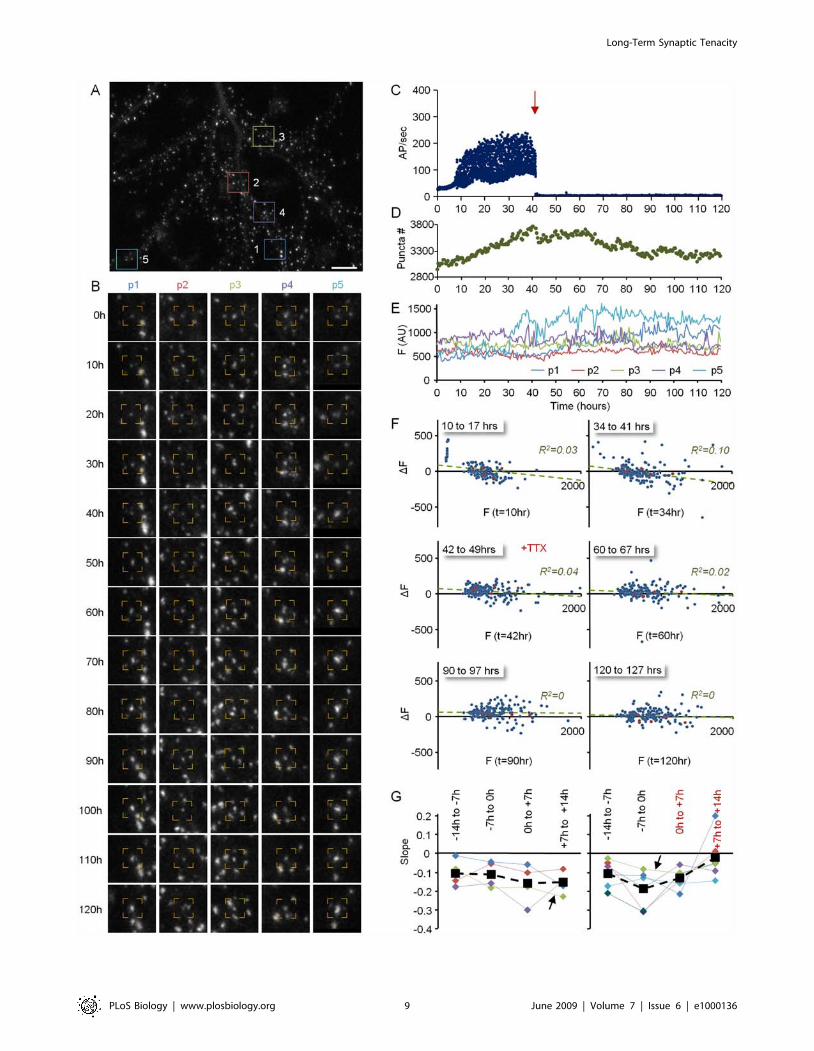
observed for small and large puncta alike (Figure 5 and Video S3).
Strikingly, however, relationships between initial PSD-95:GFP
puncta fluorescence and subsequent changes in fluorescence were
lost. This is indicated by the fact that the slopes of linear regression
lines fit to these data approached zero. Similar findings were
observed for a total of six neurons (Figure 5G). As expected, TTX
addition led to a broadening of the PSD-95:GFP puncta
fluorescence distribution (Figure S5A). Furthermore, this was seen
for both the entire PSD-95:GFP population and for the smaller
population of tracked PSD-95:GFP puncta (Figure S5B), indicat-
ing that the population of tracked puncta faithfully represented the
entire PSD-95:GFP puncta population.
Relationships between PSD-95:GFP puncta fluorescence and
subsequent changes in puncta fluorescence were also examined by
manipulating network activity with diazepam, a coagonist of
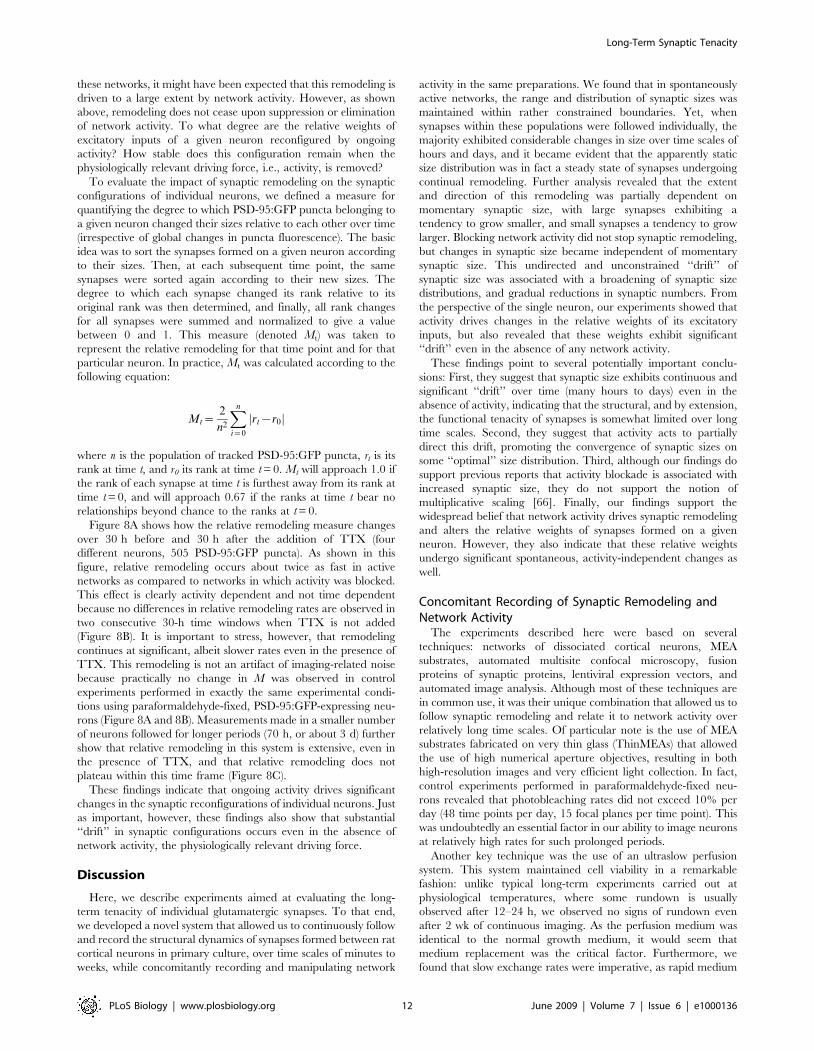
GABAA receptors in widespread clinical use. As shown in Figure 6,
bolus additions of diazepam at two different concentrations (2.5
and 25 mg/ml) led to temporary and recoverable reductions in
network activity levels (Figure 6C). Despite the reduction in
activity levels, changes in puncta fluorescence still occurred to
similar degrees, although the dependence of such changes on
initial PSD-95:GFP puncta fluorescence was reduced or lost, in
particular at higher diazepam concentrations (five experiments,
tracked synapse data from four neurons).
Several points are worth further emphasis. First, changes in
puncta fluorescence continued to occur even when activity was
suppressed or eliminated altogether. In fact, fluorescence intensity
Long-Term Synaptic Tenacity
PLoS Biology | www.plosbiology.org 7 June 2009 | Volume 7 | Issue 6 | e1000136
differences measured for individual PSD-95:GFP puncta between
consecutive images distributed similarly for TTX-treated and
untreated preparations (see Figure 7A). Second, even in active
networks, instantaneous PSD size was not the sole determinant of
subsequent changes in PSD size. This is evident, not only from the
relatively low R2 values of the linear regression fits, but also from
the fact that the distribution of PSD sizes in active networks did
not continue to constrict with time (Figure 3C and see also Figure
Figure 4. Remodeling of individual PSD-95:GFP puncta. (A) A neuron expressing PSD-95:GFP. (B). Five of the puncta (within color squares in[A]) that were tracked over the entire experiment. Note that it is not always apparent that the puncta along the time series are indeed the same ones.However, only one frame out of 20 sequential frames is shown, whereas imaging was performed at 30-min intervals, allowing for highly reliabletracking. (C) Evolution of network activity (same experiment shown in Figure 3A–3D) (D) Changes in the fluorescence of the five puncta shown in (Aand B) over more than 90 h. (E) Changes in the fluorescence of individual PSD-95:GFP puncta as a function of their momentary fluorescenceintensities at the beginning of 7-h time windows. Note that as activity levels increase, small synapses exhibit a tendency to grow larger, whereas largesynapses exhibit a tendency to become smaller. Data from 201 synapses. Bar in (A) indicates 10 mm.doi:10.1371/journal.pbio.1000136.g004
Long-Term Synaptic Tenacity
PLoS Biology | www.plosbiology.org 8 June 2009 | Volume 7 | Issue 6 | e1000136
Long-Term Synaptic Tenacity
PLoS Biology | www.plosbiology.org 9 June 2009 | Volume 7 | Issue 6 | e1000136
S5A), indicating that activity-driven convergence of synaptic size
distribution is balanced by processes that act to broaden PSD size
distribution. Third, changes in the strength of relationships
between instantaneous PSD size and subsequent changes in PSD
size were slow to develop, and occasionally were only observed
several hours after activity levels had changed significantly. Finally,
although reductions in network activity levels were generally
associated with increases in PSD size (Figure 5), we practically
never observed (except one time point for one cell) a positive
relationship between PSD size and the extent to which PSD size
changed following reductions in activity levels. Put differently,
once activity was blocked, changes in PSD size, in absolute terms,
were similar for small and large PSDs alike (see Figure 5, 90–97 h,
for example). This observation strongly argues against the
possibility that increases in PSD size following reductions in
activity levels can be viewed as simple multiplicative scaling.
Modeling Relationships between Network Activity andSynaptic Remodeling
The long-term recordings of synaptic remodeling described so
far indicate that (1) spontaneous network activity maintains
distributions of synaptic sizes within rather constrained boundar-
ies; (2) reductions in network activity levels result in a broadening
of synaptic size distributions, increases in mean synaptic size, and
reductions in synapse numbers; (3) most synapses exhibit
significant changes in size over time; (4) in active networks,
changes in synaptic size are partially dependent on momentary
synapse size: large synapses tend to become smaller, whereas small
synapses tend to become larger; and (5) when activity is blocked or
significantly suppressed, synapses continue to change their sizes,
but the direction and extent of these changes become independent
of momentary synapse size.
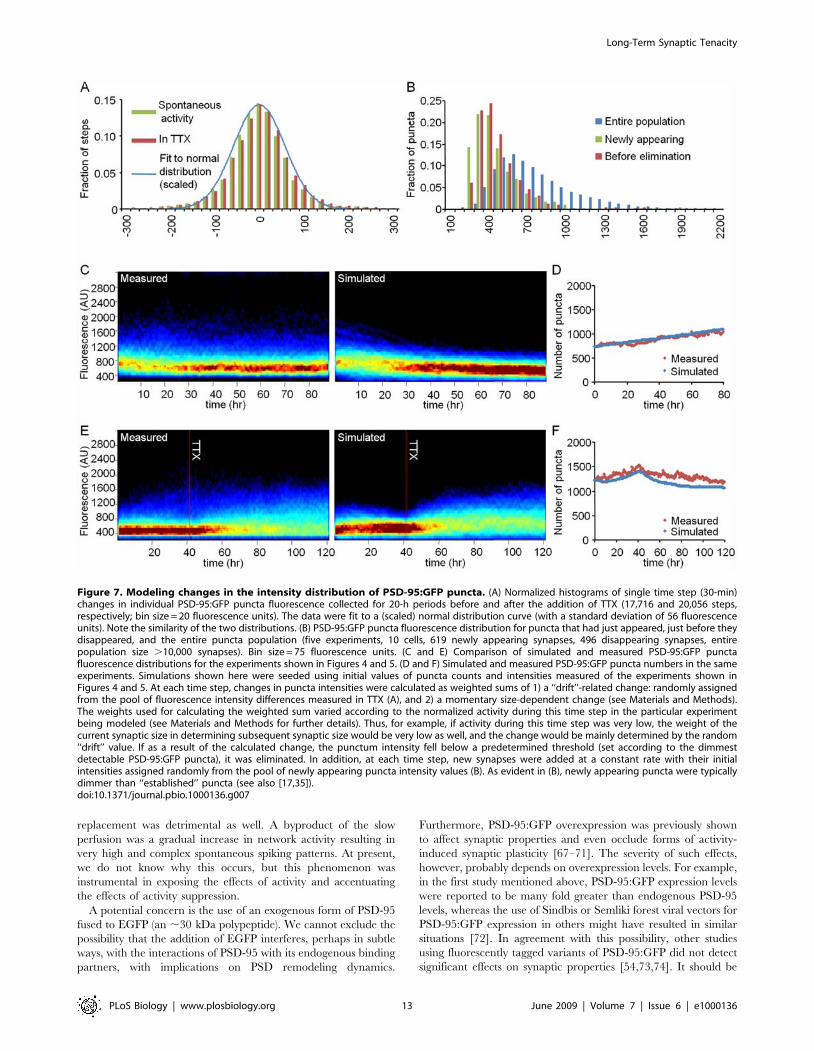
We hypothesized that the phenomenological relationships
between network activity and synaptic remodeling described
above could be explained by the following set of rules: (1) synapses
continuously undergo spontaneous, activity-independent changes
(drift) in their size; (2) activity acts to reduce the size of large
synapses on the one hand, and increase the size of small synapses
on the other; (3) new, small synapses are continually formed at a
constant rate; and 4) synapses whose size is reduced beneath some
threshold are eliminated.
To examine whether this set of rules could, at least in principle,
explain the phenomena described above and produce synaptic size
distributions similar to those measured experimentally, we created
a simple numerical model in which sizes and fates of individual
synapses were updated over time according to these four rules (see
legend of Figure 7 and Materials and Methods for further details).
Figure 7C–7F shows simulations seeded with the initial puncta
counts and intensities measured in the experiments of Figures 4
and 5. As these figures show, the numerical simulations
recapitulated the major phenomenological relationships between
network activity and synaptic size distributions (Figure 7C and 7E).
Furthermore, they predicted correctly the changes in synaptic
counts measured in these experiments (Figure 7D and 7F). These
findings indicate that relationships between synaptic size distribu-
tions and network activity levels can be accounted for, at least in
principle, by the four simple rules described above without a need
for explicit ‘‘scaling’’ or compensatory mechanisms invoked by
reductions in network activity levels (although this does not
preclude their existence).
Although the simulated data generally approximated the
experimental measurements quite well, they failed to account for
a small population of particularly large synapses observed in active
networks (visible as blue dots in the upper regions of the
histograms of Figure 7C and 7E). We do not think this is related
to imperfect simulation parameters but rather to the existence of at
least one other ‘‘rule’’ that drives the formation of large synapses in
highly active networks. Indeed, we noted that relatively large
synapses tended to appear during periods of particularly high
levels of synchronous activity, often associated with ‘‘superb-
ursting’’ [48], observable as periods of significant variability in
action potential counts from one minute to the other. In fact, a
comparison of particularly bright (1.5 standard deviations above
mean puncta fluorescence) PSD-95:GFP puncta appearance rates
to burst rates revealed strong temporal relationships between these
two phenomena (Figure S6A), relationships observed in practically
all experiments in which superbursting occurred. In one striking
example, tracking particularly bright puncta backward in time
revealed that 18 out of 18 such bright puncta exhibited dramatic
increases in fluorescence with the onset of superbursting or seemed
to appear de novo (Figure S6B, S6C, and S6E; see also Figure 6,
puncta 1 and 4). It is likely that these large PSD-95:GFP puncta
represent synapses that underwent forms of potentiation associated
with spine-head enlargement (e.g., [23,53,59–64]). In fact, we
suspect that high levels of synchronized activity, rather than high
activity levels per se are also the driving force behind the
aforementioned tendency of small puncta to grow larger in highly
active networks (see [65] and discussion below). As we did not have
access to the precise firing timings of individual pre- and
postsynaptic partners, this possibility remains somewhat specula-
tive. Interestingly, however, as our system did allow us to follow
these synapses for relatively long periods, we were able to compare
their tenacity to that of the rest of the synaptic population. These
observations indicated that newly enlarged synapses did not
necessarily fair much better than other synapses in terms of their
long-term tenacity, even in the presence of TTX (Figure S7; see
also [23,59]), although their lifespans were typically longer
(unpublished data).
Long-Term Stability of Synaptic ConfigurationsIndividual CNS neurons, even those in our cell culture
preparations, typically receive thousands of excitatory synaptic
inputs of varying strengths. The experiments described so far
reveal that individual PSD-95:GFP puncta exhibited significant
remodeling over time, probably reflecting significant changes in
synaptic strengths. Given the high levels of spontaneous activity in
Figure 5. PSD-95:GFP puncta remodeling following abrupt termination of network activity. (A) A neuron expressing PSD-95:GFP. (B). Fiveof the puncta (within color squares in [A]) that were tracked over the entire experiment. (C) Evolution of network activity. Forty-two hours after thebeginning of the experiment (red arrow), TTX was added to the MEA dish and the perfusion medium, resulting in the abrupt cessation of networkactivity. (D). Changes in the number of discernable PSD-95:GFP puncta in the same preparation (six neurons). (E) Changes in the fluorescence of thefive puncta shown in (A and B) over 120 h. (F) Changes in the fluorescence of individual PSD-95:GFP puncta as a function of their momentaryfluorescence intensities at the beginning of 7-h time windows. Note that after activity had ceased, changes in puncta fluorescence continued tooccur. However, relationships between initial puncta fluorescence and subsequent changes in fluorescence were lost. Data from approximately 170synapses (one neuron) tracked in one experiment. (G) Slopes of linear regression lines in four consecutive 7-h time windows before and after theaddition of TTX (right; six neurons) or before an arbitrary time point (,50 h; left; four neurons). Mean slopes are shown as black rectangles anddashed lines. Traces for experiments shown in Figures 4 and 5A–5F are marked with arrows. Bar in (A) indicates 10 mm.doi:10.1371/journal.pbio.1000136.g005
Long-Term Synaptic Tenacity
PLoS Biology | www.plosbiology.org 10 June 2009 | Volume 7 | Issue 6 | e1000136
Figure 6. PSD-95:GFP puncta remodeling following abrupt suppression of network activity levels. (A) A neuron expressing PSD-95:GFP.(B) Five puncta (within color squares in [A]) tracked over the entire experiment. (C) Network activity in the same experiment. Twenty-two and 44 hafter the beginning of the experiment (red arrows), diazepam (2.5 mg/ml and 25 mg/ml, respectively) was added to the MEA dish, resulting intemporary reductions in network activity levels. (D). Changes in the number of discernable PSD-95:GFP puncta in the same preparation (nineneurons). (E) Changes in the fluorescence of the five puncta shown in (A and B) over 90 h. (F) Changes in the fluorescence of individual PSD-95:GFPpuncta as a function of their momentary fluorescence intensities at the beginning of 7-h time windows. Note that changes in puncta fluorescenceoccurred throughout the entire experiment. However, relationships between initial puncta fluorescence and subsequent changes in fluorescencewere weakened or lost entirely following reductions in activity levels. Data from approximately 150 synapses (one neuron) tracked in one experiment.Bar in (A) indicates 10 mm.doi:10.1371/journal.pbio.1000136.g006
Long-Term Synaptic Tenacity
PLoS Biology | www.plosbiology.org 11 June 2009 | Volume 7 | Issue 6 | e1000136
these networks, it might have been expected that this remodeling is
driven to a large extent by network activity. However, as shown
above, remodeling does not cease upon suppression or elimination
of network activity. To what degree are the relative weights of
excitatory inputs of a given neuron reconfigured by ongoing
activity? How stable does this configuration remain when the
physiologically relevant driving force, i.e., activity, is removed?
To evaluate the impact of synaptic remodeling on the synaptic
configurations of individual neurons, we defined a measure for
quantifying the degree to which PSD-95:GFP puncta belonging to
a given neuron changed their sizes relative to each other over time
(irrespective of global changes in puncta fluorescence). The basic
idea was to sort the synapses formed on a given neuron according
to their sizes. Then, at each subsequent time point, the same
synapses were sorted again according to their new sizes. The
degree to which each synapse changed its rank relative to its
original rank was then determined, and finally, all rank changes
for all synapses were summed and normalized to give a value
between 0 and 1. This measure (denoted Mt) was taken to
represent the relative remodeling for that time point and for that
particular neuron. In practice, Mt was calculated according to the
following equation:
Mt~2
n2
Xn
i~0
rt{r0j j
where n is the population of tracked PSD-95:GFP puncta, rt is its
rank at time t, and r0 its rank at time t = 0. Mt will approach 1.0 if
the rank of each synapse at time t is furthest away from its rank at
time t = 0, and will approach 0.67 if the ranks at time t bear no
relationships beyond chance to the ranks at t = 0.
Figure 8A shows how the relative remodeling measure changes
over 30 h before and 30 h after the addition of TTX (four
different neurons, 505 PSD-95:GFP puncta). As shown in this
figure, relative remodeling occurs about twice as fast in active
networks as compared to networks in which activity was blocked.
This effect is clearly activity dependent and not time dependent
because no differences in relative remodeling rates are observed in
two consecutive 30-h time windows when TTX is not added
(Figure 8B). It is important to stress, however, that remodeling
continues at significant, albeit slower rates even in the presence of
TTX. This remodeling is not an artifact of imaging-related noise
because practically no change in M was observed in control
experiments performed in exactly the same experimental condi-
tions using paraformaldehyde-fixed, PSD-95:GFP-expressing neu-
rons (Figure 8A and 8B). Measurements made in a smaller number
of neurons followed for longer periods (70 h, or about 3 d) further
show that relative remodeling in this system is extensive, even in
the presence of TTX, and that relative remodeling does not
plateau within this time frame (Figure 8C).
These findings indicate that ongoing activity drives significant
changes in the synaptic reconfigurations of individual neurons. Just
as important, however, these findings also show that substantial
‘‘drift’’ in synaptic configurations occurs even in the absence of
network activity, the physiologically relevant driving force.
Discussion
Here, we describe experiments aimed at evaluating the long-
term tenacity of individual glutamatergic synapses. To that end,
we developed a novel system that allowed us to continuously follow
and record the structural dynamics of synapses formed between rat
cortical neurons in primary culture, over time scales of minutes to
weeks, while concomitantly recording and manipulating network
activity in the same preparations. We found that in spontaneously
active networks, the range and distribution of synaptic sizes was
maintained within rather constrained boundaries. Yet, when
synapses within these populations were followed individually, the
majority exhibited considerable changes in size over time scales of
hours and days, and it became evident that the apparently static
size distribution was in fact a steady state of synapses undergoing
continual remodeling. Further analysis revealed that the extent
and direction of this remodeling was partially dependent on
momentary synaptic size, with large synapses exhibiting a
tendency to grow smaller, and small synapses a tendency to grow
larger. Blocking network activity did not stop synaptic remodeling,
but changes in synaptic size became independent of momentary
synaptic size. This undirected and unconstrained ‘‘drift’’ of
synaptic size was associated with a broadening of synaptic size
distributions, and gradual reductions in synaptic numbers. From
the perspective of the single neuron, our experiments showed that
activity drives changes in the relative weights of its excitatory
inputs, but also revealed that these weights exhibit significant
‘‘drift’’ even in the absence of any network activity.
These findings point to several potentially important conclu-
sions: First, they suggest that synaptic size exhibits continuous and
significant ‘‘drift’’ over time (many hours to days) even in the
absence of activity, indicating that the structural, and by extension,
the functional tenacity of synapses is somewhat limited over long
time scales. Second, they suggest that activity acts to partially
direct this drift, promoting the convergence of synaptic sizes on
some ‘‘optimal’’ size distribution. Third, although our findings do
support previous reports that activity blockade is associated with
increased synaptic size, they do not support the notion of
multiplicative scaling [66]. Finally, our findings support the
widespread belief that network activity drives synaptic remodeling
and alters the relative weights of synapses formed on a given
neuron. However, they also indicate that these relative weights
undergo significant spontaneous, activity-independent changes as
well.
Concomitant Recording of Synaptic Remodeling andNetwork Activity
The experiments described here were based on several
techniques: networks of dissociated cortical neurons, MEA
substrates, automated multisite confocal microscopy, fusion
proteins of synaptic proteins, lentiviral expression vectors, and
automated image analysis. Although most of these techniques are
in common use, it was their unique combination that allowed us to
follow synaptic remodeling and relate it to network activity over
relatively long time scales. Of particular note is the use of MEA
substrates fabricated on very thin glass (ThinMEAs) that allowed
the use of high numerical aperture objectives, resulting in both
high-resolution images and very efficient light collection. In fact,
control experiments performed in paraformaldehyde-fixed neu-
rons revealed that photobleaching rates did not exceed 10% per
day (48 time points per day, 15 focal planes per time point). This
was undoubtedly an essential factor in our ability to image neurons
at relatively high rates for such prolonged periods.
Another key technique was the use of an ultraslow perfusion
system. This system maintained cell viability in a remarkable
fashion: unlike typical long-term experiments carried out at
physiological temperatures, where some rundown is usually
observed after 12–24 h, we observed no signs of rundown even
after 2 wk of continuous imaging. As the perfusion medium was
identical to the normal growth medium, it would seem that
medium replacement was the critical factor. Furthermore, we
found that slow exchange rates were imperative, as rapid medium
Long-Term Synaptic Tenacity
PLoS Biology | www.plosbiology.org 12 June 2009 | Volume 7 | Issue 6 | e1000136
replacement was detrimental as well. A byproduct of the slow
perfusion was a gradual increase in network activity resulting in
very high and complex spontaneous spiking patterns. At present,
we do not know why this occurs, but this phenomenon was
instrumental in exposing the effects of activity and accentuating
the effects of activity suppression.
A potential concern is the use of an exogenous form of PSD-95
fused to EGFP (an ,30 kDa polypeptide). We cannot exclude the
possibility that the addition of EGFP interferes, perhaps in subtle
ways, with the interactions of PSD-95 with its endogenous binding
partners, with implications on PSD remodeling dynamics.
Furthermore, PSD-95:GFP overexpression was previously shown
to affect synaptic properties and even occlude forms of activity-
induced synaptic plasticity [67–71]. The severity of such effects,
however, probably depends on overexpression levels. For example,
in the first study mentioned above, PSD-95:GFP expression levels
were reported to be many fold greater than endogenous PSD-95
levels, whereas the use of Sindbis or Semliki forest viral vectors for
PSD-95:GFP expression in others might have resulted in similar
situations [72]. In agreement with this possibility, other studies
using fluorescently tagged variants of PSD-95:GFP did not detect
significant effects on synaptic properties [54,73,74]. It should be
Figure 7. Modeling changes in the intensity distribution of PSD-95:GFP puncta. (A) Normalized histograms of single time step (30-min)changes in individual PSD-95:GFP puncta fluorescence collected for 20-h periods before and after the addition of TTX (17,716 and 20,056 steps,respectively; bin size = 20 fluorescence units). The data were fit to a (scaled) normal distribution curve (with a standard deviation of 56 fluorescenceunits). Note the similarity of the two distributions. (B) PSD-95:GFP puncta fluorescence distribution for puncta that had just appeared, just before theydisappeared, and the entire puncta population (five experiments, 10 cells, 619 newly appearing synapses, 496 disappearing synapses, entirepopulation size .10,000 synapses). Bin size = 75 fluorescence units. (C and E) Comparison of simulated and measured PSD-95:GFP punctafluorescence distributions for the experiments shown in Figures 4 and 5. (D and F) Simulated and measured PSD-95:GFP puncta numbers in the sameexperiments. Simulations shown here were seeded using initial values of puncta counts and intensities measured of the experiments shown inFigures 4 and 5. At each time step, changes in puncta intensities were calculated as weighted sums of 1) a ‘‘drift’’-related change: randomly assignedfrom the pool of fluorescence intensity differences measured in TTX (A), and 2) a momentary size-dependent change (see Materials and Methods).The weights used for calculating the weighted sum varied according to the normalized activity during this time step in the particular experimentbeing modeled (see Materials and Methods for further details). Thus, for example, if activity during this time step was very low, the weight of thecurrent synaptic size in determining subsequent synaptic size would be very low as well, and the change would be mainly determined by the random‘‘drift’’ value. If as a result of the calculated change, the punctum intensity fell below a predetermined threshold (set according to the dimmestdetectable PSD-95:GFP puncta), it was eliminated. In addition, at each time step, new synapses were added at a constant rate with their initialintensities assigned randomly from the pool of newly appearing puncta intensity values (B). As evident in (B), newly appearing puncta were typicallydimmer than ‘‘established’’ puncta (see also [17,35]).doi:10.1371/journal.pbio.1000136.g007
Long-Term Synaptic Tenacity
PLoS Biology | www.plosbiology.org 13 June 2009 | Volume 7 | Issue 6 | e1000136
noted that overexpression levels in our hands were low and similar
to those we have previously reported (,27%; [35]), and at these
expression levels, effects on postsynaptic and presynaptic proper-
ties were very small [35]. Finally, in the current study PSD-
95:GFP puncta did exhibit both ‘‘homeostatic’’ forms of synaptic
remodeling as well as synchronous activity-driven remodeling, in
agreement with studies based on immunohistochemistry, electron
microscopy, relatively inert reporter molecules such as EGFP, or
live imaging of AMPA receptors (for example, [53,63,73,75–78]).
Given the low PSD-95:GFP expression levels here and the fact
that the aforementioned forms of synaptic plasticity were not
occluded in our system, it seems unlikely that the phenomena
described here are solely artifacts of PSD-95:GFP overexpression,
although, as mentioned above, we cannot exclude the possibility of
the introduction of some quantitative inaccuracies [79].
A broader concern relates to the fact that the study was
performed in dissociated cell culture. Although it was this very fact
that allowed us to concomitantly record synaptic remodeling and
network activity as described above, we cannot ignore the
possibility that the limited tenacity exhibited by synapses here is
somehow related to this experimental system. We could mention
the fact that many phenomena pertaining to synaptic dynamics
described in cell culture were also observed in vivo (compare, for
example, [80] with [54]). Nevertheless, it would be prudent not to
take the absolute values provided here too literally. It is also
important to note that the experiments were performed in neurons
that are relatively immature (3–4 wk in vitro) as compared to those
in the mature rat brain. Given that several measures of synaptic
dynamics subside with age [15,16,54,74], the absolute rates of
synaptic remodeling reported here might overestimate those that
occur in the mature brain. Yet it is worth noting in this regard that
in vivo imaging indicates that spine-head remodeling is quantita-
tively similar in young and adult mice [15].
Finally, it is worth stressing that MEA recordings, unlike single-
cell recordings used in other studies concerning activity-induced
synaptic remodeling (for example, [53,63]), do not allow one to
directly relate changes in the structural properties of an imaged
synapse to changes in the strength of the connection it mediates
(see also [81]). However, the integrated system described here did
allow us to study the remodeling of very large numbers (thousands)
of individual postsynaptic densities over times scales of minutes to
weeks and to explore how these dynamics are affected by
measured levels of network activity, and hence expose long-term
phenomena that become apparent only at the population level.
Thus, in spite of the potential drawbacks raised above, the
advantages offered by this system are substantial.
Relationships between Network Activity and SynapticRemodeling
Previous studies, initially in cell culture and later on in vivo as
well, have shown that reductions in activity levels are followed by
general increases in the strength of excitatory glutamatergic
synapses, whereas enhanced activity levels have opposite effects
(reviewed in [56–58]). It was suggested that these changes
represent ‘‘homeostatic’’ mechanisms that serve to stabilize
neuronal activity levels. Furthermore, it was shown that activity
blockade-induced increases in synaptic strength were best
explained by a scaling of synaptic strengths by the same
multiplicative factor [66]. Finally, several studies [73,78] have
shown that synaptic scaling has a predominant, although not
exclusive, postsynaptic component, manifested as an increase in
the number of AMPA-type glutamate receptors localized to
postsynaptic compartments.
Our findings that suppression of activity broadens the
distribution of PSD-95:GFP puncta fluorescence intensities and
increases mean PSD-95:GFP fluorescence (Figures 3 and 5) are in
general agreement with the aforementioned studies (see also
[77,82]). Our findings, however, offer an alternative explanation
for this phenomenon. First, these findings indicate that activity
exerts a positive control on synaptic size, with changes in synaptic
sizes inversely related to momentary synaptic size. Second, the
findings indicate that the suppression of activity removes this
positive control, resulting in unrestricted ‘‘drift.’’ These findings
are consistent with the possibility that mean synaptic size
thereafter increases because this drift is asymmetrically constrained:
synapses grow both larger and smaller in apparently random
fashion, but synapses that become too small are eliminated (see
also [17]), further biasing the mean synaptic size toward larger
values (Figure 7). Therefore, there might be no a priori need for
mechanisms actively invoked by reductions in activity levels
(although these might exist), that act to adjust synaptic size
accordingly. Although the difference between negative signaling
and the removal of positive signaling is somewhat semantic, it is a
simpler explanation and thus, perhaps, more appealing.
An interesting finding was the observation that high levels of
network activity were associated with gradual increases in PSD-
95:GFP puncta numbers, whereas suppressed activity levels were
associated with gradual decreases in PSD-95:GFP puncta numbers
(see also [82,83]). These phenomena could have resulted from
changes in synapse formation rates, changes in synapse elimination
rates, or both [40]. However, a third possibility exists: that high
levels of activity, and in particular synchronous activity, promote
the stabilization and growth of newly formed synapses, echoing the
prominent role of synchronous activity in nervous system
development [84]. Conversely, in the absence of such activity,
the tendency of new synapses to be stabilized would be reduced,
and thus more synapses would be lost. Indeed, recent work from
De Roo and colleagues [23,74] indicates that the vast majority of
new synapses are transient, but activity, and in particular rhythmic
activity, leads to the stabilization of new spines, possibly by
promoting synaptogenic interactions with nearby axons [71] (see
also [85–87]) and to their eventual enlargement. Given that most
activity in our preparations was in the form of synchronized bursts,
new synapses were probably more likely to be stabilized in active
networks, as compared to networks in which activity was
suppressed. By way of extension, synchronous activity may serve
to promote the enlargement of a subset of small synapses—new
and preexisting alike (Figure S6)—reducing the likelihood that
their size will drift below some critical threshold resulting in their
loss, and thus providing some explanation for the tendency we
observed for small synapses to grow larger in active networks [65].
Furthermore, periods of highly synchronized activity often led to
the appearance of large PSDs (Figure S6), in agreement with
studies showing that synchronous activity and specific stimulation
patterns lead to significant spine-head enlargement (for example,
[23,53,59–64,79]). Unfortunately, as mentioned above, MEA
recordings did not allow us to relate changes in the structural
properties of an imaged synapse to the specific activity patterns it
experienced. Interestingly, however, we were able to follow the
fate of such synapses, and we noted that in many cases, this
enlargement was transient (Figure S7), in good agreement with
similar observations recently made in cultured hippocampal slices
[23]. We thus do not find strong evidence that the tenacity of such
synapses is significantly different from that of other synapses.
High activity levels also promoted reductions in the size of large
synapses (Figure 4). Given that synaptic size seems to be inherently
limited [88], it is conceivable that larger synapses may be more
Long-Term Synaptic Tenacity
PLoS Biology | www.plosbiology.org 14 June 2009 | Volume 7 | Issue 6 | e1000136
sensitive to forces that limit synaptic size, and, by extension, by
activity-driven, size-limiting forces. The exact nature of such
activity-driven forces is unknown, but given the relatively long
time scale of their actions, they are likely to involve protein
exchange [54,80,89,90], protein degradation [91], and local
protein synthesis [92], although mechanisms activated on shorter
time scales may also be involved [93]. Regardless of their specific
nature, such processes would drive continuous change in synaptic
sizes and lead to continuous reconfiguration of synaptic weights
(Figure 8).
Synaptic Drift and Synaptic TenacityThe long-term recordings of individual PSD-95:GFP puncta
described here indicate that synaptic sizes exhibit spontaneous
changes over time scales of many hours and days. This is probably
not an artifact of cell culture, as fluctuations in spine-head size from
one day to the next were observed in vivo (for example,
[14,15,17,18]). Interestingly, in a study published very recently,
Yasumatsu and colleagues [94] analyzed fluctuations in the volumes
of individual dendritic spines in cultured rat hippocampal slices. In
common with previous studies, a volume-filling dye (EGFP) and
two-photon microscopy were used to image dendritic spines once a
day for several days. However, this study also examined the effects
of NMDA-type glutamate receptor antagonists on spine volume
fluctuations and showed that such fluctuations are observed also in
the presence of such antagonists. As network activity levels were not
measured, actual activity levels remained unknown, and thus,
relationships between spine size fluctuations and network activity
remained speculative. Perhaps the fact that no synaptic homeosta-
sis-like processes were detected may indicate that basal activity levels
were rather low to start with. Nevertheless, these findings further
support the possibility that synaptic remodeling might persist even
in the absence of activity and that the findings reported here are not
solely artifacts of dissociated cell culture.
Yasumatsu et al. [94] also proposed that distributions in spine
size, rates of spine formation and elimination, and the long-term
persistence of large spines might be explained by such fluctuations
according to a mathematical model based on Brownian motion (or
‘‘random walk’’) with drift and reflecting boundaries. Indeed, we
also found that generally similar models can adequately describe
synaptic size distributions in relatively quiescent networks
(Figure 7). However, we found that such models fall short of
providing satisfactory accounts of synaptic size distributions in
highly active networks, and that these seem to be governed by
additional principles, such as network synchronicity levels (Figure
S6). Most importantly, the mere persistence of large spines
(proposed to function as ‘‘write-protected’’ devices) would not
guarantee synaptic configuration stability, in particular when
considering that these exhibited the largest activity-independent
volume fluctuations [94]. Thus, significant synaptic reconfigura-
tion seems to be an unavoidable consequence of activity-
independent synaptic remodeling.
When considering the extensive molecular dynamics occurring
in the minute synapse, the limited long-term tenacity of individual
PSDs might not seem surprising. Perhaps it may be unrealistic to
expect that a biological structure with the dimensions of a PSD,
composed of dozens to hundreds of copies of individual proteins,
whose function depends on even smaller numbers of molecules
and is located at extreme distances from the soma, will maintain its
structural and functional properties with pinpoint precision for
many months and years [12]. Consequently, and assuming that
our findings are not unique to the experimental system used here,
several tentative conclusions may be drawn.
The first conclusion concerns the significance of individual
synapses in ‘‘encoding’’ some functional characteristic of a
neuronal network. Obviously, the weight of individual excitatory
synapses in determining postsynaptic neuron output is rather
limited to start with (see, for example, [95]). However, our findings
indicate that the reliability of these weights, already challenged by
fluctuations on short time scales (release failures, quantal
fluctuations), is further challenged by processes occurring over
longer time scales. This finding indicates that if indeed persistent
changes in network function are realized by changes in synaptic
weights [1,2], the weights of many synapses might need to be
changed to produce an enduring alteration of network function.
The second conclusion concerns the possibility that the limited
tenacity of synapses, the ‘‘drift’’ they exhibit, is actually a
fundamentally important feature of synapses, in particular in
developing networks. One could imagine that synaptic drift and
the consequential drift of network function constitutes an
‘‘exploratory’’ process that allows networks to explore the space
of synaptic configurations in search of appropriate synaptic input
levels or functionally ‘‘useful’’ or ‘‘successful’’ configurations.
Following this logic, configurations that produce desirable results
would be stabilized, perhaps by diffuse neuromodulatory systems
activated by salient stimuli or ‘‘rewards,’’ input that is obviously
absent from our preparations. Although entirely speculative at this
point, it is intriguing to consider the possibility that the principles
of diversity and selection, arguably the most universal principles of
evolving biological systems, might also be fundamental principles
in the processes that govern synaptic remodeling.
Materials and Methods
Cell CulturePrimary cultures of rat cortical neurons were prepared in a
similar manner to that described previously for hippocampal
preparations [35]. Cortices of 1–2-d-old Sprague-Dawley rats
were dissected, dissociated by trypsin treatment followed by
trituration using a siliconized Pasteur pipette. A total of 1–
1.5?6106 cells were then plated on thin-glass MEA dishes
(MultiChannelSystems MCS), whose surface had been pretreated
with Polyethylenimine (Sigma) to facilitate cell adherence. Cells
were initially grown in medium containing minimal essential
medium (MEM; Sigma), 25 mg/l insulin (Sigma), 20 mM glucose
(Sigma), 2 mM L-glutamine (Sigma), 5 mg/ml gentamycin sulfate
(Sigma), and 10% NuSerum (Becton Dickinson Labware). The
preparation was then transferred to a humidified tissue culture
incubator and maintained at 37uC in a gas mixture of 5% CO2,
95% air. Half the volume of the culture medium was replaced
three times a week with feeding medium similar to the medium
described above but devoid of NuSerum, containing a lower L-
glutamine concentration (0.5 mM) and 2% B-27 supplement
(Invitrogen).
FU(PSD-95:EGFP)W Plasmid ConstructionFU(PSD-95:EGFP)W was assembled from FUGW [45], GW1-
PSD95-EGFP-N3 (a generous gift by David Clapham; [44]), and
pEGFP-N3 (Clontech Laboratories) in the following manner:
PSD-95 was cut out of GW1-PSD95-EGFP-N3 using Nhe1 and
HindIII. pEGFP-N3 was linearized using HindIII and SmaI.
Linearized pEGFP-N3 and the PSD-95 fragment were ligated,
and PSD-95:EGFP was subsequently cut out using XbaI and
NheI. FUGW was linearized and the GFP fragment removed
using XbaI. The process was completed by the ligation of the
remaining FUGW and PSD-95:EGFP.
Long-Term Synaptic Tenacity
PLoS Biology | www.plosbiology.org 15 June 2009 | Volume 7 | Issue 6 | e1000136
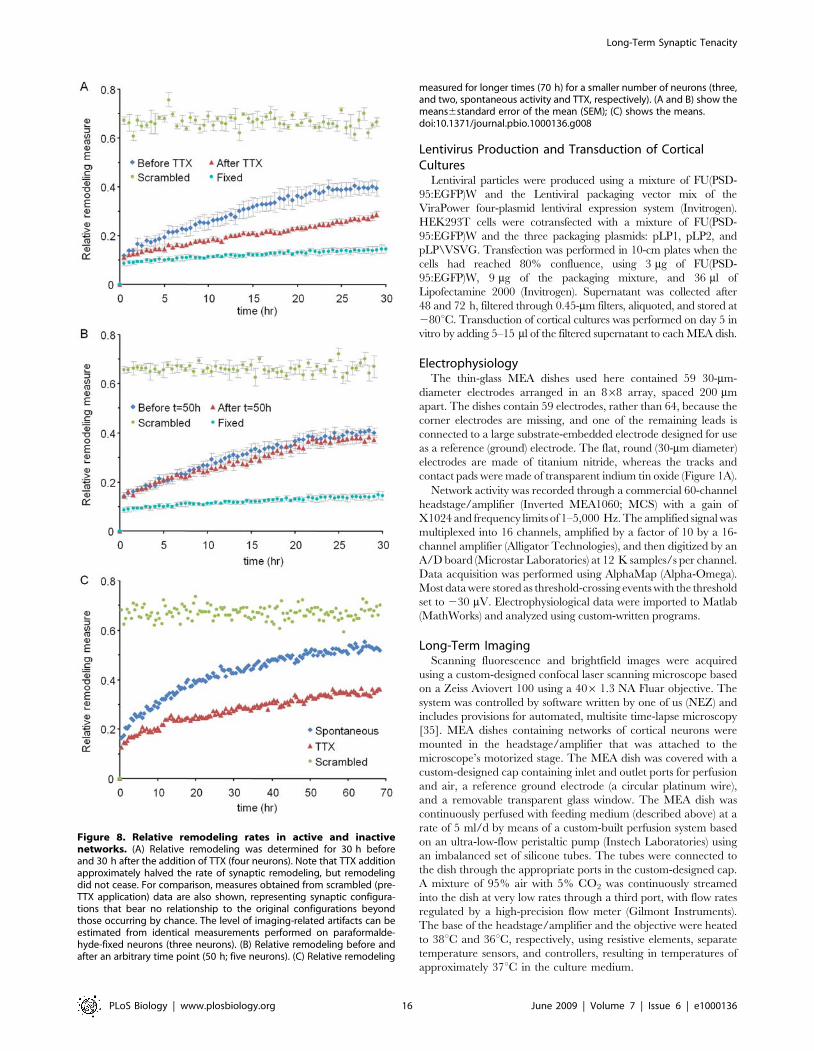
Lentivirus Production and Transduction of CorticalCultures
Lentiviral particles were produced using a mixture of FU(PSD-
95:EGFP)W and the Lentiviral packaging vector mix of the
ViraPower four-plasmid lentiviral expression system (Invitrogen).
HEK293T cells were cotransfected with a mixture of FU(PSD-
95:EGFP)W and the three packaging plasmids: pLP1, pLP2, and
pLP\VSVG. Transfection was performed in 10-cm plates when the
cells had reached 80% confluence, using 3 mg of FU(PSD-
95:EGFP)W, 9 mg of the packaging mixture, and 36 ml of
Lipofectamine 2000 (Invitrogen). Supernatant was collected after
48 and 72 h, filtered through 0.45-mm filters, aliquoted, and stored at
280uC. Transduction of cortical cultures was performed on day 5 in
vitro by adding 5–15 ml of the filtered supernatant to each MEA dish.
ElectrophysiologyThe thin-glass MEA dishes used here contained 59 30-mm-
diameter electrodes arranged in an 868 array, spaced 200 mm
apart. The dishes contain 59 electrodes, rather than 64, because the
corner electrodes are missing, and one of the remaining leads is
connected to a large substrate-embedded electrode designed for use
as a reference (ground) electrode. The flat, round (30-mm diameter)
electrodes are made of titanium nitride, whereas the tracks and
contact pads were made of transparent indium tin oxide (Figure 1A).
Network activity was recorded through a commercial 60-channel
headstage/amplifier (Inverted MEA1060; MCS) with a gain of
X1024 and frequency limits of 1–5,000 Hz. The amplified signal was
multiplexed into 16 channels, amplified by a factor of 10 by a 16-
channel amplifier (Alligator Technologies), and then digitized by an
A/D board (Microstar Laboratories) at 12 K samples/s per channel.
Data acquisition was performed using AlphaMap (Alpha-Omega).
Most data were stored as threshold-crossing events with the threshold
set to 230 mV. Electrophysiological data were imported to Matlab
(MathWorks) and analyzed using custom-written programs.
Long-Term ImagingScanning fluorescence and brightfield images were acquired
using a custom-designed confocal laser scanning microscope based
on a Zeiss Aviovert 100 using a 4061.3 NA Fluar objective. The
system was controlled by software written by one of us (NEZ) and
includes provisions for automated, multisite time-lapse microscopy
[35]. MEA dishes containing networks of cortical neurons were
mounted in the headstage/amplifier that was attached to the
microscope’s motorized stage. The MEA dish was covered with a
custom-designed cap containing inlet and outlet ports for perfusion
and air, a reference ground electrode (a circular platinum wire),
and a removable transparent glass window. The MEA dish was
continuously perfused with feeding medium (described above) at a
rate of 5 ml/d by means of a custom-built perfusion system based
on an ultra-low-flow peristaltic pump (Instech Laboratories) using
an imbalanced set of silicone tubes. The tubes were connected to
the dish through the appropriate ports in the custom-designed cap.
A mixture of 95% air with 5% CO2 was continuously streamed
into the dish at very low rates through a third port, with flow rates
regulated by a high-precision flow meter (Gilmont Instruments).
The base of the headstage/amplifier and the objective were heated
to 38uC and 36uC, respectively, using resistive elements, separate
temperature sensors, and controllers, resulting in temperatures of
approximately 37uC in the culture medium.
Figure 8. Relative remodeling rates in active and inactivenetworks. (A) Relative remodeling was determined for 30 h beforeand 30 h after the addition of TTX (four neurons). Note that TTX additionapproximately halved the rate of synaptic remodeling, but remodelingdid not cease. For comparison, measures obtained from scrambled (pre-TTX application) data are also shown, representing synaptic configura-tions that bear no relationship to the original configurations beyondthose occurring by chance. The level of imaging-related artifacts can beestimated from identical measurements performed on paraformalde-hyde-fixed neurons (three neurons). (B) Relative remodeling before andafter an arbitrary time point (50 h; five neurons). (C) Relative remodeling
measured for longer times (70 h) for a smaller number of neurons (three,and two, spontaneous activity and TTX, respectively). (A and B) show themeans6standard error of the mean (SEM); (C) shows the means.doi:10.1371/journal.pbio.1000136.g008
Long-Term Synaptic Tenacity
PLoS Biology | www.plosbiology.org 16 June 2009 | Volume 7 | Issue 6 | e1000136
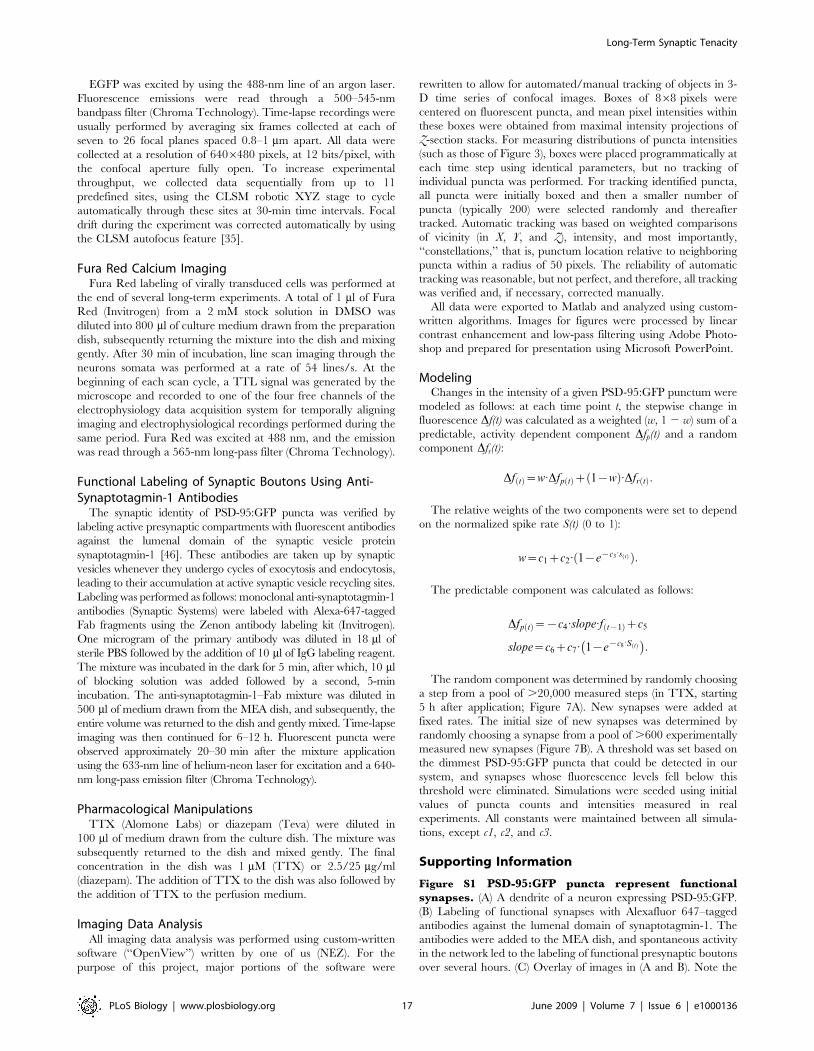
EGFP was excited by using the 488-nm line of an argon laser.
Fluorescence emissions were read through a 500–545-nm
bandpass filter (Chroma Technology). Time-lapse recordings were
usually performed by averaging six frames collected at each of
seven to 26 focal planes spaced 0.8–1 mm apart. All data were
collected at a resolution of 6406480 pixels, at 12 bits/pixel, with
the confocal aperture fully open. To increase experimental
throughput, we collected data sequentially from up to 11
predefined sites, using the CLSM robotic XYZ stage to cycle
automatically through these sites at 30-min time intervals. Focal
drift during the experiment was corrected automatically by using
the CLSM autofocus feature [35].
Fura Red Calcium ImagingFura Red labeling of virally transduced cells was performed at
the end of several long-term experiments. A total of 1 ml of Fura
Red (Invitrogen) from a 2 mM stock solution in DMSO was
diluted into 800 ml of culture medium drawn from the preparation
dish, subsequently returning the mixture into the dish and mixing
gently. After 30 min of incubation, line scan imaging through the
neurons somata was performed at a rate of 54 lines/s. At the
beginning of each scan cycle, a TTL signal was generated by the
microscope and recorded to one of the four free channels of the
electrophysiology data acquisition system for temporally aligning
imaging and electrophysiological recordings performed during the
same period. Fura Red was excited at 488 nm, and the emission
was read through a 565-nm long-pass filter (Chroma Technology).
Functional Labeling of Synaptic Boutons Using Anti-Synaptotagmin-1 Antibodies
The synaptic identity of PSD-95:GFP puncta was verified by
labeling active presynaptic compartments with fluorescent antibodies
against the lumenal domain of the synaptic vesicle protein
synaptotagmin-1 [46]. These antibodies are taken up by synaptic
vesicles whenever they undergo cycles of exocytosis and endocytosis,
leading to their accumulation at active synaptic vesicle recycling sites.
Labeling was performed as follows: monoclonal anti-synaptotagmin-1
antibodies (Synaptic Systems) were labeled with Alexa-647-tagged
Fab fragments using the Zenon antibody labeling kit (Invitrogen).
One microgram of the primary antibody was diluted in 18 ml of
sterile PBS followed by the addition of 10 ml of IgG labeling reagent.
The mixture was incubated in the dark for 5 min, after which, 10 ml
of blocking solution was added followed by a second, 5-min
incubation. The anti-synaptotagmin-1–Fab mixture was diluted in
500 ml of medium drawn from the MEA dish, and subsequently, the
entire volume was returned to the dish and gently mixed. Time-lapse
imaging was then continued for 6–12 h. Fluorescent puncta were
observed approximately 20–30 min after the mixture application
using the 633-nm line of helium-neon laser for excitation and a 640-
nm long-pass emission filter (Chroma Technology).
Pharmacological ManipulationsTTX (Alomone Labs) or diazepam (Teva) were diluted in
100 ml of medium drawn from the culture dish. The mixture was
subsequently returned to the dish and mixed gently. The final
concentration in the dish was 1 mM (TTX) or 2.5/25 mg/ml
(diazepam). The addition of TTX to the dish was also followed by
the addition of TTX to the perfusion medium.
Imaging Data AnalysisAll imaging data analysis was performed using custom-written
software (‘‘OpenView’’) written by one of us (NEZ). For the
purpose of this project, major portions of the software were
rewritten to allow for automated/manual tracking of objects in 3-
D time series of confocal images. Boxes of 868 pixels were
centered on fluorescent puncta, and mean pixel intensities within
these boxes were obtained from maximal intensity projections of
Z-section stacks. For measuring distributions of puncta intensities
(such as those of Figure 3), boxes were placed programmatically at
each time step using identical parameters, but no tracking of
individual puncta was performed. For tracking identified puncta,
all puncta were initially boxed and then a smaller number of
puncta (typically 200) were selected randomly and thereafter
tracked. Automatic tracking was based on weighted comparisons
of vicinity (in X, Y, and Z), intensity, and most importantly,
‘‘constellations,’’ that is, punctum location relative to neighboring
puncta within a radius of 50 pixels. The reliability of automatic
tracking was reasonable, but not perfect, and therefore, all tracking
was verified and, if necessary, corrected manually.
All data were exported to Matlab and analyzed using custom-
written algorithms. Images for figures were processed by linear
contrast enhancement and low-pass filtering using Adobe Photo-
shop and prepared for presentation using Microsoft PowerPoint.
ModelingChanges in the intensity of a given PSD-95:GFP punctum were
modeled as follows: at each time point t, the stepwise change in
fluorescence Df(t) was calculated as a weighted (w, 1 2 w) sum of a
predictable, activity dependent component Dfp(t) and a random
component Dfr(t):
Df tð Þ~w:Dfp tð Þz 1{wð Þ:Dfr tð Þ:
The relative weights of the two components were set to depend
on the normalized spike rate S(t) (0 to 1):
w~c1zc2: 1{e{c3
:s tð Þ Þð :
The predictable component was calculated as follows:
Dfp tð Þ~{c4:slope:f t{1ð Þzc5
slope~c6zc7: 1{e{c8
:S tð Þ� �
:
The random component was determined by randomly choosing
a step from a pool of .20,000 measured steps (in TTX, starting
5 h after application; Figure 7A). New synapses were added at
fixed rates. The initial size of new synapses was determined by
randomly choosing a synapse from a pool of .600 experimentally
measured new synapses (Figure 7B). A threshold was set based on
the dimmest PSD-95:GFP puncta that could be detected in our
system, and synapses whose fluorescence levels fell below this
threshold were eliminated. Simulations were seeded using initial
values of puncta counts and intensities measured in real
experiments. All constants were maintained between all simula-
tions, except c1, c2, and c3.
Supporting Information
Figure S1 PSD-95:GFP puncta represent functionalsynapses. (A) A dendrite of a neuron expressing PSD-95:GFP.
(B) Labeling of functional synapses with Alexafluor 647–tagged
antibodies against the lumenal domain of synaptotagmin-1. The
antibodies were added to the MEA dish, and spontaneous activity
in the network led to the labeling of functional presynaptic boutons
over several hours. (C) Overlay of images in (A and B). Note the
Long-Term Synaptic Tenacity
PLoS Biology | www.plosbiology.org 17 June 2009 | Volume 7 | Issue 6 | e1000136
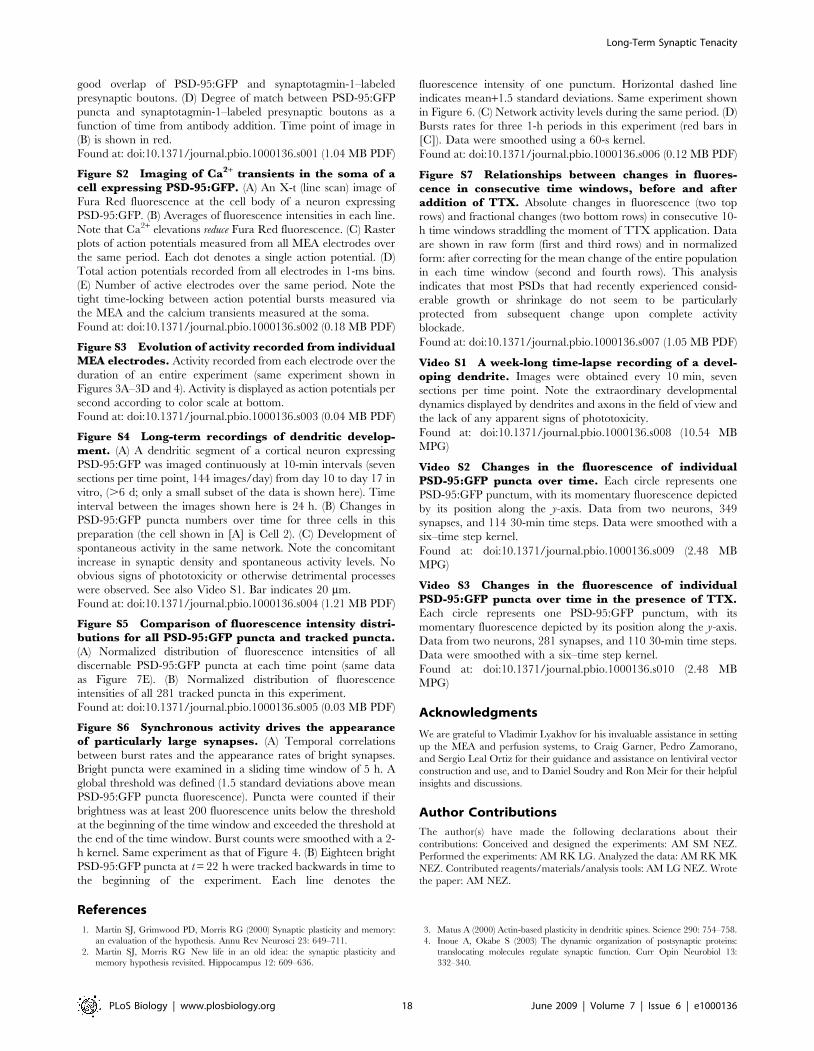
good overlap of PSD-95:GFP and synaptotagmin-1–labeled
presynaptic boutons. (D) Degree of match between PSD-95:GFP
puncta and synaptotagmin-1–labeled presynaptic boutons as a
function of time from antibody addition. Time point of image in
(B) is shown in red.
Found at: doi:10.1371/journal.pbio.1000136.s001 (1.04 MB PDF)
Figure S2 Imaging of Ca2+ transients in the soma of acell expressing PSD-95:GFP. (A) An X-t (line scan) image of
Fura Red fluorescence at the cell body of a neuron expressing
PSD-95:GFP. (B) Averages of fluorescence intensities in each line.
Note that Ca2+ elevations reduce Fura Red fluorescence. (C) Raster
plots of action potentials measured from all MEA electrodes over
the same period. Each dot denotes a single action potential. (D)
Total action potentials recorded from all electrodes in 1-ms bins.
(E) Number of active electrodes over the same period. Note the
tight time-locking between action potential bursts measured via
the MEA and the calcium transients measured at the soma.
Found at: doi:10.1371/journal.pbio.1000136.s002 (0.18 MB PDF)
Figure S3 Evolution of activity recorded from individualMEA electrodes. Activity recorded from each electrode over the
duration of an entire experiment (same experiment shown in
Figures 3A–3D and 4). Activity is displayed as action potentials per
second according to color scale at bottom.
Found at: doi:10.1371/journal.pbio.1000136.s003 (0.04 MB PDF)
Figure S4 Long-term recordings of dendritic develop-ment. (A) A dendritic segment of a cortical neuron expressing
PSD-95:GFP was imaged continuously at 10-min intervals (seven
sections per time point, 144 images/day) from day 10 to day 17 in
vitro, (.6 d; only a small subset of the data is shown here). Time
interval between the images shown here is 24 h. (B) Changes in
PSD-95:GFP puncta numbers over time for three cells in this
preparation (the cell shown in [A] is Cell 2). (C) Development of
spontaneous activity in the same network. Note the concomitant
increase in synaptic density and spontaneous activity levels. No
obvious signs of phototoxicity or otherwise detrimental processes
were observed. See also Video S1. Bar indicates 20 mm.
Found at: doi:10.1371/journal.pbio.1000136.s004 (1.21 MB PDF)
Figure S5 Comparison of fluorescence intensity distri-butions for all PSD-95:GFP puncta and tracked puncta.(A) Normalized distribution of fluorescence intensities of all
discernable PSD-95:GFP puncta at each time point (same data
as Figure 7E). (B) Normalized distribution of fluorescence
intensities of all 281 tracked puncta in this experiment.
Found at: doi:10.1371/journal.pbio.1000136.s005 (0.03 MB PDF)
Figure S6 Synchronous activity drives the appearanceof particularly large synapses. (A) Temporal correlations
between burst rates and the appearance rates of bright synapses.
Bright puncta were examined in a sliding time window of 5 h. A
global threshold was defined (1.5 standard deviations above mean
PSD-95:GFP puncta fluorescence). Puncta were counted if their
brightness was at least 200 fluorescence units below the threshold
at the beginning of the time window and exceeded the threshold at
the end of the time window. Burst counts were smoothed with a 2-
h kernel. Same experiment as that of Figure 4. (B) Eighteen bright
PSD-95:GFP puncta at t = 22 h were tracked backwards in time to
the beginning of the experiment. Each line denotes the
fluorescence intensity of one punctum. Horizontal dashed line
indicates mean+1.5 standard deviations. Same experiment shown
in Figure 6. (C) Network activity levels during the same period. (D)
Bursts rates for three 1-h periods in this experiment (red bars in
[C]). Data were smoothed using a 60-s kernel.
Found at: doi:10.1371/journal.pbio.1000136.s006 (0.12 MB PDF)
Figure S7 Relationships between changes in fluores-cence in consecutive time windows, before and afteraddition of TTX. Absolute changes in fluorescence (two top
rows) and fractional changes (two bottom rows) in consecutive 10-
h time windows straddling the moment of TTX application. Data
are shown in raw form (first and third rows) and in normalized
form: after correcting for the mean change of the entire population
in each time window (second and fourth rows). This analysis
indicates that most PSDs that had recently experienced consid-
erable growth or shrinkage do not seem to be particularly
protected from subsequent change upon complete activity
blockade.
Found at: doi:10.1371/journal.pbio.1000136.s007 (1.05 MB PDF)
Video S1 A week-long time-lapse recording of a devel-oping dendrite. Images were obtained every 10 min, seven
sections per time point. Note the extraordinary developmental
dynamics displayed by dendrites and axons in the field of view and
the lack of any apparent signs of phototoxicity.
Found at: doi:10.1371/journal.pbio.1000136.s008 (10.54 MB
MPG)
Video S2 Changes in the fluorescence of individualPSD-95:GFP puncta over time. Each circle represents one
PSD-95:GFP punctum, with its momentary fluorescence depicted
by its position along the y-axis. Data from two neurons, 349
synapses, and 114 30-min time steps. Data were smoothed with a
six–time step kernel.
Found at: doi:10.1371/journal.pbio.1000136.s009 (2.48 MB
MPG)
Video S3 Changes in the fluorescence of individualPSD-95:GFP puncta over time in the presence of TTX.Each circle represents one PSD-95:GFP punctum, with its
momentary fluorescence depicted by its position along the y-axis.
Data from two neurons, 281 synapses, and 110 30-min time steps.
Data were smoothed with a six–time step kernel.
Found at: doi:10.1371/journal.pbio.1000136.s010 (2.48 MB
MPG)
Acknowledgments
We are grateful to Vladimir Lyakhov for his invaluable assistance in setting
up the MEA and perfusion systems, to Craig Garner, Pedro Zamorano,
and Sergio Leal Ortiz for their guidance and assistance on lentiviral vector
construction and use, and to Daniel Soudry and Ron Meir for their helpful
insights and discussions.
Author Contributions
The author(s) have made the following declarations about their
contributions: Conceived and designed the experiments: AM SM NEZ.
Performed the experiments: AM RK LG. Analyzed the data: AM RK MK
NEZ. Contributed reagents/materials/analysis tools: AM LG NEZ. Wrote
the paper: AM NEZ.
References
1. Martin SJ, Grimwood PD, Morris RG (2000) Synaptic plasticity and memory:
an evaluation of the hypothesis. Annu Rev Neurosci 23: 649–711.
2. Martin SJ, Morris RG New life in an old idea: the synaptic plasticity and
memory hypothesis revisited. Hippocampus 12: 609–636.
3. Matus A (2000) Actin-based plasticity in dendritic spines. Science 290: 754–758.
4. Inoue A, Okabe S (2003) The dynamic organization of postsynaptic proteins:
translocating molecules regulate synaptic function. Curr Opin Neurobiol 13:
332–340.
Long-Term Synaptic Tenacity
PLoS Biology | www.plosbiology.org 18 June 2009 | Volume 7 | Issue 6 | e1000136
5. Choquet D, Triller A (2003) The role of receptor diffusion in the organization ofthe postsynaptic membrane. Nat Rev Neurosci 4: 251–265.
6. Merrill MA, Chen Y, Strack S, Hell JW (2005) Activity-driven postsynaptic
translocation of CaMKII. Trends Pharmacol Sci 26: 645–653.
7. Staras K (2007) Share and share alike: trading of presynaptic elements between
central synapses. Trends Neurosci 30: 292–298.
8. Alvarez VA, Sabatini BL (2007) Anatomical and physiological plasticity of
dendritic spines. Annu Rev Neurosci 30: 79–97.
9. Renner M, Specht CG, Triller A (2008) Molecular dynamics of postsynapticreceptors and scaffold proteins. Curr Opin Neurobiol 18: 532–540.
10. Newpher TM, Ehlers MD (2008) Glutamate receptor dynamics in dendriticmicrodomains. Neuron 58: 472–497.
11. Specht CG, Triller A (2008) The dynamics of synaptic scaffolds. Bioessays 30:1062–1074.
12. Chklovskii DB, Mel BW, Svoboda K (2004) Cortical rewiring and information
storage. Nature 431: 782–788.
13. Trachtenberg JT, Chen BE, Knott GW, Feng G, Sanes JR, et al. (2002) Long-
term in vivo imaging of experience-dependent synaptic plasticity in adult cortex.Nature 420: 788–794.
14. Grutzendler J, Kasthuri N, Gan WB (2002) Long-term dendritic spine stability
in the adult cortex. Nature 420: 812–816.
15. Zuo Y, Lin A, Chang P, Gan WB (2005) Development of long-term dendritic
spine stability in diverse regions of cerebral cortex. Neuron 46: 181–189.
16. Holtmaat AJ, Trachtenberg JT, Wilbrecht L, Shepherd GM, Zhang X, et al.
(2005) Transient and persistent dendritic spines in the neocortex in vivo. Neuron
45: 279–291.
17. Holtmaat A, Wilbrecht L, Knott GW, Welker E, Svoboda K (2006) Experience-
dependent and cell-type-specific spine growth in the neocortex. Nature 441:979–983.
18. Majewska AK, Newton JR, Sur M (2006) Remodeling of synaptic structure in
sensory cortical areas in vivo. J Neurosci 26: 3021–3029.
19. Stettler DD, Yamahachi H, Li W, Denk W, Gilbert CD (2006) Axons and
synaptic boutons are highly dynamic in adult visual cortex. Neuron 49: 877–887.
20. De Paola V, Holtmaat A, Knott G, Song S, Wilbrecht L, et al. (2006) Cell type-
specific structural plasticity of axonal branches and boutons in the adult
neocortex. Neuron 49: 861–875.
21. Segal M (2005) Dendritic spines and long-term plasticity. Nat Rev Neurosci 6:
277–284.
22. Marrs GS, Green SH, Dailey ME (2001) Rapid formation and remodeling of
postsynaptic densities in developing dendrites. Nat Neurosci 4: 1006–1013.
23. De Roo M, Klauser P, Muller D (2008) LTP promotes a selective long-termstabilization and clustering of dendritic spines. PLoS Biol 6: e219. doi:10.1371/
journal.pbio.0060219.
24. Gross GW (1979) Simultaneous single unit recording in vitro with a photoetched
laser deinsulated gold multimicroelectrode surface. IEEE Trans Biomed Eng 26:273–279.
25. Marom S, Shahaf G (2002) Development, learning and memory in large
random networks of cortical neurons: lessons beyond anatomy. Q Rev Biophys35: 63–87.
26. Morin FO, Takamura Y, Tamiya E (2005) Investigating neuronal activity withplanar microelectrode arrays: achievements and new perspectives. J Biosci
Bioeng 100: 131–143.
27. Van Pelt J, Vajda I, Wolters PS, Corner MA, Ramakers GJ (2005) Dynamicsand plasticity in developing neuronal networks in vitro. Prog Brain Res 147:
173–188.
28. Cho KO, Hunt CA, Kennedy MB (1992) The rat brain postsynaptic density
fraction contains a homolog of the Drosophila discs-large tumor suppressor
protein. Neuron 9: 929–942.
29. Kistner U, Wenzel BM, Veh RW, Cases-Langhoff C, Garner AM, et al. (1993)
SAP90, a rat presynaptic protein related to the product of the Drosophila tumorsuppressor gene dlg-A. J Biol Chem 5: 4580–4583.
30. Keith D, El-Husseini A (2008) Excitation control: balancing PSD-95 function at
the synapse. Front Mol Neurosci. Epub 2008: doi: 10.3389/neuro.02.002.2008.
31. Kim MJ, Futai K, Jo J, Hayashi Y, Cho K, et al. (2007) Synaptic accumulation
of PSD-95 and synaptic function regulated by phosphorylation of serine-295 ofPSD-95. Neuron 56: 488–502.
32. Chen X, Winters C, Azzam R, Li X, Galbraith JA, et al. (2008) Organization ofthe core structure of the postsynaptic density. Proc Natl Acad Sci U S A 105:
4453–4458.
33. Bats C, Groc L, Choquet D (2007) The interaction between Stargazin and PSD-95 regulates AMPA receptor surface trafficking. Neuron 53: 719–734.
34. Qin L, Marrs GS, McKim R, Dailey ME (2001) Hippocampal mossy fibersinduce assembly and clustering of PSD95-containing postsynaptic densities
independent of glutamate receptor activation. J Comp Neurol 440: 284–
298.
35. Bresler T, Ramati Y, Zamorano PL, Zhai R, Garner CC, et al. (2001) The
dynamics of SAP90/PSD-95 recruitment to new synaptic junctions. Mol CellNeurosci 18: 149–167.
36. Prange O, Murphy TH (2001) Modular transport of postsynaptic density-95
clusters and association with stable spine precursors during early development ofcortical neurons. J Neurosci 21: 9325–9333.
37. Okabe S, Miwa A, Okado H (2001) Spine formation and correlated assembly ofpresynaptic and postsynaptic molecules. J Neurosci 21: 6105–6114.
38. Ebihara T, Kawabata I, Usui S, Sobue K, Okabe S (2003) Synchronized
formation and remodeling of postsynaptic densities: long-term visualization of
hippocampal neurons expressing postsynaptic density proteins tagged with green
fluorescent protein. J Neurosci 23: 2170–2181.
39. Losi G, Prybylowski K, Fu Z, Luo J, Wenthold RJ, et al. (2003) PSD-95 regulates
NMDA receptors in developing cerebellar granule neurons of the rat. J Physiol
548: 21–29.
40. Okabe S, Kim HD, Miwa A, Kuriu T, Okado H (1999) Continual remodeling of
postsynaptic density and its regulation by synaptic activity. Nat Neurosci 2:
804–811.
41. Zha XM, Green SH, Dailey ME (2005) Regulation of hippocampal synapse
remodeling by epileptiform activity. Mol Cell Neurosci 29: 494–506.
42. Pratt KG, Taft CE, Burbea M, Turrigiano GG (2008) Dynamics underlying
synaptic gain between pairs of cortical pyramidal neurons. Dev Neurobiol 68:
143–151.
43. Blanpied TA, Kerr JM, Ehlers MD (2008) Structural plasticity with preserved
topology in the postsynaptic protein network. Proc Natl Acad Sci U S A 105:
12587–12592.
44. Arnold DB, Clapham DE (1999) Molecular determinants for subcellular
localization of PSD-95 with an interacting K+ channel. Neuron 23: 149–157.
45. Lois C, Hong EJ, Pease S, Brown EJ, Baltimore D (2002) Germline transmission
and tissue-specific expression of transgenes delivered by lentiviral vectors.
Science 295: 868–872.
46. Kraszewski K, Mundigl O, Daniell L, Verderio C, Matteoli M, et al. (1995)
Synaptic vesicle dynamics in living cultured hippocampal neurons visualized
with CY3-conjugated antibodies directed against the lumenal domain of
synaptotagmin. J Neurosci 15: 4328–4342.
47. Segev R, Baruchi I, Hulata E, Ben-Jacob E (2004) Hidden neuronal correlations
in cultured networks. Phys Rev Lett 92: 118102.
48. Eytan D, Marom S (2006) Dynamics and effective topology underlying
synchronization in networks of cortical neurons. J Neurosci 26: 8465–8476.
49. Wagenaar DA, Pine J, Potter SM (2006) An extremely rich repertoire of bursting
patterns during the development of cortical cultures. BMC Neurosci 7: 11.
50. Harris KM, Stevens JK (1989) Dendritic spines of CA 1 pyramidal cells in the
rat hippocampus: serial electron microscopy with reference to their biophysical
characteristics. J Neurosci 9: 2982–2997.
51. Takumi Y, Ramırez-Leon V, Laake P, Rinvik E, Ottersen OP (1999) Different
modes of expression of AMPA and NMDA receptors in hippocampal synapses.
Nat Neurosci 2: 618–624.
52. Matsuzaki M, Ellis-Davies GC, Nemoto T, Miyashita Y, Iino M, et al. (2001)
Dendritic spine geometry is critical for AMPA receptor expression in
hippocampal CA1 pyramidal neurons. Nat Neurosci 4: 1086–1092.
53. Matsuzaki M, Honkura N, Ellis-Davies GC, Kasai H (2004) Structural basis of
long-term potentiation in single dendritic spines. Nature 429: 761–766.
54. Gray NW, Weimer RM, Bureau I, Svoboda K (2006) Rapid redistribution of
synaptic PSD-95 in the neocortex in vivo. PLoS Biol 4: e370. doi:10.1371/
journal.pbio.0040370.
55. Takamata A, Seo Y, Ogino T, Tanaka K, Fujiki N, et al. (2001) Effects of pCO2
on the CSF turnover rate in T1-weighted magnetic resonance imaging.
Jpn J Physiol 51: 555–562.
56. Turrigiano GG, Nelson SB (2004) Homeostatic plasticity in the developing
nervous system. Nat Rev Neurosci 5: 97–107.
57. Davis GW (2006) Homeostatic control of neural activity: from phenomenology
to molecular design. Annu Rev Neurosci 29: 307–323.
58. Turrigiano G (2007) Homeostatic signaling: the positive side of negative
feedback. Curr Opin Neurobiol 17: 318–324.
59. Lang C, Barco A, Zablow L, Kandel ER, Siegelbaum SA, et al. (2004) Transient
expansion of synaptically connected dendritic spines upon induction of
hippocampal long-term potentiation. Proc Natl Acad Sci U S A 101:
16665–16670.
60. Okamoto K, Nagai T, Miyawaki A, Hayashi Y (2004) Rapid and persistent
modulation of actin dynamics regulates postsynaptic reorganization underlying
bidirectional plasticity. Nat Neurosci 7: 1104–1112.
61. Kopec CD, Li B, Wei W, Boehm J, Malinow R (2006) Glutamate receptor
exocytosis and spine enlargement during chemically induced long-term
potentiation. J Neurosci 26: 2000–2009.
62. Park M, Salgado JM, Ostroff L, Helton TD, Robinson CG, et al. (2006)
Plasticity-induced growth of dendritic spines by exocytic trafficking from
recycling endosomes. Neuron 52: 817–830.
63. Harvey CD, Svoboda K (2007) Locally dynamic synaptic learning rules in
pyramidal neuron dendrites. Nature 450: 1195–1200.
64. Yang Y, Wang XB, Frerking M, Zhou Q (2008) Spine expansion and
stabilization associated with long-term potentiation. J Neurosci 28: 5740–5751.
65. Bourne J, Harris KM (2007) Do thin spines learn to be mushroom spines that
remember? Curr Opin Neurobiol 17: 381–386.
66. Turrigiano GG, Leslie KR, Desai NS, Rutherford LC, Nelson SB (1998)
Activity-dependent scaling of quantal amplitude in neocortical neurons. Nature
391: 892–896.
67. El-Husseini AE, Schnell E, Chetkovich DM, Nicoll RA, Bredt DS (2000) PSD-
95 involvement in maturation of excitatory synapses. Science 290: 1364–1368.
68. Beıque JC, Andrade R (2003) PSD-95 regulates synaptic transmission and
plasticity in rat cerebral cortex. J Physiol 546: 859–867.
Long-Term Synaptic Tenacity
PLoS Biology | www.plosbiology.org 19 June 2009 | Volume 7 | Issue 6 | e1000136

69. Stein V, House DR, Bredt DS, Nicoll RA (2003) Postsynaptic density-95 mimics
and occludes hippocampal long-term potentiation and enhances long-term
depression. J Neurosci 23: 5503–5506.
70. Ehrlich I, Malinow R (2004) Postsynaptic density 95 controls AMPA receptor
incorporation during long-term potentiation and experience-driven synaptic
plasticity. J Neurosci 24: 916–927.
71. Nikonenko I, Boda B, Steen S, Knott G, Welker E, et al. (2008) PSD-95
promotes synaptogenesis and multiinnervated spine formation through nitric
oxide signaling. J Cell Biol 183: 1115–1127.
72. Furuta T, Tomioka R, Taki K, Nakamura K, Tamamaki N, et al. (2001) In vivo
transduction of central neurons using recombinant Sindbis virus: Golgi-like
labeling of dendrites and axons with membrane-targeted fluorescent proteins.
J Histochem Cytochem 49: 1497–1508.
73. Wierenga CJ, Ibata K, Turrigiano GG (2005) Postsynaptic expression of
homeostatic plasticity at neocortical synapses. J Neurosci 25: 2895–2905.
74. De Roo M, Klauser P, Mendez P, Poglia L, Muller D (2008) Activity-dependent
PSD formation and stabilization of newly formed spines in hippocampal slice
cultures. Cereb Cortex 18: 151–61.
75. O’Brien RJ, Kamboj S, Ehlers MD, Rosen KR, Fischbach GD, et al. (1998)
Activity-dependent modulation of synaptic AMPA receptor accumulation.
Neuron 21: 1067–1078.
76. Lissin DV, Gomperts SN, Carroll RC, Christine CW, Kalman D, et al. (1998)
Activity differentially regulates the surface expression of synaptic AMPA and
NMDA glutamate receptors. Proc Natl Acad Sci U S A 95: 7097–7102.
77. Murthy VN, Schikorski T, Stevens CF, Zhu Y (2001) Inactivity produces
increases in neurotransmitter release and synapse size. Neuron 32: 673–682.
78. Ibata K, Sun Q, Turrigiano GG (2008) Rapid synaptic scaling induced by
changes in postsynaptic firing. Neuron 57: 819–826.
79. Steiner P, Higley MJ, Xu W, Czervionke BL, Malenka RC, et al. (2008)
Destabilization of the postsynaptic density by PSD-95 serine 73 phosphorylation
inhibits spine growth and synaptic plasticity. Neuron 60: 788–802.
80. Tsuriel S, Geva R, Zamorano P, Dresbach T, Boeckers T, et al. (2006) Local
sharing as a predominant determinant of synaptic matrix molecular dynamics.
PLoS Biology 4: e271. doi:10.1371/journal.pbio.0040271.
81. Bastrikova N, Gardner GA, Reece JM, Jeromin A, Dudek SM (2008) Synapse
elimination accompanies functional plasticity in hippocampal neurons. Proc NatlAcad Sci U S A 105: 3123–3127.
82. Wallace W, Bear MF (2004) A morphological correlate of synaptic scaling in
visual cortex. J Neurosci 24: 6928–6938.83. Mateos JM, Luthi A, Savic N, Stierli B, Streit P (2007) Synaptic modifications at
the CA3-CA1 synapse after chronic AMPA receptor blockade in rathippocampal slices. J Physiol 581: 129–138.
84. Ben-Ari Y (2001) Developing networks play a similar melody. Trends Neurosci
24: 353–360.85. Uesaka N, Hirai S, Maruyama T, Ruthazer ES, Yamamoto N (2005) Activity
dependence of cortical axon branch formation: a morphological andelectrophysiological study using organotypic slice cultures. J Neurosci 25: 1–9.
86. Nagerl UV, Eberhorn N, Cambridge SB, Bonhoeffer T (2004) Bidirectional activity-dependent morphological plasticity in hippocampal neurons. Neuron 44: 759–767.
87. Lohmann C, Bonhoeffer T. A role for local calcium signaling in rapid synaptic
partner selection by dendritic filopodia. Neuron 59: 253–260.88. Craig AM, Graf ER, Linhoff MW (2006) How to build a central synapse: clues
from cell culture. Trends Neurosci 29: 8–20.89. Sharma K, Fong DK, Craig AM (2006) Postsynaptic protein mobility in
dendritic spines: long-term regulation by synaptic NMDA receptor activation.
Mol Cell Neurosci 31: 702–712.90. Kuriu T, Inoue A, Bito H, Sobue K, Okabe S (2006) Differential control of
postsynaptic density scaffolds via actin-dependent and -independent mecha-nisms. J Neurosci 26: 7693–7706.
91. Ehlers MD (2003) Activity level controls postsynaptic composition and signalingvia the ubiquitin-proteasome system. Nat Neurosci 6: 231–242.
92. Sutton MA, Wall NR, Aakalu GN, Schuman EM (2004) Regulation of dendritic
protein synthesis by miniature synaptic events. Science 304: 1979–1983.93. Zhou Q, Homma KJ, Poo MM (2004) Shrinkage of dendritic spines associated
with long-term depression of hippocampal synapses. Neuron 44: 749–757.94. Yasumatsu N, Matsuzaki M, Miyazaki T, Noguchi J, Kasai H (2008) Principles
of long-term dynamics of dendritic spines. J Neurosci 28: 13592–13608.
95. London M, Schreibman A, Hausser M, Larkum ME, Segev I (2002) Theinformation efficacy of a synapse. Nat Neurosci 5: 332–340.
Long-Term Synaptic Tenacity
PLoS Biology | www.plosbiology.org 20 June 2009 | Volume 7 | Issue 6 | e1000136


