Embed Size (px)
Citation preview

Characterization of mechanisms of myocardial
remodeling in genetic models of cardiac hypertrophy
Andrea A. Domenighetti
Submitted in total fulfillment of the requirements of
the degree of Doctor of Philosophy
December 2005
Department of Physiology
The University of Melbourne, Australia
Produced on archival quality paper

ii
To Esther and Guido Domenighetti

iii
ABSTRACT
Introduction and aims:
Cardiac hypertrophy is clinically defined as a relative increase in heart size associated
with a thickening of the ventricular wall. It is a common feature of individuals suffering
from different cardio-vascular or metabolic conditions and leads to heart failure. The
structural, functional and molecular mechanisms which induce hypertrophy
independent of hemodynamic alterations are poorly characterized. In this study,
questions about whether cardiac-specific neuro-endocrine activation or metabolic
imbalance are sufficient to induce hypertrophic structural and functional remodeling are
addressed using genetically manipulated mouse models of primary cardiac
hypertrophy.
Two different transgenic mouse models of blood pressure-independent cardiac
hypertrophy (i.e. of primary cardiac hypertrophy) were investigated: 1) a cardiac-
specific angiotensinogen-overexpressing transgenic mouse, the TG1306/1R; and 2) a
muscle-specific glucose transporter 4 (GLUT4) knock-out mouse model, the GLUT4-
KO. It was hypothesized that cardiac-specific activation of the renin-angiotensin
system or a decrease in cardiac glucose uptake are sufficient to induce the heart to
undergo pathological hypertrophy and failure. Experimental investigations included
cellular and tissue morphometric analysis combined with assessment of isolated adult
cardiomyocyte contractility and gene expression profiling using RT-PCR and cDNA
microarray assays.
Cardiac and cardiomyocyte hypertrophy in the TG1306/1R mouse:
The present study demonstrates that cardiac remodeling in TG1306/1R transgenic (TG)
mice is associated with cardiomyocyte hypertrophy but not fibrosis, when compared to
age-matched wild-type (WT) littermates. Molecular analysis showed an approximate

iv
10-fold upregulation of the angiotensinogen (Agt) mRNA, associated with an
approximate 25% reduction in GLUT4 protein level in the hearts of TG mice.
Analysis of isolated cardiomyocyte isotonic shortening showed age-dependent
impairment of contractility in TG cardiomyocytes. Comparisons between age-matched
TG and WT mycoytes showed that both rates of shortening and lengthening (maximal
rate of cell shortening [MRS] and maximal rate of cell lengthening [MRL]) were
reduced by 15-35% in the TG myocytes relative to WT. This indicates a reduction in
inotropic and lusitropic performance in the TG cardiomyocytes, independent of age.
The slowest contraction kinetics were observed in myocytes from older TG hearts.
Genotype-dependent prolongation of the contraction cycle was also evident at both
ages in TG cardiomyocytes.
In TG hearts, cardiomyocyte dysfunction was associated with a 5-fold downregulation
of the sarcoplasmic reticulum (SR) calcium ATPase pump (SERCA2) and upregulation
of the sodium-calcium exchanger NCX1.1 and the sodium-hydrogen exchanger NHE-1
mRNA levels. No significant differences were observed in the cardiac expression of the
ryanodine receptor RyR2 mRNA between WT and TG mice.
Microarray expression profiling showed that angiotensin II- (Ang II) stimulated cardiac
hypertrophy is predominantly associated with upregulation of pro-hypertrophic genes
involved in protein biosynthesis and cell differentiation. Differential gene expression
analysis of TG hearts also detected a decrease in expression of mRNA involved in
glucose and mitochondrial fatty acid metabolism relative to WT, and a possible
compensatory activation of peroxisomal free fatty acid beta oxidation.
Cardiac and cardiomyocyte remodeling in the GLUT4-KO mouse:
GLUT4 ‘Knock-out’ mice expressing the Lox+/+ and Cre+/- genetic constructs (LLC),
develope cardiac and cardiomyocyte hypertrophy accompanied by a 6-fold increase in
myocardial collagen content, when compared to genetic controls expressing the Lox+/+
(LL) construct only. In LLC mice cardiac and cardiomyocyte remodeling was
associated with a 99% reduction in GLUT4 protein and an approximate 2-fold
upregulation of cardiac Agt mRNA expression, when compared to age-matched LL

v
mice. Interestingly, an 85% reduction in GLUT4 protein was also observed in hearts of
LL mice, when compared to age-matched control C57BL6 mice (i.e. WT). This
GLUT4 reduction in LL mice relative to WT was also associated with a modest but
significant increase in cardiac and cardiomyocyte dimensions. Regression analysis
showed that suppression of GLUT4 protein levels in hearts to a level below 5% of WT
level was linked to a gross hypertrophic and pro-fibrotic cardiac phenotype in LLC
mice.
Analysis of isolated cardiomyocyte isotonic shortening showed age-dependent
impairment of contractility in LLC cardiomyocytes compare to LL. Analysis of the
specific changes in contractile cycle parameters showed that at both ages LLC
cardiomyocytes exhibited significant impairment of contractile performance and cycle
timing. MRS and MRL were reduced by 20-25% in the myocytes of both 15-20 and 35-
40 week-old LLC mice relative to myocytes from age-matched LL mice. The
maximum shortening (%S) attained by LLC myocytes was 25-35% less than that
achieved by age-matched LL myocytes. Genotype-dependent prolongation of the
contraction cycle was also evident at both ages in LLC cardiomyocytes.
In LLC hearts, cardiomyocyte dysfunction was coupled to a ~2-fold downregulation of
SERCA2 protein levels, in association with a downregulation of the NCX1.1 and an
upregulation of NHE-1 mRNA expression. A significant downregulation was observed
in cardiac mRNA levels of the ryanodine receptor RyR2 mRNA in LLC mice
compared with LL mice.
Microarray expression profiles revealed that cardiac remodeling in LLC mice was
associated with strong downregulation of genes involved in mitochondrial energy
production and upregulation of genes involved in cell proliferation and tissue
inflammation. The same analysis demonstrated a downregulation of enzymes involved
in beta-oxidation and mitochondrial electron transport chain and upregulation of
enzymes involved in glycolysis and gluconeogenesis. These data suggest a shift away
from the production of aerobically derived ATP involving mitochondrial oxidation of
NADH equivalents, to an anaerobic pathway where glucose and glycogen are
metabolized to pyruvate and then reduced to lactate by lactate dehydrogenase.

vi
In conclusion:
Activation of the intra-cardiac renin-angiotensin system or decreased cardiac glucose
uptake lead to cardiac and cardiomyocyte remodeling, resulting in cardiac hypertrophy
and failure in mice. The severity of cardiomyocyte functional remodeling is determined
by the extent of cellular and tissue hypertrophy and myocardial collagen deposition.
The present study supports the concept that cardiac-specific activation of the renin-
angiotensin system or a decrease in cardiac glucose uptake are sufficient ‘triggers’ to
activate pathologic cardiac remodeling, the severity of which is dependent on the
degree of activation of the intra-cardiac renin-angiotensin system and the extent of
glucose metabolic perturbation.

vii
STATEMENT OF AUTHORSHIP
This is to certify that:
This thesis comprises only my original work towards the PhD.
Due acknowledgment has been made in the text to all other material used.
This thesis is less than 100,000 words in length, exclusive of tables, figures and
references.
Andrea A. Domenighetti
December 2005

viii
ACKNOWLEDGMENTS
Looking back on my sojourn in Australia I have numerous people to thank, affirming
that research is meaningless without collaborative effort. In particular, I would like to
acknowledge the following people - without them I would not be submitting this
Thesis. Whether my gratitude is for intellectual supervision, or for making my time as
an overseas PhD student immensely enjoyable, both are equally acknowledged.
A/Prof. Lea M. Delbridge, for giving me the opportunity to undertake a PhD, guiding
me and encouraging me to keep persevering and to pursue science at high levels. Thank
you for giving me the freedom to explore the subject in my own way, while at the same
time offering frequent physiological insight into exciting results. Thank you also for the
good times together with Chris, Alex and Kim.
Prof. Thierry Pedrazzini (Department of Medicine, University of Lausanne Medical
School, Switzerland), for shipping the TG1306/1R transgenic mouse strain to Australia
- it was not an easy task! Thank you for your unconditional support and for acting as a
‘stand-in’ supervisor during the time spent in Lausanne.
Prof. Joseph Proietto (Department of Medicine, Repatriation Hospital, Melbourne),
for providing the GLUT4-KO mice. Thank you for the pleasant moments spent in your
laboratory and with your family!
Prof. Stephen Harrap, for allowing me to undertake my research in the Department of
Physiology at the University of Melbourne, and for keeping my cardiovascular system
fit with exciting tennis games. I’m already missing the Federer style backhands and
smashes!
Prof. Hans R. Brunner and Prof. Trefor Morgan, for beginning the collaboration
between the Department of Physiology in Melbourne and the Division of Hypertension

ix
in Lausanne, Switzerland. Your collaborative efforts gave me the fantastic opportunity
to spend four years of my life in Australia. A personal acknowledgment to Prof.
Trefor Morgan for sharing his ‘savoir faire’ and his passion for winemaking and wine
tasting. I immensely enjoyed picking grapes at Mount Charlie!
Dr. Neil Williams, for giving me my first experience of Australian friendship and
hospitality. Thank you for hosting me in your house for more than one month and for
introducing me to the tasteful and joyful world of Australian gastronomy and wine!
Dr. Stephen M. Richards (The School of Medicine, University of Tasmania), Dr.
Gregory Jones (Department of Medicine and Surgery, Otago University, New
Zealand), Mrs. Faye Doherty (Department of Anatomy and Cell Biology, Melbourne
University), Dr. Cory Griffiths (Forensic Science Service, Tasmania), Dr. Sofianos
Andrikopoulos (Department of Medicine, The Royal Melbourne Hospital), Dr. Garry
Myers (The Institute for Genomic Research -TIGR- Maryland, USA), Dr. Matthew
Ritchie (WEHI Bioinformatics Group, Melbourne), Dr. Gordon Smyth (WEHI
Bioinformatics Group, Melbourne) and Dr. Robert Di Nicolantonio (variously current
or past laboratory colleagues and/or collaborators), for collectively teaching me more
than just the basics of nucleotide amplification, histology, cardiomyocyte contractility,
Western blotting, cDNA microarray assays and statistical analysis. Thank you for
sharing your valued time, your computer desktops and your bench spaces with me.
Your warm friendship and your ‘bucatini ca pummarola’ will always be with me
(Robert)!
Other ‘Delbridge lab’ members, past and present, including Danielle Hart, Petcharat
Trongtorsak, Venne Danes, Claire Curl, Clare Lax, Catherine Huggins, Nadine
Khalil, Emad Abro, Enzo Porrello, and Anna Caldwell. Thank you for your
scientific and technical participation. I will not forget the laughter, the moments shared
during our never-ending lab meetings and the Whitlams (Clare)!
The personnel of the Department of Physiology, in particular Chris Adamidis, Joyce
Kelly, Lesley Robinson, Christine Hofsteter, Karin Diamond, Charles
Chlebowczyk, Philip Dubbin and Jim Pringle. Thank you for your prompt

x
administrative and technical support, the numerous roaming profiles created and
deleted, the tennis games, the Christmas parties and the friendship.
All my Australian mates, especially my colleague and housemate David Plant. It was
just simply too good for words! Thank you Gordon, ‘Jack’, ‘Mattoon’, ‘Bryan’,
James, Sarah, Angela, Tania, the office mates, the other PhD students of the
Department, together with Debby, Angus, Christina, Abby and Michi. Thank you for
the excursions to Mt Bulla, the Great Ocean Road, the parties and the nightlife in
Melbourne - eating, drinking, dancing, singing and keeping me (in)sane!
My beloved Sylvie Lurot. Thank you for your patience and your efficient instruction
on ‘Microsoft Word and Adobe Acrobat for dummies’. Without your support, this
thesis would not have had the same ‘look’.
Last but not least, an extra thanks to Catherine Huggins for the special and wonderful
job done in assembling the final version of this document in Melbourne for remote
submission.
The Roche Research Foundation (Fli7stm 98-120), the Swiss National Science
Foundation and the University of Melbourne are warmly acknowledged for
scholarship and financial support.

xi
INDEX CHAPTER I: General introduction and literature review 1 1. INTRODUCTION
2
2. DEFINITION OF CARDIAC HYPERTROPHY 4 2.1. Concentric cardiac hypertrophy 4 2.2. Eccentric cardiac hypertrophy 5 2.3. Ventricular dilation
6
3. FAMILIAL FORMS OF HEART DISEASES 7 3.1. Familial hypertrophic cardiomyopathy 7 3.2. Dilated cardiomyopathy 8 3.3. Congenital heart diseases 9 3.4. Cardiac arrhythmias 9 3.5. Coronary diseases
10
4. HYPERTROPHY AS A PRELUDE TO HEART FAILURE 11 4.1. Definition of heart failure 11 4.2. Transition from cardiac hypertrophy to heart failure 12 4.3. Incidence and clinical causes of heart failure
14
5. ALTERED EXCITATION-CONTRACTION COUPLING IN CARDIAC HYPERTROPHY AND FAILURE
15
5.1. Electrical changes in cardiac hypertrophy and heart failure 16 5.2. Calcium cycling in cardiac hypertrophy and heart failure 17
5.2.1. Calcium cycling in compensated cardiac hypertrophy 17 5.2.2. Calcium cycling in decompensated cardiac remodeling 18 5.2.3. The sodium/calcium exchanger (NCX) 19
5.3. Potassium currents in cardiac hypertrophy and heart failure 20 5.4. Sympathetic stimulation and electrical impairment 21 5.5. Cell-to-cell coupling and electrical communication 21 5.6. The sodium/hydrogen exchanger (NHE) and pH regulation in cardiac hypertrophy
23
6. MOLECULAR PATHWAYS FOR CARDIAC DEVELOPMENT, HYPERTROPHY AND FAILURE
26
6.1. Embryonic heart development and cell fate determination 26 6.1.1 BMP and Wnt signaling during embryonic development 27 6.1.2 Nkx and GATA signaling 28 6.1.3 MEF2 and cardiomyocyte differentiation 29
6.2. Cardiomyocyte growth and hypertrophy in the adult heart 30 6.2.1. Different signaling pathways for different hypertrophic stimuli 31 6.2.2. Signaling pathways through seven-transmembrane receptors 31 6.2.3. Signaling through mitogen-activated protein kinases (MAPKs) 33

xii
6.2.4. Calcium-dependent pathways of cardiac hypertrophy induction 33 6.3. Cardiomyocyte death 34 6.4. Cardiomyocyte growth and death: a fine balancing act 36 6.5. The fibroblast fraction: collagen production and cardiomyocyte hypertrophy 38 6.6. Extracellular matrix turnover and fibrosis 39
6.6.1 Matrix degradation 39 6.6.2 Matrix biosynthesis 39 6.6.3 Matrix cell adhesion and transduction of signaling pathways 40
7. THE RENIN-ANGIOTENSIN SYSTEM AND CARDIAC REMODELING 42
7.1. An overview 42 7.2. The different components of the renin-angiotensin system 43
7.2.1. Renin 43 7.2.2. The angiotensin-converting enzyme 44 7.2.3. The angiotensinogen precursor 45 7.2.4. Angiotensin peptides 46 7.2.5. Angiotensin II 47 7.2.6. The AT1 receptor 47 7.2.7. The AT2 receptor 49
7.3. Cardiac components of the renin-angiotensin system 51
8. METABOLIC REGULATION OF CARDIAC HYPERTROPHY 52 8.1. Metabolism in the normal heart 52
8.1.1. Fatty acid metabolism 52 8.1.2. Glucose metabolism 53
8.2. Metabolic adaptation in cardiac hypertrophy and failure 54 8.3. Cardiac metabolism in type 2 diabetes and insulin resistant states 55
8.3.1. Diabetes mellitus 55 8.3.2. Insulin resistance 56 8.3.3. Cardiac glucose transport in states of insulin resistance 57 8.3.4. Cardiac fatty acid regulation in states of insulin resistance 58
8.4. Diabetic cardiomyopathy 59 8.4.1. Metabolic disturbances in diabetic cardiomyopathy 59 8.4.2. Mechanical dysfunction in diabetic cardiomyopathy 60
9. AIMS 61 CHAPTER II: General methods 72 1. EXPERIMENTAL MODELS 73
1.1. Ethics approval 73 1.2. The transgenic angiotensinogen overexpressing mouse (TG1306/1R) 73 1.3. The GLUT4 transporter knock-out mouse (GLUT4-KO) 74
2. CARDIAC WEIGHT INDEX 75
3. WHOLE HEART HISTOLOGY AND MORPHOMETRY 76
3.1. Heart preparation and staining 76 3.2. Histological imaging 76
xiii
4. ADULT CARDIOMYOCYTE CELL ISOLATION 78
5. ADULT CARDIOMYOCYTE CONTRACTILITY 79 5.1. Experimental conditions 79 5.2. Recording and analysis 80
6. PROTEIN EXTRACTION AND WESTERN BLOTTING 81
7. TOTAL RNA EXTRACTION AND RT-PCR 82
7.1. RNA extraction 82 7.2. Optimization of RT-PCR conditions 82
8. cDNA MICROARRAY ASSAYS 85
8.1. Principles of DNA microarray analysis 85 8.2. RNA and cDNA preparation for hybridization 85 8.3. Pre-hybridization and hybridization of cDNA microarray slides 86 8.4. Slide washing and scanning 87 8.5. Statistical normalization of cDNA microarray data and clone ranking 88 8.6. Gene Ontology classification of selected transcript candidates 90
9. STATISTICS 92 CHAPTER III: Diverse evolving cardiac and cardiomyocyte phenotypes in Ang II-induced and insulin resistant cardiac hypertrophy
103
1. INTRODUCTION 104
1.1. Cardiac adaptation in response to environmental changes 104 1.2. In vivo models of Ang II-induced cardiac remodeling 104
1.2.1. Cardiac remodeling regression by Ang II suppression 104 1.2.2. Overexpressing or knocking out the intra-cardiac RAS 105 1.2.3. Overexpressing the AT receptors 105 1.2.4. Knocking out the AT receptors 107 1.2.5. Knocking out the angiotensinogen gene 109 1.2.6. Overexpressing Ang II fusion protein directly in the heart 110 1.2.7. Overexpressing the angiotensinogen gene in the heart 110
1.3. Transgenic and knock out models for the GLUT4 112 1.3.1. Overexpressing or knocking out the GLUT4 112 1.3.2. The GLUT4-KO mouse model 113
1.4. In summary 117 1.5. Aims 117
2. METHODS 119
2.1. Whole heart histology and morphometry 119 2.1.1. Procedures 119 2.1.2. Experimental groups 119
2.2. Longevity data and homozygote TG1306/1R mice 120 2.3. RNA and protein extraction and quantification 120

xiv
2.3.1. RNA extraction, RT-PCR and Western blotting 120 2.3.2. Experimental groups 121
2.4. Statistical considerations and presentation of the results 122
3. RESULTS 123 3.1. Cardiac and cardiomyocyte remodeling in TG1306/1R mice 123
3.1.1. Survival and the hypertrophic phenotype in TG mice 123 3.1.2. Myocardial and chamber remodeling in TG hearts 123 3.1.3. Cardiomyocyte hypertrophy but not fibrosis in TG hearts 124 3.1.4. Differential gene expression in TG hearts 125 3.1.5. Decreased GLUT4 protein content in TG hearts 125
3.2. Cardiac and cardiomyocyte remodeling in GLUT4-KO mice 126 3.2.1. Myocardial and chamber remodeling in GLUT4-KO hearts 126 3.2.2. Cardiomyocyte hypertrophy and fibrosis in LLC hearts 126 3.2.3. Differential gene expression in hearts from LLC mice 127 3.2.4. Decreased GLUT4 protein content in LL and LLC hearts 128
4. DISCUSSION 129
4.1. Cardiac and cardiomyocyte remodeling in TG1306/1R mice 129 4.1.1. Concentric hypertrophy and ventricular dilation in TG mice 129 4.1.2. Cardiac and cardiomyocyte remodeling but not fibrosis in TG 130 4.1.3. Differential gene expression profiles in TG hearts 131 4.1.4. Decreased GLUT4 protein levels in hearts of TG mice 133
4.2. Cardiac and cardiomyocyte remodeling in LLC mice 133 4.2.1. Cardiomyocyte hypertrophy and fibrotic remodeling in LLC 133 4.2.2. Decreased cell-to-cell connectivity in LLC hearts 135 4.2.3. Decreased GLUT4 protein levels in hearts of LLC and LL mice 136
5. IN SUMMARY 137 CHAPTER IV: Impaired cardiomyocyte contractility and differential expression of calcium and proton transporters in ageing models of Ang II-induced and insulin resistant cardiac hypertrophy
150
1. INTRODUCTION 151
1.1. E-C coupling with increased pacing frequency in the mouse 151 1.2. Modulation of cardiomyocyte contractility by Ang II 152
1.2.1. Acute modulation of myocyte contractility by Ang II 152 1.2.2. Mechanisms for differential inotropic effects of Ang II on cardiac tissue
154
1.2.3. Regulation of the sodium/hydrogen exchanger (NHE) by Ang II 155 1.2.4. Regulation of the sodium/calcium exchanger (NCX) by Ang II 156 1.2.5. Regulation of SR calcium ATPase (SERCA2) by Ang II 156 1.2.6. Regulation of the ryanodine receptors RyR by Ang II 157 1.2.7. Regulation of the voltage-operated calcium channels by Ang II 158 1.2.8. Integrating the mechanisms of Ang II modulation of cardiomyocyte inotropy
159

xv
1.3. Diabetic cardiomyopathy and cardiomyocyte contractility 161 1.3.1. Cardiac dysfunction related to diabetic cardiomyopathy 161 1.3.2. Altered pH homeostasis in diabetic cardiomyopathy 164 1.3.3. Altered calcium homeostasis in diabetic cardiomyopathy 165
1.4. Insulin resistant cardiomyopathy: evidence of activation of the renin-angiotensin system
166
1.5. Aims 167
2. METHODS 168 2.1. Cardiomyocyte contractility 168
2.1.1. Myocyte preparation and recording 168 2.1.2. Experimental groups 168 2.1.3. Recording protocols and data analysis for cardiomyocyte contractility 169
2.2. RNA and protein extraction and quantification 170 2.2.1. Procedures 170 2.2.2. Experimental groups 170
2.3. Statistical considerations and presentation of the results 171
3. RESULTS 173 3.1. Stability of contractile performance 173 3.2. Impaired cardiomyocyte contractility in Agt overexpressing mice 173
3.2.1. Decreased inotropy, lusitropy and prolonged cycle time at 5 Hz in TG 173 3.2.2. Age- and frequency-dependent alterations in cardiomyocyte function 174 3.2.3. Differential gene and protein expression profiles 175
3.3. Impaired cardiomyocyte contractility in GLUT4-deficient mice 176 3.3.1. Decreased inotropy, lusitropy and prolonged cycle timing at 5 Hz 176 3.3.2. Age- and frequency-dependent alterations in cardiomyocyte function 177 3.3.3. Differential gene and protein expression profiles 178 3.3.4. After-contraction in LLC cardiomyocytes at 1.5 Hz. 178
4. DISCUSSION 179
4.1. Decreased contractile performance in TG cardiomyocytes 179 4.2 Increased twitch duration in TG cardiomyocytes 182 4.3. Decreased inotropy and lusitropy in LLC cardiomyocytes 184 4.4. Increased twitch duration in LLC cardiomyocytes 186 4.5. Negative contraction-frequency relationship in mouse cardiomyocytes 187 4.6. After-contraction, matters of calcium overload? 189
5. IN SUMMARY 190

xvi
CHAPTER V: Microarray analysis of global changes in gene expression in Ang II-induced and insulin resistant cardiac hypertrophy
207
1. INTRODUCTION 208
1.1. Application of microarray analysis 208 1.2. cDNA versus oligonucleotide microarray assays 209 1.3. Application of microarray analysis to the study of heart development and cardiovascular diseases
210
1.3.1. Heart and cardiomyocyte development 210 1.3.2. Myocardial infarction and ischemia 212 1.3.3. Cardiac hypertrophy and heart failure 213 1.3.4. Hereditary hypertrophic cardiomyopathy 216 1.3.5. Uncomplicated and hypertension-associated human obesity 216
1.4. In summary 217 1.5. Aims 218
2. METHODS 219
2.1. RNA and cDNA preparation for hybridization 219 2.2. cDNA microarray assays and experimental groups 219
2.2.1. Choice of array design 219 2.2.2. TG versus WT hearts 220 2.2.3. LLC versus LL hearts 220
3. RESULTS 221
3.1. Differential gene expression and gene clustering in TG mice 221 3.1.1. Differential gene expression in TG mice 221 3.1.2. Gene Ontology classification of candidates 221
3.2. Differential gene expression and gene clustering in LLC mice 222 3.2.1. Differential gene expression in LLC hearts 222 3.2.2. Gene Ontology classification in LLC hearts 223
3.3. Comparative analysis of TG1306/1R and GLUT4-KO 224 3.3.1. Common and distinct gene sets altered in TG and LLC 224 3.3.2. Comparative GO analysis between TG and LLC 224
4. DISCUSSION 226
4.1. Differential gene expression in TG1306/1R mice 226 4.1.1. Evidence for general transcriptional upregulation in TG hearts 226 4.1.2. Evidence for enhanced protein synthesis in TG hearts 227 4.1.3. Overexpression of ribosomal subunits in TG hearts 228 4.1.4. Overexpression of chaperones in TG hearts 229 4.1.5. Overexpression of calreticulin in TG hearts 231 4.1.6. SR and ER stress: are they related phenomena? 232 4.1.7. Differential regulation of Wnt signaling in TG hearts 233 4.1.8. Cytoskeletal remodeling in TG hearts 235 4.1.9. Differential protein turnover and catabolism in TG hearts 236 4.1.10. Are sex hormones involved in cardiac remodeling? 237

xvii
4.1.11. Metabolic disturbances in TG hearts 239 4.1.12. Carbonic anhydrase and NHE1 upregulation 241
4.2. Differential gene expression in LLC hearts 242 4.2.1. Metabolic and mitochondrial impairment in LLC hearts 242 4.2.2. Metal and iron homeostasis in LLC hearts 244 4.2.3. Genes associated with hereditary and non-hereditary cardiomyopathy in LLC hearts
245
4.2.4. Adrenomedullin receptor overexpression in LLC hearts 246 4.2.5. Cell cycle regulation and fibroblast proliferation in LLC hearts 246
4.3. Common set of genes altered in TG and LLC hearts 248 4.3.1. Common downregulated genes 248 4.3.2. Reciprocally regulated genes 249
5. IN SUMMARY 251 CHAPTER VI: Mechanisms of cardiac remodeling in Ang II-induced and insulin resistant cardiac hypertrophy: a comparative overview
263
1. MORPHOLOGIC CHANGES IN CARDIAC HYPERTROPHY 264
2. MECHANICAL CHANGES IN CARDIAC HYPERTROPHY 266
3. DIFFERENTIAL GENE EXPRESSION OF METABOLIC
SUBSTRATES IN CARDIAC HYPERTROPHY 268
4. IN CONCLUSION 271 Bibliography 279

xviii
INDEX OF TABLES AND FIGURES
CHAPTER I: Figure I-1: Intracellular ionic homeostasis during cardiomyocyte contraction and relaxation
62
Figure I-2: Embryonic heart formation 63 Figure I-3: Signaling through 7TM receptors and G-protein 64 Figure I-4: Signaling through EGF receptor transactivation 65 Figure I-5: The MAPK signaling cascade 66 Figure I-6: Hypertrophic growth through calcineurin and NF-ATc 67 Figure I-7: Mechanisms of caspase-induced apoptosis 68 Figure I-8: The renin-angiotensin system (RAS) 69 Figure I-9: Generation and degradation of angiotensin peptides 70 Figure I-10: PPARα-dependent metabolic genes transcription 71 CHAPTER II: Figure II-1: Histological analysis of myocardial collagen density 93 Figure II-2: Histological analysis of myocardial nuclei count 94 Figure II-3: Depiction of cardiac perfusion and myocyte isolation apparatus 95 Figure II-4: Depiction of cardiomyocyte contractile function evaluation 96 Figure II-5: Illustration of RT-PCR amplification and gel analysis 97 Figure II-6: Illustration of microarray ‘target’ and ‘probe’ species 98 Figure II-7: Summarized microarray hybridization protocol 99 Figure II-8: Microarray hybridization and visualization depiction 100 Figure II-9: Depiction of a MA plot after normalization 101 Figure II-10: Side-by-side box plots of the M-values from a microarray experiment
102
CHAPTER III: Table III-1: Age-dependent cardiac structural remodeling in WT and TG mice
138
Table III-2: Age-dependent cardiac structural remodeling in LL and LLC mice
139
Figure III-1: Decreased survival and dilated hypertrophy in TG hearts 140 Figure III-2: Ang II expression levels and severity of remodeling 141 Figure III-3: Agt overexpression and downregulation of Cx43 in TG and WT hearts
142
Figure III-4: GLUT4 protein expression and negative correlation with CWI in TG and WT hearts
143
Figure III-5: Cardiac remodeling in LL and LLC hearts 144 Figure III-6: Fibrosis and non-myocyte proliferation in LLC hearts 145 Figure III-7: Diffuse and focal/reparative fibrosis in LLC hearts 146 Figure III-8: Agt and Cx43 gene expression profiles in LLC and LL hearts 147 Figure III-9: GLUT4 protein expression and correlation with CWI in LLC and LL hearts
148
Figure III-10: GLUT4 protein expression and correlation with CWI in LLC and LL versus WT hearts
149

xix
CHAPTER IV: Table IV-1: Isotonic shortening of adult cardiomyocytes from WT and TG mice
191
Table IV-2: Isotonic shortening of adult cardiomyocytes from LL and LLC mice
192
Table IV-3: Summary of the multiple-way ANOVA analysis for the TG and WT myocytes
193
Table IV-4: Summary of the multiple-way ANOVA analysis for the LLC and LL myocytes
194
Figure IV-1: Effects of acute Ang II modulation of cardiomyocyte contractility
195
Figure IV-2: Effects of chronic Ang II modulation of cardiomyocyte contractility
196
Figure IV-3: Protocol summary for the contractility experiments 197 Figure IV-4: Evaluation of %S and Tf prior to and after the frequency ramp (TG)
198
Figure IV-5: Evaluation of %S and Tf prior to and after the frequency ramp (LLC)
199
Figure IV-6: Pacing responses of isotonically shortening adult myocytes from WT and TG
200
Figure IV-7: Pacing responses of isotonically shortening adult myocytes from WT and TG
201
Figure IV-8: mRNA and protein expression profiles in WT and TG hearts 202 Figure IV-9: Pacing responses of isotonically shortening adult myocytes from LL and LLC mice
203
Figure IV-10: Pacing responses of isotonically shortening adult myocytes from LL and LLC
204
Figure IV-11: mRNA and protein expression profiles in LL and LLC hearts 205 Figure IV-12: After-contraction in LLC myocytes 206

xx
CHAPTER V: Table V-1: Upregulated clones in TG ventricle 252 Table V-2: Downregulated clones in TG ventricle 253 Table V-3: Upregulated clones in LLC ventricle 254 Table V-4: Downregulated clones in LLC ventricle 255
Figure V-1: Gene Ontology classification of genes in TG hearts according to the cellular location
256
Figure V-2: Gene Ontology classification in TG hearts according to the molecular function
257
Figure V-3: Gene Ontology classification in TG hearts according to the biological process
258
Figure V-4: Gene Ontology classification of genes in LLC mice according to the cellular location
259
Figure V-5: Gene Ontology classification in LLC hearts according to the molecular function
260
Figure V-6: Gene Ontology classification in LLC hearts according to the biological process
261
Figure V-7: Depiction of the physical and biochemical interactions between CAR - NHE-1 - AE3
262
CHAPTER VI: Figure VI-1: Comparative analysis of cardiac remodeling in WT, TG, LL and LLC mice
273
Figure VI-2: Pacing responses of isotonically shortening myocytes from WT and LL (1.5-5.0 Hz)
274
Figure VI-3: Pacing responses of isotonically shortening myocytes from WT and LL (1.5-5.0 Hz)
275
Figure VI-4: mRNA and protein expression profiles in WT and LL hearts 276 Figure VI-5: Pacing responses of isotonically shortening myocytes from TG and LLC (1.5-5.0 Hz)
277
Figure VI-6: Pacing responses of isotonically shortening myocytes from TG and LLC (1.5-5.0 Hz)
278
GRAPHICS COPYRIGHT ACKNOWLEDGEMENTS
Chapter I: http://www.myogen.com/discovery/cardiac.php
1
Chapter V: http://www.tqnyc.org/NYC040844/Mitosis.htm 207
Bibliography: http://www.usask.ca/antiquities/Collection/Rosetta_Stone.html
279

xxi
ABBREVIATIONS (excluding gene nomenclature)
7TM Seven-transmembrane (receptor)
ACE Angiotensin converting enzyme
Agt Angiotensinogen
Ang Angiotensin (e.g. Ang II= Angiotensin II)
ANP Atrial natriuretic peptide
AT Angiotensin receptor (e.g. AT1 and AT2= Angiotensin receptor 1 and 2)
β1 and 2-AR Beta 1 & 2 adrenoceptor subtypes
BMP Bone morphogenetic proteins
BNP Brain natriuretic peptide
CICR Calcium-induced calcium release
CWI Cardiac weight index (heart weight/body weight ratio)
Cx Connexin (e.g. Cx43= Connexin 43)
E-C Excitation-contraction (coupling)
ECM Extracellular matrix
EGF Epidermal growth factor
EGFR EGF receptor
ER Endoplasmic reticulum
EST Expressed sequence tag
FABP Fatty acid binding protein
FFA Free fatty acid
FGF Fibroblast growth factor (e.g. FGF-2= Fibroblast growth factor 2)
GATA G-A-T-A zing finger transcription factor family
GLUT Glucose transporter (e.g. GLUT4= Glucose transporter 4)
GLUT4-KO GLUT4 deletion mouse model (collective term includes all littermates,
LL + LLC)
GO Gene ontology
GPCR G protein-coupled receptor
HSP Heat shcok protein
xxii
ICaL L-type calcium current
IK Delayed rectifier potassium current
INCX Inward current mediated by the NCX
IDDM Insulin-dependent (i.e. Type 1) diabetes mellitus
IGF Insulin-like growth factor (e.g. IGF-I= Insulin-like growth factor I)
IL Interleukin
KO Knock-out
Lo Cell resting length
LL Lox+/+ Cre-/- (i.e. control) littermate from the GLUT4-KO mouse line
LLC Lox+/+ Cre+/- (i.e. knock-out) littermate from the GLUT4-KO mouse line
LQT Long QT syndrome
LV Left ventricle
MAPK Mitogen-activated protein kinase
MEF Myocyte-specific enhancer factor
MHC Myosin heavy chain (e.g. β-MHC= β-myosin heavy chain)
MI Myocardial infarction
MLC Myosin light chain
MMP Metalloproteinase
MRL Maximal rate of cell lengthening
MRS Maximal rate of cell shortening
MW Molecular weight
NaKATPase Sodium-Potassium ATPase
NCX Sodium-Calcium exchanger
NHE Sodium-Hydrogen Exchanger (e.g. NHE-1= Sodium-Hydrogen
Exchanger 1)
NIDDM Non insulin-dependent (i.e. Type 2) diabetes mellitus
Nkx Homeobox gene family
NO Nitric Oxide
iNOS Inducible nitric oxide synthase
PDGF Platelet-derived growth factor
PKC Protein kinase C
PPARα Peroxisome proliferator activated receptor α
RAS Renin-angiotensin system
xxiii
ROS Reactive oxygen species
RTK Tyrosine-kinase receptor
RV Right ventricle
RyR Ryanodine receptor
%S Maximum cell shortening (% resting length)
SERCA2 Calcium ATPase of the sarcoplasmic reticulum
SHR Spontaneously hypertensive rat (strain)
SR Sarcoplasmic reticulum
SRF Serum response factor
SRP Signal recognition particles
STZ Streptozotocin
Tf Time at return to resting cell length
Tf - Tm Duration of cell lengthening
Tf - To Duration of contractile cycle
Tm Time at maximum shortening
Tm - To Duration of cell shortening
To Excitation-contraction coupling latency
TAC Trans-aortic constriction
TG Transgenic littermate from the TG1306/1R mouse line
TG1306/1R Transgenic model (collective term includes all littermates, TG and WT)
TGF Transforming growth factor (e.g. TGF-β1= Transforming
growth factor-β1)
TNF Tumor necrosis factor (e.g. TNF-α= Tumor necrosis factor alpha)
%tsa Percent total sectional area
Wnt Wnt genes (drosophila melanogaster)
WT Wild-type (i.e. control) littermate from the TG1306/1R mouse line
identical with C57BL6

xxiv
PUBLICATIONS
Refereed Papers:
Containing material presented in this Thesis:
Domenighetti AA, Wang Q, Egge Mr, Richards SM, Pedrazzini T and Delbridge LMD
(2005). Angiotensin II-mediated phenotypic cardiomyocyte remodeling leads to age-
dependent cardiac dysfunction and failure. Hypertension, 46: 426-432.
Kaczmarczyk SJ, Andrikopoulos S, Favaloro J, Domenighetti AA, Dunn A, Ernst M,
Grail D, Fodero-Tavoletti M, Huggins CE, Delbridge LMD, Zajac JD and Proietto J
(2003). Threshold effects of GLUT4 deficiency on cardiac glucose uptake and
development of hypertrophy. J. Mol. Endocrinol., 31(3): 449-459.
Additional relevant publications:
Porrello ER, Huggins CE, Curl CL, Domenighetti AA, Pedrazzini T, Delbridge LMD,
Morgan TO (2004). Elevated dietary sodium intake exacerbates myocardial
hypertrophy associated with cardiac-specific overproduction of angiotensin II. J. Renin
Angiotensin Aldosterone Syst., 5(4): 169-175.
Lax CJ, Domenighetti AA, Pavia JM, Di Nicolantonio R, Curl CL, Morris MJ,
Delbridge LMD (2004). Transitory reduction in angiotensin AT2 receptor expression
level in post-infarct remodeling in rat myocardium. Clin. Exp. Pharmacol. Physiol.,
31(8): 512-517.

xxv
Huggins CE, Domenighetti AA, Pedrazzini T, Pepe S, Delbridge LMD (2003).
Elevated intracardiac angiotensin II leads to cardiac hypertrophy and mechanical
dysfunction in normotensive mice. J. Renin Angiotensin Aldosterone Syst., 4(3): 186-
190.
Communications:
Domenighetti, Ritchie, Smyth, Pedrazzini, Proietto, Delbridge (2004). Gene
expression profiling reveals distinct sets of genes altered during hormonally and
metabolically induced cardiac hypertrophies. J. Mol. Cell. Cardiol., 37: 303.
Porrello, Morgan, Huggins, Domenighetti, Pedrazzini, Delbridge (2004). Effect of
different sodium intakes on cardiac size in mice producing angiotensin II locally in the
heart. J. Hypertension, 22 (Suppl I): S10.
Domenighetti, Ritchie, Wang, Proietto, Smyth, Delbridge, Pedrazzini (2003). Gene
expression profiling reveals both common and distinct sets of genes altered during
hormonally and metabolically induced cardiac hypertrophy. Proc. Annual meeting of
the Swiss Cardiovascular Research and Training Network, Bern - Switzerland.
Huggins, Domenighetti, Pedrazzini, Pepe, Delbridge (2003). Chronic overexpression
of cardiac angiotensin suppresses basal ex vivo heart function and cardiomyocyte
contractility in hypertrophic transgenic mice. European Soc Cardiol Congress, Vienna,
Aug 30-Sept 3. Abs 22548.
Huggins, Domenighetti, Pedrazzini, Pepe, Delbridge (2003). Effects of elevated
cardiac AngII on ventricular function in mice. Proc. I.S.H.R., Melbourne, Australia.
August 7-9. J.Mol.Cell.Cardiol.
Domenighetti, Wang, Pedrazzini, Delbridge (2002). Chronic Ang II-induced
stimulation in the heart generates E-C coupling dysfunctions and leads to heart failure.
Annual meeting of the Swiss Cardiovascular Research and Training Network, Bern -
Switzerland.

xxvi
Domenighetti, Pedrazzini, Delbridge (2002). Chronic overproduction of cardiac Ang II
in transgenic mice induces cardiac hypertrophy, E-C coupling abnormalities and heart
failure. Gordon Conference on Cardiac Regulatory Mechanisms, Connecticut, - USA.
Domenighetti, Pedrazzini, Delbridge (2001). Abnormal contractile function in
cardiomyocytes from transgenic mice overexpressing Ang II in the heart. Proc. Satellite
congress to the IUPS on the Renin-Angiotensin-Aldosterone System, Melbourne -
Australia.
Domenighetti, Andrikopoulos, Kaczmarczyk, Favaloro, Zajac, Proietto, Delbridge
(2001). A deficiency in GLUT4 transporters induces fibrotic and hypertrophic cardiac
remodelling. World meeting of the International Union of Physiological Sciences
(IUPS), Christchurch - New Zealand.
Domenighetti AA (2001). ‘Myocardial remodeling in diabetic and metabolic-induced
cardiac hypertrophy’. Invited seminar at the Department of Medicine, Royal Melbourne
Hospital, Melbourne - Australia.

CHAPTER I
General introduction and literature review

Chapter I
2
1. INTRODUCTION
Cardiac hypertrophy, clinically identified as an increase in ventricular wall thickness, is
a common feature of individuals suffering from various cardiovascular or metabolic
conditions, such as hypertension, myocardial infarction or type II diabetes. In addition
to pathological conditions, in healthy populations and in athletes there is also
considerable genetic and physiological variation in cardiac mass. In general, cardiac
hypertrophy is associated with microscopic and macroscopic rearrangements of the
normal structure of the heart. This is linked with differential gene expression, leading to
cellular and interstitial changes occurring within the cardiac tissue. As a response to
these alterations the cardiac tissue changes in shape and function, and eventually
progresses toward failure. Although the multiple mechanisms underlying the transition
to heart failure are not fully understood and characterized, novel key concepts and
definitions have emerged in support of the idea that failure is not a simple matter of
reduced contractility and pump dysfunction. Heart failure is increasingly recognized to
be a highly complex clinical syndrome incorporating multiple extra-cardiac and intra-
cardiac features, including differential gene expression, neuro-endocrine activation and
changes in metabolism. Since cardiac hypertrophy development comprises many of the
changes associated with progressive heart failure, there is general acceptance that an
understanding of the molecular, structural and functional mechanisms that cause the
heart to remodel and to increase in size will largely contribute to knowledge of the
mechanisms underlying heart failure.
In this regard, experimental genetically manipulated animal models provide valuable
experimental tools for elucidating the molecular and functional mechanisms
responsible for the development of cardiac hypertrophy and the transition from the state
of compensated hypertrophy to dilation and failure. In particular, genetic animal
models of blood pressure-independent cardiac hypertrophy (i.e. of primary cardiac
hypertrophy) have been generated to address the question of whether cardiac-specific
neuro-endocrine activation and metabolic imbalance are necessary and/or sufficient to
induce the heart to remodel.

Chapter I
3
In the present work, an examination of two different genetic mouse models of primary
cardiac hypertrophy is presented: 1) a cardiac-specific angiotensinogen-overexpressing
transgenic mouse, the TG1306/1R; and 2) a glucose transporter (GLUT4) knock-out
mouse model, the GLUT4-KO. Experimental investigations included cellular and tissue
morphometric analysis on the heart of these rodents (Chapter III), combined with
experiments of cardiomyocyte contractility (Chapter IV) and cardiac gene expression
profiling by cDNA microarray assays (Chapter V). The objective was to provide new
insight into the mechanisms that are common and unique in the development of
hypertrophic states induced either by the cardiac-overproduction of the bioactive
peptide angiotensin II (Ang II) or a cardiomyocyte-specific glucose metabolic
deficiency (Chapter VI). In this initial Chapter a literature survey and the general
concepts concerning the mechanisms and the stimuli that lead to cardiac hypertrophy
and heart failure are presented, while Chapter II describes the general methods applied
in the experimental studies to follow (Chapter III- V).

Chapter I
4
2. DEFINITION OF CARDIAC HYPERTROPHY
Cardiac hypertrophy can be defined as a physiologic and pathologic condition where
the heart changes in size, shape and function in response to a variety of extra-cardiac
and intra-cardiac stimuli. Cardiac hypertrophy is itself a predictor of cardiovascular
morbidity and mortality, independent of hypertension and coronary diseases (Koren et
al., 1991; Levy et al., 1996; Schmieder and Messerli, 2000; Drazner et al. 2004). In
general, cardiac hypertrophy involves two major components of the heart: the cellular
fraction and the extracellular matrix (ECM). The degree of myocardial remodeling is
mainly determined by changes in collagen concentration or in collagen isoform
expression and cell growth (hypertrophy), proliferation (hyperplasia) or death (by
apoptosis or necrosis).
Cardiac hypertrophy is often associated with or even induced by other intra-cardiac
events, including cell necrosis, ischemia, infarction, interstitial fibrosis and vascular
sclerosis. The normal myocardial wall architecture is remodeled and the
cardiomyocytes increase either in width or in length or in both directions. Clinically,
there are two forms of anatomic cardiac hypertrophy that could progressively lead to
heart failure: these are named concentric and eccentric hypertrophies (Hunter and
Chien, 1999; Morgan and Delbridge, 1999).
2.1. Concentric cardiac hypertrophy
This form of hypertrophy is often associated with hypertension and other states of
pressure overload (e.g. aortic stenosis). It is generally believed that in this case
cardiomyocytes tend to increase in width rather than length (Hunter and Chien, 1999).
This is due to the assembling of extra contractile-protein units in parallel. Wall
thickening reduces cardiac chamber size and decreases stroke volume as a

Chapter I
5
consequence. Concentric hypertrophy is initiated by increased diastolic stretch.
Abnormal ventricular relaxation impedes atrial emptying of blood, which can passively
stretch these thin-walled chambers and cause atrial dilation, a clinically prevalent
feature of the concentric hypertrophic heart. Moreover it has been demonstrated that
concentric cardiac hypertrophy is a significant predictor of coronary heart disease (de
Simone and Palmieri, 2002; Malmqvist et al., 2002), depressed midwall systolic
function (Schillaci et al., 2002), increased QT interval duration (Oikarinen et al., 2001),
microalbuminuria in hypertensive patients (Tsioufis et al., 2002), and increased
incidence of pathologic events in patients with uncomplicated myocardial infarction
(Carluccio et al., 2000).
2.2. Eccentric cardiac hypertrophy
This form of cardiac hypertrophy is generally associated with volume overload states.
During eccentric hypertrophy, the cardiomyocytes are believed to increase in length
rather than width, because extra contractile-protein units are assembled in series.
Eccentric hypertrophy results from increased systolic stress (Katz, 2002) and is almost
always accompanied by an increase in ventricular wall thickness, which reflects
myocyte hypertrophy as well as a variable increase in interstitial fibrosis. In athletes a
physiologic eccentric hypertrophy can occur, which is caused by an increase in
workload. In this case, hypertrophy is not acutely associated with a particular
pathology, although some long-term clinical implications after deconditioning cannot
be excluded (Neri Serneri et al., 2001; Pelliccia et al., 2002). Generally, the intra-
ventricular volume expansion stretches cardiomyocytes and improves pressure-volume
relationships within the heart so as to augment cardiac output. Eccentric ventricular
hypertrophy has also been associated with left atrial enlargement in hypertensive
patients (Gerdts et al., 2002) and increased QT interval duration (Oikarinen et al.,
2001).

Chapter I
6
2.3. Ventricular dilation
Ultimately, eccentric and concentric forms of cardiac hypertrophies may degenerate
into ventricular dilation. In dilated hypertrophy regional myocardial injury and ageing
is associated with progressive and deleterious thinning of the ventricular wall and
impaired systolic function. Studying the molecular and physiological pathways leading
to acquired concentric and eccentric cardiac hypertrophy and cardiac dilation is a
complicated matter. This is generally attributable to the nature of the multifactorial
origin of these forms of hypertrophy, which are often linked with and triggered by
multiple underlying pathologies.
There is evidence suggesting that concentric and eccentric forms of remodeling and
ventricular dilation share some common important intracellular signaling pathways. For
example, transgenic and cardiac-specific over-expression of tropomodulin generates
mice with dilated cardiomyopathy (Sussman et al., 1998a). Interestingly, the dilated
phenotype can be prevented by treating the same mice with inhibitors of the calcineurin
pathway, a well-known stimulus for concentric cardiac hypertrophy (Sussman et al.,
1998b). Cross-breeding of the tropomodulin transgenic mice in heterozygous and
homozygous forms with calcineurin over-expressing mice demonstrate that different
cardiac hypertrophic phenotypes (that is, concentric and eccentric) coexist with the
same genetic background (Sussman et al., 2000). These results also suggest that
distinctions made between concentric, eccentric and dilated forms of hypertrophy to
explain different clinical pathologies of the heart may be oversimplified, especially
when molecular and cellular mechanisms are taken in account.

Chapter I
7
3. FAMILIAL FORMS OF HEART DISEASES
In recent years there has been significant progress in delineating causes of hereditary
heart diseases and primary cardiomyopathies. Today it is widely accepted that most
congenital ‘idiopathic’ heart defects are known to result from heritable gene mutations.
This is exemplified by the recurrence of heart defects in the same family. Identification
of mutations in patients with cardiomyopathies and various other heart malformations
has revealed substantial molecular complexity in the etiologies of these disorders.
3.1. Familial hypertrophic cardiomyopathy
In contrast to acquired forms of cardiac hypertrophy, primary/familial hypertrophic
cardiomyopathies are not secondary to other underlying pathologies. This form of
hypertrophy is an autosomal dominant disease of the cardiac muscle that is
characterized by disproportionate symmetric or asymmetric hypertrophy of the left
ventricle and cardiomyocyte disarray. Cardiac mass is increased due to left ventricular
wall thickening, often with particular involvement of the interventricular septum. As a
consequence of hypertrophy, the left ventricular chamber volumes are diminished,
resulting in the appearance of a muscle-bound heart. Despite the presence of even
markedly abnormal ventricular morphology and histopathology, systolic function in
familial hypertrophic cardiomyopathy is usually excellent and can often appear supra-
normal. Yet, most affected individuals develop mild to moderate symptoms of
shortness of breath (dyspnea) and chest pain (angina) due to impaired diastolic
relaxation of the hypertrophic heart (Spirito et al, 1997). In addition, patients are at
increased risk of developing heart failure, atrial and ventricular arrhythmias, and
sudden death. Indeed, hypertrophic cardiomyopathy is the most common cause of
sudden death in the young, accounting for 48% of sudden death in individuals less than
35 years of age (Basso et al., 2001). Furthermore, unrecognized familial hypertrophic

Chapter I
8
cardiomyopathy is the most common cause for sudden death in athletes (Maron et al.,
1996; Maron, 2003).
Several genes have been mapped to familial hypertrophic cardiomyopathy. The
majority encode sarcomeric proteins in the heart muscle (e.g. β-myosin heavy chain,
cardiac troponin T, tropomyosin, actinin) (reviewed in Bonne et al., 1998). Mutations
in cardiac actin, troponin I and titin are also currently recognized as rare causes of
familial hypertrophic cardiomyopathy. An important corollary to the obvious
conclusion that sarcomere mutations in hypertrophic cardiomyopathy alter the
molecular processes of muscle contraction is that these events also activate pathways
for myocyte growth. Although little is currently known about signaling pathways that
link sarcomere force production to myocyte growth, and ultimately to cardiac
hypertrophy, evidence suggests a critical role for calcium in signal transduction. For
instance, it has been demonstrated that myosin mutations cause fundamental
dysregulation of sarcomere calcium requirement and cycling (Fatkin et al., 2000).
3.2. Dilated cardiomyopathy
Defined by ventricular dilation and diminished contractile function, dilated
cardiomyopathy is a prevalent world-wide disorder that is estimated to affect 40-50
cases per 100,000 (Codd et al., 1989). Dilated cardiomyopathy causes heart failure,
serious arrhythmias and thromboembolic events, all of which account for the premature
mortality of the disease (Elliot, 2000). Although cardiac mass is increased, there is
often only modest ventricular wall hypertrophy while atrial and ventricular chambers
can be distended. Myocyte hypertrophy and interstitial fibrosis are difficult to observe.
Unlike familial hypertrophic cardiomyopathy, substantial distortion of cell architecture
or myocyte disarray is not a feature of dilated cardiomyopathy. Early clinical
manifestations of the disease are vague and often not attributed to heart failure. When
underlying causes such as coronary artery disease, chronic alcohol abuse, thyroid
disease or viral infection are excluded as etiologies, a diagnosis is often made of
‘idiopathic dilated cardiomyopathy’ (Kasper et al., 1994). Familial studies and
echocardiography of relatives of affected individuals have demonstrated that 25-30% of
Chapter I
9
‘idiopathic’ dilated cardiomyopathy is caused by inherited gene mutations (Grunig et
al., 1998; Seidman and Seidman, 2001). Interestingly, left ventricular dilation and
systolic dysfunction develop in ~15% of patients with familial hypertrophic
cardiomyopathy.
3.3. Congenital heart diseases
Congenital heart diseases are a group of structural cardiac anomalies present at birth,
affecting ~0.4% of live born infants (Ferencz et al., 1985; Roskes et al., 1990). These
are caused by abnormal cardiac morphogenesis and development. Such disorders
include defects in the valves and chambers associated with specific chromosomal
abnormalities (e.g. trisomy 21/Down syndrome or Noonan syndrome) and with genetic
dysmorphic syndromes. As an example, the search for the keyword ‘congenital heart
disease’ on the internet-based databank OMIM (Online Mendelian Inheritance in Men,
found at http://www.ncbi.nlm.gov/), reveals more than 300 entries corresponding to
tens of chromosome loci and hundred of potentially related genes, the mutation of
which could lead to various pathologic cardiac phenotypes, such as septation defects,
stenosis, neural crest defects, tetralogy of Fallot, supravalvular aortic stenosis, or
coronary artery obstructive lesions. Examples of syndromes that have been linked to
specific genetic mutations are the Holt-Oram syndrome (linked to the genes TBX-5 and
NKX2.5), the Williams syndrome (linked to the gene for elastin), the Alagille
syndrome (linked to mutations in JAG1), Down syndrome (linked to region on
chromosome 21 that contains about 28 known genes) and the Noonan syndrome (linked
to PTPN11).
3.4. Cardiac arrhythmias
Cardiac arrhythmias are a common cause of morbidity and mortality and may be
associated with genetic defects or altered expression in calcium, potassium or sodium
channels (Basso et al., 2001). Long QT (LQT) syndrome, a condition of cardiac

Chapter I
10
arrhythmias, is characterized by prolongation of the QT interval on electrocardiograms
(Wang et al., 1998; Basso et al., 2001). Various forms of inherited long QT have been
reported, including the autosomal recessive LQT of the Jervell-Lange-Nielsen
syndrome (with mutation found in the potassium channels KCNQ1 and KCNE1), the
autosomal dominant LQT of the Romano-Ward syndrome (with mutations in the
potassium channel KCNQ1) and the autosomal dominant LQT of the Andersen
cardiodysrhythmic periodic paralysis (caused by mutations in the potassium channel
KCNJ2).
3.5. Coronary diseases
Coronary artery diseases are characterized by a gradual accumulation of vascular
plaque materials including inflammatory cells and molecules, cholesterol, complex
lipids and lipoproteins and varying amounts of fibrous connective tissue containing
numerous smooth-muscle cells, collagen, T-cells and others. The clinical symptoms of
coronary heart disease, such as angina pectoris, myocardial infarction and death, result
from mild to moderate atherosclerotic lesions (atherosclerosis) that progress from fatty
streaks to fibrous plaques, and ultimately severe plaque rupture. The majority of
coronary heart disease cases are considered to be multifactorial and result from the
interaction of multiple genetic and environmental factors. Various genes, implicated in
conferring an increased risk of coronary heart disease and myocardial infarction,
include the angiotensin-converting enzyme (ACE) (Cambien et al., 1992; Ruiz et al.,
1994; Schachter et al., 1994), angiotensinogen (Agt) (Katsuya et al., 1995) and genes
regulating lipoprotein metabolism (Schachter et al., 1994).

Chapter I
11
4. HYPERTROPHY AS A PRELUDE TO
HEART FAILURE
4.1. Definition of heart failure
Although the term chronic heart failure is commonly used, there is no clear definition
for this condition. The American College of Cardiology and the American Heart
Association (ACC/AHA) joint task force ‘Guidelines for the evaluation and
management of heart failure’ defines heart failure as a “complex clinical syndrome that
can result from any structural or functional cardiac disorder that impairs the ability of
the ventricle to fill with and eject blood. The cardinal manifestations of heart failure are
dyspnea and fatigue, which may limit exercise tolerance, and fluid retention, which
may lead to pulmonary and peripheral edema” (ACC/AHA, 2001). However, such
pathophysiological conceptualization of heart failure is rapidly evolving currently to
take into account multiple extra- and intra-cardiac features, including myocardial
remodeling, metabolic disturbances, neuro-humoral activation and cytokine release.
It is now apparent to physicians and researchers that patients often go through a period
of latent or even asymptomatic left ventricular hypertrophy and diastolic dysfunction
before the development of overt signs and symptoms of heart failure (Vasan et al.,
1997). In many cases the development of cardiac hypertrophy leading to heart failure is
preceded by or associated with a cascade of ‘succeeding events’. These events can take
multiple forms, namely 1) an acute insult, like a myocardial infarction, a myocarditis or
a vessel atherosclerotic disease; 2) hemodynamic changes, such as the gradual
development of systemic hypertension or the onset of a valvular insufficiency; 3)
neuro-humoral activation, involving the upregulation of hormones, cytokines and
neuropeptides; 4) a metabolic imbalance, caused by hyperlipidemia, hyperglycemia,
insulin resistance, diabetes and obesity; 5) other systemic diseases, such as chronic
obstructive lung diseases, renal diseases or hyperthyroidism; and finally 6) the

Chapter I
12
expression of mutated genes, as in idiopathic and familial forms of hypertrophic and
dilated cardiac remodeling. In synthesis, heart failure is multifactorial and in many
cases its genesis is determined by the coexistence and the auto-induction of one or
more of the above events occurring in association with the process of normal
senescence (Smith, 1985; Kannel and Belanger, 1991; Julien, 1997; Adams, 2001).
4.2. Transition from cardiac hypertrophy to heart failure
Cardiac and cardiomyocyte hypertrophy in response to pathologic conditions has
traditionally been considered a compensatory and adaptive response required to sustain
cardiac output in the face of new pathologic working conditions. Prolonged or chronic
hypertrophy however is associated with a significant increase in the risk for decreased
cardiac output, development of ventricular arrhythmias, myocardial dilation and sudden
death, independently of the causes triggering hypertrophy (Levy et al., 1990; Vakili et
al., 2001). This notion is further confirmed by observations made in clinical trials
where inhibition or even regression of cardiac hypertrophy by certain drugs, such as
angiotensin-converting enzyme inhibitors (ACE-I), lowers the risk for several
endpoints, including progression to heart failure and death, whereas persistence of
cardiac and cardiomyocyte hypertrophy predicts adverse outcomes (Beltrami et al.,
1994; Mathew et al., 2001). According to the previous definition of heart failure
(“ventricular dysfunction with symptoms”), the transition from compensated
hypertrophy to failure could therefore indicate the limits of the molecular and
phenotypic adaptation process of the heart to pathologic working conditions.
A search for molecular markers characterizing heart failure and the transition of
compensated hypertrophy to heart failure is only beginning. Among potential clinical
markers of heart failure are the circulating natriuretic peptides, such as the atrial and
brain natriuretic peptides (ANP and BNP). These molecules are secreted by the atria
and the ventricles respectively to maintain normal cardiovascular and renal homeostasis
(Clerico and Emdin., 2004). Recent clinical studies have demonstrated that both ANP
and BNP are potentially useful in diagnosis and prognosis of heart failure, where
plasma concentration of these peptides is increased (Maisel et al., 2003). In addition,

Chapter I
13
BNP also appears to be useful in assessing the risk and predicting the outcome in
patients with myocardial infarction and failure. Natriuretic peptides are the only US
Food and Drug Administration (FDA)-cleared biomarkers for diagnosis of heart failure
to date. In addition to natriuretic peptides, plasma concentrations of various other
molecular markers have been reported to be disturbed in heart failure patients. Some of
these include mammalian cardenolides (Jortani and Valdes, 2001), various cytokines
such as interleukin-6 and tumor necrosis factor alpha (IL-6 and TNF-α) (Cicoira et al.,
2001; Parissis et al., 2003), troponin I and T (Missov and De Marco, 1999),
adrenomedullin (Tsuruda et al., 2003) and leptin (Filippatos et al., 2000; Perrego et al.,
2005).
The majority of intra-cardiac molecules which would allow characterization of the
transition from compensated to decompensated states are probes specific for the
extracellular matrix (ECM) component of the heart, such as fibronectin and the shift
between types of collagen isoforms (Pauschinger et al., 1999). The expression of
transforming growth factor-beta 1 (TGF-β1) and osteopontin (Pauschinger et al., 1999;
Singh et al., 1999), as well as the activation of metalloproteinases (MMPs) (Iwanaga et
al., 2002) are also key markers of the transition from cardiac hypertrophy to heart
failure. Among the cytoskeletal and sarcomeric changes that could enhance the
transition toward failure, depressed microtubule depolymerization (Tagawa et al.,
1998) and changes in troponin I and T function (Noguchi et al., 2003) are proposed.
Finally, cardiac beta-adrenergic desensitization (Castellano and Bohm, 1997; Tse et al.,
2000), increased protein Gαq-dependent myocyte apoptosis (Dorn and Hahn, 2004),
inducible nitric oxide synthase (iNOS) expression and nitric oxide (NO) production
(Horinaka et al., 2003), as well as a shift in sodium/potassium ATPase (NaKATPase)
isoforms (Fedorova et al., 2004) could be directly involved in the phenotypic and
mechanical changes observed in the heart during the transition to failure.
Experimentally, the age-dependent transition from compensated cardiac hypertrophy to
heart failure has been rarely studied due to the absence of valid experimental models.
Spontaneously hypertensive rats (SHR) develop impaired myocardial function and
biventricular congestive heart failure, after a long period (18 months) of compensatory
cardiac hypertrophy due to systemic hypertension (Bing et al., 2002; Boluyt et al.,
Chapter I
14
1995). A similar phenotype can be obtained in chronic pressure overload introduced
gradually in young normotensive rats after aortic banding (Boluyt et al., 2005).
Badenhorst et al. (2003) showed that chronic beta-adrenergic receptor activation
initiates the progression from compensated concentric hypertrophy to cardiac
dysfunction primarily through tissue remodeling in SHR. Dahl salt-sensitive rats fed a
high-salt diet after the age of 6 weeks develop concentric left ventricular hypertrophy at
11 weeks and heart failure with ventricular dilation at 15-20 weeks (Morii et al., 1998).
In this model, the heart failure transition is associated with a marked decrease in
myocardial contractility and with ventricular remodeling. Stenosis of the descending
aorta in guinea pigs lead to similar results, with compensated hypertrophy for up to~10
weeks after banding and the presence of heart failure after 20 weeks (Randhawa and
Singal, 1992).
4.3. Incidence and clinical causes of heart failure
Recent estimates highlight the high incidence of heart failure throughout the Western
world (Cubillos-Garzon et al., 2004; Lee et al., 2004; Remme et al., 2004). It is the only
cardiovascular disease of rapidly increasing prevalence. World-wide, it is estimated
that 3.6 million new cases occur each year. Reasons for the rising incidence of chronic
heart failure include an increased awareness amongst clinicians leading to an increase
in the rate of diagnoses, an increase in the rate of survival after an acute event (such as
myocardial infarction) as a result of recent therapeutic developments (AIRE Study
Investigators, 1993), and the advancing age of the population in the Western world
(Steward et al., 2003). The prevalence ranges from 1-2% in the middle-aged to 10-15%
in octogenarians (Cowie et al., 1997). Amongst other risk factors, hypertension,
coronary artery diseases, ischemia, left ventricular hypertrophy, sympathetic
overactivity and type 2 diabetes are important risk factors for the development of heart
failure (Wei et al., 1998; Arnold et al., 2003; Drazner et al., 2004; Elhendy et al., 2004;
Palatini and Julius, 2004).

Chapter I
15
5. ALTERED EXCITATION-CONTRACTION COUPLING
IN CARDIAC HYPERTROPHY AND FAILURE
Contraction of the cardiac muscle cell is initiated by transmission of spontaneously
generated electrical action potentials. Upon sodium-dependent cardiomyocyte
membrane depolarization (Figure I-1, A.), calcium enters the cytosol mainly through
voltage-operated calcium channels generating L-type calcium currents (ICaL) (Bers,
2001) (Figure I-1, B.). This calcium entry triggers calcium release from the
sarcoplasmic reticulum (SR). This step is regulated by the activation and inactivation of
calcium release channels, namely the ryanodine receptors (RyR) of the SR (Bers, 2001;
Marks, 2001), a process termed calcium-induced calcium release (CICR) (Figure I-1,
C.). Under certain conditions, calcium can also enter the cell via sarcolemmal
sodium/calcium exchanger (NCX) (Figure I-1, D.). Application of laser scanning
confocal microscopy techniques and calcium-sensitive fluorescent indicators has made
it possible to sustain the hypothesis that the initial phase of excitation-contraction (E-C)
coupling in cardiac cells is locally regulated by spatial and temporal
summation/coupling of single ICaL, NCX operation and SR calcium ‘sparks’ (Egger and
Niggli, 1999; Berridge et al., 2000; Niggli and Egger, 2002). These processes raise
intracellular calcium concentrations from ~100 nM to ~1 μM, causing calcium binding
to troponin C which serves to remove the inhibition of the attachment of actin to
myosin and produces shortening of the cell (Figure I-1, E.).
For relaxation to occur, calcium must be removed from the cytoplasm. The main means
of lowering cytoplasmic calcium to terminate contraction make use of active pumping
of calcium into the SR by the calcium ATPase SERCA2 (Figure I-1, F.). A component
of calcium is also removed from the cell by the NCX (Negretti et al., 1993; Bassani et
al., 1994) (Figure I-1, G.). The relative contribution of the NCX in calcium extrusion is
species- and ICaL density-dependent (Bassani et al., 1994; Bers, 2001). In addition, the
relative contribution of SERCA2 and NCX to elimination of cytosolic calcium can also
change upon altering steady-state conditions, such as increasing stimulation frequency

Chapter I
16
(Pieske et al., 1999; Maier et al., 2000). Using paired rapid cooling contractures Maier
et al. (2000) showed that increasing stimulation frequency from 0.25 to 3 Hz in rabbit
myocardium increased the apparent SERCA2 contribution from 28% to 65%, while in
rats this contribution increased only from 62% to 70%, suggesting that in the latter
species SERCA2-dependent calcium removal was already nearly maximal at low
frequency. Active extrusion of calcium across the sarcolemmal membrane by
sarcolemmal ATPase and mitochondrial uptake also occurs but it represents only 2-3%
of the total calcium transport during relaxation (Bassani et al., 1992; Berridge et al.,
2000) (Figure I-1, H.). In parallel to calcium-dependent relaxation, recovery of
excitability by repolarization of the cell membrane to resting levels (around -90 mV) is
achieved by the activation of potassium-dependent hyperpolarizing currents (Figure I-
1, I.).
5.1. Electrical changes in cardiac hypertrophy and heart failure
In recent years, electrical remodeling has emerged as an important pathophysiological
mechanism in the development of mechanical dysfunction, pump failure and sudden
death. When detected by electrocardiography, cardiac hypertrophy and heart failure are
commonly associated with the development of QT interval prolongation or dispersion
and life-threatening arrhythmias (Kulan et al., 1998; Pogwizd and Bers, 2004). Clinical
studies suggest that 50% of sudden deaths associated with heart failure are attributable
to ventricular tachycardia or fibrillation, the other half being coupled to
bradyarrhythmias or electromechanical dissociation (Janse, 2004). Mechanisms
underlying these arrhythmias are multifactorial, but they stem from disordered
electrical currents arising from differential expression or activity of ion channels,
increasing action potential duration. The resulting delay in the recovery of excitability,
a consistent feature of ventricular hypertrophy, predisposes to delayed
afterdepolarizations, especially at higher frequencies (Hart, 1994; Armoundas et al.,
2001; Janse, 2004; Pogwizd and Bers, 2004). The most consistent electrophysiological
changes associated with action potential prolongation and triggered activity involve 1)
abnormalities in intracellular calcium handling, including an increase in NCX activity;
2) a reduction in potassium currents, including the transient outward (Ito) and the

Chapter I
17
inward rectifier (IK1) currents; and 3) impaired beta-adrenergic stimulation. Additional
mechanisms include myocardial fibrosis, altered cell-to-cell junctional communication,
myocardial electrical and cellular heterogeneity, all of which predispose to re-entrant
mechanisms of arrhythmia.
5.2. Calcium cycling in cardiac hypertrophy and heart failure
It has been proposed that calcium cycling plays a major role in the development of
electrical and mechanical dysfunction in cardiac hypertrophy and failure (Wickenden et
al., 1998; Bers, 2001). Calcium-dependent cardiomyocyte contractility is indeed
affected during cardiomyocyte remodeling. This aspect will be detailed in Chapter IV,
but in general terms mechanical dysfunction in decompensated cardiac hypertrophy and
failure is normally paralleled by time- and amplitude-dependent modifications of the
calcium transient (Beuckelmann et al., 1992; Wickenden et al., 1998), and the
expression or activity of several calcium-handling proteins, including SERCA2 (Dipla
et al., 1999; Lim et al., 1999; Terracciano et al., 2001; Zhong et al., 2001; Hasenfuss
and Pieske, 2002), L-type calcium channels (He et al., 2001; Chen et al., 2002), RyR
receptors (Marks et al., 2002) and NCX (Dipla et al., 1999; Hasenfuss and Pieske,
2002; Sipido et al., 2002).
5.2.1. Calcium cycling in compensated cardiac hypertrophy
In general, there is evidence to suggest that modification of the calcium signaling is
dependent on the stage and severity of cardiac hypertrophy. In compensated
experimental cardiac hypertrophy, differential gene expression of calcium handling
proteins is modest or unchanged (De la Bastie et al., 1990; Feldman et al., 1993; Kiss et
al., 1995; Arai et al., 1996), while ICaL, systolic calcium and calcium transients are
generally increased (Brooksby et al., 1993; Kagaya et al., 1996; Mukherjee and
Spinale, 1998; Armoundas et al., 2001; Wang et al., 2001). In compensated cardiac
hypertrophy, differences in systolic calcium that exist between hypertrophied and
normal cardiomyocytes can be abolished by voltage-clamp conditions, where the

Chapter I
18
duration of depolarization is normalized (Brooksby et al., 1993). This suggests that
action potential prolongation directly correlates with elevated systolic calcium and
increased contractility (inotropy) in these hypertrophied myocytes. Thus, in
compensated cardiac hypertrophy, action potential prolongation often stems from
upregulation of inward currents, such as ICaL, which is active in ‘phase 2’ of the action
potential, and the inward current mediated by the NCX (INCX), which is active in ‘phase
3’. It could be suggested that in compensated cardiac hypertrophy, a compensatory
prolongation of the action potential would increase the amplitude of the calcium
transient and lead to a positive inotropic response of the heart to the new working and
environmental conditions.
5.2.2. Calcium cycling in decompensated cardiac remodeling
Regardless of maintained action potential prolongation, in maladaptive cardiac
hypertrophy and in heart failure, systolic calcium flux is markedly reduced
(Beuckelmann et al., 1992; Pieske et al., 1995), ICaL maybe unchanged or sometimes
decreased, while the calcium transient is significantly prolonged and SR calcium
uptake activity reduced (Beuckelmann et al., 1992; Mukherjee et al., 1995; Delbridge et
al., 1997). In animal models of severe hypertrophy, these events correlate with
downregulation of SR calcium-handling proteins, such as RyR, SERCA2 and
phospholamban (De la Bastie et al., 1990; Naudin et al., 1991; Feldman et al., 1993; Go
et al., 1995; Kiss et al., 1995; Hittinger et al., 1999; Milnes and MacLeod, 2001). This
is also confirmed in human end-stage and dilated heart failure (Flesch et al., 1996;
Hasenfuss et al., 1997). Unlike the early changes that lead to action potential
prolongation, it appears that changes in SR calcium handling are maladaptive.
Therefore, an imbalance of these regulatory mechanisms, generally leading to a shift of
the circulation of calcium from intracellular routes (cytosol and SR) to extracellular
routes (trans-sarcolemmal), could be hypothetically responsible for time-dependent
impaired diastolic and systolic function and could promote the onset of failure. These
mechanisms will be further detailed in Chapter IV dealing with cardiac remodeling
induced by cardiac Ang II overproduction and diabetic cardiomyopathy.

Chapter I
19
5.2.3. The sodium/calcium exchanger (NCX)
The NCX importantly contributes to control of intracellular calcium concentrations,
exporting cytoplasmic calcium by electrogenically exchanging it for extracellular
sodium (Figure I-1). It catalyzes the bidirectional exchange of 3 sodium ions for a
single calcium ion. Thus, one net positive charge per reaction cycle moves inwardly
during relaxation.
The density of the NCX generated calcium flux is generally found to be increased or
unchanged in cardiac hypertrophy and heart failure in humans, experimental models
and in cultured hypertrophic cardiomyocytes (Studer et al., 1994; Reinecke et al., 1997;
Brooks et al., 2000; Hobai and O’Rourke, 2000; Wang et al., 2001). Forward-mode
exchanger function (sodium in and calcium out, during repolarization) compensates for
defective SR calcium removal at the expense of depletion of the SR releasable pool of
calcium with repetitive stimulation (Hasenfuss et al., 1996; Pieske et al., 1996), thus
increasing depolarizing current. Reverse mode exchange (sodium out and calcium in,
during depolarization) has been suggested to provide inotropic support to the failing
heart (Flesch et al., 1996; Mattiello et al., 1998).
The major exception to this is probably represented by models of diabetic and
metabolic cardiomyopathy, where the NCX has been consistently shown to be
downregulated (Hattori et al., 2000; Kashihara et al., 2000; Duan et al., 2003).
Interestingly some have reported a dissociation between NCX current (INCX) density
and NCX protein expression in compensated cardiac hypertrophy, where NCX1 – the
major exchanger transcript in the heart – is overexpressed to an extent similar to that
reported in heart failure, but INCX is decreased (Wang et al., 2001). Similar
downregulation of INCX was described in the G protein (Gαq)-overexpressing mouse
model of mild cardiac hypertrophy (Mitarai et al., 2000) and dissociation of NCX
protein and activity has been described in cardiac hypertrophy (Boateng et al., 2001).
These findings contrast with heart failure, in which most, although not all (Hasenfuss et
al., 1999) studies have documented increased exchanger activity in parallel to NCX1

Chapter I
20
mRNA or protein overexpression. In some experimental models the imbalance of this
current may therefore be related to the action potential prolongation and arrhythmias.
5.3. Potassium currents in cardiac hypertrophy and heart failure
As previously mentioned, repolarization in the mammalian heart is achieved primarily
by the activity of potassium-selective ionic currents, although the exact molecular
composition of these currents varies considerably from species to species. Ventricular
myocytes express several distinct classes of voltage-dependent potassium channels.
The inward rectifier potassium current (IK1) maintains the resting membrane potential
and contributes to the terminal phase of repolarization in the ventricular myocytes. An
important potassium current is the calcium-independent transient outward current, Ito.
Unlike the inward rectifier, Ito is expressed in heart cells in a species- and cell type-
specific fashion. This current plays a crucial role in the early phase of repolarization.
The delayed rectifier K current (IK), composed of molecularly distinct rapid (IKr) and
slow (IKs) components, is important in ‘phase 3’ of repolarization (reviewed in
Armoundas et al., 2001).
It is proposed that of all the mechanisms that may contribute to action potential
prolongation, depression of Ito appears to be the most reproducible (Beuckelmann et al.,
1993; Cerbai et al., 1994; Kaab et al., 1996; Li et al., 2002). The peak Ito density is also
reduced during aging and can represent a very early event in the response to decreased
pump performance. Nuss et al. (1996) reported that failing cardiomyocytes with 66%
reduction in Ito (and prolonged action potential duration) exhibit normalized
repolarization time when transfected with potassium channel genes (ShK).
Other altered potassium currents could also impact on the action potential profile of
hypertrophied cardiomyocytes, including IK1 (Brooksby et al., 1993; Kaab et al., 1996)
and the pacemaker current If. The latter is a current that contributes to diastolic
depolarization in pacemaking cells (i.e. sinus node and Purkinje cell) and neonatal
cardiomyocytes (Er et al., 2003). If activates slowly on repolarization and deactivates
rapidly with depolarization, supporting a mixed sodium and potassium current (van

Chapter I
21
Ginneken and Giles, 1991). In heart failure, hypertrophy, and atrial fibrillation, If
current densities and/or mRNA levels of its molecular correlate hyperpolarization-
activated cyclic nucleotide-gated (HCN) channels are also recorded in hypertrophic
ventricular myocytes and are increased compared with controls (Cerbai et al., 1997;
Hoppe et al., 1998; Cerbai et al., 2001; Fernandez-Velasco et al., 2003). These
observations support a potential contribution of If to the arrhythmogenesis of working
myocardium under pathological conditions (Zorn-Pauly et al., 2004; Michels et al.,
2005).
5.4. Sympathetic stimulation and electrical impairment
Decompensated cardiac hypertrophy and heart failure are fundamentally accompanied
by a chronic activation of the sympathetic nervous system and such increased activity
often precedes the onset of overt clinic symptoms of heart failure (Bohm et al., 1997;
Esler et al., 1997). The beta- and alpha-adrenergic signaling pathways are known to
significantly affect the function of a number of ion channels and transporters in the
heart. The net effect of beta-adrenergic stimulation is to shorten the ventricular action
potential duration due to an increase in the current density and a hyperpolarizing shift
of the activation of IK (Hartzell and Duchatelle-Gourdon, 1993; Terrenoire et al., 2005),
despite beta receptor stimulation of depolarizing current through the L-type calcium
channel. Alpha-adrenergic receptor stimulation inhibits several potassium currents in
the mammalian heart, including Ito, IK1 and IK in rat ventricle with the net effect of
prolonging action potential duration (Fedida et al., 1993) and promoting early
afterdepolarizations.
5.5. Cell-to-cell coupling and electrical communication
As previously mentioned, a characteristic consequence of hypertrophic remodeling is
the increased risk for fatal ventricular arrhythmias. Alterations in action potential
duration, disturbed calcium handling, and ventricular re-entry circuits arising from
Chapter I
22
regions of slow, inhomogeneous conduction, and tissue conduction block may
contribute to arrhythmogenesis. The observed alterations in cell-to-cell conduction of
electrical impulses may be due to changes in the expression pattern and composition of
the gap junction proteins. Gap junctions are mainly located in the intercalated discs of
cardiomyocytes and consist of multiple gap junction channels. A gap junction channel
is built of gap junction proteins (connexins); six connexins interact to form a connexon
(hemichannel) on one cell surface, which aligns head-to-head with a connexon on the
opposing cell surface together forming an intercellular channel (Saetz et al., 2003).
Twenty distinct connexin genes have been identified in the human genome. Three types
of connexins, connexin-43 (Cx43), -40 (Cx40), and -45 (Cx45), are expressed in heart
(Willecke et al., 2002). Cx43 is abundant in atrial and ventricular myocardium (Davis
et al., 1995). Cx40 is expressed in atrial myocytes, coronary vascular endothelium and
the His-Purkinje conducting system. Cx45 is observed in the sinoatrial and
atrioventricular nodes and small amounts colocalize with Cx43 in adult ventricular
myocardium (Coppen et al., 1998). A major role of gap junctions in the myocardium is
to enable rapid and coordinated electrical excitation, a prerequisite for normal rhythmic
cardiac function, and probably also to facilitate intercellular exchange of small
molecules, such as regulatory proteins and metabolites.
The cardiac hypertrophic response is a dynamic continuum in which progressive
changes in protein phosphorylation and gene expression first create adaptive structural
and functional changes but which can eventually lead to increasingly maladaptive
changes, culminating in heart failure. Electrical propagation velocity first increases in
hypertrophied ventricles but then decreases as hypertrophy becomes more severe and
chronic (Cooklin et al., 1997; McIntyre and Fry, 1997). An increase in electrical
propagation velocity in compensated hypertrophy is generally associated with increased
connexin levels, increased number of gap junctions, and enhanced intercellular
coupling (Darrow et al., 1996; Dodge et al., 1998; Kostin et al., 2004). Decrements in
conduction velocity, a general feature of chronic left ventricular hypertrophy in
humans, may be related to discontinuities in extracellular resistance caused by
interstitial fibrosis (Li et al., 1999) and an increase in intercellular resistance
attributable to gradual decrease in connexin expression or phosphorylation (Danik et
al., 2004).

Chapter I
23
In general, increased junctional resistance, due to qualitative or quantitative changes in
the expression of gap junctional connexins, may delay conduction of action potentials
and predispose the heart to re-entrant arrhythmias. It has been demonstrated that
ventricular Cx43 mRNA and protein expression is reduced in patients with chronic
ischemic and non-ischemic heart diseases and decompensated cardiac hypertrophy
(Peters et al., 1993; Dupont et al., 2001; Kitamura et al., 2002; Kostin et al., 2004).
Mice with conditional inactivation of the Cx43 gene exclusively in cardiomyocytes
show profound conduction defects and develop ventricular arrhythmias and sudden
death by 2 months of age (Gutstein et al., 2001), while knock-out mice for Cx40 show
prolongation of the PR interval on the electrocardiogram, evidence of bundle-branch
block and slow conduction in the His-Purkinje conducting system (Tamaddon et al.,
2000).
At the protein level, connexin phosphorylation, modulating cardiomyocyte gap junction
permeability, is regulated by protein kinase C (PKC)-dependent intracellular signaling
(Doble et al., 2000; Bowling et al., 2001). For example, administration of the pro-
hypertrophic octapeptide Ang II to the extracellular fluid rapidly reduces gap junction
conductance in hearts of cardiomyopathic hamsters (De Mello, 1996), and also in
normal rat hearts (De Mello and Altieri, 1992). This effect is blocked by the AT1
receptor blocker losartan and also by staurosporin, a PKC inhibitor (De Mello, 1996).
5.6. The sodium/hydrogen exchanger (NHE) and pH regulation in
cardiac hypertrophy
The sodium/hydrogen exchanger (NHE), and more specifically the NHE-1 isoform, is a
ubiquitous protein in mammalian cells. It is an integral membrane protein which
exchanges one intracellular proton (H+) for an extracellular sodium (Na+) ion, thereby
protecting cells from intracellular acidification. Indeed, the major function of NHE-1 is
the regulation of intracellular pH, but it also participates in regulation of sodium fluxes
and cell volume (Orlowski and Grinstein, 2003). NHE-1 is activated by decreases in
intracellular pH, but also by numerous hormones which can activate protein kinases,
Chapter I
24
such as mitogen activated protein kinases (MAPKs) and p90rsk (Dostal and Baker,
1998; Moor and Fliegel, 1999; Takahashi et al., 1999). The activation of NHE-1 is
associated with a variety of downstream events, including cell proliferation and
differentiation (Kapus et al., 1994; Wang et al., 1997), apoptosis in mesenchymal cells
and survival in epithelial cells (Wu et al., 2003; Sun et al., 2004), cytoskeletal
organization and cell migration (Denker et al., 2000; Denker and Barber, 2002).
NHE-1 is the predominant isoform expressed in cardiac tissue and it is one of the most
important mechanisms by which protons are extruded from cardiomyocytes.
Importantly, there is extensive evidence that NHE-1 modulates cardiomyocyte
contractility (discussed in Chapter IV) and a number of lines of evidence suggests that
NHE-1 may represent a key factor mediating hypertrophic responses in the heart. The
NHE has been shown to be upregulated in pressure-overload hypertrophy in rabbits and
in stretch-activated cardiomyocytes in culture (Takewaki et al., 1995), as well as in
stretched papillary muscles from adult cats (Cingolani et al., 1998). Furthermore, the
NHE gene has been shown to be upregulated in isolated hearts ex vivo in response to
ischemia or injury (Gan et al., 1999; Karmazyn et al., 1999), while development and
ageing seems to be associated with a downregulation of the gene (Chen et al., 1995;
Haworth et al., 1997).
In vitro studies have demonstrated that NHE-1 inhibitors (e.g. amiloride and cariporide)
block hypertrophic responses to various stimuli. For example, stretch-induced
stimulation of protein synthesis in neonatal cardiac myocytes, as well as stretch-
induced alkalinization in feline papillary muscles, can be blocked by NHE inhibitors
(Cingolani et al., 1998; Yamazaki et al., 1998), as can noradrenalin-induced protein
synthesis in cultured neonatal rat cardiomyocytes (Hori et al., 1990). In vivo
experiments demonstrated that NHE-1 inhibition attenuates and reverses post-infarction
remodeling and heart failure in Sprague-Dawley rats after coronary artery ligation
(Yoshida and Karmazyn, 2000; Chen et al., 2004), whereas cariporide treatment
completely prevented the development of fibrosis, left ventricular remodeling and
contractile dysfunction in beta 1-adrenergic receptor transgenic mice (Engelhardt et al.,
2002). Similar treatment prevented hypertrophy and cellular electrical and ionic
remodeling in pressure- and volume overload-induced cardiac hypertrophy in rabbits
(Baartscheer et al., 2005).

Chapter I
25
The precise mechanism for NHE-1 involvement in the hypertrophic response and in
heart failure remains to be determined, however it is suggested that intracellular sodium
overload could be the link between abnormal NHE-1 activity and hypertrophic growth
in cardiomyocytes (Gu et al., 1998; Hayasaki-Kajiwara et al., 1999; Chahine et al.,
2005). In particular, activation of the NHE would increase intracellular levels of
sodium and activate PKC-mediated hypertrophic stimuli. Alternatively, NHE-1
involvement in cardiomyocyte hypertrophy could be mediated by the activation of
various kinases (e.g. MAPKs) resulting in cell growth (Yamazaki et al., 1998).
Investigations into the role of the NHE-1 in cardiac disease have also been examined in
the particular setting of ischemia and reperfusion. Although clinical trials have not yet
provided unequivocal evidence, it is experimentally established that NHE-1 inhibitors
applied during ischemia and/or reperfusion protect the heart against ischemic damage
ex vivo and in vivo (Myers et al., 1998; Xiao and Allen, 2000; Yoshida and Karmazyn,
2000; Chen et al., 2004).

Chapter I
26
6. MOLECULAR PATHWAYS FOR CARDIAC
DEVELOPMENT, HYPERTROPHY AND FAILURE
6.1. Embryonic heart development and cell fate determination
The processes of cell growth, proliferation and death in the heart involve qualitative
and quantitative changes in gene expression (Anversa et al., 1998). Cardiomyocyte
hypertrophy is characterized by cell structural rearrangement and growth. This is
caused by an increase in protein biosynthesis induced by gene reprogramming.
Changes in gene expression are linked with reactivation of immediate early genes and
genes that lead to expression of fetal and embryonic isoforms of structural and
secretory proteins (Fambrough et al., 1999), such as β-myosin heavy chain (β-MHC),
skeletal α-actin and ANP (Lompre et al., 1984; van Bilsen and Chien, 1993). For
instance, the shift in actin and MHC isoforms has important implications for
cardiomyocyte contractility, since fetal β-MHC and skeletal α-actin are associated with
slower shortening kinetics and lower energy-cost contraction (Barany, 1967; Alpert and
Mulieri, 1982). Since cardiac hypertrophy is a form of heart ‘re-modeling’ led by the
reactivation of embryonic gene expression patterns, unraveling the mechanisms
underlying the early modeling and development of the embryonic cardiovascular
system is of particular interest.
Embryonic heart development commences long before the appearance of electrically
functional, beating heart tissue. The heart initially forms as a simple two-layered tube
(the outer myocardial layer and the endocardium). Later the epicardium covers the
myocardium to form the outer surface of the heart. The endocardium will form the
endothelial lining of the heart, while the myocardium will constitute the cardiac muscle
mass and the epicardium will be the source of cardiac fibroblasts and coronary arteries
(for reviews, see Lough and Sugi, 2000; Männer et al., 2001). Endocardium,
epicardium and myocardium share a common lineage as they are all derived from the

Chapter I
27
same group of mesodermal cells. After the heart tube has formed, it goes through a
complex series of looping movements and tissue elaborations that result in septation
and valve formation and generate the mature, multichambered organ (Olson and
Srivastava, 1996; Moorman and Christoffels, 2003).
The earliest event in heart formation is commitment of mesodermal cells to a
‘cardiogenic fate’ and their migration into antero-lateral regions of the embryo during
late gastrulation. The heart and the derivatives of the blood islands are the first
mesodermal tissues to differentiate after gastrulation in embryos. Cells that migrate
anterior and lateral to the primitive streak in early gastrulation contribute to heart
tissue, whereas cells that move into the posterior lateral plate form the blood islands
and blood precursors (Garcia-Martinez and Schoenwolf, 1993). In this process,
morphogenic movements and cardiac fate determination are believed to be regulated by
multiple growth and morphogenic factors secreted from the underlying endodermal
cells, including bone morphogenetic proteins (BMPs), transforming growth factor-beta
(TGF-β) and fibroblast growth factors (FGFs), (Beddington and Robertson, 1999;
Azhar et al., 2003; Sugi and Markwald, 2003). Many, if not all of these growth and
morphogenic factors are differentially regulated in the adult heart during cardiac
hypertrophy and failure.
6.1.1 BMP and Wnt signaling during embryonic development
BMP signals from the lateral regions of the embryo are required for heart formation. In
particular BMP2 and BMP4 signaling in mammalian neural crest derivatives is
essential for outflow tract development and may regulate a crucial
proliferation/differentiation signal for the ventricular myocardium (Schlange et al.,
2000; Stottmann et al., 2004). Marvin et al. (2001) proposed a model for the chick
embryo in which a dorsal-ventral BMP gradient intersecting an anterior-posterior
wingless (Wnt) signal gradient would induce cardiogenesis in a region of high BMP
and low Wnt activity. Wnt genes, related to wingless in Drosophila melanogaster,
encode a number of secreted proteins that play critical roles in the development of
many organisms, especially in cell fate and patterning (Figure I-2). Wingless itself
collaborates with decapentaplegic, a BMP homologue and member of the TGF-β

Chapter I
28
superfamily, to specify the rudimentary heart tube in flies (Frasch, 1995). In the
absence of Wnt proteins, cells undertake active measures to maintain low levels of the
Wnt signaling protein β-catenin. This is realized by a glycogen synthase kinase 3β
(GSK-3β)-dependent ubiquitination of β-catenin (Liu et al., 2002). Wnt binding to the
frizzled and LRP5/6 receptors activates some associated downstream components,
leading to inactivation of GSK-3β, thereby stabilizing and inducing an accumulation of
β-catenin. Accumulation and translocation of β-catenin to the nucleus enhances
transcription of Wnt-responsive genes.
6.1.2 Nkx and GATA signaling
Homeodomain transcription factors comprise a large family of DNA binding factors
that regulate transcription and development. Many homeodomain genes arranged in
genomic clusters determine anterior-posterior patterning, while others determine the
fate of cells in specific tissues. The proliferation of cardiac myocytes and their
differentiation early in development are dependent on the coordinate expression and
action of serum response factor (SRF), GATA4 and the homeodomain factor Nkx2-5.
All three of these factors are expressed in developing cardiomyocytes and induce
expression of cardiac genes. In addition, the Hop (Homeodomain Only Protein) gene
encodes a factor expressed early in cardiac development that is involved in cardiac
differentiation. The influence of Hop on the opposing processes of cardiomyocyte
differentiation and proliferation reflect the interaction of Hop with SRF and the duel
role SRF plays. In early cardiac development, Hop opposes differentiation induction by
SRF, while at later stages Hop opposes the proliferation induced by SRF. Interestingly,
transgenic mice that overexpress Hop develop severe cardiac hypertrophy, cardiac
fibrosis, and premature death (Kook et al., 2003).
The vertebrate homeobox gene Nkx2-5 (homologous to tinman in D. melanogaster and
first identified in the mouse) is essential for early development of precardiac tissues,
suggesting that expression may be an early indication of commitment to the cardiac
lineage. Expression of Nkx2-5 within the vertebrate heart is limited to the muscular
tissues and the same expression continues in the adult heart in fully differentiated

Chapter I
29
cardiac muscle suggesting that this gene is important for maintaining heart gene
expression, not just for early heart development (Lints et al., 1993). BMP signaling is
crucial in the regulation of Nkx2.5 expression and specification of the embryonic
cardiac lineage (Brown et al., 2004).
GATA proteins are zing-finger transcription factors that bind to a DNA element that
includes the sequence GATA- hence the name. Like the tinman-related homeodomain
proteins, GATA proteins are capable of interacting with other protein in order to form
active transcription complexes. Three members of the GATA family, GATA4, GATA5
and GATA6, are expressed during heart development in both myocardial and
endocardial tissue. Transcription of all three genes commences very early in precardiac
tissue, soon after the tissue is specified, and continues in the myocardial and
endocardial layers of the heart tube and adult heart (Molkentin et al., 1997). GATA
binding sites are present in the regulatory regions of a number of cardiac specific genes,
including α-myosin heavy chain (α-MHC), myosin light chain 2 (MLC2), myocyte-
specific enhancer factor 2 (MEF2), cardiac troponin C, cardiac actin and atrial
natriuretic peptide. These are markers of cardiomyocyte differentiation and are
generally re-expressed in their fetal isoforms during adult cardiac hypertrophy.
6.1.3 MEF2 and cardiomyocyte differentiation
Members of the myocyte-specific enhancer factor 2 (MEF2) family are important for
the formation of muscle tissue in vertebrates. The mouse genome contains four genes,
MEF2A, MEF2B, MEF2C, and MEF2D, which are related to the single D.
melanogaster D-MEF2 gene. While the different vertebrate MEF2 genes are expressed
in a wide variety of muscle cell types, all are expressed in cardiac muscle at some time
during embryonic development. The MEF2 binding sequence is present in the
promoters of a number of cardiac specific sequences, including, α-MHC and MLC2. In
mice lacking MEF2C function, several cardiac differentiation markers including ANP,
cardiac actin and α-MHC are not expressed. Although a normal linear heart tube forms,
it fails to undergo looping. This may be due to the altered expression of other
transcription factors, like Hand1 and Hand2, which are involved in establishing

Chapter I
30
regional identity within the heart. Interestingly, MEF2 binding activity is necessary for
regulation of the GLUT4 glucose transporter gene promoter in muscle and adipose
tissue, thus suggesting that normal expression of MEF2 transcription factors is essential
for the glucose metabolism of the embryonic and adult heart (Thai et al., 1998; Michael
et al., 2001).
6.2. Cardiomyocyte growth and hypertrophy in the adult heart
Because of their contractile activity and numeric contribution to the final heart mass,
cardiomyocytes are fundamentally involved in all forms of cardiac remodeling. Growth
of the heart during embryogenesis occurs primarily through proliferation (hyperplasia)
of cardiac myocytes. Soon after birth, cardiomyocytes withdraw largely from the cell
cycle and subsequent growth occurs predominantly through differentiation and increase
in myocyte size (hypertrophy) rather than number. It has been generally accepted that
adult cardiomyocytes are terminally differentiated cells, which have lost their capacity
to divide (Liu and Olson, 2002). However new evidence suggests that myocyte
differentiation and tissue renewal from a pool of undifferentiated stem cells contribute
in a limited but significant way to the remodeling processes in the adult heart (Orlic et
al., 2001; Anversa et al., 2002; Penn et al., 2004; Rosenblatt-Velin et al., 2005).
It is important to highlight the fact that in terms of gene expression, there are
differences between a developing embryo and an adult patient undergoing cardiac
hypertrophy. In the first case, the embryonic expression of gene sequences are part of a
program highly regulated in space and time which deletes vestigial structures, controls
cell numbers and physiologically models structures (van den Hoff et al., 2000). In adult
life, re-expression of fetal gene programs in the heart mainly serves to maintain the
heart in a new compensatory and homeostatic state by counterbalancing deleterious
environmental changes. Therefore, in the second case, the endogenous program
interacts with new variables like ageing, mechanical stress, neuro-humoral secretion
and metabolic changes which are absent during fetal or embryonic life. In general
terms, adult cardiomyocyte hypertrophy results in intracellular production of extra
contractile proteins and sarcomeric reorganization. This sarcomeric and morphological
Chapter I
31
reorganization is associated with alterations in cardiomyocyte contractility, which
eventually will lead to impaired myocardial function. The adult hypertrophic response
is frequently characterized as a ‘fetal recapitulation’ growth pattern. As the findings to
be presented in the Thesis demonstrate, such a concept is erroneously over-simplified.
6.2.1. Different signaling pathways for different
hypertrophic stimuli
One general aim to understand the molecular mechanisms of adult cardiomyocyte
hypertrophy and remodeling is to attribute distinct phenotypic features to defined
stimuli and signaling pathways. Multiple interacting signal transduction pathways are
initiated by mediators of hypertrophic phenotypes in vitro and in vivo. Such mediators
include mechanical stretch, cytokines, growth factors, catecholamines, vasoactive
peptides and hormones. In general terms, the transmission of these signals involves
three common phases: 1) activation of receptors or adhesion molecules that are mainly
located at the cell surface, 2) transduction of the signal through activation of various
second messengers, and 3) initiation of cytosolic and nuclear events that lead to
differential gene expression and modification of cell physiology.
6.2.2. Signaling pathways through seven-transmembrane
receptors
An enormous family of over 1000 genes encodes receptor proteins that are
characterized by a signature seven-transmembrane (7TM) configuration. Members of
this family comprise receptors for many hormones, peptide and non-peptide, including
the receptors for Ang II (i.e. AT1 and AT2 receptor subtypes), endothelin-1 (ETA and
ETB receptor subtypes) and noradrenaline (α- and β-AR adrenoreceptors), which play
an important role in regulating cell physiology in the heart. The 7TM receptors are
commonly referred to as G-protein-coupled receptors (GPCRs), because most of them
transduce their signals by activating heterotrimeric G-proteins. Signals by GPCR
ligands result in transcriptional translation of immediate early genes, such as Fos and

Chapter I
32
Jun, and other genes involved in long-term remodeling of heart tissue and the
physiological response to stress in the heart, such as fetal isoforms of actin and myosin
filaments, ANP and BNP.
In the traditional view of 7TM-receptor signaling, a single cell-surface receptor protein
is activated by the binding of a single agonist ligand, and this ligand-activated receptor
can then activate many G-proteins, one at a time (Figure I-3). However, an abundance
of new information has been generated in recent years relating to the signaling events
triggered through GPCRs. It is becoming clear that receptors are not isolated entities,
but that they interact with other receptors already present or recruited to the vicinity,
which results in new signaling models where cell-surface receptors function as dimers
or even higher multimers. Several examples of functional GPCR heterodimers have
been identified. For example, the Ang II-activated AT2 receptor binds the AT1 receptor
and antagonizes its function (AbdAlla et al., 2001); while the AT1 receptor binds to the
bradykinin receptor B2 causing increased activation of Gαq and GαI proteins and
modulation of the endocytotic pathway for both receptors (AbdAlla et al., 2000).
Moreover, heterodimerization of β1- and β2-AR inhibits the agonist-promoted
internalization of the β2-AR and its ability to activate the ERK1/2 (see below)
signaling pathway (Lavoie et al., 2002).
There is increasing evidence to suggest that mitogenic and growth responses to receptor
activation by peptides such as Ang II and endothelin-1 may be mediated also by
GPCR-mediated transactivation of tyrosine-kinase receptors (RTKs), such as the
receptors mediating epidermal growth factor (EGF), platelet-derived growth factor
(PDGF) or insulin-like growth factor (IGF) activity (Thomas et al., 2002) (Figure I-4).
For example, AT1 receptor-elicited tyrosine phosphorylation and activation of
epidermal growth factor receptor (EGFR) stimulates downstream activation of ERK1/2
and vascular smooth muscle cell hyperplasia (Shah et al., 2004). In rat smooth muscle
cells, both Ang II-induced nuclear proto-oncogene expression and increase in c-Fos
protein are prevented by treatment with EGFR kinase inhibitor (Thomas et al., 2002).
Ang II-mediated EGFR transactivation also plays a role in p70 ribosomal protein S6-
kinase-induced protein synthesis leading to hypertrophy (Eguchi et al., 1999).
Furthermore, recent studies have demonstrated that EGFR activation is involved in Ang

Chapter I
33
II-induced vascular contraction and it has been demonstrated that Ang II can directly
promote cardiomyocyte growth via AT1 receptor-mediated transactivation of EGFR in
vitro (Thomas et al., 2002).
6.2.3. Signaling through mitogen-activated protein
kinases (MAPKs)
Mitogen-activated protein kinases are a family of serine/threonine protein kinases that
mediate nuclear transduction of extracellular signals by intracellular protein
phosphorylation, leading to a cascade of transcription factor activation, altered gene
expression and trophic cellular responses. Mammalian MAPKs are grouped into six
major subfamilies: a) ERK1/2 (also known as p42-kDa MAPK and p44-kDa MAPK,
respectively), b) c-Jun N-terminal/stress-activated protein kinases (JNK/SAPK), c) p38
MAPK, d) ERK6, p38-like MAPK, e) ERK3, and f) ERK5 (also called Big MAPK 1)
(Robinson and Cobb, 1997) (Figure I-5). Signals from cell surface receptors such as
GPCRs and growth factor RTKs are transduced, directly or via small G proteins such as
Ras and Rac, to multiple tiers of protein kinases that amplify these signals and/or
regulate reciprocally. MAPK-dependent signaling pathways have been associated with
cellular growth and apoptosis, cellular differentiation and transformation and vascular
contraction. ERK1/2 is activated in response to growth and differentiation factors,
whereas JNKs and p38 MAPK are usually activated in response to inflammatory
cytokines and cellular stress (Pellieux et al., 2000).
6.2.4. Calcium-dependent pathways of cardiac hypertrophy
induction
It has been shown that cardiac hypertrophy can be induced by the calcium-dependent
phosphatase calcineurin after Ang II and adrenalin stimulation (Molkentin et al., 1998).
Calcineurin dephosphorylates NF-AT3 transcription factors. NF-AT3s translocate to
the nucleus and activate cardiac zinc-finger transcription factor GATA4, resulting in
synergistic activation of cardiac transcription (Figure I-6). Interestingly, GATA4 has

Chapter I
34
also been shown to be required for transcriptional activation of genes for AT1A
receptors and different isoforms of MHC during hypertrophy (reviewed in Molkentin
and Olson, 1997). Usage of specific anti-calcineurin oligonucleotides suppressed the
decrease in expression of adult genes (e.g. α-MHC, GLUT4 and SERCA2) during
pressure-overload cardiac hypertrophy in rats (Depre et al., 1999a). Because the
calcineurin/NF-AT3 signal transduction pathway is only one of several signaling
systems shown to be capable of inducing hypertrophy, an important question is whether
this pathway is integrated with, or independent of, other hypertrophic signaling
systems. For example, certain transgenic mouse lines exhibiting cardiac hypertrophy do
not respond to calcineurin inhibition (Sussman et al., 1998b) and hypertrophy in the
SHR is not prevented by inhibition of the calcineurin pathway (Zhang et al., 1999),
indicating the existence of calcineurin-independent mechanisms of cardiac growth.
Recently, it has been shown in transgenic mice that the intracellular calcium-binding
protein calmodulin (CaMK) potently stimulates transcription factor myocyte-specific
enhancer factor (MEF2) activity through a posttranslational mechanism in the heart in
vivo (Passier et al., 2000). This activity is sufficient to induce cardiac hypertrophy in
these mice.
6.3. Cardiomyocyte death
Myocyte demise can occur by three mechanisms in the heart: apoptosis, autophagic cell
death and necrosis (Fesik, 2000; Klionsky and Emr, 2000; Knaapen et al., 2001). These
forms of cell death have a different impact on the morphology of the myocardium
(Anversa et al., 1998). Apoptosis is a form of programmed cell death which ‘shapes’
the organs during embryonic development and which also allows tissue and cell
renewal in the adult. Apoptosis does not generally lead to the activation of
inflammatory reactions, vascular proliferation or collagen deposition. It is characterized
by cell shrinkage, chromatin condensation, DNA fragmentation, membrane blebbing
and formation of apoptotic bodies (Majno and Joris, 1995). The physiological process
of apoptosis can become maladaptive as it is observed in the heart after myocardial
infarction or during the development of heart failure (Olivetti et al., 1997). Indeed,
myocyte apoptosis constitutes the earlier and primary insult of myocardial infarction,
Chapter I
35
which involves nearly 85% of cells in the ischemic region (Bardales et al., 1996).
Furthermore, myocyte apoptosis without replacement is an important mechanisms
involved in the transition from cardiac hypertrophy to heart failure occurring after
ischemia, reperfusion and myocardial infarction in humans (Olivetti et al., 1997). In
addition, apoptosis has been detected in cardiomyocytes experiencing
hypoxia/reoxygenation (Tanaka et al., 1994) and mechanical stretch (Cheng et al.,
1995) and in animal models of cardiac ischemia and reperfusion injury (Gottlieb et al.,
1994; Fliss and Gattinger, 1996). Various apoptotic pathways are active in mammalian
cells, including cardiomyocytes. One of the best characterized pathways is the death
receptor signaling pathway (Figure I-7). The death receptors are a class of cell
membrane receptors belonging to the TNF receptor gene superfamily, such as Fas or
TNFR1 (Ashkenazi and Dixit, 1998). Upon binding by their cognate ligand, they
initiate mitochondrial-mediated cellular apoptosis. The receptor-ligand mediated
apoptotic pathway is not the only mechanism in the apoptotic process: myocyte
apoptosis can also be induced by oxidative stress (Kumar and Jugdutt, 2003), by
GPCR-mediated intracellular signaling cascade (Wencker et al., 2003), and possibly by
calcium and calcineurin-dependent signaling activation (Jayaraman and Marks, 2000;
Braz et al., 2003).
Several proteins constitute a critical checkpoint in cell death. These proteins contain
agonists and antagonists of apoptosis, and alterations in their ratio determine the ‘life or
death’ outcome for a cell. Cytochrome c is localized on the outside of the inner
mitochondrial membrane and in the intermembrane space. It has an important function
in the intracellular electron transport chain reaction for the production of ATP. During
the apoptotic process cytochrome c is released in the cytosol. There it binds to the
apoptosis protease activating factor (Apaf-1) which is present in mammalian cells and
is analogous to Ced-4 in C. elegans. Cytochrome c and Apaf-1 form a complex
together with dATP, which subsequently activates procaspase-9 to caspase-9. This
results finally in the activation of procaspase-3 into caspase-3 which leads to the
characteristic morphological consequences (Figure I-7). Other examples are Bcl-2, a
protein that promotes cell survival, and Bax, which facilitates the activation of an
endogenous cell death pathway (Oltvai et al., 1993). Bax forms heterodimers with Bcl-
2, depressing its protective influence on cell viability; if Bax homodimers dominate,
cells are more predisposed to undergo apoptosis. The tumor suppressor gene p53 is a

Chapter I
36
transcriptional regulator of the Bcl-2 and Bax genes and the induction of p53
downregulates Bcl-2 and upregulates Bax in the cells. However, it has been shown that
the attenuation of Bcl-2 and the enhanced expression of Bax alone cannot trigger
apoptosis (Miyashita and Reed, 1995) and that some other factors or death stimuli are
necessary. Over-expression of p53 in adult ventricular myocytes in vitro upregulates
the transcription of Agt and the AT1 receptor subtype leading to generation of Ang II
and apoptosis (Pierzchalski et al., 1997). This suggests that Ang II may be one of the
pro-death stimuli involved in myocyte programmed cell death.
As with apoptosis, autophagic cell death is regulated and is associated with DNA
fragmentation, but unlike apoptosis it is caspase-independent and morphologically
resembles necrosis (Klionsky and Emr, 2000). Finally, necrosis is a rapid and
irreversible process that occurs when cells are severely damaged. According to Majno
and Joris (1995) necrosis is not a form of cell death but the end stage of any cell death
process, including apoptosis. Necrosis involves swelling of the cell and its organelles,
chromatin condensation, disruption of mitochondria, membrane rupture, cell lysis and
inflammatory immune response (Van Cruchten and Van Den Broeck, 2002). In the
heart, necrosis ultimately results in the generation of tissue fibrosis, diffuse or focal in
nature.
6.4. Cardiomyocyte growth and death: a fine balancing act
The interactions between various pro-growth and pro-death signaling pathways are
complex. Transition to heart failure is usually preceded by cardiac and cardiomyocyte
hypertrophy and, therefore, it has been suggested that hypertrophy could render
cardiomyocytes more sensitive to apoptosis. This notion is supported by various
studies, including work on transgenic mice overexpressing the G-protein Gαq, which
couples to receptors transducing various pro-hypertrophic and neuro-humoral signals.
In these mice, cardiac hypertrophy is associated with increased cardiomyocyte
apoptotic tendency and increases the likelihood of heart failure under stress conditions
(Yussman et al., 2002). In contrast, some hypertrophic signaling molecules appear to be
clearly protective against apoptosis, promoting survival during stress conditions. This is
Chapter I
37
the case for the cytokine receptor gp130, a receptor subunit shared in common with
other cytokines in the IL-6 family, acting via cardiotrophin1-dependent inhibition of
apoptosis (Yasukawa et al., 2001). The gp130 subunit also influences insulin-like
growth factor 1 (IGF-1) and phosphatidylinositol 3-kinase-dependent pathways (Lee et
al., 1999; Aikawa et al., 2000). A further complication is that some hypertrophic
signaling molecules have both anti- and pro-apoptotic properties. As an example, the
JNK can promote apoptosis via Fas-ligand (FasL) or Bcl2-mediated pathways
(Tournier et al., 2000). In contrast, other studies have demonstrated anti-apoptotic
effects of JNK activation in neonatal cardiomyocytes and differentiated mouse
embryonic stem cells (Minamino et al., 1999; Andreka et al., 2001). The anti-apoptotic
effects could be dependent on the activity of JNK as a transcriptional regulator of gene
expression (Minamino et al., 1999; Tournier et al., 2000). Another example of a
hypertrophic signaling molecule with dual effects on apoptosis is the
calcium/calmodulin-regulated phosphatase calcineurin. Activation and overexpression
of calcineurin confers a protective effect against apoptosis in vivo and in vitro (De
Windt et al., 2000). However, calcineurin-dependent β-adrenergic stimulation in
cardiomyocytes can promote the mitochondrial release of cytochrome c and apoptosis
(Saito et al., 2000).
At present, whether hypertrophic signaling pathways are pro-apoptotic or anti-apoptotic
remains an open question. The seemingly contradictory findings for certain signaling
molecules and pathways may be due to the complex interaction between various stimuli
and their duration or intensity on different cellular fractions of the myocardium
(cardiomyocytes, fibroblasts, etc.). Indeed, the mechanical and paracrine interaction
between cardiomyocyte and non-myocyte cells, as well as the dynamic interface
between the cellular and interstitial matrix of the myocardium adds further complexity
to shaping the cardiac response to hypertrophic stimuli.

Chapter I
38
6.5. The fibroblast fraction: collagen production and
cardiomyocyte hypertrophy
Fibroblasts represent the majority of the non-myocyte cellular component of the heart.
During cardiac hypertrophy, fibroblasts can undergo different morphological and
physiological changes: they can express smooth muscle α-actin and embryonic MHC
and develop a contractile phenotype (Frangogiannis et al., 2000), and they can
proliferate and produce ECM components, including collagen I and III, fibronectin and
laminin (Weber and Brilla, 1991; Pauschinger et al., 1999). As a consequence, fibrous
material deposition alters the organized matrix and the interconnections between
cardiomyocytes and adjacent vascular structures. The degree of fibrosis affects the
oxygenation and the metabolism of the cells in the myocardium. Fibrosis contributes to
myocardial stiffness, facilitates arrhythmogenic events, impairs myocyte contractility
and hampers systolic ejection (Swynghedauw, 1999).
Cardiac fibroblasts are also thought to actively contribute to hormone and growth
factor-induced cardiomyocyte hypertrophy. Putative pathways for humoral and
mechanical regulation of protein synthesis and hypertrophy involve cross-talk between
cardiomyocyte and fibroblast populations within the myocardium. For instance, when
the pro-hypertrophic peptide Ang II is added to purified fibroblasts and the supernatant
from the fibroblasts is added to myocytes in culture a significant increase in stimulation
of protein synthesis (and therefore cardiomyocyte hypertrophy) is obtained (Harada et
al., 1997). There is indeed growing evidence that fibroblasts (and other non-myocyte
cells) may secrete growth factors and peptides, such as endothelin-1 that stimulate
myocyte hypertrophy. According to this hypothesis, Harada et al. (1997) demonstrated
that only co-cultures of cardiomyocytes and fibroblasts respond to Ang II and TGF-β1
with growth signals. In light of these findings it can also be postulated that the degree
of cardiac and cardiomyocyte hypertrophy observed could depend on the qualitative
and quantitative presence of fibroblasts to promote paracrine interaction between
cardiomyocytes and fibroblasts in the myocardium.

Chapter I
39
6.6. Extracellular matrix turnover and fibrosis
The turnover of the extracellular matrix in the hypertrophic myocardium is regulated by
non-myocyte and myocyte activation leading to differential gene expression and
cellular secretion of both pro- and anti-fibrotic substrates.
6.6.1 Matrix degradation
Matrix metalloproteinases (MMP) are the zinc-containing, calcium-dependent
endopeptidases (e.g. collagenases, gelatinases, stromelysin, matrylisin) that maintain
homeostasis of tissue structure, including the myocardium, by digesting the various
components of the ECM. Thus, an increase in MMP activity may result in fibrillar
collagen degradation, myocyte slippage, ECM remodeling, and progressive ventricular
dilation (Olivetti et al., 1990; Gunja-Smith et al., 1996; Spinale et al., 2000). Although
several lines of evidence suggest that MMP activation and the initial development of
myocardial hypertrophy are independent events (Chancey et al., 2002), a number of
studies have demonstrated a role for increased MMP activity and abundance in the
development of experimental congestive heart failure and end-stage cardiomyopathic
disease in humans (Berry et al., 2004; Janicki et al., 2004). These data suggest that
MMP activation in the myocardium contributes to dilation (with or without
hypertrophic growth) and a consequent increase in wall stress leading to mechanical
dysfunction. Several stimuli have been linked to MMP activation in the myocardium.
The role of inflammatory cytokines, such as interleukin-1β (IL-1β), TNFα and IL-6,
and reactive oxygen species (ROS) in the production of MMPs has been demonstrated
in various models in vitro and in vivo.
6.6.2 Matrix biosynthesis
In general terms, there are two main forms of matrix biosynthesis leading to myocardial
fibrosis: 1) reparative fibrosis, occurring after ischemia, infarction or during

Chapter I
40
senescence, resulting from a scarring process in which small and large areas of necrosis
heal after direct insults; and 2) reactive fibrosis, which is suggested to be a fibrogenic
response to intra-cardiac cell activation caused by various neuro-humoral factors,
inflammatory cytokines and stretch (reviewed in Schwinghedauw, 1999). Fibrosis is
often associated with ischemia, senescence, inflammatory diseases, diabetes and
expression of growth hormones, such as Ang II and TGF-β1 (Weber and Brilla, 1991;
Shimizu et al., 1993; Pinto et al., 2000). Myocardial fibrosis is defined not only as a
quantitative change in the concentration of matrix collagen in the interstitium, but also
as a qualitative change in collagen type, organization and cross-links. Type I and III are
the predominant types of collagen in the adult heart (Pauschinger et al., 1999). Various
changes in the composition of collagen types and cross-links have been reported in
experimental models, as well as in patients with heart failure (Bishop et al., 1990;
Chapman et al., 1990). It is believed that quantitative elevations of collagen type I, and
collagen type I cross-linking, increase myocardial stiffness, while increases in type III
collagen may facilitate myocardial compliance. During cardiac remodeling normal
collagens are progressively degraded by MMP and are replaced by fibrous interstitial
deposits of poorly cross-linked collagens (Gunja-Smith et al., 1996), which may lead to
dilation of the ventricles.
6.6.3 Matrix cell adhesion and transduction of signaling
pathways
ECM substances provide cells with a structural, chemical and mechanical substrate that
is essential for normal development and responses to pathophysiological signals.
Glycoprotein transmembrane receptors termed integrins are the primary link between
ECM ligands and cytoskeletal structures. They serve both as adhesive receptors and
mechanotransducers of signaling events (Giancotti and Ruoslahti, 1999; Hynes, 1999).
Integrins orchestrate multiple functions in the intact organism including organogenesis,
regulation of gene expression, cell proliferation, differentiation, migration and death.
Integrins themselves signal through a host of pathways, but it is rare for any signaling
pathway to function in isolation. Extensive studies have been performed to show that
integrins and growth factors form a particularly robust synergy (Miyamoto et al., 1996).

Chapter I
41
RTKs, GPCRs and cytokines have all been linked to this response. Terracio et al.
(1991) were amongst the first investigators to document the importance of integrins in
the myocardium and describe how integrin expression was changed with hypertrophy.
Sadoshima and Izumo (1993a) subsequently utilized mechanical stimulation of cultured
myocytes to simulate hemodynamic loading of the intact myocardium. They showed
how a stretch stimulus activated a variety of intracellular signaling pathways (many of
which are known to be involved in growth factor and integrin signaling cascades) and
also provoked paracrine release of factors such as Ang II (Sadoshima et al., 1993).
Ang II stimulation of cardiac fibroblasts has been shown in several studies to modulate
integrin localization and expression (Burgess et al., 1994). Importantly, osteopontin, a
cytokine which binds to several cell surface receptors, including integrins, was shown
to be produced by both cardiac fibroblasts and myocytes and to be upregulated in the
hypertrophic and failing ventricle of humans and animals (Graf et al., 1997; Hsueh et
al., 1998). Osteopontin production is upregulated by Ang II and recent work has shown
that mice deficient in osteopontin have reduced Ang II-mediated cardiac fibrosis and
hypertrophy, likely due to the decreased adhesion to ECM and reduced cell
proliferation by the osteopontin-deficient cardiac fibroblasts (Collins et al., 2004).
Chapter I
42
7. THE RENIN-ANGIOTENSIN SYSTEM AND
CARDIAC REMODELING
7.1. An overview
By the end of the 19th century, the pressor effect of renal extracts had been described
and the putative substance renin was named based on its origin in the kidney (Basso
and Terragno, 2001). In the following century, the work of two independent groups
established the concept of an endocrine renin-angiotensin system (RAS). The RAS
comprises a cascade of enzymatic reactions resulting in the formation of angiotensin II
from the substrate angiotensinogen. In this classic concept, the process is initiated when
the enzyme renin acts on liver-derived Agt, an alpha-globulin, to release the
decapeptide angiotensin I (Ang I). This decapeptide has limited intrinsic
pharmacological activity, and is cleaved by angiotensin-converting enzyme (ACE),
which is present in the endothelium of the lung vessels and in the heart, to yield the
highly active octapeptide Ang II (Iwai et al., 1995). Ang II has several actions related
to blood pressure and fluid homeostasis. It is an extremely powerful vasoconstrictor; it
enhances sympathetic tone and stimulates aldosterone secretion from the adrenal gland,
increasing salt and water reabsorption (Figure I-8). Ang II undergoes hydrolysis by
aminopeptidase to yield the heptapeptide angiotensin III (Ang III), which is also
pharmacologically active. Further cleavage yields peptides with little or no pressor
activity but which possibly exert other effects, see below).
This traditional concept of the RAS has been expanded more recently to recognize the
co-existence of local level RAS in many tissue and organs, including arteries and heart
(discussed below). Several, if not all of the components of the RAS have been
identified in cardiac and vascular tissues. While a circulating RAS has a critical role in
preserving short-term cardio-renal homeostasis through acute changes in vascular tone,
aldosterone release and renal sodium and water reabsorption, a local cardiovascular

Chapter I
43
RAS influences long term control of vascular resistance and myocardial function
through Ang II-mediated contractile, mitogenic and growth promoting effects. For
instance tissue-specific RAS plays an important role in the pathogenesis of
hypertension, since drugs which inhibit Ang II production (ACE inhibitors) or its
binding to specific receptors (AT1 blockers), beneficially reduce blood pressure in
hypertensive patients. In addition, RAS blockade improves cardiac function and
metabolism in patients suffering from diabetes and/or cardiovascular diseases beyond
blood pressure reduction (Anan et al., 2004; Egan et al., 2004; Wachtell et al., 2005).
7.2. The different components of the renin-angiotensin system
7.2.1. Renin
Renin is a protease with high substrate specificity. It is both the initiating and the rate-
limiting factor in the production of Ang II in humans. Renin is a glycoprotein with a
half-life in the circulation of about 15 minutes. It is stored in the juxtaglomerular cells
of the renal afferent arteriole in an inactive form called prorenin and secreted in
response to several different physiologic stimuli (sympathetic activity and
catecholamines, sodium depletion, hypotension, hemorrhage, constriction of renal
artery or aorta and heart failure among others) (Guyton and Hall, 1996). Renin occurs
in organs other than the kidney, e.g. in the brain, where it is implicated in the regulation
of neural activities.
The mouse has a kidney-type renin gene, Ren-1, which is located on mouse
chromosome 1 (Chirgwin et al., 1984). In some mouse strains, such as IRC and NMRI,
the male sub-maxillary gland also secretes large amounts of renin (Weaver et al.,
1991). These mice have a second renin locus, Ren-2, also on chromosome 1. As
mentioned earlier, renin, and in general terms the RAS, play an important role in the
development of hypertension and the cardiac pathologies associated with a rise in blood
pressure. Transgenic over-expression of cardiac Ang II in one-renin gene strain mice
(such as C57BL6 or BALB/c) induces cardiac hypertrophy and systemic inhibition of

Chapter I
44
renin secretion which maintains normal blood pressure, while the same over-expression
in two-renin gene strains (such as the NMRI) results in cardiac hypertrophy associated
with elevated blood pressure (Mazzolai et al., 1998). This suggests that Agt expression,
not renin, is the rate-limiting factor in the production of Ang II in the mouse.
The renin gene has been genetically linked to high blood pressure in different rat
models of hypertension, such as the salt-sensitive Dahl rat and the SHR (Rapp et al.,
1989; Pravenec et al., 1991). Moreover, Mullins et al. (1990) demonstrated that
introduction of the mouse Ren-2 gene into the rat genome induces severe and fulminant
hypertension, associated with low plasma active renin and suppressed kidney renin
(and high extra-renal transgene expression).
7.2.2. The angiotensin-converting enzyme
ACE, or kininase II, is a rather non-specific metalloenzyme (containing zinc) that
cleaves dipeptide units from peptide substrates with diverse amino acid sequences.
ACE does not degrade Ang II, but plays an important role in blood pressure regulation
and electrolyte balance by hydrolyzing Ang I to Ang II. The enzyme is also able to
inactivate bradykinin, a potent vasodilator. This enzyme has a wide tissue distribution
and plays many physiological roles. The ACE gene encodes 2 isozymes. The somatic
ACE isozyme is expressed in many tissues, including vascular endothelial cells (mainly
in lungs), renal epithelial cells, and testicular Leydig cells, whereas the testicular or
germinal ACE isozyme is expressed only in sperm (Ramaraj et al., 1998). The
importance of ACE in circulatory homeostasis is well documented. ACE is abundantly
present as a membrane-bound enzyme on the surface of vascular endothelial cells, and
also ACE circulates in plasma at variable concentrations. Plasma levels of circulating
ACE are determined by an insertion (I)/deletion (D) polymorphism situated in intron 16
of the ACE gene. It is known as the ACE/ID polymorphism. Schunkert et al. (1994)
found an association between blood pressure-independent left ventricular hypertrophy
and the D/D (homozygote for the deletion) genotype of ACE. Moreover, experimental
studies have shown that ACE gene expression is increased in myocardial tissue after
aorto-caval shunt or volume-overload hypertrophy (Iwai et al., 1995; Lear et al., 1997)
and in pressure overload left ventricular hypertrophy (Schunkert et al., 1990). Pinto et

Chapter I
45
al. (1993) have also demonstrated that the cardiac ACE activity is activated early after
the induction of heart failure, suggesting that this enzyme is pathologically involved in
the early stage of heart failure.
More recently, by EST database searching and cDNA library screening Tipnis et al.
(2000) cloned a second full-length ACE cDNA (ACE2), sharing about 40% homology
with ACE. Northern blot analysis has detected high expression of ACE2 in kidney,
testis and heart. ACE2 cleaves Ang I and Ang II into Ang [1-9] and Ang [1-7]
respectively, but is not able to cleave bradykinin (Tipnis et al., 2000; Oudit et al., 2003)
(Figure I-9). ACE2 is not inhibited by classic ACE inhibitors such as captopril.
Targeted disruption of ACE2 in mice resulted in a severe cardiac contractility defect,
increased Ang II levels and upregulation of hypoxia-induced genes in the heart
(Crackower et al., 2002). Genetic ablation of ACE on an ACE2 mutant background
completely rescues the cardiac phenotype, suggesting that ACE2 is an essential
regulator of heart function in vivo and may have antagonizing ACE effects.
7.2.3. The angiotensinogen precursor
Although some other possible significant roles are not excluded (Menard et al., 1991),
the only well proven function of Agt is to provide a reservoir for Ang I, cleaved from
its N-terminal, usually by the enzyme renin. As previously mentioned, the renin-
angiotensinogen reaction is known to be the rate limiting step in the generation of Ang
II, with the exception of the mouse species, where Agt synthesis seems to be rate-
limiting. There are two variants of the Agt protein, that is a low (~50 KDa) and a high
(350-550 KDa) molecular weight (MW) variant (Campbell et al., 1985). The high MW
variant is incompletely characterized physiologically and represents less than 5% of
circulating Agt in men and menstruating women. High MW Agt markedly responds to
estrogen levels, rising to 16% in pregnancy (Tewksbury and Dart, 1982). It is also
remarkable that no function is known for the 442 residue protein produced by the
release of the decapeptide Ang I from the Agt precursor. The concentrations of the
residue protein in the plasma are nearly undetectable (Menard et al., 1983). The major
source of circulating Agt is the liver (Campbell, 1987), but Agt mRNA has been

Chapter I
46
documented in the renal cortex and medulla, adrenal gland, heart, aorta, placenta,
ovary, adipose tissue, saphenous vein and brain (Stronetta et al., 1988; Paul et al., 1993;
Yang et al., 1994). Among the stimuli that increase plasma angiotensinogen and hepatic
mRNA levels, are sex steroids (estrogens) (Krattenmacher et al., 1994), thyroid
hormones (Hong-Brown and Deschepper, 1992), Ang II (Klett et al., 1996) and
glucocorticoids (Ron et al., 1990). Mutated forms of the Agt gene have also been
genetically linked to the pathogenesis of hypertension (Jeunemaitre et al., 1992) and
coronary heart diseases (Katsuya et al., 1995) in humans.
7.2.4. Angiotensin peptides
All Ang peptides are derived from the precursor Agt. When given intravenously, Ang I
is so rapidly converted into Ang II that the pharmacological responses are
indistinguishable (provided that converting enzymes have not been inhibited). Ang II
has a short half-life (a minute or so) and it is immediately degraded by several
peptidases (Figure I-9). Of its metabolites, the heptapeptidase Ang III and the
hexapeptidase Ang IV are believed to retain significant activity. In fact, Ang II and
Ang III transduce their intracellular signals through the same receptors, possibly at
different sites and have similar affinity for at least two receptors (AT1B and AT2
receptors in rodents) (Sandberg et al., 1992; Kambayashi et al., 1993). Ang III
reproduces all the effects of Ang II but with lower potency (Blair-West et al., 1971;
Kono et al., 1975). The hexapeptide Ang IV binds to specific sites (presumptive AT4
receptors) in the brain and in peripheral tissues, including the blood vessels, endothelial
cells, heart, adrenals and kidneys. Among the cardiovascular actions of Ang IV, there is
the vasodilatory effect on lung vessels (Patel et al., 1998) and stimulation of fibroblast
proliferation in the heart (Wang et al., 1995). The pressor activity of Ang III and Ang
IV in humans is 20% (Blair-West et al., 1971; Kono et al., 1975) and 0.2% (Kono et al.,
1982) respectively, of the pressor effect of Ang II.
The heptapeptide Ang [1-7] may also play a significant role as an active molecule in
the vasculature and in the heart. According to Loot et al. (2002), chronic infusion (8
weeks) of Ang [1-7] improved endothelial aortic function and coronary perfusion and
preserved cardiac function in an experimental rat model of heart failure induced by
Chapter I
47
ligation of the left coronary artery. Furthermore, Ang [1-7] produced a significant
increase in cardiac output and stroke volume in anesthetized Wistar rats (Sampaio et
al., 2003). Finally Ang [1-7] has been shown to potentiate the vasodilator and
hypotensive effects of bradykinin in normotensive and hypertensive rats (Paula 1995;
Fernandes et al., 2001) and in porcine coronary vessels (Tom et al., 2001).
7.2.5. Angiotensin II
Numerous and increasingly complex cellular responses to Ang II are recognized. The
‘classical’ actions of Ang II (e.g. regulation of blood pressure, plasma volume and
sympathetic nervous activity) are mediated by the endocrine effects of circulating
Ang II. The autocrine and paracrine effects of locally formed Ang II are believed to
play a key role in the development of cardiovascular disease, including cardiac
hypertrophy, myocardial infarction, hypertension and atherosclerosis. As previously
mentioned, Ang II promotes its effects by acting directly through specific receptors,
indirectly through the release of other factors, and via cross-talk with intracellular
signaling pathways of other vasoactive agents, growth factors and cytokines. Ang II
receptors are coupled to multiple, specific signaling cascades, leading to diverse
biological actions. In mammalian cells, Ang II binds to two distinct high-affinity
plasma membrane receptors, AT1 and AT2 (Feng and Douglas, 2001). Two other Ang
II receptors have been described, AT3 and AT4 (Swanson et al., 1992), however the
pharmacology of these receptors has not been fully characterized.
7.2.6. The AT1 receptor
The AT1 receptor belongs to the 7TM class of GPCR. Two subtypes of the AT1
receptor have been identified, namely AT1a and AT1b, sharing 96% of protein sequence
similarity (Ye and Healy, 1992; Burson et al., 1994; Clauser et al., 1996). In humans
and rodent AT1a is the principal receptor in the vasculature, heart, brain, kidney, lung,
liver, adrenal gland and fetal pituitary, while AT1b predominates in the adult pituitary
and is only expressed in specific regions of the adrenal gland (zona glomerulosa) and
kidney (glomeruli). AT1b expression is detectable in the heart at low levels in rodents

Chapter I
48
(<10% AT1a) and may constitute a pre-junctional variant of the receptor (Guimaraes
and Pinheiro, 2005). A mutation in the SHR AT1b receptor has been linked with cardiac
hypertrophy, and may have a human homologue (Di Nicolantonio et al., 2003).
Ligand-receptor binding leads to activation of G proteins through exchange of GTP for
GDP, resulting in the release of α and ßγ complexes, which mediate downstream
actions. AT1 receptors interact with various heterotrimeric G proteins including Gαq/11,
Gαi, Gα12 and Gα13 which couple to distinct signaling cascades. AT1 receptors are
primarily found in the circumventricular organs and other regions of the hypothalamus
in the brain (Song et al., 1992; MacGregor et al., 1995), in adrenal glands (Montiel et
al., 1993), in the conducting system and atrial epicardium of the heart (Allen et al.,
1990; Sechi et al., 1992; Saavedra et al., 1993), in the vasculature, including the aorta,
pulmonary and mesenteric arteries, as well as in glomerulo-mesangial and interstitial
cells in the kidney (Zhuo et al., 1992). In the vasculature, AT1 receptors are expressed
mainly in smooth muscle cells (Touyz et al., 1999). In the myocardium, AT1 receptors
are present on fibroblasts and cardiomyocytes (Allen et al., 2000). More recently, AT1
receptors have been found expressed in the human prostate, suggesting a role played by
Ang II in cell growth and sympathetic activity in that organ and in relation to urinary
flow (Dinh et al., 2001).
To date, AT1 receptors have been shown to mediate most of the physiological actions
of Ang II and this subtype is predominant in the control of Ang II-induced vascular
functions. Ang II stimulation of AT1 receptors in blood vessels causes vasoconstriction
leading to an increase in peripheral vascular tone and systemic blood pressure
(Gustafsson and Holstein-Rathlou, 1999). In the heart, AT1 receptors mediate the
inotropic and chronotropic effects of Ang II on cardiomyocyte contractility (discussed
in Chapter IV). AT1 receptors are believed to mediate cell growth and proliferation in
cardiac myocytes and fibroblasts, as well as in vascular smooth muscle cells, and can
induce the expression and release of various endogenous growth factors, such as FGF,
TGF-β1 and PDGF (Day et al., 1999; Rosenkranz, 2004; Skaletz-Rorowski et al.,
2004). These trophic effects of Ang II are implicated in the long-term processes of
cardiac remodeling and development of hypertrophy, as well as in the pathophysiology
of hypertension. Indeed, transgenic mice over-expressing AT1 receptors in cardiac

Chapter I
49
myocytes develop cardiac hypertrophy with no changes in blood pressure, and die
prematurely of heart failure (discussed in the Introduction of Chapter III). Additional
indirect effects of Ang II on cardiac remodeling could come from the facilitation of
sympathetic transmission by enhancing the AT1-dependent release of noradrenalin from
peripheral sympathetic nerve terminals. Moreover, Ang II stimulates the release of
catecholamines from the adrenal medulla and aldosterone from the adrenal cortex
(Figure I-8). Ang II also exerts diverse AT1-mediated actions on the brain by
modulating drinking behavior and salt appetite, central control of blood pressure,
stimulation of pituitary hormone release and has effects on learning and memory
(Fitzsimons, 1998; Badaue-Passos et al., 2001; Seltzer et al., 2004; Saavedra, 2005).
Renal AT1 levels mediate regulation of sodium and water reabsorption from the
proximal tubules and inhibition of renin secretion from the cells in the macula densa
(Kurtz and Wagner, 1999; Imanishi et al., 2003).
7.2.7. The AT2 receptor
Ang II binds to the AT2 receptor with similar affinity as to the AT1 receptor (de
Gasparo et al., 1995). The AT2 receptor is also a 7TM domain receptor and shares only
34% sequence identity with the AT1 receptor (Mukoyama et al., 1993). It is still unclear
whether the AT2 receptor is coupled to a G protein, but it has been reported that an
inhibitory Gα is linked to the receptor signaling pathway (Feng et al., 2002). The AT2
receptor has been mapped to chromosome X, in both humans and rodents (Lazard et al.,
1994; Hein et al., 1995). The AT2 receptor is highly expressed during fetal
development but rapidly declines at birth (Everett et al., 1997; Samyn et al., 1998). In
the human heart, the AT2 receptor localizes mainly to fibroblasts in interstitial regions
and atria, whereas a lower degree of expression is seen in the surrounding myocardium
(Brink et al., 1996). In rabbit hearts, AT2 receptors are almost totally absent from
nervous, conductive and atrial tissues, but are expressed at low levels in ventricles
(Brink et al., 1995). AT2 receptors are markedly expressed in the adrenals of most
species including humans (Belloni et al., 1998; Tanabe et al., 1998). In the kidney of
adult rats, AT2 localized mainly in glomeruli, while in human the same expression is
seen in glomeruli, tubules, and renal blood vessels. In the human uterine myometrium,
AT2 receptors are highly abundant, but are downregulated during pregnancy, possibly
Chapter I
50
due to sex hormones (Mancina et al., 1996). In the ovary, AT2 receptors are localized in
follicular granulose cells. More importantly, the expression of the AT2 receptor is
(variably) upregulated in pathological conditions, such as heart failure, renal failure,
myocardial infarction, brain lesions, vascular injury and wound healing. Ang II, insulin,
IGF-1 and some cytokines have been shown to stimulate AT2 receptor gene expression.
Since AT2 receptors are highly abundant in fetal tissues, it is believed that they play an
important role in fetal development. However, AT2-receptor knock-out (KO) mice
appear to develop and grow normally (see the Introduction of Chapter III), suggesting
that the AT2 receptor is not that crucial for fetal development. In the adult, AT2 receptor
binding is generally found to antagonize AT1-mediated signaling effects, by inhibiting
cell growth and by inducing vasodilation (Fukada et al., 2005). In support of this
hypothesis, AbdAlla et al. (2001) have reported that the AT2 receptor may antagonize
AT1 receptor-mediated responses by direct binding to the AT1 receptor. Recent studies
have shown that the AT2 receptor is involved in the production of cGMP, NO and
prostaglandins (Hiyoshi et al., 2005; Kim et al., 2005), suggesting a role in vascular
function, including vasodilation and blood pressure regulation. The AT2 receptor has
been suggested to play a role in neointimal repair and formation after injury (Okumura
et al., 2005). Moreover AT2 activation has been shown to promote nerve generation and
neuronal differentiation in cells of neuronal origin, through an increase in NO
production (Unger, 2001). However, AT2 receptors have also been shown to mediate
anti-proliferative effects in cultured coronary endothelial cells and vascular smooth
muscle cells and to induce both regeneration and apoptosis in different neuronal cell
types in vitro (Gallinat et al., 1997; Lucius et al., 1998).
Thus, it could be speculated that a change in the expression ratio of AT1 and AT2
receptors in a given tissue or cell population could determine the type and the potency
of the intracellular signal transduced and its corresponding physiological response.

Chapter I
51
7.3. Cardiac components of the renin-angiotensin system
Some years ago, the existence of a regulated cardiac-specific RAS was postulated. It is
now established that all the elements of the RAS cascade are present in normal cardiac
tissue. It is now beyond doubt that synthesis of ACE mRNA and protein does occur in
the normal adult myocardium, where AT1 and AT2 receptors and the precursor Agt are
expressed, but generally at very low levels (Dostal and Baker; 1999). It is also agreed
that renin is not synthesized in situ but predominantly taken up from the circulation
(Dostal et al., 1994; von Lutterotti et al., 1994). Nevertheless, experimental studies
performed with infusion of radio-labeled Ang I suggested that more than 75% of
cardiac Ang II is synthesized at tissue sites (van Kats et al., 1998). This would imply
that local Ang II production is of key importance in the pathophysiology of the RAS in
the heart.
Despite the lack of evidence for substantial renin production at cardiac tissue sites
under normal conditions, gradual increases in cardiac Ang II levels have been reported
in experimental models and clinically during the development of heart failure (Wollert
et al., 1999; Serneri et al., 2001). Numerous studies have demonstrated the efficacy of
RAS blockade in the treatment of cardiac remodeling and heart failure, independently
of the reduction in systemic blood pressure (Bohm et al., 1996; Tingleff et al., 1996).
Furthermore, elevated cardiac Agt levels are observed in various animal models of
pressure and volume overload cardiac hypertrophy, where Ang II is considered to
contribute significantly to cardiac remodeling through its growth promoting properties
(Sadoshima and Izumo, 1993a; Modesti et al., 2001).

Chapter I
52
8. METABOLIC REGULATION OF CARDIAC
HYPERTROPHY
8.1. Metabolism in the normal heart
Normal cardiac function requires substantial supply of energy in the form of ATP. ATP
production results from metabolic processing of glucose, free fatty acids (FFA),
pyruvate and ketone bodies (Rodriguez and McNeill, 1992). During fetal development,
the major source of energy comes from the glycolytic process, with mitochondrial
acetyl CoA (produced from pyruvate) as the major source of reducing equivalents
generating energy. After birth and at maturity, mitochondria utilize fatty acids as major
source for energy production, degrading them in the fatty acid β-oxidation spiral. In
general, it is known that acute changes in cardiac work result in instant activation of the
metabolic processes in a highly coordinated fashion. For example, when the workload
of the heart is doubled, oxygen consumption rate doubles; simultaneously, there is a
sudden coordinated increase in the oxidation of glycogen, glucose and lactate
(Goodwin et al., 1998). Moreover, lactate is oxidized preferentially when it constitutes
the prevailing carbohydrate substrate, as during exercise (Goodwin and Taegtmeyer,
2000). In contrast, rates of FFA oxidation do not change in response to acute changes in
workload (Goodwin and Taegtmeyer, 2000).
8.1.1. Fatty acid metabolism
The adult and postnatal mammalian heart relies on long-chain fatty acids as the
principal source and substrate for ATP production (Neely et al., 1972). The transition
from glucose to fatty acid consumption occurs after birth at a time when the
mammalian diet is composed almost entirely of high-fat breast milk. This period is
accompanied by a dramatic increase in the cardiac expression of genes encoding

Chapter I
53
enzymes in the mitochondrial fatty acid beta-oxidation pathway (Lockwood and Bailey,
1970; Nagao et al., 1993). The high postnatal cardiac expression of most nuclear genes
encoding mitochondrial fatty acid β-oxidation enzymes is controlled in part by the
transcription factor PPARα (peroxisome proliferator-activated receptor α). PPARα is a
member of an extended nuclear hormone receptor subfamily which includes the
vitamin D receptor, steroid receptors and thyroid hormone receptor (Desvergne and
Wahli, 1999). In the heart, activation of PPARα increases expression of genes involved
in the cellular fatty acid utilization pathways (Figure I-10).
Free fatty acids (FFA) are supplied by lipolysis from endogenous triglycerides, or from
blood, where they are transported bound to albumin or incorporated in chylomicrons
and very low density proteins (Rodrigues and McNeill, 1992). The transport of FFA
from the blood into mitochondria is mediated partly through passive diffusion and
partly through carrier membrane proteins (Van Der Vusse et al., 2000). Among the
transporters already identified in the heart, there is the fatty acid translocase CD36
(Luiken et al., 1999) and plasma membrane associated fatty-acids transport proteins
(Schaffer and Lodish, 1994). Once in the cytoplasm, long-chain fatty acids are bound
and transported by heart-type fatty acid-binding protein (H-FABP or FABP 3) and are
rapidly esterified to acetyl CoA. Long-chain fatty acids are then transported into
mitochondria and translocated across the inner mitochondrial membrane where they
enter into the β-oxidation spiral. The latter generates the electrons that are ultimately
transferred to the electron transport chain where ATP is produced at the expense of
oxygen consumption (that is, oxidative phosphorylation).
8.1.2. Glucose metabolism
Cellular glucose uptake, vital for subsequent glucose utilization (Opie, 1968), is limited
by the rate of glucose transport across the plasma membrane of cardiomyocytes, and is
mediated by glucose transporter proteins named GLUTs. The insulin-sensitive tissues,
(heart, skeletal muscles and adipose tissue) express at least two differentially regulated
glucose transporters, namely GLUT1 and GLUT4 (Pessin and Bell, 1992). GLUT4
protein levels increase postnatally and are maximal during adulthood (Castello et al.,

Chapter I
54
1991; Vanucci et al., 2000). In contrast, GLUT1 proteins are highly expressed during
fetal growth but downregulate rapidly after birth (Castello et al., 1991). There are
different factors which influence glucose transport in the heart; an increase in pyruvate,
lactate and fatty acid substrate can lead to a 50% downregulation of glucose transport
in isolated rat cardiomyocytes (Fischer et al., 1997a). Moreover, the basal glucose
uptake is significantly reduced under the influence of insulin, FFA and ketones (Kahn,
1996; Fischer et al., 1997b). In the cytosol, glycolytic metabolism of glucose-6-
phosphate to pyruvate precedes the mitochondrial oxidation of pyruvate. The rate
limiting enzyme for pyruvate production (and for both glycolysis and glucose
oxidation) is phosphofructokinase. This enzyme is strongly inhibited by ATP and by a
reduction in pH. An increase in pH and in levels of adenosine diphosphate (ADP) and
phosphate (Pi) increases the affinity of phosphofructokinase for its substrate. The
enzyme pyruvate dehydrogenase determines the rates at which pyruvate can enter the
citric acid cycle for oxidation or, during anoxia, be degraded to lactate (Opie, 1968).
Only 10-30% of energy required in the heart can be supplied by anaerobic glycolysis
and only for 1-2 minutes.
8.2. Metabolic adaptation in cardiac hypertrophy and failure
During load-dependent cardiac hypertrophy and other severe forms of cardiac
dysfunction, myocardial metabolism shifts towards a reliance on glycolysis as the
primary pathway for energy production, constituting a re-induction of the fetal energy
metabolic program (Bishop and Altschuld, 1970; Takeyama et al., 1995). Allard et al.
(1994) showed that the hypertrophic heart possesses an increased glycolytic capacity
and the contribution of ATP production from fatty acid oxidation is markedly
decreased. This metabolic shift results in lower oxygen consumption cost per mole of
ATP generated. Myocardial energy utilization pathways also undergo alterations during
cardiac hypertrophy, as evidenced by the downregulation of genes coding for various
ATPases, like the NaKATPase and SERCA2, as well as a shift toward fetal isoforms of
the contractile proteins. Thus re-activation of the ‘fetal’ metabolic program in the
hypertrophic ventricle likely comprises an adaptive metabolic energy response that
could have long-term consequences resulting from diminished energy reserves, reduced

Chapter I
55
capacity to maintain myocyte lipid balance and altered ionic and calcium homeostasis,
ultimately leading to cardiac dysfunction. Interestingly, in hypertensive rabbits
developing pressure-overload cardiac hypertrophy, this shift occurs before there is any
change in cardiac mass (Taegtmeyer and Overturf, 1988), suggesting that metabolic
adaptation to changes in workload may precede cardiac hypertrophy.
Cardiac hypertrophy is accompanied by downregulation of various genes involved in
fatty acid metabolism. PPARα transcript levels are downregulated in hypertrophic
hearts (Young et al., 2001). Moreover, PPARα activity is decreased at the post-
transcriptional level during cardiac hypertrophy, possibly by a phosphorylation event.
MAPK pathways are an obvious candidate for mediating the deactivation of PPARα
given that they have been implicated in the hypertrophic growth (Schaub et al., 1997;
Barger et al., 2000) and are known to regulate nuclear receptors, including the PPAR
sub-family (Hu et al., 1996). Indeed these results indicate that the activity of the PPAR
gene regulation pathway is rapidly reduced by the action of the ERK pathway, but not
by the p38 and the JNK pathways. Interestingly, Ang II downregulates the expression
of PPARα and PPARγ leading to the activation of the pro-hypertrophic NFκb signaling
pathway (Tham et al., 2002). Moreover, PPARγ activators, such as the anti-diabetic
agents thiazolidinediones, inhibit Ang II-induced pressure-overload cardiac
hypertrophy in mice, and prevent the upregulation of skeletal α-actin and ANF genes in
neonatal cultured cardiomyocytes, thus suppressing hypertrophic growth (Asakawa et
al., 2002).
8.3. Cardiac metabolism in type 2 diabetes and insulin resistance states
8.3.1. Diabetes mellitus
Diabetes mellitus refers to a diverse group of metabolic diseases that are characterized
by high plasma glucose concentrations and that have been estimated to affect more than
108 people worldwide (King et al., 1998). Type 2 diabetes, previously called ‘adult
onset’ or ‘non-insulin-dependent’ diabetes mellitus (NIDDM), accounts for more than

Chapter I
56
90% of cases and, in several countries, affects up to 20% of adults (King et al., 1998).
Insulin resistance (see below) typically precedes the onset of type 2 diabetes and
predisposes individuals to various cardiovascular diseases, including hypertension,
hyperlipidemia, premature atherosclerosis, coronary artery diseases and heart failure
(Reaven, 1991; Anker et al., 1997; Grundy et al., 1999). Type 1 diabetes (or ‘juvenile-
onset’ or ‘insulin-dependent’ diabetes mellitus, IDDM) accounts for the other 10% and
it is characterized by the failure of insulin secretion by pancreatic β-cells due to
autoimmune destruction (Todd, 1999). In human heart muscle, both the myocardial
glucose uptake and glycolytic flux to lactate are decreased in type 1 diabetes.
Normalization of blood glucose with insulin supplementation restores the patterns of
lactate and ketone body kinetics (Avogaro et al., 1990).
Hyperglycemia defines both types of diabetes and results from an absolute insulin
deficiency in type 1 diabetes and tissue insulin resistance in type 2 diabetes (American
Diabetes Association, 1997). High circulating levels of glucose cause accelerated
micro- and macro-vascular diseases (such as ischemic heart diseases, stroke,
retinopathy, neuropathy and nephropathy) and increase morbidity and mortality in
diabetic patients (Klein, 1995). Diabetes is a strong independent cardiovascular risk
factor, and the likelihood of death from cardiovascular causes is two to five fold higher
in diabetics (Kannel and McGee, 1979; Stamler et al., 1993). Clinically, diabetes
mellitus is frequently associated with a diabetic cardiomyopathy which is not directly
attributable to microvascular disease, hypertension or obesity (see below) (Grundy et
al., 1999; Hayat et al., 2004).
8.3.2. Insulin resistance
Insulin resistance is a principal feature of type 2 diabetes and precedes the clinical
development of the disease by several years in patients. It is defined as a relative
inability of insulin to promote glucose transport into peripheral target tissues
(especially skeletal muscle) (Petersen and Shulman, 2002). In physiological conditions,
insulin promotes glucose uptake, which is rate limiting for cellular glucose metabolism
under most physiological settings (Manchester et al., 1994). In individuals with normal
glucose tolerance, a strong correlation exists between GLUT4 protein abundance in

Chapter I
57
muscles and the rates of glucose disposal during insulin clamp studies. This correlation
between peripheral insulin action and muscle GLUT4 is lost once diabetes mellitus is
established, suggesting that GLUT4 is a primary effector molecule for insulin-mediated
glucose disposal and that GLUT4 downregulation contributes significantly to the
development of insulin resistance in peripheral tissues.
In addition to diabetes, insulin resistance predisposes individuals to hypertension,
hyperlipidaemia, premature atherosclerosis, coronary artery diseases, muscle wasting,
left ventricular hypertrophy and chronic heart failure (Paolisso et al., 1991; Reaven,
1991; Anker et al., 1997). Risk factors for insulin resistance include inactivity, obesity,
ageing (Ferrannini et al., 1996), elevated levels of TNF-α (Hotamisligil and
Spiegelman, 1994) and increased oxidative stress (Paolisso and Giugliano, 1996).
Possible links between insulin resistance, hypertension and cardiovascular disease
include sodium retention, hyperaldosteronism, over-activity of the sympathetic nervous
system, and vascular smooth muscle proliferation and hypertrophy (DeFronzo, 1992).
8.3.3. Cardiac glucose transport in states of insulin resistance
Under conditions of increased workload or anoxia, impaired glucose uptake due to
insulin resistance could be a critical factor in the onset of metabolically-induced cardiac
remodeling (Belke et al., 2000; Semeniuk et al., 2002; Desrois et al., 2004).
As mentioned above, glucose is transported into cardiomyocytes via GLUT4 and
GLUT1. It is accepted that the effect of insulin on cardiac glucose disposal is mediated
through its action on GLUT4, which is the most abundant isoform expressed in the
adult heart (Abel, 2004; Desrois et al., 2004). In the heart GLUT4 translocates to the
plasma membrane in response to insulin (Egert et al., 1997), ischemia (Egert et al.,
1997), hypoxia (Sun et al., 1994), and high-frequency contraction (Till et al., 1997).
Decreased GLUT4 activity and expression is suggested as one of the factors
responsible for metabolic and contractile dysfunction in the diabetic heart, where
decreased glucose uptake is comprimized (Eckel and Reinauer, 1990; Garvey et al.,
1993; Desrois et al., 2004; Rosenblatt-Velin et al.,2004).

Chapter I
58
The mechanisms governing the differential regulation of GLUT4 in metabolic
pathologies and the relationship between altered glucose transporter expression and
cardiac function are incompletely understood. One approach to address this issue has
been to manipulate cardiac and body glucose transporter expression in transgenic mice.
Mice genetically engineered to overexpress the GLUT4 gene in insulin-sensitive tissues
(cardiac and skeletal muscle and adipose tissue) display enhanced insulin
responsiveness, cellular glucose uptake and peripheral glucose utilization, suggesting
that indeed GLUT4 is the primary effector molecule for insulin-mediated glucose
disposal. On the other hand, global or tissue-specific disruption of the GLUT4 leads to
insulin resistance, glucose intolerance and the development of mild-to-severe cardiac
hypertrophy. These transgenic and knock-out models for the GLUT4 protein are
presented and discussed in detail in the Introduction to Chapter III.
8.3.4. Cardiac fatty acid regulation in states of insulin resistance
In contrast to the metabolic shift observed during the development of most forms of
load-dependent cardiac hypertrophy, cardiac remodeling induced by insulin resistance
and hyperglycemia is associated with a primary increase in cardiac fatty acid
metabolism. Myocardial uptake of ketone bodies and FFA was shown to be increased
in diabetic patients compared with controls (Avogaro, 1990). Levels of fatty acid
binding protein were significantly elevated (+40-50%) in the hearts of experimental
diabetic rats (Engels et al., 1999). Protein levels of fatty acid translocase CD36, located
in the pericapillary myocardial tissues, were increased 2 to 4 fold (Pelsers et al., 1999).
Rat heart fatty acid-binding protein content was 34% higher in type 1 diabetic rats and
103% higher in type 2 diabetic rats compared with control (Glatz et al., 1994).
Moreover, the tissue triacylglycerol level in the heart is strikingly increased in various
models of diabetes (Paulson and Crass, 1982). In isolated diabetic rat hearts perfused
under diabetic metabolic conditions, elevated triacylglycerol levels were maintained,
lipolysis was reduced or unchanged and triacylglycerol synthesis was enhanced. When
the same hearts were perfused simulating normal metabolic conditions, lipolysis and β-
oxidation were markedly enhanced (Paulson and Crass, 1982). In states of diabetes and
insulin resistance, accumulation of fatty acids within the cytoplasm occurs (Rodrigues
and McNeill, 1992). This can cause various deleterious electrophysiological,

Chapter I
59
biochemical and mechanical effects in cardiac muscle cells: accumulation of fatty acids
and their toxic intermediates is associated with depression of contractility (Criddle et
al., 1990), combined with inhibition of the NaKATPase (Dhalla et al., 1991), NCX
(Ashavaid et al., 1985), and the SERCA2 (Adams et al., 1979). Fatty acids have been
demonstrated to directly interact with voltage-dependent Ca2+ channels (Spedding and
Mir, 1987).
8.4. Diabetic cardiomyopathy
Accumulating data from experimental and clinical studies have shown that diabetes
mellitus results in cardiac functional and structural changes, independent of
hypertension, coronary artery disease, or any other known cardiac disease. These
observations support the existence of a distinct diabetic cardiomyopathy. The
development of diabetic cardiomyopathy is likely to be multifactorial. Putative
mechanisms include metabolic disturbances, myocardial fibrosis, autonomic
dysfunction, and insulin resistance (reviewed in Fang et al., 2004).
8.4.1. Metabolic disturbances in diabetic cardiomyopathy
Increasing evidence suggests that altered substrate supply and utilization by cardiac
myocytes could be the primary injury in the pathogenesis and development of diabetic
cardiomyopathy (Rodrigues et al., 1998). As mentioned above, the major restriction to
glucose utilization in the diabetic heart is the slow rate of glucose transport across the
sarcolemmal membrane into the cardiomyocyte, probably due to the cellular depletion
of glucose transporters, such as the GLUT4. A second mechanism of reduced glucose
oxidation is via the inhibitory effect of fatty acid oxidation on the pyruvate
dehydrogenase complex due to high circulating FFA (Liedtke et al., 1988). This has the
net effect of reducing ATP availability and may be more detrimental in type II diabetes,
in which FFA levels tend to be higher.

Chapter I
60
8.4.2. Mechanical dysfunction in diabetic cardiomyopathy
Eventually, altered substrate supply, insulin resistance and hyperglycemia will lead to
defects in calcium and other ion transport, myocyte apoptosis and necrosis,
upregulation of the RAS and TGF-β1 activity, resulting in myocyte injury, myocardial
fibrosis and early diastolic dysfunction. This stage of diabetic cardiomyopathy is
mainly characterized by cardiomyocyte hypertrophy, fibroblast proliferation,
inflammatory response and myocardial fibrosis (these aspects are detailed in Chapter
IV). Prolonged changes in metabolism, mitochondrial stress and development of
myocardial fibrosis result in severe cardiac microvascular structural and functional
changes. Alterations in cardiac structure and function are marked and at this stage
diabetic cardiomyopathy is frequently associated with overt systolic dysfunction,
hypertension and early development of ischemic heart disease (Brands and Fitzgerald,
2002).

Chapter I
61
9. AIMS
In the following Chapters, the findings of an investigation of two different transgenic
mouse models of primary cardiac hypertrophy are presented: 1) a cardiac-specific
angiotensinogen-overexpressing transgenic mouse, the TG1306/1R; and 2) a glucose
transporter (GLUT4) knock-out mouse model, the GLUT4-KO. The objective of these
studies is to provide new insight into the mechanisms that are common and/or unique in
the development of cardiac hypertrophic states induced either by the cardiac-specific
overproduction of the bioactive peptide angiotensin II or a cardiomyocyte-specific
glucose metabolic deficiency. The general hypothesis addressed is that cardiac-specific
neuro-endocrine activation or metabolic imbalance are sufficient provocations (in the
absence of hemodynamic disturbance) to induce hypertrophic structural, functional and
molecular remodeling of the myocardium. More specific experimental hypotheses are
postulated in relation to the investigation detailed in the Chapters to follow.
Experimental investigations described include cellular and tissue morphometric
analysis on the hearts of these rodent models, combined with examination of
cardiomyocyte contractility and cardiac gene expression profiling by cDNA microarray
assay.

Chapter I
62
Figure I-1: Intracellular ionic homeostasis during cardiomyocyte contraction and relaxation
An overview of the mechanisms of intracellular calcium ionic homeostasis in cardiomyocytes during contraction (A. to E.) and relaxation (F. to I.). Refer to Section 5 of the present Chapter for more explanations. Briefly: after electrical depolarization, elevation of calcium depends upon calcium entry through voltage-dependent channels (VOC) in the plasma membrane, the sodium/calcium exchanger (NCX) and calcium release through sarcoplasmic reticulum (SR) ryanodine receptors (RyR), via the calcium-induced calcium release (CICR) mechanism. The mechanisms which remove calcium from the cytosol to the extracellular environment include ion pumps (calcium ATPases) and exchange (the NCX). The majority of calcium ions are pumped back into the SR through the SR calcium ATPase SERCA2.
[Ca2+]i
ATPase NaK-ATPase
SERCA2
VOC
[Ca2+]e
RyR-dependent calcium pools
[Na+]e
[Na+]i
[K+]e
[K+]i
[Ca2+]e
NCX
NCX
CICR CICR
Contraction
[Na+]e
[Na+]i
Depolarization
Repolarization
Relaxation
B.
C.
D. A.
E.
F.
G.H.I.
[Ca2+]i
ATPase NaK-ATPase
SERCA2
VOC
[Ca2+]e
RyR-dependent calcium pools
[Na+]e
[Na+]i
[K+]e
[K+]i
[Ca2+]e
NCX
NCX
CICR CICR
Contraction
[Na+]e
[Na+]i
Depolarization
Repolarization
Relaxation
B.
C.
D. A.
E.
F.
G.H.I.
o o
ooo
[Ca2+]i
ATPase NaK-ATPase
SERCA2
VOC
[Ca2+]e
RyR-dependent calcium pools
[Na+]e
[Na+]i
[K+]e
[K+]i
[Ca2+]e
NCX
NCX
CICR CICR
Contraction
[Na+]e
[Na+]i
Depolarization
Repolarization
Relaxation
B.
C.
D. A.
E.
F.
G.H.I.
[Ca2+]i
ATPase NaK-ATPase
SERCA2
VOC
[Ca2+]e
RyR-dependent calcium pools
[Na+]e
[Na+]i
[K+]e
[K+]i
[Ca2+]e
NCX
NCX
CICR CICR
Contraction
[Na+]e
[Na+]i
Depolarization
Repolarization
Relaxation
B.
C.
D. A.
E.
F.
G.H.I.
oo oo
oooooo

Chapter I
63
DSH
PKC
AxinAPC
GSK3
LRP
P
β-catenin β-cateninP
•Cyclin D1, D2, D3•c-MYC, c-JUN•MMP7•BMPs
RhoA/Rac JNK2/3 Apoptosis
LDLR
PP2A
UbiquitinationProteasome degradation
β-catenin
TCF
WntDkk
DSH
PKC
AxinAPC
GSK3APC
GSK3
LRP
P
β-catenin β-cateninP
β-cateninP
•Cyclin D1, D2, D3•c-MYC, c-JUN•MMP7•BMPs
RhoA/Rac JNK2/3 Apoptosis
LDLR
PP2A
UbiquitinationProteasome degradation
β-catenin
TCF
WntDkk
Figure I-2: Embryonic heart formation
Heart formation is cued by a combination of positive and negative signals from surrounding tissues. Inhibitory signals that block heart formation in anterior paraxial mesoderm include Wnt family members expressed in dorsal neural tube and anti-BMPs expressed in the axial tissues (i.e., Noggin in the notochord). Wnt signaling pathway, which is essential for setting up the entire body pattern during embryonic development involves glycogen synthase kinase-3 (GSK3). In the absence of Wnt signaling, GSK3 is active and phosphorylates beta-catenin resulting in its degradation by ubiquitin-mediated proteolysis. Activation of Wnt signaling inhibits GSK3, thereby preventing phosphorylation of beta-catenin, which is then able to move to the nucleus. There it associates with members of the LEF-1/TCF family of transcription factors, which activate the transcription of genes like cyclin-D1, Myc, and MMPs. The Wnt signaling pathway is blocked by a family of secreted proteins such as Dickkopf-1 (Dkk-1) sufficient for induction of heart formation in posterior mesoderm. BMP signaling can also be blocked by the BMP antagonists Noggin and Chordin, which are secreted from the notochord and cooperate with Wnts to prevent cardiogenesis. Receptors for BMPs are persistently expressed during cardiac development. Activin receptor-like kinase 3 (ALK3), a BMP receptor, is specifically required at mid-gestation for normal development of the trabeculae, compact myocardium, interventricular septum, and endocardial cushion. Cardiac muscle lacking ALK3 is specifically deficient in expressing TGFβ, an established paracrine mediator of cushion morphogenesis.

Chapter I
64
cFOS
Gβγ GαGDP
GαsGTP
GαiGTP
GαqGTP
Gα12GTP
PKAAC
ATP
cAMP
CRE
CREBP
P
RAS Erk1/2
A.
B.
SRE
ELKP
SRE
STATP
C.
NFAT-RE
NFAT
AP-1
cJUN
RhoAAKAP13
PKA GTPStress fiberformation
PLDD.
PLC
PIP2
IP3
DAG PKC
Ca2+ CaMCalcineurin
cFOS
Gβγ GαGDP
GαsGTP
GαiGTP
GαqGTP
Gα12GTP
PKAAC
ATP
cAMP
CRE
CREBP
P
RAS Erk1/2
A.
B.
SRE
ELKP
SRE
STATP
C.
NFAT-RE
NFAT
AP-1
cJUN
RhoAAKAP13
PKA GTPStress fiberformation
PLDD.
PLC
PIP2
IP3
DAG PKC
Ca2+ CaMCalcineurin
Figure I-3: Signaling through 7TM receptors and G-protein
A. In general, Gαs proteins couple to stimulation of adenylyl cyclase (AC) which increases cyclic adenosine monophosphate (cAMP) levels. cAMP is an activator of protein kinase A (PKA), a serine/threonine kinase that phosphorylate many substrates, including 7TM receptors, other kinases and transcription factors. B. Gαi/o couples to inhibition of AC as well as to activation of G-protein coupled inwardly rectifying potassium channels, increases c-Src tyrosine kinase activity and stimulates ERK/mitogen-activated protein kinase (MAPK) pathway. C. Gα12/13 proteins couple to the activation of the Rho guanine-nucleotide-exchange factors (proteins that facilitate the replacement of GDP with GTP) and stress-fiber formation. Gα12/13 proteins also modulate phospholipase D (PLD) activity, probably via RhoA and c-Src activity. D. Gαq/11 activates phospholipase C beta (PLCβ), which hydrolyses phosphatidylinositol 1,4-bisphosphate (PIP2) to inositol triphosphate (IP3) and diacylglycerol (DAG). IP3 binds to specific receptors on the endoplasmic reticulum (especially on endothelial and smooth muscles cells) inducing the release of calcium into the cytoplasm. DAG is a potent activator of the family of serine/threonine kinases, protein kinase C (PKC). Finally, the Gβγ subunit has been linked to modulation of inwardly rectifying potassium channels, GPCR phosphorylation and desensitization mediated by G protein-coupled receptor kinases, as well as activation of AC, PLCβ and phosphatidylinositol 3-kinase (PI3K).

Chapter I
65
EGF
Gβγ GαqGTP PLCγ
Angiotensin IIEndothelin I
DAG PKC
IP3
Adam12
EGF
RASRho
Altered myocardialcell morphology
MAPK pathway
c-FOSc-MYC c-JUNNFκb
Activation of immediate early genes
EG
F-R
EG
F-R
Cardiac/cardiomyocytehypertrophy
ROS
EGF
Gβγ GαqGTP PLCγ
Angiotensin IIEndothelin I
DAG PKC
IP3
Adam12
EGF
RASRho
Altered myocardialcell morphology
MAPK pathway
c-FOSc-MYC c-JUNNFκb
Activation of immediate early genes
EG
F-R
EG
F-R
Cardiac/cardiomyocytehypertrophy
ROS
Figure I-4: Signaling through EGF receptor transactivation
Cardiomyocyte hypertrophic stimuli can result from cross-talk between GPCR signaling and the EGF receptor pathway. Several GPCR ligands are known to stimulate cardiac hypertrophy, including factors that regulate blood pressure such as angiotensin II and endothelin-1. These factors stimulate phospholipase C (PLC) through Gαq activation, and the production of IP3 and diacylglycerol (DAG) second messengers. PKC is activated by DAG and interacts with the metalloproteinase ADAM12. ADAM12 cleaves the membrane-bound HB-EGF to release soluble EGF ligand that activates EGF receptor in myocardial cells. EGF receptor activation downstream through small G proteins (Ras, Rho) and the MAPK pathway ultimately leads to cardiac hypertrophy. Signals by GPCR ligands such as angiotensin II result in transcriptional translation of immediate early genes like fos and other genes involved in long-term remodeling of heart tissue and the physiological response to stress in the heart such as the atrial natriuretic factor. Factors such as the AKT kinase, reactive oxygen species (ROS) and NF-kB also are involved in signaling that leads to hypertrophy, although their role is not yet clear.

Chapter I
66
RACRAS
PAKMAP4K3/4GCK
MAP3K2/3/8
MEKK1
MAP2K5
ERK5
RAF
MEK1/2
ERK1/2
MAP3K4/12
MKK7 MEK4
JNK1 MAPK9
MAPK10
MAP4K1/5
ASK1 TAK1
MAP3K11
MEK3/4
MAPK11/12p38
ERK6
MAP
4K
MAP
3K
MAP
2K
MAP
K
Targ
ets
of M
APK
Other kinases Other kinases
c-MYCMEF2 CREB STAT1
ELK-1 c-FOS c-JUN ATF-2 SP1
SHC
GR
B2 SOS
Growth factors, UVtrophic factors, etc
Stress: osmotic shockγ-radiations
GPCRRTK
FASL, inflammatory cytokines, dead receptors, UV, etc.
TRAD
DTR
AF2
NIK
IKK
NFκbCaspasecascade
Figure I-5: The MAPK signaling cascade
The ever evolving mitogen-activated protein kinase (MAP kinase) pathways consist of several groupings and numerous related proteins which constitute interrelated signal transduction cascades activated by stimuli such as growth factors, stress, cytokines and inflammation. The four major groupings illustrated here are the Erk (purple), JNK or SAPK (blue), p38 (green) and the Big MAPK or ERK5 (light blue) cascades. Signals from cell surface receptors such as GPCRs and growth factor receptors are transduced, directly or via small G proteins such as Ras and Rac, to multiple tiers of protein kinases that amplify these signals and/or regulate each other. In some cascades the first activation tier involves the MAPKKKKs, MAP kinase kinase kinase kinases or MAP4K proteins. The next tier are the serine/threonine MAPKKKs, MAP kinase kinase kinase or MAP3Ks such as RAF, TAK, ASK, and MEKK1. This level has the greatest amount of cross-communication curently known. The serine/threonine/tyrosine MAPKKs, MAP Kinase kinases or MAP2Ks, such as the MKK and MEK kinases, are one step up from the MAP kinase cascade, phosphorylating and activating these kinases. The focal tier, the MAPKs or MAP kinases includes JNK1, p38, and ERKs, and are the kinases that give each cascade its name. The endpoints of these cascades, shown in the bottom tier, include the MAPK activated protein kinases (MAPKAPK) and some of the numerous transcription factors that regulate genes involved in apoptosis, inflammation, cell growth and differentiation.

Chapter I
67
RAS
RAF1MEK1ERK1
ERK2
PI3K GSK3β
GSK3β
AKT
p70s6K
p38
JNK1
NF-ATc NF-ATcP
P
AKT pathway
β-adrenergic agonistsAngiotensin IIEndothelin I
IGF-1 FGF2EGF LIF
Ca2+
CaM CaM
CAMK I
CAMK IV
IP3
Calcineurin
NF-ATcMEF2c
GATA4
ANFα-actinβ-myosinET-1
(?)
PKA
RAS
RAF1MEK1ERK1
ERK2
PI3K GSK3β
GSK3β
AKT
p70s6K
p38
JNK1
NF-ATc NF-ATcP
P
AKT pathway
β-adrenergic agonistsAngiotensin IIEndothelin I
IGF-1 FGF2EGF LIF
Ca2+
CaM CaM
CAMK I
CAMK IV
IP3
Calcineurin
NF-ATcMEF2c
GATA4GATA4
ANFα-actinβ-myosinET-1
(?)
PKA
Figure I-6: Hypertrophic growth through calcineurin and NF-ATc
A single transcriptional regulator initially associated with the activation of the T-cells (NFATc4) has been shown to link embryonic heart development (and genetic and environmental causes of congenital heart disorders) to acquired cardiac hypertrophy. Within the embryonic endocardium, specific inductive events appear to activate NF-ATc, which are localized to the nucleus only in endocardial cells that are adjacent to the interface with the cardiac jelly and myocardium, and that are thought to give the inductive stimulus to the valve primordia. Treatment with FK506, a specific calcineurin inhibitor, prevents nuclear localization of NF-ATc4. More recently, it has been demonstrated that activated CaMK stimulates calcineurin, which than acts through NF-ATc4 in association with GATA4, to induce cardiac hypertrophy. A model for the proposed role of calreticulin in the regulation of cardiac development requires a myogenic signal from extracellular space to activate the production of IP3 that results in the release of calcium ions from ER under the regulation of calreticulin (CRT). Increased intracellular calcium binds to calmodulin (CaM) and activates calcineurin. Calcineurin dephosphorylates NF-ATc4 that translocates to the nucleus. In the nucleus NF-AT forms complexes with the GATA-4 and other transcription factors leading to activation of transcription of genes (ANF, α-actin, β-myosin, TNFα, ET-1, Adss1 etc) essential for embryonic cardiac development and cardiac hypertrophy in the adult heart.

Chapter I
68
Rip
TRA
DD
TRA
F2
Bcl-2
Caspase 8
FaddCaspase 10
NIK
IKK
NFκb
Bid
Iκb
IκbNFκb
tBid
Cytochrome C
Apaf-1Caspase 9
Caspase 3
lap
Caspase 6
Dr4
/5
Dr3
Caspase 7
Parp
DNA repair
DNA fragmentationCell shrinkage
Apoptosis
Rip
TRA
DD
TRA
F2
Bcl-2
Caspase 8
FaddFaddCaspase 10
NIK
IKK
NFκb
BidBid
Iκb
IκbNFκb
tBidtBid
Cytochrome C
Apaf-1Apaf-1Caspase 9
Caspase 3
lap
Caspase 6
Dr4
/5
Dr3
Caspase 7
ParpParp
DNA repair
DNA fragmentationCell shrinkage
Apoptosis
Figure I-7: Mechanisms of caspase-induced apoptosis
Stimuli can arise from the nucleus as well as from the mitochondrion or the membrane. Ultimately, the stimuli converge on the process of activation of caspases (cysteine proteases) enzymes, whose many substrates are thought to account for terminal events of apoptosis. Apoptosis is specifically induced via signaling through a family of receptors known collectively as 'death receptors' including Fas, TNFR, DR3, -4 and -5. Death receptor ligands (e.g. ApoL, FasL, etc.) characteristically initiate signaling via receptor oligomerization, recruitment of specialized adaptor proteins and activation of caspase cascades. Apo3L (or FasL) recruits initiator caspase 8 via the adapter protein FADD. Caspase 8 then oligomerizes and is activated via autocatalysis. Activated caspase 8 stimulates apoptosis via two parallel cascades: it directly cleaves and activates caspase-3, and it cleaves Bid (a Bcl-2 family protein). Truncated Bid (tBid) translocates to mitochondria, inducing cytochrome C release, which sequentially activates caspases 9 and 3. DR-3L can deliver pro- or anti-apoptotic signals. DR-3 promote apoptosis via the adaptor proteins TRADD/FADD and the activation of caspase 8. Alternatively, apoptosis is inhibited via an adaptor protein complex including RIP which activates NF-kB and induces survival genes including IAP. Induction of apoptosis via Apo2L requires caspase activity, but the adaptor requirement is unclear.

Chapter I
69
Angiotensinogen
Angiotensin I
Angiotensin II
ACE
ACEinhibitors
Bradykinin
Nitric OxidePGE2
Inactivekinin
fragments
AT1 receptor
Smooth muscle proliferation
•Sodium resorption•Aldosterone release•Renal blood flow
•Direct vasoconstriction•Peripheral noradrenergic activity•Adrenal catecholamine release•CNS sympathetic activity
Vasoconstriction
Blood volume
Cardiac and vascular remodeling
AT2 receptor
Antiproliferative andvasodilatory effects
Renin
AT1blockers
Figure I-8: The renin-angiotensin system (RAS)
The most familiar and best studied effects of angiotensin II (Ang II) are vasoconstriction and stimulation of synthesis and secretion of aldosterone by the adrenal cortex. However, the octapeptide has numerous other effects. Some involve stimulation of the heart and the sympathetic nervous system, these complement the direct vasomotor effects and contribute to increase in blood pressure caused by Ang II. Others, such as stimulation of drinking and increased secretion of anti-diuretic hormone, complement the effects of aldosterone and contribute to retention of sodium and water.

Chapter I
70
Agt
Ang I
Ang II
Ang III Ang IV
Ang [2-10]
Ang [1-7]
Ang [1-9]
Ang [1-5]
Renin
Toni
nC
athe
psin
G
AMP
ACEChymaseCathepsin A
AMPD-Amp
AMP
ACE
ACE2
PEPNEP
ACENEP
ACE
ACE2 PEPPCP
AMPACE
Agt
Ang I
Ang II
Ang III Ang IV
Ang [2-10]
Ang [1-7]
Ang [1-9]
Ang [1-5]
Renin
Toni
nC
athe
psin
G
AMP
ACEChymaseCathepsin A
AMPD-Amp
AMP
ACE
ACE2
PEPNEP
ACENEP
ACE
ACE2 PEPPCP
AMPACE
Figure I-9: generation and degradation of angiotensin peptides
Schematic representation of the enzymatic pathways involved in the generation of angiotensin peptides. Abbreviations: ACE = angiotensin-converting enzyme; Ang = angiotensin; AMP = aminopeptidase; D-Amp = dipeptidyl-aminopeptidase; PCP = prolyl-carboxypeptidase; PEP = prolyl-endopeptidase; NEP = neutral-endopeptidase.

Chapter I
71
Diet, release from adipose
Fatty acids (PUFA, MUFA, Saturated, Conjugated)Intermediary metabolism
PPARα
PPRE ?RE
PPRE-regulated genes Non-PPRE-regulated genes
Acyl-CoA OxidaseCytochromes P450Fatty Acid Binding ProteinAcyl-CoA Binding ProteinAcyl-CoA Synthetase17β-HSD IVLipoprotein LipaseCarnitine PalmitoylTransferase 1LXRα
Inducible NO SynthaseCyclooxygenase 2ProlactinFAT/CD36C-MycIκBαTNFα
Figure I-10: PPARα-dependent metabolic genes transcription
Similar to other nuclear hormone receptors, PPAR elements act as a ligand activated transcription factors. Upon binding fatty acids or hypolipidemic drugs, PPARα interacts with RXR and regulates the expression of target genes via a proliferator-response element (PPRE)-regulated mechanism (classic mechanism) or via other PPRE-independent mechanisms. The majority of genes regulated by PPARs are involved in the metabolism and catabolism of fatty acids. PPARγ, another member of the PPAR family, is activated by prostaglandins, leukotrienes and anti-diabetic thiazolidinediones and affects the expression of genes involved in the storage of fatty acids. PPARb is only weakly activated by fatty acids, prostaglandins and leukotrienes and has no known physiologically relevant ligand.

CHAPTER II
General methods

Chapter II
73
1. EXPERIMENTAL MODELS
1.1. Ethics approval
All animals were handled in the manner specified by the Prevention of Cruelty to
Animals Act 1986 and NHMRC/CSIRO/ACC Australian Code of Practice for the Care
and Use of Animals for Scientific Purposes (1997). In addition, other conditions
specified by the University of Melbourne Animal Experimental Ethics Committee were
followed.
1.2. The transgenic angiotensinogen overexpressing mouse
(TG1306/1R)
The generation and the descriptive characteristics of the transgenic heterozygous
TG1306/1R mouse are reported in the Introduction of Chapter III. Transgenic
heterozygous (TG) and wild-type (WT) littermate control mice were obtained from the
breeding colony in the Biological Research Facility (Faculty of Medicine, University of
Melbourne), established from male heterozygous TG1306/1R founders imported from
Switzerland (Division of Hypertension, University of Lausanne Medical School). Mice
were subject to Australian Quarantine and Inspection Service (AQIS). Heterozygous
TG breeders were mated with C57BL6 strain females to generate litters composed of
half TG heterozygous and half WT progeny. Genotyping was done on DNA extracted
from tail biopsies by semi-quantitative PCR. Duplex genomic PCR reactions were
performed with specific primers detecting the transgene and the housekeeping gene
glyceraldehydes-3-phosphate dehydrogenase (GAPDH) as positive control. Primer
sequences were as follow: 5’-AAGCCCATCACCATCTTCCAGGAG-3’ (forward)
and 5’-AGCCCT TCCACAATGCCAAAG-3’ (reverse) for GAPDH (product size: 308
bp); 5’-ACAGCAGATCACGATTCTCCCG-3’ (forward) and 5’-

Chapter II
74
CAGGTCAGGATGCAGAAGATGG-3’ (reverse) for the angiotensinogen transgene
(product size: 397 bp). Animals received standard laboratory chow (Clarke King,
Australia) consisting of 20% protein, 75.5% carbohydrate and 4.5% fat. All animals
had free access to drinking water. The genetic background of the TG and WT mice was
estimated to be ~99% C57BL6.
Experiments as described in Chapters III, IV and V were conducted on mice aged 15-
20, 35-40 and 50-60 weeks. Longevity data were also collected for an additional group
of TG and WT mice over a period of 94 weeks (Chapter III). To study possible cardiac
remodeling caused by variable cardiac Ang II production levels, the creation of a small
colony of homozygous TG1306/1R mice harboring double the transgene complement
was also attempted.
1.3. The GLUT4 transporter knock-out mouse (GLUT4-KO)
Generation and characteristics of the GLUT4-KO mouse are reported in the
Introduction of Chapter III. Experimental procedures were performed on GLUT4-
Lox+/+Cre+/- ‘knock-out’ (LLC) mice and their genetic controls GLUT4-Lox+/+Cre-/-
(LL). The colony was maintained by breeding LLC with LL mice and identifying the
Cre-positive mice by RT-PCR. Primers to detect transgenic Cre-positive mice were as
follow: 5’-AGCCCGGAGTAGCAGTTGTAGC-3’ (forward) and 5’-
ATGTCCATCAGGTTCTTGCG-3’ (reverse) (product size: ~350 bp). Mice were
housed in The University of Melbourne Department of Medicine, Royal Melbourne
Hospital. Animals were fed standard mouse chow consisting of 20% protein, 75.5%
carbohydrate and 4.5% fat. All animals had free access to drinking water. The genetic
background of the LL and LLC mice was estimated to be ~60% C57BL6, ~35% 129Sv
and ~5% CBA.
Experiments as described in Chapters III, IV and V were conducted on mice aged 15-
20, 35-40 and 50-60 weeks.

Chapter II
75
2. CARDIAC WEIGHT INDEX
Mice were anaesthetized by intraperitoneal injection of pentobarbitone sodium
(Nembutal, 70mg/kg). Following excision and submersion in an ice-cold basic
physiological buffer (142mM NaCl, 5.7mM KCl, 1.5mM KH2PO4.H2O, 1.7mM
MgCl2.6H2O), hearts from 15-20, 35-40 and 50-60 week old mice were trimmed of
adipose tissue, blotted, and weighed. The degree of cardiac hypertrophy was
established by measuring the ratio between the blotted wet heart weight and the body
weight (mg/g), i.e. the cardiac weight index (CWI).

Chapter II
76
3. WHOLE HEART HISTOLOGY AND MORPHOMETRY
3.1. Heart preparation and staining
Hearts from 15-20 and 35-40 week old mice were fixed in 10% buffered formalin
(Sigma) at room temperature for 24 hours, dehydrated and embedded in paraffin blocks
at 60 oC. Transversely oriented sections (5 μm) were cut at the mid point of the heart
apex-to-base aspect ratio and mounted on glass slides (Menzel Superfrost), two
sections per slide. Two slides per heart were stained with a modified version of Van
Gieson’s stain to evaluate interstitial collagen content (Figure II-1). Two other slides
were stained with Haematoxylin-Eosin staining for macroscopic evaluation of cardiac
structure and analysis of the number of cell nuclei per mm2 of tissue (Figure II-2).
3.2. Histological imaging
For estimates of collagen content, five adjacent images per ventricle and per section
were captured electronically using a high resolution CCD ‘Spot’ camera coupled to a
standard light microscope with a 10x power bright field objective. Myocardial fibrosis
was semi-quantitatively assessed in the interstitial space of the left and right ventricles
by computer-assisted morphometry. Regions of interest were selected to exclude areas
of uneven illumination or staining. Color images were converted into gray scale and
thresholded to produce binary images with collagen staining areas depicted as white,
and background as black (Figure II-1). Binary images were densitometrically analyzed
using the software ImagePro Plus 4.0. For each heart and each ventricular wall, images
were summed and results expressed as the percentage of the total cross sectional area
covered by red-stained interstitial collagen over the total sectional area analyzed (%tsa).
Areas of perivascular collagen and large blood vessels were excluded from analysis.
This analysis area was estimated at 6-8 mm2 of cardiac tissue per heart. All %tsa counts

Chapter II
77
were pooled for each experimental group and the mean %tsa calculated. For the
evaluation of the number of cell nuclei per mm2 of tissue, similar procedures were
performed on Hematoxylin-Eosin stained sections (Figure II-2). For this analysis, the
number of purple-stained nuclei over the total sectional area was computed and results
expressed as the number of cell nuclei per mm2 of myocardial tissue. Finally, for
macroscopic evaluation of cardiac structure, 1x power bright field images stained with
Hematoxylin-Eosin were captured and evaluated geometrically for myocardial
hypertrophy and ventricular chamber dilation. Chamber morphology was evaluated by
measurement of left ventricle (LV) lumenal area (mm2), while LV free wall thickness
(mm) was digitally measured from wall transects positioned to avoid papillary muscle
protrusions (average of 5 measurements per heart).

Chapter II
78
4. ADULT CARDIOMYOCYTE CELL ISOLATION
Isolated ventricular cardiomyocytes from 15-20 and 35-40 week old mice were
prepared by collagenase dissociation procedures and cell dimensions (length and width)
measured using bright field microscopy. Hearts were excised and rinsed in calcium-free
ice-cold HEPES buffer (142mM NaCl, 5.7mM KCl, 1.5mM KH2PO4.H2O, 1.7mM
MgCl2.6H2O, 10mM HEPES free-acid, 11.7mM Glucose, 20mM Taurine, pH 7.4,
100% O2 gassed). All chemicals were purchased either from Sigma or Fluka (reagent
grade).
Isolated hearts were submerged in ice-cold HEPES buffer, cannulated with the aid of a
stereomicroscope and perfused retrogradely via the aorta for 2-3 minutes with the same
HEPES buffer supplemented with 0.5 mM EGTA at 36oC (Figure II-3). The time-delay
between cardiectomy and cannulation was under 3 minutes. After a second period of 6-
8 minutes of retrograde collagenase perfusion at 36oC standard HEPES buffer
supplemented with 1mg/ml of BSA fraction V (Sigma); 0.4mg/ml collagenase type II
and 0.1 mg/ml collagenase type IV (Worthington), the left ventricular wall was minced
and the cells dissociated by shaking in HEPES buffer at 36oC. Myocytes were filtered
on a nylon mesh filter (250 μm pore opening) and resuspended in fresh HEPES buffer
(36oC). Cell dimension measurements (length and width) and cell yield were evaluated
using an eyepiece graticule fitted to the ocular tube of an inverted microscope.
Dimensions of 100 healthy rod-shaped adult cardiomyocytes were measured for each
heart. Viable cell yield (i.e. rod-shaped cardiomyocytes) ranged between 50-85% of the
total cell number, with the TG and LLC yield usually at the lower end of this range
(typically 700,000-1,000,000 cardiomyocytes). To select calcium tolerant
cardiomyocytes for single cell contractility experiments (Section 5.1), the calcium
concentration of the buffered solution was progressively increased to 25, 50 and 300
μM.

Chapter II
79
5. ADULT CARDIOMYOCYTE CONTRACTILITY
5.1. Experimental conditions
Single cardiomyocyte contractility was evaluated using a rapid imaging system, as
previously described (Harris et al., 1987; Delbridge et al., 1989). Isolated adult mouse
cardiomyocytes were allowed to settle and lightly adhere to the glass base of a trans-
illuminated temperature- and flow-controlled superfusion chamber under an inverted
Leitz Diavert trinocular microscope. Cells were superfused with pre-oxygenated,
buffered solution containing 2mM of Ca2+ (142mM NaCl, 5.7mM KCl, 1.5mM
KH2PO4.H2O, 1.7mM MgCl2.6H2O, 10mM HEPES free-acid, 2mM CaCl, 11.7mM
Glucose, 20mM Taurine, pH 7.4, 100% O2 gassed). The chamber temperature was
maintained at 36.0±0.5oC and the superfusion flow at 1.80±0.01 ml/min.
Cardiomyocytes were stimulated to contract at different frequencies (1.5 to 5Hz) by
platinum field electrodes delivering 1 ms pulses at 30% supra-threshold. Measurement
of single cardiomyocyte contractility was undertaken using a rapid scanning camera
(Fairchild CCD 1200R) attached to the upper ocular of the microscope. The camera
incorporated a scanning array line composed of 512 photodiodes, each 13x13 μm. The
scanning line was positioned along the longitudinal axis of the cardiomyocyte to track
temporal fluctuation of cell boundaries during the contraction cycle (Figure II-4). The
length of isotonically contracting cardiomyocytes was recorded at a high temporal
resolution, every 1.088 ms for up to 557 ms per contraction cycle, with scanning
synchronized to begin with electrical stimulus delivery. The spatial resolution of the
tracking system reached 2.46 pixels/μm with a 32x objective.

Chapter II
80
5.2. Recording and analysis
The scanning device was coupled to a Windows NT workstation operating the custom-
made software ‘Cardiac2000’, originally programmed in Pascal for a UNIX-based
platform (Delbridge et al., 1989), but rewritten in Visual C language to suit a more
user-friendly Windows-based environment. For each contraction cycle ‘Cardiac2000’
automatically computed a range of normalized parameters for comparative evaluation
of contractile status and inotropic response: maximum cell shortening (%S), expressed
as a percentage of initial resting cell length (Lo); the time at which the cell commenced
shortening after stimulus application, i.e. the excitation-contraction coupling latency
(To); the time at %S (Tm); the time at which the cell length returned to Lo (Tf); the
maximal rate of cell shortening (MRS) and lengthening (MRL). The detection of an
alteration in cell length of greater than 0.005 of resting length was identified as onset of
shortening (at start of cycle) or return to resting length (at cycle completion). MRS and
MRL were determined by step differentiation in increments of one scan (i.e. 1.088 ms)
with a selected step size of four scans (i.e. 4.352 ms). Cell shortening and lengthening
data stored during recording were converted from pixel to μm values, scaled and
calibrated to produce a graphical representation of a ‘cell shortening profile’, as
illustrated in Figure II-4. Some measurements reported in Chapter IV were derived
from the above-mentioned parameters: Tf-To indicates duration of the whole contractile
cycle; Tm-To, duration of cell shortening; Tf -Tm, duration of cell lengthening.
Compared to other commercially available edge detection methods with lower time
resolution (~4 ms), the present system combined high time resolution analysis (1 ms)
with automation of parameter calculation of shortening behavior (‘Cardiac2000’). This
enabled the tracking of fine and dynamic alterations in critical parameters of E-C
coupling, especially under higher (and more physiologic) ranges of stimulus frequency
(>2-3 Hz). The high temporal resolution of the system, also allowed precision
recording of the E-C coupling latency (To), which is the period of time following
stimulation during which a cardiomyocyte transduces the electrical signal
into observable mechanical behavior.

Chapter II
81
6. PROTEIN EXTRACTION AND WESTERN BLOTTING
Hearts from 15-20 and 35-40 week old mice were homogenized in 20mM Tris, 1mM
EDTA, 0.25M Sucrose (pH 7.4) and protease inhibitors (Leupeptin and PMSF).
Homogenates were spun at 3,400 rpm for 10 minutes at 4oC and crude
extracts/supernatants decanted. Pellets were resuspended in the same Tris buffer and
spun twice at 8,500 rpm for 10 minutes. Crude extracts for each sample were combined
and spun at 160,000 g for 1h in a Beckman ultracentrifuge. Pellets containing the total
membrane-bound proteins were resuspended in Tris buffer and stored at -80oC pending
analysis. After quantification of protein concentration (BioRad Protein Assay Kit),
60 μg of protein was loaded and separated in 10% SDS-polyacrylamide gels and
transferred to Polyvinylidene Difluoride (PVDF) membranes (Sigma) by a semi-dry
transfer system (BioRad). Blots were blocked in TBS buffer and 5% non-fat milk to
prevent non-specific protein-binding sites on the blot. Total protein transfer efficacy
was visualized with Ponceau S stain (Salinovich and Montelaro, 1986). For
immunodetection of the protein of interest, membranes were incubated with diluted
primary polyclonal antibodies overnight (4oC). After washing, blots were incubated
with peroxidase-conjugated (HRP) secondary antibodies and bands were revealed using
a specific chemiluminescence detection system (ECL from SantaCruz Biotechnology)
on autoradiography film (Kodak Biomax MR Film). Bands were semi-quantitatively
analyzed by densitometry on a transilluminator attached to a CCD camera (MCID) and
a Windows-based workstation. Values were expressed as protein levels detected and
normalized by total protein transferred on PVDF membrane. Details of primary and
secondary antibodies used during the experiments are reported in Chapter III and IV.

Chapter II
82
7. TOTAL RNA EXTRACTION AND RT-PCR
7.1. RNA extraction
Expression of mRNAs of interest was assessed by semi-quantitative RT-PCR of
extracted hearts from 15-20, 35-40 or 50-60 week old mice. Total RNA was purified
from heart tissue by strong denaturants and phenol/chloroform purification steps. The
first step involved homogenizing ventricular mouse tissue samples using a Polytron
Homogenizer (Kinematica AG) in a buffer containing 3 M guanidine thiocyanate, 0.7
M trisodium citrate and 10% lauryl sarcosyl. Total RNA was purified by sequential
addition and mixing of 3M sodium acetate, citrate-saturated phenol (pH 4.3) and
chloroform. Steps were repeated twice on supernatant collected after spinning (14,000
rpm). Total RNA was precipitated in isopropanol, washed in 80% ethanol, re-
suspended in sterile diethylpyrocarbonate (DEPC)-treated water and allowed to
dissolve overnight at 4°C. Samples were DNase I treated to remove DNA contaminants
and subsequently analyzed by spectrophotometry, where measurements of absorbance
(A260 and A280 nm) were recorded. From these measurements, concentration (A260 nm)
and quality (A260/A280) of each RNA sample was estimated. As a further check of RNA
quality, each RNA sample was electrophoresed (3-5 μg RNA) under denaturing
conditions (1% agar gel in tris acetate EDTA buffer (1xTAE)). Results were visualized
for integrity of 21S and 18S rRNA bands using a UV transilluminator and CCD camera
(MCID).
7.2. Optimization of RT-PCR conditions
Total RNA was reverse transcribed (RT) into cDNA and amplified in a duplex PCR
reaction using specifically designed primers. Co-amplification of the mouse GAPDH
was used as internal ratiometric control. Primers were designed using nucleotide
Chapter II
83
sequences for the genes of interest stored in the data bank of the National Center of
Bio-Informatics NCBI (http://www.ncbi.nlm.nih.gov/Tools/index.html). Primers were
designed using the on-line software Primer 3 (http://www-genome.wi.mit.edu/cgi-
bin/primer/primer3_www.cgi). Primer sequences successfully optimized were as
follows:
sodium/calcium exchanger (NCX1.1; product size: 528 bp)
5’-TTTGAGGACACCTGTGGAGTGC-3’ (forward)
5’-ATCATCGTCACG TTCCCCAGCG-3’ (reverse)
sodium/hydrogen exchanger (NHE-1; product size: 216 bp)
5’-GTACTTCCTGAAGATGTGGAGC-3’ (forward)
5’-ATGATGAACTGG TCCTTGGGGG-3’ (reverse)
ryanodine receptor (RyR2; product size: 635 bp)
5’-GAATCAGTGAGTTACTGGGCATGG-3’ (forward)
5’-CTGGTCTCTGAG TTCTCCAAAAGC-3’ (reverse)
angiotensinogen precursor (Agt; product size: 270 bp)
5’-TATCCACTGACCCAGTTCTTGC-3’ (forward)
5’-GAGAAGTTGTTC TGGGCGTCAC-3’ (reverse)
connexin 43 (Cx43; product size: 220)
5’-GTTCAAGTATGGGATTGAAGAACACGGCAA-3’ (forward)
5’-TGGTTTTCTCCGTGGGACGTGAGAGGAAGC-3’ (reverse)
GAPDH (product size: 308 bp)
5’-AAGCCCATCACCATCTTCCAGGAG-3’ (forward)
5’-AGCCCTTCCACA ATGCCAAAG-3’ (reverse)
All primers were designed to amplify mouse- and rat-specific cDNAs.
For each gene of interest, an optimization of PCR cycling conditions was performed
involving 1) the amplification of all loci individually (single locus PCR) and in
combination with the GAPDH (duplex PCR); 2) the determination of the right
proportion of primer concentration for the gene of interest and GAPDH (typical ranges
tested were 5:1, 1:1 and 1:5 of gene of interest vs. GAPDH primers); 3) the
determination of annealing time and temperature; and 4) the adjustment of the number
of PCR cycles for each primer separately, and in duplex with GAPDH (Henegariu et

Chapter II
84
al., 1997). The right PCR cycle number was determined by a semi-quantitative analysis
of the kinetics of the reaction efficiency, i.e. the amount of cDNA produced after an
established number of cycles, and the determination of the amplification phase
(Freeman et al., 1999) (Figure II-5). PCR products were run on 1% agar gel in tris
borate EDTA buffer (0.5xTBE buffer) supplemented with ethidium bromide. Bands
were visualized using a UV transilluminator and captured using a CCD camera
(MCID). Bands were semi-quantitatively analyzed by densitometry and values
expressed as mRNA expression of the gene of interest, normalized to the GAPDH
mRNA band density (Figure II-5).

Chapter II
85
8. cDNA MICROARRAY ASSAYS
8.1. Principles of DNA microarray analysis
DNA microarray analysis has emerged in the last 3-4 years as a flexible new method
for analyzing large numbers of nucleic acid fragments in parallel. The convergence of
ideas and principles utilized in the fields of hybridization methods, fluorescence
microscopy and diagnostic assays, together with advancement in bioinformatics and
miniaturization of technology have all contributed to the emergence of DNA
microarray and microchip technologies (see Introduction of Chapter V).
A variety of technical solutions that have been developed for performing microarray
analysis, but essentially all implementations involve miniaturized hybridization assays
for studying thousands of nucleic acid fragments simultaneously. All microarray
systems share the following key components: 1) the array, which contains immobilized
nucleic acid sequences, or ‘probes’ (as oligonucleotides or cDNAs) and 2) one or more
labeled samples or ‘targets’ (usually mRNA populations converted into cDNA), which
are hybridized with the microarray (Figure II-6).
8.2. RNA and cDNA preparation for hybridization
Total RNA was extracted from 60 week old mouse ventricles (left and right ventricles
including the septum) using the procedures detailed above (Chapter II, Section 7.1).
The CyScribe cDNA Post-Labelling Kit (Amersham Pharmacia) was utilized for the
preparation of Cy3- and Cy5-labelled cDNAs for microarray hybridization according to
the manufacturer’s recommended protocol. A total of 60 μg total RNA per dye labeling
reaction was used for each ‘sample versus sample’ comparison, giving a total of 120 μg

Chapter II
86
total RNA per array (2 labeling reactions per array) (Figure II-7). RNA was reverse
transcribed (RT) into cDNA using oligo(dT) to avoid transcription of non-messenger
RNA populations (i.e. ribosomal, transfer and small nuclear RNAs). During the RT
step, amino allyl-dUTPs (AA-dUTPs) were incorporated. After removal of RNA
template and purification of the amine-modified cDNA, chemical labeling with NHS-
ester derivative of CyDye was performed resulting in the generation of fluorescently
labeled cDNAs. Removal of any unincorporated CyDye molecules was necessary in
order to minimize the non-specific slide hybridization background signal and to
improve the sensitivity of detection of low abundance CyDye-labeled cDNA species.
8.3. Pre-hybridization and hybridization of cDNA microarray slides
Microarrays consist of a collection of single-stranded nucleic acid sequences
immobilized onto a solid support so that each unique sequence forms a probe, or ‘spot’.
A glass slide acts as the solid support onto which up to tens of thousands of spots can
be arrayed in a total area of a few square centimeters.
In the present study, microarray slides were produced at the Australian Genome
Research Facility in Melbourne (Australia) by robotic printing
(http://www.agrf.org.au/). PCR amplified cDNA clones were arrayed at high density
onto Corning CMT-GAPS aminosilane-coated glass slides. The specific clone set
printed onto the slides was the NIA 15K mouse embryonic clone set (National Institute
of Aging, NIH - USA- http://lgsun.grc.nia.nih.gov/cDNA/15k.html). Each PCR-
amplified cDNA clone represented a spot on the slide and 15,247 unique clones were
spotted in duplicate on each slide. For post-experimental normalization of data, each
microarray slide also possessed a subset of control spots including positive controls,
intensity controls, ‘housekeeping’ genes, blocking controls and negative controls.
Immediately prior to hybridization, cDNA microarray slides were incubated in pre-
hybridization buffer containing BSA-fraction V (Sigma), washed and dried for
hybridization. This process ‘blocked’ or inactivated the free amine groups present on

Chapter II
87
the glass slides, preventing possible non-specific binding of Cy3- and Cy5-labelled
cDNA to the glass slide.
For each slide, a hybridization mixture was prepared (volume 60 μl) containing 0.6
mg/ml poly-A (Amersham Pharmacia), 0.8 mg/ml Salmon Sperm DNA (Gibco BRL),
0.4 μg/μl mouse Cot1 DNA (Gibco BRL) and two purified Cy5- and Cy3-labeled
cDNA samples to be compared. A 60x25 mm lifter-slip (Grale Scientific) was placed
over the marked array region on the pre-hybridized microarray slide and then the entire
hybridization mixture was pipetted underneath the slip and allowed to move by
capillary action across the surface of the array. The slide was then placed horizontally
in hybridization chambers (Corning), sealed and placed at the bottom of a 42 oC water
bath where they incubated for 16-20 hours in the dark. During the hybridization step,
the labeled fragments in the target form duplexes with their immobilized
complementary probes. The number of duplexes formed reflects the relative number of
each specific fragment in the target, as long as the amount of immobilized probe is in
excess and not limiting the kinetics of hybridization (Figure II-8).
8.4. Slide washing and scanning
Following incubation, the array slides were removed from chambers, rinsed and spun
dry in a plate centrifuge. The microarray slides were placed in slide mailers and kept in
a dark, desiccated environment prior to scanning. Each slide was imaged by a GenePix
4000B (Axon Instrument) laser scanner which acquired two gray-scaled 16-bit single
image TIFF files corresponding to the Cy5 and Cy3 fluorescence emission channels
(argon laser operating at ~650 nm and ~550 nm excitation wavelengths respectively).
The gray-scaled images were ‘pseudo colored’ (red intensities for Cy5, green
intensities for Cy3) and merged to give one single picture for dual color (red/green)
differential microarray analysis. By measuring the different fluorescent signals
associated with each spot, the relative abundance of specific sequence in each of the
samples can be determined. When equal dual color signal was obtained from a spot, the
spot appeared yellow, suggesting equal cDNA abundance for that clone in the 2

Chapter II
88
samples. Shades and tonalities of red and green denoted differences in relative
abundance in favor of one or the other sample (Figure II-8).
8.5. Statistical normalization of cDNA microarray data and
clone ranking
Microarrays generate large quantities of data even from a single experiment. As a
typical experiment will involve the use of several analyzed samples on replicate arrays,
the use of computerized data processing and bioinformatics is necessary in order to
handle the amount of data generated and to gain maximum statistical and biological
information from the experiment. This can be achieved by specialized software and
statistical algorithms that extract primary data to remove the influence of experimental
variation and artifacts, and manipulate the data so that biologically meaningful
conclusion can be made (Quackenbush, 2001; Hoffmann et al., 2002; Zapala et al.,
2002).
In the present study, the microarray analysis software packages ‘Spot’ (CSIRO
Mathematical and Information Sciences, Australia) and ‘GenePix’ (Axon Instruments,
USA) were used to analyze the 16-bit TIFF files. Spot and GenePix extracted
foreground and background intensities for individual spots on a microarray image,
producing a matrix containing Cy5 (red) and Cy3 (green) intensities for each spot on
the microarray.
An M-value was calculated to quantify differential expression between two RNA
samples by representing a log ratio of the hybridization intensities for both Cy dyes:
M = log2 (R/G) = log2 R - log2 G

Chapter II
89
where R and G were the background-corrected red (Cy5) and green (Cy3) intensities
for each spot respectively. On this scale, M=0 represents equal expression, M=1 a two-
fold differential change (200%) between RNA samples, and M=2 represents a four-fold
change (400%), etc.
The log-intensity (A) of each spot was determined:
A= (log2 R + log2 G)/2 = 0.5 log2 (R*G)
as a measurement of overall brightness of the spot. An ‘MA-plot’, which provides a
scatter plot of the M-values against the A-values for an array, was used to represent the
data and to detect any non-linear relationship between log intensities due to artifacts
present on the array or dye-specific bias (generally, green-bias at low intensity and red-
bias at high intensity) (Dudoit and Fridlyand., 2002) (Figure II-9).
Following print-tip group loess (local weighted regression) normalization (Figure II-10)
and exclusion of spots presenting visual artifacts and negative values for R or G, the
results were transferred to a spreadsheet (Microsoft Excel) and matched to the Gene
Array List file (GAL file - supplied with the purchase of the microarray slide), which
assigned to each spot a clone name according to the geographical location of each spot
on the microarray slide (Smyth et al., 2003).
Clones were ranked in order of magnitude of differential expression (i.e. normalized M-
values), for positive and negative values.
To compare results obtained from different microarray replicates, clones were further
ranked following a critical-value for the ranking statistic above which any value was
considered to be significant or ‘true’. That is, clones were ranked according to their
variation in M value between experiments (replicates) using a parametric empirical

Chapter II
90
Bayes approach (Lönnstedt and Britton, 2004). The latter used a B-statistic to estimate
differential expression:
B = Me / √[(a + s2) / n]
where Me was the mean of the M-values for any particular clone across a series of
replicate arrays; s2 was the variance of the M-values across the replicates for the clone
in question; a was a constant estimated from the mean and standard deviation of s2; n
was the number of replicate arrays. Values of B-statistic greater that zero corresponded
to a greater than 50-50 chance that the M value found for the clone was truly
representing a pattern of differential expression. The higher the B value, the greater the
chance that the result is significant.
Candidate clones that generated a B-value greater than 0, in addition to a M value
greater that 1 (2-fold upregulation) or lower than -1 (2-fold downregulation), were
verified for their sequence at the NIA web site
(http://lgsun.grc.nia.nih.gov/cDNA/PublicSeqVerify.html) and a gene name (if any)
assigned according to the best match in sequence alignment
(http://lgsun.grc.nia.nih.gov/15k/).
8.6. Gene Ontology classification of selected transcript candidates
Candidates that presented significant patterns of differential expression (M>1 or M<-1
AND B>0) were clustered according to the Gene Ontology (GO) Consortium
classification groups (http://www.geneontology.org/index.shtml): The goal of the GO
Consortium is to produce a controlled vocabulary that can be applied to all organisms,
even as knowledge of gene and protein roles in cells is accumulating and changing. GO
provides three structured networks of defined terms (molecular function, biological
process and cellular component) to describe gene product attributes. Clustering was
performed according to these three networks using the web-based software GFINDer

Chapter II
91
(http://www.medinfopoli.polimi.it/GFINDer/). GFINDer organizes lists of 'candidate'
genes (e.g., up- and downregulated genes from a microarray experiment) for biological
interpretation in the context of the Gene Ontology, Pathways, Protein Domains,
Diseases and Chromosomes (Masseroli et al., 2004). Statistical analysis and
classification of candidate genes is explained on the GFINDer website (under ‘Tutorial
Section’) and in Masseroli et al. (2004).

Chapter II
92
9. STATISTICS
With the exception of microarray data, all results are expressed as mean ± SEM. One-
way analysis of variance (ANOVA) was performed to evaluate single factor differences
between two experimental groups (usually the animal age or the genotype). Multiple-
way ANOVA was used to evaluate age and genotype differences between
experimental groups and to assess interactions of a single dependent continuous
variable with multiple independent nominal variables (that is, interactions between age,
genotype, frequency, etc.). Significant differences were identified at p<0.05. Legends
of Figures and Tables reporting specific data and results state the type of statistical test
utilized and the degree of significance.

Chapter II
93
100μm100μm
White surfaceWhite surface + Black surface
White surfaceWhite surface + Black surfaceΣ(20)
20x LV20x RV
= %tsa for 1 ventricle%
A.
B.
C.
Figure II-1: Histological analysis of myocardial collagen density
Sections stained using a modified Van Gieson’s method were viewed at 10x magnification with a bright field light microscope (A.). Ten segments per section were selected (5 for the LV, 5 for the RV) and four sections analyzed. Color images were converted to gray scale (B.) and thresholded, to create a binary mask (C.) which was densitometrically analyzed (total white pixels over the total surface area). Collagen was ‘white’ delineated against the black background. A totality of 40 fields were analyzed per mouse heart (20 for LV and 20 for RV). The summation of the analysis of the 20 segments per ventricle and per heart corresponded to one single measurement (%tsa). Measurements were averaged per ventricle and for all animals in each group. LV= left ventricle; RV= right ventricle.

Chapter II
94
100μm
Number of white areasWhite surface + Black surface
Number of white areasWhite surface + Black surfaceΣ(20)
20x LV20x RV
= Nuclei/mm2 for 1 ventriclemm2
A.
B.
C.
D.
Figure II-2: Histological analysis of myocardial nuclei count
Transverse heart sections stained using Hematoxylin-Eosin method (A.) were viewed at 10x magnification with a bright field light microscope (B.). Ten segments per section were selected (5 for the LV, 5 for the RV) and four sections analyzed. Color images were converted to gray scale (C.) and thresholded, to create a binary mask (D.) which was densitometrically analyzed (total number of white particles with a surface area > 10 pixels, over the total surface area). Nuclei were ‘white’ delineated against the ‘black’ background. A total of 40 fields were analyzed per mouse heart (20 for LV and 20 for RV). The summation of the analysis of the 20 segments per ventricle and per heart corresponded to one single measurement (number of nuclei per mm2, for a total field of 6-8 mm2). Measurements were averaged per ventricle and for all animals in each group. LV= left ventricle; RV= right ventricle.

Chapter II
95
a.
b.c.
d.e.
f.
A.
B.
a.
b.c.
d.e.
f.
A.
B.
Figure II-3: Depiction of cardiac perfusion and myocyte isolation apparatus
A. Schematic diagram of the mouse cell isolation superfusion system: a. Pre-heated (36 oC) water bath where HEPES and collagenase solutions are maintained at warm temperatures; b. Thermostat allowing adjustment of temperatures and re-circulation of pre-heated water; c. A connector allows the ‘switching’ between HEPES and collagenase solutions at any time; d. Peristaltic pump allowing the perfusion of the heart at a constant flow (1.8 ml/min); e. The perfusion is kept at warm temperature and reaches the heart at 36 oC; f. A pre-heated water jacket keeps the cannulated heart in a warm environment during the collagenase digestion phase. B. Details of a cannulated mouse heart (yellow arrow), mounted on perfusion apparatus.
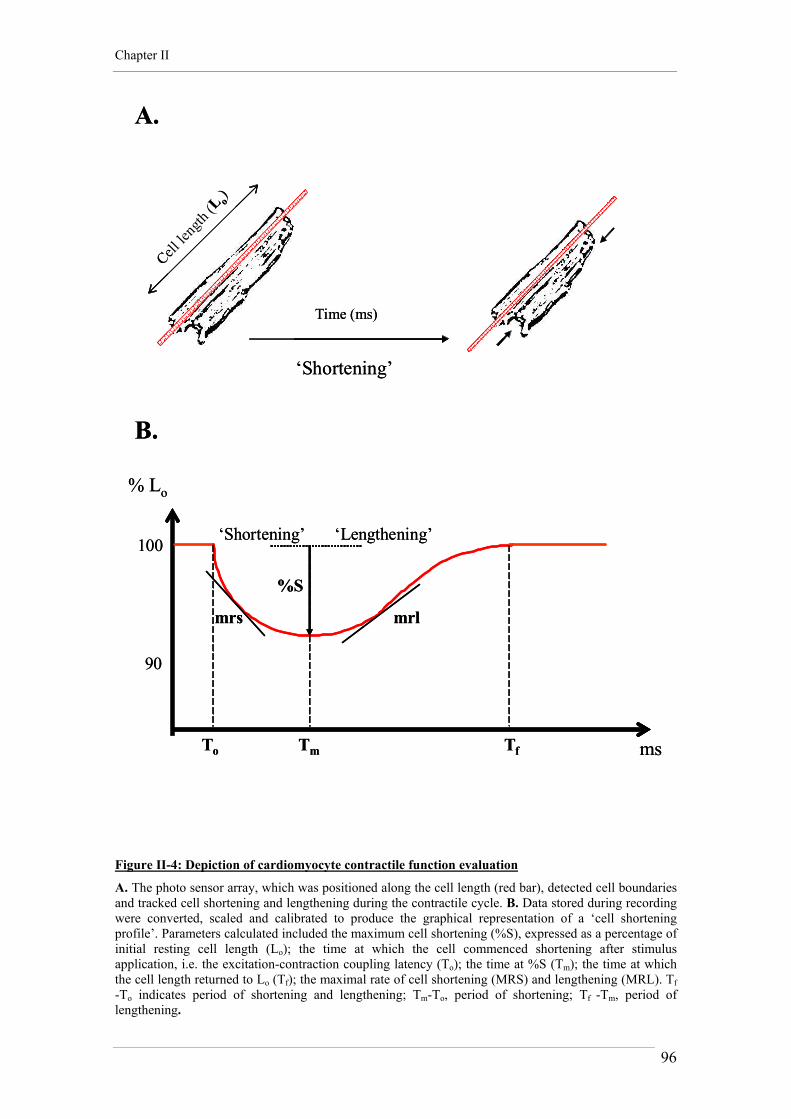
Chapter II
96
‘Shortening’
Time (ms)
A.
100
90
B.
To Tm Tf
mrlmrs
ms
% Lo
%S
Cell le
ngth
(L o)
‘Shortening’ ‘Lengthening’
‘Shortening’
Time (ms)
A.
100
90
B.
To Tm Tf
mrlmrs
ms
% Lo
%S
Cell le
ngth
(L o)
‘Shortening’ ‘Lengthening’
Figure II-4: Depiction of cardiomyocyte contractile function evaluation
A. The photo sensor array, which was positioned along the cell length (red bar), detected cell boundaries and tracked cell shortening and lengthening during the contractile cycle. B. Data stored during recording were converted, scaled and calibrated to produce the graphical representation of a ‘cell shortening profile’. Parameters calculated included the maximum cell shortening (%S), expressed as a percentage of initial resting cell length (Lo); the time at which the cell commenced shortening after stimulus application, i.e. the excitation-contraction coupling latency (To); the time at %S (Tm); the time at which the cell length returned to Lo (Tf); the maximal rate of cell shortening (MRS) and lengthening (MRL). Tf -To indicates period of shortening and lengthening; Tm-To, period of shortening; Tf -Tm, period of lengthening.

Chapter II
97
0
200
400
600
800
15 18 21 24 27 30 33 36 39 42 45
AognGAPDH
GAPDH
NCX1.1
(Mean pixel intensity x pixel number) – (Mean pixel intensity x pixel number)
(Mean pixel intensity x pixel number) – (Mean pixel intensity x pixel number)
Background
B.
A.
Amplification phase
No cycles
Expr
essi
on le
vels
(arb
. uni
ts)
ROI
NCX1.1GAPDH
Figure II-5: Illustration of RT-PCR amplification and gel analysis
A. Gel bands were densitometrically analyzed using the ‘Histogram’ Function of Photoshop (7.0). Product yield for the gene of interest was determined in arbitrary units by subtracting the background light signal from the band light signal. The light signal was the product of the mean pixel intensity and pixel number in the region of interest (ROI). The product yield for the gene of interest (here, the angiotensinogen gene Aogn) was normalized for GAPDH by computing the ratio of the values determined for each of the two bands of the duplex PCR.; B. Successful application of semi-quantitative PCR methodology to amplification of genes of interest required optimization of temperatures, magnesium concentrations, primer concentrations and number of amplification cycles. Optimal PCR cycle number was determined by a semi-quantitative analysis of the kinetic of the reaction efficiency, i.e. the amount of cDNA produced after an established number of cycles, and the determination of the exponential amplification phase (Freeman et al., 1999). In the example, after the determination of the appropriate ratio of primer concentration for the two genes in the PCR reaction (here, NCX1.1:GAPDH= 5:1), the two genes were amplified at different number of cycles, each point corresponding to the average of five reaction tubes. For this particular gene, a number of 28 cycles was finally chosen for the experiments. All points of the graphic were obtained during one single PCR experiment and for one single RNA pool made of three different mouse hearts.

Chapter II
98
Target
Probe
Hybrid.
Glass slide
Target
Probe
Hybrid.
Glass slide
Figure II-6: Illustration of microarray ‘target’ and ‘probe’ species
In the literature, there currently exist at least two nomenclature systems for referring to hybridization partners. Both use common terms ‘probes’ and ‘targets’. With symmetry akin to the hybridization reaction itself, each system mirrors the other. The strategy of the ‘standard’ microarray parallels that of a reverse dot-blot, in which the probe is immobilized on membrane. For this reason the tethered nucleic acid is described here as ‘probe’, and the free nucleic acid as ‘target’.

Chapter II
99
Total RNA Samples A (60μg) and B (60μg) (2 tubes) = 1 array
1. Annealing using oligo(dT)2. Elongation (and incorporation of AA-dUTP)3. Degradation of RNA template (alcaline treatment)
Amine-modified cDNAs A and B (2 tubes)
1. Purification2. Clean-up3. Concentration (Microcon 30)
Purified Amine-modified cDNAs A and B (2 tubes)
Over-night coupling with CyDye and Hydroxylamine step
Cy5-labelled cDNA A and Cy3-labelled cDNA B (2 tubes)
1. Purification2. Clean-up (of free unincorporated Cy5 and Cy3)3. Concentration (Microcon 30)
Purified Cy5- and Cy3-labelled cDNAs A + B (in 1 tube)
1. Washing and drying of microarray slides2. Laser scanning and first data analysis
Day 2
Day 3
RNA extraction from heart tissue Samples
Quantification (μg/μl)
Quality check RNA gel electrophoresis
OD measurement (260/280 nm)
Day 1
Over-night hybridization with BSA pre-treated microarray slide
Statistical normalization of cDNA microarray data
‘Hunting’ for differential gene expression patterns
Figure II-7: Summarized microarray hybridization protocol
Schematic diagram representing the time-line of a microarray experiment. Usually, experimental procedures were run in 3 days, while statistical normalization and ‘candidate gene hunting’ generally took several weeks to be performed.

Chapter II
100
A. B.
C.
D.
A. B.
C.
D.
Figure II-8: Microarray hybridization and visualization depiction
A. Schematic illustrating an AGRF cDNA microarray sector made of 26x26 spots (338 clones printed in duplicate). Tonalities of green (B.) or red (C.) denoted differences in relative abundance in favor of the ‘green-colored’ or the ‘red-colored’ cDNA sample, respectively. A yellow color signal (D.) was obtained from a spot where cDNA abundance for that clone was the same in the 2 samples.

Chapter II
101
Figure II-9: Depiction of a MA plot after normalization
Colored spots indicate various positive and negative controls printed on the slides. For each array a ‘Microarray Sample Pool’ (MSP) is generated and the concentration adjusted to 500 ng/μl. This is used as a positive control and also to mark the top left and the top right of each pin group. A series of standard dilutions of the MSP are used for intensity-dependent normalizations. Other controls consist of ‘housekeeping genes’, ‘blocking controls’ (polyA, Cot1 and Salmon Sperm DNA), ‘negative controls’ (yeast genes; to assess true background) and spikes controls (to evaluate dose-dependent labeling efficacy). Details about control spots used by the AGRF are reported at the web site http://www.agrf.org.au/mic_controls.html. The example presented here does not correspond to a microarray slide used during the experiments. The example illustrates where control spots and subset of genes are supposed to line up according to their expected intensity or M-value (red arrows) and where they finally are after being used to normalize the microarray experiment.

Chapter II
102
A
B
Figure II-10: Side-by-side box plots of the M-values from a microarray experiment
Loess (local weighted regression) normalization was performed according to print-tip groups, which corresponded to 48 sectors of 26x26 spots on the AGRF microarray slides (here only 32 sectors are illustrated). Box plots can be useful for comparing M-values between various groups. They display graphically the so-called 5-number summary of a set of numbers, the three quartiles and the maximum and the minimum. The central box of the plot extends from the first to the third quartile and therefore encompasses the middle 50% the data. Each box plot represents a sector on the slide. A. The graphical illustration after normalization. B. The same graphical illustration before normalization. In this case, the mean intensity was normalized from a red-green bias due to differences between the labeling efficiencies and scanning properties of the Cy3 and Cy5 dyes. The lower red intensity shifted the M-values to negative values.

CHAPTER III
Diverse evolving cardiac and cardiomyocyte
phenotypes in Ang II-induced and insulin resistant
cardiac hypertrophy

Chapter III
104
1. INTRODUCTION
1.1. Cardiac adaptation in response to environmental changes
Cardiac remodeling can be defined as a physiologic and/or a pathologic response where
the heart dynamically changes in size, shape and function in response to a variety of
extra-cardiac and intra-cardiac stimuli (described in Chapter I). It is currently a matter
of debate whether remodeling in response to pathologic signaling is detrimental from
the outset or, whether it may be initially beneficial and leads to cardiac failure only
when prolonged or exacerbated. Notwithstanding, the degree of remodeling is
determined by various structural and genetic factors, including:
1. Collagen concentration or collagen isoform expression.
2. The balance between cell growth/proliferation and cell death, which would alter
the proportion of myocyte to non-myocyte cell types in the myocardium.
3. Differential gene expression of proteins involved in cell communication, cell
activation and metabolism.
1.2. In vivo models of Ang II-induced cardiac remodeling
1.2.1. Cardiac remodeling regression by Ang II suppression
As reviewed in Chapter I, the hypertrophic and pro-fibrotic actions of Ang II
significantly influence the degree of response of the myocardium in the remodeling
process. However, there are still open questions concerning the intrinsic capacity of
Ang II to produce cardiomyocyte growth and fibrosis. Ang II codependence on
additional stimuli such as mechanical stretch or the presence of other co- factors (e.g.

Chapter III
105
endothelin-1 or TGF-β) in growth induction has been indicated in vitro and in vivo (Ito
et al., 1994; Arai et al., 1995; Campbell and Katwa, 1997; Dostal, 2000; Wenzel et al.,
2001). Animal models of left ventricular cardiac hypertrophy including the SHR, the
TGR (mRen2)27, and isoproterenol-infused or aortic banded rats, respond to blockade
of the RAS with reduction in left ventricular weight and decreased myocardial fibrosis
(Brilla et al., 1991; Pahor et al., 1991; Nagano et al., 1992; Bohm et al., 1996).
However, the majority of the beneficial effects observed on the myocardium were also
confounded by systemic reduction of plasma Ang II levels and decrease of pressure
load. Whether intra-cardiac elevation of Ang II per se (in the absence of other
coincident stimuli) is sufficient to induce myocardial growth has been identified as a
research question of considerable interest.
1.2.2. Overexpressing or knocking out the intra-cardiac RAS
Genetically engineered mice carrying cardiac-specific gain- or loss-of function
transgenic complements of components of the RAS offer a unique opportunity to
address the question of whether Ang II-specific signaling is sufficient to induce
cardiomyocyte hypertrophy and myocardial remodeling or whether stretch stimulus and
complimentary growth factors are also necessary. Different transgenic and knock-out
mouse models have been created by incorporating or deleting angiotensin or
angiotensin receptor genes in the myocardium.
1.2.3. Overexpressing the AT receptors
To elucidate whether Ang II can activate a growth response in cardiomyocytes in vivo,
Hein et al., (1997) overexpressed the AT1a receptor in a cardiomyocyte-specific
manner, under the control of the αMHC promoter. The offspring displayed a massive
atrial enlargement due to myocyte proliferation, and died within the first weeks after
birth, possibly related to bradycardia and heart block. Cardiomyocyte hyperplasia in
AT1a-overexpressing mice suggests that Ang II-mediated activation of AT1a receptors is
sufficient to induce a growth response associated with altered electrical conduction.
Interestingly, Hoffmann et al. (2001) developed a transgenic rat overexpressing the

Chapter III
106
human AT1 receptor under the αMHC promoter in the myocardium. Transgenic rats
exhibited normal cardiac growth and heart function under basal conditions, but a
pronounced cardiac hypertrophy associated with enhanced contractile response was
observed after Ang II-dependent pressure- and volume-overload. Paradis et al. (2000)
overexpressed the human AT1 receptor in transgenic mice under the control of the
αMHC. These mice were normotensive but exhibited significant cardiac hypertrophy
and fibrosis, associated with expression of ANP. Human AT1-overexpressing mice died
prematurely (after ~3 months) of heart failure. This finding partially contrasted with the
findings of Hein et al. (1997), who observed early postnatal mortality and hyperplasia
in myocyte overexpressing the murine AT1a receptor. It is important to note that
whereas the mice used by Paradis et al. (2000) had only one renin gene, the animals
used by Hein et al. (1997) were outbred from a Swiss strain, and carried two renin
genes. Because mice with two renin genes have enhanced systemic and intra-cardiac
RAS activity (Tronik et al., 1987; Clark, 1997; Mazzolai et al., 1998), the more severe
phenotype observed by Hein et al. (1997) may reflect Ang II hyperstimulation of the
already increased cardiac AT1 receptor levels. Overexpression of AT1 receptors in
mouse cardiomyocytes shows that increased receptor number is sufficient to induce and
maintain cardiac and cardiomyocyte hypertrophy, independently of changes in
hemodynamic load. Strain and species differences in the systemic expression of renin
and Agt levels, as observed in rats and in two renin gene mice, could enhance or
suppress the Ang II-dependent remodeling processes on the heart, suggesting that Ang
II production levels are also important in the degree of cardiac and cardiomyocyte
remodeling.
In a different murine model, Masaki et al. (1998) overexpressed the AT2 receptor under
the cardiac-specific αMHC promoter. These mice survived to adulthood and showed no
obvious developmental or morphological changes of the myocardium. AT2 transgenic
mice showed in vivo and ex vivo decreased sensitivity to the pressor effects of Ang II.
The authors suggested that this effect was caused by an Ang II- and AT2-mediated,
catecholamine-independent, negative chronotropic effect. Interestingly, AT1 receptor-
dependent activation of the MAPK pathways was blunted in AT2 transgenic mice,
suggesting that AT2 receptors can oppose AT1-mediated trophic responses in
cardiomyocytes in vivo. In subsequent studies, Sugino et al. (2001) showed that

Chapter III
107
cardiac-specific overexpression of AT2 receptors in vivo is not associated with
enhanced apoptosis after 28 days of Ang II infusion. Kurisu et al. (2003) demonstrated
that AT2 receptor overexpression in vivo does not lead to any suppression effect on
cardiomyocyte hypertrophy in response to Ang II-mediated pressure overload, but
attenuates myocardial perivascular fibrosis by a kinin/NO-dependent mechanism.
These data would suggest that a shift in the AT1/AT2 expression ratio by AT2
overexpression can influence perivascular collagen production and deposition in the
heart, but has limited effects on stretch-mediated cardiac remodeling.
1.2.4. Knocking out the AT receptors
Several groups have generated mice with a targeted disruption of the AT1a or AT2
receptor genes. Although gene knock-out was not induced in a cardiac-specific manner,
these mice provide some information about the functional importance of AT receptor
sub-types in the development of cardiac remodeling in the in vivo context. AT1a
receptor deficiency induced systemic hypotension but did not produce overt signs of
cardiac and cardiomyocyte hypertrophy (Sugaya et al., 1995). This indicates that AT1-
mediated signaling is necessary for the regulation of resting blood pressure in mice.
Harada et al (1998a, 1998b) demonstrated that infusion of sub-pressor doses of Ang II
induced hypertrophy and fetal gene expression in wild-type but not in AT1a knock-out
hearts, suggesting that the AT1a receptor subtype is necessary in the promotion of
cardiac hypertrophy by exogenous Ang II. In contrast, acute pressure-overload induced
by transverse aortic banding induced, in wild-type and AT1a knock-out hearts, produced
similar activation of fetal genes and MAPK kinases, in association with marked cardiac
hypertrophy, fibrosis, SERCA2 downregulation and systolic dysfunction. These data
suggest that acute hypertrophy in response to pressure overload can occur in the heart
independently of AT1a signaling pathways. Thus it could be proposed that other Ang II-
and AT1-independent mechanisms of pressure overload-induced cardiac hypertrophy
coexist in the myocardium. More recently, Harada et al. (1999) demonstrated in the
same knock-out mice that the AT1a receptor subtype plays a pivotal role in the
progression of LV remodeling after myocardial infarction. Although the response of
wild-type and knock-out mice at 1 week after infarction was comparable (with
development of LV dilatation, LV dysfunction and cardiac fibrosis in the non-infarcted

Chapter III
108
area), the survival rate and the degree of remodeling was lower in AT1a knock-out mice
than wild-type 4 weeks after infarction. These results suggest that Ang II activation of
AT1a signaling plays a negative role in the progressive development of heart failure
following infarction. Finally, Oliverio et al. (1998) generated mice lacking both the
AT1a and AT1b receptor subtypes. AT1b-deficient mice did not present any specifically
abnormal phenotype. However, mice lacking both AT1a and AT1b subtypes presented
hypotension and virtually no systemic pressor response to infusions of Ang II, thus
complementing the study from Harada et al. (1998a, 1998b). This suggests that the
AT1a, but not the AT1b receptor subtype is necessary in the promotion of cardiac
hypertrophy and vascular pressor response by exogenous Ang II.
Ichiki et al. (1995) demonstrated that AT2 receptor inactivation increased blood
pressure and enhanced sensitivity to the pressor action of Ang II, thus proposing that
AT2 receptors mediate a depressor effect and antagonize the AT1-mediated pressor
action of Ang II. Interestingly, AT2 knock-out mice show subtle behavioral
disturbances, including an impaired drinking response to water deprivation. Li et al.
(2003) showed that intracerebroventricular injection of Ang II in AT2 knock out mice
increased systolic blood pressure more markedly than in wild-type littermates,
indicating that AT2 receptors play an important role in the central regulation of
systemic blood pressure. Water intake following intracerebroventricular injection was
partly inhibited in AT2 (and AT1a) knock out mice, suggesting that both receptor
subtypes act synergistically in the regulation of water intake induced by Ang II. In
more recent work, Brede et al. (2003) demonstrated in another AT2 knock out mouse
strain that Ang II failed to induce the expression of the anti-hypertrophic endothelial
nitric oxide synthase (eNOS) in cardiomyocytes after myocardial cryoinjury,
suggesting that eNOS is expressed in cardiomyocytes via an AT2-dependent
mechanism that ultimately confers an anti-hypertrophic effect. Finally, Gross et al.
(2004) showed in the same AT2 knock out mouse strain that treatment with N-nitro-L-
arginine methyl ester (L-NAME) induced an exacerbated hypertensive phenotype,
associated with enhanced cardiac hypertrophy, fibrosis, and greater expression of
natriuretic peptides (BNP). The end-diastolic pressure-volume relationship, indicative
of LV contractility was also decreased in their AT2 knock-out mice. These data indicate
that the AT2 receptor offers a protective effect in the development of L-NAME induced
cardiac hypertrophy.
Chapter III
109
The consensus conclusion which may be drawn considering all these studies is that
cardiomyocyte AT2 receptors do not cause hypertrophy and do not independently
induce apoptosis. There is evidence however that AT2 receptors expressed by cardiac
myocytes or fibroblasts or even other cell types may be essential for hypertrophy
induction via AT1 receptor subtype.
1.2.5. Knocking out the angiotensinogen gene
Tanimoko et al. (1994) generated angiotensinogen-deficient mice which lacked Agt in
the liver and kidney, resulting in complete suppression of plasma Ang I and Ang II. As
seen with the deletion of the AT1a receptor subtype, these mice exhibited a hypotensive
phenotype, suggesting that both Ang II and AT1a levels are important modulators of the
vascular (and central) blood pressure homeostasis. In addition, Agt knock-out mice
showed defects in the development of the kidneys as well as hyperplasia of vascular
smooth muscle cells associated with altered renin sequestration from the circulation
(Nagata et al., 1996). Sumida et al. (1998) demonstrated that Agt deficient mice
exhibited an ~100% increase in the density of AT1 receptors in the heart which was not
associated with AT2 receptor expression changes. However, no cardiac or
cardiomyocyte remodeling was demonstrated in these mice. Interestingly, Kang et al.
(2002) generated a new mouse model by breeding Agt deficient mice with hypertensive
transgenic animals expressing the rat Agt gene specifically in brain and liver. Crossbred
animals lacked detectable expression of Agt in the heart and in kidneys. Brain and liver
overexpression of Agt in these crossbred animals overcame the hypotension shown in
Agt knock-out mice and even caused hypertension similar in magnitude to the Agt
overexpressing mice. As a consequence of the lack of Agt in the heart, crossbred mice
presented with less marked pressure overload-induced cardiac hypertrophy and less
pronounced perivascular and interstitial fibrosis. These experiments showed that local
Agt synthesis, independently of pressure load or circulating Ang II levels, is important
in the development of cardiac remodeling.

Chapter III
110
1.2.6. Overexpressing Ang II fusion protein directly in the heart
Van Kats et al. (2001) described various transgenic mouse lines in which
overexpression of variable levels of an Ang II-producing fusion protein was associated
with two forms of cardiac remodeling. When the fusion protein was sequestered into
the cardiac tissue, the mouse was normotensive and exhibited increased fibrosis but not
hypertrophy. When the fusion protein levels were high enough to spill into the systemic
circulation, hypertension developed inducing pressure overload cardiac hypertrophy.
Thus, the issue of whether or not Ang II alone can induce cardiac hypertrophy
independently of hemodynamic changes remained unresolved.
1.2.7. Overexpressing the angiotensinogen gene in the heart
The final genetic approach which has involved manipulation of the cardiac RAS is the
angiotensinogen (Agt)-overexpression mouse model. As this model has been employed
in the studies presented in this and subsequent Chapters, a more detailed description of
the model generation is provided here.
In order to selectively increase the production of Agt in the heart, a transgene
composed of the cardiac-specific promoter of the αMHC gene coupled to a rat Agt
cDNA was microinjected in fertilized eggs from mice, carrying either a two renin or a
one renin genotype (Tronik et al., 1987; Clark, 1997). Two transgenic lines were
obtained: the first line, the TG153/1R, carried a low copy number of the transgene
under one renin gene background. This line was normotensive and the onset of
hypertrophy was delayed (not evident until the age of 20 weeks). The second line, the
TG101/2R, carried a high number of copies of the Agt transgene and was generated in
a two renin gene strain. This second line developed hypertension and cardiac
hypertrophy, which was already significant at the age of 8-9 weeks. The main
difference between the two transgenic lines was that plasma renin activity was elevated
in TG101/2R, but not in TG153/1R mice. This was attributed to combined effects of
increased plasma renin and circulatory spillover of cardiac Agt in TG101/2R. In the

Chapter III
111
TG153/1R the normal feedback mechanism was apparently able to control renin
secretion from the kidneys.
In order to determine if hypertension was due to the high number of Agt genes or to the
two-renin gene background, the TG101/2R line was backcrossed with 1 renin gene
C57BL6 mice. At the F2 generation, heterozygote mice carrying a high number of the
transgene but only one renin gene were obtained. This line, called TG1306/1R was
normotensive, but exhibited a cardiac hypertrophy which was detectable from at least
the age of 8-9 weeks. Heterozygote TG1306/1R breeders were subsequently mated
with normal C57BL6 females to generate litters comprising of half heterozygote
transgenic and half wild-type progeny (designated TG and WT respectively in this
Thesis).
In the TG1306/1R (TG), at approximately 15 weeks, the cardiac mass increase was
estimated at 15-20% compared to littermate WT, and the development of hypertrophy
could be completely suppressed by in vivo AT1 blocker (losartan) treatment. The
cardiac levels of Ang II at 8 and 12 weeks were increased twofold in TG when
compared to WT. Interestingly, the normotensive state in this model is associated with
suppression of systemic renin secretion and circulation, thus suggesting that a negative
feedback associated with increased cardiac levels of Ang II ensures normal blood
pressure (Mazzolai et al., 1998; Mazzolai et al., 2000). These data show that the
hypertrophy developed in the TG (i.e. the TG1306/1R) is not a compensatory response
to pressure load, providing strong evidence for a role of Ang II on cardiac growth,
independent of its hemodynamic effects. The TG1306/1R mouse line offers the
opportunity to study and characterize the Ang II-induced primary hypertrophic
phenotype in the absence of hypertension (Mazzolai et al., 1998).
As published by Mazzolai et al. (1998) and Clement et al. (2001) re-expression of fetal
genes such as alpha-skeletal smooth muscle actin and ANP is evident in this transgenic
model, indicating that elevated Ang II levels are associated with a modified gene
expression profile. Moreover, blockade of the AT1 receptor induced regression of
cardiac hypertrophy, confirming that the remodeling is mediated by an AT1-receptor-
mediated signaling pathway (Mazzolai et al., 2000). Finally, Pellieux et al. (2000)
showed that in the TG mice, the cardiotrophic action of Ang II is mediated by the

Chapter III
112
interaction of Ang II with the AT1 receptor and subsequent activation of the p38
MAPK pathway.
1.3. Transgenic and knock out models for the GLUT4
1.3.1. Overexpressing or knocking out the GLUT4
GLUT4, the insulin-responsive glucose transporter, plays an important role in
postprandial glucose disposal. Altered GLUT4 activity is considered to be one of the
factors responsible for decreased glucose uptake in muscles and adipose tissue in
obesity and diabetes, where cellular insulin-resistance is present. Transgenic mice
overexpressing the human GLUT4 protein in cardiac muscle have been created (Belke
et al, 2001). As has been observed with other transgenic mice overexpressing human
GLUT4 in muscles and other insulin-sensitive tissues, these animals showed enhanced
basal and insulin-stimulated glucose disposal (Belke et al., 2001). Interestingly, a
maneuver to increase GLUT4 protein levels in diabetic C57BL/KsJ-Db/Db mice by
crossing them with a global tissue GLUT4 transgenic alleviated insulin resistance. A
similar cross, but in this instance with the cardiac-specific GLUT4 transgenic, led to
restoration of normal cardiac function ex vivo (Belke et al., 2000). To assess the role of
GLUT4 expression on whole-body glucose homeostasis and the development of type 2
diabetes, knock-out mouse models have been created by globally or selectively
disrupting the murine GLUT4 gene in all tissues (homozygote GLUT4-null) (Katz et
al., 1995), in skeletal muscles (Muscle-G4KO) (Zisman et al., 2000), in heart (G4H-/-)
(Abel et al., 1999) and in adipocytes (Adipose-G4KO) (Abel et al., 2001).
Stenbit et al. (2000) could not detect any significant difference in basal glucose uptake
in homozygote GLUT4-null mice. Signs of hyperglycemia were evident only after
insulin stimulation. Also, marked cardiac hypertrophy and increased fibrosis, without
hypertension, was demonstrated in homozygote GLUT4-null mice. Interestingly,
Stenbit et al. (1997) reported a different phenotype in heterozygote GLUT4-null mice

Chapter III
113
carrying 50% more GLUT4 levels than the homozygote: these mice suffered from
marked hyperglycemia and hypertension (Stenbit et al., 1997). Cardiac-specific
deletion of the GLUT4 in GH-/- mice also induced cardiac hypertrophy, although the
degree of remodeling was moderate and no signs of fibrosis, nor changes in blood
pressure were observed (Abel et al., 1999). Furthermore, Abel et al. (1999) observed no
changes in basal cardiac function in isolated hearts from G4H-/- mice. Interestingly,
however, ischemic conditions and catecholamine stimulation revealed diastolic
dysfunction in these mice, suggesting that additive factors such as hypoxia or systemic
changes in neuro-hormonal activation, in addition to lower GLUT4 content are
necessary to develop overt mechanical dysfunction in GLUT4-deficient hearts. Muscle-
and adipose-specific deletion of the GLUT4 did not cause any sign of cardiac
hypertrophy, although a detailed investigation of the cardiac structure and function in
these mice was not carried out.
The complex and nuanced systemic effects of the various GLUT4 gene knock-in and
knock-out in mice described above have been previously reviewed by Katz et al.
(1996), Charron et al. (1999) and more recently by Abel (2004). These reviews
extensively compare the different mouse models reported in the literature and
demonstrate that the facilitative glucose transporter GLUT4 is a primary effector
molecule for insulin-mediated glucose disposal in skeletal muscles and adipose tissue.
Indeed, the studies reported in these reviews demonstrate the important role played by
the GLUT4 transporter in the development of systemic insulin-resistance and type 2
diabetes, but fail to provide a link between glucose transporter expression and the
development of cardiac hypertrophy as it is observed in diabetic cardiomyopathy.
1.3.2. The GLUT4-KO mouse model
A more recently developed genetic model of insulin resistance is a mouse in which the
Cre-Lox system was employed to modulate GLUT4 expression in most insulin-
sensitive tissues (i.e. the GLUT4-KO mouse model). As this is the model utilized in the
study of insulin resistance-induced cardiomyopathy in this Thesis, a detailed
description of the model generation is provided below.

Chapter III
114
Kaczmarczyk et al. (2003) designed a Cre/Lox construct to selectively disrupt the
murine GLUT4 gene in tissue expressing skeletal α-actin (ie. predominantly skeletal
muscle) to induce insulin resistance. A vector was designed so that after homologous
recombination and gene replacement, the prokaryotic enzyme Cre-recombinase would
remove a 5 kb region between the two LoxP sites, which spanned exons 7 to 11 of the
GLUT4 gene together with the PGK/neoR selection cassette. F1 (C57BL6 x CBA)
mice were created to express a specific transgene containing the human muscle-specific
skeletal α-actin gene promoter (Muscat and Kedes, 1987) in association with the Cre-
recombinase (Cre+/- mice). According to wild-type developmental expression of actin
isoforms, the α-skeletal actin promoter directed transgene expression in the muscles
prenatally (cardiac muscle) and postnatally (mainly in skeletal muscles), (Brennan and
Hardeman, 1993; Miniou et al., 1999; Suurmeijer et al., 2003). Kaczmarczyk (2003)
reported strong expression of the Cre-recombinase in skeletal muscles of newborn
Cre+/- mice, with some expression in the cardiac tissue, and none in adipose tissue, liver
and kidney. Heterozygote Cre+/- mice were then mated with homozygote mice carrying
the LoxP-PGK/neoR construct (GLUT4-Lox+/+) to produce double heterozygote
GLUT4-Lox+/-Cre+/- mice. These animals were mated with GLUT4-Lox+/+ mice to
produce Lox+/+Cre+/- ‘knock-out’ mice (termed ‘Lox-Lox-Cre’ mice, LLC) and their
genetic controls GLUT4-Lox+/+Cre-/- (or ‘Lox-Lox’ mice, LL). The early genetic
background of LL and LLC mice (constituting the GLUT4-KO line) was estimated
56.25% C57BL6, 37.5% 129Sv and 6.25% CBA at the time of the experiments.
Expression studies to assess the outcome of the genetic manipulations show that control
LL mice exhibit a downregulation of GLUT4 expression in cardiac and skeletal
muscles and also in white and brown adipose tissues to levels 15–30% of wild-type
C57BL6 control mice (see Section 3.2.4 and Kaczmarczyk et al., 2003). As was
subsequently observed in other knock-out mouse models, it was concluded that the
PGK/neoR selection cassette was interfering with the normal expression of the GLUT4
gene in LL and LLC (Nagy, 2000; She et al., 2000), thus creating a Cre-independent
GLUT4 ‘knock-down’ effect in both LL and LLC mice.

Chapter III
115
Fasting glucose is not elevated, but insulin levels are double in both LL and LLC mice
when compared to C57BL6, indicating insulin resistance but not hyperglycemia in the
unstimulated state in both mice (Kaczmarczyk et al., 2003). Plasma glucose levels are
higher in the LL and LLC mice compared with C57BL6 (i.e. WT equivalent) during a
hyperinsulinemic clamp, suggesting postprandial hyperglycemia. Although the basal
rate of glucose uptake and metabolic clearance rate of glucose are not different in the
three groups of mice, in the insulin-stimulated state metabolic clearance rate is lower in
LL and LLC, indicating a defect in insulin-mediated glucose uptake in both LL and
LLC mice. Surprisingly, in both skeletal muscles and adipose tissue the levels of
GLUT4 protein downregulation are similar in LL and LLC mice, suggesting that the
expression of the Cre-recombinase in LLC mice does not reduce further the levels of
GLUT4 protein in these tissues. Although systemic metabolic abnormalities are
equivalent in LL and LLC mice, the latter present a dramatic cardiac hypertrophy,
associated with a ~99% suppression of GLUT4 levels, apparently driven by the
expression of the Cre-recombinase in this tissue. It is important to note that both LL
and LLC mice are normotensive, confirming that cardiac hypertrophy in these mice is
not related to pressure overload. When compared to C57BL6, insulin-stimulated
glucose uptake is normal in LL hearts, but is markedly reduced in LLC hearts. This
suggests that there is a threshold level of GLUT4 below which insulin-stimulated
glucose uptake is impaired.
It is not clear why the LLC mice do not exhibit full GLUT4 deletion in skeletal muscle
as is evident in the heart and as was anticipated initially. It is known that when a
transgene is passed through the female germ line, it is completely silenced in some
offspring while in others expression is reduced (Kearns et al., 2000). This phenomenon
is caused by DNA methylation. Following maternal inheritance, epigenetic
modification of the transgene locus can be cumulative over successive generations
resulting in an irreversible methylation after three consecutive germline passages in
some strains (mainly Balb/c, C57BL6 and CBA) (Allen et al., 1990). Furthermore,
cellular mosaicism due to variable gene expression and partial penetrance have been
observed in lacZ transgene expression in preimplantation stage mouse embryos
(Kothary et al., 1992; Guy et al., 1997; Lau et al., 1999) where the extent of variation in
expression was influenced by the genetic background of the oocyte. Balb/c, C57BL6

Chapter III
116
and F1 (from C57BL6 x CBA) genetic backgrounds gave none or very little lacZ
activity. DNA methylation, transgene silencing and/or different degrees of transgene
penetrance, as well as differential developmental time of α-skeletal actin promoter
activation in skeletal muscles and the myocardium, could account for the GLUT4
variability observed in LLC mice.
Compared to the other GLUT4 knockout mouse models discussed above, the model
presented here (the GLUT4-KO) shows similarities with homozygote GLUT4-null
(Katz et al., 1995). Indeed, no difference in basal glucose uptake in homozygote
GLUT4-null mice could be detected (Stenbit et al., 2000). Signs of hyperglycemia were
evident only after insulin stimulation. Also, marked cardiac hypertrophy and increased
fibrosis, without hypertension, was demonstrated in homozygote GLUT4-null mice.
The present GLUT4-KO model however presents some additional interesting and
specific traits. For instance, previous data comparing LL and LLC littermates shows
that the development of the cardiac hypertrophic phenotype in GLUT4-KO is
independent of systemic disturbances such as insulin resistance and postprandial
hyperglycemia (Kaczmarczyk et al., 2003). This is in agreement with other data
reporting that diabetic cardiomyopathy is not directly attributable to the development of
systemic microvascular disease, hypertension or systemic metabolic shift (Zarich and
Nesto, 1989; Galderisi et al., 1991; Shehadeh and Regan, 1995). Thus the GLUT4-KO
mouse model is of particular value in the investigation of the development of insulin
resistant cardiomyopathy specifically due to impaired glucose uptake in the heart.
Diabetic cardiac abnormalities are reported to occur as early as the glucose intolerance
phase - that is hyperglycemia and hyperinsulinemia that follow insulin resistance
(Celentano et al., 1995).

Chapter III
117
1.4. In summary
Transgenic and knock out models are proven tools which have been of considerable
value in the investigation of cardiac and cardiomyocyte remodeling associated with the
activation of the intra-cardiac RAS or with the disruption of the glucose metabolism.
These animals offer the unique opportunity to study the functional impact of chronic
Ang II signaling and altered glucose homeostasis in hearts of normotensive models in
vivo, where trophic effects can be evaluated in the absence of confounding loading
effects. A detailed study of structural and functional alterations associated with insulin
resistance or Ang II overproduction on the intact heart and on the cardiomyocyte has
not been previously undertaken. In particular, a morphological, physiological and
molecular characterization of TG1306/1R and GLUT4-KO mice can address
fundamental questions relating to the role of the intra-cardiac RAS and insulin
resistance in initiating cardiac remodeling processes. The extent to which these
genetically defined states exhibit common phenotypic elements is of particular interest.
1.5. Aims
The present study was designed to comparatively evaluate the effects of experimentally
induced chronic in vivo cardiac exposure to elevated Ang II levels and to impaired
GLUT4-mediated glucose uptake on cardiac and cardiomyocyte structure and
morphology. Specifically using the TG1306/1R and GLUT4-KO mice, the
experimental aims were:
1. To characterize structural remodeling of the two major components of the heart
- the cellular fraction and the extracellular matrix - and to evaluate the
progression of this remodeling with ageing.

Chapter III
118
2. To assess the levels of expression of selected genes of interest involved in the
trophic and structural cardiac remodeling of these two genetic models, namely
the angiotensinogen gene (Agt), the gap junction connexin 43 (Cx43) and the
insulin-stimulated glucose transporter GLUT4.
The goal of this study was to clarify whether cardiac and cardiomyocyte remodeling
induced by chronic Ang II overproduction or impaired GLUT4-dependent glucose
transport in vivo could have a primary and long-term impact on myocyte and
myocardial morphology, independently of hemodynamic changes. It was hypothesized
that tissue and myocyte hypertrophy would be evident in both mouse models and it
would be associated at least with differential expression of the Agt in the TG1306/1R
mouse and differential GLUT4 expression in the GLUT4-KO mouse.

Chapter III
119
2. METHODS
2.1. Whole heart histology and morphometry
2.1.1. Procedures
Immediately post-excision, the degree of cardiac hypertrophy was established by
measuring the ratio between the blotted wet heart weight and the body weight (mg/g),
i.e. the cardiac weight index (CWI). Excised hearts were fixed in 10% buffered
formalin, dehydrated and embedded in paraffin blocks as described in Chapter II,
Section 3.1. Macroscopic evaluation of cardiac structure and microscopic estimations
of collagen content (% total surface area covered by collagen fibres, %tsa) and number
of nuclei (total number per mm2) were performed by densitometric analysis as
described in Chapter II, Section 3.2.
2.1.2. Experimental groups
To investigate the age-dependent progressive effects of remodeling on cardiac
morphology, hearts of 15-20 and 35-40 week old male transgenic and knock-out mice
were studied and compared with hearts of age-matched littermate control mice. Eight
experimental groups were defined according to animal age and genotype (in Tables III-
1 and III-2 the number of animals utilized for each experimental procedure is
represented in parentheses):
1. 15-20 week TG: hearts of 15-20 week male transgenic TG1306/1R mice.
2. 15-20 week WT: hearts of 15-20 week male wild-type littermates from
heterozygote breeding of TG1306/1R with C57BL6 mice.
3. 35-40 week TG: hearts 35-40 week male transgenic TG1306/1R mice.

Chapter III
120
4. 35-40 week WT: hearts of 35-40 week male wild-type littermates from
heterozygote breeding of TG1306/1R with C57BL6 mice.
5. 15-20 week LLC: hearts of 15-20 week male knockout Lox+/+ Cre +/- mice.
6. 15-20 week LL: hearts of 15-20 week male control Lox+/+ Cre -/- littermates
from heterozygote breeding of LL and LLC mice.
7. 35-40 week LLC: hearts of 35-40 week male knockout Lox+/+ Cre +/- mice.
8. 35-40 week LL: hearts of 35-40 week male control Lox+/+ Cre -/- littermates
from heterozygote breeding of LL and LLC mice.
2.2. Longevity data and homozygote TG1306/1R mice
As mentioned in Chapter II, longevity data were also collected for an additional group
of TG (n= 13) and WT (n= 12) mice over a period of 94 weeks. In addition, to study
possible cardiac remodeling caused by variable cardiac Ang II production levels, the
creation of a small colony of homozygous TG1306/1R mice harboring double the
transgene complement was also attempted. Colony mortality data were not available for
the LL and LLC. These animals were housed in a facility not accessible to the
candidate. Anecdotal reports are strongly suggestive of premature mortality in the LLC
mice when compared to LL littermates.
2.3. RNA and protein extraction and quantification
2.3.1. RNA extraction, RT-PCR and Western blotting
Total RNA was extracted from mouse hearts and expression of angiotensinogen (Agt)
and connexin 43 (Cx43) mRNAs were assessed by semi-quantitative RT-PCR on 15-20
and 35-40 week old ventricles using the procedures detailed in Chapter II, Section 7.
The procedures for protein extraction and Western blotting were also described in
Chapter II, Section 6. For immunodetection of the glucose transporter GLUT4,

Chapter III
121
membranes were incubated with diluted rabbit anti-mouse GLUT4 polyclonal
antibodies overnight (4oC). The antibodies were kindly provided by the laboratory of
Dr. Joseph Proietto, The Royal Melbourne Hospital. After washing, blots were
incubated with peroxidase-conjugated secondary anti-rabbit IgG antibodies at room
temperature (Santa Cruz Biotechnology). In order to investigate possible correlations
between the heart weight and the expression levels of GLUT4 in the heart, the blotted
wet heart weight and the body weight were also recorded and CWI determine prior to
any RNA or protein extraction procedures.
2.3.2. Experimental groups
To investigate the gene and protein expression described above, hearts of 15-20 and 35-
40 week old male transgenic and knock-out mice were studied and compared with age-
matched control littermates.
Eight experimental groups were defined according to animal age and genotype as
previously defined. For all groups ventricular tissues were harvested for mRNA and/or
protein extraction as indicated.
1. 15-20 week TG: n=10 hearts for mRNA extraction and n=15 hearts for protein
extraction.
2. 15-20 week WT: n=13 hearts for mRNA extraction and n=10 hearts for protein
extraction.
3. 35-40 week TG: n=10 hearts for mRNA extraction.
4. 35-40 week WT: n=10 hearts for mRNA extraction.
5. 15-20 week LLC: n=10 hearts for mRNA extraction and n=18 hearts for
protein extraction.
6. 15-20 week LL: n=10 hearts for mRNA extraction and n=18 hearts for protein
extraction.
7. 35-40 week LLC: n=10 hearts for mRNA extraction.
8. 35-40 week LL: n=10 hearts for mRNA extraction.

Chapter III
122
2.4. Statistical considerations and presentation of the results
For the estimation of collagen content and the number of nuclei per mm2, the mean
values were determined according to the procedure illustrated (Figures II-1 and II-2)
and discussed in Chapter II, Section 3.2. For each experimental group, the ‘n’ values
reported here reflect the total number of hearts analyzed per experimental group.
Results are expressed as mean ± SEM. One-way ANOVA was performed to evaluate
differences between two experimental groups with respect genotype or age. A 2-way
ANOVA approach was used to statistically evaluate possible interactions between
genotype and age. Significant differences were identified at p<0.05. Legends of Figures
and Tables reporting specific results state the type of statistical test utilized and the
level of significance.

Chapter III
123
3. RESULTS
3.1. Cardiac and cardiomyocyte remodeling in TG1306/1R mice
3.1.1. Survival and the hypertrophic phenotype in TG mice
Compared with WT littermate controls, TG mice exhibited a significant increase in
mortality (Figure III-1, Panel A) over the 94 week longitudinal study (WT 83%
survival vs. TG 46% survival). Post mortem analysis showed that premature mortality
in the TG group was predominantly associated with occurrence of a dilated cardiac
phenotype, whereas the survivor TG mice exhibited a concentric hypertrophic
phenotype (Figure III-1, Panels B).
To further explore how remodeling severity and lethality were associated with variable
cardiac Ang II production levels, a small number of homozygous TG1306/1R mice
harboring double the transgene complement was generated. These mice exhibited a
dilated cardiomyopathy and died prematurely after 7-10 days (Figure III-2, Panel A).
Cardiac remodeling in homozygotes involved dramatic dilation of the right ventricle as
well as tissue and cardiomyocyte disarray (Figure III-2, Panel A and B).
3.1.2. Myocardial and chamber remodeling in TG hearts
To further evaluate the effects of Ang II on cardiac structure prior to the overt
appearance of the dilated phenotype, the cardiac morphology of 15-20 and 35-40 week
TG mice and age-matched WT littermates was investigated (Table III-1). In these TG
mice a concentric growth pattern was consistently observed, with significant increase in
left ventricular (LV) wall thickness at both ages in the absence of significant chamber
dilation. Some chamber dilation was observed in some 35-40 TG hearts, but the mean

Chapter III
124
values were not significantly different from WT. Thus the dilated phenotype observed
in about half the aged TG mice involved in the survival study appears to represent a
transition process which occurs later in life, in association with increased mortality.
In both WT and TG groups, ageing was associated with increased heart weight and LV
chamber luminal area, but no alteration in myocardial wall thickness was observed
between 15-20 and 35-40 week animals. This suggests that structural remodeling after
the age of 15-20 weeks mainly involved chamber morphology rather than myocardial
thickening.
3.1.3. Cardiomyocyte hypertrophy but not fibrosis in TG hearts
Densitometric analysis of stained histological sections showed that, despite a
significant increase in cardiac mass at both ages, there was no evidence of an increase
in interstitial fibrosis in TG hearts when compared to age-matched WT, nor in
association with ageing (Table III-1). The number of cell nuclei per mm2 was also
consistently preserved between the 4 groups. A regional difference in collagen
expression and nuclei count was observed between the LV and the right ventricle (RV)
in both WT and TG hearts. There was a ~300% increase in collagen-staining content in
the RV independent of genotype or age influence. This was associated with an increase
in the number of nuclei per mm2 observed in the RV, suggestive of an increased
number of non-myocyte/fibroblast cell types linked with increased collagen production
in the RV when compared to the LV.
Therefore, the increased cardiac mass in TG hearts appears to result primarily from
cardiomyocyte hypertrophy rather than collagen deposition. Indeed, the dimensions of
adult LV cardiomyocytes were found to be greater in TG hearts. Mean cell length was
significantly increased in the cardiomyocyte population of TG mice at both ages. In the
older TG myocytes the length change was associated with a significant increase in cell
width (Table III-1).

Chapter III
125
3.1.4. Differential gene expression in TG hearts
As cardiac and cardiomyocyte remodeling in the TG is attributed to cardiac-specific
overexpression of Agt, the mRNA levels for this gene were investigated in the hearts of
15-20 and 35-40 week old TG and WT mice. Since connexins allow electrical and
metabolic coupling between cardiomyocytes, properties that are important for
coordinated action of the heart as well as tissue homeostasis, the mRNA levels of the
connexin Cx43 was also investigated in the same hearts. mRNA analysis showed a
~10-fold upregulation of the Agt gene in the hearts of 15-20 week old TG when
compared to age-matched WT (Figure III-3, Panel A). Ageing had relatively no
influence on the Agt gene expression in TG hearts, but significantly increased the
levels of Agt mRNA in the hearts of WT mice. Cardiac and cardiomyocyte remodeling
due to Agt overexpression was associated with a 2-fold downregulation of the Cx43
mRNA levels in 15-20 week old TG hearts. Ageing also caused a general
downregulation of the expression of the Cx43. This effect was most pronounced in WT
hearts (Figure III-3, Panel B).
3.1.5. Decreased GLUT4 protein content in TG hearts
Since previous studies from GLUT4- deficient mice (including the LLC and LL) have
shown that cardiac structural and functional integrity is dependent on cell glucose
metabolism (Kaczmarczyk et al., 2003), the expression of GLUT4 was investigated in
the hearts of 15-20 week TG and WT mice. Cardiac and cardiomyocyte remodeling in
TG hearts is associated with approximately a 25% decrease in levels of GLUT4 protein
(Figure III-4, Panel A). Interestingly, in both WT and TG hearts, a negative relationship
between CWI and the level of GLUT4 was observed (i.e. the higher the CWI, the lower
the intra-cardiac concentration of GLUT4, per μl of total protein extracted) (Figure III-
4, Panel B and C). The slope of this negative relationship was accentuated in the TG
group suggesting that higher degrees of cardiac hypertrophy (CWI) induced by Ang II
overproduction results in larger decline of GLUT4 levels in the heart. This is evidence

Chapter III
126
for an indirect effect of Ang II in the regulation of GLUT4 expression levels in the
heart.
3.2. Cardiac and cardiomyocyte remodeling in GLUT4-KO mice
3.2.1. Myocardial and chamber remodeling in GLUT4-KO
hearts
Cardiac morphology was investigated in 15-20 and 30-40 week old LLC and littermate
LL hearts to evaluate the effects of a direct suppression of GLUT4 expression (Table
III-2). In the LLC a concentric growth pattern was observed at 15-20 weeks, with
significant increase in LV wall thickness, in the absence of significant chamber dilation
(Figure III-5). However, chamber dilation was observed in 35-40 week LLC hearts
when compared to age-matched LL hearts. Thus, the dilated phenotype observed in 35-
40 week LLC mice appears to represent a transition process which occurs after 15-20
weeks of age and it is preceded by concentric growth.
Ageing was associated with an increase in LV chamber luminal area, but not
myocardial wall thickening, suggesting that myocardial hypertrophy and LV wall
thickening preceded chamber dilation in this mouse model. This effect was observed in
both LL and LLC groups. Although a full longitudinal study was not carried out,
compared with LL littermate controls, LLC mice have been reported to exhibit an
apparent increase in mortality at younger age and under anesthesia (Dr. Kaczmarczyk
S, personal communication).
3.2.2. Cardiomyocyte hypertrophy and fibrosis in LLC hearts
Densitometric analysis of histological sections showed that cardiac hypertrophy in LLC
hearts was associated with a ~6-fold increase in interstitial fibrosis in the LV and a ~2-
fold increase in the RV (Table III-2). The number of cell nuclei per mm2 in the LV of

Chapter III
127
LLC hearts was positively correlated with the degree of myocardial collagen content
(Figure III-6), suggesting that an increase in collagen production could be associated
with increased number of non-myocyte/fibroblast cells in LLC hearts. A regional
difference in collagen expression and nuclei count was observed between the LV and
the right ventricle (RV) in LL hearts. Figure III-7 shows that two types of fibrosis were
present in LLC hearts: interstitial fibrosis (Panel B) and focal/reparative fibrosis (Panel
C); 6 of the 15 LLC hearts studied exhibited various degrees of focal/reparative fibrosis
on the LV and RV wall, suggesting that infarctive scars can develop and possibly
influence the rate of survival in this mouse model.
The increased cardiac mass in LLC hearts appears to result from both cardiomyocyte
hypertrophy and collagen deposition. Indeed, the dimensions of LV cardiomyocytes
were found to be greater in LLC hearts compared to those of LL hearts. Mean cell
length and width were significantly increased in the cardiomyocyte population of LLC
mice at both ages. There were no age-dependent modifications of cardiomyocyte
dimensions in LL and LLC myocytes (Table III-2).
3.2.3. Differential gene expression in hearts from LLC mice
To assess whether the intra-cardiac RAS was activated in LLC and LL hearts, the Agt
mRNA levels were investigated in 15-20 and 35-40 week old LLC and LL mice
(Figure III-8). As measured in TG and WT mice, the levels of Cx43 mRNA were
evaluated to determine whether the fibrotic remodeling in this mouse strain was
associated with altered cell-to-cell uncoupling. The results show a ~2-fold upregulation
of the Agt mRNA in the hearts of LLC when compared to age-matched LL. Ageing
caused a significant increase in the levels of Agt mRNA in the hearts of LLC and LL
mice. Cardiac and cardiomyocyte remodeling in the LLC mice was associated with a 2-
fold downregulation of the Cx43 mRNA levels in 15-20 week old LLC hearts. Ageing
was linked with a downregulation of the expression of the Cx43 in LL hearts.

Chapter III
128
3.2.4. Decreased GLUT4 protein content in LL and LLC hearts
To establish the extent to which Cre expression could be correlated with reduced levels
of the GLUT4 transporter in association with cardiac hypertrophy, protein expression
levels were investigated in the hearts of 15-20 week LLC and LL mice. Cardiac and
cardiomyocyte remodeling in LLC hearts was associated with a ~99% deletion of the
GLUT4 protein levels in the heart (Figure III-9, Panel A).
Interestingly, the proportional decline of the GLUT4 protein levels with the increase in
CWI detected in WT and TG mice (see Section 3.1.5), was not observed in LLC and
LL hearts (Figure III-9, Panel B and C). This could suggest strain differences.
Alternatively, it would confirm the hypothesis of a direct interference of the PGK-neoR
cassette in the normal modulation of the GLUT4 in LL hearts, with an additional effect
of Cre expression in the LLC mice. Indeed, when compared to 15-20 week WT
(C57BL6), an ~85% reduction in GLUT4 levels was observed in the hearts of age-
matched LL mice. This was associated with a modest but significant ~15% increase in
CWI in LL when compared with WT (C57BL6) (p<0.05, 1-way ANOVA) (Figure III-
10, Panel A). In the LLC mice, the dramatic hypertrophy (approximately 80-90%
increase in CWI when compared to WT (C57BL6) was associated with a loss of ~99%
of GLUT4 protein levels.
To explore the relationship between GLUT4 protein levels and CWI, paired data were
analyzed. The plot of cardiac GLUT4 levels and CWI in WT (C57BL6), LL and LLC
mice showed that there was a threshold effect in this relationship. Suppression of
GLUT4 protein levels in the heart to below ~5% of WT (C57BL6) levels was linked to
the fibrotic hypertrophic phenotype. There was no overlap between the WT (C57BL6),
LL and LLC distributions of these two variables, as shown in Figure III-10, Panel B.

Chapter III
129
4. DISCUSSION
4.1. Cardiac and cardiomyocyte remodeling in TG1306/1R mice
4.1.1. Concentric hypertrophy and ventricular dilation
in TG mice
The present study demonstrates that chronic overexpression of cardiac Agt is sufficient
to induce the development of two contrasting hypertrophic phenotypes in aged TG
mice. Those TG animals which died during the 94 week observation period exhibited a
dilated hypertrophic phenotype, whilst their longer-surviving TG littermates were
characterized by a concentric hypertrophy (Figure III-1). These findings indicate that
the concentric hypertrophic state is associated with a degree of functional compensation
and survival, and that the dilated phenotype is linked with increased mortality. These
results also suggest that functional decompensation precedes overt myocardial dilation
and supports the hypothesis that both concentric and dilated hypertrophy share some
common cellular pathways of development (Sussman et al., 2000).
The observations of homozygous TG mice suggest that an increased expression of the
transgene, and therefore of Ang II production, exacerbates the severity of the cardiac
phenotype observed (Figure III-2). This is consistent with preliminary findings that Agt
mRNA levels in the hearts of homozygote mice are doubled when compared with
heterozygotes (Dr. Cefai D, unpublished real-time PCR data). It could be proposed that
type and severity of myocardial remodeling are time- and Ang II dose-dependent.

Chapter III
130
4.1.2. Cardiac and cardiomyocyte remodeling but not
fibrosis in TG
This study extends previous observations that chronic overexpression of cardiac Ang II
in TG mice is sufficient to induce blood pressure-independent cardiac hypertrophy
without signs of fibrosis (Clement et al., 2001). Although qualitative changes in
collagen content can not be excluded, the detailed morphological analysis suggests that
cardiac remodeling results almost entirely from cardiomyocyte hypertrophy rather than
from ECM deposition (Table III-1). As previously observed by Caspari et al. (1977)
and Medugorac (1980), collagen concentrations in the LV free wall were substantially
lower than in the RV wall, but no age- or genotype-specific differences were detected.
These findings in the TG contrast with previous studies indicating Ang II involvement
in fibroblast proliferation and collagen production (Brilla et al., 1995; Bouzegrhane and
Thibault, 2002) and provide unambiguous evidence that elevated intracardiac Ang II
levels alone do not necessarily promote fibrosis.
An apparently contradictory finding is observed in a normotensive transgenic mouse
model in which overexpression of an Ang II-producing fusion protein was associated
with increased fibrosis but not hypertrophy (van Kats et al., 2001). These seemingly
different responses to cardiac Ang II overproduction may reflect a difference in the
origin of the Ang II (in the TG1306/1R insertion of the substrate peptide gene rather
than a protein fusion product) or trait differences between mouse strains (one renin
gene C57BL6 vs. two renin genes FVB/N mice). Lack of hypertension and stretch
stimulus on the myocardium, more rapid ECM protein turnover (Senzaki et al., 1998;
Coker et al., 2001), or absence of secondary stimuli (e.g. TNF-α, EGF and TGF-β1)
activating the non-myocyte cell population (Peng et al., 2002; Hao et al., 2004;
Stawowy et al., 2004), could account for the absence of a fibrotic phenotype in the TG
hearts. Interestingly, Min et al. (2004) have recently reported that AT1 receptor
stimulation in skin fibroblasts can increase collagen production. This is in part due to
the inhibition of collagen degradation via the increase of a tissue inhibitor of
metalloproteinase (TIMP)-1 expression. In the same study the stimulation of the AT2

Chapter III
131
receptor was found to exert the opposite effect, in part by the activation of Src
homology 2-containing protein-tyrosine phosphatase (SHP)-1. From these observations
the hypothesis arises that differential regulation of AT1 and AT2 receptor levels in
myocardial fibroblasts could result in collagen production or collagen degradation.
Most interesting is the apparent similarity between the cardiac phenotype described
here and that observed in transgenic mice overexpressing the Gαq protein specifically in
the heart. The Gαq overexpressing mice are characterized by cardiac decompensation in
the absence of cardiac fibrosis and pressure overload (D’Angelo et al., 1997; Sakata et
al., 1998). Given that signaling pathways mediated by AT1 receptors in myocytes are
known to be linked to the Gαq class of G proteins (Wettschureck et al., 2001), it is
tempting to speculate that cardiac remodeling in the TG1306/1R model is caused by
specific activation of cardiomyocyte AT1 Gαq-coupled receptors. Previous studies on
TG1306/1R mice already demonstrated that the trophic actions of Ang II on the heart
are mediated by AT1 receptors (Mazzolai et al., 1998; Mazzolai et al., 2000). This
hypothesis, where fibroblast participation in the hypertrophic response is not
obligatory, requires further investigation.
4.1.3. Differential gene expression profiles in TG hearts
The present study provides evidence of high levels of Agt mRNA produced in the
hearts of TG mice (Figure III-3). This is consistent with the expected transgenic
overexpression of the rat Agt gene in these hearts. From these data it can be
extrapolated that there is at least 10-fold higher Agt production in the hearts of
transgenic animals when compared to WT.
Interestingly, there is an age-dependent increase in Agt mRNA production in the hearts
of WT mice. This provides evidence that ageing is associated with enhanced
overexpression of the intra-cardiac RAS. This increased production of Agt in the WT
hearts is associated with an age-dependent decrease in connexin Cx43 expression.
Gradual increases in cardiac Ang II levels have been reported experimentally and
clinically during the development of chronic heart failure (Wollert and Drexler, 1999;

Chapter III
132
Serneri et al., 2001). In addition, numerous experimental and clinical studies have
demonstrated reduced Cx43 expression and impaired intercellular communication with
increased arrhythmogenic activity in the development of heart failure (Peters, 1997;
Itoh et al., 2002; Kitamura et al., 2002; Kostin et al., 2004; Poelzing and Rosenbaum,
2004). The present work suggests that age-dependent accumulation of Ang II in the
heart could lead to molecular changes promoting structural remodeling and
abnormalities in cardiomyocyte coupling, ultimately leading to abnormal cell-to-cell
communication, metabolism and E-C coupling. This age-dependent functional
deterioration is accelerated in the TG mice due to the early activation of the intra-
cardiac RAS.
The finding in the TG that intra-cardiac Ang II-overproduction leads to a decrease in
Cx43 expression contrasts with previous studies indicating Ang II involvement in
overexpression and activation of the gap junction Cx43. It is generally reported that
compensatory growth after Ang II injection or infusion is associated with increased
connexin levels, increased number of gap junctions and enhanced intercellular coupling
in neonatal cardiomyocyte cultures (Dodge et al., 1998; Shyu et al., 2001; Dhein et al.,
2002; Polontchouk et al., 2002). However, the cardiac hypertrophic response to a
chronic stimulus is a dynamic continuum in which early shifts in gene expression
initiate adaptive structural and functional changes that ultimately lead to increasing
maladaptive responses and further evolving shifts in gene expression. It is likely that
Cx43 expression is elevated after an acute hypertrophic stimulus but is suppressed in
the chronic situation. Furthermore, Ang II stimulation of adult cardiomyocytes isolated
from cardiomyopathic hamsters was associated with decreased gap junctional
conductivity and cell-to-cell uncoupling. The response was suppressed by Losartan and
Enalapril (De Mello, 1996). The mechanisms leading to connexin downregulation in
chronic heart remodeling are poorly understood, but there is evidence that signaling is
mediated by JNK and possibly involves the homeodomain transcription factor Nkx2.5
(Petrich et al., 2002; Kasahara et al., 2003). Interestingly, Itoh et al. (2002) reported
that depressed mRNA expression levels for Cx43 in volume overload-induced heart
failure in rabbits were partially restored after treatment with an AT1 blocker (CV-
11974). This suggests that volume overload may downregulate Cx43 expression
through an AT1-dependent signaling pathway.

Chapter III
133
4.1.4. Decreased GLUT4 protein levels in hearts of TG mice
The present study demonstrates that cardiac and cardiomyocyte remodeling in TG
hearts is associated with a ~25% decrease in cardiac GLUT4 protein levels (Figure III-
4, Panel A). Interestingly, in both WT and TG hearts, a negative relationship between
CWI and the level of cardiac GLUT4 is also observed (Figure III-4, Panel B and C).
This suggests that accentuated hypertrophy (CWI) results in more marked decline of
GLUT4 levels in the heart. Although the data from homozygote TG would suggest so,
it is not possible to determine from the present study whether higher CWI is associated
with higher levels of cardiac Agt mRNA expression and therefore Ang II production
(because the hearts used for detection of Agt and GLUT4 expression levels were
derived from different animals). Further experiments are required to establish such a
direct association. If confirmed, it would directly link the severity of cardiac
remodeling and the expression levels of GLUT4 to the degree of activation of the intra-
cardiac RAS. Such a finding would suggest that Ang II, via modulation of GLUT4
expression is involved in the development of insulin resistance in the heart.
4.2. Cardiac and cardiomyocyte remodeling in LLC mice
4.2.1. Cardiomyocyte hypertrophy and fibrotic remodeling
in LLC
Myocardial fibrosis and myocyte hypertrophy are the most frequently proposed
mechanisms to explain cardiac changes observed in diabetic and pre-diabetic
cardiomyopathies. Clinical and experimental studies have shown that diabetes is
associated with an increase in collagen formation in the myocardium (Shimizu et al.,
1993; Mizushige et al., 2000), as well as altered expression of contractile proteins and
mechanical dysfunction (see Chapter IV). The insulin-resistant LLC mice present
interstitial and focal/reparative fibrosis (Figure III-7), associated with cardiomyocyte

Chapter III
134
hypertrophy (Table III-2). Fibrosis would contribute to increased myocardial stiffness
and electrical heterogeneity, thus increasing susceptibility of the heart to
arrhythmogenic activity. Electrical heterogeneity and cell-to-cell discontinuity could be
exacerbated by Cx43-mediated gap junctional impairment, as shown in LLC and
senescent LL hearts (Figure III-8). The origins of fibrosis in diabetic cardiomyopathy
are probably multifactorial. A favored hypothesis is that collagen accumulation in the
diabetic myocardium is due to impaired collagen degradation resulting from
glycosylation of the lysine residues on collagen (Avendano et al., 1999; Candido et al.,
2003; Liu et al., 2003). Glycosylation processes could also involve the apoptotic signal
p53, leading to cardiac Ang II production and Ang II-dependent myocyte cell death and
reparative scar/fibrosis (Fiordaliso et al., 2001), as observed in LLC hearts. This
hypothesis is supported by the present findings where LLC hearts overexpress Agt
mRNA and exhibit reparative fibrotic scars (Figure III-7).
Hyperglycemia also results in the production of ROS and oxidative stress that could
contribute to differential gene expression of molecules involved in p53-mediated cell
death signaling (Cai et al., 2002). Ang II-mediated pro-fibrotic and pro-infarctive
effects could also be exacerbated by impaired responsiveness to insulin and insulin-like
growth factor (IGF)-I stimulation. Indeed, both p53- and Ang II-mediated apoptosis are
normally reduced by IGF-I (Jost-Vu et al., 1992; Leri et al., 2000). IGF-I is decreased
in diabetes, and exogenous IGF-I treatment has been shown to ameliorate contractile
disturbances in diabetic animals (Kajstura et al., 2001). The effects of Ang II on ECM
remodeling may also be promoted by activation of fibroblasts releasing endothelin-1
and TGF-β1 (Lee et al., 1995). Ang II-dependent release of endothelin-1 could promote
mast cells infiltration and degranulation, leading to the release of pro-inflammatory and
pro-fibrotic cytokines and chymases within the myocardium and the myocardial
vasculature (Gilber et al., 2000; Gordon, 2000; Murray et al., 2004; Skrabal et al.,
2004). Such molecular and morphological remodeling processes could be prominent in
the age-dependent LV dilatation observed in the LLC hearts. Degranulation of mast
cells, activation of fibroblasts, qualitative changes in collagen isoforms and MMP
activity could lead to disorganization of the established fibrillar network, and cause
myocyte slippage. Finally, the present study shows a positive correlation between the
collagen content in the LV myocardium of LLC mice and the number of nuclei counted

Chapter III
135
per mm2 in the same tissue (Figure III-6). This result suggests that collagen production
and deposition in LLC hearts is associated with increased number of cells per mm2 of
tissue, possibly caused by proliferation of non-myocyte cell types.
4.2.2. Decreased cell-to-cell connectivity in LLC hearts
As reviewed in Chapter I, hyperglycemia and insulin resistance appear to be important
etiologic factors in the development of cardiovascular complications in diabetic
patients. In particular, degraded gap junctional intercellular communication plays an
important role in cardiovascular tissue homeostasis of diabetic patients and
experimental models. Impaired ventricular conduction in diabetic patients and in
streptozotocin (STZ)-injected rats is associated with enhanced cardiac arrhythmic risk,
which may depend on connexin downregulation and impaired cell-to-cell
communication (Robillon et al., 1999; Inoguchi et al., 2001; Eloff et al., 2003). For
instance, downregulation of gap junction Cx43 expression by high extracellular glucose
concentrations has been demonstrated in cultured aortic smooth muscle cells (Kuroki et
al., 1998), rat microvascular endothelial cells (Sato et al., 2002) and bovine retinal
endothelial cells (Fernandes et al., 2004). Diabetic cardiomyopathy in streptozotocin-
injected rats was shown to be associated with a decrease in Cx43 expression
(Okruhlicova et al., 2002). As reviewed by Fernandez-Real and Ricart (2003), insulin
resistance and atherosclerosis share similar pathophysiological mechanisms, mainly
due to the actions of TGF-β and proinflammatory cytokines, such as TNF-α, IL-6 or
leptin. Dysregulation of the inflammatory axis predicts the development of insulin
resistance and type 2 diabetes in patients. Interestingly, hypoxia, ROS, TGF-β1 and
various cytokines have been shown to mediate downregulation of intercellular
communication in vitro between confluent fibroblast, endothelial cells or epithelial
tumor cells and in vivo in the myocardium (Hu and Cotgreave, 1997; van Rijen et al.,
1998; Nishida et al., 2000; Janczewski et al., 2004). This suggests that the same pro-
fibrotic mechanisms that are activated in diabetic cardiomyopathy could also lead to
cell-to-cell uncoupling and promote conduction defects in the diabetic heart.

Chapter III
136
4.2.3. Decreased GLUT4 protein levels in hearts of LLC and LL
mice
The study of GLUT4 protein expression in LL and LLC mouse hearts suggests that in
active cardiac muscle, there is a threshold below which GLUT4 deficiency impairs
insulin-stimulated glucose uptake (Figure III-10). Indeed, Kaczmarczyk et al. (2003)
reported that insulin-stimulated cardiac glucose uptake was normal in LL mice with
~15% of wild-type GLUT4 levels, but was reduced in mice with near complete absence
of this transporter. Earlier mouse models of GLUT4 deficiency, whether global (Stenbit
et al. 2000), or cardiac-specific (Abel et al. 1999) also exhibited cardiac hypertrophy in
association with absence of GLUT4 expression in the heart. Adipose- and skeletal
muscle-specific GLUT4 knock-out mice presented normal heart weight-to-body weight
indices in association with normal cardiac GLUT4 expressions (Zisman et al., 2000;
Abel et al., 2001). Therefore, it can be speculated that cardiac-specific downregulation
of GLUT4 levels can promote cardiac and cardiomyocyte remodeling.
In heart-specific GLUT4-deficient mice (Abel et al. 1999), the extent of hypertrophy
was more modest than that described for the homozygote GLUT4-null model (Stenbit
et al. 2000). More importantly, heart-specific GLUT4-deficiency was not associated
with systemic metabolic disturbances, nor collagen accumulation. Thus, the authors
speculated that systemic metabolic abnormalities were necessary to induce dramatic
exacerbation of the hypertrophic phenotype and appearance of interstitial fibrosis. The
present study does not support such a conclusion. LLC animals had similar deficiency
of GLUT4 levels in peripheral tissues with a consequent similar level of
hyperinsulinemia and a similar reduction in metabolic clearance rate of glucose
compared to LL mice (Kaczmarczyk et al., 2003). However, LLC mice exhibited a very
different degree of cardiac and cardiomyocyte hypertrophy, in association with reactive
and reparative fibrosis, genetic activation of the intra-cardiac RAS and evidence of cell-
to-cell uncoupling. This remodeling appeared to be related to the severity of GLUT4
deficiency and the reduction in glucose supply to the heart. Thus it could be proposed
that deranged intra-cardiac glucose metabolism, in combination with other events, such

Chapter III
137
as tissue damage and inflammatory reaction is necessary to cause dramatic remodeling
of the ECM of the myocardium and to stimulate non-myocyte proliferation and
exacerbate cardiomyocyte hypertrophy.
5. IN SUMMARY
Data presented in this Chapter substantiate the conclusion that cardiac and
cardiomyocyte remodeling in the mouse heart is associated with the stimulation of the
intra-cardiac renin angiotensin system and a decrease in GLUT4 expression levels.
Chronic myocardial remodeling is likely linked to cell-to-cell uncoupling as indicated
by the downregulation of the gap junction connexin 43 (Cx43). The severity of
cardiomyocyte and tissue remodeling is determined by the extent of myocardial
collagen deposition and possibly by the degree of perturbation of the intra-cardiac
glucose metabolism. These comparative findings will be further considered in the
concluding Chapter VI, where the variable findings described here for the two
experimental models will be discussed, and comment will be made regarding study
limitations and future directions.
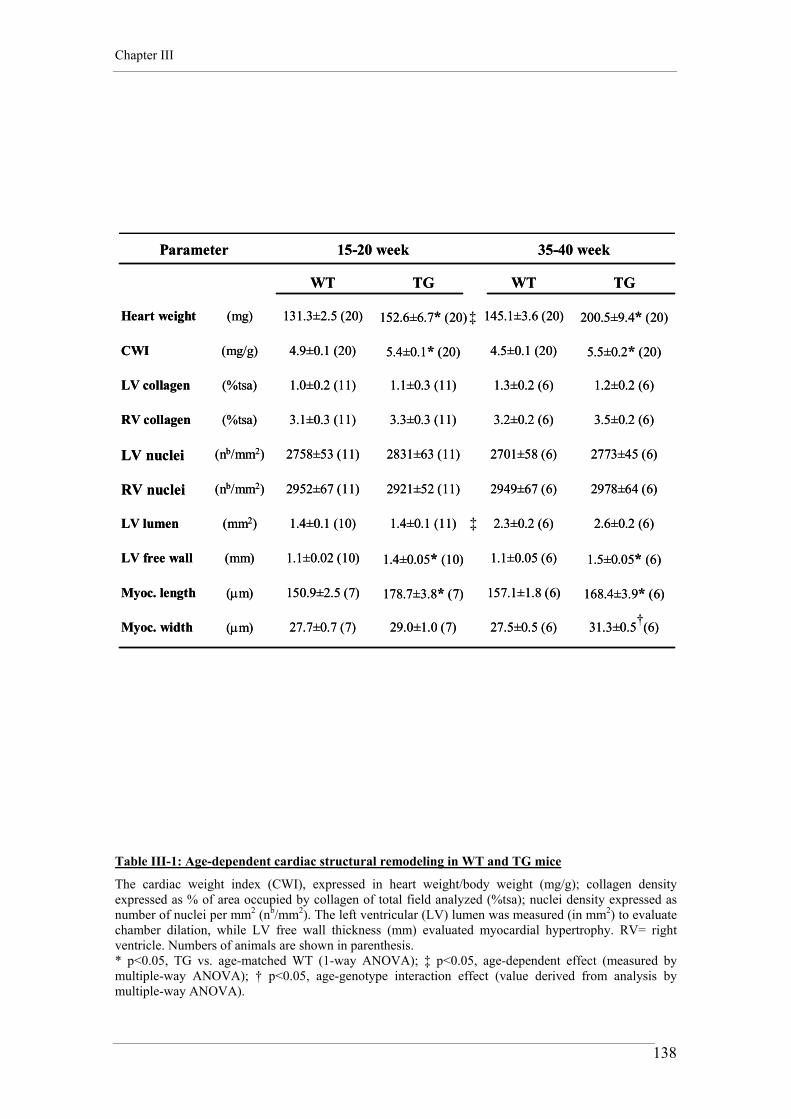
Chapter III
138
2773±45 (6)2701±58 (6)2831±63 (11)2758±53 (11)(nb/mm2)LV nuclei
2978±64 (6)2949±67 (6)2921±52 (11)2952±67 (11)(nb/mm2)RV nuclei
2.6±0.2 (6)2.3±0.2 (6)1.4±0.1 (11)1.4±0.1 (10)(mm2)LV lumen
1.5±0.05* (6)1.1±0.05 (6)1.4±0.05* (10)1.1±0.02 (10)(mm) LV free wall
(μm)
(μm)
(%tsa)
(%tsa)
(mg/g)
(mg)
31.3±0.5 (6)27.5±0.5 (6)29.0±1.0 (7)27.7±0.7 (7)Myoc. width
168.4±3.9* (6)157.1±1.8 (6)178.7±3.8* (7)150.9±2.5 (7)Myoc. length
3.5±0.2 (6)3.2±0.2 (6)3.3±0.3 (11)3.1±0.3 (11)RV collagen
1.2±0.2 (6)1.3±0.2 (6)1.1±0.3 (11)1.0±0.2 (11)LV collagen
5.5±0.2* (20)4.5±0.1 (20)5.4±0.1* (20)4.9±0.1 (20)CWI
200.5±9.4* (20)145.1±3.6 (20)152.6±6.7* (20)131.3±2.5 (20)Heart weight
TGWTTGWT
35-40 week15-20 weekParameter
†
‡
‡
Table III-1: Age-dependent cardiac structural remodeling in WT and TG mice
The cardiac weight index (CWI), expressed in heart weight/body weight (mg/g); collagen density expressed as % of area occupied by collagen of total field analyzed (%tsa); nuclei density expressed as number of nuclei per mm2 (nb/mm2). The left ventricular (LV) lumen was measured (in mm2) to evaluate chamber dilation, while LV free wall thickness (mm) evaluated myocardial hypertrophy. RV= right ventricle. Numbers of animals are shown in parenthesis. * p<0.05, TG vs. age-matched WT (1-way ANOVA); ‡ p<0.05, age-dependent effect (measured by multiple-way ANOVA); † p<0.05, age-genotype interaction effect (value derived from analysis by multiple-way ANOVA).
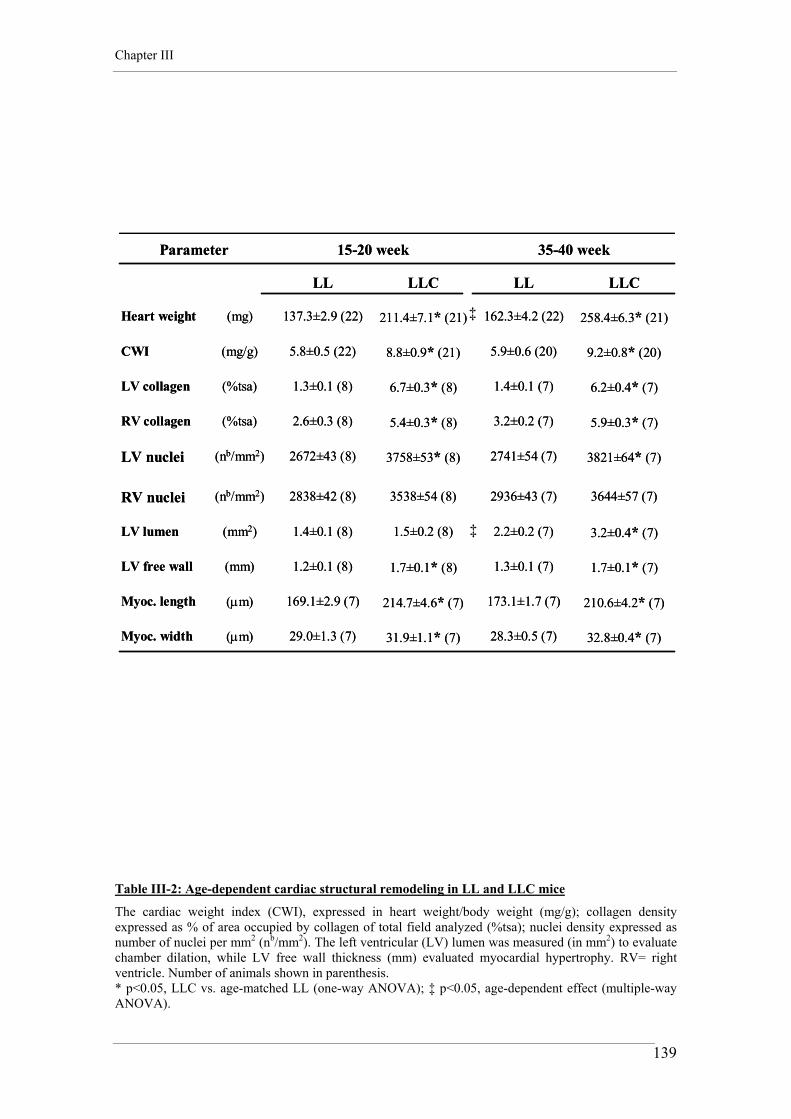
Chapter III
139
3821±64* (7)2741±54 (7)3758±53* (8)2672±43 (8)(nb/mm2)LV nuclei
3644±57 (7)2936±43 (7)3538±54 (8)2838±42 (8)(nb/mm2)RV nuclei
3.2±0.4* (7)2.2±0.2 (7)1.5±0.2 (8)1.4±0.1 (8)(mm2)LV lumen
1.7±0.1* (7)1.3±0.1 (7)1.7±0.1* (8)1.2±0.1 (8)(mm) LV free wall
(μm)
(μm)
(%tsa)
(%tsa)
(mg/g)
(mg)
32.8±0.4* (7)28.3±0.5 (7)31.9±1.1* (7)29.0±1.3 (7)Myoc. width
210.6±4.2* (7)173.1±1.7 (7)214.7±4.6* (7)169.1±2.9 (7)Myoc. length
5.9±0.3* (7)3.2±0.2 (7)5.4±0.3* (8)2.6±0.3 (8)RV collagen
6.2±0.4* (7)1.4±0.1 (7)6.7±0.3* (8)1.3±0.1 (8)LV collagen
9.2±0.8* (20)5.9±0.6 (20)8.8±0.9* (21)5.8±0.5 (22)CWI
258.4±6.3* (21)162.3±4.2 (22)211.4±7.1* (21)137.3±2.9 (22)Heart weight
LLCLLLLCLL
35-40 week15-20 weekParameter
‡
‡
Table III-2: Age-dependent cardiac structural remodeling in LL and LLC mice
The cardiac weight index (CWI), expressed in heart weight/body weight (mg/g); collagen density expressed as % of area occupied by collagen of total field analyzed (%tsa); nuclei density expressed as number of nuclei per mm2 (nb/mm2). The left ventricular (LV) lumen was measured (in mm2) to evaluate chamber dilation, while LV free wall thickness (mm) evaluated myocardial hypertrophy. RV= right ventricle. Number of animals shown in parenthesis. * p<0.05, LLC vs. age-matched LL (one-way ANOVA); ‡ p<0.05, age-dependent effect (multiple-way ANOVA).
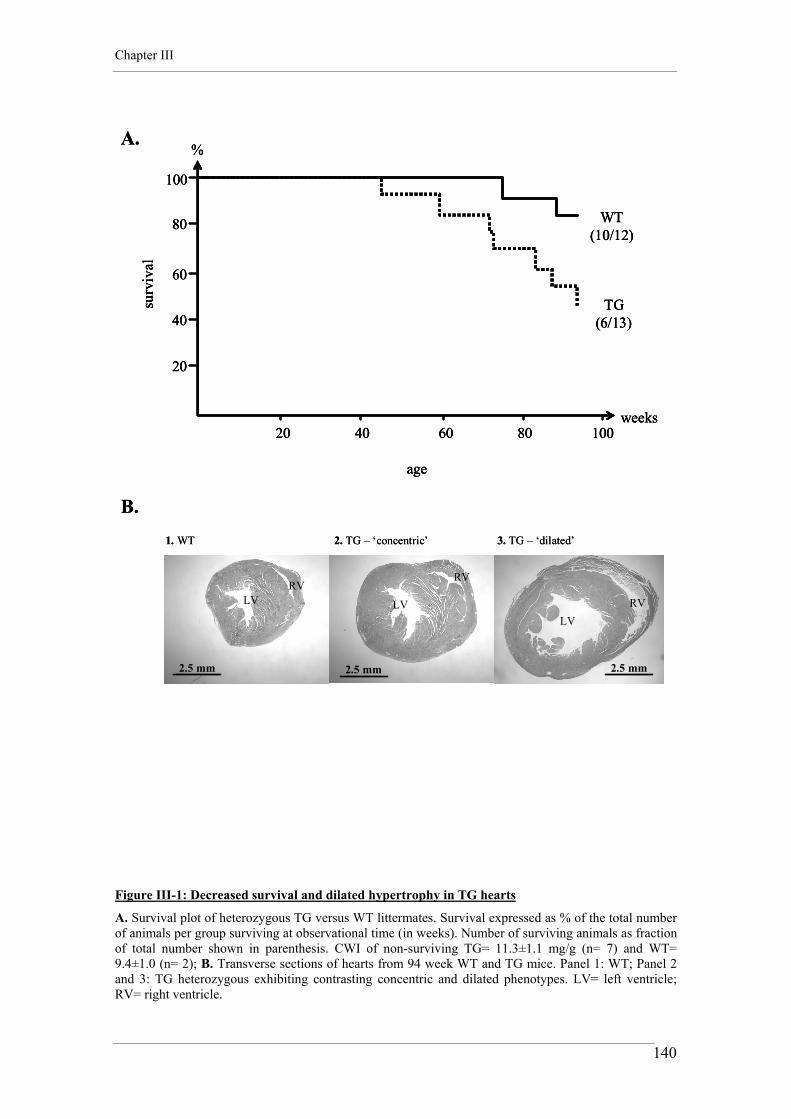
Chapter III
140
100
80
60
40
20
%
20 40 60 80 100weeks
WT(10/12)
TG(6/13)
age
surv
ival
A.
100
80
60
40
20
%
20 40 60 80 100weeks
WT(10/12)
TG(6/13)
age
surv
ival
100
80
60
40
20
%
20 40 60 80 100weeks
WT(10/12)
TG(6/13)
age
surv
ival
A.
1. WT 2. TG – ‘concentric’
2.5 mm 2.5 mm2.5 mm
RVRV
RVLV LVLV
3. TG – ‘dilated’
B.1. WT 2. TG – ‘concentric’
2.5 mm 2.5 mm2.5 mm
RVRV
RVLV LVLV
3. TG – ‘dilated’
B.
Figure III-1: Decreased survival and dilated hypertrophy in TG hearts
A. Survival plot of heterozygous TG versus WT littermates. Survival expressed as % of the total number of animals per group surviving at observational time (in weeks). Number of surviving animals as fraction of total number shown in parenthesis. CWI of non-surviving TG= 11.3±1.1 mg/g (n= 7) and WT= 9.4±1.0 (n= 2); B. Transverse sections of hearts from 94 week WT and TG mice. Panel 1: WT; Panel 2 and 3: TG heterozygous exhibiting contrasting concentric and dilated phenotypes. LV= left ventricle; RV= right ventricle.

Chapter III
141
2. TG heterozygote 3. TG homozygote1. WT
150μm150μm150μm
1 mm1 mm1 mm
LV
RV
RV
RV
LV LV
A.
B.
2. TG heterozygote 3. TG homozygote1. WT
150μm150μm150μm
1 mm1 mm1 mm
LV
RV
RV
RV
LV LV
A.
B.
Figure III-2: Ang II expression levels and severity of remodeling
A. Transverse sections of hearts from 1 week WT and TG mice. Panel 1: WT; Panels 2 and 3: heterozygote and homozygote neonatal TG phenotypes. Remodeling severity reflected Ang II production levels in the heart: TG homozygotes developed a dilated cardiomyopathy and died prematurely (<10 days). B. Only cardiac remodeling in homozygotes involved tissue and cardiomyocyte disarray.

Chapter III
142
A.
Expr
e ssi
on le
vel
(Arb
. Uni
ts)
0
70
140
210
280
350
a young old15-20 week 35-40 week
Agt
0
100
200
300
a young old15-20 week 35-40 week
B. Cx43
Expr
essi
o n le
vel
(Arb
. Uni
ts )
TG (n=10)WT (n=10)
†
†
‡ ‡
‡ ‡
Figure III-3: Agt overexpression and downregulation of Cx43 in TG and WT hearts
A. Expression profiles of Agt mRNA and B. connexin Cx43 mRNA. In parenthesis are the number of animals per group. ‡ p<0.05, genotype-dependent effect (multiple-way ANOVA); † p<0.05, age-genotype interaction effect (value derived from analysis by multiple-way ANOVA).

Chapter III
143
Figure III-4: GLUT4 protein expression and negative correlation with CWI in TG and WT hearts
A. GLUT4 protein expression in WT and TG hearts. *p<0.05, TG vs. WT (one-way ANOVA). B. Plot of cardiac GLUT4 levels and CWI in 15-20 week WT mice. C. The same plot in TG hearts. A negative relationship between the CWI and GLUT4 protein levels was observed in both TG and WT hearts.
3
4
5
6
7
8
60 80 100 120 140 160 180
Y = 6.728 - .016 * X; R2 = .781
3
4
5
6
7
8
0 20 40 60 80 100 120 140 160
Y = 8.196 - .024 * X; R2 = .827
0
40
80
120
160
Expr
essi
on le
vel
(Arb
. Uni
ts)
WT TG
*
A.
B.
C.
CW
I (m
g/g)
GLUT4 levels (Arb. Units)
CW
I (m
g/g)
GLUT4 levels (Arb. Units)
GLUT4
WT
TG
3
4
5
6
7
8
60 80 100 120 140 160 180
Y = 6.728 - .016 * X; R2 = .781
3
4
5
6
7
8
0 20 40 60 80 100 120 140 160
Y = 8.196 - .024 * X; R2 = .827
0
40
80
120
160
Expr
essi
on le
vel
(Arb
. Uni
ts)
WT TG
*
A.
B.
C.
CW
I (m
g/g)
GLUT4 levels (Arb. Units)
CW
I (m
g/g)
GLUT4 levels (Arb. Units)
GLUT4
WT
TG

Chapter III
144
A.
B.
C.
LV
1 mm
RVLV
1 mm1 mm
RV
1 mm
LVRV
1 mm1 mm
LVRV
1 mm
LV RV
1 mm1 mm
LV RV
LLC
LL
WT
Figure III-5: Cardiac remodeling in LL and LLC hearts
Transverse sections of cardiac ventricles from 15 week old A. C57BL6 (i.e. WT), B. LL mouse and C. LLC mouse. Cardiac hypertrophy without dilatation was evident in LLC mice at 15-20 weeks. Senescence caused chamber dilatation in LLC mice (not shown on the picture). LV= left ventricle; RV= right ventricle.

Chapter III
145
Figure III-6: Fibrosis and non-myocyte proliferation in LLC hearts
Plot of LV myocardial collagen content and number of counted nuclei per mm2 of tissue in LLC mice. Each point represents a LLC heart (15-20 or 35-40 weeks). A positive relationship between the collagen content and the number of nuclei was observed in fibrotic LLC hearts. Similar positive relationships were observed for the collagen and nuclei counts in the right ventricle of LL, LLC and TG hearts (data not shown).
5
6
7
8
9
3000 3400 3800 4200
Y = -3.191 + .003 * X; R2 = .831
Number of nuclei per mm2
Col
lage
n le
vels
(%ts
a )
5
6
7
8
9
3000 3400 3800 4200
Y = -3.191 + .003 * X; R2 = .831
Number of nuclei per mm2
Col
lage
n le
vels
(%ts
a )

Chapter III
146
A.
B.
C.
100μm
100μm
100μm
LLC
LLC
LL
Figure III-7: Diffuse and focal/reparative fibrosis in LLC hearts
Left ventricular histological sections stained by Van Gieson’s method. A. No fibrosis evident remodeling in LL hearts. B. Diffuse fibrosis was present in LLC mouse ventricular tissue. C. Reparative fibrosis was observable in LLC hearts, especially at the level of the pericardium.

Chapter III
147
LLC (n=10)LL (n=10)
0
40
80
120
a young old15-20 week 35-40 week
A. Agt
Expr
e ssi
on l e
vel
(Arb
. Uni
ts)
0
75
150
225
a young old15-20 week 35-40 week
B. Cx43
Expr
e ssi
on le
vel
(Arb
. Uni
ts)
†
§
‡ ‡
‡ ‡
Figure III-8: Agt and Cx43 gene expression profiles in LLC and LL hearts
A. Expression profiles of Agt mRNA and B. connexin Cx43 mRNA. In parenthesis are the number of animals per group. ‡ p<0.05, genotype-dependent effect (multiple-way ANOVA); † p<0.05, age-genotype interaction effect (value derived from analysis by multiple-way ANOVA); § p<0.05, age-dependent effect (multiple-way ANOVA).

Chapter III
148
Figure III-9: GLUT4 protein expression and correlation with CWI in LLC and LL hearts
A. GLUT4 protein expression in LL and LLC hearts. *p<0.05, LLC vs. LL (one-way ANOVA). B. Plot of cardiac GLUT4 levels and CWI in 15-20 week LL mice. C. The same plot in LLC hearts. No correlation between the the CWI and GLUT4 protein levels was observed in LLC and LL hearts.
4
5
6
7
8
0 10 20 30 40 50 60
Y = 5.408 - 0.006 * X; R2 = 0.032
0
3
6
9
12
0.0 .5 1.0 1.5 2.0
Y = 8.223 - .025 * X; R2 = 1.441E-4
CW
I (m
g/g)
GLUT4 levels (Arb. Units)
CW
I (m
g/g)
GLUT4 levels (Arb. Units)
0
5
10
15
20
25
Expr
essi
on le
vel
(Arb
. Uni
ts)
LL LLC
A.
B.
C.
*
GLUT4
LL
LLC
4
5
6
7
8
0 10 20 30 40 50 60
Y = 5.408 - 0.006 * X; R2 = 0.032
0
3
6
9
12
0.0 .5 1.0 1.5 2.0
Y = 8.223 - .025 * X; R2 = 1.441E-4
CW
I (m
g/g)
GLUT4 levels (Arb. Units)
CW
I (m
g/g)
GLUT4 levels (Arb. Units)
0
5
10
15
20
25
Expr
essi
on le
vel
(Arb
. Uni
ts)
LL LLC
A.
B.
C.
*
GLUT4
LL
LLC

Chapter III
149
Figure III-10: GLUT4 protein expression and correlation with CWI in LLC and LL vs. WT hearts
A. Western blot analysis of cardiac GLUT4 protein expression in C57BL6 (i.e. WT), LL and LLC mice. LL mice had ~85% reduction levels when compared to C57BL6. Cre expression caused further reduction in GLUT4 to very low levels. B. Plot of GLUT4 levels vs. the cardiac weight index (CWI) in C57BL6, LL and LLC hearts. A threshold level is observed below which cardiac hypertrophy is complicated by collagen deposition and impaired glucose transport (Kaczmarczyk et al., 2003). * p<0.05, LL vs. WT; † p<0.05, LLC vs. WT and LL (multiple-way ANOVA).
0
35
70
105
140
4
6
8
10
12
0 40 80 120 160
CW
I (m
g/g)
GLUT4 levels ( Arb. Units)
Expr
essio
n le
vel
(Arb
. Uni
ts)
C57BL6 LL LLC
A.
B.
GLUT4
C57BL6LLLLC
Threshold
*†
0
35
70
105
140
4
6
8
10
12
0 40 80 120 160
CW
I (m
g/g)
GLUT4 levels ( Arb. Units)
Expr
essio
n le
vel
(Arb
. Uni
ts)
C57BL6 LL LLC
A.
B.
GLUT4
C57BL6LLLLC
Threshold
*†

CHAPTER IV
Impaired cardiomyocyte contractility and
differential expression of calcium and proton
transporters in ageing models of Ang II-induced
and insulin resistant cardiac hypertrophy

Chapter IV
151
1. INTRODUCTION
1.1. E-C coupling with increased pacing frequency in the mouse
The modulation of cardiac and cardiomyocyte contractility by pacing frequency is a
fundamental property of cardiac muscle. In human and large mammals, an increase in
the steady-state frequency under physiological conditions generally enhances
contraction and relaxation and prolongs the contractile cycle (Freeman et al., 1987;
Gwathmey et al., 1990; Bers, 2001). A number of E-C coupling processes have been
shown to be frequency dependent. A positive force-frequency relationship could result
from increased inward calcium currents, increased SR calcium content, higher diastolic
intracellular calcium concentration and possible higher fractional SR calcium release
during contraction (Bers, 2001). In pathological conditions, this positive frequency
relationship may be diminished or converted into a negative relationship, as
demonstrated in human cardiac hypertrophy (Liu et al., 1993) and failure (Davies et al.,
1995; Brixius et al., 2001).
In relatively recent years, the mouse has become an important animal in which to study
cardiovascular physiology and pathology due to the development of murine transgenic
technology. Compared with larger mammals, the basic cardiac physiology would be
expected to be quite distinctive in this small animal with high heart rate in vivo. Indeed,
in studies performed in isolated tissue or with cardiomyocytes from mice, negative,
positive or even biphasic frequency relationships have been observed (Brooks and
Apstein, 1996; Hoit et al., 1997; Palakodeti et al., 1997; Gao et al., 1998; Kadambi et
al., 1999). Several E-C coupling features of the murine heart suggest that, while not
negative, the force-frequency relationship should be only moderately graded over
physiological heart rates (5-8 Hz) (reviewed in Bers, 2001). This was confirmed by
Georgakopoulos and Kass (2001) in open-chest mice and by Stull et al. (2002) in
mouse trabeculae. It has also been shown that ageing is associated with a blunted
positive force-frequency relationship in whole hearts and cardiomyocytes of mice (Lim

Chapter IV
152
et al., 1999; Lim et al., 2000). In these studies the blunted response was linked with
impaired cardiac and cardiomyocyte relaxation (or lusitropy) and a prolonged calcium
transient.
1.2. Modulation of cardiomyocyte contractility by Ang II
1.2.1. Acute modulation of myocyte contractility by Ang II
Modulation of cardiac and cardiomyocyte contractility is one of the many cellular
responses ascribed to Ang II in the heart (Koch-Weser, 1965; Kobayashi et al., 1978).
Ang II is considered to act acutely as a positive inotropic agent, although with modest
potency when compared to other peptides such as endothelin-1 (Sakurai et al., 2002).
This reflects the finding that Ang II receptor density is relatively low for adult
cardiomyocytes under normal physiological conditions (Touyz et al., 1996). A positive
contractile (or inotropic) effect of Ang II on cardiac tissue and cardiomyocytes is not
consistently observed in mammalian hearts. Positive inotropic responses have been
elicited in pigs in vivo (Broome et al., 2001) and in isolated hearts or cardiac tissue
preparations from dogs (Kobayashi et al., 1978), cats (Meulemans et al., 1990), rabbits
(Scott et al., 1992; Watanabe and Endoh, 1998), guinea pigs (Feolde et al., 1993),
hamsters and humans (Moravec et al., 1990). Furthermore, positive inotropic effects of
Ang II are documented in isolated adult cardiomyocytes in rats (Neyses and Vetter,
1989; Delbridge et al., 1995), cats (Petroff et al., 2000), dogs (Cheng et al., 1996),
rabbits (Barry et al., 1995) and hamsters (De Mello, 1998).
In contrast, a positive inotropic effect of Ang II could not be detected in a number of
other studies, including tissue preparations or isolated hearts from rats, rabbits and
human (Baker and Singer, 1988; Wikman-Coffelt et al., 1991; Marano et al., 1997) or
isolated adult cardiomyocytes from rats, guinea pigs, humans, dogs and mice (Ishihata
and Endoh, 1995; Lefroy et al., 1996; Sakurai et al., 2002). Finally, Sekine et al. (1999)
described different inotropic behaviors of isolated neonatal and adult mouse

Chapter IV
153
cardiomyocytes to Ang II, the latter producing a sustained positive inotropic response
in neonate and a maintained negative inotropic response in the adult.
The disparity in findings could be related to differences in pre-existing contractile
status (Li et al., 1994; Meissner et al., 1998), differences in type of tissue utilized
(trabeculae, papillary muscle, whole heart, ventricular or atrial tissue), variable
techniques (tissue strips or rings, isolated perfused heart, working heart,
echocardiography, etc), temperature variations and species- or age-related differences
(Ishihata and Endoh, 1995; De Mello, 1998; Sekine et al., 1999). Indeed it is possible
that the final effect of Ang II on myocardial inotropism results from the complex
combination of several of these factors as well as from the experimental duration of
Ang II exposure. This is particularly important, as duration of Ang II exposure could
elicit different ‘acute’ or ‘chronic’ inotropic responses following activation or
inhibition of Ang II-dependent intracellular signaling pathways in cardiomyocytes.
In contrast to ‘normal heart’ preparations and cardiomyocytes, it is consistently
reported that either the positive inotropic response to acute Ang II exposure is
diminished or the negative inotropic effect is enhanced in various pathological states.
Moravec et al. (1990) demonstrated that in the failing human ventricle and in
cardiomyopathic hamster hearts there was a significant decrease in inotropic response
to Ang II at the cellular level, while Ang II exacerbated contractile dysfunction in rat
papillary muscles after induction of pressure-overload cardiac hypertrophy (Meissner et
al., 1998). Furthermore, Skolnick et al. (1998) reported suppressed responsiveness to
Ang II on ventricular myocytes from infarcted rabbits, while Capasso et al. (1993)
showed negative inotropic effect of Ang II on papillary muscles from infarcted rats.
Ang II was reported to exacerbate contractile dysfunction at the tissue and cellular level
in pacing-induced heart failure in the dog (Cheng et al., 1996) and in isolated rabbit
hearts exposed to ischemic conditions (Mochizuki et al., 1992). Additionally, Xiao and
Allen (2003) demonstrated that AT1 receptor antagonists, applied during ischemia and
reperfusion in isolated rat hearts, protect against myocardial and mechanical damage.
Finally, chronic blockade of the renin-angiotensin system by ACE inhibitors and AT1
receptor blockers in a low-sodium environment converted a positive inotropic response
to a negative inotropic response in rat isolated adult cardiomyocytes (Trongtorsak et al.,
2003). These data suggest that cardiac remodeling in heart disease states may be

Chapter IV
154
associated with changes in the inotropic responsiveness to Ang II of cardiac tissues and
cardiomyocytes (Senzaki et al., 1998). The inotropic effect of acute exposure to Ang II
maybe significantly modified when endogenous levels of Ang II are chronically
elevated. Chronically high in vivo Ang II may suppress or even reverse the inotropic
response to exogenously applied Ang II. In support of this negative modulating effect
exerted by Ang II on cardiac function, progressive increases in cardiac Ang II
production have been reported experimentally and clinically in the course of cardiac
failure (Wollert and Drexler, 1999; Neri Serneri et al., 2001).
1.2.2. Mechanisms for differential inotropic effects of Ang II
on cardiac tissue
Several explanations are advanced to explain the mechanisms of the differential
inotropic effects of Ang II observed on cardiac tissue. Although Ang II could affect
cardiac performance via Ang II-sensitive inter- and intra-cardiac neurons (Horackova
and Armour, 1997), this could not explain the findings relating to isolated hearts and
cardiomyocytes, where the direct action of Ang II in the modulation of contractility
occurs through activation of AT-mediated intracellular signaling pathways. In the heart,
AT1 receptors coexist with the AT2 subtype on both myocyte and non-myocyte cell
populations. The relative proportion in which both subtypes are expressed varies
among cell types, tissues, developmental stages and species and is also affected by
ageing and the extent of cardiac remodeling in pathological responses. This variability
in expression of AT receptor sub-types could determine the positive or negative
inotropic actions of Ang II observed.
As detailed below, the precise mechanisms underlying Ang II-induced and AT-
mediated inotropic action are not well understood, but they are believed to be mediated
by activation of the AT1 receptors and linked with changes in intracellular calcium,
sodium and pH homeostasis in both myocytes and non-myocyte cells. Indeed, Ang II
has been shown to enhance the transcriptional regulation and the activity of key E-C
coupling transporters involved in sodium, calcium and hydrogen homeostasis, such as
the NHE, the NCX, the SERCA2, the RyR and the voltage-operated calcium channels.

Chapter IV
155
1.2.3. Regulation of the sodium/hydrogen exchanger (NHE) by Ang II
It is well recognized that Ang II modulates the activity of the NHE in a variety of
tissues, including the renal proximal tubule (Houillier et al., 1996; Becker et al., 2003),
vascular endothelial cells (Muscella et al., 1999), smooth muscle cells (Vallega et al.,
1988) and blood platelets (Argaman and Livne, 1988). As explained in Chapter I, the
NHE-1 is the most abundant isoform of the sodium/hydrogen exchanger found in the
heart. There is also extensive evidence that Ang II modulates NHE activity in cardiac
myocytes from experiments with isolated cells (Barry et al., 1995; Matsui et al., 1995)
and with intact myocardium (Grace et al., 1996; Camilion de Hurtado et al., 1998).
Furthermore, it was shown that the stimulation of the NHE by Ang II is impaired in
hypertrophied cardiomyocytes (Ito et al., 1997), in infarcted hearts (Skolnick et al.,
1998) and during ischemia and ischemic preconditioning (Xiao and Allen, 2003). It has
been suggested that the net inotropic effect of Ang II on cardiomyocyte performance in
various physiologic and pathologic conditions is partially dependent on NHE
stimulation and activity (Ikenouchi et al., 1994; Barry et al., 1995; Matsui et al., 1995;
Wang and Nygren, 2003; Xiao and Allen, 2003), possibly through activation of PKC-
dependent pathways (Grace et al., 1996; Cingolani et al., 1998; Maly et al., 2002).
Yet, very little is known about the direct modulation of NHE gene expression by Ang II
in the myocardium. NHE mRNA and protein levels were found to be over-expressed in
the rat LV remnant myocardium after infarction in association with an increase in the
activity of the exchanger. In the same study, the AT1 blocker valsartan, and the ACE
inhibitor ramipril, both inhibited upregulation and activity of the NHE post-infarct,
suggesting that the effects were Ang II- and AT1-mediated (Sandmann et al., 2001).

Chapter IV
156
1.2.4. Regulation of the sodium/calcium exchanger (NCX) by Ang II
Ang II has been shown to induce a PKC-mediated increase in the activity of the NCX
(Ballard and Schaffer, 1996). It is also suggested that Ang II can play a direct role in
the modulation of NCX gene expression in the myocardium. Krizanova et al. (1997)
reported that in vivo delivery of Ang I significantly increased the expression of NCX in
rat hearts via production of Ang II. In vivo captopril and candesartan treatments were
shown to reduce NCX mRNA expression in cardiac hypertrophy (Brooks et al., 2000)
and myocardial infarction (Hanatani et al., 1998). However, these in vivo findings
contrast with the in vitro finding of Ju et al. (1996) who reported decreased NCX
mRNA abundance in rat cultured neonatal cardiomyocytes following stimulation with
low or high doses of Ang II. How these conflicting in vivo and in vitro observations can
be reconciled is not clear. Ang II regulation of NCX expression in vivo in the neonatal
heart or in vitro may be different to that occurring in the adult heart or in pathologic
conditions.
Interestingly, recent work from Aiello et al. (2002) has suggested that the Ang II-
dependent modulation of the NCX is mediated by the autocrine action of endothelin-1
released from the myocytes after Ang II stimulation. This hypothesis could be extended
to a paracrine action of endothelin-1 released from fibroblasts acting on the
cardiomyocyte population.
1.2.5. Regulation of SR calcium ATPase (SERCA2) by Ang II
Among the calcium-regulating proteins, the calcium ATPase SERCA2 is generally
reported to be decreased in concentration during cardiac remodeling, independently of
the etiology or the model (Suko et al., 1970; Ito et al., 1974; Lim et al., 1999;
Terracciano et al., 2001; Zhong et al., 2001). Indeed, the diminished expression of
SERCA2 protein levels is considered to be one of the best markers of chronic cardiac
remodeling and failure (Kiss et al., 1995). Very little is known about the direct
modulation of cardiac SERCA2 activity and gene expression by Ang II. Ju et al. (1996)

Chapter IV
157
reported a decrease in SERCA2 mRNA abundance in cultured isolated neonatal rat
cardiomyocytes after treatment with low and high doses of Ang II. However, this effect
was seen neither in adult isolated cardiomyocytes, nor in rat ventricular samples after a
similar treatment, suggesting that angiotensin modulation of calcium signaling in
neonatal and adult myocytes may be different.
Other indirect evidence suggests that Ang II modulates the activity and expression of
the SERCA2 in pathological states. In rats, treatment of volume-overload cardiac
hypertrophy with an AT1 receptor antagonist (TCV-116) restored suppressed
myocardial SERCA2 mRNA levels to control levels (Hashida et al., 1999), while
captopril, an ACE inhibitor, attenuated the reduction of SERCA2 protein and mRNA
expression observed in heart failure after myocardial infarction (Shao et al., 1999).
Similar results were observed in cardiac hypertrophy in aortic-banded rats and guinea
pigs, where treatment with ACE inhibitors or AT1 blockers attenuated the depression of
SERCA2 activity and expression (Boateng et al., 1998; Liu et al., 1999; Takeishi et al.,
1999).
1.2.6. Regulation of the ryanodine receptors RyR by Ang II
In a number of models of experimental cardiac hypertrophy, in cyclically stretched
neonatal cardiomyocyte cultures, and in human heart failure, RyR binding site density
and/or the RyR mRNA expression are reported to be reduced (Brillantes et al., 1992;
Rannou et al., 1996; Cadre et al., 1998; Hashida et al., 1999; Hittinger et al., 1999;
Milnes and MacLeod, 2001). Other studies have reported unchanged (Assayag et al.,
1997) and increased (Arai et al., 1996) levels of RyR expression in senescent hearts and
in compensated cardiac hypertrophy respectively. Little is known, however, about the
direct modulation of RyR gene expression and activity by Ang II in the heart. Ju et al.
(1996) reported an AT1-dependent downregulation of RyR mRNA in isolated neonatal
rat cardiomyocytes after stimulation by Ang II, but there was no evidence of such an
AT1-mediated effect in vivo or with adult isolated cardiomyocytes. Guo et al. (2003)
showed that partial improvement in LV function by AT1 blockers and ACE inhibitors
in infarcted rats was associated with partial reversal of RyR (and SERCA2)
downregulation. Similarly, Hashida et al. (1999) demonstrated that treatment of

Chapter IV
158
volume-overloaded rat hearts with an Ang II receptor antagonist improved left
ventricular function in association with restored levels of RyR (and SERCA2) mRNA.
1.2.7. Regulation of the voltage-operated calcium channels by Ang II
Although it is accepted that Ang II can modulate L-type calcium currents in
cardiomyocytes, the mechanisms of Ang II action remain controversial. Kaibara et al.
(1994) proposed that Ang II can stimulate the L-type calcium channels in adult rabbit
ventricular myocytes through an AT1-mediated activation of the NHE. Aiello and
Cingolan, (2001) showed that this mechanism could be prevented by strong
intracellular calcium buffering and PKC inhibition. However these results were not
confirmed by Ichiyanagi et al. (2002) who reported NHE- and PKC-independent
modulation of L-type calcium currents by Ang II in single adult rabbit ventricular
myocytes using a perforated patch-clamp technique. Finally, De Mello (1998)
demonstrated that species-differences could account for differential modulation of L-
type calcium channels in ventricular myocytes by Ang II. De Mello (1998) also
described the modulation of the inward calcium current in single adult rat and hamster
myocytes by intracellular administration of Ang II and suggested that the peptide was
acting intracellularly, possibly through a PKC-independent pathway in rats. This raises
the possibility that Ang II can modulate the magnitude of calcium transients and
cardiomyocyte contractility through separate intracellular and extracellular pathways.
Interestingly, recent work from Ferron et al. (2003) suggested that an AT1-activated
MAPK kinase-1/2 (MEK1/2) pathway and a separate autocrine endothelin-1 pathway
can upregulate T-type calcium channel expression and density in hypertrophic isolated
cardiomyocytes from aortic-banded rats.

Chapter IV
159
1.2.8. Integrating the mechanisms of Ang II modulation of
cardiomyocyte inotropy
Taken together, these data would suggest the scheme summarized in Figures IV-1 and
IV-2, relating to Ang II modulation of cardiomyocyte contractility. The downstream
effect of acute Ang II exposure associated with protein kinase C (PKC) stimulation
appears to lead to:
a) increased inward calcium current, through activation of the voltage-operated
channels and the NCX (Figure IV-1, ‘Pathway’ A); this process would promote SR
calcium-induced calcium release, yielding a positive inotropic response associated
with a prolonged calcium transient;
b) activation of the NHE, leading to sodium load and consequently to an increase in
the activity of the NCX working in the reverse mode (calcium ‘in’) (Figure IV-1,
‘Pathway’ B);
c) activation of the NCX working in the forward mode (calcium ‘out’), promoting
arrhythmogenic activity as calcium efflux is associated with inward depolarizing
current (Figure IV-1, ‘Pathway’ C). However, sodium load could suppress the NCX
to operation in the calcium extrusion mode during relaxation. This would lead to
cytoplasmic and SR calcium overload and prolonged calcium transient and
relaxation time.
d) proton extrusion inducing alkalinization of the cytoplasm and positive inotropism
due to a change in the myofilament calcium sensitivity (Figure IV-1, ‘Pathway’ D)
(Ballard and Schaffer, 1996; Mattiazzi et al., 1997; Talukder and Endoh, 1997; De
Mello, 1998; Watanabe and Endoh, 1998; Petroff et al., 2000).
In a chronic state of Ang II stimulation, differential gene expression and
metabolic/mitochondrial remodeling could change the mechanical response of the cell
to Ang II. In a transition from acute to chronic exposure to Ang II, alkalinization
associated with increased NHE activity can stimulate gene and protein expression,
leading to cell growth and proliferation (Grinstein et al., 1989; Cingolani, 1999) (Figure
IV-2, A.). Alkalosis can also disrupt mitochondrial metabolism and reduce ATP
production (Figure IV-2, B.), decreasing the energy available for contraction, thus

Chapter IV
160
inducing a negative inotropic response. Through the mitochondrion, alkalinization can
promote apoptosis (Khaled et al., 2001), a phenomenon that could ultimately shift the
balance between cell growth and cell death (Figure IV-2, C.).
In chronic states, Ang II acts directly as a growth factor on cardiomyocytes, increasing
protein synthesis and also reprogramming gene expression. For instance, Ang II was
shown to induce the expression of immediate early genes (c-Fos and c-Jun) and
endothelin-1, a potent modulator of cardiomyocyte inotropy, through a PKC-mediated
activation of JNK (Figure IV-2, D. and E.). Autocrine and non myocyte-dependent
paracrine actions of endothelin-1 and other neuro-humoral factors such as
prostaglandins (Meulemans et al., 1990), could enhance and activate further
intracellular signaling pathways leading to a more sustained differential gene
expression and cardiomyocyte remodeling (Figure IV-2, E.). Ang II-dependent re-
expression of slow-twitch fetal isoforms of contractile proteins, such as α-skeletal actin
or β-myosin heavy chain, would be associated with a decreased cross-bridge cycling
rate and slower contraction kinetics (Lecarpentier et al., 1987; Kim et al., 1995;
Clement et al., 2001) (Figure IV-2, F.). In addition, differential gene expression of key
‘players’ in calcium homeostasis could shift calcium cycling from an intracellular
pathway toward an extracellular one (downregulation of SERCA2 and possible
upregulation of the NCX), depleting SR calcium stores and possibly decreasing the
amplitude of the calcium transients (Figure IV-2). The negative inotropic effects of
Ang II were previously associated either with no changes in the amplitude of the
calcium transient in mouse cardiomyocytes (Sakurai et al., 2002) or with decreased
calcium transient in isolated rat hearts (Wikman-Coffelt et al., 1991), in infarct-remnant
rabbit ventricular myocytes (Skolnick et al., 1998) and in hypertrophied rat papillary
muscles (Meissner et al., 1998).
Finally, Ang II may modulate positive and negative inotropic effects through oxidative
stress. Indeed, Ang II can activate phospholipase D (PLD) and NADPH oxidase,
leading to production of superoxide anions in cardiomyocytes and vascular smooth
muscle cells (Figure IV-1, E.) (Sadoshima and Izumo, 1993; Touyz and Schiffrin,
2001; Privratsky et al., 2003). The production of superoxide induces activation of the
NHE in adult rat ventricular myocytes (Snabaitis et al., 2002). When this activation is

Chapter IV
161
mediated by the MAPK, Erk the final inotropic response to Ang II is positive
(Figure IV-2, G), whereas an activation of the p38 MAPK would lead to negative
inotropism (Khaled et al., 2001), possibly secondary to a shift in gene expression and
mitochondrial damage (Figure IV-2, H).
These hypotheses suggest that Ang II can modulate different contractile responses
according to the duration of the stimulus and the pre-existing physiological (or
pathological) status of the myocardium. At the present time, the chronic effects of
elevated intra-cardiac levels of Ang II on cardiomyocyte function are not well
characterized. This is essentially due to the lack of appropriate models of Ang II-
induced heart failure where hypertension and mechanical stretch do not confound the
chronic effects of Ang II on cardiomyocyte function. For this reason, the use of
transgenic animals to address the question of whether upregulation of the cardiac RAS
alone is sufficient to induce cardiomyocyte dysfunction in the absence of confounding
hypertension is of significant interest.
1.3. Diabetic cardiomyopathy and cardiomyocyte contractility
1.3.1. Cardiac dysfunction related to diabetic cardiomyopathy
As discussed in Chapter I, cardiovascular disease is a leading cause of mortality and
morbidity in type 2 diabetes. Clinically, diabetic cardiomyopathy is frequently
associated with systolic and diastolic dysfunction which is not directly attributable to
microvascular disease, hypertension or obesity. Furthermore, in clinical studies,
detectable cardiac dysfunction is reported to occur as early as the glucose intolerance
phase - that is with the development of hyperglycemia and hyperinsulinemia following
association with insulin resistance (Celentano et al., 1995). In type-2 diabetic
cardiomyopathy, diastolic dysfunction usually precedes impaired systolic dysfunction
(Galderisi et al., 1991).

Chapter IV
162
The mechanisms of cardiac and cardiomyocyte dysfunction underlying diabetic
cardiomyopathy are relatively well characterized in animal models of type 1 diabetes.
This is due to a preponderance of studies conducted using chemically-induced models
of insulin-deficient diabetes, such as the STZ-treated diabetic rat. Another useful model
of type 1 diabetes is the spontaneously diabetic Bio-Breeding/Worcester (BB/W) rat, a
strain in which diabetes occurs spontaneously and closely resembles IDDM in humans
(Miller, 1983; Malhotra et al., 1985). Among the mouse models, the OVE26 transgenic
strain exhibits diabetic cardiomyopathy and complications associated with type 1
diabetes. This mouse over-expresses calmodulin in pancreatic β-cells, a feature that
causes type 1 diabetes in this strain. Duan et al. (2003) reported decreased
cardiomyocyte peak shortening, maximal velocity of shortening and lengthening,
prolonged time of peak contraction and reduced IGF-1 response in these mice.
In general, in type 1 diabetes abnormal cardiomyocyte E-C coupling includes
prolonged action potentials, reduced diastolic and peak systolic intracellular calcium
concentrations, slower rate of decay and prolongation of the calcium transient, negative
inotropy and prolonged time to peak shortening (Noda et al., 1993; Jourdon and
Feuvray, 1993; Yu et al., 1994; Lagadig-Gossmann et al., 1996). Kotsanas et al. (2000)
reported delayed onset of shortening and a depressed calcium-frequency relationship in
cardiomyocytes from STZ-diabetic rats. In addition Ren and Davidoff (1997) suggested
that long term diabetes (8 weeks) but not short-term (4-6 days) is necessary to cause
negative inotropy in STZ rat myocytes. These pathological E-C coupling characteristics
are generally accompanied by a shift in myosin isoenzymes (Hofmann et al., 1995; Kita
et al., 1996). Similar alterations in contractile function are observed in papillary
muscles of STZ-treated rats (Yu and McNeill, 1991; Ishikawa et al., 1999; Ren et al.,
1999). In the latter case a blunted inotropic response to increasing stimulus frequency
was also observed. These results were confirmed in isolated perfused hearts (Zhong et
al., 2001). Interestingly, Ren et al. (1999) demonstrated an increase in cardiac and
cardiomyocyte inotropy after administration of insulin in STZ-treated but not in control
rat hearts and cardiomyocytes.
Although the adult STZ-injected rat is primarily utilized as a model of type 1 diabetes,
some studies employ the STZ-treated rats as a model of type 2 diabetes with an insulin

Chapter IV
163
secretory defect. This state is obtained by an injection of STZ in neonatal rather than
adult rats. While this model cannot be considered as a true representation of the type 2
diabetic condition, a marked glucose intolerance due to insulin resistance that is
associated with normal plasma fasting and non-fasting glucose values is observed
(Schaffer et al., 1985; Schaffer and Wilson, 1993). Differences in myocardial
contractility in rats injected with STZ at both early ‘type 2’ and late ‘type 1’ stages in
development were studied by Banyasz et al. (1996). They reported decreased velocity
of contraction and relaxation in type 1, but not in ‘type 2’ isolated ventricular muscles
and a decreased sensitivity to catecholamines in both types of diabetes.
Type 2 diabetes is considerably more prevalent than type 1 diabetes, but understanding
the pathogenesis of cardiomyopathy in the type 2 condition is complicated by
numerous co-morbidities in both humans and animals (i.e. hypertension, obesity,
hyperinsulinemia, hyperglycemia and dislipidemia). For these reasons the study of
cardiac and cardiomyocyte function in type 2 diabetes has received far less research
attention. Sucrose-fed rats have been used to study the early stage of type 2 diabetes
(Pierce et al., 1989; Pagliassotti et al., 1996), which is characterized by whole-body
insulin resistance and hyperinsulinemia in humans. Dutta et al. (2001) reported slower
rate of shortening and re-lengthening, slower cytosolic calcium clearing and depressed
peak shortening (albeit inconsistent) in cardiomyocytes from sucrose-fed rats. These
changes in cardiomyocyte function were associated with prolonged calcium transients.
In genetic models of type 2 diabetes (i.e. non insulin-deficient) indirect evidence of
cardiomyocyte and cardiac dysfunction have been observed. The insulin-resistant and
diabetic Wistar Bonn/Kobori (WBN/Kob) rat showed impaired L-type calcium channel
response to β-adrenergic stimulation and a prolonged action potential due to depressed
transient outward potassium current (Ito) (Tsuchida et al., 1994; Tsuchida and
Watajima, 1997). Similarly, spontaneously diabetic KK mice showed an increase in the
action potential duration, possibly driven by a suppression of potassium current, such
as Ito and IK1 (Aomine and Yamato, 2000). Finally, very little is known about cardiac
and cardiomyocyte function in recently developed GLUT4 deficient mouse models.
Abel et al. (1999) reported that isovolumetric contractile performance is preserved in
isolated perfused hearts with selective cardiac deletion of GLUT4 protein (G4H-/-

Chapter IV
164
mice). Such hearts developed diastolic dysfunction only after low-flow ischemia ex
vivo and in response to catecholamines in vivo (Tian and Abel, 2001).
No studies on isolated cardiomyocyte contractility have been performed by these
investigators using previously described GLUT4 deficient models (Chapter III Section
1.3.1). Virtually all the information available relating to altered E-C coupling status in
diabetic cardiomyopathy (altered ion homeostasis in particular) has been gleaned from
type 1 models as is evident from this discussion and as considered below.
1.3.2. Altered pH homeostasis in diabetic cardiomyopathy
Pierce et al. (1990) demonstrated depressed cardiomyocyte NHE activity in
sarcolemmal membrane vesicles isolated from STZ-induced (type 1) diabetic rats, a
phenomenon that was paralleled by a reduction in activity of the NCX and sodium-
potassium ATPase (NaKATPase). Le Prigent et al. (1997) observed that diabetes
significantly decreased acid efflux through the NHE in ventricular myocytes from STZ
diabetic rats. This phenomenon was associated with decreased intracellular calcium and
sodium concentrations (Noda et al., 1992, Imahashi et al., 1998), but no changes in
intracellular pH, or proton buffering capacity were observed (Noda et al., 1992, Le
Prigent et al., 1997). Dyck and Lopaschuk (1998) suggested that such depressed NHE
activity could be compensatory to decreased rates of glycolysis and reduced production
of acid charges (H+). Inhibition of the NHE would lead to decreased intracellular
calcium and sodium concentrations, protecting diabetic hearts from acidosis-dependent
ischemic injuries and preserving ATP levels (Ramasamy and Schaefer, 1999; Allen and
Xiao, 2003). However, some studies reported no changes in NHE mRNA or protein
concentrations in STZ diabetic hearts (Dyck and Lopaschuk, 1998; Hileeto et al.,
2002).

Chapter IV
165
1.3.3. Altered calcium homeostasis in diabetic cardiomyopathy
It is generally agreed that calcium homeostasis is affected in diabetic cardiomyopathy.
Significant insulin-dependent depression in sodium-calcium exchange, resulting from
reduced activity of the NCX exchanger, was observed in cardiac sarcolemmal vesicles,
neonatal and adult cardiomyocytes isolated from STZ-injected rats (Pierce et al., 1990;
Chattou et al., 1999; Hattori et al., 2000; Choi et al., 2002). This reduced activity was
associated with a decrease in NCX protein levels (Hattori et al., 2000; Choi et al.,
2002), with and without a decrease in NCX mRNA expression (Hattori et al., 2000;
Schaffer et al., 1997). Golfman et al. (1998) observed reduced activity of the NCX in
sarcolemmal vesicles from alloxane-induced diabetic rats. The same authors also
observed a significant increase in NCX mRNA abundance at 3 weeks after induction of
diabetes. However, these mRNA levels returned to control by 5 weeks of diabetes.
Finally, Duan et al. (2003) demonstrated a reduced NCX activity and protein content in
cardiomyocytes isolated from OVE26 (type 1) diabetic mice.
Very little is known about cardiac NCX regulation in type 2 diabetes or in the pre-
diabetic insulin-resistant state. Dutta et al. (2002) observed unchanged NCX activity
and in mRNA expression in isolated rat ventricular myocytes cultured in a medium
containing high concentrations of glucose. There appears to be no information available
about how NCX activity and expression may be modified in mouse models of non-
insulin dependent diabetic or pre-diabetic states, such as the GLUT4 knock-out mouse
models described in Chapter III.
Altered SERCA protein and mRNA expression associated with contractile and SR
dysfunction have been observed in STZ diabetic rat hearts. Teshima et al. (2000)
reported decreased SERCA2 and RyR mRNA and protein levels in rats after 3 weeks of
STZ treatment. This downregulation of SERCA2 was associated with a downregulation
of RyR mRNA after 12 weeks of treatment. Zhong et al. (2001) reported a similar
decrease in cardiac SERCA2 protein content after 6 weeks, but not after 4 weeks, of
STZ treatment in rats. These general trends were confirmed by Kim et al. (2001) and
Choi et al. (2002), who reported decreased SERCA2, NCX and RyR protein levels in

Chapter IV
166
STZ-treated rats. This decrease in protein content was associated with impaired rates of
SR calcium release and sequestration. More recently, Duan et al. (2003) reported
similar trends of decreased SERCA2 protein and mRNA levels, associated with
decreased SERCA2 activity in type 1 diabetic OVE26 mice.
In isolated rat ventricular myocytes cultured in a medium containing high
concentrations of glucose, Dutta et al. (2002) failed to detect any alteration in SERCA2
protein or mRNA expression. It appears that no data are available which describe
SERCA2 or RyR protein and mRNA expression profiles in type 2 diabetic
cardiomyopathy.
1.4. Insulin resistant cardiomyopathy: evidence of activation of the
renin-angiotensin system
There is strong clinical evidence that non insulin-dependent type 2 diabetic patients
suffer from a cardiomyopathy and left ventricular dysfunction independent of co-
morbidities such as hypertension and coronary artery diseases (reviewed in Fang et al.,
2004). It is also well documented that stimulation of the local intra-cardiac RAS,
together with endothelin-1 production and enhanced NHE activity characterize the
diabetic heart (Sechi et al., 1994; Hileeto et al., 2002). In diabetic hearts, local effects
of Ang II appear to be modulated by PKC- and/or NADPH oxidase-dependent
pathways (Malhotra et al., 1997; Privratsky et al., 2003). Furthermore, IGF-1 attenuates
Ang II- and p53-mediated apoptosis and oxidative stress (Kajstura et al., 2001;
Privratsky et al., 2003) and AT1 receptor blockade protects the heart from the
development of cellular mechanical alterations typically associated with diabetes
(Raimondi et al., 2004). This evidence would suggest that many of the mechanical
disturbances observed in the diabetic heart at the tissue and cellular levels can be
accounted for by accumulating tissue Ang II levels, leading to cardiac dysfunction
through oxidative stress (Privratsky et al., 2003). Thus a comparative study of the
alterations in cardiomyocyte E-C coupling induced by the chronic exposure to Ang II,
Chapter IV
167
and by insulin resistance, in the absence of confounding hypertension, is of
considerable interest.
1.5. Aims
The present study was designed to comparatively evaluate the cardiomyocyte
functional effects of experimentally induced in vivo 1) chronic elevation of Ang II
levels and 2) impaired GLUT4-mediated glucose uptake. Specifically, using adult
myocytes isolated from the left ventricle of TG1306/1R and GLUT4-KO mice, the
experimental aims were:
1. To characterize myocyte intrinsic basal contractile function in their pathologies,
and to determine how contractility is modified by ageing and disease
progression.
2. To evaluate age-dependent alterations in the gene expression of the
sodium/calcium exchanger (NCX1.1) and sodium/hydrogen exchanger (NHE-
1), as well as the calcium release channel ryanodine receptor (RyR2). The
protein levels of the calcium ATPase SERCA2 were also evaluated at 15-20
weeks of age.
The goal of this study was to clarify whether cardiac and cardiomyocyte remodeling
induced by chronic Ang II overproduction or GLUT4 transporter suppression in vivo
could have a primary and long-term impact on myocyte function, independently of
hemodynamic changes. It was hypothesized that cardiomyocyte contractile dysfunction
would be evident in both mouse models and it would be associated with differential
gene (or protein) expression of key players in calcium, sodium and hydrogen
homeostasis.

Chapter IV
168
2. METHODS
2.1. Cardiomyocyte contractility
2.1.1. Myocyte preparation and recording
Myocytes were prepared from mouse hearts by the procedures detailed in Chapter II,
Section 5. Measurement of single cardiomyocyte contractility was performed by using
a rapid imaging system, incorporating a photodiode array line scan camera coupled to a
digitizing-equipped workstation, as described in Chapter II, Section 5. A range of
normalized parameters were automatically computed for each contraction cycle and
recorded for comparative evaluation of inotropic status as described earlier (Figure II-
4).
2.1.2. Experimental groups
To investigate the age-dependent effects of hypertrophic remodeling on cardiomyocyte
function, 15-20 and 35-40 week old male transgenic and knock-out mice were studied
and compared with age-matched control littermates. Experimental groups were defined
according to animal age and genotype. Isolated left ventricular cardiomyocytes from
the following 8 groups were studied:
1. 15-20 week TG: n=15 (from 5 different animals).
2. 15-20 week WT: n=17 (from 5 different animals).
3. 35-40 week TG: n=15 (from 5 different animals).
4. 35-40 week WT: n=16 (from 5 different animals).
5. 15-20 week LLC: n=16 (from 5 different animals).
6. 15-20 week LL: n=15 (from 5 different animals).

Chapter IV
169
7. 35-40 week LLC: n=16 (from 5 different animals).
8. 35-40 week LL: n=15 (from 5 different animals).
2.1.3. Recording protocols and data analysis for cardiomyocyte
contractility
Measurements of cardiomyocyte contractility were carried out at 36.0±0.5oC, with a
superfusate flow rate of 1.8 ml/min, extracellular Ca2+ 2mM and pH 7.4 (Delbridge et
al., 1989) (details of buffer are reported in Chapter II, Section 5). Cardiomyocytes were
initially stimulated to contract at 3Hz and cell performance was allowed to achieve
steady state before the test recording period commenced (5 minutes allowed).
Cardiomyocyte contractility was then monitored for 7-8 minutes following the protocol
illustrated in Figure IV-3. The protocol was designed to evaluate cardiomyocyte
contractile performance throughout an ascending ramp of four different frequencies
(1.5Hz – 3Hz – 4Hz – 5Hz) before returning to the basal rate at 3Hz. Thus, the pre- and
post-ramp performance levels could be compared to assess myocyte functional stability
during the test period.
Thirty contractile cycles were averaged at the end of each frequency step within the
ramp for statistical evaluation. To standardize the recording period relative to frequency
transition, 100 contractile cycles for 1.5Hz and 3Hz and 50 contractile cycles for 4Hz
and 5Hz were specified for the frequency ramp protocol. In addition, to assess myocyte
stability during the test period 100 contractile cycles at 3Hz before the frequency ramp
and at the end of the frequency ramp were averaged for comparison. Mean values were
determined for each experimental group using the average values computed for each
myocyte at each frequency.
Myocytes were included in analysis if the following criteria were satisfied: 1) rod-
shaped morphology with clear striation patterns; 2) calcium tolerant (see Chapter II,
Section 4); 3) quiescent in the absence of electrical stimulation; 4) stable mechanical
behavior at 3Hz during the run-in period. Furthermore, because cell size could
potentially introduce additional physiological and mechanical variables to the
functional study, myocytes were selected to ensure experimental groups were

Chapter IV
170
comprised of equivalently sized cells. Thus, myocyte dimensions were not different for
the eight experimental groups tested (mean length: 129.0 ± 13.0 μm; mean width: 29.0
± 3.0 μm), although it is important to note as demonstrated by data presented in
Chapter III (Table III-1 and III-2) that there were significant size differences in the
general cell populations comprising these groups.
2.2. RNA and protein extraction and quantification
2.2.1. Procedures
Total RNA was extracted from mouse hearts and expression of NCX1, NHE-1 and
RyR2 mRNA was assessed by semi-quantitative RT-PCR on 15-20 and 35-40 week old
ventricles using the procedures detailed in Chapter II, Section 7. The procedures for
protein extraction and Western blotting for evaluation of SERCA2 expression are
described in Chapter II, Section 6. For immunodetection of SERCA2, membranes were
incubated with diluted goat anti-mouse SERCA2 polyclonal antibodies (Santa Cruz
Biotechnology, product C-20) overnight (4oC). After washing, blots were incubated
with peroxidase-conjugated secondary anti-goat IgG antibodies at room temperature
(Santa Cruz Biotechnology).
2.2.2 Experimental groups
For the gene and protein expression investigations described above, 15-20 and 35-40
week old male transgenic mice were studied and compared with age-matched control
littermates.
Eight experimental groups were defined according to animal age and genotype. Left
ventricular tissues from the following 8 groups were studied:

Chapter IV
171
1. 15-20 week TG: n=10 hearts for mRNA extraction and n=10 hearts for protein
extraction.
2. 15-20 week WT: n=10 hearts for mRNA extraction and n=10 hearts for protein
extraction.
3. 35-40 week TG: n=10 hearts for mRNA extraction.
4. 35-40 week WT: n=10 hearts for mRNA extraction.
5. 15-20 week LLC: n=10 hearts for mRNA extraction and n=10 hearts for
protein extraction.
6. 15-20 week LL: n=10 hearts for mRNA extraction and n=10 hearts for protein
extraction.
7. 35-40 week LLC: n=10 hearts for mRNA extraction.
8. 35-40 week LL: n=10 hearts for mRNA extraction.
2.3. Statistical considerations and presentation of the results
As previously described, for myocyte contractility experiments mean group values
were determined using the average parameter values computed for each myocyte at
each frequency. For each experimental group, the ‘n’ values reported in the Results
Section reflect the total number of myocytes recorded. To ensure that the intra-heart
and inter-heart variability in myocyte performance was consistent between each
experimental group, an equal number of myocytes per heart were incorporated in each
group. Results are expressed as mean ± SEM. A multiple-way ANOVA with repeated
measures was used to statistically evaluate the contraction frequency staircase and to
evaluate possible interactions between the genotype and the age for each contraction
parameter. A subset of data comparing age-matched transgenic (or knock-out) mice and
their wild-type littermates were analyzed by one-way ANOVA and are presented for
the pacing frequency of 5 Hz, which is the pacing value closest to physiological range
in the mouse.
For the gene and protein expression data, a multiple-way ANOVA was used to
statistically evaluate the expression shifts and to identify possible interactions between
genotype and age.

Chapter IV
172
For all data, significant differences were identified at p<0.05. Legends of Figures and
Tables reporting specific results state the type of statistical test utilized and the degree
of significance.

Chapter IV
173
3. RESULTS
3.1. Stability of contractile performance
To ensure that only myocytes which exhibited stable contractile function were included
in the experimental groups, the performance of cells before and after applying the ramp
protocol was evaluated. Comparison of the contractile parameters prior to the
frequency ramp and at the end of the experiment reveals that no differences were
observed for these values in any of the TG1306/1R or GLUT4-KO experimental groups
(Figures IV-4 and 5). This confirms that the cells remain functional and responsive in
their contractile performance through the duration of the experiment and that changes
in pacing elicit physiologic homeostatic responses. Furthermore, there were no
statistical changes in cardiomyocyte length (Lo) over the experiment duration,
indicating that changes in frequency were not associated with a change in diastolic
status in contracting cardiomyocytes (data not shown).
3.2. Impaired cardiomyocyte contractility in Ang II-overproducing
transgenic mice
3.2.1. Decreased inotropy, lusitropy and prolonged cycle time at 5 Hz in TG
Examination of the specific alterations in contractile cycle parameters at near
physiologic range (5Hz) showed that at both ages studied, TG myocytes exhibited
significant functional impairment. Both rates of shortening and lengthening (MRS and
MRL) were reduced in the TG myocytes relative to WT controls at 5 Hz (Table IV-1).
The maximal rates of shortening were reduced by 15% and 35% in 15-20 and 35-40
week old TG myocyte groups respectively, while the maximal rate of lengthening was

Chapter IV
174
reduced by ~30% at both ages. This is indicative of a reduction in contraction
(inotropy) and relaxation (lusitropy) performance in the TG cardiomyocytes,
independent of the age. The slowest contraction kinetics were observed in the group of
older TG myocytes.
Genotype-dependent prolongation effects on contraction cycle timing events were also
evident at both ages: the latency (To), the shortening (Tm -To) and lengthening (Tf -Tm)
periods and total cycle (Tf -To) times were significantly longer in TG myocytes when
compared to age-matched WT (Table IV-1). All contraction cycle timing parameters in
15-20 week old TG myocytes were approximately 15-25% longer than WT. The same
parameters were 35-40% longer than WT in 35-40 week old TG myocytes. The total
cycle time (Tf) including the latency was also significantly prolonged in TG
cardiomyocytes at both ages. These data suggest that the timing of events in the
contractile cycle is significantly modified in TG cells, independent of age. The most
prolonged period of E-C coupling latency (To) was observed in the group of older TG
cells (+40%).
A particularly surprising finding was that, despite these significant alterations in rate
and timing parameters, the maximal shortening (%S) attained by TG myocytes was not
diminished relative to age-matched WT myocytes.
3.2.2. Age- and frequency-dependent alterations in cardiomyocyte function
A more extensive comparison of TG and WT myocyte function was undertaken by
analysis of data obtained at both ages for all frequencies using a multiple-way ANOVA
approach (Table IV-3; Figures IV-6 and IV-7). This extended analysis demonstrated
that all contractile parameters, except %S, exhibited significant genotype specific
shifts, as identified above in relation to the 5Hz data. A negative frequency relationship
was observed for all shortening and lengthening performance parameters (%S, MRS
and MRL) in WT and TG myocytes at both ages (Figure IV-6). In 15-20 week WT
myocytes, the overall shift from 1.5 to 5 Hz produced an approximate 45% reduction in
the magnitude of the maximum cell shortening (%S) and a reduction of 30% in the
magnitude of the rates of shortening and lengthening (MRS and MRL). A similar trend

Chapter IV
175
was observed in the other experimental groups, suggesting that the frequency-
dependent performance modulation was similar for the WT and TG groups, at the 2
developmental stages.
A negative frequency ‘staircase’ was also observed for all contraction cycle timing
parameters at both ages, except for the latency (To), which exhibited a modest but
positive frequency relationship (Figure IV-7). That is, E-C coupling delay increased at
higher frequency by ~15% for all groups. A similar trend was observed for all
experimental groups, thus no significant frequency-dependent shift in the magnitude of
contractile cycle timing was observed between the WT and TG groups.
Myocytes from older animals, both WT and TG, exhibited reduced maximal shortening
(%S) and rate of shortening (MRS) (Figures IV-6, Panel A and B), together with an
abbreviated duration of total cycle time (Tf -To) and lengthening period (Tf-Tm) relative
to their younger counterparts (Figure IV-7, Panels B and D). These findings
demonstrate that in these mouse myocytes, ageing per se regardless of genetic type, is
associated with decreased shortening activity and abbreviated contractile cycle and
lengthening periods. Interestingly, the E-C coupling latency (To), the period of
shortening (Tm-To) and the rate of lengthening (MRL) exhibited significant genotype-
specific alterations with ageing (i.e. showed a statistical age-genotype interaction).
Thus, in the WT, MRL showed an age-dependent reduction which was not observed in
the TG, where this parameter was already relatively depressed even in young animals
(Figure IV-6, Panel C). Similarly, while the shortening period (Tm-To) was decreased
with age in the WT, minimal alteration was evident with ageing in the TG myocytes.
The large increase in excitation-contraction coupling latency (To) seen in the older TG
myocytes was not apparent in the myocytes from the older WT.
3.2.3. Differential gene and protein expression profiles
The expression of calcium and proton handling transporters in the hearts of 15-20 and
35-40 week old TG and WT mice was investigated. Protein analysis showed an ~5-fold
downregulation of the SR calcium pump SERCA2 in the hearts of 15-20 week old TG
when compared with age-matched WT (Figure IV-8). This was in association with

Chapter IV
176
upregulation of both the NCX1.1 and the NHE-1 mRNA levels in the TG myocytes.
The difference in expression between TG and WT of the NCX1.1 was less marked at
15-20 weeks. Ageing was also associated with a general downregulation of expression
of the NHE-1 in both TG and WT. No significant differences were observed in the
expression of the ryanodine receptor RyR2 mRNA between WT or TG in younger or
older animals.
3.3. Impaired cardiomyocyte contractility in GLUT4-deficient mice
3.3.1. Decreased inotropy, lusitropy and prolonged cycle timing at 5 Hz
Analysis of the specific changes in contractile cycle parameters at 5Hz showed that at
both ages LLC cardiomyocytes exhibited significant impairment of contractile
performance and cycle timing. Maximal rates of shortening and lengthening (MRS and
MRL) were 20-25% reduced in the myocytes of both 15-20 and 35-40 week LLC
relative to LL at 5Hz (Table IV-2). The maximum shortening (%S) attained by LLC
myocytes was 25-35% smaller when compared to age-matched LL myocytes. This is
indicative of a reduction in inotropic and lusitropic performance in the LLC
cardiomyocytes, independent of age.
Genotype-dependent prolongation effects on contraction cycle timing were evident at
both ages for the latency (To) and cycle time (Tf). Tf was prolonged approximately 10-
15% in LLC. This result was mainly influenced by the delay of To in LLC
cardiomyocytes, as the total cycle time (Tf -To) and the duration of lengthening (Tf -Tm)
were not significantly changed in LLC myocytes when compared to age-matched LL at
5 Hz (Table IV-2). Interestingly, the shortening time (Tm-To) was significantly
extended (+15%) in LLC myocytes at 35-40 weeks when compared with age-matched
LL. The largest delay in E-C coupling (To) was observed in the group of younger LLC
cells, where latency was approximately 50% longer than LL. These data suggest that
the timing of events in the contractile cycle is relatively disturbed in LLC cells when
compared to LL at 5Hz.

Chapter IV
177
3.3.2. Age- and frequency-dependent alterations in cardiomyocyte function
Analysis of the data using the more robust multiple-way ANOVA approach
demonstrated that all contractile parameters exhibited genotypic-dependent shifts
(Table IV-4). In particular, when the pooled frequency data were considered, a
significant reduction in some cycle time parameters for LLC myocytes was detected -
an effect not evident when the 5Hz dataset alone was evaluated by one-way ANOVA.
This is the case for the total cycle time (Tf -To), the duration of lengthening (Tf -Tm), as
well as the shortening time (Tm -To) in younger LLC (Figure IV-10). A negative
frequency relationship was observed for all shortening and lengthening performance
parameters (%S, MRS and MRL) in LL and LLC myocytes at both ages. In 15-20
week LL myocytes, the overall shift from 1.5 to 5 Hz produced an approximate 30%
reduction in the magnitude of the maximum cell shortening (%S) and a reduction of
15% in the magnitude of the rates of shortening and lengthening (MRS and MRL)
(Figure IV-9). A similar trend was observed in all the experimental groups, suggesting
that the frequency-dependent performance modulation was similar for the LL and LLC
groups at the two developmental stages. A negative frequency ‘staircase’ was also
observed for all contraction cycle timing parameters at both ages, except for the latency
(To), which exhibited a positive frequency relationship (Figure IV-10). A similar trend
was observed for all experimental groups, thus no significant frequency-dependent shift
in the magnitude of contractile cycle timing was observed between the LL and LLC
groups.
Both LL and LLC myocytes from older animals exhibited increased maximal rate of
lengthening (MRL). This finding demonstrates that in these myocytes, ageing per se
regardless of genetic type, is associated with accelerated cardiomyocyte relaxation
performance. Genotype-specific alterations with ageing were observed for the time of
latency (To) and the shortening and lengthening periods (Tm -To, Tf -Tm) between LL
and LLC myocytes (Figures IV-10). In the LL, the myocytes shortening period (Tm-To)
showed an age-dependent reduction of greater magnitude when compared to LLC
myocytes. The opposite was observed for the lengthening period (Tf -Tm), where the
age-dependent reduction was greater in LLC myocytes. The large delay in E-C

Chapter IV
178
coupling latency (To) seen in the younger LLC myocytes was less marked in the older
LLC. The WT showed a similar pattern of age-related latency shift, but the differential
age effect was modest.
A particularly surprising finding was that, despite genotype-dependent alterations in
maximal shortening and rate of shortening (%S and MRS) in LLC myocytes, these
parameters did not exhibit significant age dependency in this myocyte population
(Figure IV-9).
3.3.3. Differential gene and protein expression profiles
Protein analysis showed a ~2-fold downregulation of the sarcoplasmic reticulum (SR)
calcium pump SERCA2 in the hearts of 15-20 week old LLC mice, in association with
downregulation of the sodium-calcium exchanger NCX1.1 and an upregulation of the
sodium-hydrogen exchanger NHE-1 mRNAs (Figure IV-11). Ageing caused a general
downregulation of the expression of the NHE-1. Finally, a significant downregulation
was observed in the expression of the ryanodine receptor RyR2 mRNA between LL
and LLC mice at both ages.
3.3.4. After-contraction in LLC cardiomyocytes at 1.5 Hz.
At the pacing frequency of 1.5Hz it was not unusual to observe unstable contractile
behavior associated with non-stimulated after-contractions in 35-40 week old LLC
cardiomyocytes (Figure IV-12). These after-contractions were generated in the early
post relaxation phase. Relative to stimulated twitches, they were reduced in amplitude
and were not evident at higher frequencies (3Hz to 5Hz).

Chapter IV
179
4. DISCUSSION
4.1. Decreased contractile performance in TG cardiomyocytes
The present study demonstrates that long-term elevated expression of cardiac Ang II
has a detrimental effect on E-C coupling at the cardiomyocyte level, even when there is
no elevation of afterload. This ‘functional remodeling’ is marked by a decrease in the
maximum rates of shortening and lengthening (MRS and MRL) in cardiomyocytes
from 15-20 and 35-40 week old TG (Table IV-1 and Figure IV-6). Assuming that
differential gene expression of the transgene and consequent cardiac-specific
overproduction of Ang II should occur at birth, if not in utero, this phenomenon could
be related to early changes in Ang II-induced gene and protein expression, leading
progressively to homeostatic disturbance in regulation of calcium and other ions and
encroachment of the contractile reserve. Slower rates of shortening and lengthening, as
observed in TG cardiomyocytes, may reflect a shift in fetal myosin and actin
isoenzymes, which has been observed in other models of cardiac hypertrophy in mice
(Dorn et al., 1994). Indeed, it has been previously established in this model that Ang II
chronically stimulates re-expression of fetal low-twitch alpha-skeletal and smooth
muscle actin in 20 week old TG mice (Clement et al., 2001). Changes in myosin
isoforms from α to β in the ventricle of small animals, such as the mouse, could reduce
ATPase activity and maximum shortening velocity, concomitant with increased
economy of isometric force development and decreased ATP utilization per gram of
tension (Hasenfuss et al., 1991).
A slower contraction rate observed in TG cardiomyocytes could also reflect differential
myofilament responsiveness to calcium ions (myofilament sensitivity). Indeed, new
evidence suggests that p38 MAPK activation mediates negative inotropic effect in
cardiac myocytes by decreasing myofilament response to calcium, independently of
alterations in calcium and pH homeostasis or troponin I phosphorylation (Liao et al.,

Chapter IV
180
2002; Chen et al., 2003). Interestingly, Pellieux et al. (2000) demonstrated p38 MAPK
activation in the same transgenic animals with Ang II-induced cardiac hypertrophy.
The age-dependent reduction in relaxation performance (MRL) observed in the 35-40
week old WT population was already evident in TG myocytes at 15-20 weeks (Figure
IV-4, Panel C). Thus, a significant genotype-specific alteration with ageing was
observed for MRL (Table IV-3). This suggests that TG cardiomyocytes have already
exhausted part of their relaxation performance reserve at a younger age, predisposing
them to more profound mechanical abnormalities with disease progression. These
findings indicate that chronic overproduction of Ang II in the heart causes pronounced
cardiomyocyte contractile dysfunction linked with early onset of relaxation dysfunction
- a prominent sign of heart failure. These data also complement the study of Huggins et
al. (2003) who demonstrated reduced peak developed pressure and maximum rate of
pressure development in 30-40 week old ex vivo Langendorff-perfused hearts from the
same TG mouse line. Furthermore, in a related collaborative study, myocardial
remodeling in 50-60 week TG mice was shown to be associated with decreased in vivo
contractility and relaxation, and preceded by more subtle sign of relaxation delay
observed in hearts of 15-20 week TG (Domenighetti et al., 2005). Taken together, these
data would suggest that the hypodynamic performance of TG hearts in vivo reflects
fundamental abnormalities in cardiomyocyte E-C coupling.
Additionally, these data emphasize the important role played by ageing in the
development of inotropic dysfunction. Indeed, the age is the only determinant of the
reduced maximal peak of shortening (%S) and rate of shortening (MRS) observed in
35-40 week old cardiomyocytes (Table IV-3). Thus, it could be suggested that age-
dependent factors are associated with deterioration of cardiomyocyte kinetics consistent
with the development of systolic dysfunction. With the data presented in Chapter III,
showing increased Agt mRNA expression levels in 35-40 week old WT, the results
presented here suggest that age-dependent increased production of Ang II in the heart
could amplify late maturity abnormalities in cardiomyocyte E-C coupling resulting in
hypodynamic performance of myocardial tissue in vivo and heart failure. These age-
dependent mechanisms are accelerated and exacerbated in the TG mice due to the early
activation of the intra-cardiac RAS.

Chapter IV
181
In support of this interpretation, Wei et al. (1984) documented that ageing hearts can
exhibit prolonged LV relaxation periods and decreased contractility. This phenomenon
was also reported in studies using isolated adult mouse cardiomyocytes and in whole
heart preparations (Lim et al., 1999; Lim et al., 2000), where a decreased rate of
cytosolic calcium removal was suggested to be a causal mechanism. In addition,
gradual increases in cardiac Ang II levels were reported in experimental models and
clinically during the development of chronic heart failure where systolic dysfunction is
evident (Wollert and Drexler, 1999; Serneri et al., 2001).
This study is in partial agreement with the work in vitro done by Sakurai et al. (2002)
who demonstrated a decreased inotropy in isolated adult mouse cardiomyocytes in the
presence of various concentrations of Ang II. These authors observed a decrease in the
maximal cell shortening (%S) in cardiomyocytes in the presence of Ang II, a result
which is not confirmed by the present study. However it is important to note that, due
to methodological limitations, Sakurai et al. (2002) stimulated their cardiomyocytes at
one single and very low frequency rate (0.25 Hz), which could explain some of the
discrepancies observed between that study and the present investigation. As stated in
the Introduction of this Chapter, other differences could be related to the nature of the
cardiomyocyte and stimulus utilized, that is normal adult cardiomyocytes from
C57BL6 mice stimulated with Ang II (acute stimulus) versus Agt over-producing
cardiomyocytes (chronic stimulus). Therefore it seems likely that in the TG
overexpression model, compensatory mechanisms associated with Ang II-dependent
cardiac and cardiomyocyte remodeling are recruited to sustain maximum shortening, in
the context of slowed contraction kinetics shortening and lengthening rates.
Finally, the results reported in this study accord with findings in the Gαq-
overexpressing transgenic mouse, where cardiomyocyte dysfunction (decreased rates of
shortening and lengthening) is associated with downregulation of SERCA2 and
prolonged duration of calcium transients (Yatani et al., 1999). Given that signaling
pathways mediated by AT1 receptors in myocytes are known to be linked to the Gαq
class of G proteins (Wettschureck et al., 2001), it is tempting to speculate that chronic
cardiomyocyte dysfunction in the TG mice is caused by specific Ang II-dependent
chronic activation of cardiomyocyte AT1 Gαq-coupled receptors. This hypothesis,
Chapter IV
182
where fibroblast participation in the hypertrophic response is not obligatory, requires
further investigation.
4.2 Increased twitch duration in TG cardiomyocytes
This study also demonstrates that chronic over-production of cardiac Ang II is
associated with an increase in cardiomyocyte cycle duration at both ages (Figure IV-7).
This extended twitch duration in TG myocytes is due to delayed E-C coupling latency
(To) and prolonged duration of the shortening and lengthening periods (Tm-To; Tf-Tm)
summing to extend the whole contraction cycle period (Tf-To).
Prolongation of the lengthening period (Tf-Tm) in TG myocytes (Figure IV-7) may
reflect a decrease in the rate of calcium removal from the cytoplasm. This could be
caused by a slower calcium re-uptake into the SR by the SERCA2, which normally
accounts for the removal of ~90% of the intracellular calcium concentrations in the
rodent (Bassani et al., 1994). Indeed, a characteristic of the failing and hypertrophic
heart is a reduction in myocardial SERCA2 protein expression (De La Bastie et al.,
1990; Schotten et al., 1999). This could explain reduced calcium re-uptake in
pathological conditions. Such reduction in SERCA2 could be partially or totally
compensated by an upregulation of the NCX, enhancing efflux of calcium ions to the
extracellular medium (Terracciano et al., 2001). These hypotheses are partially
supported by the results of the present study where a decrease in SERCA2 is observed
already at the age of 15-20 weeks in TG hearts (Figure IV-8). Downregulation of
SERCA2 would suppress the re-uptake of calcium into the SR and delay myocyte
relaxation. The concomitant upregulation of the NCX1.1 (Figure IV-8) in younger
cardiomyocytes could suggest an early compensatory mechanism that would ultimately
shift the calcium cycling from an intracellular pathway toward an extracellular one,
thus reducing the levels of releasable SR calcium and chronically eroding systolic
functional reserve. This hypothesis is strengthened by a related collaborative study,
where myocardial dysfunction in TG mice was shown to be associated with decreased
systolic calcium levels and increased calcium transient duration (Domenighetti et al.,
2005). In addition, NCX overexpression in adult rabbit ventricular myocytes was
Chapter IV
183
shown to cause depressed contractility related to decreased SR calcium stores and low
diastolic calcium levels (Ranu et al., 2002).
These data emphasize the important role played by ageing in the differential regulation
of twitch duration in both WT and TG myocytes. Cardiomyocytes from older WT and
TG hearts exhibit an abbreviated whole contraction period (Tf-To) and abbreviated
duration in lengthening period (Tf-Tm). The presence of a shorter contractile cycle
period, associated with decreased maximum shortening in older myocytes would
suggest a blunted calcium transient, possibly associated with a shorter action potential
duration. A shorter contractile cycle period would also mean longer beat-to-beat
‘diastolic’ interval (for a given frequency) which could enhance recovery of voltage
operated L-type calcium channels and therefore facilitate calcium-induced calcium
release from the sarcoplasmic reticulum. This could be an important antiarrhythmic
compensatory mechanism which would counteract age-dependent decrease in rates of
shortening and lengthening. The intrinsic decrease in the cycle duration in older
myocytes may also reflect a compensatory response to offset the effects of age related
Ang II-dependent and -independent desensitization to β-adrenergic stimulation (Ai et
al., 1998; Meissner et al., 1998; Lim et al., 1999; Barki-Harrington et al., 2003), or a
change in the preload in the situation in vivo.
Prolonged contractile cycle period (Tf -To) in younger TG cardiomyocytes is a prelude
to the later emergence of increased latency (To), a phenomenon which is not observed
in WT myocytes. This is a significant genotype-specific alteration associated with
ageing (Table IV-3). The explanation for a delayed onset of shortening (To) in the older
TG cardiomyocytes is rather speculative, but may be partly due to an increase in
cellular stiffness, decreased SR calcium release (Marks, 2001) or altered action
potential threshold conditions due to increased pH-dependent cardiac background
potassium currents (Backx and Marban, 1993; Lopes et al., 2000). Increased
refractoriness of voltage operated L-type calcium channels could also lead to delayed
E-C coupling latency (Antoons et al., 2002). Additionally, a delayed onset of
shortening (To) in the older TG cardiomyocytes could be explained by a decreased
activity of the NCX working in the reverse mode. Indeed, it could be further speculated
that an upregulation of the NHE-1 and NCX exchangers, as observed at the mRNA

Chapter IV
184
level in younger TG cardiomyocytes, could lead to cardiomyocyte sodium loading and
consequently enhanced inward calcium current driven by the NCX working in the
reverse mode. In a chronic state such as that which occurs with elevated Ang II in the
TG myocardium, these same mechanisms could work to maintain an appropriate E-C
coupling and action potential duration in an environment where cardiomyocyte
molecular remodeling is associated with sodium load, alkalinization and a shift of the
calcium cycling from an intracellular pathway toward an extracellular one (decrease in
SERCA2 protein expression). However, the age-dependent decrease of the NCX1.1 and
NHE-1 would cause a substantial decrease in NCX-dependent inward calcium current,
delaying the triggering of calcium release from the SR and delaying contraction.
Finally, cardiomyocytes from older WT and TG exhibit an abbreviated shortening
period (Tm-To). There is a significant genotype-specific alteration associated with
ageing for this parameter, with an approximate 25% age-dependent reduction in WT
myocytes but only ~10% reduction in TG myocytes (Figure IV-7, Table IV-3). Age-
dependent reduction in shortening duration is consistent with downregulation of the
NHE-1 in both WT and TG myocytes (Figure IV-8). Decreasing in proton export
would reduce myofilament calcium sensitivity and shortening duration. As NHE-1 is
upregulated in older TG myocytes relative to WT, the age-dependent effect on pH
would be more limited in TG myocytes, diminishing the magnitude of reduction for
this time parameter in older TG cardiomyocytes.
4.3. Decreased inotropy and lusitropy in LLC cardiomyocytes
The present study also demonstrates that the insulin resistant cardiomyopathy driven by
the deletion of the insulin-dependent GLUT4 transporter in LLC mice is associated
with impaired cardiomyocyte inotropy (MRS and %S) and lusitropy (MRL). These
findings indicate that chronic suppression of GLUT4-mediated glucose transport in
cardiomyocytes causes pronounced contractile dysfunction. These data also
complement the study of Huggins et al. (2004) who demonstrated reduction in peak
developed pressure and maximum rate of pressure development in ex vivo Langendorff-
perfused hearts from the same knock-out mouse line. As already suggested for the TG

Chapter IV
185
myocytes, the slower MRS and MRL observed in LLC cardiomyocytes may reflect a
shift in myosin and actin isoenzymes, probably associated with decreased actomyosin
ATPase activity and depletion of high energy phosphates. A shift in actomyosin
isoforms was previously shown to occur in experimental diabetic cardiomyopathy
(Garber and Neely, 1983; Pierce et al., 1989). Slower contraction rates observed in
LLC cardiomyocytes, where intracardiac glucose transport is impaired, could reflect
differential gene expression associated with ischemic conditions, and depressed
mitochondrial activity.
This study supports the results obtained by Dutta et al. (2001), who reported reduced
rates of shortening and lengthening and depressed peak maximal shortening (albeit
inconsistent) in cardiomyocytes isolated from sucrose-fed rats. No direct comparison of
the present results can be made with the contractile function measured by Abel et al.
(1999) in cardiac-specific GLUT4 knockout mouse (G4H-/-) hearts, as the phenotype
and cardiac function observed in that model (G4H-/-) are rather different to what is
described here for the LLC. Abel et al. (1999) observed no changes in basal cardiac
function in isolated hearts from G4H-/- mice. Interestingly however, ischemic
conditions and catecholamine stimulation revealed diastolic dysfunction in these mice,
suggesting that additive factors such as systemic changes in neuro-hormonal activation,
and possibly hypoxia are all necessary to develop overt mechanical dysfunction in
GLUT4-deficient hearts. Finally, the alterations in LLC cardiomyocyte contractility
reported here are somewhat similar to those observed in type 1 diabetic experimental
models, where negative inotropy and prolonged time to peak shortening are generally
noted (Noda et al., 1993; Jourdon and Feuvray, 1993; Yu et al., 1994; Lagadic-
Gossmann et al., 1996).
Surprisingly, ageing has no effect on cardiomyocyte inotropy (%S and MRS) in LL
and LLC myocytes. However ageing was associated with an increase in the rate of
lengthening (MRL) in the same myocytes (Table IV-4; Figure IV-9). This would
suggest that in this mouse strain ageing does not impair cardiomyocyte inotropy and
surprisingly improves relaxation dynamics. This age-dependent increase in lusitropy is
difficult to explain. An increase in rate of lengthening could represent an important
compensatory mechanism in this mouse model to shorten the contractile cycle and
preserve peak shortening (%S). It is also important to remember that LL mice are not

Chapter IV
186
exempt from systemic metabolic disturbances (insulin-signaling desensitization,
impaired glucose disposal) and cardiac remodeling (+15% in CWI) when compared to
C57BL6 controls (i.e. WT) (see Chapter III, Section 1.3.2), which could partly explain
why age-dependent changes in contractile parameters between LL and LLC myocytes
present a similar trend.
4.4. Increased twitch duration in LLC cardiomyocytes
This study demonstrates that there is an increased contractile cycle duration in LLC
cardiomyocytes when compared with LL. The increase in time parameters in LLC
myocytes is due to prolonged duration of E-C coupling latency (To) and increased
duration of shortening and lengthening periods (Tm-To; Tf-Tm) summating in an
extended contraction period (Tf-To). A delayed To in type 1 diabetes was previously
reported by Kotsanas et al. (2000) in cardiomyocytes isolated from STZ-treated
diabetic rats. Decreased SR calcium release due to RyR downregulation or increased
refractoriness of voltage operated calcium channels could explain the delayed onset of
contraction in LLC myocytes and the prolonged time of contraction. This interpretation
is consistent with the downregulation of the RyR2 receptors in LLC myocardium
(Figure IV-11, Panel B.) and also with decreased voltage-operated L-type calcium
current density observed in 15 to 35 week old LLC myocytes (Danes, 2004). A reduced
cytosolic calcium influx could account for the delay in E-C coupling and myocyte
shortening in LLC myocytes.
As discussed in relation to the TG myocyte data, a prolongation of the lengthening
period (Tf-Tm) in LLC may reflect a decrease in the rate of calcium removal from the
cytoplasm. This could be caused by slower calcium re-uptake into the SR by SERCA2,
combined with reduced calcium exit by the NCX. Both NCX and SERCA2 are
downregulated in LLC hearts (Figure IV-11, Panel A & C). Interestingly, embryos
from NCX knock-out heart tubes (at day 9.5) show E-C impairment associated with
increased diastolic calcium levels, decreased systolic calcium but unchanged SERCA2
expression levels (Reuter et al., 2003), suggesting a major developmental role played

Chapter IV
187
by the NCX in the role and longitudinal regulation of contractile cycle duration and E-
C coupling in heart myocytes.
The age-dependent decrease in the contraction period (Tf-To) observed in both LL and
LLC myocytes is associated with different trends in the shortening and lengthening
periods in each myocyte type. LLC cardiomyocytes from older animals show a more
pronounced age-dependent decrease of the lengthening period (Tf-Tm), while the LL
myocytes exhibit a more pronounced decrease of the shortening period (Tm-To) with
ageing (Figure IV-10). The significant genotype-specific alteration associated with
ageing for the shortening period (Tm-To), evidenced by an approximate 25% age-
dependent reduction in LL and only about 15% in LLC myocytes, is consistent with
previous observations made for the WT and TG myocytes (Figure IV-7). The
phenomenon was attributed to an age-dependent decrease in pH due to NHE-1
downregulation which is postulated to decrease myofilament calcium sensitivity and
reduce shortening duration. Since NHE-1 is still upregulated in older LLC myocytes
relative to LL, the age-dependent reduction in pH would be limited in LLC, thus
diminishing the magnitude of reduction for this time parameter in old LLC
cardiomyocytes. An explanation for the genotype-specific alteration associated with
ageing for the lengthening period is not immediately apparent and requires further
investigation.
4.5. Negative contraction-frequency relationship in mouse
cardiomyocytes
Rodent species such as the mouse and the rat have a short action potential, high
reliance on SR calcium cycling and high intracellular sodium concentrations. These
models generally exhibit a negative contraction-frequency relationship (Bers, 2001).
This negative relationship, widely documented in the rat (Orchard and Lakatta, 1986;
Capogrossi et al., 1986), may be related to exhaustion of the contractile and SR calcium
reserves, shortened SR filling times and/or oxygenation limitations at higher pacing
rates. In the perfused mouse heart and in isolated mouse myocardial preparations

Chapter IV
188
(trabeculae or intact mouse ventricles), biphasic frequency responses have been
reported with a modest positive contraction-frequency relationship at lower frequencies
(0.2-2Hz) which converts to a modest negative slope at higher frequencies (Gao et al.,
1998; Lim et al., 1999; Stull et al., 2002). Taking into account various aspects of E-C
coupling in the mouse heart, Georgakopoulos and Kass (2001) proposed that while not
negative, the frequency relationship should be quite modest over physiological heart
rates and stimulation frequencies.
This study demonstrates a negative contraction-frequency relationship in
cardiomyocytes from all experimental groups. The present work aimed to study the
response of isotonically contracting cardiomyocytes to frequency changes spanning
from 1.5 Hz to 5Hz, the latter being the closest pacing value to physiological range
tested here. It is interesting to note that at higher frequencies (i.e. 4 Hz and 5 Hz), no
statistical differences were observed for the inotropic and lusitropic values (%S, MRS
and MRL) in the 8 experimental groups. This would suggest that the negative
frequency relationship observed at lower frequency values could reach a plateau at
5 Hz (or higher) and possibly convert into a positive staircase at even higher pacing
values. Recent work with P12 cardiomyocytes and cardiomyocytes isolated from
C57BL6 mice support this idea, since a shift between negative and positive staircases
were observed around a specific stimulatory frequency, which corresponded to 6 Hz for
P12 cardiomyocytes and 2 Hz for C57BL6 myocytes (Tiemann et al., 2003).
The decrease in inotropic and lusitropic values observed with increased pacing
frequency in cardiomyocytes from TG1306/1R and GLUT4-KO mice could be related
to a reduction of inward calcium flux (mainly driven by the L-type calcium channels
and the NCX in the reverse mode) or a reduced fractional release of calcium from the
SR. Competition between the SERCA2 and NCX for calcium extrusion from the
cytosol may also change as a function of frequency. As reviewed by Bers (2001) the
SERCA2 becomes increasingly dominant over the NCX exchanger in transporting the
calcium from the cytosol at higher frequencies. This phenomenon is probably less
important in the mouse and the rat, where calcium removal from the cytosol is ~90%
driven by the SERCA2. For all the experimental groups reported in the present study,
differences in cardiomyocyte contractile parameters were proportionally consistent over
the range of pacing frequencies evaluated, indicating that decreases in SERCA2 protein
Chapter IV
189
levels and/or shifts in NCX gene expression do not directly affect the SR calcium
loading capability of myocytes under different genotypic backgrounds or at different
ages during a frequency staircase.
In agreement with previous observations (Lim et al., 2000; Antoons et al., 2002), the
present study reports a negative frequency relationship also for the twitch duration, that
is, shorter shortening and lengthening cycle periods at higher frequencies, in
combination with an increase in time of latency (To). Interestingly, Antoons et al.
(2002) reported a loss of trigger for calcium release from the SR at higher frequencies
in the mouse cardiomyocyte, which could explain in part the increase in To observed
here. In addition, a slowed recovery from inactivation of the voltage-operated channels
at higher frequencies could lead to a diminished inward calcium current via the voltage-
operated L-type calcium channels.
4.6. After-contraction, matters of calcium overload?
The NCX can have an adverse effect on contractility and arrhythmogenesis under
pathophysiological conditions. For instance, SR calcium overload is characterized by
waves of spontaneous SR calcium release that propagate through the cytoplasm
generating inward NCX currents (calcium out, sodium in) and delayed after-
depolarizations (Schlotthauer and Bers, 2000; Mackenzie et al., 2002; Pogwizd and
Bers, 2004). This mechanism is thought to underlie arrhythmias and after-contractions
associated with myocardial ischemia-reperfusion (Ch’en et al., 1998). Delayed after-
contractions observed in LLC myocytes at 1.5Hz could be generated by spontaneous
SR calcium release caused by calcium overloading conditions. At a low frequency rate
(1.5Hz), increased and prolonged systolic calcium transient, coupled with SERCA2 and
NCX1 downregulation, could create a state of calcium overload under low SR calcium
reserves in LLC myocytes. This would elicit spontaneous SR calcium release and
resting calcium levels to rise significantly. This state of calcium overload could trigger
ectopic beats and cause arrhythmias as observed in LLC cardiomyocytes at 1.5Hz.

Chapter IV
190
5. IN SUMMARY
The present Chapter reports impaired contractile function of isolated cardiomyocytes
and differential expression of key transporters involved in the calcium and pH
homeostasis in TG1306/1R and GLUT4-KO mice. A summary of the age-dependent
and genotype-dependent trends and variations of the contractile parameters for the 2
mouse models are reported in Tables IV-3 and IV-4. These data are further considered,
in the broader comparative context in conjunction with other morphological and
molecular data, in Chapter VI.

Chapter IV
191
98.7±2.7*79.3±4.2(ms)Tf
(ms)
(ms)
(ms)
(ms)
(Lo/s)
(Lo/s)
(L/Lo) 5.7±0.35.9±0.5%S
85.1±2.7*67.9±3.8Tf - To
53.8±1.9*41.9±2.5Tf - Tm
31.3±1.6*26.0±1.5Tm - To
13.7±1.1*11.5±0.8To
2.9±0.1*4.2±0.3MRL
3.6±0.2*4.1±0.2MRS
1517n (myocytes) =
TGWT
15-20 weekParameter
98.7±2.7*79.3±4.2(ms)Tf
(ms)
(ms)
(ms)
(ms)
(Lo/s)
(Lo/s)
(L/Lo) 5.7±0.35.9±0.5%S
85.1±2.7*67.9±3.8Tf - To
53.8±1.9*41.9±2.5Tf - Tm
31.3±1.6*26.0±1.5Tm - To
13.7±1.1*11.5±0.8To
2.9±0.1*4.2±0.3MRL
3.6±0.2*4.1±0.2MRS
1517n (myocytes) =
TGWT
15-20 weekParameterA.
99.6±4.4*67.9±3.3(ms)Tf
(ms)
(ms)
(ms)
(ms)
(Lo/s)
(Lo/s)
(L/Lo) 4.2±0.55.0±0.4%S
80±3.5*56.1±2.5Tf - To
52.9±3.0*36.2±2.2Tf - Tm
27.1±1.3*19.9±0.7Tm - To
19.6±2.0*11.8±1.0To
2.6±0.3*3.5±0.3MRL
2.6±0.2*3.8±0.3MRS
1516n (myocytes) =
TGWT
35-40 weekParameter
99.6±4.4*67.9±3.3(ms)Tf
(ms)
(ms)
(ms)
(ms)
(Lo/s)
(Lo/s)
(L/Lo) 4.2±0.55.0±0.4%S
80±3.5*56.1±2.5Tf - To
52.9±3.0*36.2±2.2Tf - Tm
27.1±1.3*19.9±0.7Tm - To
19.6±2.0*11.8±1.0To
2.6±0.3*3.5±0.3MRL
2.6±0.2*3.8±0.3MRS
1516n (myocytes) =
TGWT
35-40 weekParameterB.
Table IV-1: Isotonic shortening of adult cardiomyocytes from WT and TG mice (5 Hz)
A. 15-20 week old WT and TG; B. 35-40 week old WT and TG. Parameters calculated included the maximum cell shortening (%S), expressed as a percentage of initial resting cell length (Lo); the time at which the cell commenced shortening after stimulus application, i.e. the excitation-contraction coupling latency (To); the time at %S (Tm); the time at which the cell length returned to Lo (Tf); the maximal rate of cell shortening (MRS) and lengthening (MRL). Tf -To indicates duration of the whole contractile cycle; Tm-To, duration of shortening; Tf -Tm, duration of lengthening. * p<0.05, TG vs. age-matched WT (one-way ANOVA)

Chapter IV
192
98.7±2.7*79.3±4.2(ms)Tf
(ms)
(ms)
(ms)
(ms)
(Lo/s)
(Lo/s)
(L/Lo) 5.7±0.35.9±0.5%S
85.1±2.7*67.9±3.8Tf - To
53.8±1.9*41.9±2.5Tf - Tm
31.3±1.6*26.0±1.5Tm - To
13.7±1.1*11.5±0.8To
2.9±0.1*4.2±0.3MRL
3.6±0.2*4.1±0.2MRS
1517n (myocytes) =
LLCLL
15-20 weekParameter
98.7±2.7*79.3±4.2(ms)Tf
(ms)
(ms)
(ms)
(ms)
(Lo/s)
(Lo/s)
(L/Lo) 5.7±0.35.9±0.5%S
85.1±2.7*67.9±3.8Tf - To
53.8±1.9*41.9±2.5Tf - Tm
31.3±1.6*26.0±1.5Tm - To
13.7±1.1*11.5±0.8To
2.9±0.1*4.2±0.3MRL
3.6±0.2*4.1±0.2MRS
1517n (myocytes) =
LLCLL
15-20 weekParameterA.
4.8±0.7*6.6±0.3
75.0±7.870.9±2.0
51.2±5.245.0±1.5
23.7±2.725.9±1.4
24.6±2.3*12.1±0.6
2.6±0.3*3.9±0.1
3.2±0.4*4.4±0.2
1615
99.6±6.4*83.0±2.4
99.6±4.4*67.9±3.3(ms)Tf
(ms)
(ms)
(ms)
(ms)
(Lo/s)
(Lo/s)
(L/Lo) 4.2±0.55.0±0.4%S
80±3.5*56.1±2.5Tf - To
52.9±3.0*36.2±2.2Tf - Tm
27.1±1.3*19.9±0.7Tm - To
19.6±2.0*11.8±1.0To
2.6±0.3*3.5±0.3MRL
2.6±0.2*3.8±0.3MRS
1516n (myocytes) =
LLCLL
35-40 weekParameter
99.6±4.4*67.9±3.3(ms)Tf
(ms)
(ms)
(ms)
(ms)
(Lo/s)
(Lo/s)
(L/Lo) 4.2±0.55.0±0.4%S
80±3.5*56.1±2.5Tf - To
52.9±3.0*36.2±2.2Tf - Tm
27.1±1.3*19.9±0.7Tm - To
19.6±2.0*11.8±1.0To
2.6±0.3*3.5±0.3MRL
2.6±0.2*3.8±0.3MRS
1516n (myocytes) =
LLCLL
35-40 weekParameterB.
5.0±0.4*6.2±0.6
63.3±3.259.7±3.3
38.8±2.139.5±2.7
24.5±1.2*20.2±1.0
15.4±1.3*11.3±1.1
3.4±0.4*4.5±0.5
3.8±0.5*4.8±0.5
1615
78.7±4.5*71.0±3.0
Table IV-2: Isotonic shortening of adult cardiomyocytes from LL and LLC mice (5 Hz)
A. 15-20 week old LL and LLC; B. 35-40 week old LL and LLC. Parameters calculated included the maximum cell shortening (%S), expressed as a percentage of initial resting cell length (Lo); the time at which the cell commenced shortening after stimulus application, i.e. the excitation-contraction coupling latency (To); the time at %S (Tm); the time at which the cell length returned to Lo (Tf); the maximal rate of cell shortening (MRS) and lengthening (MRL). Tf -To indicates duration of the whole contractile cycle; Tm-To, duration of shortening; Tf -Tm, duration of lengthening. * p<0.05, LLC vs. age-matched LL (one-way ANOVA)

Chapter IV
193
(ms)
(ms)
(ms)
(ms)
(Lo/s)
(Lo/s)
(L/Lo) ‡†%S
‡†*Tf - To
‡†*Tf - Tm
¶‡†*Tm - To
¶‡†*To
¶‡†*MRL
‡†*MRS
Age-Genot.FrequencyAgeGenotypeParameter
(ms)
(ms)
(ms)
(ms)
(Lo/s)
(Lo/s)
(L/Lo) ‡†%S
‡†*Tf - To
‡†*Tf - Tm
¶‡†*Tm - To
¶‡†*To
¶‡†*MRL
‡†*MRS
Age-Genot.FrequencyAgeGenotypeParameter
Table IV-3: Summary of the multiple-way ANOVA analysis for the TG and WT myocytes
Significant genotype-, age-, frequency-dependent and interaction (age-genotype) findings for the contractile parameters of WT and TG cardiomyocytes at 15-20 and 35-40 weeks.

Chapter IV
194
(ms)
(ms)
(ms)
(ms)
(Lo/s)
(Lo/s)
(L/Lo) ‡%S
‡†*Tf - To
‡†*Tf - Tm
¶‡†*Tm - To
¶‡†*To
¶
‡†*MRL
‡*MRS
Age-Genot.FrequencyAgeGenotypeParameter
*
(ms)
(ms)
(ms)
(ms)
(Lo/s)
(Lo/s)
(L/Lo) ‡%S
‡†*Tf - To
‡†*Tf - Tm
¶‡†*Tm - To
¶‡†*To
¶
‡†*MRL
‡*MRS
Age-Genot.FrequencyAgeGenotypeParameter
*
Table IV-4: Summary of the multiple-way ANOVA analysis for the LLC and LL myocytes
Significant genotype-, age-, frequency-dependent and interaction (age-genotype) findings for the contractile parameters of LL and LLC cardiomyocytes at 15-20 and 35-40 weeks.

Chapter IV
195
Figure IV-1: Effects of acute Ang II modulation of cardiomyocyte contractility
Refer to text in Section 1.2.8 of this Chapter for a detailed explanation of the different pathways. A. Ang II can activate the sodium-calcium exchanger (NCX) working in reverse mode (calcium ‘in’) via a PKC-dependent signal; B. Ang II can activate the sodium-hydrogen exchanger (NHE) via a PKC-dependent signaling pathway; C. Acutely, Ang II can promote calcium efflux via the NCX; D. Activation of the NHE result in cytosolic alkalinization and sodium load, influencing the myofilament calcium sensitivity and the activity of the NCX working in the reverse mode E. Ang II can modulate the positive inotropic effect through activation of the phospholipase D (PLD) and the NADPH oxidase, leading to production of reactive oxygen species (ROS). These superoxide anions induce the activation of the NHE via an ERK/MAPK-dependent pathway.
VOC
[Na+]i
[Ca2+]e
NCX
NCX
[H+]i
NHE-1
‘alkalosis’
[Ca2+]i
A.A.
[Na+]e
B.B.
‘inwardcalcium current’
‘positive inotropiceffect’
SR
[Na+]e
[Ca2+]i
C.C.
[Ca2+]i
[Na+]i
Ang II
AT1
myofilamentsensitivity
‘calciumoverload’
SERCA2
D.D.
PKC
NADPH oxidase
‘ROS’
‘Erk MAPK’ E.E.
‘calcium in’
‘calcium out’
oo
oo
oo

Chapter IV
196
Figure IV-2: Effects of chronic Ang II modulation of cardiomyocyte contractility
Refer to text in Section 1.2.8 of this Chapter for a detailed explanation of the different pathways. A. Alkalosis promotes growth and proliferation; B. Alkalosis also reduces ATP production and C. can promote apoptosis; D. Ang II-induced expression of endothelin-1 can (E.) enhance intracellular signaling and sustain differential gene expression and remodeling; F. re-expression of fetal isoforms of contractile proteins can result in slower contraction kinetics; G. NADPH oxidase-induced production of reactive oxygen species (ROS) can activate the NHE via an ERK MAPK pathway; H. mitochondria-induced production of ROS, can activate the p38 MAPK and JNK leading to differential gene expression.
‘growthproliferation’
(?) VOC
[Na+]i
[Ca2+]e
NCX (?)
NCX (?)
[H+]i
(?) NHE-1
‘alkalosis’
[Ca2+]i
A.A.
[Na+]e
B.B.
‘inwardcalcium current’
‘negative inotropiceffect’
SR
[Na+]e
[Ca2+]i
C.C.
[Ca2+]i
Ang II
AT1
SERCA2
D.D.
PKC
NADPH oxidase
‘ROS’
Endothelin-1ETA
α-SkAβ-MHC
ATP Mitoch.
‘gene expression’
‘ROS’
‘apoptosis’
NucleusE.E.
G.G.
F.F.
H.H.
p38 and JNK
o
o
o
‘growthproliferation’
(?) VOC
[Na+]i
[Ca2+]e
NCX (?)
NCX (?)
[H+]i
(?) NHE-1
‘alkalosis’
[Ca2+]i
A.A.
[Na+]e
B.B.
‘inwardcalcium current’
‘negative inotropiceffect’
SR
[Na+]e
[Ca2+]i
C.C.
[Ca2+]i
Ang II
AT1
SERCA2
D.D.
PKC
NADPH oxidase
‘ROS’
Endothelin-1ETA
α-SkAβ-MHC
ATP Mitoch.
‘gene expression’
‘ROS’
‘apoptosis’
NucleusE.E.
G.G.
F.F.
H.H.
p38 and JNK
oo
oo
oo

Chapter IV
197
0
2
4
6
8
1 0
1 2
1 4
1 6
1 8
%S
3Hz (basal) 1.5Hz 3Hz 4Hz 5HzFrequency:
100 30 30 30 30 100No cycles averaged:
Time (min): 2:00 4:25 7:00
A.
B.
3Hz (basal)
0
2
4
6
8
1 0
1 2
1 4
1 6
1 8
%S
3Hz (basal) 1.5Hz 3Hz 4Hz 5HzFrequency:
100 30 30 30 30 100No cycles averaged:
Time (min): 2:00 4:25 7:00
A.
B.
3Hz (basal)
Figure IV-3: Protocol summary for the contractility experiments
A. Protocol summary for contractility experiments with frequency variation and description of variable times and frequencies of parameter measurement. B. Typical shortening profile (%S) for a cell contracting according to the protocol illustrated above and number of contractile cycles averaged (with their location) at each frequency for analysis.

Chapter IV
198
Figure IV-4: Evaluation of %S and Tf prior to and after the frequency ramp
Evaluation of %S (A, B, C, D) and Tf (E, F, G, H) prior to the frequency ramp (‘pre’) and at the end of the experimental protocol (‘post’) in 15-20 and 35-40 week WT and TG myocytes. No statistical differences were observed.
%S TfA
B
C
D
E
F
G
H
15-2
0 w
. WT
15-2
0 w
. TG
35-4
0 w
. WT
35-4
0 w
. TG
0
2
4
6
8
WT pre WT post
0
2
4
6
8
TG pre TG post
0
2
4
6
8
WT pre WT post
0
2
4
6
8
TG pre TG post
0
20
40
60
80
100
120
140
WT pre WT post
0
20
40
60
80
100
120
140
TG pre TG post
0
20
40
60
80
100
120
140
WT pre WT post
0
20
40
60
80
100
120
140
TG pre TG post
f%S TfA
B
C
D
E
F
G
H
15-2
0 w
. WT
15-2
0 w
. TG
35-4
0 w
. WT
35-4
0 w
. TG
0
2
4
6
8
WT pre WT post
0
2
4
6
8
TG pre TG post
0
2
4
6
8
WT pre WT post
0
2
4
6
8
TG pre TG post
0
20
40
60
80
100
120
140
WT pre WT post
0
20
40
60
80
100
120
140
TG pre TG post
0
20
40
60
80
100
120
140
WT pre WT post
0
20
40
60
80
100
120
140
TG pre TG post
%S TfA
B
C
D
E
F
G
H
15-2
0 w
. WT
15-2
0 w
. TG
35-4
0 w
. WT
35-4
0 w
. TG
0
2
4
6
8
WT pre WT post
0
2
4
6
8
TG pre TG post
0
2
4
6
8
WT pre WT post
0
2
4
6
8
TG pre TG post
0
20
40
60
80
100
120
140
WT pre WT post
0
20
40
60
80
100
120
140
TG pre TG post
0
20
40
60
80
100
120
140
WT pre WT post
0
20
40
60
80
100
120
140
TG pre TG post
ff

Chapter IV
199
Figure IV-5: Evaluation of %S and Tf prior to and after the frequency ramp
Evaluation of %S (A, B, C, D) and Tf (E, F, G, H) prior to the frequency ramp (‘pre’) and at the end of the experimental protocol (‘post’) in 15-20 and 35-40 week LL and LLC myocytes. No statistical differences were observed.
%S Tf
A
B
C
D
E
F
G
H
15-2
0 w
. LL
15-2
0 w
. LLC
35-4
0 w
. LL
35-4
0 w
. LLC
0
2
4
6
8
LL Pre LL Post
0
2
4
6
8
LLC Pre LLC Post
0
2
4
6
8
LL Pre LL Post
0
2
4
6
8
LLC Pre LLC Post
0
40
80
120
LL Pre LL Post
0
40
80
120
LLC Pre LLC Post
0
40
80
120
LL Pre LL Post
0
40
80
120
LLC Pre LLC Post
f%S Tf
A
B
C
D
E
F
G
H
15-2
0 w
. LL
15-2
0 w
. LLC
35-4
0 w
. LL
35-4
0 w
. LLC
0
2
4
6
8
LL Pre LL Post
0
2
4
6
8
LLC Pre LLC Post
0
2
4
6
8
LL Pre LL Post
0
2
4
6
8
LLC Pre LLC Post
0
40
80
120
LL Pre LL Post
0
40
80
120
LLC Pre LLC Post
0
40
80
120
LL Pre LL Post
0
40
80
120
LLC Pre LLC Post
ff

Chapter IV
200
3
6
9
12
Hz 1.5 Hz 3 Hz 4 Hz 5
2
3.5
5
6.5
Hz 1.5 Hz 3 Hz 4 Hz 5
2
3
4
5
6
Hz 1.5 Hz 3 Hz 4 Hz 5
A.
B.
C.
Normalized %S
Normalized MRS
Normalized MRL
1.5 3 4 5
Lo/s
Lo/
s%
Lo
(Hz)
(Hz)
(Hz)
1.5 3 4 5
1.5 3 4 5 3
6
9
12
Hz 1.5 Hz 3 Hz 4 Hz 5
2
3.5
5
6.5
Hz 1.5 Hz 3 Hz 4 Hz 5
2
3
4
5
6
Hz 1.5 Hz 3 Hz 4 Hz 5
A.
B.
C.
Normalized %S
Normalized MRS
Normalized MRL
1.5 3 4 5
Lo/s
Lo/
s%
Lo
(Hz)
(Hz)
(Hz)
1.5 3 4 5
1.5 3 4 5
*
*†
†
†
‡
‡
‡
¶
A. Normalized %S
B. Normalized MRS
C. Normalized MRL
35-40 week, WT
15-20 week, WT
35-40 week, TG
15-20 week, TG
Figure IV-6: Pacing responses of isotonically shortening adult myocytes from WT and TG
Inotropic and lusitropic parameters. See legend of Table IV-1 for description of abbreviations. * p<0.05, TG vs. WT cardiomyocytes; † p<0.05, 35-40 vs. 15-20 week old cardiomyocytes; ‡ p<0.05, pacing frequency effect; ¶ p<0.05, age-genotype interaction effect (all values derived from analysis by multiple-way ANOVA for repeated measures).

Chapter IV
201
35-40 week, WT
15-20 week, WT
35-40 week, TG
15-20 week, TG
Figure IV-7: Pacing responses of isotonically shortening adult myocytes from WT and TG
Cycle time parameters. See legend of Table IV-1 for description of abbreviations. * p<0.05, TG vs. WT cardiomyocytes; † p<0.05, 35-40 vs. 15-20 week old cardiomyocytes; ‡ p<0.05, pacing frequency effect; ¶ p<0.05, age-genotype interaction effect (all values derived from analysis by multiple-way ANOVA for repeated measures).
8
12
16
20
24
Hz 1.5 Hz 3 Hz 4 Hz 540
80
120
160
Hz 1.5 Hz 3 Hz 4 Hz 5
10
20
30
40
50
Hz 1.5 Hz 3 Hz 4 Hz 530
50
70
90
110
Hz 1.5 Hz 3 Hz 4 Hz 5
A.
C.
B.
D.
Tf-To
Tf - Tm
To
Tm-To1.5 3 4 5
ms
ms
(Hz)(Hz)
1.5 3 4 5 (Hz)
1.5 3 4 5
(Hz)1.5 3 4 5
ms
ms
*†
‡ ¶
*
†
‡ ¶
*
†
‡
*
†
‡
A. To B. Tf-To
C. Tm-To D. Tf-Tm
To Tf -To
Tf -TmTm-To

Chapter IV
202
Figure IV-8: mRNA and protein expression profiles in WT and TG hearts
Expression profiles of sarcoplasmic reticulum calcium pump SERCA2 protein levels (A.), ryanodine receptor RyR2 mRNA (B.), sodium-calcium exchanger NCX1.1 mRNA (C.) and sodium-hydrogen exchanger NHE-1 mRNA (D.). In parenthesis are the number of animals per group. Statistical analysis: * p<0.05, TG vs. WT (one-way ANOVA, i.e. unpaired t-test); † p<0.05, age-genotype interaction effect (multiple-way ANOVA); ‡ p<0.05, TG vs. WT (multiple-way ANOVA); § p<0.05, 35-40 vs. 15-20 week old cardiomyocytes (multiple-way ANOVA).
TG1306/1R (n=10)WT (n=10)
15-20 week 15-20 week
15-20 week15-20 week
35-40 week
35-40 week35-40 week
A. B.
C. D.
Expr
essi
on le
v el
(Arb
. Uni
ts)
*
†
‡
NCX1.1
SERCA2 RyR2
NHE-1
§ ‡
0
40
80
120
160
010
2030
40
50
60
0
10
20
30
40
50
0
2
4
6
8
10
Expr
essi
on le
v el
(Arb
. Uni
ts)
Expr
essi
on le
vel
(Ar b
. Uni
ts)
Expr
essi
on le
vel
(Arb
. Uni
ts)
‡ ‡
SERCA2 RyR2
NCX1.1 NHE-1
*
(n=10)(n=10) TG1306/1R (n=10)WT (n=10)
15-20 week 15-20 week
15-20 week15-20 week
35-40 week
35-40 week35-40 week
A. B.
C. D.
Expr
essi
on le
v el
(Arb
. Uni
ts)
*
†
‡
NCX1.1
SERCA2 RyR2
NHE-1
§ ‡
0
40
80
120
160
010
2030
40
50
60
0
10
20
30
40
50
0
2
4
6
8
10
Expr
essi
on le
v el
(Arb
. Uni
ts)
Expr
essi
on le
vel
(Ar b
. Uni
ts)
Expr
essi
on le
vel
(Arb
. Uni
ts)
‡ ‡
TG1306/1R (n=10)WT (n=10)
15-20 week 15-20 week
15-20 week15-20 week
35-40 week
35-40 week35-40 week
A. B.
C. D.
Expr
essi
on le
v el
(Arb
. Uni
ts)
*
†
‡
NCX1.1
SERCA2 RyR2
NHE-1
§ ‡
0
40
80
120
160
010
2030
40
50
60
0
10
20
30
40
50
0
2
4
6
8
10
Expr
essi
on le
v el
(Arb
. Uni
ts)
Expr
essi
on le
vel
(Ar b
. Uni
ts)
Expr
essi
on le
vel
(Arb
. Uni
ts)
‡ ‡
SERCA2 RyR2
NCX1.1 NHE-1
TG1306/1R (n=10)WT (n=10)
15-20 week 15-20 week
15-20 week15-20 week
35-40 week
35-40 week35-40 week
A. B.
C. D.
Expr
essi
on le
v el
(Arb
. Uni
ts)
*
†
‡
NCX1.1
SERCA2 RyR2
NHE-1
§ ‡
0
40
80
120
160
010
2030
40
50
60
0
10
20
30
40
50
0
2
4
6
8
10
Expr
essi
on le
v el
(Arb
. Uni
ts)
Expr
essi
on le
vel
(Ar b
. Uni
ts)
Expr
essi
on le
vel
(Arb
. Uni
ts)
‡ ‡
SERCA2 RyR2
NCX1.1 NHE-1
*
(n=10)(n=10)

Chapter IV
203
3
6
9
12
Hz 1.5 Hz 3 Hz 4 Hz 5
2
3
4
5
6
7
Hz 1.5 Hz 3 Hz 4 Hz 5
2
3
4
5
6
7
Hz 1.5 Hz 3 Hz 4 Hz 51.5 3 4 5
Lo/
sL
o/s
%L
o
(Hz)
(Hz)
(Hz)
1.5 3 4 5
1.5 3 4 5
*
*†
‡
‡
‡*
A. Normalized %S
B. Normalized MRS
C. Normalized MRL
35-40 week, LL
15-20 week, LL
35-40 week, LLC
15-20 week, LLC
35-40 week, LL
15-20 week, LL
35-40 week, LL
15-20 week, LL
35-40 week, LLC
15-20 week, LLC
35-40 week, LLC
15-20 week, LLC
Figure IV-9: Pacing responses of isotonically shortening adult myocytes from LL and LLC mice
Inotropic and lusitropic parameters. See legend of Table IV-2 for description of abbreviations. * p<0.05, LLC vs. LL cardiomyocytes; † p<0.05, 35-40 vs. 15-20 week old cardiomyocytes; ‡ p<0.05, pacing frequency effect (all values derived from analysis by multiple-way ANOVA for repeated measures).

Chapter IV
204
35-40 week, LL
15-20 week, LL
35-40 week, LLC
15-20 week, LLC
35-40 week, LL
15-20 week, LL
35-40 week, LL
15-20 week, LL
35-40 week, LLC
15-20 week, LLC
35-40 week, LLC
15-20 week, LLC
Figure IV-10: Pacing responses of isotonically shortening adult myocytes from LL and LLC
Cycle time parameters. See legend of Table IV-2 for description of abbreviations. * p<0.05, LLC vs. LL cardiomyocytes; † p<0.05, 35-40 vs. 15-20 week old cardiomyocytes; ‡ p<0.05, pacing frequency effect; ¶ p<0.05, age-genotype interaction effect (all values derived from analysis by multiple-way ANOVA for repeated measures).
8
12
16
20
24
28
Hz 1.5 Hz 3 Hz 4 Hz 5
18
26
34
42
Hz 1.5 Hz 3 Hz 4 Hz 520
40
60
80
100
Hz 1.5 Hz 3 Hz 4 Hz 5
50
80
110
140
Hz 1.5 Hz 3 Hz 4 Hz 5
ms
ms
1.5 3 4 5 (Hz) (Hz)1.5 3 4 5
ms
ms
*
†
‡ ¶
*
†
‡ ¶
8
12
16
20
24
28
Hz 1.5 Hz 3 Hz 4 Hz 51.5 3 4 5 (Hz)
*†
‡ ¶
50
80
110
140
Hz 1.5 Hz 3 Hz 4 Hz 5
*
†
‡
(Hz)1.5 3 4 5
A. To B. Tf-To
C. Tm-To D. Tf-Tm
To Tf -To
Tf -TmTm-To
8
12
16
20
24
28
Hz 1.5 Hz 3 Hz 4 Hz 5
18
26
34
42
Hz 1.5 Hz 3 Hz 4 Hz 520
40
60
80
100
Hz 1.5 Hz 3 Hz 4 Hz 5
50
80
110
140
Hz 1.5 Hz 3 Hz 4 Hz 5
ms
ms
1.5 3 4 5 (Hz) (Hz)1.5 3 4 5
ms
ms
*
†
‡ ¶
*
†
‡ ¶
8
12
16
20
24
28
Hz 1.5 Hz 3 Hz 4 Hz 51.5 3 4 5 (Hz)
*†
‡ ¶
50
80
110
140
Hz 1.5 Hz 3 Hz 4 Hz 5
*
†
‡
(Hz)1.5 3 4 5
A. To B. Tf-To
C. Tm-To D. Tf-Tm
To Tf -To
Tf -TmTm-To

Chapter IV
205
Figure IV-11: mRNA and protein expression profiles in LL and LLC hearts
Expression profiles of sarcoplasmic reticulum calcium pump SERCA2 protein levels (A.), ryanodine receptor RyR2 mRNA (B.), sodium-calcium exchanger NCX1.1 mRNA (C.) and sodium-hydrogen exchanger NHE-1 mRNA (D.). In parenthesis are the number of animals per group. Statistical analysis: * p<0.05, LLC vs. LL (one-way ANOVA); † p<0.05, age-genotype interaction effect (multiple-way ANOVA); ‡ p<0.05 LLC vs. LL (multiple-way ANOVA): § p<0.05, 35-40 vs. 15-20 week myocytes (multiple-way ANOVA).
LLC (n=10)LL (n=10)
15-20 week 15-20 week 35-40 week
A. SERCA2 B. RyR2
C. NCX1.1 D. NHE-1
E xpr
essi
o n le
vel
(Arb
. Uni
ts)
*
Expr
essi
o n le
vel
(Arb
. Un i
ts)
Expr
e ssi
on le
v el
(Arb
. Uni
ts)
Expr
e ssi
on le
v el
(Arb
. Uni
ts)
20
60
100
140
0
10
20
30
40
50
0
10
20
30
40
50
15-20 week 35-40 week0
2
4
68
1012
0
2
4
68
1012
15-20 week 35-40 week
‡ ‡
0
3
69
12
15
18
0
3
69
12
15
18
‡ ‡
‡ ‡§
†
*

Chapter IV
206
%S
100
90
50 100 ms200150
Figure IV-12: After-contraction in LLC myocytes
Cell shortening profile and ‘delayed after contraction’ recorded from a 35-40 week old LLC cardiomyocyte at a pacing frequency of 1.5Hz.

CHAPTER V
Microarray analysis of global changes in gene
expression in Ang II-induced and insulin resistant
cardiac hypertrophy

Chapter V
208
1. INTRODUCTION
1.1. Application of microarray analysis
The microarray technique is rapidly developing as a general molecular biology
analytical technique. The technique is currently being exploited as a new tool to
perform genomic analysis and gene expression analysis.
Identification of new genes by examining nucleic acid sequences derived from open
reading frames has proved to be an efficient way of annotating the human genome and
facilitating the use of genomic information for experimental purposes (Shoemaker et
al., 2001). Furthermore, microarrays have been applied as a cost-effective technology
to screen for all possible mutations and sequence variations in genomic DNA (Hacia,
1999; Larsen et al., 2001). Samples can be sequenced using microarray hybridization
(Drobyshev et al., 1997), thus providing convenient means for identifying new genetic
variants.
Gene expression analysis examines the composition of cellular RNA populations. The
identity of transcripts that make up these populations and their expression levels are
informative of gene activity and cell state. As the precursors of translated proteins,
changes in mRNA levels are related to changes in the proteome and, ultimately, to the
physiology of the cell. A typical microarray gene expression analysis experiment
compares the relative expression levels of specific transcripts in two samples as
detailed in Chapter II (Section 8). One of these samples is a control and the other is
derived from cells or tissues whose response or status is being investigated (e.g. in
disease conditions, or after drug treatment and genetic modification) (Debouck and
Goodfellow, 1999, Duggan et al., 1999; Burgess, 2001). Each sample is labeled with
different fluorescent dyes (e.g. Cy3 and Cy5) and equal amounts of the labeled samples
are combined and hybridized with the microarray. The fluorescent signals
corresponding to the two dyes are measured independently from each spot on the

Chapter V
209
microarray (i.e. ‘probe’ nucleic acid sequences complementary to the labeled target
sample) after hybridization. After normalization, the intensity of the two hybridization
signals for each spot can be compared. Equal signal intensity from both samples
suggests equal expression in both samples (see Chapter II for further details).
1.2. cDNA versus oligonucleotides microarray assays
Before the availability of complete or near-complete eukaryotic genome sequences,
genes expressed in cells, tissues and organs were identified through sequence analysis
of cDNA banks. cDNA clones from cDNA banks of Arabidopsis and human peripheral
blood lymphocytes were used in the construction of the first cDNA expression arrays
(Schena et al., 1995). Briefly, a library of cDNA clones contained in 96- or 384-well
plates is cultured in bacteria. cDNA inserts from plasmids are amplified and products
are spotted onto activated glass slides. Two targets from mRNA are differentially
labeled, hybridized to slides and scanned. This method has been the foundation of most
gene expression research where the starting material is plasmids from cDNA banks (see
below and Duggan et al., 1999; Lou et al., 2001).
Oligonucleotide arrays were developed by Affymetrix (http://www.affymetrix.com)
using photolithographic methods similar to the production of computer chips that were
subsequently adapted to gene expression studies (Lockhart et al., 1996; Lipshutz et al.,
1999). In brief, pairs of oligonucleotides (~25 bases in length) with exact sequence (i.e.
perfect match) and one mismatch are synthesized in situ by photolithographic methods.
The mismatch oligonucleotide has one-base mismatch in the center position and it is
used as a control to detect background noise and cross-hybridization from unrelated
targets. Eleven-to-twenty different oligonucleotides are made for each gene or
transcript sequence to ‘tile’ or cover a portion of the 3’ end of the target mRNA. The
present commercial format is a 1.28 x 1.28 cm microarray ‘chip’ containing up to
500,000 different oligonucleotide sequences. One single target is hybridized to each
chip and differential analysis between targets is made by comparing different chip sets.

Chapter V
210
Technology has progressed to such an extent that publication of new genome sequences
has become commonplace. Therefore, the flexibility in designing and producing new
arrays to capitalize on this wealth of sequence data is an important issue. The
production of new arrays via the synthesis of long, 60-mer oligonucleotides by an ink-
jet printing process addresses this point (Blanchard and Hood., 1996; Hughes et al.,
2001). Algorithms are used to design long oligonucleotides of the same size, but with
little sequence homology. Protocols for printing, hybridizing and analyses are similar to
cDNA arrays. This versatile system can routinely produce arrays with 25,000 or more
elements.
1.3. Application of microarray analysis to the study of heart
development and cardiovascular diseases
The cDNA microarray technique has been used to investigate cellular and tissue
mechanisms of cardiac physiology and pathophysiology. In recent years, the number of
microarray studies reporting differentially upregulated genes in the cardiovascular
system under various pathophysiological conditions has literally exploded, producing
an exponential amount of data and information. The following Section summarizes a
selection of studies where the microarray technique was applied to pioneer the study of
gene expression in the cardiac tissue under different pathophysiological conditions.
1.3.1. Heart and cardiomyocyte development
Sehl et al. (2000) used cDNA microarray hybridization to determine differential gene
expression in embryonic and neonatal (vs. adult) rat ventricular cardiac tissue. The
greatest contrast was seen when comparing neonatal with adult myocardium and, as
expected, this reflected higher expression of signal transduction and growth regulatory
proteins in the developing heart. Among the upregulated genes in the embryonic state
(a ratio >1.5 between embryo and adult tissue) were the apoptotic Bcl-x, genes coding

Chapter V
211
for stress-related heat-shock proteins (Hsp70, Hsp90, Hsc70), transporters (β-globin,
ferritin, annexin VI), transcription factors (c-Myc, n-Myc, Ubf-1), translation factors
(Ef-1α), ribosomal units (11S, 20S, mitochondrial 12S and 16S), G proteins (Giα-1, -2,
-3 and Gs), receptors (Ppar-δ, IGF-1 receptor), structural proteins (vimentin, β-Actin,
MLC isoforms, collagen III, fibronectin, osteopontin), hormones (ANP, BNP, TNF-α)
and metabolism or energy-related proteins (GAPDH, aldehyde reductase, pyruvate
kinase). Other genes, such as SERCA2, troponin I and lipoprotein lipase were found to
be downregulated in the embryo relative to the adult (a ratio <0.6 between embryo and
adult tissue). All together, in that study 12 genes previously described as being
differentially expressed during myocardial development were identified together with
10 uncharacterized expressed sequence tags (ESTs) and 36 genes not previously
associated with cardiac development.
Peng et al. (2002) used cDNA microarray assays to study the gene expression profile of
a sub-line of P19 cells (P19CL6) differentiating into spontaneously beating
cardiomyocytes after 2 to 14 days of DMSO stimulation. Having demonstrated that
treatment with DMSO for a minimum of 4 days was required for differentiation and
initiation of contractions, the authors were particularly interested in genes for which
expression was altered during or after this 4 day time period. Thirteen genes for which
expression increased more than 2-fold before day 4 were identified (including c-Myc,
the downstream effector of Wnt signaling LEF1 and the metabolism-related genes
carbonic anhydrase 2 and phosphoenolpyruvate carboxykinase), in addition to a set of
16 unknown ESTs. Among the genes of which expression was increased more than 2-
fold after day 4, Peng et al. found 69 known genes and 105 unknown ESTs. Known
genes coded for transcription factors (including the pro-hypertrophic MEF2C), ECM
and signaling proteins (elastin, fibrillin 2, lamin and laminin isoforms, collagen V,
tenascin C, TIMP3, BMP-1), growth factors and hormones (TGF-β2, placental growth
factor, IGFBP), cytoskeleton (MLC isoforms) and intracellular signalling-related
molecules (annexin V, annexin A3 and A6, calcineurin catalytic subunit, Akt2,
MAPKK2).

Chapter V
212
1.3.2. Myocardial infarction and ischemia
Rodent models of myocardial infarction (MI) result in ischemic, inflammatory and
fibrotic repair responses within necrotic myocardium in addition to compensatory
hypertrophy of the remnant viable ventricle. Sehl et al. (2000) used cDNA microarrays
to compare gene expression profiles at different times after MI (1, 3 and 7 days).
Among the differentially expressed genes, they identified 14 genes not previously
associated with MI which exhibited significant change in their expression pattern (>1-
fold overexpression vs. sham-operated animals), including: an ATP synthase (at day 3
after MI), β-globin (at day 3 after MI), cathepsin B (from day 1 after MI), ferritin light
chain (at day 3 after MI), nonmuscular MLC (from 1 week after MI), phospholemman
(from day 3 after MI) and several ribosomal units (11S, 20S, mitochondrial 12S and
16S).
Stanton et al. (2000) examined the infarcted LV free wall and septum at 5 different
time points after MI in the rat, evaluating the expression of 7000 clones isolated from a
normalized rat left ventricular cDNA library. Over 700 genes, classified in 7 functional
clusters by the authors, were shown to have reproducible patterns of differential
expression (http://circres.ahajournals.org/cgi/content/full/86/9/939/DC2/1/). Among the
genes, Stanton et al. found several new genes not previously associated with the
process of repair and remodeling. Within the functional groups 'protein expression' and
'gene expression', most of the elevated expression was for ribosomal proteins,
elongation factors (eIF-5A, EF1α), genes encoding enzymes involved in protein
modification and degradation, transcription factors and total RNA synthesis (RNA
polymerase II, transcription factor S-II, basic transcription factors, MEF2C, GATA-
GT1); in the 'cell structure/motility' group, there was enhanced expression of genes
encoding for cytoskeletal and ECM proteins (collagens I, III, V, VI and XV, TIMP3,
gelsolin, fibrillins, fibronectins) and suppression of genes encoding for contractile
proteins. Many genes in the 'metabolism' category encoded proteins involved in energy
metabolism and, within this group, lipid metabolism genes were primarily suppressed.
In contrast, very few genes in the 'cell division' (a DNA polymerase and some histones)

Chapter V
213
or 'cell and organism defense' (hsp27 and hsp70) were found to be differentially
regulated. Among the genes whose the expression was upregulated in the 'cell
signaling/communication' category, Stanton et al. found some growth factors and
hormones (ANF, BNP, FGF12), calcyclin, some Rab and Rho molecule isoforms,
Grb2, and an L-type calcium channel isoform, while the downregulated genes included
the RyR receptor and SERCA2. Most of these genes showed different patterns of
expression between the LV and the septum, with some genes uniquely expressed in the
LV. Interestingly, Stanton et al. (2000) did not find genes with a unique and specific
expression in the septum when compared to the LV free wall.
1.3.3. Cardiac hypertrophy and heart failure
Friddle et al. (2000) applied microarray expression profiling to identify genes altered
during induction and regression phases of Ang II- and isoproterenol-induced cardiac
hypertrophy in the mouse. The set of genes exhibiting expression changes identified by
their analysis was limited to the induction (32 genes) or regression (8 genes) phase and
a group of 15 genes exhibiting biphasic expression changes. Their study identified 30
genes which were not previously associated with cardiac hypertrophy. Among the
genes differentially expressed during the induction phase of cardiac hypertrophy are: an
ATP synthase chain, the vasopressin receptor, natriuretic peptides, TGF alpha, annexin
I, PKC binding protein (beta and an alpha actin isoform) were upregulated, whereas
some ribosomal subunits (28S and mitochondrial 16S), the estrogen receptor and the
endothelin converting enzyme 2 were downregulated. The important finding of the
study was the identification of a set of genes specifically altered during the regression
of hypertrophy (cytochrome C oxidase polypeptide I and oligosaccharyltransferase,
both upregulated) and another set of genes whose expression was differentially
regulated between induction and regression (NADH dehydrogenase 6 and IGF-II,
upregulated during regression but downregulated during induction of cardiac
hypertrophy).

Chapter V
214
More recently, Yun et al. (2003) used transgenic mice overexpressing the α1b-
adrenergic receptor to identify genes whose expression was altered in a heart failure-
independent model of cardiac hypertrophy. Integrin α4, protein tyrosine phosphatase,
RAS GAP, phosphoinositide 3-kinase, uteroglobin, importin α, calbindin-28K, MEF2,
procollagen type XVIII and insulin II were all upregulated, whereas formin, FGF-7,
carboxypeptidase A3 and LIM were downregulated.
Ueno et al. (2003) used DNA microarray assays to study the development of blood
pressure-dependent heart failure in Dahl salt-sensitive rats fed a high (or low) sodium
diet. The development of cardiac hypertrophy and heart failure was associated with an
upregulation of genes such as ANP, actin and myosin isoforms, aldolase A, 12-
lipoxygenase and DBP transcription factor.
To restrict the set of genes to those specifically involved in the development of the
hypertrophic phenotype, Mirotsou et al. (2003) compared two different models of
cardiac hypertrophy to define genes concordantly regulated during the development of
cardiac remodeling in the LV or septum after MI or transverse aortic constriction
(TAC). Both MI and TAC resulted in cardiac and cardiomyocyte hypertrophy. Among
the genes that were upregulated in the LV and septum after MI but exhibiting little or
no change after TAC were the cell-cycle elements, cyclin D3 and tropomodulin 3, the
EGFR pathway substrate, growth arrest genes (specifically 1 and 2). In contrast genes
upregulated in the LV and septum after constriction but not after infarction included
genes encoding immune response proteins and genes involved in cytoskeleton
organization and biogenesis. Mirotsou et al. (2003) distinguished two additional groups
of genes: 1) those upregulated in the LV and septum after TAC and LV after MI, with
little or no change post MI in the septum (a group highly enriched with ECM genes and
genes involved in cell differentiation, proliferation and adhesion), and 2) genes
downregulated in LV and septum of both models (enriched for genes encoding
enzymes).
Chapter V
215
Larkin et al. (2004) evaluated alterations in cardiac gene expression in response to
pressure overload after acute (24h) and chronic (14 days) infusion of Ang II in mice. In
both groups the ribosome pathway was highly expressed, with upregulation of
ribosomal subunits, as well as initiation and elongation factors (eIF1A, iIF2B, eEF1-
α1). In addition to an increased ribosome and translation activity, Larkin et al. (2004)
identified a significant upregulation of genes linked to the RhoA-signaling pathway, the
ECM, cytoskeleton, cell cycle, steroid biosynthesis and the integrin-mediated signaling
pathway. Most of the genes were already documented to be increased in expression in
response to hypertension and Ang II treatment, but novel genes, such as follistatin-like
3 (Fstl3), epithelial membrane protein 1 (Emp1) and the transferrin receptor 1 (Tfr1)
were identified. Common downregulated pathways included: metabolic mitochondrial
fatty acid oxidation, citric acid cycle, carbohydrate metabolism, valine-leucine-
isoleucine degradation pathway and the oxidative phosphorylation. Other single
candidates included the non-muscle myosin heavy chain (MHC), SERCA2, estrogen
receptors, the peroxisomal protein (PeP) and the metabotropic glutamate receptor 1
(GRM1).
Recently, Rysä et al. (2005) used oligonucleotide microarrays to describe gene
expression profiles in the SHR during the development of LV hypertrophy (at 12
months) and the transition to diastolic heart failure (at 20 months). They identified 92
genes and 35 ESTs that were differentially regulated in the LV of 20 month SHR
compared to 12 month SHR. The relatively small number of altered genes agrees with
previous observations by Larkin et al. (2004), showing that more genes alter in
response to acute than chronic overload. The majority of upregulated genes encoded for
cell structure and signaling proteins (e.g. thrombospondin 4), whereas most of the
downregulated genes encoded for proteins involved in fatty acid and energy
metabolism (e.g. enoyl-CoA isomerase and acyl-CoA dehydrogenase).

Chapter V
216
1.3.4. Hereditary hypertrophic cardiomyopathy
The so-called ‘Toronto group’ used an extensive cardiac EST library to create a large
‘Cardiochip’ cDNA array to probe samples from patients with familial dilated and/or
hypertrophic cardiomyopathies associated with end-stage heart failure (Barrans et al.,
2002; Hwang et al., 2002). The genetic basis of inherited cardiomyopathy appeared to
revolve around genes involved in structural alterations in the sarcomere and
cytoskeleton, although some genes were also identified which have been found to be
upregulated or downregulated in other forms of cardiac hypertrophy and non-familial
heart failure (e.g. ANF, actins alpha and beta, elongation factor 2, hsp90, collagen type
I, ribosomal proteins S12, S6, L10, UBF2 transcription factor, SERCA2, elastin, fatty
acid binding protein, antigen CD36).
1.3.5. Uncomplicated and hypertension-associated human
obesity
Philip-Couderc et al. (2004) investigated heart transcriptome remodeling focusing on
changes specifically related to metabolic syndrome and obesity. In their study, they
used microarray analysis to compare right atrial samples from non-obese and obese
hypertensives and normotensive patients to discriminate between changes specifically
linked to obesity and arterial hypertension. The main finding of the study was that the
expression profile related to obesity dramatically differed to that observed in obesity-
related hypertension but also to that observed in arterial hypertension. One very
interesting example was the opposite change in genes encoding proteins involved in the
Wnt signaling pathway in obese and hypertensive patients. The Wnt pathway plays a
major role in cardiac myogenesis, hypertrophy and heart failure (Chapter I). Contrary
to observations in hypertension-related cardiac hypertrophy, obesity is characterized by
an overexpression of genes antagonizing and suppressing the Wnt pathway and
favoring β-catenin ubiquitination and degradation in proteasomes. Thus the expression

Chapter V
217
of several transcription factors that play a pivotal role in cardiac hypertrophy in other
contexts is suppressed in obesity (e.g. c-Myc, GATA4 and MEF2B).
1.4. In summary
With the development of the microarray technique and the advances in bioinformatics,
the candidate gene approach has been in part replaced with a broader, genomic scale
approach. However, analysis at this level can yield hundreds of genes that are
differentially regulated between control and experimental tissues, without indication of
their pathophysiological importance. Attempts at expression profiling in experimental
or human cardiac hypertrophy and failure have yielded ‘snapshots’ of differentially
regulated genes and sets of genes, with some overlapping (e.g. metabolic pathways
generally downregulated; structural proteins synthesis and cell cycle generally
upregulated). It is unclear whether these differences are important in mediating
pathophysiology or merely represent secondary and compensatory phenomena. These
findings emphasize the importance of an initial pathophysiological characterization of
the different experimental models of cardiac hypertrophy and the evaluation of model-
specific and condition-specific processes leading to heart remodeling prior to
undertaking gene profiling.

Chapter V
218
1.5. Aims
The goal of this study was to identify whether cardiac and cardiomyocyte remodeling
induced by chronic Ang II overproduction or impaired glucose transport in vivo could
have a primary and long-term impact on differential expression of the cardiac
transcriptome. It was hypothesized that the previously described chronic tissue and
myocyte remodeling in the TG1306/1R and GLUT4-KO mice would be associated with
a shift in expression of distinct sets of genes involved in various aspects of cell
physiology, morphogenesis and metabolism. It was also postulated that some
differentially regulated genes would be common to both models of remodeling.

Chapter V
219
2. METHODS
2.1. RNA and cDNA preparation for hybridization
Total RNA was extracted from 60 week old mouse ventricles (left and right ventricles
in addition to the septum) using the procedures detailed in Chapter II. The CyScribe
cDNA Post-Labelling Kit (Amersham Pharmacia, RPN5660) was utilized for the
preparation of Cy3- and Cy5-labelled cDNA for microarray hybridization according to
the manufacturer’s recommended protocol. Procedures are detailed in Chapter II.
2.2. cDNA microarray assays and experimental groups
2.2.1. Choice of array design
The microarrays used in the present study incorporate characteristics which are
particularly relevant in the investigation of differential gene expression induced by
cardiac remodeling in genetically manipulated mice. The NIA mouse embryonic clone
set printed on the microarray slides obtained from the Australian Genome Research
Facility
• is composed of embryonic clones, and thus allows the study of the possible re-
expression of embryonic genes, which has previously been observed during the
development of cardiac hypertrophy (and frequently interpreted to be
genetically a ‘fetal recapitulation’ state).
• consists of a substantial number of clones coding for unknown genes, making
these microarrays a dynamic tool to evaluate the expression of known and
unknown genes at the same time. As the mouse genome project progresses,

Chapter V
220
more ESTs will be linked to novel genes, unraveling new aspects of gene
expression and function in cardiac remodeling.
2.2.2. TG versus WT hearts
In the first set of experiments, comparison was made between 60 week male TG and
WT ventricles to screen for possible differences in gene expression induced by chronic
local overexpression of the Agt gene (gene ‘knock-in’). Eight mice (from different
parental crosses) were selected for each group. TG hearts were also selected according
to morphological criteria to avoid the presence of the dilated phenotype in the sample
population (see Chapter III). The mean CWI of the hearts were 4.7±0.2 mg/g for the
WT group (n=8) and 5.6±0.3 mg/g for the TG group (n=8). RNA from 2 ventricles
from the TG group were randomly pooled and directly compared with 2 pooled RNA
samples from the WT group. A dye-swap was performed for each comparison to
minimize the effects of any gene-specific dye-bias. This comparison was performed 4
times with different samples for a total of 8 cDNA slides hybridized (i.e. 4 replicates
with dye swap).
2.2.3. LLC versus LL hearts
In this experiment, comparison was made between 60 week male LLC and LL
ventricles to screen for possible differences in gene expression induced by the deletion
of the GLUT4 in the heart (gene ‘knock-out’). Eight mice (from different parental
crosses) were selected for each group. The mean CWI of the hearts used were 5.7±0.5
for the LL group (n=8) and 10.0±0.7 for the LLC group (n=8). RNA from 2 ventricles
of the LLC group were pooled and directly compared with 2 RNA samples pooled from
the LL group (the internal control group). Again, a dye-swap was performed for each
comparison to minimize the effects of any gene-specific dye-bias. This comparison was
performed 4 times with different samples for a total of 8 cDNA slides hybridized (i.e. 4
replicates with dye swap).
Chapter V
221
3. RESULTS
3.1. Differential gene expression and gene clustering in TG mice
3.1.1. Differential gene expression in TG mice
At 60 weeks chronic cardiac overexpression of Agt is associated with altered
expression of a number of genes. Compared with age-matched WT littermate controls,
TG mice exhibited differential expression of 181 clones in cardiac tissue, of which 91
were upregulated and 90 were downregulated. These data show that only ~1% of the
clone set printed on the microarray slide presented significant patterns of differential
expression after statistical normalization and ranking (M>1 or M<1 and B>0, see
Chapter II for further explanations). The 91 upregulated clones were successfully
linked to 72 annotated gene sequences and 9 unknown expressed ESTs. Similarly, of
the 90 downregulated clones, 76 known gene sequences and 3 ESTs were identified
(Tables V-1 and V-2).
3.1.2. Gene Ontology classification of candidates
Candidate genes (72 upregulated and 76 downregulated) were clustered according to
the Gene Ontology Consortium classification groups (Chapter II). Figures V-1, V-2 and
V-3 depict stacked bar charts illustrating differential distribution of GO terms for the
upregulated and downregulated genes according to the 3 common classifications: cell
component, molecular function and biological process. These data show that
considering all genes either up- or downregulated, ~37% of the selected genes coded
for cytoplasmic proteins (GO:0005737), ~21% for membrane proteins (GO:0016021)
and ~18% for nuclear proteins (GO:0005634) (Figure V-1). With respect to the
molecular function of the proteins translated from candidate genes, ~39% had binding

Chapter V
222
(or ligand) activity (GO:0005488), ~22% catalyzed biochemical reactions
(GO:0003824), ~10% functioned as transporter molecules (GO:0005215) and ~8%
transduced extracellular signals into the cells (GO:0004871) (Figure V-2). About 37%
of the putative proteins are involved in cellular metabolic regulation (GO:0008152),
~26% are involved in processes pertinent to the integrated physiology of the cell, such
as cell death, growth, defense or cell motility (GO:0050875), ~12% mediate interaction
of a cell with its surrounding, such as cell-to-cell communication or cell adhesion
(GO:0007154), and ~9% are known to modulate frequency, rate, or extent of a
physiological processes at the cellular or organ level (GO:0050791) (Figure V-3).
These data show that there is an even distribution of upregulated and downregulated
genes for each major GO category in TG ventricles (relative to WT), suggesting that
the pattern of differential upregulation and downregulation of genes in hypertrophic TG
hearts is relatively balanced. A statistical analysis across all GO categories at all levels
of classification (Chapter II) confirmed this general trend.
3.2. Differential gene expression and gene clustering in LLC mice
3.2.1. Differential gene expression in LLC hearts
Chronic suppression of myocardial GLUT4-mediated glucose uptake is associated with
altered expression of numerous genes at the 60 week time point. Compared with age-
matched LL littermate controls, LLC mice exhibited a differential expression of 96
clones in cardiac tissue, of which 50 were upregulated and 46 were downregulated.
These data showed that only ~0.5% of the clone set printed on the microarray slide
presented significant patterns of differential expression after statistical normalization
and ranking. The 50 upregulated clones were successfully linked to 39 annotated gene
sequences and 10 unknown ESTs. Similarly, of the 46 downregulated clones, 37 known
gene sequences and 5 ESTs were identified (Tables V-3 and V-4).

Chapter V
223
3.2.2. Gene Ontology classification in LLC hearts
Candidate genes (39 upregulated and 37 downregulated) were clustered according to
the Gene Ontology classification groups (Figures V-4, V-5 and V-6). The clustering of
candidate genes for GLUT4-KO hearts was relatively similar to the one observed for
TG1306/1R. Indeed, of all genes exhibiting differential regulation (either upregulated
or doenregulated), a majority of the selected genes encoded for cytoplasmic (~40%;
GO:0005737), membrane (~20%; GO:0016021) and/or nuclear proteins (~10%;
GO:0005634) (Figure V-4). At the level of the molecular function, the majority of the
candidate genes encoded proteins with binding (~37%; GO:0005488), catalytic (~30%;
GO:0003824), transporter (~20%; GO:0005215) and/or transducer (~5%; GO:0004871)
activity (Figure V-5). At a physiological level, the proteins encoded by the candidate
genes were involved in cell metabolism (~43%; GO:0008152), cell physiology (~29%;
GO:0050875) and cell communication (~10%; GO:0007154) (Figure V-6).
Interestingly, a statistical analysis performed across all GO categories at all levels of
classification (see Chapter II) showed that there was an uneven distribution of
upregulated and downregulated genes for the categories ‘mitochondrion’
(GO:0005739; a cellular component, with 12 downregulated genes vs. 3 upregulated,
p<0.05), ‘oxido-reductase activity’ (GO:0016491; a molecular function, with 5 genes
downregulated vs. 0 upregulated, p<0.05) and ‘ATP binding’ (GO:0006412; a
molecular function, with 8 genes downregulated vs. 2 upregulated, p<0.05). These data
suggest that the insulin resistant cardiomyopathy driven by the deletion of the insulin-
stimulated glucose transporter GLUT4 is associated with a significant downregulation
of genes encoding proteins involved in the mitochondrial energetic pathways.

Chapter V
224
3.3. Comparative analysis of TG1306/1R and GLUT4-KO
3.3.1. Common and distinct gene sets altered in TG and LLC
Gene expression profiling revealed both distinct and common sets of genes altered
during hormonally (TG) and metabolically (LLC) induced cardiac hypertrophies.
Among the 224 genes differentially regulated in LLC and TG ventricles, only 7
presented significant patterns of differential expression in both hypertrophic models.
The carboxylesterase 3 (Ces3), the mitochondrial cytochrome C oxidase 1 (mt-CO1)
and the mitochondrial 16S rRNA (mt-Rnr2) were found to be significantly
downregulated in both mouse models. The homologue of the human chromosome
condensation protein G (hCAPG, or 5730507H05Rik in the mouse), the CD2 antigen
binding protein 2 (Cd2bp2) and the ICOS ligand (Icosl) genes were upregulated in LLC
and downregulated in TG hearts. Finally, the fatty acid binding protein 3 (Fabp3) was
downregulated in LLC hearts and upregulated in TG.
3.3.2. Comparative GO analysis between TG and LLC
A comparative statistical analysis of upregulated and downregulated genes for the two
mouse models showed that TG hearts, when contrasted with LLC, exhibited a
significant upregulation of genes encoding for DNA-binding nuclear proteins
(GO:0005634; GO:0003677) involved in regulation of gene transcription
(GO:0006355) and protein biosynthesis (GO:0006412). TG hearts also showed
significant downregulation of genes encoding for proteins interacting with the
extracellular medium (GO:0003615) or involved in some type of receptor activity
(GO:0004872) when compared to LLC. LLC mice showed a significant
downregulation of genes encoding for proteins involved in mitochondrial proton
transport and ATP production when compared to TG hearts (GO:0005739;
GO:0015986; GO:0015992; GO:0016469; GO:0015078; GO:0046933; GO:0046961).
These results suggest that the major driving ‘signaling force’ underlying cardiac

Chapter V
225
hypertrophy in the TG hearts is protein synthesis, while remodeling in LLC hearts is
significantly influenced by downregulation of mitochondrial proteins and
mitochondrial pathophysiology.

Chapter V
226
4. DISCUSSION
4.1. Differential gene expression in TG1306/1R mice
In the present study, cDNA microarray expression profiling was used to identify genes
differentially expressed between TG and WT ventricles. Chronic overexpression of rat
Agt in the heart of 60 week old TG mice caused many genes to be altered in expression
(Table V-1) - a number exhibiting even higher M values than the Agt itself. Although it
is obvious that cardiac remodeling in TG hearts is primarily ‘triggered’ by chronic
overexpression of Agt, this study identifies novel candidate genes playing a major role
in the development of the cardiac phenotype in TG mice in response to the altered
myocardial humoral environment
4.1.1. Evidence for general transcriptional upregulation
in TG hearts
Although the cluster analysis suggested an even distribution of upregulated and
downregulated genes for each major GO category, a closer look at the list of the
differentially upregulated genes shows that in TG hearts several candidates code for
factors responsible for the de novo synthesis, folding and sorting of proteins. This is a
molecular trait that distinguishes the cardiac hypertrophy of TG mice from the LLC
cardiomyopathy. For instance, TG mice overexpress genes coding for various proteins
involved in DNA binding and transcription (Table V-1). Control of transcription by
RNA polymerase II involves the basal transcription machinery, a collection of proteins
which include TFIIB, TFIIE, TFIIF, TBP, TFIIA and TAFs. These, with RNA
polymerase II, assemble into complexes which are modulated by transactivator proteins
that bind to cis-regulatory elements located adjacent to the transcription start site. TG
mouse hearts overexpress the gene coding for the TATA box-binding protein-

Chapter V
227
associated factor 11 (TAF11), also known as TAFIID9, or TAFII28, suggesting that
gene transcription is enhanced in hearts from TG mice.
4.1.2. Evidence for enhanced protein synthesis in TG hearts
The protein translation factor SUI1 homolog (Sui1-rs1) codes for a protein related to
the translation initiation factor SUI1, a homologue of the human eukaryotic initiation
factor 1, eIF1. The latter is a low weight factor critical for stringent AUG (start codon)
selection in eukaryotic translation. It is recruited to the 40S ribosomal complex in the
multifactor complex (MFC) with eIF2 and eIF3 and eIF5 (Pestova et al., 2001; Singh et
al., 2004). Both these genes are upregulated in the TG (Table V-1). Sheikh et al. (1999)
demonstrated that the gene encoding eIF1 is induced during cellular stress and may also
represent an important adaptive response to ER stress. Interestingly, other specific
initiation factors are downregulated in TG hearts: the product of the gene Wbscr1 (also
known as Eif4h - Eukaryotic translation initiation factor 4h), stimulates protein
synthesis and it is highly expressed in heart, liver and testis. EIF4H stimulates the
RNA-dependent ATPase activities of eIF4A, eIF4B (also downregulated in TG hearts)
and eIF4F during translation initiation. It exerts its activity through protein-protein
interactions and possibly stabilizes conformational changes in eIF4A facilitating the
binding of the mRNA to the 40S ribosomal subunit (Richter-Cook et al., 1998).
Deletion of the Eif4h gene partly characterizes the multi-system developmental
disorder known as Williams-Beuren syndrome. This syndrome is characterized by a
constellation of features including mental retardation and cardiovascular diseases, such
as supravalvular stenosis, progressive left main coronary artery obstruction and
arrhythmias (Bruno et al., 2003). In general, the Williams-Beuren syndrome is caused
by the deletion of contiguous genes in the human locus 7q11.23, on chromosome 7,
which contains genes for elastin (ELN), LIM kinase-1 (LMK), RFC2, CYLN2,
CACNL2A, GPR56 and YWHAG, the latter also being downregulated in TG hearts. It
could be speculated that the specific downregulation of Wbscr1/Eif4h and Eif4b in TG
hearts is directly or indirectly associated with cardiac remodeling, and further
investigation is warranted.

Chapter V
228
Various elongation factors are upregulated in TG hearts. Examples are the eukaryotic
elongation factor-1 alpha 1 (Eef1a1) and delta (Eef1d). The alpha subunit of the
elongation factor-1 (eEF1α1) is a key factor in protein synthesis, where it promotes the
GTP-dependent transfer of aminoacylated tRNAs to the A-site of the 80S ribosomal
subunit (Bischoff et al., 2000). To do so, eEF1α1 needs first to interact with the
complex formed by the beta, gamma and delta (eEF1δ) subunits of the elongation
factor-1 to exchange bound GDP for GTP. Both Eef1a1 and Eef1d genes, encoding
eEF1α1 and eEF1δ proteins are upregulated in TG mouse hearts. In eukaryotic cells,
and in particular in human fibroblasts, the beta-gamma-delta complex colocalizes with
the endoplasmic reticulum (ER) and it is upregulated during ER stress responses, while
the alpha subunit shows a more diffuse distribution throughout the cytoplasm and it is
also associated with the nucleus (Sanders et al., 1996).
4.1.3. Overexpression of ribosomal subunits in TG hearts
Various components of the large 60S ribosomal subunit, such as Rpl10 (60S ribosomal
protein L10), Rpl5 (60S ribosomal protein L5), Rpl12 (60S ribosomal protein L12) and
Rpl4 (60S ribosomal protein L4) are upregulated in TG hearts. The mammalian
ribosome is composed of 4 RNA species and approximately 80 different proteins. In
eukaryotic cells, some ribosomes are free in the cytosol, whereas others are bound to
the ER. Membrane-bound ribosomes synthesize 3 major classes of proteins, that is
lysosomal proteins, secretory proteins and transmembrane proteins. Rpl10 gene
encoding for the 60S ribosomal protein L10 is also known as the QM gene. L10 binds
and negatively regulates c-Jun transcription activity by preventing homodimerization
between c-Jun units and therefore inhibiting transactivation of AP-1 transcription
factor-regulated promoters (Oh et al., 2002). L10 is differentially expressed in the
cardiac neural crest cells during embryonic heart development. In general, the pattern
of L10 expression suggests an inverse relationship with proliferative capacity and a
positive relationship with cell cycle arrest, differentiation and replicative senescence,
making it a tumor suppressor gene or a contributing factor in differentiation and aging
(Dimri et al., 1996; Mills et al., 1999). Thus, it could be speculated that an upregulation
of L10 in TG hearts could be associated with accelerated cellular senescence,

Chapter V
229
diminished cell proliferation and promotion of hypertrophy over hyperplasia in the
myocardium.
The cytosolic protein-synthesizing machinery is adapted to the protein-translocating
machinery in the ER membrane through ribonucleoproteins called signal recognition
particles (SRPs) (Larsen et al., 1998). A SRP complex consists of a 7S RNA and 6
different protein subunits. SRP14 and SRP9, the latter being upregulated in TG hearts,
constitute the Alu domain of 7S, whereas the other 4 proteins belong to the S domain.
While the S domain of SRP binds the N-terminal signal sequence on the nascent
polypeptide, the Alu domain temporarily interferes with the ribosomal elongation cycle
until the membrane translocation pore and the translocation machinery in the ER is
correctly engaged (Weichenrieder et al., 2001). SRP has at least 3 distinct functions
that can be associated with the protein subunits: signal recognition, translational arrest
and ER membrane targeting by interaction with the docking protein. Thus, an
overexpression of the Srp9 gene in hypertrophic hearts could be an indication of
increased trafficking of nascent proteins towards the plasma membrane via the ER, a
phenomenon that could contribute to ER stress.
4.1.4. Overexpression of chaperones in TG hearts
Heat-shock proteins (HSPs) are molecular chaperones which are essential for cell
survival. They play an important role in protein-protein interactions, including protein
folding, stability and turnover. HSPs have been named according to their molecular
weights. The family of approximately 70 kDa heat-shock proteins, forming the
complex HSC70, has been shown to be upregulated and synthesized under pathological
and stress conditions in the heart, including inflammation, ischemia and familial
hypertrophic cardiomyopathy (Hammerer-Lercher et al., 2001; Tanonaka et al., 2001).
TG mice present an upregulation of at least two members of the HSP70 family in their
hearts: Hspa8, coding for the HSPA8/HSP73 cognate protein, and Hspa5, coding for
HSPA5, also known as glucose-regulated protein 78 kDa, or GRP78.
Chapter V
230
HSPA8/HSP73 plays an important role in cells by transiently associating with nascent
polypeptides to facilitate correct folding and by functioning as an ATPase in the
disassembly of clathrin-coated vesicles during transport of membrane components
through the cell (Tavaria et al., 1995). It also interacts with tubulin and may protect
selected elements of the microtubule network to limit myofibril disruption during
cardiac remodeling (Decker et al., 2002).
HSPA5/GRP78 is a calcium-binding protein which is involved in the folding and
assembly of proteins in the ER (Nigam et al., 1994; Dierks et al., 1996). It may also
monitor protein transport through the cell. Barnes et al. (2000) demonstrated that
HSPA5/GRP78 is elevated in embryonic mouse hearts, it decreases significantly by the
fetal period and it can be re-induced following severe hypoglycemic stress, hence the
name ‘glucose-regulated protein’ - GRP. They concluded that HSPA5/GRP78 may play
a significant role in the normal differentiation and development of cardiac tissue and
that compensatory HSPA5/GRP78 induction may be involved in hypoglycemia-
associated myocyte dysmorphogenesis. Furthermore, HSPA5/GRP78 possesses an
ATP-binding domain which is also involved in the binding of the protein with
procaspase-7. Specific overexpression of HSPA5/GRP78 in cell lines (CHO, T cell or
carcinoma-derived) results in reduced apoptosis induced by caspase-7 and higher
colony survival when challenged with topoisomerase inhibitors, such as doxorubicin
and camptothecin (Reddy et al., 2003).
Thus, overexpression of this chaperone could provide protection against apoptosis in
TG hearts. Also, upregulation of Hspa5 could function as a mechanism to prevent or
limit cellular oxidative injury in TG. Indeed, Hung et al. (2003) demonstrated in renal
epithelial cells that transfection of cells with antisense RNA targeted against Hspa5
prevented the induction of HSPA5/GRP78, disabled the compensatory ER stress
response, sensitized the cells to oxidative injury (H2O2 toxicity), and prevented the
development of tolerance to H2O2 that normally occurs with preconditioning. Thus,
upregulation of genes involved in quality control of protein folding and calcium
buffering in the ER could be an adaptive response to chronic oxidative injury and
hypoxia

Chapter V
231
Various types of chaperones function in the ER to ensure proper synthesis of most
proteins. Some chaperones and escort proteins are highly specialized and are involved
in the folding of specific proteins. This is the case for the mesoderm development
candidate gene 2 (Mesdc2), also known for its Drosophila’s counterpart boca, which is
upregulated in TG hearts. Hsieh et al. (2003) demonstrated that Mesdc2, a gene
identified in the mesoderm development (Mesd) deletion interval on mouse
chromosome 7, is essential for specification of embryonic polarity and mesoderm
induction. They determined that the patterning and cell differentiation defects observed
in Mesd deletion homozygotes resulted solely from loss of the Mesdc2 gene. The latter
functions in the ER as a specific chaperone for the LDL receptor family members,
specifically Lrp5 and Lrp6, which in conjunction with frizzled are co receptors for the
canonical wingless (Wnt) signal transduction (Schweizer and Varmus, 2003). In the
absence (or mutation) of MESDC2 protein, LRP5 and LRP6 fail to reach the cell
surface and instead remain sequestered as insoluble aggregates in the ER. Thus, it could
be speculated that an upregulation of Mesdc2 in TG hearts could enhance membrane
sorting of LRP5 and LRP6 proteins, leading to activation of the Wnt signaling pathway
and also controlling cholesterol and glucose disposal in the hypertrophic heart, possibly
as a compensatory mechanism to preserve ATP/ADP ratio and energy production.
Interestingly, recent collaborative work at the University of Lausanne, Switzerland,
extends these findings and confirms upregulation of the Wnt signaling pathway in 50-
60 week old TG ventricles using cDNA microarray methodology (Domenighetti AA.,
data not shown).
4.1.5. Overexpression of calreticulin in TG hearts
Monoglucosylated oligosaccharides are recognized in the ER by two calcium-binding
lectins, calnexin and its soluble homologue calreticulin. Calreticulin is a
multifunctional protein that acts as a major calcium-binding/storage protein in the
lumen of the ER (Nigam et al., 1994; Llewellyn and Roderick, 1998). Calreticulin
alone retains misfolded or incompletely assembled proteins in the ER, where they are
degraded without transport to the Golgi complex (Zhang et al., 1997). In addition,
calreticulin and HSPA5/GRP78 can associate in an ATP-dependent manner in the ER

Chapter V
232
to retain misfolded protein fragments and to achieve cellular recovery from acute stress
(Zhang et al., 1997; Jethmalani and Henle, 1998). Thus, both proteins can combine to
serve as a quality control backup in retaining misfolded protein fragments in the ER.
Upregulation of both genes in the myocardium of TG mice would suggest that an
enhanced quality control in the pathway that leads to protein maturation is needed.
4.1.6. SR and ER stress: are they related phenomena?
As described in Chapter IV, cardiomyocyte remodeling and hypertrophy induced by
Ang II or metabolic disturbance is associated with impaired contractility and possible
dysfunctional calcium cycling by the SR. The results presented in this Chapter confirm
the pivotal role played by the endoplasmic reticulum (ER) in cell stress during Ang II-
induced cardiac hypertrophy. The ER stress response in TG hearts is certainly
associated with increased protein synthesis and trafficking through the reticulum. Also,
ER stress could function as a mechanism to prevent or limit oxidative injury in TG
hearts. From the present data it is not possible to determine which type of cell is subject
to ER stress in the heart.
Calreticulin is a functional homologue of calsequestrin in the ER of adult non-myocyte
cells, thus it could be first hypothesized that overexpression of calreticulin in TG hearts
is related to enhanced protein synthesis and ER stress in non-myocytes. Imanaka-
Yoshida et al. (1996) demonstrated that calreticulin is abundant in 2 week old fetal rat
cardiomyocytes and it is progressively replaced by calsequestrin after birth. This
suggests that maturation of cardiomyocytes involves the qualitative and/or quantitative
shift from non-muscle ER structures toward highly specialized muscle-specific SR
membranes. Calreticulin is also expressed in dedifferentiating adult cardiomyocytes in
long-term culture. These results indicate that calreticulin expression is downregulated
in cardiomyocytes during differentiation but can be expressed in vitro after
dedifferentiation. Further information comes from the study of calreticulin knock-out
mice (Mesaeli et al., 1999). The gene deletion is embryonic lethal and it is associated
with a marked decrease in the thickness of the ventricular wall (Mesaeli et al., 1999).
Study of the knock-out model indicated that calreticulin is abundantly expressed in
cardiomyocytes during early stages of development. While calreticulin-deficient

Chapter V
233
cardiomyocytes develop a functional SR and contract spontaneously, calreticulin
knock-out fibroblasts have ER impaired calcium homeostasis.
This indicates that SR and ER may exist as functionally distinct compartments in
cardiomyocytes. In addition, studies on the formation of SR and triads during skeletal
and cardiac muscle development suggest that the SR is not just a continuation of the
existing ER membranes but can be physically distinct (Franzini-Armstrong and
Jorgensen, 1994; Flucher and Franzini-Armstrong, 1996). At the functional level, it has
been demonstrated that ER calcium handling linked with the IP-dependent pathway and
nuclear translocation of NF-AT are impaired in calreticulin deficient cells. This
suggests that calreticulin is a part of the calcineurin/NF-AT/GATA-4 pathway
described for cardiac hypertrophy (see Chapter I) and that this unique pathway is also
activated during cardiac development by the ER. Taken together, these various findings
indicate that the ER membrane plays a critical role not only in protein synthesis,
modification and secretion, but also in control of calcium homeostasis in the
developing heart. Thus, it is tempting to speculate that ER membrane proteins such as
calreticulin play a role in the development of cardiomyocyte hypertrophy in TG hearts.
Stress-dependent stimulation of cardiomyocytes could result in a qualitative and
quantitative modification of ER and SR membrane structures and activation of both the
NF-AT and calreticulin pathways.
4.1.7. Differential regulation of Wnt signaling in TG hearts
As detailed in Chapter I, members of the Wnt gene family of secreted glycoproteins are
involved in different developmental processes such as cell differentiation, migration,
adhesion and organ development. The canonical Wnt/β-catenin pathway leads to the
stabilization of cytoplasmic β-catenin which subsequently enters the nucleus where, in
combination with various transcription factors, it regulates gene expression. A second
Wnt signaling pathway, triggered by Wnt5a (and possibly other Wnt isoforms),
stimulates the intracellular increase of calcium via PKC- and/or calmodulin-dependent
activation. These Wnt signaling pathways have been previously linked to the
development of the cardiovascular system (Chapter I). The present data suggest that
both the activity and the regulation of Wnt signaling pathways are enhanced in TG

Chapter V
234
hearts. Indeed, TG ventricles overexpress Mesdc, which is involved in the sorting of
LRP5 and LRP6, which have well known co-receptors of the canonical Wnt pathway.
In parallel, TG hearts exhibited downregulated Lrp1 encoding a suppressor of the same
pathway. Among other genes, the canonical Wnt-repressor adenomatous polyposis coli
gene (or Apc) is downregulated, while a subunit of the protein phosphatase 2A
(Ppp2r1a), a positive regulator of the Wnt signaling pathway, is upregulated. Finally,
TG ventricles show a positive regulation of the Wnt regulator Dickkopf3 (Dkk3) and
the metalloproteinase Mmp7 (known also as ‘matrilysin’ or ‘uterine’), the latter being a
target gene of the canonical Wnt signaling pathway (Crawford et al., 1999).
Interestingly, phospholipase C, delta subunit (Plcd), previously shown to be involved in
the calcium rise induced by Wnt activation, is downregulated in TG hearts.
In addition, calreticulin (overexpressed in TG hearts as discussed above) has been
shown to increase cell adhesiveness via activation of the Wnt pathway leading to
dephosphorylation of β-catenin and overexpression of N-cadherin (Fadel et al., 2001).
As noted above, additional experiments using cDNA microarray technology have been
undertaken to characterize alterations in Wnt pathway signaling in more detail. These
more extensive Wnt pathway-directed investigations have revealed TG upregulation of
Wnt1, Wnt3, Wnt3a, Wnt4, Wnt7a, Wnt10b and Wnt11 isoforms, together with
overexpression of disheveled 2 (Dvl2), frizzled 1 (Fzd1) and various phosphatase
subunits, which could dephosphorylate β-catenin and induce gene expression. Target
genes of the Wnt signaling such as Mmp7, cyclin D1 (Ccnd1) and bone morphogenic
protein 4 (Bmp4) were also upregulated on the complimentary microarray
(Domenighetti A., data not shown). Taken together, these data suggest that the Wnt
signaling pathways are upregulated in ventricles from TG mice. The reasons are
unknown, but possible re-activation of specific pro-growth fetal programs of gene
expression is a valid hypothesis. Haq et al. (2003) demonstrated that β-catenin is both
sufficient to induce growth in cardiomyocytes in culture and in vivo and is necessary
for hypertrophic stimulus-induced growth.

Chapter V
235
Interestingly, Bond et al. (2003) showed that endothelin-1 stimulates the expression of
Wnt11 and Wnt7a in differentiating cardiac cells destined for functional specialization
in the electrical conduction system in the developing heart. Marvin et al. (2001) found
that suppression of Wnt signaling by Dikkopf1 and/or Crescent promotes heart
formation in the anterior lateral mesoderm in chick embryos, whereas active Wnt
signaling in the posterior lateral mesoderm promotes blood cell development. They also
showed that Wnt signals can repress heart formation from anterior mesoderm in vitro
and in vivo, while forced expression of either Wnt3a or Wnt8c in the same region can
promote development of primitive erythrocytes from the precardiac region. Intriguingly
TG hearts overexpress both adult and embryonic forms of hemoglobin genes (Hbb-a1,
Hbb-b2, Hbb-y) indicating that a form of cell differentiation leading to erythropoiesis,
rather that myogenesis could be activated in these hearts.
4.1.8. Cytoskeletal remodeling in TG hearts
In TG hearts there is upregulation of genes involved in cytoskeletal rearrangements,
including the ARF1 GTPase activating protein 1 (Arfgap1) and the protein kinase 9
(Ptk9), also known as Twinfilin-1.
Furman et al. (2002) demonstrated that the actin-bound protein ARFGAP1 co-localizes
with focal adhesions and it can function as a regulator of the cytoskeleton. ARFGAP1
upregulation interferes with formation of focal adhesions and with PDGF-induced
membrane ruffling in 3T3 cells. Also, ectopic ARFGAP1 enhances 3T3 cell migration
toward PDGF or IGF-1 and increases cell spreading in general. Thus, it could be
speculated that an upregulation of the gene coding for ARFGAP1 in TG hearts could
enhance or stimulate non-myocyte motility and ‘myocyte slippage’ within the
myocardium, contributing to dysmorphogenesis.
Ptk9/Twinfilin is a ubiquitous actin monomer-binding protein that is composed of two
ADF-homology domains. It forms a 1:1 complex with ADP-actin monomers, inhibits
nucleotide exchange on actin monomers and prevents assembly of the monomers into
filaments. Vartiainen et al. (2003) showed that mammals have two forms of twinfilin.

Chapter V
236
Twinfilin-1 is the major isoform in embryos and in most adult mouse non-muscle cell-
types, whereas twinfilin-2 is the predominant isoform of adult heart and skeletal
muscles. They are regulated by distinct cellular signaling pathways. Studies on budding
yeast suggest that twinfilin contributes to actin filament turnover by localizing actin
monomers, in their ‘inactive’ ADP form, to the sites of rapid filament assembly. This is
mediated through direct interactions between twinfilin and capping proteins (Falck et
al., 2004). Thus, an upregulation of twinfilin-1 in TG hearts could be associated with
re-expression of the fetal isoform in myocytes or an upregulation of this isoform in
non-myocyte cells. Either way, it could be speculated that re-expression (or
upregulation) of twinfilin-1 in TG hearts leads to cytoskeletal rearrangement and
remodeling, possibly in association with the re-expression of the fetal isoform alpha-
skeletal actin in the same mouse model (Clement et al., 2001).
4.1.9. Differential protein turnover and catabolism in TG hearts
Selective protein degradation plays an important role in cellular regulation, since it can
protect cells against environmental stress by eliminating aberrant proteins generated
under physiologic and pathologic conditions (Hochstrasser, 1996; Patton et al., 1998).
In eukaryotes, selective protein degradation proceeds primarily through the enzymes of
the ubiquitin conjugation system, which requires essential action of 3 enzymes: an
activating enzyme E1, a conjugating enzyme E2 and a ligase E3 (Hochstrasser, 1996).
TG hearts exhibit an upregulation of the gene Ube4 which codes for a novel
ubiquitination factor E4. The latter has been linked to stress tolerance and degradation
of stress-induced aberrant proteins. Substrates of an E4-dependent degradation pathway
are supposed to be proteins whose stabilization does not interfere with vital functions of
the cell under normal growth conditions. However, E4-dependent degradation becomes
crucial when cells are exposed to stress. Indeed, the yeast homologue Ufd2 is
functionally implicated in cell survival under stressful conditions. Histones and actin
are among the substrates whose turnover might be regulated by E4 (Koegl et al., 1999).
Meacham et al. (2001) demonstrated that for mutant forms of the cystic-fibrosis
transmembrane-conductance regulator (CFTF), a plasma-membrane chloride channel,
the chaperone CHIP converts the heat-shock complex 70 (Hsc70) from a protein-
folding machine into a degradation factor that functions in ER quality control through

Chapter V
237
an E4-dependent pathway. These data reinforce the idea that TG hearts suffer from
manifest ER and more generalized cell stress, probably caused by enhanced protein
biosynthesis. Upregulation of the Ube4 in TG hearts is associated with the positive
regulation of the Apc7, which is one of the subunits composing the anaphase promoting
complex, or cyclosome, involved in protein turnover and cell cycle progression.
Interestingly, the positive regulation of the E4-dependent degradation pathway in TG
hearts is associated with downregulation of the ubiquitin protein ligase E3b (Ube3b),
the ubiquitin-conjugating enzyme E2G2 (Ube2g2) and the subunits Psmd2 and Psmd13
of the proteasome complex. The latter is a key enzymatic complex responsible for
selective turnover of short-lived and misfolded proteins. These data suggest that
cellular remodeling in TG hearts is associated with differential downregulation of
proteolytic pathways in favor of a stress-mediated ubiquitination pathway.
4.1.10. Are sex hormones involved in cardiac remodeling?
One of the most upregulated genes in TG hearts encodes for the Estradiol 17 beta-
dehydrogenase 4 protein (HSD17B4) This enzyme is one of the isoforms of the
estradiol 17 beta-dehydrogenase enzyme family that is responsible for the
interconversion of estrone and estradiol, as well as the interconversion of
androstenedione and testosterone (Andersson and Moghrabi, 1997). In general,
HSD17B4 inactivates the sex steroids by catalyzing the production of the keto forms. It
exhibits catalytic preference for oxidation with cofactor preference for NAD+ and
substrate preference for C18 steroids (i.e. preference for estrogens over androgens). It is
the first steroid metabolizing enzyme found to be localized in peroxisomes (in contrast
to the other HSDs which are found in microsomes or in the cytoplasm).
HSD17B4 is also known as D-bifunctional protein (DBP). HSD17B4 catalyzes the
formation of 3-ketoacyl-CoA intermediates from both straight-chain and 2-methyl-
branched-chain fatty acids and therefore it is involved in peroxisomal beta-oxidation of
fatty acids (Moller et al., 2001). Indeed, mutations or deletions in HSD17B4 have been
shown to cause defects in liver and fibroblast peroxisomal beta-oxidation, with
accumulation of both very long-chain fatty acids and bile acid intermediates, as it is
observed in Zellweger syndrome or in adrenoleukodystrophy (de Launoit and Adamski,

Chapter V
238
1999; Moller etal., 2001). As oxygen radicals are both produced and scavenged in
peroxisomes, evidence for increased oxidative stress in HSD17B4 deficiency has also
been reported (Ferdinandusse et al., 2003).
HSD17B4 has yet to be fully characterized for capacity for stimulation by modulators
of both steroid and fatty acid metabolism, such as progesterone and peroxisome
proliferators - the latter mechanism being dependent on activation of peroxisome
proliferator-activated receptor alpha (PPARα) (see Chapter I). Accordingly, in PPARα
knock-out mice the expression of HSD17B4 is low and does not change after treatment
with peroxisome proliferators, such as WY 14643 (Aoyama et al., 1998). Structurally,
HSD17B4 is expressed in many tissues as an approximately 3.0-kb transcript, with
highest expression in liver, kidney, ovary, lungs, heart, prostate, and testis. The enzyme
is primarily translated as an 80 kDa protein. The post-translational modifications
include an N-terminal cleavage leading to a 32 kDa peptide, which is covalently bound
to actin (Leenders et al., 1994). The N-terminal part shows homologies to the family of
short chain alcohol dehydrogenases, especially to the two short chain alcohol
dehydrogenases domains of the multifunctional (hydratase-dehydrogenase) enzymes of
peroxisomal beta-oxidation of fatty acids. The C-terminal extension of the 80-kDa
protein shows an intriguing similarity to the sterol carrier protein 2 (SCP2) which is
assumed to participate in the intracellular transport of sterols and lipids (Leenders et al.,
1994). In SCP2 knock-out mice marked alterations in gene expression, peroxisome
proliferation, hypolipidemia, impaired body weight control and neuropathy were
observed (Seedorf et al., 1998). The gene disruption led to impaired catabolism of
methyl-branched fatty acyl-CoAs and inefficient import of phytanoyl-CoA into
peroxisomes.
Although no information is available concerning the role played by HSD17B4 in the
myocardium, estrogens have been previously shown to confer cardio-protection.
17β-estradiol has been shown to attenuate the development of pressure-overload
cardiac hypertrophy in mice (van Eickels et al., 2001), while the same steroid has been
shown to activate ERK1/2 and JNK (but only marginally p38) MAPK pathways
through an estrogen receptor-dependent mechanism in isolated adult rat
cardiomyocytes (Nuedling et al., 1999). Thus it could be hypothesized that during Ang

Chapter V
239
II-induced cardiac hypertrophy, an increased conversion of estradiol to the less-active
estrone by HSD17B4 overexpression (and induction), could lead to decrease in tissue
(and serum) estradiol levels with suppression of some of the cardio-protective effects of
estrogens mentioned above. Hence, the diminished cardio-protective role played by
estrogens could be associated with decreased availability of free fatty acids at the
cellular level and therefore decreased availability of energy for cardiomyocyte function.
Alternatively, it is known that peroxisomal beta-oxidation enzymes acyl-coA oxidase
and HSD17B4 can produce a retro-conversion pathway for the production of
docosahexaenoic acid (DHA), a long-chain polyunsaturated fatty acid of the omega-3
family (C22:6n-3) (Su et al., 2001). DHA is relatively abundant in fish oil, and has long
been recognized for its beneficial effects on the cardiovascular system. Clinically, DHA
and other long-chain polyunsaturated fatty acids are believed to have anti-hypertensive
properties by inhibiting ACE activity (and Ang II formation) and enhancing endothelial
NO production. Also, perinatal supplementation of DHA and other long-chain
polyunsaturated fatty acids decrease insulin resistance and prevent the development of
hypertension in adult life (Diep et al., 2002; Engler et al., 2003; Das, 2004). At the
cardiomyocyte level, DHA inhibits calcium sparks and RyR activity in rat and sheep
ventricular myocytes (Honen et al., 2003) and can directly or indirectly block several
calcium and potassium ionic currents and therefore modulate contraction (Fournier et
al., 1995; Jude et al., 2003). Thus, an overexpression of HSD17B4 in the heart could be
associated with enhanced DHA production, leading to NO- and bradykinin-induced
vasodilation and to the modulation of E-C coupling in cardiomyocytes. These effects
could be a compensatory mechanism to counterbalance the increased cellular oxidative
stress and the remodeling effects of high levels of Ang II produced in the TG hearts.
4.1.11. Metabolic disturbances in TG hearts
TG mice exhibit differential regulation of genes involved in various metabolic
processes of the heart.
Among the upregulated processes, there is also evidence of increased
• purine and pyrimidine metabolism, with upregulation of the ribonucleotide
reductase M2 (Rrm2),

Chapter V
240
• N-glycan degradation (Aga),
• nitrogen metabolism, with upregulation of the carbonic anhydrases 8 and 14 (Car8
and Car14).
• nuclear-coded mitochondrial oxidative phosphorylation, with upregulation of the
cytochrome c oxidase subunit VII Cox7a2l and cytochrome b of complex III (mt-
Cytb).
Downregulated processes apparently include:
• glycolysis and gluconeogenesis, with downregulation of the phosphofructokinase
(Pfk1),
• mitochondrial oxidative phosphorylation, with downregulation of the mitochondrial
cytochrome c oxidase 1 of complex IV (mt-Co1),
• flux through the pentose phosphate pathway (Pfk1),
• fructose/mannose/galactose metabolism (Pfk1),
• mitochondrial fatty acid metabolism, with downregulation of the acetyl-coA
dehydrogenase (Acads),
• chondroitin/heparan sulfate metabolism, with downregulation of the carbohydrate
sulfotransferase 11 (Chst11),
• the inositol phosphate metabolism, with downregulation of the phospholipase C,
delta, (Plcd1),
• valine/leucine/isoleucine degradation, with downregulation of the branched chain
keto-acid dehydrogenase E1 (Bckdha) and Acads,
• citrate cycle, with downregulation of the citrate synthase (Cs),
• glyoxylate and dicarboxylate metabolism (Cs),
• butanoate metabolism (Acads) and
• sulfur metabolism (Chst11).
In overview, TG hearts show differential expression of key enzymes involved in
multiple metabolic processes, such as glycolysis and fatty acid oxidation. This suggests
that cardiac and cardiomyocyte remodeling in TG hearts is linked with important
metabolic adaptations. As detailed in Chapter I, during cardiac remodeling and
hypertrophy the heart is believed to switch from free fatty acid to glucose metabolism,
in a recapitulation of the embryonic metabolic state. The data reported here partially

Chapter V
241
disagrees with this ‘generic’ concept, suggesting that the decrease in mitochondrial
fatty acid metabolism is also associated with a decrease in the glucose metabolism. The
downregulation of mt-Co1 in the electron transport chain could be balanced by the
upregulation of mt-Cyb and Cox7a2l. Interestingly, there is a possible compensatory
activation of the peroxisomal free fatty acid beta oxidation (with the upregulation of the
HSD17B4 enzyme).
4.1.12. Carbonic anhydrase and NHE-1 upregulation
Carbonic anhydrases form a large family of genes encoding zinc metalloenzymes are of
great physiological importance. As catalysts of the reversible hydration of carbon
dioxide, these enzymes participate in a variety of physiological processes, including
respiration, calcification, acid-base balance, bone resorption and the formation of
aqueous humor. TG hearts overexpress the genes encoding carbonic anhydrases 8 and
14 (CAR8 and CAR14). cDNA microarray studies (University of Lausanne) not
mentioned in detail here suggest there is upregulation of three other carbonic anhydrase
enzymes, namely CAR2, CAR4 and CAR6. CAR2 and other isoforms bearing CO2
hydration activity enhance the activity of the NHE-1 and the anion exchanger AE3 in a
synergistic way (Figure V-7) (Li et al., 2002; Alvarez et al., 2003; Loiselle et al., 2004).
Interestingly, Alvarez et al. (2004) proposed that catecholamine-induced
cardiomyocyte hypertrophy in vitro can be suppressed by treating the cells with ETZ,
an inhibitor of the carbonic anhydrases, suggesting an important role played by
synergistic activity of carbonic anhydrases, NHE-1 and anion exchangers in the process
of cardiomyocyte functional remodeling. As shown in Chapter IV (Figure IV-8), TG
hearts upregulate the NHE-1. The present data strengthen the idea that sodium-
hydrogen exchange is enhanced in hearts from Agt-overexpressing transgenic mice,
leading to cellular sodium load and cardiomyocyte hypertrophy.

Chapter V
242
4.2. Differential gene expression in LLC hearts
Microarray expression profiling was used to identify genes differentially expressed
between LLC and LL ventricles. In hearts of 60 week LLC, genetically manipulated
ablation of the glucose transporter, GLUT4, was associated with altered expression of
numerous genes, including the hypertrophic markers BNP (Nppb) and SERCA2
(Atp2a2), which are up- and downregulated respectively in LLC hearts (Tables V-3 and
V-4). This study provides novel insights into the genetic alterations underlying the
development of insulin resistant cardiomyopathy.
4.2.1. Metabolic and mitochondrial impairment in LLC hearts
The most evident shift in gene expression in LLC ventricles is a general
downregulation of ‘key players’ of the mitochondrial oxidative phosphorylation. LLC
hearts exhibit downregulation of proton-transporting ATP synthase subunits Atp5b,
Atp5c1 and Atp5j (complex V) as well as the NADH dehydrogenase subunits Ndufs2
and Ndufb9 (complex I) and the cytochrome c1 oxidase (mt-Co1) (complex IV). As a
result, ATP production would be expected to be impaired in the LLC hearts. These data
suggest that cardiac remodeling in insulin resistant cardiomyopathy is associated with
mitochondrial dysfunction, possibly linked with the disruption of the glucose
metabolism following GLUT4 deletion. Other evidence of mitochondrial impairment in
LLC hearts comes from the downregulation of acetyl-Coenzyme A acyltransferase 2
(Acaa2), which is involved in the fatty acid beta oxidation. Interestingly, the
cytoplasmic acyl-CoA synthetase Acsl5, which activates fatty acids and requires ATP,
is upregulated. Together, these data propose a disruption of the mitochondrial electron
chain transport, decreased ATP synthesis and downregulation of beta-oxidation, which
is consistent with the interpretation that fatty acid metabolism is downregulated during
cardiac hypertrophy.
LLC hearts also exhibit downregulation of soluble malate dehydrogenase 1 (Mdh1) and
isocitrate dehydrogenase 2 (Idh2), suggesting impaired citric acid cycle and decreased
Chapter V
243
pyruvate and glyoxylate/dicarboxylate metabolism, with decreased CO2 fixation.
Interestingly, the glyceraldehyde-3-phosphate dehydrogenase (Gapd) involved in
glycolysis and gluconeogenesis, is upregulated in LLC hearts, suggesting that the
glycolytic pathway may be enhanced in LLC hearts. Together these data could suggest
that there is a shift in the production of ATP from the aerobic pathway, involving
mitochondrial oxidation of NADH equivalents, to an anaerobic pathway, where glucose
and glycogen are metabolized to pyruvate and then reduced to lactate by the lactate
dehydrogenase. This could be a compensatory mechanism to salvage ATP production
in an environment characterized by decreased glucose intake and possibly low oxygen
levels. Lactate and proton accumulation in the heart could potentially induce changes in
pH linked with activation of the sodium/hydrogen exchanger (NHE) (Chapter IV),
which in turn could induce the decrease of GLUT4 translocation toward the membrane
and further reduce myocyte glucose uptake (Yang et al., 2002).
There is evidence that other metabolic pathways are differentially regulated in LLC
hearts. For instance, downregulation of the methionine adenosyltransferase I alpha
(Mat1a) could decrease methionine and the selenoamino acid metabolism, while
downregulation of Acaa2 (see above) could also prevent the degradation of valine,
leucine and isoleucine, as well as the degradation of benzoate. The dual-specificity
tyrosine-phosphorylation regulated kinase Dyrk1a, also downregulated in LLC hearts,
is linked to the starch/sucrose metabolism and the nicotinate/nicotinamide metabolism.
Dyrk1a, together with the kinase GSK-3, is known to modulate glycogen synthesis by
phosphorylating glycogen synthase (Skurat and Dietrich, 2004). Downregulation of
Drk1a would decrease glycogen synthase phosphorylation and enhance glycogen
storage. This is a surprising and unexpected finding as increased glycogen breakdown
and suppressed glycogen synthesis is generally observed in type 2 diabetic skeletal
muscles, in association with insulin resistance and diminished glucose disposal.
However, if similar expression shifts occur in the LLC skeletal muscle, this would
explain the lack of hyperglycemia in the GLUT4-KO mice (Kaczmarczyk et al., 2003).

Chapter V
244
4.2.2. Metal and iron homeostasis in LLC hearts
Hearts of LLC mice exhibit upregulation of proteins playing a central role in iron
homeostasis. The solute Carrier 11 alpha 2 (Slc11a2), is best known as natural
resistance-associated macrophage protein 2 (NRAMP2). It is a proton-dependent cation
transporter, which plays an important role in iron homeostasis. NRAMP2 is present in
the plasma membrane and in acidified endomembrane compartments (Tabuchi et al.,
2000). Their subcellular colocalization and parallel trafficking suggest that NRAMP2
and transferrin receptors are functionally coupled to effect pH-dependent iron uptake
across the endosomal membrane (Touret et al., 2003).
Ferritin light chain 1 (Ftl1) is also upregulated in LLC hearts. Ferritin is the major
intracellular iron storage protein in all organisms. This gene has been shown to be
upregulated in rat heart after myocardial infarction (Zhu et al., 2000). Ferritin
accumulation in the heart causes alterations in systolic and diastolic function and can
provide an arrhythmogenic substrate inducing atrial and ventricular tachyarrhythmia
(Parkes et al., 1993). Metal ions are essential cofactors for a variety of biologic
processes, including oxidative phosphorylation, gene regulation, and free-radical
homeostasis. Iron-overload is associated with hereditary disorders such as
hemochromatosis, which causes cirrhosis of the liver, hepatocarcinoma, diabetes,
hypermelanotic pigmentation of the skin, cardiomyopathy, myocardial inflammation
and heart failure (Burke et al., 2001; Imperatore et al., 2003). Interestingly, Oudit et al.
(2003) showed that iron-overload in mice was associated with increased myocardial
fibrosis and elevated oxidative stress, in association with increased mortality, systolic
and diastolic dysfunction, bradycardia and hypotension. They also showed that L-type
voltage-operated calcium channels were key transporters of iron into cardiomyocytes
under iron-overloaded conditions. Thus, it could be speculated that cardiomyopathy in
LLC mice is associated with (and possibly induced by) non-hereditary form of iron-
overload.

Chapter V
245
4.2.3. Genes associated with hereditary and non-hereditary
cardiomyopathy in LLC hearts
Differential regulation of genes that have been previously associated with various
forms of hereditary cardiomyopathy (see Chapter I for more details) are observed in
LLC hearts. A gene which is commonly implicated in hereditary cardiomyopathy is
tropomyosin 1 alpha chain (Tpm1). This gene is downregulated in LLC hearts. It
usually binds to actin filaments in muscle and non-muscle cells and plays a central role,
in association with the troponin complex, in the calcium dependent regulation of
vertebrate striated muscle contraction (Murakami et al., 2005). In non-muscle cells it is
involved in stabilizing cytoskeleton actin filaments. Mutations and downregulation of
this gene causes hypertrophic cardiomyopathy CMH3 in humans.
Another gene involved in heart defects in Down’s syndrome, is the SH3 domain-
binding glutamic acid-rich protein (Sh3bgr). This gene maps to chromosome 21 within
the Down’s syndrome congenital heart disease minimal region in humans. The
expression of Sh3bgr is restricted to the heart between embryonic E7.75-E10.5 and it
plays a possible role in heart morphogenesis (Egeo et al., 2000). This gene belongs to a
new family of highly conserved small proteins related to the thioredoxin super family
(Mazzocco et al., 2002). Upregulation of this gene in Down’s syndrome (due to the
presence of an extra copy of chromosome 21) causes important cardiac defects which
ultimately reduce the life expectancy of Down’s individuals. Recently, Sandri et al.
(2004) reported that transgenic mice overexpressing the Sh3bgr gene do not present
any morphogenetic and developmentally regulated heart defect. Nevertheless, non-
familial upregulation of Sh3bgr and downregulation of Tpm1 could play an important
part in the development of the cardiomyopathic phenotype in LLC hearts.

Chapter V
246
4.2.4. Adrenomedullin receptor overexpression in LLC hearts
Transcription of the gene coding for the receptor activity-modifying protein 2 precursor
is upregulated in LLC hearts. This gene transports the calcitonin-receptor-like receptor
to the plasma membrane where it acts as an adrenomedullin receptor (Bomberger et al.,
2005). The calcitonin-receptor-like receptor binds calcitonin gene-related peptide one
of the most potent known endogenous vasodilators known. Calcitonin gene-related
peptide and its related peptide adrenomedullin are potent smooth muscle relaxants in a
variety of tissues and upregulation of adrenomedullin and the receptor activity-
modifying protein 2 precursor in the myocardium and aorta may be significant in the
pathogenesis of ischemic cardiomyopathy. Upregulation of the cardiac adrenomedullin
system, including the ligand, receptor, and activity, may modulate pathophysiology
during the transition from LV hypertrophy to heart failure in hypertensive rats
(Romppanen et al., 1997). Furthermore, adrenomedullin stimulates heart rate, cardiac
output, plasma levels of cAMP, prolactin, norepinephrine and renin whilst inhibiting
any concomitant response in plasma aldosterone (Troughton et al., 2000). Acute
hyperinsulinemia induces a significant increase in the plasma levels of adrenomedullin
in patients with type 2 diabetes mellitus, thus suggesting that increased plasma insulin
levels may regulate circulating levels of adrenomedullin in patients with type 2 diabetes
mellitus (Katsuki et al., 2002). Furthermore, the adrenomedullin response is
upregulated by hypoxia and inflammatory stimuli and may play an anti-inflammatory
role via a PI3K pathway (Okumura et al., 2004). All these data could suggest that
overexpression of receptor activity-modifying protein 2 precursor in the heart of LLC
mice could enhance adrenomedullin activity at the vascular and myocardial levels.
4.2.5. Cell cycle regulation and fibroblast proliferation
in LLC hearts
As suggested in Chapter III, collagen production in LLC hearts could be associated
with fibroblast proliferation. The gene encoding the S100 calcium binding protein A6
(S100A6), also known as calcyclin, is upregulated in the LLC ventricles. Calcyclin, a

Chapter V
247
prolactin receptor-associated protein that binds calcium and zinc ions is highly
expressed in fibroblasts and epithelial cells of various organs, including the heart
(Kuznicki et al., 1989; Kuznicki et al., 1992). Breen and Tang (2003) reported that
calcyclin expression modulates calcium-dependent signaling events that regulate
progression through the cell cycle and induce proliferation of fibroblasts. Calcyclin also
seems to interact with other proteins in a calcium-dependent manner, such as GAPD,
annexin II and a protein CacyBP/SIP (Zeng et al., 1993; Filipek et al., 1995; Nowotny
et al., 2003). Interestingly, CacyBP/SIP is a component of a novel ubiquitinylation
pathway regulating β-catenin degradation (Filipek et al., 2002) and inhibiting the
canonical Wnt signaling pathway. LLC hearts upregulate another mitotic checkpoint
gene, the budding uninhibited by benzimidazoles 1 homolog beta gene (Bub1b). Bub1b
codes for a protein that can target other proteins for degradation by proteasomes during
mitosis (Davenport et al., 1999). In synchronized cells, expression of Bub1 gene peaks
in G2/M phase, suggesting that it controls transition from the G phase to mitosis.
Finally, the most upregulated gene in LLC hearts encodes for the n-Myc downstream
regulated gene 4 (Ndr4). This gene encodes for a protein which is identical to the
mouse cardiac-specific SMAP8 (Nishimoto et al., 2003). Interestingly, Nishimoto et al.
(2003) showed that PDGF-induced proliferation was significantly enhanced in SMAP8-
transfected smooth muscle-derived cell lines compared to control. Consistent with this,
Ciani et al. (2004) demonstrated that downregulation of n-Myc negatively regulates
proliferation and promotes neuronal differentiation in neuroblastoma cell lines. These
data strengthen the hypothesis that collagen production in LLC hearts is associated with
fibroblast proliferation and suppression of differentiation processes. Proliferation could
be associated with the activation of novel ubiquitinylation pathways leading to mitosis
and to the inhibition of the Wnt signaling pathways that regulate differentiation.

Chapter V
248
4.3. Common set of genes altered in TG and LLC hearts
Gene expression profiling revealed a large number of distinct genes altered during
hormonally (TG) and metabolically (LLC) induced cardiac hypertrophies. Among the
224 genes differentially regulated in LLC and TG ventricles, only 7 presented
significant patterns of differential expression in both models. In both TG and LLC, 3
genes were downregulated, 4 genes were reciprocally regulated and none were
upregulated in common. It is important to note that statistical normalization of
microarray experiments and gene ranking leads to the positive selection of the most
robustly regulated genes in each model. Thus, genes that were found to be differentially
regulated only in one model could be differentially regulated in the other model too, but
less markedly.
4.3.1. Common downregulated genes
The mitochondrial cytochrome C oxidase 1 (mt-CO1) and the mitochondrial 16S rRNA
(mt-Rnr2) were found to be significantly downregulated in both mouse models. mt-
CO1 and mt-Rnr2 are genes expressed by the mitochondrial genome. Downregulation
of these genes could suggest that mitochondrial gene expression is impaired in both
LLC and TG hearts. Independently of the etiology and the severity of remodeling, this
could be regarded as a major common factor for the development of heart failure in
both mouse models. Interestingly, LLC hearts downregulate the gene coding for the
optic atrophy 1 homolog (human) (OPA1). This protein may be involved in
mitochondrial biogenesis. It is highly expressed in retina, but also expressed in brain,
testis, heart and skeletal muscle. Downregulation of this gene by siRNA leads to
fragmentation of the mitochondrial network, dissipation of the mitochondrial
membrane potential, cytochrome C release and caspase-dependent apoptosis (Olichon
et al., 2003). OPA1 may be involved in cytochrome C sequestration. This is in
agreement with the concept that developing mitochondrial damage could cause the
downregulation of the aerobic metabolic pathways, ultimately leading to energy
starvation and the development of heart failure.

Chapter V
249
The carboxyl esterase 3 (Ces3) was also found to be downregulated in both LLC and
TG hearts. Carboxyl esterases metabolize ester, thioester, carbamate and amide
compounds to more soluble acid, alcohol and amine products. The consequence of a
downregulation of Ces3 in the hearts of TG and LLC mice is unknown. Ces3 exhibits
relatively lower enzymatic activity than the other two isoforms Ces1 and Ces2
(Sanghani et al., 2004).
4.3.2. Reciprocally regulated genes
The homologue of the human chromosome condensation protein G (hCAPG, or
5730507H05Rik in the mouse), the CD2 antigen binding protein 2 (Cd2bp2) and the
ICOS ligand (Icosl) were upregulated in LLC but were downregulated in TG hearts.
hCAPG plays a central role in mitotic chromosome condensation and chromatine
stability (Geiman et al., 2004). Analysis of hCAPG mRNA expression showed highest
expression in the testis among normal tissues and variable expression in tumor cells,
reflecting the proliferative activity in these cells. This mitosis-related expression
suggests hCAPG as a possible proliferation marker and it could be associated with the
proliferative activity of fibroblasts in the LLC hearts. This would strengthen the idea
that a major difference between LLC and TG could be the balance between cell
proliferation and cell differentiation of non-myocyte cells. Some hypertrophic signaling
pathways present in the LLC hearts could activate non-myocyte proliferation in the
myocardium leading to collagen production and fibrosis, while other hypertrophic
signals specific to the TG mouse could preferentially activate non-myocyte cell
differentiation and prevent collagen production.
The ICOS ligand (Icosl) and the CD2 antigen binding protein 2 (Cd2bp2) were
upregulated in LLC and downregulated in TG hearts. ICOS ligand precursor (ICOSL),
regulates CD4 as well as CD8 T-cell responses via interaction with its receptor ICOS
on activated T cells. ICOSL expression is markedly increased in muscle fibres in
inflammatory myopathies and in myocarditis (Wiendl et al., 2003). Induction of ICOSL
is dependent on TNF-alpha and is regulated via NF-kappa B. Blockade of T cell

Chapter V
250
activation through ICOS suppresses expression of cytokines including INF-gamma,
IL4, IL6, IL-0, IL1beta, and TNF-alpha and inhibits T cell proliferation in vitro.
The CD2 antigen binding protein 2 (CD2BP2) is expressed in a wide variety of tissues
and organs. It interacts with the cytoplasmic tale of CD2, a surface antigen of the
human T-lymphocyte lineage that is expressed on all peripheral blood T cells. CD2BP2
expression selectively enhances IL2 production on cross-linking with CD2 (Nishizawa
et al., 1998). Thus, both ICOSL and CD2BP2 are markers of tissue penetration of
immune cell, inflammation and cytokine production. This evidence suggests that LLC
hearts suffer from fibrotic cardiomyopathy associated with cytokine-related
inflammation, while TG hearts suffer from inflammation-independent cardiomyocyte
and cardiac hypertrophy.
Finally, the fatty acid binding protein 3 (Fabp3) was found to be downregulated in LLC
hearts and upregulated in TG. Fatty acid metabolism in mammalian cells depends on
flux of fatty acids, between the plasma membrane and mitochondria or peroxisomes for
beta-oxidation, and between other cellular organelles for lipid synthesis. FABP proteins
play a role as transport vehicles of fatty acid compounds throughout the cytoplasm.
FABP3, also known as heart-type fatty acid binding protein (H-FABP) is abundant in
the heart and has low concentrations in the blood and in tissues outside the heart
(Alhadi and Fox, 2004). Overexpression of this gene in TG hearts could relate to
increased (or increased need for) fatty acid shuttling into the cytoplasm, possibly in
association with an enhancement of peroxisomal beta-oxidation. Interestingly, FABP3
has been reported as a sensitive and specific marker for the early diagnosis of acute
myocardial infarction, myocardial ischemia and development of congestive heart
failure (Goto et al., 2003; Chan et al., 2004; Tambara et al., 2004). FABP3 can be
secreted into the interstitial space by increased permeability of the cardiomyocyte
membrane associated with ischemic conditions, thus high serum of FABP3 can indicate
recent occurrence of an infarctive event within the previous 24 hours, while high
pericardial fluid levels can reflect chronic hypoxic conditions. To date there is no
evidence of a positive or negative correlation between mRNA expression levels and
serum or fluid levels for FABP3.

Chapter V
251
5. IN SUMMARY
The present study demonstrates differential expression of various set of genes in forms
of Ang II-induced cardiac hypertrophy and insulin resistant cardiomyopathy. Ang II-
stimulated cardiac hypertrophy is predominantly associated with differential expression
of pro-hypertrophic genes involved in protein biosynthesis and cell differentiation. In
contrast, cardiac remodeling induced by impaired myocardial glucose uptake is
associated with strong downregulation of genes involved in mitochondrial energy
production and upregulation of genes involved in cell proliferation and tissue
inflammation. Both forms of hypertrophy show evidence of impairment of
mitochondrial function, although mitochondrial dysfunction and damage seems to be
more important in LLC hearts. Collectively these data suggest that cardiac remodeling
in LLC and TG hearts is associated with the expression of separate sets of genes which
ultimately determine the morphological and mechanical differences observed between
the two hypertrophic models. The concept of a generic metabolic fetal recapitulation in
these two forms of normotensive hypertrophy is not supported.
These data are further considered in conjunction with other functional and morphologic
findings in the next Chapter.

Chapter V
252
M value Clone Symbol Name Heart*2.27 H3117D07 Hsd17b4 Hydroxysteroid (17-beta) dehydrogenase 4 ***2.19 H3114C04 EST no1.94 H3120F02 Tia1 Cytotoxic granule-associated RNA binding protein 1 **1.92 H3118A03 Hbb-y Hemoglobin Y, beta-like embryonic chain **1.87 H3118A04 Hbb-y Hemoglobin Y, beta-like embryonic chain **1.82 H3129G10 EST no1.80 H3118A05 Hbb-y Hemoglobin Y, beta-like embryonic chain **1.77 H3045A12 Hba-a1 Hemoglobin alpha, adult chain 1 ***1.74 H3097C06 Tgfb1i4 Transforming growth factor beta 1 induced transcript 4 ***1.72 H3054E05 AI385631 Expressed sequence AI385631 no1.72 H3144C04 1300010M03Rik RIKEN cDNA 1300010M03 gene ***1.61 H3136E01 E130307J07Rik RIKEN cDNA E130307J07 gene ***1.58 H3122A02 Hoxb3 Homeo box B3 **1.56 H3120G01 EST no1.53 H3065D08 Morc Microrchidia no1.52 H3117D02 Hbb-b2 Hemoglobin, beta adult minor chain ***1.51 H3128H08 LOC114601 Tangerin - provisional ***1.49 H3001B06 9330177P20Rik RIKEN cDNA 9330177P20 gene **1.48 H3032A08 Hspa5 Heat shock 70kD protein 5 (glucose-regulated protein) ***1.48 H3115C01 Car8 Carbonic anhydrase 8 **1.47 H3133A09 Sfrs4 Splicing factor, arginine/serine-rich 4 (SRp75) ***1.46 H3129G11 Dscr2 Down syndrome critical region homolog 2 (human) **1.45 H3139E01 Hspa8 Heat shock protein 8 ***1.43 H3144C11 Hspa5 Heat shock 70kD protein 5 (glucose-regulated protein) ***1.42 H3119D02 2810480G15Rik Riken cDNA 2810480G15 gene ***1.42 H3149E05 Agt Angiotensinogen ***1.39 H3118A06 Hbb-y Hemoglobin Y, beta-like embryonic chain **1.39 H3148G03 Dkk3 Dickkopf homolog 3 (Xenopus laevis) ***1.37 H3005A12 Taf11 TAF11 RNA polymerase II, TATA box binding protein (TBP)-associated factor **1.35 H3128A04 Arfgap1 ADP-ribosylation factor GTPase activating protein 1 **1.34 H3099G04 Slc28a3 Solute carrier family 28 (Na-coupled nucleoside transporter), member 3 **1.33 H3130A11 Fabp3 Fatty acid binding protein 3, muscle and heart ****1.29 H3126G11 Col15a1 Procollagen, type XV, alpha 1 ***1.29 H3072G05 Elavl2 ELAV (embryonic lethal, abnormal vision, Drosophila)-like 2 **1.28 H3127H08 EST no1.27 H3069D12 Ube4b Ubiquitination factor E4B, UFD2 homolog (S. cerevisiae) **1.26 H3036C07 Rpl10 Ribosomal protein 10 ***1.26 H3120C09 Rpl10 Ribosomal protein 10 ***1.26 H3125D02 EST no1.24 H3068D06 1110007A06Rik RIKEN cDNA 1110007A06 gene no1.21 H3022B03 Srp9 Signal recognition particle 9 ***1.20 H3018H04 Ptk9 Protein tyrosine kinase 9 **1.20 H3024A11 Rrm2 Ribonucleotide reductase M2 **1.20 H3017H10 Lasp1 LIM and SH3 protein 1 ***1.20 H3073F12 EST no1.19 H3017A12 Syngr1 Synaptogyrin 1 **1.19 H3001H10 Tmsb10 Thymosin, beta 10 ****1.19 H3007H07 EST no1.19 H3074B11 EST no1.19 H3100H03 3110001A13Rik RIKEN cDNA 3110001A13 gene *1.19 H3010F12 Smyd4 SET and MYND domain containing 4 ***1.18 H3021B10 Mta2 Metastasis-associated gene family, member 2 no1.18 H3013D11 Mt2 Metallothionein 2 ***1.18 H3028D05 Rpl5 Ribosomal protein L5 ***1.18 H3027G10 Zfp94 Zinc finger protein 94 **1.18 H3025A06 2400006P09Rik RIKEN cDNA 2400006P09 gene **1.18 H3014D04 Gtpbp1 GTP binding protein 1 **1.17 H3073C07 Phip Pleckstrin homology domain interacting protein **1.17 H3023H05 mt-Cytb cytochrome b, mitochondrial ?1.17 H3024F03 Cox7a2l Cytochrome c oxidase subunit VIIa polypeptide 2-like ***1.17 H3023C04 Itm1 Intergral membrane protein 1 **1.17 H3032F12 EST no1.17 H3021G11 Calr Calreticulin **1.16 H3022F12 Csh1 Chorionic somatomammotropin hormone 1 no1.16 H3028B06 D4Ertd478e DNA segment, Chr 4, ERATO Doi 478, expressed no1.15 H3140F07 Eef1a1 Eukaryotic translation elongation factor 1 alpha 1 ****1.15 H3031B10 Usf2 Upstream transcription factor 2 ***1.15 H3019G12 2510048O06Rik RIKEN cDNA 2510048O06 gene ***1.15 H3055F03 Gtl7 gene trap locus 7 **1.15 H3025B09 Pdcd11 Programmed cell death 11 *1.15 H3011H11 Rpl4 Ribosomal protein L4 ***1.14 H3032B09 Mesdc2 Mesoderm development candiate 2 **1.14 H3093H12 Mmp7 Matrix metalloproteinase 7 *1.14 H3062H08 1810030M08Rik RIKEN cDNA 1810030M08 gene ***1.14 H3010F11 Liph Lipase, member H **1.13 H3028C10 Farp1 FERM, RhoGEF (Arhgef) and pleckstrin domain protein 1 **1.13 H3079A02 Rpl12 Ribosomal protein L12 ***1.13 H3053H06 Slc25a13 Solute carrier family 25 (mitoch. carrier; adenine nucleotide translocator), member 13 **1.13 H3073C03 1500041J02Rik RIKEN cDNA 1500041J02 gene no1.13 H3021C04 Sui1-rs1 Suppressor of initiator codon mutations, related sequence 1 (S. cerevisiae) ****1.12 H3025F03 Car14 Carbonic anhydrase 14 **1.12 H3005H03 Rab18 RAB18, member RAS oncogene family **1.12 H3018F10 Gprc5c G protein-coupled receptor, family C, group 5, member C **1.12 H3025D10 Aga Aspartylglucosaminidase **1.11 H3021B04 Sypl Synaptophysin-like protein ***1.10 H3022D11 Ppp4r1 Protein phosphatase 4, regulatory subunit 1 **1.09 H3021F12 Pcna Proliferating cell nuclear antigen **1.09 H3022D12 Anapc7 Anaphase promoting complex subunit 7 **1.09 H3028E04 Ppp2r1a Protein phosphatase 2 (formerly 2A), regulatory subunit A (PR 65), alpha isoform ***1.09 H3005H10 Eef1d Eukaryotic translation elongation factor 1 delta (guanine nucleotide exchange protein) ***1.09 H3055C04 G3bp Ras-GTPase-activating protein SH3-domain binding protein -pending ***
Table V-1: Upregulated clones in TG ventricle
Clones are ranked according to their M value, in descending order. *The last column reports evidence for cardiac expression of the candidate gene. Evidence is based either on Weizmann Institute of Science DNA array experiments, performed with the Affymetrix HG-U95 set A-E, or from SAGE tags listed by the Cancer Genome Anatomy Project (*<10 copies/tag; **10-100 copies/tag; ***100-1000 copies/tag; ****>1000 copies/tag).
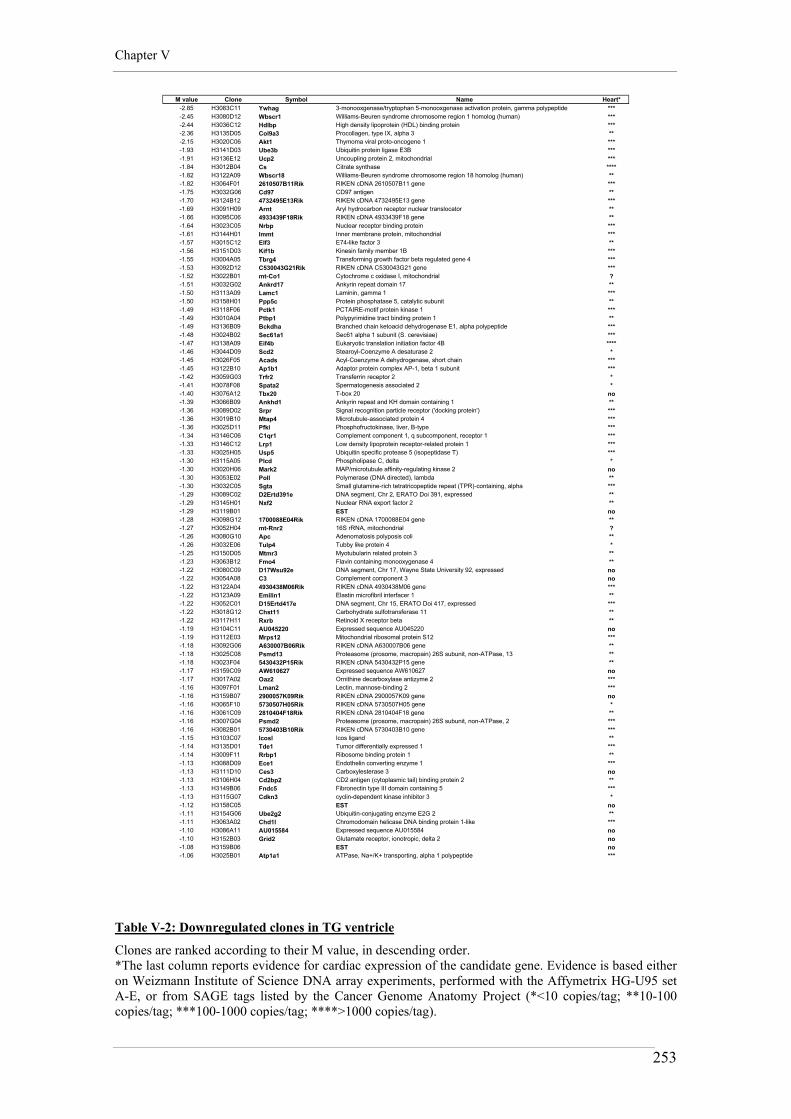
Chapter V
253
M value Clone Symbol Name Heart*-2.85 H3083C11 Ywhag 3-monooxgenase/tryptophan 5-monooxgenase activation protein, gamma polypeptide ***-2.45 H3080D12 Wbscr1 Williams-Beuren syndrome chromosome region 1 homolog (human) ***-2.44 H3036C12 Hdlbp High density lipoprotein (HDL) binding protein ***-2.36 H3135D05 Col9a3 Procollagen, type IX, alpha 3 **-2.15 H3020C06 Akt1 Thymoma viral proto-oncogene 1 ***-1.93 H3141D03 Ube3b Ubiquitin protein ligase E3B ***-1.91 H3136E12 Ucp2 Uncoupling protein 2, mitochondrial ***-1.84 H3012B04 Cs Citrate synthase ****-1.82 H3122A09 Wbscr18 Williams-Beuren syndrome chromosome region 18 homolog (human) **-1.82 H3064F01 2610507B11Rik RIKEN cDNA 2610507B11 gene ***-1.75 H3032G06 Cd97 CD97 antigen **-1.70 H3124B12 4732495E13Rik RIKEN cDNA 4732495E13 gene ***-1.69 H3091H09 Arnt Aryl hydrocarbon receptor nuclear translocator **-1.66 H3095C06 4933439F18Rik RIKEN cDNA 4933439F18 gene **-1.64 H3023C05 Nrbp Nuclear receptor binding protein ***-1.61 H3144H01 Immt Inner membrane protein, mitochondrial ***-1.57 H3015C12 Elf3 E74-like factor 3 **-1.56 H3151D03 Kif1b Kinesin family member 1B ***-1.55 H3004A05 Tbrg4 Transforming growth factor beta regulated gene 4 ***-1.53 H3092D12 C530043G21Rik RIKEN cDNA C530043G21 gene ***-1.52 H3022B01 mt-Co1 Cytochrome c oxidase I, mitochondrial ?-1.51 H3032G02 Ankrd17 Ankyrin repeat domain 17 **-1.50 H3113A09 Lamc1 Laminin, gamma 1 ***-1.50 H3158H01 Ppp5c Protein phosphatase 5, catalytic subunit **-1.49 H3118F06 Pctk1 PCTAIRE-motif protein kinase 1 ***-1.49 H3010A04 Ptbp1 Polypyrimidine tract binding protein 1 **-1.49 H3136B09 Bckdha Branched chain ketoacid dehydrogenase E1, alpha polypeptide ***-1.48 H3024B02 Sec61a1 Sec61 alpha 1 subunit (S. cerevisiae) ***-1.47 H3138A09 Eif4b Eukaryotic translation initiation factor 4B ****-1.46 H3044D09 Scd2 Stearoyl-Coenzyme A desaturase 2 *-1.45 H3026F05 Acads Acyl-Coenzyme A dehydrogenase, short chain ***-1.45 H3122B10 Ap1b1 Adaptor protein complex AP-1, beta 1 subunit ***-1.42 H3059G03 Trfr2 Transferrin receptor 2 *-1.41 H3078F08 Spata2 Spermatogenesis associated 2 *-1.40 H3076A12 Tbx20 T-box 20 no-1.39 H3066B09 Ankhd1 Ankyrin repeat and KH domain containing 1 **-1.36 H3089D02 Srpr Signal recognition particle receptor ('docking protein') ***-1.36 H3019B10 Mtap4 Microtubule-associated protein 4 ***-1.36 H3025D11 Pfkl Phosphofructokinase, liver, B-type ***-1.34 H3146C06 C1qr1 Complement component 1, q subcomponent, receptor 1 ***-1.33 H3146C12 Lrp1 Low density lipoprotein receptor-related protein 1 ***-1.33 H3025H05 Usp5 Ubiquitin specific protease 5 (isopeptidase T) ***-1.30 H3115A05 Plcd Phospholipase C, delta *-1.30 H3020H06 Mark2 MAP/microtubule affinity-regulating kinase 2 no-1.30 H3053E02 Poll Polymerase (DNA directed), lambda **-1.30 H3032C05 Sgta Small glutamine-rich tetratricopeptide repeat (TPR)-containing, alpha ***-1.29 H3089C02 D2Ertd391e DNA segment, Chr 2, ERATO Doi 391, expressed **-1.29 H3145H01 Nxf2 Nuclear RNA export factor 2 **-1.29 H3119B01 EST no-1.28 H3098G12 1700088E04Rik RIKEN cDNA 1700088E04 gene **-1.27 H3052H04 mt-Rnr2 16S rRNA, mitochondrial ?-1.26 H3080G10 Apc Adenomatosis polyposis coli **-1.26 H3032E06 Tulp4 Tubby like protein 4 *-1.25 H3150D05 Mtmr3 Myotubularin related protein 3 **-1.23 H3063B12 Fmo4 Flavin containing monooxygenase 4 **-1.22 H3080C09 D17Wsu92e DNA segment, Chr 17, Wayne State University 92, expressed no-1.22 H3054A08 C3 Complement component 3 no-1.22 H3122A04 4930438M06Rik RIKEN cDNA 4930438M06 gene ***-1.22 H3123A09 Emilin1 Elastin microfibril interfacer 1 **-1.22 H3052C01 D15Ertd417e DNA segment, Chr 15, ERATO Doi 417, expressed ***-1.22 H3018G12 Chst11 Carbohydrate sulfotransferase 11 **-1.22 H3117H11 Rxrb Retinoid X receptor beta **-1.19 H3104C11 AU045220 Expressed sequence AU045220 no-1.19 H3112E03 Mrps12 Mitochondrial ribosomal protein S12 ***-1.18 H3092G06 A630007B06Rik RIKEN cDNA A630007B06 gene **-1.18 H3025C08 Psmd13 Proteasome (prosome, macropain) 26S subunit, non-ATPase, 13 **-1.18 H3023F04 5430432P15Rik RIKEN cDNA 5430432P15 gene **-1.17 H3159C09 AW610627 Expressed sequence AW610627 no-1.17 H3017A02 Oaz2 Ornithine decarboxylase antizyme 2 ***-1.16 H3097F01 Lman2 Lectin, mannose-binding 2 ***-1.16 H3159B07 2900057K09Rik RIKEN cDNA 2900057K09 gene no-1.16 H3065F10 5730507H05Rik RIKEN cDNA 5730507H05 gene *-1.16 H3061C09 2810404F18Rik RIKEN cDNA 2810404F18 gene **-1.16 H3007G04 Psmd2 Proteasome (prosome, macropain) 26S subunit, non-ATPase, 2 ***-1.16 H3082B01 5730403B10Rik RIKEN cDNA 5730403B10 gene ***-1.15 H3103C07 Icosl Icos ligand **-1.14 H3135D01 Tde1 Tumor differentially expressed 1 ***-1.14 H3009F11 Rrbp1 Ribosome binding protein 1 **-1.13 H3088D09 Ece1 Endothelin converting enzyme 1 ***-1.13 H3111D10 Ces3 Carboxylesterase 3 no-1.13 H3106H04 Cd2bp2 CD2 antigen (cytoplasmic tail) binding protein 2 **-1.13 H3149B06 Fndc5 Fibronectin type III domain containing 5 ***-1.13 H3115G07 Cdkn3 cyclin-dependent kinase inhibitor 3 *-1.12 H3158C05 EST no-1.11 H3154G06 Ube2g2 Ubiquitin-conjugating enzyme E2G 2 **-1.11 H3063A02 Chd1l Chromodomain helicase DNA binding protein 1-like ***-1.10 H3086A11 AU015584 Expressed sequence AU015584 no-1.10 H3152B03 Grid2 Glutamate receptor, ionotropic, delta 2 no-1.08 H3159B06 EST no-1.06 H3025B01 Atp1a1 ATPase, Na+/K+ transporting, alpha 1 polypeptide ***
Table V-2: Downregulated clones in TG ventricle
Clones are ranked according to their M value, in descending order. *The last column reports evidence for cardiac expression of the candidate gene. Evidence is based either on Weizmann Institute of Science DNA array experiments, performed with the Affymetrix HG-U95 set A-E, or from SAGE tags listed by the Cancer Genome Anatomy Project (*<10 copies/tag; **10-100 copies/tag; ***100-1000 copies/tag; ****>1000 copies/tag).

Chapter V
254
M value Clone Symbol Name Heart*
2.93 H3078D03 Ndr4 N-myc downstream regulated gene 4 ***2.72 H3014C07 Nppb Natriuretic peptide precursor type B ***2.50 H3147B06 Gapd Glyceraldehyde-3-phosphate dehydrogenase ****2.38 H3097B03 Slc11a2 Solute carrier family 11 (proton-coupled divalent metal ion transporters), member 2 **2.36 H3103D04 Bub1b Budding uninhibited by benzimidazoles 1 homolog, beta (S. cerevisiae) **2.28 H3087D01 EST no2.21 H3159D08 2610014H22Rik RIKEN cDNA 2610014H22 gene no2.20 H3103B09 Cdh22 Cadherin 22 *2.17 H3102E11 EST no2.15 H3065F10 5730507H05Rik RIKEN cDNA 5730507H05 gene *2.02 H3045E04 Ybx2 Y box protein 2 **1.99 H3087A06 Falz Fetal Alzheimer antigen **1.96 H3087H09 S100a6 S100 calcium binding protein A6 (calcyclin) ***1.91 H3031E11 Gapd Glyceraldehyde-3-phosphate dehydrogenase ****1.88 H3050D06 Sh3bgr SH3-binding domain glutamic acid-rich protein **1.83 H3083H03 EST no1.82 H3098A01 EST no1.81 H3022B04 EST no1.80 H3092G11 Lmbr1 Limb region 1 **1.77 H3133E08 9630010G10Rik RIKEN cDNA 9630010G10 gene no1.76 H3102A09 Synj2bp Synaptojanin 2 binding protein **1.74 H3066G03 Gna14 Guanine nucleotide binding protein, alpha 14 **1.73 H3090C11 Rsb30 RAB30, member RAS oncogene family **1.68 H3106H04 Cd2bp2 CD2 antigen (cytoplasmic tail) binding protein 2 **1.66 H3093C06 6030413G23Rik RIKEN cDNA 6030413G23 gene no1.65 H3101C10 Gapd Glyceraldehyde-3-phosphate dehydrogenase ****1.64 H3010H10 Ramp2 Receptor (calcitonin) activity modifying protein 2 ***1.64 H3149G11 Mrvldc1 MARVEL (membrane-associating) domain containing 1 ***1.61 H3145A03 Prkar1a Protein kinase, cAMP dependent regulatory, type I, alpha ***1.60 H3083B05 Fusip1 FUS interacting protein (serine-arginine rich) 1 **1.60 H3093F01 1190002L16Rik RIKEN cDNA 1190002L16 gene ***1.59 H3089D10 AU016599 Expressed sequence AU016599 no1.58 H3097F06 Acsl5 Acyl-CoA synthetase long-chain family member 5 **1.57 H3062G07 EST no1.46 H3101A09 2810453I06Rik RIKEN cDNA 2810453I06 gene ***1.45 H3083D07 C87580 Expressed sequence C87580 no1.37 H3100B12 EST no1.36 H3097A02 Lap3 Leucine aminopeptidase 3 ***1.36 H3061H07 Greb1 Gene regulated by estrogen in breast cancer protein ***1.34 H3022B06 Triobp TRIO and F-actin binding protein ***1.33 H3103C07 Icosl Icos ligand **1.32 H3104H06 Nbr1 Neighbor of Brca1 gene 1 **1.31 H3025G07 Cdc2l2 Cell division cycle 2 homolog (S. pombe)-like 2 ***1.20 H3009D08 EST no1.19 H3102C03 C87499 Expressed sequence C87499 no1.15 H3061D06 Fath Fat tumor suppressor homolog (Drosophila) ***1.15 H3138E04 EST no1.14 H3020B08 Ftl1 Ferritin light chain 1 ****1.12 H3107F10 Ssr1 Signal sequence receptor, alpha **1.10 H3121E09 4930513H15Rik RIKEN cDNA 4930513H15 gene no
Table V-3: Upregulated clones in LLC ventricle
Clones are ranked according to their M value, in descending order. *The last column reports evidence for cardiac expression of the candidate gene. Evidence is based either on Weizmann Institute of Science DNA array experiments, performed with the Affymetrix HG-U95 set A-E, or from SAGE tags listed by the Cancer Genome Anatomy Project (*<10 copies/tag; **10-100 copies/tag; ***100-1000 copies/tag; ****>1000 copies/tag).

Chapter V
255
M value Clone Symbol Name Heart*
-3.11 H3131A07 Ech1 Enoyl coenzyme A hydratase 1, peroxisomal ****-2.86 H3109F07 Atp2a2 ATPase, Ca++ transporting, cardiac muscle, slow twitch 2 ****-2.75 H3120G06 Tpm1 Tropomyosin 1, alpha ****-2.18 H3112B07 Acaa2 Acetyl-Coenzyme A acyltransferase 2 (mitochondrial 3-oxoacyl-Coenzyme A thiolase) ***-2.14 H3137E02 Ndufs2 NADH dehydrogenase (ubiquinone) Fe-S protein 2 ***-2.04 H3140D12 Etfa Electron transferring flavoprotein, alpha polypeptide ***-2.00 H3024G04 mt-Co1 Cytochrome c oxidase I, mitochondrial ?-1.94 H3033C07 Fhl2 Four and a half LIM domains 2 ****-1.94 H3115C07 Opa1 Optic atrophy 1 homolog (human) **-1.93 H3120E09 BC020002 cDNA sequence BC020002 **-1.90 H3118E09 Tpm1 Tropomyosin 1, alpha ****-1.86 H3122F01 Atp5b ATP synthase, H+ transporting mitochondrial F1 complex, beta subunit ***-1.81 H3122E12 Atp5b ATP synthase, H+ transporting mitochondrial F1 complex, beta subunit ***-1.78 H3099H03 EST no-1.77 H3054E07 2610019A05Rik RIKEN cDNA 2610019A05 gene ***-1.75 H3138F10 Nsmaf Neutral sphingomyelinase (N-SMase) activation associated factor **-1.74 H3025C05 Mdh1 Malate dehydrogenase 1, NAD (soluble) ****-1.73 H3145E01 Slc25a3 Solute carrier family 25 (mitochondrial carrier; phosphate carrier), member 3 ****-1.72 H3144B03 Ndufb9 NADH dehydrogenase (ubiquinone) 1 beta subcomplex, 9 ****-1.72 H3011G11 EST no-1.69 H3066F05 mt-Rnr2 16S rRNA, mitochondrial ?-1.69 H3080H02 AF322649 cDNA sequence AF322649 **-1.67 H3003E04 Gcnt2 Glucosaminyl (N-acetyl) transferase 2, I-branching enzyme **-1.65 H3058C12 Stk11 Serine/threonine kinase 11 **-1.64 H3111D10 Ces3 Carboxylesterase 3 no-1.63 H3005E04 Atp5b ATP synthase, H+ transporting mitochondrial F1 complex, beta subunit ****-1.62 H3104D07 Fabp3 Fatty acid binding protein 3, muscle and heart ****-1.58 H3057E08 C87286 expressed sequence C87286 no-1.54 H3084G09 Tcl1b5 T-cell leukemia/lymphoma 1B, 5 *-1.51 H3059E05 Mdh1 Malate dehydrogenase 1, NAD (soluble) ****-1.46 H3115C02 Atp5j ATP synthase, H+ transporting, mitochondrial F0 complex, subunit F ***-1.45 H3066C07 Scye1 Small inducible cytokine subfamily E, member 1 **-1.43 H3110F07 EST no-1.37 H3061A08 Dyrk1a Dual-specificity tyrosine-(Y)-phosphorylation regulated kinase 1a ***-1.33 H3090C05 Gpiap1 GPI-anchored membrane protein 1 **-1.33 H3111F04 EST no-1.30 H3054E09 C88045 Expressed sequence C88045 no-1.27 H3115H10 Atp5c1 ATP synthase, H+ transporting, mitochondrial F1 complex, gamma polypeptide 1 ****-1.22 H3062C03 D8Ertd514e D8Ertd514e no-1.22 H3128D01 Mat1a Methionine adenosyltransferase I, alpha **-1.21 H3131C01 1700022L09Rik RIKEN cDNA 1700022L09 gene **-1.15 H3002D07 Rps6ka1 Ribosomal protein S6 kinase polypeptide 1 **-1.14 H3059G06 Mtf1 Metal response element binding transcription factor 1 *-1.13 H3062E02 Idh2 Isocitrate dehydrogenase 2 (NADP+), mitochondrial **-1.10 H3121D12 EST (similar to general transcription factor IIIC, polypeptide 3, 102kDa) no-1.10 H3110G03 Pink1 PTEN induced putative kinase 1 ***
Table V-4: Downregulated clones in LLC ventricle
Clones are ranked according to their M value, in descending order. *The last column reports evidence for cardiac expression of the candidate gene. Evidence is based either on Weizmann Institute of Science DNA array experiments, performed with the Affymetrix HG-U95 set A-E, or from SAGE tags listed by the Cancer Genome Anatomy Project (*<10 copies/tag; **10-100 copies/tag; ***100-1000 copies/tag; ****>1000 copies/tag).

Chapter V
256
0 10 20 30 40 50 60
cytoplasm (GO:0005737)
integral to membrane(GO:0016021)
nucleus (GO:0005634)
plasma membrane(GO:0005886)
ribonucleoprotein complex(GO:0030529)
inner membrane(GO:0019866)
mitochondrial membrane(GO:0005740)
membrane fraction(GO:0005624)
endomembrane system(GO:0012505)
chromosome (GO:0005694)
collagen (GO:0005581)
cyclin-dep. prot. kinaseholoenzyme (GO:0000307)
synapse (GO:0045202)
basement membrane(GO:0005604)
respiratory chain complexIV (GO:0045277)
Figure V-1: Gene Ontology classification of genes in TG hearts according to the cellular location
Differential distribution of GO terms for the upregulated (green) and downregulated (red) genes according to the ‘cellular component’ classification, at level 4.
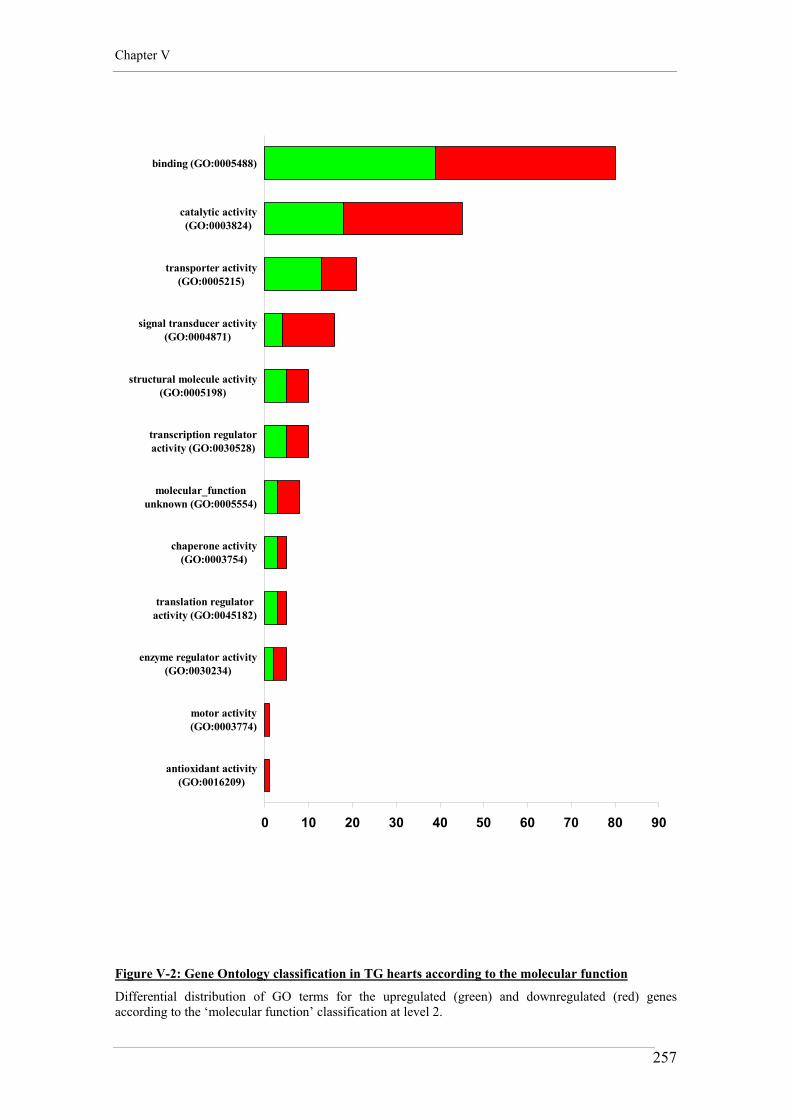
Chapter V
257
0 10 20 30 40 50 60 70 80 90
binding (GO:0005488)
catalytic activity(GO:0003824)
transporter activity(GO:0005215)
signal transducer activity(GO:0004871)
structural molecule activity(GO:0005198)
transcription regulatoractivity (GO:0030528)
molecular_functionunknown (GO:0005554)
chaperone activity(GO:0003754)
translation regulatoractivity (GO:0045182)
enzyme regulator activity(GO:0030234)
motor activity(GO:0003774)
antioxidant activity(GO:0016209)
Figure V-2: Gene Ontology classification in TG hearts according to the molecular function
Differential distribution of GO terms for the upregulated (green) and downregulated (red) genes according to the ‘molecular function’ classification at level 2.

Chapter V
258
0 10 20 30 40 50 60 70 80
metabolism (GO:0008152)
cellular physiologicalprocess (GO:0050875)
cell communication(GO:0007154)
regulation of physiologicalprocess (GO:0050791)
response to stimulus(GO:0050896)
organismal physiologicalprocess (GO:0050874)
death (GO:0016265)
regulation of cellularprocess (GO:0050794)
morphogenesis(GO:0009653)
homeostasis (GO:0042592)
pattern specification(GO:0007389)
reproduction (GO:0000003)
pathogenesis (GO:0009405)
embryonic development(GO:0009790)
extracell. structure org. &bio. (GO:0043062)
Figure V-3: Gene Ontology classification in TG hearts according to the biological process
Differential distribution of GO terms for the upregulated (green) and downregulated (red) genes according to the ‘biological process’ classification at level 3.

Chapter V
259
0 5 10 15 20 25 30
cytoplasm (GO:0005737)
integral to membrane(GO:0016021)
nucleus (GO:0005634)
mitochondrial membrane(GO:0005740)
inner membrane(GO:0019866)
plasma membrane(GO:0005886)
membrane fraction(GO:0005624)
chromosome (GO:0005694)
endosome membrane(GO:0010008)
endomembrane system(GO:0012505)
outer membrane(GO:0019867)
extrinsic to membrane(GO:0019898)
ribonucleoprotein complex(GO:0030529)
proton-transp. ATP syntha.complex (GO:0045259)
respiratory chain complexIV (GO:0045277)
Figure V-4: Gene Ontology classification of genes in LLC mice according to the cellular location
Differential distribution of GO terms for the upregulated (green) and downregulated (red) genes according to the ‘cellular component’ classification, at level 4.
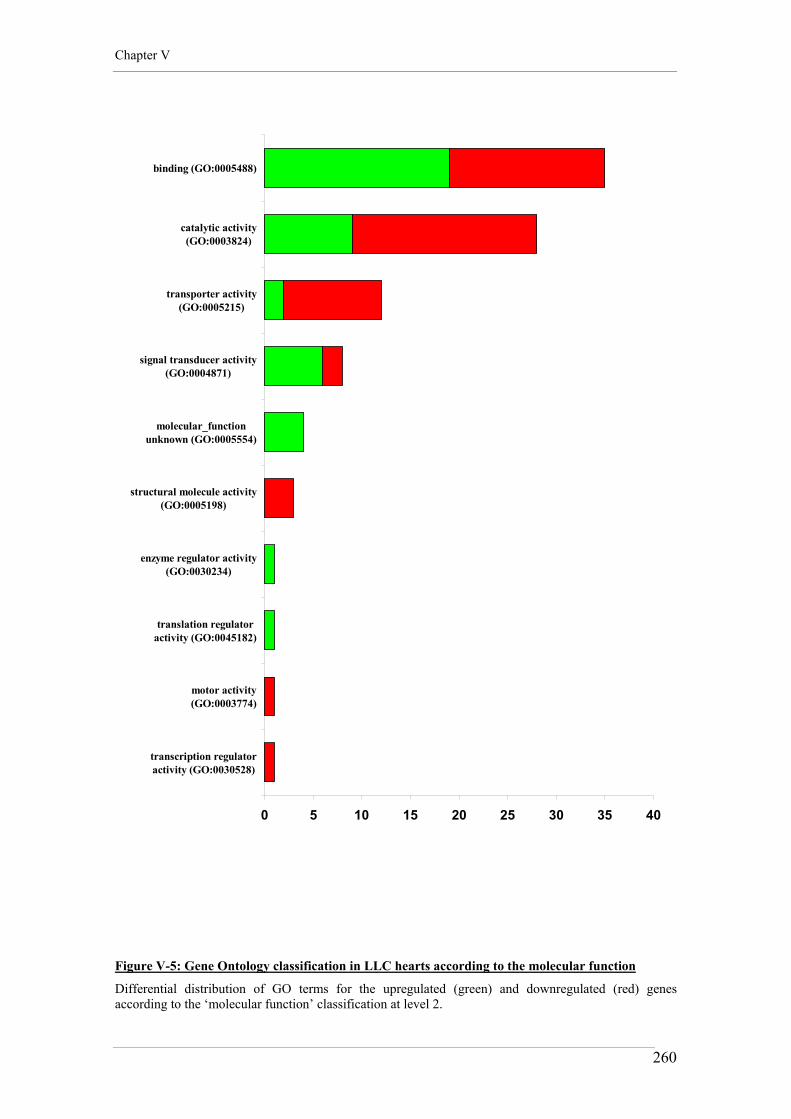
Chapter V
260
0 5 10 15 20 25 30 35 40
binding (GO:0005488)
catalytic activity(GO:0003824)
transporter activity(GO:0005215)
signal transducer activity(GO:0004871)
molecular_functionunknown (GO:0005554)
structural molecule activity(GO:0005198)
enzyme regulator activity(GO:0030234)
translation regulatoractivity (GO:0045182)
motor activity(GO:0003774)
transcription regulatoractivity (GO:0030528)
Figure V-5: Gene Ontology classification in LLC hearts according to the molecular function
Differential distribution of GO terms for the upregulated (green) and downregulated (red) genes according to the ‘molecular function’ classification at level 2.
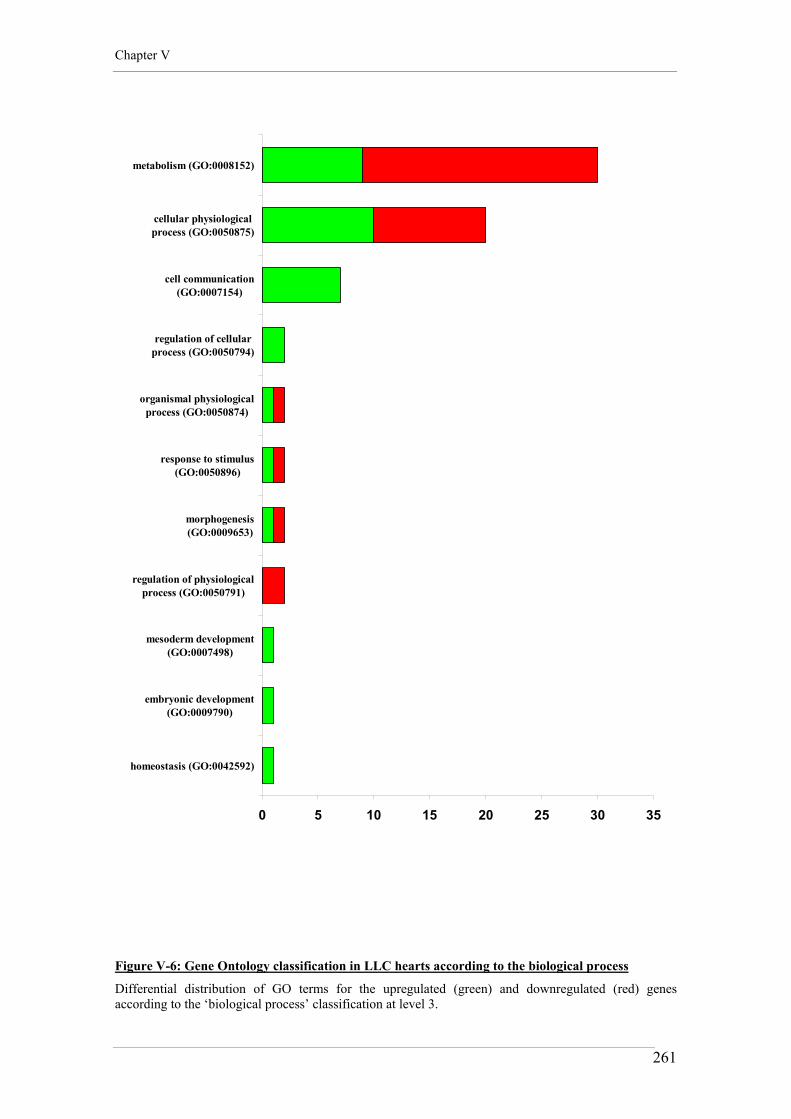
Chapter V
261
0 5 10 15 20 25 30 35
metabolism (GO:0008152)
cellular physiologicalprocess (GO:0050875)
cell communication(GO:0007154)
regulation of cellularprocess (GO:0050794)
organismal physiologicalprocess (GO:0050874)
response to stimulus(GO:0050896)
morphogenesis(GO:0009653)
regulation of physiologicalprocess (GO:0050791)
mesoderm development(GO:0007498)
embryonic development(GO:0009790)
homeostasis (GO:0042592)
Figure V-6: Gene Ontology classification in LLC hearts according to the biological process
Differential distribution of GO terms for the upregulated (green) and downregulated (red) genes according to the ‘biological process’ classification at level 3.

Chapter V
262
Carbonic anhydrase
NH
E1
AE
3
CO2 + H2O
H+ HCO3-
Cl-Na+
Carbonic anhydrase
NH
E1
AE
3
CO2 + H2O
H+ HCO3-
Cl-Na+
Figure V-7: Depiction of the physical and biochemical interactions between CAR - NHE-1 - AE3
TG hearts differentially upregulate various isoforms of the carbonic anhydrases (CAR). Together with the upregulation of the NHE-1, it could be speculated that increased acid load could be compensated by an exchange with sodium chloride, leading to sodium overload and cardiomyocyte hypertrophy. CAR= carbonic anhydrase; NHE-1= sodium/hydrogen exchanger 1; AE3= anion exchanger 3.

CHAPTER VI
Mechanisms of cardiac remodeling in
Ang II-induced and insulin resistant cardiac
hypertrophy: a comparative overview

Chapter VI
264
1. MORPHOLOGIC CHANGES IN CARDIAC
HYPERTROPHY
As it is demonstrated for both TG1306/1R and GLUT4-KO mouse models, that cardiac
hypertrophy is associated with an increase in ventricular mass and chamber volume
(Chapter III, Tables III-1 and III-2). Common features observed in the development of
cardiac hypertrophy in both models are the stimulation of the intra-cardiac renin-
angiotensin system, with overexpression of Agt mRNA, and decreased GLUT4 protein
levels (Chapter III, Figures III-3 & III-4 and III-8 & III-9). A comparative analysis of
WT, TG, LL and LLC hearts shows that the severity of morphologic remodeling, that is
myocardial collagen deposition, fibroblast proliferation and cardiomyocyte
hypertrophy, is determined by the extent and cumulative effect of neuro-humoral
activation and metabolic imbalance.
When compared to WT mice (that is non-transgenic littermate mice from the
TG1306/1R strain), LL mice present evidence of modest cardiac and cardiomyocyte
hypertrophy (Figure VI-1). As described by Kaczmarczyk et al. (2003), LL mice are
exposed to systemic metabolic disturbances (insulin-signaling desensitization, impaired
glucose disposal) and downregulation of cardiac GLUT4 levels to 10-15 % of WT
(Chapter III, Figure III-10). These systemic and tissue-specific modifications could
predispose LL hearts to a degree of cardiac and cardiomyocyte remodeling, the
magnitude of which is similar to that observed in Agt-overexpressing transgenic mice:
that is, 15-20% increase in CWI and cardiomyocyte dimensions without collagen
deposition, when compared to non-transgenic littermates (i.e. WT) (Chapter III,
comparative analysis of Tables III-1 and III-2). Strain-specific differences due to
variability in genetic background should also be considered, since WT and TG mice are
estimated to be ~99% C57BL6-derived, while LL and LLC mice carry a more
heterogeneous genetic background composed of C57BL6 (~60%), 129Sv (~35%) and
CBA (~5%).

Chapter VI
265
While cardiac hypertrophy in TG mice is induced by the stimulation of the intracardiac
renin-angiotensin system, a downregulation of cardiac GLUT4 levels is also observed,
the extent of which correlates with the degree of remodeling (Chapter III, Figure III-4).
These data suggest that a decrease in cardiac GLUT4 protein level is associated with
the development of hypertrophy, independently of the upregulation of the cardiac RAS
or insulin resistance.
The data presented in Chapter III also demonstrate that without additional provocation,
systemic insulin resistance (as observed in LL mice) and cardiac overexpression of Agt
(induced in TG mice) are insufficient to stimulate fibroblast proliferation and collagen
deposition in the myocardium. The insulin-resistant LLC mice exhibit a very different
degree of remodeling, which associates cardiomyocyte hypertrophy with fibrosis
(Table III-2 and Figure III-7), activation of the intra-cardiac RAS (Figure III-8) and
evidence of reduction in glucose uptake in the heart (Kaczmarczyk et al., 2003). Thus it
could be proposed that deranged intracardiac glucose metabolism (due to the severity
of GLUT4 deficiency), in combination with other events, such as hypoxia, increased
production of reactive oxygen species, inflammation and tissue damage, are necessary
to cause dramatic restructuring of the extracellular matrix of the myocardium and to
stimulate non-myocyte proliferation and collagen accumulation.

Chapter VI
266
2. MECHANICAL CHANGES IN CARDIAC
HYPERTROPHY
The morphological analysis presented in Chapter III shows that the severity of tissue
remodeling is determined by the extent and the cumulative effect of neuro-humoral
activation and metabolic imbalance. Chapter IV reports that cardiomyocyte
hypertrophy is associated with impaired contractile function of isolated myocytes and
differential expression of key transporters involved in calcium and pH homeostasis.
In Figures VI-2 and VI-3 a comparative evaluation of the cardiomyocyte contractile
function in WT and LL is presented. The two ‘control’ groups exhibit equivalent
duration of excitation-contraction coupling latency (To) and duration of the shortening
and lengthening periods (Tm-To; Tf -Tm), summing to produce a comparable whole
contraction period (Tf -To) (Figure VI-2). As NHE-1 and SERCA2 expression levels in
WT and LL hearts are similar (Figure VI-4), the stability observed in twitch duration
may suggest that pH regulation of myofilament sensitivity and calcium removal
mechanisms are preserved in these two mouse lines. This hypothesis is strengthened by
additional information showing that the age-dependent shift in the same contraction
parameters is comparable for WT and LL cardiomyocytes and it is consistent with
NHE-1 downregulation in both types of myocytes (Figure VI-4). Decrease in proton
export, possibly secondary to decreased rates of glycolysis and reduced production of
acid charges (H+), would reduce myofilament calcium sensitivity and shortening
duration, causing age-dependent dysregulation of intracellular pH homeostasis in both
WT and LL hearts. An explanation for the age-dependent alteration for the lengthening
period (Tf -Tm) in WT and LL myocytes is not immediately apparent, but it could be
secondary to depressed NHE activity, leading to sodium and calcium depletion,
ultimately reducing the duration of the whole contraction period.
In contrast to what it is seen in WT cardiomyocytes, ageing has no effect on LL
cardiomyocyte inotropy (%S and MRS) and lusitropy (MRL) (Figure VI-3). A similar

Chapter VI
267
pattern is also observed for LLC cardiomyocytes (Chapter IV, Table IV-4 and Figure
IV-9), suggesting that ageing does not impair cardiomyocyte inotropy, and surprisingly
improves relaxation dynamics in LL and LLC mice. As explained in Chapter IV, an
increase in rate of lengthening in LL and LLC myocytes could represent an important
compensatory mechanism to shorten the contractile cycle and preserve peak shortening
(%S). Further experiments are needed to determine whether these disparities in
contractile and relaxation performances are determined by the genetic background or
whether they are related to systemic insulin-signaling desensitization and impaired
glucose disposal in LL and LLC mice.
In Figures VI-5 and VI-6 a comparative evaluation of the contractile function in TG
and LLC cardiomyocyte is shown. Not surprisingly, cardiac hypertrophy in TG and
LLC mice is associated with different age- and genotype-dependent alterations in
cardiomyocyte contractile function. Generally lower rates of shortening and
lengthening (MRS and MRL) and longer contractile cycle timing periods are observed
for the older TG cardiomyocytes when compared to age-matched LLC. This could be
caused by a slower calcium re-uptake into the SR by the SR calcium ATPase SERCA2,
which normally accounts for the removal of ~90% of the intracellular calcium
concentrations in the rodent. Indeed, a characteristic of the TG heart is a more
pronounced reduction in myocardial SERCA2 protein expression already at 15-20
weeks of age when compared to LLC (28.3±1.6 vs. 65.4±0.4 in arbitrary units, p<0.05).
Downregulation of the SERCA2 calcium pump would suppress the re-uptake of
calcium into the SR and delay myocyte relaxation. The concomitant upregulation of the
NCX in TG hearts (at 15-20 weeks: 37.4±4.6 vs. 5.4±0.4 in arbitrary units; at 35-40
weeks: 28.0±2.5 vs. 4.9±0.4 in arbitrary units, when compared to LLC; p<0.05, 2-way
ANOVA), could enhance export of calcium ions to the extracellular medium and shift
the calcium cycling from an intracellular pathway toward an extracellular one. This
would reduce the levels of releasable SR calcium in TG mice and chronically erode
systolic functional reserve with ageing.
Differential expression of contractile protein isoforms and metabolic genes could also
account for the differences observed in contractile performance between TG and LLC
mice and further investigation of these possibilities is merited.
Chapter VI
268
3. DIFFERENTIAL GENE EXPRESSION OF METABOLIC
SUBSTRATES IN CARDIAC HYPERTROPHY
The findings reported in Chapter V demonstrate cDNA microarray assays to be a useful
tool in describing the differential expression of the whole transcriptome in cardiac
tissue of TG1306/1R and GLUT4 knock-out mice. The large amount of information
reported in Chapter V makes the interpretation of the data a very complex task to
perform. Nevertheless the results suggest that metabolic regulatory responses are
crucial in the development of the cardiac phenotypes in TG and LLC mice. These
metabolic responses include differential activation of signal transduction events and the
regulation of genes encoding rate-limiting enzymes and proteins. Indeed, the results
presented in Chapter V show that many of the metabolic regulatory events that dictate
fuel selection and capacity for ATP production in the failing heart occur at the level of
gene expression.
Metabolic regulation is inevitably linked with cardiac and cardiomyocyte function. This
metabolism-function relationship is relevant to diseases that lead to cardiac
hypertrophy and heart failure. The progression to heart failure of any cause is
associated with a gradual but progressive decline in the activity of mitochondrial
respiratory pathways leading to diminished capacity for ATP production (reviewed in
Russell et al., 2005). The functional results presented in Chapter IV, combined with the
gene expression data reported in Chapter V suggest that energy deficiency can be a
cause and an effect of cardiomyocyte functional deterioration in the contrasting
hypertrophic etiologies exhibited by TG and LLC mice.
As mentioned in the introductory Chapter I, the oxidation of free fatty acids and
glucose in mitochondria accounts for the vast majority of ATP production in the
healthy adult heart. Studies using animal models of ventricular hypertrophy induced by
pressure overload have consistently demonstrated a myocardial shift away from fatty
acid oxidation toward glycolytic metabolism. Changes in gene expression in pressure-

Chapter VI
269
load hypertrophied and failing hearts, showing downregulation of mitochondrial
enzymes involved in fatty acid oxidation are consistent with the observed metabolic
alterations. Data presented in Chapter V for the TG mouse model partially conflict with
this ‘generic’ hypertrophy concept, since the decrease in mitochondrial fatty acid
metabolism is accompanied by a decrease in enzymes involved in glucose metabolism
(e.g. phosphofructokinase), combined with an apparent compensatory activation of
peroxisomal free fatty acid beta oxidation (Chapter V). This ‘double downregulation’
of glucose and fatty acid metabolism could account for the slower rates of shortening
and lengthening observed in TG cardiomyocytes (Figure VI-6) and the transition to
heart failure.
On the contrary, The data derived from the GLUT4-KO model supports the concept of
a myocardial shift from fatty acid oxidation toward glucose oxidation during the
development of this cardiomyopathy (Chapter V). Furthermore, the data from LLC
would suggest a shift from aerobic production of ATP, involving mitochondrial
oxidation of NADH equivalents, to an anaerobic pathway, where glucose and glycogen
are metabolized to pyruvate and then reduced to lactate by the lactate dehydrogenase.
Interestingly, exogenous pyruvate supplementation “by-passes” dysfunctional GLUT4
dependent glucose transport, apparently facilitates ATP production, and selectively
enhances cardiac performance ex vivo in LLC mice (Huggins et al., 2004), suggesting
that the machinery for glucose-dependent ATP production is not disrupted but just
‘silenced’, due to diminished glucose uptake in LLC hearts. This major difference in
fuel selection and energetics could account for the significant differences observed in
contractile parameters between TG and LLC cardiomyocytes when the contractile
behavior is examined under similar ex vivo conditions (Figure VI-5 and VI-6).
It is important to note that previous studies have reported a primary increase in the
cardiac fatty acid metabolism during cardiac remodeling induced by insulin resistance
and hyperglycemia (Chapter I, Section 8.3.4). This fuel switch is believed to be linked
to the combined effects of myocyte insulin- and pH-dependent decrease in GLUT4
membrane translocation, leading to diminished glucose uptake, with systemic
dyslipidemia and increased cardiac PPARα-dependent fatty acid oxidation rates. One
proposed mechanism for cardiac and cardiomyocyte dysfunction in these diabetic

Chapter VI
270
conditions is excess intracellular lipid accumulation resulting in myocyte dysfunction
or death, termed ‘lipotoxicity’. In LLC hearts the opposite occurs: upregulation of
enzymes involved in glycolysis and gluconeogenesis is associated with downregulation
of enzymes involved in the beta-oxidation and disruption of the mitochondrial electron
chain. It could be speculated that in the insulin resistant LLC heart early compensatory
mechanisms could lead to increased fatty acid oxidation and diminished glucose
utilization, leading to myocyte death by lipotoxicity and scar formation (Chapter III,
Figure III-7). Despite increased rates of fatty acid oxidation, chronic downstream
defects in mitochondrial oxidative phosphorylation could progressively develop with
age, leading to mitochondrial oxidative damage, myocyte death and eventual
impairment of aerobic respiration. Moreover, an ‘uncoupling’ between rates of fatty
acid oxidation and oxidative phosphorylation could lead to toxic intermediate
accumulation and perpetuate a continued cycle of mitochondrial damage which would
eventually undermine any mitochondrion-related metabolic process. Further
investigation of these possibilities is required.
Thus, chronic alterations in myocardial and cardiomyocyte fuel selection and energetics
are linked to the development of cardiomyocyte dysfunction and progression of heart
failure. The direction of the ‘fuel shift’ varies according to the etiology and possibly
according to the time course and the combination of substrate and functional insults.

Chapter VI
271
4. IN CONCLUSION
This Thesis demonstrates that overexpression of the cardiac renin-angiotensin system
(in TG mice) or decreased cardiac glucose uptake and insulin-resistance (in LLC mice)
leads to tissue and cellular remodeling, producing cardiac hypertrophy and failure. In
these models, important differences in the cardiac adaptive response to chronic neuro-
humoral or metabolic imbalance emerge:
1. Compared to TG hearts, myocardial remodeling in the LLC involves more
pronounced cardiomyocyte hypertrophy, with extracellular matrix accumulation
and development of fibrosis and fibrotic scars (Chapter III).
2. Although morphological remodeling is exacerbated in LLC hearts,
cardiomyocytes from TG hearts show longer contraction cycle timing periods
when compared to age-matched LLC myocytes (Chapter IV).
3. In addition, inotropic and lusitropic parameters are reduced in the older TG
cardiomyocytes when compared to age-matched LLC (Chapter IV).
4. These differences in myocyte contractile performance between TG and LLC
mice are associated with differential gene (and protein) expression of key
players governing pH, calcium and metabolic homeostasis in the heart
(Chapters III to V).
There is a critical threshold of cardiac GLUT4 protein expression below which
exacerbated cardiomyocyte hypertrophy with fibroblast proliferation and collagen
production is triggered. Metabolically speaking, there is a threshold under which
GLUT4 deficiency impairs cardiac insulin-stimulated glucose uptake and compromises
cardiomyocyte function. Under these conditions the intra-cardiac renin-angiotensin
system is also triggered, with elevated Agt mRNA overexpression in LLC hearts. It

Chapter VI
272
demonstrates the important role played by the glucose transporter GLUT4 in regulating
cardiomyocyte metabolic balance, gene expression and contractile function. As low as
5-15% of GLUT4 protein expression is sufficient to preserve cardiomyocytes from
exacerbated hypertrophy and dysfunction.
Ang II, a peptide known for its pro-hypertrophic and pro-fibrotic properties, is an
important trigger of cardiomyocyte hypertrophy, as demonstrated in TG mice, but it is
not sufficient to induce fibroblast proliferation and collagen accumulation in vivo
conditions. Other coincident processes, such as inhibition of extracellular matrix
degradation, pronounced glucose metabolic imbalance, development of inflammation
and production of cytokines and other peptides are probably required to jointly
stimulate Ang II-mediated collagen production and fibrosis in the heart.
Thus, overexpression of the cardiac renin-angiotensin system and decreased cardiac
glucose intake lead to cardiac and cardiomyocyte remodeling, producing cardiac
hypertrophy and failure in mice. The severity of cardiomyocyte and tissue remodeling
is determined by the extent of cardiomyocyte hypertrophy and myocardial collagen
deposition. The present study support the concept that cardiac-specific activation of the
renin-angiotensin system and decrease in cardiac glucose uptake are sufficient
‘triggers’ to activate pathologic cardiac remodeling, the severity of which is dependent
on the cumulative activation of the intra-cardiac renin-angiotensin system and the
extent of glucose metabolic perturbation.
The maladaptive responses to cardiac-specific angiotensinogen overexpression and to
decreased cardiac glucose uptake and insulin-resistance are different, suggesting that
not all hypertrophic responses are the same. The concept that cardiac hypertrophy
represents a generic growth ‘recapitulation’ is not supported by these findings.
Regardless of the phenotype observed, this study demonstrates that overexpression of
cardiac angiotensinogen mRNA producing Ang II, and low expression of GLUT4
protein are independent but cumulative triggers of cardiac hypertrophy, leading to
mechanical dysfunction and failure

Chapter VI
273
0
2
4
6
8
10
WT TG LL LLC
0
2
4
6
8
WT TG LL LLC
0
60
120
180
240
WT TG LL LLC
A. Cardiac weight index (mg/g)
B. LV collagen (%tsa)
C. Myocyte length (μm)
0
2
4
6
8
10
WT TG LL LLC
0
2
4
6
8
WT TG LL LLC
0
60
120
180
240
WT TG LL LLC
A. Cardiac weight index (mg/g)
B. LV collagen (%tsa)
C. Myocyte length (μm)
Figure VI-1: Comparative analysis of cardiac remodeling in WT, TG, LL and LLC mice
Comparison of the cardiac weight index (A.), the myocardial collagen content (B.) and the cardiomyocyte length (C.) between the different mouse strains. For each group, data from animals aged 15-20 and 35-40 weeks were pooled. The severity of tissue remodeling, that is cardiac and cardiomyocyte hypertrophy and myocardial collagen deposition, is maximal in the LLC mouse where neuro-humoral activation and metabolic imbalance produce a cumulative effect.

Chapter VI
274
Figure VI-2: Pacing responses of isotonically shortening myocytes from WT and LL (1.5-5.0 Hz)
Cycle time parameters. (To= the excitation-contraction coupling latency; Tf -To= duration of the whole contractile cycle; Tm-To= duration of shortening; Tf -Tm,= duration of lengthening). † p<0.05, 35-40 vs. 15-20 week old cardiomyocytes; ‡ p<0.05, pacing frequency effect (all values derived from analysis by multiple-way ANOVA for repeated measures).
8
9
10
11
12
13
14
Hz 1.5 Hz 3 Hz 4 Hz 550
70
90
110
130
Hz 1.5 Hz 3 Hz 4 Hz 5
15
20
25
30
35
40
45
Hz 1.5 Hz 3 Hz 4 Hz 530
40
50
60
70
80
90
Hz 1.5 Hz 3 Hz 4 Hz 5
1.5 3 4 5
ms
ms
(Hz)(Hz)
1.5 3 4 5 (Hz)
1.5 3 4 5
(Hz)1.5 3 4 5
ms
ms
†
‡
†
‡
†
‡
35-40, WT35-40, LL15-20, WT15-20, LL
35-40, WT35-40, LL15-20, WT15-20, LL
35-40, WT35-40, LL15-20, WT15-20, LL
35-40, WT35-40, LL15-20, WT15-20, LL
A. To B. Tf-To
C. Tm-To D. Tf-Tm
To Tf -To
Tf -TmTm-To

Chapter VI
275
4
6
8
10
12
Hz 1.5 Hz 3 Hz 4 Hz 5
2
3
4
5
6
7
8
Hz 1.5 Hz 3 Hz 4 Hz 5
2
3
4
5
6
7
Hz 1.5 Hz 3 Hz 4 Hz 51.5 3 4 5
Lo/
sL
o/s
%L
o
(Hz)
(Hz)
(Hz)
1.5 3 4 5
1.5 3 4 5
*‡
‡*
¶
†
¶
*‡ ¶
35-40, WT35-40, LL15-20, WT15-20, LL
35-40, WT35-40, LL15-20, WT15-20, LL
35-40, WT35-40, LL15-20, WT15-20, LL
35-40, WT35-40, LL15-20, WT15-20, LL
A. Normalized %S
B. Normalized MRS
C. Normalized MRL
Figure VI-3: Pacing responses of isotonically shortening myocytes from WT and LL (1.5-5.0 Hz)
Inotropic and lusitropic parameters (%S= maximum cell shortening; MRS= maximal rate of cell shortening; MRL= maximal rate of cell lengthening). * p<0.05, LL vs. WT cardiomyocytes; † p<0.05, 35-40 vs. 15-20 week old cardiomyocytes; ‡ p<0.05, pacing frequency effect; ¶ p<0.05, age-genotype interaction effect (all values derived from analysis by multiple-way ANOVA for repeated measures).

Chapter VI
276
0
40
80
120
160
CTRL LL
01
23
45
67
15-20 35-40Cell
A.Ex
pres
sion
leve
l(A
rb. U
nits
)
15-20 week 35-40 week
NHE-1
LLWT
B. SERCA2
Expr
essi
on le
vel
(Arb
. Uni
ts)
†
0
40
80
120
160
CTRL LL
01
23
45
67
15-20 35-40Cell
A.Ex
pres
sion
leve
l(A
rb. U
nits
)
15-20 week 35-40 week
NHE-1
LLWT
B. SERCA2
Expr
essi
on le
vel
(Arb
. Uni
ts)
†
Figure VI-4: mRNA and protein expression profiles in WT and LL hearts
Expression profiles of sodium-calcium exchanger NHE-1 mRNA (A.) and sarcoplasmic reticulum calcium pump SERCA2 protein levels at 15-20 weeks of age (B.). † p<0.05, 35-40 vs. 15-20 week old hearts (2-way ANOVA). Comparative analysis across the two sets of data is validated by equal conditions of PCR amplification, electrophoresis and Western blotting for GLUT4-KO and TG1306/1R mice.

Chapter VI
277
Figure VI-5: Pacing responses of isotonically shortening myocytes from TG and LLC (1.5-5.0 Hz)
Cycle time parameters. (To= the excitation-contraction coupling latency; Tf -To= duration of the whole contractile cycle; Tm-To= duration of shortening; Tf -Tm,= duration of lengthening). * p<0.05, TG vs. LLC cardiomyocytes; † p<0.05, 35-40 vs. 15-20 week old cardiomyocytes; ‡ p<0.05, pacing frequency effect; ¶ p<0.05, age-genotype interaction effect (all values derived from analysis by multiple-way ANOVA for repeated measures).
20
30
40
50
Hz 1.5 Hz 3 Hz 4 Hz 5 30
50
70
90
110
Hz 1.5 Hz 3 Hz 4 Hz 5
50
75
100
125
150
Hz 1.5 Hz 3 Hz 4 Hz 58
12
16
20
24
28
Hz 1.5 Hz 3 Hz 4 Hz 51.5 3 4 5
ms
ms
(Hz)(Hz)
1.5 3 4 5 (Hz)
1.5 3 4 5
(Hz)1.5 3 4 5
ms
ms
†
‡
†
‡
†
‡
‡
*
¶
*¶
*
¶
*
35-40, TG35-40, LLC15-20, TG15-20, LLC
A. To B. Tf-To
C. Tm-To D. Tf-Tm
35-40, TG35-40, LLC15-20, TG15-20, LLC
To Tf -To
Tf -TmTm-To
20
30
40
50
Hz 1.5 Hz 3 Hz 4 Hz 5 30
50
70
90
110
Hz 1.5 Hz 3 Hz 4 Hz 5
50
75
100
125
150
Hz 1.5 Hz 3 Hz 4 Hz 58
12
16
20
24
28
Hz 1.5 Hz 3 Hz 4 Hz 51.5 3 4 5
ms
ms
(Hz)(Hz)
1.5 3 4 5 (Hz)
1.5 3 4 5
(Hz)1.5 3 4 5
ms
ms
†
‡
†
‡
†
‡
‡
*
¶
*¶
*
¶
*
35-40, TG35-40, LLC15-20, TG15-20, LLC
A. To B. Tf-To
C. Tm-To D. Tf-Tm
35-40, TG35-40, LLC15-20, TG15-20, LLC
To Tf -To
Tf -TmTm-To

Chapter VI
278
2
3
4
5
6
7
Hz 1.5 Hz 3 Hz 4 Hz 5
2
3
4
5
6
Hz 1.5 Hz 3 Hz 4 Hz 5
3
5
7
9
11
Hz 1.5 Hz 3 Hz 4 Hz 5
1.5 3 4 5
Lo/
sL
o/s
%L
o
(Hz)
(Hz)
(Hz)
1.5 3 4 5
1.5 3 4 5
*‡
‡¶
†
¶
*‡ ¶
†
35-40, TG35-40, LLC15-20, TG15-20, LLC
A. Normalized %S
B. Normalized MRS
C. Normalized MRL
35-40, TG35-40, LLC15-20, TG15-20, LLC
35-40, TG35-40, LLC15-20, TG15-20, LLC
Figure VI-6: Pacing responses of isotonically shortening myocytes from TG and LLC (1.5-5.0 Hz)
Inotropic and lusitropic parameters (%S= maximum cell shortening; MRS= maximal rate of cell shortening; MRL= maximal rate of cell lengthening). * p<0.05, TG vs. LLC cardiomyocytes; † p<0.05, 35-40 vs. 15-20 week old cardiomyocytes; ‡ p<0.05, pacing frequency effect; ¶ p<0.05, age-genotype interaction effect (all values derived from analysis by multiple-way ANOVA for repeated measures).

Bibliography

Bibliography
280
AbdAlla S, Lother H and Quitterer U (2000). AT1-receptor heterodimers show enhanced G-protein activation and altered receptor sequestration. Nature, 407: 94-98. AbdAlla S, Lother H, Abdel-tawab AM and Quitterer U (2001). The angiotensin II AT2 receptor is an AT1 receptor antagonist. J Biol Chem, 276: 39721-39726. Abel ED (2004). Glucose transport in the heart. Front Biosci, 9: 201-215. Abel ED, Kaulbach HC, Tian R, Hopkins JC, Duffy J, Doetschman T, Minnemann T, Boers ME, Hadro E, Oberste-Berghaus C, Quist W, Lowell BB, Ingwall JS, Kahn BB (1999). Cardiac hypertrophy with preserved contractile function after selective deletion of GLUT4 from the heart. J Clin Invest, 104: 1703-1714. Abel ED, Peroni O, Kim JK, Kim YB, Boss O, Hadro E, Minnemann T, Shulman GI and Kahn BB (2001). Adipose-selective targeting of the GLUT4 gene impairs insulin action in muscle and liver. Nature, 409: 729-733. ACC/AHA (2001). Guidelines for the evaluation and management of chronic heart failure in the adult: executive summary. Circulation, 104: 2996-3007. Adams Jr KF (2001). New epidemiologic perspectives concerning mild-to-moderate heart failure. Am J Med, 110 (Suppl 7A): 6S-13S. Adams RJ, Cohen DW, Gupte S, Johnson JD, Wallick ET, Wang T and Schwartz A (1979). In vitro effects of palmitylcarnitine on cardiac plasma membrane Na+, K+-ATPase and sarcoplasmic reticulum Ca2+-ATPase and Ca2+ transport. J Biol Chem, 254: 12404-12410. Ai T, Horie M, Obayashi K and Sasayama S (1998). Accentuated antagonism by angiotensin II on guinea-pig cardiac L-type Ca-currents enhanced by beta-adrenergic stimulation. Pflugers Arch, 436: 168-174. AIRE (Acute Infarction Ramipril Efficacy) Study Investigators (1993). Effect of ramipril on mortality and morbidity of survivors of acute myocardial infarction with clinical evidence of heart failure. Lancet, 342: 821-828. Aiello EA and Cingolani HE (2001). Angiotensin II stimulates cardiac L-type Ca(2+) current by a Ca(2+)- and protein kinase C-dependent mechanism. Am J Physiol, 280: H1528-H1536. Aiello EA, Villa-Abrille MC and Cingolani HE (2002). Autocrine stimulation of cardiac Na(+)-Ca(2+) exchanger currents by endogenous endothelin released by angiotensin II. Circ Res, 90: 374-376. Aikawa R, Nawano M, Gu Y, Katagiri H, Asano T, Zhu W, Nagai R and Komuro I (2000). Insulin prevents cardiomyocytes from oxidative stress-induced apoptosis through activation of PI3 kinase/Akt. Circulation, 102: 2873-2879.

Bibliography
281
Allard MF, Schonekess BO, Henning SL, English DR and Lopaschuck GD (1994). Contribution of oxidative metabolism and glycolysis to ATP production in hypertrophied hearts. Am J Physiol, 267: H742-H750. Allen AM, Zhuo J and Mendelsohn FAO (2000). Localization and function of angiotensin AT1 receptors. Am J Hypertens, 13: 31S-38S. Allen DG and Xiao XH (2003). Role of the cardiac Na+/H+ exchanger during ischemia and reperfusion. Cardiovasc Res, 57: 934-941. Allen ND, Norris ML and Surani MA (1990). Epigenetic control of transgene expression and imprinting by genotype-specific modifiers. Cell, 61: 853-861. Alpert NR and Mulieri LA (1982). Increased myothermal economy of isometric force generation in compensated cardiac hypertrophy induced by pulmonary artery constriction in rabbit: a characterization of heat liberation in normal and hypertrophied right ventricular papillary muscle. Circ Res, 50: 491-500. Alvarez BV, Loiselle FB, Supuran CT, Schwartz GJ and Casey JR (2003). Direct extracellular interaction between carbonic anhydrase IV and the human NBC1 sodium/bicarbonate co-transporter. Biochemistry, 42: 12321-12329. American Diabetes Association (1997). Clinical practice recommendations. Diabetes Care, 20 (Suppl 1): S1-S70. Anan F, Takahashi N, Ooie T, Hara M, Yoshimatsu H and Saikawa T (2004). Candesartan, an angiotensin II receptor blocker, improves left ventricular hypertrophy and insulin resistance. Metabolism, 53: 777-781. Andersson S and Moghrabi N (1997). Physiology and molecular genetics of 17 beta-hydroxysteroid dehydrogenases. Steroids, 62: 143-147. Andreka P, Zang J, Dougherty C, Slepak TI, Webster KA and Bishopric NH (2001). Cytoprotection by Jun kinase during nitric oxide-induced cardiac myocyte apoptosis. Circ Res, 88: 305-312. Anker SD, Ponikowski P, Varney S, Chua TP, Clark AL, Webb-Peploe KM, Harrington D, Kox WJ, Poole-Wilson PA and Coats AJ (1997). Wasting as independent risk factor for mortality in chronic heart failure. Lancet, 349: 1050-1053. Antoons G, Mubagwa K, Nevelsteen I and Sipido KR (2002). Mechanisms underlying the frequency dependence of contraction and [Ca2+]i transients in mouse ventricular myocytes. J Physiol, 543: 889-898. Anversa P, Leri A, Beltrami CA, Guerra S and Kajstura J (1998). Myocyte death and growth in the failing heart. Lab. Invest., 78: 767-786. Anversa P, Leri A, Kajstura J and Nadal-Ginard B (2002). Myocyte growth and cardiac repair. J Mol Cell Cardiol, 34: 91-105.
Bibliography
282
Aomine M and Yamato T (2000). Electrophysiological properties of ventricular muscle obtained from spontaneously diabetic mice. Exp Anim, 49: 23-33. Aoyama T, Peters JM, Iritani N, Nakajima T, Furihata K, Hashimoto T and Gonzalez FJ (1998). Altered constitutive expression of fatty acid-metabolizing enzymes in mice lacking the peroxisome proliferator-activated receptor alpha (PPARalpha). J Biol Chem, 273: 5678-5684. Arai M, Yoguchi A, Iso T, Takahashi T, Imai S, Murata K and Suzuki T (1995). Endothelin-1 and its binding sites are upregulated in pressure overload cardiac hypertrophy. Am J Physiol, 268: H2084-H2091. Arai M, Suzuki T and Nagai R (1996). Sarcoplasmic reticulum genes are upregulated in mild cardiac hypertrophy but downregulated in severe cardiac hypertrophy induced by pressure overload. J Mol Cell Cardiol, 28: 1583-1590. Argaman A and Livne A (1988). Angiotensin II and Na+/H+ exchange in human blood platelets. J Hum Hypertens, 2: 161-166. Armoundas AA, Wu R, Juang G, Marban E and Tomaselli GF (2001). Electrical and structural remodeling of the failing ventricle. Pharmacol Ther, 92: 213-230. Arnold JM, Yusuf S, Young J, Mathew J, Johnstone D, Avezum A, Lonn E, Pogue J, Bosch J and HOPE Investigators (2003). Prevention of Heart Failure in Patients in the Heart Outcomes Prevention Evaluation (HOPE) Study. Circulation, 107: 1284-1290. Asakawa M, Takano H, Nagai T, Uozumi H, Hasegawa H, Kubota N, Saito T, Masuda Y, Kadowaki T and Komuro I (2002). Peroxisome proliferator-activated receptor gamma plays a critical role in inhibition of cardiac hypertrophy in vitro and in vivo. Circulation, 105: 1240-1246. Ashavaid TF, Colvin RA, Messineo FC, MacAlister T and Katz AM (1985). Effects of fatty acids on Na/Ca exchange in cardiac sarcolemmal membranes. J Mol Cell Cardiol, 17: 851-861. Ashkenazi A and Dixit VM (1998). Death receptors: signaling and modulation. Science, 281: 1305-1308. Assayag P, Charlemagne D, de Leiris J, Boucher F, Valere PE, Lorte S, Swynghedauw B and Besse S (1997). Senescent heart compared with pressure overload-induced hypertrophy. Hypertension, 29: 15-21. Avendano GF, Agarwal RK, Bashey RI, Lyons MM, Soni BJ, Jyothirmayi GN and Regan TJ (1999). Effects of glucose intolerance on myocardial function and collagen-linked glycation. Diabetes, 48: 1443-1447. Avogaro A, Nosadini R, Doria A, Fioretto P, Velussi M, Vigorito C, Sacca L, Toffolo G, Cobelli C, Trevisan R, et al. (1990). Myocardial metabolism in insulin-deficient diabetic humans without coronary artery disease. Am J Physiol, 258: E606-E618.

Bibliography
283
Azhar M, Schultz Jel J, Grupp I, Dorn GW 2nd, Meneton P, Molin DG, Gittenberger-de Groot AC and Doetschman T (2003). Transforming growth factor beta in cardiovascular development and function. Cytokine Growth Factor Rev, 14: 391-407. Baartscheer A, Schumacher CA, van Borren MM, Belterman CN, Coronel R, Opthof T and Fiolet JW (2005). Chronic inhibition of Na+/H+-exchanger attenuates cardiac hypertrophy and prevents cellular remodeling in heart failure. Cardiovasc Res, 65: 83-92. Badaue-Passos D Jr, Ventura RR, Silva LF, Olivares EL, Ramalho MJ, Antunes Rodrigues J and Reis LC (2001). Effect of losartan on sodium appetite of hypothyroid rats subjected to water and sodium depletion and water, sodium and food deprivation. Exp Physiol, 86: 621-628. Badenhorst D, Veliotes D, Maseko M, Tsotetsi OJ, Brooksbank R, Naidoo A, Woodiwiss AJ and Norton GR (2003). Beta-adrenergic activation initiates chamber dilatation in concentric hypertrophy. Hypertension, 41: 499-504. Baker KM and Singer HA (1988). Identification and characterization of guinea pig angiotensin II ventricular and atrial receptors: coupling to inositol phosphate production. Circ Res, 62: 896-904. Ballard C and Schaffer S (1996). Stimulation of the Na+/Ca2+ exchanger by phenylephrine, angiotensin II and endothelin 1. J Mol Cell Cardiol, 28: 11-17. Banyasz T, Kalapos I, Kelemen SZ and Kovacs T (1996). Changes in cardiac contractility in IDDM and NIDDM diabetic rats. Gen Physiol Biophys, 15: 357-369. Barany M (1967). ATPase activity of myosin correlated with speed of muscle shortening. J Gen Physiol, 50 (Suppl): 197-218. Bardales RH, Hailey LS, Xie SS, Schaefer RF and Hsu SM (1996). In situ apoptosis assay for detection of early acute myocardial infarction. Am J Pathol, 149: 821-829. Barger PM, Brandt JM, Leone TC, Weinheimer CJ and Kelly DP (2000). Deactivation of peroxisome proliferator-activated receptor-α during cardiac hypertrophic growth. J Clin Invest, 105: 1723-1730. Barki-Harrington L, Luttrell LM and Rockman HA (2003). Dual inhibition of beta-adrenergic and angiotensin II receptors by a single antagonist: a functional role for receptor-receptor interaction in vivo. Circulation, 108: 1611-1618. Barnes JA and Smoak IW (2000). Glucose-regulated protein 78 (GRP78) is elevated in embryonic mouse heart and induced following hypoglycemic stress. Anat Embryol (Berl), 202: 67-74. Barrans JD, Allen PD, Stamatiou D, Dzau VJ and Liew CC (2002). Global gene expression profiling of end-stage dilated cardiomyopathy using a human cardiovascular-based cDNA microarray. Am J Pathol, 160: 2035-2043.

Bibliography
284
Barry WH, Matsui H, Bridge JH and Spitzer KW (1995). Excitation-contraction coupling in ventricular myocytes: effects of angiotensin II. Adv Exp Med Biol, 382: 31-39. Bassani RA, Bassani JW and Bers DM (1992). Mitochondrial and sarcolemmal Ca2+ transport reduce [Ca2+]i during caffeine contractures in rabbit cardiac myocytes. J Physiol, 453: 591-608. Bassani JWM, Bassani RA and Bers DM (1994). Relaxation in rabbit and rat cardiac cells: species-dependent differences in cellular mechanisms. J Physiol, 476: 279-293. Basso C, Calabrese F, Corrado D and Thiene G (2001). Postmortem diagnosis in sudden cardiac death victims: macroscopic, microscopic and molecular findings. Cardiovasc Res, 50: 290-300. Basso N and Terragno NA (2001). History about the discoveryof the renin-angiotensin system. Hypertension, 38: 1246-1249. Becker M, Umrani D, Lokhandwala MF and Hussain T (2003). Increased renal angiotensin II AT1 receptor function in obese Zucker rat. Clin exp Hypertens, 25: 35-47. Beddington RS and Robertson EJ (1999). Axis development and early asymmetry in mammals. Cell, 96: 195-209. Belke DD, Betuing S, Tuttle MJ, Graveleau C, Young ME, Pham M, Zhang D, Cooksey RC, McClain DA, Litwin SE, Taegtmeyer H, Severson D, Kahn CR and Abel ED (2002). Insulin signaling coordinately regulates cardiac size, metabolism, and contractile protein isoform expression. J Clin Invest, 109: 629-639. Belke DD, Larsen TS, Gibbs EM and Severson DL (2000). Altered metabolism causes cardiac dysfunction in perfused hearts from diabetic (db/db) mice. Am J Physiol, 279: E1104-E1113. Belke DD, Larsen TS, Gibbs EM and Severson DL (2001). Glucose metabolism in perfused mouse hearts overexpressing human GLUT-4 glucose transporter. Am J Physiol, 280: E420-E427. Belloni AS, Andreis PG, Macchi V, Gottardo G, Malendowicz LK and Nussdorfer GG (1998). Distribution and functional significance of angiotensin-II AT1- and AT2-receptor subtypes in the rat adrenal gland. Endocr Res, 24: 1-15. Beltrami CA, Finato N, Rocco M, Feruglio GA, Puricelli C, Cigola E, Quaini F, Sonnenblick EH, Olivetti G and Anversa P (1994). Structural basis of end-stage failure in ischemic cardiomyopathy in humans. Circulation, 89: 151-163. Berridge MJ, Lipp P and Bootman MD (2000). The versatility and universality of calcium signalling. Nat Rev Mol Cell Biol, 1: 11-21.

Bibliography
285
Bers DM (2001). In: ‘Excitation-contraction coupling and cardiac contractile force’. Kluwe Academic Publishers, (2nd Edition). Berry MF, Woo YJ, Pirolli TJ, Bish LT, Moise MA, Burdick JW, Morine KJ, Jayasankar V, Gardner TJ and Sweeney HL (2004). Administration of a tumor necrosis factor inhibitor at the time of myocardial infarction attenuates subsequent ventricular remodeling. J Heart Lung Transplant, 23: 1061-1068. Beuckelmann DJ, Nabauer M and Erdmann E (1992). Intracellular calcium handling in isolated ventricular myocytes from patients with terminal heart failure. Circulation, 85: 1046-1055. Beuckelmann DJ, Nabauer M and Erdmann E (1993). Alterations of K+ currents in isolated human ventricular myocytes from patients with terminal heart failure. Circ Res, 73: 379-385. Bing OH, Conrad CH, Boluyt MO, Robinson KG and Brooks WW (2002). Studies of prevention, treatment and mechanisms of heart failure in the aging spontaneously hypertensive rat. Heart Fail Rev, 7: 71-88. Bischoff C, Kahns S, Lund A, Jorgensen HF, Praestegaard M, Clark BF and Leffers H (2000). The human elongation factor 1 A-2 gene (EEF1A2): complete sequence and characterization of gene structure and promoter activity. Genomics, 68: 63-70. Bishop SP and Altschuld RA (1970). Increased glycolytic metabolism in cardiac hypertrophy and congestive failure. Am J Physiol, 218: 153-159. Bishop JE, Greenbaum R, Gibson DG, Yacoub M and Laurent GJ (1990). Enhanced deposition of predominantly type I collagen in myocardial disease. J Mol Cell Cardiol, 22: 1157-1165. Blair-West JR, Coghlan JP, Denton DA, Funder JW, Scoggins BA and Wright RD (1971). The effect of the heptapeptide (2-8) and hexapeptide (3-8) fragments of angiotensin II on aldosterone secretion. J Clin Endocrinol Metab, 32: 575-578. Blanchard AP and Hood L (1996). Sequence to array: probing the genome's secrets. Nat Biotechnol, 14: 1649. Boateng SY, Naqvi RU, Koban MU, Yacoub MH, MacLeod KT and Boheler KR (2001). Low-dose ramipril treatment improves relaxation and calcium cycling after established cardiac hypertrophy. Am J Physiol, 280: H1029-H1038. Boateng SY, Seymour AM, Bhutta NS, Dunn MJ, Yacoub MH and Boheler KR (1998). Sub-antihypertensive doses of ramipril normalize sarcoplasmic reticulum calcium ATPase expression and function following cardiac hypertrophy in rats. J Mol Cell Cardiol, 30: 2683-2694.
Bibliography
286
Bohm M, Lippoldt A, Wienen W, Ganten D and Bader M (1996). Reduction of cardiac hypertrophy in TGR(mREN2)27 by angiotensin II receptor blockade. Mol Cell Biochem, 163-164: 217-221. Bohm M, Flesch M and Schnabel P (1997). Beta-adrenergic signal transduction in the failing and hypertrophied myocardium. J Mol Med, 75: 842–848. Boluyt MO, Robinson KG, Meredith AL, Sen S, Lakatta EG, Crow MT, Brooks WW, Conrad CH and Bing OH (2005). Heart failure after long-term supravalvular aortic constriction in rats. Am J Hypertens, 18: 202-212. Bomberger JM, Spielman WS, Hall CS, Weinman EJ and Parameswaran N (2005). Receptor activity-modifying protein (RAMP) isoform-specific regulation of adrenomedullin receptor trafficking by NHERF-1. J Biol Chem, 280: 23926-23935. Bond J, Sedmera D, Jourdan J, Zhang Y, Eisenberg CA, Eisenberg LM and Gourdie RG (2003). Wnt11 and Wnt7a are up-regulated in association with differentiation of cardiac conduction cells in vitro and in vivo. Dev Dyn, 227: 536-543. Bonne G, Carrier L, Richard P, Hainque B and Schwartz K (1998). Familial hypertrophic cardiomyopathy: from mutations to functional defects. Circ Res, 83: 580-593. Bonneux L, Barendregt JJ, Meeter K, Bonsel GJ and van der Maas PJ (1994). Estimating clinical morbidity due to ischaemic heart disease and congestive heart failure: the future rise of heart failure. Am J Public Health, 84: 20-28. Bouzegrhane F and Thibault G (2002). Is angiotensin II a proliferative factor of cardiac fibroblasts? Cardiovasc Res, 53: 304-312. Bowling N, Huang X, Sandusky GE, Fouts RL, Mintze K, Esterman M, Allen PD, Maddi R, McCall E and Vlahos CJ (2001). Protein kinase C-alpha and –epsilon modulate connexin-43 phosphorylation in human heart. J Mol Cell Cardiol, 33: 789-798. Braun-Mendez E and Page IH (1958). Suggested revision of nomenclature: angiotensin. Science, 127: 242. Braz JC, Bueno OF, Liang Q, Wilkins BJ, Dai YS, Parsons S, Braunwart J, Glascock BJ, Klevitsky R, Kimball TF, Hewett TE and Molkentin JD (2003). Targeted inhibition of p38 MAPK promotes hypertrophic cardiomyopathy through upregulation of calcineurin-NFAT signaling. J Clin Invest, 111: 1475-1486. Brede M, Roell W, Ritter O, Wiesmann F, Jahns R, Haase A, Fleischmann BK and Hein L (2003). Cardiac hypertrophy is associated with decreased eNOS expression in angiotensin AT2 receptor-deficient mice. Hypertension, 42: 1177-1182.
Bibliography
287
Breen EC and Tang K (2003). Calcyclin (S100A6) regulates pulmonary fibroblast proliferation, morphology, and cytoskeletal organization in vitro. J Cell Biochem, 88: 848-854. Brennan KJ and Hardeman EC (1993). Quantitative analysis of the human alpha-skeletal actin gene in transgenic mice. J Biol Chem, 268: 719-725. Brilla CG, Janicki JS and Weber KT (1991). Cardioreparative effects of lisinopril in rats with genetic hypertension and left ventricular hypertrophy. Circulation, 83: 1771-1779. Brilla CG, Rupp H, Funck R and Maisch B (1995). The renin-angiotensin-aldosterone system and myocardial collagen matrix remodelling in congestive heart failure. Eur Heart J, 16 (Suppl O):107-109. Brillantes AM, Allen P, Takahashi T, Izumo S and Marks AR (1992). Differences in cardiac calcium release channel (ryanodine receptor) expression in myocardium from patients with end-stage heart failure caused by ischemic versus dilated cardiomyopathy. Circ Res, 71: 18-26. Brink M, de Gasparo M, Rogg H, Whitebread S and Bullock G (1995). Localization of angiotensin II receptor subtypes in the rabbit heart. J Mol Cell Cardiol, 27: 459-470. Brink M, Erne P, de Gasparo M, Rogg H, Schmid A, Stulz P and Bullock G (1996). Localization of the angiotensin II receptor subtypes in the human atrium. J Mol Cell Cardiol, 28: 1789-1799. Brixius K, Hoischen S, Reuter H, Lasek K and Schwinger RH (2001). Force/shortening-frequency relationship in multicellular muscle strips and single cardiomyocytes of human failing and nonfailing hearts. J Card Fail, 7: 335-341. Brooks WW and Apstein CS (1996). Effect of treppe on isovolumic function in the isolated blood-perfused mouse heart. J Mol Cell Cardiol, 28: 1817-1822. Brooks WW, Bing OH, Boluyt MO, Malhotra A, Morgan JP, Satoh N, Colucci WS and Conrad CH (2000). Altered inotropic responsiveness and gene expression of hypertrophied myocardium with captopril. Hypertension, 35: 1203-1209. Brooksby P, Levi AJ and Jones JV (1993). The electrophysiological characteristics of hypertrophied ventricular myocytes from the spontaneously hypertensive rat. J Hypertens, 11: 611-622. Broome M, Hanley M, Haggmark S, Johansson G, Aneman A and Biber B (2001). Acute effects of angiotensin II on myocardial performance. Acta Anaesthesiol Scand, 45: 1147-1154. Brown CO 3rd, Chi X, Garcia-Gras E, Shirai M, Feng XH and Schwartz RJ (2004). The cardiac determination factor, Nkx2-5, is activated by mutual cofactors GATA-4 and Smad1/4 via a novel upstream enhancer. J Biol Chem, 279: 10659-10669.

Bibliography
288
Bruno E, Rossi N, Thuer O, Cordoba R and Alday LE (2003). Cardiovascular findings, and clinical course, in patients with Williams syndrome. Cardiol Young, 13: 532-536. Burgess JK (2001). Gene expression studies using microarrays. Clin Exp Pharmacol Physiol, 28: 321-328. Burgess ML, Carver WE, Terracio L, Wilson SP, Wilson MA and Borg TK (1994). Integrin-mediated collagen gel contraction by cardiac fibroblasts. Effects of angiotensin II. Circ Res, 74: 291-298. Burke W, Imperatore G and Reyes M (2001). Iron deficiency and iron overload: effects of diet and genes. Proc Nutr Soc, 60: 73-80. Burson JM, Aguilera G, Gross KW and Sigmund CD (1994). Differential expression of angiotensin receptor 1A and 1B in mouse. Am J Physiol, 267: E260-E267. Cadre BM, Qi M, Eble DM, Shannon TR, Bers DM and Samarel AM (1998). Cyclic stretch down-regulates calcium transporter gene expression in neonatal rat ventricular myocytes. J Mol Cell Cardiol, 30: 2247-2259. Cai L, Li W, Wang G, Guo L, Jiang Y and Kang YJ (2002). Hyperglycemia-induced apoptosis in mouse myocardium: mitochondrial cytochrome C-mediated caspase-3 activation pathway. Diabetes, 51: 1938-1948. Cambien F, Poirier O, Lecerf L, Evans A, Cambou JP, Arveiler D, Luc G, Bard JM, Bara L, Ricard S, et al. (1992). Deletion polymorphism in the gene for angiotensin-converting enzyme is a potent risk factor for myocardial infarction. Nature, 359: 641-644. Camilion de Hurtado MC, Alvarez BV, Perez NG, Ennis IL and Cingolani HE (1998). Angiotensin II activates Na+-independent Cl--HCO3
- exchange in ventricular myocardium. Circ Res, 82: 473-481. Campbell DJ (1987). Circulating and tissue angiotensin systems. J Clin Invest, 79: 1-6. Campbell DJ, Bouhnik J, Coezy E, Menard J and Corvol P (1985). Characterization of precursor and secreted forms of human angiotensinogen. J Clin Invest, 75: 1880-1893. Campbell SE and Katwa LC (1997). Angiotensin II stimulated expression of transforming growth factor-beta1 in cardiac fibroblasts and myofibroblasts. J Mol Cell Cardiol, 29: 1947-1958. Candido R, Forbes JM, Thomas MC, Thallas V, Dean RG, Burns WC, Tikellis C, Ritchie RH, Twigg SM, Cooper ME and Burrell LM (2003). A breaker of advanced glycation end products attenuates diabetes-induced myocardial structural changes. Circ Res, 92: 785-792.

Bibliography
289
Capasso JM, Li P, Zhang X, Meggs LG and Anversa P (1993). Alterations in Ang II responsiveness in left and right myocardium after infarction-induced heart failure in rats. Am J Physiol, 264: H2056-H2067. Capogrossi MC, Kort AA, Spurgeon HA and Lakatta EG (1986). Single adult rabbit and rat cardiac myocytes retain the Ca2+- and species-dependent systolic and diastolic contractile properties of intact muscle. J Gen Physiol, 88: 589-613. Capogrossi MC, Suarez-Isla BA and Lakatta EG (1986). The interaction of electrically stimulated twitches and spontaneous contractile waves in single cardiac myocytes. J Gen Physiol, 88: 615-633. Carluccio E, Tommasi S, Bentivoglio M, Buccolieri M, Filippucci L, Prosciutti L and Corea L (2000). Prognostic value of left ventricular hypertrophy and geometry in patients with a first, uncomplicated myocardial infarction. Int J Cardiol, 74: 177-183. Caspari PG, Newcomb M, Gibson K and Harris P (1977). Collagen in the normal and hypertrophied human ventricle. Cardiovasc Res, 11: 554-558. Castellano M and Bohm M (1997). The cardiac beta-adrenoceptor-mediated signaling pathway and its alterations in hypertensive heart disease. Hypertension, 29: 715-722. Castello A, Rodriguez-Manzaneque JC, Camps M, Perez-Castillo A, Testar X, Palacin M, Santos A and Zorzano A (1991). Perinatal hypothyroidism impairs the normal transition of GLUT4 and GLUT1 glucose transporters from fetal to neonatal levels in heart and brown adipose tissue. J Biol Chem, 269: 5905-5912. Celentano A, Vaccaro O, Tammaro P, Galderisi M, Crivaro M, Oliviero M, Imperatore G, Palmieri V, Iovino V and Riccardi G (1995). Early abnormalities of cardiac function in non-insulin-dependent diabetes mellitus and impaired glucose tolerance. Am J Cardiol, 76: 1173-1176. Cerbai E, Barbieri M, Li Q and Mugelli A (1994). Ionic basis of action potential prolongation of hypertrophied cardiac myocytes isolated from hypertensive rats of different ages. Cardiovasc Res, 28: 1180-1187. Cerbai E, Pino R, Porciatti F, Sani G, Toscano M, Maccherini M, Giunti G and Mugelli A (1997). Characterization of the hyperpolarization-activated current, If, in ventricular myocytes from human failing heart. Circulation, 95: 568–571. Cerbai E, Sartiani L, DePaoli P, Pino R, Maccherini M, Bizzarri F, DiCiolla F, Davoli G, Sani G and Mugelli A (2001). The properties of the pacemaker current I(F) in human ventricular myocytes are modulated by cardiac disease. J Mol Cell Cardiol, 33: 441–448. Ch'en FF, Vaughan-Jones RD, Clarke K and Noble D (1998). Modelling myocardial ischaemia and reperfusion. Prog Biophys Mol Biol, 69: 515-538.

Bibliography
290
Chahine M, Bkaily G, Nader M, Al-Khoury J, Jacques D, Beier N and Scholz W (2005). NHE-1-dependent intracellular sodium overload in hypertrophic hereditary cardiomyopathy: prevention by NHE-1 inhibitor. J Mol Cell Cardiol, 38: 571-582. Chan CP, Sanderson JE, Glatz JF, Cheng WS, Hempel A and Renneberg R (2004). A superior early myocardial infarction marker. Human heart-type fatty acid-binding protein. Z Kardiol, 93: 388-397. Chancey AL, Brower GL, Peterson JT and Janicki JS (2002). Effects of matrix metalloproteinase inhibition on ventricular remodeling due to volume overload. Circulation, 105: 1983-1988. Chapman D, Weber KT and Eghbali M (1990). Regulation of fibrillar collagen types I and III and basement membrane type IV collagen gene expression in pressure overloaded rat myocardium. Circ Res, 67: 787-794. Charron MJ, Katz EB and Olson AL (1999). GLUT4 gene regulation and manipulation. J Biol Chem, 274: 3253-3256. Chattou S, Diacono J and Feuvray D (1999). Decrease in sodium-calcium exchange and calcium currents in diabetic rat ventricular myocytes. Acta Physiol Scand, 166: 137-144. Chen F, Jarmakani JM and Van Dop C (1995). Developmental changes in mRNA encoding cardiac Na+/H+ exchanger (NHE-1) in rabbit. Biochem Biophys Res Commun, 212: 960-967. Chen X, Piacentino V 3rd, Furukawa S, Goldman B, Margulies KB and Houser SR (2002). L-type Ca2+ channel density and regulation are altered in failing human ventricular myocytes and recover after support with mechanical assist devices. Circ Res, 91: 517-524. Chen L, Chen CX, Gan XT, Beier N, Scholz W and Karmazyn M (2004) Inhibition and reversal of myocardial infarction-induced hypertrophy and heart failure by NHE-1 inhibition. Am J Physiol, 286: H381–H387. Chen Y, Rajashree R, Liu Q and Hofmann P (2003). Acute p38 MAPK activation decreases force development in ventricular myocytes. Am J Physiol, 285: H2578-H2586. Cheng CP, Suzuki M, Ohte N, Ohno M, Wang ZM and Little WC (1996). Altered ventricular and myocyte response to angiotensin II in pacing-induced heart failure. Circ Res, 78: 880-892. Cheng W, Li B, Kajstura J, Li P, Wolin MS, Sonnenblick EH, Hintze TH, Olivetti G and Anversa P (1995). Stretch-induced programmed myocyte cell death. J Clin Invest, 96: 2247-2259.
Bibliography
291
Chirgwin JM, Schaefer IM, Diaz JA and Lalley PA (1984). Mouse kidney renin gene is on chromosome one. Somat Cell Molec Genet, 10: 633-637. Choi KM, Zhong Y, Hoit BD, Grupp IL, Hahn H, Dilly KW, Guatimosim S, Lederer WJ and Matlib MA (2002). Defective intracellular Ca2+ signaling contributes to cardiomyopathy in type 1 diabetic rats. Am J Physiol, 283: H1398-H1408. Ciani E, Severi S, Contestabile A, Bartesaghi R and Contestabile A (2004). Nitric oxide negatively regulates proliferation and promotes neuronal differentiation through N-Myc downregulation. J Cell Sci, 117: 4727-4737. Cicoira M, Bolger AP, Doehner W, Rauchhaus M, Davos C, Sharma R, Al-Nasser FO, Coats AJ and Anker SD (2001). High tumour necrosis factor-alpha levels are associated with exercise intolerance and neurohormonal activation in chronic heart failure patients. Cytokine, 15: 80-86. Cingolani HE, Alvarez BV, Ennis IL and Camilion de Hurtado MC (1998). Stretch-induced alkalinization of feline papillary muscle. An autocrine-paracrine system. Circ Res, 83: 775-780. Clark AF, Sharp MG, Morley SD, Fleming S, Peters J and Mullins JJ (1997). Renin-1 is essential for normal renal juxtaglomerular cell granulation and macula densa morphology. J Biol Chem, 272: 18185-18190. Clauser E, Curnow KM, Davies E, Conchon S, Teutsch B, Vianello B, Monnot C and Corvol P (1996). Angiotensin II receptors: protein and gene structures, expression and potential pathological involvements. Eur J Endocrinol, 134: 403-411. Clement S, Pellieux C, Chaponnier C, Pedrazzini T and Gabbiani G (2001). Angiotensin II stimulates α-skeletal actin expression in cardiomyocytes in vitro and in vivo in the absence of hypertension. Differentiation, 69: 66-74. Clerico A and Emdin M (2004). Diagnostic accuracy and prognostic relevance of the measurement of cardiac natriuretic peptides: a review. Clin Chem, 50: 33-50. Codd MB, Sugrue DD, Gersh BJ and Melton 3rd LJ (1989). Epidemiology of idiopathic dilated and hypertrophic cardiomyopathy: a population-based study in Olmsted County, Minnesota, 1975–1984. Circulation, 80: 564–572. Coker ML, Jolly JR, Joffs C, Etoh T, Holder JR, Bond BR and Spinale FG (2001). Matrix metalloproteinase expression and activity in isolated myocytes after neurohormonal stimulation. Am J Physiol, 281: H543-H551. Collins AR, Schnee J, Wang W, Kim S, Fishbein MC, Bruemmer D, Law RE, Nicholas S, Ross RS and Hsueh WA (2004). Osteopontin modulates angiotensin II-induced fibrosis in the intact murine heart. J Am Coll Cardiol, 43: 1698-1705. Cooklin M, Wallis WR, Sheridan DJ and Fry CH (1997). Changes in cell-to-cell electrical coupling associated with left ventricular hypertrophy. Circ Res, 80: 765–771.

Bibliography
292
Cooper EL (1976). Evolution of blood cells. Ann Immunol (Paris), 127: 817-825. Coppen SR, Dupont E, Rothery S and Severs NJ (1998). Connexin45 expression is preferentially associated with the ventricular conduction system in mouse and rat heart. Circ Res, 82: 232–243. Cowie MR, Mosterd A, Wood DA, Deckers JW, Poole-Wilson PA, Sutton GC and Grobbee DE (1997). The epidemiology of heart failure. Eur Heart J, 18: 208-225. Crackower MA, Sarao R, Oudit GY, Yagil C, Kozieradzki I, Scanga SE, Oliveira-dos-Santos AJ, da Costa J, Zhang L, Pei Y, Scholey J, Ferrario CM, Manoukian AS, Chappell MC, Backx PH, Yagil Y and Penniger JM (2002). Angiotensin-converting enzyme 2 is an essential regulator of heart function. Nature, 417: 822-828. Crawford HC, Fingleton BM, Rudolph-Owen LA, Goss KJ, Rubinfeld B, Polakis P and Matrisian LM (1999). The metalloproteinase matrilysin is a target of beta-catenin transactivation in intestinal tumors. Oncogene, 18: 2883-2891. Criddle DN, Dewar GH, Wathey WB and Woodward (1990). The effects of novel vasodilator long chain acyl carnitine ester in the isolated perfused heart of the rat. Br J Pharmacol, 99: 477-480. Cubillos-Garzon LA, Casas JP, Morillo CA and Bautista LE (2004). Congestive heart failure in Latin America: the next epidemic. Am Heart J, 147: 412-417. D'Angelo DD, Sakata Y, Lorenz JN, Boivin GP, Walsh RA, Liggett SB, Dorn GW 2nd (1997). Transgenic Galphaq overexpression induces cardiac contractile failure in mice. Proc Natl Acad Sci U S A, 94: 8121-8126. Danik SB, Liu F, Zhang J, Suk HJ, Morley GE, Fishman GI and Gutstein DE (2004). Modulation of cardiac gap junction expression and arrhythmic susceptibility. Circ Res, 95: 1035-1041. Dargie HJ, McMurray JJV and McDonald TA (1996). Heart failure- implications of the true size of the problem. J Intern Med, 239: 309-315. Darrow BJ, Fast VG, Kleber AG, Beyer EC and Saffitz JE (1996). Functional and structural assessment of intercellular communication: increased conduction velocity and enhanced connexin expression in dibutyryl cAMP-treated cultured cardiac myocytes. Circ Res, 79: 174–183. Das UN (2004). Long-chain polyunsaturated fatty acids interact with nitric oxide, superoxide anion, and transforming growth factor-beta to prevent human essential hypertension. Eur J Clin Nutr, 58: 195-203. Davenport JW, Fernandes ER, Harris LD, Neale GA and Goorha R (1999). The mouse mitotic checkpoint gene bub1b, a novel bub1 family member, is expressed in a cell cycle-dependent manner. Genomics, 55: 113-117.
Bibliography
293
Davies CH, Davia K, Bennett JG, Pepper JR, Poole-Wilson PA and Harding SE (1995). Reduced contraction and altered frequency response of isolated ventricular myocytes from patients with heart failure. Circulation, 92: 2540-2549. Davis LM, Rodefeld ME, Green K, Beyer EC and Saffitz JE (1995). Gap junction protein phenotypes of the human heart and conduction system. J Cardiovasc Electrophysiol, 6: 813–822. Day FL, Rafty LA, Chesterman CN and Khachigian LM (1999). Angiotensin II (ATII)-inducible platelet-derived growth factor A-chain gene expression is p42/44 extracellular signal-regulated kinase-1/2 and Egr-1-dependent and mediated via the ATII type 1 but not type 2 receptor. Induction by ATII antagonized by nitric oxide. J Biol Chem, 274: 23726-23733. de Gasparo M, Husain A, Alexander W, Catt KJ, Chiu AT, Drew M, Goodfriend T, Harding JW, Inagami T and Timmermans PB (1995). Proposed update of angiotensin receptor nomenclature. Hypertension, 25: 924-927. De La Bastie D, Levitsky D, Rappaport L, Mercadier JJ, Marotte F, Wisnewsky C, Brokovich V, Schwartz K and Lompre AM (1990). Function of the sarcoplasmic reticulum and expression of its Ca2+ ATPase gene in pressure overload-induced cardiac hypertrophy in the rat. Circ Res, 66: 554-564. de Launoit Y and Adamski J (1999). Unique multifunctional HSD17B4 gene product: 17beta-hydroxysteroid dehydrogenase 4 and D-3-hydroxyacyl-coenzyme A dehydrogenase/hydratase involved in Zellweger syndrome. J Mol Endocrinol, 22: 227-240. De Mello WC and Altieri PI (1992). The role of the renin-angiotensin system in the control of cell communication in heart; effects of angiotensin II and enalapril. J Cardiovasc Pharmacol, 20: 643-651. De Mello WC (1996). Renin-angiotensin system and cell communication in the failing heart. Hypertension, 27: 1267-1272. De Mello WC (1998). Intracellular angiotensin II regulates the inward calcium current in cardiac myocytes. Hypertension, 32: 976-982. de Simone G and Palmieri V (2002). Left ventricular hypertrophy in hypertension as a predictor of coronary events: relation to geometry. Curr Opin Nephrol Hypertens, 11: 215-220. De Windt LJ, Lim HW, Taigen T, Wencker D, Condorelli G, Dorn GW 2nd, Kitsis RN and Molkentin JD (2000). Calcineurin-mediated hypertrophy protects cardiomyocytes from apoptosis in vitro and in vivo: An apoptosis-independent model of dilated heart failure. Circ Res, 86: 255-263. Debouck C and Goodfellow PN (1999). DNA microarrays in drug discovery and development. Nat Genet, 21(Suppl 1): 48-50.

Bibliography
294
Decker RS, Decker ML, Nakamura S, Zhao YS, Hedjbeli S, Harris KR and Klocke FJ (2002). HSC73-tubulin complex formation during low-flow ischemia in the canine myocardium. Am J Physiol, 283: H1322-H1333. DeFronzo RA (1992). Insulin resistance, hyperinsulinemia, and coronary artery disease: a complex metabolic web. J Cardiovasc Parmacol, 20 (Suppl 11): S1-S16. Delbridge LM, Harris PJ and Morgan TO (1989). Characterization of single heart cell contractility by rapid imaging. Clin Exp Pharmacol Physiol, 16: 179-184. Delbridge LM, Harris PJ, Pringle JT, Dally LJ and Morgan TO (1990). A superfusion bath for single-cell recording with high-precision optical depth control, temperature regulation, and rapid solution switching. Pflűgers Arch, 416: 94-97. Delbridge LM, Morgan TO and Harris PJ (1995). Effects of endothelin-1 on the contractility of cardiomyocytes from the spontaneously hypertensive rats. Clin Exp Pharmacol Physiol, 22: 755-762. Delbridge LM, Satoh H, Yuan W, Bassani JW, Qi M, Ginsburg KS, Samarel AM and Bers DM (1997). Cardiac myocyte volume, Ca2+ fluxes, and sarcoplasmic reticulum loading in pressure-overload hypertrophy. Am J Physiol, 272: H2425-H2435. Denker SP and Barber DL (2002). Cell migration requires both ion translocation and cytoskeletal anchoring by the Na-H exchanger NHE1. J Cell Biol, 159: 1087-1096. Denker SP, Huang DC, Orlowski J, Furthmayr H and Barber DL (2000). Direct binding of the Na--H exchanger NHE1 to ERM proteins regulates the cortical cytoskeleton and cell shape independently of H(+) translocation. Mol Cell, 6: 1425-1436. Depre C, Shipley GL, Chen W, Han Q, Doenst T, Moore ML, Stepkowski S, Davies PJ and Taegtmeyer H (1999a). Unloaded heart in vivo replicates fetal gene expression of cardiac hypertrophy. Nat Med, 4: 1269-1275. Desrois M, Sidell RJ, Gauguier D, King LM, Radda GK and Clarke K (2004). Initial steps of insulin signaling and glucose transport are defective in the type 2 diabetic rat heart. Cardiovasc Res, 61: 288-296. Desvergne B and Wahli W (1999). Peroxisome proliferator-activated receptors. Nuclear control of metabolism. Endocr Rev, 20: 649-688. Dhein S, Polontchouk L, Salameh A and Haefliger JA (2002). Pharmacological modulation and differential regulation of the cardiac gap junction proteins connexin 43 and connexin 40. Biol Cell, 94: 409-422. Diep QN, Amiri F, Touyz RM, Cohn JS, Endemann D, Neves MF and Schiffrin EL (2002). PPARalpha activator effects on Ang II-induced vascular oxidative stress and inflammation. Hypertension, 40: 866-871.
Bibliography
295
Dierks T, Volkmer J, Schlenstedt G, Jung C, Sandholzer U, Zachmann K, Schlotterhose P, Neifer K, Schmidt B and Zimmermann R (1996). A microsomal ATP-binding protein involved in efficient protein transport into the mammalian endoplasmic reticulum. EMBO J, 15: 6931-6942. Dimri GP, Testori A, Acosta M and Campisi J (1996). Replicative senescence, aging and growth-regulatory transcription factors. Biol Signals, 5: 154-162. Dinh DT, Frauman AG, Sourial M, Casley DJ, Johnston CI and Fabiani ME (2001). Identification, distribution and expression of angiotensin II receptors in the normal human prostate and benign prostate hyperplasia. Endocrinology, 142: 1349-1356. Di Nicolantonio R, Kostka V, Chow MZ, Jansa P, Harrap SB. The Lvm-1 locus controlling left ventricular size contains a variant of the angiotensin II type 1b receptor. Rat Genomics and Models Meeting, 2003, Cold Spring Harbour. Dipla K, Mattiello JA, Margulies KB, Jeevanandam V and Houser SR (1999). The sarcoplasmic reticulum and the Na+/Ca2+ exchanger both contribute to the Ca2+ transient of failing human ventricular myocytes. Circ Res, 84: 435-444. Doble BW, Ping P and Kardami E (2000). The epsilon subtype of protein kinase C is required for cardiomyocyte connexion-43 phosphorylation. Circ Res, 86: 293-301. Dodge SM, Beardslee MA, Darrow BJ, Green KG, Beyer EC and Saffitz JE (1998). Effects of angiotensin II on expression of the gap junction channel protein connexin43 in neonatal rat ventricular myocytes. J Am Coll Cardiol, 32: 800-807. Domenighetti AA, Wang Q, Egger M, Richards SM, Pedrazzini T and Delbridge LM (2005). Angiotensin II-mediated phenotypic cardiomyocyte remodeling leads to age-dependent cardiac dysfunction and failure. Hypertension, 46: 426-432. Dorn 2nd GW and Hahn HS (2004). Genetic factors in cardiac hypertrophy. Ann N Y Acad Sci, 1015:225-237. Dorn GW, Robbins J, Ball N and Walsh RA (1994). Myosin heavy chain regulation and myocyte contractile depression after LV hypertrophy in aortic-banded mice. Am J Physiol, 267: H400-H405. Dostal DE (2000). The cardiac renin-angiotensin system: novel signaling mechanisms related to cardiac growth and function. Regul Pept, 91: 1-11. Dostal DE and Baker KM (1998). Angiotensin and endothelin: messengers that couple ventricular stretch to the Na+/H+ exchanger and cardiac hypertrophy. Circ Res, 83: 870-873. Dostal DE and Baker KM (1999). The cardiac renin-angiotensin system: conceptual, or a regulator of cardiac function ? Circ Res, 85: 643-650.
Bibliography
296
Dostal DE, Rothblum KC and Baker KM (1994). An improved method for absolute quantification of mRNA using multiplex polymerase chain reaction: determination of renin and angiotensinogen mRNA levels in various tissues. Anal Biochem, 223: 239-250. Drazner MH, Rame JE, Marino EK, Gottdiener JS, Kitzman DW, Gardin JM, Manolio TA, Dries DL and Siscovick DS (2004). Increased left ventricular mass is a risk factor for the development of a depressed left ventricular ejection fraction within five years: the Cardiovascular Health Study. J Am Coll Cardiol, 43: 2207-2215. Drobyshev A, Mologina N, Shik V, Pobedimskaya D, Yershov G and Mirzabekov A (1997). Sequence analysis by hybridization with oligonucleotide microchip: identification of beta-thalassemia mutations. Gene, 188: 45-52. Duan J, Zhang HY, Adkins SD, Ren BH, Norby FL, Zhan X, Benoit JN, Epstein PN and Ren J (2003). Impaired cardiac function and IGF-I response in myocytes from calmodulin-diabetic mice: role of Akt and RhoA. Am J Physiol Endocrinol Metab, 284: E366-E376. Dudoit S and Fridlyand J (2002). A prediction-based resampling method for estimating the number of clusters in a dataset. Genome Biol, 3: RESEARCH0036. Duggan DJ, Bittner M, Chen Y, Meltzer P and Trent JM (1999). Expression profiling using cDNA microarrays. Nat Genet, 21(Suppl 1):10-14. Dupont E, Matsushita T, Kaba RA, Vozzi C, Coppen SR, Khan N, Kaprielian R, Yacoub MH and Severs NJ (2001). Altered connexin expression in human congestive heart failure. J Mol Cell Cardiol, 33: 359-371. Dutta K, Podolin DA, Davidson MB and Davidoff AJ (2001). Cardiomyocyte dysfunction in sucrose-fed rats is associated with insulin resistance. Diabetes, 50: 1186-1192. Dutta K, Carmody MW, Cala SE and Davidoff AJ (2002). Depressed PKA activity contributes to impaired SERCA function and is linked to the pathogenesis of glucose-induced cardiomyopathy. J Mol Cell Cardiol, 34: 985-996. Dyck JR and Lopaschuk GD (1998). Glucose metabolism, H+ production and Na+/H+-exchanger mRNA levels in ischemic hearts from diabetic rats. Mol Cell Biochem, 180: 85-93 Eckel J and Reinauer H (1990). Insulin action on glucose transport in isolated cardiac myocytes: signalling pathways and diabetes-induced alterations. Biochem Soc Trans, 18: 1125-1127. Egan B, Gleim G and Panish J (2004). Use of losartan in diabetic patients in the primary care setting: review of the results in LIFE and RENAAL. Curr Med Res Opin, 20: 1909-1917.

Bibliography
297
Egeo A, Di Lisi1 R, Sandri C, Mazzocco M, Lapide M, Schiaffino S and Scartezzini P (2000). Developmental expression of the SH3BGR gene, mapping to the Down syndrome heart critical region. Mech Dev, 90: 313-316. Eguchi S, Iwasaki H, Ueno H, Frank GD, Motley ED, Eguchi K, Marumo F, Hirata Y and Inagami T (1999). Intracellular signaling of angiotensin II-induced p70 S6 kinase phosphorylation at Ser(411) in vascular smooth muscle cells. Possible requirement of epidermal growth factor receptor, Ras, extracellular signal-regulated kinase, and Akt. J Biol Chem, 274: 36843-36851. Elhendy A, Schinkel AF, van Domburg RT, Bax JJ and Poldermans D (2004). Incidence and predictors of heart failure during long-term follow-up after stress Tc-99m sestamibi tomography in patients with suspected coronary artery disease. J Nucl Cardiol, 11: 527-533. Elliott P (2000). Cardiomyopathy. Diagnosis and management of dilated cardiomyopathy. Heart 84: 106–112. Eloff BC, Gilat E, Wan X and Rosenbaum DS (2003). Pharmacological modulation of cardiac gap junctions to enhance cardiac conduction: evidence supporting a novel target for antiarrhythmic therapy. Circulation, 108: 3157-3163. Egert S, Nguyen N, Brosius FC 3rd and Schwaiger M (1997). Effects of wortmannin on insulin- and ischemia-induced stimulation of GLUT4 translocation and FDG uptake in perfused rat hearts. Cardiovasc Res, 35: 283-293. Egger M and Niggli E (1999). Regulatory function of Na-Ca exchange in the heart: milestones and outlook. J Membr Biol, 168: 107-130. Eguchi S, Iwasaki H, Ueno H, Frank GD, Motley ED, Eguchi K, Marumo F, Hirata Y and Inagami T (1999). Intracellular signaling of angiotensin II-induced p70 S6 kinase phosphorylation at Ser(411) in vascular smooth muscle cells. Possible requirement of epidermal growth factor receptor, Ras, extracellular signal-regulated kinase, and Akt. J Biol Chem, 274: 36843-36851. Engelhardt S, Hein L, Keller U, Klambt K and Lohse MJ (2002). Inhibition of Na+-H+ exchange prevents hypertrophy, fibrosis, and heart failure in β1-adrenergic receptor transgenic mice. Circ Res, 90: 814-819. Engels W, van Bilsen M, Wolffenbuttel BH, van der Vusse GJ and Glatz JF (1999). Cytochrome P450, peroxysome proliferation and cytoplasmic fatty acid-binding protein content in liver, heart and kidney of the diabetic rat. Mol Cell Biochem, 192: 53-61. Engler MM, Engler MB, Pierson DM, Molteni LB and Molteni A (2003). Effects of docosahexaenoic acid on vascular pathology and reactivity in hypertension. Exp Biol Med (Maywood), 228: 299-307.

Bibliography
298
Er F, Larbig R, Ludwig A, Biel M, Hofmann F, Beuckelmann DJ and Hoppe UC (2003). Dominant-negative suppression of HCN channels markedly reduces the native pacemaker current I(f) and undermines spontaneous beating of neonatal cardiomyocytes. Circulation, 107: 485–489. Esler M, Kaye D, Lambert G, Esler D and Jenning G (1997). Adrenergic nervous system in heart failure. Am J Cardiol, 80 (Suppl): 7L-14L. Everett AD, Fisher A, Tufro-McReddie A and Harris M (1997). Developmental regulation of angiotensin type 1 and 2 receptor gene expression and heart growth. J Mol Cell Cardiol, 29: 141-148. Fadel MP, Szewczenko-Pawlikowski M, Leclerc P, Dziak E, Symonds JM, Blaschuk O, Michalak M and Opas M (2001). Calreticulin affects beta-catenin-associated pathways. J Biol Chem, 276: 27083-27089. Falck S, Paavilainen VO, Wear MA, Grossmann JG, Cooper JA and Lappalainen P (2004). Biological role and structural mechanism of twinfilin-capping protein interaction. EMBO J, 23: 3010-3019. Fambrough D, McClure K, Kazlauskas A and Lander ES (1999). Diverse signaling pathways activated by growth factor receptors induce broadly overlapping, rather than independent, sets of genes. Cell, 97: 727-741. Fang ZY, Prins JB and Marwick TH (2004). Diabetic cardiomyopathy: evidence, mechanisms, and therapeutic implications. Endocr Rev, 25: 543-567. Fatkin D, McConnell BK, Mudd JO, Semsarian C, Moskowitz IG, Schoen FJ, Giewat M, Seidman CE and Seidman JG (2000). An abnormal Ca(2+) response in mutant sarcomere protein-mediated familial hypertrophic cardiomyopathy. J Clin Invest, 106: 1351-1359. Fedida D, Braun AP and Giles WR (1993). Alpha1-Adrenoceptors in myocardium: functional aspects and transmembrane signaling mechanisms. Physiol Rev, 73: 469–487. Fedorova OV, Talan MI, Agalakova NI, Lakatta EG and Bagrov AY (2004). Coordinated shifts in Na/K-ATPase isoforms and their endogenous ligands during cardiac hypertrophy and failure in NaCl-sensitive hypertension. J Hypertens, 22: 389-397. Feldman AM, Weinberg EO, Ray PE and Lorell BH (1993). Selective changes in cardiac gene expression during compensated hypertrophy and the transition to cardiac decompensation in rats with chronic aortic banding. Circ Res, 73: 184-192. Feng YH and Douglas JG (2001). Angiotensin receptors: an overview. In: Epstein,M and Brunner, HR editors, ‘Angiotensin II receptor antagonists’, Philadelphia: Hanley & Belfus, Inc., pp. 29-48.

Bibliography
299
Feng YH, Sun Y and Douglas JG (2002). Gbeta gamma -independent constitutive association of Galpha s with SHP-1 and angiotensin II receptor AT2 is essential in AT2-mediated ITIM-independent activation of SHP-1. Proc Natl Acad Sci U S A, 99: 12049-12054. Feolde E, Vigne P and Frelin C (1993). Angiotensin AT1 receptors mediate a positive inotropic effect of angiotensin II in guinea pig atria. Eur J Pharmacol, 245: 63-66. Ferdinandusse S, Finckh B, de Hingh YC, Stroomer LE, Denis S, Kohlschutter A and Wanders RJ (2003). Evidence for increased oxidative stress in peroxisomal D-bifunctional protein deficiency. Mol Genet Metab, 79: 281-287. Ferencz C, Rubin JD, McCarter RJ, Brenner JI, Neill CA, Perry LW, Hepner SI and Downing JW (1985). Congenital heart disease: prevalence at livebirth. The Baltimore-Washington Infant Study. Am J Epidemiol, 121: 31-36. Fernandes L, Fortes ZB, Nigro D, Tostes RCA, Santos RAS and Carvalho MHC (2001). Potentiation of bradykinin by angiotensin-(1-7) on arterioles of spontaneously hypertensive rats studied in vivo. Hypertension, 37: 703-709. Fernandes R, Girao H and Pereira P (2004). High glucose down-regulates intercellular communication in retinal endothelial cells by enhancing degradation of connexin 43 by a proteasome-dependent mechanism. J Biol Chem, 279: 27219-27224. Fernandez-Real JM and Ricart W (2003). Insulin resistance and chronic cardiovascular inflammatory syndrome. Endocr Rev, 24: 278-301. Fernandez-Velasco M, Goren N, Benito G, Blanco-Rivero J, Bosca L and Delgado C (2003). Regional distribution of hyperpolarization-activated current (If) and hyperpolarization-activated cyclic nucleotide-gated channel mRNA expression in ventricular cells from control and hypertrophied rat hearts. J Physiol, 553: 395-405. Ferrannini E, Vichi S, Bech-Nielsen H, Laakso M, Paolisso G and Smith U (1996). Insulin action and age. Diabetes, 45: 947-953. Ferron L, Capuano V, Ruchon Y, Deroubaix E, Coulombe A and Renaud JF (2003). Angiotensin II signaling pathways mediate expression of cardiac T-type calcium channels. Circ Res, 93: 1241-1248. Fesik SW (2000). Insights into programmed cell death through structural biology. Cell, 103: 273-282. Filipek A, Jastrzebska B, Nowotny M and Kuznicki J (2002). CacyBP/SIP, a calcyclin and Siah-1-interacting protein, binds EF-hand proteins of the S100 family. J Biol Chem, 277: 28848-28852. Filipek A, Wojda U and Lesniak W (1995). Interaction of calcyclin and its cyanogen bromide fragments with annexin II and glyceraldehyde 3-phosphate dehydrogenase. Int J Biochem Cell Biol, 27:1123-1131.

Bibliography
300
Filippatos GS, Tsilias K, Venetsanou K, Karambinos E, Manolatos D, Kranidis A, Antonellis J, Kardaras F, Anthopoulos L and Baltopoulos G (2000). Leptin serum levels in cachectic heart failure patients. Relationship with tumor necrosis factor-alpha system. Int J Cardiol, 76: 117-122. Fiordaliso F, Leri A, Cesselli D, Limana F, Safai B, Nadal-Ginard B, Anversa P and Kajstura J (2001). Hyperglycemia activates p53 and p53-regulated genes leading to myocyte cell death. Diabetes, 50: 2363-2375. Fischer Y, Bottcher U, Eblenkamp M, Thomas J, Jungling E, Rosen P and Kammermeier H (1997a). Glucose transport and glucose transporter GLUT4 are regulated by product(s) of intermediary metabolism in cardiomyocytes. Biochem J, 321: 629-638. Fischer Y, Thomas J, Sevilla L, Munoz P, Becker C, Holman G, Kozka IJ, Palacin M, Testar X, Kammermeier H and Zorzano A (1997b). Insulin-induced recruitment of glucose transporter 4 (GLUT4) and GLUT1 in isolated rat myocytes. J Biol Chem, 272: 7085-7092. Fitzsimons JT (1998). Angiotensin, thirst, and sodium appetite. Physiol Rev, 78: 583-686. Flesch M, Schwinger RH, Schiffer F, Frank K, Sudkamp M, Kuhn-Regnier F, Arnold G and Bohm M (1996). Evidence for functional relevance of an enhanced expression of the Na(+)-Ca2+ exchanger in failing human myocardium. Circulation, 94: 992-1002. Flesch M, Schwinger RH, Schnabel P, Schiffer F, van Gelder I, Bavendiek U, Sudkamp M, Kuhn-Regnier F and Bohm M (1997). Sarcoplasmic reticulum Ca2+ATPase and phospholamban mRNA and protein levels in end-stage heart failure due to ischemic or dilated cardiomyopathy. J Mol Med, 74: 321-332. Fliss H and Gattinger D (1996). Apoptosis in ischemic and reperfused rat myocardium. Circ Res, 79: 949-956. Flucher BE and Franzini-Armstrong C (1996). Formation of junctions involved in excitation-contraction coupling in skeletal and cardiac muscle. Proc Natl Acad Sci U S A, 93: 8101-8106. Fournier A, Fantini E, Sergiel JP, Athias P and Grynberg A (1995). Influence of the phospholipid content in docosahexaenoic acid on electrophysiology and contraction of rat heart muscle cells. Cardioscience, 6: 71-78. Frangogiannis NG, Michael LH and Entman ML (2000). Myofibroblasts in reperfused myocardial infarcts express the embryonic form of smooth muscle myosin heavy chain (SMemb). Cardiovasc Res, 48: 89-100. Franzini-Armstrong C and Jorgensen AO (1994). Structure and development of E-C coupling units in skeletal muscle. Annu Rev Physiol, 56: 509-534.

Bibliography
301
Frasch M (1995). Induction of visceral and cardiac mesoderm by ectodermal Dpp in the early Drosophila embryo. Nature, 374: 464-467. Freeman GL, Little WC and O’Rourke RA (1987). Influence of heart rate on left ventricular performance in conscious dogs. Circ Res, 61: 455-464. Freeman WM, Walker SJ and Vrana KE (1999). Quantitative RT-PCT: pitfalls and potential. Biotechniques, 26:112-125. Frey N and Olson EN (2003). Cardiac hypertrophy: the good, the bad, and the ugly. Annu Rev Physiol, 65: 45-79. Friddle CJ, Koga T, Rubin EM and Bristow J (2000). Expression profiling reveals distinct sets of genes altered during induction and regression of cardiac hypertrophy. Proc Natl Acad Sci U S A, 97: 6745-6750. Fukada SY, Tirapelli CR, de Godoy MA and de Oliveira AM (2005). Mechanisms underlying the endothelium-independent relaxation induced by angiotensin II in rat aorta. J Cardiovasc Pharmacol, 45: 136-143. Furman C, Short SM, Subramanian RR, Zetter BR and Roberts TM (2002). DEF-1/ASAP1 is a GTPase-activating protein (GAP) for ARF1 that enhances cell motility through a GAP-dependent mechanism. J Biol Chem, 277: 7962-7969. Gallinat S, Csikos T, Meffert S, Herdegen T, Stoll M and Unger T (1997). The angiotensin AT2 receptor down-regulates neurofilament M in PC12W cells. Neurosci Lett, 227: 29-32. Galderisi M, Anderson KM, Wilson PWF and Levy D (1991). Echocardiographic evidence for the existence of a distinct diabetic cardiomyopathy (the Framingham Heart Study). Am J Cardiol, 68: 85-89. Gan XT, Chakrabarti S and Karmazyn M (1999). Modulation of Na+/H+ exchange isoform 1 mRNA expression in isolated rat hearts. Am J Physiol, 277: H993-H998. Gao WD, Perez NG and Marban E (1998). Calcium cycling and contractile activation in intact mouse cardiac muscle. J Physiol, 507: 175-184. Garber DW and Neely JR (1983). Decreased myocardial function and myosin ATPase in hearts from diabetic rats. Am J Physiol, 244: H586-H591. Garcia-Martinez V and Schoenwolf GC (1993). Primitive-streak origin of the cardiovascular system in avian embryos. Dev Biol, 159: 706-719. Garvey WT, Hardin T, Juhaszova M and Dominguez JH (1993). Effects of diabetes on myocardial glucose transport system in rats: implications for diabetic cardiomyopathy. Am J Physiol, 264: H837-H844.

Bibliography
302
Geiman TM, Sankpal UT, Robertson AK, Chen Y, Mazumdar M, Heale JT, Schmiesing JA, Kim W, Yokomori K, Zhao Y and Robertson KD (2004). Isolation and characterization of a novel DNA methyltransferase complex linking DNMT3B with components of the mitotic chromosome condensation machinery. Nucleic Acids Res, 32: 2716-2729. Georgakopoulos D and Kass DA (2001). Minimal force-frequency modulation of inotropy and relaxation of in situ murine heart. J Physiol, 534: 535-545. Gerdts E, Oikarinen L, Palmieri V, Otterstad JE, Wachtell K, Boman K, Dahlof B and Devereux RB (2002). Correlates of left atrial size in hypertensive patients with left ventricular hypertrophy: the Losartan Intervention For Endpoint Reduction in Hypertension (LIFE) Study. Hypertension, 39: 739-743. Giancotti FG and Ruoslahti E (1999). Integrin signaling. Science, 285: 1028–1032. Gilbert RE, Rumble JR, Cao Z, Cox AJ, van Eeden P, Allen TJ, Kelly DJ and Cooper ME (2000). Endothelin receptor antagonism ameliorates mast cell infiltration, vascular hypertrophy, and epidermal growth factor expression in experimental diabetes. Circ Res, 86: 158-165. Glatz JF, van Breda E, Keizer HA, de Jong YF, Lakey JR, Rajotte RV, Thompson A, van der Vusse GJ and Lopaschuk GD (1994). Rat heart fatty acid-binding protein content is increased in experimental diabetes. Biochem Biophys Res Commun, 199: 639-646. Go LO, Moschella MC, Watras J, Handa KK, Fyfe BS and Marks AR (1995). Differential regulation of two types of intracellular calcium release channels during end-stage heart failure. J Clin Invest, 95: 888-894. Golfman L, Dixon IM, Takeda N, Lukas A, Dakshinamurti K and Dhalla NS (1998). Cardiac sarcolemmal Na(+)-Ca2+ exchange and Na(+)-K+ ATPase activities and gene expression in alloxan-induced diabetes in rats. Mol Cell Biochem, 188: 91-101. Goto T, Takase H, Toriyama T, Sugiura T, Sato K, Ueda R and Dohi Y (2003). Circulating concentrations of cardiac proteins indicate the severity of congestive heart failure. Heart, 89: 1303-1307. Goodwin GW, Taylor CS and Taegtmeyer H (1998). Regulation of energy metabolism of the heart during acute increase in heart work. J Biol Chem, 273: 29530-29539. Goodwin GW and Taegtmeyer H (2000). Improved energy homeostasis of the heart in the metabolic state of exercise. Am J Physiol Heart Circ Physiol, 279: H1490-H1501. Gordon JR (2000). TGFbeta1 and TNFalpha secreted by mast cells stimulated via the FcepsilonRI activate fibroblasts for high-level production of monocyte chemoattractant protein-1 (MCP-1). Cell Immunol, 201: 42-49. Gottlieb RA, Burleson KO, Kloner RA, Babior BM and Engler RL (1994). Reperfusion injury induces apoptosis in rabbit cardiomyocytes. J Clin Invest, 94: 1621-1628.

Bibliography
303
Grace AA, Metcalfe JC, Weissberg PL, Bethell HW and Vandenberg JI (1996). Angiotensin II stimulates sodium-dependent proton extrusion in perfused ferret heart. Am J Physiol, 270: C1687-C1694. Graf K, Do YS, Ashizawa N, Meehan WP, Giachelli CM, Marboe CC, Fleck E and Hsueh WA (1997). Myocardial osteopontin expression is associated with left ventricular hypertrophy. Circulation, 96: 3063-3071. Grinstein S, Rotin D and Mason MJ (1989). Na+/H+ exchange and growth factor-induced cytosolic pH changes. Role in cellular proliferation. Biochim Biophys Acta, 988: 73-97. Gross V, Obst M, Kiss E, Janke J, Mazak I, Shagdarsuren E, Muller DN, Langenickel TH, Grone HJ and Luft FC (2004). Cardiac hypertrophy and fibrosis in chronic L-NAME-treated AT2 receptor-deficient mice. J Hypertens, 22: 997-1005. Grundy SM, Benjamin IJ, Burke GL, Chait A, Eckel RH, Howard BV, Mitch W, Smith SC Jr and Sowers JR (1999). Diabetes and cardiovascular disease: a statement for healthcare professionals from the American Heart Association. Circulation, 100: 1134-1146. Grünig E, Tasman JA, Kücherer H, Franz W, Kübler W and Katus HA (1998). Frequency and phenotypes of familial dilated cardiomyopathy. J Am Coll Cardiol, 31: 186–194. Gu JW, Anand V, Shek EW, Moore MC, Brady AL, Kelly WC and Adair TH (1998). Sodium induces hypertrophy of cultured myocardial myoblasts and vascular smooth muscle cells. Hypertension, 31: 1083-1087. Guimaraes S, Pinheiro (2005). Functional evidence that in the cardiovascular system AT1 angiotensin II receptors are AT1b prejunctionally and AT1A postjunctionally. Cardiovasc Res, 67: 208-215. Gunja-Smith Z, Morales AR, Romanelli R and Woessner Jr. JF (1996). Remodeling of human myocardial collagen in idiopathic dilated cardiomyopathy. Role of metalloproteinases and pyridinoline cross-links. Am J Pathol, 148: 1639-1648. Guo X, Chapman D and Dhalla NS (2003). Partial prevention of changes in SR gene expression in congestive heart failure due to myocardial infarction by enalapril or losartan. Mol Cell Biochem, 254: 163-172. Gustafsson F and Holstein-Rathlou NH (1999). Angiotensin II modulates conducted vasoconstriction to norepinephrine and local electrical stimulation in rat mesenteric arterioles. Cardiovasc Res, 44: 176-184. Gutstein DE, Morley GE, Tamaddon H, Vaidya D, Schneider MD, Chen J, Chien KR, Stuhlmann H and Fishman GI (2001). Conduction slowing and sudden arrhythmic death in mice with cardiac-restricted inactivation of connexin43. Circ Res, 88: 333-339.

Bibliography
304
Guy LG, Kothary R and Wall L (1997). Position effects in mice carrying a lacZ transgene in cis with the beta-globin LCR can be explained by a graded model. Nucleic Acids Res, 25: 4400-4407. Guyton AC and Hall JE (1996). Renin-angiotensin system: its role in pressure control and hypertension. In: Saunders, WB, editor, ‘Textbook of medical physiology’, Philadelphia, pp. 227-233. Gwathmey JK, Slawsky MT, Hajjar RJ, Briggs GM and Morgan JP (1990). Role of intracellular calcium handling in force-interval relationships of human ventricular myocardium. J Clin Invest, 85: 1599-1613. Hacia JG (1999). Resequencing and mutational analysis using oligonucleotide microarrays. Nat Genet, 21 (Suppl 1): 42-47. Hammerer-Lercher A, Mair J, Bonatti J, Watzka SB, Puschendorf B and Dirnhofer S (2001). Hypoxia induces heat shock protein expression in human coronary artery bypass grafts. Cardiovasc Res, 50: 115-124. Hao L, Du M, Lopez-Campistrous A and Fernandez-Patron C (2004). Agonist-induced activation of matrix metalloproteinase-7 promotes vasoconstriction through the epidermal growth factor-receptor pathway. Circ Res, 94: 68-76. Haq S, Michael A, Andreucci M, Bhattacharya K, Dotto P, Walters B, Woodgett J, Kilter H and Force T (2003). Stabilization of beta-catenin by a Wnt-independent mechanism regulates cardiomyocyte growth. Proc Natl Acad Sci U S A, 100: 4610-4615. Harada K, Komuro I, Shiojima I, Hayashi D, Kudoh S, Mizuno T, Kijima K, Matsubara H, Sugaya T, Murakami K and Yazaki Y (1998). Pressure overload induces cardiac hypertrophy in angiotensin II type 1A receptor knockout mice. Circulation, 97: 1952-1959. Harada K, Komuro I, Zou Y, Kudoh S, Kijima K, Matsubara H, Sugaya T, Murakami K and Yazaki Y (1998). Acute pressure overload could induce hypertrophic responses in the heart of angiotensin II type 1a knockout mice. Circ Res, 82: 779-785. Harada K, Sugaya T, Murakami K, Yazaki Y and Komuro I (1999). Angiotensin II type 1A receptor knockout mice display less left ventricular remodeling and improved survival after myocardial infarction. Circulation, 100: 2093-2099. Harada M, Saito Y, Nakagawa O, Miyamoto Y, Ishikawa M, Kuwahara K, Ogawa E, Nakayama M, Kamitani S, Hamanaka I, Kajiyama N, Masuda I, Itoh H, Tanaka I and Nakao K (1997). Role of cardiac nonmyocytes in cyclic mechanical stretch-induced myocyte hypertrophy. Heart Vessels, 12 (Suppl):198-200. Harris PJ, Steward D, Cullinan MC, Delbridger LM, Dally L and Grinwald P (1987). Rapid measurement of isolated cardiac muscle cell length using a line-scan camera. IEEE Trans Biomed Eng, 34: 463-467.

Bibliography
305
Hart G (1994). Cellular electrophysiology in cardiac hypertrophy and failure. Cardiovasc Res, 28: 933-946. Hartzell HC and Duchatelle-Gourdon I (1997). Regulation of the cardiac delayed rectifier K current by neurotransmitters and magnesium. Cardiovasc Drugs Ther, 7 (Suppl 3): 547-554. Hasenfuss G and Pieske B (2002). Calcium cycling in congestive heart failure. J Mol Cell Cardiol, 34: 951-969. Hasenfuss G, Meyer M, Schillinger W, Preuss M, Pieske B and Just H (1997). Calcium handling proteins in the failing human heart. Basic Res Cardiol, 92 (Suppl 1): 87-93. Hasenfuss G, Mulieri LA, Blanchard EM, Holubarsch C, Leavitt BJ, Ittleman F and Alpert NR (1991). Energetics of isometric force development in control and volume-overload human myocardium. Comparison with animal species. Circ Res, 68: 836-846. Hasenfuss G, Reinecke H, Studer R, Pieske B, Meyer M, Drexler H and Just H (1996). Calcium cycling proteins and force-frequency relationship in heart failure. Basic Res Cardiol, 91 (Suppl 2): 17-22. Hasenfuss G, Schillinger W, Lehnart SE, Preuss M, Pieske B, Maier LS, Prestle J, Minami K and Just H (1999). Relationship between Na+-Ca2+-exchanger protein levels and diastolic function of failing human myocardium. Circulation, 99: 641-648. Hashida H, Hamada M and Hiwada K (1999). Serial changes in sarcoplasmic reticulum gene expression in volume-overloaded cardiac hypertrophy in the rat: effect of an angiotensin II receptor antagonist. Clin Sci, 96: 387-395. Hattori Y, Matsuda N, Kimura J, Ishitani T, Tamada A, Gando S, Kemmotsu O and Kanno M (2000). Diminished function and expression of the cardiac Na+-Ca2+ exchanger in diabetic rats: implication in Ca2+ overload. J Physiol, 527: 85-94. Haworth RS, Yasutake M, Brooks G and Avkiran M (1997). Cardiac Na+-H+ exchanger during postnatal development in the rat: changes in mRNA expression and sarcolemmal activity. J Mol Cell Cardiol, 29: 321-332. Hayasaki-Kajiwara Y, Kitano Y, Iwasaki T, Shimamura T, Naya N, Iwaki K and Nakajima M (1999). Na(+)influx via Na(+)/H(+)exchange activates protein kinase C isozymes delta and epsilon in cultured neonatal rat cardiac myocytes. J Mol Cell Cardiol, 31: 1559-1572. Hayat SA, Patel B, Khattar RS and Malik RA (2004). Diabetic cardiomyopathy: mechanisms, diagnosis and treatment. Clin Sci (Lond), 107: 539-557. He J, Conklin MW, Foell JD, Wolff MR, Haworth RA, Coronado R and Kamp TJ (2001). Reduction in density of transverse tubules and L-type Ca(2+) channels in canine tachycardia-induced heart failure. Cardiovasc Res, 49: 298-307.
Bibliography
306
Hein L, Dzau VJ and Barsh GS (2005). Linkage mapping of the angiotensin AT2 receptor gene (Agtr2) to the mouse X chromosome. Genomics, 30: 369-371. Hein L, Stevens ME, Barsh GS, Pratt RE, Kobilka BK and Dzau VJ (1997). Overexpression of angiotensin AT1 receptor transgene in the mouse myocardium produces a lethal phenotype associated with myocyte hyperplasia and heart block. Proc Natl Acad Sci U S A, 94: 6391-6396. Henegariu O, Heerema NA, Dlouhy SR, Vance GH and Vogt PH (1997). Multiplex PCR: critical parameters and step-by-step protocol. Biotechniques, 23:504-511. Hileeto D, Cukiernik M, Mukherjee S, Evans T, Barbin Y, Downey D, Karmazyn M and Chakrabarti S (2002). Contributions of endothelin-1 and sodium hydrogen exchanger-1 in the diabetic myocardium. Diabetes Metab Res Rev, 18: 386-394. Hittinger L, Ghaleh B, Chen J, Edwards JG, Kudej RK, Iwase M, Ki SJ, Vatner SF and Vatner DE (1999). Reduced subendocardial ryanodine receptors and consequent effects on cardiac function in conscious dogs with left ventricular hypertrophy. Circ Res, 84: 999-1006. Hiyoshi H, Yayama K, Takano M and Okamoto H (2005). Angiotensin type 2 receptor-mediated phosphorylation of eNOS in the aortas of mice with 2-kidney, 1-clip hypertension. Hypertension, 45: 967-973. Hobai IA and O’Rourke B (2000). Enhanced Ca2+-activated Na+-Ca2+ exchange activity in canine pacing-induced heart failure. Circ Res, 87: 690-698. Hochstrasser M (1996). Protein degradation or regulation: Ub the judge. Cell, 84: 813-815. Hofmann PA, Menon V and Gannaway KF (1995). Effects of diabetes on isometric tension as a function of [Ca2+] and pH in rat skinned cardiac myocytes. Am J Physiol, 269: H1656-H1663. Hoffmann R, Seidl T and Dugas M (2002). Profound effect of normalization on detection of differentially expressed genes in oligonucleotide microarray data analysis. Genome Biol, 3: RESEARCH0033. Hoffmann S, Krause T, van Geel PP, Willenbrock R, Pagel I, Pinto YM, Buikema H, van Gilst WH, Lindschau C, Paul M, Inagami T, Ganten D and Urata H (2001). Overexpression of the human angiotensin II type 1 receptor in the rat heart augments load induced cardiac hypertrophy. J Mol Med, 79: 601-608. Hoit BD, Ball N and Walsh RA (1997). Invasive hemodynamics and force-frequency relationships in open- versus closed-chest mice. Am J Physiol, 273: H2528-H2533. Honen BN, Saint DA and Laver DR (2003). Suppression of calcium sparks in rat ventricular myocytes and direct inhibition of sheep cardiac RyR channels by EPA, DHA and oleic acid. J Membr Biol, 196: 95-103.

Bibliography
307
Hong-Brown LQ and Deschepper CF (1992). Effects of thyroid hormones on angiotensinogen gene expression in rat liver, brain and cultured cells. Endocrinology, 130: 1231-1237. Hoppe UC, Jansen E, Südkamp M and Beuckelmann DJ (1998). A hyperpolarization-activated inward current (If) in ventricular myocytes from normal and failing human hearts. Circulation, 97: 55–65. Horackova M and Armour JA (1997). Ang II modifies cardiomyocyte function via extracardiac and intracardiac neurons: in situ and in vitro studies. Am J Physiol, 272: R766-R775. Hori M, Nakatsubo N, Kagiya T, Iwai K, Sato H, Iwakura K, Kitabatake A and Kamada T (1990). The role of Na+/H+ exchange in norepinephrine-induced protein synthesis in neonatal cultured rat cardiomyocytes. Jpn Circ J, 54: 535-539. Horinaka S, Kobayashi N, Mori Y, Yagi H, Onoda M, Matsuoka H (2003). Expression of inducible nitric oxide synthase, left ventricular function and remodeling in Dahl salt-sensitive hypertensive rats. Int J Cardiol, 91: 25-35. Hotamisligil GS and Spiegelman BM (1994). Tumor necrosis factor-(alpha): a key component of the obesity-diabetes link. Diabetes, 43: 1271-1278. Houiller P, Chambrey R, Achard JM, Froissart M, Poggioli J and Paillard M (1996). Signaling pathways in the biphasic effect of angiotensin II on apical Na/H antiport activity in proximal tubule. Kidney Int, 50: 1496-1505. Hsieh JC, Lee L, Zhang L, Wefer S, Brown K, DeRossi C, Wines ME, Rosenquist T and Holdener BC (2003). Mesd encodes an LRP5/6 chaperone essential for specification of mouse embryonic polarity. Cell, 112: 355-367. Hsueh WA, Law RE and Do YS (1998). Integrins, adhesion, and cardiac remodeling. Hypertension, 31: 176-180. Hu E, Kim JB, Sarraf P and Spiegelman BM (1996). Inhibition of adipogenesis through MAP kinase-mediated phosphorylation of PPARγ. Science, 274: 2100-2103. Hu J and Cotgreave IA (1997). Differential regulation of gap junctions by proinflammatory mediators in vitro. J Clin Invest, 99: 2312-2316. Huggins CE, Domenighetti AA, Pedrazzini T, Pepe S and Delbridge LM (2003). Elevated intracardiac angiotensin II leads to cardiac hypertrophy and mechanical dysfunction in normotensive mice. J Renin Angiotensin Aldosterone Syst, 4: 186-190. Huggins CE, Kalil N, Proietto J, Pepe S, Delbridge LMD (2004). Pyruvate supplementation ameliorates ex vivo cardiac dysfunction in GLUT4 deficient mice. J Mol Cell Cardiol, 37: C79 (abstract).

Bibliography
308
Hughes TR, Mao M, Jones AR, Burchard J, Marton MJ, Shannon KW, Lefkowitz SM, Ziman M, Schelter JM, Meyer MR, Kobayashi S, Davis C, Dai H, He YD, Stephaniants SB, Cavet G, Walker WL, West A, Coffey E, Shoemaker DD, Stoughton R, Blanchard AP, Friend SH and Linsley PS (2001). Expression profiling using microarrays fabricated by an ink-jet oligonucleotide synthesizer. Nat Biotechnol, 19: 342-347. Hung CC, Ichimura T, Stevens JL and Bonventre JV (2003). Protection of renal epithelial cells against oxidative injury by endoplasmic reticulum stress preconditioning is mediated by ERK1/2 activation. J Biol Chem, 278: 29317-29326. Hunter JJ and Chien KR (1999). Signaling pathways for cardiac hypertrophy and failure. New Engl J Med, 341:1276-1283. Hwang JJ, Allen PD, Tseng GC, Lam CW, Fananapazir L, Dzau VJ and Liew CC (2002). Microarray gene expression profiles in dilated and hypertrophic cardiomyopathic end-stage heart failure. Physiol Genomics, 10: 31-44. Hynes RO (1999). Cell adhesion: old and new questions. Trends Cell Biol, 9: M33–M37. Ichiki T, Labosky PA, Shiota C, Okuyama S, Imagawa Y, Fogo A, Niimura F, Ichikawa I, Hogan BL and Inagami T (1995). Effects on blood pressure and exploratory behaviour of mice lacking angiotensin II type-2 receptor. Nature, 377: 748-750. Ichiyanagi O, Ishii K and Endoh M (2002). Angiotensin II increases L-type Ca2+ current in gramicidin D-perforated adult rabbit ventricular myocytes: comparison with conventional patch-clamp method. Pflugers Arch, 444: 107-116. Ikenouchi H, Barry WH, Bridge JH, Weinberg EO, Apstein CS and Lorell BH (1994). Effects of angiotensin II in intracellular Ca2+ and pH in isolated beating rabbit hearts and myocytes loaded with indicator indo-1. J Physiol, 480: 203-215. Imahashi K, Hashimoto K, Yamaguchi H, Nishimura T and Kusuoka H (1998). Alteration of intracellular Na+ during ischemia in diabetic rat hearts: the role of reduced activity in Na+/H+ exchange against stunning. J Mol Cell Cardiol, 30: 509-517. Imanaka-Yoshida K, Amitani A, Ioshii SO, Koyabu S, Yamakado T and Yoshida T (1996). Alterations of expression and distribution of the Ca(2+)-storing proteins in endo/sarcoplasmic reticulum during differentiation of rat cardiomyocytes. J Mol Cell Cardiol, 28: 553-562. Imanishi K, Nonoguchi H, Nakayama Y, Machida K, Ikebe M and Tomita K (2003). Type 1A angiotensin II receptor is regulated differently in proximal and distal nephron segments. Hypertens Res, 26: 405-411. Imperatore G, Pinsky LE, Motulsky A, Reyes M, Bradley LA and Burke W (2003). Hereditary hemochromatosis: perspectives of public health, medical genetics, and primary care. Genet Med, 5: 1-8.

Bibliography
309
Inoguchi T, Yu HY, Imamura M, Kakimoto M, Kuroki T, Maruyama T and Nawata H (2001). Altered gap junction activity in cardiovascular tissues of diabetes. Med Electron Microsc, 34: 86-91. Ishihata A and Endoh M (1995). Species-related differences in inotropic effects of angiotensin II in mammalian ventricular muscle: receptors, subtypes and phosphoinositide hydrolysis. Br J Pharmacol, 114: 447-453. Ishikawa T, Kajiwara H and Kurihara S (1999). Alterations in contractile properties and Ca2+ handling in streptozotocin-induced diabetic rat myocardium. Am J Physiol, 277: H2185-H2194. Ito H, Hiroe M, Hirata Y, Fujisaki H, Adachi S, Akimoto H, Ohta Y, and Marumo F (1994). Endothelin ETA receptor antagonist blocks cardiac hypertrophy provoked by hemodynamic overload. Circulation, 89: 2198-2203. Ito N, Kagaya Y, Weinberg EO, Barry WH and Lorell BH (1997). Endothelin and angiotensin II stimulation of Na+-H+ exchange is impaired in cardiac hypertrophy. J Clin Invest, 99: 125-135. Ito Y, Suko J and Chidsey CA (1974). Intracellular calcium and myocardial contractility. V. Calcium uptake of sarcoplasmic reticulum fractions in hypertrophied and failing rabbit hearts. J Mol Cell Cardiol, 6: 237-247. Iwai N, Shimoike H and Kinoshita M (1995). Cardiac renin-angiotensin system in the hypertrophied heart. Circulation, 92: 2690-2696. Iwanaga Y, Aoyama T, Kihara Y, Onozawa Y, Yoneda T and Sasayama S (2002). Excessive activation of matrix metalloproteinases coincides with left ventricular remodeling during transition from hypertrophy to heart failure in hypertensive rats. J Am Coll Cardiol, 39: 1384-1391. Janczewski AM, Zahid M, Lemster BH, Frye CS, Gibson G, Higuchi Y, Kranias EG, Feldman AM and McTiernan CF (2004). Phospholamban gene ablation improves calcium transients but not cardiac function in a heart failure model. Cardiovasc Res, 62: 468-480. Janicki JS, Brower GL, Gardner JD, Chancey AL and Stewart JA Jr (2004). The dynamic interaction between matrix metalloproteinase activity and adverse myocardial remodeling. Heart Fail Rev, 9: 33-42. Janse MJ (2004). Electrophysiological changes in heart failure and their relationship to arrhythmogenesis. Cardiovasc Res, 61: 208-217. Jayaraman T and Marks AR (2000). Calcineurin is downstream of the inositol 1,4,5-trisphosphate receptor in the apoptotic and cell growth pathways. J Biol Chem, 275: 6417-6420.
Bibliography
310
Jethmalani SM and Henle KJ (1998). Calreticulin associates with stress proteins: implications for chaperone function during heat stress. J Cell Biochem, 69: 30-43. Jeunemaitre X, Soubrier F, Kotelevtsev YV, Lifton RP, Williams CS, Charru A, Hunt SC, Hopkins PN, Williams RR, Lalouel JM and Corvol P (1992). Molecular basis of human hypertension: role of angiotensinogen. Cell, 71: 7-20. Jortani SA and Valdes Jr R (2001). Mammalian cardenolides as biomarkers in congestive heart failure. Cardiovasc Toxicol, 1: 165-170. Jost-Vu E, Horton R and Antonipillai I (1992). Altered regulation of renin secretion by insulinlike growth factors and angiotensin II in diabetic rats. Diabetes, 41: 1100-1105. Jourdon P and Feuvray D (1993). Calcium and potassium currents in ventricular myocytes isolated from diabetic hearts. J Physiol, 470: 411-429. Ju H, Scammel-La Fleur T and Dixon IM (1996). Altered mRNA abundance of calcium transport genes in cardiac myocytes induced by angiotensin II. J Mol Cell Cardiol, 28: 1119-1128. Jude S, Bedut S, Roger S, Pinault M, Champeroux P, White E and Le Guennec JY (2003). Peroxidation of docosahexaenoic acid is responsible for its effects on I TO and I SS in rat ventricular myocytes. Br J Pharmacol, 139: 816-822. Julien J (1997). Cardiac complications in non-insulin-dependent diabetes mellitus. J Diabetes Complications, 11: 123-130. Kaab S, Nuss HB, Chiamvimonvat N, O'Rourke B, Pak PH, Kass DA, Marban E and Tomaselli GF (1996). Ionic mechanism of action potential prolongation in ventricular myocytes from dogs with pacing-induced heart failure. Circ Res, 78: 262-273. Kaczmarczyk SJ, Andrikopoulos S, Favaloro J, Domenighetti AA, Dunn A, Ernst M, Grail D, Fodero-Tavoletti M, Huggins CE, Delbridge LM, Zajac JD and Proietto J (2003). Threshold effects of glucose transporter-4 (GLUT4) deficiency on cardiac glucose uptake and development of hypertrophy. J Mol Endocrinol, 31: 449-459. Kadambi VJ, Ball N, Kranias EG, Walsh RA and Hoit BD (1999). Modulation of force-frequency relation by phospholamban in genetically engineered mice. Am J Physiol, 276: H2245-H2250. Kagaya Y, Hajjar RJ, Gwathmey JK, Barry WH and Lorell BH (1996). Long-term angiotensin-converting enzyme inhibition with fosinopril improves depressed responsiveness to Ca2+ in myocytes from aortic-banded rats. Circulation, 94: 2915-2922. Kahn BB (1996). Glucose transport: pivotal step in insulin action. Diabetes, 45: 1644-1654.

Bibliography
311
Kahn BB (2000). Targeted disruption of the glucose transporter 4 selectively in muscle causes insulin resistance and glucose intolerance. Nat Med, 6: 924-928. Kaibara M, Mitarai S, Yano K and Kameyama M (1994). Involvement of Na+-H+ antiporter in regulation of L-type Ca2+ channel current by angiotensin II in rabbit ventricular myocytes. Circ Res, 75: 1121-1125. Kajstura J, Fiordaliso F, Andreoli AM, Li B, Chimenti S, Medow MS, Limana F, Nadal-Ginard B, Leri A and Anversa P (2001). IGF-1 overexpression inhibits the development of diabetic cardiomyopathy and angiotensin II-mediated oxidative stress. Diabetes, 50: 1414-1424. Kambayashi Y, Bardhan S, Takahashi K, Tsuzuki S, Inui H, Hamakubo T and Inagami T (1993). Molecular cloning of a novel angiotensin II receptor isoform involved in phosphotyrosine phosphatase inhibition. J Biol Chem, 268: 24543-24546. Kannel WB and McGee DL (1979). Diabetes and cardiovascular disease: the Framingham study. JAMA, 241: 2035-2038. Kannel WB and Belanger AJ (1991). Epidemiology of heart failure. Am Heart J, 121: 951. Kang N, Walther T, Tian XL, Bohlender J, Fukamizu A, Ganten D and Bader M (2002). Reduced hypertension-induced end-organ damage in mice lacking cardiac and renal angiotensinogen synthesis. J Mol Med, 80: 359-366. Kapus A, Grinstein S, Wasan S, Kandasamy R and Orlowski J (1994). Functional characterization of three isoforms of the Na+/H+ exchanger stably expressed in Chinese hamster ovary cells. ATP dependence, osmotic sensitivity, and role in cell proliferation. J Biol Chem, 269: 23544-23552. Karmazyn M, Gan XT, Humphreys RA, Yoshida H and Kusumoto K (1999). The myocardial Na+/H+ exchange: structure, regulation, and its role in heart disease. Circ Res, 85: 777-786. Kasahara H, Ueyama T, Wakimoto H, Liu MK, Maguire CT, Converso KL, Kang PM, Manning WJ, Lawitts J, Paul DL, Berul CI and Izumo S (2003). Nkx2.5 homeoprotein regulates expression of gap junction protein connexin 43 and sarcomere organization in postnatal cardiomyocytes. J Mol Cell Cardiol, 35: 243-256. Kashihara H, Shi ZQ, Yu JZ, McNeill JH and Tibbits GF (2000). Effects of diabetes and hypertension on myocardial Na+-Ca2+ exchange. Can J Physiol Pharmacol, 78: 12-19. Kasper EK, Agema WR, Hutchins GM, Deckers JW, Hare JM and Baughman KL (1994). The causes of dilated cardiomyopathy: a clinicopathologic review of 673 consecutive patients. J Am Coll Cardiol, 23: 586-590.

Bibliography
312
Katsuki A, Sumida Y, Gabazza EC, Murashima S, Urakawa H, Morioka K, Kitagawa N, Tanaka T, Araki-Sasaki R, Hori Y, Nakatani K, Yano Y and Adachi Y (2002). Acute hyperinsulinemia is associated with increased circulating levels of adrenomedullin in patients with type 2 diabetes mellitus. Eur J Endocrinol, 147: 71-75. Katsuya T, Koike G, Yee TW, Sharpe N, Jackson R, Norton R, Horiuchi M, Pratt RE, Dzau VJ and MacMahon S (1995). Association of angiotensinogen gene T235 variant with increased risk of coronary heart disease. Lancet, 345: 1600-1603. Katz AM (2002). Maladaptive growth in the failing heart: the cardiomyopathy of overload. Cardiovasc Drugs Ther, 16: 245-249. Katz EB, Burcelin R, Tsao TS, Stenbit AE and Charron MJ (1996). The metabolic consequences of altered glucose transporter expression in transgenic mice. J Mol Med, 74: 639-652. Katz EB, Stenbit AE, Hatton K, Depinho R and Charron MJ (1995). Cardiac and adipose tissue abnormalities but not diabetes in mice deficient in GLUT4. Nature, 377: 151-155. Kearns M, Preis J, McDonald M, Morris C and Whitelaw E (2000). Complex patterns of inheritance of an imprinted murine transgene suggest incomplete germline erasure. Nucleic Acids Res, 28: 3301-3309. Khaled AR, Moor AN, Li A, Kim K, Ferris DK, Muegge K, Fisher RJ, Fliegel L and Durum SK (2001). Trophic factor withdrawal: p38 mitogen-activated protein kinase activates NHE1, which induces intracellular alkalinization. Mol Cell Biol, 21: 7545-7557. Kim HW, Ch YS, Lee HR, Park SY and Kim YH (2001). Diabetic alterations in cardiac sarcoplasmic reticulum Ca2+-ATPase and phospholamban protein expression. Life Sci, 70: 367-379. Kim S, Ohta K, Hamaguchi A, Yukimura T, Miura K and Iwao H (1995). Angiotensin II induces cardiac phenotypic modulation and remodeling in vivo in rats. Hypertension, 25: 1252-1259. King H, Aubert RE and Herman WH (1998). Global burden of diabetes 1995-2025. Diabetes Care, 21: 1414-1431. Kiss E, Ball NA, Kranias EG and Walsh RA (1995). Differential changes in cardiac phospholamban and sarcoplasmic reticular Ca2+-ATPase protein levels. Circ Res, 77: 759-764. Kita Y, Shimizu M, Shibayama S, Yoshio H, Ino H and Mabuchi H (1996). Correlation between myocardial dysfunction and changes in myosin isoenzymes in diabetic rat hearts. J Diabetes Complications, 10: 38-42.

Bibliography
313
Kitamura H, Ohnishi Y, Yoshida A, Okajima K, Azumi H, Ishida A, Galeano EJ, Kubo S, Hayashi Y, Itoh H and Yokoyama M (2002). Heterogeneous loss of connexin43 protein in nonischemic dilated cardiomyopathy with ventricular tachycardia. J Cardiovasc Electrophysiol, 13: 865-870. Klein F (1995). Hyperglycemia and microvascular and macrovascular disease in diabetes. Diabetes Care, 18: 258-268. Klett CP, Printz MP, Bader M, Ganten D and Eggena P (1996). Angiotensinogen messenger RNA stabilization by angiotensin II. J Hypertens, 15 (Suppl): S25-S36. Klionsky DJ and Emr SD (2000). Autophagy as a regulated pathway of cellular degradation. Science, 290: 1717-1721. Knaapen MW, Davies MJ, De Bie M, Haven AJ, Martinet W and Kockx MM (2001). Apoptotic versus autophagic cell death in heart failure. Cardiovasc Res, 51: 304-312. Kobayashi M, Furukawa Y and Chiba S (1978). Positive chronotropic and inotropic effects of angiotensin II in the dog heart. Eur J Pharmacol, 50: 17-25. Koch-Weser J (1965). Nature of the inotropic action of angiotensin on ventricular myocardium. Circ Res, 16: 230-237. Koegl M, Hoppe T, Schlenker S, Ulrich HD, Mayer TU and Jentsch S (1999). A novel ubiquitination factor, E4, is involved in multiubiquitin chain assembly. Cell, 96: 635-644. Kono T, Ikeda F, Oseko F, Ohmori Y, Nakano R, Muranaka H, Taniguchi A, Imura H, Khosla MC and Bumpus FM (1982). Biological activity of des-asp1-des-arg2-angiotensin II in man. Acta Endocrinol (Copenh), 99: 577-584. Kono T, Oseko F, Shimpo S, Nanno M and Endo J (1975). Biological activity of des-asp1-angiotensin II (angiotensin III) in man. J Clin Endocrinol Metab, 41: 1174-1177. Kook H, Lepore JJ, Gitler AD, Lu MM, Wing-Man Yung W, Mackay J, Zhou R, Ferrari V, Gruber P and Epstein JA (2003). Cardiac hypertrophy and histone deacetylase-dependent transcriptional repression mediated by the atypical homeodomain protein Hop. J Clin Invest, 112: 863-871. Koren MJ, Devereux RB, Casale PN, Savage DD and Laragh JH (1991). Relation of left ventricular mass and geometry to morbidity and mortality in uncomplicated essential hypertension. Ann Intern Med, 114: 345-352. Kostin S, Dammer S, Hein S, Klovekorn WP, Bauer EP and Schaper J (2004). Connexin 43 expression and distribution in compensated and decompensated cardiac hypertrophy in patients with aortic stenosis. Cardiovasc Res, 62: 426-436.

Bibliography
314
Kothary RK, Allen ND, Barton SC, Norris ML and Surani MA (1992). Factors affecting cellular mosaicism in the expression of a lacZ transgene in two-cell stage mouse embryos. Biochem Cell Biol, 70: 1097-1104. Kotsanas G, Delbridge LMD and Wendt IR (2000). Stimulus interval-dependent differences in Ca2+ transients and contractile responses of diabetic rat cardiomyocytes. Cardiovasc Res, 46: 450-462. Krattenmacher R, Knauthe R, Parczyk K, Walker A, Hilgenfeldt U and Fritzemeier KH (1994). Estrogen action on hepatic synthesis of angiotensinogen and IGF-I: direct and indirect estrogen effects. J Steroid Biochem Mol Biol, 48: 207-214. Krizanova O, Orlicky J, Masanova C, Juhaszova M and Hudecova S (1997). Angiotensin I modulates Ca-transport systems in the rat heart through angiotensin II. J Mol Cell Cardiol, 29: 1739-1746. Kulan K, Ural D, Komsuoglu B, Agacdiken A, Goldeli O and Komsuoglu SS (1998). Significance of QTc prolongation on ventricular arrhythmias in patients with left ventricular hypertrophy secondary to essential hypertension. Int J Cardiol, 64: 179-184. Kumar D and Jugdutt BI (2003). Apoptosis and oxidants in the heart. J Lab Clin Med, 142: 288-297. Kurisu S, Ozono R, Oshima T, Kambe M, Ishida T, Sugino H, Matsuura H, Chayama K, Teranishi Y, Iba O, Amano K and Matsubara H (2003). Cardiac angiotensin II type 2 receptor activates the kinin/NO system and inhibits fibrosis. Hypertension, 41: 99-107. Kuroki T, Inoguchi T, Umeda F, Ueda F and Nawata H (1998). High glucose induces alteration of gap junction permeability and phosphorylation of connexin-43 in cultured aortic smooth muscle cells. Diabetes, 47: 931-936. Kurtz A and Wagner C (1999). Regulation of renin secretion by angiotensin II-AT1 receptors. J Am Soc Nephrol, 10 (Suppl 11): S162-S168. Kuznicki J, Filipek A, Heimann P, Kaczmarek L and Kaminska B (1989). Tissue specific distribution of calcyclin--10.5 kDa Ca2+-binding protein. FEBS Lett, 254: 141-144. Kuznicki J, Kordowska J, Puzianowska M and Wozniewicz BM (1992). Calcyclin as a marker of human epithelial cells and fibroblasts. Exp Cell Res, 200: 425-430. Lagadic-Gossmann D, Buckler KJ, Le Prigent K and Feuvray D (1996). Altered Ca2+ handling in ventricular myocytes isolated from diabetic rats. Am J Physiol, 270: H1529-H1537.

Bibliography
315
Larkin JE, Frank BC, Gaspard RM, Duka I, Gavras H and Quackenbush F (2004). Cardiac transcriptional response to acute and chronic angiotensin II treatment. Physiol Genomics, 18: 152-166. Larsen LA, Christiansen M, Vuust J and Andersen PS (2001). Recent developments in high-throughput mutation screening. Pharmacogenomics, 2: 387-399. Larsen N, Samuelsson T and Zwieb C (1998). The Signal Recognition Particle Database (SRPDB). Nucleic Acids Res, 26: 177-178. Lau S, Jardine K and McBurney MW (1999). DNA methylation pattern of a tandemly repeated LacZ transgene indicates that most copies are silent. Dev Dyn, 215: 126-138. Lavoie C, Mercier JF, Salahpour A, Umapathy D, Breit A, Villeneuve LR, Zhu WZ, Xiao RP, Lakatta EG, Bouvier M and Hebert TE (2002). Beta 1/beta 2-adrenergic receptor heterodimerization regulates beta 2-adrenergic receptor internalization and ERK signaling efficacy. J Biol Chem, 277: 35402-35410. Le Prigent K, Lagadic-Gossmann D and Feuvray D (1997). Modulation by pH0 and intracellular Ca2+ of Na+-H+ exchange in diabetic rat isolated ventricular myocytes. Circ Res, 80: 253-260. Lear W, Ruzicka M and Leenen FHH (1997). ACE inhibitors and cardiac ACE mRNA in volume overload-induced cardiac hypertrophy. Am J Physiol, 273: H641-H646. Lecarpentier Y, Bugaisky LB, Chemla D, Mercadier JJ, Schwartz K, Whalen RG and Martin JL (1987). Coordinated changes in myocardial contractility, energetics and myosin isozyme pattern following thoracic aortic stenosis in the young rat. Am J Physiol, 252: H275-H282. Lee AA, Dillmann WH, McCulloch AD and Villarreal FJ (1995). Angiotensin II stimulates the autocrine production of transforming growth factor-beta 1 in adult rat cardiac fibroblasts. J Mol Cell Cardiol, 27: 2347-2357. Lee DS, Johansen H, Gong Y, Hall RE, Tu JV, Cox JL and Canadian Cardiovascular Outcomes Research Team (2004). Regional outcomes of heart failure in Canada. Can J Cardiol, 20: 599-607. Lee WL, Chen JW, Ting CT, Ishiwata T, Lin SJ, Korc M and Wang PH (1999). Insulin-like growth factor I improves cardiovascular function and suppresses apoptosis of cardiomyocytes in dilated cardiomyopathy. Endocrinology, 140: 4831-4840. Leenders F, Husen B, Thole HH and Adamski J (1994). The sequence of porcine 80 kDa 17 beta-estradiol dehydrogenase reveals similarities to the short chain alcohol dehydrogenase family, to actin binding motifs and to sterol carrier protein 2. Mol Cell Endocrinol, 104: 127-131.

Bibliography
316
Lefroy DC, Crake T, Del Monte F, Vescovo G, Dalla Libera L, Harding S and Poole-Wilson PA (1996). Angiotensin II and contraction of isolated myocytes from human, guinea pig, and infarcted rat hearts. Am J Physiol, 270: H2060-H2069. Leri A, Fiordaliso F, Setoguchi M, Limana F, Bishopric NH, Kajstura J, Webster K and Anversa P (2000). Inhibition of p53 function prevents renin-angiotensin system activation and stretch-mediated myocyte apoptosis. Am J Pathol, 157: 843-857. Levy D, Garrison RJ, Savage DD, Kannel WB and Castelli WP (1990). Prognostic implications of echocardiographically determined left ventricular mass in the Framingham Heart Study. N Engl J Med, 322: 1561-1566. Levy D, Larson MG, Vasan RS, Kannel WB and Ho KK (1996). The progression from hypertension to congestive heart failure. JAMA, 275: 1557-1562. Li D, Fareh S, Leung TK and Nattel S (1999). Promotion of atrial fibrillation by heart failure in dogs: atrial remodeling of a different sort. Circulation, 100: 87-95. Li GR, Lau CP, Ducharme A, Tardif JC and Nattel S (2002). Transmural action potential and ionic current remodeling in ventricles of failing canine hearts. Am J Physiol, 283: H1031-H1041. Li P, Sonnenblick EH, Anversa P and Capasso JM (1994). Length-dependent modulation of Ang II inotropism in rat myocardium: effects of myocardial infarction. Am J Physiol, 266: H779-H786. Li X, Alvarez B, Casey JR, Reithmeier RA and Fliegel L (2002). Carbonic anhydrase II binds to and enhances activity of the Na+/H+ exchanger. J Biol Chem, 277: 36085-36091. Li Z, Iwai M, Wu L, Shiuchi T, Jinno T, Cui TX and Horiuchi M (2003). Role of AT2 receptor in the brain in regulation of blood pressure and water intake. Am J Physiol, 284: H116-H121. Liao P, Wang SQ, Wang S, Zheng M, Zheng M, Zhang SJ, Cheng H, Wang Y and Xiao RP (2002). p38 Mitogen-activated protein kinase mediates a negative inotropic effect in cardiac myocytes. Circ Res, 90: 190-196. Liedtke AJ, DeMaison L, Eggleston AM, Cohen LM and Nellis SH (1988). Changes in substrate metabolism and effects of excess fatty acids in reperfused myocardium. Circ Res, 62: 535-542. Lim CC, Liao R, Varma N and Apstein CS (1999). Impaired lusitropy-frequency in the aging mouse: role of Ca2+-handling proteins and effects of isoproterenol. Am J Physiol, 274: H2083-H2090. Lim CC, Apstein CS, Colucci WS and Liao R (2000). Impaired cell shortening and relengthening with increased pacing frequency are intrinsic to the senescent mouse cardiomyocyte. J Mol Cell Cardiol, 32: 2075-2082.

Bibliography
317
Lints TJ, Parsons LM, Hartley L, Lyons I and Harvey RP (1993). Nkx-2.5: a novel murine homeobox gene expressed in early heart progenitor cells and their myogenic descendants. Development, 119: 419-431. Lipshutz RJ, Fodor SP, Gingeras TR and Lockhart DJ (1999). High density synthetic oligonucleotide arrays. Nat Genet, 21 (Suppl 1): 20-24. Liu C, Li Y, Semenov M, Han C, Baeg GH, Tan Y, Zhang Z, Lin X and He X (2002). Control of beta-catenin phosphorylation/degradation by a dual-kinase mechanism. Cell, 108: 837-847. Liu CP, Ting CT, Lawrence W, Maughan WL, Chang MS and Kass DA (1993). Diminished contractile response to increased heart rate in intact human left ventricular hypertrophy: systolic versus diastolic determinants. Circulation, 88: 1893-1906. Liu J, Masurekar MR, Vatner DE, Jyothirmayi GN, Regan TJ, Vatner SF, Meggs LG and Malhotra A (2003). Glycation end-product cross-link breaker reduces collagen and improves cardiac function in aging diabetic heart. Am J Physiol, 285: H2587-H2591. Liu X, Sentex E, Golfman L, Takeda S, Osada M and Dhalla NS (1999). Modification of cardiac subcellular remodeling due to pressure overload by captopril and losartan. Clin Exp Hypertens, 21: 145-156. Liu ZP and Olson EN (2002). Suppression of proliferation and cardiomyocyte hypertrophy by CHAMP, a cardiac-specific RNA helicase. Proc Natl Acad Sci, 99: 2043-2048. Llewellyn DH and Roderick HL (1998). Overexpression of calreticulin fails to abolish its induction by perturbation of normal ER function. Biochem Cell Biol, 76: 875-880. Lockhart DJ, Dong H, Byrne MC, Follettie MT, Gallo MV, Chee MS, Mittmann M, Wang C, Kobayashi M, Horton H and Brown EL (1996). Expression monitoring by hybridization to high-density oligonucleotide arrays. Nat Biotechnol, 14: 1675-1680. Lockwood EA and Bailey E (1970). Fatty acid utilization during development of the rat. Biochem J, 120: 49-54. Loiselle FB, Morgan PE, Alvarez BV and Casey JR (2004). Regulation of the human NBC3 Na+/HCO3- cotransporter by carbonic anhydrase II and PKA. Am J Physiol, 286: C1423-C1433. Lompre AM, Nadal-Ginard B and Mahdavi V (1984). Expression of the cardiac ventricular alpha- and beta-myosin heavy chain is developmentally and hormonally regulated. J Biol Chem, 259: 6437-6446. Lönnstedt I and Britton T (2005). Hierarchical Bayes models for cDNA microarray gene expression. Biostatistics, 6: 279-291.

Bibliography
318
Loot AE, Roks AJM, Henning RH, Tio RA, Suurmeijer AJH, Boomsma F and van Gilst WH (2002). Angiotensin-(1-7) attenuates the development of heart failure after myocardial infarction in rats. Circulation, 105: 1548-1550. Lopes CMB, Gallagher PG, Buck ME, Butler MH and Goldstein SAN (2000). Proton block and voltage-gating are potassium-dependent in the cardiac leak channel Kcnk3. J Biol Chem, 275: 16969-16978. Lou XJ, Schena M, Horrigan FT, Lawn RM and Davis RW (2001). Expression monitoring using cDNA microarrays. A general protocol. Methods Mol Biol, 175: 323-340. Lough J and Sugi Y (2000). Endoderm and heart development. Dev Dyn, 217: 327-342. Lucius R, Gallinat S, Rosenstiel P, Herdegen T, Sievers J and Unger T (1998). The angiotensin II type 2 (AT2) receptor promotes axonal regeneration in the optic nerve of adult rats. J Exp Med, 188: 661-670. Luiken JJ, Turkotte LP and Bonen A (1999). Protein-mediated palmitate uptake and expression of fatty acid transport proteins in heart giant vesicles. J Lipid Res, 40: 1007-1016. MacGregor DP, Murone C, Song K, Allen AM, Paxinos G and Mendelsohn FA (1995). Angiotensin II receptor subtypes in the human central nervous system. Brain Res, 675: 231-240. Mackenzie L, Bootman MD, Laine M, Berridge MJ, Thuring J, Holmes A, Li WH and Lipp P (2002). The role of inositol 1,4,5-trisphosphate receptors in Ca(2+) signalling and the generation of arrhythmias in rat atrial myocytes. J Physiol 541: 395-409. Maier LS, Bers DM and Pieske B (2000). Differences in Ca(2+)-handling and sarcoplasmic reticulum Ca(2+)-content in isolated rat and rabbit myocardium. J Mol Cell Cardiol, 32: 2249-2258. Maisel AS, McCord J, Nowak RM, Hollander JE, Wu AH, Duc P, Omland T, Storrow AB, Krishnaswamy P, Abraham WT, Clopton P, Steg G, Aumont MC, Westheim A, Knudsen CW, Perez A, Kamin R, Kazanegra R, Herrmann HC, McCullough PA and Breathing Not Properly Multinational Study Investigators (2003). Bedside B-Type natriuretic peptide in the emergency diagnosis of heart failure with reduced or preserved ejection fraction. Results from the Breathing Not Properly Multinational Study. J Am Coll Cardiol, 41: 2010-2017. Majno G and Joris I (1995). Apoptosis, oncosis, and necrosis. An overview of cell death. Am J Pathol, 146: 3-15. Malhotra A, Mordes JP, McDermott L and Schaible TF (1985). Abnormal cardiac biochemistry in spontaneously diabetic Bio-Breeding/Worcester rat. Am J Physiol, 249: H1051-H1055.

Bibliography
319
Malhotra A, Reich D, Reich D, Nakouzi A, Sanghi V, Geenen DL and Buttrick PM (1997). Experimental diabetes is associated with functional activation of protein kinase C epsilon and phosphorylation of troponin I in the heart, which are prevented by angiotensin II receptor blockade. Circ Res, 81: 1027-1033. Malmqvist K, Wallen HN, Held C and Kahan T (2002). Soluble cell adhesion molecules in hypertensive concentric left ventricular hypertrophy. J Hypertens, 20: 1563-1569. Maly K, Strese K, Kampfer S, Ueberall F, Baier G, Ghaffari-Tabrizi N, Grunicke HH and Leitges M (2002). Critical role of protein kinase C alpha and calcium in growth factor induced activation of the Na+/H+ exchanger NHE1. FEBS Lett, 521: 205-210. Manchester J, Kong X, Nerbonne J, Lowry OH and Lawrence Jr JC (1994). Glucose transport and phosphorylation in single cardiac myocytes: rate-limiting steps in glucose metabolism. Am J Physiol, 266: E326-E333. Mancina R, Susini T, Renzetti A, Forti G, Razzoli E, Serio M and Maggi M (1996). Sex steroid modulation of AT2 receptors in human myometrium. J Clin Endocrinol Metab, 81: 1753-1757. Marano G, Formigari R and Vergari A (1997). Effects of angiotensin II on myocardial contractility during short-term pressor responses to angiotensin II. J Hypertens, 15: 1019-1025. Marks AR (2001). Ryanodine receptors/calcium release channels in heart failure and sudden cardiac death. J Mol Cell Cardiol, 33: 615-624. Marks AR, Marx SO and Reiken S (2002). Regulation of ryanodine receptors via macromolecular complexes: a novel role for leucine/isoleucine zippers. Trends Cardiovasc Med, 12: 166-170. Maron BJ, Poliac LC and Roberts WO (1996). Risk for sudden cardiac death associated with marathon running. J Am Coll Cardiol, 28: 428-431. Maron BJ (2003). Sudden death in young athletes. N Engl J Med, 349: 1064-1075. Marvin MJ, Di Rocco G, Gardiner A, Bush SM and Lassar AB (2001). Inhibition of Wnt activity induces heart formation from posterior mesoderm. Genes Dev, 15: 316-327. Masaki H, Kurihara T, Yamaki A, Inomata N, Nozawa Y, Mori Y, Murasawa S, Kizima K, Maruyama K, Horiuchi M, Dzau VJ, Takahashi H, Iwasaka T, Inada M and Matsubara H (1998). Cardiac-specific overexpression of angiotensin II AT2 receptor causes attenuated response to AT1 receptor-mediated pressor and chronotropic effects. J Clin Invest, 101: 527-535.

Bibliography
320
Masseroli M, Martucci D and Pinciroli F (2004). GFINDer: Genome Function INtegrated Discoverer through dynamic annotation, statistical analysis, and mining. Nucleic Acids Res, 32 (Web Server issue): W293-W300. Mathew J, Sleight P, Lonn E, Johnstone D, Pogue J, Yi Q, Bosch J, Sussex B, Probstfield J, Yusuf S and Heart Outcomes Prevention Evaluation (HOPE) Investigators (2001). Reduction of cardiovascular risk by regression of electrocardiographic markers of left ventricular hypertrophy by the angiotensin-converting enzyme inhibitor ramipril. Circulation, 104: 1615-1621. Mattiello JA, Margulies KB, Jeevanandam V and Houser SR (1988). Contribution of reverse-mode sodium-calcium exchange to contractions in failing human left ventricular myocytes. Cardiovasc Res, 37: 424-431. Matsui H, Barry WH, Livsey C and Spitzer KW (1995). Angiotensin II stimulates sodium-hydrogen exchange in adult rabbit ventricular myocytes. Cardiovasc Res, 29: 215-221. Mattiazzi A, Perez NG, Vila-Petroff MG, Alvarez B, Camilion de Hurtado MC and Cingolani HE (1997). Dissociation between positive inotropic and alkalinizing effects of angiotensin II in feline myocardium. Am J Physiol, 272: H1131-H1136. Mazzocco M, Maffei M, Egeo A, Vergano A, Arrigo P, Di Lisi R, Ghiotto F and Scartezzini P (2002). The identification of a novel human homologue of the SH3 binding glutamic acid-rich (SH3BGR) gene establishes a new family of highly conserved small proteins related to Thioredoxin Superfamily. Gene, 291: 233-239. Mazzolai L, Nussberger J, Aubert JF, Brunner DB, Gabbiani G, Brunner HR and Pedrazzini T (1998). Blood pressure-independent cardiac hypertrophy induced by locally activated renin-angiotensin system. Hypertension, 31: 1324-1330. Mazzolai L, Pedrazzini T, Nicoud F, Gabbiani G, Brunner HR and Nussberger J (2000). Increased cardiac angiotensin II levels induce right and left ventricular hypertrophy in normotensive mice. Hypertension, 35: 985-991. McIntyre H and Fry CH (1997). Abnormal action potential conduction in isolated human hypertrophied left ventricular myocardium. J Cardiovasc Electrophysiol, 8: 887–894. Meacham GC, Patterson C, Zhang W, Younger JM and Cyr DM (2001). The Hsc70 co-chaperone CHIP targets immature CFTR for proteasomal degradation. Nat Cell Biol, 3: 100-105. Medugorac I (1980). Collagen content in different areas of normal and hypertrophied rat myocardium. Cardiovasc Res, 14: 551-554. Meissner A, Min JY and Simon R (1998). Effects of angiotensin II on inotropy and intracellular Ca2+ handling in normal and hypertrophied rat myocardium. J Mol Cell Cardiol, 30: 2507-2518.

Bibliography
321
Menard J, Bouhnik J, Clauser E, Richoux JP and Corvol P (1983). Biochemistry and regulation of angiotensinogen. Clin Exp Hypertens, 5: 1005-1019. Menard J, El Amrani AIK, Savoie F and Bouhnik (1991). Angiotensinogen: an attractive and underrated participant in hypertension and inflammation. Hypertension, 18: 705-707. Meulemans AL, Andries LJ and Brutsaert DL (1990). Does endocardial endothelium mediate positive inotropic response to angiotensin I and angiotensin II? Circ Res, 66: 1591-1601. Michael LF, Wu Z, Cheatham RB, Puigserver P, Adelmant G, Lehman JJ, Kelly DP and Spiegelman BM (2001). Restoration of insulin-sensitive glucose transporter (GLUT4) gene expression in muscle cells by the transcriptional coactivator PGC-1. Proc Natl Acad Sci U S A, 98: 3820-3825. Michels G, Er F, Khan I, Sudkamp M, Herzig S and Hoppe UC (2005). Single-channel properties support a potential contribution of hyperpolarization-activated cyclic nucleotide-gated channels and If to cardiac arrhythmias. Circulation, 111: 399-404. Miller TB (1983). Altered regulation of cardiac glycogen metabolism in spontaneously diabetic rats. Am J Physiol, 245: E379-E383. Mills AA, Mills MJ, Gardiner DM, Bryant SV and Stanbridge EJ (1999). Analysis of the pattern of QM expression during mouse development. Differentiation, 64: 161-171. Milnes JT and MacLeod KT (2001). Reduced ryanodine receptor to dihydropyridine receptor ratio may underlie slowed contraction in a rabbit model of left ventricular cardiac hypertrophy. J Mol Cell Cardiol, 33: 473-485. Min LJ, Cui TX, Yahata Y, Yamasaki K, Shiuchi T, Liu HW, Chen R, Li JM, Okumura M, Jinno T, Wu L, Iwai M, Nahmias C, Hashimoto K and Horiuchi M (2004). Regulation of collagen synthesis in mouse skin fibroblasts by distinct angiotensin II receptor subtypes. Endocrinology, 145: 253-260. Minamino T, Yujiri T, Papst PJ, Chan ED, Johnson GL and Terada N (1999). MEKK1 suppresses oxidative stress-induced apoptosis of embryonic stem cell-derived cardiac myocytes. Proc Natl Acad Sci U S A, 96: 15127-15132. Miniou P, Tiziano D, Frugier T, Roblot N, Le Meur M and Melki J (1999). Gene targeting restricted to mouse striated muscle lineage. Nucleic Acids Res, 27: e27. Mirotsou M, Watanabe CM, Schultz PG, Pratt RE and Dzau VJ (2003). Elucidating the molecular mechanism of cardiac remodeling using a comparative genomic approach. Physiol Genomics, 15: 115-126. Missov ED and De Marco T (1999). Clinical insights on the use of highly sensitive cardiac troponin assays. Clin Chim Acta, 284: 175-185.

Bibliography
322
Mitarai S, Reed TD and Yatani A (2000). Changes in ionic currents and beta-adrenergic receptor signaling in hypertrophied myocytes overexpressing G alpha(q). Am J Physiol, 279: H139-H148. Miyashita T and Reed JC (1995). Tumor suppressor p53 is a direct transcriptional activator of the human bax gene. Cell, 80: 293-299. Mizushige K, Yao L, Noma T, Kiyomoto H, Yu Y, Hosomi N, Ohmori K and Matsuo H (2000). Alteration in left ventricular diastolic filling and accumulation of myocardial collagen at insulin-resistant prediabetic stage of a type II diabetic rat model. Circulation, 101: 899-907. Mochizuki T, Eberli FR, Apstein CS and Lorell BH (1992). Exacerbation of ischemic dysfunction by angiotensin II in red cell-perfused rabbit hearts. Effects on coronary flow, contractility, and high-energy phosphate metabolism. J Clin Invest, 89: 490-498. Modesti PA, Vanni S, Bertolozzi I, Cecioni I, Polidori G, Paniccia R, Bandinelli B, Perna A, Liguori P, Boddi M, Galanti G, Serneri GG (2000). Early sequence of cardiac adaptations and growth factor formation in pressure- and volume-overload hypertrophy. Am J Physiol, 279: H976-H985. Molkentin JD and Olson EN (1997). GATA4: a novel transcriptional regulator of cardiac hypertrophy? Circulation, 96: 3833-3835. Molkentin JD, Lu JR, Antos CL, Markham B, Richardson J, Robbins J, Grant SR, and Olson EN (1998). A calcineurin-dependent transcriptional pathway for cardiac hypertrophy. Cell, 93: 215-228. Moller G, van Grunsven EG, Wanders RJn and Adamski J (2001). Molecular basis of D-bifunctional protein deficiency. Mol Cell Endocrinol, 171: 61-70. Montiel M, Barker S, Vinson GP and Jimenez E (1993). Angiotensin II receptor isoforms in the rat adrenal gland: studies with selective subtype antagonists DuP 753 and CGP41221A. J Mol Endocrinol, 11: 69-75. Moor AN and Fliegel L (1999). Protein kinase-mediated regulation of the Na(+)/H(+) exchanger in the rat myocardium by mitogen-activated protein kinase-dependent pathways. J Biol Chem, 274: 22985-22992. Moorman AF and Christoffels VM (2003). Cardiac chamber formation: development, genes, and evolution. Physiol Rev, 83: 1223-1267. Moravec CS, Schluchter MD, Paranandi L, Czerska B, Stewart RW, Rosenkranz E and Bond M (1990). Inotropic effects of angiotensin II on human cardiac muscle in vitro. Circulation, 82: 1973-1984. Morgan TO and Delbridge LMD (1999). Angiotensin blocking drugs and the heart beyond 2000. J Am Soc Nephrol, 10: 243-247.

Bibliography
323
Morii I, Kihara Y, Inoko M and Sasayama S (1998). Myocardial contractile efficiency and oxygen cost of contractility are preserved during transition from compensated hypertrophy to failure in rats with salt-sensitive hypertension. Hypertension, 31: 949-960. Mukherjee R and Spinale FG (1998). L-type calcium channel abundance and function with cardiac hypertrophy and failure: a review. J Mol Cell Cardiol, 30: 1899-1916. Mukherjee R, Hewett KW and Spinale FG (1995). Myocyte electrophysiological properties following the development of supraventricular tachycardia-induced cardiomyopathy. J Mol Cell Cardiol, 27: 1333-1348. Mukoyama M, Nakajima M, Horiuchi M, Sasamura H, Pratt RE and Dzau VJ (1993). Expression cloning of type 2 angiotensin II receptor reveals a unique class of seven-transmembrane receptors. J Biol Chem, 268: 24539-24542. Mullins JJ, Peters J and Ganten D (1990). Fulminant hypertension in transgenic rats harbouring the mouse Ren-2 gene. Nature, 344: 541-544. Murakami K, Yumoto F, Ohki SY, Yasunaga T, Tanokura M and Wakabayashi T (2005). Structural basis for Ca2+-regulated muscle relaxation at interaction sites of troponin with actin and tropomyosin. J Mol Biol, 352: 178-201. Murray DB, Gardner JD, Brower GL and Janicki JS (2004). Endothelin-1 mediates cardiac mast cell degranulation, matrix metalloproteinase activation, and myocardial remodeling in rats. Am J Physiol, 287: H2295-H2299. Muscat GE and Kedes L (1987). Multiple 5'-flanking regions of the human alpha-skeletal actin gene synergistically modulate muscle-specific expression. Mol Cell Biol, 7: 4089-4099. Muscella A, Marsigliante S, Vilella S, Jimenez E and Storelli C (1999). Angiotensin II stimulates Na+/H+ exchanger in human umbilical vein endothelial cells via AT1 receptor. Life Sci, 65: 2385-2394. Miyamoto S, Teramoto H, Gutkind JS and Yamada KM (1996). Integrins can collaborate with growth factors for phosphorylation of receptor tyrosine kinases and MAP kinase activation: roles of integrin aggregation and occupancy of receptors. J Cell Biol, 135: 1633–1642. Miyashita T and Reed JC (1995). Tumor suppressor p53 is a direct transcriptional activator of the human bax gene. Cell, 80: 293-299. Myers ML, Farhangkhoee P and Karmazyn M (1998). Hydrogen peroxide induced impairment of post-ischemic ventricular function is prevented by the sodium-hydrogen exchange inhibitor HOE 642 (cariporide). Cardiovasc Res, 40: 290-296.

Bibliography
324
Nagano M, Higaki J, Nakamura F, Higashimori K, Nagano N, Mikami H and Ogihara T (1992). Role of cardiac angiotensin II in isoproterenol-induced left ventricular hypertrophy. Hypertension, 19: 708-712. Nagao M, Parimoo B and Tanaka K (1993). Developmental, nutritional, and hormonal regulation of tissue-specific expression of the genes encoding various acyl-CoA dehydrogenases and a-subunit of electron transfer flavoprotein in rat. J Biol Chem, 268: 24114-24124. Nagata M, Tanimoto K, Fukamizu A, Kon Y, Sugiyama F, Yagami K, Murakami K and Watanabe T (1996). Nephrogenesis and renovascular development in angiotensinogen-deficient mice. Lab Invest, 75: 745-753. Nagy A (2000). Cre recombinase: the universal reagent for genome tailoring. Genesis, 26: 99-109. Naudin V, Oliviero P, Rannou F, Sainte Beuve C and Charlemagne D (1991). The density of ryanodine receptors decreases with pressure overload-induced rat cardiac hypertrophy. FEBS Lett, 285: 135-138. Neely JR, Rovetto MJ and Oram JF (1972). Myocardial utilization of carbohydrate and lipids. Prog Cardiovasc Dis, 15: 289-329. Neri Serneri GG, Boddi M, Modesti PA, Cecioni I, Coppo M, Padeletti L, Michelucci A, Colella A and Galanti G (2001). Increased cardiac sympathetic activity and insulin-like growth factor-I formation are associated with physiological hypertrophy in athletes. Circ Res, 89: 977-982. Negretti N, O'Neill SC and Eisner DA (1993). The relative contributions of different intracellular and sarcolemmal systems to relaxation in rat ventricular myocytes. Cardiovasc Res, 27: 1826-1830. Neyses L and Vetter H (1989). Action of atrial natriuretic peptide and angiotensin II on the myocardium: studies in isolated rat ventricular cardiomyocytes. Biochem Biophys Res Commun, 163: 1435-1443. Nigam SK, Goldberg AL, Ho S, Rohde MF, Bush KT and Sherman My (1994). A set of endoplasmic reticulum proteins possessing properties of molecular chaperones includes Ca(2+)-binding proteins and members of the thioredoxin superfamily. J Biol Chem, 269: 1744-1749. Niggli E and Egger M (2002). Calcium quarks. Front Biosci, 7: d1288-d1297. Nishida M, Futami S, Morita I, Maekawa K and Murota SI (2000). Hypoxia-reoxygenation inhibits gap junctional communication in cultured human umbilical vein endothelial cells. Endothelium, 7: 279-286.

Bibliography
325
Nishimoto S, Tawara J, Toyoda H, Kitamura K and Komurasaki T (2003). A novel homocysteine-responsive gene, smap8, modulates mitogenesis in rat vascular smooth muscle cells. Eur J Biochem, 270: 2521-2531. Nishizawa K, Freund C, Li J, Wagner G and Reinherz EL (1998). Identification of a proline-binding motif regulating CD2-triggered T lymphocyte activation. Proc Natl Acad Sci U S A, 95: 14897-14902. Noda N, Hayashi H, Miyata H, Suzuki S, Kobayashi A and Yamazaki N (1992). Cytosolic Ca2+ concentration and pH of diabetic rat myocytes during metabolic inhibition. J Mol Cell Cardiol, 24: 435-446. Noda N, Hayashi H, Satoh H, Terada H, Hirano M, Kobayashi A and Yamazaki N (1993). Ca2+ transients and cell shortening in diabetic rat ventricular myocytes. Jpn Circ J, 57: 449-457. Noguchi T, Kihara Y, Begin KJ, Gorga JA, Palmiter KA, LeWinter MM and VanBuren P (2003). Altered myocardial thin-filament function in the failing Dahl salt-sensitive rat heart: amelioration by endothelin blockade. Circulation, 107: 630-635. Nowotny M, Spiechowicz M, Jastrzebska B, Filipek A, Kitagawa K and Kuznicki J (2003). Calcium-regulated interaction of Sgt1 with S100A6 (calcyclin) and other S100 proteins. J Biol Chem, 278: 26923-26928. Nuedling S, Kahlert S, Loebbert K, Meyer R, Vetter H and Grohe C (1999). Differential effects of 17beta-estradiol on mitogen-activated protein kinase pathways in rat cardiomyocytes. FEBS Lett, 454: 271-276. Nuss HB, Johns DC, Kaab S, Tomaselli GF, Kass D, Lawrence JH and Marban E (1996). Reversal of potassium channel deficiency in cells from failing hearts by adenoviral gene transfer: a prototype for gene therapy for disorders of cardiac excitability and contractility. Gene Ther, 3: 900-912. Oh HS, Kwon H, Sun SK and Yang CH (2002). QM, a putative tumor suppressor, regulates proto-oncogene c-yes. J Biol Chem, 277: 36489-36498. Oikarinen L, Nieminen MS, Viitasalo M, Toivonen L, Wachtell K, Papademetriou V, Jern S, Dahlof B, Devereux RB and Okin PM (2001). Relation of QT interval and QT dispersion to echocardiographic left ventricular hypertrophy and geometric pattern in hypertensive patients. The LIFE study. The Losartan Intervention For Endpoint Reduction. J Hypertens, 19: 1883-1891. Okruhlicova L, Tribulova N, Misejkova M, Kucka M, Stetka R, Slezak J and Manoach M (2002). Gap junction remodelling is involved in the susceptibility of diabetic rats to hypokalemia-induced ventricular fibrillation. Acta Histochem, 104: 387-391.

Bibliography
326
Okumura H, Nagaya N, Itoh T, Okano I, Hino J, Mori K, Tsukamoto Y, Ishibashi-Ueda H, Miwa S, Tambara K, Toyokuni S, Yutani C and Kangawa K (2004). Adrenomedullin infusion attenuates myocardial ischemia/reperfusion injury through the phosphatidylinositol 3-kinase/Akt-dependent pathway. Circulation, 109: 242-248. Okumura M, Iwai M, Ide A, Mogi M, Ito M and Horiuchi M (2005). Sex difference in vascular injury and the vasoprotective effect of valsartan are related to differential AT2 receptor expression. Hypertension, 46: 577-583. Olichon A, Baricault L, Gas N, Guillou E, Valette A, Belenguer P and Lenaers G (2003). Loss of OPA1 perturbates the mitochondrial inner membrane structure and integrity, leading to cytochrome c release and apoptosis. J Biol Chem, 278: 7743-7746. Oliverio MI, Kim HS, Ito M, Le T, Audoly L, Best CF, Hiller S, Kluckman K, Maeda N, Smithies O and Coffman TM (1998). Reduced growth, abnormal kidney structure, and type 2 (AT2) angiotensin receptor-mediated blood pressure regulation in mice lacking both AT1A and AT1B receptors for angiotensin II. Proc Natl Acad Sci U S A, 5: 15496-15501. Olivetti G, Abbi R, Quaini F, Kajstura J, Cheng W and Nitahara JA (1997). Apoptosis in the failing human heart. N Engl J Med, 336: 1131-1141. Olivetti G, Capasso JM, Sonnenblick EH and Anversa P (1990). Side-to-side slippage of myocytes in ventricular wall remodeling acutely after myocardial infarction in rats. Circ Res, 67: 23-24. Olson EN and Srivastava D (1996). Molecular pathways controlling heart development. Science, 272: 671-676. Oltvai ZN, Milliman CL and Korsmeyer SJ (1993). Bcl-2 heterodimerizes in vivo with a conserved homolog, Bax, that accelerates programmed cell death. Cell, 74: 609-619. Opie LH (1968). Metabolism of the heart in health and disease. Am Heart J, 76:685-689. Orchard CH and Lakatta EG (1986). Intracellular calcium transients and developed tension in rat heart muscle. A mechanism for the negative interval-strength relationship. J Gen Physiol, 86: 637-651. Orlic D, Kajstura J, Chimenti S, Jakoniuk I, Anderson SM, Li B, Pickel J, McKay R, Nadal-Ginard B, Bodine DM, Leri A and Anversa P (2001). Bone marrow cells regenerate infarcted myocardium. Nature, 410: 240-243. Orlowski J and Grinstein S (2003). In M. Karmazyn, M. Avkiran, & L. Fliegel (Eds.), The Na+/H+ exchanger, from molecular to its role in disease (pp. 17–34). Boston, Dordrecht, London: Kluwer Academic Publishers. Oudit GY, Crackower MA, Backx PH and Penninger JM (2003). The role of ACE2 in cardiovascular physiology. Trends Cardiovasc Med, 13: 93-101.

Bibliography
327
Oudit GY, Sun H, Trivieri MG, Koch SE, Dawood F, Ackerley C, Yazdanpanah M, Wilson GJ, Schwartz A, Liu PP and Backx PH (2003). L-type Ca2+ channels provide a major pathway for iron entry into cardiomyocytes in iron-overload cardiomyopathy. Nat Med, 9: 1187-1194. Pagliassotti MJ, Prach PA, Koppenhafer TA and Pan DA (1996). Changes in insulin action, triglycerides, and lipid composition during sucrose feeding in rats. Am J Physiol, 271: R1319-R1326. Pahor M, Bernabei R, Sgadari A, Gambassi G Jr, Lo Giudice P, Pacifici L, Ramacci MT, Lagrasta C, Olivetti G and Carbonin P (1991). Enalapril prevents cardiac fibrosis and arrhythmias in hypertensive rats. Hypertension, 18: 148-157. Palakodeti V, Oh S, Oh BH, Mao L, Hongo M, Peterson KL and Ross J (1997). Force-frequency effect is a powerful determinant of myocardial contractility in the mouse. Am J Physiol, 273: H1283-H1290. Palatini P and Julius S (2004). Elevated heart rate: a major risk factor for cardiovascular disease. Clin Exp Hypertens, 26: 637-644. Paolisso G and Giugliano D (1996). Oxidative stress and insulin action: is there a relationship ? Diabetologia, 39: 357-363. Paolisso G, De Riu S, Marrazzo G, Verza M, Varricchio M and D’Onofrio F (1991). Insulin resistance and hyperinsulinemia in patients with chronic congestive heart failure. Metabolism, 40: 972-977. Paradis P, Dali-Youcef N, Paradis FW, Thibault G and Nemer M (2000). Overexpression of angiotensin II type I receptor in cardiomyocytes induces cardiac hypertrophy and remodeling. Proc Natl Acad Sci U S A, 97: 931-936. Parissis JT, Adamopoulos SN, Venetsanou KF, Karas SM and Kremastinos DT (2003). Elevated plasma amylase levels in advanced chronic heart failure secondary to ischemic or idiopathic dilated cardiomyopathy: correlation with circulating interleukin-6 activity. J Interferon Cytokine Res, 23: 329-333. Parkes JG, Hussain RA, Olivieri NF and Templeton DM (1993). Effects of iron loading on uptake, speciation, and chelation of iron in cultured myocardial cells. J Lab Clin Med, 122: 36-47. Passier R, Zeng H, Frey N, Naya FJ, Nicol RL, McKinsey TA, Overbeek P, Richardson JA, Grant SR and Olson EN (2000). CaM kinase signaling induces cardiac hypertrophy and activates the MEF2 transcription factor in vivo. J Clin Invest, 105: 1395-1406. Patel JM, Martens JR, Li YD, Gelband CH, Raizada MK and Block ER (1998). Angiotensin IV receptor-mediated activation of lung endothelial NOS is associated with vasorelaxation. Am J Physiol, 275: L1061-L1068.

Bibliography
328
Patton EE, Willems AR and Tyers M (1998). Combinatorial control in ubiquitin-dependent proteolysis: don't Skp the F-box hypothesis. Trends Genet, 14: 236-243. Paul M, Wagner J and Dzau VJ (1993). Gene expression of the renin-angiotensin system in human tissue. Quantitative analysis by the polymerase chain reaction. J Clin Invest, 91: 2058-2064. Paula RD, Lima CV, Khosla MC and Santos RAS (1995). Angiotensin-(1-7) potentiates the hypotensive effect of bradykinin in conscious rats. Hypertension, 26: 1154-1159. Paulson DJ and Crass MF (1982). Endogenous triacylglycerol metabolism in diabetic heart. Am J Physiol, 242: H1084-H1094. Pauschinger M, Knopf D, Petschauer S, Doerner A, Poller W, Schwimmbeck PL, Kühl U and Schultheiss HP (1999). Dilated cardiomyopathy is associated with significant changes in collagen type I/III ratio. Circulation, 99: 2750-2756. Pelliccia A, Maron BJ, De Luca R, Di Paolo FM, Spataro A and Culasso F (2002) Remodeling of left ventricular hypertrophy in elite athletes after long-term deconditioning. Circulation, 105: 944-949. Pellieux C, Sauthier T, Aubert JF, Brunner HR and Pedrazzini T (2000). Angiotensin II-induced cardiac hypertrophy is associated with different mitogen-activated protein kinase activation in normotensive and hypertensive mice. J Hypertens, 18: 1307-1317. Pelsers MM, Lutgerink JT, Nieuwenhoven FA, Tandon NN, van der Vusse GJ, Arends JW, Hoogenboom HR and Glatz JF (1999). A sensitive immunoassay for rat fatty acid translocase (CD 36) using phage antibodies selected on cell transfectants: abundant presence of fatty acid translocase/CD 36 in cardiac and red skeletal muscle and upregulation in diabetes. Biochem J, 337: 407-414. Peng CF, Wei Y, Levsky JM, McDonald TV, Childs G and Kitsis RN (2002). Microarray analysis of global changes in gene expression during cardiac myocyte differentiation. Physiol Genomics, 9: 145-155. Peng J, Gurantz D, Tran V, Cowling RT and Greenberg BH (2002). Tumor necrosis factor-alpha-induced AT1 receptor upregulation enhances angiotensin II-mediated cardiac fibroblast responses that favor fibrosis. Circ Res, 91: 1119-1126. Perego L, Pizzocri P, Corradi D, Maisano F, Paganelli M, Fiorina P, Barbieri M, Morabito A, Paolisso G, Folli F and Pontiroli AE (2005). Circulating leptin correlates with left ventricular mass in morbid (grade III) obesity before and after weigth loss induced by LAGB. A potential role for leptin in mediating human left ventricular hypertrophy. J Clin Endocrinol Metab, Apr 26 [Electronic pub. ahead of print]. Pessin JE and Bell GI (1992). Mammalian facilitative glucose-transporter family: structure and molecular regulation. Annu Rev Physiol, 54: 911-930.
Bibliography
329
Pestova TV, Borukhov SI and Hellen CU (1998). Eukaryotic ribosomes require initiation factors 1 and 1A to locate initiation codons. Nature, 394: 854-859. Peters NS, Coromilas J, Severs NJ and Wit AL (1997). Disturbed connexin43 gap junction distribution correlates with the location of reentrant circuits in the epicardial border zone of healing canine infarcts that cause ventricular tachycardia. Circulation, 95: 988-996. Peters NS, Green CR, Poole-Wilson PA and Severs NJ (1993). Reduced content of connexin43 gap junctions in ventricular myocardium from hypertrophied and ischemic human hearts. Circulation. 1993, 88: 864-875. Petersen KF and Shulman GI (2002). Pathogenesis of skeletal muscle insulin resistance in type 2 diabetes mellitus. Am J Cardiol, 90: 11G-18G. Petrich BG, Gong X, Lerner DL, Wang X, Brown JH, Saffitz JE and Wang Y (2002). c-Jun N-terminal kinase activation mediates downregulation of connexin43 in cardiomyocytes. Circ Res, 91: 640-647. Petroff MG, Aiello EA, Palomeque J, Salas MA and Mattiazzi A (2000). Subcellular mechanisms of the positive inotropic effect of angiotensin II in cat myocardium. J Physiol, 529: 189-203. Philip-Couderc P, Pathak A, Smih F, Dambrin C, Harmancey R, Buys S, Galinier M, Massabuau P, Roncalli J, Senard JM and Rouet P (2004). Uncomplicated human obesity is associated with a specific cardiac transcriptome: involvement of the Wnt pathway. FASEB J, 18: 1539-1540. Pierce GN, Lockwood MK and Eckhert CD (1989). Cardiac contractile protein ATPase activity in a diet induced model of noninsulin dependent diabetes mellitus. Can J Cardiol, 5: 117-120. Pierce GN, Ramjiawan B, Dhalla NS and Ferrari R (1990). Na+-H+ exchange in cardiac sarcolemmal vesicles isolated from diabetic rats. Am J Physiol, 258: H255-H261. Pierzchalski P, Reiss K, Cheng W, Cirielli C, Kajstura J, Nitahara JA, Rizk M, Capogrossi MC and Anversa P (1997). p53 Induces myocyte apoptosis via the activation of the renin-angiotensin system. Exp Cell Res, 234: 57-65. Pieske B, Kretschmann B, Meyer M, Holubarsch C, Weirich J, Posival H, Minami K, Just H and Hasenfuss G (1995). Alterations in intracellular calcium handling associated with the inverse force-frequency relation in human dilated cardiomyopathy. Circulation, 92: 1169-1178. Pieske B, Maier LS, Bers DM and Hasenfuss G (1999). Ca2+ handling and sarcoplasmic reticulum Ca2+ content in isolated failing and nonfailing human myocardium. Circ Res, 85: 38-46.

Bibliography
330
Pieske B, Sutterlin M, Schmidt-Schweda S, Minami K, Meyer M, Olschewski M, Holubarsch C, Just H and Hasenfuss G (1996). Diminished post-rest potentiation of contractile force in human dilated cardiomyopathy. Functional evidence for alterations in intracellular Ca2+ handling. J Clin Invest, 98: 764-776. Pinto YM, de Smet BG, van Gilst WH, Scholtens E, Monnink S, de Graeff PA and Wesseling H (1993). Selective and time related activation of the cardiac renin-angiotensin system after experimental heart failure: relation to ventricular function and morphology. Cardiovasc Res, 27: 1933-1938. Pinto YM, Pinto-Sietsma SJ, Philipp T, Engler S, Kossamehl P, Hocher B, Marquardt H, Sethmann S, Lauster R, Merker HJ and Paul M (2000). Reduction in left ventricular messenger RNA for transforming growth factor b1 attenuates left ventricular fibrosis and improves survival without lowering blood pressure in the hypertensive TGR(mRen2)27 rat. Hypertension, 36: 747-754. Poelzing S and Rosenbaum DS (2004). Altered connexin43 expression produces arrhythmia substrate in heart failure. Am J Physiol, 287: H1762-H1770. Polontchouk L, Ebelt B, Jackels M and Dhein S (2002). Chronic effects of endothelin 1 and angiotensin II on gap junctions and intercellular communication in cardiac cells. FASEB J, 16: 87-89. Pogwizd SM and Bers DM (2004). Cellular basis of triggered arrhythmias in heart failure. Trends Cardiovasc Med, 14: 61-66. Pravenec M, Simonet L, Kren V, Kunes J, Levan G, Szpirer J, Szpirer C and Kurtz T (1991). The rat renin gene: assignment to chromosome 13 and linkage to the regulation of blood pressure. Genomics, 9: 466-472. Privratsky JR, Wold LE, Sowers JR, Quinn MT and Ren J (2003). AT1 blockade prevents glucose-induced cardiac dysfunction in ventricular myocytes: role of the AT1 receptor and NADPH oxidase. Hypertension, 42: 206-12. Quackenbush J (2001). Computational analysis of microarray data. Nat Rev Genet, 2: 418-427. Raimondi L, De Paoli P, Mannucci E, Lonardo G, Sartiani L, Banchelli G, Pirisino R, Mugelli A and Cerbai E (2004). Restoration of cardiomyocyte functional properties by angiotensin II receptor blockade in diabetic rats. Diabetes, 53: 1927-1933. Ramaraj P, Kessler SP, Colmenares C and Sen GC (1998). Selective restoration of male fertility in mice lacking angiotensin-converting enzymes by sperm-specific expression of the testicular isozyme. J Clin Invest, 102: 371-378. Ramasamy R and Schaefer S (1999). Inhibition of Na+-H+ exchanger protects diabetic and non-diabetic hearts from ischemic injury: insight into altered susceptibility of diabetic hearts to ischemic injury. J Mol Cell Cardiol, 31: 785-797.
Bibliography
331
Randhawa AK and Singal PK (1992). Pressure overload-induced cardiac hypertrophy with and without dilation. J Am Coll Cardiol, 20: 1569-1575. Rannou F, Dambrin G, Marty I, Carre F, Trouve P, Lompre AM and Charlemagne D (1996). Expression of the cardiac ryanodine receptor in the compensated phase of hypertrophy in rat heart. Cardiovasc Res, 32: 258-265. Ranu HK, Terracciano CM, Davia K, Bernobich E, Chaudhri B, Robinson SE, Bin Kang Z, Hajjar RJ, MacLeod KT and Harding SE (2002). Effects of Na(+)/Ca(2+)-exchanger overexpression on excitation-contraction coupling in adult rabbit ventricular myocytes. J Mol Cell Cardiol, 34: 389-400. Rapp JP, Wang SM and Dene H (1989). A genetic polymorphism in the renin gene of Dahl rats cosegregates with blood pressure. Science, 243: 542-544. Reaven GM, Hollenbeck C, Jeng CY, Wu MS and Chen YD (1988). Measurement of plasma glucose, free fatty acid, lactate and insulin for 24 h in patients in NIDDM. Diabetes, 37: 1020-1024. Reaven GM (1991). Insulin resistance, hyperinsulinaemia, hypertriglyceridaemia, and hypertension: parallels between human disease and rodent models. Diabetes Care, 14: 195-202. Reddy RK, Mao C, Baumeister P, Austin RC, Kaufman RJ and Lee AS (2003). Endoplasmic reticulum chaperone protein GRP78 protects cells from apoptosis induced by topoisomerase inhibitors: role of ATP binding site in suppression of caspase-7 activation. J Biol Chem, 278: 20915-20924. Reinecke H, Vetter R and Drexler H (1997). Effects of alpha-adrenergic stimulation on the sarcolemmal Na+/Ca2+-exchanger in adult rat ventricular cardiocytes. Cardiovasc Res, 36: 216-222. Remme W, Boccanelli A, Cline C, Cohen-Solal A, Dietz R, Hobbs R, Keukelaar K, Sendon JL, Macarie C, McMurray J, Rauch B, Ruzyllo W, Zannad F and SHAPE Study (2004). Increasing awareness and perception of heart failure in Europe and improving care--rationale and design of the SHAPE Study. Cardiovasc Drugs Ther, 18: 153-159. Ren J and Davidoff AJ (1997). Diabetes rapidly induces contractile dysfunctions in isolated ventricular myocytes. Am J Physiol, 272: H148-H158. Ren J, Walsh MF, Hamaty M, Sowers JR and Brown RA (1999). Augmentation of the inotropic response to insulin in diabetic rat hearts. Life Sci, 65: 369-380. Reuter H, Henderson SA, Han T, Ross RS, Goldhaber JI and Philipson KD (2002). The Na+-Ca2+ exchanger is essential for the action of cardiac glycosides. Circ Res, 90: 305-308.

Bibliography
332
Richter-Cook NJ, Dever TE, Hensold JO, Merrick WC (1998). Purification and characterization of a new eukaryotic protein translation factor. Eukaryotic initiation factor 4H. J Biol Chem, 273: 7579-7587. Robillon JF, Sadoul JL, Benmerabet S, Joly-Lemoine L, Fredenrich A and Canivet B (1999). Assessment of cardiac arrhythmic risk in diabetic patients using QT dispersion abnormalities. Diabetes Metab, 25: 419-423. Robinson MJ and Cobb MH (1997). Mitogen-activated protein kinase pathways. Curr Opin Cell Biol, 9: 180-186. Rodrigues B, Cam MC, McNeill JH (1998). Metabolic disturbances in diabetic cardiomyopathy. Mol Cell Biochem, 180: 53-57. Rodrigues B and McNeill JH (1992). The diabetic heart: causes for the development of a cardiomyopathy. Cardiovasc Res, 26: 913-922. Romppanen H, Marttila M, Magga J, Vuolteenaho O, Kinnunen P, Szokodi I and Ruskoaho H (1997). Adrenomedullin gene expression in the rat heart is stimulated by acute pressure overload: blunted effect in experimental hypertension. Endocrinology, 138: 2636-2639. Ron D, Brasier A and Habener J (1990). Transcriptional regulation of hepatic angiotensinogen gene expression by the acute-phase response. Mol Cell Endocrinol, 74: C97-C104. Rosenblatt-Velin N, Lepore MG, Cartoni C, Beermann F and Pedrazzini T (2005). FGF-2 controls the differentiation of resident cardiac precursors into functional cardiomyocytes. J Clin Invest, 115: 1724-1733. Rosenkranz S (2004). TGF-beta1 and angiotensin networking in cardiac remodeling. Cardiovasc Res, 3: 423-432. Roskes EJ, Boughman JA, Schwartz S and Cohen MM (1990). Congenital cardiovascular malformations (CCVM) and structural chromosome abnormalities: a report of 9 cases and literature review. Clin Genet, 38: 198-210. Ruiz J, Blanche H, Cohen N, Velho G, Cambien F, Cohen D, Passa P and Froguel P (1994). Insertion/deletion polymorphism of the angiotensin-converting enzyme gene is strongly associated with coronary heart disease in non-insulin-dependent diabetes mellitus. Proc Natl Acad Sci U S A, 91: 3662-3665. Russell LK, Finck BN and Kelly DP (2005). Mouse models of mitochondrial dysfunction and heart failure. J Mol Cell Cardiol, 38: 81-91. Rysa J, Leskinen H, Ilves M and Ruskoaho H (2004). Distinct upregulation of extracellular matrix genes in transition from hypertrophy to hypertensive heart failure. Hypertension, 45: 927-933.

Bibliography
333
Saavedra JM (2005). Brain angiotensin II: new developments, unanswered questions and therapeutic opportunities. Cell Mol Neurobiol, 25: 485-512. Saavedra JM, Viswanathan M and Shigematsu K (1993). Localization of angiotensin AT1 receptors in the rat heart conduction system. Eur J Pharmacol, 235: 301-303. Sadoshima J and Izumo S (1993a). Mechanotransduction in stretch-induced hypertrophy of cardiac myocytes. J Recept Res, 13: 777–794. Sadoshima J, Xu Y, Slayter HS and Izumo S (1993). Autocrine release of angiotensin II mediates stretch-induced hypertrophy of cardiac myocytes in vitro. Cell 75 (1993), pp. 977–984. Saez JC, Berthoud VM, Branes MC, Martinez AD and Beyer EC (2003). Plasma membrane channels formed by connexins: their regulation and functions. Physiol Rev, 83: 1359-1400. Saito S, Hiroi Y, Zou Y, Aikawa R, Toko H, Shibasaki F, Yazaki Y, Nagai R and Komuro I (2000). beta-Adrenergic pathway induces apoptosis through calcineurin activation in cardiac myocytes. J Biol Chem, 275: 34528-34533. Sakata Y, Hoit BD, Liggett SB, Walsh RA and Dorn GW 2nd (1998). Decompensation of pressure-overload hypertrophy in G alpha q-overexpressing mice. Circulation, 97: 1488-1495. Sakurai K, Norota I, Tanaka H, Kubota I, Tomoike H and Endoh M (2002). Negative inotropic effects of angiotensin II, endothelin-1 and phenylephrine in indo-1 loaded adult mouse ventricular myocytes. Life Sci, 70: 1173-1184. Salinovich O and Montelaro RC (1986). Reversible staining and peptide mapping of proteins transferred to nitrocellulose after separation by sodium dodecyl sulfate-polyacrylamide gel electrophoresis. Anal Biochem, 156: 341-347. Sampaio WO, Nascimento AA and Santos RAS (2003). Systemic and regional hemodynamic effects of angiotensin-(1-7) in rats. Am J Physiol, 284: H1985-H1994. Samyn ME, Petershack JA, Bedell KA, Mathews MS and Segar JL (1998). Ontogeny and regulation of cardiac angiotensin types 1 and 2 receptors during fetal life in sheep. Pediatr Res, 44: 323-329. Sandberg K, Ji H, Clark AJ, Shapira H and Catt KJ (1992). Cloning and expression of a novel angiotensin II receptor subtype. J Biol Chem, 267: 9455-9458. Sanders J, Brandsma M, Janssen GM, Dijk J and Moller W (1996). Immunofluorescence studies of human fibroblasts demonstrate the presence of the complex of elongation factor-1 beta gamma delta in the endoplasmic reticulum. J Cell Sci, 109: 1113-1117.

Bibliography
334
Sandmann S, Yu M, Kaschina E, Blume A, Bouzinova E, Aalkjaer C and Unger T (2001). Differential effects of angiotensin AT1 and AT2 receptors on the expression translation and function of the Na+-H+ exchanger and Na+-HCO3- symporter in the rat heart after myocardial infarction. J Am Coll Cardiol, 37: 2154-2165. Sandri C, Di Lisi R, Picard A, Argentini C, Calabria E, Myklak K, Scartezzini P and Schiaffino S (2004). Heart morphogenesis is not affected by overexpression of the Sh3bgr gene mapping to the Down syndrome heart critical region. Hum Genet, 114: 517-519. Sanghani SP, Quinney SK, Fredenburg TB, Davis WI, Murry DJ and Bosron WF (2004). Hydrolysis of irinotecan and its oxidative metabolites, 7-ethyl-10-[4-N-(5-aminopentanoic acid)-1-piperidino] carbonyloxycamptothecin and 7-ethyl-10-[4-(1-piperidino)-1-amino]-carbonyloxycamptothecin, by human carboxylesterases CES1A1, CES2, and a newly expressed carboxylesterase isoenzyme, CES3. Drug Metab Dispos, 32: 505-511. Sato T, Haimovici R, Kao R, Li AF and Roy S (2002). Downregulation of connexin 43 expression by high glucose reduces gap junction activity in microvascular endothelial cells. Diabetes, 51: 1565-1571. Schachter F, Faure-Delanef L, Guenot F, Rouger H, Froguel P, Lesueur-Ginot L and Cohen D (1994). Genetic associations with human longevity at the APOE and ACE loci. Nat Genet, 6: 29-32. Schaffer JE and Lodish HF (1994). Expression cloning and characterization of a novel adipocite long-chain fatty acid transport protein. Cell, 79: 427-436. Schaffer SW, Ballard-Croft C, Boerth S and Allo SN (1997). Mechanisms underlying depressed Na+/Ca2+ exchanger activity in the diabetic heart. Cardiovasc Res, 34: 129-136. Schaffer SW, Tan BH and Wilson GL (1985). Development of a cardiomyopathy in a model of noninsulin-dependent diabetes. Am J Physiol, 248: H179-H185. Schaffer SW and Wilson GL (1993). Insulin resistance and mechanical dysfunction in hearts of Wistar rats with streptozotocin-induced non-insulin-dependent diabetes mellitus. Diabetologia, 36: 195-199. Schaub MC, Hefti MA, Harder BA and Eppenberger HM (1997). Various hypertrophic stimuli induce distinct phenotypes in cardiomyocytes. J Mol Med, 75: 901-920. Schena M, Shalon D, Davis RW and Brown PO (1995). Quantitative monitoring of gene expression patterns with a complementary DNA microarray. Science, 270: 467-70. Schillaci G, Vaudo G, Pasqualini L, Reboldi G, Porcellati C and Verdecchia P (2002). Left ventricular mass and systolic dysfunction in essential hypertension. J Hum Hypertens, 16: 117-122.

Bibliography
335
Schlange T, Andree B, Arnold HH and Brand T (2000). BMP2 is required for early heart development during a distinct time period. Mech Dev, 91: 259-270. Schlotthauer K and Bers DM (2000). Sarcoplasmic reticulum Ca(2+) release causes myocyte depolarization. Underlying mechanism and threshold for triggered action potentials. Circ Res, 87: 774-780. Schmieder RE and Messerli FH (2000). Hypertension and the heart. J Hum Hypertens, 14: 597-604. Schotten U, Koenigs B, Rueppel M, Schoendube F, Boknik P, Schmitz W and Hanrath P (1999). Reduced myocardial sarcoplasmic reticulum Ca2+-ATPase protein expression in compensated primary and secondary human cardiac hypertrophy. J Mol Cell Cardiol, 31: 1483-1494. Schunkert H, Dzau VJ, Tang SS, Hirsch AT, Apstein CS and Lorell BH (1990). Increased rat cardiac angiotensin converting enzyme activity and mRNA expression in pressure overload left ventricular hypertrophy. J Clin Invest, 86: 1913-1920. Schunkert H, Hense HW, Holmer SR, Stender M, Perz S, Keil U, Lorell BH and Riegger GAJ (1994). Association between a deletion polymorphism of the angiotensin-converting-enzyme gene and left ventricular hypertrophy. New Eng J Med, 330: 1634-1638. Schweizer L and Varmus H (2003). Wnt/Wingless signaling through beta-catenin requires the function of both LRP/Arrow and frizzled classes of receptors. BMC Cell Biol, 4: 4. Scott AL, Chang RS, Lotti VJ and Siegl PK (1992). Cardiac angiotensin receptors: effects of selective angiotensin II receptor antagonists, DUP 753 and PD 121981, in rabbit heart. J Pharmacol Exp Ther, 261: 931-935. Sechi LA, Griffin CA, Grady EF, Kalinyak JE and Schambelan M (1992). Characterization of angiotensin II receptor subtypes in rat heart. Circ Res, 71: 1482-1489. Sechi LA, Griffin CA and Schambelan M (1994). The cardiac renin-angiotensin system in STZ-induced diabetes. Diabetes, 43: 1180-1184. Seedorf U, Raabe M, Ellinghaus P, Kannenberg F, Fobker M, Engel T, Denis S, Wouters F, Wirtz KW, Wanders RJ, Maeda N and Assmann G (1998). Defective peroxisomal catabolism of branched fatty acyl coenzyme A in mice lacking the sterol carrier protein-2/sterol carrier protein-x gene function. Genes Dev, 12: 1189-1201. Sehl PD, Tai JT, Hillan KJ, Brown LA, Goddard A, Yang R, Jin H and Lowe DG (2000). Application of cDNA microarrays in determining molecular phenotype in cardiac growth, development, and response to injury. Circulation, 101: 1990-1999.

Bibliography
336
Seidman JG and Seidman C (2001). The genetic basis for cardiomyopathy: from mutation identification to mechanistic paradigms. Cell, 104: 557–567. Sekine T, Kusano H, Nishimaru K, Tanaka Y, Tanaka H and Shigenobu K (1999). Developmental conversion of inotropism by endothelin I and angiotensin II from positive to negative in mice. Eur J Pharmacol, 374: 411-415. Seltzer A, Bregonzio C, Armando I, Baiardi G and Saavedra JM (2004). Oral administration of an AT1 receptor antagonist prevents the central effects of angiotensin II in spontaneously hypertensive rats. Brain Res, 1028: 9-18. Semeniuk LM, Kryski AJ and Severson DL (2002). Echocardiographic assessment of cardiac function in diabetic db/db and transgenic db/db-hGLUT4 mice. Am J Physiol, 283: H976-H982. Senzaki H, Gluzband YA, Pak PH, Crow MT, Janicki JS and Kass DA (1998). Synergistic exacerbation of diastolic stiffness from short-term tachycardia-induced cardiodepression and angiotensin II. Circ Res, 82: 503-512. Serneri GG, Boddi M, Cecioni I, Vanni S, Coppo M, Papa ML, Bandinelli B, Bertolozzi I, Polidori G, Toscano T, Maccherini M and Modesti PA (2001). Cardiac angiotensin II formation in the clinical course of heart failure and its relationship with left ventricular function. Circ Res, 88: 961-968. Shah BH, Yesilkaya A, Olivares-Reyes JA, Chen HD, Hunyady L and Catt KJ (2004). Differential pathways of angiotensin II-induced extracellularly regulated kinase 1/2 phosphorylation in specific cell types: role of heparin-binding epidermal growth factor. Mol Endocrinol, 18: 2035-2048. Shao Q, Ren B, Zarain-Herzberg A, Ganguly PK and Dhalla NS (1999). Captopril treatment improves the sarcoplasmic reticular Ca2+ transport in heart failure due to myocardial infarction. J Mol Cell Cardiol, 31: 1663-1672. She P, Shiota M, Shelton KD, Chalkley R, Postic C and Magnuson MA (2000). Phosphoenolpyruvate carboxykinase is necessary for the integration of hepatic energy metabolism. Mol Cell Biol, 20: 6508-6517. Shehadeh A and Regan TJ (1995). Cardiac consequences of diabetes mellitus. Clin Cardiol, 18: 301-305. Sheikh MS, Fernandez-Salas E, Yu M, Hussain A, Dinman JD, Peltz SW, Huang Y and Fornace AJ Jr (1999). Cloning and characterization of a human genotoxic and endoplasmic reticulum stress-inducible cDNA that encodes translation initiation factor 1(eIF1(A121/SUI1)). J Biol Chem, 274: 16487-16493. Shimizu M, Umeda K, Sugihara N, Yoshio H, Ino H, Takeda R, Okada Y and Nakanishi I (1993). Collagen remodeling in myocardia of patients with diabetes. J Clin Pathol, 46: 32-36.
Bibliography
337
Shoemaker CA, Pungliya M, Sao Pedro MA, Ruiz C, Alvarez SA, Ward M, Ryder EF and Krushkal J (2001). Computational methods for single-point and multipoint analysis of genetic variants associated with a simulated complex disorder in a general population. Genet Epidemiol, 21 (Suppl 1): S738-S745. Shyu KG, Chen CC, Wang BW, Kuan P (2001). Angiotensin II receptor antagonist blocks the expression of connexin43 induced by cyclical mechanical stretch in cultured neonatal rat cardiac myocytes. J Mol Cell Cardiol, 33: 691-698. Singh CR, He H, Ii M, Yamamoto Y and Asano K (2004). Efficient incorporation of eukaryotic initiation factor 1 into the multifactor complex is critical for formation of functional ribosomal preinitiation complexes in vivo. J Biol Chem, 279: 31910-31920. Singh K, Sirokman G, Communal C, Robinson KG, Conrad CH, Brooks WW, Bing OH and Colucci WS (1999). Myocardial osteopontin expression coincides with the development of heart failure. Hypertension, 33: 663-670. Sipido KR, Volders PG, Schoenmakers M, De Groot SH, Verdonck F and Vos MA (2002). Role of the Na/Ca exchanger in arrhythmias in compensated hypertrophy. Ann N Y Acad Sci, 976: 438-445. Skaletz-Rorowski A, Pinkernell K, Sindermann JR, Schriever C, Muller JG, Eschert H and Breithardt G (2004). Angiotensin AT1 receptor upregulates expression of basic fibroblast growth factor, basic fibroblast growth factor receptor and coreceptor in human coronary smooth muscle cells. Basic Res Cardiol, 99: 272-278. Skolnick RL, Litwin SE, Barry WH and Spitzer KW (1998). Effect of Ang II on pHi, [Ca2+]I, and contraction in rabbit ventricular myocytes from infarcted hearts. Am J Physiol, 275: H1788-H1797. Skrabal CA, Thompson LO, Southard RE, Joyce DL, Noon GP, Loebe M and Youker KA (2004). Interaction between isolated human myocardial mast cells and cultured fibroblasts. J Surg Res, 118: 66-70. Skurat AV and Dietrich AD (2004). Phosphorylation of Ser640 in muscle glycogen synthase by DYRK family protein kinases. J Biol Chem, 279:2490-2498. Smith WM (1985). Epidemiology of congestive heart failure. Am J Cardiol, 55: 3A-8A. Smyth GK, Yang YH and Speed T (2003). Statistical issues in cDNA microarray data analysis. Methods Mol Biol, 224: 111-136. Snabaitis AK, Hearse DJ and Avkiran M (2002). Regulation of sarcolemmal Na(+)/H(+) exchange by hydrogen peroxide in adult rat ventricular myocytes. Cardiovasc Res, 53: 470-480. Song K, Allen AM, Paxinos G and Mendelsohn FA (1992). Mapping of angiotensin II receptor subtype heterogeneity in rat brain. J Comp Neurol, 316: 467-484.

Bibliography
338
Spedding M and Mir AK (1987). Direct activation of Ca2+ channels by palmitoyl carnitine, a putative endogenous ligand. Br J Pharmacol, 92: 457-468. Spinale FG, Coker ML, Bond BR and Zellner JL (2000). Myocardial matrix degradation and metalloproteinase activation in the failing heart: a potential therapeutic target. Cardiovasc Res, 46: 225-238. Spirito P, Seidman CE, McKenna WJ and Maron BJ (1997). The management of hypertrophic cardiomyopathy. N Engl J Med, 336: 775-785. Stamler J, Vaccaro O, Neaton JD and Wentworth D (1993). Diabetes, other risk factors, and 12-yr cardiovascular mortality for men screened in the Multiple Risk Factor Intervention Trial. Diabetes Care, 16: 434-444. Stanton LW, Garrard LJ, Damm D, Garrick BL, Lam A, Kapoun AM, Zheng Q, Protter AA, Schreiner GF and White RT (2000). Altered patterns of gene expression in response to myocardial infarction. Circ Res, 86: 939-945. Stawowy P, Margeta C, Kallisch H, Seidah NG, Chretien M, Fleck E and Graf K (2004). Regulation of matrix metalloproteinase MT1-MMP/MMP-2 in cardiac fibroblasts by TGF-beta1 involves furin-convertase. Cardiovasc Res, 63: 87-97. Stenbit AE, Katz EB, Chatham JC, Geenen DL, Factor SM, Weiss RG, Tsao TS, Malhotra A, Chacko VP, Ocampo C, Jelicks LA and Charron MJ (2000). Preservation of glucose metabolism in hypertrophic GLUT4-null hearts. Am J Physiol, 279: H313-H318. Stenbit AE, Tsao TS, Li J, Burcelin R, Geenen DL, Factor SM, Houseknecht K, Katz EB and Charron MJ (1997). GLUT4 heterozygous knockout mice develop muscle insulin resistance and diabetes. Nat Med, 3: 1096-1101. Stewart S, MacIntyre K, Capewell S and McMurray JJ (2003). Heart failure and the aging population: an increasing burden in the 21st century? Heart, 89: 49-53. Stottmann RW, Choi M, Mishina Y, Meyers EN and Klingensmith J (2004). BMP receptor IA is required in mammalian neural crest cells for development of the cardiac outflow tract and ventricular myocardium. Development, 131: 2205-2218. Stronetta RL, Hawelu-Johnson CL, Guyenet PG and Lynch KR (1988). Astrocytes synthesize angiotensinogen in brain. Science, 242: 1444-1446. Studer R, Reinecke H, Bilger J, Eschenhagen T, Bohm M, Hasenfuss G, Just H, Holtz J and Drexler H (1994). Gene expression of the cardiac Na+/Ca2+ exchanger in end-stage human heart failure. Circ Res, 75: 443-453. Stull LB, Leppo MK, Marban E and Janssen PML (2002). Physiological determinants of contractile force generation and calcium handling in mouse myocardium. J Mol Cell Cardiol, 34: 1367-1376.

Bibliography
339
Su HM, Moser AB, Moser HW and Watkins PA (2001). Peroxisomal straight-chain Acyl-CoA oxidase and D-bifunctional protein are essential for the retroconversion step in docosahexaenoic acid synthesis. J Biol Chem, 276: 38115-38120. Sugaya T, Nishimatsu S, Tanimoto K, Takimoto E, Yamagishi T, Imamura K, Goto S, Imaizumi K, Hisada Y, Otsuka A, et al. (1995). Angiotensin II type 1a receptor-deficient mice with hypotension and hyperreninemia. J Biol Chem, 270: 18719-18722. Sugi Y and Markwald RR (2003). Endodermal growth factors promote endocardial precursor cell formation from precardiac mesoderm. Dev Biol, 263: 35-49. Sugino H, Ozono R, Kurisu S, Matsuura H, Ishida M, Oshima T, Kambe M, Teranishi Y, Masaki H and Matsubara H (2001). Apoptosis is not increased in myocardium overexpressing type 2 angiotensin II receptor in transgenic mice. Hypertension, 37: 1394-1398. Suko J, Vogel JHK and Chidsey CA (1970). Intracellular calcium and myocardial contractility. III. Reduced calcium uptake and ATPase of the sarcoplasmic reticulum fraction prepared from chronically failing calf hearts. Circ Res, 27: 235-247. Sumida Y, Umemura S, Tamura K, Kihara M, Kobayashi S, Ishigami T, Yabana M, Nyui N, Ochiai H, Fukamizu A, Miyazaki H, Murakami K and Ishii M (1998). Increased cardiac angiotensin II receptors in angiotensinogen-deficient mice. Hypertension, 31: 45-49. Sun D, Nguyen N, Degrado TR, Schwaiger M and Brosius FC (1994). Ischemia induces translocation of the insulin-responsive glucose transporter GLUT4 to the plasma membrane of cardiac myocytes. Circulation, 89: 793-798. Sun HY, Wang NP, Halkos ME, Kerendi F, Kin H, Wang RX, Guyton RA and Zhao ZQ (2004). Involvement of Na+/H+ exchanger in hypoxia/re-oxygenation-induced neonatal rat cardiomyocyte apoptosis. Eur J Pharmacol, 486: 121-131. Sussman MA, Welch S, Cambon N, Klevitsky R, Hewett TE, Price R, Witt SA and Kimball TR (1998a). Myofibril degeneration caused by tropomodulin overexpression leads to dilated cardiomyopathy in juvenile mice. J Clin Invest, 101: 51-61. Sussman MA, Lim HW, Gude N, Taigen T, Olson EN, Robbins J, Colbert MC, Gualberto A, Wieczorek DF and Molkentin JD (1998b). Prevention of cardiac hypertrophy in mice by calcineurin inhibition. Science, 281: 1690-1693. Sussman MA, Welch S, Walker A, Klevitsky R, Hewett TE, Witt SA, Kimball TR, Price R, Lim HW and Molkentin JD (2000). Hypertrophic defect unmasked by calcineurin expression in asymptomatic tropomodulin overexpressing transgenic mice. Cardiovasc Res, 46: 90-101.

Bibliography
340
Suurmeijer AJ, Clement S, Francesconi A, Bocchi L, Angelini A, Van Veldhuisen DJ, Spagnoli LG, Gabbiani G and Orlandi A (2003). Alpha-actin isoform distribution in normal and failing human heart: a morphological, morphometric, and biochemical study. J Pathol, 199: 387-397. Swanson GN, Hanesworth JM, Sardinia MF, Coleman JK, Wright JW, Hall KL, Miller-Wing AV, Stobb JW, Cook VI, Harding EC, et al. (1992). Discovery of a distinct binding site for angiotensin II (3-8), a putative angiotensin IV receptor. Regul Pept, 40: 409-419. Swynghedauw B (1999). Molecular mechanisms of myocardial remodeling. Physiol Rev, 79: 215-62. Tabuchi M, Yoshimori T, Yamaguchi K, Yoshida T and Kishi F (2000). Human NRAMP2/DMT1, which mediates iron transport across endosomal membranes, is localized to late endosomes and lysosomes in HEp-2 cells. J Biol Chem, 275: 22220-22228. Taegtmeyer H and Overturf L (1988). Effects of moderate hypertension on cardiac function and metabolism in the rabbit. Hypertension, 11: 416-426. Tagawa H, Koide M, Sato H, Zile MR, Carabello BA and Cooper G 4th (1998). Cytoskeletal role in the transition from compensated to decompensated hypertrophy during adult canine left ventricular pressure overloading. Circ Res, 82: 751-761. Takahashi E, Abe J, Gallis B, Aebersold R, Spring DJ, Krebs EG and Berk BC (1999). p90(RSK) is a serum-stimulated Na+/H+ exchanger isoform-1 kinase. Regulatory phosphorylation of serine 703 of Na+/H+ exchanger isoform-1. J Biol Chem, 274: 20206-20214. Takewaki S, Kuro-o M, Hiroi Y, Yamazaki T, Noguchi T, Miyagishi A, Nakahara K, Aikawa M, Manabe I, Yazaki Y et al. (1995). Activation of Na+-H+ antiporter (NHE-1) gene expression during growth, hypertrophy and proliferation of the rabbit cardiovascular system. J Mol Cell Cardiol, 27: 729-742. Takeyama D, Kagaya Y, Yamane Y, Shiba N, Chida M, Takahashi T, Ido T, Ishide N and Takishima T (1995). Effects of chronic right ventricular pressure overload on myocardial glucose and free fatty acid metabolism in the conscious rat. Cardiovasc Res, 29: 763-767. Talukder MA and Endoh M (1997). Pharmacological differentiation of synergistic contribution of L-type Ca2+ channels and Na+/H+ exchange to the positive inotropic effect of phenylephrine, endothelin-3 and angiotensin II in rabbit ventricular myocardium. Naunyn Schmiedebergs Arch Pharmacol, 355: 87-96. Tamaddon HS, Vaidya D, Simon AM, Paul DL, Jalife J and Morley GE (2000). High-resolution optical mapping of the right bundle branch in connexin40 knockout mice reveals slow conduction in the specialized conduction system. Circ Res, 87: 929-936.

Bibliography
341
Tambara K, Fujita M, Miyamoto S, Doi K, Nishimura K and Komeda M (2004). Pericardial fluid level of heart-type cytoplasmic fatty acid-binding protein (H-FABP) is an indicator of severe myocardial ischemia. Int J Cardiol, 93: 281-284. Tanabe A, Naruse M, Arai K, Naruse K, Yoshimoto T, Seki T, Imaki T, Miyazaki H, Zeng ZP, Demura R and Demura H (1998). Gene expression and roles of angiotensin II type 1 and type 2 receptors in human adrenals. Horm Metab Res, 30: 490-495. Tanaka M, Ito H, Adachi S, Akimoto H, Nishikawa T, Kasajima T, Marumo F and Hiroe M (1994). Hypoxia induces apoptosis with enhanced expression of Fas antigen messenger RNA in cultured neonatal rat cardiomyocytes. Circ Res, 75: 426-433. Tanimoto K, Sugiyama F, Goto Y, Ishida J, Takimoto E, Yagami K, Fukamizu A and Murakami K (1994). Angiotensinogen-deficient mice with hypotension. J Biol Chem, 269: 31334-31337. Tanonaka K, Yoshida H, Toga W, Furuhama K and Takeo S (2001). Myocardial heat shock proteins during the development of heart failure. Biochem Biophys Res Commun, 283: 520-525. Tavaria M, Gabriele T, Anderson RL, Mirault ME, Baker E, Sutherland G and Kola I (1995). Localization of the gene encoding the human heat shock cognate protein, HSP73, to chromosome 11. Genomics, 29: 266-268. Terracciano CMN, Philipson KD and MacLeod KT (2001). Overexpression of the Na+/Ca2+ exchanger and inhibition of the sarcoplasmic reticulum Ca2+-ATPase in ventricular myocytes from transgenic mice. Cardiovasc Res, 49: 38-47. Terracio L, Rubin K, Gullberg D, Balog E, Carver W, Jyring R and Borg TK (1991). Expression of collagen binding integrins during cardiac development and hypertrophy. Circ Res, 68: 734-744. Terrenoire C, Clancy CE, Cormier JW, Sampson KJ and Kass RS (2005). Autonomic control of cardiac action potentials: role of potassium channel kinetics in response to sympathetic stimulation. Circ Res, 96: e25-e34. Teshima Y, Takahashi N, Saikawa T, Hara M, Yasunaga S, Hidaka S and Sakata T (2000). Diminished expression of sarcoplasmic reticulum Ca2+-ATPase and ryanodine sensitive Ca2+ Channel mRNA in streptozotocin-induced diabetic rat heart. J Mol Cell Cardiol, 32: 655-664. Tewksbury DA and Dart RA (1982). High molecular weight angiotensinogen levels in hypertensive pregnant women. Hypertension, 4: 729-734. Thai MV, Guruswamy S, Cao KT, Pessin JE and Olson AL (1998). Myocyte enhancer factor 2 (MEF2)-binding site is required for GLUT4 gene expression in transgenic mice. Regulation of MEF2 DNA binding activity in insulin-deficient diabetes. J Biol Chem, 273: 14285-14292.

Bibliography
342
Tham DM, Martin-McNulty B, Wang YX, Wilson DW, Vergona R, Sullivan ME, Dole W and Rutledge JC (2002). Angiotensin II is associated with activation of NF-kappaB-mediated genes and downregulation of PPARs. Physiol Genomics, 11: 21-30. Thomas WG, Brandenburger Y, Auteliano DJ, Pham T, Qian H and Hannan RD (2002). Adenoviral-directed expression of the type 1A angiotensin receptor promotes cardiomyocyte hypertrophy via transactivation of the epidermal growth factor receptor. Circ Res, 90: 135-142. Tian R, Pham M and Abel ED (1999). Cardiac glucose transporter deficiency increases the susceptibility of the heart to ischemic injury. Diabetes, 100 (Suppl I): I-118 (Abstract). Tiemann K, Weyer D, Djoufack PC, Ghanem A, Lewalter T, Dreiner U, Meyer R, Grohe C and Fink KB (2003). Increasing myocardial contraction and blood pressure in C57BL/6 mice during early postnatal development. Am J Physiol, 284: H464-H474. Till M, Kolter T and Eckel J (1997). Molecular mechanisms of contraction-induced translocation of GLUT4 in isolated cardiomyocytes. Am J Cardiol, 80: 85A-89A. Tingleff J, Munch M, Jakobsen TJ, Torp-Pedersen C, Olsen ME, Jensen KH, Jorgensen T and Kirchoff M (1996). Prevalence of left ventricular hypertrophy in a hypertensive population. Eur Heart J, 17: 143-149. Tipnis SR, Hooper NM, Hyde R, Karran E, Christie G and Turner AJ (2000). A human homolog of angiotensin-converting enzyme: cloning and functional expression as a captopril-insensitive carboxypeptidase. J Biol Chem, 275: 33238-33243. Todd JA (1999). From genome to aetiology in a multifactorial disease, type I diabetes. Bioessays, 21: 164-174. Tom B, de Vries R, Saxena PR and Danser AH (2001). Bradykinin potentiation by angiotensin-(1-7) and ACE inhibitors correlates with ACE C- and N-domain blockade. Hypertension, 38: 95-99. Touret N, Furuya W, Forbes J, Gros P and Grinstein S (2003). Dynamic traffic through the recycling compartment couples the metal transporter Nramp2 (DMT1) with the transferrin receptor. J Biol Chem, 278: 25548-25557. Tournier C, Hess P, Yang DD, Xu J, Turner TK, Nimnual A, Bar-Sagi D, Jones SN, Flavell RA and Davis RJ (2000). Requirement of JNK for stress-induced activation of the cytochrome c-mediated death pathway. Science, 288: 870-874. Touyz RM, Fareh J, Thibault G, Tolloczko B, Lariviere R and Schiffrin EL (1996). Modulation of Ca2+ transients in neonatal and adult rat cardiomyocytes by angiotensin II and endothelin-1. Am J Physiol, 270: H857-H868.

Bibliography
343
Touyz RM, Deng LY, He G, Wu XH and Schiffrin EL (1999). Angiotensin II stimulates DNA and protein synthesis in vascular smooth muscle cells from human arteries: role of extracellular signal-regulated kinases. J Hypertens, 17: 907-916. Touyz RM and Schiffrin EL (2001). Increased generation of superoxide by angiotensin II in smooth muscle cells from resistance arteries of hypertensive patients: role of phospholipase D-dependent NAD(P)H oxidase-sensitive pathways. J Hypertens, 19: 1245-1254. Trongtorsak P, Morgan TO and Delbridge LM (2003). Combined renin-angiotensin system blockade and dietary sodium restriction impairs cardiomyocyte contractility. J Renin Angiotensin Aldosterone Syst, 4: 213-219. Tronik D, Dreyfus M, Babinet C and Rougeon F (1987). Regulated expression of the Ren-2 gene in transgenic mice derived from parental strains carrying only the Ren-1 gene. EMBO J, 6: 983-987. Troughton RW, Lewis LK, Yandle TG, Richards AM and Nicholls MG (2000). Hemodynamic, hormone, and urinary effects of adrenomedullin infusion in essential hypertension. Hypertension, 36: 588-593. Tse J, Huang MW, Leone RJ, Weiss HR, He YQ and Scholz PM (2000). Down regulation of myocardial beta1-adrenoceptor signal transduction system in pacing-induced failure in dogs with aortic stenosis-induced left ventricular hypertrophy. Mol Cell Biochem, 205: 67-73. Tsioufis C, Stefanadis C, Toutouza M, Kallikazaros I, Toutouzas K, Tousoulis D, Pitsavos C, Papademetriou V and Toutouzas P (2002). Microalbuminuria is associated with unfavourable cardiac geometric adaptations in essential hypertensive subjects. J Hum Hypertens, 16: 249-254. Tsuchida K, Watajima H and Otomo S (1994). Calcium current in rat diabetic ventricular myocytes. Am J Physiol, 267: H2280-H2289. Tsuchida K and Watajima H (1997). Potassium currents in ventricular myocytes from genetically diabetic rats. Am J Physiol, 273: E695-E700. Tsuruda T, Jougasaki M, Boerrigter G, Costello-Boerrigter LC, Cataliotti A, Lee SC, Salz-Gilman L, Nordstrom LJ, McGregor CG and Burnett JC (2003). Ventricular adrenomedullin is associated with myocyte hypertrophy in human transplanted heart. Regul Pept, 112: 161-166. Ueno S, Ohki R, Hashimoto T, Takizawa T, Takeuchi K, Yamashita Y, Ota J, Choi YL, Wada T, Koinuma K, Yamamoto K, Ikeda U, Shimada K and Mano H (2003). DNA microarray analysis of in vivo progression mechanism of heart failure. Biochem Biophys Res Commun, 307: 771-777. Unger T (2001). Inhibiting renin-angiotensin in the brain: the possible therapeutic implications. Blood Press Suppl, 1: 12-6.

Bibliography
344
Vakili BA, Okin PM and Devereux RB (2001). Prognostic implications of left ventricular hypertrophy. Am Heart J, 141: 334-341. Vallega GA, Canessa ML, Berk BC, Brock TA and Alexander RW (1988). Vascular smooth muscle Na+-H+ exchanger kinetics and its activation by angiotensin II. Am J Physiol, 254: C751-C758. van Bilsen M and Chien KR (1993). Growth and hypertrophy of the heart: towards an understanding of cardiac specific and inducible gene expression. Cardiovasc Res, 27: 1140-1149. Van Cruchten S and Van Den Broeck W (2002). Morphological and biochemical aspects of apoptosis, oncosis and necrosis. Anat Histol Embryol, 31: 214-223. van den Hoff MJ, van den Eijnde SM, Viragh S and Moorman AF (2000). Programmed cell death in the developing heart. Cardiovasc Res, 45: 603-620. Van Der Vusse GJ, Van Bilsen M and Glatz JFC (2000) Cardiac fatty acid uptake and transport in health and disease. Cardiovasc Res, 45: 279-293. van Eickels M, Grohe C, Cleutjens JP, Janssen BJ, Wellens HJ and Doevendans PA (2001). 17beta-estradiol attenuates the development of pressure-overload hypertrophy. Circulation, 104: 1419-1423. van Ginneken AC and Giles W (1991). Voltage clamp measurements of the hyperpolarization-activated inward current I(f) in single cells from rabbit sino-atrial node. J Physiol, 434: 57-83. van Kats JP, Danser AH, van Meegen JR, Sassen LM, Verdouw PD and Schalekamp MA (1998). Angiotensin production by the heart: a quantitative study in pigs with the use of radiolabeled angiotensin infusions. Circulation, 98: 73-81. van Kats JP, Methot D, Paradis P, Silversides DW and Reudelhuber TL (2001). Use of a biological peptide pump to study chronic peptide hormone action in transgenic mice. Direct and indirect effects of angiotensin II on the heart. J Biol Chem, 276: 44012-44017. van Rijen HV, van Kempen MJ, Postma S and Jongsma HJ (1998). Tumour necrosis factor alpha alters the expression of connexin43, connexin40, and connexin37 in human umbilical vein endothelial cells. Cytokine, 10: 258-264. Vanucci SJ, Rutherford T, Wilkie MB, Simpson IA and Lauder JM (2000). Prenatal expression of the GLUT4 glucose transporter in the mouse. Dev Neurosci, 22: 274-282. Vartiainen M, Ojala PJ, Auvinen P, Peranen J and Lappalainen P (2000). Mouse A6/twinfilin is an actin monomer-binding protein that localizes to the regions of rapid actin dynamics. Mol Cell Biol, 20: 1772-1783.

Bibliography
345
von Lutterotti N, Catanzaro DF, Sealey JE and Laragh JH (1994). Renin is not synthesized by cardiac and extrarenal vascular tissues: a review of experimental evidence. Circulation, 89: 458-470. Wachtell K, Lehto M, Gerdts E, Olsen MH, Hornestam B, Dahlof B, Ibsen H, Julius S, Kjeldsen SE, Lindholm LH, Nieminen MS and Devereux RB (2005). Angiotensin II receptor blockade reduces new-onset atrial fibrillation and subsequent stroke compared to atenolol: the Losartan Intervention For End Point Reduction in Hypertension (LIFE) study. J Am Coll Cardiol, 45: 712-719. Wang H, Singh D and Fliegel L (1997). The Na+/H+ antiporter potentiates growth and retinoic acid-induced differentiation of P19 embryonal carcinoma cells. J Biol Chem, 272: 26545-26549. Wang L, Eberhard M and Erne P (1995). Stimulation of DNA and RNA synthesis in cultured rabbit cardiac fibroblasts by angiotensin IV. Clin Sci (Lond), 88: 557-562. Wang Q, Chen Q and Towbin JA (1998). Genetics, molecular mechanisms and management of long QT syndrome. Annals of Medicine, 30: 58-65. Wang QD and Nygren E (2003). Various inotropic effects of angiotensin II in post-ischaemic rat hearts depending on ischaemic time with possible involvement of protein kinase C. Acta Physiol Scand, 178: 189-196. Wang Z, Nolan B, Kutschke W and Hill JA (2001). Na+-Ca2+ exchanger remodeling in pressure-overload cardiac hypertrophy. J Biol Chem, 276: 17706-17711. Watanabe A and Endoh M (1998). Relationship between the increase in Ca2+ transient and contractile force induced by angiotensin II in aequorin-loaded rabbit ventricular myocardium. Cardiovasc Res, 37:524-531. Weaver D, Skinner S, Walker L and Sangster M (1991). Phenotypic inhibition of the renin-angiotensin system, emergence of the Ren-2 gene, and adaptive radiation of mice. Gen Comp Endocr, 83: 306-315. Weber KT and Brilla CG (1991). Pathological hypertrophy and cardiac interstitium. Fibrosis and rennin-angiotensin-aldosterone system. Circulation, 83: 1849-1865. Wei JY, Spurgeon A and Lakatta EG (1984). Excitation-contraction in rat myocardium: alterations with adult aging. Am J Physiol, 246: H784-H791. Wei M, Gaskill SP, Haffner SM and Stern MP (1998). Effects of diabetes and level of glycemia on all-cause and cardiovascular mortality. The San Antonio Heart Study. Diabetes Care, 21: 1167-1172. Weichenrieder O, Stehlin C, Kapp U, Birse DE, Timmins PA, Strub K and Cusack S (2001). Hierarchical assembly of the Alu domain of the mammalian signal recognition particle. RNA, 7: 731-740.

Bibliography
346
Wencker D, Chandra M, Nguyen K, Miao W, Garantziotis S, Factor SM, Shirani J, Armstrong RC and Kitsis RN (2003). A mechanistic role for cardiac myocyte apoptosis in heart failure. J Clin Invest, 111: 1497-1504. Wenzel S, Taimor G, Piper HM and Schlüter KD (2001). Redox-sensitive intermediates mediate angiotensin II-induced p38 MAP kinase activation, AP-1 binding activity, and TGF-beta expression in adult ventricular cardiomyocytes. FASEB J, 15: 2291–2293. Wettschureck N, Rutten H, Zywietz A, Gehring D, Wilkie TM, Chen J, Chien KR and Offermanns S (2001). Absence of pressure overload induced myocardial hypertrophy after conditional inactivation of Galphaq/Galpha11 in cardiomyocytes. Nat Med, 7: 1236-1240. Wickenden AD, Kaprielian R, Kassiri Z, Tsoporis JN, Tsushima R, Fishman GI and Backx PH (1998). The role of action potential prolongation and altered intracellular calcium handling in the pathogenesis of heart failure. Cardiovasc Res, 37: 312-323. Wiendl H, Mitsdoerffer M, Schneider D, Melms A, Lochmuller H, Hohlfeld R and Weller M (2003). Muscle fibres and cultured muscle cells express the B7.1/2-related inducible co-stimulatory molecule, ICOSL: implications for the pathogenesis of inflammatory myopathies. Brain,126:1026-1035. Wikman-Coffelt J, Wu ST, Parmley WW and Mason DT (1991). Angiotensin II and phorbol esters depress cardiac performance and decrease diastolic and systolic [Ca2+]i in isolated perfused rat hearts. Am Heart J, 122: 786-794. Willecke K, Eiberger J, Degen J, Eckardt D, Romualdi A, Guldenagel M, Deutsch U, and Sohl G (2002). Structural and functional diversity of connexin genes in the mouse and human genome. Biol Chem, 383: 725–737. Wollert KC and Drexler H (1999). The renin-angiotensin system and experimental heart failure. Cardiovasc Res, 43:838-849. Xiao XH and Allen DG (2000). Activity of the Na(+)/H(+) exchanger is critical to reperfusion damage and preconditioning in the isolated rat heart. Cardiovasc Res, 48: 244-253. Yamazaki T, Komuro I, Kudoh S, Zou Y, Nagai R, Aikawa R, Uozumi H, Yazaki Y (1998). Role of ion channels and exchangers in mechanical stretch-induced cardiomyocyte hypertrophy. Circ Res, 82: 430-437. Yang G, Merrill DC, Thompson MW, Robillard JE and Sigmund CD (1994). Functional expression of the human angiotensinogen gene in transgenic mice. J Biol Chem, 269: 32497-32502. Yang J, Gillingham AK, Hodel A, Koumanov F, Woodward B and Holman GD (2002). Insulin-stimulated cytosol alkalinization facilitates optimal activation of glucose transport in cardiomyocytes. Am J Physiol, 283: E1299-E1307.

Bibliography
347
Yasukawa H, Hoshijima M, Gu Y, Nakamura T, Pradervand S, Hanada T, Hanakawa Y, Yoshimura A, Ross J Jr, Chien KR (2001). Suppressor of cytokine signaling-3 is a biomechanical stress-inducible gene that suppresses gp130-mediated cardiac myocyte hypertrophy and survival pathways. J Clin Invest, 108: 1459-1467. Yatani A, Frank K, Sako H, Kranias EG and Dorn GW 2nd (1999). Cardiac-specific overexpression of Galphaq alters excitation-contraction coupling in isolated cardiac myocytes. J Mol Cell Cardiol, 31: 1327-1336. Ye MQ and Healy DP (1992). Characterization of an angiotensin type-1 receptor partial cDNA from rat kidney: evidence for a novel AT1B receptor subtype. Biochem Biophys Res Commun, 185: 204-210. Yoshida H and Karmazyn M (2000). Na+–H+ exchange inhibition attenuates hypertrophy and heart failure in 1-week postinfarction rat myocardium. Am J Physiol, 278: H300–H304. Young ME, Laws FA, Goodwin GW and Taegtmeyer H (2001). Reactivation of peroxisome proliferator-activated receptor alpha is associated with contractile dysfunction in hypertrophied rat heart. J Biol Chem, 276: 44390-44395. Yu Z and Mcneill JH (1991). Force-interval relationship and its response to ryanodine in streptozotocin-induced diabetic rats. Can J Physiol Pharmacol, 69: 1268-1276. Yu Z, Tibbits GF and McNeill JH (1994). Cellular functions of diabetic cardiomyocytes: contractility, rapid-cooling contracture, and ryanodine binding. Am J Physiol, 266: H2082-H2089. Yun J, Zuscik MJ, Gonzalez-Cabrera P, McCune DF, Ross SA, Gaivin R, Piascik MT and Perez DM (2003). Gene expression profiling of alpha(1b)-adrenergic receptor-induced cardiac hypertrophy by oligonucleotide arrays. Cardiovasc Res, 57: 443-455. Yussman MG, Toyokawa T, Odley A, Lynch RA, Wu G, Colbert MC, Aronow BJ, Lorenz JN and Dorn GW 2nd (2002). Mitochondrial death protein Nix is induced in cardiac hypertrophy and triggers apoptotic cardiomyopathy. Nat Med, 8: 725-730. Zapala MA, Lockhart DJ, Pankratz DG, Garcia AJ, Barlow C and Lockhart DJ (2002). Software and methods for oligonucleotide and cDNA array data analysis. Genome Biol, 3: SOFTWARE0001. Zarich SW and Nesto RW (1989). Diabetic cardiomyopathy. Am Heart J, 118: 1000-1012. Zeng FY, Gerke V and Gabius HJ (1993). Identification of annexin II, annexin VI and glyceraldehyde-3-phosphate dehydrogenase as calcyclin-binding proteins in bovine heart. Int J Biochem, 25: 1019-1027.

Bibliography
348
Zhang JX, Braakman I, Matlack KE and Helenius A (1997). Quality control in the secretory pathway: the role of calreticulin, calnexin and BiP in the retention of glycoproteins with C-terminal truncations. Mol Biol Cell, 8: 1943-1954. Zhang W, Kowal RC, Rusnak F, Sikkink RA, Olson EN and Victor RG (1999). Failure of calcineurin inhibitors to prevent pressure-overload left ventricular hypertrophy in rats. Circ Res, 84: 722-728. Zhong Y, Ahmed S, Grupp IL and Matlib MA (2001). Altered SR protein expression associated with contractile dysfunction in diabetic rat hearts. Am J Physiol, 281: H1137-H1147. Zhu YZ, Zhu YC, Stoll M and Unger T (2000). Identification of regulated genes in rat heart after myocardial infarction by means of differential mRNA display. Jpn Heart J, 41: 59-66. Zhuo J, Alcorn D, Allen AM and Mendelsohn FA (1992). High resolution localization of angiotensin II receptors in rat renal medulla. Kidney Int, 42: 1372-1380. Zisman A, Peroni OD, Abel ED, Michael MD, Mauvais-Jarvis F, Lowell BB, Wojtaszewski JF, Hirshman MF, Virkamaki A, Goodyear LJ, Kahn CR and Kahn BB (2000). Targeted disruption of the glucose transporter 4 selectively in muscle causes insulin resistance and glucose intolerance. Nat Med, 6: 924-928. Zorn-Pauly K, Schaffer P, Pelzmann B, Lang P, Machler H, Rigler B and Koidl B (2004). If in left human atrium: a potential contributor to atrial ectopy. Cardiovasc Res, 64: 250-259.


