Embed Size (px)
Citation preview
Published: December 22, 2011
r 2011 American Chemical Society 2946 dx.doi.org/10.1021/jp209824f | J. Phys. Chem. C 2012, 116, 2946–2951
ARTICLE
pubs.acs.org/JPCC
Local Atomic Density of Microporous CarbonsWojtek Dmowski,*,† Cristian I. Contescu,‡ Anna Llobet,§ Nidia C. Gallego,‡ and Takeshi Egami†,‡,^
†Department of Materials Science and Engineering, University of Tennessee, Knoxville, Tennessee 37996, United States‡Oak Ridge National Laboratory, Oak Ridge, Tennessee 37831, United States§Lujan Neutron Scattering Center, Los Alamos National Laboratory, Los Alamos, New Mexico 87545, United States^Department of Physics and Astronomy, University of Tennessee, Knoxville, Tennessee 37996, United States
’ INTRODUCTION
A multitude of porous materials have been evaluated in searchfor an efficient adsorbent of hydrogen at near-ambient tempera-tures. Adsorptive storage of hydrogen has been studied inactivated carbon and carbon fibers, carbon nanotubes, fullerenes,metal�organic frameworks, inorganic oxides, and porous poly-mers. However, so far none of these materials meet the desiredtarget for storage of 5.5 wt %. Recently, carbons with porousstructure enhanced through chemical activation have attractedattention. It was reported1,2 that a chemical activation with alkalihydroxides produced materials with well-defined pore sizes andwith good hydrogen adsorption properties. The resulting carbonhas highly porous structure with a very large surface area.According to studies,3 the strongest interaction between molec-ular hydrogen and carbon occurs in narrow micropores <7 Å, inagreement with the theoretical modeling.4,5
It remains a challenge to relate adsorption of the hydrogen tothe atomic structure (arrangement of atoms in space) of dis-ordered carbons albeit the diffraction studies of carbons have along past. Graphite with a turbostractic disorder was a historiccase study by Warren showing 2-dimensional character of thereflections originating from the graphite layers.6 The first sys-tematic study of graphitizing and non-graphitizing carbons wasdone by Franklin.7 She proposed structural models for both typesof disordered carbons. A more recent review of different struc-tural models for non-graphitizing (microporous) carbons is alsogiven byHarris.8 The structure of the microporous carbon can bedescribed as a twisted network of defective carbon layer planes,cross-linked by aliphatic bridging groups. The layers or sheetsand strips can be bent and resemble a mixture of wood shavingsand crumpled paper. The variable spacing between these sheetswould define micropores. This model is well pictured in Figure 1of ref 9. At minimum, there are two important features of the
model that should be resolved to differentiate non-graphitizingcarbon’s structures and also adequately use it in theoreticalstudies. First, the integrity of the six-member ring and sp2
bonding has to be characterized, i.e., how defective is graphenelayer. The next important parameter is the layer stacking orspacing. According to theoretical modeling,4 the optimumseparation between graphene sheets to maximize hydrogenuptake is about 6.2 Å. Such a separation would result in materialwith a very low atomic density (∼0.06 atoms/Å3; in graphiteatomic density is 0.11 atoms/Å3). The ultramicroporous carbons(UMC and ACF) have low density (density of carbon grains),∼0.7�0.9 g/cm3 equivalent to ∼0.035�0.045 atoms/Å3, andcould satisfy predicted optimum spacing. However, such lowatomic density could be achieved either by graphenes beingspaced uniformly with large spacing or by high porosity with thelocal carbon density being relatively high. Therefore, relation orequivalence of the local atomic density to the powder density isan important question. We note that frequently the densitydetermined for example by Hg porosimetry is used as the localatomic density in many structural modeling and simulations.This is only correct if spacing between layers is even and allpores are accessible. However, the same powder density can beachieved by stacking layers closer and creating larger micropores.
We examined two microporous disordered carbons: UMCand activated carbon fibers (ACF). Bhat and co-workers10 obs-erved that the adsorption and desorption branches did notoverlap in UMC, but more importantly, a long equilibrationtime resulted in almost doubling of the amount of hydrogenadsorbed. In contrast, activated carbon fibers (ACF) achieve
Received: October 12, 2011Revised: December 19, 2011
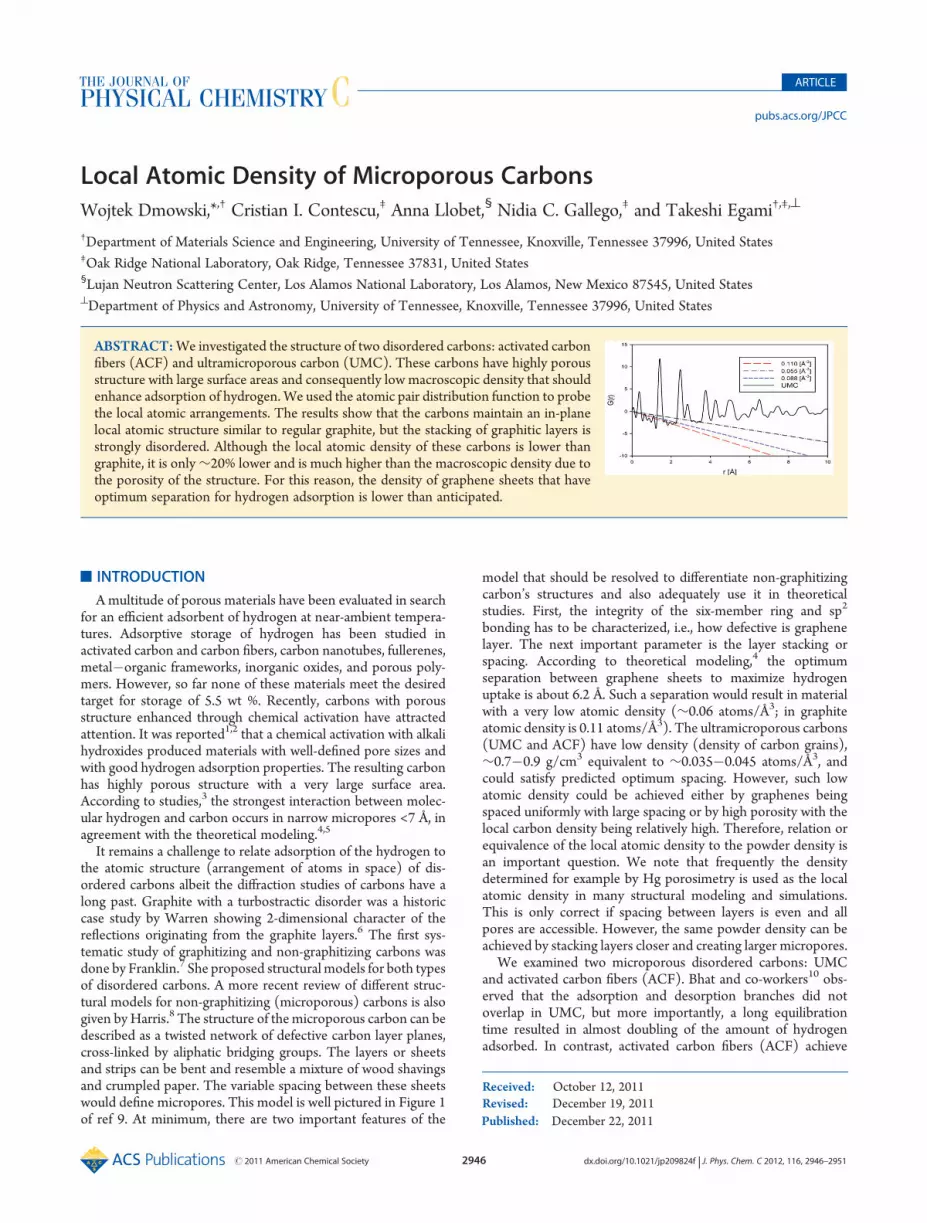
ABSTRACT:We investigated the structure of two disordered carbons: activated carbonfibers (ACF) and ultramicroporous carbon (UMC). These carbons have highly porousstructure with large surface areas and consequently low macroscopic density that shouldenhance adsorption of hydrogen. We used the atomic pair distribution function to probethe local atomic arrangements. The results show that the carbons maintain an in-planelocal atomic structure similar to regular graphite, but the stacking of graphitic layers isstrongly disordered. Although the local atomic density of these carbons is lower thangraphite, it is only∼20% lower and is much higher than the macroscopic density due tothe porosity of the structure. For this reason, the density of graphene sheets that haveoptimum separation for hydrogen adsorption is lower than anticipated.

2947 dx.doi.org/10.1021/jp209824f |J. Phys. Chem. C 2012, 116, 2946–2951
The Journal of Physical Chemistry C ARTICLE
equilibrium in less than 5 min at subatmospheric pressure, andthe maximum uptake in the volumetric system at 25 �C and 1 baris less than 0.05 wt %. The data shown10 revealed the unusuallyhigh hydrogen adsorption capacity of 0.8 wt % at 2 MPa (at25 �C) for UMC. It was suggested that adsorption of hydrogenon UMC is a combination of two processes: a fast processoccurring at pressures below∼0.2 bar (0.02 MPa), followed by aslow process, which is more evident at higher pressures. How-ever, it remains unclear why such an effect was not observed forother activated carbon as the ACF.
The regular wide-angle X-ray diffraction (WAX) pattern fromdisordered carbons is strongly diffuse. Therefore, standarddiffraction analysis based on the Bragg peak position is of limiteduse and in fact could be misleading.11 In this study we used theX-ray and neutron atomic pair distribution function (PDF)method to characterize atomic structure of the disordered ACFand UMC carbons. The advantage of the PDF is that it allowsstudying both the local and medium range structure of disor-dered and nanocrystalline materials in real space without relyingon the particulars of the diffraction pattern.12,13
’EXPERIMENTAL METHODS
Sample Preparation. We examined samples of two disor-dered carbons and a graphite powder purchased from Alfa-Aesarthat was used as a reference material. The ACF carbon wasobtained by fiber spinning of an isotropic pitch (with softeningpoint of 230 �C) followed by slow oxidative stabilization in air,carbonization in N2 (at 1000 �C), and physical activation in CO2
(at 900 �C) up to 40�45% weight loss.14 UMC is a develop-mental activated carbon material produced by MeadWestvacoCorp. (Charleston, SC). A sample of UMC from a near-industrialscale batch of the material was used for this project. For theproduction of UMC, a wood-based activated carbon, producedthrough the activation of wood with phosphoric acid, wassubjected to a second stage of activation with KOH. Both ACFand UMC samples were characterized with respect to theirhydrogen adsorption properties at near-ambient temperaturesand at moderate pressures. TheH2 capacity at 2MPa and 25 �C is0.15 wt % for ACF (BET surface area 2017 m2/g)15 and 0.8 wt %for UMC (BET surface area 2450 m2/g).10 The mean pore size is
∼9 Å for UMC and ∼7 Å for ACF. References 14, 15, and 10include more detailed physical and chemical characterization ofthe samples.Diffraction Experiment. The pulsed neutron diffraction was
carried out at the Lujan Neutron Center of the Los AlamosNational Laboratory using a High-Intensity Powder Diffractom-eter (HIPD). Hydrogen has a very large incoherent scatteringcross section, which obscures elastic scattering. Therefore,powder samples of ∼10 g of each carbon were degassed bycontinuous pumping at 650 �C with a turbo pump at 10�5 Torrfor 24 h. This successfully eliminated most of the hydrogen fromthe samples as evidenced by a low incoherent background.Neutron scattering is very sensitive to the presence of hydrogenbecause its incoherent cross section is enormous, 80.26 barns(coherent 1.76); for carbon 0.001 (5.55), respectively. In addi-tion, unbounded hydrogen gives characteristic inelastic back-ground strongly rising at low angles. The sample background,vanadium can, and vanadium standard were measured. The datawere processed to obtain the structure function S(Q) and thenreduced pair distribution function G(r).13 We used only highangle detector banks at 150� and 90� to obtainG(r). The reducedpair distribution function is obtained by the direct Fouriertransformation of the total scattering function including boththe Bragg peaks and diffuse scattering intensities, as given in eq 1,where scattering vector Q = 4π sin θ/λ, and θ is the scatteringangle and λ denotes the wavelength of the probe.G(r) is given by
GðrÞ ¼ 4πrðFðrÞ � F0Þ
¼ 2π
Z ∞
0Q ½SðQ Þ � 1� sinðQrÞ dQ ð1Þ
The F(r) is an atomic pair density function; F0 is the averageatomic density. The F0 represents the average density of thescattering atoms, not necessarily the powder density. We alsoexamined the structure of the carbons by high-energy X-raydiffraction, using the as-prepared samples, i.e., without thedegassing procedure used for the neutron studies. The room-temperature measurements were done at the 11-ID-C beamlineat the Advanced Photon Source (APS) with incident X-rayenergy of 115 keV. Powder sample was placed in 1 mm thickaluminum frame and covered by a thin Kapton tape. The imageplate (MAR-345 IP) located 33 cm behind the sample was usedas an area detector. The 2D detector pattern was integrated overthe 360� azimuth angle to obtain the intensity as a function of themagnitude of the scattering vector Q. The detector calibrationwas done using CeO2 NIST powder standard. The FIT2Dprogram16 was used to correct the data for detector geometricalerrors due to small angular misalignments, obliqueness, X-raybeam polarization, dark current, and incidentmonitor counts andfor 2D image generation and file format conversion. The back-grounds due to a Kapton holder and capillary were determinedseparately and subtracted during data analysis. Azimuthallyintegrated intensities were processed using the pdfgetX2package17 to obtain the structure function and reduced pairdistribution function G(r).
’RESULTS
Neutron Diffraction. The diffraction patterns obtained fromthe HIPD detectors for the disordered carbons UMC and ACFare shown in the Figure 1. In addition, data for the commercialgraphite are displayed for a reference, which show the strong
Figure 1. Low-temperature diffraction patterns for graphite and micro-porous ACF and UMC carbons. Indexed Bragg peaks correspond tohexagonal structure.

2948 dx.doi.org/10.1021/jp209824f |J. Phys. Chem. C 2012, 116, 2946–2951
The Journal of Physical Chemistry C ARTICLE
Bragg peaks expected for the alpha-hexagonal P63/mmc, spacegroup #194 (A9), a = 2.464 Å, c = 6.711 Å, γ = 120�. Thediffraction patterns for the ACF and UMC show strong 2-dimen-sional character: The peaks have a sawtooth shape and are shiftedin Q, indicating that they originate from diffraction rods fromsingle graphite layers. The shift of the 2D peaks (2D (10) vs(100) and (11) vs (110)) depends on the lateral extent of thelayer. It is inversely proportional to the number of unit cells in theplane.18 Shift of the 2D (10) peaks for the UMC and ACFcarbons is∼3%. This indicates that the coherent lateral extent inthe (10) direction is in the range of ∼8�9 units (∼13 Å) onaverage.18 The shift of the (11) peak is also ∼3%. However, thecoherence length along (11) is longer than (10); thus, the shiftsindicate roughly square fragments. The (11) peak of the UMCcarbon is more shifted toward high Q than that of ACF (δQ ∼0.16 vs 0.14 Å�1). It suggests that UMC is more laterallyextended or has nonuniform distortion in the layer. The evalua-tion of the peak shifts assumes that lattice fragment is ideally flat.Although better resolution of higher order peaks is required for amore methodical analysis, the diffraction patterns of ACF andUMC presented here clearly indicate limited lateral coherencelength. The diffuseness of the pattern is much higher thanobserved for glassy carbon.19,20 Peaks corresponding to (0,0,2l)are very broad or absent, e.g., (004). Thus, in addition to theturbostratic disorder, the number of layers must be small, andthey could be deformed, tilted, or folded. If the disorder betweenlayers was only turbostratic, the (0,0,2l) peaks should be present.Also, there is a difference in the (002) Bragg peak shape. Whilethe ACF carbon shows a diffuse, broad peak, for the UMC theintensity merges with the small-angle scattering, albeit there is aclear change of slope. The different pattern of (002) suggests thatthe stacking order/disorder along the z direction may bedissimilar in these samples. Both UMC and ACF show significantsmall-angle scattering extending to high Q’s ∼ 1 Å�1, indicatingporous nature in the nanometer range. Figure 2 illustrates thereduced pair distribution function, G(r), obtained for the gra-phite powder that we used as a reference sample. The graphiticcarbon structure with G(r) distances labeled can be found forinstance in ref 11. The first peak inG(r) at 1.42 Å corresponds to
the C�C bonds with three nearest neighbors in carbons with sp2
bonding. The second peak at 2.47 Å represents the distancebetween the three atoms coordinating central carbon or theshortest diagonal in the hexagon. The third peak at 2.84 Å, whichis twice the first C�C distance, is the second, long diagonal in thehexagon. There are such three distances corresponding to threeneighboring hexagons in the plane. If the carbon plane wasbuckled, this third peak would not be exactly twice the first one.The dashed curve (blue) shows the calculated G(r) for ahexagonal (AB...) structure and the dotted curve (red) for arhombohedral (ABC...) stacking of the hexagonal planes. It isseen that theG(r) in the short range is very similar for both typesof stacking. This is because the change in the every third layerarrangement is subtle and is clearly detectable only in the 12�14Å range peaks. Despite small particle size, our reference sample isquite well ordered in all three dimensions.Figure 3 presents experimental G(r) for the reference sample,
ACF, and UMC carbons. The data are shown up to 15 Å. Thedifference in the PDF’s between the disordered carbons andthe reference sample is clearly visible. The first PDF peaks for theACF and UMCmatch well in position with those of the graphite
Figure 2. Experimental G(r) for the reference sample. The fitted PDFsare for hexagonal (P63/mmc, #194) and rhombohedral (R�3m, #166)models, dashed and dotted curves, respectively (blue, dashed; red, dash-dotted lines).
Figure 3. Experimental G(r) for the reference sample, ACF (dashedcurve, blue), and UMC (dot-dashed curve, red) carbons.
Figure 4. Experimental and simulated G(r) for the ACF carbon: circlesand dashed curve, respectively (black and red).

2949 dx.doi.org/10.1021/jp209824f |J. Phys. Chem. C 2012, 116, 2946–2951
The Journal of Physical Chemistry C ARTICLE
up to 6�7 Å. Their widths are broader and amplitudes arereduced. Above 6�7 Å the peaks are strongly overlapping and donot follow the pattern in the reference sample. The atomiccorrelations are clearly lost beyond 14 Å for the ACF and UMC.This is the range corresponding to the lateral coherence deducedfrom the shift of the 2D diffraction peaks (Figure 1) and alsowhere stacking differences are becoming important in thereference sample. This behavior of G(r) indicates that short-range two-dimensional atomic order in disordered carbons issimilar to graphite but stacking along the c-axis is stronglydisordered and the long-range coherence is absent in all direc-tions. The patterns for the ACF and UMC in the Figure 3 appearto be quite similar. However, the G(r) peaks are slightly broaderfor UMC. For example, the first peak in PDF, which originatesfrom the coordination entirely in a single plane, has full width athalf-maximum larger by 15%, indicating that the layer of UMCmust be more strained. Figure 4 shows the best fit to the G(r)data for the ACF carbon using the hexagonal graphite model witha modified c-axis lattice constant and anisotropic displacementsfactors. The fit was obtained using the PDFgui software.21 Theparticle size was set to 20 Å. The particle size was established byadjusting the damping factor of the PDF amplitude, and it is closeto the estimate form the shift in the position of the 2D diffraction(10) peak in the Figure 1. The refined in-plane thermal factorswere only∼20% larger than in the reference sample (0.17 vs 0.14 Å).The c-axis constant was increased from 6.711 Å for graphiteto 7.42 Å, and a large c-axis displacement factor of ∼0.5 Å wasused. Interestingly, this simple model fits the G(r) data for thedisordered carbons quite well in the whole range up to 14 Å. Theinterlayer distance∼3.7 Å with a thermal factor of 0.5 Å gives anaverage increase in the spacing between layers along the c-axis∼0.35 ((0.25) Å, or about 18% if we include uncertainty due toz component displacements. The thermal factor used here is nota real thermal factor due to thermal vibration but is an effectivethermal factor (displacement amplitude), which represents theeffect of randomness, for instance the waviness of the sheet, ordeviation from the ideal flat graphitic layer. The large displace-ment amplitude indicates disorder between the stacking frag-ments. It affects the PDF pattern beyond 3.7 Å. This resultsuggests that deviations from the graphite-like structure beyond6�7 Å seen in the Figure 3 are also a consequence of a disorder in
the z direction. We should note that the (002) peak position forACF carbon is shifted toward lowerQ vs graphite (Figure 1). Theposition at∼1.7 Å�1 corresponds well to 2π/d, where d = 3.7 Åand is consistent with the expanded layer spacing.X-ray Diffraction Studies. In addition to the neutron studies,
we performed room-temperature X-ray diffraction studies. Inparticular, we wanted to determine the PDF of the sampleswithout the degassing procedure. Figure 5 compares the PDFsfor the UMC carbon obtained from the X-ray diffraction andneutron scattering. The difference is not significant and can beattributed to experimental inaccuracy. Therefore, the annealing/degassing procedure did not affect theG(r). Analysis of the X-raydiffraction is more challenging because the powder density of thedisordered carbons is very small. Also, the scattering power ofcarbon is quite small, and the atomic scattering factor falls offrapidly with Q.
’DISCUSSION
The “non-graphitizing” carbons are typically low-densitymaterials with isotropic, microporous structures at differentlength scales, from micrometers to few nanometers.7,22,23 Thebasic model of Franklin7 describes microstructure of the non-graphitizing carbons as a cross-linked network of stacks ofgraphite containing only few layers. The bridging fragmentsprovide resistance to high-temperature graphitization. The exactnature of the bridging groups, degree of stacking, defects, andbonding are still debatable. In addition, because of the weak vander Waals bonds between the layers, graphitic structures areprone to the turbostratic disorder. The turbostratic disorderchanges the character of the Bragg peaks. They are no longerpoints in reciprocal space but are 1-dimensional rods. As wasshown by Warren,6 the powder average of these rods producesa characteristic sawtooth peak shape. This pattern is clearlyseen in Figure 1. Thus, the layers in stacks must be disordered(disoriented or shifted—the effect is the same) in both ACFand UMC microporous carbons. The diffraction pattern is toomuch damped to analyze high-order 2D peaks and peak profilesin detail as it was done for glassy carbons.24,25 Nevertheless, itpoints to limited lateral coherence and strong disorder in thec-axis direction.
The local atomic structure of disordered carbons had beenstudied also by the PDF technique. The work by Franklin19 ismoreover the first application of the PDF to study disorderedcrystalline structures. Most of the PDF studies had been focusedon the structure of glassy carbons,20,26 in particular on thepresence of the tetrahedrons and sp3 bonding. Also, activatedand hard carbons used as anodes in electrochemistry had beenstudied.11,27�30
The positions of peaks in the PDF of the UMC and ACFcarbons match very well with those of the reference sample in theshort range up to 6�7 Å. In this range the PDF is mostlydetermined by the in-plane structure. Therefore, locally thestructure of the carbons must be very similar to that of thehexagonal graphite plane. The peaks are marginally broader,indicating only slightly larger distribution of the interatomicdistances. However, this is expected because of relaxation of theedge atoms or strain induced by a curvature. Clearly, the G(r) upto 6 Å is graphite-like; thus, we cannot anticipate significantdeviation from the 3-coordinated sp2 bonds. The departure inthe G(r) from the graphite-like pattern beyond ∼7 Å was alsoobserved for the activated29 and other carbons31 and had been
Figure 5. Experimental G(r) for the UMC carbon obtained using X-raydiffraction (X-UMC) (red) and neutron scattering (N-UMC) (blue).

2950 dx.doi.org/10.1021/jp209824f |J. Phys. Chem. C 2012, 116, 2946–2951
The Journal of Physical Chemistry C ARTICLE
attributed to a paracrystalline disorder. The in-layer paracrystal-line disorder was suggested to be due to the presence of quinoidstructure (resonating carbon double bonds) and/or defects suchas pentagons and heptagons. However, as was mentioned beforejudging from the G(r) patterns in the Figure 3, the local atomicstructure in UMC and ACF must be graphite-like; therefore, thedeparture from the graphite-like pattern beyond ∼7 Å is mostlikely due to limited lateral coherence and stacking disorder. TheG(r) patterns are sometimes modeled using Monte Carlofitting.32,33 Although seemingly appealing, these fits should betreated with caution. Reverse Monte Carlo and similar ap-proaches do not check the energy of the system; as a result,high-energy structures can be incorporated if they improveagreement factor. Modifications to the original reverse MonteCarlo method had been proposed by others34,35 that incorporateenergy constraints by adding a pair potential term. This helpsavoiding the formation of unphysical structural features such as3-member carbon rings; however, the procedure is biased bychoice of the interaction. Also, sampling of the solution space isalways small due to inherent computational limitations fordisordered structures such as number of atoms, complexity ofthe interactions, and time scale. The theoretical models are usefulto study hydrogen interactions with the carbon; however, theymay overestimate adsorption and storage capabilities. Themodels of disordered carbons with high surface area implystructures that have very low atomic density, reflecting powderdensity. However, a simple fit seen in Figure 4 suggests other-wise. This model is based on graphite, with expansion of thec lattice constant by ∼0.7 Å, or about 10%, and a large displac-ement factor of 0.5 Å, without invoking specific defects in thehexagonal plane. In the simple model, which assumes flatgraphite-like layers, the displacement amplitude most likelyreflects local curvature of the sheet. This curvature (or waviness)makes the sheet appear expanded (thicker). Also, it limitscoherence in the plane and along the c-axis. We can interpretthis result as if the effective “thickness” of the layer is 3.7( 0.25 Åinstead of 3.35 Å in the graphite. Therefore, the local atomicdensity could be only about∼18% smaller than in graphite. Thestacking arrangement, which depends on topology of the layers,may further relax the density. However, the ∼0.7�0.9 g/cm3
density of the UMC would imply only ∼0.038 atoms/Å3 andseparation between graphene sheets ∼9.8 Å (assuming there areno pores at all and the graphenes are flat). It is also possible toestimate the effective atomic density of the scattering volume
using measured G(r). Equation 1 implies that whenever theG(r)peaks do not overlap (i.e., F(r) = 0) the slope is equal to�4πF0,where F0 is the average atomic density (density of the scatterers).This is illustrated in the Figure 6a for the graphite. From theFigure 6b we can estimate that atomic density of the UMC isbetween the slope for 0.088 atoms/Å3, which corresponds todensity 20% lower than in the graphite, and the slope for 0.11atoms/Å3, which corresponds to the density of graphite. This isconsistent with the density we estimated from the simple fit inthe Figure 4. There is always some uncertainty in the slopedetermination due to the quality of the data and proper normal-ization of the structure function S(Q), but the Fourier transformworks as a band-pass filter and removes high- and low-frequencynoise. It is seen from the Figure 6b that local atomic density in theUMC should be between 0.11 and 0.088 atoms/Å3. Also, as wasnoticed before the position of the (002) peak for ACF (Figure 1)corresponds to the expanded interlayer separation of 3.7 Å,which would result in comparable density.
Therefore, the (002) peak position (in ACF), simple fit toG(r), and the slope of G(r) consistently indicate that the localatomic density in both carbons is at most on average ∼20%smaller than in graphite. Therefore, the graphene sheets in theUMC and ACF should be packed more closely than it issuggested in low-density models that frequently consist of aone extended surface enclosing and separating pores.
The UMC and ACF carbons have very similar G(r) patterns,which almost overlap in Figure 3, suggestive of graphite-likeatomic short-range order up to 7 Å and also similar local atomicdensities. However, the UMC has very diffuse (002) peak(Figure 1). The diffuseness of the (002) peaks clearly reflectsweak coherence in the UMC between sheets in the c-axis. Thiscould be the result of the curvature or folds, like cusps andsaddles, caused by small number of compensating defects such aspentagons and heptagons. It was shown that 1% of these types ofdefects in the graphene sheet creates enough curvature to affectG(r) beyond 7 Å but maintains sp2 bonding.35 It was pointed outbefore11 that diffuseness of the (002) peak can be caused byrelative misalignment or tilts of the layers. Therefore, thedifference between UMC and ACF may be more in micro-texture, i.e., shape and relative orientation of the sheets inthe stacks. In the ACF the folds may repeat themselves inthe next layer, resulting in a better coherence along thec-axis. This could be a consequence of the drawing processto prepare fibers.
Figure 6. (a) G(r) for graphite with the slope corresponding to atomic density 0.11 atoms/Å3. (b) G(r) for the UMC with three different slopes.The 0.088 atoms/Å3 density corresponds to 80% density of graphite.
2951 dx.doi.org/10.1021/jp209824f |J. Phys. Chem. C 2012, 116, 2946–2951
The Journal of Physical Chemistry C ARTICLE
The folded and less coherent microstructure in UMC couldprovide some flexibility to accommodate hydrogen adsorption.The observed low-pressure hysteresis adsorption10 in UMCmaybe at least in part due to adsorption-induced strain. Suchhysteresis was observed in metal�organic frameworks36 andwas attributed to dynamic opening and closing of the porousstructure, characterized as “structure breathing”.
’CONCLUSIONS
We have studied local structure of activated carbon fibers andultramicroporous, non-graphitizing, activated carbons. In bothcarbons atoms are organized to form two-dimensional graphenelayers. However, the in-plane coherence is limited to about 14 Å.The local atomic order is graphite-like, characterized by sp2
bonding, in both UMC and ACF carbons. These carbons havedifferent microtexture defined by stacking of the sheets, whichcould result in different adsorption characteristic. The graphenesheets are likely to have small fraction of defects causing localfolds and cusps that limit extent of the flat area, thus limiting alsolateral coherence as observed in the diffraction pattern. However,the local atomic density is only ∼20% lower than in graphite,suggesting that graphene layers are stacked closely but withoutinterlayer atomic correlation. This observation sets a severe limiton the local density of the graphene-based models of porouscarbons.
’AUTHOR INFORMATION
Corresponding Author*E-mail: [email protected].
’ACKNOWLEDGMENT
This research is supported by the U.S. Department of Energy,Basic Energy Sciences, Materials Science and Engineering Divi-sion. This work has benefited from the use of HIPD at the LujanCenter at LANSCE, funded by the DOE Office of Basic EnergySciences. Los Alamos National Laboratory is operated by LosAlamos National Security LLC under DOE Contract DE-AC52-06NA25396. Use of the Advanced Photon Source is supportedby the U.S. Department of Energy (DOE), Office of Science,under Contract DE-AC02-06CH11357.
’REFERENCES
(1) Lozano-Castello, D.; Lillo-Rodenas, M. A.; Cazorla-Amoros, D.;Linares-Solano, A. Carbon 2001, 39, 741–749.(2) de la Casa-Lillo, M. A.; Lamari-Darkrim, F.; Cazorla-Amoros, D.;
Linares-Solano, A. J. Phys. Chem. B 2002, 106, 10930–10934.(3) Texier-Mandoki, N.; Dentzer, J.; Piquero, T.; Saadallah, S.;
David, P.; Vix-Guterl, C. Carbon 2004, 42, 2744–2747.(4) Aga, R. C.; Fu, C, L.; Krcmar, M.; Morris, J. R. Phys. Rev. B 2007,
76, 165404(7p).(5) Cabria, I.; Lopez, M. J.; Alonso, J. A.Carbon 2007, 45, 2649–2658.(6) Warren, B. E. Phys. Rev. 1941, 59, 693–698.(7) Franklin, R. E. Proc. R. Soc. London, Ser. A 1951, A209, 196–218.(8) Harris, P. J. F. Crit. Rev. Solid State Mater. Sci. 2005, 30, 235–253.(9) Stoeckli, H. F. Carbon 1990, 28, 1–6.(10) Bhat, V. V.; Contescu, C. I.; Gallego, N. C.; Baker, F. S. Carbon
2010, 48, 1331–1340.(11) Claye, A.; Fischer, J. E. Electrochim. Acta 1999, 45, 107–120.(12) Dmowski, W.; Egami, T.; Swider-Lyons, K. E.; Love, C. T.;
Rolison, D. R. J. Phys. Chem. B 2002, 106, 12677–12683.
(13) Egami, T.; Billinge, S. J. L. Underneath the Bragg Peaks:Structural Analysis of Complex Materials; Pergamon Press: Oxford, 2004.
(14) Wu., X.; Gallego, N. C.; Contescu, C. I.; Tekinalp, H.; Bhat,V. V.; Baker, F. S.; et al. Carbon 2008, 46, 54–61.
(15) Contescu, C. I.; Brown, C. M.; Liu, Y.; Bhat, V. V.; Gallego,N. C. J. Phys. Chem. C 2009, 113, 5886–5890.
(16) Hammersley, A. P.; Svensson, S. O.; Thompson, A. Nucl.Instrum. Methods, A 1994, 346, 312–321.
(17) Qiu, X.; Thompson, J. W.; Billinge, S. J. L. J. Appl. Crystallogr.2004, 37, 678(1p).
(18) Yang, D.; Frindt, R. F. J. Appl. Phys. 1996, 79, 2376–2385.(19) Franklin, R. E. Acta Crystallogr. 1950, 3, 107–121.(20) Wignall, G. D.; Pings, C. J. Carbon 1974, 12, 51–55.(21) Farrow, C. L.; Juhas, P.; Liu, J. W.; Bryndin, D.; Bozin, E. S.;
Bloch, J.; et al. J. Phys.: Condens. Matter 2007, 19, 335219(7p).(22) McEnaney, B. Carbon 1988, 26, 267–274.(23) Edwards, I. A. S., Marsh, H., Eds.; Introduction to Carbon Science;
Butterworths: London, 1989.(24) Ergun, S.; Schehl, R. R. Carbon 1973, 11, 127–158.(25) Rousseaux, F.; Tchoubar, D. Carbon 1977, 15, 55–61.(26) Mildner, D. F. R.; Carpenter, J. M. J. Non-Cryst. Solids 1982,
47, 391–402.(27) Liu, Y.; Xue, J. S.; Tao, Z.; Dahn, J. R. Carbon 1996, 34,
193–200.(28) Zhou, P.; Lee, R.; Claye, A.; Fischer, J. E. Carbon 1998, 36,
1777–1781.(29) Burian, A.; Ratuszyna, A.; Dore, J. C.; Howells, S. W. Carbon
1998, 36, 1613–1621.(30) Petkov, V.; et al. Philos. Mag. B 1999, 79, 1519–1530.(31) Hawezek, L.; Kozoczek, J.; Br�odka, A.; Dore, J. C.; Honkim€aki,
V.; Burian, A. Philos. Mag. 2007, 87, 4973–4986.(32) Pikunic, J.; Clinard, Ch.; Cohaut, N.; Gubbins, K. E.; Guet,
J.-M.; Pellenq, R. J.-M.; et al. Langmuir 2003, 19, 8565–8582.(33) Palmer, J. C.; Jain, S. K.; Gubbins, K. E.; Cohaut, N.; Fischer,
J. E.; Dash, R. K.; Gogots, Y. In Proceedings of the VIII InternationalConference on Characterization of Porous Solids; Cambridge SpecialPublication; Kaskel, S., Llewellyn, P., Rodriguez-Reinsos, F., Seaton,N. A., Eds.; Royal Society of Chemistry: London, 2009; Vol. 318, pp56�63.
(34) Jain, S. K.; Pellenq, R. J.-M.; Pikunic, J. P.; Gubbins, K. E.Langmuir 2006, 22, 9942–9948.
(35) Nguyen, T. X.; Cohaut, N.; Jun-Seok Bae, J.-S.; Bhatia, S. K.Langmuir 2008, 24, 7912–7922.
(36) Smith, M. A.; Foley, H. C.; Lobo, R. F. Carbon 2004,42, 2041–2048.
(37) Thomas, K. M. Dalton Trans. 2009, 1487–1505.