Embed Size (px)
Citation preview

Published: March 15, 2011
r 2011 American Chemical Society 1974 dx.doi.org/10.1021/je100973t | J. Chem. Eng. Data 2011, 56, 1974–1981
ARTICLE
pubs.acs.org/jced
Carbon Dioxide Adsorption Isotherms on Activated CarbonsBidyut Baran Saha,*,† Skander Jribi,‡ Shigeru Koyama,‡ and Ibrahim I. El-Sharkawy§
†Department of Mechanical Engineering, Faculty of Engineering, Kyushu University, 744, Motooka, Nishi-ku, Fukuoka-shi 819-0395,Japan‡Department of Energy and Environmental Engineering, Interdisciplinary Graduate School of Engineering Sciences, Kyushu University,6-1 Kasuga-koen, Kasuga-shi, Fukuoka 816-8580, Japan§Mechanical Power Engineering Department, Faculty of Engineering, Mansoura University, El-Mansoura, Egypt
ABSTRACT: This paper presents adsorption isotherm data of CO2 onto two different types of highly porous activated carbons(ACs) for temperatures ranging from (�18 to 80) �C and pressures up to 10 MPa. The assorted adsorbents are activated carbonfiber (ACF) of type A-20 and activated carbon powder of type Maxsorb III. Adsorption isotherm data have been obtained using avolumetric technique and fitted to the Dubinin�Astakhov (D�A), T�oth, Langmuir, and modified D�A equations. The latterconsiders the pseudosaturation pressure of CO2 that plays an important role for supercritical gas adsorption, and thepseudosaturation pressure was determined from the experimental data. The T�oth and modified D�A isotherms correlate withthe experimental data within 5 % root-mean-square deviation (rmsd) and present a better fitting than that of the Langmuir and theD�A equations. The isosteric heat of adsorption data were derived from the T�oth and modified D�A isotherm equations and thecorrelation proposed by Chakraborty et al., and the average heat of adsorption values were found to be comparable. These data areessential for designing CO2-based adsorption cooling, refrigeration, and gas storage systems.
’ INTRODUCTION
Physical adsorption on carbonaceous adsorbents has beenextensively studied for the separation and purification of gases,1�3
gas storage,4�6 and adsorption cooling7�11 applications. For theadsorption cooling and adsorbed gas storage applications, it isessential to estimate correct isotherms and isosteric heat ofadsorption of the assorted adsorbent�adsorbate pairs for design-ing adsorption systems. Using these key data, the numericalmodeling of the processes of chiller operation and gas storageperformance can be performed with a high level of confidence.
As one of the countermeasures against global warming andenergy conservation problems, Saha et al.8 and El-Sharkawyet al.12 investigated experimentally the adsorption characteristicsof ethanol and methanol, respectively, onto activated carbonfiber and Maxsorb III. However, these adsorbent�refrigerantpairs work on subatmospheric pressures, and thus the systemfootprint becomes large. Accordingly, it is inevitable to developadsorption cooling systems based on natural working pairs whichwork above atmospheric pressure. Among natural refrigerants,CO2 has the advantage of having no problems related toflammability and toxicity as opposed to ammonia and thus hasreceived considerable attention especially in the field of auto-motive air conditioners.
Himeno et al.13 reported a systematic study of the adsorptionof carbon dioxide onto five different activated carbons using thestatic volumetric method. Experiments were performed at tem-peratures ranging from (0 to 50) �C and pressures up to 6 MPa.However, CO2-based transcritical adsorption cooling systemscan go up to 10MPa. From the above perspective, the adsorptionisotherms of CO2 on two different types of highly porousactivated carbons for temperatures ranging from (�18 to80) �C and pressures up to 10 MPa were determined as these
data are not available in the open literature. Experimental datawere correlated with the D�A, modified D�A, T�oth, andLangmuir isotherm models. The isosteric heat of adsorptiondata are also evaluated.
’EXPERIMENTAL SECTION
Materials. The adsorbents used in this study are ACF of typeA-20 and activated carbon powder of type Maxsorb III, and theseactivated carbons were developed by AD’ALL Co. Ltd., Japan,and Kansai Coke & Chemicals Co. Ltd., Japan, respectively. Themicroporus ACF (A-20) has a large surface area of 2000 m2
3 g�1,
micropore volume (vμ) of 1.03 cm33 g
�1, and average porediameter of 21.6 Å.7 It is suitable for physical adsorption andeasy to pack. On the other hand, Maxsorb III has a surface area ashigh as 3150 m2
3 g�1, micropore volume of 1.7 cm3
3 g�1, and
mean pore diameter of 2 nm.14 Samples of CO2 and helium weresupplied by Asahi Sanso Shokai Ltd. Japan having a purity of99.995 %.Experimental Apparatus. Measurements of the adsorption
equilibrium of CO2 ontoMaxsorb III and ACF (A-20) have beenconducted using a volumetric technique. Figure 1 shows theschematic diagram of the experimental apparatus which com-prises: (i) adsorption and load cells, and these cells are designedto stand a pressure of 12 MPa; (ii) two water baths of typeAdvantec TBN402DA connected with two water circulators oftype Eyela CTP-3000 and CTP-6000; and (iii) a 25.8 μmmesh isattached at the center of the adsorption cell. The adsorption cell
Received: September 27, 2010Accepted: February 25, 2011

1975 dx.doi.org/10.1021/je100973t |J. Chem. Eng. Data 2011, 56, 1974–1981
Journal of Chemical & Engineering Data ARTICLE
is connected to the load cell through 1/4” stainless steelplumbing and a set of Swagelok fittings (connectors, T’s, andreducers). Other parts are stopping valves of type SS-1KS4, safetyvalves of type SS-4R3A, and 15 μm pore size filter of type SS-4TF-15. The tubes shown by zigzag lines in Figure 1 aremountedby a tape heater to control their temperatures.Instrumentation. The instrumentation used in the present
study was: (i) a vacuum pressure gauge of type Phil PG-D5A, (ii)a 10 MPa absolute pressure transducer of type Kyowa PHS-100KA with an uncertainty of ( 0.2 % of full scale in measure-ment, (iii) several K type thermocouples within ( 0.1 �Cuncertainty calibrated with a standard platinum resistance ther-mometer, and (iv) a data acquisition system comprising aYokogawa MX data logger and a personal computer to recordthe experimental data each second.Procedure. Before conducting experiments, the volume of
load and adsorption cells along with their connecting tubes aremeasured using a water filling method by measuring the mass ofpure water filled in the cell using a digital balance of type MettlerToledo PR8002 with ( 0.01 g uncertainty. At first, the assortedadsorbent was dried in an electric oven at a temperature of 373 Kfor 12 h and then packed in the adsorption cell. The mass of thedried adsorbent packed in the adsorption cell was also measuredprior to the adsorption isotherm experiment. Adsorption iso-therm measurements were performed according to the followingchronological steps:(i) Both of the load and adsorption cells are evacuated with a
vacuum pump for 6 h until the pressure reaches as low as20 Pa. At the same time, the activated carbon packed insidethe adsorption cell is being regenerated with a band heater,and the temperature is maintained at 120 �C.
(ii) A certain amount of CO2 is released into the loading cellwhere the equilibrium is reached within 30 min. The stateof the gas in terms of pressure and temperature is thenrecorded using the data acquisition system.
(iii) The valve between the adsorption cell and the load cell isopened. The starting of adsorption is characterized by asharp increase of the adsorption bed temperature and apressure drop from the loading pressure to near theequilibrium pressure, which are shown in Figure 2. The
adsorption cell reaches its equilibrium in about an hour,and then the equilibrium pressure is recorded. Then,steps (ii) and (iii) are repeated until reaching the satura-tion pressure at the assorted adsorption isotherm tem-perature or the maximum pressure of the CO2 cylinderwhich is typically about 6 MPa.
(iv) To measure the adsorption equilibrium for pressuresabove 6 MPa, the load cell is used as an intermediatevessel to increase the pressure. At first, the load cell isconnected to the CO2 cylinder and cooled to increase themass of adsorbate in the cell. After that, the load cell isisolated from the CO2 cylinder and heated until the loadpressure increases to the desired value.
Assuming that adsorption occurs in micropores, the voidvolume, Vvoid, is calculated by the following equation.
Vvoid ¼ Vcell �mch
Fs� υμmch ð1Þ
where the third term in the RHS of eq 1 is the void volumecorrection. Vcell stands for the volume of adsorption cell; mch, Fs,and vμ denote the mass, solid density, and micropore volume ofthe activated carbon, respectively.A mass of 16.82 g of ACF (A-20) has been packed into the
adsorption cell of 76.38 cm3, assuming a solid density of carbon(Fs) of 1.8 g 3 cm
�3 as stated by the ACF manufacturer, and theadsorption cell void is 67.03 cm3. This value is in good agreementwith the cell void measured by helium expansion. Taking intoaccount the micropore volume (vμ), the void volume (Vvoid) inthe adsorption cell packed with ACF (A-20) is found to be48.53 cm3.With the same approach, a mass of 18.67 g of Maxsorb III is
packed into a second cell of 80.27 cm3, with Fs/g 3 cm�3 = 2.2 for
Maxsorb III, and the adsorption cell void is 71.78 cm3. Vvoid inthis case is estimated to be 40.04 cm3.Data Reduction. The primary data are the load pressure Pl,
the equilibrium pressure Peq, the load temperature Tl, and theadsorbent temperature Ta. The mass adsorbed in the nth mea-surement can be determined by eq 2 below, where n varies from 1to 7.
mn ¼ mn � 1 þΔmload, n �Δmvoid, n ð2Þwhere mn�1 is the previous amount adsorbed; Δmload,n is themass difference in the load cell between the load state andequilibrium state; and Δmvoid,n is the mass added to the voidvolume.
Figure 1. Schematic diagram of volumetric experimental apparatus (1,load cell; 2, filter; 3, adsorption cell; 4, thermocouple; 5, pressuretransducer; 6, vacuum gauge; 7, tape heater; 8, water bath; 9, watercirculator; 10, vacuum pump).
Figure 2. Evolution of pressure and temperature during adsorption.
1976 dx.doi.org/10.1021/je100973t |J. Chem. Eng. Data 2011, 56, 1974–1981
Journal of Chemical & Engineering Data ARTICLE
The experiments measure excess adsorption, and correlationsrelate absolute adsorption. The adsorbed phase volume isassumed to be negligible compared to the bulk gas phase volume.Correlation of Isotherms. Adsorption experimental data
were correlated with four different isotherms, namely, Langmuir,T�oth, Dubinin�Astakhov (D�A), and modified D�A equa-tions.Langmuir and T�oth Isotherms. The well-known Langmuir
and T�oth isotherm models can be expressed by eqs 3 and 4,respectively.15
CC0
¼ bP1þ bP
ð3Þ
CC0
¼ bP
ð1þ ðbPÞtÞ1=tð4Þ
where C/kg 3 kg�1 is the amount adsorbed; C0/kg 3 kg
�1 is thesaturated amount adsorbed; P/MPa is the equilibrium pressure;and b/MPa�1 is the adsorption affinity given by
b ¼ b0eðQ=RTÞ ð5Þ
where b0 is the adsorption affinity at infinite temperature andQ is the isosteric heat of adsorption. The parameter t in eq 4 issaid to characterize the system heterogeneity which is acharacteristic of the adsorbent or adsorbate or a combinationof both. The lower the value of t, the more heterogeneous thesystem. If t is equal to unity, the T�oth isotherm is reduced tothe Langmuir isotherm.D�A Isotherm. The Dubinin�Astakhov (D�A) model is
given by16
W ¼ W0 exp � AE
� �n" #
ð6Þ
where W/cm33 g
�1 is the volume adsorbed; W0/cm33 g
�1 isthe limiting micropore volume; E/J 3mol�1 is the character-istic energy; n is the structural heterogeneity parameter; andA is the adsorption potential. The adsorbed phase volumeW/cm3
3 g�1 is obtained by multiplying the adsorption up-
take C/kg 3 kg�1 by the molar volume Vm which can be
expressed as17
Vm ¼ Vt expðRðT � TtÞÞ ð7Þwhere Vt is the molar volume of the liquid adsorbate at thetriple point (Tt = 216.6 K and Pt = 0.51814 MPa) and thenumerical value of Vt is found to be 0.84858 cm3
3 g�1. The
thermal expansion of the superheated liquid R is taken as0.0025 K�1 as suggested by Ozawa.17 It is noteworthy tomention here that the values of Vm which are found by thepresent method are almost identical to those of Cook andBasmadjian.18 The adsorption potential A is given by
A ¼ RT lnPsP
� �ð8Þ
where R is the gas constant; Ps is the saturated vapor pressureat the temperature T; and P is the equilibrium pressure. Athigh pressure, the pressure should be replaced by the fugacityto correct for the nonideality of gases. The adsorptionpotential becomes
A ¼ RT lnfsf
� �ð9Þ
where f and fs are the corresponding fugacities of P and Ps,respectively.Above the critical temperature (Tc) of CO2, the concept of
liquid is nonexistent. Dubinin suggested the following empiricalequation to compute the values of the pseudovapor pressureabove the critical temperature.19
Ps ¼ TTc
� �2
Pc for ðT > TcÞ ð10Þ
Modified D�A Model. Amankwah and Schwarz20 proposed amodified D�A model where the estimation of pseudovaporpressures takes into account the interactions between theadsorbate�adsorbent system and is given by
Ps ¼ TTc
� �k
Pc ð11Þ
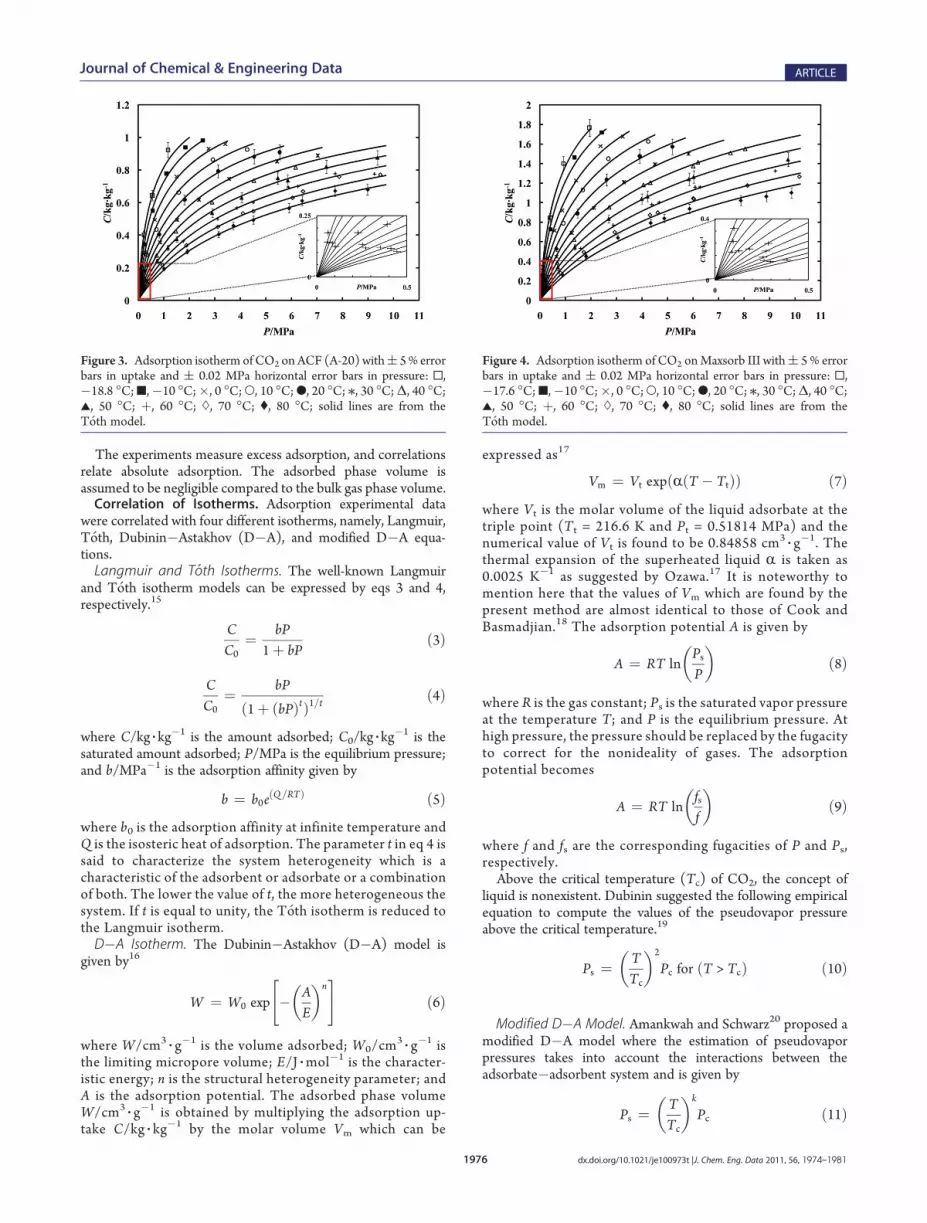
Figure 3. Adsorption isotherm of CO2 onACF (A-20) with( 5% errorbars in uptake and ( 0.02 MPa horizontal error bars in pressure: 0,�18.8 �C;9,�10 �C;�, 0 �C;O, 10 �C;b, 20 �C; /, 30 �C;Δ, 40 �C;2, 50 �C; þ, 60 �C; ), 70 �C; (, 80 �C; solid lines are from theT�oth model.
Figure 4. Adsorption isotherm of CO2 onMaxsorb III with( 5 % errorbars in uptake and ( 0.02 MPa horizontal error bars in pressure: 0,�17.6 �C;9,�10 �C;�, 0 �C;O, 10 �C;b, 20 �C; /, 30 �C;Δ, 40 �C;2, 50 �C; þ, 60 �C; ), 70 �C; (, 80 �C; solid lines are from theT�oth model.

1977 dx.doi.org/10.1021/je100973t |J. Chem. Eng. Data 2011, 56, 1974–1981
Journal of Chemical & Engineering Data ARTICLE
where k is a constant obtained from the fitting of experimentaladsorption isotherm data. This modified D�A equation providesbetter fitting in the case of the adsorption isotherm of methaneand hydrogen onto four types of activated carbons.20 The kvalues vary from 2.1 to 2.73 for methane and from 2.72 to 4.16 forhydrogen. For CO2 adsorption on ACF (A-20) and Maxsorb III,k is found to be 3.86 and 4.49, respectively.Isosteric Heat of Adsorption. Knowledge of the thermo-
dynamic properties of the adsorbent þ adsorbate system allowsbetter understanding of the adsorption process. The determina-tion of heat of adsorption permits measurement of the degree ofenergetic heterogeneity of gas�solid interactions. The Clau-sius�Clapeyron (CC) equation has been widely used to estimatethe heat of adsorption (ΔH) from isotherm equations and can be
expressed as
ΔHCC ¼ RT2 D ln PDT
� �C
ð12Þ
The ΔHCC derived from the Langmuir and T�oth isotherms isconstant and is equal to the parameter Q in eq 5. The ΔHCC
derived from the modified D�A equation reduces to
ΔHCC,D�A ¼ RT2D ln PsDT
þ Aþ RnTEnA1 � n ð13Þ
where RT2(∂ ln Ps)/(∂T) = kRT for T > Tc.Recently, from the rigor of thermodynamic formalisms,
Chakraborty et al.21 modified the Clausius�Clapeyron heat of
Table 1. Raw Adsorption Data of CO2 onto ACF (A-20) for Adsorption Temperatures of (�10, 10, 30, 50, and 70) �C
measurement number Tl/�C Pl/MPa Ta/�C Peq/MPa Δmload/g Δmvoid/g mn/g C/kg 3 kg�1
1 30 0.491 �10 0.060 2.463 0.061 2.402 0.143
2 30 0.843 �10 0.239 3.549 0.182 5.768 0.343
3 30 1.208 �10 0.572 3.870 0.355 9.283 0.553
4 30 1.795 �10 1.108 4.464 0.617 13.130 0.782
5 30 2.382 �10 1.853 3.735 0.989 15.876 0.947
6 30 2.778 �10 2.535 1.854 1.115 16.615 0.992
1 30 0.486 10 0.103 2.196 0.096 2.101 0.125
2 30 0.824 10 0.339 2.858 0.226 4.733 0.282
3 30 1.199 10 0.713 2.982 0.371 7.344 0.438
4 30 2.281 10 1.585 4.801 0.945 11.200 0.668
5 30 3.556 10 2.931 5.231 1.785 14.646 0.876
6 30 4.617 10 4.266 3.757 2.614 15.789 0.947
1 30 1.056 30 0.391 3.980 0.346 3.634 0.217
2 30 1.311 30 0.860 2.807 0.433 6.008 0.358
3 30 1.982 30 1.536 3.003 0.664 8.347 0.498
4 30 2.784 30 2.382 3.029 0.911 10.465 0.625
5 30 3.965 30 3.565 3.691 1.482 12.674 0.759
6 30 5.770 30 5.438 5.160 3.241 14.593 0.878
7 32 7.201 30 7.037 7.316 6.499 15.411 0.935
1 50 0.683 50 0.272 2.229 0.224 2.005 0.120
2 50 1.184 50 0.745 2.476 0.401 4.080 0.243
3 50 1.999 50 1.512 2.953 0.684 6.349 0.379
4 50 3.485 50 2.897 4.126 1.367 9.108 0.545
5 50 4.420 50 4.053 2.927 1.309 10.726 0.643
6 50 6.275 50 5.866 4.385 2.518 12.594 0.758
1 32 1.925 50 1.159 4.985 1.235 3.750 0.326a
2 32 6.171 50 5.472 11.194 6.126 8.818 0.771a
3 39 7.564 50 7.367 5.192 4.311 9.699 0.852a
4 45 9.531 50 9.373 8.858 8.053 10.504 0.931a
1 30 0.799 70 0.412 2.290 0.320 1.970 0.118
2 30 1.292 70 0.955 2.105 0.435 3.641 0.218
3 30 2.299 70 1.890 2.873 0.788 5.726 0.343
4 30 3.484 70 3.121 3.064 1.122 7.668 0.460
5 30 4.781 70 4.508 3.068 1.408 9.328 0.560
6 30 6.206 70 6.047 3.240 1.793 10.775 0.649
1 35 5.146 70 4.102 10.805 4.550 6.254 0.546a
2 35 6.710 70 6.458 5.058 3.437 7.875 0.690a
3 35 7.906 70 7.877 3.631 2.549 8.957 0.787a
4 36 9.708 70 9.488 3.749 3.538 9.168 0.809a
aThe mass of ACF (A-20) is taken as 11.56 g.
1978 dx.doi.org/10.1021/je100973t |J. Chem. Eng. Data 2011, 56, 1974–1981
Journal of Chemical & Engineering Data ARTICLE
adsorption equation (eq 12) by introducing an extra term (secondterm of the RHS of eq 14), which accounts for the heat of adsorbedmass with respect to pressure and temperature changes duringadsorption, and the modified equation is expressed by
ΔHads ¼ RT2 D ln PDT
� �C
þ TvgDPDT
� �ð14Þ
Accordingly, the corrected heat of adsorption employing the mod-ified D�A equation reduces to
ΔHads, D�A ¼ kRT þ Aþ RnTEnA1�n þ Tvg
DPDT
� �ð15Þ
’RESULTS AND DISCUSSION
The experimental uptake curves of CO2 onto ACF (A-20) andMaxsorb III for temperatures ranging from (�18 to 80) �C andpressures up to 10 MPa are shown in Figures 3 and 4, respectively.
The shape of the adsorption isotherms of CO2 in the assortedmicroporous materials is monotonically concave and therefore canbe classified as type I in the IUPAC classification.22 The raw data forCO2 adsorption on ACF (A-20) and Maxsorb III are presented inTable 1 and Table 2, respectively.
The experimental data are fitted with the Langmuir, T�oth,Dubinin�Astakhov (D�A), and modified D�A isotherm equa-tions. A nonlinear optimization routine is used to optimize theparameters of these models to fit the experimental data for multipletemperatures.15 The root-mean-square deviation (rmsd) betweenthe calculated values (cal) and experimental data (exp) is defined as
rmsd ¼
ffiffiffiffiffiffiffiffiffiffiffiffiffiffiffiffiffiffiffiffiffiffiffiffiffiffiffiffiffiffiffiffiffiffiffiffiffiffiffiffiffi∑N
0
Cexp � Ccal
Cexp3 100
!2
N
vuuuutð16Þ
As can be seen from Figures 3 and 4, the maximum uptake ofCO2 onto ACF (A-20) near the saturation pressure is 1 kg of
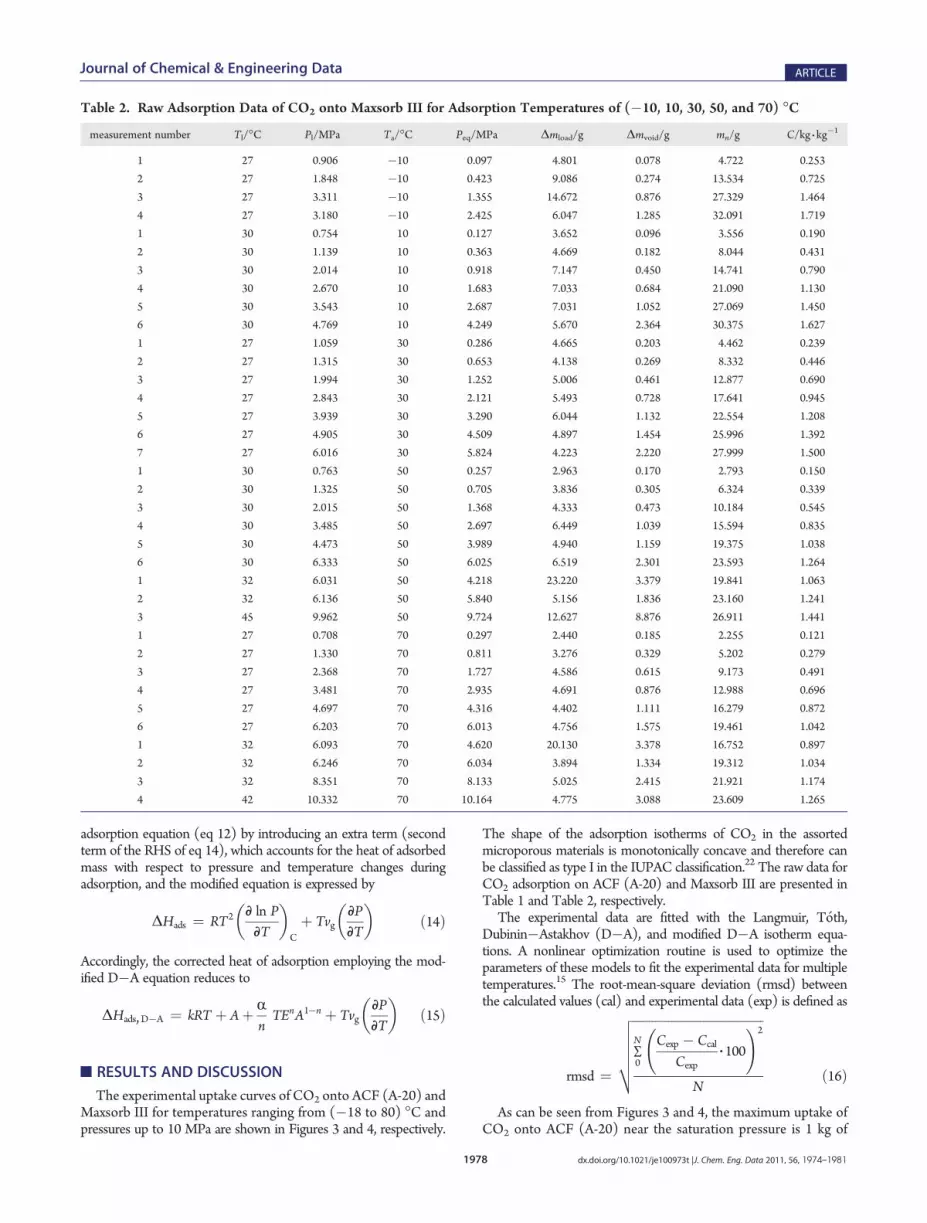
Table 2. Raw Adsorption Data of CO2 onto Maxsorb III for Adsorption Temperatures of (�10, 10, 30, 50, and 70) �C
measurement number Tl/�C Pl/MPa Ta/�C Peq/MPa Δmload/g Δmvoid/g mn/g C/kg 3 kg�1
1 27 0.906 �10 0.097 4.801 0.078 4.722 0.253
2 27 1.848 �10 0.423 9.086 0.274 13.534 0.725
3 27 3.311 �10 1.355 14.672 0.876 27.329 1.464
4 27 3.180 �10 2.425 6.047 1.285 32.091 1.719
1 30 0.754 10 0.127 3.652 0.096 3.556 0.190
2 30 1.139 10 0.363 4.669 0.182 8.044 0.431
3 30 2.014 10 0.918 7.147 0.450 14.741 0.790
4 30 2.670 10 1.683 7.033 0.684 21.090 1.130
5 30 3.543 10 2.687 7.031 1.052 27.069 1.450
6 30 4.769 10 4.249 5.670 2.364 30.375 1.627
1 27 1.059 30 0.286 4.665 0.203 4.462 0.239
2 27 1.315 30 0.653 4.138 0.269 8.332 0.446
3 27 1.994 30 1.252 5.006 0.461 12.877 0.690
4 27 2.843 30 2.121 5.493 0.728 17.641 0.945
5 27 3.939 30 3.290 6.044 1.132 22.554 1.208
6 27 4.905 30 4.509 4.897 1.454 25.996 1.392
7 27 6.016 30 5.824 4.223 2.220 27.999 1.500
1 30 0.763 50 0.257 2.963 0.170 2.793 0.150
2 30 1.325 50 0.705 3.836 0.305 6.324 0.339
3 30 2.015 50 1.368 4.333 0.473 10.184 0.545
4 30 3.485 50 2.697 6.449 1.039 15.594 0.835
5 30 4.473 50 3.989 4.940 1.159 19.375 1.038
6 30 6.333 50 6.025 6.519 2.301 23.593 1.264
1 32 6.031 50 4.218 23.220 3.379 19.841 1.063
2 32 6.136 50 5.840 5.156 1.836 23.160 1.241
3 45 9.962 50 9.724 12.627 8.876 26.911 1.441
1 27 0.708 70 0.297 2.440 0.185 2.255 0.121
2 27 1.330 70 0.811 3.276 0.329 5.202 0.279
3 27 2.368 70 1.727 4.586 0.615 9.173 0.491
4 27 3.481 70 2.935 4.691 0.876 12.988 0.696
5 27 4.697 70 4.316 4.402 1.111 16.279 0.872
6 27 6.203 70 6.013 4.756 1.575 19.461 1.042
1 32 6.093 70 4.620 20.130 3.378 16.752 0.897
2 32 6.246 70 6.034 3.894 1.334 19.312 1.034
3 32 8.351 70 8.133 5.025 2.415 21.921 1.174
4 42 10.332 70 10.164 4.775 3.088 23.609 1.265
1979 dx.doi.org/10.1021/je100973t |J. Chem. Eng. Data 2011, 56, 1974–1981
Journal of Chemical & Engineering Data ARTICLE
CO2 per kg of ACF (A-20), and that of CO2 onto Maxsorb III is1.7 kg of CO2 per kg of Maxsorb III. In both cases, eachexperimental point is found within ( 5 % deviation with theT�oth model.
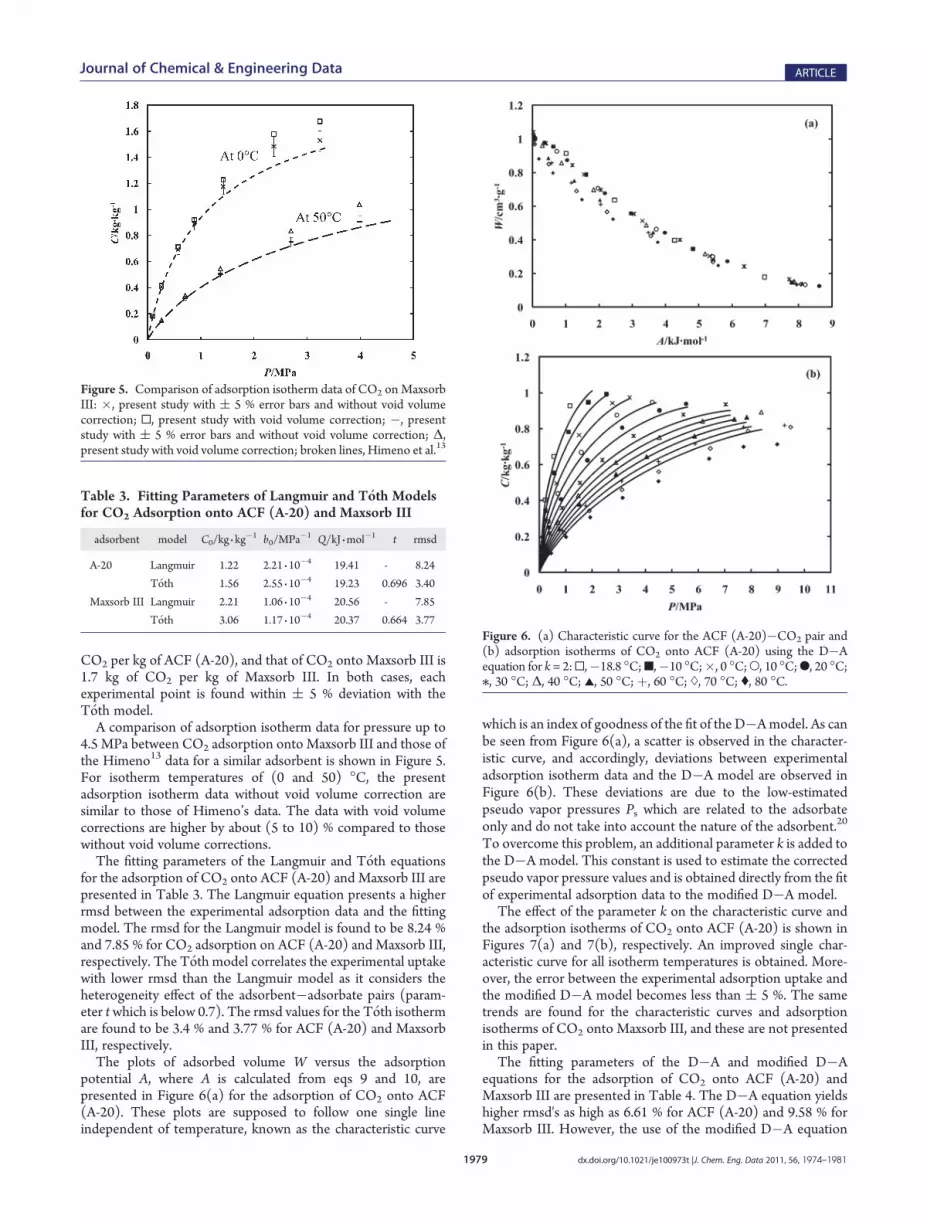
A comparison of adsorption isotherm data for pressure up to4.5 MPa between CO2 adsorption onto Maxsorb III and those ofthe Himeno13 data for a similar adsorbent is shown in Figure 5.For isotherm temperatures of (0 and 50) �C, the presentadsorption isotherm data without void volume correction aresimilar to those of Himeno’s data. The data with void volumecorrections are higher by about (5 to 10) % compared to thosewithout void volume corrections.
The fitting parameters of the Langmuir and T�oth equationsfor the adsorption of CO2 onto ACF (A-20) and Maxsorb III arepresented in Table 3. The Langmuir equation presents a higherrmsd between the experimental adsorption data and the fittingmodel. The rmsd for the Langmuir model is found to be 8.24 %and 7.85 % for CO2 adsorption on ACF (A-20) and Maxsorb III,respectively. The T�oth model correlates the experimental uptakewith lower rmsd than the Langmuir model as it considers theheterogeneity effect of the adsorbent�adsorbate pairs (param-eter t which is below 0.7). The rmsd values for the T�oth isothermare found to be 3.4 % and 3.77 % for ACF (A-20) and MaxsorbIII, respectively.
The plots of adsorbed volume W versus the adsorptionpotential A, where A is calculated from eqs 9 and 10, arepresented in Figure 6(a) for the adsorption of CO2 onto ACF(A-20). These plots are supposed to follow one single lineindependent of temperature, known as the characteristic curve
which is an index of goodness of the fit of the D�Amodel. As canbe seen from Figure 6(a), a scatter is observed in the character-istic curve, and accordingly, deviations between experimentaladsorption isotherm data and the D�A model are observed inFigure 6(b). These deviations are due to the low-estimatedpseudo vapor pressures Ps which are related to the adsorbateonly and do not take into account the nature of the adsorbent.20
To overcome this problem, an additional parameter k is added tothe D�A model. This constant is used to estimate the correctedpseudo vapor pressure values and is obtained directly from the fitof experimental adsorption data to the modified D�A model.
The effect of the parameter k on the characteristic curve andthe adsorption isotherms of CO2 onto ACF (A-20) is shown inFigures 7(a) and 7(b), respectively. An improved single char-acteristic curve for all isotherm temperatures is obtained. More-over, the error between the experimental adsorption uptake andthe modified D�A model becomes less than ( 5 %. The sametrends are found for the characteristic curves and adsorptionisotherms of CO2 onto Maxsorb III, and these are not presentedin this paper.
The fitting parameters of the D�A and modified D�Aequations for the adsorption of CO2 onto ACF (A-20) andMaxsorb III are presented in Table 4. The D�A equation yieldshigher rmsd's as high as 6.61 % for ACF (A-20) and 9.58 % forMaxsorb III. However, the use of the modified D�A equation
Figure 5. Comparison of adsorption isotherm data of CO2 onMaxsorbIII: �, present study with ( 5 % error bars and without void volumecorrection; 0, present study with void volume correction; �, presentstudy with ( 5 % error bars and without void volume correction; Δ,present study with void volume correction; broken lines, Himeno et al.13
Table 3. Fitting Parameters of Langmuir and T�oth Modelsfor CO2 Adsorption onto ACF (A-20) and Maxsorb III
adsorbent model C0/kg 3 kg�1 b0/MPa�1 Q/kJ 3mol
�1 t rmsd
A-20 Langmuir 1.22 2.21 3 10�4 19.41 - 8.24
T�oth 1.56 2.55 3 10�4 19.23 0.696 3.40
Maxsorb III Langmuir 2.21 1.06 3 10�4 20.56 - 7.85
T�oth 3.06 1.17 3 10�4 20.37 0.664 3.77
Figure 6. (a) Characteristic curve for the ACF (A-20)�CO2 pair and(b) adsorption isotherms of CO2 onto ACF (A-20) using the D�Aequation for k = 2:0,�18.8 �C;9,�10 �C;�, 0 �C;O, 10 �C;b, 20 �C;/, 30 �C; Δ, 40 �C; 2, 50 �C; þ, 60 �C; ), 70 �C; (, 80 �C.

1980 dx.doi.org/10.1021/je100973t |J. Chem. Eng. Data 2011, 56, 1974–1981
Journal of Chemical & Engineering Data ARTICLE
reduces the rmsd as low as 3.58% and 4.53% for ACF (A-20) andMaxsorb III, respectively.
The plots of the heat of adsorption versus the adsorbedamount for ACF (A-20)�CO2 and Maxsorb III�CO2 pairsare shown in Figures 8(a) and 8(b), respectively. The Clausius�Clapeyron heats of adsorption (ΔHCC) derived from the T�othisotherm equation are constant, and these are equal to (19.23 and20.37) kJ 3mol
�1 for ACF (A-20)�CO2 and Maxsorb III�CO2
pairs, respectively. On the other hand, the isosteric heat ofadsorption (ΔHads) proposed by Chakraborty et al.21 yieldshigher isosteric heat of adsorption values than those obtainedfrom ΔHCC,D�A. It is noteworthy to mention that for bothadsorbent�adsorbate pairs the values of ΔHads,D�A are higherthan those obtained from the T�oth equation during low loading
and are almost the same during relatively higher loading where Cis above 0.5 kg 3 kg
�1 for ACF (A-20) and above 0.8 kg 3 kg�1 for
Maxsorb III.
’CONCLUSIONS
Adsorption isotherm data for CO2 onto ACF (A-20) andMaxsorb III have been obtained through a volumetric technique.The adsorption uptake measurements cover the temperatureranging from (�18 to 80) �C and pressures up to 10 MPa. Thedata have been successfully correlated to popular isothermequations within ( 5 % uncertainty. For the measured adsorp-tion isotherm data, an improvement in accuracy has beenobserved in the present study over that of an earlier methodfor the similar adsorbent�adsorbate pairs. Adsorption uptake ofCO2 on Maxsorb III is about 1.7 times higher than that of ACF(A-20). The isosteric heat of adsorption data have been extractedfrom the experimental measurements, which appear to be wellinterpreted from that derived from the modified D�A equation.The average heats of adsorption of CO2 in Maxsorb III and ACF(A-20) are found to be (20.37 and 19.23) kJ 3mol�1, respectively.
Figure 7. (a) Characteristic curve for the ACF (A-20)�CO2 pair and(b) adsorption isotherms of CO2 onto ACF (A-20) using the modifiedD�A equation for k = 3.86:0,�18.8 �C;9,�10 �C;�, 0 �C;O, 10 �C;b, 20 �C; /, 30 �C; Δ, 40 �C; 2, 50 �C; þ, 60 �C; ), 70 �C; (, 80 �C.
Table 4. Fitting Parameters of D�A and Modified D�AModels for CO2 Adsorption onto ACF (A-20) and MaxsorbIII
adsorbent model k W0/cm33 g
�1 E/J 3mol�1 n rmsd
A-20 D�A 2 1.002 4468.22 1.14 6.61
modified D�A 3.86 1.03 4549.92 1.18 3.58
Maxsorb III D�A 2 1.727 3983.24 1.12 9.58
modified D�A 4.49 1.759 4159.89 1.18 4.53
Figure 8. (a)Heat of adsorption for the ACF (A-20)�CO2 pair and (b)heat of adsorption for the Maxsorb III�CO2 pair: ---, ΔHCC derivedfrom the T�oth isotherm; O, ΔHCC derived from the modified D�Aequation (eq 13); Δ, corrected heat of adsorption derived from themodified D�A equation (eq 15).

1981 dx.doi.org/10.1021/je100973t |J. Chem. Eng. Data 2011, 56, 1974–1981
Journal of Chemical & Engineering Data ARTICLE
’AUTHOR INFORMATION
Corresponding Author*Phone:þ81-92-802-3101. Fax:þ81-92-802-3125. E-mail: [email protected].
’ACKNOWLEDGMENT
The authors wish to express their thanks to their formercolleague, Dr. Kuwahara, for his help during the experimentalwork.
’REFERENCES
(1) Majlan, E. H.; Daud, W. R. W.; Iyuke, S. E.; Mohamad, A. B.;Kadhum, A. A. H.; Mohammad, A. W.; Takriff, M. S.; Bahaman, N.Hydrogen purification using compact pressure swing adsorption systemfor fuel cell. Int. J. Hydrogen Energy 2009, 34, 2771–2777.(2) Yates, M.; Blanco, J.; Avila, P.; Martin, M. P. Honeycomb
monoliths of activated carbons for effluent gas purification.MicroporousMesoporous Mater. 2000, 37, 201–208.(3) Knoblauch, K. Activated carbon and carbon molecular sieves in
gas separation and purification. Gas Sep. Purif. 1993, 7, 195–196.(4) Saha, B. B.; Koyama, S.; El-Sharkawy, I. I.; Habib, K.; Srinivasan,
K.; Dutta, P. Evaluation of adsorption parameters and heats of adsorp-tion through desorption measurements. J. Chem. Eng. Data 2007,52, 2419–2424.(5) Himeno, S.; Komatsu, T.; Fujita, S. Development of a new effective
biogas adsorption storage technology. Adsorption 2005, 11 (1 SUPPL.),899–904.(6) Sircar, S.; Golden, T. C.; Rao, M. B. Activated carbon for gas
separation and storage. Carbon 1996, 34, 1–12.(7) El-Sharkawy, I. I.; Kuwahara, K.; Saha, B. B.; Koyama, S.; Ng,
K. C. Experimental investigation of activated carbon fibers/ethanol pairsfor adsorption cooling system application. Appl. Thermal Eng. 2006,26, 859–865.(8) Saha, B. B.; El-Sharkawy, I. I.; Chakraborty, A.; Koyama, S. Study on
an activated carbon fiber-ethanol adsorption chiller: Part II— performanceevaluation. Int. J. Refrig. 2007, 30, 96–102.(9) Saha, B. B.; Chakraborty, A.; Koyama, S.; Ng, K. C.; Sai, M. A.
Performance modelling of an electro-adsorption chiller. Philos. Mag.2006, 86, 3613–3632.(10) Al Mers, A.; Azzabakh, A.; Mimet, A.; El Kalkha, H. Optimal
design study of cylindrical finned reactor for solar adsorption coolingmachine working with activated carbon�ammonia pair. Appl. ThermalEng. 2006, 26, 1866–1875.(11) Critoph, R. E.; Metcalf, S. J.; Tamainot-Telto, Z. Proof of
concept car adsorption air-conditioning system using a compact sorp-tion reactor. Heat Transfer Eng. 2010, 31, 950–956.(12) El-Sharkawy, I. I.; Hassan, M.; Saha, B. B.; Koyama, S.; Nasr,
M. M. Study on adsorption of methanol onto carbon based adsorbents.Int. J. Refrig. 2009, 32, 1579–1586.(13) Himeno, S.; Komatsu, T.; Fujita, S. High-pressure adsorption
equilibria of methane and carbon dioxide on several activated carbons.J. Chem. Eng. Data 2005, 50, 369–376.(14) Saha, B. B.; Chakraborty, A.; Koyama, S.; Yoon, S.; Mochida, L.;
Kumja, M.; Yap, C.; Ng, K. C. Isotherms and thermodynamics for theadsorption of n-butane on pitch based activated carbon. Int. J. Heat MassTransfer 2008, 51, 1582–1589.(15) Do, D. D. Adsorption Analysis: Equilibria and Kinetics. Series in
Chem. Eng.; Imperial College Press: 1998.(16) Dubinin, M. M. Fundamentals of the theory of adsorption in
micropores of carbon adsorbents: Characteristics of their adsorptionproperties and microporous structures. Carbon 1989, 27, 457–467.(17) Ozawa, S.; Kusumi, S.; Ogino, Y. Physical adsorption of gases at
high pressure. IV. An improvement of the Dubinin-Astakhov adsorptionequation. J. Colloid Interface Sci. 1976, 56, 83–91.
(18) Agarwal, R. K.; Schwarz, J. A. Analysis of high pressureadsorption of gases on activated carbon by potential theory. Carbon1988, 26, 873–887.
(19) Dubinin, M. M. Prog. Surface and Membrane Science; Cadenhead,D. A., Eds. et al. ; Academic Press: New York, 1975; Vol. 9, Ch. 1.
(20) Amankwah, K. A. G.; Schwarz, J. A. A. Modified approach forestimating pseudo-vapor pressures in the application of the Dubinin-Astakhov equation. Carbon 1995, 33, 1313–1319.
(21) Chakraborty, A.; Saha, B. B.; Koyama, S.; Ng, K. C. On thethermodynamic modeling of the isosteric heat of adsorption andcomparison with experiments. Appl. Phys. Lett. 2006, 89, 171901.
(22) Sing, K. S. W.; Everett, D. H.; Haul, R. A. W.; Moscoul, L.;Pierotti, R. A.; Rouqerol, J.; Siemieniewska, T. Reporting PhysisorptionData for Gas/Solid Systems with Special Reference to theDetermination ofSurface Area and Porosity. Pure Appl. Chem. 1985, 57, 603–619.


