Embed Size (px)
Citation preview
Separation and Purification Technology 134 (2014) 26–36
Contents lists available at ScienceDirect
Separation and Purification Technology
journal homepage: www.elsevier .com/locate /seppur
Microporous assembly of MnO2 nanosheets for malachite greendegradation
http://dx.doi.org/10.1016/j.seppur.2014.07.0211383-5866/� 2014 Published by Elsevier B.V.
⇑ Corresponding author. Tel.: +91 3222 281920; fax: +91 3222 282254.E-mail address: [email protected] (A. Pal).
Sandip Saha b,a, Anjali Pal a,⇑a Department of Civil Engineering, Indian Institute of Technology, Kharagpur 721302, Indiab Department of Chemistry, Indian Institute of Technology, Kharagpur 721302, India
a r t i c l e i n f o a b s t r a c t
Article history:Received 4 May 2014Received in revised form 9 July 2014Accepted 10 July 2014Available online 18 July 2014
Keywords:MnO2 nanosheetPorous soft assemblyMalachite greenOxidative degradationMineralization
Porous assembly of MnO2 nanosheets has been prepared via a simple redox co-precipitation methodusing Mn(OAc)2 and KMnO4. The material has been characterized by XRD, XPS, FESEM, TEM, FTIR, andN2-adsorption–desorption analyses. The as-prepared MnO2 nanomaterial is microporous (average porediameter: 0.8 nm; surface area: 162 m2/g) and poorly crystalline. The TEM and SEM images reveal the for-mation of spherical assembly of fine nanosheets. The oxidation state of manganese is determined by XPSanalysis. The porous nature and the oxidizing property of the nano MnO2 has been exploited for MG deg-radation in aqueous media under ambient condition. The effects of various parameters (such as pH, MnO2
dose, initial MG concentration, air/O2, and organic acids) on MG degradation are evaluated. The mineral-ization of MG is monitored through TOC analyses. About 99% decolorization and �44% mineralization ofMG (conc.: 50 mg/L) is achieved in 120 min with MnO2 (dose: 0.5 g/L). The decolorization follows firstorder kinetics. During the oxidative degradation, slight leaching of Mn2+ is observed. The reusability ofthe material has been shown for three consecutive cycles with good performance.
� 2014 Published by Elsevier B.V.
1. Introduction
At present thousands of synthetic dyes are being used in textile,pharmaceutical, cosmetics, food and beverage processing, solarcells, paper making, and computer industries. They also find wideapplications in biological sample imaging. Many of these dyeshaving intense color are being discharged in water bodies. Around10–15% of the manufactured dyes are lost every year. These col-ored dyes pollute both surface water and ground water. Many ofthem are non-biodegradable under normal environmental condi-tions, and show mutagenic, carcinogenic and micro toxic behavior.As a consequence they affect biota and human beings. Althoughvarious technologies are developed for the removal and treatmentof dye contaminated water and wastewater, but they have theirown limitations. For example, the biological treatments [1,2] maybe suitable for decolorizing the dyes effectively, but in many casesthe intermediates produced during the degradation are more toxicthan the mother compound. Malachite green (MG) is a cationic dyeused worldwide as a biocide in the aquaculture industry. Theusefulness of MG against protozoan and fungal infection is verywell-known. Although it is a therapeutic agent for tropical
treatment in fishery, but it is potent enough to produce significantinternal effects through systematic adsorption on fishes. It mainlyworks as an ectoparasiticide in aquaculture industry. The otherapplications of MG are as a food additive, coloring agent, medicaldisinfectant and antihelminthic. Application of MG in silk, wool,jute, leather, cotton, and paper industries is also enormous. Thetoxic effects of MG have been studied widely [3,4]. The carcino-genic effects in immune and reproductive system, and genotoxicitywas observed due to the consumption of MG treated fishes [5,6].This caused the dye to be banned in many countries. Recentlythe US Food and Drug Administration have designated MG as a pri-ority chemical for carcinogenicity testing. In spite of all these factsthis dye is still being used in many countries due to its low cost,easy availability and efficaciousness [7]. The reduced MG i.e. leuco-malachite green (LMG) is not only considered as a contaminant inaquatic and earthly ecosystems, but also it is recognized as apotential hazard for human health. During the treatment of fungaland parasitic infection in fishes, MG is reduced to LMG andadsorbed in the exposed tissues like liver, kidney, muscle, skinand viscera [8–13].
Recently nanomaterials have found wide applications as cata-lyst [14–16]. These fine particles have very large surface area andthey offer special binding sites to the reacting species. This makesthem active for various types of homogeneous and heterogeneous
S. Saha, A. Pal / Separation and Purification Technology 134 (2014) 26–36 27
catalytic reactions. The applications of transition metal oxidenanoparticles for the treatment of organic/dye contaminated efflu-ents have invoked another challenging field in recent years. Theseinorganic oxide materials have wide applications in catalysis, ionexchange, molecular adsorption, biosensing, and especially inenergy storage. The MnO2 is one such easily available nontoxictransition metal oxide. It is a well-known oxidative agent for soils,sediments and marine environments. The Mn(III) and Mn(IV) oxi-des are potential oxidizing agents for different natural and xenobi-otic organic compounds [17]. The redox reaction takes place at theMnO2/water interface after the sorption of the compound [17,18].The removal of micro pollutants such as synthetic hormones [19],anti-inflammatory drugs [20], antibacterial agents [21,22], bisphe-nol A [23], phenols [24], sulfides [25], 2-mercaptobenzothiazole(2MBT) [18], and sulfadiazine [26,27], have been achieved byMnO2. The decolorization of methylene blue (MB) [28], oxidationof N-oxides [29] and polybrominated diphenyl ethers [30], trans-formation of heavy metals (viz., As(III) and Cr(III) [31–33]) to theirhigher oxidation states have also been studied by MnO2. Somenanostructured MnO2 materials have also been applied for Fentonlike catalytic degradation of rhodamine B, congo red, ethylene blue,and methylene blue [34,35].
Here we report the oxidative degradation of MG at the nanoMnO2/water interface. The MG degradation was carried out underambient condition without adding any other chemical. To the bestof our knowledge degradation of MG by nano MnO2 is not reportedso far. The MnO2 nanoparticles were synthesized in gram levelthrough a soft chemistry oxidation–reduction approach. The influ-ence of various parameters has been examined to optimize thereaction condition.
2. Experimental procedure
2.1. Reagents and materials
Potassium permanganate, malachite green oxalate, mercuricsulfate, silver sulfate, potassium dichromate, sulfuric acid, sodiumperdisulfate, ortho-phosphoric acid, potassium hydrogen phthalate(KHP), commercial MnO2 were purchased from Merck (India).Manganese(II) acetate tetra hydrate was purchased from LOBAchemicals. The chemicals used such as methanol, ethyl acetate, tar-taric acid, malonic acid, malic acid, oxalic acid, citric acid, hydrogenperoxide, sodium chloride, NaOH, and conc. HCl were purchasedfrom SRL, India. Double distilled water was used throughout theexperiments whenever required.
2.2. Synthesis of MnO2 nanoparticles
Manganese dioxide nanoparticles were prepared using a modi-fied co-precipitation method reported earlier [36,37]. Two precur-sors, 0.742 g of Mn(OAc)2�4H2O and 0.316 g of KMnO4 weredissolved in 100 mL deionized water separately. KMnO4 solutionwas added drop wise to the solution of Mn2+ under gentle mag-netic stirring. Upon complete addition of KMnO4, the solutiongradually turned to dark brown. The stoichiometric mol ratio ofMn(OAc)2:KMnO4 was 3:2. The following reaction occurred insolution phase:
2KMnO4ðaqÞ þ 3MnðOAcÞ2ðaqÞ þ 2H2O
! 5MnO2ðsÞ þ 2AcOKðaqÞ þ 4AcOHðaqÞ ð1Þ
The solution was aged for 24 h under ambient condition in openair. Brown precipitate was centrifuged and washed with plenty ofdouble distilled water. Later on the solid brown precipitate wascollected and finally dried in oven at 100 �C for 4 h. The dried solidmass was again dispersed in water under gentle magnetic stirring.
Washing was performed until a clear supernatant was observed.The mass was separated through centrifugation and dried at100 �C for 12 h in an oven. Hereafter the as-obtained material willbe designated as ‘nano MnO2’.
2.3. Oxidative degradation experiments
The oxidative degradation of MG using the as-synthesizednano MnO2 material was studied on MG. Reaction was performedin a 50-mL hard glass centrifuge tube at ambient temperatureunder gentle magnetic stirring. Under optimum experimentalcondition, the dose of nano MnO2 was 0.5 g/L and volume ofMG solution was 10 mL. After the reaction, the mixture was cen-trifuged for 1 min at 1500 rpm and the absorbance of the super-natant was measured at 617 nm. Most of the studies such as,effects of pH, interference by low molecular weight (LMW)organic acids, effect of atmospheric oxygen, and reuse of catalystwere carried out with MG solution (volume: 10 mL; conc.: 30 mg/L) with nano MnO2 at a dose of 0.5 g/L, if otherwise notmentioned.
2.4. Analytical procedure for total organic carbon (TOC) determination
The extent of mineralization of the dye was monitored by thedetermination of total organic carbon (TOC) in the sample. Thesamples were analyzed at different times of reaction after centrifu-gation. Prior to the TOC analysis, 10–100 mg/L KHP standards wereprepared following the standard method [38], and the calibrationcurve was drawn.
2.5. Instruments
The X-ray diffraction (XRD) analysis was done in atmosphericair using powdered sample in a Panalytical High Resolution X’Cel-erator, PW 3040/60, (PANalytical B.V., Netherland) using Co(Ka = 1.54056) as the X-ray source. Fourier transform infrared(FTIR) spectra were collected in transmittance mode in a ThermoNEXUS – 870 (Madison, USA) instrument. Samples were dried invacuum and IR spectra were recorded in KBr pellet. Field emis-sion scanning electron microscopic (FESEM) images were accu-mulated by placing the samples on a carbon tape in a JEOL JSM5800 field emission scanning electron microscope. The energydispersive X-ray spectroscopy (EDS) was carried out from theOXFORD ISI 300 EDS X-ray microanalysis system. The atomic per-centage was determined from EDS data. Transmission electronmicroscopic (TEM) images were recorded in a Phillips FEI TECH-NAI G2 20S TWIN instrument with an accelerating voltage of200 kV. Samples were prepared by drop-wise addition of anappropriate solution onto a carbon-coated 400 mesh Cu grid(EM Sciences, Gibbstown, NJ) followed by solvent evaporation inair. Absorption spectra were recorded in a Spectrascan UV 2600Spectrophotometer (Chemito, India) equipped with a 1-cm well-stoppered quartz cuvette.
Nitrogen adsorption and desorption measurements were per-formed at 77 K using a Quantachrome Autosorb Automated GasSorption System utilizing Brunauer–Emmett–Teller (BET) calcula-tions for the surface area and Barrett–Joyner–Halenda (BJH) calcu-lations for the pore-size distribution after the samples weredegassed in a vacuum overnight. The TOC was measured in an Aur-ora 1030 Wet Oxidation TOC Analyzer, OI Analytical, USA,equipped with OI 1088 rotary Autosampler. The leaching of Mn2+
ion in reaction medium was determined in a Varian AA240FS fastsequential Atomic Absorption Spectrophotometer.
100 (a)
28 S. Saha, A. Pal / Separation and Purification Technology 134 (2014) 26–36
3. Results and discussions
3.1. Characterization of MnO2 nanoparticles
1000 2000 3000 400040
50
60
70
80
90
1530
(b)
511
1625
3400471
1020
1410
442
Tran
smitt
ance
(%)
Wavenumber (cm-1)
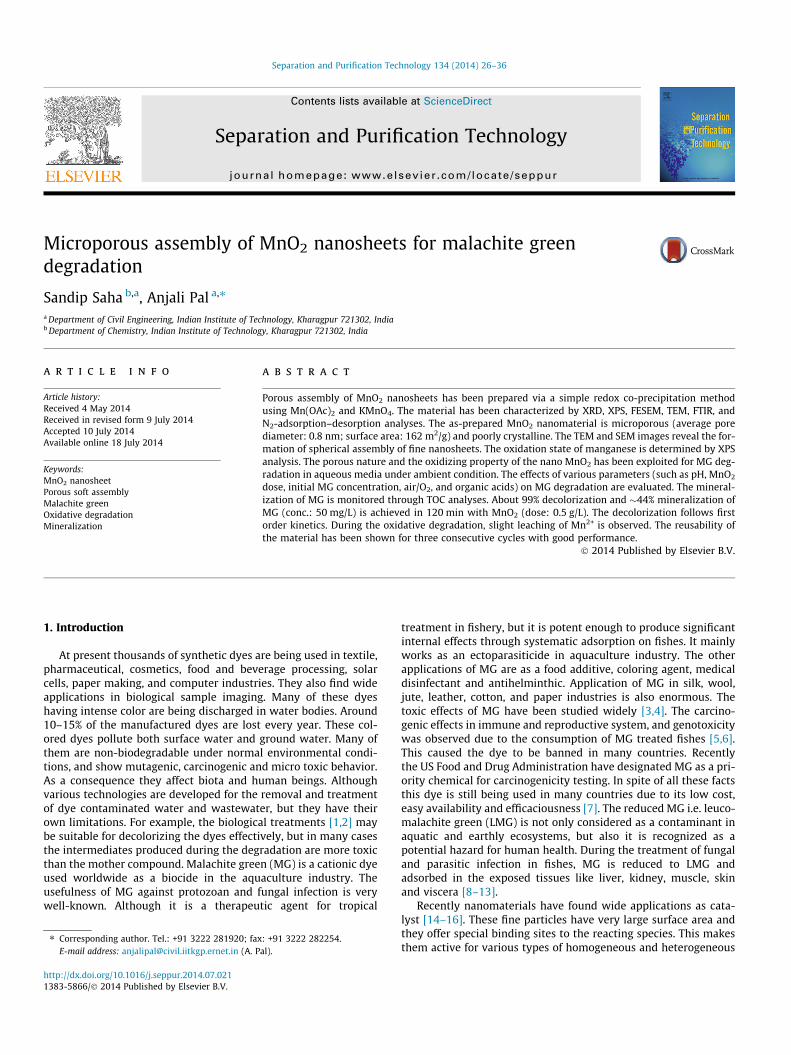
Fig. 2. FTIR spectra of the nano MnO2 (a) before and (b) after MG degradation.
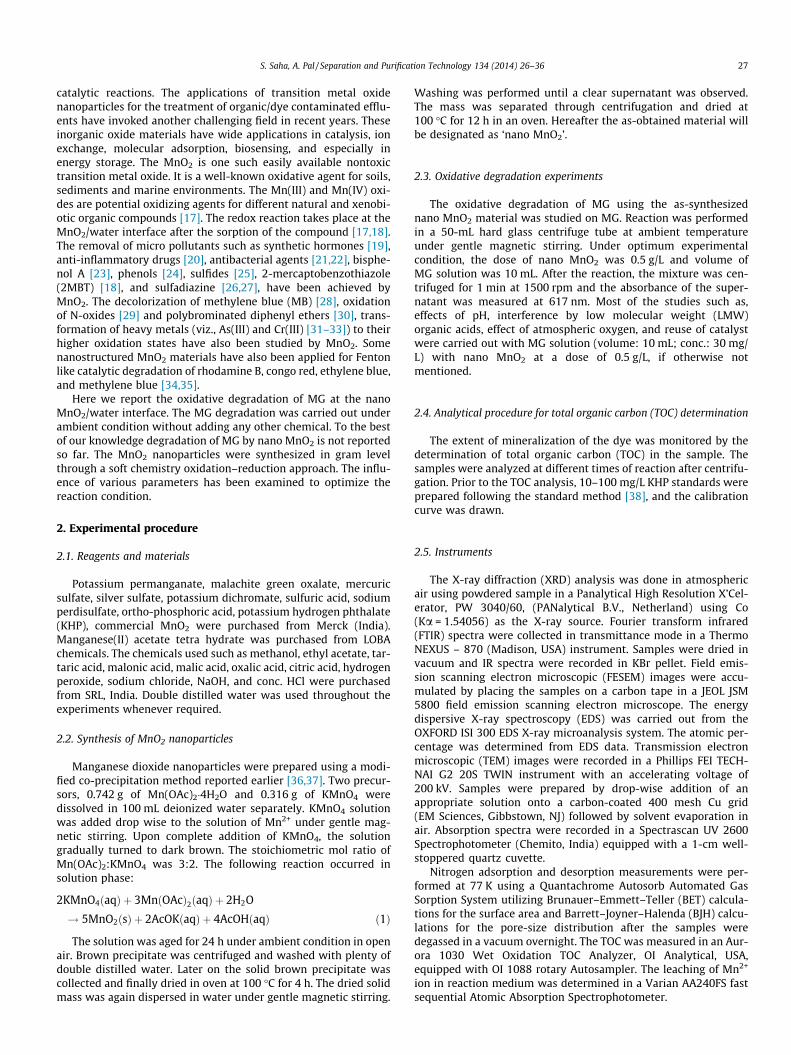
3.1.1. X-ray diffraction (XRD) analysisThe phase purity of the nano MnO2 was examined by XRD. The
spectrum of the as-prepared nano MnO2 did not show a goodnumber of significant peaks (Fig. 1; spectrum a) for phasedetermination. This situation is common in case of MnO2 preparedby co-precipitation method [36,37,39]. However, the material aftercalcinations showed distinct peaks for the pure phase of a-MnO2.Spectrum b and spectrum c of Fig. 1 show the XRD pattern ofMnO2 after 4 h calcinations at 300 �C and 400 �C, respectively. Allthe reflections in the XRD pattern of the calcined MnO2 materialsshowed distinct peaks which matched well with the a-MnO2
(JCPDS file No. 44-0141). The broad and asymmetric reflectionsin XRD pattern of as-synthesized nano MnO2 (before calcination),however, could be due to the presence of poorly crystallized microdomains and staking faults [36]. The reaction rate between Mn(II)and Mn(VII) was very fast and hence a large number of nuclei wereformed in the solution within a very short period of time, whichwas inadequate for the growth of crystals. Thus the as-synthesizednano MnO2 was poorly crystalline [40], but it is a precursor ofa-MnO2.
3.1.2. Fourier transform infrared (FTIR) analysisInfrared spectroscopy is a simple and valuable technique for the
determination of characteristic bonds in various molecules. TheFTIR data can be used to yield important information aboutMnO2 materials. In FTIR spectrum the presence of O–H or boundwater molecules could be identified by the appearance of a bandaround 3400 and 1600 cm�1 [41]. The FTIR spectrum (Fig. 2, spec-trum a) of nano MnO2 shows well defined peaks at 1625 and3400 cm�1, which could be attributed to bending and stretchingmode, respectively of O–H vibration either due to the presence ofsmall quantities of adsorbed interlayer water molecules, or dueto OH� in the lattice. The peak in the range of 2000–900 cm�1
could arise due to different degree of hydrogen bonding in thesample. A typical hydrous manganese oxide exhibits three peaksat 1510, 1280 and 1050 cm�1, and c-MnO2 exhibits peak at1620 cm�1. These four absorptions are attributed to O–H bendingvibrations associated with Mn atom [41]. In the present case thepeaks appeared at 1625, 1530 and 1020 cm�1. Analysis of low
20 40 60 800
300
600
900
1200
1500
c
a
b
(312
)
(541
)
(002
)(521
)
(600
)(411
)
(301
)
(211)
(310
)
(200
)
(110
)
Inte
nsity
2Θ (degree)
Fig. 1. XRD pattern of the as-prepared nano MnO2 (a) before, and (b and c) aftertreatment at 300 �C and 400 �C for 4 h, respectively.
frequency region could provide the information of MnO6 octahe-dral material. The MnO6 octahedral materials were indicated byproper analysis of IR spectrum around 600–540 cm�1 and feeblydeveloped doublet in 460–440 cm�1 region. This region of the IRspectrum contains the compositional information of materials.The presence of a weak doublet at �510 cm�1 in Fig. 2a is due tothe Mn–O asymmetric stretching. The nano MnO2 after the oxida-tive reaction with MG was also subjected to FTIR analysis. Fig. 2,spectrum b shows the FTIR spectrum of nano MnO2 materials afterthe reaction. The two spectra of nano MnO2 before and after theMG degradation resemble each other. This confirms that the nanoMnO2 remains unchanged even after the reaction. Moreover, sinceno other peak related to MG was observed in the MnO2 after thereaction, the possibility of removal of MG from the reaction med-ium via adsorption was ruled out.
3.1.3. Electron microscopy and energy dispersive X-ray (EDS)spectroscopy analysis
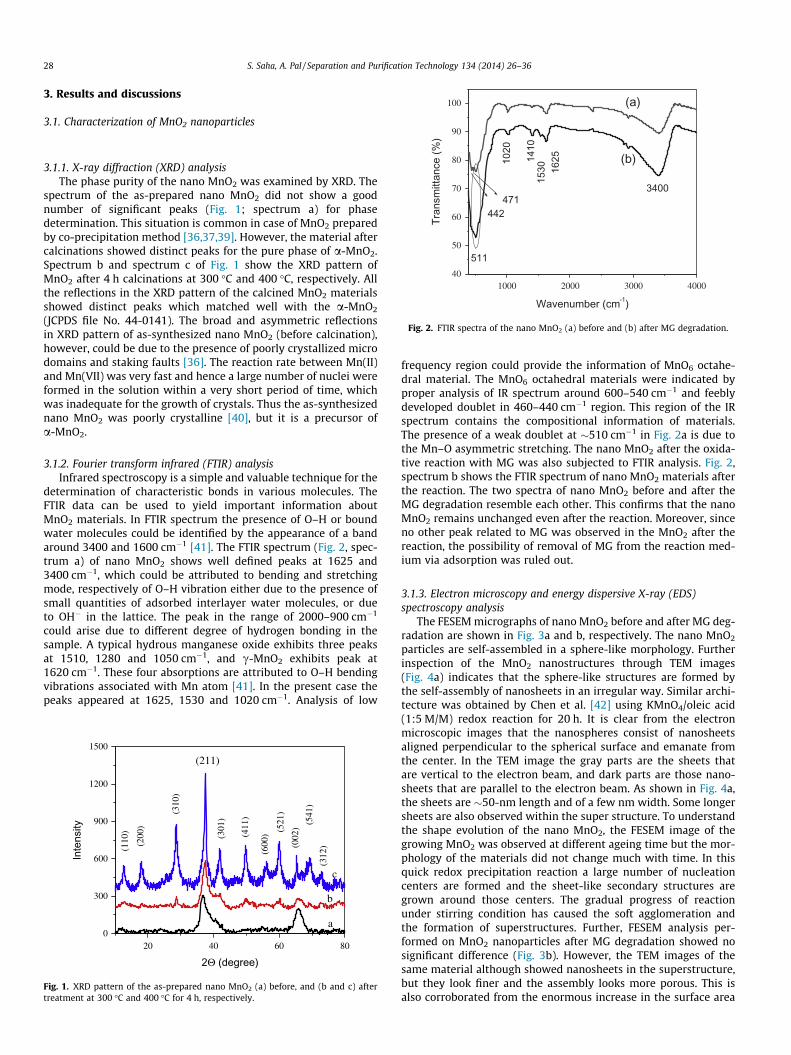
The FESEM micrographs of nano MnO2 before and after MG deg-radation are shown in Fig. 3a and b, respectively. The nano MnO2
particles are self-assembled in a sphere-like morphology. Furtherinspection of the MnO2 nanostructures through TEM images(Fig. 4a) indicates that the sphere-like structures are formed bythe self-assembly of nanosheets in an irregular way. Similar archi-tecture was obtained by Chen et al. [42] using KMnO4/oleic acid(1:5 M/M) redox reaction for 20 h. It is clear from the electronmicroscopic images that the nanospheres consist of nanosheetsaligned perpendicular to the spherical surface and emanate fromthe center. In the TEM image the gray parts are the sheets thatare vertical to the electron beam, and dark parts are those nano-sheets that are parallel to the electron beam. As shown in Fig. 4a,the sheets are �50-nm length and of a few nm width. Some longersheets are also observed within the super structure. To understandthe shape evolution of the nano MnO2, the FESEM image of thegrowing MnO2 was observed at different ageing time but the mor-phology of the materials did not change much with time. In thisquick redox precipitation reaction a large number of nucleationcenters are formed and the sheet-like secondary structures aregrown around those centers. The gradual progress of reactionunder stirring condition has caused the soft agglomeration andthe formation of superstructures. Further, FESEM analysis per-formed on MnO2 nanoparticles after MG degradation showed nosignificant difference (Fig. 3b). However, the TEM images of thesame material although showed nanosheets in the superstructure,but they look finer and the assembly looks more porous. This isalso corroborated from the enormous increase in the surface area
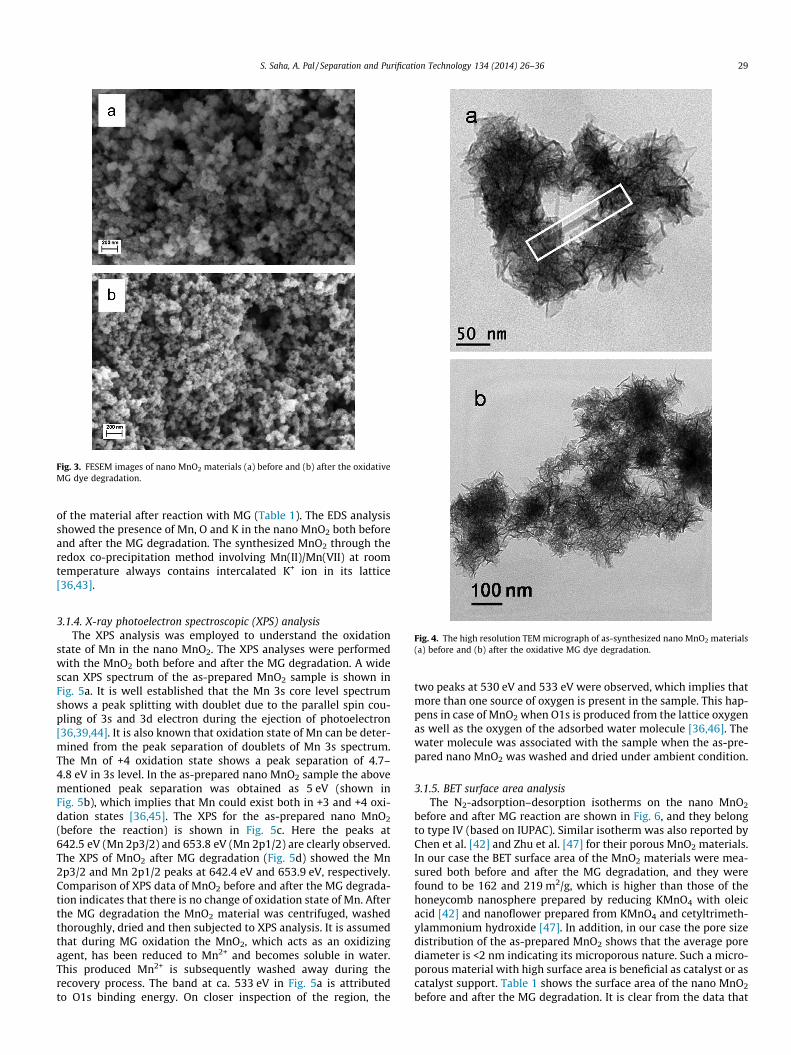
Fig. 3. FESEM images of nano MnO2 materials (a) before and (b) after the oxidativeMG dye degradation.
S. Saha, A. Pal / Separation and Purification Technology 134 (2014) 26–36 29
of the material after reaction with MG (Table 1). The EDS analysisshowed the presence of Mn, O and K in the nano MnO2 both beforeand after the MG degradation. The synthesized MnO2 through theredox co-precipitation method involving Mn(II)/Mn(VII) at roomtemperature always contains intercalated K+ ion in its lattice[36,43].
Fig. 4. The high resolution TEM micrograph of as-synthesized nano MnO2 materials(a) before and (b) after the oxidative MG dye degradation.
3.1.4. X-ray photoelectron spectroscopic (XPS) analysisThe XPS analysis was employed to understand the oxidation
state of Mn in the nano MnO2. The XPS analyses were performedwith the MnO2 both before and after the MG degradation. A widescan XPS spectrum of the as-prepared MnO2 sample is shown inFig. 5a. It is well established that the Mn 3s core level spectrumshows a peak splitting with doublet due to the parallel spin cou-pling of 3s and 3d electron during the ejection of photoelectron[36,39,44]. It is also known that oxidation state of Mn can be deter-mined from the peak separation of doublets of Mn 3s spectrum.The Mn of +4 oxidation state shows a peak separation of 4.7–4.8 eV in 3s level. In the as-prepared nano MnO2 sample the abovementioned peak separation was obtained as 5 eV (shown inFig. 5b), which implies that Mn could exist both in +3 and +4 oxi-dation states [36,45]. The XPS for the as-prepared nano MnO2
(before the reaction) is shown in Fig. 5c. Here the peaks at642.5 eV (Mn 2p3/2) and 653.8 eV (Mn 2p1/2) are clearly observed.The XPS of MnO2 after MG degradation (Fig. 5d) showed the Mn2p3/2 and Mn 2p1/2 peaks at 642.4 eV and 653.9 eV, respectively.Comparison of XPS data of MnO2 before and after the MG degrada-tion indicates that there is no change of oxidation state of Mn. Afterthe MG degradation the MnO2 material was centrifuged, washedthoroughly, dried and then subjected to XPS analysis. It is assumedthat during MG oxidation the MnO2, which acts as an oxidizingagent, has been reduced to Mn2+ and becomes soluble in water.This produced Mn2+ is subsequently washed away during therecovery process. The band at ca. 533 eV in Fig. 5a is attributedto O1s binding energy. On closer inspection of the region, the
two peaks at 530 eV and 533 eV were observed, which implies thatmore than one source of oxygen is present in the sample. This hap-pens in case of MnO2 when O1s is produced from the lattice oxygenas well as the oxygen of the adsorbed water molecule [36,46]. Thewater molecule was associated with the sample when the as-pre-pared nano MnO2 was washed and dried under ambient condition.
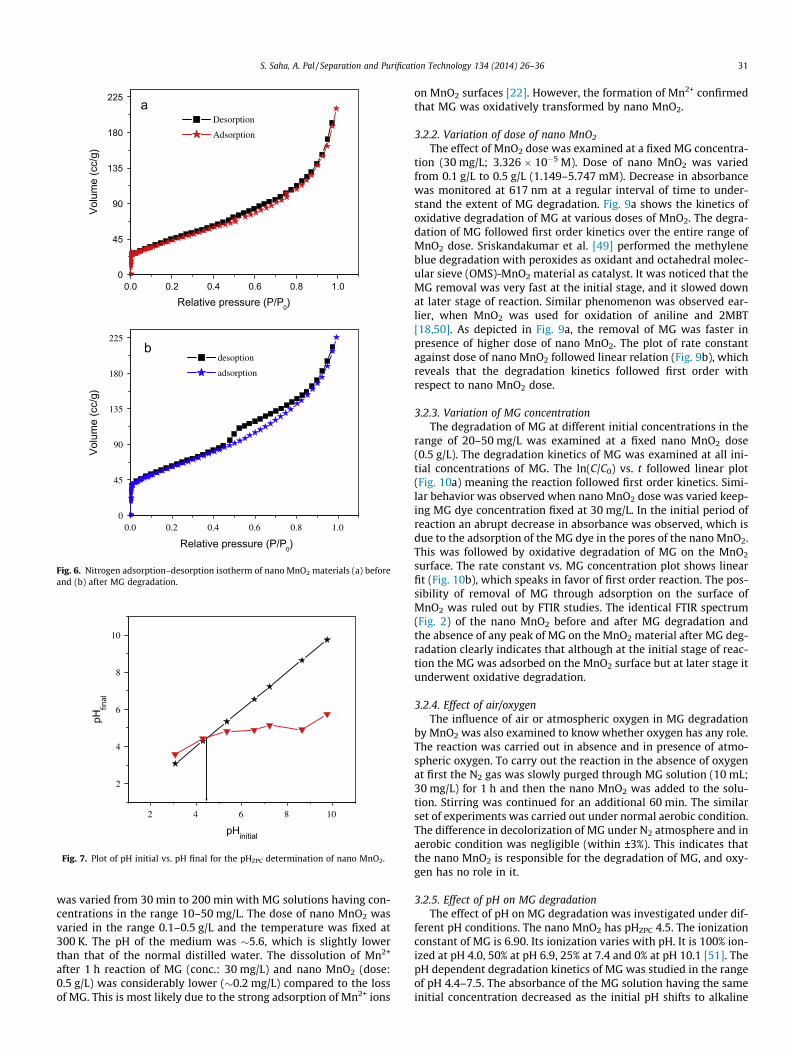
3.1.5. BET surface area analysisThe N2-adsorption–desorption isotherms on the nano MnO2
before and after MG reaction are shown in Fig. 6, and they belongto type IV (based on IUPAC). Similar isotherm was also reported byChen et al. [42] and Zhu et al. [47] for their porous MnO2 materials.In our case the BET surface area of the MnO2 materials were mea-sured both before and after the MG degradation, and they werefound to be 162 and 219 m2/g, which is higher than those of thehoneycomb nanosphere prepared by reducing KMnO4 with oleicacid [42] and nanoflower prepared from KMnO4 and cetyltrimeth-ylammonium hydroxide [47]. In addition, in our case the pore sizedistribution of the as-prepared MnO2 shows that the average porediameter is <2 nm indicating its microporous nature. Such a micro-porous material with high surface area is beneficial as catalyst or ascatalyst support. Table 1 shows the surface area of the nano MnO2
before and after the MG degradation. It is clear from the data that
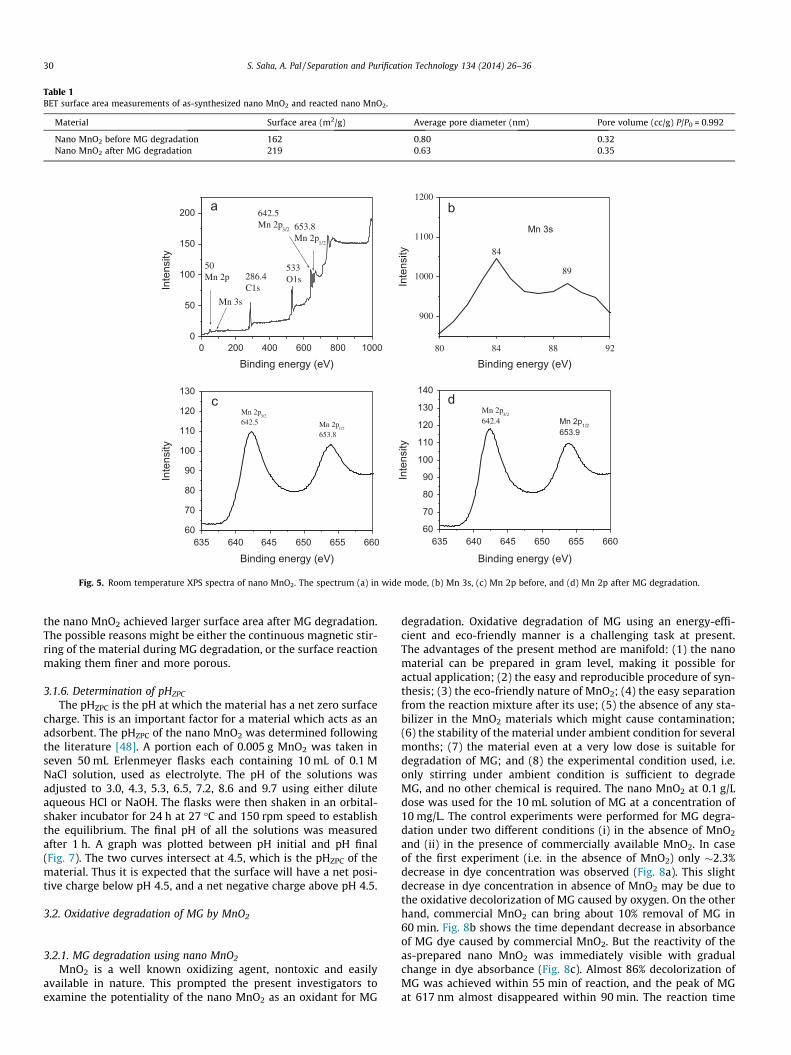
Table 1BET surface area measurements of as-synthesized nano MnO2 and reacted nano MnO2.
Material Surface area (m2/g) Average pore diameter (nm) Pore volume (cc/g) P/P0 = 0.992
Nano MnO2 before MG degradation 162 0.80 0.32Nano MnO2 after MG degradation 219 0.63 0.35
60
70
80
90
100
110
120
130
140d
Mn 2p1/2653.9
Mn 2p3/2
642.4
Inte
nsity
Binding energy (eV)
80 84 88 92
900
1000
1100
1200b
Mn 3s
Binding energy (eV)
89
84
Inte
nsity
60
70
80
90
100
110
120
130c
Mn 2p1/2
653.8
Mn 2p3/2
642.5
Inte
nsity
Binding energy (eV)635 640 645 650 655 660635 640 645 650 655 660
0 200 400 600 800 10000
50
100
150
200 a
Mn 3s
Binding energy (eV)
Inte
nsity
653.8Mn 2p
1/2
642.5Mn 2p
3/2
533O1s286.4
C1s
50Mn 2p
Fig. 5. Room temperature XPS spectra of nano MnO2. The spectrum (a) in wide mode, (b) Mn 3s, (c) Mn 2p before, and (d) Mn 2p after MG degradation.
30 S. Saha, A. Pal / Separation and Purification Technology 134 (2014) 26–36
the nano MnO2 achieved larger surface area after MG degradation.The possible reasons might be either the continuous magnetic stir-ring of the material during MG degradation, or the surface reactionmaking them finer and more porous.
3.1.6. Determination of pHZPC
The pHZPC is the pH at which the material has a net zero surfacecharge. This is an important factor for a material which acts as anadsorbent. The pHZPC of the nano MnO2 was determined followingthe literature [48]. A portion each of 0.005 g MnO2 was taken inseven 50 mL Erlenmeyer flasks each containing 10 mL of 0.1 MNaCl solution, used as electrolyte. The pH of the solutions wasadjusted to 3.0, 4.3, 5.3, 6.5, 7.2, 8.6 and 9.7 using either diluteaqueous HCl or NaOH. The flasks were then shaken in an orbital-shaker incubator for 24 h at 27 �C and 150 rpm speed to establishthe equilibrium. The final pH of all the solutions was measuredafter 1 h. A graph was plotted between pH initial and pH final(Fig. 7). The two curves intersect at 4.5, which is the pHZPC of thematerial. Thus it is expected that the surface will have a net posi-tive charge below pH 4.5, and a net negative charge above pH 4.5.
3.2. Oxidative degradation of MG by MnO2
3.2.1. MG degradation using nano MnO2
MnO2 is a well known oxidizing agent, nontoxic and easilyavailable in nature. This prompted the present investigators toexamine the potentiality of the nano MnO2 as an oxidant for MG
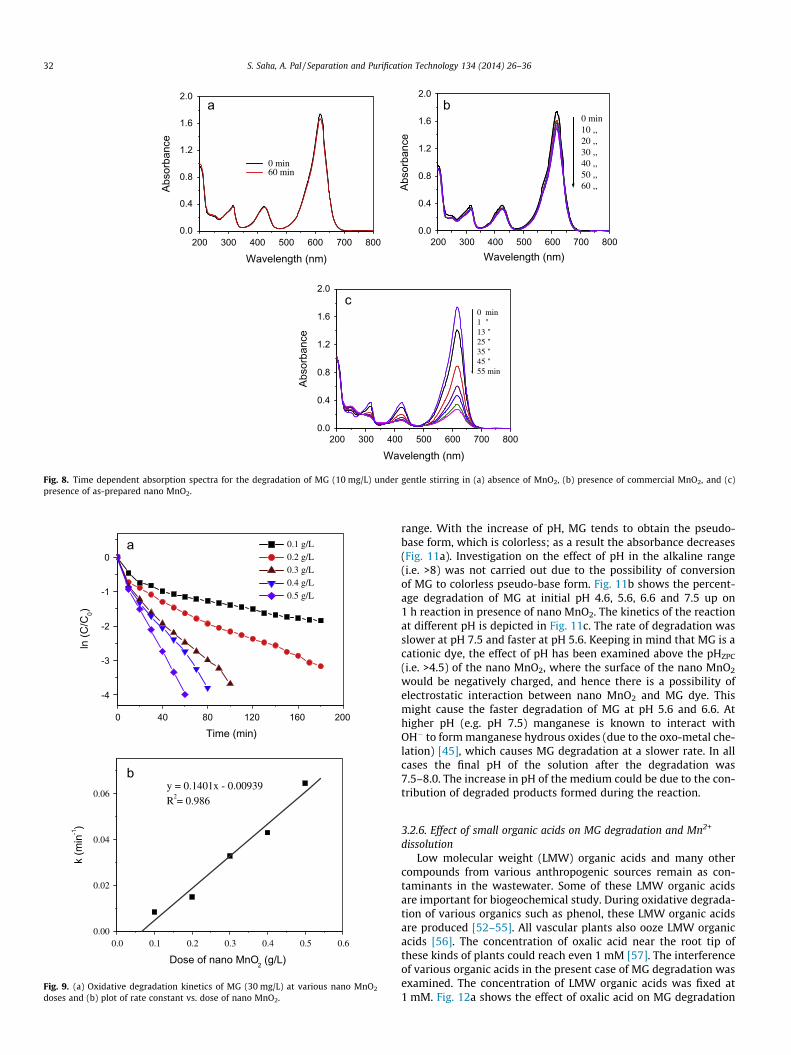
degradation. Oxidative degradation of MG using an energy-effi-cient and eco-friendly manner is a challenging task at present.The advantages of the present method are manifold: (1) the nanomaterial can be prepared in gram level, making it possible foractual application; (2) the easy and reproducible procedure of syn-thesis; (3) the eco-friendly nature of MnO2; (4) the easy separationfrom the reaction mixture after its use; (5) the absence of any sta-bilizer in the MnO2 materials which might cause contamination;(6) the stability of the material under ambient condition for severalmonths; (7) the material even at a very low dose is suitable fordegradation of MG; and (8) the experimental condition used, i.e.only stirring under ambient condition is sufficient to degradeMG, and no other chemical is required. The nano MnO2 at 0.1 g/Ldose was used for the 10 mL solution of MG at a concentration of10 mg/L. The control experiments were performed for MG degra-dation under two different conditions (i) in the absence of MnO2
and (ii) in the presence of commercially available MnO2. In caseof the first experiment (i.e. in the absence of MnO2) only �2.3%decrease in dye concentration was observed (Fig. 8a). This slightdecrease in dye concentration in absence of MnO2 may be due tothe oxidative decolorization of MG caused by oxygen. On the otherhand, commercial MnO2 can bring about 10% removal of MG in60 min. Fig. 8b shows the time dependant decrease in absorbanceof MG dye caused by commercial MnO2. But the reactivity of theas-prepared nano MnO2 was immediately visible with gradualchange in dye absorbance (Fig. 8c). Almost 86% decolorization ofMG was achieved within 55 min of reaction, and the peak of MGat 617 nm almost disappeared within 90 min. The reaction time
0
45
90
135
180
225b
Volu
me
(cc/
g)
Relative pressure (P/P0)
desoption
adsorption
0.0 0.2 0.4 0.6 0.8 1.0
0.0 0.2 0.4 0.6 0.8 1.00
45
90
135
180
225 aVo
lum
e (c
c/g)
Relative pressure (P/P0)
Desorption
Adsorption
Fig. 6. Nitrogen adsorption–desorption isotherm of nano MnO2 materials (a) beforeand (b) after MG degradation.
2 4 6 8 10
2
4
6
8
10
pHfin
al
pHinitial
Fig. 7. Plot of pH initial vs. pH final for the pHZPC determination of nano MnO2.
S. Saha, A. Pal / Separation and Purification Technology 134 (2014) 26–36 31
was varied from 30 min to 200 min with MG solutions having con-centrations in the range 10–50 mg/L. The dose of nano MnO2 wasvaried in the range 0.1–0.5 g/L and the temperature was fixed at300 K. The pH of the medium was �5.6, which is slightly lowerthan that of the normal distilled water. The dissolution of Mn2+
after 1 h reaction of MG (conc.: 30 mg/L) and nano MnO2 (dose:0.5 g/L) was considerably lower (�0.2 mg/L) compared to the lossof MG. This is most likely due to the strong adsorption of Mn2+ ions
on MnO2 surfaces [22]. However, the formation of Mn2+ confirmedthat MG was oxidatively transformed by nano MnO2.
3.2.2. Variation of dose of nano MnO2
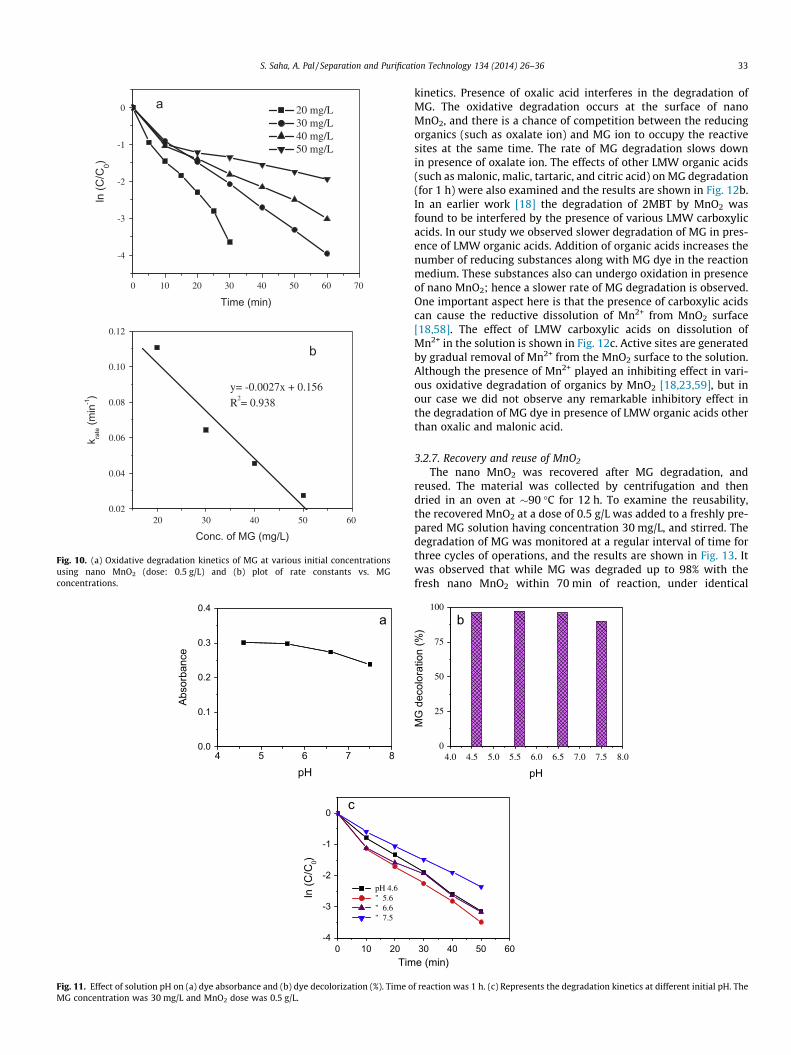
The effect of MnO2 dose was examined at a fixed MG concentra-tion (30 mg/L; 3.326 � 10�5 M). Dose of nano MnO2 was variedfrom 0.1 g/L to 0.5 g/L (1.149–5.747 mM). Decrease in absorbancewas monitored at 617 nm at a regular interval of time to under-stand the extent of MG degradation. Fig. 9a shows the kinetics ofoxidative degradation of MG at various doses of MnO2. The degra-dation of MG followed first order kinetics over the entire range ofMnO2 dose. Sriskandakumar et al. [49] performed the methyleneblue degradation with peroxides as oxidant and octahedral molec-ular sieve (OMS)-MnO2 material as catalyst. It was noticed that theMG removal was very fast at the initial stage, and it slowed downat later stage of reaction. Similar phenomenon was observed ear-lier, when MnO2 was used for oxidation of aniline and 2MBT[18,50]. As depicted in Fig. 9a, the removal of MG was faster inpresence of higher dose of nano MnO2. The plot of rate constantagainst dose of nano MnO2 followed linear relation (Fig. 9b), whichreveals that the degradation kinetics followed first order withrespect to nano MnO2 dose.
3.2.3. Variation of MG concentrationThe degradation of MG at different initial concentrations in the
range of 20–50 mg/L was examined at a fixed nano MnO2 dose(0.5 g/L). The degradation kinetics of MG was examined at all ini-tial concentrations of MG. The ln(C/C0) vs. t followed linear plot(Fig. 10a) meaning the reaction followed first order kinetics. Simi-lar behavior was observed when nano MnO2 dose was varied keep-ing MG dye concentration fixed at 30 mg/L. In the initial period ofreaction an abrupt decrease in absorbance was observed, which isdue to the adsorption of the MG dye in the pores of the nano MnO2.This was followed by oxidative degradation of MG on the MnO2
surface. The rate constant vs. MG concentration plot shows linearfit (Fig. 10b), which speaks in favor of first order reaction. The pos-sibility of removal of MG through adsorption on the surface ofMnO2 was ruled out by FTIR studies. The identical FTIR spectrum(Fig. 2) of the nano MnO2 before and after MG degradation andthe absence of any peak of MG on the MnO2 material after MG deg-radation clearly indicates that although at the initial stage of reac-tion the MG was adsorbed on the MnO2 surface but at later stage itunderwent oxidative degradation.
3.2.4. Effect of air/oxygenThe influence of air or atmospheric oxygen in MG degradation
by MnO2 was also examined to know whether oxygen has any role.The reaction was carried out in absence and in presence of atmo-spheric oxygen. To carry out the reaction in the absence of oxygenat first the N2 gas was slowly purged through MG solution (10 mL;30 mg/L) for 1 h and then the nano MnO2 was added to the solu-tion. Stirring was continued for an additional 60 min. The similarset of experiments was carried out under normal aerobic condition.The difference in decolorization of MG under N2 atmosphere and inaerobic condition was negligible (within ±3%). This indicates thatthe nano MnO2 is responsible for the degradation of MG, and oxy-gen has no role in it.
3.2.5. Effect of pH on MG degradationThe effect of pH on MG degradation was investigated under dif-
ferent pH conditions. The nano MnO2 has pHZPC 4.5. The ionizationconstant of MG is 6.90. Its ionization varies with pH. It is 100% ion-ized at pH 4.0, 50% at pH 6.9, 25% at 7.4 and 0% at pH 10.1 [51]. ThepH dependent degradation kinetics of MG was studied in the rangeof pH 4.4–7.5. The absorbance of the MG solution having the sameinitial concentration decreased as the initial pH shifts to alkaline
0.0
0.4
0.8
1.2
1.6
2.0a
Abso
rban
ce
Wavelength (nm)
0 min 60 min
0.0
0.4
0.8
1.2
1.6
2.0c
0 min1 "13 "25 "35 " 45 "55 min
Abso
rban
ce
Wavelength (nm)
200 300 400 500 600 700 800
200 300 400 500 600 700 800
200 300 400 500 600 700 8000.0
0.4
0.8
1.2
1.6
2.0b
Abso
rban
ce
Wavelength (nm)
0 min10 ,,20 ,,30 ,,40 ,,50 ,,60 ,,
Fig. 8. Time dependent absorption spectra for the degradation of MG (10 mg/L) under gentle stirring in (a) absence of MnO2, (b) presence of commercial MnO2, and (c)presence of as-prepared nano MnO2.
0.00
0.02
0.04
0.06
by = 0.1401x - 0.00939R2= 0.986
k (m
in-1)
Dose of nano MnO2 (g/L)0.0 0.1 0.2 0.3 0.4 0.5 0.6
0 40 80 120 160 200
-4
-3
-2
-1
0a
ln (C
/C0)
Time (min)
0.1 g/L 0.2 g/L 0.3 g/L 0.4 g/L 0.5 g/L
Fig. 9. (a) Oxidative degradation kinetics of MG (30 mg/L) at various nano MnO2
doses and (b) plot of rate constant vs. dose of nano MnO2.
32 S. Saha, A. Pal / Separation and Purification Technology 134 (2014) 26–36
range. With the increase of pH, MG tends to obtain the pseudo-base form, which is colorless; as a result the absorbance decreases(Fig. 11a). Investigation on the effect of pH in the alkaline range(i.e. >8) was not carried out due to the possibility of conversionof MG to colorless pseudo-base form. Fig. 11b shows the percent-age degradation of MG at initial pH 4.6, 5.6, 6.6 and 7.5 up on1 h reaction in presence of nano MnO2. The kinetics of the reactionat different pH is depicted in Fig. 11c. The rate of degradation wasslower at pH 7.5 and faster at pH 5.6. Keeping in mind that MG is acationic dye, the effect of pH has been examined above the pHZPC
(i.e. >4.5) of the nano MnO2, where the surface of the nano MnO2
would be negatively charged, and hence there is a possibility ofelectrostatic interaction between nano MnO2 and MG dye. Thismight cause the faster degradation of MG at pH 5.6 and 6.6. Athigher pH (e.g. pH 7.5) manganese is known to interact withOH� to form manganese hydrous oxides (due to the oxo-metal che-lation) [45], which causes MG degradation at a slower rate. In allcases the final pH of the solution after the degradation was7.5–8.0. The increase in pH of the medium could be due to the con-tribution of degraded products formed during the reaction.
3.2.6. Effect of small organic acids on MG degradation and Mn2+
dissolutionLow molecular weight (LMW) organic acids and many other
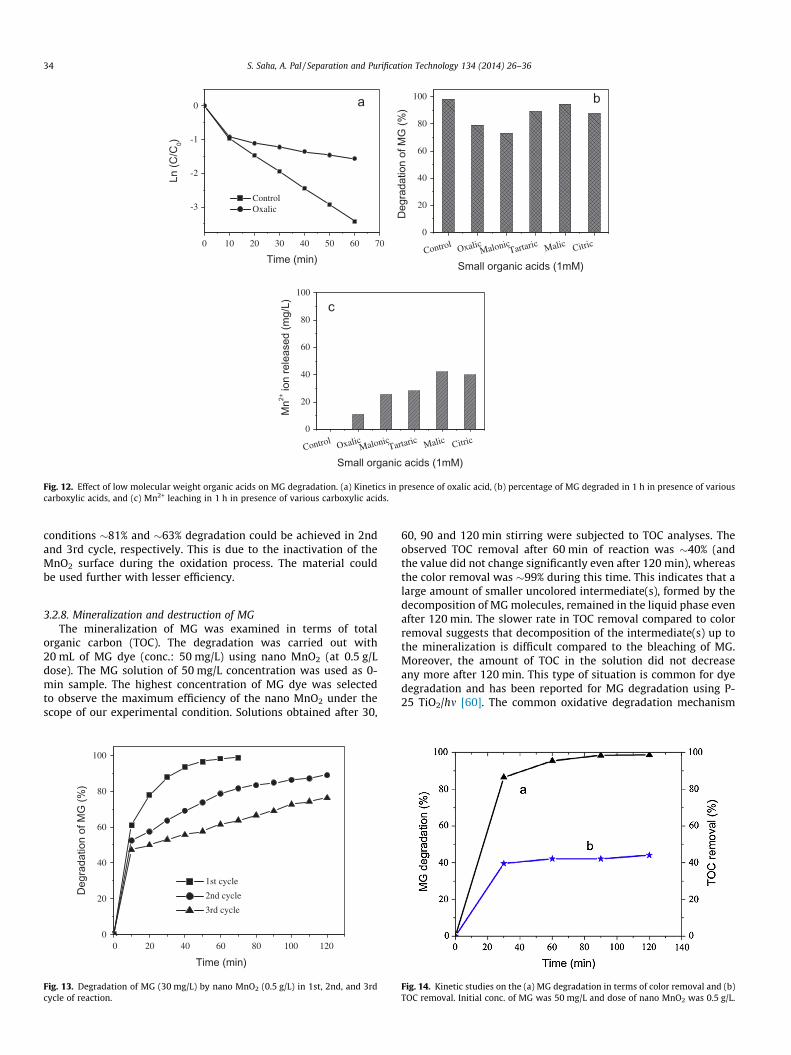
compounds from various anthropogenic sources remain as con-taminants in the wastewater. Some of these LMW organic acidsare important for biogeochemical study. During oxidative degrada-tion of various organics such as phenol, these LMW organic acidsare produced [52–55]. All vascular plants also ooze LMW organicacids [56]. The concentration of oxalic acid near the root tip ofthese kinds of plants could reach even 1 mM [57]. The interferenceof various organic acids in the present case of MG degradation wasexamined. The concentration of LMW organic acids was fixed at1 mM. Fig. 12a shows the effect of oxalic acid on MG degradation
-4
-3
-2
-1
0 aln
(C/C
0)
Time (min)
20 mg/L 30 mg/L 40 mg/L 50 mg/L
0 10 20 30 40 50 60 70
20 30 40 50 600.02
0.04
0.06
0.08
0.10
0.12
b
y= -0.0027x + 0.156
R2= 0.938
k rate (m
in-1)
Conc. of MG (mg/L)
Fig. 10. (a) Oxidative degradation kinetics of MG at various initial concentrationsusing nano MnO2 (dose: 0.5 g/L) and (b) plot of rate constants vs. MGconcentrations.
0 10 20-4
-3
-2
-1
0c
ln (C
/C0)
Tim
pH 4.6 " 5.6 " 6.6 " 7.5
4 5 6 7 80.0
0.1
0.2
0.3
0.4a
Abso
rban
ce
pH
Fig. 11. Effect of solution pH on (a) dye absorbance and (b) dye decolorization (%). Time oMG concentration was 30 mg/L and MnO2 dose was 0.5 g/L.
S. Saha, A. Pal / Separation and Purification Technology 134 (2014) 26–36 33
kinetics. Presence of oxalic acid interferes in the degradation ofMG. The oxidative degradation occurs at the surface of nanoMnO2, and there is a chance of competition between the reducingorganics (such as oxalate ion) and MG ion to occupy the reactivesites at the same time. The rate of MG degradation slows downin presence of oxalate ion. The effects of other LMW organic acids(such as malonic, malic, tartaric, and citric acid) on MG degradation(for 1 h) were also examined and the results are shown in Fig. 12b.In an earlier work [18] the degradation of 2MBT by MnO2 wasfound to be interfered by the presence of various LMW carboxylicacids. In our study we observed slower degradation of MG in pres-ence of LMW organic acids. Addition of organic acids increases thenumber of reducing substances along with MG dye in the reactionmedium. These substances also can undergo oxidation in presenceof nano MnO2; hence a slower rate of MG degradation is observed.One important aspect here is that the presence of carboxylic acidscan cause the reductive dissolution of Mn2+ from MnO2 surface[18,58]. The effect of LMW carboxylic acids on dissolution ofMn2+ in the solution is shown in Fig. 12c. Active sites are generatedby gradual removal of Mn2+ from the MnO2 surface to the solution.Although the presence of Mn2+ played an inhibiting effect in vari-ous oxidative degradation of organics by MnO2 [18,23,59], but inour case we did not observe any remarkable inhibitory effect inthe degradation of MG dye in presence of LMW organic acids otherthan oxalic and malonic acid.
3.2.7. Recovery and reuse of MnO2
The nano MnO2 was recovered after MG degradation, andreused. The material was collected by centrifugation and thendried in an oven at �90 �C for 12 h. To examine the reusability,the recovered MnO2 at a dose of 0.5 g/L was added to a freshly pre-pared MG solution having concentration 30 mg/L, and stirred. Thedegradation of MG was monitored at a regular interval of time forthree cycles of operations, and the results are shown in Fig. 13. Itwas observed that while MG was degraded up to 98% with thefresh nano MnO2 within 70 min of reaction, under identical
30 40 50 60e (min)
4.0 4.5 5.0 5.5 6.0 6.5 7.0 7.5 8.00
25
50
75
100
b
MG
dec
olor
atio
n (%
)
pH
f reaction was 1 h. (c) Represents the degradation kinetics at different initial pH. The
0 10 20 30 40 50 60 70
-3
-2
-1
0 a
Ln (C
/C0)
Time (min)
Control Oxalic
0
20
40
60
80
100 b
Deg
rada
tion
of M
G (%
)
Control OxalicMalonic
Tartaric Malic Citric0
20
40
60
80
100
c
Small organic acids (1mM)
Control OxalicMalonic
Tartaric Malic Citric
Small organic acids (1mM)M
n2+ io
n re
leas
ed (m
g/L)
Fig. 12. Effect of low molecular weight organic acids on MG degradation. (a) Kinetics in presence of oxalic acid, (b) percentage of MG degraded in 1 h in presence of variouscarboxylic acids, and (c) Mn2+ leaching in 1 h in presence of various carboxylic acids.
34 S. Saha, A. Pal / Separation and Purification Technology 134 (2014) 26–36
conditions �81% and �63% degradation could be achieved in 2ndand 3rd cycle, respectively. This is due to the inactivation of theMnO2 surface during the oxidation process. The material couldbe used further with lesser efficiency.
3.2.8. Mineralization and destruction of MGThe mineralization of MG was examined in terms of total
organic carbon (TOC). The degradation was carried out with20 mL of MG dye (conc.: 50 mg/L) using nano MnO2 (at 0.5 g/Ldose). The MG solution of 50 mg/L concentration was used as 0-min sample. The highest concentration of MG dye was selectedto observe the maximum efficiency of the nano MnO2 under thescope of our experimental condition. Solutions obtained after 30,
0 20 40 60 80 100 1200
20
40
60
80
100
Time (min)
Deg
rada
tion
of M
G (%
)
1st cycle
2nd cycle
3rd cycle
Fig. 13. Degradation of MG (30 mg/L) by nano MnO2 (0.5 g/L) in 1st, 2nd, and 3rdcycle of reaction.
60, 90 and 120 min stirring were subjected to TOC analyses. Theobserved TOC removal after 60 min of reaction was �40% (andthe value did not change significantly even after 120 min), whereasthe color removal was �99% during this time. This indicates that alarge amount of smaller uncolored intermediate(s), formed by thedecomposition of MG molecules, remained in the liquid phase evenafter 120 min. The slower rate in TOC removal compared to colorremoval suggests that decomposition of the intermediate(s) up tothe mineralization is difficult compared to the bleaching of MG.Moreover, the amount of TOC in the solution did not decreaseany more after 120 min. This type of situation is common for dyedegradation and has been reported for MG degradation using P-25 TiO2/hm [60]. The common oxidative degradation mechanism
Fig. 14. Kinetic studies on the (a) MG degradation in terms of color removal and (b)TOC removal. Initial conc. of MG was 50 mg/L and dose of nano MnO2 was 0.5 g/L.
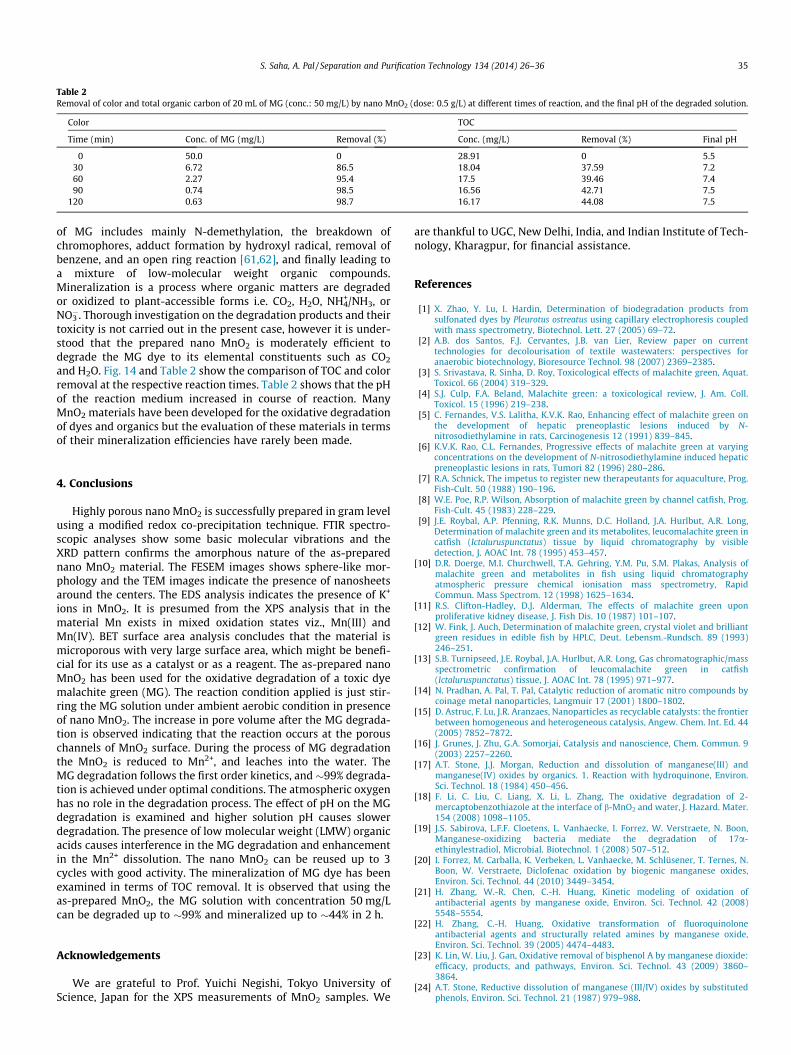
Table 2Removal of color and total organic carbon of 20 mL of MG (conc.: 50 mg/L) by nano MnO2 (dose: 0.5 g/L) at different times of reaction, and the final pH of the degraded solution.
Color TOC
Time (min) Conc. of MG (mg/L) Removal (%) Conc. (mg/L) Removal (%) Final pH
0 50.0 0 28.91 0 5.530 6.72 86.5 18.04 37.59 7.260 2.27 95.4 17.5 39.46 7.490 0.74 98.5 16.56 42.71 7.5
120 0.63 98.7 16.17 44.08 7.5
S. Saha, A. Pal / Separation and Purification Technology 134 (2014) 26–36 35
of MG includes mainly N-demethylation, the breakdown ofchromophores, adduct formation by hydroxyl radical, removal ofbenzene, and an open ring reaction [61,62], and finally leading toa mixture of low-molecular weight organic compounds.Mineralization is a process where organic matters are degradedor oxidized to plant-accessible forms i.e. CO2, H2O, NH4
+/NH3, orNO3�. Thorough investigation on the degradation products and their
toxicity is not carried out in the present case, however it is under-stood that the prepared nano MnO2 is moderately efficient todegrade the MG dye to its elemental constituents such as CO2
and H2O. Fig. 14 and Table 2 show the comparison of TOC and colorremoval at the respective reaction times. Table 2 shows that the pHof the reaction medium increased in course of reaction. ManyMnO2 materials have been developed for the oxidative degradationof dyes and organics but the evaluation of these materials in termsof their mineralization efficiencies have rarely been made.
4. Conclusions
Highly porous nano MnO2 is successfully prepared in gram levelusing a modified redox co-precipitation technique. FTIR spectro-scopic analyses show some basic molecular vibrations and theXRD pattern confirms the amorphous nature of the as-preparednano MnO2 material. The FESEM images shows sphere-like mor-phology and the TEM images indicate the presence of nanosheetsaround the centers. The EDS analysis indicates the presence of K+
ions in MnO2. It is presumed from the XPS analysis that in thematerial Mn exists in mixed oxidation states viz., Mn(III) andMn(IV). BET surface area analysis concludes that the material ismicroporous with very large surface area, which might be benefi-cial for its use as a catalyst or as a reagent. The as-prepared nanoMnO2 has been used for the oxidative degradation of a toxic dyemalachite green (MG). The reaction condition applied is just stir-ring the MG solution under ambient aerobic condition in presenceof nano MnO2. The increase in pore volume after the MG degrada-tion is observed indicating that the reaction occurs at the porouschannels of MnO2 surface. During the process of MG degradationthe MnO2 is reduced to Mn2+, and leaches into the water. TheMG degradation follows the first order kinetics, and �99% degrada-tion is achieved under optimal conditions. The atmospheric oxygenhas no role in the degradation process. The effect of pH on the MGdegradation is examined and higher solution pH causes slowerdegradation. The presence of low molecular weight (LMW) organicacids causes interference in the MG degradation and enhancementin the Mn2+ dissolution. The nano MnO2 can be reused up to 3cycles with good activity. The mineralization of MG dye has beenexamined in terms of TOC removal. It is observed that using theas-prepared MnO2, the MG solution with concentration 50 mg/Lcan be degraded up to �99% and mineralized up to �44% in 2 h.
Acknowledgements
We are grateful to Prof. Yuichi Negishi, Tokyo University ofScience, Japan for the XPS measurements of MnO2 samples. We
are thankful to UGC, New Delhi, India, and Indian Institute of Tech-nology, Kharagpur, for financial assistance.
References
[1] X. Zhao, Y. Lu, I. Hardin, Determination of biodegradation products fromsulfonated dyes by Pleurotus ostreatus using capillary electrophoresis coupledwith mass spectrometry, Biotechnol. Lett. 27 (2005) 69–72.
[2] A.B. dos Santos, F.J. Cervantes, J.B. van Lier, Review paper on currenttechnologies for decolourisation of textile wastewaters: perspectives foranaerobic biotechnology, Bioresource Technol. 98 (2007) 2369–2385.
[3] S. Srivastava, R. Sinha, D. Roy, Toxicological effects of malachite green, Aquat.Toxicol. 66 (2004) 319–329.
[4] S.J. Culp, F.A. Beland, Malachite green: a toxicological review, J. Am. Coll.Toxicol. 15 (1996) 219–238.
[5] C. Fernandes, V.S. Lalitha, K.V.K. Rao, Enhancing effect of malachite green onthe development of hepatic preneoplastic lesions induced by N-nitrosodiethylamine in rats, Carcinogenesis 12 (1991) 839–845.
[6] K.V.K. Rao, C.L. Fernandes, Progressive effects of malachite green at varyingconcentrations on the development of N-nitrosodiethylamine induced hepaticpreneoplastic lesions in rats, Tumori 82 (1996) 280–286.
[7] R.A. Schnick, The impetus to register new therapeutants for aquaculture, Prog.Fish-Cult. 50 (1988) 190–196.
[8] W.E. Poe, R.P. Wilson, Absorption of malachite green by channel catfish, Prog.Fish-Cult. 45 (1983) 228–229.
[9] J.E. Roybal, A.P. Pfenning, R.K. Munns, D.C. Holland, J.A. Hurlbut, A.R. Long,Determination of malachite green and its metabolites, leucomalachite green incatfish (Ictaluruspunctatus) tissue by liquid chromatography by visibledetection, J. AOAC Int. 78 (1995) 453–457.
[10] D.R. Doerge, M.I. Churchwell, T.A. Gehring, Y.M. Pu, S.M. Plakas, Analysis ofmalachite green and metabolites in fish using liquid chromatographyatmospheric pressure chemical ionisation mass spectrometry, RapidCommun. Mass Spectrom. 12 (1998) 1625–1634.
[11] R.S. Clifton-Hadley, D.J. Alderman, The effects of malachite green uponproliferative kidney disease, J. Fish Dis. 10 (1987) 101–107.
[12] W. Fink, J. Auch, Determination of malachite green, crystal violet and brilliantgreen residues in edible fish by HPLC, Deut. Lebensm.-Rundsch. 89 (1993)246–251.
[13] S.B. Turnipseed, J.E. Roybal, J.A. Hurlbut, A.R. Long, Gas chromatographic/massspectrometric confirmation of leucomalachite green in catfish(Ictaluruspunctatus) tissue, J. AOAC Int. 78 (1995) 971–977.
[14] N. Pradhan, A. Pal, T. Pal, Catalytic reduction of aromatic nitro compounds bycoinage metal nanoparticles, Langmuir 17 (2001) 1800–1802.
[15] D. Astruc, F. Lu, J.R. Aranzaes, Nanoparticles as recyclable catalysts: the frontierbetween homogeneous and heterogeneous catalysis, Angew. Chem. Int. Ed. 44(2005) 7852–7872.
[16] J. Grunes, J. Zhu, G.A. Somorjai, Catalysis and nanoscience, Chem. Commun. 9(2003) 2257–2260.
[17] A.T. Stone, J.J. Morgan, Reduction and dissolution of manganese(III) andmanganese(IV) oxides by organics. 1. Reaction with hydroquinone, Environ.Sci. Technol. 18 (1984) 450–456.
[18] F. Li, C. Liu, C. Liang, X. Li, L. Zhang, The oxidative degradation of 2-mercaptobenzothiazole at the interface of b-MnO2 and water, J. Hazard. Mater.154 (2008) 1098–1105.
[19] J.S. Sabirova, L.F.F. Cloetens, L. Vanhaecke, I. Forrez, W. Verstraete, N. Boon,Manganese-oxidizing bacteria mediate the degradation of 17a-ethinylestradiol, Microbial. Biotechnol. 1 (2008) 507–512.
[20] I. Forrez, M. Carballa, K. Verbeken, L. Vanhaecke, M. Schlüsener, T. Ternes, N.Boon, W. Verstraete, Diclofenac oxidation by biogenic manganese oxides,Environ. Sci. Technol. 44 (2010) 3449–3454.
[21] H. Zhang, W.-R. Chen, C.-H. Huang, Kinetic modeling of oxidation ofantibacterial agents by manganese oxide, Environ. Sci. Technol. 42 (2008)5548–5554.
[22] H. Zhang, C.-H. Huang, Oxidative transformation of fluoroquinoloneantibacterial agents and structurally related amines by manganese oxide,Environ. Sci. Technol. 39 (2005) 4474–4483.
[23] K. Lin, W. Liu, J. Gan, Oxidative removal of bisphenol A by manganese dioxide:efficacy, products, and pathways, Environ. Sci. Technol. 43 (2009) 3860–3864.
[24] A.T. Stone, Reductive dissolution of manganese (III/IV) oxides by substitutedphenols, Environ. Sci. Technol. 21 (1987) 979–988.
36 S. Saha, A. Pal / Separation and Purification Technology 134 (2014) 26–36
[25] P.S. Nico, R.J. Zasoski, Mn(III) center availability as a rate controlling factor inthe oxidation of phenol and sulfide on d-MnO2, Environ. Sci. Technol. 35 (2001)3338–3343.
[26] C. Liu, L. Zhang, F. Li, Y. Wang, Y. Gao, X. Li, W. Cao, C. Feng, J. Dong, L. Sun,Dependence of sulfadiazine oxidative degradation on physicochemicalproperties of manganese dioxides, Ind. Eng. Chem. Res. 48 (2009) 10408–10413.
[27] J. Dong, Y. Li, L. Zhang, C. Liu, L. Zhuang, L. Sun, J. Zhou, The oxidativedegradation of sulfadiazine at the interface of a-MnO2 and water, J. Chem.Technol. Biotechnol. 84 (2009) 1848–1853.
[28] M.-X. Zhu, Z. Wang, S.-H. Xu, T. Li, Decolorization of methylene blue by d-MnO2-coated montmorillonite complexes: emphasizing redox reactivity ofMn-oxide coatings, J. Hazard. Mater. 181 (2010) 57–64.
[29] H. Zhang, C.H. Huang, Reactivity and transformation of antibacterial N-oxidesin the presence of manganese oxide, Environ. Sci. Technol. 39 (2005) 593–601.
[30] M.Y. Ahn, T.R. Filley, C.T. Jafvert, L. Nies, I. Hua, J. Bezares-Cruz,Photodegradation of decabromodiphenyl ether adsorbed onto clay minerals,metal oxides, and sediment, Environ. Sci. Technol. 40 (2006) 215–220.
[31] S.E. Fendorf, R.J. Zasoski, Chromium(III) oxidation by d-MnO2. 1.Characterization, Environ. Sci. Technol. 26 (1992) 79–85.
[32] X.H. Feng, Y.Q. Zu, W.F. Tan, F. Liu, Arsenite oxidation by three types ofmanganese oxides, J. Environ. Sci. 18 (2006) 292–298.
[33] A.D. Apte, V. Tare, P. Bose, Extent of oxidation of Cr(III) to Cr(VI) under variousconditions pertaining to natural environment, J. Hazard. Mater. B 128 (2006)164–174.
[34] N. Sui, Y. Duan, X. Jiao, D. Chen, Large-scale preparation and catalyticproperties of one-dimensional a/b-MnO2 nanostructures, J. Phys. Chem. C113 (2009) 8560–8565.
[35] G. Cao, L. Su, X. Zhang, H. Li, Hydrothermal synthesis and catalytic properties ofa- and b MnO2 nanorods, Mater. Res. Bull. 45 (2010) 425–428.
[36] M. Toupin, T. Brousse, D. Belanger, Influence of microstucture on the chargestorage properties of chemically synthesized manganese dioxide, Chem.Mater. 14 (2002) 3946–3952.
[37] X.-L. Luo, J.-J. Xu, W. Zhao, H.-Y. Chen, A novel glucose ENFET based on thespecial reactivity of MnO2 nanoparticles, Biosens. Bioelectron. 19 (2004)1295–1300.
[38] American Public Health Association, American Water Works Association,Water Pollution Control Federation, Standard Methods for the Examination ofWater and Waste Water, 17th Edition, vol. 5220, Port City Press, Baltimore,Maryland, 1989, pp. 5–15.
[39] M. Toupin, T. Brousse, D. Belanger, Charge storage mechanism of MnO2
electrode used in aqueous electrochemical capacitor, Chem. Mater. 16 (2004)3184–3190.
[40] S. Chen, J. Zhu, Q. Han, Z. Zheng, Y. Yang, X. Wang, Shape-controlled synthesisof one-dimentional MnO2 via a facile quick-precipitation procedure and itselectrochemical properties, Cryst. Growth Des. 9 (2009) 4356–4361.
[41] M.V. Ananth, S. Pethkar, K. Dakshinamurthi, Distortion of MnO6 octahedra andelectrochemical activity of Nstutite-based MnO2 polymorphs for alkalineelectrolytes – an FTIR study, J. Power Sources 75 (1998) 278–282.
[42] H. Chen, J. He, C. Zhang, H. He, Self-assembly of novel mesoporous manganeseoxide nanostructures and their application in oxidative decomposition offormaldehyde, J. Phys. Chem. C 111 (2007) 18033–18038.
[43] H.-Q. Wang, G.-F. Yang, Q.-Y. Li, X.-X. Zhong, F.P. Wang, Z.-S. Li, Y.-H. Li, Porousnano-MnO2: large scale synthesis via a facile quick-redox procedure andapplication in super capacitor, New J. Chem. 35 (2011) 469–475.
[44] V. Subramanian, H. Zhu, B. Wei, Alcohol-assisted room temperature synthesisof different nanostructured manganese oxides and their pseudocapacitanceproperties in neutral electrolyte, Chem. Phys. Lett. 453 (2008) 242–249.
[45] V. Subramanian, H. Zhu, R. Vajtai, P.M. Ajayan, B. Wei, Hydrothermal synthesisand pseudocapacitance properties of MnO2 nanostructures, J. Phys. Chem. B109 (2005) 20207–20214.
[46] M. Manickam, P. Singh, T.B. Issa, S. Thurgate, R.D. Marco, Lithium insertion intomanganese dioxide electrode in MnO2/Zn aqueous battery: Part I. Apreliminary study, J. Power Sources 130 (2004) 254–259.
[47] G. Zhu, L. Deng, J. Wang, L. Kang, Z-H. Liu, Hydrothermal preparation and thecapacitance of hierarchical MnO2 nanoflower, Colloids Surf. A: Physicochem.Eng. Asp. 434 (2013) 42–48.
[48] M. Oliveira, A.V. Machado, R. Nogueira, Development of permeable reactivebarrier for phosphorus removal, Mater. Sci. Forum 636–637 (2010) 1365–1370.
[49] T. Sriskandakumar, N. Opembe, C.-H. Chen, A. Morey, C. King’ondu, S.L. Suib,Green decomposition of organic dyes using octahedral molecular sievemanganese oxide catalysts, J. Phys. Chem. A 113 (2009) 1523–1530.
[50] J. Klausen, S.B. Haderlein, R.P. Schwarzenbach, Oxidation of substitutedanilines by aqueous MnO2: effect of co-solutes on initial and quasi-steady-state kinetics, Environ. Sci. Technol. 31 (1997) 2642–2649.
[51] D.J. Alderman, Malachite green: a review, J. Fish Dis. 8 (1985) 289–298.[52] H. Kušic, N. Koprivanac, A.L. Bozic, I. Selanec, Photo-assisted Fenton type
processes for the degradation of phenol: a kinetic study, J. Hazard. Mater. B136 (2006) 632–644.
[53] O. Gimeno, M. Carbajo, F.J. Beltran, F.J. Rivas, Phenol and substituted phenolsAOPs remediation, J. Hazard. Mater. B 119 (2005) 99–108.
[54] B. Roig, C. Gonzalez, O. Thomas, Monitoring of phenol photodegradation byultraviolet spectroscopy, Spectrochim. Acta A 59 (2003) 303–307.
[55] P. Lukes, B.R. Locke, Degradation of substituted phenols in a hybrid gas–liquidelectrical discharge reactor, Ind. Eng. Chem. Res. 44 (2005) 2921–2930.
[56] H. Marschner, Mineral Nutrition of Higher Plants, Academic Press, New York,1995.
[57] T.R. Fox, N.B. Comerford, Low-molecular-weight organic acids in selectedforest soils of the southeastern USA, Soil Sci. Soc. Am. J. 54 (1990) 1139–1144.
[58] Y. Wang, A.T. Stone, Reaction of MnIII,IV (hydr)oxides with oxalic acid, glyoxylicacid, phosphonoformic acid, and structurally-related organic compounds,Geochim. Cosmochim. Acta 70 (2006) 4477–4490.
[59] H. Zhang, C.-H. Huang, Oxidative transformation of triclosan and chloropheneby manganese oxides, Environ. Sci. Technol. 37 (2003) 2421–2430.
[60] H. Kominami, H. Kumamoto, Y. Kera, B. Ohtani, Photocatalytic decolorizationand mineralization of malachite green in an aqueous suspension oftitanium(IV) oxide nano-particles under aerated conditions: correlationbetween some physical properties and their photocatalytic activity, J.Photochem. Photobiol. A: Chem. 160 (2003) 99–104.
[61] Y. Ju, S. Yang, Y. Ding, C. Sun, A. Zhang, L. Wang, Microwave-assisted rapidphotocatalytic degradation of malachite green in TiO2 suspensions:mechanism and pathways, J. Phys. Chem. A 112 (2008) 11172–11177.
[62] C.C. Chen, C.S. Lu, Y.C. Chung, J.L. Jan, UV light induced photodegradation ofmalachite green on TiO2 nanoparticles, J. Hazard. Mater. 141 (2007) 520–528.


![Oxidation of iodide and iodine on birnessite ([delta]-MnO2) in the pH range 4-8](https://img.dokumen.tips/doc/110x75/6331d8c6576b626f850d21a5/oxidation-of-iodide-and-iodine-on-birnessite-delta-mno2-in-the-ph-range-4-8.jpg)
