Embed Size (px)
Citation preview

Light effects on alewife–mysid interactions in Lake Ontario: A combined sensory
physiology, behavioral, and spatial approach
Brent T. Boscarino,a,* Lars G. Rudstam,a Jill Tirabassi,a John Janssen,b and Ellis R. Loewc
a Cornell Biological Field Station, Department of Natural Resources, Cornell University, Bridgeport, New YorkbGreat Lakes WATER Institute, Milwaukee, Wisconsinc Department of Biomedical Science, T7-020 Veterinary Research Tower, Cornell University, Ithaca, New York
Abstract
An understanding of the effect of light on predator–prey interactions in aquatic systems requires the integrationof sensory physiology, behavioral ecology, and spatial distributions of predator and prey in the field. Here, wepresent such an integrative approach to a study on the interactions between the alewife, Alosa pseudoharengus, andthe mysid shrimp, Mysis diluviana, (formerly M. relicta) in Lake Ontario at night, when it is unknown whether visualfeeding is possible. Visual pigment analyses of alewife rod photoreceptors were used to derive an alewife-specific unitof brightness—the ‘alelux’ (wavelength of maximum absorbance, lmax 5 505 nm)—which formed the basic unit oflight intensity in alewife feeding-rate experiments and field applications. At light levels of 1027 alelux (, 1024.1 lux)and greater in the laboratory, alewives engaged in visual search and strike behaviors and fed at rates that weresignificantly higher than those under completely dark conditions. Field observations from Lake Ontario showedthat light levels at the upper edge of the mysid distribution were within the range of those required for visual feedingin the laboratory on a full moon night, but not on a new moon night. These increased light levels translated intofeeding rates that were . 30 times higher on the full moon night, despite a larger degree of spatial separation of thetwo trophic levels. We hypothesize that observed increased water clarity in Lake Ontario in recent years has led toincreased consumption of mysids by alewife at night and associated food-web changes.
Of the many factors that affect fish feeding success, lightmay be the most dynamic because light intensity changesover many orders of magnitude throughout the day–nightcycle. Light levels, together with prey size (Colloca et al.2010), prey escape response (Peterka and Matena 2009),and prey visibility (Utne-Palm 2000) all interact with thefishes’ own visual system (Lythgoe 1979; Utne-Palm 2002)to determine capture success in visually feeding plankti-vores. Ambient light levels can also determine the spatialdistribution, feeding behaviors, and extent of verticalmigration of planktivorous fish and their prey in both lake(Lester et al. 2004; Jensen et al. 2006; Boscarino et al.2009a) and marine systems (Balino and Aksnes 1993;Kaartvedt et al. 1996). An understanding of how lightlevels affect predation rates thus requires information onhow both the predator and prey of interest physicallyprocess and behaviorally react to light levels present in theirzone of overlap and how these responses vary throughoutthe course of a day–night cycle.
Comparatively little is known about how pelagicplanktivores utilize vision to enhance their feeding ratesat night relative to the day and twilight hours (see review inFeuerwerker and Ali 1975). For example, most theoreticalmodels of planktivore feeding rates assume that foragingsuccess will not vary with light level at night, when reactiondistance is assumed to have reached some minimum value(Mason and Patrick 1993; Beauchamp et al. 1999).However, certain visually feeding planktivores can enhancetheir detection of prey and other conspecifics in low-lightconditions using some combination of vision and othersenses, such as the acoustico–lateralis system (Pitcher 1979;
Richmond et al. 2004). If this is the case, standard reactiondistance models will underestimate prey consumptionunder low-light conditions. Untangling the effects of lighton feeding success of planktivorous fish at night can bemade even more difficult in marine systems, which typicallyhave a more diverse assemblage of fishes, many with laterallines specialized for enhanced sensitivity (Janssen 2004),relative to freshwater systems. Even in simpler marinesystems such as fjords, the interacting species and theirsensory specializations can be quite complex relative todeep freshwater systems, thus confounding attempts todiscern the effects of light on predation (but see Aksnes etal. 2004), particularly during the night when lateral linesensing may become more prominent. A more thoroughunderstanding of how planktivorous fish use vision toenhance their foraging success at night is necessary if therelationship between light and predation is to have a robusttheoretical basis over a complete diel cycle in bothfreshwater and marine systems.
In this study, we use a multifaceted approach toinvestigating the role of light in structuring the trophicinteractions of the alewife, Alosa pseudoharengus, and themysid shrimp, Mysis diluviana (formerly M. relicta;hereafter, mysids), at night in Lake Ontario, one of theLaurentian Great Lakes of North America. Lake Ontario isan ideal system to examine the effects of light on predatorforaging ability at night because there is essentially oneprey of interest, Mysis (a good analog for euphausiids inmarine systems), and one predator—alewife (a good analogfor other open-water clupeids in marine systems). Mysidsare a high-energy food resource with a large proportion ofpolyunsaturated fatty acids thought to be essential to theover-winter survival and gonad development of alewife* Corresponding author: [email protected]
Limnol. Oceanogr., 55(5), 2010, 2061–2072
E 2010, by the American Society of Limnology and Oceanography, Inc.doi:10.4319/lo.2010.55.5.2061
2061
(Arts 1999; Snyder and Hennessey 2003), the mostabundant open-water planktivore and primary prey itemof salmonines in the Great Lakes.
The influence of light on mysid behavior and spatialdistribution at night has been well-documented (Gal et al.1999; Boscarino et al. 2009b), but comparatively little isknown about alewife responses to light at night. In general,mysids do not become available to alewife until after duskwhen mysids ascend from their daytime, benthic habitatinto open waters to feed (Janssen and Brandt 1980). Mysidvertical ascent and nighttime distribution is influenced byambient light conditions and temperature (Beeton andBowers 1982; Boscarino et al. 2009a). They will rarely enterinto waters brighter than 1024 lux or temperatures above12uC (Gal et al. 1999; Boscarino et al. 2007, 2009b). Fullmoon conditions will often provide sufficient light torestrict the majority of the mysid distribution to depthssubstantially below the thermocline (Janssen and Brandt1980; Boscarino et al. 2009a). Under new moon conditions,the mysid distribution tends to be limited by temperatureand mysids are found at lower light levels than on fullmoon nights even though they are in shallower water. Howthese changes in mysid distribution with moonlight affectalewife–mysid feeding dynamics is dependent on light’seffect on alewife feeding rates (see below), and on whetheralewives will move into deeper, colder water than istypically preferred by this fish species to feed on mysids.In Lake Ontario, both adult and juvenile alewives typicallyinhabit the warmest waters of the epilimnion (Olson et al.1988; Boscarino et al. 2009a). Full moon conditions should,therefore, create a larger degree of spatial separationbetween alewife and mysids during periods of thermalstratification, because mysids will be forced to deeper,colder waters due to light limitations.
In addition to influencing the spatial dynamics ofalewife–mysid trophic interactions, moon phase may alsoaffect the feeding rates of alewives at night. Experimentswith other clupeids suggest that the light intensity necessaryfor visual feeding is $ 10 times greater than the light levellikely to be experienced by alewives feeding within themysid layer. For example, Batty et al. (1990) found that theAtlantic herring, Clupea harengus, ceased particulatefeeding at a light level of 0.001 lux when fed a naturalassemblage of zooplankton; however, when fed Artemianauplii, the visual threshold was even higher (, 0.01 lux)—a value that is over two orders of magnitude brighter thanthe 1024 lux that limits mysid ascent (Gal et al. 2004;Boscarino et al. 2009a,b). Previous studies that haveattempted to model mysid predator distribution as afunction of light and prey abundance have used encounterrate functions, which assume that alewives are not capableof using light levels available at night to enhance theirfeeding rates on mysids, regardless of moon phase (Masonand Patrick 1993; Jensen et al. 2006). Instead, it is generallyassumed that alewives use their lateral line (Janssen et al.1995) and ram filter feeding (Janssen 1980) while feeding atlight levels similar to those available in the mysid layer atnight. However, alewives are not capable of filter feedingon prey as evasive as Mysis (Janssen 1980). Mysids are overten times larger than most other zooplankton prey of
alewife in northern lakes and the light level required forvisual feeding may be lower for alewife feeding on mysidsthan for alewife feeding on smaller zooplankton. AlthoughJanssen and Brandt (1980) speculated that alewives likelyuse both vision and the acoustico–lateralis system to feedon mysids, our present study is the first to specificallyinvestigate whether a clupeid predator is capable of usinglight to enhance its feeding rates on a pelagic prey as largeor as evasive as Mysis at night.
Measurements of light levels need to be related to thevisual capacity of the organism of interest. In our case, thisrequires a unit of measurement relevant to alewife. This isnot often done; for example, the light-level thresholdsreported by Batty et al. (1990) were recorded in the unit oflux. Lux is a unit of measure based on the photopic spectralsensitivity of the human eye and measuring light in lux maynot be appropriate for quantifying the amount of lightperceived by an alewife eye. Clupeids do not use photopicvision to feed at night; they use scotopic vision (viaabsorption of light through rod visual pigments) to capturethe small amount of light available at night (Blaxter 1970).The relevant light levels should be measured in a similarunit to lux, but designed for alewife (as done for mysids byGal et al. 1999, for copepods by Cohen and Forward[2005], and for euphausiids by Widder and Frank [2001]).We derive such a unit, ‘alelux,’ and construct an alewife-specific photometer that accounts for the scotopic spectralsensitivity of the alewife eye to different wavelengths oflight in order to accurately measure the amount of lightavailable to alewife for feeding. Similar species-specificphotometers have been constructed for a number of aquaticorganisms (Widder and Frank 2001; Cohen and Forward2005) by placing a set of filters that closely matches thespectral sensitivity curve of the organism of interest in frontof a light-recording device.
To improve our understanding of the multifaceted effectsof light on predator–prey interactions, and in particular theinteractions between alewife and mysids, we combine: (1)sensitivity analyses of alewife visual pigments, with (2)behavioral experiments of fish feeding at different alewife-specific light levels, (3) vertical distribution information, and(4) gut content analyses of alewife caught on both a newmoon and full moon night (representing both extremes oflight conditions) in August 2004 in Lake Ontario. Wehypothesize that alewife use vision to enhance their feedingrates on mysids, even at the low light levels present within themysid layer at night. This would increase alewife feedingrates on mysids during full moon conditions. However, wealso hypothesize that full moon conditions (i.e., increasedlight penetration) should increase the degree of spatialseparation between mysids and alewives relative to newmoon conditions due to light limitations imposed on themysid distribution. This should decrease alewife feedingrates on mysids. The effect of light, therefore, depends on therelative magnitude of light effects on feeding rates and ondistributions, and cannot be predicted from either experi-ments or field observations alone. The combined approachused here is necessary for predicting alewife–mysid interac-tions under past, present, and future light regimes in LakeOntario and other deep-water systems.
2062 Boscarino et al.

Methods
Collection and maintenance of experimental alewivesand mysids—Alewives collected for use in the feedingexperiments were caught with a beach seine (38 m 3 3 m,6.0-mm stretch mesh) off the shore of Meyers Point onCayuga Lake, New York, U.S.A., on 13 June 2006—a timewhen adult alewives are abundant in the nearshore of thelake (Klumb et al. 2003). Cayuga Lake is a deep,mesotrophic lake in the Finger Lakes region of New YorkState and was used as our sampling lake (as opposed toLake Ontario), given that the Cornell Biological FieldStation has had success in capturing large amounts ofthese fish in this same sampling spot in years past and intransporting them back to the laboratory with low ratesof mortality. Cayuga Lake alewife likely invaded fromLake Ontario (or vice versa) and both systems containmysids.
Fish were transferred into an aerated 800-liter round,fiberglass tank filled with 20uC lake water. These tankswere held at a conductivity level of 1500 mS cm21 and weretreated with ProlineTM de-foamer. Such conditions havebeen shown to decrease the stress levels of alewifeimmediately following capture and during transportationback to the laboratory (Lepak et al. 2008).
Upon arrival to the Cornell Biological Field Station’slaboratory facilities, alewife were transferred to another800-liter circular stock tank, which was maintainedbetween 1500 mS?cm21 and 1800 mS?cm21 until the end ofthe feeding experiments. Conductivity levels were main-tained through use of a peristaltic pump (MityFlexH 14revolutions min21 Peristaltic Pump, Anko Products) thatdelivered the appropriate concentration of salt water atregular intervals to the stock tank. A steady flow offreshwater was also added to help control any buildup ofurea and other nitrogenous wastes in the stock tank.Ammonia levels were monitored on a daily basis inaddition to salinity levels and temperatures. Stocktanks were cleaned with a siphon on a daily basis toremove any feces that had accumulated on the bottom ofthe tank.
A total of 234 alewife were held in these tanks on a 13h : 11 h light : dark photoperiod through to the end of thefeeding experiments on 15 December 2005. Fish were in-spected daily for signs of disease or abnormal behaviors;mortality levels were very low during this time period (,3%). Fish were fed HikariH fish fry plankton (0.37–0.61 mm)at hourly intervals through the use of an automatic fishfeeder (AF6 Fish Feeder, Sweeney Enterprises).
Mysids used as prey in the fish feeding experiments werecollected with vertical net hauls (1-m diameter, 1-mm mesh)at a 70-m site on Cayuga Lake, New York. Mysids wereimmediately placed into light-proofed coolers and trans-ported back to the Cornell Biological Field Station wherethey were held at 12uC prior to experimentation. Mysidswere fed ad libitum densities of Cyclop-eezH and all feedingand handling of mysids were done in infrared or far-redlight (mysids are not sensitive to these wavelengths—Gal etal. 1999) to ensure that mysids were not blinded whenplaced into the alewife feeding experiments.
Spectral sensitivity analyses—Three adult alewife wereselected, at random, from the 800-liter stock tanks formicrospectrophotometric (MSP) examination. These fishwere placed into black bags and were transported to theDepartment of Biomedical Sciences at Cornell Universitywhere they were held in the dark for a minimum of 4 h tocomplete dark adaptation.
The dark-adapted fish were euthanized with MS-222 andrapidly enucleated under dim red light. All further isolationand preparation was done using a dissecting scopeequipped with infrared illuminators and image converters.The eyes were hemisected and the retinas isolated from theposterior segment under PBS (potential hydrogen [pH] 7.4)supplemented with 6% sucrose. Small pieces of isolatedretina were transferred in buffer to cover slips, cut andteased with No. 11 scalpel blades, and sandwiched withanother cover slip edged with silicone vacuum grease.
The computer-controlled, single-beam MSP has beenpreviously described (Loew 1994). Absorbance was mea-sured at 1-nm intervals from 750 nm to 350 nm with areturn scan done to confirm that there had not beensignificant bleaching during measurement. Because onlyscotopic spectral sensitivity was of interest, only rodphotoreceptors were measured.
Using the results from the MSP analyses, a photometerwas constructed that measured the brightness of theenvironment as perceived by the alewife eye. Followingthe approach of Widder and Frank (2001), a filter wasinserted in front of a radiometer (International LightH lightmeter, Model IL1400A) so that its transmission propertiesmimicked the absorbance properties of the rod visualpigments of an alewife. Hereafter, we refer to all light levelsas perceived by the alewife eye in units of alelux.
Derivation of alelux units—If the spectral distribution oflight is known or can be estimated, alelux, lux, and W m22
can be calculated absolutely at any depth with thefollowing equations:
W m{2
ð700
400
W(l)|dl ð1Þ
Alelux~
ð700
400
Ya(l)|W(l)|dl ð2Þ
Lux~683
ð700
400
Yl(l)|W(l)|dl ð3Þ
where W(l) is irradiance, in W m22, as a function ofwavelength of light, l (nm). The function W(l) is specific tothe light source of interest (i.e., moonlight, slide projector,sunlight, or starlight). Ya(l) represents the value of thenormalized alewife visual spectrum (range 5 0–1), as afunction of wavelength (see Results: Visual pigmentanalysis and Fig. 1 for these values evaluated at 10-nmintervals). Yl(l) is the value of the luminosity coefficient of
Light effects on mysids and alewife 2063

the standard photopic curve with Yl (555 nm) 5 1(wavelength of maximum absorption, lmax 5 555 nm inEq. 3; Williamson and Cummins 1983). The constant infront of the photopic lux curve represents the absolutevalue of luminous efficacy (683 lumens watt21) at lmax 5555 nm (Williamson and Cummins 1983). Because theabsolute value of luminous efficacy at lmax is not knownfor alewife, we set the value of this constant to equal one inEq. 2. The lack of a known luminous efficacy constant inthe alelux equation accounts for the large differential inabsolute values between human lux and alelux (see below).
Researchers interested in using alelux units in fieldapplications can use the following conversions, specific tothe relative spectral output of moonlight at the surface ofthe water (Gal et al. 1999): 1 W m22 5 0.424 alelux 5343 lux 5 1.96 mylux (the mysid-specific unit of brightnessderived by Gal et al. 1999) over a wavelength range of 400–700 nm. Note that these conversions will change with depthbecause the spectral distribution of light changes withdepth due to differences in wavelength-specific attenuation.Therefore, using these conversions below the surface willonly be approximate for comparison with other studies inwhich the spectral distribution of light is unavailable. Asdefined in this study, researchers can now calculate aleluxin one of two ways: by applying Eq. 2 given the spectralirradiance of the light source and absorbance properties ofthe alewife rod visual pigment, or by measuring aleluxdirectly by placing a RoscoH RoscoluxH filter, No. 91 infront of the light meter. In the latter case, the light valuesthat are obtained after having passed through the ‘aleluxfilter’ can be reported directly in alelux units, after applyingslight correction factors for the transparency and absor-bance properties of the filter paper (see Results: Visualpigment analysis section).
Alewife feeding experiments—Alewife selected for use inthe feeding experiments were removed from the stock tanks
and placed into round, 100-liter polypropylene tanks in a14uC, temperature-controlled room. Round tanks wereused for experimentation to ensure that there were no‘corner’ effects on feeding rate. Tanks were chosen suchthat they were taller (1 m) than they were wide (0.5 m) toincrease the probability of mysids being found in the upperregion of the tanks, because mysids respond to kairomonesby choosing depths farthest from alewife (Boscarino et al.2007). Exploratory trials confirmed that alewife consistent-ly swam in the bottom of these tanks, and mysids werefrequently found in the upper half of the tanks.
Three alewives were placed into each tank and three tofour tanks were used in each trial (the number of mysidprey in stock in our laboratory limited us to the use of threetanks on certain trial dates). A trial was defined as a light-level treatment administered concurrently to a set of threeor four experimental tanks. No tank effects with regard tofish behavior were noted throughout the experiments and,therefore, each tank was assumed to be a replicate. We tookseveral measures to control for potentially confoundingfactors such as diurnal feeding patterns (we comparedfeeding rates at the same time of day for each trial) and‘learned’ behavior by alewives over time (treatmentsassigned to each trial date were completely randomized).Light-level treatments were selected based on preliminaryfield sampling and extrapolation of light levels at the depthof the mysid layer based on surface light readings andwavelength-specific attenuation coefficients (Boscarino etal. 2009a). Seven different light-level treatments wereadministered to the tanks, including one completely darkcondition, which served as a control against which thefeeding rates on mysids at other light levels was tested.
Light was delivered to each of the experimental tanksfrom a diffuse light source (120 V, 1 Watt Light EmittingDiode (LED) bulb, EliteLED.com) that transmitted lightprimarily within the green portion of the visual spectrum(range 5 480–570 nm, lmax 5 525). The alewife-specificphotometer (above) was placed near the bottom of each ofthe tanks to record light intensity in alelux both before andafter each trial. Because the variance in light levels betweeneach of the tanks was low (, 5%), we assumed that each wasexposed to the same light level for each trial. Light-leveltreatments were controlled through the addition of differentcombinations of fabric (black plastic and felt) that served asneutral density filters. The overall attenuation of bothfabrics was quantified prior to experimentation, halfwaythrough the feeding rate experiments and at the end of thefeeding rate experiments to ensure that the attenuationproperties of the fabric remained the same over the course ofthe experiments (variance was , 1% for each fabric).
Feeding experiments were run at much higher mysiddensities (100 mysids m23) than those typically found in thefield. We were interested only in the relative effect of lighton feeding rate across a range of light intensities and, thus,ran trials at a mysid density that would minimize the effectof prey depletion. The size of mysids used in the feedingexperiments ranged from 5 mm to 15 mm and were selectedat random from the stock mysid aquarium. Experimentswere run for 3 h. At the end of this time period, alewiveswere taken out of the tank and the water strained through a
Fig. 1. Absorbance characteristics of the visual pigment inthe rods of Alosa pseudoharengus (alelux curve) and thetransmission properties of the filter used in the alewife-specificphotometer in comparison to the human photopic visual spectrum(lux curve) and the mysid visual spectrum (mylux curve; Gal et al.1999). Percent absorbance represents the relative probability ofphoton absorption at a given wavelength (spectrum normalized torange between 0 and 100). Percent transmission represents theprobability of a photon of light at that wavelength passingthrough the filter (normalized to a maximum of 100%).
2064 Boscarino et al.

1-mm mesh net to collect any remaining mysids. Tankswere selected at random for gut content analysis to confirmthat the above procedure was correctly accounting for thenumber of mysids eaten in a given trial. In all cases (n 512), the number of mysids missing from the tanks wereaccounted for in the stomachs of alewife.
The feeding rate (mysids fish21 h21) of alewife on mysidsin each tank was calculated for each 3-h trial period. Weassumed that all three alewife were feeding at equal ratesand cleared a constant proportion of the mysids availablein the tank over a 3-h time interval. We performed one-wayANOVA and Dunnett’s t-test (a 5 0.05) to test fordifferences in feeding rates at different light levels relativeto control conditions (completely dark). We defined thethreshold for visual feeding as the lowest light level atwhich the mean feeding rate was significantly greater thanunder control (dark) conditions.
Behavioral observations—In addition to the abovealewife feeding experiments, we videotaped an additionalset of feeding trials at five different light levels (1022, 1026,1027, 1028 alelux and complete darkness—i.e., infraredlight) to provide insight into the feeding behavior ofalewife. Each light-level treatment was taped both with andwithout mysids present to better elucidate differences inpredator behavior with and without prey. All taped trialswere run with three alewife in a 0.5-m3, rectangularaquarium. The aquarium was fitted with white sheets ofpolyvinyl chloride on three of the four sides to maximizethe contrast between the alewife and the background of theaquarium. All taped trials were conducted at a mysiddensity of 100 mysids m23 and filmed horizontally with aninfrared-sensitive camera (Sony Digital HandycamH,TRV18) mounted , 5 m from the aquarium. Each trialwas conducted over a 45-min time period.
We were not present in the room at the time ofvideotaping to minimize disturbance and quantified feedingbehaviors on a television with a videocassette recorder afterthe trials had finished. Analysis of video observations andgut contents yielded the following statistics for alltreatments: (1) total number of strikes, (2) total numberof captures (determined by gut content analyses), (3)percent of attacks that led to successful capture, and (4)angle of strike. Percent of attacks leading to capture wasdetermined by dividing the total number of mysids found inthe stomachs of the fish at the end of the 45-min trial by thetotal number of strikes observed from the tape at each lightlevel. Strike angles were determined by pausing thevideotape during the strike and measuring the body anglewith a protractor in relation to the water’s surface (i.e., thehorizon). Preliminary analyses of videotape indicate thatbody angle acted as a direct measure of swimming angle, orangle of attack. We also made note of more generalobservations of swimming and search behavior to deter-mine how other aspects of predator behavior may havevaried between trials. All tape analysis was performed blind(we recorded all strike and capture data without priorknowledge of the light treatment) so as not to bias the dataanalysis. One video trial was recorded for each of the fivedifferent light treatments.
Field sampling and analyses—Two sampling cruises onLake Ontario on 16 August 2004 (new moon) and 27August 2004 (full moon) were conducted to investigate theeffect of moon phase on the degree of spatial overlapbetween mysids and alewife and the prevalence of mysids inthe stomachs of alewife. The data for these two field pro-files were collected at a 170-m-deep site several kilometersoffshore of Oswego, New York (43u33.220 N, 76u34.849 W)and represent a subset of a larger spatial modeling projectof alewife and mysids for the offshore of Lake Ontarioconducted between 2004 and 2005, the methods of whichare described in detail in Boscarino et al. (2009a).
Depth-specific light and temperature data were collectedon both nights with a SeaBird profiler lowered to a fewmeters above the lake bottom. The normalized alewifevisual spectrum (Fig. 1) was applied to the spectra availablebetween 400 nm and 700 nm (in W?m22) for each depth andwavelength to calculate alelux at depth. Wavelength-specific attenuation was accounted for, after determiningthe vertical light extinction coefficient, KPAR, on each night,by applying the equations of Jerome et al. (1983; seeBoscarino et al. 2009a,b).
Mysid and fish vertical distributions for both Augustnights were measured with a 70-kHz (Simrad EY500; 11.4ubeam width, split beam) and a 430-kHz (Biosonics DtX; 6ubeam width, single beam) hydroacoustics units, bothoperating at 0.6 ms pulse length, and 1 ping s21. Datawere collected while in transit from a 100-m to 170-mbottom depth station. Calibration and density estimates forboth fish and mysids were done in the same manner asdescribed in Boscarino et al. (2009a).
The degree of spatial overlap between fish and mysids onthe two sampling nights were compared using theCzekanowski index of overlap (|1 2 (0.5 S (Mi 2 Fi)|100;Feinsinger et al. 1981), where Mi and Fi represent therelative mysid and fish density value at depth i, respectively,evaluated at 1-m depth intervals from the surface to themaximum depth of detection (zmax). We define the upperedge of the mysid layer as the depth associated with theupper 10% of the peak of the mysid distribution.
Fish were collected for species identification and gutcontent analyses by setting mid-water gill-nets between 15 mand 35 m on both nights. Decisions on the depth of set weremade prior to each sampling night and were based on thedepth of the water column expected to be inhabited bymysids. Each gill-net set consisted of seven different 3-m-wide 3 20-m-deep nets, each with a different mesh size(6.25, 8, 10, 12.5, 15, 18.5, and 25 mm bar measure). Thisset should capture alewife between 50 mm and 250 mm(Warner et al. 2002). Gill-nets were set before dusk andretrieved at 02:00 h the next morning on both samplingdates. Total catch was recorded in terms of number of fishcaught per hour sampled. Fish were immediately flash-frozen on dry ice after gill-nets were pulled in to preservegut contents. All fish caught in gill-nets were analyzed forthe number of mysids per stomach at the Cornell BiologicalField Station. The number of mysids per stomach per hour(calculated as the time between when mysids first appearedon our acoustic echograms and when gill-nets wereretrieved) was used as the basis for comparing capture
Light effects on mysids and alewife 2065

success of fish on the new moon vs. the full moon night.Because it could not be determined when most of thenighttime feeding occurred, these feeding rates are usedonly to compare relative foraging success on the two nightsand should not be used to calculate absolute feeding rates.
Results
Visual pigment analysis—Only a single vitamin A1–basedpigment was found in all alewife eyes examined with a peakabsorbance, lmax, at 505 nm (Fig. 1). The smoothed,normalized visual pigment data were used to select a filter(RoscoH RoscoluxH filter No. 91, peak transmission, lmax
5 510 nm) whose transmission properties closely resembledthe absorbance characteristics of the alewife visual pig-ment. There were some differences between the transmis-sion characteristics of this filter and the absorbance of thealewife visual pigment (Fig. 1) and, thus, a correctionfactor of 8.75 (factor of 5 to adjust for transmissionproperties of the filter multiplied by 1.75 to adjust fordifferences in breadth and lmax) was applied to allmeasurements obtained with the light meter in thelaboratory to arrive at the filtered alelux units discussedin the methods. This correction factor is specific for thegreen LED light source described in the methods. Nocorrection factor was necessary for all light levels estimatedin the field because these were done according to Eq. 2 andnot measured in situ with the photometer. The respectivevisual spectrum curves for alewife, mysids, and humans arecompared in Fig. 1.
Alewife feeding experiments—The feeding rate of ale-wives generally declined as light levels decreased (one-wayANOVA at a 5 0.05; F7,64 5 8.77, p , 0.0001; Table 1).Under simulated dusk to full moon light conditions at thesurface of the lake (1022–1024 alelux), mean feeding ratesremained above 0.70 mysids fish21 h21 (Fig. 2). The visual
threshold (defined as the lowest light level at which meanfeeding rates were significantly different from controlconditions) occurred at 1027 alelux—a light intensity closeto that experienced by alewife at the upper edge of themysid scattering layer on a full moon night in Lake Ontario(Boscarino et al. 2009a; Dunnett’s t-test at a 5 0.05, control(n 5 10) vs. the 1027 alelux treatment (n 5 14), p 5 0.04).Feeding did not cease entirely under completely darkconditions (Fig. 2), indicating that alewives can use othersenses besides vision to feed on mysids. At least one mysidwas consumed in the dark in all replicates.
Behavioral observations—We observed 3, 1, 28, 24, and20 strikes per trial for the dark, 1028 alelux, 1027 alelux,1026 alelux, and 1022 alelux trials, respectively (Table 2).Out of these strikes, the highest capture success occurred inthe 1022 alelux trial (90% of observed strikes led tosuccessful captures), followed by 83% and 61% for the 1026
alelux and 1027 alelux trials, respectively. No successfulcaptures were recorded in the 1028 alelux and dark trials.Capture success in the dark was significantly lower than the1027, 1026, and 1022 alelux treatments (series of pair-wisez-tests of capture success proportions, p 5 0.046, 0.008,0.0028; Table 2). Comparisons could not be made with the1028 alelux treatment because we observed only oneunsuccessful strike at this light level.
We observed that alewife swimming and search behav-iors in the feeding trials changed depending on the amountof light available in the tank (Table 2). Alewife in both thedark and the 1028 alelux trials tended to stay near thebottom of the tank, while alewife in the higher light-leveltrials ventured more into ‘open’ waters to search for food.We stopped the video tape at regular 2-min intervals toobserve alewife position in the water column and noted that. 90% of observations of alewife were in the lower half ofthe tank in both the 1028 alelux and completely dark trials.These percentages of observations of alewives in thebottom half of the tank were both significantly higher inthe dark trial and 1028 alelux trial relative to the highestlight trial (pair-wise z-tests of tank position, p 5 0.0129 and
Fig. 2. Mean feeding rates (mysids fish21 h21) of alewife atdifferent light intensities. All trials are 3 h in length withoutreplacement of prey items at a 100 mysid m23 density. Thenumber of replicates is shown above each mean feeding rate. Errorbars represent 6 1 SE from the mean feeding rate.
Table 1. Results of one-way ANOVA with feeding rate ofalewife (mysids21 fish21 h21) as a function of light intensity, in log-transformed alelux units. ‘‘Number’’ refers to the number ofreplicate runs for each experimental light treatment. ‘‘Mean’’ refersto the mean feeding rate at each light-level treatment, 6 1 SE.Significant differences between mean feeding rates at a particularlight intensity vs. control (dark) was based on Dunnett’s t-test (a50.05). SS 5 sums of squares, MS 5 mean squares.
df SS MS F Significance F
Regression 7 4.28 0.61 8.77 ,0.0001Residual 64 4.46 0.07 — —
Total 71 8.74 — —
Log10 (alelux) No. Mean 61 SE Significant?
22 10 0.86 0.081 yes23 6 0.70 0.11 yes24 6 0.74 0.12 yes25 10 0.50 0.083 yes26 10 0.61 0.083 yes27 14 0.40 0.095 yes28 6 0.19 0.053 noDark (control) 10 0.10 0.026 —
2066 Boscarino et al.

0.0035, respectively; Table 2). In addition, alewives indarker trials were almost always found swimming in ahorizontal position and displayed lower activity levels thanthose fish swimming in higher light conditions. Fish tendedto slowly flick their tails to maintain approximately thesame depth every 2–3 s in the two darkest treatments. In the1022 alelux trials, fish were swimming more rapidly,regularly moving between the lower and upper half of thetank with stronger, more frequent tail movements.
Alewives in the highest light-level treatment of 1022
alelux were commonly found swimming in a horizontaldirection, but often tilted their bodies at , 20u to thehorizontal to survey the water column above them. Whentilted at the 20u orientation, the fish ceased flicking its tailand seemed actively engaged in prey-searching above them,as evidenced by movement of their eyes toward the top ofthe tank—presumably to locate prey swimming abovethem. We hereafter refer to this type of prey-searchbehavior as ‘coasting’—a behavior that was not evidentin any trials in which mysids were absent, indicating thatthe behavior was prey-induced. Coasting was also apparentin the 1026 alelux and 1027 alelux trials but ceasedaltogether in the 1028 alelux and dark trials, suggestingthat these light levels are too low to elicit the same type ofprey-searching behavior seen in the higher light trials.
Strike behavior also changed depending on the light level(Table 2). For all light-level trials of 1027 alelux andgreater, we observed a strike sequence similar to thatdescribed by Janssen (1978): coasting (i.e., cessation of tailflick and ‘faster’ horizontal movement, followed byadoption of a 20u body axis tilt to the horizontal), then aquick ‘dart’ toward prey located above the fish in the water.All strikes at these light levels occurred from below—a fishnever attacked a prey item that was below it in the watercolumn. In . 75% of all strikes analyzed for treatments of1027 alelux and greater, the dart was made between anangle of 50–60u to the horizontal (median angle 5 55u,mean angle 5 52u, SE 5 1.5; Table 2). Out of the threestrikes recorded in the dark, all were made entirely alongthe horizontal plane—never from below. In the 1028 aleluxtrial, we recorded only one strike—which was made at an
angle almost completely perpendicular to the horizontal(straight up). Strike angles in all trials of 1027 alelux andgreater were not significantly different from one another,but all were significantly different than the mean angle inthe dark trials (overall one-way ANOVA at a 5 0.05; F3,52
5 24.70, p , 0.0001; for all Tukey’s HSD comparisonsbetween light treatments and dark, p , 0.0001; Table 2).The 1028 alelux treatment was not included in theseanalyses because only one strike was observed. Strikebehavior from below was never noted in any trials in whichmysids were absent. In general, fish preferred to swim alongthe longitudinal axis and in the center of the tank, avoidingmost corners, and we therefore believe that the angleapproximations are not biased by fish striking at anglesaway or toward the camera (Janssen 1981).
Field applications: Environmental conditions and mysidand fish vertical distributions—Temperature conditions onthe two nights were nearly identical—surface temperaturewas , 21uC on both nights and the thermocline (defined asthe depth at which the temperature change per meter wasmaximized) was only 2 m deeper on the full moon night(21 m) than the new moon night (19 m; Fig. 3). Light levelsat the upper edge and peak of the mysid layer wereapproximately two orders of magnitude greater on the fullmoon night than on the new moon night (Table 3).
Mysids were deeper in the water column on the fullmoon vs. the new moon night, as we originally hypothe-sized (Fig. 3). The depth of maximum mysid abundanceshifted from 30 m to 36 m from the new moon to full moonnight due to higher light levels penetrating deeper into thewater column on the full moon night given that temper-ature conditions were similar on the two nights (Boscarinoet al. 2009a). Peak mysid density was similar on both nights(17 mysids m23 at 36 m on the full moon night and 12mysids m23 at 30 m on the new moon night), but totalmysid abundance was higher on the full moon vs. the newmoon night (290 mysids?m22 compared to 125 mysids?m22,respectively). Note however that the average mysid densityacross the depth ranges of the gill-net sets (15–35 m) wasnearly identical on both nights (Table 3).
Table 2. Behavioral observations of alewife feeding on mysids. Trials were run in 0.5-m3 tanks at a prey density of 100 mysids m23 ofwater. Number of strikes and captures are based on one taped 45-min trial for each light treatment. Each trial had three alewife in a tank.Point of attack refers to the position of the fish in the tanks relative to the prey prior to a strike. Mean attack angles are reported indegrees from the horizontal, with standard errors in parentheses. Presence in bottom half refers to the percent of observations of fishfound in the bottom half of the tank. Significant differences in attack angles and capture successes are denoted by different lettersuperscripts (one-way ANOVA with Tukey’s post-hoc test for attack angle differences and pair-wise z-tests for differences in proportionsfor capture success and presence in bottom half, a 5 0.05). ‘‘na’’ means that the data could not be analyzed for that condition(not applicable).
Behavioral observation
Light treatment (alelux)
1022 1026 1027 1028 Dark
No. strikes 20 24 28 1 3No. captures 18 20 17 0 0Capture success 90%a 83%a 61%b 0% 0%c
Coasting? yes yes yes no noPoint of attack below below below below horizontallyAttack angle 53(2.2)a 47(3.8)a 55(1.4)a 90(na) 0(0)b
Presence in bottom half 63%a 77%a,b 82%a,b 96%c 93%b,c
Light effects on mysids and alewife 2067
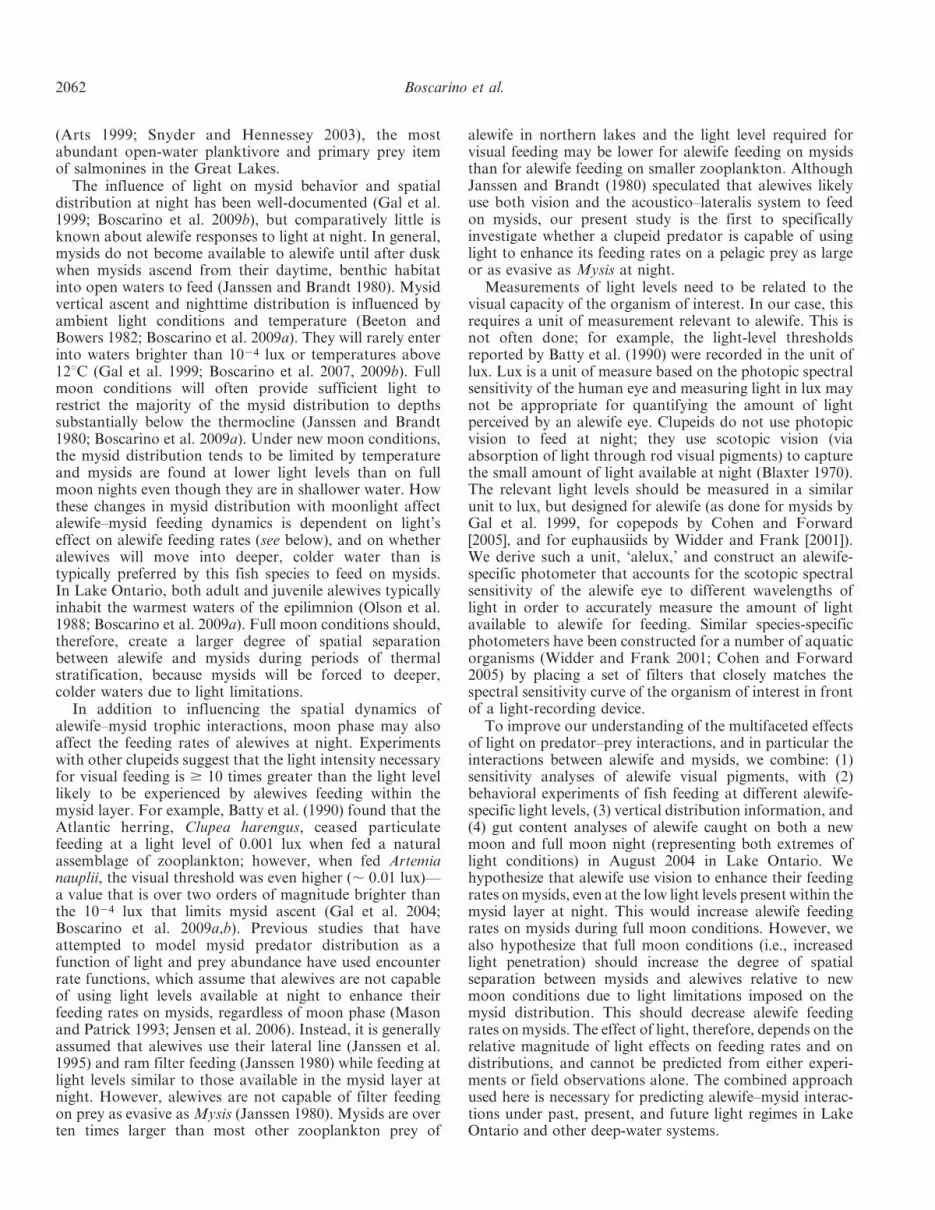
Fish displayed a bimodal distribution on both nightswith a shallower and larger peak found between 5 m and15 m and a deeper, smaller peak between 15 m and 30 m(Fig. 3). The peak of the mysid distribution was 30 m ordeeper on both nights. Total fish abundance per unit area(as estimated through acoustics) was lower on the newmoon compared to the full moon night (0.046 fish m22 and0.185 fish m22, respectively), although densities averagedacross the depth of the gill-net sets were nearly identical(0.0012 fish m23 compared to 0.0017 fish m23, respectively;Table 3). Light levels were at least two orders of magnitudehigher at the depths of peak fish density than at depths ofmaximum mysid density, because fish were shallower in thewater column than mysids. The depth of maximum alewifeabundance in both the shallower and the deeper peaks didnot change substantially from the new moon to full moonnight (9 m compared to 7 m in the shallower peak and 23and 21 m in the deeper peak, respectively; Table 3).However, the deeper peak represented a larger proportionof the total fish abundance on the new moon night than onthe full moon night (Fig. 3). This translated into a higherdegree of overlap between mysid and fish distributions onthe new moon (23%) vs. the full moon night (10%;Table 3). These values represent an estimate of nicheoverlap using proportional mysid and alewife distributions,which should provide an estimate of light’s effect ondistribution patterns , relative to other habitat indices suchas Williamson’s density risk (Williamson et al. 1989) orLloyd’s mean crowding indices (Lloyd 1967), which alsofactor in absolute density overlaps.
Fish present between 15 m and 35 m were primarilyalewife because alewife constituted . 90% of the catch inour gill-nets set between 15 m and 35 m on both nights(only one individual rainbow smelt, Osmerus mordax, wascaught on each of the nights). Seventy-three and 29 alewifewere caught and analyzed on the new moon and full moonnight, respectively. Given that acoustic estimates of fishacross the depth of the gill-net set were nearly identical onthe two nights and given our experimental results on fishvision at light levels at the mysid layer at night, the highercatch on the new moon night may have been due to netavoidance on the full moon night (Hansson and Rudstam1995). Fifty-five percent of the fish contained mysids on thefull moon night (16 out of 29 fish) compared to 5% on thenew moon night (4 out of 73 fish; Table 3). The observedfeeding rates of alewife were thirty-two times higher on thefull moon vs. the new moon night.
Discussion
Properly characterizing the role that light plays instructuring aquatic food-web interactions requires infor-mation on the visual reception capabilities of both predatorand prey, as well as on the behavioral and distributionalresponses of both trophic levels to different intensities oflight (Blaxter 1970; Lythgoe 1979). In other words,foraging success needs to be considered from a physiolog-ical, spatial, and behavioral perspective of both predatorand prey. In this study, we use such an integrative approach
Fig. 3. Mysid and fish vertical distribution on (A) a newmoon night on 16 August 2004 and (B) a full moon night on 27August 2004. Mysids were found deeper in the water column onthe full moon night, but a larger proportion of the total fishabundance was found deeper on the new moon night. Please notethe different scales on the x-axis for fish density in each panel.Gill-nets were set between 15 m and 35 m and sampling revealedthat the majority of fish present were alewife. Temperature (uC)conditions were similar on both nights.
Table 3. Environmental conditions and observed feedingrates (mysids fish21 h21) of alewife for both sampling nights onLake Ontario. Light levels are reported in alelux (1 alelux, 809 lux). Light at peak and upper edge of the mysiddistribution refer to the light conditions at the depth ofmaximum mysid density and at the depth of the upper 10% ofthe peak of the mysid distribution, respectively. Light at theshallower peak and deeper peak of the alewife distribution refer tolight at the depths of maximum alewife abundance associated withboth peaks of the bimodal alewife distribution. Mysid and fishdensity represent the mean density (No. m23) across the depthrange of 15–35 m, or the depth of the gill-net sets. Observedfeeding rates are based on gut contents of alewife caught with thegill-nets. % overlap was calculated using Czekanowski’s index.
Environmental data 16 Aug 04 27 Aug 04
Moon phase new fullLight at surface 931027 431025
Light at upper edge of mysiddistribution (depth) 531029(21 m) 131027(27 m)
Light at peak of mysiddistribution (depth) 9310210(30 m) 331028(36 m)
Light at shallower peak ofalewife distribution (depth) 931028(9 m) 431026(7 m)
Light at deeper peak of alewifedistribution (depth) 231029(23 m) 231027(21 m)
Mysid density 4.2 4.6Alewife density 0.0012 0.0017% overlap 23% 10%% occurrence 5% 55%Observed feeding rate 0.02 0.64
2068 Boscarino et al.

to understanding how light is affecting the feedinginteractions of a planktivorous fish, A. pseudoharengus,and a migrating invertebrate, M. diluviana, in Lake Ontarioat night—a time of day in which vision is often notconsidered to be a primary determinant of foraging successin clupeids. Our study is significant because it provides atemplate for how to study light effects over a range of scalesfrom the absorption properties of visual pigments in theretina, to behavioral experiments in the laboratory, toimplications at larger spatial and temporal scales relevantto the populations in lake and marine ecosystems.
Through a combination of visual pigment analyses,laboratory feeding experiments and field observations, wedemonstrate that alewives are capable of visual feeding at theupper edge, but not at the peak, of the mysid layer under fullmoon conditions but are not capable of visual feeding at anydepth under new moon conditions. Higher light levels at theupper edge of the mysid distribution on the full moon nightled to higher overall feeding rates on mysids (0.64 mysidsfish21 h21 compared to 0.020 mysids fish21 h21), despite alarger degree of spatial separation between the two trophiclevels (percent spatial overlap was 23% compared to 10% onthe new moon and full moon nights, respectively). Cumu-latively, these results suggest that although increased lightpenetration leads to a larger degree of spatial separationbetween alewives and mysids, those fish present within thelayer feed more effectively on mysids, leading to higheroverall feeding rates on mysids.
Although the photopic spectral sensitivity of alewiveshas been previously investigated (Wald 1939), this study isthe first to report the absorbance characteristics of the rodvisual pigments of alewife. A single Vitamin A1–based rodvisual pigment was found with a wavelength of maximumabsorbance, lmax, at 505 nm. These results are similar tothose obtained through microspectrophotometric analysesof retinal pigments of dark-adapted herring, Clupeaharengus (lmax 5 500 nm; Blaxter 1964). This observedshort wavelength lmax is a common characteristic of mostrhodopsin-based pigments in mesopelagic marine fish(Blaxter 1970) and may represent an adaptation tomaximize contrast between the spectral distribution ofbackground light and the spectral reflectance of a targetprey item, such as mysids. For example, Lythgoe (1979)hypothesized that a visual pigment with a lmax offset fromthe wavelength of maximum water transparency mayconfer an advantage in the detection of a brighter objectagainst a dark background. The peak irradiance at night atthe depth of maximum mysid density on both the newmoon and full moon nights occurred at significantly longerwavelengths (550 nm) than the wavelength of maximumabsorbance derived for alewife in this study. Furthersupport for this contrast hypothesis is offered by observa-tions of Atlantic herring (Clupea harengus harengus), whichsilhouettes its prey against down-welling light (Blaxter1966), suggesting that clupeids primarily use contrast tocapture prey in low-light environments.
Our results indicate that alewives are capable of visualfeeding on mysids at light levels that are lower than thosereported for other clupeids. Experiments with the herring,Clupea harengus, suggest that the threshold for visual feeding
in clupeids lies somewhere between 0.01 and 0.001 lux, or1025 to 1026 alelux, depending on the type of prey sourceused and direction of the light source (Blaxter 1964; Batty etal. 1990). The feeding rate experiments, behavioral observa-tions, and field gut-content analysis in our study all suggestthat light significantly increases feeding rates on mysidsdown to 1027 alelux relative to darker conditions. Becauseour experiments were not designed to tease apart the relativecontributions of other senses besides vision to alewifefeeding ecology, we cannot definitively state that alewifeare using primarily vision to feed at the low light levelsavailable at night, only that their feeding is enhanced at lightlevels of 1027 alelux and greater. For example, Janssen et al.(1995) demonstrated that alewives are capable of lateral line-mediated particulate feeding under completely dark condi-tions. Fish in our experiments were also capable of capturingmysids in the dark, likely through lateral line sensing.Furthermore, clupeids presumably have a highly sensitiveauditory system due to a connection between the swimbladder and inner ear (Denton and Blaxter 1976). Denton andBlaxter (1976) also found that clupeid lateral lines are coupledto their ears so it may not be possible to fully segregate thelateral line sense and auditory senses in clupeids. Olfactionplays a role in larval herring feeding (Dempsey 1978) and mayalso be used by larger individuals or other clupeid species.
Observations of fish feeding behavior yielded interestinginsight into the mechanisms through which alewives arelocating and striking at prey at the low light levels presentat the mysid layer at night. Greater than 75% of the attacksmade on mysids at light levels of $ 1027 alelux were madeat an angle of 50–60u to the horizontal (mean angle 5 52u;SE 5 1.6), suggesting that alewife are locating prey that areabove them in the water column. These results aresomewhat similar, but not identical, to those found forthe blueback herring, Alosa aestivalis, which attackedArtemia prey under well-lighted conditions at a mean angleof 36u to the horizontal (Janssen 1981). Similarly,Thetmeyer and Kils (1995) observed adult herring, Clupeaharengus, to attack the littoral mysid, Praunus flexuous,from an average angle of 48u to the horizontal. Our resultssuggest that alewives attack mysid prey at greater anglesthan these previous studies, but well within the range ofthose both predicted, as well as observed, to be mostvisually optimal by Thetmeyer and Kils (1995). Thedifferences in mean angle of strike between ours and theseprevious studies is that both Janssen (1981) and Thetmeyerand Kils (1995) created an artificial Snell’s window (thecone created by rotating Snell’s angle of 41.4u to thehorizontal around the fish eye’s zenith), which would haveallowed the fish to use a dark-field effect created by lightreflected and refracted off of the prey item within the areajust beyond Snell’s window. In our experiments, we did notcreate a Snell’s window ‘cone of illumination,’ which willaffect both the angle and possibly the mechanism (i.e.,maximizing contrast or overall quantal catch), throughwhich the fish are optimally detecting their prey. Ourexperiments were not designed to tease apart thesemechanisms. However, the one common thread betweenthese three studies is that clupeids searched for andattacked prey from below when using light to feed.
Light effects on mysids and alewife 2069

Alewife strike behavior changed in complete darkness,with alewife instead striking at prey horizontally. Fishswimming behavior was greatly reduced in the dark as well,suggesting that fish may be minimizing turbulence so thatprey could be located more easily through lateral linesystem. We caution that we were only able to witness threeattacks in the complete darkness (none of which led to asuccessful capture); thus, a more thorough analysis of fishfeeding behavior in complete darkness would have to beperformed before concluding that alewife only attack preyhorizontally in the absence of light.
In addition to its effects on capture success and feedingbehavior in the laboratory, light also influenced the degreeof overlap between mysids and alewives in the field. Mysidsinhabited deeper portions of the water column on the fullmoon night relative to the new moon night due tolimitations imposed by higher light levels penetrating fartherinto the water column (the depth associated with the peak ofthe mysid distribution shifted . 6 m from the new moon tofull moon night). The depths associated with both peaks ofthe bimodal alewife distribution did not shift to deeperwaters on the full moon night. This, in combination with themysid distribution shifting to deeper waters due to lightlimitations, led to larger spatial separation between alewivesand mysids on the full moon night.
Despite the increased spatial separation between mysidsand alewives on the full moon night, gut content analysessuggest that those alewives found within the mysid layeruse the increased light levels available at the upper edge ofthe mysid distribution to enhance their feeding rates onmysids. Light levels associated with the shallowest 10% ofthe mysid population were two orders of magnitude greateron the full moon night and fell within the range of lightlevels that alewives are capable of using for vision-orientedfeeding in the laboratory (, 1027 alelux); however, lightlevels associated with the peak of the mysid distribution onthe full moon night and at the upper edge of the mysiddistribution on the new moon night were below the visualthreshold for alewife. These differences in light levels acrossthe two nights translated into a substantially higher percentof mysids in alewife stomachs on the full moon night (55%)compared to the new moon night (5%) and an over 30-foldincrease in feeding rate (0.64 compared to 0.020 mysidsfish21 h21) despite the lower degree of spatial overlapbetween the two species and lower densities of alewiveswithin the mysid layer. Given the relative similarity inmysid abundances in the region of overlap with the alewifedistribution on the two nights, these results suggest thatalewives can use light at the upper edge of the mysiddistribution to enhance their feeding rates on mysids on fullmoon nights, but are likely not capable of visual feeding atdepths associated with the peak of the mysid layer, evenwhen the moon is full. This is consistent with the hypothesisthat light preference of mysids at night is associated withminimizing predation by planktivorous fish (Boscarino etal. 2009b).
The laboratory and field results are complementary inthat they indicate that alewife can detect mysids under lightconditions associated with the upper edge of the mysiddistribution, but that some feeding by the fish occurs both
in the field and lab under lighting conditions insufficient forvisual detection of prey. During full moon there may be amix of alewife strategies, with some individuals engaging inram filter feeding in shallower waters on smaller zooplank-ton, some favoring feeding near the upper edge of themysid distribution, and some feeding deeper under theconstraint of insufficient light for seeing the prey. Insystems with more diverse predators it is likely that thereare species specialized on one vs. other sensory modes. Forexample, in Lake Baikal the analog for Mysis is thegammarid amphipod Macroheptopus and the predators aretwo species of pelagic sculpins of the genus Comephorusthat feed primarily on Macroheptopus. The sensoryapparatus of the two pelagic sculpins is strikingly different.C. baikalensis has a very large eye with elongate receptorcells. The pupil is directed upward and the eye shape issomewhat tubular, converging on that of certain mesope-lagic marine fishes (Pankhurst et al. 1994). In contrast, C.dybowski has very tiny eyes, but the lateral line canals aremassive and of a type commonly found in some deep-seafishes (Janssen 2004). It may be that the feeding strategiesof the two pelagic sculpins are complementary andfacilitate each other by forcing Macroheptopus to diversifydefense strategies. The alewife eye is not particularlyspecialized for seeing under low-light conditions (Ali andAnctil 1976); its lateral line is somewhat unusual in that thecanals, which are limited to the head and anterior trunk,are branched, but this condition is not characteristic offishes that inhabit low-light conditions (Janssen et al. 1995).
This study is not only important in terms of ourunderstanding of alewife feeding ecology, but also in itsimplications for understanding the effect of ecologicalchange on pelagic food-web dynamics in the Great Lakesand elsewhere. In many systems in North America, theestablishment of dreissenid mussels and decreases innutrient loading have led to substantial increases in lightpenetration and water clarity, creating an ‘illumination’ ofthe interactions that form both benthic and pelagic foodwebs (Mills et al. 2003; Zhu et al. 2006). During periods ofstrong thermal stratification, the thermocline is more likelyto restrict mysid distributions than light, and mysids will,therefore, reside in darker waters than isothermal condi-tions or conditions with bright moon light, when mysiddistributions are limited by light (Beeton and Bowers 1982).We hypothesize that in an era of increased water clarity,mysid distributions should more often be limited by lightrather than temperature, which would lead to higher lightlevels at the upper edge of the mysid layer for more days ofthe year (Boscarino 2009). Our study is the first todemonstrate that a light-limited mysid distribution willlead to a better foraging environment for alewives onmysids. This is consistent with recent observations byStewart et al. (2009), who found that alewives are becomingincreasingly reliant on mysids throughout the year. Ourresults suggest a possible mechanism for this switch—enhancement of the visual foraging environment at night. Aswitch toward a high-calorie mysid diet following increas-ing light levels may be advantageous to the alewifepopulation and the reason for the apparent paradox thatalewife body condition indices have increased in Lake
2070 Boscarino et al.

Ontario in recent years despite declines in epilimneticcopepods and cladocerans and increased feeding on low-calorie prey such as Bythotrephes (Storch et al. 2007;Holeck et al. 2008; O’Gorman et al. 2008).
This study takes a multidimensional approach to under-standing pelagic food-web dynamics in a time of ongoingecological change—one that considers not only predator andprey distributions and behaviors but also considers thevariety of environmental factors and underlying biologicaland physiological mechanisms shaping trophic interactions.We focus on how one such mechanism, light, is affecting oneof the most central feeding relationships in Great Lakespelagic food webs, that between alewife and the mysidshrimp. We believe that the results of these investigationsmay be used to forecast how future changes in lightpenetration will continue to affect alewife–mysid feedingdynamics and pelagic food-web dynamics, in general.
AcknowledgmentsWe thank Bill Thelen, Brian Young, Jesse Lepak, Jim Watkins,
and Willie Fetzer, who assisted in a number of ways with both theset-up and execution of the feeding experiments, and BobO’Gorman, Emily Freund, and June Eillenberger for their hardwork and guidance with field work and the initial set-up of thisstudy. We also thank Ed Mills, the Associate Editor of L&O andtwo anonymous reviewers for their helpful comments on ourmanuscript. This is contribution No. 275 of the Cornell BiologicalField Station. This research was funded by New York Sea Grantproject R/FBF-19. The U.S. Government is authorized to produceand distribute reprints for governmental purposes notwithstand-ing any copyright notation that may appear herein.
References
AKSNES, D. L., J. NEJSTGAARD, E. SOEDBERG, AND T. SORNES. 2004.Optical control of fish and zooplankton populations. Limnol.Oceanogr. 49: 233–238.
ALI, M. A., AND M. ANCTIL. 1976. Retinas of fish. Springer-Verlag.ARTS, M. T. 1999. Lipids in freshwater zooplankton: Selected
ecological and physiological aspects, p. 71–90. In M. T. Artsand B. C. Wainman [eds.], Lipids in freshwater ecosystems.Springer-Verlag.
BALINO, B. M., AND D. L. AKSNES. 1993. Winter distribution andmigration of the sound-scattering layers, zooplankton,micronekton in Masfjorden, Western Norway. Mar. Ecol.Prog. Ser. 102: 35–50, doi:10.3354/meps102035
BATTY, R. S., J. H. S. BLAXTER, AND J. M. RICHARD. 1990. Lightintensity and the feeding behavior of herring, Clupeaharengus. Mar. Biol. 107: 383–388, doi:10.1007/BF01313419
BEAUCHAMP, D. A., C. M. BALDWIN, J. L. VOGEL, AND C. P. GUBALA.1999. Estimating diel, depth-specific foraging opportunitieswith a visual encounter rate model for pelagic piscivores. Can.J. Fish. Aquat. Sci. 56: 128–139, doi:10.1139/cjfas-56-S1-128
BEETON, A. M., AND J. A. BOWERS. 1982. Vertical migration ofMysis relicta Loven. Hydrobiologia 93: 53–61, doi:10.1007/BF00008098
BLAXTER, J. H. S. 1964. Spectral sensitivity of the herring, Clupeaharengus. J. Exp. Biol. 41: 155–162.
———. 1966. The effect of light intensity on the feeding ecologyof herring, p. 393–409. In R. Bainbridge, G. C. Evans and O.Rackham [eds.], Light as an ecological factor. Blackwell.
———. 1970. 2. Light. 2.3 animals 2.32 fishes, p. 213–286. In O.Kinne [ed.], Marine ecology. Wiley.
BOSCARINO, B. T. 2009. Effects of light on the feeding interactionsand spatial distributions of the opossum shrimp, Mysisrelicta, and the alewife, Alosa pseudoharengus, in LakeOntario. Ph.D. thesis. Cornell Univ.
———, L. G. RUDSTAM, J. EILLENBERGER, AND R. O’GORMAN.2009a. Importance of light, temperature, zooplankton andfish in predicting the nighttime vertical distribution of Mysisdiluviana. Aquat. Biol. 5: 263–279, doi:10.3354/ab00161
———, ———, E. R. LOEW, AND E. L. MILLS. 2009b. Predictingthe vertical distribution of the opossum shrimp, Mysis relicta,in Lake Ontario: A test of laboratory-based light preferences.Can. J. Fish. Aquat. Sci. 66: 101–113, doi:10.1139/F08-190
———, ———, S. MATA, G. GAL, O. E. JOHANNSSON, AND E. L.MILLS. 2007. The effects of temperature and predator–preyinteractions on the migration behavior and vertical distribu-tion of Mysis relicta. Limnol. Oceanogr. 52: 1599–1613.
COHEN, J. H., AND R. B. FORWARD. 2005. Diel vertical migrationof the marine copepod Calanopia americana. I. Twilight DVMand its relation to the diel light cycle. Mar. Biol. 147: 387–395,doi:10.1007/s00227-005-1569-x
COLLOCA, F., P. CARPENTIERI, E. BALESTRI, AND G. ARDIZZONE.2010. Food resource partitioning in a Mediterranean demersalfish assemblage: The effect of body size and niche width. Mar.Biol. 157: 565–574, doi:10.1007/s00227-009-1342-7
DEMPSEY, C. H. 1978. Chemical stimuli as a factor in feeding andintraspecific behavior of herring larvae. J. Mar. Biol. Assoc.U. K. 58: 739–747, doi:10.1017/S0025315400041400
DENTON, E. J., AND J. H. S. BLAXTER. 1976. The mechanicalrelationships between the clupeid swimbladder, inner ear andlateral line. J. Mar. Biol. Assoc. U. K. 56: 787–807,doi:10.1017/S0025315400020804
FEINSINGER, P., E. E. SPEARS, AND R. W. POOLE. 1981. A simplemeasure of niche breadth. Ecology 62: 27–32, doi:10.2307/1936664
FEUERWERKER, E., AND M. A. ALI. 1975. Fish vision—historicaland bibliographic review. Rev. Can. Biol. 34: 221–285.
GAL, G., E. R. LOEW, L. G. RUDSTAM, AND A. M. MOHAMMADIAN.1999. Light and diel vertical migration: Spectral sensitivityand light avoidance by Mysis relicta. Can. J. Fish. Aquat. Sci.56: 311–322, doi:10.1139/cjfas-56-2-311
———, L. G. RUDSTAM, AND O. E. JOHANNSSON. 2004. PredictingMysis relicta vertical distribution in Lake Ontario. Arch.Hydrobiol. 159: 1–23, doi:10.1127/0003-9136/2004/0159-0001
HANSSON, S., AND L. G. RUDSTAM. 1995. Gillnet catches as anestimate of fish abundance—a comparison between verticalgillnet catches and hydroacoustic abundances of Baltic Seaherring (Clupea harengus) and sprat (Sprattus sprattus). Can.J. Fish. Aquat. Sci. 52: 75–83, doi:10.1139/f95-007
HOLECK, K. T., J. WATKINS, E. L. MILLS, O. JOHANNSSON, S.MILLARD, V. RICHARDSON, AND K. BOWEN. 2008. Spatial andlong-term temporal assessment of Lake Ontario water clarity,nutrients, chlorophyll a, and zooplankton. Aquat. Ecosyst.Health Manag. 11: 377–391, doi:10.1080/14634980802515302
JANSSEN, J. 1978. Feeding-behavior repertoire of the alewife, Alosapseudoharengus, and the ciscoes Coregonus hoyi and C. artedii.J. Fish. Res. Bd. Can. 35: 249–253.
———. 1980. Alewives (Alosa pseudoharengus) and ciscoes(Coregonus artedii) as selective and nonselective planktivores,p. 580–585. In W. C. Kerfoot [ed.], Ecology and evolution ofzooplankton communities. New England Press.
———. 1981. Searching for zooplankton just outside Snell’swindow. Limnol. Oceanogr. 26: 1168–1171, doi:10.4319/lo.1981.26.6.1168
———. 2004. Lateral line sensory ecology, p. 231–264. In E. G.Vonder and J. Mogdans [eds.], The senses of fishes:Adaptations for the reception of natural stimuli. Narosa.
Light effects on mysids and alewife 2071
———, AND S. B. BRANDT. 1980. Feeding ecology and verticalmigration of adult alewives (Alosa pseudoharengus) in LakeMichigan. Can. J. Fish. Aquat. Sci. 37: 177–184, doi:10.1139/f80-023
———, W. R. JONES, A. WHANG, AND P. E. OSHEL. 1995. Use ofthe lateral line in particulate feeding in the dark by juvenilealewife (Alosa pseudoharengus). Can. J. Fish. Aquat. Sci. 52:358–363, doi:10.1139/f95-037
JENSEN, O. P., T. R. HRABIK, S. J. D. MARTELL, C. J. WALTERS,AND J. F. KITCHELL. 2006. Diel vertical migration in the LakeSuperior pelagic community. II. Modeling trade-offs at anintermediate trophic level. Can. J. Fish. Aquat. Sci. 63:2296–2307, doi:10.1139/F06-125
JEROME, J. H., R. P. BUKATA, AND J. E. BRUTON. 1983. Spectralattenuation and irradiance in the Laurentian Great Lakes. J.Gt. Lakes Res. 9: 60–68, doi:10.1016/S0380-1330(83)71872-1
KAARTVEDT, S., W. MELLE, T. KNUTSEN, AND H. R. SKJOLDAL.1996. Vertical distribution of fish and krill beneath water ofvarying optical properties. Mar. Ecol. Prog. Ser. 136: 51–58,doi:10.3354/meps136051
KLUMB, R. A., L. G. RUDSTAM, E. L. MILLS, C. P. SCHNEIDER, AND
P. M. SAWYKO. 2003. Importance of Lake Ontario embay-ments and nearshore habitats as nurseries for larval fisheswith emphasis on alewife (Alosa pseudoharengus). J. Gt. LakesRes. 29: 181–198, doi:10.1016/S0380-1330(03)70426-2
LEPAK, J. M., C. E. KRAFT, D. C. HONEYFIELD, AND S. B. BROWN.2008. Evaluating the effect of stressors on thiaminase activityin alewife. J. Aquat. Anim. Health 20: 63–71, doi:10.1577/H07-026.1
LESTER, N. P., A. J. DEXTRASE, R. S. KUSHNERIUK, M. R. RAWSON,AND P. A. RYAN. 2004. Light and temperature: Key factorsaffecting walleye abundance and production. Trans. Am.Fish. Soc. 133: 588–605, doi:10.1577/T02-111.1
LLOYD, M. 1967. Mean crowding. J. Anim. Ecol. 36: 1–30,doi:10.2307/3012
LOEW, E. R. 1994. A third, ultraviolet-sensitive, visual pigment inthe Tokay gecko, Gekko gecko. Vision Res. 34: 1427–1432,doi:10.1016/0042-6989(94)90143-0
LYTHGOE, J. N. 1979. The ecology of vision. Oxford.MASON, D. M., AND E. V. PATRICK. 1993. A model for the space-
time dependence of feeding for pelagic fish populations.Trans. Am. Fish. Soc. 122: 884–901, doi:10.1577/1548-8659(1993)122,0884:AMFTST.2.3.CO;2
MILLS, E. L., AND oTHERS. 2003. Lake Ontario: Food webdynamics in a changing ecosystem (1970–2000). Can. J. Fish.Aquat. Sci. 60: 471–490, doi:10.1139/f03-033
O’GORMAN, R., S. E. PRINDLE, J. R. LANTRY, AND B. F. LANTRY.2008. Disruption of the lower food web in Lake Ontario: Didit affect alewife growth or condition? Aquat. Ecosyst. HealthManag. 11: 392–402, doi:10.1080/14634980802515526
OLSON, R. A., J. D. WINTER, D. C. NETTLES, AND J. M. HAYNES.1988. Resource partitioning in summer by salmonids in south-central Lake Ontario. Trans. Am. Fish. Soc. 117: 552–559,doi:10.1577/1548-8659(1988)117,0552:RPISBS.2.3.CO;2
PANKHURST, N., V. SIDELEVA, O. SMIRNOVA, AND J. JANSSEN. 1994.Ocular morphology of the Baikal sculpin-oilfishes, Come-phorus baikalensis and C. dybowski (Comephoridae). Environ.Biol. Fishes 39: 51–58, doi:10.1007/BF00004756
PETERKA, J., AND J. MATENA. 2009. Differences in feedingselectivity and efficiency between young-of-the-year yellowperch (Perca fluviatilis) and roach (Rutilis rutilis)—field
observations and laboratory experiments on the importanceof prey movement apparency vs. evasiveness. Biologia 64:786–794, doi:10.2478/s11756-009-0133-4
PITCHER, T. 1979. Sensory information and the organization ofbehaviour in a shoaling cyprinid fish. Anim. Behav. 27:126–149, doi:10.1016/0003-3472(79)90133-7
RICHMOND, H. E., T. R. HRABIK, AND A. F. MENSINGER. 2004.Light intensity, prey detection and foraging mechanisms ofage 0 year yellow perch. J. Fish Biol. 65: 195–205, doi:10.1111/j.0022-1112.2004.00444.x
SNYDER, R. J., AND T. M. HENNESSEY. 2003. Cold tolerance andhomeoviscous adaptation in freshwater alewives (Alosapseudoharengus). Fish Physiol. Biochem. 29: 117–126,doi:10.1023/B:FISH.0000035920.60817.11
STEWART, T. J., W. G. SPRULES, AND R. O’GORMAN. 2009. Shifts inthe diet of Lake Ontario alewife in response to ecosystemchange. J. Gt. Lakes Res. 35: 241–249, doi:10.1016/j.jglr.2008.12.010
STORCH, A. J., K. L. SCHULZ, C. E. CACERES, P. M. SMYNTEK, J. M.DETTMERS, AND M. A. TEECE. 2007. Consumption of twoexotic zooplankton by alewife (Alosa pseudoharengus) andrainbow smelt (Osmerus mordax) in three Laurentian GreatLakes. Can. J. Fish. Aquat. Sci. 64: 1314–1328, doi:10.1139/F07-096
THETMEYER, H., AND U. KILS. 1995. To see and not be seen: Thevisibility of predator and prey with respect to feedingbehavior. Mar. Ecol. Prog. Ser. 126: 1–8, doi:10.3354/meps126001
UTNE-PALM, A. C. 2000. Prey visibility, activity, size andcatchability (evasiveness) influence on Gobiusculus flavescensprey choice. Sarsia 85: 157–165.
———. 2002. Visual feeding of fish in a turbid environment:Physical and behavioral aspects. Mar. Freshw. Behav.Physiol. 35: 111–128, doi:10.1080/10236240290025644
WALD, G. 1939. On the distribution of vitamins A1 and A2. J.Gen. Physiol. 22: 391–415, doi:10.1085/jgp.22.3.391
WARNER, D. M., L. G. RUDSTAM, AND R. A. KLUMB. 2002. In situtarget strength of alewives in freshwater. Trans. Am. Fish.Soc. 131: 212–223, doi:10.1577/1548-8659(2002)131,0212:ISTSOA.2.0.CO;2
WIDDER, E. A., AND J. A. FRANK. 2001. The speed of an isolume:A shrimp’s eye view. Mar. Biol. 138: 669–677, doi:10.1007/s002270000504
WILLIAMSON, C. E., M. E. STOECKEL, AND L. J. SCHOENECK. 1989.Predation risk and the structure of freshwater zooplanktoncommunities. Oecologia 79: 76–82, doi:10.1007/BF00378242
WILLIAMSON, S. J., AND H. Z. CUMMINS. 1983. Light and color innature and art. Wiley.
ZHU, B., D. G. FITZGERALD, C. M. MAYER, L. G. RUDSTAM, AND
E. L. MILLS. 2006. Alteration of ecosystem function by zebramussels in Oneida Lake: Impacts on submerged macrophytes.Ecosystems 9: 1017–1028, doi:10.1007/s10021-005-0049-y
Associate editor: Thomas Kiørboe
Received: 15 October 2009Accepted: 22 April 2010Amended: 14 June 2010
2072 Boscarino et al.


