Embed Size (px)
Citation preview
INFECTION AND IMMUNITY, Aug. 2009, p. 3432–3441 Vol. 77, No. 80019-9567/09/$08.00�0 doi:10.1128/IAI.00346-09Copyright © 2009, American Society for Microbiology. All Rights Reserved.
Kinetics of Lethal Factor and Poly-D-Glutamic Acid Antigenemiaduring Inhalation Anthrax in Rhesus Macaques�
Anne E. Boyer,1,2 Conrad P. Quinn,1,3 Alex R. Hoffmaster,1,4 Thomas R. Kozel,5 Elke Saile,1,3
Chung K. Marston,1,4 Ann Percival,5 Brian D. Plikaytis,1,3 Adrian R. Woolfitt,1,2 Maribel Gallegos,1,2,6
Patrick Sabourin,7 Lisa G. McWilliams,1,2,6 James L. Pirkle,1,2 and John R. Barr1,2*Centers for Disease Control and Prevention,1 National Center for Environmental Health, 4770 Buford Highway NE, Atlanta,Georgia 303412; National Center for Immunization and Respiratory Diseases, 1600 Clifton Road, Atlanta, Georgia 303333;
National Center for Zoonotic, Vector Borne, and Enteric Diseases, 1600 Clifton Road, Atlanta, Georgia 303334; University ofNevada School of Medicine, Reno, Nevada5; Battelle Memorial Institute, Centers for Disease Control and Prevention,
4770 Buford Highway NE, Atlanta, Georgia 303416; and Battelle Biomedical Research Center, West Jefferson, Ohio7
Received 25 March 2009/Returned for modification 5 May 2009/Accepted 2 June 2009
Systemic anthrax manifests as toxemia, rapidly disseminating septicemia, immune collapse, and death.Virulence factors include the anti-phagocytic �-linked poly-D-glutamic acid (PGA) capsule and two binarytoxins, complexes of protective antigen (PA) with lethal factor (LF) and edema factor. We report the charac-terization of LF, PA, and PGA levels during the course of inhalation anthrax in five rhesus macaques. Wedescribe bacteremia, blood differentials, and detection of the PA gene (pagA) by PCR analysis of the blood asconfirmation of infection. For four of five animals tested, LF exhibited a triphasic kinetic profile. LF levels(mean � standard error [SE] between animals) were low at 24 h postchallenge (0.03 � 1.82 ng/ml), increasedat 48 h to 39.53 � 0.12 ng/ml (phase 1), declined at 72 h to 13.31 � 0.24 ng/ml (phase 2), and increased at 96 h(82.78 � 2.01 ng/ml) and 120 h (185.12 � 5.68 ng/ml; phase 3). The fifth animal had an extended phase 2. PGAlevels were triphasic; they were nondetectable at 24 h, increased at 48 h (2,037 � 2 ng/ml), declined at 72 h(14 � 0.2 ng/ml), and then increased at 96 h (3,401 � 8 ng/ml) and 120 h (6,004 � 187 ng/ml). Bacteremia wasalso triphasic: positive at 48 h, negative at 72 h, and positive at euthanasia. Blood neutrophils increased frompreexposure (34.4% � 0.13%) to 48 h (75.6% � 0.08%) and declined at 72 h (62.4% � 0.05%). The 72-h declinesmay establish a “go/no go” turning point in infection, after which systemic bacteremia ensues and the host’scondition deteriorates. This study emphasizes the value of LF detection as a tool for early diagnosis ofinhalation anthrax before the onset of fulminant systemic infection.
Bacillus anthracis is the gram-positive spore-forming organ-ism that causes anthrax. Spores gain entry through threeroutes, dermal, ingestion, and inhalation, causing three distinctdisease forms (31). Inhalation anthrax has a rapid onset and isusually fatal. In the anthrax attacks of 2001, the fatality ratewas 45% despite the use of antibiotics and supportive treat-ment (16, 17). Recent studies in a murine model using a non-toxigenic encapsulated strain indicate that for all three routesof entry, bacterial growth may occur at the site of inoculation(11). Vegetative organisms may then disseminate to the drain-ing lymph node, the spleen, and finally to the lungs and blood(11). The guinea pig model for dissemination of fully patho-genic B. anthracis indicates that spores may be engulfed by lungmacrophages and then transported to mediastinal thoraciclymph nodes where they germinate and subsequently dissem-inate to the bloodstream (35). In all models of untreated ful-minant anthrax, the virulent B. anthracis infection results insystemic bacteremia, sepsis-induced shock, respiratory distress,and extensive hemorrhage and is often fatal (31).
The vegetative anthrax bacilli circumvent host defenses byproducing a poly-D-glutamic acid (PGA) capsule that may pro-
tect them from phagocytosis (36) and two major binary toxinswhich disrupt immune signaling (1, 41, 47). Protective antigen(PA), which binds cell receptors to internalize the toxins, com-bines with both of the catalytic toxin components: lethal factor(LF), a zinc-dependent endoproteinase, and edema factor(EF), an adenylate cyclase that forms lethal toxin (LTx) andedema toxin, respectively (31). The known targets of LF in-clude five members of the family of mitogen-activated proteinkinase kinase (MAPKK) response regulators (31). LF cleavesand inactivates MAPKKs, which plays an intermediate role inMAPK immune activation (41). LTx affects a broad range ofimmune cells, including macrophages, neutrophils, dendriticcells, and T and B lymphocytes, activities which are central tothe ability of B. anthracis to disable host defenses (1, 41, 47).The other catalytic protein, EF, converts ATP to cyclic AMP,causing an efflux of fluid from the cell and localized edema(31). In addition, the EF-induced rise in cyclic AMP inhibitsphagocytosis, microbiocidal activity, neutrophil chemotaxis,and superoxide production, contributing to extensive physio-logical immune dysfunction (41). Edema toxin was also shownto contribute to increased transcription of the anthrax toxinreceptor genes in host cells, theoretically contributing to en-hanced receptor expression and toxin uptake (48).
Since LTx is integral to the pathogenesis of anthrax, under-standing its levels over the disease course and during treatmentmay help to understand the clinical course and to devise strat-
* Corresponding author. Mailing address: Centers for DiseaseControl and Prevention, 4770 Buford Hwy NE, MS-F50, Atlanta,GA 30341. Phone: (770) 488-7848. Fax: (770) 488-4609. E-mail:[email protected].
� Published ahead of print on 8 June 2009.
3432
egies for and timing of therapeutic intervention (44). The PGAcapsule antigen is also a key virulence factor in anthrax and isan abundant antigen produced on the surfaces of B. anthracisvegetative cells. During infection, PGA is shed from the bac-terium, and serum PGA levels have been shown to correlatewith bacterial load (23). Previous studies quantifying PA andLF in rabbits and guinea pigs succeeded in measuring thesetoxins in late infection or during the final 24 h of the infectioncycle (22, 25, 40). While these studies provide important in-formation about toxin levels prior to death, they do not offer adetailed understanding of the dynamics of toxemia immedi-ately postexposure and at the onset of infection—critical timepoints for diagnosis and early intervention.
We have previously reported the development of a rapid, high-specificity, high-sensitivity mass spectroscopy (MS) method forthe quantification of LF in serum and plasma (4). The aimof this study, therefore, was to evaluate the MS technologyfor early and rapid diagnosis of disease in a rhesus macaquemodel of inhalation anthrax. We also sought to comparedetection of LF with other B. anthracis antigens secreted orreleased during infection, specifically PA and PGA, and tocompare these with hematological parameters and the moreestablished diagnostic tools for anthrax, detection of thepagA gene and bacteremia (http://www.bt.cdc.gov/agent/anthrax/lab-testing/approvedlrntests.asp). This is the firststudy to demonstrate the early and extended kinetics ofanthrax LF toxemia and its relationship to innate immunecell changes and the infection cycle in rhesus macaques withinhalation anthrax.
MATERIALS AND METHODS
Materials. All chemicals and reagents were from Sigma-Aldrich (Saint Louis,MO) except where indicated.
Animal care. The inhalation anthrax study in rhesus macaques (Macaca mu-latta) was done at the Battelle Biomedical Research Center (Columbus, OH).The study protocol was approved by both Battelle and the Centers for DiseaseControl and Prevention (CDC) Institutional Animal Care and Use Committees(IACUC) and followed the stringent requirements for care and use set down byCDC IACUC guidelines, which adhere to the National Institutes of Healthguidelines for the care and use of laboratory animals. All aspects of the studywere designed to minimize stress in the animals. Five female rhesus macaques,3.3 to 4.0 kg prior to challenge, were obtained from Covance (Alice, TX).Animals were quarantined for 6 weeks and tuberculin tested every 2 weeks withnegative results. Animals judged to be moribund after the spore challenge werehumanely euthanized.
Challenge protocol. Bacillus anthracis Ames strain was prepared and charac-terized at Battelle. Anesthetized rhesus macaques were challenged via head-onlyexposure in a class III biosafety cabinet with approximately 300 to 400 50% lethaldose (LD50) equivalents of B. anthracis Ames spores by methods describedpreviously (approximately 1.7 � 107 to 2.2 � 107 spores, where 1 � LD50 equals55,000 spores or CFU) (14). The spore dose corresponds to that which has beenused to yield high infection rates (43). Aerosol exposure time was adjusted sothat each animal inhaled the required cumulative volume of air to attain thetargeted dose, assuming 100% retention of the inhaled dose. Exposure timesranged from 10 to 30 min, and animals were anesthetized for the entire periodto minimize stress. Actual total spore exposure doses ranged from 308 to 460LD50 equivalents of B. anthracis Ames spores (geometric mean � percent SE �378 � 8 LD50).
Blood collection. Blood was collected in serum separation tubes at 42 dayspreexposure and postexposure at 2, 4, 6, 12, 24, 48, 72, 96, and 120 h fordetermining LF, PA, and PGA concentrations. Serum was filter sterilized, andsterility was confirmed by culture before other analyses. For bacteremia andpagA PCR, whole blood was collected in EDTA tubes at 42 days preexposure, at2, 4, 6, 12, 24, 48, and 72 h postexposure, and at euthanasia. Whole blood wasalso collected for hematology at 42 days preexposure and postexposure at 2, 24,48, and 72 h.
Bacteremia. Approximately 10 to 40 �l of whole blood was inoculated by looponto a blood agar plate which was incubated at 37°C � 2°C for a minimum of48 h. A positive bacteremia for B. anthracis was indicated by the presence ofwhite colonies, 4 to 10 mm in diameter with a rough appearance and irregularedges. The specific grading of bacteremia is indicated in “Data reporting andstatistical analyses.”
Hematology. Complete blood counts and differentials were determined usingan Advia 120 hematology system (Siemens Healthcare Diagnostics, Deerfield,IL) according to the manufacturer’s guidelines. Normal reference range bloodlevels were obtained from a review of the existing literature, which gave themeans and standard deviations (SD) for several hematological variables (24).Normal ranges for the relevant hematological variables were calculated as themean � the SD.
LF quantification. LF activity was quantified by methods reported previ-ously (4). Briefly, LF in a sample was captured by anti-LF monoclonal anti-bodies (MAb) on magnetic protein G beads (Invitrogen Corporation, Carls-bad, CA) and then mixed with 40 �l of buffer and a synthetic peptidesubstrate optimized for cleavage by LF. This mixture was incubated at 37°Cfor 2 h, and then a 2-�l volume was analyzed by isotope dilution matrix-assisted laser desorption ionization–mass spectrometry. The remaining LF-substrate mixture was incubated for 21 h and then analyzed by MS again. Toachieve the necessary dynamic range and to account for high-sensitivityrapid-response sample analysis, two standard curves were prepared, one for20 ng/ml, �l (“low volume” [LV]) and the other for 200 ng/ml, �l (“highvolume” [HV]) serum volumes. In addition, three quality control samples(QCs) were prepared in human serum pools (Interstate Blood Bank, Mem-phis, TN) using recombinant LF (List Biological Laboratory, Campbell, CA)and validated. The LV standard curve ranged from 0.025 to 100 ng/ml, withQCs at 2 and 20 ng/ml. LV analysis at a 2-h incubation covered 0.5 to 100ng/ml, and at a 21-h incubation it covered 0.05 to 25 ng/ml. The HV standardsand samples were analyzed at 2 h for high sensitivity qualitative diagnostics(the limit of detection for HV analysis at 2 h was 0.05 ng/ml) and at 21 h forquantification, which covered 0.005 to 2.5 ng/ml and included QCs at 0.2 and2.0 ng/ml. The lowest standard for each analytical range represents thedetection limit for that range. The relative SD for QC validation ranged from8.5 to 14.7% (A. E. Boyer et al., unpublished data).
In an anthrax emergency, a high volume of sample would be analyzed for themost sensitive results in less than 4 h. However, to conserve usage of animal studysamples, smaller volumes were analyzed initially. Specifically, 20-�l volumes ofsera from rhesus macaques were assayed for LF at all time points using the LVstandard curve and QCs. Test samples which were negative after 21 h using 20 �lwere reevaluated using a 200-�l sample to increase analytic sensitivity using theHV standards and QCs. Unknown samples were quantified from the appropriate2-h or 21-h standard curve when responses were within the specified standardcurve range. Samples with responses higher than 50 ng/ml after the LV analysisat a 2-h incubation were diluted appropriately, and analysis was repeated withthe 20-�l standards and QCs.
PA antigen capture immunoassay. Microtiter plates (Thermo Labsystems,Franklin, MA) were coated with monoclonal anti-PA antibody AVR1046 ob-tained by the same methodologies used for anti-LF monoclonal described pre-viously (4) at 1.28 �g/ml in 0.01 M phosphate-buffered saline (PBS), pH 7.4.Coated plates were washed with a wash buffer consisting of PBS and 0.1% Tween20, pH 7.4. Recombinant PA (rPA; List Biological Laboratories, Inc., Campbell,CA) was serially diluted twofold using a 1/25 or a 1/100 dilution of normal rhesusmacaque serum (RMS). The rPA dilutions formed a seven-point standard curvefrom 0.6 to 37.5 ng/ml. Samples were serially diluted twofold in dilution buffer(DB; PBS, 5% skim milk, 0.5% Tween 20, pH 7.4). Sample and rPA standarddilutions were incubated for 30 min at 37°C and then washed. Captured antigenwas detected by adding human standard reference serum AVR801 (109.4 �g/mlanti-PA immunoglobulin G) (37) diluted 100-fold in DB and incubated for 60min at 37°C. Plates were washed and then incubated with horseradish peroxi-dase-conjugated mouse anti-human immunoglobulin G Fc PAN MAb HP6043(Hybridoma Reagent Laboratory, Baldwin, MD) diluted 1:10,000 for 60 min at37°C. Washed plates were developed with 2,2�-azinobis (3-ethylbenzothiazoline-6-sulfonic acid)-diammonium salt (ABTS)–H2O2 (Kirkegaard and Perry Labo-ratories, Gaithersburg, MD) for 15 min or 30 min for starting test sera dilutionsof 1/25 and 1/100, respectively, and stopped with peroxidase stop solution. Theoptical density at 410 nm (OD410) was read with a 490-nm reference filter.Samples were analyzed in duplicate in two or more separate analytical runs. Datawere analyzed using a four-parameter logistic-curve fitting model with enzyme-linked immunosorbent assay (ELISA) for Windows software version 2.15 (34;http://www.cdc.gov/Ncidod/dbmd/bimb/ELISA/downloadelisa_2.htm).
VOL. 77, 2009 KINETICS OF LF AND PGA IN INHALATION ANTHRAX 3433
The reactivity threshold (RT) of the PA ELISA was determined from dupli-cate analyses of 88 PA-negative RMS diluted 1/25 in DB, yielding a mean OD of0.047 and an SD of 0.021. The RT (mean OD plus 2 SD) was 0.089, below theaverage OD of 0.142 (n � 27) for the lowest rPA standard (0.6 ng/ml). The RTwas below the minimum detectable concentration (MDC) of the assay; therefore,the MDC was used as the default RT. The MDC (32) was determined from 27independent calibration curves. The analytic sensitivity of the antigen captureELISA using the MDC was calculated as 4.84 ng/ml PA analyte after a 1/25dilution.
PGA antigen capture immunoassay. A quantitative antigen capture ELISA forPGA was constructed using a 50:50 mixture of PGA MAbs F24F2 and F26G3(23). Microtiter plates were coated overnight with 100 �l of PGA MAb (1�g/ml), washed with 0.05% Tween 20 in PBS (PT), and blocked for 90 min withPT. Serum samples were initially diluted 1/40 or 1/10 and then twofold seriallydiluted in PT and incubated for 90 min in the MAb-coated wells (100 �l/well).Plates were washed with PT, incubated for 90 min with 100 �l of horseradishperoxidase-labeled PGA MAb (1 �g/ml), washed again, and then incubated withtetramethylbenzidine substrate (Kirkegaard & Perry Laboratories, Gaithersburg,MD). The reaction was stopped with 1 M H3PO4. The plates were read using aVersaMax plate reader (Molecular Devices, Sunnyvale, CA). Concentrations ofPGA in the serum were calculated using purified B. anthracis PGA as a standardwith the assistance of SoftMax Pro (Molecular Devices). An OD450 of 0.5 wasused as the end point. Values were adjusted as described previously to correct for thebackground (33). The sensitivity of the antigen capture ELISA was approximately 9ng/ml of serum after a 1/40 dilution and 2.25 ng/ml for a 1:10 dilution. Due tolimitations with sample volumes, PGA analyses were from single readings.
PCR assay. DNA was extracted from whole-blood samples of rhesus macaquespreexposure (�42 days), at 24, 48, and 72 h, and at euthanasia using the QiagenDNA mini kit (Germantown, MD). Isolated DNA was analyzed by PCR for thepresence of the PA gene (pagA) of B. anthracis using the LightCycler Bacillusanthracis detection kit (Roche Applied Science, Indianapolis, IN) according tothe manufacturer’s instructions.
Data reporting and statistical analyses. Values for PA, LF, and PGA werereported in nanograms per milliliter for 24 to 120 h. The LF assay reportedvalues of �1 ng/ml to the nearest 0.01 ng/ml and �1 ng/ml to the nearest 0.001ng/ml. Both the PA and PGA assay measurements were reported to the nearestnanogram per milliliter. Animal survival times were rounded to the nearest fullday. Due to limitations on allowable blood sample volumes from animals, PGAdata were from a single analysis per animal per time point. Qualitative results forPCR of pagA were reported as positive or negative. Culture results were gradedas positive if six or more colonies were present, low positive if one to five colonieswere present in the primary phase, or negative if no colonies were present. Dueto standard limitations for blood collection during animal studies, samples foranimal D from days 6 through 9 (144 to 216 h) were not available for PCR, LF,PA, and PGA testing. Standard formulas for calculating the geometric mean andpercent SE were generated in Microsoft Excel for comparing measurements pertime point. LF and PGA results collected after 24 h were transformed using log10
and analyzed using least squares regression and the correlation coefficient cal-culated.
RESULTS
Animal exposures and survival. The mean B. anthracis sporeaerosol dose (LD50 equivalents � percent SE) for the fiverhesus macaques was 378 LD50 � 8%. Animals A, C, and Esurvived to 96 h and received 308, 434, and 326 LD50, respec-tively. Animal B received 385 LD50 and survived to 120 h.Animal D, which received 460 LD50, survived to day 9. Thegeometric mean time to death for the entire cohort was 118.06 h� 0.17 h (4.92 days).
Detection and kinetics of B. anthracis antigens in rhesusmacaques. Tables 1 and 2 summarize the quantitative andqualitative results for parameters of infection in rhesus ma-caques and include the serum levels of the proteins, PA andLF, the capsule antigen PGA, detection of the pagA gene byPCR, and bacteremia status. These parameters were not de-tected at time points earlier than 24 h. Therefore, the 2, 4, 6,and 12 h time points were excluded from Tables 1 and 2.
PA detection in rhesus macaques. The earliest time point forwhich PA was detected in serum was 96 to 120 h. Thus, samplesfor time points earlier than 96 to 120 h had levels lower thanthe detection limit, an MDC of 4.8 ng/ml. PA was detected at
TABLE 1. Quantitative values for parameters of infection in rhesusmacaques infected by spore aerosol exposure to B. anthracis
Ames strain: PA, LF, PGAa
Factoranalyzed
AnimalID
Concn (ng/ml) at indicated time point
�42 days 24 h 48 h 72 h 96 h 120 h
PA A � � � � 147*B � � � � � 3,153*C � � � � �*D � � � � � �E � � � � 19,434*
LF A � 0.006 45.16 10.29 103.08*B � � 25.87 18.97 63.58 1,235.76*C � 0.200 51.66 10.57 34.07*D � 0.018 38.10 8.06 4.48 27.73E � � 42.00 25.08 3,885.89*
GM 0.028 39.53 13.31 82.78 185.12SE 1.82 0.12 0.24 2.01 5.68
PGA A � � 10,394 20 32,000*B � � 48 17 681 1,126,388*C � � 7,061 16 3,541*D � � 1,523 7 3 32E � � 6,527 18 1,965,663*
GM 2,037 14 3,401 6004SE 2 0.2 8 187
a Values for PA, LF, and PGA are shown in nanograms per milliliter for 24, 48,72, 96, and 120 h. The LF assay reported values of �1 ng/ml to the nearest 0.01ng/ml and �1 ng/ml to the nearest 0.001 ng/ml. Both the PA and PGA assaymeasurements were reported to the nearest nanograms per milliliter. Asterisksindicate the measurement at euthanasia. Geometric means (GM) and SE werecalculated by standard methods. Measurements for postexposure time points at2, 4, 6, and 12 h were negative for all parameters and thus were not included. Dueto standard requirements for blood collection during animal studies, samples foranimal D from days 6 through 9 were not available for LF, PA, and PGA testing.�, negative values obtained for PA, LF, and PGA.
TABLE 2. Qualitative values for parameters of infection in rhesusmacaques infected by spore aerosol exposure to B. anthracis
Ames strain: pagA and bacteremia status
Quantitativeassay
AnimalID
Resulta at indicated time point
�42 days 24 h 48 h 72 h 96 h 120 h
pagA PCR A � � � � �*B � � � � NS �*C � � � � �*D � � � � NS NSE � � � � �*
Bacteremia status A � � � � �*B � � � � NS �*C � � � � �*D � � � � NS NSE � � � � �*
a Qualitative results for pagA PCR are indicated as positive (�) or negative(�). Culture results were graded as positive (�) if there were more than fivecolonies, negative (�) if there were no colonies, and low positive (�) if therewere one to five colonies in primary phase. NS, no sample was available. Aster-isks indicate the measurement at euthanasia. Measurements for postexposuretime points at 2, 4, 6, and 12 h were negative for all parameters and thus were notincluded. Due to standard requirements for blood collection during animalstudies, samples for animal D from days 6 through 9 were not available for pagAPCR. At euthanasia on day 9, animal D was found to be bacteremic.
3434 BOYER ET AL. INFECT. IMMUN.
the latest time point in three of the five rhesus macaques whichhad the highest levels of LF and PGA (Table 1). PA levels wereconsistently higher than those of LF at these late time points,with the highest at 19,434 ng/ml in animal E at 96 h (Table 1).Animals A and B had PA levels of 147 ng/ml at 96 h and 3,153ng/ml at 120 h, respectively.
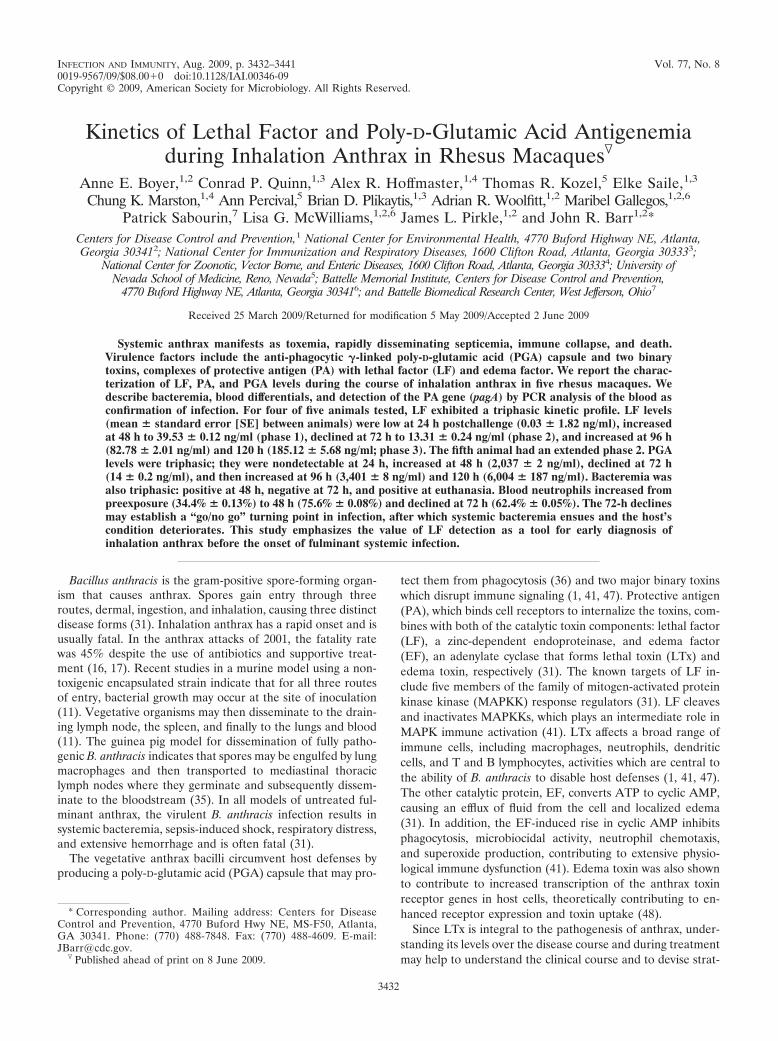
LF detection and kinetics in rhesus macaques. LF was firstdetected in serum at 24 h postexposure in three of five animalsand in all animals at 48 h and through 120 h (Table 1). Thekinetic profile for LF was triphasic during infection (Fig. 1A).LF levels were low at 24 h, ranging from 0.006 to 0.200 ng/ml(Table 1). By 48 h, LF levels increased more than 100-fold(phase 1) and were similar in all animals (range, 25.87 to 51.66ng/ml). At 72 h, LF decreased 1.3-fold to 4.8-fold (phase 2) andremained similar among all animals (range, 8.06 to 25.08 ng/ml). At 96 and 120 h, LF levels increased (phase 3) in animalsA, B, C, and E and varied by as much as 100-fold at euthanasia.For example, at 96 h, animal C had 34.07 ng/ml and animal Ehad 3,885.89 ng/ml (Table 1). LF levels in animal D declined at72 h and continued to decline at 96 h before increasing slightly
at 120 h. Thus, animal D had an extended phase 2 compared tothe other animals. LF levels for animal D were also the lowestamong all animals at 72, 96, and 120 h (the last data pointavailable), possibly due to a lower severity of disease resultingin the animal’s survival to day 9. The kinetic profile for LFillustrates the three phases, the similarity of LF levels amonganimals at 48 h, their decline at 72 h, rapid increases anddivergence by 96 h until euthanasia, and the lower LF levelsfrom 72 to 120 h in animal D (Fig. 1A).
PGA detection and kinetics in rhesus macaques. PGA wasdetectable in sera of all five animals by 48 h postexposure andat all subsequent time points (Table 1). The kinetics of PGAwere similar to those of LF, with a triphasic profile (Fig. 1B).At 48 h (phase 1), PGA ranged from 48 to 10,394 ng/ml (Table1). At 72 h (phase 2), PGA fell by as much as 500-fold (rangingfrom 7 to 20 ng/ml). At 96 and 120 h (phase 3), PGA increasedsubstantially in animals A, B, C, and E, ranging from 3,541 to1,965,663 ng/ml at death (Table 1). However, in animal D,which survived to day 9, a decline in PGA was observed at 72and 96 h, similar to that seen for LF in this animal. PGA levelsin this animal declined from 1,523 ng/ml at 48 h to 7 ng/ml at72 h and to 3 ng/ml at 96 h, suggesting an initial rapid andextended (48-h) clearance of PGA-producing bacilli. A subtleincrease in PGA levels to 32 ng/ml at 120 h may indicate thebeginning of a resurgence in bacterial load. The triphasic ki-netics of PGA are clearly depicted with the variable extremesin PGA at 48, 96, and 120 h compared to the sharp decline at72 h and the extended decline and substantially lower PGA foranimal D at 72, 96, and 120 h (Fig. 1B).
PCR and culture status in rhesus macaques complement LFand PGA levels. PCR of pagA was positive in four animals by48 h and by 72 h and in the four animals tested at euthanasiaby 96 h and 120 h (Table 2). Blood was culture positive in allfive animals by 48 h (Table 2). However, at 72 h, blood cultureswere negative for three animals, A, C, and D, and low positivein a fourth animal, B. All animals were bacteremic at eutha-nasia. PCR for pagA also reverted to negative at 72 h in animalD, the 9-day survivor with the lowest PGA and LF levels at thattime point (Table 2). The change in bacteremia from positiveat 48 h to negative at 72 h, together with the falling levels ofboth LF and PGA, is a significant finding and suggests anactive process of microbial clearance. The threefold reductionin the geometric mean concentrations from 48 to 72 h for LFcompared to 143-fold for PGA is also important (Table 1) andindicates that, despite the significant systemic changes duringthe course of disease, LF remains a consistent and reliablemarker of infection from at least 24 h onwards. LF analysis ofadditional sampling time points between 12 and 24 h mayextend this time frame to even earlier.
The qualitative results for bacteremia and the pagA PCR arein agreement with the observed changes in LF and PGA overtime, as well as the differences between animals (Tables 1 and2). For example, at 48 h, a negative PCR result that wasobserved for animal B was paralleled by much lower PGA levelin this animal (48 ng/ml) than in others (1,523 to 10,394 ng/ml).Also, the change in bacteremic status from positive at 48 h tonegative at 72 h corresponded with 72-h declines in LF andPGA. Both bacteremia and pagA PCR analysis were negativeat 72 h for animal D, which also exhibited the lowest 72-h LFand PGA levels (Tables 1 and 2).
FIG. 1. Kinetics profile for LF and PGA in rhesus macaques.(A) The geometric mean and individual values of LF (ng/ml) for eachanimal infected with B. anthracis Ames strain were plotted on a log10scale for each time point in hours to compare the kinetic profiles overtime. (B) The geometric mean and individual values of PGA (ng/ml)were plotted on a log10 scale for each time point. The same symbols areused for panels A and B: animal A, �; animal B, �; animal C, E;animal D, ‚; animal E, �; and geometric mean, F. The negative valuefor PGA at 24 h was assigned a value of the limit of detection dividedby two of 1.125 ng/ml according to Hornung et al. (13a).
VOL. 77, 2009 KINETICS OF LF AND PGA IN INHALATION ANTHRAX 3435
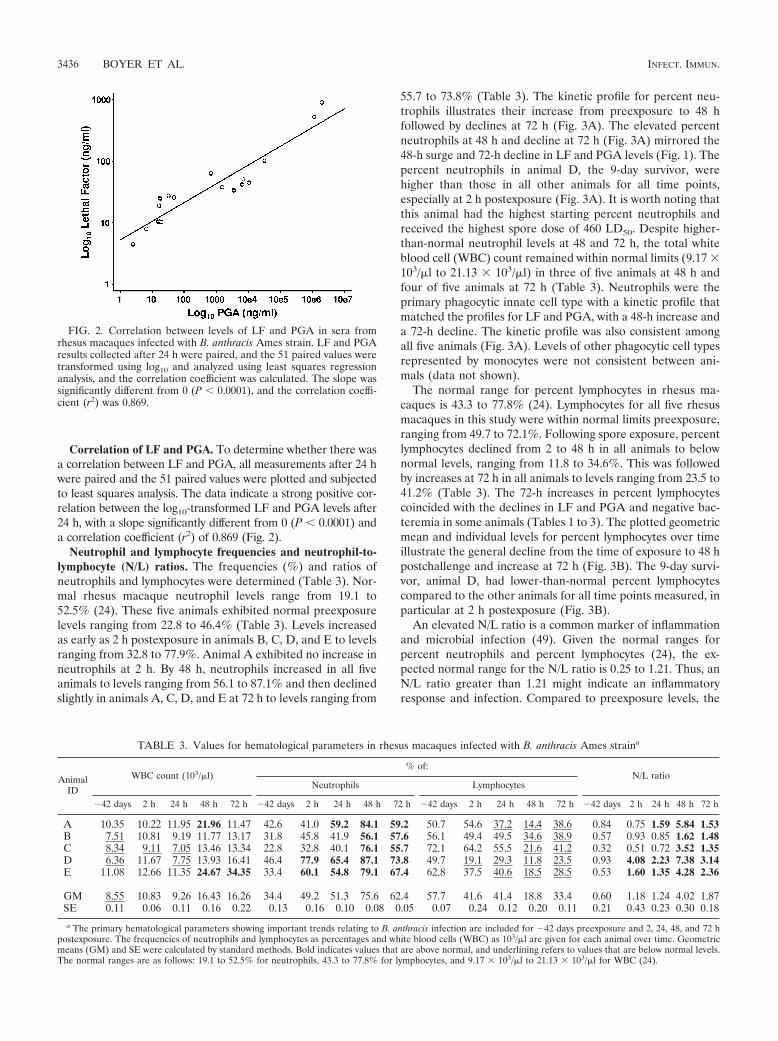
Correlation of LF and PGA. To determine whether there wasa correlation between LF and PGA, all measurements after 24 hwere paired and the 51 paired values were plotted and subjectedto least squares analysis. The data indicate a strong positive cor-relation between the log10-transformed LF and PGA levels after24 h, with a slope significantly different from 0 (P � 0.0001) anda correlation coefficient (r2) of 0.869 (Fig. 2).
Neutrophil and lymphocyte frequencies and neutrophil-to-lymphocyte (N/L) ratios. The frequencies (%) and ratios ofneutrophils and lymphocytes were determined (Table 3). Nor-mal rhesus macaque neutrophil levels range from 19.1 to52.5% (24). These five animals exhibited normal preexposurelevels ranging from 22.8 to 46.4% (Table 3). Levels increasedas early as 2 h postexposure in animals B, C, D, and E to levelsranging from 32.8 to 77.9%. Animal A exhibited no increase inneutrophils at 2 h. By 48 h, neutrophils increased in all fiveanimals to levels ranging from 56.1 to 87.1% and then declinedslightly in animals A, C, D, and E at 72 h to levels ranging from
55.7 to 73.8% (Table 3). The kinetic profile for percent neu-trophils illustrates their increase from preexposure to 48 hfollowed by declines at 72 h (Fig. 3A). The elevated percentneutrophils at 48 h and decline at 72 h (Fig. 3A) mirrored the48-h surge and 72-h decline in LF and PGA levels (Fig. 1). Thepercent neutrophils in animal D, the 9-day survivor, werehigher than those in all other animals for all time points,especially at 2 h postexposure (Fig. 3A). It is worth noting thatthis animal had the highest starting percent neutrophils andreceived the highest spore dose of 460 LD50. Despite higher-than-normal neutrophil levels at 48 and 72 h, the total whiteblood cell (WBC) count remained within normal limits (9.17 �103/�l to 21.13 � 103/�l) in three of five animals at 48 h andfour of five animals at 72 h (Table 3). Neutrophils were theprimary phagocytic innate cell type with a kinetic profile thatmatched the profiles for LF and PGA, with a 48-h increase anda 72-h decline. The kinetic profile was also consistent amongall five animals (Fig. 3A). Levels of other phagocytic cell typesrepresented by monocytes were not consistent between ani-mals (data not shown).
The normal range for percent lymphocytes in rhesus ma-caques is 43.3 to 77.8% (24). Lymphocytes for all five rhesusmacaques in this study were within normal limits preexposure,ranging from 49.7 to 72.1%. Following spore exposure, percentlymphocytes declined from 2 to 48 h in all animals to belownormal levels, ranging from 11.8 to 34.6%. This was followedby increases at 72 h in all animals to levels ranging from 23.5 to41.2% (Table 3). The 72-h increases in percent lymphocytescoincided with the declines in LF and PGA and negative bac-teremia in some animals (Tables 1 to 3). The plotted geometricmean and individual levels for percent lymphocytes over timeillustrate the general decline from the time of exposure to 48 hpostchallenge and increase at 72 h (Fig. 3B). The 9-day survi-vor, animal D, had lower-than-normal percent lymphocytescompared to the other animals for all time points measured, inparticular at 2 h postexposure (Fig. 3B).
An elevated N/L ratio is a common marker of inflammationand microbial infection (49). Given the normal ranges forpercent neutrophils and percent lymphocytes (24), the ex-pected normal range for the N/L ratio is 0.25 to 1.21. Thus, anN/L ratio greater than 1.21 might indicate an inflammatoryresponse and infection. Compared to preexposure levels, the
FIG. 2. Correlation between levels of LF and PGA in sera fromrhesus macaques infected with B. anthracis Ames strain. LF and PGAresults collected after 24 h were paired, and the 51 paired values weretransformed using log10 and analyzed using least squares regressionanalysis, and the correlation coefficient was calculated. The slope wassignificantly different from 0 (P � 0.0001), and the correlation coeffi-cient (r2) was 0.869.
TABLE 3. Values for hematological parameters in rhesus macaques infected with B. anthracis Ames straina
AnimalID
WBC count (103/�l)% of:
N/L ratioNeutrophils Lymphocytes
�42 days 2 h 24 h 48 h 72 h �42 days 2 h 24 h 48 h 72 h �42 days 2 h 24 h 48 h 72 h �42 days 2 h 24 h 48 h 72 h
A 10.35 10.22 11.95 21.96 11.47 42.6 41.0 59.2 84.1 59.2 50.7 54.6 37.2 14.4 38.6 0.84 0.75 1.59 5.84 1.53B 7.51 10.81 9.19 11.77 13.17 31.8 45.8 41.9 56.1 57.6 56.1 49.4 49.5 34.6 38.9 0.57 0.93 0.85 1.62 1.48C 8.34 9.11 7.05 13.46 13.34 22.8 32.8 40.1 76.1 55.7 72.1 64.2 55.5 21.6 41.2 0.32 0.51 0.72 3.52 1.35D 6.36 11.67 7.75 13.93 16.41 46.4 77.9 65.4 87.1 73.8 49.7 19.1 29.3 11.8 23.5 0.93 4.08 2.23 7.38 3.14E 11.08 12.66 11.35 24.67 34.35 33.4 60.1 54.8 79.1 67.4 62.8 37.5 40.6 18.5 28.5 0.53 1.60 1.35 4.28 2.36
GM 8.55 10.83 9.26 16.43 16.26 34.4 49.2 51.3 75.6 62.4 57.7 41.6 41.4 18.8 33.4 0.60 1.18 1.24 4.02 1.87SE 0.11 0.06 0.11 0.16 0.22 0.13 0.16 0.10 0.08 0.05 0.07 0.24 0.12 0.20 0.11 0.21 0.43 0.23 0.30 0.18
a The primary hematological parameters showing important trends relating to B. anthracis infection are included for �42 days preexposure and 2, 24, 48, and 72 hpostexposure. The frequencies of neutrophils and lymphocytes as percentages and white blood cells (WBC) as 103/�l are given for each animal over time. Geometricmeans (GM) and SE were calculated by standard methods. Bold indicates values that are above normal, and underlining refers to values that are below normal levels.The normal ranges are as follows: 19.1 to 52.5% for neutrophils, 43.3 to 77.8% for lymphocytes, and 9.17 � 103/�l to 21.13 � 103/�l for WBC (24).
3436 BOYER ET AL. INFECT. IMMUN.
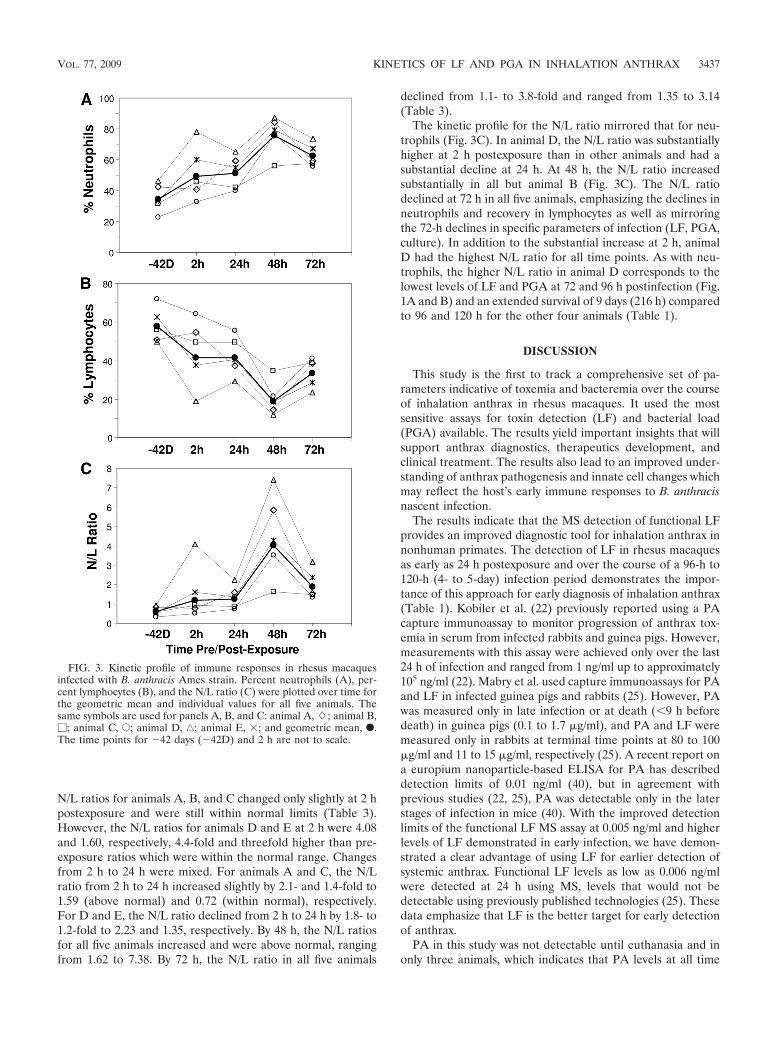
N/L ratios for animals A, B, and C changed only slightly at 2 hpostexposure and were still within normal limits (Table 3).However, the N/L ratios for animals D and E at 2 h were 4.08and 1.60, respectively, 4.4-fold and threefold higher than pre-exposure ratios which were within the normal range. Changesfrom 2 h to 24 h were mixed. For animals A and C, the N/Lratio from 2 h to 24 h increased slightly by 2.1- and 1.4-fold to1.59 (above normal) and 0.72 (within normal), respectively.For D and E, the N/L ratio declined from 2 h to 24 h by 1.8- to1.2-fold to 2.23 and 1.35, respectively. By 48 h, the N/L ratiosfor all five animals increased and were above normal, rangingfrom 1.62 to 7.38. By 72 h, the N/L ratio in all five animals
declined from 1.1- to 3.8-fold and ranged from 1.35 to 3.14(Table 3).
The kinetic profile for the N/L ratio mirrored that for neu-trophils (Fig. 3C). In animal D, the N/L ratio was substantiallyhigher at 2 h postexposure than in other animals and had asubstantial decline at 24 h. At 48 h, the N/L ratio increasedsubstantially in all but animal B (Fig. 3C). The N/L ratiodeclined at 72 h in all five animals, emphasizing the declines inneutrophils and recovery in lymphocytes as well as mirroringthe 72-h declines in specific parameters of infection (LF, PGA,culture). In addition to the substantial increase at 2 h, animalD had the highest N/L ratio for all time points. As with neu-trophils, the higher N/L ratio in animal D corresponds to thelowest levels of LF and PGA at 72 and 96 h postinfection (Fig.1A and B) and an extended survival of 9 days (216 h) comparedto 96 and 120 h for the other four animals (Table 1).
DISCUSSION
This study is the first to track a comprehensive set of pa-rameters indicative of toxemia and bacteremia over the courseof inhalation anthrax in rhesus macaques. It used the mostsensitive assays for toxin detection (LF) and bacterial load(PGA) available. The results yield important insights that willsupport anthrax diagnostics, therapeutics development, andclinical treatment. The results also lead to an improved under-standing of anthrax pathogenesis and innate cell changes whichmay reflect the host’s early immune responses to B. anthracisnascent infection.
The results indicate that the MS detection of functional LFprovides an improved diagnostic tool for inhalation anthrax innonhuman primates. The detection of LF in rhesus macaquesas early as 24 h postexposure and over the course of a 96-h to120-h (4- to 5-day) infection period demonstrates the impor-tance of this approach for early diagnosis of inhalation anthrax(Table 1). Kobiler et al. (22) previously reported using a PAcapture immunoassay to monitor progression of anthrax tox-emia in serum from infected rabbits and guinea pigs. However,measurements with this assay were achieved only over the last24 h of infection and ranged from 1 ng/ml up to approximately105 ng/ml (22). Mabry et al. used capture immunoassays for PAand LF in infected guinea pigs and rabbits (25). However, PAwas measured only in late infection or at death (�9 h beforedeath) in guinea pigs (0.1 to 1.7 �g/ml), and PA and LF weremeasured only in rabbits at terminal time points at 80 to 100�g/ml and 11 to 15 �g/ml, respectively (25). A recent report ona europium nanoparticle-based ELISA for PA has describeddetection limits of 0.01 ng/ml (40), but in agreement withprevious studies (22, 25), PA was detectable only in the laterstages of infection in mice (40). With the improved detectionlimits of the functional LF MS assay at 0.005 ng/ml and higherlevels of LF demonstrated in early infection, we have demon-strated a clear advantage of using LF for earlier detection ofsystemic anthrax. Functional LF levels as low as 0.006 ng/mlwere detected at 24 h using MS, levels that would not bedetectable using previously published technologies (25). Thesedata emphasize that LF is the better target for early detectionof anthrax.
PA in this study was not detectable until euthanasia and inonly three animals, which indicates that PA levels at all time
FIG. 3. Kinetic profile of immune responses in rhesus macaquesinfected with B. anthracis Ames strain. Percent neutrophils (A), per-cent lymphocytes (B), and the N/L ratio (C) were plotted over time forthe geometric mean and individual values for all five animals. Thesame symbols are used for panels A, B, and C: animal A, �; animal B,�; animal C, E; animal D, ‚; animal E, �; and geometric mean, F.The time points for �42 days (�42D) and 2 h are not to scale.
VOL. 77, 2009 KINETICS OF LF AND PGA IN INHALATION ANTHRAX 3437
points preceding death were below the 4.84 ng/ml detectionlimit for the PA ELISA reported here. Nonetheless, PA de-tection provided an additional confirmation of anthrax-specifictoxemia. The late-infection PA levels reported here of 147 to19,434 ng/ml correspond with those reported previously forguinea pigs at 100 to 1,700 ng/ml but are much lower thanreported for rabbits at 80 and 100 �g/ml (25).
Although there are differences in detection limits betweenthe LF and PA assays described here, the measured LF levelsat the early time points 48 to 72 h were higher than the 4.84ng/ml detection limit for PA, and therefore, LF levels werehigher than PA at these early time points. These data suggestthat either more LF is produced or this antigen is less rapidlysequestered by host tissues than PA at earlier time points, andthus the LF/PA ratios in serum are high. Conversely, we ob-served that LF/PA ratios were lower in late infection. Theselower ratios during late infection in rhesus macaques may bedue to saturation of host receptors, decreased cellular uptake,and thus accumulation of PA in serum (30). Accumulation ofserum PA in late infection is in agreement with previous stud-ies in rabbits (22, 25), guinea pigs (25), and mice (40). Conse-quently, lower serum LF/PA ratios will reflect the uptake of LFvia the PA-primed host cells.
These findings raise interesting questions about appropriateinterventions after exposure to or infection with B. anthracisspores. One interpretation of the low serum PA levels at 24 to72 h is that PA is rapidly adsorbed to host tissues (30), and thuscirculating PA is the rate-limiting toxin component for poten-tiating early infection and the associated bacteremia of an-thrax. In this context, a potential concern might be raised thatan rPA vaccine given postexposure during this phase mightfacilitate additional uptake of LF and thus exacerbate theinfection.
The perceived risk of potentiating the infection due to pos-texposure vaccination with the current U.S. licensed anthraxvaccine and for rPA vaccines in development is low. First, inthe course of the overall infection the rate limitation is mostlikely PA processing and turnover at the host cell receptorrather than the levels in serum. Second, PA is not readilyreleased from an aluminum hydroxide vaccine formulation(15). Third, the quantity of PA contributed by a vaccine givenintramuscularly to a patient would be insignificant in compar-ison to the quantity produced by the bacterium at that stage ofinfection. Fourth, the anthrax vaccine is formalin treated whichis anticipated to inactivate its protein components (18),thereby reducing the risk of additional toxin uptake. Further-more, the likelihood of vaccination during infection is low; theanthrax vaccine is contraindicated in persons who have recov-ered from anthrax (9), and where vaccination is recommendedfor use in a postexposure setting prior to onset of infection, itis coadministered with antibiotics (8).
The PGA capture immunoassay also represents a valuablediagnostic tool and facilitates a surrogate measurement of bac-terial load (23). PGA was consistently detected from 48 honwards postexposure. The rapid increases in PGA at 48 h anddeclines at 72 h are reflected in the positive 48-h and negative72-h bacteremia. Compared to LF, PGA was much higher thanLF at 48, 96, and 120 h. This probably reflects the accumula-tion of PGA in the blood when bacteremia is positive, whereassome LF secreted by the organism is sequestered intracellu-
larly. PGA declined much more rapidly at 72 h than LF, whichmay be due to the rapid clearance of bacilli; the cellular uptakeof LF may be slower, allowing a portion of LF to linger in theblood in the absence of bacteremia (44). Future studiesplanned may define how quickly PGA clears from the bloodwith antibiotic treatment.
LF and PGA were highly correlated with a coefficient oflinearity (r2) of 0.869, which is similar to that reported previ-ously for PA and bacteremia in rabbits (r2 � 0.864) (22). SincePGA correlates with bacterial levels (23) and LF correlateswith PGA, it is likely that LF may also correlate with bacteriallevels and therefore may represent an alternative measure-ment for the stage or severity of infection. Studies in progressmay yield additional measurements to support this association.
While LF and PGA were consistently detectable in RMS,reversion in bacteremia and pagA PCR reactivity over timeprovides a key insight to the onset and progression of systemicanthrax. Although most animals were bacteremic and had de-tectable pagA at 48 h, some reverted to a negative result at72 h. These changing response patterns for pagA detection andbacteremia define a potential window of diagnostic uncertaintyfor these methods. Culture-dependent methods may fail if apatient is presented during this critical window of infection.This illustrates the importance of applying multiple analysesfor diagnosis of anthrax and emphasizes the central role thatthe high-sensitivity and high-throughput capability of MS pro-vides as a diagnostic technology.
A triphasic kinetics profile for B. anthracis infection in rhe-sus macaques was defined with a 48-h increase in LF, PGA,and percent neutrophils, followed by 72-h declines, before thefinal surge in parameters of infection and subsequent death.Importantly, the reversal of bacteremia from positive detectionat 48 h to negative detection at 72 h provides compellingevidence supporting these quantitative declines. All elementsdefine a 72-h decline in infection and represent tangible mea-sures of antigen (LF) and microbial (PGA and culture) clear-ance in early anthrax infection. A similar but shorter triphasicprofile for LF was also observed in rabbits and suggests thatthey may also be mounting innate cell changes that lead toantigen clearance (unpublished data).
Our data from rhesus macaques suggest an important con-tribution by neutrophils in the innate cell changes leading totemporary reduction in bacterial burden and antigenemia. The48- and 72-h kinetics of neutrophils mirrored those of theparameters of infection with a 48-h increase and 72-h decline.Since the percent neutrophil kinetic profiles were consistentbetween all five infected animals, it is the most likely immunesource responsible for the temporary clearance of microbialproducts observed at 72 h. We conclude from our data thatthere are two critical time periods during the infection processin rhesus macaques. The earliest period is at the spore-tissueinterface. This first interaction of microbes with tissues ini-tiates signaling events that sequentially recruit neutrophils (1to 2 h) and then macrophages and other phagocytic cells to thesite of tissue inflammation (10, 13, 21, 39). The second criticalperiod coincides with the appearance of bacilli in the blood.Mature neutrophils are released from the marrow pool intothe blood in response to increased demands for neutrophilsduring tissue inflammation (12). Thus, blood neutrophil levelsmay be used as an indicator of increases in neutrophils at the
3438 BOYER ET AL. INFECT. IMMUN.
inflammatory sites, similar to that reported to occur for mono-cytes (13). In this context, the increase in neutrophils at 2 h infour of the five animals suggests a role for neutrophil involve-ment in the earliest stages of infection at the spore-tissueinterface. However, the second increase in the neutrophils at48 h in all five animals was consistent with the onset of bacte-remia and increase in LF and PGA. This suggests that theneutrophils responded appropriately to the initial infectionthreat at 2 h and to the escalating sepsis at 48 h, which wasfollowed by comprehensive declines in parameters of infection.It is interesting to note that animal D, with the highest neu-trophil response at 2 h and throughout infection, had thelowest parameters of infection and survived an additional 96 to120 h (4 to 5 days) longer than the other animals, indicatingthat the neutrophils may have contributed to the delay offulminant bacteremia in this animal.
Data supporting the importance of neutrophils and theirproducts in anthrax infection (3, 19, 20, 28, 29, 45, 46) andother important infections (26, 27, 42) are substantial. In vitro,human neutrophils engulf B. anthracis spores, induce germina-tion, and kill vegetative B. anthracis (29). Neutrophils alsoproduce abundant antimicrobial peptides called defensins (20,29), which can kill vegetative bacilli (29), neutralize anthraxlethal toxin, and protect against lethal toxin killing (20). Re-lated defensins, found in primates, kill both spores and veg-etative bacilli and neutralize lethal toxin (45). In cutaneousanthrax, neutrophils are the first cell type recruited to infectedtissues (46). Resistant mice with enhanced neutrophil and re-duced macrophage function had an accumulation of neutro-phils at the infection site (3). Neutrophils were also prominentin the cutaneous anthrax cases from 2001 (38). For inhalationanthrax, neutrophil recruitment in the lungs of dogs and pigswas associated with survival after high exposure doses (28).Furthermore, the inhalation anthrax patients from the 2001event had elevated circulating neutrophils or band forms eventhough overall WBC counts were normal (17), consistent withother microbial infections (2). Most rhesus macaques in thisstudy also fit this description, with elevated neutrophils andnormal WBC counts as late as 72 h. Therefore, current evi-dence suggests that early recruitment of neutrophils is an im-portant feature of cutaneous and inhalation anthrax. It may bepresumed that this is also the case for gastrointestinal anthrax(28).
Our study provides additional information on neutrophilinvolvement in the early stages of inhalation anthrax. We candeduce that the substantial neutrophil recruitment observed at2 h in animal D may have contributed to its extended survival.Importantly, since it is well established that neutrophils are thefirst cell type recruited (within 1 to 2 h) to the lung tissues inother infections (10, 13), it is reasonable to assume that thesame is true for anthrax.
Whereas neutrophils increased during inhalation anthrax inthis study, we observed that the percentage of lymphocytesdecreased over time. Many microbial infections, includingthose caused by B. anthracis, Yersinia spp., Streptococcus spp.,Staphylococcus aureus, and Listeria monocytogenes, are charac-terized by decreased lymphocytes along with increased neutro-phils (7, 49). The lymphocyte declines occur because microbialproducts trigger lymphocyte cell death by apoptosis (6). In ourstudy, lymphocyte profiles declined early and at 48 h, which
was consistent with the expected response (7). The increase inlymphocytes observed at 72 h may reflect their recovery, con-current with declines in bacterial load.
In this study, we have observed a classical response to mi-crobial infections with elevated neutrophils and reduced lym-phocytes during B. anthracis infection. Their combination, ex-pressed as the N/L ratio (49), yielded a clear measure of thechanges in inflammation over time. While excess inflammationis considered detrimental, capable of causing widespread tissuedamage, it is often associated with resistance to serious infec-tions (26, 27, 42). This study included one animal with en-hanced early inflammation and extended survival. The en-hanced inflammation at 48 h in all five macaques led to atemporary clearance of microbial products. The temporaryclearance of microbial products was longer in the 9-day survi-vor and might be viewed clinically as a “false” recovery, whichhas also been reported for human inhalation anthrax cases (5).Ongoing animal studies are suggesting that the levels of circu-lating LF are associated with the length of survival and may beof prognostic value. These studies may also further explain thetriphasic kinetics of toxemia described here.
Conclusions. This study is the first to track both LF andPGA levels in inhalation anthrax in rhesus macaques and tocompare these with bacteremia and innate immune cell re-cruitment. A triphasic kinetic profile of LF and PGA, but notPA antigenemia, was observed in rhesus macaques. This studyalso identified a potential source of early innate defense, anassociation between neutrophil recruitment and temporaryclearance of infection. Our data support the previously definedrole for neutrophils in protection from cutaneous infections (3,29). These data also suggest that neutrophils may attempt toclear bacilli early in systemic B. anthracis inhalation infection,before they are overwhelmed or “disarmed” by the effects ofthe anthrax toxins, which leads to the characteristic exponen-tial increase in bacteremia, antigenemia, and death. Brachmandescribed human inhalation anthrax as a “biphasic” diseasewith two distinct periods of illness (5). The first period ismanifest as mild and flu-like and is followed by an improve-ment in clinical status (the second phase described in ourstudy). The final clinical stage is acute, sudden, and usuallyfatal (5). We have defined the central stage of clinical improve-ment observed by Brachman as a brief remission with reducedPGA and LF and absence of bacteremia. This period alsorepresents a window of potential false negative diagnoses forculture-based tests and illustrates the importance of using acombination of tests for diagnosis. The sensitivity of the MS LFassay circumvents this problem with early and consistent de-tection of infection. The MS LF assay has provided an im-proved understanding of anthrax infection dynamics with thisfirst description of the initial acute phase, through the remis-sion phase, and beyond. The ability to detect infection in theinitial phase prior to the onset of high-density bacteremia isimportant for successful intervention. Use of the LF MS assayin emergencies may give the earliest and most reliable measureof anthrax, leading to earlier and more successful intervention.
ACKNOWLEDGMENTS
We thank Ed Nuzum and Judith Hewitt of the Office of BiodefenseResearch Affairs, DMID/NIAID/NIH, and Gabriel Meister at the Bat-telle Biomedical Research Center for their critical review of the manu-
VOL. 77, 2009 KINETICS OF LF AND PGA IN INHALATION ANTHRAX 3439
script. Additional thanks go to Hercules Moura, Suzanne Kalb, JaradSchiffer, and Stephen D. Soroka of the CDC for assistance.
This study was supported in part by Public Health Service grantsAI059348 (T.R.K. and A.P.) and AI061200 (T.R.K. and A.P.). Theresearch described in this publication was supported by funds madeavailable from the Centers for Disease Control and Prevention, Co-ordinating Office for Terrorism Preparedness and Emergency Re-sponse.
The findings and conclusions in this report are those of the authorsand do not necessarily represent the official position of the Centers forDisease Control and Prevention.
REFERENCES
1. Agrawal, A., J. Lingappa, S. H. Leppla, S. Agrawal, A. Jabbar, C. Quinn, andB. Pulendran. 2003. Impairment of dendritic cells and adaptive immunity byanthrax lethal toxin. Nature 424:329–334.
2. Ardron, M. J., J. C. Westengard, and T. F. Dutcher. 1994. Band neutrophilcounts are unnecessary for the diagnosis of infection in patients with normaltotal leukocyte counts. Am. J. Clin. Pathol. 102:646–649.
3. Bischof, T. S., B. L. Hahn, and P. G. Sohnle. 2007. Experimental cutaneousBacillus anthracis infections in hairless HRS/J mice. Int. J. Exp. Pathol.88:75–84.
4. Boyer, A. E., C. P. Quinn, A. R. Woolfitt, J. L. Pirkle, L. G. McWilliams, K. L.Stamey, D. A. Bagarozzi, J. C. Hart, Jr., and J. R. Barr. 2007. Detection andquantification of anthrax lethal factor in serum by mass spectrometry. Anal.Chem. 79:8463–8470.
5. Brachman, P. S. 1980. Inhalation anthrax. Ann. N. Y. Acad. Sci. 353:83–93.6. Carrero, J. A., B. Calderon, and E. R. Unanue. 2006. Lymphocytes are
detrimental during the early innate immune response against Listeria mono-cytogenes. J. Exp. Med. 203:933–940.
7. Carrero, J. A., and E. R. Unanue. 2006. Lymphocyte apoptosis as an immunesubversion strategy of microbial pathogens. Trends Immunol. 27:497–503.
8. Centers for Disease Control and Prevention. 2002. Use of anthrax vaccine inresponse to terrorism: supplemental recommendations of the advisory com-mittee on immunization practices. MMWR Morb. Mortal. Wkly. Rep. 51:1024–1026.
9. Centers for Disease Control and Prevention. 2000. Use of anthrax vaccine inthe United States: recommendations of the advisory committee on immuni-zation practices. MMWR Recommend. Rep. 49(RR-15):1–20.
10. Doherty, D. E., G. P. Downey, G. S. Worthen, C. Haslett, and P. M. Henson.1988. Monocyte retention and migration in pulmonary inflammation. Re-quirement for neutrophils. Lab. Investig. 59:200–213.
11. Glomski, I. J., A. Piris-Gimenez, M. Huerre, M. Mock, and P. L. Goossens.2007. Primary involvement of pharynx and Peyer’s patch in inhalational andintestinal anthrax. PLoS Pathog. 3:e76.
12. Gossett, K. A., P. S. MacWilliams, and B. Cleghorn. 1985. Sequential mor-phological and quantitative changes in blood and bone marrow neutrophilsin dogs with acute inflammation. Can. J. Comp. Med. 49:291–297.
13. Goto, Y., J. C. Hogg, T. Suwa, K. B. Quinlan, and S. F. van Eeden. 2003. Anovel method to quantify the turnover and release of monocytes from thebone marrow using the thymidine analog 5�-bromo-2�-deoxyuridine. Am. J.Physiol. Cell Physiol. 285:C253–C259.
13a.Hornung, R. W., and L. D. Reed. 1990. Estimation of average concentration inthe presence of nondetectable values. Appl. Occup. Environ. Hug. 5:46–51.
14. Ivins, B. E., P. F. Fellows, M. L. M. Pitt, J. E. Estep, S. L. Welkos, P. L.Worsham, and A. M. Friedlander. 1996. Efficacy of a standard human an-thrax vaccine against Bacillus anthracis aerosol spore challenge in rhesusmonkeys. Salisbury Med. Bull. 87(Suppl. 7):125–126.
15. Jendrek, S., S. F. Little, S. Hem, G. Mitra, and S. Giardina. 2003. Evaluationof the compatibility of a second generation recombinant anthrax vaccine withaluminum-containing adjuvants. Vaccine 21:3011–3018.
16. Jernigan, D. B., P. L. Raghunathan, B. P. Bell, R. Brechner, E. A. Bresnitz,J. C. Butler, M. Cetron, M. Cohen, T. Doyle, M. Fischer, C. Greene, K. S.Griffith, J. J. Guarner, J. L. Hadler, J. A. Hayslett, R. Meyer, L. R. Petersen,M. Phillips, R. Pinner, T. Popovic, C. P. Quinn, J. Reefhuis, D. Reissman, N.Rosenstein, A. Schuchat, W. J. Shieh, L. Siegal, D. L. Swerdlow, F. C.Tenover, M. Traeger, J. W. Ward, I. Weisfuse, S. Wiersma, K. Yeskey, S.Zaki, D. A. Ashford, B. A. Perkins, S. Ostroff, J. Hughes, D. Fleming, J. P.Koplan, J. L. Gerberding, and the National Anthrax Epidemiologic Inves-tigation Team. 2002. Investigation of bioterrorism-related anthrax, UnitedStates, 2001: epidemiologic findings. Emerg. Infect. Dis. 8:1019–1028.
17. Jernigan, J. A., D. S. Stephens, D. A. Ashford, C. Omenaca, M. S. Topiel, M.Galbraith, M. Tapper, T. L. Fisk, S. Zaki, T. Popovic, R. F. Meyer, C. P.Quinn, S. A. Harper, S. K. Fridkin, J. J. Sejvar, C. W. Shepard, M.McConnell, J. Guarner, W. J. Shieh, J. M. Malecki, J. L. Gerberding, J. M.Hughes, B. A. Perkins, and the Anthrax Bioterrorism Investigation Team.2001. Bioterrorism-related inhalational anthrax: the first 10 cases reported inthe United States. Emerg. Infect. Dis. 7:933–944.
18. Joellenbeck, L. M., L. L. Zwanziger, J. S. Durch, and B. S. Strom. 2002. Theanthrax vaccine. Is it safe? Does it work? National Academy Press, Washington,DC.
19. Kaufmann, S. H. E., A. Sher, and R. Ahmed. 2002. Immunology of infectiousdiseases. ASM Press, Washington, DC.
20. Kim, C., N. Gajendran, H. W. Mittrucker, M. Weiwad, Y. H. Song, R.Hurwitz, M. Wilmanns, G. Fischer, and S. H. Kaufmann. 2005. Humanalpha-defensins neutralize anthrax lethal toxin and protect against its fatalconsequences. Proc. Natl. Acad. Sci. USA 102:4830–4835.
21. Kobayashi, S. D., J. M. Voyich, C. Burlak, and F. R. DeLeo. 2005. Neutro-phils in the innate immune response. Arch. Immunol. Ther. Exp. (Warsaw)53:505–517.
22. Kobiler, D., S. Weiss, H. Levy, M. Fisher, A. Mechaly, A. Pass, and Z.Altboum. 2006. Protective antigen as a correlative marker for anthrax inanimal models. Infect. Immun. 74:5871–5876.
23. Kozel, T. R., W. J. Murphy, S. Brandt, B. R. Blazar, J. A. Lovchik, P.Thorkildson, A. Percival, and C. R. Lyons. 2004. mAbs to Bacillus anthraciscapsular antigen for immunoprotection in anthrax and detection of antigen-emia. Proc. Natl. Acad. Sci. USA 101:5042–5047.
24. Krise, G. M. 1960. Hematology of the normal monkey. Ann. N. Y. Acad. Sci.85:803–810.
25. Mabry, R., K. Brasky, R. Geiger, R. Carrion, Jr., G. B. Hubbard, S. Leppla,J. L. Patterson, G. Georgiou, and B. L. Iverson. 2006. Detection of anthraxtoxin in the serum of animals infected with Bacillus anthracis by using engi-neered immunoassays. Clin. Vaccine Immunol. 13:671–677.
26. Martineau, A. R., S. M. Newton, K. A. Wilkinson, B. Kampmann, B. M. Hall,N. Nawroly, G. E. Packe, R. N. Davidson, C. J. Griffiths, and R. J. Wilkinson.2007. Neutrophil-mediated innate immune resistance to mycobacteria.J. Clin. Investig. 117:1988–1994.
27. Maung, A. A., S. Fujimi, M. P. MacConmara, G. Tajima, A. M. McKenna,A. J. Delisle, C. Stallwood, A. B. Onderdonk, J. A. Mannick, and J. A.Lederer. 2008. Injury enhances resistance to Escherichia coli infection byboosting innate immune system function. J. Immunol. 180:2450–2458.
28. Mayer-Scholl, A. 2006. A review of the interaction of Bacillus anthracis withcells of the innate immune response. Berl. Munch. Tierarztl. Wochenschr.119:216–221.
29. Mayer-Scholl, A., R. Hurwitz, V. Brinkmann, M. Schmid, P. Jungblut, Y.Weinrauch, and A. Zychlinsky. 2005. Human neutrophils kill Bacillus an-thracis. PLoS Pathog. 1:e23.
30. Moayeri, M., J. F. Wiggins, and S. H. Leppla. 2007. Anthrax protectiveantigen cleavage and clearance from the blood of mice and rats. Infect.Immun. 75:5175–5184.
31. Mock, M., and T. Mignot. 2003. Anthrax toxins and the host: a story ofintimacy. Cell. Microbiol. 5:15–23.
32. O’Connell, M. A., B. A. Belanger, and P. D. Haaland. 1993. Calibration andassay development using the four-parameter logistic model. ChemometricsIntelligent Lab. Syst. 20:97–114.
33. Peterman, J. H. 1991. Immunochemical considerations in the analysis of datafrom non-competitive solid-phase immunoassays, p. 47–65. In J. E. Butler(ed.), Immunochemistry of solid-phase immunoassay. CRC Press, Inc., BocaRaton, FL.
34. Plikaytis, B. D., P. F. Holder, and G. M. Carlone. 1996. Program ELISA forWindows user’s manual, version 1.00. Centers for Disease Control and Pre-vention, Atlanta, GA.
35. Ross, J. M. 1957. The pathogenesis of anthrax following the administrationof spores by the respiratory route. J. Pathol. Bacteriol. 73:485–494.
36. Scorpio, A., D. J. Chabot, W. A. Day, D. K. O’Brien, N. J. Vietri, Y. Itoh, M.Mohamadzadeh, and A. M. Friedlander. 2007. Poly--glutamate capsule-degrading enzyme treatment enhances phagocytosis and killing of encapsu-lated Bacillus anthracis. Antimicrob. Agents Chemother. 51:215–222.
37. Semenova, V. A., E. Steward-Clark, K. L. Stamey, T. H. Taylor, Jr., D. S.Schmidt, S. K. Martin, N. Marano, and C. P. Quinn. 2004. Mass valueassignment of total and subclass immunoglobulin G in a human standardanthrax reference serum. Clin. Diagn. Lab. Immunol. 11:919–923.
38. Shieh, W. J., J. Guarner, C. Paddock, P. Greer, K. Tatti, M. Fischer, M.Layton, M. Philips, E. Bresnitz, C. P. Quinn, T. Popovic, B. A. Perkins, andS. R. Zaki, and the Anthrax Bioterrorism Investigation Team. 2003. Thecritical role of pathology in the investigation of bioterrorism-related cutane-ous anthrax. Am. J. Pathol. 163:1901–1910.
39. Soehnlein, O., E. Kenne, P. Rotzius, E. E. Eriksson, and L. Lindbom. 2008.Neutrophil secretion products regulate anti-bacterial activity in monocytesand macrophages. Clin. Exp. Immunol. 151:139–145.
40. Tang, S., M. Moayeri, Z. Chen, H. Harma, J. Zhao, H. Hu, R. H. Purcell,S. H. Leppla, and I. K. Hewlett. 2009. Detection of anthrax toxin by anultrasensitive immunoassay using europium nanoparticles. Clin. Vaccine Im-munol. 16:408–413.
41. Turk, B. E. 2007. Manipulation of host signaling pathways by anthrax toxins.Biochem. J. 402:405–417.
42. van Faassen, H., R. KuoLee, G. Harris, X. Zhao, J. W. Conlan, and W. Chen.2007. Neutrophils play an important role in host resistance to respiratoryinfection with Acinetobacter baumannii in mice. Infect. Immun. 75:5597–5608.
43. Vietri, N. J., B. K. Purcell, S. A. Tobery, S. L. Rasmussen, E. K. Leffel, N. A.Twenhafel, B. E. Ivins, M. D. Kellogg, W. M. Webster, M. E. Wright, andA. M. Friedlander. 2009. A short course of antibiotic treatment is effective in
3440 BOYER ET AL. INFECT. IMMUN.

preventing death from experimental inhalational anthrax after discontinuingantibiotics. J. Infect. Dis. 199:336–341.
44. Walsh, J. J., N. Pesik, C. P. Quinn, B. Urdaneta, C. A. Dykewicz, A. E. Boyer,J. Guarner, P. Wilkins, K. J. Norville, J. R. Barr, S. R. Zaki, J. B. Patel, S. P.Reagan, J. L. Pirkle, T. A. Treadwell, N. R. Messonnier, L. D. Rotz,R. F. R. F. Meyer, and D. S. Stephens. 2007. A case of naturally acquiredinhalation anthrax: clinical care and analyses of anti-protective antigen im-munoglobulin G and lethal factor. Clin. Infect. Dis. 44:968–971.
45. Wang, W., C. Mulakala, S. C. Ward, G. Jung, H. Luong, D. Pham, A. J.Waring, Y. Kaznessis, W. Lu, K. A. Bradley, and R. I. Lehrer. 2006. Retro-cyclins kill bacilli and germinating spores of Bacillus anthracis and inactivateanthrax lethal toxin. J. Biol. Chem. 281:32755–32764.
46. Welkos, S. L., R. W. Trotter, D. M. Becker, and G. O. Nelson. 1989. Resis-tance to the Sterne strain of B. anthracis: phagocytic cell responses of resis-tant and susceptible mice. Microb. Pathog. 7:15–35.
47. Xu, L., and D. M. Frucht. 2007. Bacillus anthracis: a multi-faceted role foranthrax lethal toxin in thwarting host immune defenses. Int. J. Biochem. CellBiol. 39:20–24.
48. Xu, Q., E. D. Hesek, and M. Zeng. 2007. Transcriptional stimulation ofanthrax toxin receptors by anthrax edema toxin and Bacillus anthracis Sternespore. Microb. Pathog. 43:37–45.
49. Zahorec, R. 2001. Ratio of neutrophil to lymphocyte counts: rapid andsimple parameter of systemic inflammation and stress in critically ill. Bratisl.Lek. Listy. 102:5–14.
Editor: S. R. Blanke
VOL. 77, 2009 KINETICS OF LF AND PGA IN INHALATION ANTHRAX 3441


