Embed Size (px)
Citation preview
DISCLOSURE APPENDIX AT THE BACK OF THIS REPORT CONTAINS IMPORTANT DISCLOSURES, ANALYST CERTIFICATIONS, AND THE STATUS OF NON-US ANALYSTS. US Disclosure: Credit Suisse does and seeks to do business with companies covered in its research reports. As a result, investors should be aware that the Firm may have a conflict of interest that could affect the objectivity of this report. Investors should consider this report as only a single factor in making their investment decision.
CREDIT SUISSE SECURITIES RESEARCH & ANALYTICS BEYOND INFORMATION™
Client-Driven Solutions, Insights, and Access
16 April 2014
Asia Pacific
Equity Research
Investment Strategy
Jump-Start STRATEGY
Jump-Start aims to provide you with a summary of the week that was and helps you prepare
for the week ahead with a results calendar, economic forecasts and valuation summaries.
China Market Strategy – SOE : Real or "cut-and-paste" reform? China had undergone a
major round of SOE reform in the late 1990s, with almost 60,000 industrial SOEs closed and
30 mn state workers laid off. Operating efficiency improved significantly, but still lagged the
non-SOEs. Improving operating efficiency through a more diversified ownership is the core
principle of the new SOE reform, write Vincent Chan and team. We evaluated the possible
reform plans of 11 major non-financial listed SOEs, and the banking sector. The possible
telecom (China Telecom & Unicom) sector reforms look most interesting to us. While chance
may not be high, the macro impact of the reform of Chalco and Beijing Enterprise could be the
biggest. (click here)
CS NJA Focus List. We are relaunching the Credit Suisse Asia ex Japan Focus List. These
are 14 of our highest conviction ideas from around the region. The list is not supposed to be a
balanced portfolio, but simply our strongest bottom-up ideas. We intend to limit the stock count
to <20. The final selection of stocks appears to have a quality and a GARP bias. Overall, the
simple average EPS growth on offer for the list is 16%/21% (2014E/15E) with an average P/E
of 14x/11x (2014E/15E) and a simple average ROE of 16.3% for 2014E. Overall, HK/China at
the country level and tech at the sector level constitute a large proportion of the list. The Focus
List will be monitored regularly with changes to the list being made simultaneously with the
change in view on any of the selected stocks, or when we find any new idea compelling
enough for an inclusion to the list. (Click here)
Must-read recently published reports
1) Credit Suisse Asia ex Japan Focus List – Our best ideas (16/4)
Manish Nigam Felix Rusli
These are 14 of our highest conviction ideas from around the region. The list is not supposed to be a balanced portfolio, but simply our strongest bottom-up ideas. While we did not start off with any specific themes in mind, the current Focus List seems to have a quality and a GARP (growth at a reasonable price) bias.
2) China Market Strategy – SOE: Real or 'cut-and-paste' reform?(15/4)
Vincent Chan Improving operating efficiency through a more diversified ownership is the core principle of the new SOE reform. We evaluated the possible reform plans of 11 major non-financial listed SOEs, and the banking sector. The possible telecom (China Telecom & Unicom) sector reforms look most interesting to us.
3) Asia Telecoms Sector – Killer app: OTT voice (13/3)
Colin McCallum OTT threat level rises given the global scale of OTT communities together with the level of stickiness and critical mass OTT apps have created market-by-market. Bundling is the best response.
4) China Power Equipment Sector – Let the wind blow! (3/3)
Edmond Huang We see multi-year investment opportunities in the wind-related business given: (1) resilient demand driven by supportive government policies; (2) alleviated oversupply and improving pricing discipline, and (3) decent profitability recovery.
5) India Steel Sector – Industry-wide high debt hurts discipline (28/2)
Neelkanth Mishra Indian steel companies reach ~5x debt/EBITDA. Market seems unaware of how widespread this is, affecting at least 2/3rd of capacity. Even on forward 12M EBITDA, the ratio is similar despite our current forecasts building in stable EBITDA/t. Debt/EBITDA may rise as competition brings down EBITDA/t.
Research Analyst
Manish Nigam
852 2101 7067
Credit Suisse forthcoming events
Hong Kong / China
China State Construction International Holdings (3311.HK)
Date 29 April, Shenzhen
Analyst Baiding Rong
China Environmental Conference
Date 19-20 May, Hong Kong
Analyst Trina Chen
Singapore
Woori Finance Holdings (053000.KS)
Date 15-17 April, Singapore
Analyst Gil Kim
Sinopac Holdings (2890.TW)
Date 21-24 April, Singapore
Analyst Chung Hsu
Energy Development Corporation (EDC.PS)
Date 28-29 April, Singapore
Analyst Alvin Arogo
Westports Holdings Berhad (WPHB.KL)
Date 05 May, Singapore
Analyst Timothy Ross
Singapore Airlines (SIAL.SI) Post-results
Date 15 May, Singapore
Analyst Timothy Ross
China Property Corporate Day
Date 02 July, Singapore
Analyst Jinsong Du
US
Pacific Basin Shipping Ltd (2343.HK)
Date 12-16 May, US
Analyst Timothy Ross
China Corporate Day in US
Date 24-26 June, US
Analyst Vincent Chan
Others
China Industrial/Auto Conference
Date 2H May
15th Annual Asian Technology Conference
Date 10-12 September, Taipei
Analyst Manish Nigam
Contact [email protected] or your usual sales representative
16 A
pril 2
014
Ju
mp
-Sta
rt 2
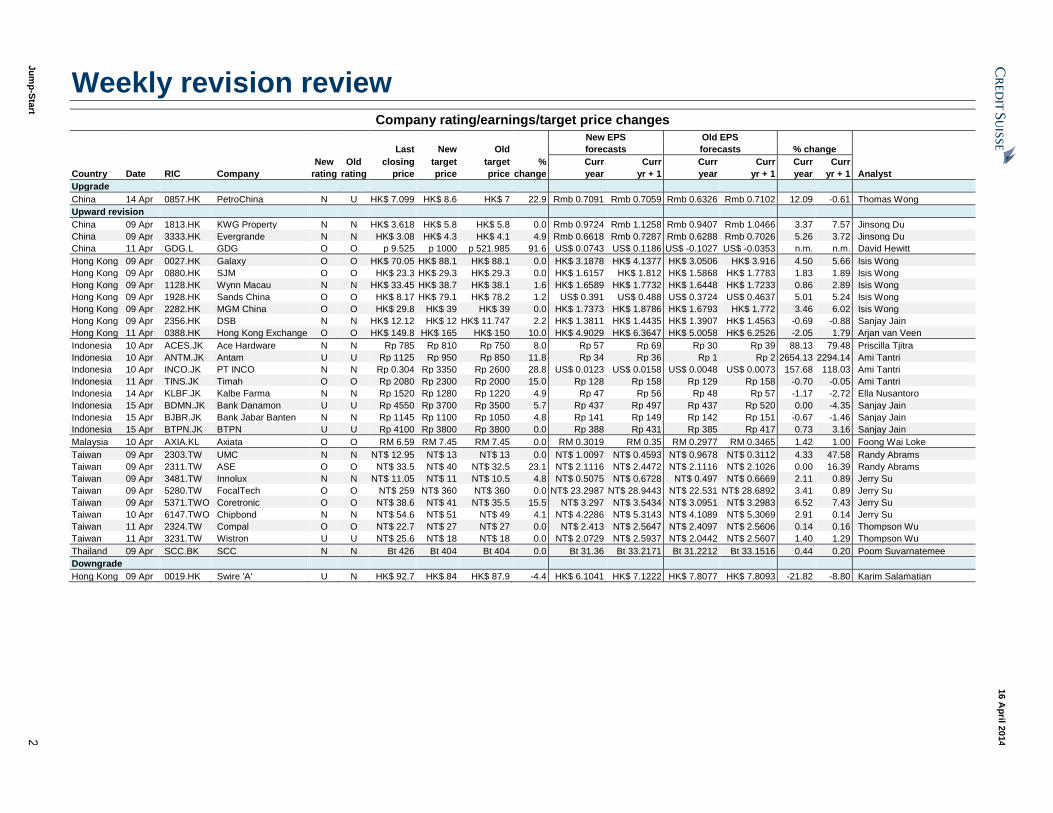
Weekly revision review
Company rating/earnings/target price changes
New EPS Old EPS
Last New Old forecasts forecasts % change
New Old closing target target % Curr Curr Curr Curr Curr Curr
Country Date RIC Company rating rating price price price change year yr + 1 year yr + 1 year yr + 1 Analyst
Upgrade
China 14 Apr 0857.HK PetroChina N U HK$ 7.099 HK$ 8.6 HK$ 7 22.9 Rmb 0.7091 Rmb 0.7059 Rmb 0.6326 Rmb 0.7102 12.09 -0.61 Thomas Wong
Upward revision
China 09 Apr 1813.HK KWG Property N N HK$ 3.618 HK$ 5.8 HK$ 5.8 0.0 Rmb 0.9724 Rmb 1.1258 Rmb 0.9407 Rmb 1.0466 3.37 7.57 Jinsong Du
China 09 Apr 3333.HK Evergrande N N HK$ 3.08 HK$ 4.3 HK$ 4.1 4.9 Rmb 0.6618 Rmb 0.7287 Rmb 0.6288 Rmb 0.7026 5.26 3.72 Jinsong Du
China 11 Apr GDG.L GDG O O p 9.525 p 1000 p 521.985 91.6 US$ 0.0743 US$ 0.1186 US$ -0.1027 US$ -0.0353 n.m. n.m. David Hewitt
Hong Kong 09 Apr 0027.HK Galaxy O O HK$ 70.05 HK$ 88.1 HK$ 88.1 0.0 HK$ 3.1878 HK$ 4.1377 HK$ 3.0506 HK$ 3.916 4.50 5.66 Isis Wong
Hong Kong 09 Apr 0880.HK SJM O O HK$ 23.3 HK$ 29.3 HK$ 29.3 0.0 HK$ 1.6157 HK$ 1.812 HK$ 1.5868 HK$ 1.7783 1.83 1.89 Isis Wong
Hong Kong 09 Apr 1128.HK Wynn Macau N N HK$ 33.45 HK$ 38.7 HK$ 38.1 1.6 HK$ 1.6589 HK$ 1.7732 HK$ 1.6448 HK$ 1.7233 0.86 2.89 Isis Wong
Hong Kong 09 Apr 1928.HK Sands China O O HK$ 8.17 HK$ 79.1 HK$ 78.2 1.2 US$ 0.391 US$ 0.488 US$ 0.3724 US$ 0.4637 5.01 5.24 Isis Wong
Hong Kong 09 Apr 2282.HK MGM China O O HK$ 29.8 HK$ 39 HK$ 39 0.0 HK$ 1.7373 HK$ 1.8786 HK$ 1.6793 HK$ 1.772 3.46 6.02 Isis Wong
Hong Kong 09 Apr 2356.HK DSB N N HK$ 12.12 HK$ 12 HK$ 11.747 2.2 HK$ 1.3811 HK$ 1.4435 HK$ 1.3907 HK$ 1.4563 -0.69 -0.88 Sanjay Jain
Hong Kong 11 Apr 0388.HK Hong Kong Exchange O O HK$ 149.8 HK$ 165 HK$ 150 10.0 HK$ 4.9029 HK$ 6.3647 HK$ 5.0058 HK$ 6.2526 -2.05 1.79 Arjan van Veen
Indonesia 10 Apr ACES.JK Ace Hardware N N Rp 785 Rp 810 Rp 750 8.0 Rp 57 Rp 69 Rp 30 Rp 39 88.13 79.48 Priscilla Tjitra
Indonesia 10 Apr ANTM.JK Antam U U Rp 1125 Rp 950 Rp 850 11.8 Rp 34 Rp 36 Rp 1 Rp 2 2654.13 2294.14 Ami Tantri
Indonesia 10 Apr INCO.JK PT INCO N N Rp 0.304 Rp 3350 Rp 2600 28.8 US$ 0.0123 US$ 0.0158 US$ 0.0048 US$ 0.0073 157.68 118.03 Ami Tantri
Indonesia 11 Apr TINS.JK Timah O O Rp 2080 Rp 2300 Rp 2000 15.0 Rp 128 Rp 158 Rp 129 Rp 158 -0.70 -0.05 Ami Tantri
Indonesia 14 Apr KLBF.JK Kalbe Farma N N Rp 1520 Rp 1280 Rp 1220 4.9 Rp 47 Rp 56 Rp 48 Rp 57 -1.17 -2.72 Ella Nusantoro
Indonesia 15 Apr BDMN.JK Bank Danamon U U Rp 4550 Rp 3700 Rp 3500 5.7 Rp 437 Rp 497 Rp 437 Rp 520 0.00 -4.35 Sanjay Jain
Indonesia 15 Apr BJBR.JK Bank Jabar Banten N N Rp 1145 Rp 1100 Rp 1050 4.8 Rp 141 Rp 149 Rp 142 Rp 151 -0.67 -1.46 Sanjay Jain
Indonesia 15 Apr BTPN.JK BTPN U U Rp 4100 Rp 3800 Rp 3800 0.0 Rp 388 Rp 431 Rp 385 Rp 417 0.73 3.16 Sanjay Jain
Malaysia 10 Apr AXIA.KL Axiata O O RM 6.59 RM 7.45 RM 7.45 0.0 RM 0.3019 RM 0.35 RM 0.2977 RM 0.3465 1.42 1.00 Foong Wai Loke
Taiwan 09 Apr 2303.TW UMC N N NT$ 12.95 NT$ 13 NT$ 13 0.0 NT$ 1.0097 NT$ 0.4593 NT$ 0.9678 NT$ 0.3112 4.33 47.58 Randy Abrams
Taiwan 09 Apr 2311.TW ASE O O NT$ 33.5 NT$ 40 NT$ 32.5 23.1 NT$ 2.1116 NT$ 2.4472 NT$ 2.1116 NT$ 2.1026 0.00 16.39 Randy Abrams
Taiwan 09 Apr 3481.TW Innolux N N NT$ 11.05 NT$ 11 NT$ 10.5 4.8 NT$ 0.5075 NT$ 0.6728 NT$ 0.497 NT$ 0.6669 2.11 0.89 Jerry Su
Taiwan 09 Apr 5280.TW FocalTech O O NT$ 259 NT$ 360 NT$ 360 0.0 NT$ 23.2987 NT$ 28.9443 NT$ 22.531 NT$ 28.6892 3.41 0.89 Jerry Su
Taiwan 09 Apr 5371.TWO Coretronic O O NT$ 38.6 NT$ 41 NT$ 35.5 15.5 NT$ 3.297 NT$ 3.5434 NT$ 3.0951 NT$ 3.2983 6.52 7.43 Jerry Su
Taiwan 10 Apr 6147.TWO Chipbond N N NT$ 54.6 NT$ 51 NT$ 49 4.1 NT$ 4.2286 NT$ 5.3143 NT$ 4.1089 NT$ 5.3069 2.91 0.14 Jerry Su
Taiwan 11 Apr 2324.TW Compal O O NT$ 22.7 NT$ 27 NT$ 27 0.0 NT$ 2.413 NT$ 2.5647 NT$ 2.4097 NT$ 2.5606 0.14 0.16 Thompson Wu
Taiwan 11 Apr 3231.TW Wistron U U NT$ 25.6 NT$ 18 NT$ 18 0.0 NT$ 2.0729 NT$ 2.5937 NT$ 2.0442 NT$ 2.5607 1.40 1.29 Thompson Wu
Thailand 09 Apr SCC.BK SCC N N Bt 426 Bt 404 Bt 404 0.0 Bt 31.36 Bt 33.2171 Bt 31.2212 Bt 33.1516 0.44 0.20 Poom Suvarnatemee
Downgrade
Hong Kong 09 Apr 0019.HK Swire 'A' U N HK$ 92.7 HK$ 84 HK$ 87.9 -4.4 HK$ 6.1041 HK$ 7.1222 HK$ 7.8077 HK$ 7.8093 -21.82 -8.80 Karim Salamatian
16 A
pril 2
014
Ju
mp
-Sta
rt 3
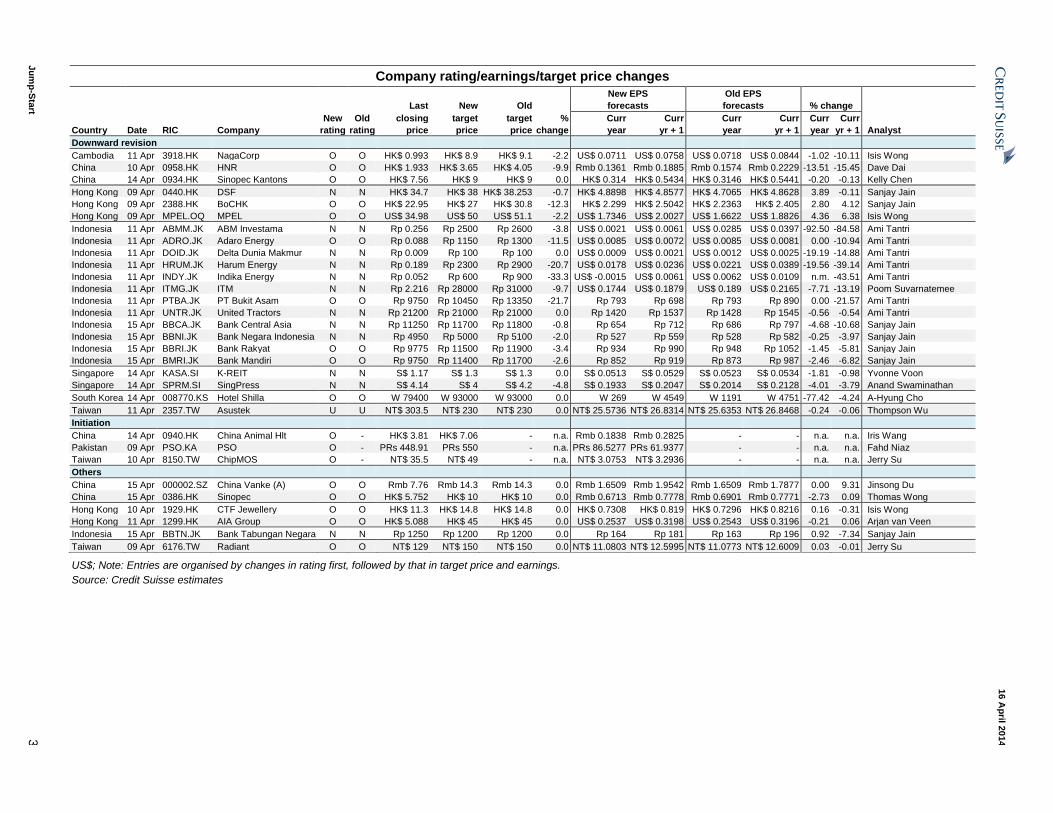
Company rating/earnings/target price changes
New EPS Old EPS
Last New Old forecasts forecasts % change
New Old closing target target % Curr Curr Curr Curr Curr Curr
Country Date RIC Company rating rating price price price change year yr + 1 year yr + 1 year yr + 1 Analyst
Downward revision
Cambodia 11 Apr 3918.HK NagaCorp O O HK$ 0.993 HK$ 8.9 HK$ 9.1 -2.2 US$ 0.0711 US$ 0.0758 US$ 0.0718 US$ 0.0844 -1.02 -10.11 Isis Wong
China 10 Apr 0958.HK HNR O O HK$ 1.933 HK$ 3.65 HK$ 4.05 -9.9 Rmb 0.1361 Rmb 0.1885 Rmb 0.1574 Rmb 0.2229 -13.51 -15.45 Dave Dai
China 14 Apr 0934.HK Sinopec Kantons O O HK$ 7.56 HK$ 9 HK$ 9 0.0 HK$ 0.314 HK$ 0.5434 HK$ 0.3146 HK$ 0.5441 -0.20 -0.13 Kelly Chen
Hong Kong 09 Apr 0440.HK DSF N N HK$ 34.7 HK$ 38 HK$ 38.253 -0.7 HK$ 4.8898 HK$ 4.8577 HK$ 4.7065 HK$ 4.8628 3.89 -0.11 Sanjay Jain
Hong Kong 09 Apr 2388.HK BoCHK O O HK$ 22.95 HK$ 27 HK$ 30.8 -12.3 HK$ 2.299 HK$ 2.5042 HK$ 2.2363 HK$ 2.405 2.80 4.12 Sanjay Jain
Hong Kong 09 Apr MPEL.OQ MPEL O O US$ 34.98 US$ 50 US$ 51.1 -2.2 US$ 1.7346 US$ 2.0027 US$ 1.6622 US$ 1.8826 4.36 6.38 Isis Wong
Indonesia 11 Apr ABMM.JK ABM Investama N N Rp 0.256 Rp 2500 Rp 2600 -3.8 US$ 0.0021 US$ 0.0061 US$ 0.0285 US$ 0.0397 -92.50 -84.58 Ami Tantri
Indonesia 11 Apr ADRO.JK Adaro Energy O O Rp 0.088 Rp 1150 Rp 1300 -11.5 US$ 0.0085 US$ 0.0072 US$ 0.0085 US$ 0.0081 0.00 -10.94 Ami Tantri
Indonesia 11 Apr DOID.JK Delta Dunia Makmur N N Rp 0.009 Rp 100 Rp 100 0.0 US$ 0.0009 US$ 0.0021 US$ 0.0012 US$ 0.0025 -19.19 -14.88 Ami Tantri
Indonesia 11 Apr HRUM.JK Harum Energy N N Rp 0.189 Rp 2300 Rp 2900 -20.7 US$ 0.0178 US$ 0.0236 US$ 0.0221 US$ 0.0389 -19.56 -39.14 Ami Tantri
Indonesia 11 Apr INDY.JK Indika Energy N N Rp 0.052 Rp 600 Rp 900 -33.3 US$ -0.0015 US$ 0.0061 US$ 0.0062 US$ 0.0109 n.m. -43.51 Ami Tantri
Indonesia 11 Apr ITMG.JK ITM N N Rp 2.216 Rp 28000 Rp 31000 -9.7 US$ 0.1744 US$ 0.1879 US$ 0.189 US$ 0.2165 -7.71 -13.19 Poom Suvarnatemee
Indonesia 11 Apr PTBA.JK PT Bukit Asam O O Rp 9750 Rp 10450 Rp 13350 -21.7 Rp 793 Rp 698 Rp 793 Rp 890 0.00 -21.57 Ami Tantri
Indonesia 11 Apr UNTR.JK United Tractors N N Rp 21200 Rp 21000 Rp 21000 0.0 Rp 1420 Rp 1537 Rp 1428 Rp 1545 -0.56 -0.54 Ami Tantri
Indonesia 15 Apr BBCA.JK Bank Central Asia N N Rp 11250 Rp 11700 Rp 11800 -0.8 Rp 654 Rp 712 Rp 686 Rp 797 -4.68 -10.68 Sanjay Jain
Indonesia 15 Apr BBNI.JK Bank Negara Indonesia N N Rp 4950 Rp 5000 Rp 5100 -2.0 Rp 527 Rp 559 Rp 528 Rp 582 -0.25 -3.97 Sanjay Jain
Indonesia 15 Apr BBRI.JK Bank Rakyat O O Rp 9775 Rp 11500 Rp 11900 -3.4 Rp 934 Rp 990 Rp 948 Rp 1052 -1.45 -5.81 Sanjay Jain
Indonesia 15 Apr BMRI.JK Bank Mandiri O O Rp 9750 Rp 11400 Rp 11700 -2.6 Rp 852 Rp 919 Rp 873 Rp 987 -2.46 -6.82 Sanjay Jain
Singapore 14 Apr KASA.SI K-REIT N N S$ 1.17 S$ 1.3 S$ 1.3 0.0 S$ 0.0513 S$ 0.0529 S$ 0.0523 S$ 0.0534 -1.81 -0.98 Yvonne Voon
Singapore 14 Apr SPRM.SI SingPress N N S$ 4.14 S$ 4 S$ 4.2 -4.8 S$ 0.1933 S$ 0.2047 S$ 0.2014 S$ 0.2128 -4.01 -3.79 Anand Swaminathan
South Korea 14 Apr 008770.KS Hotel Shilla O O W 79400 W 93000 W 93000 0.0 W 269 W 4549 W 1191 W 4751 -77.42 -4.24 A-Hyung Cho
Taiwan 11 Apr 2357.TW Asustek U U NT$ 303.5 NT$ 230 NT$ 230 0.0 NT$ 25.5736 NT$ 26.8314 NT$ 25.6353 NT$ 26.8468 -0.24 -0.06 Thompson Wu
Initiation
China 14 Apr 0940.HK China Animal Hlt O - HK$ 3.81 HK$ 7.06 - n.a. Rmb 0.1838 Rmb 0.2825 - - n.a. n.a. Iris Wang
Pakistan 09 Apr PSO.KA PSO O - PRs 448.91 PRs 550 - n.a. PRs 86.5277 PRs 61.9377 - - n.a. n.a. Fahd Niaz
Taiwan 10 Apr 8150.TW ChipMOS O - NT$ 35.5 NT$ 49 - n.a. NT$ 3.0753 NT$ 3.2936 - - n.a. n.a. Jerry Su
Others
China 15 Apr 000002.SZ China Vanke (A) O O Rmb 7.76 Rmb 14.3 Rmb 14.3 0.0 Rmb 1.6509 Rmb 1.9542 Rmb 1.6509 Rmb 1.7877 0.00 9.31 Jinsong Du
China 15 Apr 0386.HK Sinopec O O HK$ 5.752 HK$ 10 HK$ 10 0.0 Rmb 0.6713 Rmb 0.7778 Rmb 0.6901 Rmb 0.7771 -2.73 0.09 Thomas Wong
Hong Kong 10 Apr 1929.HK CTF Jewellery O O HK$ 11.3 HK$ 14.8 HK$ 14.8 0.0 HK$ 0.7308 HK$ 0.819 HK$ 0.7296 HK$ 0.8216 0.16 -0.31 Isis Wong
Hong Kong 11 Apr 1299.HK AIA Group O O HK$ 5.088 HK$ 45 HK$ 45 0.0 US$ 0.2537 US$ 0.3198 US$ 0.2543 US$ 0.3196 -0.21 0.06 Arjan van Veen
Indonesia 15 Apr BBTN.JK Bank Tabungan Negara N N Rp 1250 Rp 1200 Rp 1200 0.0 Rp 164 Rp 181 Rp 163 Rp 196 0.92 -7.34 Sanjay Jain
Taiwan 09 Apr 6176.TW Radiant O O NT$ 129 NT$ 150 NT$ 150 0.0 NT$ 11.0803 NT$ 12.5995 NT$ 11.0773 NT$ 12.6009 0.03 -0.01 Jerry Su
US$; Note: Entries are organised by changes in rating first, followed by that in target price and earnings.
Source: Credit Suisse estimates
16 April 2014
Jump-Start 4
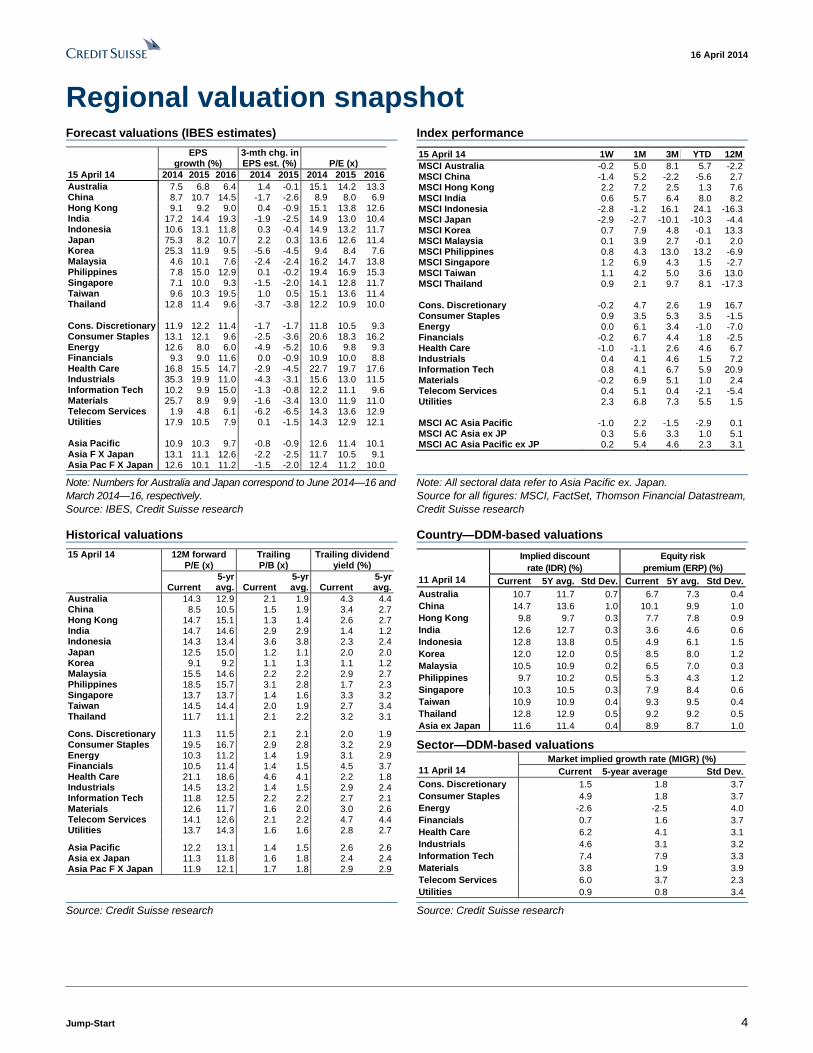
Regional valuation snapshot Forecast valuations (IBES estimates) Index performance
EPS 3-mth chg. in growth (%) EPS est. (%) P/E (x)
15 April 14 2014 2015 2016 2014 2015 2014 2015 2016
Australia 7.5 6.8 6.4 1.4 -0.1 15.1 14.2 13.3 China 8.7 10.7 14.5 -1.7 -2.6 8.9 8.0 6.9 Hong Kong 9.1 9.2 9.0 0.4 -0.9 15.1 13.8 12.6 India 17.2 14.4 19.3 -1.9 -2.5 14.9 13.0 10.4 Indonesia 10.6 13.1 11.8 0.3 -0.4 14.9 13.2 11.7 Japan 75.3 8.2 10.7 2.2 0.3 13.6 12.6 11.4 Korea 25.3 11.9 9.5 -5.6 -4.5 9.4 8.4 7.6 Malaysia 4.6 10.1 7.6 -2.4 -2.4 16.2 14.7 13.8 Philippines 7.8 15.0 12.9 0.1 -0.2 19.4 16.9 15.3 Singapore 7.1 10.0 9.3 -1.5 -2.0 14.1 12.8 11.7 Taiwan 9.6 10.3 19.5 1.0 0.5 15.1 13.6 11.4 Thailand 12.8 11.4 9.6 -3.7 -3.8 12.2 10.9 10.0 Cons. Discretionary 11.9 12.2 11.4 -1.7 -1.7 11.8 10.5 9.3 Consumer Staples 13.1 12.1 9.6 -2.5 -3.6 20.6 18.3 16.2 Energy 12.6 8.0 6.0 -4.9 -5.2 10.6 9.8 9.3 Financials 9.3 9.0 11.6 0.0 -0.9 10.9 10.0 8.8 Health Care 16.8 15.5 14.7 -2.9 -4.5 22.7 19.7 17.6 Industrials 35.3 19.9 11.0 -4.3 -3.1 15.6 13.0 11.5 Information Tech 10.2 9.9 15.0 -1.3 -0.8 12.2 11.1 9.6 Materials 25.7 8.9 9.9 -1.6 -3.4 13.0 11.9 11.0 Telecom Services 1.9 4.8 6.1 -6.2 -6.5 14.3 13.6 12.9 Utilities 17.9 10.5 7.9 0.1 -1.5 14.3 12.9 12.1 Asia Pacific 10.9 10.3 9.7 -0.8 -0.9 12.6 11.4 10.1 Asia F X Japan 13.1 11.1 12.6 -2.2 -2.5 11.7 10.5 9.1 Asia Pac F X Japan 12.6 10.1 11.2 -1.5 -2.0 12.4 11.2 10.0
15 April 14 1W 1M 3M YTD 12M
MSCI Australia -0.2 5.0 8.1 5.7 -2.2 MSCI China -1.4 5.2 -2.2 -5.6 2.7 MSCI Hong Kong 2.2 7.2 2.5 1.3 7.6 MSCI India 0.6 5.7 6.4 8.0 8.2 MSCI Indonesia -2.8 -1.2 16.1 24.1 -16.3 MSCI Japan -2.9 -2.7 -10.1 -10.3 -4.4 MSCI Korea 0.7 7.9 4.8 -0.1 13.3 MSCI Malaysia 0.1 3.9 2.7 -0.1 2.0 MSCI Philippines 0.8 4.3 13.0 13.2 -6.9 MSCI Singapore 1.2 6.9 4.3 1.5 -2.7 MSCI Taiwan 1.1 4.2 5.0 3.6 13.0 MSCI Thailand 0.9 2.1 9.7 8.1 -17.3 Cons. Discretionary -0.2 4.7 2.6 1.9 16.7 Consumer Staples 0.9 3.5 5.3 3.5 -1.5 Energy 0.0 6.1 3.4 -1.0 -7.0 Financials -0.2 6.7 4.4 1.8 -2.5 Health Care -1.0 -1.1 2.6 4.6 6.7 Industrials 0.4 4.1 4.6 1.5 7.2 Information Tech 0.8 4.1 6.7 5.9 20.9 Materials -0.2 6.9 5.1 1.0 2.4 Telecom Services 0.4 5.1 0.4 -2.1 -5.4 Utilities 2.3 6.8 7.3 5.5 1.5 MSCI AC Asia Pacific -1.0 2.2 -1.5 -2.9 0.1 MSCI AC Asia ex JP 0.3 5.6 3.3 1.0 5.1 MSCI AC Asia Pacific ex JP 0.2 5.4 4.6 2.3 3.1
Note: Numbers for Australia and Japan correspond to June 2014—16 and
March 2014—16, respectively.
Source: IBES, Credit Suisse research
Note: All sectoral data refer to Asia Pacific ex. Japan.
Source for all figures: MSCI, FactSet, Thomson Financial Datastream,
Credit Suisse research
Historical valuations Country—DDM-based valuations
15 April 14 12M forward P/E (x)
Trailing P/B (x)
Trailing dividend yield (%)
Current 5-yr avg. Current
5-yr avg. Current
5-yr avg.
Australia 14.3 12.9 2.1 1.9 4.3 4.4 China 8.5 10.5 1.5 1.9 3.4 2.7 Hong Kong 14.7 15.1 1.3 1.4 2.6 2.7 India 14.7 14.6 2.9 2.9 1.4 1.2 Indonesia 14.3 13.4 3.6 3.8 2.3 2.4 Japan 12.5 15.0 1.2 1.1 2.0 2.0 Korea 9.1 9.2 1.1 1.3 1.1 1.2 Malaysia 15.5 14.6 2.2 2.2 2.9 2.7 Philippines 18.5 15.7 3.1 2.8 1.7 2.3 Singapore 13.7 13.7 1.4 1.6 3.3 3.2 Taiwan 14.5 14.4 2.0 1.9 2.7 3.4 Thailand 11.7 11.1 2.1 2.2 3.2 3.1 Cons. Discretionary 11.3 11.5 2.1 2.1 2.0 1.9 Consumer Staples 19.5 16.7 2.9 2.8 3.2 2.9 Energy 10.3 11.2 1.4 1.9 3.1 2.9 Financials 10.5 11.4 1.4 1.5 4.5 3.7 Health Care 21.1 18.6 4.6 4.1 2.2 1.8 Industrials 14.5 13.2 1.4 1.5 2.9 2.4 Information Tech 11.8 12.5 2.2 2.2 2.7 2.1 Materials 12.6 11.7 1.6 2.0 3.0 2.6 Telecom Services 14.1 12.6 2.1 2.2 4.7 4.4 Utilities 13.7 14.3 1.6 1.6 2.8 2.7 Asia Pacific 12.2 13.1 1.4 1.5 2.6 2.6 Asia ex Japan 11.3 11.8 1.6 1.8 2.4 2.4 Asia Pac F X Japan 11.9 12.1 1.7 1.8 2.9 2.9
Implied discount Equity risk
rate (IDR) (%) premium (ERP) (%)
11 April 14 Current 5Y avg. Std Dev. Current 5Y avg. Std Dev.
Australia 10.7 11.7 0.7 6.7 7.3 0.4
China 14.7 13.6 1.0 10.1 9.9 1.0
Hong Kong 9.8 9.7 0.3 7.7 7.8 0.9
India 12.6 12.7 0.3 3.6 4.6 0.6
Indonesia 12.8 13.8 0.5 4.9 6.1 1.5
Korea 12.0 12.0 0.5 8.5 8.0 1.2
Malaysia 10.5 10.9 0.2 6.5 7.0 0.3
Philippines 9.7 10.2 0.5 5.3 4.3 1.2
Singapore 10.3 10.5 0.3 7.9 8.4 0.6
Taiwan 10.9 10.9 0.4 9.3 9.5 0.4
Thailand 12.8 12.9 0.5 9.2 9.2 0.5
Asia ex Japan 11.6 11.4 0.4 8.9 8.7 1.0
Sector—DDM-based valuations Market implied growth rate (MIGR) (%)
11 April 14 Current 5-year average Std Dev.
Cons. Discretionary 1.5 1.8 3.7
Consumer Staples 4.9 1.8 3.7
Energy -2.6 -2.5 4.0
Financials 0.7 1.6 3.7
Health Care 6.2 4.1 3.1
Industrials 4.6 3.1 3.2
Information Tech 7.4 7.9 3.3
Materials 3.8 1.9 3.9
Telecom Services 6.0 3.7 2.3
Utilities 0.9 0.8 3.4
Source: Credit Suisse research Source: Credit Suisse research
16 April 2014
Jump-Start 5
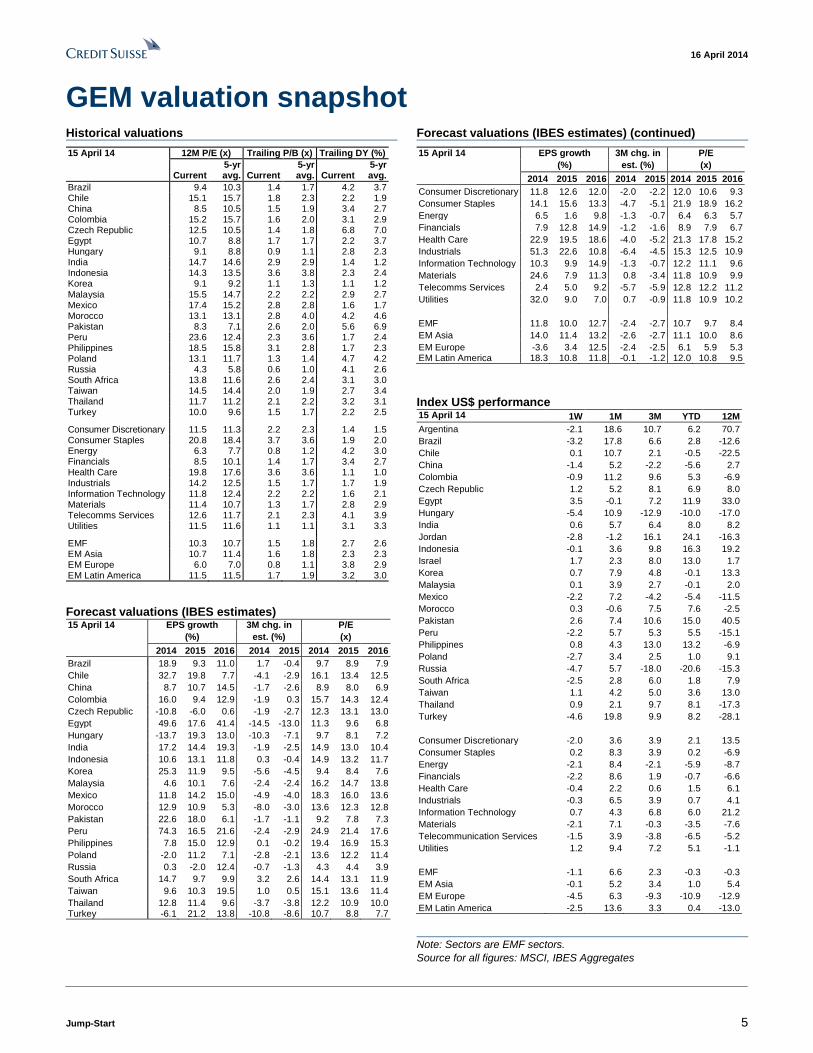
GEM valuation snapshot Historical valuations Forecast valuations (IBES estimates) (continued)
15 April 14 12M P/E (x) Trailing P/B (x) Trailing DY (%)
Current 5-yr
avg. Current 5-yr avg. Current
5-yr avg.
Brazil 9.4 10.3 1.4 1.7 4.2 3.7 Chile 15.1 15.7 1.8 2.3 2.2 1.9 China 8.5 10.5 1.5 1.9 3.4 2.7 Colombia 15.2 15.7 1.6 2.0 3.1 2.9 Czech Republic 12.5 10.5 1.4 1.8 6.8 7.0 Egypt 10.7 8.8 1.7 1.7 2.2 3.7 Hungary 9.1 8.8 0.9 1.1 2.8 2.3 India 14.7 14.6 2.9 2.9 1.4 1.2 Indonesia 14.3 13.5 3.6 3.8 2.3 2.4 Korea 9.1 9.2 1.1 1.3 1.1 1.2
Malaysia 15.5 14.7 2.2 2.2 2.9 2.7 Mexico 17.4 15.2 2.8 2.8 1.6 1.7 Morocco 13.1 13.1 2.8 4.0 4.2 4.6 Pakistan 8.3 7.1 2.6 2.0 5.6 6.9 Peru 23.6 12.4 2.3 3.6 1.7 2.4 Philippines 18.5 15.8 3.1 2.8 1.7 2.3 Poland 13.1 11.7 1.3 1.4 4.7 4.2 Russia 4.3 5.8 0.6 1.0 4.1 2.6 South Africa 13.8 11.6 2.6 2.4 3.1 3.0 Taiwan 14.5 14.4 2.0 1.9 2.7 3.4 Thailand 11.7 11.2 2.1 2.2 3.2 3.1 Turkey 10.0 9.6 1.5 1.7 2.2 2.5 Consumer Discretionary 11.5 11.3 2.2 2.3 1.4 1.5 Consumer Staples 20.8 18.4 3.7 3.6 1.9 2.0 Energy 6.3 7.7 0.8 1.2 4.2 3.0 Financials 8.5 10.1 1.4 1.7 3.4 2.7 Health Care 19.8 17.6 3.6 3.6 1.1 1.0 Industrials 14.2 12.5 1.5 1.7 1.7 1.9 Information Technology 11.8 12.4 2.2 2.2 1.6 2.1 Materials 11.4 10.7 1.3 1.7 2.8 2.9 Telecomms Services 12.6 11.7 2.1 2.3 4.1 3.9 Utilities 11.5 11.6 1.1 1.1 3.1 3.3 EMF 10.3 10.7 1.5 1.8 2.7 2.6 EM Asia 10.7 11.4 1.6 1.8 2.3 2.3 EM Europe 6.0 7.0 0.8 1.1 3.8 2.9 EM Latin America 11.5 11.5 1.7 1.9 3.2 3.0
Forecast valuations (IBES estimates) 15 April 14 EPS growth 3M chg. in P/E
(%) est. (%) (x)
2014 2015 2016 2014 2015 2014 2015 2016
Brazil 18.9 9.3 11.0 1.7 -0.4 9.7 8.9 7.9
Chile 32.7 19.8 7.7 -4.1 -2.9 16.1 13.4 12.5
China 8.7 10.7 14.5 -1.7 -2.6 8.9 8.0 6.9
Colombia 16.0 9.4 12.9 -1.9 0.3 15.7 14.3 12.4
Czech Republic -10.8 -6.0 0.6 -1.9 -2.7 12.3 13.1 13.0
Egypt 49.6 17.6 41.4 -14.5 -13.0 11.3 9.6 6.8
Hungary -13.7 19.3 13.0 -10.3 -7.1 9.7 8.1 7.2
India 17.2 14.4 19.3 -1.9 -2.5 14.9 13.0 10.4
Indonesia 10.6 13.1 11.8 0.3 -0.4 14.9 13.2 11.7
Korea 25.3 11.9 9.5 -5.6 -4.5 9.4 8.4 7.6
Malaysia 4.6 10.1 7.6 -2.4 -2.4 16.2 14.7 13.8
Mexico 11.8 14.2 15.0 -4.9 -4.0 18.3 16.0 13.6
Morocco 12.9 10.9 5.3 -8.0 -3.0 13.6 12.3 12.8
Pakistan 22.6 18.0 6.1 -1.7 -1.1 9.2 7.8 7.3
Peru 74.3 16.5 21.6 -2.4 -2.9 24.9 21.4 17.6
Philippines 7.8 15.0 12.9 0.1 -0.2 19.4 16.9 15.3
Poland -2.0 11.2 7.1 -2.8 -2.1 13.6 12.2 11.4
Russia 0.3 -2.0 12.4 -0.7 -1.3 4.3 4.4 3.9
South Africa 14.7 9.7 9.9 3.2 2.6 14.4 13.1 11.9
Taiwan 9.6 10.3 19.5 1.0 0.5 15.1 13.6 11.4
Thailand 12.8 11.4 9.6 -3.7 -3.8 12.2 10.9 10.0 Turkey -6.1 21.2 13.8 -10.8 -8.6 10.7 8.8 7.7
15 April 14 EPS growth 3M chg. in P/E
(%) est. (%) (x)
2014 2015 2016 2014 2015 2014 2015 2016
Consumer Discretionary 11.8 12.6 12.0 -2.0 -2.2 12.0 10.6 9.3
Consumer Staples 14.1 15.6 13.3 -4.7 -5.1 21.9 18.9 16.2
Energy 6.5 1.6 9.8 -1.3 -0.7 6.4 6.3 5.7
Financials 7.9 12.8 14.9 -1.2 -1.6 8.9 7.9 6.7
Health Care 22.9 19.5 18.6 -4.0 -5.2 21.3 17.8 15.2
Industrials 51.3 22.6 10.8 -6.4 -4.5 15.3 12.5 10.9
Information Technology 10.3 9.9 14.9 -1.3 -0.7 12.2 11.1 9.6
Materials 24.6 7.9 11.3 0.8 -3.4 11.8 10.9 9.9
Telecomms Services 2.4 5.0 9.2 -5.7 -5.9 12.8 12.2 11.2
Utilities 32.0 9.0 7.0 0.7 -0.9 11.8 10.9 10.2
EMF 11.8 10.0 12.7 -2.4 -2.7 10.7 9.7 8.4
EM Asia 14.0 11.4 13.2 -2.6 -2.7 11.1 10.0 8.6
EM Europe -3.6 3.4 12.5 -2.4 -2.5 6.1 5.9 5.3 EM Latin America 18.3 10.8 11.8 -0.1 -1.2 12.0 10.8 9.5
Index US$ performance 15 April 14 1W 1M 3M YTD 12M
Argentina -2.1 18.6 10.7 6.2 70.7
Brazil -3.2 17.8 6.6 2.8 -12.6
Chile 0.1 10.7 2.1 -0.5 -22.5
China -1.4 5.2 -2.2 -5.6 2.7
Colombia -0.9 11.2 9.6 5.3 -6.9
Czech Republic 1.2 5.2 8.1 6.9 8.0
Egypt 3.5 -0.1 7.2 11.9 33.0
Hungary -5.4 10.9 -12.9 -10.0 -17.0
India 0.6 5.7 6.4 8.0 8.2
Jordan -2.8 -1.2 16.1 24.1 -16.3
Indonesia -0.1 3.6 9.8 16.3 19.2
Israel 1.7 2.3 8.0 13.0 1.7
Korea 0.7 7.9 4.8 -0.1 13.3
Malaysia 0.1 3.9 2.7 -0.1 2.0
Mexico -2.2 7.2 -4.2 -5.4 -11.5
Morocco 0.3 -0.6 7.5 7.6 -2.5
Pakistan 2.6 7.4 10.6 15.0 40.5
Peru -2.2 5.7 5.3 5.5 -15.1
Philippines 0.8 4.3 13.0 13.2 -6.9
Poland -2.7 3.4 2.5 1.0 9.1
Russia -4.7 5.7 -18.0 -20.6 -15.3
South Africa -2.5 2.8 6.0 1.8 7.9
Taiwan 1.1 4.2 5.0 3.6 13.0
Thailand 0.9 2.1 9.7 8.1 -17.3
Turkey -4.6 19.8 9.9 8.2 -28.1
Consumer Discretionary -2.0 3.6 3.9 2.1 13.5
Consumer Staples 0.2 8.3 3.9 0.2 -6.9
Energy -2.1 8.4 -2.1 -5.9 -8.7
Financials -2.2 8.6 1.9 -0.7 -6.6
Health Care -0.4 2.2 0.6 1.5 6.1
Industrials -0.3 6.5 3.9 0.7 4.1
Information Technology 0.7 4.3 6.8 6.0 21.2
Materials -2.1 7.1 -0.3 -3.5 -7.6
Telecommunication Services -1.5 3.9 -3.8 -6.5 -5.2
Utilities 1.2 9.4 7.2 5.1 -1.1
EMF -1.1 6.6 2.3 -0.3 -0.3
EM Asia -0.1 5.2 3.4 1.0 5.4
EM Europe -4.5 6.3 -9.3 -10.9 -12.9
EM Latin America -2.5 13.6 3.3 0.4 -13.0
Note: Sectors are EMF sectors.
Source for all figures: MSCI, IBES Aggregates
16 April 2014
Jump-Start 6
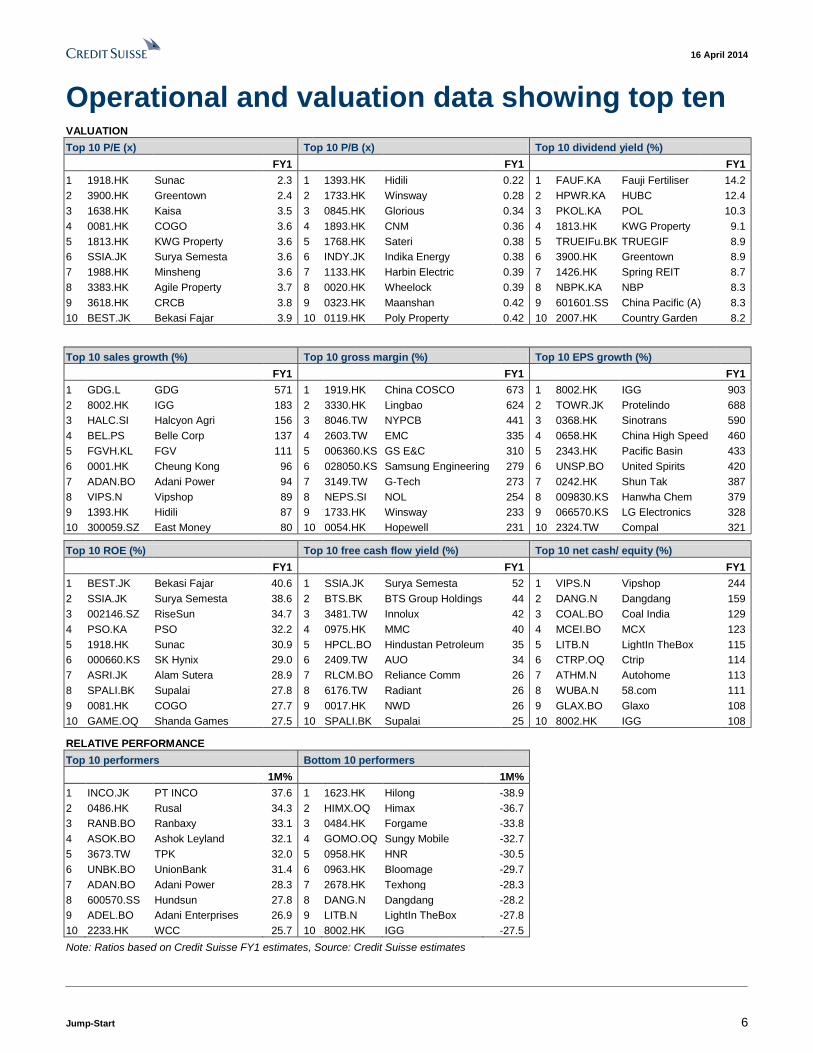
Operational and valuation data showing top ten VALUATION
Top 10 P/E (x) Top 10 P/B (x) Top 10 dividend yield (%)
FY1 FY1 FY1
1 1918.HK Sunac 2.3 1 1393.HK Hidili 0.22 1 FAUF.KA Fauji Fertiliser 14.2
2 3900.HK Greentown 2.4 2 1733.HK Winsway 0.28 2 HPWR.KA HUBC 12.4
3 1638.HK Kaisa 3.5 3 0845.HK Glorious 0.34 3 PKOL.KA POL 10.3
4 0081.HK COGO 3.6 4 1893.HK CNM 0.36 4 1813.HK KWG Property 9.1
5 1813.HK KWG Property 3.6 5 1768.HK Sateri 0.38 5 TRUEIFu.BK TRUEGIF 8.9
6 SSIA.JK Surya Semesta 3.6 6 INDY.JK Indika Energy 0.38 6 3900.HK Greentown 8.9
7 1988.HK Minsheng 3.6 7 1133.HK Harbin Electric 0.39 7 1426.HK Spring REIT 8.7
8 3383.HK Agile Property 3.7 8 0020.HK Wheelock 0.39 8 NBPK.KA NBP 8.3
9 3618.HK CRCB 3.8 9 0323.HK Maanshan 0.42 9 601601.SS China Pacific (A) 8.3
10 BEST.JK Bekasi Fajar 3.9 10 0119.HK Poly Property 0.42 10 2007.HK Country Garden 8.2
Top 10 sales growth (%) Top 10 gross margin (%) Top 10 EPS growth (%)
FY1 FY1 FY1
1 GDG.L GDG 571 1 1919.HK China COSCO 673 1 8002.HK IGG 903
2 8002.HK IGG 183 2 3330.HK Lingbao 624 2 TOWR.JK Protelindo 688
3 HALC.SI Halcyon Agri 156 3 8046.TW NYPCB 441 3 0368.HK Sinotrans 590
4 BEL.PS Belle Corp 137 4 2603.TW EMC 335 4 0658.HK China High Speed 460
5 FGVH.KL FGV 111 5 006360.KS GS E&C 310 5 2343.HK Pacific Basin 433
6 0001.HK Cheung Kong 96 6 028050.KS Samsung Engineering 279 6 UNSP.BO United Spirits 420
7 ADAN.BO Adani Power 94 7 3149.TW G-Tech 273 7 0242.HK Shun Tak 387
8 VIPS.N Vipshop 89 8 NEPS.SI NOL 254 8 009830.KS Hanwha Chem 379
9 1393.HK Hidili 87 9 1733.HK Winsway 233 9 066570.KS LG Electronics 328
10 300059.SZ East Money 80 10 0054.HK Hopewell 231 10 2324.TW Compal 321
Top 10 ROE (%) Top 10 free cash flow yield (%) Top 10 net cash/ equity (%)
FY1 FY1 FY1
1 BEST.JK Bekasi Fajar 40.6 1 SSIA.JK Surya Semesta 52 1 VIPS.N Vipshop 244
2 SSIA.JK Surya Semesta 38.6 2 BTS.BK BTS Group Holdings 44 2 DANG.N Dangdang 159
3 002146.SZ RiseSun 34.7 3 3481.TW Innolux 42 3 COAL.BO Coal India 129
4 PSO.KA PSO 32.2 4 0975.HK MMC 40 4 MCEI.BO MCX 123
5 1918.HK Sunac 30.9 5 HPCL.BO Hindustan Petroleum 35 5 LITB.N LightIn TheBox 115
6 000660.KS SK Hynix 29.0 6 2409.TW AUO 34 6 CTRP.OQ Ctrip 114
7 ASRI.JK Alam Sutera 28.9 7 RLCM.BO Reliance Comm 26 7 ATHM.N Autohome 113
8 SPALI.BK Supalai 27.8 8 6176.TW Radiant 26 8 WUBA.N 58.com 111
9 0081.HK COGO 27.7 9 0017.HK NWD 26 9 GLAX.BO Glaxo 108
10 GAME.OQ Shanda Games 27.5 10 SPALI.BK Supalai 25 10 8002.HK IGG 108
RELATIVE PERFORMANCE
Top 10 performers Bottom 10 performers
1M% 1M%
1 INCO.JK PT INCO 37.6 1 1623.HK Hilong -38.9
2 0486.HK Rusal 34.3 2 HIMX.OQ Himax -36.7
3 RANB.BO Ranbaxy 33.1 3 0484.HK Forgame -33.8
4 ASOK.BO Ashok Leyland 32.1 4 GOMO.OQ Sungy Mobile -32.7
5 3673.TW TPK 32.0 5 0958.HK HNR -30.5
6 UNBK.BO UnionBank 31.4 6 0963.HK Bloomage -29.7
7 ADAN.BO Adani Power 28.3 7 2678.HK Texhong -28.3
8 600570.SS Hundsun 27.8 8 DANG.N Dangdang -28.2
9 ADEL.BO Adani Enterprises 26.9 9 LITB.N LightIn TheBox -27.8
10 2233.HK WCC 25.7 10 8002.HK IGG -27.5
Note: Ratios based on Credit Suisse FY1 estimates, Source: Credit Suisse estimates
16 April 2014
Jump-Start 7
Credit Suisse macroeconomic forecasts
16 April 2014
Jump-Start 8
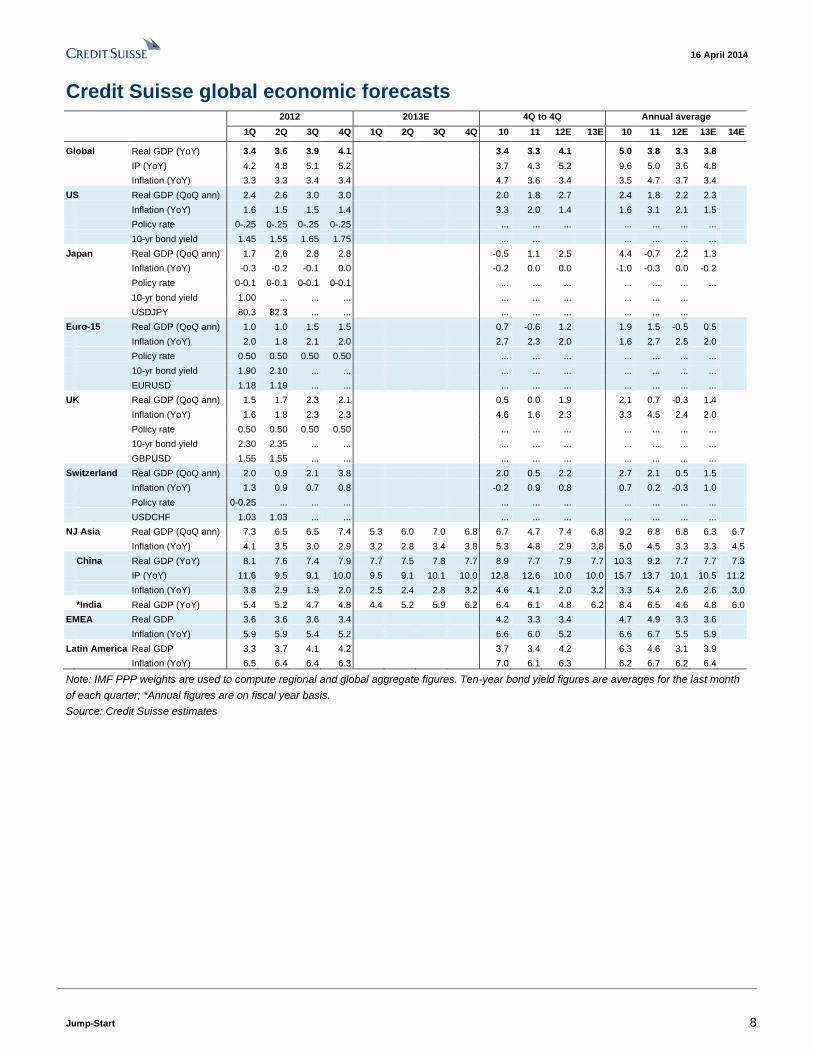
Credit Suisse global economic forecasts
2012 2013E 4Q to 4Q Annual average
1Q 2Q 3Q 4Q 1Q 2Q 3Q 4Q 10 11 12E 13E 10 11 12E 13E 14E
Global Real GDP (YoY) 3.4 3.6 3.9 4.1 3.4 3.3 4.1 5.0 3.8 3.3 3.8 IP (YoY) 4.2 4.8 5.1 5.2 3.7 4.3 5.2 9.6 5.0 3.6 4.8 Inflation (YoY) 3.3 3.3 3.4 3.4 4.7 3.6 3.4 3.5 4.7 3.7 3.4
US Real GDP (QoQ ann) 2.4 2.6 3.0 3.0 2.0 1.8 2.7 2.4 1.8 2.2 2.3 Inflation (YoY) 1.6 1.5 1.5 1.4 3.3 2.0 1.4 1.6 3.1 2.1 1.5 Policy rate 0-.25 0-.25 0-.25 0-.25 ... ... ... ... ... ... ... 10-yr bond yield 1.45 1.55 1.65 1.75 ... ... ... ... ... ...
Japan Real GDP (QoQ ann) 1.7 2.6 2.8 2.8 -0.5 1.1 2.5 4.4 -0.7 2.2 1.3 Inflation (YoY) -0.3 -0.2 -0.1 0.0 -0.2 0.0 0.0 -1.0 -0.3 0.0 -0.2 Policy rate 0-0.1 0-0.1 0-0.1 0-0.1 ... ... ... ... ... ... ... 10-yr bond yield 1.00 ... ... ... ... ... ... ... ... ... USDJPY 80.3 82.3 ... ... ... ... ... ... ... ...
Euro-15 Real GDP (QoQ ann) 1.0 1.0 1.5 1.5 0.7 -0.6 1.2 1.9 1.5 -0.5 0.5 Inflation (YoY) 2.0 1.8 2.1 2.0 2.7 2.3 2.0 1.6 2.7 2.5 2.0 Policy rate 0.50 0.50 0.50 0.50 ... ... ... ... ... ... ... 10-yr bond yield 1.90 2.10 ... ... ... ... ... ... ... ... ... EURUSD 1.18 1.19 ... ... ... ... ... ... ... ... ...
UK Real GDP (QoQ ann) 1.5 1.7 2.3 2.1 0.5 0.0 1.9 2.1 0.7 -0.3 1.4 Inflation (YoY) 1.6 1.8 2.3 2.3 4.6 1.6 2.3 3.3 4.5 2.4 2.0 Policy rate 0.50 0.50 0.50 0.50 ... ... ... ... ... ... ... 10-yr bond yield 2.30 2.35 ... ... ... ... ... ... ... ... ... GBPUSD 1.55 1.55 ... ... ... ... ... ... ... ... ...
Switzerland Real GDP (QoQ ann) 2.0 0.9 2.1 3.8 2.0 0.5 2.2 2.7 2.1 0.5 1.5 Inflation (YoY) 1.3 0.9 0.7 0.8 -0.2 0.9 0.8 0.7 0.2 -0.3 1.0 Policy rate 0-0.25 ... ... ... ... ... ... ... ... ... ... USDCHF 1.03 1.03 ... ... ... ... ... ... ... ... ...
NJ Asia Real GDP (QoQ ann) 7.3 6.5 6.5 7.4 5.3 6.0 7.0 6.8 6.7 4.7 7.4 6.8 9.2 6.8 6.8 6.3 6.7
Inflation (YoY) 4.1 3.5 3.0 2.9 3.2 2.8 3.4 3.8 5.3 4.8 2.9 3.8 5.0 4.5 3.3 3.3 4.5 China Real GDP (YoY) 8.1 7.6 7.4 7.9 7.7 7.5 7.8 7.7 8.9 7.7 7.9 7.7 10.3 9.2 7.7 7.7 7.3 IP (YoY) 11.6 9.5 9.1 10.0 9.5 9.1 10.1 10.0 12.8 12.6 10.0 10.0 15.7 13.7 10.1 10.5 11.2 Inflation (YoY) 3.8 2.9 1.9 2.0 2.5 2.4 2.8 3.2 4.6 4.1 2.0 3.2 3.3 5.4 2.6 2.6 3.0 *India Real GDP (YoY) 5.4 5.2 4.7 4.8 4.4 5.2 5.9 6.2 6.4 6.1 4.8 6.2 8.4 6.5 4.6 4.8 6.0
EMEA Real GDP 3.6 3.6 3.6 3.4 4.2 3.3 3.4 4.7 4.9 3.3 3.6 Inflation (YoY) 5.9 5.9 5.4 5.2 6.6 6.0 5.2 6.6 6.7 5.5 5.9
Latin America Real GDP 3.3 3.7 4.1 4.2 3.7 3.4 4.2 6.3 4.6 3.1 3.9 Inflation (YoY) 6.5 6.4 6.4 6.3 7.0 6.1 6.3 6.2 6.7 6.2 6.4
Note: IMF PPP weights are used to compute regional and global aggregate figures. Ten-year bond yield figures are averages for the last month
of each quarter; *Annual figures are on fiscal year basis.
Source: Credit Suisse estimates
16 April 2014
Jump-Start 9
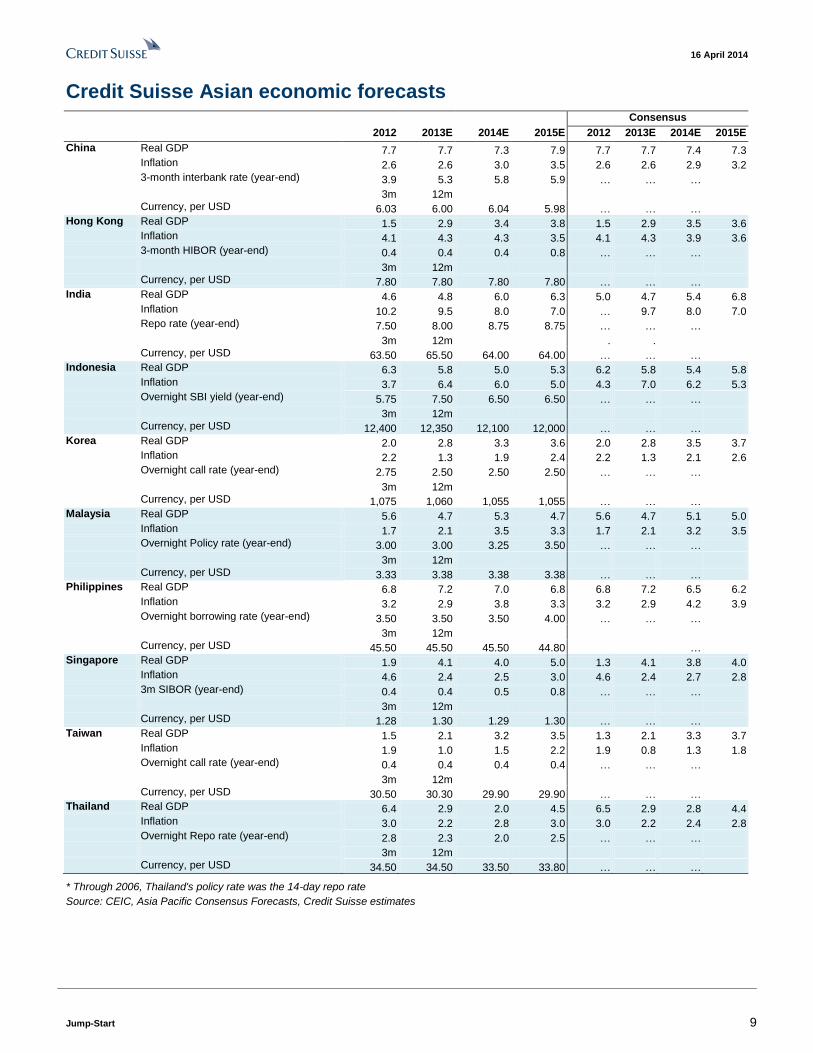
Credit Suisse Asian economic forecasts Consensus
2012 2013E 2014E 2015E 2012 2013E 2014E 2015E
China Real GDP 7.7 7.7 7.3 7.9 7.7 7.7 7.4 7.3 Inflation 2.6 2.6 3.0 3.5 2.6 2.6 2.9 3.2 3-month interbank rate (year-end) 3.9 5.3 5.8 5.9 … … … 3m 12m Currency, per USD 6.03 6.00 6.04 5.98 … … … Hong Kong Real GDP 1.5 2.9 3.4 3.8 1.5 2.9 3.5 3.6 Inflation 4.1 4.3 4.3 3.5 4.1 4.3 3.9 3.6 3-month HIBOR (year-end) 0.4 0.4 0.4 0.8 … … … 3m 12m Currency, per USD 7.80 7.80 7.80 7.80 … … … India Real GDP 4.6 4.8 6.0 6.3 5.0 4.7 5.4 6.8 Inflation 10.2 9.5 8.0 7.0 … 9.7 8.0 7.0 Repo rate (year-end) 7.50 8.00 8.75 8.75 … … … 3m 12m . . Currency, per USD 63.50 65.50 64.00 64.00 … … … Indonesia Real GDP 6.3 5.8 5.0 5.3 6.2 5.8 5.4 5.8 Inflation 3.7 6.4 6.0 5.0 4.3 7.0 6.2 5.3 Overnight SBI yield (year-end) 5.75 7.50 6.50 6.50 … … … 3m 12m Currency, per USD 12,400 12,350 12,100 12,000 … … … Korea Real GDP 2.0 2.8 3.3 3.6 2.0 2.8 3.5 3.7 Inflation 2.2 1.3 1.9 2.4 2.2 1.3 2.1 2.6 Overnight call rate (year-end) 2.75 2.50 2.50 2.50 … … … 3m 12m Currency, per USD 1,075 1,060 1,055 1,055 … … … Malaysia Real GDP 5.6 4.7 5.3 4.7 5.6 4.7 5.1 5.0 Inflation 1.7 2.1 3.5 3.3 1.7 2.1 3.2 3.5 Overnight Policy rate (year-end) 3.00 3.00 3.25 3.50 … … … 3m 12m Currency, per USD 3.33 3.38 3.38 3.38 … … … Philippines Real GDP 6.8 7.2 7.0 6.8 6.8 7.2 6.5 6.2 Inflation 3.2 2.9 3.8 3.3 3.2 2.9 4.2 3.9 Overnight borrowing rate (year-end) 3.50 3.50 3.50 4.00 … … … 3m 12m Currency, per USD 45.50 45.50 45.50 44.80 … Singapore Real GDP 1.9 4.1 4.0 5.0 1.3 4.1 3.8 4.0 Inflation 4.6 2.4 2.5 3.0 4.6 2.4 2.7 2.8 3m SIBOR (year-end) 0.4 0.4 0.5 0.8 … … … 3m 12m Currency, per USD 1.28 1.30 1.29 1.30 … … … Taiwan Real GDP 1.5 2.1 3.2 3.5 1.3 2.1 3.3 3.7 Inflation 1.9 1.0 1.5 2.2 1.9 0.8 1.3 1.8 Overnight call rate (year-end) 0.4 0.4 0.4 0.4 … … … 3m 12m Currency, per USD 30.50 30.30 29.90 29.90 … … … Thailand Real GDP 6.4 2.9 2.0 4.5 6.5 2.9 2.8 4.4 Inflation 3.0 2.2 2.8 3.0 3.0 2.2 2.4 2.8 Overnight Repo rate (year-end) 2.8 2.3 2.0 2.5 … … … 3m 12m Currency, per USD 34.50 34.50 33.50 33.80 … … …
* Through 2006, Thailand's policy rate was the 14-day repo rate
Source: CEIC, Asia Pacific Consensus Forecasts, Credit Suisse estimates
16 April 2014
Jump-Start 10
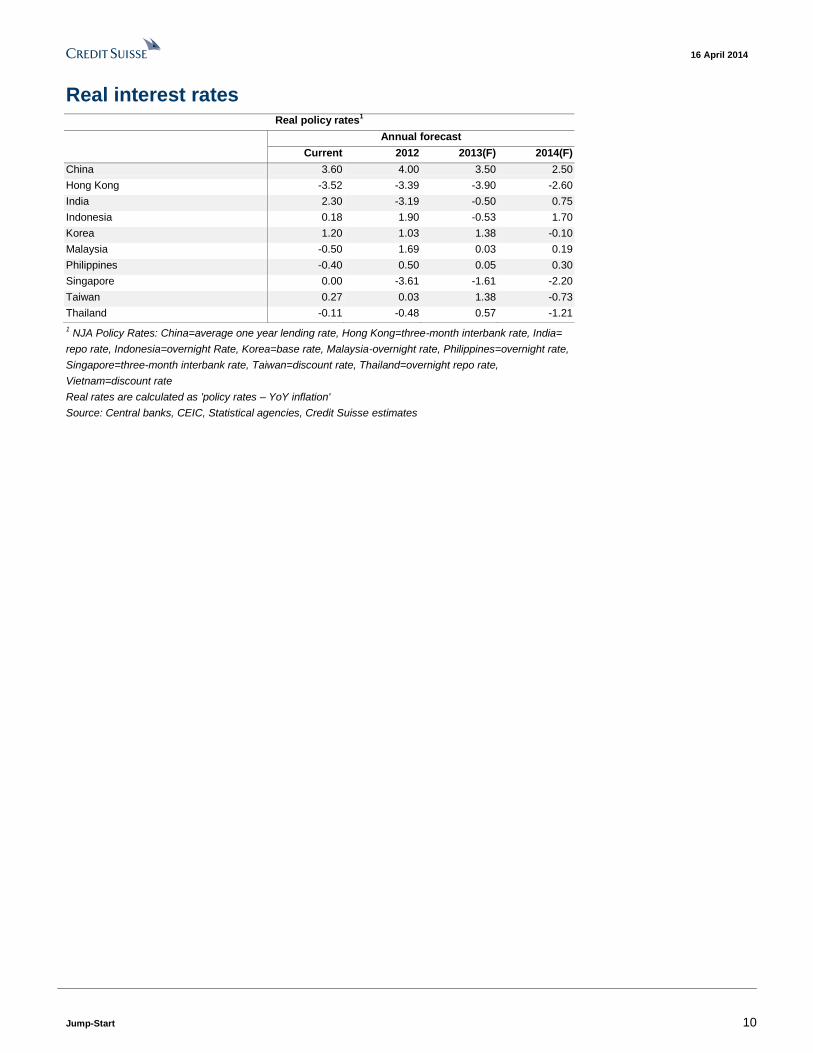
Real interest rates Real policy rates
1
Annual forecast
Current 2012 2013(F) 2014(F)
China 3.60 4.00 3.50 2.50
Hong Kong -3.52 -3.39 -3.90 -2.60
India 2.30 -3.19 -0.50 0.75
Indonesia 0.18 1.90 -0.53 1.70
Korea 1.20 1.03 1.38 -0.10
Malaysia -0.50 1.69 0.03 0.19
Philippines -0.40 0.50 0.05 0.30
Singapore 0.00 -3.61 -1.61 -2.20
Taiwan 0.27 0.03 1.38 -0.73
Thailand -0.11 -0.48 0.57 -1.21
1 NJA Policy Rates: China=average one year lending rate, Hong Kong=three-month interbank rate, India=
repo rate, Indonesia=overnight Rate, Korea=base rate, Malaysia-overnight rate, Philippines=overnight rate,
Singapore=three-month interbank rate, Taiwan=discount rate, Thailand=overnight repo rate,
Vietnam=discount rate
Real rates are calculated as 'policy rates – YoY inflation'
Source: Central banks, CEIC, Statistical agencies, Credit Suisse estimates
16 April 2014
Jump-Start 11
Top stories from Credit Suisse research last week
16 April 2014
Jump-Start 12
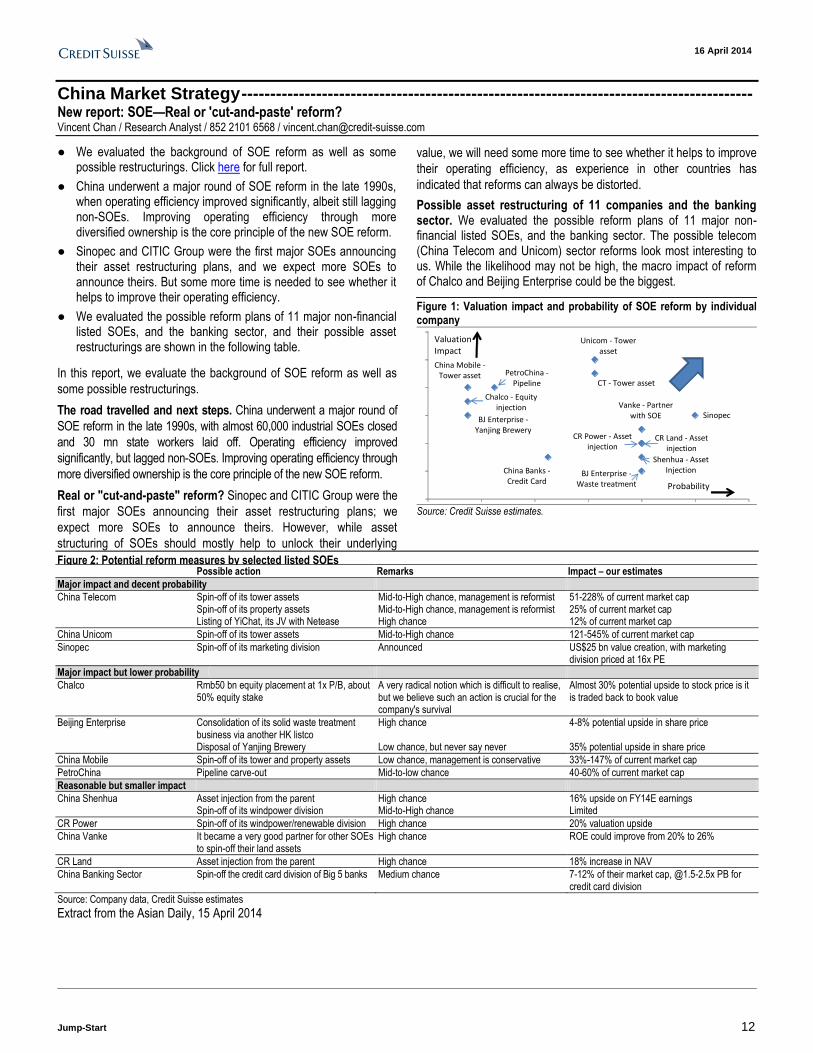
China Market Strategy ----------------------------------------------------------------------------------------- New report: SOE—Real or 'cut-and-paste' reform? Vincent Chan / Research Analyst / 852 2101 6568 / [email protected]
● We evaluated the background of SOE reform as well as some possible restructurings. Click here for full report.
● China underwent a major round of SOE reform in the late 1990s, when operating efficiency improved significantly, albeit still lagging non-SOEs. Improving operating efficiency through more diversified ownership is the core principle of the new SOE reform.
● Sinopec and CITIC Group were the first major SOEs announcing their asset restructuring plans, and we expect more SOEs to announce theirs. But some more time is needed to see whether it helps to improve their operating efficiency.
● We evaluated the possible reform plans of 11 major non-financial listed SOEs, and the banking sector, and their possible asset restructurings are shown in the following table.
In this report, we evaluate the background of SOE reform as well as
some possible restructurings.
The road travelled and next steps. China underwent a major round of
SOE reform in the late 1990s, with almost 60,000 industrial SOEs closed
and 30 mn state workers laid off. Operating efficiency improved
significantly, but lagged non-SOEs. Improving operating efficiency through
more diversified ownership is the core principle of the new SOE reform.
Real or "cut-and-paste" reform? Sinopec and CITIC Group were the
first major SOEs announcing their asset restructuring plans; we
expect more SOEs to announce theirs. However, while asset
structuring of SOEs should mostly help to unlock their underlying
value, we will need some more time to see whether it helps to improve
their operating efficiency, as experience in other countries has
indicated that reforms can always be distorted.
Possible asset restructuring of 11 companies and the banking sector. We evaluated the possible reform plans of 11 major non-financial listed SOEs, and the banking sector. The possible telecom (China Telecom and Unicom) sector reforms look most interesting to us. While the likelihood may not be high, the macro impact of reform of Chalco and Beijing Enterprise could be the biggest.
Figure 1: Valuation impact and probability of SOE reform by individual company
Shenhua - Asset Injection
Chalco - Equity injection
CR Power - Asset injection
BJ Enterprise -Waste treatment
BJ Enterprise -Yanjing Brewery
China Mobile -Tower asset
CT - Tower asset
Unicom - Tower asset
Vanke - Partner with SOE
CR Land - Asset injection
Sinopec
PetroChina -Pipeline
China Banks -Credit Card
Valuation Impact
Probability
Source: Credit Suisse estimates.
Figure 2: Potential reform measures by selected listed SOEs Possible action Remarks Impact – our estimates
Major impact and decent probability
China Telecom Spin-off of its tower assets Mid-to-High chance, management is reformist 51-228% of current market cap Spin-off of its property assets Mid-to-High chance, management is reformist 25% of current market cap Listing of YiChat, its JV with Netease High chance 12% of current market cap
China Unicom Spin-off of its tower assets Mid-to-High chance 121-545% of current market cap
Sinopec Spin-off of its marketing division Announced US$25 bn value creation, with marketing division priced at 16x PE
Major impact but lower probability
Chalco Rmb50 bn equity placement at 1x P/B, about 50% equity stake
A very radical notion which is difficult to realise, but we believe such an action is crucial for the company's survival
Almost 30% potential upside to stock price is it is traded back to book value
Beijing Enterprise Consolidation of its solid waste treatment business via another HK listco
High chance 4-8% potential upside in share price
Disposal of Yanjing Brewery Low chance, but never say never 35% potential upside in share price
China Mobile Spin-off of its tower and property assets Low chance, management is conservative 33%-147% of current market cap
PetroChina Pipeline carve-out Mid-to-low chance 40-60% of current market cap
Reasonable but smaller impact
China Shenhua Asset injection from the parent High chance 16% upside on FY14E earnings Spin-off of its windpower division Mid-to-High chance Limited
CR Power Spin-off of its windpower/renewable division High chance 20% valuation upside
China Vanke It became a very good partner for other SOEs to spin-off their land assets
High chance ROE could improve from 20% to 26%
CR Land Asset injection from the parent High chance 18% increase in NAV
China Banking Sector Spin-off the credit card division of Big 5 banks Medium chance 7-12% of their market cap, @1.5-2.5x PB for credit card division
Source: Company data, Credit Suisse estimates
Extract from the Asian Daily, 15 April 2014
16 April 2014
Jump-Start 13
Credit Suisse AxJ Focus List ------------------------------------------------------------------------------- New report: Relaunching the focus list—here are our best ideas Manish Nigam / Research Analyst / 852 2101 7067 / [email protected] Felix Rusli / Research Analyst / 852 2101 6482 / [email protected]
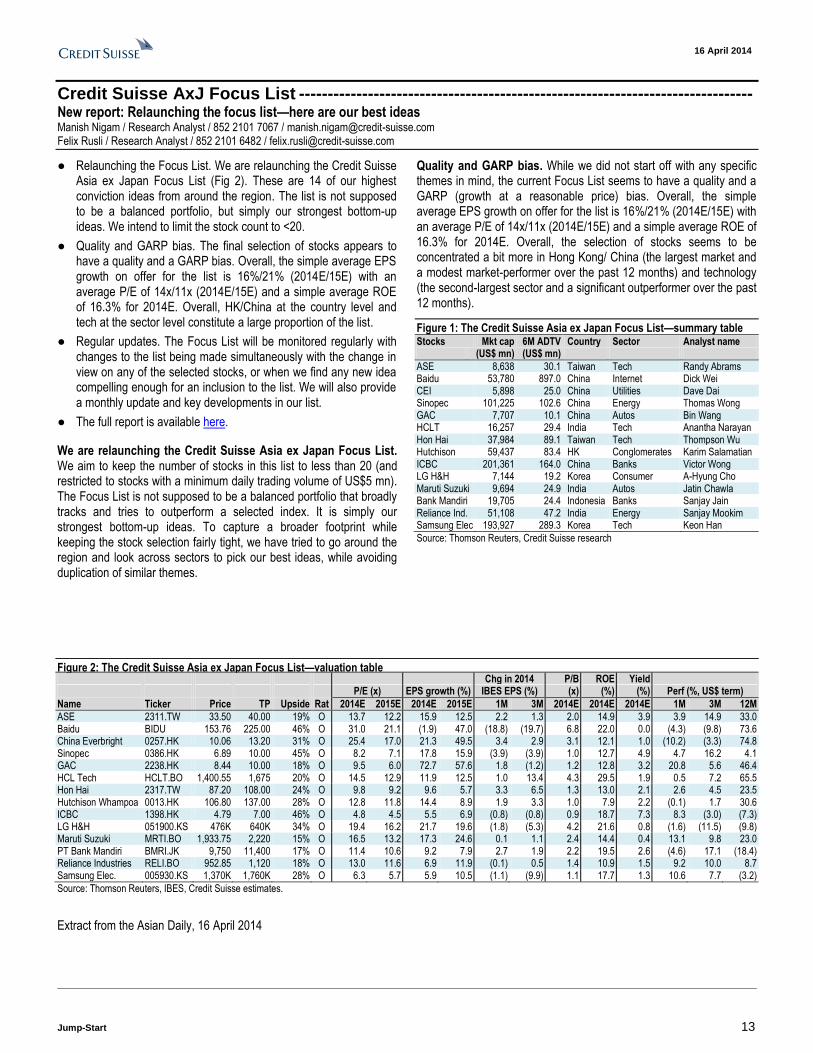
● Relaunching the Focus List. We are relaunching the Credit Suisse Asia ex Japan Focus List (Fig 2). These are 14 of our highest conviction ideas from around the region. The list is not supposed to be a balanced portfolio, but simply our strongest bottom-up ideas. We intend to limit the stock count to <20.
● Quality and GARP bias. The final selection of stocks appears to have a quality and a GARP bias. Overall, the simple average EPS growth on offer for the list is 16%/21% (2014E/15E) with an average P/E of 14x/11x (2014E/15E) and a simple average ROE of 16.3% for 2014E. Overall, HK/China at the country level and tech at the sector level constitute a large proportion of the list.
● Regular updates. The Focus List will be monitored regularly with changes to the list being made simultaneously with the change in view on any of the selected stocks, or when we find any new idea compelling enough for an inclusion to the list. We will also provide a monthly update and key developments in our list.
● The full report is available here.
We are relaunching the Credit Suisse Asia ex Japan Focus List. We aim to keep the number of stocks in this list to less than 20 (and restricted to stocks with a minimum daily trading volume of US$5 mn). The Focus List is not supposed to be a balanced portfolio that broadly tracks and tries to outperform a selected index. It is simply our strongest bottom-up ideas. To capture a broader footprint while keeping the stock selection fairly tight, we have tried to go around the region and look across sectors to pick our best ideas, while avoiding duplication of similar themes.
Quality and GARP bias. While we did not start off with any specific themes in mind, the current Focus List seems to have a quality and a GARP (growth at a reasonable price) bias. Overall, the simple average EPS growth on offer for the list is 16%/21% (2014E/15E) with an average P/E of 14x/11x (2014E/15E) and a simple average ROE of 16.3% for 2014E. Overall, the selection of stocks seems to be concentrated a bit more in Hong Kong/ China (the largest market and a modest market-performer over the past 12 months) and technology (the second-largest sector and a significant outperformer over the past 12 months).
Figure 1: The Credit Suisse Asia ex Japan Focus List—summary table Stocks Mkt cap 6M ADTV Country Sector Analyst name (US$ mn) (US$ mn)
ASE 8,638 30.1 Taiwan Tech Randy Abrams Baidu 53,780 897.0 China Internet Dick Wei CEI 5,898 25.0 China Utilities Dave Dai Sinopec 101,225 102.6 China Energy Thomas Wong GAC 7,707 10.1 China Autos Bin Wang HCLT 16,257 29.4 India Tech Anantha Narayan Hon Hai 37,984 89.1 Taiwan Tech Thompson Wu Hutchison 59,437 83.4 HK Conglomerates Karim Salamatian ICBC 201,361 164.0 China Banks Victor Wong LG H&H 7,144 19.2 Korea Consumer A-Hyung Cho Maruti Suzuki 9,694 24.9 India Autos Jatin Chawla Bank Mandiri 19,705 24.4 Indonesia Banks Sanjay Jain Reliance Ind. 51,108 47.2 India Energy Sanjay Mookim Samsung Elec 193,927 289.3 Korea Tech Keon Han
Source: Thomson Reuters, Credit Suisse research
Figure 2: The Credit Suisse Asia ex Japan Focus List—valuation table Chg in 2014 P/B ROE Yield P/E (x) EPS growth (%) IBES EPS (%) (x) (%) (%) Perf (%, US$ term)
Name Ticker Price TP Upside Rat 2014E 2015E 2014E 2015E 1M 3M 2014E 2014E 2014E 1M 3M 12M
ASE 2311.TW 33.50 40.00 19% O 13.7 12.2 15.9 12.5 2.2 1.3 2.0 14.9 3.9 3.9 14.9 33.0 Baidu BIDU 153.76 225.00 46% O 31.0 21.1 (1.9) 47.0 (18.8) (19.7) 6.8 22.0 0.0 (4.3) (9.8) 73.6 China Everbright 0257.HK 10.06 13.20 31% O 25.4 17.0 21.3 49.5 3.4 2.9 3.1 12.1 1.0 (10.2) (3.3) 74.8 Sinopec 0386.HK 6.89 10.00 45% O 8.2 7.1 17.8 15.9 (3.9) (3.9) 1.0 12.7 4.9 4.7 16.2 4.1 GAC 2238.HK 8.44 10.00 18% O 9.5 6.0 72.7 57.6 1.8 (1.2) 1.2 12.8 3.2 20.8 5.6 46.4 HCL Tech HCLT.BO 1,400.55 1,675 20% O 14.5 12.9 11.9 12.5 1.0 13.4 4.3 29.5 1.9 0.5 7.2 65.5 Hon Hai 2317.TW 87.20 108.00 24% O 9.8 9.2 9.6 5.7 3.3 6.5 1.3 13.0 2.1 2.6 4.5 23.5 Hutchison Whampoa 0013.HK 106.80 137.00 28% O 12.8 11.8 14.4 8.9 1.9 3.3 1.0 7.9 2.2 (0.1) 1.7 30.6 ICBC 1398.HK 4.79 7.00 46% O 4.8 4.5 5.5 6.9 (0.8) (0.8) 0.9 18.7 7.3 8.3 (3.0) (7.3) LG H&H 051900.KS 476K 640K 34% O 19.4 16.2 21.7 19.6 (1.8) (5.3) 4.2 21.6 0.8 (1.6) (11.5) (9.8) Maruti Suzuki MRTI.BO 1,933.75 2,220 15% O 16.5 13.2 17.3 24.6 0.1 1.1 2.4 14.4 0.4 13.1 9.8 23.0 PT Bank Mandiri BMRI.JK 9,750 11,400 17% O 11.4 10.6 9.2 7.9 2.7 1.9 2.2 19.5 2.6 (4.6) 17.1 (18.4) Reliance Industries RELI.BO 952.85 1,120 18% O 13.0 11.6 6.9 11.9 (0.1) 0.5 1.4 10.9 1.5 9.2 10.0 8.7 Samsung Elec. 005930.KS 1,370K 1,760K 28% O 6.3 5.7 5.9 10.5 (1.1) (9.9) 1.1 17.7 1.3 10.6 7.7 (3.2)
Source: Thomson Reuters, IBES, Credit Suisse estimates.
Extract from the Asian Daily, 16 April 2014
16 April 2014
Jump-Start 14
Asia Technology Strategy ------------------------------------------------------------------------------------ CS proprietary survey shows European corporate spending getting stronger Manish Nigam / Research Analyst / 852 2101 7067 / [email protected] Emerson Chan / Research Analyst / 852 3969 5761 / [email protected]
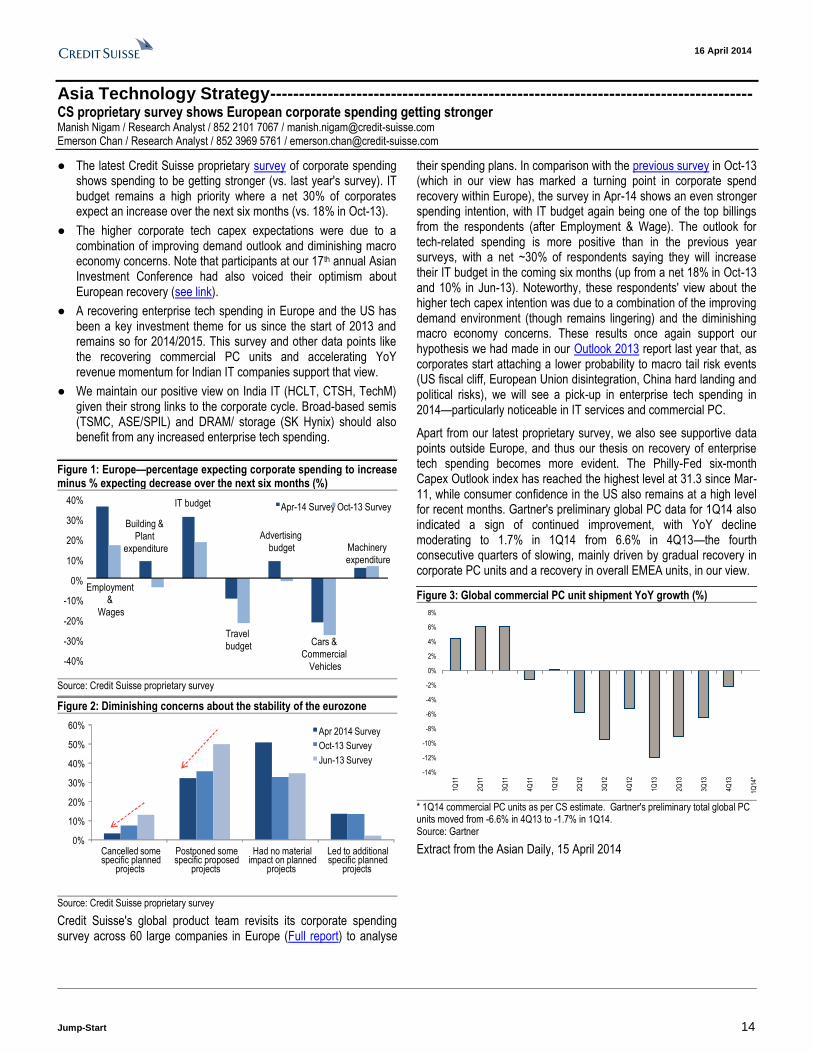
● The latest Credit Suisse proprietary survey of corporate spending shows spending to be getting stronger (vs. last year's survey). IT budget remains a high priority where a net 30% of corporates expect an increase over the next six months (vs. 18% in Oct-13).
● The higher corporate tech capex expectations were due to a combination of improving demand outlook and diminishing macro economy concerns. Note that participants at our 17th annual Asian Investment Conference had also voiced their optimism about European recovery (see link).
● A recovering enterprise tech spending in Europe and the US has been a key investment theme for us since the start of 2013 and remains so for 2014/2015. This survey and other data points like the recovering commercial PC units and accelerating YoY revenue momentum for Indian IT companies support that view.
● We maintain our positive view on India IT (HCLT, CTSH, TechM) given their strong links to the corporate cycle. Broad-based semis (TSMC, ASE/SPIL) and DRAM/ storage (SK Hynix) should also benefit from any increased enterprise tech spending.
Figure 1: Europe—percentage expecting corporate spending to increase minus % expecting decrease over the next six months (%)
Employment
&
Wages
Building &
Plant
expenditure
IT budget
Travel
budget
Advertising
budget
Cars &
Commercial
Vehicles
Machinery
expenditure
-40%
-30%
-20%
-10%
0%
10%
20%
30%
40%Apr-14 Survey Oct-13 Survey
Source: Credit Suisse proprietary survey
Figure 2: Diminishing concerns about the stability of the eurozone
0%
10%
20%
30%
40%
50%
60%
Cancelled somespecific planned
projects
Postponed somespecific proposed
projects
Had no materialimpact on planned
projects
Led to additionalspecific planned
projects
Apr 2014 Survey
Oct-13 Survey
Jun-13 Survey
Source: Credit Suisse proprietary survey
Credit Suisse's global product team revisits its corporate spending survey across 60 large companies in Europe (Full report) to analyse
their spending plans. In comparison with the previous survey in Oct-13 (which in our view has marked a turning point in corporate spend recovery within Europe), the survey in Apr-14 shows an even stronger spending intention, with IT budget again being one of the top billings from the respondents (after Employment & Wage). The outlook for tech-related spending is more positive than in the previous year surveys, with a net ~30% of respondents saying they will increase their IT budget in the coming six months (up from a net 18% in Oct-13 and 10% in Jun-13). Noteworthy, these respondents' view about the higher tech capex intention was due to a combination of the improving demand environment (though remains lingering) and the diminishing macro economy concerns. These results once again support our hypothesis we had made in our Outlook 2013 report last year that, as corporates start attaching a lower probability to macro tail risk events (US fiscal cliff, European Union disintegration, China hard landing and political risks), we will see a pick-up in enterprise tech spending in 2014—particularly noticeable in IT services and commercial PC.
Apart from our latest proprietary survey, we also see supportive data points outside Europe, and thus our thesis on recovery of enterprise tech spending becomes more evident. The Philly-Fed six-month Capex Outlook index has reached the highest level at 31.3 since Mar-11, while consumer confidence in the US also remains at a high level for recent months. Gartner's preliminary global PC data for 1Q14 also indicated a sign of continued improvement, with YoY decline moderating to 1.7% in 1Q14 from 6.6% in 4Q13—the fourth consecutive quarters of slowing, mainly driven by gradual recovery in corporate PC units and a recovery in overall EMEA units, in our view.
Figure 3: Global commercial PC unit shipment YoY growth (%)
-14%
-12%
-10%
-8%
-6%
-4%
-2%
0%
2%
4%
6%
8%
1Q11
2Q11
3Q11
4Q11
1Q12
2Q12
3Q12
4Q12
1Q13
2Q13
3Q13
4Q13
1Q14
*
* 1Q14 commercial PC units as per CS estimate. Gartner's preliminary total global PC units moved from -6.6% in 4Q13 to -1.7% in 1Q14. Source: Gartner
Extract from the Asian Daily, 15 April 2014
16 April 2014
Jump-Start 15
Asia Semiconductor Sector --------------------------------------------------------------------------------- New report: China tablet/smartphone chain—3G exports still healthy, 4G gearing up Randy Abrams, CFA / Research Analyst / 886 2 2715 6366 / [email protected] Jerry Su / Research Analyst / 886 2 2715 6361 / [email protected]
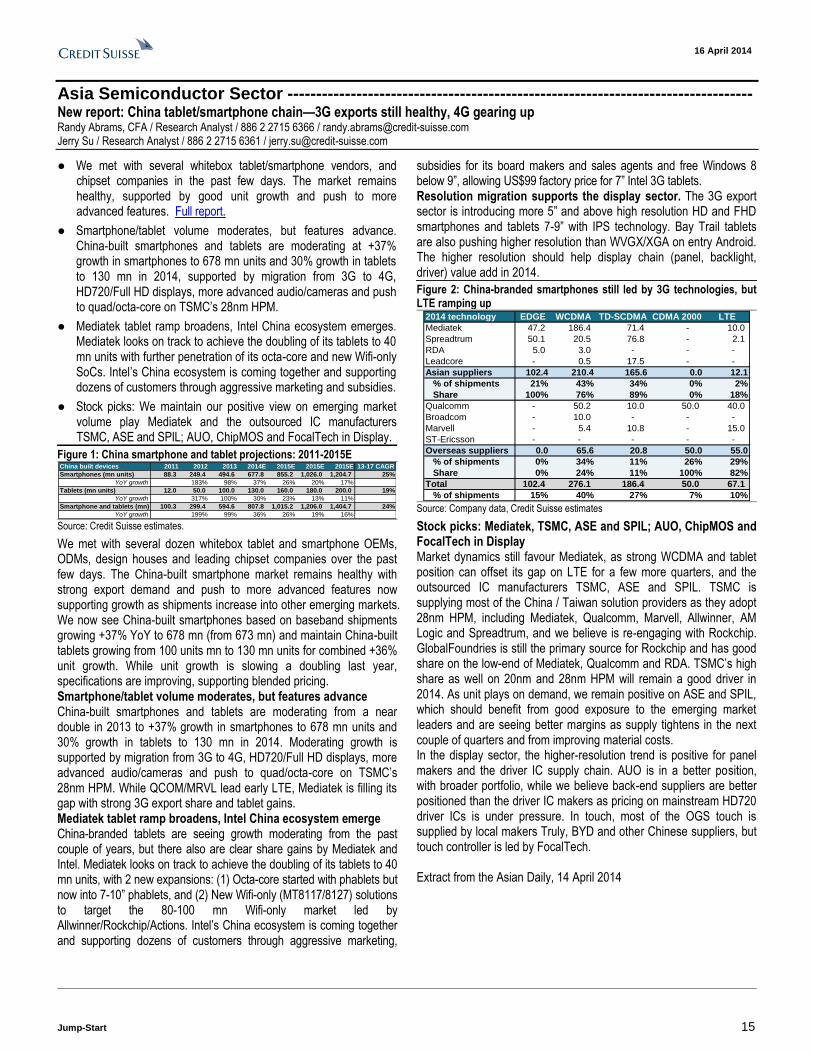
● We met with several whitebox tablet/smartphone vendors, and chipset companies in the past few days. The market remains healthy, supported by good unit growth and push to more advanced features. Full report.
● Smartphone/tablet volume moderates, but features advance. China-built smartphones and tablets are moderating at +37% growth in smartphones to 678 mn units and 30% growth in tablets to 130 mn in 2014, supported by migration from 3G to 4G, HD720/Full HD displays, more advanced audio/cameras and push to quad/octa-core on TSMC’s 28nm HPM.
● Mediatek tablet ramp broadens, Intel China ecosystem emerges. Mediatek looks on track to achieve the doubling of its tablets to 40 mn units with further penetration of its octa-core and new Wifi-only SoCs. Intel’s China ecosystem is coming together and supporting dozens of customers through aggressive marketing and subsidies.
● Stock picks: We maintain our positive view on emerging market volume play Mediatek and the outsourced IC manufacturers TSMC, ASE and SPIL; AUO, ChipMOS and FocalTech in Display.
Figure 1: China smartphone and tablet projections: 2011-2015E China built devices 2011 2012 2013 2014E 2015E 2015E 2015E 13-17 CAGR
Smartphones (mn units) 88.3 249.4 494.6 677.8 855.2 1,026.0 1,204.7 25%
YoY growth 183% 98% 37% 26% 20% 17%
Tablets (mn units) 12.0 50.0 100.0 130.0 160.0 180.0 200.0 19%
YoY growth 317% 100% 30% 23% 13% 11%
Smartphone and tablets (mn) 100.3 299.4 594.6 807.8 1,015.2 1,206.0 1,404.7 24%
YoY growth 199% 99% 36% 26% 19% 16% Source: Credit Suisse estimates.
We met with several dozen whitebox tablet and smartphone OEMs, ODMs, design houses and leading chipset companies over the past few days. The China-built smartphone market remains healthy with strong export demand and push to more advanced features now supporting growth as shipments increase into other emerging markets. We now see China-built smartphones based on baseband shipments growing +37% YoY to 678 mn (from 673 mn) and maintain China-built tablets growing from 100 units mn to 130 mn units for combined +36% unit growth. While unit growth is slowing a doubling last year, specifications are improving, supporting blended pricing. Smartphone/tablet volume moderates, but features advance China-built smartphones and tablets are moderating from a near double in 2013 to +37% growth in smartphones to 678 mn units and 30% growth in tablets to 130 mn in 2014. Moderating growth is supported by migration from 3G to 4G, HD720/Full HD displays, more advanced audio/cameras and push to quad/octa-core on TSMC’s 28nm HPM. While QCOM/MRVL lead early LTE, Mediatek is filling its gap with strong 3G export share and tablet gains. Mediatek tablet ramp broadens, Intel China ecosystem emerge China-branded tablets are seeing growth moderating from the past couple of years, but there also are clear share gains by Mediatek and Intel. Mediatek looks on track to achieve the doubling of its tablets to 40 mn units, with 2 new expansions: (1) Octa-core started with phablets but now into 7-10” phablets, and (2) New Wifi-only (MT8117/8127) solutions to target the 80-100 mn Wifi-only market led by Allwinner/Rockchip/Actions. Intel’s China ecosystem is coming together and supporting dozens of customers through aggressive marketing,
subsidies for its board makers and sales agents and free Windows 8 below 9”, allowing US$99 factory price for 7” Intel 3G tablets. Resolution migration supports the display sector. The 3G export sector is introducing more 5” and above high resolution HD and FHD smartphones and tablets 7-9” with IPS technology. Bay Trail tablets are also pushing higher resolution than WVGX/XGA on entry Android. The higher resolution should help display chain (panel, backlight, driver) value add in 2014.
Figure 2: China-branded smartphones still led by 3G technologies, but LTE ramping up
2014 technology EDGE WCDMA TD-SCDMA CDMA 2000 LTE
Mediatek 47.2 186.4 71.4 - 10.0
Spreadtrum 50.1 20.5 76.8 - 2.1
RDA 5.0 3.0 - - -
Leadcore - 0.5 17.5 - -
Asian suppliers 102.4 210.4 165.6 0.0 12.1
% of shipments 21% 43% 34% 0% 2%
Share 100% 76% 89% 0% 18%
Qualcomm - 50.2 10.0 50.0 40.0
Broadcom - 10.0 - - -
Marvell - 5.4 10.8 - 15.0
ST-Ericsson - - - - -
Overseas suppliers 0.0 65.6 20.8 50.0 55.0
% of shipments 0% 34% 11% 26% 29%
Share 0% 24% 11% 100% 82%
Total 102.4 276.1 186.4 50.0 67.1
% of shipments 15% 40% 27% 7% 10% Source: Company data, Credit Suisse estimates
Stock picks: Mediatek, TSMC, ASE and SPIL; AUO, ChipMOS and FocalTech in Display Market dynamics still favour Mediatek, as strong WCDMA and tablet position can offset its gap on LTE for a few more quarters, and the outsourced IC manufacturers TSMC, ASE and SPIL. TSMC is supplying most of the China / Taiwan solution providers as they adopt 28nm HPM, including Mediatek, Qualcomm, Marvell, Allwinner, AM Logic and Spreadtrum, and we believe is re-engaging with Rockchip. GlobalFoundries is still the primary source for Rockchip and has good share on the low-end of Mediatek, Qualcomm and RDA. TSMC’s high share as well on 20nm and 28nm HPM will remain a good driver in 2014. As unit plays on demand, we remain positive on ASE and SPIL, which should benefit from good exposure to the emerging market leaders and are seeing better margins as supply tightens in the next couple of quarters and from improving material costs. In the display sector, the higher-resolution trend is positive for panel makers and the driver IC supply chain. AUO is in a better position, with broader portfolio, while we believe back-end suppliers are better positioned than the driver IC makers as pricing on mainstream HD720 driver ICs is under pressure. In touch, most of the OGS touch is supplied by local makers Truly, BYD and other Chinese suppliers, but touch controller is led by FocalTech. Extract from the Asian Daily, 14 April 2014
16 April 2014
Jump-Start 16
China Basic Materials Monthly ----------------------------------------------------------------------------- New report: April 2014—no sign of "railway" Trina Chen / Research Analyst / 852 2101 7031 / [email protected] Owen Liang, CFA / Research Analyst / 852 2101 6093 / [email protected] Frankie Zhu / Research Analyst / 852 2101 7426 / [email protected] Gary Xu / Research Analyst / 86 21 3856 0335 / [email protected]
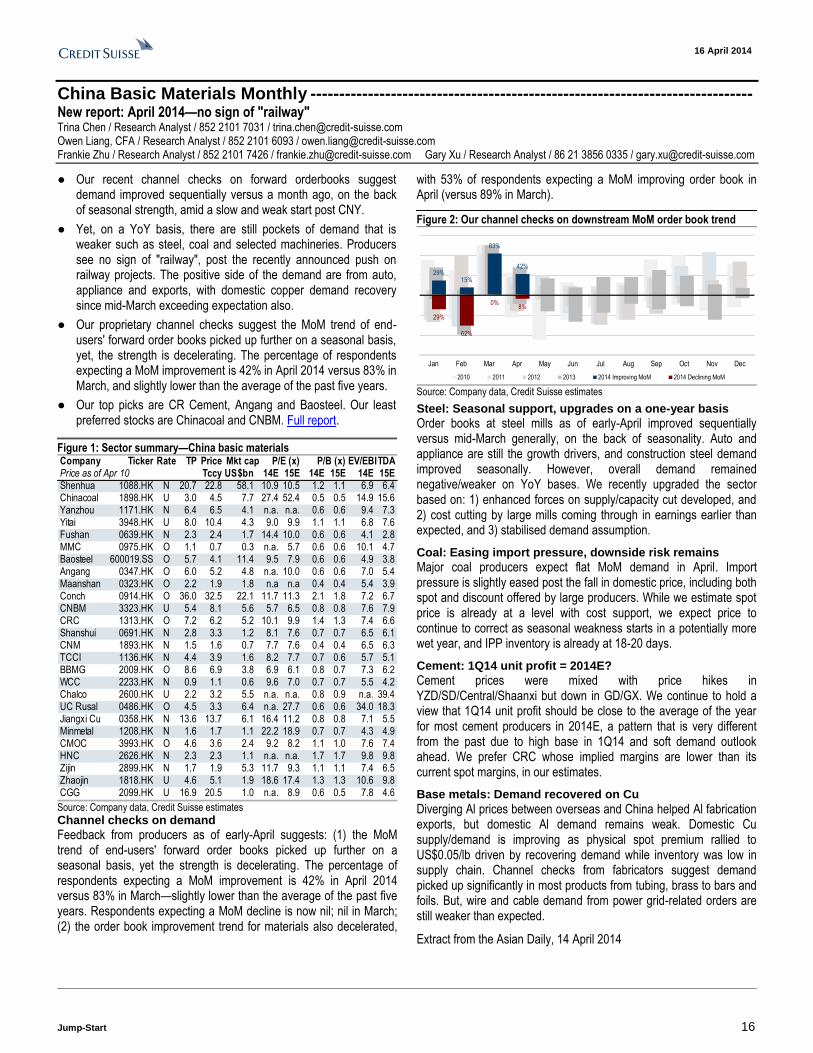
● Our recent channel checks on forward orderbooks suggest demand improved sequentially versus a month ago, on the back of seasonal strength, amid a slow and weak start post CNY.
● Yet, on a YoY basis, there are still pockets of demand that is weaker such as steel, coal and selected machineries. Producers see no sign of "railway", post the recently announced push on railway projects. The positive side of the demand are from auto, appliance and exports, with domestic copper demand recovery since mid-March exceeding expectation also.
● Our proprietary channel checks suggest the MoM trend of end-users' forward order books picked up further on a seasonal basis, yet, the strength is decelerating. The percentage of respondents expecting a MoM improvement is 42% in April 2014 versus 83% in March, and slightly lower than the average of the past five years.
● Our top picks are CR Cement, Angang and Baosteel. Our least preferred stocks are Chinacoal and CNBM. Full report.
Figure 1: Sector summary—China basic materials Company Ticker Rate TP Price Mkt cap P/E (x) P/B (x) EV/EBITDAPrice as of Apr 10 Tccy US$bn 14E 15E 14E 15E 14E 15EShenhua 1088.HK N 20.7 22.8 58.1 10.9 10.5 1.2 1.1 6.9 6.4Chinacoal 1898.HK U 3.0 4.5 7.7 27.4 52.4 0.5 0.5 14.9 15.6Yanzhou 1171.HK N 6.4 6.5 4.1 n.a. n.a. 0.6 0.6 9.4 7.3Yitai 3948.HK U 8.0 10.4 4.3 9.0 9.9 1.1 1.1 6.8 7.6Fushan 0639.HK N 2.3 2.4 1.7 14.4 10.0 0.6 0.6 4.1 2.8MMC 0975.HK O 1.1 0.7 0.3 n.a. 5.7 0.6 0.6 10.1 4.7Baosteel 600019.SS O 5.7 4.1 11.4 9.5 7.9 0.6 0.6 4.9 3.8Angang 0347.HK O 6.0 5.2 4.8 n.a. 10.0 0.6 0.6 7.0 5.4Maanshan 0323.HK O 2.2 1.9 1.8 n.a n.a 0.4 0.4 5.4 3.9Conch 0914.HK O 36.0 32.5 22.1 11.7 11.3 2.1 1.8 7.2 6.7CNBM 3323.HK U 5.4 8.1 5.6 5.7 6.5 0.8 0.8 7.6 7.9CRC 1313.HK O 7.2 6.2 5.2 10.1 9.9 1.4 1.3 7.4 6.6Shanshui 0691.HK N 2.8 3.3 1.2 8.1 7.6 0.7 0.7 6.5 6.1CNM 1893.HK N 1.5 1.6 0.7 7.7 7.6 0.4 0.4 6.5 6.3TCCI 1136.HK N 4.4 3.9 1.6 8.2 7.7 0.7 0.6 5.7 5.1BBMG 2009.HK O 8.6 6.9 3.8 6.9 6.1 0.8 0.7 7.3 6.2WCC 2233.HK N 0.9 1.1 0.6 9.6 7.0 0.7 0.7 5.5 4.2Chalco 2600.HK U 2.2 3.2 5.5 n.a. n.a. 0.8 0.9 n.a. 39.4UC Rusal 0486.HK O 4.5 3.3 6.4 n.a. 27.7 0.6 0.6 34.0 18.3Jiangxi Cu 0358.HK N 13.6 13.7 6.1 16.4 11.2 0.8 0.8 7.1 5.5Minmetal 1208.HK N 1.6 1.7 1.1 22.2 18.9 0.7 0.7 4.3 4.9CMOC 3993.HK O 4.6 3.6 2.4 9.2 8.2 1.1 1.0 7.6 7.4HNC 2626.HK N 2.3 2.3 1.1 n.a. n.a. 1.7 1.7 9.8 9.8Zijin 2899.HK N 1.7 1.9 5.3 11.7 9.3 1.1 1.1 7.4 6.5Zhaojin 1818.HK U 4.6 5.1 1.9 18.6 17.4 1.3 1.3 10.6 9.8CGG 2099.HK U 16.9 20.5 1.0 n.a. 8.9 0.6 0.5 7.8 4.6
Source: Company data, Credit Suisse estimates
Channel checks on demand
Feedback from producers as of early-April suggests: (1) the MoM trend of end-users' forward order books picked up further on a seasonal basis, yet the strength is decelerating. The percentage of respondents expecting a MoM improvement is 42% in April 2014 versus 83% in March—slightly lower than the average of the past five years. Respondents expecting a MoM decline is now nil; nil in March; (2) the order book improvement trend for materials also decelerated,
with 53% of respondents expecting a MoM improving order book in April (versus 89% in March).
Figure 2: Our channel checks on downstream MoM order book trend
29%15%
83%
42%
29%
62%
0%8%
Jan Feb Mar Apr May Jun Jul Aug Sep Oct Nov Dec
2010 2011 2012 2013 2014 Improving MoM 2014 Declining MoM
Source: Company data, Credit Suisse estimates
Steel: Seasonal support, upgrades on a one-year basis
Order books at steel mills as of early-April improved sequentially versus mid-March generally, on the back of seasonality. Auto and appliance are still the growth drivers, and construction steel demand improved seasonally. However, overall demand remained negative/weaker on YoY bases. We recently upgraded the sector based on: 1) enhanced forces on supply/capacity cut developed, and 2) cost cutting by large mills coming through in earnings earlier than expected, and 3) stabilised demand assumption.
Coal: Easing import pressure, downside risk remains
Major coal producers expect flat MoM demand in April. Import pressure is slightly eased post the fall in domestic price, including both spot and discount offered by large producers. While we estimate spot price is already at a level with cost support, we expect price to continue to correct as seasonal weakness starts in a potentially more wet year, and IPP inventory is already at 18-20 days.
Cement: 1Q14 unit profit = 2014E?
Cement prices were mixed with price hikes in YZD/SD/Central/Shaanxi but down in GD/GX. We continue to hold a view that 1Q14 unit profit should be close to the average of the year for most cement producers in 2014E, a pattern that is very different from the past due to high base in 1Q14 and soft demand outlook ahead. We prefer CRC whose implied margins are lower than its current spot margins, in our estimates.
Base metals: Demand recovered on Cu
Diverging Al prices between overseas and China helped Al fabrication exports, but domestic Al demand remains weak. Domestic Cu supply/demand is improving as physical spot premium rallied to US$0.05/lb driven by recovering demand while inventory was low in supply chain. Channel checks from fabricators suggest demand picked up significantly in most products from tubing, brass to bars and foils. But, wire and cable demand from power grid-related orders are still weaker than expected.
Extract from the Asian Daily, 14 April 2014
16 April 2014
Jump-Start 17
China Banks Sector ---------------------------------------------------------- Maintain OVERWEIGHT New report: Checking China's real corporate funding cost Victor Wang / Research Analyst / 852 2101 6730 / [email protected] Jiang, Claire / Research Analyst / 852 2101 6651 / [email protected]
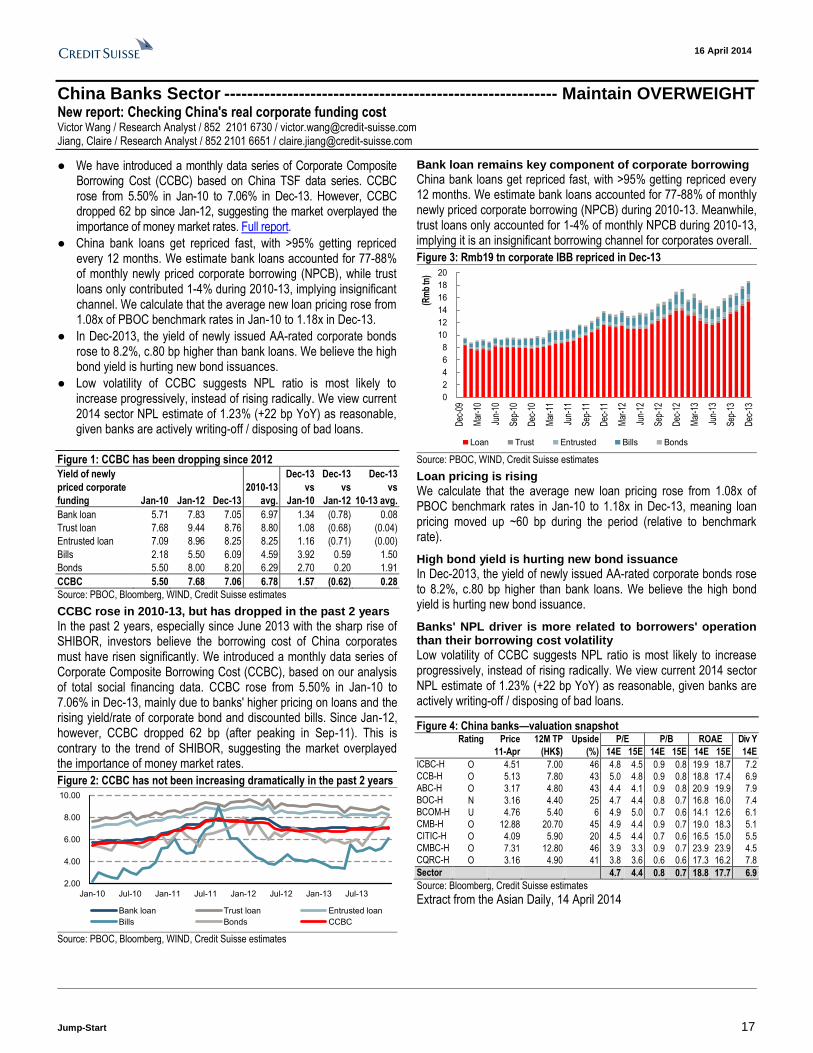
● We have introduced a monthly data series of Corporate Composite Borrowing Cost (CCBC) based on China TSF data series. CCBC rose from 5.50% in Jan-10 to 7.06% in Dec-13. However, CCBC dropped 62 bp since Jan-12, suggesting the market overplayed the importance of money market rates. Full report.
● China bank loans get repriced fast, with >95% getting repriced every 12 months. We estimate bank loans accounted for 77-88% of monthly newly priced corporate borrowing (NPCB), while trust loans only contributed 1-4% during 2010-13, implying insignificant channel. We calculate that the average new loan pricing rose from 1.08x of PBOC benchmark rates in Jan-10 to 1.18x in Dec-13.
● In Dec-2013, the yield of newly issued AA-rated corporate bonds rose to 8.2%, c.80 bp higher than bank loans. We believe the high bond yield is hurting new bond issuances.
● Low volatility of CCBC suggests NPL ratio is most likely to increase progressively, instead of rising radically. We view current 2014 sector NPL estimate of 1.23% (+22 bp YoY) as reasonable, given banks are actively writing-off / disposing of bad loans.
Figure 1: CCBC has been dropping since 2012
Yield of newly Dec-13 Dec-13 Dec-13
priced corporate 2010-13 vs vs vs
funding Jan-10 Jan-12 Dec-13 avg. Jan-10 Jan-12 10-13 avg.
Bank loan 5.71 7.83 7.05 6.97 1.34 (0.78) 0.08
Trust loan 7.68 9.44 8.76 8.80 1.08 (0.68) (0.04)
Entrusted loan 7.09 8.96 8.25 8.25 1.16 (0.71) (0.00)
Bills 2.18 5.50 6.09 4.59 3.92 0.59 1.50
Bonds 5.50 8.00 8.20 6.29 2.70 0.20 1.91
CCBC 5.50 7.68 7.06 6.78 1.57 (0.62) 0.28
Source: PBOC, Bloomberg, WIND, Credit Suisse estimates
CCBC rose in 2010-13, but has dropped in the past 2 years
In the past 2 years, especially since June 2013 with the sharp rise of SHIBOR, investors believe the borrowing cost of China corporates must have risen significantly. We introduced a monthly data series of Corporate Composite Borrowing Cost (CCBC), based on our analysis of total social financing data. CCBC rose from 5.50% in Jan-10 to 7.06% in Dec-13, mainly due to banks' higher pricing on loans and the rising yield/rate of corporate bond and discounted bills. Since Jan-12, however, CCBC dropped 62 bp (after peaking in Sep-11). This is contrary to the trend of SHIBOR, suggesting the market overplayed the importance of money market rates.
Figure 2: CCBC has not been increasing dramatically in the past 2 years
2.00
4.00
6.00
8.00
10.00
Jan-10 Jul-10 Jan-11 Jul-11 Jan-12 Jul-12 Jan-13 Jul-13
Bank loan Trust loan Entrusted loan
Bills Bonds CCBC
Source: PBOC, Bloomberg, WIND, Credit Suisse estimates
Bank loan remains key component of corporate borrowing
China bank loans get repriced fast, with >95% getting repriced every 12 months. We estimate bank loans accounted for 77-88% of monthly newly priced corporate borrowing (NPCB) during 2010-13. Meanwhile, trust loans only accounted for 1-4% of monthly NPCB during 2010-13, implying it is an insignificant borrowing channel for corporates overall.
Figure 3: Rmb19 tn corporate IBB repriced in Dec-13
0
2
4
6
8
10
12
14
16
18
20
Dec
-09
Mar
-10
Jun-
10
Sep
-10
Dec
-10
Mar
-11
Jun-
11
Sep
-11
Dec
-11
Mar
-12
Jun-
12
Sep
-12
Dec
-12
Mar
-13
Jun-
13
Sep
-13
Dec
-13
(Rm
b tn
)
Loan Trust Entrusted Bills Bonds
Source: PBOC, WIND, Credit Suisse estimates
Loan pricing is rising
We calculate that the average new loan pricing rose from 1.08x of PBOC benchmark rates in Jan-10 to 1.18x in Dec-13, meaning loan pricing moved up ~60 bp during the period (relative to benchmark rate).
High bond yield is hurting new bond issuance
In Dec-2013, the yield of newly issued AA-rated corporate bonds rose to 8.2%, c.80 bp higher than bank loans. We believe the high bond yield is hurting new bond issuance.
Banks' NPL driver is more related to borrowers' operation than their borrowing cost volatility
Low volatility of CCBC suggests NPL ratio is most likely to increase progressively, instead of rising radically. We view current 2014 sector NPL estimate of 1.23% (+22 bp YoY) as reasonable, given banks are actively writing-off / disposing of bad loans.
Figure 4: China banks—valuation snapshot Rating Price 12M TP Upside P/E P/B ROAE Div Y
11-Apr (HK$) (%) 14E 15E 14E 15E 14E 15E 14E
ICBC-H O 4.51 7.00 46 4.8 4.5 0.9 0.8 19.9 18.7 7.2 CCB-H O 5.13 7.80 43 5.0 4.8 0.9 0.8 18.8 17.4 6.9 ABC-H O 3.17 4.80 43 4.4 4.1 0.9 0.8 20.9 19.9 7.9 BOC-H N 3.16 4.40 25 4.7 4.4 0.8 0.7 16.8 16.0 7.4 BCOM-H U 4.76 5.40 6 4.9 5.0 0.7 0.6 14.1 12.6 6.1 CMB-H O 12.88 20.70 45 4.9 4.4 0.9 0.7 19.0 18.3 5.1 CITIC-H O 4.09 5.90 20 4.5 4.4 0.7 0.6 16.5 15.0 5.5 CMBC-H O 7.31 12.80 46 3.9 3.3 0.9 0.7 23.9 23.9 4.5 CQRC-H O 3.16 4.90 41 3.8 3.6 0.6 0.6 17.3 16.2 7.8
Sector 4.7 4.4 0.8 0.7 18.8 17.7 6.9
Source: Bloomberg, Credit Suisse estimates
Extract from the Asian Daily, 14 April 2014
16 April 2014
Jump-Start 18
Beijing Office Sector ------------------------------------------------------------------------------------------- New report: Momentum turnaround in 1Q14 Joyce Kwock / Research Analyst / 852 2101 7496 / [email protected] Wayne Lee / Research Analyst / 852 2101 7165 / [email protected]
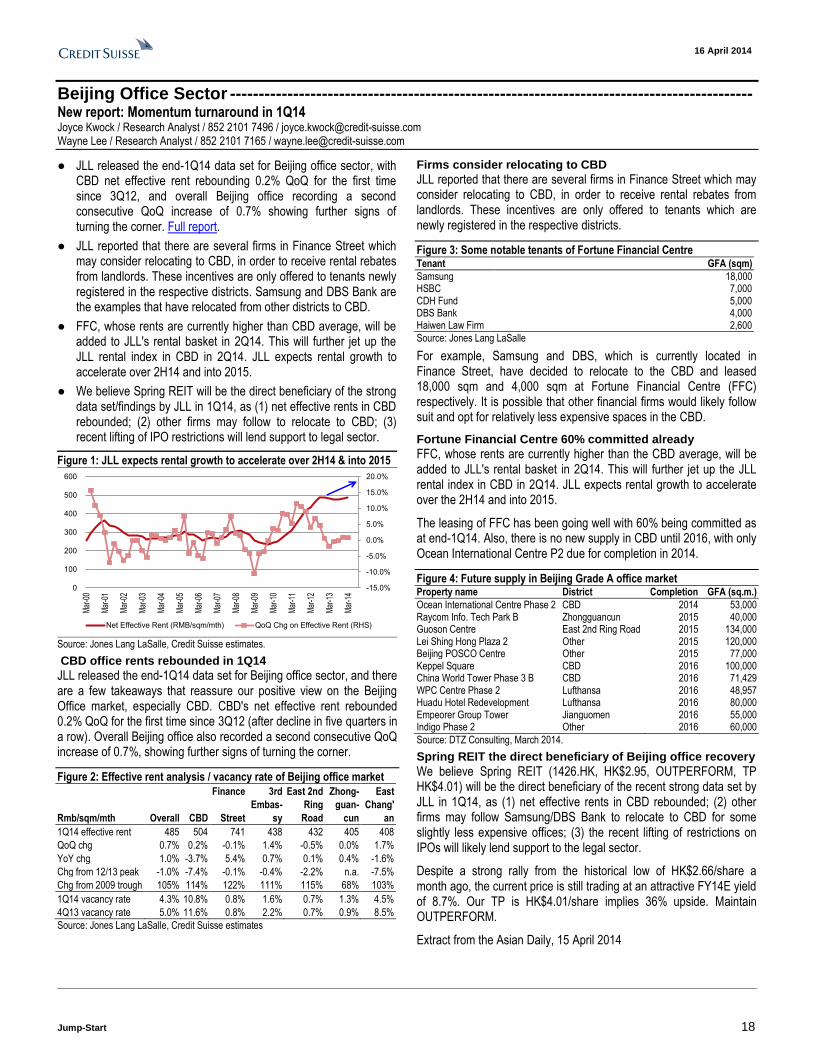
● JLL released the end-1Q14 data set for Beijing office sector, with CBD net effective rent rebounding 0.2% QoQ for the first time since 3Q12, and overall Beijing office recording a second consecutive QoQ increase of 0.7% showing further signs of turning the corner. Full report.
● JLL reported that there are several firms in Finance Street which may consider relocating to CBD, in order to receive rental rebates from landlords. These incentives are only offered to tenants newly registered in the respective districts. Samsung and DBS Bank are the examples that have relocated from other districts to CBD.
● FFC, whose rents are currently higher than CBD average, will be added to JLL's rental basket in 2Q14. This will further jet up the JLL rental index in CBD in 2Q14. JLL expects rental growth to accelerate over 2H14 and into 2015.
● We believe Spring REIT will be the direct beneficiary of the strong data set/findings by JLL in 1Q14, as (1) net effective rents in CBD rebounded; (2) other firms may follow to relocate to CBD; (3) recent lifting of IPO restrictions will lend support to legal sector.
Figure 1: JLL expects rental growth to accelerate over 2H14 & into 2015
-15.0%
-10.0%
-5.0%
0.0%
5.0%
10.0%
15.0%
20.0%
0
100
200
300
400
500
600
Mar
-00
Mar
-01
Mar
-02
Mar
-03
Mar
-04
Mar
-05
Mar
-06
Mar
-07
Mar
-08
Mar
-09
Mar
-10
Mar
-11
Mar
-12
Mar
-13
Mar
-14
Net Effective Rent (RMB/sqm/mth) QoQ Chg on Effective Rent (RHS)
Source: Jones Lang LaSalle, Credit Suisse estimates.
CBD office rents rebounded in 1Q14
JLL released the end-1Q14 data set for Beijing office sector, and there are a few takeaways that reassure our positive view on the Beijing Office market, especially CBD. CBD's net effective rent rebounded 0.2% QoQ for the first time since 3Q12 (after decline in five quarters in a row). Overall Beijing office also recorded a second consecutive QoQ increase of 0.7%, showing further signs of turning the corner.
Figure 2: Effective rent analysis / vacancy rate of Beijing office market
Finance 3rd East 2nd Zhong- East
Embas- Ring guan- Chang'
Rmb/sqm/mth Overall CBD Street sy Road cun an
1Q14 effective rent 485 504 741 438 432 405 408
QoQ chg 0.7% 0.2% -0.1% 1.4% -0.5% 0.0% 1.7%
YoY chg 1.0% -3.7% 5.4% 0.7% 0.1% 0.4% -1.6%
Chg from 12/13 peak -1.0% -7.4% -0.1% -0.4% -2.2% n.a. -7.5%
Chg from 2009 trough 105% 114% 122% 111% 115% 68% 103%
1Q14 vacancy rate 4.3% 10.8% 0.8% 1.6% 0.7% 1.3% 4.5%
4Q13 vacancy rate 5.0% 11.6% 0.8% 2.2% 0.7% 0.9% 8.5%
Source: Jones Lang LaSalle, Credit Suisse estimates
Firms consider relocating to CBD
JLL reported that there are several firms in Finance Street which may consider relocating to CBD, in order to receive rental rebates from landlords. These incentives are only offered to tenants which are newly registered in the respective districts.
Figure 3: Some notable tenants of Fortune Financial Centre Tenant GFA (sqm)
Samsung 18,000 HSBC 7,000 CDH Fund 5,000 DBS Bank 4,000 Haiwen Law Firm 2,600
Source: Jones Lang LaSalle
For example, Samsung and DBS, which is currently located in Finance Street, have decided to relocate to the CBD and leased 18,000 sqm and 4,000 sqm at Fortune Financial Centre (FFC) respectively. It is possible that other financial firms would likely follow suit and opt for relatively less expensive spaces in the CBD.
Fortune Financial Centre 60% committed already
FFC, whose rents are currently higher than the CBD average, will be added to JLL's rental basket in 2Q14. This will further jet up the JLL rental index in CBD in 2Q14. JLL expects rental growth to accelerate over the 2H14 and into 2015.
The leasing of FFC has been going well with 60% being committed as at end-1Q14. Also, there is no new supply in CBD until 2016, with only Ocean International Centre P2 due for completion in 2014.
Figure 4: Future supply in Beijing Grade A office market Property name District Completion GFA (sq.m.)
Ocean International Centre Phase 2 CBD 2014 53,000 Raycom Info. Tech Park B Zhongguancun 2015 40,000 Guoson Centre East 2nd Ring Road 2015 134,000 Lei Shing Hong Plaza 2 Other 2015 120,000 Beijing POSCO Centre Other 2015 77,000 Keppel Square CBD 2016 100,000 China World Tower Phase 3 B CBD 2016 71,429 WPC Centre Phase 2 Lufthansa 2016 48,957 Huadu Hotel Redevelopment Lufthansa 2016 80,000 Empeorer Group Tower Jianguomen 2016 55,000 Indigo Phase 2 Other 2016 60,000
Source: DTZ Consulting, March 2014.
Spring REIT the direct beneficiary of Beijing office recovery
We believe Spring REIT (1426.HK, HK$2.95, OUTPERFORM, TP HK$4.01) will be the direct beneficiary of the recent strong data set by JLL in 1Q14, as (1) net effective rents in CBD rebounded; (2) other firms may follow Samsung/DBS Bank to relocate to CBD for some slightly less expensive offices; (3) the recent lifting of restrictions on IPOs will likely lend support to the legal sector.
Despite a strong rally from the historical low of HK$2.66/share a month ago, the current price is still trading at an attractive FY14E yield of 8.7%. Our TP is HK$4.01/share implies 36% upside. Maintain OUTPERFORM.
Extract from the Asian Daily, 15 April 2014
16 April 2014
Jump-Start 19
China Animal Healthcare Ltd ------------------------ Initiating Coverage with OUTPERFORM New report: Enriching animal life in China EPS: ◄► TP: ◄► Iris Wang / Research Analyst / 852 2101 7646 / [email protected]
● We initiate coverage on China Animal Heathcare with an OUTPERFORM rating and HK$7.06 TP (61.2% upside). (Link)
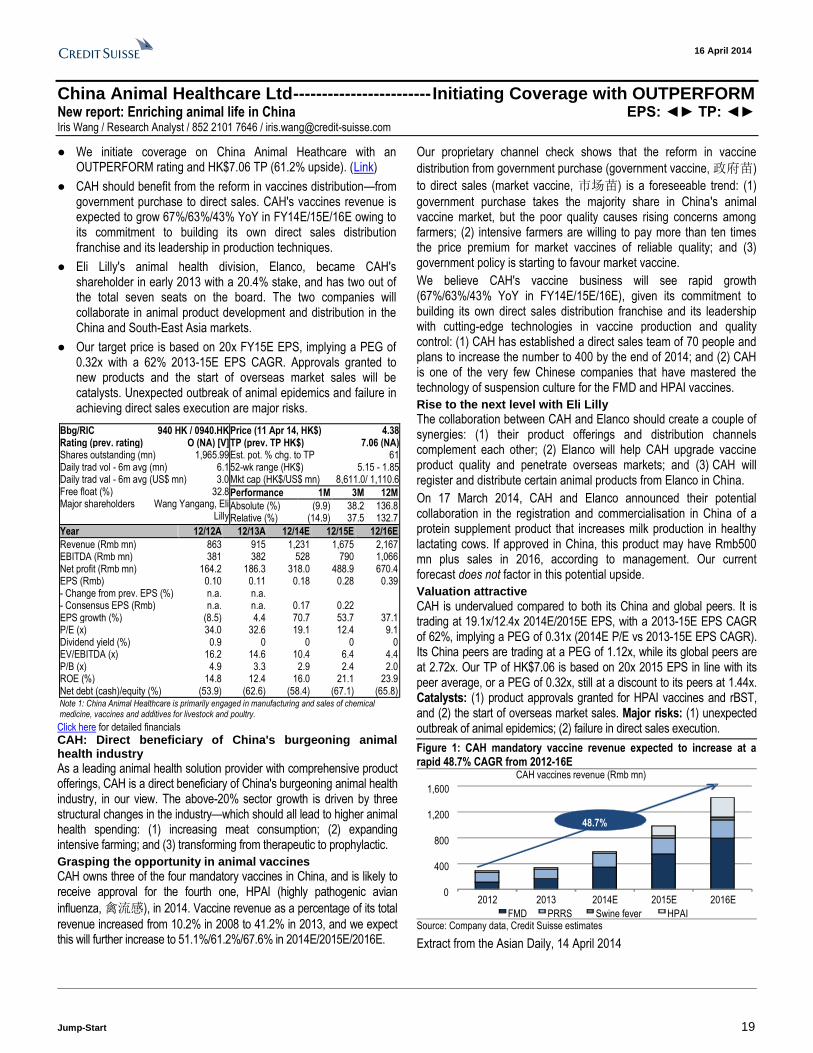
● CAH should benefit from the reform in vaccines distribution—from government purchase to direct sales. CAH's vaccines revenue is expected to grow 67%/63%/43% YoY in FY14E/15E/16E owing to its commitment to building its own direct sales distribution franchise and its leadership in production techniques.
● Eli Lilly's animal health division, Elanco, became CAH's shareholder in early 2013 with a 20.4% stake, and has two out of the total seven seats on the board. The two companies will collaborate in animal product development and distribution in the China and South-East Asia markets.
● Our target price is based on 20x FY15E EPS, implying a PEG of 0.32x with a 62% 2013-15E EPS CAGR. Approvals granted to new products and the start of overseas market sales will be catalysts. Unexpected outbreak of animal epidemics and failure in achieving direct sales execution are major risks.
Click here for detailed financials
CAH: Direct beneficiary of China's burgeoning animal health industry
As a leading animal health solution provider with comprehensive product offerings, CAH is a direct beneficiary of China's burgeoning animal health industry, in our view. The above-20% sector growth is driven by three structural changes in the industry—which should all lead to higher animal health spending: (1) increasing meat consumption; (2) expanding intensive farming; and (3) transforming from therapeutic to prophylactic.
Grasping the opportunity in animal vaccines
CAH owns three of the four mandatory vaccines in China, and is likely to receive approval for the fourth one, HPAI (highly pathogenic avian
influenza, 禽流感), in 2014. Vaccine revenue as a percentage of its total
revenue increased from 10.2% in 2008 to 41.2% in 2013, and we expect this will further increase to 51.1%/61.2%/67.6% in 2014E/2015E/2016E.
Our proprietary channel check shows that the reform in vaccine
distribution from government purchase (government vaccine, 政府苗)
to direct sales (market vaccine, 市场苗) is a foreseeable trend: (1)
government purchase takes the majority share in China's animal vaccine market, but the poor quality causes rising concerns among farmers; (2) intensive farmers are willing to pay more than ten times the price premium for market vaccines of reliable quality; and (3) government policy is starting to favour market vaccine.
We believe CAH's vaccine business will see rapid growth (67%/63%/43% YoY in FY14E/15E/16E), given its commitment to building its own direct sales distribution franchise and its leadership with cutting-edge technologies in vaccine production and quality control: (1) CAH has established a direct sales team of 70 people and plans to increase the number to 400 by the end of 2014; and (2) CAH is one of the very few Chinese companies that have mastered the technology of suspension culture for the FMD and HPAI vaccines.
Rise to the next level with Eli Lilly
The collaboration between CAH and Elanco should create a couple of synergies: (1) their product offerings and distribution channels complement each other; (2) Elanco will help CAH upgrade vaccine product quality and penetrate overseas markets; and (3) CAH will register and distribute certain animal products from Elanco in China.
On 17 March 2014, CAH and Elanco announced their potential collaboration in the registration and commercialisation in China of a protein supplement product that increases milk production in healthy lactating cows. If approved in China, this product may have Rmb500 mn plus sales in 2016, according to management. Our current forecast does not factor in this potential upside.
Valuation attractive
CAH is undervalued compared to both its China and global peers. It is trading at 19.1x/12.4x 2014E/2015E EPS, with a 2013-15E EPS CAGR of 62%, implying a PEG of 0.31x (2014E P/E vs 2013-15E EPS CAGR). Its China peers are trading at a PEG of 1.12x, while its global peers are at 2.72x. Our TP of HK$7.06 is based on 20x 2015 EPS in line with its peer average, or a PEG of 0.32x, still at a discount to its peers at 1.44x. Catalysts: (1) product approvals granted for HPAI vaccines and rBST, and (2) the start of overseas market sales. Major risks: (1) unexpected outbreak of animal epidemics; (2) failure in direct sales execution.
Figure 1: CAH mandatory vaccine revenue expected to increase at a rapid 48.7% CAGR from 2012-16E
0
400
800
1,200
1,600
2012 2013 2014E 2015E 2016E
CAH vaccines revenue (Rmb mn)
FMD PRRS Swine fever HPAI
48.7%
Source: Company data, Credit Suisse estimates
Extract from the Asian Daily, 14 April 2014
Bbg/RIC 940 HK / 0940.HK Rating (prev. rating) O (NA) [V] Shares outstanding (mn) 1,965.99 Daily trad vol - 6m avg (mn) 6.1 Daily trad val - 6m avg (US$ mn) 3.0 Free float (%) 32.8 Major shareholders Wang Yangang, Eli
Lilly
Price (11 Apr 14, HK$) 4.38 TP (prev. TP HK$) 7.06 (NA) Est. pot. % chg. to TP 61 52-wk range (HK$) 5.15 - 1.85 Mkt cap (HK$/US$ mn) 8,611.0/ 1,110.6
Performance 1M 3M 12M
Absolute (%) (9.9) 38.2 136.8 Relative (%) (14.9) 37.5 132.7
Year 12/12A 12/13A 12/14E 12/15E 12/16E
Revenue (Rmb mn) 863 915 1,231 1,675 2,167 EBITDA (Rmb mn) 381 382 528 790 1,066 Net profit (Rmb mn) 164.2 186.3 318.0 488.9 670.4 EPS (Rmb) 0.10 0.11 0.18 0.28 0.39 - Change from prev. EPS (%) n.a. n.a. - Consensus EPS (Rmb) n.a. n.a. 0.17 0.22 EPS growth (%) (8.5) 4.4 70.7 53.7 37.1 P/E (x) 34.0 32.6 19.1 12.4 9.1 Dividend yield (%) 0.9 0 0 0 0 EV/EBITDA (x) 16.2 14.6 10.4 6.4 4.4 P/B (x) 4.9 3.3 2.9 2.4 2.0 ROE (%) 14.8 12.4 16.0 21.1 23.9 Net debt (cash)/equity (%) (53.9) (62.6) (58.4) (67.1) (65.8)
Note 1: China Animal Healthcare is primarily engaged in manufacturing and sales of chemical medicine, vaccines and additives for livestock and poultry.
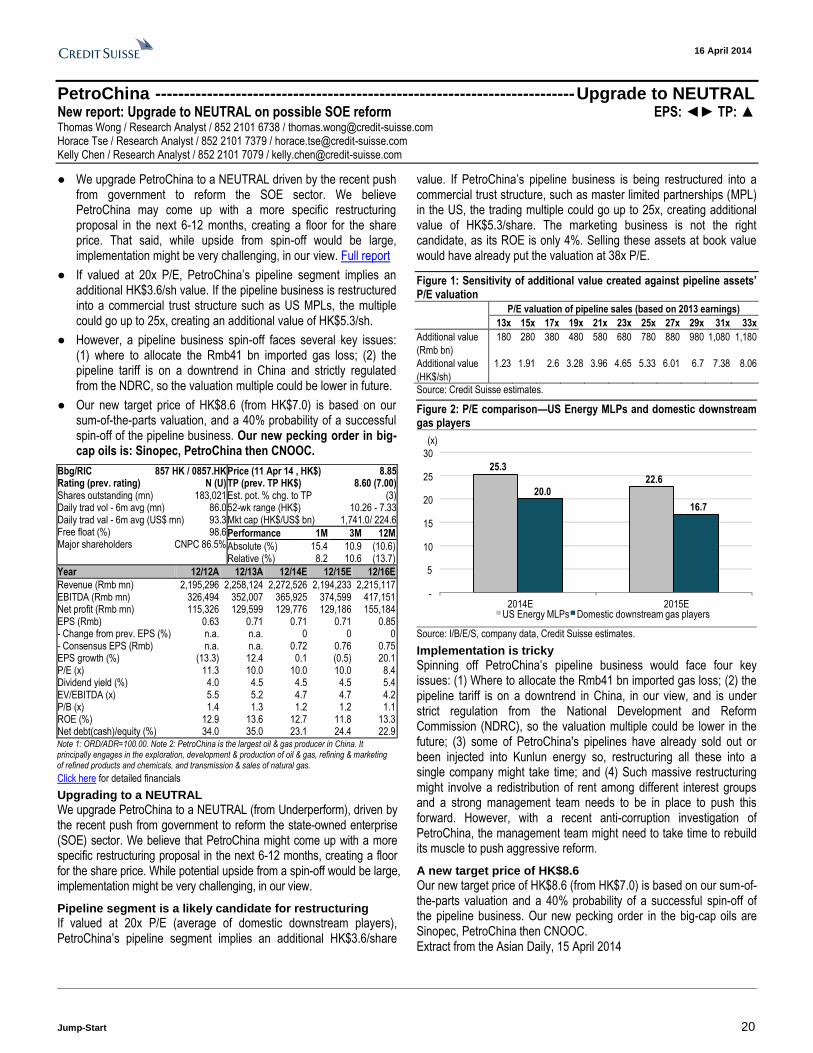
16 April 2014
Jump-Start 20
PetroChina ------------------------------------------------------------------------- Upgrade to NEUTRAL New report: Upgrade to NEUTRAL on possible SOE reform EPS: ◄► TP: ▲ Thomas Wong / Research Analyst / 852 2101 6738 / [email protected] Horace Tse / Research Analyst / 852 2101 7379 / [email protected] Kelly Chen / Research Analyst / 852 2101 7079 / [email protected]
● We upgrade PetroChina to a NEUTRAL driven by the recent push from government to reform the SOE sector. We believe PetroChina may come up with a more specific restructuring proposal in the next 6-12 months, creating a floor for the share price. That said, while upside from spin-off would be large, implementation might be very challenging, in our view. Full report
● If valued at 20x P/E, PetroChina’s pipeline segment implies an additional HK$3.6/sh value. If the pipeline business is restructured into a commercial trust structure such as US MPLs, the multiple could go up to 25x, creating an additional value of HK$5.3/sh.
● However, a pipeline business spin-off faces several key issues: (1) where to allocate the Rmb41 bn imported gas loss; (2) the pipeline tariff is on a downtrend in China and strictly regulated from the NDRC, so the valuation multiple could be lower in future.
● Our new target price of HK$8.6 (from HK$7.0) is based on our sum-of-the-parts valuation, and a 40% probability of a successful spin-off of the pipeline business. Our new pecking order in big-cap oils is: Sinopec, PetroChina then CNOOC.
Click here for detailed financials
Upgrading to a NEUTRAL
We upgrade PetroChina to a NEUTRAL (from Underperform), driven by the recent push from government to reform the state-owned enterprise (SOE) sector. We believe that PetroChina might come up with a more specific restructuring proposal in the next 6-12 months, creating a floor for the share price. While potential upside from a spin-off would be large, implementation might be very challenging, in our view.
Pipeline segment is a likely candidate for restructuring
If valued at 20x P/E (average of domestic downstream players), PetroChina’s pipeline segment implies an additional HK$3.6/share
value. If PetroChina’s pipeline business is being restructured into a commercial trust structure, such as master limited partnerships (MPL) in the US, the trading multiple could go up to 25x, creating additional value of HK$5.3/share. The marketing business is not the right candidate, as its ROE is only 4%. Selling these assets at book value would have already put the valuation at 38x P/E.
Figure 1: Sensitivity of additional value created against pipeline assets’ P/E valuation
P/E valuation of pipeline sales (based on 2013 earnings)
13x 15x 17x 19x 21x 23x 25x 27x 29x 31x 33x
Additional value
(Rmb bn)
180 280 380 480 580 680 780 880 980 1,080 1,180
Additional value
(HK$/sh)
1.23 1.91 2.6 3.28 3.96 4.65 5.33 6.01 6.7 7.38 8.06
Source: Credit Suisse estimates.
Figure 2: P/E comparison—US Energy MLPs and domestic downstream gas players
25.3
22.6 20.0
16.7
-
5
10
15
20
25
30
2014E 2015EUS Energy MLPs Domestic downstream gas players
(x)
Source: I/B/E/S, company data, Credit Suisse estimates.
Implementation is tricky
Spinning off PetroChina’s pipeline business would face four key issues: (1) Where to allocate the Rmb41 bn imported gas loss; (2) the pipeline tariff is on a downtrend in China, in our view, and is under strict regulation from the National Development and Reform Commission (NDRC), so the valuation multiple could be lower in the future; (3) some of PetroChina's pipelines have already sold out or been injected into Kunlun energy so, restructuring all these into a single company might take time; and (4) Such massive restructuring might involve a redistribution of rent among different interest groups and a strong management team needs to be in place to push this forward. However, with a recent anti-corruption investigation of PetroChina, the management team might need to take time to rebuild its muscle to push aggressive reform.
A new target price of HK$8.6
Our new target price of HK$8.6 (from HK$7.0) is based on our sum-of-the-parts valuation and a 40% probability of a successful spin-off of the pipeline business. Our new pecking order in the big-cap oils are Sinopec, PetroChina then CNOOC. Extract from the Asian Daily, 15 April 2014
Bbg/RIC 857 HK / 0857.HK Rating (prev. rating) N (U) Shares outstanding (mn) 183,021 Daily trad vol - 6m avg (mn) 86.0 Daily trad val - 6m avg (US$ mn) 93.3 Free float (%) 98.6 Major shareholders CNPC 86.5%
Price (11 Apr 14 , HK$) 8.85 TP (prev. TP HK$) 8.60 (7.00) Est. pot. % chg. to TP (3) 52-wk range (HK$) 10.26 - 7.33 Mkt cap (HK$/US$ bn) 1,741.0/ 224.6
Performance 1M 3M 12M
Absolute (%) 15.4 10.9 (10.6) Relative (%) 8.2 10.6 (13.7)
Year 12/12A 12/13A 12/14E 12/15E 12/16E
Revenue (Rmb mn) 2,195,296 2,258,124 2,272,526 2,194,233 2,215,117 EBITDA (Rmb mn) 326,494 352,007 365,925 374,599 417,151 Net profit (Rmb mn) 115,326 129,599 129,776 129,186 155,184 EPS (Rmb) 0.63 0.71 0.71 0.71 0.85 - Change from prev. EPS (%) n.a. n.a. 0 0 0 - Consensus EPS (Rmb) n.a. n.a. 0.72 0.76 0.75 EPS growth (%) (13.3) 12.4 0.1 (0.5) 20.1 P/E (x) 11.3 10.0 10.0 10.0 8.4 Dividend yield (%) 4.0 4.5 4.5 4.5 5.4 EV/EBITDA (x) 5.5 5.2 4.7 4.7 4.2 P/B (x) 1.4 1.3 1.2 1.2 1.1 ROE (%) 12.9 13.6 12.7 11.8 13.3 Net debt(cash)/equity (%) 34.0 35.0 23.1 24.4 22.9
Note 1: ORD/ADR=100.00. Note 2: PetroChina is the largest oil & gas producer in China. It principally engages in the exploration, development & production of oil & gas, refining & marketing of refined products and chemicals, and transmission & sales of natural gas.
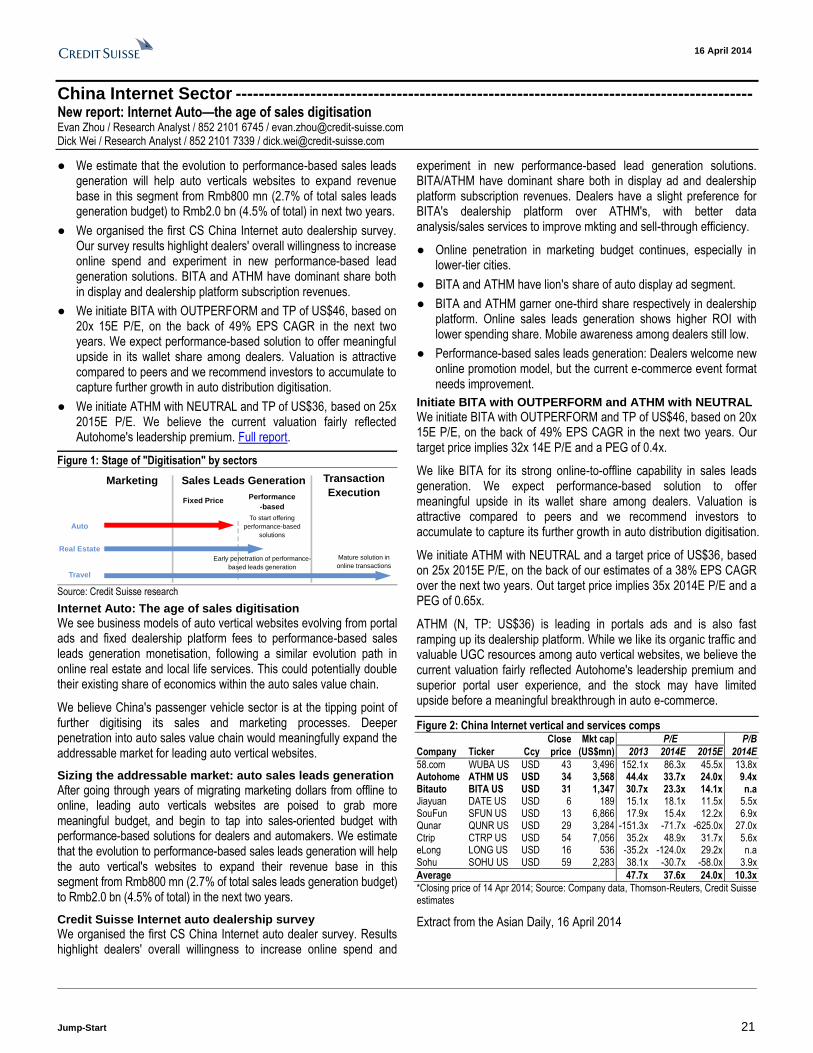
16 April 2014
Jump-Start 21
China Internet Sector ------------------------------------------------------------------------------------------ New report: Internet Auto—the age of sales digitisation Evan Zhou / Research Analyst / 852 2101 6745 / [email protected] Dick Wei / Research Analyst / 852 2101 7339 / [email protected]
● We estimate that the evolution to performance-based sales leads generation will help auto verticals websites to expand revenue base in this segment from Rmb800 mn (2.7% of total sales leads generation budget) to Rmb2.0 bn (4.5% of total) in next two years.
● We organised the first CS China Internet auto dealership survey. Our survey results highlight dealers' overall willingness to increase online spend and experiment in new performance-based lead generation solutions. BITA and ATHM have dominant share both in display and dealership platform subscription revenues.
● We initiate BITA with OUTPERFORM and TP of US$46, based on 20x 15E P/E, on the back of 49% EPS CAGR in the next two years. We expect performance-based solution to offer meaningful upside in its wallet share among dealers. Valuation is attractive compared to peers and we recommend investors to accumulate to capture further growth in auto distribution digitisation.
● We initiate ATHM with NEUTRAL and TP of US$36, based on 25x 2015E P/E. We believe the current valuation fairly reflected Autohome's leadership premium. Full report.
Figure 1: Stage of "Digitisation" by sectors
Marketing Sales Leads Generation Transaction
ExecutionFixed Price
Performance
-based
Auto
Real Estate
Travel
To start offering
performance-based
solutions
Mature solution in
online transactionsEarly penetration of performance-
based leads generation
Source: Credit Suisse research
Internet Auto: The age of sales digitisation
We see business models of auto vertical websites evolving from portal ads and fixed dealership platform fees to performance-based sales leads generation monetisation, following a similar evolution path in online real estate and local life services. This could potentially double their existing share of economics within the auto sales value chain.
We believe China's passenger vehicle sector is at the tipping point of further digitising its sales and marketing processes. Deeper penetration into auto sales value chain would meaningfully expand the addressable market for leading auto vertical websites.
Sizing the addressable market: auto sales leads generation
After going through years of migrating marketing dollars from offline to online, leading auto verticals websites are poised to grab more meaningful budget, and begin to tap into sales-oriented budget with performance-based solutions for dealers and automakers. We estimate that the evolution to performance-based sales leads generation will help the auto vertical's websites to expand their revenue base in this segment from Rmb800 mn (2.7% of total sales leads generation budget) to Rmb2.0 bn (4.5% of total) in the next two years.
Credit Suisse Internet auto dealership survey
We organised the first CS China Internet auto dealer survey. Results highlight dealers' overall willingness to increase online spend and
experiment in new performance-based lead generation solutions. BITA/ATHM have dominant share both in display ad and dealership platform subscription revenues. Dealers have a slight preference for BITA's dealership platform over ATHM's, with better data analysis/sales services to improve mkting and sell-through efficiency.
● Online penetration in marketing budget continues, especially in lower-tier cities.
● BITA and ATHM have lion's share of auto display ad segment.
● BITA and ATHM garner one-third share respectively in dealership platform. Online sales leads generation shows higher ROI with lower spending share. Mobile awareness among dealers still low.
● Performance-based sales leads generation: Dealers welcome new online promotion model, but the current e-commerce event format needs improvement.
Initiate BITA with OUTPERFORM and ATHM with NEUTRAL
We initiate BITA with OUTPERFORM and TP of US$46, based on 20x 15E P/E, on the back of 49% EPS CAGR in the next two years. Our target price implies 32x 14E P/E and a PEG of 0.4x.
We like BITA for its strong online-to-offline capability in sales leads generation. We expect performance-based solution to offer meaningful upside in its wallet share among dealers. Valuation is attractive compared to peers and we recommend investors to accumulate to capture its further growth in auto distribution digitisation.
We initiate ATHM with NEUTRAL and a target price of US$36, based on 25x 2015E P/E, on the back of our estimates of a 38% EPS CAGR over the next two years. Out target price implies 35x 2014E P/E and a PEG of 0.65x.
ATHM (N, TP: US$36) is leading in portals ads and is also fast ramping up its dealership platform. While we like its organic traffic and valuable UGC resources among auto vertical websites, we believe the current valuation fairly reflected Autohome's leadership premium and superior portal user experience, and the stock may have limited upside before a meaningful breakthrough in auto e-commerce.
Figure 2: China Internet vertical and services comps Close Mkt cap P/E P/B
Company Ticker Ccy price (US$mn) 2013 2014E 2015E 2014E
58.com WUBA US USD 43 3,496 152.1x 86.3x 45.5x 13.8x Autohome ATHM US USD 34 3,568 44.4x 33.7x 24.0x 9.4x Bitauto BITA US USD 31 1,347 30.7x 23.3x 14.1x n.a Jiayuan DATE US USD 6 189 15.1x 18.1x 11.5x 5.5x SouFun SFUN US USD 13 6,866 17.9x 15.4x 12.2x 6.9x Qunar QUNR US USD 29 3,284 -151.3x -71.7x -625.0x 27.0x Ctrip CTRP US USD 54 7,056 35.2x 48.9x 31.7x 5.6x eLong LONG US USD 16 536 -35.2x -124.0x 29.2x n.a Sohu SOHU US USD 59 2,283 38.1x -30.7x -58.0x 3.9x
Average 47.7x 37.6x 24.0x 10.3x
*Closing price of 14 Apr 2014; Source: Company data, Thomson-Reuters, Credit Suisse estimates
Extract from the Asian Daily, 16 April 2014
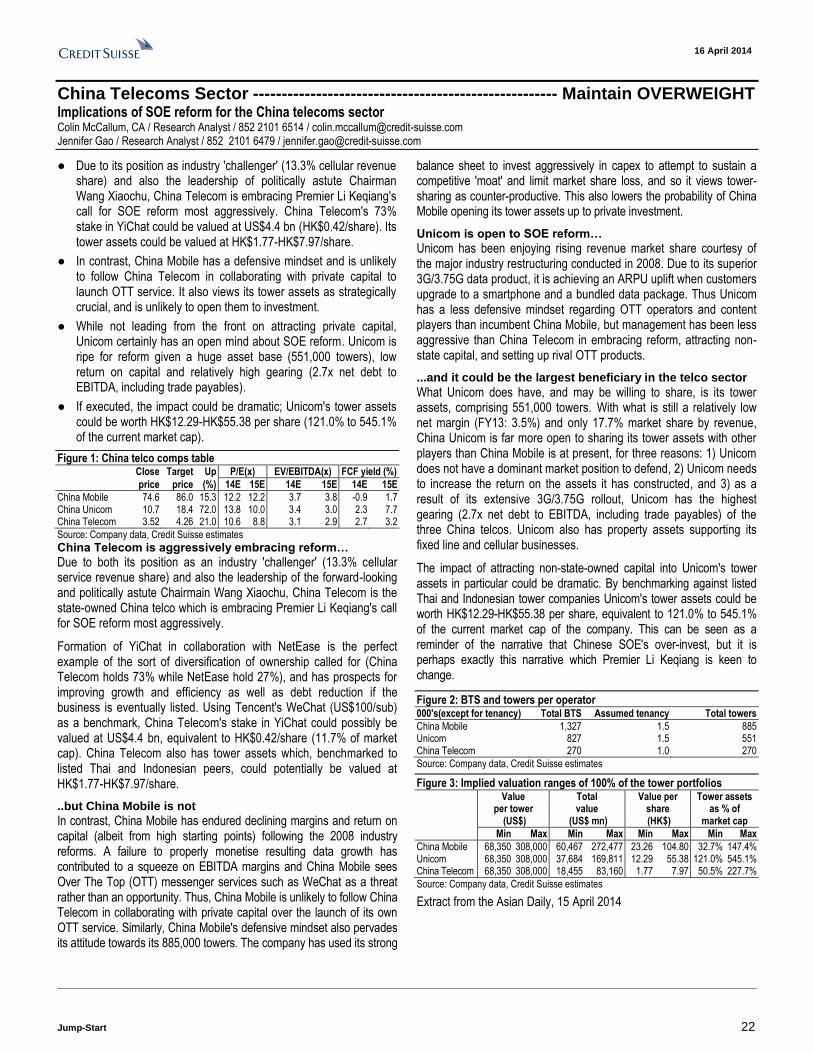
16 April 2014
Jump-Start 22
China Telecoms Sector ----------------------------------------------------- Maintain OVERWEIGHT Implications of SOE reform for the China telecoms sector Colin McCallum, CA / Research Analyst / 852 2101 6514 / [email protected] Jennifer Gao / Research Analyst / 852 2101 6479 / [email protected]
● Due to its position as industry 'challenger' (13.3% cellular revenue share) and also the leadership of politically astute Chairman Wang Xiaochu, China Telecom is embracing Premier Li Keqiang's call for SOE reform most aggressively. China Telecom's 73% stake in YiChat could be valued at US$4.4 bn (HK$0.42/share). Its tower assets could be valued at HK$1.77-HK$7.97/share.
● In contrast, China Mobile has a defensive mindset and is unlikely to follow China Telecom in collaborating with private capital to launch OTT service. It also views its tower assets as strategically crucial, and is unlikely to open them to investment.
● While not leading from the front on attracting private capital, Unicom certainly has an open mind about SOE reform. Unicom is ripe for reform given a huge asset base (551,000 towers), low return on capital and relatively high gearing (2.7x net debt to EBITDA, including trade payables).
● If executed, the impact could be dramatic; Unicom's tower assets could be worth HK$12.29-HK$55.38 per share (121.0% to 545.1% of the current market cap).
Figure 1: China telco comps table Close Target Up P/E(x) EV/EBITDA(x) FCF yield (%)
price price (%) 14E 15E 14E 15E 14E 15E
China Mobile 74.6 86.0 15.3 12.2 12.2 3.7 3.8 -0.9 1.7 China Unicom 10.7 18.4 72.0 13.8 10.0 3.4 3.0 2.3 7.7 China Telecom 3.52 4.26 21.0 10.6 8.8 3.1 2.9 2.7 3.2
Source: Company data, Credit Suisse estimates China Telecom is aggressively embracing reform…
Due to both its position as an industry 'challenger' (13.3% cellular service revenue share) and also the leadership of the forward-looking and politically astute Chairmain Wang Xiaochu, China Telecom is the state-owned China telco which is embracing Premier Li Keqiang's call for SOE reform most aggressively.
Formation of YiChat in collaboration with NetEase is the perfect example of the sort of diversification of ownership called for (China Telecom holds 73% while NetEase hold 27%), and has prospects for improving growth and efficiency as well as debt reduction if the business is eventually listed. Using Tencent's WeChat (US$100/sub) as a benchmark, China Telecom's stake in YiChat could possibly be valued at US$4.4 bn, equivalent to HK$0.42/share (11.7% of market cap). China Telecom also has tower assets which, benchmarked to listed Thai and Indonesian peers, could potentially be valued at HK$1.77-HK$7.97/share.
..but China Mobile is not
In contrast, China Mobile has endured declining margins and return on capital (albeit from high starting points) following the 2008 industry reforms. A failure to properly monetise resulting data growth has contributed to a squeeze on EBITDA margins and China Mobile sees Over The Top (OTT) messenger services such as WeChat as a threat rather than an opportunity. Thus, China Mobile is unlikely to follow China Telecom in collaborating with private capital over the launch of its own OTT service. Similarly, China Mobile's defensive mindset also pervades its attitude towards its 885,000 towers. The company has used its strong
balance sheet to invest aggressively in capex to attempt to sustain a competitive 'moat' and limit market share loss, and so it views tower-sharing as counter-productive. This also lowers the probability of China Mobile opening its tower assets up to private investment.
Unicom is open to SOE reform…
Unicom has been enjoying rising revenue market share courtesy of the major industry restructuring conducted in 2008. Due to its superior 3G/3.75G data product, it is achieving an ARPU uplift when customers upgrade to a smartphone and a bundled data package. Thus Unicom has a less defensive mindset regarding OTT operators and content players than incumbent China Mobile, but management has been less aggressive than China Telecom in embracing reform, attracting non-state capital, and setting up rival OTT products.
...and it could be the largest beneficiary in the telco sector
What Unicom does have, and may be willing to share, is its tower assets, comprising 551,000 towers. With what is still a relatively low net margin (FY13: 3.5%) and only 17.7% market share by revenue, China Unicom is far more open to sharing its tower assets with other players than China Mobile is at present, for three reasons: 1) Unicom does not have a dominant market position to defend, 2) Unicom needs to increase the return on the assets it has constructed, and 3) as a result of its extensive 3G/3.75G rollout, Unicom has the highest gearing (2.7x net debt to EBITDA, including trade payables) of the three China telcos. Unicom also has property assets supporting its fixed line and cellular businesses.
The impact of attracting non-state-owned capital into Unicom's tower assets in particular could be dramatic. By benchmarking against listed Thai and Indonesian tower companies Unicom's tower assets could be worth HK$12.29-HK$55.38 per share, equivalent to 121.0% to 545.1% of the current market cap of the company. This can be seen as a reminder of the narrative that Chinese SOE's over-invest, but it is perhaps exactly this narrative which Premier Li Keqiang is keen to change.
Figure 2: BTS and towers per operator 000's(except for tenancy) Total BTS Assumed tenancy Total towers
China Mobile 1,327 1.5 885 Unicom 827 1.5 551 China Telecom 270 1.0 270
Source: Company data, Credit Suisse estimates
Figure 3: Implied valuation ranges of 100% of the tower portfolios Value Total Value per Tower assets per tower value share as % of (US$) (US$ mn) (HK$) market cap
Min Max Min Max Min Max Min Max
China Mobile 68,350 308,000 60,467 272,477 23.26 104.80 32.7% 147.4% Unicom 68,350 308,000 37,684 169,811 12.29 55.38 121.0% 545.1% China Telecom 68,350 308,000 18,455 83,160 1.77 7.97 50.5% 227.7%
Source: Company data, Credit Suisse estimates
Extract from the Asian Daily, 15 April 2014
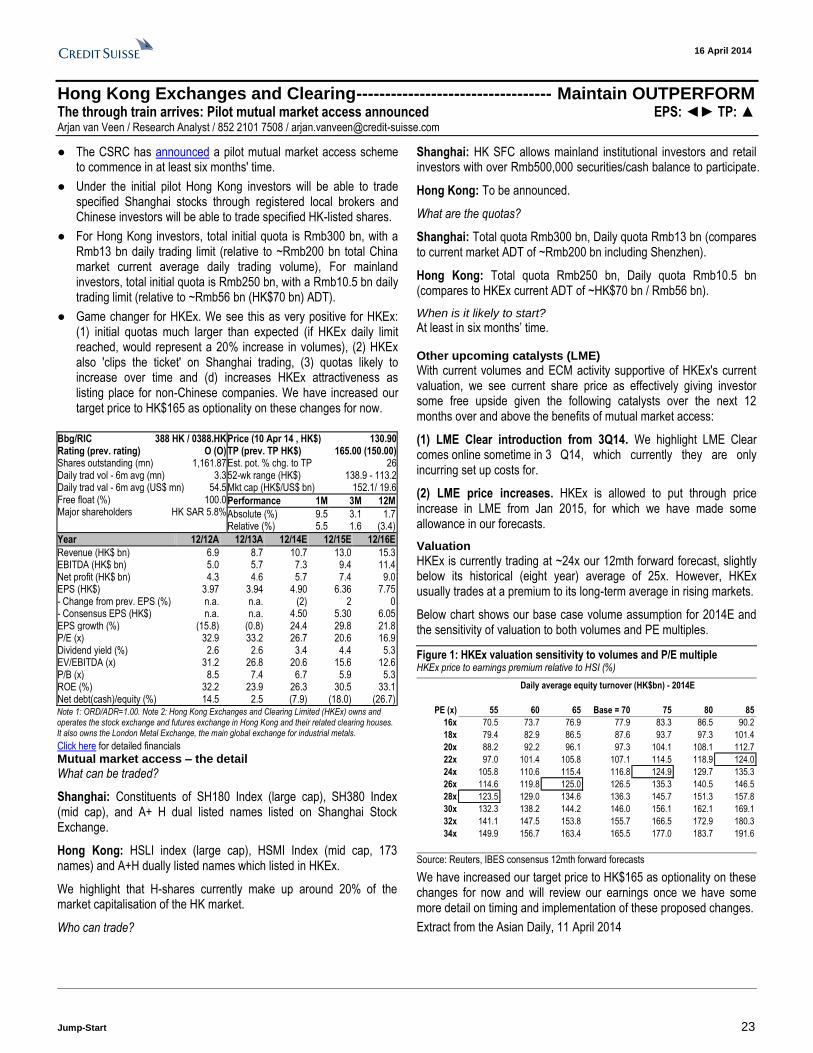
16 April 2014
Jump-Start 23
Hong Kong Exchanges and Clearing---------------------------------- Maintain OUTPERFORM The through train arrives: Pilot mutual market access announced EPS: ◄► TP: ▲ Arjan van Veen / Research Analyst / 852 2101 7508 / [email protected]
● The CSRC has announced a pilot mutual market access scheme to commence in at least six months' time.
● Under the initial pilot Hong Kong investors will be able to trade specified Shanghai stocks through registered local brokers and Chinese investors will be able to trade specified HK-listed shares.
● For Hong Kong investors, total initial quota is Rmb300 bn, with a Rmb13 bn daily trading limit (relative to ~Rmb200 bn total China market current average daily trading volume), For mainland investors, total initial quota is Rmb250 bn, with a Rmb10.5 bn daily trading limit (relative to ~Rmb56 bn (HK$70 bn) ADT).
● Game changer for HKEx. We see this as very positive for HKEx: (1) initial quotas much larger than expected (if HKEx daily limit reached, would represent a 20% increase in volumes), (2) HKEx also 'clips the ticket' on Shanghai trading, (3) quotas likely to increase over time and (d) increases HKEx attractiveness as listing place for non-Chinese companies. We have increased our target price to HK$165 as optionality on these changes for now.
Click here for detailed financials
Mutual market access – the detail
What can be traded?
Shanghai: Constituents of SH180 Index (large cap), SH380 Index (mid cap), and A+ H dual listed names listed on Shanghai Stock Exchange.
Hong Kong: HSLI index (large cap), HSMI Index (mid cap, 173 names) and A+H dually listed names which listed in HKEx.
We highlight that H-shares currently make up around 20% of the market capitalisation of the HK market.
Who can trade?
Shanghai: HK SFC allows mainland institutional investors and retail investors with over Rmb500,000 securities/cash balance to participate.
Hong Kong: To be announced.
What are the quotas?
Shanghai: Total quota Rmb300 bn, Daily quota Rmb13 bn (compares to current market ADT of ~Rmb200 bn including Shenzhen).
Hong Kong: Total quota Rmb250 bn, Daily quota Rmb10.5 bn (compares to HKEx current ADT of ~HK$70 bn / Rmb56 bn).
When is it likely to start?
At least in six months’ time. Other upcoming catalysts (LME)
With current volumes and ECM activity supportive of HKEx's current valuation, we see current share price as effectively giving investor some free upside given the following catalysts over the next 12 months over and above the benefits of mutual market access:
(1) LME Clear introduction from 3Q14. We highlight LME Clear comes online sometime in 3 Q14, which currently they are only incurring set up costs for.
(2) LME price increases. HKEx is allowed to put through price increase in LME from Jan 2015, for which we have made some allowance in our forecasts.
Valuation
HKEx is currently trading at ~24x our 12mth forward forecast, slightly below its historical (eight year) average of 25x. However, HKEx usually trades at a premium to its long-term average in rising markets.
Below chart shows our base case volume assumption for 2014E and the sensitivity of valuation to both volumes and PE multiples.
Figure 1: HKEx valuation sensitivity to volumes and P/E multiple HKEx price to earnings premium relative to HSI (%)
Daily average equity turnover (HK$bn) - 2014E
PE (x) 55 60 65 Base = 70 75 80 85
16x 70.5 73.7 76.9 77.9 83.3 86.5 90.2
18x 79.4 82.9 86.5 87.6 93.7 97.3 101.4
20x 88.2 92.2 96.1 97.3 104.1 108.1 112.7
22x 97.0 101.4 105.8 107.1 114.5 118.9 124.0
24x 105.8 110.6 115.4 116.8 124.9 129.7 135.3
26x 114.6 119.8 125.0 126.5 135.3 140.5 146.5
28x 123.5 129.0 134.6 136.3 145.7 151.3 157.8
30x 132.3 138.2 144.2 146.0 156.1 162.1 169.1
32x 141.1 147.5 153.8 155.7 166.5 172.9 180.3
34x 149.9 156.7 163.4 165.5 177.0 183.7 191.6
Source: Reuters, IBES consensus 12mth forward forecasts
We have increased our target price to HK$165 as optionality on these changes for now and will review our earnings once we have some more detail on timing and implementation of these proposed changes.
Extract from the Asian Daily, 11 April 2014
Bbg/RIC 388 HK / 0388.HK Rating (prev. rating) O (O) Shares outstanding (mn) 1,161.87 Daily trad vol - 6m avg (mn) 3.3 Daily trad val - 6m avg (US$ mn) 54.5 Free float (%) 100.0 Major shareholders HK SAR 5.8%
Price (10 Apr 14 , HK$) 130.90 TP (prev. TP HK$) 165.00 (150.00) Est. pot. % chg. to TP 26 52-wk range (HK$) 138.9 - 113.2 Mkt cap (HK$/US$ bn) 152.1/ 19.6
Performance 1M 3M 12M
Absolute (%) 9.5 3.1 1.7 Relative (%) 5.5 1.6 (3.4)
Year 12/12A 12/13A 12/14E 12/15E 12/16E
Revenue (HK$ bn) 6.9 8.7 10.7 13.0 15.3 EBITDA (HK$ bn) 5.0 5.7 7.3 9.4 11.4 Net profit (HK$ bn) 4.3 4.6 5.7 7.4 9.0 EPS (HK$) 3.97 3.94 4.90 6.36 7.75 - Change from prev. EPS (%) n.a. n.a. (2) 2 0 - Consensus EPS (HK$) n.a. n.a. 4.50 5.30 6.05 EPS growth (%) (15.8) (0.8) 24.4 29.8 21.8 P/E (x) 32.9 33.2 26.7 20.6 16.9 Dividend yield (%) 2.6 2.6 3.4 4.4 5.3 EV/EBITDA (x) 31.2 26.8 20.6 15.6 12.6 P/B (x) 8.5 7.4 6.7 5.9 5.3 ROE (%) 32.2 23.9 26.3 30.5 33.1 Net debt(cash)/equity (%) 14.5 2.5 (7.9) (18.0) (26.7)
Note 1: ORD/ADR=1.00. Note 2: Hong Kong Exchanges and Clearing Limited (HKEx) owns and operates the stock exchange and futures exchange in Hong Kong and their related clearing houses. It also owns the London Metal Exchange, the main global exchange for industrial metals.
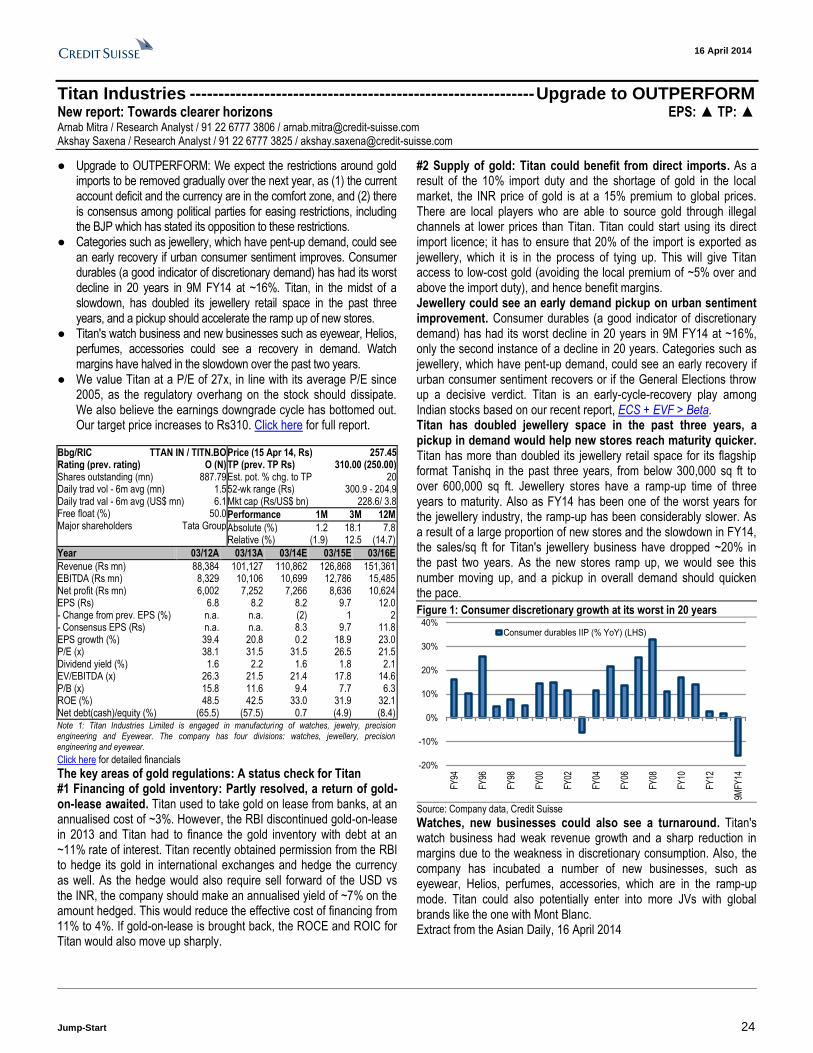
16 April 2014
Jump-Start 24
Titan Industries ------------------------------------------------------------ Upgrade to OUTPERFORM New report: Towards clearer horizons EPS: ▲ TP: ▲ Arnab Mitra / Research Analyst / 91 22 6777 3806 / [email protected] Akshay Saxena / Research Analyst / 91 22 6777 3825 / [email protected]
● Upgrade to OUTPERFORM: We expect the restrictions around gold imports to be removed gradually over the next year, as (1) the current account deficit and the currency are in the comfort zone, and (2) there is consensus among political parties for easing restrictions, including the BJP which has stated its opposition to these restrictions.
● Categories such as jewellery, which have pent-up demand, could see an early recovery if urban consumer sentiment improves. Consumer durables (a good indicator of discretionary demand) has had its worst decline in 20 years in 9M FY14 at ~16%. Titan, in the midst of a slowdown, has doubled its jewellery retail space in the past three years, and a pickup should accelerate the ramp up of new stores.
● Titan's watch business and new businesses such as eyewear, Helios, perfumes, accessories could see a recovery in demand. Watch margins have halved in the slowdown over the past two years.
● We value Titan at a P/E of 27x, in line with its average P/E since 2005, as the regulatory overhang on the stock should dissipate. We also believe the earnings downgrade cycle has bottomed out. Our target price increases to Rs310. Click here for full report.
Click here for detailed financials
The key areas of gold regulations: A status check for Titan #1 Financing of gold inventory: Partly resolved, a return of gold-on-lease awaited. Titan used to take gold on lease from banks, at an annualised cost of ~3%. However, the RBI discontinued gold-on-lease in 2013 and Titan had to finance the gold inventory with debt at an ~11% rate of interest. Titan recently obtained permission from the RBI to hedge its gold in international exchanges and hedge the currency as well. As the hedge would also require sell forward of the USD vs the INR, the company should make an annualised yield of ~7% on the amount hedged. This would reduce the effective cost of financing from 11% to 4%. If gold-on-lease is brought back, the ROCE and ROIC for Titan would also move up sharply.
#2 Supply of gold: Titan could benefit from direct imports. As a result of the 10% import duty and the shortage of gold in the local market, the INR price of gold is at a 15% premium to global prices. There are local players who are able to source gold through illegal channels at lower prices than Titan. Titan could start using its direct import licence; it has to ensure that 20% of the import is exported as jewellery, which it is in the process of tying up. This will give Titan access to low-cost gold (avoiding the local premium of ~5% over and above the import duty), and hence benefit margins. Jewellery could see an early demand pickup on urban sentiment improvement. Consumer durables (a good indicator of discretionary demand) has had its worst decline in 20 years in 9M FY14 at ~16%, only the second instance of a decline in 20 years. Categories such as jewellery, which have pent-up demand, could see an early recovery if urban consumer sentiment recovers or if the General Elections throw up a decisive verdict. Titan is an early-cycle-recovery play among Indian stocks based on our recent report, ECS + EVF > Beta. Titan has doubled jewellery space in the past three years, a pickup in demand would help new stores reach maturity quicker. Titan has more than doubled its jewellery retail space for its flagship format Tanishq in the past three years, from below 300,000 sq ft to over 600,000 sq ft. Jewellery stores have a ramp-up time of three years to maturity. Also as FY14 has been one of the worst years for the jewellery industry, the ramp-up has been considerably slower. As a result of a large proportion of new stores and the slowdown in FY14, the sales/sq ft for Titan's jewellery business have dropped ~20% in the past two years. As the new stores ramp up, we would see this number moving up, and a pickup in overall demand should quicken the pace.
Figure 1: Consumer discretionary growth at its worst in 20 years
-20%
-10%
0%
10%
20%
30%
40%
FY94
FY96
FY98
FY00
FY02
FY04
FY06
FY08
FY10
FY12
9MFY
14
Consumer durables IIP (% YoY) (LHS)
Source: Company data, Credit Suisse
Watches, new businesses could also see a turnaround. Titan's watch business had weak revenue growth and a sharp reduction in margins due to the weakness in discretionary consumption. Also, the company has incubated a number of new businesses, such as eyewear, Helios, perfumes, accessories, which are in the ramp-up mode. Titan could also potentially enter into more JVs with global brands like the one with Mont Blanc. Extract from the Asian Daily, 16 April 2014
Bbg/RIC TTAN IN / TITN.BO Rating (prev. rating) O (N) Shares outstanding (mn) 887.79 Daily trad vol - 6m avg (mn) 1.5 Daily trad val - 6m avg (US$ mn) 6.1 Free float (%) 50.0 Major shareholders Tata Group
Price (15 Apr 14, Rs) 257.45 TP (prev. TP Rs) 310.00 (250.00) Est. pot. % chg. to TP 20 52-wk range (Rs) 300.9 - 204.9 Mkt cap (Rs/US$ bn) 228.6/ 3.8
Performance 1M 3M 12M
Absolute (%) 1.2 18.1 7.8 Relative (%) (1.9) 12.5 (14.7)
Year 03/12A 03/13A 03/14E 03/15E 03/16E
Revenue (Rs mn) 88,384 101,127 110,862 126,868 151,361 EBITDA (Rs mn) 8,329 10,106 10,699 12,786 15,485 Net profit (Rs mn) 6,002 7,252 7,266 8,636 10,624 EPS (Rs) 6.8 8.2 8.2 9.7 12.0 - Change from prev. EPS (%) n.a. n.a. (2) 1 2 - Consensus EPS (Rs) n.a. n.a. 8.3 9.7 11.8 EPS growth (%) 39.4 20.8 0.2 18.9 23.0 P/E (x) 38.1 31.5 31.5 26.5 21.5 Dividend yield (%) 1.6 2.2 1.6 1.8 2.1 EV/EBITDA (x) 26.3 21.5 21.4 17.8 14.6 P/B (x) 15.8 11.6 9.4 7.7 6.3 ROE (%) 48.5 42.5 33.0 31.9 32.1 Net debt(cash)/equity (%) (65.5) (57.5) 0.7 (4.9) (8.4)
Note 1: Titan Industries Limited is engaged in manufacturing of watches, jewelry, precision engineering and Eyewear. The company has four divisions: watches, jewellery, precision engineering and eyewear.
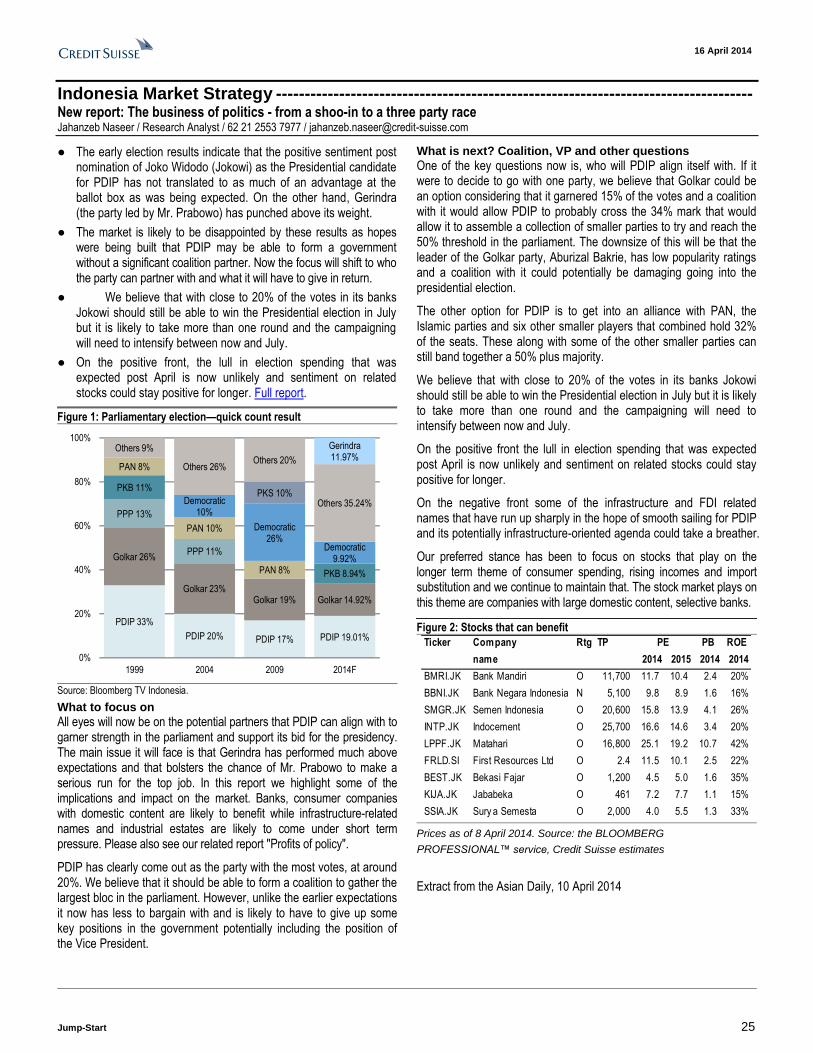
16 April 2014
Jump-Start 25
Indonesia Market Strategy ----------------------------------------------------------------------------------- New report: The business of politics - from a shoo-in to a three party race Jahanzeb Naseer / Research Analyst / 62 21 2553 7977 / [email protected]
● The early election results indicate that the positive sentiment post nomination of Joko Widodo (Jokowi) as the Presidential candidate for PDIP has not translated to as much of an advantage at the ballot box as was being expected. On the other hand, Gerindra (the party led by Mr. Prabowo) has punched above its weight.
● The market is likely to be disappointed by these results as hopes were being built that PDIP may be able to form a government without a significant coalition partner. Now the focus will shift to who the party can partner with and what it will have to give in return.
● We believe that with close to 20% of the votes in its banks Jokowi should still be able to win the Presidential election in July but it is likely to take more than one round and the campaigning will need to intensify between now and July.
● On the positive front, the lull in election spending that was expected post April is now unlikely and sentiment on related stocks could stay positive for longer. Full report.
Figure 1: Parliamentary election—quick count result
PDIP 33%
PDIP 20% PDIP 17% PDIP 19.01%
Golkar 26%
Golkar 23%Golkar 19% Golkar 14.92%
PPP 13%
PPP 11%
PKB 11%
PKB 8.94%
PAN 8%
PAN 10%
PAN 8%
Democratic 10%
Democratic 26%
Democratic 9.92%
PKS 10%
Others 9%
Others 26%Others 20%
Others 35.24%
Gerindra 11.97%
0%
20%
40%
60%
80%
100%
1999 2004 2009 2014F
Source: Bloomberg TV Indonesia.
What to focus on
All eyes will now be on the potential partners that PDIP can align with to garner strength in the parliament and support its bid for the presidency. The main issue it will face is that Gerindra has performed much above expectations and that bolsters the chance of Mr. Prabowo to make a serious run for the top job. In this report we highlight some of the implications and impact on the market. Banks, consumer companies with domestic content are likely to benefit while infrastructure-related names and industrial estates are likely to come under short term pressure. Please also see our related report "Profits of policy".
PDIP has clearly come out as the party with the most votes, at around 20%. We believe that it should be able to form a coalition to gather the largest bloc in the parliament. However, unlike the earlier expectations it now has less to bargain with and is likely to have to give up some key positions in the government potentially including the position of the Vice President.
What is next? Coalition, VP and other questions
One of the key questions now is, who will PDIP align itself with. If it were to decide to go with one party, we believe that Golkar could be an option considering that it garnered 15% of the votes and a coalition with it would allow PDIP to probably cross the 34% mark that would allow it to assemble a collection of smaller parties to try and reach the 50% threshold in the parliament. The downsize of this will be that the leader of the Golkar party, Aburizal Bakrie, has low popularity ratings and a coalition with it could potentially be damaging going into the presidential election.
The other option for PDIP is to get into an alliance with PAN, the Islamic parties and six other smaller players that combined hold 32% of the seats. These along with some of the other smaller parties can still band together a 50% plus majority.
We believe that with close to 20% of the votes in its banks Jokowi should still be able to win the Presidential election in July but it is likely to take more than one round and the campaigning will need to intensify between now and July.
On the positive front the lull in election spending that was expected post April is now unlikely and sentiment on related stocks could stay positive for longer.
On the negative front some of the infrastructure and FDI related names that have run up sharply in the hope of smooth sailing for PDIP and its potentially infrastructure-oriented agenda could take a breather.
Our preferred stance has been to focus on stocks that play on the longer term theme of consumer spending, rising incomes and import substitution and we continue to maintain that. The stock market plays on this theme are companies with large domestic content, selective banks.
Figure 2: Stocks that can benefit
Ticker Company Rtg TP PB ROE
name 2014 2015 2014 2014
BMRI.JK Bank Mandiri O 11,700 11.7 10.4 2.4 20%
BBNI.JK Bank Negara Indonesia N 5,100 9.8 8.9 1.6 16%
SMGR.JK Semen Indonesia O 20,600 15.8 13.9 4.1 26%
INTP.JK Indocement O 25,700 16.6 14.6 3.4 20%
LPPF.JK Matahari O 16,800 25.1 19.2 10.7 42%
FRLD.SI First Resources Ltd O 2.4 11.5 10.1 2.5 22%
BEST.JK Bekasi Fajar O 1,200 4.5 5.0 1.6 35%
KIJA.JK Jababeka O 461 7.2 7.7 1.1 15%
SSIA.JK Sury a Semesta O 2,000 4.0 5.5 1.3 33%
PE
Prices as of 8 April 2014. Source: the BLOOMBERG
PROFESSIONAL™ service, Credit Suisse estimates
Extract from the Asian Daily, 10 April 2014
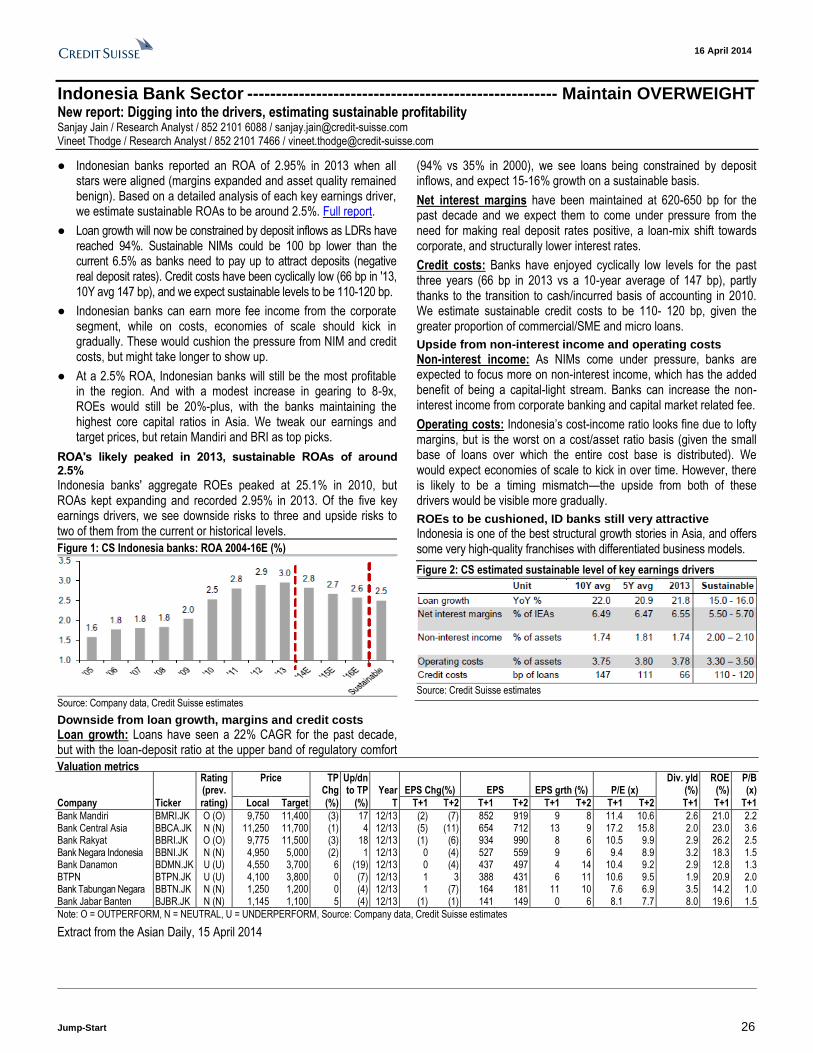
16 April 2014
Jump-Start 26
Indonesia Bank Sector ------------------------------------------------------ Maintain OVERWEIGHT New report: Digging into the drivers, estimating sustainable profitability Sanjay Jain / Research Analyst / 852 2101 6088 / [email protected] Vineet Thodge / Research Analyst / 852 2101 7466 / [email protected]
● Indonesian banks reported an ROA of 2.95% in 2013 when all stars were aligned (margins expanded and asset quality remained benign). Based on a detailed analysis of each key earnings driver, we estimate sustainable ROAs to be around 2.5%. Full report.
● Loan growth will now be constrained by deposit inflows as LDRs have reached 94%. Sustainable NIMs could be 100 bp lower than the current 6.5% as banks need to pay up to attract deposits (negative real deposit rates). Credit costs have been cyclically low (66 bp in '13, 10Y avg 147 bp), and we expect sustainable levels to be 110-120 bp.
● Indonesian banks can earn more fee income from the corporate segment, while on costs, economies of scale should kick in gradually. These would cushion the pressure from NIM and credit costs, but might take longer to show up.
● At a 2.5% ROA, Indonesian banks will still be the most profitable in the region. And with a modest increase in gearing to 8-9x, ROEs would still be 20%-plus, with the banks maintaining the highest core capital ratios in Asia. We tweak our earnings and target prices, but retain Mandiri and BRI as top picks.
ROA's likely peaked in 2013, sustainable ROAs of around 2.5%
Indonesia banks' aggregate ROEs peaked at 25.1% in 2010, but ROAs kept expanding and recorded 2.95% in 2013. Of the five key earnings drivers, we see downside risks to three and upside risks to two of them from the current or historical levels.
Figure 1: CS Indonesia banks: ROA 2004-16E (%)
Source: Company data, Credit Suisse estimates
Downside from loan growth, margins and credit costs
Loan growth: Loans have seen a 22% CAGR for the past decade, but with the loan-deposit ratio at the upper band of regulatory comfort
(94% vs 35% in 2000), we see loans being constrained by deposit inflows, and expect 15-16% growth on a sustainable basis.
Net interest margins have been maintained at 620-650 bp for the past decade and we expect them to come under pressure from the need for making real deposit rates positive, a loan-mix shift towards corporate, and structurally lower interest rates.
Credit costs: Banks have enjoyed cyclically low levels for the past three years (66 bp in 2013 vs a 10-year average of 147 bp), partly thanks to the transition to cash/incurred basis of accounting in 2010. We estimate sustainable credit costs to be 110- 120 bp, given the greater proportion of commercial/SME and micro loans.
Upside from non-interest income and operating costs
Non-interest income: As NIMs come under pressure, banks are expected to focus more on non-interest income, which has the added benefit of being a capital-light stream. Banks can increase the non-interest income from corporate banking and capital market related fee.
Operating costs: Indonesia’s cost-income ratio looks fine due to lofty margins, but is the worst on a cost/asset ratio basis (given the small base of loans over which the entire cost base is distributed). We would expect economies of scale to kick in over time. However, there is likely to be a timing mismatch—the upside from both of these drivers would be visible more gradually.
ROEs to be cushioned, ID banks still very attractive
Indonesia is one of the best structural growth stories in Asia, and offers some very high-quality franchises with differentiated business models.
Figure 2: CS estimated sustainable level of key earnings drivers
Source: Credit Suisse estimates
Valuation metrics Rating Price TP Up/dn Div. yld ROE P/B (prev. Chg to TP Year EPS Chg(%) EPS EPS grth (%) P/E (x) (%) (%) (x)
Company Ticker rating) Local Target (%) (%) T T+1 T+2 T+1 T+2 T+1 T+2 T+1 T+2 T+1 T+1 T+1
Bank Mandiri BMRI.JK O (O) 9,750 11,400 (3) 17 12/13 (2) (7) 852 919 9 8 11.4 10.6 2.6 21.0 2.2 Bank Central Asia BBCA.JK N (N) 11,250 11,700 (1) 4 12/13 (5) (11) 654 712 13 9 17.2 15.8 2.0 23.0 3.6 Bank Rakyat BBRI.JK O (O) 9,775 11,500 (3) 18 12/13 (1) (6) 934 990 8 6 10.5 9.9 2.9 26.2 2.5 Bank Negara Indonesia BBNI.JK N (N) 4,950 5,000 (2) 1 12/13 0 (4) 527 559 9 6 9.4 8.9 3.2 18.3 1.5 Bank Danamon BDMN.JK U (U) 4,550 3,700 6 (19) 12/13 0 (4) 437 497 4 14 10.4 9.2 2.9 12.8 1.3 BTPN BTPN.JK U (U) 4,100 3,800 0 (7) 12/13 1 3 388 431 6 11 10.6 9.5 1.9 20.9 2.0 Bank Tabungan Negara BBTN.JK N (N) 1,250 1,200 0 (4) 12/13 1 (7) 164 181 11 10 7.6 6.9 3.5 14.2 1.0 Bank Jabar Banten BJBR.JK N (N) 1,145 1,100 5 (4) 12/13 (1) (1) 141 149 0 6 8.1 7.7 8.0 19.6 1.5
Note: O = OUTPERFORM, N = NEUTRAL, U = UNDERPERFORM, Source: Company data, Credit Suisse estimates
Extract from the Asian Daily, 15 April 2014
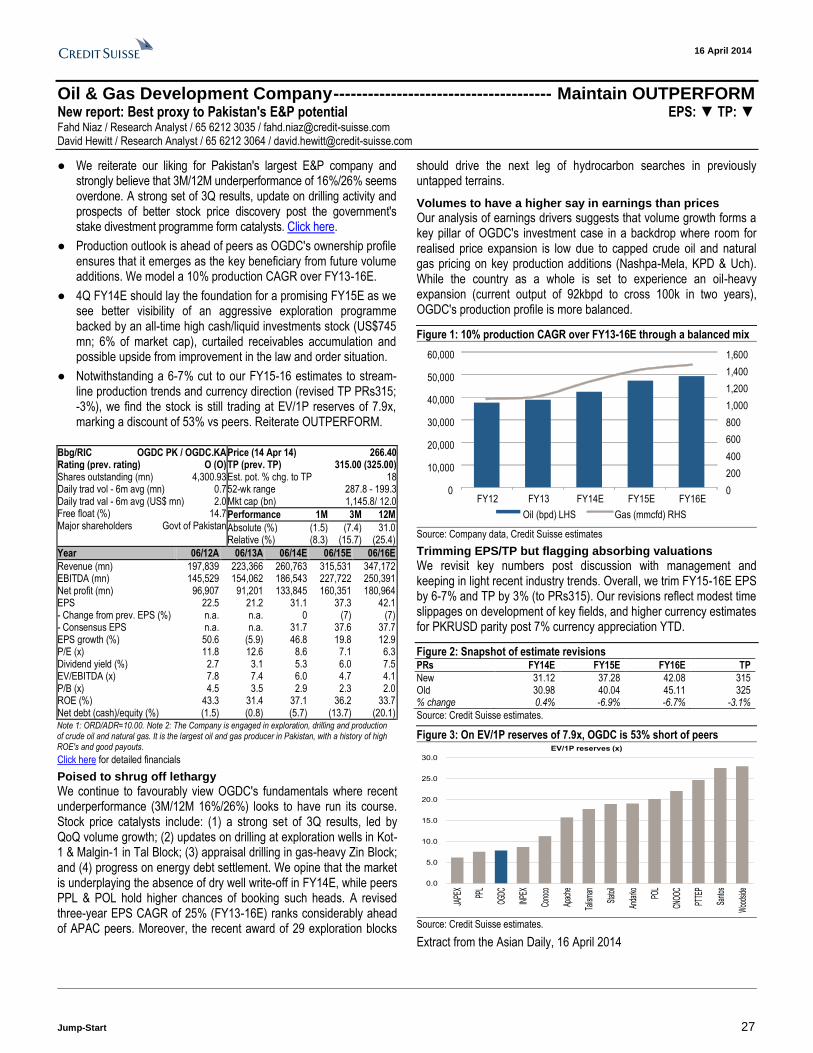
16 April 2014
Jump-Start 27
Oil & Gas Development Company -------------------------------------- Maintain OUTPERFORM New report: Best proxy to Pakistan's E&P potential EPS: ▼ TP: ▼ Fahd Niaz / Research Analyst / 65 6212 3035 / [email protected] David Hewitt / Research Analyst / 65 6212 3064 / [email protected]
● We reiterate our liking for Pakistan's largest E&P company and strongly believe that 3M/12M underperformance of 16%/26% seems overdone. A strong set of 3Q results, update on drilling activity and prospects of better stock price discovery post the government's stake divestment programme form catalysts. Click here.
● Production outlook is ahead of peers as OGDC's ownership profile ensures that it emerges as the key beneficiary from future volume additions. We model a 10% production CAGR over FY13-16E.
● 4Q FY14E should lay the foundation for a promising FY15E as we see better visibility of an aggressive exploration programme backed by an all-time high cash/liquid investments stock (US$745 mn; 6% of market cap), curtailed receivables accumulation and possible upside from improvement in the law and order situation.
● Notwithstanding a 6-7% cut to our FY15-16 estimates to stream-line production trends and currency direction (revised TP PRs315; -3%), we find the stock is still trading at EV/1P reserves of 7.9x, marking a discount of 53% vs peers. Reiterate OUTPERFORM.
Click here for detailed financials
Poised to shrug off lethargy
We continue to favourably view OGDC's fundamentals where recent underperformance (3M/12M 16%/26%) looks to have run its course. Stock price catalysts include: (1) a strong set of 3Q results, led by QoQ volume growth; (2) updates on drilling at exploration wells in Kot-1 & Malgin-1 in Tal Block; (3) appraisal drilling in gas-heavy Zin Block; and (4) progress on energy debt settlement. We opine that the market is underplaying the absence of dry well write-off in FY14E, while peers PPL & POL hold higher chances of booking such heads. A revised three-year EPS CAGR of 25% (FY13-16E) ranks considerably ahead of APAC peers. Moreover, the recent award of 29 exploration blocks
should drive the next leg of hydrocarbon searches in previously untapped terrains.
Volumes to have a higher say in earnings than prices
Our analysis of earnings drivers suggests that volume growth forms a key pillar of OGDC's investment case in a backdrop where room for realised price expansion is low due to capped crude oil and natural gas pricing on key production additions (Nashpa-Mela, KPD & Uch). While the country as a whole is set to experience an oil-heavy expansion (current output of 92kbpd to cross 100k in two years), OGDC's production profile is more balanced.
Figure 1: 10% production CAGR over FY13-16E through a balanced mix
0
200
400
600
800
1,000
1,200
1,400
1,600
0
10,000
20,000
30,000
40,000
50,000
60,000
FY12 FY13 FY14E FY15E FY16E
Oil (bpd) LHS Gas (mmcfd) RHS
Source: Company data, Credit Suisse estimates
Trimming EPS/TP but flagging absorbing valuations
We revisit key numbers post discussion with management and keeping in light recent industry trends. Overall, we trim FY15-16E EPS by 6-7% and TP by 3% (to PRs315). Our revisions reflect modest time slippages on development of key fields, and higher currency estimates for PKRUSD parity post 7% currency appreciation YTD.
Figure 2: Snapshot of estimate revisions PRs FY14E FY15E FY16E TP
New 31.12 37.28 42.08 315 Old 30.98 40.04 45.11 325 % change 0.4% -6.9% -6.7% -3.1%
Source: Credit Suisse estimates.
Figure 3: On EV/1P reserves of 7.9x, OGDC is 53% short of peers
0.0
5.0
10.0
15.0
20.0
25.0
30.0
JAPE
X
PPL
OGDC
INPE
X
Cono
co
Apac
he
Talis
man
Stato
il
Anda
rko POL
CNOO
C
PTTE
P
Sant
os
Woo
dside
EV/1P reserves (x)
Source: Credit Suisse estimates.
Extract from the Asian Daily, 16 April 2014
Bbg/RIC OGDC PK / OGDC.KA Rating (prev. rating) O (O) Shares outstanding (mn) 4,300.93 Daily trad vol - 6m avg (mn) 0.7 Daily trad val - 6m avg (US$ mn) 2.0 Free float (%) 14.7 Major shareholders Govt of Pakistan
Price (14 Apr 14) 266.40 TP (prev. TP) 315.00 (325.00) Est. pot. % chg. to TP 18 52-wk range 287.8 - 199.3 Mkt cap (bn) 1,145.8/ 12.0
Performance 1M 3M 12M
Absolute (%) (1.5) (7.4) 31.0 Relative (%) (8.3) (15.7) (25.4)
Year 06/12A 06/13A 06/14E 06/15E 06/16E
Revenue (mn) 197,839 223,366 260,763 315,531 347,172 EBITDA (mn) 145,529 154,062 186,543 227,722 250,391 Net profit (mn) 96,907 91,201 133,845 160,351 180,964 EPS 22.5 21.2 31.1 37.3 42.1 - Change from prev. EPS (%) n.a. n.a. 0 (7) (7) - Consensus EPS n.a. n.a. 31.7 37.6 37.7 EPS growth (%) 50.6 (5.9) 46.8 19.8 12.9 P/E (x) 11.8 12.6 8.6 7.1 6.3 Dividend yield (%) 2.7 3.1 5.3 6.0 7.5 EV/EBITDA (x) 7.8 7.4 6.0 4.7 4.1 P/B (x) 4.5 3.5 2.9 2.3 2.0 ROE (%) 43.3 31.4 37.1 36.2 33.7 Net debt (cash)/equity (%) (1.5) (0.8) (5.7) (13.7) (20.1)
Note 1: ORD/ADR=10.00. Note 2: The Company is engaged in exploration, drilling and production of crude oil and natural gas. It is the largest oil and gas producer in Pakistan, with a history of high ROE's and good payouts.
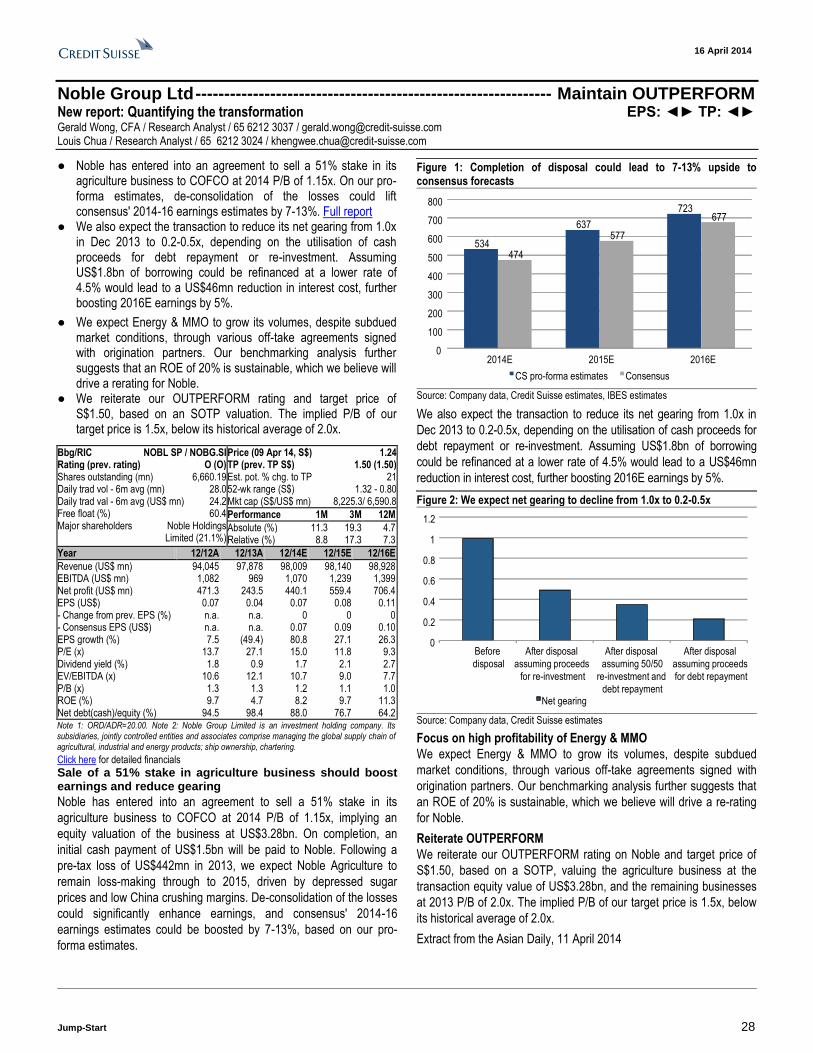
16 April 2014
Jump-Start 28
Noble Group Ltd -------------------------------------------------------------- Maintain OUTPERFORM New report: Quantifying the transformation EPS: ◄► TP: ◄► Gerald Wong, CFA / Research Analyst / 65 6212 3037 / [email protected] Louis Chua / Research Analyst / 65 6212 3024 / [email protected]
● Noble has entered into an agreement to sell a 51% stake in its agriculture business to COFCO at 2014 P/B of 1.15x. On our pro-forma estimates, de-consolidation of the losses could lift consensus' 2014-16 earnings estimates by 7-13%. Full report
● We also expect the transaction to reduce its net gearing from 1.0x in Dec 2013 to 0.2-0.5x, depending on the utilisation of cash proceeds for debt repayment or re-investment. Assuming US$1.8bn of borrowing could be refinanced at a lower rate of 4.5% would lead to a US$46mn reduction in interest cost, further boosting 2016E earnings by 5%.
● We expect Energy & MMO to grow its volumes, despite subdued market conditions, through various off-take agreements signed with origination partners. Our benchmarking analysis further suggests that an ROE of 20% is sustainable, which we believe will drive a rerating for Noble.
● We reiterate our OUTPERFORM rating and target price of S$1.50, based on an SOTP valuation. The implied P/B of our target price is 1.5x, below its historical average of 2.0x.
Click here for detailed financials
Sale of a 51% stake in agriculture business should boost earnings and reduce gearing
Noble has entered into an agreement to sell a 51% stake in its
agriculture business to COFCO at 2014 P/B of 1.15x, implying an
equity valuation of the business at US$3.28bn. On completion, an
initial cash payment of US$1.5bn will be paid to Noble. Following a
pre-tax loss of US$442mn in 2013, we expect Noble Agriculture to
remain loss-making through to 2015, driven by depressed sugar
prices and low China crushing margins. De-consolidation of the losses
could significantly enhance earnings, and consensus' 2014-16
earnings estimates could be boosted by 7-13%, based on our pro-
forma estimates.
Figure 1: Completion of disposal could lead to 7-13% upside to consensus forecasts
534
637
723
474
577
677
0
100
200
300
400
500
600
700
800
2014E 2015E 2016E
CS pro-forma estimates Consensus
Source: Company data, Credit Suisse estimates, IBES estimates
We also expect the transaction to reduce its net gearing from 1.0x in
Dec 2013 to 0.2-0.5x, depending on the utilisation of cash proceeds for
debt repayment or re-investment. Assuming US$1.8bn of borrowing
could be refinanced at a lower rate of 4.5% would lead to a US$46mn
reduction in interest cost, further boosting 2016E earnings by 5%.
Figure 2: We expect net gearing to decline from 1.0x to 0.2-0.5x
0
0.2
0.4
0.6
0.8
1
1.2
Before
disposal
After disposal
assuming proceeds
for re-investment
After disposal
assuming 50/50
re-investment and
debt repayment
After disposal
assuming proceeds
for debt repayment
Net gearing
Source: Company data, Credit Suisse estimates
Focus on high profitability of Energy & MMO
We expect Energy & MMO to grow its volumes, despite subdued
market conditions, through various off-take agreements signed with
origination partners. Our benchmarking analysis further suggests that
an ROE of 20% is sustainable, which we believe will drive a re-rating
for Noble.
Reiterate OUTPERFORM
We reiterate our OUTPERFORM rating on Noble and target price of
S$1.50, based on a SOTP, valuing the agriculture business at the
transaction equity value of US$3.28bn, and the remaining businesses
at 2013 P/B of 2.0x. The implied P/B of our target price is 1.5x, below
its historical average of 2.0x.
Extract from the Asian Daily, 11 April 2014
Bbg/RIC NOBL SP / NOBG.SI Rating (prev. rating) O (O) Shares outstanding (mn) 6,660.19 Daily trad vol - 6m avg (mn) 28.0 Daily trad val - 6m avg (US$ mn) 24.2 Free float (%) 60.4 Major shareholders Noble Holdings
Limited (21.1%)
Price (09 Apr 14, S$) 1.24 TP (prev. TP S$) 1.50 (1.50) Est. pot. % chg. to TP 21 52-wk range (S$) 1.32 - 0.80 Mkt cap (S$/US$ mn) 8,225.3/ 6,590.8
Performance 1M 3M 12M
Absolute (%) 11.3 19.3 4.7 Relative (%) 8.8 17.3 7.3
Year 12/12A 12/13A 12/14E 12/15E 12/16E
Revenue (US$ mn) 94,045 97,878 98,009 98,140 98,928 EBITDA (US$ mn) 1,082 969 1,070 1,239 1,399 Net profit (US$ mn) 471.3 243.5 440.1 559.4 706.4 EPS (US$) 0.07 0.04 0.07 0.08 0.11 - Change from prev. EPS (%) n.a. n.a. 0 0 0 - Consensus EPS (US$) n.a. n.a. 0.07 0.09 0.10 EPS growth (%) 7.5 (49.4) 80.8 27.1 26.3 P/E (x) 13.7 27.1 15.0 11.8 9.3 Dividend yield (%) 1.8 0.9 1.7 2.1 2.7 EV/EBITDA (x) 10.6 12.1 10.7 9.0 7.7 P/B (x) 1.3 1.3 1.2 1.1 1.0 ROE (%) 9.7 4.7 8.2 9.7 11.3 Net debt(cash)/equity (%) 94.5 98.4 88.0 76.7 64.2
Note 1: ORD/ADR=20.00. Note 2: Noble Group Limited is an investment holding company. Its subsidiaries, jointly controlled entities and associates comprise managing the global supply chain of agricultural, industrial and energy products; ship ownership, chartering.
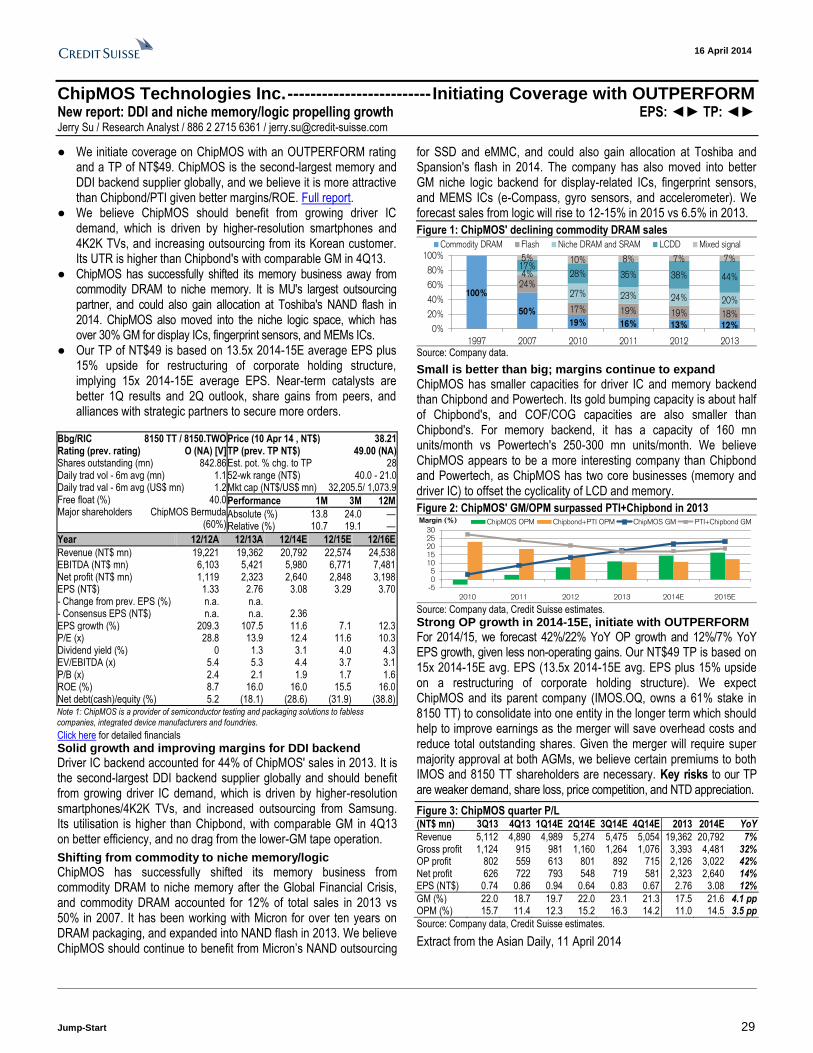
16 April 2014
Jump-Start 29
ChipMOS Technologies Inc. ------------------------- Initiating Coverage with OUTPERFORM New report: DDI and niche memory/logic propelling growth EPS: ◄► TP: ◄► Jerry Su / Research Analyst / 886 2 2715 6361 / [email protected]
● We initiate coverage on ChipMOS with an OUTPERFORM rating and a TP of NT$49. ChipMOS is the second-largest memory and DDI backend supplier globally, and we believe it is more attractive than Chipbond/PTI given better margins/ROE. Full report.
● We believe ChipMOS should benefit from growing driver IC demand, which is driven by higher-resolution smartphones and 4K2K TVs, and increasing outsourcing from its Korean customer. Its UTR is higher than Chipbond's with comparable GM in 4Q13.
● ChipMOS has successfully shifted its memory business away from commodity DRAM to niche memory. It is MU's largest outsourcing partner, and could also gain allocation at Toshiba's NAND flash in 2014. ChipMOS also moved into the niche logic space, which has over 30% GM for display ICs, fingerprint sensors, and MEMs ICs.
● Our TP of NT$49 is based on 13.5x 2014-15E average EPS plus 15% upside for restructuring of corporate holding structure, implying 15x 2014-15E average EPS. Near-term catalysts are better 1Q results and 2Q outlook, share gains from peers, and alliances with strategic partners to secure more orders.
Click here for detailed financials
Solid growth and improving margins for DDI backend
Driver IC backend accounted for 44% of ChipMOS' sales in 2013. It is the second-largest DDI backend supplier globally and should benefit from growing driver IC demand, which is driven by higher-resolution smartphones/4K2K TVs, and increased outsourcing from Samsung. Its utilisation is higher than Chipbond, with comparable GM in 4Q13 on better efficiency, and no drag from the lower-GM tape operation.
Shifting from commodity to niche memory/logic
ChipMOS has successfully shifted its memory business from commodity DRAM to niche memory after the Global Financial Crisis, and commodity DRAM accounted for 12% of total sales in 2013 vs 50% in 2007. It has been working with Micron for over ten years on DRAM packaging, and expanded into NAND flash in 2013. We believe ChipMOS should continue to benefit from Micron’s NAND outsourcing
for SSD and eMMC, and could also gain allocation at Toshiba and Spansion's flash in 2014. The company has also moved into better GM niche logic backend for display-related ICs, fingerprint sensors, and MEMS ICs (e-Compass, gyro sensors, and accelerometer). We forecast sales from logic will rise to 12-15% in 2015 vs 6.5% in 2013.
Figure 1: ChipMOS' declining commodity DRAM sales
100%
50%
19% 16% 13% 12%
24%
17% 19% 19% 18%
4%
27% 23% 24% 20%
17%28% 35% 38% 44%
5% 10% 8% 7% 7%
0%
20%
40%
60%
80%
100%
1997 2007 2010 2011 2012 2013
Commodity DRAM Flash Niche DRAM and SRAM LCDD Mixed signal
Source: Company data.
Small is better than big; margins continue to expand
ChipMOS has smaller capacities for driver IC and memory backend than Chipbond and Powertech. Its gold bumping capacity is about half of Chipbond's, and COF/COG capacities are also smaller than Chipbond's. For memory backend, it has a capacity of 160 mn units/month vs Powertech's 250-300 mn units/month. We believe ChipMOS appears to be a more interesting company than Chipbond and Powertech, as ChipMOS has two core businesses (memory and driver IC) to offset the cyclicality of LCD and memory.
Figure 2: ChipMOS' GM/OPM surpassed PTI+Chipbond in 2013
-505
1015202530
2010 2011 2012 2013 2014E 2015E
Margin (%) ChipMOS OPM Chipbond+PTI OPM ChipMOS GM PTI+Chipbond GM
Source: Company data, Credit Suisse estimates.
Strong OP growth in 2014-15E, initiate with OUTPERFORM
For 2014/15, we forecast 42%/22% YoY OP growth and 12%/7% YoY EPS growth, given less non-operating gains. Our NT$49 TP is based on 15x 2014-15E avg. EPS (13.5x 2014-15E avg. EPS plus 15% upside on a restructuring of corporate holding structure). We expect ChipMOS and its parent company (IMOS.OQ, owns a 61% stake in 8150 TT) to consolidate into one entity in the longer term which should help to improve earnings as the merger will save overhead costs and reduce total outstanding shares. Given the merger will require super majority approval at both AGMs, we believe certain premiums to both IMOS and 8150 TT shareholders are necessary. Key risks to our TP are weaker demand, share loss, price competition, and NTD appreciation.
Figure 3: ChipMOS quarter P/L (NT$ mn) 3Q13 4Q13 1Q14E 2Q14E 3Q14E 4Q14E 2013 2014E YoY
Revenue 5,112 4,890 4,989 5,274 5,475 5,054 19,362 20,792 7% Gross profit 1,124 915 981 1,160 1,264 1,076 3,393 4,481 32% OP profit 802 559 613 801 892 715 2,126 3,022 42% Net profit 626 722 793 548 719 581 2,323 2,640 14% EPS (NT$) 0.74 0.86 0.94 0.64 0.83 0.67 2.76 3.08 12%
GM (%) 22.0 18.7 19.7 22.0 23.1 21.3 17.5 21.6 4.1 pp OPM (%) 15.7 11.4 12.3 15.2 16.3 14.2 11.0 14.5 3.5 pp
Source: Company data, Credit Suisse estimates.
Extract from the Asian Daily, 11 April 2014
Bbg/RIC 8150 TT / 8150.TWO Rating (prev. rating) O (NA) [V] Shares outstanding (mn) 842.86 Daily trad vol - 6m avg (mn) 1.1 Daily trad val - 6m avg (US$ mn) 1.2 Free float (%) 40.0 Major shareholders ChipMOS Bermuda
(60%)
Price (10 Apr 14 , NT$) 38.21 TP (prev. TP NT$) 49.00 (NA) Est. pot. % chg. to TP 28 52-wk range (NT$) 40.0 - 21.0 Mkt cap (NT$/US$ mn) 32,205.5/ 1,073.9
Performance 1M 3M 12M
Absolute (%) 13.8 24.0 — Relative (%) 10.7 19.1 —
Year 12/12A 12/13A 12/14E 12/15E 12/16E
Revenue (NT$ mn) 19,221 19,362 20,792 22,574 24,538 EBITDA (NT$ mn) 6,103 5,421 5,980 6,771 7,481 Net profit (NT$ mn) 1,119 2,323 2,640 2,848 3,198 EPS (NT$) 1.33 2.76 3.08 3.29 3.70 - Change from prev. EPS (%) n.a. n.a. - Consensus EPS (NT$) n.a. n.a. 2.36 EPS growth (%) 209.3 107.5 11.6 7.1 12.3 P/E (x) 28.8 13.9 12.4 11.6 10.3 Dividend yield (%) 0 1.3 3.1 4.0 4.3 EV/EBITDA (x) 5.4 5.3 4.4 3.7 3.1 P/B (x) 2.4 2.1 1.9 1.7 1.6 ROE (%) 8.7 16.0 16.0 15.5 16.0 Net debt(cash)/equity (%) 5.2 (18.1) (28.6) (31.9) (38.8)
Note 1: ChipMOS is a provider of semiconductor testing and packaging solutions to fabless companies, integrated device manufacturers and foundries.
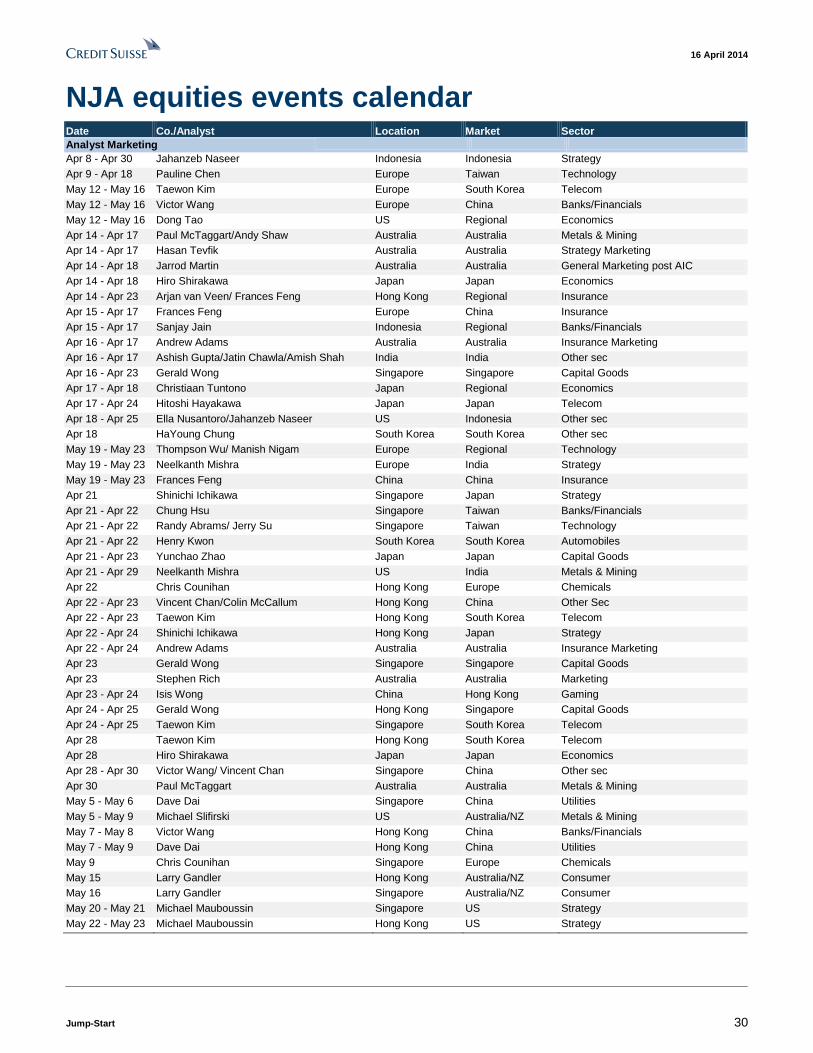
16 April 2014
Jump-Start 30
NJA equities events calendar Date Co./Analyst Location Market Sector
Analyst Marketing
Apr 8 - Apr 30 Jahanzeb Naseer Indonesia Indonesia Strategy
Apr 9 - Apr 18 Pauline Chen Europe Taiwan Technology
May 12 - May 16 Taewon Kim Europe South Korea Telecom
May 12 - May 16 Victor Wang Europe China Banks/Financials
May 12 - May 16 Dong Tao US Regional Economics
Apr 14 - Apr 17 Paul McTaggart/Andy Shaw Australia Australia Metals & Mining
Apr 14 - Apr 17 Hasan Tevfik Australia Australia Strategy Marketing
Apr 14 - Apr 18 Jarrod Martin Australia Australia General Marketing post AIC
Apr 14 - Apr 18 Hiro Shirakawa Japan Japan Economics
Apr 14 - Apr 23 Arjan van Veen/ Frances Feng Hong Kong Regional Insurance
Apr 15 - Apr 17 Frances Feng Europe China Insurance
Apr 15 - Apr 17 Sanjay Jain Indonesia Regional Banks/Financials
Apr 16 - Apr 17 Andrew Adams Australia Australia Insurance Marketing
Apr 16 - Apr 17 Ashish Gupta/Jatin Chawla/Amish Shah India India Other sec
Apr 16 - Apr 23 Gerald Wong Singapore Singapore Capital Goods
Apr 17 - Apr 18 Christiaan Tuntono Japan Regional Economics
Apr 17 - Apr 24 Hitoshi Hayakawa Japan Japan Telecom
Apr 18 - Apr 25 Ella Nusantoro/Jahanzeb Naseer US Indonesia Other sec
Apr 18 HaYoung Chung South Korea South Korea Other sec
May 19 - May 23 Thompson Wu/ Manish Nigam Europe Regional Technology
May 19 - May 23 Neelkanth Mishra Europe India Strategy
May 19 - May 23 Frances Feng China China Insurance
Apr 21 Shinichi Ichikawa Singapore Japan Strategy
Apr 21 - Apr 22 Chung Hsu Singapore Taiwan Banks/Financials
Apr 21 - Apr 22 Randy Abrams/ Jerry Su Singapore Taiwan Technology
Apr 21 - Apr 22 Henry Kwon South Korea South Korea Automobiles
Apr 21 - Apr 23 Yunchao Zhao Japan Japan Capital Goods
Apr 21 - Apr 29 Neelkanth Mishra US India Metals & Mining
Apr 22 Chris Counihan Hong Kong Europe Chemicals
Apr 22 - Apr 23 Vincent Chan/Colin McCallum Hong Kong China Other Sec
Apr 22 - Apr 23 Taewon Kim Hong Kong South Korea Telecom
Apr 22 - Apr 24 Shinichi Ichikawa Hong Kong Japan Strategy
Apr 22 - Apr 24 Andrew Adams Australia Australia Insurance Marketing
Apr 23 Gerald Wong Singapore Singapore Capital Goods
Apr 23 Stephen Rich Australia Australia Marketing
Apr 23 - Apr 24 Isis Wong China Hong Kong Gaming
Apr 24 - Apr 25 Gerald Wong Hong Kong Singapore Capital Goods
Apr 24 - Apr 25 Taewon Kim Singapore South Korea Telecom
Apr 28 Taewon Kim Hong Kong South Korea Telecom
Apr 28 Hiro Shirakawa Japan Japan Economics
Apr 28 - Apr 30 Victor Wang/ Vincent Chan Singapore China Other sec
Apr 30 Paul McTaggart Australia Australia Metals & Mining
May 5 - May 6 Dave Dai Singapore China Utilities
May 5 - May 9 Michael Slifirski US Australia/NZ Metals & Mining
May 7 - May 8 Victor Wang Hong Kong China Banks/Financials
May 7 - May 9 Dave Dai Hong Kong China Utilities
May 9 Chris Counihan Singapore Europe Chemicals
May 15 Larry Gandler Hong Kong Australia/NZ Consumer
May 16 Larry Gandler Singapore Australia/NZ Consumer
May 20 - May 21 Michael Mauboussin Singapore US Strategy
May 22 - May 23 Michael Mauboussin Hong Kong US Strategy
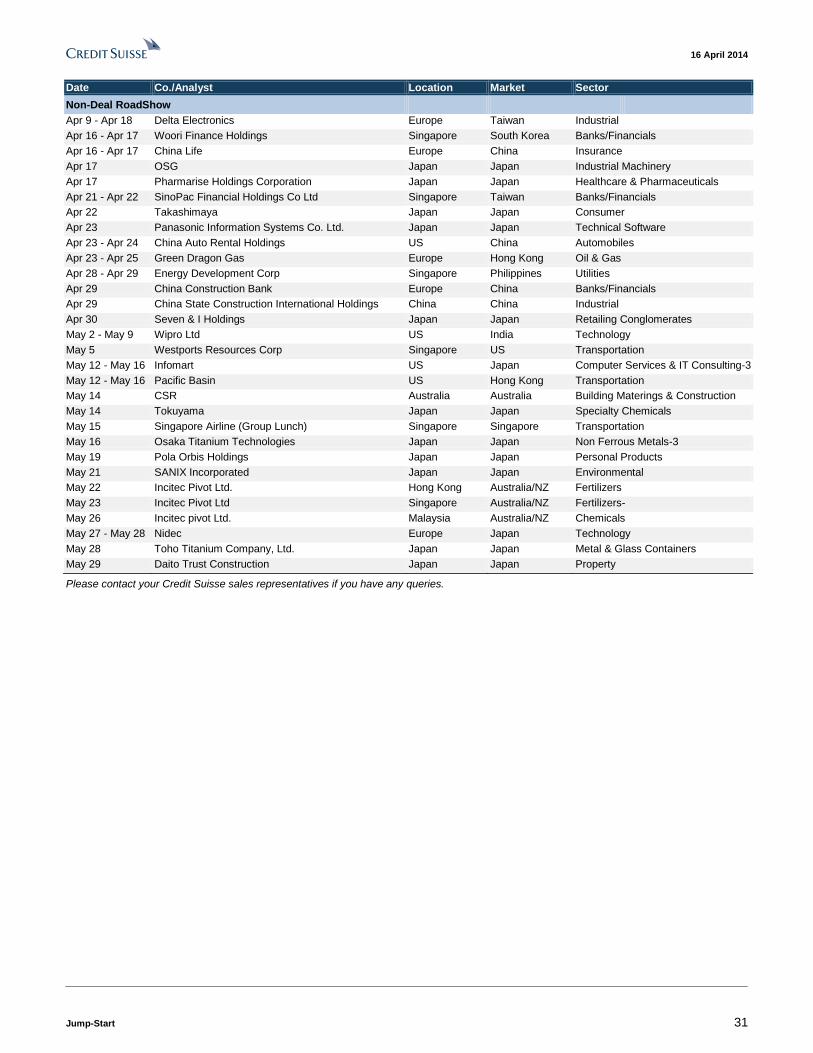
16 April 2014
Jump-Start 31
Date Co./Analyst Location Market Sector
Non-Deal RoadShow
Apr 9 - Apr 18 Delta Electronics Europe Taiwan Industrial
Apr 16 - Apr 17 Woori Finance Holdings Singapore South Korea Banks/Financials
Apr 16 - Apr 17 China Life Europe China Insurance
Apr 17 OSG Japan Japan Industrial Machinery
Apr 17 Pharmarise Holdings Corporation Japan Japan Healthcare & Pharmaceuticals
Apr 21 - Apr 22 SinoPac Financial Holdings Co Ltd Singapore Taiwan Banks/Financials
Apr 22 Takashimaya Japan Japan Consumer
Apr 23 Panasonic Information Systems Co. Ltd. Japan Japan Technical Software
Apr 23 - Apr 24 China Auto Rental Holdings US China Automobiles
Apr 23 - Apr 25 Green Dragon Gas Europe Hong Kong Oil & Gas
Apr 28 - Apr 29 Energy Development Corp Singapore Philippines Utilities
Apr 29 China Construction Bank Europe China Banks/Financials
Apr 29 China State Construction International Holdings China China Industrial
Apr 30 Seven & I Holdings Japan Japan Retailing Conglomerates
May 2 - May 9 Wipro Ltd US India Technology
May 5 Westports Resources Corp Singapore US Transportation
May 12 - May 16 Infomart US Japan Computer Services & IT Consulting-3
May 12 - May 16 Pacific Basin US Hong Kong Transportation
May 14 CSR Australia Australia Building Materings & Construction
May 14 Tokuyama Japan Japan Specialty Chemicals
May 15 Singapore Airline (Group Lunch) Singapore Singapore Transportation
May 16 Osaka Titanium Technologies Japan Japan Non Ferrous Metals-3
May 19 Pola Orbis Holdings Japan Japan Personal Products
May 21 SANIX Incorporated Japan Japan Environmental
May 22 Incitec Pivot Ltd. Hong Kong Australia/NZ Fertilizers
May 23 Incitec Pivot Ltd Singapore Australia/NZ Fertilizers-
May 26 Incitec pivot Ltd. Malaysia Australia/NZ Chemicals
May 27 - May 28 Nidec Europe Japan Technology
May 28 Toho Titanium Company, Ltd. Japan Japan Metal & Glass Containers
May 29 Daito Trust Construction Japan Japan Property
Please contact your Credit Suisse sales representatives if you have any queries.
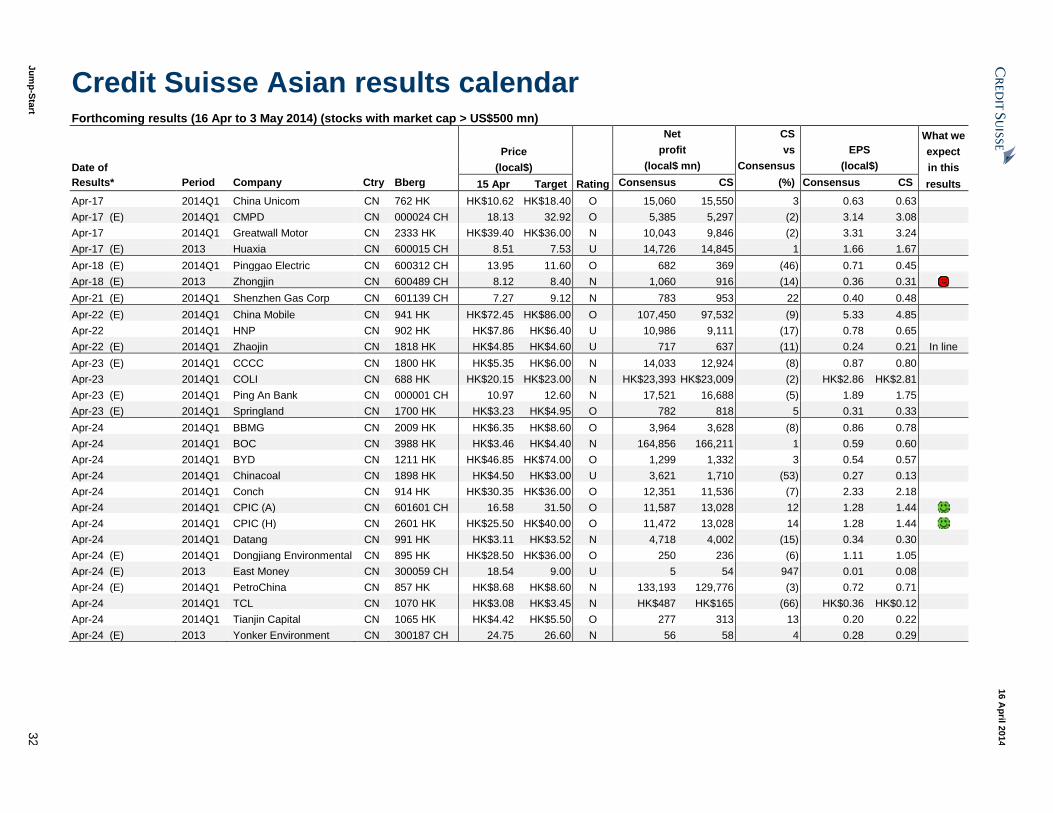
Ju
mp
-Sta
rt 3
2
16 A
pril 2
014
Credit Suisse Asian results calendar Forthcoming results (16 Apr to 3 May 2014) (stocks with market cap > US$500 mn)
Net CS What we
Price profit vs EPS expect
Date of (local$) (local$ mn) Consensus (local$) in this
Results* Period Company Ctry Bberg 15 Apr Target Rating Consensus CS (%) Consensus CS results
Apr-17 2014Q1 China Unicom CN 762 HK HK$10.62 HK$18.40 O 15,060 15,550 3 0.63 0.63
Apr-17 (E) 2014Q1 CMPD CN 000024 CH 18.13 32.92 O 5,385 5,297 (2) 3.14 3.08
Apr-17 2014Q1 Greatwall Motor CN 2333 HK HK$39.40 HK$36.00 N 10,043 9,846 (2) 3.31 3.24
Apr-17 (E) 2013 Huaxia CN 600015 CH 8.51 7.53 U 14,726 14,845 1 1.66 1.67
Apr-18 (E) 2014Q1 Pinggao Electric CN 600312 CH 13.95 11.60 O 682 369 (46) 0.71 0.45
Apr-18 (E) 2013 Zhongjin CN 600489 CH 8.12 8.40 N 1,060 916 (14) 0.36 0.31 Apr-21 (E) 2014Q1 Shenzhen Gas Corp CN 601139 CH 7.27 9.12 N 783 953 22 0.40 0.48
Apr-22 (E) 2014Q1 China Mobile CN 941 HK HK$72.45 HK$86.00 O 107,450 97,532 (9) 5.33 4.85
Apr-22 2014Q1 HNP CN 902 HK HK$7.86 HK$6.40 U 10,986 9,111 (17) 0.78 0.65
Apr-22 (E) 2014Q1 Zhaojin CN 1818 HK HK$4.85 HK$4.60 U 717 637 (11) 0.24 0.21 In line
Apr-23 (E) 2014Q1 CCCC CN 1800 HK HK$5.35 HK$6.00 N 14,033 12,924 (8) 0.87 0.80
Apr-23 2014Q1 COLI CN 688 HK HK$20.15 HK$23.00 N HK$23,393 HK$23,009 (2) HK$2.86 HK$2.81
Apr-23 (E) 2014Q1 Ping An Bank CN 000001 CH 10.97 12.60 N 17,521 16,688 (5) 1.89 1.75
Apr-23 (E) 2014Q1 Springland CN 1700 HK HK$3.23 HK$4.95 O 782 818 5 0.31 0.33
Apr-24 2014Q1 BBMG CN 2009 HK HK$6.35 HK$8.60 O 3,964 3,628 (8) 0.86 0.78
Apr-24 2014Q1 BOC CN 3988 HK HK$3.46 HK$4.40 N 164,856 166,211 1 0.59 0.60
Apr-24 2014Q1 BYD CN 1211 HK HK$46.85 HK$74.00 O 1,299 1,332 3 0.54 0.57
Apr-24 2014Q1 Chinacoal CN 1898 HK HK$4.50 HK$3.00 U 3,621 1,710 (53) 0.27 0.13
Apr-24 2014Q1 Conch CN 914 HK HK$30.35 HK$36.00 O 12,351 11,536 (7) 2.33 2.18
Apr-24 2014Q1 CPIC (A) CN 601601 CH 16.58 31.50 O 11,587 13,028 12 1.28 1.44 Apr-24 2014Q1 CPIC (H) CN 2601 HK HK$25.50 HK$40.00 O 11,472 13,028 14 1.28 1.44 Apr-24 2014Q1 Datang CN 991 HK HK$3.11 HK$3.52 N 4,718 4,002 (15) 0.34 0.30
Apr-24 (E) 2014Q1 Dongjiang Environmental CN 895 HK HK$28.50 HK$36.00 O 250 236 (6) 1.11 1.05
Apr-24 (E) 2013 East Money CN 300059 CH 18.54 9.00 U 5 54 947 0.01 0.08
Apr-24 (E) 2014Q1 PetroChina CN 857 HK HK$8.68 HK$8.60 N 133,193 129,776 (3) 0.72 0.71
Apr-24 2014Q1 TCL CN 1070 HK HK$3.08 HK$3.45 N HK$487 HK$165 (66) HK$0.36 HK$0.12
Apr-24 2014Q1 Tianjin Capital CN 1065 HK HK$4.42 HK$5.50 O 277 313 13 0.20 0.22
Apr-24 (E) 2013 Yonker Environment CN 300187 CH 24.75 26.60 N 56 58 4 0.28 0.29
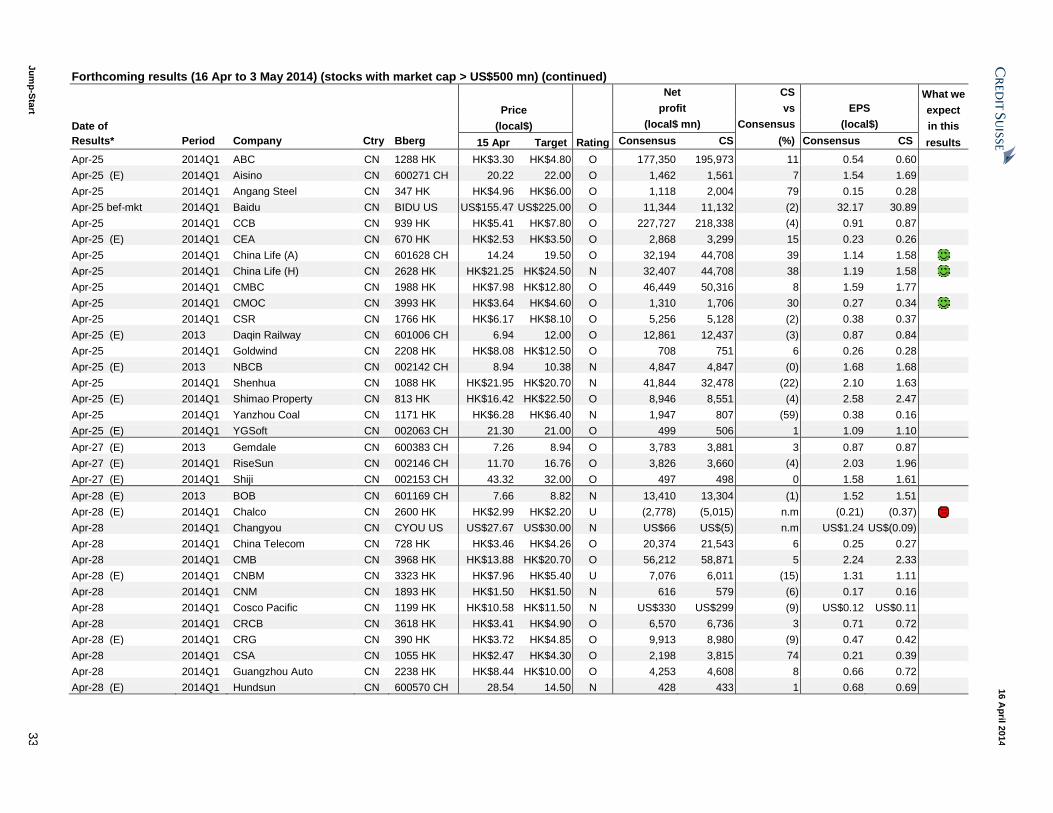
Ju
mp
-Sta
rt 3
3
16 A
pril 2
014
Forthcoming results (16 Apr to 3 May 2014) (stocks with market cap > US$500 mn) (continued)
Net CS What we
Price profit vs EPS expect
Date of (local$) (local$ mn) Consensus (local$) in this
Results* Period Company Ctry Bberg 15 Apr Target Rating Consensus CS (%) Consensus CS results
Apr-25 2014Q1 ABC CN 1288 HK HK$3.30 HK$4.80 O 177,350 195,973 11 0.54 0.60
Apr-25 (E) 2014Q1 Aisino CN 600271 CH 20.22 22.00 O 1,462 1,561 7 1.54 1.69
Apr-25 2014Q1 Angang Steel CN 347 HK HK$4.96 HK$6.00 O 1,118 2,004 79 0.15 0.28
Apr-25 bef-mkt 2014Q1 Baidu CN BIDU US US$155.47 US$225.00 O 11,344 11,132 (2) 32.17 30.89
Apr-25 2014Q1 CCB CN 939 HK HK$5.41 HK$7.80 O 227,727 218,338 (4) 0.91 0.87
Apr-25 (E) 2014Q1 CEA CN 670 HK HK$2.53 HK$3.50 O 2,868 3,299 15 0.23 0.26
Apr-25 2014Q1 China Life (A) CN 601628 CH 14.24 19.50 O 32,194 44,708 39 1.14 1.58 Apr-25 2014Q1 China Life (H) CN 2628 HK HK$21.25 HK$24.50 N 32,407 44,708 38 1.19 1.58 Apr-25 2014Q1 CMBC CN 1988 HK HK$7.98 HK$12.80 O 46,449 50,316 8 1.59 1.77
Apr-25 2014Q1 CMOC CN 3993 HK HK$3.64 HK$4.60 O 1,310 1,706 30 0.27 0.34 Apr-25 2014Q1 CSR CN 1766 HK HK$6.17 HK$8.10 O 5,256 5,128 (2) 0.38 0.37
Apr-25 (E) 2013 Daqin Railway CN 601006 CH 6.94 12.00 O 12,861 12,437 (3) 0.87 0.84
Apr-25 2014Q1 Goldwind CN 2208 HK HK$8.08 HK$12.50 O 708 751 6 0.26 0.28
Apr-25 (E) 2013 NBCB CN 002142 CH 8.94 10.38 N 4,847 4,847 (0) 1.68 1.68
Apr-25 2014Q1 Shenhua CN 1088 HK HK$21.95 HK$20.70 N 41,844 32,478 (22) 2.10 1.63
Apr-25 (E) 2014Q1 Shimao Property CN 813 HK HK$16.42 HK$22.50 O 8,946 8,551 (4) 2.58 2.47
Apr-25 2014Q1 Yanzhou Coal CN 1171 HK HK$6.28 HK$6.40 N 1,947 807 (59) 0.38 0.16
Apr-25 (E) 2014Q1 YGSoft CN 002063 CH 21.30 21.00 O 499 506 1 1.09 1.10
Apr-27 (E) 2013 Gemdale CN 600383 CH 7.26 8.94 O 3,783 3,881 3 0.87 0.87
Apr-27 (E) 2014Q1 RiseSun CN 002146 CH 11.70 16.76 O 3,826 3,660 (4) 2.03 1.96
Apr-27 (E) 2014Q1 Shiji CN 002153 CH 43.32 32.00 O 497 498 0 1.58 1.61
Apr-28 (E) 2013 BOB CN 601169 CH 7.66 8.82 N 13,410 13,304 (1) 1.52 1.51
Apr-28 (E) 2014Q1 Chalco CN 2600 HK HK$2.99 HK$2.20 U (2,778) (5,015) n.m (0.21) (0.37) Apr-28 2014Q1 Changyou CN CYOU US US$27.67 US$30.00 N US$66 US$(5) n.m US$1.24 US$(0.09)
Apr-28 2014Q1 China Telecom CN 728 HK HK$3.46 HK$4.26 O 20,374 21,543 6 0.25 0.27
Apr-28 2014Q1 CMB CN 3968 HK HK$13.88 HK$20.70 O 56,212 58,871 5 2.24 2.33
Apr-28 (E) 2014Q1 CNBM CN 3323 HK HK$7.96 HK$5.40 U 7,076 6,011 (15) 1.31 1.11
Apr-28 2014Q1 CNM CN 1893 HK HK$1.50 HK$1.50 N 616 579 (6) 0.17 0.16
Apr-28 2014Q1 Cosco Pacific CN 1199 HK HK$10.58 HK$11.50 N US$330 US$299 (9) US$0.12 US$0.11
Apr-28 2014Q1 CRCB CN 3618 HK HK$3.41 HK$4.90 O 6,570 6,736 3 0.71 0.72
Apr-28 (E) 2014Q1 CRG CN 390 HK HK$3.72 HK$4.85 O 9,913 8,980 (9) 0.47 0.42
Apr-28 2014Q1 CSA CN 1055 HK HK$2.47 HK$4.30 O 2,198 3,815 74 0.21 0.39
Apr-28 2014Q1 Guangzhou Auto CN 2238 HK HK$8.44 HK$10.00 O 4,253 4,608 8 0.66 0.72
Apr-28 (E) 2014Q1 Hundsun CN 600570 CH 28.54 14.50 N 428 433 1 0.68 0.69
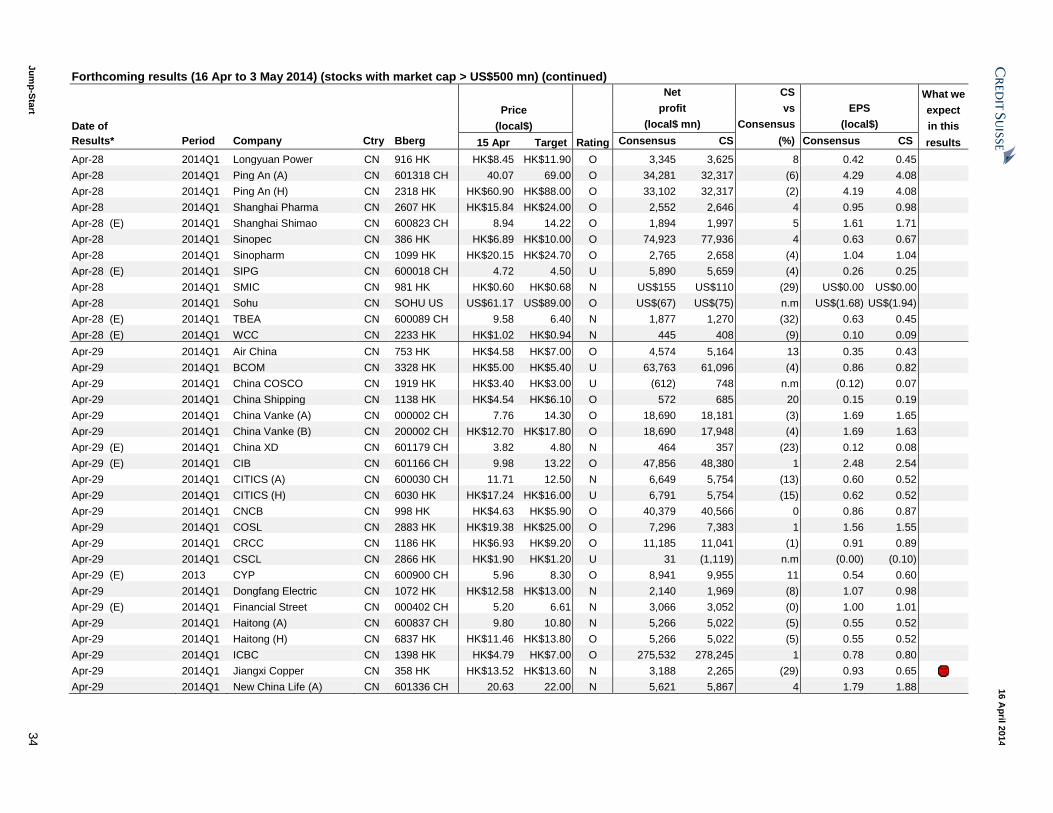
Ju
mp
-Sta
rt 3
4
16 A
pril 2
014
Forthcoming results (16 Apr to 3 May 2014) (stocks with market cap > US$500 mn) (continued)
Net CS What we
Price profit vs EPS expect
Date of (local$) (local$ mn) Consensus (local$) in this
Results* Period Company Ctry Bberg 15 Apr Target Rating Consensus CS (%) Consensus CS results
Apr-28 2014Q1 Longyuan Power CN 916 HK HK$8.45 HK$11.90 O 3,345 3,625 8 0.42 0.45
Apr-28 2014Q1 Ping An (A) CN 601318 CH 40.07 69.00 O 34,281 32,317 (6) 4.29 4.08
Apr-28 2014Q1 Ping An (H) CN 2318 HK HK$60.90 HK$88.00 O 33,102 32,317 (2) 4.19 4.08
Apr-28 2014Q1 Shanghai Pharma CN 2607 HK HK$15.84 HK$24.00 O 2,552 2,646 4 0.95 0.98
Apr-28 (E) 2014Q1 Shanghai Shimao CN 600823 CH 8.94 14.22 O 1,894 1,997 5 1.61 1.71
Apr-28 2014Q1 Sinopec CN 386 HK HK$6.89 HK$10.00 O 74,923 77,936 4 0.63 0.67
Apr-28 2014Q1 Sinopharm CN 1099 HK HK$20.15 HK$24.70 O 2,765 2,658 (4) 1.04 1.04
Apr-28 (E) 2014Q1 SIPG CN 600018 CH 4.72 4.50 U 5,890 5,659 (4) 0.26 0.25
Apr-28 2014Q1 SMIC CN 981 HK HK$0.60 HK$0.68 N US$155 US$110 (29) US$0.00 US$0.00
Apr-28 2014Q1 Sohu CN SOHU US US$61.17 US$89.00 O US$(67) US$(75) n.m US$(1.68) US$(1.94)
Apr-28 (E) 2014Q1 TBEA CN 600089 CH 9.58 6.40 N 1,877 1,270 (32) 0.63 0.45
Apr-28 (E) 2014Q1 WCC CN 2233 HK HK$1.02 HK$0.94 N 445 408 (9) 0.10 0.09
Apr-29 2014Q1 Air China CN 753 HK HK$4.58 HK$7.00 O 4,574 5,164 13 0.35 0.43
Apr-29 2014Q1 BCOM CN 3328 HK HK$5.00 HK$5.40 U 63,763 61,096 (4) 0.86 0.82
Apr-29 2014Q1 China COSCO CN 1919 HK HK$3.40 HK$3.00 U (612) 748 n.m (0.12) 0.07
Apr-29 2014Q1 China Shipping CN 1138 HK HK$4.54 HK$6.10 O 572 685 20 0.15 0.19
Apr-29 2014Q1 China Vanke (A) CN 000002 CH 7.76 14.30 O 18,690 18,181 (3) 1.69 1.65
Apr-29 2014Q1 China Vanke (B) CN 200002 CH HK$12.70 HK$17.80 O 18,690 17,948 (4) 1.69 1.63
Apr-29 (E) 2014Q1 China XD CN 601179 CH 3.82 4.80 N 464 357 (23) 0.12 0.08
Apr-29 (E) 2014Q1 CIB CN 601166 CH 9.98 13.22 O 47,856 48,380 1 2.48 2.54
Apr-29 2014Q1 CITICS (A) CN 600030 CH 11.71 12.50 N 6,649 5,754 (13) 0.60 0.52
Apr-29 2014Q1 CITICS (H) CN 6030 HK HK$17.24 HK$16.00 U 6,791 5,754 (15) 0.62 0.52
Apr-29 2014Q1 CNCB CN 998 HK HK$4.63 HK$5.90 O 40,379 40,566 0 0.86 0.87
Apr-29 2014Q1 COSL CN 2883 HK HK$19.38 HK$25.00 O 7,296 7,383 1 1.56 1.55
Apr-29 2014Q1 CRCC CN 1186 HK HK$6.93 HK$9.20 O 11,185 11,041 (1) 0.91 0.89
Apr-29 2014Q1 CSCL CN 2866 HK HK$1.90 HK$1.20 U 31 (1,119) n.m (0.00) (0.10)
Apr-29 (E) 2013 CYP CN 600900 CH 5.96 8.30 O 8,941 9,955 11 0.54 0.60
Apr-29 2014Q1 Dongfang Electric CN 1072 HK HK$12.58 HK$13.00 N 2,140 1,969 (8) 1.07 0.98
Apr-29 (E) 2014Q1 Financial Street CN 000402 CH 5.20 6.61 N 3,066 3,052 (0) 1.00 1.01
Apr-29 2014Q1 Haitong (A) CN 600837 CH 9.80 10.80 N 5,266 5,022 (5) 0.55 0.52
Apr-29 2014Q1 Haitong (H) CN 6837 HK HK$11.46 HK$13.80 O 5,266 5,022 (5) 0.55 0.52
Apr-29 2014Q1 ICBC CN 1398 HK HK$4.79 HK$7.00 O 275,532 278,245 1 0.78 0.80
Apr-29 2014Q1 Jiangxi Copper CN 358 HK HK$13.52 HK$13.60 N 3,188 2,265 (29) 0.93 0.65 Apr-29 2014Q1 New China Life (A) CN 601336 CH 20.63 22.00 N 5,621 5,867 4 1.79 1.88
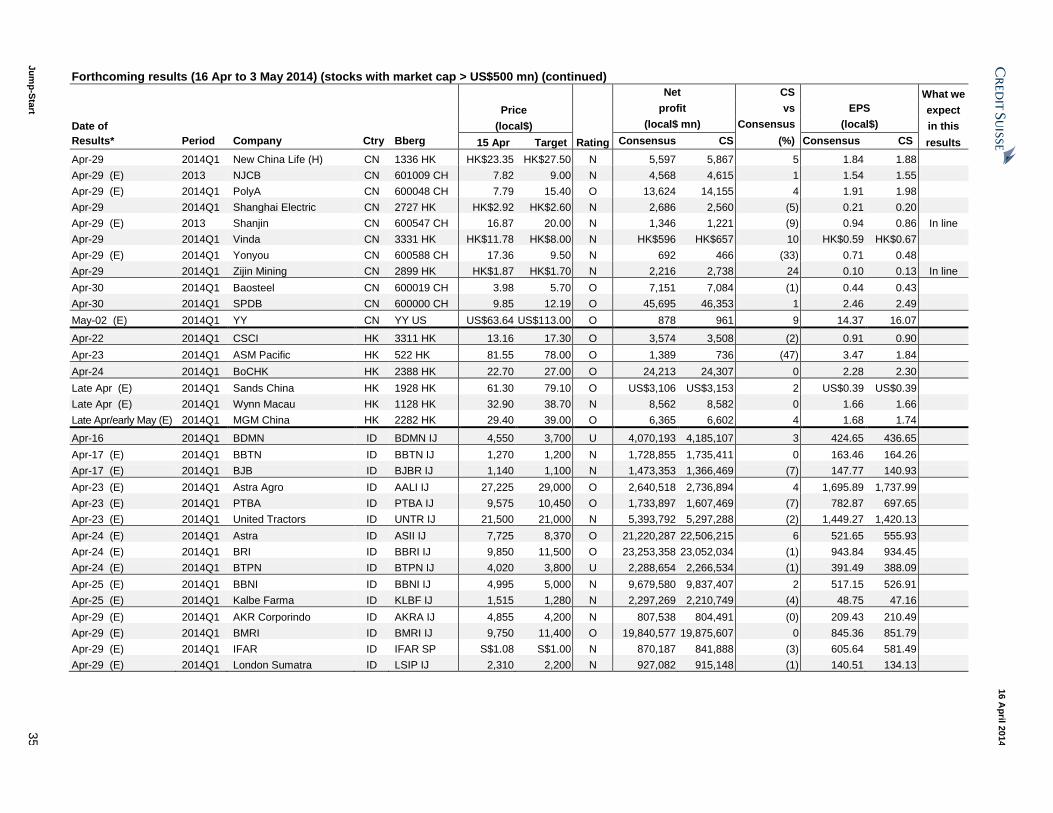
Ju
mp
-Sta
rt 3
5
16 A
pril 2
014
Forthcoming results (16 Apr to 3 May 2014) (stocks with market cap > US$500 mn) (continued)
Net CS What we
Price profit vs EPS expect
Date of (local$) (local$ mn) Consensus (local$) in this
Results* Period Company Ctry Bberg 15 Apr Target Rating Consensus CS (%) Consensus CS results
Apr-29 2014Q1 New China Life (H) CN 1336 HK HK$23.35 HK$27.50 N 5,597 5,867 5 1.84 1.88
Apr-29 (E) 2013 NJCB CN 601009 CH 7.82 9.00 N 4,568 4,615 1 1.54 1.55
Apr-29 (E) 2014Q1 PolyA CN 600048 CH 7.79 15.40 O 13,624 14,155 4 1.91 1.98
Apr-29 2014Q1 Shanghai Electric CN 2727 HK HK$2.92 HK$2.60 N 2,686 2,560 (5) 0.21 0.20
Apr-29 (E) 2013 Shanjin CN 600547 CH 16.87 20.00 N 1,346 1,221 (9) 0.94 0.86 In line
Apr-29 2014Q1 Vinda CN 3331 HK HK$11.78 HK$8.00 N HK$596 HK$657 10 HK$0.59 HK$0.67
Apr-29 (E) 2014Q1 Yonyou CN 600588 CH 17.36 9.50 N 692 466 (33) 0.71 0.48
Apr-29 2014Q1 Zijin Mining CN 2899 HK HK$1.87 HK$1.70 N 2,216 2,738 24 0.10 0.13 In line
Apr-30 2014Q1 Baosteel CN 600019 CH 3.98 5.70 O 7,151 7,084 (1) 0.44 0.43
Apr-30 2014Q1 SPDB CN 600000 CH 9.85 12.19 O 45,695 46,353 1 2.46 2.49
May-02 (E) 2014Q1 YY CN YY US US$63.64 US$113.00 O 878 961 9 14.37 16.07
Apr-22 2014Q1 CSCI HK 3311 HK 13.16 17.30 O 3,574 3,508 (2) 0.91 0.90
Apr-23 2014Q1 ASM Pacific HK 522 HK 81.55 78.00 O 1,389 736 (47) 3.47 1.84
Apr-24 2014Q1 BoCHK HK 2388 HK 22.70 27.00 O 24,213 24,307 0 2.28 2.30
Late Apr (E) 2014Q1 Sands China HK 1928 HK 61.30 79.10 O US$3,106 US$3,153 2 US$0.39 US$0.39
Late Apr (E) 2014Q1 Wynn Macau HK 1128 HK 32.90 38.70 N 8,562 8,582 0 1.66 1.66
Late Apr/early May (E) 2014Q1 MGM China HK 2282 HK 29.40 39.00 O 6,365 6,602 4 1.68 1.74
Apr-16 2014Q1 BDMN ID BDMN IJ 4,550 3,700 U 4,070,193 4,185,107 3 424.65 436.65
Apr-17 (E) 2014Q1 BBTN ID BBTN IJ 1,270 1,200 N 1,728,855 1,735,411 0 163.46 164.26
Apr-17 (E) 2014Q1 BJB ID BJBR IJ 1,140 1,100 N 1,473,353 1,366,469 (7) 147.77 140.93
Apr-23 (E) 2014Q1 Astra Agro ID AALI IJ 27,225 29,000 O 2,640,518 2,736,894 4 1,695.89 1,737.99
Apr-23 (E) 2014Q1 PTBA ID PTBA IJ 9,575 10,450 O 1,733,897 1,607,469 (7) 782.87 697.65
Apr-23 (E) 2014Q1 United Tractors ID UNTR IJ 21,500 21,000 N 5,393,792 5,297,288 (2) 1,449.27 1,420.13
Apr-24 (E) 2014Q1 Astra ID ASII IJ 7,725 8,370 O 21,220,287 22,506,215 6 521.65 555.93
Apr-24 (E) 2014Q1 BRI ID BBRI IJ 9,850 11,500 O 23,253,358 23,052,034 (1) 943.84 934.45
Apr-24 (E) 2014Q1 BTPN ID BTPN IJ 4,020 3,800 U 2,288,654 2,266,534 (1) 391.49 388.09
Apr-25 (E) 2014Q1 BBNI ID BBNI IJ 4,995 5,000 N 9,679,580 9,837,407 2 517.15 526.91
Apr-25 (E) 2014Q1 Kalbe Farma ID KLBF IJ 1,515 1,280 N 2,297,269 2,210,749 (4) 48.75 47.16
Apr-29 (E) 2014Q1 AKR Corporindo ID AKRA IJ 4,855 4,200 N 807,538 804,491 (0) 209.43 210.49
Apr-29 (E) 2014Q1 BMRI ID BMRI IJ 9,750 11,400 O 19,840,577 19,875,607 0 845.36 851.79
Apr-29 (E) 2014Q1 IFAR ID IFAR SP S$1.08 S$1.00 N 870,187 841,888 (3) 605.64 581.49
Apr-29 (E) 2014Q1 London Sumatra ID LSIP IJ 2,310 2,200 N 927,082 915,148 (1) 140.51 134.13
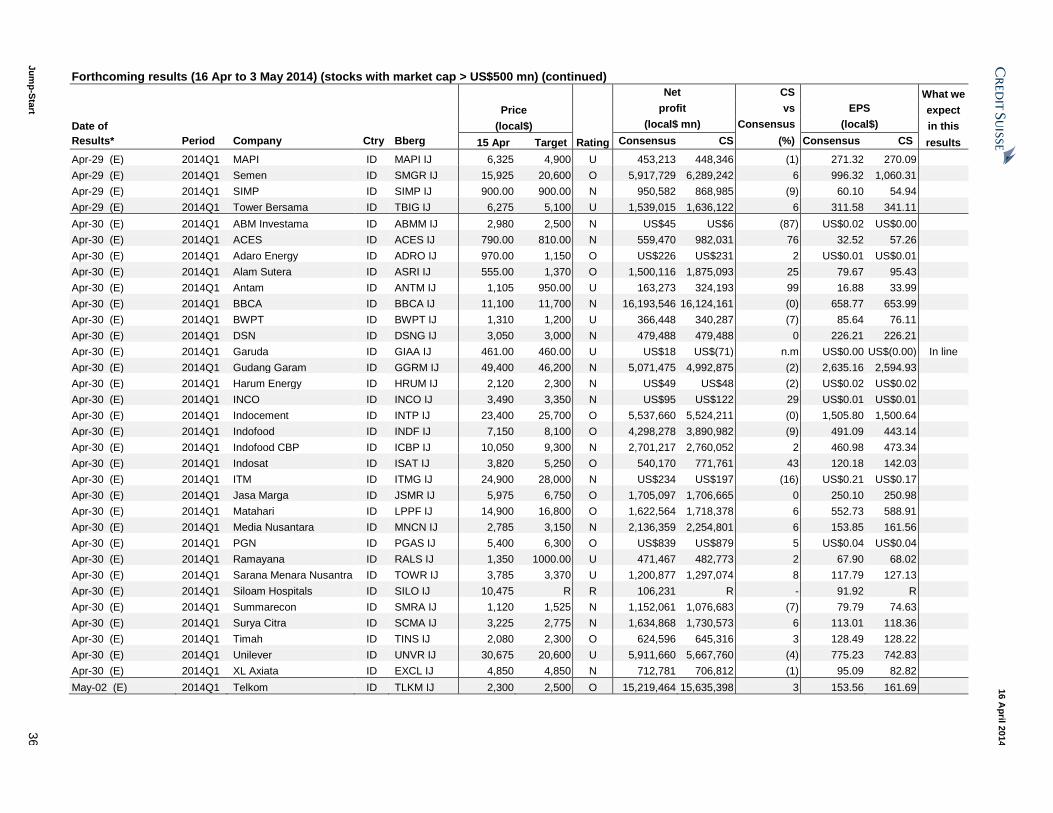
Ju
mp
-Sta
rt 3
6
16 A
pril 2
014
Forthcoming results (16 Apr to 3 May 2014) (stocks with market cap > US$500 mn) (continued)
Net CS What we
Price profit vs EPS expect
Date of (local$) (local$ mn) Consensus (local$) in this
Results* Period Company Ctry Bberg 15 Apr Target Rating Consensus CS (%) Consensus CS results
Apr-29 (E) 2014Q1 MAPI ID MAPI IJ 6,325 4,900 U 453,213 448,346 (1) 271.32 270.09
Apr-29 (E) 2014Q1 Semen ID SMGR IJ 15,925 20,600 O 5,917,729 6,289,242 6 996.32 1,060.31
Apr-29 (E) 2014Q1 SIMP ID SIMP IJ 900.00 900.00 N 950,582 868,985 (9) 60.10 54.94
Apr-29 (E) 2014Q1 Tower Bersama ID TBIG IJ 6,275 5,100 U 1,539,015 1,636,122 6 311.58 341.11
Apr-30 (E) 2014Q1 ABM Investama ID ABMM IJ 2,980 2,500 N US$45 US$6 (87) US$0.02 US$0.00
Apr-30 (E) 2014Q1 ACES ID ACES IJ 790.00 810.00 N 559,470 982,031 76 32.52 57.26
Apr-30 (E) 2014Q1 Adaro Energy ID ADRO IJ 970.00 1,150 O US$226 US$231 2 US$0.01 US$0.01
Apr-30 (E) 2014Q1 Alam Sutera ID ASRI IJ 555.00 1,370 O 1,500,116 1,875,093 25 79.67 95.43
Apr-30 (E) 2014Q1 Antam ID ANTM IJ 1,105 950.00 U 163,273 324,193 99 16.88 33.99
Apr-30 (E) 2014Q1 BBCA ID BBCA IJ 11,100 11,700 N 16,193,546 16,124,161 (0) 658.77 653.99
Apr-30 (E) 2014Q1 BWPT ID BWPT IJ 1,310 1,200 U 366,448 340,287 (7) 85.64 76.11
Apr-30 (E) 2014Q1 DSN ID DSNG IJ 3,050 3,000 N 479,488 479,488 0 226.21 226.21
Apr-30 (E) 2014Q1 Garuda ID GIAA IJ 461.00 460.00 U US$18 US$(71) n.m US$0.00 US$(0.00) In line
Apr-30 (E) 2014Q1 Gudang Garam ID GGRM IJ 49,400 46,200 N 5,071,475 4,992,875 (2) 2,635.16 2,594.93
Apr-30 (E) 2014Q1 Harum Energy ID HRUM IJ 2,120 2,300 N US$49 US$48 (2) US$0.02 US$0.02
Apr-30 (E) 2014Q1 INCO ID INCO IJ 3,490 3,350 N US$95 US$122 29 US$0.01 US$0.01
Apr-30 (E) 2014Q1 Indocement ID INTP IJ 23,400 25,700 O 5,537,660 5,524,211 (0) 1,505.80 1,500.64
Apr-30 (E) 2014Q1 Indofood ID INDF IJ 7,150 8,100 O 4,298,278 3,890,982 (9) 491.09 443.14
Apr-30 (E) 2014Q1 Indofood CBP ID ICBP IJ 10,050 9,300 N 2,701,217 2,760,052 2 460.98 473.34
Apr-30 (E) 2014Q1 Indosat ID ISAT IJ 3,820 5,250 O 540,170 771,761 43 120.18 142.03
Apr-30 (E) 2014Q1 ITM ID ITMG IJ 24,900 28,000 N US$234 US$197 (16) US$0.21 US$0.17
Apr-30 (E) 2014Q1 Jasa Marga ID JSMR IJ 5,975 6,750 O 1,705,097 1,706,665 0 250.10 250.98
Apr-30 (E) 2014Q1 Matahari ID LPPF IJ 14,900 16,800 O 1,622,564 1,718,378 6 552.73 588.91
Apr-30 (E) 2014Q1 Media Nusantara ID MNCN IJ 2,785 3,150 N 2,136,359 2,254,801 6 153.85 161.56
Apr-30 (E) 2014Q1 PGN ID PGAS IJ 5,400 6,300 O US$839 US$879 5 US$0.04 US$0.04
Apr-30 (E) 2014Q1 Ramayana ID RALS IJ 1,350 1000.00 U 471,467 482,773 2 67.90 68.02
Apr-30 (E) 2014Q1 Sarana Menara Nusantra ID TOWR IJ 3,785 3,370 U 1,200,877 1,297,074 8 117.79 127.13
Apr-30 (E) 2014Q1 Siloam Hospitals ID SILO IJ 10,475 R R 106,231 R - 91.92 R
Apr-30 (E) 2014Q1 Summarecon ID SMRA IJ 1,120 1,525 N 1,152,061 1,076,683 (7) 79.79 74.63
Apr-30 (E) 2014Q1 Surya Citra ID SCMA IJ 3,225 2,775 N 1,634,868 1,730,573 6 113.01 118.36
Apr-30 (E) 2014Q1 Timah ID TINS IJ 2,080 2,300 O 624,596 645,316 3 128.49 128.22
Apr-30 (E) 2014Q1 Unilever ID UNVR IJ 30,675 20,600 U 5,911,660 5,667,760 (4) 775.23 742.83
Apr-30 (E) 2014Q1 XL Axiata ID EXCL IJ 4,850 4,850 N 712,781 706,812 (1) 95.09 82.82
May-02 (E) 2014Q1 Telkom ID TLKM IJ 2,300 2,500 O 15,219,464 15,635,398 3 153.56 161.69
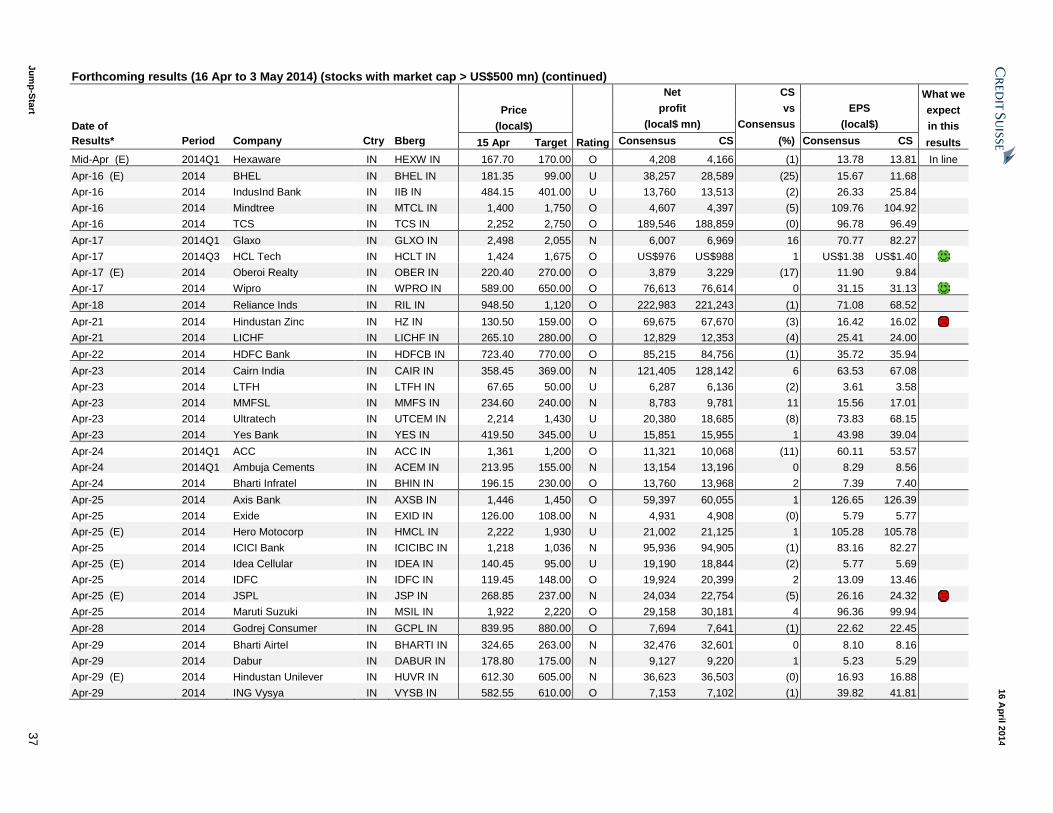
Ju
mp
-Sta
rt 3
7
16 A
pril 2
014
Forthcoming results (16 Apr to 3 May 2014) (stocks with market cap > US$500 mn) (continued)
Net CS What we
Price profit vs EPS expect
Date of (local$) (local$ mn) Consensus (local$) in this
Results* Period Company Ctry Bberg 15 Apr Target Rating Consensus CS (%) Consensus CS results
Mid-Apr (E) 2014Q1 Hexaware IN HEXW IN 167.70 170.00 O 4,208 4,166 (1) 13.78 13.81 In line
Apr-16 (E) 2014 BHEL IN BHEL IN 181.35 99.00 U 38,257 28,589 (25) 15.67 11.68
Apr-16 2014 IndusInd Bank IN IIB IN 484.15 401.00 U 13,760 13,513 (2) 26.33 25.84
Apr-16 2014 Mindtree IN MTCL IN 1,400 1,750 O 4,607 4,397 (5) 109.76 104.92
Apr-16 2014 TCS IN TCS IN 2,252 2,750 O 189,546 188,859 (0) 96.78 96.49
Apr-17 2014Q1 Glaxo IN GLXO IN 2,498 2,055 N 6,007 6,969 16 70.77 82.27
Apr-17 2014Q3 HCL Tech IN HCLT IN 1,424 1,675 O US$976 US$988 1 US$1.38 US$1.40 Apr-17 (E) 2014 Oberoi Realty IN OBER IN 220.40 270.00 O 3,879 3,229 (17) 11.90 9.84
Apr-17 2014 Wipro IN WPRO IN 589.00 650.00 O 76,613 76,614 0 31.15 31.13 Apr-18 2014 Reliance Inds IN RIL IN 948.50 1,120 O 222,983 221,243 (1) 71.08 68.52
Apr-21 2014 Hindustan Zinc IN HZ IN 130.50 159.00 O 69,675 67,670 (3) 16.42 16.02 Apr-21 2014 LICHF IN LICHF IN 265.10 280.00 O 12,829 12,353 (4) 25.41 24.00
Apr-22 2014 HDFC Bank IN HDFCB IN 723.40 770.00 O 85,215 84,756 (1) 35.72 35.94
Apr-23 2014 Cairn India IN CAIR IN 358.45 369.00 N 121,405 128,142 6 63.53 67.08
Apr-23 2014 LTFH IN LTFH IN 67.65 50.00 U 6,287 6,136 (2) 3.61 3.58
Apr-23 2014 MMFSL IN MMFS IN 234.60 240.00 N 8,783 9,781 11 15.56 17.01
Apr-23 2014 Ultratech IN UTCEM IN 2,214 1,430 U 20,380 18,685 (8) 73.83 68.15
Apr-23 2014 Yes Bank IN YES IN 419.50 345.00 U 15,851 15,955 1 43.98 39.04
Apr-24 2014Q1 ACC IN ACC IN 1,361 1,200 O 11,321 10,068 (11) 60.11 53.57
Apr-24 2014Q1 Ambuja Cements IN ACEM IN 213.95 155.00 N 13,154 13,196 0 8.29 8.56
Apr-24 2014 Bharti Infratel IN BHIN IN 196.15 230.00 O 13,760 13,968 2 7.39 7.40
Apr-25 2014 Axis Bank IN AXSB IN 1,446 1,450 O 59,397 60,055 1 126.65 126.39
Apr-25 2014 Exide IN EXID IN 126.00 108.00 N 4,931 4,908 (0) 5.79 5.77
Apr-25 (E) 2014 Hero Motocorp IN HMCL IN 2,222 1,930 U 21,002 21,125 1 105.28 105.78
Apr-25 2014 ICICI Bank IN ICICIBC IN 1,218 1,036 N 95,936 94,905 (1) 83.16 82.27
Apr-25 (E) 2014 Idea Cellular IN IDEA IN 140.45 95.00 U 19,190 18,844 (2) 5.77 5.69
Apr-25 2014 IDFC IN IDFC IN 119.45 148.00 O 19,924 20,399 2 13.09 13.46
Apr-25 (E) 2014 JSPL IN JSP IN 268.85 237.00 N 24,034 22,754 (5) 26.16 24.32 Apr-25 2014 Maruti Suzuki IN MSIL IN 1,922 2,220 O 29,158 30,181 4 96.36 99.94
Apr-28 2014 Godrej Consumer IN GCPL IN 839.95 880.00 O 7,694 7,641 (1) 22.62 22.45
Apr-29 2014 Bharti Airtel IN BHARTI IN 324.65 263.00 N 32,476 32,601 0 8.10 8.16
Apr-29 2014 Dabur IN DABUR IN 178.80 175.00 N 9,127 9,220 1 5.23 5.29
Apr-29 (E) 2014 Hindustan Unilever IN HUVR IN 612.30 605.00 N 36,623 36,503 (0) 16.93 16.88
Apr-29 2014 ING Vysya IN VYSB IN 582.55 610.00 O 7,153 7,102 (1) 39.82 41.81
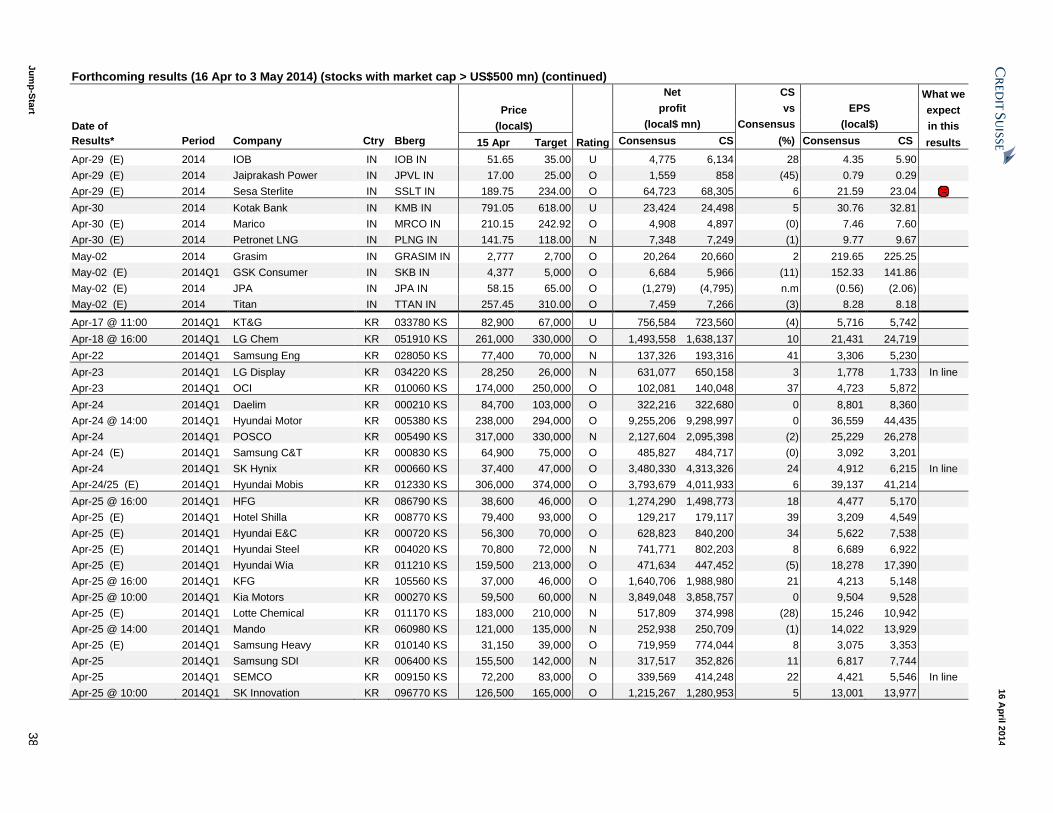
Ju
mp
-Sta
rt 3
8
16 A
pril 2
014
Forthcoming results (16 Apr to 3 May 2014) (stocks with market cap > US$500 mn) (continued)
Net CS What we
Price profit vs EPS expect
Date of (local$) (local$ mn) Consensus (local$) in this
Results* Period Company Ctry Bberg 15 Apr Target Rating Consensus CS (%) Consensus CS results
Apr-29 (E) 2014 IOB IN IOB IN 51.65 35.00 U 4,775 6,134 28 4.35 5.90
Apr-29 (E) 2014 Jaiprakash Power IN JPVL IN 17.00 25.00 O 1,559 858 (45) 0.79 0.29
Apr-29 (E) 2014 Sesa Sterlite IN SSLT IN 189.75 234.00 O 64,723 68,305 6 21.59 23.04 Apr-30 2014 Kotak Bank IN KMB IN 791.05 618.00 U 23,424 24,498 5 30.76 32.81
Apr-30 (E) 2014 Marico IN MRCO IN 210.15 242.92 O 4,908 4,897 (0) 7.46 7.60
Apr-30 (E) 2014 Petronet LNG IN PLNG IN 141.75 118.00 N 7,348 7,249 (1) 9.77 9.67
May-02 2014 Grasim IN GRASIM IN 2,777 2,700 O 20,264 20,660 2 219.65 225.25
May-02 (E) 2014Q1 GSK Consumer IN SKB IN 4,377 5,000 O 6,684 5,966 (11) 152.33 141.86
May-02 (E) 2014 JPA IN JPA IN 58.15 65.00 O (1,279) (4,795) n.m (0.56) (2.06)
May-02 (E) 2014 Titan IN TTAN IN 257.45 310.00 O 7,459 7,266 (3) 8.28 8.18
Apr-17 @ 11:00 2014Q1 KT&G KR 033780 KS 82,900 67,000 U 756,584 723,560 (4) 5,716 5,742
Apr-18 @ 16:00 2014Q1 LG Chem KR 051910 KS 261,000 330,000 O 1,493,558 1,638,137 10 21,431 24,719
Apr-22 2014Q1 Samsung Eng KR 028050 KS 77,400 70,000 N 137,326 193,316 41 3,306 5,230
Apr-23 2014Q1 LG Display KR 034220 KS 28,250 26,000 N 631,077 650,158 3 1,778 1,733 In line
Apr-23 2014Q1 OCI KR 010060 KS 174,000 250,000 O 102,081 140,048 37 4,723 5,872
Apr-24 2014Q1 Daelim KR 000210 KS 84,700 103,000 O 322,216 322,680 0 8,801 8,360
Apr-24 @ 14:00 2014Q1 Hyundai Motor KR 005380 KS 238,000 294,000 O 9,255,206 9,298,997 0 36,559 44,435
Apr-24 2014Q1 POSCO KR 005490 KS 317,000 330,000 N 2,127,604 2,095,398 (2) 25,229 26,278
Apr-24 (E) 2014Q1 Samsung C&T KR 000830 KS 64,900 75,000 O 485,827 484,717 (0) 3,092 3,201
Apr-24 2014Q1 SK Hynix KR 000660 KS 37,400 47,000 O 3,480,330 4,313,326 24 4,912 6,215 In line
Apr-24/25 (E) 2014Q1 Hyundai Mobis KR 012330 KS 306,000 374,000 O 3,793,679 4,011,933 6 39,137 41,214
Apr-25 @ 16:00 2014Q1 HFG KR 086790 KS 38,600 46,000 O 1,274,290 1,498,773 18 4,477 5,170
Apr-25 (E) 2014Q1 Hotel Shilla KR 008770 KS 79,400 93,000 O 129,217 179,117 39 3,209 4,549
Apr-25 (E) 2014Q1 Hyundai E&C KR 000720 KS 56,300 70,000 O 628,823 840,200 34 5,622 7,538
Apr-25 (E) 2014Q1 Hyundai Steel KR 004020 KS 70,800 72,000 N 741,771 802,203 8 6,689 6,922
Apr-25 (E) 2014Q1 Hyundai Wia KR 011210 KS 159,500 213,000 O 471,634 447,452 (5) 18,278 17,390
Apr-25 @ 16:00 2014Q1 KFG KR 105560 KS 37,000 46,000 O 1,640,706 1,988,980 21 4,213 5,148
Apr-25 @ 10:00 2014Q1 Kia Motors KR 000270 KS 59,500 60,000 N 3,849,048 3,858,757 0 9,504 9,528
Apr-25 (E) 2014Q1 Lotte Chemical KR 011170 KS 183,000 210,000 N 517,809 374,998 (28) 15,246 10,942
Apr-25 @ 14:00 2014Q1 Mando KR 060980 KS 121,000 135,000 N 252,938 250,709 (1) 14,022 13,929
Apr-25 (E) 2014Q1 Samsung Heavy KR 010140 KS 31,150 39,000 O 719,959 774,044 8 3,075 3,353
Apr-25 2014Q1 Samsung SDI KR 006400 KS 155,500 142,000 N 317,517 352,826 11 6,817 7,744
Apr-25 2014Q1 SEMCO KR 009150 KS 72,200 83,000 O 339,569 414,248 22 4,421 5,546 In line
Apr-25 @ 10:00 2014Q1 SK Innovation KR 096770 KS 126,500 165,000 O 1,215,267 1,280,953 5 13,001 13,977
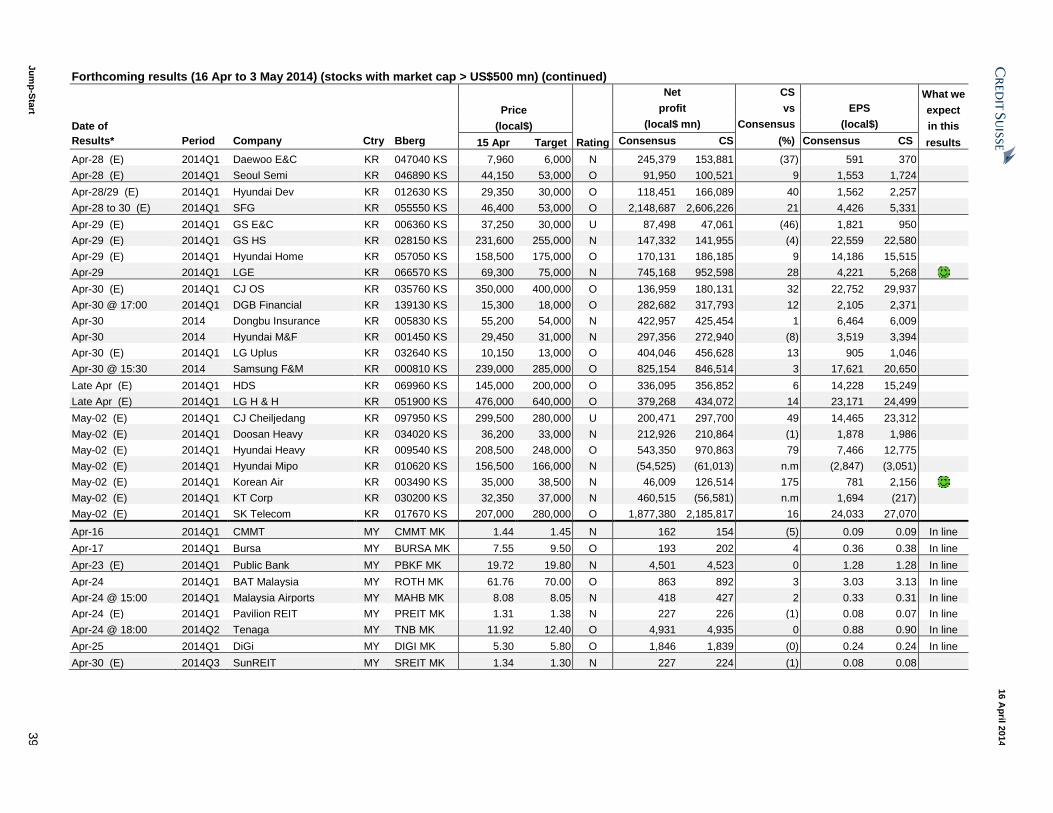
Ju
mp
-Sta
rt 3
9
16 A
pril 2
014
Forthcoming results (16 Apr to 3 May 2014) (stocks with market cap > US$500 mn) (continued)
Net CS What we
Price profit vs EPS expect
Date of (local$) (local$ mn) Consensus (local$) in this
Results* Period Company Ctry Bberg 15 Apr Target Rating Consensus CS (%) Consensus CS results
Apr-28 (E) 2014Q1 Daewoo E&C KR 047040 KS 7,960 6,000 N 245,379 153,881 (37) 591 370
Apr-28 (E) 2014Q1 Seoul Semi KR 046890 KS 44,150 53,000 O 91,950 100,521 9 1,553 1,724
Apr-28/29 (E) 2014Q1 Hyundai Dev KR 012630 KS 29,350 30,000 O 118,451 166,089 40 1,562 2,257
Apr-28 to 30 (E) 2014Q1 SFG KR 055550 KS 46,400 53,000 O 2,148,687 2,606,226 21 4,426 5,331
Apr-29 (E) 2014Q1 GS E&C KR 006360 KS 37,250 30,000 U 87,498 47,061 (46) 1,821 950
Apr-29 (E) 2014Q1 GS HS KR 028150 KS 231,600 255,000 N 147,332 141,955 (4) 22,559 22,580
Apr-29 (E) 2014Q1 Hyundai Home KR 057050 KS 158,500 175,000 O 170,131 186,185 9 14,186 15,515
Apr-29 2014Q1 LGE KR 066570 KS 69,300 75,000 N 745,168 952,598 28 4,221 5,268 Apr-30 (E) 2014Q1 CJ OS KR 035760 KS 350,000 400,000 O 136,959 180,131 32 22,752 29,937
Apr-30 @ 17:00 2014Q1 DGB Financial KR 139130 KS 15,300 18,000 O 282,682 317,793 12 2,105 2,371
Apr-30 2014 Dongbu Insurance KR 005830 KS 55,200 54,000 N 422,957 425,454 1 6,464 6,009
Apr-30 2014 Hyundai M&F KR 001450 KS 29,450 31,000 N 297,356 272,940 (8) 3,519 3,394
Apr-30 (E) 2014Q1 LG Uplus KR 032640 KS 10,150 13,000 O 404,046 456,628 13 905 1,046
Apr-30 @ 15:30 2014 Samsung F&M KR 000810 KS 239,000 285,000 O 825,154 846,514 3 17,621 20,650
Late Apr (E) 2014Q1 HDS KR 069960 KS 145,000 200,000 O 336,095 356,852 6 14,228 15,249
Late Apr (E) 2014Q1 LG H & H KR 051900 KS 476,000 640,000 O 379,268 434,072 14 23,171 24,499
May-02 (E) 2014Q1 CJ Cheiljedang KR 097950 KS 299,500 280,000 U 200,471 297,700 49 14,465 23,312
May-02 (E) 2014Q1 Doosan Heavy KR 034020 KS 36,200 33,000 N 212,926 210,864 (1) 1,878 1,986
May-02 (E) 2014Q1 Hyundai Heavy KR 009540 KS 208,500 248,000 O 543,350 970,863 79 7,466 12,775
May-02 (E) 2014Q1 Hyundai Mipo KR 010620 KS 156,500 166,000 N (54,525) (61,013) n.m (2,847) (3,051)
May-02 (E) 2014Q1 Korean Air KR 003490 KS 35,000 38,500 N 46,009 126,514 175 781 2,156 May-02 (E) 2014Q1 KT Corp KR 030200 KS 32,350 37,000 N 460,515 (56,581) n.m 1,694 (217)
May-02 (E) 2014Q1 SK Telecom KR 017670 KS 207,000 280,000 O 1,877,380 2,185,817 16 24,033 27,070
Apr-16 2014Q1 CMMT MY CMMT MK 1.44 1.45 N 162 154 (5) 0.09 0.09 In line
Apr-17 2014Q1 Bursa MY BURSA MK 7.55 9.50 O 193 202 4 0.36 0.38 In line
Apr-23 (E) 2014Q1 Public Bank MY PBKF MK 19.72 19.80 N 4,501 4,523 0 1.28 1.28 In line
Apr-24 2014Q1 BAT Malaysia MY ROTH MK 61.76 70.00 O 863 892 3 3.03 3.13 In line
Apr-24 @ 15:00 2014Q1 Malaysia Airports MY MAHB MK 8.08 8.05 N 418 427 2 0.33 0.31 In line
Apr-24 (E) 2014Q1 Pavilion REIT MY PREIT MK 1.31 1.38 N 227 226 (1) 0.08 0.07 In line
Apr-24 @ 18:00 2014Q2 Tenaga MY TNB MK 11.92 12.40 O 4,931 4,935 0 0.88 0.90 In line
Apr-25 2014Q1 DiGi MY DIGI MK 5.30 5.80 O 1,846 1,839 (0) 0.24 0.24 In line
Apr-30 (E) 2014Q3 SunREIT MY SREIT MK 1.34 1.30 N 227 224 (1) 0.08 0.08
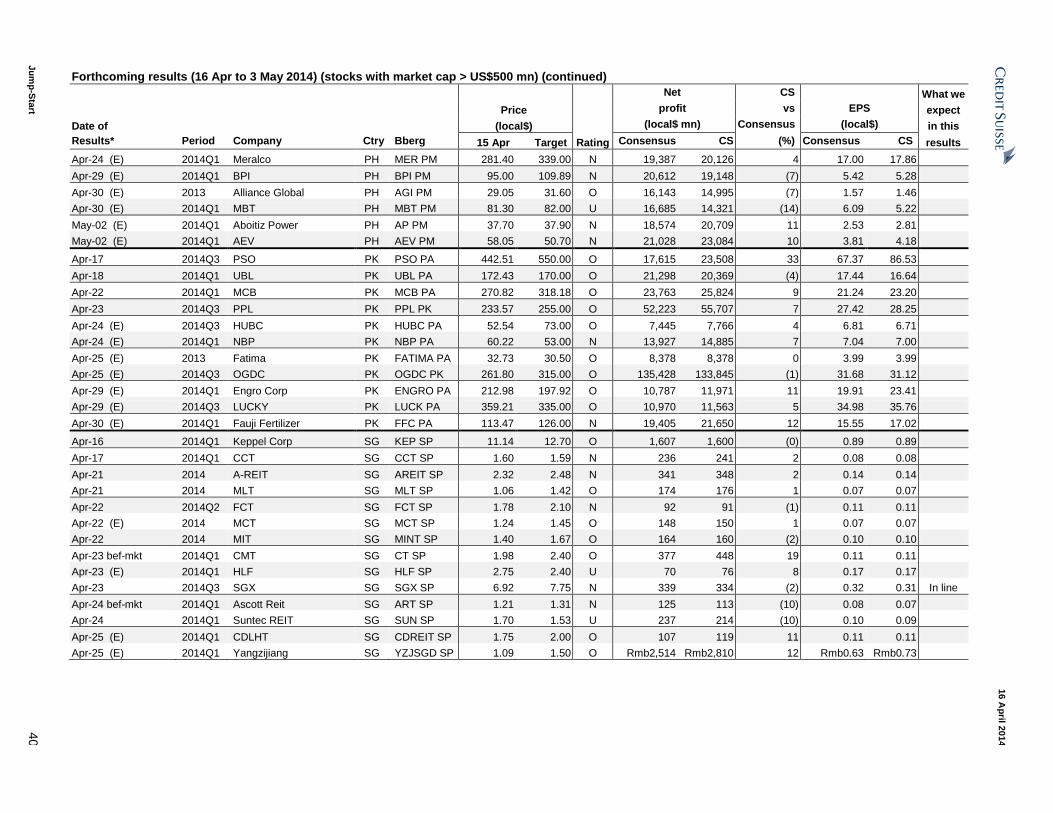
Ju
mp
-Sta
rt 4
0
16 A
pril 2
014
Forthcoming results (16 Apr to 3 May 2014) (stocks with market cap > US$500 mn) (continued)
Net CS What we
Price profit vs EPS expect
Date of (local$) (local$ mn) Consensus (local$) in this
Results* Period Company Ctry Bberg 15 Apr Target Rating Consensus CS (%) Consensus CS results
Apr-24 (E) 2014Q1 Meralco PH MER PM 281.40 339.00 N 19,387 20,126 4 17.00 17.86
Apr-29 (E) 2014Q1 BPI PH BPI PM 95.00 109.89 N 20,612 19,148 (7) 5.42 5.28
Apr-30 (E) 2013 Alliance Global PH AGI PM 29.05 31.60 O 16,143 14,995 (7) 1.57 1.46
Apr-30 (E) 2014Q1 MBT PH MBT PM 81.30 82.00 U 16,685 14,321 (14) 6.09 5.22
May-02 (E) 2014Q1 Aboitiz Power PH AP PM 37.70 37.90 N 18,574 20,709 11 2.53 2.81
May-02 (E) 2014Q1 AEV PH AEV PM 58.05 50.70 N 21,028 23,084 10 3.81 4.18
Apr-17 2014Q3 PSO PK PSO PA 442.51 550.00 O 17,615 23,508 33 67.37 86.53
Apr-18 2014Q1 UBL PK UBL PA 172.43 170.00 O 21,298 20,369 (4) 17.44 16.64
Apr-22 2014Q1 MCB PK MCB PA 270.82 318.18 O 23,763 25,824 9 21.24 23.20
Apr-23 2014Q3 PPL PK PPL PK 233.57 255.00 O 52,223 55,707 7 27.42 28.25
Apr-24 (E) 2014Q3 HUBC PK HUBC PA 52.54 73.00 O 7,445 7,766 4 6.81 6.71
Apr-24 (E) 2014Q1 NBP PK NBP PA 60.22 53.00 N 13,927 14,885 7 7.04 7.00
Apr-25 (E) 2013 Fatima PK FATIMA PA 32.73 30.50 O 8,378 8,378 0 3.99 3.99
Apr-25 (E) 2014Q3 OGDC PK OGDC PK 261.80 315.00 O 135,428 133,845 (1) 31.68 31.12
Apr-29 (E) 2014Q1 Engro Corp PK ENGRO PA 212.98 197.92 O 10,787 11,971 11 19.91 23.41
Apr-29 (E) 2014Q3 LUCKY PK LUCK PA 359.21 335.00 O 10,970 11,563 5 34.98 35.76
Apr-30 (E) 2014Q1 Fauji Fertilizer PK FFC PA 113.47 126.00 N 19,405 21,650 12 15.55 17.02
Apr-16 2014Q1 Keppel Corp SG KEP SP 11.14 12.70 O 1,607 1,600 (0) 0.89 0.89
Apr-17 2014Q1 CCT SG CCT SP 1.60 1.59 N 236 241 2 0.08 0.08
Apr-21 2014 A-REIT SG AREIT SP 2.32 2.48 N 341 348 2 0.14 0.14
Apr-21 2014 MLT SG MLT SP 1.06 1.42 O 174 176 1 0.07 0.07
Apr-22 2014Q2 FCT SG FCT SP 1.78 2.10 N 92 91 (1) 0.11 0.11
Apr-22 (E) 2014 MCT SG MCT SP 1.24 1.45 O 148 150 1 0.07 0.07
Apr-22 2014 MIT SG MINT SP 1.40 1.67 O 164 160 (2) 0.10 0.10
Apr-23 bef-mkt 2014Q1 CMT SG CT SP 1.98 2.40 O 377 448 19 0.11 0.11
Apr-23 (E) 2014Q1 HLF SG HLF SP 2.75 2.40 U 70 76 8 0.17 0.17
Apr-23 2014Q3 SGX SG SGX SP 6.92 7.75 N 339 334 (2) 0.32 0.31 In line
Apr-24 bef-mkt 2014Q1 Ascott Reit SG ART SP 1.21 1.31 N 125 113 (10) 0.08 0.07
Apr-24 2014Q1 Suntec REIT SG SUN SP 1.70 1.53 U 237 214 (10) 0.10 0.09
Apr-25 (E) 2014Q1 CDLHT SG CDREIT SP 1.75 2.00 O 107 119 11 0.11 0.11
Apr-25 (E) 2014Q1 Yangzijiang SG YZJSGD SP 1.09 1.50 O Rmb2,514 Rmb2,810 12 Rmb0.63 Rmb0.73
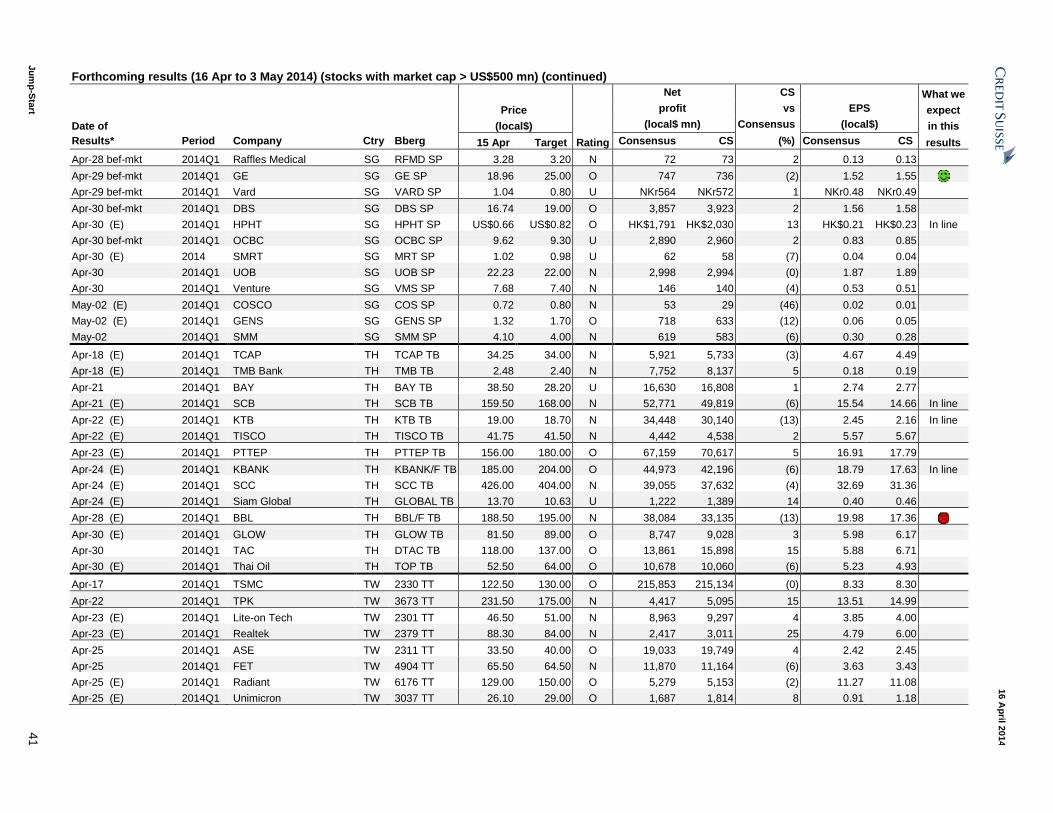
Ju
mp
-Sta
rt 4
1
16 A
pril 2
014
Forthcoming results (16 Apr to 3 May 2014) (stocks with market cap > US$500 mn) (continued)
Net CS What we
Price profit vs EPS expect
Date of (local$) (local$ mn) Consensus (local$) in this
Results* Period Company Ctry Bberg 15 Apr Target Rating Consensus CS (%) Consensus CS results
Apr-28 bef-mkt 2014Q1 Raffles Medical SG RFMD SP 3.28 3.20 N 72 73 2 0.13 0.13
Apr-29 bef-mkt 2014Q1 GE SG GE SP 18.96 25.00 O 747 736 (2) 1.52 1.55 Apr-29 bef-mkt 2014Q1 Vard SG VARD SP 1.04 0.80 U NKr564 NKr572 1 NKr0.48 NKr0.49
Apr-30 bef-mkt 2014Q1 DBS SG DBS SP 16.74 19.00 O 3,857 3,923 2 1.56 1.58
Apr-30 (E) 2014Q1 HPHT SG HPHT SP US$0.66 US$0.82 O HK$1,791 HK$2,030 13 HK$0.21 HK$0.23 In line
Apr-30 bef-mkt 2014Q1 OCBC SG OCBC SP 9.62 9.30 U 2,890 2,960 2 0.83 0.85
Apr-30 (E) 2014 SMRT SG MRT SP 1.02 0.98 U 62 58 (7) 0.04 0.04
Apr-30 2014Q1 UOB SG UOB SP 22.23 22.00 N 2,998 2,994 (0) 1.87 1.89
Apr-30 2014Q1 Venture SG VMS SP 7.68 7.40 N 146 140 (4) 0.53 0.51
May-02 (E) 2014Q1 COSCO SG COS SP 0.72 0.80 N 53 29 (46) 0.02 0.01
May-02 (E) 2014Q1 GENS SG GENS SP 1.32 1.70 O 718 633 (12) 0.06 0.05
May-02 2014Q1 SMM SG SMM SP 4.10 4.00 N 619 583 (6) 0.30 0.28
Apr-18 (E) 2014Q1 TCAP TH TCAP TB 34.25 34.00 N 5,921 5,733 (3) 4.67 4.49
Apr-18 (E) 2014Q1 TMB Bank TH TMB TB 2.48 2.40 N 7,752 8,137 5 0.18 0.19
Apr-21 2014Q1 BAY TH BAY TB 38.50 28.20 U 16,630 16,808 1 2.74 2.77
Apr-21 (E) 2014Q1 SCB TH SCB TB 159.50 168.00 N 52,771 49,819 (6) 15.54 14.66 In line
Apr-22 (E) 2014Q1 KTB TH KTB TB 19.00 18.70 N 34,448 30,140 (13) 2.45 2.16 In line
Apr-22 (E) 2014Q1 TISCO TH TISCO TB 41.75 41.50 N 4,442 4,538 2 5.57 5.67
Apr-23 (E) 2014Q1 PTTEP TH PTTEP TB 156.00 180.00 O 67,159 70,617 5 16.91 17.79
Apr-24 (E) 2014Q1 KBANK TH KBANK/F TB 185.00 204.00 O 44,973 42,196 (6) 18.79 17.63 In line
Apr-24 (E) 2014Q1 SCC TH SCC TB 426.00 404.00 N 39,055 37,632 (4) 32.69 31.36
Apr-24 (E) 2014Q1 Siam Global TH GLOBAL TB 13.70 10.63 U 1,222 1,389 14 0.40 0.46
Apr-28 (E) 2014Q1 BBL TH BBL/F TB 188.50 195.00 N 38,084 33,135 (13) 19.98 17.36 Apr-30 (E) 2014Q1 GLOW TH GLOW TB 81.50 89.00 O 8,747 9,028 3 5.98 6.17
Apr-30 2014Q1 TAC TH DTAC TB 118.00 137.00 O 13,861 15,898 15 5.88 6.71
Apr-30 (E) 2014Q1 Thai Oil TH TOP TB 52.50 64.00 O 10,678 10,060 (6) 5.23 4.93
Apr-17 2014Q1 TSMC TW 2330 TT 122.50 130.00 O 215,853 215,134 (0) 8.33 8.30
Apr-22 2014Q1 TPK TW 3673 TT 231.50 175.00 N 4,417 5,095 15 13.51 14.99
Apr-23 (E) 2014Q1 Lite-on Tech TW 2301 TT 46.50 51.00 N 8,963 9,297 4 3.85 4.00
Apr-23 (E) 2014Q1 Realtek TW 2379 TT 88.30 84.00 N 2,417 3,011 25 4.79 6.00
Apr-25 2014Q1 ASE TW 2311 TT 33.50 40.00 O 19,033 19,749 4 2.42 2.45
Apr-25 2014Q1 FET TW 4904 TT 65.50 64.50 N 11,870 11,164 (6) 3.63 3.43
Apr-25 (E) 2014Q1 Radiant TW 6176 TT 129.00 150.00 O 5,279 5,153 (2) 11.27 11.08
Apr-25 (E) 2014Q1 Unimicron TW 3037 TT 26.10 29.00 O 1,687 1,814 8 0.91 1.18
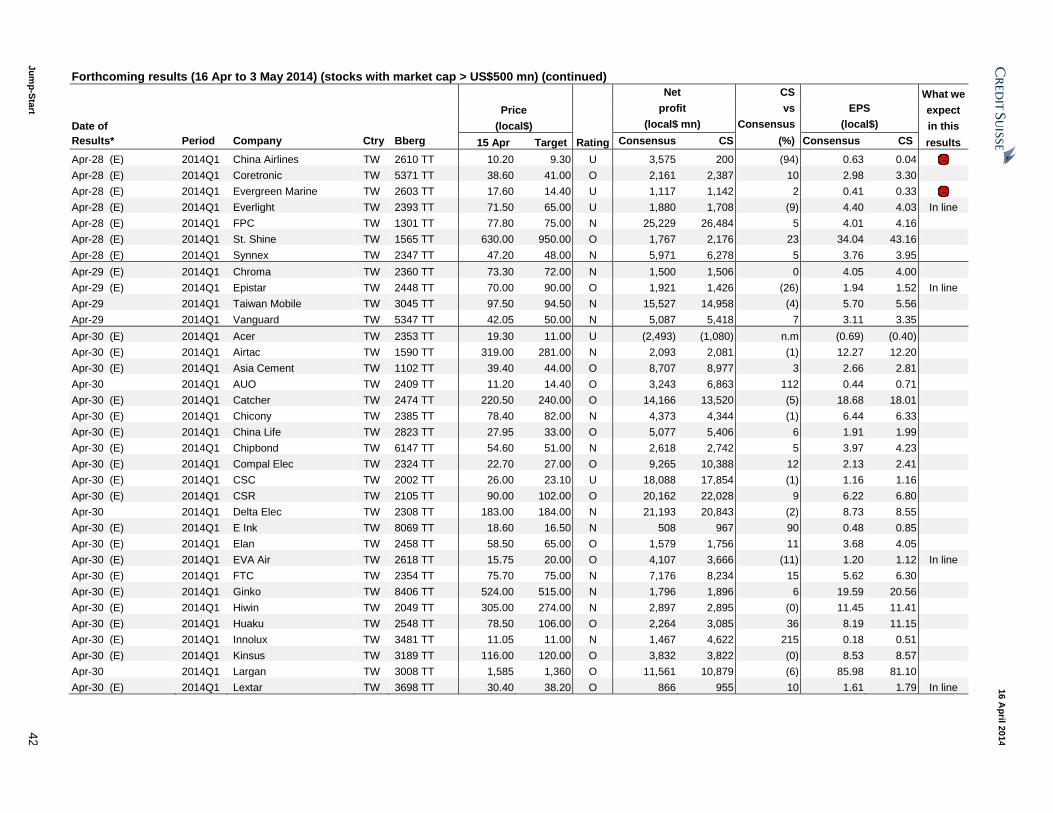
Ju
mp
-Sta
rt 4
2
16 A
pril 2
014
Forthcoming results (16 Apr to 3 May 2014) (stocks with market cap > US$500 mn) (continued)
Net CS What we
Price profit vs EPS expect
Date of (local$) (local$ mn) Consensus (local$) in this
Results* Period Company Ctry Bberg 15 Apr Target Rating Consensus CS (%) Consensus CS results
Apr-28 (E) 2014Q1 China Airlines TW 2610 TT 10.20 9.30 U 3,575 200 (94) 0.63 0.04 Apr-28 (E) 2014Q1 Coretronic TW 5371 TT 38.60 41.00 O 2,161 2,387 10 2.98 3.30
Apr-28 (E) 2014Q1 Evergreen Marine TW 2603 TT 17.60 14.40 U 1,117 1,142 2 0.41 0.33 Apr-28 (E) 2014Q1 Everlight TW 2393 TT 71.50 65.00 U 1,880 1,708 (9) 4.40 4.03 In line
Apr-28 (E) 2014Q1 FPC TW 1301 TT 77.80 75.00 N 25,229 26,484 5 4.01 4.16
Apr-28 (E) 2014Q1 St. Shine TW 1565 TT 630.00 950.00 O 1,767 2,176 23 34.04 43.16
Apr-28 (E) 2014Q1 Synnex TW 2347 TT 47.20 48.00 N 5,971 6,278 5 3.76 3.95
Apr-29 (E) 2014Q1 Chroma TW 2360 TT 73.30 72.00 N 1,500 1,506 0 4.05 4.00
Apr-29 (E) 2014Q1 Epistar TW 2448 TT 70.00 90.00 O 1,921 1,426 (26) 1.94 1.52 In line
Apr-29 2014Q1 Taiwan Mobile TW 3045 TT 97.50 94.50 N 15,527 14,958 (4) 5.70 5.56
Apr-29 2014Q1 Vanguard TW 5347 TT 42.05 50.00 N 5,087 5,418 7 3.11 3.35
Apr-30 (E) 2014Q1 Acer TW 2353 TT 19.30 11.00 U (2,493) (1,080) n.m (0.69) (0.40)
Apr-30 (E) 2014Q1 Airtac TW 1590 TT 319.00 281.00 N 2,093 2,081 (1) 12.27 12.20
Apr-30 (E) 2014Q1 Asia Cement TW 1102 TT 39.40 44.00 O 8,707 8,977 3 2.66 2.81
Apr-30 2014Q1 AUO TW 2409 TT 11.20 14.40 O 3,243 6,863 112 0.44 0.71
Apr-30 (E) 2014Q1 Catcher TW 2474 TT 220.50 240.00 O 14,166 13,520 (5) 18.68 18.01
Apr-30 (E) 2014Q1 Chicony TW 2385 TT 78.40 82.00 N 4,373 4,344 (1) 6.44 6.33
Apr-30 (E) 2014Q1 China Life TW 2823 TT 27.95 33.00 O 5,077 5,406 6 1.91 1.99
Apr-30 (E) 2014Q1 Chipbond TW 6147 TT 54.60 51.00 N 2,618 2,742 5 3.97 4.23
Apr-30 (E) 2014Q1 Compal Elec TW 2324 TT 22.70 27.00 O 9,265 10,388 12 2.13 2.41
Apr-30 (E) 2014Q1 CSC TW 2002 TT 26.00 23.10 U 18,088 17,854 (1) 1.16 1.16
Apr-30 (E) 2014Q1 CSR TW 2105 TT 90.00 102.00 O 20,162 22,028 9 6.22 6.80
Apr-30 2014Q1 Delta Elec TW 2308 TT 183.00 184.00 N 21,193 20,843 (2) 8.73 8.55
Apr-30 (E) 2014Q1 E Ink TW 8069 TT 18.60 16.50 N 508 967 90 0.48 0.85
Apr-30 (E) 2014Q1 Elan TW 2458 TT 58.50 65.00 O 1,579 1,756 11 3.68 4.05
Apr-30 (E) 2014Q1 EVA Air TW 2618 TT 15.75 20.00 O 4,107 3,666 (11) 1.20 1.12 In line
Apr-30 (E) 2014Q1 FTC TW 2354 TT 75.70 75.00 N 7,176 8,234 15 5.62 6.30
Apr-30 (E) 2014Q1 Ginko TW 8406 TT 524.00 515.00 N 1,796 1,896 6 19.59 20.56
Apr-30 (E) 2014Q1 Hiwin TW 2049 TT 305.00 274.00 N 2,897 2,895 (0) 11.45 11.41
Apr-30 (E) 2014Q1 Huaku TW 2548 TT 78.50 106.00 O 2,264 3,085 36 8.19 11.15
Apr-30 (E) 2014Q1 Innolux TW 3481 TT 11.05 11.00 N 1,467 4,622 215 0.18 0.51
Apr-30 (E) 2014Q1 Kinsus TW 3189 TT 116.00 120.00 O 3,832 3,822 (0) 8.53 8.57
Apr-30 2014Q1 Largan TW 3008 TT 1,585 1,360 O 11,561 10,879 (6) 85.98 81.10
Apr-30 (E) 2014Q1 Lextar TW 3698 TT 30.40 38.20 O 866 955 10 1.61 1.79 In line
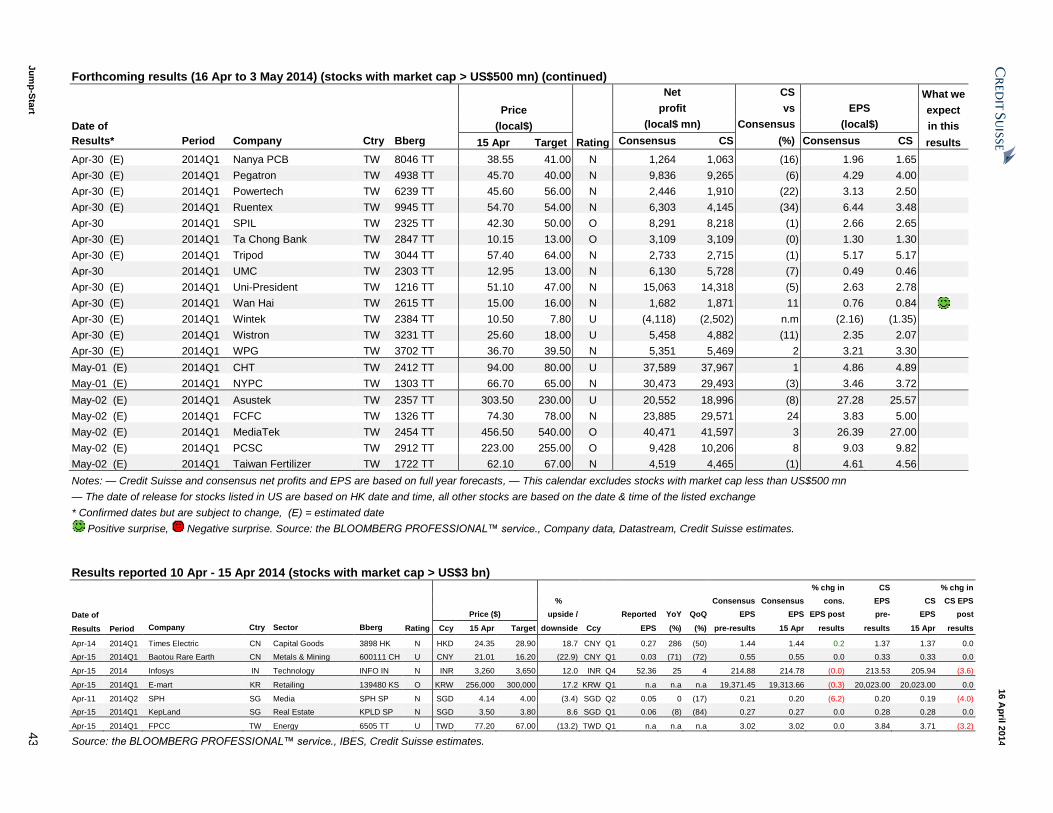
Ju
mp
-Sta
rt 4
3
16 A
pril 2
014
Forthcoming results (16 Apr to 3 May 2014) (stocks with market cap > US$500 mn) (continued)
Net CS What we
Price profit vs EPS expect
Date of (local$) (local$ mn) Consensus (local$) in this
Results* Period Company Ctry Bberg 15 Apr Target Rating Consensus CS (%) Consensus CS results
Apr-30 (E) 2014Q1 Nanya PCB TW 8046 TT 38.55 41.00 N 1,264 1,063 (16) 1.96 1.65
Apr-30 (E) 2014Q1 Pegatron TW 4938 TT 45.70 40.00 N 9,836 9,265 (6) 4.29 4.00
Apr-30 (E) 2014Q1 Powertech TW 6239 TT 45.60 56.00 N 2,446 1,910 (22) 3.13 2.50
Apr-30 (E) 2014Q1 Ruentex TW 9945 TT 54.70 54.00 N 6,303 4,145 (34) 6.44 3.48
Apr-30 2014Q1 SPIL TW 2325 TT 42.30 50.00 O 8,291 8,218 (1) 2.66 2.65
Apr-30 (E) 2014Q1 Ta Chong Bank TW 2847 TT 10.15 13.00 O 3,109 3,109 (0) 1.30 1.30
Apr-30 (E) 2014Q1 Tripod TW 3044 TT 57.40 64.00 N 2,733 2,715 (1) 5.17 5.17
Apr-30 2014Q1 UMC TW 2303 TT 12.95 13.00 N 6,130 5,728 (7) 0.49 0.46
Apr-30 (E) 2014Q1 Uni-President TW 1216 TT 51.10 47.00 N 15,063 14,318 (5) 2.63 2.78
Apr-30 (E) 2014Q1 Wan Hai TW 2615 TT 15.00 16.00 N 1,682 1,871 11 0.76 0.84 Apr-30 (E) 2014Q1 Wintek TW 2384 TT 10.50 7.80 U (4,118) (2,502) n.m (2.16) (1.35)
Apr-30 (E) 2014Q1 Wistron TW 3231 TT 25.60 18.00 U 5,458 4,882 (11) 2.35 2.07
Apr-30 (E) 2014Q1 WPG TW 3702 TT 36.70 39.50 N 5,351 5,469 2 3.21 3.30
May-01 (E) 2014Q1 CHT TW 2412 TT 94.00 80.00 U 37,589 37,967 1 4.86 4.89
May-01 (E) 2014Q1 NYPC TW 1303 TT 66.70 65.00 N 30,473 29,493 (3) 3.46 3.72
May-02 (E) 2014Q1 Asustek TW 2357 TT 303.50 230.00 U 20,552 18,996 (8) 27.28 25.57
May-02 (E) 2014Q1 FCFC TW 1326 TT 74.30 78.00 N 23,885 29,571 24 3.83 5.00
May-02 (E) 2014Q1 MediaTek TW 2454 TT 456.50 540.00 O 40,471 41,597 3 26.39 27.00
May-02 (E) 2014Q1 PCSC TW 2912 TT 223.00 255.00 O 9,428 10,206 8 9.03 9.82
May-02 (E) 2014Q1 Taiwan Fertilizer TW 1722 TT 62.10 67.00 N 4,519 4,465 (1) 4.61 4.56
Notes: — Credit Suisse and consensus net profits and EPS are based on full year forecasts, — This calendar excludes stocks with market cap less than US$500 mn
— The date of release for stocks listed in US are based on HK date and time, all other stocks are based on the date & time of the listed exchange
* Confirmed dates but are subject to change, (E) = estimated date
Positive surprise, Negative surprise. Source: the BLOOMBERG PROFESSIONAL™ service., Company data, Datastream, Credit Suisse estimates.
Results reported 10 Apr - 15 Apr 2014 (stocks with market cap > US$3 bn) % chg in CS % chg in
% Consensus Consensus cons. EPS CS CS EPS
Date of
Price ($) upside / Reported YoY QoQ EPS EPS EPS post pre- EPS post
Results Period Company Ctry Sector Bberg Rating Ccy 15 Apr Target downside Ccy EPS (%) (%) pre-results 15 Apr results results 15 Apr results
Apr-14 2014Q1 Times Electric CN Capital Goods 3898 HK N HKD 24.35 28.90 18.7 CNY Q1 0.27 286 (50) 1.44 1.44 0.2 1.37 1.37 0.0
Apr-15 2014Q1 Baotou Rare Earth CN Metals & Mining 600111 CH U CNY 21.01 16.20 (22.9) CNY Q1 0.03 (71) (72) 0.55 0.55 0.0 0.33 0.33 0.0
Apr-15 2014 Infosys IN Technology INFO IN N INR 3,260 3,650 12.0 INR Q4 52.36 25 4 214.88 214.78 (0.0) 213.53 205.94 (3.6)
Apr-15 2014Q1 E-mart KR Retailing 139480 KS O KRW 256,000 300,000 17.2 KRW Q1 n.a n.a n.a 19,371.45 19,313.66 (0.3) 20,023.00 20,023.00 0.0
Apr-11 2014Q2 SPH SG Media SPH SP N SGD 4.14 4.00 (3.4) SGD Q2 0.05 0 (17) 0.21 0.20 (6.2) 0.20 0.19 (4.0)
Apr-15 2014Q1 KepLand SG Real Estate KPLD SP N SGD 3.50 3.80 8.6 SGD Q1 0.06 (8) (84) 0.27 0.27 0.0 0.28 0.28 0.0
Apr-15 2014Q1 FPCC TW Energy 6505 TT U TWD 77.20 67.00 (13.2) TWD Q1 n.a n.a n.a 3.02 3.02 0.0 3.84 3.71 (3.2)
Source: the BLOOMBERG PROFESSIONAL™ service., IBES, Credit Suisse estimates.
Ju
mp
-Sta
rt 4
4
16 A
pril 2
014
Credit Suisse Valuation Summary (by country)
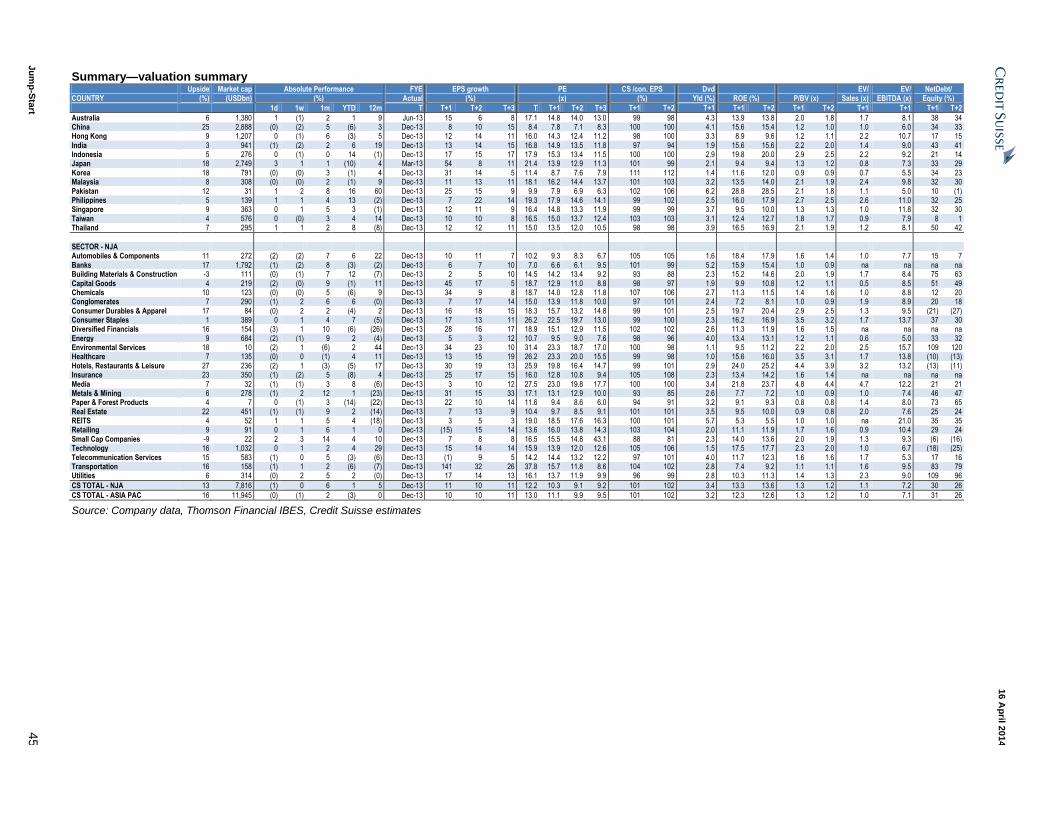
Ju
mp
-Sta
rt 4
5
16 A
pril 2
014
Summary—valuation summary Upside Market cap Absolute Performance FYE EPS growth PE CS /con. EPS Dvd EV/ EV/ NetDebt/ COUNTRY (%) (USDbn) (%) Actual (%) (x) (%) Yld (%) ROE (%) P/BV (x) Sales (x) EBITDA (x) Equity (%)
1d 1w 1m YTD 12m T T+1 T+2 T+3 T T+1 T+2 T+3 T+1 T+2 T+1 T+1 T+2 T+1 T+2 T+1 T+1 T+1 T+2
Australia 6 1,380 1 (1) 2 1 9 Jun-13 15 6 8 17.1 14.8 14.0 13.0 99 98 4.3 13.9 13.8 2.0 1.8 1.7 8.1 38 34 China 25 2,888 (0) (2) 5 (6) 3 Dec-13 8 10 15 8.4 7.8 7.1 8.3 100 100 4.1 15.6 15.4 1.2 1.0 1.0 6.0 34 33 Hong Kong 9 1,207 0 (1) 6 (3) 5 Dec-13 12 14 11 16.0 14.3 12.4 11.2 98 100 3.3 8.9 9.6 1.2 1.1 2.2 10.7 17 15 India 3 941 (1) (2) 2 6 19 Dec-13 13 14 15 16.8 14.9 13.5 11.8 97 94 1.9 15.6 15.6 2.2 2.0 1.4 9.0 43 41 Indonesia 5 276 0 (1) 0 14 (1) Dec-13 17 15 17 17.9 15.3 13.4 11.5 100 100 2.9 19.8 20.0 2.9 2.5 2.2 9.2 21 14 Japan 18 2,749 3 1 1 (10) 4 Mar-13 54 8 11 21.4 13.9 12.9 11.3 101 99 2.1 9.4 9.4 1.3 1.2 0.8 7.3 33 29 Korea 18 791 (0) (0) 3 (1) 4 Dec-13 31 14 5 11.4 8.7 7.6 7.9 111 112 1.4 11.6 12.0 0.9 0.9 0.7 5.5 34 23 Malaysia 8 308 (0) (0) 2 (1) 9 Dec-13 11 13 11 18.1 16.2 14.4 13.7 101 103 3.2 13.5 14.0 2.1 1.9 2.4 9.8 32 30 Pakistan 12 31 1 2 8 16 60 Dec-13 25 15 9 9.9 7.9 6.9 6.3 102 106 6.2 28.8 28.5 2.1 1.8 1.1 5.0 10 (1) Philippines 5 139 1 1 4 13 (2) Dec-13 7 22 14 19.3 17.9 14.6 14.1 99 102 2.5 16.0 17.9 2.7 2.5 2.6 11.0 32 25 Singapore 9 363 0 1 5 3 (1) Dec-13 12 11 9 16.4 14.8 13.3 11.9 99 99 3.7 9.5 10.0 1.3 1.3 1.0 11.8 32 30 Taiwan 4 576 0 (0) 3 4 14 Dec-13 10 10 8 16.5 15.0 13.7 12.4 103 103 3.1 12.4 12.7 1.8 1.7 0.9 7.9 8 1 Thailand 7 295 1 1 2 8 (8) Dec-13 12 12 11 15.0 13.5 12.0 10.5 98 98 3.9 16.5 16.9 2.1 1.9 1.2 8.1 50 42
SECTOR - NJA Automobiles & Components 11 272 (2) (2) 7 6 22 Dec-13 10 11 7 10.2 9.3 8.3 6.7 105 105 1.6 18.4 17.9 1.6 1.4 1.0 7.7 15 7 Banks 17 1,792 (1) (2) 8 (3) (2) Dec-13 6 7 10 7.0 6.6 6.1 9.5 101 99 5.2 15.9 15.4 1.0 0.9 na na na na Building Materials & Construction -3 111 (0) (1) 7 12 (7) Dec-13 2 5 10 14.5 14.2 13.4 9.2 93 88 2.3 15.2 14.6 2.0 1.9 1.7 8.4 75 63 Capital Goods 4 219 (2) (0) 9 (1) 11 Dec-13 45 17 5 18.7 12.9 11.0 8.8 98 97 1.9 9.9 10.8 1.2 1.1 0.5 8.5 51 49 Chemicals 10 123 (0) (0) 5 (6) 9 Dec-13 34 9 8 18.7 14.0 12.8 11.8 107 106 2.7 11.3 11.5 1.4 1.6 1.0 8.8 12 20 Conglomerates 7 290 (1) 2 6 6 (0) Dec-13 7 17 14 15.0 13.9 11.8 10.0 97 101 2.4 7.2 8.1 1.0 0.9 1.9 8.9 20 18 Consumer Durables & Apparel 17 84 (0) 2 2 (4) 2 Dec-13 16 18 15 18.3 15.7 13.2 14.8 99 101 2.5 19.7 20.4 2.9 2.5 1.3 9.5 (21) (27) Consumer Staples 1 389 0 1 4 7 (5) Dec-13 17 13 11 26.2 22.5 19.7 13.0 99 100 2.3 16.2 16.9 3.5 3.2 1.7 13.7 37 30 Diversified Financials 16 154 (3) 1 10 (6) (26) Dec-13 28 16 17 18.9 15.1 12.9 11.5 102 102 2.6 11.3 11.9 1.6 1.5 na na na na Energy 9 684 (2) (1) 9 2 (4) Dec-13 5 3 12 10.7 9.5 9.0 7.6 98 96 4.0 13.4 13.1 1.2 1.1 0.6 5.0 33 32 Environmental Services 18 10 (2) 1 (6) 2 44 Dec-13 34 23 10 31.4 23.3 18.7 17.0 100 98 1.1 9.5 11.2 2.2 2.0 2.5 15.7 109 120 Healthcare 7 135 (0) 0 (1) 4 11 Dec-13 13 15 19 26.2 23.3 20.0 15.5 99 98 1.0 15.6 16.0 3.5 3.1 1.7 13.8 (10) (13) Hotels, Restaurants & Leisure 27 236 (2) 1 (3) (5) 17 Dec-13 30 19 13 25.9 19.8 16.4 14.7 99 101 2.9 24.0 25.2 4.4 3.9 3.2 13.2 (13) (11) Insurance 23 350 (1) (2) 5 (8) 4 Dec-13 25 17 15 16.0 12.8 10.8 9.4 105 108 2.3 13.4 14.2 1.6 1.4 na na na na Media 7 32 (1) (1) 3 8 (6) Dec-13 3 10 12 27.5 23.0 19.8 17.7 100 100 3.4 21.8 23.7 4.8 4.4 4.7 12.2 21 21 Metals & Mining 6 278 (1) 2 12 1 (23) Dec-13 31 15 33 17.1 13.1 12.9 10.0 93 85 2.6 7.7 7.2 1.0 0.9 1.0 7.4 46 47 Paper & Forest Products 4 7 0 (1) 3 (14) (22) Dec-13 22 10 14 11.6 9.4 8.6 6.0 94 91 3.2 9.1 9.3 0.8 0.8 1.4 8.0 73 65 Real Estate 22 451 (1) (1) 9 2 (14) Dec-13 7 13 9 10.4 9.7 8.5 9.1 101 101 3.5 9.5 10.0 0.9 0.8 2.0 7.6 25 24 REITS 4 52 1 1 5 4 (18) Dec-13 3 5 3 19.0 18.5 17.6 16.3 100 101 5.7 5.3 5.5 1.0 1.0 na 21.0 35 35 Retailing 9 91 0 1 6 1 0 Dec-13 (15) 15 14 13.6 16.0 13.8 14.3 103 104 2.0 11.1 11.9 1.7 1.6 0.9 10.4 29 24 Small Cap Companies -9 22 2 3 14 4 10 Dec-13 7 8 8 16.5 15.5 14.8 43.1 88 81 2.3 14.0 13.6 2.0 1.9 1.3 9.3 (6) (16) Technology 16 1,032 0 1 2 4 29 Dec-13 15 14 14 15.9 13.9 12.0 12.6 105 106 1.5 17.5 17.7 2.3 2.0 1.0 6.7 (18) (25) Telecommunication Services 15 583 (1) 0 5 (3) (6) Dec-13 (1) 9 5 14.2 14.4 13.2 12.2 97 101 4.0 11.7 12.3 1.6 1.6 1.7 5.3 17 16 Transportation 16 158 (1) 1 2 (6) (7) Dec-13 141 32 26 37.8 15.7 11.8 8.6 104 102 2.8 7.4 9.2 1.1 1.1 1.6 9.5 83 79 Utilities 6 314 (0) 2 5 2 (0) Dec-13 17 14 13 16.1 13.7 11.9 9.9 96 99 2.8 10.3 11.3 1.4 1.3 2.3 9.0 109 96
CS TOTAL - NJA 13 7,816 (1) 0 6 1 5 Dec-13 11 10 11 12.2 10.3 9.1 9.2 101 102 3.4 13.3 13.6 1.3 1.2 1.1 7.2 30 26
CS TOTAL - ASIA PAC 16 11,945 (0) (1) 2 (3) 0 Dec-13 10 10 11 13.0 11.1 9.9 9.5 101 102 3.2 12.3 12.6 1.3 1.2 1.0 7.1 31 26
Source: Company data, Thomson Financial IBES, Credit Suisse estimates
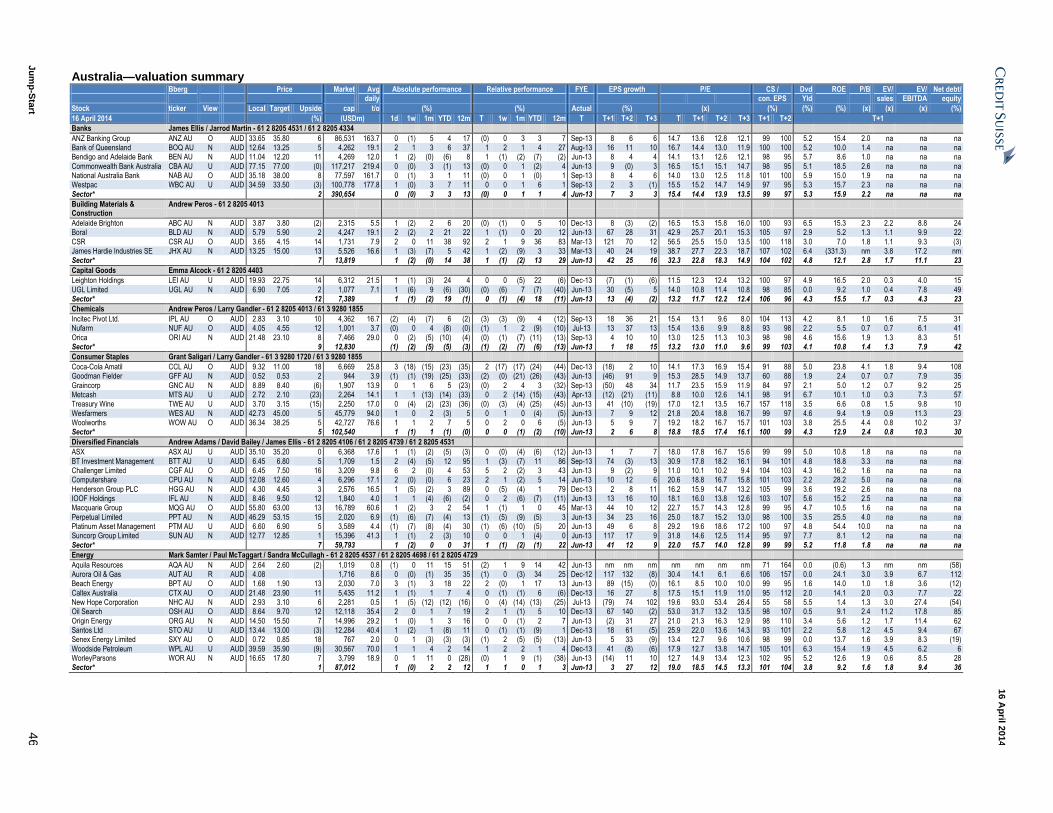
Ju
mp
-Sta
rt 4
6
16 A
pril 2
014
Australia—valuation summary Bberg Price Market Avg Absolute performance Relative performance FYE EPS growth P/E CS / Dvd ROE P/B EV/ EV/ Net debt/ daily con. EPS Yld sales EBITDA equity
Stock ticker View Local Target Upside cap t/o (%) (%) Actual (%) (x) (%) (%) (%) (x) (x) (x) (%)
16 April 2014 (%) (USDm) 1d 1w 1m YTD 12m T 1w 1m YTD 12m T T+1 T+2 T+3 T T+1 T+2 T+3 T+1 T+2 T+1
Banks James Ellis / Jarrod Martin - 61 2 8205 4531 / 61 2 8205 4334
ANZ Banking Group ANZ AU O AUD 33.65 35.80 6 86,531 163.7 0 (1) 5 4 17 (0) 0 3 3 7 Sep-13 8 6 6 14.7 13.6 12.8 12.1 99 100 5.2 15.4 2.0 na na na Bank of Queensland BOQ AU N AUD 12.64 13.25 5 4,262 19.1 2 1 3 6 37 1 2 1 4 27 Aug-13 16 11 10 16.7 14.4 13.0 11.9 100 100 5.2 10.0 1.4 na na na Bendigo and Adelaide Bank BEN AU N AUD 11.04 12.20 11 4,269 12.0 1 (2) (0) (6) 8 1 (1) (2) (7) (2) Jun-13 8 4 4 14.1 13.1 12.6 12.1 98 95 5.7 8.6 1.0 na na na
Commonwealth Bank Australia CBA AU U AUD 77.15 77.00 (0) 117,217 219.4 0 (0) 3 (1) 13 (0) 0 1 (2) 4 Jun-13 9 (0) 3 16.5 15.1 15.1 14.7 98 95 5.1 18.5 2.6 na na na National Australia Bank NAB AU O AUD 35.18 38.00 8 77,597 161.7 0 (1) 3 1 11 (0) 0 1 (0) 1 Sep-13 8 4 6 14.0 13.0 12.5 11.8 101 100 5.9 15.0 1.9 na na na Westpac WBC AU U AUD 34.59 33.50 (3) 100,778 177.8 1 (0) 3 7 11 0 0 1 6 1 Sep-13 2 3 (1) 15.5 15.2 14.7 14.9 97 95 5.3 15.7 2.3 na na na
Sector* 2 390,654 0 (0) 3 3 13 (0) 0 1 1 4 Jun-13 7 3 3 15.4 14.4 13.9 13.5 99 97 5.3 15.9 2.2 na na na
Building Materials & Construction
Andrew Peros - 61 2 8205 4013
Adelaide Brighton ABC AU N AUD 3.87 3.80 (2) 2,315 5.5 1 (2) 2 6 20 (0) (1) 0 5 10 Dec-13 8 (3) (2) 16.5 15.3 15.8 16.0 100 93 6.5 15.3 2.3 2.2 8.8 24 Boral BLD AU N AUD 5.79 5.90 2 4,247 19.1 2 (2) 2 21 22 1 (1) 0 20 12 Jun-13 67 28 31 42.9 25.7 20.1 15.3 105 97 2.9 5.2 1.3 1.1 9.9 22
CSR CSR AU O AUD 3.65 4.15 14 1,731 7.9 2 0 11 38 92 2 1 9 36 83 Mar-13 121 70 12 56.5 25.5 15.0 13.5 100 118 3.0 7.0 1.8 1.1 9.3 (3) James Hardie Industries SE JHX AU N AUD 13.25 15.00 13 5,526 16.6 1 (3) (7) 5 42 1 (2) (9) 3 33 Mar-13 40 24 19 38.7 27.7 22.3 18.7 107 102 6.4 (331.3) nm 3.8 17.2 nm Sector* 7 13,819 1 (2) (0) 14 38 1 (1) (2) 13 29 Jun-13 42 25 16 32.3 22.8 18.3 14.9 104 102 4.8 12.1 2.8 1.7 11.1 23
Capital Goods Emma Alcock - 61 2 8205 4403
Leighton Holdings LEI AU U AUD 19.93 22.75 14 6,312 21.5 1 (1) (3) 24 4 0 0 (5) 22 (6) Dec-13 (7) (1) (6) 11.5 12.3 12.4 13.2 100 97 4.9 16.5 2.0 0.3 4.0 15
UGL Limited UGL AU N AUD 6.90 7.05 2 1,077 7.1 1 (6) 9 (6) (30) (0) (6) 7 (7) (40) Jun-13 30 (5) 5 14.0 10.8 11.4 10.8 98 85 0.0 9.2 1.0 0.4 7.8 49 Sector* 12 7,389 1 (1) (2) 19 (1) 0 (1) (4) 18 (11) Jun-13 13 (4) (2) 13.2 11.7 12.2 12.4 106 96 4.3 15.5 1.7 0.3 4.3 23
Chemicals Andrew Peros / Larry Gandler - 61 2 8205 4013 / 61 3 9280 1855
Incitec Pivot Ltd. IPL AU O AUD 2.83 3.10 10 4,362 16.7 (2) (4) (7) 6 (2) (3) (3) (9) 4 (12) Sep-13 18 36 21 15.4 13.1 9.6 8.0 104 113 4.2 8.1 1.0 1.6 7.5 31 Nufarm NUF AU O AUD 4.05 4.55 12 1,001 3.7 (0) 0 4 (8) (0) (1) 1 2 (9) (10) Jul-13 13 37 13 15.4 13.6 9.9 8.8 93 98 2.2 5.5 0.7 0.7 6.1 41
Orica ORI AU N AUD 21.48 23.10 8 7,466 29.0 0 (2) (5) (10) (4) (0) (1) (7) (11) (13) Sep-13 4 10 10 13.0 12.5 11.3 10.3 98 98 4.6 15.6 1.9 1.3 8.3 51 Sector* 9 12,830 (1) (2) (5) (5) (3) (1) (2) (7) (6) (13) Jun-13 1 18 15 13.2 13.0 11.0 9.6 99 103 4.1 10.8 1.4 1.3 7.9 42
Consumer Staples Grant Saligari / Larry Gandler - 61 3 9280 1720 / 61 3 9280 1855
Coca-Cola Amatil CCL AU O AUD 9.32 11.00 18 6,669 25.8 3 (18) (15) (23) (35) 2 (17) (17) (24) (44) Dec-13 (18) 2 10 14.1 17.3 16.9 15.4 91 88 5.0 23.8 4.1 1.8 9.4 108 Goodman Fielder GFF AU N AUD 0.52 0.53 2 944 3.9 (1) (1) (19) (25) (33) (2) (0) (21) (26) (43) Jun-13 (46) 91 9 15.3 28.5 14.9 13.7 60 88 1.9 2.4 0.7 0.7 7.9 35
Graincorp GNC AU N AUD 8.89 8.40 (6) 1,907 13.9 0 1 6 5 (23) (0) 2 4 3 (32) Sep-13 (50) 48 34 11.7 23.5 15.9 11.9 84 97 2.1 5.0 1.2 0.7 9.2 25 Metcash MTS AU U AUD 2.72 2.10 (23) 2,264 14.1 1 1 (13) (14) (33) 0 2 (14) (15) (43) Apr-13 (12) (21) (11) 8.8 10.0 12.6 14.1 98 91 6.7 10.1 1.0 0.3 7.3 57 Treasury Wine TWE AU U AUD 3.70 3.15 (15) 2,250 17.0 0 (4) (2) (23) (36) (0) (3) (4) (25) (45) Jun-13 41 (10) (19) 17.0 12.1 13.5 16.7 157 118 3.5 6.6 0.8 1.5 9.8 10
Wesfarmers WES AU N AUD 42.73 45.00 5 45,779 94.0 1 0 2 (3) 5 0 1 0 (4) (5) Jun-13 7 9 12 21.8 20.4 18.8 16.7 99 97 4.6 9.4 1.9 0.9 11.3 23 Woolworths WOW AU O AUD 36.34 38.25 5 42,727 76.6 1 1 2 7 5 0 2 0 6 (5) Jun-13 5 9 7 19.2 18.2 16.7 15.7 101 103 3.8 25.5 4.4 0.8 10.2 37 Sector* 5 102,540 1 (1) 1 (1) (0) 0 0 (1) (2) (10) Jun-13 2 6 8 18.8 18.5 17.4 16.1 100 99 4.3 12.9 2.4 0.8 10.3 30
Diversified Financials Andrew Adams / David Bailey / James Ellis - 61 2 8205 4106 / 61 2 8205 4739 / 61 2 8205 4531
ASX ASX AU U AUD 35.10 35.20 0 6,368 17.6 1 (1) (2) (5) (3) 0 (0) (4) (6) (12) Jun-13 1 7 7 18.0 17.8 16.7 15.6 99 99 5.0 10.8 1.8 na na na
BT Investment Management BTT AU U AUD 6.45 6.80 5 1,709 1.5 2 (4) (5) 12 95 1 (3) (7) 11 86 Sep-13 74 (3) 13 30.9 17.8 18.2 16.1 94 101 4.8 18.8 3.3 na na na Challenger Limited CGF AU O AUD 6.45 7.50 16 3,209 9.8 6 2 (0) 4 53 5 2 (2) 3 43 Jun-13 9 (2) 9 11.0 10.1 10.2 9.4 104 103 4.3 16.2 1.6 na na na Computershare CPU AU N AUD 12.08 12.60 4 6,296 17.1 2 (0) (0) 6 23 2 1 (2) 5 14 Jun-13 10 12 6 20.6 18.8 16.7 15.8 101 103 2.2 28.2 5.0 na na na
Henderson Group PLC HGG AU N AUD 4.30 4.45 3 2,576 16.5 1 (5) (2) 3 89 0 (5) (4) 1 79 Dec-13 2 8 11 16.2 15.9 14.7 13.2 105 99 3.6 19.2 2.6 na na na IOOF Holdings IFL AU N AUD 8.46 9.50 12 1,840 4.0 1 1 (4) (6) (2) 0 2 (6) (7) (11) Jun-13 13 16 10 18.1 16.0 13.8 12.6 103 107 5.6 15.2 2.5 na na na Macquarie Group MQG AU O AUD 55.80 63.00 13 16,789 60.6 1 (2) 3 2 54 1 (1) 1 0 45 Mar-13 44 10 12 22.7 15.7 14.3 12.8 99 95 4.7 10.5 1.6 na na na
Perpetual Limited PPT AU N AUD 46.29 53.15 15 2,020 6.9 (1) (6) (7) (4) 13 (1) (5) (9) (5) 3 Jun-13 34 23 16 25.0 18.7 15.2 13.0 98 100 3.5 25.5 4.0 na na na Platinum Asset Management PTM AU U AUD 6.60 6.90 5 3,589 4.4 (1) (7) (8) (4) 30 (1) (6) (10) (5) 20 Jun-13 49 6 8 29.2 19.6 18.6 17.2 100 97 4.8 54.4 10.0 na na na Suncorp Group Limited SUN AU N AUD 12.77 12.85 1 15,396 41.3 1 (1) 2 (3) 10 0 0 1 (4) 0 Jun-13 117 17 9 31.8 14.6 12.5 11.4 95 97 7.7 8.1 1.2 na na na
Sector* 7 59,793 1 (2) 0 0 31 1 (1) (2) (1) 22 Jun-13 41 12 9 22.0 15.7 14.0 12.8 99 99 5.2 11.8 1.8 na na na
Energy Mark Samter / Paul McTaggart / Sandra McCullagh - 61 2 8205 4537 / 61 2 8205 4698 / 61 2 8205 4729
Aquila Resources AQA AU N AUD 2.64 2.60 (2) 1,019 0.8 (1) 0 11 15 51 (2) 1 9 14 42 Jun-13 nm nm nm nm nm nm nm 71 164 0.0 (0.6) 1.3 nm nm (58) Aurora Oil & Gas AUT AU R AUD 4.08 1,716 8.6 0 (0) (1) 35 35 (1) 0 (3) 34 25 Dec-12 117 132 (8) 30.4 14.1 6.1 6.6 106 157 0.0 24.1 3.0 3.9 6.7 112 Beach Energy BPT AU O AUD 1.68 1.90 13 2,030 7.0 3 (1) 3 18 22 2 (0) 1 17 13 Jun-13 89 (15) (0) 16.1 8.5 10.0 10.0 99 95 1.6 14.0 1.0 1.8 3.6 (12)
Caltex Australia CTX AU O AUD 21.48 23.90 11 5,435 11.2 1 (1) 1 7 4 0 (1) (1) 6 (6) Dec-13 16 27 8 17.5 15.1 11.9 11.0 95 112 2.0 14.1 2.0 0.3 7.7 22 New Hope Corporation NHC AU N AUD 2.93 3.10 6 2,281 0.5 1 (5) (12) (12) (16) 0 (4) (14) (13) (25) Jul-13 (79) 74 102 19.6 93.0 53.4 26.4 55 58 5.5 1.4 1.3 3.0 27.4 (54) Oil Search OSH AU O AUD 8.64 9.70 12 12,118 35.4 2 0 1 7 19 2 1 (1) 5 10 Dec-13 67 140 (2) 53.0 31.7 13.2 13.5 98 107 0.5 9.1 2.4 11.2 17.8 85
Origin Energy ORG AU N AUD 14.50 15.50 7 14,996 29.2 1 (0) 1 3 16 0 0 (1) 2 7 Jun-13 (2) 31 27 21.0 21.3 16.3 12.9 98 110 3.4 5.6 1.2 1.7 11.4 62 Santos Ltd STO AU U AUD 13.44 13.00 (3) 12,284 40.4 1 (2) 1 (8) 11 0 (1) (1) (9) 1 Dec-13 18 61 (5) 25.9 22.0 13.6 14.3 93 101 2.2 5.8 1.2 4.5 9.4 67 Senex Energy Limited SXY AU O AUD 0.72 0.85 18 767 2.0 0 1 (3) (3) (3) (1) 2 (5) (5) (13) Jun-13 5 33 (9) 13.4 12.7 9.6 10.6 98 99 0.0 13.7 1.6 3.9 8.3 (19)
Woodside Petroleum WPL AU U AUD 39.59 35.90 (9) 30,567 70.0 1 1 4 2 14 1 2 2 1 4 Dec-13 41 (8) (6) 17.9 12.7 13.8 14.7 105 101 6.3 15.4 1.9 4.5 6.2 6 WorleyParsons WOR AU N AUD 16.65 17.80 7 3,799 18.9 0 1 11 0 (28) (0) 1 9 (1) (38) Jun-13 (14) 11 10 12.7 14.9 13.4 12.3 102 95 5.2 12.6 1.9 0.6 8.5 28 Sector* 1 87,012 1 (0) 2 2 12 1 1 0 1 3 Jun-13 3 27 12 19.0 18.5 14.5 13.3 101 104 3.8 9.2 1.6 1.8 9.4 36
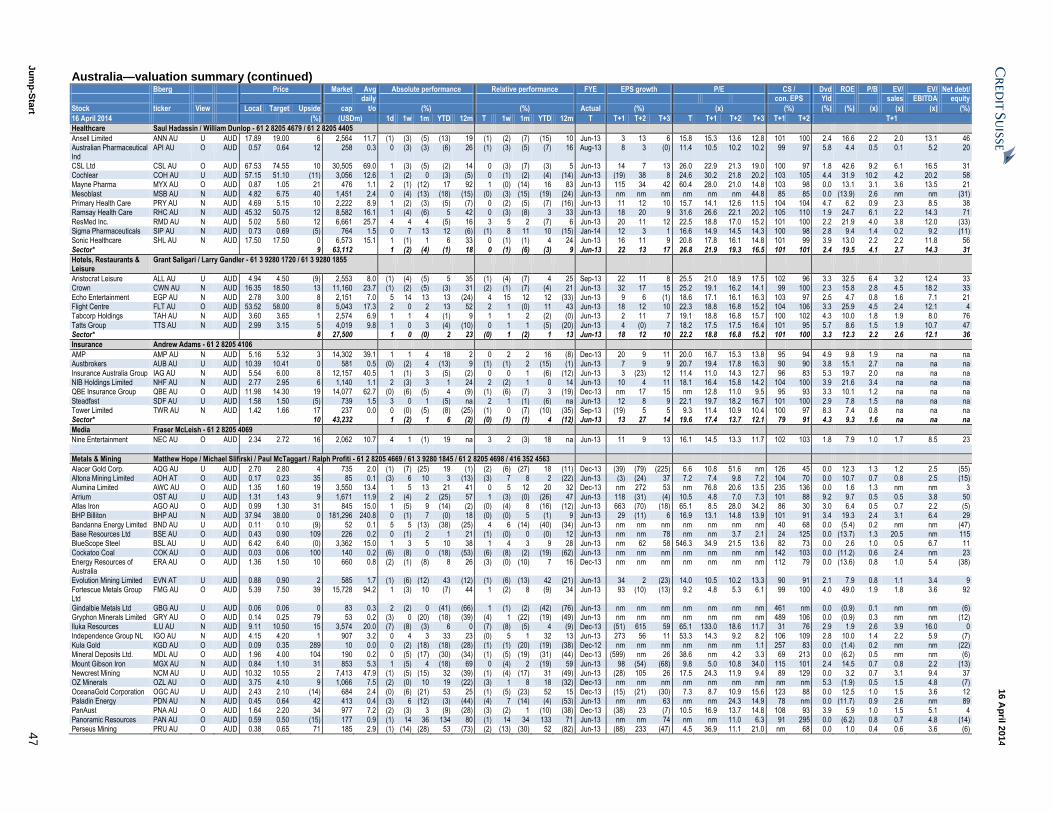
Ju
mp
-Sta
rt 4
7
16 A
pril 2
014
Australia—valuation summary (continued) Bberg Price Market Avg Absolute performance Relative performance FYE EPS growth P/E CS / Dvd ROE P/B EV/ EV/ Net debt/ daily con. EPS Yld sales EBITDA equity
Stock ticker View Local Target Upside cap t/o (%) (%) Actual (%) (x) (%) (%) (%) (x) (x) (x) (%)
16 April 2014 (%) (USDm) 1d 1w 1m YTD 12m T 1w 1m YTD 12m T T+1 T+2 T+3 T T+1 T+2 T+3 T+1 T+2 T+1
Healthcare Saul Hadassin / William Dunlop - 61 2 8205 4679 / 61 2 8205 4405
Ansell Limited ANN AU U AUD 17.89 19.00 6 2,564 11.7 (1) (3) (5) (13) 19 (1) (2) (7) (15) 10 Jun-13 3 13 6 15.8 15.3 13.6 12.8 101 100 2.4 16.6 2.2 2.0 13.1 46 Australian Pharmaceutical Ind
API AU O AUD 0.57 0.64 12 258 0.3 0 (3) (3) (6) 26 (1) (3) (5) (7) 16 Aug-13 8 3 (0) 11.4 10.5 10.2 10.2 99 97 5.8 4.4 0.5 0.1 5.2 20
CSL Ltd CSL AU O AUD 67.53 74.55 10 30,505 69.0 1 (3) (5) (2) 14 0 (3) (7) (3) 5 Jun-13 14 7 13 26.0 22.9 21.3 19.0 100 97 1.8 42.6 9.2 6.1 16.5 31 Cochlear COH AU U AUD 57.15 51.10 (11) 3,056 12.6 1 (2) 0 (3) (5) 0 (1) (2) (4) (14) Jun-13 (19) 38 8 24.6 30.2 21.8 20.2 103 105 4.4 31.9 10.2 4.2 20.2 58 Mayne Pharma MYX AU O AUD 0.87 1.05 21 476 1.1 2 (1) (12) 17 92 1 (0) (14) 16 83 Jun-13 115 34 42 60.4 28.0 21.0 14.8 103 98 0.0 13.1 3.1 3.6 13.5 21
Mesoblast MSB AU N AUD 4.82 6.75 40 1,451 2.4 0 (4) (13) (18) (15) (0) (3) (15) (19) (24) Jun-13 nm nm nm nm nm nm 44.8 85 85 0.0 (13.9) 2.6 nm nm (31) Primary Health Care PRY AU N AUD 4.69 5.15 10 2,222 8.9 1 (2) (3) (5) (7) 0 (2) (5) (7) (16) Jun-13 11 12 10 15.7 14.1 12.6 11.5 104 104 4.7 6.2 0.9 2.3 8.5 38 Ramsay Health Care RHC AU N AUD 45.32 50.75 12 8,582 16.1 1 (4) (6) 5 42 0 (3) (8) 3 33 Jun-13 18 20 9 31.6 26.6 22.1 20.2 105 110 1.9 24.7 6.1 2.2 14.3 71
ResMed Inc. RMD AU N AUD 5.02 5.60 12 6,661 25.7 4 4 4 (5) 16 3 5 2 (7) 6 Jun-13 20 11 12 22.5 18.8 17.0 15.2 101 100 2.2 21.9 4.0 3.8 12.0 (33) Sigma Pharmaceuticals SIP AU N AUD 0.73 0.69 (5) 764 1.5 0 7 13 12 (6) (1) 8 11 10 (15) Jan-14 12 3 1 16.6 14.9 14.5 14.3 100 98 2.8 9.4 1.4 0.2 9.2 (11) Sonic Healthcare SHL AU N AUD 17.50 17.50 0 6,573 15.1 1 (1) 1 6 33 0 (1) (1) 4 24 Jun-13 16 11 9 20.8 17.8 16.1 14.8 101 99 3.9 13.0 2.2 2.2 11.8 56
Sector* 9 63,112 1 (2) (4) (1) 18 0 (1) (6) (3) 9 Jun-13 22 13 17 26.8 21.9 19.3 16.5 101 101 2.4 19.5 4.1 2.7 14.3 31
Hotels, Restaurants & Leisure
Grant Saligari / Larry Gandler - 61 3 9280 1720 / 61 3 9280 1855
Aristocrat Leisure ALL AU U AUD 4.94 4.50 (9) 2,553 8.0 (1) (4) (5) 5 35 (1) (4) (7) 4 25 Sep-13 22 11 8 25.5 21.0 18.9 17.5 102 96 3.3 32.5 6.4 3.2 12.4 33 Crown CWN AU N AUD 16.35 18.50 13 11,160 23.7 (1) (2) (5) (3) 31 (2) (1) (7) (4) 21 Jun-13 32 17 15 25.2 19.1 16.2 14.1 99 100 2.3 15.8 2.8 4.5 18.2 33
Echo Entertainment EGP AU N AUD 2.78 3.00 8 2,151 7.0 5 14 13 13 (24) 4 15 12 12 (33) Jun-13 9 6 (1) 18.6 17.1 16.1 16.3 103 97 2.5 4.7 0.8 1.6 7.1 21 Flight Centre FLT AU O AUD 53.52 58.00 8 5,043 17.3 2 0 2 13 52 2 1 (0) 11 43 Jun-13 18 12 10 22.3 18.8 16.8 15.2 104 106 3.3 25.9 4.5 2.4 12.1 4 Tabcorp Holdings TAH AU N AUD 3.60 3.65 1 2,574 6.9 1 1 4 (1) 9 1 1 2 (2) (0) Jun-13 2 11 7 19.1 18.8 16.8 15.7 100 102 4.3 10.0 1.8 1.9 8.0 76
Tatts Group TTS AU N AUD 2.99 3.15 5 4,019 9.8 1 0 3 (4) (10) 0 1 1 (5) (20) Jun-13 4 (0) 7 18.2 17.5 17.5 16.4 101 95 5.7 8.6 1.5 1.9 10.7 47 Sector* 8 27,500 1 0 (0) 2 23 (0) 1 (2) 1 13 Jun-13 18 12 10 22.2 18.8 16.8 15.2 101 100 3.3 12.3 2.2 2.6 12.1 36
Insurance Andrew Adams - 61 2 8205 4106
AMP AMP AU N AUD 5.16 5.32 3 14,302 39.1 1 1 4 18 2 0 2 2 16 (8) Dec-13 20 9 11 20.0 16.7 15.3 13.8 95 94 4.9 9.8 1.9 na na na Austbrokers AUB AU U AUD 10.39 10.41 0 581 0.5 (0) (2) 4 (13) 9 (1) (1) 2 (15) (1) Jun-13 7 9 9 20.7 19.4 17.8 16.3 90 90 3.8 15.1 2.7 na na na
Insurance Australia Group IAG AU N AUD 5.54 6.00 8 12,157 40.5 1 (1) 3 (5) (2) 0 0 1 (6) (12) Jun-13 3 (23) 12 11.4 11.0 14.3 12.7 96 83 5.3 19.7 2.0 na na na NIB Holdings Limited NHF AU N AUD 2.77 2.95 6 1,140 1.1 2 (3) 3 1 24 2 (2) 1 0 14 Jun-13 10 4 11 18.1 16.4 15.8 14.2 104 100 3.9 21.6 3.4 na na na QBE Insurance Group QBE AU O AUD 11.98 14.30 19 14,077 62.7 (0) (6) (5) 4 (9) (1) (6) (7) 3 (19) Dec-13 nm 17 15 nm 12.8 11.0 9.5 95 93 3.3 10.1 1.2 na na na
Steadfast SDF AU U AUD 1.58 1.50 (5) 739 1.5 3 0 1 (5) na 2 1 (1) (6) na Jun-13 12 8 9 22.1 19.7 18.2 16.7 101 100 2.9 7.8 1.5 na na na Tower Limited TWR AU N AUD 1.42 1.66 17 237 0.0 0 (0) (5) (8) (25) (1) 0 (7) (10) (35) Sep-13 (19) 5 5 9.3 11.4 10.9 10.4 100 97 8.3 7.4 0.8 na na na Sector* 10 43,232 1 (2) 1 6 (2) (0) (1) (1) 4 (12) Jun-13 13 27 14 19.6 17.4 13.7 12.1 79 91 4.3 9.3 1.6 na na na
Media Fraser McLeish - 61 2 8205 4069
Nine Entertainment NEC AU O AUD 2.34 2.72 16 2,062 10.7 4 1 (1) 19 na 3 2 (3) 18 na Jun-13 11 9 13 16.1 14.5 13.3 11.7 102 103 1.8 7.9 1.0 1.7 8.5 23
Metals & Mining Matthew Hope / Michael Slifirski / Paul McTaggart / Ralph Profiti - 61 2 8205 4669 / 61 3 9280 1845 / 61 2 8205 4698 / 416 352 4563
Alacer Gold Corp. AQG AU U AUD 2.70 2.80 4 735 2.0 (1) (7) (25) 19 (1) (2) (6) (27) 18 (11) Dec-13 (39) (79) (225) 6.6 10.8 51.6 nm 126 45 0.0 12.3 1.3 1.2 2.5 (55) Altona Mining Limited AOH AT O AUD 0.17 0.23 35 85 0.1 (3) 6 10 3 (13) (3) 7 8 2 (22) Jun-13 (3) (24) 37 7.2 7.4 9.8 7.2 104 70 0.0 10.7 0.7 0.8 2.5 (15) Alumina Limited AWC AU O AUD 1.35 1.60 19 3,550 13.4 1 5 13 21 41 0 5 12 20 32 Dec-13 nm 272 53 nm 76.8 20.6 13.5 235 136 0.0 1.6 1.3 nm nm 3
Arrium OST AU U AUD 1.31 1.43 9 1,671 11.9 2 (4) 2 (25) 57 1 (3) (0) (26) 47 Jun-13 118 (31) (4) 10.5 4.8 7.0 7.3 101 88 9.2 9.7 0.5 0.5 3.8 50 Atlas Iron AGO AU O AUD 0.99 1.30 31 845 15.0 1 (5) 9 (14) (2) (0) (4) 8 (16) (12) Jun-13 663 (70) (18) 65.1 8.5 28.0 34.2 86 30 3.0 6.4 0.5 0.7 2.2 (5) BHP Billiton BHP AU N AUD 37.94 38.00 0 181,296 240.8 0 (1) 7 (0) 18 (0) (0) 5 (1) 9 Jun-13 29 (11) 6 16.9 13.1 14.8 13.9 101 91 3.4 19.3 2.4 3.1 6.4 29
Bandanna Energy Limited BND AU U AUD 0.11 0.10 (9) 52 0.1 5 5 (13) (38) (25) 4 6 (14) (40) (34) Jun-13 nm nm nm nm nm nm nm 40 68 0.0 (5.4) 0.2 nm nm (47) Base Resources Ltd BSE AU O AUD 0.43 0.90 109 226 0.2 0 (1) 2 1 21 (1) (0) 0 (0) 12 Jun-13 nm nm 78 nm nm 3.7 2.1 24 125 0.0 (13.7) 1.3 20.5 nm 115 BlueScope Steel BSL AU U AUD 6.42 6.40 (0) 3,362 15.0 1 3 5 10 38 1 4 3 9 28 Jun-13 nm 62 58 546.3 34.9 21.5 13.6 82 73 0.0 2.6 1.0 0.5 6.7 11
Cockatoo Coal COK AU O AUD 0.03 0.06 100 140 0.2 (6) (8) 0 (18) (53) (6) (8) (2) (19) (62) Jun-13 nm nm nm nm nm nm nm 142 103 0.0 (11.2) 0.6 2.4 nm 23 Energy Resources of Australia
ERA AU O AUD 1.36 1.50 10 660 0.8 (2) (1) (8) 8 26 (3) (0) (10) 7 16 Dec-13 nm nm nm nm nm nm nm 112 79 0.0 (13.6) 0.8 1.0 5.4 (38)
Evolution Mining Limited EVN AT U AUD 0.88 0.90 2 585 1.7 (1) (6) (12) 43 (12) (1) (6) (13) 42 (21) Jun-13 34 2 (23) 14.0 10.5 10.2 13.3 90 91 2.1 7.9 0.8 1.1 3.4 9 Fortescue Metals Group Ltd
FMG AU O AUD 5.39 7.50 39 15,728 94.2 1 (3) 10 (7) 44 1 (2) 8 (9) 34 Jun-13 93 (10) (13) 9.2 4.8 5.3 6.1 99 100 4.0 49.0 1.9 1.8 3.6 92
Gindalbie Metals Ltd GBG AU U AUD 0.06 0.06 0 83 0.3 2 (2) 0 (41) (66) 1 (1) (2) (42) (76) Jun-13 nm nm nm nm nm nm nm 461 nm 0.0 (0.9) 0.1 nm nm (6) Gryphon Minerals Limited GRY AU O AUD 0.14 0.25 79 53 0.2 (3) 0 (20) (18) (39) (4) 1 (22) (19) (49) Jun-13 nm nm nm nm nm nm nm 489 106 0.0 (0.9) 0.3 nm nm (12) Iluka Resources ILU AU N AUD 9.11 10.50 15 3,574 20.0 (7) (8) (3) 6 0 (7) (8) (5) 4 (9) Dec-13 (51) 615 59 65.1 133.0 18.6 11.7 31 76 2.9 1.9 2.6 3.9 16.0 0
Independence Group NL IGO AU N AUD 4.15 4.20 1 907 3.2 0 4 3 33 23 (0) 5 1 32 13 Jun-13 273 56 11 53.3 14.3 9.2 8.2 106 109 2.8 10.0 1.4 2.2 5.9 (7) Kula Gold KGD AU O AUD 0.09 0.35 289 10 0.0 0 (2) (18) (18) (28) (1) (1) (20) (19) (38) Dec-12 nm nm nm nm nm nm 1.1 257 83 0.0 (1.4) 0.2 nm nm (22) Mineral Deposits Ltd. MDL AU O AUD 1.96 4.00 104 190 0.2 0 (5) (17) (30) (34) (1) (5) (19) (31) (44) Dec-13 (599) nm 26 38.6 nm 4.2 3.3 69 213 0.0 (6.2) 0.5 nm nm (6)
Mount Gibson Iron MGX AU N AUD 0.84 1.10 31 853 5.3 1 (5) 4 (18) 69 0 (4) 2 (19) 59 Jun-13 98 (54) (68) 9.8 5.0 10.8 34.0 115 101 2.4 14.5 0.7 0.8 2.2 (13) Newcrest Mining NCM AU U AUD 10.32 10.55 2 7,413 47.9 (1) (5) (15) 32 (39) (1) (4) (17) 31 (49) Jun-13 (28) 105 26 17.5 24.3 11.9 9.4 89 129 0.0 3.2 0.7 3.1 9.4 37 OZ Minerals OZL AU O AUD 3.75 4.10 9 1,066 7.5 (2) (0) 10 19 (22) (3) 1 8 18 (32) Dec-13 nm nm nm nm nm nm nm nm nm 5.3 (1.9) 0.5 1.5 4.8 (7)
OceanaGold Corporation OGC AU U AUD 2.43 2.10 (14) 684 2.4 (0) (6) (21) 53 25 (1) (5) (23) 52 15 Dec-13 (15) (21) (30) 7.3 8.7 10.9 15.6 123 88 0.0 12.5 1.0 1.5 3.6 12 Paladin Energy PDN AU N AUD 0.45 0.64 42 413 0.4 (3) 6 (12) (3) (44) (4) 7 (14) (4) (53) Jun-13 nm nm 63 nm nm 24.3 14.9 78 nm 0.0 (11.7) 0.9 2.6 nm 89 PanAust PNA AU O AUD 1.64 2.20 34 977 7.2 (2) (3) 3 (9) (28) (3) (2) 1 (10) (38) Dec-13 (38) 23 (7) 10.5 16.9 13.7 14.8 108 93 3.9 5.9 1.0 1.5 5.1 4
Panoramic Resources PAN AU O AUD 0.59 0.50 (15) 177 0.9 (1) 14 36 134 80 (1) 14 34 133 71 Jun-13 nm nm 74 nm nm 11.0 6.3 91 295 0.0 (6.2) 0.8 0.7 4.8 (14) Perseus Mining PRU AU O AUD 0.38 0.65 71 185 2.9 (1) (14) (28) 53 (73) (2) (13) (30) 52 (82) Jun-13 (88) 233 (47) 4.5 36.9 11.1 21.0 nm 68 0.0 1.0 0.4 0.6 3.6 (6)
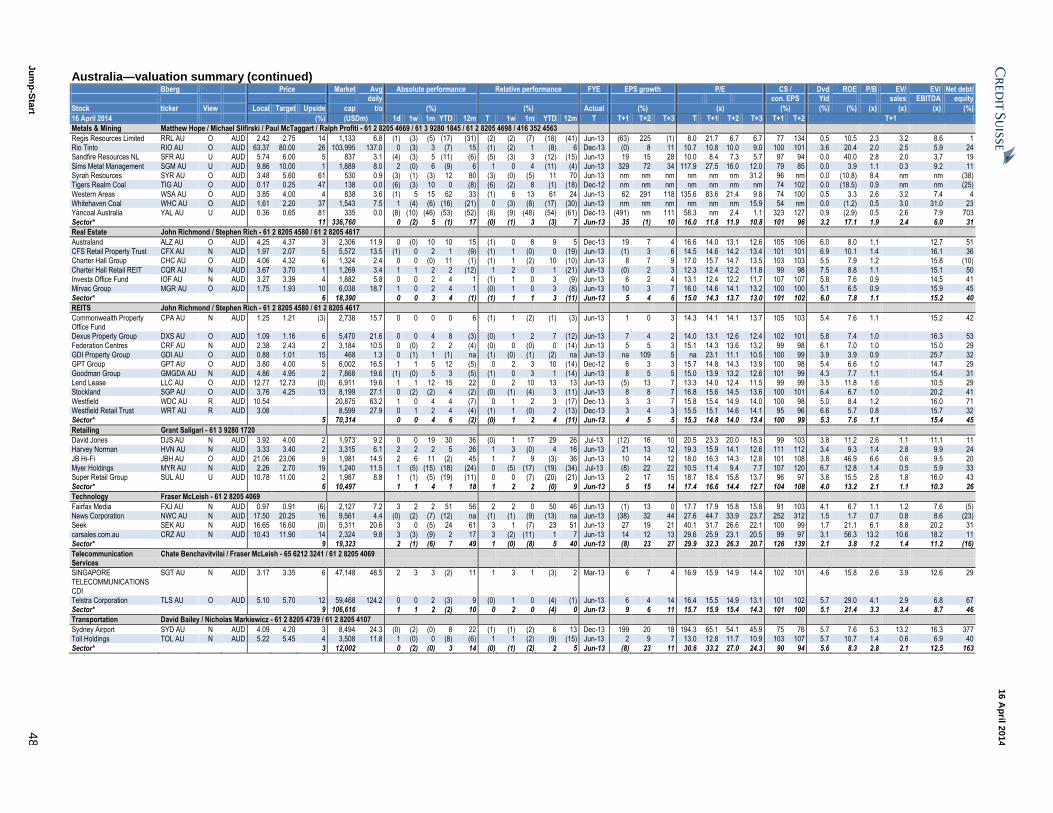
Ju
mp
-Sta
rt 4
8
16 A
pril 2
014
Australia—valuation summary (continued) Bberg Price Market Avg Absolute performance Relative performance FYE EPS growth P/E CS / Dvd ROE P/B EV/ EV/ Net debt/ daily con. EPS Yld sales EBITDA equity
Stock ticker View Local Target Upside cap t/o (%) (%) Actual (%) (x) (%) (%) (%) (x) (x) (x) (%)
16 April 2014 (%) (USDm) 1d 1w 1m YTD 12m T 1w 1m YTD 12m T T+1 T+2 T+3 T T+1 T+2 T+3 T+1 T+2 T+1
Metals & Mining Matthew Hope / Michael Slifirski / Paul McTaggart / Ralph Profiti - 61 2 8205 4669 / 61 3 9280 1845 / 61 2 8205 4698 / 416 352 4563
Regis Resources Limited RRL AU O AUD 2.42 2.75 14 1,133 6.8 (1) (3) (5) (17) (31) (2) (2) (7) (18) (41) Jun-13 (63) 225 (1) 8.0 21.7 6.7 6.7 77 134 0.5 10.5 2.3 3.2 8.6 1 Rio Tinto RIO AU O AUD 63.37 80.00 26 103,995 137.0 0 (3) 3 (7) 15 (1) (2) 1 (8) 6 Dec-13 (0) 8 11 10.7 10.8 10.0 9.0 100 101 3.6 20.4 2.0 2.5 5.9 24 Sandfire Resources NL SFR AU U AUD 5.74 6.00 5 837 3.1 (4) (3) 5 (11) (6) (5) (3) 3 (12) (15) Jun-13 19 15 28 10.0 8.4 7.3 5.7 97 94 0.0 40.0 2.8 2.0 3.7 19
Sims Metal Management SGM AU U AUD 9.86 10.00 1 1,889 8.0 2 (0) 6 (9) 6 1 0 4 (11) (4) Jun-13 329 72 34 117.9 27.5 16.0 12.0 79 85 0.0 3.9 1.1 0.3 9.2 11 Syrah Resources SYR AU O AUD 3.48 5.60 61 530 0.9 (3) (1) (3) 12 80 (3) (0) (5) 11 70 Jun-13 nm nm nm nm nm nm 31.2 96 nm 0.0 (10.8) 8.4 nm nm (38) Tigers Realm Coal TIG AU O AUD 0.17 0.25 47 138 0.0 (6) (3) 10 0 (8) (6) (2) 8 (1) (18) Dec-12 nm nm nm nm nm nm nm 74 102 0.0 (18.5) 0.9 nm nm (25)
Western Areas WSA AU O AUD 3.85 4.00 4 838 3.6 (1) 5 15 62 33 (1) 6 13 61 24 Jun-13 62 291 118 135.6 83.6 21.4 9.8 74 100 0.5 3.3 2.6 3.2 7.4 4 Whitehaven Coal WHC AU O AUD 1.61 2.20 37 1,543 7.5 1 (4) (6) (16) (21) 0 (3) (8) (17) (30) Jun-13 nm nm nm nm nm nm 15.9 54 nm 0.0 (1.2) 0.5 3.0 31.0 23 Yancoal Australia YAL AU U AUD 0.36 0.65 81 335 0.0 (8) (10) (46) (53) (52) (8) (9) (48) (54) (61) Dec-13 (491) nm 111 58.3 nm 2.4 1.1 323 127 0.9 (2.9) 0.5 2.6 7.9 703
Sector* 11 336,760 0 (2) 5 (1) 17 (0) (1) 3 (3) 7 Jun-13 35 (1) 10 16.0 11.8 11.9 10.8 101 96 3.2 17.1 1.9 2.4 6.0 31
Real Estate John Richmond / Stephen Rich - 61 2 8205 4580 / 61 2 8205 4617
Australand ALZ AU O AUD 4.25 4.37 3 2,306 11.9 0 (0) 10 10 15 (1) 0 8 9 5 Dec-13 19 7 4 16.6 14.0 13.1 12.6 105 106 6.0 8.0 1.1 12.7 51 CFS Retail Property Trust CFX AU N AUD 1.97 2.07 5 5,572 13.5 (1) 0 2 1 (9) (1) 1 (0) 0 (19) Jun-13 (1) 3 6 14.5 14.6 14.2 13.4 101 101 6.9 10.1 1.4 16.1 36 Charter Hall Group CHC AU O AUD 4.06 4.32 6 1,324 2.4 0 0 (0) 11 (1) (1) 1 (2) 10 (10) Jun-13 8 7 9 17.0 15.7 14.7 13.5 103 103 5.5 7.9 1.2 15.8 (10)
Charter Hall Retail REIT CQR AU N AUD 3.67 3.70 1 1,269 3.4 1 1 2 2 (12) 1 2 0 1 (21) Jun-13 (0) 2 3 12.3 12.4 12.2 11.8 99 98 7.5 8.8 1.1 15.1 50 Investa Office Fund IOF AU N AUD 3.27 3.39 4 1,882 5.8 0 0 2 4 1 (1) 1 0 3 (9) Jun-13 6 2 4 13.1 12.4 12.2 11.7 107 107 5.8 7.6 0.9 14.5 41 Mirvac Group MGR AU O AUD 1.75 1.93 10 6,038 18.7 1 0 2 4 1 (0) 1 0 3 (8) Jun-13 10 3 7 16.0 14.6 14.1 13.2 100 100 5.1 6.5 0.9 15.9 45
Sector* 6 18,390 0 0 3 4 (1) (1) 1 1 3 (11) Jun-13 5 4 6 15.0 14.3 13.7 13.0 101 102 6.0 7.8 1.1 15.2 40
REITS John Richmond / Stephen Rich - 61 2 8205 4580 / 61 2 8205 4617
Commonwealth Property Office Fund
CPA AU N AUD 1.25 1.21 (3) 2,738 15.7 0 0 0 0 6 (1) 1 (2) (1) (3) Jun-13 1 0 3 14.3 14.1 14.1 13.7 105 103 5.4 7.6 1.1 15.2 42
Dexus Property Group DXS AU O AUD 1.09 1.16 6 5,470 21.6 0 0 4 8 (3) (0) 1 2 7 (12) Jun-13 7 4 2 14.0 13.1 12.6 12.4 102 101 5.8 7.4 1.0 16.3 53
Federation Centres CRF AU N AUD 2.38 2.43 2 3,184 10.5 0 (0) 2 2 (4) (0) 0 (0) 0 (14) Jun-13 5 5 3 15.1 14.3 13.6 13.2 99 98 6.1 7.0 1.0 15.0 29 GDI Property Group GDI AU O AUD 0.88 1.01 15 468 1.3 0 (1) 1 (1) na (1) (0) (1) (2) na Jun-13 na 109 5 na 23.1 11.1 10.5 100 99 3.9 3.9 0.9 25.7 32 GPT Group GPT AU O AUD 3.80 4.00 5 6,002 16.5 1 1 5 12 (5) 0 2 3 10 (14) Dec-12 6 3 3 15.7 14.8 14.3 13.9 100 98 5.4 6.6 1.0 14.7 29
Goodman Group GMGDA AU N AUD 4.86 4.95 2 7,868 19.6 (1) (0) 5 3 (5) (1) 0 3 1 (14) Jun-13 8 5 5 15.0 13.9 13.2 12.6 101 99 4.3 7.7 1.1 15.4 31 Lend Lease LLC AU O AUD 12.77 12.73 (0) 6,911 19.6 1 1 12 15 22 0 2 10 13 13 Jun-13 (5) 13 7 13.3 14.0 12.4 11.5 99 99 3.5 11.8 1.6 10.5 29 Stockland SGP AU O AUD 3.76 4.25 13 8,199 27.1 0 (2) (2) 4 (2) (0) (1) (4) 3 (11) Jun-13 8 8 7 16.8 15.6 14.5 13.6 100 101 6.4 6.7 1.0 20.2 41
Westfield WDC AU R AUD 10.54 20,875 63.2 1 0 4 4 (7) 0 1 2 3 (17) Dec-13 3 3 7 15.8 15.4 14.9 14.0 100 98 5.0 8.4 1.2 16.0 71 Westfield Retail Trust WRT AU R AUD 3.08 8,599 27.9 0 1 2 4 (4) (1) 1 (0) 2 (13) Dec-13 3 4 3 15.5 15.1 14.6 14.1 95 96 6.6 5.7 0.8 15.7 32 Sector* 5 70,314 0 0 4 6 (2) (0) 1 2 4 (11) Jun-13 4 5 5 15.3 14.8 14.0 13.4 100 99 5.3 7.6 1.1 15.4 45
Retailing Grant Saligari - 61 3 9280 1720
David Jones DJS AU N AUD 3.92 4.00 2 1,973 9.2 0 0 19 30 36 (0) 1 17 29 26 Jul-13 (12) 16 10 20.5 23.3 20.0 18.3 99 103 3.8 11.2 2.6 1.1 11.1 11 Harvey Norman HVN AU N AUD 3.33 3.40 2 3,315 6.1 2 2 2 5 26 1 3 (0) 4 16 Jun-13 21 13 12 19.3 15.9 14.1 12.6 111 112 3.4 9.3 1.4 2.8 9.9 24
JB Hi-Fi JBH AU O AUD 21.06 23.06 9 1,981 14.5 2 6 11 (2) 45 1 7 9 (3) 36 Jun-13 10 14 12 18.0 16.3 14.3 12.8 101 108 3.8 46.9 6.6 0.6 9.5 20 Myer Holdings MYR AU N AUD 2.26 2.70 19 1,240 11.5 1 (5) (15) (18) (24) 0 (5) (17) (19) (34) Jul-13 (8) 22 22 10.5 11.4 9.4 7.7 107 120 6.7 12.8 1.4 0.5 5.9 33 Super Retail Group SUL AU U AUD 10.78 11.00 2 1,987 8.8 1 (1) (5) (19) (11) 0 0 (7) (20) (21) Jun-13 2 17 15 18.7 18.4 15.8 13.7 96 97 3.8 15.5 2.8 1.8 16.0 43
Sector* 6 10,497 1 1 4 1 18 1 2 2 (0) 9 Jun-13 5 15 14 17.4 16.6 14.4 12.7 104 108 4.0 13.2 2.1 1.1 10.3 26
Technology Fraser McLeish - 61 2 8205 4069
Fairfax Media FXJ AU N AUD 0.97 0.91 (6) 2,127 7.2 3 2 2 51 56 2 2 0 50 46 Jun-13 (1) 13 0 17.7 17.9 15.8 15.8 91 103 4.1 6.7 1.1 1.2 7.6 (5) News Corporation NWC AU N AUD 17.50 20.25 16 9,561 4.4 (0) (2) (7) (12) na (1) (1) (9) (13) na Jun-13 (38) 32 44 27.6 44.7 33.9 23.7 252 312 1.5 1.7 0.7 0.8 8.6 (23) Seek SEK AU N AUD 16.65 16.60 (0) 5,311 20.6 3 0 (5) 24 61 3 1 (7) 23 51 Jun-13 27 19 21 40.1 31.7 26.6 22.1 100 99 1.7 21.1 6.1 8.8 20.2 31
carsales.com.au CRZ AU N AUD 10.43 11.90 14 2,324 9.8 3 (3) (9) 2 17 3 (2) (11) 1 7 Jun-13 14 12 13 29.6 25.9 23.1 20.5 99 97 3.1 56.3 13.2 10.6 18.2 11 Sector* 9 19,323 2 (1) (6) 7 49 1 (0) (8) 5 40 Jun-13 (8) 23 27 29.9 32.3 26.3 20.7 126 139 2.1 3.8 1.2 1.4 11.2 (16)
Telecommunication Services
Chate Benchavitvilai / Fraser McLeish - 65 6212 3241 / 61 2 8205 4069
SINGAPORE TELECOMMUNICATIONS CDI
SGT AU N AUD 3.17 3.35 6 47,148 48.5 2 3 3 (2) 11 1 3 1 (3) 2 Mar-13 6 7 4 16.9 15.9 14.9 14.4 102 101 4.6 15.8 2.6 3.9 12.6 29
Telstra Corporation TLS AU O AUD 5.10 5.70 12 59,468 124.2 0 0 2 (3) 9 (0) 1 0 (4) (1) Jun-13 6 4 14 16.4 15.5 14.9 13.1 101 102 5.7 29.0 4.1 2.9 6.8 67 Sector* 9 106,616 1 1 2 (2) 10 0 2 0 (4) 0 Jun-13 9 6 11 15.7 15.9 15.4 14.3 101 100 5.1 21.4 3.3 3.4 8.7 46
Transportation David Bailey / Nicholas Markiewicz - 61 2 8205 4739 / 61 2 8205 4107
Sydney Airport SYD AU N AUD 4.09 4.20 3 8,494 24.3 (0) (2) (0) 8 22 (1) (1) (2) 6 13 Dec-13 199 20 18 194.3 65.1 54.1 45.9 75 76 5.7 7.6 5.3 13.2 16.3 377 Toll Holdings TOL AU N AUD 5.22 5.45 4 3,508 11.8 1 (0) 0 (8) (6) 1 1 (2) (9) (15) Jun-13 2 9 7 13.0 12.8 11.7 10.9 103 107 5.7 10.7 1.4 0.6 6.9 40
Sector* 3 12,002 0 (2) (0) 3 14 (0) (1) (2) 2 5 Jun-13 (8) 23 11 30.6 33.2 27.0 24.3 90 94 5.6 8.3 2.8 2.1 12.5 163
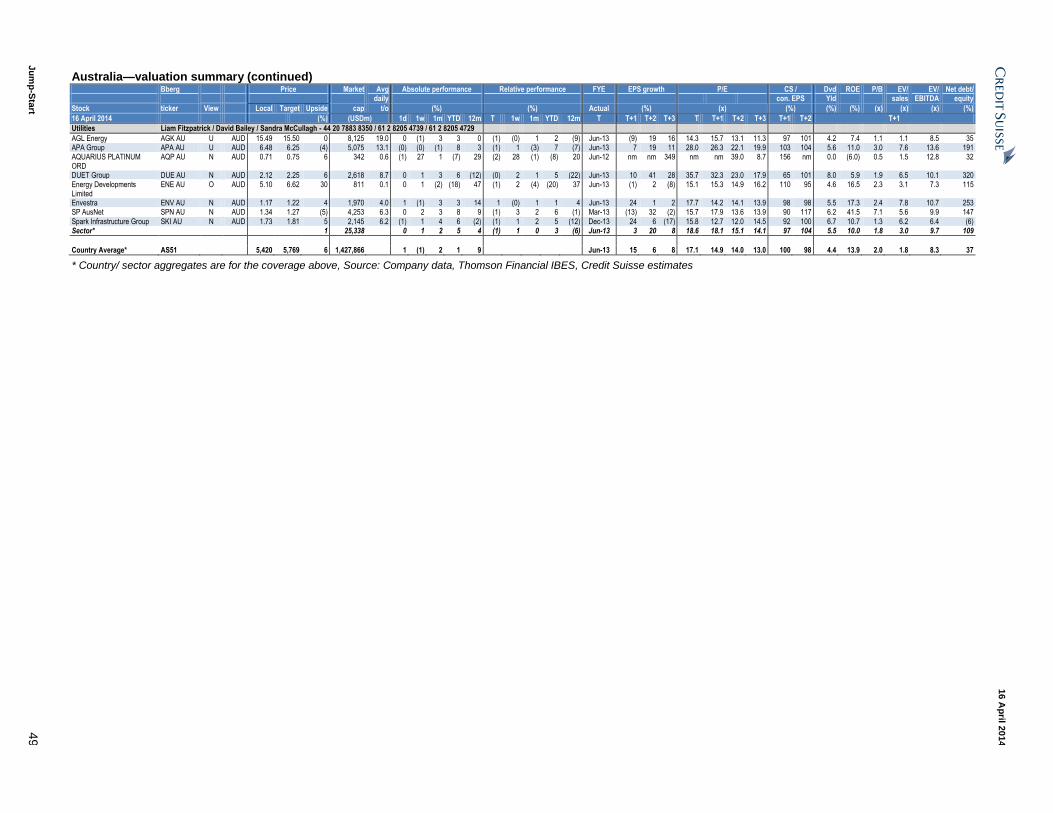
Ju
mp
-Sta
rt 4
9
16 A
pril 2
014
Australia—valuation summary (continued) Bberg Price Market Avg Absolute performance Relative performance FYE EPS growth P/E CS / Dvd ROE P/B EV/ EV/ Net debt/ daily con. EPS Yld sales EBITDA equity
Stock ticker View Local Target Upside cap t/o (%) (%) Actual (%) (x) (%) (%) (%) (x) (x) (x) (%)
16 April 2014 (%) (USDm) 1d 1w 1m YTD 12m T 1w 1m YTD 12m T T+1 T+2 T+3 T T+1 T+2 T+3 T+1 T+2 T+1
Utilities Liam Fitzpatrick / David Bailey / Sandra McCullagh - 44 20 7883 8350 / 61 2 8205 4739 / 61 2 8205 4729
AGL Energy AGK AU U AUD 15.49 15.50 0 8,125 19.0 0 (1) 3 3 0 (1) (0) 1 2 (9) Jun-13 (9) 19 16 14.3 15.7 13.1 11.3 97 101 4.2 7.4 1.1 1.1 8.5 35 APA Group APA AU U AUD 6.48 6.25 (4) 5,075 13.1 (0) (0) (1) 8 3 (1) 1 (3) 7 (7) Jun-13 7 19 11 28.0 26.3 22.1 19.9 103 104 5.6 11.0 3.0 7.6 13.6 191 AQUARIUS PLATINUM ORD
AQP AU N AUD 0.71 0.75 6 342 0.6 (1) 27 1 (7) 29 (2) 28 (1) (8) 20 Jun-12 nm nm 349 nm nm 39.0 8.7 156 nm 0.0 (6.0) 0.5 1.5 12.8 32
DUET Group DUE AU N AUD 2.12 2.25 6 2,618 8.7 0 1 3 6 (12) (0) 2 1 5 (22) Jun-13 10 41 28 35.7 32.3 23.0 17.9 65 101 8.0 5.9 1.9 6.5 10.1 320 Energy Developments Limited
ENE AU O AUD 5.10 6.62 30 811 0.1 0 1 (2) (18) 47 (1) 2 (4) (20) 37 Jun-13 (1) 2 (8) 15.1 15.3 14.9 16.2 110 95 4.6 16.5 2.3 3.1 7.3 115
Envestra ENV AU N AUD 1.17 1.22 4 1,970 4.0 1 (1) 3 3 14 1 (0) 1 1 4 Jun-13 24 1 2 17.7 14.2 14.1 13.9 98 98 5.5 17.3 2.4 7.8 10.7 253 SP AusNet SPN AU N AUD 1.34 1.27 (5) 4,253 6.3 0 2 3 8 9 (1) 3 2 6 (1) Mar-13 (13) 32 (2) 15.7 17.9 13.6 13.9 90 117 6.2 41.5 7.1 5.6 9.9 147
Spark Infrastructure Group SKI AU N AUD 1.73 1.81 5 2,145 6.2 (1) 1 4 6 (2) (1) 1 2 5 (12) Dec-13 24 6 (17) 15.8 12.7 12.0 14.5 92 100 6.7 10.7 1.3 6.2 6.4 (6) Sector* 1 25,338 0 1 2 5 4 (1) 1 0 3 (6) Jun-13 3 20 8 18.6 18.1 15.1 14.1 97 104 5.5 10.0 1.8 3.0 9.7 109
Country Average* AS51 5,420 5,769 6 1,427,866 1 (1) 2 1 9 Jun-13 15 6 8 17.1 14.9 14.0 13.0 100 98 4.4 13.9 2.0 1.8 8.3 37
* Country/ sector aggregates are for the coverage above, Source: Company data, Thomson Financial IBES, Credit Suisse estimates
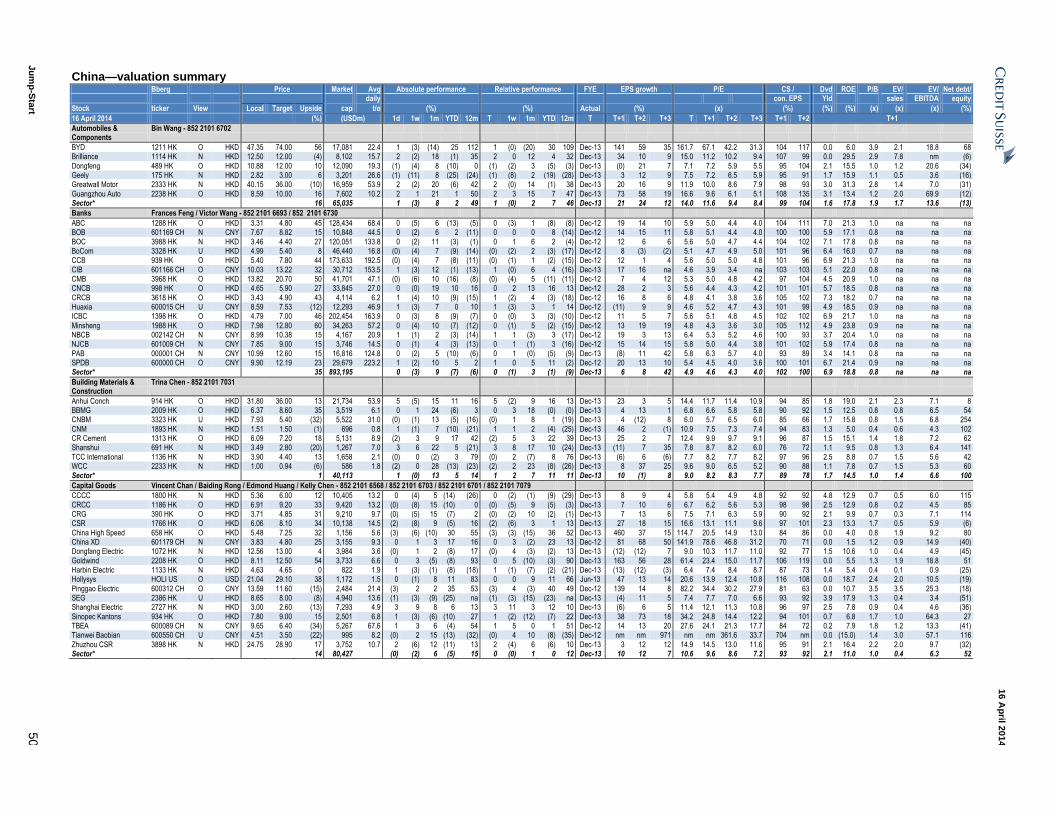
Ju
mp
-Sta
rt 5
0
16 A
pril 2
014
China—valuation summary Bberg Price Market Avg Absolute performance Relative performance FYE EPS growth P/E CS / Dvd ROE P/B EV/ EV/ Net debt/ daily con. EPS Yld sales EBITDA equity
Stock ticker View Local Target Upside cap t/o (%) (%) Actual (%) (x) (%) (%) (%) (x) (x) (x) (%)
16 April 2014 (%) (USDm) 1d 1w 1m YTD 12m T 1w 1m YTD 12m T T+1 T+2 T+3 T T+1 T+2 T+3 T+1 T+2 T+1
Automobiles & Components
Bin Wang - 852 2101 6702
BYD 1211 HK O HKD 47.35 74.00 56 17,081 22.4 1 (3) (14) 25 112 1 (0) (20) 30 109 Dec-13 141 59 35 161.7 67.1 42.2 31.3 104 117 0.0 6.0 3.9 2.1 18.8 68 Brilliance 1114 HK N HKD 12.50 12.00 (4) 8,102 15.7 2 (2) 18 (1) 35 2 0 12 4 32 Dec-13 34 10 9 15.0 11.2 10.2 9.4 107 99 0.0 29.5 2.9 7.8 nm (6)
Dongfeng 489 HK O HKD 10.88 12.00 10 12,090 19.3 (1) (4) 8 (10) 0 (1) (2) 3 (5) (3) Dec-13 (0) 21 7 7.1 7.2 5.9 5.5 95 104 2.1 15.5 1.0 1.2 20.6 (34) Geely 175 HK N HKD 2.82 3.00 6 3,201 26.6 (1) (11) 8 (25) (24) (1) (8) 2 (19) (28) Dec-13 3 12 9 7.5 7.2 6.5 5.9 95 91 1.7 15.9 1.1 0.5 3.6 (16) Greatwall Motor 2333 HK N HKD 40.15 36.00 (10) 16,959 53.9 2 (2) 20 (6) 42 2 (0) 14 (1) 38 Dec-13 20 16 9 11.9 10.0 8.6 7.9 98 93 3.0 31.3 2.8 1.4 7.0 (31)
Guangzhou Auto 2238 HK O HKD 8.59 10.00 16 7,602 10.2 2 1 21 1 50 2 3 15 7 47 Dec-13 73 58 19 16.6 9.6 6.1 5.1 108 135 3.1 13.4 1.2 2.0 69.9 (12) Sector* 16 65,035 1 (3) 8 2 49 1 (0) 2 7 46 Dec-13 21 24 12 14.0 11.6 9.4 8.4 99 104 1.6 17.8 1.9 1.7 13.6 (13)
Banks Frances Feng / Victor Wang - 852 2101 6693 / 852 2101 6730
ABC 1288 HK O HKD 3.31 4.80 45 128,434 68.4 0 (5) 6 (13) (5) 0 (3) 1 (8) (8) Dec-12 19 14 10 5.9 5.0 4.4 4.0 104 111 7.0 21.3 1.0 na na na BOB 601169 CH N CNY 7.67 8.82 15 10,848 44.5 0 (2) 6 2 (11) 0 0 0 8 (14) Dec-12 14 15 11 5.8 5.1 4.4 4.0 100 100 5.9 17.1 0.8 na na na
BOC 3988 HK N HKD 3.46 4.40 27 120,051 133.8 0 (2) 11 (3) (1) 0 1 6 2 (4) Dec-12 12 6 6 5.6 5.0 4.7 4.4 104 102 7.1 17.8 0.8 na na na BoCom 3328 HK U HKD 4.99 5.40 8 46,440 16.8 (0) (4) 7 (9) (14) (0) (2) 2 (3) (17) Dec-12 8 (3) (2) 5.1 4.7 4.9 5.0 101 96 6.4 16.0 0.7 na na na CCB 939 HK O HKD 5.40 7.80 44 173,633 192.5 (0) (4) 7 (8) (11) (0) (1) 1 (2) (15) Dec-12 12 1 4 5.6 5.0 5.0 4.8 101 96 6.9 21.3 1.0 na na na
CIB 601166 CH O CNY 10.03 13.22 32 30,712 153.5 1 (3) 12 (1) (13) 1 (0) 6 4 (16) Dec-13 17 16 na 4.6 3.9 3.4 na 103 103 5.1 22.0 0.8 na na na CMB 3968 HK O HKD 13.82 20.70 50 41,701 47.1 (0) (6) 10 (16) (8) (0) (4) 5 (11) (11) Dec-12 7 4 12 5.3 5.0 4.8 4.2 97 104 4.5 20.9 1.0 na na na CNCB 998 HK O HKD 4.65 5.90 27 33,845 27.0 0 (0) 19 10 16 0 2 13 16 13 Dec-12 28 2 3 5.6 4.4 4.3 4.2 101 101 5.7 18.5 0.8 na na na
CRCB 3618 HK O HKD 3.43 4.90 43 4,114 6.2 1 (4) 10 (9) (15) 1 (2) 4 (3) (18) Dec-12 16 8 6 4.8 4.1 3.8 3.6 105 102 7.3 18.2 0.7 na na na Huaxia 600015 CH U CNY 8.59 7.53 (12) 12,293 46.9 1 (3) 7 0 10 1 (3) 3 1 14 Dec-12 (11) 9 9 4.6 5.2 4.7 4.3 101 99 4.9 18.5 0.9 na na na ICBC 1398 HK O HKD 4.79 7.00 46 202,454 163.9 0 (3) 8 (9) (7) 0 (0) 3 (3) (10) Dec-12 11 5 7 5.6 5.1 4.8 4.5 102 102 6.9 21.7 1.0 na na na
Minsheng 1988 HK O HKD 7.98 12.80 60 34,263 57.2 0 (4) 10 (7) (12) 0 (1) 5 (2) (15) Dec-12 13 19 19 4.8 4.3 3.6 3.0 105 112 4.9 23.8 0.9 na na na NBCB 002142 CH N CNY 8.99 10.38 15 4,167 20.9 1 (1) 2 (3) (14) 1 1 (3) 3 (17) Dec-12 19 3 13 6.4 5.3 5.2 4.6 100 93 3.7 20.4 1.0 na na na NJCB 601009 CH N CNY 7.85 9.00 15 3,746 14.5 0 (1) 4 (3) (13) 0 1 (1) 3 (16) Dec-12 15 14 15 5.8 5.0 4.4 3.8 101 102 5.9 17.4 0.8 na na na
PAB 000001 CH N CNY 10.99 12.60 15 16,816 124.8 0 (2) 5 (10) (6) 0 1 (0) (5) (9) Dec-13 (8) 11 42 5.8 6.3 5.7 4.0 93 89 3.4 14.1 0.8 na na na SPDB 600000 CH O CNY 9.90 12.19 23 29,679 223.2 1 (2) 10 5 2 1 0 5 11 (2) Dec-12 20 13 10 5.4 4.5 4.0 3.6 100 101 6.7 21.4 0.9 na na na Sector* 35 893,195 0 (3) 9 (7) (6) 0 (1) 3 (1) (9) Dec-13 6 8 42 4.9 4.6 4.3 4.0 102 100 6.9 18.8 0.8 na na na
Building Materials & Construction
Trina Chen - 852 2101 7031
Anhui Conch 914 HK O HKD 31.80 36.00 13 21,734 53.9 5 (5) 15 11 16 5 (2) 9 16 13 Dec-13 23 3 5 14.4 11.7 11.4 10.9 94 85 1.8 19.0 2.1 2.3 7.1 8 BBMG 2009 HK O HKD 6.37 8.60 35 3,519 6.1 0 1 24 (6) 3 0 3 18 (0) (0) Dec-13 4 13 1 6.8 6.6 5.8 5.8 90 92 1.5 12.5 0.8 0.8 6.5 54 CNBM 3323 HK U HKD 7.93 5.40 (32) 5,522 31.0 (0) (1) 13 (5) (16) (0) 1 8 1 (19) Dec-13 4 (12) 8 6.0 5.7 6.5 6.0 85 66 1.7 15.8 0.8 1.5 6.8 254
CNM 1893 HK N HKD 1.51 1.50 (1) 696 0.8 1 (1) 7 (10) (21) 1 1 2 (4) (25) Dec-13 46 2 (1) 10.9 7.5 7.3 7.4 94 83 1.3 5.0 0.4 0.6 4.3 102 CR Cement 1313 HK O HKD 6.09 7.20 18 5,131 8.9 (2) 3 9 17 42 (2) 5 3 22 39 Dec-13 25 2 7 12.4 9.9 9.7 9.1 96 87 1.5 15.1 1.4 1.8 7.2 62 Shanshui 691 HK N HKD 3.49 2.80 (20) 1,267 7.0 3 6 22 5 (21) 3 8 17 10 (24) Dec-13 (11) 7 35 7.8 8.7 8.2 6.0 76 72 1.1 9.5 0.8 1.3 6.4 141
TCC International 1136 HK N HKD 3.90 4.40 13 1,658 2.1 (0) 0 (2) 3 79 (0) 2 (7) 8 76 Dec-13 (6) 6 (6) 7.7 8.2 7.7 8.2 97 96 2.5 8.8 0.7 1.5 5.6 42 WCC 2233 HK N HKD 1.00 0.94 (6) 586 1.8 (2) 0 28 (13) (23) (2) 2 23 (8) (26) Dec-13 8 37 25 9.6 9.0 6.5 5.2 90 88 1.1 7.8 0.7 1.5 5.3 60 Sector* 1 40,113 1 (0) 13 5 14 1 2 7 11 11 Dec-13 10 (1) 8 9.0 8.2 8.3 7.7 89 78 1.7 14.5 1.0 1.4 6.6 100
Capital Goods Vincent Chan / Baiding Rong / Edmond Huang / Kelly Chen - 852 2101 6568 / 852 2101 6703 / 852 2101 6701 / 852 2101 7079
CCCC 1800 HK N HKD 5.36 6.00 12 10,405 13.2 0 (4) 5 (14) (26) 0 (2) (1) (9) (29) Dec-13 8 9 4 5.8 5.4 4.9 4.8 92 92 4.8 12.9 0.7 0.5 6.0 115
CRCC 1186 HK O HKD 6.91 9.20 33 9,420 13.2 (0) (8) 15 (10) 0 (0) (5) 9 (5) (3) Dec-13 7 10 6 6.7 6.2 5.6 5.3 98 98 2.5 12.9 0.8 0.2 4.5 85 CRG 390 HK O HKD 3.71 4.85 31 9,210 9.7 (0) (5) 15 (7) 2 (0) (2) 10 (2) (1) Dec-13 7 13 6 7.5 7.1 6.3 5.9 90 92 2.1 9.9 0.7 0.3 7.1 114 CSR 1766 HK O HKD 6.06 8.10 34 10,138 14.5 (2) (8) 9 (5) 16 (2) (6) 3 1 13 Dec-13 27 18 15 16.6 13.1 11.1 9.6 97 101 2.3 13.3 1.7 0.5 5.9 (6)
China High Speed 658 HK O HKD 5.48 7.25 32 1,156 5.6 (3) (6) (10) 30 55 (3) (3) (15) 36 52 Dec-13 460 37 15 114.7 20.5 14.9 13.0 84 86 0.0 4.0 0.8 1.9 9.2 80 China XD 601179 CH N CNY 3.83 4.80 25 3,155 9.3 0 1 3 17 16 0 3 (2) 23 13 Dec-12 81 68 50 141.9 78.6 46.8 31.2 70 71 0.0 1.5 1.2 0.9 14.9 (40) Dongfang Electric 1072 HK N HKD 12.56 13.00 4 3,984 3.6 (0) 1 2 (8) 17 (0) 4 (3) (2) 13 Dec-13 (12) (12) 7 9.0 10.3 11.7 11.0 92 77 1.5 10.6 1.0 0.4 4.9 (45)
Goldwind 2208 HK O HKD 8.11 12.50 54 3,733 6.6 0 3 (5) (8) 93 0 5 (10) (3) 90 Dec-13 163 56 28 61.4 23.4 15.0 11.7 106 119 0.0 5.5 1.3 1.9 18.8 51 Harbin Electric 1133 HK N HKD 4.63 4.65 0 822 1.9 1 (3) (1) (8) (18) 1 (1) (7) (2) (21) Dec-13 (13) (12) (3) 6.4 7.4 8.4 8.7 87 73 1.4 5.4 0.4 0.1 0.9 (25) Hollysys HOLI US O USD 21.04 29.10 38 1,172 1.5 0 (1) 8 11 83 0 0 9 11 66 Jun-13 47 13 14 20.6 13.9 12.4 10.8 116 108 0.0 18.7 2.4 2.0 10.5 (19)
Pinggao Electric 600312 CH O CNY 13.59 11.60 (15) 2,484 21.4 (3) 2 2 35 53 (3) 4 (3) 40 49 Dec-12 139 14 8 82.2 34.4 30.2 27.9 81 63 0.0 10.7 3.5 3.5 25.3 (18) SEG 2386 HK U HKD 8.65 8.00 (8) 4,940 13.6 (1) (3) (9) (25) na (1) (3) (15) (23) na Dec-13 (4) 11 5 7.4 7.7 7.0 6.6 93 92 3.9 17.9 1.3 0.4 3.4 (51) Shanghai Electric 2727 HK N HKD 3.00 2.60 (13) 7,293 4.9 3 9 8 6 13 3 11 3 12 10 Dec-13 (6) 6 5 11.4 12.1 11.3 10.8 96 97 2.5 7.8 0.9 0.4 4.6 (36)
Sinopec Kantons 934 HK O HKD 7.80 9.00 15 2,501 6.8 1 (3) (6) (10) 27 1 (2) (12) (7) 22 Dec-13 38 73 18 34.2 24.8 14.4 12.2 94 101 0.7 6.8 1.7 1.0 64.3 27 TBEA 600089 CH N CNY 9.65 6.40 (34) 5,267 67.6 1 3 6 (4) 54 1 5 0 1 51 Dec-12 14 13 20 27.6 24.1 21.3 17.7 84 72 0.2 7.9 1.8 1.2 13.3 (41) Tianwei Baobian 600550 CH U CNY 4.51 3.50 (22) 995 8.2 (0) 2 15 (13) (32) (0) 4 10 (8) (35) Dec-12 nm nm 971 nm nm 361.6 33.7 704 nm 0.0 (15.0) 1.4 3.0 57.1 116
Zhuzhou CSR 3898 HK N HKD 24.75 28.90 17 3,752 10.7 2 (6) 12 (11) 13 2 (4) 6 (6) 10 Dec-13 3 12 12 14.9 14.5 13.0 11.6 95 91 2.1 16.4 2.2 2.0 9.7 (32) Sector* 14 80,427 (0) (2) 6 (5) 15 0 (0) 1 0 12 Dec-13 10 12 7 10.6 9.6 8.6 7.2 93 92 2.1 11.0 1.0 0.4 6.3 52
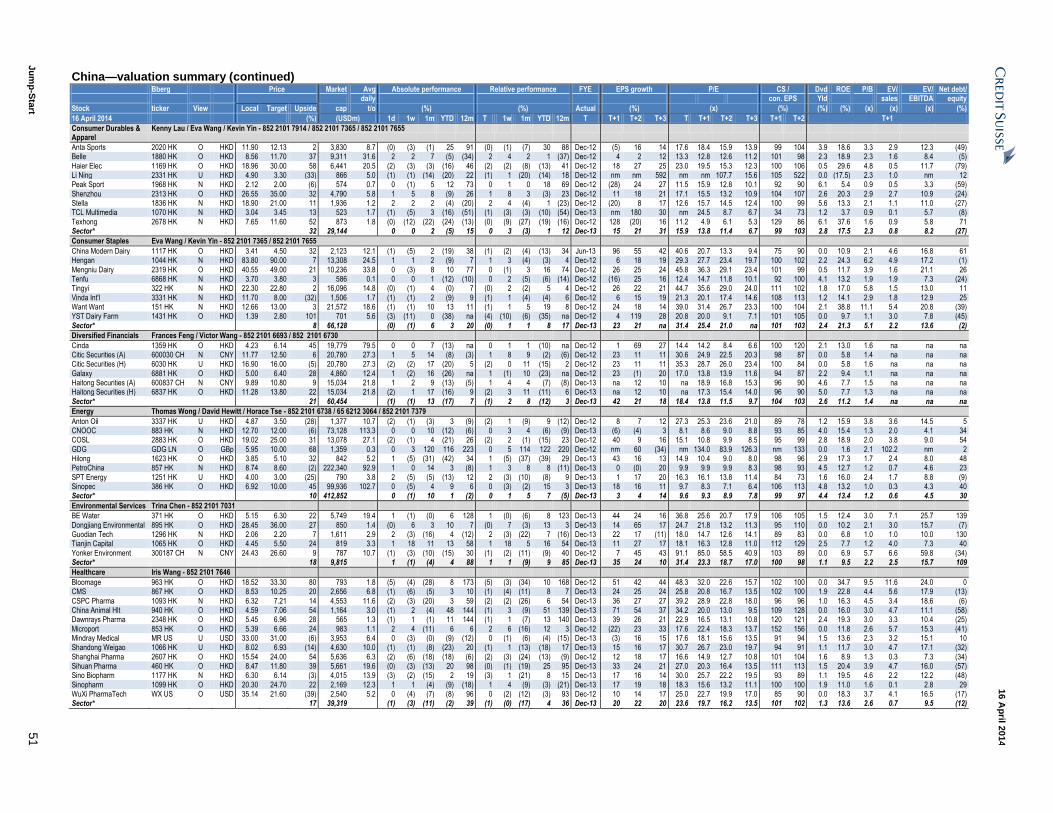
Ju
mp
-Sta
rt 5
1
16 A
pril 2
014
China—valuation summary (continued) Bberg Price Market Avg Absolute performance Relative performance FYE EPS growth P/E CS / Dvd ROE P/B EV/ EV/ Net debt/ daily con. EPS Yld sales EBITDA equity
Stock ticker View Local Target Upside cap t/o (%) (%) Actual (%) (x) (%) (%) (%) (x) (x) (x) (%)
16 April 2014 (%) (USDm) 1d 1w 1m YTD 12m T 1w 1m YTD 12m T T+1 T+2 T+3 T T+1 T+2 T+3 T+1 T+2 T+1
Consumer Durables & Apparel
Kenny Lau / Eva Wang / Kevin Yin - 852 2101 7914 / 852 2101 7365 / 852 2101 7655
Anta Sports 2020 HK O HKD 11.90 12.13 2 3,830 8.7 (0) (3) (1) 25 91 (0) (1) (7) 30 88 Dec-12 (5) 16 14 17.6 18.4 15.9 13.9 99 104 3.9 18.6 3.3 2.9 12.3 (49) Belle 1880 HK O HKD 8.56 11.70 37 9,311 31.6 2 2 7 (5) (34) 2 4 2 1 (37) Dec-12 4 2 12 13.3 12.8 12.6 11.2 101 98 2.3 18.9 2.3 1.6 8.4 (5)
Haier Elec 1169 HK O HKD 18.96 30.00 58 6,441 20.5 (2) (3) (3) (16) 46 (2) (2) (8) (13) 41 Dec-12 18 27 25 23.0 19.5 15.3 12.3 100 106 0.5 29.6 4.8 0.5 11.7 (79) Li Ning 2331 HK U HKD 4.90 3.30 (33) 866 5.0 (1) (1) (14) (20) 22 (1) 1 (20) (14) 18 Dec-12 nm nm 592 nm nm 107.7 15.6 105 522 0.0 (17.5) 2.3 1.0 nm 12 Peak Sport 1968 HK N HKD 2.12 2.00 (6) 574 0.7 0 (1) 5 12 73 0 1 0 18 69 Dec-12 (28) 24 27 11.5 15.9 12.8 10.1 92 90 6.1 5.4 0.9 0.5 3.3 (59)
Shenzhou 2313 HK O HKD 26.55 35.00 32 4,790 5.8 1 5 8 (9) 26 1 8 3 (3) 23 Dec-12 11 18 21 17.1 15.5 13.2 10.9 104 107 2.6 20.3 2.9 2.7 10.9 (24) Stella 1836 HK N HKD 18.90 21.00 11 1,936 1.2 2 2 2 (4) (20) 2 4 (4) 1 (23) Dec-12 (20) 8 17 12.6 15.7 14.5 12.4 100 99 5.6 13.3 2.1 1.1 11.0 (27) TCL Multimedia 1070 HK N HKD 3.04 3.45 13 523 1.7 (1) (5) 3 (16) (51) (1) (3) (3) (10) (54) Dec-13 nm 180 30 nm 24.5 8.7 6.7 34 73 1.2 3.7 0.9 0.1 5.7 (8)
Texhong 2678 HK N HKD 7.65 11.60 52 873 1.8 (0) (12) (22) (24) (13) (0) (9) (27) (19) (16) Dec-12 128 (20) 16 11.2 4.9 6.1 5.3 129 86 6.1 37.6 1.6 0.9 5.8 71 Sector* 32 29,144 0 0 2 (5) 15 0 3 (3) 1 12 Dec-13 15 21 31 15.9 13.8 11.4 6.7 99 103 2.8 17.5 2.3 0.8 8.2 (27)
Consumer Staples Eva Wang / Kevin Yin - 852 2101 7365 / 852 2101 7655
China Modern Dairy 1117 HK O HKD 3.41 4.50 32 2,123 12.1 (1) (5) 2 (19) 38 (1) (2) (4) (13) 34 Jun-13 96 55 42 40.6 20.7 13.3 9.4 75 90 0.0 10.9 2.1 4.6 16.8 61 Hengan 1044 HK N HKD 83.80 90.00 7 13,308 24.5 1 1 2 (9) 7 1 3 (4) (3) 4 Dec-12 6 18 19 29.3 27.7 23.4 19.7 100 102 2.2 24.3 6.2 4.9 17.2 (1)
Mengniu Dairy 2319 HK O HKD 40.55 49.00 21 10,236 33.8 0 (3) 8 10 77 0 (1) 3 16 74 Dec-12 26 25 24 45.8 36.3 29.1 23.4 101 99 0.5 11.7 3.9 1.6 21.1 26 Tenfu 6868 HK N HKD 3.70 3.80 3 586 0.1 0 0 1 (12) (10) 0 2 (5) (6) (14) Dec-12 (16) 25 16 12.4 14.7 11.8 10.1 92 100 4.1 13.2 1.9 1.9 7.3 (24) Tingyi 322 HK N HKD 22.30 22.80 2 16,096 14.8 (0) (1) 4 (0) 7 (0) 2 (2) 5 4 Dec-12 26 22 21 44.7 35.6 29.0 24.0 111 102 1.8 17.0 5.8 1.5 13.0 11
Vinda Int'l 3331 HK N HKD 11.70 8.00 (32) 1,506 1.7 (1) (1) 2 (9) 9 (1) 1 (4) (4) 6 Dec-12 6 15 19 21.3 20.1 17.4 14.6 108 113 1.2 14.1 2.9 1.8 12.9 25 Want Want 151 HK N HKD 12.66 13.00 3 21,572 18.6 (1) (1) 10 13 11 (1) 1 5 19 8 Dec-12 24 18 14 39.0 31.4 26.7 23.3 100 104 2.1 38.8 11.1 5.4 20.8 (39) YST Dairy Farm 1431 HK O HKD 1.39 2.80 101 701 5.6 (3) (11) 0 (38) na (4) (10) (6) (35) na Dec-12 4 119 28 20.8 20.0 9.1 7.1 101 105 0.0 9.7 1.1 3.0 7.8 (45)
Sector* 8 66,128 (0) (1) 6 3 20 (0) 1 1 8 17 Dec-13 23 21 na 31.4 25.4 21.0 na 101 103 2.4 21.3 5.1 2.2 13.6 (2)
Diversified Financials Frances Feng / Victor Wang - 852 2101 6693 / 852 2101 6730
Cinda 1359 HK O HKD 4.23 6.14 45 19,779 79.5 0 0 7 (13) na 0 1 1 (10) na Dec-12 1 69 27 14.4 14.2 8.4 6.6 100 120 2.1 13.0 1.6 na na na Citic Securities (A) 600030 CH N CNY 11.77 12.50 6 20,780 27.3 1 5 14 (8) (3) 1 8 9 (2) (6) Dec-12 23 11 11 30.6 24.9 22.5 20.3 98 87 0.0 5.8 1.4 na na na Citic Securities (H) 6030 HK U HKD 16.90 16.00 (5) 20,780 27.3 (2) (2) 17 (20) 5 (2) 0 11 (15) 2 Dec-12 23 11 11 35.3 28.7 26.0 23.4 100 84 0.0 5.8 1.6 na na na
Galaxy 6881 HK O HKD 5.00 6.40 28 4,860 12.4 1 (2) 16 (26) na 1 (1) 10 (23) na Dec-12 23 (1) 20 17.0 13.8 13.9 11.6 94 87 2.2 9.4 1.1 na na na Haitong Securities (A) 600837 CH N CNY 9.89 10.80 9 15,034 21.8 1 2 9 (13) (5) 1 4 4 (7) (8) Dec-13 na 12 10 na 18.9 16.8 15.3 96 90 4.6 7.7 1.5 na na na Haitong Securities (H) 6837 HK O HKD 11.28 13.80 22 15,034 21.8 (2) 1 17 (16) 9 (2) 3 11 (11) 6 Dec-13 na 12 10 na 17.3 15.4 14.0 96 90 5.0 7.7 1.3 na na na
Sector* 21 60,454 (1) (1) 13 (17) 7 (1) 2 8 (12) 3 Dec-13 42 21 18 18.4 13.8 11.5 9.7 104 103 2.6 11.2 1.4 na na na
Energy Thomas Wong / David Hewitt / Horace Tse - 852 2101 6738 / 65 6212 3064 / 852 2101 7379
Anton Oil 3337 HK U HKD 4.87 3.50 (28) 1,377 10.7 (2) (1) (3) 3 (9) (2) 1 (9) 9 (12) Dec-12 8 7 12 27.3 25.3 23.6 21.0 89 78 1.2 15.9 3.8 3.6 14.5 5 CNOOC 883 HK N HKD 12.70 12.00 (6) 73,128 113.3 0 0 10 (12) (6) 0 3 4 (6) (9) Dec-13 (6) (4) 3 8.1 8.6 9.0 8.8 93 85 4.0 15.4 1.3 2.0 4.1 34 COSL 2883 HK O HKD 19.02 25.00 31 13,078 27.1 (2) (1) 4 (21) 26 (2) 2 (1) (15) 23 Dec-12 40 9 16 15.1 10.8 9.9 8.5 95 99 2.8 18.9 2.0 3.8 9.0 54
GDG GDG LN O GBp 5.95 10.00 68 1,359 0.3 0 3 120 116 223 0 5 114 122 220 Dec-12 nm 60 (34) nm 134.0 83.9 126.3 nm 133 0.0 1.6 2.1 102.2 nm 2 Hilong 1623 HK O HKD 3.85 5.10 32 842 5.2 1 (5) (31) (42) 34 1 (5) (37) (39) 29 Dec-13 43 16 13 14.9 10.4 9.0 8.0 98 96 2.9 17.3 1.7 2.4 8.0 48 PetroChina 857 HK N HKD 8.74 8.60 (2) 222,340 92.9 1 0 14 3 (8) 1 3 8 8 (11) Dec-13 0 (0) 20 9.9 9.9 9.9 8.3 98 93 4.5 12.7 1.2 0.7 4.6 23
SPT Energy 1251 HK U HKD 4.00 3.00 (25) 790 3.8 2 (5) (5) (13) 12 2 (3) (10) (8) 9 Dec-13 1 17 20 16.3 16.1 13.8 11.4 84 73 1.6 16.0 2.4 1.7 8.8 (9) Sinopec 386 HK O HKD 6.92 10.00 45 99,936 102.7 0 (5) 4 9 6 0 (3) (2) 15 3 Dec-13 18 16 11 9.7 8.3 7.1 6.4 106 113 4.8 13.2 1.0 0.3 4.3 40 Sector* 10 412,852 0 (1) 10 1 (2) 0 1 5 7 (5) Dec-13 3 4 14 9.6 9.3 8.9 7.8 99 97 4.4 13.4 1.2 0.6 4.5 30
Environmental Services Trina Chen - 852 2101 7031
BE Water 371 HK O HKD 5.15 6.30 22 5,749 19.4 1 (1) (0) 6 128 1 (0) (6) 8 123 Dec-13 44 24 16 36.8 25.6 20.7 17.9 106 105 1.5 12.4 3.0 7.1 25.7 139
Dongjiang Environmental 895 HK O HKD 28.45 36.00 27 850 1.4 (0) 6 3 10 7 (0) 7 (3) 13 3 Dec-13 14 65 17 24.7 21.8 13.2 11.3 95 110 0.0 10.2 2.1 3.0 15.7 (7) Guodian Tech 1296 HK N HKD 2.06 2.20 7 1,611 2.9 2 (3) (16) 4 (12) 2 (3) (22) 7 (16) Dec-13 22 17 (11) 18.0 14.7 12.6 14.1 89 83 0.0 6.8 1.0 1.0 10.0 130 Tianjin Capital 1065 HK O HKD 4.45 5.50 24 819 3.3 1 18 11 13 58 1 18 5 16 54 Dec-13 11 27 17 18.1 16.3 12.8 11.0 112 129 2.5 7.7 1.2 4.0 7.3 40
Yonker Environment 300187 CH N CNY 24.43 26.60 9 787 10.7 (1) (3) (10) (15) 30 (1) (2) (11) (9) 40 Dec-12 7 45 43 91.1 85.0 58.5 40.9 103 89 0.0 6.9 5.7 6.6 59.8 (34) Sector* 18 9,815 1 (1) (4) 4 88 1 1 (9) 9 85 Dec-13 35 24 10 31.4 23.3 18.7 17.0 100 98 1.1 9.5 2.2 2.5 15.7 109
Healthcare Iris Wang - 852 2101 7646
Bloomage 963 HK O HKD 18.52 33.30 80 793 1.8 (5) (4) (28) 8 173 (5) (3) (34) 10 168 Dec-12 51 42 44 48.3 32.0 22.6 15.7 102 100 0.0 34.7 9.5 11.6 24.0 0 CMS 867 HK O HKD 8.53 10.25 20 2,656 6.8 (1) (6) (5) 3 10 (1) (4) (11) 8 7 Dec-13 24 25 24 25.8 20.8 16.7 13.5 102 100 1.9 22.8 4.4 5.6 17.9 (13)
CSPC Pharma 1093 HK N HKD 6.32 7.21 14 4,553 11.6 (2) (3) (20) 3 59 (2) (2) (26) 6 54 Dec-13 36 27 27 39.2 28.9 22.8 18.0 96 96 1.0 16.3 4.5 3.4 18.6 (6) China Animal Hlt 940 HK O HKD 4.59 7.06 54 1,164 3.0 (1) 2 (4) 48 144 (1) 3 (9) 51 139 Dec-13 71 54 37 34.2 20.0 13.0 9.5 109 128 0.0 16.0 3.0 4.7 11.1 (58) Dawnrays Pharma 2348 HK O HKD 5.45 6.96 28 565 1.3 (1) 1 (1) 11 144 (1) 1 (7) 13 140 Dec-13 39 26 21 22.9 16.5 13.1 10.8 120 121 2.4 19.3 3.0 3.3 10.4 (25)
Microport 853 HK O HKD 5.39 6.66 24 983 1.1 2 4 (11) 6 6 2 6 (16) 12 3 Dec-12 (22) 23 33 17.6 22.4 18.3 13.7 152 156 0.0 11.8 2.6 5.7 15.3 (41) Mindray Medical MR US U USD 33.00 31.00 (6) 3,953 6.4 0 (3) (0) (9) (12) 0 (1) (6) (4) (15) Dec-13 (3) 16 15 17.6 18.1 15.6 13.5 91 94 1.5 13.6 2.3 3.2 15.1 10 Shandong Weigao 1066 HK U HKD 8.02 6.93 (14) 4,630 10.0 (1) (1) (8) (23) 20 (1) 1 (13) (18) 17 Dec-13 15 16 17 30.7 26.7 23.0 19.7 94 91 1.1 11.7 3.0 4.7 17.1 (32)
Shanghai Pharma 2607 HK O HKD 15.54 24.00 54 5,636 6.3 (2) (6) (18) (18) (6) (2) (3) (24) (13) (9) Dec-12 12 18 17 16.6 14.9 12.7 10.8 101 104 1.6 8.9 1.3 0.3 7.3 (34) Sihuan Pharma 460 HK O HKD 8.47 11.80 39 5,661 19.6 (0) (3) (13) 20 98 (0) (1) (19) 25 95 Dec-13 33 24 21 27.0 20.3 16.4 13.5 111 113 1.5 20.4 3.9 4.7 16.0 (57) Sino Biopharm 1177 HK N HKD 6.30 6.14 (3) 4,015 13.9 (3) (2) (15) 2 19 (3) 1 (21) 8 15 Dec-13 17 16 14 30.0 25.7 22.2 19.5 93 89 1.1 19.5 4.6 2.2 12.2 (48)
Sinopharm 1099 HK O HKD 20.30 24.70 22 2,169 12.3 1 1 (4) (9) (18) 1 4 (9) (3) (21) Dec-13 17 19 18 18.3 15.6 13.2 11.1 100 100 1.9 11.0 1.6 0.1 2.8 29 WuXi PharmaTech WX US O USD 35.14 21.60 (39) 2,540 5.2 0 (4) (7) (8) 96 0 (2) (12) (3) 93 Dec-12 10 14 17 25.0 22.7 19.9 17.0 85 90 0.0 18.3 3.7 4.1 16.5 (17) Sector* 17 39,319 (1) (3) (11) (2) 39 (1) (0) (17) 4 36 Dec-13 20 22 20 23.6 19.7 16.2 13.5 101 102 1.3 13.6 2.6 0.7 9.5 (12)
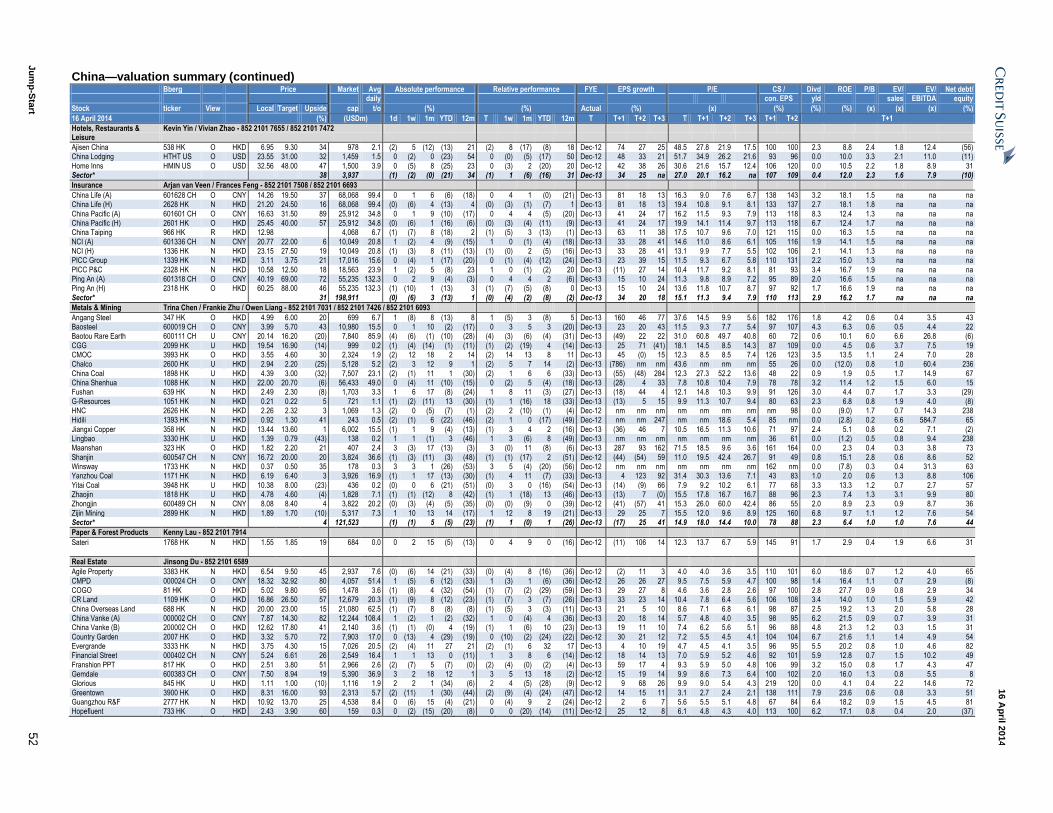
Ju
mp
-Sta
rt 5
2
16 A
pril 2
014
China—valuation summary (continued) Bberg Price Market Avg Absolute performance Relative performance FYE EPS growth P/E CS / Divd ROE P/B EV/ EV/ Net debt/ daily con. EPS yld sales EBITDA equity
Stock ticker View Local Target Upside cap t/o (%) (%) Actual (%) (x) (%) (%) (%) (x) (x) (x) (%)
16 April 2014 (%) (USDm) 1d 1w 1m YTD 12m T 1w 1m YTD 12m T T+1 T+2 T+3 T T+1 T+2 T+3 T+1 T+2 T+1
Hotels, Restaurants & Leisure
Kevin Yin / Vivian Zhao - 852 2101 7655 / 852 2101 7472
Ajisen China 538 HK O HKD 6.95 9.30 34 978 2.1 (2) 5 (12) (13) 21 (2) 8 (17) (8) 18 Dec-12 74 27 25 48.5 27.8 21.9 17.5 100 100 2.3 8.8 2.4 1.8 12.4 (56) China Lodging HTHT US O USD 23.55 31.00 32 1,459 1.5 0 (2) 0 (23) 54 0 (0) (5) (17) 50 Dec-12 48 33 21 51.7 34.9 26.2 21.6 93 96 0.0 10.0 3.3 2.1 11.0 (11)
Home Inns HMIN US O USD 32.56 48.00 47 1,500 3.9 0 (5) 8 (25) 23 0 (3) 2 (20) 20 Dec-12 42 38 26 30.6 21.6 15.7 12.4 106 120 0.0 10.5 2.2 1.8 8.9 31 Sector* 38 3,937 (1) (2) (0) (21) 34 (1) 1 (6) (16) 31 Dec-13 34 25 na 27.0 20.1 16.2 na 107 109 0.4 12.0 2.3 1.6 7.9 (10)
Insurance Arjan van Veen / Frances Feng - 852 2101 7508 / 852 2101 6693
China Life (A) 601628 CH O CNY 14.26 19.50 37 68,068 99.4 0 1 6 (6) (18) 0 4 1 (0) (21) Dec-13 81 18 13 16.3 9.0 7.6 6.7 138 143 3.2 18.1 1.5 na na na China Life (H) 2628 HK N HKD 21.20 24.50 16 68,068 99.4 (0) (6) 4 (13) 4 (0) (3) (1) (7) 1 Dec-13 81 18 13 19.4 10.8 9.1 8.1 133 137 2.7 18.1 1.8 na na na
China Pacific (A) 601601 CH O CNY 16.63 31.50 89 25,912 34.8 0 1 9 (10) (17) 0 4 4 (5) (20) Dec-13 41 24 17 16.2 11.5 9.3 7.9 113 118 8.3 12.4 1.3 na na na China Pacific (H) 2601 HK O HKD 25.45 40.00 57 25,912 34.8 (0) (6) 1 (16) (6) (0) (3) (4) (11) (9) Dec-13 41 24 17 19.9 14.1 11.4 9.7 113 118 6.7 12.4 1.7 na na na China Taiping 966 HK R HKD 12.98 4,068 6.7 (1) (7) 8 (18) 2 (1) (5) 3 (13) (1) Dec-13 63 11 38 17.5 10.7 9.6 7.0 121 115 0.0 16.3 1.5 na na na
NCI (A) 601336 CH N CNY 20.77 22.00 6 10,049 20.8 1 (2) 4 (9) (15) 1 0 (1) (4) (18) Dec-13 33 28 41 14.6 11.0 8.6 6.1 105 116 1.9 14.1 1.5 na na na NCI (H) 1336 HK N HKD 23.15 27.50 19 10,049 20.8 (1) (3) 8 (11) (13) (1) (0) 2 (5) (16) Dec-13 33 28 41 13.1 9.9 7.7 5.5 102 106 2.1 14.1 1.3 na na na PICC Group 1339 HK N HKD 3.11 3.75 21 17,016 15.6 0 (4) 1 (17) (20) 0 (1) (4) (12) (24) Dec-13 23 39 15 11.5 9.3 6.7 5.8 110 131 2.2 15.0 1.3 na na na
PICC P&C 2328 HK N HKD 10.58 12.50 18 18,563 23.9 1 (2) 5 (8) 23 1 0 (1) (2) 20 Dec-13 (11) 27 14 10.4 11.7 9.2 8.1 81 93 3.4 16.7 1.9 na na na Ping An (A) 601318 CH O CNY 40.19 69.00 72 55,235 132.3 0 2 9 (4) (3) 0 4 4 2 (6) Dec-13 15 10 24 11.3 9.8 8.9 7.2 95 89 2.0 16.6 1.5 na na na Ping An (H) 2318 HK O HKD 60.25 88.00 46 55,235 132.3 (1) (10) 1 (13) 3 (1) (7) (5) (8) 0 Dec-13 15 10 24 13.6 11.8 10.7 8.7 97 92 1.7 16.6 1.9 na na na
Sector* 31 198,911 (0) (6) 3 (13) 1 (0) (4) (2) (8) (2) Dec-13 34 20 18 15.1 11.3 9.4 7.9 110 113 2.9 16.2 1.7 na na na
Metals & Mining Trina Chen / Frankie Zhu / Owen Liang - 852 2101 7031 / 852 2101 7426 / 852 2101 6093
Angang Steel 347 HK O HKD 4.99 6.00 20 699 6.7 1 (8) 8 (13) 8 1 (5) 3 (8) 5 Dec-13 160 46 77 37.6 14.5 9.9 5.6 182 176 1.8 4.2 0.6 0.4 3.5 43 Baosteel 600019 CH O CNY 3.99 5.70 43 10,980 15.5 0 1 10 (2) (17) 0 3 5 3 (20) Dec-13 23 20 43 11.5 9.3 7.7 5.4 97 107 4.3 6.3 0.6 0.5 4.4 22 Baotou Rare Earth 600111 CH U CNY 20.14 16.20 (20) 7,840 85.9 (4) (6) (1) (10) (28) (4) (3) (6) (4) (31) Dec-13 (49) 22 22 31.0 60.8 49.7 40.8 60 72 0.6 10.1 6.0 6.6 26.8 (6)
CGG 2099 HK U HKD 19.54 16.90 (14) 999 0.2 (1) (4) (14) (1) (11) (1) (2) (19) 4 (14) Dec-13 25 71 (41) 18.1 14.5 8.5 14.3 87 109 0.0 4.5 0.6 3.7 7.5 19 CMOC 3993 HK O HKD 3.55 4.60 30 2,324 1.9 (2) 12 18 2 14 (2) 14 13 8 11 Dec-13 45 (0) 15 12.3 8.5 8.5 7.4 126 123 3.5 13.5 1.1 2.4 7.0 28 Chalco 2600 HK U HKD 2.94 2.20 (25) 5,128 5.2 (2) 3 12 9 1 (2) 5 7 14 (2) Dec-13 (786) nm nm 43.6 nm nm nm 55 26 0.0 (12.0) 0.8 1.0 60.4 236
China Coal 1898 HK U HKD 4.39 3.00 (32) 7,507 23.1 (2) (1) 11 1 (30) (2) 1 6 6 (33) Dec-13 (55) (48) 284 12.3 27.3 52.2 13.6 48 22 0.9 1.9 0.5 1.7 14.9 67 China Shenhua 1088 HK N HKD 22.00 20.70 (6) 56,433 49.0 0 (4) 11 (10) (15) 0 (2) 5 (4) (18) Dec-13 (28) 4 33 7.8 10.8 10.4 7.9 78 78 3.2 11.4 1.2 1.5 6.0 15 Fushan 639 HK N HKD 2.49 2.30 (8) 1,703 3.3 1 6 17 (8) (24) 1 8 11 (3) (27) Dec-13 (18) 44 4 12.1 14.8 10.3 9.9 91 126 3.0 4.4 0.7 1.7 3.3 (29)
G-Resources 1051 HK N HKD 0.21 0.22 5 721 1.1 (1) (2) (11) 13 (30) (1) 1 (16) 18 (33) Dec-13 (13) 5 15 9.9 11.3 10.7 9.4 80 63 2.3 6.8 0.8 1.9 4.0 (8) HNC 2626 HK N HKD 2.26 2.32 3 1,069 1.3 (2) 0 (5) (7) (1) (2) 2 (10) (1) (4) Dec-12 nm nm nm nm nm nm nm nm 98 0.0 (9.0) 1.7 0.7 14.3 238 Hidili 1393 HK N HKD 0.92 1.30 41 243 0.5 (2) (1) 6 (22) (46) (2) 1 0 (17) (49) Dec-12 nm nm 247 nm nm 18.6 5.4 85 nm 0.0 (2.8) 0.2 6.6 584.7 65
Jiangxi Copper 358 HK N HKD 13.44 13.60 1 6,002 15.5 (1) 1 9 (4) (13) (1) 3 4 2 (16) Dec-13 (36) 46 7 10.5 16.5 11.3 10.6 71 97 2.4 5.1 0.8 0.2 7.1 (2) Lingbao 3330 HK U HKD 1.39 0.79 (43) 138 0.2 1 1 (1) 3 (46) 1 3 (6) 8 (49) Dec-13 nm nm nm nm nm nm nm 36 61 0.0 (1.2) 0.5 0.8 9.4 238 Maanshan 323 HK O HKD 1.82 2.20 21 407 2.4 3 (3) 17 (13) (3) 3 (0) 11 (8) (6) Dec-13 287 93 162 71.5 18.5 9.6 3.6 161 164 0.0 2.3 0.4 0.3 3.8 73
Shanjin 600547 CH N CNY 16.72 20.00 20 3,824 36.6 (1) (3) (11) (3) (48) (1) (1) (17) 2 (51) Dec-12 (44) (54) 59 11.0 19.5 42.4 26.7 91 49 0.8 15.1 2.8 0.6 8.6 52 Winsway 1733 HK N HKD 0.37 0.50 35 178 0.3 3 3 1 (26) (53) 3 5 (4) (20) (56) Dec-12 nm nm nm nm nm nm nm 162 nm 0.0 (7.8) 0.3 0.4 31.3 63 Yanzhou Coal 1171 HK N HKD 6.19 6.40 3 3,926 16.9 (1) 1 17 (13) (30) (1) 4 11 (7) (33) Dec-13 4 123 92 31.4 30.3 13.6 7.1 43 83 1.0 2.0 0.6 1.3 8.8 106
Yitai Coal 3948 HK U HKD 10.38 8.00 (23) 436 0.2 (0) 0 6 (21) (51) (0) 3 0 (16) (54) Dec-13 (14) (9) 66 7.9 9.2 10.2 6.1 77 68 3.3 13.3 1.2 0.7 2.7 57 Zhaojin 1818 HK U HKD 4.78 4.60 (4) 1,828 7.1 (1) (1) (12) 8 (42) (1) 1 (18) 13 (46) Dec-13 (13) 7 (0) 15.5 17.8 16.7 16.7 88 96 2.3 7.4 1.3 3.1 9.9 80 Zhongjin 600489 CH N CNY 8.08 8.40 4 3,822 20.2 (0) (3) (4) (5) (35) (0) (0) (9) 0 (39) Dec-12 (41) (57) 41 15.3 26.0 60.0 42.4 86 55 2.0 8.9 2.3 0.9 8.7 36
Zijin Mining 2899 HK N HKD 1.89 1.70 (10) 5,317 7.3 1 10 13 14 (17) 1 12 8 19 (21) Dec-13 29 25 7 15.5 12.0 9.6 8.9 125 160 6.8 9.7 1.1 1.2 7.6 54 Sector* 4 121,523 (1) (1) 5 (5) (23) (1) 1 (0) 1 (26) Dec-13 (17) 25 41 14.9 18.0 14.4 10.0 78 88 2.3 6.4 1.0 1.0 7.6 44
Paper & Forest Products Kenny Lau - 852 2101 7914
Sateri 1768 HK N HKD 1.55 1.85 19 684 0.0 0 2 15 (5) (13) 0 4 9 0 (16) Dec-12 (11) 106 14 12.3 13.7 6.7 5.9 145 91 1.7 2.9 0.4 1.9 6.6 31
Real Estate Jinsong Du - 852 2101 6589
Agile Property 3383 HK N HKD 6.54 9.50 45 2,937 7.6 (0) (6) 14 (21) (33) (0) (4) 8 (16) (36) Dec-12 (2) 11 3 4.0 4.0 3.6 3.5 110 101 6.0 18.6 0.7 1.2 4.0 65
CMPD 000024 CH O CNY 18.32 32.92 80 4,057 51.4 1 (5) 6 (12) (33) 1 (3) 1 (6) (36) Dec-12 26 26 27 9.5 7.5 5.9 4.7 100 98 1.4 16.4 1.1 0.7 2.9 (8) COGO 81 HK O HKD 5.02 9.80 95 1,478 3.6 (1) (8) 4 (32) (54) (1) (7) (2) (29) (59) Dec-13 29 27 8 4.6 3.6 2.8 2.6 97 100 2.8 27.7 0.9 0.8 2.9 34 CR Land 1109 HK O HKD 16.86 26.50 57 12,679 20.3 (1) (9) 8 (12) (23) (1) (7) 3 (7) (26) Dec-13 33 23 14 10.4 7.8 6.4 5.6 106 108 3.4 14.0 1.0 1.5 5.9 42
China Overseas Land 688 HK N HKD 20.00 23.00 15 21,080 62.5 (1) (7) 8 (8) (8) (1) (5) 3 (3) (11) Dec-13 21 5 10 8.6 7.1 6.8 6.1 98 87 2.5 19.2 1.3 2.0 5.8 28 China Vanke (A) 000002 CH O CNY 7.87 14.30 82 12,244 108.4 1 (2) 1 (2) (32) 1 0 (4) 4 (36) Dec-13 20 18 14 5.7 4.8 4.0 3.5 98 95 6.2 21.5 0.9 0.7 3.9 31 China Vanke (B) 200002 CH O HKD 12.62 17.80 41 2,140 3.6 (1) (1) (0) 4 (19) (1) 1 (6) 10 (23) Dec-13 19 11 10 7.4 6.2 5.6 5.1 96 88 4.8 21.3 1.2 0.3 1.5 31
Country Garden 2007 HK O HKD 3.32 5.70 72 7,903 17.0 0 (13) 4 (29) (19) 0 (10) (2) (24) (22) Dec-12 30 21 12 7.2 5.5 4.5 4.1 104 104 6.7 21.6 1.1 1.4 4.9 54 Evergrande 3333 HK N HKD 3.75 4.30 15 7,026 20.5 (2) (4) 11 27 21 (2) (1) 6 32 17 Dec-13 4 10 19 4.7 4.5 4.1 3.5 96 95 5.5 20.2 0.8 1.0 4.6 82 Financial Street 000402 CH N CNY 5.24 6.61 26 2,549 16.4 1 1 13 0 (11) 1 3 8 6 (14) Dec-12 18 14 13 7.0 5.9 5.2 4.6 92 101 5.9 12.8 0.7 1.5 10.2 49
Franshion PPT 817 HK O HKD 2.51 3.80 51 2,966 2.6 (2) (7) 5 (7) (0) (2) (4) (0) (2) (4) Dec-13 59 17 4 9.3 5.9 5.0 4.8 106 99 3.2 15.0 0.8 1.7 4.3 47 Gemdale 600383 CH O CNY 7.50 8.94 19 5,390 36.9 3 2 18 12 1 3 5 13 18 (2) Dec-12 15 19 14 9.9 8.6 7.3 6.4 100 102 2.0 16.0 1.3 0.8 5.5 8 Glorious 845 HK U HKD 1.11 1.00 (10) 1,116 1.9 2 2 1 (34) (6) 2 4 (5) (28) (9) Dec-12 9 68 26 9.9 9.0 5.4 4.3 219 120 0.0 4.1 0.4 2.2 14.6 72
Greentown 3900 HK O HKD 8.31 16.00 93 2,313 5.7 (2) (11) 1 (30) (44) (2) (9) (4) (24) (47) Dec-12 14 15 11 3.1 2.7 2.4 2.1 138 111 7.9 23.6 0.6 0.8 3.3 51 Guangzhou R&F 2777 HK N HKD 10.92 13.70 25 4,538 8.4 0 (6) 15 (4) (21) 0 (4) 9 2 (24) Dec-12 2 6 7 5.6 5.5 5.1 4.8 67 84 6.4 18.2 0.9 1.5 4.5 81 Hopefluent 733 HK O HKD 2.43 3.90 60 159 0.3 0 (2) (15) (20) (8) 0 0 (20) (14) (11) Dec-12 25 12 8 6.1 4.8 4.3 4.0 113 100 6.2 17.1 0.8 0.4 2.0 (37)
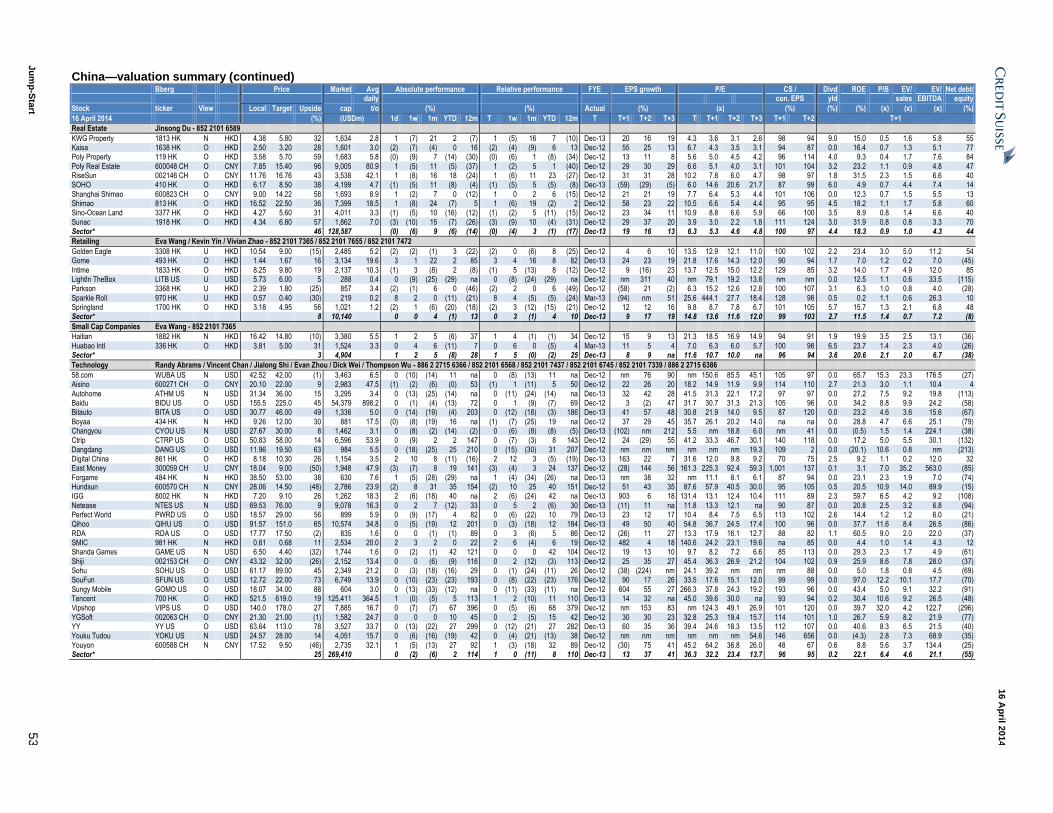
Ju
mp
-Sta
rt 5
3
16 A
pril 2
014
China—valuation summary (continued) Bberg Price Market Avg Absolute performance Relative performance FYE EPS growth P/E CS / Divd ROE P/B EV/ EV/ Net debt/ daily con. EPS yld sales EBITDA equity
Stock ticker View Local Target Upside cap t/o (%) (%) Actual (%) (x) (%) (%) (%) (x) (x) (x) (%)
16 April 2014 (%) (USDm) 1d 1w 1m YTD 12m T 1w 1m YTD 12m T T+1 T+2 T+3 T T+1 T+2 T+3 T+1 T+2 T+1
Real Estate Jinsong Du - 852 2101 6589
KWG Property 1813 HK N HKD 4.38 5.80 32 1,634 2.8 1 (7) 21 2 (7) 1 (5) 16 7 (10) Dec-13 20 16 19 4.3 3.6 3.1 2.6 98 94 9.0 15.0 0.5 1.6 5.8 55 Kaisa 1638 HK O HKD 2.50 3.20 28 1,601 3.0 (2) (7) (4) 0 16 (2) (4) (9) 6 13 Dec-12 55 25 13 6.7 4.3 3.5 3.1 94 87 0.0 16.4 0.7 1.3 5.1 77 Poly Property 119 HK O HKD 3.58 5.70 59 1,683 5.8 (0) (9) 7 (14) (30) (0) (6) 1 (8) (34) Dec-12 13 11 8 5.6 5.0 4.5 4.2 96 114 4.0 9.3 0.4 1.7 7.6 84
Poly Real Estate 600048 CH O CNY 7.85 15.40 96 9,005 80.9 1 (5) 11 (5) (37) 1 (2) 5 1 (40) Dec-12 29 30 29 6.6 5.1 4.0 3.1 101 104 3.2 23.2 1.1 0.9 4.8 47 RiseSun 002146 CH O CNY 11.76 16.76 43 3,538 42.1 1 (8) 16 18 (24) 1 (6) 11 23 (27) Dec-12 31 31 28 10.2 7.8 6.0 4.7 98 97 1.8 31.5 2.3 1.5 6.6 40 SOHO 410 HK O HKD 6.17 8.50 38 4,199 4.7 (1) (5) 11 (8) (4) (1) (5) 5 (5) (8) Dec-13 (59) (29) (5) 6.0 14.6 20.6 21.7 87 99 6.0 4.9 0.7 4.4 7.4 14
Shanghai Shimao 600823 CH O CNY 9.00 14.22 58 1,693 8.9 1 (2) 7 0 (12) 1 0 2 6 (15) Dec-12 21 21 19 7.7 6.4 5.3 4.4 101 106 0.0 12.3 0.7 1.5 5.5 13 Shimao 813 HK O HKD 16.52 22.50 36 7,399 18.5 1 (8) 24 (7) 5 1 (6) 19 (2) 2 Dec-12 58 23 22 10.5 6.6 5.4 4.4 95 95 4.5 18.2 1.1 1.7 5.8 60 Sino-Ocean Land 3377 HK O HKD 4.27 5.60 31 4,011 3.3 (1) (5) 10 (16) (12) (1) (2) 5 (11) (15) Dec-12 23 34 11 10.9 8.8 6.6 5.9 66 100 3.5 8.9 0.8 1.4 6.6 40
Sunac 1918 HK O HKD 4.34 6.80 57 1,862 7.0 (3) (10) 15 (7) (26) (3) (9) 10 (4) (31) Dec-12 29 37 20 3.9 3.0 2.2 1.8 111 124 3.0 31.9 0.8 0.8 3.3 70 Sector* 46 128,587 (0) (6) 9 (6) (14) (0) (4) 3 (1) (17) Dec-13 19 16 13 6.3 5.3 4.6 4.8 100 97 4.4 18.3 0.9 1.0 4.3 44
Retailing Eva Wang / Kevin Yin / Vivian Zhao - 852 2101 7365 / 852 2101 7655 / 852 2101 7472
Golden Eagle 3308 HK U HKD 10.54 9.00 (15) 2,485 5.2 (2) (2) (1) 3 (22) (2) 0 (6) 8 (25) Dec-12 4 6 10 13.5 12.9 12.1 11.0 100 102 2.2 23.4 3.0 5.0 11.2 54 Gome 493 HK O HKD 1.44 1.67 16 3,134 19.6 3 1 22 2 85 3 4 16 8 82 Dec-13 24 23 19 21.8 17.6 14.3 12.0 90 94 1.7 7.0 1.2 0.2 7.0 (45)
Intime 1833 HK O HKD 8.25 9.80 19 2,137 10.3 (1) 3 (8) 2 (8) (1) 5 (13) 8 (12) Dec-12 9 (16) 23 13.7 12.5 15.0 12.2 129 85 3.2 14.0 1.7 4.9 12.0 85 LightIn TheBox LITB US U USD 5.73 6.00 5 288 0.4 0 (9) (25) (29) na 0 (8) (24) (29) na Dec-12 nm 311 40 nm 79.1 19.2 13.8 nm nm 0.0 12.5 1.1 0.6 33.5 (115) Parkson 3368 HK U HKD 2.39 1.80 (25) 857 3.4 (2) (1) 6 0 (46) (2) 2 0 6 (49) Dec-12 (58) 21 (2) 6.3 15.2 12.6 12.8 100 107 3.1 6.3 1.0 0.8 4.0 (28)
Sparkle Roll 970 HK U HKD 0.57 0.40 (30) 219 0.2 8 2 0 (11) (21) 8 4 (5) (5) (24) Mar-13 (94) nm 51 25.6 444.1 27.7 18.4 128 98 0.5 0.2 1.1 0.6 26.3 10 Springland 1700 HK O HKD 3.18 4.95 56 1,021 1.2 (2) 1 (6) (20) (18) (2) 3 (12) (15) (21) Dec-12 12 12 16 9.8 8.7 7.8 6.7 101 105 5.7 15.7 1.3 2.1 6.8 48 Sector* 8 10,140 0 0 4 (1) 13 0 3 (1) 4 10 Dec-13 9 17 19 14.8 13.6 11.6 12.0 99 103 2.7 11.5 1.4 0.7 7.2 (8)
Small Cap Companies Eva Wang - 852 2101 7365
Haitian 1882 HK N HKD 16.42 14.80 (10) 3,380 5.5 1 2 5 (6) 37 1 4 (1) (1) 34 Dec-12 15 9 13 21.3 18.5 16.9 14.9 94 91 1.9 19.9 3.5 2.5 13.1 (36)
Huabao Intl 336 HK O HKD 3.81 5.00 31 1,524 3.3 0 4 6 (11) 7 0 6 0 (5) 4 Mar-13 11 5 4 7.0 6.3 6.0 5.7 100 98 6.5 23.7 1.4 2.3 4.0 (26) Sector* 3 4,904 1 2 5 (8) 28 1 5 (0) (2) 25 Dec-13 8 9 na 11.6 10.7 10.0 na 96 94 3.6 20.6 2.1 2.0 6.7 (38)
Technology Randy Abrams / Vincent Chan / Jialong Shi / Evan Zhou / Dick Wei / Thompson Wu - 886 2 2715 6366 / 852 2101 6568 / 852 2101 7437 / 852 2101 6745 / 852 2101 7339 / 886 2 2715 6386
58.com WUBA US N USD 42.52 42.00 (1) 3,463 6.5 0 (10) (14) 11 na 0 (8) (13) 11 na Dec-12 nm 76 90 nm 150.6 85.5 45.1 105 97 0.0 65.7 15.3 23.3 176.5 (27) Aisino 600271 CH O CNY 20.10 22.00 9 2,983 47.5 (1) (2) (6) (0) 53 (1) 1 (11) 5 50 Dec-12 22 26 20 18.2 14.9 11.9 9.9 114 110 2.7 21.3 3.0 1.1 10.4 4
Autohome ATHM US N USD 31.34 36.00 15 3,295 3.4 0 (13) (25) (14) na 0 (11) (24) (14) na Dec-13 32 42 28 41.5 31.3 22.1 17.2 97 97 0.0 27.2 7.5 9.2 19.8 (113) Baidu BIDU US O USD 155.5 225.0 45 54,379 898.2 0 (1) (4) (13) 72 0 1 (9) (7) 69 Dec-12 3 (2) 47 31.7 30.7 31.3 21.3 105 96 0.0 34.2 8.8 9.9 24.2 (58) Bitauto BITA US O USD 30.77 46.00 49 1,336 5.0 0 (14) (19) (4) 203 0 (12) (18) (3) 186 Dec-13 41 57 48 30.8 21.9 14.0 9.5 87 120 0.0 23.2 4.6 3.6 15.6 (67)
Boyaa 434 HK N HKD 9.26 12.00 30 881 17.5 (0) (8) (19) 16 na (1) (7) (25) 19 na Dec-12 37 29 45 35.7 26.1 20.2 14.0 na na 0.0 28.8 4.7 6.6 25.1 (79) Changyou CYOU US N USD 27.67 30.00 8 1,462 3.1 0 (8) (2) (14) (2) 0 (6) (8) (8) (5) Dec-13 (102) nm 212 5.5 nm 18.8 6.0 nm 41 0.0 (0.5) 1.5 1.4 224.1 (38) Ctrip CTRP US O USD 50.83 58.00 14 6,596 53.9 0 (9) 2 2 147 0 (7) (3) 8 143 Dec-12 24 (29) 55 41.2 33.3 46.7 30.1 140 118 0.0 17.2 5.0 5.5 30.1 (132)
Dangdang DANG US O USD 11.96 19.50 63 984 5.5 0 (18) (25) 25 210 0 (15) (30) 31 207 Dec-12 nm nm nm nm nm nm 19.3 109 2 0.0 (20.1) 10.6 0.8 nm (213) Digital China 861 HK O HKD 8.18 10.30 26 1,154 3.5 2 10 8 (11) (16) 2 12 3 (5) (19) Dec-13 163 22 7 31.6 12.0 9.8 9.2 70 75 2.5 9.2 1.1 0.2 12.0 32 East Money 300059 CH U CNY 18.04 9.00 (50) 1,948 47.9 (3) (7) 8 19 141 (3) (4) 3 24 137 Dec-12 (28) 144 56 161.3 225.3 92.4 59.3 1,001 137 0.1 3.1 7.0 35.2 563.0 (85)
Forgame 484 HK N HKD 38.50 53.00 38 630 7.6 1 (5) (28) (29) na 1 (4) (34) (26) na Dec-13 nm 38 32 nm 11.1 8.1 6.1 87 94 0.0 23.1 2.3 1.9 7.0 (74) Hundsun 600570 CH N CNY 28.06 14.50 (48) 2,786 23.9 (2) 8 31 35 154 (2) 10 25 40 151 Dec-12 51 43 35 87.6 57.9 40.5 30.0 95 105 0.5 20.5 10.9 14.0 89.9 (15) IGG 8002 HK N HKD 7.20 9.10 26 1,262 18.3 2 (6) (18) 40 na 2 (6) (24) 42 na Dec-13 903 6 18 131.4 13.1 12.4 10.4 111 89 2.3 59.7 6.5 4.2 9.2 (108)
Netease NTES US N USD 69.53 76.00 9 9,078 16.3 0 2 7 (12) 33 0 5 2 (6) 30 Dec-13 (11) 11 na 11.8 13.3 12.1 na 90 87 0.0 20.8 2.5 3.2 6.8 (94) Perfect World PWRD US O USD 18.57 29.00 56 899 5.9 0 (9) (17) 4 82 0 (6) (22) 10 79 Dec-13 23 12 17 10.4 8.4 7.5 6.5 113 102 2.6 14.4 1.2 1.2 6.0 (21) Qihoo QIHU US O USD 91.57 151.0 65 10,574 34.8 0 (5) (19) 12 201 0 (3) (18) 12 184 Dec-13 49 50 40 54.8 36.7 24.5 17.4 100 96 0.0 37.7 11.6 8.4 26.5 (86)
RDA RDA US O USD 17.77 17.50 (2) 835 1.6 0 0 (1) (1) 89 0 3 (6) 5 86 Dec-12 (26) 11 27 13.3 17.9 16.1 12.7 88 82 1.1 60.5 9.0 2.0 22.0 (37) SMIC 981 HK N HKD 0.61 0.68 11 2,534 20.0 2 3 2 0 22 2 6 (4) 6 19 Dec-12 482 4 18 140.6 24.2 23.1 19.6 na 85 0.0 4.4 1.0 1.4 4.3 12 Shanda Games GAME US N USD 6.50 4.40 (32) 1,744 1.6 0 (2) (1) 42 121 0 0 0 42 104 Dec-12 19 13 10 9.7 8.2 7.2 6.6 85 113 0.0 29.3 2.3 1.7 4.9 (61)
Shiji 002153 CH O CNY 43.32 32.00 (26) 2,152 13.4 0 0 (6) (9) 116 0 2 (12) (3) 113 Dec-12 25 35 27 45.4 36.3 26.9 21.2 104 102 0.9 25.9 8.6 7.8 28.0 (37) Sohu SOHU US O USD 61.17 89.00 45 2,349 21.2 0 (3) (18) (16) 29 0 (1) (24) (11) 26 Dec-12 (38) (224) nm 24.1 39.2 nm nm nm 88 0.0 5.0 1.8 0.8 4.5 (69) SouFun SFUN US O USD 12.72 22.00 73 6,749 13.9 0 (10) (23) (23) 193 0 (8) (22) (23) 176 Dec-12 90 17 26 33.5 17.6 15.1 12.0 99 99 0.0 97.0 12.2 10.1 17.7 (70)
Sungy Mobile GOMO US O USD 18.07 34.00 88 604 3.0 0 (13) (33) (12) na 0 (11) (33) (11) na Dec-12 604 55 27 266.3 37.8 24.3 19.2 193 96 0.0 43.4 5.0 9.1 32.2 (91) Tencent 700 HK O HKD 521.5 619.0 19 125,411 364.5 1 (0) (5) 5 113 1 2 (10) 11 110 Dec-13 14 32 na 45.0 39.6 30.0 na 93 94 0.2 30.4 10.6 9.2 26.5 (48) Vipshop VIPS US O USD 140.0 178.0 27 7,885 16.7 0 (7) (7) 67 396 0 (5) (6) 68 379 Dec-12 nm 153 83 nm 124.3 49.1 26.9 101 120 0.0 39.7 32.0 4.2 122.7 (296)
YGSoft 002063 CH O CNY 21.30 21.00 (1) 1,582 24.7 0 0 0 10 45 0 2 (5) 15 42 Dec-12 30 30 23 32.8 25.3 19.4 15.7 114 101 1.0 26.7 5.9 8.2 21.9 (77) YY YY US O USD 63.64 113.0 78 3,527 33.7 0 (13) (22) 27 299 0 (12) (21) 27 282 Dec-13 60 35 36 39.4 24.6 18.3 13.5 112 107 0.0 40.6 8.3 6.5 21.5 (40) Youku Tudou YOKU US N USD 24.57 28.00 14 4,051 15.7 0 (6) (16) (19) 42 0 (4) (21) (13) 38 Dec-12 nm nm nm nm nm nm 54.6 146 656 0.0 (4.3) 2.8 7.3 68.9 (35)
Youyon 600588 CH N CNY 17.52 9.50 (46) 2,735 32.1 1 (5) (13) 27 92 1 (3) (18) 32 89 Dec-12 (30) 75 41 45.2 64.2 36.8 26.0 48 67 0.6 8.8 5.6 3.7 134.4 (25) Sector* 25 269,410 0 (2) (6) 2 114 1 0 (11) 8 110 Dec-13 13 37 41 36.3 32.2 23.4 13.7 96 95 0.2 22.1 6.4 4.6 21.1 (55)
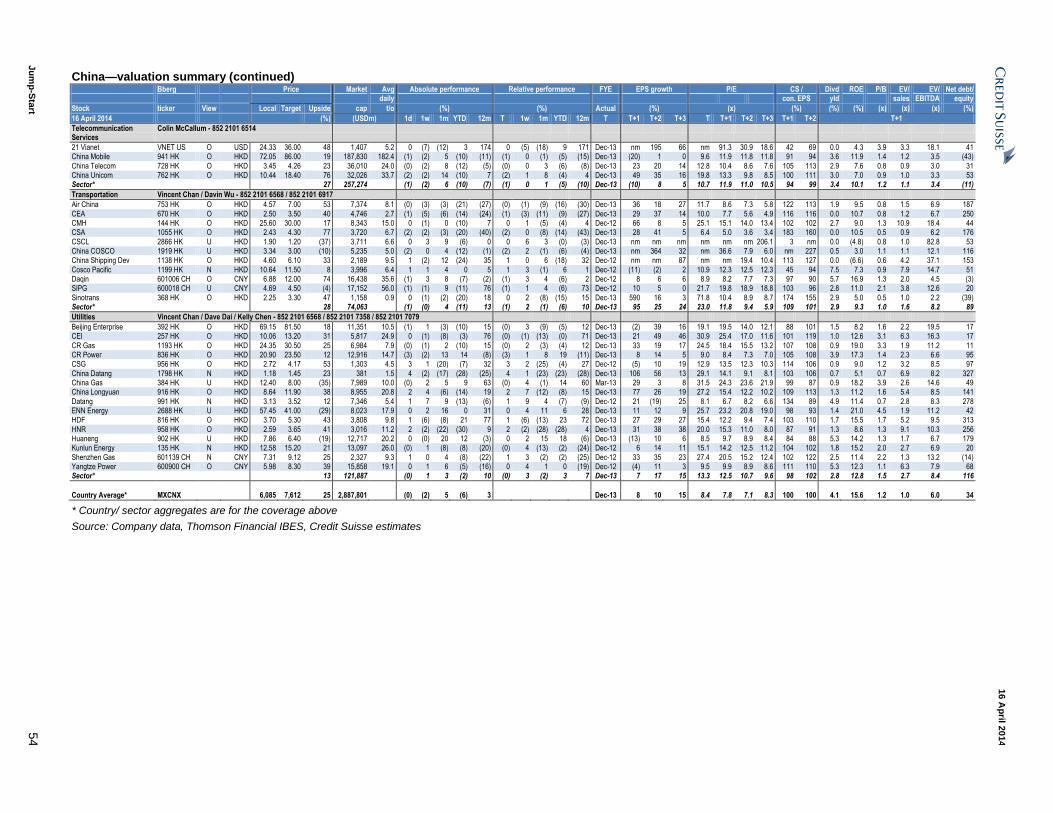
Ju
mp
-Sta
rt 5
4
16 A
pril 2
014
China—valuation summary (continued) Bberg Price Market Avg Absolute performance Relative performance FYE EPS growth P/E CS / Divd ROE P/B EV/ EV/ Net debt/ daily con. EPS yld sales EBITDA equity
Stock ticker View Local Target Upside cap t/o (%) (%) Actual (%) (x) (%) (%) (%) (x) (x) (x) (%)
16 April 2014 (%) (USDm) 1d 1w 1m YTD 12m T 1w 1m YTD 12m T T+1 T+2 T+3 T T+1 T+2 T+3 T+1 T+2 T+1
Telecommunication Services
Colin McCallum - 852 2101 6514
21 Vianet VNET US O USD 24.33 36.00 48 1,407 5.2 0 (7) (12) 3 174 0 (5) (18) 9 171 Dec-13 nm 195 66 nm 91.3 30.9 18.6 42 69 0.0 4.3 3.9 3.3 18.1 41 China Mobile 941 HK O HKD 72.05 86.00 19 187,830 182.4 (1) (2) 5 (10) (11) (1) 0 (1) (5) (15) Dec-13 (20) 1 0 9.6 11.9 11.8 11.8 91 94 3.6 11.9 1.4 1.2 3.5 (43)
China Telecom 728 HK O HKD 3.45 4.26 23 36,010 24.0 (0) (2) 8 (12) (5) (0) 0 3 (6) (8) Dec-13 23 20 14 12.8 10.4 8.6 7.6 105 113 2.9 7.6 0.8 0.9 3.0 31 China Unicom 762 HK O HKD 10.44 18.40 76 32,026 33.7 (2) (2) 14 (10) 7 (2) 1 8 (4) 4 Dec-13 49 35 16 19.8 13.3 9.8 8.5 100 111 3.0 7.0 0.9 1.0 3.3 53 Sector* 27 257,274 (1) (2) 6 (10) (7) (1) 0 1 (5) (10) Dec-13 (10) 8 5 10.7 11.9 11.0 10.5 94 99 3.4 10.1 1.2 1.1 3.4 (11)
Transportation Vincent Chan / Davin Wu - 852 2101 6568 / 852 2101 6917
Air China 753 HK O HKD 4.57 7.00 53 7,374 8.1 (0) (3) (3) (21) (27) (0) (1) (9) (16) (30) Dec-13 36 18 27 11.7 8.6 7.3 5.8 122 113 1.9 9.5 0.8 1.5 6.9 187
CEA 670 HK O HKD 2.50 3.50 40 4,746 2.7 (1) (5) (6) (14) (24) (1) (3) (11) (9) (27) Dec-13 29 37 14 10.0 7.7 5.6 4.9 116 116 0.0 10.7 0.8 1.2 6.7 250 CMH 144 HK O HKD 25.60 30.00 17 8,343 15.0 0 (1) 0 (10) 7 0 1 (5) (4) 4 Dec-12 66 8 5 25.1 15.1 14.0 13.4 102 102 2.7 9.0 1.3 10.9 18.4 44 CSA 1055 HK O HKD 2.43 4.30 77 3,720 6.7 (2) (2) (3) (20) (40) (2) 0 (8) (14) (43) Dec-13 28 41 5 6.4 5.0 3.6 3.4 183 160 0.0 10.5 0.5 0.9 6.2 176
CSCL 2866 HK U HKD 1.90 1.20 (37) 3,711 6.6 0 3 9 (6) 0 0 6 3 (0) (3) Dec-13 nm nm nm nm nm nm 206.1 3 nm 0.0 (4.8) 0.8 1.0 82.8 53 China COSCO 1919 HK U HKD 3.34 3.00 (10) 5,235 5.0 (2) 0 4 (12) (1) (2) 2 (1) (6) (4) Dec-13 nm 364 32 nm 36.6 7.9 6.0 nm 227 0.5 3.0 1.1 1.1 12.1 116 China Shipping Dev 1138 HK O HKD 4.60 6.10 33 2,189 9.5 1 (2) 12 (24) 35 1 0 6 (18) 32 Dec-12 nm nm 87 nm nm 19.4 10.4 113 127 0.0 (6.6) 0.6 4.2 37.1 153
Cosco Pacific 1199 HK N HKD 10.64 11.50 8 3,996 6.4 1 1 4 0 5 1 3 (1) 6 1 Dec-12 (11) (2) 2 10.9 12.3 12.5 12.3 45 94 7.5 7.3 0.9 7.9 14.7 51 Daqin 601006 CH O CNY 6.88 12.00 74 16,438 35.6 (1) 3 8 (7) (2) (1) 3 4 (6) 2 Dec-12 8 6 6 8.9 8.2 7.7 7.3 97 90 5.7 16.9 1.3 2.0 4.5 (3) SIPG 600018 CH U CNY 4.69 4.50 (4) 17,152 56.0 (1) (1) 9 (11) 76 (1) 1 4 (6) 73 Dec-12 10 5 0 21.7 19.8 18.9 18.8 103 96 2.8 11.0 2.1 3.8 12.6 20
Sinotrans 368 HK O HKD 2.25 3.30 47 1,158 0.9 0 (1) (2) (20) 18 0 2 (8) (15) 15 Dec-13 590 16 3 71.8 10.4 8.9 8.7 174 155 2.9 5.0 0.5 1.0 2.2 (39) Sector* 28 74,063 (1) (0) 4 (11) 13 (1) 2 (1) (6) 10 Dec-13 95 25 24 23.0 11.8 9.4 5.9 109 101 2.9 9.3 1.0 1.6 8.2 89
Utilities Vincent Chan / Dave Dai / Kelly Chen - 852 2101 6568 / 852 2101 7358 / 852 2101 7079
Beijing Enterprise 392 HK O HKD 69.15 81.50 18 11,351 10.5 (1) 1 (3) (10) 15 (0) 3 (9) (5) 12 Dec-13 (2) 39 16 19.1 19.5 14.0 12.1 88 101 1.5 8.2 1.6 2.2 19.5 17 CEI 257 HK O HKD 10.06 13.20 31 5,817 24.9 0 (1) (8) (3) 76 (0) (1) (13) (0) 71 Dec-13 21 49 46 30.9 25.4 17.0 11.6 101 119 1.0 12.6 3.1 6.3 16.3 17
CR Gas 1193 HK O HKD 24.35 30.50 25 6,984 7.9 (0) (1) 2 (10) 15 (0) 2 (3) (4) 12 Dec-13 33 19 17 24.5 18.4 15.5 13.2 107 108 0.9 19.0 3.3 1.9 11.2 11 CR Power 836 HK O HKD 20.90 23.50 12 12,916 14.7 (3) (2) 13 14 (8) (3) 1 8 19 (11) Dec-13 8 14 5 9.0 8.4 7.3 7.0 105 108 3.9 17.3 1.4 2.3 6.6 95 CSG 956 HK O HKD 2.72 4.17 53 1,303 4.5 3 1 (20) (7) 32 3 2 (25) (4) 27 Dec-12 (5) 10 19 12.9 13.5 12.3 10.3 114 106 0.9 9.0 1.2 3.2 8.5 97
China Datang 1798 HK N HKD 1.18 1.45 23 381 1.5 4 (2) (17) (28) (25) 4 1 (23) (23) (28) Dec-13 106 56 13 29.1 14.1 9.1 8.1 103 106 0.7 5.1 0.7 6.9 8.2 327 China Gas 384 HK U HKD 12.40 8.00 (35) 7,989 10.0 (0) 2 5 9 63 (0) 4 (1) 14 60 Mar-13 29 3 8 31.5 24.3 23.6 21.9 99 87 0.9 18.2 3.9 2.6 14.6 49 China Longyuan 916 HK O HKD 8.64 11.90 38 8,955 20.8 2 4 (6) (14) 19 2 7 (12) (8) 15 Dec-13 77 26 19 27.2 15.4 12.2 10.2 109 113 1.3 11.2 1.6 5.4 8.5 141
Datang 991 HK N HKD 3.13 3.52 12 7,346 5.4 1 7 9 (13) (6) 1 9 4 (7) (9) Dec-12 21 (19) 25 8.1 6.7 8.2 6.6 134 89 4.9 11.4 0.7 2.8 8.3 278 ENN Energy 2688 HK U HKD 57.45 41.00 (29) 8,023 17.9 0 2 16 0 31 0 4 11 6 28 Dec-13 11 12 9 25.7 23.2 20.8 19.0 98 93 1.4 21.0 4.5 1.9 11.2 42 HDF 816 HK O HKD 3.70 5.30 43 3,808 9.8 1 (6) (8) 21 77 1 (6) (13) 23 72 Dec-13 27 29 27 15.4 12.2 9.4 7.4 103 110 1.7 15.5 1.7 5.2 9.5 313
HNR 958 HK O HKD 2.59 3.65 41 3,016 11.2 2 (2) (22) (30) 9 2 (2) (28) (28) 4 Dec-13 31 38 38 20.0 15.3 11.0 8.0 87 91 1.3 8.6 1.3 9.1 10.3 256 Huaneng 902 HK U HKD 7.86 6.40 (19) 12,717 20.2 0 (0) 20 12 (3) 0 2 15 18 (6) Dec-13 (13) 10 6 8.5 9.7 8.9 8.4 84 88 5.3 14.2 1.3 1.7 6.7 179 Kunlun Energy 135 HK N HKD 12.58 15.20 21 13,097 26.0 (0) 1 (8) (8) (20) (0) 4 (13) (2) (24) Dec-12 6 14 11 15.1 14.2 12.5 11.2 104 102 1.8 15.2 2.0 2.7 6.9 20
Shenzhen Gas 601139 CH N CNY 7.31 9.12 25 2,327 9.3 1 0 4 (8) (22) 1 3 (2) (2) (25) Dec-12 33 35 23 27.4 20.5 15.2 12.4 102 122 2.5 11.4 2.2 1.3 13.2 (14) Yangtze Power 600900 CH O CNY 5.98 8.30 39 15,858 19.1 0 1 6 (5) (16) 0 4 1 0 (19) Dec-12 (4) 11 3 9.5 9.9 8.9 8.6 111 110 5.3 12.3 1.1 6.3 7.9 68 Sector* 13 121,887 (0) 1 3 (2) 10 (0) 3 (2) 3 7 Dec-13 7 17 15 13.3 12.5 10.7 9.6 98 102 2.8 12.8 1.5 2.7 8.4 116
Country Average* MXCNX 6,085 7,612 25 2,887,801 (0) (2) 5 (6) 3 Dec-13 8 10 15 8.4 7.8 7.1 8.3 100 100 4.1 15.6 1.2 1.0 6.0 34
* Country/ sector aggregates are for the coverage above
Source: Company data, Thomson Financial IBES, Credit Suisse estimates
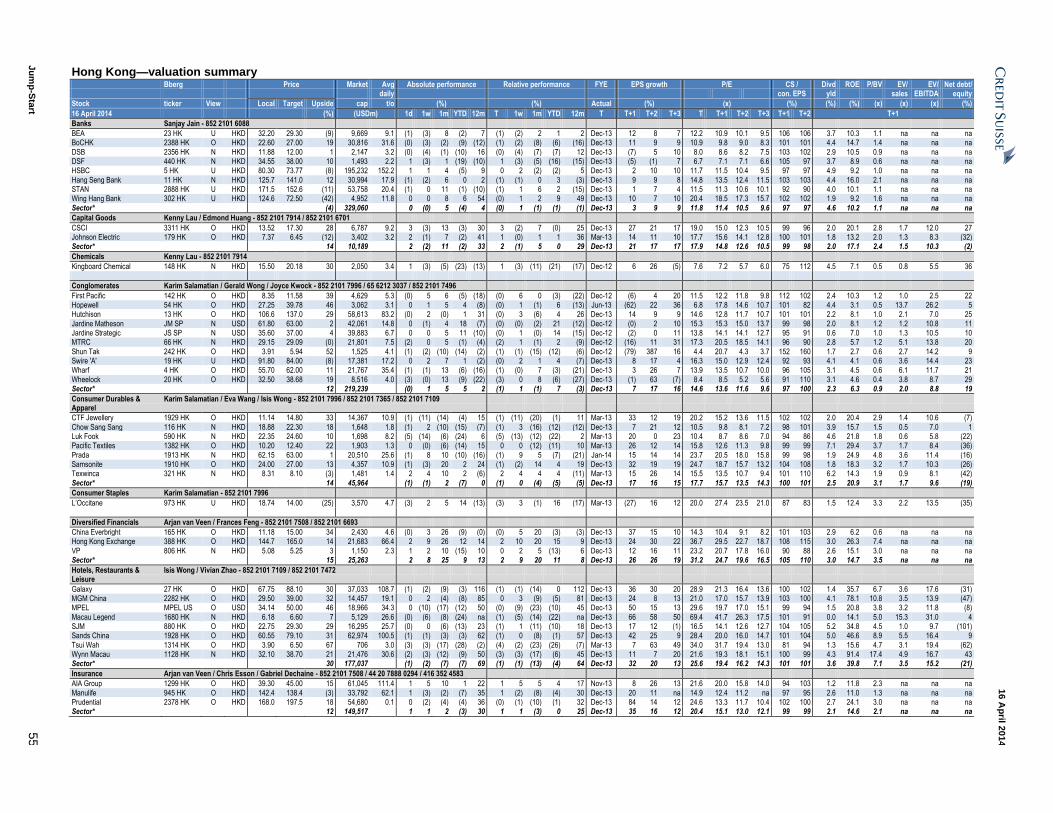
Ju
mp
-Sta
rt 5
5
16 A
pril 2
014
Hong Kong—valuation summary Bberg Price Market Avg Absolute performance Relative performance FYE EPS growth P/E CS / Divd ROE P/BV EV/ EV/ Net debt/ daily con. EPS yld sales EBITDA equity
Stock ticker View Local Target Upside cap t/o (%) (%) Actual (%) (x) (%) (%) (%) (x) (x) (x) (%)
16 April 2014 (%) (USDm) 1d 1w 1m YTD 12m T 1w 1m YTD 12m T T+1 T+2 T+3 T T+1 T+2 T+3 T+1 T+2 T+1
Banks Sanjay Jain - 852 2101 6088
BEA 23 HK U HKD 32.20 29.30 (9) 9,669 9.1 (1) (3) 8 (2) 7 (1) (2) 2 1 2 Dec-13 12 8 7 12.2 10.9 10.1 9.5 106 106 3.7 10.3 1.1 na na na BoCHK 2388 HK O HKD 22.60 27.00 19 30,816 31.6 (0) (3) (2) (9) (12) (1) (2) (8) (6) (16) Dec-13 11 9 9 10.9 9.8 9.0 8.3 101 101 4.4 14.7 1.4 na na na
DSB 2356 HK N HKD 11.88 12.00 1 2,147 3.2 (0) (4) (1) (10) 16 (0) (4) (7) (7) 12 Dec-13 (7) 5 10 8.0 8.6 8.2 7.5 103 102 2.9 10.5 0.9 na na na DSF 440 HK N HKD 34.55 38.00 10 1,493 2.2 1 (3) 1 (19) (10) 1 (3) (5) (16) (15) Dec-13 (5) (1) 7 6.7 7.1 7.1 6.6 105 97 3.7 8.9 0.6 na na na HSBC 5 HK U HKD 80.30 73.77 (8) 195,232 152.2 1 1 4 (5) 9 0 2 (2) (2) 5 Dec-13 2 10 10 11.7 11.5 10.4 9.5 97 97 4.9 9.2 1.0 na na na
Hang Seng Bank 11 HK N HKD 125.7 141.0 12 30,994 17.9 (1) (2) 6 0 2 (1) (1) 0 3 (3) Dec-13 9 9 8 14.8 13.5 12.4 11.5 103 103 4.4 16.0 2.1 na na na STAN 2888 HK U HKD 171.5 152.6 (11) 53,758 20.4 (1) 0 11 (1) (10) (1) 1 6 2 (15) Dec-13 1 7 4 11.5 11.3 10.6 10.1 92 90 4.0 10.1 1.1 na na na Wing Hang Bank 302 HK U HKD 124.6 72.50 (42) 4,952 11.8 0 0 8 6 54 (0) 1 2 9 49 Dec-13 10 7 10 20.4 18.5 17.3 15.7 102 102 1.9 9.2 1.6 na na na
Sector* (4) 329,060 0 (0) 5 (4) 4 (0) 1 (1) (1) (1) Dec-13 3 9 9 11.8 11.4 10.5 9.6 97 97 4.6 10.2 1.1 na na na
Capital Goods Kenny Lau / Edmond Huang - 852 2101 7914 / 852 2101 6701
CSCI 3311 HK O HKD 13.52 17.30 28 6,787 9.2 3 (3) 13 (3) 30 3 (2) 7 (0) 25 Dec-13 27 21 17 19.0 15.0 12.3 10.5 99 96 2.0 20.1 2.8 1.7 12.0 27 Johnson Electric 179 HK O HKD 7.37 6.45 (12) 3,402 3.2 2 (1) 7 (2) 41 1 (0) 1 1 36 Mar-13 14 11 10 17.7 15.6 14.1 12.8 100 101 1.8 13.2 2.0 1.3 8.3 (32) Sector* 14 10,189 2 (2) 11 (2) 33 2 (1) 5 0 29 Dec-13 21 17 17 17.9 14.8 12.6 10.5 99 98 2.0 17.1 2.4 1.5 10.3 (2)
Chemicals Kenny Lau - 852 2101 7914
Kingboard Chemical 148 HK N HKD 15.50 20.18 30 2,050 3.4 1 (3) (5) (23) (13) 1 (3) (11) (21) (17) Dec-12 6 26 (5) 7.6 7.2 5.7 6.0 75 112 4.5 7.1 0.5 0.8 5.5 36
Conglomerates Karim Salamatian / Gerald Wong / Joyce Kwock - 852 2101 7996 / 65 6212 3037 / 852 2101 7496
First Pacific 142 HK O HKD 8.35 11.58 39 4,629 5.3 (0) 5 6 (5) (18) (0) 6 0 (3) (22) Dec-12 (6) 4 20 11.5 12.2 11.8 9.8 112 102 2.4 10.3 1.2 1.0 2.5 22 Hopewell 54 HK O HKD 27.25 39.78 46 3,062 3.1 0 1 5 4 (8) (0) 1 (1) 6 (13) Jun-13 (62) 22 36 6.8 17.8 14.6 10.7 101 82 4.4 3.1 0.5 13.7 26.2 5 Hutchison 13 HK O HKD 106.6 137.0 29 58,613 83.2 (0) 2 (0) 1 31 (0) 3 (6) 4 26 Dec-13 14 9 9 14.6 12.8 11.7 10.7 101 101 2.2 8.1 1.0 2.1 7.0 25
Jardine Matheson JM SP N USD 61.80 63.00 2 42,061 14.8 0 (1) 4 18 (7) (0) (0) (2) 21 (12) Dec-12 (0) 2 10 15.3 15.3 15.0 13.7 99 98 2.0 8.1 1.2 1.2 10.8 11 Jardine Strategic JS SP N USD 35.60 37.00 4 39,883 6.7 0 0 5 11 (10) (0) 1 (0) 14 (15) Dec-12 (2) 0 11 13.8 14.1 14.1 12.7 95 91 0.6 7.0 1.0 1.3 10.5 10 MTRC 66 HK N HKD 29.15 29.09 (0) 21,801 7.5 (2) 0 5 (1) (4) (2) 1 (1) 2 (9) Dec-12 (16) 11 31 17.3 20.5 18.5 14.1 96 90 2.8 5.7 1.2 5.1 13.8 20
Shun Tak 242 HK O HKD 3.91 5.94 52 1,525 4.1 (1) (2) (10) (14) (2) (1) (1) (15) (12) (6) Dec-12 (79) 387 16 4.4 20.7 4.3 3.7 152 160 1.7 2.7 0.6 2.7 14.2 9 Swire 'A' 19 HK U HKD 91.80 84.00 (8) 17,381 17.2 0 2 7 1 (2) (0) 2 1 4 (7) Dec-13 8 17 4 16.3 15.0 12.9 12.4 92 93 4.1 4.1 0.6 3.6 14.4 23 Wharf 4 HK O HKD 55.70 62.00 11 21,767 35.4 (1) (1) 13 (6) (16) (1) (0) 7 (3) (21) Dec-13 3 26 7 13.9 13.5 10.7 10.0 96 105 3.1 4.5 0.6 6.1 11.7 21
Wheelock 20 HK O HKD 32.50 38.68 19 8,516 4.0 (3) (0) 13 (9) (22) (3) 0 8 (6) (27) Dec-13 (1) 63 (7) 8.4 8.5 5.2 5.6 91 110 3.1 4.6 0.4 3.8 8.7 29 Sector* 12 219,239 (0) 1 5 5 2 (1) 1 (1) 7 (3) Dec-13 7 17 16 14.6 13.6 11.6 9.6 97 100 2.3 6.3 0.9 2.0 8.8 19
Consumer Durables & Apparel
Karim Salamatian / Eva Wang / Isis Wong - 852 2101 7996 / 852 2101 7365 / 852 2101 7109
CTF Jewellery 1929 HK O HKD 11.14 14.80 33 14,367 10.9 (1) (11) (14) (4) 15 (1) (11) (20) (1) 11 Mar-13 33 12 19 20.2 15.2 13.6 11.5 102 102 2.0 20.4 2.9 1.4 10.6 (7)
Chow Sang Sang 116 HK N HKD 18.88 22.30 18 1,648 1.8 (1) 2 (10) (15) (7) (1) 3 (16) (12) (12) Dec-13 7 21 12 10.5 9.8 8.1 7.2 98 101 3.9 15.7 1.5 0.5 7.0 1 Luk Fook 590 HK N HKD 22.35 24.60 10 1,698 8.2 (5) (14) (6) (24) 6 (5) (13) (12) (22) 2 Mar-13 20 0 23 10.4 8.7 8.6 7.0 94 86 4.6 21.8 1.8 0.6 5.8 (22) Pacific Textiles 1382 HK O HKD 10.20 12.40 22 1,903 1.3 0 (0) (6) (14) 15 0 0 (12) (11) 10 Mar-13 26 12 14 15.8 12.6 11.3 9.8 99 99 7.1 29.4 3.7 1.7 8.4 (36)
Prada 1913 HK N HKD 62.15 63.00 1 20,510 25.6 (1) 8 10 (10) (16) (1) 9 5 (7) (21) Jan-14 15 14 14 23.7 20.5 18.0 15.8 99 98 1.9 24.9 4.8 3.6 11.4 (16) Samsonite 1910 HK O HKD 24.00 27.00 13 4,357 10.9 (1) (3) 20 2 24 (1) (2) 14 4 19 Dec-13 32 19 19 24.7 18.7 15.7 13.2 104 108 1.8 18.3 3.2 1.7 10.3 (26) Texwinca 321 HK N HKD 8.31 8.10 (3) 1,481 1.4 2 4 10 2 (6) 2 4 4 4 (11) Mar-13 15 26 14 15.5 13.5 10.7 9.4 101 110 6.2 14.3 1.9 0.9 8.1 (42)
Sector* 14 45,964 (1) (1) 2 (7) 0 (1) 0 (4) (5) (5) Dec-13 17 16 15 17.7 15.7 13.5 14.3 100 101 2.5 20.9 3.1 1.7 9.6 (19)
Consumer Staples Karim Salamatian - 852 2101 7996
L’Occitane 973 HK U HKD 18.74 14.00 (25) 3,570 4.7 (3) 2 5 14 (13) (3) 3 (1) 16 (17) Mar-13 (27) 16 12 20.0 27.4 23.5 21.0 87 83 1.5 12.4 3.3 2.2 13.5 (35)
Diversified Financials Arjan van Veen / Frances Feng - 852 2101 7508 / 852 2101 6693
China Everbright 165 HK O HKD 11.18 15.00 34 2,430 4.6 (0) 3 26 (9) (0) (0) 5 20 (3) (3) Dec-13 37 15 10 14.3 10.4 9.1 8.2 101 103 2.9 6.2 0.6 na na na Hong Kong Exchange 388 HK O HKD 144.7 165.0 14 21,683 66.4 2 9 26 12 14 2 10 20 15 9 Dec-13 24 30 22 36.7 29.5 22.7 18.7 108 115 3.0 26.3 7.4 na na na
VP 806 HK N HKD 5.08 5.25 3 1,150 2.3 1 2 10 (15) 10 0 2 5 (13) 6 Dec-13 12 16 11 23.2 20.7 17.8 16.0 90 88 2.6 15.1 3.0 na na na Sector* 15 25,263 2 8 25 9 13 2 9 20 11 8 Dec-13 26 26 19 31.2 24.7 19.6 16.5 105 110 3.0 14.7 3.5 na na na
Hotels, Restaurants & Leisure
Isis Wong / Vivian Zhao - 852 2101 7109 / 852 2101 7472
Galaxy 27 HK O HKD 67.75 88.10 30 37,033 108.7 (1) (2) (9) (3) 116 (1) (1) (14) 0 112 Dec-13 36 30 20 28.9 21.3 16.4 13.6 100 102 1.4 35.7 6.7 3.6 17.6 (31) MGM China 2282 HK O HKD 29.50 39.00 32 14,457 19.1 0 2 (4) (8) 85 0 3 (9) (5) 81 Dec-13 24 8 13 21.0 17.0 15.7 13.9 103 100 4.1 78.1 10.8 3.5 13.9 (47) MPEL MPEL US O USD 34.14 50.00 46 18,966 34.3 0 (10) (17) (12) 50 (0) (9) (23) (10) 45 Dec-13 50 15 13 29.6 19.7 17.0 15.1 99 94 1.5 20.8 3.8 3.2 11.8 (8)
Macau Legend 1680 HK N HKD 6.18 6.60 7 5,129 26.6 (0) (6) (8) (24) na (1) (5) (14) (22) na Dec-13 66 58 50 69.4 41.7 26.3 17.5 101 91 0.0 14.1 5.0 15.3 31.0 4 SJM 880 HK O HKD 22.75 29.30 29 16,295 25.7 (0) 0 (6) (13) 23 (1) 1 (11) (10) 18 Dec-13 17 12 (1) 16.5 14.1 12.6 12.7 104 105 5.2 34.8 4.5 1.0 9.7 (101) Sands China 1928 HK O HKD 60.55 79.10 31 62,974 100.5 (1) (1) (3) (3) 62 (1) 0 (8) (1) 57 Dec-13 42 25 9 28.4 20.0 16.0 14.7 101 104 5.0 46.6 8.9 5.5 16.4 9
Tsui Wah 1314 HK O HKD 3.90 6.50 67 706 3.0 (3) (3) (17) (28) (2) (4) (2) (23) (26) (7) Mar-13 7 63 49 34.0 31.7 19.4 13.0 81 94 1.3 15.6 4.7 3.1 19.4 (62) Wynn Macau 1128 HK N HKD 32.10 38.70 21 21,476 30.6 (2) (3) (12) (9) 50 (3) (3) (17) (6) 45 Dec-13 11 7 20 21.6 19.3 18.1 15.1 100 99 4.3 91.4 17.4 4.9 16.7 43 Sector* 30 177,037 (1) (2) (7) (7) 69 (1) (1) (13) (4) 64 Dec-13 32 20 13 25.6 19.4 16.2 14.3 101 101 3.6 39.8 7.1 3.5 15.2 (21)
Insurance Arjan van Veen / Chris Esson / Gabriel Dechaine - 852 2101 7508 / 44 20 7888 0294 / 416 352 4583
AIA Group 1299 HK O HKD 39.30 45.00 15 61,045 111.4 1 5 10 1 22 1 5 5 4 17 Nov-13 8 26 13 21.6 20.0 15.8 14.0 94 103 1.2 11.8 2.3 na na na
Manulife 945 HK O HKD 142.4 138.4 (3) 33,792 62.1 1 (3) (2) (7) 35 1 (2) (8) (4) 30 Dec-13 20 11 na 14.9 12.4 11.2 na 97 95 2.6 11.0 1.3 na na na Prudential 2378 HK O HKD 168.0 197.5 18 54,680 0.1 0 (2) (4) (4) 36 (0) (1) (10) (1) 32 Dec-13 84 14 12 24.6 13.3 11.7 10.4 102 100 2.7 24.1 3.0 na na na Sector* 12 149,517 1 1 2 (3) 30 1 1 (3) 0 25 Dec-13 35 16 12 20.4 15.1 13.0 12.1 99 99 2.1 14.6 2.1 na na na
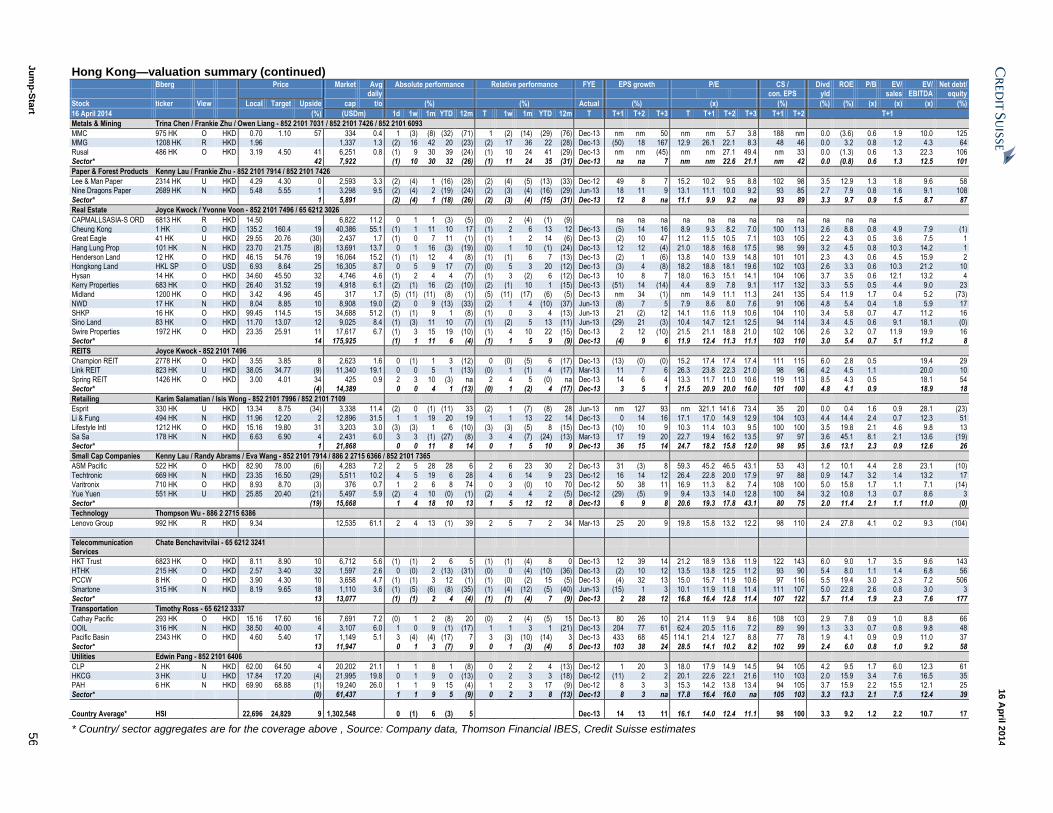
Ju
mp
-Sta
rt 5
6
16 A
pril 2
014
Hong Kong—valuation summary (continued) Bberg Price Market Avg Absolute performance Relative performance FYE EPS growth P/E CS / Divd ROE P/B EV/ EV/ Net debt/ daily con. EPS yld sales EBITDA equity
Stock ticker View Local Target Upside cap t/o (%) (%) Actual (%) (x) (%) (%) (%) (x) (x) (x) (%)
16 April 2014 (%) (USDm) 1d 1w 1m YTD 12m T 1w 1m YTD 12m T T+1 T+2 T+3 T T+1 T+2 T+3 T+1 T+2 T+1
Metals & Mining Trina Chen / Frankie Zhu / Owen Liang - 852 2101 7031 / 852 2101 7426 / 852 2101 6093
MMC 975 HK O HKD 0.70 1.10 57 334 0.4 1 (3) (8) (32) (71) 1 (2) (14) (29) (76) Dec-13 nm nm 50 nm nm 5.7 3.8 188 nm 0.0 (3.6) 0.6 1.9 10.0 125 MMG 1208 HK R HKD 1.96 1,337 1.3 (2) 16 42 20 (23) (2) 17 36 22 (28) Dec-13 (50) 18 167 12.9 26.1 22.1 8.3 48 46 0.0 3.2 0.8 1.2 4.3 64
Rusal 486 HK O HKD 3.19 4.50 41 6,251 0.8 (1) 9 30 39 (24) (1) 10 24 41 (29) Dec-13 nm nm (45) nm nm 27.1 49.4 nm 33 0.0 (1.3) 0.6 1.3 22.3 106 Sector* 42 7,922 (1) 10 30 32 (26) (1) 11 24 35 (31) Dec-13 na na 7 nm nm 22.6 21.1 nm 42 0.0 (0.8) 0.6 1.3 12.5 101
Paper & Forest Products Kenny Lau / Frankie Zhu - 852 2101 7914 / 852 2101 7426
Lee & Man Paper 2314 HK U HKD 4.29 4.30 0 2,593 3.3 (2) (4) 1 (16) (28) (2) (4) (5) (13) (33) Dec-12 49 8 7 15.2 10.2 9.5 8.8 102 98 3.5 12.9 1.3 1.8 9.6 58 Nine Dragons Paper 2689 HK N HKD 5.48 5.55 1 3,298 9.5 (2) (4) 2 (19) (24) (2) (3) (4) (16) (29) Jun-13 18 11 9 13.1 11.1 10.0 9.2 93 85 2.7 7.9 0.8 1.6 9.1 108
Sector* 1 5,891 (2) (4) 1 (18) (26) (2) (3) (4) (15) (31) Dec-13 12 8 na 11.1 9.9 9.2 na 93 89 3.3 9.7 0.9 1.5 8.7 87
Real Estate Joyce Kwock / Yvonne Voon - 852 2101 7496 / 65 6212 3026
CAPMALLSASIA-S ORD 6813 HK R HKD 14.50 6,822 11.2 0 1 1 (3) (5) (0) 2 (4) (1) (9) na na na na na na na na na na na na Cheung Kong 1 HK O HKD 135.2 160.4 19 40,386 55.1 (1) 1 11 10 17 (1) 2 6 13 12 Dec-13 (5) 14 16 8.9 9.3 8.2 7.0 100 113 2.6 8.8 0.8 4.9 7.9 (1) Great Eagle 41 HK U HKD 29.55 20.76 (30) 2,437 1.7 (1) 0 7 11 (1) (1) 1 2 14 (6) Dec-13 (2) 10 47 11.2 11.5 10.5 7.1 103 105 2.2 4.3 0.5 3.6 7.5 1
Hang Lung Prop 101 HK N HKD 23.70 21.75 (8) 13,691 13.7 0 1 16 (3) (19) (0) 1 10 (1) (24) Dec-13 12 12 (4) 21.0 18.8 16.8 17.5 98 99 3.2 4.5 0.8 10.3 14.2 1 Henderson Land 12 HK O HKD 46.15 54.76 19 16,064 15.2 (1) (1) 12 4 (8) (1) (1) 6 7 (13) Dec-13 (2) 1 (6) 13.8 14.0 13.9 14.8 101 101 2.3 4.3 0.6 4.5 15.9 2 Hongkong Land HKL SP O USD 6.93 8.64 25 16,305 8.7 0 5 9 17 (7) (0) 5 3 20 (12) Dec-13 (3) 4 (8) 18.2 18.8 18.1 19.6 102 103 2.6 3.3 0.6 10.3 21.2 10
Hysan 14 HK O HKD 34.60 45.50 32 4,746 4.6 (1) 2 4 4 (7) (1) 3 (2) 6 (12) Dec-13 10 8 7 18.0 16.3 15.1 14.1 104 106 3.7 3.5 0.6 12.1 13.2 4 Kerry Properties 683 HK O HKD 26.40 31.52 19 4,918 6.1 (2) (1) 16 (2) (10) (2) (1) 10 1 (15) Dec-13 (51) 14 (14) 4.4 8.9 7.8 9.1 117 132 3.3 5.5 0.5 4.4 9.0 23 Midland 1200 HK O HKD 3.42 4.96 45 317 1.7 (5) (11) (11) (8) (1) (5) (11) (17) (6) (5) Dec-13 nm 34 (1) nm 14.9 11.1 11.3 241 135 5.4 11.9 1.7 0.4 5.2 (73)
NWD 17 HK N HKD 8.04 8.85 10 8,908 19.0 (2) 0 9 (13) (33) (2) 1 4 (10) (37) Jun-13 (8) 7 5 7.9 8.6 8.0 7.6 91 106 4.8 5.4 0.4 1.8 5.9 17 SHKP 16 HK O HKD 99.45 114.5 15 34,688 51.2 (1) (1) 9 1 (8) (1) 0 3 4 (13) Jun-13 21 (2) 12 14.1 11.6 11.9 10.6 104 110 3.4 5.8 0.7 4.7 11.2 16 Sino Land 83 HK O HKD 11.70 13.07 12 9,025 8.4 (1) (3) 11 10 (7) (1) (2) 5 13 (11) Jun-13 (29) 21 (3) 10.4 14.7 12.1 12.5 94 114 3.4 4.5 0.6 9.1 18.1 (0)
Swire Properties 1972 HK O HKD 23.35 25.91 11 17,617 6.7 (1) 3 15 19 (10) (1) 4 10 22 (15) Dec-13 2 12 (10) 21.5 21.1 18.8 21.0 102 106 2.6 3.2 0.7 11.9 19.9 16 Sector* 14 175,925 (1) 1 11 6 (4) (1) 1 5 9 (9) Dec-13 (4) 9 6 11.9 12.4 11.3 11.1 103 110 3.0 5.4 0.7 5.1 11.2 8
REITS Joyce Kwock - 852 2101 7496
Champion REIT 2778 HK O HKD 3.55 3.85 8 2,623 1.6 0 (1) 1 3 (12) 0 (0) (5) 6 (17) Dec-13 (13) (0) (0) 15.2 17.4 17.4 17.4 111 115 6.0 2.8 0.5 19.4 29 Link REIT 823 HK U HKD 38.05 34.77 (9) 11,340 19.1 0 0 5 1 (13) (0) 1 (1) 4 (17) Mar-13 11 7 6 26.3 23.8 22.3 21.0 98 96 4.2 4.5 1.1 20.0 10
Spring REIT 1426 HK O HKD 3.00 4.01 34 425 0.9 2 3 10 (3) na 2 4 5 (0) na Dec-13 14 6 4 13.3 11.7 11.0 10.6 119 113 8.5 4.3 0.5 18.1 54 Sector* (4) 14,389 0 0 4 1 (13) (0) 1 (2) 4 (17) Dec-13 3 5 1 21.5 20.9 20.0 16.0 101 100 4.8 4.1 0.9 18.9 18
Retailing Karim Salamatian / Isis Wong - 852 2101 7996 / 852 2101 7109
Esprit 330 HK U HKD 13.34 8.75 (34) 3,338 11.4 (2) 0 (1) (11) 33 (2) 1 (7) (8) 28 Jun-13 nm 127 93 nm 321.1 141.6 73.4 35 20 0.0 0.4 1.6 0.9 28.1 (23) Li & Fung 494 HK N HKD 11.96 12.20 2 12,896 31.5 1 1 19 20 19 1 1 13 22 14 Dec-13 0 14 16 17.1 17.0 14.9 12.9 104 103 4.4 14.4 2.4 0.7 12.3 51
Lifestyle Intl 1212 HK O HKD 15.16 19.80 31 3,203 3.0 (3) (3) 1 6 (10) (3) (3) (5) 8 (15) Dec-13 (10) 10 9 10.3 11.4 10.3 9.5 100 100 3.5 19.8 2.1 4.6 9.8 13 Sa Sa 178 HK N HKD 6.63 6.90 4 2,431 6.0 3 3 (1) (27) (8) 3 4 (7) (24) (13) Mar-13 17 19 20 22.7 19.4 16.2 13.5 97 97 3.6 45.1 8.1 2.1 13.6 (19) Sector* 1 21,868 0 0 11 8 14 0 1 5 10 9 Dec-13 36 15 14 24.7 18.2 15.8 12.0 98 95 3.6 13.1 2.3 0.9 12.6 26
Small Cap Companies Kenny Lau / Randy Abrams / Eva Wang - 852 2101 7914 / 886 2 2715 6366 / 852 2101 7365
ASM Pacific 522 HK O HKD 82.90 78.00 (6) 4,283 7.2 2 5 28 28 6 2 6 23 30 2 Dec-13 31 (3) 8 59.3 45.2 46.5 43.1 53 43 1.2 10.1 4.4 2.8 23.1 (10)
Techtronic 669 HK N HKD 23.35 16.50 (29) 5,511 10.2 4 5 19 6 28 4 6 14 9 23 Dec-12 16 14 12 26.4 22.8 20.0 17.9 97 88 0.9 14.7 3.2 1.4 13.2 17 Varitronix 710 HK O HKD 8.93 8.70 (3) 376 0.7 1 2 6 8 74 0 3 (0) 10 70 Dec-12 50 38 11 16.9 11.3 8.2 7.4 108 100 5.0 15.8 1.7 1.1 7.1 (14) Yue Yuen 551 HK U HKD 25.85 20.40 (21) 5,497 5.9 (2) 4 10 (0) (1) (2) 4 4 2 (5) Dec-12 (29) (5) 9 9.4 13.3 14.0 12.8 100 84 3.2 10.8 1.3 0.7 8.6 3
Sector* (19) 15,668 1 4 18 10 13 1 5 12 12 8 Dec-13 6 9 8 20.6 19.3 17.8 43.1 80 75 2.0 11.4 2.1 1.1 11.0 (0)
Technology Thompson Wu - 886 2 2715 6386
Lenovo Group 992 HK R HKD 9.34 12,535 61.1 2 4 13 (1) 39 2 5 7 2 34 Mar-13 25 20 9 19.8 15.8 13.2 12.2 98 110 2.4 27.8 4.1 0.2 9.3 (104)
Telecommunication Services
Chate Benchavitvilai - 65 6212 3241
HKT Trust 6823 HK O HKD 8.11 8.90 10 6,712 5.6 (1) (1) 2 6 5 (1) (1) (4) 8 0 Dec-13 12 39 14 21.2 18.9 13.6 11.9 122 143 6.0 9.0 1.7 3.5 9.6 143
HTHK 215 HK O HKD 2.57 3.40 32 1,597 2.6 0 (0) 2 (13) (31) (0) 0 (4) (10) (36) Dec-13 (2) 10 12 13.5 13.8 12.5 11.2 93 90 5.4 8.0 1.1 1.4 6.8 56 PCCW 8 HK O HKD 3.90 4.30 10 3,658 4.7 (1) (1) 3 12 (1) (1) (0) (2) 15 (5) Dec-13 (4) 32 13 15.0 15.7 11.9 10.6 97 116 5.5 19.4 3.0 2.3 7.2 506 Smartone 315 HK N HKD 8.19 9.65 18 1,110 3.6 (1) (5) (6) (8) (35) (1) (4) (12) (5) (40) Jun-13 (15) 1 3 10.1 11.9 11.8 11.4 111 107 5.0 22.8 2.6 0.8 3.0 3
Sector* 13 13,077 (1) (1) 2 4 (4) (1) (1) (4) 7 (9) Dec-13 2 28 12 16.8 16.4 12.8 11.4 107 122 5.7 11.4 1.9 2.3 7.6 177
Transportation Timothy Ross - 65 6212 3337
Cathay Pacific 293 HK O HKD 15.16 17.60 16 7,691 7.2 (0) 1 2 (8) 20 (0) 2 (4) (5) 15 Dec-13 80 26 10 21.4 11.9 9.4 8.6 108 103 2.9 7.8 0.9 1.0 8.8 66 OOIL 316 HK N HKD 38.50 40.00 4 3,107 6.0 1 0 9 (1) (17) 1 1 3 1 (21) Dec-13 204 77 61 62.4 20.5 11.6 7.2 89 99 1.3 3.3 0.7 0.8 9.8 48 Pacific Basin 2343 HK O HKD 4.60 5.40 17 1,149 5.1 3 (4) (4) (17) 7 3 (3) (10) (14) 3 Dec-13 433 68 45 114.1 21.4 12.7 8.8 77 78 1.9 4.1 0.9 0.9 11.0 37
Sector* 13 11,947 0 1 3 (7) 9 0 1 (3) (4) 5 Dec-13 103 38 24 28.5 14.1 10.2 8.2 102 99 2.4 6.0 0.8 1.0 9.2 58
Utilities Edwin Pang - 852 2101 6406
CLP 2 HK N HKD 62.00 64.50 4 20,202 21.1 1 1 8 1 (8) 0 2 2 4 (13) Dec-12 1 20 3 18.0 17.9 14.9 14.5 94 105 4.2 9.5 1.7 6.0 12.3 61 HKCG 3 HK U HKD 17.84 17.20 (4) 21,995 19.8 0 1 9 0 (13) 0 2 3 3 (18) Dec-12 (11) 2 2 20.1 22.6 22.1 21.6 110 103 2.0 15.9 3.4 7.6 16.5 35 PAH 6 HK N HKD 69.90 68.88 (1) 19,240 26.0 1 1 9 15 (4) 1 2 3 17 (9) Dec-12 8 3 3 15.3 14.2 13.8 13.4 94 105 3.7 15.9 2.2 15.5 12.1 25
Sector* (0) 61,437 1 1 9 5 (9) 0 2 3 8 (13) Dec-13 8 3 na 17.8 16.4 16.0 na 105 103 3.3 13.3 2.1 7.5 12.4 39
Country Average* HSI 22,696 24,829 9 1,302,548 0 (1) 6 (3) 5 Dec-13 14 13 11 16.1 14.0 12.4 11.1 98 100 3.3 9.2 1.2 2.2 10.7 17
* Country/ sector aggregates are for the coverage above , Source: Company data, Thomson Financial IBES, Credit Suisse estimates
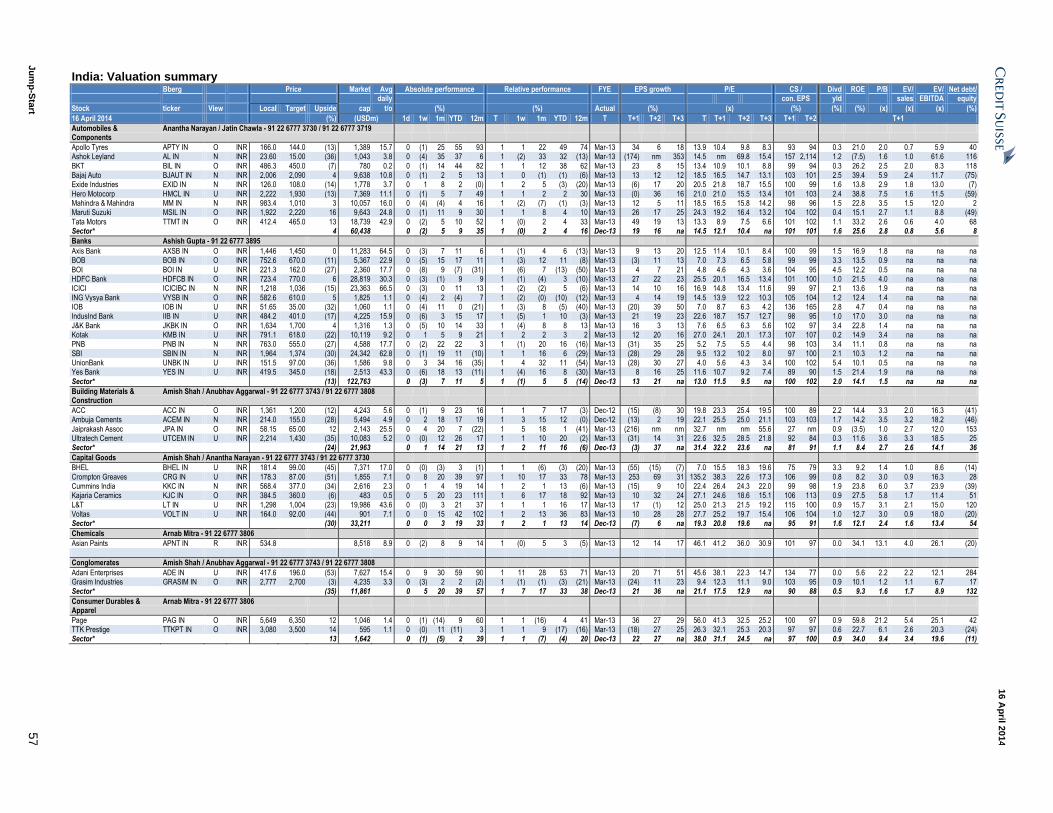
Ju
mp
-Sta
rt 5
7
16 A
pril 2
014
India: Valuation summary Bberg Price Market Avg Absolute performance Relative performance FYE EPS growth P/E CS / Divd ROE P/B EV/ EV/ Net debt/ daily con. EPS yld sales EBITDA equity
Stock ticker View Local Target Upside cap t/o (%) (%) Actual (%) (x) (%) (%) (%) (x) (x) (x) (%)
16 April 2014 (%) (USDm) 1d 1w 1m YTD 12m T 1w 1m YTD 12m T T+1 T+2 T+3 T T+1 T+2 T+3 T+1 T+2 T+1
Automobiles & Components
Anantha Narayan / Jatin Chawla - 91 22 6777 3730 / 91 22 6777 3719
Apollo Tyres APTY IN O INR 166.0 144.0 (13) 1,389 15.7 0 (1) 25 55 93 1 1 22 49 74 Mar-13 34 6 18 13.9 10.4 9.8 8.3 93 94 0.3 21.0 2.0 0.7 5.9 40 Ashok Leyland AL IN N INR 23.60 15.00 (36) 1,043 3.8 0 (4) 35 37 6 1 (2) 33 32 (13) Mar-13 (174) nm 353 14.5 nm 69.8 15.4 157 2,114 1.2 (7.5) 1.6 1.0 61.6 116
BKT BIL IN O INR 486.3 450.0 (7) 780 0.2 0 (1) 14 44 82 1 1 12 38 62 Mar-13 23 8 15 13.4 10.9 10.1 8.8 99 94 0.3 26.2 2.5 2.0 8.3 118 Bajaj Auto BJAUT IN N INR 2,006 2,090 4 9,638 10.8 0 (1) 2 5 13 1 0 (1) (1) (6) Mar-13 13 12 12 18.5 16.5 14.7 13.1 103 101 2.5 39.4 5.9 2.4 11.7 (75) Exide Industries EXID IN N INR 126.0 108.0 (14) 1,778 3.7 0 1 8 2 (0) 1 2 5 (3) (20) Mar-13 (6) 17 20 20.5 21.8 18.7 15.5 100 99 1.6 13.8 2.9 1.8 13.0 (7)
Hero Motocorp HMCL IN U INR 2,222 1,930 (13) 7,369 11.1 0 (1) 5 7 49 1 1 2 2 30 Mar-13 (0) 36 16 21.0 21.0 15.5 13.4 101 103 2.4 38.8 7.5 1.6 11.5 (59) Mahindra & Mahindra MM IN N INR 983.4 1,010 3 10,057 16.0 0 (4) (4) 4 16 1 (2) (7) (1) (3) Mar-13 12 5 11 18.5 16.5 15.8 14.2 98 96 1.5 22.8 3.5 1.5 12.0 2 Maruti Suzuki MSIL IN O INR 1,922 2,220 16 9,643 24.8 0 (1) 11 9 30 1 1 8 4 10 Mar-13 26 17 25 24.3 19.2 16.4 13.2 104 102 0.4 15.1 2.7 1.1 8.8 (49)
Tata Motors TTMT IN O INR 412.4 465.0 13 18,739 42.9 0 (2) 5 10 52 1 (0) 2 4 33 Mar-13 49 19 13 13.3 8.9 7.5 6.6 101 102 1.1 33.2 2.6 0.6 4.0 68 Sector* 4 60,438 0 (2) 5 9 35 1 (0) 2 4 16 Dec-13 19 16 na 14.5 12.1 10.4 na 101 101 1.6 25.6 2.8 0.8 5.6 8
Banks Ashish Gupta - 91 22 6777 3895
Axis Bank AXSB IN O INR 1,446 1,450 0 11,283 64.5 0 (3) 7 11 6 1 (1) 4 6 (13) Mar-13 9 13 20 12.5 11.4 10.1 8.4 100 99 1.5 16.9 1.8 na na na BOB BOB IN O INR 752.6 670.0 (11) 5,367 22.9 0 (5) 15 17 11 1 (3) 12 11 (8) Mar-13 (3) 11 13 7.0 7.3 6.5 5.8 99 99 3.3 13.5 0.9 na na na
BOI BOI IN U INR 221.3 162.0 (27) 2,360 17.7 0 (8) 9 (7) (31) 1 (6) 7 (13) (50) Mar-13 4 7 21 4.8 4.6 4.3 3.6 104 95 4.5 12.2 0.5 na na na HDFC Bank HDFCB IN O INR 723.4 770.0 6 28,819 30.3 0 (3) (1) 9 9 1 (1) (4) 3 (10) Mar-13 27 22 23 25.5 20.1 16.5 13.4 101 100 1.0 21.5 4.0 na na na ICICI ICICIBC IN N INR 1,218 1,036 (15) 23,363 66.5 0 (3) 0 11 13 1 (2) (2) 5 (6) Mar-13 14 10 16 16.9 14.8 13.4 11.6 99 97 2.1 13.6 1.9 na na na
ING Vysya Bank VYSB IN O INR 582.6 610.0 5 1,825 1.1 0 (4) 2 (4) 7 1 (2) (0) (10) (12) Mar-13 4 14 19 14.5 13.9 12.2 10.3 105 104 1.2 12.4 1.4 na na na IOB IOB IN U INR 51.65 35.00 (32) 1,060 1.1 0 (4) 11 0 (21) 1 (3) 8 (5) (40) Mar-13 (20) 39 50 7.0 8.7 6.3 4.2 136 165 2.8 4.7 0.4 na na na IndusInd Bank IIB IN U INR 484.2 401.0 (17) 4,225 15.9 0 (6) 3 15 17 1 (5) 1 10 (3) Mar-13 21 19 23 22.6 18.7 15.7 12.7 98 95 1.0 17.0 3.0 na na na
J&K Bank JKBK IN O INR 1,634 1,700 4 1,316 1.3 0 (5) 10 14 33 1 (4) 8 8 13 Mar-13 16 3 13 7.6 6.5 6.3 5.6 102 97 3.4 22.8 1.4 na na na Kotak KMB IN U INR 791.1 618.0 (22) 10,119 9.2 0 1 5 9 21 1 2 2 3 2 Mar-13 12 20 16 27.0 24.1 20.1 17.3 107 107 0.2 14.9 3.4 na na na PNB PNB IN N INR 763.0 555.0 (27) 4,588 17.7 0 (2) 22 22 3 1 (1) 20 16 (16) Mar-13 (31) 35 25 5.2 7.5 5.5 4.4 98 103 3.4 11.1 0.8 na na na
SBI SBIN IN N INR 1,964 1,374 (30) 24,342 62.8 0 (1) 19 11 (10) 1 1 16 6 (29) Mar-13 (28) 29 28 9.5 13.2 10.2 8.0 97 100 2.1 10.3 1.2 na na na UnionBank UNBK IN U INR 151.5 97.00 (36) 1,586 9.8 0 3 34 16 (35) 1 4 32 11 (54) Mar-13 (28) 30 27 4.0 5.6 4.3 3.4 100 102 5.4 10.1 0.5 na na na Yes Bank YES IN U INR 419.5 345.0 (18) 2,513 43.3 0 (6) 18 13 (11) 1 (4) 16 8 (30) Mar-13 8 16 25 11.6 10.7 9.2 7.4 89 90 1.5 21.4 1.9 na na na
Sector* (13) 122,763 0 (3) 7 11 5 1 (1) 5 5 (14) Dec-13 13 21 na 13.0 11.5 9.5 na 100 102 2.0 14.1 1.5 na na na
Building Materials & Construction
Amish Shah / Anubhav Aggarwal - 91 22 6777 3743 / 91 22 6777 3808
ACC ACC IN O INR 1,361 1,200 (12) 4,243 5.6 0 (1) 9 23 16 1 1 7 17 (3) Dec-12 (15) (8) 30 19.8 23.3 25.4 19.5 100 89 2.2 14.4 3.3 2.0 16.3 (41) Ambuja Cements ACEM IN N INR 214.0 155.0 (28) 5,494 4.9 0 2 18 17 19 1 3 15 12 (0) Dec-12 (13) 2 19 22.1 25.5 25.0 21.1 103 103 1.7 14.2 3.5 3.2 18.2 (46)
Jaiprakash Assoc JPA IN O INR 58.15 65.00 12 2,143 25.5 0 4 20 7 (22) 1 5 18 1 (41) Mar-13 (216) nm nm 32.7 nm nm 55.6 27 nm 0.9 (3.5) 1.0 2.7 12.0 153 Ultratech Cement UTCEM IN U INR 2,214 1,430 (35) 10,083 5.2 0 (0) 12 26 17 1 1 10 20 (2) Mar-13 (31) 14 31 22.6 32.5 28.5 21.8 92 84 0.3 11.6 3.6 3.3 18.5 25 Sector* (24) 21,963 0 1 14 21 13 1 2 11 16 (6) Dec-13 (3) 37 na 31.4 32.2 23.6 na 81 91 1.1 8.4 2.7 2.6 14.1 36
Capital Goods Amish Shah / Anantha Narayan - 91 22 6777 3743 / 91 22 6777 3730
BHEL BHEL IN U INR 181.4 99.00 (45) 7,371 17.0 0 (0) (3) 3 (1) 1 1 (6) (3) (20) Mar-13 (55) (15) (7) 7.0 15.5 18.3 19.6 75 79 3.3 9.2 1.4 1.0 8.6 (14)
Crompton Greaves CRG IN U INR 178.3 87.00 (51) 1,855 7.1 0 8 20 39 97 1 10 17 33 78 Mar-13 253 69 31 135.2 38.3 22.6 17.3 106 99 0.8 8.2 3.0 0.9 16.3 28 Cummins India KKC IN N INR 568.4 377.0 (34) 2,616 2.3 0 1 4 19 14 1 2 1 13 (6) Mar-13 (15) 9 10 22.4 26.4 24.3 22.0 99 98 1.9 23.8 6.0 3.7 23.9 (39) Kajaria Ceramics KJC IN O INR 384.5 360.0 (6) 483 0.5 0 5 20 23 111 1 6 17 18 92 Mar-13 10 32 24 27.1 24.6 18.6 15.1 106 113 0.9 27.5 5.8 1.7 11.4 51
L&T LT IN U INR 1,298 1,004 (23) 19,986 43.6 0 (0) 3 21 37 1 1 1 16 17 Mar-13 17 (1) 12 25.0 21.3 21.5 19.2 115 100 0.9 15.7 3.1 2.1 15.0 120 Voltas VOLT IN U INR 164.0 92.00 (44) 901 7.1 0 0 15 42 102 1 2 13 36 83 Mar-13 10 28 28 27.7 25.2 19.7 15.4 106 104 1.0 12.7 3.0 0.9 18.0 (20) Sector* (30) 33,211 0 0 3 19 33 1 2 1 13 14 Dec-13 (7) 6 na 19.3 20.8 19.6 na 95 91 1.6 12.1 2.4 1.6 13.4 54
Chemicals Arnab Mitra - 91 22 6777 3806
Asian Paints APNT IN R INR 534.8 8,518 8.9 0 (2) 8 9 14 1 (0) 5 3 (5) Mar-13 12 14 17 46.1 41.2 36.0 30.9 101 97 0.0 34.1 13.1 4.0 26.1 (20)
Conglomerates Amish Shah / Anubhav Aggarwal - 91 22 6777 3743 / 91 22 6777 3808
Adani Enterprises ADE IN U INR 417.6 196.0 (53) 7,627 15.4 0 9 30 59 90 1 11 28 53 71 Mar-13 20 71 51 45.6 38.1 22.3 14.7 134 77 0.0 5.6 2.2 2.2 12.1 284 Grasim Industries GRASIM IN O INR 2,777 2,700 (3) 4,235 3.3 0 (3) 2 2 (2) 1 (1) (1) (3) (21) Mar-13 (24) 11 23 9.4 12.3 11.1 9.0 103 95 0.9 10.1 1.2 1.1 6.7 17 Sector* (35) 11,861 0 5 20 39 57 1 7 17 33 38 Dec-13 21 36 na 21.1 17.5 12.9 na 90 88 0.5 9.3 1.6 1.7 8.9 132
Consumer Durables & Apparel
Arnab Mitra - 91 22 6777 3806
Page PAG IN O INR 5,649 6,350 12 1,046 1.4 0 (1) (14) 9 60 1 1 (16) 4 41 Mar-13 36 27 29 56.0 41.3 32.5 25.2 100 97 0.9 59.8 21.2 5.4 25.1 42 TTK Prestige TTKPT IN O INR 3,080 3,500 14 595 1.1 0 (0) 11 (11) 3 1 1 9 (17) (16) Mar-13 (18) 27 25 26.3 32.1 25.3 20.3 97 97 0.6 22.7 6.1 2.6 20.3 (24) Sector* 13 1,642 0 (1) (5) 2 39 1 1 (7) (4) 20 Dec-13 22 27 na 38.0 31.1 24.5 na 97 100 0.9 34.0 9.4 3.4 19.6 (11)
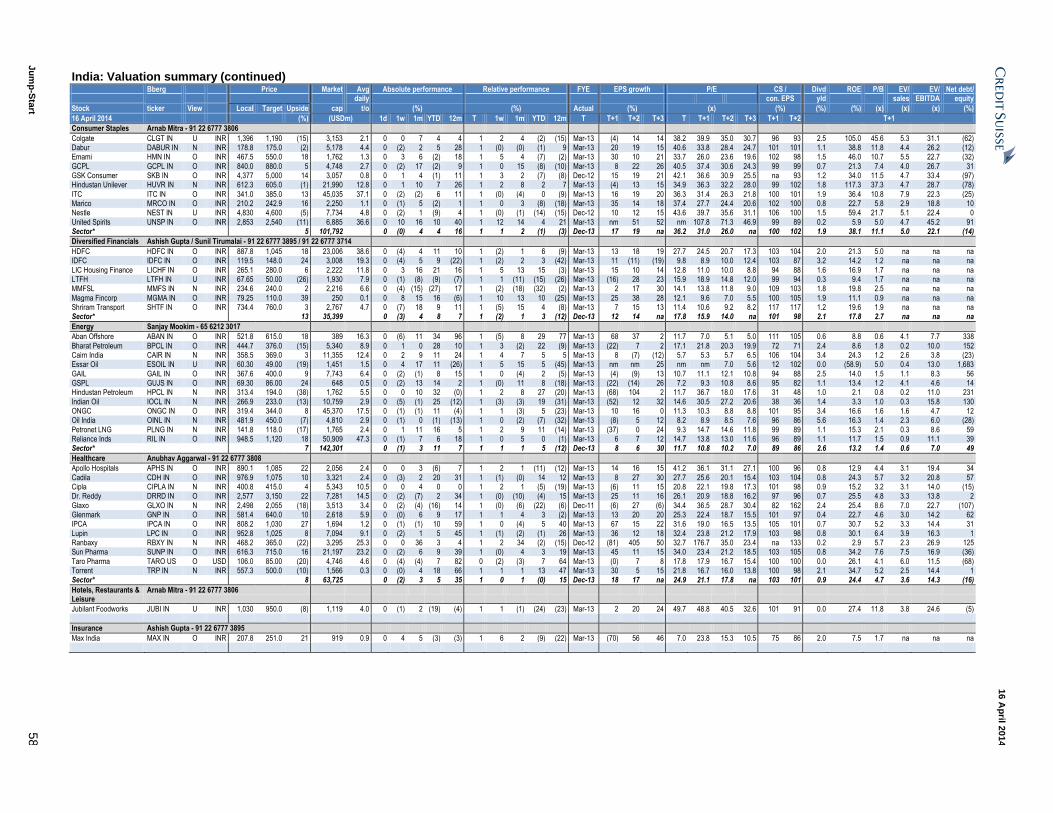
Ju
mp
-Sta
rt 5
8
16 A
pril 2
014
India: Valuation summary (continued) Bberg Price Market Avg Absolute performance Relative performance FYE EPS growth P/E CS / Divd ROE P/B EV/ EV/ Net debt/ daily con. EPS yld sales EBITDA equity
Stock ticker View Local Target Upside cap t/o (%) (%) Actual (%) (x) (%) (%) (%) (x) (x) (x) (%)
16 April 2014 (%) (USDm) 1d 1w 1m YTD 12m T 1w 1m YTD 12m T T+1 T+2 T+3 T T+1 T+2 T+3 T+1 T+2 T+1
Consumer Staples Arnab Mitra - 91 22 6777 3806
Colgate CLGT IN U INR 1,396 1,190 (15) 3,153 2.1 0 0 7 4 4 1 2 4 (2) (15) Mar-13 (4) 14 14 38.2 39.9 35.0 30.7 96 93 2.5 105.0 45.6 5.3 31.1 (62) Dabur DABUR IN N INR 178.8 175.0 (2) 5,178 4.4 0 (2) 2 5 28 1 (0) (0) (1) 9 Mar-13 20 19 15 40.6 33.8 28.4 24.7 101 101 1.1 38.8 11.8 4.4 26.2 (12) Emami HMN IN O INR 467.5 550.0 18 1,762 1.3 0 3 6 (2) 18 1 5 4 (7) (2) Mar-13 30 10 21 33.7 26.0 23.6 19.6 102 98 1.5 46.0 10.7 5.5 22.7 (32)
GCPL GCPL IN O INR 840.0 880.0 5 4,748 2.7 0 (2) 17 (2) 9 1 0 15 (8) (10) Mar-13 8 22 26 40.5 37.4 30.6 24.3 99 99 0.7 21.3 7.4 4.0 26.7 31 GSK Consumer SKB IN O INR 4,377 5,000 14 3,057 0.8 0 1 4 (1) 11 1 3 2 (7) (8) Dec-12 15 19 21 42.1 36.6 30.9 25.5 na 93 1.2 34.0 11.5 4.7 33.4 (97) Hindustan Unilever HUVR IN N INR 612.3 605.0 (1) 21,990 12.8 0 1 10 7 26 1 2 8 2 7 Mar-13 (4) 13 15 34.9 36.3 32.2 28.0 99 102 1.8 117.3 37.3 4.7 28.7 (78)
ITC ITC IN O INR 341.0 385.0 13 45,035 37.1 0 (2) (2) 6 11 1 (0) (4) 0 (9) Mar-13 16 19 20 36.3 31.4 26.3 21.8 100 101 1.9 36.4 10.8 7.9 22.3 (25) Marico MRCO IN O INR 210.2 242.9 16 2,250 1.1 0 (1) 5 (2) 1 1 0 3 (8) (18) Mar-13 35 14 18 37.4 27.7 24.4 20.6 102 100 0.8 22.7 5.8 2.9 18.8 10 Nestle NEST IN U INR 4,830 4,600 (5) 7,734 4.8 0 (2) 1 (9) 4 1 (0) (1) (14) (15) Dec-12 10 12 15 43.6 39.7 35.6 31.1 106 100 1.5 59.4 21.7 5.1 22.4 0
United Spirits UNSP IN O INR 2,853 2,540 (11) 6,885 36.6 0 10 16 10 40 1 12 14 4 21 Mar-13 nm 51 52 nm 107.8 71.3 46.9 99 89 0.2 5.9 5.0 4.7 45.2 91 Sector* 5 101,792 0 (0) 4 4 16 1 1 2 (1) (3) Dec-13 17 19 na 36.2 31.0 26.0 na 100 102 1.9 38.1 11.1 5.0 22.1 (14)
Diversified Financials Ashish Gupta / Sunil Tirumalai - 91 22 6777 3895 / 91 22 6777 3714
HDFC HDFC IN O INR 887.8 1,045 18 23,006 38.6 0 (4) 4 11 10 1 (2) 1 6 (9) Mar-13 13 18 19 27.7 24.5 20.7 17.3 103 104 2.0 21.3 5.0 na na na IDFC IDFC IN O INR 119.5 148.0 24 3,008 19.3 0 (4) 5 9 (22) 1 (2) 2 3 (42) Mar-13 11 (11) (19) 9.8 8.9 10.0 12.4 103 87 3.2 14.2 1.2 na na na
LIC Housing Finance LICHF IN O INR 265.1 280.0 6 2,222 11.8 0 3 16 21 16 1 5 13 15 (3) Mar-13 15 10 14 12.8 11.0 10.0 8.8 94 88 1.6 16.9 1.7 na na na LTFH LTFH IN U INR 67.65 50.00 (26) 1,930 7.9 0 (1) (8) (9) (7) 1 1 (11) (15) (26) Mar-13 (16) 28 23 15.9 18.9 14.8 12.0 99 94 0.3 9.4 1.7 na na na MMFSL MMFS IN N INR 234.6 240.0 2 2,216 6.6 0 (4) (15) (27) 17 1 (2) (18) (32) (2) Mar-13 2 17 30 14.1 13.8 11.8 9.0 109 103 1.8 19.8 2.5 na na na
Magma Fincorp MGMA IN O INR 79.25 110.0 39 250 0.1 0 8 15 16 (6) 1 10 13 10 (25) Mar-13 25 38 28 12.1 9.6 7.0 5.5 100 105 1.9 11.1 0.9 na na na Shriram Transport SHTF IN O INR 734.4 760.0 3 2,767 4.7 0 (7) 18 9 11 1 (5) 15 4 (8) Mar-13 7 15 13 11.4 10.6 9.2 8.2 117 117 1.2 19.6 1.9 na na na Sector* 13 35,399 0 (3) 4 8 7 1 (2) 1 3 (12) Dec-13 12 14 na 17.8 15.9 14.0 na 101 98 2.1 17.8 2.7 na na na
Energy Sanjay Mookim - 65 6212 3017
Aban Offshore ABAN IN O INR 521.8 615.0 18 389 16.3 0 (6) 11 34 96 1 (5) 8 29 77 Mar-13 68 37 2 11.7 7.0 5.1 5.0 111 105 0.6 8.8 0.6 4.1 7.7 338
Bharat Petroleum BPCL IN O INR 444.7 376.0 (15) 5,340 8.9 0 1 0 28 10 1 3 (2) 22 (9) Mar-13 (22) 7 2 17.1 21.8 20.3 19.9 72 71 2.4 8.6 1.8 0.2 10.0 152 Cairn India CAIR IN N INR 358.5 369.0 3 11,355 12.4 0 2 9 11 24 1 4 7 5 5 Mar-13 8 (7) (12) 5.7 5.3 5.7 6.5 106 104 3.4 24.3 1.2 2.6 3.8 (23) Essar Oil ESOIL IN U INR 60.30 49.00 (19) 1,451 1.5 0 4 17 11 (26) 1 5 15 5 (45) Mar-13 nm nm 25 nm nm 7.0 5.6 12 102 0.0 (58.9) 5.0 0.4 13.0 1,683
GAIL GAIL IN O INR 367.6 400.0 9 7,743 6.4 0 (2) (1) 8 15 1 0 (4) 2 (5) Mar-13 (4) (9) 13 10.7 11.1 12.1 10.8 94 88 2.5 14.0 1.5 1.1 8.3 56 GSPL GUJS IN O INR 69.30 86.00 24 648 0.5 0 (2) 13 14 2 1 (0) 11 8 (18) Mar-13 (22) (14) 26 7.2 9.3 10.8 8.6 95 82 1.1 13.4 1.2 4.1 4.6 14 Hindustan Petroleum HPCL IN N INR 313.4 194.0 (38) 1,762 5.5 0 0 10 32 (0) 1 2 8 27 (20) Mar-13 (68) 104 2 11.7 36.7 18.0 17.6 31 48 1.0 2.1 0.8 0.2 11.0 231
Indian Oil IOCL IN N INR 266.9 233.0 (13) 10,759 2.9 0 (5) (1) 25 (12) 1 (3) (3) 19 (31) Mar-13 (52) 12 32 14.6 30.5 27.2 20.6 38 36 1.4 3.3 1.0 0.3 15.8 130 ONGC ONGC IN O INR 319.4 344.0 8 45,370 17.5 0 (1) (1) 11 (4) 1 1 (3) 5 (23) Mar-13 10 16 0 11.3 10.3 8.8 8.8 101 95 3.4 16.6 1.6 1.6 4.7 12 Oil India OINL IN N INR 481.9 450.0 (7) 4,810 2.9 0 (1) 0 (1) (13) 1 0 (2) (7) (32) Mar-13 (8) 5 12 8.2 8.9 8.5 7.6 96 86 5.6 16.3 1.4 2.3 6.0 (28)
Petronet LNG PLNG IN N INR 141.8 118.0 (17) 1,765 2.4 0 1 11 16 5 1 2 9 11 (14) Mar-13 (37) 0 24 9.3 14.7 14.6 11.8 99 89 1.1 15.3 2.1 0.3 8.6 59 Reliance Inds RIL IN O INR 948.5 1,120 18 50,909 47.3 0 (1) 7 6 18 1 0 5 0 (1) Mar-13 6 7 12 14.7 13.8 13.0 11.6 96 89 1.1 11.7 1.5 0.9 11.1 39 Sector* 7 142,301 0 (1) 3 11 7 1 1 1 5 (12) Dec-13 8 6 30 11.7 10.8 10.2 7.0 89 86 2.6 13.2 1.4 0.6 7.0 49
Healthcare Anubhav Aggarwal - 91 22 6777 3808
Apollo Hospitals APHS IN O INR 890.1 1,085 22 2,056 2.4 0 0 3 (6) 7 1 2 1 (11) (12) Mar-13 14 16 15 41.2 36.1 31.1 27.1 100 96 0.8 12.9 4.4 3.1 19.4 34
Cadila CDH IN O INR 976.9 1,075 10 3,321 2.4 0 (3) 2 20 31 1 (1) (0) 14 12 Mar-13 8 27 30 27.7 25.6 20.1 15.4 103 104 0.8 24.3 5.7 3.2 20.8 57 Cipla CIPLA IN N INR 400.8 415.0 4 5,343 10.5 0 0 4 0 0 1 2 1 (5) (19) Mar-13 (6) 11 15 20.8 22.1 19.8 17.3 101 98 0.9 15.2 3.2 3.1 14.0 (15) Dr. Reddy DRRD IN O INR 2,577 3,150 22 7,281 14.5 0 (2) (7) 2 34 1 (0) (10) (4) 15 Mar-13 25 11 16 26.1 20.9 18.8 16.2 97 96 0.7 25.5 4.8 3.3 13.8 2
Glaxo GLXO IN N INR 2,498 2,055 (18) 3,513 3.4 0 (2) (4) (16) 14 1 (0) (6) (22) (6) Dec-11 (6) 27 (6) 34.4 36.5 28.7 30.4 82 162 2.4 25.4 8.6 7.0 22.7 (107) Glenmark GNP IN O INR 581.4 640.0 10 2,618 5.9 0 (0) 6 9 17 1 1 4 3 (2) Mar-13 13 20 20 25.3 22.4 18.7 15.5 101 97 0.4 22.7 4.6 3.0 14.2 62 IPCA IPCA IN O INR 808.2 1,030 27 1,694 1.2 0 (1) (1) 10 59 1 0 (4) 5 40 Mar-13 67 15 22 31.6 19.0 16.5 13.5 105 101 0.7 30.7 5.2 3.3 14.4 31
Lupin LPC IN O INR 952.8 1,025 8 7,094 9.1 0 (2) 1 5 45 1 (1) (2) (1) 26 Mar-13 36 12 18 32.4 23.8 21.2 17.9 103 98 0.8 30.1 6.4 3.9 16.3 1 Ranbaxy RBXY IN N INR 468.2 365.0 (22) 3,295 25.3 0 0 36 3 4 1 2 34 (2) (15) Dec-12 (81) 405 50 32.7 176.7 35.0 23.4 na 133 0.2 2.9 5.7 2.3 26.9 125 Sun Pharma SUNP IN O INR 616.3 715.0 16 21,197 23.2 0 (2) 6 9 39 1 (0) 4 3 19 Mar-13 45 11 15 34.0 23.4 21.2 18.5 103 105 0.8 34.2 7.6 7.5 16.9 (36)
Taro Pharma TARO US O USD 106.0 85.00 (20) 4,746 4.6 0 (4) (4) 7 82 0 (2) (3) 7 64 Mar-13 (0) 7 8 17.8 17.9 16.7 15.4 100 100 0.0 26.1 4.1 6.0 11.5 (68) Torrent TRP IN N INR 557.3 500.0 (10) 1,566 0.3 0 (0) 4 18 66 1 1 1 13 47 Mar-13 30 5 15 21.8 16.7 16.0 13.8 100 98 2.1 34.7 5.2 2.5 14.4 1 Sector* 8 63,725 0 (2) 3 5 35 1 0 1 (0) 15 Dec-13 18 17 na 24.9 21.1 17.8 na 103 101 0.9 24.4 4.7 3.6 14.3 (16)
Hotels, Restaurants & Leisure
Arnab Mitra - 91 22 6777 3806
Jubilant Foodworks JUBI IN U INR 1,030 950.0 (8) 1,119 4.0 0 (1) 2 (19) (4) 1 1 (1) (24) (23) Mar-13 2 20 24 49.7 48.8 40.5 32.6 101 91 0.0 27.4 11.8 3.8 24.6 (5)
Insurance Ashish Gupta - 91 22 6777 3895
Max India MAX IN O INR 207.8 251.0 21 919 0.9 0 4 5 (3) (3) 1 6 2 (9) (22) Mar-13 (70) 56 46 7.0 23.8 15.3 10.5 75 86 2.0 7.5 1.7 na na na
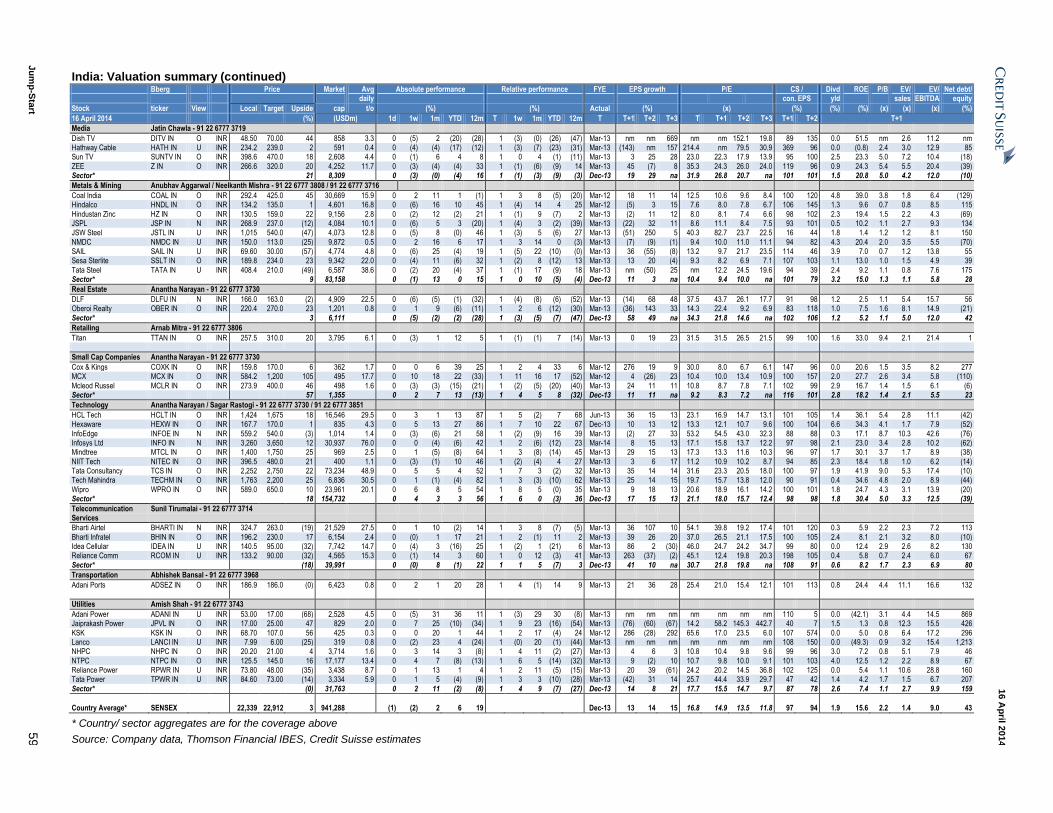
Ju
mp
-Sta
rt 5
9
16 A
pril 2
014
India: Valuation summary (continued) Bberg Price Market Avg Absolute performance Relative performance FYE EPS growth P/E CS / Divd ROE P/B EV/ EV/ Net debt/ daily con. EPS yld sales EBITDA equity
Stock ticker View Local Target Upside cap t/o (%) (%) Actual (%) (x) (%) (%) (%) (x) (x) (x) (%)
16 April 2014 (%) (USDm) 1d 1w 1m YTD 12m T 1w 1m YTD 12m T T+1 T+2 T+3 T T+1 T+2 T+3 T+1 T+2 T+1
Media Jatin Chawla - 91 22 6777 3719
Dish TV DITV IN O INR 48.50 70.00 44 858 3.3 0 (5) 2 (20) (28) 1 (3) (0) (26) (47) Mar-13 nm nm 669 nm nm 152.1 19.8 89 135 0.0 51.5 nm 2.6 11.2 nm Hathway Cable HATH IN U INR 234.2 239.0 2 591 0.4 0 (4) (4) (17) (12) 1 (3) (7) (23) (31) Mar-13 (143) nm 157 214.4 nm 79.5 30.9 369 96 0.0 (0.8) 2.4 3.0 12.9 85 Sun TV SUNTV IN O INR 398.6 470.0 18 2,608 4.4 0 (1) 6 4 8 1 0 4 (1) (11) Mar-13 3 25 28 23.0 22.3 17.9 13.9 95 100 2.5 23.3 5.0 7.2 10.4 (18)
ZEE Z IN O INR 266.6 320.0 20 4,252 11.7 0 (3) (4) (4) 33 1 (1) (6) (9) 14 Mar-13 45 (7) 8 35.3 24.3 26.0 24.0 119 96 0.9 24.3 5.4 5.5 20.4 (39) Sector* 21 8,309 0 (3) (0) (4) 16 1 (1) (3) (9) (3) Dec-13 19 29 na 31.9 26.8 20.7 na 101 101 1.5 20.8 5.0 4.2 12.0 (10)
Metals & Mining Anubhav Aggarwal / Neelkanth Mishra - 91 22 6777 3808 / 91 22 6777 3716
Coal India COAL IN O INR 292.4 425.0 45 30,669 15.9 0 2 11 1 (1) 1 3 8 (5) (20) Mar-12 18 11 14 12.5 10.6 9.6 8.4 100 120 4.8 39.0 3.8 1.8 6.4 (129) Hindalco HNDL IN O INR 134.2 135.0 1 4,601 16.8 0 (6) 16 10 45 1 (4) 14 4 25 Mar-12 (5) 3 15 7.6 8.0 7.8 6.7 106 145 1.3 9.6 0.7 0.8 8.5 115
Hindustan Zinc HZ IN O INR 130.5 159.0 22 9,156 2.8 0 (2) 12 (2) 21 1 (1) 9 (7) 2 Mar-13 (2) 11 12 8.0 8.1 7.4 6.6 98 102 2.3 19.4 1.5 2.2 4.3 (69) JSPL JSP IN N INR 268.9 237.0 (12) 4,084 10.1 0 (6) 5 3 (20) 1 (4) 3 (2) (39) Mar-13 (22) 32 11 8.6 11.1 8.4 7.5 93 101 0.5 10.2 1.1 2.7 9.3 134 JSW Steel JSTL IN U INR 1,015 540.0 (47) 4,073 12.8 0 (5) 8 (0) 46 1 (3) 5 (6) 27 Mar-13 (51) 250 5 40.3 82.7 23.7 22.5 16 44 1.8 1.4 1.2 1.2 8.1 150
NMDC NMDC IN U INR 150.0 113.0 (25) 9,872 0.5 0 2 16 6 17 1 3 14 0 (3) Mar-13 (7) (9) (1) 9.4 10.0 11.0 11.1 94 82 4.3 20.4 2.0 3.5 5.5 (70) SAIL SAIL IN U INR 69.60 30.00 (57) 4,774 4.8 0 (6) 25 (4) 19 1 (5) 22 (10) (0) Mar-13 36 (55) (8) 13.2 9.7 21.7 23.5 114 46 3.9 7.0 0.7 1.2 13.8 55 Sesa Sterlite SSLT IN O INR 189.8 234.0 23 9,342 22.0 0 (4) 11 (6) 32 1 (2) 8 (12) 13 Mar-13 13 20 (4) 9.3 8.2 6.9 7.1 107 103 1.1 13.0 1.0 1.5 4.9 39
Tata Steel TATA IN U INR 408.4 210.0 (49) 6,587 38.6 0 (2) 20 (4) 37 1 (1) 17 (9) 18 Mar-13 nm (50) 25 nm 12.2 24.5 19.6 94 39 2.4 9.2 1.1 0.8 7.6 175 Sector* 9 83,158 0 (1) 13 0 15 1 0 10 (5) (4) Dec-13 11 3 na 10.4 9.4 10.0 na 101 79 3.2 15.0 1.3 1.1 5.8 28
Real Estate Anantha Narayan - 91 22 6777 3730
DLF DLFU IN N INR 166.0 163.0 (2) 4,909 22.5 0 (6) (5) (1) (32) 1 (4) (8) (6) (52) Mar-13 (14) 68 48 37.5 43.7 26.1 17.7 91 98 1.2 2.5 1.1 5.4 15.7 56 Oberoi Realty OBER IN O INR 220.4 270.0 23 1,201 0.8 0 1 9 (6) (11) 1 2 6 (12) (30) Mar-13 (36) 143 33 14.3 22.4 9.2 6.9 83 118 1.0 7.5 1.6 8.1 14.9 (21)
Sector* 3 6,111 0 (5) (2) (2) (28) 1 (3) (5) (7) (47) Dec-13 58 49 na 34.3 21.8 14.6 na 102 106 1.2 5.2 1.1 5.0 12.0 42
Retailing Arnab Mitra - 91 22 6777 3806
Titan TTAN IN O INR 257.5 310.0 20 3,795 6.1 0 (3) 1 12 5 1 (1) (1) 7 (14) Mar-13 0 19 23 31.5 31.5 26.5 21.5 99 100 1.6 33.0 9.4 2.1 21.4 1
Small Cap Companies Anantha Narayan - 91 22 6777 3730
Cox & Kings COXK IN O INR 159.8 170.0 6 362 1.7 0 0 6 39 25 1 2 4 33 6 Mar-12 276 19 9 30.0 8.0 6.7 6.1 147 96 0.0 20.6 1.5 3.5 8.2 277 MCX MCX IN O INR 584.2 1,200 105 495 17.7 0 10 18 22 (33) 1 11 16 17 (52) Mar-12 4 (26) 23 10.4 10.0 13.4 10.9 100 157 2.0 27.7 2.6 3.4 5.8 (110)
Mcleod Russel MCLR IN O INR 273.9 400.0 46 498 1.6 0 (3) (3) (15) (21) 1 (2) (5) (20) (40) Mar-13 24 11 11 10.8 8.7 7.8 7.1 102 99 2.9 16.7 1.4 1.5 6.1 (6) Sector* 57 1,355 0 2 7 13 (13) 1 4 5 8 (32) Dec-13 11 11 na 9.2 8.3 7.2 na 116 101 2.8 18.2 1.4 2.1 5.5 23
Technology Anantha Narayan / Sagar Rastogi - 91 22 6777 3730 / 91 22 6777 3851
HCL Tech HCLT IN O INR 1,424 1,675 18 16,546 29.5 0 3 1 13 87 1 5 (2) 7 68 Jun-13 36 15 13 23.1 16.9 14.7 13.1 101 105 1.4 36.1 5.4 2.8 11.1 (42) Hexaware HEXW IN O INR 167.7 170.0 1 835 4.3 0 5 13 27 86 1 7 10 22 67 Dec-13 10 13 12 13.3 12.1 10.7 9.6 100 104 6.6 34.3 4.1 1.7 7.9 (52)
InfoEdge INFOE IN N INR 559.2 540.0 (3) 1,014 1.4 0 (3) (6) 21 58 1 (2) (9) 16 39 Mar-13 (2) 27 33 53.2 54.5 43.0 32.3 88 88 0.3 17.1 8.7 10.3 42.6 (76) Infosys Ltd INFO IN N INR 3,260 3,650 12 30,937 76.0 0 0 (4) (6) 42 1 2 (6) (12) 23 Mar-14 8 15 13 17.1 15.8 13.7 12.2 97 98 2.1 23.0 3.4 2.8 10.2 (62) Mindtree MTCL IN O INR 1,400 1,750 25 969 2.5 0 1 (5) (8) 64 1 3 (8) (14) 45 Mar-13 29 15 13 17.3 13.3 11.6 10.3 96 97 1.7 30.1 3.7 1.7 8.9 (38)
NIIT Tech NITEC IN O INR 396.5 480.0 21 400 1.1 0 (3) (1) 10 46 1 (2) (4) 4 27 Mar-13 3 6 17 11.2 10.9 10.2 8.7 94 85 2.3 18.4 1.8 1.0 6.2 (14) Tata Consultancy TCS IN O INR 2,252 2,750 22 73,234 48.9 0 5 5 4 52 1 7 3 (2) 32 Mar-13 35 14 14 31.6 23.3 20.5 18.0 100 97 1.9 41.9 9.0 5.3 17.4 (10) Tech Mahindra TECHM IN O INR 1,763 2,200 25 6,836 30.5 0 1 (1) (4) 82 1 3 (3) (10) 62 Mar-13 25 14 15 19.7 15.7 13.8 12.0 90 91 0.4 34.6 4.8 2.0 8.9 (44)
Wipro WPRO IN O INR 589.0 650.0 10 23,961 20.1 0 6 8 5 54 1 8 5 (0) 35 Mar-13 9 18 13 20.6 18.9 16.1 14.2 100 101 1.8 24.7 4.3 3.1 13.9 (20) Sector* 18 154,732 0 4 3 3 56 1 6 0 (3) 36 Dec-13 17 15 13 21.1 18.0 15.7 12.4 98 98 1.8 30.4 5.0 3.3 12.5 (39)
Telecommunication Services
Sunil Tirumalai - 91 22 6777 3714
Bharti Airtel BHARTI IN N INR 324.7 263.0 (19) 21,529 27.5 0 1 10 (2) 14 1 3 8 (7) (5) Mar-13 36 107 10 54.1 39.8 19.2 17.4 101 120 0.3 5.9 2.2 2.3 7.2 113
Bharti Infratel BHIN IN O INR 196.2 230.0 17 6,154 2.4 0 (0) 1 17 21 1 2 (1) 11 2 Mar-13 39 26 20 37.0 26.5 21.1 17.5 100 105 2.4 8.1 2.1 3.2 8.0 (10) Idea Cellular IDEA IN U INR 140.5 95.00 (32) 7,742 14.7 0 (4) 3 (16) 25 1 (2) 1 (21) 6 Mar-13 86 2 (30) 46.0 24.7 24.2 34.7 99 80 0.0 12.4 2.9 2.6 8.2 130 Reliance Comm RCOM IN U INR 133.2 90.00 (32) 4,565 15.3 0 (1) 14 3 60 1 0 12 (3) 41 Mar-13 263 (37) (2) 45.1 12.4 19.8 20.3 198 105 0.4 5.8 0.7 2.4 6.0 67
Sector* (18) 39,991 0 (0) 8 (1) 22 1 1 5 (7) 3 Dec-13 41 10 na 30.7 21.8 19.8 na 108 91 0.6 8.2 1.7 2.3 6.9 80
Transportation Abhishek Bansal - 91 22 6777 3968
Adani Ports ADSEZ IN O INR 186.9 186.0 (0) 6,423 0.8 0 2 1 20 28 1 4 (1) 14 9 Mar-13 21 36 28 25.4 21.0 15.4 12.1 101 113 0.8 24.4 4.4 11.1 16.6 132
Utilities Amish Shah - 91 22 6777 3743
Adani Power ADANI IN U INR 53.00 17.00 (68) 2,528 4.5 0 (5) 31 36 11 1 (3) 29 30 (8) Mar-13 nm nm nm nm nm nm nm 110 5 0.0 (42.1) 3.1 4.4 14.5 869 Jaiprakash Power JPVL IN O INR 17.00 25.00 47 829 2.0 0 7 25 (10) (34) 1 9 23 (16) (54) Mar-13 (76) (60) (67) 14.2 58.2 145.3 442.7 40 7 1.5 1.3 0.8 12.3 15.5 426
KSK KSK IN O INR 68.70 107.0 56 425 0.3 0 0 20 1 44 1 2 17 (4) 24 Mar-12 286 (28) 292 65.6 17.0 23.5 6.0 107 574 0.0 5.0 0.8 6.4 17.2 296 Lanco LANCI IN U INR 7.99 6.00 (25) 319 0.8 0 (2) 23 4 (24) 1 (0) 20 (1) (44) Mar-13 nm nm nm nm nm nm nm 108 150 0.0 (49.3) 0.9 3.2 15.4 1,213 NHPC NHPC IN O INR 20.20 21.00 4 3,714 1.6 0 3 14 3 (8) 1 4 11 (2) (27) Mar-13 4 6 3 10.8 10.4 9.8 9.6 99 96 3.0 7.2 0.8 5.1 7.9 46
NTPC NTPC IN O INR 125.5 145.0 16 17,177 13.4 0 4 7 (8) (13) 1 6 5 (14) (32) Mar-13 9 (2) 10 10.7 9.8 10.0 9.1 101 103 4.0 12.5 1.2 2.2 8.9 67 Reliance Power RPWR IN U INR 73.80 48.00 (35) 3,438 8.7 0 1 13 1 4 1 2 11 (5) (15) Mar-13 20 39 (61) 24.2 20.2 14.5 36.8 102 125 0.0 5.4 1.1 10.6 28.8 160 Tata Power TPWR IN U INR 84.60 73.00 (14) 3,334 5.9 0 1 5 (4) (9) 1 3 3 (10) (28) Mar-13 (42) 31 14 25.7 44.4 33.9 29.7 47 42 1.4 4.2 1.7 1.5 6.7 207
Sector* (0) 31,763 0 2 11 (2) (8) 1 4 9 (7) (27) Dec-13 14 8 21 17.7 15.5 14.7 9.7 87 78 2.6 7.4 1.1 2.7 9.9 159
Country Average* SENSEX 22,339 22,912 3 941,288 (1) (2) 2 6 19 Dec-13 13 14 15 16.8 14.9 13.5 11.8 97 94 1.9 15.6 2.2 1.4 9.0 43
* Country/ sector aggregates are for the coverage above
Source: Company data, Thomson Financial IBES, Credit Suisse estimates
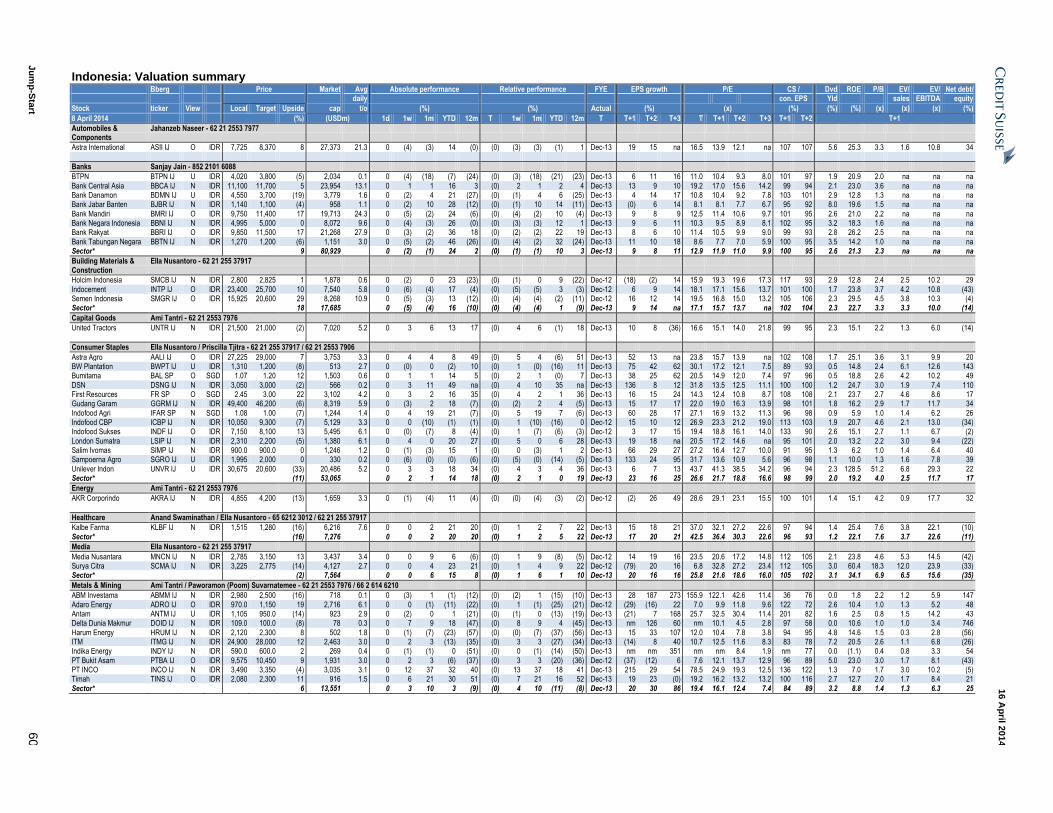
Ju
mp
-Sta
rt 6
0
16 A
pril 2
014
Indonesia: Valuation summary Bberg Price Market Avg Absolute performance Relative performance FYE EPS growth P/E CS / Dvd ROE P/B EV/ EV/ Net debt/ daily con. EPS Yld sales EBITDA equity
Stock ticker View Local Target Upside cap t/o (%) (%) Actual (%) (x) (%) (%) (%) (x) (x) (x) (%)
8 April 2014 (%) (USDm) 1d 1w 1m YTD 12m T 1w 1m YTD 12m T T+1 T+2 T+3 T T+1 T+2 T+3 T+1 T+2 T+1
Automobiles & Components
Jahanzeb Naseer - 62 21 2553 7977
Astra International ASII IJ O IDR 7,725 8,370 8 27,373 21.3 0 (4) (3) 14 (0) (0) (3) (3) (1) 1 Dec-13 19 15 na 16.5 13.9 12.1 na 107 107 5.6 25.3 3.3 1.6 10.8 34
Banks Sanjay Jain - 852 2101 6088
BTPN BTPN IJ U IDR 4,020 3,800 (5) 2,034 0.1 0 (4) (18) (7) (24) (0) (3) (18) (21) (23) Dec-13 6 11 16 11.0 10.4 9.3 8.0 101 97 1.9 20.9 2.0 na na na
Bank Central Asia BBCA IJ N IDR 11,100 11,700 5 23,954 13.1 0 1 1 16 3 (0) 2 1 2 4 Dec-13 13 9 10 19.2 17.0 15.6 14.2 99 94 2.1 23.0 3.6 na na na Bank Danamon BDMN IJ U IDR 4,550 3,700 (19) 3,779 1.6 0 (2) 4 21 (27) (0) (1) 4 6 (25) Dec-13 4 14 17 10.8 10.4 9.2 7.8 103 101 2.9 12.8 1.3 na na na Bank Jabar Banten BJBR IJ N IDR 1,140 1,100 (4) 958 1.1 0 (2) 10 28 (12) (0) (1) 10 14 (11) Dec-13 (0) 6 14 8.1 8.1 7.7 6.7 95 92 8.0 19.6 1.5 na na na
Bank Mandiri BMRI IJ O IDR 9,750 11,400 17 19,713 24.3 0 (5) (2) 24 (6) (0) (4) (2) 10 (4) Dec-13 9 8 9 12.5 11.4 10.6 9.7 101 95 2.6 21.0 2.2 na na na Bank Negara Indonesia BBNI IJ N IDR 4,995 5,000 0 8,072 9.6 0 (4) (3) 26 (0) (0) (3) (3) 12 1 Dec-13 9 6 11 10.3 9.5 8.9 8.1 102 95 3.2 18.3 1.6 na na na Bank Rakyat BBRI IJ O IDR 9,850 11,500 17 21,268 27.9 0 (3) (2) 36 18 (0) (2) (2) 22 19 Dec-13 8 6 10 11.4 10.5 9.9 9.0 99 93 2.8 26.2 2.5 na na na
Bank Tabungan Negara BBTN IJ N IDR 1,270 1,200 (6) 1,151 3.0 0 (5) (2) 46 (26) (0) (4) (2) 32 (24) Dec-13 11 10 18 8.6 7.7 7.0 5.9 100 95 3.5 14.2 1.0 na na na Sector* 9 80,929 0 (2) (1) 24 2 (0) (1) (1) 10 3 Dec-13 9 8 11 12.9 11.9 11.0 9.9 100 95 2.6 21.3 2.3 na na na
Building Materials & Construction
Ella Nusantoro - 62 21 255 37917
Holcim Indonesia SMCB IJ N IDR 2,800 2,825 1 1,878 0.6 0 (2) 0 23 (23) (0) (1) 0 9 (22) Dec-12 (18) (2) 14 15.9 19.3 19.6 17.3 117 93 2.9 12.8 2.4 2.5 10.2 29
Indocement INTP IJ O IDR 23,400 25,700 10 7,540 5.8 0 (6) (4) 17 (4) (0) (5) (5) 3 (3) Dec-12 6 9 14 18.1 17.1 15.6 13.7 101 100 1.7 23.8 3.7 4.2 10.8 (43) Semen Indonesia SMGR IJ O IDR 15,925 20,600 29 8,268 10.9 0 (5) (3) 13 (12) (0) (4) (4) (2) (11) Dec-12 16 12 14 19.5 16.8 15.0 13.2 105 106 2.3 29.5 4.5 3.8 10.3 (4) Sector* 18 17,685 0 (5) (4) 16 (10) (0) (4) (4) 1 (9) Dec-13 9 14 na 17.1 15.7 13.7 na 102 104 2.3 22.7 3.3 3.3 10.0 (14)
Capital Goods Ami Tantri - 62 21 2553 7976
United Tractors UNTR IJ N IDR 21,500 21,000 (2) 7,020 5.2 0 3 6 13 17 (0) 4 6 (1) 18 Dec-13 10 8 (36) 16.6 15.1 14.0 21.8 99 95 2.3 15.1 2.2 1.3 6.0 (14)
Consumer Staples Ella Nusantoro / Priscilla Tjitra - 62 21 255 37917 / 62 21 2553 7906
Astra Agro AALI IJ O IDR 27,225 29,000 7 3,753 3.3 0 4 4 8 49 (0) 5 4 (6) 51 Dec-13 52 13 na 23.8 15.7 13.9 na 102 108 1.7 25.1 3.6 3.1 9.9 20 BW Plantation BWPT IJ U IDR 1,310 1,200 (8) 513 2.7 0 (0) 0 (2) 10 (0) 1 (0) (16) 11 Dec-13 75 42 62 30.1 17.2 12.1 7.5 89 93 0.5 14.8 2.4 6.1 12.6 143 Bumitama BAL SP O SGD 1.07 1.20 12 1,503 0.6 0 1 1 14 5 (0) 2 1 (0) 7 Dec-13 38 25 62 20.5 14.9 12.0 7.4 97 96 0.5 18.8 2.6 4.2 10.2 49
DSN DSNG IJ N IDR 3,050 3,000 (2) 566 0.2 0 3 11 49 na (0) 4 10 35 na Dec-13 136 8 12 31.8 13.5 12.5 11.1 100 100 1.2 24.7 3.0 1.9 7.4 110 First Resources FR SP O SGD 2.45 3.00 22 3,102 4.2 0 3 2 16 35 (0) 4 2 1 36 Dec-13 16 15 24 14.3 12.4 10.8 8.7 108 108 2.1 23.7 2.7 4.6 8.6 17 Gudang Garam GGRM IJ N IDR 49,400 46,200 (6) 8,319 5.9 0 (3) 2 18 (7) (0) (2) 2 4 (5) Dec-13 15 17 17 22.0 19.0 16.3 13.9 98 101 1.8 16.2 2.9 1.7 11.7 34
Indofood Agri IFAR SP N SGD 1.08 1.00 (7) 1,244 1.4 0 4 19 21 (7) (0) 5 19 7 (6) Dec-13 60 28 17 27.1 16.9 13.2 11.3 96 98 0.9 5.9 1.0 1.4 6.2 26 Indofood CBP ICBP IJ N IDR 10,050 9,300 (7) 5,129 3.3 0 0 (10) (1) (1) (0) 1 (10) (16) 0 Dec-12 15 10 12 26.9 23.3 21.2 19.0 113 103 1.9 20.7 4.6 2.1 13.0 (34) Indofood Sukses INDF IJ O IDR 7,150 8,100 13 5,495 6.1 0 (0) (7) 8 (4) (0) 1 (7) (6) (3) Dec-12 3 17 15 19.4 18.8 16.1 14.0 133 90 2.6 15.1 2.7 1.1 6.7 (2)
London Sumatra LSIP IJ N IDR 2,310 2,200 (5) 1,380 6.1 0 4 0 20 27 (0) 5 0 6 28 Dec-13 19 18 na 20.5 17.2 14.6 na 95 101 2.0 13.2 2.2 3.0 9.4 (22) Salim Ivomas SIMP IJ N IDR 900.0 900.0 0 1,246 1.2 0 (1) (3) 15 1 (0) 0 (3) 1 2 Dec-13 66 29 27 27.2 16.4 12.7 10.0 91 95 1.3 6.2 1.0 1.4 6.4 40 Sampoerna Agro SGRO IJ U IDR 1,995 2,000 0 330 0.2 0 (6) (0) (0) (6) (0) (5) (0) (14) (5) Dec-13 133 24 95 31.7 13.6 10.9 5.6 96 98 1.1 10.0 1.3 1.6 7.8 39
Unilever Indon UNVR IJ U IDR 30,675 20,600 (33) 20,486 5.2 0 3 3 18 34 (0) 4 3 4 36 Dec-13 6 7 13 43.7 41.3 38.5 34.2 96 94 2.3 128.5 51.2 6.8 29.3 22 Sector* (11) 53,065 0 2 1 14 18 (0) 2 1 0 19 Dec-13 23 16 25 26.6 21.7 18.8 16.6 98 99 2.0 19.2 4.0 2.5 11.7 17
Energy Ami Tantri - 62 21 2553 7976
AKR Corporindo AKRA IJ N IDR 4,855 4,200 (13) 1,659 3.3 0 (1) (4) 11 (4) (0) (0) (4) (3) (2) Dec-12 (2) 26 49 28.6 29.1 23.1 15.5 100 101 1.4 15.1 4.2 0.9 17.7 32
Healthcare Anand Swaminathan / Ella Nusantoro - 65 6212 3012 / 62 21 255 37917
Kalbe Farma KLBF IJ N IDR 1,515 1,280 (16) 6,216 7.6 0 0 2 21 20 (0) 1 2 7 22 Dec-13 15 18 21 37.0 32.1 27.2 22.6 97 94 1.4 25.4 7.6 3.8 22.1 (10)
Sector* (16) 7,276 0 0 2 20 20 (0) 1 2 5 22 Dec-13 17 20 21 42.5 36.4 30.3 22.6 96 93 1.2 22.1 7.6 3.7 22.6 (11)
Media Ella Nusantoro - 62 21 255 37917
Media Nusantara MNCN IJ N IDR 2,785 3,150 13 3,437 3.4 0 0 9 6 (6) (0) 1 9 (8) (5) Dec-12 14 19 16 23.5 20.6 17.2 14.8 112 105 2.1 23.8 4.6 5.3 14.5 (42) Surya Citra SCMA IJ N IDR 3,225 2,775 (14) 4,127 2.7 0 0 4 23 21 (0) 1 4 9 22 Dec-12 (79) 20 16 6.8 32.8 27.2 23.4 112 105 3.0 60.4 18.3 12.0 23.9 (33) Sector* (2) 7,564 0 0 6 15 8 (0) 1 6 1 10 Dec-13 20 16 16 25.8 21.6 18.6 16.0 105 102 3.1 34.1 6.9 6.5 15.6 (35)
Metals & Mining Ami Tantri / Paworamon (Poom) Suvarnatemee - 62 21 2553 7976 / 66 2 614 6210
ABM Investama ABMM IJ N IDR 2,980 2,500 (16) 718 0.1 0 (3) 1 (1) (12) (0) (2) 1 (15) (10) Dec-13 28 187 273 155.9 122.1 42.6 11.4 36 76 0.0 1.8 2.2 1.2 5.9 147
Adaro Energy ADRO IJ O IDR 970.0 1,150 19 2,716 6.1 0 0 (1) (11) (22) (0) 1 (1) (25) (21) Dec-12 (29) (16) 22 7.0 9.9 11.8 9.6 122 72 2.6 10.4 1.0 1.3 5.2 48 Antam ANTM IJ U IDR 1,105 950.0 (14) 923 2.9 0 (2) 0 1 (21) (0) (1) 0 (13) (19) Dec-13 (21) 7 168 25.7 32.5 30.4 11.4 201 82 1.6 2.5 0.8 1.5 14.2 43 Delta Dunia Makmur DOID IJ N IDR 109.0 100.0 (8) 78 0.3 0 7 9 18 (47) (0) 8 9 4 (45) Dec-13 nm 126 60 nm 10.1 4.5 2.8 97 58 0.0 10.6 1.0 1.0 3.4 746
Harum Energy HRUM IJ N IDR 2,120 2,300 8 502 1.8 0 (1) (7) (23) (57) (0) (0) (7) (37) (56) Dec-13 15 33 107 12.0 10.4 7.8 3.8 94 95 4.8 14.6 1.5 0.3 2.8 (56) ITM ITMG IJ N IDR 24,900 28,000 12 2,463 3.0 0 2 3 (13) (35) (0) 3 3 (27) (34) Dec-13 (14) 8 40 10.7 12.5 11.6 8.3 83 78 7.2 20.5 2.6 1.1 6.8 (26) Indika Energy INDY IJ N IDR 590.0 600.0 2 269 0.4 0 (1) (1) 0 (51) (0) 0 (1) (14) (50) Dec-13 nm nm 351 nm nm 8.4 1.9 nm 77 0.0 (1.1) 0.4 0.8 3.3 54
PT Bukit Asam PTBA IJ O IDR 9,575 10,450 9 1,931 3.0 0 2 3 (6) (37) (0) 3 3 (20) (36) Dec-12 (37) (12) 6 7.6 12.1 13.7 12.9 96 89 5.0 23.0 3.0 1.7 8.1 (43) PT INCO INCO IJ N IDR 3,490 3,350 (4) 3,035 3.1 0 12 37 32 40 (0) 13 37 18 41 Dec-13 215 29 54 78.5 24.9 19.3 12.5 136 122 1.3 7.0 1.7 3.0 10.2 (5) Timah TINS IJ O IDR 2,080 2,300 11 916 1.5 0 6 21 30 51 (0) 7 21 16 52 Dec-13 19 23 (0) 19.2 16.2 13.2 13.2 100 116 2.7 12.7 2.0 1.7 8.4 21
Sector* 6 13,551 0 3 10 3 (9) (0) 4 10 (11) (8) Dec-13 20 30 86 19.4 16.1 12.4 7.4 84 89 3.2 8.8 1.4 1.3 6.3 25
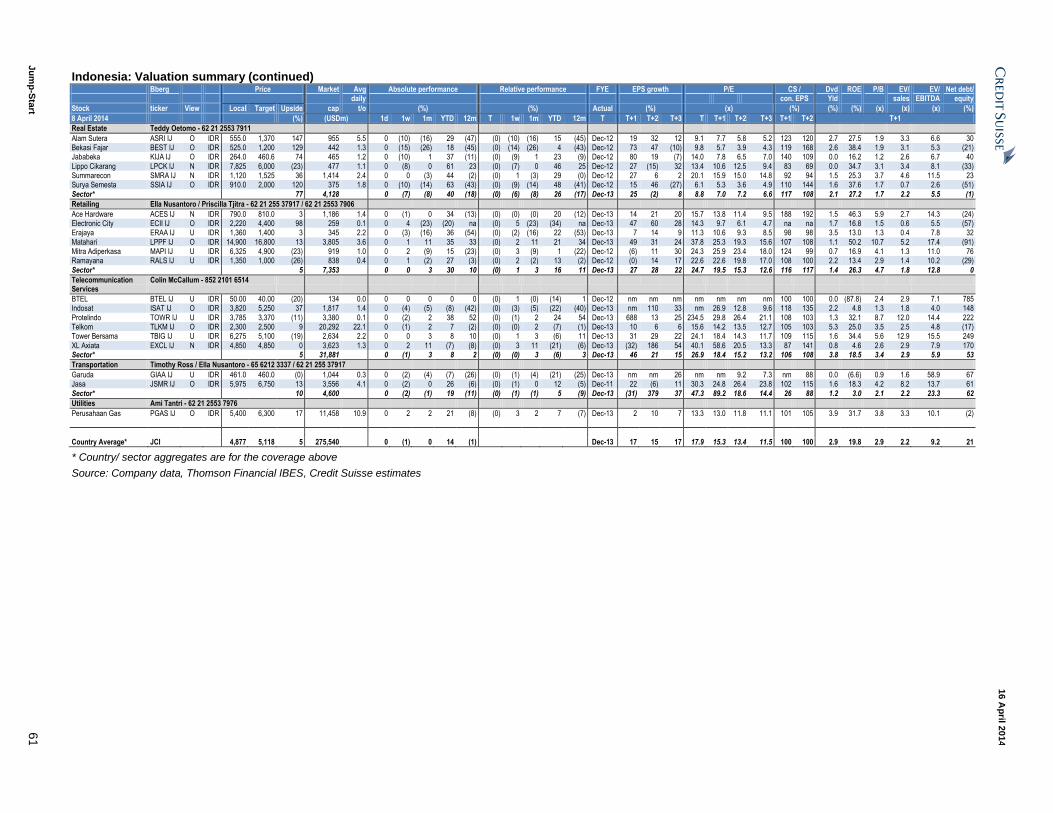
Ju
mp
-Sta
rt 6
1
16 A
pril 2
014
Indonesia: Valuation summary (continued) Bberg Price Market Avg Absolute performance Relative performance FYE EPS growth P/E CS / Dvd ROE P/B EV/ EV/ Net debt/ daily con. EPS Yld sales EBITDA equity
Stock ticker View Local Target Upside cap t/o (%) (%) Actual (%) (x) (%) (%) (%) (x) (x) (x) (%)
8 April 2014 (%) (USDm) 1d 1w 1m YTD 12m T 1w 1m YTD 12m T T+1 T+2 T+3 T T+1 T+2 T+3 T+1 T+2 T+1
Real Estate Teddy Oetomo - 62 21 2553 7911
Alam Sutera ASRI IJ O IDR 555.0 1,370 147 955 5.5 0 (10) (16) 29 (47) (0) (10) (16) 15 (45) Dec-12 19 32 12 9.1 7.7 5.8 5.2 123 120 2.7 27.5 1.9 3.3 6.6 30 Bekasi Fajar BEST IJ O IDR 525.0 1,200 129 442 1.3 0 (15) (26) 18 (45) (0) (14) (26) 4 (43) Dec-12 73 47 (10) 9.8 5.7 3.9 4.3 119 168 2.6 38.4 1.9 3.1 5.3 (21) Jababeka KIJA IJ O IDR 264.0 460.6 74 465 1.2 0 (10) 1 37 (11) (0) (9) 1 23 (9) Dec-12 80 19 (7) 14.0 7.8 6.5 7.0 140 109 0.0 16.2 1.2 2.6 6.7 40
Lippo Cikarang LPCK IJ N IDR 7,825 6,000 (23) 477 1.1 0 (8) 0 61 23 (0) (7) 0 46 25 Dec-12 27 (15) 32 13.4 10.6 12.5 9.4 83 69 0.0 34.7 3.1 3.4 8.1 (33) Summarecon SMRA IJ N IDR 1,120 1,525 36 1,414 2.4 0 0 (3) 44 (2) (0) 1 (3) 29 (0) Dec-12 27 6 2 20.1 15.9 15.0 14.8 92 94 1.5 25.3 3.7 4.6 11.5 23 Surya Semesta SSIA IJ O IDR 910.0 2,000 120 375 1.8 0 (10) (14) 63 (43) (0) (9) (14) 48 (41) Dec-12 15 46 (27) 6.1 5.3 3.6 4.9 110 144 1.6 37.6 1.7 0.7 2.6 (51)
Sector* 77 4,128 0 (7) (8) 40 (18) (0) (6) (8) 26 (17) Dec-13 25 (2) 8 8.8 7.0 7.2 6.6 117 108 2.1 27.2 1.7 2.2 5.5 (1)
Retailing Ella Nusantoro / Priscilla Tjitra - 62 21 255 37917 / 62 21 2553 7906
Ace Hardware ACES IJ N IDR 790.0 810.0 3 1,186 1.4 0 (1) 0 34 (13) (0) (0) (0) 20 (12) Dec-13 14 21 20 15.7 13.8 11.4 9.5 188 192 1.5 46.3 5.9 2.7 14.3 (24) Electronic City ECII IJ O IDR 2,220 4,400 98 259 0.1 0 4 (23) (20) na (0) 5 (23) (34) na Dec-13 47 60 28 14.3 9.7 6.1 4.7 na na 1.7 16.8 1.5 0.6 5.5 (57) Erajaya ERAA IJ U IDR 1,360 1,400 3 345 2.2 0 (3) (16) 36 (54) (0) (2) (16) 22 (53) Dec-13 7 14 9 11.3 10.6 9.3 8.5 98 98 3.5 13.0 1.3 0.4 7.8 32
Matahari LPPF IJ O IDR 14,900 16,800 13 3,805 3.6 0 1 11 35 33 (0) 2 11 21 34 Dec-13 49 31 24 37.8 25.3 19.3 15.6 107 108 1.1 50.2 10.7 5.2 17.4 (91) Mitra Adiperkasa MAPI IJ U IDR 6,325 4,900 (23) 919 1.0 0 2 (9) 15 (23) (0) 3 (9) 1 (22) Dec-12 (6) 11 30 24.3 25.9 23.4 18.0 124 99 0.7 16.9 4.1 1.3 11.0 76 Ramayana RALS IJ U IDR 1,350 1,000 (26) 838 0.4 0 1 (2) 27 (3) (0) 2 (2) 13 (2) Dec-12 (0) 14 17 22.6 22.6 19.8 17.0 108 100 2.2 13.4 2.9 1.4 10.2 (29)
Sector* 5 7,353 0 0 3 30 10 (0) 1 3 16 11 Dec-13 27 28 22 24.7 19.5 15.3 12.6 116 117 1.4 26.3 4.7 1.8 12.8 0
Telecommunication Services
Colin McCallum - 852 2101 6514
BTEL BTEL IJ U IDR 50.00 40.00 (20) 134 0.0 0 0 0 0 0 (0) 1 (0) (14) 1 Dec-12 nm nm nm nm nm nm nm 100 100 0.0 (87.8) 2.4 2.9 7.1 785 Indosat ISAT IJ O IDR 3,820 5,250 37 1,817 1.4 0 (4) (5) (8) (42) (0) (3) (5) (22) (40) Dec-13 nm 110 33 nm 26.9 12.8 9.6 118 135 2.2 4.8 1.3 1.8 4.0 148
Protelindo TOWR IJ U IDR 3,785 3,370 (11) 3,380 0.1 0 (2) 2 38 52 (0) (1) 2 24 54 Dec-13 688 13 25 234.5 29.8 26.4 21.1 108 103 1.3 32.1 8.7 12.0 14.4 222 Telkom TLKM IJ O IDR 2,300 2,500 9 20,292 22.1 0 (1) 2 7 (2) (0) (0) 2 (7) (1) Dec-13 10 6 6 15.6 14.2 13.5 12.7 105 103 5.3 25.0 3.5 2.5 4.8 (17) Tower Bersama TBIG IJ U IDR 6,275 5,100 (19) 2,634 2.2 0 0 3 8 10 (0) 1 3 (6) 11 Dec-13 31 29 22 24.1 18.4 14.3 11.7 109 115 1.6 34.4 5.6 12.9 15.5 249
XL Axiata EXCL IJ N IDR 4,850 4,850 0 3,623 1.3 0 2 11 (7) (8) (0) 3 11 (21) (6) Dec-13 (32) 186 54 40.1 58.6 20.5 13.3 87 141 0.8 4.6 2.6 2.9 7.9 170 Sector* 5 31,881 0 (1) 3 8 2 (0) (0) 3 (6) 3 Dec-13 46 21 15 26.9 18.4 15.2 13.2 106 108 3.8 18.5 3.4 2.9 5.9 53
Transportation Timothy Ross / Ella Nusantoro - 65 6212 3337 / 62 21 255 37917
Garuda GIAA IJ U IDR 461.0 460.0 (0) 1,044 0.3 0 (2) (4) (7) (26) (0) (1) (4) (21) (25) Dec-13 nm nm 26 nm nm 9.2 7.3 nm 88 0.0 (6.6) 0.9 1.6 58.9 67 Jasa JSMR IJ O IDR 5,975 6,750 13 3,556 4.1 0 (2) 0 26 (6) (0) (1) 0 12 (5) Dec-11 22 (6) 11 30.3 24.8 26.4 23.8 102 115 1.6 18.3 4.2 8.2 13.7 61
Sector* 10 4,600 0 (2) (1) 19 (11) (0) (1) (1) 5 (9) Dec-13 (31) 379 37 47.3 89.2 18.6 14.4 26 88 1.2 3.0 2.1 2.2 23.3 62
Utilities Ami Tantri - 62 21 2553 7976
Perusahaan Gas PGAS IJ O IDR 5,400 6,300 17 11,458 10.9 0 2 2 21 (8) (0) 3 2 7 (7) Dec-13 2 10 7 13.3 13.0 11.8 11.1 101 105 3.9 31.7 3.8 3.3 10.1 (2)
Country Average* JCI 4,877 5,118 5 275,540 0 (1) 0 14 (1) Dec-13 17 15 17 17.9 15.3 13.4 11.5 100 100 2.9 19.8 2.9 2.2 9.2 21
* Country/ sector aggregates are for the coverage above
Source: Company data, Thomson Financial IBES, Credit Suisse estimates
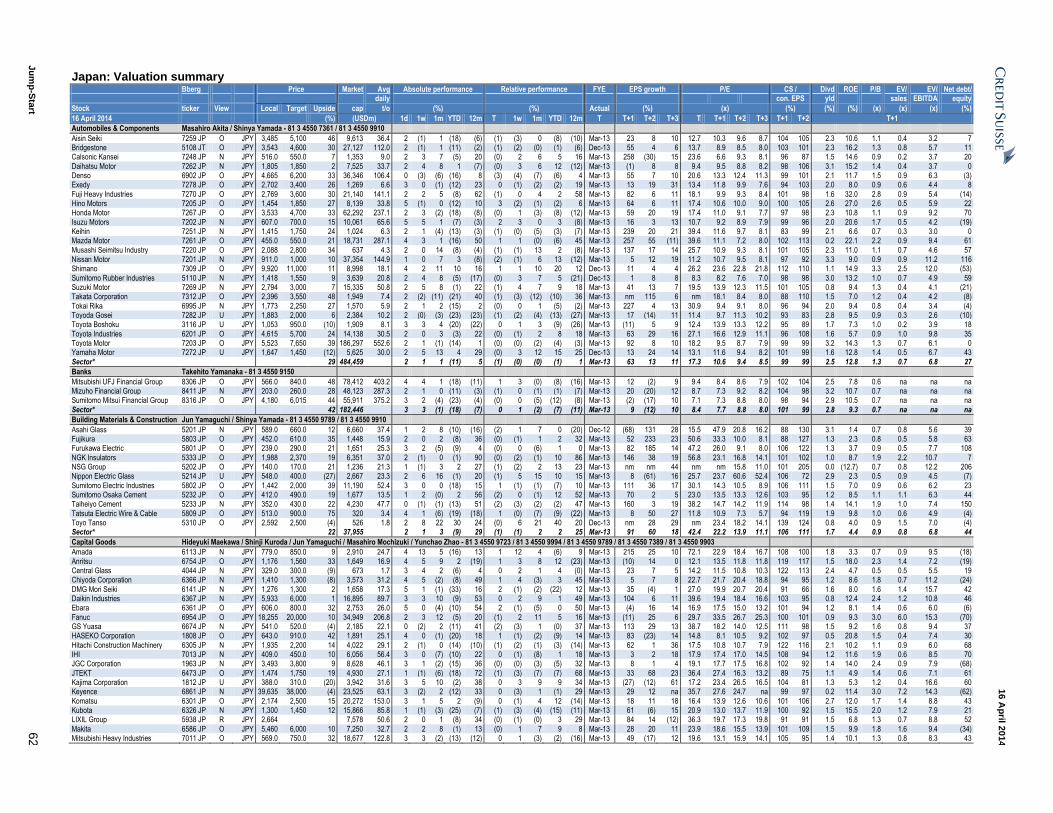
Ju
mp
-Sta
rt 6
2
16 A
pril 2
014
Japan: Valuation summary Bberg Price Market Avg Absolute performance Relative performance FYE EPS growth P/E CS / Divd ROE P/B EV/ EV/ Net debt/ daily con. EPS yld sales EBITDA equity
Stock ticker View Local Target Upside cap t/o (%) (%) Actual (%) (x) (%) (%) (%) (x) (x) (x) (%)
16 April 2014 (%) (USDm) 1d 1w 1m YTD 12m T 1w 1m YTD 12m T T+1 T+2 T+3 T T+1 T+2 T+3 T+1 T+2 T+1
Automobiles & Components Masahiro Akita / Shinya Yamada - 81 3 4550 7361 / 81 3 4550 9910
Aisin Seiki 7259 JP O JPY 3,485 5,100 46 9,613 36.4 2 (1) 1 (18) (6) (1) (3) 0 (8) (10) Mar-13 23 8 10 12.7 10.3 9.6 8.7 104 105 2.3 10.6 1.1 0.4 3.2 7 Bridgestone 5108 JT O JPY 3,543 4,600 30 27,127 112.0 2 (1) 1 (11) (2) (1) (2) (0) (1) (6) Dec-13 55 4 6 13.7 8.9 8.5 8.0 103 101 2.3 16.2 1.3 0.8 5.7 11 Calsonic Kansei 7248 JP N JPY 516.0 550.0 7 1,353 9.0 2 3 7 (5) 20 (0) 2 6 5 16 Mar-13 258 (30) 15 23.6 6.6 9.3 8.1 96 87 1.5 14.6 0.9 0.2 3.7 20
Daihatsu Motor 7262 JP N JPY 1,805 1,850 2 7,525 33.7 2 4 8 1 (7) (0) 3 6 12 (12) Mar-13 (1) 8 8 9.4 9.5 8.8 8.2 98 106 3.1 15.2 1.4 0.4 3.7 0 Denso 6902 JP O JPY 4,665 6,200 33 36,346 106.4 0 (3) (6) (16) 8 (3) (4) (7) (6) 4 Mar-13 55 7 10 20.6 13.3 12.4 11.3 99 101 2.1 11.7 1.5 0.9 6.3 (3) Exedy 7278 JP O JPY 2,702 3,400 26 1,269 6.6 3 0 (1) (12) 23 0 (1) (2) (2) 19 Mar-13 13 19 31 13.4 11.8 9.9 7.6 94 103 2.0 8.0 0.9 0.6 4.4 8
Fuji Heavy Industries 7270 JP O JPY 2,769 3,600 30 21,140 141.1 2 2 5 (8) 62 (1) 0 4 2 58 Mar-13 82 6 11 18.1 9.9 9.3 8.4 101 98 1.6 32.0 2.8 0.9 5.4 (14) Hino Motors 7205 JP O JPY 1,454 1,850 27 8,139 33.8 5 (1) 0 (12) 10 3 (2) (1) (2) 6 Mar-13 64 6 11 17.4 10.6 10.0 9.0 100 105 2.6 27.0 2.6 0.5 5.9 22 Honda Motor 7267 JP O JPY 3,533 4,700 33 62,292 237.1 2 3 (2) (18) (8) (0) 1 (3) (8) (12) Mar-13 59 20 19 17.4 11.0 9.1 7.7 97 98 2.3 10.8 1.1 0.9 9.2 70
Isuzu Motors 7202 JP N JPY 607.0 700.0 15 10,061 65.6 5 5 1 (7) (3) 2 3 0 3 (8) Mar-13 16 3 13 10.7 9.2 8.9 7.9 99 96 2.0 20.6 1.7 0.5 4.2 (19) Keihin 7251 JP N JPY 1,415 1,750 24 1,024 6.3 2 1 (4) (13) (3) (1) (0) (5) (3) (7) Mar-13 239 20 21 39.4 11.6 9.7 8.1 83 99 2.1 6.6 0.7 0.3 3.0 0 Mazda Motor 7261 JP O JPY 455.0 550.0 21 18,731 287.1 4 3 1 (16) 50 1 1 (0) (6) 45 Mar-13 257 55 (11) 39.6 11.1 7.2 8.0 102 113 0.2 22.1 2.2 0.9 9.4 61
Musashi Seimitsu Industry 7220 JP O JPY 2,088 2,800 34 637 4.3 2 0 14 (8) (4) (1) (1) 13 2 (8) Mar-13 137 17 14 25.7 10.9 9.3 8.1 101 105 2.3 11.0 1.1 0.7 4.6 57 Nissan Motor 7201 JP N JPY 911.0 1,000 10 37,354 144.9 1 0 7 3 (8) (2) (1) 6 13 (12) Mar-13 5 12 19 11.2 10.7 9.5 8.1 97 92 3.3 9.0 0.9 0.9 11.2 116 Shimano 7309 JP O JPY 9,920 11,000 11 8,998 18.1 4 2 11 10 16 1 1 10 20 12 Dec-13 11 4 4 26.2 23.6 22.8 21.8 112 110 1.1 14.9 3.3 2.5 12.0 (53)
Sumitomo Rubber Industries 5110 JP N JPY 1,418 1,550 9 3,639 20.8 2 4 8 (5) (17) (0) 3 7 5 (21) Dec-13 1 8 8 8.3 8.2 7.6 7.0 98 98 3.0 13.2 1.0 0.7 4.9 59 Suzuki Motor 7269 JP N JPY 2,794 3,000 7 15,335 50.8 2 5 8 (1) 22 (1) 4 7 9 18 Mar-13 41 13 7 19.5 13.9 12.3 11.5 101 105 0.8 9.4 1.3 0.4 4.1 (21) Takata Corporation 7312 JP O JPY 2,396 3,550 48 1,949 7.4 2 (2) (11) (21) 40 (1) (3) (12) (10) 36 Mar-13 nm 115 6 nm 18.1 8.4 8.0 88 110 1.5 7.0 1.2 0.4 4.2 (8)
Tokai Rika 6995 JP N JPY 1,773 2,250 27 1,570 5.9 2 1 2 (15) 2 (0) 0 1 (5) (2) Mar-13 227 4 13 30.9 9.4 9.1 8.0 96 94 2.0 9.4 0.8 0.4 3.4 (4) Toyoda Gosei 7282 JP U JPY 1,883 2,000 6 2,384 10.2 2 (0) (3) (23) (23) (1) (2) (4) (13) (27) Mar-13 17 (14) 11 11.4 9.7 11.3 10.2 93 83 2.8 9.5 0.9 0.3 2.6 (10) Toyota Boshoku 3116 JP U JPY 1,053 950.0 (10) 1,909 8.1 3 3 4 (20) (22) 0 1 3 (9) (26) Mar-13 (11) 5 9 12.4 13.9 13.3 12.2 95 89 1.7 7.3 1.0 0.2 3.9 18
Toyota Industries 6201 JP O JPY 4,615 5,700 24 14,138 30.5 2 0 3 (3) 22 (0) (1) 2 8 18 Mar-13 63 29 16 27.1 16.6 12.9 11.1 96 108 1.6 5.7 0.9 1.0 9.8 35 Toyota Motor 7203 JP O JPY 5,523 7,650 39 186,297 552.6 2 1 (1) (14) 1 (0) (0) (2) (4) (3) Mar-13 92 8 10 18.2 9.5 8.7 7.9 99 99 3.2 14.3 1.3 0.7 6.1 0 Yamaha Motor 7272 JP U JPY 1,647 1,450 (12) 5,625 30.0 2 5 13 4 29 (0) 3 12 15 25 Dec-13 13 24 14 13.1 11.6 9.4 8.2 101 99 1.6 12.8 1.4 0.5 6.7 43
Sector* 29 484,459 2 1 1 (11) 5 (1) (0) (0) (1) 1 Mar-13 63 13 11 17.3 10.6 9.4 8.5 99 99 2.5 12.8 1.3 0.7 6.8 27
Banks Takehito Yamanaka - 81 3 4550 9150
Mitsubishi UFJ Financial Group 8306 JP O JPY 566.0 840.0 48 78,412 403.2 4 4 1 (18) (11) 1 3 (0) (8) (16) Mar-13 12 (2) 9 9.4 8.4 8.6 7.9 102 104 2.5 7.8 0.6 na na na Mizuho Financial Group 8411 JP N JPY 203.0 260.0 28 48,123 287.3 2 1 0 (11) (3) (1) 0 (1) (1) (7) Mar-13 20 (20) 12 8.7 7.3 9.2 8.2 104 98 3.2 10.7 0.7 na na na Sumitomo Mitsui Financial Group 8316 JP O JPY 4,180 6,015 44 55,911 375.2 3 2 (4) (23) (4) (0) 0 (5) (12) (8) Mar-13 (2) (17) 10 7.1 7.3 8.8 8.0 98 94 2.9 10.5 0.7 na na na
Sector* 42 182,446 3 3 (1) (18) (7) 0 1 (2) (7) (11) Mar-13 9 (12) 10 8.4 7.7 8.8 8.0 101 99 2.8 9.3 0.7 na na na
Building Materials & Construction Jun Yamaguchi / Shinya Yamada - 81 3 4550 9789 / 81 3 4550 9910
Asahi Glass 5201 JP N JPY 589.0 660.0 12 6,660 37.4 1 2 8 (10) (16) (2) 1 7 0 (20) Dec-12 (68) 131 28 15.5 47.9 20.8 16.2 88 130 3.1 1.4 0.7 0.8 5.6 39 Fujikura 5803 JP O JPY 452.0 610.0 35 1,448 15.9 2 0 2 (8) 36 (0) (1) 1 2 32 Mar-13 52 233 23 50.6 33.3 10.0 8.1 88 127 1.3 2.3 0.8 0.5 5.8 63 Furukawa Electric 5801 JP O JPY 239.0 290.0 21 1,651 25.3 3 2 (5) (9) 4 (0) 0 (6) 1 0 Mar-13 82 185 14 47.2 26.0 9.1 8.0 106 122 1.3 3.7 0.9 0.5 7.7 108
NGK Insulators 5333 JP O JPY 1,988 2,370 19 6,351 37.0 2 (1) 0 (1) 90 (0) (2) (1) 10 86 Mar-13 146 38 19 56.8 23.1 16.8 14.1 101 102 1.0 8.7 1.9 2.2 10.7 7 NSG Group 5202 JP O JPY 140.0 170.0 21 1,236 21.3 1 (1) 3 2 27 (1) (2) 2 13 23 Mar-13 nm nm 44 nm nm 15.8 11.0 101 205 0.0 (12.7) 0.7 0.8 12.2 206 Nippon Electric Glass 5214 JP U JPY 548.0 400.0 (27) 2,667 23.3 2 6 16 (1) 20 (1) 5 15 10 15 Mar-13 8 (61) 16 25.7 23.7 60.6 52.4 106 72 2.9 2.3 0.5 0.9 4.5 (7)
Sumitomo Electric Industries 5802 JP O JPY 1,442 2,000 39 11,190 52.4 3 0 0 (18) 15 1 (1) (1) (7) 10 Mar-13 111 36 17 30.1 14.3 10.5 8.9 106 111 1.5 7.0 0.9 0.6 6.2 23 Sumitomo Osaka Cement 5232 JP O JPY 412.0 490.0 19 1,677 13.5 1 2 (0) 2 56 (2) 0 (1) 12 52 Mar-13 70 2 5 23.0 13.5 13.3 12.6 103 95 1.2 8.5 1.1 1.1 6.3 44 Taiheiyo Cement 5233 JP N JPY 352.0 430.0 22 4,230 47.7 0 (1) (1) (13) 51 (2) (3) (2) (2) 47 Mar-13 160 3 19 38.2 14.7 14.2 11.9 114 98 1.4 14.1 1.9 1.0 7.4 150
Tatsuta Electric Wire & Cable 5809 JP O JPY 513.0 900.0 75 320 3.4 4 1 (6) (19) (18) 1 (0) (7) (9) (22) Mar-13 8 50 27 11.8 10.9 7.3 5.7 94 119 1.9 9.8 1.0 0.6 4.9 (4) Toyo Tanso 5310 JP O JPY 2,592 2,500 (4) 526 1.8 2 8 22 30 24 (0) 6 21 40 20 Dec-13 nm 28 29 nm 23.4 18.2 14.1 139 124 0.8 4.0 0.9 1.5 7.0 (4) Sector* 22 37,955 2 1 3 (9) 29 (1) (1) 2 2 25 Mar-13 91 60 18 42.4 22.2 13.9 11.1 106 111 1.7 4.4 0.9 0.8 6.8 44
Capital Goods Hideyuki Maekawa / Shinji Kuroda / Jun Yamaguchi / Masahiro Mochizuki / Yunchao Zhao - 81 3 4550 9723 / 81 3 4550 9994 / 81 3 4550 9789 / 81 3 4550 7389 / 81 3 4550 9903
Amada 6113 JP N JPY 779.0 850.0 9 2,910 24.7 4 13 5 (16) 13 1 12 4 (6) 9 Mar-13 215 25 10 72.1 22.9 18.4 16.7 108 100 1.8 3.3 0.7 0.9 9.5 (18)
Anritsu 6754 JP O JPY 1,176 1,560 33 1,649 16.9 4 5 9 2 (19) 1 3 8 12 (23) Mar-13 (10) 14 0 12.1 13.5 11.8 11.8 119 117 1.5 18.0 2.3 1.4 7.2 (19) Central Glass 4044 JP N JPY 329.0 300.0 (9) 673 1.7 3 4 2 (6) 4 0 2 1 4 (0) Mar-13 23 7 5 14.2 11.5 10.8 10.3 122 113 2.4 4.7 0.5 0.5 5.5 19 Chiyoda Corporation 6366 JP N JPY 1,410 1,300 (8) 3,573 31.2 4 5 (2) (8) 49 1 4 (3) 3 45 Mar-13 5 7 8 22.7 21.7 20.4 18.8 94 95 1.2 8.6 1.8 0.7 11.2 (24)
DMG Mori Seiki 6141 JP N JPY 1,276 1,300 2 1,658 17.3 5 1 (1) (33) 16 2 (1) (2) (22) 12 Mar-13 35 (4) 1 27.0 19.9 20.7 20.4 91 66 1.6 8.0 1.6 1.4 15.7 42 Daikin Industries 6367 JP N JPY 5,933 6,000 1 16,895 89.7 3 3 10 (9) 53 0 2 9 1 49 Mar-13 104 6 11 39.6 19.4 18.4 16.6 103 95 0.8 12.4 2.4 1.2 10.8 46 Ebara 6361 JP O JPY 606.0 800.0 32 2,753 26.0 5 0 (4) (10) 54 2 (1) (5) 0 50 Mar-13 (4) 16 14 16.9 17.5 15.0 13.2 101 94 1.2 8.1 1.4 0.6 6.0 (6)
Fanuc 6954 JP O JPY 18,255 20,000 10 34,949 206.8 2 3 12 (5) 20 (1) 2 11 5 16 Mar-13 (11) 25 6 29.7 33.5 26.7 25.3 100 101 0.9 9.3 3.0 6.0 15.3 (70) GS Yuasa 6674 JP N JPY 541.0 520.0 (4) 2,185 22.1 0 (2) 2 (11) 41 (2) (3) 1 (0) 37 Mar-13 113 29 13 38.7 18.2 14.0 12.5 111 98 1.5 9.2 1.6 0.8 9.4 37 HASEKO Corporation 1808 JP O JPY 643.0 910.0 42 1,891 25.1 4 0 (1) (20) 18 1 (1) (2) (9) 14 Mar-13 83 (23) 14 14.8 8.1 10.5 9.2 102 97 0.5 20.8 1.5 0.4 7.4 30
Hitachi Construction Machinery 6305 JP N JPY 1,935 2,200 14 4,022 29.1 2 (1) 0 (14) (10) (1) (2) (1) (3) (14) Mar-13 62 1 36 17.5 10.8 10.7 7.9 122 116 2.1 10.2 1.1 0.9 6.0 68 IHI 7013 JP N JPY 409.0 450.0 10 6,056 56.4 3 0 (7) (10) 22 0 (1) (8) 1 18 Mar-13 3 2 18 17.9 17.4 17.0 14.5 108 94 1.2 11.6 1.9 0.6 8.5 70 JGC Corporation 1963 JP N JPY 3,493 3,800 9 8,628 46.1 3 1 (2) (15) 36 (0) (0) (3) (5) 32 Mar-13 8 1 4 19.1 17.7 17.5 16.8 102 92 1.4 14.0 2.4 0.9 7.9 (68)
JTEKT 6473 JP O JPY 1,474 1,750 19 4,930 27.1 1 (1) (6) (18) 72 (1) (3) (7) (7) 68 Mar-13 33 68 23 36.4 27.4 16.3 13.2 89 75 1.1 4.9 1.4 0.6 7.1 61 Kajima Corporation 1812 JP U JPY 388.0 310.0 (20) 3,942 31.6 3 5 10 (2) 38 0 3 9 9 34 Mar-13 (27) (12) 61 17.2 23.4 26.5 16.5 104 81 1.3 5.3 1.2 0.4 16.6 60 Keyence 6861 JP N JPY 39,635 38,000 (4) 23,525 63.1 3 (2) 2 (12) 33 0 (3) 1 (1) 29 Mar-13 29 12 na 35.7 27.6 24.7 na 99 97 0.2 11.4 3.0 7.2 14.3 (62)
Komatsu 6301 JP O JPY 2,174 2,500 15 20,272 153.0 3 1 5 2 (9) 0 (1) 4 12 (14) Mar-13 18 11 18 16.4 13.9 12.6 10.6 101 106 2.7 12.0 1.7 1.4 8.8 43 Kubota 6326 JP N JPY 1,300 1,450 12 15,866 85.8 1 (1) (3) (25) (7) (1) (3) (4) (15) (11) Mar-13 61 (6) 15 20.9 13.0 13.7 11.9 100 92 1.5 15.5 2.0 1.2 7.9 21 LIXIL Group 5938 JP R JPY 2,664 7,578 50.6 2 0 1 (8) 34 (0) (1) (0) 3 29 Mar-13 84 14 (12) 36.3 19.7 17.3 19.8 91 91 1.5 6.8 1.3 0.7 8.8 52
Makita 6586 JP O JPY 5,460 6,000 10 7,250 32.7 2 2 8 (1) 13 (0) 1 7 9 8 Mar-13 28 20 11 23.9 18.6 15.5 13.9 101 109 1.5 9.9 1.8 1.6 9.4 (34) Mitsubishi Heavy Industries 7011 JP O JPY 569.0 750.0 32 18,677 122.8 3 3 (2) (13) (12) 0 1 (3) (2) (16) Mar-13 49 (17) 12 19.6 13.1 15.9 14.1 105 95 1.4 10.1 1.3 0.8 8.3 43
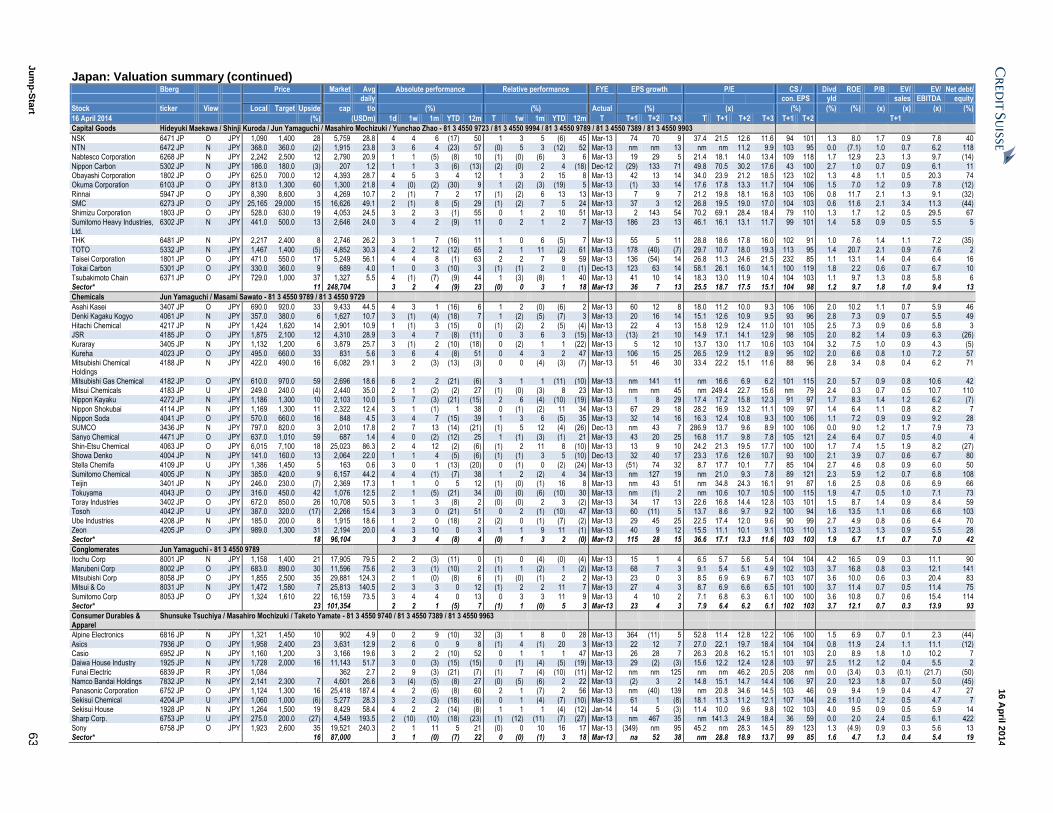
Ju
mp
-Sta
rt 6
3
16 A
pril 2
014
Japan: Valuation summary (continued) Bberg Price Market Avg Absolute performance Relative performance FYE EPS growth P/E CS / Divd ROE P/B EV/ EV/ Net debt/ daily
con. EPS yld sales EBITDA equity
Stock ticker View Local Target Upside cap t/o (%) (%) Actual (%) (x) (%) (%) (%) (x) (x) (x) (%)
16 April 2014 (%) (USDm) 1d 1w 1m YTD 12m T 1w 1m YTD 12m T T+1 T+2 T+3 T T+1 T+2 T+3 T+1 T+2 T+1
Capital Goods Hideyuki Maekawa / Shinji Kuroda / Jun Yamaguchi / Masahiro Mochizuki / Yunchao Zhao - 81 3 4550 9723 / 81 3 4550 9994 / 81 3 4550 9789 / 81 3 4550 7389 / 81 3 4550 9903
NSK 6471 JP O JPY 1,090 1,400 28 5,759 28.8 4 4 6 (17) 50 1 3 5 (6) 45 Mar-13 74 70 9 37.4 21.5 12.6 11.6 94 101 1.3 8.0 1.7 0.9 7.8 40 NTN 6472 JP N JPY 368.0 360.0 (2) 1,915 23.8 3 6 4 (23) 57 (0) 5 3 (12) 52 Mar-13 nm nm 13 nm nm 11.2 9.9 103 95 0.0 (7.1) 1.0 0.7 6.2 118 Nabtesco Corporation 6268 JP N JPY 2,242 2,500 12 2,790 20.9 1 1 (5) (8) 10 (1) (0) (6) 3 6 Mar-13 19 29 5 21.4 18.1 14.0 13.4 109 118 1.7 12.9 2.3 1.3 9.7 (14)
Nippon Carbon 5302 JP N JPY 186.0 180.0 (3) 207 1.2 1 1 3 (6) (13) (2) (0) 2 4 (18) Dec-12 (29) 133 71 49.8 70.5 30.2 17.6 43 100 2.7 1.0 0.7 0.9 6.1 11 Obayashi Corporation 1802 JP O JPY 625.0 700.0 12 4,393 28.7 4 5 3 4 12 1 3 2 15 8 Mar-13 42 13 14 34.0 23.9 21.2 18.5 123 102 1.3 4.8 1.1 0.5 20.3 74 Okuma Corporation 6103 JP O JPY 813.0 1,300 60 1,300 21.8 4 (0) (2) (30) 9 1 (2) (3) (19) 5 Mar-13 (1) 33 14 17.6 17.8 13.3 11.7 104 106 1.5 7.0 1.2 0.9 7.8 (12)
Rinnai 5947 JP O JPY 8,390 8,600 3 4,269 10.7 2 (1) 7 2 17 (1) (2) 6 13 13 Mar-13 7 9 7 21.2 19.8 18.1 16.8 103 106 0.8 11.7 2.1 1.3 9.1 (32) SMC 6273 JP O JPY 25,165 29,000 15 16,626 49.1 2 (1) 8 (5) 29 (1) (2) 7 5 24 Mar-13 37 3 12 26.8 19.5 19.0 17.0 104 103 0.6 11.6 2.1 3.4 11.3 (44) Shimizu Corporation 1803 JP O JPY 528.0 630.0 19 4,053 24.5 3 2 3 (1) 55 0 1 2 10 51 Mar-13 2 143 54 70.2 69.1 28.4 18.4 79 110 1.3 1.7 1.2 0.5 29.5 67
Sumitomo Heavy Industries, Ltd.
6302 JP N JPY 441.0 500.0 13 2,646 24.0 3 4 2 (9) 11 0 2 1 2 7 Mar-13 186 23 13 46.1 16.1 13.1 11.7 99 101 1.4 5.8 0.9 0.5 5.5 5
THK 6481 JP N JPY 2,217 2,400 8 2,746 26.2 3 1 7 (16) 11 1 0 6 (5) 7 Mar-13 55 5 11 28.8 18.6 17.8 16.0 102 91 1.0 7.6 1.4 1.1 7.2 (35)
TOTO 5332 JP N JPY 1,467 1,400 (5) 4,852 30.3 4 2 12 (12) 65 2 1 11 (2) 61 Mar-13 178 (40) (7) 29.7 10.7 18.0 19.3 113 95 1.4 20.7 2.1 0.9 7.6 2 Taisei Corporation 1801 JP O JPY 471.0 550.0 17 5,249 56.1 4 4 8 (1) 63 2 2 7 9 59 Mar-13 136 (54) 14 26.8 11.3 24.6 21.5 232 85 1.1 13.1 1.4 0.4 6.4 16 Tokai Carbon 5301 JP O JPY 330.0 360.0 9 689 4.0 1 0 3 (10) 3 (1) (1) 2 0 (1) Dec-13 123 63 14 58.1 26.1 16.0 14.1 100 119 1.8 2.2 0.6 0.7 6.7 10
Tsubakimoto Chain 6371 JP O JPY 729.0 1,000 37 1,327 5.5 4 (1) (7) (9) 44 1 (3) (8) 1 40 Mar-13 41 10 14 18.3 13.0 11.9 10.4 104 103 1.1 9.7 1.3 0.8 5.8 6 Sector* 11 248,704 3 2 4 (9) 23 (0) 0 3 1 18 Mar-13 36 7 13 25.5 18.7 17.5 15.1 104 98 1.2 9.7 1.8 1.0 9.4 13
Chemicals Jun Yamaguchi / Masami Sawato - 81 3 4550 9789 / 81 3 4550 9729
Asahi Kasei 3407 JP O JPY 690.0 920.0 33 9,433 44.5 4 3 1 (16) 6 1 2 (0) (6) 2 Mar-13 60 12 8 18.0 11.2 10.0 9.3 106 106 2.0 10.2 1.1 0.7 5.9 46 Denki Kagaku Kogyo 4061 JP N JPY 357.0 380.0 6 1,627 10.7 3 (1) (4) (18) 7 1 (2) (5) (7) 3 Mar-13 20 16 14 15.1 12.6 10.9 9.5 93 96 2.8 7.3 0.9 0.7 5.5 49
Hitachi Chemical 4217 JP N JPY 1,424 1,620 14 2,901 10.9 1 (1) 3 (15) 0 (1) (2) 2 (5) (4) Mar-13 22 4 13 15.8 12.9 12.4 11.0 101 105 2.5 7.3 0.9 0.6 5.8 3 JSR 4185 JP O JPY 1,875 2,100 12 4,310 28.9 3 4 7 (8) (11) 0 3 6 3 (15) Mar-13 (13) 21 10 14.9 17.1 14.1 12.9 98 105 2.0 8.2 1.4 0.9 6.3 (26) Kuraray 3405 JP N JPY 1,132 1,200 6 3,879 25.7 3 (1) 2 (10) (18) 0 (2) 1 1 (22) Mar-13 5 12 10 13.7 13.0 11.7 10.6 103 104 3.2 7.5 1.0 0.9 4.3 (5)
Kureha 4023 JP O JPY 495.0 660.0 33 831 5.6 3 6 4 (8) 51 0 4 3 2 47 Mar-13 106 15 25 26.5 12.9 11.2 8.9 95 102 2.0 6.6 0.8 1.0 7.2 57 Mitsubishi Chemical Holdings
4188 JP N JPY 422.0 490.0 16 6,082 29.1 3 2 (3) (13) (3) 0 0 (4) (3) (7) Mar-13 51 46 30 33.4 22.2 15.1 11.6 88 96 2.8 3.4 0.8 0.4 6.2 71
Mitsubishi Gas Chemical 4182 JP O JPY 610.0 970.0 59 2,696 18.6 6 2 2 (21) (6) 3 1 1 (11) (10) Mar-13 nm 141 11 nm 16.6 6.9 6.2 101 115 2.0 5.7 0.9 0.8 10.6 42 Mitsui Chemicals 4183 JP U JPY 249.0 240.0 (4) 2,440 35.0 2 1 (2) (2) 27 (1) (0) (3) 8 23 Mar-13 nm nm 45 nm 249.4 22.7 15.6 nm 79 2.4 0.3 0.7 0.5 10.7 110 Nippon Kayaku 4272 JP N JPY 1,186 1,300 10 2,103 10.0 5 7 (3) (21) (15) 2 6 (4) (10) (19) Mar-13 1 8 29 17.4 17.2 15.8 12.3 91 97 1.7 8.3 1.4 1.2 6.2 (7)
Nippon Shokubai 4114 JP N JPY 1,169 1,300 11 2,322 12.4 3 1 (1) 1 38 0 (1) (2) 11 34 Mar-13 67 29 18 28.2 16.9 13.2 11.1 109 97 1.4 6.4 1.1 0.8 8.2 7 Nippon Soda 4041 JP O JPY 570.0 660.0 16 848 4.5 3 4 7 (15) 39 1 3 6 (5) 35 Mar-13 32 14 16 16.3 12.4 10.8 9.3 100 106 1.1 7.2 0.9 0.9 9.2 28 SUMCO 3436 JP N JPY 797.0 820.0 3 2,010 17.8 2 7 13 (14) (21) (1) 5 12 (4) (26) Dec-13 nm 43 7 286.9 13.7 9.6 8.9 100 106 0.0 9.0 1.2 1.7 7.9 73
Sanyo Chemical 4471 JP O JPY 637.0 1,010 59 687 1.4 4 0 (2) (12) 25 1 (1) (3) (1) 21 Mar-13 43 20 25 16.8 11.7 9.8 7.8 105 121 2.4 6.4 0.7 0.5 4.0 4 Shin-Etsu Chemical 4063 JP O JPY 6,015 7,100 18 25,023 86.3 2 4 12 (2) (6) (1) 2 11 8 (10) Mar-13 13 9 10 24.2 21.3 19.5 17.7 100 100 1.7 7.4 1.5 1.9 8.2 (27) Showa Denko 4004 JP N JPY 141.0 160.0 13 2,064 22.0 1 1 4 (5) (6) (1) (1) 3 5 (10) Dec-13 32 40 17 23.3 17.6 12.6 10.7 93 100 2.1 3.9 0.7 0.6 6.7 80
Stella Chemifa 4109 JP U JPY 1,386 1,450 5 163 0.6 3 0 1 (13) (20) 0 (1) 0 (2) (24) Mar-13 (51) 74 32 8.7 17.7 10.1 7.7 85 104 2.7 4.6 0.8 0.9 6.0 50 Sumitomo Chemical 4005 JP N JPY 385.0 420.0 9 6,157 44.2 4 4 (1) (7) 38 1 2 (2) 4 34 Mar-13 nm 127 19 nm 21.0 9.3 7.8 89 121 2.3 5.9 1.2 0.7 6.8 108 Teijin 3401 JP N JPY 246.0 230.0 (7) 2,369 17.3 1 1 0 5 12 (1) (0) (1) 16 8 Mar-13 nm 43 51 nm 34.8 24.3 16.1 91 87 1.6 2.5 0.8 0.6 6.9 66
Tokuyama 4043 JP O JPY 316.0 450.0 42 1,076 12.5 2 1 (5) (21) 34 (0) (0) (6) (10) 30 Mar-13 nm (1) 2 nm 10.6 10.7 10.5 100 115 1.9 4.7 0.5 1.0 7.1 73 Toray Industries 3402 JP O JPY 672.0 850.0 26 10,708 50.5 3 1 3 (8) 2 (0) (0) 2 3 (2) Mar-13 34 17 13 22.6 16.8 14.4 12.8 103 101 1.5 8.7 1.4 0.9 8.4 59 Tosoh 4042 JP U JPY 387.0 320.0 (17) 2,266 15.4 3 3 0 (21) 51 0 2 (1) (10) 47 Mar-13 60 (11) 5 13.7 8.6 9.7 9.2 100 94 1.6 13.5 1.1 0.6 6.6 103
Ube Industries 4208 JP N JPY 185.0 200.0 8 1,915 18.6 1 2 0 (18) 2 (2) 0 (1) (7) (2) Mar-13 29 45 25 22.5 17.4 12.0 9.6 90 99 2.7 4.9 0.8 0.6 6.4 70 Zeon 4205 JP O JPY 989.0 1,300 31 2,194 20.0 4 3 10 0 3 1 1 9 11 (1) Mar-13 40 9 12 15.5 11.1 10.1 9.1 103 110 1.3 12.3 1.3 0.9 5.5 28 Sector* 18 96,104 3 3 4 (8) 4 (0) 1 3 2 (0) Mar-13 115 28 15 36.6 17.1 13.3 11.6 103 103 1.9 6.7 1.1 0.7 7.0 42
Conglomerates Jun Yamaguchi - 81 3 4550 9789
Itochu Corp 8001 JP N JPY 1,158 1,400 21 17,905 79.5 2 2 (3) (11) 0 (1) 0 (4) (0) (4) Mar-13 15 1 4 6.5 5.7 5.6 5.4 104 104 4.2 16.5 0.9 0.3 11.1 90
Marubeni Corp 8002 JP O JPY 683.0 890.0 30 11,596 75.6 2 3 (1) (10) 2 (1) 1 (2) 1 (2) Mar-13 68 7 3 9.1 5.4 5.1 4.9 102 103 3.7 16.8 0.8 0.3 12.1 141 Mitsubishi Corp 8058 JP O JPY 1,855 2,500 35 29,881 124.3 2 1 (0) (8) 6 (1) (0) (1) 2 2 Mar-13 23 0 3 8.5 6.9 6.9 6.7 103 107 3.6 10.0 0.6 0.3 20.4 83 Mitsui & Co 8031 JP N JPY 1,472 1,580 7 25,813 140.5 2 3 3 0 12 (1) 2 2 11 7 Mar-13 27 4 3 8.7 6.9 6.6 6.5 101 100 3.7 11.4 0.7 0.5 11.4 75
Sumitomo Corp 8053 JP O JPY 1,324 1,610 22 16,159 73.5 3 4 4 0 13 0 3 3 11 9 Mar-13 4 10 2 7.1 6.8 6.3 6.1 100 100 3.6 10.8 0.7 0.6 15.4 114 Sector* 23 101,354 2 2 1 (5) 7 (1) 1 (0) 5 3 Mar-13 23 4 3 7.9 6.4 6.2 6.1 102 103 3.7 12.1 0.7 0.3 13.9 93
Consumer Durables & Apparel
Shunsuke Tsuchiya / Masahiro Mochizuki / Taketo Yamate - 81 3 4550 9740 / 81 3 4550 7389 / 81 3 4550 9963
Alpine Electronics 6816 JP N JPY 1,321 1,450 10 902 4.9 0 2 9 (10) 32 (3) 1 8 0 28 Mar-13 364 (11) 5 52.8 11.4 12.8 12.2 106 100 1.5 6.9 0.7 0.1 2.3 (44)
Asics 7936 JP O JPY 1,958 2,400 23 3,631 12.9 2 6 0 9 8 (1) 4 (1) 20 3 Mar-13 22 12 7 27.0 22.1 19.7 18.4 104 104 0.8 11.9 2.4 1.1 11.1 (12) Casio 6952 JP N JPY 1,160 1,200 3 3,166 19.6 3 2 2 (10) 52 0 1 1 1 47 Mar-13 26 28 7 26.3 20.8 16.2 15.1 101 103 2.0 8.9 1.8 1.0 10.2 7 Daiwa House Industry 1925 JP N JPY 1,728 2,000 16 11,143 51.7 3 0 (3) (15) (15) 0 (1) (4) (5) (19) Mar-13 29 (2) (3) 15.6 12.2 12.4 12.8 103 97 2.5 11.2 1.2 0.4 5.5 2
Funai Electric 6839 JP R JPY 1,084 362 2.7 2 9 (3) (21) (7) (1) 7 (4) (10) (11) Mar-12 nm nm 125 nm nm 46.2 20.5 208 nm 0.0 (3.4) 0.3 (0.1) (21.7) (50) Namco Bandai Holdings 7832 JP N JPY 2,141 2,300 7 4,601 26.6 3 (4) (5) (8) 27 (0) (5) (6) 2 22 Mar-13 (2) 3 2 14.8 15.1 14.7 14.4 106 97 2.0 12.3 1.8 0.7 5.0 (45) Panasonic Corporation 6752 JP O JPY 1,124 1,300 16 25,418 187.4 4 2 (6) (8) 60 2 1 (7) 2 56 Mar-13 nm (40) 139 nm 20.8 34.6 14.5 103 46 0.9 9.4 1.9 0.4 4.7 27
Sekisui Chemical 4204 JP U JPY 1,060 1,000 (6) 5,277 28.3 3 2 (3) (18) (6) 0 1 (4) (7) (10) Mar-13 61 1 (8) 18.1 11.3 11.2 12.1 107 104 2.6 11.0 1.2 0.5 4.7 7 Sekisui House 1928 JP N JPY 1,264 1,500 19 8,429 58.4 4 2 2 (14) (8) 1 1 1 (4) (12) Jan-14 14 5 (3) 11.4 10.0 9.6 9.8 102 103 4.0 9.5 0.9 0.5 5.9 14 Sharp Corp. 6753 JP U JPY 275.0 200.0 (27) 4,549 193.5 2 (10) (10) (18) (23) (1) (12) (11) (7) (27) Mar-13 nm 467 35 nm 141.3 24.9 18.4 36 59 0.0 2.0 2.4 0.5 6.1 422
Sony 6758 JP O JPY 1,923 2,600 35 19,521 240.3 2 1 11 5 21 (0) 0 10 16 17 Mar-13 (349) nm 95 45.2 nm 28.3 14.5 89 123 1.3 (4.9) 0.9 0.3 5.6 13 Sector* 16 87,000 3 1 (0) (7) 22 0 (0) (1) 3 18 Mar-13 na 52 38 nm 28.8 18.9 13.7 99 85 1.6 4.7 1.3 0.4 5.4 19
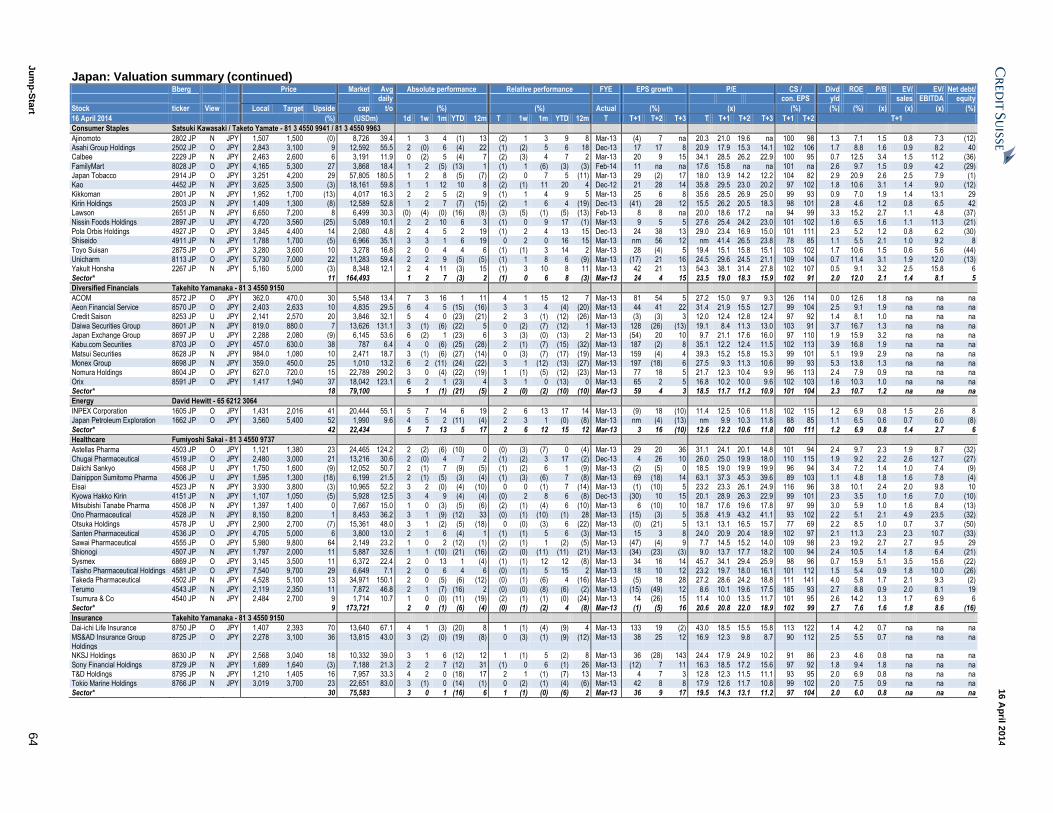
Ju
mp
-Sta
rt 6
4
16 A
pril 2
014
Japan: Valuation summary (continued) Bberg Price Market Avg Absolute performance Relative performance FYE EPS growth P/E CS / Divd ROE P/B EV/ EV/ Net debt/ daily con. EPS yld sales EBITDA equity
Stock ticker View Local Target Upside cap t/o (%) (%) Actual (%) (x) (%) (%) (%) (x) (x) (x) (%)
16 April 2014 (%) (USDm) 1d 1w 1m YTD 12m T 1w 1m YTD 12m T T+1 T+2 T+3 T T+1 T+2 T+3 T+1 T+2 T+1
Consumer Staples Satsuki Kawasaki / Taketo Yamate - 81 3 4550 9941 / 81 3 4550 9963
Ajinomoto 2802 JP N JPY 1,507 1,500 (0) 8,726 39.4 1 3 4 (1) 13 (2) 1 3 9 8 Mar-13 (4) 7 na 20.3 21.0 19.6 na 100 98 1.3 7.1 1.5 0.8 7.3 (12) Asahi Group Holdings 2502 JP O JPY 2,843 3,100 9 12,592 55.5 2 (0) 6 (4) 22 (1) (2) 5 6 18 Dec-13 17 17 8 20.9 17.9 15.3 14.1 102 106 1.7 8.8 1.6 0.9 8.2 40 Calbee 2229 JP N JPY 2,463 2,600 6 3,191 11.9 0 (2) 5 (4) 7 (2) (3) 4 7 2 Mar-13 20 9 15 34.1 28.5 26.2 22.9 100 95 0.7 12.5 3.4 1.5 11.2 (36)
FamilyMart 8028 JP O JPY 4,165 5,300 27 3,868 18.4 1 2 (5) (13) 1 (1) 1 (6) (3) (3) Feb-14 11 na na 17.6 15.8 na na 101 na 2.6 9.7 1.5 0.9 4.2 (29) Japan Tobacco 2914 JP O JPY 3,251 4,200 29 57,805 180.5 1 2 8 (5) (7) (2) 0 7 5 (11) Mar-13 29 (2) 17 18.0 13.9 14.2 12.2 104 82 2.9 20.9 2.6 2.5 7.9 (1) Kao 4452 JP N JPY 3,625 3,500 (3) 18,161 59.8 1 1 12 10 8 (2) (1) 11 20 4 Dec-12 21 28 14 35.8 29.5 23.0 20.2 97 102 1.8 10.6 3.1 1.4 9.0 (12)
Kikkoman 2801 JP N JPY 1,952 1,700 (13) 4,017 16.3 2 2 5 (2) 9 (1) 1 4 9 5 Mar-13 25 6 8 35.6 28.5 26.9 25.0 99 93 0.9 7.0 1.9 1.4 13.1 29 Kirin Holdings 2503 JP N JPY 1,409 1,300 (8) 12,589 52.8 1 2 7 (7) (15) (2) 1 6 4 (19) Dec-13 (41) 28 12 15.5 26.2 20.5 18.3 98 101 2.8 4.6 1.2 0.8 6.5 42 Lawson 2651 JP N JPY 6,650 7,200 8 6,499 30.3 (0) (4) (0) (16) (8) (3) (5) (1) (5) (13) Feb-13 8 8 na 20.0 18.6 17.2 na 94 99 3.3 15.2 2.7 1.1 4.8 (37)
Nissin Foods Holdings 2897 JP U JPY 4,720 3,560 (25) 5,089 10.1 2 2 10 6 3 (1) 0 9 17 (1) Mar-13 9 5 5 27.6 25.4 24.2 23.0 101 102 1.6 6.5 1.6 1.1 11.3 (21) Pola Orbis Holdings 4927 JP O JPY 3,845 4,400 14 2,080 4.8 2 4 5 2 19 (1) 2 4 13 15 Dec-13 24 38 13 29.0 23.4 16.9 15.0 101 111 2.3 5.2 1.2 0.8 6.2 (30) Shiseido 4911 JP N JPY 1,788 1,700 (5) 6,966 35.1 3 3 1 6 19 0 2 0 16 15 Mar-13 nm 56 12 nm 41.4 26.5 23.8 78 85 1.1 5.5 2.1 1.0 9.2 8
Toyo Suisan 2875 JP O JPY 3,280 3,600 10 3,278 16.8 2 0 4 4 6 (1) (1) 3 14 2 Mar-13 28 (4) 5 19.4 15.1 15.8 15.1 103 102 1.7 10.6 1.5 0.6 5.6 (44) Unicharm 8113 JP O JPY 5,730 7,000 22 11,283 59.4 2 2 9 (5) (5) (1) 1 8 6 (9) Mar-13 (17) 21 16 24.5 29.6 24.5 21.1 109 104 0.7 11.4 3.1 1.9 12.0 (13) Yakult Honsha 2267 JP N JPY 5,160 5,000 (3) 8,348 12.1 2 4 11 (3) 15 (1) 3 10 8 11 Mar-13 42 21 13 54.3 38.1 31.4 27.8 102 107 0.5 9.1 3.2 2.5 15.8 6
Sector* 11 164,493 1 2 7 (3) 2 (1) 0 6 8 (3) Mar-13 24 4 15 23.5 19.0 18.3 15.9 102 91 2.0 12.0 2.1 1.4 8.1 5
Diversified Financials Takehito Yamanaka - 81 3 4550 9150
ACOM 8572 JP O JPY 362.0 470.0 30 5,548 13.4 7 3 16 1 11 4 1 15 12 7 Mar-13 81 54 5 27.2 15.0 9.7 9.3 126 114 0.0 12.6 1.8 na na na Aeon Financial Service 8570 JP O JPY 2,403 2,633 10 4,835 29.5 6 4 5 (15) (16) 3 3 4 (4) (20) Mar-13 44 41 22 31.4 21.9 15.5 12.7 99 104 2.5 9.1 1.9 na na na Credit Saison 8253 JP U JPY 2,141 2,570 20 3,846 32.1 5 4 0 (23) (21) 2 3 (1) (12) (26) Mar-13 (3) (3) 3 12.0 12.4 12.8 12.4 97 92 1.4 8.1 1.0 na na na
Daiwa Securities Group 8601 JP N JPY 819.0 880.0 7 13,626 131.1 3 (1) (6) (22) 5 0 (2) (7) (12) 1 Mar-13 128 (26) (13) 19.1 8.4 11.3 13.0 103 91 3.7 16.7 1.3 na na na Japan Exchange Group 8697 JP U JPY 2,288 2,080 (9) 6,145 53.6 6 (2) 1 (23) 6 3 (3) (0) (13) 2 Mar-13 (54) 20 10 9.7 21.1 17.6 16.0 97 110 1.9 15.9 3.2 na na na Kabu.com Securities 8703 JP O JPY 457.0 630.0 38 787 6.4 4 0 (6) (25) (28) 2 (1) (7) (15) (32) Mar-13 187 (2) 8 35.1 12.2 12.4 11.5 102 113 3.9 16.8 1.9 na na na
Matsui Securities 8628 JP N JPY 984.0 1,080 10 2,471 18.7 3 (1) (6) (27) (14) 0 (3) (7) (17) (19) Mar-13 159 (4) 4 39.3 15.2 15.8 15.3 99 101 5.1 19.9 2.9 na na na Monex Group 8698 JP N JPY 359.0 450.0 25 1,010 13.2 6 2 (11) (24) (22) 3 1 (12) (13) (27) Mar-13 197 (18) 6 27.5 9.3 11.3 10.6 99 93 5.3 13.8 1.3 na na na Nomura Holdings 8604 JP O JPY 627.0 720.0 15 22,789 290.2 3 0 (4) (22) (19) 1 (1) (5) (12) (23) Mar-13 77 18 5 21.7 12.3 10.4 9.9 96 113 2.4 7.9 0.9 na na na
Orix 8591 JP O JPY 1,417 1,940 37 18,042 123.1 6 2 1 (23) 4 3 1 0 (13) 0 Mar-13 65 2 5 16.8 10.2 10.0 9.6 102 103 1.6 10.3 1.0 na na na Sector* 18 79,100 5 1 (1) (21) (5) 2 (0) (2) (10) (10) Mar-13 59 4 3 18.5 11.7 11.2 10.9 101 104 2.3 10.7 1.2 na na na
Energy David Hewitt - 65 6212 3064
INPEX Corporation 1605 JP O JPY 1,431 2,016 41 20,444 55.1 5 7 14 6 19 2 6 13 17 14 Mar-13 (9) 18 (10) 11.4 12.5 10.6 11.8 102 115 1.2 6.9 0.8 1.5 2.6 8 Japan Petroleum Exploration 1662 JP O JPY 3,560 5,400 52 1,990 9.6 4 5 2 (11) (4) 2 3 1 (0) (8) Mar-13 nm (4) (13) nm 9.9 10.3 11.8 88 85 1.1 6.5 0.6 0.7 6.0 (8)
Sector* 42 22,434 5 7 13 5 17 2 6 12 15 12 Mar-13 3 16 (10) 12.6 12.2 10.6 11.8 100 111 1.2 6.9 0.8 1.4 2.7 6
Healthcare Fumiyoshi Sakai - 81 3 4550 9737
Astellas Pharma 4503 JP O JPY 1,121 1,380 23 24,465 124.2 2 (2) (6) (10) 0 (0) (3) (7) 0 (4) Mar-13 29 20 36 31.1 24.1 20.1 14.8 101 94 2.4 9.7 2.3 1.9 8.7 (32) Chugai Pharmaceutical 4519 JP O JPY 2,480 3,000 21 13,216 30.6 2 (0) 4 7 2 (1) (2) 3 17 (2) Dec-13 4 26 10 26.0 25.0 19.9 18.0 110 115 1.9 9.2 2.2 2.6 12.7 (27) Daiichi Sankyo 4568 JP U JPY 1,750 1,600 (9) 12,052 50.7 2 (1) 7 (9) (5) (1) (2) 6 1 (9) Mar-13 (2) (5) 0 18.5 19.0 19.9 19.9 96 94 3.4 7.2 1.4 1.0 7.4 (9)
Dainippon Sumitomo Pharma 4506 JP U JPY 1,595 1,300 (18) 6,199 21.5 2 (1) (5) (3) (4) (1) (3) (6) 7 (8) Mar-13 69 (18) 14 63.1 37.3 45.3 39.6 89 103 1.1 4.8 1.8 1.6 7.8 (4) Eisai 4523 JP N JPY 3,930 3,800 (3) 10,965 52.2 3 2 (0) (4) (10) 0 0 (1) 7 (14) Mar-13 (1) (10) 5 23.2 23.3 26.1 24.9 116 96 3.8 10.1 2.4 2.0 9.8 10 Kyowa Hakko Kirin 4151 JP N JPY 1,107 1,050 (5) 5,928 12.5 3 4 9 (4) (4) (0) 2 8 6 (8) Dec-13 (30) 10 15 20.1 28.9 26.3 22.9 99 101 2.3 3.5 1.0 1.6 7.0 (10)
Mitsubishi Tanabe Pharma 4508 JP N JPY 1,397 1,400 0 7,667 15.0 1 0 (3) (5) (6) (2) (1) (4) 6 (10) Mar-13 6 (10) 10 18.7 17.6 19.6 17.8 97 99 3.0 5.9 1.0 1.6 8.4 (13) Ono Pharmaceutical 4528 JP N JPY 8,150 8,200 1 8,453 36.2 3 1 (9) (12) 33 (0) (1) (10) (1) 28 Mar-13 (15) (3) 5 35.8 41.9 43.2 41.1 93 102 2.2 5.1 2.1 4.9 23.5 (32) Otsuka Holdings 4578 JP U JPY 2,900 2,700 (7) 15,361 48.0 3 1 (2) (5) (18) 0 (0) (3) 6 (22) Mar-13 (0) (21) 5 13.1 13.1 16.5 15.7 77 69 2.2 8.5 1.0 0.7 3.7 (50)
Santen Pharmaceutical 4536 JP O JPY 4,705 5,000 6 3,800 13.0 2 1 6 (4) 1 (1) (1) 5 6 (3) Mar-13 15 3 8 24.0 20.9 20.4 18.9 102 97 2.1 11.3 2.3 2.3 10.7 (33) Sawai Pharmaceutical 4555 JP O JPY 5,980 9,800 64 2,149 23.2 1 0 2 (12) (1) (2) (1) 1 (2) (5) Mar-13 (47) (4) 9 7.7 14.5 15.2 14.0 109 98 2.3 19.2 2.7 2.7 9.5 29 Shionogi 4507 JP N JPY 1,797 2,000 11 5,887 32.6 1 1 (10) (21) (16) (2) (0) (11) (11) (21) Mar-13 (34) (23) (3) 9.0 13.7 17.7 18.2 100 94 2.4 10.5 1.4 1.8 6.4 (21)
Sysmex 6869 JP O JPY 3,145 3,500 11 6,372 22.4 2 0 13 1 (4) (1) (1) 12 12 (8) Mar-13 34 16 14 45.7 34.1 29.4 25.9 98 96 0.7 15.9 5.1 3.5 15.6 (22) Taisho Pharmaceutical Holdings 4581 JP O JPY 7,540 9,700 29 6,649 7.1 2 0 6 4 6 (0) (1) 5 15 2 Mar-13 18 10 12 23.2 19.7 18.0 16.1 101 112 1.5 5.4 0.9 1.8 10.0 (26) Takeda Pharmaceutical 4502 JP N JPY 4,528 5,100 13 34,971 150.1 2 0 (5) (6) (12) (0) (1) (6) 4 (16) Mar-13 (5) 18 28 27.2 28.6 24.2 18.8 111 141 4.0 5.8 1.7 2.1 9.3 (2)
Terumo 4543 JP N JPY 2,119 2,350 11 7,872 46.8 2 1 (7) (16) 2 (0) (0) (8) (6) (2) Mar-13 (15) (49) 12 8.6 10.1 19.6 17.5 185 93 2.7 8.8 0.9 2.0 8.1 19 Tsumura & Co 4540 JP N JPY 2,484 2,700 9 1,714 10.7 1 0 (0) (11) (19) (2) (1) (1) (0) (24) Mar-13 14 (26) 15 11.4 10.0 13.5 11.7 101 95 2.6 14.2 1.3 1.7 6.9 6 Sector* 9 173,721 2 0 (1) (6) (4) (0) (1) (2) 4 (8) Mar-13 (1) (5) 16 20.6 20.8 22.0 18.9 102 99 2.7 7.6 1.6 1.8 8.6 (16)
Insurance Takehito Yamanaka - 81 3 4550 9150
Dai-ichi Life Insurance 8750 JP O JPY 1,407 2,393 70 13,640 67.1 4 1 (3) (20) 8 1 (1) (4) (9) 4 Mar-13 133 19 (2) 43.0 18.5 15.5 15.8 113 122 1.4 4.2 0.7 na na na
MS&AD Insurance Group Holdings
8725 JP O JPY 2,278 3,100 36 13,815 43.0 3 (2) (0) (19) (8) 0 (3) (1) (9) (12) Mar-13 38 25 12 16.9 12.3 9.8 8.7 90 112 2.5 5.5 0.7 na na na
NKSJ Holdings 8630 JP N JPY 2,568 3,040 18 10,332 39.0 3 1 6 (12) 12 1 (1) 5 (2) 8 Mar-13 36 (28) 143 24.4 17.9 24.9 10.2 91 86 2.3 4.6 0.8 na na na
Sony Financial Holdings 8729 JP N JPY 1,689 1,640 (3) 7,188 21.3 2 2 7 (12) 31 (1) 0 6 (1) 26 Mar-13 (12) 7 11 16.3 18.5 17.2 15.6 97 92 1.8 9.4 1.8 na na na T&D Holdings 8795 JP N JPY 1,210 1,405 16 7,957 33.3 4 2 0 (18) 17 2 1 (1) (7) 13 Mar-13 4 7 3 12.8 12.3 11.5 11.1 93 95 2.0 6.9 0.8 na na na Tokio Marine Holdings 8766 JP N JPY 3,019 3,700 23 22,651 83.0 3 (1) 0 (14) (1) 0 (2) (1) (4) (6) Mar-13 42 8 8 17.9 12.6 11.7 10.8 99 102 2.0 7.5 0.9 na na na
Sector* 30 75,583 3 0 1 (16) 6 1 (1) (0) (6) 2 Mar-13 36 9 17 19.5 14.3 13.1 11.2 97 104 2.0 6.0 0.8 na na na
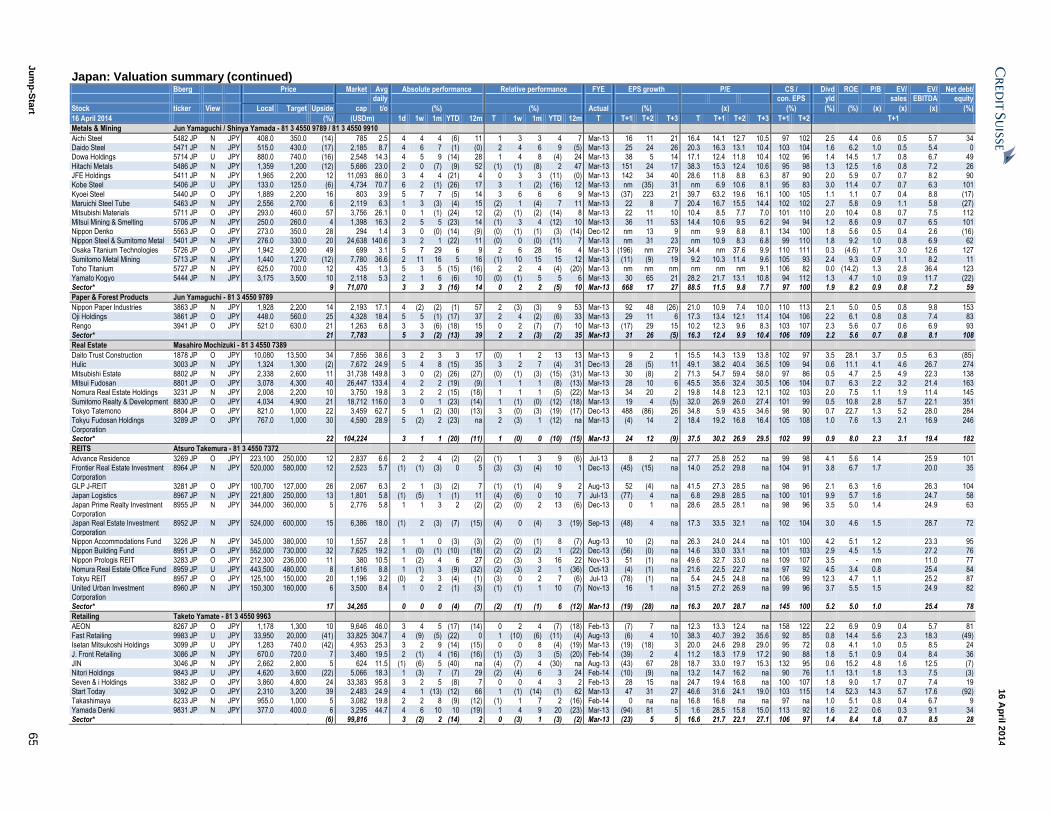
Ju
mp
-Sta
rt 6
5
16 A
pril 2
014
Japan: Valuation summary (continued) Bberg Price Market Avg Absolute performance Relative performance FYE EPS growth P/E CS / Divd ROE P/B EV/ EV/ Net debt/ daily con. EPS yld sales EBITDA equity
Stock ticker View Local Target Upside cap t/o (%) (%) Actual (%) (x) (%) (%) (%) (x) (x) (x) (%)
16 April 2014 (%) (USDm) 1d 1w 1m YTD 12m T 1w 1m YTD 12m T T+1 T+2 T+3 T T+1 T+2 T+3 T+1 T+2 T+1
Metals & Mining Jun Yamaguchi / Shinya Yamada - 81 3 4550 9789 / 81 3 4550 9910
Aichi Steel 5482 JP N JPY 408.0 350.0 (14) 785 2.5 4 4 4 (6) 11 1 3 3 4 7 Mar-13 16 11 21 16.4 14.1 12.7 10.5 97 102 2.5 4.4 0.6 0.5 5.7 34 Daido Steel 5471 JP N JPY 515.0 430.0 (17) 2,185 8.7 4 6 7 (1) (0) 2 4 6 9 (5) Mar-13 25 24 26 20.3 16.3 13.1 10.4 103 104 1.6 6.2 1.0 0.5 5.4 0 Dowa Holdings 5714 JP U JPY 880.0 740.0 (16) 2,548 14.3 4 5 9 (14) 28 1 4 8 (4) 24 Mar-13 38 5 14 17.1 12.4 11.8 10.4 102 96 1.4 14.5 1.7 0.8 6.7 49
Hitachi Metals 5486 JP N JPY 1,359 1,200 (12) 5,686 23.0 2 0 (7) (9) 52 (1) (1) (8) 2 47 Mar-13 151 24 17 38.3 15.3 12.4 10.6 95 98 1.3 12.5 1.6 0.8 7.2 26 JFE Holdings 5411 JP N JPY 1,965 2,200 12 11,093 86.0 3 4 4 (21) 4 0 3 3 (11) (0) Mar-13 142 34 40 28.6 11.8 8.8 6.3 87 90 2.0 5.9 0.7 0.7 8.2 90 Kobe Steel 5406 JP U JPY 133.0 125.0 (6) 4,734 70.7 6 2 (1) (26) 17 3 1 (2) (16) 12 Mar-13 nm (35) 31 nm 6.9 10.6 8.1 95 83 3.0 11.4 0.7 0.7 6.3 101
Kyoei Steel 5440 JP O JPY 1,889 2,200 16 803 3.9 5 7 7 (5) 14 3 6 6 6 9 Mar-13 (37) 223 21 39.7 63.2 19.6 16.1 100 105 1.1 1.1 0.7 0.4 8.8 (17) Maruichi Steel Tube 5463 JP N JPY 2,556 2,700 6 2,119 6.3 1 3 (3) (4) 15 (2) 1 (4) 7 11 Mar-13 22 8 7 20.4 16.7 15.5 14.4 102 102 2.7 5.8 0.9 1.1 5.8 (27) Mitsubishi Materials 5711 JP O JPY 293.0 460.0 57 3,756 26.1 0 1 (1) (24) 12 (2) (1) (2) (14) 8 Mar-13 22 11 10 10.4 8.5 7.7 7.0 101 110 2.0 10.4 0.8 0.7 7.5 112
Mitsui Mining & Smelting 5706 JP N JPY 250.0 260.0 4 1,398 16.3 2 5 5 (23) 14 (1) 3 4 (12) 10 Mar-13 36 11 53 14.4 10.6 9.5 6.2 94 94 1.2 8.6 0.9 0.7 6.5 101 Nippon Denko 5563 JP O JPY 273.0 350.0 28 294 1.4 3 0 (0) (14) (9) (0) (1) (1) (3) (14) Dec-12 nm 13 9 nm 9.9 8.8 8.1 134 100 1.8 5.6 0.5 0.4 2.6 (16) Nippon Steel & Sumitomo Metal 5401 JP N JPY 276.0 330.0 20 24,638 140.6 3 2 1 (22) 11 (0) 0 (0) (11) 7 Mar-13 nm 31 23 nm 10.9 8.3 6.8 99 110 1.8 9.2 1.0 0.8 6.9 62
Osaka Titanium Technologies 5726 JP O JPY 1,942 2,900 49 699 3.1 5 7 29 6 9 2 6 28 16 4 Mar-13 (196) nm 279 34.4 nm 37.6 9.9 110 111 0.3 (4.6) 1.7 3.0 12.6 127 Sumitomo Metal Mining 5713 JP N JPY 1,440 1,270 (12) 7,780 36.6 2 11 16 5 16 (1) 10 15 15 12 Mar-13 (11) (9) 19 9.2 10.3 11.4 9.6 105 93 2.4 9.3 0.9 1.1 8.2 11 Toho Titanium 5727 JP N JPY 625.0 700.0 12 435 1.3 5 3 5 (15) (16) 2 2 4 (4) (20) Mar-13 nm nm nm nm nm nm 9.1 106 82 0.0 (14.2) 1.3 2.8 36.4 123
Yamato Kogyo 5444 JP N JPY 3,175 3,500 10 2,118 5.3 2 1 6 (6) 10 (0) (1) 5 5 6 Mar-13 30 65 21 28.2 21.7 13.1 10.8 94 112 1.3 4.7 1.0 0.9 11.7 (22) Sector* 9 71,070 3 3 3 (16) 14 0 2 2 (5) 10 Mar-13 668 17 27 88.5 11.5 9.8 7.7 97 100 1.9 8.2 0.9 0.8 7.2 59
Paper & Forest Products Jun Yamaguchi - 81 3 4550 9789
Nippon Paper Industries 3863 JP N JPY 1,928 2,200 14 2,193 17.1 4 (2) (2) (1) 57 2 (3) (3) 9 53 Mar-13 92 48 (26) 21.0 10.9 7.4 10.0 110 113 2.1 5.0 0.5 0.8 9.8 153 Oji Holdings 3861 JP O JPY 448.0 560.0 25 4,328 18.4 5 5 (1) (17) 37 2 4 (2) (6) 33 Mar-13 29 11 6 17.3 13.4 12.1 11.4 104 106 2.2 6.1 0.8 0.8 7.4 83
Rengo 3941 JP O JPY 521.0 630.0 21 1,263 6.8 3 3 (6) (18) 15 0 2 (7) (7) 10 Mar-13 (17) 29 15 10.2 12.3 9.6 8.3 103 107 2.3 5.6 0.7 0.6 6.9 93 Sector* 21 7,783 5 3 (2) (13) 39 2 2 (3) (2) 35 Mar-13 31 26 (5) 16.3 12.4 9.9 10.4 106 109 2.2 5.6 0.7 0.8 8.1 108
Real Estate Masahiro Mochizuki - 81 3 4550 7389
Daito Trust Construction 1878 JP O JPY 10,080 13,500 34 7,856 38.6 3 2 3 3 17 (0) 1 2 13 13 Mar-13 9 2 1 15.5 14.3 13.9 13.8 102 97 3.5 28.1 3.7 0.5 6.3 (85) Hulic 3003 JP N JPY 1,324 1,300 (2) 7,672 24.9 5 4 8 (15) 35 3 2 7 (4) 31 Dec-13 28 (5) 11 49.1 38.2 40.4 36.5 109 94 0.6 11.1 4.1 4.6 26.7 274
Mitsubishi Estate 8802 JP N JPY 2,338 2,600 11 31,738 149.8 3 0 (2) (26) (27) (0) (1) (3) (15) (31) Mar-13 30 (8) 2 71.3 54.7 59.4 58.0 97 86 0.5 4.7 2.5 4.9 22.3 138 Mitsui Fudosan 8801 JP O JPY 3,078 4,300 40 26,447 133.4 4 2 2 (19) (9) 1 1 1 (8) (13) Mar-13 28 10 6 45.5 35.6 32.4 30.5 106 104 0.7 6.3 2.2 3.2 21.4 163 Nomura Real Estate Holdings 3231 JP N JPY 2,008 2,200 10 3,750 19.8 3 2 2 (15) (18) 1 1 1 (5) (22) Mar-13 34 20 2 19.8 14.8 12.3 12.1 102 103 2.0 7.5 1.1 1.9 11.4 145
Sumitomo Realty & Development 8830 JP O JPY 4,034 4,900 21 18,712 116.0 3 0 1 (23) (14) 1 (1) (0) (12) (18) Mar-13 19 4 (5) 32.0 26.9 26.0 27.4 101 99 0.5 10.8 2.8 5.7 22.1 351 Tokyo Tatemono 8804 JP O JPY 821.0 1,000 22 3,459 62.7 5 1 (2) (30) (13) 3 (0) (3) (19) (17) Dec-13 488 (86) 26 34.8 5.9 43.5 34.6 98 90 0.7 22.7 1.3 5.2 28.0 284 Tokyu Fudosan Holdings Corporation
3289 JP O JPY 767.0 1,000 30 4,590 28.9 5 (2) 2 (23) na 2 (3) 1 (12) na Mar-13 (4) 14 2 18.4 19.2 16.8 16.4 105 108 1.0 7.6 1.3 2.1 16.9 246
Sector* 22 104,224 3 1 1 (20) (11) 1 (0) 0 (10) (15) Mar-13 24 12 (9) 37.5 30.2 26.9 29.5 102 99 0.9 8.0 2.3 3.1 19.4 182
REITS Atsuro Takemura - 81 3 4550 7372
Advance Residence 3269 JP O JPY 223,100 250,000 12 2,837 6.6 2 2 4 (2) (2) (1) 1 3 9 (6) Jul-13 8 2 na 27.7 25.8 25.2 na 99 98 4.1 5.6 1.4 25.9 101 Frontier Real Estate Investment Corporation
8964 JP N JPY 520,000 580,000 12 2,523 5.7 (1) (1) (3) 0 5 (3) (3) (4) 10 1 Dec-13 (45) (15) na 14.0 25.2 29.8 na 104 91 3.8 6.7 1.7 20.0 35
GLP J-REIT 3281 JP O JPY 100,700 127,000 26 2,067 6.3 2 1 (3) (2) 7 (1) (1) (4) 9 2 Aug-13 52 (4) na 41.5 27.3 28.5 na 98 96 2.1 6.3 1.6 26.3 104 Japan Logistics 8967 JP N JPY 221,800 250,000 13 1,801 5.8 (1) (5) 1 (1) 11 (4) (6) 0 10 7 Jul-13 (77) 4 na 6.8 29.8 28.5 na 100 101 9.9 5.7 1.6 24.7 58
Japan Prime Realty Investment Corporation
8955 JP N JPY 344,000 360,000 5 2,776 5.8 1 1 3 2 (2) (2) (0) 2 13 (6) Dec-13 0 1 na 28.6 28.5 28.1 na 98 96 3.5 5.0 1.4 24.9 63
Japan Real Estate Investment Corporation
8952 JP N JPY 524,000 600,000 15 6,386 18.0 (1) 2 (3) (7) (15) (4) 0 (4) 3 (19) Sep-13 (48) 4 na 17.3 33.5 32.1 na 102 104 3.0 4.6 1.5 28.7 72
Nippon Accommodations Fund 3226 JP N JPY 345,000 380,000 10 1,557 2.8 1 1 0 (3) (3) (2) (0) (1) 8 (7) Aug-13 10 (2) na 26.3 24.0 24.4 na 101 100 4.2 5.1 1.2 23.3 95 Nippon Building Fund 8951 JP O JPY 552,000 730,000 32 7,625 19.2 1 (0) (1) (10) (18) (2) (2) (2) 1 (22) Dec-13 (56) (0) na 14.6 33.0 33.1 na 101 103 2.9 4.5 1.5 27.2 76
Nippon Prologis REIT 3283 JP O JPY 212,300 236,000 11 380 10.5 1 (2) 4 6 27 (2) (3) 3 16 22 Nov-13 51 (1) na 49.6 32.7 33.0 na 109 107 3.5 - nm 11.0 77 Nomura Real Estate Office Fund 8959 JP U JPY 443,500 480,000 8 1,616 8.8 1 (1) 3 (9) (32) (2) (3) 2 1 (36) Oct-13 (4) (1) na 21.6 22.5 22.7 na 97 92 4.5 3.4 0.8 25.4 84 Tokyu REIT 8957 JP O JPY 125,100 150,000 20 1,196 3.2 (0) 2 3 (4) (1) (3) 0 2 7 (6) Jul-13 (78) (1) na 5.4 24.5 24.8 na 106 99 12.3 4.7 1.1 25.2 87
United Urban Investment Corporation
8960 JP N JPY 150,300 160,000 6 3,500 8.4 1 0 2 (1) (3) (1) (1) 1 10 (7) Nov-13 16 1 na 31.5 27.2 26.9 na 99 96 3.7 5.5 1.5 24.9 82
Sector* 17 34,265 0 0 0 (4) (7) (2) (1) (1) 6 (12) Mar-13 (19) (28) na 16.3 20.7 28.7 na 145 100 5.2 5.0 1.0 25.4 78
Retailing Taketo Yamate - 81 3 4550 9963
AEON 8267 JP O JPY 1,178 1,300 10 9,646 46.0 3 4 5 (17) (14) 0 2 4 (7) (18) Feb-13 (7) 7 na 12.3 13.3 12.4 na 158 122 2.2 6.9 0.9 0.4 5.7 81 Fast Retailing 9983 JP U JPY 33,950 20,000 (41) 33,825 304.7 4 (9) (5) (22) 0 1 (10) (6) (11) (4) Aug-13 (6) 4 10 38.3 40.7 39.2 35.6 92 85 0.8 14.4 5.6 2.3 18.3 (49) Isetan Mitsukoshi Holdings 3099 JP U JPY 1,283 740.0 (42) 4,953 25.3 3 2 9 (14) (15) 0 0 8 (4) (19) Mar-13 (19) (18) 3 20.0 24.6 29.8 29.0 95 72 0.8 4.1 1.0 0.5 8.5 24
J. Front Retailing 3086 JP N JPY 670.0 720.0 7 3,460 19.5 2 (1) 4 (16) (16) (1) (3) 3 (5) (20) Feb-14 (39) 2 4 11.2 18.3 17.9 17.2 90 88 1.8 5.1 0.9 0.4 8.4 36 JIN 3046 JP N JPY 2,662 2,800 5 624 11.5 (1) (6) 5 (40) na (4) (7) 4 (30) na Aug-13 (43) 67 28 18.7 33.0 19.7 15.3 132 95 0.6 15.2 4.8 1.6 12.5 (7) Nitori Holdings 9843 JP U JPY 4,620 3,600 (22) 5,066 18.3 1 (3) 7 (7) 29 (2) (4) 6 3 24 Feb-14 (10) (9) na 13.2 14.7 16.2 na 90 76 1.1 13.1 1.8 1.3 7.5 (3)
Seven & i Holdings 3382 JP O JPY 3,860 4,800 24 33,383 95.8 3 2 5 (8) 7 0 0 4 3 2 Feb-13 28 15 na 24.7 19.4 16.8 na 100 107 1.8 9.0 1.7 0.7 7.4 19 Start Today 3092 JP O JPY 2,310 3,200 39 2,483 24.9 4 1 (13) (12) 66 1 (1) (14) (1) 62 Mar-13 47 31 27 46.6 31.6 24.1 19.0 103 115 1.4 52.3 14.3 5.7 17.6 (92) Takashimaya 8233 JP N JPY 955.0 1,000 5 3,082 19.8 2 2 8 (9) (12) (1) 1 7 2 (16) Feb-14 0 na na 16.8 16.8 na na 97 na 1.0 5.1 0.8 0.4 6.7 9
Yamada Denki 9831 JP N JPY 377.0 400.0 6 3,295 44.7 4 6 10 10 (19) 1 4 9 20 (23) Mar-13 (94) 81 5 1.6 28.5 15.8 15.0 113 92 1.6 2.2 0.6 0.3 9.1 34 Sector* (6) 99,816 3 (2) 2 (14) 2 0 (3) 1 (3) (2) Mar-13 (23) 5 5 16.6 21.7 22.1 27.1 106 97 1.4 8.4 1.8 0.7 8.5 28
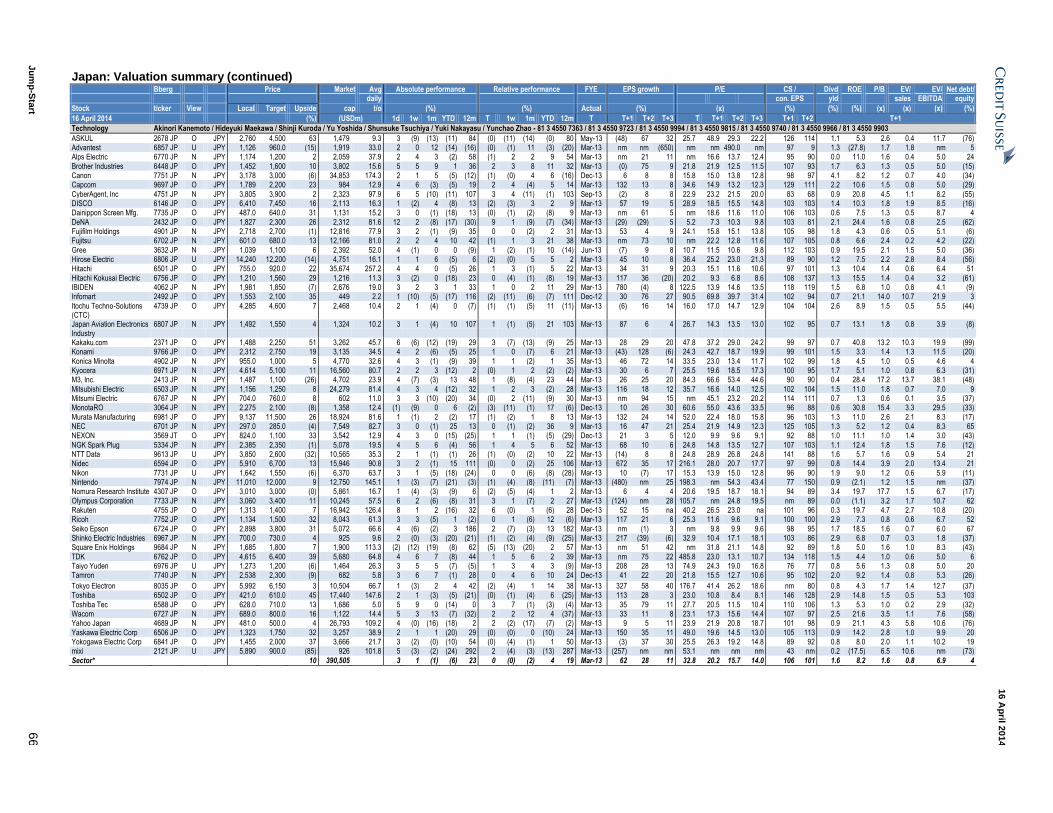
Ju
mp
-Sta
rt 6
6
16 A
pril 2
014
Japan: Valuation summary (continued) Bberg Price Market Avg Absolute performance Relative performance FYE EPS growth P/E CS / Divd ROE P/B EV/ EV/ Net debt/ daily con. EPS yld sales EBITDA equity
Stock ticker View Local Target Upside cap t/o (%) (%) Actual (%) (x) (%) (%) (%) (x) (x) (x) (%)
16 April 2014 (%) (USDm) 1d 1w 1m YTD 12m T 1w 1m YTD 12m T T+1 T+2 T+3 T T+1 T+2 T+3 T+1 T+2 T+1
Technology Akinori Kanemoto / Hideyuki Maekawa / Shinji Kuroda / Yu Yoshida / Shunsuke Tsuchiya / Yuki Nakayasu / Yunchao Zhao - 81 3 4550 7363 / 81 3 4550 9723 / 81 3 4550 9994 / 81 3 4550 9815 / 81 3 4550 9740 / 81 3 4550 9966 / 81 3 4550 9903
ASKUL 2678 JP O JPY 2,760 4,500 63 1,479 9.3 3 (9) (13) (11) 84 (0) (11) (14) (0) 80 May-13 (48) 67 32 25.7 48.9 29.3 22.2 126 114 1.1 5.3 2.6 0.4 11.7 (76) Advantest 6857 JP U JPY 1,126 960.0 (15) 1,919 33.0 2 0 12 (14) (16) (0) (1) 11 (3) (20) Mar-13 nm nm (650) nm nm 490.0 nm 97 9 1.3 (27.8) 1.7 1.8 nm 5 Alps Electric 6770 JP N JPY 1,174 1,200 2 2,059 37.9 2 4 3 (2) 58 (1) 2 2 9 54 Mar-13 nm 21 11 nm 16.6 13.7 12.4 95 90 0.0 11.0 1.6 0.4 5.0 24
Brother Industries 6448 JP O JPY 1,452 1,600 10 3,802 15.6 5 5 9 1 36 2 3 8 11 32 Mar-13 (0) 75 9 21.8 21.9 12.5 11.5 107 93 1.7 6.3 1.3 0.5 5.0 (15) Canon 7751 JP N JPY 3,178 3,000 (6) 34,853 174.3 2 1 5 (5) (12) (1) (0) 4 6 (16) Dec-13 6 8 8 15.8 15.0 13.8 12.8 98 97 4.1 8.2 1.2 0.7 4.0 (34) Capcom 9697 JP O JPY 1,789 2,200 23 984 12.9 4 6 (3) (5) 19 2 4 (4) 5 14 Mar-13 132 13 8 34.6 14.9 13.2 12.3 129 111 2.2 10.6 1.5 0.8 5.0 (29)
CyberAgent, Inc 4751 JP N JPY 3,805 3,900 2 2,323 97.9 6 5 (10) (11) 107 3 4 (11) (1) 103 Sep-13 (2) 8 8 22.9 23.2 21.5 20.0 83 68 0.9 20.8 4.5 1.1 8.2 (55) DISCO 6146 JP O JPY 6,410 7,450 16 2,113 16.3 1 (2) 4 (8) 13 (2) (3) 3 2 9 Mar-13 57 19 5 28.9 18.5 15.5 14.8 103 103 1.4 10.3 1.8 1.9 8.5 (16) Dainippon Screen Mfg. 7735 JP O JPY 487.0 640.0 31 1,131 15.2 3 0 (1) (18) 13 (0) (1) (2) (8) 9 Mar-13 nm 61 5 nm 18.6 11.6 11.0 106 103 0.6 7.5 1.3 0.5 8.7 4
DeNA 2432 JP O JPY 1,827 2,300 26 2,312 81.6 12 2 (8) (17) (30) 9 1 (9) (7) (34) Mar-13 (29) (29) 5 5.2 7.3 10.3 9.8 103 81 2.1 24.4 1.6 0.8 2.5 (62) Fujifilm Holdings 4901 JP N JPY 2,718 2,700 (1) 12,816 77.9 3 2 (1) (9) 35 0 0 (2) 2 31 Mar-13 53 4 9 24.1 15.8 15.1 13.8 105 98 1.8 4.3 0.6 0.5 5.1 (6) Fujitsu 6702 JP N JPY 601.0 680.0 13 12,166 81.0 2 2 4 10 42 (1) 1 3 21 38 Mar-13 nm 73 10 nm 22.2 12.8 11.6 107 105 0.8 6.6 2.4 0.2 4.2 (22)
Gree 3632 JP N JPY 1,039 1,100 6 2,392 52.0 4 (1) 0 0 (9) 1 (2) (1) 10 (14) Jun-13 (7) 9 8 10.7 11.5 10.6 9.8 112 103 0.9 19.5 2.1 1.5 5.0 (36) Hirose Electric 6806 JP U JPY 14,240 12,200 (14) 4,751 16.1 1 1 6 (5) 6 (2) (0) 5 5 2 Mar-13 45 10 8 36.4 25.2 23.0 21.3 89 90 1.2 7.5 2.2 2.8 8.4 (56) Hitachi 6501 JP O JPY 755.0 920.0 22 35,674 257.2 4 4 0 (5) 26 1 3 (1) 5 22 Mar-13 34 31 9 20.3 15.1 11.6 10.6 97 101 1.3 10.4 1.4 0.6 6.4 51
Hitachi Kokusai Electric 6756 JP O JPY 1,210 1,560 29 1,216 11.3 3 (2) 0 (18) 23 0 (4) (1) (8) 19 Mar-13 117 36 (20) 20.2 9.3 6.8 8.6 108 137 1.3 15.5 1.4 0.4 3.2 (61) IBIDEN 4062 JP N JPY 1,981 1,850 (7) 2,676 19.0 3 2 3 1 33 1 0 2 11 29 Mar-13 780 (4) 8 122.5 13.9 14.6 13.5 118 119 1.5 6.8 1.0 0.8 4.1 (9) Infomart 2492 JP O JPY 1,553 2,100 35 449 2.2 1 (10) (5) (17) 116 (2) (11) (6) (7) 111 Dec-12 30 76 27 90.5 69.8 39.7 31.4 102 94 0.7 21.1 14.0 10.7 21.9 3
Itochu Techno-Solutions (CTC)
4739 JP O JPY 4,285 4,600 7 2,468 10.4 2 1 (4) 0 (7) (1) (1) (5) 11 (11) Mar-13 (6) 16 14 16.0 17.0 14.7 12.9 104 104 2.6 8.9 1.5 0.5 5.5 (44)
Japan Aviation Electronics Industry
6807 JP N JPY 1,492 1,550 4 1,324 10.2 3 1 (4) 10 107 1 (1) (5) 21 103 Mar-13 87 6 4 26.7 14.3 13.5 13.0 102 95 0.7 13.1 1.8 0.8 3.9 (8)
Kakaku.com 2371 JP O JPY 1,488 2,250 51 3,262 45.7 6 (6) (12) (19) 29 3 (7) (13) (9) 25 Mar-13 28 29 20 47.8 37.2 29.0 24.2 99 97 0.7 40.8 13.2 10.3 19.9 (99) Konami 9766 JP O JPY 2,312 2,750 19 3,135 34.5 4 2 (6) (5) 25 1 0 (7) 6 21 Mar-13 (43) 128 (6) 24.3 42.7 18.7 19.9 99 101 1.5 3.3 1.4 1.3 11.5 (20)
Konica Minolta 4902 JP N JPY 955.0 1,000 5 4,770 32.6 4 3 (1) (9) 39 1 1 (2) 1 35 Mar-13 46 72 14 33.5 23.0 13.4 11.7 102 99 1.8 4.5 1.0 0.5 4.6 4 Kyocera 6971 JP N JPY 4,614 5,100 11 16,560 80.7 2 2 3 (12) 2 (0) 1 2 (2) (2) Mar-13 30 6 7 25.5 19.6 18.5 17.3 100 95 1.7 5.1 1.0 0.8 6.3 (31) M3, Inc. 2413 JP N JPY 1,487 1,100 (26) 4,702 23.9 4 (7) (3) 13 48 1 (8) (4) 23 44 Mar-13 26 25 20 84.3 66.6 53.4 44.6 90 90 0.4 28.4 17.2 13.7 38.1 (48)
Mitsubishi Electric 6503 JP N JPY 1,156 1,250 8 24,279 81.4 4 3 4 (12) 32 1 2 3 (2) 28 Mar-13 116 18 12 35.7 16.6 14.0 12.5 102 104 1.5 11.0 1.8 0.7 7.0 9 Mitsumi Electric 6767 JP N JPY 704.0 760.0 8 602 11.0 3 3 (10) (20) 34 (0) 2 (11) (9) 30 Mar-13 nm 94 15 nm 45.1 23.2 20.2 114 111 0.7 1.3 0.6 0.1 3.5 (37) MonotaRO 3064 JP N JPY 2,275 2,100 (8) 1,358 12.4 (1) (9) 0 6 (2) (3) (11) (1) 17 (6) Dec-13 10 26 30 60.6 55.0 43.6 33.5 96 88 0.6 30.8 15.4 3.3 29.5 (33)
Murata Manufacturing 6981 JP O JPY 9,137 11,500 26 18,924 81.6 1 (1) 2 (2) 17 (1) (2) 1 8 13 Mar-13 132 24 14 52.0 22.4 18.0 15.8 96 103 1.3 11.0 2.6 2.1 8.3 (17) NEC 6701 JP N JPY 297.0 285.0 (4) 7,549 82.7 3 0 (1) 25 13 0 (1) (2) 36 9 Mar-13 16 47 21 25.4 21.9 14.9 12.3 125 105 1.3 5.2 1.2 0.4 8.3 65 NEXON 3569 JT O JPY 824.0 1,100 33 3,542 12.9 4 3 0 (15) (25) 1 1 (1) (5) (29) Dec-13 21 3 5 12.0 9.9 9.6 9.1 92 88 1.0 11.1 1.0 1.4 3.0 (43)
NGK Spark Plug 5334 JP N JPY 2,385 2,350 (1) 5,078 19.5 4 5 6 (4) 56 1 4 5 6 52 Mar-13 68 10 6 24.8 14.8 13.5 12.7 107 103 1.1 12.4 1.8 1.5 7.6 (12) NTT Data 9613 JP U JPY 3,850 2,600 (32) 10,565 35.3 2 1 (1) (1) 26 (1) (0) (2) 10 22 Mar-13 (14) 8 8 24.8 28.9 26.8 24.8 141 88 1.6 5.7 1.6 0.9 5.4 21 Nidec 6594 JP O JPY 5,910 6,700 13 15,946 90.8 3 2 (1) 15 111 (0) 0 (2) 25 106 Mar-13 672 35 17 216.1 28.0 20.7 17.7 97 99 0.8 14.4 3.9 2.0 13.4 21
Nikon 7731 JP U JPY 1,642 1,550 (6) 6,370 63.7 3 1 (5) (18) (24) 0 0 (6) (8) (28) Mar-13 10 (7) 17 15.3 13.9 15.0 12.8 96 90 1.9 9.0 1.2 0.6 5.9 (11) Nintendo 7974 JP N JPY 11,010 12,000 9 12,750 145.1 1 (3) (7) (21) (3) (1) (4) (8) (11) (7) Mar-13 (480) nm 25 198.3 nm 54.3 43.4 77 150 0.9 (2.1) 1.2 1.5 nm (37) Nomura Research Institute 4307 JP O JPY 3,010 3,000 (0) 5,861 16.7 1 (4) (3) (9) 6 (2) (5) (4) 1 2 Mar-13 6 4 4 20.6 19.5 18.7 18.1 94 89 3.4 19.7 17.7 1.5 6.7 (17)
Olympus Corporation 7733 JP N JPY 3,060 3,400 11 10,245 57.5 6 2 (6) (8) 31 3 1 (7) 2 27 Mar-13 (124) nm 28 105.7 nm 24.8 19.5 nm 89 0.0 (1.1) 3.2 1.7 10.7 62 Rakuten 4755 JP O JPY 1,313 1,400 7 16,942 126.4 8 1 2 (16) 32 6 (0) 1 (6) 28 Dec-13 52 15 na 40.2 26.5 23.0 na 101 96 0.3 19.7 4.7 2.7 10.8 (20) Ricoh 7752 JP O JPY 1,134 1,500 32 8,043 61.3 3 3 (5) 1 (2) 0 1 (6) 12 (6) Mar-13 117 21 6 25.3 11.6 9.6 9.1 100 100 2.9 7.3 0.8 0.6 6.7 52
Seiko Epson 6724 JP O JPY 2,898 3,800 31 5,072 66.6 4 (6) (2) 3 186 2 (7) (3) 13 182 Mar-13 nm (1) 3 nm 9.8 9.9 9.6 98 95 1.7 18.5 1.6 0.7 6.0 67 Shinko Electric Industries 6967 JP N JPY 700.0 730.0 4 925 9.6 2 (0) (3) (20) (21) (1) (2) (4) (9) (25) Mar-13 217 (39) (6) 32.9 10.4 17.1 18.1 103 86 2.9 6.8 0.7 0.3 1.8 (37) Square Enix Holdings 9684 JP N JPY 1,685 1,800 7 1,900 113.3 (2) (12) (19) (8) 62 (5) (13) (20) 2 57 Mar-13 nm 51 42 nm 31.8 21.1 14.8 92 89 1.8 5.0 1.6 1.0 8.3 (43)
TDK 6762 JP O JPY 4,615 6,400 39 5,680 64.8 4 6 7 (8) 44 1 5 6 2 39 Mar-13 nm 75 22 485.8 23.0 13.1 10.7 134 118 1.5 4.4 1.0 0.6 5.0 6 Taiyo Yuden 6976 JP U JPY 1,273 1,200 (6) 1,464 26.3 3 5 5 (7) (5) 1 3 4 3 (9) Mar-13 208 28 13 74.9 24.3 19.0 16.8 76 77 0.8 5.6 1.3 0.8 5.0 20 Tamron 7740 JP N JPY 2,538 2,300 (9) 682 5.8 3 6 7 (1) 28 0 4 6 10 24 Dec-13 41 22 20 21.8 15.5 12.7 10.6 95 102 2.0 9.2 1.4 0.8 5.3 (26)
Tokyo Electron 8035 JP O JPY 5,992 6,150 3 10,504 66.7 1 (3) 2 4 42 (2) (4) 1 14 38 Mar-13 327 58 40 176.7 41.4 26.2 18.6 nm 80 0.8 4.3 1.7 1.4 12.7 (37) Toshiba 6502 JP O JPY 421.0 610.0 45 17,440 147.6 2 1 (3) (5) (21) (0) (1) (4) 6 (25) Mar-13 113 28 3 23.0 10.8 8.4 8.1 146 128 2.9 14.8 1.5 0.5 5.3 103
Toshiba Tec 6588 JP O JPY 628.0 710.0 13 1,686 5.0 5 9 0 (14) 0 3 7 (1) (3) (4) Mar-13 35 79 11 27.7 20.5 11.5 10.4 110 106 1.3 5.3 1.0 0.2 2.9 (32) Wacom 6727 JP N JPY 689.0 800.0 16 1,122 14.4 5 3 13 (7) (32) 2 2 12 4 (37) Mar-13 33 11 8 23.1 17.3 15.6 14.4 107 97 2.5 21.6 3.5 1.1 7.6 (58) Yahoo Japan 4689 JP N JPY 481.0 500.0 4 26,793 109.2 4 (0) (16) (18) 2 2 (2) (17) (7) (2) Mar-13 9 5 11 23.9 21.9 20.8 18.7 101 98 0.9 21.1 4.3 5.8 10.6 (76)
Yaskawa Electric Corp 6506 JP O JPY 1,323 1,750 32 3,257 38.9 2 1 1 (20) 29 (0) (0) 0 (10) 24 Mar-13 150 35 11 49.0 19.6 14.5 13.0 105 113 0.9 14.2 2.8 1.0 9.9 20 Yokogawa Electric Corp 6841 JP O JPY 1,455 2,000 37 3,666 21.7 3 (2) (0) (10) 54 (0) (4) (1) 1 50 Mar-13 (3) 37 30 25.5 26.3 19.2 14.8 89 92 0.8 8.0 2.0 1.1 10.2 19 mixi 2121 JP U JPY 5,890 900.0 (85) 926 101.8 5 (3) (2) (24) 292 2 (4) (3) (13) 287 Mar-13 (257) nm nm 53.1 nm nm nm 43 nm 0.2 (17.5) 6.5 10.6 nm (73)
Sector* 10 390,505 3 1 (1) (6) 23 0 (0) (2) 4 19 Mar-13 62 28 11 32.8 20.2 15.7 14.0 106 101 1.6 8.2 1.6 0.8 6.9 4
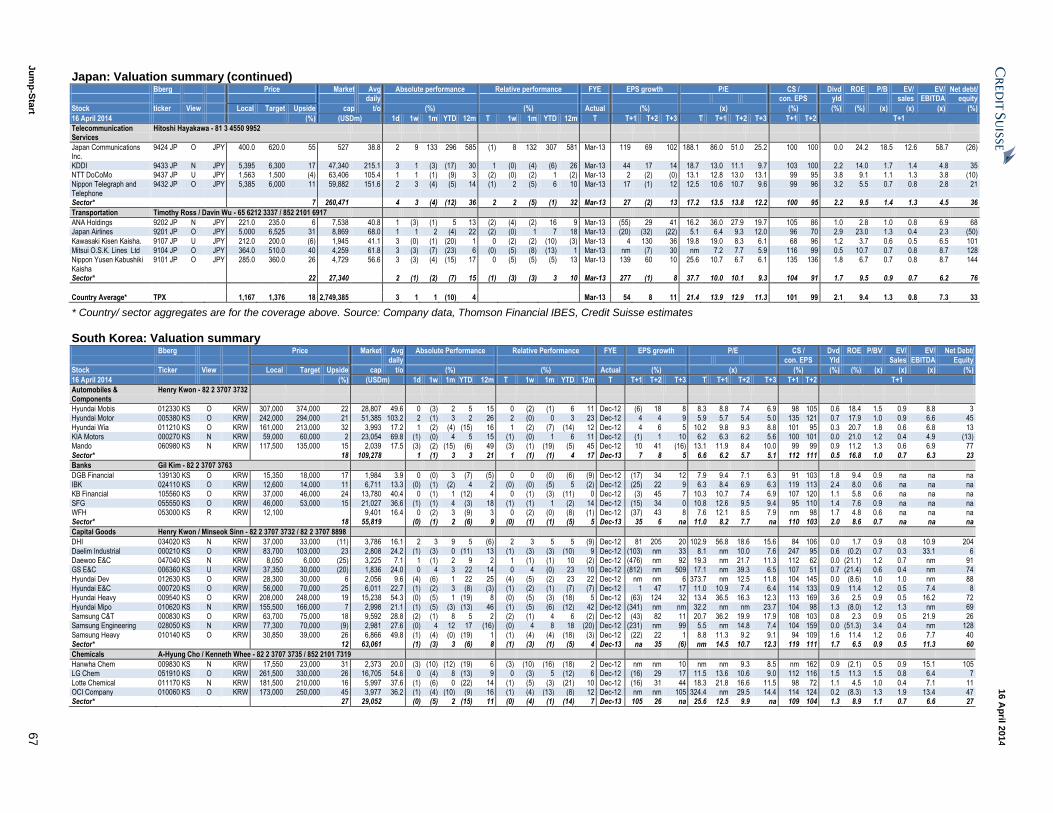
Ju
mp
-Sta
rt 6
7
16 A
pril 2
014
Japan: Valuation summary (continued) Bberg Price Market Avg Absolute performance Relative performance FYE EPS growth P/E CS / Divd ROE P/B EV/ EV/ Net debt/ daily con. EPS yld sales EBITDA equity
Stock ticker View Local Target Upside cap t/o (%) (%) Actual (%) (x) (%) (%) (%) (x) (x) (x) (%)
16 April 2014 (%) (USDm) 1d 1w 1m YTD 12m T 1w 1m YTD 12m T T+1 T+2 T+3 T T+1 T+2 T+3 T+1 T+2 T+1
Telecommunication Services
Hitoshi Hayakawa - 81 3 4550 9952
Japan Communications Inc.
9424 JP O JPY 400.0 620.0 55 527 38.8 2 9 133 296 585 (1) 8 132 307 581 Mar-13 119 69 102 188.1 86.0 51.0 25.2 100 100 0.0 24.2 18.5 12.6 58.7 (26)
KDDI 9433 JP N JPY 5,395 6,300 17 47,340 215.1 3 1 (3) (17) 30 1 (0) (4) (6) 26 Mar-13 44 17 14 18.7 13.0 11.1 9.7 103 100 2.2 14.0 1.7 1.4 4.8 35 NTT DoCoMo 9437 JP U JPY 1,563 1,500 (4) 63,406 105.4 1 1 (1) (9) 3 (2) (0) (2) 1 (2) Mar-13 2 (2) (0) 13.1 12.8 13.0 13.1 99 95 3.8 9.1 1.1 1.3 3.8 (10) Nippon Telegraph and Telephone
9432 JP O JPY 5,385 6,000 11 59,882 151.6 2 3 (4) (5) 14 (1) 2 (5) 6 10 Mar-13 17 (1) 12 12.5 10.6 10.7 9.6 99 96 3.2 5.5 0.7 0.8 2.8 21
Sector* 7 260,471 4 3 (4) (12) 36 2 2 (5) (1) 32 Mar-13 27 (2) 13 17.2 13.5 13.8 12.2 100 95 2.2 9.5 1.4 1.3 4.5 36
Transportation Timothy Ross / Davin Wu - 65 6212 3337 / 852 2101 6917
ANA Holdings 9202 JP N JPY 221.0 235.0 6 7,538 40.8 1 (3) (1) 5 13 (2) (4) (2) 16 9 Mar-13 (55) 29 41 16.2 36.0 27.9 19.7 105 86 1.0 2.8 1.0 0.8 6.9 68 Japan Airlines 9201 JP O JPY 5,000 6,525 31 8,869 68.0 1 1 2 (4) 22 (2) (0) 1 7 18 Mar-13 (20) (32) (22) 5.1 6.4 9.3 12.0 96 70 2.9 23.0 1.3 0.4 2.3 (50)
Kawasaki Kisen Kaisha. 9107 JP U JPY 212.0 200.0 (6) 1,945 41.1 3 (0) (1) (20) 1 0 (2) (2) (10) (3) Mar-13 4 130 36 19.8 19.0 8.3 6.1 68 96 1.2 3.7 0.6 0.5 6.5 101 Mitsui O.S.K. Lines Ltd 9104 JP O JPY 364.0 510.0 40 4,259 61.8 3 (3) (7) (23) 6 (0) (5) (8) (13) 1 Mar-13 nm (7) 30 nm 7.2 7.7 5.9 116 99 0.5 10.7 0.7 0.8 8.7 128 Nippon Yusen Kabushiki Kaisha
9101 JP O JPY 285.0 360.0 26 4,729 56.6 3 (3) (4) (15) 17 0 (5) (5) (5) 13 Mar-13 139 60 10 25.6 10.7 6.7 6.1 135 136 1.8 6.7 0.7 0.8 8.7 144
Sector* 22 27,340 2 (1) (2) (7) 15 (1) (3) (3) 3 10 Mar-13 277 (1) 8 37.7 10.0 10.1 9.3 104 91 1.7 9.5 0.9 0.7 6.2 76
Country Average* TPX 1,167 1,376 18 2,749,385 3 1 1 (10) 4 Mar-13 54 8 11 21.4 13.9 12.9 11.3 101 99 2.1 9.4 1.3 0.8 7.3 33
* Country/ sector aggregates are for the coverage above. Source: Company data, Thomson Financial IBES, Credit Suisse estimates
South Korea: Valuation summary Bberg Price Market Avg Absolute Performance Relative Performance FYE EPS growth P/E CS / Dvd ROE P/BV EV/ EV/ Net Debt/ daily con. EPS Yld Sales EBITDA Equity
Stock Ticker View Local Target Upside cap t/o (%) (%) Actual (%) (x) (%) (%) (%) (x) (x) (x) (%)
16 April 2014 (%) (USDm) 1d 1w 1m YTD 12m T 1w 1m YTD 12m T T+1 T+2 T+3 T T+1 T+2 T+3 T+1 T+2 T+1
Automobiles & Components
Henry Kwon - 82 2 3707 3732
Hyundai Mobis 012330 KS O KRW 307,000 374,000 22 28,807 49.6 0 (3) 2 5 15 0 (2) (1) 6 11 Dec-12 (6) 18 8 8.3 8.8 7.4 6.9 98 105 0.6 18.4 1.5 0.9 8.8 3 Hyundai Motor 005380 KS O KRW 242,000 294,000 21 51,385 103.2 2 (1) 3 2 26 2 (0) 0 3 23 Dec-12 4 4 9 5.9 5.7 5.4 5.0 135 121 0.7 17.9 1.0 0.9 6.6 45
Hyundai Wia 011210 KS O KRW 161,000 213,000 32 3,993 17.2 1 (2) (4) (15) 16 1 (2) (7) (14) 12 Dec-12 4 6 5 10.2 9.8 9.3 8.8 101 95 0.3 20.7 1.8 0.6 6.8 13 KIA Motors 000270 KS N KRW 59,000 60,000 2 23,054 69.8 (1) (0) 4 5 15 (1) (0) 1 6 11 Dec-12 (1) 1 10 6.2 6.3 6.2 5.6 100 101 0.0 21.0 1.2 0.4 4.9 (13) Mando 060980 KS N KRW 117,500 135,000 15 2,039 17.5 (3) (2) (15) (6) 49 (3) (1) (19) (5) 45 Dec-12 10 41 (16) 13.1 11.9 8.4 10.0 99 99 0.9 11.2 1.3 0.6 6.9 77
Sector* 18 109,278 1 (1) 3 3 21 1 (1) (1) 4 17 Dec-13 7 8 5 6.6 6.2 5.7 5.1 112 111 0.5 16.8 1.0 0.7 6.3 23
Banks Gil Kim - 82 2 3707 3763
DGB Financial 139130 KS O KRW 15,350 18,000 17 1,984 3.9 0 (0) 3 (7) (5) 0 0 (0) (6) (9) Dec-12 (17) 34 12 7.9 9.4 7.1 6.3 91 103 1.8 9.4 0.9 na na na IBK 024110 KS O KRW 12,600 14,000 11 6,711 13.3 (0) (1) (2) 4 2 (0) (0) (5) 5 (2) Dec-12 (25) 22 9 6.3 8.4 6.9 6.3 119 113 2.4 8.0 0.6 na na na KB Financial 105560 KS O KRW 37,000 46,000 24 13,780 40.4 0 (1) 1 (12) 4 0 (1) (3) (11) 0 Dec-12 (3) 45 7 10.3 10.7 7.4 6.9 107 120 1.1 5.8 0.6 na na na
SFG 055550 KS O KRW 46,000 53,000 15 21,027 36.6 (1) (1) 4 (3) 18 (1) (1) 1 (2) 14 Dec-12 (15) 34 0 10.8 12.6 9.5 9.4 95 110 1.4 7.6 0.9 na na na WFH 053000 KS R KRW 12,100 9,401 16.4 0 (2) 3 (9) 3 0 (2) (0) (8) (1) Dec-12 (37) 43 8 7.6 12.1 8.5 7.9 nm 98 1.7 4.8 0.6 na na na Sector* 18 55,819 (0) (1) 2 (6) 9 (0) (1) (1) (5) 5 Dec-13 35 6 na 11.0 8.2 7.7 na 110 103 2.0 8.6 0.7 na na na
Capital Goods Henry Kwon / Minseok Sinn - 82 2 3707 3732 / 82 2 3707 8898
DHI 034020 KS N KRW 37,000 33,000 (11) 3,786 16.1 2 3 9 5 (6) 2 3 5 5 (9) Dec-12 81 205 20 102.9 56.8 18.6 15.6 84 106 0.0 1.7 0.9 0.8 10.9 204
Daelim Industrial 000210 KS O KRW 83,700 103,000 23 2,808 24.2 (1) (3) 0 (11) 13 (1) (3) (3) (10) 9 Dec-12 (103) nm 33 8.1 nm 10.0 7.6 247 95 0.6 (0.2) 0.7 0.3 33.1 6 Daewoo E&C 047040 KS N KRW 8,050 6,000 (25) 3,225 7.1 1 (1) 2 9 2 1 (1) (1) 10 (2) Dec-12 (476) nm 92 19.3 nm 21.7 11.3 112 62 0.0 (21.1) 1.2 0.7 nm 91 GS E&C 006360 KS U KRW 37,350 30,000 (20) 1,836 24.0 0 4 3 22 14 0 4 (0) 23 10 Dec-12 (812) nm 509 17.1 nm 39.3 6.5 107 51 0.7 (21.4) 0.6 0.4 nm 74
Hyundai Dev 012630 KS O KRW 28,300 30,000 6 2,056 9.6 (4) (6) 1 22 25 (4) (5) (2) 23 22 Dec-12 nm nm 6 373.7 nm 12.5 11.8 104 145 0.0 (8.6) 1.0 1.0 nm 88 Hyundai E&C 000720 KS O KRW 56,000 70,000 25 6,011 22.7 (1) (2) 3 (8) (3) (1) (2) (1) (7) (7) Dec-12 1 47 17 11.0 10.9 7.4 6.4 114 133 0.9 11.4 1.2 0.5 7.4 8 Hyundai Heavy 009540 KS O KRW 208,000 248,000 19 15,238 54.3 (0) (5) 1 (19) 8 (0) (5) (3) (18) 5 Dec-12 (63) 124 32 13.4 36.5 16.3 12.3 113 169 3.6 2.5 0.9 0.5 16.2 72
Hyundai Mipo 010620 KS N KRW 155,500 166,000 7 2,998 21.1 (1) (5) (3) (13) 46 (1) (5) (6) (12) 42 Dec-12 (341) nm nm 32.2 nm nm 23.7 104 98 1.3 (8.0) 1.2 1.3 nm 69 Samsung C&T 000830 KS O KRW 63,700 75,000 18 9,592 28.8 (2) (1) 8 5 2 (2) (1) 4 6 (2) Dec-12 (43) 82 11 20.7 36.2 19.9 17.9 108 103 0.8 2.3 0.9 0.5 21.9 26 Samsung Engineering 028050 KS N KRW 77,300 70,000 (9) 2,981 27.6 (0) 4 12 17 (16) (0) 4 8 18 (20) Dec-12 (231) nm 99 5.5 nm 14.8 7.4 104 159 0.0 (51.3) 3.4 0.4 nm 128
Samsung Heavy 010140 KS O KRW 30,850 39,000 26 6,866 49.8 (1) (4) (0) (19) 1 (1) (4) (4) (18) (3) Dec-12 (22) 22 1 8.8 11.3 9.2 9.1 94 109 1.6 11.4 1.2 0.6 7.7 40 Sector* 12 63,061 (1) (3) 3 (6) 8 (1) (3) (1) (5) 4 Dec-13 na 35 (6) nm 14.5 10.7 12.3 119 111 1.7 6.5 0.9 0.5 11.3 60
Chemicals A-Hyung Cho / Kenneth Whee - 82 2 3707 3735 / 852 2101 7319
Hanwha Chem 009830 KS N KRW 17,550 23,000 31 2,373 20.0 (3) (10) (12) (19) 6 (3) (10) (16) (18) 2 Dec-12 nm nm 10 nm nm 9.3 8.5 nm 162 0.9 (2.1) 0.5 0.9 15.1 105 LG Chem 051910 KS O KRW 261,500 330,000 26 16,705 54.6 0 (4) 8 (13) 9 0 (3) 5 (12) 6 Dec-12 (16) 29 17 11.5 13.6 10.6 9.0 112 116 1.5 11.3 1.5 0.8 6.4 7
Lotte Chemical 011170 KS N KRW 181,500 210,000 16 5,997 37.6 (1) (6) 0 (22) 14 (1) (5) (3) (21) 10 Dec-12 (16) 31 44 18.3 21.8 16.6 11.5 98 72 1.1 4.5 1.0 0.4 7.1 11 OCI Company 010060 KS O KRW 173,000 250,000 45 3,977 36.2 (1) (4) (10) (9) 16 (1) (4) (13) (8) 12 Dec-12 nm nm 105 324.4 nm 29.5 14.4 114 124 0.2 (8.3) 1.3 1.9 13.4 47 Sector* 27 29,052 (0) (5) 2 (15) 11 (0) (4) (1) (14) 7 Dec-13 105 26 na 25.6 12.5 9.9 na 109 104 1.3 8.9 1.1 0.7 6.6 27
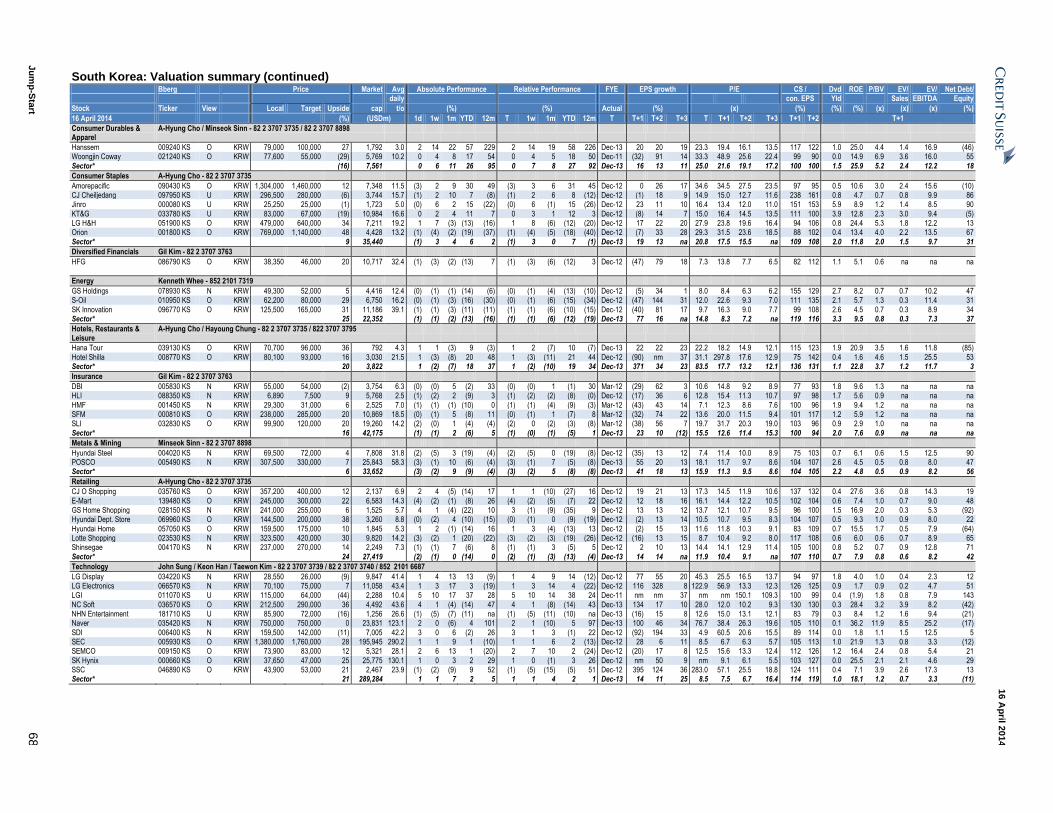
Ju
mp
-Sta
rt 6
8
16 A
pril 2
014
South Korea: Valuation summary (continued) Bberg Price Market Avg Absolute Performance Relative Performance FYE EPS growth P/E CS / Dvd ROE P/BV EV/ EV/ Net Debt/ daily con. EPS Yld Sales EBITDA Equity
Stock Ticker View Local Target Upside cap t/o (%) (%) Actual (%) (x) (%) (%) (%) (x) (x) (x) (%)
16 April 2014 (%) (USDm) 1d 1w 1m YTD 12m T 1w 1m YTD 12m T T+1 T+2 T+3 T T+1 T+2 T+3 T+1 T+2 T+1
Consumer Durables & Apparel
A-Hyung Cho / Minseok Sinn - 82 2 3707 3735 / 82 2 3707 8898
Hanssem 009240 KS O KRW 79,000 100,000 27 1,792 3.0 2 14 22 57 229 2 14 19 58 226 Dec-13 20 20 19 23.3 19.4 16.1 13.5 117 122 1.0 25.0 4.4 1.4 16.9 (46) Woongjin Coway 021240 KS O KRW 77,600 55,000 (29) 5,769 10.2 0 4 8 17 54 0 4 5 18 50 Dec-11 (32) 91 14 33.3 48.9 25.6 22.4 99 90 0.0 14.9 6.9 3.6 16.0 55
Sector* (16) 7,561 0 6 11 26 95 0 7 8 27 92 Dec-13 16 13 11 25.0 21.6 19.1 17.2 100 100 1.5 25.9 5.2 2.4 12.2 18
Consumer Staples A-Hyung Cho - 82 2 3707 3735
Amorepacific 090430 KS O KRW 1,304,000 1,460,000 12 7,348 11.5 (3) 2 9 30 49 (3) 3 6 31 45 Dec-12 0 26 17 34.6 34.5 27.5 23.5 97 95 0.5 10.6 3.0 2.4 15.6 (10) CJ Cheiljedang 097950 KS U KRW 296,500 280,000 (6) 3,744 15.7 (1) 2 10 7 (8) (1) 2 6 8 (12) Dec-12 (1) 18 9 14.9 15.0 12.7 11.6 238 161 0.8 4.7 0.7 0.8 9.9 86 Jinro 000080 KS U KRW 25,250 25,000 (1) 1,723 5.0 (0) 6 2 15 (22) (0) 6 (1) 15 (26) Dec-12 23 11 10 16.4 13.4 12.0 11.0 151 153 5.9 8.9 1.2 1.4 8.5 90
KT&G 033780 KS U KRW 83,000 67,000 (19) 10,984 16.6 0 2 4 11 7 0 3 1 12 3 Dec-12 (8) 14 7 15.0 16.4 14.5 13.5 111 100 3.9 12.8 2.3 3.0 9.4 (5) LG H&H 051900 KS O KRW 479,000 640,000 34 7,211 19.2 1 7 (3) (13) (16) 1 8 (6) (12) (20) Dec-12 17 22 20 27.9 23.8 19.6 16.4 94 106 0.8 24.4 5.3 1.8 12.2 13 Orion 001800 KS O KRW 769,000 1,140,000 48 4,428 13.2 (1) (4) (2) (19) (37) (1) (4) (5) (18) (40) Dec-12 (7) 33 28 29.3 31.5 23.6 18.5 88 102 0.4 13.4 4.0 2.2 13.5 67
Sector* 9 35,440 (1) 3 4 6 2 (1) 3 0 7 (1) Dec-13 19 13 na 20.8 17.5 15.5 na 109 108 2.0 11.8 2.0 1.5 9.7 31
Diversified Financials Gil Kim - 82 2 3707 3763
HFG 086790 KS O KRW 38,350 46,000 20 10,717 32.4 (1) (3) (2) (13) 7 (1) (3) (6) (12) 3 Dec-12 (47) 79 18 7.3 13.8 7.7 6.5 82 112 1.1 5.1 0.6 na na na
Energy Kenneth Whee - 852 2101 7319
GS Holdings 078930 KS N KRW 49,300 52,000 5 4,416 12.4 (0) (1) (1) (14) (6) (0) (1) (4) (13) (10) Dec-12 (5) 34 1 8.0 8.4 6.3 6.2 155 129 2.7 8.2 0.7 0.7 10.2 47 S-Oil 010950 KS O KRW 62,200 80,000 29 6,750 16.2 (0) (1) (3) (16) (30) (0) (1) (6) (15) (34) Dec-12 (47) 144 31 12.0 22.6 9.3 7.0 111 135 2.1 5.7 1.3 0.3 11.4 31
SK Innovation 096770 KS O KRW 125,500 165,000 31 11,186 39.1 (1) (1) (3) (11) (11) (1) (1) (6) (10) (15) Dec-12 (40) 81 17 9.7 16.3 9.0 7.7 99 108 2.6 4.5 0.7 0.3 8.9 34 Sector* 25 22,352 (1) (1) (2) (13) (16) (1) (1) (6) (12) (19) Dec-13 77 16 na 14.8 8.3 7.2 na 119 116 3.3 9.5 0.8 0.3 7.3 37
Hotels, Restaurants & Leisure
A-Hyung Cho / Hayoung Chung - 82 2 3707 3735 / 822 3707 3795
Hana Tour 039130 KS O KRW 70,700 96,000 36 792 4.3 1 1 (3) 9 (3) 1 2 (7) 10 (7) Dec-13 22 22 23 22.2 18.2 14.9 12.1 115 123 1.9 20.9 3.5 1.6 11.8 (85)
Hotel Shilla 008770 KS O KRW 80,100 93,000 16 3,030 21.5 1 (3) (8) 20 48 1 (3) (11) 21 44 Dec-12 (90) nm 37 31.1 297.8 17.6 12.9 75 142 0.4 1.6 4.6 1.5 25.5 53 Sector* 20 3,822 1 (2) (7) 18 37 1 (2) (10) 19 34 Dec-13 371 34 23 83.5 17.7 13.2 12.1 136 131 1.1 22.8 3.7 1.2 11.7 3
Insurance Gil Kim - 82 2 3707 3763
DBI 005830 KS N KRW 55,000 54,000 (2) 3,754 6.3 (0) (0) 5 (2) 33 (0) (0) 1 (1) 30 Mar-12 (29) 62 3 10.6 14.8 9.2 8.9 77 93 1.8 9.6 1.3 na na na HLI 088350 KS N KRW 6,890 7,500 9 5,768 2.5 (1) (2) 2 (9) 3 (1) (2) (2) (8) (0) Dec-12 (17) 36 6 12.8 15.4 11.3 10.7 97 98 1.7 5.6 0.9 na na na
HMF 001450 KS N KRW 29,300 31,000 6 2,525 7.0 (1) (1) (1) (10) 0 (1) (1) (4) (9) (3) Mar-12 (43) 43 14 7.1 12.3 8.6 7.6 100 96 1.9 9.4 1.2 na na na SFM 000810 KS O KRW 238,000 285,000 20 10,869 18.5 (0) (1) 5 (8) 11 (0) (1) 1 (7) 8 Mar-12 (32) 74 22 13.6 20.0 11.5 9.4 101 117 1.2 5.9 1.2 na na na SLI 032830 KS O KRW 99,900 120,000 20 19,260 14.2 (2) (0) 1 (4) (4) (2) 0 (2) (3) (8) Mar-12 (38) 56 7 19.7 31.7 20.3 19.0 103 96 0.9 2.9 1.0 na na na
Sector* 16 42,175 (1) (1) 2 (6) 5 (1) (0) (1) (5) 1 Dec-13 23 10 (12) 15.5 12.6 11.4 15.3 100 94 2.0 7.6 0.9 na na na
Metals & Mining Minseok Sinn - 82 2 3707 8898
Hyundai Steel 004020 KS N KRW 69,500 72,000 4 7,808 31.8 (2) (5) 3 (19) (4) (2) (5) 0 (19) (8) Dec-12 (35) 13 12 7.4 11.4 10.0 8.9 75 103 0.7 6.1 0.6 1.5 12.5 90 POSCO 005490 KS N KRW 307,500 330,000 7 25,843 58.3 (3) (1) 10 (6) (4) (3) (1) 7 (5) (8) Dec-13 55 20 13 18.1 11.7 9.7 8.6 104 107 2.6 4.5 0.5 0.8 8.0 47 Sector* 6 33,652 (3) (2) 9 (9) (4) (3) (2) 5 (8) (8) Dec-13 41 18 13 15.9 11.3 9.5 8.6 104 105 2.2 4.8 0.5 0.9 8.2 56
Retailing A-Hyung Cho - 82 2 3707 3735
CJ O Shopping 035760 KS O KRW 357,200 400,000 12 2,137 6.9 2 4 (5) (14) 17 1 1 (10) (27) 16 Dec-12 19 21 13 17.3 14.5 11.9 10.6 137 132 0.4 27.6 3.6 0.8 14.3 19
E-Mart 139480 KS O KRW 245,000 300,000 22 6,583 14.3 (4) (2) (1) (8) 26 (4) (2) (5) (7) 22 Dec-12 12 18 16 16.1 14.4 12.2 10.5 102 104 0.6 7.4 1.0 0.7 9.0 48 GS Home Shopping 028150 KS N KRW 241,000 255,000 6 1,525 5.7 4 1 (4) (22) 10 3 (1) (9) (35) 9 Dec-12 13 13 12 13.7 12.1 10.7 9.5 96 100 1.5 16.9 2.0 0.3 5.3 (92) Hyundai Dept. Store 069960 KS O KRW 144,500 200,000 38 3,260 8.8 (0) (2) 4 (10) (15) (0) (1) 0 (9) (19) Dec-12 (2) 13 14 10.5 10.7 9.5 8.3 104 107 0.5 9.3 1.0 0.9 8.0 22
Hyundai Home 057050 KS O KRW 159,500 175,000 10 1,845 5.3 1 2 (1) (14) 16 1 3 (4) (13) 13 Dec-12 (2) 15 13 11.6 11.8 10.3 9.1 83 109 0.7 15.5 1.7 0.5 7.9 (64) Lotte Shopping 023530 KS N KRW 323,500 420,000 30 9,820 14.2 (3) (2) 1 (20) (22) (3) (2) (3) (19) (26) Dec-12 (16) 13 15 8.7 10.4 9.2 8.0 117 108 0.6 6.0 0.6 0.7 8.9 65 Shinsegae 004170 KS N KRW 237,000 270,000 14 2,249 7.3 (1) (1) 7 (6) 8 (1) (1) 3 (5) 5 Dec-12 2 10 13 14.4 14.1 12.9 11.4 105 100 0.8 5.2 0.7 0.9 12.8 71
Sector* 24 27,419 (2) (1) 0 (14) 0 (2) (1) (3) (13) (4) Dec-13 14 14 na 11.9 10.4 9.1 na 107 110 0.7 7.9 0.8 0.6 8.2 42
Technology John Sung / Keon Han / Taewon Kim - 82 2 3707 3739 / 82 2 3707 3740 / 852 2101 6687
LG Display 034220 KS N KRW 28,550 26,000 (9) 9,847 41.4 1 4 13 13 (9) 1 4 9 14 (12) Dec-12 77 55 20 45.3 25.5 16.5 13.7 94 97 1.8 4.0 1.0 0.4 2.3 12 LG Electronics 066570 KS N KRW 70,100 75,000 7 11,058 43.4 1 3 17 3 (19) 1 3 14 4 (22) Dec-12 116 328 8 122.9 56.9 13.3 12.3 126 125 0.9 1.7 0.9 0.2 4.7 51 LGI 011070 KS U KRW 115,000 64,000 (44) 2,288 10.4 5 10 17 37 28 5 10 14 38 24 Dec-11 nm nm 37 nm nm 150.1 109.3 100 99 0.4 (1.9) 1.8 0.8 7.9 143
NC Soft 036570 KS O KRW 212,500 290,000 36 4,492 43.6 4 1 (4) (14) 47 4 1 (8) (14) 43 Dec-13 134 17 10 28.0 12.0 10.2 9.3 130 130 0.3 28.4 3.2 3.9 8.2 (42) NHN Entertainment 181710 KS U KRW 85,900 72,000 (16) 1,256 26.6 (1) (5) (7) (11) na (1) (5) (11) (10) na Dec-13 (16) 15 8 12.6 15.0 13.1 12.1 83 79 0.3 8.4 1.2 1.6 9.4 (21) Naver 035420 KS N KRW 750,000 750,000 0 23,831 123.1 2 0 (6) 4 101 2 1 (10) 5 97 Dec-13 100 46 34 76.7 38.4 26.3 19.6 105 110 0.1 36.2 11.9 8.5 25.2 (17)
SDI 006400 KS N KRW 159,500 142,000 (11) 7,005 42.2 3 0 6 (2) 26 3 1 3 (1) 22 Dec-12 (92) 194 33 4.9 60.5 20.6 15.5 89 114 0.0 1.8 1.1 1.5 12.5 5 SEC 005930 KS O KRW 1,380,000 1,760,000 28 195,945 290.2 1 1 9 1 (10) 1 1 6 2 (13) Dec-12 28 6 11 8.5 6.7 6.3 5.7 105 113 1.0 21.9 1.3 0.8 3.3 (12) SEMCO 009150 KS O KRW 73,900 83,000 12 5,321 28.1 2 6 13 1 (20) 2 7 10 2 (24) Dec-12 (20) 17 8 12.5 15.6 13.3 12.4 112 126 1.2 16.4 2.4 0.8 5.4 21
SK Hynix 000660 KS O KRW 37,650 47,000 25 25,775 130.1 1 0 3 2 29 1 0 (1) 3 26 Dec-12 nm 50 9 nm 9.1 6.1 5.5 103 127 0.0 25.5 2.1 2.1 4.6 29 SSC 046890 KS O KRW 43,900 53,000 21 2,467 23.9 (1) (2) (9) 9 52 (1) (5) (15) (5) 51 Dec-12 395 124 36 283.0 57.1 25.5 18.8 124 111 0.4 7.1 3.9 2.6 17.3 13 Sector* 21 289,284 1 1 7 2 5 1 1 4 2 1 Dec-13 14 11 25 8.5 7.5 6.7 16.4 114 119 1.0 18.1 1.2 0.7 3.3 (11)
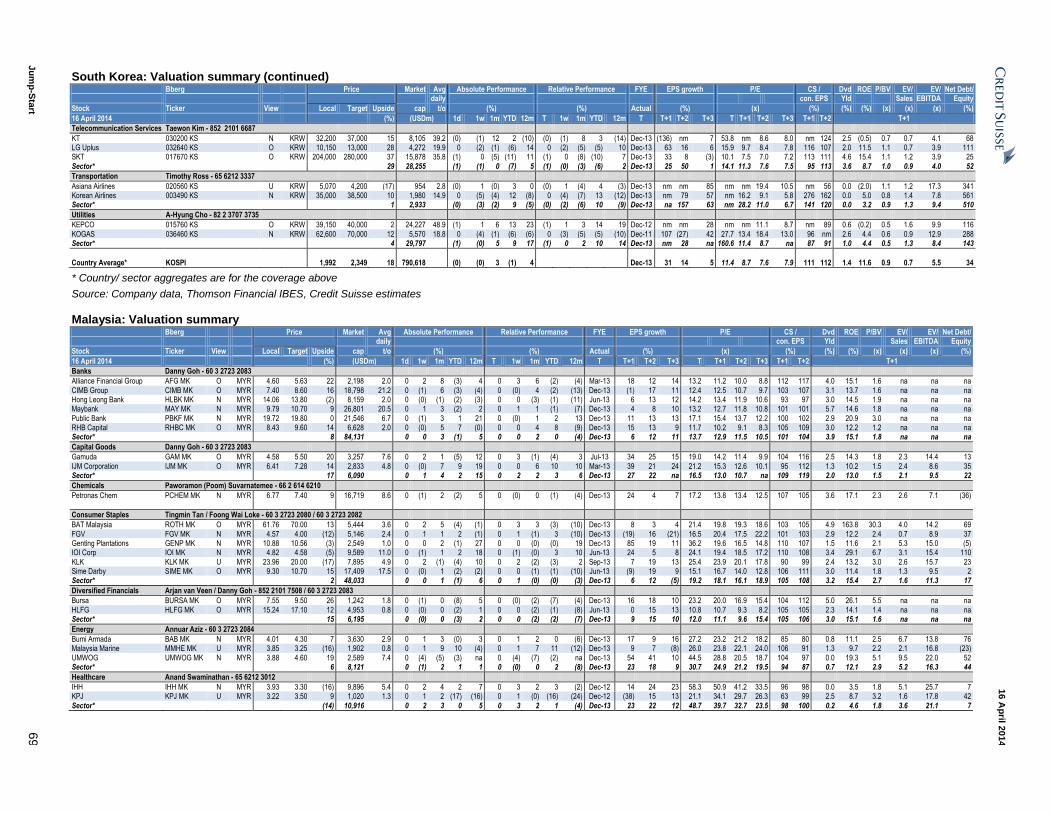
Ju
mp
-Sta
rt 6
9
16 A
pril 2
014
South Korea: Valuation summary (continued) Bberg Price Market Avg Absolute Performance Relative Performance FYE EPS growth P/E CS / Dvd ROE P/BV EV/ EV/ Net Debt/ daily con. EPS Yld Sales EBITDA Equity
Stock Ticker View Local Target Upside cap t/o (%) (%) Actual (%) (x) (%) (%) (%) (x) (x) (x) (%)
16 April 2014 (%) (USDm) 1d 1w 1m YTD 12m T 1w 1m YTD 12m T T+1 T+2 T+3 T T+1 T+2 T+3 T+1 T+2 T+1
Telecommunication Services Taewon Kim - 852 2101 6687
KT 030200 KS N KRW 32,200 37,000 15 8,105 39.2 (0) (1) 12 2 (10) (0) (1) 8 3 (14) Dec-13 (136) nm 7 53.8 nm 8.6 8.0 nm 124 2.5 (0.5) 0.7 0.7 4.1 68 LG Uplus 032640 KS O KRW 10,150 13,000 28 4,272 19.9 0 (2) (1) (6) 14 0 (2) (5) (5) 10 Dec-13 63 16 6 15.9 9.7 8.4 7.8 116 107 2.0 11.5 1.1 0.7 3.9 111 SKT 017670 KS O KRW 204,000 280,000 37 15,878 35.8 (1) 0 (5) (11) 11 (1) 0 (8) (10) 7 Dec-13 33 8 (3) 10.1 7.5 7.0 7.2 113 111 4.6 15.4 1.1 1.2 3.9 25
Sector* 29 28,255 (1) (1) 0 (7) 5 (1) (0) (3) (6) 2 Dec-13 25 50 1 14.1 11.3 7.6 7.5 95 113 3.6 8.7 1.0 0.9 4.0 52
Transportation Timothy Ross - 65 6212 3337
Asiana Airlines 020560 KS U KRW 5,070 4,200 (17) 954 2.8 (0) 1 (0) 3 0 (0) 1 (4) 4 (3) Dec-13 nm nm 85 nm nm 19.4 10.5 nm 56 0.0 (2.0) 1.1 1.2 17.3 341 Korean Airlines 003490 KS N KRW 35,000 38,500 10 1,980 14.9 0 (5) (4) 12 (8) 0 (4) (7) 13 (12) Dec-13 nm 79 57 nm 16.2 9.1 5.8 276 162 0.0 5.0 0.8 1.4 7.8 561 Sector* 1 2,933 (0) (3) (2) 9 (5) (0) (2) (6) 10 (9) Dec-13 na 157 63 nm 28.2 11.0 6.7 141 120 0.0 3.2 0.9 1.3 9.4 510
Utilities A-Hyung Cho - 82 2 3707 3735
KEPCO 015760 KS O KRW 39,150 40,000 2 24,227 48.9 (1) 1 6 13 23 (1) 1 3 14 19 Dec-12 nm nm 28 nm nm 11.1 8.7 nm 89 0.6 (0.2) 0.5 1.6 9.9 116
KOGAS 036460 KS N KRW 62,600 70,000 12 5,570 18.8 0 (4) (1) (6) (6) 0 (3) (5) (5) (10) Dec-11 107 (27) 42 27.7 13.4 18.4 13.0 96 nm 2.6 4.4 0.6 0.9 12.9 288 Sector* 4 29,797 (1) (0) 5 9 17 (1) 0 2 10 14 Dec-13 nm 28 na 160.6 11.4 8.7 na 87 91 1.0 4.4 0.5 1.3 8.4 143
Country Average* KOSPI 1,992 2,349 18 790,618 (0) (0) 3 (1) 4 Dec-13 31 14 5 11.4 8.7 7.6 7.9 111 112 1.4 11.6 0.9 0.7 5.5 34
* Country/ sector aggregates are for the coverage above
Source: Company data, Thomson Financial IBES, Credit Suisse estimates
Malaysia: Valuation summary Bberg Price Market Avg Absolute Performance Relative Performance FYE EPS growth P/E CS / Dvd ROE P/BV EV/ EV/ Net Debt/ daily con. EPS Yld Sales EBITDA Equity
Stock Ticker View Local Target Upside cap t/o (%) (%) Actual (%) (x) (%) (%) (%) (x) (x) (x) (%)
16 April 2014 (%) (USDm) 1d 1w 1m YTD 12m T 1w 1m YTD 12m T T+1 T+2 T+3 T T+1 T+2 T+3 T+1 T+2 T+1
Banks Danny Goh - 60 3 2723 2083
Alliance Financial Group AFG MK O MYR 4.60 5.63 22 2,198 2.0 0 2 8 (3) 4 0 3 6 (2) (4) Mar-13 18 12 14 13.2 11.2 10.0 8.8 112 117 4.0 15.1 1.6 na na na
CIMB Group CIMB MK O MYR 7.40 8.60 16 18,798 21.2 0 (1) 6 (3) (4) 0 (0) 4 (2) (13) Dec-13 (1) 17 11 12.4 12.5 10.7 9.7 103 107 3.1 13.7 1.6 na na na Hong Leong Bank HLBK MK N MYR 14.06 13.80 (2) 8,159 2.0 0 (0) (1) (2) (3) 0 0 (3) (1) (11) Jun-13 6 13 12 14.2 13.4 11.9 10.6 93 97 3.0 14.5 1.9 na na na Maybank MAY MK N MYR 9.79 10.70 9 26,801 20.5 0 1 3 (2) 2 0 1 1 (1) (7) Dec-13 4 8 10 13.2 12.7 11.8 10.8 101 101 5.7 14.6 1.8 na na na
Public Bank PBKF MK N MYR 19.72 19.80 0 21,546 6.7 0 (1) 3 1 21 0 (0) 1 2 13 Dec-13 11 13 13 17.1 15.4 13.7 12.2 100 102 2.9 20.9 3.0 na na na RHB Capital RHBC MK O MYR 8.43 9.60 14 6,628 2.0 0 (0) 5 7 (0) 0 0 4 8 (9) Dec-13 15 13 9 11.7 10.2 9.1 8.3 105 109 3.0 12.2 1.2 na na na Sector* 8 84,131 0 0 3 (1) 5 0 0 2 0 (4) Dec-13 6 12 11 13.7 12.9 11.5 10.5 101 104 3.9 15.1 1.8 na na na
Capital Goods Danny Goh - 60 3 2723 2083
Gamuda GAM MK O MYR 4.58 5.50 20 3,257 7.6 0 2 1 (5) 12 0 3 (1) (4) 3 Jul-13 34 25 15 19.0 14.2 11.4 9.9 104 116 2.5 14.3 1.8 2.3 14.4 13
IJM Corporation IJM MK O MYR 6.41 7.28 14 2,833 4.8 0 (0) 7 9 19 0 0 6 10 10 Mar-13 39 21 24 21.2 15.3 12.6 10.1 95 112 1.3 10.2 1.5 2.4 8.6 35 Sector* 17 6,090 0 1 4 2 15 0 2 2 3 6 Dec-13 27 22 na 16.5 13.0 10.7 na 109 119 2.0 13.0 1.5 2.1 9.5 22
Chemicals Paworamon (Poom) Suvarnatemee - 66 2 614 6210
Petronas Chem PCHEM MK N MYR 6.77 7.40 9 16,719 8.6 0 (1) 2 (2) 5 0 (0) 0 (1) (4) Dec-13 24 4 7 17.2 13.8 13.4 12.5 107 105 3.6 17.1 2.3 2.6 7.1 (36)
Consumer Staples Tingmin Tan / Foong Wai Loke - 60 3 2723 2080 / 60 3 2723 2082
BAT Malaysia ROTH MK O MYR 61.76 70.00 13 5,444 3.6 0 2 5 (4) (1) 0 3 3 (3) (10) Dec-13 8 3 4 21.4 19.8 19.3 18.6 103 105 4.9 163.8 30.3 4.0 14.2 69
FGV FGV MK N MYR 4.57 4.00 (12) 5,146 2.4 0 1 1 2 (1) 0 1 (1) 3 (10) Dec-13 (19) 16 (21) 16.5 20.4 17.5 22.2 101 103 2.9 12.2 2.4 0.7 8.9 37 Genting Plantations GENP MK N MYR 10.88 10.56 (3) 2,549 1.0 0 0 2 (1) 27 0 0 (0) (0) 19 Dec-13 85 19 11 36.2 19.6 16.5 14.8 110 107 1.5 11.6 2.1 5.3 15.0 (5) IOI Corp IOI MK N MYR 4.82 4.58 (5) 9,589 11.0 0 (1) 1 2 18 0 (1) (0) 3 10 Jun-13 24 5 8 24.1 19.4 18.5 17.2 110 108 3.4 29.1 6.7 3.1 15.4 110
KLK KLK MK U MYR 23.96 20.00 (17) 7,895 4.9 0 2 (1) (4) 10 0 2 (2) (3) 2 Sep-13 7 19 13 25.4 23.9 20.1 17.8 90 99 2.4 13.2 3.0 2.6 15.7 23 Sime Darby SIME MK O MYR 9.30 10.70 15 17,409 17.5 0 (0) 1 (2) (2) 0 0 (1) (1) (10) Jun-13 (9) 19 9 15.1 16.7 14.0 12.8 106 111 3.0 11.4 1.8 1.3 9.5 2 Sector* 2 48,033 0 0 1 (1) 6 0 1 (0) (0) (3) Dec-13 6 12 (5) 19.2 18.1 16.1 18.9 105 108 3.2 15.4 2.7 1.6 11.3 17
Diversified Financials Arjan van Veen / Danny Goh - 852 2101 7508 / 60 3 2723 2083
Bursa BURSA MK O MYR 7.55 9.50 26 1,242 1.8 0 (1) 0 (8) 5 0 (0) (2) (7) (4) Dec-13 16 18 10 23.2 20.0 16.9 15.4 104 112 5.0 26.1 5.5 na na na
HLFG HLFG MK O MYR 15.24 17.10 12 4,953 0.8 0 (0) 0 (2) 1 0 0 (2) (1) (8) Jun-13 0 15 13 10.8 10.7 9.3 8.2 105 105 2.3 14.1 1.4 na na na Sector* 15 6,195 0 (0) 0 (3) 2 0 0 (2) (2) (7) Dec-13 9 15 10 12.0 11.1 9.6 15.4 105 106 3.0 15.1 1.6 na na na
Energy Annuar Aziz - 60 3 2723 2084
Bumi Armada BAB MK N MYR 4.01 4.30 7 3,630 2.9 0 1 3 (0) 3 0 1 2 0 (6) Dec-13 17 9 16 27.2 23.2 21.2 18.2 85 80 0.8 11.1 2.5 6.7 13.8 76 Malaysia Marine MMHE MK U MYR 3.85 3.25 (16) 1,902 0.8 0 1 9 10 (4) 0 1 7 11 (12) Dec-13 9 7 (8) 26.0 23.8 22.1 24.0 106 91 1.3 9.7 2.2 2.1 16.8 (23)
UMWOG UMWOG MK N MYR 3.88 4.60 19 2,589 7.4 0 (4) (5) (3) na 0 (4) (7) (2) na Dec-13 54 41 10 44.5 28.8 20.5 18.7 104 97 0.0 19.3 5.1 9.5 22.0 52 Sector* 6 8,121 0 (1) 2 1 1 0 (0) 0 2 (8) Dec-13 23 18 9 30.7 24.9 21.2 19.5 94 87 0.7 12.1 2.9 5.2 16.3 44
Healthcare Anand Swaminathan - 65 6212 3012
IHH IHH MK N MYR 3.93 3.30 (16) 9,896 5.4 0 2 4 2 7 0 3 2 3 (2) Dec-12 14 24 23 58.3 50.9 41.2 33.5 96 98 0.0 3.5 1.8 5.1 25.7 7 KPJ KPJ MK U MYR 3.22 3.50 9 1,020 1.3 0 1 2 (17) (16) 0 1 (0) (16) (24) Dec-12 (38) 15 13 21.1 34.1 29.7 26.3 63 99 2.5 8.7 3.2 1.6 17.8 42
Sector* (14) 10,916 0 2 3 0 5 0 3 2 1 (4) Dec-13 23 22 12 48.7 39.7 32.7 23.5 98 100 0.2 4.6 1.8 3.6 21.1 7
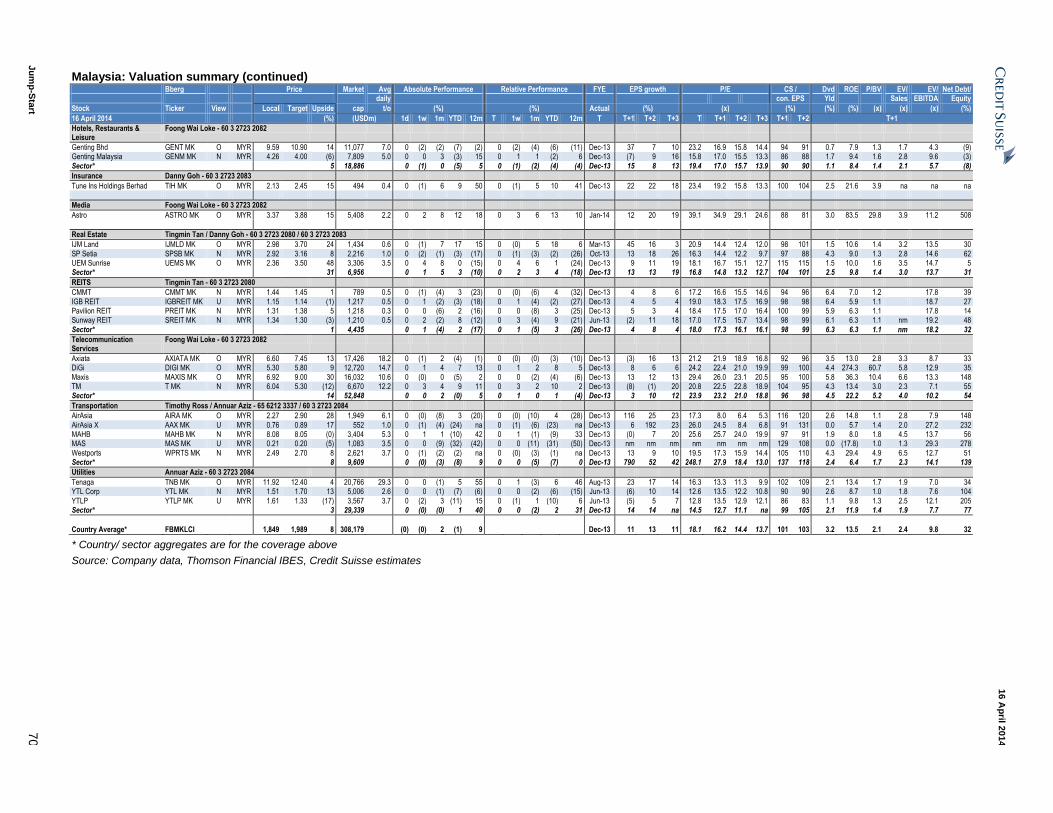
Ju
mp
-Sta
rt 7
0
16 A
pril 2
014
Malaysia: Valuation summary (continued) Bberg Price Market Avg Absolute Performance Relative Performance FYE EPS growth P/E CS / Dvd ROE P/BV EV/ EV/ Net Debt/ daily con. EPS Yld Sales EBITDA Equity
Stock Ticker View Local Target Upside cap t/o (%) (%) Actual (%) (x) (%) (%) (%) (x) (x) (x) (%)
16 April 2014 (%) (USDm) 1d 1w 1m YTD 12m T 1w 1m YTD 12m T T+1 T+2 T+3 T T+1 T+2 T+3 T+1 T+2 T+1
Hotels, Restaurants & Leisure
Foong Wai Loke - 60 3 2723 2082
Genting Bhd GENT MK O MYR 9.59 10.90 14 11,077 7.0 0 (2) (2) (7) (2) 0 (2) (4) (6) (11) Dec-13 37 7 10 23.2 16.9 15.8 14.4 94 91 0.7 7.9 1.3 1.7 4.3 (9) Genting Malaysia GENM MK N MYR 4.26 4.00 (6) 7,809 5.0 0 0 3 (3) 15 0 1 1 (2) 6 Dec-13 (7) 9 16 15.8 17.0 15.5 13.3 86 88 1.7 9.4 1.6 2.8 9.6 (3)
Sector* 5 18,886 0 (1) 0 (5) 5 0 (1) (2) (4) (4) Dec-13 15 8 13 19.4 17.0 15.7 13.9 90 90 1.1 8.4 1.4 2.1 5.7 (8)
Insurance Danny Goh - 60 3 2723 2083
Tune Ins Holdings Berhad TIH MK O MYR 2.13 2.45 15 494 0.4 0 (1) 6 9 50 0 (1) 5 10 41 Dec-13 22 22 18 23.4 19.2 15.8 13.3 100 104 2.5 21.6 3.9 na na na
Media Foong Wai Loke - 60 3 2723 2082
Astro ASTRO MK O MYR 3.37 3.88 15 5,408 2.2 0 2 8 12 18 0 3 6 13 10 Jan-14 12 20 19 39.1 34.9 29.1 24.6 88 81 3.0 83.5 29.8 3.9 11.2 508
Real Estate Tingmin Tan / Danny Goh - 60 3 2723 2080 / 60 3 2723 2083
IJM Land IJMLD MK O MYR 2.98 3.70 24 1,434 0.6 0 (1) 7 17 15 0 (0) 5 18 6 Mar-13 45 16 3 20.9 14.4 12.4 12.0 98 101 1.5 10.6 1.4 3.2 13.5 30
SP Setia SPSB MK N MYR 2.92 3.16 8 2,216 1.0 0 (2) (1) (3) (17) 0 (1) (3) (2) (26) Oct-13 13 18 26 16.3 14.4 12.2 9.7 97 88 4.3 9.0 1.3 2.8 14.6 62 UEM Sunrise UEMS MK O MYR 2.36 3.50 48 3,306 3.5 0 4 8 0 (15) 0 4 6 1 (24) Dec-13 9 11 19 18.1 16.7 15.1 12.7 115 115 1.5 10.0 1.6 3.5 14.7 5 Sector* 31 6,956 0 1 5 3 (10) 0 2 3 4 (18) Dec-13 13 13 19 16.8 14.8 13.2 12.7 104 101 2.5 9.8 1.4 3.0 13.7 31
REITS Tingmin Tan - 60 3 2723 2080
CMMT CMMT MK N MYR 1.44 1.45 1 789 0.5 0 (1) (4) 3 (23) 0 (0) (6) 4 (32) Dec-13 4 8 6 17.2 16.6 15.5 14.6 94 96 6.4 7.0 1.2 17.8 39
IGB REIT IGBREIT MK U MYR 1.15 1.14 (1) 1,217 0.5 0 1 (2) (3) (18) 0 1 (4) (2) (27) Dec-13 4 5 4 19.0 18.3 17.5 16.9 98 98 6.4 5.9 1.1 18.7 27 Pavilion REIT PREIT MK N MYR 1.31 1.38 5 1,218 0.3 0 0 (6) 2 (16) 0 0 (8) 3 (25) Dec-13 5 3 4 18.4 17.5 17.0 16.4 100 99 5.9 6.3 1.1 17.8 14 Sunway REIT SREIT MK N MYR 1.34 1.30 (3) 1,210 0.5 0 2 (2) 8 (12) 0 3 (4) 9 (21) Jun-13 (2) 11 18 17.0 17.5 15.7 13.4 98 99 6.1 6.3 1.1 nm 19.2 48
Sector* 1 4,435 0 1 (4) 2 (17) 0 1 (5) 3 (26) Dec-13 4 8 4 18.0 17.3 16.1 16.1 98 99 6.3 6.3 1.1 nm 18.2 32
Telecommunication Services
Foong Wai Loke - 60 3 2723 2082
Axiata AXIATA MK O MYR 6.60 7.45 13 17,426 18.2 0 (1) 2 (4) (1) 0 (0) (0) (3) (10) Dec-13 (3) 16 13 21.2 21.9 18.9 16.8 92 96 3.5 13.0 2.8 3.3 8.7 33 DiGi DIGI MK O MYR 5.30 5.80 9 12,720 14.7 0 1 4 7 13 0 1 2 8 5 Dec-13 8 6 6 24.2 22.4 21.0 19.9 99 100 4.4 274.3 60.7 5.8 12.9 35
Maxis MAXIS MK O MYR 6.92 9.00 30 16,032 10.6 0 (0) 0 (5) 2 0 0 (2) (4) (6) Dec-13 13 12 13 29.4 26.0 23.1 20.5 95 100 5.8 36.3 10.4 6.6 13.3 148 TM T MK N MYR 6.04 5.30 (12) 6,670 12.2 0 3 4 9 11 0 3 2 10 2 Dec-13 (8) (1) 20 20.8 22.5 22.8 18.9 104 95 4.3 13.4 3.0 2.3 7.1 55 Sector* 14 52,848 0 0 2 (0) 5 0 1 0 1 (4) Dec-13 3 10 12 23.9 23.2 21.0 18.8 96 98 4.5 22.2 5.2 4.0 10.2 54
Transportation Timothy Ross / Annuar Aziz - 65 6212 3337 / 60 3 2723 2084
AirAsia AIRA MK O MYR 2.27 2.90 28 1,949 6.1 0 (0) (8) 3 (20) 0 (0) (10) 4 (28) Dec-13 116 25 23 17.3 8.0 6.4 5.3 116 120 2.6 14.8 1.1 2.8 7.9 148
AirAsia X AAX MK U MYR 0.76 0.89 17 552 1.0 0 (1) (4) (24) na 0 (1) (6) (23) na Dec-13 6 192 23 26.0 24.5 8.4 6.8 91 131 0.0 5.7 1.4 2.0 27.2 232 MAHB MAHB MK N MYR 8.08 8.05 (0) 3,404 5.3 0 1 1 (10) 42 0 1 (1) (9) 33 Dec-13 (0) 7 20 25.6 25.7 24.0 19.9 97 91 1.9 8.0 1.8 4.5 13.7 56 MAS MAS MK U MYR 0.21 0.20 (5) 1,083 3.5 0 0 (9) (32) (42) 0 0 (11) (31) (50) Dec-13 nm nm nm nm nm nm nm 129 108 0.0 (17.8) 1.0 1.3 29.3 278
Westports WPRTS MK N MYR 2.49 2.70 8 2,621 3.7 0 (1) (2) (2) na 0 (0) (3) (1) na Dec-13 13 9 10 19.5 17.3 15.9 14.4 105 110 4.3 29.4 4.9 6.5 12.7 51 Sector* 8 9,609 0 (0) (3) (8) 9 0 0 (5) (7) 0 Dec-13 790 52 42 248.1 27.9 18.4 13.0 137 118 2.4 6.4 1.7 2.3 14.1 139
Utilities Annuar Aziz - 60 3 2723 2084
Tenaga TNB MK O MYR 11.92 12.40 4 20,766 29.3 0 0 (1) 5 55 0 1 (3) 6 46 Aug-13 23 17 14 16.3 13.3 11.3 9.9 102 109 2.1 13.4 1.7 1.9 7.0 34 YTL Corp YTL MK N MYR 1.51 1.70 13 5,006 2.6 0 0 (1) (7) (6) 0 0 (2) (6) (15) Jun-13 (6) 10 14 12.6 13.5 12.2 10.8 90 90 2.6 8.7 1.0 1.8 7.6 104
YTLP YTLP MK U MYR 1.61 1.33 (17) 3,567 3.7 0 (2) 3 (11) 15 0 (1) 1 (10) 6 Jun-13 (5) 5 7 12.8 13.5 12.9 12.1 86 83 1.1 9.8 1.3 2.5 12.1 205 Sector* 3 29,339 0 (0) (0) 1 40 0 0 (2) 2 31 Dec-13 14 14 na 14.5 12.7 11.1 na 99 105 2.1 11.9 1.4 1.9 7.7 77
Country Average* FBMKLCI 1,849 1,989 8 308,179 (0) (0) 2 (1) 9 Dec-13 11 13 11 18.1 16.2 14.4 13.7 101 103 3.2 13.5 2.1 2.4 9.8 32
* Country/ sector aggregates are for the coverage above
Source: Company data, Thomson Financial IBES, Credit Suisse estimates
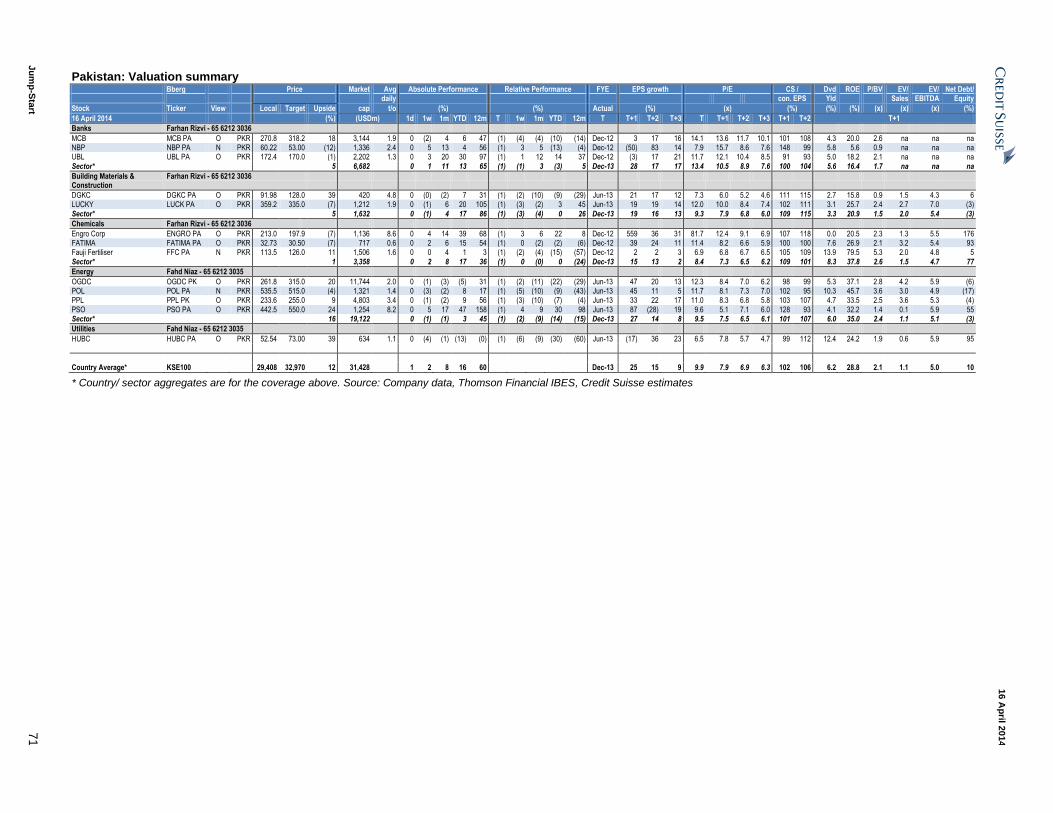
Ju
mp
-Sta
rt 7
1
16 A
pril 2
014
Pakistan: Valuation summary Bberg Price Market Avg Absolute Performance Relative Performance FYE EPS growth P/E CS / Dvd ROE P/BV EV/ EV/ Net Debt/ daily con. EPS Yld Sales EBITDA Equity
Stock Ticker View Local Target Upside cap t/o (%) (%) Actual (%) (x) (%) (%) (%) (x) (x) (x) (%)
16 April 2014 (%) (USDm) 1d 1w 1m YTD 12m T 1w 1m YTD 12m T T+1 T+2 T+3 T T+1 T+2 T+3 T+1 T+2 T+1
Banks Farhan Rizvi - 65 6212 3036
MCB MCB PA O PKR 270.8 318.2 18 3,144 1.9 0 (2) 4 6 47 (1) (4) (4) (10) (14) Dec-12 3 17 16 14.1 13.6 11.7 10.1 101 108 4.3 20.0 2.6 na na na NBP NBP PA N PKR 60.22 53.00 (12) 1,336 2.4 0 5 13 4 56 (1) 3 5 (13) (4) Dec-12 (50) 83 14 7.9 15.7 8.6 7.6 148 99 5.8 5.6 0.9 na na na UBL UBL PA O PKR 172.4 170.0 (1) 2,202 1.3 0 3 20 30 97 (1) 1 12 14 37 Dec-12 (3) 17 21 11.7 12.1 10.4 8.5 91 93 5.0 18.2 2.1 na na na
Sector* 5 6,682 0 1 11 13 65 (1) (1) 3 (3) 5 Dec-13 28 17 17 13.4 10.5 8.9 7.6 100 104 5.6 16.4 1.7 na na na
Building Materials & Construction
Farhan Rizvi - 65 6212 3036
DGKC DGKC PA O PKR 91.98 128.0 39 420 4.8 0 (0) (2) 7 31 (1) (2) (10) (9) (29) Jun-13 21 17 12 7.3 6.0 5.2 4.6 111 115 2.7 15.8 0.9 1.5 4.3 6 LUCKY LUCK PA O PKR 359.2 335.0 (7) 1,212 1.9 0 (1) 6 20 105 (1) (3) (2) 3 45 Jun-13 19 19 14 12.0 10.0 8.4 7.4 102 111 3.1 25.7 2.4 2.7 7.0 (3)
Sector* 5 1,632 0 (1) 4 17 86 (1) (3) (4) 0 26 Dec-13 19 16 13 9.3 7.9 6.8 6.0 109 115 3.3 20.9 1.5 2.0 5.4 (3)
Chemicals Farhan Rizvi - 65 6212 3036
Engro Corp ENGRO PA O PKR 213.0 197.9 (7) 1,136 8.6 0 4 14 39 68 (1) 3 6 22 8 Dec-12 559 36 31 81.7 12.4 9.1 6.9 107 118 0.0 20.5 2.3 1.3 5.5 176 FATIMA FATIMA PA O PKR 32.73 30.50 (7) 717 0.6 0 2 6 15 54 (1) 0 (2) (2) (6) Dec-12 39 24 11 11.4 8.2 6.6 5.9 100 100 7.6 26.9 2.1 3.2 5.4 93 Fauji Fertiliser FFC PA N PKR 113.5 126.0 11 1,506 1.6 0 0 4 1 3 (1) (2) (4) (15) (57) Dec-12 2 2 3 6.9 6.8 6.7 6.5 105 109 13.9 79.5 5.3 2.0 4.8 5
Sector* 1 3,358 0 2 8 17 36 (1) 0 (0) 0 (24) Dec-13 15 13 2 8.4 7.3 6.5 6.2 109 101 8.3 37.8 2.6 1.5 4.7 77
Energy Fahd Niaz - 65 6212 3035
OGDC OGDC PK O PKR 261.8 315.0 20 11,744 2.0 0 (1) (3) (5) 31 (1) (2) (11) (22) (29) Jun-13 47 20 13 12.3 8.4 7.0 6.2 98 99 5.3 37.1 2.8 4.2 5.9 (6) POL POL PA N PKR 535.5 515.0 (4) 1,321 1.4 0 (3) (2) 8 17 (1) (5) (10) (9) (43) Jun-13 45 11 5 11.7 8.1 7.3 7.0 102 95 10.3 45.7 3.6 3.0 4.9 (17) PPL PPL PK O PKR 233.6 255.0 9 4,803 3.4 0 (1) (2) 9 56 (1) (3) (10) (7) (4) Jun-13 33 22 17 11.0 8.3 6.8 5.8 103 107 4.7 33.5 2.5 3.6 5.3 (4)
PSO PSO PA O PKR 442.5 550.0 24 1,254 8.2 0 5 17 47 158 (1) 4 9 30 98 Jun-13 87 (28) 19 9.6 5.1 7.1 6.0 128 93 4.1 32.2 1.4 0.1 5.9 55 Sector* 16 19,122 0 (1) (1) 3 45 (1) (2) (9) (14) (15) Dec-13 27 14 8 9.5 7.5 6.5 6.1 101 107 6.0 35.0 2.4 1.1 5.1 (3)
Utilities Fahd Niaz - 65 6212 3035
HUBC HUBC PA O PKR 52.54 73.00 39 634 1.1 0 (4) (1) (13) (0) (1) (6) (9) (30) (60) Jun-13 (17) 36 23 6.5 7.8 5.7 4.7 99 112 12.4 24.2 1.9 0.6 5.9 95
Country Average* KSE100 29,408 32,970 12 31,428 1 2 8 16 60 Dec-13 25 15 9 9.9 7.9 6.9 6.3 102 106 6.2 28.8 2.1 1.1 5.0 10
* Country/ sector aggregates are for the coverage above. Source: Company data, Thomson Financial IBES, Credit Suisse estimates
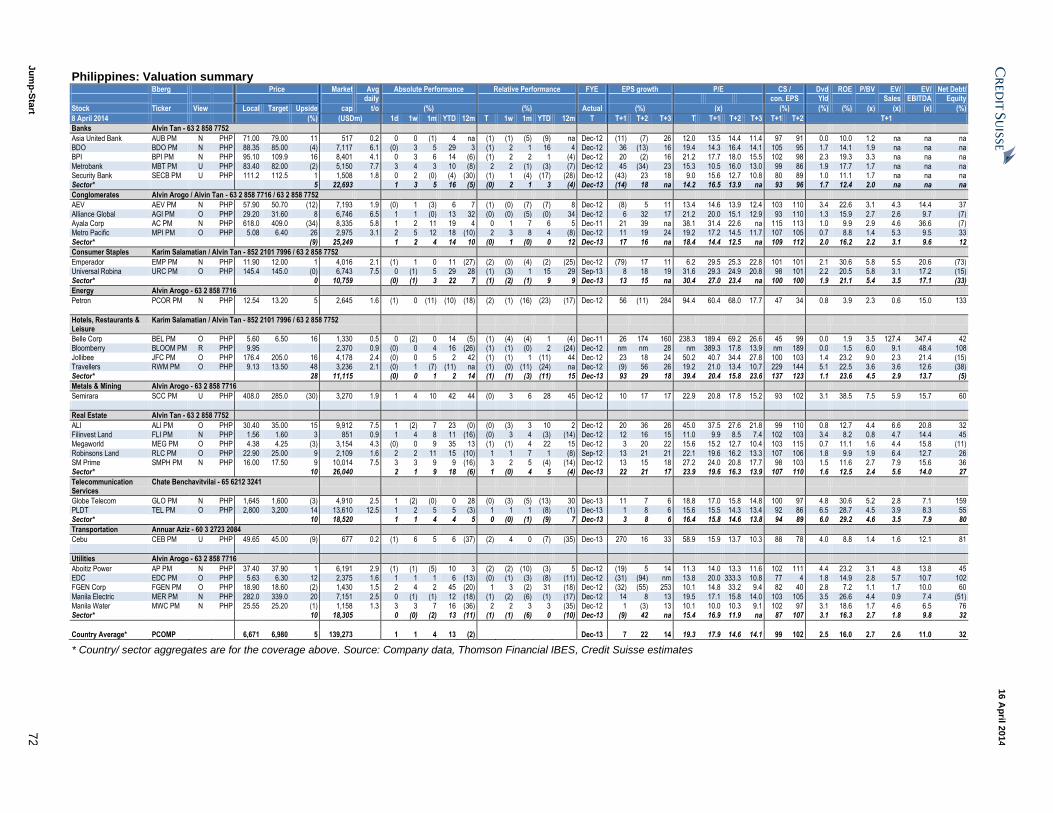
Ju
mp
-Sta
rt 7
2
16 A
pril 2
014
Philippines: Valuation summary Bberg Price Market Avg Absolute Performance Relative Performance FYE EPS growth P/E CS / Dvd ROE P/BV EV/ EV/ Net Debt/ daily con. EPS Yld Sales EBITDA Equity
Stock Ticker View Local Target Upside cap t/o (%) (%) Actual (%) (x) (%) (%) (%) (x) (x) (x) (%)
8 April 2014 (%) (USDm) 1d 1w 1m YTD 12m T 1w 1m YTD 12m T T+1 T+2 T+3 T T+1 T+2 T+3 T+1 T+2 T+1
Banks Alvin Tan - 63 2 858 7752
Asia United Bank AUB PM N PHP 71.00 79.00 11 517 0.2 0 0 (1) 4 na (1) (1) (5) (9) na Dec-12 (11) (7) 26 12.0 13.5 14.4 11.4 97 91 0.0 10.0 1.2 na na na BDO BDO PM N PHP 88.35 85.00 (4) 7,117 6.1 (0) 3 5 29 3 (1) 2 1 16 4 Dec-12 36 (13) 16 19.4 14.3 16.4 14.1 105 95 1.7 14.1 1.9 na na na BPI BPI PM N PHP 95.10 109.9 16 8,401 4.1 0 3 6 14 (6) (1) 2 2 1 (4) Dec-12 20 (2) 16 21.2 17.7 18.0 15.5 102 98 2.3 19.3 3.3 na na na
Metrobank MBT PM U PHP 83.40 82.00 (2) 5,150 7.7 3 4 3 10 (8) 2 2 (1) (3) (7) Dec-12 45 (34) 23 15.3 10.5 16.0 13.0 99 86 1.9 17.7 1.7 na na na Security Bank SECB PM U PHP 111.2 112.5 1 1,508 1.8 0 2 (0) (4) (30) (1) 1 (4) (17) (28) Dec-12 (43) 23 18 9.0 15.6 12.7 10.8 80 89 1.0 11.1 1.7 na na na Sector* 5 22,693 1 3 5 16 (5) (0) 2 1 3 (4) Dec-13 (14) 18 na 14.2 16.5 13.9 na 93 96 1.7 12.4 2.0 na na na
Conglomerates Alvin Arogo / Alvin Tan - 63 2 858 7716 / 63 2 858 7752
AEV AEV PM N PHP 57.90 50.70 (12) 7,193 1.9 (0) 1 (3) 6 7 (1) (0) (7) (7) 8 Dec-12 (8) 5 11 13.4 14.6 13.9 12.4 103 110 3.4 22.6 3.1 4.3 14.4 37
Alliance Global AGI PM O PHP 29.20 31.60 8 6,746 6.5 1 1 (0) 13 32 (0) (0) (5) (0) 34 Dec-12 6 32 17 21.2 20.0 15.1 12.9 93 110 1.3 15.9 2.7 2.6 9.7 (7) Ayala Corp AC PM N PHP 618.0 409.0 (34) 8,335 5.8 1 2 11 19 4 0 1 7 6 5 Dec-11 21 39 na 38.1 31.4 22.6 na 115 113 1.0 9.9 2.9 4.6 36.6 (7) Metro Pacific MPI PM O PHP 5.08 6.40 26 2,975 3.1 2 5 12 18 (10) 2 3 8 4 (8) Dec-12 11 19 24 19.2 17.2 14.5 11.7 107 105 0.7 8.8 1.4 5.3 9.5 33
Sector* (9) 25,249 1 2 4 14 10 (0) 1 (0) 0 12 Dec-13 17 16 na 18.4 14.4 12.5 na 109 112 2.0 16.2 2.2 3.1 9.6 12
Consumer Staples Karim Salamatian / Alvin Tan - 852 2101 7996 / 63 2 858 7752
Emperador EMP PM N PHP 11.90 12.00 1 4,016 2.1 (1) 1 0 11 (27) (2) (0) (4) (2) (25) Dec-12 (79) 17 11 6.2 29.5 25.3 22.8 101 101 2.1 30.6 5.8 5.5 20.6 (73) Universal Robina URC PM O PHP 145.4 145.0 (0) 6,743 7.5 0 (1) 5 29 28 (1) (3) 1 15 29 Sep-13 8 18 19 31.6 29.3 24.9 20.8 98 101 2.2 20.5 5.8 3.1 17.2 (15) Sector* 0 10,759 (0) (1) 3 22 7 (1) (2) (1) 9 9 Dec-13 13 15 na 30.4 27.0 23.4 na 100 100 1.9 21.1 5.4 3.5 17.1 (33)
Energy Alvin Arogo - 63 2 858 7716
Petron PCOR PM N PHP 12.54 13.20 5 2,645 1.6 (1) 0 (11) (10) (18) (2) (1) (16) (23) (17) Dec-12 56 (11) 284 94.4 60.4 68.0 17.7 47 34 0.8 3.9 2.3 0.6 15.0 133
Hotels, Restaurants & Leisure
Karim Salamatian / Alvin Tan - 852 2101 7996 / 63 2 858 7752
Belle Corp BEL PM O PHP 5.60 6.50 16 1,330 0.5 0 (2) 0 14 (5) (1) (4) (4) 1 (4) Dec-11 26 174 160 238.3 189.4 69.2 26.6 45 99 0.0 1.9 3.5 127.4 347.4 42 Bloomberry BLOOM PM R PHP 9.95 2,370 0.9 (0) 0 4 16 (26) (1) (1) (0) 2 (24) Dec-12 nm nm 28 nm 389.3 17.8 13.9 nm 189 0.0 1.5 6.0 9.1 48.4 108
Jollibee JFC PM O PHP 176.4 205.0 16 4,178 2.4 (0) 0 5 2 42 (1) (1) 1 (11) 44 Dec-12 23 18 24 50.2 40.7 34.4 27.8 100 103 1.4 23.2 9.0 2.3 21.4 (15) Travellers RWM PM O PHP 9.13 13.50 48 3,236 2.1 (0) 1 (7) (11) na (1) (0) (11) (24) na Dec-12 (9) 56 26 19.2 21.0 13.4 10.7 229 144 5.1 22.5 3.6 3.6 12.6 (38) Sector* 28 11,115 (0) 0 1 2 14 (1) (1) (3) (11) 15 Dec-13 93 29 18 39.4 20.4 15.8 23.6 137 123 1.1 23.6 4.5 2.9 13.7 (5)
Metals & Mining Alvin Arogo - 63 2 858 7716
Semirara SCC PM U PHP 408.0 285.0 (30) 3,270 1.9 1 4 10 42 44 (0) 3 6 28 45 Dec-12 10 17 17 22.9 20.8 17.8 15.2 93 102 3.1 38.5 7.5 5.9 15.7 60
Real Estate Alvin Tan - 63 2 858 7752
ALI ALI PM O PHP 30.40 35.00 15 9,912 7.5 1 (2) 7 23 (0) (0) (3) 3 10 2 Dec-12 20 36 26 45.0 37.5 27.6 21.8 99 110 0.8 12.7 4.4 6.6 20.8 32 Filinvest Land FLI PM N PHP 1.56 1.60 3 851 0.9 1 4 8 11 (16) (0) 3 4 (3) (14) Dec-12 12 16 15 11.0 9.9 8.5 7.4 102 103 3.4 8.2 0.8 4.7 14.4 45 Megaworld MEG PM O PHP 4.38 4.25 (3) 3,154 4.3 (0) 0 9 35 13 (1) (1) 4 22 15 Dec-12 3 20 22 15.6 15.2 12.7 10.4 103 115 0.7 11.1 1.6 4.4 15.8 (11)
Robinsons Land RLC PM O PHP 22.90 25.00 9 2,109 1.6 2 2 11 15 (10) 1 1 7 1 (8) Sep-12 13 21 21 22.1 19.6 16.2 13.3 107 106 1.8 9.9 1.9 6.4 12.7 26 SM Prime SMPH PM N PHP 16.00 17.50 9 10,014 7.5 3 3 9 9 (16) 3 2 5 (4) (14) Dec-12 13 15 18 27.2 24.0 20.8 17.7 98 103 1.5 11.6 2.7 7.9 15.6 36 Sector* 10 26,040 2 1 9 18 (6) 1 (0) 4 5 (4) Dec-13 22 21 17 23.9 19.6 16.3 13.9 107 110 1.6 12.5 2.4 5.6 14.0 27
Telecommunication Services
Chate Benchavitvilai - 65 6212 3241
Globe Telecom GLO PM N PHP 1,645 1,600 (3) 4,910 2.5 1 (2) (0) 0 28 (0) (3) (5) (13) 30 Dec-13 11 7 6 18.8 17.0 15.8 14.8 100 97 4.8 30.6 5.2 2.8 7.1 159 PLDT TEL PM O PHP 2,800 3,200 14 13,610 12.5 1 2 5 5 (3) 1 1 1 (8) (1) Dec-13 1 8 6 15.6 15.5 14.3 13.4 92 86 6.5 28.7 4.5 3.9 8.3 55 Sector* 10 18,520 1 1 4 4 5 0 (0) (1) (9) 7 Dec-13 3 8 6 16.4 15.8 14.6 13.8 94 89 6.0 29.2 4.6 3.5 7.9 80
Transportation Annuar Aziz - 60 3 2723 2084
Cebu CEB PM U PHP 49.65 45.00 (9) 677 0.2 (1) 6 5 6 (37) (2) 4 0 (7) (35) Dec-13 270 16 33 58.9 15.9 13.7 10.3 88 78 4.0 8.8 1.4 1.6 12.1 81
Utilities Alvin Arogo - 63 2 858 7716
Aboitiz Power AP PM N PHP 37.40 37.90 1 6,191 2.9 (1) (1) (5) 10 3 (2) (2) (10) (3) 5 Dec-12 (19) 5 14 11.3 14.0 13.3 11.6 102 111 4.4 23.2 3.1 4.8 13.8 45 EDC EDC PM O PHP 5.63 6.30 12 2,375 1.6 1 1 1 6 (13) (0) (1) (3) (8) (11) Dec-12 (31) (94) nm 13.8 20.0 333.3 10.8 77 4 1.8 14.9 2.8 5.7 10.7 102 FGEN Corp FGEN PM O PHP 18.90 18.60 (2) 1,430 1.5 2 4 2 45 (20) 1 3 (2) 31 (18) Dec-12 (32) (55) 253 10.1 14.8 33.2 9.4 82 40 2.8 7.2 1.1 1.7 10.0 60
Manila Electric MER PM N PHP 282.0 339.0 20 7,151 2.5 0 (1) (1) 12 (18) (1) (2) (6) (1) (17) Dec-12 14 8 13 19.5 17.1 15.8 14.0 103 105 3.5 26.6 4.4 0.9 7.4 (51) Manila Water MWC PM N PHP 25.55 25.20 (1) 1,158 1.3 3 3 7 16 (36) 2 2 3 3 (35) Dec-12 1 (3) 13 10.1 10.0 10.3 9.1 102 97 3.1 18.6 1.7 4.6 6.5 76 Sector* 10 18,305 0 (0) (2) 13 (11) (1) (1) (6) 0 (10) Dec-13 (9) 42 na 15.4 16.9 11.9 na 87 107 3.1 16.3 2.7 1.8 9.8 32
Country Average* PCOMP 6,671 6,980 5 139,273 1 1 4 13 (2) Dec-13 7 22 14 19.3 17.9 14.6 14.1 99 102 2.5 16.0 2.7 2.6 11.0 32
* Country/ sector aggregates are for the coverage above. Source: Company data, Thomson Financial IBES, Credit Suisse estimates
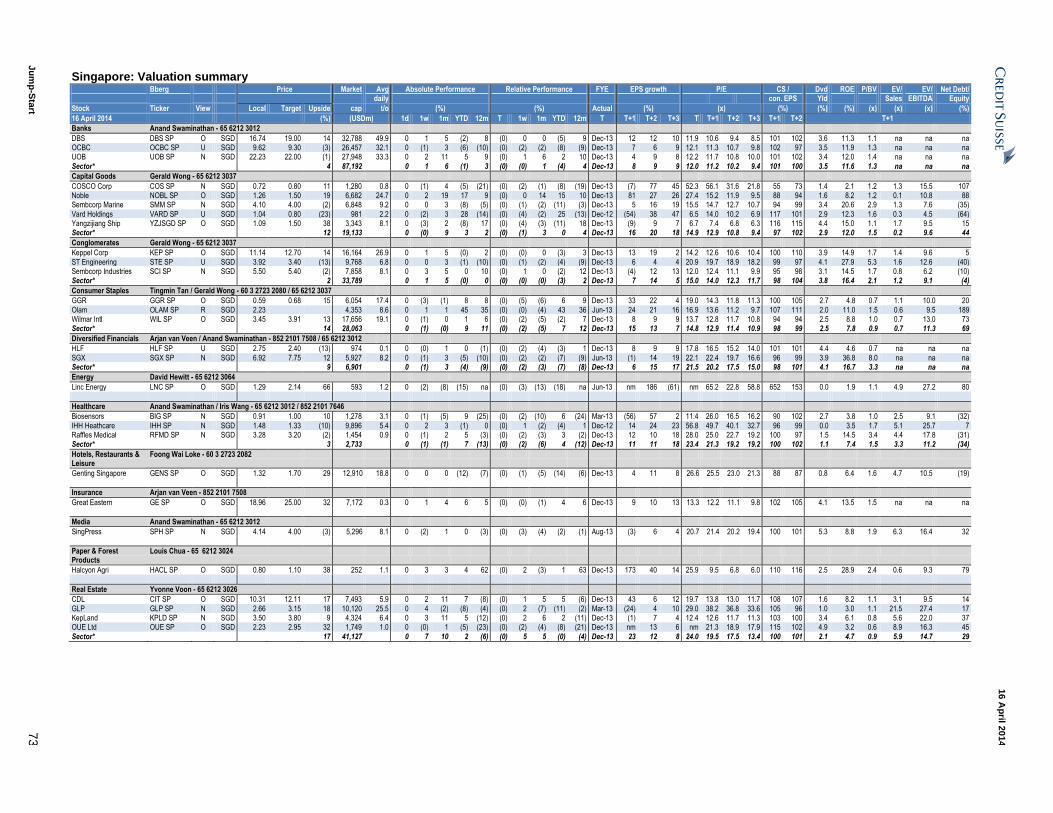
Ju
mp
-Sta
rt 7
3
16 A
pril 2
014
Singapore: Valuation summary Bberg Price Market Avg Absolute Performance Relative Performance FYE EPS growth P/E CS / Dvd ROE P/BV EV/ EV/ Net Debt/ daily con. EPS Yld Sales EBITDA Equity
Stock Ticker View Local Target Upside cap t/o (%) (%) Actual (%) (x) (%) (%) (%) (x) (x) (x) (%)
16 April 2014 (%) (USDm) 1d 1w 1m YTD 12m T 1w 1m YTD 12m T T+1 T+2 T+3 T T+1 T+2 T+3 T+1 T+2 T+1
Banks Anand Swaminathan - 65 6212 3012
DBS DBS SP O SGD 16.74 19.00 14 32,788 49.9 0 1 5 (2) 8 (0) 0 0 (5) 9 Dec-13 12 12 10 11.9 10.6 9.4 8.5 101 102 3.6 11.3 1.1 na na na OCBC OCBC SP U SGD 9.62 9.30 (3) 26,457 32.1 0 (1) 3 (6) (10) (0) (2) (2) (8) (9) Dec-13 7 6 9 12.1 11.3 10.7 9.8 102 97 3.5 11.9 1.3 na na na UOB UOB SP N SGD 22.23 22.00 (1) 27,948 33.3 0 2 11 5 9 (0) 1 6 2 10 Dec-13 4 9 8 12.2 11.7 10.8 10.0 101 102 3.4 12.0 1.4 na na na
Sector* 4 87,192 0 1 6 (1) 3 (0) (0) 1 (4) 4 Dec-13 8 9 9 12.0 11.2 10.2 9.4 101 100 3.5 11.6 1.3 na na na
Capital Goods Gerald Wong - 65 6212 3037
COSCO Corp COS SP N SGD 0.72 0.80 11 1,280 0.8 0 (1) 4 (5) (21) (0) (2) (1) (8) (19) Dec-13 (7) 77 45 52.3 56.1 31.6 21.8 55 73 1.4 2.1 1.2 1.3 15.5 107 Noble NOBL SP O SGD 1.26 1.50 19 6,682 24.7 0 2 19 17 9 (0) 0 14 15 10 Dec-13 81 27 26 27.4 15.2 11.9 9.5 88 94 1.6 8.2 1.2 0.1 10.8 88 Sembcorp Marine SMM SP N SGD 4.10 4.00 (2) 6,848 9.2 0 0 3 (8) (5) (0) (1) (2) (11) (3) Dec-13 5 16 19 15.5 14.7 12.7 10.7 94 99 3.4 20.6 2.9 1.3 7.6 (35)
Vard Holdings VARD SP U SGD 1.04 0.80 (23) 981 2.2 0 (2) 3 28 (14) (0) (4) (2) 25 (13) Dec-12 (54) 38 47 6.5 14.0 10.2 6.9 117 101 2.9 12.3 1.6 0.3 4.5 (64) Yangzijiang Ship YZJSGD SP O SGD 1.09 1.50 38 3,343 8.1 0 (3) 2 (8) 17 (0) (4) (3) (11) 18 Dec-13 (9) 9 7 6.7 7.4 6.8 6.3 116 115 4.4 15.0 1.1 1.7 9.5 15 Sector* 12 19,133 0 (0) 9 3 2 (0) (1) 3 0 4 Dec-13 16 20 18 14.9 12.9 10.8 9.4 97 102 2.9 12.0 1.5 0.2 9.6 44
Conglomerates Gerald Wong - 65 6212 3037
Keppel Corp KEP SP O SGD 11.14 12.70 14 16,164 26.9 0 1 5 (0) 2 (0) (0) 0 (3) 3 Dec-13 13 19 2 14.2 12.6 10.6 10.4 100 110 3.9 14.9 1.7 1.4 9.6 5
ST Engineering STE SP U SGD 3.92 3.40 (13) 9,768 6.8 0 0 3 (1) (10) (0) (1) (2) (4) (9) Dec-13 6 4 4 20.9 19.7 18.9 18.2 99 97 4.1 27.9 5.3 1.6 12.6 (40) Sembcorp Industries SCI SP N SGD 5.50 5.40 (2) 7,858 8.1 0 3 5 0 10 (0) 1 0 (2) 12 Dec-13 (4) 12 13 12.0 12.4 11.1 9.9 95 98 3.1 14.5 1.7 0.8 6.2 (10) Sector* 2 33,789 0 1 5 (0) 0 (0) (0) (0) (3) 2 Dec-13 7 14 5 15.0 14.0 12.3 11.7 98 104 3.8 16.4 2.1 1.2 9.1 (4)
Consumer Staples Tingmin Tan / Gerald Wong - 60 3 2723 2080 / 65 6212 3037
GGR GGR SP O SGD 0.59 0.68 15 6,054 17.4 0 (3) (1) 8 8 (0) (5) (6) 6 9 Dec-13 33 22 4 19.0 14.3 11.8 11.3 100 105 2.7 4.8 0.7 1.1 10.0 20
Olam OLAM SP R SGD 2.23 4,353 8.6 0 1 1 45 35 (0) (0) (4) 43 36 Jun-13 24 21 16 16.9 13.6 11.2 9.7 107 111 2.0 11.0 1.5 0.6 9.5 189 Wilmar Intl WIL SP O SGD 3.45 3.91 13 17,656 19.1 0 (1) 0 1 6 (0) (2) (5) (2) 7 Dec-13 8 9 9 13.7 12.8 11.7 10.8 94 94 2.5 8.8 1.0 0.7 13.0 73 Sector* 14 28,063 0 (1) (0) 9 11 (0) (2) (5) 7 12 Dec-13 15 13 7 14.8 12.9 11.4 10.9 98 99 2.5 7.8 0.9 0.7 11.3 69
Diversified Financials Arjan van Veen / Anand Swaminathan - 852 2101 7508 / 65 6212 3012
HLF HLF SP U SGD 2.75 2.40 (13) 974 0.1 0 (0) 1 0 (1) (0) (2) (4) (3) 1 Dec-13 8 9 9 17.8 16.5 15.2 14.0 101 101 4.4 4.6 0.7 na na na
SGX SGX SP N SGD 6.92 7.75 12 5,927 8.2 0 (1) 3 (5) (10) (0) (2) (2) (7) (9) Jun-13 (1) 14 19 22.1 22.4 19.7 16.6 96 99 3.9 36.8 8.0 na na na Sector* 9 6,901 0 (1) 3 (4) (9) (0) (2) (3) (7) (8) Dec-13 6 15 17 21.5 20.2 17.5 15.0 98 101 4.1 16.7 3.3 na na na
Energy David Hewitt - 65 6212 3064
Linc Energy LNC SP O SGD 1.29 2.14 66 593 1.2 0 (2) (8) (15) na (0) (3) (13) (18) na Jun-13 nm 186 (61) nm 65.2 22.8 58.8 652 153 0.0 1.9 1.1 4.9 27.2 80
Healthcare Anand Swaminathan / Iris Wang - 65 6212 3012 / 852 2101 7646
Biosensors BIG SP N SGD 0.91 1.00 10 1,278 3.1 0 (1) (5) 9 (25) (0) (2) (10) 6 (24) Mar-13 (56) 57 2 11.4 26.0 16.5 16.2 90 102 2.7 3.8 1.0 2.5 9.1 (32)
IHH Heathcare IHH SP N SGD 1.48 1.33 (10) 9,896 5.4 0 2 3 (1) 0 (0) 1 (2) (4) 1 Dec-12 14 24 23 56.8 49.7 40.1 32.7 96 99 0.0 3.5 1.7 5.1 25.7 7 Raffles Medical RFMD SP N SGD 3.28 3.20 (2) 1,454 0.9 0 (1) 2 5 (3) (0) (2) (3) 3 (2) Dec-13 12 10 18 28.0 25.0 22.7 19.2 100 97 1.5 14.5 3.4 4.4 17.8 (31) Sector* 3 2,733 0 (1) (1) 7 (13) (0) (2) (6) 4 (12) Dec-13 11 11 18 23.4 21.3 19.2 19.2 100 102 1.1 7.4 1.5 3.3 11.2 (34)
Hotels, Restaurants & Leisure
Foong Wai Loke - 60 3 2723 2082
Genting Singapore GENS SP O SGD 1.32 1.70 29 12,910 18.8 0 0 0 (12) (7) (0) (1) (5) (14) (6) Dec-13 4 11 8 26.6 25.5 23.0 21.3 88 87 0.8 6.4 1.6 4.7 10.5 (19)
Insurance Arjan van Veen - 852 2101 7508
Great Eastern GE SP O SGD 18.96 25.00 32 7,172 0.3 0 1 4 6 5 (0) (0) (1) 4 6 Dec-13 9 10 13 13.3 12.2 11.1 9.8 102 105 4.1 13.5 1.5 na na na
Media Anand Swaminathan - 65 6212 3012
SingPress SPH SP N SGD 4.14 4.00 (3) 5,296 8.1 0 (2) 1 0 (3) (0) (3) (4) (2) (1) Aug-13 (3) 6 4 20.7 21.4 20.2 19.4 100 101 5.3 8.8 1.9 6.3 16.4 32
Paper & Forest Products
Louis Chua - 65 6212 3024
Halcyon Agri HACL SP O SGD 0.80 1.10 38 252 1.1 0 3 3 4 62 (0) 2 (3) 1 63 Dec-13 173 40 14 25.9 9.5 6.8 6.0 110 116 2.5 28.9 2.4 0.6 9.3 79
Real Estate Yvonne Voon - 65 6212 3026
CDL CIT SP O SGD 10.31 12.11 17 7,493 5.9 0 2 11 7 (8) (0) 1 5 5 (6) Dec-13 43 6 12 19.7 13.8 13.0 11.7 108 107 1.6 8.2 1.1 3.1 9.5 14
GLP GLP SP N SGD 2.66 3.15 18 10,120 25.5 0 4 (2) (8) (4) (0) 2 (7) (11) (2) Mar-13 (24) 4 10 29.0 38.2 36.8 33.6 105 96 1.0 3.0 1.1 21.5 27.4 17 KepLand KPLD SP N SGD 3.50 3.80 9 4,324 6.4 0 3 11 5 (12) (0) 2 6 2 (11) Dec-13 (1) 7 4 12.4 12.6 11.7 11.3 103 100 3.4 6.1 0.8 5.6 22.0 37 OUE Ltd OUE SP O SGD 2.23 2.95 32 1,749 1.0 0 (0) 1 (5) (23) (0) (2) (4) (8) (21) Dec-13 nm 13 6 nm 21.3 18.9 17.9 115 102 4.9 3.2 0.6 8.9 16.3 45
Sector* 17 41,127 0 7 10 2 (6) (0) 5 5 (0) (4) Dec-13 23 12 8 24.0 19.5 17.5 13.4 100 101 2.1 4.7 0.9 5.9 14.7 29
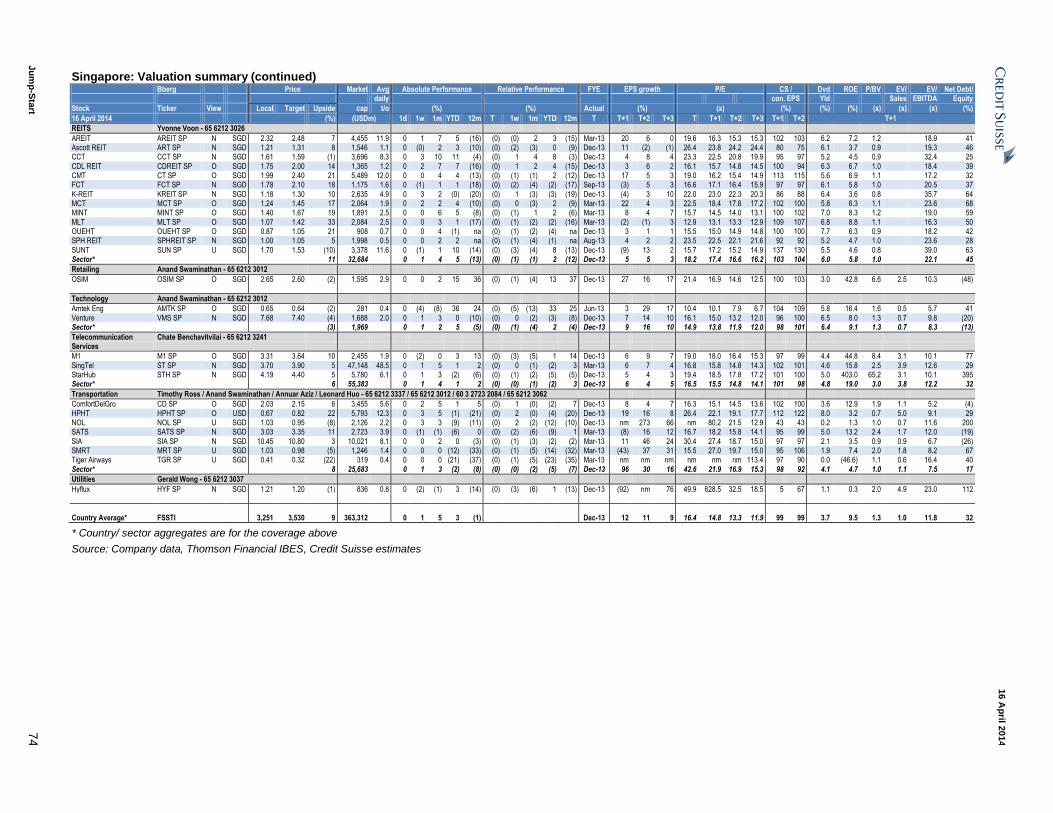
Ju
mp
-Sta
rt 7
4
16 A
pril 2
014
Singapore: Valuation summary (continued) Bberg Price Market Avg Absolute Performance Relative Performance FYE EPS growth P/E CS / Dvd ROE P/BV EV/ EV/ Net Debt/ daily con. EPS Yld Sales EBITDA Equity
Stock Ticker View Local Target Upside cap t/o (%) (%) Actual (%) (x) (%) (%) (%) (x) (x) (x) (%)
16 April 2014 (%) (USDm) 1d 1w 1m YTD 12m T 1w 1m YTD 12m T T+1 T+2 T+3 T T+1 T+2 T+3 T+1 T+2 T+1
REITS Yvonne Voon - 65 6212 3026
AREIT AREIT SP N SGD 2.32 2.48 7 4,455 11.9 0 1 7 5 (16) (0) (0) 2 3 (15) Mar-13 20 6 0 19.6 16.3 15.3 15.3 102 103 6.2 7.2 1.2 18.9 41 Ascott REIT ART SP N SGD 1.21 1.31 8 1,546 1.1 0 (0) 2 3 (10) (0) (2) (3) 0 (9) Dec-13 11 (2) (1) 26.4 23.8 24.2 24.4 80 75 6.1 3.7 0.9 19.3 46 CCT CCT SP N SGD 1.61 1.59 (1) 3,696 8.3 0 3 10 11 (4) (0) 1 4 8 (3) Dec-13 4 8 4 23.3 22.5 20.8 19.9 95 97 5.2 4.5 0.9 32.4 25
CDL REIT CDREIT SP O SGD 1.75 2.00 14 1,365 1.2 0 2 7 7 (16) (0) 1 2 4 (15) Dec-13 3 6 2 16.1 15.7 14.8 14.5 100 94 6.3 6.7 1.0 18.4 39 CMT CT SP O SGD 1.99 2.40 21 5,489 12.0 0 0 4 4 (13) (0) (1) (1) 2 (12) Dec-13 17 5 3 19.0 16.2 15.4 14.9 113 115 5.6 6.9 1.1 17.2 32 FCT FCT SP N SGD 1.78 2.10 18 1,175 1.6 0 (1) 1 1 (18) (0) (2) (4) (2) (17) Sep-13 (3) 5 3 16.6 17.1 16.4 15.9 97 97 6.1 5.8 1.0 20.5 37
K-REIT KREIT SP N SGD 1.18 1.30 10 2,635 4.9 0 3 2 (0) (20) (0) 1 (3) (3) (19) Dec-13 (4) 3 10 22.0 23.0 22.3 20.3 86 88 6.4 3.6 0.8 35.7 64 MCT MCT SP O SGD 1.24 1.45 17 2,064 1.9 0 2 2 4 (10) (0) 0 (3) 2 (9) Mar-13 22 4 3 22.5 18.4 17.8 17.2 102 100 5.8 6.3 1.1 23.6 68 MINT MINT SP O SGD 1.40 1.67 19 1,891 2.5 0 0 6 5 (8) (0) (1) 1 2 (6) Mar-13 8 4 7 15.7 14.5 14.0 13.1 100 102 7.0 8.3 1.2 19.0 59
MLT MLT SP O SGD 1.07 1.42 33 2,084 2.5 0 0 3 1 (17) (0) (1) (2) (2) (16) Mar-13 (2) (1) 3 12.9 13.1 13.3 12.9 109 107 6.8 8.8 1.1 16.3 50 OUEHT OUEHT SP O SGD 0.87 1.05 21 908 0.7 0 0 4 (1) na (0) (1) (2) (4) na Dec-13 3 1 1 15.5 15.0 14.9 14.8 100 100 7.7 6.3 0.9 18.2 42 SPH REIT SPHREIT SP N SGD 1.00 1.05 5 1,998 0.5 0 0 2 2 na (0) (1) (4) (1) na Aug-13 4 2 2 23.5 22.5 22.1 21.6 92 92 5.2 4.7 1.0 23.6 28
SUNT SUN SP U SGD 1.70 1.53 (10) 3,378 11.6 0 (1) 1 10 (14) (0) (3) (4) 8 (13) Dec-13 (9) 13 2 15.7 17.2 15.2 14.9 137 130 5.5 4.6 0.8 39.0 63 Sector* 11 32,684 0 1 4 5 (13) (0) (1) (1) 2 (12) Dec-13 5 5 3 18.2 17.4 16.6 16.2 103 104 6.0 5.8 1.0 22.1 45
Retailing Anand Swaminathan - 65 6212 3012
OSIM OSIM SP O SGD 2.65 2.60 (2) 1,595 2.9 0 0 2 15 36 (0) (1) (4) 13 37 Dec-13 27 16 17 21.4 16.9 14.6 12.5 100 103 3.0 42.8 6.6 2.5 10.3 (48)
Technology Anand Swaminathan - 65 6212 3012
Amtek Eng AMTK SP O SGD 0.65 0.64 (2) 281 0.4 0 (4) (8) 36 24 (0) (5) (13) 33 25 Jun-13 3 29 17 10.4 10.1 7.9 6.7 104 109 5.8 16.4 1.6 0.5 5.7 41
Venture VMS SP N SGD 7.68 7.40 (4) 1,688 2.0 0 1 3 0 (10) (0) 0 (2) (3) (8) Dec-13 7 14 10 16.1 15.0 13.2 12.0 96 100 6.5 8.0 1.3 0.7 9.8 (20) Sector* (3) 1,969 0 1 2 5 (5) (0) (1) (4) 2 (4) Dec-13 9 16 10 14.9 13.8 11.9 12.0 98 101 6.4 9.1 1.3 0.7 8.3 (13)
Telecommunication Services
Chate Benchavitvilai - 65 6212 3241
M1 M1 SP O SGD 3.31 3.64 10 2,455 1.9 0 (2) 0 3 13 (0) (3) (5) 1 14 Dec-13 6 9 7 19.0 18.0 16.4 15.3 97 99 4.4 44.8 8.4 3.1 10.1 77
SingTel ST SP N SGD 3.70 3.90 5 47,148 48.5 0 1 5 1 2 (0) 0 (1) (2) 3 Mar-13 6 7 4 16.8 15.8 14.8 14.3 102 101 4.6 15.8 2.5 3.9 12.6 29 StarHub STH SP N SGD 4.19 4.40 5 5,780 6.1 0 1 3 (2) (6) (0) (1) (2) (5) (5) Dec-13 5 4 3 19.4 18.5 17.8 17.2 101 100 5.0 403.0 65.2 3.1 10.1 395 Sector* 6 55,383 0 1 4 1 2 (0) (0) (1) (2) 3 Dec-13 6 4 5 16.5 15.5 14.8 14.1 101 98 4.8 19.0 3.0 3.8 12.2 32
Transportation Timothy Ross / Anand Swaminathan / Annuar Aziz / Leonard Huo - 65 6212 3337 / 65 6212 3012 / 60 3 2723 2084 / 65 6212 3062
ComfortDelGro CD SP O SGD 2.03 2.15 6 3,455 5.6 0 2 5 1 5 (0) 1 (0) (2) 7 Dec-13 8 4 7 16.3 15.1 14.5 13.6 102 100 3.6 12.9 1.9 1.1 5.2 (4)
HPHT HPHT SP O USD 0.67 0.82 22 5,793 12.3 0 3 5 (1) (21) (0) 2 (0) (4) (20) Dec-13 19 16 8 26.4 22.1 19.1 17.7 112 122 8.0 3.2 0.7 5.0 9.1 29 NOL NOL SP U SGD 1.03 0.95 (8) 2,126 2.2 0 3 3 (9) (11) (0) 2 (2) (12) (10) Dec-13 nm 273 66 nm 80.2 21.5 12.9 43 43 0.2 1.3 1.0 0.7 11.6 200 SATS SATS SP N SGD 3.03 3.35 11 2,723 3.9 0 (1) (1) (6) 0 (0) (2) (6) (9) 1 Mar-13 (8) 16 12 16.7 18.2 15.8 14.1 95 99 5.0 13.2 2.4 1.7 12.0 (19)
SIA SIA SP N SGD 10.45 10.80 3 10,021 8.1 0 0 2 0 (3) (0) (1) (3) (2) (2) Mar-13 11 46 24 30.4 27.4 18.7 15.0 97 97 2.1 3.5 0.9 0.9 6.7 (26) SMRT MRT SP U SGD 1.03 0.98 (5) 1,246 1.4 0 0 0 (12) (33) (0) (1) (5) (14) (32) Mar-13 (43) 37 31 15.5 27.0 19.7 15.0 95 106 1.9 7.4 2.0 1.8 8.2 67 Tiger Airways TGR SP U SGD 0.41 0.32 (22) 319 0.4 0 0 0 (21) (37) (0) (1) (5) (23) (35) Mar-13 nm nm nm nm nm nm 113.4 97 90 0.0 (46.6) 1.1 0.6 16.4 40
Sector* 8 25,683 0 1 3 (2) (8) (0) (0) (2) (5) (7) Dec-13 96 30 16 42.6 21.9 16.9 15.3 98 92 4.1 4.7 1.0 1.1 7.5 17
Utilities Gerald Wong - 65 6212 3037
Hyflux HYF SP N SGD 1.21 1.20 (1) 836 0.8 0 (2) (1) 3 (14) (0) (3) (6) 1 (13) Dec-13 (92) nm 76 49.9 628.5 32.5 18.5 5 67 1.1 0.3 2.0 4.9 23.0 112
Country Average* FSSTI 3,251 3,530 9 363,312 0 1 5 3 (1) Dec-13 12 11 9 16.4 14.8 13.3 11.9 99 99 3.7 9.5 1.3 1.0 11.8 32
* Country/ sector aggregates are for the coverage above
Source: Company data, Thomson Financial IBES, Credit Suisse estimates
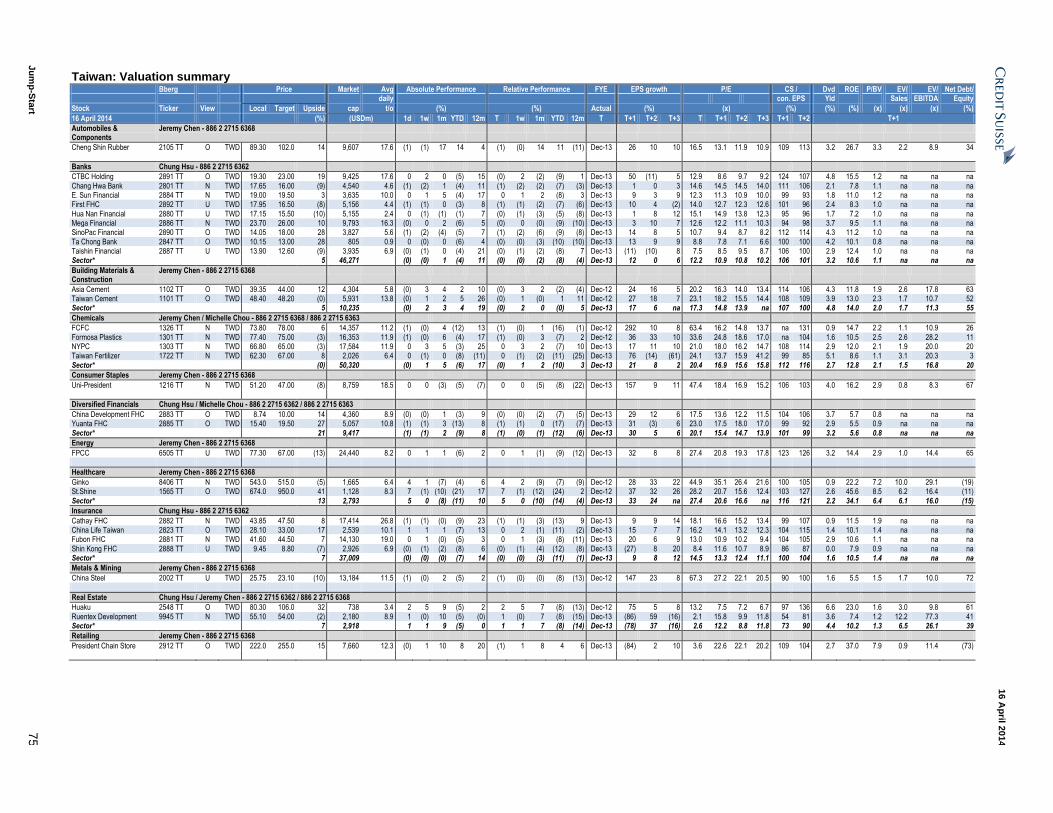
Ju
mp
-Sta
rt 7
5
16 A
pril 2
014
Taiwan: Valuation summary Bberg Price Market Avg Absolute Performance Relative Performance FYE EPS growth P/E CS / Dvd ROE P/BV EV/ EV/ Net Debt/ daily con. EPS Yld Sales EBITDA Equity
Stock Ticker View Local Target Upside cap t/o (%) (%) Actual (%) (x) (%) (%) (%) (x) (x) (x) (%)
16 April 2014 (%) (USDm) 1d 1w 1m YTD 12m T 1w 1m YTD 12m T T+1 T+2 T+3 T T+1 T+2 T+3 T+1 T+2 T+1
Automobiles & Components
Jeremy Chen - 886 2 2715 6368
Cheng Shin Rubber 2105 TT O TWD 89.30 102.0 14 9,607 17.6 (1) (1) 17 14 4 (1) (0) 14 11 (11) Dec-13 26 10 10 16.5 13.1 11.9 10.9 109 113 3.2 26.7 3.3 2.2 8.9 34
Banks Chung Hsu - 886 2 2715 6362
CTBC Holding 2891 TT O TWD 19.30 23.00 19 9,425 17.6 0 2 0 (5) 15 (0) 2 (2) (9) 1 Dec-13 50 (11) 5 12.9 8.6 9.7 9.2 124 107 4.8 15.5 1.2 na na na
Chang Hwa Bank 2801 TT N TWD 17.65 16.00 (9) 4,540 4.6 (1) (2) 1 (4) 11 (1) (2) (2) (7) (3) Dec-13 1 0 3 14.6 14.5 14.5 14.0 111 106 2.1 7.8 1.1 na na na E. Sun Financial 2884 TT N TWD 19.00 19.50 3 3,635 10.0 0 1 5 (4) 17 0 1 2 (8) 3 Dec-13 9 3 9 12.3 11.3 10.9 10.0 99 93 1.8 11.0 1.2 na na na First FHC 2892 TT U TWD 17.95 16.50 (8) 5,156 4.4 (1) (1) 0 (3) 8 (1) (1) (2) (7) (6) Dec-13 10 4 (2) 14.0 12.7 12.3 12.6 101 96 2.4 8.3 1.0 na na na
Hua Nan Financial 2880 TT U TWD 17.15 15.50 (10) 5,155 2.4 0 (1) (1) (1) 7 (0) (1) (3) (5) (8) Dec-13 1 8 12 15.1 14.9 13.8 12.3 95 96 1.7 7.2 1.0 na na na Mega Financial 2886 TT N TWD 23.70 26.00 10 9,793 16.3 (0) 0 2 (6) 5 (0) 0 (0) (9) (10) Dec-13 3 10 7 12.6 12.2 11.1 10.3 94 98 3.7 9.5 1.1 na na na SinoPac Financial 2890 TT O TWD 14.05 18.00 28 3,827 5.6 (1) (2) (4) (5) 7 (1) (2) (6) (9) (8) Dec-13 14 8 5 10.7 9.4 8.7 8.2 112 114 4.3 11.2 1.0 na na na
Ta Chong Bank 2847 TT O TWD 10.15 13.00 28 805 0.9 0 (0) 0 (6) 4 (0) (0) (3) (10) (10) Dec-13 13 9 9 8.8 7.8 7.1 6.6 100 100 4.2 10.1 0.8 na na na Taishin Financial 2887 TT U TWD 13.90 12.60 (9) 3,935 6.9 (0) (1) 0 (4) 21 (0) (1) (2) (8) 7 Dec-13 (11) (10) 8 7.5 8.5 9.5 8.7 106 100 2.9 12.4 1.0 na na na Sector* 5 46,271 (0) (0) 1 (4) 11 (0) (0) (2) (8) (4) Dec-13 12 0 6 12.2 10.9 10.8 10.2 106 101 3.2 10.6 1.1 na na na
Building Materials & Construction
Jeremy Chen - 886 2 2715 6368
Asia Cement 1102 TT O TWD 39.35 44.00 12 4,304 5.8 (0) 3 4 2 10 (0) 3 2 (2) (4) Dec-12 24 16 5 20.2 16.3 14.0 13.4 114 106 4.3 11.8 1.9 2.6 17.8 63 Taiwan Cement 1101 TT O TWD 48.40 48.20 (0) 5,931 13.8 (0) 1 2 5 26 (0) 1 (0) 1 11 Dec-12 27 18 7 23.1 18.2 15.5 14.4 108 109 3.9 13.0 2.3 1.7 10.7 52 Sector* 5 10,235 (0) 2 3 4 19 (0) 2 0 (0) 5 Dec-13 17 6 na 17.3 14.8 13.9 na 107 100 4.8 14.0 2.0 1.7 11.3 55
Chemicals Jeremy Chen / Michelle Chou - 886 2 2715 6368 / 886 2 2715 6363
FCFC 1326 TT N TWD 73.80 78.00 6 14,357 11.2 (1) (0) 4 (12) 13 (1) (0) 1 (16) (1) Dec-12 292 10 8 63.4 16.2 14.8 13.7 na 131 0.9 14.7 2.2 1.1 10.9 26
Formosa Plastics 1301 TT N TWD 77.40 75.00 (3) 16,353 11.9 (1) (0) 6 (4) 17 (1) (0) 3 (7) 2 Dec-12 36 33 10 33.6 24.8 18.6 17.0 na 104 1.6 10.5 2.5 2.6 28.2 11 NYPC 1303 TT N TWD 66.80 65.00 (3) 17,584 11.9 0 3 5 (3) 25 0 3 2 (7) 10 Dec-13 17 11 10 21.0 18.0 16.2 14.7 108 114 2.9 12.0 2.1 1.9 20.0 20 Taiwan Fertilizer 1722 TT N TWD 62.30 67.00 8 2,026 6.4 0 (1) 0 (8) (11) 0 (1) (2) (11) (25) Dec-13 76 (14) (61) 24.1 13.7 15.9 41.2 99 85 5.1 8.6 1.1 3.1 20.3 3
Sector* (0) 50,320 (0) 1 5 (6) 17 (0) 1 2 (10) 3 Dec-13 21 8 2 20.4 16.9 15.6 15.8 112 116 2.7 12.8 2.1 1.5 16.8 20
Consumer Staples Jeremy Chen - 886 2 2715 6368
Uni-President 1216 TT N TWD 51.20 47.00 (8) 8,759 18.5 0 0 (3) (5) (7) 0 0 (5) (8) (22) Dec-13 157 9 11 47.4 18.4 16.9 15.2 106 103 4.0 16.2 2.9 0.8 8.3 67
Diversified Financials Chung Hsu / Michelle Chou - 886 2 2715 6362 / 886 2 2715 6363
China Development FHC 2883 TT O TWD 8.74 10.00 14 4,360 8.9 (0) (0) 1 (3) 9 (0) (0) (2) (7) (5) Dec-13 29 12 6 17.5 13.6 12.2 11.5 104 106 3.7 5.7 0.8 na na na Yuanta FHC 2885 TT O TWD 15.40 19.50 27 5,057 10.8 (1) (1) 3 (13) 8 (1) (1) 0 (17) (7) Dec-13 31 (3) 6 23.0 17.5 18.0 17.0 99 92 2.9 5.5 0.9 na na na
Sector* 21 9,417 (1) (1) 2 (9) 8 (1) (0) (1) (12) (6) Dec-13 30 5 6 20.1 15.4 14.7 13.9 101 99 3.2 5.6 0.8 na na na
Energy Jeremy Chen - 886 2 2715 6368
FPCC 6505 TT U TWD 77.30 67.00 (13) 24,440 8.2 0 1 1 (6) 2 0 1 (1) (9) (12) Dec-13 32 8 8 27.4 20.8 19.3 17.8 123 126 3.2 14.4 2.9 1.0 14.4 65
Healthcare Jeremy Chen - 886 2 2715 6368
Ginko 8406 TT N TWD 543.0 515.0 (5) 1,665 6.4 4 1 (7) (4) 6 4 2 (9) (7) (9) Dec-12 28 33 22 44.9 35.1 26.4 21.6 100 105 0.9 22.2 7.2 10.0 29.1 (19) St.Shine 1565 TT O TWD 674.0 950.0 41 1,128 8.3 7 (1) (10) (21) 17 7 (1) (12) (24) 2 Dec-12 37 32 26 28.2 20.7 15.6 12.4 103 127 2.6 45.6 8.5 6.2 16.4 (11)
Sector* 13 2,793 5 0 (8) (11) 10 5 0 (10) (14) (4) Dec-13 33 24 na 27.4 20.6 16.6 na 116 121 2.2 34.1 6.4 6.1 16.0 (15)
Insurance Chung Hsu - 886 2 2715 6362
Cathay FHC 2882 TT N TWD 43.85 47.50 8 17,414 26.8 (1) (1) (0) (9) 23 (1) (1) (3) (13) 9 Dec-13 9 9 14 18.1 16.6 15.2 13.4 99 107 0.9 11.5 1.9 na na na China Life Taiwan 2823 TT O TWD 28.10 33.00 17 2,539 10.1 1 1 1 (7) 13 0 2 (1) (11) (2) Dec-13 15 7 7 16.2 14.1 13.2 12.3 104 115 1.4 10.1 1.4 na na na Fubon FHC 2881 TT N TWD 41.60 44.50 7 14,130 19.0 0 1 (0) (5) 3 0 1 (3) (8) (11) Dec-13 20 6 9 13.0 10.9 10.2 9.4 104 105 2.9 10.6 1.1 na na na
Shin Kong FHC 2888 TT U TWD 9.45 8.80 (7) 2,926 6.9 (0) (1) (2) (8) 6 (0) (1) (4) (12) (8) Dec-13 (27) 8 20 8.4 11.6 10.7 8.9 86 87 0.0 7.9 0.9 na na na Sector* 7 37,009 (0) (0) (0) (7) 14 (0) (0) (3) (11) (1) Dec-13 9 8 12 14.5 13.3 12.4 11.1 100 104 1.6 10.5 1.4 na na na
Metals & Mining Jeremy Chen - 886 2 2715 6368
China Steel 2002 TT U TWD 25.75 23.10 (10) 13,184 11.5 (1) (0) 2 (5) 2 (1) (0) (0) (8) (13) Dec-12 147 23 8 67.3 27.2 22.1 20.5 90 100 1.6 5.5 1.5 1.7 10.0 72
Real Estate Chung Hsu / Jeremy Chen - 886 2 2715 6362 / 886 2 2715 6368
Huaku 2548 TT O TWD 80.30 106.0 32 738 3.4 2 5 9 (5) 2 2 5 7 (8) (13) Dec-12 75 5 8 13.2 7.5 7.2 6.7 97 136 6.6 23.0 1.6 3.0 9.8 61
Ruentex Development 9945 TT N TWD 55.10 54.00 (2) 2,180 8.9 1 (0) 10 (5) (0) 1 (0) 7 (8) (15) Dec-13 (86) 59 (16) 2.1 15.8 9.9 11.8 54 81 3.6 7.4 1.2 12.2 77.3 41 Sector* 7 2,918 1 1 9 (5) 0 1 1 7 (8) (14) Dec-13 (78) 37 (16) 2.6 12.2 8.8 11.8 73 90 4.4 10.2 1.3 6.5 26.1 39
Retailing Jeremy Chen - 886 2 2715 6368
President Chain Store 2912 TT O TWD 222.0 255.0 15 7,660 12.3 (0) 1 10 8 20 (1) 1 8 4 6 Dec-13 (84) 2 10 3.6 22.6 22.1 20.2 109 104 2.7 37.0 7.9 0.9 11.4 (73)
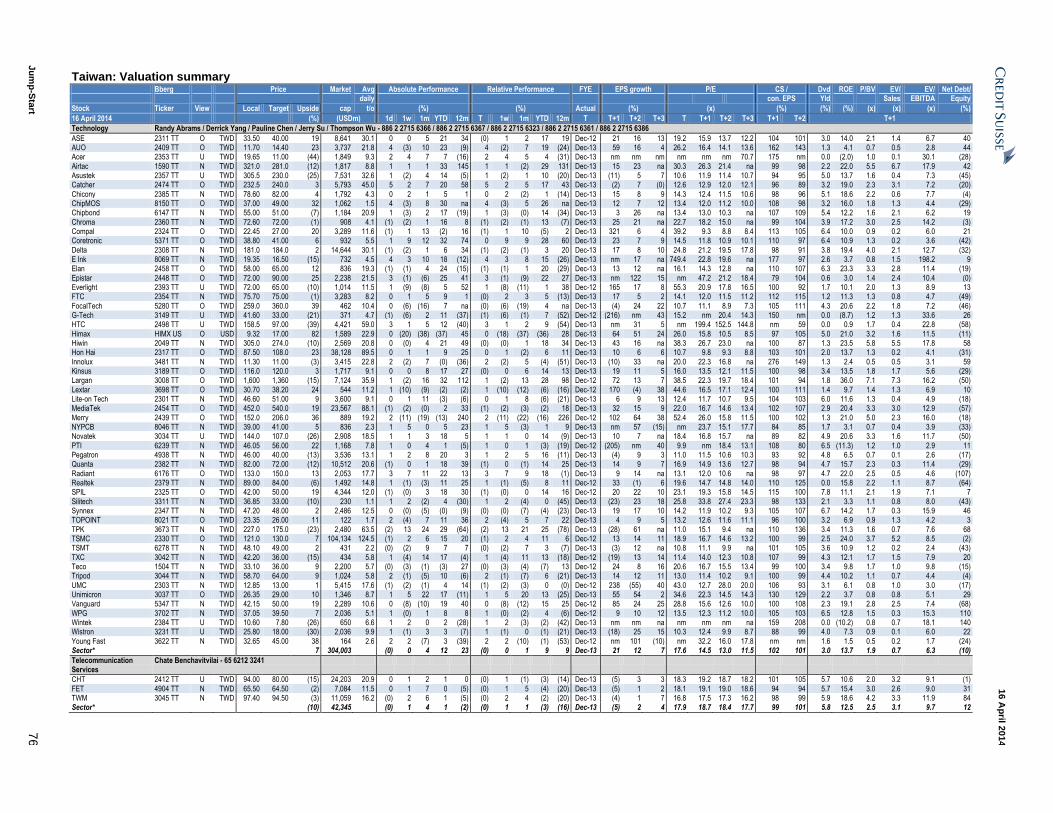
Ju
mp
-Sta
rt 7
6
16 A
pril 2
014
Taiwan: Valuation summary Bberg Price Market Avg Absolute Performance Relative Performance FYE EPS growth P/E CS / Dvd ROE P/BV EV/ EV/ Net Debt/ daily con. EPS Yld Sales EBITDA Equity
Stock Ticker View Local Target Upside cap t/o (%) (%) Actual (%) (x) (%) (%) (%) (x) (x) (x) (%)
16 April 2014 (%) (USDm) 1d 1w 1m YTD 12m T 1w 1m YTD 12m T T+1 T+2 T+3 T T+1 T+2 T+3 T+1 T+2 T+1
Technology Randy Abrams / Derrick Yang / Pauline Chen / Jerry Su / Thompson Wu - 886 2 2715 6366 / 886 2 2715 6367 / 886 2 2715 6323 / 886 2 2715 6361 / 886 2 2715 6386
ASE 2311 TT O TWD 33.50 40.00 19 8,641 30.1 0 0 5 21 34 (0) 1 2 17 19 Dec-12 21 16 13 19.2 15.9 13.7 12.2 104 101 3.0 14.0 2.1 1.4 6.7 40 AUO 2409 TT O TWD 11.70 14.40 23 3,737 21.8 4 (3) 10 23 (9) 4 (2) 7 19 (24) Dec-13 59 16 4 26.2 16.4 14.1 13.6 162 143 1.3 4.1 0.7 0.5 2.8 44 Acer 2353 TT U TWD 19.65 11.00 (44) 1,849 9.3 2 4 7 7 (16) 2 4 5 4 (31) Dec-13 nm nm nm nm nm nm 70.7 175 nm 0.0 (2.0) 1.0 0.1 30.1 (28)
Airtac 1590 TT N TWD 321.0 281.0 (12) 1,817 8.8 1 1 1 33 145 1 1 (2) 29 131 Dec-13 15 23 na 30.3 26.3 21.4 na 99 98 2.2 22.0 5.5 6.7 17.9 42 Asustek 2357 TT U TWD 305.5 230.0 (25) 7,531 32.6 1 (2) 4 14 (5) 1 (2) 1 10 (20) Dec-13 (11) 5 7 10.6 11.9 11.4 10.7 94 95 5.0 13.7 1.6 0.4 7.3 (45) Catcher 2474 TT O TWD 232.5 240.0 3 5,793 45.0 5 2 7 20 58 5 2 5 17 43 Dec-13 (2) 7 (0) 12.6 12.9 12.0 12.1 96 89 3.2 19.0 2.3 3.1 7.2 (20)
Chicony 2385 TT N TWD 78.60 82.00 4 1,792 4.3 0 2 1 5 1 0 2 (2) 1 (14) Dec-13 15 8 9 14.3 12.4 11.5 10.6 98 96 5.1 18.6 2.2 0.6 7.7 (4) ChipMOS 8150 TT O TWD 37.00 49.00 32 1,062 1.5 4 (3) 8 30 na 4 (3) 5 26 na Dec-13 12 7 12 13.4 12.0 11.2 10.0 108 98 3.2 16.0 1.8 1.3 4.4 (29) Chipbond 6147 TT N TWD 55.00 51.00 (7) 1,184 20.9 1 (3) 2 17 (19) 1 (3) (0) 14 (34) Dec-13 3 26 na 13.4 13.0 10.3 na 107 109 5.4 12.2 1.6 2.1 6.2 19
Chroma 2360 TT N TWD 72.60 72.00 (1) 908 4.1 (1) (2) 1 16 8 (1) (2) (1) 13 (7) Dec-13 25 21 na 22.7 18.2 15.0 na 99 104 3.9 17.2 3.0 2.5 14.2 (3) Compal 2324 TT O TWD 22.45 27.00 20 3,289 11.6 (1) 1 13 (2) 16 (1) 1 10 (5) 2 Dec-13 321 6 4 39.2 9.3 8.8 8.4 113 105 6.4 10.0 0.9 0.2 6.0 21 Coretronic 5371 TT O TWD 38.80 41.00 6 932 5.5 1 9 12 32 74 0 9 9 28 60 Dec-13 23 7 9 14.5 11.8 10.9 10.1 110 97 6.4 10.9 1.3 0.2 3.6 (42)
Delta 2308 TT N TWD 181.0 184.0 2 14,644 30.1 (1) (2) 1 6 34 (1) (2) (1) 3 20 Dec-13 17 8 10 24.8 21.2 19.5 17.8 98 91 3.8 19.4 4.0 2.1 12.7 (32) E Ink 8069 TT N TWD 19.35 16.50 (15) 732 4.5 4 3 10 18 (12) 4 3 8 15 (26) Dec-13 nm 17 na 749.4 22.8 19.6 na 177 97 2.6 3.7 0.8 1.5 198.2 9 Elan 2458 TT O TWD 58.00 65.00 12 836 19.3 (1) (1) 4 24 (15) (1) (1) 1 20 (29) Dec-13 13 12 na 16.1 14.3 12.8 na 110 107 6.3 23.3 3.3 2.8 11.4 (19)
Epistar 2448 TT O TWD 72.00 90.00 25 2,238 21.5 3 (1) (6) 25 41 3 (1) (9) 22 27 Dec-13 nm 122 15 nm 47.2 21.2 18.4 79 104 0.6 3.0 1.4 2.4 10.4 (0) Everlight 2393 TT U TWD 72.00 65.00 (10) 1,014 11.5 1 (9) (8) 5 52 1 (8) (11) 1 38 Dec-12 165 17 8 55.3 20.9 17.8 16.5 100 92 1.7 10.1 2.0 1.3 8.9 13 FTC 2354 TT N TWD 75.70 75.00 (1) 3,283 8.2 0 1 5 9 1 (0) 2 3 5 (13) Dec-13 17 5 2 14.1 12.0 11.5 11.2 112 115 1.2 11.3 1.3 0.8 4.7 (49)
FocalTech 5280 TT O TWD 259.0 360.0 39 462 10.4 0 (6) (16) 7 na (0) (6) (19) 4 na Dec-13 (4) 24 22 10.7 11.1 8.9 7.3 105 111 4.3 20.6 2.2 1.8 7.2 (46) G-Tech 3149 TT U TWD 41.60 33.00 (21) 371 4.7 (1) (6) 2 11 (37) (1) (6) (1) 7 (52) Dec-12 (216) nm 43 15.2 nm 20.4 14.3 150 nm 0.0 (8.7) 1.2 1.3 33.6 26 HTC 2498 TT U TWD 158.5 97.00 (39) 4,421 59.0 3 1 5 12 (40) 3 1 2 9 (54) Dec-13 nm 31 5 nm 199.4 152.5 144.8 nm 59 0.0 0.9 1.7 0.4 22.8 (58)
Himax HIMX US O USD 9.32 17.00 82 1,589 22.9 0 (20) (38) (37) 45 0 (18) (37) (36) 28 Dec-13 64 51 24 26.0 15.8 10.5 8.5 97 105 5.0 21.0 3.2 1.6 11.5 (11) Hiwin 2049 TT N TWD 305.0 274.0 (10) 2,569 20.8 0 (0) 4 21 49 (0) (0) 1 18 34 Dec-13 43 16 na 38.3 26.7 23.0 na 100 87 1.3 23.5 5.8 5.5 17.8 58 Hon Hai 2317 TT O TWD 87.50 108.0 23 38,128 89.5 0 1 1 9 25 0 1 (2) 6 11 Dec-13 10 6 6 10.7 9.8 9.3 8.8 103 101 2.0 13.7 1.3 0.2 4.1 (31)
Innolux 3481 TT N TWD 11.30 11.00 (3) 3,415 22.8 2 (2) 7 (0) (36) 2 (2) 5 (4) (51) Dec-13 (10) 33 na 20.0 22.3 16.8 na 276 149 1.3 2.4 0.5 0.5 3.1 59 Kinsus 3189 TT O TWD 116.0 120.0 3 1,717 9.1 0 0 8 17 27 (0) 0 6 14 13 Dec-13 19 11 5 16.0 13.5 12.1 11.5 100 98 3.4 13.5 1.8 1.7 5.6 (29) Largan 3008 TT O TWD 1,600 1,360 (15) 7,124 35.9 1 (2) 16 32 112 1 (2) 13 28 98 Dec-12 72 13 7 38.5 22.3 19.7 18.4 101 94 1.8 36.0 7.1 7.3 16.2 (50)
Lextar 3698 TT O TWD 30.70 38.20 24 544 11.2 1 (10) (9) (2) (2) 1 (10) (12) (6) (16) Dec-12 170 (4) 38 44.6 16.5 17.1 12.4 100 111 1.4 9.7 1.4 1.3 6.9 10 Lite-on Tech 2301 TT N TWD 46.60 51.00 9 3,600 9.1 0 1 11 (3) (6) 0 1 8 (6) (21) Dec-13 6 9 13 12.4 11.7 10.7 9.5 104 103 6.0 11.6 1.3 0.4 4.9 (18) MediaTek 2454 TT O TWD 452.0 540.0 19 23,567 88.1 (1) (2) (0) 2 33 (1) (2) (3) (2) 18 Dec-13 32 15 9 22.0 16.7 14.6 13.4 102 107 2.9 20.4 3.3 3.0 12.9 (57)
Merry 2439 TT O TWD 152.0 206.0 36 889 19.2 2 (11) (19) (13) 240 2 (11) (22) (16) 226 Dec-12 102 64 38 52.4 26.0 15.8 11.5 100 102 1.3 21.0 5.0 2.3 16.0 (18) NYPCB 8046 TT N TWD 39.00 41.00 5 836 2.3 1 5 0 5 23 1 5 (3) 1 9 Dec-13 nm 57 (15) nm 23.7 15.1 17.7 84 85 1.7 3.1 0.7 0.4 3.9 (33) Novatek 3034 TT U TWD 144.0 107.0 (26) 2,908 18.5 1 1 3 18 5 1 1 0 14 (9) Dec-13 10 7 na 18.4 16.8 15.7 na 89 82 4.9 20.6 3.3 1.6 11.7 (50)
PTI 6239 TT N TWD 46.05 56.00 22 1,168 7.8 1 0 4 1 (5) 1 0 1 (3) (19) Dec-12 (205) nm 40 9.9 nm 18.4 13.1 108 80 6.5 (11.3) 1.2 1.0 2.9 11 Pegatron 4938 TT N TWD 46.00 40.00 (13) 3,536 13.1 1 2 8 20 3 1 2 5 16 (11) Dec-13 (4) 9 3 11.0 11.5 10.6 10.3 93 92 4.8 6.5 0.7 0.1 2.6 (17) Quanta 2382 TT N TWD 82.00 72.00 (12) 10,512 20.6 (1) 0 1 18 39 (1) 0 (1) 14 25 Dec-13 14 9 7 16.9 14.9 13.6 12.7 98 94 4.7 15.7 2.3 0.3 11.4 (29)
Radiant 6176 TT O TWD 133.0 150.0 13 2,053 17.7 3 7 11 22 13 3 7 9 18 (1) Dec-13 9 14 na 13.1 12.0 10.6 na 98 97 4.7 22.0 2.5 0.5 4.6 (107) Realtek 2379 TT N TWD 89.00 84.00 (6) 1,492 14.8 1 (1) (3) 11 25 1 (1) (5) 8 11 Dec-12 33 (1) 6 19.6 14.7 14.8 14.0 110 125 0.0 15.8 2.2 1.1 8.7 (64) SPIL 2325 TT O TWD 42.00 50.00 19 4,344 12.0 (1) (0) 3 18 30 (1) (0) 0 14 16 Dec-12 20 22 10 23.1 19.3 15.8 14.5 115 100 7.8 11.1 2.1 1.9 7.1 7
Silitech 3311 TT N TWD 36.85 33.00 (10) 230 1.1 1 2 (2) 4 (30) 1 2 (4) 0 (45) Dec-13 (23) 23 18 25.8 33.8 27.4 23.3 98 133 2.1 3.3 1.1 0.8 8.0 (43) Synnex 2347 TT N TWD 47.20 48.00 2 2,486 12.5 0 (0) (5) (0) (9) (0) (0) (7) (4) (23) Dec-13 19 17 10 14.2 11.9 10.2 9.3 105 107 6.7 14.2 1.7 0.3 15.9 46 TOPOINT 8021 TT O TWD 23.35 26.00 11 122 1.7 2 (4) 7 11 36 2 (4) 5 7 22 Dec-13 4 9 5 13.2 12.6 11.6 11.1 96 100 3.2 6.9 0.9 1.3 4.2 3
TPK 3673 TT N TWD 227.0 175.0 (23) 2,480 63.5 (2) 13 24 29 (64) (2) 13 21 25 (78) Dec-13 (28) 61 na 11.0 15.1 9.4 na 110 136 3.4 11.3 1.6 0.7 7.6 68 TSMC 2330 TT O TWD 121.0 130.0 7 104,134 124.5 (1) 2 6 15 20 (1) 2 4 11 6 Dec-12 13 14 11 18.9 16.7 14.6 13.2 100 99 2.5 24.0 3.7 5.2 8.5 (2) TSMT 6278 TT N TWD 48.10 49.00 2 431 2.2 (0) (2) 9 7 7 (0) (2) 7 3 (7) Dec-13 (3) 12 na 10.8 11.1 9.9 na 101 105 3.6 10.9 1.2 0.2 2.4 (43)
TXC 3042 TT N TWD 42.20 36.00 (15) 434 5.8 1 (4) 14 17 (4) 1 (4) 11 13 (18) Dec-12 (19) 13 14 11.4 14.0 12.3 10.8 107 99 4.3 12.1 1.7 1.5 7.9 20 Teco 1504 TT N TWD 33.10 36.00 9 2,200 5.7 (0) (3) (1) (3) 27 (0) (3) (4) (7) 13 Dec-12 24 8 16 20.6 16.7 15.5 13.4 99 100 3.4 9.8 1.7 1.0 9.8 (15) Tripod 3044 TT N TWD 58.70 64.00 9 1,024 5.8 2 (1) (5) 10 (6) 2 (1) (7) 6 (21) Dec-13 14 12 11 13.0 11.4 10.2 9.1 100 99 4.4 10.2 1.1 0.7 4.4 (4)
UMC 2303 TT N TWD 12.85 13.00 1 5,415 17.6 (1) (2) (1) 4 14 (1) (2) (3) 0 (0) Dec-12 238 (55) 40 43.0 12.7 28.0 20.0 106 93 3.1 6.1 0.8 1.0 3.0 (17) Unimicron 3037 TT O TWD 26.35 29.00 10 1,346 8.7 1 5 22 17 (11) 1 5 20 13 (25) Dec-13 55 54 2 34.6 22.3 14.5 14.3 130 129 2.2 3.7 0.8 0.8 5.1 29 Vanguard 5347 TT N TWD 42.15 50.00 19 2,289 10.6 0 (8) (10) 19 40 0 (8) (12) 15 25 Dec-12 85 24 25 28.8 15.6 12.6 10.0 100 108 2.3 19.1 2.8 2.5 7.4 (68)
WPG 3702 TT N TWD 37.05 39.50 7 2,036 5.1 1 (0) 1 8 8 1 (0) (2) 4 (6) Dec-12 9 10 12 13.5 12.3 11.2 10.0 105 103 6.5 12.8 1.5 0.3 15.3 110 Wintek 2384 TT U TWD 10.60 7.80 (26) 650 6.6 1 2 0 2 (28) 1 2 (3) (2) (42) Dec-13 nm nm na nm nm nm na 159 208 0.0 (10.2) 0.8 0.7 18.1 140 Wistron 3231 TT U TWD 25.80 18.00 (30) 2,036 9.9 1 (1) 3 3 (7) 1 (1) 0 (1) (21) Dec-13 (18) 25 15 10.3 12.4 9.9 8.7 88 99 4.0 7.3 0.9 0.1 6.0 22
Young Fast 3622 TT N TWD 32.65 45.00 38 164 2.6 2 2 (7) 3 (39) 2 2 (10) (1) (53) Dec-12 nm 101 (10) nm 32.2 16.0 17.8 nm nm 1.6 1.5 0.5 0.2 1.7 (24) Sector* 7 304,003 (0) 0 4 12 23 (0) 0 1 9 9 Dec-13 21 12 7 17.6 14.5 13.0 11.5 102 101 3.0 13.7 1.9 0.7 6.3 (10)
Telecommunication Services
Chate Benchavitvilai - 65 6212 3241
CHT 2412 TT U TWD 94.00 80.00 (15) 24,203 20.9 0 1 2 1 0 (0) 1 (1) (3) (14) Dec-13 (5) 3 3 18.3 19.2 18.7 18.2 101 105 5.7 10.6 2.0 3.2 9.1 (1)
FET 4904 TT N TWD 65.50 64.50 (2) 7,084 11.5 0 1 7 0 (5) (0) 1 5 (4) (20) Dec-13 (5) 1 2 18.1 19.1 19.0 18.6 94 94 5.7 15.4 3.0 2.6 9.0 31 TWM 3045 TT N TWD 97.40 94.50 (3) 11,059 16.2 (0) 2 6 1 (5) (0) 2 4 (2) (20) Dec-13 (4) 1 7 16.8 17.5 17.3 16.2 98 99 5.9 18.6 4.2 3.3 11.9 84 Sector* (10) 42,345 (0) 1 4 1 (2) (0) 1 1 (3) (16) Dec-13 (5) 2 4 17.9 18.7 18.4 17.7 99 101 5.8 12.5 2.5 3.1 9.7 12
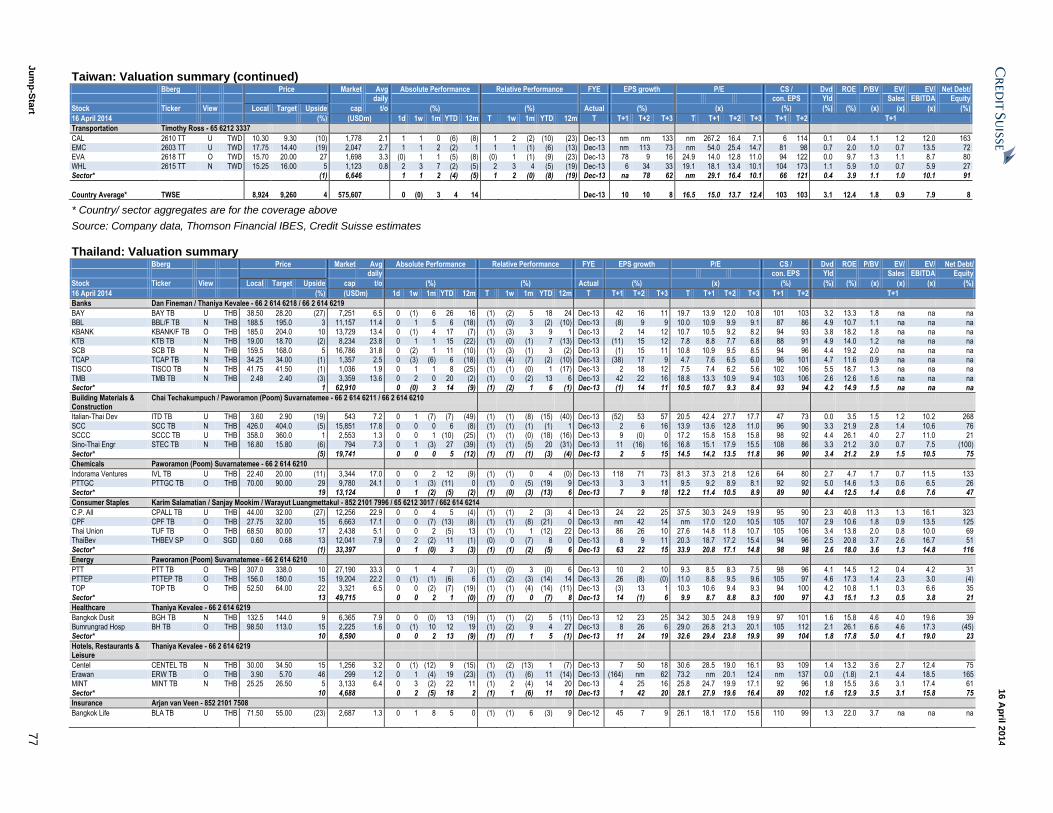
Ju
mp
-Sta
rt 7
7
16 A
pril 2
014
Taiwan: Valuation summary (continued) Bberg Price Market Avg Absolute Performance Relative Performance FYE EPS growth P/E CS / Dvd ROE P/BV EV/ EV/ Net Debt/ daily con. EPS Yld Sales EBITDA Equity
Stock Ticker View Local Target Upside cap t/o (%) (%) Actual (%) (x) (%) (%) (%) (x) (x) (x) (%)
16 April 2014 (%) (USDm) 1d 1w 1m YTD 12m T 1w 1m YTD 12m T T+1 T+2 T+3 T T+1 T+2 T+3 T+1 T+2 T+1
Transportation Timothy Ross - 65 6212 3337
CAL 2610 TT U TWD 10.30 9.30 (10) 1,778 2.1 1 1 0 (6) (8) 1 2 (2) (10) (23) Dec-13 nm nm 133 nm 267.2 16.4 7.1 6 114 0.1 0.4 1.1 1.2 12.0 163 EMC 2603 TT U TWD 17.75 14.40 (19) 2,047 2.7 1 1 2 (2) 1 1 1 (1) (6) (13) Dec-13 nm 113 73 nm 54.0 25.4 14.7 81 98 0.7 2.0 1.0 0.7 13.5 72 EVA 2618 TT O TWD 15.70 20.00 27 1,698 3.3 (0) 1 1 (5) (8) (0) 1 (1) (9) (23) Dec-13 78 9 16 24.9 14.0 12.8 11.0 94 122 0.0 9.7 1.3 1.1 8.7 80
WHL 2615 TT N TWD 15.25 16.00 5 1,123 0.8 2 3 7 (2) (5) 2 3 4 (5) (19) Dec-13 6 34 33 19.1 18.1 13.4 10.1 104 173 1.1 5.9 1.0 0.7 5.9 27 Sector* (1) 6,646 1 1 2 (4) (5) 1 2 (0) (8) (19) Dec-13 na 78 62 nm 29.1 16.4 10.1 66 121 0.4 3.9 1.1 1.0 10.1 91
Country Average* TWSE 8,924 9,260 4 575,607 0 (0) 3 4 14 Dec-13 10 10 8 16.5 15.0 13.7 12.4 103 103 3.1 12.4 1.8 0.9 7.9 8
* Country/ sector aggregates are for the coverage above
Source: Company data, Thomson Financial IBES, Credit Suisse estimates
Thailand: Valuation summary Bberg Price Market Avg Absolute Performance Relative Performance FYE EPS growth P/E CS / Dvd ROE P/BV EV/ EV/ Net Debt/ daily con. EPS Yld Sales EBITDA Equity
Stock Ticker View Local Target Upside cap t/o (%) (%) Actual (%) (x) (%) (%) (%) (x) (x) (x) (%)
16 April 2014 (%) (USDm) 1d 1w 1m YTD 12m T 1w 1m YTD 12m T T+1 T+2 T+3 T T+1 T+2 T+3 T+1 T+2 T+1
Banks Dan Fineman / Thaniya Kevalee - 66 2 614 6218 / 66 2 614 6219
BAY BAY TB U THB 38.50 28.20 (27) 7,251 6.5 0 (1) 6 26 16 (1) (2) 5 18 24 Dec-13 42 16 11 19.7 13.9 12.0 10.8 101 103 3.2 13.3 1.8 na na na
BBL BBL/F TB N THB 188.5 195.0 3 11,157 11.4 0 1 5 6 (18) (1) (0) 3 (2) (10) Dec-13 (8) 9 9 10.0 10.9 9.9 9.1 87 86 4.9 10.7 1.1 na na na KBANK KBANK/F TB O THB 185.0 204.0 10 13,729 13.4 0 (1) 4 17 (7) (1) (3) 3 9 1 Dec-13 2 14 12 10.7 10.5 9.2 8.2 94 93 3.8 18.2 1.8 na na na KTB KTB TB N THB 19.00 18.70 (2) 8,234 23.8 0 1 1 15 (22) (1) (0) (1) 7 (13) Dec-13 (11) 15 12 7.8 8.8 7.7 6.8 88 91 4.9 14.0 1.2 na na na
SCB SCB TB N THB 159.5 168.0 5 16,786 31.8 0 (2) 1 11 (10) (1) (3) (1) 3 (2) Dec-13 (1) 15 11 10.8 10.9 9.5 8.5 94 96 4.4 19.2 2.0 na na na TCAP TCAP TB N THB 34.25 34.00 (1) 1,357 2.5 0 (3) (6) 6 (18) (1) (4) (7) (2) (10) Dec-13 (38) 17 9 4.7 7.6 6.5 6.0 96 101 4.7 11.6 0.9 na na na TISCO TISCO TB N THB 41.75 41.50 (1) 1,036 1.9 0 1 1 8 (25) (1) (1) (0) 1 (17) Dec-13 2 18 12 7.5 7.4 6.2 5.6 102 106 5.5 18.7 1.3 na na na
TMB TMB TB N THB 2.48 2.40 (3) 3,359 13.6 0 2 0 20 (2) (1) 0 (2) 13 6 Dec-13 42 22 16 18.8 13.3 10.9 9.4 103 106 2.6 12.6 1.6 na na na Sector* 1 62,910 0 (0) 3 14 (9) (1) (2) 1 6 (1) Dec-13 (1) 14 11 10.5 10.7 9.3 8.4 93 94 4.2 14.9 1.5 na na na
Building Materials & Construction
Chai Techakumpuch / Paworamon (Poom) Suvarnatemee - 66 2 614 6211 / 66 2 614 6210
Italian-Thai Dev ITD TB U THB 3.60 2.90 (19) 543 7.2 0 1 (7) (7) (49) (1) (1) (8) (15) (40) Dec-13 (52) 53 57 20.5 42.4 27.7 17.7 47 73 0.0 3.5 1.5 1.2 10.2 268
SCC SCC TB N THB 426.0 404.0 (5) 15,851 17.8 0 0 0 6 (8) (1) (1) (1) (1) 1 Dec-13 2 6 16 13.9 13.6 12.8 11.0 96 90 3.3 21.9 2.8 1.4 10.6 76 SCCC SCCC TB U THB 358.0 360.0 1 2,553 1.3 0 0 1 (10) (25) (1) (1) (0) (18) (16) Dec-13 9 (0) 0 17.2 15.8 15.8 15.8 98 92 4.4 26.1 4.0 2.7 11.0 21 Sino-Thai Engr STEC TB N THB 16.80 15.80 (6) 794 7.3 0 1 (3) 27 (39) (1) (1) (5) 20 (31) Dec-13 11 (16) 16 16.8 15.1 17.9 15.5 108 86 3.3 21.2 3.0 0.7 7.5 (100)
Sector* (5) 19,741 0 0 0 5 (12) (1) (1) (1) (3) (4) Dec-13 2 5 15 14.5 14.2 13.5 11.8 96 90 3.4 21.2 2.9 1.5 10.5 75
Chemicals Paworamon (Poom) Suvarnatemee - 66 2 614 6210
Indorama Ventures IVL TB U THB 22.40 20.00 (11) 3,344 17.0 0 0 2 12 (9) (1) (1) 0 4 (0) Dec-13 118 71 73 81.3 37.3 21.8 12.6 64 80 2.7 4.7 1.7 0.7 11.5 133 PTTGC PTTGC TB O THB 70.00 90.00 29 9,780 24.1 0 1 (3) (11) 0 (1) 0 (5) (19) 9 Dec-13 3 3 11 9.5 9.2 8.9 8.1 92 92 5.0 14.6 1.3 0.6 6.5 26 Sector* 19 13,124 0 1 (2) (5) (2) (1) (0) (3) (13) 6 Dec-13 7 9 18 12.2 11.4 10.5 8.9 89 90 4.4 12.5 1.4 0.6 7.6 47
Consumer Staples Karim Salamatian / Sanjay Mookim / Warayut Luangmettakul - 852 2101 7996 / 65 6212 3017 / 662 614 6214
C.P. All CPALL TB U THB 44.00 32.00 (27) 12,256 22.9 0 0 4 5 (4) (1) (1) 2 (3) 4 Dec-13 24 22 25 37.5 30.3 24.9 19.9 95 90 2.3 40.8 11.3 1.3 16.1 323
CPF CPF TB O THB 27.75 32.00 15 6,663 17.1 0 0 (7) (13) (8) (1) (1) (8) (21) 0 Dec-13 nm 42 14 nm 17.0 12.0 10.5 105 107 2.9 10.6 1.8 0.9 13.5 125 Thai Union TUF TB O THB 68.50 80.00 17 2,438 5.1 0 0 2 (5) 13 (1) (1) 1 (12) 22 Dec-13 86 26 10 27.6 14.8 11.8 10.7 105 106 3.4 13.8 2.0 0.8 10.0 69 ThaiBev THBEV SP O SGD 0.60 0.68 13 12,041 7.9 0 2 (2) 11 (1) (0) 0 (7) 8 0 Dec-13 8 9 11 20.3 18.7 17.2 15.4 94 96 2.5 20.8 3.7 2.6 16.7 51
Sector* (1) 33,397 0 1 (0) 3 (3) (1) (1) (2) (5) 6 Dec-13 63 22 15 33.9 20.8 17.1 14.8 98 98 2.6 18.0 3.6 1.3 14.8 116
Energy Paworamon (Poom) Suvarnatemee - 66 2 614 6210
PTT PTT TB O THB 307.0 338.0 10 27,190 33.3 0 1 4 7 (3) (1) (0) 3 (0) 6 Dec-13 10 2 10 9.3 8.5 8.3 7.5 98 96 4.1 14.5 1.2 0.4 4.2 31 PTTEP PTTEP TB O THB 156.0 180.0 15 19,204 22.2 0 (1) (1) (6) 6 (1) (2) (3) (14) 14 Dec-13 26 (8) (0) 11.0 8.8 9.5 9.6 105 97 4.6 17.3 1.4 2.3 3.0 (4) TOP TOP TB O THB 52.50 64.00 22 3,321 6.5 0 0 (2) (7) (19) (1) (1) (4) (14) (11) Dec-13 (3) 13 1 10.3 10.6 9.4 9.3 94 100 4.2 10.8 1.1 0.3 6.6 35
Sector* 13 49,715 0 0 2 1 (0) (1) (1) 0 (7) 8 Dec-13 14 (1) 6 9.9 8.7 8.8 8.3 100 97 4.3 15.1 1.3 0.5 3.8 21
Healthcare Thaniya Kevalee - 66 2 614 6219
Bangkok Dusit BGH TB N THB 132.5 144.0 9 6,365 7.9 0 0 (0) 13 (19) (1) (1) (2) 5 (11) Dec-13 12 23 25 34.2 30.5 24.8 19.9 97 101 1.6 15.8 4.6 4.0 19.6 39 Bumrungrad Hosp BH TB O THB 98.50 113.0 15 2,225 1.6 0 (1) 10 12 19 (1) (2) 9 4 27 Dec-13 8 26 6 29.0 26.8 21.3 20.1 105 112 2.1 26.1 6.6 4.6 17.3 (45) Sector* 10 8,590 0 0 2 13 (9) (1) (1) 1 5 (1) Dec-13 11 24 19 32.6 29.4 23.8 19.9 99 104 1.8 17.8 5.0 4.1 19.0 23
Hotels, Restaurants & Leisure
Thaniya Kevalee - 66 2 614 6219
Centel CENTEL TB N THB 30.00 34.50 15 1,256 3.2 0 (1) (12) 9 (15) (1) (2) (13) 1 (7) Dec-13 7 50 18 30.6 28.5 19.0 16.1 93 109 1.4 13.2 3.6 2.7 12.4 75 Erawan ERW TB O THB 3.90 5.70 46 299 1.2 0 1 (4) 19 (23) (1) (1) (6) 11 (14) Dec-13 (164) nm 62 73.2 nm 20.1 12.4 nm 137 0.0 (1.8) 2.1 4.4 18.5 165 MINT MINT TB N THB 25.25 26.50 5 3,133 6.4 0 3 (2) 22 11 (1) 2 (4) 14 20 Dec-13 4 25 16 25.8 24.7 19.9 17.1 92 96 1.8 15.5 3.6 3.1 17.4 61
Sector* 10 4,688 0 2 (5) 18 2 (1) 1 (6) 11 10 Dec-13 1 42 20 28.1 27.9 19.6 16.4 89 102 1.6 12.9 3.5 3.1 15.8 75
Insurance Arjan van Veen - 852 2101 7508
Bangkok Life BLA TB U THB 71.50 55.00 (23) 2,687 1.3 0 1 8 5 0 (1) (1) 6 (3) 9 Dec-12 45 7 9 26.1 18.1 17.0 15.6 110 99 1.3 22.0 3.7 na na na
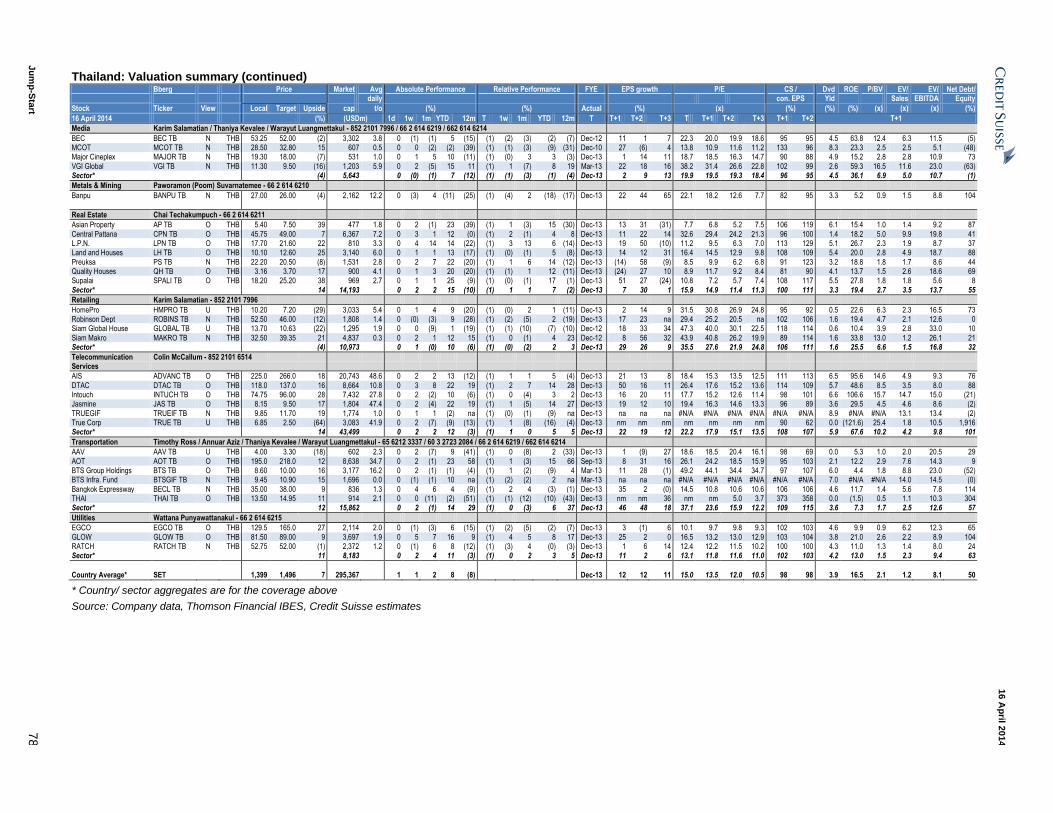
Ju
mp
-Sta
rt 7
8
16 A
pril 2
014
Thailand: Valuation summary (continued) Bberg Price Market Avg Absolute Performance Relative Performance FYE EPS growth P/E CS / Dvd ROE P/BV EV/ EV/ Net Debt/ daily con. EPS Yld Sales EBITDA Equity
Stock Ticker View Local Target Upside cap t/o (%) (%) Actual (%) (x) (%) (%) (%) (x) (x) (x) (%)
16 April 2014 (%) (USDm) 1d 1w 1m YTD 12m T 1w 1m YTD 12m T T+1 T+2 T+3 T T+1 T+2 T+3 T+1 T+2 T+1
Media Karim Salamatian / Thaniya Kevalee / Warayut Luangmettakul - 852 2101 7996 / 66 2 614 6219 / 662 614 6214
BEC BEC TB N THB 53.25 52.00 (2) 3,302 3.8 0 (1) (1) 5 (15) (1) (2) (3) (2) (7) Dec-12 11 1 7 22.3 20.0 19.9 18.6 95 95 4.5 63.8 12.4 6.3 11.5 (5) MCOT MCOT TB N THB 28.50 32.80 15 607 0.5 0 0 (2) (2) (39) (1) (1) (3) (9) (31) Dec-10 27 (6) 4 13.8 10.9 11.6 11.2 133 96 8.3 23.3 2.5 2.5 5.1 (48) Major Cineplex MAJOR TB N THB 19.30 18.00 (7) 531 1.0 0 1 5 10 (11) (1) (0) 3 3 (3) Dec-13 1 14 11 18.7 18.5 16.3 14.7 90 88 4.9 15.2 2.8 2.8 10.9 73
VGI Global VGI TB N THB 11.30 9.50 (16) 1,203 5.9 0 2 (5) 15 11 (1) 1 (7) 8 19 Mar-13 22 18 16 38.2 31.4 26.6 22.8 102 99 2.6 59.3 16.5 11.6 23.0 (63) Sector* (4) 5,643 0 (0) (1) 7 (12) (1) (1) (3) (1) (4) Dec-13 2 9 13 19.9 19.5 19.3 18.4 96 95 4.5 36.1 6.9 5.0 10.7 (1)
Metals & Mining Paworamon (Poom) Suvarnatemee - 66 2 614 6210
Banpu BANPU TB N THB 27.00 26.00 (4) 2,162 12.2 0 (3) 4 (11) (25) (1) (4) 2 (18) (17) Dec-13 22 44 65 22.1 18.2 12.6 7.7 82 95 3.3 5.2 0.9 1.5 8.8 104
Real Estate Chai Techakumpuch - 66 2 614 6211
Asian Property AP TB O THB 5.40 7.50 39 477 1.8 0 2 (1) 23 (39) (1) 1 (3) 15 (30) Dec-13 13 31 (31) 7.7 6.8 5.2 7.5 106 119 6.1 15.4 1.0 1.4 9.2 87
Central Pattana CPN TB O THB 45.75 49.00 7 6,367 7.2 0 3 1 12 (0) (1) 2 (1) 4 8 Dec-13 11 22 14 32.6 29.4 24.2 21.3 96 100 1.4 18.2 5.0 9.9 19.8 41 L.P.N. LPN TB O THB 17.70 21.60 22 810 3.3 0 4 14 14 (22) (1) 3 13 6 (14) Dec-13 19 50 (10) 11.2 9.5 6.3 7.0 113 129 5.1 26.7 2.3 1.9 8.7 37 Land and Houses LH TB O THB 10.10 12.60 25 3,140 6.0 0 1 1 13 (17) (1) (0) (1) 5 (8) Dec-13 14 12 31 16.4 14.5 12.9 9.8 108 109 5.4 20.0 2.8 4.9 18.7 88
Preuksa PS TB N THB 22.20 20.50 (8) 1,531 2.8 0 2 7 22 (20) (1) 1 6 14 (12) Dec-13 (14) 58 (9) 8.5 9.9 6.2 6.8 91 123 3.2 18.8 1.8 1.7 8.6 44 Quality Houses QH TB O THB 3.16 3.70 17 900 4.1 0 1 3 20 (20) (1) (1) 1 12 (11) Dec-13 (24) 27 10 8.9 11.7 9.2 8.4 81 90 4.1 13.7 1.5 2.6 18.6 69 Supalai SPALI TB O THB 18.20 25.20 38 969 2.7 0 1 1 25 (9) (1) (0) (1) 17 (1) Dec-13 51 27 (24) 10.8 7.2 5.7 7.4 108 117 5.5 27.8 1.8 1.8 5.6 8
Sector* 14 14,193 0 2 2 15 (10) (1) 1 1 7 (2) Dec-13 7 30 1 15.9 14.9 11.4 11.3 100 111 3.3 19.4 2.7 3.5 13.7 55
Retailing Karim Salamatian - 852 2101 7996
HomePro HMPRO TB U THB 10.20 7.20 (29) 3,033 5.4 0 1 4 9 (20) (1) (0) 2 1 (11) Dec-13 2 14 9 31.5 30.8 26.9 24.8 95 92 0.5 22.6 6.3 2.3 16.5 73 Robinson Dept ROBINS TB N THB 52.50 46.00 (12) 1,808 1.4 0 (0) (3) 9 (28) (1) (2) (5) 2 (19) Dec-13 17 23 na 29.4 25.2 20.5 na 102 106 1.6 19.4 4.7 2.1 12.6 0 Siam Global House GLOBAL TB U THB 13.70 10.63 (22) 1,295 1.9 0 0 (9) 1 (19) (1) (1) (10) (7) (10) Dec-12 18 33 34 47.3 40.0 30.1 22.5 118 114 0.6 10.4 3.9 2.8 33.0 10
Siam Makro MAKRO TB N THB 32.50 39.35 21 4,837 0.3 0 2 1 12 15 (1) 0 (1) 4 23 Dec-12 8 56 32 43.9 40.8 26.2 19.9 89 114 1.6 33.8 13.0 1.2 26.1 21 Sector* (4) 10,973 0 1 (0) 10 (6) (1) (0) (2) 2 3 Dec-13 29 26 9 35.5 27.6 21.9 24.8 106 111 1.6 25.5 6.6 1.5 16.8 32
Telecommunication Services
Colin McCallum - 852 2101 6514
AIS ADVANC TB O THB 225.0 266.0 18 20,743 48.6 0 2 2 13 (12) (1) 1 1 5 (4) Dec-13 21 13 8 18.4 15.3 13.5 12.5 111 113 6.5 95.6 14.6 4.9 9.3 76
DTAC DTAC TB O THB 118.0 137.0 16 8,664 10.8 0 3 8 22 19 (1) 2 7 14 28 Dec-13 50 16 11 26.4 17.6 15.2 13.6 114 109 5.7 48.6 8.5 3.5 8.0 88 Intouch INTUCH TB O THB 74.75 96.00 28 7,432 27.8 0 2 (2) 10 (6) (1) 0 (4) 3 2 Dec-13 16 20 11 17.7 15.2 12.6 11.4 98 101 6.6 106.6 15.7 14.7 15.0 (21) Jasmine JAS TB O THB 8.15 9.50 17 1,804 47.4 0 2 (4) 22 19 (1) 1 (5) 14 27 Dec-13 19 12 10 19.4 16.3 14.6 13.3 96 89 3.6 29.5 4.5 4.6 8.6 (2)
TRUEGIF TRUEIF TB N THB 9.85 11.70 19 1,774 1.0 0 1 1 (2) na (1) (0) (1) (9) na Dec-13 na na na #N/A #N/A #N/A #N/A #N/A #N/A 8.9 #N/A #N/A 13.1 13.4 (2) True Corp TRUE TB U THB 6.85 2.50 (64) 3,083 41.9 0 2 (7) (9) (13) (1) 1 (8) (16) (4) Dec-13 nm nm nm nm nm nm nm 90 62 0.0 (121.6) 25.4 1.8 10.5 1,916 Sector* 14 43,499 0 2 2 12 (3) (1) 1 0 5 5 Dec-13 22 19 12 22.2 17.9 15.1 13.5 108 107 5.9 67.6 10.2 4.2 9.8 101
Transportation Timothy Ross / Annuar Aziz / Thaniya Kevalee / Warayut Luangmettakul - 65 6212 3337 / 60 3 2723 2084 / 66 2 614 6219 / 662 614 6214
AAV AAV TB U THB 4.00 3.30 (18) 602 2.3 0 2 (7) 9 (41) (1) 0 (8) 2 (33) Dec-13 1 (9) 27 18.6 18.5 20.4 16.1 98 69 0.0 5.3 1.0 2.0 20.5 29
AOT AOT TB O THB 195.0 218.0 12 8,638 34.7 0 2 (1) 23 58 (1) 1 (3) 15 66 Sep-13 8 31 16 26.1 24.2 18.5 15.9 95 103 2.1 12.2 2.9 7.6 14.3 9 BTS Group Holdings BTS TB O THB 8.60 10.00 16 3,177 16.2 0 2 (1) (1) (4) (1) 1 (2) (9) 4 Mar-13 11 28 (1) 49.2 44.1 34.4 34.7 97 107 6.0 4.4 1.8 8.8 23.0 (52) BTS Infra. Fund BTSGIF TB N THB 9.45 10.90 15 1,696 0.0 0 (1) (1) 10 na (1) (2) (2) 2 na Mar-13 na na na #N/A #N/A #N/A #N/A #N/A #N/A 7.0 #N/A #N/A 14.0 14.5 (0)
Bangkok Expressway BECL TB N THB 35.00 38.00 9 836 1.3 0 4 6 4 (9) (1) 2 4 (3) (1) Dec-13 35 2 (0) 14.5 10.8 10.6 10.6 106 106 4.6 11.7 1.4 5.6 7.8 114 THAI THAI TB O THB 13.50 14.95 11 914 2.1 0 0 (11) (2) (51) (1) (1) (12) (10) (43) Dec-13 nm nm 36 nm nm 5.0 3.7 373 358 0.0 (1.5) 0.5 1.1 10.3 304 Sector* 12 15,862 0 2 (1) 14 29 (1) 0 (3) 6 37 Dec-13 46 48 18 37.1 23.6 15.9 12.2 109 115 3.6 7.3 1.7 2.5 12.6 57
Utilities Wattana Punyawattanakul - 66 2 614 6215
EGCO EGCO TB O THB 129.5 165.0 27 2,114 2.0 0 (1) (3) 6 (15) (1) (2) (5) (2) (7) Dec-13 3 (1) 6 10.1 9.7 9.8 9.3 102 103 4.6 9.9 0.9 6.2 12.3 65
GLOW GLOW TB O THB 81.50 89.00 9 3,697 1.9 0 5 7 16 9 (1) 4 5 8 17 Dec-13 25 2 0 16.5 13.2 13.0 12.9 103 104 3.8 21.0 2.6 2.2 8.9 104 RATCH RATCH TB N THB 52.75 52.00 (1) 2,372 1.2 0 (1) 6 8 (12) (1) (3) 4 (0) (3) Dec-13 1 6 14 12.4 12.2 11.5 10.2 100 100 4.3 11.0 1.3 1.4 8.0 24 Sector* 11 8,183 0 2 4 11 (3) (1) 0 2 3 5 Dec-13 11 2 6 13.1 11.8 11.6 11.0 102 103 4.2 13.0 1.5 2.3 9.4 63
Country Average* SET 1,399 1,496 7 295,367 1 1 2 8 (8) Dec-13 12 12 11 15.0 13.5 12.0 10.5 98 98 3.9 16.5 2.1 1.2 8.1 50
* Country/ sector aggregates are for the coverage above
Source: Company data, Thomson Financial IBES, Credit Suisse estimates
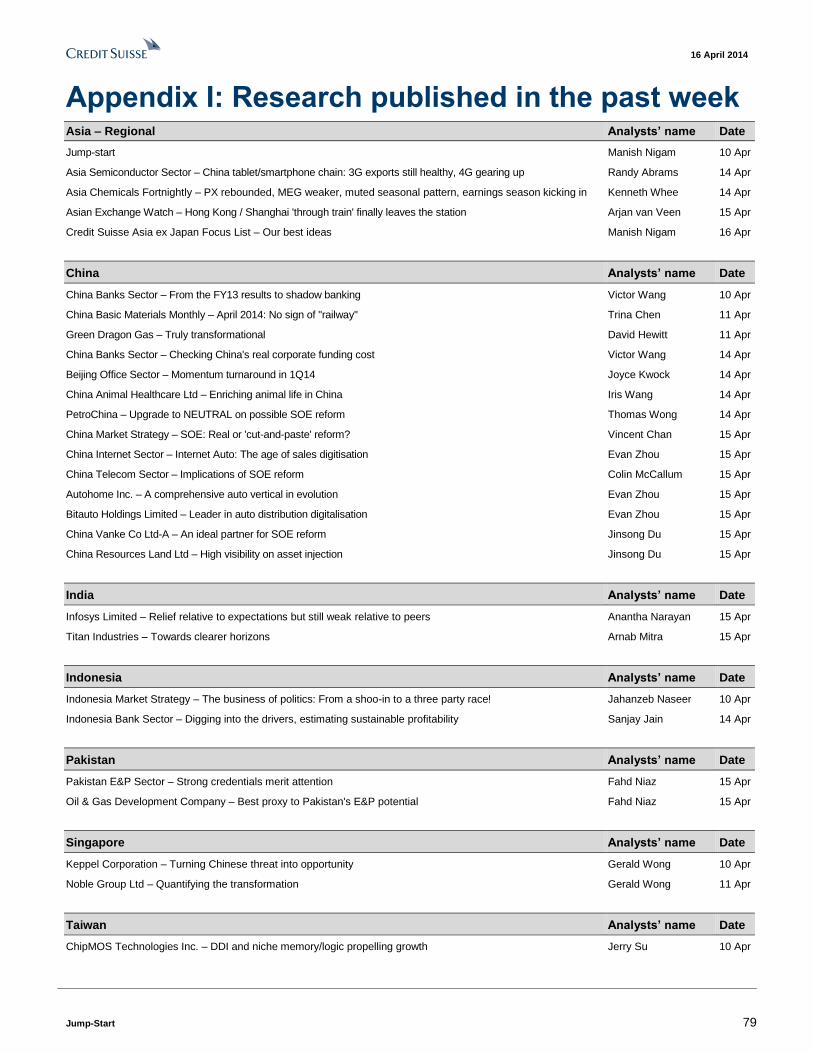
16 April 2014
Jump-Start 79
Appendix I: Research published in the past week Asia – Regional Analysts’ name Date
Jump-start Manish Nigam 10 Apr
Asia Semiconductor Sector – China tablet/smartphone chain: 3G exports still healthy, 4G gearing up Randy Abrams 14 Apr
Asia Chemicals Fortnightly – PX rebounded, MEG weaker, muted seasonal pattern, earnings season kicking in Kenneth Whee 14 Apr
Asian Exchange Watch – Hong Kong / Shanghai 'through train' finally leaves the station Arjan van Veen 15 Apr
Credit Suisse Asia ex Japan Focus List – Our best ideas Manish Nigam 16 Apr
China Analysts’ name Date
China Banks Sector – From the FY13 results to shadow banking Victor Wang 10 Apr
China Basic Materials Monthly – April 2014: No sign of "railway'' Trina Chen 11 Apr
Green Dragon Gas – Truly transformational David Hewitt 11 Apr
China Banks Sector – Checking China's real corporate funding cost Victor Wang 14 Apr
Beijing Office Sector – Momentum turnaround in 1Q14 Joyce Kwock 14 Apr
China Animal Healthcare Ltd – Enriching animal life in China Iris Wang 14 Apr
PetroChina – Upgrade to NEUTRAL on possible SOE reform Thomas Wong 14 Apr
China Market Strategy – SOE: Real or 'cut-and-paste' reform? Vincent Chan 15 Apr
China Internet Sector – Internet Auto: The age of sales digitisation Evan Zhou 15 Apr
China Telecom Sector – Implications of SOE reform Colin McCallum 15 Apr
Autohome Inc. – A comprehensive auto vertical in evolution Evan Zhou 15 Apr
Bitauto Holdings Limited – Leader in auto distribution digitalisation Evan Zhou 15 Apr
China Vanke Co Ltd-A – An ideal partner for SOE reform Jinsong Du 15 Apr
China Resources Land Ltd – High visibility on asset injection Jinsong Du 15 Apr
India Analysts’ name Date
Infosys Limited – Relief relative to expectations but still weak relative to peers Anantha Narayan 15 Apr
Titan Industries – Towards clearer horizons Arnab Mitra 15 Apr
Indonesia Analysts’ name Date
Indonesia Market Strategy – The business of politics: From a shoo-in to a three party race! Jahanzeb Naseer 10 Apr
Indonesia Bank Sector – Digging into the drivers, estimating sustainable profitability Sanjay Jain 14 Apr
Pakistan Analysts’ name Date
Pakistan E&P Sector – Strong credentials merit attention Fahd Niaz 15 Apr
Oil & Gas Development Company – Best proxy to Pakistan's E&P potential Fahd Niaz 15 Apr
Singapore Analysts’ name Date
Keppel Corporation – Turning Chinese threat into opportunity Gerald Wong 10 Apr
Noble Group Ltd – Quantifying the transformation Gerald Wong 11 Apr
Taiwan Analysts’ name Date
ChipMOS Technologies Inc. – DDI and niche memory/logic propelling growth Jerry Su 10 Apr
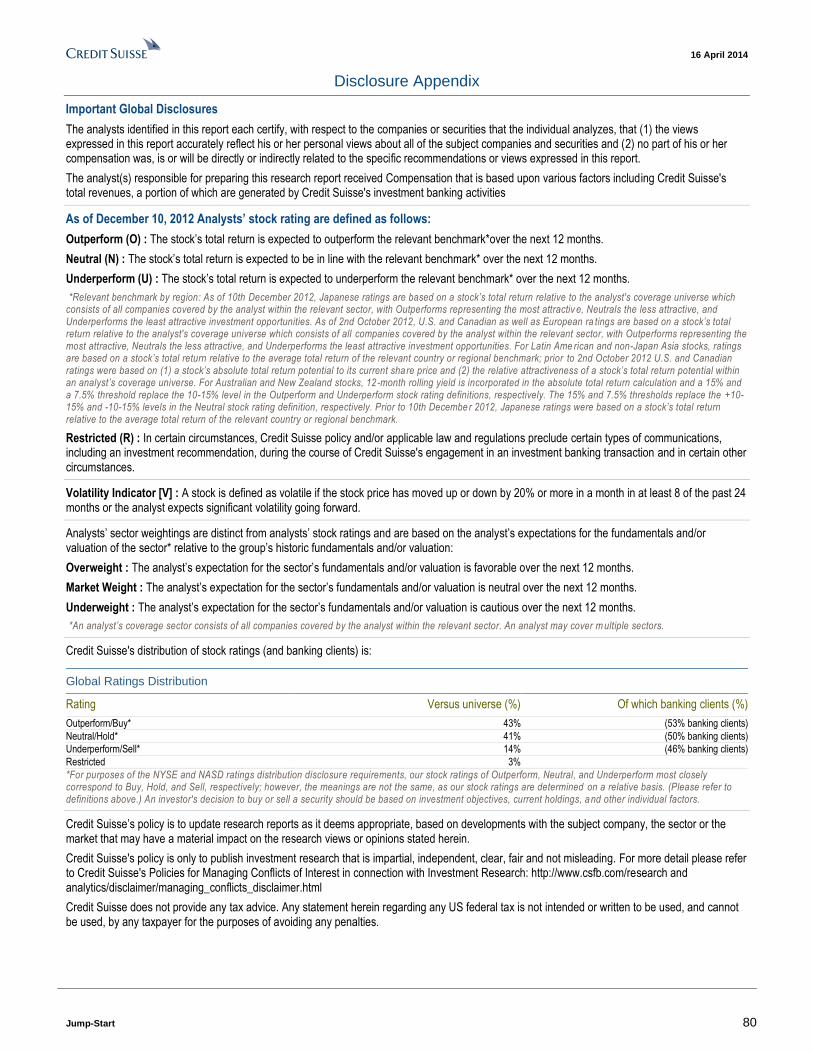
16 April 2014
Jump-Start 80
Disclosure Appendix
Important Global Disclosures
The analysts identified in this report each certify, with respect to the companies or securities that the individual analyzes, that (1) the views expressed in this report accurately reflect his or her personal views about all of the subject companies and securities and (2) no part of his or her compensation was, is or will be directly or indirectly related to the specific recommendations or views expressed in this report.
The analyst(s) responsible for preparing this research report received Compensation that is based upon various factors including Credit Suisse's total revenues, a portion of which are generated by Credit Suisse's investment banking activities
As of December 10, 2012 Analysts’ stock rating are defined as follows:
Outperform (O) : The stock’s total return is expected to outperform the relevant benchmark*over the next 12 months.
Neutral (N) : The stock’s total return is expected to be in line with the relevant benchmark* over the next 12 months.
Underperform (U) : The stock’s total return is expected to underperform the relevant benchmark* over the next 12 months.
*Relevant benchmark by region: As of 10th December 2012, Japanese ratings are based on a stock’s total return relative to the analyst's coverage universe which consists of all companies covered by the analyst within the relevant sector, with Outperforms representing the most attractiv e, Neutrals the less attractive, and Underperforms the least attractive investment opportunities. As of 2nd October 2012, U.S. and Canadian as well as European ra tings are based on a stock’s total return relative to the analyst's coverage universe which consists of all companies covered by the analyst within the relevant sector, with Outperforms representing the most attractive, Neutrals the less attractive, and Underperforms the least attractive investment opportunities. For Latin Ame rican and non-Japan Asia stocks, ratings are based on a stock’s total return relative to the average total return of the relevant country or regional benchmark; prior to 2nd October 2012 U.S. and Canadian ratings were based on (1) a stock’s absolute total return potential to its current share price and (2) the relative attractiveness of a stock’s total return potential within an analyst’s coverage universe. For Australian and New Zealand stocks, 12 -month rolling yield is incorporated in the absolute total return calculation and a 15% and a 7.5% threshold replace the 10-15% level in the Outperform and Underperform stock rating definitions, respectively. The 15% and 7.5% thresholds replace the +10-15% and -10-15% levels in the Neutral stock rating definition, respectively. Prior to 10th Decembe r 2012, Japanese ratings were based on a stock’s total return relative to the average total return of the relevant country or regional benchmark.
Restricted (R) : In certain circumstances, Credit Suisse policy and/or applicable law and regulations preclude certain types of communications, including an investment recommendation, during the course of Credit Suisse's engagement in an investment banking transaction and in certain other circumstances.
Volatility Indicator [V] : A stock is defined as volatile if the stock price has moved up or down by 20% or more in a month in at least 8 of the past 24 months or the analyst expects significant volatility going forward.
Analysts’ sector weightings are distinct from analysts’ stock ratings and are based on the analyst’s expectations for the fundamentals and/or valuation of the sector* relative to the group’s historic fundamentals and/or valuation:
Overweight : The analyst’s expectation for the sector’s fundamentals and/or valuation is favorable over the next 12 months.
Market Weight : The analyst’s expectation for the sector’s fundamentals and/or valuation is neutral over the next 12 months.
Underweight : The analyst’s expectation for the sector’s fundamentals and/or valuation is cautious over the next 12 months.
*An analyst’s coverage sector consists of all companies covered by the analyst within the relevant sector. An analyst may cover m ultiple sectors.
Credit Suisse's distribution of stock ratings (and banking clients) is:
Global Ratings Distribution
Rating Versus universe (%) Of which banking clients (%)
Outperform/Buy* 43% (53% banking clients)
Neutral/Hold* 41% (50% banking clients)
Underperform/Sell* 14% (46% banking clients)
Restricted 3%
*For purposes of the NYSE and NASD ratings distribution disclosure requirements, our stock ratings of Outperform, Neutral, and Underperform most closely correspond to Buy, Hold, and Sell, respectively; however, the meanings are not the same, as our stock ratings are determined on a relative basis. (Please refer to definitions above.) An investor's decision to buy or sell a security should be based on investment objectives, current holdings, a nd other individual factors.
Credit Suisse’s policy is to update research reports as it deems appropriate, based on developments with the subject company, the sector or the market that may have a material impact on the research views or opinions stated herein.
Credit Suisse's policy is only to publish investment research that is impartial, independent, clear, fair and not misleading. For more detail please refer to Credit Suisse's Policies for Managing Conflicts of Interest in connection with Investment Research: http://www.csfb.com/research and analytics/disclaimer/managing_conflicts_disclaimer.html
Credit Suisse does not provide any tax advice. Any statement herein regarding any US federal tax is not intended or written to be used, and cannot be used, by any taxpayer for the purposes of avoiding any penalties.
16 April 2014
Jump-Start 81
Important Regional Disclosures
Singapore recipients should contact Credit Suisse AG, Singapore Branch for any matters arising from this research report.
Restrictions on certain Canadian securities are indicated by the following abbreviations: NVS--Non-Voting shares; RVS--Restricted Voting Shares; SVS--Subordinate Voting Shares.
Individuals receiving this report from a Canadian investment dealer that is not affiliated with Credit Suisse should be advised that this report may not contain regulatory disclosures the non-affiliated Canadian investment dealer would be required to make if this were its own report.
For Credit Suisse Securities (Canada), Inc.'s policies and procedures regarding the dissemination of equity research, please visit http://www.csfb.com/legal_terms/canada_research_policy.shtml.
As of the date of this report, Credit Suisse acts as a market maker or liquidity provider in the equities securities that are the subject of this report.
Principal is not guaranteed in the case of equities because equity prices are variable.
Commission is the commission rate or the amount agreed with a customer when setting up an account or at any time after that.
Please find the full reports, including disclosure information, on Credit Suisse's Research and Analytics Website (http://www.researchandanalytics.com)
Important MSCI Disclosures
The MSCI sourced information is the exclusive property of Morgan Stanley Capital International Inc. (MSCI). Without prior written permission of MSCI, this information and any other MSCI intellectual property may not be reproduced, re-disseminated or used to create and financial products, including any indices. This information is provided on an "as is" basis. The user assumes the entire risk of any use made of this information. MSCI, its affiliates and any third party involved in, or related to, computing or compiling the information hereby expressly disclaim all warranties of originality, accuracy, completeness, merchantability or fitness for a particular purpose with respect to any of this information. Without limiting any of the foregoing, in no event shall MSCI, any of its affiliates or any third party involved in, or related to, computing or compiling the information have any liability for any damages of any kind. MSCI, Morgan Stanley Capital International and the MSCI indexes are services marks of MSCI and its affiliates.
The Global Industry Classification Standard (GICS) was developed by and is the exclusive property of Morgan Stanley Capital International Inc. and Standard & Poor’s. GICS is a service mark of MSCI and S&P and has been licensed for use by Credit Suisse.
Important Credit Suisse HOLT Disclosures
With respect to the analysis in this report based on the Credit Suisse HOLT methodology, Credit Suisse certifies that (1) the views expressed in this report accurately reflect the Credit Suisse HOLT methodology and (2) no part of the Firm’s compensation was, is, or will be directly related to the specific views disclosed in this report.
The Credit Suisse HOLT methodology does not assign ratings to a security. It is an analytical tool that involves use of a set of proprietary quantitative algorithms and warranted value calculations, collectively called the Credit Suisse HOLT valuation model, that are consistently applied to all the companies included in its database. Third-party data (including consensus earnings estimates) are systematically translated into a number of default algorithms available in the Credit Suisse HOLT valuation model. The source financial statement, pricing, and earnings data provided by outside data vendors are subject to quality control and may also be adjusted to more closely measure the underlying economics of firm performance. The adjustments provide consistency when analyzing a single company across time, or analyzing multiple companies across industries or national borders. The default scenario that is produced by the Credit Suisse HOLT valuation model establishes the baseline valuation for a security, and a user then may adjust the default variables to produce alternative scenarios, any of which could occur.
Additional information about the Credit Suisse HOLT methodology is available on request.
The Credit Suisse HOLT methodology does not assign a price target to a security. The default scenario that is produced by the Credit Suisse HOLT valuation model establishes a warranted price for a security, and as the third-party data are updated, the warranted price may also change. The default variable may also be adjusted to produce alternative warranted prices, any of which could occur.
CFROI®, HOLT, HOLTfolio, ValueSearch, AggreGator, Signal Flag and “Powered by HOLT” are trademarks or service marks or registered trademarks or registered service marks of Credit Suisse or its affiliates in the United States and other countries. HOLT is a corporate performance and valuation advisory service of Credit Suisse.
For Credit Suisse disclosure information on other companies mentioned in this report, please visit the website at https://rave.credit-suisse.com/disclosures or call +1 (877) 291-2683.
16 April 2014
Jump-Start 82
References in this report to Credit Suisse include all of the subsidiaries and affiliates of Credit Suisse operating under its investment banking division. For more information on our structure, please use the following link: https://www.credit-suisse.com/who_we_are/en/This report may contain material that is not directed to, or intended for distribution to or use by, any person or entity who is a citizen or resident of or located in any locality, state, country or other jurisdiction where such distribution, publication, availability or use would be contrary to law or regulation or which would subject Credit Suisse AG or its affiliates ("CS") to any registration or licensing requirement within such jurisdiction. All material presented in this report, unless specifically indicated otherwise, is under copyright to CS. None of the material, nor its content, nor any copy of it, may be altered in any way, transmitted to, copied or distributed to any other party, without the prior express written permission of CS. All trademarks, service marks and logos used in this report are trademarks or service marks or registered trademarks or service marks of CS or its affiliates. The information, tools and material presented in this report are provided to you for information purposes only and are not to be used or considered as an offer or the solicitation of an offer to sell or to buy or subscribe for securities or other financial instruments. CS may not have taken any steps to ensure that the securities referred to in this report are suitable for any particular investor. CS will not treat recipients of this report as its customers by virtue of their receiving this report. The investments and services contained or referred to in this report may not be suitable for you and it is recommended that you consult an independent investment advisor if you are in doubt about such investments or investment services. Nothing in this report constitutes investment, legal, accounting or tax advice, or a representation that any investment or strategy is suitable or appropriate to your individual circumstances, or otherwise constitutes a personal recommendation to you. CS does not advise on the tax consequences of investments and you are advised to contact an independent tax adviser. Please note in particular that the bases and levels of taxation may change. Information and opinions presented in this report have been obtained or derived from sources believed by CS to be reliable, but CS makes no representation as to their accuracy or completeness. CS accepts no liability for loss arising from the use of the material presented in this report, except that this exclusion of liability does not apply to the extent that such liability arises under specific statutes or regulations applicable to CS. This report is not to be relied upon in substitution for the exercise of independent judgment. CS may have issued, and may in the future issue, other communications that are inconsistent with, and reach different conclusions from, the information presented in this report. Those communications reflect the different assumptions, views and analytical methods of the analysts who prepared them and CS is under no obligation to ensure that such other communications are brought to the attention of any recipient of this report. CS may, to the extent permitted by law, participate or invest in financing transactions with the issuer(s) of the securities referred to in this report, perform services for or solicit business from such issuers, and/or have a position or holding, or other material interest, or effect transactions, in such securities or options thereon, or other investments related thereto. In addition, it may make markets in the securities mentioned in the material presented in this report. CS may have, within the last three years, served as manager or co-manager of a public offering of securities for, or currently may make a primary market in issues of, any or all of the entities mentioned in this report or may be providing, or have provided within the previous 12 months, significant advice or investment services in relation to the investment concerned or a related investment. Additional information is, subject to duties of confidentiality, available on request. Some investments referred to in this report will be offered solely by a single entity and in the case of some investments solely by CS, or an associate of CS or CS may be the only market maker in such investments. Past performance should not be taken as an indication or guarantee of future performance, and no representation or warranty, express or implied, is made regarding future performance. Information, opinions and estimates contained in this report reflect a judgment at its original date of publication by CS and are subject to change without notice. The price, value of and income from any of the securities or financial instruments mentioned in this report can fall as well as rise. The value of securities and financial instruments is subject to exchange rate fluctuation that may have a positive or adverse effect on the price or income of such securities or financial instruments. Investors in securities such as ADR's, the values of which are influenced by currency volatility, effectively assume this risk. Structured securities are complex instruments, typically involve a high degree of risk and are intended for sale only to sophisticated investors who are capable of understanding and assuming the risks involved. The market value of any structured security may be affected by changes in economic, financial and political factors (including, but not limited to, spot and forward interest and exchange rates), time to maturity, market conditions and volatility, and the credit quality of any issuer or reference issuer. Any investor interested in purchasing a structured product should conduct their own investigation and analysis of the product and consult with their own professional advisers as to the risks involved in making such a purchase. Some investments discussed in this report may have a high level of volatility. High volatility investments may experience sudden and large falls in their value causing losses when that investment is realised. Those losses may equal your original investment. Indeed, in the case of some investments the potential losses may exceed the amount of initial investment and, in such circumstances, you may be required to pay more money to support those losses. Income yields from investments may fluctuate and, in consequence, initial capital paid to make the investment may be used as part of that income yield. Some investments may not be readily realisable and it may be difficult to sell or realise those investments, similarly it may prove difficult for you to obtain reliable information about the value, or risks, to which such an investment is exposed. This report may provide the addresses of, or contain hyperlinks to, websites. Except to the extent to which the report refers to website material of CS, CS has not reviewed any such site and takes no responsibility for the content contained therein. Such address or hyperlink (including addresses or hyperlinks to CS's own website material) is provided solely for your convenience and information and the content of any such website does not in any way form part of this document. Accessing such website or following such link through this report or CS's website shall be at your own risk. This report is issued and distributed in Europe (except Switzerland) by Credit Suisse Securities (Europe) Limited, One Cabot Square, London E14 4QJ, England, which is authorised by the Prudential Regulation Authority and regulated by the Financial Conduct Authority and the Prudential Regulation Authority. This report is being distributed in Germany by Credit Suisse Securities (Europe) Limited Niederlassung Frankfurt am Main regulated by the Bundesanstalt fuer Finanzdienstleistungsaufsicht ("BaFin"). This report is being distributed in the United States and Canada by Credit Suisse Securities (USA) LLC; in Switzerland by Credit Suisse AG; in Brazil by Banco de Investimentos Credit Suisse (Brasil) S.A or its affiliates; in Mexico by Banco Credit Suisse (México), S.A. (transactions related to the securities mentioned in this report will only be effected in compliance with applicable regulation); in Japan by Credit Suisse Securities (Japan) Limited, Financial Instruments Firm, Director-General of Kanto Local Finance Bureau (Kinsho) No. 66, a member of Japan Securities Dealers Association, The Financial Futures Association of Japan, Japan Investment Advisers Association, Type II Financial Instruments Firms Association; elsewhere in Asia/ Pacific by whichever of the following is the appropriately authorised entity in the relevant jurisdiction: Credit Suisse (Hong Kong) Limited, Credit Suisse Equities (Australia) Limited, Credit Suisse Securities (Thailand) Limited, having registered address at 990 Abdulrahim Place, 27 Floor, Unit 2701, Rama IV Road, Silom, Bangrak, Bangkok 10500, Thailand, Tel. +66 2614 6000, Credit Suisse Securities (Malaysia) Sdn Bhd, Credit Suisse AG, Singapore Branch, Credit Suisse Securities (India) Private Limited regulated by the Securities and Exchange Board of India (registration Nos. INB230970637; INF230970637; INB010970631; INF010970631), having registered address at 9th Floor, Ceejay House, Dr.A.B. Road, Worli, Mumbai - 18, India, T- +91-22 6777 3777, Credit Suisse Securities (Europe) Limited, Seoul Branch, Credit Suisse AG, Taipei Securities Branch, PT Credit Suisse Securities Indonesia, Credit Suisse Securities (Philippines ) Inc., and elsewhere in the world by the relevant authorised affiliate of the above. Research on Taiwanese securities produced by Credit Suisse AG, Taipei Securities Branch has been prepared by a registered Senior Business Person. Research provided to residents of Malaysia is authorised by the Head of Research for Credit Suisse Securities (Malaysia) Sdn Bhd, to whom they should direct any queries on +603 2723 2020. This report has been prepared and issued for distribution in Singapore to institutional investors, accredited investors and expert investors (each as defined under the Financial Advisers Regulations) only, and is also distributed by Credit Suisse AG, Singapore branch to overseas investors (as defined under the Financial Advisers Regulations). By virtue of your status as an institutional investor, accredited investor, expert investor or overseas investor, Credit Suisse AG, Singapore branch is exempted from complying with certain compliance requirements under the Financial Advisers Act, Chapter 110 of Singapore (the "FAA"), the Financial Advisers Regulations and the relevant Notices and Guidelines issued thereunder, in respect of any financial advisory service which Credit Suisse AG, Singapore branch may provide to you. This research may not conform to Canadian disclosure requirements. In jurisdictions where CS is not already registered or licensed to trade in securities, transactions will only be effected in accordance with applicable securities legislation, which will vary from jurisdiction to jurisdiction and may require that the trade be made in accordance with applicable exemptions from registration or licensing requirements. Non-U.S. customers wishing to effect a transaction should contact a CS entity in their local jurisdiction unless governing law permits otherwise. U.S. customers wishing to effect a transaction should do so only by contacting a representative at Credit Suisse Securities (USA) LLC in the U.S. Please note that this research was originally prepared and issued by CS for distribution to their market professional and institutional investor customers. Recipients who are not market professional or institutional investor customers of CS should seek the advice of their independent financial advisor prior to taking any investment decision based on this report or for any necessary explanation of its contents. This research may relate to investments or services of a person outside of the UK or to other matters which are not authorised by the Prudential Regulation Authority and regulated by the Financial Conduct Authority and the Prudential Regulation Authority or in respect of which the protections of the Prudential Regulation Authority and Financial Conduct Authority for private customers and/or the UK compensation scheme may not be available, and further details as to where this may be the case are available upon request in respect of this report. CS may provide various services to US municipal entities or obligated persons ("municipalities"), including suggesting individual transactions or trades and entering into such transactions. Any services CS provides to municipalities are not viewed as "advice" within the meaning of Section 975 of the Dodd-Frank Wall Street Reform and Consumer Protection Act. CS is providing any such services and related information solely on an arm's length basis and not as an advisor or fiduciary to the municipality. In connection with the provision of the any such services, there is no agreement, direct or indirect, between any municipality (including the officials, management, employees or agents thereof) and CS for CS to provide advice to the municipality. Municipalities should consult with their financial, accounting and legal advisors regarding any such services provided by CS. In addition, CS is not acting for direct or indirect compensation to solicit the municipality on behalf of an unaffiliated broker, dealer, municipal securities dealer, municipal advisor, or investment adviser for the purpose of obtaining or retaining an engagement by the municipality for or in connection with Municipal Financial Products, the issuance of municipal securities, or of an investment adviser to provide investment advisory services to or on behalf of the municipality. If this report is being distributed by a financial institution other than Credit Suisse AG, or its affiliates, that financial institution is solely responsible for distribution. Clients of that institution should contact that institution to effect a transaction in the securities mentioned in this report or require further information. This report does not constitute investment advice by Credit Suisse to the clients of the distributing financial institution, and neither Credit Suisse AG, its affiliates, and their respective officers, directors and employees accept any liability whatsoever for any direct or consequential loss arising from their use of this report or its content. Principal is not guaranteed. Commission is the commission rate or the amount agreed with a customer when setting up an account or at any time after that.
Copyright © 2014 CREDIT SUISSE AG and/or its affiliates. All rights reserved.
Investment principal on bonds can be eroded depending on sale price or market price. In addition, there are bonds on which investment principal can be eroded due to changes in redemption amounts. Care is required when investing in such instruments. When you purchase non-listed Japanese fixed income securities (Japanese government bonds, Japanese municipal bonds, Japanese government guaranteed bonds, Japanese corporate bonds) from CS as a seller, you will be requested to pay the purchase price only.
0417_jump start.doc


