Embed Size (px)
Citation preview
DISCLOSURE APPENDIX CONTAINS ANALYST CERTIFICATIONS AND THE STATUS OF NON US ANALYSTS. US Disclosure: Credit Suisse does and seeks to do business with companies covered in its research reports. As a result, investors should be aware that the Firm may have a conflict of interest that could affect the objectivity of this report. Investors should consider this report as only a single factor in making their investment decision.
CREDIT SUISSE SECURITIES RESEARCH & ANALYTICS BEYOND INFORMATION™
Client-Driven Solutions, Insights, and Access
13 June 2013
Asia Pacific
Equity Research
Investment Strategy
Jump-Start STRATEGY
Jump-Start aims to provide you with a summary of the week that was and helps you prepare
for the week ahead with a results calendar, economic forecasts and valuation summaries.
TIPS—Buying opportunity or mean reversion? With the TIPs falling by at least 15% in USD
terms from their recent highs, investors may consider this a buying opportunity. But, Sakthi Siva
argues, it is not a buying opportunity and instead mean reversion is starting. The P/B gap
between the three most undervalued markets (China, Korea, Hong Kong) and the three most
overvalued (TIPs) is the biggest since 2007. In 2007, the gap between the two cheapest and two
most overvalued narrowed from a low of -54% to -37% within six months. Thus, the gap could
narrow from the current -57%. Sakthi believes the recent rise in bond yields, currency weakness
and lower EPS revisions could act as catalysts for this mean reversion. Of the three most
undervalued markets, Korea looks the most attractive with P/B close to the last two troughs,
underowned by foreign investors, and yen and EPS revisions stabilising. Full reports
China coal—Finding a floor: It is déjà vu of 2Q12, according to Trina Chen—weak demand,
strong hydro and rising imports. Trina estimates it would take a demand growth acceleration of 6-
7% from the current level for the coastal coal market to move back to balance; optimistic, based
on the macro outlook. Nevertheless, she believes the spot coal price in China has mostly floored,
given 15-30% of production is already at loss in our estimates, due to low calorific value, or high
cost. Our stress test suggests ROE versus P/B is more attractive for Shenhua, but negative for
Yanzhou, Yitai and MMC. Our top picks are: Shenhua for thermal and Fushan for met coal. We
downgrade both Chinacoal and Yitai to NEUTRAL (from Outperform). Full report.
Taiwan Discovery Series—The hunt is on: Our first Taiwan Discovery Series aims to unveil
interesting small-cap ideas in Taiwan. Last month, we visited 20+ small companies, many global
leaders in their respective fields. Although from different industries, they have certain common
traits: long operation history, solid growth track record, strong balance sheet, and consistently
high dividends. Here, we highlight 12 small-cap stories, including two companies we cover: Ginko
and St. Shine. Key stories: KMC (world’s No.1 bike chain maker); Sanshing (supplies industrial
nuts for 15% of global auto production); and Yao-I Fabric (leading fishing line and tennis racket
string-maker globally). Full report
Must-read recently published reports
1) APAC E-Commerce Primer – An evolutionary force (28/5)
Karim P. Salamatian
E-commerce in emerging Asia is an integral evolutionary force behind consumption and retail sales growth; China will emerge as the largest e-commerce market globally by 2013
2) India Market Strategy – INR: Currency crisis? Unlikely for now (22/4)
Neelkanth Mishra
Neelkanth Mishra argues that at least the pressure on INR is changing. Medium-term risks aside, a “crisis” is not imminent
3) Research Institute – Credit Suisse Global Investment Returns Yearbook 2013
Andrew Garthwaite
CS examines how stocks and bonds perform in a world of resurgency in investor risk appetite and might soon see inflation expectations rise.
4) Asia Emerging Consumer Survey 2013: Confidence revival (23/1)
Karim P. Salamatian
Asian consumers show the strongest confidence momentum. Superior return potential in discretionary, brand-driven ideas
5) China Market Strategy: The worst is probably over (16/10)
Vincent Chan
Economy may have bottomed out. Valuations back to 2008 levels. Add beta.
6) APAC: Consumption S curve: Winners & losers as Asian consumers evolve (6/8)
Karim P. Salamatian
A unique report as it is perhaps the first time that country-by-country S curves for consumption have been constructed.
Research Analyst
Jahanzeb Naseer
852 2101 6554
Credit Suisse forthcoming events
Hong Kong
China/Hong Kong Emerging Corporate Day
Date 19 June, Hong Kong
Coverage Analyst Kenny Lau
CESC Ltd (CESC.BO)
Date 24 June, Hong Kong
Coverage Analyst Amish Shah
APAC Transport Corporate Day
Date 26 June, Hong Kong
Coverage Analyst Timothy Ross
21 Vianet Group Inc (VNET.O)
Date 11-12 July, Hong Kong
Coverage Analyst Colin McCallum
Singapore
Skyworth Digital (0751.HK)
Date 03-05 July, Singapore
Coverage Analyst Kenny Lau
21 Vianet Group Inc (VNET.O)
Date 10 July, Hong Kong
Coverage Analyst Colin McCallum
US
HDFC Bank (HDBK.BO)
Date 17-21 June, US
Coverage Analyst Ashish Gupta
Charoen Pokphand Foods Public (CPF.BK)
Date 9-15 July, US
Coverage Analyst Chai Techakumpuch
Europe
Reserve Bank of India
Date 14 June, London
Coverage Analyst Ashish Gupta
China Life Taiwan (2823.TW)
Date 17-21 June, Europe
Coverage Analyst Chung Hsu
Wharf Holdings (004.HK)
Date 17-21 June, Europe
Coverage Analyst Cusson Leung
Skyworth Digital (0751.HK)
Date 08-12 July, London
Coverage Analyst Kenny Lau
Others
Credit Suisse Asian Technology Conference
Date 11-13 September, Taiwan
Coverage Analyst Manish Nigam
Asian Investment Conference 2014
Date 24-28 March, Hong Kong
Contact [email protected] or your usual sales representative
13 u
ne 2
013
Ju
mp
-Sta
rt 2
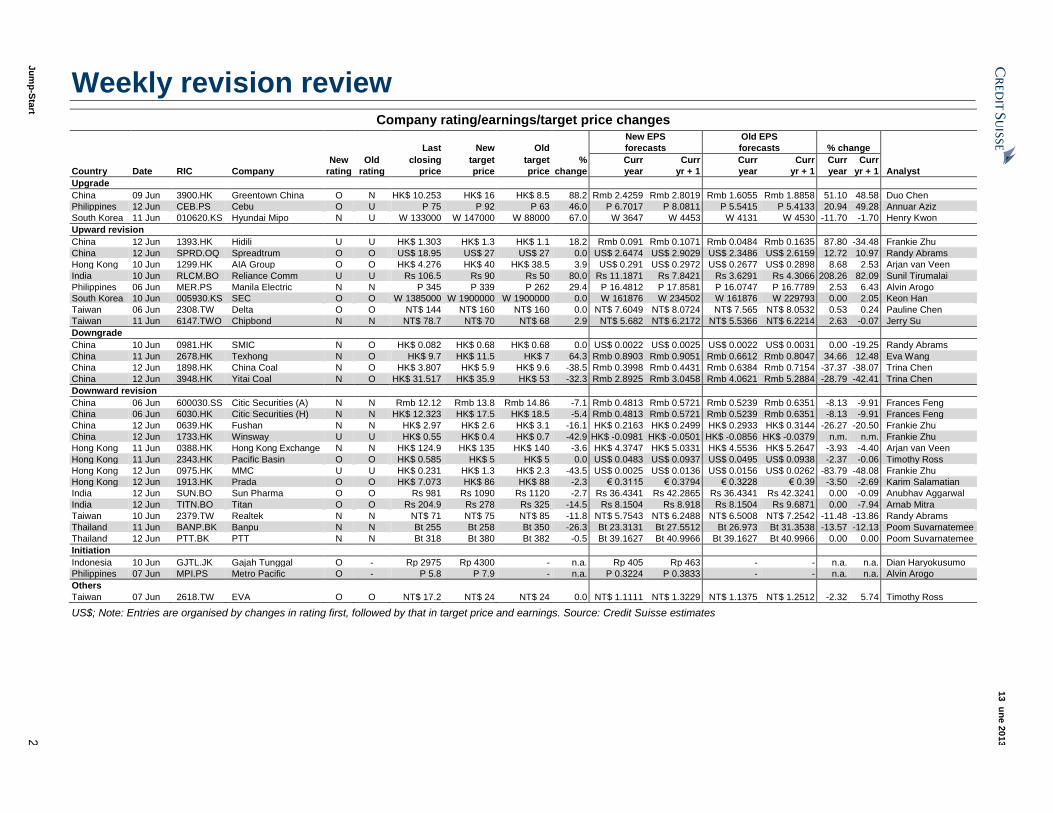
Weekly revision review
Company rating/earnings/target price changes New EPS Old EPS
Last New Old forecasts forecasts % change
New Old closing target target % Curr Curr Curr Curr Curr Curr
Country Date RIC Company rating rating price price price change year yr + 1 year yr + 1 year yr + 1 Analyst
Upgrade
China 09 Jun 3900.HK Greentown China O N HK$ 10.253 HK$ 16 HK$ 8.5 88.2 Rmb 2.4259 Rmb 2.8019 Rmb 1.6055 Rmb 1.8858 51.10 48.58 Duo Chen
Philippines 12 Jun CEB.PS Cebu O U P 75 P 92 P 63 46.0 P 6.7017 P 8.0811 P 5.5415 P 5.4133 20.94 49.28 Annuar Aziz
South Korea 11 Jun 010620.KS Hyundai Mipo N U W 133000 W 147000 W 88000 67.0 W 3647 W 4453 W 4131 W 4530 -11.70 -1.70 Henry Kwon
Upward revision
China 12 Jun 1393.HK Hidili U U HK$ 1.303 HK$ 1.3 HK$ 1.1 18.2 Rmb 0.091 Rmb 0.1071 Rmb 0.0484 Rmb 0.1635 87.80 -34.48 Frankie Zhu
China 12 Jun SPRD.OQ Spreadtrum O O US$ 18.95 US$ 27 US$ 27 0.0 US$ 2.6474 US$ 2.9029 US$ 2.3486 US$ 2.6159 12.72 10.97 Randy Abrams
Hong Kong 10 Jun 1299.HK AIA Group O O HK$ 4.276 HK$ 40 HK$ 38.5 3.9 US$ 0.291 US$ 0.2972 US$ 0.2677 US$ 0.2898 8.68 2.53 Arjan van Veen
India 10 Jun RLCM.BO Reliance Comm U U Rs 106.5 Rs 90 Rs 50 80.0 Rs 11.1871 Rs 7.8421 Rs 3.6291 Rs 4.3066 208.26 82.09 Sunil Tirumalai
Philippines 06 Jun MER.PS Manila Electric N N P 345 P 339 P 262 29.4 P 16.4812 P 17.8581 P 16.0747 P 16.7789 2.53 6.43 Alvin Arogo
South Korea 10 Jun 005930.KS SEC O O W 1385000 W 1900000 W 1900000 0.0 W 161876 W 234502 W 161876 W 229793 0.00 2.05 Keon Han
Taiwan 06 Jun 2308.TW Delta O O NT$ 144 NT$ 160 NT$ 160 0.0 NT$ 7.6049 NT$ 8.0724 NT$ 7.565 NT$ 8.0532 0.53 0.24 Pauline Chen
Taiwan 11 Jun 6147.TWO Chipbond N N NT$ 78.7 NT$ 70 NT$ 68 2.9 NT$ 5.682 NT$ 6.2172 NT$ 5.5366 NT$ 6.2214 2.63 -0.07 Jerry Su
Downgrade
China 10 Jun 0981.HK SMIC N O HK$ 0.082 HK$ 0.68 HK$ 0.68 0.0 US$ 0.0022 US$ 0.0025 US$ 0.0022 US$ 0.0031 0.00 -19.25 Randy Abrams
China 11 Jun 2678.HK Texhong N O HK$ 9.7 HK$ 11.5 HK$ 7 64.3 Rmb 0.8903 Rmb 0.9051 Rmb 0.6612 Rmb 0.8047 34.66 12.48 Eva Wang
China 12 Jun 1898.HK China Coal N O HK$ 3.807 HK$ 5.9 HK$ 9.6 -38.5 Rmb 0.3998 Rmb 0.4431 Rmb 0.6384 Rmb 0.7154 -37.37 -38.07 Trina Chen
China 12 Jun 3948.HK Yitai Coal N O HK$ 31.517 HK$ 35.9 HK$ 53 -32.3 Rmb 2.8925 Rmb 3.0458 Rmb 4.0621 Rmb 5.2884 -28.79 -42.41 Trina Chen
Downward revision
China 06 Jun 600030.SS Citic Securities (A) N N Rmb 12.12 Rmb 13.8 Rmb 14.86 -7.1 Rmb 0.4813 Rmb 0.5721 Rmb 0.5239 Rmb 0.6351 -8.13 -9.91 Frances Feng
China 06 Jun 6030.HK Citic Securities (H) N N HK$ 12.323 HK$ 17.5 HK$ 18.5 -5.4 Rmb 0.4813 Rmb 0.5721 Rmb 0.5239 Rmb 0.6351 -8.13 -9.91 Frances Feng
China 12 Jun 0639.HK Fushan N N HK$ 2.97 HK$ 2.6 HK$ 3.1 -16.1 HK$ 0.2163 HK$ 0.2499 HK$ 0.2933 HK$ 0.3144 -26.27 -20.50 Frankie Zhu
China 12 Jun 1733.HK Winsway U U HK$ 0.55 HK$ 0.4 HK$ 0.7 -42.9 HK$ -0.0981 HK$ -0.0501 HK$ -0.0856 HK$ -0.0379 n.m. n.m. Frankie Zhu
Hong Kong 11 Jun 0388.HK Hong Kong Exchange N N HK$ 124.9 HK$ 135 HK$ 140 -3.6 HK$ 4.3747 HK$ 5.0331 HK$ 4.5536 HK$ 5.2647 -3.93 -4.40 Arjan van Veen
Hong Kong 11 Jun 2343.HK Pacific Basin O O HK$ 0.585 HK$ 5 HK$ 5 0.0 US$ 0.0483 US$ 0.0937 US$ 0.0495 US$ 0.0938 -2.37 -0.06 Timothy Ross
Hong Kong 12 Jun 0975.HK MMC U U HK$ 0.231 HK$ 1.3 HK$ 2.3 -43.5 US$ 0.0025 US$ 0.0136 US$ 0.0156 US$ 0.0262 -83.79 -48.08 Frankie Zhu
Hong Kong 12 Jun 1913.HK Prada O O HK$ 7.073 HK$ 86 HK$ 88 -2.3 € 0.3115 € 0.3794 € 0.3228 € 0.39 -3.50 -2.69 Karim Salamatian
India 12 Jun SUN.BO Sun Pharma O O Rs 981 Rs 1090 Rs 1120 -2.7 Rs 36.4341 Rs 42.2865 Rs 36.4341 Rs 42.3241 0.00 -0.09 Anubhav Aggarwal
India 12 Jun TITN.BO Titan O O Rs 204.9 Rs 278 Rs 325 -14.5 Rs 8.1504 Rs 8.918 Rs 8.1504 Rs 9.6871 0.00 -7.94 Arnab Mitra
Taiwan 10 Jun 2379.TW Realtek N N NT$ 71 NT$ 75 NT$ 85 -11.8 NT$ 5.7543 NT$ 6.2488 NT$ 6.5008 NT$ 7.2542 -11.48 -13.86 Randy Abrams
Thailand 11 Jun BANP.BK Banpu N N Bt 255 Bt 258 Bt 350 -26.3 Bt 23.3131 Bt 27.5512 Bt 26.973 Bt 31.3538 -13.57 -12.13 Poom Suvarnatemee
Thailand 12 Jun PTT.BK PTT N N Bt 318 Bt 380 Bt 382 -0.5 Bt 39.1627 Bt 40.9966 Bt 39.1627 Bt 40.9966 0.00 0.00 Poom Suvarnatemee
Initiation
Indonesia 10 Jun GJTL.JK Gajah Tunggal O - Rp 2975 Rp 4300 - n.a. Rp 405 Rp 463 - - n.a. n.a. Dian Haryokusumo
Philippines 07 Jun MPI.PS Metro Pacific O - P 5.8 P 7.9 - n.a. P 0.3224 P 0.3833 - - n.a. n.a. Alvin Arogo
Others
Taiwan 07 Jun 2618.TW EVA O O NT$ 17.2 NT$ 24 NT$ 24 0.0 NT$ 1.1111 NT$ 1.3229 NT$ 1.1375 NT$ 1.2512 -2.32 5.74 Timothy Ross
US$; Note: Entries are organised by changes in rating first, followed by that in target price and earnings. Source: Credit Suisse estimates
13 June 2013
Jump-Start 3
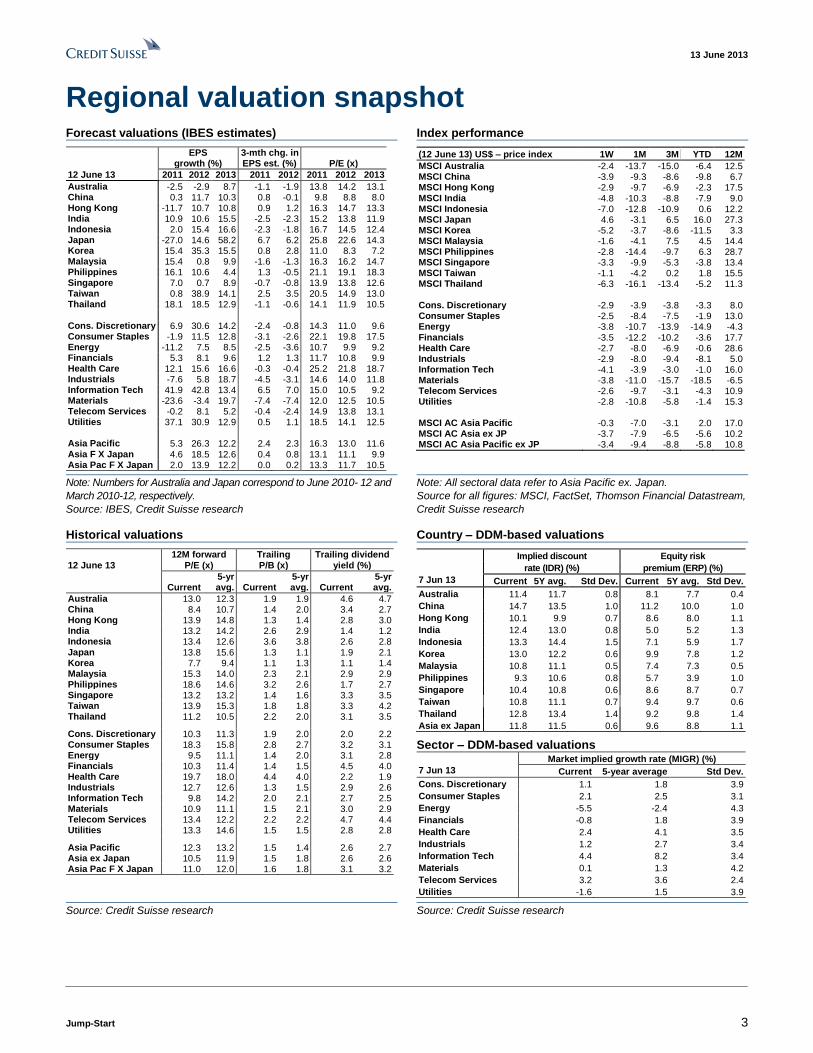
Regional valuation snapshot Forecast valuations (IBES estimates) Index performance
EPS 3-mth chg. in growth (%) EPS est. (%) P/E (x)
12 June 13 2011 2012 2013 2011 2012 2011 2012 2013
Australia -2.5 -2.9 8.7 -1.1 -1.9 13.8 14.2 13.1 China 0.3 11.7 10.3 0.8 -0.1 9.8 8.8 8.0 Hong Kong -11.7 10.7 10.8 0.9 1.2 16.3 14.7 13.3 India 10.9 10.6 15.5 -2.5 -2.3 15.2 13.8 11.9 Indonesia 2.0 15.4 16.6 -2.3 -1.8 16.7 14.5 12.4 Japan -27.0 14.6 58.2 6.7 6.2 25.8 22.6 14.3 Korea 15.4 35.3 15.5 0.8 2.8 11.0 8.3 7.2 Malaysia 15.4 0.8 9.9 -1.6 -1.3 16.3 16.2 14.7 Philippines 16.1 10.6 4.4 1.3 -0.5 21.1 19.1 18.3 Singapore 7.0 0.7 8.9 -0.7 -0.8 13.9 13.8 12.6 Taiwan 0.8 38.9 14.1 2.5 3.5 20.5 14.9 13.0 Thailand 18.1 18.5 12.9 -1.1 -0.6 14.1 11.9 10.5 Cons. Discretionary 6.9 30.6 14.2 -2.4 -0.8 14.3 11.0 9.6 Consumer Staples -1.9 11.5 12.8 -3.1 -2.6 22.1 19.8 17.5 Energy -11.2 7.5 8.5 -2.5 -3.6 10.7 9.9 9.2 Financials 5.3 8.1 9.6 1.2 1.3 11.7 10.8 9.9 Health Care 12.1 15.6 16.6 -0.3 -0.4 25.2 21.8 18.7 Industrials -7.6 5.8 18.7 -4.5 -3.1 14.6 14.0 11.8 Information Tech 41.9 42.8 13.4 6.5 7.0 15.0 10.5 9.2 Materials -23.6 -3.4 19.7 -7.4 -7.4 12.0 12.5 10.5 Telecom Services -0.2 8.1 5.2 -0.4 -2.4 14.9 13.8 13.1 Utilities 37.1 30.9 12.9 0.5 1.1 18.5 14.1 12.5 Asia Pacific 5.3 26.3 12.2 2.4 2.3 16.3 13.0 11.6 Asia F X Japan 4.6 18.5 12.6 0.4 0.8 13.1 11.1 9.9 Asia Pac F X Japan 2.0 13.9 12.2 0.0 0.2 13.3 11.7 10.5
(12 June 13) US$ – price index 1W 1M 3M YTD 12M
MSCI Australia -2.4 -13.7 -15.0 -6.4 12.5 MSCI China -3.9 -9.3 -8.6 -9.8 6.7 MSCI Hong Kong -2.9 -9.7 -6.9 -2.3 17.5 MSCI India -4.8 -10.3 -8.8 -7.9 9.0 MSCI Indonesia -7.0 -12.8 -10.9 0.6 12.2 MSCI Japan 4.6 -3.1 6.5 16.0 27.3 MSCI Korea -5.2 -3.7 -8.6 -11.5 3.3 MSCI Malaysia -1.6 -4.1 7.5 4.5 14.4 MSCI Philippines -2.8 -14.4 -9.7 6.3 28.7 MSCI Singapore -3.3 -9.9 -5.3 -3.8 13.4 MSCI Taiwan -1.1 -4.2 0.2 1.8 15.5 MSCI Thailand -6.3 -16.1 -13.4 -5.2 11.3 Cons. Discretionary -2.9 -3.9 -3.8 -3.3 8.0 Consumer Staples -2.5 -8.4 -7.5 -1.9 13.0 Energy -3.8 -10.7 -13.9 -14.9 -4.3 Financials -3.5 -12.2 -10.2 -3.6 17.7 Health Care -2.7 -8.0 -6.9 -0.6 28.6 Industrials -2.9 -8.0 -9.4 -8.1 5.0 Information Tech -4.1 -3.9 -3.0 -1.0 16.0 Materials -3.8 -11.0 -15.7 -18.5 -6.5 Telecom Services -2.6 -9.7 -3.1 -4.3 10.9 Utilities -2.8 -10.8 -5.8 -1.4 15.3 MSCI AC Asia Pacific -0.3 -7.0 -3.1 2.0 17.0 MSCI AC Asia ex JP -3.7 -7.9 -6.5 -5.6 10.2 MSCI AC Asia Pacific ex JP -3.4 -9.4 -8.8 -5.8 10.8
Note: Numbers for Australia and Japan correspond to June 2010- 12 and
March 2010-12, respectively.
Source: IBES, Credit Suisse research
Note: All sectoral data refer to Asia Pacific ex. Japan.
Source for all figures: MSCI, FactSet, Thomson Financial Datastream,
Credit Suisse research
Historical valuations Country – DDM-based valuations
12 June 13
12M forward P/E (x)
Trailing P/B (x)
Trailing dividend yield (%)
Current 5-yr avg. Current
5-yr avg. Current
5-yr avg.
Australia 13.0 12.3 1.9 1.9 4.6 4.7 China 8.4 10.7 1.4 2.0 3.4 2.7 Hong Kong 13.9 14.8 1.3 1.4 2.8 3.0 India 13.2 14.2 2.6 2.9 1.4 1.2 Indonesia 13.4 12.6 3.6 3.8 2.6 2.8 Japan 13.8 15.6 1.3 1.1 1.9 2.1 Korea 7.7 9.4 1.1 1.3 1.1 1.4 Malaysia 15.3 14.0 2.3 2.1 2.9 2.9 Philippines 18.6 14.6 3.2 2.6 1.7 2.7 Singapore 13.2 13.2 1.4 1.6 3.3 3.5 Taiwan 13.9 15.3 1.8 1.8 3.3 4.2 Thailand 11.2 10.5 2.2 2.0 3.1 3.5 Cons. Discretionary 10.3 11.3 1.9 2.0 2.0 2.2 Consumer Staples 18.3 15.8 2.8 2.7 3.2 3.1 Energy 9.5 11.1 1.4 2.0 3.1 2.8 Financials 10.3 11.4 1.4 1.5 4.5 4.0 Health Care 19.7 18.0 4.4 4.0 2.2 1.9 Industrials 12.7 12.6 1.3 1.5 2.9 2.6 Information Tech 9.8 14.2 2.0 2.1 2.7 2.5 Materials 10.9 11.1 1.5 2.1 3.0 2.9 Telecom Services 13.4 12.2 2.2 2.2 4.7 4.4 Utilities 13.3 14.6 1.5 1.5 2.8 2.8 Asia Pacific 12.3 13.2 1.5 1.4 2.6 2.7 Asia ex Japan 10.5 11.9 1.5 1.8 2.6 2.6 Asia Pac F X Japan 11.0 12.0 1.6 1.8 3.1 3.2
Implied discount Equity risk
rate (IDR) (%) premium (ERP) (%)
7 Jun 13 Current 5Y avg. Std Dev. Current 5Y avg. Std Dev.
Australia 11.4 11.7 0.8 8.1 7.7 0.4
China 14.7 13.5 1.0 11.2 10.0 1.0
Hong Kong 10.1 9.9 0.7 8.6 8.0 1.1
India 12.4 13.0 0.8 5.0 5.2 1.3
Indonesia 13.3 14.4 1.5 7.1 5.9 1.7
Korea 13.0 12.2 0.6 9.9 7.8 1.2
Malaysia 10.8 11.1 0.5 7.4 7.3 0.5
Philippines 9.3 10.6 0.8 5.7 3.9 1.0
Singapore 10.4 10.8 0.6 8.6 8.7 0.7
Taiwan 10.8 11.1 0.7 9.4 9.7 0.6
Thailand 12.8 13.4 1.4 9.2 9.8 1.4
Asia ex Japan 11.8 11.5 0.6 9.6 8.8 1.1
Sector – DDM-based valuations Market implied growth rate (MIGR) (%)
7 Jun 13 Current 5-year average Std Dev.
Cons. Discretionary 1.1 1.8 3.9
Consumer Staples 2.1 2.5 3.1
Energy -5.5 -2.4 4.3
Financials -0.8 1.8 3.9
Health Care 2.4 4.1 3.5
Industrials 1.2 2.7 3.4
Information Tech 4.4 8.2 3.4
Materials 0.1 1.3 4.2
Telecom Services 3.2 3.6 2.4
Utilities -1.6 1.5 3.9
Source: Credit Suisse research Source: Credit Suisse research
13 June 2013
Jump-Start 4
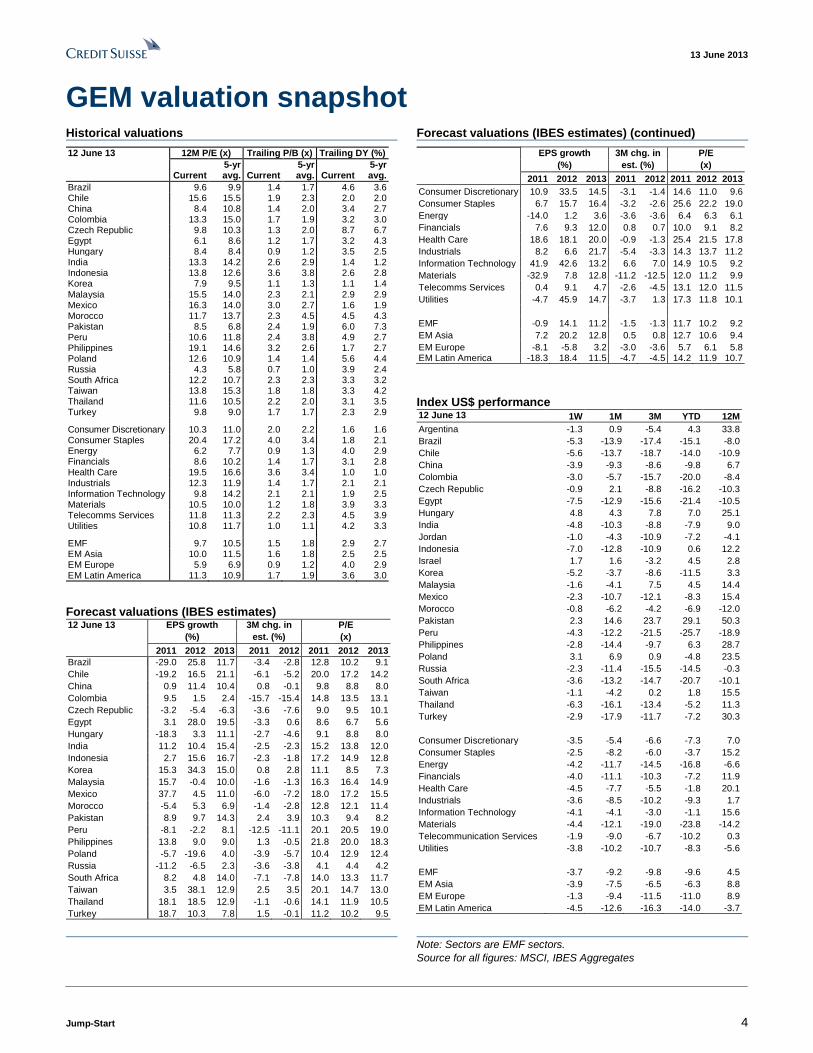
GEM valuation snapshot Historical valuations Forecast valuations (IBES estimates) (continued)
12 June 13 12M P/E (x) Trailing P/B (x) Trailing DY (%)
Current 5-yr
avg. Current 5-yr avg. Current
5-yr avg.
Brazil 9.6 9.9 1.4 1.7 4.6 3.6 Chile 15.6 15.5 1.9 2.3 2.0 2.0 China 8.4 10.8 1.4 2.0 3.4 2.7 Colombia 13.3 15.0 1.7 1.9 3.2 3.0 Czech Republic 9.8 10.3 1.3 2.0 8.7 6.7 Egypt 6.1 8.6 1.2 1.7 3.2 4.3 Hungary 8.4 8.4 0.9 1.2 3.5 2.5 India 13.3 14.2 2.6 2.9 1.4 1.2 Indonesia 13.8 12.6 3.6 3.8 2.6 2.8 Korea 7.9 9.5 1.1 1.3 1.1 1.4
Malaysia 15.5 14.0 2.3 2.1 2.9 2.9 Mexico 16.3 14.0 3.0 2.7 1.6 1.9 Morocco 11.7 13.7 2.3 4.5 4.5 4.3 Pakistan 8.5 6.8 2.4 1.9 6.0 7.3 Peru 10.6 11.8 2.4 3.8 4.9 2.7 Philippines 19.1 14.6 3.2 2.6 1.7 2.7 Poland 12.6 10.9 1.4 1.4 5.6 4.4 Russia 4.3 5.8 0.7 1.0 3.9 2.4 South Africa 12.2 10.7 2.3 2.3 3.3 3.2 Taiwan 13.8 15.3 1.8 1.8 3.3 4.2 Thailand 11.6 10.5 2.2 2.0 3.1 3.5 Turkey 9.8 9.0 1.7 1.7 2.3 2.9 Consumer Discretionary 10.3 11.0 2.0 2.2 1.6 1.6 Consumer Staples 20.4 17.2 4.0 3.4 1.8 2.1 Energy 6.2 7.7 0.9 1.3 4.0 2.9 Financials 8.6 10.2 1.4 1.7 3.1 2.8 Health Care 19.5 16.6 3.6 3.4 1.0 1.0 Industrials 12.3 11.9 1.4 1.7 2.1 2.1 Information Technology 9.8 14.2 2.1 2.1 1.9 2.5 Materials 10.5 10.0 1.2 1.8 3.9 3.3 Telecomms Services 11.8 11.3 2.2 2.3 4.5 3.9 Utilities 10.8 11.7 1.0 1.1 4.2 3.3 EMF 9.7 10.5 1.5 1.8 2.9 2.7 EM Asia 10.0 11.5 1.6 1.8 2.5 2.5 EM Europe 5.9 6.9 0.9 1.2 4.0 2.9 EM Latin America 11.3 10.9 1.7 1.9 3.6 3.0
Forecast valuations (IBES estimates) 12 June 13 EPS growth 3M chg. in P/E
(%) est. (%) (x)
2011 2012 2013 2011 2012 2011 2012 2013
Brazil -29.0 25.8 11.7 -3.4 -2.8 12.8 10.2 9.1
Chile -19.2 16.5 21.1 -6.1 -5.2 20.0 17.2 14.2
China 0.9 11.4 10.4 0.8 -0.1 9.8 8.8 8.0
Colombia 9.5 1.5 2.4 -15.7 -15.4 14.8 13.5 13.1
Czech Republic -3.2 -5.4 -6.3 -3.6 -7.6 9.0 9.5 10.1
Egypt 3.1 28.0 19.5 -3.3 0.6 8.6 6.7 5.6
Hungary -18.3 3.3 11.1 -2.7 -4.6 9.1 8.8 8.0
India 11.2 10.4 15.4 -2.5 -2.3 15.2 13.8 12.0
Indonesia 2.7 15.6 16.7 -2.3 -1.8 17.2 14.9 12.8
Korea 15.3 34.3 15.0 0.8 2.8 11.1 8.5 7.3
Malaysia 15.7 -0.4 10.0 -1.6 -1.3 16.3 16.4 14.9
Mexico 37.7 4.5 11.0 -6.0 -7.2 18.0 17.2 15.5
Morocco -5.4 5.3 6.9 -1.4 -2.8 12.8 12.1 11.4
Pakistan 8.9 9.7 14.3 2.4 3.9 10.3 9.4 8.2
Peru -8.1 -2.2 8.1 -12.5 -11.1 20.1 20.5 19.0
Philippines 13.8 9.0 9.0 1.3 -0.5 21.8 20.0 18.3
Poland -5.7 -19.6 4.0 -3.9 -5.7 10.4 12.9 12.4
Russia -11.2 -6.5 2.3 -3.6 -3.8 4.1 4.4 4.2
South Africa 8.2 4.8 14.0 -7.1 -7.8 14.0 13.3 11.7
Taiwan 3.5 38.1 12.9 2.5 3.5 20.1 14.7 13.0
Thailand 18.1 18.5 12.9 -1.1 -0.6 14.1 11.9 10.5
Turkey 18.7 10.3 7.8 1.5 -0.1 11.2 10.2 9.5
EPS growth 3M chg. in P/E
(%) est. (%) (x)
2011 2012 2013 2011 2012 2011 2012 2013
Consumer Discretionary 10.9 33.5 14.5 -3.1 -1.4 14.6 11.0 9.6
Consumer Staples 6.7 15.7 16.4 -3.2 -2.6 25.6 22.2 19.0
Energy -14.0 1.2 3.6 -3.6 -3.6 6.4 6.3 6.1
Financials 7.6 9.3 12.0 0.8 0.7 10.0 9.1 8.2
Health Care 18.6 18.1 20.0 -0.9 -1.3 25.4 21.5 17.8
Industrials 8.2 6.6 21.7 -5.4 -3.3 14.3 13.7 11.2
Information Technology 41.9 42.6 13.2 6.6 7.0 14.9 10.5 9.2
Materials -32.9 7.8 12.8 -11.2 -12.5 12.0 11.2 9.9
Telecomms Services 0.4 9.1 4.7 -2.6 -4.5 13.1 12.0 11.5
Utilities -4.7 45.9 14.7 -3.7 1.3 17.3 11.8 10.1
EMF -0.9 14.1 11.2 -1.5 -1.3 11.7 10.2 9.2
EM Asia 7.2 20.2 12.8 0.5 0.8 12.7 10.6 9.4
EM Europe -8.1 -5.8 3.2 -3.0 -3.6 5.7 6.1 5.8 EM Latin America -18.3 18.4 11.5 -4.7 -4.5 14.2 11.9 10.7
Index US$ performance 12 June 13 1W 1M 3M YTD 12M
Argentina -1.3 0.9 -5.4 4.3 33.8
Brazil -5.3 -13.9 -17.4 -15.1 -8.0
Chile -5.6 -13.7 -18.7 -14.0 -10.9
China -3.9 -9.3 -8.6 -9.8 6.7
Colombia -3.0 -5.7 -15.7 -20.0 -8.4
Czech Republic -0.9 2.1 -8.8 -16.2 -10.3
Egypt -7.5 -12.9 -15.6 -21.4 -10.5
Hungary 4.8 4.3 7.8 7.0 25.1
India -4.8 -10.3 -8.8 -7.9 9.0
Jordan -1.0 -4.3 -10.9 -7.2 -4.1
Indonesia -7.0 -12.8 -10.9 0.6 12.2
Israel 1.7 1.6 -3.2 4.5 2.8
Korea -5.2 -3.7 -8.6 -11.5 3.3
Malaysia -1.6 -4.1 7.5 4.5 14.4
Mexico -2.3 -10.7 -12.1 -8.3 15.4
Morocco -0.8 -6.2 -4.2 -6.9 -12.0
Pakistan 2.3 14.6 23.7 29.1 50.3
Peru -4.3 -12.2 -21.5 -25.7 -18.9
Philippines -2.8 -14.4 -9.7 6.3 28.7
Poland 3.1 6.9 0.9 -4.8 23.5
Russia -2.3 -11.4 -15.5 -14.5 -0.3
South Africa -3.6 -13.2 -14.7 -20.7 -10.1
Taiwan -1.1 -4.2 0.2 1.8 15.5
Thailand -6.3 -16.1 -13.4 -5.2 11.3
Turkey -2.9 -17.9 -11.7 -7.2 30.3
Consumer Discretionary -3.5 -5.4 -6.6 -7.3 7.0
Consumer Staples -2.5 -8.2 -6.0 -3.7 15.2
Energy -4.2 -11.7 -14.5 -16.8 -6.6
Financials -4.0 -11.1 -10.3 -7.2 11.9
Health Care -4.5 -7.7 -5.5 -1.8 20.1
Industrials -3.6 -8.5 -10.2 -9.3 1.7
Information Technology -4.1 -4.1 -3.0 -1.1 15.6
Materials -4.4 -12.1 -19.0 -23.8 -14.2
Telecommunication Services -1.9 -9.0 -6.7 -10.2 0.3
Utilities -3.8 -10.2 -10.7 -8.3 -5.6
EMF -3.7 -9.2 -9.8 -9.6 4.5
EM Asia -3.9 -7.5 -6.5 -6.3 8.8
EM Europe -1.3 -9.4 -11.5 -11.0 8.9
EM Latin America -4.5 -12.6 -16.3 -14.0 -3.7
Note: Sectors are EMF sectors.
Source for all figures: MSCI, IBES Aggregates
13 June 2013
Jump-Start 5
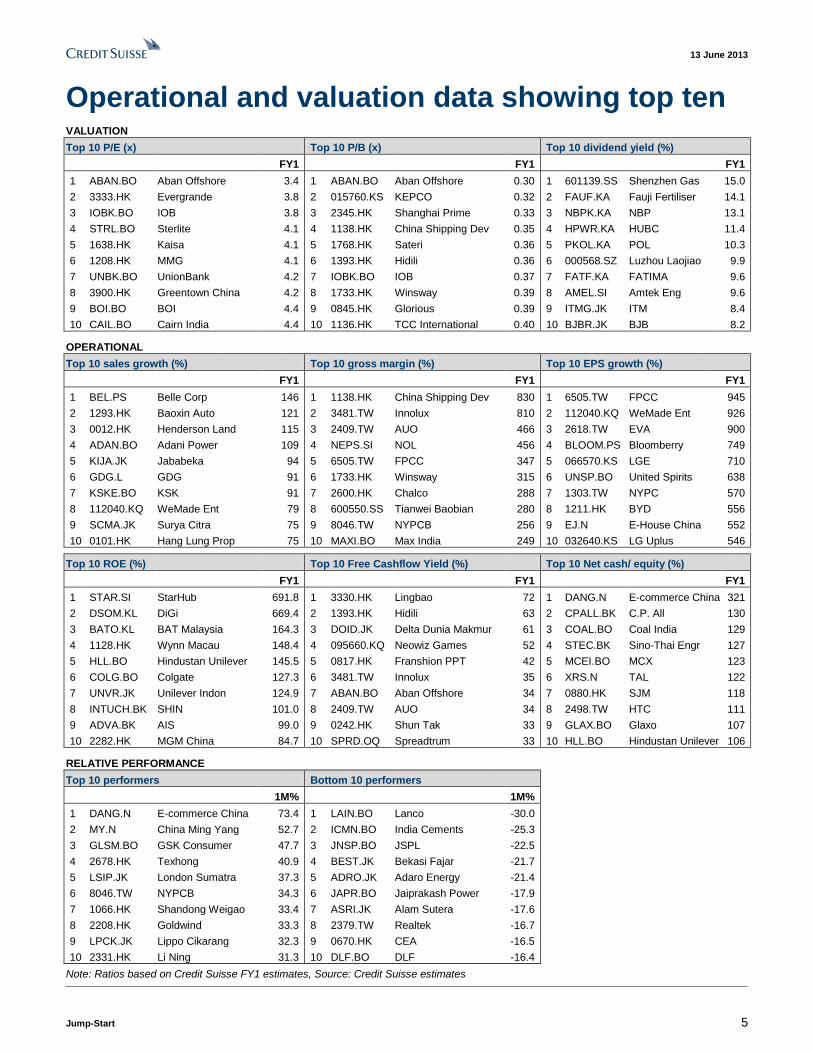
Operational and valuation data showing top ten VALUATION
Top 10 P/E (x) Top 10 P/B (x) Top 10 dividend yield (%)
FY1 FY1 FY1
1 ABAN.BO Aban Offshore 3.4 1 ABAN.BO Aban Offshore 0.30 1 601139.SS Shenzhen Gas 15.0
2 3333.HK Evergrande 3.8 2 015760.KS KEPCO 0.32 2 FAUF.KA Fauji Fertiliser 14.1
3 IOBK.BO IOB 3.8 3 2345.HK Shanghai Prime 0.33 3 NBPK.KA NBP 13.1
4 STRL.BO Sterlite 4.1 4 1138.HK China Shipping Dev 0.35 4 HPWR.KA HUBC 11.4
5 1638.HK Kaisa 4.1 5 1768.HK Sateri 0.36 5 PKOL.KA POL 10.3
6 1208.HK MMG 4.1 6 1393.HK Hidili 0.36 6 000568.SZ Luzhou Laojiao 9.9
7 UNBK.BO UnionBank 4.2 7 IOBK.BO IOB 0.37 7 FATF.KA FATIMA 9.6
8 3900.HK Greentown China 4.2 8 1733.HK Winsway 0.39 8 AMEL.SI Amtek Eng 9.6
9 BOI.BO BOI 4.4 9 0845.HK Glorious 0.39 9 ITMG.JK ITM 8.4
10 CAIL.BO Cairn India 4.4 10 1136.HK TCC International 0.40 10 BJBR.JK BJB 8.2
OPERATIONAL
Top 10 sales growth (%) Top 10 gross margin (%) Top 10 EPS growth (%)
FY1 FY1 FY1
1 BEL.PS Belle Corp 146 1 1138.HK China Shipping Dev 830 1 6505.TW FPCC 945
2 1293.HK Baoxin Auto 121 2 3481.TW Innolux 810 2 112040.KQ WeMade Ent 926
3 0012.HK Henderson Land 115 3 2409.TW AUO 466 3 2618.TW EVA 900
4 ADAN.BO Adani Power 109 4 NEPS.SI NOL 456 4 BLOOM.PS Bloomberry 749
5 KIJA.JK Jababeka 94 5 6505.TW FPCC 347 5 066570.KS LGE 710
6 GDG.L GDG 91 6 1733.HK Winsway 315 6 UNSP.BO United Spirits 638
7 KSKE.BO KSK 91 7 2600.HK Chalco 288 7 1303.TW NYPC 570
8 112040.KQ WeMade Ent 79 8 600550.SS Tianwei Baobian 280 8 1211.HK BYD 556
9 SCMA.JK Surya Citra 75 9 8046.TW NYPCB 256 9 EJ.N E-House China 552
10 0101.HK Hang Lung Prop 75 10 MAXI.BO Max India 249 10 032640.KS LG Uplus 546
Top 10 ROE (%) Top 10 Free Cashflow Yield (%) Top 10 Net cash/ equity (%)
FY1 FY1 FY1
1 STAR.SI StarHub 691.8 1 3330.HK Lingbao 72 1 DANG.N E-commerce China 321
2 DSOM.KL DiGi 669.4 2 1393.HK Hidili 63 2 CPALL.BK C.P. All 130
3 BATO.KL BAT Malaysia 164.3 3 DOID.JK Delta Dunia Makmur 61 3 COAL.BO Coal India 129
4 1128.HK Wynn Macau 148.4 4 095660.KQ Neowiz Games 52 4 STEC.BK Sino-Thai Engr 127
5 HLL.BO Hindustan Unilever 145.5 5 0817.HK Franshion PPT 42 5 MCEI.BO MCX 123
6 COLG.BO Colgate 127.3 6 3481.TW Innolux 35 6 XRS.N TAL 122
7 UNVR.JK Unilever Indon 124.9 7 ABAN.BO Aban Offshore 34 7 0880.HK SJM 118
8 INTUCH.BK SHIN 101.0 8 2409.TW AUO 34 8 2498.TW HTC 111
9 ADVA.BK AIS 99.0 9 0242.HK Shun Tak 33 9 GLAX.BO Glaxo 107
10 2282.HK MGM China 84.7 10 SPRD.OQ Spreadtrum 33 10 HLL.BO Hindustan Unilever 106
RELATIVE PERFORMANCE
Top 10 performers Bottom 10 performers
1M% 1M%
1 DANG.N E-commerce China 73.4 1 LAIN.BO Lanco -30.0
2 MY.N China Ming Yang 52.7 2 ICMN.BO India Cements -25.3
3 GLSM.BO GSK Consumer 47.7 3 JNSP.BO JSPL -22.5
4 2678.HK Texhong 40.9 4 BEST.JK Bekasi Fajar -21.7
5 LSIP.JK London Sumatra 37.3 5 ADRO.JK Adaro Energy -21.4
6 8046.TW NYPCB 34.3 6 JAPR.BO Jaiprakash Power -17.9
7 1066.HK Shandong Weigao 33.4 7 ASRI.JK Alam Sutera -17.6
8 2208.HK Goldwind 33.3 8 2379.TW Realtek -16.7
9 LPCK.JK Lippo Cikarang 32.3 9 0670.HK CEA -16.5
10 2331.HK Li Ning 31.3 10 DLF.BO DLF -16.4
Note: Ratios based on Credit Suisse FY1 estimates, Source: Credit Suisse estimates
13 June 2013
Jump-Start 6
Credit Suisse macroeconomic forecasts
13 June 2013
Jump-Start 7
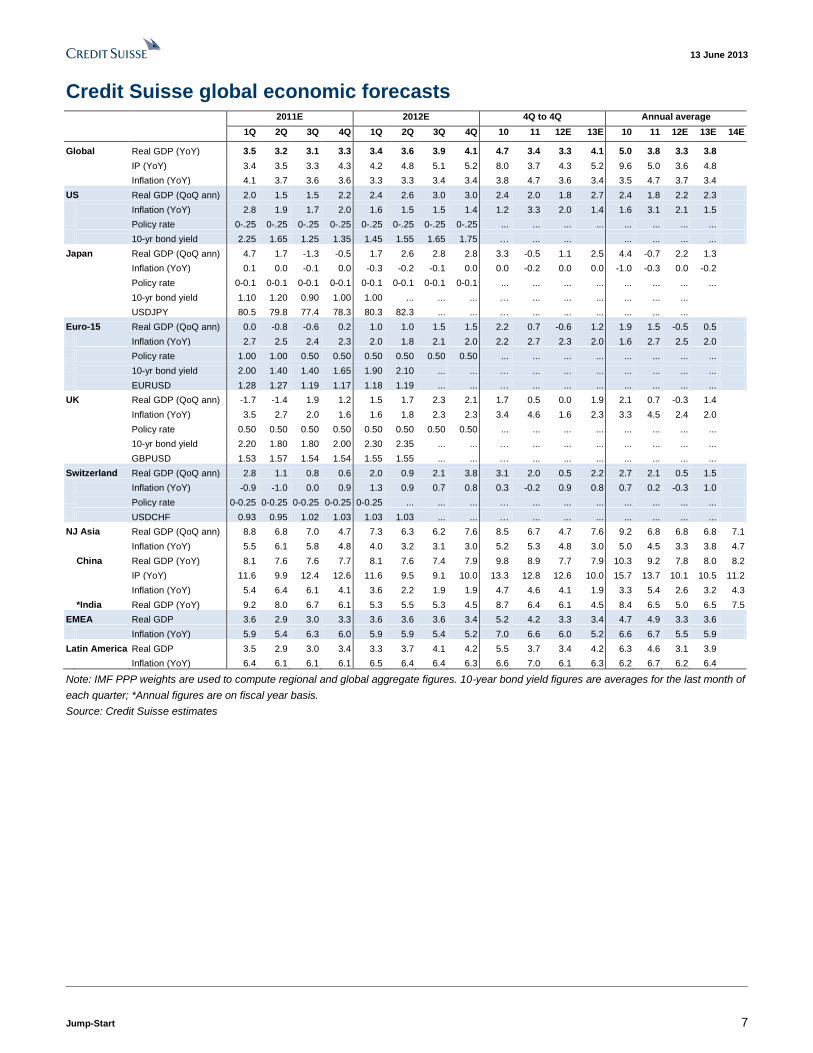
Credit Suisse global economic forecasts
2011E 2012E 4Q to 4Q Annual average
1Q 2Q 3Q 4Q 1Q 2Q 3Q 4Q 10 11 12E 13E 10 11 12E 13E 14E
Global Real GDP (YoY) 3.5 3.2 3.1 3.3 3.4 3.6 3.9 4.1 4.7 3.4 3.3 4.1 5.0 3.8 3.3 3.8 IP (YoY) 3.4 3.5 3.3 4.3 4.2 4.8 5.1 5.2 8.0 3.7 4.3 5.2 9.6 5.0 3.6 4.8 Inflation (YoY) 4.1 3.7 3.6 3.6 3.3 3.3 3.4 3.4 3.8 4.7 3.6 3.4 3.5 4.7 3.7 3.4
US Real GDP (QoQ ann) 2.0 1.5 1.5 2.2 2.4 2.6 3.0 3.0 2.4 2.0 1.8 2.7 2.4 1.8 2.2 2.3 Inflation (YoY) 2.8 1.9 1.7 2.0 1.6 1.5 1.5 1.4 1.2 3.3 2.0 1.4 1.6 3.1 2.1 1.5 Policy rate 0-.25 0-.25 0-.25 0-.25 0-.25 0-.25 0-.25 0-.25 ... ... ... ... ... ... ... ... 10-yr bond yield 2.25 1.65 1.25 1.35 1.45 1.55 1.65 1.75 … ... ... ... ... ... ...
Japan Real GDP (QoQ ann) 4.7 1.7 -1.3 -0.5 1.7 2.6 2.8 2.8 3.3 -0.5 1.1 2.5 4.4 -0.7 2.2 1.3 Inflation (YoY) 0.1 0.0 -0.1 0.0 -0.3 -0.2 -0.1 0.0 0.0 -0.2 0.0 0.0 -1.0 -0.3 0.0 -0.2 Policy rate 0-0.1 0-0.1 0-0.1 0-0.1 0-0.1 0-0.1 0-0.1 0-0.1 ... ... ... ... ... ... ... ... 10-yr bond yield 1.10 1.20 0.90 1.00 1.00 ... ... ... … ... ... ... ... ... ... USDJPY 80.5 79.8 77.4 78.3 80.3 82.3 ... ... … ... ... ... ... ... ...
Euro-15 Real GDP (QoQ ann) 0.0 -0.8 -0.6 0.2 1.0 1.0 1.5 1.5 2.2 0.7 -0.6 1.2 1.9 1.5 -0.5 0.5 Inflation (YoY) 2.7 2.5 2.4 2.3 2.0 1.8 2.1 2.0 2.2 2.7 2.3 2.0 1.6 2.7 2.5 2.0 Policy rate 1.00 1.00 0.50 0.50 0.50 0.50 0.50 0.50 ... ... ... ... ... ... ... ... 10-yr bond yield 2.00 1.40 1.40 1.65 1.90 2.10 ... ... … ... ... ... ... ... ... ... EURUSD 1.28 1.27 1.19 1.17 1.18 1.19 ... ... … ... ... ... ... ... ... ...
UK Real GDP (QoQ ann) -1.7 -1.4 1.9 1.2 1.5 1.7 2.3 2.1 1.7 0.5 0.0 1.9 2.1 0.7 -0.3 1.4 Inflation (YoY) 3.5 2.7 2.0 1.6 1.6 1.8 2.3 2.3 3.4 4.6 1.6 2.3 3.3 4.5 2.4 2.0 Policy rate 0.50 0.50 0.50 0.50 0.50 0.50 0.50 0.50 ... ... ... ... ... ... ... ... 10-yr bond yield 2.20 1.80 1.80 2.00 2.30 2.35 ... ... … ... ... ... ... ... ... ... GBPUSD 1.53 1.57 1.54 1.54 1.55 1.55 ... ... … ... ... ... ... ... ... ...
Switzerland Real GDP (QoQ ann) 2.8 1.1 0.8 0.6 2.0 0.9 2.1 3.8 3.1 2.0 0.5 2.2 2.7 2.1 0.5 1.5 Inflation (YoY) -0.9 -1.0 0.0 0.9 1.3 0.9 0.7 0.8 0.3 -0.2 0.9 0.8 0.7 0.2 -0.3 1.0 Policy rate 0-0.25 0-0.25 0-0.25 0-0.25 0-0.25 ... ... ... … ... ... ... ... ... ... ... USDCHF 0.93 0.95 1.02 1.03 1.03 1.03 ... ... … ... ... ... ... ... ... ...
NJ Asia Real GDP (QoQ ann) 8.8 6.8 7.0 4.7 7.3 6.3 6.2 7.6 8.5 6.7 4.7 7.6 9.2 6.8 6.8 6.8 7.1
Inflation (YoY) 5.5 6.1 5.8 4.8 4.0 3.2 3.1 3.0 5.2 5.3 4.8 3.0 5.0 4.5 3.3 3.8 4.7 China Real GDP (YoY) 8.1 7.6 7.6 7.7 8.1 7.6 7.4 7.9 9.8 8.9 7.7 7.9 10.3 9.2 7.8 8.0 8.2 IP (YoY) 11.6 9.9 12.4 12.6 11.6 9.5 9.1 10.0 13.3 12.8 12.6 10.0 15.7 13.7 10.1 10.5 11.2 Inflation (YoY) 5.4 6.4 6.1 4.1 3.6 2.2 1.9 1.9 4.7 4.6 4.1 1.9 3.3 5.4 2.6 3.2 4.3 *India Real GDP (YoY) 9.2 8.0 6.7 6.1 5.3 5.5 5.3 4.5 8.7 6.4 6.1 4.5 8.4 6.5 5.0 6.5 7.5
EMEA Real GDP 3.6 2.9 3.0 3.3 3.6 3.6 3.6 3.4 5.2 4.2 3.3 3.4 4.7 4.9 3.3 3.6 Inflation (YoY) 5.9 5.4 6.3 6.0 5.9 5.9 5.4 5.2 7.0 6.6 6.0 5.2 6.6 6.7 5.5 5.9
Latin America Real GDP 3.5 2.9 3.0 3.4 3.3 3.7 4.1 4.2 5.5 3.7 3.4 4.2 6.3 4.6 3.1 3.9 Inflation (YoY) 6.4 6.1 6.1 6.1 6.5 6.4 6.4 6.3 6.6 7.0 6.1 6.3 6.2 6.7 6.2 6.4
Note: IMF PPP weights are used to compute regional and global aggregate figures. 10-year bond yield figures are averages for the last month of
each quarter; *Annual figures are on fiscal year basis.
Source: Credit Suisse estimates
13 June 2013
Jump-Start 8
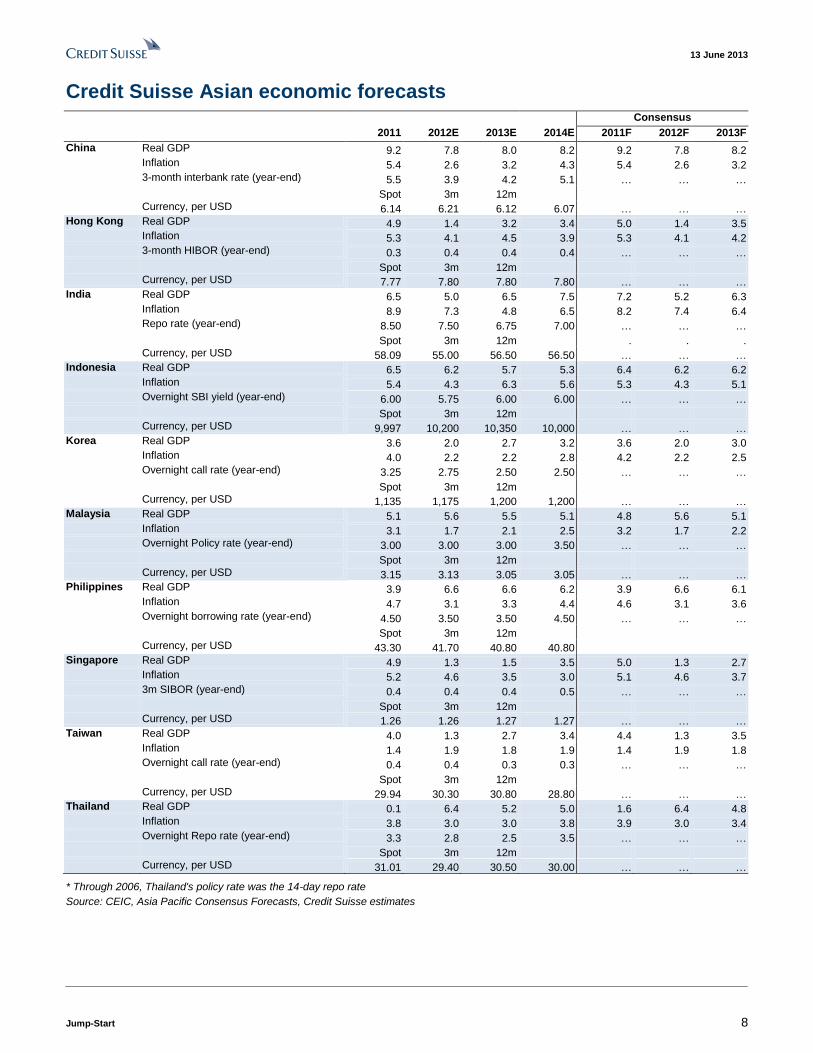
Credit Suisse Asian economic forecasts Consensus
2011 2012E 2013E 2014E 2011F 2012F 2013F
China Real GDP 9.2 7.8 8.0 8.2 9.2 7.8 8.2 Inflation 5.4 2.6 3.2 4.3 5.4 2.6 3.2 3-month interbank rate (year-end) 5.5 3.9 4.2 5.1 … … … Spot 3m 12m Currency, per USD 6.14 6.21 6.12 6.07 … … … Hong Kong Real GDP 4.9 1.4 3.2 3.4 5.0 1.4 3.5 Inflation 5.3 4.1 4.5 3.9 5.3 4.1 4.2 3-month HIBOR (year-end) 0.3 0.4 0.4 0.4 … … … Spot 3m 12m Currency, per USD 7.77 7.80 7.80 7.80 … … … India Real GDP 6.5 5.0 6.5 7.5 7.2 5.2 6.3 Inflation 8.9 7.3 4.8 6.5 8.2 7.4 6.4 Repo rate (year-end) 8.50 7.50 6.75 7.00 … … … Spot 3m 12m . . . Currency, per USD 58.09 55.00 56.50 56.50 … … … Indonesia Real GDP 6.5 6.2 5.7 5.3 6.4 6.2 6.2 Inflation 5.4 4.3 6.3 5.6 5.3 4.3 5.1 Overnight SBI yield (year-end) 6.00 5.75 6.00 6.00 … … … Spot 3m 12m Currency, per USD 9,997 10,200 10,350 10,000 … … … Korea Real GDP 3.6 2.0 2.7 3.2 3.6 2.0 3.0 Inflation 4.0 2.2 2.2 2.8 4.2 2.2 2.5 Overnight call rate (year-end) 3.25 2.75 2.50 2.50 … … … Spot 3m 12m Currency, per USD 1,135 1,175 1,200 1,200 … … … Malaysia Real GDP 5.1 5.6 5.5 5.1 4.8 5.6 5.1 Inflation 3.1 1.7 2.1 2.5 3.2 1.7 2.2 Overnight Policy rate (year-end) 3.00 3.00 3.00 3.50 … … … Spot 3m 12m Currency, per USD 3.15 3.13 3.05 3.05 … … … Philippines Real GDP 3.9 6.6 6.6 6.2 3.9 6.6 6.1 Inflation 4.7 3.1 3.3 4.4 4.6 3.1 3.6 Overnight borrowing rate (year-end) 4.50 3.50 3.50 4.50 … … … Spot 3m 12m Currency, per USD 43.30 41.70 40.80 40.80 Singapore Real GDP 4.9 1.3 1.5 3.5 5.0 1.3 2.7 Inflation 5.2 4.6 3.5 3.0 5.1 4.6 3.7 3m SIBOR (year-end) 0.4 0.4 0.4 0.5 … … … Spot 3m 12m Currency, per USD 1.26 1.26 1.27 1.27 … … … Taiwan Real GDP 4.0 1.3 2.7 3.4 4.4 1.3 3.5 Inflation 1.4 1.9 1.8 1.9 1.4 1.9 1.8 Overnight call rate (year-end) 0.4 0.4 0.3 0.3 … … … Spot 3m 12m Currency, per USD 29.94 30.30 30.80 28.80 … … … Thailand Real GDP 0.1 6.4 5.2 5.0 1.6 6.4 4.8 Inflation 3.8 3.0 3.0 3.8 3.9 3.0 3.4 Overnight Repo rate (year-end) 3.3 2.8 2.5 3.5 … … … Spot 3m 12m Currency, per USD 31.01 29.40 30.50 30.00 … … …
* Through 2006, Thailand's policy rate was the 14-day repo rate
Source: CEIC, Asia Pacific Consensus Forecasts, Credit Suisse estimates
13 June 2013
Jump-Start 9
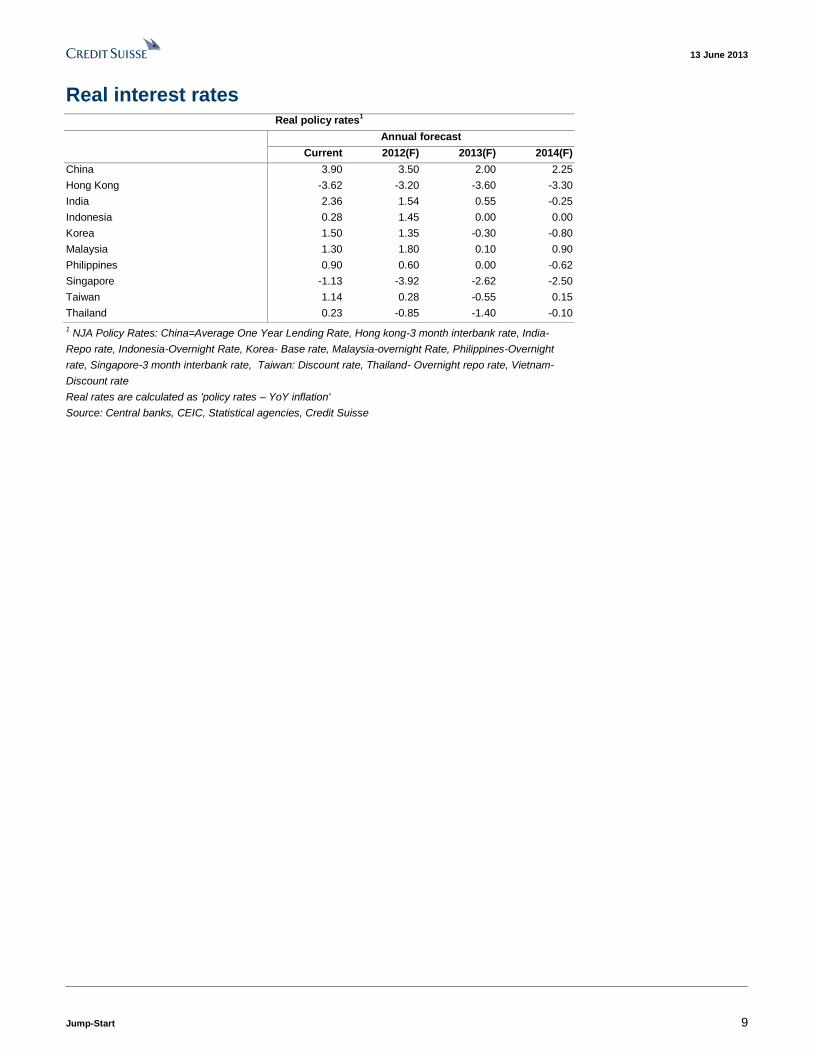
Real interest rates Real policy rates
1
Annual forecast
Current 2012(F) 2013(F) 2014(F)
China 3.90 3.50 2.00 2.25
Hong Kong -3.62 -3.20 -3.60 -3.30
India 2.36 1.54 0.55 -0.25
Indonesia 0.28 1.45 0.00 0.00
Korea 1.50 1.35 -0.30 -0.80
Malaysia 1.30 1.80 0.10 0.90
Philippines 0.90 0.60 0.00 -0.62
Singapore -1.13 -3.92 -2.62 -2.50
Taiwan 1.14 0.28 -0.55 0.15
Thailand 0.23 -0.85 -1.40 -0.10
1 NJA Policy Rates: China=Average One Year Lending Rate, Hong kong-3 month interbank rate, India-
Repo rate, Indonesia-Overnight Rate, Korea- Base rate, Malaysia-overnight Rate, Philippines-Overnight
rate, Singapore-3 month interbank rate, Taiwan: Discount rate, Thailand- Overnight repo rate, Vietnam-
Discount rate
Real rates are calculated as 'policy rates – YoY inflation'
Source: Central banks, CEIC, Statistical agencies, Credit Suisse
13 June 2013
Jump-Start 10
Top stories from Credit Suisse research last week
13 June 2013
Jump-Start 11
Asia Equity Strategy ------------------------------------------------------------------------------------------- New report: QE tapering—Are we getting too pessimistic on its impact? Sakthi Siva / Research Analyst / 65 6212 3027 / [email protected] Kin Nang Chik / Research Analyst / 852 2101 7482 / [email protected]
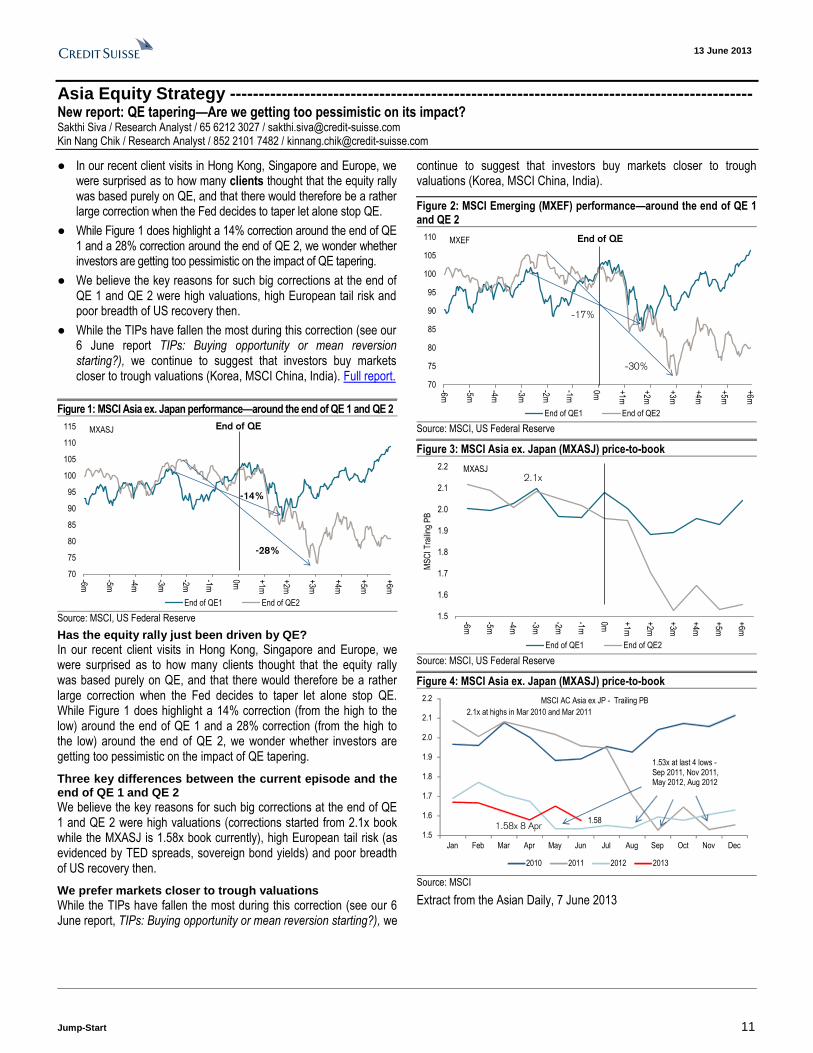
● In our recent client visits in Hong Kong, Singapore and Europe, we were surprised as to how many clients thought that the equity rally was based purely on QE, and that there would therefore be a rather large correction when the Fed decides to taper let alone stop QE.
● While Figure 1 does highlight a 14% correction around the end of QE 1 and a 28% correction around the end of QE 2, we wonder whether investors are getting too pessimistic on the impact of QE tapering.
● We believe the key reasons for such big corrections at the end of QE 1 and QE 2 were high valuations, high European tail risk and poor breadth of US recovery then.
● While the TIPs have fallen the most during this correction (see our 6 June report TIPs: Buying opportunity or mean reversion starting?), we continue to suggest that investors buy markets closer to trough valuations (Korea, MSCI China, India). Full report.
Figure 1: MSCI Asia ex. Japan performance—around the end of QE 1 and QE 2
70
75
80
85
90
95
100
105
110
115
-6m
-5m
-4m
-3m
-2m
-1m
0m +1m
+2m
+3m
+4m
+5m
+6m
MXASJ
End of QE1 End of QE2
-14%
-28%
End of QE
Source: MSCI, US Federal Reserve
Has the equity rally just been driven by QE?
In our recent client visits in Hong Kong, Singapore and Europe, we were surprised as to how many clients thought that the equity rally was based purely on QE, and that there would therefore be a rather large correction when the Fed decides to taper let alone stop QE. While Figure 1 does highlight a 14% correction (from the high to the low) around the end of QE 1 and a 28% correction (from the high to the low) around the end of QE 2, we wonder whether investors are getting too pessimistic on the impact of QE tapering.
Three key differences between the current episode and the end of QE 1 and QE 2
We believe the key reasons for such big corrections at the end of QE 1 and QE 2 were high valuations (corrections started from 2.1x book while the MXASJ is 1.58x book currently), high European tail risk (as evidenced by TED spreads, sovereign bond yields) and poor breadth of US recovery then.
We prefer markets closer to trough valuations
While the TIPs have fallen the most during this correction (see our 6 June report, TIPs: Buying opportunity or mean reversion starting?), we
continue to suggest that investors buy markets closer to trough valuations (Korea, MSCI China, India).
Figure 2: MSCI Emerging (MXEF) performance—around the end of QE 1 and QE 2
70
75
80
85
90
95
100
105
110
-6m
-5m
-4m
-3m
-2m
-1m
0m +1m
+2m
+3m
+4m
+5m
+6m
MXEF
End of QE1 End of QE2
-30%
-17%
End of QE
Source: MSCI, US Federal Reserve
Figure 3: MSCI Asia ex. Japan (MXASJ) price-to-book
1.5
1.6
1.7
1.8
1.9
2.0
2.1
2.2
-6m
-5m
-4m
-3m
-2m
-1m
0m +1m
+2m
+3m
+4m
+5m
+6m
MS
CI T
raili
ng P
B
MXASJ
End of QE1 End of QE2
2.1x
Source: MSCI, US Federal Reserve
Figure 4: MSCI Asia ex. Japan (MXASJ) price-to-book
1.58
1.5
1.6
1.7
1.8
1.9
2.0
2.1
2.2
Jan Feb Mar Apr May Jun Jul Aug Sep Oct Nov Dec
MSCI AC Asia ex JP - Trailing PB
2010 2011 2012 2013
1.53x at last 4 lows -Sep 2011, Nov 2011, May 2012, Aug 2012
2.1x at highs in Mar 2010 and Mar 2011
1.58x 8 Apr
Source: MSCI
Extract from the Asian Daily, 7 June 2013
13 June 2013
Jump-Start 12
Asia Equity Strategy ------------------------------------------------------------------------------------------- New report: TIPs—buying opportunity or mean reversion starting? Sakthi Siva / Research Analyst / 65 6212 3027 / [email protected] Kin Nang Chik / Research Analyst / 852 2101 7482 / [email protected]
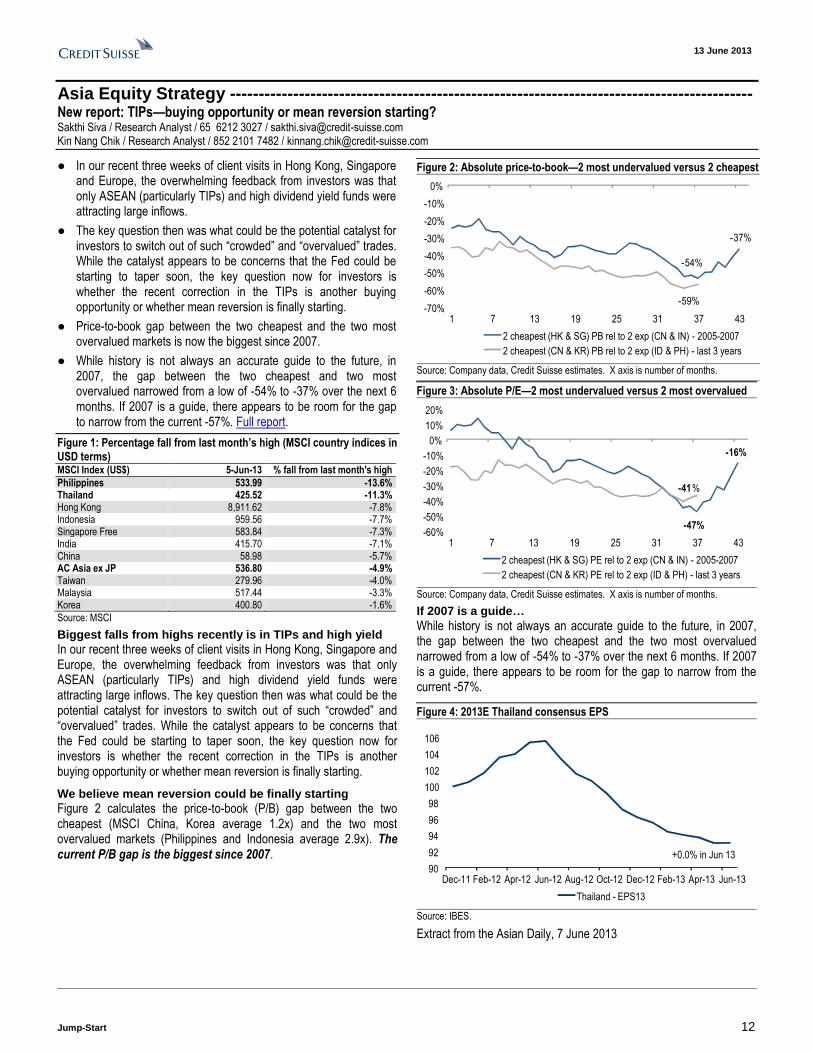
● In our recent three weeks of client visits in Hong Kong, Singapore and Europe, the overwhelming feedback from investors was that only ASEAN (particularly TIPs) and high dividend yield funds were attracting large inflows.
● The key question then was what could be the potential catalyst for investors to switch out of such “crowded” and “overvalued” trades. While the catalyst appears to be concerns that the Fed could be starting to taper soon, the key question now for investors is whether the recent correction in the TIPs is another buying opportunity or whether mean reversion is finally starting.
● Price-to-book gap between the two cheapest and the two most overvalued markets is now the biggest since 2007.
● While history is not always an accurate guide to the future, in 2007, the gap between the two cheapest and two most overvalued narrowed from a low of -54% to -37% over the next 6 months. If 2007 is a guide, there appears to be room for the gap to narrow from the current -57%. Full report.
Figure 1: Percentage fall from last month’s high (MSCI country indices in USD terms) MSCI Index (US$) 5-Jun-13 % fall from last month's high
Philippines 533.99 -13.6% Thailand 425.52 -11.3% Hong Kong 8,911.62 -7.8% Indonesia 959.56 -7.7% Singapore Free 583.84 -7.3% India 415.70 -7.1% China 58.98 -5.7% AC Asia ex JP 536.80 -4.9% Taiwan 279.96 -4.0% Malaysia 517.44 -3.3% Korea 400.80 -1.6%
Source: MSCI
Biggest falls from highs recently is in TIPs and high yield
In our recent three weeks of client visits in Hong Kong, Singapore and Europe, the overwhelming feedback from investors was that only ASEAN (particularly TIPs) and high dividend yield funds were attracting large inflows. The key question then was what could be the potential catalyst for investors to switch out of such “crowded” and “overvalued” trades. While the catalyst appears to be concerns that the Fed could be starting to taper soon, the key question now for investors is whether the recent correction in the TIPs is another buying opportunity or whether mean reversion is finally starting.
We believe mean reversion could be finally starting
Figure 2 calculates the price-to-book (P/B) gap between the two cheapest (MSCI China, Korea average 1.2x) and the two most overvalued markets (Philippines and Indonesia average 2.9x). The current P/B gap is the biggest since 2007.
Figure 2: Absolute price-to-book—2 most undervalued versus 2 cheapest
-70%
-60%
-50%
-40%
-30%
-20%
-10%
0%
1 7 13 19 25 31 37 43
2 cheapest (HK & SG) PB rel to 2 exp (CN & IN) - 2005-2007
2 cheapest (CN & KR) PB rel to 2 exp (ID & PH) - last 3 years
-59%
-54%
-37%
Source: Company data, Credit Suisse estimates. X axis is number of months.
Figure 3: Absolute P/E—2 most undervalued versus 2 most overvalued
-60%
-50%
-40%
-30%
-20%
-10%
0%
10%
20%
1 7 13 19 25 31 37 43
2 cheapest (HK & SG) PE rel to 2 exp (CN & IN) - 2005-2007
2 cheapest (CN & KR) PE rel to 2 exp (ID & PH) - last 3 years
-47%
-16%
-41%
Source: Company data, Credit Suisse estimates. X axis is number of months.
If 2007 is a guide…
While history is not always an accurate guide to the future, in 2007, the gap between the two cheapest and the two most overvalued narrowed from a low of -54% to -37% over the next 6 months. If 2007 is a guide, there appears to be room for the gap to narrow from the current -57%.
Figure 4: 2013E Thailand consensus EPS
90
92
94
96
98
100
102
104
106
Dec-11 Feb-12 Apr-12 Jun-12 Aug-12 Oct-12 Dec-12 Feb-13 Apr-13 Jun-13
Thailand - EPS13
+0.0% in Jun 13
Source: IBES.
Extract from the Asian Daily, 7 June 2013
13 June 2013
Jump-Start 13
Asia Equity Strategy ------------------------------------------------------------------------------------------- New report: TIPs—buying opportunity or mean reversion? Part 2 Sakthi Siva / Research Analyst / 65 6212 3027 / [email protected] Kin Nang Chik / Research Analyst / 852 2101 7482 / [email protected]
● TIPs – not yet a buying opportunity. With the TIPs falling by at least 15% in USD terms from their recent highs, investors may consider this a buying opportunity. But as discussed previously in our 6 June report, we believe it is not yet a buying opportunity and instead believe mean reversion is starting.
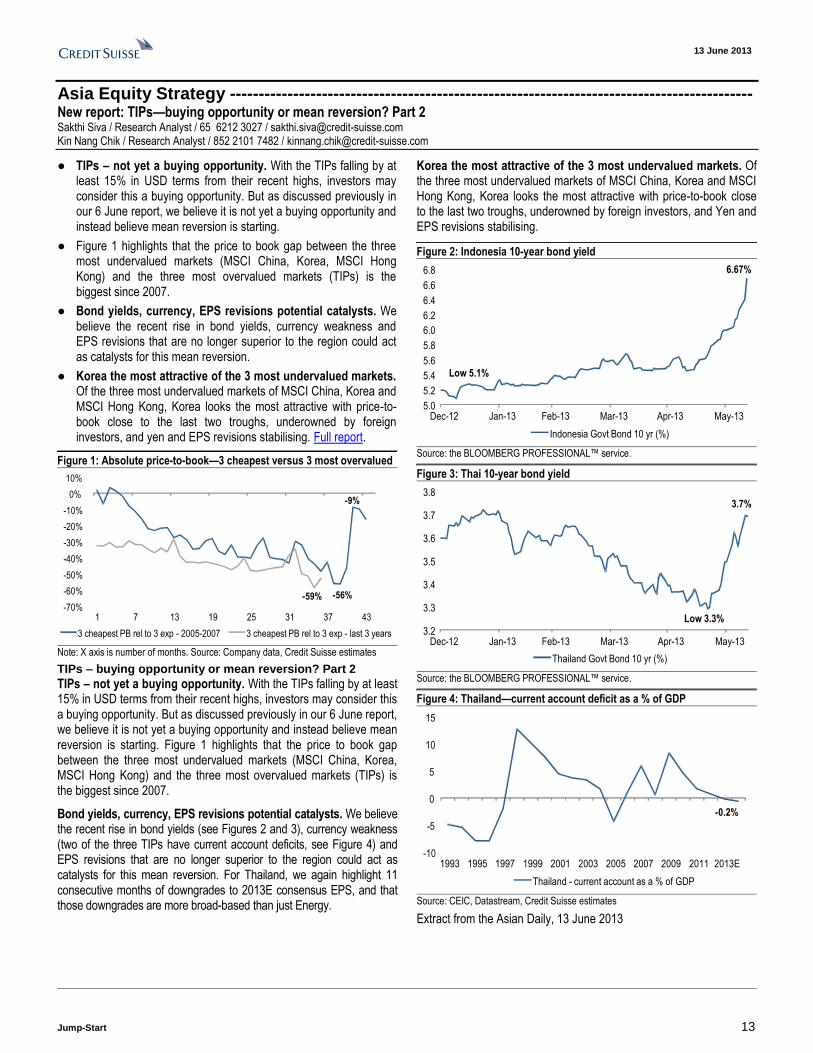
● Figure 1 highlights that the price to book gap between the three most undervalued markets (MSCI China, Korea, MSCI Hong Kong) and the three most overvalued markets (TIPs) is the biggest since 2007.
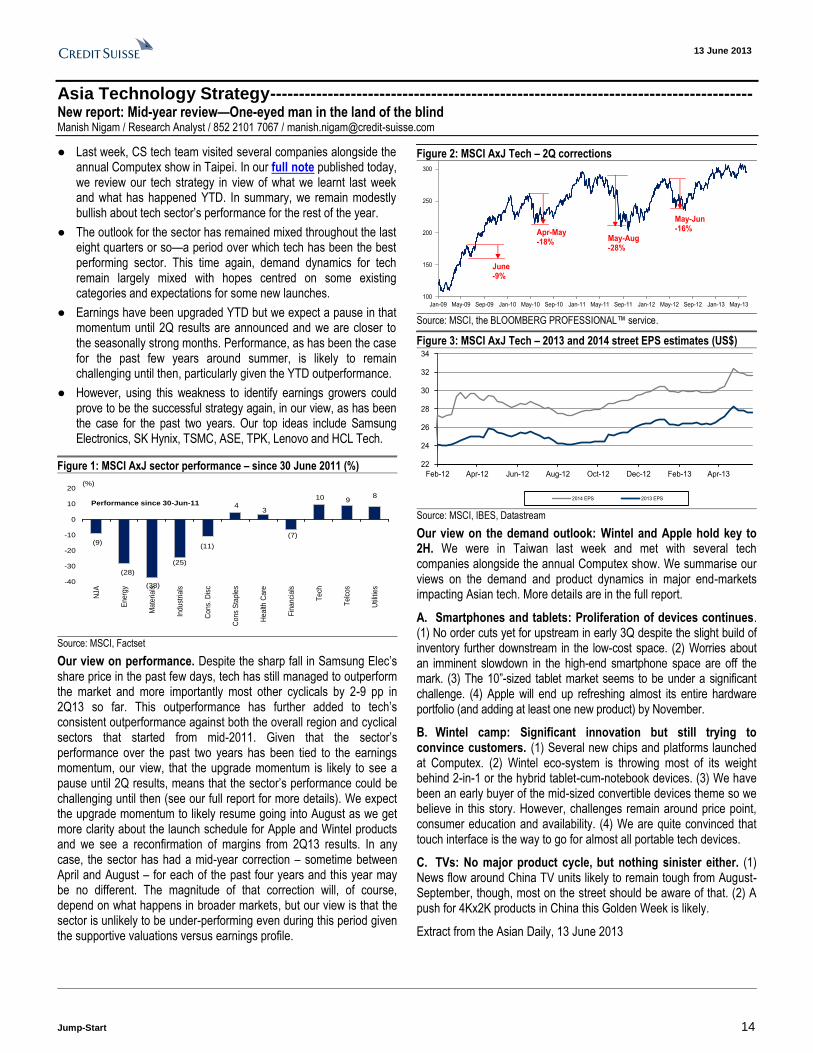
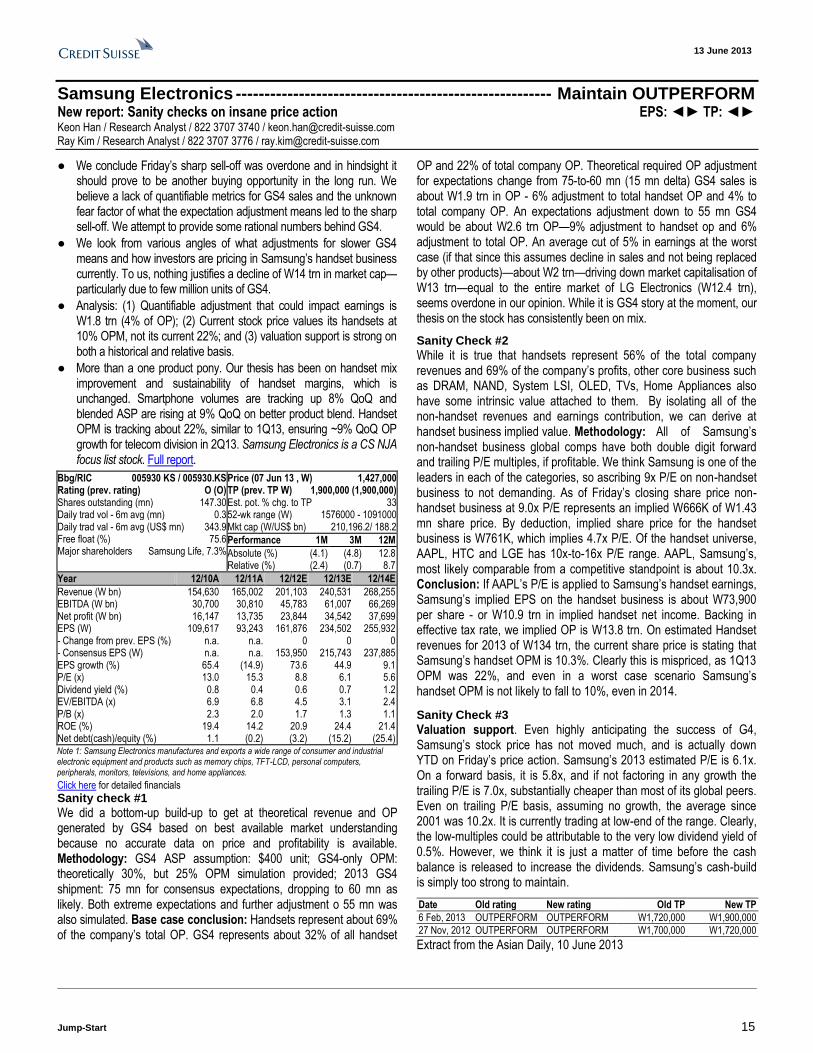
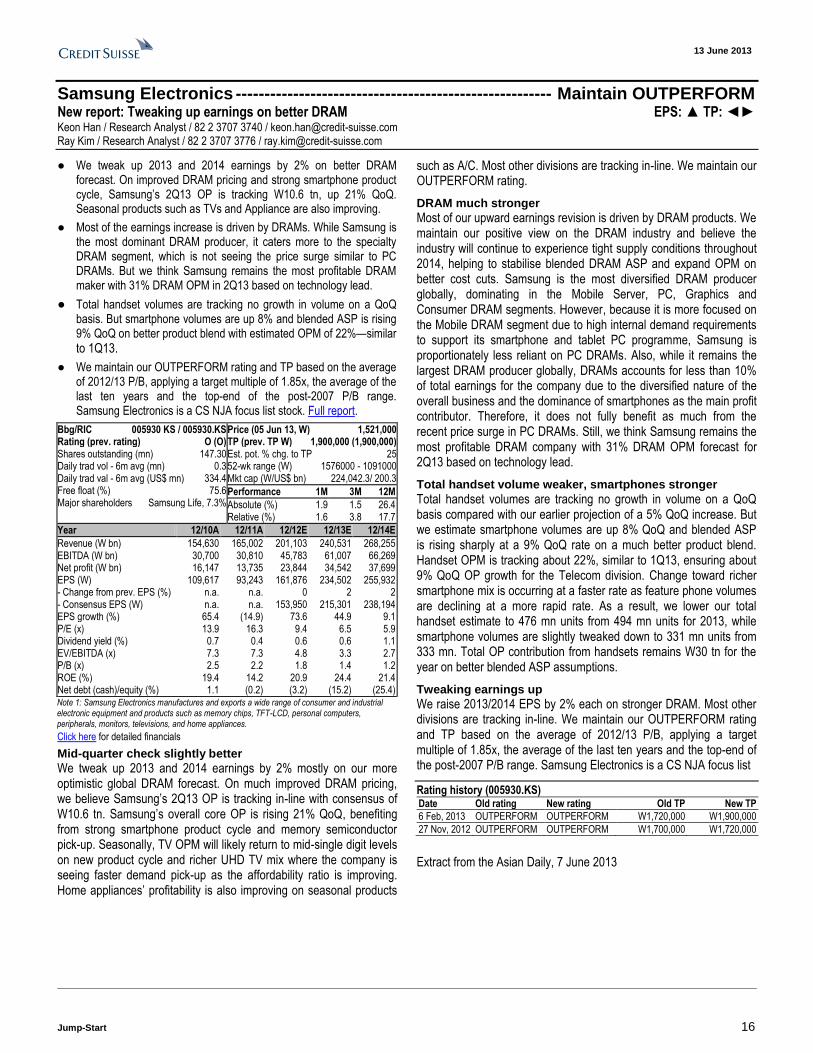
● Bond yields, currency, EPS revisions potential catalysts. We believe the recent rise in bond yields, currency weakness and EPS revisions that are no longer superior to the region could act as catalysts for this mean reversion.
● Korea the most attractive of the 3 most undervalued markets. Of the three most undervalued markets of MSCI China, Korea and MSCI Hong Kong, Korea looks the most attractive with price-to-book close to the last two troughs, underowned by foreign investors, and yen and EPS revisions stabilising. Full report.
Figure 1: Absolute price-to-book—3 cheapest versus 3 most overvalued
-70%
-60%
-50%
-40%
-30%
-20%
-10%
0%
10%
1 7 13 19 25 31 37 43
3 cheapest PB rel to 3 exp - 2005-2007 3 cheapest PB rel to 3 exp - last 3 years
-56%
-9%
-59%
Note: X axis is number of months. Source: Company data, Credit Suisse estimates
TIPs – buying opportunity or mean reversion? Part 2
TIPs – not yet a buying opportunity. With the TIPs falling by at least 15% in USD terms from their recent highs, investors may consider this a buying opportunity. But as discussed previously in our 6 June report, we believe it is not yet a buying opportunity and instead believe mean reversion is starting. Figure 1 highlights that the price to book gap between the three most undervalued markets (MSCI China, Korea, MSCI Hong Kong) and the three most overvalued markets (TIPs) is the biggest since 2007.
Bond yields, currency, EPS revisions potential catalysts. We believe the recent rise in bond yields (see Figures 2 and 3), currency weakness (two of the three TIPs have current account deficits, see Figure 4) and EPS revisions that are no longer superior to the region could act as catalysts for this mean reversion. For Thailand, we again highlight 11 consecutive months of downgrades to 2013E consensus EPS, and that those downgrades are more broad-based than just Energy.
Korea the most attractive of the 3 most undervalued markets. Of the three most undervalued markets of MSCI China, Korea and MSCI Hong Kong, Korea looks the most attractive with price-to-book close to the last two troughs, underowned by foreign investors, and Yen and EPS revisions stabilising.
Figure 2: Indonesia 10-year bond yield
5.0
5.2
5.4
5.6
5.8
6.0
6.2
6.4
6.6
6.8
Dec-12 Jan-13 Feb-13 Mar-13 Apr-13 May-13
Indonesia Govt Bond 10 yr (%)
Low 5.1%
6.67%
Source: the BLOOMBERG PROFESSIONAL™ service.
Figure 3: Thai 10-year bond yield
3.2
3.3
3.4
3.5
3.6
3.7
3.8
Dec-12 Jan-13 Feb-13 Mar-13 Apr-13 May-13
Thailand Govt Bond 10 yr (%)
Low 3.3%
3.7%
Source: the BLOOMBERG PROFESSIONAL™ service.
Figure 4: Thailand—current account deficit as a % of GDP
-10
-5
0
5
10
15
1993 1995 1997 1999 2001 2003 2005 2007 2009 2011 2013E
Thailand - current account as a % of GDP
-0.2%
Source: CEIC, Datastream, Credit Suisse estimates
Extract from the Asian Daily, 13 June 2013
13 June 2013
Jump-Start 14
Asia Technology Strategy ------------------------------------------------------------------------------------ New report: Mid-year review—One-eyed man in the land of the blind Manish Nigam / Research Analyst / 852 2101 7067 / [email protected]
● Last week, CS tech team visited several companies alongside the annual Computex show in Taipei. In our full note published today, we review our tech strategy in view of what we learnt last week and what has happened YTD. In summary, we remain modestly bullish about tech sector’s performance for the rest of the year.
● The outlook for the sector has remained mixed throughout the last eight quarters or so—a period over which tech has been the best performing sector. This time again, demand dynamics for tech remain largely mixed with hopes centred on some existing categories and expectations for some new launches.
● Earnings have been upgraded YTD but we expect a pause in that momentum until 2Q results are announced and we are closer to the seasonally strong months. Performance, as has been the case for the past few years around summer, is likely to remain challenging until then, particularly given the YTD outperformance.
● However, using this weakness to identify earnings growers could prove to be the successful strategy again, in our view, as has been the case for the past two years. Our top ideas include Samsung Electronics, SK Hynix, TSMC, ASE, TPK, Lenovo and HCL Tech.
Figure 1: MSCI AxJ sector performance – since 30 June 2011 (%)
(9)
(28)
(38)
(25)
(11)
4 3
(7)
10 9 8
-40
-30
-20
-10
0
10
20
NJA
En
erg
y
Ma
teria
ls
Indu
stri
als
Con
s. D
isc
Co
ns
Sta
ple
s
Hea
lth C
are
Fin
an
cia
ls
Te
ch
Te
lcos
Util
ities
(%)
Performance since 30-Jun-11
Source: MSCI, Factset
Our view on performance. Despite the sharp fall in Samsung Elec’s share price in the past few days, tech has still managed to outperform the market and more importantly most other cyclicals by 2-9 pp in 2Q13 so far. This outperformance has further added to tech’s consistent outperformance against both the overall region and cyclical sectors that started from mid-2011. Given that the sector’s performance over the past two years has been tied to the earnings momentum, our view, that the upgrade momentum is likely to see a pause until 2Q results, means that the sector’s performance could be challenging until then (see our full report for more details). We expect the upgrade momentum to likely resume going into August as we get more clarity about the launch schedule for Apple and Wintel products and we see a reconfirmation of margins from 2Q13 results. In any case, the sector has had a mid-year correction – sometime between April and August – for each of the past four years and this year may be no different. The magnitude of that correction will, of course, depend on what happens in broader markets, but our view is that the sector is unlikely to be under-performing even during this period given the supportive valuations versus earnings profile.
Figure 2: MSCI AxJ Tech – 2Q corrections
100
150
200
250
300
Jan-09 May-09 Sep-09 Jan-10 May-10 Sep-10 Jan-11 May-11 Sep-11 Jan-12 May-12 Sep-12 Jan-13 May-13
June-9%
Apr-May-18% May-Aug
-28%
May-Jun-16%
Source: MSCI, the BLOOMBERG PROFESSIONAL™ service.
Figure 3: MSCI AxJ Tech – 2013 and 2014 street EPS estimates (US$)
22
24
26
28
30
32
34
Feb-12 Apr-12 Jun-12 Aug-12 Oct-12 Dec-12 Feb-13 Apr-13
2014 EPS 2013 EPS
Source: MSCI, IBES, Datastream
Our view on the demand outlook: Wintel and Apple hold key to 2H. We were in Taiwan last week and met with several tech companies alongside the annual Computex show. We summarise our views on the demand and product dynamics in major end-markets impacting Asian tech. More details are in the full report.
A. Smartphones and tablets: Proliferation of devices continues. (1) No order cuts yet for upstream in early 3Q despite the slight build of inventory further downstream in the low-cost space. (2) Worries about an imminent slowdown in the high-end smartphone space are off the mark. (3) The 10”-sized tablet market seems to be under a significant challenge. (4) Apple will end up refreshing almost its entire hardware portfolio (and adding at least one new product) by November.
B. Wintel camp: Significant innovation but still trying to convince customers. (1) Several new chips and platforms launched at Computex. (2) Wintel eco-system is throwing most of its weight behind 2-in-1 or the hybrid tablet-cum-notebook devices. (3) We have been an early buyer of the mid-sized convertible devices theme so we believe in this story. However, challenges remain around price point, consumer education and availability. (4) We are quite convinced that touch interface is the way to go for almost all portable tech devices.
C. TVs: No major product cycle, but nothing sinister either. (1) News flow around China TV units likely to remain tough from August-September, though, most on the street should be aware of that. (2) A push for 4Kx2K products in China this Golden Week is likely.
Extract from the Asian Daily, 13 June 2013
13 June 2013
Jump-Start 15
Samsung Electronics ------------------------------------------------------- Maintain OUTPERFORM New report: Sanity checks on insane price action EPS: ◄► TP: ◄► Keon Han / Research Analyst / 822 3707 3740 / [email protected] Ray Kim / Research Analyst / 822 3707 3776 / [email protected]
● We conclude Friday’s sharp sell-off was overdone and in hindsight it should prove to be another buying opportunity in the long run. We believe a lack of quantifiable metrics for GS4 sales and the unknown fear factor of what the expectation adjustment means led to the sharp sell-off. We attempt to provide some rational numbers behind GS4.
● We look from various angles of what adjustments for slower GS4 means and how investors are pricing in Samsung’s handset business currently. To us, nothing justifies a decline of W14 trn in market cap—particularly due to few million units of GS4.
● Analysis: (1) Quantifiable adjustment that could impact earnings is W1.8 trn (4% of OP); (2) Current stock price values its handsets at 10% OPM, not its current 22%; and (3) valuation support is strong on both a historical and relative basis.
● More than a one product pony. Our thesis has been on handset mix improvement and sustainability of handset margins, which is unchanged. Smartphone volumes are tracking up 8% QoQ and blended ASP are rising at 9% QoQ on better product blend. Handset OPM is tracking about 22%, similar to 1Q13, ensuring ~9% QoQ OP growth for telecom division in 2Q13. Samsung Electronics is a CS NJA focus list stock. Full report.
Click here for detailed financials
Sanity check #1
We did a bottom-up build-up to get at theoretical revenue and OP generated by GS4 based on best available market understanding because no accurate data on price and profitability is available. Methodology: GS4 ASP assumption: $400 unit; GS4-only OPM: theoretically 30%, but 25% OPM simulation provided; 2013 GS4 shipment: 75 mn for consensus expectations, dropping to 60 mn as likely. Both extreme expectations and further adjustment o 55 mn was also simulated. Base case conclusion: Handsets represent about 69% of the company’s total OP. GS4 represents about 32% of all handset
OP and 22% of total company OP. Theoretical required OP adjustment for expectations change from 75-to-60 mn (15 mn delta) GS4 sales is about W1.9 trn in OP - 6% adjustment to total handset OP and 4% to total company OP. An expectations adjustment down to 55 mn GS4 would be about W2.6 trn OP—9% adjustment to handset op and 6% adjustment to total OP. An average cut of 5% in earnings at the worst case (if that since this assumes decline in sales and not being replaced by other products)—about W2 trn—driving down market capitalisation of W13 trn—equal to the entire market of LG Electronics (W12.4 trn), seems overdone in our opinion. While it is GS4 story at the moment, our thesis on the stock has consistently been on mix.
Sanity Check #2
While it is true that handsets represent 56% of the total company revenues and 69% of the company’s profits, other core business such as DRAM, NAND, System LSI, OLED, TVs, Home Appliances also have some intrinsic value attached to them. By isolating all of the non-handset revenues and earnings contribution, we can derive at handset business implied value. Methodology: All of Samsung’s non-handset business global comps have both double digit forward and trailing P/E multiples, if profitable. We think Samsung is one of the leaders in each of the categories, so ascribing 9x P/E on non-handset business to not demanding. As of Friday’s closing share price non-handset business at 9.0x P/E represents an implied W666K of W1.43 mn share price. By deduction, implied share price for the handset business is W761K, which implies 4.7x P/E. Of the handset universe, AAPL, HTC and LGE has 10x-to-16x P/E range. AAPL, Samsung’s, most likely comparable from a competitive standpoint is about 10.3x. Conclusion: If AAPL’s P/E is applied to Samsung’s handset earnings, Samsung’s implied EPS on the handset business is about W73,900 per share - or W10.9 trn in implied handset net income. Backing in effective tax rate, we implied OP is W13.8 trn. On estimated Handset revenues for 2013 of W134 trn, the current share price is stating that Samsung’s handset OPM is 10.3%. Clearly this is mispriced, as 1Q13 OPM was 22%, and even in a worst case scenario Samsung’s handset OPM is not likely to fall to 10%, even in 2014.
Sanity Check #3
Valuation support. Even highly anticipating the success of G4, Samsung’s stock price has not moved much, and is actually down YTD on Friday’s price action. Samsung’s 2013 estimated P/E is 6.1x. On a forward basis, it is 5.8x, and if not factoring in any growth the trailing P/E is 7.0x, substantially cheaper than most of its global peers. Even on trailing P/E basis, assuming no growth, the average since 2001 was 10.2x. It is currently trading at low-end of the range. Clearly, the low-multiples could be attributable to the very low dividend yield of 0.5%. However, we think it is just a matter of time before the cash balance is released to increase the dividends. Samsung’s cash-build is simply too strong to maintain.
Date Old rating New rating Old TP New TP
6 Feb, 2013 OUTPERFORM OUTPERFORM W1,720,000 W1,900,000
27 Nov, 2012 OUTPERFORM OUTPERFORM W1,700,000 W1,720,000
Extract from the Asian Daily, 10 June 2013
Bbg/RIC 005930 KS / 005930.KS Rating (prev. rating) O (O) Shares outstanding (mn) 147.30 Daily trad vol - 6m avg (mn) 0.3 Daily trad val - 6m avg (US$ mn) 343.9 Free float (%) 75.6 Major shareholders Samsung Life, 7.3%
Price (07 Jun 13 , W) 1,427,000 TP (prev. TP W) 1,900,000 (1,900,000) Est. pot. % chg. to TP 33 52-wk range (W) 1576000 - 1091000 Mkt cap (W/US$ bn) 210,196.2/ 188.2
Performance 1M 3M 12M
Absolute (%) (4.1) (4.8) 12.8 Relative (%) (2.4) (0.7) 8.7
Year 12/10A 12/11A 12/12E 12/13E 12/14E
Revenue (W bn) 154,630 165,002 201,103 240,531 268,255 EBITDA (W bn) 30,700 30,810 45,783 61,007 66,269 Net profit (W bn) 16,147 13,735 23,844 34,542 37,699 EPS (W) 109,617 93,243 161,876 234,502 255,932 - Change from prev. EPS (%) n.a. n.a. 0 0 0 - Consensus EPS (W) n.a. n.a. 153,950 215,743 237,885 EPS growth (%) 65.4 (14.9) 73.6 44.9 9.1 P/E (x) 13.0 15.3 8.8 6.1 5.6 Dividend yield (%) 0.8 0.4 0.6 0.7 1.2 EV/EBITDA (x) 6.9 6.8 4.5 3.1 2.4 P/B (x) 2.3 2.0 1.7 1.3 1.1 ROE (%) 19.4 14.2 20.9 24.4 21.4 Net debt(cash)/equity (%) 1.1 (0.2) (3.2) (15.2) (25.4)
Note 1: Samsung Electronics manufactures and exports a wide range of consumer and industrial electronic equipment and products such as memory chips, TFT-LCD, personal computers, peripherals, monitors, televisions, and home appliances.
13 June 2013
Jump-Start 16
Samsung Electronics ------------------------------------------------------- Maintain OUTPERFORM New report: Tweaking up earnings on better DRAM EPS: ▲ TP: ◄► Keon Han / Research Analyst / 82 2 3707 3740 / [email protected] Ray Kim / Research Analyst / 82 2 3707 3776 / [email protected]
● We tweak up 2013 and 2014 earnings by 2% on better DRAM forecast. On improved DRAM pricing and strong smartphone product cycle, Samsung’s 2Q13 OP is tracking W10.6 tn, up 21% QoQ. Seasonal products such as TVs and Appliance are also improving.
● Most of the earnings increase is driven by DRAMs. While Samsung is the most dominant DRAM producer, it caters more to the specialty DRAM segment, which is not seeing the price surge similar to PC DRAMs. But we think Samsung remains the most profitable DRAM maker with 31% DRAM OPM in 2Q13 based on technology lead.
● Total handset volumes are tracking no growth in volume on a QoQ basis. But smartphone volumes are up 8% and blended ASP is rising 9% QoQ on better product blend with estimated OPM of 22%—similar to 1Q13.
● We maintain our OUTPERFORM rating and TP based on the average of 2012/13 P/B, applying a target multiple of 1.85x, the average of the last ten years and the top-end of the post-2007 P/B range. Samsung Electronics is a CS NJA focus list stock. Full report.
Click here for detailed financials
Mid-quarter check slightly better
We tweak up 2013 and 2014 earnings by 2% mostly on our more optimistic global DRAM forecast. On much improved DRAM pricing, we believe Samsung’s 2Q13 OP is tracking in-line with consensus of W10.6 tn. Samsung’s overall core OP is rising 21% QoQ, benefiting from strong smartphone product cycle and memory semiconductor pick-up. Seasonally, TV OPM will likely return to mid-single digit levels on new product cycle and richer UHD TV mix where the company is seeing faster demand pick-up as the affordability ratio is improving. Home appliances’ profitability is also improving on seasonal products
such as A/C. Most other divisions are tracking in-line. We maintain our OUTPERFORM rating.
DRAM much stronger
Most of our upward earnings revision is driven by DRAM products. We maintain our positive view on the DRAM industry and believe the industry will continue to experience tight supply conditions throughout 2014, helping to stabilise blended DRAM ASP and expand OPM on better cost cuts. Samsung is the most diversified DRAM producer globally, dominating in the Mobile Server, PC, Graphics and Consumer DRAM segments. However, because it is more focused on the Mobile DRAM segment due to high internal demand requirements to support its smartphone and tablet PC programme, Samsung is proportionately less reliant on PC DRAMs. Also, while it remains the largest DRAM producer globally, DRAMs accounts for less than 10% of total earnings for the company due to the diversified nature of the overall business and the dominance of smartphones as the main profit contributor. Therefore, it does not fully benefit as much from the recent price surge in PC DRAMs. Still, we think Samsung remains the most profitable DRAM company with 31% DRAM OPM forecast for 2Q13 based on technology lead.
Total handset volume weaker, smartphones stronger
Total handset volumes are tracking no growth in volume on a QoQ basis compared with our earlier projection of a 5% QoQ increase. But we estimate smartphone volumes are up 8% QoQ and blended ASP is rising sharply at a 9% QoQ rate on a much better product blend. Handset OPM is tracking about 22%, similar to 1Q13, ensuring about 9% QoQ OP growth for the Telecom division. Change toward richer smartphone mix is occurring at a faster rate as feature phone volumes are declining at a more rapid rate. As a result, we lower our total handset estimate to 476 mn units from 494 mn units for 2013, while smartphone volumes are slightly tweaked down to 331 mn units from 333 mn. Total OP contribution from handsets remains W30 tn for the year on better blended ASP assumptions.
Tweaking earnings up
We raise 2013/2014 EPS by 2% each on stronger DRAM. Most other divisions are tracking in-line. We maintain our OUTPERFORM rating and TP based on the average of 2012/13 P/B, applying a target multiple of 1.85x, the average of the last ten years and the top-end of the post-2007 P/B range. Samsung Electronics is a CS NJA focus list
Rating history (005930.KS) Date Old rating New rating Old TP New TP
6 Feb, 2013 OUTPERFORM OUTPERFORM W1,720,000 W1,900,000
27 Nov, 2012 OUTPERFORM OUTPERFORM W1,700,000 W1,720,000
Extract from the Asian Daily, 7 June 2013
Bbg/RIC 005930 KS / 005930.KS Rating (prev. rating) O (O) Shares outstanding (mn) 147.30 Daily trad vol - 6m avg (mn) 0.3 Daily trad val - 6m avg (US$ mn) 334.4 Free float (%) 75.6 Major shareholders Samsung Life, 7.3%
Price (05 Jun 13, W) 1,521,000 TP (prev. TP W) 1,900,000 (1,900,000) Est. pot. % chg. to TP 25 52-wk range (W) 1576000 - 1091000 Mkt cap (W/US$ bn) 224,042.3/ 200.3
Performance 1M 3M 12M
Absolute (%) 1.9 1.5 26.4 Relative (%) 1.6 3.8 17.7
Year 12/10A 12/11A 12/12E 12/13E 12/14E
Revenue (W bn) 154,630 165,002 201,103 240,531 268,255 EBITDA (W bn) 30,700 30,810 45,783 61,007 66,269 Net profit (W bn) 16,147 13,735 23,844 34,542 37,699 EPS (W) 109,617 93,243 161,876 234,502 255,932 - Change from prev. EPS (%) n.a. n.a. 0 2 2 - Consensus EPS (W) n.a. n.a. 153,950 215,301 238,194 EPS growth (%) 65.4 (14.9) 73.6 44.9 9.1 P/E (x) 13.9 16.3 9.4 6.5 5.9 Dividend yield (%) 0.7 0.4 0.6 0.6 1.1 EV/EBITDA (x) 7.3 7.3 4.8 3.3 2.7 P/B (x) 2.5 2.2 1.8 1.4 1.2 ROE (%) 19.4 14.2 20.9 24.4 21.4 Net debt (cash)/equity (%) 1.1 (0.2) (3.2) (15.2) (25.4)
Note 1: Samsung Electronics manufactures and exports a wide range of consumer and industrial electronic equipment and products such as memory chips, TFT-LCD, personal computers, peripherals, monitors, televisions, and home appliances.
13 June 2013
Jump-Start 17
Metro Pacific Investments --------------------------- Initiating Coverage with OUTPERFORM New report: Hospitals biz deserves a second look Alvin Arogo / Research Analyst / 63 2 858 7716 / [email protected] Gab Roque / Research Analyst / 63 2 858 7756 / [email protected]
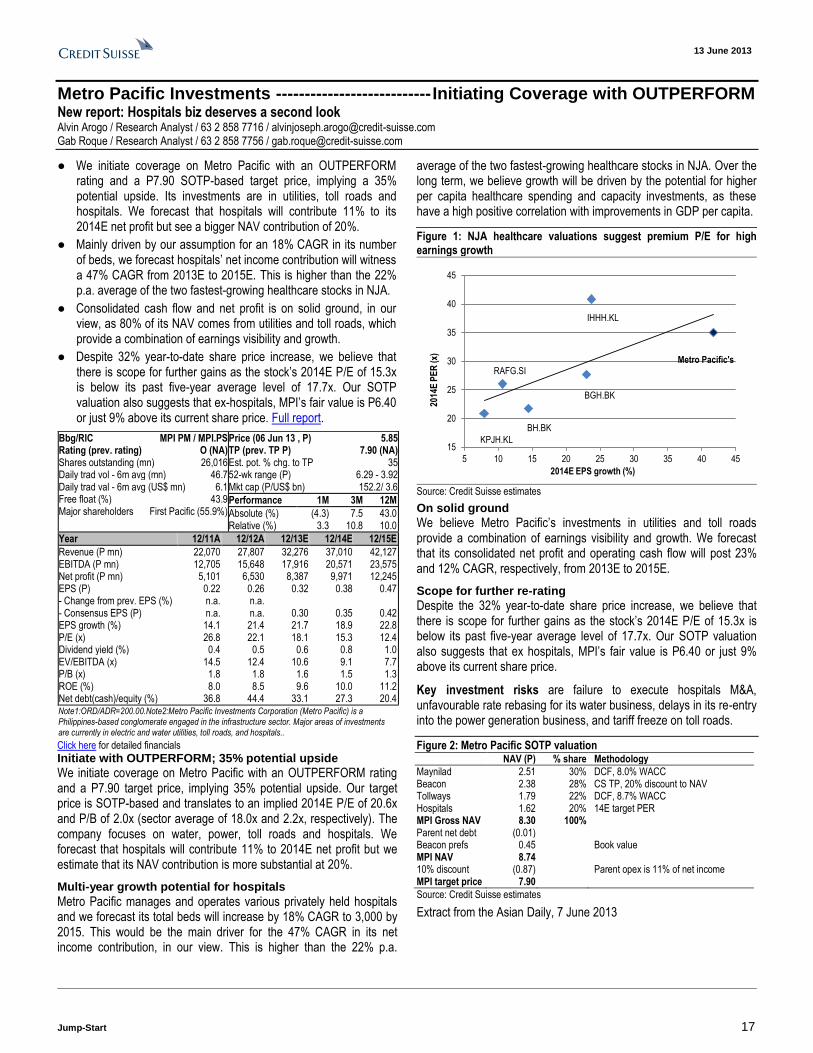
● We initiate coverage on Metro Pacific with an OUTPERFORM rating and a P7.90 SOTP-based target price, implying a 35% potential upside. Its investments are in utilities, toll roads and hospitals. We forecast that hospitals will contribute 11% to its 2014E net profit but see a bigger NAV contribution of 20%.
● Mainly driven by our assumption for an 18% CAGR in its number of beds, we forecast hospitals’ net income contribution will witness a 47% CAGR from 2013E to 2015E. This is higher than the 22% p.a. average of the two fastest-growing healthcare stocks in NJA.
● Consolidated cash flow and net profit is on solid ground, in our view, as 80% of its NAV comes from utilities and toll roads, which provide a combination of earnings visibility and growth.
● Despite 32% year-to-date share price increase, we believe that there is scope for further gains as the stock’s 2014E P/E of 15.3x is below its past five-year average level of 17.7x. Our SOTP valuation also suggests that ex-hospitals, MPI’s fair value is P6.40 or just 9% above its current share price. Full report.
Click here for detailed financials
Initiate with OUTPERFORM; 35% potential upside
We initiate coverage on Metro Pacific with an OUTPERFORM rating and a P7.90 target price, implying 35% potential upside. Our target price is SOTP-based and translates to an implied 2014E P/E of 20.6x and P/B of 2.0x (sector average of 18.0x and 2.2x, respectively). The company focuses on water, power, toll roads and hospitals. We forecast that hospitals will contribute 11% to 2014E net profit but we estimate that its NAV contribution is more substantial at 20%.
Multi-year growth potential for hospitals
Metro Pacific manages and operates various privately held hospitals and we forecast its total beds will increase by 18% CAGR to 3,000 by 2015. This would be the main driver for the 47% CAGR in its net income contribution, in our view. This is higher than the 22% p.a.
average of the two fastest-growing healthcare stocks in NJA. Over the long term, we believe growth will be driven by the potential for higher per capita healthcare spending and capacity investments, as these have a high positive correlation with improvements in GDP per capita.
Figure 1: NJA healthcare valuations suggest premium P/E for high earnings growth
15
20
25
30
35
40
45
5 10 15 20 25 30 35 40 45
2014E EPS growth (%)
2014
E P
ER
(x) Metro Pacific's
IHHH.KL
BGH.BK
BH.BK
RAFG.SI
KPJH.KL
Source: Credit Suisse estimates
On solid ground
We believe Metro Pacific’s investments in utilities and toll roads provide a combination of earnings visibility and growth. We forecast that its consolidated net profit and operating cash flow will post 23% and 12% CAGR, respectively, from 2013E to 2015E.
Scope for further re-rating
Despite the 32% year-to-date share price increase, we believe that there is scope for further gains as the stock’s 2014E P/E of 15.3x is below its past five-year average level of 17.7x. Our SOTP valuation also suggests that ex hospitals, MPI’s fair value is P6.40 or just 9% above its current share price.
Key investment risks are failure to execute hospitals M&A, unfavourable rate rebasing for its water business, delays in its re-entry into the power generation business, and tariff freeze on toll roads.
Figure 2: Metro Pacific SOTP valuation NAV (P) % share Methodology
Maynilad 2.51 30% DCF, 8.0% WACC Beacon 2.38 28% CS TP, 20% discount to NAV Tollways 1.79 22% DCF, 8.7% WACC Hospitals 1.62 20% 14E target PER MPI Gross NAV 8.30 100% Parent net debt (0.01) Beacon prefs 0.45 Book value MPI NAV 8.74 10% discount (0.87) Parent opex is 11% of net income MPI target price 7.90
Source: Credit Suisse estimates
Extract from the Asian Daily, 7 June 2013
Bbg/RIC MPI PM / MPI.PS Rating (prev. rating) O (NA) Shares outstanding (mn) 26,016 Daily trad vol - 6m avg (mn) 46.7 Daily trad val - 6m avg (US$ mn) 6.1 Free float (%) 43.9 Major shareholders First Pacific (55.9%)
Price (06 Jun 13 , P) 5.85 TP (prev. TP P) 7.90 (NA) Est. pot. % chg. to TP 35 52-wk range (P) 6.29 - 3.92 Mkt cap (P/US$ bn) 152.2/ 3.6
Performance 1M 3M 12M
Absolute (%) (4.3) 7.5 43.0 Relative (%) 3.3 10.8 10.0
Year 12/11A 12/12A 12/13E 12/14E 12/15E
Revenue (P mn) 22,070 27,807 32,276 37,010 42,127 EBITDA (P mn) 12,705 15,648 17,916 20,571 23,575 Net profit (P mn) 5,101 6,530 8,387 9,971 12,245 EPS (P) 0.22 0.26 0.32 0.38 0.47 - Change from prev. EPS (%) n.a. n.a. - Consensus EPS (P) n.a. n.a. 0.30 0.35 0.42 EPS growth (%) 14.1 21.4 21.7 18.9 22.8 P/E (x) 26.8 22.1 18.1 15.3 12.4 Dividend yield (%) 0.4 0.5 0.6 0.8 1.0 EV/EBITDA (x) 14.5 12.4 10.6 9.1 7.7 P/B (x) 1.8 1.8 1.6 1.5 1.3 ROE (%) 8.0 8.5 9.6 10.0 11.2 Net debt(cash)/equity (%) 36.8 44.4 33.1 27.3 20.4
Note1:ORD/ADR=200.00.Note2:Metro Pacific Investments Corporation (Metro Pacific) is a Philippines-based conglomerate engaged in the infrastructure sector. Major areas of investments are currently in electric and water utilities, toll roads, and hospitals..
13 June 2013
Jump-Start 18
Gajah Tunggal -------------------------------------------- Initiating Coverage with OUTPERFORM New report: Full of grip Dian Haryokusumo / Research Analyst / 62 21 255 37974 / [email protected]
● We initiate coverage on Gajah Tunggal (GT) with an OUTPERFORM rating and a target price of Rp4,300. It is the largest integrated SEA tyre manufacturer with own production of synthetic rubber and tyre cords. Click here for the full report.
● For radial tyre, GT has 24% market share in replacement market. We expect this to improve to 27% by FY15 through better penetration into OEM tyre by: (1) being the biggest tyre supplier for Suzuki Ertiga (the new breakthrough low-end MPV after Toyota Avanza and Daihatsu Xenia), and (2) supplying the potential low cost green car (LCGC) market.
● GT to continue to dominate 2W and bias (heavy duty) tyres. Over 70% of revenue came from replacement, a high-margin business. GT has been the biggest tyre supplier for Yamaha / Suzuki motorcycles.
● Undemanding valuation. The stock is trading at 8.0x FY13E P/E, 13% discount to regional tyre peers, 33% discount to Indo auto. The stock is also a play on domestic consumption, benefitting from rising middle-high income population, where it is trading at a steep discount of around 76% to Indonesian consumer stocks.
Click here for detailed financials
Initiate coverage with an OUTPERFORM rating
Gajah Tunggal (GT) is the largest integrated SEA tyre manufacturer with own production of synthetic rubber and tyre cords. We believe Indonesia’s tyre industry would benefit from growing auto industry, where we started to see an inflection point in 4W population, growing at 11% CAGR over FY13–15E. GT’s valuation is undemanding, trading at 8.0x FY13E P/E, 13% discount to regional tyre peers, 33% discount to Indonesia auto. The stock is also a play on domestic consumption, benefitting from rising middle-high income population, where it is trading at a steep discount of around 76% to Indonesian consumer stocks.
Improvement in the replacement market by better penetrating into OEM business
Domestic replacement tyre contributing more than 50% of GT’s total tyre revenue. For radial tyre, GT has 24% market share in the replacement market. We expect this market share to improve to 27% by FY15 through better penetration into OEM tyre by: (1) being the biggest tyre supplier for Suzuki Ertiga (the new breakthrough low-end MPV after Toyota Avanza and Daihatsu Xenia), (2) supplying the potential LCGC market. We expect domestic radial tyre revenue to grow at 28% CAGR.
Continues to dominate 2W and bias (heavy duty) tyres
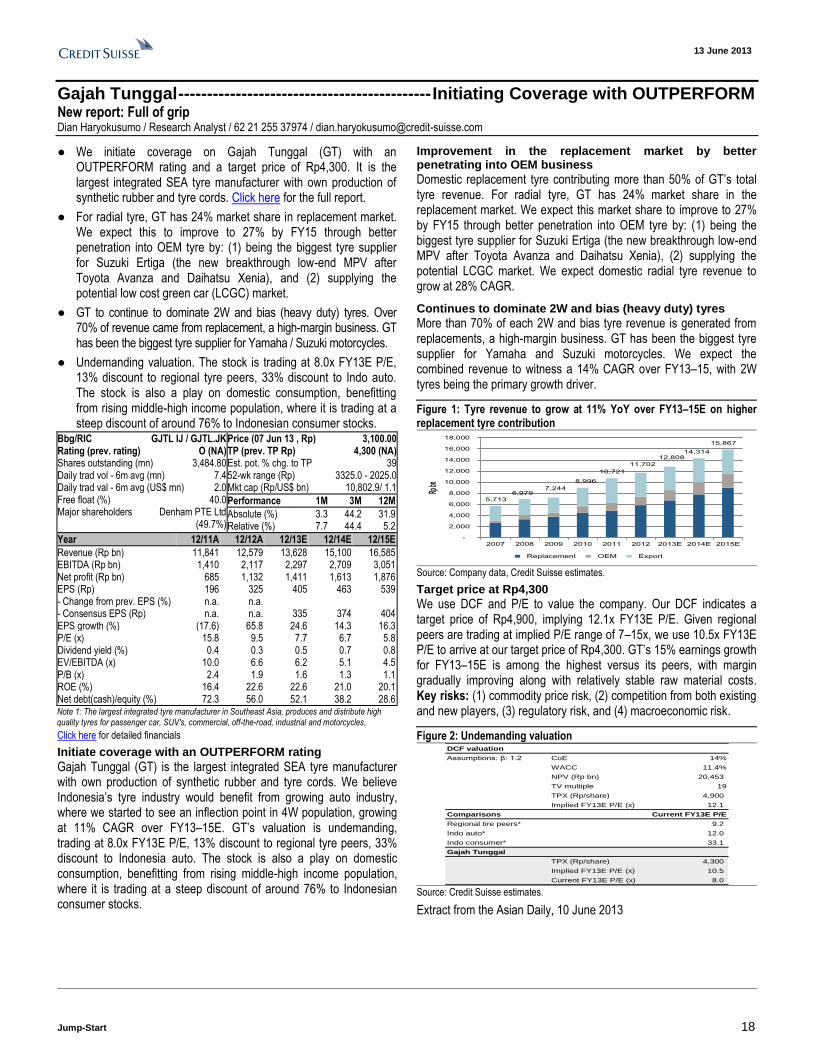
More than 70% of each 2W and bias tyre revenue is generated from replacements, a high-margin business. GT has been the biggest tyre supplier for Yamaha and Suzuki motorcycles. We expect the combined revenue to witness a 14% CAGR over FY13–15, with 2W tyres being the primary growth driver.
Figure 1: Tyre revenue to grow at 11% YoY over FY13–15E on higher replacement tyre contribution
5,713
6,979 7,244
8,996
10,721
11,702
12,808 14,314
15,867
-
2,000
4,000
6,000
8,000
10,000
12,000
14,000
16,000
18,000
2007 2008 2009 2010 2011 2012 2013E 2014E 2015E
Rp bn
Replacement OEM Export
Source: Company data, Credit Suisse estimates.
Target price at Rp4,300
We use DCF and P/E to value the company. Our DCF indicates a target price of Rp4,900, implying 12.1x FY13E P/E. Given regional peers are trading at implied P/E range of 7–15x, we use 10.5x FY13E P/E to arrive at our target price of Rp4,300. GT’s 15% earnings growth for FY13–15E is among the highest versus its peers, with margin gradually improving along with relatively stable raw material costs. Key risks: (1) commodity price risk, (2) competition from both existing and new players, (3) regulatory risk, and (4) macroeconomic risk.
Figure 2: Undemanding valuation DCF valuation
Assumptions: β: 1.2 CoE 14%
WACC 11.4%
NPV (Rp bn) 20,453
TV multiple 19
TPX (Rp/share) 4,900
Implied FY13E P/E (x) 12.1
Comparisons Current FY13E P/E
Regional tire peers* 9.2
Indo auto* 12.0
Indo consumer* 33.1
Gajah Tunggal
TPX (Rp/share) 4,300
Implied FY13E P/E (x) 10.5
Current FY13E P/E (x) 8.0 Source: Credit Suisse estimates.
Extract from the Asian Daily, 10 June 2013
Bbg/RIC GJTL IJ / GJTL.JK Rating (prev. rating) O (NA) Shares outstanding (mn) 3,484.80 Daily trad vol - 6m avg (mn) 7.4 Daily trad val - 6m avg (US$ mn) 2.0 Free float (%) 40.0 Major shareholders Denham PTE Ltd
(49.7%)
Price (07 Jun 13 , Rp) 3,100.00 TP (prev. TP Rp) 4,300 (NA) Est. pot. % chg. to TP 39 52-wk range (Rp) 3325.0 - 2025.0 Mkt cap (Rp/US$ bn) 10,802.9/ 1.1
Performance 1M 3M 12M
Absolute (%) 3.3 44.2 31.9 Relative (%) 7.7 44.4 5.2
Year 12/11A 12/12A 12/13E 12/14E 12/15E
Revenue (Rp bn) 11,841 12,579 13,628 15,100 16,585 EBITDA (Rp bn) 1,410 2,117 2,297 2,709 3,051 Net profit (Rp bn) 685 1,132 1,411 1,613 1,876 EPS (Rp) 196 325 405 463 539 - Change from prev. EPS (%) n.a. n.a. - Consensus EPS (Rp) n.a. n.a. 335 374 404 EPS growth (%) (17.6) 65.8 24.6 14.3 16.3 P/E (x) 15.8 9.5 7.7 6.7 5.8 Dividend yield (%) 0.4 0.3 0.5 0.7 0.8 EV/EBITDA (x) 10.0 6.6 6.2 5.1 4.5 P/B (x) 2.4 1.9 1.6 1.3 1.1 ROE (%) 16.4 22.6 22.6 21.0 20.1 Net debt(cash)/equity (%) 72.3 56.0 52.1 38.2 28.6
Note 1: The largest integrated tyre manufacturer in Southeast Asia, produces and distribute high quality tyres for passenger car, SUV's, commercial, off-the-road, industrial and motorcycles.
13 June 2013
Jump-Start 19
China Coal Sector ----------------------------------------------------------------------------------------------- New report: Finding floor Trina Chen / Research Analyst / 852 2101 7031 / [email protected] Frankie Zhu / Research Analyst / 852 2101 7426 / [email protected]
● It is Déjà vu of 2Q12—weak demand, strong hydro and rising imports. We estimate it would take a demand growth acceleration of 6-7% from the current level for the coastal coal market to move back to balance: optimistic based on macro outlook. Full report
● Nevertheless, we believe the spot coal price in China has mostly floored, given 15-30% of the production is already at loss in our estimates, due to low calorific value, or high cost.
● While coal price may stay flat for longer, earnings risk is on the downside in the coming months, driven by short-fall in ASP partly due to discount of mid-ranged CV coal, potential miss in cost targets (Yanzhou and Chinacoal), coupled with operational leverage. Our stress test suggests ROE versus P/B is more attractive for Shenhua, but negative for Yanzhou, Yitai and MMC.
● Our top picks are Shenhua (maintain OUTPERFORM) for thermal and Fushan (maintain NEUTRAL) for met coal. We downgrade Chinacoal to NEUTRAL (from Outperform) with a revised target of HK$5.9 (from $9.6), and Yitai to NEUTRAL from Outperform with a revised TP of HK$35.9. Maintain UNDERPERFORM on Yanzhou.
Figure 1: Coverage summary—China coal sector Company Ticker Shr Ratings Target Earnings chg P/E P/B EV/EBITDA
Price as of Jun 11 Price New Old New Old 13E 14E 13E 14E 13E 14E 13E 14E
Shenhua 1088.HK 24.6 O O 34.9 39.7 -9% -16% 8.8 7.8 1.4 1.2 5.4 4.6
Chinacoal 1898.HK 4.8 N O 5.9 9.6 -37% -38% 9.7 8.8 0.6 0.6 8.0 7.1
Yanzhou 1171.HK 7.6 U U 6.6 6.6 -21% -21% 14.6 11.6 0.7 0.6 10.4 7.4
Yitai 3948.HK 39.9 N O 35.9 53.0 -29% -42% 11.1 10.6 2.3 2.0 7.9 7.6
Fushan 0639.HK 3.0 N N 2.6 3.1 -26% -21% 13.7 11.9 0.8 0.8 4.7 3.9
Hidili 1393.HK 1.7 U U 1.3 1.1 n.a. -34% n.a. 12.4 0.4 0.4 16.4 10.1
MMC 0975.HK 1.8 U U 1.3 2.3 -84% -48% 91.0 16.9 1.1 1.0 13.9 8.9
Winsway 1733.HK 0.6 U U 0.4 0.7 15% 32% n.a. n.a. 0.4 0.4 10.7 7.6 Source: Company data, Credit Suisse estimates.
Figure 2: P/B versus ROE (base case and stress test case)
1.4
0.6 0.7
2.3
0.8
0.4
1.1
0.4
-1.0
-0.5
0.0
0.5
1.0
1.5
2.0
2.5
-10%
-5%
0%
5%
10%
15%
20%
25%
Shenhua Chinacoal Yanzhou Yitai Fushan Hidili MMC Winsway
Base case Stress test case (spot coal price soften by another Rmb50/t) P/B
2013E ROE (recurring) (%) P/B (x)
Source: Company data, Credit Suisse estimates.
Has coal price floored?
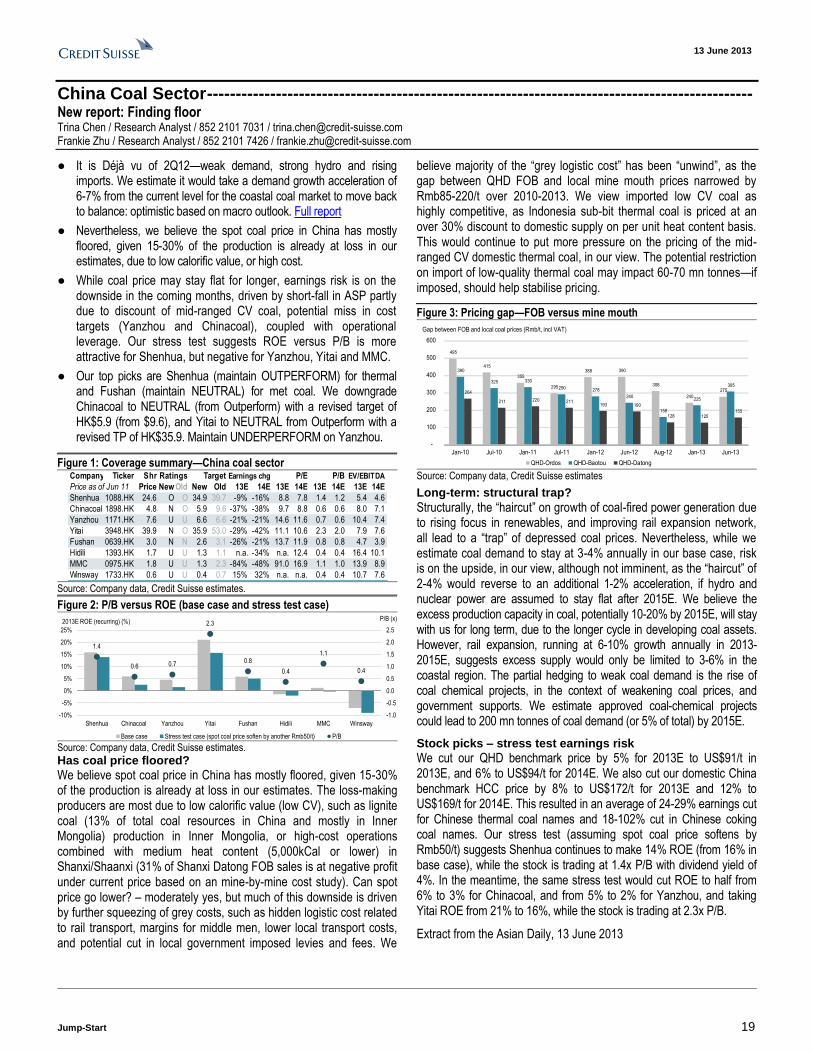
We believe spot coal price in China has mostly floored, given 15-30% of the production is already at loss in our estimates. The loss-making producers are most due to low calorific value (low CV), such as lignite coal (13% of total coal resources in China and mostly in Inner Mongolia) production in Inner Mongolia, or high-cost operations combined with medium heat content (5,000kCal or lower) in Shanxi/Shaanxi (31% of Shanxi Datong FOB sales is at negative profit under current price based on an mine-by-mine cost study). Can spot price go lower? – moderately yes, but much of this downside is driven by further squeezing of grey costs, such as hidden logistic cost related to rail transport, margins for middle men, lower local transport costs, and potential cut in local government imposed levies and fees. We
believe majority of the “grey logistic cost” has been “unwind”, as the gap between QHD FOB and local mine mouth prices narrowed by Rmb85-220/t over 2010-2013. We view imported low CV coal as highly competitive, as Indonesia sub-bit thermal coal is priced at an over 30% discount to domestic supply on per unit heat content basis. This would continue to put more pressure on the pricing of the mid-ranged CV domestic thermal coal, in our view. The potential restriction on import of low-quality thermal coal may impact 60-70 mn tonnes—if imposed, should help stabilise pricing.
Figure 3: Pricing gap—FOB versus mine mouth
495
415
355
295
388 390
308
240
275
390
325 330
290 278
240
158
225
305
264
211 220 211 193 190
128 125 155
-
100
200
300
400
500
600
Jan-10 Jul-10 Jan-11 Jul-11 Jan-12 Jun-12 Aug-12 Jan-13 Jun-13
QHD-Ordos QHD-Baotou QHD-Datong
Gap between FOB and local coal prices (Rmb/t, incl VAT)
Source: Company data, Credit Suisse estimates
Long-term: structural trap?
Structurally, the “haircut” on growth of coal-fired power generation due to rising focus in renewables, and improving rail expansion network, all lead to a “trap” of depressed coal prices. Nevertheless, while we estimate coal demand to stay at 3-4% annually in our base case, risk is on the upside, in our view, although not imminent, as the “haircut” of 2-4% would reverse to an additional 1-2% acceleration, if hydro and nuclear power are assumed to stay flat after 2015E. We believe the excess production capacity in coal, potentially 10-20% by 2015E, will stay with us for long term, due to the longer cycle in developing coal assets. However, rail expansion, running at 6-10% growth annually in 2013-2015E, suggests excess supply would only be limited to 3-6% in the coastal region. The partial hedging to weak coal demand is the rise of coal chemical projects, in the context of weakening coal prices, and government supports. We estimate approved coal-chemical projects could lead to 200 mn tonnes of coal demand (or 5% of total) by 2015E.
Stock picks – stress test earnings risk
We cut our QHD benchmark price by 5% for 2013E to US$91/t in 2013E, and 6% to US$94/t for 2014E. We also cut our domestic China benchmark HCC price by 8% to US$172/t for 2013E and 12% to US$169/t for 2014E. This resulted in an average of 24-29% earnings cut for Chinese thermal coal names and 18-102% cut in Chinese coking coal names. Our stress test (assuming spot coal price softens by Rmb50/t) suggests Shenhua continues to make 14% ROE (from 16% in base case), while the stock is trading at 1.4x P/B with dividend yield of 4%. In the meantime, the same stress test would cut ROE to half from 6% to 3% for Chinacoal, and from 5% to 2% for Yanzhou, and taking Yitai ROE from 21% to 16%, while the stock is trading at 2.3x P/B.
Extract from the Asian Daily, 13 June 2013
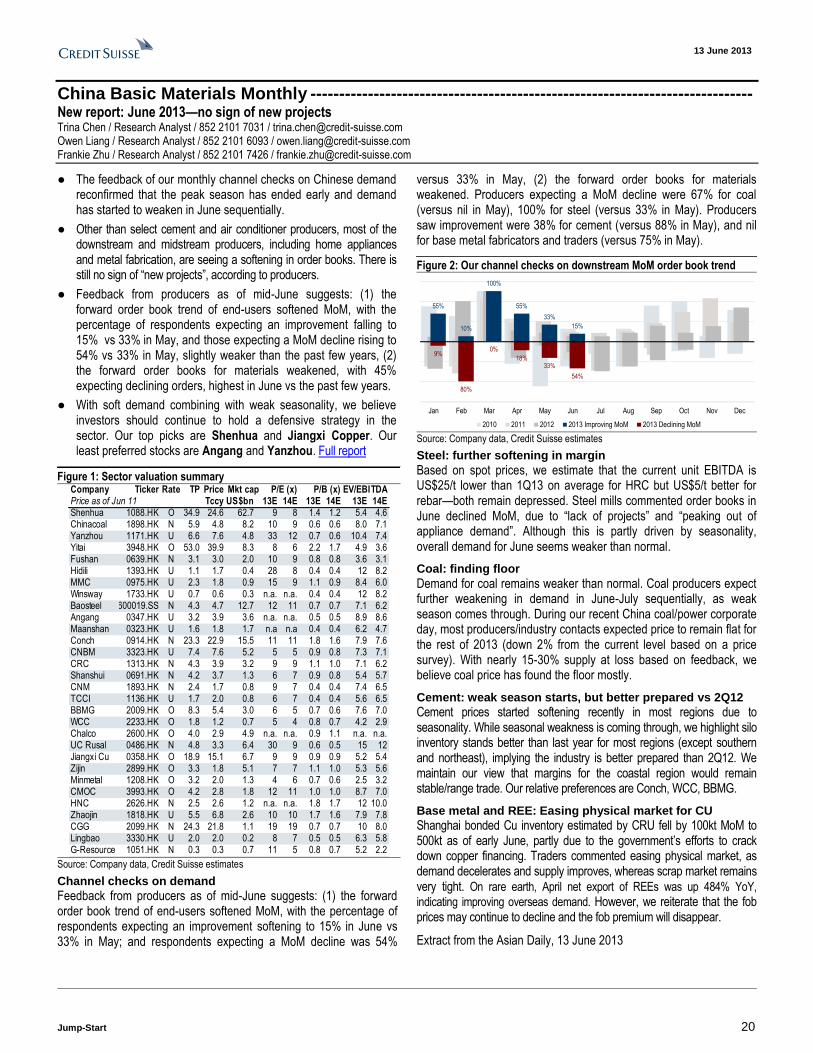
13 June 2013
Jump-Start 20
China Basic Materials Monthly ----------------------------------------------------------------------------- New report: June 2013—no sign of new projects Trina Chen / Research Analyst / 852 2101 7031 / [email protected] Owen Liang / Research Analyst / 852 2101 6093 / [email protected] Frankie Zhu / Research Analyst / 852 2101 7426 / [email protected]
● The feedback of our monthly channel checks on Chinese demand reconfirmed that the peak season has ended early and demand has started to weaken in June sequentially.
● Other than select cement and air conditioner producers, most of the downstream and midstream producers, including home appliances and metal fabrication, are seeing a softening in order books. There is still no sign of “new projects”, according to producers.
● Feedback from producers as of mid-June suggests: (1) the forward order book trend of end-users softened MoM, with the percentage of respondents expecting an improvement falling to 15% vs 33% in May, and those expecting a MoM decline rising to 54% vs 33% in May, slightly weaker than the past few years, (2) the forward order books for materials weakened, with 45% expecting declining orders, highest in June vs the past few years.
● With soft demand combining with weak seasonality, we believe investors should continue to hold a defensive strategy in the sector. Our top picks are Shenhua and Jiangxi Copper. Our least preferred stocks are Angang and Yanzhou. Full report
Figure 1: Sector valuation summary Company Ticker Rate TP Price Mkt cap P/E (x) P/B (x) EV/EBITDAPrice as of Jun 11 Tccy US$bn 13E 14E 13E 14E 13E 14EShenhua 1088.HK O 34.9 24.6 62.7 9 8 1.4 1.2 5.4 4.6Chinacoal 1898.HK N 5.9 4.8 8.2 10 9 0.6 0.6 8.0 7.1Yanzhou 1171.HK U 6.6 7.6 4.8 33 12 0.7 0.6 10.4 7.4Yitai 3948.HK O 53.0 39.9 8.3 8 6 2.2 1.7 4.9 3.6Fushan 0639.HK N 3.1 3.0 2.0 10 9 0.8 0.8 3.6 3.1Hidili 1393.HK U 1.1 1.7 0.4 28 8 0.4 0.4 12 8.2MMC 0975.HK U 2.3 1.8 0.9 15 9 1.1 0.9 8.4 6.0Winsway 1733.HK U 0.7 0.6 0.3 n.a. n.a. 0.4 0.4 12 8.2Baosteel 600019.SS N 4.3 4.7 12.7 12 11 0.7 0.7 7.1 6.2Angang 0347.HK U 3.2 3.9 3.6 n.a. n.a. 0.5 0.5 8.9 8.6Maanshan 0323.HK U 1.6 1.8 1.7 n.a n.a 0.4 0.4 6.2 4.7Conch 0914.HK N 23.3 22.9 15.5 11 11 1.8 1.6 7.9 7.6CNBM 3323.HK U 7.4 7.6 5.2 5 5 0.9 0.8 7.3 7.1CRC 1313.HK N 4.3 3.9 3.2 9 9 1.1 1.0 7.1 6.2Shanshui 0691.HK N 4.2 3.7 1.3 6 7 0.9 0.8 5.4 5.7CNM 1893.HK N 2.4 1.7 0.8 9 7 0.4 0.4 7.4 6.5TCCI 1136.HK U 1.7 2.0 0.8 6 7 0.4 0.4 5.6 6.5BBMG 2009.HK O 8.3 5.4 3.0 6 5 0.7 0.6 7.6 7.0WCC 2233.HK O 1.8 1.2 0.7 5 4 0.8 0.7 4.2 2.9Chalco 2600.HK O 4.0 2.9 4.9 n.a. n.a. 0.9 1.1 n.a. n.a.UC Rusal 0486.HK N 4.8 3.3 6.4 30 9 0.6 0.5 15 12Jiangxi Cu 0358.HK O 18.9 15.1 6.7 9 9 0.9 0.9 5.2 5.4Zijin 2899.HK O 3.3 1.8 5.1 7 7 1.1 1.0 5.3 5.6Minmetal 1208.HK O 3.2 2.0 1.3 4 6 0.7 0.6 2.5 3.2CMOC 3993.HK O 4.2 2.8 1.8 12 11 1.0 1.0 8.7 7.0HNC 2626.HK N 2.5 2.6 1.2 n.a. n.a. 1.8 1.7 12 10.0Zhaojin 1818.HK U 5.5 6.8 2.6 10 10 1.7 1.6 7.9 7.8CGG 2099.HK N 24.3 21.8 1.1 19 19 0.7 0.7 10 8.0Lingbao 3330.HK U 2.0 2.0 0.2 8 7 0.5 0.5 6.3 5.8G-Resource 1051.HK N 0.3 0.3 0.7 11 5 0.8 0.7 5.2 2.2
Source: Company data, Credit Suisse estimates
Channel checks on demand
Feedback from producers as of mid-June suggests: (1) the forward order book trend of end-users softened MoM, with the percentage of respondents expecting an improvement softening to 15% in June vs 33% in May; and respondents expecting a MoM decline was 54%
versus 33% in May, (2) the forward order books for materials weakened. Producers expecting a MoM decline were 67% for coal (versus nil in May), 100% for steel (versus 33% in May). Producers saw improvement were 38% for cement (versus 88% in May), and nil for base metal fabricators and traders (versus 75% in May).
Figure 2: Our channel checks on downstream MoM order book trend
55%
10%
100%
55%
33%
15%
9%
80%
0%
18%33%
54%
Jan Feb Mar Apr May Jun Jul Aug Sep Oct Nov Dec
2010 2011 2012 2013 Improving MoM 2013 Declining MoM Source: Company data, Credit Suisse estimates
Steel: further softening in margin
Based on spot prices, we estimate that the current unit EBITDA is US$25/t lower than 1Q13 on average for HRC but US$5/t better for rebar—both remain depressed. Steel mills commented order books in June declined MoM, due to “lack of projects” and “peaking out of appliance demand”. Although this is partly driven by seasonality, overall demand for June seems weaker than normal.
Coal: finding floor
Demand for coal remains weaker than normal. Coal producers expect further weakening in demand in June-July sequentially, as weak season comes through. During our recent China coal/power corporate day, most producers/industry contacts expected price to remain flat for the rest of 2013 (down 2% from the current level based on a price survey). With nearly 15-30% supply at loss based on feedback, we believe coal price has found the floor mostly.
Cement: weak season starts, but better prepared vs 2Q12
Cement prices started softening recently in most regions due to seasonality. While seasonal weakness is coming through, we highlight silo inventory stands better than last year for most regions (except southern and northeast), implying the industry is better prepared than 2Q12. We maintain our view that margins for the coastal region would remain stable/range trade. Our relative preferences are Conch, WCC, BBMG.
Base metal and REE: Easing physical market for CU
Shanghai bonded Cu inventory estimated by CRU fell by 100kt MoM to 500kt as of early June, partly due to the government’s efforts to crack down copper financing. Traders commented easing physical market, as demand decelerates and supply improves, whereas scrap market remains very tight. On rare earth, April net export of REEs was up 484% YoY,
indicating improving overseas demand. However, we reiterate that the fob prices may continue to decline and the fob premium will disappear.
Extract from the Asian Daily, 13 June 2013
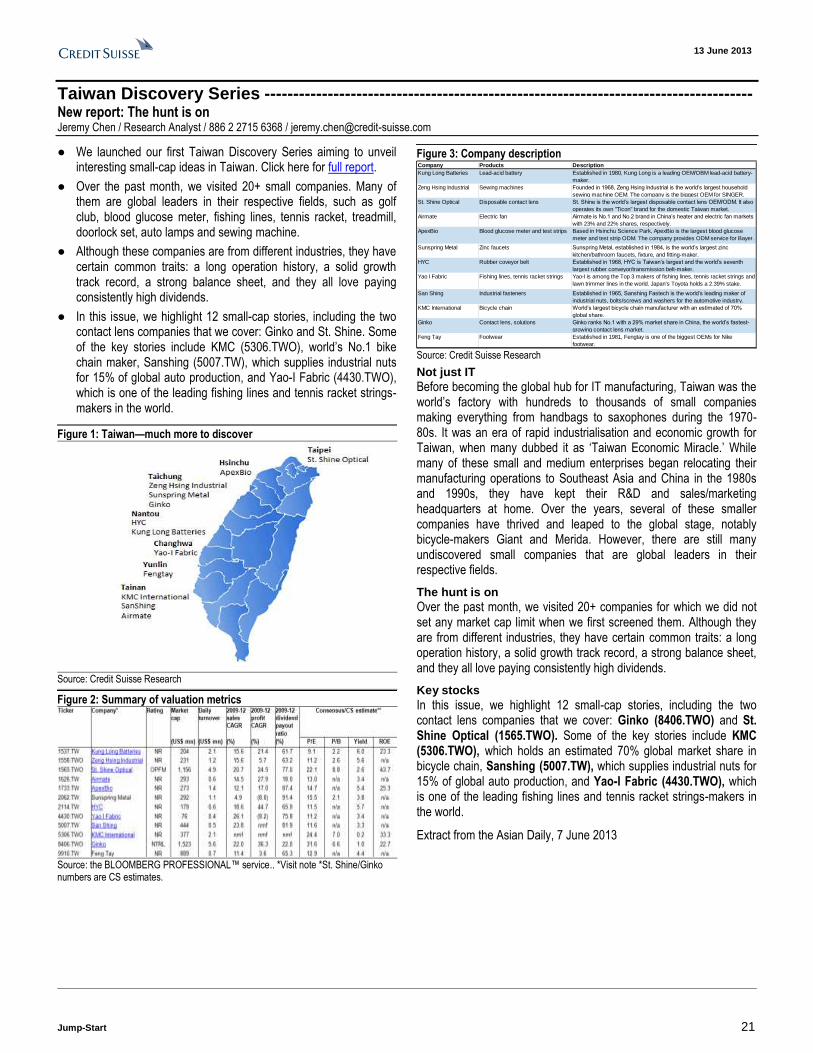
13 June 2013
Jump-Start 21
Taiwan Discovery Series ------------------------------------------------------------------------------------- New report: The hunt is on Jeremy Chen / Research Analyst / 886 2 2715 6368 / [email protected]
● We launched our first Taiwan Discovery Series aiming to unveil interesting small-cap ideas in Taiwan. Click here for full report.
● Over the past month, we visited 20+ small companies. Many of them are global leaders in their respective fields, such as golf club, blood glucose meter, fishing lines, tennis racket, treadmill, doorlock set, auto lamps and sewing machine.
● Although these companies are from different industries, they have certain common traits: a long operation history, a solid growth track record, a strong balance sheet, and they all love paying consistently high dividends.
● In this issue, we highlight 12 small-cap stories, including the two contact lens companies that we cover: Ginko and St. Shine. Some of the key stories include KMC (5306.TWO), world’s No.1 bike chain maker, Sanshing (5007.TW), which supplies industrial nuts for 15% of global auto production, and Yao-I Fabric (4430.TWO), which is one of the leading fishing lines and tennis racket strings-makers in the world.
Figure 1: Taiwan—much more to discover
Source: Credit Suisse Research
Figure 2: Summary of valuation metrics
Source: the BLOOMBERG PROFESSIONAL™ service.. *Visit note *St. Shine/Ginko numbers are CS estimates.
Figure 3: Company description Company Products Description
Kung Long Batteries Lead-acid battery Established in 1980, Kung Long is a leading OEM/OBM lead-acid battery-
maker.
Zeng Hsing Industrial Sewing machines Founded in 1968, Zeng Hsing Industrial is the world’s largest household
sewing machine OEM. The company is the biggest OEM for SINGER.
St. Shine Optical Disposable contact lens St. Shine is the world’s largest disposable contact lens OEM/ODM. It also
operates its own "Ticon" brand for the domestic Taiwan market.
Airmate Electric fan Airmate is No.1 and No.2 brand in China’s heater and electric fan markets
with 23% and 22% shares, respectively.
ApexBio Blood glucose meter and test strips Based in Hsinchu Science Park, ApexBio is the largest blood glucose
meter and test strip ODM. The company provides ODM service for Bayer.
Sunspring Metal Zinc faucets Sunspring Metal, established in 1984, is the world’s largest zinc
kitchen/bathroom faucets, fixture, and fitting-maker.
HYC Rubber coveyor belt Established in 1968, HYC is Taiwan’s largest and the world’s seventh
largest rubber conveyor/transmission belt-maker.
Yao I Fabric Fishing lines, tennis racket strings Yao-I is among the Top 3 makers of fishing lines, tennis racket strings and
lawn trimmer lines in the world. Japan's Toyota holds a 2.39% stake.
San Shing Industrial fasteners Established in 1965, Sanshing Fastech is the world’s leading maker of
industrial nuts, bolts/screws and washers for the automotive industry.
KMC International Bicycle chain World’s largest bicycle chain manufacturer with an estimated of 70%
global share.
Ginko Contact lens, solutions Ginko ranks No.1 with a 29% market share in China, the world’s fastest-
growing contact lens market.
Feng Tay Footwear Established in 1981, Fengtay is one of the biggest OEMs for Nike
footwear. Source: Credit Suisse Research
Not just IT
Before becoming the global hub for IT manufacturing, Taiwan was the world’s factory with hundreds to thousands of small companies making everything from handbags to saxophones during the 1970-80s. It was an era of rapid industrialisation and economic growth for Taiwan, when many dubbed it as ‘Taiwan Economic Miracle.’ While many of these small and medium enterprises began relocating their manufacturing operations to Southeast Asia and China in the 1980s and 1990s, they have kept their R&D and sales/marketing headquarters at home. Over the years, several of these smaller companies have thrived and leaped to the global stage, notably bicycle-makers Giant and Merida. However, there are still many undiscovered small companies that are global leaders in their respective fields.
The hunt is on
Over the past month, we visited 20+ companies for which we did not set any market cap limit when we first screened them. Although they are from different industries, they have certain common traits: a long operation history, a solid growth track record, a strong balance sheet, and they all love paying consistently high dividends.
Key stocks
In this issue, we highlight 12 small-cap stories, including the two contact lens companies that we cover: Ginko (8406.TWO) and St. Shine Optical (1565.TWO). Some of the key stories include KMC (5306.TWO), which holds an estimated 70% global market share in bicycle chain, Sanshing (5007.TW), which supplies industrial nuts for 15% of global auto production, and Yao-I Fabric (4430.TWO), which is one of the leading fishing lines and tennis racket strings-makers in the world.
Extract from the Asian Daily, 7 June 2013
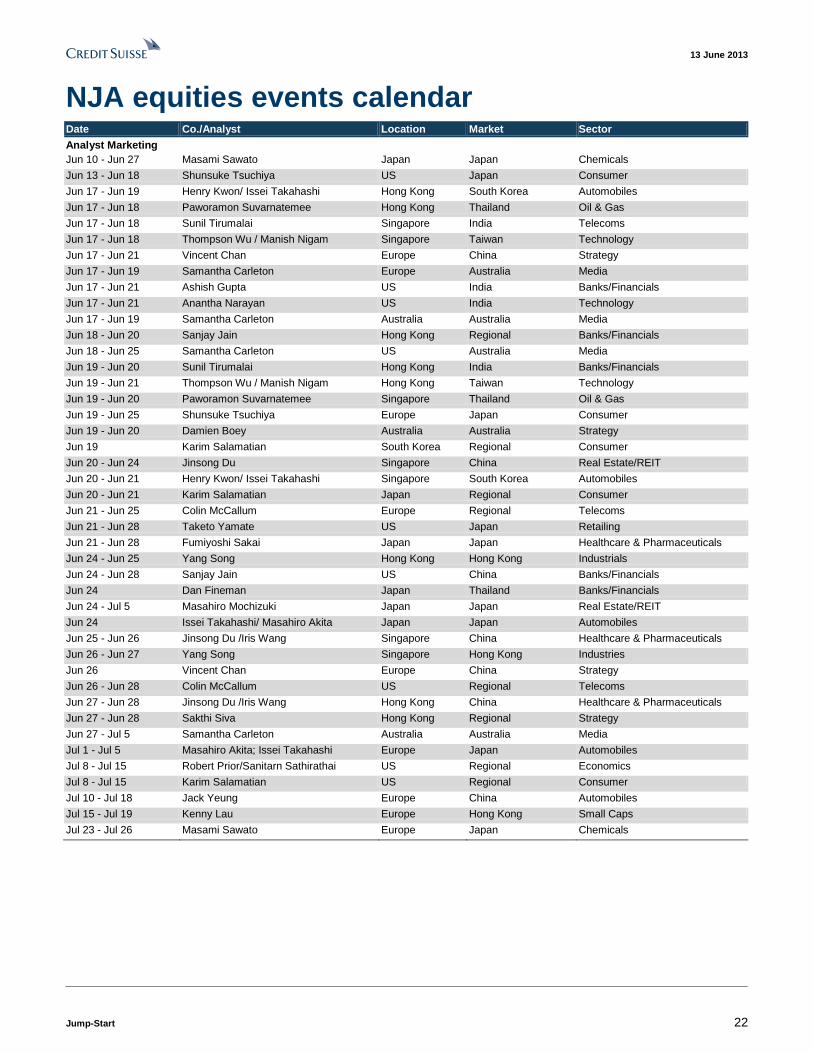
13 June 2013
Jump-Start 22
NJA equities events calendar Date Co./Analyst Location Market Sector
Analyst Marketing
Jun 10 - Jun 27 Masami Sawato Japan Japan Chemicals
Jun 13 - Jun 18 Shunsuke Tsuchiya US Japan Consumer
Jun 17 - Jun 19 Henry Kwon/ Issei Takahashi Hong Kong South Korea Automobiles
Jun 17 - Jun 18 Paworamon Suvarnatemee Hong Kong Thailand Oil & Gas
Jun 17 - Jun 18 Sunil Tirumalai Singapore India Telecoms
Jun 17 - Jun 18 Thompson Wu / Manish Nigam Singapore Taiwan Technology
Jun 17 - Jun 21 Vincent Chan Europe China Strategy
Jun 17 - Jun 19 Samantha Carleton Europe Australia Media
Jun 17 - Jun 21 Ashish Gupta US India Banks/Financials
Jun 17 - Jun 21 Anantha Narayan US India Technology
Jun 17 - Jun 19 Samantha Carleton Australia Australia Media
Jun 18 - Jun 20 Sanjay Jain Hong Kong Regional Banks/Financials
Jun 18 - Jun 25 Samantha Carleton US Australia Media
Jun 19 - Jun 20 Sunil Tirumalai Hong Kong India Banks/Financials
Jun 19 - Jun 21 Thompson Wu / Manish Nigam Hong Kong Taiwan Technology
Jun 19 - Jun 20 Paworamon Suvarnatemee Singapore Thailand Oil & Gas
Jun 19 - Jun 25 Shunsuke Tsuchiya Europe Japan Consumer
Jun 19 - Jun 20 Damien Boey Australia Australia Strategy
Jun 19 Karim Salamatian South Korea Regional Consumer
Jun 20 - Jun 24 Jinsong Du Singapore China Real Estate/REIT
Jun 20 - Jun 21 Henry Kwon/ Issei Takahashi Singapore South Korea Automobiles
Jun 20 - Jun 21 Karim Salamatian Japan Regional Consumer
Jun 21 - Jun 25 Colin McCallum Europe Regional Telecoms
Jun 21 - Jun 28 Taketo Yamate US Japan Retailing
Jun 21 - Jun 28 Fumiyoshi Sakai Japan Japan Healthcare & Pharmaceuticals
Jun 24 - Jun 25 Yang Song Hong Kong Hong Kong Industrials
Jun 24 - Jun 28 Sanjay Jain US China Banks/Financials
Jun 24 Dan Fineman Japan Thailand Banks/Financials
Jun 24 - Jul 5 Masahiro Mochizuki Japan Japan Real Estate/REIT
Jun 24 Issei Takahashi/ Masahiro Akita Japan Japan Automobiles
Jun 25 - Jun 26 Jinsong Du /Iris Wang Singapore China Healthcare & Pharmaceuticals
Jun 26 - Jun 27 Yang Song Singapore Hong Kong Industries
Jun 26 Vincent Chan Europe China Strategy
Jun 26 - Jun 28 Colin McCallum US Regional Telecoms
Jun 27 - Jun 28 Jinsong Du /Iris Wang Hong Kong China Healthcare & Pharmaceuticals
Jun 27 - Jun 28 Sakthi Siva Hong Kong Regional Strategy
Jun 27 - Jul 5 Samantha Carleton Australia Australia Media
Jul 1 - Jul 5 Masahiro Akita; Issei Takahashi Europe Japan Automobiles
Jul 8 - Jul 15 Robert Prior/Sanitarn Sathirathai US Regional Economics
Jul 8 - Jul 15 Karim Salamatian US Regional Consumer
Jul 10 - Jul 18 Jack Yeung Europe China Automobiles
Jul 15 - Jul 19 Kenny Lau Europe Hong Kong Small Caps
Jul 23 - Jul 26 Masami Sawato Europe Japan Chemicals
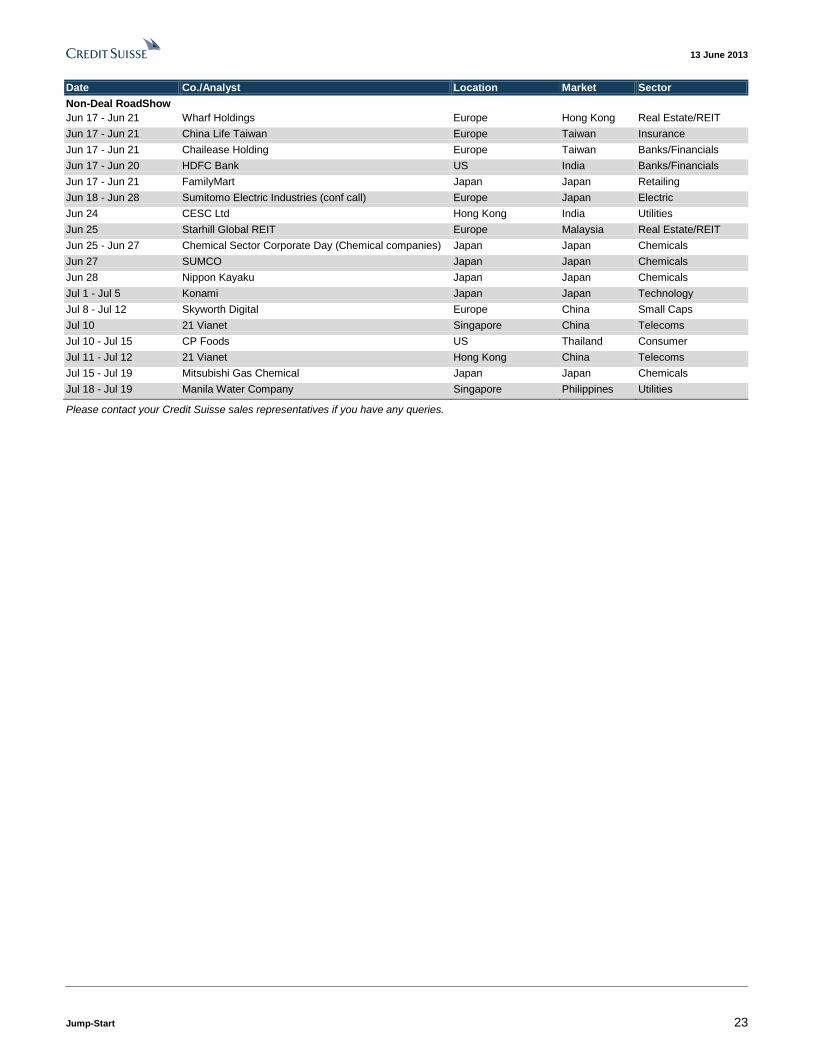
13 June 2013
Jump-Start 23
Date Co./Analyst Location Market Sector
Non-Deal RoadShow
Jun 17 - Jun 21 Wharf Holdings Europe Hong Kong Real Estate/REIT
Jun 17 - Jun 21 China Life Taiwan Europe Taiwan Insurance
Jun 17 - Jun 21 Chailease Holding Europe Taiwan Banks/Financials
Jun 17 - Jun 20 HDFC Bank US India Banks/Financials
Jun 17 - Jun 21 FamilyMart Japan Japan Retailing
Jun 18 - Jun 28 Sumitomo Electric Industries (conf call) Europe Japan Electric
Jun 24 CESC Ltd Hong Kong India Utilities
Jun 25 Starhill Global REIT Europe Malaysia Real Estate/REIT
Jun 25 - Jun 27 Chemical Sector Corporate Day (Chemical companies) Japan Japan Chemicals
Jun 27 SUMCO Japan Japan Chemicals
Jun 28 Nippon Kayaku Japan Japan Chemicals
Jul 1 - Jul 5 Konami Japan Japan Technology
Jul 8 - Jul 12 Skyworth Digital Europe China Small Caps
Jul 10 21 Vianet Singapore China Telecoms
Jul 10 - Jul 15 CP Foods US Thailand Consumer
Jul 11 - Jul 12 21 Vianet Hong Kong China Telecoms
Jul 15 - Jul 19 Mitsubishi Gas Chemical Japan Japan Chemicals
Jul 18 - Jul 19 Manila Water Company Singapore Philippines Utilities
Please contact your Credit Suisse sales representatives if you have any queries.
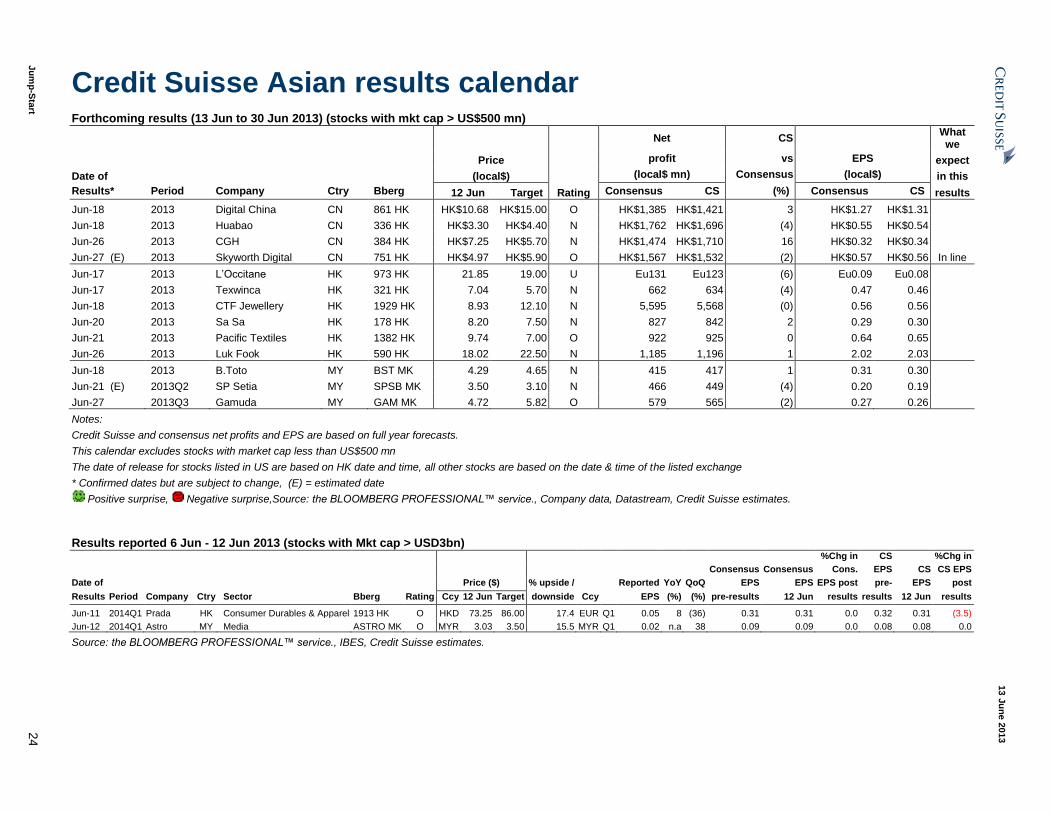
13 J
un
e 2
013
Ju
mp
-Sta
rt 2
4
Credit Suisse Asian results calendar Forthcoming results (13 Jun to 30 Jun 2013) (stocks with mkt cap > US$500 mn)
Net CS
What we
Price profit vs EPS expect
Date of (local$) (local$ mn) Consensus (local$) in this
Results* Period Company Ctry Bberg 12 Jun Target Rating Consensus CS (%) Consensus CS results
Jun-18 2013 Digital China CN 861 HK HK$10.68 HK$15.00 O HK$1,385 HK$1,421 3 HK$1.27 HK$1.31
Jun-18 2013 Huabao CN 336 HK HK$3.30 HK$4.40 N HK$1,762 HK$1,696 (4) HK$0.55 HK$0.54
Jun-26 2013 CGH CN 384 HK HK$7.25 HK$5.70 N HK$1,474 HK$1,710 16 HK$0.32 HK$0.34
Jun-27 (E) 2013 Skyworth Digital CN 751 HK HK$4.97 HK$5.90 O HK$1,567 HK$1,532 (2) HK$0.57 HK$0.56 In line
Jun-17 2013 L’Occitane HK 973 HK 21.85 19.00 U Eu131 Eu123 (6) Eu0.09 Eu0.08
Jun-17 2013 Texwinca HK 321 HK 7.04 5.70 N 662 634 (4) 0.47 0.46
Jun-18 2013 CTF Jewellery HK 1929 HK 8.93 12.10 N 5,595 5,568 (0) 0.56 0.56
Jun-20 2013 Sa Sa HK 178 HK 8.20 7.50 N 827 842 2 0.29 0.30
Jun-21 2013 Pacific Textiles HK 1382 HK 9.74 7.00 O 922 925 0 0.64 0.65
Jun-26 2013 Luk Fook HK 590 HK 18.02 22.50 N 1,185 1,196 1 2.02 2.03
Jun-18 2013 B.Toto MY BST MK 4.29 4.65 N 415 417 1 0.31 0.30
Jun-21 (E) 2013Q2 SP Setia MY SPSB MK 3.50 3.10 N 466 449 (4) 0.20 0.19
Jun-27 2013Q3 Gamuda MY GAM MK 4.72 5.82 O 579 565 (2) 0.27 0.26
Notes:
Credit Suisse and consensus net profits and EPS are based on full year forecasts.
This calendar excludes stocks with market cap less than US$500 mn
The date of release for stocks listed in US are based on HK date and time, all other stocks are based on the date & time of the listed exchange
* Confirmed dates but are subject to change, (E) = estimated date
Positive surprise, Negative surprise,Source: the BLOOMBERG PROFESSIONAL™ service., Company data, Datastream, Credit Suisse estimates.
Results reported 6 Jun - 12 Jun 2013 (stocks with Mkt cap > USD3bn) %Chg in CS %Chg in
Consensus Consensus Cons. EPS CS CS EPS
Date of Price ($) % upside / Reported YoY QoQ EPS EPS EPS post pre- EPS post
Results Period Company Ctry Sector Bberg Rating Ccy 12 Jun Target downside Ccy EPS (%) (%) pre-results 12 Jun results results 12 Jun results
Jun-11 2014Q1 Prada HK Consumer Durables & Apparel 1913 HK O HKD 73.25 86.00 17.4 EUR Q1 0.05 8 (36) 0.31 0.31 0.0 0.32 0.31 (3.5)
Jun-12 2014Q1 Astro MY Media ASTRO MK O MYR 3.03 3.50 15.5 MYR Q1 0.02 n.a 38 0.09 0.09 0.0 0.08 0.08 0.0
Source: the BLOOMBERG PROFESSIONAL™ service., IBES, Credit Suisse estimates.
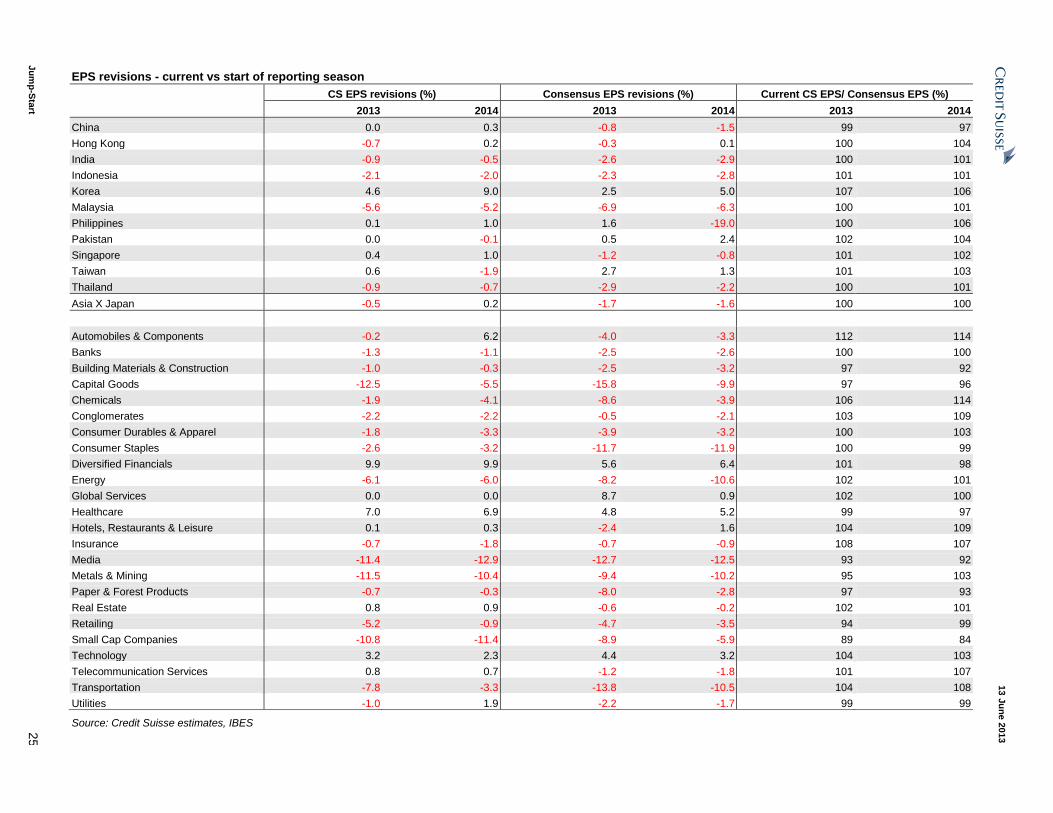
13 J
un
e 2
013
Ju
mp
-Sta
rt 2
5
EPS revisions - current vs start of reporting season
CS EPS revisions (%) Consensus EPS revisions (%) Current CS EPS/ Consensus EPS (%)
2013 2014 2013 2014 2013 2014
China 0.0 0.3 -0.8 -1.5 99 97
Hong Kong -0.7 0.2 -0.3 0.1 100 104
India -0.9 -0.5 -2.6 -2.9 100 101
Indonesia -2.1 -2.0 -2.3 -2.8 101 101
Korea 4.6 9.0 2.5 5.0 107 106
Malaysia -5.6 -5.2 -6.9 -6.3 100 101
Philippines 0.1 1.0 1.6 -19.0 100 106
Pakistan 0.0 -0.1 0.5 2.4 102 104
Singapore 0.4 1.0 -1.2 -0.8 101 102
Taiwan 0.6 -1.9 2.7 1.3 101 103
Thailand -0.9 -0.7 -2.9 -2.2 100 101
Asia X Japan -0.5 0.2 -1.7 -1.6 100 100
Automobiles & Components -0.2 6.2 -4.0 -3.3 112 114
Banks -1.3 -1.1 -2.5 -2.6 100 100
Building Materials & Construction -1.0 -0.3 -2.5 -3.2 97 92
Capital Goods -12.5 -5.5 -15.8 -9.9 97 96
Chemicals -1.9 -4.1 -8.6 -3.9 106 114
Conglomerates -2.2 -2.2 -0.5 -2.1 103 109
Consumer Durables & Apparel -1.8 -3.3 -3.9 -3.2 100 103
Consumer Staples -2.6 -3.2 -11.7 -11.9 100 99
Diversified Financials 9.9 9.9 5.6 6.4 101 98
Energy -6.1 -6.0 -8.2 -10.6 102 101
Global Services 0.0 0.0 8.7 0.9 102 100
Healthcare 7.0 6.9 4.8 5.2 99 97
Hotels, Restaurants & Leisure 0.1 0.3 -2.4 1.6 104 109
Insurance -0.7 -1.8 -0.7 -0.9 108 107
Media -11.4 -12.9 -12.7 -12.5 93 92
Metals & Mining -11.5 -10.4 -9.4 -10.2 95 103
Paper & Forest Products -0.7 -0.3 -8.0 -2.8 97 93
Real Estate 0.8 0.9 -0.6 -0.2 102 101
Retailing -5.2 -0.9 -4.7 -3.5 94 99
Small Cap Companies -10.8 -11.4 -8.9 -5.9 89 84
Technology 3.2 2.3 4.4 3.2 104 103
Telecommunication Services 0.8 0.7 -1.2 -1.8 101 107
Transportation -7.8 -3.3 -13.8 -10.5 104 108
Utilities -1.0 1.9 -2.2 -1.7 99 99
Source: Credit Suisse estimates, IBES
13 J
un
e 2
013
Ju
mp
-Sta
rt 2
6
Credit Suisse Valuation Summary (by country)
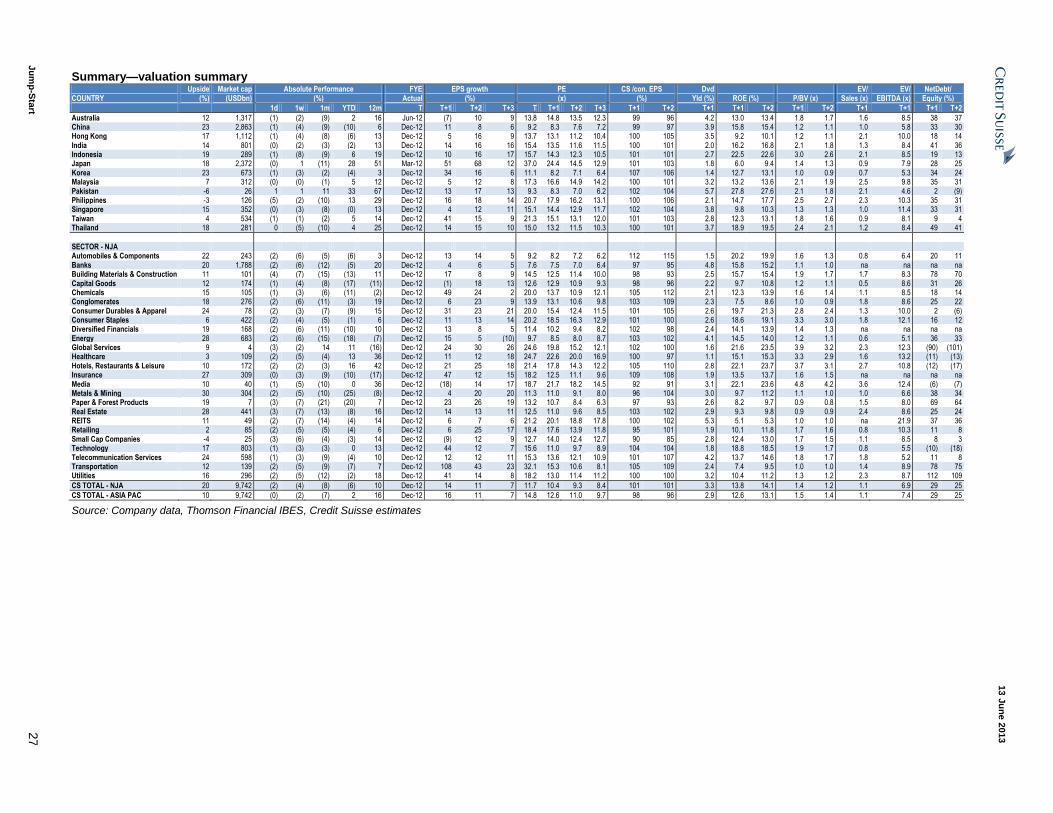
13 J
un
e 2
013
Ju
mp
-Sta
rt 2
7
Summary—valuation summary Upside Market cap Absolute Performance FYE EPS growth PE CS /con. EPS Dvd EV/ EV/ NetDebt/ COUNTRY (%) (USDbn) (%) Actual (%) (x) (%) Yld (%) ROE (%) P/BV (x) Sales (x) EBITDA (x) Equity (%)
1d 1w 1m YTD 12m T T+1 T+2 T+3 T T+1 T+2 T+3 T+1 T+2 T+1 T+1 T+2 T+1 T+2 T+1 T+1 T+1 T+2
Australia 12 1,317 (1) (2) (9) 2 16 Jun-12 (7) 10 9 13.8 14.8 13.5 12.3 99 96 4.2 13.0 13.4 1.8 1.7 1.6 8.5 38 37 China 23 2,863 (1) (4) (9) (10) 6 Dec-12 11 8 6 9.2 8.3 7.6 7.2 99 97 3.9 15.8 15.4 1.2 1.1 1.0 5.8 33 30 Hong Kong 17 1,112 (1) (4) (8) (6) 13 Dec-12 5 16 9 13.7 13.1 11.2 10.4 100 105 3.5 9.2 10.1 1.2 1.1 2.1 10.0 18 14 India 14 801 (0) (2) (3) (2) 13 Dec-12 14 16 16 15.4 13.5 11.6 11.5 100 101 2.0 16.2 16.8 2.1 1.8 1.3 8.4 41 36 Indonesia 19 289 (1) (8) (9) 6 19 Dec-12 10 16 17 15.7 14.3 12.3 10.5 101 101 2.7 22.5 22.6 3.0 2.6 2.1 8.5 19 13 Japan 18 2,372 (0) 1 (11) 28 51 Mar-12 51 68 12 37.0 24.4 14.5 12.9 101 103 1.8 6.0 9.4 1.4 1.3 0.9 7.9 28 25 Korea 23 673 (1) (3) (2) (4) 3 Dec-12 34 16 6 11.1 8.2 7.1 6.4 107 106 1.4 12.7 13.1 1.0 0.9 0.7 5.3 34 24 Malaysia 7 312 (0) (0) (1) 5 12 Dec-12 5 12 8 17.3 16.6 14.9 14.2 100 101 3.2 13.2 13.6 2.1 1.9 2.5 9.8 35 31 Pakistan -6 26 1 1 11 33 67 Dec-12 13 17 13 9.3 8.3 7.0 6.2 102 104 5.7 27.8 27.6 2.1 1.8 2.1 4.6 2 (9) Philippines -3 126 (5) (2) (10) 13 29 Dec-12 16 18 14 20.7 17.9 16.2 13.1 100 106 2.1 14.7 17.7 2.5 2.7 2.3 10.3 35 31 Singapore 15 352 (0) (3) (8) (0) 13 Dec-12 4 12 11 15.1 14.4 12.9 11.7 102 104 3.8 9.8 10.3 1.3 1.3 1.0 11.4 33 31 Taiwan 4 534 (1) (1) (2) 5 14 Dec-12 41 15 9 21.3 15.1 13.1 12.0 101 103 2.8 12.3 13.1 1.8 1.6 0.9 8.1 9 4 Thailand 18 281 0 (5) (10) 4 25 Dec-12 14 15 10 15.0 13.2 11.5 10.3 100 101 3.7 18.9 19.5 2.4 2.1 1.2 8.4 49 41
SECTOR - NJA Automobiles & Components 22 243 (2) (6) (5) (6) 3 Dec-12 13 14 5 9.2 8.2 7.2 6.2 112 115 1.5 20.2 19.9 1.6 1.3 0.8 6.4 20 11 Banks 20 1,788 (2) (6) (12) (5) 20 Dec-12 4 6 5 7.6 7.5 7.0 6.4 97 95 4.8 15.8 15.2 1.1 1.0 na na na na Building Materials & Construction 11 101 (4) (7) (15) (13) 11 Dec-12 17 8 9 14.5 12.5 11.4 10.0 98 93 2.5 15.7 15.4 1.9 1.7 1.7 8.3 78 70 Capital Goods 12 174 (1) (4) (8) (17) (11) Dec-12 (1) 18 13 12.6 12.9 10.9 9.3 98 96 2.2 9.7 10.8 1.2 1.1 0.5 8.6 31 26 Chemicals 15 105 (1) (3) (6) (11) (2) Dec-12 49 24 2 20.0 13.7 10.9 12.1 105 112 2.1 12.3 13.9 1.6 1.4 1.1 8.5 18 14 Conglomerates 18 276 (2) (6) (11) (3) 19 Dec-12 6 23 9 13.9 13.1 10.6 9.8 103 109 2.3 7.5 8.6 1.0 0.9 1.8 8.6 25 22 Consumer Durables & Apparel 24 78 (2) (3) (7) (9) 15 Dec-12 31 23 21 20.0 15.4 12.4 11.5 101 105 2.6 19.7 21.3 2.8 2.4 1.3 10.0 2 (6) Consumer Staples 6 422 (2) (4) (5) (1) 6 Dec-12 11 13 14 20.2 18.5 16.3 12.9 101 100 2.6 18.6 19.1 3.3 3.0 1.8 12.1 16 12 Diversified Financials 19 168 (2) (6) (11) (10) 10 Dec-12 13 8 5 11.4 10.2 9.4 8.2 102 98 2.4 14.1 13.9 1.4 1.3 na na na na Energy 28 683 (2) (6) (15) (18) (7) Dec-12 15 5 (10) 9.7 8.5 8.0 8.7 103 102 4.1 14.5 14.0 1.2 1.1 0.6 5.1 36 33 Global Services 9 4 (3) (2) 14 11 (16) Dec-12 24 30 26 24.6 19.8 15.2 12.1 102 100 1.6 21.6 23.5 3.9 3.2 2.3 12.3 (90) (101) Healthcare 3 109 (2) (5) (4) 13 36 Dec-12 11 12 18 24.7 22.6 20.0 16.9 100 97 1.1 15.1 15.3 3.3 2.9 1.6 13.2 (11) (13) Hotels, Restaurants & Leisure 10 172 (2) (2) (3) 16 42 Dec-12 21 25 18 21.4 17.8 14.3 12.2 105 110 2.8 22.1 23.7 3.7 3.1 2.7 10.8 (12) (17) Insurance 27 309 (0) (3) (9) (10) (17) Dec-12 47 12 15 18.2 12.5 11.1 9.6 109 108 1.9 13.5 13.7 1.6 1.5 na na na na Media 10 40 (1) (5) (10) 0 36 Dec-12 (18) 14 17 18.7 21.7 18.2 14.5 92 91 3.1 22.1 23.6 4.8 4.2 3.6 12.4 (6) (7) Metals & Mining 30 304 (2) (5) (10) (25) (8) Dec-12 4 20 20 11.3 11.0 9.1 8.0 96 104 3.0 9.7 11.2 1.1 1.0 1.0 6.6 38 34 Paper & Forest Products 19 7 (3) (7) (21) (20) 7 Dec-12 23 26 19 13.2 10.7 8.4 6.3 97 93 2.6 8.2 9.7 0.9 0.8 1.5 8.0 69 64 Real Estate 28 441 (3) (7) (13) (8) 16 Dec-12 14 13 11 12.5 11.0 9.6 8.5 103 102 2.9 9.3 9.8 0.9 0.9 2.4 8.6 25 24 REITS 11 49 (2) (7) (14) (4) 14 Dec-12 6 7 6 21.2 20.1 18.8 17.8 100 102 5.3 5.1 5.3 1.0 1.0 na 21.9 37 36 Retailing 2 85 (2) (5) (5) (4) 6 Dec-12 6 25 17 18.4 17.6 13.9 11.8 95 101 1.9 10.1 11.8 1.7 1.6 0.8 10.3 11 8 Small Cap Companies -4 25 (3) (6) (4) (3) 14 Dec-12 (9) 12 9 12.7 14.0 12.4 12.7 90 85 2.8 12.4 13.0 1.7 1.5 1.1 8.5 8 3 Technology 17 803 (1) (3) (3) 0 13 Dec-12 44 12 7 15.6 11.0 9.7 8.9 104 104 1.8 18.8 18.5 1.9 1.7 0.8 5.5 (10) (18) Telecommunication Services 24 598 (1) (3) (9) (4) 10 Dec-12 12 12 11 15.3 13.6 12.1 10.9 101 107 4.2 13.7 14.6 1.8 1.7 1.8 5.2 11 8 Transportation 12 139 (2) (5) (9) (7) 7 Dec-12 108 43 23 32.1 15.3 10.6 8.1 105 109 2.4 7.4 9.5 1.0 1.0 1.4 8.9 78 75 Utilities 16 296 (2) (5) (12) (2) 18 Dec-12 41 14 8 18.2 13.0 11.4 11.2 100 100 3.2 10.4 11.2 1.3 1.2 2.3 8.7 112 109
CS TOTAL - NJA 20 9,742 (2) (4) (8) (6) 10 Dec-12 14 11 7 11.7 10.4 9.3 8.4 101 101 3.3 13.8 14.1 1.4 1.2 1.1 6.9 29 25
CS TOTAL - ASIA PAC 10 9,742 (0) (2) (7) 2 16 Dec-12 16 11 7 14.8 12.6 11.0 9.7 98 96 2.9 12.6 13.1 1.5 1.4 1.1 7.4 29 25
Source: Company data, Thomson Financial IBES, Credit Suisse estimates
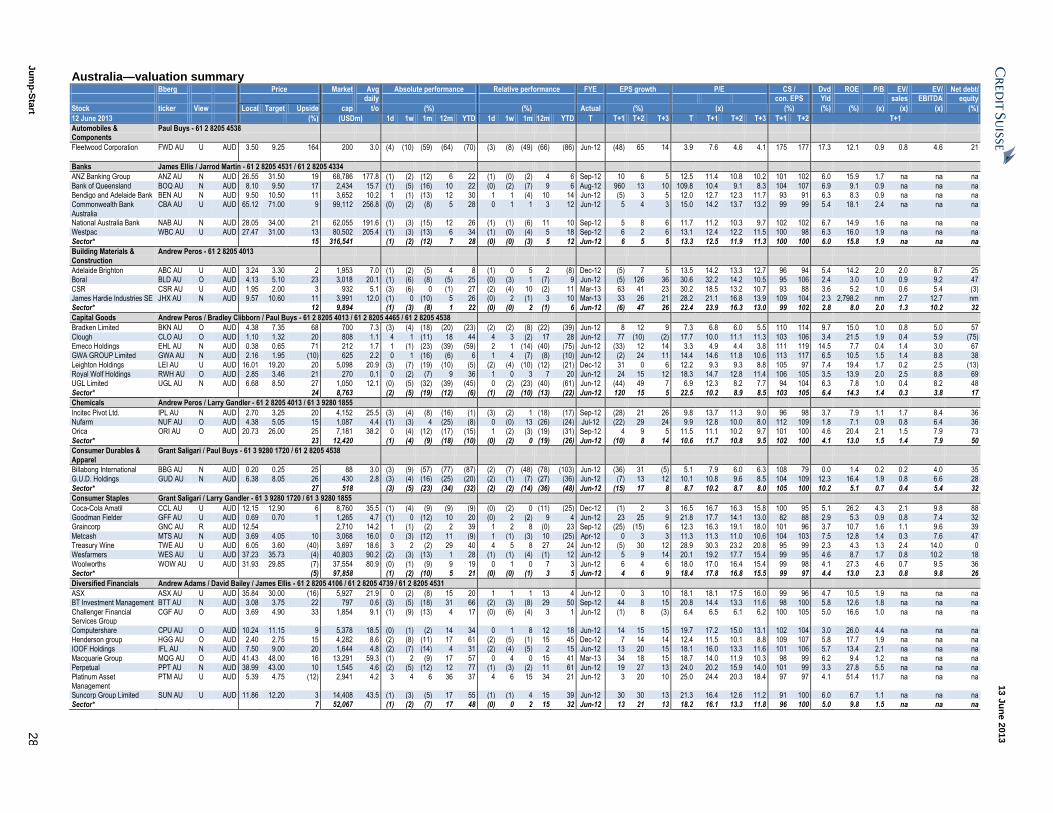
13 J
un
e 2
013
Ju
mp
-Sta
rt 2
8
Australia—valuation summary Bberg Price Market Avg Absolute performance Relative performance FYE EPS growth P/E CS / Dvd ROE P/B EV/ EV/ Net debt/ daily con. EPS Yld sales EBITDA equity
Stock ticker View Local Target Upside cap t/o (%) (%) Actual (%) (x) (%) (%) (%) (x) (x) (x) (%)
12 June 2013 (%) (USDm) 1d 1w 1m 12m YTD 1d 1w 1m 12m YTD T T+1 T+2 T+3 T T+1 T+2 T+3 T+1 T+2 T+1
Automobiles & Components
Paul Buys - 61 2 8205 4538
Fleetwood Corporation FWD AU U AUD 3.50 9.25 164 200 3.0 (4) (10) (59) (64) (70) (3) (8) (49) (66) (86) Jun-12 (48) 65 14 3.9 7.6 4.6 4.1 175 177 17.3 12.1 0.9 0.8 4.6 21
Banks James Ellis / Jarrod Martin - 61 2 8205 4531 / 61 2 8205 4334
ANZ Banking Group ANZ AU N AUD 26.55 31.50 19 68,786 177.8 (1) (2) (12) 6 22 (1) (0) (2) 4 6 Sep-12 10 6 5 12.5 11.4 10.8 10.2 101 102 6.0 15.9 1.7 na na na
Bank of Queensland BOQ AU N AUD 8.10 9.50 17 2,434 15.7 (1) (5) (16) 10 22 (0) (2) (7) 9 6 Aug-12 960 13 10 109.8 10.4 9.1 8.3 104 107 6.9 9.1 0.9 na na na Bendigo and Adelaide Bank BEN AU N AUD 9.50 10.50 11 3,652 10.2 1 (1) (13) 12 30 1 1 (4) 10 14 Jun-12 (5) 3 5 12.0 12.7 12.3 11.7 93 91 6.3 8.3 0.9 na na na Commonwealth Bank Australia
CBA AU U AUD 65.12 71.00 9 99,112 256.8 (0) (2) (8) 5 28 0 1 1 3 12 Jun-12 5 4 3 15.0 14.2 13.7 13.2 99 99 5.4 18.1 2.4 na na na
National Australia Bank NAB AU N AUD 28.05 34.00 21 62,055 191.6 (1) (3) (15) 12 26 (1) (1) (6) 11 10 Sep-12 5 8 6 11.7 11.2 10.3 9.7 102 102 6.7 14.9 1.6 na na na Westpac WBC AU U AUD 27.47 31.00 13 80,502 205.4 (1) (3) (13) 6 34 (1) (0) (4) 5 18 Sep-12 6 2 6 13.1 12.4 12.2 11.5 100 98 6.3 16.0 1.9 na na na
Sector* 15 316,541 (1) (2) (12) 7 28 (0) (0) (3) 5 12 Jun-12 6 5 5 13.3 12.5 11.9 11.3 100 100 6.0 15.8 1.9 na na na
Building Materials & Construction
Andrew Peros - 61 2 8205 4013
Adelaide Brighton ABC AU U AUD 3.24 3.30 2 1,953 7.0 (1) (2) (5) 4 8 (1) 0 5 2 (8) Dec-12 (5) 7 5 13.5 14.2 13.3 12.7 96 94 5.4 14.2 2.0 2.0 8.7 25 Boral BLD AU O AUD 4.13 5.10 23 3,018 20.1 (1) (6) (8) (5) 25 (0) (3) 1 (7) 9 Jun-12 (5) 126 36 30.6 32.2 14.2 10.5 95 106 2.4 3.0 1.0 0.9 9.2 47
CSR CSR AU U AUD 1.95 2.00 3 932 5.1 (3) (6) 0 (1) 27 (2) (4) 10 (2) 11 Mar-13 63 41 23 30.2 18.5 13.2 10.7 93 88 3.6 5.2 1.0 0.6 5.4 (3) James Hardie Industries SE JHX AU N AUD 9.57 10.60 11 3,991 12.0 (1) 0 (10) 5 26 (0) 2 (1) 3 10 Mar-13 33 26 21 28.2 21.1 16.8 13.9 109 104 2.3 2,798.2 nm 2.7 12.7 nm Sector* 12 9,894 (1) (3) (8) 1 22 (0) (0) 2 (1) 6 Jun-12 (6) 47 26 22.4 23.9 16.3 13.0 99 102 2.8 8.0 2.0 1.3 10.2 32
Capital Goods Andrew Peros / Bradley Clibborn / Paul Buys - 61 2 8205 4013 / 61 2 8205 4465 / 61 2 8205 4538
Bradken Limited BKN AU O AUD 4.38 7.35 68 700 7.3 (3) (4) (18) (20) (23) (2) (2) (8) (22) (39) Jun-12 8 12 9 7.3 6.8 6.0 5.5 110 114 9.7 15.0 1.0 0.8 5.0 57
Clough CLO AU O AUD 1.10 1.32 20 808 1.1 4 1 (11) 18 44 4 3 (2) 17 28 Jun-12 77 (10) (2) 17.7 10.0 11.1 11.3 103 106 3.4 21.5 1.9 0.4 5.9 (75) Emeco Holdings EHL AU N AUD 0.38 0.65 71 212 1.7 1 (1) (23) (39) (59) 2 1 (14) (40) (75) Jun-12 (33) 12 14 3.3 4.9 4.4 3.8 111 119 14.5 7.7 0.4 1.4 3.0 67 GWA GROUP Limited GWA AU N AUD 2.16 1.95 (10) 625 2.2 0 1 (16) (6) 6 1 4 (7) (8) (10) Jun-12 (2) 24 11 14.4 14.6 11.8 10.6 113 117 6.5 10.5 1.5 1.4 8.8 38
Leighton Holdings LEI AU U AUD 16.01 19.20 20 5,098 20.9 (3) (7) (19) (10) (5) (2) (4) (10) (12) (21) Dec-12 31 0 6 12.2 9.3 9.3 8.8 105 97 7.4 19.4 1.7 0.2 2.5 (13) Royal Wolf Holdings RWH AU O AUD 2.85 3.46 21 270 0.1 0 (2) (7) 9 36 1 0 3 7 20 Jun-12 24 15 12 18.3 14.7 12.8 11.4 106 105 3.5 13.9 2.0 2.5 8.8 69 UGL Limited UGL AU N AUD 6.68 8.50 27 1,050 12.1 (0) (5) (32) (39) (45) 0 (2) (23) (40) (61) Jun-12 (44) 49 7 6.9 12.3 8.2 7.7 94 104 6.3 7.8 1.0 0.4 8.2 48
Sector* 24 8,763 (2) (5) (19) (12) (6) (1) (2) (10) (13) (22) Jun-12 120 15 5 22.5 10.2 8.9 8.5 103 105 6.4 14.3 1.4 0.3 3.8 17
Chemicals Andrew Peros / Larry Gandler - 61 2 8205 4013 / 61 3 9280 1855
Incitec Pivot Ltd. IPL AU N AUD 2.70 3.25 20 4,152 25.5 (3) (4) (8) (16) (1) (3) (2) 1 (18) (17) Sep-12 (28) 21 26 9.8 13.7 11.3 9.0 96 98 3.7 7.9 1.1 1.7 8.4 36 Nufarm NUF AU O AUD 4.38 5.05 15 1,087 4.4 (1) (3) 4 (25) (8) 0 (0) 13 (26) (24) Jul-12 (22) 29 24 9.9 12.8 10.0 8.0 112 109 1.8 7.1 0.9 0.8 6.4 36 Orica ORI AU O AUD 20.73 26.00 25 7,181 38.2 0 (4) (12) (17) (15) 1 (2) (3) (19) (31) Sep-12 4 9 5 11.5 11.1 10.2 9.7 101 100 4.6 20.4 2.1 1.5 7.9 73
Sector* 23 12,420 (1) (4) (9) (18) (10) (0) (2) 0 (19) (26) Jun-12 (10) 8 14 10.6 11.7 10.8 9.5 102 100 4.1 13.0 1.5 1.4 7.9 50
Consumer Durables & Apparel
Grant Saligari / Paul Buys - 61 3 9280 1720 / 61 2 8205 4538
Billabong International BBG AU N AUD 0.20 0.25 25 88 3.0 (3) (9) (57) (77) (87) (2) (7) (48) (78) (103) Jun-12 (36) 31 (5) 5.1 7.9 6.0 6.3 108 79 0.0 1.4 0.2 0.2 4.0 35 G.U.D. Holdings GUD AU N AUD 6.38 8.05 26 430 2.8 (3) (4) (16) (25) (20) (2) (1) (7) (27) (36) Jun-12 (7) 13 12 10.1 10.8 9.6 8.5 104 109 12.3 16.4 1.9 0.8 6.6 28
Sector* 27 518 (3) (5) (23) (34) (32) (2) (2) (14) (36) (48) Jun-12 (15) 17 8 8.7 10.2 8.7 8.0 105 100 10.2 5.1 0.7 0.4 5.4 32
Consumer Staples Grant Saligari / Larry Gandler - 61 3 9280 1720 / 61 3 9280 1855
Coca-Cola Amatil CCL AU U AUD 12.15 12.90 6 8,760 35.5 (1) (4) (9) (9) (9) (0) (2) 0 (11) (25) Dec-12 (1) 2 3 16.5 16.7 16.3 15.8 100 95 5.1 26.2 4.3 2.1 9.8 88 Goodman Fielder GFF AU U AUD 0.69 0.70 1 1,265 4.7 (1) 0 (12) 10 20 (0) 2 (2) 9 4 Jun-12 23 25 9 21.8 17.7 14.1 13.0 82 88 2.9 5.3 0.9 0.8 7.4 32 Graincorp GNC AU R AUD 12.54 2,710 14.2 1 (1) (2) 2 39 1 2 8 (0) 23 Sep-12 (25) (15) 6 12.3 16.3 19.1 18.0 101 96 3.7 10.7 1.6 1.1 9.6 39
Metcash MTS AU N AUD 3.69 4.05 10 3,068 16.0 0 (3) (12) 11 (9) 1 (1) (3) 10 (25) Apr-12 0 3 3 11.3 11.3 11.0 10.6 104 103 7.5 12.8 1.4 0.3 7.6 47 Treasury Wine TWE AU U AUD 6.05 3.60 (40) 3,697 18.6 3 2 (2) 29 40 4 5 8 27 24 Jun-12 (5) 30 12 28.9 30.3 23.2 20.8 95 99 2.3 4.3 1.3 2.4 14.0 0 Wesfarmers WES AU U AUD 37.23 35.73 (4) 40,803 90.2 (2) (3) (13) 1 28 (1) (1) (4) (1) 12 Jun-12 5 9 14 20.1 19.2 17.7 15.4 99 95 4.6 8.7 1.7 0.8 10.2 18
Woolworths WOW AU U AUD 31.93 29.85 (7) 37,554 80.9 (0) (1) (9) 9 19 0 1 0 7 3 Jun-12 6 4 6 18.0 17.0 16.4 15.4 99 98 4.1 27.3 4.6 0.7 9.5 36 Sector* (5) 97,858 (1) (2) (10) 5 21 (0) (0) (1) 3 5 Jun-12 4 6 9 18.4 17.8 16.8 15.5 99 97 4.4 13.0 2.3 0.8 9.8 26
Diversified Financials Andrew Adams / David Bailey / James Ellis - 61 2 8205 4106 / 61 2 8205 4739 / 61 2 8205 4531
ASX ASX AU U AUD 35.84 30.00 (16) 5,927 21.9 0 (2) (8) 15 20 1 1 1 13 4 Jun-12 0 3 10 18.1 18.1 17.5 16.0 99 96 4.7 10.5 1.9 na na na BT Investment Management BTT AU N AUD 3.08 3.75 22 797 0.6 (3) (5) (18) 31 66 (2) (3) (8) 29 50 Sep-12 44 8 15 20.8 14.4 13.3 11.6 98 100 5.8 12.6 1.8 na na na
Challenger Financial Services Group
CGF AU O AUD 3.69 4.90 33 1,854 9.1 (1) (9) (13) 4 17 (0) (6) (4) 3 1 Jun-12 (1) 8 (3) 6.4 6.5 6.1 6.2 100 105 5.0 16.6 1.0 na na na
Computershare CPU AU O AUD 10.24 11.15 9 5,378 18.5 (0) (1) (2) 14 34 0 1 8 12 18 Jun-12 14 15 15 19.7 17.2 15.0 13.1 102 104 3.0 26.0 4.4 na na na Henderson group HGG AU O AUD 2.40 2.75 15 4,282 8.6 (2) (8) (11) 17 61 (2) (5) (1) 15 45 Dec-12 7 14 14 12.4 11.5 10.1 8.8 109 107 5.8 17.7 1.9 na na na IOOF Holdings IFL AU N AUD 7.50 9.00 20 1,644 4.8 (2) (7) (14) 4 31 (2) (4) (5) 2 15 Jun-12 13 20 15 18.1 16.0 13.3 11.6 101 106 5.7 13.4 2.1 na na na
Macquarie Group MQG AU O AUD 41.43 48.00 16 13,291 59.3 (1) 2 (9) 17 57 0 4 0 15 41 Mar-13 34 18 15 18.7 14.0 11.9 10.3 98 99 6.2 9.4 1.2 na na na Perpetual PPT AU N AUD 38.99 43.00 10 1,545 4.6 (2) (5) (12) 12 77 (1) (3) (2) 11 61 Jun-12 19 27 13 24.0 20.2 15.9 14.0 101 99 3.3 27.8 5.5 na na na Platinum Asset Management
PTM AU U AUD 5.39 4.75 (12) 2,941 4.2 3 4 6 36 37 4 6 15 34 21 Jun-12 3 20 10 25.0 24.4 20.3 18.4 97 97 4.1 51.4 11.7 na na na
Suncorp Group Limited SUN AU U AUD 11.86 12.20 3 14,408 43.5 (1) (3) (5) 17 55 (1) (1) 4 15 39 Jun-12 30 30 13 21.3 16.4 12.6 11.2 91 100 6.0 6.7 1.1 na na na Sector* 7 52,067 (1) (2) (7) 17 48 (0) 0 2 15 32 Jun-12 13 21 13 18.2 16.1 13.3 11.8 96 100 5.0 9.8 1.5 na na na
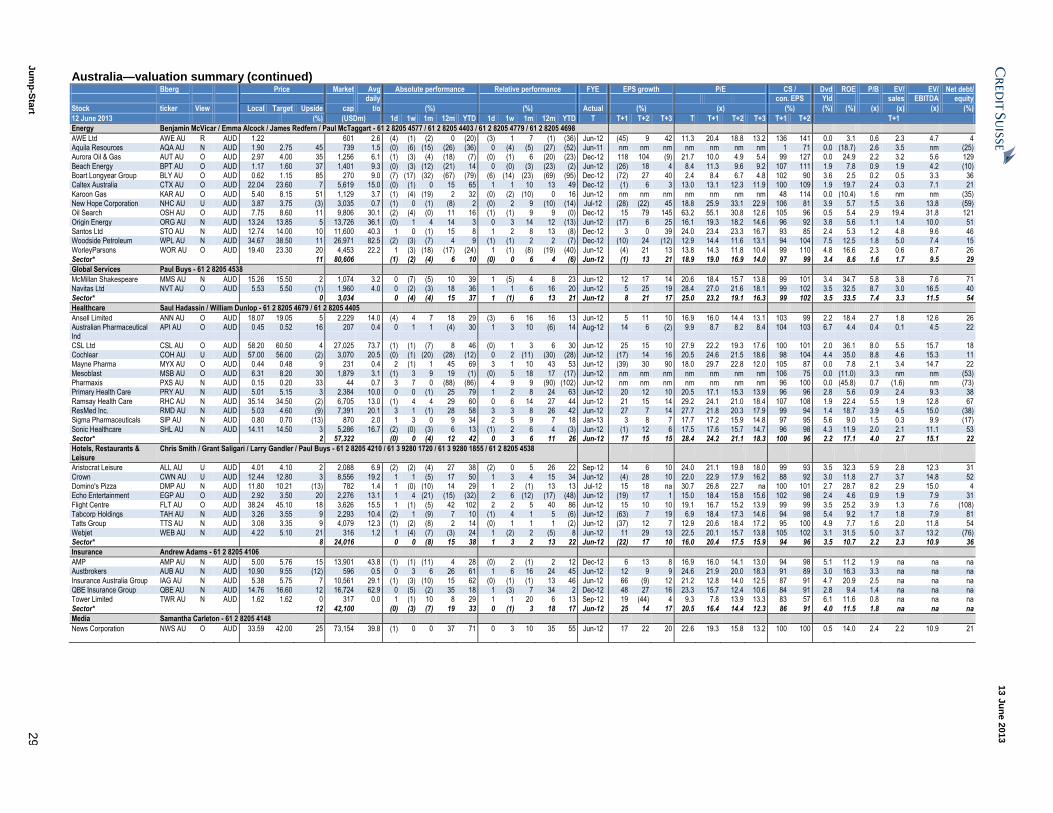
13 J
un
e 2
013
Ju
mp
-Sta
rt 2
9
Australia—valuation summary (continued) Bberg Price Market Avg Absolute performance Relative performance FYE EPS growth P/E CS / Dvd ROE P/B EV/ EV/ Net debt/ daily con. EPS Yld sales EBITDA equity
Stock ticker View Local Target Upside cap t/o (%) (%) Actual (%) (x) (%) (%) (%) (x) (x) (x) (%)
12 June 2013 (%) (USDm) 1d 1w 1m 12m YTD 1d 1w 1m 12m YTD T T+1 T+2 T+3 T T+1 T+2 T+3 T+1 T+2 T+1
Energy Benjamin McVicar / Emma Alcock / James Redfern / Paul McTaggart - 61 2 8205 4577 / 61 2 8205 4403 / 61 2 8205 4779 / 61 2 8205 4698
AWE Ltd AWE AU R AUD 1.22 601 2.6 (4) (1) (2) 0 (20) (3) 1 7 (1) (36) Jun-12 (45) 9 42 11.3 20.4 18.8 13.2 136 141 0.0 3.1 0.6 2.3 4.7 4 Aquila Resources AQA AU N AUD 1.90 2.75 45 739 1.5 (0) (6) (15) (26) (36) 0 (4) (5) (27) (52) Jun-11 nm nm nm nm nm nm nm 1 71 0.0 (18.7) 2.6 3.5 nm (25) Aurora Oil & Gas AUT AU O AUD 2.97 4.00 35 1,256 6.1 (1) (3) (4) (18) (7) (0) (1) 6 (20) (23) Dec-12 118 104 (9) 21.7 10.0 4.9 5.4 99 127 0.0 24.9 2.2 3.2 5.6 129
Beach Energy BPT AU O AUD 1.17 1.60 37 1,401 9.3 (0) (3) (12) (21) 14 0 (0) (3) (23) (2) Jun-12 (26) 18 4 8.4 11.3 9.6 9.2 107 111 1.9 7.8 0.9 1.9 4.2 (10) Boart Longyear Group BLY AU O AUD 0.62 1.15 85 270 9.0 (7) (17) (32) (67) (79) (6) (14) (23) (69) (95) Dec-12 (72) 27 40 2.4 8.4 6.7 4.8 102 90 3.6 2.5 0.2 0.5 3.3 36 Caltex Australia CTX AU O AUD 22.04 23.60 7 5,619 15.0 (0) (1) 0 15 65 1 1 10 13 49 Dec-12 (1) 6 3 13.0 13.1 12.3 11.9 100 109 1.9 19.7 2.4 0.3 7.1 21
Karoon Gas KAR AU O AUD 5.40 8.15 51 1,129 3.7 (1) (4) (19) 2 32 (0) (2) (10) 0 16 Jun-12 nm nm nm nm nm nm nm 48 114 0.0 (10.4) 1.6 nm nm (35) New Hope Corporation NHC AU U AUD 3.87 3.75 (3) 3,035 0.7 (1) 0 (1) (8) 2 (0) 2 9 (10) (14) Jul-12 (28) (22) 45 18.8 25.9 33.1 22.9 106 81 3.9 5.7 1.5 3.6 13.8 (59) Oil Search OSH AU O AUD 7.75 8.60 11 9,806 30.1 (2) (4) (0) 11 16 (1) (1) 9 9 (0) Dec-12 15 79 145 63.2 55.1 30.8 12.6 105 96 0.5 5.4 2.9 19.4 31.8 121
Origin Energy ORG AU N AUD 13.24 13.85 5 13,726 36.1 (0) 1 4 14 3 0 3 14 12 (13) Jun-12 (17) 6 25 16.1 19.3 18.2 14.6 96 92 3.8 5.6 1.1 1.4 10.0 51 Santos Ltd STO AU N AUD 12.74 14.00 10 11,600 40.3 1 0 (1) 15 8 1 2 8 13 (8) Dec-12 3 0 39 24.0 23.4 23.3 16.7 93 85 2.4 5.3 1.2 4.8 9.6 46 Woodside Petroleum WPL AU N AUD 34.67 38.50 11 26,971 82.5 (2) (3) (7) 4 9 (1) (1) 2 2 (7) Dec-12 (10) 24 (12) 12.9 14.4 11.6 13.1 94 104 7.5 12.5 1.8 5.0 7.4 15
WorleyParsons WOR AU O AUD 19.40 23.30 20 4,453 22.2 1 (3) (18) (17) (24) 1 (1) (8) (19) (40) Jun-12 (4) 21 13 13.8 14.3 11.8 10.4 99 110 4.8 16.6 2.3 0.6 8.7 26 Sector* 11 80,606 (1) (2) (4) 6 10 (0) 0 6 4 (6) Jun-12 (1) 13 21 18.9 19.0 16.9 14.0 97 99 3.4 8.6 1.6 1.7 9.5 29
Global Services Paul Buys - 61 2 8205 4538
McMillan Shakespeare MMS AU N AUD 15.26 15.50 2 1,074 3.2 0 (7) (5) 10 39 1 (5) 4 8 23 Jun-12 12 17 14 20.6 18.4 15.7 13.8 99 101 3.4 34.7 5.8 3.8 7.6 71 Navitas Ltd NVT AU O AUD 5.53 5.50 (1) 1,960 4.0 0 (2) (3) 18 36 1 1 6 16 20 Jun-12 5 25 19 28.4 27.0 21.6 18.1 99 102 3.5 32.5 8.7 3.0 16.5 40
Sector* 0 3,034 0 (4) (4) 15 37 1 (1) 6 13 21 Jun-12 8 21 17 25.0 23.2 19.1 16.3 99 102 3.5 33.5 7.4 3.3 11.5 54
Healthcare Saul Hadassin / William Dunlop - 61 2 8205 4679 / 61 2 8205 4405
Ansell Limited ANN AU O AUD 18.07 19.05 5 2,229 14.0 (4) 4 7 18 29 (3) 6 16 16 13 Jun-12 5 11 10 16.9 16.0 14.4 13.1 103 99 2.2 18.4 2.7 1.8 12.6 26 Australian Pharmaceutical Ind
API AU O AUD 0.45 0.52 16 207 0.4 0 1 1 (4) 30 1 3 10 (6) 14 Aug-12 14 6 (2) 9.9 8.7 8.2 8.4 104 103 6.7 4.4 0.4 0.1 4.5 22
CSL Ltd CSL AU O AUD 58.20 60.50 4 27,025 73.7 (1) (1) (7) 8 46 (0) 1 3 6 30 Jun-12 25 15 10 27.9 22.2 19.3 17.6 100 101 2.0 36.1 8.0 5.5 15.7 18 Cochlear COH AU U AUD 57.00 56.00 (2) 3,070 20.5 (0) (1) (20) (28) (12) 0 2 (11) (30) (28) Jun-12 (17) 14 16 20.5 24.6 21.5 18.6 98 104 4.4 35.0 8.8 4.6 15.3 11 Mayne Pharma MYX AU O AUD 0.44 0.48 9 231 0.4 2 (1) 1 45 69 3 1 10 43 53 Jun-12 (39) 30 90 18.0 29.7 22.8 12.0 105 87 0.0 7.8 2.1 3.4 14.7 22
Mesoblast MSB AU O AUD 6.31 8.20 30 1,879 3.1 (1) 3 9 19 (1) (0) 5 18 17 (17) Jun-12 nm nm nm nm nm nm nm 106 75 0.0 (11.0) 3.3 nm nm (53) Pharmaxis PXS AU N AUD 0.15 0.20 33 44 0.7 3 7 0 (88) (86) 4 9 9 (90) (102) Jun-12 nm nm nm nm nm nm nm 96 100 0.0 (45.8) 0.7 (1.6) nm (73) Primary Health Care PRY AU N AUD 5.01 5.15 3 2,384 10.0 0 0 (1) 25 79 1 2 8 24 63 Jun-12 20 12 10 20.5 17.1 15.3 13.9 96 96 2.8 5.6 0.9 2.4 9.3 38
Ramsay Health Care RHC AU N AUD 35.14 34.50 (2) 6,705 13.0 (1) 4 4 29 60 0 6 14 27 44 Jun-12 21 15 14 29.2 24.1 21.0 18.4 107 108 1.9 22.4 5.5 1.9 12.8 67 ResMed Inc. RMD AU N AUD 5.03 4.60 (9) 7,391 20.1 3 1 (1) 28 58 3 3 8 26 42 Jun-12 27 7 14 27.7 21.8 20.3 17.9 99 94 1.4 18.7 3.9 4.5 15.0 (38) Sigma Pharmaceuticals SIP AU N AUD 0.80 0.70 (13) 870 2.0 1 3 0 9 34 2 5 9 7 18 Jan-13 3 8 7 17.7 17.2 15.9 14.8 97 95 5.6 9.0 1.5 0.3 9.9 (17)
Sonic Healthcare SHL AU N AUD 14.11 14.50 3 5,286 16.7 (2) (0) (3) 6 13 (1) 2 6 4 (3) Jun-12 (1) 12 6 17.5 17.6 15.7 14.7 96 98 4.3 11.9 2.0 2.1 11.1 53 Sector* 2 57,322 (0) 0 (4) 12 42 0 3 6 11 26 Jun-12 17 15 15 28.4 24.2 21.1 18.3 100 96 2.2 17.1 4.0 2.7 15.1 22
Hotels, Restaurants & Leisure
Chris Smith / Grant Saligari / Larry Gandler / Paul Buys - 61 2 8205 4210 / 61 3 9280 1720 / 61 3 9280 1855 / 61 2 8205 4538
Aristocrat Leisure ALL AU U AUD 4.01 4.10 2 2,088 6.9 (2) (2) (4) 27 38 (2) 0 5 26 22 Sep-12 14 6 10 24.0 21.1 19.8 18.0 99 93 3.5 32.3 5.9 2.8 12.3 31
Crown CWN AU U AUD 12.44 12.80 3 8,556 19.2 1 1 (5) 17 50 1 3 4 15 34 Jun-12 (4) 28 10 22.0 22.9 17.9 16.2 88 92 3.0 11.8 2.7 3.7 14.8 52 Domino's Pizza DMP AU N AUD 11.80 10.21 (13) 782 1.4 1 (0) (10) 14 29 1 2 (1) 13 13 Jul-12 15 18 na 30.7 26.8 22.7 na 100 101 2.7 28.7 8.2 2.9 15.0 4 Echo Entertainment EGP AU O AUD 2.92 3.50 20 2,276 13.1 1 4 (21) (15) (32) 2 6 (12) (17) (48) Jun-12 (19) 17 1 15.0 18.4 15.8 15.6 102 98 2.4 4.6 0.9 1.9 7.9 31
Flight Centre FLT AU O AUD 38.24 45.10 18 3,626 15.5 1 (1) (5) 42 102 2 2 5 40 86 Jun-12 15 10 10 19.1 16.7 15.2 13.9 99 99 3.5 25.2 3.9 1.3 7.6 (108) Tabcorp Holdings TAH AU N AUD 3.26 3.55 9 2,293 10.4 (2) 1 (9) 7 10 (1) 4 1 5 (6) Jun-12 (63) 7 19 6.9 18.4 17.3 14.6 94 98 5.4 9.2 1.7 1.8 7.9 81 Tatts Group TTS AU N AUD 3.08 3.35 9 4,079 12.3 (1) (2) (8) 2 14 (0) 1 1 1 (2) Jun-12 (37) 12 7 12.9 20.6 18.4 17.2 95 100 4.9 7.7 1.6 2.0 11.8 54
Webjet WEB AU N AUD 4.22 5.10 21 316 1.2 1 (4) (7) (3) 24 1 (2) 2 (5) 8 Jun-12 11 29 13 22.5 20.1 15.7 13.8 105 102 3.1 31.5 5.0 3.7 13.2 (76) Sector* 8 24,016 0 0 (8) 15 38 1 3 2 13 22 Jun-12 (22) 17 10 16.0 20.4 17.5 15.9 94 96 3.5 10.7 2.2 2.3 10.9 36
Insurance Andrew Adams - 61 2 8205 4106
AMP AMP AU N AUD 5.00 5.76 15 13,901 43.8 (1) (1) (11) 4 28 (0) 2 (1) 2 12 Dec-12 6 13 8 16.9 16.0 14.1 13.0 94 98 5.1 11.2 1.9 na na na Austbrokers AUB AU N AUD 10.90 9.55 (12) 596 0.5 0 3 6 26 61 1 6 16 24 45 Jun-12 12 9 9 24.6 21.9 20.0 18.3 91 89 3.0 16.3 3.3 na na na
Insurance Australia Group IAG AU N AUD 5.38 5.75 7 10,561 29.1 (1) (3) (10) 15 62 (0) (1) (1) 13 46 Jun-12 66 (9) 12 21.2 12.8 14.0 12.5 87 91 4.7 20.9 2.5 na na na QBE Insurance Group QBE AU N AUD 14.76 16.60 12 16,724 62.9 0 (5) (2) 35 18 1 (3) 7 34 2 Dec-12 48 27 16 23.3 15.7 12.4 10.6 84 91 2.8 9.4 1.4 na na na Tower Limited TWR AU N AUD 1.62 1.62 0 317 0.0 1 (1) 10 8 29 1 1 20 6 13 Sep-12 19 (44) 4 9.3 7.8 13.9 13.3 83 57 6.1 11.6 0.8 na na na
Sector* 12 42,100 (0) (3) (7) 19 33 0 (1) 3 18 17 Jun-12 25 14 17 20.5 16.4 14.4 12.3 86 91 4.0 11.5 1.8 na na na
Media Samantha Carleton - 61 2 8205 4148
News Corporation NWS AU O AUD 33.59 42.00 25 73,154 39.8 (1) 0 0 37 71 0 3 10 35 55 Jun-12 17 22 20 22.6 19.3 15.8 13.2 100 100 0.5 14.0 2.4 2.2 10.9 21
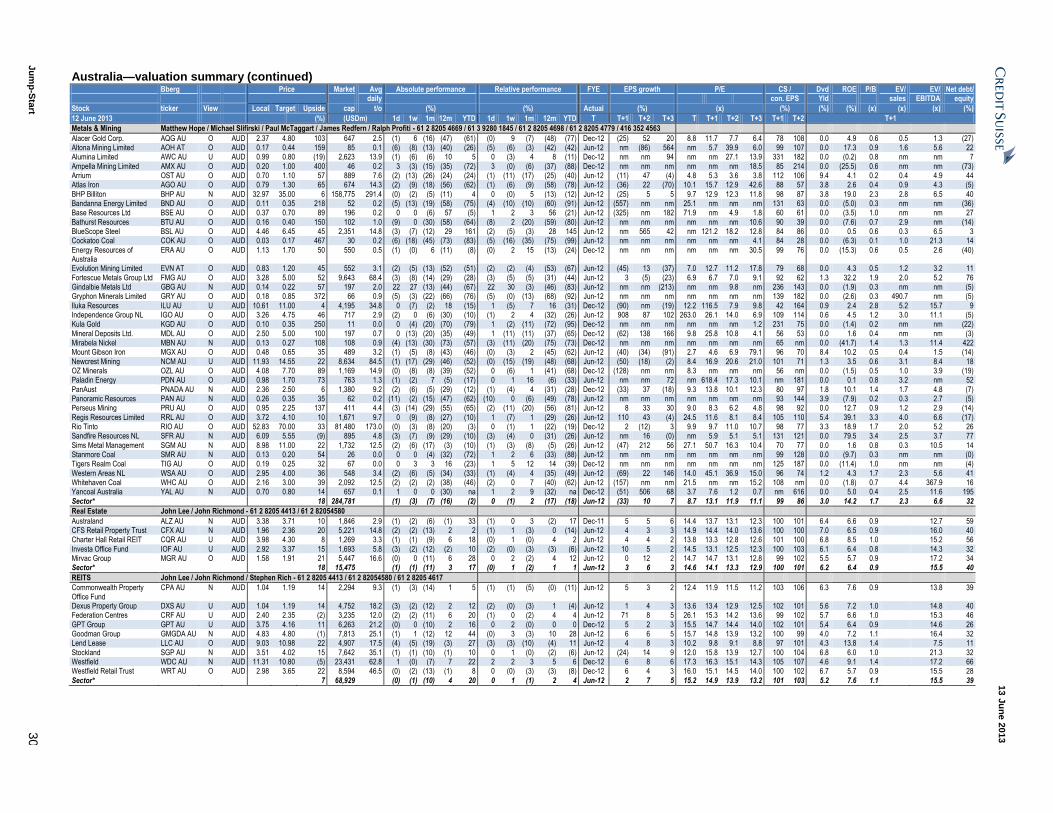
13 J
un
e 2
013
Ju
mp
-Sta
rt 3
0
Australia—valuation summary (continued) Bberg Price Market Avg Absolute performance Relative performance FYE EPS growth P/E CS / Dvd ROE P/B EV/ EV/ Net debt/ daily con. EPS Yld sales EBITDA equity
Stock ticker View Local Target Upside cap t/o (%) (%) Actual (%) (x) (%) (%) (%) (x) (x) (x) (%)
12 June 2013 (%) (USDm) 1d 1w 1m 12m YTD 1d 1w 1m 12m YTD T T+1 T+2 T+3 T T+1 T+2 T+3 T+1 T+2 T+1
Metals & Mining Matthew Hope / Michael Slifirski / Paul McTaggart / James Redfern / Ralph Profiti - 61 2 8205 4669 / 61 3 9280 1845 / 61 2 8205 4698 / 61 2 8205 4779 / 416 352 4563
Alacer Gold Corp. AQG AU O AUD 2.37 4.80 103 647 2.5 (1) 6 (16) (47) (61) (0) 9 (7) (48) (77) Dec-12 (25) 52 20 8.8 11.7 7.7 6.4 78 108 0.0 4.9 0.6 0.5 1.3 (27) Altona Mining Limited AOH AT O AUD 0.17 0.44 159 85 0.1 (6) (8) (13) (40) (26) (5) (6) (3) (42) (42) Jun-12 nm (86) 564 nm 5.7 39.9 6.0 99 107 0.0 17.3 0.9 1.6 5.6 22 Alumina Limited AWC AU U AUD 0.99 0.80 (19) 2,623 13.9 (1) (6) (6) 10 5 0 (3) 4 8 (11) Dec-12 nm nm 94 nm nm 27.1 13.9 331 182 0.0 (0.2) 0.8 nm nm 7
Ampella Mining Limited AMX AU O AUD 0.20 1.00 400 46 0.2 3 (3) (15) (35) (72) 3 (0) (6) (37) (88) Dec-12 nm nm nm nm nm nm 18.5 85 214 0.0 (25.5) 0.6 nm nm (73) Arrium OST AU O AUD 0.70 1.10 57 889 7.6 (2) (13) (26) (24) (24) (1) (11) (17) (25) (40) Jun-12 (11) 47 (4) 4.8 5.3 3.6 3.8 112 106 9.4 4.1 0.2 0.4 4.9 44 Atlas Iron AGO AU O AUD 0.79 1.30 65 674 14.3 (2) (9) (18) (56) (62) (1) (6) (9) (58) (78) Jun-12 (36) 22 (70) 10.1 15.7 12.9 42.6 88 57 3.8 2.6 0.4 0.9 4.3 (5)
BHP Billiton BHP AU N AUD 32.97 35.00 6 158,775 291.4 (0) (2) (5) (11) 4 0 (0) 5 (13) (12) Jun-12 (25) 5 5 9.7 12.9 12.3 11.8 98 87 3.8 19.0 2.3 2.8 6.5 40 Bandanna Energy Limited BND AU O AUD 0.11 0.35 218 52 0.2 (5) (13) (19) (58) (75) (4) (10) (10) (60) (91) Jun-12 (557) nm nm 25.1 nm nm nm 131 63 0.0 (5.0) 0.3 nm nm (36) Base Resources Ltd BSE AU O AUD 0.37 0.70 89 196 0.2 0 0 (6) 57 (5) 1 2 3 56 (21) Jun-12 (325) nm 182 71.9 nm 4.9 1.8 60 61 0.0 (3.5) 1.0 nm nm 27
Bathurst Resources BTU AU O AUD 0.16 0.40 150 102 1.0 (9) 0 (30) (58) (64) (8) 2 (20) (59) (80) Jun-12 nm nm nm nm nm nm 10.6 90 39 0.0 (7.6) 0.7 2.9 nm (14) BlueScope Steel BSL AU O AUD 4.46 6.45 45 2,351 14.8 (3) (7) (12) 29 161 (2) (5) (3) 28 145 Jun-12 nm 565 42 nm 121.2 18.2 12.8 84 86 0.0 0.5 0.6 0.3 6.5 3 Cockatoo Coal COK AU O AUD 0.03 0.17 467 30 0.2 (6) (18) (45) (73) (83) (5) (16) (35) (75) (99) Jun-12 nm nm nm nm nm nm 4.1 84 28 0.0 (6.3) 0.1 1.0 21.3 14
Energy Resources of Australia
ERA AU O AUD 1.13 1.70 50 550 0.5 (1) (0) 6 (11) (8) (0) 2 15 (13) (24) Dec-12 nm nm nm nm nm nm 30.5 99 76 0.0 (15.3) 0.6 0.5 2.6 (40)
Evolution Mining Limited EVN AT O AUD 0.83 1.20 45 552 3.1 (2) (5) (13) (52) (51) (2) (2) (4) (53) (67) Jun-12 (45) 13 (37) 7.0 12.7 11.2 17.8 79 68 0.0 4.3 0.5 1.2 3.2 11
Fortescue Metals Group Ltd FMG AU O AUD 3.28 5.00 52 9,643 68.4 (3) (8) (14) (29) (28) (3) (5) (5) (31) (44) Jun-12 3 (5) (23) 6.9 6.7 7.0 9.1 92 62 1.3 32.2 1.9 2.0 5.2 76 Gindalbie Metals Ltd GBG AU N AUD 0.14 0.22 57 197 2.0 22 27 (13) (44) (67) 22 30 (3) (46) (83) Jun-12 nm nm (213) nm nm 9.8 nm 236 143 0.0 (1.9) 0.3 nm nm (5) Gryphon Minerals Limited GRY AU O AUD 0.18 0.85 372 66 0.9 (5) (3) (22) (66) (76) (5) (0) (13) (68) (92) Jun-12 nm nm nm nm nm nm nm 139 182 0.0 (2.6) 0.3 490.7 nm (5)
Iluka Resources ILU AU U AUD 10.61 11.00 4 4,195 34.8 0 (7) (2) 18 (15) 1 (5) 7 16 (31) Dec-12 (90) nm (19) 12.2 116.5 7.9 9.8 42 164 0.9 2.4 2.8 5.2 15.7 9 Independence Group NL IGO AU O AUD 3.26 4.75 46 717 2.9 (2) 0 (6) (30) (10) (1) 2 4 (32) (26) Jun-12 908 87 102 263.0 26.1 14.0 6.9 109 114 0.6 4.5 1.2 3.0 11.1 (5) Kula Gold KGD AU O AUD 0.10 0.35 250 11 0.0 0 (4) (20) (70) (79) 1 (2) (11) (72) (95) Dec-12 nm nm nm nm nm nm 1.2 231 75 0.0 (1.4) 0.2 nm nm (22)
Mineral Deposits Ltd. MDL AU O AUD 2.50 5.00 100 197 0.7 0 (13) (20) (35) (49) 1 (11) (11) (37) (65) Dec-12 (62) 138 166 9.8 25.8 10.8 4.1 56 53 0.0 1.6 0.4 nm nm (3) Mirabela Nickel MBN AU N AUD 0.13 0.27 108 108 0.9 (4) (13) (30) (73) (57) (3) (11) (20) (75) (73) Dec-12 nm nm nm nm nm nm nm 65 nm 0.0 (41.7) 1.4 1.3 11.4 422 Mount Gibson Iron MGX AU O AUD 0.48 0.65 35 489 3.2 (1) (5) (8) (43) (46) (0) (3) 2 (45) (62) Jun-12 (40) (34) (91) 2.7 4.6 6.9 79.1 96 70 8.4 10.2 0.5 0.4 1.5 (14)
Newcrest Mining NCM AU U AUD 11.93 14.55 22 8,634 84.5 (1) (17) (29) (46) (52) (0) (15) (19) (48) (68) Jun-12 (50) (18) (2) 8.4 16.9 20.6 21.0 101 71 1.3 3.5 0.6 3.1 8.4 18 OZ Minerals OZL AU O AUD 4.08 7.70 89 1,169 14.9 (0) (8) (8) (39) (52) 0 (6) 1 (41) (68) Dec-12 (128) nm nm 8.3 nm nm nm 56 nm 0.0 (1.5) 0.5 1.0 3.9 (19) Paladin Energy PDN AU O AUD 0.98 1.70 73 763 1.3 (1) (2) 7 (5) (17) 0 1 16 (6) (33) Jun-12 nm nm 72 nm 618.4 17.3 10.1 nm 181 0.0 0.1 0.8 3.2 nm 52
PanAust PNADA AU N AUD 2.36 2.50 6 1,380 9.2 (2) (6) (5) (29) (12) (1) (4) 4 (31) (28) Dec-12 (33) 37 (18) 9.3 13.8 10.1 12.3 80 97 1.8 10.1 1.4 1.7 4.8 (7) Panoramic Resources PAN AU N AUD 0.26 0.35 35 62 0.2 (11) (2) (15) (47) (62) (10) 0 (6) (49) (78) Jun-12 nm nm nm nm nm nm nm 93 144 3.9 (7.9) 0.2 0.3 2.7 (5) Perseus Mining PRU AU O AUD 0.95 2.25 137 411 4.4 (3) (14) (29) (55) (65) (2) (11) (20) (56) (81) Jun-12 8 33 30 9.0 8.3 6.2 4.8 98 92 0.0 12.7 0.9 1.2 2.9 (14)
Regis Resources Limited RRL AU O AUD 3.72 4.10 10 1,671 9.7 0 (9) (8) (27) (10) 1 (7) 1 (29) (26) Jun-12 110 43 (4) 24.5 11.6 8.1 8.4 105 110 5.4 39.1 3.3 4.0 6.6 (17) Rio Tinto RIO AU O AUD 52.83 70.00 33 81,480 173.0 (0) (3) (8) (20) (3) 0 (1) 1 (22) (19) Dec-12 2 (12) 3 9.9 9.7 11.0 10.7 98 77 3.3 18.9 1.7 2.0 5.2 26 Sandfire Resources NL SFR AU N AUD 6.09 5.55 (9) 895 4.8 (3) (7) (9) (29) (10) (3) (4) 0 (31) (26) Jun-12 nm 16 (0) nm 5.9 5.1 5.1 131 121 0.0 79.5 3.4 2.5 3.7 77
Sims Metal Management SGM AU N AUD 8.98 11.00 22 1,732 12.5 (2) (6) (17) (3) (10) (1) (3) (8) (5) (26) Jun-12 (47) 212 56 27.1 50.7 16.3 10.4 70 77 0.0 1.6 0.8 0.3 10.5 14 Stanmore Coal SMR AU N AUD 0.13 0.20 54 26 0.0 0 0 (4) (32) (72) 1 2 6 (33) (88) Jun-12 nm nm nm nm nm nm nm 99 128 0.0 (9.7) 0.3 nm nm (0) Tigers Realm Coal TIG AU O AUD 0.19 0.25 32 67 0.0 0 3 3 16 (23) 1 5 12 14 (39) Dec-12 nm nm nm nm nm nm nm 125 187 0.0 (11.4) 1.0 nm nm (4)
Western Areas NL WSA AU O AUD 2.95 4.00 36 548 3.4 (2) (6) (5) (34) (33) (1) (4) 4 (35) (49) Jun-12 (69) 22 146 14.0 45.1 36.9 15.0 96 74 1.2 4.3 1.7 2.3 5.6 41 Whitehaven Coal WHC AU O AUD 2.16 3.00 39 2,092 12.5 (2) (2) (2) (38) (46) (2) 0 7 (40) (62) Jun-12 (157) nm nm 21.5 nm nm 15.2 108 nm 0.0 (1.8) 0.7 4.4 367.9 16 Yancoal Australia YAL AU N AUD 0.70 0.80 14 657 0.1 1 0 0 (30) na 1 2 9 (32) na Dec-12 (51) 506 68 3.7 7.6 1.2 0.7 nm 616 0.0 5.0 0.4 2.5 11.6 195
Sector* 18 284,781 (1) (3) (7) (16) (2) 0 (1) 2 (17) (18) Jun-12 (33) 10 7 8.7 13.1 11.9 11.1 99 86 3.0 14.2 1.7 2.3 6.6 32
Real Estate John Lee / John Richmond - 61 2 8205 4413 / 61 2 82054580
Australand ALZ AU N AUD 3.38 3.71 10 1,846 2.9 (1) (2) (6) (1) 33 (1) 0 3 (2) 17 Dec-11 5 5 6 14.4 13.7 13.1 12.3 100 101 6.4 6.6 0.9 12.7 59 CFS Retail Property Trust CFX AU N AUD 1.96 2.36 20 5,221 14.8 (2) (2) (13) 2 2 (1) 1 (3) 0 (14) Jun-12 4 3 3 14.9 14.4 14.0 13.6 100 100 7.0 6.5 0.9 16.0 40 Charter Hall Retail REIT CQR AU U AUD 3.98 4.30 8 1,269 3.3 (1) (1) (9) 6 18 (0) 1 (0) 4 2 Jun-12 4 4 2 13.8 13.3 12.8 12.6 101 100 6.8 8.5 1.0 15.2 56
Investa Office Fund IOF AU U AUD 2.92 3.37 15 1,693 5.8 (3) (2) (12) (2) 10 (2) (0) (3) (3) (6) Jun-12 10 5 2 14.5 13.1 12.5 12.3 100 103 6.1 6.4 0.8 14.3 32 Mirvac Group MGR AU O AUD 1.58 1.91 21 5,447 16.6 (0) 0 (11) 6 28 0 2 (2) 4 12 Jun-12 0 12 2 14.7 14.7 13.1 12.8 99 102 5.5 5.7 0.9 17.2 34 Sector* 18 15,475 (1) (1) (11) 3 17 (0) 1 (2) 1 1 Jun-12 3 6 3 14.6 14.1 13.3 12.9 100 101 6.2 6.4 0.9 15.5 40
REITS John Lee / John Richmond / Stephen Rich - 61 2 8205 4413 / 61 2 82054580 / 61 2 8205 4617
Commonwealth Property Office Fund
CPA AU N AUD 1.04 1.19 14 2,294 9.3 (1) (3) (14) 1 5 (1) (1) (5) (0) (11) Jun-12 5 3 2 12.4 11.9 11.5 11.2 103 106 6.3 7.6 0.9 13.8 39
Dexus Property Group DXS AU U AUD 1.04 1.19 14 4,752 18.2 (3) (2) (12) 2 12 (2) (0) (3) 1 (4) Jun-12 1 4 3 13.6 13.4 12.9 12.5 102 101 5.6 7.2 1.0 14.8 40 Federation Centres CRF AU U AUD 2.40 2.35 (2) 3,235 12.0 (2) (2) (11) 6 20 (1) 0 (2) 4 4 Jun-12 71 8 5 26.1 15.3 14.2 13.6 99 102 5.7 6.6 1.0 15.3 46
GPT Group GPT AU U AUD 3.75 4.16 11 6,263 21.2 (0) 0 (10) 2 16 0 2 (0) 0 0 Dec-12 5 2 3 15.5 14.7 14.4 14.0 102 101 5.4 6.4 0.9 14.6 26 Goodman Group GMGDA AU N AUD 4.83 4.80 (1) 7,813 25.1 (1) 1 (12) 12 44 (0) 3 (3) 10 28 Jun-12 6 6 5 15.7 14.8 13.9 13.2 100 99 4.0 7.2 1.1 16.4 32 Lend Lease LLC AU O AUD 9.03 10.98 22 4,907 17.5 (4) (5) (19) (3) 27 (3) (3) (10) (4) 11 Jun-12 4 8 3 10.2 9.8 9.1 8.8 97 101 4.3 13.8 1.4 7.5 11
Stockland SGP AU N AUD 3.51 4.02 15 7,642 35.1 (1) (1) (10) (1) 10 0 1 (0) (2) (6) Jun-12 (24) 14 9 12.0 15.8 13.9 12.7 100 104 6.8 6.0 1.0 21.3 32 Westfield WDC AU N AUD 11.31 10.80 (5) 23,431 62.8 1 (0) (7) 7 22 2 2 3 5 6 Dec-12 6 8 6 17.3 16.3 15.1 14.3 105 107 4.6 9.1 1.4 17.2 66 Westfield Retail Trust WRT AU O AUD 2.98 3.65 22 8,594 46.5 (0) (2) (13) (1) 8 0 (0) (3) (3) (8) Dec-12 6 4 3 16.0 15.1 14.5 14.0 100 102 6.7 5.7 0.9 15.5 28
Sector* 7 68,929 (0) (1) (10) 4 20 0 1 (1) 2 4 Jun-12 2 7 5 15.2 14.9 13.9 13.2 101 103 5.2 7.6 1.1 15.5 39
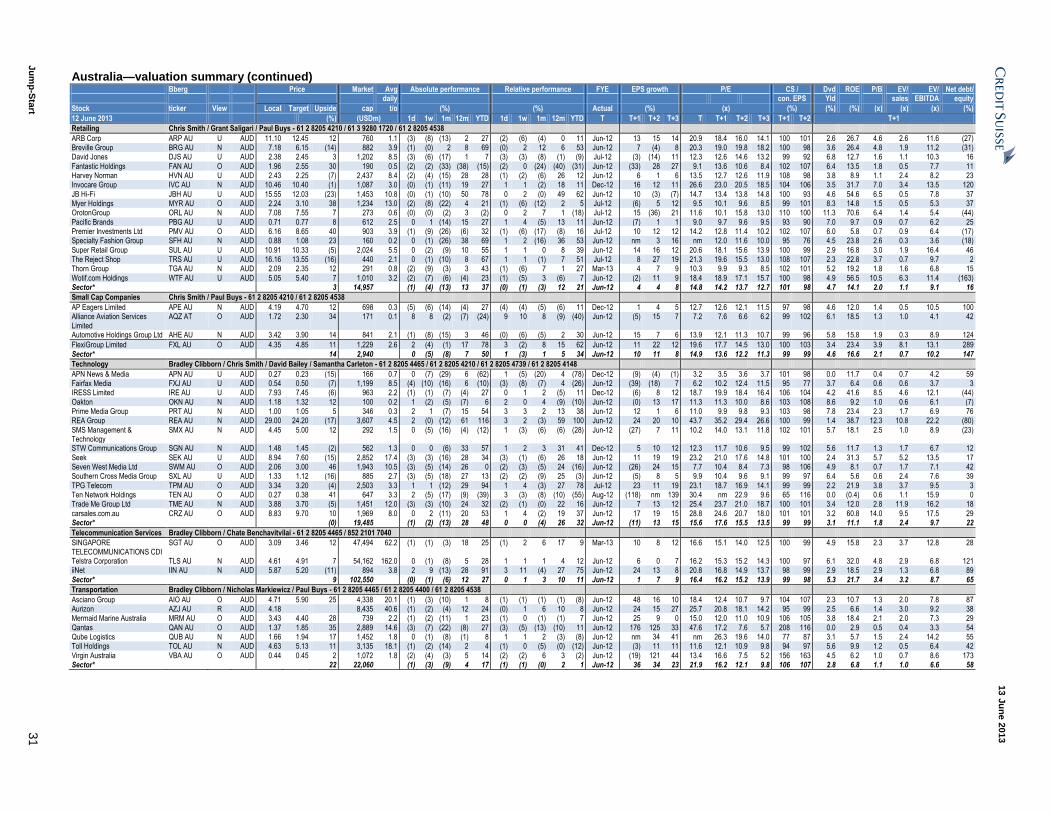
13 J
un
e 2
013
Ju
mp
-Sta
rt 3
1
Australia—valuation summary (continued) Bberg Price Market Avg Absolute performance Relative performance FYE EPS growth P/E CS / Dvd ROE P/B EV/ EV/ Net debt/ daily con. EPS Yld sales EBITDA equity
Stock ticker View Local Target Upside cap t/o (%) (%) Actual (%) (x) (%) (%) (%) (x) (x) (x) (%)
12 June 2013 (%) (USDm) 1d 1w 1m 12m YTD 1d 1w 1m 12m YTD T T+1 T+2 T+3 T T+1 T+2 T+3 T+1 T+2 T+1
Retailing Chris Smith / Grant Saligari / Paul Buys - 61 2 8205 4210 / 61 3 9280 1720 / 61 2 8205 4538
ARB Corp ARP AU U AUD 11.10 12.45 12 760 1.1 (3) (8) (13) 2 27 (2) (6) (4) 0 11 Jun-12 13 15 14 20.9 18.4 16.0 14.1 100 101 2.6 26.7 4.6 2.6 11.6 (27) Breville Group BRG AU N AUD 7.18 6.15 (14) 882 3.9 (1) (0) 2 8 69 (0) 2 12 6 53 Jun-12 7 (4) 8 20.3 19.0 19.8 18.2 100 98 3.6 26.4 4.8 1.9 11.2 (31) David Jones DJS AU U AUD 2.38 2.45 3 1,202 8.5 (3) (6) (17) 1 7 (3) (3) (8) (1) (9) Jul-12 (3) (14) 11 12.3 12.6 14.6 13.2 99 92 6.8 12.7 1.6 1.1 10.3 16
Fantastic Holdings FAN AU O AUD 1.96 2.55 30 190 0.5 (2) (2) (33) (38) (15) (2) 0 (24) (40) (31) Jun-12 (33) 28 27 9.1 13.6 10.6 8.4 102 107 6.4 13.5 1.8 0.5 7.7 11 Harvey Norman HVN AU U AUD 2.43 2.25 (7) 2,437 8.4 (2) (4) (15) 28 28 (1) (2) (6) 26 12 Jun-12 6 1 6 13.5 12.7 12.6 11.9 108 98 3.8 8.9 1.1 2.4 8.2 23 Invocare Group IVC AU N AUD 10.46 10.40 (1) 1,087 3.0 (0) (1) (11) 19 27 1 1 (2) 18 11 Dec-12 16 12 11 26.6 23.0 20.5 18.5 104 106 3.5 31.7 7.0 3.4 13.5 120
JB Hi-Fi JBH AU U AUD 15.55 12.03 (23) 1,453 10.8 (0) (1) (10) 50 78 0 2 (0) 49 62 Jun-12 10 (3) (7) 14.7 13.4 13.8 14.8 100 93 4.6 54.6 6.5 0.5 7.8 37 Myer Holdings MYR AU O AUD 2.24 3.10 38 1,234 13.0 (2) (8) (22) 4 21 (1) (6) (12) 2 5 Jul-12 (6) 5 12 9.5 10.1 9.6 8.5 99 101 8.3 14.8 1.5 0.5 5.3 37 OrotonGroup ORL AU N AUD 7.08 7.55 7 273 0.6 (0) (0) (2) 3 (2) 0 2 7 1 (18) Jul-12 15 (36) 21 11.6 10.1 15.8 13.0 110 100 11.3 70.6 6.4 1.4 5.4 (44)
Pacific Brands PBG AU U AUD 0.71 0.77 8 612 2.5 0 1 (14) 15 27 1 4 (5) 13 11 Jun-12 (7) 1 1 9.0 9.7 9.6 9.5 93 90 7.0 9.7 0.9 0.7 6.2 25 Premier Investments Ltd PMV AU O AUD 6.16 8.65 40 903 3.9 (1) (9) (26) (6) 32 (1) (6) (17) (8) 16 Jul-12 10 12 12 14.2 12.8 11.4 10.2 102 107 6.0 5.8 0.7 0.9 6.4 (17) Specialty Fashion Group SFH AU N AUD 0.88 1.08 23 160 0.2 0 (1) (26) 38 69 1 2 (16) 36 53 Jun-12 nm 3 16 nm 12.0 11.6 10.0 95 76 4.5 23.8 2.6 0.3 3.6 (18)
Super Retail Group SUL AU U AUD 10.91 10.33 (5) 2,024 5.5 0 (2) (9) 10 55 1 1 0 8 39 Jun-12 14 16 12 20.6 18.1 15.6 13.9 100 99 2.9 16.8 3.0 1.9 16.4 46 The Reject Shop TRS AU U AUD 16.16 13.55 (16) 440 2.1 0 (1) (10) 8 67 1 1 (1) 7 51 Jul-12 8 27 19 21.3 19.6 15.5 13.0 108 107 2.3 22.8 3.7 0.7 9.7 2 Thorn Group TGA AU N AUD 2.09 2.35 12 291 0.8 (2) (9) (3) 3 43 (1) (6) 7 1 27 Mar-13 4 7 9 10.3 9.9 9.3 8.5 102 101 5.2 19.2 1.8 1.6 6.8 15
Wotif.com Holdings WTF AU U AUD 5.05 5.40 7 1,010 3.2 (2) (7) (6) (4) 23 (1) (5) 3 (6) 7 Jun-12 (2) 11 9 18.4 18.9 17.1 15.7 100 98 4.9 56.5 10.5 6.3 11.4 (163) Sector* 3 14,957 (1) (4) (13) 13 37 (0) (1) (3) 12 21 Jun-12 4 4 8 14.8 14.2 13.7 12.7 101 98 4.7 14.1 2.0 1.1 9.1 16
Small Cap Companies Chris Smith / Paul Buys - 61 2 8205 4210 / 61 2 8205 4538
AP Eagers Limited APE AU N AUD 4.19 4.70 12 698 0.3 (5) (6) (14) (4) 27 (4) (4) (5) (6) 11 Dec-12 1 4 5 12.7 12.6 12.1 11.5 97 98 4.6 12.0 1.4 0.5 10.5 100 Alliance Aviation Services Limited
AQZ AT O AUD 1.72 2.30 34 171 0.1 8 8 (2) (7) (24) 9 10 8 (9) (40) Jun-12 (5) 15 7 7.2 7.6 6.6 6.2 99 102 6.1 18.5 1.3 1.0 4.1 42
Automotive Holdings Group Ltd AHE AU N AUD 3.42 3.90 14 841 2.1 (1) (8) (15) 3 46 (0) (6) (5) 2 30 Jun-12 15 7 6 13.9 12.1 11.3 10.7 99 96 5.8 15.8 1.9 0.3 8.9 124
FlexiGroup Limited FXL AU O AUD 4.35 4.85 11 1,229 2.6 2 (4) (1) 17 78 3 (2) 8 15 62 Jun-12 11 22 12 19.6 17.7 14.5 13.0 100 103 3.4 23.4 3.9 8.1 13.1 289
Sector* 14 2,940 0 (5) (8) 7 50 1 (3) 1 5 34 Jun-12 10 11 8 14.9 13.6 12.2 11.3 99 99 4.6 16.6 2.1 0.7 10.2 147
Technology Bradley Clibborn / Chris Smith / David Bailey / Samantha Carleton - 61 2 8205 4465 / 61 2 8205 4210 / 61 2 8205 4739 / 61 2 8205 4148
APN News & Media APN AU U AUD 0.27 0.23 (15) 166 0.7 0 (7) (29) 6 (62) 1 (5) (20) 4 (78) Dec-12 (9) (4) (1) 3.2 3.5 3.6 3.7 101 98 0.0 11.7 0.4 0.7 4.2 59 Fairfax Media FXJ AU U AUD 0.54 0.50 (7) 1,199 8.5 (4) (10) (16) 6 (10) (3) (8) (7) 4 (26) Jun-12 (39) (18) 7 6.2 10.2 12.4 11.5 95 77 3.7 6.4 0.6 0.6 3.7 3 IRESS Limited IRE AU U AUD 7.93 7.45 (6) 963 2.2 (1) (1) (7) (4) 27 0 1 2 (5) 11 Dec-12 (6) 8 12 18.7 19.9 18.4 16.4 106 104 4.2 41.6 8.5 4.6 12.1 (44)
Oakton OKN AU N AUD 1.18 1.32 12 100 0.2 1 (2) (5) (7) 6 2 0 4 (9) (10) Jun-12 (0) 13 17 11.3 11.3 10.0 8.6 103 108 8.6 9.2 1.0 0.6 6.1 (7) Prime Media Group PRT AU N AUD 1.00 1.05 5 346 0.3 2 1 (7) 15 54 3 3 2 13 38 Jun-12 12 1 6 11.0 9.9 9.8 9.3 103 98 7.8 23.4 2.3 1.7 6.9 76 REA Group REA AU N AUD 29.00 24.20 (17) 3,607 4.5 2 (0) (12) 61 116 3 2 (3) 59 100 Jun-12 24 20 10 43.7 35.2 29.4 26.6 100 99 1.4 38.7 12.3 10.8 22.2 (80)
SMS Management & Technology
SMX AU N AUD 4.45 5.00 12 292 1.5 0 (5) (16) (4) (12) 1 (3) (6) (6) (28) Jun-12 (27) 7 11 10.2 14.0 13.1 11.8 102 101 5.7 18.1 2.5 1.0 8.9 (23)
STW Communications Group SGN AU N AUD 1.48 1.45 (2) 562 1.3 0 0 (6) 33 57 1 2 3 31 41 Dec-12 5 10 12 12.3 11.7 10.6 9.5 99 102 5.6 11.7 1.3 1.7 6.7 12
Seek SEK AU U AUD 8.94 7.60 (15) 2,852 17.4 (3) (3) (16) 28 34 (3) (1) (6) 26 18 Jun-12 11 19 19 23.2 21.0 17.6 14.8 101 100 2.4 31.3 5.7 5.2 13.5 17 Seven West Media Ltd SWM AU O AUD 2.06 3.00 46 1,943 10.5 (3) (5) (14) 26 0 (2) (3) (5) 24 (16) Jun-12 (26) 24 15 7.7 10.4 8.4 7.3 98 106 4.9 8.1 0.7 1.7 7.1 42 Southern Cross Media Group SXL AU U AUD 1.33 1.12 (16) 885 2.7 (3) (5) (18) 27 13 (2) (2) (9) 25 (3) Jun-12 (5) 8 5 9.9 10.4 9.6 9.1 99 97 6.4 5.6 0.6 2.4 7.6 39
TPG Telecom TPM AU O AUD 3.34 3.20 (4) 2,503 3.3 1 1 (12) 29 94 1 4 (3) 27 78 Jul-12 23 11 19 23.1 18.7 16.9 14.1 99 99 2.2 21.9 3.8 3.7 9.5 3 Ten Network Holdings TEN AU O AUD 0.27 0.38 41 647 3.3 2 (5) (17) (9) (39) 3 (3) (8) (10) (55) Aug-12 (118) nm 139 30.4 nm 22.9 9.6 65 116 0.0 (0.4) 0.6 1.1 15.9 0 Trade Me Group Ltd TME AU N AUD 3.88 3.70 (5) 1,451 12.0 (3) (3) (10) 24 32 (2) (1) (0) 22 16 Jun-12 7 13 12 25.4 23.7 21.0 18.7 100 101 3.4 12.0 2.8 11.9 16.2 18
carsales.com.au CRZ AU O AUD 8.83 9.70 10 1,969 8.0 0 2 (11) 20 53 1 4 (2) 19 37 Jun-12 17 19 15 28.8 24.6 20.7 18.0 101 101 3.2 60.8 14.0 9.5 17.5 29 Sector* (0) 19,485 (1) (2) (13) 28 48 0 0 (4) 26 32 Jun-12 (11) 13 15 15.6 17.6 15.5 13.5 99 99 3.1 11.1 1.8 2.4 9.7 22
Telecommunication Services Bradley Clibborn / Chate Benchavitvilai - 61 2 8205 4465 / 852 2101 7040
SINGAPORE TELECOMMUNICATIONS CDI
SGT AU O AUD 3.09 3.46 12 47,494 62.2 (1) (1) (3) 18 25 (1) 2 6 17 9 Mar-13 10 8 12 16.6 15.1 14.0 12.5 100 99 4.9 15.8 2.3 3.7 12.8 28
Telstra Corporation TLS AU N AUD 4.61 4.91 7 54,162 162.0 0 (1) (8) 5 28 1 1 1 4 12 Jun-12 6 0 7 16.2 15.3 15.2 14.3 100 97 6.1 32.0 4.8 2.9 6.8 121 iiNet IIN AU N AUD 5.87 5.20 (11) 894 3.8 2 9 (13) 28 91 3 11 (4) 27 75 Jun-12 24 13 8 20.8 16.8 14.9 13.7 98 99 2.9 18.5 2.9 1.3 6.8 89
Sector* 9 102,550 (0) (1) (6) 12 27 0 1 3 10 11 Jun-12 1 7 9 16.4 16.2 15.2 13.9 99 98 5.3 21.7 3.4 3.2 8.7 65
Transportation Bradley Clibborn / Nicholas Markiewicz / Paul Buys - 61 2 8205 4465 / 61 2 8205 4400 / 61 2 8205 4538
Asciano Group AIO AU O AUD 4.71 5.90 25 4,338 20.1 (1) (3) (10) 1 8 (1) (1) (1) (1) (8) Jun-12 48 16 10 18.4 12.4 10.7 9.7 104 107 2.3 10.7 1.3 2.0 7.8 87 Aurizon AZJ AU R AUD 4.18 8,435 40.6 (1) (2) (4) 12 24 (0) 1 6 10 8 Jun-12 24 15 27 25.7 20.8 18.1 14.2 95 99 2.5 6.6 1.4 3.0 9.2 38 Mermaid Marine Australia MRM AU O AUD 3.43 4.40 28 739 2.2 (1) (2) (11) 1 23 (1) 0 (1) (1) 7 Jun-12 25 9 0 15.0 12.0 11.0 10.9 106 105 3.8 18.4 2.1 2.0 7.3 29
Qantas QAN AU O AUD 1.37 1.85 35 2,889 14.6 (3) (7) (22) (8) 27 (3) (5) (13) (10) 11 Jun-12 176 125 33 47.6 17.2 7.6 5.7 208 116 0.0 2.9 0.5 0.4 3.3 54 Qube Logistics QUB AU N AUD 1.66 1.94 17 1,452 1.8 0 (1) (8) (1) 8 1 1 2 (3) (8) Jun-12 nm 34 41 nm 26.3 19.6 14.0 77 87 3.1 5.7 1.5 2.4 14.2 55 Toll Holdings TOL AU N AUD 4.63 5.13 11 3,135 18.1 (1) (2) (14) 2 4 (1) 0 (5) (0) (12) Jun-12 (3) 11 11 11.6 12.1 10.9 9.8 94 97 5.6 9.9 1.2 0.5 6.4 42
Virgin Australia VBA AU O AUD 0.44 0.45 2 1,072 1.8 (2) (4) (3) 5 14 (2) (2) 6 3 (2) Jun-12 (19) 121 44 13.4 16.6 7.5 5.2 156 163 4.5 6.2 1.0 0.7 8.6 173 Sector* 22 22,060 (1) (3) (9) 4 17 (1) (1) (0) 2 1 Jun-12 36 34 23 21.9 16.2 12.1 9.8 106 107 2.8 6.8 1.1 1.0 6.6 58
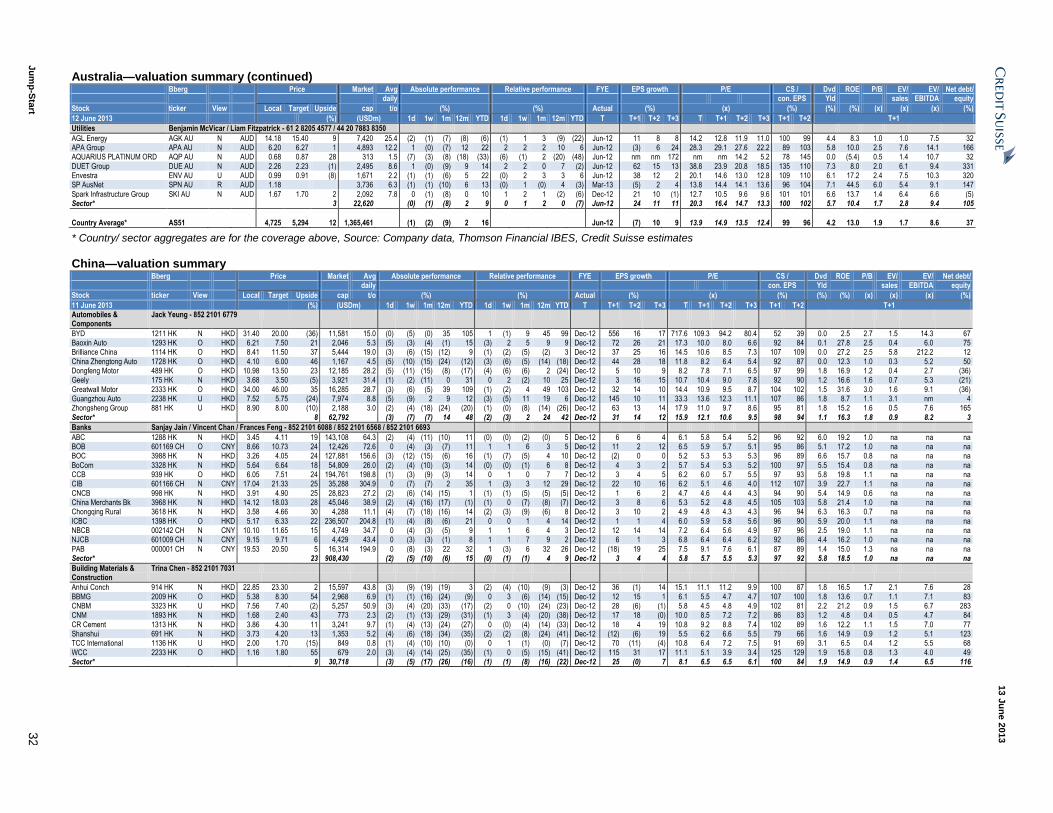
13 J
un
e 2
013
Ju
mp
-Sta
rt 3
2
Australia—valuation summary (continued) Bberg Price Market Avg Absolute performance Relative performance FYE EPS growth P/E CS / Dvd ROE P/B EV/ EV/ Net debt/ daily con. EPS Yld sales EBITDA equity
Stock ticker View Local Target Upside cap t/o (%) (%) Actual (%) (x) (%) (%) (%) (x) (x) (x) (%)
12 June 2013 (%) (USDm) 1d 1w 1m 12m YTD 1d 1w 1m 12m YTD T T+1 T+2 T+3 T T+1 T+2 T+3 T+1 T+2 T+1
Utilities Benjamin McVicar / Liam Fitzpatrick - 61 2 8205 4577 / 44 20 7883 8350
AGL Energy AGK AU N AUD 14.18 15.40 9 7,420 25.4 (2) (1) (7) (8) (6) (1) 1 3 (9) (22) Jun-12 11 8 8 14.2 12.8 11.9 11.0 100 99 4.4 8.3 1.0 1.0 7.5 32 APA Group APA AU N AUD 6.20 6.27 1 4,893 12.2 1 (0) (7) 12 22 2 2 2 10 6 Jun-12 (3) 6 24 28.3 29.1 27.6 22.2 89 103 5.8 10.0 2.5 7.6 14.1 166 AQUARIUS PLATINUM ORD AQP AU N AUD 0.68 0.87 28 313 1.5 (7) (3) (8) (18) (33) (6) (1) 2 (20) (48) Jun-12 nm nm 172 nm nm 14.2 5.2 78 145 0.0 (5.4) 0.5 1.4 10.7 32
DUET Group DUE AU N AUD 2.26 2.23 (1) 2,495 8.6 1 (0) (9) 9 14 2 2 0 7 (2) Jun-12 62 15 13 38.8 23.9 20.8 18.5 135 110 7.3 8.0 2.0 6.1 9.4 331 Envestra ENV AU U AUD 0.99 0.91 (8) 1,671 2.2 (1) (1) (6) 5 22 (0) 2 3 3 6 Jun-12 38 12 2 20.1 14.6 13.0 12.8 109 110 6.1 17.2 2.4 7.5 10.3 320 SP AusNet SPN AU R AUD 1.18 3,736 6.3 (1) (1) (10) 6 13 (0) 1 (0) 4 (3) Mar-13 (5) 2 4 13.8 14.4 14.1 13.6 96 104 7.1 44.5 6.0 5.4 9.1 147
Spark Infrastructure Group SKI AU N AUD 1.67 1.70 2 2,092 7.8 0 (1) (8) 0 10 1 2 1 (2) (6) Dec-12 21 10 (1) 12.7 10.5 9.6 9.6 101 101 6.6 13.7 1.4 6.4 6.6 (5) Sector* 3 22,620 (0) (1) (8) 2 9 0 1 2 0 (7) Jun-12 24 11 11 20.3 16.4 14.7 13.3 100 102 5.7 10.4 1.7 2.8 9.4 105
Country Average* AS51 4,725 5,294 12 1,365,461 (1) (2) (9) 2 16 Jun-12 (7) 10 9 13.9 14.9 13.5 12.4 99 96 4.2 13.0 1.9 1.7 8.6 37
* Country/ sector aggregates are for the coverage above, Source: Company data, Thomson Financial IBES, Credit Suisse estimates
China—valuation summary Bberg Price Market Avg Absolute performance Relative performance FYE EPS growth P/E CS / Dvd ROE P/B EV/ EV/ Net debt/ daily con. EPS Yld sales EBITDA equity
Stock ticker View Local Target Upside cap t/o (%) (%) Actual (%) (x) (%) (%) (%) (x) (x) (x) (%)
11 June 2013 (%) (USDm) 1d 1w 1m 12m YTD 1d 1w 1m 12m YTD T T+1 T+2 T+3 T T+1 T+2 T+3 T+1 T+2 T+1 Automobiles & Components
Jack Yeung - 852 2101 6779
BYD 1211 HK N HKD 31.40 20.00 (36) 11,581 15.0 (0) (5) (0) 35 105 1 (1) 9 45 99 Dec-12 556 16 17 717.6 109.3 94.2 80.4 52 39 0.0 2.5 2.7 1.5 14.3 67 Baoxin Auto 1293 HK O HKD 6.21 7.50 21 2,046 5.3 (5) (3) (4) (1) 15 (3) 2 5 9 9 Dec-12 72 26 21 17.3 10.0 8.0 6.6 92 84 0.1 27.8 2.5 0.4 6.0 75 Brilliance China 1114 HK O HKD 8.41 11.50 37 5,444 19.0 (3) (6) (15) (12) 9 (1) (2) (5) (2) 3 Dec-12 37 25 16 14.5 10.6 8.5 7.3 107 109 0.0 27.2 2.5 5.8 212.2 12
China Zhengtong Auto 1728 HK O HKD 4.10 6.00 46 1,167 4.5 (5) (10) (15) (24) (12) (3) (6) (5) (14) (18) Dec-12 44 28 18 11.8 8.2 6.4 5.4 92 87 0.0 12.3 1.0 0.3 5.2 50 Dongfeng Motor 489 HK O HKD 10.98 13.50 23 12,185 28.2 (5) (11) (15) (8) (17) (4) (6) (6) 2 (24) Dec-12 5 10 9 8.2 7.8 7.1 6.5 97 99 1.8 16.9 1.2 0.4 2.7 (36) Geely 175 HK N HKD 3.68 3.50 (5) 3,921 31.4 (1) (2) (11) 0 31 0 2 (2) 10 25 Dec-12 3 16 15 10.7 10.4 9.0 7.8 92 90 1.2 16.6 1.6 0.7 5.3 (21)
Greatwall Motor 2333 HK O HKD 34.00 46.00 35 16,285 28.7 (3) (6) (5) 39 109 (1) (2) 4 49 103 Dec-12 32 14 10 14.4 10.9 9.5 8.7 104 102 1.5 31.6 3.0 1.6 9.1 (36) Guangzhou Auto 2238 HK U HKD 7.52 5.75 (24) 7,974 8.8 (5) (9) 2 9 12 (3) (5) 11 19 6 Dec-12 145 10 11 33.3 13.6 12.3 11.1 107 86 1.8 8.7 1.1 3.1 nm 4 Zhongsheng Group 881 HK U HKD 8.90 8.00 (10) 2,188 3.0 (2) (4) (18) (24) (20) (1) (0) (8) (14) (26) Dec-12 63 13 14 17.9 11.0 9.7 8.6 95 81 1.8 15.2 1.6 0.5 7.6 165
Sector* 8 62,792 (3) (7) (7) 14 48 (2) (3) 2 24 42 Dec-12 31 14 12 15.9 12.1 10.6 9.5 98 94 1.1 16.3 1.8 0.9 8.2 3
Banks Sanjay Jain / Vincent Chan / Frances Feng - 852 2101 6088 / 852 2101 6568 / 852 2101 6693
ABC 1288 HK N HKD 3.45 4.11 19 143,108 64.3 (2) (4) (11) (10) 11 (0) (0) (2) (0) 5 Dec-12 6 6 4 6.1 5.8 5.4 5.2 96 92 6.0 19.2 1.0 na na na BOB 601169 CH O CNY 8.66 10.73 24 12,426 72.6 0 (4) (3) (7) 11 1 1 6 3 5 Dec-12 11 2 12 6.5 5.9 5.7 5.1 95 86 5.1 17.2 1.0 na na na BOC 3988 HK N HKD 3.26 4.05 24 127,881 156.6 (3) (12) (15) (6) 16 (1) (7) (5) 4 10 Dec-12 (2) 0 0 5.2 5.3 5.3 5.3 96 89 6.6 15.7 0.8 na na na
BoCom 3328 HK N HKD 5.64 6.64 18 54,809 26.0 (2) (4) (10) (3) 14 (0) (0) (1) 6 8 Dec-12 4 3 2 5.7 5.4 5.3 5.2 100 97 5.5 15.4 0.8 na na na CCB 939 HK O HKD 6.05 7.51 24 194,761 198.8 (1) (3) (9) (3) 14 0 1 0 7 7 Dec-12 3 4 5 6.2 6.0 5.7 5.5 97 93 5.8 19.8 1.1 na na na CIB 601166 CH N CNY 17.04 21.33 25 35,288 304.9 0 (7) (7) 2 35 1 (3) 3 12 29 Dec-12 22 10 16 6.2 5.1 4.6 4.0 112 107 3.9 22.7 1.1 na na na
CNCB 998 HK N HKD 3.91 4.90 25 28,823 27.2 (2) (6) (14) (15) 1 (1) (1) (5) (5) (5) Dec-12 1 6 2 4.7 4.6 4.4 4.3 94 90 5.4 14.9 0.6 na na na China Merchants Bk 3968 HK N HKD 14.12 18.03 28 45,046 38.9 (2) (4) (16) (17) (1) (1) 0 (7) (8) (7) Dec-12 3 8 6 5.3 5.2 4.8 4.5 105 103 5.8 21.4 1.0 na na na Chongqing Rural 3618 HK N HKD 3.58 4.66 30 4,288 11.1 (4) (7) (18) (16) 14 (2) (3) (9) (6) 8 Dec-12 3 10 2 4.9 4.8 4.3 4.3 96 94 6.3 16.3 0.7 na na na
ICBC 1398 HK O HKD 5.17 6.33 22 236,507 204.8 (1) (4) (8) (6) 21 0 0 1 4 14 Dec-12 1 1 4 6.0 5.9 5.8 5.6 96 90 5.9 20.0 1.1 na na na NBCB 002142 CH N CNY 10.10 11.65 15 4,749 34.7 0 (4) (3) (5) 9 1 1 6 4 3 Dec-12 12 14 14 7.2 6.4 5.6 4.9 97 96 2.5 19.0 1.1 na na na NJCB 601009 CH N CNY 9.15 9.71 6 4,429 43.4 0 (3) (3) (1) 8 1 1 7 9 2 Dec-12 6 1 3 6.8 6.4 6.4 6.2 92 86 4.4 16.2 1.0 na na na
PAB 000001 CH N CNY 19.53 20.50 5 16,314 194.9 0 (8) (3) 22 32 1 (3) 6 32 26 Dec-12 (18) 19 25 7.5 9.1 7.6 6.1 87 89 1.4 15.0 1.3 na na na Sector* 23 908,430 (2) (5) (10) (6) 15 (0) (1) (1) 4 9 Dec-12 3 4 4 5.8 5.7 5.5 5.3 97 92 5.8 18.5 1.0 na na na
Building Materials & Construction
Trina Chen - 852 2101 7031
Anhui Conch 914 HK N HKD 22.85 23.30 2 15,597 43.8 (3) (9) (19) (19) 3 (2) (4) (10) (9) (3) Dec-12 36 (1) 14 15.1 11.1 11.2 9.9 100 87 1.8 16.5 1.7 2.1 7.6 28
BBMG 2009 HK O HKD 5.38 8.30 54 2,968 6.9 (1) (1) (16) (24) (9) 0 3 (6) (14) (15) Dec-12 12 15 1 6.1 5.5 4.7 4.7 107 100 1.8 13.6 0.7 1.1 7.1 83 CNBM 3323 HK U HKD 7.56 7.40 (2) 5,257 50.9 (3) (4) (20) (33) (17) (2) 0 (10) (24) (23) Dec-12 28 (6) (1) 5.8 4.5 4.8 4.9 102 81 2.2 21.2 0.9 1.5 6.7 283 CNM 1893 HK N HKD 1.68 2.40 43 773 2.3 (2) (1) (13) (29) (31) (1) 3 (4) (20) (38) Dec-12 17 18 (0) 10.0 8.5 7.2 7.2 86 83 1.2 4.8 0.4 0.5 4.7 84
CR Cement 1313 HK N HKD 3.86 4.30 11 3,241 9.7 (1) (4) (13) (24) (27) 0 (0) (4) (14) (33) Dec-12 18 4 19 10.8 9.2 8.8 7.4 102 89 1.6 12.2 1.1 1.5 7.0 77 Shanshui 691 HK N HKD 3.73 4.20 13 1,353 5.2 (4) (6) (18) (34) (35) (2) (2) (8) (24) (41) Dec-12 (12) (6) 19 5.5 6.2 6.6 5.5 79 66 1.6 14.9 0.9 1.2 5.1 123 TCC International 1136 HK U HKD 2.00 1.70 (15) 849 0.8 (1) (4) (10) (10) (0) 0 1 (1) (0) (7) Dec-12 70 (11) (4) 10.8 6.4 7.2 7.5 91 69 3.1 6.5 0.4 1.2 5.5 68
WCC 2233 HK O HKD 1.16 1.80 55 679 2.0 (3) (4) (14) (25) (35) (1) 0 (5) (15) (41) Dec-12 115 31 17 11.1 5.1 3.9 3.4 125 129 1.9 15.8 0.8 1.3 4.0 49 Sector* 9 30,718 (3) (5) (17) (26) (16) (1) (1) (8) (16) (22) Dec-12 25 (0) 7 8.1 6.5 6.5 6.1 100 84 1.9 14.9 0.9 1.4 6.5 116
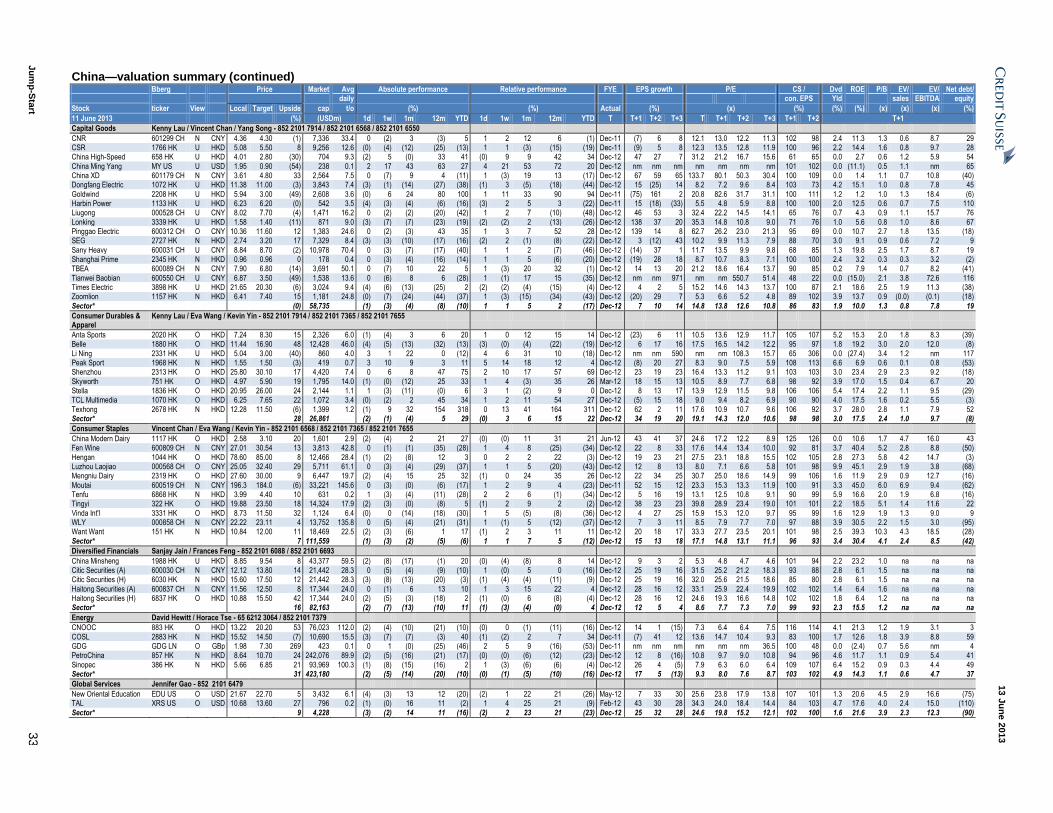
13 J
un
e 2
013
Ju
mp
-Sta
rt 3
3
China—valuation summary (continued) Bberg Price Market Avg Absolute performance Relative performance FYE EPS growth P/E CS / Dvd ROE P/B EV/ EV/ Net debt/ daily con. EPS Yld sales EBITDA equity
Stock ticker View Local Target Upside cap t/o (%) (%) Actual (%) (x) (%) (%) (%) (x) (x) (x) (%)
11 June 2013 (%) (USDm) 1d 1w 1m 12m YTD 1d 1w 1m 12m YTD T T+1 T+2 T+3 T T+1 T+2 T+3 T+1 T+2 T+1
Capital Goods Kenny Lau / Vincent Chan / Yang Song - 852 2101 7914 / 852 2101 6568 / 852 2101 6550
CNR 601299 CH N CNY 4.36 4.30 (1) 7,336 33.4 0 (2) 3 (3) 5 1 2 12 6 (1) Dec-11 (7) 6 8 12.1 13.0 12.2 11.3 102 98 2.4 11.3 1.3 0.6 8.7 29 CSR 1766 HK U HKD 5.08 5.50 8 9,256 12.6 (0) (4) (12) (25) (13) 1 1 (3) (15) (19) Dec-11 (9) 5 8 12.3 13.5 12.8 11.9 100 96 2.2 14.4 1.6 0.8 9.7 28 China High-Speed 658 HK U HKD 4.01 2.80 (30) 704 9.3 (2) 5 (0) 33 41 (0) 9 9 42 34 Dec-12 47 27 7 31.2 21.2 16.7 15.6 61 65 0.0 2.7 0.6 1.2 5.9 54
China Ming Yang MY US U USD 1.95 0.90 (54) 238 0.1 2 17 43 63 27 4 21 53 72 20 Dec-12 nm nm nm nm nm nm nm 101 102 0.0 (11.1) 0.5 1.1 nm 65 China XD 601179 CH N CNY 3.61 4.80 33 2,564 7.5 0 (7) 9 4 (11) 1 (3) 19 13 (17) Dec-12 67 59 65 133.7 80.1 50.3 30.4 100 109 0.0 1.4 1.1 0.7 10.8 (40) Dongfang Electric 1072 HK U HKD 11.38 11.00 (3) 3,843 7.4 (3) (1) (14) (27) (38) (1) 3 (5) (18) (44) Dec-12 15 (25) 14 8.2 7.2 9.6 8.4 103 73 4.2 15.1 1.0 0.8 7.8 45
Goldwind 2208 HK U HKD 5.94 3.00 (49) 2,608 3.6 (0) 6 24 80 100 1 11 33 90 94 Dec-11 (75) 161 2 20.8 82.6 31.7 31.1 100 111 1.2 1.2 1.0 1.3 18.4 (6) Harbin Power 1133 HK U HKD 6.23 6.20 (0) 542 3.5 (4) (3) (4) (6) (16) (3) 2 5 3 (22) Dec-11 15 (18) (33) 5.5 4.8 5.9 8.8 100 100 2.0 12.5 0.6 0.7 7.5 110 Liugong 000528 CH U CNY 8.02 7.70 (4) 1,471 16.2 0 (2) (2) (20) (42) 1 2 7 (10) (48) Dec-12 46 53 3 32.4 22.2 14.5 14.1 65 76 0.7 4.3 0.9 1.1 15.7 76
Lonking 3339 HK U HKD 1.58 1.40 (11) 871 9.0 (3) (7) (7) (23) (19) (2) (2) 2 (13) (26) Dec-12 138 37 20 35.3 14.8 10.8 9.0 71 76 1.0 5.6 0.8 1.0 8.6 67 Pinggao Electric 600312 CH O CNY 10.36 11.60 12 1,383 24.6 0 (2) (3) 43 35 1 3 7 52 28 Dec-12 139 14 8 62.7 26.2 23.0 21.3 95 69 0.0 10.7 2.7 1.8 13.5 (18) SEG 2727 HK N HKD 2.74 3.20 17 7,329 8.4 (3) (3) (10) (17) (16) (2) 2 (1) (8) (22) Dec-12 3 (12) 43 10.2 9.9 11.3 7.9 88 70 3.0 9.1 0.9 0.6 7.2 9
Sany Heavy 600031 CH U CNY 8.84 8.70 (2) 10,978 70.4 0 (3) (7) (17) (40) 1 1 2 (7) (46) Dec-12 (14) 37 1 11.7 13.5 9.9 9.8 68 85 1.3 19.8 2.5 1.7 8.7 19 Shanghai Prime 2345 HK N HKD 0.96 0.96 0 178 0.4 0 (3) (4) (16) (14) 1 1 5 (6) (20) Dec-12 (19) 28 18 8.7 10.7 8.3 7.1 100 100 2.4 3.2 0.3 0.3 3.2 (2) TBEA 600089 CH N CNY 7.90 6.80 (14) 3,691 50.1 0 (7) 10 22 5 1 (3) 20 32 (1) Dec-12 14 13 20 21.2 18.6 16.4 13.7 90 85 0.2 7.9 1.4 0.7 8.2 (41)
Tianwei Baobian 600550 CH U CNY 6.87 3.50 (49) 1,538 13.6 0 (6) 8 6 (28) 1 (1) 17 15 (35) Dec-12 nm nm 971 nm nm 550.7 51.4 48 22 0.0 (15.0) 2.1 3.8 72.6 116 Times Electric 3898 HK U HKD 21.65 20.30 (6) 3,024 9.4 (4) (6) (13) (25) 2 (2) (2) (4) (15) (4) Dec-12 4 2 5 15.2 14.6 14.3 13.7 100 87 2.1 18.6 2.5 1.9 11.3 (38) Zoomlion 1157 HK N HKD 6.41 7.40 15 1,181 24.8 (0) (7) (24) (44) (37) 1 (3) (15) (34) (43) Dec-12 (20) 29 7 5.3 6.6 5.2 4.8 89 102 3.9 13.7 0.9 (0.0) (0.1) (18)
Sector* (0) 58,735 (1) (3) (4) (8) (10) 1 1 5 2 (17) Dec-12 7 10 14 14.8 13.8 12.6 10.8 86 83 1.9 10.0 1.3 0.8 7.8 19
Consumer Durables & Apparel
Kenny Lau / Eva Wang / Kevin Yin - 852 2101 7914 / 852 2101 7365 / 852 2101 7655
Anta Sports 2020 HK O HKD 7.24 8.30 15 2,326 6.0 (1) (4) 3 6 20 1 0 12 15 14 Dec-12 (23) 6 11 10.5 13.6 12.9 11.7 105 107 5.2 15.3 2.0 1.8 8.3 (39) Belle 1880 HK O HKD 11.44 16.90 48 12,428 46.0 (4) (5) (13) (32) (13) (3) (0) (4) (22) (19) Dec-12 6 17 16 17.5 16.5 14.2 12.2 95 97 1.8 19.2 3.0 2.0 12.0 (8)
Li Ning 2331 HK U HKD 5.04 3.00 (40) 860 4.0 3 1 22 0 (12) 4 6 31 10 (18) Dec-12 nm nm 590 nm nm 108.3 15.7 65 306 0.0 (27.4) 3.4 1.2 nm 117 Peak Sport 1968 HK N HKD 1.55 1.50 (3) 419 0.7 3 10 9 3 11 5 14 18 12 4 Dec-12 (8) 20 27 8.3 9.0 7.5 5.9 108 113 6.6 6.9 0.6 0.1 0.8 (53) Shenzhou 2313 HK O HKD 25.80 30.10 17 4,420 7.4 0 6 8 47 75 2 10 17 57 69 Dec-12 23 19 23 16.4 13.3 11.2 9.1 103 103 3.0 23.4 2.9 2.3 9.2 (18)
Skyworth 751 HK O HKD 4.97 5.90 19 1,795 14.0 (1) (0) (12) 25 33 1 4 (3) 35 26 Mar-12 18 15 13 10.5 8.9 7.7 6.8 98 92 3.9 17.0 1.5 0.4 6.7 20 Stella 1836 HK O HKD 20.95 26.00 24 2,144 1.1 1 (3) (11) (0) 6 3 1 (2) 9 0 Dec-12 8 13 17 13.9 12.9 11.5 9.8 106 106 5.4 17.4 2.2 1.1 9.5 (29) TCL Multimedia 1070 HK O HKD 6.25 7.65 22 1,072 3.4 (0) (2) 2 45 34 1 2 11 54 27 Dec-12 (5) 15 18 9.0 9.4 8.2 6.9 90 90 4.0 17.5 1.6 0.2 5.5 (3)
Texhong 2678 HK N HKD 12.28 11.50 (6) 1,399 1.2 (1) 9 32 154 318 0 13 41 164 311 Dec-12 62 2 11 17.6 10.9 10.7 9.6 106 92 3.7 28.0 2.8 1.1 7.9 52 Sector* 28 26,861 (2) (1) (4) 5 29 (0) 3 6 15 22 Dec-12 34 19 20 19.1 14.3 12.0 10.6 98 98 3.0 17.5 2.4 1.0 9.7 (8)
Consumer Staples Vincent Chan / Eva Wang / Kevin Yin - 852 2101 6568 / 852 2101 7365 / 852 2101 7655
China Modern Dairy 1117 HK O HKD 2.58 3.10 20 1,601 2.9 (2) (4) 2 21 27 (0) (0) 11 31 21 Jun-12 43 41 37 24.6 17.2 12.2 8.9 125 126 0.0 10.6 1.7 4.7 16.0 43 Fen Wine 600809 CH N CNY 27.01 30.54 13 3,813 42.8 0 (1) (1) (35) (28) 1 4 8 (25) (34) Dec-12 22 8 33 17.6 14.4 13.4 10.0 92 81 3.7 40.4 5.2 2.8 8.8 (50)
Hengan 1044 HK O HKD 78.60 85.00 8 12,466 28.4 (1) (2) (8) 12 3 0 2 2 22 (3) Dec-12 19 23 21 27.5 23.1 18.8 15.5 102 105 2.8 27.3 5.8 4.2 14.7 (3) Luzhou Laojiao 000568 CH O CNY 25.05 32.40 29 5,711 61.1 0 (3) (4) (29) (37) 1 1 5 (20) (43) Dec-12 12 8 13 8.0 7.1 6.6 5.8 101 98 9.9 45.1 2.9 1.9 3.8 (68) Mengniu Dairy 2319 HK O HKD 27.60 30.00 9 6,447 19.7 (2) (4) 15 25 32 (1) 0 24 35 26 Dec-12 22 34 25 30.7 25.0 18.6 14.9 99 106 1.6 11.9 2.9 0.9 12.7 (16)
Moutai 600519 CH N CNY 196.3 184.0 (6) 33,221 145.6 0 (3) (0) (6) (17) 1 2 9 4 (23) Dec-11 52 15 12 23.3 15.3 13.3 11.9 100 91 3.3 45.0 6.0 6.9 9.4 (62) Tenfu 6868 HK N HKD 3.99 4.40 10 631 0.2 1 (3) (4) (11) (28) 2 2 6 (1) (34) Dec-12 5 16 19 13.1 12.5 10.8 9.1 90 99 5.9 16.6 2.0 1.9 6.8 (16) Tingyi 322 HK O HKD 19.88 23.50 18 14,324 17.9 (2) (3) (0) (8) 5 (1) 2 9 2 (2) Dec-12 38 23 23 39.8 28.9 23.4 19.0 101 101 2.2 18.5 5.1 1.4 11.6 22
Vinda Int'l 3331 HK O HKD 8.73 11.50 32 1,124 6.4 (0) 0 (14) (18) (30) 1 5 (5) (8) (36) Dec-12 4 27 25 15.9 15.3 12.0 9.7 95 99 1.6 12.9 1.9 1.3 9.0 9 WLY 000858 CH N CNY 22.22 23.11 4 13,752 135.8 0 (5) (4) (21) (31) 1 (1) 5 (12) (37) Dec-12 7 3 11 8.5 7.9 7.7 7.0 97 88 3.9 30.5 2.2 1.5 3.0 (95) Want Want 151 HK N HKD 10.84 12.00 11 18,469 22.5 (2) (3) (6) 1 17 (1) 2 3 11 11 Dec-12 20 18 17 33.3 27.7 23.5 20.1 101 98 2.5 39.3 10.3 4.3 18.5 (28)
Sector* 7 111,559 (1) (3) (2) (5) (6) 1 1 7 5 (12) Dec-12 15 13 18 17.1 14.8 13.1 11.1 96 93 3.4 30.4 4.1 2.4 8.5 (42)
Diversified Financials Sanjay Jain / Frances Feng - 852 2101 6088 / 852 2101 6693
China Minsheng 1988 HK U HKD 8.85 9.54 8 43,377 59.5 (2) (8) (17) (1) 20 (0) (4) (8) 8 14 Dec-12 9 3 2 5.3 4.8 4.7 4.6 101 94 2.2 23.2 1.0 na na na Citic Securities (A) 600030 CH N CNY 12.12 13.80 14 21,442 28.3 0 (5) (4) (9) (10) 1 (0) 5 0 (16) Dec-12 25 19 16 31.5 25.2 21.2 18.3 93 88 2.8 6.1 1.5 na na na Citic Securities (H) 6030 HK N HKD 15.60 17.50 12 21,442 28.3 (3) (8) (13) (20) (3) (1) (4) (4) (11) (9) Dec-12 25 19 16 32.0 25.6 21.5 18.6 85 80 2.8 6.1 1.5 na na na
Haitong Securities (A) 600837 CH N CNY 11.56 12.50 8 17,344 24.0 0 (1) 6 13 10 1 3 15 22 4 Dec-12 28 16 12 33.1 25.9 22.4 19.9 102 102 1.4 6.4 1.6 na na na Haitong Securities (H) 6837 HK O HKD 10.88 15.50 42 17,344 24.0 (2) (5) (3) (18) 2 (1) (0) 6 (8) (4) Dec-12 28 16 12 24.6 19.3 16.6 14.8 102 102 1.8 6.4 1.2 na na na Sector* 16 82,163 (2) (7) (13) (10) 11 (1) (3) (4) (0) 4 Dec-12 12 5 4 8.6 7.7 7.3 7.0 99 93 2.3 15.5 1.2 na na na
Energy David Hewitt / Horace Tse - 65 6212 3064 / 852 2101 7379
CNOOC 883 HK O HKD 13.22 20.20 53 76,023 112.0 (2) (4) (10) (21) (10) (0) 0 (1) (11) (16) Dec-12 14 1 (15) 7.3 6.4 6.4 7.5 116 114 4.1 21.3 1.2 1.9 3.1 3
COSL 2883 HK N HKD 15.52 14.50 (7) 10,690 15.5 (3) (7) (7) (3) 40 (1) (2) 2 7 34 Dec-11 (7) 41 12 13.6 14.7 10.4 9.3 83 100 1.7 12.6 1.8 3.9 8.8 59 GDG GDG LN O GBp 1.98 7.30 269 423 0.1 0 1 (0) (25) (46) 2 5 9 (16) (53) Dec-11 nm nm nm nm nm nm 36.5 100 48 0.0 (2.4) 0.7 5.6 nm 4 PetroChina 857 HK N HKD 8.64 10.70 24 242,076 89.9 (2) (5) (16) (21) (17) (0) (0) (6) (12) (23) Dec-12 12 8 (16) 10.8 9.7 9.0 10.8 94 96 4.6 11.7 1.1 0.9 5.4 41
Sinopec 386 HK N HKD 5.66 6.85 21 93,969 100.3 (1) (8) (15) (16) 2 1 (3) (6) (6) (4) Dec-12 26 4 (5) 7.9 6.3 6.0 6.4 109 107 6.4 15.2 0.9 0.3 4.4 49 Sector* 31 423,180 (2) (5) (14) (20) (10) (0) (1) (5) (10) (16) Dec-12 17 5 (13) 9.3 8.0 7.6 8.7 103 102 4.9 14.3 1.1 0.6 4.7 37
Global Services Jennifer Gao - 852 2101 6479
New Oriental Education EDU US O USD 21.67 22.70 5 3,432 6.1 (4) (3) 13 12 (20) (2) 1 22 21 (26) May-12 7 33 30 25.6 23.8 17.9 13.8 107 101 1.3 20.6 4.5 2.9 16.6 (75) TAL XRS US O USD 10.68 13.60 27 796 0.2 (1) (0) 16 11 (2) 1 4 25 21 (9) Feb-12 43 30 28 34.3 24.0 18.4 14.4 84 103 4.7 17.6 4.0 2.4 15.0 (110)
Sector* 9 4,228 (3) (2) 14 11 (16) (2) 2 23 21 (23) Dec-12 25 32 28 24.6 19.8 15.2 12.1 102 100 1.6 21.6 3.9 2.3 12.3 (90)
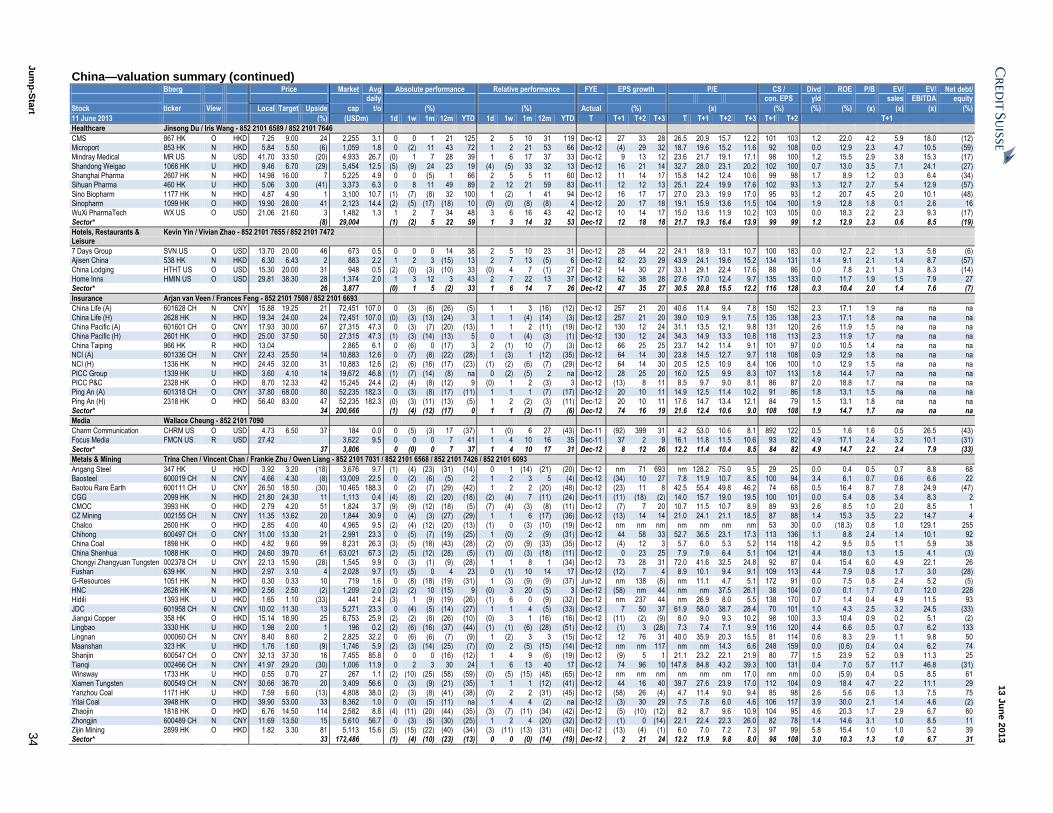
13 J
un
e 2
013
Ju
mp
-Sta
rt 3
4
China—valuation summary (continued) Bberg Price Market Avg Absolute performance Relative performance FYE EPS growth P/E CS / Divd ROE P/B EV/ EV/ Net debt/ daily con. EPS yld sales EBITDA equity
Stock ticker View Local Target Upside cap t/o (%) (%) Actual (%) (x) (%) (%) (%) (x) (x) (x) (%)
11 June 2013 (%) (USDm) 1d 1w 1m 12m YTD 1d 1w 1m 12m YTD T T+1 T+2 T+3 T T+1 T+2 T+3 T+1 T+2 T+1
Healthcare Jinsong Du / Iris Wang - 852 2101 6589 / 852 2101 7646
CMS 867 HK O HKD 7.25 9.00 24 2,255 3.1 0 0 1 21 125 2 5 10 31 119 Dec-12 27 33 28 26.5 20.9 15.7 12.2 101 103 1.2 22.0 4.2 5.9 18.0 (12) Microport 853 HK N HKD 5.84 5.50 (6) 1,059 1.8 0 (2) 11 43 72 1 2 21 53 66 Dec-12 (4) 29 32 18.7 19.6 15.2 11.6 92 108 0.0 12.9 2.3 4.7 10.5 (59) Mindray Medical MR US N USD 41.70 33.50 (20) 4,933 26.7 (0) 1 7 28 39 1 6 17 37 33 Dec-12 9 13 12 23.6 21.7 19.1 17.1 98 100 1.2 15.5 2.9 3.8 15.3 (17)
Shandong Weigao 1066 HK U HKD 9.46 6.70 (29) 5,454 12.5 (5) (9) 24 23 19 (4) (5) 33 32 13 Dec-12 16 21 14 32.7 28.0 23.1 20.2 102 100 0.7 13.0 3.5 7.1 24.1 (27) Shanghai Pharma 2607 HK N HKD 14.98 16.00 7 5,225 4.9 0 0 (5) 1 66 2 5 5 11 60 Dec-12 11 14 17 15.8 14.2 12.4 10.6 99 98 1.7 8.9 1.2 0.3 6.4 (34) Sihuan Pharma 460 HK U HKD 5.06 3.00 (41) 3,373 6.3 0 8 11 49 89 2 12 21 59 83 Dec-11 12 12 13 25.1 22.4 19.9 17.6 102 93 1.3 12.7 2.7 5.4 12.9 (57)
Sino Biopharm 1177 HK N HKD 4.87 4.90 1 3,100 10.7 (1) (7) (8) 32 100 1 (2) 1 41 94 Dec-12 16 17 17 27.0 23.3 19.9 17.0 95 93 1.2 20.7 4.5 2.0 10.1 (48) Sinopharm 1099 HK O HKD 19.90 28.00 41 2,123 14.4 (2) (5) (17) (18) 10 (0) (0) (8) (8) 4 Dec-12 20 17 18 19.1 15.9 13.6 11.5 104 100 1.9 12.8 1.8 0.1 2.6 16 WuXi PharmaTech WX US O USD 21.06 21.60 3 1,482 1.3 1 2 7 34 48 3 6 16 43 42 Dec-12 10 14 17 15.0 13.6 11.9 10.2 103 105 0.0 18.3 2.2 2.3 9.3 (17)
Sector* (8) 29,004 (1) (2) 5 22 59 1 3 14 32 53 Dec-12 12 18 18 21.7 19.3 16.4 13.9 99 99 1.2 12.9 2.3 0.6 8.5 (19)
Hotels, Restaurants & Leisure
Kevin Yin / Vivian Zhao - 852 2101 7655 / 852 2101 7472
7 Days Group SVN US O USD 13.70 20.00 46 673 0.5 0 0 0 14 38 2 5 10 23 31 Dec-12 28 44 22 24.1 18.9 13.1 10.7 100 183 0.0 12.7 2.2 1.3 5.8 (6) Ajisen China 538 HK N HKD 6.30 6.43 2 883 2.2 1 2 3 (15) 13 2 7 13 (5) 6 Dec-12 82 23 29 43.9 24.1 19.6 15.2 134 131 1.4 9.1 2.1 1.4 8.7 (57)
China Lodging HTHT US O USD 15.30 20.00 31 948 0.5 (2) (0) (3) (10) 33 (0) 4 7 (1) 27 Dec-12 14 30 27 33.1 29.1 22.4 17.6 88 86 0.0 7.8 2.1 1.3 8.3 (14) Home Inns HMIN US O USD 29.81 38.30 28 1,374 2.0 1 3 12 3 43 2 7 22 13 37 Dec-12 62 38 28 27.6 17.0 12.4 9.7 135 133 0.0 11.7 1.9 1.5 7.9 27 Sector* 26 3,877 (0) 1 5 (2) 33 1 6 14 7 26 Dec-12 47 35 27 30.5 20.8 15.5 12.2 116 128 0.3 10.4 2.0 1.4 7.6 (7)
Insurance Arjan van Veen / Frances Feng - 852 2101 7508 / 852 2101 6693
China Life (A) 601628 CH N CNY 15.88 19.25 21 72,451 107.0 0 (3) (6) (26) (5) 1 1 3 (16) (12) Dec-12 257 21 20 40.6 11.4 9.4 7.8 150 152 2.3 17.1 1.9 na na na
China Life (H) 2628 HK N HKD 19.34 24.00 24 72,451 107.0 (0) (3) (13) (24) 3 1 1 (4) (14) (3) Dec-12 257 21 20 39.0 10.9 9.1 7.5 135 138 2.3 17.1 1.8 na na na China Pacific (A) 601601 CH O CNY 17.93 30.00 67 27,315 47.3 0 (3) (7) (20) (13) 1 1 2 (11) (19) Dec-12 130 12 24 31.1 13.5 12.1 9.8 131 120 2.6 11.9 1.5 na na na China Pacific (H) 2601 HK O HKD 25.00 37.50 50 27,315 47.3 (1) (3) (14) (13) 5 0 1 (4) (3) (1) Dec-12 130 12 24 34.3 14.9 13.3 10.8 118 113 2.3 11.9 1.7 na na na
China Taiping 966 HK R HKD 13.04 2,865 6.1 0 (6) 0 (17) 3 2 (1) 10 (7) (3) Dec-12 66 25 25 23.7 14.2 11.4 9.1 101 97 0.0 10.5 1.4 na na na NCI (A) 601336 CH N CNY 22.43 25.50 14 10,883 12.6 0 (7) (8) (22) (28) 1 (3) 1 (12) (35) Dec-12 64 14 30 23.8 14.5 12.7 9.7 118 108 0.9 12.9 1.8 na na na NCI (H) 1336 HK N HKD 24.45 32.00 31 10,883 12.6 (2) (6) (16) (17) (23) (1) (2) (6) (7) (29) Dec-12 64 14 30 20.5 12.5 10.9 8.4 106 100 1.0 12.9 1.5 na na na
PICC Group 1339 HK U HKD 3.60 4.10 14 19,672 46.8 (1) (7) (14) (8) na 0 (2) (5) 2 na Dec-12 28 25 20 16.0 12.5 9.9 8.3 107 113 1.8 14.4 1.7 na na na PICC P&C 2328 HK O HKD 8.70 12.33 42 15,245 24.4 (2) (4) (8) (12) 9 (0) 1 2 (3) 3 Dec-12 (13) 8 11 8.5 9.7 9.0 8.1 86 87 2.0 18.8 1.7 na na na Ping An (A) 601318 CH O CNY 37.80 68.00 80 52,235 182.3 0 (3) (8) (17) (11) 1 1 1 (7) (17) Dec-12 20 10 11 14.9 12.5 11.4 10.2 91 86 1.8 13.1 1.5 na na na
Ping An (H) 2318 HK O HKD 56.40 83.00 47 52,235 182.3 (0) (3) (11) (13) (5) 1 2 (2) (3) (11) Dec-12 20 10 11 17.6 14.7 13.4 12.1 84 79 1.5 13.1 1.8 na na na Sector* 34 200,666 (1) (4) (12) (17) 0 1 1 (3) (7) (6) Dec-12 74 16 19 21.6 12.4 10.6 9.0 108 108 1.9 14.7 1.7 na na na
Media Wallace Cheung - 852 2101 7090
Charm Communication CHRM US O USD 4.73 6.50 37 184 0.0 0 (5) (3) 17 (37) 1 (0) 6 27 (43) Dec-11 (92) 399 31 4.2 53.0 10.6 8.1 892 122 0.5 1.6 1.6 0.5 26.5 (43) Focus Media FMCN US R USD 27.42 3,622 9.5 0 0 0 7 41 1 4 10 16 35 Dec-11 37 2 9 16.1 11.8 11.5 10.6 93 82 4.9 17.1 2.4 3.2 10.1 (31)
Sector* 37 3,806 0 (0) 0 7 37 1 4 10 17 31 Dec-12 8 12 26 12.2 11.4 10.4 8.5 84 82 4.9 14.7 2.2 2.4 7.9 (33)
Metals & Mining Trina Chen / Vincent Chan / Frankie Zhu / Owen Liang - 852 2101 7031 / 852 2101 6568 / 852 2101 7426 / 852 2101 6093
Angang Steel 347 HK U HKD 3.92 3.20 (18) 3,676 9.7 (1) (4) (23) (31) (14) 0 1 (14) (21) (20) Dec-12 nm 71 693 nm 128.2 75.0 9.5 29 25 0.0 0.4 0.5 0.7 8.8 68 Baosteel 600019 CH N CNY 4.66 4.30 (8) 13,009 22.5 0 (2) (6) (5) 2 1 2 3 5 (4) Dec-12 (34) 10 27 7.8 11.9 10.7 8.5 100 94 3.4 6.1 0.7 0.6 6.6 22 Baotou Rare Earth 600111 CH U CNY 26.50 18.50 (30) 10,465 188.3 0 (2) (7) (29) (42) 1 2 2 (20) (48) Dec-12 (23) 11 8 42.5 55.4 49.8 46.2 74 68 0.5 16.4 8.7 7.8 24.9 (47)
CGG 2099 HK N HKD 21.80 24.30 11 1,113 0.4 (4) (8) (2) (20) (18) (2) (4) 7 (11) (24) Dec-11 (11) (18) (2) 14.0 15.7 19.0 19.5 100 101 0.0 5.4 0.8 3.4 8.3 2 CMOC 3993 HK O HKD 2.79 4.20 51 1,824 3.7 (9) (9) (12) (18) (5) (7) (4) (3) (8) (11) Dec-12 (7) 7 20 10.7 11.5 10.7 8.9 89 93 2.6 8.5 1.0 2.0 8.5 1 CZ Mining 002155 CH N CNY 11.35 13.62 20 1,844 30.9 0 (4) (3) (27) (29) 1 1 6 (17) (36) Dec-12 (13) 14 14 21.0 24.1 21.1 18.5 87 88 1.4 15.3 3.5 2.2 14.7 4
Chalco 2600 HK O HKD 2.85 4.00 40 4,965 9.5 (2) (4) (12) (20) (13) (1) 0 (3) (10) (19) Dec-12 nm nm nm nm nm nm nm 53 30 0.0 (18.3) 0.8 1.0 129.1 255 Chihong 600497 CH O CNY 11.00 13.30 21 2,991 23.3 0 (5) (7) (19) (25) 1 (0) 2 (9) (31) Dec-12 44 58 33 52.7 36.5 23.1 17.3 113 136 1.1 8.8 2.4 1.4 10.1 92 China Coal 1898 HK O HKD 4.82 9.60 99 8,231 26.3 (3) (5) (18) (43) (28) (2) (0) (9) (33) (35) Dec-12 (4) 12 3 5.7 6.0 5.3 5.2 114 118 4.2 9.5 0.5 1.1 5.9 38
China Shenhua 1088 HK O HKD 24.60 39.70 61 63,021 67.3 (2) (5) (12) (28) (5) (1) (0) (3) (18) (11) Dec-12 0 23 25 7.9 7.9 6.4 5.1 104 121 4.4 18.0 1.3 1.5 4.1 (3) Chongyi Zhangyuan Tungsten 002378 CH U CNY 22.13 15.90 (28) 1,545 9.9 0 (3) (1) (9) (28) 1 1 8 1 (34) Dec-12 73 28 31 72.0 41.6 32.5 24.8 92 87 0.4 15.4 6.0 4.9 22.1 26 Fushan 639 HK N HKD 2.97 3.10 4 2,028 9.7 (1) (5) 0 4 23 0 (1) 10 14 17 Dec-12 (12) 7 4 8.9 10.1 9.4 9.1 109 113 4.4 7.9 0.8 1.7 3.0 (28)
G-Resources 1051 HK N HKD 0.30 0.33 10 719 1.6 0 (8) (18) (19) (31) 1 (3) (9) (9) (37) Jun-12 nm 138 (8) nm 11.1 4.7 5.1 172 91 0.0 7.5 0.8 2.4 5.2 (5) HNC 2626 HK N HKD 2.56 2.50 (2) 1,209 2.0 (2) (2) 10 (15) 9 (0) 3 20 (5) 3 Dec-12 (58) nm 44 nm nm 37.5 26.1 38 104 0.0 0.1 1.7 0.7 12.0 228 Hidili 1393 HK U HKD 1.65 1.10 (33) 441 2.4 (3) 1 (9) (19) (26) (1) 6 0 (9) (32) Dec-12 nm 237 44 nm 26.9 8.0 5.5 138 170 0.7 1.4 0.4 4.9 11.5 93
JDC 601958 CH N CNY 10.02 11.30 13 5,271 23.3 0 (4) (5) (14) (27) 1 1 4 (5) (33) Dec-12 7 50 37 61.9 58.0 38.7 28.4 70 101 1.0 4.3 2.5 3.2 24.5 (33) Jiangxi Copper 358 HK O HKD 15.14 18.90 25 6,753 25.9 (2) (2) (8) (26) (10) (0) 3 1 (16) (16) Dec-12 (11) (2) (9) 8.0 9.0 9.3 10.2 98 100 3.3 10.4 0.9 0.2 5.1 (2) Lingbao 3330 HK U HKD 1.98 2.00 1 196 0.2 (2) (6) (16) (37) (44) (1) (1) (6) (28) (51) Dec-12 (1) 3 (28) 7.3 7.4 7.1 9.9 116 120 4.4 6.6 0.5 0.7 6.2 133
Lingnan 000060 CH N CNY 8.40 8.60 2 2,825 32.2 0 (6) (6) (7) (9) 1 (2) 3 3 (15) Dec-12 12 76 31 40.0 35.9 20.3 15.5 81 114 0.6 8.3 2.9 1.1 9.8 50 Maanshan 323 HK U HKD 1.76 1.60 (9) 1,746 5.9 (2) (3) (14) (25) (7) (0) 2 (5) (15) (14) Dec-12 nm nm 117 nm nm 14.3 6.6 248 159 0.0 (0.6) 0.4 0.4 6.2 74 Shanjin 600547 CH O CNY 32.13 37.30 16 7,455 85.8 0 0 0 (16) (12) 1 4 9 (6) (19) Dec-12 (9) 5 1 21.1 23.2 22.1 21.9 80 77 1.5 23.9 5.2 0.9 11.3 25
Tianqi 002466 CH N CNY 41.97 29.20 (30) 1,006 11.9 0 2 3 30 24 1 6 13 40 17 Dec-12 74 96 10 147.8 84.8 43.2 39.3 100 131 0.4 7.0 5.7 11.7 46.8 (31) Winsway 1733 HK U HKD 0.55 0.70 27 267 1.1 (2) (10) (25) (58) (59) (0) (5) (15) (48) (65) Dec-12 nm nm nm nm nm nm 17.0 nm nm 0.0 (5.9) 0.4 0.5 8.5 61 Xiamen Tungsten 600549 CH N CNY 30.66 36.70 20 3,409 56.6 0 (3) (9) (21) (35) 1 1 1 (12) (41) Dec-12 44 16 40 39.7 27.6 23.9 17.0 112 104 0.9 18.4 4.7 2.2 11.1 29
Yanzhou Coal 1171 HK U HKD 7.59 6.60 (13) 4,808 38.0 (2) (3) (8) (41) (38) (0) 2 2 (31) (45) Dec-12 (58) 26 (4) 4.7 11.4 9.0 9.4 85 98 2.6 5.6 0.6 1.3 7.5 75 Yitai Coal 3948 HK O HKD 39.90 53.00 33 8,362 1.0 0 (0) (5) (11) na 1 4 4 (2) na Dec-12 (3) 30 29 7.5 7.8 6.0 4.6 106 117 3.9 30.0 2.1 1.4 4.6 (2) Zhaojin 1818 HK O HKD 6.76 14.50 114 2,582 8.8 (4) (11) (20) (44) (35) (3) (7) (11) (34) (42) Dec-12 (5) (10) (12) 8.2 8.7 9.6 10.9 104 95 4.6 20.3 1.7 2.9 6.7 60
Zhongjin 600489 CH N CNY 11.69 13.50 15 5,610 56.7 0 (3) (5) (30) (25) 1 2 4 (20) (32) Dec-12 (1) 0 (14) 22.1 22.4 22.3 26.0 82 78 1.4 14.6 3.1 1.0 8.5 11 Zijin Mining 2899 HK O HKD 1.82 3.30 81 5,113 15.6 (5) (15) (22) (40) (34) (3) (11) (13) (31) (40) Dec-12 (13) (4) (1) 6.0 7.0 7.2 7.3 97 99 5.8 15.4 1.0 1.0 5.2 39 Sector* 33 172,486 (1) (4) (10) (23) (13) 0 0 (0) (14) (19) Dec-12 2 21 24 12.2 11.9 9.8 8.0 98 108 3.0 10.3 1.3 1.0 6.7 31
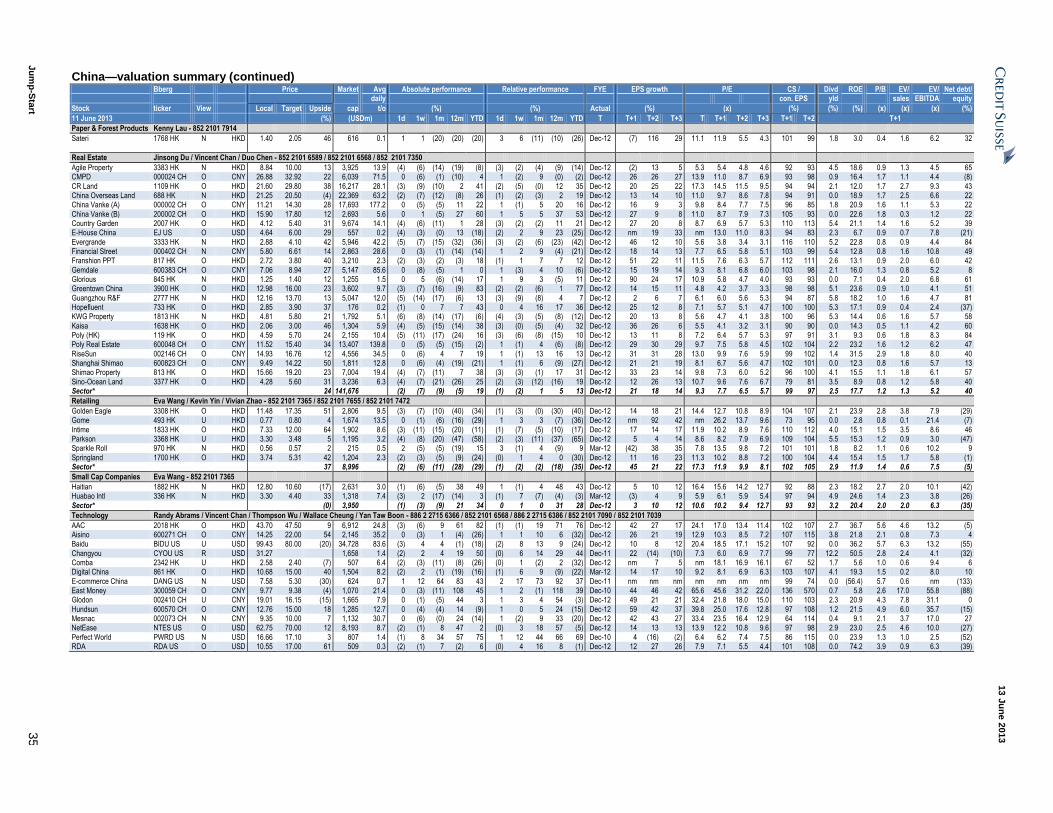
13 J
un
e 2
013
Ju
mp
-Sta
rt 3
5
China—valuation summary (continued) Bberg Price Market Avg Absolute performance Relative performance FYE EPS growth P/E CS / Divd ROE P/B EV/ EV/ Net debt/ daily con. EPS yld sales EBITDA equity
Stock ticker View Local Target Upside cap t/o (%) (%) Actual (%) (x) (%) (%) (%) (x) (x) (x) (%)
11 June 2013 (%) (USDm) 1d 1w 1m 12m YTD 1d 1w 1m 12m YTD T T+1 T+2 T+3 T T+1 T+2 T+3 T+1 T+2 T+1
Paper & Forest Products Kenny Lau - 852 2101 7914
Sateri 1768 HK N HKD 1.40 2.05 46 616 0.1 1 1 (20) (20) (20) 3 6 (11) (10) (26) Dec-12 (7) 116 29 11.1 11.9 5.5 4.3 101 99 1.8 3.0 0.4 1.6 6.2 32
Real Estate Jinsong Du / Vincent Chan / Duo Chen - 852 2101 6589 / 852 2101 6568 / 852 2101 7350
Agile Property 3383 HK N HKD 8.84 10.00 13 3,925 13.9 (4) (6) (14) (19) (8) (3) (2) (4) (9) (14) Dec-12 (2) 13 5 5.3 5.4 4.8 4.6 92 93 4.5 18.6 0.9 1.3 4.5 65 CMPD 000024 CH O CNY 26.88 32.92 22 6,039 71.5 0 (6) (1) (10) 4 1 (2) 9 (0) (2) Dec-12 26 26 27 13.9 11.0 8.7 6.9 93 98 0.9 16.4 1.7 1.1 4.4 (8)
CR Land 1109 HK O HKD 21.60 29.80 38 16,217 28.1 (3) (9) (10) 2 41 (2) (5) (0) 12 35 Dec-12 20 25 22 17.3 14.5 11.5 9.5 94 94 2.1 12.0 1.7 2.7 9.3 43 China Overseas Land 688 HK N HKD 21.25 20.50 (4) 22,369 63.2 (2) (7) (12) (8) 26 (1) (2) (3) 2 19 Dec-12 13 14 10 11.0 9.7 8.6 7.8 94 91 0.0 18.9 1.7 2.5 6.6 22 China Vanke (A) 000002 CH O CNY 11.21 14.30 28 17,693 177.2 0 (5) (5) 11 22 1 (1) 5 20 16 Dec-12 16 9 3 9.8 8.4 7.7 7.5 96 85 1.8 20.9 1.6 1.1 5.3 22
China Vanke (B) 200002 CH O HKD 15.90 17.80 12 2,693 5.6 0 1 (5) 27 60 1 5 5 37 53 Dec-12 27 9 8 11.0 8.7 7.9 7.3 105 93 0.0 22.6 1.8 0.3 1.2 22 Country Garden 2007 HK O HKD 4.12 5.40 31 9,674 14.1 (4) (6) (11) 1 28 (3) (2) (2) 11 21 Dec-12 27 20 8 8.7 6.9 5.7 5.3 110 113 5.4 21.1 1.4 1.6 5.2 39 E-House China EJ US O USD 4.64 6.00 29 557 0.2 (4) (3) (0) 13 (18) (2) 2 9 23 (25) Dec-12 nm 19 33 nm 13.0 11.0 8.3 94 83 2.3 6.7 0.9 0.7 7.8 (21)
Evergrande 3333 HK N HKD 2.88 4.10 42 5,946 42.2 (5) (7) (15) (32) (36) (3) (2) (6) (23) (42) Dec-12 46 12 10 5.6 3.8 3.4 3.1 116 110 5.2 22.8 0.8 0.9 4.4 84 Financial Street 000402 CH N CNY 5.80 6.61 14 2,863 28.6 0 (3) (1) (14) (14) 1 2 9 (4) (21) Dec-12 18 14 13 7.7 6.5 5.8 5.1 103 99 5.4 12.8 0.8 1.6 10.8 49 Franshion PPT 817 HK O HKD 2.72 3.80 40 3,210 2.3 (2) (3) (2) (3) 18 (1) 1 7 7 12 Dec-12 51 22 11 11.5 7.6 6.3 5.7 112 111 2.6 13.1 0.9 2.0 6.0 42
Gemdale 600383 CH O CNY 7.06 8.94 27 5,147 85.6 0 (8) (5) 1 0 1 (3) 4 10 (6) Dec-12 15 19 14 9.3 8.1 6.8 6.0 103 98 2.1 16.0 1.3 0.8 5.2 8 Glorious 845 HK N HKD 1.25 1.40 12 1,255 1.5 0 5 (6) (14) 17 1 9 3 (5) 11 Dec-12 90 24 17 10.9 5.8 4.7 4.0 93 93 0.0 7.1 0.4 2.0 6.8 61 Greentown China 3900 HK O HKD 12.98 16.00 23 3,602 9.7 (3) (7) (16) (9) 83 (2) (2) (6) 1 77 Dec-12 14 15 11 4.8 4.2 3.7 3.3 98 98 5.1 23.6 0.9 1.0 4.1 51
Guangzhou R&F 2777 HK N HKD 12.16 13.70 13 5,047 12.0 (5) (14) (17) (6) 13 (3) (9) (8) 4 7 Dec-12 2 6 7 6.1 6.0 5.6 5.3 94 87 5.8 18.2 1.0 1.6 4.7 81 Hopefluent 733 HK O HKD 2.85 3.90 37 176 0.2 (1) 0 7 7 43 0 4 16 17 36 Dec-12 25 12 8 7.1 5.7 5.1 4.7 100 100 5.3 17.1 0.9 0.4 2.4 (37) KWG Property 1813 HK N HKD 4.81 5.80 21 1,792 5.1 (6) (8) (14) (17) (6) (4) (3) (5) (8) (12) Dec-12 20 13 8 5.6 4.7 4.1 3.8 100 96 5.3 14.4 0.6 1.6 5.7 58
Kaisa 1638 HK O HKD 2.06 3.00 46 1,304 5.9 (4) (5) (15) (14) 38 (3) (0) (5) (4) 32 Dec-12 36 26 6 5.5 4.1 3.2 3.1 90 90 0.0 14.3 0.5 1.1 4.2 60 Poly (HK) 119 HK O HKD 4.59 5.70 24 2,155 10.4 (5) (11) (17) (24) 16 (3) (6) (8) (15) 10 Dec-12 13 11 8 7.2 6.4 5.7 5.3 97 91 3.1 9.3 0.6 1.8 8.3 84 Poly Real Estate 600048 CH O CNY 11.52 15.40 34 13,407 139.8 0 (5) (5) (15) (2) 1 (1) 4 (6) (8) Dec-12 29 30 29 9.7 7.5 5.8 4.5 102 104 2.2 23.2 1.6 1.2 6.2 47
RiseSun 002146 CH O CNY 14.93 16.76 12 4,556 34.5 0 (6) 4 7 19 1 (1) 13 16 13 Dec-12 31 31 28 13.0 9.9 7.6 5.9 99 102 1.4 31.5 2.9 1.8 8.0 40 Shanghai Shimao 600823 CH O CNY 9.49 14.22 50 1,811 12.8 0 (6) (4) (19) (21) 1 (1) 6 (9) (27) Dec-12 21 21 19 8.1 6.7 5.6 4.7 102 101 0.0 12.3 0.8 1.6 5.7 13 Shimao Property 813 HK O HKD 15.66 19.20 23 7,004 19.4 (4) (7) (11) 7 38 (3) (3) (1) 17 31 Dec-12 33 23 14 9.8 7.3 6.0 5.2 96 100 4.1 15.5 1.1 1.8 6.1 57
Sino-Ocean Land 3377 HK O HKD 4.28 5.60 31 3,236 6.3 (4) (7) (21) (26) 25 (2) (3) (12) (16) 19 Dec-12 12 26 13 10.7 9.6 7.6 6.7 79 81 3.5 8.9 0.8 1.2 5.8 40 Sector* 24 141,676 (2) (7) (9) (5) 19 (1) (2) 1 5 13 Dec-12 21 18 14 9.3 7.7 6.5 5.7 99 97 2.5 17.7 1.2 1.3 5.2 40
Retailing Eva Wang / Kevin Yin / Vivian Zhao - 852 2101 7365 / 852 2101 7655 / 852 2101 7472
Golden Eagle 3308 HK O HKD 11.48 17.35 51 2,806 9.5 (3) (7) (10) (40) (34) (1) (3) (0) (30) (40) Dec-12 14 18 21 14.4 12.7 10.8 8.9 104 107 2.1 23.9 2.8 3.8 7.9 (29) Gome 493 HK U HKD 0.77 0.80 4 1,674 13.5 0 (1) (6) (16) (29) 1 3 3 (7) (36) Dec-12 nm 92 42 nm 26.2 13.7 9.6 73 95 0.0 2.8 0.8 0.1 21.4 (7)
Intime 1833 HK O HKD 7.33 12.00 64 1,902 8.6 (3) (11) (15) (20) (11) (1) (7) (5) (10) (17) Dec-12 17 14 17 11.9 10.2 8.9 7.6 110 112 4.0 15.1 1.5 3.5 8.6 46 Parkson 3368 HK U HKD 3.30 3.48 5 1,195 3.2 (4) (8) (20) (47) (58) (2) (3) (11) (37) (65) Dec-12 5 4 14 8.6 8.2 7.9 6.9 109 104 5.5 15.3 1.2 0.9 3.0 (47) Sparkle Roll 970 HK N HKD 0.56 0.57 2 215 0.5 2 (5) (5) (19) 15 3 (1) 4 (9) 9 Mar-12 (42) 38 35 7.8 13.5 9.8 7.2 101 101 1.8 8.2 1.1 0.6 10.2 9
Springland 1700 HK O HKD 3.74 5.31 42 1,204 2.3 (2) (3) (5) (9) (24) (0) 1 4 0 (30) Dec-12 11 16 23 11.3 10.2 8.8 7.2 100 104 4.4 15.4 1.5 1.7 5.8 (1) Sector* 37 8,996 (2) (6) (11) (28) (29) (1) (2) (2) (18) (35) Dec-12 45 21 22 17.3 11.9 9.9 8.1 102 105 2.9 11.9 1.4 0.6 7.5 (5)
Small Cap Companies Eva Wang - 852 2101 7365
Haitian 1882 HK N HKD 12.80 10.60 (17) 2,631 3.0 (1) (6) (5) 38 49 1 (1) 4 48 43 Dec-12 5 10 12 16.4 15.6 14.2 12.7 92 88 2.3 18.2 2.7 2.0 10.1 (42) Huabao Intl 336 HK N HKD 3.30 4.40 33 1,318 7.4 (3) 2 (17) (14) 3 (1) 7 (7) (4) (3) Mar-12 (3) 4 9 5.9 6.1 5.9 5.4 97 94 4.9 24.6 1.4 2.3 3.8 (26)
Sector* (0) 3,950 (1) (3) (9) 21 34 0 1 0 31 28 Dec-12 3 10 12 10.6 10.2 9.4 12.7 93 93 3.2 20.4 2.0 2.0 6.3 (35)
Technology Randy Abrams / Vincent Chan / Thompson Wu / Wallace Cheung / Yan Taw Boon - 886 2 2715 6366 / 852 2101 6568 / 886 2 2715 6386 / 852 2101 7090 / 852 2101 7039
AAC 2018 HK O HKD 43.70 47.50 9 6,912 24.8 (3) (6) 9 61 82 (1) (1) 19 71 76 Dec-12 42 27 17 24.1 17.0 13.4 11.4 102 107 2.7 36.7 5.6 4.6 13.2 (5) Aisino 600271 CH O CNY 14.25 22.00 54 2,145 35.2 0 (3) 1 (4) (26) 1 1 10 6 (32) Dec-12 26 21 19 12.9 10.3 8.5 7.2 107 115 3.8 21.8 2.1 0.8 7.3 4 Baidu BIDU US U USD 99.43 80.00 (20) 34,728 83.6 (3) 4 4 (1) (18) (2) 8 13 9 (24) Dec-12 10 8 12 20.4 18.5 17.1 15.2 107 92 0.0 36.2 5.7 6.3 13.2 (55)
Changyou CYOU US R USD 31.27 1,658 1.4 (2) 2 4 19 50 (0) 6 14 29 44 Dec-11 22 (14) (10) 7.3 6.0 6.9 7.7 99 77 12.2 50.5 2.8 2.4 4.1 (32) Comba 2342 HK U HKD 2.58 2.40 (7) 507 6.4 (2) (3) (11) (8) (26) (0) 1 (2) 2 (32) Dec-12 nm 7 5 nm 18.1 16.9 16.1 67 52 1.7 5.6 1.0 0.6 9.4 6 Digital China 861 HK O HKD 10.68 15.00 40 1,504 8.2 (2) 2 (1) (19) (16) (1) 6 9 (9) (22) Mar-12 14 17 10 9.2 8.1 6.9 6.3 103 107 4.1 19.3 1.5 0.2 8.0 10
E-commerce China DANG US N USD 7.58 5.30 (30) 624 0.7 1 12 64 83 43 2 17 73 92 37 Dec-11 nm nm nm nm nm nm nm 99 74 0.0 (56.4) 5.7 0.6 nm (133) East Money 300059 CH O CNY 9.77 9.38 (4) 1,070 21.4 0 (3) (11) 108 45 1 2 (1) 118 39 Dec-10 44 46 42 65.6 45.6 31.2 22.0 136 570 0.7 5.8 2.6 17.0 55.8 (88) Glodon 002410 CH U CNY 19.01 16.15 (15) 1,665 7.9 0 (1) (5) 44 3 1 3 4 54 (3) Dec-12 49 21 21 32.4 21.8 18.0 15.0 110 103 2.3 20.9 4.3 7.8 31.1 0
Hundsun 600570 CH O CNY 12.76 15.00 18 1,285 12.7 0 (4) (4) 14 (9) 1 0 5 24 (15) Dec-12 59 42 37 39.8 25.0 17.6 12.8 97 108 1.2 21.5 4.9 6.0 35.7 (15) Mesnac 002073 CH N CNY 9.35 10.00 7 1,132 30.7 0 (6) (0) 24 (14) 1 (2) 9 33 (20) Dec-12 42 43 27 33.4 23.5 16.4 12.9 64 114 0.4 9.1 2.1 3.7 17.0 27 NetEase NTES US O USD 62.75 70.00 12 8,193 8.7 (2) (1) 8 47 2 (0) 3 18 57 (5) Dec-12 14 13 13 13.9 12.2 10.8 9.6 97 98 2.9 23.0 2.5 4.6 10.0 (27)
Perfect World PWRD US N USD 16.66 17.10 3 807 1.4 (1) 8 34 57 75 1 12 44 66 69 Dec-10 4 (16) (2) 6.4 6.2 7.4 7.5 86 115 0.0 23.9 1.3 1.0 2.5 (52) RDA RDA US O USD 10.55 17.00 61 509 0.3 (2) (1) 7 (2) 6 (0) 4 16 8 (1) Dec-12 12 27 26 7.9 7.1 5.5 4.4 101 108 0.0 74.2 3.9 0.9 6.3 (39)
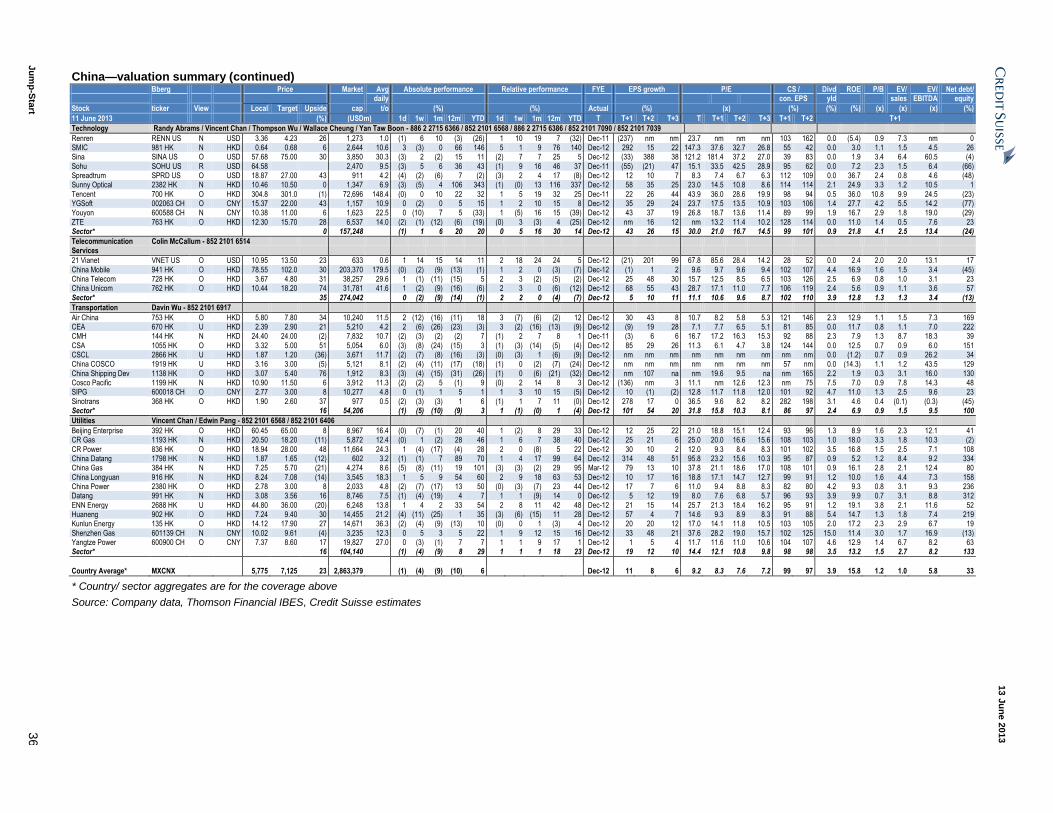
13 J
un
e 2
013
Ju
mp
-Sta
rt 3
6
China—valuation summary (continued) Bberg Price Market Avg Absolute performance Relative performance FYE EPS growth P/E CS / Divd ROE P/B EV/ EV/ Net debt/ daily con. EPS yld sales EBITDA equity
Stock ticker View Local Target Upside cap t/o (%) (%) Actual (%) (x) (%) (%) (%) (x) (x) (x) (%)
11 June 2013 (%) (USDm) 1d 1w 1m 12m YTD 1d 1w 1m 12m YTD T T+1 T+2 T+3 T T+1 T+2 T+3 T+1 T+2 T+1
Technology Randy Abrams / Vincent Chan / Thompson Wu / Wallace Cheung / Yan Taw Boon - 886 2 2715 6366 / 852 2101 6568 / 886 2 2715 6386 / 852 2101 7090 / 852 2101 7039
Renren RENN US N USD 3.36 4.23 26 1,273 1.0 (1) 6 10 (3) (26) 1 10 19 7 (32) Dec-11 (237) nm nm 23.7 nm nm nm 103 162 0.0 (5.4) 0.9 7.3 nm 0 SMIC 981 HK N HKD 0.64 0.68 6 2,644 10.6 3 (3) 0 66 146 5 1 9 76 140 Dec-12 292 15 22 147.3 37.6 32.7 26.8 55 42 0.0 3.0 1.1 1.5 4.5 26 Sina SINA US O USD 57.68 75.00 30 3,850 30.3 (3) 2 (2) 15 11 (2) 7 7 25 5 Dec-12 (33) 388 38 121.2 181.4 37.2 27.0 39 83 0.0 1.9 3.4 6.4 60.5 (4)
Sohu SOHU US R USD 64.58 2,470 9.5 (3) 5 6 36 43 (1) 9 16 46 37 Dec-11 (55) (21) 47 15.1 33.5 42.5 28.9 95 62 0.0 7.2 2.3 1.5 6.4 (66) Spreadtrum SPRD US O USD 18.87 27.00 43 911 4.2 (4) (2) (6) 7 (2) (3) 2 4 17 (8) Dec-12 12 10 7 8.3 7.4 6.7 6.3 112 109 0.0 36.7 2.4 0.8 4.6 (48) Sunny Optical 2382 HK N HKD 10.46 10.50 0 1,347 6.9 (3) (5) 4 106 343 (1) (0) 13 116 337 Dec-12 58 35 25 23.0 14.5 10.8 8.6 114 114 2.1 24.9 3.3 1.2 10.5 1
Tencent 700 HK O HKD 304.8 301.0 (1) 72,696 148.4 (0) 0 10 22 32 1 5 19 32 25 Dec-11 22 26 44 43.9 36.0 28.6 19.9 98 94 0.5 36.0 10.8 9.9 24.5 (23) YGSoft 002063 CH O CNY 15.37 22.00 43 1,157 10.9 0 (2) 0 5 15 1 2 10 15 8 Dec-12 35 29 24 23.7 17.5 13.5 10.9 103 106 1.4 27.7 4.2 5.5 14.2 (77) Youyon 600588 CH N CNY 10.38 11.00 6 1,623 22.5 0 (10) 7 5 (33) 1 (5) 16 15 (39) Dec-12 43 37 19 26.8 18.7 13.6 11.4 89 99 1.9 16.7 2.9 1.8 19.0 (29)
ZTE 763 HK O HKD 12.30 15.70 28 6,537 14.0 (2) (1) (12) (6) (19) (0) 3 (3) 4 (25) Dec-12 nm 16 12 nm 13.2 11.4 10.2 128 114 0.0 11.0 1.4 0.5 7.6 23 Sector* 0 157,248 (1) 1 6 20 20 0 5 16 30 14 Dec-12 43 26 15 30.0 21.0 16.7 14.5 99 101 0.9 21.8 4.1 2.5 13.4 (24)
Telecommunication Services
Colin McCallum - 852 2101 6514
21 Vianet VNET US O USD 10.95 13.50 23 633 0.6 1 14 15 14 11 2 18 24 24 5 Dec-12 (21) 201 99 67.8 85.6 28.4 14.2 28 52 0.0 2.4 2.0 2.0 13.1 17
China Mobile 941 HK O HKD 78.55 102.0 30 203,370 179.5 (0) (2) (9) (13) (1) 1 2 0 (3) (7) Dec-12 (1) 1 2 9.6 9.7 9.6 9.4 102 107 4.4 16.9 1.6 1.5 3.4 (45) China Telecom 728 HK O HKD 3.67 4.80 31 38,257 29.6 1 (1) (11) (15) 5 2 3 (2) (5) (2) Dec-12 25 48 30 15.7 12.5 8.5 6.5 103 126 2.5 6.9 0.8 1.0 3.1 23 China Unicom 762 HK O HKD 10.44 18.20 74 31,781 41.6 1 (2) (9) (16) (6) 2 3 0 (6) (12) Dec-12 68 55 43 28.7 17.1 11.0 7.7 106 119 2.4 5.6 0.9 1.1 3.6 57
Sector* 35 274,042 0 (2) (9) (14) (1) 2 2 0 (4) (7) Dec-12 5 10 11 11.1 10.6 9.6 8.7 102 110 3.9 12.8 1.3 1.3 3.4 (13)
Transportation Davin Wu - 852 2101 6917
Air China 753 HK O HKD 5.80 7.80 34 10,240 11.5 2 (12) (16) (11) 18 3 (7) (6) (2) 12 Dec-12 30 43 8 10.7 8.2 5.8 5.3 121 146 2.3 12.9 1.1 1.5 7.3 169 CEA 670 HK U HKD 2.39 2.90 21 5,210 4.2 2 (6) (26) (23) (3) 3 (2) (16) (13) (9) Dec-12 (9) 19 28 7.1 7.7 6.5 5.1 81 85 0.0 11.7 0.8 1.1 7.0 222 CMH 144 HK N HKD 24.40 24.00 (2) 7,832 10.7 (2) (3) (2) (2) 7 (1) 2 7 8 1 Dec-11 (3) 6 6 16.7 17.2 16.3 15.3 92 88 2.3 7.9 1.3 8.7 18.3 39
CSA 1055 HK O HKD 3.32 5.00 51 5,054 6.0 (3) (8) (24) (15) 3 (1) (3) (14) (5) (4) Dec-12 85 29 26 11.3 6.1 4.7 3.8 124 144 0.0 12.5 0.7 0.9 6.0 151 CSCL 2866 HK U HKD 1.87 1.20 (36) 3,671 11.7 (2) (7) (8) (16) (3) (0) (3) 1 (6) (9) Dec-12 nm nm nm nm nm nm nm nm nm 0.0 (1.2) 0.7 0.9 26.2 34 China COSCO 1919 HK U HKD 3.16 3.00 (5) 5,121 8.1 (2) (4) (11) (17) (18) (1) 0 (2) (7) (24) Dec-12 nm nm nm nm nm nm nm 57 nm 0.0 (14.3) 1.1 1.2 43.5 129
China Shipping Dev 1138 HK O HKD 3.07 5.40 76 1,912 8.3 (3) (4) (15) (31) (26) (1) 0 (6) (21) (32) Dec-12 nm 107 na nm 19.6 9.5 na nm 165 2.2 1.9 0.3 3.1 16.0 130 Cosco Pacific 1199 HK N HKD 10.90 11.50 6 3,912 11.3 (2) (2) 5 (1) 9 (0) 2 14 8 3 Dec-12 (136) nm 3 11.1 nm 12.6 12.3 nm 75 7.5 7.0 0.9 7.8 14.3 48 SIPG 600018 CH O CNY 2.77 3.00 8 10,277 4.8 0 (1) 1 5 1 1 3 10 15 (5) Dec-12 10 (1) (2) 12.8 11.7 11.8 12.0 101 92 4.7 11.0 1.3 2.5 9.6 23
Sinotrans 368 HK O HKD 1.90 2.60 37 977 0.5 (2) (3) (3) 1 6 (1) 1 7 11 (0) Dec-12 278 17 0 36.5 9.6 8.2 8.2 282 198 3.1 4.6 0.4 (0.1) (0.3) (45) Sector* 16 54,206 (1) (5) (10) (9) 3 1 (1) (0) 1 (4) Dec-12 101 54 20 31.8 15.8 10.3 8.1 86 97 2.4 6.9 0.9 1.5 9.5 100
Utilities Vincent Chan / Edwin Pang - 852 2101 6568 / 852 2101 6406
Beijing Enterprise 392 HK O HKD 60.45 65.00 8 8,967 16.4 (0) (7) (1) 20 40 1 (2) 8 29 33 Dec-12 12 25 22 21.0 18.8 15.1 12.4 93 96 1.3 8.9 1.6 2.3 12.1 41 CR Gas 1193 HK N HKD 20.50 18.20 (11) 5,872 12.4 (0) 1 (2) 28 46 1 6 7 38 40 Dec-12 25 21 6 25.0 20.0 16.6 15.6 108 103 1.0 18.0 3.3 1.8 10.3 (2)
CR Power 836 HK O HKD 18.94 28.00 48 11,664 24.3 1 (4) (17) (4) 28 2 0 (8) 5 22 Dec-12 30 10 2 12.0 9.3 8.4 8.3 101 102 3.5 16.8 1.5 2.5 7.1 108 China Datang 1798 HK N HKD 1.87 1.65 (12) 602 3.2 (1) (1) 7 89 70 1 4 17 99 64 Dec-12 314 48 51 95.8 23.2 15.6 10.3 95 87 0.9 5.2 1.2 8.4 9.2 334 China Gas 384 HK N HKD 7.25 5.70 (21) 4,274 8.6 (5) (8) (11) 19 101 (3) (3) (2) 29 95 Mar-12 79 13 10 37.8 21.1 18.6 17.0 108 101 0.9 16.1 2.8 2.1 12.4 80
China Longyuan 916 HK N HKD 8.24 7.08 (14) 3,545 18.3 1 5 9 54 60 2 9 18 63 53 Dec-12 10 17 16 18.8 17.1 14.7 12.7 99 91 1.2 10.0 1.6 4.4 7.3 158 China Power 2380 HK O HKD 2.78 3.00 8 2,033 4.8 (2) (7) (17) 13 50 (0) (3) (7) 23 44 Dec-12 17 7 6 11.0 9.4 8.8 8.3 82 80 4.2 9.3 0.8 3.1 9.3 236 Datang 991 HK N HKD 3.08 3.56 16 8,746 7.5 (1) (4) (19) 4 7 1 1 (9) 14 0 Dec-12 5 12 19 8.0 7.6 6.8 5.7 96 93 3.9 9.9 0.7 3.1 8.8 312
ENN Energy 2688 HK U HKD 44.80 36.00 (20) 6,248 13.8 1 4 2 33 54 2 8 11 42 48 Dec-12 21 15 14 25.7 21.3 18.4 16.2 95 91 1.2 19.1 3.8 2.1 11.6 52 Huaneng 902 HK O HKD 7.24 9.40 30 14,455 21.2 (4) (11) (25) 1 35 (3) (6) (15) 11 28 Dec-12 57 4 7 14.6 9.3 8.9 8.3 91 88 5.4 14.7 1.3 1.8 7.4 219 Kunlun Energy 135 HK O HKD 14.12 17.90 27 14,671 36.3 (2) (4) (9) (13) 10 (0) 0 1 (3) 4 Dec-12 20 20 12 17.0 14.1 11.8 10.5 103 105 2.0 17.2 2.3 2.9 6.7 19
Shenzhen Gas 601139 CH N CNY 10.02 9.61 (4) 3,235 12.3 0 5 3 5 22 1 9 12 15 16 Dec-12 33 48 21 37.6 28.2 19.0 15.7 102 125 15.0 11.4 3.0 1.7 16.9 (13) Yangtze Power 600900 CH O CNY 7.37 8.60 17 19,827 27.0 0 (3) (1) 7 7 1 1 9 17 1 Dec-12 1 5 4 11.7 11.6 11.0 10.6 104 107 4.6 12.9 1.4 6.7 8.2 63 Sector* 16 104,140 (1) (4) (9) 8 29 1 1 1 18 23 Dec-12 19 12 10 14.4 12.1 10.8 9.8 98 98 3.5 13.2 1.5 2.7 8.2 133
Country Average* MXCNX 5,775 7,125 23 2,863,379 (1) (4) (9) (10) 6 Dec-12 11 8 6 9.2 8.3 7.6 7.2 99 97 3.9 15.8 1.2 1.0 5.8 33
* Country/ sector aggregates are for the coverage above
Source: Company data, Thomson Financial IBES, Credit Suisse estimates
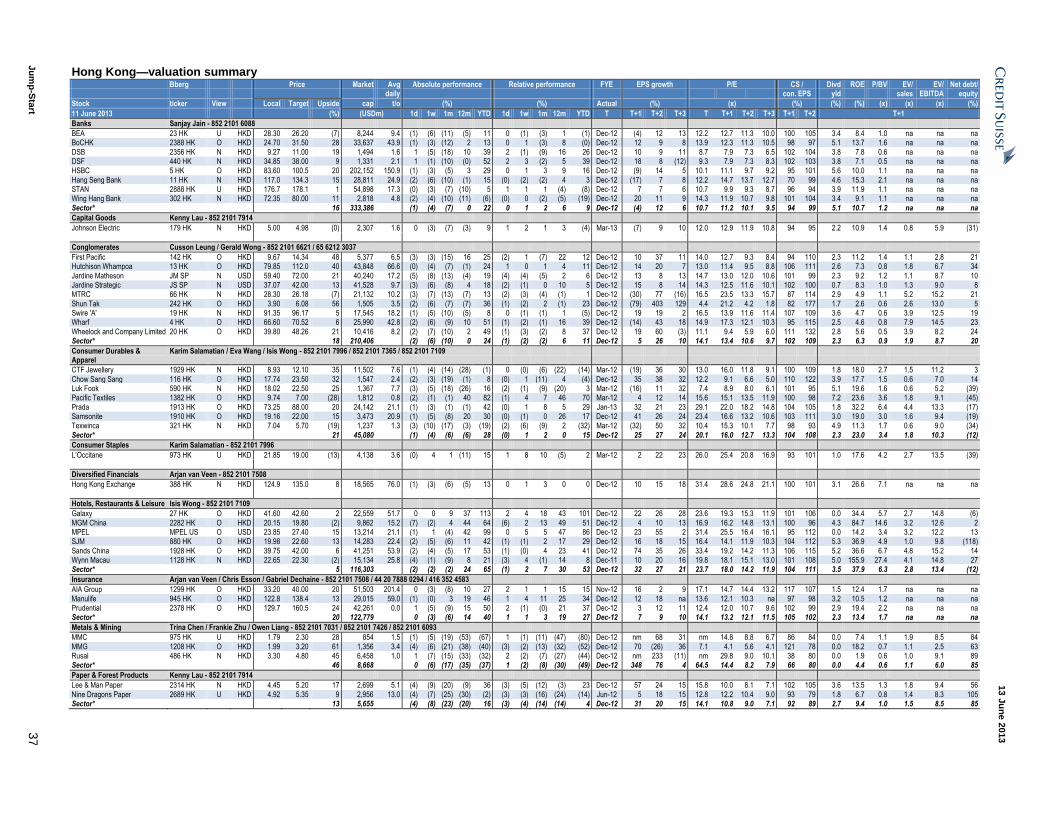
13 J
un
e 2
013
Ju
mp
-Sta
rt 3
7
Hong Kong—valuation summary Bberg Price Market Avg Absolute performance Relative performance FYE EPS growth P/E CS / Divd ROE P/BV EV/ EV/ Net debt/ daily con. EPS yld sales EBITDA equity
Stock ticker View Local Target Upside cap t/o (%) (%) Actual (%) (x) (%) (%) (%) (x) (x) (x) (%)
11 June 2013 (%) (USDm) 1d 1w 1m 12m YTD 1d 1w 1m 12m YTD T T+1 T+2 T+3 T T+1 T+2 T+3 T+1 T+2 T+1
Banks Sanjay Jain - 852 2101 6088
BEA 23 HK U HKD 28.30 26.20 (7) 8,244 9.4 (1) (6) (11) (5) 11 0 (1) (3) 1 (1) Dec-12 (4) 12 13 12.2 12.7 11.3 10.0 100 105 3.4 8.4 1.0 na na na BoCHK 2388 HK O HKD 24.70 31.50 28 33,637 43.9 (1) (3) (12) 2 13 0 1 (3) 8 (0) Dec-12 12 9 8 13.9 12.3 11.3 10.5 98 97 5.1 13.7 1.6 na na na
DSB 2356 HK N HKD 9.27 11.00 19 1,494 1.6 1 (5) (18) 10 39 2 (1) (9) 16 26 Dec-12 10 9 11 8.7 7.9 7.3 6.5 102 104 3.8 7.8 0.6 na na na DSF 440 HK N HKD 34.85 38.00 9 1,331 2.1 1 (1) (10) (0) 52 2 3 (2) 5 39 Dec-12 18 8 (12) 9.3 7.9 7.3 8.3 102 103 3.8 7.1 0.5 na na na HSBC 5 HK O HKD 83.60 100.5 20 202,152 150.9 (1) (3) (5) 3 29 0 1 3 9 16 Dec-12 (9) 14 5 10.1 11.1 9.7 9.2 95 101 5.6 10.0 1.1 na na na
Hang Seng Bank 11 HK N HKD 117.0 134.3 15 28,811 24.9 (2) (6) (10) (1) 15 (0) (2) (2) 4 3 Dec-12 (17) 7 8 12.2 14.7 13.7 12.7 70 99 4.6 15.3 2.1 na na na STAN 2888 HK U HKD 176.7 178.1 1 54,898 17.3 (0) (3) (7) (10) 5 1 1 1 (4) (8) Dec-12 7 7 6 10.7 9.9 9.3 8.7 96 94 3.9 11.9 1.1 na na na Wing Hang Bank 302 HK N HKD 72.35 80.00 11 2,818 4.8 (2) (4) (10) (11) (6) (0) 0 (2) (5) (19) Dec-12 20 11 9 14.3 11.9 10.7 9.8 101 104 3.4 9.1 1.1 na na na
Sector* 16 333,386 (1) (4) (7) 0 22 0 1 2 6 9 Dec-12 (4) 12 6 10.7 11.2 10.1 9.5 94 99 5.1 10.7 1.2 na na na
Capital Goods Kenny Lau - 852 2101 7914
Johnson Electric 179 HK N HKD 5.00 4.98 (0) 2,307 1.6 0 (3) (7) (3) 9 1 2 1 3 (4) Mar-13 (7) 9 10 12.0 12.9 11.9 10.8 94 95 2.2 10.9 1.4 0.8 5.9 (31)
Conglomerates Cusson Leung / Gerald Wong - 852 2101 6621 / 65 6212 3037
First Pacific 142 HK O HKD 9.67 14.34 48 5,377 6.5 (3) (3) (15) 16 25 (2) 1 (7) 22 12 Dec-12 10 37 11 14.0 12.7 9.3 8.4 94 110 2.3 11.2 1.4 1.1 2.8 21 Hutchison Whampoa 13 HK O HKD 79.85 112.0 40 43,848 66.6 (0) (4) (7) (1) 24 1 0 1 4 11 Dec-12 14 20 7 13.0 11.4 9.5 8.8 106 111 2.6 7.3 0.8 1.8 6.7 34
Jardine Matheson JM SP N USD 59.40 72.00 21 40,240 17.2 (5) (8) (13) (4) 19 (4) (4) (5) 2 6 Dec-12 13 8 13 14.7 13.0 12.0 10.6 101 99 2.3 9.2 1.2 1.1 8.7 10 Jardine Strategic JS SP N USD 37.07 42.00 13 41,528 9.7 (3) (6) (8) 4 18 (2) (1) 0 10 5 Dec-12 15 8 14 14.3 12.5 11.6 10.1 102 100 0.7 8.3 1.0 1.3 9.0 8 MTRC 66 HK N HKD 28.30 26.18 (7) 21,132 10.2 (3) (7) (13) (7) 13 (2) (3) (4) (1) 1 Dec-12 (30) 77 (16) 16.5 23.5 13.3 15.7 87 114 2.9 4.9 1.1 5.2 15.2 21
Shun Tak 242 HK O HKD 3.90 6.08 56 1,505 3.5 (2) (6) (7) (7) 36 (1) (2) 2 (1) 23 Dec-12 (79) 403 129 4.4 21.2 4.2 1.8 82 177 1.7 2.6 0.6 2.6 13.0 5 Swire 'A' 19 HK N HKD 91.35 96.17 5 17,545 18.2 (1) (5) (10) (5) 8 0 (1) (1) 1 (5) Dec-12 19 19 2 16.5 13.9 11.6 11.4 107 109 3.6 4.7 0.6 3.9 12.5 19 Wharf 4 HK O HKD 66.60 70.52 6 25,990 42.8 (2) (6) (9) 10 51 (1) (2) (1) 16 39 Dec-12 (14) 43 18 14.9 17.3 12.1 10.3 95 115 2.5 4.6 0.8 7.9 14.5 23
Wheelock and Company Limited 20 HK O HKD 39.80 48.26 21 10,416 8.2 (2) (7) (10) 2 49 (1) (3) (2) 8 37 Dec-12 19 60 (3) 11.1 9.4 5.9 6.0 111 132 2.8 5.6 0.5 3.9 8.2 24 Sector* 18 210,406 (2) (6) (10) 0 24 (1) (2) (2) 6 11 Dec-12 5 26 10 14.1 13.4 10.6 9.7 102 109 2.3 6.3 0.9 1.9 8.7 20
Consumer Durables & Apparel
Karim Salamatian / Eva Wang / Isis Wong - 852 2101 7996 / 852 2101 7365 / 852 2101 7109
CTF Jewellery 1929 HK N HKD 8.93 12.10 35 11,502 7.6 (1) (4) (14) (28) (1) 0 (0) (6) (22) (14) Mar-12 (19) 36 30 13.0 16.0 11.8 9.1 100 109 1.8 18.0 2.7 1.5 11.2 3
Chow Sang Sang 116 HK O HKD 17.74 23.50 32 1,547 2.4 (2) (3) (19) (1) 8 (0) 1 (11) 4 (4) Dec-12 35 38 32 12.2 9.1 6.6 5.0 110 122 3.9 17.7 1.5 0.6 7.0 14 Luk Fook 590 HK N HKD 18.02 22.50 25 1,367 7.7 (3) (5) (18) (26) 16 (2) (1) (9) (20) 3 Mar-12 (16) 11 32 7.4 8.9 8.0 6.1 101 95 5.1 19.6 1.6 0.6 5.2 (39) Pacific Textiles 1382 HK O HKD 9.74 7.00 (28) 1,812 0.8 (2) (1) (1) 40 82 (1) 4 7 46 70 Mar-12 4 12 14 15.6 15.1 13.5 11.9 100 98 7.2 23.6 3.6 1.8 9.1 (45)
Prada 1913 HK O HKD 73.25 88.00 20 24,142 21.1 (1) (3) (1) (1) 42 (0) 1 8 5 29 Jan-13 32 21 23 29.1 22.0 18.2 14.8 104 105 1.8 32.2 6.4 4.4 13.3 (17) Samsonite 1910 HK O HKD 19.16 22.00 15 3,473 20.9 (1) (5) (8) 20 30 (0) (1) 0 26 17 Dec-12 41 26 24 23.4 16.6 13.2 10.6 103 111 3.0 19.0 3.0 1.6 9.4 (19) Texwinca 321 HK N HKD 7.04 5.70 (19) 1,237 1.3 (3) (10) (17) (3) (19) (2) (6) (9) 2 (32) Mar-12 (32) 50 32 10.4 15.3 10.1 7.7 98 93 4.9 11.3 1.7 0.6 9.0 (34)
Sector* 21 45,080 (1) (4) (6) (6) 28 (0) 1 2 0 15 Dec-12 25 27 24 20.1 16.0 12.7 13.3 104 108 2.3 23.0 3.4 1.8 10.3 (12)
Consumer Staples Karim Salamatian - 852 2101 7996
L’Occitane 973 HK U HKD 21.85 19.00 (13) 4,138 3.6 (0) 4 1 (11) 15 1 8 10 (5) 2 Mar-12 2 22 23 26.0 25.4 20.8 16.9 93 101 1.0 17.6 4.2 2.7 13.5 (39)
Diversified Financials Arjan van Veen - 852 2101 7508
Hong Kong Exchange 388 HK N HKD 124.9 135.0 8 18,565 76.0 (1) (3) (6) (5) 13 0 1 3 0 0 Dec-12 10 15 18 31.4 28.6 24.8 21.1 100 101 3.1 26.6 7.1 na na na
Hotels, Restaurants & Leisure Isis Wong - 852 2101 7109
Galaxy 27 HK O HKD 41.60 42.60 2 22,559 51.7 0 0 9 37 113 2 4 18 43 101 Dec-12 22 26 28 23.6 19.3 15.3 11.9 101 106 0.0 34.4 5.7 2.7 14.8 (6)
MGM China 2282 HK O HKD 20.15 19.80 (2) 9,862 15.2 (7) (2) 4 44 64 (6) 2 13 49 51 Dec-12 4 10 13 16.9 16.2 14.8 13.1 100 96 4.3 84.7 14.6 3.2 12.6 2 MPEL MPEL US O USD 23.85 27.40 15 13,214 21.1 (1) 1 (4) 42 99 0 5 5 47 86 Dec-12 23 55 2 31.4 25.5 16.4 16.1 95 112 0.0 14.2 3.4 3.2 12.2 13 SJM 880 HK O HKD 19.98 22.60 13 14,283 22.4 (2) (5) (6) 11 42 (1) (1) 2 17 29 Dec-12 16 18 15 16.4 14.1 11.9 10.3 104 112 5.3 36.9 4.9 1.0 9.8 (118)
Sands China 1928 HK O HKD 39.75 42.00 6 41,251 53.9 (2) (4) (5) 17 53 (1) (0) 4 23 41 Dec-12 74 35 26 33.4 19.2 14.2 11.3 106 115 5.2 36.6 6.7 4.8 15.2 14 Wynn Macau 1128 HK N HKD 22.65 22.30 (2) 15,134 25.8 (4) (1) (9) 8 21 (3) 4 (1) 14 8 Dec-11 10 20 16 19.8 18.1 15.1 13.0 101 108 5.0 155.9 27.4 4.1 14.8 27 Sector* 5 116,303 (2) (2) (2) 24 65 (1) 2 7 30 53 Dec-12 32 27 21 23.7 18.0 14.2 11.9 104 111 3.5 37.9 6.3 2.8 13.4 (12)
Insurance Arjan van Veen / Chris Esson / Gabriel Dechaine - 852 2101 7508 / 44 20 7888 0294 / 416 352 4583
AIA Group 1299 HK O HKD 33.20 40.00 20 51,503 201.4 0 (3) (8) 10 27 2 1 1 15 15 Nov-12 16 2 9 17.1 14.7 14.4 13.2 117 107 1.5 12.4 1.7 na na na
Manulife 945 HK O HKD 122.8 138.4 13 29,015 59.0 (1) (0) 3 19 46 1 4 11 25 34 Dec-12 12 18 na 13.6 12.1 10.3 na 97 98 3.2 10.5 1.2 na na na Prudential 2378 HK O HKD 129.7 160.5 24 42,261 0.0 1 (5) (9) 15 50 2 (1) (0) 21 37 Dec-12 3 12 11 12.4 12.0 10.7 9.6 102 99 2.9 19.4 2.2 na na na Sector* 20 122,779 0 (3) (6) 14 40 1 1 3 19 27 Dec-12 7 9 10 14.1 13.2 12.1 11.5 105 102 2.3 13.4 1.7 na na na
Metals & Mining Trina Chen / Frankie Zhu / Owen Liang - 852 2101 7031 / 852 2101 7426 / 852 2101 6093
MMC 975 HK U HKD 1.79 2.30 28 854 1.5 (1) (5) (19) (53) (67) 1 (1) (11) (47) (80) Dec-12 nm 68 31 nm 14.8 8.8 6.7 86 84 0.0 7.4 1.1 1.9 8.5 84
MMG 1208 HK O HKD 1.99 3.20 61 1,356 3.4 (4) (6) (21) (38) (40) (3) (2) (13) (32) (52) Dec-12 70 (26) 36 7.1 4.1 5.6 4.1 121 78 0.0 18.2 0.7 1.1 2.5 63 Rusal 486 HK N HKD 3.30 4.80 45 6,458 1.0 1 (7) (15) (33) (32) 2 (2) (7) (27) (44) Dec-12 nm 233 (11) nm 29.8 9.0 10.1 38 80 0.0 1.9 0.6 1.0 9.1 89 Sector* 46 8,668 0 (6) (17) (35) (37) 1 (2) (8) (30) (49) Dec-12 348 76 4 64.5 14.4 8.2 7.9 66 80 0.0 4.4 0.6 1.1 6.0 85
Paper & Forest Products Kenny Lau - 852 2101 7914
Lee & Man Paper 2314 HK N HKD 4.45 5.20 17 2,699 5.1 (4) (9) (20) (9) 36 (3) (5) (12) (3) 23 Dec-12 57 24 15 15.8 10.0 8.1 7.1 102 105 3.6 13.5 1.3 1.8 9.4 56
Nine Dragons Paper 2689 HK U HKD 4.92 5.35 9 2,956 13.0 (4) (7) (25) (30) (2) (3) (3) (16) (24) (14) Jun-12 5 18 15 12.8 12.2 10.4 9.0 93 79 1.8 6.7 0.8 1.4 8.3 105 Sector* 13 5,655 (4) (8) (23) (20) 16 (3) (4) (14) (14) 4 Dec-12 31 20 15 14.1 10.8 9.0 7.1 92 89 2.7 9.4 1.0 1.5 8.5 85
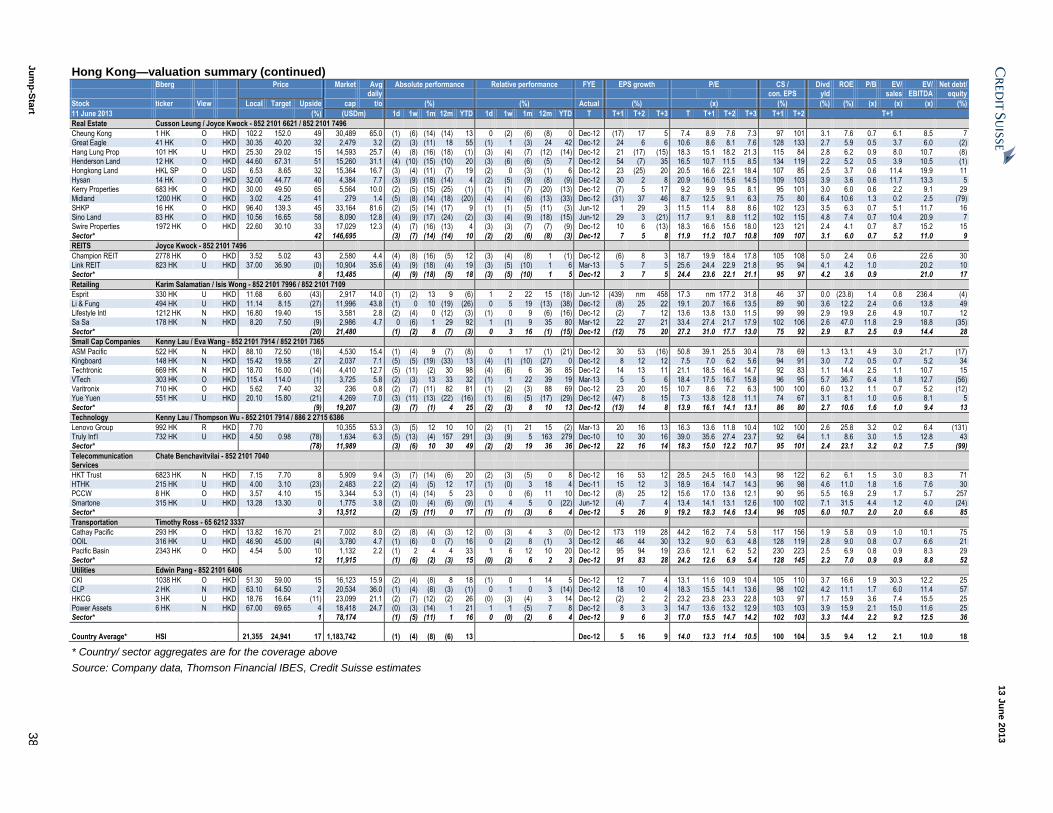
13 J
un
e 2
013
Ju
mp
-Sta
rt 3
8
Hong Kong—valuation summary (continued) Bberg Price Market Avg Absolute performance Relative performance FYE EPS growth P/E CS / Divd ROE P/B EV/ EV/ Net debt/ daily con. EPS yld sales EBITDA equity
Stock ticker View Local Target Upside cap t/o (%) (%) Actual (%) (x) (%) (%) (%) (x) (x) (x) (%)
11 June 2013 (%) (USDm) 1d 1w 1m 12m YTD 1d 1w 1m 12m YTD T T+1 T+2 T+3 T T+1 T+2 T+3 T+1 T+2 T+1
Real Estate Cusson Leung / Joyce Kwock - 852 2101 6621 / 852 2101 7496
Cheung Kong 1 HK O HKD 102.2 152.0 49 30,489 65.0 (1) (6) (14) (14) 13 0 (2) (6) (8) 0 Dec-12 (17) 17 5 7.4 8.9 7.6 7.3 97 101 3.1 7.6 0.7 6.1 8.5 7 Great Eagle 41 HK O HKD 30.35 40.20 32 2,479 3.2 (2) (3) (11) 18 55 (1) 1 (3) 24 42 Dec-12 24 6 6 10.6 8.6 8.1 7.6 128 133 2.7 5.9 0.5 3.7 6.0 (2)
Hang Lung Prop 101 HK U HKD 25.30 29.02 15 14,593 25.7 (4) (8) (16) (18) (1) (3) (4) (7) (12) (14) Dec-12 21 (17) (15) 18.3 15.1 18.2 21.3 115 84 2.8 6.2 0.9 8.0 10.7 (8) Henderson Land 12 HK O HKD 44.60 67.31 51 15,260 31.1 (4) (10) (15) (10) 20 (3) (6) (6) (5) 7 Dec-12 54 (7) 35 16.5 10.7 11.5 8.5 134 119 2.2 5.2 0.5 3.9 10.5 (1) Hongkong Land HKL SP O USD 6.53 8.65 32 15,364 16.7 (3) (4) (11) (7) 19 (2) 0 (3) (1) 6 Dec-12 23 (25) 20 20.5 16.6 22.1 18.4 107 85 2.5 3.7 0.6 11.4 19.9 11
Hysan 14 HK O HKD 32.00 44.77 40 4,384 7.7 (3) (9) (18) (14) 4 (2) (5) (9) (8) (9) Dec-12 30 2 8 20.9 16.0 15.6 14.5 109 103 3.9 3.6 0.6 11.7 13.3 5 Kerry Properties 683 HK O HKD 30.00 49.50 65 5,564 10.0 (2) (5) (15) (25) (1) (1) (1) (7) (20) (13) Dec-12 (7) 5 17 9.2 9.9 9.5 8.1 95 101 3.0 6.0 0.6 2.2 9.1 29 Midland 1200 HK O HKD 3.02 4.25 41 279 1.4 (5) (8) (14) (18) (20) (4) (4) (6) (13) (33) Dec-12 (31) 37 46 8.7 12.5 9.1 6.3 75 80 6.4 10.6 1.3 0.2 2.5 (79)
SHKP 16 HK O HKD 96.40 139.3 45 33,164 81.6 (2) (5) (14) (17) 9 (1) (1) (5) (11) (3) Jun-12 1 29 3 11.5 11.4 8.8 8.6 102 123 3.5 6.3 0.7 5.1 11.7 16 Sino Land 83 HK O HKD 10.56 16.65 58 8,090 12.8 (4) (9) (17) (24) (2) (3) (4) (9) (18) (15) Jun-12 29 3 (21) 11.7 9.1 8.8 11.2 102 115 4.8 7.4 0.7 10.4 20.9 7 Swire Properties 1972 HK O HKD 22.60 30.10 33 17,029 12.3 (4) (7) (16) (13) 4 (3) (3) (7) (7) (9) Dec-12 10 6 (13) 18.3 16.6 15.6 18.0 123 121 2.4 4.1 0.7 8.7 15.2 15
Sector* 42 146,695 (3) (7) (14) (14) 10 (2) (2) (6) (8) (3) Dec-12 7 5 8 11.9 11.2 10.7 10.8 109 107 3.1 6.0 0.7 5.2 11.0 9
REITS Joyce Kwock - 852 2101 7496
Champion REIT 2778 HK O HKD 3.52 5.02 43 2,580 4.4 (4) (8) (16) (5) 12 (3) (4) (8) 1 (1) Dec-12 (6) 8 3 18.7 19.9 18.4 17.8 105 108 5.0 2.4 0.6 22.6 30 Link REIT 823 HK U HKD 37.00 36.90 (0) 10,904 35.6 (4) (9) (18) (4) 19 (3) (5) (10) 1 6 Mar-13 5 7 5 25.6 24.4 22.9 21.8 95 94 4.1 4.2 1.0 20.2 10 Sector* 8 13,485 (4) (9) (18) (5) 18 (3) (5) (10) 1 5 Dec-12 3 7 5 24.4 23.6 22.1 21.1 95 97 4.2 3.6 0.9 21.0 17
Retailing Karim Salamatian / Isis Wong - 852 2101 7996 / 852 2101 7109
Esprit 330 HK U HKD 11.68 6.60 (43) 2,917 14.0 (1) (2) 13 9 (6) 1 2 22 15 (18) Jun-12 (439) nm 458 17.3 nm 177.2 31.8 46 37 0.0 (23.8) 1.4 0.8 236.4 (4)
Li & Fung 494 HK U HKD 11.14 8.15 (27) 11,996 43.8 (1) 0 10 (19) (26) 0 5 19 (13) (38) Dec-12 (8) 25 22 19.1 20.7 16.6 13.5 89 90 3.6 12.2 2.4 0.6 13.8 49 Lifestyle Intl 1212 HK N HKD 16.80 19.40 15 3,581 2.8 (2) (4) 0 (12) (3) (1) 0 9 (6) (16) Dec-12 (2) 7 12 13.6 13.8 13.0 11.5 99 99 2.9 19.9 2.6 4.9 10.7 12 Sa Sa 178 HK N HKD 8.20 7.50 (9) 2,986 4.7 0 (6) 1 29 92 1 (1) 9 35 80 Mar-12 22 27 21 33.4 27.4 21.7 17.9 102 106 2.6 47.0 11.8 2.9 18.8 (35)
Sector* (20) 21,480 (1) (2) 8 (7) (3) 0 3 16 (1) (15) Dec-12 (12) 75 20 27.2 31.0 17.7 13.0 75 92 2.9 8.7 2.5 0.9 14.4 28
Small Cap Companies Kenny Lau / Eva Wang - 852 2101 7914 / 852 2101 7365
ASM Pacific 522 HK N HKD 88.10 72.50 (18) 4,530 15.4 (1) (4) 9 (7) (8) 0 1 17 (1) (21) Dec-12 30 53 (16) 50.8 39.1 25.5 30.4 78 69 1.3 13.1 4.9 3.0 21.7 (17) Kingboard 148 HK N HKD 15.42 19.58 27 2,037 7.1 (5) (5) (19) (33) 13 (4) (1) (10) (27) 0 Dec-12 8 12 12 7.5 7.0 6.2 5.6 94 91 3.0 7.2 0.5 0.7 5.2 34 Techtronic 669 HK N HKD 18.70 16.00 (14) 4,410 12.7 (5) (11) (2) 30 98 (4) (6) 6 36 85 Dec-12 14 13 11 21.1 18.5 16.4 14.7 92 83 1.1 14.4 2.5 1.1 10.7 15
VTech 303 HK O HKD 115.4 114.0 (1) 3,725 5.8 (2) (3) 13 33 32 (1) 1 22 39 19 Mar-13 5 5 6 18.4 17.5 16.7 15.8 96 95 5.7 36.7 6.4 1.8 12.7 (56) Varitronix 710 HK O HKD 5.62 7.40 32 236 0.8 (2) (7) (11) 82 81 (1) (2) (3) 88 69 Dec-12 23 20 15 10.7 8.6 7.2 6.3 100 100 6.0 13.2 1.1 0.7 5.2 (12) Yue Yuen 551 HK U HKD 20.10 15.80 (21) 4,269 7.0 (3) (11) (13) (22) (16) (1) (6) (5) (17) (29) Dec-12 (47) 8 15 7.3 13.8 12.8 11.1 74 67 3.1 8.1 1.0 0.6 8.1 5
Sector* (9) 19,207 (3) (7) (1) 4 25 (2) (3) 8 10 13 Dec-12 (13) 14 8 13.9 16.1 14.1 13.1 86 80 2.7 10.6 1.6 1.0 9.4 13
Technology Kenny Lau / Thompson Wu - 852 2101 7914 / 886 2 2715 6386
Lenovo Group 992 HK R HKD 7.70 10,355 53.3 (3) (5) 12 10 10 (2) (1) 21 15 (2) Mar-13 20 16 13 16.3 13.6 11.8 10.4 102 100 2.6 25.8 3.2 0.2 6.4 (131) Truly Int'l 732 HK U HKD 4.50 0.98 (78) 1,634 6.3 (5) (13) (4) 157 291 (3) (9) 5 163 279 Dec-10 10 30 16 39.0 35.6 27.4 23.7 92 64 1.1 8.6 3.0 1.5 12.8 43 Sector* (78) 11,989 (3) (6) 10 30 49 (2) (2) 19 36 36 Dec-12 22 16 14 18.3 15.0 12.2 10.7 95 101 2.4 23.1 3.2 0.2 7.5 (99)
Telecommunication Services
Chate Benchavitvilai - 852 2101 7040
HKT Trust 6823 HK N HKD 7.15 7.70 8 5,909 9.4 (3) (7) (14) (6) 20 (2) (3) (5) 0 8 Dec-12 16 53 12 28.5 24.5 16.0 14.3 98 122 6.2 6.1 1.5 3.0 8.3 71 HTHK 215 HK U HKD 4.00 3.10 (23) 2,483 2.2 (2) (4) (5) 12 17 (1) (0) 3 18 4 Dec-11 15 12 3 18.9 16.4 14.7 14.3 96 98 4.6 11.0 1.8 1.6 7.6 30 PCCW 8 HK O HKD 3.57 4.10 15 3,344 5.3 (1) (4) (14) 5 23 0 0 (6) 11 10 Dec-12 (8) 25 12 15.6 17.0 13.6 12.1 90 95 5.5 16.9 2.9 1.7 5.7 257
Smartone 315 HK U HKD 13.28 13.30 0 1,775 3.8 (2) (0) (4) (6) (9) (1) 4 5 0 (22) Jun-12 (4) 7 4 13.4 14.1 13.1 12.6 100 102 7.1 31.5 4.4 1.2 4.0 (24) Sector* 3 13,512 (2) (5) (11) 0 17 (1) (1) (3) 6 4 Dec-12 5 26 9 19.2 18.3 14.6 13.4 96 105 6.0 10.7 2.0 2.0 6.6 85
Transportation Timothy Ross - 65 6212 3337
Cathay Pacific 293 HK O HKD 13.82 16.70 21 7,002 8.0 (2) (8) (4) (3) 12 (0) (3) 4 3 (0) Dec-12 173 119 28 44.2 16.2 7.4 5.8 117 156 1.9 5.8 0.9 1.0 10.1 75 OOIL 316 HK U HKD 46.90 45.00 (4) 3,780 4.7 (1) (6) 0 (7) 16 0 (2) 8 (1) 3 Dec-12 46 44 30 13.2 9.0 6.3 4.8 128 119 2.8 9.0 0.8 0.7 6.6 21
Pacific Basin 2343 HK O HKD 4.54 5.00 10 1,132 2.2 (1) 2 4 4 33 1 6 12 10 20 Dec-12 95 94 19 23.6 12.1 6.2 5.2 230 223 2.5 6.9 0.8 0.9 8.3 29 Sector* 12 11,915 (1) (6) (2) (3) 15 (0) (2) 6 2 3 Dec-12 91 83 28 24.2 12.6 6.9 5.4 128 145 2.2 7.0 0.9 0.9 8.8 52
Utilities Edwin Pang - 852 2101 6406
CKI 1038 HK O HKD 51.30 59.00 15 16,123 15.9 (2) (4) (8) 8 18 (1) 0 1 14 5 Dec-12 12 7 4 13.1 11.6 10.9 10.4 105 110 3.7 16.6 1.9 30.3 12.2 25 CLP 2 HK N HKD 63.10 64.50 2 20,534 36.0 (1) (4) (8) (3) (1) 0 1 0 3 (14) Dec-12 18 10 4 18.3 15.5 14.1 13.6 98 102 4.2 11.1 1.7 6.0 11.4 57
HKCG 3 HK U HKD 18.76 16.64 (11) 23,099 21.1 (2) (7) (12) (2) 26 (0) (3) (4) 3 14 Dec-12 (2) 2 2 23.2 23.8 23.3 22.8 103 97 1.7 15.9 3.6 7.4 15.5 25 Power Assets 6 HK N HKD 67.00 69.65 4 18,418 24.7 (0) (3) (14) 1 21 1 1 (5) 7 8 Dec-12 8 3 3 14.7 13.6 13.2 12.9 103 103 3.9 15.9 2.1 15.0 11.6 25 Sector* 1 78,174 (1) (5) (11) 1 16 0 (0) (2) 6 4 Dec-12 9 6 3 17.0 15.5 14.7 14.2 102 103 3.3 14.4 2.2 9.2 12.5 36
Country Average* HSI 21,355 24,941 17 1,183,742 (1) (4) (8) (6) 13 Dec-12 5 16 9 14.0 13.3 11.4 10.5 100 104 3.5 9.4 1.2 2.1 10.0 18
* Country/ sector aggregates are for the coverage above
Source: Company data, Thomson Financial IBES, Credit Suisse estimates
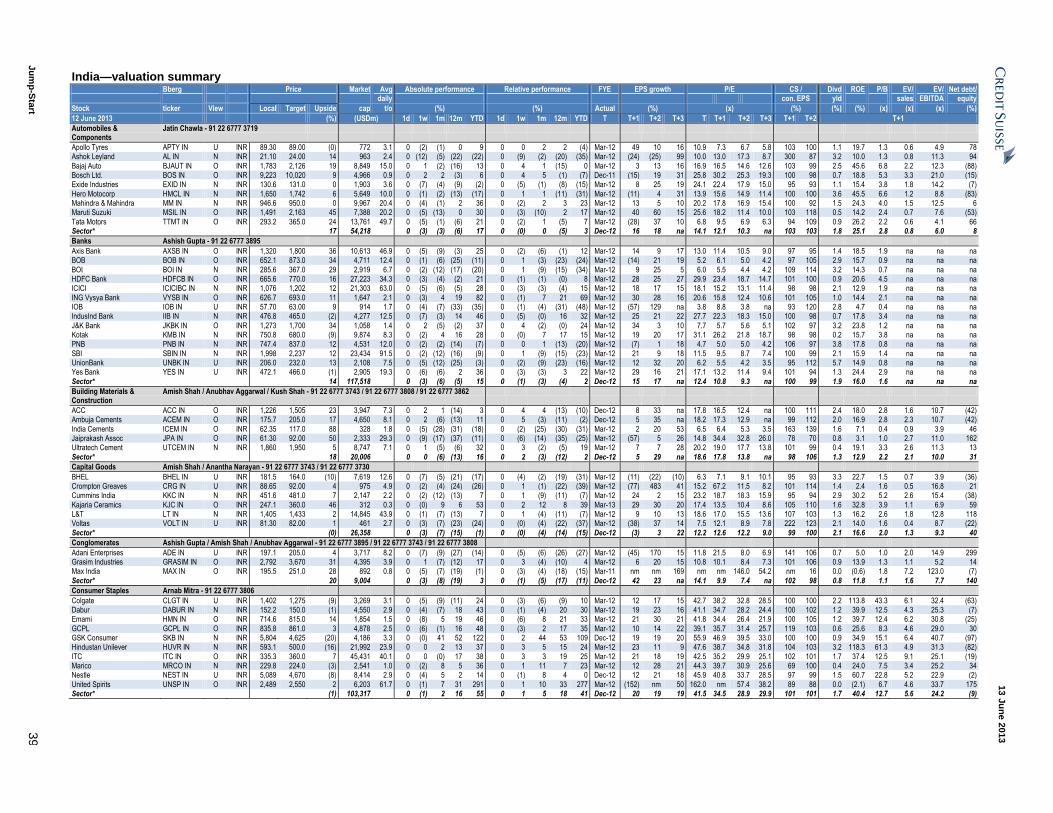
13 J
un
e 2
013
Ju
mp
-Sta
rt 3
9
India—valuation summary Bberg Price Market Avg Absolute performance Relative performance FYE EPS growth P/E CS / Divd ROE P/B EV/ EV/ Net debt/ daily con. EPS yld sales EBITDA equity
Stock ticker View Local Target Upside cap t/o (%) (%) Actual (%) (x) (%) (%) (%) (x) (x) (x) (%)
12 June 2013 (%) (USDm) 1d 1w 1m 12m YTD 1d 1w 1m 12m YTD T T+1 T+2 T+3 T T+1 T+2 T+3 T+1 T+2 T+1
Automobiles & Components
Jatin Chawla - 91 22 6777 3719
Apollo Tyres APTY IN U INR 89.30 89.00 (0) 772 3.1 0 (2) (1) 0 9 0 0 2 2 (4) Mar-12 49 10 16 10.9 7.3 6.7 5.8 103 100 1.1 19.7 1.3 0.6 4.9 78 Ashok Leyland AL IN N INR 21.10 24.00 14 963 2.4 0 (12) (5) (22) (22) 0 (9) (2) (20) (35) Mar-12 (24) (25) 99 10.0 13.0 17.3 8.7 300 87 3.2 10.0 1.3 0.8 11.3 94
Bajaj Auto BJAUT IN O INR 1,783 2,126 19 8,849 15.0 0 1 (2) (16) 13 0 4 1 (15) 0 Mar-12 3 13 16 16.9 16.5 14.6 12.6 103 99 2.5 45.6 6.8 2.2 12.3 (88) Bosch Ltd. BOS IN O INR 9,223 10,020 9 4,966 0.9 0 2 2 (3) 6 0 4 5 (1) (7) Dec-11 (15) 19 31 25.8 30.2 25.3 19.3 100 98 0.7 18.8 5.3 3.3 21.0 (15) Exide Industries EXID IN N INR 130.6 131.0 0 1,903 3.6 0 (7) (4) (9) (2) 0 (5) (1) (8) (15) Mar-12 8 25 19 24.1 22.4 17.9 15.0 95 93 1.1 15.4 3.8 1.8 14.2 (7)
Hero Motocorp HMCL IN N INR 1,650 1,742 6 5,649 10.0 0 (1) (2) (13) (17) 0 1 1 (11) (31) Mar-12 (11) 4 31 13.9 15.6 14.9 11.4 100 100 3.6 45.5 6.6 1.2 8.8 (83) Mahindra & Mahindra MM IN N INR 946.6 950.0 0 9,967 20.4 0 (4) (1) 2 36 0 (2) 2 3 23 Mar-12 13 5 10 20.2 17.8 16.9 15.4 100 92 1.5 24.3 4.0 1.5 12.5 6 Maruti Suzuki MSIL IN O INR 1,491 2,163 45 7,388 20.2 0 (5) (13) 0 30 0 (3) (10) 2 17 Mar-12 40 60 15 25.6 18.2 11.4 10.0 103 118 0.5 14.2 2.4 0.7 7.6 (53)
Tata Motors TTMT IN O INR 293.2 365.0 24 13,761 49.7 0 (5) (1) (6) 21 0 (2) 1 (5) 7 Mar-12 (28) 37 10 6.8 9.5 6.9 6.3 94 109 0.9 26.2 2.2 0.6 4.1 66 Sector* 17 54,218 0 (3) (3) (6) 17 0 (0) 0 (5) 3 Dec-12 16 18 na 14.1 12.1 10.3 na 103 103 1.8 25.1 2.8 0.8 6.0 8
Banks Ashish Gupta - 91 22 6777 3895
Axis Bank AXSB IN O INR 1,320 1,800 36 10,613 46.9 0 (5) (9) (3) 25 0 (2) (6) (1) 12 Mar-12 14 9 17 13.0 11.4 10.5 9.0 97 95 1.4 18.5 1.9 na na na BOB BOB IN O INR 652.1 873.0 34 4,711 12.4 0 (1) (6) (25) (11) 0 1 (3) (23) (24) Mar-12 (14) 21 19 5.2 6.1 5.0 4.2 97 105 2.9 15.7 0.9 na na na
BOI BOI IN N INR 285.6 367.0 29 2,919 6.7 0 (2) (12) (17) (20) 0 1 (9) (15) (34) Mar-12 9 25 5 6.0 5.5 4.4 4.2 109 114 3.2 14.3 0.7 na na na HDFC Bank HDFCB IN O INR 665.6 770.0 16 27,223 34.3 0 (3) (4) (2) 21 0 (1) (1) (0) 8 Mar-12 28 25 27 29.9 23.4 18.7 14.7 101 100 0.9 20.6 4.5 na na na ICICI ICICIBC IN N INR 1,076 1,202 12 21,303 63.0 0 (5) (6) (5) 28 0 (3) (3) (4) 15 Mar-12 18 17 15 18.1 15.2 13.1 11.4 98 98 2.1 12.9 1.9 na na na
ING Vysya Bank VYSB IN O INR 626.7 693.0 11 1,647 2.1 0 (3) 4 19 82 0 (1) 7 21 69 Mar-12 30 28 16 20.6 15.8 12.4 10.6 101 105 1.0 14.4 2.1 na na na IOB IOB IN U INR 57.70 63.00 9 914 1.7 0 (4) (7) (33) (35) 0 (1) (4) (31) (48) Mar-12 (57) 129 na 3.8 8.8 3.8 na 93 120 2.8 4.7 0.4 na na na IndusInd Bank IIB IN N INR 476.8 465.0 (2) 4,277 12.5 0 (7) (3) 14 46 0 (5) (0) 16 32 Mar-12 25 21 22 27.7 22.3 18.3 15.0 100 98 0.7 17.8 3.4 na na na
J&K Bank JKBK IN O INR 1,273 1,700 34 1,058 1.4 0 2 (5) (2) 37 0 4 (2) (0) 24 Mar-12 34 3 10 7.7 5.7 5.6 5.1 102 97 3.2 23.8 1.2 na na na Kotak KMB IN N INR 750.8 680.0 (9) 9,874 8.3 0 (2) 4 16 28 0 (0) 7 17 15 Mar-12 19 20 17 31.1 26.2 21.8 18.7 98 98 0.2 15.7 3.8 na na na PNB PNB IN N INR 747.4 837.0 12 4,531 12.0 0 (2) (2) (14) (7) 0 0 1 (13) (20) Mar-12 (7) 1 18 4.7 5.0 5.0 4.2 106 97 3.8 17.8 0.8 na na na
SBI SBIN IN N INR 1,998 2,237 12 23,434 91.5 0 (2) (12) (16) (9) 0 1 (9) (15) (23) Mar-12 21 9 18 11.5 9.5 8.7 7.4 100 99 2.1 15.9 1.4 na na na UnionBank UNBK IN U INR 206.0 232.0 13 2,108 7.5 0 (5) (12) (25) (3) 0 (2) (9) (23) (16) Mar-12 12 32 20 6.2 5.5 4.2 3.5 95 112 5.7 14.9 0.8 na na na Yes Bank YES IN U INR 472.1 466.0 (1) 2,905 19.3 0 (6) (6) 2 36 0 (3) (3) 3 22 Mar-12 29 16 21 17.1 13.2 11.4 9.4 101 94 1.3 24.4 2.9 na na na
Sector* 14 117,518 0 (3) (6) (5) 15 0 (1) (3) (4) 2 Dec-12 15 17 na 12.4 10.8 9.3 na 100 99 1.9 16.0 1.6 na na na
Building Materials & Construction
Amish Shah / Anubhav Aggarwal / Kush Shah - 91 22 6777 3743 / 91 22 6777 3808 / 91 22 6777 3862
ACC ACC IN O INR 1,226 1,505 23 3,947 7.3 0 2 1 (14) 3 0 4 4 (13) (10) Dec-12 8 33 na 17.8 16.5 12.4 na 100 111 2.4 18.0 2.8 1.6 10.7 (42) Ambuja Cements ACEM IN O INR 175.7 205.0 17 4,650 8.1 0 2 (6) (13) 11 0 5 (3) (11) (2) Dec-12 5 35 na 18.2 17.3 12.9 na 99 112 2.0 16.9 2.8 2.3 10.7 (42)
India Cements ICEM IN O INR 62.35 117.0 88 328 1.8 0 (5) (28) (31) (18) 0 (2) (25) (30) (31) Mar-12 2 20 53 6.5 6.4 5.3 3.5 163 139 1.6 7.1 0.4 0.9 3.9 46 Jaiprakash Assoc JPA IN O INR 61.30 92.00 50 2,333 29.3 0 (9) (17) (37) (11) 0 (6) (14) (35) (25) Mar-12 (57) 5 26 14.8 34.4 32.8 26.0 78 70 0.8 3.1 1.0 2.7 11.0 162 Ultratech Cement UTCEM IN N INR 1,860 1,950 5 8,747 7.1 0 1 (5) (6) 32 0 3 (2) (5) 19 Mar-12 7 7 28 20.2 19.0 17.7 13.8 101 99 0.4 19.1 3.3 2.6 11.3 13
Sector* 18 20,006 0 0 (6) (13) 16 0 2 (3) (12) 2 Dec-12 5 29 na 18.6 17.8 13.8 na 98 106 1.3 12.9 2.2 2.1 10.0 31
Capital Goods Amish Shah / Anantha Narayan - 91 22 6777 3743 / 91 22 6777 3730
BHEL BHEL IN U INR 181.5 164.0 (10) 7,619 12.6 0 (7) (5) (21) (17) 0 (4) (2) (19) (31) Mar-12 (11) (22) (10) 6.3 7.1 9.1 10.1 95 93 3.3 22.7 1.5 0.7 3.9 (36) Crompton Greaves CRG IN U INR 88.65 92.00 4 975 4.9 0 (2) (4) (24) (26) 0 1 (1) (22) (39) Mar-12 (77) 483 41 15.2 67.2 11.5 8.2 101 114 1.4 2.4 1.6 0.5 16.8 21 Cummins India KKC IN N INR 451.6 481.0 7 2,147 2.2 0 (2) (12) (13) 7 0 1 (9) (11) (7) Mar-12 24 2 15 23.2 18.7 18.3 15.9 95 94 2.9 30.2 5.2 2.6 15.4 (38)
Kajaria Ceramics KJC IN O INR 247.1 360.0 46 312 0.3 0 (0) 9 6 53 0 2 12 8 39 Mar-13 29 30 20 17.4 13.5 10.4 8.6 105 110 1.6 32.8 3.9 1.1 6.9 59 L&T LT IN N INR 1,405 1,433 2 14,845 43.9 0 (1) (7) (13) 7 0 1 (4) (11) (7) Mar-12 9 10 13 18.6 17.0 15.5 13.6 107 103 1.3 16.2 2.6 1.8 12.8 118 Voltas VOLT IN U INR 81.30 82.00 1 461 2.7 0 (3) (7) (23) (24) 0 (0) (4) (22) (37) Mar-12 (38) 37 14 7.5 12.1 8.9 7.8 222 123 2.1 14.0 1.6 0.4 8.7 (22)
Sector* (0) 26,358 0 (3) (7) (15) (1) 0 (0) (4) (14) (15) Dec-12 (3) 3 22 12.2 12.6 12.2 9.0 99 100 2.1 16.6 2.0 1.3 9.3 40
Conglomerates Ashish Gupta / Amish Shah / Anubhav Aggarwal - 91 22 6777 3895 / 91 22 6777 3743 / 91 22 6777 3808
Adani Enterprises ADE IN U INR 197.1 205.0 4 3,717 8.2 0 (7) (9) (27) (14) 0 (5) (6) (26) (27) Mar-12 (45) 170 15 11.8 21.5 8.0 6.9 141 106 0.7 5.0 1.0 2.0 14.9 299 Grasim Industries GRASIM IN O INR 2,792 3,670 31 4,395 3.9 0 1 (7) (12) 17 0 3 (4) (10) 4 Mar-12 6 20 15 10.8 10.1 8.4 7.3 101 106 0.9 13.9 1.3 1.1 5.2 14 Max India MAX IN O INR 195.5 251.0 28 892 0.8 0 (5) (7) (19) (1) 0 (3) (4) (18) (15) Mar-11 nm nm 169 nm nm 146.0 54.2 nm 16 0.0 (0.6) 1.8 7.2 123.0 (7)
Sector* 20 9,004 0 (3) (8) (19) 3 0 (1) (5) (17) (11) Dec-12 42 23 na 14.1 9.9 7.4 na 102 98 0.8 11.8 1.1 1.6 7.7 140
Consumer Staples Arnab Mitra - 91 22 6777 3806
Colgate CLGT IN U INR 1,402 1,275 (9) 3,269 3.1 0 (5) (9) (11) 24 0 (3) (6) (9) 10 Mar-12 12 17 15 42.7 38.2 32.8 28.5 100 100 2.2 113.8 43.3 6.1 32.4 (63) Dabur DABUR IN N INR 152.2 150.0 (1) 4,550 2.9 0 (4) (7) 18 43 0 (1) (4) 20 30 Mar-12 19 23 16 41.1 34.7 28.2 24.4 100 102 1.2 39.9 12.5 4.3 25.3 (7) Emami HMN IN O INR 714.6 815.0 14 1,854 1.5 0 (8) 5 19 46 0 (6) 8 21 33 Mar-12 21 30 21 41.8 34.4 26.4 21.9 100 105 1.2 39.7 12.4 6.2 30.8 (25)
GCPL GCPL IN O INR 835.8 861.0 3 4,878 2.5 0 (6) (1) 16 48 0 (3) 2 17 35 Mar-12 10 14 22 39.1 35.7 31.4 25.7 119 103 0.6 25.6 8.3 4.6 29.0 30 GSK Consumer SKB IN N INR 5,804 4,625 (20) 4,186 3.3 0 (0) 41 52 122 0 2 44 53 109 Dec-12 19 19 20 55.9 46.9 39.5 33.0 100 100 0.9 34.9 15.1 6.4 40.7 (97) Hindustan Unilever HUVR IN N INR 593.1 500.0 (16) 21,992 23.9 0 0 2 13 37 0 3 5 15 24 Mar-12 23 11 9 47.6 38.7 34.8 31.8 104 103 3.2 118.3 61.3 4.9 31.3 (82)
ITC ITC IN O INR 335.3 360.0 7 45,431 40.1 0 0 (0) 17 38 0 3 3 19 25 Mar-12 21 18 19 42.5 35.2 29.9 25.1 102 101 1.7 37.4 12.5 9.1 25.1 (19) Marico MRCO IN N INR 229.8 224.0 (3) 2,541 1.0 0 (2) 8 5 36 0 1 11 7 23 Mar-12 12 28 21 44.3 39.7 30.9 25.6 69 100 0.4 24.0 7.5 3.4 25.2 34 Nestle NEST IN U INR 5,089 4,670 (8) 8,414 2.9 0 (4) 5 2 14 0 (1) 8 4 0 Dec-12 12 21 18 45.9 40.8 33.7 28.5 97 99 1.5 60.7 22.8 5.2 22.9 (2)
United Spirits UNSP IN O INR 2,489 2,550 2 6,203 61.7 0 (1) 7 31 291 0 1 10 33 277 Mar-12 (152) nm 50 162.0 nm 57.4 38.2 89 88 0.0 (2.1) 6.7 4.6 33.7 175 Sector* (1) 103,317 0 (1) 2 16 55 0 1 5 18 41 Dec-12 20 19 19 41.5 34.5 28.9 29.9 101 101 1.7 40.4 12.7 5.6 24.2 (9)
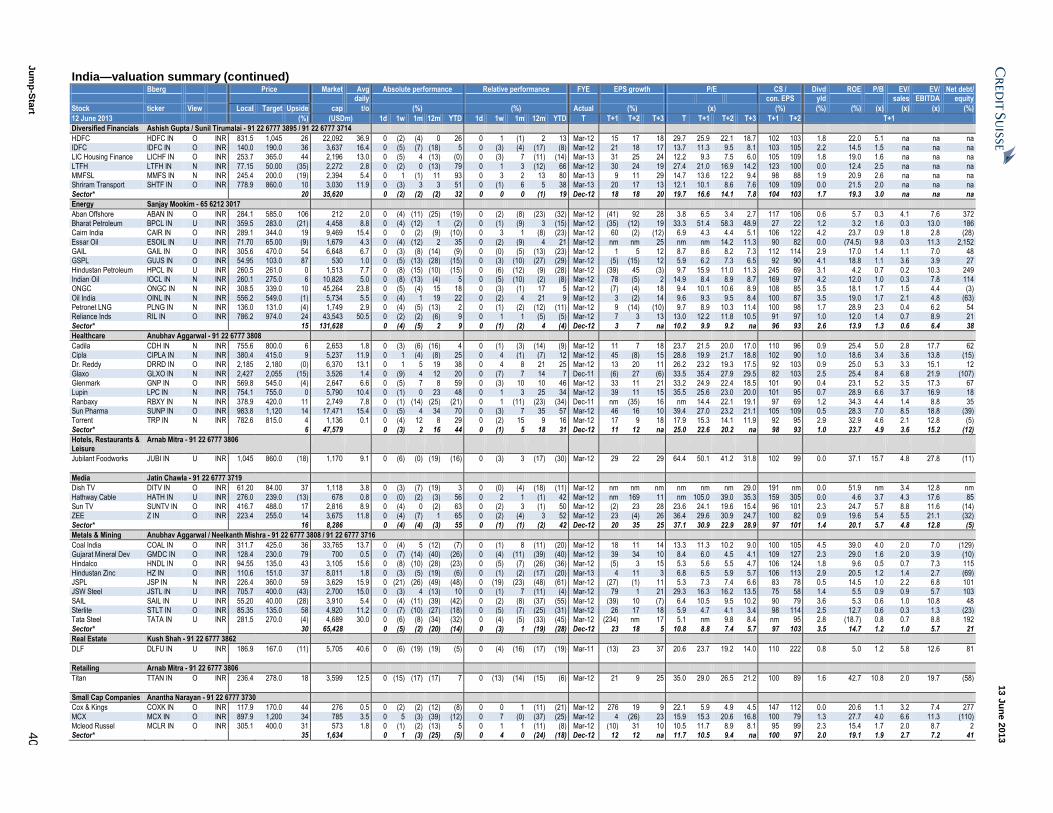
13 J
un
e 2
013
Ju
mp
-Sta
rt 4
0
India—valuation summary (continued) Bberg Price Market Avg Absolute performance Relative performance FYE EPS growth P/E CS / Divd ROE P/B EV/ EV/ Net debt/ daily con. EPS yld sales EBITDA equity
Stock ticker View Local Target Upside cap t/o (%) (%) Actual (%) (x) (%) (%) (%) (x) (x) (x) (%)
12 June 2013 (%) (USDm) 1d 1w 1m 12m YTD 1d 1w 1m 12m YTD T T+1 T+2 T+3 T T+1 T+2 T+3 T+1 T+2 T+1
Diversified Financials Ashish Gupta / Sunil Tirumalai - 91 22 6777 3895 / 91 22 6777 3714
HDFC HDFC IN O INR 831.5 1,045 26 22,092 36.9 0 (2) (4) 0 26 0 1 (1) 2 13 Mar-12 15 17 18 29.7 25.9 22.1 18.7 102 103 1.8 22.0 5.1 na na na IDFC IDFC IN O INR 140.0 190.0 36 3,637 16.4 0 (5) (7) (18) 5 0 (3) (4) (17) (8) Mar-12 21 18 17 13.7 11.3 9.5 8.1 103 105 2.2 14.5 1.5 na na na LIC Housing Finance LICHF IN O INR 253.7 365.0 44 2,196 13.0 0 (5) 4 (13) (0) 0 (3) 7 (11) (14) Mar-13 31 25 24 12.2 9.3 7.5 6.0 105 109 1.8 19.0 1.6 na na na
LTFH LTFH IN N INR 77.15 50.00 (35) 2,272 2.8 0 (2) 0 (13) 79 0 1 3 (12) 66 Mar-12 30 24 19 27.4 21.0 16.9 14.2 123 100 0.0 12.4 2.5 na na na MMFSL MMFS IN N INR 245.4 200.0 (19) 2,394 5.4 0 1 (1) 11 93 0 3 2 13 80 Mar-13 9 11 29 14.7 13.6 12.2 9.4 98 88 1.9 20.9 2.6 na na na Shriram Transport SHTF IN O INR 778.9 860.0 10 3,030 11.9 0 (3) 3 3 51 0 (1) 6 5 38 Mar-13 20 17 13 12.1 10.1 8.6 7.6 109 109 0.0 21.5 2.0 na na na
Sector* 20 35,620 0 (2) (2) (2) 32 0 0 0 (1) 19 Dec-12 18 18 20 19.7 16.6 14.1 7.8 104 103 1.7 19.3 3.0 na na na
Energy Sanjay Mookim - 65 6212 3017
Aban Offshore ABAN IN O INR 284.1 585.0 106 212 2.0 0 (4) (11) (25) (19) 0 (2) (8) (23) (32) Mar-12 (41) 92 28 3.8 6.5 3.4 2.7 117 106 0.6 5.7 0.3 4.1 7.6 372 Bharat Petroleum BPCL IN U INR 359.5 283.0 (21) 4,458 8.8 0 (4) (12) 1 (2) 0 (1) (9) 3 (15) Mar-12 (35) (12) 19 33.3 51.4 58.3 48.9 27 22 1.2 3.2 1.6 0.3 13.0 186 Cairn India CAIR IN O INR 289.1 344.0 19 9,469 15.4 0 0 (2) (9) (10) 0 3 1 (8) (23) Mar-12 60 (2) (12) 6.9 4.3 4.4 5.1 106 122 4.2 23.7 0.9 1.8 2.8 (28)
Essar Oil ESOIL IN U INR 71.70 65.00 (9) 1,679 4.3 0 (4) (12) 2 35 0 (2) (9) 4 21 Mar-12 nm nm 25 nm nm 14.2 11.3 90 82 0.0 (74.5) 9.8 0.3 11.3 2,152 GAIL GAIL IN O INR 305.6 470.0 54 6,648 6.7 0 (3) (8) (14) (9) 0 (0) (5) (13) (23) Mar-12 1 5 12 8.7 8.6 8.2 7.3 112 114 2.9 17.0 1.4 1.1 7.0 48 GSPL GUJS IN O INR 54.95 103.0 87 530 1.0 0 (5) (13) (28) (15) 0 (3) (10) (27) (29) Mar-12 (5) (15) 12 5.9 6.2 7.3 6.5 92 90 4.1 18.8 1.1 3.6 3.9 27
Hindustan Petroleum HPCL IN U INR 260.5 261.0 0 1,513 7.7 0 (8) (15) (10) (15) 0 (6) (12) (9) (28) Mar-12 (39) 45 (3) 9.7 15.9 11.0 11.3 245 69 3.1 4.2 0.7 0.2 10.3 249 Indian Oil IOCL IN N INR 260.1 275.0 6 10,828 5.0 0 (8) (13) (4) 5 0 (5) (10) (2) (8) Mar-12 78 (5) 2 14.9 8.4 8.9 8.7 169 97 4.2 12.0 1.0 0.3 7.8 114 ONGC ONGC IN N INR 308.5 339.0 10 45,264 23.8 0 (5) (4) 15 18 0 (3) (1) 17 5 Mar-12 (7) (4) 18 9.4 10.1 10.6 8.9 108 85 3.5 18.1 1.7 1.5 4.4 (3)
Oil India OINL IN N INR 556.2 549.0 (1) 5,734 5.5 0 (4) 1 19 22 0 (2) 4 21 9 Mar-12 3 (2) 14 9.6 9.3 9.5 8.4 100 87 3.5 19.0 1.7 2.1 4.8 (63) Petronet LNG PLNG IN N INR 136.0 131.0 (4) 1,749 2.9 0 (4) (5) (13) 2 0 (1) (2) (12) (11) Mar-12 9 (14) (10) 9.7 8.9 10.3 11.4 100 98 1.7 28.9 2.3 0.4 6.2 54 Reliance Inds RIL IN O INR 786.2 974.0 24 43,543 50.5 0 (2) (2) (6) 9 0 1 1 (5) (5) Mar-12 7 3 13 13.0 12.2 11.8 10.5 91 97 1.0 12.0 1.4 0.7 8.9 21
Sector* 15 131,628 0 (4) (5) 2 9 0 (1) (2) 4 (4) Dec-12 3 7 na 10.2 9.9 9.2 na 96 93 2.6 13.9 1.3 0.6 6.4 38
Healthcare Anubhav Aggarwal - 91 22 6777 3808
Cadila CDH IN N INR 755.6 800.0 6 2,653 1.8 0 (3) (6) (16) 4 0 (1) (3) (14) (9) Mar-12 11 7 18 23.7 21.5 20.0 17.0 110 96 0.9 25.4 5.0 2.8 17.7 62 Cipla CIPLA IN N INR 380.4 415.0 9 5,237 11.9 0 1 (4) (8) 25 0 4 (1) (7) 12 Mar-12 45 (8) 15 28.8 19.9 21.7 18.8 102 90 1.0 18.6 3.4 3.6 13.8 (15) Dr. Reddy DRRD IN O INR 2,185 2,180 (0) 6,370 13.1 0 1 5 19 38 0 4 8 21 25 Mar-12 13 20 11 26.2 23.2 19.3 17.5 92 103 0.9 25.0 5.3 3.3 15.1 12
Glaxo GLXO IN N INR 2,427 2,055 (15) 3,526 1.4 0 (9) 4 12 20 0 (7) 7 14 7 Dec-11 (6) 27 (6) 33.5 35.4 27.9 29.5 82 103 2.5 25.4 8.4 6.8 21.9 (107) Glenmark GNP IN O INR 569.8 545.0 (4) 2,647 6.6 0 (5) 7 8 59 0 (3) 10 10 46 Mar-12 33 11 21 33.2 24.9 22.4 18.5 101 90 0.4 23.1 5.2 3.5 17.3 67 Lupin LPC IN N INR 754.1 755.0 0 5,790 10.4 0 (1) 0 23 48 0 1 3 25 34 Mar-12 39 11 15 35.5 25.6 23.0 20.0 101 95 0.7 28.9 6.6 3.7 16.9 18
Ranbaxy RBXY IN N INR 378.9 420.0 11 2,749 7.8 0 (1) (14) (25) (21) 0 1 (11) (23) (34) Dec-11 nm (35) 16 nm 14.4 22.1 19.1 97 69 1.2 34.3 4.4 1.4 8.8 35 Sun Pharma SUNP IN O INR 983.8 1,120 14 17,471 15.4 0 (5) 4 34 70 0 (3) 7 35 57 Mar-12 46 16 10 39.4 27.0 23.2 21.1 105 109 0.5 28.3 7.0 8.5 18.8 (39) Torrent TRP IN N INR 782.6 815.0 4 1,136 0.1 0 (4) 12 8 29 0 (2) 15 9 16 Mar-12 17 9 18 17.9 15.3 14.1 11.9 92 95 2.9 32.9 4.6 2.1 12.8 (5)
Sector* 6 47,579 0 (3) 2 16 44 0 (1) 5 18 31 Dec-12 11 12 na 25.0 22.6 20.2 na 98 93 1.0 23.7 4.9 3.6 15.2 (12)
Hotels, Restaurants & Leisure
Arnab Mitra - 91 22 6777 3806
Jubilant Foodworks JUBI IN U INR 1,045 860.0 (18) 1,170 9.1 0 (6) (0) (19) (16) 0 (3) 3 (17) (30) Mar-12 29 22 29 64.4 50.1 41.2 31.8 102 99 0.0 37.1 15.7 4.8 27.8 (11)
Media Jatin Chawla - 91 22 6777 3719
Dish TV DITV IN O INR 61.20 84.00 37 1,118 3.8 0 (3) (7) (19) 3 0 (0) (4) (18) (11) Mar-12 nm nm nm nm nm nm 29.0 191 nm 0.0 51.9 nm 3.4 12.8 nm
Hathway Cable HATH IN U INR 276.0 239.0 (13) 678 0.8 0 (0) (2) (3) 56 0 2 1 (1) 42 Mar-12 nm 169 11 nm 105.0 39.0 35.3 159 305 0.0 4.6 3.7 4.3 17.6 85 Sun TV SUNTV IN O INR 416.7 488.0 17 2,816 8.9 0 (4) 0 (2) 63 0 (2) 3 (1) 50 Mar-12 (2) 23 28 23.6 24.1 19.6 15.4 96 101 2.3 24.7 5.7 8.8 11.6 (14) ZEE Z IN O INR 223.4 255.0 14 3,675 11.8 0 (4) (7) 1 65 0 (2) (4) 3 52 Mar-12 23 (4) 26 36.4 29.6 30.9 24.7 100 82 0.9 19.6 5.4 5.5 21.1 (32)
Sector* 16 8,286 0 (4) (4) (3) 55 0 (1) (1) (2) 42 Dec-12 20 35 25 37.1 30.9 22.9 28.9 97 101 1.4 20.1 5.7 4.8 12.8 (5)
Metals & Mining Anubhav Aggarwal / Neelkanth Mishra - 91 22 6777 3808 / 91 22 6777 3716
Coal India COAL IN O INR 311.7 425.0 36 33,765 13.7 0 (4) 5 (12) (7) 0 (1) 8 (11) (20) Mar-12 18 11 14 13.3 11.3 10.2 9.0 100 105 4.5 39.0 4.0 2.0 7.0 (129) Gujarat Mineral Dev GMDC IN O INR 128.4 230.0 79 700 0.5 0 (7) (14) (40) (26) 0 (4) (11) (39) (40) Mar-12 39 34 10 8.4 6.0 4.5 4.1 109 127 2.3 29.0 1.6 2.0 3.9 (10) Hindalco HNDL IN O INR 94.55 135.0 43 3,105 15.6 0 (8) (10) (28) (23) 0 (5) (7) (26) (36) Mar-12 (5) 3 15 5.3 5.6 5.5 4.7 106 124 1.8 9.6 0.5 0.7 7.3 115
Hindustan Zinc HZ IN O INR 110.6 151.0 37 8,011 1.8 0 (3) (5) (19) (6) 0 (1) (2) (17) (20) Mar-13 4 11 3 6.8 6.5 5.9 5.7 106 113 2.9 20.5 1.2 1.4 2.7 (69) JSPL JSP IN N INR 226.4 360.0 59 3,629 15.9 0 (21) (26) (49) (48) 0 (19) (23) (48) (61) Mar-12 (27) (1) 11 5.3 7.3 7.4 6.6 83 78 0.5 14.5 1.0 2.2 6.8 101 JSW Steel JSTL IN U INR 705.7 400.0 (43) 2,700 15.0 0 (3) 4 (13) 10 0 (1) 7 (11) (4) Mar-12 79 1 21 29.3 16.3 16.2 13.5 75 58 1.4 5.5 0.9 0.9 5.7 103
SAIL SAIL IN U INR 55.20 40.00 (28) 3,910 5.4 0 (4) (11) (39) (42) 0 (2) (8) (37) (55) Mar-12 (39) 10 (7) 6.4 10.5 9.5 10.2 90 79 3.6 5.3 0.6 1.0 10.8 48 Sterlite STLT IN O INR 85.35 135.0 58 4,920 11.2 0 (7) (10) (27) (18) 0 (5) (7) (25) (31) Mar-12 26 17 18 5.9 4.7 4.1 3.4 98 114 2.5 12.7 0.6 0.3 1.3 (23) Tata Steel TATA IN U INR 281.5 270.0 (4) 4,689 30.0 0 (6) (8) (34) (32) 0 (4) (5) (33) (45) Mar-12 (234) nm 17 5.1 nm 9.8 8.4 nm 95 2.8 (18.7) 0.8 0.7 8.8 192
Sector* 30 65,428 0 (5) (2) (20) (14) 0 (3) 1 (19) (28) Dec-12 23 18 5 10.8 8.8 7.4 5.7 97 103 3.5 14.7 1.2 1.0 5.7 21
Real Estate Kush Shah - 91 22 6777 3862
DLF DLFU IN U INR 186.9 167.0 (11) 5,705 40.6 0 (6) (19) (19) (5) 0 (4) (16) (17) (19) Mar-11 (13) 23 37 20.6 23.7 19.2 14.0 110 222 0.8 5.0 1.2 5.8 12.6 81
Retailing Arnab Mitra - 91 22 6777 3806
Titan TTAN IN O INR 236.4 278.0 18 3,599 12.5 0 (15) (17) (17) 7 0 (13) (14) (15) (6) Mar-12 21 9 25 35.0 29.0 26.5 21.2 100 89 1.6 42.7 10.8 2.0 19.7 (58)
Small Cap Companies Anantha Narayan - 91 22 6777 3730
Cox & Kings COXK IN O INR 117.9 170.0 44 276 0.5 0 (2) (2) (12) (8) 0 0 1 (11) (21) Mar-12 276 19 9 22.1 5.9 4.9 4.5 147 112 0.0 20.6 1.1 3.2 7.4 277
MCX MCX IN O INR 897.9 1,200 34 785 3.5 0 5 (3) (39) (12) 0 7 (0) (37) (25) Mar-12 4 (26) 23 15.9 15.3 20.6 16.8 100 79 1.3 27.7 4.0 6.6 11.3 (110) Mcleod Russel MCLR IN O INR 305.1 400.0 31 573 1.8 0 (1) (2) (13) 5 0 1 1 (11) (8) Mar-12 (10) 31 10 10.5 11.7 8.9 8.1 95 99 2.3 15.4 1.7 2.0 8.7 2 Sector* 35 1,634 0 1 (3) (25) (5) 0 4 0 (24) (18) Dec-12 12 12 na 11.7 10.5 9.4 na 100 97 2.0 19.1 1.9 2.7 7.2 41
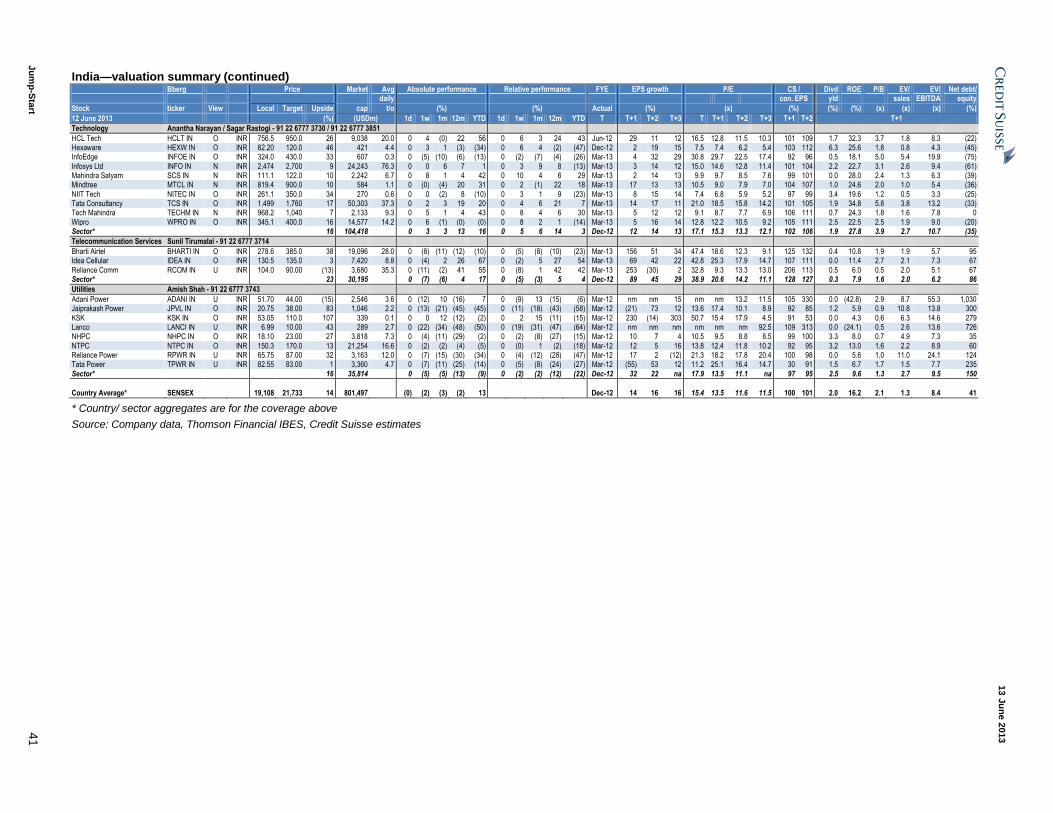
13 J
un
e 2
013
Ju
mp
-Sta
rt 4
1
India—valuation summary (continued) Bberg Price Market Avg Absolute performance Relative performance FYE EPS growth P/E CS / Divd ROE P/B EV/ EV/ Net debt/ daily con. EPS yld sales EBITDA equity
Stock ticker View Local Target Upside cap t/o (%) (%) Actual (%) (x) (%) (%) (%) (x) (x) (x) (%)
12 June 2013 (%) (USDm) 1d 1w 1m 12m YTD 1d 1w 1m 12m YTD T T+1 T+2 T+3 T T+1 T+2 T+3 T+1 T+2 T+1
Technology Anantha Narayan / Sagar Rastogi - 91 22 6777 3730 / 91 22 6777 3851
HCL Tech HCLT IN O INR 756.5 950.0 26 9,038 20.0 0 4 (0) 22 56 0 6 3 24 43 Jun-12 29 11 12 16.5 12.8 11.5 10.3 101 109 1.7 32.3 3.7 1.8 8.3 (22) Hexaware HEXW IN O INR 82.20 120.0 46 421 4.4 0 3 1 (3) (34) 0 6 4 (2) (47) Dec-12 2 19 15 7.5 7.4 6.2 5.4 103 112 6.3 25.6 1.8 0.8 4.3 (45) InfoEdge INFOE IN O INR 324.0 430.0 33 607 0.3 0 (5) (10) (6) (13) 0 (2) (7) (4) (26) Mar-13 4 32 29 30.8 29.7 22.5 17.4 92 96 0.5 18.1 5.0 5.4 19.9 (75)
Infosys Ltd INFO IN N INR 2,474 2,700 9 24,243 76.3 0 0 6 7 1 0 3 9 8 (13) Mar-13 3 14 12 15.0 14.6 12.8 11.4 101 104 2.2 22.7 3.1 2.6 9.4 (61) Mahindra Satyam SCS IN N INR 111.1 122.0 10 2,242 6.7 0 8 1 4 42 0 10 4 6 29 Mar-13 2 14 13 9.9 9.7 8.5 7.6 99 101 0.0 28.0 2.4 1.3 6.3 (39) Mindtree MTCL IN N INR 819.4 900.0 10 584 1.1 0 (0) (4) 20 31 0 2 (1) 22 18 Mar-13 17 13 13 10.5 9.0 7.9 7.0 104 107 1.0 24.6 2.0 1.0 5.4 (36)
NIIT Tech NITEC IN O INR 261.1 350.0 34 270 0.6 0 0 (2) 8 (10) 0 3 1 9 (23) Mar-13 8 15 14 7.4 6.8 5.9 5.2 97 99 3.4 19.6 1.2 0.5 3.3 (25) Tata Consultancy TCS IN O INR 1,499 1,760 17 50,303 37.3 0 2 3 19 20 0 4 6 21 7 Mar-13 14 17 11 21.0 18.5 15.8 14.2 101 105 1.9 34.8 5.8 3.8 13.2 (33) Tech Mahindra TECHM IN N INR 968.2 1,040 7 2,133 9.3 0 5 1 4 43 0 8 4 6 30 Mar-13 5 12 12 9.1 8.7 7.7 6.9 106 111 0.7 24.3 1.8 1.6 7.8 0
Wipro WPRO IN O INR 345.1 400.0 16 14,577 14.2 0 6 (1) (0) (0) 0 8 2 1 (14) Mar-13 5 16 14 12.8 12.2 10.5 9.2 105 111 2.5 22.5 2.5 1.9 9.0 (20) Sector* 16 104,418 0 3 3 13 16 0 5 6 14 3 Dec-12 12 14 13 17.1 15.3 13.3 12.1 102 106 1.9 27.8 3.9 2.7 10.7 (35)
Telecommunication Services Sunil Tirumalai - 91 22 6777 3714
Bharti Airtel BHARTI IN O INR 278.6 385.0 38 19,096 28.0 0 (8) (11) (12) (10) 0 (5) (8) (10) (23) Mar-13 156 51 34 47.4 18.6 12.3 9.1 125 132 0.4 10.8 1.9 1.9 5.7 95 Idea Cellular IDEA IN O INR 130.5 135.0 3 7,420 8.8 0 (4) 2 26 67 0 (2) 5 27 54 Mar-13 69 42 22 42.8 25.3 17.9 14.7 107 111 0.0 11.4 2.7 2.1 7.3 67
Reliance Comm RCOM IN U INR 104.0 90.00 (13) 3,680 35.3 0 (11) (2) 41 55 0 (8) 1 42 42 Mar-13 253 (30) 2 32.8 9.3 13.3 13.0 206 113 0.5 6.0 0.5 2.0 5.1 67 Sector* 23 30,195 0 (7) (6) 4 17 0 (5) (3) 5 4 Dec-12 89 45 29 38.9 20.6 14.2 11.1 128 127 0.3 7.9 1.6 2.0 6.2 86
Utilities Amish Shah - 91 22 6777 3743
Adani Power ADANI IN U INR 51.70 44.00 (15) 2,546 3.6 0 (12) 10 (16) 7 0 (9) 13 (15) (6) Mar-12 nm nm 15 nm nm 13.2 11.5 105 330 0.0 (42.8) 2.9 8.7 55.3 1,030 Jaiprakash Power JPVL IN O INR 20.75 38.00 83 1,046 2.2 0 (13) (21) (45) (45) 0 (11) (18) (43) (58) Mar-12 (21) 73 12 13.6 17.4 10.1 8.9 92 85 1.2 5.9 0.9 10.8 13.8 300
KSK KSK IN O INR 53.05 110.0 107 339 0.1 0 0 12 (12) (2) 0 2 15 (11) (15) Mar-12 230 (14) 303 50.7 15.4 17.9 4.5 91 53 0.0 4.3 0.6 6.3 14.6 279 Lanco LANCI IN U INR 6.99 10.00 43 289 2.7 0 (22) (34) (48) (50) 0 (19) (31) (47) (64) Mar-12 nm nm nm nm nm nm 92.5 109 313 0.0 (24.1) 0.5 2.6 13.6 726 NHPC NHPC IN O INR 18.10 23.00 27 3,818 7.3 0 (4) (11) (29) (2) 0 (2) (8) (27) (15) Mar-12 10 7 4 10.5 9.5 8.8 8.5 99 100 3.3 8.0 0.7 4.9 7.3 35
NTPC NTPC IN O INR 150.3 170.0 13 21,254 16.6 0 (2) (2) (4) (5) 0 (0) 1 (2) (18) Mar-12 12 5 16 13.8 12.4 11.8 10.2 92 95 3.2 13.0 1.6 2.2 8.9 60 Reliance Power RPWR IN U INR 65.75 87.00 32 3,163 12.0 0 (7) (15) (30) (34) 0 (4) (12) (28) (47) Mar-12 17 2 (12) 21.3 18.2 17.8 20.4 100 98 0.0 5.6 1.0 11.0 24.1 124 Tata Power TPWR IN U INR 82.55 83.00 1 3,360 4.7 0 (7) (11) (25) (14) 0 (5) (8) (24) (27) Mar-12 (55) 53 12 11.2 25.1 16.4 14.7 30 91 1.5 6.7 1.7 1.5 7.7 235
Sector* 16 35,814 0 (5) (5) (13) (9) 0 (2) (2) (12) (22) Dec-12 32 22 na 17.9 13.5 11.1 na 97 95 2.5 9.6 1.3 2.7 9.5 150
Country Average* SENSEX 19,108 21,733 14 801,497 (0) (2) (3) (2) 13 Dec-12 14 16 16 15.4 13.5 11.6 11.5 100 101 2.0 16.2 2.1 1.3 8.4 41
* Country/ sector aggregates are for the coverage above
Source: Company data, Thomson Financial IBES, Credit Suisse estimates
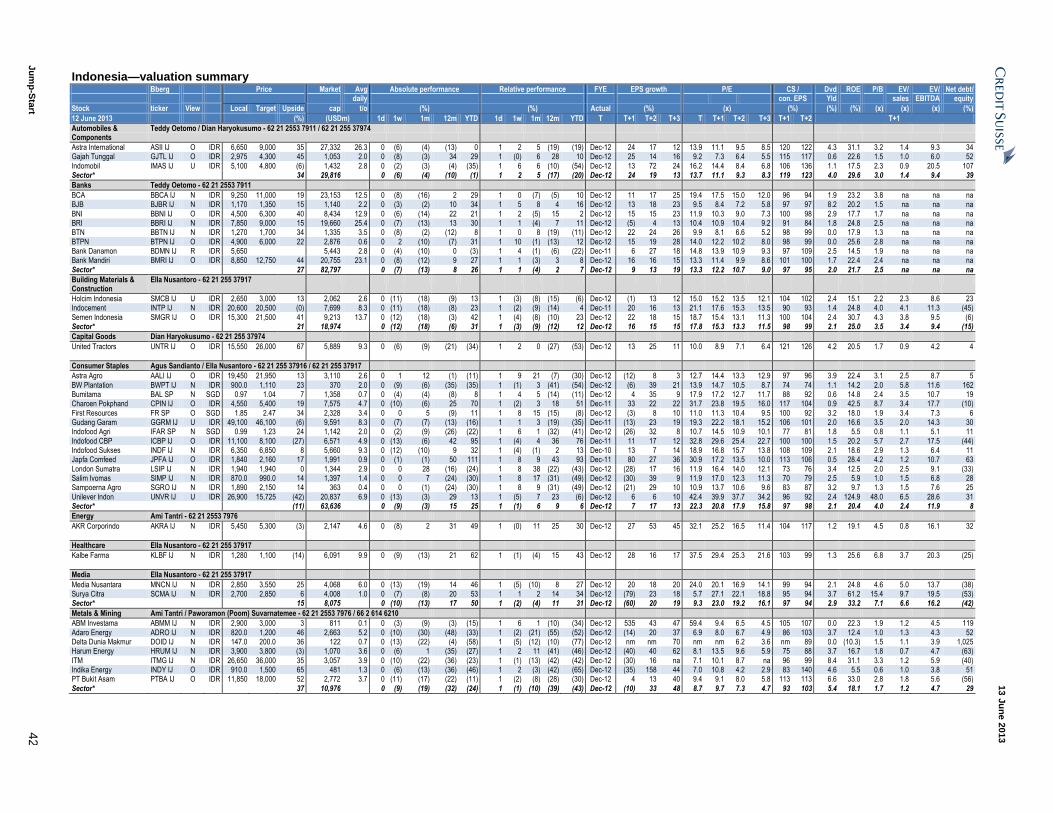
13 J
un
e 2
013
Ju
mp
-Sta
rt 4
2
Indonesia—valuation summary Bberg Price Market Avg Absolute performance Relative performance FYE EPS growth P/E CS / Dvd ROE P/B EV/ EV/ Net debt/ daily con. EPS Yld sales EBITDA equity
Stock ticker View Local Target Upside cap t/o (%) (%) Actual (%) (x) (%) (%) (%) (x) (x) (x) (%)
12 June 2013 (%) (USDm) 1d 1w 1m 12m YTD 1d 1w 1m 12m YTD T T+1 T+2 T+3 T T+1 T+2 T+3 T+1 T+2 T+1
Automobiles & Components
Teddy Oetomo / Dian Haryokusumo - 62 21 2553 7911 / 62 21 255 37974
Astra International ASII IJ O IDR 6,650 9,000 35 27,332 26.3 0 (6) (4) (13) 0 1 2 5 (19) (19) Dec-12 24 17 12 13.9 11.1 9.5 8.5 120 122 4.3 31.1 3.2 1.4 9.3 34 Gajah Tunggal GJTL IJ O IDR 2,975 4,300 45 1,053 2.0 0 (8) (3) 34 29 1 (0) 6 28 10 Dec-12 25 14 16 9.2 7.3 6.4 5.5 115 117 0.6 22.6 1.5 1.0 6.0 52
Indomobil IMAS IJ U IDR 5,100 4,800 (6) 1,432 2.8 0 (2) (3) (4) (35) 1 6 6 (10) (54) Dec-12 13 72 24 16.2 14.4 8.4 6.8 106 136 1.1 17.5 2.3 0.9 20.5 107 Sector* 34 29,816 0 (6) (4) (10) (1) 1 2 5 (17) (20) Dec-12 24 19 13 13.7 11.1 9.3 8.3 119 123 4.0 29.6 3.0 1.4 9.4 39
Banks Teddy Oetomo - 62 21 2553 7911
BCA BBCA IJ N IDR 9,250 11,000 19 23,153 12.5 0 (8) (16) 2 29 1 0 (7) (5) 10 Dec-12 11 17 25 19.4 17.5 15.0 12.0 96 94 1.9 23.2 3.8 na na na BJB BJBR IJ N IDR 1,170 1,350 15 1,140 2.2 0 (3) (2) 10 34 1 5 8 4 16 Dec-12 13 18 23 9.5 8.4 7.2 5.8 97 97 8.2 20.2 1.5 na na na
BNI BBNI IJ O IDR 4,500 6,300 40 8,434 12.9 0 (6) (14) 22 21 1 2 (5) 15 2 Dec-12 15 15 23 11.9 10.3 9.0 7.3 100 98 2.9 17.7 1.7 na na na BRI BBRI IJ N IDR 7,850 9,000 15 19,660 25.4 0 (7) (13) 13 30 1 1 (4) 7 11 Dec-12 (5) 4 13 10.4 10.9 10.4 9.2 91 84 1.8 24.8 2.5 na na na BTN BBTN IJ N IDR 1,270 1,700 34 1,335 3.5 0 (8) (2) (12) 8 1 0 8 (19) (11) Dec-12 22 24 26 9.9 8.1 6.6 5.2 98 99 0.0 17.9 1.3 na na na
BTPN BTPN IJ O IDR 4,900 6,000 22 2,876 0.6 0 2 (10) (7) 31 1 10 (1) (13) 12 Dec-12 15 19 28 14.0 12.2 10.2 8.0 98 99 0.0 25.6 2.8 na na na Bank Danamon BDMN IJ R IDR 5,650 5,443 2.8 0 (4) (10) 0 (3) 1 4 (1) (6) (22) Dec-11 6 27 18 14.8 13.9 10.9 9.3 97 109 2.5 14.5 1.9 na na na Bank Mandiri BMRI IJ O IDR 8,850 12,750 44 20,755 23.1 0 (8) (12) 9 27 1 1 (3) 3 8 Dec-12 16 16 15 13.3 11.4 9.9 8.6 101 100 1.7 22.4 2.4 na na na
Sector* 27 82,797 0 (7) (13) 8 26 1 1 (4) 2 7 Dec-12 9 13 19 13.3 12.2 10.7 9.0 97 95 2.0 21.7 2.5 na na na
Building Materials & Construction
Ella Nusantoro - 62 21 255 37917
Holcim Indonesia SMCB IJ U IDR 2,650 3,000 13 2,062 2.6 0 (11) (18) (9) 13 1 (3) (8) (15) (6) Dec-12 (1) 13 12 15.0 15.2 13.5 12.1 104 102 2.4 15.1 2.2 2.3 8.6 23 Indocement INTP IJ N IDR 20,600 20,500 (0) 7,699 8.3 0 (11) (18) (8) 23 1 (2) (9) (14) 4 Dec-11 20 16 13 21.1 17.6 15.3 13.5 90 93 1.4 24.8 4.0 4.1 11.3 (45)
Semen Indonesia SMGR IJ O IDR 15,300 21,500 41 9,213 13.7 0 (12) (18) (3) 42 1 (4) (8) (10) 23 Dec-12 22 18 15 18.7 15.4 13.1 11.3 100 104 2.4 30.7 4.3 3.8 9.5 (6) Sector* 21 18,974 0 (12) (18) (6) 31 1 (3) (9) (12) 12 Dec-12 16 15 15 17.8 15.3 13.3 11.5 98 99 2.1 25.0 3.5 3.4 9.4 (15)
Capital Goods Dian Haryokusumo - 62 21 255 37974
United Tractors UNTR IJ O IDR 15,550 26,000 67 5,889 9.3 0 (6) (9) (21) (34) 1 2 0 (27) (53) Dec-12 13 25 11 10.0 8.9 7.1 6.4 121 126 4.2 20.5 1.7 0.9 4.2 4
Consumer Staples Agus Sandianto / Ella Nusantoro - 62 21 255 37916 / 62 21 255 37917
Astra Agro AALI IJ O IDR 19,450 21,950 13 3,110 2.6 0 1 12 (1) (11) 1 9 21 (7) (30) Dec-12 (12) 8 3 12.7 14.4 13.3 12.9 97 96 3.9 22.4 3.1 2.5 8.7 5
BW Plantation BWPT IJ N IDR 900.0 1,110 23 370 2.0 0 (9) (6) (35) (35) 1 (1) 3 (41) (54) Dec-12 (6) 39 21 13.9 14.7 10.5 8.7 74 74 1.1 14.2 2.0 5.8 11.6 162 Bumitama BAL SP N SGD 0.97 1.04 7 1,358 0.7 0 (4) (4) (8) 8 1 4 5 (14) (11) Dec-12 4 35 9 17.9 17.2 12.7 11.7 88 92 0.6 14.8 2.4 3.5 10.7 19 Charoen Pokphand CPIN IJ O IDR 4,550 5,400 19 7,575 4.7 0 (10) (6) 25 70 1 (2) 3 18 51 Dec-11 33 22 22 31.7 23.8 19.5 16.0 117 104 0.9 42.5 8.7 3.4 17.7 (10)
First Resources FR SP O SGD 1.85 2.47 34 2,328 3.4 0 0 5 (9) 11 1 8 15 (15) (8) Dec-12 (3) 8 10 11.0 11.3 10.4 9.5 100 92 3.2 18.0 1.9 3.4 7.3 6 Gudang Garam GGRM IJ U IDR 49,100 46,100 (6) 9,591 8.3 0 (7) (7) (13) (16) 1 1 3 (19) (35) Dec-11 (13) 23 19 19.3 22.2 18.1 15.2 106 101 2.0 16.6 3.5 2.0 14.3 30 Indofood Agri IFAR SP N SGD 0.99 1.23 24 1,142 2.0 0 (2) (9) (26) (22) 1 6 1 (32) (41) Dec-12 (26) 32 8 10.7 14.5 10.9 10.1 77 81 1.8 5.5 0.8 1.1 5.1 11
Indofood CBP ICBP IJ O IDR 11,100 8,100 (27) 6,571 4.9 0 (13) (6) 42 95 1 (4) 4 36 76 Dec-11 11 17 12 32.8 29.6 25.4 22.7 100 100 1.5 20.2 5.7 2.7 17.5 (44) Indofood Sukses INDF IJ N IDR 6,350 6,850 8 5,660 9.3 0 (12) (10) 9 32 1 (4) (1) 2 13 Dec-10 13 7 14 18.9 16.8 15.7 13.8 108 109 2.1 18.6 2.9 1.3 6.4 11 Japfa Comfeed JPFA IJ O IDR 1,840 2,160 17 1,991 0.9 0 (1) (1) 50 111 1 8 9 43 93 Dec-11 80 27 36 30.9 17.2 13.5 10.0 113 106 0.5 28.4 4.2 1.2 10.7 63
London Sumatra LSIP IJ N IDR 1,940 1,940 0 1,344 2.9 0 0 28 (16) (24) 1 8 38 (22) (43) Dec-12 (28) 17 16 11.9 16.4 14.0 12.1 73 76 3.4 12.5 2.0 2.5 9.1 (33) Salim Ivomas SIMP IJ N IDR 870.0 990.0 14 1,397 1.4 0 0 7 (24) (30) 1 8 17 (31) (49) Dec-12 (30) 39 9 11.9 17.0 12.3 11.3 70 79 2.5 5.9 1.0 1.5 6.8 28 Sampoerna Agro SGRO IJ N IDR 1,890 2,150 14 363 0.4 0 0 (1) (24) (30) 1 8 9 (31) (49) Dec-12 (21) 29 10 10.9 13.7 10.6 9.6 83 87 3.2 9.7 1.3 1.5 7.6 25
Unilever Indon UNVR IJ U IDR 26,900 15,725 (42) 20,837 6.9 0 (13) (3) 29 13 1 (5) 7 23 (6) Dec-12 6 6 10 42.4 39.9 37.7 34.2 96 92 2.4 124.9 48.0 6.5 28.6 31 Sector* (11) 63,636 0 (9) (3) 15 25 1 (1) 6 9 6 Dec-12 7 17 13 22.3 20.8 17.9 15.8 97 98 2.1 20.4 4.0 2.4 11.9 8
Energy Ami Tantri - 62 21 2553 7976
AKR Corporindo AKRA IJ N IDR 5,450 5,300 (3) 2,147 4.6 0 (8) 2 31 49 1 (0) 11 25 30 Dec-12 27 53 45 32.1 25.2 16.5 11.4 104 117 1.2 19.1 4.5 0.8 16.1 32
Healthcare Ella Nusantoro - 62 21 255 37917
Kalbe Farma KLBF IJ N IDR 1,280 1,100 (14) 6,091 9.9 0 (9) (13) 21 62 1 (1) (4) 15 43 Dec-12 28 16 17 37.5 29.4 25.3 21.6 103 99 1.3 25.6 6.8 3.7 20.3 (25)
Media Ella Nusantoro - 62 21 255 37917
Media Nusantara MNCN IJ N IDR 2,850 3,550 25 4,068 6.0 0 (13) (19) 14 46 1 (5) (10) 8 27 Dec-12 20 18 20 24.0 20.1 16.9 14.1 99 94 2.1 24.8 4.6 5.0 13.7 (38) Surya Citra SCMA IJ N IDR 2,700 2,850 6 4,008 1.0 0 (7) (8) 20 53 1 1 2 14 34 Dec-12 (79) 23 18 5.7 27.1 22.1 18.8 95 94 3.7 61.2 15.4 9.7 19.5 (53) Sector* 15 8,075 0 (10) (13) 17 50 1 (2) (4) 11 31 Dec-12 (60) 20 19 9.3 23.0 19.2 16.1 97 94 2.9 33.2 7.1 6.6 16.2 (42)
Metals & Mining Ami Tantri / Paworamon (Poom) Suvarnatemee - 62 21 2553 7976 / 66 2 614 6210
ABM Investama ABMM IJ N IDR 2,900 3,000 3 811 0.1 0 (3) (9) (3) (15) 1 6 1 (10) (34) Dec-12 535 43 47 59.4 9.4 6.5 4.5 105 107 0.0 22.3 1.9 1.2 4.5 119
Adaro Energy ADRO IJ N IDR 820.0 1,200 46 2,663 5.2 0 (10) (30) (48) (33) 1 (2) (21) (55) (52) Dec-12 (14) 20 37 6.9 8.0 6.7 4.9 86 103 3.7 12.4 1.0 1.3 4.3 52 Delta Dunia Makmur DOID IJ N IDR 147.0 200.0 36 122 0.7 0 (13) (22) (4) (58) 1 (5) (12) (10) (77) Dec-12 nm nm 70 nm nm 6.2 3.6 nm 89 0.0 (10.3) 1.5 1.1 3.9 1,025 Harum Energy HRUM IJ N IDR 3,900 3,800 (3) 1,070 3.6 0 (6) 1 (35) (27) 1 2 11 (41) (46) Dec-12 (40) 40 62 8.1 13.5 9.6 5.9 75 88 3.7 16.7 1.8 0.7 4.7 (63)
ITM ITMG IJ N IDR 26,650 36,000 35 3,057 3.9 0 (10) (22) (36) (23) 1 (1) (13) (42) (42) Dec-12 (30) 16 na 7.1 10.1 8.7 na 96 99 8.4 31.1 3.3 1.2 5.9 (40) Indika Energy INDY IJ O IDR 910.0 1,500 65 481 1.3 0 (6) (13) (36) (46) 1 2 (3) (42) (65) Dec-12 (35) 158 44 7.0 10.8 4.2 2.9 83 140 4.6 5.5 0.6 1.0 3.8 51 PT Bukit Asam PTBA IJ O IDR 11,850 18,000 52 2,772 3.7 0 (11) (17) (22) (11) 1 (2) (8) (28) (30) Dec-12 4 13 40 9.4 9.1 8.0 5.8 113 113 6.6 33.0 2.8 1.8 5.6 (56)
Sector* 37 10,976 0 (9) (19) (32) (24) 1 (1) (10) (39) (43) Dec-12 (10) 33 48 8.7 9.7 7.3 4.7 93 103 5.4 18.1 1.7 1.2 4.7 29
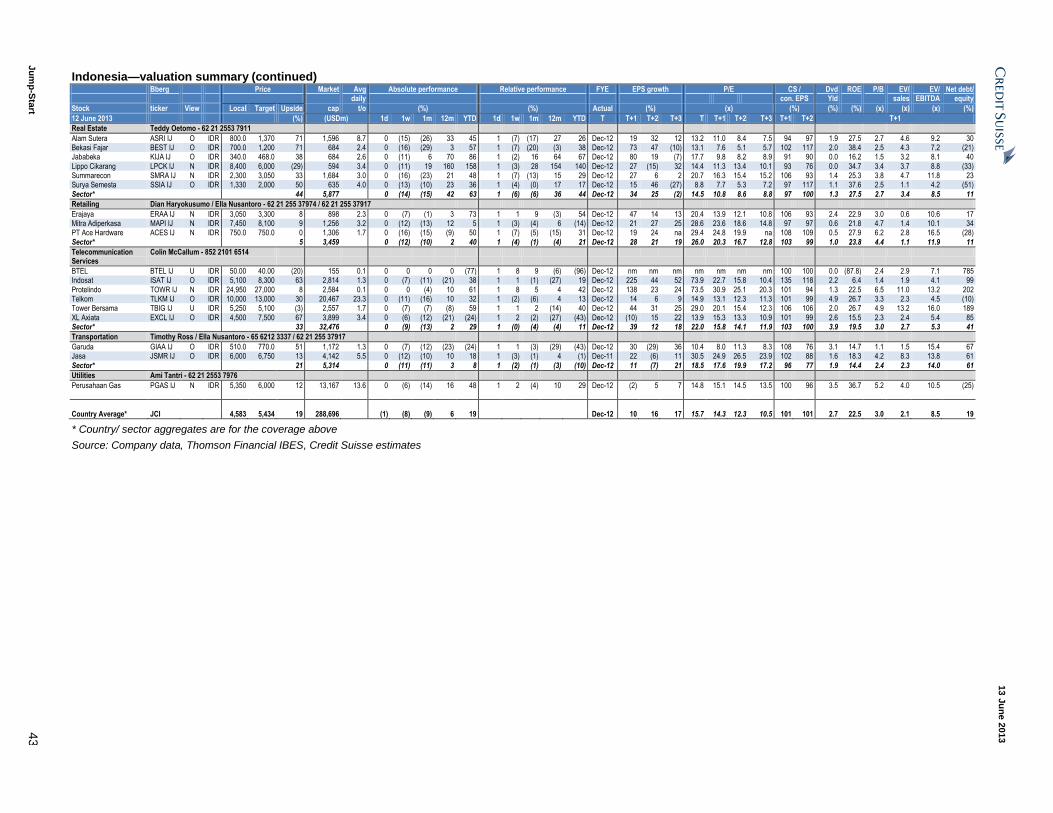
13 J
un
e 2
013
Ju
mp
-Sta
rt 4
3
Indonesia—valuation summary (continued) Bberg Price Market Avg Absolute performance Relative performance FYE EPS growth P/E CS / Dvd ROE P/B EV/ EV/ Net debt/ daily con. EPS Yld sales EBITDA equity
Stock ticker View Local Target Upside cap t/o (%) (%) Actual (%) (x) (%) (%) (%) (x) (x) (x) (%)
12 June 2013 (%) (USDm) 1d 1w 1m 12m YTD 1d 1w 1m 12m YTD T T+1 T+2 T+3 T T+1 T+2 T+3 T+1 T+2 T+1
Real Estate Teddy Oetomo - 62 21 2553 7911
Alam Sutera ASRI IJ O IDR 800.0 1,370 71 1,596 8.7 0 (15) (26) 33 45 1 (7) (17) 27 26 Dec-12 19 32 12 13.2 11.0 8.4 7.5 94 97 1.9 27.5 2.7 4.6 9.2 30 Bekasi Fajar BEST IJ O IDR 700.0 1,200 71 684 2.4 0 (16) (29) 3 57 1 (7) (20) (3) 38 Dec-12 73 47 (10) 13.1 7.6 5.1 5.7 102 117 2.0 38.4 2.5 4.3 7.2 (21) Jababeka KIJA IJ O IDR 340.0 468.0 38 684 2.6 0 (11) 6 70 86 1 (2) 16 64 67 Dec-12 80 19 (7) 17.7 9.8 8.2 8.9 91 90 0.0 16.2 1.5 3.2 8.1 40
Lippo Cikarang LPCK IJ N IDR 8,400 6,000 (29) 594 3.4 0 (11) 19 160 158 1 (3) 28 154 140 Dec-12 27 (15) 32 14.4 11.3 13.4 10.1 93 76 0.0 34.7 3.4 3.7 8.8 (33) Summarecon SMRA IJ N IDR 2,300 3,050 33 1,684 3.0 0 (16) (23) 21 48 1 (7) (13) 15 29 Dec-12 27 6 2 20.7 16.3 15.4 15.2 106 93 1.4 25.3 3.8 4.7 11.8 23 Surya Semesta SSIA IJ O IDR 1,330 2,000 50 635 4.0 0 (13) (10) 23 36 1 (4) (0) 17 17 Dec-12 15 46 (27) 8.8 7.7 5.3 7.2 97 117 1.1 37.6 2.5 1.1 4.2 (51)
Sector* 44 5,877 0 (14) (15) 42 63 1 (6) (6) 36 44 Dec-12 34 25 (2) 14.5 10.8 8.6 8.8 97 100 1.3 27.5 2.7 3.4 8.5 11
Retailing Dian Haryokusumo / Ella Nusantoro - 62 21 255 37974 / 62 21 255 37917
Erajaya ERAA IJ N IDR 3,050 3,300 8 898 2.3 0 (7) (1) 3 73 1 1 9 (3) 54 Dec-12 47 14 13 20.4 13.9 12.1 10.8 106 93 2.4 22.9 3.0 0.6 10.6 17 Mitra Adiperkasa MAPI IJ N IDR 7,450 8,100 9 1,256 3.2 0 (12) (13) 12 5 1 (3) (4) 6 (14) Dec-12 21 27 25 28.6 23.6 18.6 14.8 97 97 0.6 21.8 4.7 1.4 10.1 34 PT Ace Hardware ACES IJ N IDR 750.0 750.0 0 1,306 1.7 0 (16) (15) (9) 50 1 (7) (5) (15) 31 Dec-12 19 24 na 29.4 24.8 19.9 na 108 109 0.5 27.9 6.2 2.8 16.5 (28)
Sector* 5 3,459 0 (12) (10) 2 40 1 (4) (1) (4) 21 Dec-12 28 21 19 26.0 20.3 16.7 12.8 103 99 1.0 23.8 4.4 1.1 11.9 11
Telecommunication Services
Colin McCallum - 852 2101 6514
BTEL BTEL IJ U IDR 50.00 40.00 (20) 155 0.1 0 0 0 0 (77) 1 8 9 (6) (96) Dec-12 nm nm nm nm nm nm nm 100 100 0.0 (87.8) 2.4 2.9 7.1 785 Indosat ISAT IJ O IDR 5,100 8,300 63 2,814 1.3 0 (7) (11) (21) 38 1 1 (1) (27) 19 Dec-12 225 44 52 73.9 22.7 15.8 10.4 135 118 2.2 6.4 1.4 1.9 4.1 99
Protelindo TOWR IJ N IDR 24,950 27,000 8 2,584 0.1 0 0 (4) 10 61 1 8 5 4 42 Dec-12 138 23 24 73.5 30.9 25.1 20.3 101 94 1.3 22.5 6.5 11.0 13.2 202 Telkom TLKM IJ O IDR 10,000 13,000 30 20,467 23.3 0 (11) (16) 10 32 1 (2) (6) 4 13 Dec-12 14 6 9 14.9 13.1 12.3 11.3 101 99 4.9 26.7 3.3 2.3 4.5 (10) Tower Bersama TBIG IJ U IDR 5,250 5,100 (3) 2,557 1.7 0 (7) (7) (8) 59 1 1 2 (14) 40 Dec-12 44 31 25 29.0 20.1 15.4 12.3 106 106 2.0 26.7 4.9 13.2 16.0 189
XL Axiata EXCL IJ O IDR 4,500 7,500 67 3,899 3.4 0 (6) (12) (21) (24) 1 2 (2) (27) (43) Dec-12 (10) 15 22 13.9 15.3 13.3 10.9 101 99 2.6 15.5 2.3 2.4 5.4 85 Sector* 33 32,476 0 (9) (13) 2 29 1 (0) (4) (4) 11 Dec-12 39 12 18 22.0 15.8 14.1 11.9 103 100 3.9 19.5 3.0 2.7 5.3 41
Transportation Timothy Ross / Ella Nusantoro - 65 6212 3337 / 62 21 255 37917
Garuda GIAA IJ O IDR 510.0 770.0 51 1,172 1.3 0 (7) (12) (23) (24) 1 1 (3) (29) (43) Dec-12 30 (29) 36 10.4 8.0 11.3 8.3 108 76 3.1 14.7 1.1 1.5 15.4 67 Jasa JSMR IJ O IDR 6,000 6,750 13 4,142 5.5 0 (12) (10) 10 18 1 (3) (1) 4 (1) Dec-11 22 (6) 11 30.5 24.9 26.5 23.9 102 88 1.6 18.3 4.2 8.3 13.8 61
Sector* 21 5,314 0 (11) (11) 3 8 1 (2) (1) (3) (10) Dec-12 11 (7) 21 18.5 17.6 19.9 17.2 96 77 1.9 14.4 2.4 2.3 14.0 61
Utilities Ami Tantri - 62 21 2553 7976
Perusahaan Gas PGAS IJ N IDR 5,350 6,000 12 13,167 13.6 0 (6) (14) 16 48 1 2 (4) 10 29 Dec-12 (2) 5 7 14.8 15.1 14.5 13.5 100 96 3.5 36.7 5.2 4.0 10.5 (25)
Country Average* JCI 4,583 5,434 19 288,696 (1) (8) (9) 6 19 Dec-12 10 16 17 15.7 14.3 12.3 10.5 101 101 2.7 22.5 3.0 2.1 8.5 19
* Country/ sector aggregates are for the coverage above
Source: Company data, Thomson Financial IBES, Credit Suisse estimates
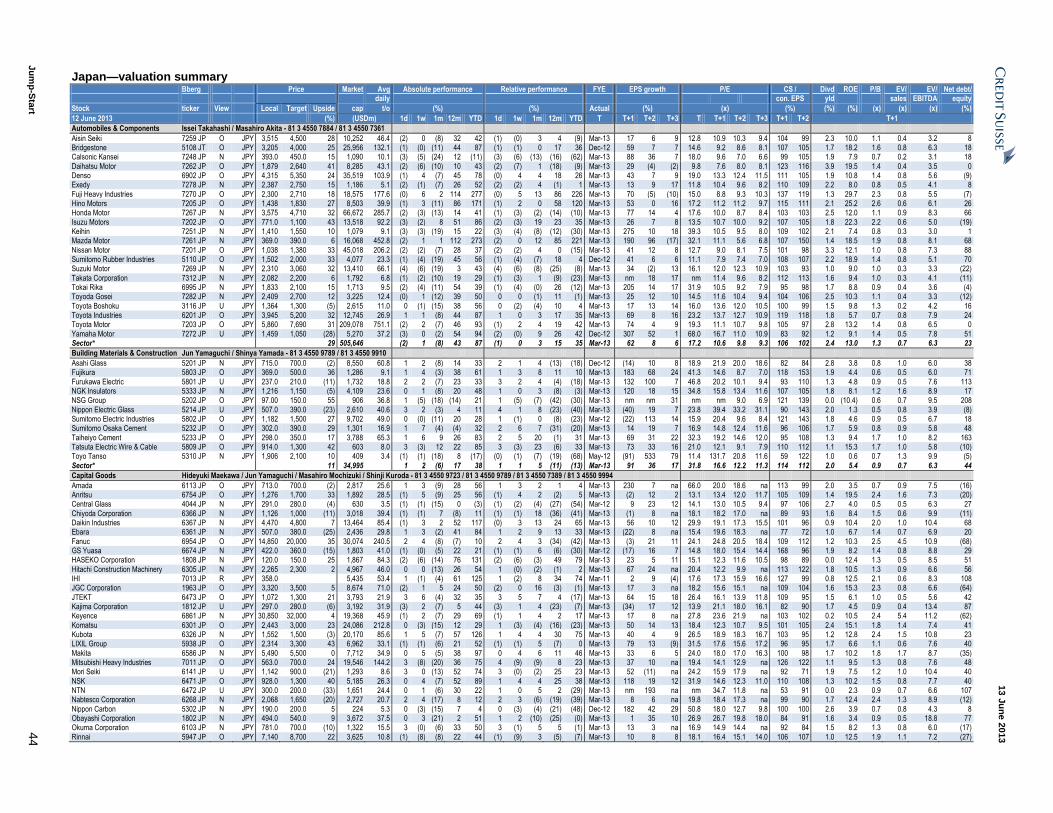
13 J
un
e 2
013
Ju
mp
-Sta
rt 4
4
Japan—valuation summary Bberg Price Market Avg Absolute performance Relative performance FYE EPS growth P/E CS / Divd ROE P/B EV/ EV/ Net debt/ daily con. EPS yld sales EBITDA equity
Stock ticker View Local Target Upside cap t/o (%) (%) Actual (%) (x) (%) (%) (%) (x) (x) (x) (%)
12 June 2013 (%) (USDm) 1d 1w 1m 12m YTD 1d 1w 1m 12m YTD T T+1 T+2 T+3 T T+1 T+2 T+3 T+1 T+2 T+1
Automobiles & Components Issei Takahashi / Masahiro Akita - 81 3 4550 7884 / 81 3 4550 7361
Aisin Seiki 7259 JP O JPY 3,515 4,500 28 10,252 46.4 (2) 0 (8) 32 42 (1) (0) 3 4 (9) Mar-13 17 6 9 12.8 10.9 10.3 9.4 104 99 2.3 10.0 1.1 0.4 3.2 8 Bridgestone 5108 JT O JPY 3,205 4,000 25 25,956 132.1 (1) (0) (11) 44 87 (1) (1) 0 17 36 Dec-12 59 7 7 14.6 9.2 8.6 8.1 107 105 1.7 18.2 1.6 0.8 6.3 18 Calsonic Kansei 7248 JP N JPY 393.0 450.0 15 1,090 10.1 (3) (5) (24) 12 (11) (3) (6) (13) (16) (62) Mar-13 88 36 7 18.0 9.6 7.0 6.6 99 105 1.9 7.9 0.7 0.2 3.1 18
Daihatsu Motor 7262 JP O JPY 1,879 2,640 41 8,285 43.1 (2) (6) (10) 10 43 (2) (7) 1 (18) (9) Mar-13 29 (4) (2) 9.8 7.6 8.0 8.1 123 116 3.9 19.5 1.4 0.4 3.5 0 Denso 6902 JP O JPY 4,315 5,350 24 35,519 103.9 (1) 4 (7) 45 78 (0) 4 4 18 26 Mar-13 43 7 9 19.0 13.3 12.4 11.5 111 105 1.9 10.8 1.4 0.8 5.6 (9) Exedy 7278 JP N JPY 2,387 2,750 15 1,186 5.1 (2) (1) (7) 26 52 (2) (2) 4 (1) 1 Mar-13 13 9 17 11.8 10.4 9.6 8.2 110 109 2.2 8.0 0.8 0.5 4.1 8
Fuji Heavy Industries 7270 JP O JPY 2,300 2,710 18 18,575 177.6 (0) 6 2 114 277 (0) 5 13 86 226 Mar-13 70 (5) (10) 15.0 8.8 9.3 10.3 137 119 1.3 29.7 2.3 0.8 5.5 (7) Hino Motors 7205 JP O JPY 1,438 1,830 27 8,503 39.9 (1) 3 (11) 86 171 (1) 2 0 58 120 Mar-13 53 0 16 17.2 11.2 11.2 9.7 115 111 2.1 25.2 2.6 0.6 6.1 26 Honda Motor 7267 JP N JPY 3,575 4,710 32 66,672 285.7 (2) (3) (13) 14 41 (1) (3) (2) (14) (10) Mar-13 77 14 4 17.6 10.0 8.7 8.4 103 103 2.5 12.0 1.1 0.9 8.3 66
Isuzu Motors 7202 JP O JPY 771.0 1,100 43 13,518 92.2 (3) (2) 8 51 86 (2) (3) 19 23 35 Mar-13 26 7 8 13.5 10.7 10.0 9.2 107 105 1.8 22.3 2.2 0.6 5.0 (19) Keihin 7251 JP N JPY 1,410 1,550 10 1,079 9.1 (3) (3) (19) 15 22 (3) (4) (8) (12) (30) Mar-13 275 10 18 39.3 10.5 9.5 8.0 109 102 2.1 7.4 0.8 0.3 3.0 1 Mazda Motor 7261 JP N JPY 369.0 390.0 6 16,068 452.8 (2) 1 1 112 273 (2) 0 12 85 221 Mar-13 190 96 (17) 32.1 11.1 5.6 6.8 107 150 1.4 18.5 1.9 0.8 8.1 68
Nissan Motor 7201 JP O JPY 1,038 1,380 33 45,018 206.2 (2) (2) (7) 28 37 (2) (2) 4 0 (15) Mar-13 41 12 8 12.7 9.0 8.1 7.5 101 98 3.3 12.1 1.0 0.8 7.3 88 Sumitomo Rubber Industries 5110 JP O JPY 1,502 2,000 33 4,077 23.3 (1) (4) (19) 45 56 (1) (4) (7) 18 4 Dec-12 41 6 6 11.1 7.9 7.4 7.0 108 107 2.2 18.9 1.4 0.8 5.1 70 Suzuki Motor 7269 JP N JPY 2,310 3,060 32 13,410 66.1 (4) (6) (19) 3 43 (4) (6) (8) (25) (8) Mar-13 34 (2) 13 16.1 12.0 12.3 10.9 103 93 1.0 9.0 1.0 0.3 3.3 (22)
Takata Corporation 7312 JP N JPY 2,082 2,200 6 1,792 6.8 (1) (2) (10) 19 29 (1) (3) 1 (9) (23) Mar-13 nm 18 17 nm 11.4 9.6 8.2 112 113 1.6 9.4 1.0 0.3 4.1 (11) Tokai Rika 6995 JP N JPY 1,833 2,100 15 1,713 9.5 (2) (4) (11) 54 39 (1) (4) (0) 26 (12) Mar-13 205 14 17 31.9 10.5 9.2 7.9 95 98 1.7 8.8 0.9 0.4 3.6 (4) Toyoda Gosei 7282 JP N JPY 2,409 2,700 12 3,225 12.4 (0) 1 (12) 39 50 0 0 (1) 11 (1) Mar-13 25 12 10 14.5 11.6 10.4 9.4 104 106 2.5 10.3 1.1 0.4 3.3 (12)
Toyota Boshoku 3116 JP U JPY 1,364 1,300 (5) 2,615 11.0 0 (1) (15) 38 56 0 (2) (4) 10 4 Mar-13 17 13 14 16.0 13.6 12.0 10.5 100 99 1.5 9.8 1.3 0.2 4.2 16 Toyota Industries 6201 JP O JPY 3,945 5,200 32 12,745 26.9 1 1 (8) 44 87 1 0 3 17 35 Mar-13 69 8 16 23.2 13.7 12.7 10.9 119 118 1.8 5.7 0.7 0.8 7.9 24 Toyota Motor 7203 JP O JPY 5,860 7,690 31 209,078 751.1 (2) 2 (7) 46 93 (1) 2 4 19 42 Mar-13 74 4 9 19.3 11.1 10.7 9.8 105 97 2.8 13.2 1.4 0.8 6.5 0
Yamaha Motor 7272 JP U JPY 1,459 1,050 (28) 5,270 37.2 (3) 0 (2) 54 94 (2) (0) 9 26 42 Dec-12 307 52 1 68.0 16.7 11.0 10.9 83 92 1.2 9.1 1.4 0.5 7.8 51 Sector* 29 505,646 (2) 1 (8) 43 87 (1) 0 3 15 35 Mar-13 62 8 6 17.2 10.6 9.8 9.3 106 102 2.4 13.0 1.3 0.7 6.3 23
Building Materials & Construction Jun Yamaguchi / Shinya Yamada - 81 3 4550 9789 / 81 3 4550 9910
Asahi Glass 5201 JP N JPY 715.0 700.0 (2) 8,550 60.8 1 2 (8) 14 33 2 1 4 (13) (18) Dec-12 (14) 10 8 18.9 21.9 20.0 18.6 82 84 2.8 3.8 0.8 1.0 6.0 38 Fujikura 5803 JP O JPY 369.0 500.0 36 1,286 9.1 1 4 (3) 38 61 1 3 8 11 10 Mar-13 183 68 24 41.3 14.6 8.7 7.0 118 153 1.9 4.4 0.6 0.5 6.0 71
Furukawa Electric 5801 JP U JPY 237.0 210.0 (11) 1,732 18.8 2 2 (7) 23 33 3 2 4 (4) (18) Mar-13 132 100 7 46.8 20.2 10.1 9.4 93 110 1.3 4.8 0.9 0.5 7.6 113 NGK Insulators 5333 JP N JPY 1,216 1,150 (5) 4,109 23.6 0 1 (8) 20 48 1 0 3 (8) (3) Mar-13 120 18 15 34.8 15.8 13.4 11.6 107 105 1.8 8.1 1.2 1.6 8.9 17 NSG Group 5202 JP O JPY 97.00 150.0 55 906 36.8 1 (5) (18) (14) 21 1 (5) (7) (42) (30) Mar-13 nm nm 31 nm nm 9.0 6.9 121 139 0.0 (10.4) 0.6 0.7 9.5 208
Nippon Electric Glass 5214 JP U JPY 507.0 390.0 (23) 2,610 40.6 3 2 (3) 4 11 4 1 8 (23) (40) Mar-13 (40) 19 7 23.8 39.4 33.2 31.1 90 143 2.0 1.3 0.5 0.8 3.9 (8) Sumitomo Electric Industries 5802 JP O JPY 1,182 1,500 27 9,702 49.0 0 (0) (11) 20 28 1 (1) 0 (8) (23) Mar-12 (22) 113 14 15.9 20.4 9.6 8.4 121 143 1.8 4.6 0.9 0.5 6.7 18 Sumitomo Osaka Cement 5232 JP O JPY 302.0 390.0 29 1,301 16.9 1 7 (4) (4) 32 2 6 7 (31) (20) Mar-13 14 19 7 16.9 14.8 12.4 11.6 96 106 1.7 5.9 0.8 0.9 5.8 48
Taiheiyo Cement 5233 JP O JPY 298.0 350.0 17 3,788 65.3 1 6 9 26 83 2 5 20 (1) 31 Mar-13 69 31 22 32.3 19.2 14.6 12.0 95 108 1.3 9.4 1.7 1.0 8.2 163 Tatsuta Electric Wire & Cable 5809 JP O JPY 914.0 1,300 42 603 8.0 3 (3) 12 22 85 3 (3) 23 (6) 33 Mar-13 73 33 16 21.0 12.1 9.1 7.9 110 112 1.1 15.3 1.7 1.0 5.8 (10) Toyo Tanso 5310 JP N JPY 1,906 2,100 10 409 3.4 (1) (1) (18) 8 (17) (0) (1) (7) (19) (68) May-12 (91) 533 79 11.4 131.7 20.8 11.6 59 122 1.0 0.6 0.7 1.3 9.9 (5)
Sector* 11 34,995 1 2 (6) 17 38 1 1 5 (11) (13) Mar-13 91 36 17 31.8 16.6 12.2 11.3 114 112 2.0 5.4 0.9 0.7 6.3 44
Capital Goods Hideyuki Maekawa / Jun Yamaguchi / Masahiro Mochizuki / Shinji Kuroda - 81 3 4550 9723 / 81 3 4550 9789 / 81 3 4550 7389 / 81 3 4550 9994
Amada 6113 JP O JPY 713.0 700.0 (2) 2,817 25.6 1 3 (9) 28 56 1 3 2 1 4 Mar-13 230 7 na 66.0 20.0 18.6 na 113 99 2.0 3.5 0.7 0.9 7.5 (16) Anritsu 6754 JP O JPY 1,276 1,700 33 1,892 28.5 (1) 5 (9) 25 56 (1) 4 2 (2) 5 Mar-13 (2) 12 2 13.1 13.4 12.0 11.7 105 109 1.4 19.5 2.4 1.6 7.3 (20) Central Glass 4044 JP N JPY 291.0 280.0 (4) 630 3.5 (1) (1) (15) 0 (3) (1) (2) (4) (27) (54) Mar-12 9 23 12 14.1 13.0 10.5 9.4 97 106 2.7 4.0 0.5 0.5 6.3 27
Chiyoda Corporation 6366 JP N JPY 1,126 1,000 (11) 3,018 39.4 (1) (1) 7 (8) 11 (1) (1) 18 (36) (41) Mar-13 (1) 8 na 18.1 18.2 17.0 na 89 93 1.6 8.4 1.5 0.6 9.9 (11) Daikin Industries 6367 JP N JPY 4,470 4,800 7 13,464 85.4 (1) 3 2 52 117 (0) 3 13 24 65 Mar-13 56 10 12 29.9 19.1 17.3 15.5 101 96 0.9 10.4 2.0 1.0 10.4 68 Ebara 6361 JP N JPY 507.0 380.0 (25) 2,436 29.8 1 3 (2) 41 84 1 2 9 13 33 Mar-13 (22) 8 na 15.4 19.6 18.3 na 77 72 1.0 6.7 1.4 0.7 6.9 20
Fanuc 6954 JP O JPY 14,850 20,000 35 30,074 240.5 2 4 (8) (7) 10 2 4 3 (34) (42) Mar-13 (3) 21 11 24.1 24.8 20.5 18.4 109 112 1.2 10.3 2.5 4.5 10.9 (68) GS Yuasa 6674 JP N JPY 422.0 360.0 (15) 1,803 41.0 (1) (0) (5) 22 21 (1) (1) 6 (6) (30) Mar-12 (17) 16 7 14.8 18.0 15.4 14.4 168 96 1.9 8.2 1.4 0.8 8.8 29 HASEKO Corporation 1808 JP N JPY 120.0 150.0 25 1,867 84.3 (2) (6) (14) 76 131 (2) (6) (3) 49 79 Mar-13 23 5 11 15.1 12.3 11.6 10.5 98 89 0.0 12.4 1.3 0.5 8.5 51
Hitachi Construction Machinery 6305 JP N JPY 2,265 2,300 2 4,967 46.0 0 0 (13) 26 54 1 (0) (2) (1) 2 Mar-13 67 24 na 20.4 12.2 9.9 na 113 122 1.8 10.5 1.3 0.9 6.6 56 IHI 7013 JP R JPY 358.0 5,435 53.4 1 (1) (4) 61 125 1 (2) 8 34 74 Mar-11 2 9 (4) 17.6 17.3 15.9 16.6 127 99 0.8 12.5 2.1 0.6 8.3 108 JGC Corporation 1963 JP O JPY 3,320 3,500 5 8,674 71.0 (2) 1 5 24 50 (2) 0 16 (3) (1) Mar-13 17 3 na 18.2 15.6 15.1 na 109 104 1.6 15.3 2.3 0.8 6.6 (64)
JTEKT 6473 JP O JPY 1,072 1,300 21 3,793 21.9 3 6 (4) 32 35 3 5 7 4 (17) Mar-13 64 15 18 26.4 16.1 13.9 11.8 109 95 1.5 6.1 1.0 0.5 5.6 42 Kajima Corporation 1812 JP U JPY 297.0 280.0 (6) 3,192 31.9 (3) 2 (7) 5 44 (3) 1 4 (23) (7) Mar-13 (34) 17 12 13.9 21.1 18.0 16.1 82 90 1.7 4.5 0.9 0.4 13.4 87 Keyence 6861 JP N JPY 30,850 32,000 4 19,368 45.9 (1) 2 (7) 29 69 (1) 1 4 2 17 Mar-13 17 8 na 27.8 23.6 21.9 na 103 102 0.2 10.5 2.4 5.4 11.2 (62)
Komatsu 6301 JP O JPY 2,443 3,000 23 24,086 212.8 0 (3) (15) 12 29 1 (3) (4) (16) (23) Mar-13 50 14 13 18.4 12.3 10.7 9.5 101 105 2.4 15.1 1.8 1.4 7.4 41 Kubota 6326 JP N JPY 1,552 1,500 (3) 20,170 85.6 1 5 (7) 57 126 1 4 4 30 75 Mar-13 40 4 9 26.5 18.9 18.3 16.7 103 95 1.2 12.8 2.4 1.5 10.8 23 LIXIL Group 5938 JP O JPY 2,314 3,300 43 6,962 33.1 (1) (1) (6) 21 52 (1) (1) 5 (7) 0 Mar-13 79 13 (9) 31.5 17.6 15.6 17.2 96 95 1.7 6.6 1.1 0.6 7.6 40
Makita 6586 JP N JPY 5,490 5,500 0 7,712 34.9 0 5 (5) 38 97 0 4 6 11 46 Mar-13 33 6 5 24.0 18.0 17.0 16.3 100 98 1.7 10.2 1.8 1.7 8.7 (35) Mitsubishi Heavy Industries 7011 JP O JPY 563.0 700.0 24 19,546 144.2 3 (8) (20) 36 75 4 (9) (9) 8 23 Mar-13 37 10 na 19.4 14.1 12.9 na 126 122 1.1 9.5 1.3 0.8 7.6 48 Mori Seiki 6141 JP U JPY 1,142 900.0 (21) 1,293 8.6 3 0 (13) 52 74 3 (0) (2) 25 23 Mar-13 52 (11) na 24.2 15.9 17.9 na 92 71 1.9 7.5 1.2 1.0 10.4 40
NSK 6471 JP O JPY 928.0 1,300 40 5,185 26.3 0 4 (7) 52 89 1 4 4 25 38 Mar-13 118 19 12 31.9 14.6 12.3 11.0 110 108 1.3 10.2 1.5 0.8 7.7 40 NTN 6472 JP U JPY 300.0 200.0 (33) 1,651 24.4 0 1 (6) 30 22 1 0 5 2 (29) Mar-13 nm 193 na nm 34.7 11.8 na 53 91 0.0 2.3 0.9 0.7 6.6 107 Nabtesco Corporation 6268 JP N JPY 2,068 1,650 (20) 2,727 20.7 2 4 (17) 8 12 2 3 (6) (19) (39) Mar-13 8 6 na 19.8 18.4 17.3 na 99 90 1.7 12.4 2.4 1.3 8.9 (12)
Nippon Carbon 5302 JP N JPY 190.0 200.0 5 224 5.3 0 (3) (15) 7 4 0 (3) (4) (21) (48) Dec-12 182 42 29 50.8 18.0 12.7 9.8 100 100 2.6 3.9 0.7 0.8 4.3 8 Obayashi Corporation 1802 JP N JPY 494.0 540.0 9 3,672 37.5 0 3 (21) 2 51 1 2 (10) (25) (0) Mar-13 1 35 10 26.9 26.7 19.8 18.0 84 91 1.6 3.4 0.9 0.5 18.8 77 Okuma Corporation 6103 JP N JPY 781.0 700.0 (10) 1,322 15.5 3 (0) (6) 33 50 3 (1) 5 5 (1) Mar-13 13 3 na 16.9 14.9 14.4 na 92 84 1.5 8.2 1.3 0.8 6.0 (17)
Rinnai 5947 JP O JPY 7,140 8,700 22 3,625 10.8 (1) (8) (8) 22 44 (1) (9) 3 (5) (7) Mar-13 10 8 8 18.1 16.4 15.1 14.0 106 107 1.0 12.5 1.9 1.1 7.2 (27)
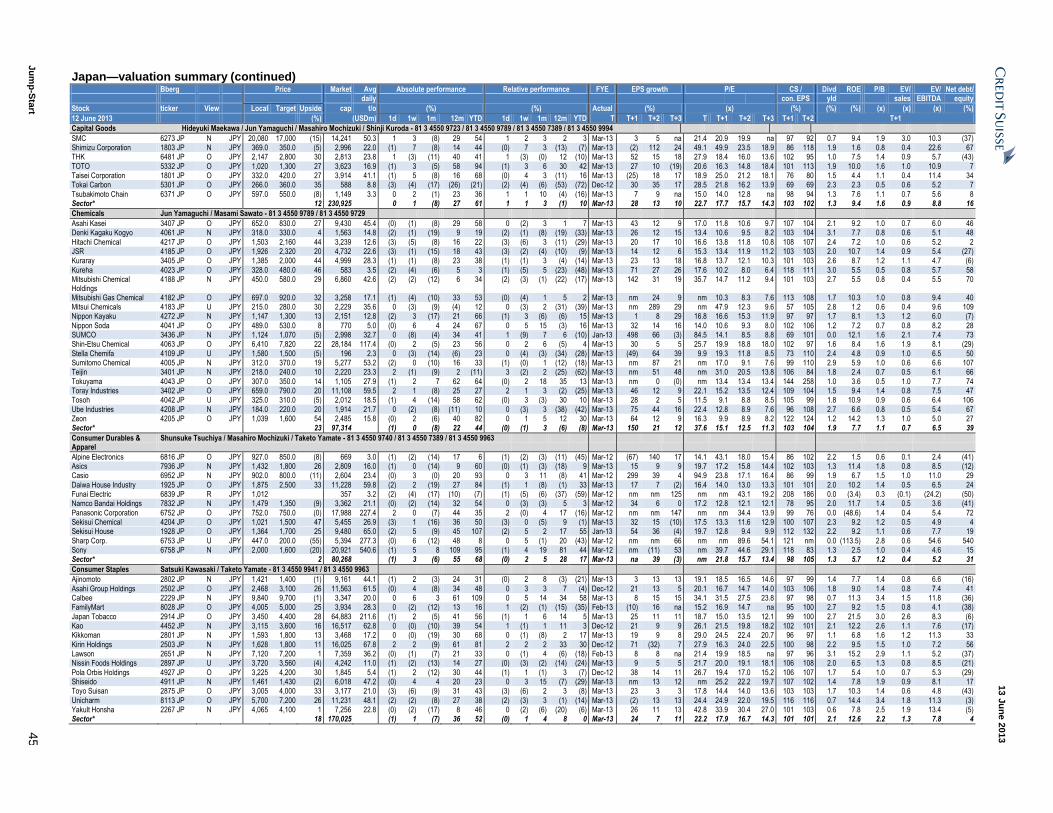
13 J
un
e 2
013
Ju
mp
-Sta
rt 4
5
Japan—valuation summary (continued) Bberg Price Market Avg Absolute performance Relative performance FYE EPS growth P/E CS / Divd ROE P/B EV/ EV/ Net debt/ daily
con. EPS yld sales EBITDA equity
Stock ticker View Local Target Upside cap t/o (%) (%) Actual (%) (x) (%) (%) (%) (x) (x) (x) (%)
12 June 2013 (%) (USDm) 1d 1w 1m 12m YTD 1d 1w 1m 12m YTD T T+1 T+2 T+3 T T+1 T+2 T+3 T+1 T+2 T+1
Capital Goods Hideyuki Maekawa / Jun Yamaguchi / Masahiro Mochizuki / Shinji Kuroda - 81 3 4550 9723 / 81 3 4550 9789 / 81 3 4550 7389 / 81 3 4550 9994
SMC 6273 JP N JPY 20,080 17,000 (15) 14,241 50.3 1 3 (8) 29 54 1 2 3 2 3 Mar-13 3 5 na 21.4 20.9 19.9 na 97 92 0.7 9.4 1.9 3.0 10.3 (37) Shimizu Corporation 1803 JP N JPY 369.0 350.0 (5) 2,996 22.0 (1) 7 (8) 14 44 (0) 7 3 (13) (7) Mar-13 (2) 112 24 49.1 49.9 23.5 18.9 86 118 1.9 1.6 0.8 0.4 22.6 67 THK 6481 JP O JPY 2,147 2,800 30 2,813 23.8 1 (3) (11) 40 41 1 (3) (0) 12 (10) Mar-13 52 15 18 27.9 18.4 16.0 13.6 102 95 1.0 7.5 1.4 0.9 5.7 (43)
TOTO 5332 JP O JPY 1,020 1,300 27 3,623 16.9 (1) 3 (5) 58 94 (1) 3 6 30 42 Mar-13 27 10 (19) 20.6 16.3 14.8 18.4 101 113 1.9 10.0 1.6 1.0 10.9 7 Taisei Corporation 1801 JP O JPY 332.0 420.0 27 3,914 41.1 (1) 5 (8) 16 68 (0) 4 3 (11) 16 Mar-13 (25) 18 17 18.9 25.0 21.2 18.1 76 80 1.5 4.4 1.1 0.4 11.4 34 Tokai Carbon 5301 JP O JPY 266.0 360.0 35 588 8.8 (3) (4) (17) (26) (21) (2) (4) (6) (53) (72) Dec-12 30 35 17 28.5 21.8 16.2 13.9 69 69 2.3 2.3 0.5 0.6 5.2 7
Tsubakimoto Chain 6371 JP O JPY 597.0 550.0 (8) 1,149 3.3 0 2 (1) 23 36 1 1 10 (4) (16) Mar-13 7 9 na 15.0 14.0 12.8 na 98 94 1.3 7.6 1.1 0.7 5.6 8 Sector* 12 230,925 0 1 (8) 27 61 1 1 3 (1) 10 Mar-13 28 13 10 22.7 17.7 15.7 14.3 103 102 1.3 9.4 1.6 0.9 8.8 16
Chemicals Jun Yamaguchi / Masami Sawato - 81 3 4550 9789 / 81 3 4550 9729
Asahi Kasei 3407 JP O JPY 652.0 830.0 27 9,430 45.4 (0) (1) (8) 29 58 0 (2) 3 1 7 Mar-13 43 12 9 17.0 11.8 10.6 9.7 107 104 2.1 9.2 1.0 0.7 6.0 46 Denki Kagaku Kogyo 4061 JP N JPY 318.0 330.0 4 1,563 14.8 (2) (1) (19) 9 19 (2) (1) (8) (19) (33) Mar-13 26 12 15 13.4 10.6 9.5 8.2 103 104 3.1 7.7 0.8 0.6 5.1 48
Hitachi Chemical 4217 JP O JPY 1,503 2,160 44 3,239 12.6 (3) (5) (8) 16 22 (3) (6) 3 (11) (29) Mar-13 20 17 10 16.6 13.8 11.8 10.8 108 107 2.4 7.2 1.0 0.6 5.2 2 JSR 4185 JP O JPY 1,926 2,320 20 4,732 22.6 (3) (1) (15) 18 43 (3) (2) (4) (10) (9) Mar-13 14 12 6 15.3 13.4 11.9 11.2 103 103 2.0 10.7 1.4 0.9 5.4 (27) Kuraray 3405 JP O JPY 1,385 2,000 44 4,999 28.3 (1) (1) (8) 23 38 (1) (1) 3 (4) (14) Mar-13 23 13 18 16.8 13.7 12.1 10.3 101 103 2.6 8.7 1.2 1.1 4.7 (6)
Kureha 4023 JP O JPY 328.0 480.0 46 583 3.5 (2) (4) (6) 5 3 (1) (5) 5 (23) (48) Mar-13 71 27 26 17.6 10.2 8.0 6.4 118 111 3.0 5.5 0.5 0.8 5.7 58 Mitsubishi Chemical Holdings
4188 JP N JPY 450.0 580.0 29 6,860 42.6 (2) (2) (12) 6 34 (2) (3) (1) (22) (17) Mar-13 142 31 19 35.7 14.7 11.2 9.4 101 103 2.7 5.5 0.8 0.4 5.5 70
Mitsubishi Gas Chemical 4182 JP O JPY 697.0 920.0 32 3,258 17.1 (1) (4) (10) 33 53 (0) (4) 1 5 2 Mar-13 nm 24 9 nm 10.3 8.3 7.6 113 108 1.7 10.3 1.0 0.8 9.4 40 Mitsui Chemicals 4183 JP U JPY 215.0 280.0 30 2,229 35.6 0 (3) (9) (4) 12 0 (3) 2 (31) (39) Mar-13 nm 289 29 nm 47.9 12.3 9.6 57 105 2.8 1.2 0.6 0.4 9.6 109 Nippon Kayaku 4272 JP N JPY 1,147 1,300 13 2,151 12.8 (2) 3 (17) 21 66 (1) 3 (6) (6) 15 Mar-13 1 8 29 16.8 16.6 15.3 11.9 97 97 1.7 8.1 1.3 1.2 6.0 (7)
Nippon Soda 4041 JP O JPY 489.0 530.0 8 770 5.0 (0) 6 4 24 67 0 5 15 (3) 16 Mar-13 32 14 16 14.0 10.6 9.3 8.0 102 106 1.2 7.2 0.7 0.8 8.2 28 SUMCO 3436 JP N JPY 1,124 1,070 (5) 2,998 32.7 0 (8) (4) 34 41 1 (9) 7 6 (10) Jan-13 498 66 (3) 84.5 14.1 8.5 8.8 69 101 0.0 12.1 1.6 2.1 7.4 73 Shin-Etsu Chemical 4063 JP O JPY 6,410 7,820 22 28,184 117.4 (0) 2 (5) 23 56 0 2 6 (5) 4 Mar-13 30 5 5 25.7 19.9 18.8 18.0 102 97 1.6 8.4 1.6 1.9 8.1 (29)
Stella Chemifa 4109 JP U JPY 1,580 1,500 (5) 196 2.3 0 (3) (14) (6) 23 0 (4) (3) (34) (28) Mar-13 (49) 64 39 9.9 19.3 11.8 8.5 73 110 2.4 4.8 0.9 1.0 6.5 50 Sumitomo Chemical 4005 JP N JPY 312.0 370.0 19 5,277 53.2 (2) 0 (10) 16 33 (1) (0) 1 (12) (18) Mar-13 nm 87 21 nm 17.0 9.1 7.6 99 110 2.9 5.9 1.0 0.6 6.6 107 Teijin 3401 JP N JPY 218.0 240.0 10 2,220 23.3 2 (1) (9) 2 (11) 3 (2) 2 (25) (62) Mar-13 nm 51 48 nm 31.0 20.5 13.8 106 84 1.8 2.4 0.7 0.5 6.1 66
Tokuyama 4043 JP O JPY 307.0 350.0 14 1,105 27.9 (1) 2 7 62 64 (0) 2 18 35 13 Mar-13 nm 0 (0) nm 13.4 13.4 13.4 144 258 1.0 3.6 0.5 1.0 7.7 74 Toray Industries 3402 JP O JPY 659.0 790.0 20 11,108 59.5 2 1 (8) 25 27 2 1 3 (2) (25) Mar-13 46 12 9 22.1 15.2 13.5 12.4 109 104 1.5 9.4 1.4 0.8 7.5 47 Tosoh 4042 JP U JPY 325.0 310.0 (5) 2,012 18.5 (1) 4 (14) 58 62 (0) 3 (3) 30 10 Mar-13 28 2 5 11.5 9.1 8.8 8.5 105 99 1.8 10.9 0.9 0.6 6.4 106
Ube Industries 4208 JP N JPY 184.0 220.0 20 1,914 21.7 0 (2) (8) (11) 10 0 (3) 3 (38) (42) Mar-13 75 44 16 22.4 12.8 8.9 7.6 96 108 2.7 6.6 0.8 0.5 5.4 67 Zeon 4205 JP O JPY 1,039 1,600 54 2,485 15.8 (0) 2 (6) 40 82 0 1 5 12 30 Mar-13 64 12 9 16.3 9.9 8.9 8.2 122 124 1.2 14.2 1.3 1.0 5.0 27 Sector* 23 97,314 (1) 0 (8) 22 44 (0) (1) 3 (6) (8) Mar-13 150 21 12 37.6 15.1 12.5 11.3 103 104 1.9 7.7 1.1 0.7 6.5 39
Consumer Durables & Apparel
Shunsuke Tsuchiya / Masahiro Mochizuki / Taketo Yamate - 81 3 4550 9740 / 81 3 4550 7389 / 81 3 4550 9963
Alpine Electronics 6816 JP O JPY 927.0 850.0 (8) 669 3.0 (1) (2) (14) 17 6 (1) (2) (3) (11) (45) Mar-12 (67) 140 17 14.1 43.1 18.0 15.4 86 102 2.2 1.5 0.6 0.1 2.4 (41) Asics 7936 JP N JPY 1,432 1,800 26 2,809 16.0 (1) 0 (14) 9 60 (0) (1) (3) (18) 9 Mar-13 15 9 9 19.7 17.2 15.8 14.4 102 103 1.3 11.4 1.8 0.8 8.5 (12) Casio 6952 JP N JPY 902.0 800.0 (11) 2,604 23.4 (0) 3 (0) 20 93 0 3 11 (8) 41 Mar-12 299 39 4 94.9 23.8 17.1 16.4 86 99 1.9 6.7 1.5 1.0 11.0 29
Daiwa House Industry 1925 JP O JPY 1,875 2,500 33 11,228 59.8 (2) 2 (19) 27 84 (1) 1 (8) (1) 33 Mar-13 17 7 (2) 16.4 14.0 13.0 13.3 101 101 2.0 10.2 1.4 0.5 6.5 24 Funai Electric 6839 JP R JPY 1,012 357 3.2 (2) (4) (17) (10) (7) (1) (5) (6) (37) (59) Mar-12 nm nm 125 nm nm 43.1 19.2 208 186 0.0 (3.4) 0.3 (0.1) (24.2) (50) Namco Bandai Holdings 7832 JP N JPY 1,479 1,350 (9) 3,362 21.1 (0) (2) (14) 32 54 0 (3) (3) 5 3 Mar-12 34 6 0 17.2 12.8 12.1 12.1 78 95 2.0 11.7 1.4 0.5 3.6 (41)
Panasonic Corporation 6752 JP O JPY 752.0 750.0 (0) 17,988 227.4 2 0 (7) 44 35 2 (0) 4 17 (16) Mar-12 nm nm 147 nm nm 34.4 13.9 99 76 0.0 (48.6) 1.4 0.4 5.4 72 Sekisui Chemical 4204 JP O JPY 1,021 1,500 47 5,455 26.9 (3) 1 (16) 36 50 (3) 0 (5) 9 (1) Mar-13 32 15 (10) 17.5 13.3 11.6 12.9 100 107 2.3 9.2 1.2 0.5 4.9 4 Sekisui House 1928 JP O JPY 1,364 1,700 25 9,480 65.0 (2) 5 (9) 45 107 (2) 5 2 17 55 Jan-13 54 36 (4) 19.7 12.8 9.4 9.9 112 132 2.2 9.2 1.1 0.6 7.7 19
Sharp Corp. 6753 JP U JPY 447.0 200.0 (55) 5,394 277.3 (0) 6 (12) 48 8 0 5 (1) 20 (43) Mar-12 nm nm 66 nm nm 89.6 54.1 121 nm 0.0 (113.5) 2.8 0.6 54.6 540 Sony 6758 JP N JPY 2,000 1,600 (20) 20,921 540.6 (1) 5 8 109 95 (1) 4 19 81 44 Mar-12 nm (11) 53 nm 39.7 44.6 29.1 118 83 1.3 2.5 1.0 0.4 4.6 15 Sector* 2 80,268 (1) 3 (6) 55 68 (0) 2 5 28 17 Mar-13 na 39 (3) nm 21.8 15.7 13.4 98 105 1.3 5.7 1.2 0.4 5.2 31
Consumer Staples Satsuki Kawasaki / Taketo Yamate - 81 3 4550 9941 / 81 3 4550 9963
Ajinomoto 2802 JP N JPY 1,421 1,400 (1) 9,161 44.1 (1) 2 (3) 24 31 (0) 2 8 (3) (21) Mar-13 3 13 13 19.1 18.5 16.5 14.6 97 99 1.4 7.7 1.4 0.8 6.6 (16)
Asahi Group Holdings 2502 JP O JPY 2,468 3,100 26 11,563 61.5 (0) 4 (8) 34 48 0 3 3 7 (4) Dec-12 21 13 5 20.1 16.7 14.7 14.0 103 106 1.8 9.0 1.4 0.8 7.4 41 Calbee 2229 JP N JPY 9,840 9,700 (1) 3,347 20.0 0 6 3 61 109 0 5 14 34 58 Mar-13 8 15 15 34.1 31.5 27.5 23.8 97 98 0.7 11.3 3.4 1.5 11.8 (36) FamilyMart 8028 JP O JPY 4,005 5,000 25 3,934 28.3 0 (2) (12) 13 16 1 (2) (1) (15) (35) Feb-13 (10) 16 na 15.2 16.9 14.7 na 95 100 2.7 9.2 1.5 0.8 4.1 (38)
Japan Tobacco 2914 JP O JPY 3,450 4,400 28 64,883 211.6 (1) 2 (5) 41 56 (1) 1 6 14 5 Mar-13 25 11 11 18.7 15.0 13.5 12.1 99 100 2.7 21.5 3.0 2.6 8.3 (6) Kao 4452 JP N JPY 3,115 3,600 16 16,517 62.8 0 (0) (10) 39 54 1 (1) 1 11 3 Dec-12 21 9 9 26.1 21.5 19.8 18.2 102 101 2.1 12.2 2.6 1.1 7.6 (17) Kikkoman 2801 JP N JPY 1,593 1,800 13 3,468 17.2 0 (0) (19) 30 68 0 (1) (8) 2 17 Mar-13 19 9 8 29.0 24.5 22.4 20.7 96 97 1.1 6.8 1.6 1.2 11.3 33
Kirin Holdings 2503 JP N JPY 1,628 1,800 11 16,025 67.8 2 2 (9) 61 81 2 2 2 33 30 Dec-12 71 (32) 7 27.9 16.3 24.0 22.5 100 98 2.2 9.5 1.5 1.0 7.2 56 Lawson 2651 JP N JPY 7,120 7,200 1 7,359 36.2 (0) (1) (7) 21 33 0 (1) 4 (6) (18) Feb-13 8 8 na 21.4 19.9 18.5 na 97 96 3.1 15.2 2.9 1.1 5.2 (37) Nissin Foods Holdings 2897 JP U JPY 3,720 3,560 (4) 4,242 11.0 (1) (2) (13) 14 27 (0) (3) (2) (14) (24) Mar-13 9 5 5 21.7 20.0 19.1 18.1 106 108 2.0 6.5 1.3 0.8 8.5 (21)
Pola Orbis Holdings 4927 JP O JPY 3,225 4,200 30 1,845 5.4 (1) 2 (12) 30 44 (1) 1 (1) 3 (7) Dec-12 38 14 11 26.7 19.4 17.0 15.2 106 107 1.7 5.4 1.0 0.7 5.3 (29) Shiseido 4911 JP N JPY 1,461 1,430 (2) 6,018 47.2 (0) 4 4 20 23 0 3 15 (7) (29) Mar-13 nm 13 12 nm 25.2 22.2 19.7 107 102 1.4 7.8 1.9 0.9 8.1 17 Toyo Suisan 2875 JP O JPY 3,005 4,000 33 3,177 21.0 (3) (6) (9) 31 43 (3) (6) 2 3 (8) Mar-13 23 3 3 17.8 14.4 14.0 13.6 103 103 1.7 10.3 1.4 0.6 4.8 (43)
Unicharm 8113 JP O JPY 5,700 7,200 26 11,231 48.1 (2) (2) (8) 27 38 (2) (3) 3 (1) (14) Mar-13 (2) 13 13 24.4 24.9 22.0 19.5 116 116 0.7 14.4 3.4 1.8 11.3 (3) Yakult Honsha 2267 JP N JPY 4,065 4,100 1 7,256 22.8 (0) (2) (17) 8 46 0 (2) (6) (20) (6) Mar-13 26 11 13 42.8 33.9 30.4 27.0 101 103 0.6 7.8 2.5 1.9 13.4 (5) Sector* 18 170,025 (1) 1 (7) 36 52 (0) 1 4 8 0 Mar-13 24 7 11 22.2 17.9 16.7 14.3 101 101 2.1 12.6 2.2 1.3 7.8 4
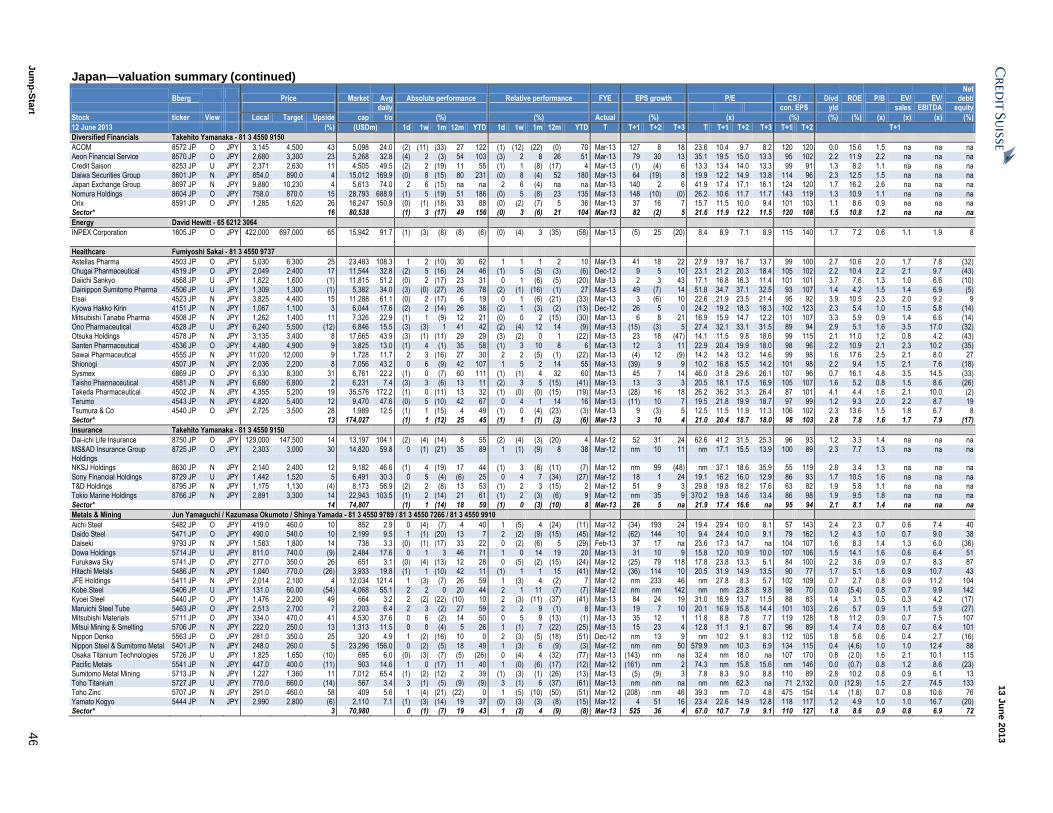
13 J
un
e 2
013
Ju
mp
-Sta
rt 4
6
Japan—valuation summary (continued)
Bberg
Price Market Avg Absolute performance Relative performance FYE EPS growth P/E CS / Divd ROE P/B EV/ EV/
Net debt/
daily con. EPS yld sales EBITDA equity
Stock ticker View Local Target Upside cap t/o (%) (%) Actual (%) (x) (%) (%) (%) (x) (x) (x) (%)
12 June 2013 (%) (USDm) 1d 1w 1m 12m YTD 1d 1w 1m 12m YTD T T+1 T+2 T+3 T T+1 T+2 T+3 T+1 T+2 T+1
Diversified Financials Takehito Yamanaka - 81 3 4550 9150
ACOM 8572 JP O JPY 3,145 4,500 43 5,098 24.0 (2) (11) (33) 27 122 (1) (12) (22) (0) 70 Mar-13 127 8 18 23.6 10.4 9.7 8.2 120 120 0.0 15.6 1.5 na na na Aeon Financial Service 8570 JP O JPY 2,680 3,300 23 5,268 32.8 (4) 2 (3) 54 103 (3) 2 8 26 51 Mar-13 79 30 13 35.1 19.5 15.0 13.3 95 102 2.2 11.9 2.2 na na na
Credit Saison 8253 JP U JPY 2,371 2,630 11 4,505 49.5 (2) 2 (19) 11 55 (1) 1 (8) (17) 4 Mar-13 (1) (4) 6 13.3 13.4 14.0 13.3 99 91 1.3 8.2 1.1 na na na Daiwa Securities Group 8601 JP N JPY 854.0 890.0 4 15,012 169.9 (0) 8 (15) 80 231 (0) 8 (4) 52 180 Mar-13 64 (19) 8 19.9 12.2 14.9 13.8 114 96 2.3 12.5 1.5 na na na Japan Exchange Group 8697 JP N JPY 9,880 10,230 4 5,613 74.0 2 6 (15) na na 2 6 (4) na na Mar-13 140 2 6 41.9 17.4 17.1 16.1 124 120 1.7 16.2 2.6 na na na
Nomura Holdings 8604 JP O JPY 758.0 870.0 15 28,793 688.9 (1) 5 (19) 51 186 (0) 5 (8) 23 135 Mar-13 148 (10) (0) 26.2 10.6 11.7 11.7 143 119 1.3 10.9 1.1 na na na Orix 8591 JP O JPY 1,285 1,620 26 16,247 150.9 (0) (1) (18) 33 88 (0) (2) (7) 5 36 Mar-13 37 16 7 15.7 11.5 10.0 9.4 101 103 1.1 8.6 0.9 na na na Sector* 16 80,538 (1) 3 (17) 49 156 (0) 3 (6) 21 104 Mar-13 82 (2) 5 21.6 11.9 12.2 11.5 120 108 1.5 10.8 1.2 na na na
Energy David Hewitt - 65 6212 3064
INPEX Corporation 1605 JP O JPY 422,000 697,000 65 15,942 91.7 (1) (3) (8) (8) (6) (0) (4) 3 (35) (58) Mar-13 (5) 25 (20) 8.4 8.9 7.1 8.9 115 140 1.7 7.2 0.6 1.1 1.9 8
Healthcare Fumiyoshi Sakai - 81 3 4550 9737
Astellas Pharma 4503 JP O JPY 5,030 6,300 25 23,483 108.3 1 2 (10) 30 62 1 1 1 2 10 Mar-13 41 18 22 27.9 19.7 16.7 13.7 99 100 2.7 10.6 2.0 1.7 7.8 (32) Chugai Pharmaceutical 4519 JP O JPY 2,049 2,400 17 11,544 32.8 (2) 5 (16) 24 46 (1) 5 (5) (3) (6) Dec-12 9 5 10 23.1 21.2 20.3 18.4 105 102 2.2 10.4 2.2 2.1 9.7 (43) Daiichi Sankyo 4568 JP U JPY 1,622 1,600 (1) 11,815 51.2 (0) 2 (17) 23 31 0 1 (6) (5) (20) Mar-13 2 3 43 17.1 16.8 16.3 11.4 101 101 3.7 7.6 1.3 1.0 6.6 (10)
Dainippon Sumitomo Pharma 4506 JP U JPY 1,309 1,300 (1) 5,382 34.0 (3) (0) (27) 26 78 (2) (1) (16) (1) 27 Mar-13 49 (7) 14 51.8 34.7 37.1 32.5 93 107 1.4 4.2 1.5 1.4 6.9 (5) Eisai 4523 JP N JPY 3,825 4,400 15 11,288 61.1 (0) 2 (17) 6 19 0 1 (6) (21) (33) Mar-13 3 (6) 10 22.6 21.9 23.5 21.4 95 92 3.9 10.5 2.3 2.0 9.2 9 Kyowa Hakko Kirin 4151 JP N JPY 1,067 1,100 3 6,044 17.6 (2) 2 (14) 26 38 (2) 1 (3) (2) (13) Dec-12 26 5 0 24.2 19.2 18.3 18.3 102 123 2.3 5.4 1.0 1.5 5.8 (14)
Mitsubishi Tanabe Pharma 4508 JP N JPY 1,262 1,400 11 7,326 22.9 (1) 1 (9) 12 21 (0) 0 2 (15) (30) Mar-13 6 8 21 16.9 15.9 14.7 12.2 101 107 3.3 5.9 0.9 1.4 6.6 (14) Ono Pharmaceutical 4528 JP U JPY 6,240 5,500 (12) 6,846 15.5 (3) (3) 1 41 42 (2) (4) 12 14 (9) Mar-13 (15) (3) 5 27.4 32.1 33.1 31.5 89 94 2.9 5.1 1.6 3.5 17.0 (32) Otsuka Holdings 4578 JP N JPY 3,135 3,400 8 17,665 43.9 (3) (1) (11) 29 29 (3) (2) 0 1 (22) Mar-13 23 18 (47) 14.1 11.5 9.8 18.6 99 115 2.1 11.0 1.2 0.8 4.2 (43)
Santen Pharmaceutical 4536 JP O JPY 4,480 4,900 9 3,825 13.0 (1) 4 (1) 35 58 (1) 3 10 8 6 Mar-13 12 3 11 22.9 20.4 19.9 18.0 98 96 2.2 10.9 2.1 2.3 10.2 (35) Sawai Pharmaceutical 4555 JP N JPY 11,020 12,000 9 1,728 11.7 2 3 (16) 27 30 2 2 (5) (1) (22) Mar-13 (4) 12 (9) 14.2 14.8 13.2 14.6 99 98 1.6 17.6 2.5 2.1 8.0 27 Shionogi 4507 JP N JPY 2,036 2,200 8 7,056 43.2 0 6 (9) 42 107 1 5 2 14 55 Mar-13 (39) 9 9 10.2 16.8 15.5 14.2 101 98 2.2 9.4 1.5 2.1 7.6 (18)
Sysmex 6869 JP O JPY 6,330 8,300 31 6,761 22.2 (1) 0 (7) 60 111 (1) (1) 4 32 60 Mar-13 45 7 14 46.0 31.8 29.6 26.1 107 96 0.7 16.1 4.8 3.5 14.5 (33) Taisho Pharmaceutical 4581 JP N JPY 6,680 6,800 2 6,231 7.4 (3) 3 (6) 13 11 (2) 3 5 (15) (41) Mar-13 13 3 3 20.5 18.1 17.5 16.9 105 107 1.6 5.2 0.8 1.5 8.6 (26) Takeda Pharmaceutical 4502 JP N JPY 4,355 5,200 19 35,576 172.2 (1) 0 (11) 13 32 (1) (0) (0) (15) (19) Mar-13 (28) 16 18 26.2 36.2 31.3 26.4 87 101 4.1 4.4 1.6 2.1 10.0 (2)
Terumo 4543 JP N JPY 4,820 5,400 12 9,470 47.6 (0) 5 (10) 42 67 0 4 1 14 16 Mar-13 (11) 10 7 19.5 21.8 19.9 18.7 97 99 1.2 9.3 2.0 2.2 8.7 19 Tsumura & Co 4540 JP O JPY 2,725 3,500 28 1,989 12.5 (1) 1 (15) 4 49 (1) 0 (4) (23) (3) Mar-13 9 (3) 5 12.5 11.5 11.9 11.3 106 102 2.3 13.6 1.5 1.8 6.7 8 Sector* 13 174,027 (1) 1 (12) 25 45 (1) 1 (1) (3) (6) Mar-13 3 10 4 21.0 20.4 18.7 18.0 98 103 2.8 7.8 1.6 1.7 7.9 (17)
Insurance Takehito Yamanaka - 81 3 4550 9150
Dai-ichi Life Insurance 8750 JP O JPY 129,000 147,500 14 13,197 104.1 (2) (4) (14) 8 55 (2) (4) (3) (20) 4 Mar-12 52 31 24 62.6 41.2 31.5 25.3 96 93 1.2 3.3 1.4 na na na
MS&AD Insurance Group Holdings
8725 JP O JPY 2,303 3,000 30 14,820 59.8 0 (1) (21) 35 89 1 (1) (9) 8 38 Mar-12 nm 10 11 nm 17.1 15.5 13.9 100 89 2.3 7.7 1.3 na na na
NKSJ Holdings 8630 JP N JPY 2,140 2,400 12 9,182 46.6 (1) 4 (19) 17 44 (1) 3 (8) (11) (7) Mar-12 nm 99 (48) nm 37.1 18.6 35.9 55 119 2.8 3.4 1.3 na na na
Sony Financial Holdings 8729 JP U JPY 1,442 1,520 5 6,491 30.3 0 5 (4) (6) 25 0 4 7 (34) (27) Mar-12 18 1 24 19.1 16.2 16.0 12.9 86 93 1.7 10.5 1.6 na na na T&D Holdings 8795 JP N JPY 1,175 1,130 (4) 8,173 56.9 (2) 2 (8) 13 53 (1) 2 3 (15) 2 Mar-12 51 9 3 29.8 19.8 18.2 17.6 63 82 1.9 5.8 1.1 na na na Tokio Marine Holdings 8766 JP N JPY 2,891 3,300 14 22,943 103.5 (1) 2 (14) 21 61 (1) 2 (3) (6) 9 Mar-12 nm 35 9 370.2 19.8 14.6 13.4 86 98 1.9 9.5 1.8 na na na
Sector* 14 74,807 (1) 1 (14) 18 59 (1) 0 (3) (10) 8 Mar-13 26 5 na 21.9 17.4 16.6 na 95 94 2.1 8.1 1.4 na na na
Metals & Mining Jun Yamaguchi / Kazumasa Okumoto / Shinya Yamada - 81 3 4550 9789 / 81 3 4550 7266 / 81 3 4550 9910
Aichi Steel 5482 JP O JPY 419.0 460.0 10 852 2.9 0 (4) (7) 4 40 1 (5) 4 (24) (11) Mar-12 (34) 193 24 19.4 29.4 10.0 8.1 57 143 2.4 2.3 0.7 0.6 7.4 40 Daido Steel 5471 JP O JPY 490.0 540.0 10 2,199 9.5 1 (1) (20) 13 7 2 (2) (9) (15) (45) Mar-12 (62) 144 10 9.4 24.4 10.0 9.1 79 162 1.2 4.3 1.0 0.7 9.0 38 Daiseki 9793 JP N JPY 1,583 1,800 14 738 3.3 (0) (1) (17) 33 22 0 (2) (6) 5 (29) Feb-13 37 17 na 23.6 17.3 14.7 na 104 107 1.6 8.3 1.4 1.3 6.0 (36)
Dowa Holdings 5714 JP U JPY 811.0 740.0 (9) 2,484 17.6 0 1 3 46 71 1 0 14 19 20 Mar-13 31 10 9 15.8 12.0 10.9 10.0 107 106 1.5 14.1 1.6 0.6 6.4 51 Furukawa Sky 5741 JP O JPY 277.0 350.0 26 651 3.1 (0) (4) (13) 12 28 0 (5) (2) (15) (24) Mar-12 (25) 79 118 17.8 23.8 13.3 6.1 84 100 2.2 3.6 0.9 0.7 8.3 87 Hitachi Metals 5486 JP N JPY 1,040 770.0 (26) 3,933 19.8 (1) 1 (10) 42 11 (1) 1 1 15 (41) Mar-12 (36) 114 10 20.5 31.9 14.9 13.5 90 77 1.7 5.1 1.6 0.9 10.7 43
JFE Holdings 5411 JP N JPY 2,014 2,100 4 12,034 121.4 1 (3) (7) 26 59 1 (3) 4 (2) 7 Mar-12 nm 233 46 nm 27.8 8.3 5.7 102 109 0.7 2.7 0.8 0.9 11.2 104 Kobe Steel 5406 JP U JPY 131.0 60.00 (54) 4,068 55.1 2 2 0 20 44 2 1 11 (7) (7) Mar-12 nm nm 142 nm nm 23.8 9.8 98 70 0.0 (5.4) 0.8 0.7 9.9 142 Kyoei Steel 5440 JP O JPY 1,476 2,200 49 664 3.2 2 (2) (22) (10) 10 2 (3) (11) (37) (41) Mar-13 84 24 19 31.0 16.9 13.7 11.5 88 83 1.4 3.1 0.5 0.3 4.2 (17)
Maruichi Steel Tube 5463 JP O JPY 2,513 2,700 7 2,203 6.4 2 3 (2) 27 59 2 2 9 (1) 8 Mar-13 19 7 10 20.1 16.9 15.8 14.4 101 103 2.6 5.7 0.9 1.1 5.9 (27) Mitsubishi Materials 5711 JP O JPY 334.0 470.0 41 4,530 37.6 0 6 (2) 14 50 0 5 9 (13) (1) Mar-13 35 12 1 11.8 8.8 7.8 7.7 119 128 1.8 11.2 0.9 0.7 7.5 107 Mitsui Mining & Smelting 5706 JP N JPY 222.0 250.0 13 1,313 11.5 0 0 (4) 5 26 1 (1) 7 (22) (25) Mar-13 15 23 4 12.8 11.1 9.1 8.7 96 89 1.4 7.4 0.8 0.7 6.4 101
Nippon Denko 5563 JP O JPY 281.0 350.0 25 320 4.9 1 (2) (16) 10 0 2 (3) (5) (18) (51) Dec-12 nm 13 9 nm 10.2 9.1 8.3 112 105 1.8 5.6 0.6 0.4 2.7 (16) Nippon Steel & Sumitomo Metal 5401 JP N JPY 248.0 260.0 5 23,296 156.0 0 (2) (5) 18 49 1 (3) 6 (9) (3) Mar-12 nm nm 50 579.9 nm 10.3 6.9 134 115 0.4 (4.6) 1.0 1.0 12.4 88 Osaka Titanium Technologies 5726 JP U JPY 1,825 1,650 (10) 695 6.0 (0) (3) (7) (5) (26) 0 (4) 4 (32) (77) Mar-13 (143) nm na 32.4 nm 18.0 na 107 170 0.8 (2.0) 1.6 2.1 10.1 115
Pacific Metals 5541 JP N JPY 447.0 400.0 (11) 903 14.6 1 0 (17) 11 40 1 (0) (6) (17) (12) Mar-12 (161) nm 2 74.3 nm 15.8 15.6 nm 146 0.0 (0.7) 0.8 1.2 8.6 (23) Sumitomo Metal Mining 5713 JP N JPY 1,227 1,360 11 7,012 65.4 (1) (2) (12) 2 39 (1) (3) (1) (26) (13) Mar-13 (5) (9) 3 7.8 8.3 9.0 8.8 110 89 2.8 10.2 0.8 0.9 6.1 13 Toho Titanium 5727 JP U JPY 770.0 660.0 (14) 567 3.4 3 (1) (5) (9) (9) 3 (1) 6 (37) (61) Mar-13 nm nm na nm nm 62.3 na 71 2,132 0.0 (12.9) 1.5 2.7 74.5 133
Toho Zinc 5707 JP N JPY 291.0 460.0 58 409 5.6 1 (4) (21) (22) 0 1 (5) (10) (50) (51) Mar-12 (208) nm 46 39.3 nm 7.0 4.8 475 154 1.4 (1.8) 0.7 0.8 10.6 76 Yamato Kogyo 5444 JP N JPY 2,990 2,800 (6) 2,110 7.1 (1) (3) (14) 19 37 (0) (3) (3) (8) (15) Mar-12 4 51 16 23.4 22.6 14.9 12.8 118 117 1.2 4.9 1.0 1.0 16.7 (20) Sector* 3 70,980 0 (1) (7) 19 43 1 (2) 4 (9) (8) Mar-13 525 36 4 67.0 10.7 7.9 9.1 110 127 1.8 8.6 0.9 0.8 6.9 72
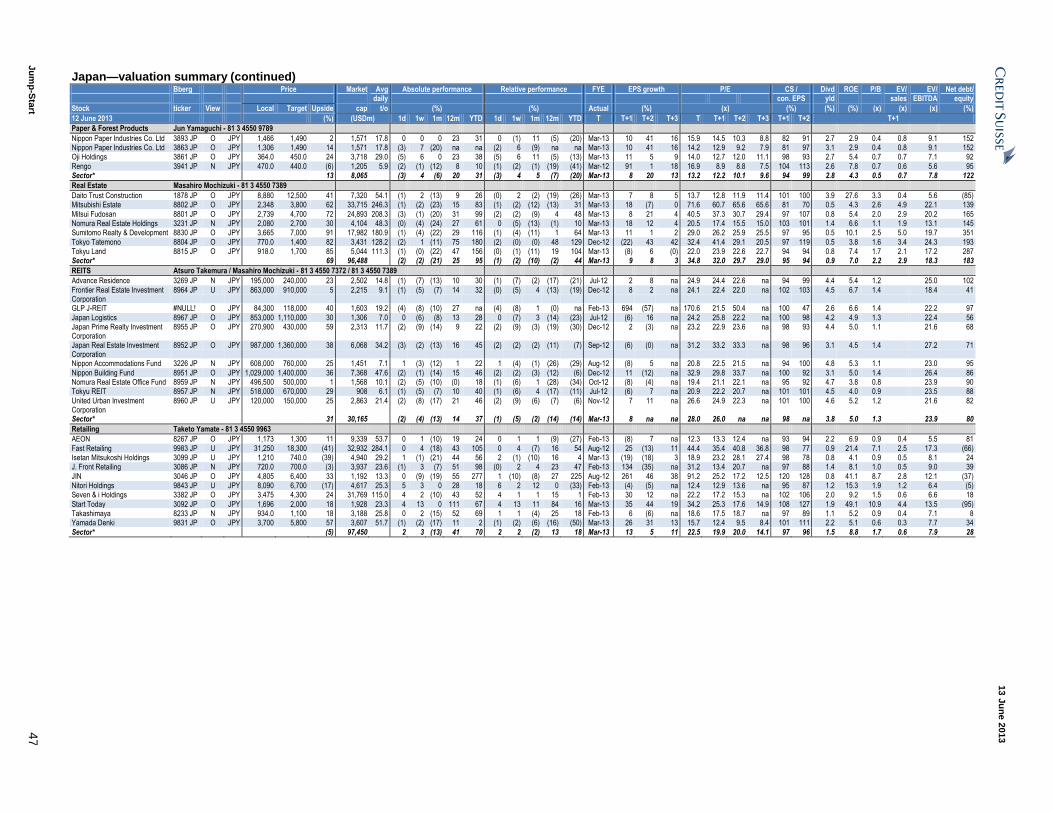
13 J
un
e 2
013
Ju
mp
-Sta
rt 4
7
Japan—valuation summary (continued) Bberg Price Market Avg Absolute performance Relative performance FYE EPS growth P/E CS / Divd ROE P/B EV/ EV/ Net debt/ daily con. EPS yld sales EBITDA equity
Stock ticker View Local Target Upside cap t/o (%) (%) Actual (%) (x) (%) (%) (%) (x) (x) (x) (%)
12 June 2013 (%) (USDm) 1d 1w 1m 12m YTD 1d 1w 1m 12m YTD T T+1 T+2 T+3 T T+1 T+2 T+3 T+1 T+2 T+1
Paper & Forest Products Jun Yamaguchi - 81 3 4550 9789
Nippon Paper Industries Co. Ltd 3893 JP O JPY 1,466 1,490 2 1,571 17.8 0 0 0 23 31 0 (1) 11 (5) (20) Mar-13 10 41 16 15.9 14.5 10.3 8.8 82 91 2.7 2.9 0.4 0.8 9.1 152 Nippon Paper Industries Co. Ltd 3863 JP O JPY 1,306 1,490 14 1,571 17.8 (3) 7 (20) na na (2) 6 (9) na na Mar-13 10 41 16 14.2 12.9 9.2 7.9 81 97 3.1 2.9 0.4 0.8 9.1 152 Oji Holdings 3861 JP O JPY 364.0 450.0 24 3,718 29.0 (5) 6 0 23 38 (5) 6 11 (5) (13) Mar-13 11 5 9 14.0 12.7 12.0 11.1 98 93 2.7 5.4 0.7 0.7 7.1 92
Rengo 3941 JP N JPY 470.0 440.0 (6) 1,205 5.9 (2) (1) (12) 8 10 (1) (2) (1) (19) (41) Mar-12 91 1 18 16.9 8.9 8.8 7.5 104 113 2.6 7.8 0.7 0.6 5.6 95 Sector* 13 8,065 (3) 4 (6) 20 31 (3) 4 5 (7) (20) Mar-13 8 20 13 13.2 12.2 10.1 9.6 94 99 2.8 4.3 0.5 0.7 7.8 122
Real Estate Masahiro Mochizuki - 81 3 4550 7389
Daito Trust Construction 1878 JP O JPY 8,880 12,500 41 7,320 54.1 (1) 2 (13) 9 26 (0) 2 (2) (19) (26) Mar-13 7 8 5 13.7 12.8 11.9 11.4 101 100 3.9 27.6 3.3 0.4 5.6 (85) Mitsubishi Estate 8802 JP O JPY 2,348 3,800 62 33,715 246.3 (1) (2) (23) 15 83 (1) (2) (12) (13) 31 Mar-13 18 (7) 0 71.6 60.7 65.6 65.6 81 70 0.5 4.3 2.6 4.9 22.1 139
Mitsui Fudosan 8801 JP O JPY 2,739 4,700 72 24,893 208.3 (3) (1) (20) 31 99 (2) (2) (9) 4 48 Mar-13 8 21 4 40.5 37.3 30.7 29.4 97 107 0.8 5.4 2.0 2.9 20.2 165 Nomura Real Estate Holdings 3231 JP N JPY 2,080 2,700 30 4,104 48.3 (0) (4) (24) 27 61 0 (5) (13) (1) 10 Mar-13 18 12 4 20.5 17.4 15.5 15.0 103 101 1.4 6.6 1.1 1.9 13.1 145 Sumitomo Realty & Development 8830 JP O JPY 3,665 7,000 91 17,982 180.9 (1) (4) (22) 29 116 (1) (4) (11) 1 64 Mar-13 11 1 2 29.0 26.2 25.9 25.5 97 95 0.5 10.1 2.5 5.0 19.7 351
Tokyo Tatemono 8804 JP O JPY 770.0 1,400 82 3,431 128.2 (2) 1 (11) 75 180 (2) (0) (0) 48 129 Dec-12 (22) 43 42 32.4 41.4 29.1 20.5 97 119 0.5 3.8 1.6 3.4 24.3 193 Tokyu Land 8815 JP O JPY 918.0 1,700 85 5,044 111.3 (1) (0) (22) 47 156 (0) (1) (11) 19 104 Mar-13 (8) 6 (0) 22.0 23.9 22.6 22.7 94 94 0.8 7.4 1.7 2.1 17.2 287 Sector* 69 96,488 (2) (2) (21) 25 95 (1) (2) (10) (2) 44 Mar-13 9 8 3 34.8 32.0 29.7 29.0 95 94 0.9 7.0 2.2 2.9 18.3 183
REITS Atsuro Takemura / Masahiro Mochizuki - 81 3 4550 7372 / 81 3 4550 7389
Advance Residence 3269 JP N JPY 195,000 240,000 23 2,502 14.8 (1) (7) (13) 10 30 (1) (7) (2) (17) (21) Jul-12 2 8 na 24.9 24.4 22.6 na 94 99 4.4 5.4 1.2 25.0 102
Frontier Real Estate Investment Corporation
8964 JP U JPY 863,000 910,000 5 2,215 9.1 (1) (5) (7) 14 32 (0) (5) 4 (13) (19) Dec-12 8 2 na 24.1 22.4 22.0 na 102 103 4.5 6.7 1.4 18.4 41
GLP J-REIT #NULL! O JPY 84,300 118,000 40 1,603 19.2 (4) (8) (10) 27 na (4) (8) 1 (0) na Feb-13 694 (57) na 170.6 21.5 50.4 na 100 47 2.6 6.6 1.4 22.2 97
Japan Logistics 8967 JP O JPY 853,000 1,110,000 30 1,306 7.0 0 (6) (8) 13 28 0 (7) 3 (14) (23) Jul-12 (6) 16 na 24.2 25.8 22.2 na 100 98 4.2 4.9 1.3 22.4 56 Japan Prime Realty Investment Corporation
8955 JP O JPY 270,900 430,000 59 2,313 11.7 (2) (9) (14) 9 22 (2) (9) (3) (19) (30) Dec-12 2 (3) na 23.2 22.9 23.6 na 98 93 4.4 5.0 1.1 21.6 68
Japan Real Estate Investment Corporation
8952 JP O JPY 987,000 1,360,000 38 6,068 34.2 (3) (2) (13) 16 45 (2) (2) (2) (11) (7) Sep-12 (6) (0) na 31.2 33.2 33.3 na 98 96 3.1 4.5 1.4 27.2 71
Nippon Accommodations Fund 3226 JP N JPY 608,000 760,000 25 1,451 7.1 1 (3) (12) 1 22 1 (4) (1) (26) (29) Aug-12 (8) 5 na 20.8 22.5 21.5 na 94 100 4.8 5.3 1.1 23.0 95
Nippon Building Fund 8951 JP O JPY 1,029,000 1,400,000 36 7,368 47.6 (2) (1) (14) 15 46 (2) (2) (3) (12) (6) Dec-12 11 (12) na 32.9 29.8 33.7 na 100 92 3.1 5.0 1.4 26.4 86 Nomura Real Estate Office Fund 8959 JP N JPY 496,500 500,000 1 1,568 10.1 (2) (5) (10) (0) 18 (1) (6) 1 (28) (34) Oct-12 (8) (4) na 19.4 21.1 22.1 na 95 92 4.7 3.8 0.8 23.9 90 Tokyu REIT 8957 JP N JPY 518,000 670,000 29 908 6.1 (1) (5) (7) 10 40 (1) (6) 4 (17) (11) Jul-12 (6) 7 na 20.9 22.2 20.7 na 101 101 4.5 4.0 0.9 23.5 88
United Urban Investment Corporation
8960 JP U JPY 120,000 150,000 25 2,863 21.4 (2) (8) (17) 21 46 (2) (9) (6) (7) (6) Nov-12 7 11 na 26.6 24.9 22.3 na 101 100 4.6 5.2 1.2 21.6 82
Sector* 31 30,165 (2) (4) (13) 14 37 (1) (5) (2) (14) (14) Mar-13 8 na na 28.0 26.0 na na 98 na 3.8 5.0 1.3 23.9 80
Retailing Taketo Yamate - 81 3 4550 9963
AEON 8267 JP O JPY 1,173 1,300 11 9,339 53.7 0 1 (10) 19 24 0 1 1 (9) (27) Feb-13 (8) 7 na 12.3 13.3 12.4 na 93 94 2.2 6.9 0.9 0.4 5.5 81
Fast Retailing 9983 JP U JPY 31,250 18,300 (41) 32,932 284.1 0 4 (18) 43 105 0 4 (7) 16 54 Aug-12 25 (13) 11 44.4 35.4 40.8 36.8 98 77 0.9 21.4 7.1 2.5 17.3 (66) Isetan Mitsukoshi Holdings 3099 JP U JPY 1,210 740.0 (39) 4,940 29.2 1 (1) (21) 44 56 2 (1) (10) 16 4 Mar-13 (19) (18) 3 18.9 23.2 28.1 27.4 98 78 0.8 4.1 0.9 0.5 8.1 24 J. Front Retailing 3086 JP N JPY 720.0 700.0 (3) 3,937 23.6 (1) 3 (7) 51 98 (0) 2 4 23 47 Feb-13 134 (35) na 31.2 13.4 20.7 na 97 88 1.4 8.1 1.0 0.5 9.0 39
JIN 3046 JP O JPY 4,805 6,400 33 1,192 13.3 0 (9) (19) 55 277 1 (10) (8) 27 225 Aug-12 261 46 38 91.2 25.2 17.2 12.5 120 128 0.8 41.1 8.7 2.8 12.1 (37) Nitori Holdings 9843 JP U JPY 8,090 6,700 (17) 4,617 25.3 5 3 0 28 18 6 2 12 0 (33) Feb-13 (4) (5) na 12.4 12.9 13.6 na 95 87 1.2 15.3 1.9 1.2 6.4 (5) Seven & i Holdings 3382 JP O JPY 3,475 4,300 24 31,769 115.0 4 2 (10) 43 52 4 1 1 15 1 Feb-13 30 12 na 22.2 17.2 15.3 na 102 106 2.0 9.2 1.5 0.6 6.6 18
Start Today 3092 JP O JPY 1,696 2,000 18 1,928 23.3 4 13 0 111 67 4 13 11 84 16 Mar-13 35 44 19 34.2 25.3 17.6 14.9 108 127 1.9 49.1 10.9 4.4 13.5 (95) Takashimaya 8233 JP N JPY 934.0 1,100 18 3,188 25.8 0 2 (15) 52 69 1 1 (4) 25 18 Feb-13 6 (6) na 18.6 17.5 18.7 na 97 89 1.1 5.2 0.9 0.4 7.1 8 Yamada Denki 9831 JP O JPY 3,700 5,800 57 3,607 51.7 (1) (2) (17) 11 2 (1) (2) (6) (16) (50) Mar-13 26 31 13 15.7 12.4 9.5 8.4 101 111 2.2 5.1 0.6 0.3 7.7 34
Sector* (5) 97,450 2 3 (13) 41 70 2 2 (2) 13 18 Mar-13 13 5 11 22.5 19.9 20.0 14.1 97 96 1.5 8.8 1.7 0.6 7.9 28
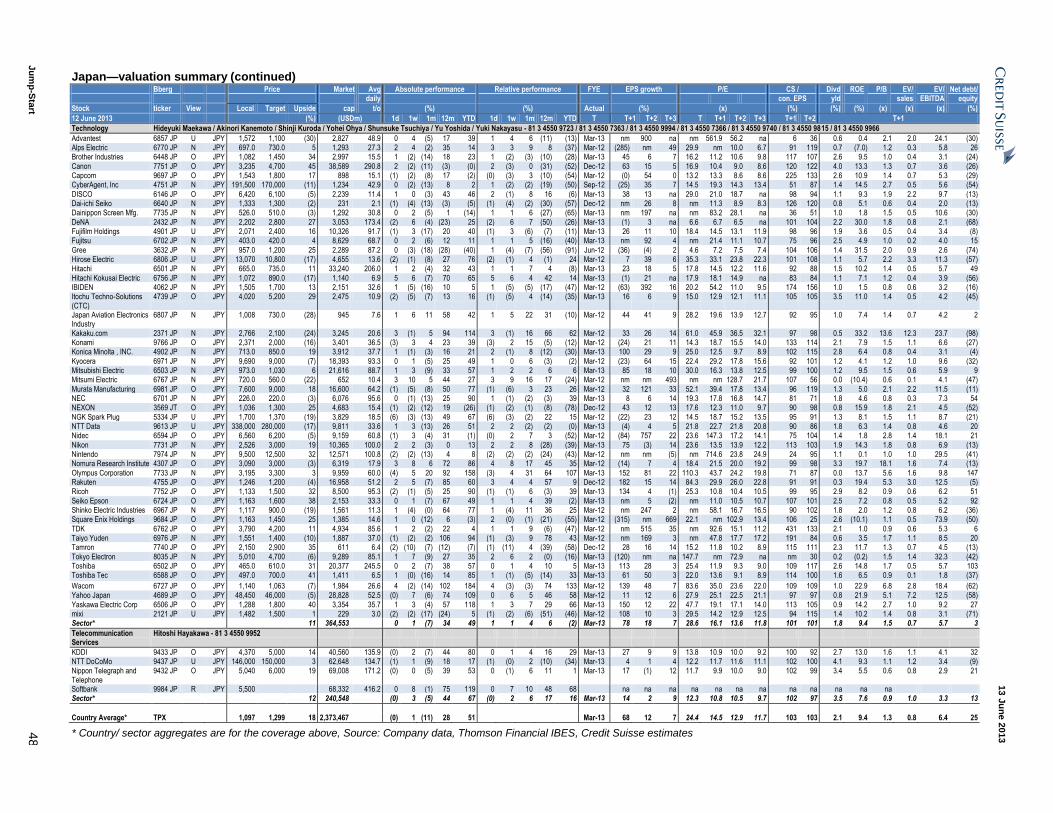
13 J
un
e 2
013
Ju
mp
-Sta
rt 4
8
Japan—valuation summary (continued) Bberg Price Market Avg Absolute performance Relative performance FYE EPS growth P/E CS / Divd ROE P/B EV/ EV/ Net debt/ daily con. EPS yld sales EBITDA equity
Stock ticker View Local Target Upside cap t/o (%) (%) Actual (%) (x) (%) (%) (%) (x) (x) (x) (%)
12 June 2013 (%) (USDm) 1d 1w 1m 12m YTD 1d 1w 1m 12m YTD T T+1 T+2 T+3 T T+1 T+2 T+3 T+1 T+2 T+1
Technology Hideyuki Maekawa / Akinori Kanemoto / Shinji Kuroda / Yohei Ohya / Shunsuke Tsuchiya / Yu Yoshida / Yuki Nakayasu - 81 3 4550 9723 / 81 3 4550 7363 / 81 3 4550 9994 / 81 3 4550 7366 / 81 3 4550 9740 / 81 3 4550 9815 / 81 3 4550 9966
Advantest 6857 JP U JPY 1,572 1,100 (30) 2,827 48.9 0 4 (5) 17 39 1 4 6 (11) (13) Mar-13 nm 900 na nm 561.9 56.2 na 6 36 0.6 0.4 2.1 2.0 24.1 (30) Alps Electric 6770 JP N JPY 697.0 730.0 5 1,293 27.3 2 4 (2) 35 14 3 3 9 8 (37) Mar-12 (285) nm 49 29.9 nm 10.0 6.7 91 119 0.7 (7.0) 1.2 0.3 5.8 26 Brother Industries 6448 JP O JPY 1,082 1,450 34 2,997 15.5 1 (2) (14) 18 23 1 (2) (3) (10) (28) Mar-13 45 6 7 16.2 11.2 10.6 9.8 117 107 2.6 9.5 1.0 0.4 3.1 (24)
Canon 7751 JP O JPY 3,235 4,700 45 38,589 290.8 2 (2) (11) (3) (0) 2 (3) 0 (31) (52) Dec-12 63 15 5 16.9 10.4 9.0 8.6 120 122 4.0 13.3 1.3 0.7 3.6 (26) Capcom 9697 JP O JPY 1,543 1,800 17 898 15.1 (1) (2) (8) 17 (2) (0) (3) 3 (10) (54) Mar-12 (0) 54 0 13.2 13.3 8.6 8.6 225 133 2.6 10.9 1.4 0.7 5.3 (29) CyberAgent, Inc 4751 JP N JPY 191,500 170,000 (11) 1,234 42.9 0 (2) (13) 8 2 1 (2) (2) (19) (50) Sep-12 (25) 35 7 14.5 19.3 14.3 13.4 51 87 1.4 14.5 2.7 0.5 5.6 (54)
DISCO 6146 JP O JPY 6,420 6,100 (5) 2,239 11.4 1 0 (3) 43 46 2 (1) 8 16 (6) Mar-13 38 13 na 29.0 21.0 18.7 na 98 94 1.1 9.3 1.9 2.2 9.7 (13) Dai-ichi Seiko 6640 JP N JPY 1,333 1,300 (2) 231 2.1 (1) (4) (13) (3) (5) (1) (4) (2) (30) (57) Dec-12 nm 26 8 nm 11.3 8.9 8.3 126 120 0.8 5.1 0.6 0.4 2.0 (13) Dainippon Screen Mfg. 7735 JP N JPY 526.0 510.0 (3) 1,292 30.8 0 2 (5) 1 (14) 1 1 6 (27) (65) Mar-13 nm 197 na nm 83.2 28.1 na 36 51 1.0 1.8 1.5 0.5 10.6 (30)
DeNA 2432 JP N JPY 2,202 2,800 27 3,053 173.4 (2) 6 (4) (23) 25 (2) 6 7 (50) (26) Mar-13 (1) 3 na 6.6 6.7 6.5 na 101 104 2.2 30.0 1.8 0.8 2.1 (68) Fujifilm Holdings 4901 JP U JPY 2,071 2,400 16 10,326 91.7 (1) 3 (17) 20 40 (1) 3 (6) (7) (11) Mar-13 26 11 10 18.4 14.5 13.1 11.9 98 96 1.9 3.6 0.5 0.4 3.4 (8) Fujitsu 6702 JP N JPY 403.0 420.0 4 8,629 68.7 0 2 (6) 12 11 1 1 5 (16) (40) Mar-13 nm 92 4 nm 21.4 11.1 10.7 75 96 2.5 4.9 1.0 0.2 4.0 15
Gree 3632 JP N JPY 957.0 1,200 25 2,289 87.2 0 (3) (18) (28) (40) 1 (4) (7) (56) (91) Jun-12 (36) (4) 2 4.6 7.2 7.5 7.4 104 106 1.4 31.5 2.0 0.9 2.6 (74) Hirose Electric 6806 JP U JPY 13,070 10,800 (17) 4,655 13.6 (2) (1) (8) 27 76 (2) (1) 4 (1) 24 Mar-12 7 39 6 35.3 33.1 23.8 22.3 101 108 1.1 5.7 2.2 3.3 11.3 (57) Hitachi 6501 JP N JPY 665.0 735.0 11 33,240 206.0 1 2 (4) 32 43 1 1 7 4 (8) Mar-13 23 18 5 17.8 14.5 12.2 11.6 92 88 1.5 10.2 1.4 0.5 5.7 49
Hitachi Kokusai Electric 6756 JP N JPY 1,072 890.0 (17) 1,140 6.9 5 6 (7) 70 65 5 6 4 42 14 Mar-13 (1) 21 na 17.9 18.1 14.9 na 83 84 1.1 7.1 1.2 0.4 3.9 (56) IBIDEN 4062 JP N JPY 1,505 1,700 13 2,151 32.6 1 (5) (16) 10 5 1 (5) (5) (17) (47) Mar-12 (63) 392 16 20.2 54.2 11.0 9.5 174 156 1.0 1.5 0.8 0.6 3.2 (16) Itochu Techno-Solutions (CTC)
4739 JP O JPY 4,020 5,200 29 2,475 10.9 (2) (5) (7) 13 16 (1) (5) 4 (14) (35) Mar-13 16 6 9 15.0 12.9 12.1 11.1 105 105 3.5 11.0 1.4 0.5 4.2 (45)
Japan Aviation Electronics Industry
6807 JP N JPY 1,008 730.0 (28) 945 7.6 1 6 11 58 42 1 5 22 31 (10) Mar-12 44 41 9 28.2 19.6 13.9 12.7 92 95 1.0 7.4 1.4 0.7 4.2 2
Kakaku.com 2371 JP N JPY 2,766 2,100 (24) 3,245 20.6 3 (1) 5 94 114 3 (1) 16 66 62 Mar-12 33 26 14 61.0 45.9 36.5 32.1 97 98 0.5 33.2 13.6 12.3 23.7 (98) Konami 9766 JP O JPY 2,371 2,000 (16) 3,401 36.5 (3) 3 4 23 39 (3) 2 15 (5) (12) Mar-12 (24) 21 11 14.3 18.7 15.5 14.0 133 114 2.1 7.9 1.5 1.1 6.6 (27) Konica Minolta , INC. 4902 JP N JPY 713.0 850.0 19 3,912 37.7 1 (1) (3) 16 21 2 (1) 8 (12) (30) Mar-13 100 29 9 25.0 12.5 9.7 8.9 102 115 2.8 6.4 0.8 0.4 3.1 (4)
Kyocera 6971 JP N JPY 9,690 9,000 (7) 18,393 93.3 0 1 (5) 25 49 1 0 6 (3) (2) Mar-12 (23) 64 15 22.4 29.2 17.8 15.6 92 101 1.2 4.1 1.2 1.0 9.6 (32) Mitsubishi Electric 6503 JP N JPY 973.0 1,030 6 21,616 88.7 1 3 (9) 33 57 1 2 2 6 6 Mar-13 85 18 10 30.0 16.3 13.8 12.5 99 100 1.2 9.5 1.5 0.6 5.9 9 Mitsumi Electric 6767 JP N JPY 720.0 560.0 (22) 652 10.4 3 10 5 44 27 3 9 16 17 (24) Mar-12 nm nm 493 nm nm 128.7 21.7 107 56 0.0 (10.4) 0.6 0.1 4.1 (47)
Murata Manufacturing 6981 JP O JPY 7,600 9,000 18 16,600 64.2 (1) (5) (8) 50 77 (1) (6) 3 23 26 Mar-12 32 121 33 52.1 39.4 17.8 13.4 96 119 1.3 5.0 2.1 2.2 11.5 (11) NEC 6701 JP N JPY 226.0 220.0 (3) 6,076 95.6 0 (1) (13) 25 90 1 (1) (2) (3) 39 Mar-13 8 6 14 19.3 17.8 16.8 14.7 81 71 1.8 4.6 0.8 0.3 7.3 54 NEXON 3569 JT O JPY 1,036 1,300 25 4,683 15.4 (1) (2) (12) 19 (26) (1) (2) (1) (8) (78) Dec-12 43 12 13 17.6 12.3 11.0 9.7 90 98 0.8 15.9 1.8 2.1 4.5 (52)
NGK Spark Plug 5334 JP U JPY 1,700 1,370 (19) 3,829 18.5 (6) (3) (13) 49 67 (6) (3) (2) 22 15 Mar-12 (22) 23 12 14.5 18.7 15.2 13.5 95 91 1.3 8.1 1.5 1.1 8.7 (21) NTT Data 9613 JP U JPY 338,000 280,000 (17) 9,811 33.6 1 3 (13) 26 51 2 2 (2) (2) (0) Mar-13 (4) 4 5 21.8 22.7 21.8 20.8 90 86 1.8 6.3 1.4 0.8 4.6 20 Nidec 6594 JP O JPY 6,560 6,200 (5) 9,159 60.8 (1) 3 (4) 31 (1) (0) 2 7 3 (52) Mar-12 (84) 757 22 23.6 147.3 17.2 14.1 75 104 1.4 1.8 2.8 1.4 18.1 21
Nikon 7731 JP N JPY 2,526 3,000 19 10,365 100.0 2 2 (3) 0 13 2 2 8 (28) (39) Mar-13 75 (3) 14 23.6 13.5 13.9 12.2 113 103 1.9 14.3 1.8 0.8 6.9 (13) Nintendo 7974 JP N JPY 9,500 12,500 32 12,571 100.8 (2) (2) (13) 4 8 (2) (2) (2) (24) (43) Mar-12 nm nm (5) nm 714.6 23.8 24.9 24 95 1.1 0.1 1.0 1.0 29.5 (41) Nomura Research Institute 4307 JP O JPY 3,090 3,000 (3) 6,319 17.9 3 8 6 72 86 4 8 17 45 35 Mar-12 (14) 7 4 18.4 21.5 20.0 19.2 99 98 3.3 19.7 18.1 1.6 7.4 (13)
Olympus Corporation 7733 JP N JPY 3,195 3,300 3 9,959 60.0 (4) 5 20 92 158 (3) 4 31 64 107 Mar-13 152 81 22 110.3 43.7 24.2 19.8 71 87 0.0 13.7 5.6 1.6 9.8 147 Rakuten 4755 JP O JPY 1,246 1,200 (4) 16,958 51.2 2 5 (7) 85 60 3 4 4 57 9 Dec-12 182 15 14 84.3 29.9 26.0 22.8 91 91 0.3 19.4 5.3 3.0 12.5 (5) Ricoh 7752 JP O JPY 1,133 1,500 32 8,500 95.3 (2) (1) (5) 25 90 (1) (1) 6 (3) 39 Mar-13 134 4 (1) 25.3 10.8 10.4 10.5 99 95 2.9 8.2 0.9 0.6 6.2 51
Seiko Epson 6724 JP O JPY 1,163 1,600 38 2,153 33.3 0 1 (7) 67 49 1 1 4 39 (2) Mar-13 nm 5 (2) nm 11.0 10.5 10.7 107 101 2.5 7.2 0.8 0.5 5.2 92 Shinko Electric Industries 6967 JP N JPY 1,117 900.0 (19) 1,561 11.3 1 (4) (0) 64 77 1 (4) 11 36 25 Mar-12 nm 247 2 nm 58.1 16.7 16.5 90 102 1.8 2.0 1.2 0.8 6.2 (36) Square Enix Holdings 9684 JP O JPY 1,163 1,450 25 1,385 14.6 1 0 (12) 6 (3) 2 (0) (1) (21) (55) Mar-12 (315) nm 669 22.1 nm 102.9 13.4 106 25 2.6 (10.1) 1.1 0.5 73.9 (50)
TDK 6762 JP O JPY 3,790 4,200 11 4,934 85.6 1 2 (2) 22 4 1 1 9 (6) (47) Mar-12 nm 515 35 nm 92.6 15.1 11.2 431 133 2.1 1.0 0.9 0.6 5.3 6 Taiyo Yuden 6976 JP N JPY 1,551 1,400 (10) 1,887 37.0 (1) (2) (2) 106 94 (1) (3) 9 78 43 Mar-12 nm 169 3 nm 47.8 17.7 17.2 191 84 0.6 3.5 1.7 1.1 8.5 20 Tamron 7740 JP O JPY 2,150 2,900 35 611 6.4 (2) (10) (7) (12) (7) (1) (11) 4 (39) (58) Dec-12 28 16 14 15.2 11.8 10.2 8.9 115 111 2.3 11.7 1.3 0.7 4.5 (13)
Tokyo Electron 8035 JP N JPY 5,010 4,700 (6) 9,289 85.1 1 7 (9) 27 35 2 6 2 (0) (16) Mar-13 (120) nm na 147.7 nm 72.9 na nm 30 0.2 (0.2) 1.5 1.4 32.3 (42) Toshiba 6502 JP O JPY 465.0 610.0 31 20,377 245.5 0 2 (7) 38 57 0 1 4 10 5 Mar-13 113 28 3 25.4 11.9 9.3 9.0 109 117 2.6 14.8 1.7 0.5 5.7 103 Toshiba Tec 6588 JP O JPY 497.0 700.0 41 1,411 6.5 1 (0) (16) 14 85 1 (1) (5) (14) 33 Mar-13 61 50 3 22.0 13.6 9.1 8.9 114 100 1.6 6.5 0.9 0.1 1.8 (37)
Wacom 6727 JP O JPY 1,140 1,063 (7) 1,984 26.6 4 (2) (14) 102 184 4 (3) (3) 74 133 Mar-12 139 48 7 83.6 35.0 23.6 22.0 109 109 1.0 22.9 6.8 2.8 18.4 (62) Yahoo Japan 4689 JP O JPY 48,450 46,000 (5) 28,828 52.5 (0) 7 (6) 74 109 0 6 5 46 58 Mar-12 11 12 6 27.9 25.1 22.5 21.1 97 97 0.8 21.9 5.1 7.2 12.5 (58)
Yaskawa Electric Corp 6506 JP O JPY 1,288 1,800 40 3,354 35.7 1 3 (4) 57 118 1 3 7 29 66 Mar-13 150 12 22 47.7 19.1 17.1 14.0 113 105 0.9 14.2 2.7 1.0 9.2 27 mixi 2121 JP U JPY 1,482 1,500 1 229 3.0 (2) (2) (17) (24) 5 (1) (2) (6) (51) (46) Mar-12 108 10 3 29.5 14.2 12.9 12.5 94 115 1.4 10.2 1.4 0.8 3.1 (71) Sector* 11 364,553 0 1 (7) 34 49 1 1 4 6 (2) Mar-13 78 18 7 28.6 16.1 13.6 11.8 101 101 1.8 9.4 1.5 0.7 5.7 3
Telecommunication Services
Hitoshi Hayakawa - 81 3 4550 9952
KDDI 9433 JP O JPY 4,370 5,000 14 40,560 135.9 (0) 2 (7) 44 80 0 1 4 16 29 Mar-13 27 9 9 13.8 10.9 10.0 9.2 100 92 2.7 13.0 1.6 1.1 4.1 32 NTT DoCoMo 9437 JP U JPY 146,000 150,000 3 62,648 134.7 (1) 1 (9) 18 17 (1) (0) 2 (10) (34) Mar-13 4 1 4 12.2 11.7 11.6 11.1 102 100 4.1 9.3 1.1 1.2 3.4 (9) Nippon Telegraph and Telephone
9432 JP O JPY 5,040 6,000 19 69,008 171.2 (0) 0 (5) 39 53 0 (1) 6 11 1 Mar-13 17 (1) 12 11.7 9.9 10.0 9.0 102 99 3.4 5.5 0.6 0.8 2.9 21
Softbank 9984 JP R JPY 5,500 68,332 416.2 0 8 (1) 75 119 0 7 10 48 68 na na na na na na na na na na na na Sector* 12 240,548 (0) 3 (5) 44 67 (0) 2 6 17 16 Mar-13 14 2 9 12.3 10.8 10.5 9.7 102 97 3.5 7.6 0.9 1.0 3.3 13
Country Average* TPX 1,097 1,299 18 2,373,467 (0) 1 (11) 28 51 Mar-13 68 12 7 24.4 14.5 12.9 11.7 103 103 2.1 9.4 1.3 0.8 6.4 25
* Country/ sector aggregates are for the coverage above, Source: Company data, Thomson Financial IBES, Credit Suisse estimates
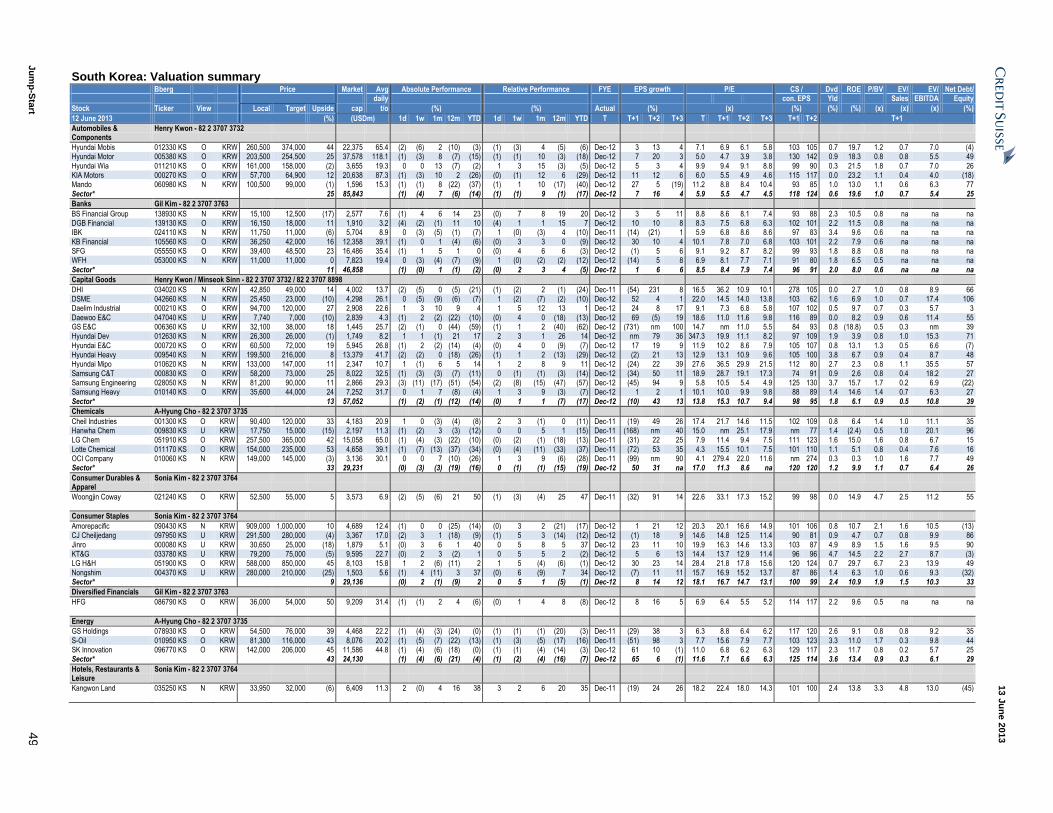
13 J
un
e 2
013
Ju
mp
-Sta
rt 4
9
South Korea: Valuation summary Bberg Price Market Avg Absolute Performance Relative Performance FYE EPS growth P/E CS / Dvd ROE P/BV EV/ EV/ Net Debt/ daily con. EPS Yld Sales EBITDA Equity
Stock Ticker View Local Target Upside cap t/o (%) (%) Actual (%) (x) (%) (%) (%) (x) (x) (x) (%)
12 June 2013 (%) (USDm) 1d 1w 1m 12m YTD 1d 1w 1m 12m YTD T T+1 T+2 T+3 T T+1 T+2 T+3 T+1 T+2 T+1
Automobiles & Components
Henry Kwon - 82 2 3707 3732
Hyundai Mobis 012330 KS O KRW 260,500 374,000 44 22,375 65.4 (2) (6) 2 (10) (3) (1) (3) 4 (5) (6) Dec-12 3 13 4 7.1 6.9 6.1 5.8 103 105 0.7 19.7 1.2 0.7 7.0 (4) Hyundai Motor 005380 KS O KRW 203,500 254,500 25 37,578 118.1 (1) (3) 8 (7) (15) (1) (1) 10 (3) (18) Dec-12 7 20 3 5.0 4.7 3.9 3.8 130 142 0.9 18.3 0.8 0.8 5.5 49
Hyundai Wia 011210 KS O KRW 161,000 158,000 (2) 3,655 19.3 0 0 13 (7) (2) 1 3 15 (3) (5) Dec-12 5 3 4 9.9 9.4 9.1 8.8 99 90 0.3 21.5 1.8 0.7 7.0 26 KIA Motors 000270 KS O KRW 57,700 64,900 12 20,638 87.3 (1) (3) 10 2 (26) (0) (1) 12 6 (29) Dec-12 11 12 6 6.0 5.5 4.9 4.6 115 117 0.0 23.2 1.1 0.4 4.0 (18) Mando 060980 KS N KRW 100,500 99,000 (1) 1,596 15.3 (1) (1) 8 (22) (37) (1) 1 10 (17) (40) Dec-12 27 5 (19) 11.2 8.8 8.4 10.4 93 85 1.0 13.0 1.1 0.6 6.3 77
Sector* 25 85,843 (1) (4) 7 (6) (14) (1) (1) 9 (1) (17) Dec-12 7 16 4 5.9 5.5 4.7 4.5 118 124 0.6 19.6 1.0 0.7 5.4 25
Banks Gil Kim - 82 2 3707 3763
BS Financial Group 138930 KS N KRW 15,100 12,500 (17) 2,577 7.6 (1) 4 6 14 23 (0) 7 8 19 20 Dec-12 3 5 11 8.8 8.6 8.1 7.4 93 88 2.3 10.5 0.8 na na na DGB Financial 139130 KS O KRW 16,150 18,000 11 1,910 3.2 (4) (2) (1) 11 10 (4) 1 1 15 7 Dec-12 10 10 8 8.3 7.5 6.8 6.3 102 101 2.2 11.5 0.8 na na na IBK 024110 KS N KRW 11,750 11,000 (6) 5,704 8.9 0 (3) (5) (1) (7) 1 (0) (3) 4 (10) Dec-11 (14) (21) 1 5.9 6.8 8.6 8.6 97 83 3.4 9.6 0.6 na na na
KB Financial 105560 KS O KRW 36,250 42,000 16 12,358 39.1 (1) 0 1 (4) (6) (0) 3 3 0 (9) Dec-12 30 10 4 10.1 7.8 7.0 6.8 103 101 2.2 7.9 0.6 na na na SFG 055550 KS O KRW 39,400 48,500 23 16,486 35.4 (1) 1 5 1 0 (0) 4 6 6 (3) Dec-12 (1) 5 6 9.1 9.2 8.7 8.2 99 93 1.8 8.8 0.8 na na na WFH 053000 KS N KRW 11,000 11,000 0 7,823 19.4 0 (3) (4) (7) (9) 1 (0) (2) (2) (12) Dec-12 (14) 5 8 6.9 8.1 7.7 7.1 91 80 1.8 6.5 0.5 na na na
Sector* 11 46,858 (1) (0) 1 (1) (2) (0) 2 3 4 (5) Dec-12 1 6 6 8.5 8.4 7.9 7.4 96 91 2.0 8.0 0.6 na na na
Capital Goods Henry Kwon / Minseok Sinn - 82 2 3707 3732 / 82 2 3707 8898
DHI 034020 KS N KRW 42,850 49,000 14 4,002 13.7 (2) (5) 0 (5) (21) (1) (2) 2 (1) (24) Dec-11 (54) 231 8 16.5 36.2 10.9 10.1 278 105 0.0 2.7 1.0 0.8 8.9 66 DSME 042660 KS N KRW 25,450 23,000 (10) 4,298 26.1 0 (5) (9) (6) (7) 1 (2) (7) (2) (10) Dec-12 52 4 1 22.0 14.5 14.0 13.8 103 62 1.6 6.9 1.0 0.7 17.4 106 Daelim Industrial 000210 KS O KRW 94,700 120,000 27 2,908 22.6 1 3 10 9 4 1 5 12 13 1 Dec-12 24 8 17 9.1 7.3 6.8 5.8 107 102 0.5 9.7 0.7 0.3 5.7 3
Daewoo E&C 047040 KS U KRW 7,740 7,000 (10) 2,839 4.3 (1) 2 (2) (22) (10) (0) 4 0 (18) (13) Dec-12 69 (5) 19 18.6 11.0 11.6 9.8 116 89 0.0 8.2 0.9 0.6 11.4 55 GS E&C 006360 KS U KRW 32,100 38,000 18 1,445 25.7 (2) (1) 0 (44) (59) (1) 1 2 (40) (62) Dec-12 (731) nm 100 14.7 nm 11.0 5.5 84 93 0.8 (18.8) 0.5 0.3 nm 39 Hyundai Dev 012630 KS N KRW 26,300 26,000 (1) 1,749 8.2 1 1 (1) 21 17 2 3 1 26 14 Dec-12 nm 79 36 347.3 19.9 11.1 8.2 97 109 1.9 3.9 0.8 1.0 15.3 71
Hyundai E&C 000720 KS O KRW 60,500 72,000 19 5,945 26.8 (1) 2 (2) (14) (4) (0) 4 0 (9) (7) Dec-12 17 19 9 11.9 10.2 8.6 7.9 105 107 0.8 13.1 1.3 0.5 6.6 (7) Hyundai Heavy 009540 KS N KRW 199,500 216,000 8 13,379 41.7 (2) (2) 0 (18) (26) (1) 1 2 (13) (29) Dec-12 (2) 21 13 12.9 13.1 10.9 9.6 105 100 3.8 6.7 0.9 0.4 8.7 48 Hyundai Mipo 010620 KS N KRW 133,000 147,000 11 2,347 10.7 1 (1) 6 5 14 1 2 8 9 11 Dec-12 (24) 22 39 27.6 36.5 29.9 21.5 112 80 2.7 2.3 0.8 1.1 35.5 57
Samsung C&T 000830 KS O KRW 58,200 73,000 25 8,022 32.5 (1) (3) (3) (7) (11) 0 (1) (1) (3) (14) Dec-12 (34) 50 11 18.9 28.7 19.1 17.3 74 91 0.9 2.6 0.8 0.4 18.2 27 Samsung Engineering 028050 KS N KRW 81,200 90,000 11 2,866 29.3 (3) (11) (17) (51) (54) (2) (8) (15) (47) (57) Dec-12 (45) 94 9 5.8 10.5 5.4 4.9 125 130 3.7 15.7 1.7 0.2 6.9 (22) Samsung Heavy 010140 KS O KRW 35,600 44,000 24 7,252 31.7 0 1 7 (8) (4) 1 3 9 (3) (7) Dec-12 1 2 1 10.1 10.0 9.9 9.8 88 89 1.4 14.6 1.4 0.7 6.3 27
Sector* 13 57,052 (1) (2) (1) (12) (14) (0) 1 1 (7) (17) Dec-12 (10) 43 13 13.8 15.3 10.7 9.4 98 95 1.8 6.1 0.9 0.5 10.8 39
Chemicals A-Hyung Cho - 82 2 3707 3735
Cheil Industries 001300 KS O KRW 90,400 120,000 33 4,183 20.9 1 0 (3) (4) (8) 2 3 (1) 0 (11) Dec-11 (19) 49 26 17.4 21.7 14.6 11.5 102 109 0.8 6.4 1.4 1.0 11.1 35 Hanwha Chem 009830 KS U KRW 17,750 15,000 (15) 2,197 11.3 (1) (2) 3 (3) (12) 0 0 5 1 (15) Dec-11 (168) nm 40 15.0 nm 25.1 17.9 nm 77 1.4 (2.4) 0.5 1.0 20.1 96 LG Chem 051910 KS O KRW 257,500 365,000 42 15,058 65.0 (1) (4) (3) (22) (10) (0) (2) (1) (18) (13) Dec-11 (31) 22 25 7.9 11.4 9.4 7.5 111 123 1.6 15.0 1.6 0.8 6.7 15
Lotte Chemical 011170 KS O KRW 154,000 235,000 53 4,658 39.1 (1) (7) (13) (37) (34) (0) (4) (11) (33) (37) Dec-11 (72) 53 35 4.3 15.5 10.1 7.5 101 110 1.1 5.1 0.8 0.4 7.6 16 OCI Company 010060 KS N KRW 149,000 145,000 (3) 3,136 30.1 0 0 7 (10) (26) 1 3 9 (6) (28) Dec-11 (99) nm 90 4.1 279.4 22.0 11.6 nm 274 0.3 0.3 1.0 1.6 7.7 49 Sector* 33 29,231 (0) (3) (3) (19) (16) 0 (1) (1) (15) (19) Dec-12 50 31 na 17.0 11.3 8.6 na 120 120 1.2 9.9 1.1 0.7 6.4 26
Consumer Durables & Apparel
Sonia Kim - 82 2 3707 3764
Woongjin Coway 021240 KS O KRW 52,500 55,000 5 3,573 6.9 (2) (5) (6) 21 50 (1) (3) (4) 25 47 Dec-11 (32) 91 14 22.6 33.1 17.3 15.2 99 98 0.0 14.9 4.7 2.5 11.2 55
Consumer Staples Sonia Kim - 82 2 3707 3764
Amorepacific 090430 KS N KRW 909,000 1,000,000 10 4,689 12.4 (1) 0 0 (25) (14) (0) 3 2 (21) (17) Dec-12 1 21 12 20.3 20.1 16.6 14.9 101 106 0.8 10.7 2.1 1.6 10.5 (13) CJ Cheiljedang 097950 KS U KRW 291,500 280,000 (4) 3,367 17.0 (2) 3 1 (18) (9) (1) 5 3 (14) (12) Dec-12 (1) 18 9 14.6 14.8 12.5 11.4 90 81 0.9 4.7 0.7 0.8 9.9 86
Jinro 000080 KS U KRW 30,650 25,000 (18) 1,879 5.1 (0) 3 6 1 40 0 5 8 5 37 Dec-12 23 11 10 19.9 16.3 14.6 13.3 103 87 4.9 8.9 1.5 1.6 9.5 90 KT&G 033780 KS U KRW 79,200 75,000 (5) 9,595 22.7 (0) 2 3 (2) 1 0 5 5 2 (2) Dec-12 5 6 13 14.4 13.7 12.9 11.4 96 96 4.7 14.5 2.2 2.7 8.7 (3) LG H&H 051900 KS O KRW 588,000 850,000 45 8,103 15.8 1 2 (6) (11) 2 1 5 (4) (6) (1) Dec-12 30 23 14 28.4 21.8 17.8 15.6 120 124 0.7 29.7 6.7 2.3 13.9 49
Nongshim 004370 KS U KRW 280,000 210,000 (25) 1,503 5.6 (1) 4 (11) 3 37 (0) 6 (9) 7 34 Dec-12 (7) 11 11 15.7 16.9 15.2 13.7 87 86 1.4 6.3 1.0 0.6 9.3 (32) Sector* 9 29,136 (0) 2 (1) (9) 2 0 5 1 (5) (1) Dec-12 8 14 12 18.1 16.7 14.7 13.1 100 99 2.4 10.9 1.9 1.5 10.3 33
Diversified Financials Gil Kim - 82 2 3707 3763
HFG 086790 KS O KRW 36,000 54,000 50 9,209 31.4 (1) (1) 2 4 (6) (0) 1 4 8 (8) Dec-12 8 16 5 6.9 6.4 5.5 5.2 114 117 2.2 9.6 0.5 na na na
Energy A-Hyung Cho - 82 2 3707 3735
GS Holdings 078930 KS O KRW 54,500 76,000 39 4,468 22.2 (1) (4) (3) (24) (0) (1) (1) (1) (20) (3) Dec-11 (29) 38 3 6.3 8.8 6.4 6.2 117 120 2.6 9.1 0.8 0.8 9.2 35
S-Oil 010950 KS O KRW 81,300 116,000 43 8,076 20.2 (1) (5) (7) (22) (13) (1) (3) (5) (17) (16) Dec-11 (51) 98 3 7.7 15.6 7.9 7.7 103 123 3.3 11.0 1.7 0.3 9.8 44 SK Innovation 096770 KS O KRW 142,000 206,000 45 11,586 44.8 (1) (4) (6) (18) (0) (1) (1) (4) (14) (3) Dec-12 61 10 (1) 11.0 6.8 6.2 6.3 129 117 2.3 11.7 0.8 0.2 5.7 25 Sector* 43 24,130 (1) (4) (6) (21) (4) (1) (2) (4) (16) (7) Dec-12 65 6 (1) 11.6 7.1 6.6 6.3 125 114 3.6 13.4 0.9 0.3 6.1 29
Hotels, Restaurants & Leisure
Sonia Kim - 82 2 3707 3764
Kangwon Land 035250 KS N KRW 33,950 32,000 (6) 6,409 11.3 2 (0) 4 16 38 3 2 6 20 35 Dec-11 (19) 24 26 18.2 22.4 18.0 14.3 101 100 2.4 13.8 3.3 4.8 13.0 (45)
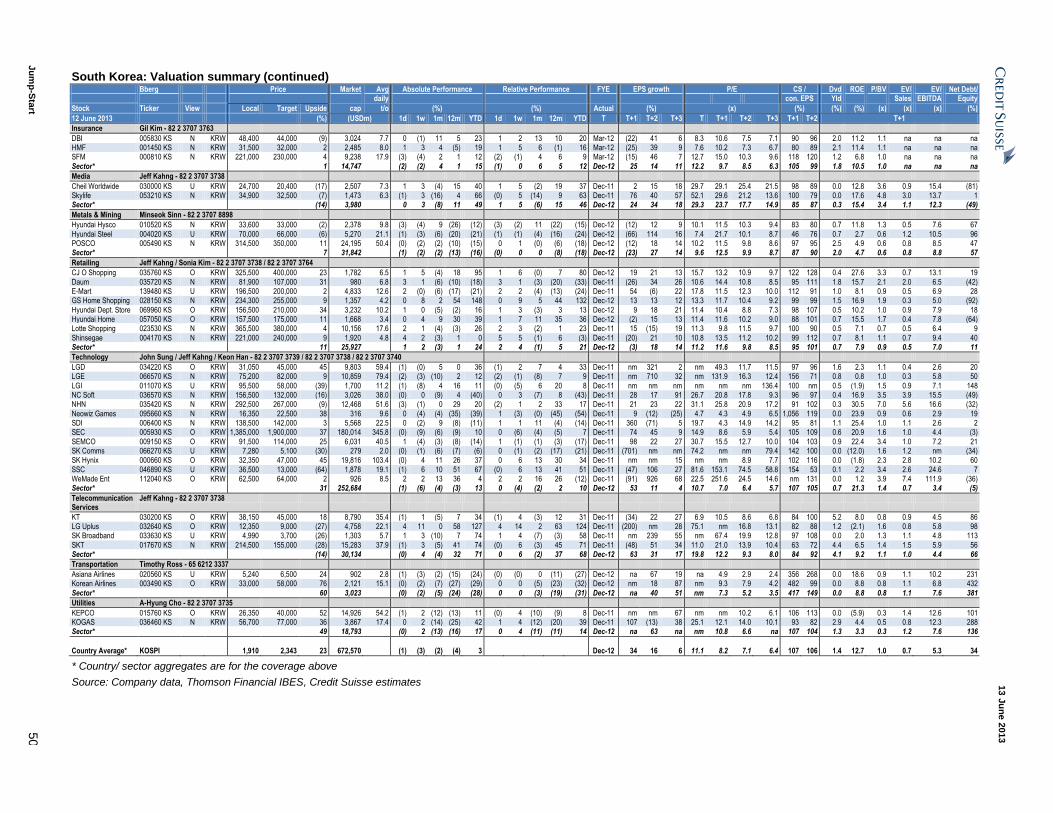
13 J
un
e 2
013
Ju
mp
-Sta
rt 5
0
South Korea: Valuation summary (continued) Bberg Price Market Avg Absolute Performance Relative Performance FYE EPS growth P/E CS / Dvd ROE P/BV EV/ EV/ Net Debt/ daily con. EPS Yld Sales EBITDA Equity
Stock Ticker View Local Target Upside cap t/o (%) (%) Actual (%) (x) (%) (%) (%) (x) (x) (x) (%)
12 June 2013 (%) (USDm) 1d 1w 1m 12m YTD 1d 1w 1m 12m YTD T T+1 T+2 T+3 T T+1 T+2 T+3 T+1 T+2 T+1
Insurance Gil Kim - 82 2 3707 3763
DBI 005830 KS N KRW 48,400 44,000 (9) 3,024 7.7 0 (1) 11 5 23 1 2 13 10 20 Mar-12 (22) 41 6 8.3 10.6 7.5 7.1 90 96 2.0 11.2 1.1 na na na HMF 001450 KS N KRW 31,500 32,000 2 2,485 8.0 1 3 4 (5) 19 1 5 6 (1) 16 Mar-12 (25) 39 9 7.6 10.2 7.3 6.7 80 89 2.1 11.4 1.1 na na na SFM 000810 KS N KRW 221,000 230,000 4 9,238 17.9 (3) (4) 2 1 12 (2) (1) 4 6 9 Mar-12 (15) 46 7 12.7 15.0 10.3 9.6 118 120 1.2 6.8 1.0 na na na
Sector* 1 14,747 (2) (2) 4 1 15 (1) 0 6 5 12 Dec-12 25 14 11 12.2 9.7 8.5 6.3 105 99 1.8 10.5 1.0 na na na
Media Jeff Kahng - 82 2 3707 3738
Cheil Worldwide 030000 KS U KRW 24,700 20,400 (17) 2,507 7.3 1 3 (4) 15 40 1 5 (2) 19 37 Dec-11 2 15 18 29.7 29.1 25.4 21.5 98 89 0.0 12.8 3.6 0.9 15.4 (81) Skylife 053210 KS N KRW 34,900 32,500 (7) 1,473 6.3 (1) 3 (16) 4 66 (0) 5 (14) 9 63 Dec-11 76 40 57 52.1 29.6 21.2 13.6 100 79 0.0 17.6 4.8 3.0 13.7 1 Sector* (14) 3,980 0 3 (8) 11 49 1 5 (6) 15 46 Dec-12 24 34 18 29.3 23.7 17.7 14.9 85 87 0.3 15.4 3.4 1.1 12.3 (49)
Metals & Mining Minseok Sinn - 82 2 3707 8898
Hyundai Hysco 010520 KS N KRW 33,600 33,000 (2) 2,378 9.8 (3) (4) 9 (26) (12) (3) (2) 11 (22) (15) Dec-12 (12) 12 9 10.1 11.5 10.3 9.4 83 80 0.7 11.8 1.3 0.5 7.6 67
Hyundai Steel 004020 KS U KRW 70,000 66,000 (6) 5,270 21.1 (1) (3) (6) (20) (21) (1) (1) (4) (16) (24) Dec-12 (66) 114 16 7.4 21.7 10.1 8.7 46 76 0.7 2.7 0.6 1.2 10.5 96 POSCO 005490 KS N KRW 314,500 350,000 11 24,195 50.4 (0) (2) (2) (10) (15) 0 1 (0) (6) (18) Dec-12 (12) 18 14 10.2 11.5 9.8 8.6 97 95 2.5 4.9 0.6 0.8 8.5 47 Sector* 7 31,842 (1) (2) (2) (13) (16) (0) 0 0 (8) (18) Dec-12 (23) 27 14 9.6 12.5 9.9 8.7 87 90 2.0 4.7 0.6 0.8 8.8 57
Retailing Jeff Kahng / Sonia Kim - 82 2 3707 3738 / 82 2 3707 3764
CJ O Shopping 035760 KS O KRW 325,500 400,000 23 1,782 6.5 1 5 (4) 18 95 1 6 (0) 7 80 Dec-12 19 21 13 15.7 13.2 10.9 9.7 122 128 0.4 27.6 3.3 0.7 13.1 19
Daum 035720 KS N KRW 81,900 107,000 31 980 6.8 3 1 (6) (10) (18) 3 1 (3) (20) (33) Dec-11 (26) 34 26 10.6 14.4 10.8 8.5 95 111 1.8 15.7 2.1 2.0 6.5 (42) E-Mart 139480 KS U KRW 196,500 200,000 2 4,833 12.6 2 (0) (6) (17) (21) 2 2 (4) (13) (24) Dec-11 54 (6) 22 17.8 11.5 12.3 10.0 112 91 1.0 8.1 0.9 0.5 6.9 28 GS Home Shopping 028150 KS N KRW 234,300 255,000 9 1,357 4.2 0 8 2 54 148 0 9 5 44 132 Dec-12 13 13 12 13.3 11.7 10.4 9.2 99 99 1.5 16.9 1.9 0.3 5.0 (92)
Hyundai Dept. Store 069960 KS O KRW 156,500 210,000 34 3,232 10.2 1 0 (5) (2) 16 1 3 (3) 3 13 Dec-12 9 18 21 11.4 10.4 8.8 7.3 98 107 0.5 10.2 1.0 0.9 7.9 18 Hyundai Home 057050 KS O KRW 157,500 175,000 11 1,668 3.4 0 4 9 30 39 1 7 11 35 36 Dec-12 (2) 15 13 11.4 11.6 10.2 9.0 88 101 0.7 15.5 1.7 0.4 7.8 (64) Lotte Shopping 023530 KS N KRW 365,500 380,000 4 10,156 17.6 2 1 (4) (3) 26 2 3 (2) 1 23 Dec-11 15 (15) 19 11.3 9.8 11.5 9.7 100 90 0.5 7.1 0.7 0.5 6.4 9
Shinsegae 004170 KS N KRW 221,000 240,000 9 1,920 4.8 4 2 (3) 1 0 5 5 (1) 6 (3) Dec-11 (20) 21 10 10.8 13.5 11.2 10.2 99 112 0.7 8.1 1.1 0.7 9.4 40 Sector* 11 25,927 1 2 (3) 1 24 2 4 (1) 5 21 Dec-12 (3) 18 14 11.2 11.6 9.8 8.5 95 101 0.7 7.9 0.9 0.5 7.0 11
Technology John Sung / Jeff Kahng / Keon Han - 82 2 3707 3739 / 82 2 3707 3738 / 82 2 3707 3740
LGD 034220 KS O KRW 31,050 45,000 45 9,803 59.4 (1) (0) 5 0 36 (1) 2 7 4 33 Dec-11 nm 321 2 nm 49.3 11.7 11.5 97 96 1.6 2.3 1.1 0.4 2.6 20 LGE 066570 KS N KRW 75,200 82,000 9 10,859 79.4 (2) (3) (10) 2 12 (2) (1) (8) 7 9 Dec-11 nm 710 32 nm 131.9 16.3 12.4 156 71 0.8 0.8 1.0 0.3 5.8 50
LGI 011070 KS U KRW 95,500 58,000 (39) 1,700 11.2 (1) (8) 4 16 11 (0) (5) 6 20 8 Dec-11 nm nm nm nm nm nm 136.4 100 nm 0.5 (1.9) 1.5 0.9 7.1 148 NC Soft 036570 KS N KRW 156,500 132,000 (16) 3,026 38.0 (0) 0 (9) 4 (40) 0 3 (7) 8 (43) Dec-11 28 17 91 26.7 20.8 17.8 9.3 96 97 0.4 16.9 3.5 3.9 15.5 (49) NHN 035420 KS N KRW 292,500 267,000 (9) 12,468 51.6 (3) (1) 0 29 20 (2) 1 2 33 17 Dec-11 21 23 22 31.1 25.8 20.9 17.2 91 102 0.3 30.5 7.0 5.6 16.6 (32)
Neowiz Games 095660 KS N KRW 16,350 22,500 38 316 9.6 0 (4) (4) (35) (39) 1 (3) (0) (45) (54) Dec-11 9 (12) (25) 4.7 4.3 4.9 6.5 1,056 119 0.0 23.9 0.9 0.6 2.9 19 SDI 006400 KS N KRW 138,500 142,000 3 5,568 22.5 0 (2) 9 (8) (11) 1 1 11 (4) (14) Dec-11 360 (71) 5 19.7 4.3 14.9 14.2 95 81 1.1 25.4 1.0 1.1 2.6 2 SEC 005930 KS O KRW 1,385,000 1,900,000 37 180,014 345.8 (0) (9) (6) (9) 10 0 (6) (4) (5) 7 Dec-11 74 45 9 14.9 8.6 5.9 5.4 105 109 0.6 20.9 1.6 1.0 4.4 (3)
SEMCO 009150 KS O KRW 91,500 114,000 25 6,031 40.5 1 (4) (3) (8) (14) 1 (1) (1) (3) (17) Dec-11 98 22 27 30.7 15.5 12.7 10.0 104 103 0.9 22.4 3.4 1.0 7.2 21 SK Comms 066270 KS U KRW 7,280 5,100 (30) 279 2.0 (0) (1) (6) (7) (6) 0 (1) (2) (17) (21) Dec-11 (701) nm nm 74.2 nm nm 79.4 142 100 0.0 (12.0) 1.6 1.2 nm (34) SK Hynix 000660 KS O KRW 32,350 47,000 45 19,816 103.4 (0) 4 11 26 37 0 6 13 30 34 Dec-11 nm nm 15 nm nm 8.9 7.7 102 116 0.0 (1.8) 2.3 2.8 10.2 60
SSC 046890 KS U KRW 36,500 13,000 (64) 1,878 19.1 (1) 6 10 51 67 (0) 6 13 41 51 Dec-11 (47) 106 27 81.6 153.1 74.5 58.8 154 53 0.1 2.2 3.4 2.6 24.6 7 WeMade Ent 112040 KS O KRW 62,500 64,000 2 926 8.5 2 2 13 36 4 2 2 16 26 (12) Dec-11 (91) 926 68 22.5 251.6 24.5 14.6 nm 131 0.0 1.2 3.9 7.4 111.9 (36) Sector* 31 252,684 (1) (6) (4) (3) 13 0 (4) (2) 2 10 Dec-12 53 11 4 10.7 7.0 6.4 5.7 107 105 0.7 21.3 1.4 0.7 3.4 (5)
Telecommunication Services
Jeff Kahng - 82 2 3707 3738
KT 030200 KS O KRW 38,150 45,000 18 8,790 35.4 (1) 1 (5) 7 34 (1) 4 (3) 12 31 Dec-11 (34) 22 27 6.9 10.5 8.6 6.8 84 100 5.2 8.0 0.8 0.9 4.5 86 LG Uplus 032640 KS O KRW 12,350 9,000 (27) 4,758 22.1 4 11 0 58 127 4 14 2 63 124 Dec-11 (200) nm 28 75.1 nm 16.8 13.1 82 88 1.2 (2.1) 1.6 0.8 5.8 98 SK Broadband 033630 KS U KRW 4,990 3,700 (26) 1,303 5.7 1 3 (10) 7 74 1 4 (7) (3) 58 Dec-11 nm 239 55 nm 67.4 19.9 12.8 97 108 0.0 2.0 1.3 1.1 4.8 113
SKT 017670 KS N KRW 214,500 155,000 (28) 15,283 37.9 (1) 3 (5) 41 74 (0) 6 (3) 45 71 Dec-11 (48) 51 34 11.0 21.0 13.9 10.4 63 72 4.4 6.5 1.4 1.5 5.9 56 Sector* (14) 30,134 (0) 4 (4) 32 71 0 6 (2) 37 68 Dec-12 63 31 17 19.8 12.2 9.3 8.0 84 92 4.1 9.2 1.1 1.0 4.4 66
Transportation Timothy Ross - 65 6212 3337
Asiana Airlines 020560 KS U KRW 5,240 6,500 24 902 2.8 (1) (3) (2) (15) (24) (0) (0) 0 (11) (27) Dec-12 na 67 19 na 4.9 2.9 2.4 356 268 0.0 18.6 0.9 1.1 10.2 231 Korean Airlines 003490 KS O KRW 33,000 58,000 76 2,121 15.1 (0) (2) (7) (27) (29) 0 0 (5) (23) (32) Dec-12 nm 18 87 nm 9.3 7.9 4.2 482 99 0.0 8.8 0.8 1.1 6.8 432
Sector* 60 3,023 (0) (2) (5) (24) (28) 0 0 (3) (19) (31) Dec-12 na 40 51 nm 7.3 5.2 3.5 417 149 0.0 8.8 0.8 1.1 7.6 381
Utilities A-Hyung Cho - 82 2 3707 3735
KEPCO 015760 KS O KRW 26,350 40,000 52 14,926 54.2 (1) 2 (12) (13) 11 (0) 4 (10) (9) 8 Dec-11 nm nm 67 nm nm 10.2 6.1 106 113 0.0 (5.9) 0.3 1.4 12.6 101 KOGAS 036460 KS N KRW 56,700 77,000 36 3,867 17.4 0 2 (14) (25) 42 1 4 (12) (20) 39 Dec-11 107 (13) 38 25.1 12.1 14.0 10.1 93 82 2.9 4.4 0.5 0.8 12.3 288 Sector* 49 18,793 (0) 2 (13) (16) 17 0 4 (11) (11) 14 Dec-12 na 63 na nm 10.8 6.6 na 107 104 1.3 3.3 0.3 1.2 7.6 136
Country Average* KOSPI 1,910 2,343 23 672,570 (1) (3) (2) (4) 3 Dec-12 34 16 6 11.1 8.2 7.1 6.4 107 106 1.4 12.7 1.0 0.7 5.3 34
* Country/ sector aggregates are for the coverage above
Source: Company data, Thomson Financial IBES, Credit Suisse estimates
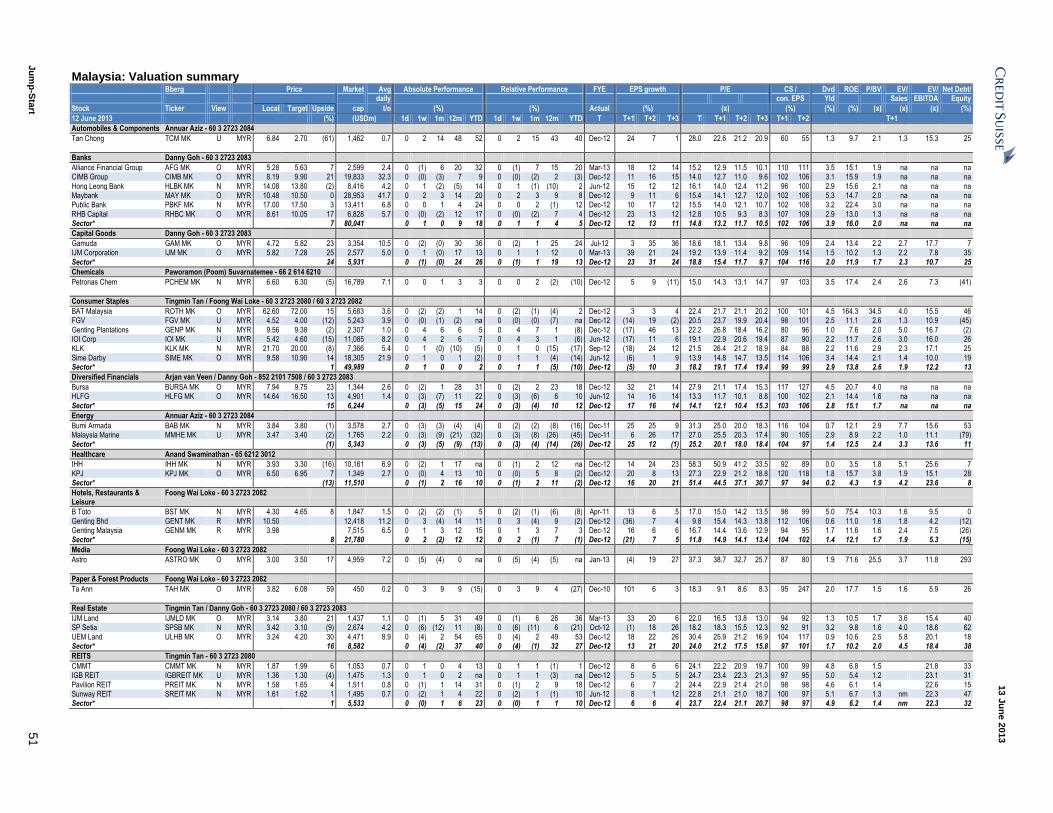
13 J
un
e 2
013
Ju
mp
-Sta
rt 5
1
Malaysia: Valuation summary Bberg Price Market Avg Absolute Performance Relative Performance FYE EPS growth P/E CS / Dvd ROE P/BV EV/ EV/ Net Debt/ daily con. EPS Yld Sales EBITDA Equity
Stock Ticker View Local Target Upside cap t/o (%) (%) Actual (%) (x) (%) (%) (%) (x) (x) (x) (%)
12 June 2013 (%) (USDm) 1d 1w 1m 12m YTD 1d 1w 1m 12m YTD T T+1 T+2 T+3 T T+1 T+2 T+3 T+1 T+2 T+1
Automobiles & Components Annuar Aziz - 60 3 2723 2084
Tan Chong TCM MK U MYR 6.84 2.70 (61) 1,462 0.7 0 2 14 48 52 0 2 15 43 40 Dec-12 24 7 1 28.0 22.6 21.2 20.9 60 55 1.3 9.7 2.1 1.3 15.3 25
Banks Danny Goh - 60 3 2723 2083
Alliance Financial Group AFG MK O MYR 5.28 5.63 7 2,599 2.4 0 (1) 6 20 32 0 (1) 7 15 20 Mar-13 18 12 14 15.2 12.9 11.5 10.1 110 111 3.5 15.1 1.9 na na na CIMB Group CIMB MK O MYR 8.19 9.90 21 19,833 32.3 0 (0) (3) 7 9 0 (0) (2) 2 (3) Dec-12 11 16 15 14.0 12.7 11.0 9.6 102 106 3.1 15.9 1.9 na na na
Hong Leong Bank HLBK MK N MYR 14.08 13.80 (2) 8,416 4.2 0 1 (2) (5) 14 0 1 (1) (10) 2 Jun-12 15 12 12 16.1 14.0 12.4 11.2 96 100 2.9 15.6 2.1 na na na Maybank MAY MK O MYR 10.48 10.50 0 28,953 41.7 0 2 3 14 20 0 2 3 9 8 Dec-12 9 11 6 15.4 14.1 12.7 12.0 102 106 5.3 14.7 2.0 na na na Public Bank PBKF MK N MYR 17.00 17.50 3 13,411 6.8 0 0 1 4 24 0 0 2 (1) 12 Dec-12 10 17 12 15.5 14.0 12.1 10.7 102 108 3.2 22.4 3.0 na na na
RHB Capital RHBC MK O MYR 8.61 10.05 17 6,828 5.7 0 (0) (2) 12 17 0 (0) (2) 7 4 Dec-12 23 13 12 12.8 10.5 9.3 8.3 107 109 2.9 13.0 1.3 na na na Sector* 7 80,041 0 1 0 9 18 0 1 1 4 5 Dec-12 12 13 11 14.8 13.2 11.7 10.5 102 106 3.9 16.0 2.0 na na na
Capital Goods Danny Goh - 60 3 2723 2083
Gamuda GAM MK O MYR 4.72 5.82 23 3,354 10.5 0 (2) (0) 30 36 0 (2) 1 25 24 Jul-12 3 35 36 18.6 18.1 13.4 9.8 96 109 2.4 13.4 2.2 2.7 17.7 7 IJM Corporation IJM MK O MYR 5.82 7.28 25 2,577 5.0 0 1 (0) 17 13 0 1 1 12 0 Mar-13 39 21 24 19.2 13.9 11.4 9.2 109 114 1.5 10.2 1.3 2.2 7.8 35
Sector* 24 5,931 0 (1) (0) 24 26 0 (1) 1 19 13 Dec-12 23 31 24 18.8 15.4 11.7 9.7 104 116 2.0 11.9 1.7 2.3 10.7 25
Chemicals Paworamon (Poom) Suvarnatemee - 66 2 614 6210
Petronas Chem PCHEM MK N MYR 6.60 6.30 (5) 16,789 7.1 0 0 1 3 3 0 0 2 (2) (10) Dec-12 5 9 (11) 15.0 14.3 13.1 14.7 97 103 3.5 17.4 2.4 2.6 7.3 (41)
Consumer Staples Tingmin Tan / Foong Wai Loke - 60 3 2723 2080 / 60 3 2723 2082
BAT Malaysia ROTH MK O MYR 62.60 72.00 15 5,683 3.6 0 (2) (2) 1 14 0 (2) (1) (4) 2 Dec-12 3 3 4 22.4 21.7 21.1 20.2 100 101 4.5 164.3 34.5 4.0 15.5 46 FGV FGV MK U MYR 4.52 4.00 (12) 5,243 3.9 0 (0) (1) (2) na 0 (0) (0) (7) na Dec-12 (14) 19 (2) 20.5 23.7 19.9 20.4 98 101 2.5 11.1 2.6 1.3 10.9 (45)
Genting Plantations GENP MK N MYR 9.56 9.38 (2) 2,307 1.0 0 4 6 6 5 0 4 7 1 (8) Dec-12 (17) 46 13 22.2 26.8 18.4 16.2 80 96 1.0 7.6 2.0 5.0 16.7 (2) IOI Corp IOI MK U MYR 5.42 4.60 (15) 11,085 8.2 0 4 2 6 7 0 4 3 1 (6) Jun-12 (17) 11 6 19.1 22.9 20.6 19.4 87 90 2.2 11.7 2.6 3.0 16.0 26 KLK KLK MK N MYR 21.70 20.00 (8) 7,366 5.4 0 1 (0) (10) (5) 0 1 0 (15) (17) Sep-12 (18) 24 12 21.5 26.4 21.2 18.9 84 88 2.2 11.6 2.9 2.3 17.1 25
Sime Darby SIME MK O MYR 9.58 10.90 14 18,305 21.9 0 1 0 1 (2) 0 1 1 (4) (14) Jun-12 (6) 1 9 13.9 14.8 14.7 13.5 114 106 3.4 14.4 2.1 1.4 10.0 19 Sector* 1 49,989 0 1 0 0 2 0 1 1 (5) (10) Dec-12 (5) 10 3 18.2 19.1 17.4 19.4 99 99 2.9 13.8 2.6 1.9 12.2 13
Diversified Financials Arjan van Veen / Danny Goh - 852 2101 7508 / 60 3 2723 2083
Bursa BURSA MK O MYR 7.94 9.75 23 1,344 2.6 0 (2) 1 28 31 0 (2) 2 23 18 Dec-12 32 21 14 27.9 21.1 17.4 15.3 117 127 4.5 20.7 4.0 na na na HLFG HLFG MK O MYR 14.64 16.50 13 4,901 1.4 0 (3) (7) 11 22 0 (3) (6) 6 10 Jun-12 14 16 14 13.3 11.7 10.1 8.8 100 102 2.1 14.4 1.6 na na na
Sector* 15 6,244 0 (3) (5) 15 24 0 (3) (4) 10 12 Dec-12 17 16 14 14.1 12.1 10.4 15.3 103 106 2.8 15.1 1.7 na na na
Energy Annuar Aziz - 60 3 2723 2084
Bumi Armada BAB MK N MYR 3.84 3.80 (1) 3,578 2.7 0 (3) (3) (4) (4) 0 (2) (2) (8) (16) Dec-11 25 25 9 31.3 25.0 20.0 18.3 116 104 0.7 12.1 2.9 7.7 15.6 53 Malaysia Marine MMHE MK U MYR 3.47 3.40 (2) 1,765 2.2 0 (3) (9) (21) (32) 0 (3) (8) (26) (45) Dec-11 6 26 17 27.0 25.5 20.3 17.4 90 105 2.9 8.9 2.2 1.0 11.1 (79) Sector* (1) 5,343 0 (3) (5) (9) (13) 0 (3) (4) (14) (26) Dec-12 25 12 (1) 25.2 20.1 18.0 18.4 104 97 1.4 12.5 2.4 3.3 13.6 11
Healthcare Anand Swaminathan - 65 6212 3012
IHH IHH MK N MYR 3.93 3.30 (16) 10,161 6.9 0 (2) 1 17 na 0 (1) 2 12 na Dec-12 14 24 23 58.3 50.9 41.2 33.5 92 89 0.0 3.5 1.8 5.1 25.6 7
KPJ KPJ MK O MYR 6.50 6.95 7 1,349 2.7 0 (0) 4 13 10 0 (0) 5 8 (2) Dec-12 20 8 13 27.3 22.9 21.2 18.8 120 118 1.8 15.7 3.8 1.9 15.1 28 Sector* (13) 11,510 0 (1) 2 16 10 0 (1) 2 11 (2) Dec-12 16 20 21 51.4 44.5 37.1 30.7 97 94 0.2 4.3 1.9 4.2 23.6 8
Hotels, Restaurants & Leisure
Foong Wai Loke - 60 3 2723 2082
B Toto BST MK N MYR 4.30 4.65 8 1,847 1.5 0 (2) (2) (1) 5 0 (2) (1) (6) (8) Apr-11 13 6 5 17.0 15.0 14.2 13.5 98 99 5.0 75.4 10.3 1.6 9.5 0
Genting Bhd GENT MK R MYR 10.50 12,418 11.2 0 3 (4) 14 11 0 3 (4) 9 (2) Dec-12 (36) 7 4 9.8 15.4 14.3 13.8 112 106 0.6 11.0 1.6 1.8 4.2 (12) Genting Malaysia GENM MK R MYR 3.98 7,515 6.5 0 1 3 12 15 0 1 3 7 3 Dec-12 16 6 6 16.7 14.4 13.6 12.9 94 95 1.7 11.6 1.6 2.4 7.5 (26) Sector* 8 21,780 0 2 (2) 12 12 0 2 (1) 7 (1) Dec-12 (21) 7 5 11.8 14.9 14.1 13.4 104 102 1.4 12.1 1.7 1.9 5.3 (15)
Media Foong Wai Loke - 60 3 2723 2082
Astro ASTRO MK O MYR 3.00 3.50 17 4,959 7.2 0 (5) (4) 0 na 0 (5) (4) (5) na Jan-13 (4) 19 27 37.3 38.7 32.7 25.7 87 80 1.9 71.6 25.5 3.7 11.8 293
Paper & Forest Products Foong Wai Loke - 60 3 2723 2082
Ta Ann TAH MK O MYR 3.82 6.08 59 450 0.2 0 3 9 9 (15) 0 3 9 4 (27) Dec-10 101 6 3 18.3 9.1 8.6 8.3 95 247 2.0 17.7 1.5 1.6 5.9 26
Real Estate Tingmin Tan / Danny Goh - 60 3 2723 2080 / 60 3 2723 2083
IJM Land IJMLD MK O MYR 3.14 3.80 21 1,437 1.1 0 (1) 5 31 49 0 (1) 6 26 36 Mar-13 33 20 6 22.0 16.5 13.8 13.0 94 92 1.3 10.5 1.7 3.6 15.4 40 SP Setia SPSB MK N MYR 3.42 3.10 (9) 2,674 4.2 0 (6) (12) 11 (8) 0 (6) (11) 6 (21) Oct-12 (1) 18 26 18.2 18.3 15.5 12.3 92 91 3.2 9.8 1.6 4.0 18.6 62
UEM Land ULHB MK O MYR 3.24 4.20 30 4,471 8.9 0 (4) 2 54 65 0 (4) 2 49 53 Dec-12 18 22 26 30.4 25.9 21.2 16.9 104 117 0.9 10.6 2.5 5.8 20.1 18 Sector* 16 8,582 0 (4) (2) 37 40 0 (4) (1) 32 27 Dec-12 13 21 20 24.0 21.2 17.5 15.8 97 101 1.7 10.2 2.0 4.5 18.4 38
REITS Tingmin Tan - 60 3 2723 2080
CMMT CMMT MK N MYR 1.87 1.99 6 1,053 0.7 0 1 0 4 13 0 1 1 (1) 1 Dec-12 8 6 6 24.1 22.2 20.9 19.7 100 99 4.8 6.8 1.5 21.8 33 IGB REIT IGBREIT MK U MYR 1.36 1.30 (4) 1,475 1.3 0 1 0 2 na 0 1 1 (3) na Dec-12 5 5 5 24.7 23.4 22.3 21.3 97 95 5.0 5.4 1.2 23.1 31
Pavilion REIT PREIT MK N MYR 1.58 1.65 4 1,511 0.8 0 (1) 1 14 31 0 (1) 2 9 18 Dec-12 6 7 2 24.4 22.9 21.4 21.0 98 98 4.6 6.1 1.4 22.6 15 Sunway REIT SREIT MK N MYR 1.61 1.62 1 1,495 0.7 0 (2) 1 4 22 0 (2) 1 (1) 10 Jun-12 8 1 12 22.8 21.1 21.0 18.7 100 97 5.1 6.7 1.3 nm 22.3 47 Sector* 1 5,533 0 (0) 1 6 23 0 (0) 1 1 10 Dec-12 6 6 4 23.7 22.4 21.1 20.7 98 97 4.9 6.2 1.4 nm 22.3 32
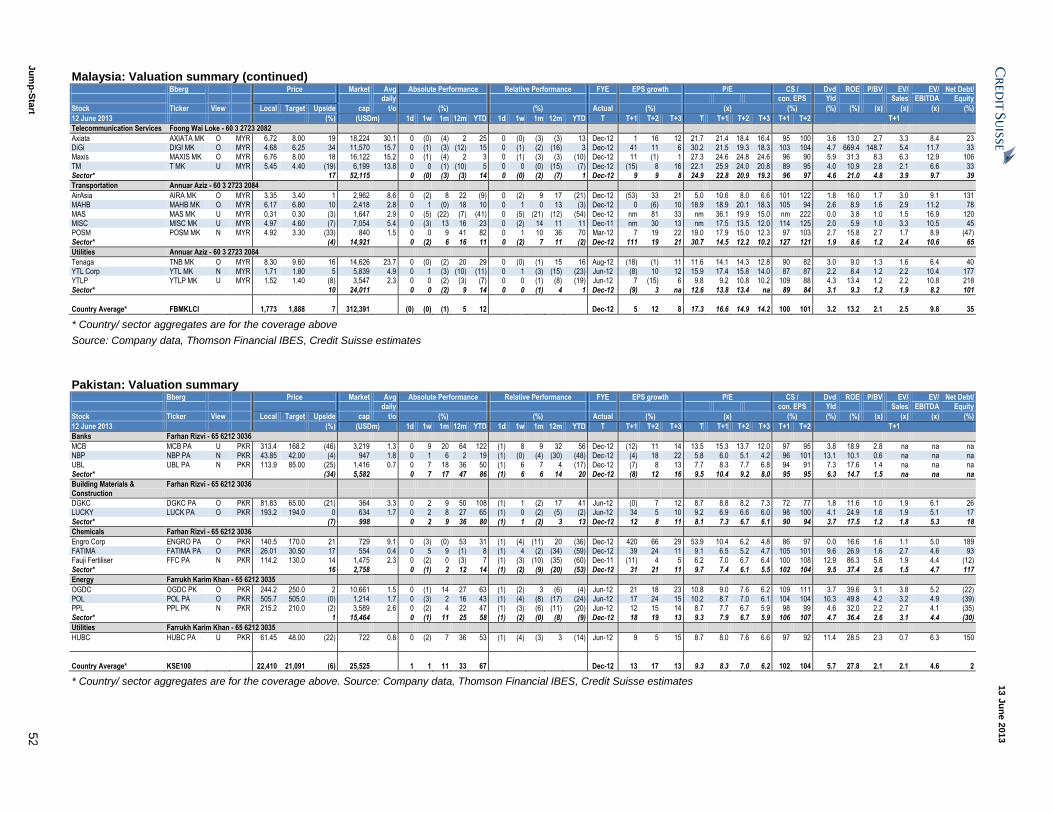
13 J
un
e 2
013
Ju
mp
-Sta
rt 5
2
Malaysia: Valuation summary (continued) Bberg Price Market Avg Absolute Performance Relative Performance FYE EPS growth P/E CS / Dvd ROE P/BV EV/ EV/ Net Debt/ daily con. EPS Yld Sales EBITDA Equity
Stock Ticker View Local Target Upside cap t/o (%) (%) Actual (%) (x) (%) (%) (%) (x) (x) (x) (%)
12 June 2013 (%) (USDm) 1d 1w 1m 12m YTD 1d 1w 1m 12m YTD T T+1 T+2 T+3 T T+1 T+2 T+3 T+1 T+2 T+1
Telecommunication Services Foong Wai Loke - 60 3 2723 2082
Axiata AXIATA MK O MYR 6.72 8.00 19 18,224 30.1 0 (0) (4) 2 25 0 (0) (3) (3) 13 Dec-12 1 16 12 21.7 21.4 18.4 16.4 95 100 3.6 13.0 2.7 3.3 8.4 23 DiGi DIGI MK O MYR 4.68 6.25 34 11,570 15.7 0 (1) (3) (12) 15 0 (1) (2) (16) 3 Dec-12 41 11 6 30.2 21.5 19.3 18.3 103 104 4.7 669.4 148.7 5.4 11.7 33 Maxis MAXIS MK O MYR 6.76 8.00 18 16,122 15.2 0 (1) (4) 2 3 0 (1) (3) (3) (10) Dec-12 11 (1) 1 27.3 24.6 24.8 24.6 96 90 5.9 31.3 8.3 6.3 12.9 106
TM T MK U MYR 5.45 4.40 (19) 6,199 13.8 0 0 (1) (10) 5 0 0 (0) (15) (7) Dec-12 (15) 8 16 22.1 25.9 24.0 20.8 89 95 4.0 10.9 2.8 2.1 6.6 33 Sector* 17 52,115 0 (0) (3) (3) 14 0 (0) (2) (7) 1 Dec-12 9 9 8 24.9 22.8 20.9 19.3 96 97 4.6 21.0 4.8 3.9 9.7 39
Transportation Annuar Aziz - 60 3 2723 2084
AirAsia AIRA MK O MYR 3.35 3.40 1 2,962 8.6 0 (2) 8 22 (9) 0 (2) 9 17 (21) Dec-12 (53) 33 21 5.0 10.6 8.0 6.6 101 122 1.8 16.0 1.7 3.0 9.1 131 MAHB MAHB MK O MYR 6.17 6.80 10 2,418 2.8 0 1 (0) 18 10 0 1 0 13 (3) Dec-12 0 (6) 10 18.9 18.9 20.1 18.3 105 94 2.6 8.9 1.6 2.9 11.2 78
MAS MAS MK U MYR 0.31 0.30 (3) 1,647 2.9 0 (5) (22) (7) (41) 0 (5) (21) (12) (54) Dec-12 nm 81 33 nm 36.1 19.9 15.0 nm 222 0.0 3.8 1.0 1.5 16.9 120 MISC MISC MK U MYR 4.97 4.60 (7) 7,054 5.4 0 (3) 13 16 23 0 (2) 14 11 11 Dec-11 nm 30 13 nm 17.5 13.5 12.0 114 125 2.0 5.9 1.0 3.3 10.5 45 POSM POSM MK N MYR 4.92 3.30 (33) 840 1.5 0 0 9 41 82 0 1 10 36 70 Mar-12 7 19 22 19.0 17.9 15.0 12.3 97 103 2.7 15.8 2.7 1.7 8.9 (47)
Sector* (4) 14,921 0 (2) 6 16 11 0 (2) 7 11 (2) Dec-12 111 19 21 30.7 14.5 12.2 10.2 127 121 1.9 8.6 1.2 2.4 10.6 65
Utilities Annuar Aziz - 60 3 2723 2084
Tenaga TNB MK O MYR 8.30 9.60 16 14,626 23.7 0 (0) (2) 20 29 0 (0) (1) 15 16 Aug-12 (18) (1) 11 11.6 14.1 14.3 12.8 90 82 3.0 9.0 1.3 1.6 6.4 40 YTL Corp YTL MK N MYR 1.71 1.80 5 5,839 4.9 0 1 (3) (10) (11) 0 1 (3) (15) (23) Jun-12 (8) 10 12 15.9 17.4 15.8 14.0 87 87 2.2 8.4 1.2 2.2 10.4 177 YTLP YTLP MK U MYR 1.52 1.40 (8) 3,547 2.3 0 0 (2) (3) (7) 0 0 (1) (8) (19) Jun-12 7 (15) 6 9.8 9.2 10.8 10.2 109 88 4.3 13.4 1.2 2.2 10.8 218
Sector* 10 24,011 0 0 (2) 9 14 0 0 (1) 4 1 Dec-12 (9) 3 na 12.6 13.8 13.4 na 89 84 3.1 9.3 1.2 1.9 8.2 101
Country Average* FBMKLCI 1,773 1,888 7 312,391 (0) (0) (1) 5 12 Dec-12 5 12 8 17.3 16.6 14.9 14.2 100 101 3.2 13.2 2.1 2.5 9.8 35
* Country/ sector aggregates are for the coverage above
Source: Company data, Thomson Financial IBES, Credit Suisse estimates
Pakistan: Valuation summary Bberg Price Market Avg Absolute Performance Relative Performance FYE EPS growth P/E CS / Dvd ROE P/BV EV/ EV/ Net Debt/ daily con. EPS Yld Sales EBITDA Equity
Stock Ticker View Local Target Upside cap t/o (%) (%) Actual (%) (x) (%) (%) (%) (x) (x) (x) (%)
12 June 2013 (%) (USDm) 1d 1w 1m 12m YTD 1d 1w 1m 12m YTD T T+1 T+2 T+3 T T+1 T+2 T+3 T+1 T+2 T+1
Banks Farhan Rizvi - 65 6212 3036
MCB MCB PA U PKR 313.4 168.2 (46) 3,219 1.3 0 9 20 64 122 (1) 8 9 32 56 Dec-12 (12) 11 14 13.5 15.3 13.7 12.0 97 95 3.8 18.9 2.8 na na na NBP NBP PA N PKR 43.85 42.00 (4) 947 1.8 0 1 6 2 19 (1) (0) (4) (30) (48) Dec-12 (4) 18 22 5.8 6.0 5.1 4.2 96 101 13.1 10.1 0.6 na na na UBL UBL PA N PKR 113.9 85.00 (25) 1,416 0.7 0 7 18 36 50 (1) 6 7 4 (17) Dec-12 (7) 8 13 7.7 8.3 7.7 6.8 94 91 7.3 17.6 1.4 na na na
Sector* (34) 5,582 0 7 17 47 86 (1) 6 6 14 20 Dec-12 (8) 12 16 9.5 10.4 9.2 8.0 95 95 6.3 14.7 1.5 na na na
Building Materials & Construction
Farhan Rizvi - 65 6212 3036
DGKC DGKC PA O PKR 81.83 65.00 (21) 364 3.3 0 2 9 50 108 (1) 1 (2) 17 41 Jun-12 (0) 7 12 8.7 8.8 8.2 7.3 72 77 1.8 11.6 1.0 1.9 6.1 26 LUCKY LUCK PA O PKR 193.2 194.0 0 634 1.7 0 2 8 27 65 (1) 0 (2) (5) (2) Jun-12 34 5 10 9.2 6.9 6.6 6.0 98 100 4.1 24.9 1.6 1.9 5.1 17
Sector* (7) 998 0 2 9 36 80 (1) 1 (2) 3 13 Dec-12 12 8 11 8.1 7.3 6.7 6.1 90 94 3.7 17.5 1.2 1.8 5.3 18
Chemicals Farhan Rizvi - 65 6212 3036
Engro Corp ENGRO PA O PKR 140.5 170.0 21 729 9.1 0 (3) (0) 53 31 (1) (4) (11) 20 (36) Dec-12 420 66 29 53.9 10.4 6.2 4.8 86 97 0.0 16.6 1.6 1.1 5.0 189 FATIMA FATIMA PA O PKR 26.01 30.50 17 554 0.4 0 5 9 (1) 8 (1) 4 (2) (34) (59) Dec-12 39 24 11 9.1 6.5 5.2 4.7 105 101 9.6 26.9 1.6 2.7 4.6 93 Fauji Fertiliser FFC PA N PKR 114.2 130.0 14 1,475 2.3 0 (2) 0 (3) 7 (1) (3) (10) (35) (60) Dec-11 (11) 4 5 6.2 7.0 6.7 6.4 100 108 12.9 86.3 5.8 1.9 4.4 (12)
Sector* 16 2,758 0 (1) 2 12 14 (1) (2) (9) (20) (53) Dec-12 31 21 11 9.7 7.4 6.1 5.5 102 104 9.5 37.4 2.6 1.5 4.7 117
Energy Farrukh Karim Khan - 65 6212 3035
OGDC OGDC PK O PKR 244.2 250.0 2 10,661 1.5 0 (1) 14 27 63 (1) (2) 3 (6) (4) Jun-12 21 18 23 10.8 9.0 7.6 6.2 109 111 3.7 39.6 3.1 3.8 5.2 (22) POL POL PA O PKR 505.7 505.0 (0) 1,214 1.7 0 (3) 2 16 43 (1) (4) (8) (17) (24) Jun-12 17 24 15 10.2 8.7 7.0 6.1 104 104 10.3 49.8 4.2 3.2 4.9 (39) PPL PPL PK N PKR 215.2 210.0 (2) 3,589 2.6 0 (2) 4 22 47 (1) (3) (6) (11) (20) Jun-12 12 15 14 8.7 7.7 6.7 5.9 98 99 4.6 32.0 2.2 2.7 4.1 (35)
Sector* 1 15,464 0 (1) 11 25 58 (1) (2) (0) (8) (9) Dec-12 18 19 13 9.3 7.9 6.7 5.9 106 107 4.7 36.4 2.6 3.1 4.4 (30)
Utilities Farrukh Karim Khan - 65 6212 3035
HUBC HUBC PA U PKR 61.45 48.00 (22) 722 0.8 0 (2) 7 36 53 (1) (4) (3) 3 (14) Jun-12 9 5 15 8.7 8.0 7.6 6.6 97 92 11.4 28.5 2.3 0.7 6.3 150
Country Average* KSE100 22,410 21,091 (6) 25,525 1 1 11 33 67 Dec-12 13 17 13 9.3 8.3 7.0 6.2 102 104 5.7 27.8 2.1 2.1 4.6 2
* Country/ sector aggregates are for the coverage above. Source: Company data, Thomson Financial IBES, Credit Suisse estimates
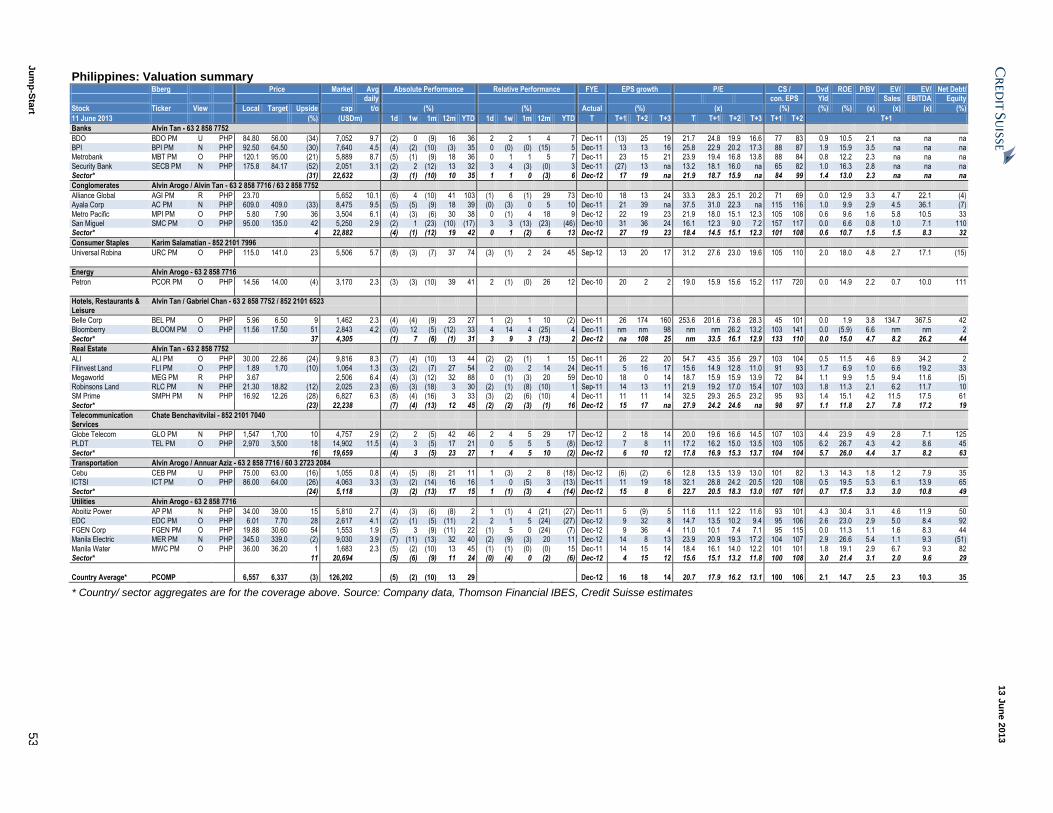
13 J
un
e 2
013
Ju
mp
-Sta
rt 5
3
Philippines: Valuation summary Bberg Price Market Avg Absolute Performance Relative Performance FYE EPS growth P/E CS / Dvd ROE P/BV EV/ EV/ Net Debt/ daily con. EPS Yld Sales EBITDA Equity
Stock Ticker View Local Target Upside cap t/o (%) (%) Actual (%) (x) (%) (%) (%) (x) (x) (x) (%)
11 June 2013 (%) (USDm) 1d 1w 1m 12m YTD 1d 1w 1m 12m YTD T T+1 T+2 T+3 T T+1 T+2 T+3 T+1 T+2 T+1
Banks Alvin Tan - 63 2 858 7752
BDO BDO PM U PHP 84.80 56.00 (34) 7,052 9.7 (2) 0 (9) 16 36 2 2 1 4 7 Dec-11 (13) 25 19 21.7 24.8 19.9 16.6 77 83 0.9 10.5 2.1 na na na BPI BPI PM N PHP 92.50 64.50 (30) 7,640 4.5 (4) (2) (10) (3) 35 0 (0) (0) (15) 5 Dec-11 13 13 16 25.8 22.9 20.2 17.3 88 87 1.9 15.9 3.5 na na na Metrobank MBT PM O PHP 120.1 95.00 (21) 5,889 8.7 (5) (1) (9) 18 36 0 1 1 5 7 Dec-11 23 15 21 23.9 19.4 16.8 13.8 88 84 0.8 12.2 2.3 na na na
Security Bank SECB PM N PHP 175.8 84.17 (52) 2,051 3.1 (2) 2 (12) 13 32 3 4 (3) (0) 3 Dec-11 (27) 13 na 13.2 18.1 16.0 na 65 82 1.0 16.3 2.8 na na na Sector* (31) 22,632 (3) (1) (10) 10 35 1 1 0 (3) 6 Dec-12 17 19 na 21.9 18.7 15.9 na 84 99 1.4 13.0 2.3 na na na
Conglomerates Alvin Arogo / Alvin Tan - 63 2 858 7716 / 63 2 858 7752
Alliance Global AGI PM R PHP 23.70 5,652 10.1 (6) 4 (10) 41 103 (1) 6 (1) 29 73 Dec-10 18 13 24 33.3 28.3 25.1 20.2 71 69 0.0 12.9 3.3 4.7 22.1 (4) Ayala Corp AC PM N PHP 609.0 409.0 (33) 8,475 9.5 (5) (5) (9) 18 39 (0) (3) 0 5 10 Dec-11 21 39 na 37.5 31.0 22.3 na 115 116 1.0 9.9 2.9 4.5 36.1 (7)
Metro Pacific MPI PM O PHP 5.80 7.90 36 3,504 6.1 (4) (3) (6) 30 38 0 (1) 4 18 9 Dec-12 22 19 23 21.9 18.0 15.1 12.3 105 108 0.6 9.6 1.6 5.8 10.5 33 San Miguel SMC PM O PHP 95.00 135.0 42 5,250 2.9 (2) 1 (23) (10) (17) 3 3 (13) (23) (46) Dec-10 31 36 24 16.1 12.3 9.0 7.2 157 117 0.0 6.6 0.8 1.0 7.1 110 Sector* 4 22,882 (4) (1) (12) 19 42 0 1 (2) 6 13 Dec-12 27 19 23 18.4 14.5 15.1 12.3 101 108 0.6 10.7 1.5 1.5 8.3 32
Consumer Staples Karim Salamatian - 852 2101 7996
Universal Robina URC PM O PHP 115.0 141.0 23 5,506 5.7 (8) (3) (7) 37 74 (3) (1) 2 24 45 Sep-12 13 20 17 31.2 27.6 23.0 19.6 105 110 2.0 18.0 4.8 2.7 17.1 (15)
Energy Alvin Arogo - 63 2 858 7716
Petron PCOR PM O PHP 14.56 14.00 (4) 3,170 2.3 (3) (3) (10) 39 41 2 (1) (0) 26 12 Dec-10 20 2 2 19.0 15.9 15.6 15.2 117 720 0.0 14.9 2.2 0.7 10.0 111
Hotels, Restaurants & Leisure
Alvin Tan / Gabriel Chan - 63 2 858 7752 / 852 2101 6523
Belle Corp BEL PM O PHP 5.96 6.50 9 1,462 2.3 (4) (4) (9) 23 27 1 (2) 1 10 (2) Dec-11 26 174 160 253.6 201.6 73.6 28.3 45 101 0.0 1.9 3.8 134.7 367.5 42
Bloomberry BLOOM PM O PHP 11.56 17.50 51 2,843 4.2 (0) 12 (5) (12) 33 4 14 4 (25) 4 Dec-11 nm nm 98 nm nm 26.2 13.2 103 141 0.0 (5.9) 6.6 nm nm 2 Sector* 37 4,305 (1) 7 (6) (1) 31 3 9 3 (13) 2 Dec-12 na 108 25 nm 33.5 16.1 12.9 133 110 0.0 15.0 4.7 8.2 26.2 44
Real Estate Alvin Tan - 63 2 858 7752
ALI ALI PM O PHP 30.00 22.86 (24) 9,816 8.3 (7) (4) (10) 13 44 (2) (2) (1) 1 15 Dec-11 26 22 20 54.7 43.5 35.6 29.7 103 104 0.5 11.5 4.6 8.9 34.2 2 Filinvest Land FLI PM O PHP 1.89 1.70 (10) 1,064 1.3 (3) (2) (7) 27 54 2 (0) 2 14 24 Dec-11 5 16 17 15.6 14.9 12.8 11.0 91 93 1.7 6.9 1.0 6.6 19.2 33
Megaworld MEG PM R PHP 3.67 2,506 6.4 (4) (3) (12) 32 88 0 (1) (3) 20 59 Dec-10 18 0 14 18.7 15.9 15.9 13.9 72 84 1.1 9.9 1.5 9.4 11.6 (5) Robinsons Land RLC PM N PHP 21.30 18.82 (12) 2,025 2.3 (6) (3) (18) 3 30 (2) (1) (8) (10) 1 Sep-11 14 13 11 21.9 19.2 17.0 15.4 107 103 1.8 11.3 2.1 6.2 11.7 10 SM Prime SMPH PM N PHP 16.92 12.26 (28) 6,827 6.3 (8) (4) (16) 3 33 (3) (2) (6) (10) 4 Dec-11 11 11 14 32.5 29.3 26.5 23.2 95 93 1.4 15.1 4.2 11.5 17.5 61
Sector* (23) 22,238 (7) (4) (13) 12 45 (2) (2) (3) (1) 16 Dec-12 15 17 na 27.9 24.2 24.6 na 98 97 1.1 11.8 2.7 7.8 17.2 19
Telecommunication Services
Chate Benchavitvilai - 852 2101 7040
Globe Telecom GLO PM N PHP 1,547 1,700 10 4,757 2.9 (2) 2 (5) 42 46 2 4 5 29 17 Dec-12 2 18 14 20.0 19.6 16.6 14.5 107 103 4.4 23.9 4.9 2.8 7.1 125 PLDT TEL PM O PHP 2,970 3,500 18 14,902 11.5 (4) 3 (5) 17 21 0 5 5 5 (8) Dec-12 7 8 11 17.2 16.2 15.0 13.5 103 105 6.2 26.7 4.3 4.2 8.6 45
Sector* 16 19,659 (4) 3 (5) 23 27 1 4 5 10 (2) Dec-12 6 10 12 17.8 16.9 15.3 13.7 104 104 5.7 26.0 4.4 3.7 8.2 63
Transportation Alvin Arogo / Annuar Aziz - 63 2 858 7716 / 60 3 2723 2084
Cebu CEB PM U PHP 75.00 63.00 (16) 1,055 0.8 (4) (5) (8) 21 11 1 (3) 2 8 (18) Dec-12 (6) (2) 6 12.8 13.5 13.9 13.0 101 82 1.3 14.3 1.8 1.2 7.9 35 ICTSI ICT PM O PHP 86.00 64.00 (26) 4,063 3.3 (3) (2) (14) 16 16 1 0 (5) 3 (13) Dec-11 11 19 18 32.1 28.8 24.2 20.5 120 108 0.5 19.5 5.3 6.1 13.9 65 Sector* (24) 5,118 (3) (2) (13) 17 15 1 (1) (3) 4 (14) Dec-12 15 8 6 22.7 20.5 18.3 13.0 107 101 0.7 17.5 3.3 3.0 10.8 49
Utilities Alvin Arogo - 63 2 858 7716
Aboitiz Power AP PM N PHP 34.00 39.00 15 5,810 2.7 (4) (3) (6) (8) 2 1 (1) 4 (21) (27) Dec-11 5 (9) 5 11.6 11.1 12.2 11.6 93 101 4.3 30.4 3.1 4.6 11.9 50
EDC EDC PM O PHP 6.01 7.70 28 2,617 4.1 (2) (1) (5) (11) 2 2 1 5 (24) (27) Dec-12 9 32 8 14.7 13.5 10.2 9.4 95 106 2.6 23.0 2.9 5.0 8.4 92 FGEN Corp FGEN PM O PHP 19.88 30.60 54 1,553 1.9 (5) 3 (9) (11) 22 (1) 5 0 (24) (7) Dec-12 9 36 4 11.0 10.1 7.4 7.1 95 115 0.0 11.3 1.1 1.6 8.3 44 Manila Electric MER PM N PHP 345.0 339.0 (2) 9,030 3.9 (7) (11) (13) 32 40 (2) (9) (3) 20 11 Dec-12 14 8 13 23.9 20.9 19.3 17.2 104 107 2.9 26.6 5.4 1.1 9.3 (51)
Manila Water MWC PM O PHP 36.00 36.20 1 1,683 2.3 (5) (2) (10) 13 45 (1) (1) (0) (0) 15 Dec-11 14 15 14 18.4 16.1 14.0 12.2 101 101 1.8 19.1 2.9 6.7 9.3 82 Sector* 11 20,694 (5) (6) (9) 11 24 (0) (4) 0 (2) (6) Dec-12 4 15 12 15.6 15.1 13.2 11.8 100 108 3.0 21.4 3.1 2.0 9.6 29
Country Average* PCOMP 6,557 6,337 (3) 126,202 (5) (2) (10) 13 29 Dec-12 16 18 14 20.7 17.9 16.2 13.1 100 106 2.1 14.7 2.5 2.3 10.3 35
* Country/ sector aggregates are for the coverage above. Source: Company data, Thomson Financial IBES, Credit Suisse estimates
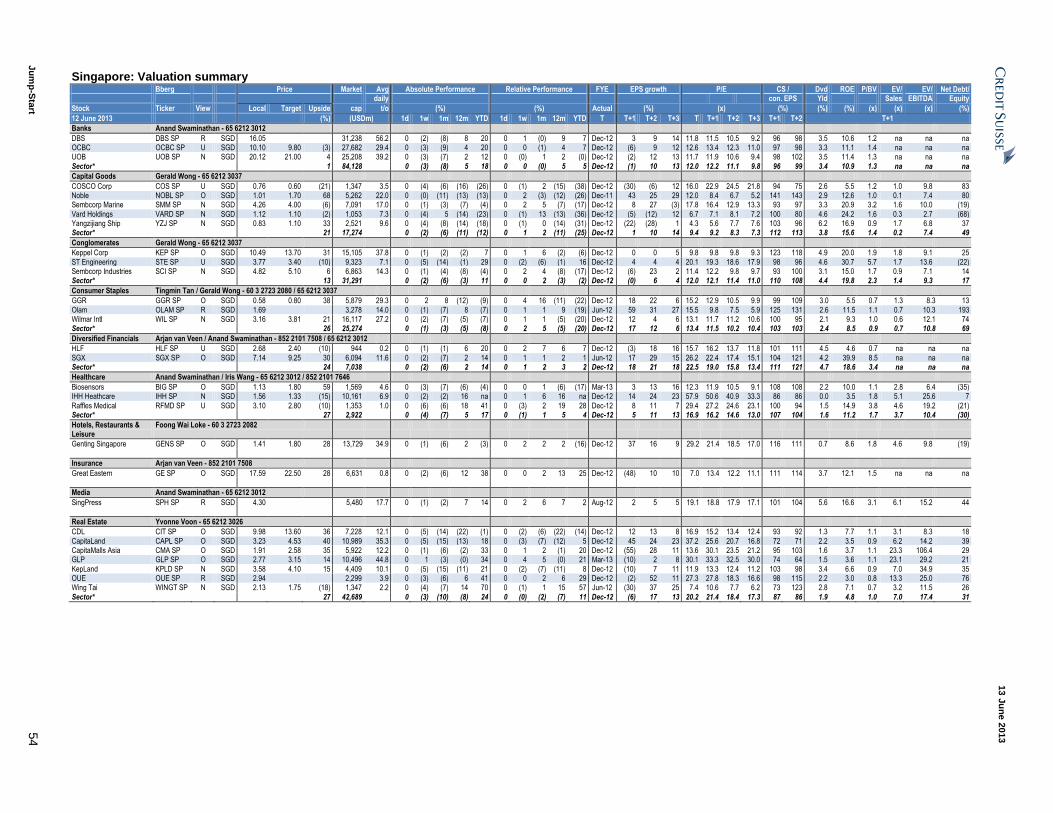
13 J
un
e 2
013
Ju
mp
-Sta
rt 5
4
Singapore: Valuation summary Bberg Price Market Avg Absolute Performance Relative Performance FYE EPS growth P/E CS / Dvd ROE P/BV EV/ EV/ Net Debt/ daily con. EPS Yld Sales EBITDA Equity
Stock Ticker View Local Target Upside cap t/o (%) (%) Actual (%) (x) (%) (%) (%) (x) (x) (x) (%)
12 June 2013 (%) (USDm) 1d 1w 1m 12m YTD 1d 1w 1m 12m YTD T T+1 T+2 T+3 T T+1 T+2 T+3 T+1 T+2 T+1
Banks Anand Swaminathan - 65 6212 3012
DBS DBS SP R SGD 16.05 31,238 56.2 0 (2) (8) 8 20 0 1 (0) 9 7 Dec-12 3 9 14 11.8 11.5 10.5 9.2 96 98 3.5 10.6 1.2 na na na OCBC OCBC SP U SGD 10.10 9.80 (3) 27,682 29.4 0 (3) (9) 4 20 0 0 (1) 4 7 Dec-12 (6) 9 12 12.6 13.4 12.3 11.0 97 98 3.3 11.1 1.4 na na na UOB UOB SP N SGD 20.12 21.00 4 25,208 39.2 0 (3) (7) 2 12 0 (0) 1 2 (0) Dec-12 (2) 12 13 11.7 11.9 10.6 9.4 98 102 3.5 11.4 1.3 na na na
Sector* 1 84,128 0 (3) (8) 5 18 0 0 (0) 5 5 Dec-12 (1) 10 13 12.0 12.2 11.1 9.8 96 99 3.4 10.9 1.3 na na na
Capital Goods Gerald Wong - 65 6212 3037
COSCO Corp COS SP U SGD 0.76 0.60 (21) 1,347 3.5 0 (4) (6) (16) (26) 0 (1) 2 (15) (38) Dec-12 (30) (6) 12 16.0 22.9 24.5 21.8 94 75 2.6 5.5 1.2 1.0 9.8 83 Noble NOBL SP O SGD 1.01 1.70 68 5,262 22.0 0 (0) (11) (13) (13) 0 2 (3) (12) (26) Dec-11 43 25 29 12.0 8.4 6.7 5.2 141 143 2.9 12.6 1.0 0.1 7.4 80 Sembcorp Marine SMM SP N SGD 4.26 4.00 (6) 7,091 17.0 0 (1) (3) (7) (4) 0 2 5 (7) (17) Dec-12 8 27 (3) 17.8 16.4 12.9 13.3 93 97 3.3 20.9 3.2 1.6 10.0 (19)
Vard Holdings VARD SP N SGD 1.12 1.10 (2) 1,053 7.3 0 (4) 5 (14) (23) 0 (1) 13 (13) (36) Dec-12 (5) (12) 12 6.7 7.1 8.1 7.2 100 80 4.6 24.2 1.6 0.3 2.7 (68) Yangzijiang Ship YZJ SP N SGD 0.83 1.10 33 2,521 9.6 0 (4) (8) (14) (18) 0 (1) 0 (14) (31) Dec-12 (22) (28) 1 4.3 5.6 7.7 7.6 103 96 6.2 16.9 0.9 1.7 6.8 37 Sector* 21 17,274 0 (2) (6) (11) (12) 0 1 2 (11) (25) Dec-12 1 10 14 9.4 9.2 8.3 7.3 112 113 3.8 15.6 1.4 0.2 7.4 49
Conglomerates Gerald Wong - 65 6212 3037
Keppel Corp KEP SP O SGD 10.49 13.70 31 15,105 37.8 0 (1) (2) (2) 7 0 1 6 (2) (6) Dec-12 0 0 5 9.8 9.8 9.8 9.3 123 118 4.9 20.0 1.9 1.8 9.1 25
ST Engineering STE SP U SGD 3.77 3.40 (10) 9,323 7.1 0 (5) (14) (1) 29 0 (2) (6) (1) 16 Dec-12 4 4 4 20.1 19.3 18.6 17.9 98 96 4.6 30.7 5.7 1.7 13.6 (22) Sembcorp Industries SCI SP N SGD 4.82 5.10 6 6,863 14.3 0 (1) (4) (8) (4) 0 2 4 (8) (17) Dec-12 (6) 23 2 11.4 12.2 9.8 9.7 93 100 3.1 15.0 1.7 0.9 7.1 14 Sector* 13 31,291 0 (2) (6) (3) 11 0 0 2 (3) (2) Dec-12 (0) 6 4 12.0 12.1 11.4 11.0 110 108 4.4 19.8 2.3 1.4 9.3 17
Consumer Staples Tingmin Tan / Gerald Wong - 60 3 2723 2080 / 65 6212 3037
GGR GGR SP O SGD 0.58 0.80 38 5,879 29.3 0 2 8 (12) (9) 0 4 16 (11) (22) Dec-12 18 22 6 15.2 12.9 10.5 9.9 99 109 3.0 5.5 0.7 1.3 8.3 13
Olam OLAM SP R SGD 1.69 3,278 14.0 0 (1) (7) 8 (7) 0 1 1 9 (19) Jun-12 59 31 27 15.5 9.8 7.5 5.9 125 131 2.6 11.5 1.1 0.7 10.3 193 Wilmar Intl WIL SP N SGD 3.16 3.81 21 16,117 27.2 0 (2) (7) (5) (7) 0 1 1 (5) (20) Dec-12 12 4 6 13.1 11.7 11.2 10.6 100 95 2.1 9.3 1.0 0.6 12.1 74 Sector* 26 25,274 0 (1) (3) (5) (8) 0 2 5 (5) (20) Dec-12 17 12 6 13.4 11.5 10.2 10.4 103 103 2.4 8.5 0.9 0.7 10.8 69
Diversified Financials Arjan van Veen / Anand Swaminathan - 852 2101 7508 / 65 6212 3012
HLF HLF SP U SGD 2.68 2.40 (10) 944 0.2 0 (1) (1) 6 20 0 2 7 6 7 Dec-12 (3) 18 16 15.7 16.2 13.7 11.8 101 111 4.5 4.6 0.7 na na na
SGX SGX SP O SGD 7.14 9.25 30 6,094 11.6 0 (2) (7) 2 14 0 1 1 2 1 Jun-12 17 29 15 26.2 22.4 17.4 15.1 104 121 4.2 39.9 8.5 na na na Sector* 24 7,038 0 (2) (6) 2 14 0 1 2 3 2 Dec-12 18 21 18 22.5 19.0 15.8 13.4 111 121 4.7 18.6 3.4 na na na
Healthcare Anand Swaminathan / Iris Wang - 65 6212 3012 / 852 2101 7646
Biosensors BIG SP O SGD 1.13 1.80 59 1,569 4.6 0 (3) (7) (6) (4) 0 0 1 (6) (17) Mar-13 3 13 16 12.3 11.9 10.5 9.1 108 108 2.2 10.0 1.1 2.8 6.4 (35) IHH Heathcare IHH SP N SGD 1.56 1.33 (15) 10,161 6.9 0 (2) (2) 16 na 0 1 6 16 na Dec-12 14 24 23 57.9 50.6 40.9 33.3 86 86 0.0 3.5 1.8 5.1 25.6 7
Raffles Medical RFMD SP U SGD 3.10 2.80 (10) 1,353 1.0 0 (6) (6) 18 41 0 (3) 2 19 28 Dec-12 8 11 7 29.4 27.2 24.6 23.1 100 94 1.5 14.9 3.8 4.6 19.2 (21) Sector* 27 2,922 0 (4) (7) 5 17 0 (1) 1 5 4 Dec-12 5 11 13 16.9 16.2 14.6 13.0 107 104 1.6 11.2 1.7 3.7 10.4 (30)
Hotels, Restaurants & Leisure
Foong Wai Loke - 60 3 2723 2082
Genting Singapore GENS SP O SGD 1.41 1.80 28 13,729 34.9 0 (1) (6) 2 (3) 0 2 2 2 (16) Dec-12 37 16 9 29.2 21.4 18.5 17.0 116 111 0.7 8.6 1.8 4.6 9.8 (19)
Insurance Arjan van Veen - 852 2101 7508
Great Eastern GE SP O SGD 17.59 22.50 28 6,631 0.8 0 (2) (6) 12 38 0 0 2 13 25 Dec-12 (48) 10 10 7.0 13.4 12.2 11.1 111 114 3.7 12.1 1.5 na na na
Media Anand Swaminathan - 65 6212 3012
SingPress SPH SP R SGD 4.30 5,480 17.7 0 (1) (2) 7 14 0 2 6 7 2 Aug-12 2 5 5 19.1 18.8 17.9 17.1 101 104 5.6 16.6 3.1 6.1 15.2 44
Real Estate Yvonne Voon - 65 6212 3026
CDL CIT SP O SGD 9.98 13.60 36 7,228 12.1 0 (5) (14) (22) (1) 0 (2) (6) (22) (14) Dec-12 12 13 8 16.9 15.2 13.4 12.4 93 92 1.3 7.7 1.1 3.1 8.3 18
CapitaLand CAPL SP O SGD 3.23 4.53 40 10,989 35.3 0 (5) (15) (13) 18 0 (3) (7) (12) 5 Dec-12 45 24 23 37.2 25.6 20.7 16.8 72 71 2.2 3.5 0.9 6.2 14.2 39 CapitaMalls Asia CMA SP O SGD 1.91 2.58 35 5,922 12.2 0 (1) (6) (2) 33 0 1 2 (1) 20 Dec-12 (55) 28 11 13.6 30.1 23.5 21.2 95 103 1.6 3.7 1.1 23.3 106.4 29 GLP GLP SP O SGD 2.77 3.15 14 10,496 44.8 0 1 (3) (0) 34 0 4 5 (0) 21 Mar-13 (10) 2 8 30.1 33.3 32.5 30.0 74 64 1.5 3.6 1.1 23.1 29.2 21
KepLand KPLD SP N SGD 3.58 4.10 15 4,409 10.1 0 (5) (15) (11) 21 0 (2) (7) (11) 8 Dec-12 (10) 7 11 11.9 13.3 12.4 11.2 103 98 3.4 6.6 0.9 7.0 34.9 35 OUE OUE SP R SGD 2.94 2,299 3.9 0 (3) (6) 6 41 0 0 2 6 29 Dec-12 (2) 52 11 27.3 27.8 18.3 16.6 98 115 2.2 3.0 0.8 13.3 25.0 76 Wing Tai WINGT SP N SGD 2.13 1.75 (18) 1,347 2.2 0 (4) (7) 14 70 0 (1) 1 15 57 Jun-12 (30) 37 25 7.4 10.6 7.7 6.2 73 123 2.8 7.1 0.7 3.2 11.5 26
Sector* 27 42,689 0 (3) (10) (8) 24 0 (0) (2) (7) 11 Dec-12 (6) 17 13 20.2 21.4 18.4 17.3 87 86 1.9 4.8 1.0 7.0 17.4 31
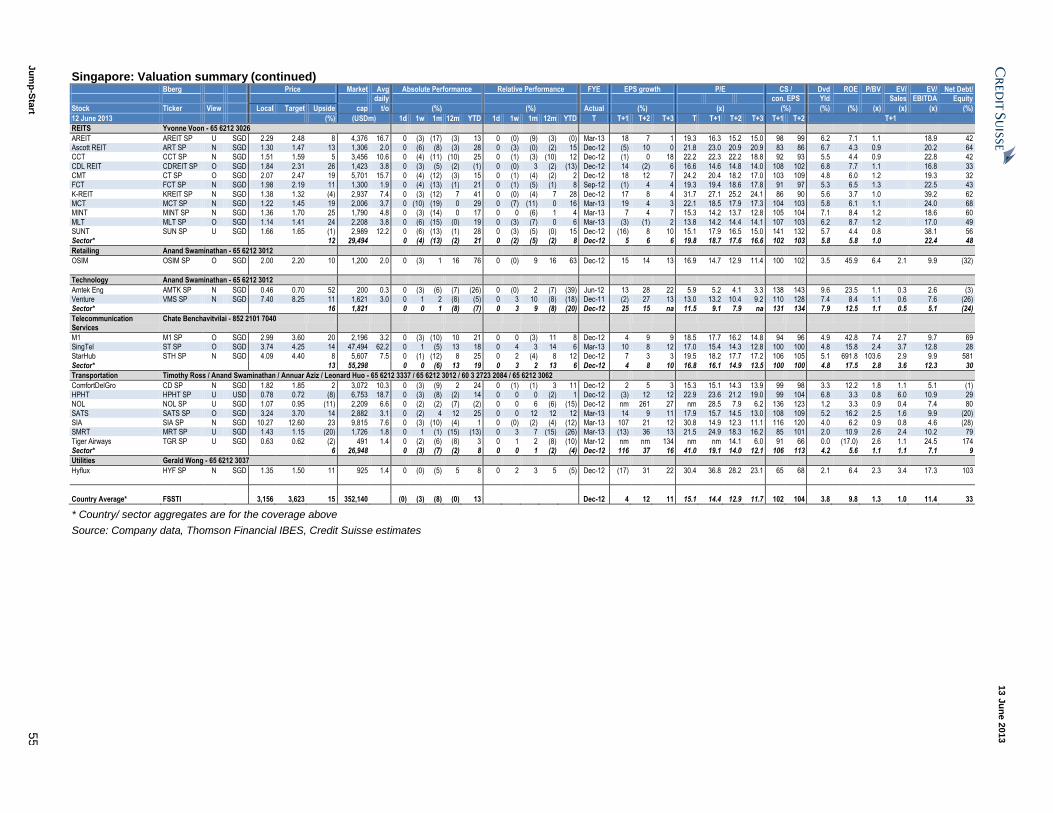
13 J
un
e 2
013
Ju
mp
-Sta
rt 5
5
Singapore: Valuation summary (continued) Bberg Price Market Avg Absolute Performance Relative Performance FYE EPS growth P/E CS / Dvd ROE P/BV EV/ EV/ Net Debt/ daily con. EPS Yld Sales EBITDA Equity
Stock Ticker View Local Target Upside cap t/o (%) (%) Actual (%) (x) (%) (%) (%) (x) (x) (x) (%)
12 June 2013 (%) (USDm) 1d 1w 1m 12m YTD 1d 1w 1m 12m YTD T T+1 T+2 T+3 T T+1 T+2 T+3 T+1 T+2 T+1
REITS Yvonne Voon - 65 6212 3026
AREIT AREIT SP U SGD 2.29 2.48 8 4,376 16.7 0 (3) (17) (3) 13 0 (0) (9) (3) (0) Mar-13 18 7 1 19.3 16.3 15.2 15.0 98 99 6.2 7.1 1.1 18.9 42 Ascott REIT ART SP N SGD 1.30 1.47 13 1,306 2.0 0 (6) (8) (3) 28 0 (3) (0) (2) 15 Dec-12 (5) 10 0 21.8 23.0 20.9 20.9 83 86 6.7 4.3 0.9 20.2 64 CCT CCT SP N SGD 1.51 1.59 5 3,456 10.6 0 (4) (11) (10) 25 0 (1) (3) (10) 12 Dec-12 (1) 0 18 22.2 22.3 22.2 18.8 92 93 5.5 4.4 0.9 22.8 42
CDL REIT CDREIT SP O SGD 1.84 2.31 26 1,423 3.8 0 (3) (5) (2) (1) 0 (0) 3 (2) (13) Dec-12 14 (2) 6 16.6 14.6 14.8 14.0 108 102 6.8 7.7 1.1 16.8 33 CMT CT SP O SGD 2.07 2.47 19 5,701 15.7 0 (4) (12) (3) 15 0 (1) (4) (2) 2 Dec-12 18 12 7 24.2 20.4 18.2 17.0 103 109 4.8 6.0 1.2 19.3 32 FCT FCT SP N SGD 1.98 2.19 11 1,300 1.9 0 (4) (13) (1) 21 0 (1) (5) (1) 8 Sep-12 (1) 4 4 19.3 19.4 18.6 17.8 91 97 5.3 6.5 1.3 22.5 43
K-REIT KREIT SP N SGD 1.38 1.32 (4) 2,937 7.4 0 (3) (12) 7 41 0 (0) (4) 7 28 Dec-12 17 8 4 31.7 27.1 25.2 24.1 86 90 5.6 3.7 1.0 39.2 62 MCT MCT SP N SGD 1.22 1.45 19 2,006 3.7 0 (10) (19) 0 29 0 (7) (11) 0 16 Mar-13 19 4 3 22.1 18.5 17.9 17.3 104 103 5.8 6.1 1.1 24.0 68 MINT MINT SP N SGD 1.36 1.70 25 1,790 4.8 0 (3) (14) 0 17 0 0 (6) 1 4 Mar-13 7 4 7 15.3 14.2 13.7 12.8 105 104 7.1 8.4 1.2 18.6 60
MLT MLT SP O SGD 1.14 1.41 24 2,208 3.8 0 (6) (15) (0) 19 0 (3) (7) 0 6 Mar-13 (3) (1) 2 13.8 14.2 14.4 14.1 107 103 6.2 8.7 1.2 17.0 49 SUNT SUN SP U SGD 1.66 1.65 (1) 2,989 12.2 0 (6) (13) (1) 28 0 (3) (5) (0) 15 Dec-12 (16) 8 10 15.1 17.9 16.5 15.0 141 132 5.7 4.4 0.8 38.1 56 Sector* 12 29,494 0 (4) (13) (2) 21 0 (2) (5) (2) 8 Dec-12 5 6 6 19.8 18.7 17.6 16.6 102 103 5.8 5.8 1.0 22.4 48
Retailing Anand Swaminathan - 65 6212 3012
OSIM OSIM SP O SGD 2.00 2.20 10 1,200 2.0 0 (3) 1 16 76 0 (0) 9 16 63 Dec-12 15 14 13 16.9 14.7 12.9 11.4 100 102 3.5 45.9 6.4 2.1 9.9 (32)
Technology Anand Swaminathan - 65 6212 3012
Amtek Eng AMTK SP N SGD 0.46 0.70 52 200 0.3 0 (3) (6) (7) (26) 0 (0) 2 (7) (39) Jun-12 13 28 22 5.9 5.2 4.1 3.3 138 143 9.6 23.5 1.1 0.3 2.6 (3) Venture VMS SP N SGD 7.40 8.25 11 1,621 3.0 0 1 2 (8) (5) 0 3 10 (8) (18) Dec-11 (2) 27 13 13.0 13.2 10.4 9.2 110 128 7.4 8.4 1.1 0.6 7.6 (26) Sector* 16 1,821 0 0 1 (8) (7) 0 3 9 (8) (20) Dec-12 25 15 na 11.5 9.1 7.9 na 131 134 7.9 12.5 1.1 0.5 5.1 (24)
Telecommunication Services
Chate Benchavitvilai - 852 2101 7040
M1 M1 SP O SGD 2.99 3.60 20 2,196 3.2 0 (3) (10) 10 21 0 0 (3) 11 8 Dec-12 4 9 9 18.5 17.7 16.2 14.8 94 96 4.9 42.8 7.4 2.7 9.7 69 SingTel ST SP O SGD 3.74 4.25 14 47,494 62.2 0 1 (5) 13 18 0 4 3 14 6 Mar-13 10 8 12 17.0 15.4 14.3 12.8 100 100 4.8 15.8 2.4 3.7 12.8 28 StarHub STH SP N SGD 4.09 4.40 8 5,607 7.5 0 (1) (12) 8 25 0 2 (4) 8 12 Dec-12 7 3 3 19.5 18.2 17.7 17.2 106 105 5.1 691.8 103.6 2.9 9.9 581
Sector* 13 55,298 0 0 (6) 13 19 0 3 2 13 6 Dec-12 4 8 10 16.8 16.1 14.9 13.5 100 100 4.8 17.5 2.8 3.6 12.3 30
Transportation Timothy Ross / Anand Swaminathan / Annuar Aziz / Leonard Huo - 65 6212 3337 / 65 6212 3012 / 60 3 2723 2084 / 65 6212 3062
ComfortDelGro CD SP N SGD 1.82 1.85 2 3,072 10.3 0 (3) (9) 2 24 0 (1) (1) 3 11 Dec-12 2 5 3 15.3 15.1 14.3 13.9 99 98 3.3 12.2 1.8 1.1 5.1 (1) HPHT HPHT SP U USD 0.78 0.72 (8) 6,753 18.7 0 (3) (8) (2) 14 0 0 0 (2) 1 Dec-12 (3) 12 12 22.9 23.6 21.2 19.0 99 104 6.8 3.3 0.8 6.0 10.9 29 NOL NOL SP U SGD 1.07 0.95 (11) 2,209 6.6 0 (2) (2) (7) (2) 0 0 6 (6) (15) Dec-12 nm 261 27 nm 28.5 7.9 6.2 136 123 1.2 3.3 0.9 0.4 7.4 80
SATS SATS SP O SGD 3.24 3.70 14 2,882 3.1 0 (2) 4 12 25 0 0 12 12 12 Mar-13 14 9 11 17.9 15.7 14.5 13.0 108 109 5.2 16.2 2.5 1.6 9.9 (20) SIA SIA SP N SGD 10.27 12.60 23 9,815 7.6 0 (3) (10) (4) 1 0 (0) (2) (4) (12) Mar-13 107 21 12 30.8 14.9 12.3 11.1 116 120 4.0 6.2 0.9 0.8 4.6 (28) SMRT MRT SP U SGD 1.43 1.15 (20) 1,726 1.8 0 1 (1) (15) (13) 0 3 7 (15) (26) Mar-13 (13) 36 13 21.5 24.9 18.3 16.2 85 101 2.0 10.9 2.6 2.4 10.2 79
Tiger Airways TGR SP U SGD 0.63 0.62 (2) 491 1.4 0 (2) (6) (8) 3 0 1 2 (8) (10) Mar-12 nm nm 134 nm nm 14.1 6.0 91 66 0.0 (17.0) 2.6 1.1 24.5 174 Sector* 6 26,948 0 (3) (7) (2) 8 0 0 1 (2) (4) Dec-12 116 37 16 41.0 19.1 14.0 12.1 106 113 4.2 5.6 1.1 1.1 7.1 9
Utilities Gerald Wong - 65 6212 3037
Hyflux HYF SP N SGD 1.35 1.50 11 925 1.4 0 (0) (5) 5 8 0 2 3 5 (5) Dec-12 (17) 31 22 30.4 36.8 28.2 23.1 65 68 2.1 6.4 2.3 3.4 17.3 103
Country Average* FSSTI 3,156 3,623 15 352,140 (0) (3) (8) (0) 13 Dec-12 4 12 11 15.1 14.4 12.9 11.7 102 104 3.8 9.8 1.3 1.0 11.4 33
* Country/ sector aggregates are for the coverage above
Source: Company data, Thomson Financial IBES, Credit Suisse estimates
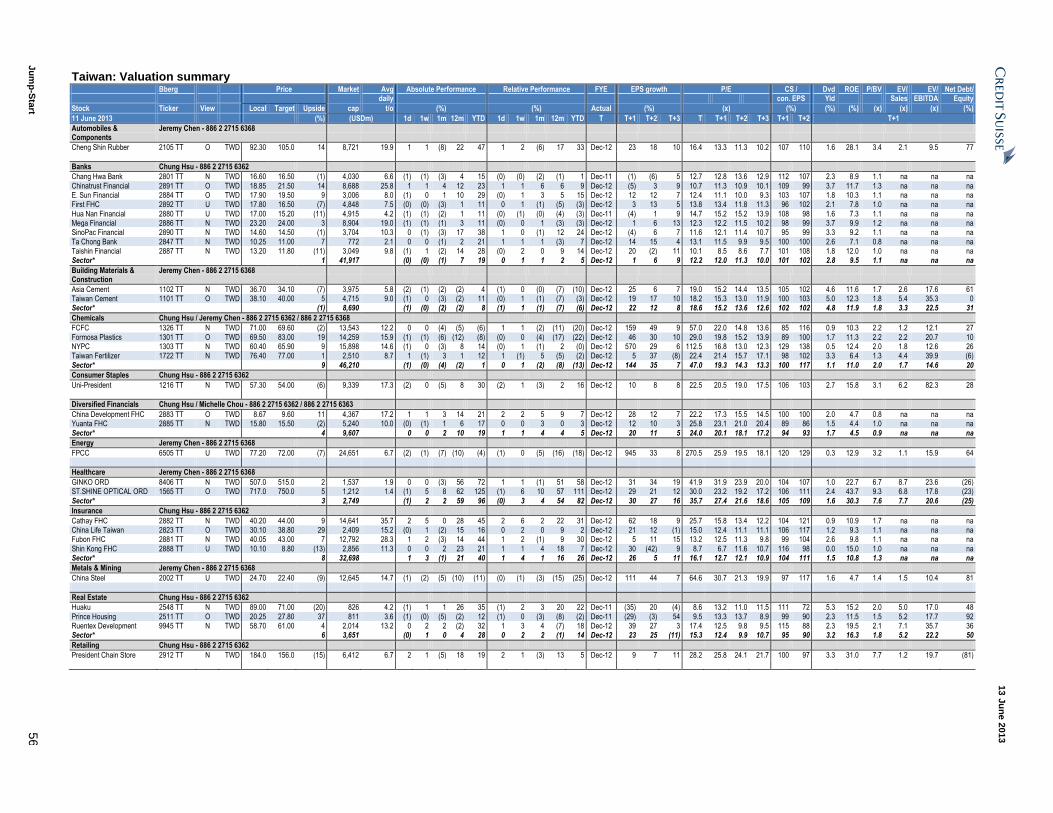
13 J
un
e 2
013
Ju
mp
-Sta
rt 5
6
Taiwan: Valuation summary Bberg Price Market Avg Absolute Performance Relative Performance FYE EPS growth P/E CS / Dvd ROE P/BV EV/ EV/ Net Debt/ daily con. EPS Yld Sales EBITDA Equity
Stock Ticker View Local Target Upside cap t/o (%) (%) Actual (%) (x) (%) (%) (%) (x) (x) (x) (%)
11 June 2013 (%) (USDm) 1d 1w 1m 12m YTD 1d 1w 1m 12m YTD T T+1 T+2 T+3 T T+1 T+2 T+3 T+1 T+2 T+1
Automobiles & Components
Jeremy Chen - 886 2 2715 6368
Cheng Shin Rubber 2105 TT O TWD 92.30 105.0 14 8,721 19.9 1 1 (8) 22 47 1 2 (6) 17 33 Dec-12 23 18 10 16.4 13.3 11.3 10.2 107 110 1.6 28.1 3.4 2.1 9.5 77
Banks Chung Hsu - 886 2 2715 6362
Chang Hwa Bank 2801 TT N TWD 16.60 16.50 (1) 4,030 6.6 (1) (1) (3) 4 15 (0) (0) (2) (1) 1 Dec-11 (1) (6) 5 12.7 12.8 13.6 12.9 112 107 2.3 8.9 1.1 na na na
Chinatrust Financial 2891 TT O TWD 18.85 21.50 14 8,688 25.8 1 1 4 12 23 1 1 6 6 9 Dec-12 (5) 3 9 10.7 11.3 10.9 10.1 109 99 3.7 11.7 1.3 na na na E. Sun Financial 2884 TT O TWD 17.90 19.50 9 3,006 8.0 (1) 0 1 10 29 (0) 1 3 5 15 Dec-12 12 12 7 12.4 11.1 10.0 9.3 103 107 1.8 10.3 1.1 na na na First FHC 2892 TT U TWD 17.80 16.50 (7) 4,848 7.5 (0) (0) (3) 1 11 0 1 (1) (5) (3) Dec-12 3 13 5 13.8 13.4 11.8 11.3 96 102 2.1 7.8 1.0 na na na
Hua Nan Financial 2880 TT U TWD 17.00 15.20 (11) 4,915 4.2 (1) (1) (2) 1 11 (0) (1) (0) (4) (3) Dec-11 (4) 1 9 14.7 15.2 15.2 13.9 108 98 1.6 7.3 1.1 na na na Mega Financial 2886 TT N TWD 23.20 24.00 3 8,904 19.0 (1) (1) (1) 3 11 (0) 0 1 (3) (3) Dec-12 1 6 13 12.3 12.2 11.5 10.2 98 99 3.7 9.9 1.2 na na na SinoPac Financial 2890 TT N TWD 14.60 14.50 (1) 3,704 10.3 0 (1) (3) 17 38 1 0 (1) 12 24 Dec-12 (4) 6 7 11.6 12.1 11.4 10.7 95 99 3.3 9.2 1.1 na na na
Ta Chong Bank 2847 TT N TWD 10.25 11.00 7 772 2.1 0 0 (1) 2 21 1 1 1 (3) 7 Dec-12 14 15 4 13.1 11.5 9.9 9.5 100 100 2.6 7.1 0.8 na na na Taishin Financial 2887 TT N TWD 13.20 11.80 (11) 3,049 9.8 (1) 1 (2) 14 28 (0) 2 0 9 14 Dec-12 20 (2) 11 10.1 8.5 8.6 7.7 101 108 1.8 12.0 1.0 na na na Sector* 1 41,917 (0) (0) (1) 7 19 0 1 1 2 5 Dec-12 1 6 9 12.2 12.0 11.3 10.0 101 102 2.8 9.5 1.1 na na na
Building Materials & Construction
Jeremy Chen - 886 2 2715 6368
Asia Cement 1102 TT N TWD 36.70 34.10 (7) 3,975 5.8 (2) (1) (2) (2) 4 (1) 0 (0) (7) (10) Dec-12 25 6 7 19.0 15.2 14.4 13.5 105 102 4.6 11.6 1.7 2.6 17.6 61 Taiwan Cement 1101 TT O TWD 38.10 40.00 5 4,715 9.0 (1) 0 (3) (2) 11 (0) 1 (1) (7) (3) Dec-12 19 17 10 18.2 15.3 13.0 11.9 100 103 5.0 12.3 1.8 5.4 35.3 0 Sector* (1) 8,690 (1) (0) (2) (2) 8 (1) 1 (1) (7) (6) Dec-12 22 12 8 18.6 15.2 13.6 12.6 102 102 4.8 11.9 1.8 3.3 22.5 31
Chemicals Chung Hsu / Jeremy Chen - 886 2 2715 6362 / 886 2 2715 6368
FCFC 1326 TT N TWD 71.00 69.60 (2) 13,543 12.2 0 0 (4) (5) (6) 1 1 (2) (11) (20) Dec-12 159 49 9 57.0 22.0 14.8 13.6 85 116 0.9 10.3 2.2 1.2 12.1 27
Formosa Plastics 1301 TT O TWD 69.50 83.00 19 14,259 15.9 (1) (1) (6) (12) (8) (0) 0 (4) (17) (22) Dec-12 46 30 10 29.0 19.8 15.2 13.9 89 100 1.7 11.3 2.2 2.2 20.7 10 NYPC 1303 TT N TWD 60.40 65.90 9 15,898 14.6 (1) 0 (3) 8 14 (0) 1 (1) 2 (0) Dec-12 570 29 6 112.5 16.8 13.0 12.3 129 138 0.5 12.4 2.0 1.8 12.6 26 Taiwan Fertilizer 1722 TT N TWD 76.40 77.00 1 2,510 8.7 1 (1) 3 1 12 1 (1) 5 (5) (2) Dec-12 5 37 (8) 22.4 21.4 15.7 17.1 98 102 3.3 6.4 1.3 4.4 39.9 (6)
Sector* 9 46,210 (1) (0) (4) (2) 1 0 1 (2) (8) (13) Dec-12 144 35 7 47.0 19.3 14.3 13.3 100 117 1.1 11.0 2.0 1.7 14.6 20
Consumer Staples Chung Hsu - 886 2 2715 6362
Uni-President 1216 TT N TWD 57.30 54.00 (6) 9,339 17.3 (2) 0 (5) 8 30 (2) 1 (3) 2 16 Dec-12 10 8 8 22.5 20.5 19.0 17.5 106 103 2.7 15.8 3.1 6.2 82.3 28
Diversified Financials Chung Hsu / Michelle Chou - 886 2 2715 6362 / 886 2 2715 6363
China Development FHC 2883 TT O TWD 8.67 9.60 11 4,367 17.2 1 1 3 14 21 2 2 5 9 7 Dec-12 28 12 7 22.2 17.3 15.5 14.5 100 100 2.0 4.7 0.8 na na na Yuanta FHC 2885 TT N TWD 15.80 15.50 (2) 5,240 10.0 (0) (1) 1 6 17 0 0 3 0 3 Dec-12 12 10 3 25.8 23.1 21.0 20.4 89 86 1.5 4.4 1.0 na na na
Sector* 4 9,607 0 0 2 10 19 1 1 4 4 5 Dec-12 20 11 5 24.0 20.1 18.1 17.2 94 93 1.7 4.5 0.9 na na na
Energy Jeremy Chen - 886 2 2715 6368
FPCC 6505 TT U TWD 77.20 72.00 (7) 24,651 6.7 (2) (1) (7) (10) (4) (1) 0 (5) (16) (18) Dec-12 945 33 8 270.5 25.9 19.5 18.1 120 129 0.3 12.9 3.2 1.1 15.9 64
Healthcare Jeremy Chen - 886 2 2715 6368
GINKO ORD 8406 TT N TWD 507.0 515.0 2 1,537 1.9 0 0 (3) 56 72 1 1 (1) 51 58 Dec-12 31 34 19 41.9 31.9 23.9 20.0 104 107 1.0 22.7 6.7 8.7 23.6 (26) ST.SHINE OPTICAL ORD 1565 TT O TWD 717.0 750.0 5 1,212 1.4 (1) 5 8 62 125 (1) 6 10 57 111 Dec-12 29 21 12 30.0 23.2 19.2 17.2 106 111 2.4 43.7 9.3 6.8 17.8 (23)
Sector* 3 2,749 (1) 2 2 59 96 (0) 3 4 54 82 Dec-12 30 27 16 35.7 27.4 21.6 18.6 105 109 1.6 30.3 7.6 7.7 20.6 (25)
Insurance Chung Hsu - 886 2 2715 6362
Cathay FHC 2882 TT N TWD 40.20 44.00 9 14,641 35.7 2 5 0 28 45 2 6 2 22 31 Dec-12 62 18 9 25.7 15.8 13.4 12.2 104 121 0.9 10.9 1.7 na na na China Life Taiwan 2823 TT O TWD 30.10 38.80 29 2,409 15.2 (0) 1 (2) 15 16 0 2 0 9 2 Dec-12 21 12 (1) 15.0 12.4 11.1 11.1 106 117 1.2 9.3 1.1 na na na Fubon FHC 2881 TT N TWD 40.05 43.00 7 12,792 28.3 1 2 (3) 14 44 1 2 (1) 9 30 Dec-12 5 11 15 13.2 12.5 11.3 9.8 99 104 2.6 9.8 1.1 na na na
Shin Kong FHC 2888 TT U TWD 10.10 8.80 (13) 2,856 11.3 0 0 2 23 21 1 1 4 18 7 Dec-12 30 (42) 9 8.7 6.7 11.6 10.7 116 98 0.0 15.0 1.0 na na na Sector* 8 32,698 1 3 (1) 21 40 1 4 1 16 26 Dec-12 26 5 11 16.1 12.7 12.1 10.9 104 111 1.5 10.8 1.3 na na na
Metals & Mining Jeremy Chen - 886 2 2715 6368
China Steel 2002 TT U TWD 24.70 22.40 (9) 12,645 14.7 (1) (2) (5) (10) (11) (0) (1) (3) (15) (25) Dec-12 111 44 7 64.6 30.7 21.3 19.9 97 117 1.6 4.7 1.4 1.5 10.4 81
Real Estate Chung Hsu - 886 2 2715 6362
Huaku 2548 TT N TWD 89.00 71.00 (20) 826 4.2 (1) 1 1 26 35 (1) 2 3 20 22 Dec-11 (35) 20 (4) 8.6 13.2 11.0 11.5 111 72 5.3 15.2 2.0 5.0 17.0 48
Prince Housing 2511 TT O TWD 20.25 27.80 37 811 3.6 (1) (0) (5) (2) 12 (1) 0 (3) (8) (2) Dec-11 (29) (3) 54 9.5 13.3 13.7 8.9 99 90 2.3 11.5 1.5 5.2 17.7 92 Ruentex Development 9945 TT N TWD 58.70 61.00 4 2,014 13.2 0 2 2 (2) 32 1 3 4 (7) 18 Dec-12 39 27 3 17.4 12.5 9.8 9.5 115 88 2.3 19.5 2.1 7.1 35.7 36 Sector* 6 3,651 (0) 1 0 4 28 0 2 2 (1) 14 Dec-12 23 25 (11) 15.3 12.4 9.9 10.7 95 90 3.2 16.3 1.8 5.2 22.2 50
Retailing Chung Hsu - 886 2 2715 6362
President Chain Store 2912 TT N TWD 184.0 156.0 (15) 6,412 6.7 2 1 (5) 18 19 2 1 (3) 13 5 Dec-12 9 7 11 28.2 25.8 24.1 21.7 100 97 3.3 31.0 7.7 1.2 19.7 (81)
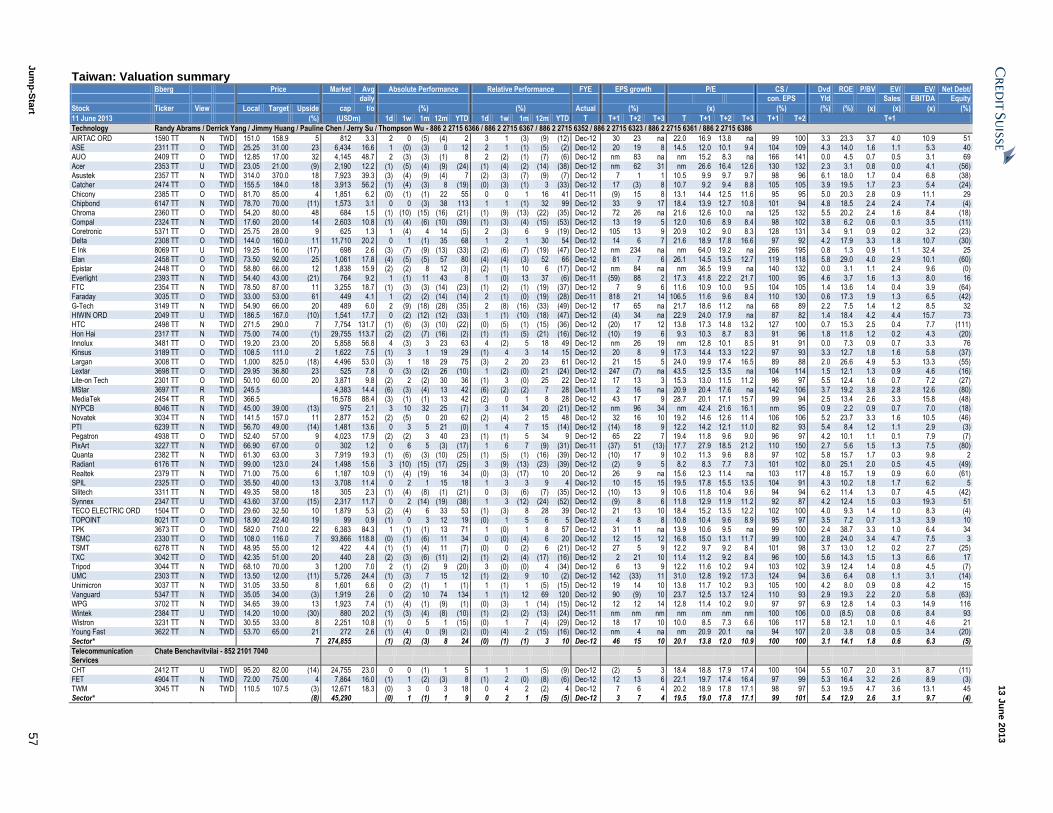
13 J
un
e 2
013
Ju
mp
-Sta
rt 5
7
Taiwan: Valuation summary Bberg Price Market Avg Absolute Performance Relative Performance FYE EPS growth P/E CS / Dvd ROE P/BV EV/ EV/ Net Debt/ daily con. EPS Yld Sales EBITDA Equity
Stock Ticker View Local Target Upside cap t/o (%) (%) Actual (%) (x) (%) (%) (%) (x) (x) (x) (%)
11 June 2013 (%) (USDm) 1d 1w 1m 12m YTD 1d 1w 1m 12m YTD T T+1 T+2 T+3 T T+1 T+2 T+3 T+1 T+2 T+1
Technology Randy Abrams / Derrick Yang / Jimmy Huang / Pauline Chen / Jerry Su / Thompson Wu - 886 2 2715 6366 / 886 2 2715 6367 / 886 2 2715 6352 / 886 2 2715 6323 / 886 2 2715 6361 / 886 2 2715 6386
AIRTAC ORD 1590 TT N TWD 151.0 158.9 5 812 3.3 2 0 (5) (4) 2 3 1 (3) (9) (12) Dec-12 30 23 na 22.0 16.9 13.8 na 99 100 3.3 23.3 3.7 4.0 10.9 51 ASE 2311 TT O TWD 25.25 31.00 23 6,434 16.6 1 (0) (3) 0 12 2 1 (1) (5) (2) Dec-12 20 19 8 14.5 12.0 10.1 9.4 104 109 4.3 14.0 1.6 1.1 5.3 40 AUO 2409 TT O TWD 12.85 17.00 32 4,145 48.7 2 (3) (3) (1) 8 2 (2) (1) (7) (6) Dec-12 nm 83 na nm 15.2 8.3 na 166 141 0.0 4.5 0.7 0.5 3.1 69
Acer 2353 TT U TWD 23.05 21.00 (9) 2,190 12.2 (1) (5) (4) (9) (24) (1) (4) (2) (14) (38) Dec-12 nm 62 31 nm 26.6 16.4 12.6 130 132 2.3 3.1 0.8 0.0 4.1 (56) Asustek 2357 TT N TWD 314.0 370.0 18 7,923 39.3 (3) (4) (9) (4) 7 (2) (3) (7) (9) (7) Dec-12 7 1 1 10.5 9.9 9.7 9.7 98 96 6.1 18.0 1.7 0.4 6.8 (38) Catcher 2474 TT O TWD 155.5 184.0 18 3,913 56.2 (1) (4) (3) 8 (19) (0) (3) (1) 3 (33) Dec-12 17 (3) 8 10.7 9.2 9.4 8.8 105 105 3.9 19.5 1.7 2.3 5.4 (24)
Chicony 2385 TT O TWD 81.70 85.00 4 1,851 6.2 (0) (1) (1) 22 55 0 0 1 16 41 Dec-11 (9) 15 8 13.1 14.4 12.5 11.6 95 95 5.0 20.3 2.8 0.9 11.1 29 Chipbond 6147 TT N TWD 78.70 70.00 (11) 1,573 3.1 0 0 (3) 38 113 1 1 (1) 32 99 Dec-12 33 9 17 18.4 13.9 12.7 10.8 101 94 4.8 18.5 2.4 2.4 7.4 (4) Chroma 2360 TT O TWD 54.20 80.00 48 684 1.5 (1) (10) (15) (16) (21) (1) (9) (13) (22) (35) Dec-12 72 26 na 21.6 12.6 10.0 na 125 132 5.5 20.2 2.4 1.6 8.4 (18)
Compal 2324 TT N TWD 17.60 20.00 14 2,603 10.8 (1) (4) (6) (10) (39) (1) (3) (4) (15) (53) Dec-12 13 19 5 12.0 10.6 8.9 8.4 98 102 3.8 6.2 0.6 0.1 3.5 (11) Coretronic 5371 TT O TWD 25.75 28.00 9 625 1.3 1 (4) 4 14 (5) 2 (3) 6 9 (19) Dec-12 105 13 9 20.9 10.2 9.0 8.3 128 131 3.4 9.1 0.9 0.2 3.2 (23) Delta 2308 TT O TWD 144.0 160.0 11 11,710 20.2 0 1 (1) 35 68 1 2 1 30 54 Dec-12 14 6 7 21.6 18.9 17.8 16.6 97 92 4.2 17.9 3.3 1.8 10.7 (30)
E Ink 8069 TT U TWD 19.25 16.00 (17) 698 2.6 (3) (7) (9) (13) (33) (2) (6) (7) (19) (47) Dec-12 nm 234 na nm 64.0 19.2 na 266 195 0.8 1.3 0.9 1.1 32.4 25 Elan 2458 TT O TWD 73.50 92.00 25 1,061 17.8 (4) (5) (5) 57 80 (4) (4) (3) 52 66 Dec-12 81 7 6 26.1 14.5 13.5 12.7 119 118 5.8 29.0 4.0 2.9 10.1 (60) Epistar 2448 TT O TWD 58.80 66.00 12 1,838 15.9 (2) (2) 8 12 (3) (2) (1) 10 6 (17) Dec-12 nm 84 na nm 36.5 19.9 na 140 132 0.0 3.1 1.1 2.4 9.6 (0)
Everlight 2393 TT N TWD 54.40 43.00 (21) 764 9.2 1 (1) 11 43 8 1 (0) 13 37 (6) Dec-11 (59) 88 2 17.3 41.8 22.2 21.7 100 95 4.6 3.7 1.6 1.3 8.0 16 FTC 2354 TT N TWD 78.50 87.00 11 3,255 18.7 (1) (3) (3) (14) (23) (1) (2) (1) (19) (37) Dec-12 7 9 6 11.6 10.9 10.0 9.5 104 105 1.4 13.6 1.4 0.4 3.9 (64) Faraday 3035 TT O TWD 33.00 53.00 61 449 4.1 1 (2) (2) (14) (14) 2 (1) (0) (19) (28) Dec-11 818 21 14 106.5 11.6 9.6 8.4 110 130 0.6 17.3 1.9 1.3 6.5 (42)
G-Tech 3149 TT N TWD 54.90 66.00 20 489 6.0 2 (9) (18) (28) (35) 2 (8) (16) (33) (49) Dec-12 17 65 na 21.7 18.6 11.2 na 68 89 2.2 7.5 1.4 1.2 8.5 32 HIWIN ORD 2049 TT U TWD 186.5 167.0 (10) 1,541 17.7 0 (2) (12) (12) (33) 1 (1) (10) (18) (47) Dec-12 (4) 34 na 22.9 24.0 17.9 na 87 82 1.4 18.4 4.2 4.4 15.7 73 HTC 2498 TT N TWD 271.5 290.0 7 7,754 131.7 (1) (6) (3) (10) (22) (0) (5) (1) (15) (36) Dec-12 (20) 17 12 13.8 17.3 14.8 13.2 127 100 0.7 15.3 2.5 0.4 7.7 (111)
Hon Hai 2317 TT N TWD 75.00 74.00 (1) 29,755 113.7 (2) (2) (7) (16) (2) (1) (1) (5) (21) (16) Dec-12 (10) 19 6 9.3 10.3 8.7 8.3 91 96 1.8 11.8 1.2 0.2 4.3 (20) Innolux 3481 TT O TWD 19.20 23.00 20 5,858 56.8 4 (3) 3 23 63 4 (2) 5 18 49 Dec-12 nm 26 19 nm 12.8 10.1 8.5 91 91 0.0 7.3 0.9 0.7 3.3 76 Kinsus 3189 TT O TWD 108.5 111.0 2 1,622 7.5 (1) 3 1 19 29 (1) 4 3 14 15 Dec-12 20 8 9 17.3 14.4 13.3 12.2 97 93 3.3 12.7 1.8 1.6 5.8 (37)
Largan 3008 TT O TWD 1,000 825.0 (18) 4,496 53.0 (3) 1 18 29 75 (3) 2 20 23 61 Dec-12 21 15 5 24.0 19.9 17.4 16.5 89 88 2.0 26.6 4.9 5.3 13.3 (55) Lextar 3698 TT O TWD 29.95 36.80 23 525 7.8 0 (3) (2) 26 (10) 1 (2) (0) 21 (24) Dec-12 247 (7) na 43.5 12.5 13.5 na 104 114 1.5 12.1 1.3 0.9 4.6 (16) Lite-on Tech 2301 TT O TWD 50.10 60.00 20 3,871 9.8 (2) 2 (2) 30 36 (1) 3 (0) 25 22 Dec-12 17 13 3 15.3 13.0 11.5 11.2 96 97 5.5 12.4 1.6 0.7 7.2 (27)
MStar 3697 TT R TWD 245.5 4,383 14.4 (6) (3) (4) 13 42 (6) (2) (2) 7 28 Dec-11 2 16 na 20.9 20.4 17.6 na 142 106 3.7 19.2 3.8 2.8 12.6 (80) MediaTek 2454 TT R TWD 366.5 16,578 88.4 (3) (1) (1) 13 42 (2) 0 1 8 28 Dec-12 43 17 9 28.7 20.1 17.1 15.7 99 94 2.5 13.4 2.6 3.3 15.8 (48) NYPCB 8046 TT N TWD 45.00 39.00 (13) 975 2.1 3 10 32 25 (7) 3 11 34 20 (21) Dec-12 nm 96 34 nm 42.4 21.6 16.1 nm 95 0.9 2.2 0.9 0.7 7.0 (18)
Novatek 3034 TT N TWD 141.5 157.0 11 2,877 15.2 (2) (5) 0 20 62 (2) (4) 2 15 48 Dec-12 32 16 10 19.2 14.6 12.6 11.4 106 106 5.2 23.7 3.3 1.6 10.5 (46) PTI 6239 TT N TWD 56.70 49.00 (14) 1,481 13.6 0 3 5 21 (0) 1 4 7 15 (14) Dec-12 (14) 18 9 12.2 14.2 12.1 11.0 82 93 5.4 8.4 1.2 1.1 2.9 (3) Pegatron 4938 TT O TWD 52.40 57.00 9 4,023 17.9 (2) (2) 3 40 23 (1) (1) 5 34 9 Dec-12 65 22 7 19.4 11.8 9.6 9.0 96 97 4.2 10.1 1.1 0.1 7.9 (7)
PixArt 3227 TT N TWD 66.90 67.00 0 302 1.2 0 6 5 (3) (17) 1 6 7 (9) (31) Dec-11 (37) 51 (13) 17.7 27.9 18.5 21.2 110 150 2.7 5.6 1.5 1.3 7.5 (80) Quanta 2382 TT N TWD 61.30 63.00 3 7,919 19.3 (1) (6) (3) (10) (25) (1) (5) (1) (16) (39) Dec-12 (10) 17 9 10.2 11.3 9.6 8.8 97 102 5.8 15.7 1.7 0.3 9.8 2 Radiant 6176 TT N TWD 99.00 123.0 24 1,498 15.6 3 (10) (15) (17) (25) 3 (9) (13) (23) (39) Dec-12 (2) 9 5 8.2 8.3 7.7 7.3 101 102 8.0 25.1 2.0 0.5 4.5 (49)
Realtek 2379 TT N TWD 71.00 75.00 6 1,187 10.9 (1) (4) (19) 16 34 (0) (3) (17) 10 20 Dec-12 26 9 na 15.6 12.3 11.4 na 103 117 4.8 15.7 1.9 0.9 6.0 (61) SPIL 2325 TT O TWD 35.50 40.00 13 3,708 11.4 0 2 1 15 18 1 3 3 9 4 Dec-12 10 15 15 19.5 17.8 15.5 13.5 104 91 4.3 10.2 1.8 1.7 6.2 5 Silitech 3311 TT N TWD 49.35 58.00 18 305 2.3 (1) (4) (8) (1) (21) 0 (3) (6) (7) (35) Dec-12 (10) 13 9 10.6 11.8 10.4 9.6 94 94 6.2 11.4 1.3 0.7 4.5 (42)
Synnex 2347 TT U TWD 43.60 37.00 (15) 2,317 11.7 0 2 (14) (19) (38) 1 3 (12) (24) (52) Dec-12 (9) 8 6 11.8 12.9 11.9 11.2 92 87 4.2 12.4 1.5 0.3 19.3 51 TECO ELECTRIC ORD 1504 TT O TWD 29.60 32.50 10 1,879 5.3 (2) (4) 6 33 53 (1) (3) 8 28 39 Dec-12 21 13 10 18.4 15.2 13.5 12.2 102 100 4.0 9.3 1.4 1.0 8.3 (4) TOPOINT 8021 TT O TWD 18.90 22.40 19 99 0.9 (1) 0 3 12 19 (0) 1 5 6 5 Dec-12 4 8 8 10.8 10.4 9.6 8.9 95 97 3.5 7.2 0.7 1.3 3.9 10
TPK 3673 TT O TWD 582.0 710.0 22 6,383 84.3 1 (1) (1) 13 71 1 (0) 1 8 57 Dec-12 31 11 na 13.9 10.6 9.5 na 99 100 2.4 38.7 3.3 1.0 6.4 34 TSMC 2330 TT O TWD 108.0 116.0 7 93,866 118.8 (0) (1) (6) 11 34 0 (0) (4) 6 20 Dec-12 12 15 12 16.8 15.0 13.1 11.7 99 100 2.8 24.0 3.4 4.7 7.5 3 TSMT 6278 TT N TWD 48.95 55.00 12 422 4.4 (1) (1) (4) 11 (7) (0) 0 (2) 6 (21) Dec-12 27 5 9 12.2 9.7 9.2 8.4 101 98 3.7 13.0 1.2 0.2 2.7 (25)
TXC 3042 TT O TWD 42.35 51.00 20 440 2.8 (2) (3) (6) (11) (2) (1) (2) (4) (17) (16) Dec-12 2 21 10 11.4 11.2 9.2 8.4 96 100 5.6 14.3 1.5 1.3 6.6 17 Tripod 3044 TT N TWD 68.10 70.00 3 1,200 7.0 2 (1) (2) 9 (20) 3 (0) (0) 4 (34) Dec-12 6 13 9 12.2 11.6 10.2 9.4 103 102 3.9 12.4 1.4 0.8 4.5 (7) UMC 2303 TT N TWD 13.50 12.00 (11) 5,726 24.4 (1) (3) 7 15 12 (1) (2) 9 10 (2) Dec-12 142 (33) 11 31.0 12.8 19.2 17.3 124 94 3.6 6.4 0.8 1.1 3.1 (14)
Unimicron 3037 TT N TWD 31.05 33.50 8 1,601 6.6 0 (2) (1) 1 (1) 1 (1) 1 (5) (15) Dec-12 19 14 10 13.8 11.7 10.2 9.3 105 100 4.2 8.0 0.9 0.8 4.2 15 Vanguard 5347 TT N TWD 35.05 34.00 (3) 1,919 2.6 0 (2) 10 74 134 1 (1) 12 69 120 Dec-12 90 (9) 10 23.7 12.5 13.7 12.4 110 93 2.9 19.3 2.2 2.0 5.8 (63) WPG 3702 TT N TWD 34.65 39.00 13 1,923 7.4 (1) (4) (1) (9) (1) (0) (3) 1 (14) (15) Dec-12 12 12 14 12.8 11.4 10.2 9.0 97 97 6.9 12.8 1.4 0.3 14.9 116
Wintek 2384 TT U TWD 14.20 10.00 (30) 880 20.2 (1) (3) (4) (8) (10) (1) (2) (2) (13) (24) Dec-11 nm nm nm nm nm nm nm 100 106 0.0 (8.5) 0.8 0.6 8.4 93 Wistron 3231 TT N TWD 30.55 33.00 8 2,251 10.8 (1) 0 5 1 (15) (0) 1 7 (4) (29) Dec-12 18 17 10 10.0 8.5 7.3 6.6 106 117 5.8 12.1 1.0 0.1 4.6 21 Young Fast 3622 TT N TWD 53.70 65.00 21 272 2.6 (1) (4) 0 (9) (2) (0) (4) 2 (15) (16) Dec-12 nm 4 na nm 20.9 20.1 na 94 107 2.0 3.8 0.8 0.5 3.4 (20)
Sector* 7 274,855 (1) (2) (3) 8 24 (0) (1) (1) 3 10 Dec-12 46 15 10 20.1 13.8 12.0 10.9 100 100 3.1 14.1 1.8 0.6 6.3 (5)
Telecommunication Services
Chate Benchavitvilai - 852 2101 7040
CHT 2412 TT U TWD 95.20 82.00 (14) 24,755 23.0 0 0 (1) 1 5 1 1 1 (5) (9) Dec-12 (2) 5 3 18.4 18.8 17.9 17.4 100 104 5.5 10.7 2.0 3.1 8.7 (11) FET 4904 TT N TWD 72.00 75.00 4 7,864 16.0 (1) 1 (2) (3) 8 (1) 2 (0) (8) (6) Dec-12 12 13 6 22.1 19.7 17.4 16.4 97 99 5.3 16.4 3.2 2.6 8.9 (3)
TWM 3045 TT N TWD 110.5 107.5 (3) 12,671 18.3 (0) 3 0 3 18 0 4 2 (2) 4 Dec-12 7 6 4 20.2 18.9 17.8 17.1 98 97 5.3 19.5 4.7 3.6 13.1 45 Sector* (8) 45,290 (0) 1 (1) 1 9 0 2 1 (5) (5) Dec-12 3 7 4 19.5 19.0 17.8 17.1 99 101 5.4 12.9 2.6 3.1 9.7 (4)
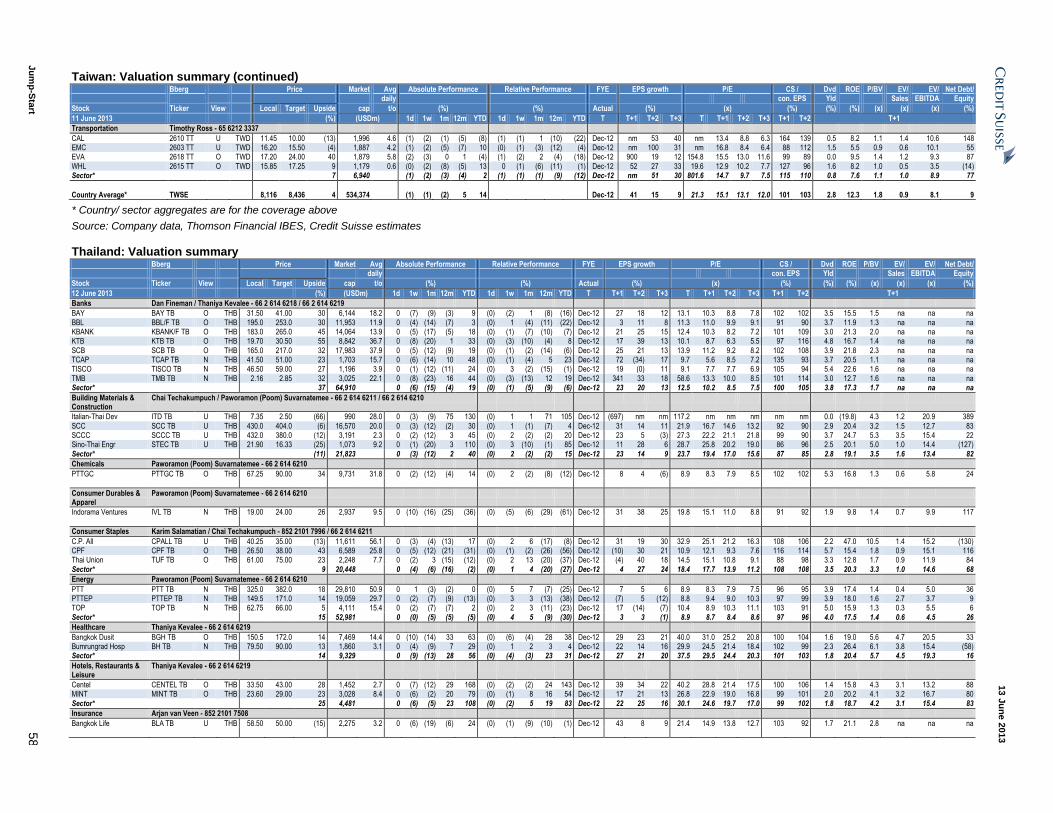
13 J
un
e 2
013
Ju
mp
-Sta
rt 5
8
Taiwan: Valuation summary (continued) Bberg Price Market Avg Absolute Performance Relative Performance FYE EPS growth P/E CS / Dvd ROE P/BV EV/ EV/ Net Debt/ daily con. EPS Yld Sales EBITDA Equity
Stock Ticker View Local Target Upside cap t/o (%) (%) Actual (%) (x) (%) (%) (%) (x) (x) (x) (%)
11 June 2013 (%) (USDm) 1d 1w 1m 12m YTD 1d 1w 1m 12m YTD T T+1 T+2 T+3 T T+1 T+2 T+3 T+1 T+2 T+1
Transportation Timothy Ross - 65 6212 3337
CAL 2610 TT U TWD 11.45 10.00 (13) 1,996 4.6 (1) (2) (1) (5) (8) (1) (1) 1 (10) (22) Dec-12 nm 53 40 nm 13.4 8.8 6.3 164 139 0.5 8.2 1.1 1.4 10.6 148 EMC 2603 TT U TWD 16.20 15.50 (4) 1,887 4.2 (1) (2) (5) (7) 10 (0) (1) (3) (12) (4) Dec-12 nm 100 31 nm 16.8 8.4 6.4 88 112 1.5 5.5 0.9 0.6 10.1 55 EVA 2618 TT O TWD 17.20 24.00 40 1,879 5.8 (2) (3) 0 1 (4) (1) (2) 2 (4) (18) Dec-12 900 19 12 154.8 15.5 13.0 11.6 99 89 0.0 9.5 1.4 1.2 9.3 87
WHL 2615 TT O TWD 15.85 17.25 9 1,179 0.6 (0) (2) (8) (5) 13 0 (1) (6) (11) (1) Dec-12 52 27 33 19.6 12.9 10.2 7.7 127 96 1.6 8.2 1.0 0.5 3.5 (14) Sector* 7 6,940 (1) (2) (3) (4) 2 (1) (1) (1) (9) (12) Dec-12 nm 51 30 801.6 14.7 9.7 7.5 115 110 0.8 7.6 1.1 1.0 8.9 77
Country Average* TWSE 8,116 8,436 4 534,374 (1) (1) (2) 5 14 Dec-12 41 15 9 21.3 15.1 13.1 12.0 101 103 2.8 12.3 1.8 0.9 8.1 9
* Country/ sector aggregates are for the coverage above
Source: Company data, Thomson Financial IBES, Credit Suisse estimates
Thailand: Valuation summary Bberg Price Market Avg Absolute Performance Relative Performance FYE EPS growth P/E CS / Dvd ROE P/BV EV/ EV/ Net Debt/ daily con. EPS Yld Sales EBITDA Equity
Stock Ticker View Local Target Upside cap t/o (%) (%) Actual (%) (x) (%) (%) (%) (x) (x) (x) (%)
12 June 2013 (%) (USDm) 1d 1w 1m 12m YTD 1d 1w 1m 12m YTD T T+1 T+2 T+3 T T+1 T+2 T+3 T+1 T+2 T+1
Banks Dan Fineman / Thaniya Kevalee - 66 2 614 6218 / 66 2 614 6219
BAY BAY TB O THB 31.50 41.00 30 6,144 18.2 0 (7) (9) (3) 9 (0) (2) 1 (8) (16) Dec-12 27 18 12 13.1 10.3 8.8 7.8 102 102 3.5 15.5 1.5 na na na
BBL BBL/F TB O THB 195.0 253.0 30 11,953 11.9 0 (4) (14) (7) 3 (0) 1 (4) (11) (22) Dec-12 3 11 8 11.3 11.0 9.9 9.1 91 90 3.7 11.9 1.3 na na na KBANK KBANK/F TB O THB 183.0 265.0 45 14,064 13.9 0 (5) (17) (5) 18 (0) (1) (7) (10) (7) Dec-12 21 25 15 12.4 10.3 8.2 7.2 101 109 3.0 21.3 2.0 na na na KTB KTB TB O THB 19.70 30.50 55 8,842 36.7 0 (8) (20) 1 33 (0) (3) (10) (4) 8 Dec-12 17 39 13 10.1 8.7 6.3 5.5 97 116 4.8 16.7 1.4 na na na
SCB SCB TB O THB 165.0 217.0 32 17,983 37.9 0 (5) (12) (9) 19 (0) (1) (2) (14) (6) Dec-12 25 21 13 13.9 11.2 9.2 8.2 102 108 3.9 21.8 2.3 na na na TCAP TCAP TB N THB 41.50 51.00 23 1,703 15.7 0 (6) (14) 10 48 (0) (1) (4) 5 23 Dec-12 72 (34) 17 9.7 5.6 8.5 7.2 135 93 3.7 20.5 1.1 na na na TISCO TISCO TB N THB 46.50 59.00 27 1,196 3.9 0 (1) (12) (11) 24 (0) 3 (2) (15) (1) Dec-12 19 (0) 11 9.1 7.7 7.7 6.9 105 94 5.4 22.6 1.6 na na na
TMB TMB TB N THB 2.16 2.85 32 3,025 22.1 0 (8) (23) 16 44 (0) (3) (13) 12 19 Dec-12 341 33 18 58.6 13.3 10.0 8.5 101 114 3.0 12.7 1.6 na na na Sector* 37 64,910 0 (6) (15) (4) 19 (0) (1) (5) (9) (6) Dec-12 23 20 13 12.5 10.2 8.5 7.5 100 105 3.8 17.3 1.7 na na na
Building Materials & Construction
Chai Techakumpuch / Paworamon (Poom) Suvarnatemee - 66 2 614 6211 / 66 2 614 6210
Italian-Thai Dev ITD TB U THB 7.35 2.50 (66) 990 28.0 0 (3) (9) 75 130 (0) 1 1 71 105 Dec-12 (697) nm nm 117.2 nm nm nm nm nm 0.0 (19.8) 4.3 1.2 20.9 389
SCC SCC TB U THB 430.0 404.0 (6) 16,570 20.0 0 (3) (12) (2) 30 (0) 1 (1) (7) 4 Dec-12 31 14 11 21.9 16.7 14.6 13.2 92 90 2.9 20.4 3.2 1.5 12.7 83 SCCC SCCC TB U THB 432.0 380.0 (12) 3,191 2.3 0 (2) (12) 3 45 (0) 2 (2) (2) 20 Dec-12 23 5 (3) 27.3 22.2 21.1 21.8 99 90 3.7 24.7 5.3 3.5 15.4 22 Sino-Thai Engr STEC TB U THB 21.90 16.33 (25) 1,073 9.2 0 (1) (20) 3 110 (0) 3 (10) (1) 85 Dec-12 11 28 6 28.7 25.8 20.2 19.0 86 96 2.5 20.1 5.0 1.0 14.4 (127)
Sector* (11) 21,823 0 (3) (12) 2 40 (0) 2 (2) (2) 15 Dec-12 23 14 9 23.7 19.4 17.0 15.6 87 85 2.8 19.1 3.5 1.6 13.4 82
Chemicals Paworamon (Poom) Suvarnatemee - 66 2 614 6210
PTTGC PTTGC TB O THB 67.25 90.00 34 9,731 31.8 0 (2) (12) (4) 14 (0) 2 (2) (8) (12) Dec-12 8 4 (6) 8.9 8.3 7.9 8.5 102 102 5.3 16.8 1.3 0.6 5.8 24
Consumer Durables & Apparel
Paworamon (Poom) Suvarnatemee - 66 2 614 6210
Indorama Ventures IVL TB N THB 19.00 24.00 26 2,937 9.5 0 (10) (16) (25) (36) (0) (5) (6) (29) (61) Dec-12 31 38 25 19.8 15.1 11.0 8.8 91 92 1.9 9.8 1.4 0.7 9.9 117
Consumer Staples Karim Salamatian / Chai Techakumpuch - 852 2101 7996 / 66 2 614 6211
C.P. All CPALL TB U THB 40.25 35.00 (13) 11,611 56.1 0 (3) (4) (13) 17 (0) 2 6 (17) (8) Dec-12 31 19 30 32.9 25.1 21.2 16.3 108 106 2.2 47.0 10.5 1.4 15.2 (130) CPF CPF TB O THB 26.50 38.00 43 6,589 25.8 0 (5) (12) (21) (31) (0) (1) (2) (26) (56) Dec-12 (10) 30 21 10.9 12.1 9.3 7.6 116 114 5.7 15.4 1.8 0.9 15.1 116 Thai Union TUF TB O THB 61.00 75.00 23 2,248 7.7 0 (2) 3 (15) (12) (0) 2 13 (20) (37) Dec-12 (4) 40 18 14.5 15.1 10.8 9.1 88 98 3.3 12.8 1.7 0.9 11.9 84
Sector* 9 20,448 0 (4) (6) (16) (2) (0) 1 4 (20) (27) Dec-12 4 27 24 18.4 17.7 13.9 11.2 108 108 3.5 20.3 3.3 1.0 14.6 68
Energy Paworamon (Poom) Suvarnatemee - 66 2 614 6210
PTT PTT TB N THB 325.0 382.0 18 29,810 50.9 0 1 (3) (2) 0 (0) 5 7 (7) (25) Dec-12 7 5 6 8.9 8.3 7.9 7.5 96 95 3.9 17.4 1.4 0.4 5.0 36 PTTEP PTTEP TB N THB 149.5 171.0 14 19,059 29.7 0 (2) (7) (9) (13) (0) 3 3 (13) (38) Dec-12 (7) 5 (12) 8.8 9.4 9.0 10.3 97 99 3.9 18.0 1.6 2.7 3.7 9 TOP TOP TB N THB 62.75 66.00 5 4,111 15.4 0 (2) (7) (7) 2 (0) 2 3 (11) (23) Dec-12 17 (14) (7) 10.4 8.9 10.3 11.1 103 91 5.0 15.9 1.3 0.3 5.5 6
Sector* 15 52,981 0 (0) (5) (5) (5) (0) 4 5 (9) (30) Dec-12 3 3 (1) 8.9 8.7 8.4 8.6 97 96 4.0 17.5 1.4 0.6 4.5 26
Healthcare Thaniya Kevalee - 66 2 614 6219
Bangkok Dusit BGH TB O THB 150.5 172.0 14 7,469 14.4 0 (10) (14) 33 63 (0) (6) (4) 28 38 Dec-12 29 23 21 40.0 31.0 25.2 20.8 100 104 1.6 19.0 5.6 4.7 20.5 33 Bumrungrad Hosp BH TB N THB 79.50 90.00 13 1,860 3.1 0 (4) (9) 7 29 (0) 1 2 3 4 Dec-12 22 14 16 29.9 24.5 21.4 18.4 102 99 2.3 26.4 6.1 3.8 15.4 (58) Sector* 14 9,329 0 (9) (13) 28 56 (0) (4) (3) 23 31 Dec-12 27 21 20 37.5 29.5 24.4 20.3 101 103 1.8 20.4 5.7 4.5 19.3 16
Hotels, Restaurants & Leisure
Thaniya Kevalee - 66 2 614 6219
Centel CENTEL TB O THB 33.50 43.00 28 1,452 2.7 0 (7) (12) 29 168 (0) (2) (2) 24 143 Dec-12 39 34 22 40.2 28.8 21.4 17.5 100 106 1.4 15.8 4.3 3.1 13.2 88 MINT MINT TB O THB 23.60 29.00 23 3,028 8.4 0 (6) (2) 20 79 (0) (1) 8 16 54 Dec-12 17 21 13 26.8 22.9 19.0 16.8 99 101 2.0 20.2 4.1 3.2 16.7 80
Sector* 25 4,481 0 (6) (5) 23 108 (0) (2) 5 19 83 Dec-12 22 25 16 30.1 24.6 19.7 17.0 99 102 1.8 18.7 4.2 3.1 15.4 83
Insurance Arjan van Veen - 852 2101 7508
Bangkok Life BLA TB U THB 58.50 50.00 (15) 2,275 3.2 0 (6) (19) (6) 24 (0) (1) (9) (10) (1) Dec-12 43 8 9 21.4 14.9 13.8 12.7 103 92 1.7 21.1 2.8 na na na
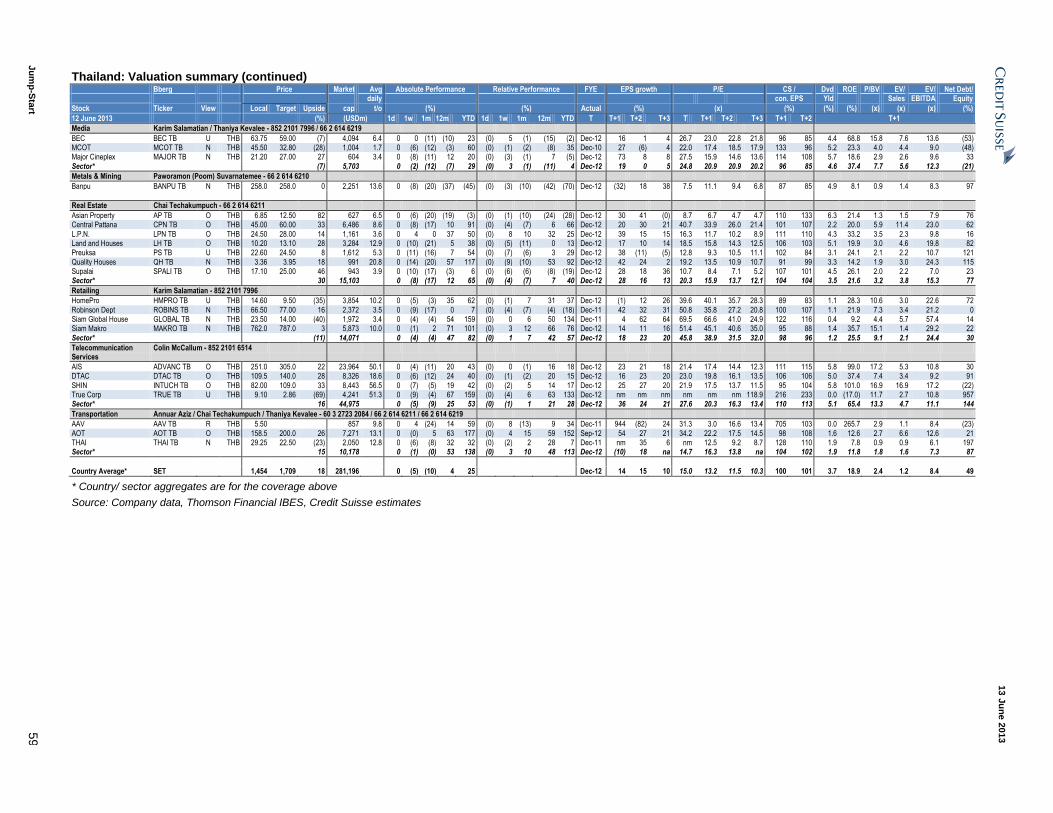
13 J
un
e 2
013
Ju
mp
-Sta
rt 5
9
Thailand: Valuation summary (continued) Bberg Price Market Avg Absolute Performance Relative Performance FYE EPS growth P/E CS / Dvd ROE P/BV EV/ EV/ Net Debt/ daily con. EPS Yld Sales EBITDA Equity
Stock Ticker View Local Target Upside cap t/o (%) (%) Actual (%) (x) (%) (%) (%) (x) (x) (x) (%)
12 June 2013 (%) (USDm) 1d 1w 1m 12m YTD 1d 1w 1m 12m YTD T T+1 T+2 T+3 T T+1 T+2 T+3 T+1 T+2 T+1
Media Karim Salamatian / Thaniya Kevalee - 852 2101 7996 / 66 2 614 6219
BEC BEC TB U THB 63.75 59.00 (7) 4,094 6.4 0 0 (11) (10) 23 (0) 5 (1) (15) (2) Dec-12 16 1 4 26.7 23.0 22.8 21.8 96 85 4.4 68.8 15.8 7.6 13.6 (53) MCOT MCOT TB N THB 45.50 32.80 (28) 1,004 1.7 0 (6) (12) (3) 60 (0) (1) (2) (8) 35 Dec-10 27 (6) 4 22.0 17.4 18.5 17.9 133 96 5.2 23.3 4.0 4.4 9.0 (48) Major Cineplex MAJOR TB N THB 21.20 27.00 27 604 3.4 0 (8) (11) 12 20 (0) (3) (1) 7 (5) Dec-12 73 8 8 27.5 15.9 14.6 13.6 114 108 5.7 18.6 2.9 2.6 9.6 33
Sector* (7) 5,703 0 (2) (12) (7) 29 (0) 3 (1) (11) 4 Dec-12 19 0 5 24.8 20.9 20.9 20.2 96 85 4.6 37.4 7.7 5.6 12.3 (21)
Metals & Mining Paworamon (Poom) Suvarnatemee - 66 2 614 6210
Banpu BANPU TB N THB 258.0 258.0 0 2,251 13.6 0 (8) (20) (37) (45) (0) (3) (10) (42) (70) Dec-12 (32) 18 38 7.5 11.1 9.4 6.8 87 85 4.9 8.1 0.9 1.4 8.3 97
Real Estate Chai Techakumpuch - 66 2 614 6211
Asian Property AP TB O THB 6.85 12.50 82 627 6.5 0 (6) (20) (19) (3) (0) (1) (10) (24) (28) Dec-12 30 41 (0) 8.7 6.7 4.7 4.7 110 133 6.3 21.4 1.3 1.5 7.9 76 Central Pattana CPN TB O THB 45.00 60.00 33 6,486 8.6 0 (8) (17) 10 91 (0) (4) (7) 6 66 Dec-12 20 30 21 40.7 33.9 26.0 21.4 101 107 2.2 20.0 5.9 11.4 23.0 62
L.P.N. LPN TB O THB 24.50 28.00 14 1,161 3.6 0 4 0 37 50 (0) 8 10 32 25 Dec-12 39 15 15 16.3 11.7 10.2 8.9 111 110 4.3 33.2 3.5 2.3 9.8 16 Land and Houses LH TB O THB 10.20 13.10 28 3,284 12.9 0 (10) (21) 5 38 (0) (5) (11) 0 13 Dec-12 17 10 14 18.5 15.8 14.3 12.5 106 103 5.1 19.9 3.0 4.6 19.8 82 Preuksa PS TB U THB 22.60 24.50 8 1,612 5.3 0 (11) (16) 7 54 (0) (7) (6) 3 29 Dec-12 38 (11) (5) 12.8 9.3 10.5 11.1 102 84 3.1 24.1 2.1 2.2 10.7 121
Quality Houses QH TB N THB 3.36 3.95 18 991 20.8 0 (14) (20) 57 117 (0) (9) (10) 53 92 Dec-12 42 24 2 19.2 13.5 10.9 10.7 91 99 3.3 14.2 1.9 3.0 24.3 115 Supalai SPALI TB O THB 17.10 25.00 46 943 3.9 0 (10) (17) (3) 6 (0) (6) (6) (8) (19) Dec-12 28 18 36 10.7 8.4 7.1 5.2 107 101 4.5 26.1 2.0 2.2 7.0 23 Sector* 30 15,103 0 (8) (17) 12 65 (0) (4) (7) 7 40 Dec-12 28 16 13 20.3 15.9 13.7 12.1 104 104 3.5 21.6 3.2 3.8 15.3 77
Retailing Karim Salamatian - 852 2101 7996
HomePro HMPRO TB U THB 14.60 9.50 (35) 3,854 10.2 0 (5) (3) 35 62 (0) (1) 7 31 37 Dec-12 (1) 12 26 39.6 40.1 35.7 28.3 89 83 1.1 28.3 10.6 3.0 22.6 72
Robinson Dept ROBINS TB N THB 66.50 77.00 16 2,372 3.5 0 (9) (17) 0 7 (0) (4) (7) (4) (18) Dec-11 42 32 31 50.8 35.8 27.2 20.8 100 107 1.1 21.9 7.3 3.4 21.2 0 Siam Global House GLOBAL TB N THB 23.50 14.00 (40) 1,972 3.4 0 (4) (4) 54 159 (0) 0 6 50 134 Dec-11 4 62 64 69.5 66.6 41.0 24.9 122 116 0.4 9.2 4.4 5.7 57.4 14 Siam Makro MAKRO TB N THB 762.0 787.0 3 5,873 10.0 0 (1) 2 71 101 (0) 3 12 66 76 Dec-12 14 11 16 51.4 45.1 40.6 35.0 95 88 1.4 35.7 15.1 1.4 29.2 22
Sector* (11) 14,071 0 (4) (4) 47 82 (0) 1 7 42 57 Dec-12 18 23 20 45.8 38.9 31.5 32.0 98 96 1.2 25.5 9.1 2.1 24.4 30
Telecommunication Services
Colin McCallum - 852 2101 6514
AIS ADVANC TB O THB 251.0 305.0 22 23,964 50.1 0 (4) (11) 20 43 (0) 0 (1) 16 18 Dec-12 23 21 18 21.4 17.4 14.4 12.3 111 115 5.8 99.0 17.2 5.3 10.8 30 DTAC DTAC TB O THB 109.5 140.0 28 8,326 18.6 0 (6) (12) 24 40 (0) (1) (2) 20 15 Dec-12 16 23 20 23.0 19.8 16.1 13.5 106 106 5.0 37.4 7.4 3.4 9.2 91
SHIN INTUCH TB O THB 82.00 109.0 33 8,443 56.5 0 (7) (5) 19 42 (0) (2) 5 14 17 Dec-12 25 27 20 21.9 17.5 13.7 11.5 95 104 5.8 101.0 16.9 16.9 17.2 (22) True Corp TRUE TB U THB 9.10 2.86 (69) 4,241 51.3 0 (9) (4) 67 159 (0) (4) 6 63 133 Dec-12 nm nm nm nm nm nm 118.9 216 233 0.0 (17.0) 11.7 2.7 10.8 957 Sector* 16 44,975 0 (5) (9) 25 53 (0) (1) 1 21 28 Dec-12 36 24 21 27.6 20.3 16.3 13.4 110 113 5.1 65.4 13.3 4.7 11.1 144
Transportation Annuar Aziz / Chai Techakumpuch / Thaniya Kevalee - 60 3 2723 2084 / 66 2 614 6211 / 66 2 614 6219
AAV AAV TB R THB 5.50 857 9.8 0 4 (24) 14 59 (0) 8 (13) 9 34 Dec-11 944 (82) 24 31.3 3.0 16.6 13.4 705 103 0.0 265.7 2.9 1.1 8.4 (23)
AOT AOT TB O THB 158.5 200.0 26 7,271 13.1 0 (0) 5 63 177 (0) 4 15 59 152 Sep-12 54 27 21 34.2 22.2 17.5 14.5 98 108 1.6 12.6 2.7 6.6 12.6 21 THAI THAI TB N THB 29.25 22.50 (23) 2,050 12.8 0 (6) (8) 32 32 (0) (2) 2 28 7 Dec-11 nm 35 6 nm 12.5 9.2 8.7 128 110 1.9 7.8 0.9 0.9 6.1 197 Sector* 15 10,178 0 (1) (0) 53 138 (0) 3 10 48 113 Dec-12 (10) 18 na 14.7 16.3 13.8 na 104 102 1.9 11.8 1.8 1.6 7.3 87
Country Average* SET 1,454 1,709 18 281,196 0 (5) (10) 4 25 Dec-12 14 15 10 15.0 13.2 11.5 10.3 100 101 3.7 18.9 2.4 1.2 8.4 49
* Country/ sector aggregates are for the coverage above
Source: Company data, Thomson Financial IBES, Credit Suisse estimates
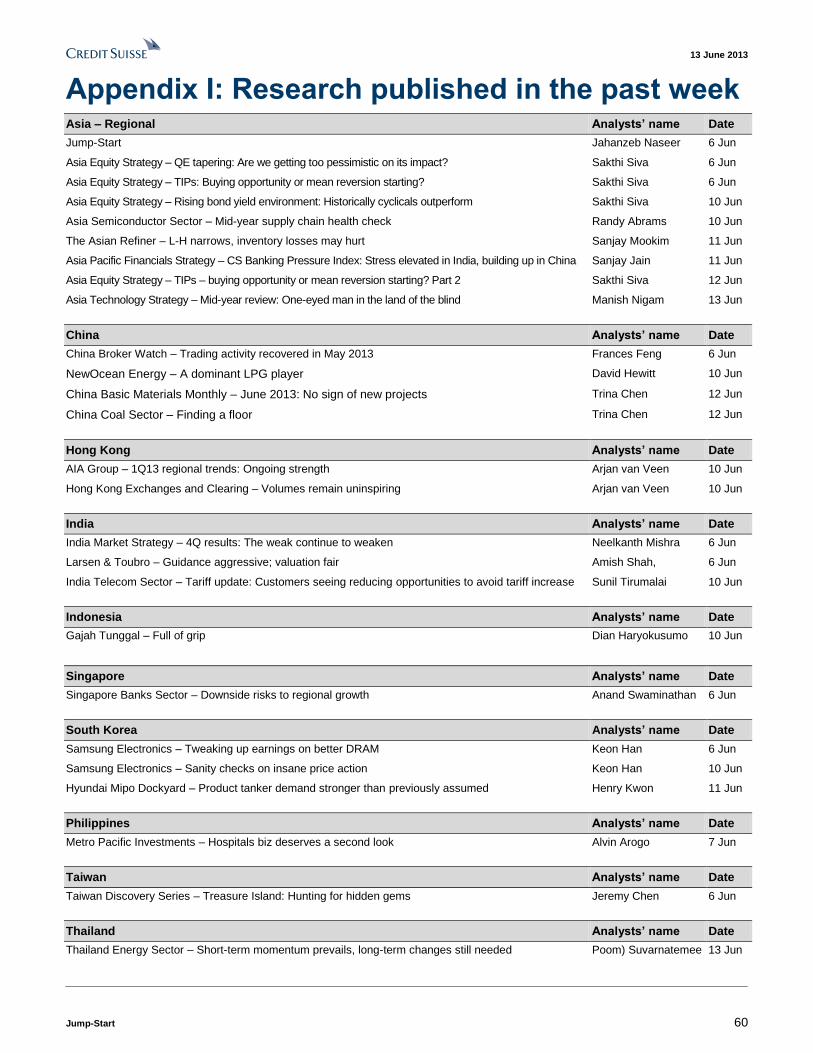
13 June 2013
Jump-Start 60
Appendix I: Research published in the past week Asia – Regional Analysts’ name Date
Jump-Start Jahanzeb Naseer 6 Jun
Asia Equity Strategy – QE tapering: Are we getting too pessimistic on its impact? Sakthi Siva 6 Jun
Asia Equity Strategy – TIPs: Buying opportunity or mean reversion starting? Sakthi Siva 6 Jun
Asia Equity Strategy – Rising bond yield environment: Historically cyclicals outperform Sakthi Siva 10 Jun
Asia Semiconductor Sector – Mid-year supply chain health check Randy Abrams 10 Jun
The Asian Refiner – L-H narrows, inventory losses may hurt Sanjay Mookim 11 Jun
Asia Pacific Financials Strategy – CS Banking Pressure Index: Stress elevated in India, building up in China Sanjay Jain 11 Jun
Asia Equity Strategy – TIPs – buying opportunity or mean reversion starting? Part 2 Sakthi Siva 12 Jun
Asia Technology Strategy – Mid-year review: One-eyed man in the land of the blind Manish Nigam 13 Jun
China Analysts’ name Date
China Broker Watch – Trading activity recovered in May 2013 Frances Feng 6 Jun
NewOcean Energy – A dominant LPG player David Hewitt 10 Jun
China Basic Materials Monthly – June 2013: No sign of new projects Trina Chen 12 Jun
China Coal Sector – Finding a floor Trina Chen 12 Jun
Hong Kong Analysts’ name Date
AIA Group – 1Q13 regional trends: Ongoing strength Arjan van Veen 10 Jun
Hong Kong Exchanges and Clearing – Volumes remain uninspiring Arjan van Veen 10 Jun
India Analysts’ name Date
India Market Strategy – 4Q results: The weak continue to weaken Neelkanth Mishra 6 Jun
Larsen & Toubro – Guidance aggressive; valuation fair Amish Shah, 6 Jun
India Telecom Sector – Tariff update: Customers seeing reducing opportunities to avoid tariff increase Sunil Tirumalai 10 Jun
Indonesia Analysts’ name Date
Gajah Tunggal – Full of grip Dian Haryokusumo 10 Jun
Singapore Analysts’ name Date
Singapore Banks Sector – Downside risks to regional growth Anand Swaminathan 6 Jun
South Korea Analysts’ name Date
Samsung Electronics – Tweaking up earnings on better DRAM Keon Han 6 Jun
Samsung Electronics – Sanity checks on insane price action Keon Han 10 Jun
Hyundai Mipo Dockyard – Product tanker demand stronger than previously assumed Henry Kwon 11 Jun
Philippines Analysts’ name Date
Metro Pacific Investments – Hospitals biz deserves a second look Alvin Arogo 7 Jun
Taiwan Analysts’ name Date
Taiwan Discovery Series – Treasure Island: Hunting for hidden gems Jeremy Chen 6 Jun
Thailand Analysts’ name Date
Thailand Energy Sector – Short-term momentum prevails, long-term changes still needed Poom) Suvarnatemee 13 Jun
13 June 2013
Jump-Start 61
Disclosure Appendix
Important Global Disclosures
The analysts identified in this report each certify, with respect to the companies or securities that the individual analyzes, that (1) the views expressed in this report accurately reflect his or her personal views about all of the subject companies and securities and (2) no part of his or her compensation was, is or will be directly or indirectly related to the specific recommendations or views expressed in this report.
The analyst(s) responsible for preparing this research report received Compensation that is based upon various factors including Credit Suisse's total revenues, a portion of which are generated by Credit Suisse's investment banking activities
As of December 10, 2012 Analysts’ stock rating are defined as follows:
Outperform (O) : The stock’s total return is expected to outperform the relevant benchmark*over the next 12 months.
Neutral (N) : The stock’s total return is expected to be in line with the relevant benchmark* over the next 12 months.
Underperform (U) : The stock’s total return is expected to underperform the relevant benchmark* over the next 12 months.
*Relevant benchmark by region: As of 10th December 2012, Japanese ratings are based on a stock’s total return relative to the analyst's coverage universe which consists of all companies covered by the analyst within the relevant sector, with Outperforms representing the most attractive, Neutrals the less attractive, and Underperforms the least attractive investment opportunities. As of 2nd October 2012, U.S. and Canadian as well as European ra tings are based on a stock’s total return relative to the analyst's coverage universe which consists of all companies covered by the analyst within the relevant sector, with Outperfor ms representing the most attractive, Neutrals the less attractive, and Underperforms the least attractive investment opportunities. For Latin American and non-Japan Asia stocks, ratings are based on a stock’s total return relative to the average total return of the relevant country or regional benchmark; Australia, New Zealand are, and prior to 2nd October 2012 U.S. and Canadian ratings were based on (1) a stock’s absolute total return potential to its current share price and (2) the relative attractiveness of a stock’s total return potential within an analyst’s coverage universe. For Australian and New Zealand stocks, 12 -month rolling yield is incorporated in the absolute total return calculation and a 15% and a 7.5% threshold replace the 10-15% level in the Outperform and Underperform stock rating definitions, respectively. The 15% and 7.5% thresholds replace the +10-15% and -10-15% levels in the Neutral stock rating definition, respectively. Prior to 10th December 2012, Japanese ratings were based on a stock’s total return relative to the average total return of the relevant country or regional benchmark.
Restricted (R) : In certain circumstances, Credit Suisse policy and/or applicable law and regulations preclude certain types of communications, including an investment recommendation, during the course of Credit Suisse's engagement in an investment banking transaction and in certain other circumstances.
Volatility Indicator [V] : A stock is defined as volatile if the stock price has moved up or down by 20% or more in a month in at least 8 of the past 24 months or the analyst expects significant volatility going forward.
Analysts’ sector weightings are distinct from analysts’ stock ratings and are based on the analyst’s expectations for the fundamentals and/or valuation of the sector* relative to the group’s historic fundamentals and/or valuation:
Overweight : The analyst’s expectation for the sector’s fundamentals and/or valuation is favorable over the next 12 months.
Market Weight : The analyst’s expectation for the sector’s fundamentals and/or valuation is neutral over the next 12 months.
Underweight : The analyst’s expectation for the sector’s fundamentals and/or valuation is cautious over the next 12 months.
*An analyst’s coverage sector consists of all companies covered by the analyst within the relevant sector. An analyst may cover multiple sectors.
Credit Suisse's distribution of stock ratings (and banking clients) is:
Global Ratings Distribution
Rating Versus universe (%) Of which banking clients (%)
Outperform/Buy* 42% (54% banking clients)
Neutral/Hold* 39% (48% banking clients)
Underperform/Sell* 15% (40% banking clients)
Restricted 3%
*For purposes of the NYSE and NASD ratings distribution disclosure requirements, our stock ratings of Outperform, Neutral, an d Underperform most closely correspond to Buy, Hold, and Sell, respectively; however, the meanings are not the same, as our stock ratings are determined on a relative basis. (Please refer to definitions above.) An investor's decision to buy or sell a security should be based on investment objectives, current holdin gs, and other individual factors.
Credit Suisse’s policy is to update research reports as it deems appropriate, based on developments with the subject company, the sector or the market that may have a material impact on the research views or opinions stated herein.
Credit Suisse's policy is only to publish investment research that is impartial, independent, clear, fair and not misleading. For more detail please refer to Credit Suisse's Policies for Managing Conflicts of Interest in connection with Investment Research: http://www.csfb.com/research and analytics/disclaimer/managing_conflicts_disclaimer.html
Credit Suisse does not provide any tax advice. Any statement herein regarding any US federal tax is not intended or written to be used, and cannot be used, by any taxpayer for the purposes of avoiding any penalties.
13 June 2013
Jump-Start 62
Please refer to the firm's disclosure website at www.credit-suisse.com/researchdisclosures for the definitions of abbreviations typically used in the target price method and risk sections.
Important Regional Disclosures
Singapore recipients should contact Credit Suisse AG, Singapore Branch for any matters arising from this research report.
Restrictions on certain Canadian securities are indicated by the following abbreviations: NVS--Non-Voting shares; RVS--Restricted Voting Shares; SVS--Subordinate Voting Shares.
Individuals receiving this report from a Canadian investment dealer that is not affiliated with Credit Suisse should be advised that this report may not contain regulatory disclosures the non-affiliated Canadian investment dealer would be required to make if this were its own report.
For Credit Suisse Securities (Canada), Inc.'s policies and procedures regarding the dissemination of equity research, please visit http://www.csfb.com/legal_terms/canada_research_policy.shtml.
As of the date of this report, Credit Suisse acts as a market maker or liquidity provider in the equities securities that are the subject of this report.
Principal is not guaranteed in the case of equities because equity prices are variable.
Commission is the commission rate or the amount agreed with a customer when setting up an account or at any time after that.
Please find the full reports, including disclosure information, on Credit Suisse's Research and Analytics Website (http://www.researchandanalytics.com)
Important MSCI Disclosures
The MSCI sourced information is the exclusive property of Morgan Stanley Capital International Inc. (MSCI). Without prior written permission of MSCI, this information and any other MSCI intellectual property may not be reproduced, re-disseminated or used to create and financial products, including any indices. This information is provided on an "as is" basis. The user assumes the entire risk of any use made of this information. MSCI, its affiliates and any third party involved in, or related to, computing or compiling the information hereby expressly disclaim all warranties of originality, accuracy, completeness, merchantability or fitness for a particular purpose with respect to any of this information. Without limiting any of the foregoing, in no event shall MSCI, any of its affiliates or any third party involved in, or related to, computing or compiling the information have any liability for any damages of any kind. MSCI, Morgan Stanley Capital International and the MSCI indexes are services marks of MSCI and its affiliates.
The Global Industry Classification Standard (GICS) was developed by and is the exclusive property of Morgan Stanley Capital International Inc. and Standard & Poor’s. GICS is a service mark of MSCI and S&P and has been licensed for use by Credit Suisse.
Important Credit Suisse HOLT Disclosures
With respect to the analysis in this report based on the Credit Suisse HOLT methodology, Credit Suisse certifies that (1) the views expressed in this report accurately reflect the Credit Suisse HOLT methodology and (2) no part of the Firm’s compensation was, is, or will be directly related to the specific views disclosed in this report.
The Credit Suisse HOLT methodology does not assign ratings to a security. It is an analytical tool that involves use of a set of proprietary quantitative algorithms and warranted value calculations, collectively called the Credit Suisse HOLT valuation model, that are consistently applied to all the companies included in its database. Third-part data (including consensus earnings estimates) are systematically translated into a number of default algorithms available in the Credit Suisse HOLT valuation model. The source financial statement, pricing, and earnings data provided by outside data vendors are subject to quality control and may also be adjusted to more closely measure the underlying economics of firm performance. The adjustments provide consistency when analyzing a single company across time, or analyzing multiple companies across industries or national borders. The default scenario that is produced by the Credit Suisse HOLT valuation model establishes the baseline valuation for a security, and a user then may adjust the default variables to produce alternative scenarios, any of which could occur.
Additional information about the Credit Suisse HOLT methodology is available on request.
The Credit Suisse HOLT methodology does not assign a price target to a security. The default scenario that is produced by the Credit Suisse HOLT valuation model establishes a warranted price for a security, and as the third-party data are updated, the warranted price may also change. The default variable may also be adjusted to produce alternative warranted prices, any of which could occur.
CFROI®, HOLT, HOLTfolio, ValueSearch, AggreGator, Signal Flag and “Powered by HOLT” are trademarks or service marks or registered trademarks or registered service marks of Credit Suisse or its affiliates in the United States and other countries. HOLT is a corporate performance and valuation advisory service of Credit Suisse.
For Credit Suisse disclosure information on other companies mentioned in this report, please visit the website at www.credit-suisse.com/researchdisclosures or call +1 (877) 291-2683.
13 June 2013
Jump-Start 63
References in this report to Credit Suisse include all of the subsidiaries and affiliates of Credit Suisse operating under its investment banking division. For more information on our structure, please use the following link: https://www.credit-suisse.com/who_we_are/en/.This report may contain material that is not directed to, or intended for distribution to or use by, any person or entity who is a citizen or resident of or located in any locality, state, country or other jurisdiction where such distribution, publication, availability or use would be contrary to law or regulation or which would subject Credit Suisse AG or its affiliates ("CS") to any registration or licensing requirement within such jurisdiction. All material presented in this report, unless specifically indicated otherwise, is under copyright to CS. None of the material, nor its content, nor any copy of it, may be altered in any way, transmitted to, copied or distributed to any other party, without the prior express written permission of CS. All trademarks, service marks and logos used in this report are trademarks or service marks or registered trademarks or service marks of CS or its affiliates. The information, tools and material presented in this report are provided to you for information purposes only and are not to be used or considered as an offer or the solicitation of an offer to sell or to buy or subscribe for securities or other financial instruments. CS may not have taken any steps to ensure that the securities referred to in this report are suitable for any particular investor. CS will not treat recipients of this report as its customers by virtue of their receiving this report. The investments and services contained or referred to in this report may not be suitable for you and it is recommended that you consult an independent investment advisor if you are in doubt about such investments or investment services. Nothing in this report constitutes investment, legal, accounting or tax advice, or a representation that any investment or strategy is suitable or appropriate to your individual circumstances, or otherwise constitutes a personal recommendation to you. CS does not advise on the tax consequences of investments and you are advised to contact an independent tax adviser. Please note in particular that the bases and levels of taxation may change. Information and opinions presented in this report have been obtained or derived from sources believed by CS to be reliable, but CS makes no representation as to their accuracy or completeness. CS accepts no liability for loss arising from the use of the material presented in this report, except that this exclusion of liability does not apply to the extent that such liability arises under specific statutes or regulations applicable to CS. This report is not to be relied upon in substitution for the exercise of independent judgment. CS may have issued, and may in the future issue, other communications that are inconsistent with, and reach different conclusions from, the information presented in this report. Those communications reflect the different assumptions, views and analytical methods of the analysts who prepared them and CS is under no obligation to ensure that such other communications are brought to the attention of any recipient of this report. CS may, to the extent permitted by law, participate or invest in financing transactions with the issuer(s) of the securities referred to in this report, perform services for or solicit business from such issuers, and/or have a position or holding, or other material interest, or effect transactions, in such securities or options thereon, or other investments related thereto. In addition, it may make markets in the securities mentioned in the material presented in this report. CS may have, within the last three years, served as manager or co-manager of a public offering of securities for, or currently may make a primary market in issues of, any or all of the entities mentioned in this report or may be providing, or have provided within the previous 12 months, significant advice or investment services in relation to the investment concerned or a related investment. Additional information is, subject to duties of confidentiality, available on request. Some investments referred to in this report will be offered solely by a single entity and in the case of some investments solely by CS, or an associate of CS or CS may be the only market maker in such investments. Past performance should not be taken as an indication or guarantee of future performance, and no representation or warranty, express or implied, is made regarding future performance. Information, opinions and estimates contained in this report reflect a judgment at its original date of publication by CS and are subject to change without notice. The price, value of and income from any of the securities or financial instruments mentioned in this report can fall as well as rise. The value of securities and financial instruments is subject to exchange rate fluctuation that may have a positive or adverse effect on the price or income of such securities or financial instruments. Investors in securities such as ADR's, the values of which are influenced by currency volatility, effectively assume this risk. Structured securities are complex instruments, typically involve a high degree of risk and are intended for sale only to sophisticated investors who are capable of understanding and assuming the risks involved. The market value of any structured security may be affected by changes in economic, financial and political factors (including, but not limited to, spot and forward interest and exchange rates), time to maturity, market conditions and volatility, and the credit quality of any issuer or reference issuer. Any investor interested in purchasing a structured product should conduct their own investigation and analysis of the product and consult with their own professional advisers as to the risks involved in making such a purchase. Some investments discussed in this report may have a high level of volatility. High volatility investments may experience sudden and large falls in their value causing losses when that investment is realised. Those losses may equal your original investment. Indeed, in the case of some investments the potential losses may exceed the amount of initial investment and, in such circumstances, you may be required to pay more money to support those losses. Income yields from investments may fluctuate and, in consequence, initial capital paid to make the investment may be used as part of that income yield. Some investments may not be readily realisable and it may be difficult to sell or realise those investments, similarly it may prove difficult for you to obtain reliable information about the value, or risks, to which such an investment is exposed. This report may provide the addresses of, or contain hyperlinks to, websites. Except to the extent to which the report refers to website material of CS, CS has not reviewed any such site and takes no responsibility for the content contained therein. Such address or hyperlink (including addresses or hyperlinks to CS's own website material) is provided solely for your convenience and information and the content of any such website does not in any way form part of this document. Accessing such website or following such link through this report or CS's website shall be at your own risk. This report is issued and distributed in Europe (except Switzerland) by Credit Suisse Securities (Europe) Limited, One Cabot Square, London E14 4QJ, England, which is regulated in the United Kingdom by The Financial Services Authority ("FSA"). This report is being distributed in Germany by Credit Suisse Securities (Europe) This report is being distributed in the United States and Canada by Credit Suisse Securities (USA) LLC; in Switzerland by Credit Suisse AG; in Brazil by Banco de Investimentos Credit Suisse (Brasil) S.A or its affiliates; in Mexico by Banco Credit Suisse (México), S.A. (transactions related to the securities mentioned in this report will only be effected in compliance with applicable regulation); in Japan by Credit Suisse Securities (Japan) Limited, Financial Instruments Firm, Director-General of Kanto Local Finance Bureau (Kinsho) No. 66, a member of Japan Securities Dealers Association, The Financial Futures Association of Japan, Japan Investment Advisers Association, Type II Financial Instruments Firms Association; elsewhere in Asia/ Pacific by whichever of the following is the appropriately authorised entity in the relevant jurisdiction: Credit Suisse (Hong Kong) Limited, Credit Suisse Equities (Australia) Limited, Credit Suisse Securities (Thailand) Limited, having registered address at 990 Abdulrahim Place, 27 Floor, Unit 2701, Rama IV Road, Silom, Bangrak, Bangkok 10500, Thailand, Tel. +66 2614 6000, Credit Suisse Securities (Malaysia) Sdn Bhd, Credit Suisse AG, Singapore Branch, Credit Suisse Securities (India) Private Limited regulated by the Securities and Exchange Board of India (registration Nos. INB230970637; INF230970637; INB010970631; INF010970631), having registered address at 9th Floor, Ceejay House, Dr.A.B. Road, Worli, Mumbai - 18, India, T- +91-22 6777 3777, Credit Suisse Securities (Europe) Limited, Seoul Branch, Credit Suisse AG, Taipei Securities Branch, PT Credit Suisse Securities Indonesia, Credit Suisse Securities (Philippines ) Inc., and elsewhere in the world by the relevant authorised affiliate of the above. Research on Taiwanese securities produced by Credit Suisse AG, Taipei Securities Branch has been prepared by a registered Senior Business Person. Research provided to residents of Malaysia is authorised by the Head of Research for Credit Suisse Securities (Malaysia) Sdn Bhd, to whom they should direct any queries on +603 2723 2020. This report has been prepared and issued for distribution in Singapore to institutional investors, accredited investors and expert investors (each as defined under the Financial Advisers Regulations) only, and is also distributed by Credit Suisse AG, Singapore branch to overseas investors (as defined under the Financial Advisers Regulations). By virtue of your status as an institutional investor, accredited investor, expert investor or overseas investor, Credit Suisse AG, Singapore branch is exempted from complying with certain compliance requirements under the Financial Advisers Act, Chapter 110 of Singapore (the "FAA"), the Financial Advisers Regulations and the relevant Notices and Guidelines issued thereunder, in respect of any financial advisory service which Credit Suisse AG, Singapore branch may provide to you. This research may not conform to Canadian disclosure requirements. In jurisdictions where CS is not already registered or licensed to trade in securities, transactions will only be effected in accordance with applicable securities legislation, which will vary from jurisdiction to jurisdiction and may require that the trade be made in accordance with applicable exemptions from registration or licensing requirements. Non-U.S. customers wishing to effect a transaction should contact a CS entity in their local jurisdiction unless governing law permits otherwise. U.S. customers wishing to effect a transaction should do so only by contacting a representative at Credit Suisse Securities (USA) LLC in the U.S. Please note that this research was originally prepared and issued by CS for distribution to their market professional and institutional investor customers. Recipients who are not market professional or institutional investor customers of CS should seek the advice of their independent financial advisor prior to taking any investment decision based on this report or for any necessary explanation of its contents. This research may relate to investments or services of a person outside of the UK or to other matters which are not regulated by the FSA or in respect of which the protections of the FSA for private customers and/or the UK compensation scheme may not be available, and further details as to where this may be the case are available upon request in respect of this report. CS may provide various services to US municipal entities or obligated persons ("municipalities"), including suggesting individual transactions or trades and entering into such transactions. Any services CS provides to municipalities are not viewed as "advice" within the meaning of Section 975 of the Dodd-Frank Wall Street Reform and Consumer Protection Act. CS is providing any such services and related information solely on an arm's length basis and not as an advisor or fiduciary to the municipality. In connection with the provision of the any such services, there is no agreement, direct or indirect, between any municipality (including the officials, management, employees or agents thereof) and CS for CS to provide advice to the municipality. Municipalities should consult with their financial, accounting and legal advisors regarding any such services provided by CS. In addition, CS is not acting for direct or indirect compensation to solicit the municipality on behalf of an unaffiliated broker, dealer, municipal securities dealer, municipal advisor, or investment adviser for the purpose of obtaining or retaining an engagement by the municipality for or in connection with Municipal Financial Products, the issuance of municipal securities, or of an investment adviser to provide investment advisory services to or on behalf of the municipality. If this report is being distributed by a financial institution other than Credit Suisse AG, or its affiliates, that financial institution is solely responsible for distribution. Clients of that institution should contact that institution to effect a transaction in the securities mentioned in this report or require further information. This report does not constitute investment advice by Credit Suisse to the clients of the distributing financial institution, and neither Credit Suisse AG, its affiliates, and their respective officers, directors and employees accept any liability whatsoever for any direct or consequential loss arising from their use of this report or its content. Principal is not guaranteed. Commission is the commission rate or the amount agreed with a customer when setting up an account or at any time after that.
Copyright © 2013 CREDIT SUISSE AG and/or its affiliates. All rights reserved.
Investment principal on bonds can be eroded depending on sale price or market price. In addition, there are bonds on which investment principal can be eroded due to changes in redemption amounts. Care is required when investing in such instruments.
When you purchase non-listed Japanese fixed income securities (Japanese government bonds, Japanese municipal bonds, Japanese government guaranteed bonds, Japanese corporate bonds) from CS as a seller, you will be requested to pay the purchase price only.
0613_jump start.doc


