Embed Size (px)
Citation preview
FOTO CAPA
24 March 2016 Equity Research
Braz il ian Malls First Rule of Retailers’ Woes Is You Don’t Talk About
Retailers’ Woes
Nicole Hirakawa 55 11 3701 6307 [email protected]
Luis Stacchini 55 11 3701 6121 [email protected]
Vanessa Quiroga 52 55 5283 8939 [email protected]
After two years of weak sales performance (2016 to be no different) and significant inflationary pressure, several large retailers
are struggling. In this report, we investigate the financial health of the main retailers and malls’ exposure to mom & pop shops.
One-third of the largest retailers face some degree of financial hardship. We analyzed the largest mall retailers in the
segments of apparel, home appliances and miscellaneous (super-market, cosmetics and others). 6.5% of these retailers were
considered red flags, i.e. already filed for chapter 11 or are in serious financial distress. 25% of the surveyed universe was
considered yellow flag for having a substantial amount of protested bills by creditors or ND/EBITDA above 2.5x. All listed
companies have some exposure to these riskier retailers, 8%-10% of total store count.
If the largest chains are in financial difficulty, we wonder how the mom & pop shops are coping. These tier 5 retailers,
account for 30% of malls’ store count and are the most exposed to economic downturns for being less professionally managed
and having little or no access to capital. Multiplan and Iguatemi have the lowest exposure to mom & pop shops, which represent
22% and 27% of their store count, respectively, vs. ~32% for the other companies.
Micro to show its ugly face. After recent rally, we no longer see the malls as a reasonable way to play a potential political shift.
In 2016, we expect micro conditions to slowly become apparent while valuations don’t seem supportive. Vacancy and
delinquency risks are higher and key factor will be ability to replace retailers reducing store fleet and the ones that will go bust.
Lowering our estimates for 2016-17. In this spirit, we are factoring in a longer period until recovery, as retailers are in poor
financial shape. The higher occupancy costs and lower productivity (sales per sqm) vs. historical make us believe that future SSS
growth, when it comes, will serve to put retailers back on their feet, taking longer to translate in rent growth. In this scenario, we
favor Multiplan for its lower exposure to risky retailers and above average capacity to attract tenants – company increased the
number of top tier stores by 5% during 2Q15-1Q16.
DISCLOSURE APPENDIX AT THE BACK OF THIS REPORT CONTAINS IMPORTANT DISCLOSURES, ANALYST CERTIFICATIONS, AND THE STATUS OF NON-US ANALYSTS. US Disclosure: Credit Suisse does and seeks to do business with companies covered in its research reports. As a result, investors should be aware that the Firm may have a conflict of interest that could affect the objectivity of this report. Investors should consider this report as only a single factor in making their investment decision.
2
24 March 2016
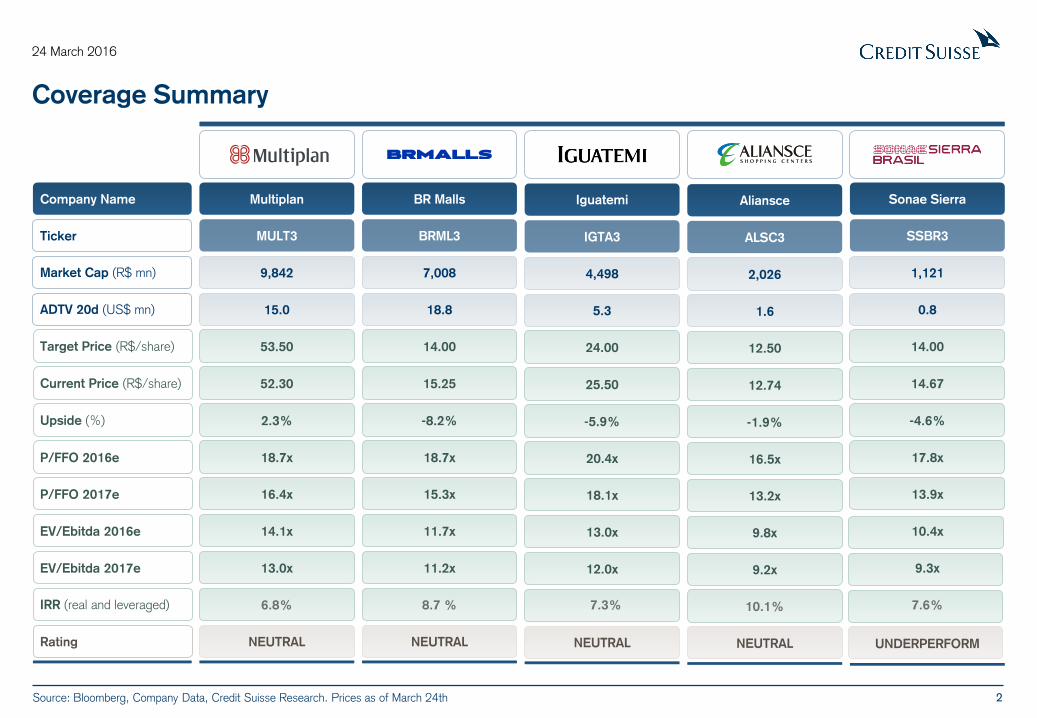
Coverage Summary
Company Name
Ticker
Market Cap (R$ mn)
ADTV 20d (US$ mn)
Target Price (R$/share)
Current Price (R$/share)
Upside (%)
Rating
P/FFO 2016e
P/FFO 2017e
EV/Ebitda 2016e
EV/Ebitda 2017e
IRR (real and leveraged)
Multiplan
MULT3
9,842
15.0
53.50
52.30
2.3%
18.7x
16.4x
14.1x
13.0x
6.8%
NEUTRAL
BR Malls
BRML3
7,008
18.8
14.00
15.25
-8.2%
18.7x
15.3x
11.7x
11.2x
8.7 %
NEUTRAL
Aliansce
ALSC3
2,026
1.6
12.50
12.74
-1.9%
16.5x
13.2x
9.8x
9.2x
10.1%
NEUTRAL
Sonae Sierra
SSBR3
1,121
0.8
14.00
14.67
-4.6%
17.8x
13.9x
10.4x
9.3x
7.6%
UNDERPERFORM
Iguatemi
IGTA3
4,498
5.3
24.00
25.50
-5.9%
20.4x
18.1x
13.0x
12.0x
7.3%
NEUTRAL
Source: Bloomberg, Company Data, Credit Suisse Research. Prices as of March 24th
3
24 March 2016
Top Tier Tenants Account For 50% Of Malls’ Stores; Mom & Pop Shops For 30%
In this report, we present our proprietary methodology to map malls’ tenant-mix and track mix changes in each mall belonging to our listed companies' sample. We look for
insights to anticipate future turnover trends, exposure to fragile retailers and ultimately, delinquency and vacancy risks. We analyzed key portfolio changes during 2Q15 and 1Q16.
Our coverage sample of five listed companies had in total 21,632 stores and kiosks as of February 16, distributed across 104 assets.
Large representativeness of top-tier tenants helps explain resilience amid economic woes. There are 387 top-tier (tier 1 or 2) brands that together have 11K stores in
the listed players' malls, or 50% of total store count. We define tier-1 tenants as the ones with more than 25 stores in our sample (or international brands) and tier-2 as operations
with more than 10 stores. Interestingly, ~40% of the malls’ stores lay within the tier-1 cluster (215 brands). The franchisees of operations classified as Tier 1 and 2 are also
included in the respective groups, as we presume them to rely, to a certain degree, on brand recognition and training.
Mom and pop stores account for ~30% of tenant base. The representativeness of mom and pops, defined as operations with 1 or 2 stores, was stable from 2Q15. This type
of stores, in general, are the most exposed to the economic downturn as they usually have a less professional management and little or no access to capital.
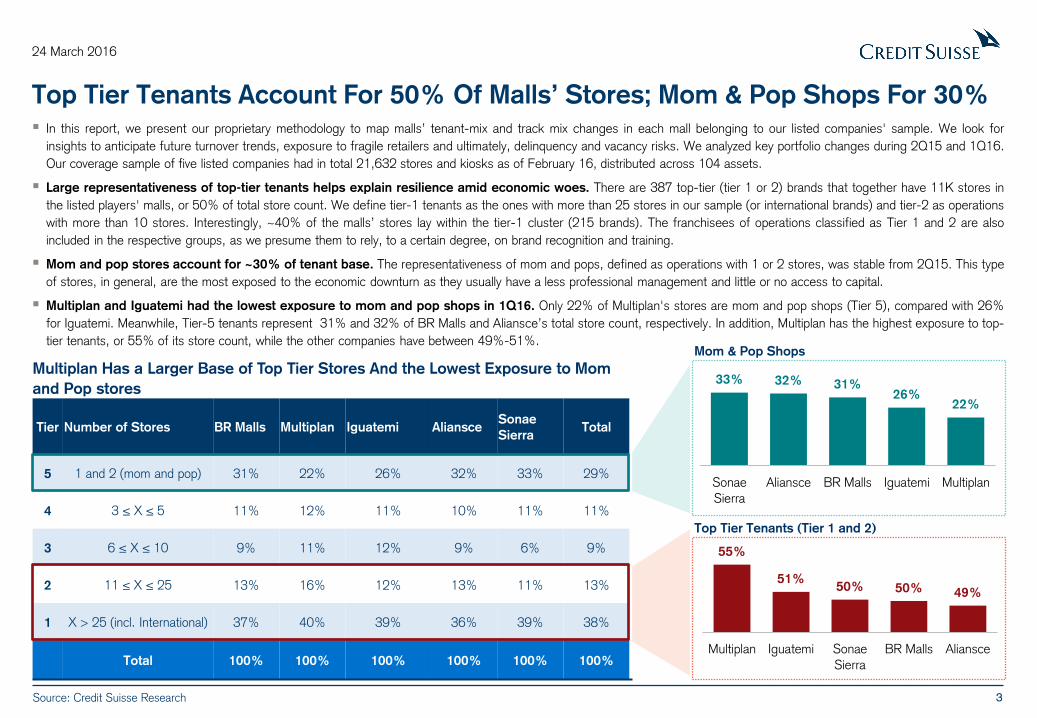
Multiplan and Iguatemi had the lowest exposure to mom and pop shops in 1Q16. Only 22% of Multiplan's stores are mom and pop shops (Tier 5), compared with 26%
for Iguatemi. Meanwhile, Tier-5 tenants represent 31% and 32% of BR Malls and Aliansce’s total store count, respectively. In addition, Multiplan has the highest exposure to top-
tier tenants, or 55% of its store count, while the other companies have between 49%-51%.
Source: Credit Suisse Research
Tier Number of Stores BR Malls Multiplan Iguatemi Aliansce Sonae
Sierra Total
5 1 and 2 (mom and pop) 31% 22% 26% 32% 33% 29%
4 3 ≤ X ≤ 5 11% 12% 11% 10% 11% 11%
3 6 ≤ X ≤ 10 9% 11% 12% 9% 6% 9%
2 11 ≤ X ≤ 25 13% 16% 12% 13% 11% 13%
1 X > 25 (incl. International) 37% 40% 39% 36% 39% 38%
Total 100% 100% 100% 100% 100% 100%
Multiplan Has a Larger Base of Top Tier Stores And the Lowest Exposure to Mom
and Pop stores
55%
51% 50% 50% 49%
Multiplan Iguatemi Sonae
Sierra
BR Malls Aliansce
33% 32% 31% 26%
22%
Sonae
Sierra
Aliansce BR Malls Iguatemi Multiplan
Mom & Pop Shops
Top Tier Tenants (Tier 1 and 2)
4
24 March 2016
Multiplan and BR Malls Added More Top Tier Stores To Tenant-Mix
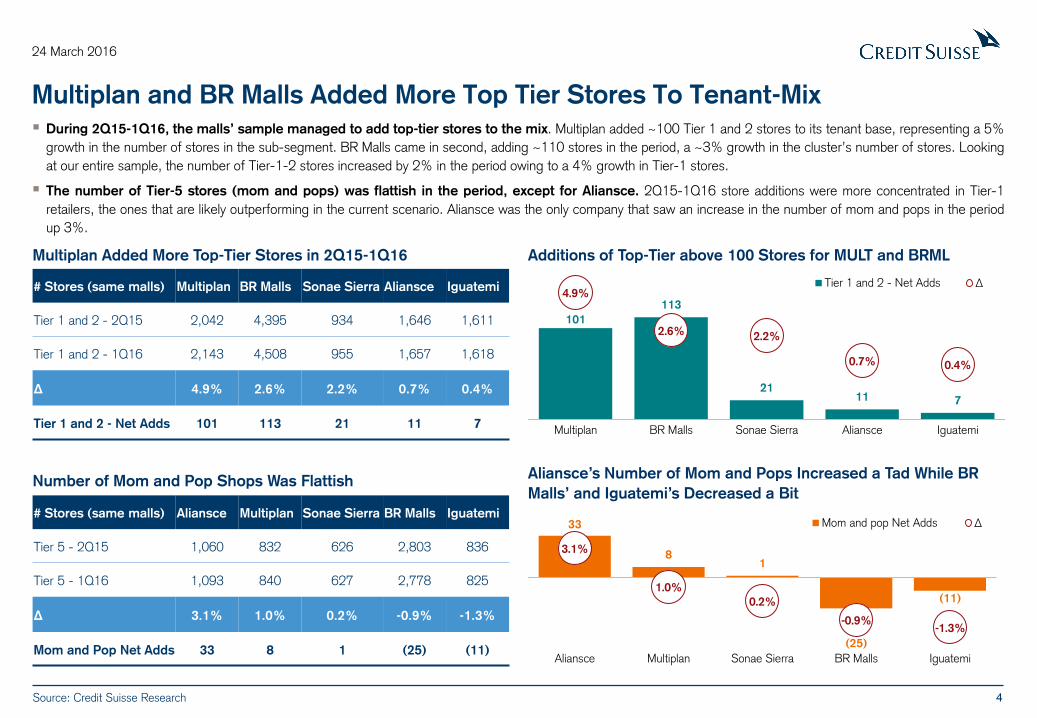
During 2Q15-1Q16, the malls’ sample managed to add top-tier stores to the mix. Multiplan added ~100 Tier 1 and 2 stores to its tenant base, representing a 5%
growth in the number of stores in the sub-segment. BR Malls came in second, adding ~110 stores in the period, a ~3% growth in the cluster’s number of stores. Looking
at our entire sample, the number of Tier-1-2 stores increased by 2% in the period owing to a 4% growth in Tier-1 stores.
The number of Tier-5 stores (mom and pops) was flattish in the period, except for Aliansce. 2Q15-1Q16 store additions were more concentrated in Tier-1
retailers, the ones that are likely outperforming in the current scenario. Aliansce was the only company that saw an increase in the number of mom and pops in the period
up 3%.
Source: Credit Suisse Research
Multiplan Added More Top-Tier Stores in 2Q15-1Q16
Number of Mom and Pop Shops Was Flattish
101
113
21 11 7
4.9%
2.6% 2.2%
0.7% 0.4%
Multiplan BR Malls Sonae Sierra Aliansce Iguatemi
Tier 1 and 2 - Net Adds ∆
33
8 1
(25)
(11)
3.1%
1.0%
0.2%
-0.9% -1.3%
Aliansce Multiplan Sonae Sierra BR Malls Iguatemi
Mom and pop Net Adds ∆
Aliansce’s Number of Mom and Pops Increased a Tad While BR
Malls’ and Iguatemi’s Decreased a Bit
# Stores (same malls) Multiplan BR Malls Sonae Sierra Aliansce Iguatemi
Tier 1 and 2 - 2Q15 2,042 4,395 934 1,646 1,611
Tier 1 and 2 - 1Q16 2,143 4,508 955 1,657 1,618
∆ 4.9% 2.6% 2.2% 0.7% 0.4%
Tier 1 and 2 - Net Adds 101 113 21 11 7
# Stores (same malls) Aliansce Multiplan Sonae Sierra BR Malls Iguatemi
Tier 5 - 2Q15 1,060 832 626 2,803 836
Tier 5 - 1Q16 1,093 840 627 2,778 825
∆ 3.1% 1.0% 0.2% -0.9% -1.3%
Mom and Pop Net Adds 33 8 1 (25) (11)
Additions of Top-Tier above 100 Stores for MULT and BRML
5
24 March 2016
More Large Brands Expanding Than Contracting; Balance Still Favorable
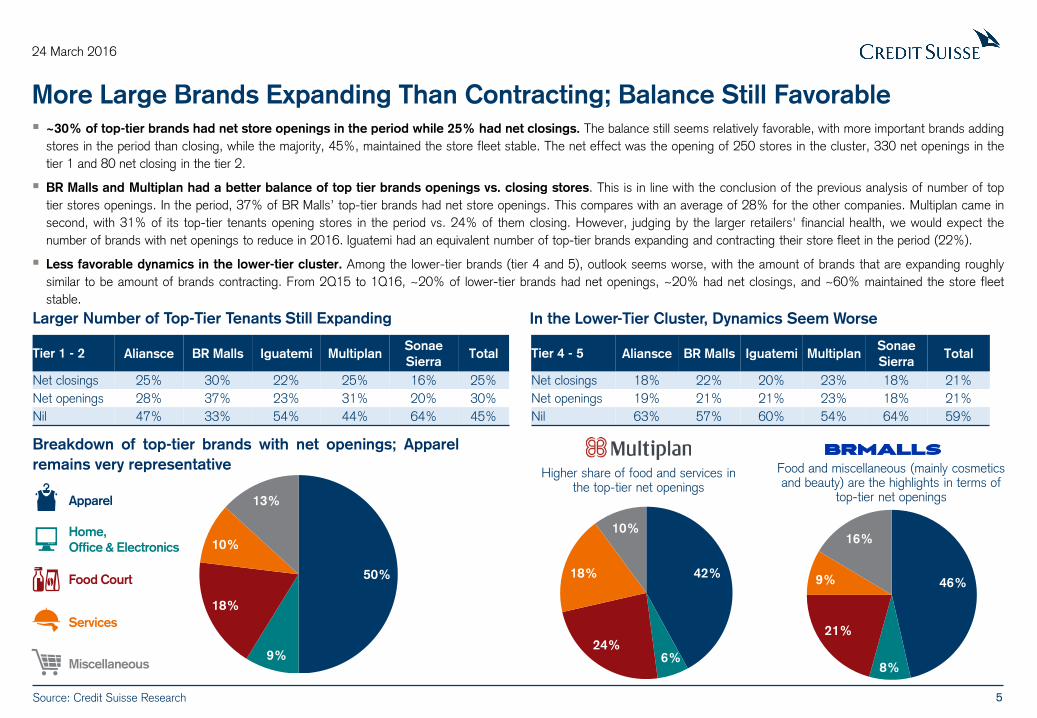
~30% of top-tier brands had net store openings in the period while 25% had net closings. The balance still seems relatively favorable, with more important brands adding
stores in the period than closing, while the majority, 45%, maintained the store fleet stable. The net effect was the opening of 250 stores in the cluster, 330 net openings in the
tier 1 and 80 net closing in the tier 2.
BR Malls and Multiplan had a better balance of top tier brands openings vs. closing stores. This is in line with the conclusion of the previous analysis of number of top
tier stores openings. In the period, 37% of BR Malls’ top-tier brands had net store openings. This compares with an average of 28% for the other companies. Multiplan came in
second, with 31% of its top-tier tenants opening stores in the period vs. 24% of them closing. However, judging by the larger retailers' financial health, we would expect the
number of brands with net openings to reduce in 2016. Iguatemi had an equivalent number of top-tier brands expanding and contracting their store fleet in the period (22%).
Less favorable dynamics in the lower-tier cluster. Among the lower-tier brands (tier 4 and 5), outlook seems worse, with the amount of brands that are expanding roughly
similar to be amount of brands contracting. From 2Q15 to 1Q16, ~20% of lower-tier brands had net openings, ~20% had net closings, and ~60% maintained the store fleet
stable.
Tier 4 - 5 Aliansce BR Malls Iguatemi Multiplan Sonae
Sierra Total
Net closings 18% 22% 20% 23% 18% 21%
Net openings 19% 21% 21% 23% 18% 21%
Nil 63% 57% 60% 54% 64% 59%
Larger Number of Top-Tier Tenants Still Expanding In the Lower-Tier Cluster, Dynamics Seem Worse
Breakdown of top-tier brands with net openings; Apparel
remains very representative
42%
6% 24%
18%
10%
46%
8%
21%
9%
16%
Higher share of food and services in the top-tier net openings
Food and miscellaneous (mainly cosmetics and beauty) are the highlights in terms of
top-tier net openings
Tier 1 - 2 Aliansce BR Malls Iguatemi Multiplan Sonae
Sierra Total
Net closings 25% 30% 22% 25% 16% 25%
Net openings 28% 37% 23% 31% 20% 30%
Nil 47% 33% 54% 44% 64% 45%
Source: Credit Suisse Research
Apparel
Home,
Office & Electronics
Food Court
Services
Miscellaneous
50%
9%
18%
10%
13%
6
24 March 2016
What Are the Outperforming Brands that Could Fill Future Vacant Space?
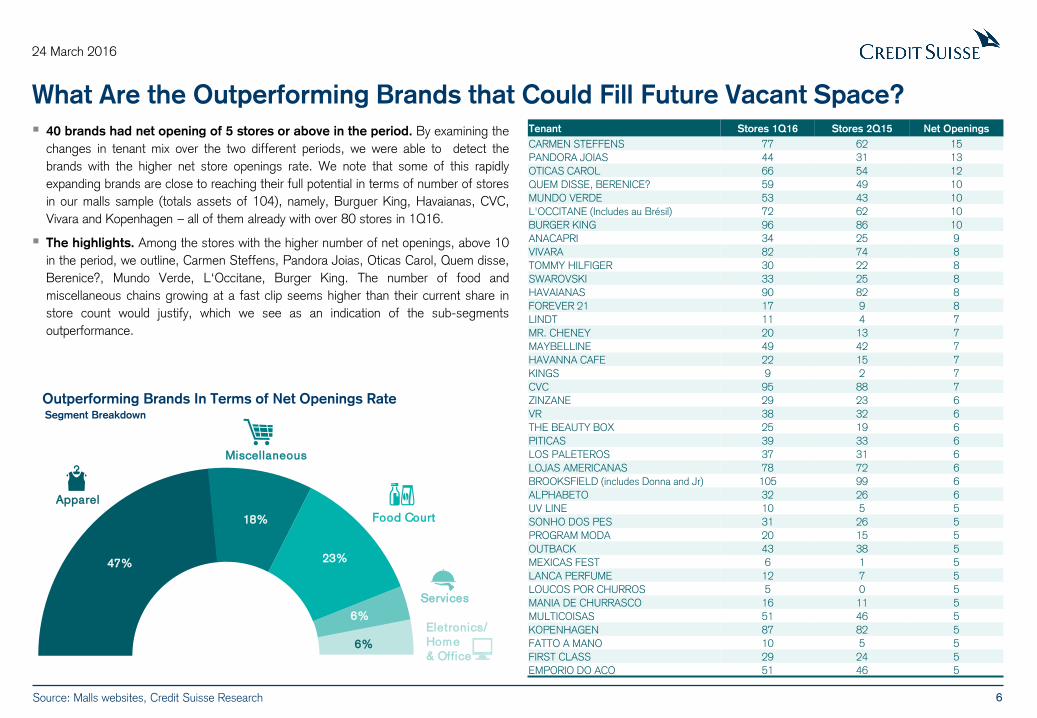
40 brands had net opening of 5 stores or above in the period. By examining the
changes in tenant mix over the two different periods, we were able to detect the
brands with the higher net store openings rate. We note that some of this rapidly
expanding brands are close to reaching their full potential in terms of number of stores
in our malls sample (totals assets of 104), namely, Burguer King, Havaianas, CVC,
Vivara and Kopenhagen – all of them already with over 80 stores in 1Q16.
The highlights. Among the stores with the higher number of net openings, above 10
in the period, we outline, Carmen Steffens, Pandora Joias, Oticas Carol, Quem disse,
Berenice?, Mundo Verde, L‘Occitane, Burger King. The number of food and
miscellaneous chains growing at a fast clip seems higher than their current share in
store count would justify, which we see as an indication of the sub-segments
outperformance.
Tenant Stores 1Q16 Stores 2Q15 Net Openings
CARMEN STEFFENS 77 62 15
PANDORA JOIAS 44 31 13
OTICAS CAROL 66 54 12
QUEM DISSE, BERENICE? 59 49 10
MUNDO VERDE 53 43 10
L'OCCITANE (Includes au Brésil) 72 62 10
BURGER KING 96 86 10
ANACAPRI 34 25 9
VIVARA 82 74 8
TOMMY HILFIGER 30 22 8
SWAROVSKI 33 25 8
HAVAIANAS 90 82 8
FOREVER 21 17 9 8
LINDT 11 4 7
MR. CHENEY 20 13 7
MAYBELLINE 49 42 7
HAVANNA CAFE 22 15 7
KINGS 9 2 7
CVC 95 88 7
ZINZANE 29 23 6
VR 38 32 6
THE BEAUTY BOX 25 19 6
PITICAS 39 33 6
LOS PALETEROS 37 31 6
LOJAS AMERICANAS 78 72 6
BROOKSFIELD (includes Donna and Jr) 105 99 6
ALPHABETO 32 26 6
UV LINE 10 5 5
SONHO DOS PES 31 26 5
PROGRAM MODA 20 15 5
OUTBACK 43 38 5
MEXICAS FEST 6 1 5
LANCA PERFUME 12 7 5
LOUCOS POR CHURROS 5 0 5
MANIA DE CHURRASCO 16 11 5
MULTICOISAS 51 46 5
KOPENHAGEN 87 82 5
FATTO A MANO 10 5 5
FIRST CLASS 29 24 5
EMPORIO DO ACO 51 46 5
Outperforming Brands In Terms of Net Openings Rate
Source: Malls websites, Credit Suisse Research
Apparel
Eletronics/
Home
& Office
Services
Food Court
47%
18%
23%
6%
6%
Miscellaneous
Segment Breakdown
7
24 March 2016
What Are the Main Brands Downsizing Their Store Fleet?
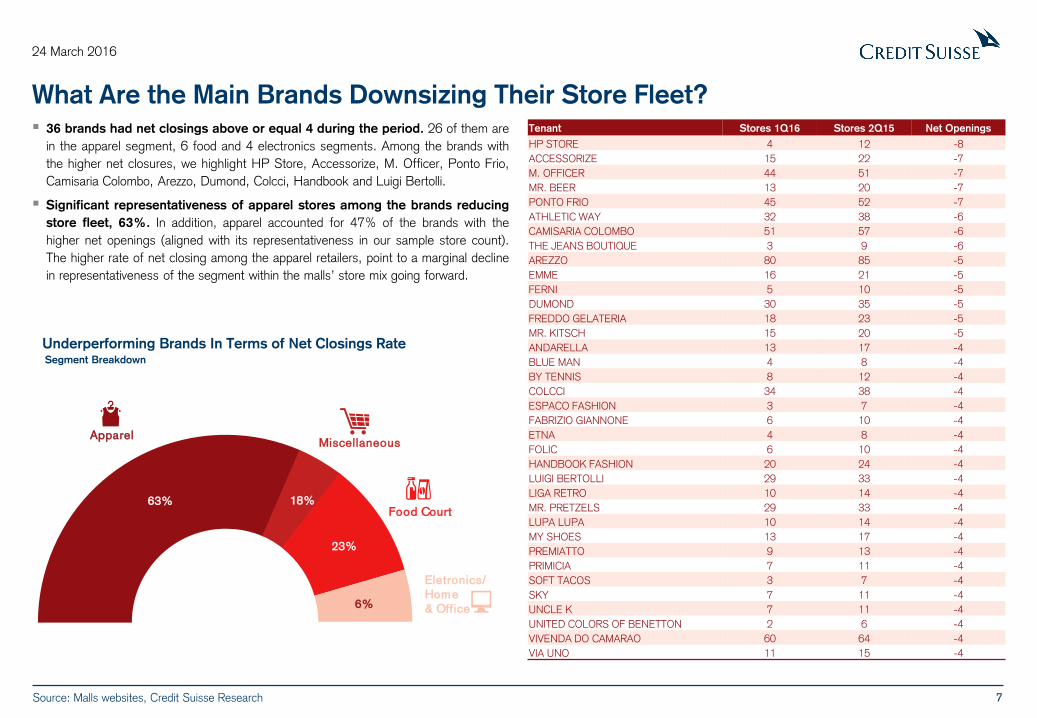
36 brands had net closings above or equal 4 during the period. 26 of them are
in the apparel segment, 6 food and 4 electronics segments. Among the brands with
the higher net closures, we highlight HP Store, Accessorize, M. Officer, Ponto Frio,
Camisaria Colombo, Arezzo, Dumond, Colcci, Handbook and Luigi Bertolli.
Significant representativeness of apparel stores among the brands reducing
store fleet, 63%. In addition, apparel accounted for 47% of the brands with the
higher net openings (aligned with its representativeness in our sample store count).
The higher rate of net closing among the apparel retailers, point to a marginal decline
in representativeness of the segment within the malls’ store mix going forward.
Tenant Stores 1Q16 Stores 2Q15 Net Openings
HP STORE 4 12 -8
ACCESSORIZE 15 22 -7
M. OFFICER 44 51 -7
MR. BEER 13 20 -7
PONTO FRIO 45 52 -7
ATHLETIC WAY 32 38 -6
CAMISARIA COLOMBO 51 57 -6
THE JEANS BOUTIQUE 3 9 -6
AREZZO 80 85 -5
EMME 16 21 -5
FERNI 5 10 -5
DUMOND 30 35 -5
FREDDO GELATERIA 18 23 -5
MR. KITSCH 15 20 -5
ANDARELLA 13 17 -4
BLUE MAN 4 8 -4
BY TENNIS 8 12 -4
COLCCI 34 38 -4
ESPACO FASHION 3 7 -4
FABRIZIO GIANNONE 6 10 -4
ETNA 4 8 -4
FOLIC 6 10 -4
HANDBOOK FASHION 20 24 -4
LUIGI BERTOLLI 29 33 -4
LIGA RETRO 10 14 -4
MR. PRETZELS 29 33 -4
LUPA LUPA 10 14 -4
MY SHOES 13 17 -4
PREMIATTO 9 13 -4
PRIMICIA 7 11 -4
SOFT TACOS 3 7 -4
SKY 7 11 -4
UNCLE K 7 11 -4
UNITED COLORS OF BENETTON 2 6 -4
VIVENDA DO CAMARAO 60 64 -4
VIA UNO 11 15 -4
Source: Malls websites, Credit Suisse Research
Apparel
Eletronics/
Home
& Office
Food Court 63% 18%
23%
6%
Miscellaneous
Underperforming Brands In Terms of Net Closings Rate Segment Breakdown
8
24 March 2016
Apparel Still Predominant; Food Court Gaining Ground
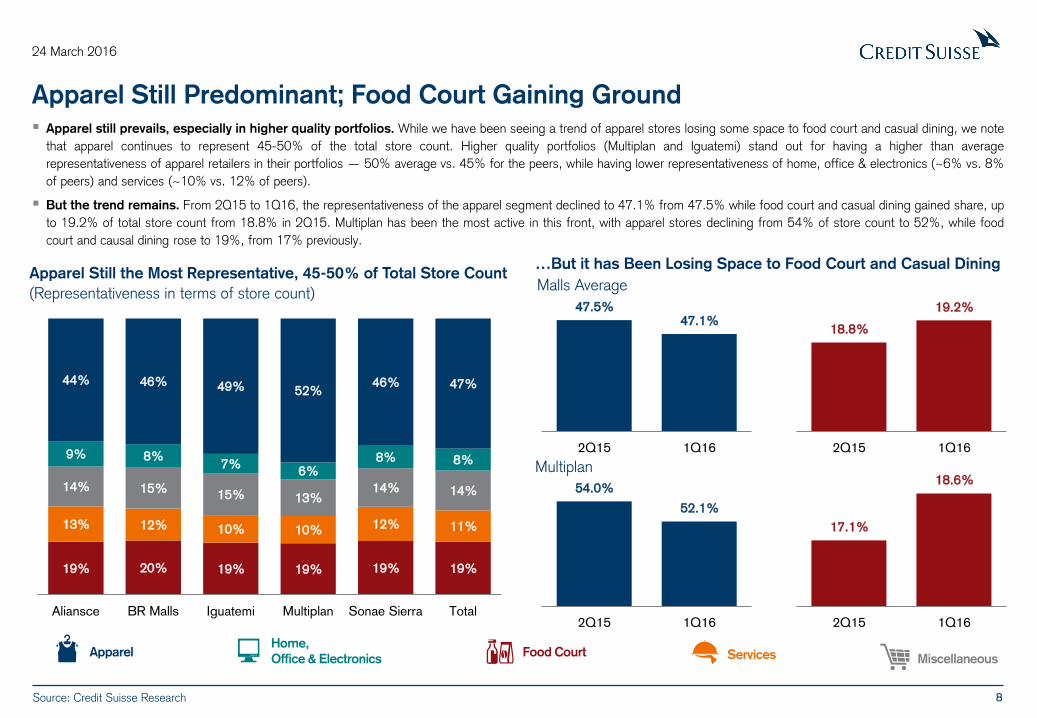
Apparel still prevails, especially in higher quality portfolios. While we have been seeing a trend of apparel stores losing some space to food court and casual dining, we note
that apparel continues to represent 45-50% of the total store count. Higher quality portfolios (Multiplan and Iguatemi) stand out for having a higher than average
representativeness of apparel retailers in their portfolios — 50% average vs. 45% for the peers, while having lower representativeness of home, office & electronics (~6% vs. 8%
of peers) and services (~10% vs. 12% of peers).
But the trend remains. From 2Q15 to 1Q16, the representativeness of the apparel segment declined to 47.1% from 47.5% while food court and casual dining gained share, up
to 19.2% of total store count from 18.8% in 2Q15. Multiplan has been the most active in this front, with apparel stores declining from 54% of store count to 52%, while food
court and causal dining rose to 19%, from 17% previously.
Apparel Home,
Office & Electronics Food Court Services Miscellaneous
47.5% 47.1%
2Q15 1Q16
18.8%
19.2%
2Q15 1Q16
Apparel Still the Most Representative, 45-50% of Total Store Count
(Representativeness in terms of store count)
…But it has Been Losing Space to Food Court and Casual Dining
Malls Average
Multiplan
54.0%
52.1%
2Q15 1Q16
17.1%
18.6%
2Q15 1Q16
19% 20% 19% 19% 19% 19%
13% 12% 10% 10% 12% 11%
14% 15% 15% 13%
14% 14%
9% 8% 7%
6% 8% 8%
44% 46% 49% 52% 46% 47%
Aliansce BR Malls Iguatemi Multiplan Sonae Sierra Total
Source: Credit Suisse Research
9
24 March 2016
6,225
2,343
2,051
2,837
8,176
5,235
646
270
172
215
Tier 5 (1≤N≤2)
Tier 4 (3≤N≤5)
Tier 3 (6≤N≤10)
Tier 2 (10<N≤25)
Tier 1 (N>25)
Total Brands Total Stores
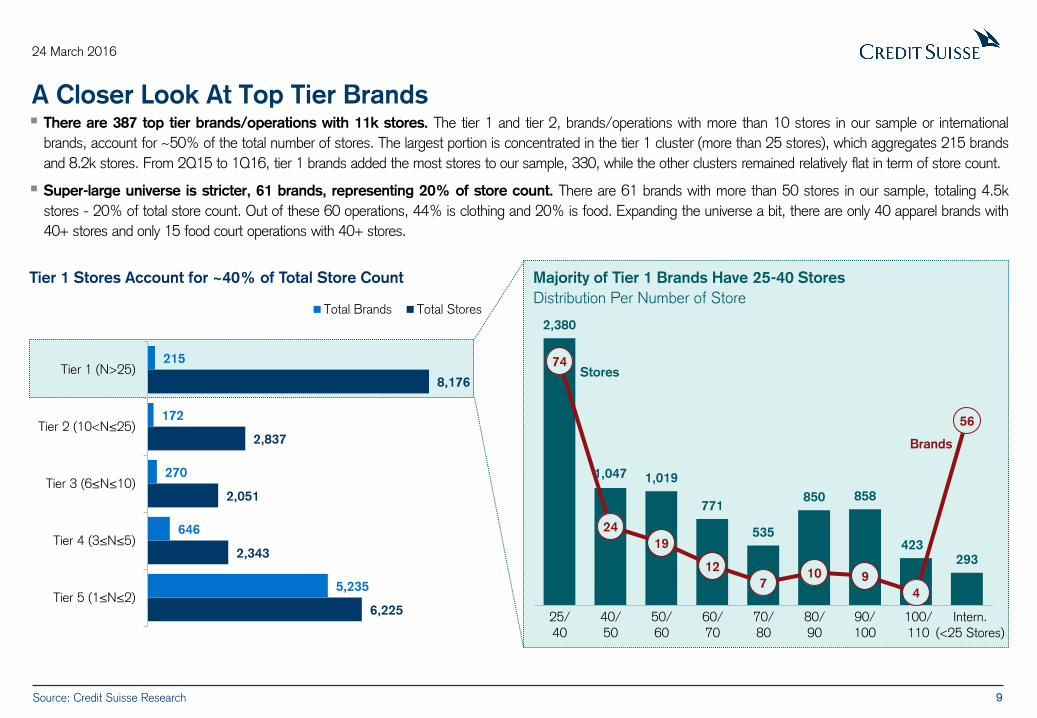
A Closer Look At Top Tier Brands There are 387 top tier brands/operations with 11k stores. The tier 1 and tier 2, brands/operations with more than 10 stores in our sample or international
brands, account for ~50% of the total number of stores. The largest portion is concentrated in the tier 1 cluster (more than 25 stores), which aggregates 215 brands
and 8.2k stores. From 2Q15 to 1Q16, tier 1 brands added the most stores to our sample, 330, while the other clusters remained relatively flat in term of store count.
Super-large universe is stricter, 61 brands, representing 20% of store count. There are 61 brands with more than 50 stores in our sample, totaling 4.5k
stores - 20% of total store count. Out of these 60 operations, 44% is clothing and 20% is food. Expanding the universe a bit, there are only 40 apparel brands with
40+ stores and only 15 food court operations with 40+ stores.
Tier 1 Stores Account for ~40% of Total Store Count Majority of Tier 1 Brands Have 25-40 Stores
2,380
1,047 1,019
771
535
850 858
423
293
74
24
19
12
7 10 9
4
56
25/
40
40/
50
50/
60
60/
70
70/
80
80/
90
90/
100
100/
110
Intern.
(<25 Stores)
Brands
Stores
Distribution Per Number of Store
Source: Credit Suisse Research
10
24 March 2016
-20%
-10%
0%
10%
20%
30%
40%
1Q
01
4Q
01
3Q
02
2Q
03
1Q
04
4Q
04
3Q
05
2Q
06
1Q
07
4Q
07
3Q
08
2Q
09
1Q
10
4Q
10
3Q
11
2Q
12
1Q
13
4Q
13
3Q
14
2Q
15
rea
l sa
les g
row
th y
oy
Apparel Home Appliances
Financial Health Of Large and Mid-Sized Retailers Isn’t What It Used to Be
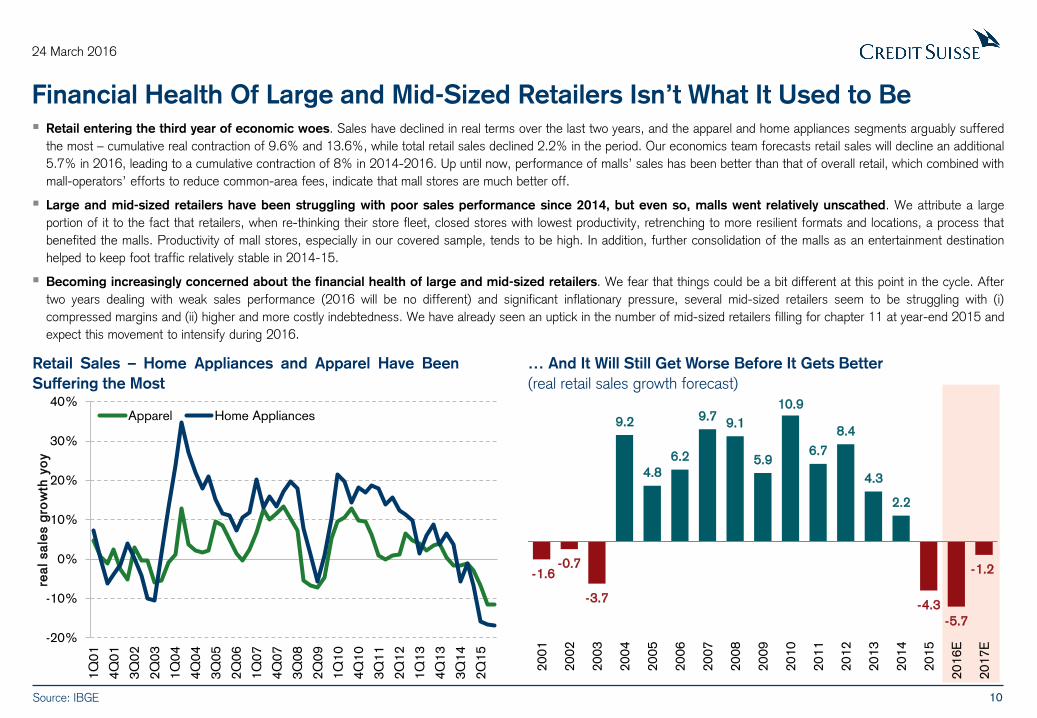
Retail entering the third year of economic woes. Sales have declined in real terms over the last two years, and the apparel and home appliances segments arguably suffered
the most – cumulative real contraction of 9.6% and 13.6%, while total retail sales declined 2.2% in the period. Our economics team forecasts retail sales will decline an additional
5.7% in 2016, leading to a cumulative contraction of 8% in 2014-2016. Up until now, performance of malls’ sales has been better than that of overall retail, which combined with
mall-operators’ efforts to reduce common-area fees, indicate that mall stores are much better off.
Large and mid-sized retailers have been struggling with poor sales performance since 2014, but even so, malls went relatively unscathed. We attribute a large
portion of it to the fact that retailers, when re-thinking their store fleet, closed stores with lowest productivity, retrenching to more resilient formats and locations, a process that
benefited the malls. Productivity of mall stores, especially in our covered sample, tends to be high. In addition, further consolidation of the malls as an entertainment destination
helped to keep foot traffic relatively stable in 2014-15.
Becoming increasingly concerned about the financial health of large and mid-sized retailers. We fear that things could be a bit different at this point in the cycle. After
two years dealing with weak sales performance (2016 will be no different) and significant inflationary pressure, several mid-sized retailers seem to be struggling with (i)
compressed margins and (ii) higher and more costly indebtedness. We have already seen an uptick in the number of mid-sized retailers filling for chapter 11 at year-end 2015 and
expect this movement to intensify during 2016.
Source: IBGE
Retail Sales – Home Appliances and Apparel Have Been
Suffering the Most
… And It Will Still Get Worse Before It Gets Better
(real retail sales growth forecast)
-1.6 -0.7
-3.7
9.2
4.8
6.2
9.7 9.1
5.9
10.9
6.7
8.4
4.3
2.2
-4.3
-5.7
-1.2
20
01
20
02
20
03
20
04
20
05
20
06
20
07
20
08
20
09
20
10
20
11
20
12
20
13
20
14
20
15
20
16E
20
17E
11
24 March 2016
One-Third of Large Retailers Are Facing Some Kind of Financial Hardship
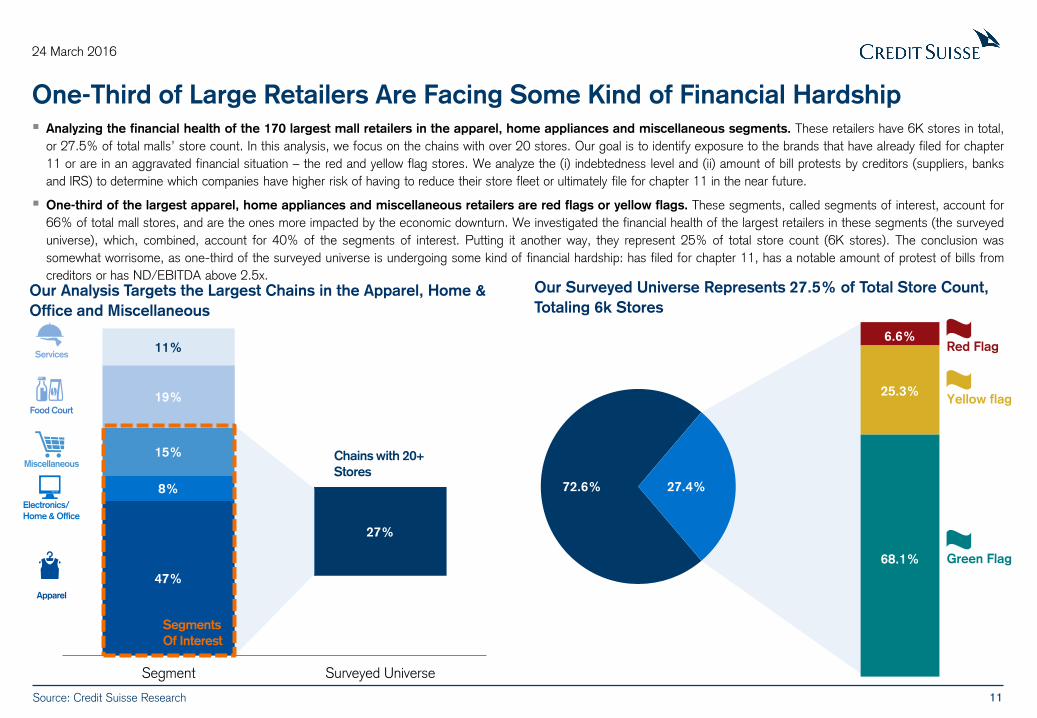
Analyzing the financial health of the 170 largest mall retailers in the apparel, home appliances and miscellaneous segments. These retailers have 6K stores in total,
or 27.5% of total malls’ store count. In this analysis, we focus on the chains with over 20 stores. Our goal is to identify exposure to the brands that have already filed for chapter
11 or are in an aggravated financial situation – the red and yellow flag stores. We analyze the (i) indebtedness level and (ii) amount of bill protests by creditors (suppliers, banks
and IRS) to determine which companies have higher risk of having to reduce their store fleet or ultimately file for chapter 11 in the near future.
One-third of the largest apparel, home appliances and miscellaneous retailers are red flags or yellow flags. These segments, called segments of interest, account for
66% of total mall stores, and are the ones more impacted by the economic downturn. We investigated the financial health of the largest retailers in these segments (the surveyed
universe), which, combined, account for 40% of the segments of interest. Putting it another way, they represent 25% of total store count (6K stores). The conclusion was
somewhat worrisome, as one-third of the surveyed universe is undergoing some kind of financial hardship: has filed for chapter 11, has a notable amount of protest of bills from
creditors or has ND/EBITDA above 2.5x.
Our Analysis Targets the Largest Chains in the Apparel, Home &
Office and Miscellaneous
Our Surveyed Universe Represents 27.5% of Total Store Count,
Totaling 6k Stores
Source: Credit Suisse Research
Red Flag
Yellow flag
Green Flag
6.6%
25.3%
68.1%
27.4% 72.6%
Apparel
Electronics/
Home & Office
Miscellaneous
Food Court
Services
47%
8%
15%
19%
11%
27%
Segment Surveyed Universe
Segments
Of Interest
Chains with 20+
Stores
12
24 March 2016
Red Flag,
6.7%
Yellow Flag,
24.6%
Other, 69%
Red Flags Represent 6.5% of Surveyed Universe and 2% of Total Store Count
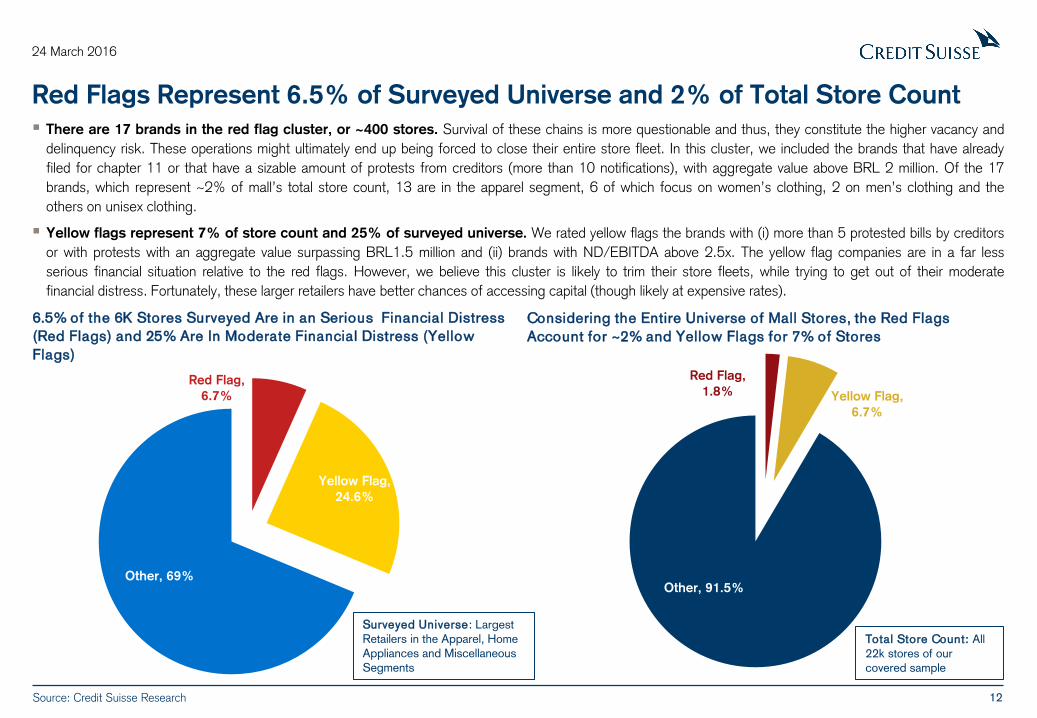
There are 17 brands in the red flag cluster, or ~400 stores. Survival of these chains is more questionable and thus, they constitute the higher vacancy and
delinquency risk. These operations might ultimately end up being forced to close their entire store fleet. In this cluster, we included the brands that have already
filed for chapter 11 or that have a sizable amount of protests from creditors (more than 10 notifications), with aggregate value above BRL 2 million. Of the 17
brands, which represent ~2% of mall’s total store count, 13 are in the apparel segment, 6 of which focus on women’s clothing, 2 on men’s clothing and the
others on unisex clothing.
Yellow flags represent 7% of store count and 25% of surveyed universe. We rated yellow flags the brands with (i) more than 5 protested bills by creditors
or with protests with an aggregate value surpassing BRL1.5 million and (ii) brands with ND/EBITDA above 2.5x. The yellow flag companies are in a far less
serious financial situation relative to the red flags. However, we believe this cluster is likely to trim their store fleets, while trying to get out of their moderate
financial distress. Fortunately, these larger retailers have better chances of accessing capital (though likely at expensive rates).
6.5% of the 6K Stores Surveyed Are in an Serious Financial Distress
(Red Flags) and 25% Are In Moderate Financial Distress (Yellow
Flags)
Considering the Entire Universe of Mall Stores, the Red Flags
Account for ~2% and Yellow Flags for 7% of Stores
Source: Credit Suisse Research
Red Flag,
1.8% Yellow Flag,
6.7%
Other, 91.5%
Surveyed Universe: Largest
Retailers in the Apparel, Home
Appliances and Miscellaneous
Segments
Total Store Count: All
22k stores of our
covered sample
13
24 March 2016
~35% of Apparel Segment Is Facing Financial Difficulty
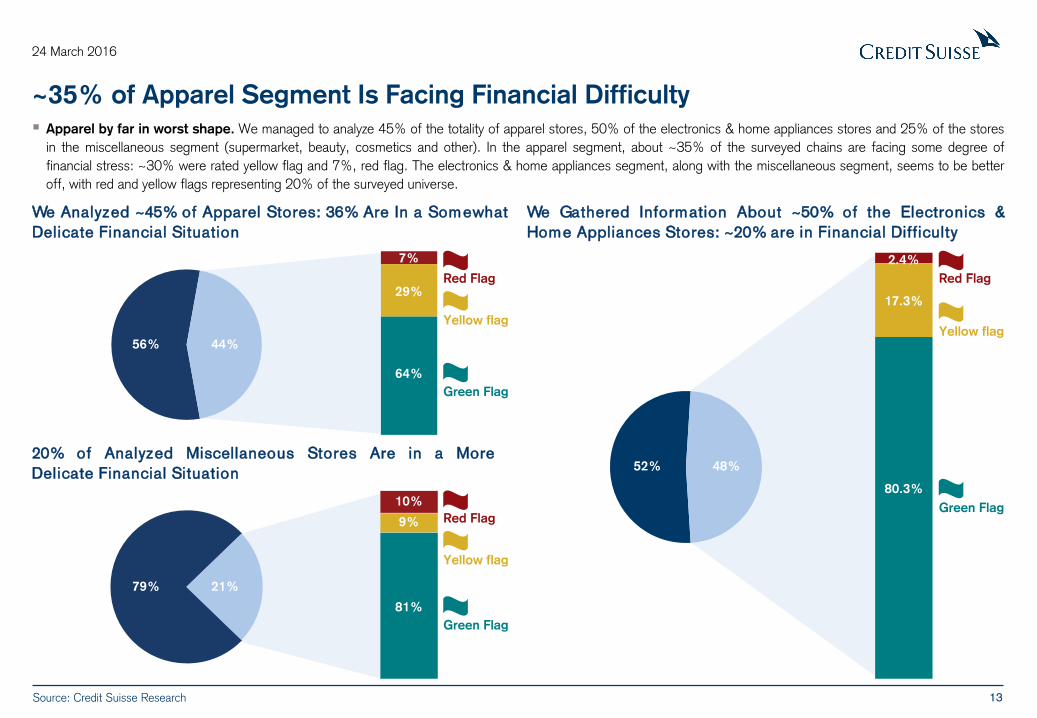
Apparel by far in worst shape. We managed to analyze 45% of the totality of apparel stores, 50% of the electronics & home appliances stores and 25% of the stores
in the miscellaneous segment (supermarket, beauty, cosmetics and other). In the apparel segment, about ~35% of the surveyed chains are facing some degree of
financial stress: ~30% were rated yellow flag and 7%, red flag. The electronics & home appliances segment, along with the miscellaneous segment, seems to be better
off, with red and yellow flags representing 20% of the surveyed universe.
We Analyzed ~45% of Apparel Stores: 36% Are In a Somewhat
Delicate Financial Situation
We Gathered Information About ~50% of the Electronics &
Home Appliances Stores: ~20% are in Financial Difficulty
Source: Credit Suisse Research
20% of Analyzed Miscellaneous Stores Are in a More
Delicate Financial Situation
Red Flag
Yellow flag
Green Flag
Red Flag
Yellow flag
Green Flag
7%
29%
64%
10%
9%
81%
44%
21%
56%
79%
Red Flag
Yellow flag
Green Flag
2.4%
17.3%
80.3%
48% 52%
14
24 March 2016
Assessing total vacancy risk
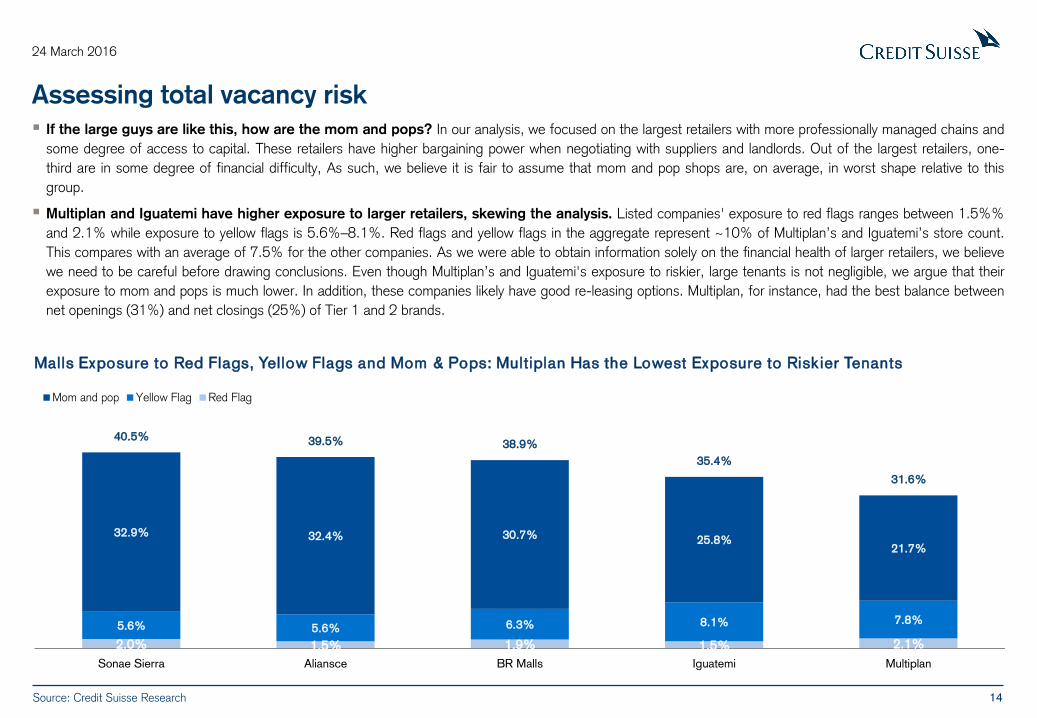
If the large guys are like this, how are the mom and pops? In our analysis, we focused on the largest retailers with more professionally managed chains and
some degree of access to capital. These retailers have higher bargaining power when negotiating with suppliers and landlords. Out of the largest retailers, one-
third are in some degree of financial difficulty, As such, we believe it is fair to assume that mom and pop shops are, on average, in worst shape relative to this
group.
Multiplan and Iguatemi have higher exposure to larger retailers, skewing the analysis. Listed companies' exposure to red flags ranges between 1.5%%
and 2.1% while exposure to yellow flags is 5.6%–8.1%. Red flags and yellow flags in the aggregate represent ~10% of Multiplan’s and Iguatemi’s store count.
This compares with an average of 7.5% for the other companies. As we were able to obtain information solely on the financial health of larger retailers, we believe
we need to be careful before drawing conclusions. Even though Multiplan’s and Iguatemi's exposure to riskier, large tenants is not negligible, we argue that their
exposure to mom and pops is much lower. In addition, these companies likely have good re-leasing options. Multiplan, for instance, had the best balance between
net openings (31%) and net closings (25%) of Tier 1 and 2 brands.
2.0% 1.5% 1.9% 1.5% 2.1%
5.6% 5.6% 6.3% 8.1% 7.8%
32.9% 32.4% 30.7% 25.8% 21.7%
40.5% 39.5% 38.9%
35.4%
31.6%
Sonae Sierra Aliansce BR Malls Iguatemi Multiplan
Mom and pop Yellow Flag Red Flag
Malls Exposure to Red Flags, Yellow Flags and Mom & Pops: Multiplan Has the Lowest Exposure to Riskier Tenants
Source: Credit Suisse Research
15
24 March 2016
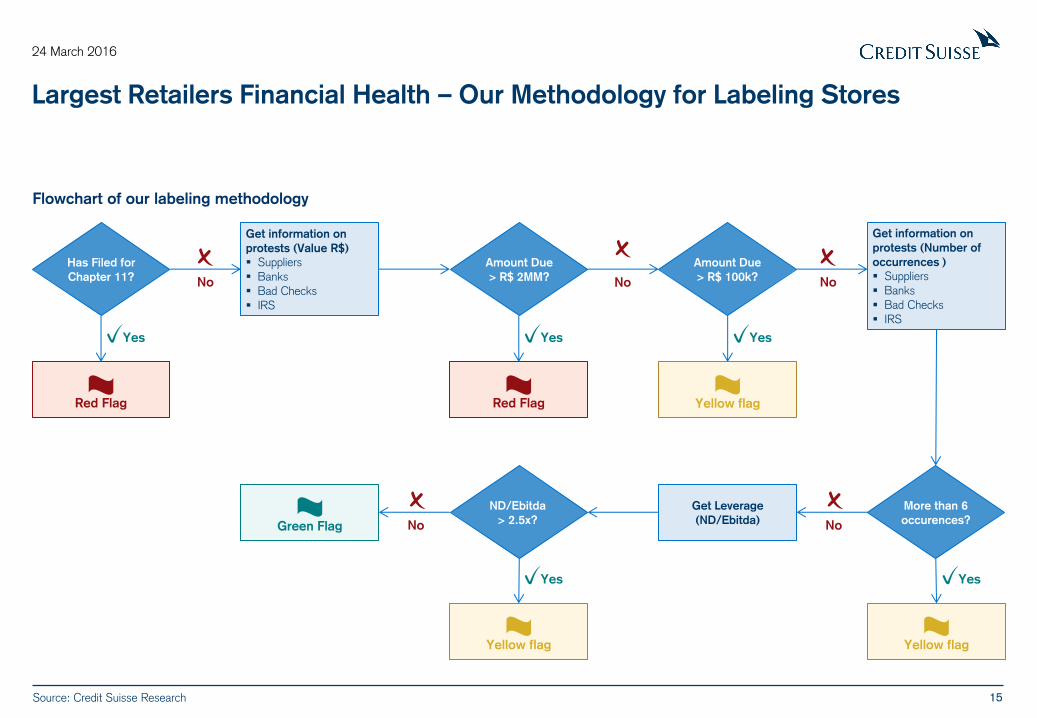
Largest Retailers Financial Health – Our Methodology for Labeling Stores
Flowchart of our labeling methodology
Source: Credit Suisse Research
Get information on
protests (Value R$)
Suppliers Banks Bad Checks
IRS
Get information on
protests (Number of
occurrences )
Suppliers Banks
Bad Checks IRS
Get Leverage
(ND/Ebitda)
Red Flag Yellow flag
Green Flag
Yellow flag Yellow flag
Red Flag
Yes
No No
Yes Yes
No No
Yes Yes
No
Has Filed for
Chapter 11?
Amount Due
> R$ 2MM?
Amount Due
> R$ 100k?
ND/Ebitda
> 2.5x?
More than 6
occurences?
16
24 March 2016
New vs. Old Estimates
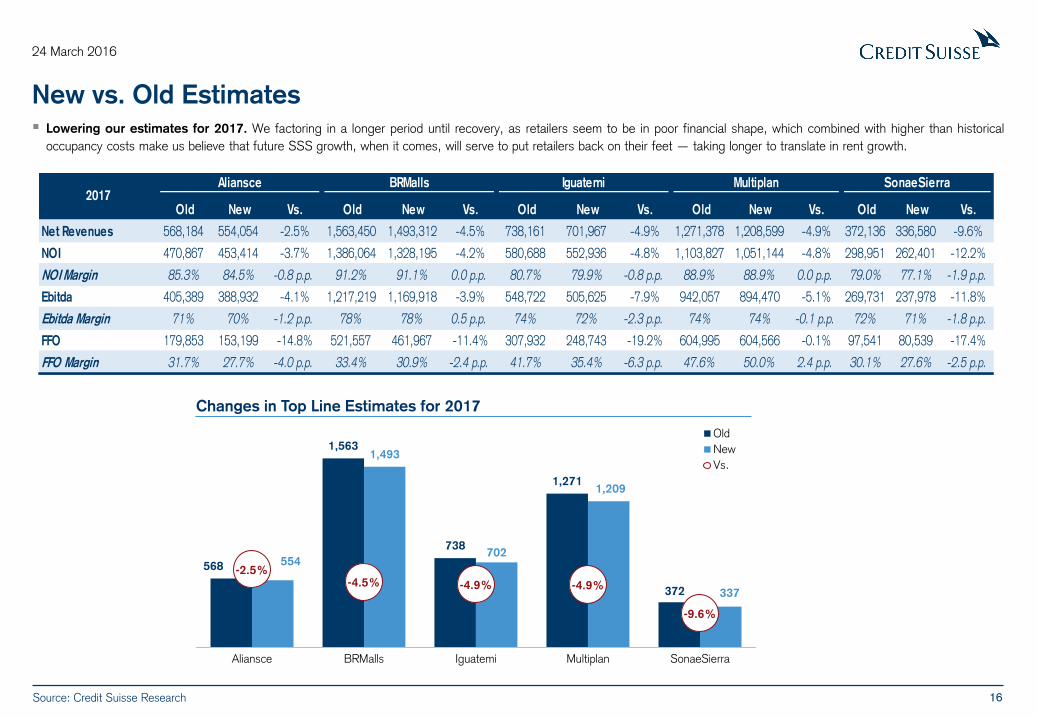
Lowering our estimates for 2017. We factoring in a longer period until recovery, as retailers seem to be in poor financial shape, which combined with higher than historical
occupancy costs make us believe that future SSS growth, when it comes, will serve to put retailers back on their feet — taking longer to translate in rent growth.
Old New Vs. Old New Vs. Old New Vs. Old New Vs. Old New Vs.
Net Revenues 568,184 554,054 -2.5% 1,563,450 1,493,312 -4.5% 738,161 701,967 -4.9% 1,271,378 1,208,599 -4.9% 372,136 336,580 -9.6%
NOI 470,867 453,414 -3.7% 1,386,064 1,328,195 -4.2% 580,688 552,936 -4.8% 1,103,827 1,051,144 -4.8% 298,951 262,401 -12.2%
NOI Margin 85.3% 84.5% -0.8 p.p. 91.2% 91.1% 0.0 p.p. 80.7% 79.9% -0.8 p.p. 88.9% 88.9% 0.0 p.p. 79.0% 77.1% -1.9 p.p.
Ebitda 405,389 388,932 -4.1% 1,217,219 1,169,918 -3.9% 548,722 505,625 -7.9% 942,057 894,470 -5.1% 269,731 237,978 -11.8%
Ebitda Margin 71% 70% -1.2 p.p. 78% 78% 0.5 p.p. 74% 72% -2.3 p.p. 74% 74% -0.1 p.p. 72% 71% -1.8 p.p.
FFO 179,853 153,199 -14.8% 521,557 461,967 -11.4% 307,932 248,743 -19.2% 604,995 604,566 -0.1% 97,541 80,539 -17.4%
FFO Margin 31.7% 27.7% -4.0 p.p. 33.4% 30.9% -2.4 p.p. 41.7% 35.4% -6.3 p.p. 47.6% 50.0% 2.4 p.p. 30.1% 27.6% -2.5 p.p.
SonaeSierra2017
Aliansce BRMalls Iguatemi Multiplan
568
1,563
738
1,271
372
554
1,493
702
1,209
337
-2.5% -4.5% -4.9% -4.9%
-9.6%
Aliansce BRMalls Iguatemi Multiplan SonaeSierra
Old
New
Vs.
Changes in Top Line Estimates for 2017
Source: Credit Suisse Research
17
24 March 2016
Aliansce: Overview
Source: Malls websites, Credit Suisse Research
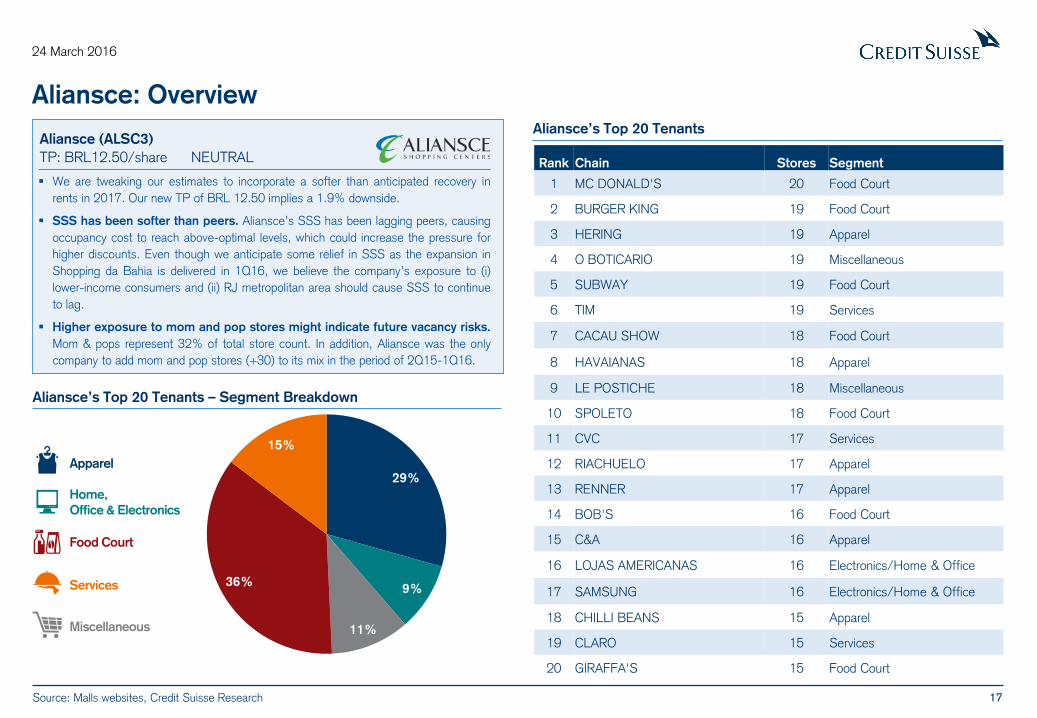
We are tweaking our estimates to incorporate a softer than anticipated recovery in
rents in 2017. Our new TP of BRL 12.50 implies a 1.9% downside.
SSS has been softer than peers. Aliansce’s SSS has been lagging peers, causing
occupancy cost to reach above-optimal levels, which could increase the pressure for
higher discounts. Even though we anticipate some relief in SSS as the expansion in
Shopping da Bahia is delivered in 1Q16, we believe the company’s exposure to (i)
lower-income consumers and (ii) RJ metropolitan area should cause SSS to continue
to lag.
Higher exposure to mom and pop stores might indicate future vacancy risks.
Mom & pops represent 32% of total store count. In addition, Aliansce was the only
company to add mom and pop stores (+30) to its mix in the period of 2Q15-1Q16.
Aliansce’s Top 20 Tenants Aliansce (ALSC3)
TP: BRL12.50/share NEUTRAL Rank Chain Stores Segment
1 MC DONALD'S 20 Food Court
2 BURGER KING 19 Food Court
3 HERING 19 Apparel
4 O BOTICARIO 19 Miscellaneous
5 SUBWAY 19 Food Court
6 TIM 19 Services
7 CACAU SHOW 18 Food Court
8 HAVAIANAS 18 Apparel
9 LE POSTICHE 18 Miscellaneous
10 SPOLETO 18 Food Court
11 CVC 17 Services
12 RIACHUELO 17 Apparel
13 RENNER 17 Apparel
14 BOB'S 16 Food Court
15 C&A 16 Apparel
16 LOJAS AMERICANAS 16 Electronics/Home & Office
17 SAMSUNG 16 Electronics/Home & Office
18 CHILLI BEANS 15 Apparel
19 CLARO 15 Services
20 GIRAFFA'S 15 Food Court
29%
9%
11%
36%
15%
Apparel
Home,
Office & Electronics
Food Court
Services
Miscellaneous
Aliansce’s Top 20 Tenants – Segment Breakdown
18
24 March 2016
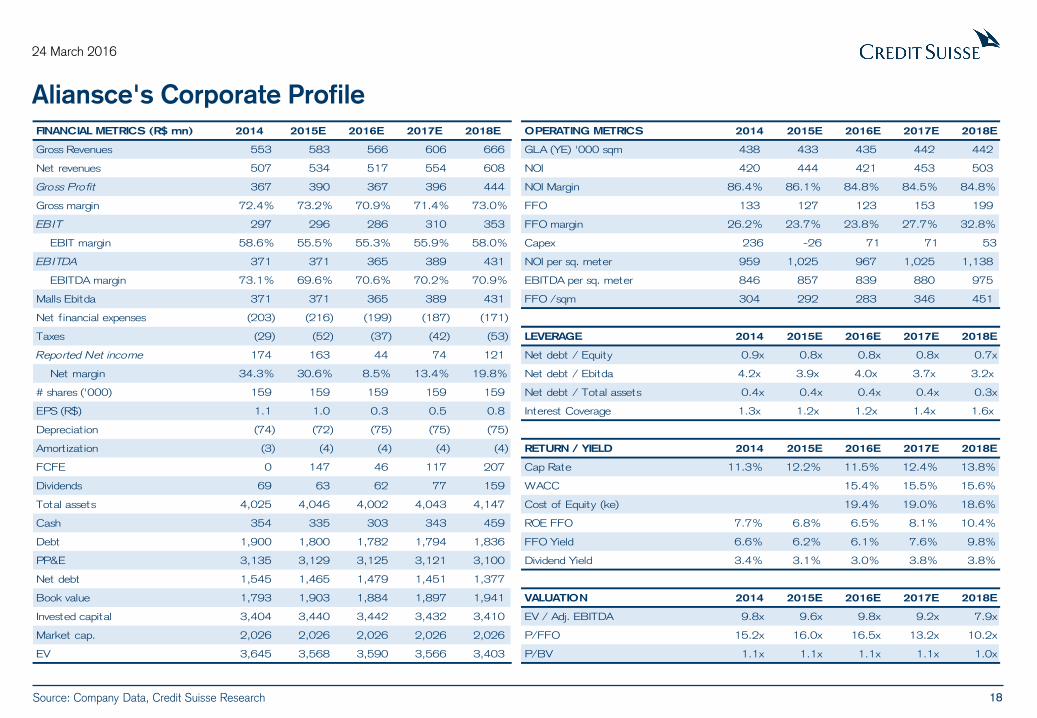
Aliansce's Corporate Profile
Source: Company Data, Credit Suisse Research
FINANCIAL METRICS (R$ mn) 2014 2015E 2016E 2017E 2018E OPERATING METRICS 2014 2015E 2016E 2017E 2018E
Gross Revenues 553 583 566 606 666 GLA (YE) '000 sqm 438 433 435 442 442
Net revenues 507 534 517 554 608 NOI 420 444 421 453 503
Gross Profit 367 390 367 396 444 NOI Margin 86.4% 86.1% 84.8% 84.5% 84.8%
Gross margin 72.4% 73.2% 70.9% 71.4% 73.0% FFO 133 127 123 153 199
EBIT 297 296 286 310 353 FFO margin 26.2% 23.7% 23.8% 27.7% 32.8%
EBIT margin 58.6% 55.5% 55.3% 55.9% 58.0% Capex 236 -26 71 71 53
EBITDA 371 371 365 389 431 NOI per sq. meter 959 1,025 967 1,025 1,138
EBITDA margin 73.1% 69.6% 70.6% 70.2% 70.9% EBITDA per sq. meter 846 857 839 880 975
Malls Ebitda 371 371 365 389 431 FFO /sqm 304 292 283 346 451
Net financial expenses (203) (216) (199) (187) (171)
Taxes (29) (52) (37) (42) (53) LEVERAGE 2014 2015E 2016E 2017E 2018E
Reported Net income 174 163 44 74 121 Net debt / Equity 0.9x 0.8x 0.8x 0.8x 0.7x
Net margin 34.3% 30.6% 8.5% 13.4% 19.8% Net debt / Ebitda 4.2x 3.9x 4.0x 3.7x 3.2x
# shares ('000) 159 159 159 159 159 Net debt / Total assets 0.4x 0.4x 0.4x 0.4x 0.3x
EPS (R$) 1.1 1.0 0.3 0.5 0.8 Interest Coverage 1.3x 1.2x 1.2x 1.4x 1.6x
Depreciat ion (74) (72) (75) (75) (75)
Amort izat ion (3) (4) (4) (4) (4) RETURN / YIELD 2014 2015E 2016E 2017E 2018E
FCFE 0 147 46 117 207 Cap Rate 11.3% 12.2% 11.5% 12.4% 13.8%
Dividends 69 63 62 77 159 WACC 15.4% 15.5% 15.6%
Total assets 4,025 4,046 4,002 4,043 4,147 Cost of Equity (ke) 19.4% 19.0% 18.6%
Cash 354 335 303 343 459 ROE FFO 7.7% 6.8% 6.5% 8.1% 10.4%
Debt 1,900 1,800 1,782 1,794 1,836 FFO Yield 6.6% 6.2% 6.1% 7.6% 9.8%
PP&E 3,135 3,129 3,125 3,121 3,100 Dividend Yield 3.4% 3.1% 3.0% 3.8% 3.8%
Net debt 1,545 1,465 1,479 1,451 1,377
Book value 1,793 1,903 1,884 1,897 1,941 VALUATION 2014 2015E 2016E 2017E 2018E
Invested capital 3,404 3,440 3,442 3,432 3,410 EV / Adj. EBITDA 9.8x 9.6x 9.8x 9.2x 7.9x
Market cap. 2,026 2,026 2,026 2,026 2,026 P/FFO 15.2x 16.0x 16.5x 13.2x 10.2x
EV 3,645 3,568 3,590 3,566 3,403 P/BV 1.1x 1.1x 1.1x 1.1x 1.0x
19
24 March 2016
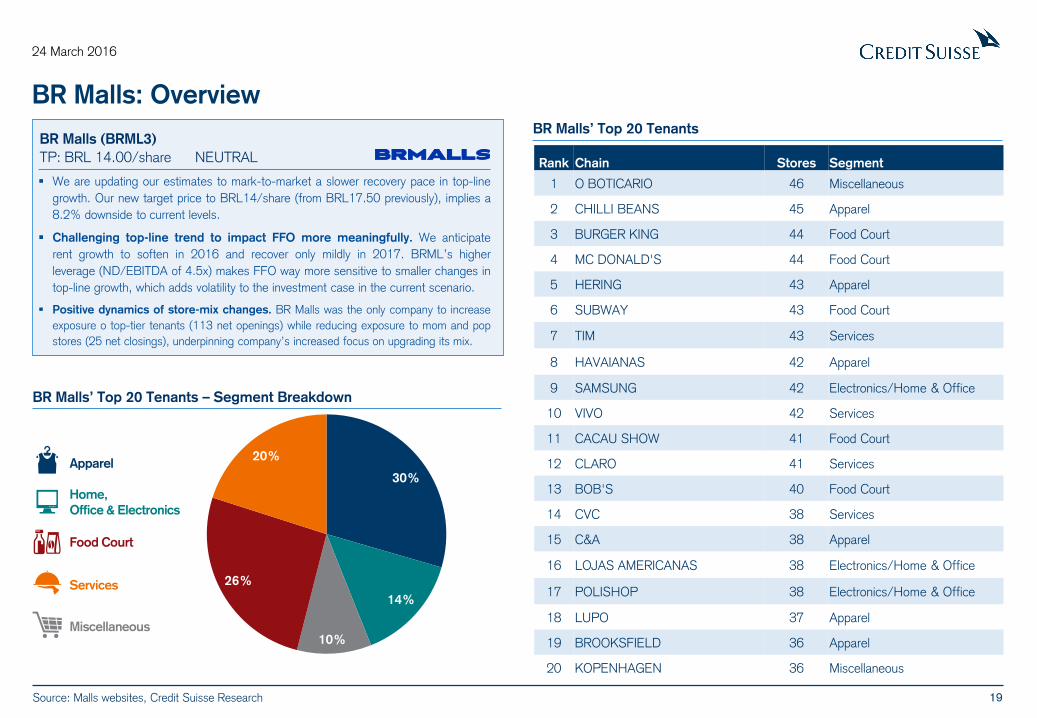
BR Malls: Overview
Source: Malls websites, Credit Suisse Research
We are updating our estimates to mark-to-market a slower recovery pace in top-line
growth. Our new target price to BRL14/share (from BRL17.50 previously), implies a
8.2% downside to current levels.
Challenging top-line trend to impact FFO more meaningfully. We anticipate
rent growth to soften in 2016 and recover only mildly in 2017. BRML’s higher
leverage (ND/EBITDA of 4.5x) makes FFO way more sensitive to smaller changes in
top-line growth, which adds volatility to the investment case in the current scenario.
Positive dynamics of store-mix changes. BR Malls was the only company to increase
exposure o top-tier tenants (113 net openings) while reducing exposure to mom and pop
stores (25 net closings), underpinning company’s increased focus on upgrading its mix.
BR Malls (BRML3)
TP: BRL 14.00/share NEUTRAL
BR Malls’ Top 20 Tenants
Rank Chain Stores Segment
1 O BOTICARIO 46 Miscellaneous
2 CHILLI BEANS 45 Apparel
3 BURGER KING 44 Food Court
4 MC DONALD'S 44 Food Court
5 HERING 43 Apparel
6 SUBWAY 43 Food Court
7 TIM 43 Services
8 HAVAIANAS 42 Apparel
9 SAMSUNG 42 Electronics/Home & Office
10 VIVO 42 Services
11 CACAU SHOW 41 Food Court
12 CLARO 41 Services
13 BOB'S 40 Food Court
14 CVC 38 Services
15 C&A 38 Apparel
16 LOJAS AMERICANAS 38 Electronics/Home & Office
17 POLISHOP 38 Electronics/Home & Office
18 LUPO 37 Apparel
19 BROOKSFIELD 36 Apparel
20 KOPENHAGEN 36 Miscellaneous
30%
14%
10%
26%
20% Apparel
Home,
Office & Electronics
Food Court
Services
Miscellaneous
BR Malls’ Top 20 Tenants – Segment Breakdown
20
24 March 2016
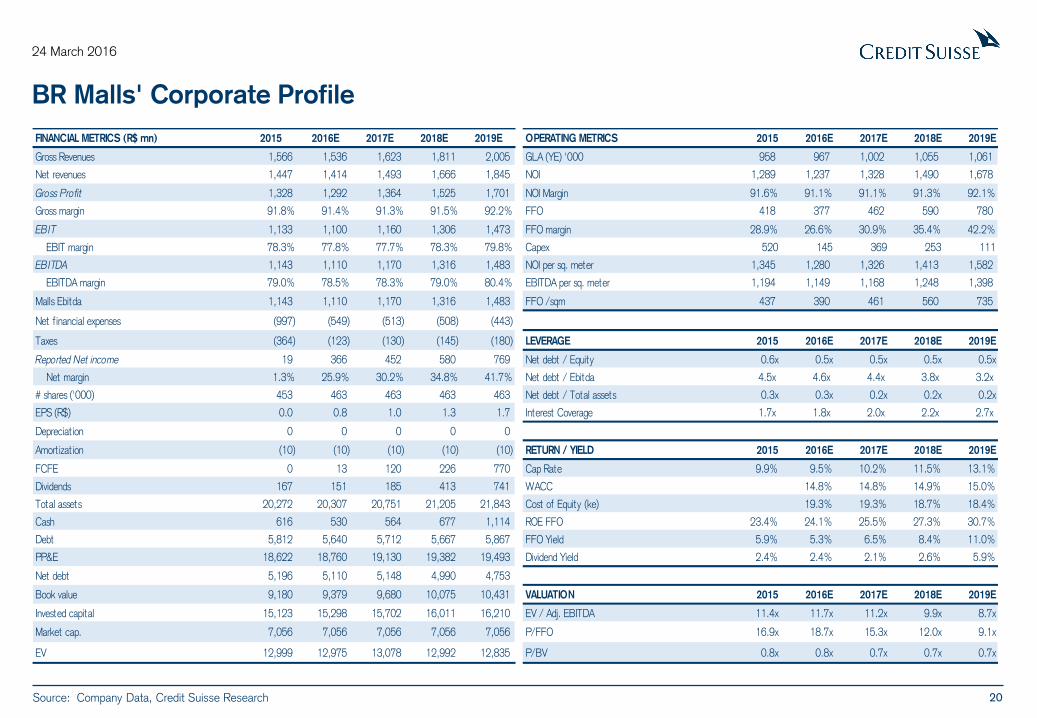
BR Malls' Corporate Profile
Source: Company Data, Credit Suisse Research
FINANCIAL METRICS (R$ mn) 2015 2016E 2017E 2018E 2019E OPERATING METRICS 2015 2016E 2017E 2018E 2019E
Gross Revenues 1,566 1,536 1,623 1,811 2,005 GLA (YE) '000 958 967 1,002 1,055 1,061
Net revenues 1,447 1,414 1,493 1,666 1,845 NOI 1,289 1,237 1,328 1,490 1,678
Gross Profit 1,328 1,292 1,364 1,525 1,701 NOI Margin 91.6% 91.1% 91.1% 91.3% 92.1%
Gross margin 91.8% 91.4% 91.3% 91.5% 92.2% FFO 418 377 462 590 780
EBIT 1,133 1,100 1,160 1,306 1,473 FFO margin 28.9% 26.6% 30.9% 35.4% 42.2%
EBIT margin 78.3% 77.8% 77.7% 78.3% 79.8% Capex 520 145 369 253 111
EBITDA 1,143 1,110 1,170 1,316 1,483 NOI per sq. meter 1,345 1,280 1,326 1,413 1,582
EBITDA margin 79.0% 78.5% 78.3% 79.0% 80.4% EBITDA per sq. meter 1,194 1,149 1,168 1,248 1,398
Malls Ebitda 1,143 1,110 1,170 1,316 1,483 FFO /sqm 437 390 461 560 735
Net financial expenses (997) (549) (513) (508) (443)
Taxes (364) (123) (130) (145) (180) LEVERAGE 2015 2016E 2017E 2018E 2019E
Reported Net income 19 366 452 580 769 Net debt / Equity 0.6x 0.5x 0.5x 0.5x 0.5x
Net margin 1.3% 25.9% 30.2% 34.8% 41.7% Net debt / Ebitda 4.5x 4.6x 4.4x 3.8x 3.2x
# shares ('000) 453 463 463 463 463 Net debt / Total assets 0.3x 0.3x 0.2x 0.2x 0.2x
EPS (R$) 0.0 0.8 1.0 1.3 1.7 Interest Coverage 1.7x 1.8x 2.0x 2.2x 2.7x
Depreciat ion 0 0 0 0 0
Amort izat ion (10) (10) (10) (10) (10) RETURN / YIELD 2015 2016E 2017E 2018E 2019E
FCFE 0 13 120 226 770 Cap Rate 9.9% 9.5% 10.2% 11.5% 13.1%
Dividends 167 151 185 413 741 WACC 14.8% 14.8% 14.9% 15.0%
Total assets 20,272 20,307 20,751 21,205 21,843 Cost of Equity (ke) 19.3% 19.3% 18.7% 18.4%
Cash 616 530 564 677 1,114 ROE FFO 23.4% 24.1% 25.5% 27.3% 30.7%
Debt 5,812 5,640 5,712 5,667 5,867 FFO Yield 5.9% 5.3% 6.5% 8.4% 11.0%
PP&E 18,622 18,760 19,130 19,382 19,493 Dividend Yield 2.4% 2.4% 2.1% 2.6% 5.9%
Net debt 5,196 5,110 5,148 4,990 4,753
Book value 9,180 9,379 9,680 10,075 10,431 VALUATION 2015 2016E 2017E 2018E 2019E
Invested capital 15,123 15,298 15,702 16,011 16,210 EV / Adj. EBITDA 11.4x 11.7x 11.2x 9.9x 8.7x
Market cap. 7,056 7,056 7,056 7,056 7,056 P/FFO 16.9x 18.7x 15.3x 12.0x 9.1x
EV 12,999 12,975 13,078 12,992 12,835 P/BV 0.8x 0.8x 0.7x 0.7x 0.7x
21
24 March 2016
Iguatemi: Overview
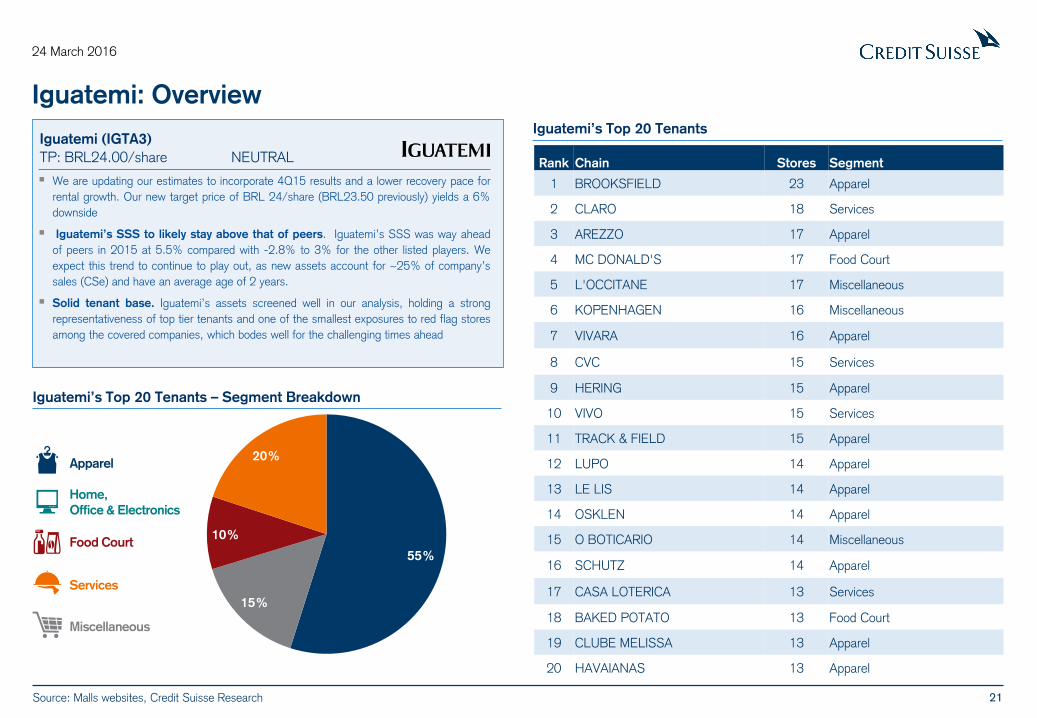
We are updating our estimates to incorporate 4Q15 results and a lower recovery pace for
rental growth. Our new target price of BRL 24/share (BRL23.50 previously) yields a 6%
downside
Iguatemi’s SSS to likely stay above that of peers. Iguatemi’s SSS was way ahead
of peers in 2015 at 5.5% compared with -2.8% to 3% for the other listed players. We
expect this trend to continue to play out, as new assets account for ~25% of company’s
sales (CSe) and have an average age of 2 years.
Solid tenant base. Iguatemi’s assets screened well in our analysis, holding a strong
representativeness of top tier tenants and one of the smallest exposures to red flag stores
among the covered companies, which bodes well for the challenging times ahead
Iguatemi (IGTA3)
TP: BRL24.00/share NEUTRAL
Iguatemi’s Top 20 Tenants
Rank Chain Stores Segment
1 BROOKSFIELD 23 Apparel
2 CLARO 18 Services
3 AREZZO 17 Apparel
4 MC DONALD'S 17 Food Court
5 L'OCCITANE 17 Miscellaneous
6 KOPENHAGEN 16 Miscellaneous
7 VIVARA 16 Apparel
8 CVC 15 Services
9 HERING 15 Apparel
10 VIVO 15 Services
11 TRACK & FIELD 15 Apparel
12 LUPO 14 Apparel
13 LE LIS 14 Apparel
14 OSKLEN 14 Apparel
15 O BOTICARIO 14 Miscellaneous
16 SCHUTZ 14 Apparel
17 CASA LOTERICA 13 Services
18 BAKED POTATO 13 Food Court
19 CLUBE MELISSA 13 Apparel
20 HAVAIANAS 13 Apparel
55%
0%
15%
10%
20% Apparel
Home,
Office & Electronics
Food Court
Services
Miscellaneous
Iguatemi’s Top 20 Tenants – Segment Breakdown
Source: Malls websites, Credit Suisse Research
22
24 March 2016
Iguatemi's Corporate Profile
Source: Company Data, Credit Suisse Research
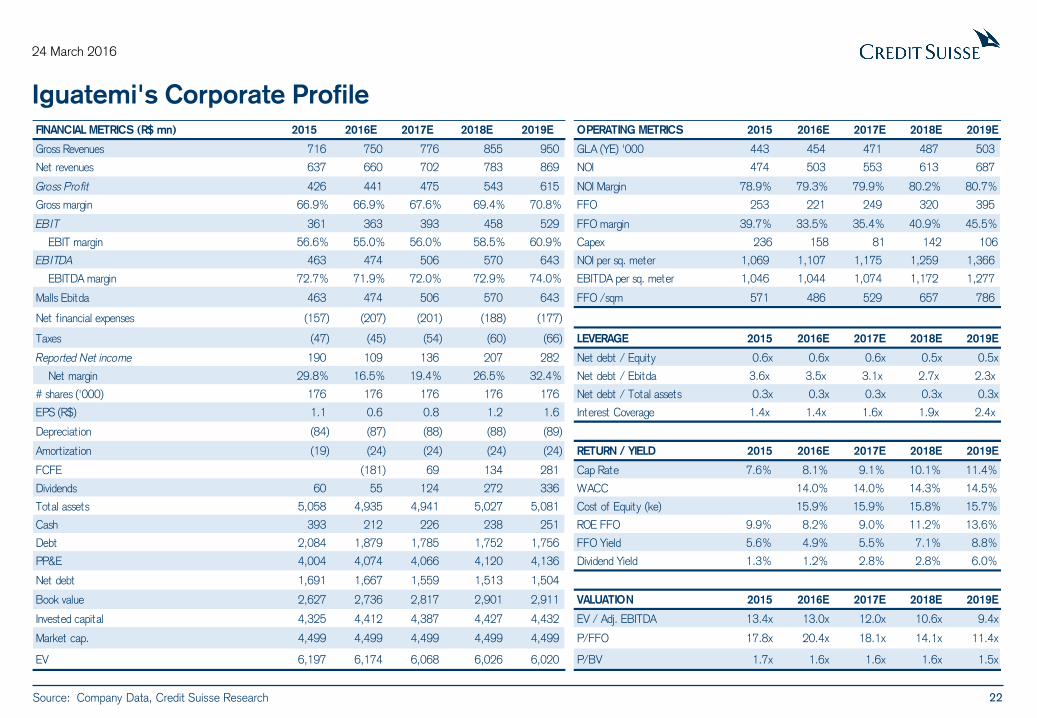
FINANCIAL METRICS (R$ mn) 2015 2016E 2017E 2018E 2019E OPERATING METRICS 2015 2016E 2017E 2018E 2019E
Gross Revenues 716 750 776 855 950 GLA (YE) '000 443 454 471 487 503
Net revenues 637 660 702 783 869 NOI 474 503 553 613 687
Gross Profit 426 441 475 543 615 NOI Margin 78.9% 79.3% 79.9% 80.2% 80.7%
Gross margin 66.9% 66.9% 67.6% 69.4% 70.8% FFO 253 221 249 320 395
EBIT 361 363 393 458 529 FFO margin 39.7% 33.5% 35.4% 40.9% 45.5%
EBIT margin 56.6% 55.0% 56.0% 58.5% 60.9% Capex 236 158 81 142 106
EBITDA 463 474 506 570 643 NOI per sq. meter 1,069 1,107 1,175 1,259 1,366
EBITDA margin 72.7% 71.9% 72.0% 72.9% 74.0% EBITDA per sq. meter 1,046 1,044 1,074 1,172 1,277
Malls Ebitda 463 474 506 570 643 FFO /sqm 571 486 529 657 786
Net financial expenses (157) (207) (201) (188) (177)
Taxes (47) (45) (54) (60) (66) LEVERAGE 2015 2016E 2017E 2018E 2019E
Reported Net income 190 109 136 207 282 Net debt / Equity 0.6x 0.6x 0.6x 0.5x 0.5x
Net margin 29.8% 16.5% 19.4% 26.5% 32.4% Net debt / Ebitda 3.6x 3.5x 3.1x 2.7x 2.3x
# shares ('000) 176 176 176 176 176 Net debt / Total assets 0.3x 0.3x 0.3x 0.3x 0.3x
EPS (R$) 1.1 0.6 0.8 1.2 1.6 Interest Coverage 1.4x 1.4x 1.6x 1.9x 2.4x
Depreciat ion (84) (87) (88) (88) (89)
Amort izat ion (19) (24) (24) (24) (24) RETURN / YIELD 2015 2016E 2017E 2018E 2019E
FCFE (181) 69 134 281 Cap Rate 7.6% 8.1% 9.1% 10.1% 11.4%
Dividends 60 55 124 272 336 WACC 14.0% 14.0% 14.3% 14.5%
Total assets 5,058 4,935 4,941 5,027 5,081 Cost of Equity (ke) 15.9% 15.9% 15.8% 15.7%
Cash 393 212 226 238 251 ROE FFO 9.9% 8.2% 9.0% 11.2% 13.6%
Debt 2,084 1,879 1,785 1,752 1,756 FFO Yield 5.6% 4.9% 5.5% 7.1% 8.8%
PP&E 4,004 4,074 4,066 4,120 4,136 Dividend Yield 1.3% 1.2% 2.8% 2.8% 6.0%
Net debt 1,691 1,667 1,559 1,513 1,504
Book value 2,627 2,736 2,817 2,901 2,911 VALUATION 2015 2016E 2017E 2018E 2019E
Invested capital 4,325 4,412 4,387 4,427 4,432 EV / Adj. EBITDA 13.4x 13.0x 12.0x 10.6x 9.4x
Market cap. 4,499 4,499 4,499 4,499 4,499 P/FFO 17.8x 20.4x 18.1x 14.1x 11.4x
EV 6,197 6,174 6,068 6,026 6,020 P/BV 1.7x 1.6x 1.6x 1.6x 1.5x
23
24 March 2016
Multiplan: Overview
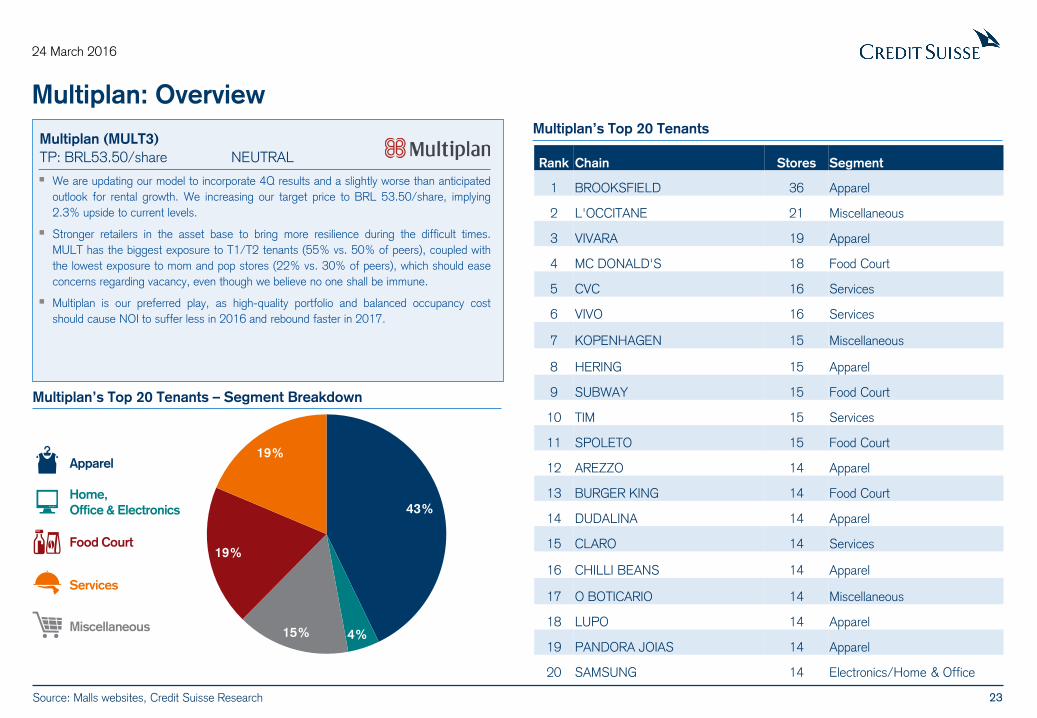
We are updating our model to incorporate 4Q results and a slightly worse than anticipated
outlook for rental growth. We increasing our target price to BRL 53.50/share, implying
2.3% upside to current levels.
Stronger retailers in the asset base to bring more resilience during the difficult times.
MULT has the biggest exposure to T1/T2 tenants (55% vs. 50% of peers), coupled with
the lowest exposure to mom and pop stores (22% vs. 30% of peers), which should ease
concerns regarding vacancy, even though we believe no one shall be immune.
Multiplan is our preferred play, as high-quality portfolio and balanced occupancy cost
should cause NOI to suffer less in 2016 and rebound faster in 2017.
Multiplan (MULT3)
TP: BRL53.50/share NEUTRAL
Multiplan’s Top 20 Tenants
Rank Chain Stores Segment
1 BROOKSFIELD 36 Apparel
2 L'OCCITANE 21 Miscellaneous
3 VIVARA 19 Apparel
4 MC DONALD'S 18 Food Court
5 CVC 16 Services
6 VIVO 16 Services
7 KOPENHAGEN 15 Miscellaneous
8 HERING 15 Apparel
9 SUBWAY 15 Food Court
10 TIM 15 Services
11 SPOLETO 15 Food Court
12 AREZZO 14 Apparel
13 BURGER KING 14 Food Court
14 DUDALINA 14 Apparel
15 CLARO 14 Services
16 CHILLI BEANS 14 Apparel
17 O BOTICARIO 14 Miscellaneous
18 LUPO 14 Apparel
19 PANDORA JOIAS 14 Apparel
20 SAMSUNG 14 Electronics/Home & Office
43%
4% 15%
19%
19% Apparel
Home,
Office & Electronics
Food Court
Services
Miscellaneous
Multiplan’s Top 20 Tenants – Segment Breakdown
Source: Malls websites, Credit Suisse Research
24
24 March 2016
Multiplan's Corporate Profile
Source: Company Data, Credit Suisse Research
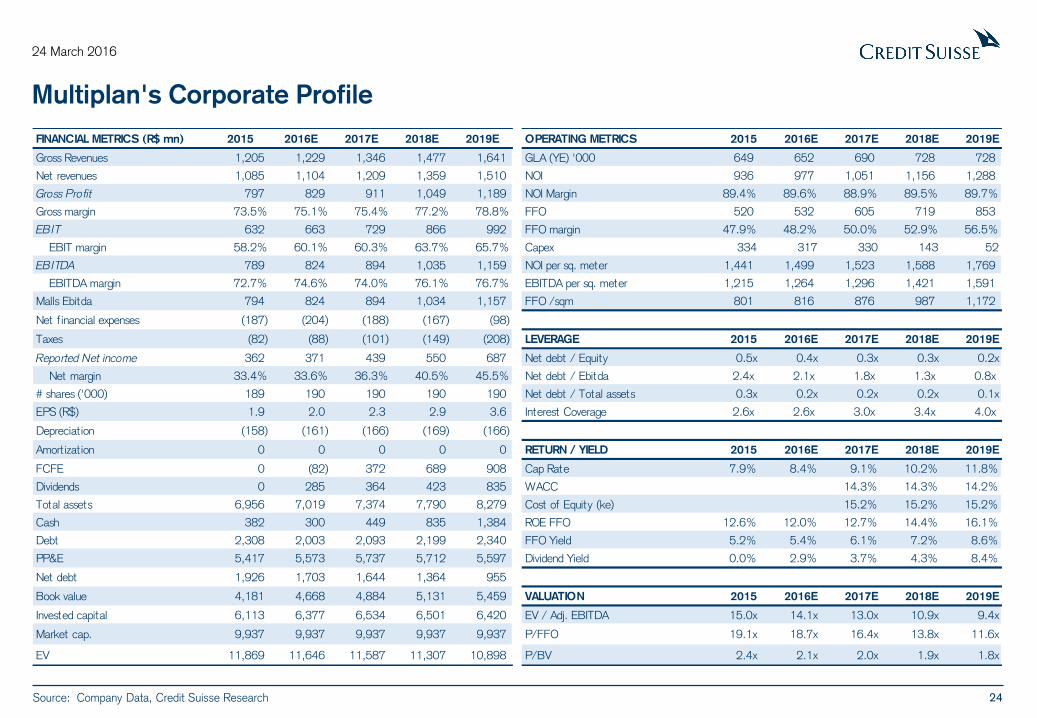
FINANCIAL METRICS (R$ mn) 2015 2016E 2017E 2018E 2019E OPERATING METRICS 2015 2016E 2017E 2018E 2019E
Gross Revenues 1,205 1,229 1,346 1,477 1,641 GLA (YE) '000 649 652 690 728 728
Net revenues 1,085 1,104 1,209 1,359 1,510 NOI 936 977 1,051 1,156 1,288
Gross Profit 797 829 911 1,049 1,189 NOI Margin 89.4% 89.6% 88.9% 89.5% 89.7%
Gross margin 73.5% 75.1% 75.4% 77.2% 78.8% FFO 520 532 605 719 853
EBIT 632 663 729 866 992 FFO margin 47.9% 48.2% 50.0% 52.9% 56.5%
EBIT margin 58.2% 60.1% 60.3% 63.7% 65.7% Capex 334 317 330 143 52
EBITDA 789 824 894 1,035 1,159 NOI per sq. meter 1,441 1,499 1,523 1,588 1,769
EBITDA margin 72.7% 74.6% 74.0% 76.1% 76.7% EBITDA per sq. meter 1,215 1,264 1,296 1,421 1,591
Malls Ebitda 794 824 894 1,034 1,157 FFO /sqm 801 816 876 987 1,172
Net financial expenses (187) (204) (188) (167) (98)
Taxes (82) (88) (101) (149) (208) LEVERAGE 2015 2016E 2017E 2018E 2019E
Reported Net income 362 371 439 550 687 Net debt / Equity 0.5x 0.4x 0.3x 0.3x 0.2x
Net margin 33.4% 33.6% 36.3% 40.5% 45.5% Net debt / Ebitda 2.4x 2.1x 1.8x 1.3x 0.8x
# shares ('000) 189 190 190 190 190 Net debt / Total assets 0.3x 0.2x 0.2x 0.2x 0.1x
EPS (R$) 1.9 2.0 2.3 2.9 3.6 Interest Coverage 2.6x 2.6x 3.0x 3.4x 4.0x
Depreciat ion (158) (161) (166) (169) (166)
Amort izat ion 0 0 0 0 0 RETURN / YIELD 2015 2016E 2017E 2018E 2019E
FCFE 0 (82) 372 689 908 Cap Rate 7.9% 8.4% 9.1% 10.2% 11.8%
Dividends 0 285 364 423 835 WACC 14.3% 14.3% 14.2%
Total assets 6,956 7,019 7,374 7,790 8,279 Cost of Equity (ke) 15.2% 15.2% 15.2%
Cash 382 300 449 835 1,384 ROE FFO 12.6% 12.0% 12.7% 14.4% 16.1%
Debt 2,308 2,003 2,093 2,199 2,340 FFO Yield 5.2% 5.4% 6.1% 7.2% 8.6%
PP&E 5,417 5,573 5,737 5,712 5,597 Dividend Yield 0.0% 2.9% 3.7% 4.3% 8.4%
Net debt 1,926 1,703 1,644 1,364 955
Book value 4,181 4,668 4,884 5,131 5,459 VALUATION 2015 2016E 2017E 2018E 2019E
Invested capital 6,113 6,377 6,534 6,501 6,420 EV / Adj. EBITDA 15.0x 14.1x 13.0x 10.9x 9.4x
Market cap. 9,937 9,937 9,937 9,937 9,937 P/FFO 19.1x 18.7x 16.4x 13.8x 11.6x
EV 11,869 11,646 11,587 11,307 10,898 P/BV 2.4x 2.1x 2.0x 1.9x 1.8x
25
24 March 2016
Sonae Sierra: Overview
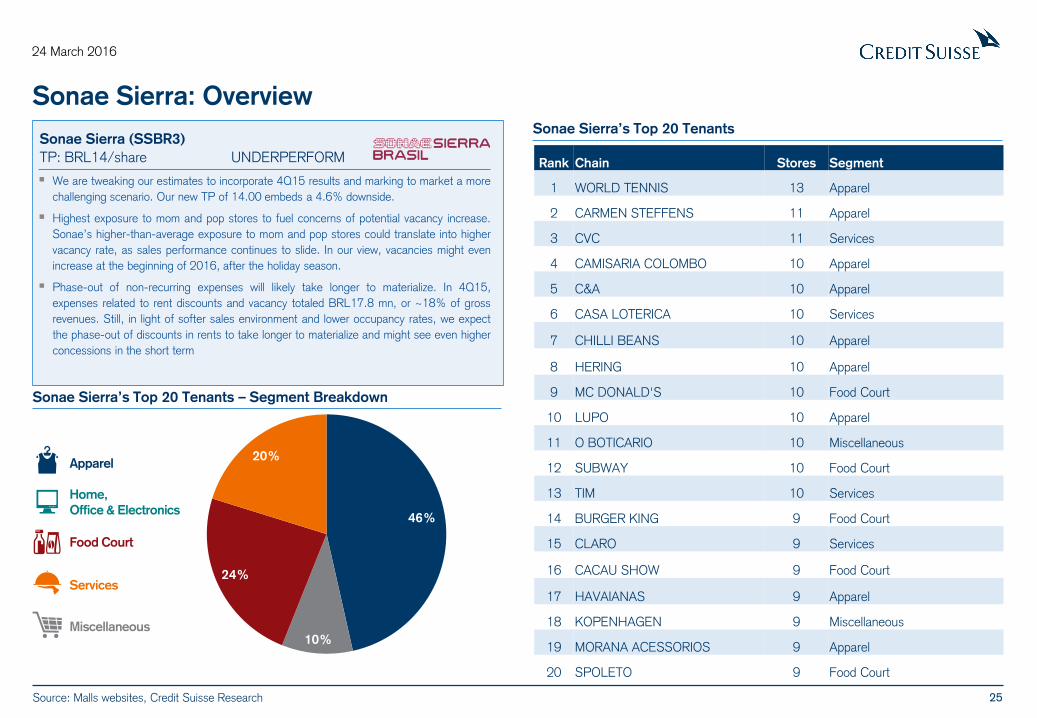
We are tweaking our estimates to incorporate 4Q15 results and marking to market a more
challenging scenario. Our new TP of 14.00 embeds a 4.6% downside.
Highest exposure to mom and pop stores to fuel concerns of potential vacancy increase.
Sonae’s higher-than-average exposure to mom and pop stores could translate into higher
vacancy rate, as sales performance continues to slide. In our view, vacancies might even
increase at the beginning of 2016, after the holiday season.
Phase-out of non-recurring expenses will likely take longer to materialize. In 4Q15,
expenses related to rent discounts and vacancy totaled BRL17.8 mn, or ~18% of gross
revenues. Still, in light of softer sales environment and lower occupancy rates, we expect
the phase-out of discounts in rents to take longer to materialize and might see even higher
concessions in the short term
Sonae Sierra (SSBR3)
TP: BRL14/share UNDERPERFORM
Sonae Sierra’s Top 20 Tenants
Rank Chain Stores Segment
1 WORLD TENNIS 13 Apparel
2 CARMEN STEFFENS 11 Apparel
3 CVC 11 Services
4 CAMISARIA COLOMBO 10 Apparel
5 C&A 10 Apparel
6 CASA LOTERICA 10 Services
7 CHILLI BEANS 10 Apparel
8 HERING 10 Apparel
9 MC DONALD'S 10 Food Court
10 LUPO 10 Apparel
11 O BOTICARIO 10 Miscellaneous
12 SUBWAY 10 Food Court
13 TIM 10 Services
14 BURGER KING 9 Food Court
15 CLARO 9 Services
16 CACAU SHOW 9 Food Court
17 HAVAIANAS 9 Apparel
18 KOPENHAGEN 9 Miscellaneous
19 MORANA ACESSORIOS 9 Apparel
20 SPOLETO 9 Food Court
46%
0%
10%
24%
20% Apparel
Home,
Office & Electronics
Food Court
Services
Miscellaneous
Sonae Sierra’s Top 20 Tenants – Segment Breakdown
Source: Malls websites, Credit Suisse Research
26
24 March 2016
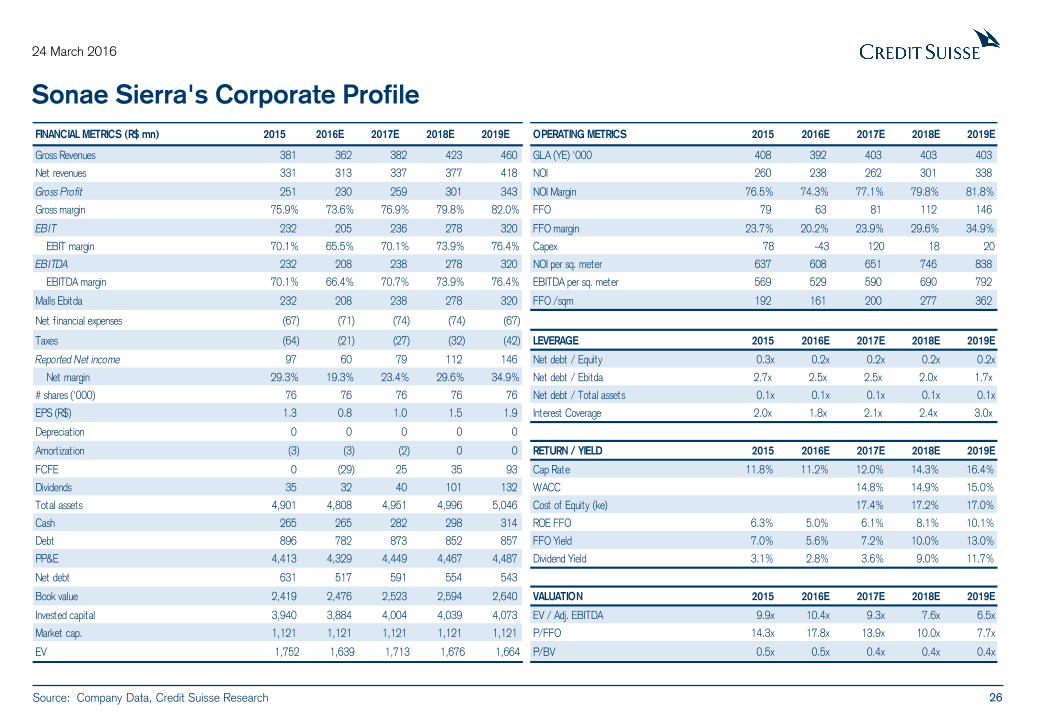
Sonae Sierra's Corporate Profile
Source: Company Data, Credit Suisse Research
FINANCIAL METRICS (R$ mn) 2015 2016E 2017E 2018E 2019E OPERATING METRICS 2015 2016E 2017E 2018E 2019E
Gross Revenues 381 362 382 423 460 GLA (YE) '000 408 392 403 403 403
Net revenues 331 313 337 377 418 NOI 260 238 262 301 338
Gross Profit 251 230 259 301 343 NOI Margin 76.5% 74.3% 77.1% 79.8% 81.8%
Gross margin 75.9% 73.6% 76.9% 79.8% 82.0% FFO 79 63 81 112 146
EBIT 232 205 236 278 320 FFO margin 23.7% 20.2% 23.9% 29.6% 34.9%
EBIT margin 70.1% 65.5% 70.1% 73.9% 76.4% Capex 78 -43 120 18 20
EBITDA 232 208 238 278 320 NOI per sq. meter 637 608 651 746 838
EBITDA margin 70.1% 66.4% 70.7% 73.9% 76.4% EBITDA per sq. meter 569 529 590 690 792
Malls Ebitda 232 208 238 278 320 FFO /sqm 192 161 200 277 362
Net financial expenses (67) (71) (74) (74) (67)
Taxes (64) (21) (27) (32) (42) LEVERAGE 2015 2016E 2017E 2018E 2019E
Reported Net income 97 60 79 112 146 Net debt / Equity 0.3x 0.2x 0.2x 0.2x 0.2x
Net margin 29.3% 19.3% 23.4% 29.6% 34.9% Net debt / Ebitda 2.7x 2.5x 2.5x 2.0x 1.7x
# shares ('000) 76 76 76 76 76 Net debt / Total assets 0.1x 0.1x 0.1x 0.1x 0.1x
EPS (R$) 1.3 0.8 1.0 1.5 1.9 Interest Coverage 2.0x 1.8x 2.1x 2.4x 3.0x
Depreciat ion 0 0 0 0 0
Amort izat ion (3) (3) (2) 0 0 RETURN / YIELD 2015 2016E 2017E 2018E 2019E
FCFE 0 (29) 25 35 93 Cap Rate 11.8% 11.2% 12.0% 14.3% 16.4%
Dividends 35 32 40 101 132 WACC 14.8% 14.9% 15.0%
Total assets 4,901 4,808 4,951 4,996 5,046 Cost of Equity (ke) 17.4% 17.2% 17.0%
Cash 265 265 282 298 314 ROE FFO 6.3% 5.0% 6.1% 8.1% 10.1%
Debt 896 782 873 852 857 FFO Yield 7.0% 5.6% 7.2% 10.0% 13.0%
PP&E 4,413 4,329 4,449 4,467 4,487 Dividend Yield 3.1% 2.8% 3.6% 9.0% 11.7%
Net debt 631 517 591 554 543
Book value 2,419 2,476 2,523 2,594 2,640 VALUATION 2015 2016E 2017E 2018E 2019E
Invested capital 3,940 3,884 4,004 4,039 4,073 EV / Adj. EBITDA 9.9x 10.4x 9.3x 7.6x 6.5x
Market cap. 1,121 1,121 1,121 1,121 1,121 P/FFO 14.3x 17.8x 13.9x 10.0x 7.7x
EV 1,752 1,639 1,713 1,676 1,664 P/BV 0.5x 0.5x 0.4x 0.4x 0.4x
27
24 March 2016
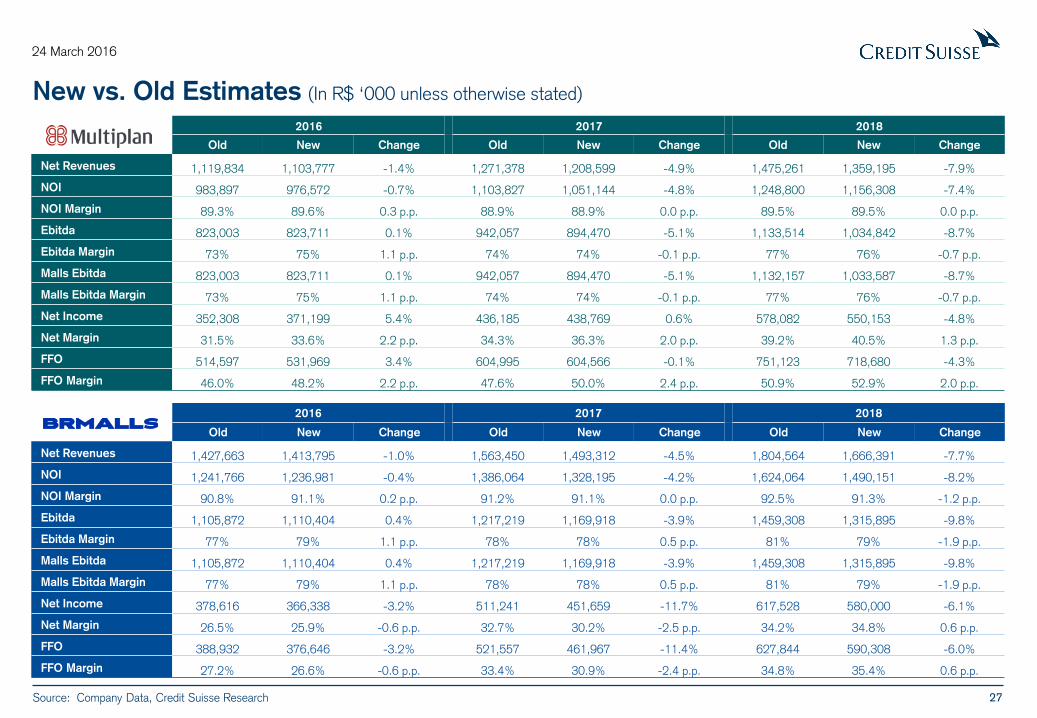
New vs. Old Estimates (In R$ ‘000 unless otherwise stated)
Source: Company Data, Credit Suisse Research
2016 2017 2018
Old New Change Old New Change Old New Change
Net Revenues 1,119,834 1,103,777 -1.4% 1,271,378 1,208,599 -4.9% 1,475,261 1,359,195 -7.9%
NOI 983,897 976,572 -0.7% 1,103,827 1,051,144 -4.8% 1,248,800 1,156,308 -7.4%
NOI Margin 89.3% 89.6% 0.3 p.p. 88.9% 88.9% 0.0 p.p. 89.5% 89.5% 0.0 p.p.
Ebitda 823,003 823,711 0.1% 942,057 894,470 -5.1% 1,133,514 1,034,842 -8.7%
Ebitda Margin 73% 75% 1.1 p.p. 74% 74% -0.1 p.p. 77% 76% -0.7 p.p.
Malls Ebitda 823,003 823,711 0.1% 942,057 894,470 -5.1% 1,132,157 1,033,587 -8.7%
Malls Ebitda Margin 73% 75% 1.1 p.p. 74% 74% -0.1 p.p. 77% 76% -0.7 p.p.
Net Income 352,308 371,199 5.4% 436,185 438,769 0.6% 578,082 550,153 -4.8%
Net Margin 31.5% 33.6% 2.2 p.p. 34.3% 36.3% 2.0 p.p. 39.2% 40.5% 1.3 p.p.
FFO 514,597 531,969 3.4% 604,995 604,566 -0.1% 751,123 718,680 -4.3%
FFO Margin 46.0% 48.2% 2.2 p.p. 47.6% 50.0% 2.4 p.p. 50.9% 52.9% 2.0 p.p.
2016 2017 2018
Old New Change Old New Change Old New Change
Net Revenues 1,427,663 1,413,795 -1.0% 1,563,450 1,493,312 -4.5% 1,804,564 1,666,391 -7.7%
NOI 1,241,766 1,236,981 -0.4% 1,386,064 1,328,195 -4.2% 1,624,064 1,490,151 -8.2%
NOI Margin 90.8% 91.1% 0.2 p.p. 91.2% 91.1% 0.0 p.p. 92.5% 91.3% -1.2 p.p.
Ebitda 1,105,872 1,110,404 0.4% 1,217,219 1,169,918 -3.9% 1,459,308 1,315,895 -9.8%
Ebitda Margin 77% 79% 1.1 p.p. 78% 78% 0.5 p.p. 81% 79% -1.9 p.p.
Malls Ebitda 1,105,872 1,110,404 0.4% 1,217,219 1,169,918 -3.9% 1,459,308 1,315,895 -9.8%
Malls Ebitda Margin 77% 79% 1.1 p.p. 78% 78% 0.5 p.p. 81% 79% -1.9 p.p.
Net Income 378,616 366,338 -3.2% 511,241 451,659 -11.7% 617,528 580,000 -6.1%
Net Margin 26.5% 25.9% -0.6 p.p. 32.7% 30.2% -2.5 p.p. 34.2% 34.8% 0.6 p.p.
FFO 388,932 376,646 -3.2% 521,557 461,967 -11.4% 627,844 590,308 -6.0%
FFO Margin 27.2% 26.6% -0.6 p.p. 33.4% 30.9% -2.4 p.p. 34.8% 35.4% 0.6 p.p.
28
24 March 2016
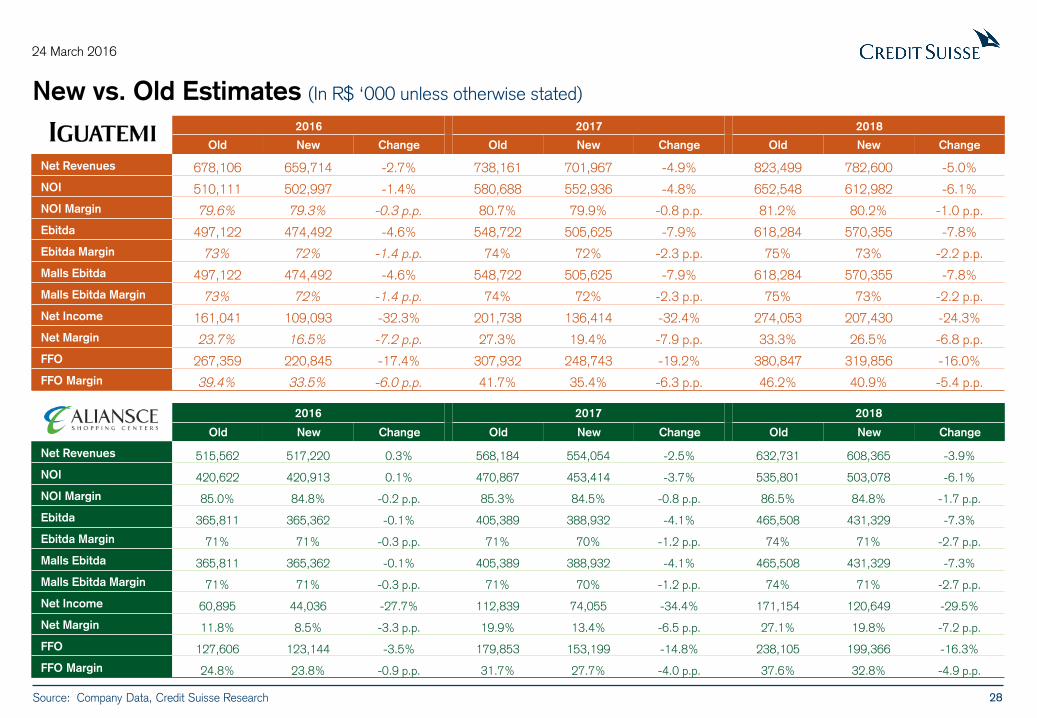
New vs. Old Estimates (In R$ ‘000 unless otherwise stated)
Source: Company Data, Credit Suisse Research
2016 2017 2018
Old New Change Old New Change Old New Change
Net Revenues 678,106 659,714 -2.7% 738,161 701,967 -4.9% 823,499 782,600 -5.0%
NOI 510,111 502,997 -1.4% 580,688 552,936 -4.8% 652,548 612,982 -6.1%
NOI Margin 79.6% 79.3% -0.3 p.p. 80.7% 79.9% -0.8 p.p. 81.2% 80.2% -1.0 p.p.
Ebitda 497,122 474,492 -4.6% 548,722 505,625 -7.9% 618,284 570,355 -7.8%
Ebitda Margin 73% 72% -1.4 p.p. 74% 72% -2.3 p.p. 75% 73% -2.2 p.p.
Malls Ebitda 497,122 474,492 -4.6% 548,722 505,625 -7.9% 618,284 570,355 -7.8%
Malls Ebitda Margin 73% 72% -1.4 p.p. 74% 72% -2.3 p.p. 75% 73% -2.2 p.p.
Net Income 161,041 109,093 -32.3% 201,738 136,414 -32.4% 274,053 207,430 -24.3%
Net Margin 23.7% 16.5% -7.2 p.p. 27.3% 19.4% -7.9 p.p. 33.3% 26.5% -6.8 p.p.
FFO 267,359 220,845 -17.4% 307,932 248,743 -19.2% 380,847 319,856 -16.0%
FFO Margin 39.4% 33.5% -6.0 p.p. 41.7% 35.4% -6.3 p.p. 46.2% 40.9% -5.4 p.p.
2016 2017 2018
Old New Change Old New Change Old New Change
Net Revenues 515,562 517,220 0.3% 568,184 554,054 -2.5% 632,731 608,365 -3.9%
NOI 420,622 420,913 0.1% 470,867 453,414 -3.7% 535,801 503,078 -6.1%
NOI Margin 85.0% 84.8% -0.2 p.p. 85.3% 84.5% -0.8 p.p. 86.5% 84.8% -1.7 p.p.
Ebitda 365,811 365,362 -0.1% 405,389 388,932 -4.1% 465,508 431,329 -7.3%
Ebitda Margin 71% 71% -0.3 p.p. 71% 70% -1.2 p.p. 74% 71% -2.7 p.p.
Malls Ebitda 365,811 365,362 -0.1% 405,389 388,932 -4.1% 465,508 431,329 -7.3%
Malls Ebitda Margin 71% 71% -0.3 p.p. 71% 70% -1.2 p.p. 74% 71% -2.7 p.p.
Net Income 60,895 44,036 -27.7% 112,839 74,055 -34.4% 171,154 120,649 -29.5%
Net Margin 11.8% 8.5% -3.3 p.p. 19.9% 13.4% -6.5 p.p. 27.1% 19.8% -7.2 p.p.
FFO 127,606 123,144 -3.5% 179,853 153,199 -14.8% 238,105 199,366 -16.3%
FFO Margin 24.8% 23.8% -0.9 p.p. 31.7% 27.7% -4.0 p.p. 37.6% 32.8% -4.9 p.p.
29
24 March 2016
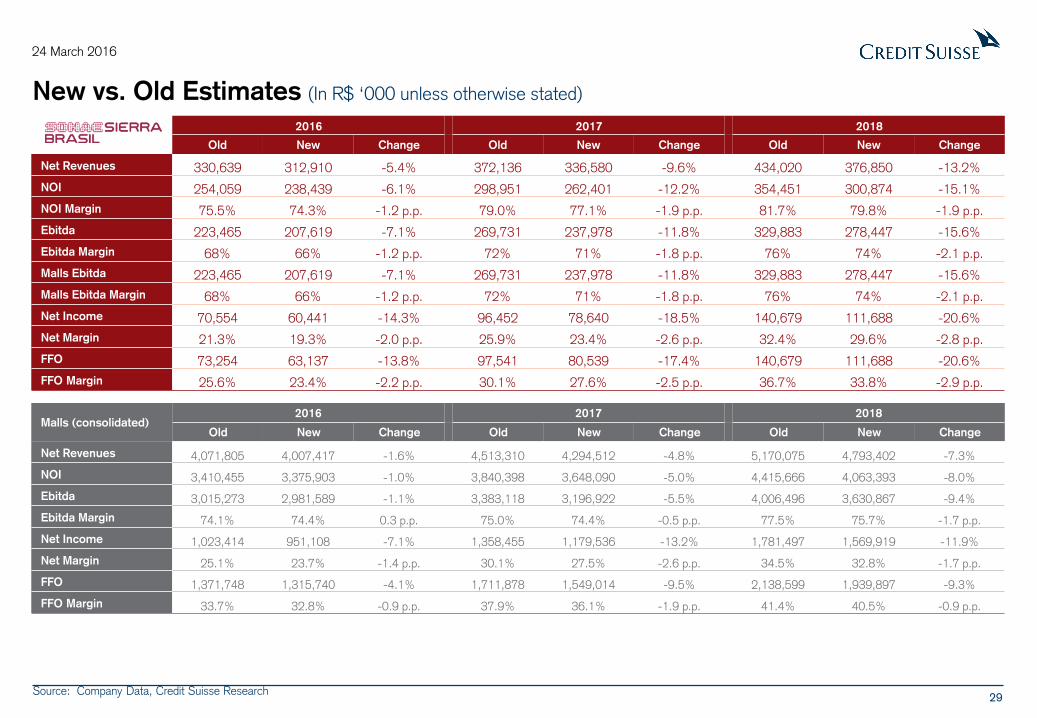
New vs. Old Estimates (In R$ ‘000 unless otherwise stated)
Source: Company Data, Credit Suisse Research
2016 2017 2018
Old New Change Old New Change Old New Change
Net Revenues 330,639 312,910 -5.4% 372,136 336,580 -9.6% 434,020 376,850 -13.2%
NOI 254,059 238,439 -6.1% 298,951 262,401 -12.2% 354,451 300,874 -15.1%
NOI Margin 75.5% 74.3% -1.2 p.p. 79.0% 77.1% -1.9 p.p. 81.7% 79.8% -1.9 p.p.
Ebitda 223,465 207,619 -7.1% 269,731 237,978 -11.8% 329,883 278,447 -15.6%
Ebitda Margin 68% 66% -1.2 p.p. 72% 71% -1.8 p.p. 76% 74% -2.1 p.p.
Malls Ebitda 223,465 207,619 -7.1% 269,731 237,978 -11.8% 329,883 278,447 -15.6%
Malls Ebitda Margin 68% 66% -1.2 p.p. 72% 71% -1.8 p.p. 76% 74% -2.1 p.p.
Net Income 70,554 60,441 -14.3% 96,452 78,640 -18.5% 140,679 111,688 -20.6%
Net Margin 21.3% 19.3% -2.0 p.p. 25.9% 23.4% -2.6 p.p. 32.4% 29.6% -2.8 p.p.
FFO 73,254 63,137 -13.8% 97,541 80,539 -17.4% 140,679 111,688 -20.6%
FFO Margin 25.6% 23.4% -2.2 p.p. 30.1% 27.6% -2.5 p.p. 36.7% 33.8% -2.9 p.p.
Malls (consolidated) 2016 2017 2018
Old New Change Old New Change Old New Change
Net Revenues 4,071,805 4,007,417 -1.6% 4,513,310 4,294,512 -4.8% 5,170,075 4,793,402 -7.3%
NOI 3,410,455 3,375,903 -1.0% 3,840,398 3,648,090 -5.0% 4,415,666 4,063,393 -8.0%
Ebitda 3,015,273 2,981,589 -1.1% 3,383,118 3,196,922 -5.5% 4,006,496 3,630,867 -9.4%
Ebitda Margin 74.1% 74.4% 0.3 p.p. 75.0% 74.4% -0.5 p.p. 77.5% 75.7% -1.7 p.p.
Net Income 1,023,414 951,108 -7.1% 1,358,455 1,179,536 -13.2% 1,781,497 1,569,919 -11.9%
Net Margin 25.1% 23.7% -1.4 p.p. 30.1% 27.5% -2.6 p.p. 34.5% 32.8% -1.7 p.p.
FFO 1,371,748 1,315,740 -4.1% 1,711,878 1,549,014 -9.5% 2,138,599 1,939,897 -9.3%
FFO Margin 33.7% 32.8% -0.9 p.p. 37.9% 36.1% -1.9 p.p. 41.4% 40.5% -0.9 p.p.
30
24 March 2016
DISCLOSURE APPENDIX AT THE BACK OF THIS REPORT CONTAINS IMPORTANT DISCLOSURES, ANALYST CERTIFICATIONS, AND THE STATUS OF NON-US ANALYSTS. US Disclosure: Credit Suisse does and seeks to do business with companies covered in its research reports. As a result, investors should be aware that the Firm may have a conflict of interest that could affect the objectivity of this report. Investors should consider this report as only a single factor in making their investment decision.
Companies Mentioned (Price as of 24-Mar-2016)
Aliansce Shopping Centers (ALSC3.SA, R$12.74, NEUTRAL, TP R$12.5) Alpargatas SA (ALPA4.SA, R$7.75) Arezzo Industria e Comercio SA (ARZZ3.SA, R$22.0) BR Malls Participacoes (BRML3.SA, R$15.25, NEUTRAL, TP R$14.0) Burger King Worldwide, Inc. (BKW.N, $35.5) CIA Hering S.A. (HGTX3.SA, R$15.06) CVC Brasil (CVCB3.SA, R$15.95) Guararapes Confe (GUAR3.SA, R$52.99) Hewlett Packard Enterprise (HPE.N, $17.57) Iguatemi (IGTA3.SA, R$25.5, NEUTRAL, TP R$24.0) Lindt & Sprungli (LISN.S, SFr68450.0) Lojas Americanas S.A. (LAME4.SA, R$21.14) Lojas Renner S.A. (LREN3.SA, R$21.5) McDonald's Corp (MCD.N, $123.29) Multiplan Empreendimentos. Imobiliarios S/A (MULT3.SA, R$52.3, NEUTRAL, TP R$53.5) Restoque Comércio e Confecções de Roupas S.A. (LLIS3.SA, R$5.21) Samsung Elec (SMSN.BA, $366.5) Sonae Sierra Brasil (SSBR3.SA, R$14.67, UNDERPERFORM, TP R$14.0) TIM Participacoes (TIMP3.SA, R$8.2) Via Varejo S.A (VVAR11.SA, R$5.9)
Disclosure Appendix
Important Global Disclosures
Nicole Hirakawa, Luis Stacchini and Vanessa Quiroga, CFA each certify, with respect to the companies or securities that the individual analyzes, that (1) the views expressed in this report accurately reflect his or her personal views about all of the subject companies and securities and (2) no part of his or her compensation was, is or will be directly or indirectly related to the specific recommendations or views expressed in this report.
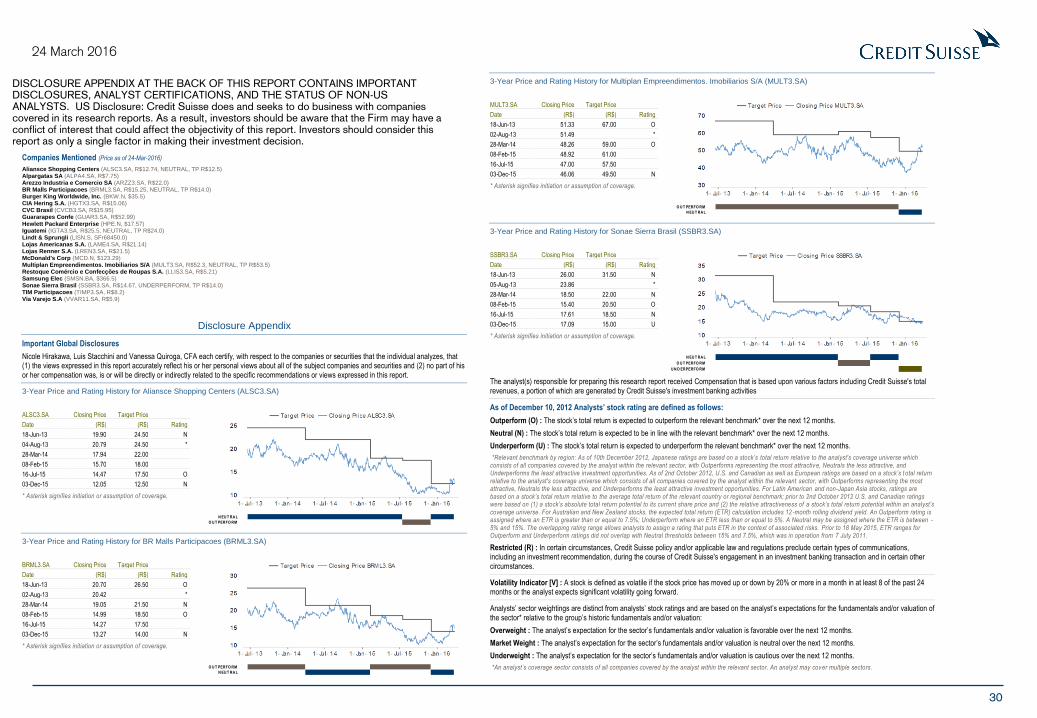
3-Year Price and Rating History for Aliansce Shopping Centers (ALSC3.SA)
ALSC3.SA Closing Price Target Price
Date (R$) (R$) Rating
18-Jun-13 19.90 24.50 N
04-Aug-13 20.79 24.50 *
28-Mar-14 17.94 22.00
08-Feb-15 15.70 18.00
16-Jul-15 14.47 17.50 O
03-Dec-15 12.05 12.50 N
* Asterisk signifies initiation or assumption of coverage.
N EU T RA L
O U T PERFO RM
3-Year Price and Rating History for BR Malls Participacoes (BRML3.SA)
BRML3.SA Closing Price Target Price
Date (R$) (R$) Rating
18-Jun-13 20.70 26.50 O
02-Aug-13 20.42 *
28-Mar-14 19.05 21.50 N
08-Feb-15 14.99 18.50 O
16-Jul-15 14.27 17.50
03-Dec-15 13.27 14.00 N
* Asterisk signifies initiation or assumption of coverage.
O U T PERFO RM
N EU T RA L
3-Year Price and Rating History for Multiplan Empreendimentos. Imobiliarios S/A (MULT3.SA)
MULT3.SA Closing Price Target Price
Date (R$) (R$) Rating
18-Jun-13 51.33 67.00 O
02-Aug-13 51.49 *
28-Mar-14 48.26 59.00 O
08-Feb-15 48.92 61.00
16-Jul-15 47.00 57.50
03-Dec-15 46.06 49.50 N
* Asterisk signifies initiation or assumption of coverage.
O U T PERFO RM
N EU T RA L
3-Year Price and Rating History for Sonae Sierra Brasil (SSBR3.SA)
SSBR3.SA Closing Price Target Price
Date (R$) (R$) Rating
18-Jun-13 26.00 31.50 N
05-Aug-13 23.86 *
28-Mar-14 18.50 22.00 N
08-Feb-15 15.40 20.50 O
16-Jul-15 17.61 18.50 N
03-Dec-15 17.09 15.00 U
* Asterisk signifies initiation or assumption of coverage.
N EU T RA L
O U T PERFO RM
U N D ERPERFO RM
The analyst(s) responsible for preparing this research report received Compensation that is based upon various factors including Credit Suisse's total revenues, a portion of which are generated by Credit Suisse's investment banking activities
As of December 10, 2012 Analysts’ stock rating are defined as follows:
Outperform (O) : The stock’s total return is expected to outperform the relevant benchmark* over the next 12 months.
Neutral (N) : The stock’s total return is expected to be in line with the relevant benchmark* over the next 12 months.
Underperform (U) : The stock’s total return is expected to underperform the relevant benchmark* over the next 12 months.
*Relevant benchmark by region: As of 10th December 2012, Japanese ratings are based on a stock’s total return relative to the analyst's coverage universe which consists of all companies covered by the analyst within the relevant sector, with Outperforms representing the most attractiv e, Neutrals the less attractive, and Underperforms the least attractive investment opportunities. As of 2nd October 2012, U.S. and Canadian as well as European ratings are based on a stock’s t otal return relative to the analyst's coverage universe which consists of all companies covered by the analyst within the relevant sector, with Outperforms representing the most attractive, Neutrals the less attractive, and Underperforms the least attractive investment opportunities. For Latin American and non-Japan Asia stocks, ratings are based on a stock’s total return relative to the average total return of the relevant country or regional benchmark; prior to 2nd October 2012 U.S. and Canadian ratings were based on (1) a stock’s absolute total return potential to its current share price and (2) the relative attractiveness of a stock’s total return potential within an analyst’s coverage universe. For Australian and New Zealand stocks, the expected total return (ETR) calculation includes 12 -month rolling dividend yield. An Outperform rating is assigned where an ETR is greater than or equal to 7.5%; Underperform where an ETR less than or equal to 5%. A Neutral may be assigned where the ETR is between -5% and 15%. The overlapping rating range allows analysts to assign a rating that puts ETR in the context of associated risks. Prior to 18 May 2015, ETR ranges for Outperform and Underperform ratings did not overlap with Neutral thresholds between 15% and 7.5%, which was in operation from 7 July 2011.
Restricted (R) : In certain circumstances, Credit Suisse policy and/or applicable law and regulations preclude certain types of communications, including an investment recommendation, during the course of Credit Suisse's engagement in an investment banking transaction and in certain other circumstances.
Volatility Indicator [V] : A stock is defined as volatile if the stock price has moved up or down by 20% or more in a month in at least 8 of the past 24 months or the analyst expects significant volatility going forward.
Analysts’ sector weightings are distinct from analysts’ stock ratings and are based on the analyst’s expectations for the fundamentals and/or valuation of the sector* relative to the group’s historic fundamentals and/or valuation:
Overweight : The analyst’s expectation for the sector’s fundamentals and/or valuation is favorable over the next 12 months.
Market Weight : The analyst’s expectation for the sector’s fundamentals and/or valuation is neutral over the next 12 months.
Underweight : The analyst’s expectation for the sector’s fundamentals and/or valuation is cautious over the next 12 months.
*An analyst’s coverage sector consists of all companies covered by the analyst within the relevant sector. An analyst may cover multiple sectors.
31
24 March 2016
Credit Suisse's distribution of stock ratings (and banking clients) is:
Global Ratings Distribution
Rating Versus universe (%) Of which banking clients (%)
Outperform/Buy* 57% (39% banking clients)
Neutral/Hold* 31% (29% banking clients)
Underperform/Sell* 11% (45% banking clients)
Restricted 1%
*For purposes of the NYSE and NASD ratings distribution disclosure requirements, our stock ratings of Outperform, Neutral, an d Underperform most closely correspond to Buy, Hold, and Sell, respectively; however, the meanings are not the same, as our stock ratings are determined on a relative basis. (Please refer to definitions above.) An investor's decision to buy or sell a security should be based on investment objectives, current holdings, and other indivi dual factors.
Credit Suisse’s policy is to update research reports as it deems appropriate, based on developments with the subject company, the sector or the market that may have a material impact on the research views or opinions stated herein.
Credit Suisse's policy is only to publish investment research that is impartial, independent, clear, fair and not misleading. For more detail please refer to Credit Suisse's Policies for Managing Conflicts of Interest in connection with Investment Research: http://www.csfb.com/research-and-analytics/disclaimer/managing_conflicts_disclaimer.html
Credit Suisse does not provide any tax advice. Any statement herein regarding any US federal tax is not intended or written to be used, and cannot be used, by any taxpayer for the purposes of avoiding any penalties.
Target Price and Rating Valuation Methodology and Risks: (12 months) for Aliansce Shopping Centers (ALSC3.SA)
Method: Our blended NAV (50% weight) and DCF (50% weight) price target of BRL 12.50 for ALSC3 assumes a 16.3% WACC and implies a target P/FFO multiple of 16.1x for 2016. Our rating of NEUTRAL is based on the company's valuation and the stock's expected return relative to country's benchmark over the next 12 months.
Risk: Factors that could impede achievement of our BRL 12.50 target price and change the rating of NEUTRAL for ALSC3 shares include: (1) Competition from new players driving yields downwards; (2) increase in the basic interest rate, (3) deterioration in consuption could lead to lower earnings given sector's leverage on the retail industry performance.
Target Price and Rating Valuation Methodology and Risks: (12 months) for BR Malls Participacoes (BRML3.SA)
Method: Our target price of R$14/share for BRML3 shares is based on a blended discounted cash flow to firm method (50% weight) using a 15.2%% WACC and a target NAV multiple (50% weight). At our R$14 TP, BR Malls would be trading at a P/FFO of 18x for 2016. Our rating of NEUTRAL is based on the company's valuation and the stock's expected return relative to country's benchmark over the next 12 months.
Risk: Risks to our R$14 target price and rating of NEUTRAL for BRML3 are (1) Competition from new players driving yields downwards; (2) increase in the basic interest rate; (3) deterioration in consumption could lead to lower earnings given the sector's leverage on the retail industry performance
Target Price and Rating Valuation Methodology and Risks: (12 months) for Iguatemi (IGTA3.SA)
Method: Our target price of R$24/share for IGTA3 shares is based on our blended discounted cash flow to firm method using a 14.2% WACC (50% weight) and a target NAV multiple (50% weight). At our TP of R$23/share , Iguatemi would be trading at a P/FFO (price/funds from operations) of 19x for 2016. Our rating of NEUTRAL is based on the company's valuation and the stock's expected return relative to country's benchmark over the next 12 months.
Risk: Factors that could impede achievement of our R$24 target price and change the rating of NEUTRAL for IGTA3 shares include: (1) competition from new players driving yields downwards; (2) increase in the basic interest rate; (3) deterioration in consumption could lead to lower earnings given the sector's leverage on the retail industry performance.
Target Price and Rating Valuation Methodology and Risks: (12 months) for Multiplan Empreendimentos. Imobiliarios S/A (MULT3.SA)
Method: Our target price of R$53.5/share for MULT3 shares is based on our blended discounted cash flow to firm (FCFF) using a 13.8% WACC (50% weight) and a target NAV multiple (50% weight). At our R$53.5/share TP, Multiplan would be trading at R$19.1x P/FFO (price/funds from operations) for 2016. Our rating of NEUTRAL is based on the company's valuation and the stock's expected return relative to country's benchmark over the next 12 months.
Risk: Factors that could impede achievement of our R$53.5 target price and change the rating of NEUTRAL for MULT3 shares include: (1) competition from new players driving yields downwards; (2) increase in the real interest rates of the economy and (3) Deterioration in consumption could lead to lower NOIs given the sector's leverage on the retail industry performance
Target Price and Rating Valuation Methodology and Risks: (12 months) for Sonae Sierra Brasil (SSBR3.SA)
Method: Our target price of R$14/share for SSBR3 shares is based on our blended discounted cash flow to firm method using a 14.9% WACC (50% weight) and a target NAV multiple (50% weight) . At our R$14 TP, Sonae Sierra would be trading at 16.9x P/FFO 2016. Our rating of UNDERPERFORM is based on the company's valuation and the stock's expected return relative to country's benchmark over the next 12 months.
Risk: Factors that could impede achievement of our R$14 target price and change the rating of UNDERPERFORM for SSBR3 shares include: (1) Over competition from new players driving yields downwards; (2) increase in the basic interest rate, which could lead acquisition yields to lower levels faster than expected (3) Deterioration in consumption could lead to lower earnings given the sector's leverage on the retail industry performance.
Please refer to the firm's disclosure website at https://rave.credit-suisse.com/disclosures for the definitions of abbreviations typically used in the target price method and risk sections.
See the Companies Mentioned section for full company names
The subject company (BRML3.SA, IGTA3.SA, MULT3.SA) currently is, or was during the 12-month period preceding the date of distribution of this report, a client of Credit Suisse.
Credit Suisse expects to receive or intends to seek investment banking related compensation from the subject company (BRML3.SA, IGTA3.SA, MULT3.SA, SSBR3.SA) within the next 3 months.
Important Regional Disclosures
Singapore recipients should contact Credit Suisse AG, Singapore Branch for any matters arising from this research report.
The analyst(s) involved in the preparation of this report may participate in events hosted by the subject company, including site visits. Credit Suisse does not accept or permit analysts to accept payment or reimbursement for travel expenses associated with these events.
Restrictions on certain Canadian securities are indicated by the following abbreviations: NVS--Non-Voting shares; RVS--Restricted Voting Shares; SVS--Subordinate Voting Shares.
Individuals receiving this report from a Canadian investment dealer that is not affiliated with Credit Suisse should be advised that this report may not contain regulatory disclosures the non-affiliated Canadian investment dealer would be required to make if this were its own report.
For Credit Suisse Securities (Canada), Inc.'s policies and procedures regarding the dissemination of equity research, please visit https://www.credit-suisse.com/sites/disclaimers-ib/en/canada-research-policy.html.
Credit Suisse has acted as lead manager or syndicate member in a public offering of securities for the subject company (IGTA3.SA, MULT3.SA, SSBR3.SA) within the past 3 years.
As of the date of this report, Credit Suisse acts as a market maker or liquidity provider in the equities securities that are the subject of this report.
Principal is not guaranteed in the case of equities because equity prices are variable.
Commission is the commission rate or the amount agreed with a customer when setting up an account or at any time after that.
Nicole Hirakawa & Luis Stacchini & Vanessa Quiroga, CFA each certify that (1) The views expressed in this report solely and exclusively reflect my personal opinions and have been prepared independently, including with respect to Banco de Investimentos Credit Suisse (Brasil) S.A. or its affiliates ("Credit Suisse"). (2) Part of my compensation is based on various factors, including the total revenues of Credit Suisse, but no part of my compensation has been, is, or will be related to the specific recommendations or views expressed in this report. In addition, Credit Suisse declares that: Credit Suisse has provided, and/or may in the future provide investment banking, brokerage, asset management, commercial banking and other financial services to the subject company/companies or its affiliates, for which they have received or may receive customary fees and commissions, and which constituted or may constitute relevant financial or commercial interests in relation to the subject company/companies or the subject securities.
Nicole Hirakawa is the responsible analyst for this report according to Instruction CVM 483
To the extent this is a report authored in whole or in part by a non-U.S. analyst and is made available in the U.S., the following are important disclosures regarding any non-U.S. analyst contributors: The non-U.S. research analysts listed below (if any) are not registered/qualified as research analysts with FINRA. The non-U.S. research analysts listed below may not be associated persons of CSSU and therefore may not be subject to the NASD Rule 2711 and NYSE Rule 472 restrictions on communications with a subject company, public appearances and trading securities held by a research analyst account.
Casa de Bolsa Credit Suisse (Mexico), S.A ......................................................................................................................... Vanessa Quiroga, CFA
Banco de Investments Credit Suisse (Brasil) SA or its affiliates. ....................................................................... Nicole Hirakawa ; Luis Stacchini
For Credit Suisse disclosure information on other companies mentioned in this report, please visit the website at https://rave.credit-suisse.com/disclosures or call +1 (877) 291-2683.
32
24 March 2016
References in this report to Credit Suisse include all of the subsidiaries and affiliates of Credit Suisse operating under its investment banking division. For more information on our structure, please use the following link: https://www.credit-suisse.com/who-we-are This report may contain material that is not directed to, or intended for distribution to or use by, any person or entity who is a citizen or resident of or located in any locality, state, country or other jurisdiction where such distribution, publication, availability or use would be contrary to law or regulation or which would subject Credit Suisse AG or its affiliates ("CS") to any registration or licensing requirement within such jurisdiction. All material presented in this report, unless specifically indicated otherwise, is under copyright to CS. None of the material, nor its content, nor any copy of it, may be altered in any way, transmitted to, copied or distributed to any other party, without the prior express written permission of CS. All trademarks, service marks and logos used in this report are trademarks or service marks or registered trademarks or service marks of CS or its affiliates. The information, tools and material presented in this report are provided to you for information purposes only and are not to be used or considered as an offer or the solicitation of an offer to sell or to buy or subscribe for securities or other financial instruments. CS may not have taken any steps to ensure that the securities referred to in this report are suitable for any particular investor. CS will not treat recipients of this report as its customers by virtue of their receiving this report. The investments and services contained or referred to in this report may not be suitable for you and it is recommended that you consult an independent investment advisor if you are in doubt about such investments or investment services. Nothing in this report constitutes investment, legal, accounting or tax advice, or a representation that any investment or strategy is suitable or appropriate to your individual circumstances, or otherwise constitutes a personal recommendation to you. CS does not advise on the tax consequences of investments and you are advised to contact an independent tax adviser. Please note in particular that the bases and levels of taxation may change. Information and opinions presented in this report have been obtained or derived from sources believed by CS to be reliable, but CS makes no representation as to their accuracy or completeness. CS accepts no liability for loss arising from the use of the material presented in this report, except that this exclusion of liability does not apply to the extent that such liability arises under specific statutes or regulations applicable to CS. This report is not to be relied upon in substitution for the exercise of independent judgment. CS may have issued, and may in the future issue, other communications that are inconsistent with, and reach different conclusions from, the information presented in this report. Those communications reflect the different assumptions, views and analytical methods of the analysts who prepared them and CS is under no obligation to ensure that such other communications are brought to the attention of any recipient of this report. Some investments referred to in this report will be offered solely by a single entity and in the case of some investments solely by CS, or an associate of CS or CS may be the only market maker in such investments. Past performance should not be taken as an indication or guarantee of future performance, and no representation or warranty, express or implied, is made regarding future performance. Information, opinions and estimates contained in this report reflect a judgment at its original date of publication by CS and are subject to change without notice. The price, value of and income from any of the securities or financial instruments mentioned in this report can fall as well as rise. The value of securities and financial instruments is subject to exchange rate fluctuation that may have a positive or adverse effect on the price or income of such securities or financial instruments. Investors in securities such as ADR's, the values of which are influenced by currency volatility, effectively assume this risk. Structured securities are complex instruments, typically involve a high degree of risk and are intended for sale only to sophisticated investors who are capable of understanding and assuming the risks involved. The market value of any structured security may be affected by changes in economic, financial and political factors (including, but not limited to, spot and forward interest and exchange rates), time to maturity, market conditions and volatility, and the credit quality of any issuer or reference issuer. Any investor interested in purchasing a structured product should conduct their own investigation and analysis of the product and consult with their own professional advisers as to the risks involved in making such a purchase. Some investments discussed in this report may have a high level of volatility. High volatility investments may experience sudden and large falls in their value causing losses when that investment is realised. Those losses may equal your original investment. Indeed, in the case of some investments the potential losses may exceed the amount of initial investment and, in such circumstances, you may be required to pay more money to support those losses. Income yields from investments may fluctuate and, in consequence, initial capital paid to make the investment may be used as part of that income yield. Some investments may not be readily realisable and it may be difficult to sell or realise those investments, similarly it may prove difficult for you to obtain reliable information about the value, or risks, to which such an investment is exposed. This report may provide the addresses of, or contain hyperlinks to, websites. Except to the extent to which the report refers to website material of CS, CS has not reviewed any such site and takes no responsibility for the content contained therein. Such address or hyperlink (including addresses or hyperlinks to CS's own website material) is provided solely for your convenience and information and the content of any such website does not in any way form part of this document. Accessing such website or following such link through this report or CS's website shall be at your own risk. This report is issued and distributed in Europe (except Switzerland) by Credit Suisse Securities (Europe) Limited, One Cabot Square, London E14 4QJ, England, which is authorised by the Prudential Regulation Authority and regulated by the Financial Conduct Authority and the Prudential Regulation Authority. This report is issued and distributed in Europe (except Switzerland) by Credit Suisse International, One Cabot Square, London E14 4QJ, England, which is authorised by the Prudential Regulation Authority and regulated by the Financial Conduct Authority and the Prudential Regulation Authority. This report is being distributed in Germany by Credit Suisse Securities (Europe) Limited Niederlassung Frankfurt am Main regulated by the Bundesanstalt fuer Finanzdienstleistungsaufsicht ("BaFin"). This report is being distributed in the United States and Canada by Credit Suisse Securities (USA) LLC; in Switzerland by Credit Suisse AG; in Brazil by Banco de Investimentos Credit Suisse (Brasil) S.A or its affiliates; in Mexico by Banco Credit Suisse (México), S.A. (transactions related to the securities mentioned in this report will only be effected in compliance with applicable regulation); in Japan by Credit Suisse Securities (Japan) Limited, Financial Instruments Firm, Director-General of Kanto Local Finance Bureau (Kinsho) No. 66, a member of Japan Securities Dealers Association, The Financial Futures Association of Japan, Japan Investment Advisers Association, Type II Financial Instruments Firms Association; elsewhere in Asia/ Pacific by whichever of the following is the appropriately authorised entity in the relevant jurisdiction: Credit Suisse (Hong Kong) Limited, Credit Suisse Equities (Australia) Limited, Credit Suisse Securities (Thailand) Limited, regulated by the Office of the Securities and Exchange Commission, Thailand, having registered address at 990 Abdulrahim Place, 27th Floor, Unit 2701, Rama IV Road, Silom, Bangrak, Bangkok 10500, Thailand, Tel. +66 2614 6000, Credit Suisse Securities (Malaysia) Sdn Bhd, Credit Suisse AG, Singapore Branch, Credit Suisse Securities (India) Private Limited (CIN no. U67120MH1996PTC104392) regulated by the Securities and Exchange Board of India as Research Analyst (registration no. INH 000001030) and as Stock Broker (registration no. INB230970637; INF230970637; INB010970631; INF010970631), having registered address at 9th Floor, Ceejay House, Dr.A.B. Road, Worli, Mumbai - 18, India, T- +91-22 6777 3777, Credit Suisse Securities (Europe) Limited, Seoul Branch, Credit Suisse AG, Taipei Securities Branch, PT Credit Suisse Securities Indonesia, Credit Suisse Securities (Philippines ) Inc., and elsewhere in the world by the relevant authorised affiliate of the above. Credit Suisse (Hong Kong) Limited ("CSHK") is licensed and regulated by the Securities and Futures Commission of Hong Kong under the laws of Hong Kong, which differ from Australian laws. CSHKL does not hold an Australian financial services licence (AFSL) and is exempt from the requirement to hold an AFSL under the Corporations Act 2001 (the Act) under Class Order 03/1103 published by the ASIC in respect of financial services provided to Australian wholesale clients (within the meaning of section 761G of the Act). Research on Taiwanese securities produced by Credit Suisse AG, Taipei Securities Branch has been prepared by a registered Senior Business Person. Research provided to residents of Malaysia is authorised by the Head of Research for Credit Suisse Securities (Malaysia) Sdn Bhd, to whom they should direct any queries on +603 2723 2020. This report has been prepared and issued for distribution in Singapore to institutional investors, accredited investors and expert investors (each as defined under the Financial Advisers Regulations) only, and is also distributed by Credit Suisse AG, Singapore branch to overseas investors (as defined under the Financial Advisers Regulations). By virtue of your status as an institutional investor, accredited investor, expert investor or overseas investor, Credit Suisse AG, Singapore branch is exempted from complying with certain compliance requirements under the Financial Advisers Act, Chapter 110 of Singapore (the "FAA"), the Financial Advisers Regulations and the relevant Notices and Guidelines issued thereunder, in respect of any financial advisory service which Credit Suisse AG, Singapore branch may provide to you. This information is being distributed by Credit Suisse AG (DIFC Branch), duly licensed and regulated by the Dubai Financial Services Authority (“DFSA”). Related financial services or products are only made available to Professional Clients or Market Counterparties, as defined by the DFSA, and are not intended for any other persons. Credit Suisse AG (DIFC Branch) is located on Level 9 East, The Gate Building, DIFC, Dubai, United Arab Emirates. This research may not conform to Canadian disclosure requirements. In jurisdictions where CS is not already registered or licensed to trade in securities, transactions will only be effected in accordance with applicable securities legislation, which will vary from jurisdiction to jurisdiction and may require that the trade be made in accordance with applicable exemptions from registration or licensing requirements. Non-U.S. customers wishing to effect a transaction should contact a CS entity in their local jurisdiction unless governing law permits otherwise. U.S. customers wishing to effect a transaction should do so only by contacting a representative at Credit Suisse Securities (USA) LLC in the U.S. Please note that this research was originally prepared and issued by CS for distribution to their market professional and institutional investor customers. Recipients who are not market professional or institutional investor customers of CS should seek the advice of their independent financial advisor prior to taking any investment decision based on this report or for any necessary explanation of its contents. This research may relate to investments or services of a person outside of the UK or to other matters which are not authorised by the Prudential Regulation Authority and regulated by the Financial Conduct Authority and the Prudential Regulation Authority or in respect of which the protections of the Prudential Regulation Authority and Financial Conduct Authority for private customers and/or the UK compensation scheme may not be available, and further details as to where this may be the case are available upon request in respect of this report. CS may provide various services to US municipal entities or obligated persons ("municipalities"), including suggesting individual transactions or trades and entering into such transactions. Any services CS provides to municipalities are not viewed as "advice" within the meaning of Section 975 of the Dodd-Frank Wall Street Reform and Consumer Protection Act. CS is providing any such services and related information solely on an arm's length basis and not as an advisor or fiduciary to the municipality. In connection with the provision of the any such services, there is no agreement, direct or indirect, between any municipality (including the officials, management, employees or agents thereof) and CS for CS to provide advice to the municipality. Municipalities should consult with their financial, accounting and legal advisors regarding any such services provided by CS. In addition, CS is not acting for direct or indirect compensation to solicit the municipality on behalf of an unaffiliated broker, dealer, municipal securities dealer, municipal advisor, or investment adviser for the purpose of obtaining or retaining an engagement by the municipality for or in connection with Municipal Financial Products, the issuance of municipal securities, or of an investment adviser to provide investment advisory services to or on behalf of the municipality. If this report is being distributed by a financial institution other than Credit Suisse AG, or its affiliates, that financial institution is solely responsible for distribution. Clients of that institution should contact that institution to effect a transaction in the securities mentioned in this report or require further information. This report does not constitute investment advice by Credit Suisse to the clients of the distributing financial institution, and neither Credit Suisse AG, its affiliates, and their respective officers, directors and employees accept any liability whatsoever for any direct or consequential loss arising from their use of this report or its content. Principal is not guaranteed. Commission is the commission rate or the amount agreed with a customer when setting up an account or at any time after that. Copyright © 2016 CREDIT SUISSE AG and/or its affiliates. All rights reserved.
Investment principal on bonds can be eroded depending on sale price or market price. In addition, there are bonds on which investment principal can be eroded due to changes in redemption amounts. Care is required when investing in such instruments. When you purchase non-listed Japanese fixed income securities (Japanese government bonds, Japanese municipal bonds, Japanese government guaranteed bonds, Japanese corporate bonds) from CS as a seller, you will be requested to pay the purchase price only


