Embed Size (px)
Citation preview
A thesis entitled
THEORY, MANUFACTURE AND PERFORMANCE
OF HOLOGRAPHIC X-RAY GRATINGS
by
ROBERT LAWRENCE JOHNSON
submitted for the degree of
Doctor of Philosophy
in the University of London
Department of Physics
Imperial College of Science and Technology
London SW7 2BZ
DECEMBER 1975
- 2-
ABSTRACT
The aim of the work described in this thesis is to improve the
performance of grazing incidence grating spectrometers and spectro-
graphs used in the soft x-ray wavelength region 5 A to 150 A.
In recent years a considerable amount of interest has developed
in the application of soft x-rays in such diverse fields as high
temperature plasma diagnostics, x-ray astronomy, valence band analysis,
light element analysis, long wavelength x-ray diffraction and x-ray
microscopy.
During the course of the present work, diffraction gratings,
suitable for use in the soft x-ray region, have been examined in
collaboration with several grating manufacturers. The results of
some of these examinations will be described; however, the most
significant advance in the past three years has been the develop-
ment of highly efficient holographically-formed diffraction gratings
for use in the soft x-ray region.
The holographic method opens up new design possibilities for
spectrographs and some of these are investigated theoretically in
this work. The processes used in the manufacture of holographic
gratings are described. Finally, the performance of the present
generation of holographic gratings is discussed.
- 3
CONTENTS
ABSTRACT 2
PREFACE 6
CHAPTER 1 - INTRODUCTION
1.1 Historical Review of the Development of
Holographic Gratings 8
1.2 The First Efficiency Measurements of Holographic
Gratings in the Soft X-Ray Region 11
CHAPTER 2 - THE THEORY OF THE HOLOGRAPHIC X-RAY GRATING
2.1 The Theory of the Concave Grating 15
2.2 Aspheric Gratings 33
2.3 The Variable Frequency Grating 49
2.4 Derivation of Speer-Turner Grating Frequency Law 66
2.5 Grating Efficiency in the Soft X-Ray Region 72
CHAPTER 3 - RAY-TRACING
3.1 Introduction 82
3.2 Description of the Ray-Tracing Method 83
3.3 The Transfer Operation from Object Coordinate
System to Grating Coordinate System 85
3.4 Notation for Grating Coordinate System 88
3.5 The Diffraction Operation 90
3.6 Transfer Operation from Grating Surface to
Image Surface 96
3.7 To Find the Intersection of the Diffracted Ray
with the Rowland Cylinder 99

3.8 Specification of Grating Vectors for Classical
Gratings 102
3.9 Specification of the Grating Vectors and Spatial
Frequency of Holographic Gratings 104
3.10 Ray-Tracing Results and Discussions
- Spherical Gratings 110
- Cylindrical Gratings 127
- Toroidal Gratings 130
- Variable Frequency Gratings 162
- "Elliptical" Gratings 169
CHAPTER 4 - THE MANUFACTURE OF HOLOGRAPHIC X-RAY GRATINGS
4.1 The Manufacture of Holographic X-Ray Gratings 179
4.2 Experimental Conditions Necessary for Producing
Holographic Gratings 185
4.3 The Properties of Photoresist 190
4.4 Methods for Producing Holographic X-Ray Gratings 196
4.5 Preparation of Holographic Gratings by the
"Etching Technique" 207
4.6 Further Methods for the Production of Soft X-Ray
Gratings 211
CHAPTER 5 - INSTRUMENTATION
5.1 General Description of Grating Test Apparatus 218
5.2 The X-Ray Sources 226
5.3 Experimental Method
- Alignment 230
- Plane Gratings 231
Spherical Gratings 232
- Data Acquisition 234
-5
CHAPTER 6 - THE REFLECTION OF SOFT X-RAYS
6.1 Previous Work and General Considerations 241
6.2 Theory 252
6.3 Experimental Results 259
CHAPTER 7 - THE PERFORMANCE OF HOLOGRAPHIC X-RAY GRATINGS
7.1 The Efficiency of Diffraction Gratings in the
Soft X-Ray Region 274
7.2 The Properties of Holographic X-Ray Gratings
made by the "Etching Technique"
281
7.3 Comparison of Scattered Light Distributions 307
7.4 Practical Soft X-Ray Spectroscopy 319
CONCLUSION
325
ACKNOWLEDGEMENTS
327
REFERENCES
329
-6
PREFACE
This thesis describes some of the more important work per-
formed by the author while supported by an S.R.C. CAPS research
studentship in conjunction with I.C. Optical Systems Ltd. in the
period 1972 - 1975.
The research programme is concerned with diffraction gra-
tings for use at grazing incidence in the soft x-ray region and
continues the work performed in this laboratory by Dr. J.M. Bennett
(1967-71). The research has involved successful collaboration with
grating producers in America, France, Germany and U.K. Grating
calibrations have. also been performed for users in other parts of
the world. Since the importance of the soft x-ray region of the
spectrum has only recently been realised, it is to be expected that
the international collaboration and importance of the grating test
facility at Imperial College will increase in the future.
Although the subject of the research programme has been
"soft x-ray diffraction gratings", the work has involved a large
number of disciplines including optics, solid state physics, elec-
tronics, computer science, and some mechanical engineering.
I am very grateful to the experts at Imperial College who
have advised me in these fields and in particular my supervisor,
Dr. R.J. Speer. The financial support of the S.R.C. is gratefully
acknowledged.
- 7 -
Most of the units have been expressed in S.I. form except for
vacuum pressure (expressed throughout in torr = 1.33Nm-2) and wave-
lengths (expressed in Angstrom E 0.1nm).
In the soft x-ray region it is convenient to specify the
grazing angle of incidence measured between the incident ray and
the surface rather than the usual angle of incidence measured
between the incident ray and the normal. In this work the grazing
angle of incidence has been denoted by, a, and the grazing angle of
diffraction by, 13.
It should be noted that the term "classical grating" as used
in this thesis means any grating whose rulings would be equispaced
straight lines when projected onto the tangent plane at the pole
of the grating. Such gratings are produced by a conventional ruling
engine and may also be formed by recording the interference fringes
from two plane waves.
Gratings produced by recording the interference fringes formed
with light from a laser in a photosensitive medium have been termed
both "interference" (or more formally "interferographic") and "holo-
graphic" gratings. The concept of gratings formed using laser light
as holograms is more general than considering them as interferograms.
The term "holographic grating" avoids any possible confusion with the
wavefront interferograms produced when optically testing gratings
and also avoids confusion with the interferometric control system
used on modern ruling engines. The term "holographic grating" has
been used throughout th'Ls work since it is unambiguous and also because
concepts from holography allow the properties of focussing gratings to
be more easily understood.

- 8 -
CHAPTER 1
INTRODUCTION
1.1 HISTORICAL REVIEW OF THE DEVELOPMENT OF HOLOGRAPHIC GRATINGS
The history of the ruled grating has been extensively reviewed
in the literature and a most comprehensive description has been given
by Stroke (1). The history of the holographic grating is much less
well known, even though it is shorter than that of the ruled grating.
The concept of the holographic grating can be traced back one
hundred years to Cornu (68) who realised the relationship between
interference fringes and the rulings of a grating. Cornu showed that
gratings with a systematically varying spacing would have focussing
properties and he demonstrated these focussing properties experimen-
tally with two photographs of interference fringes. This important
work is considered in greater detail in Chapter 2, section 3.
Lord Rayleigh considered photographic reduction as a method
for producing gratings but concluded it was impossible for practical
reasons, however, he showed that it was possible to photograph gra-
tings ruled on glass by contact printing (134). In 1927 Michelson (2)
suggested that it would be possible to make a grating by photogra-
phing standing wave interference fringes. However, it was not until
1958 that Burch (3) at NPL succeeded in making gratings for measuring
purposes photographically by this method using Kodak Maximum Reso-
lution emulsion and light from a high intensity Hg lamp. These gra-
tings had little spectroscopic value because of the granularity of
the emulsion and its instability; however, they made gratings of
considerable size and with frequencies up to 22740mm-1. Also in 1958
- 9 -
Ritschl and Polze (4) reported photographing interference fringes
to produce a grating. In 1962 Denisyuk (5) reported the possibility
of using Lippman emulsions for recording diffraction gratings.
Labeyrie (6) suggested various methods for recording the interference
fringes produced by two coherent laser light beams; however, they
required the use of photosensitive materials which were not sufficient-
ly stable for the production of high-quality gratings.
In 1967 Rudolph and Schmahl (7) in Germany demonstrated that
gratings could be made holographically by recording two beam inter-
ference fringes from an argon ion laser in a photoresist layer coated
on an optical flat. They also showed that gratings produced by this
method had sufficient dimensional stability and diffraction efficiency
to make them useful for spectroscopic purposes. Also in 1967 the
prototype commercial holographic gratings were produced at the firm
of Jobin-Yvon in France (8).
In America, Shankoff of Bell Laboratories received a patent (9)
on the production of relief gratings to obtain blaze aualities, and
a patent on the technique of imparting focussing properties to a flat
holographic grating is held by Brooks and Haflinger of TRW Inc. (10).
In 1968 Sheridon (11) described a method for producing "blazed"
holographic gratings and in 1969 Rudolph and Schmahl (12) published
a full description of the processes they used and also how they pro-
duced gratings in metallic form with no photoresist present in the
final grating. In 1969 Rudolph and Schmahl also spelled out the
special advantages of the holographic method:
1) size only limited by the optics used to produce the
light beams
- 10 -
2) completely ghost-free spectra with very low stray
light
the possibility of introducing focussing properties
when constructing the grating.
Since 1970 several groups have been working in this field and
the performance of holographic gratings in the visible to UV region
has been investigated by several authors (13 - 20). The major
commercial supplier of holographic gratings is Jobin-Yvon so that
most of the reports published discuss the properties of their gra-
tings. However, it was clear that although holographic gratings
would not entirely replace classically ruled gratings, they immediate-
ly earned a place in spectroscopic instrumentation and were generally
considered to be complementary to classically ruled gratings in the
visible and UV regicns.
Because the efficiency of classical ruled gratings was very
low in the soft x-ray region (typically %1-2%), the potential gains
in efficiency which could be achieved by using the holographic method
to make soft x-ray gratings were much higher than any possible improve-
ments which could be obtained in the visible region where ruled gra-
tings had already nearly attained the maximum theoretical efficiency.
Furthermore, the holographic technique offered the possibility of
correcting the aberrations which limited the performance of classical
grazing incidence systems. If efficient holographic gratings for use
at soft x-ray wavelengths could be produced, a new era in grazing inci-
dence instrument design would begin.

1.2 THE FIRST EFFICIENCY MEASUREMENTS OF HOLOGRAPHIC GRATINGS
IN THE SOFT X-RAY REGION
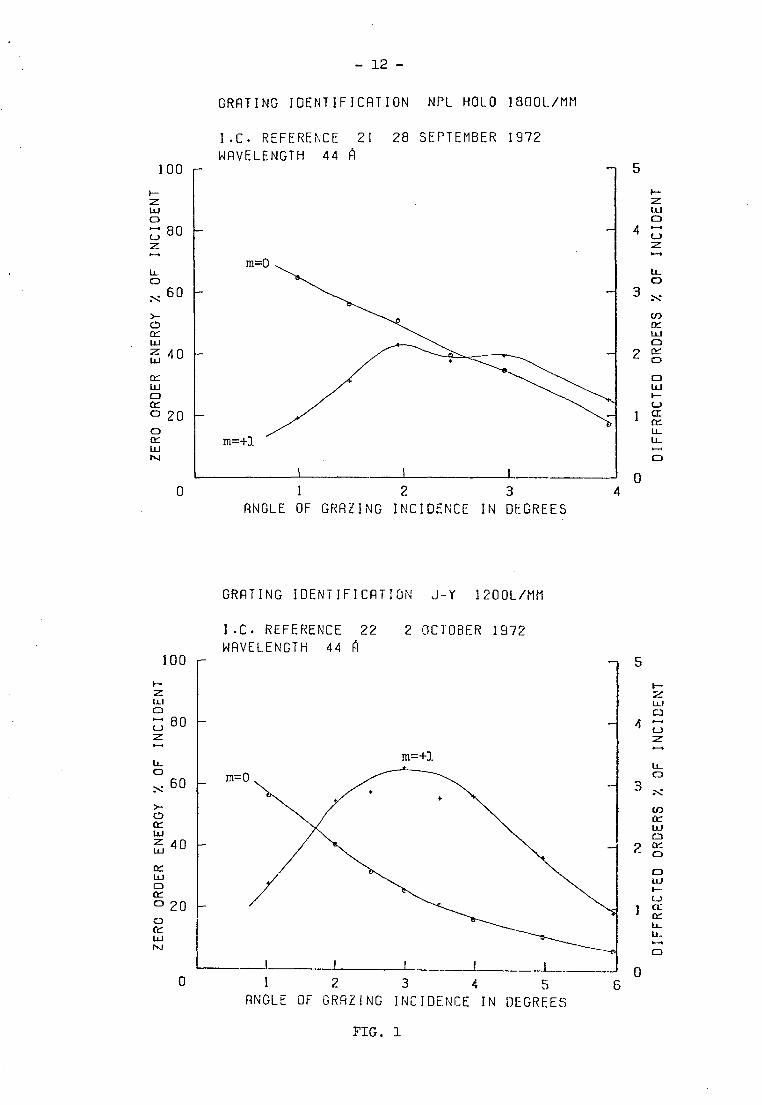
Our early measurements on the efficiency of holographic gratings
in 1972 showed that they had a useable efficiency in the soft x-ray
region, see Fig. 1 and 2. The efficiency of the 1200 1/mm holographic
grating produced by Jobin-Yvon compares very favourably with a typical
Bausch and Lomb 1200 1/mm shallow blazed grating when it is considered
that the holographic grating is only a first prototype. A comparison
of the spectra shows the stray light to be lower for the holographic
grating.
The N.P.L. holographic gratings and Jobin-Yvon gratings shown in
Fig. 1 are both resist gratings coated with respectively aluminium
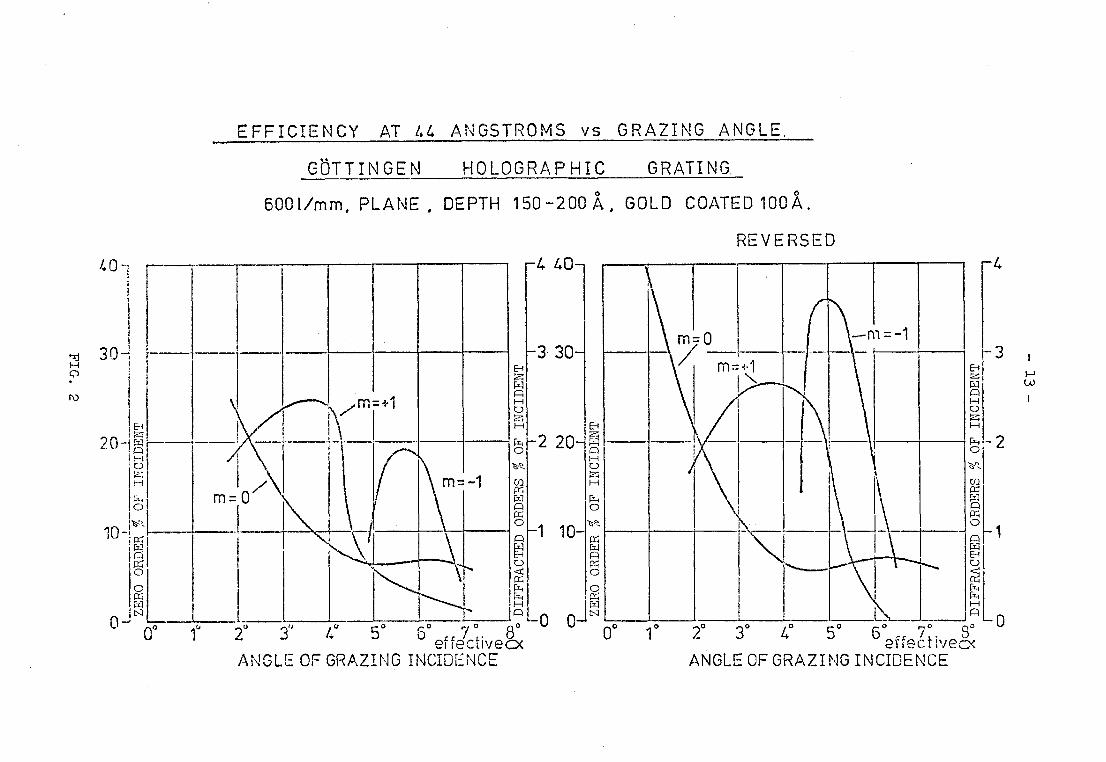
and gold, and both have a sinusoidal profile. Since photoresist is an
easily degradable organic material, it seemed that the method developed
by Rudolph and Schmahl for producing gratings with an all-metallic
structure would be preferable for use in the soft x-ray region. The
efficiency of the first grating made for us at Gottingen is shown in
Fig. 2. Although the absolute efficiency is no better than that of the
other early holographic grating types, it is an important result since
the zero order curve shows evidence of phase cancellation, i.e. the
grating is behaving like a phase grating. Since the manufacturing
process used at Gottingen was intended to produce a laminar profile on
the grating surface, this result was to be expected.
However, this was the first holographic grating which we had exa-
mined with other than a sinusoidal Profile. It is to be noted that we
had asked for the grating to be made with a groove depth of 160 1 and
- 12 -
100
LLJ O rj 80
0 u_
60
>-
CC UJ ifj 40
0 cc
20 CD CC UJ NJ
GRATING IDENTIFICATION NPL HOLO 1800L/MM
I.C. REFERENCE 21 28 SEPTEMBER 1972
WAVELENGTH 44 A 5
4
z LLI O
z .--4
3
2
lt_
U)
UJ 0
0
1 Cr a. U_ U_
O
0 0 1 2 3
ANGLE OF GRAZING INCIDENCE IN DEGREES
GRATING IDENTIFICATION J-Y 1200L/MM
I.C. REFERENCE 22 2 OCTOBER 1972
WAVELENGTH 44 A
4
100
UJ
4
r-z O "C_, 80
m=+1 U_ CD
U) Ic LU CD
O
LLJ
1 0: CC
3
2
Lt_ O
60
>-
CC LLJ
j 40
LtJ O
c) 20 0 cc
NJ
0 I _I _1_
1 2 3 4 5
ANGLE OF GRAZING INCIDENCE IN DEGREES
0 6
FIG. 1
40-
301
E4 20-N
1
10- bn nrCri
O
orz
W
0 0° lc"
EFFICIENCY AT 44 ANGSTROMS vs GRAZING ANGLE.
GOTTINGEN HOLOGRAPHIC GRATING.
6001/mm, PLANE , DEPTH 150-200 A , GOLD COATED 100A.
REVERSED
m::+1
-4 40
-3 30
-4
3 , H m.+1 E--,
z-, W W P P H H 0 C..)
c-,-,11 -2 20` 0-2 cci 1-,
z - 2
0 P i-i V.. CD Vs...
'-■ Ca I--t U]
p=1 1, pc] n 0 P M X 0 '-°.. 0
wn —1 10 irl P 1
ril r4 El P E-I C., X 0 0
1-,1 4 H E
-,- H r,
P N Q`0 0
20 34 4° 5' 6° -, 7 0 8° 2° 3° 4° 5° 6 .. 7°. S° `'
etiectivec:x 2ife:t:vecx ANGLE OF GRAZING INCIDENCE ANGLE OF GRAZING INCIDENCE
the position of the diffraction maxima showed that the groove depth
was in fact 160 A. Since the Gottingen group was also particularly
interested in the development of soft x-ray gratings and had already
done a lot of work on zone plates for soft x-ray use (21), a joint
collaborative research program was set up to develop the holographic
grating for use in the soft x-ray region.
The results of the collaboration with the Grating Laboratory of
the University of Gottingen and my work there form the basis of this
thesis. The Group at National Physical Laboratory under Dr. A. Franks
has also done some very important work recently on holographic or
interference gratings for x-ray use and this work will also be reviewed.
- 15 -
CHAPTER 2
THE THEORY OF THE HOLOGRAPHIC X-RAY GRATING
2.1 THE THEORY OF THE CONCAVE GRATING
From Rowland's time to the present day, the theory of the concave
grating has been treated extensively in the literature (52, 53, 54, 55,
60, 62) and particularly notable are the papers by Beutler (56) and
Namioka (57, 58). In order to introduce the notation and make the
foundations for later discussions, the theory of the concave grating
will be briefly reviewed.
It is conventional to use a Cartesian coordinate system when
describing the theory of the diffraction grating. The origin of the
coordinate system, 0, is taken as the centre of the grating and we
will take the x-axis parallel to the rulings and the z-axis as the
normal to the surface at O. The grating surface is defined by its
equation in Cartesian coordinates or may, in general, be described by
a series expansion. The groove shape is ignored in the treatment of
the aberrations of the grating but it is of course extremely important
in calculations of the intensity distribution in the spectrum.
An incident ray from point A (xA, yA, zA) to point P (x,y,z)
on the grating surface is diffracted towards point B (xB, yB, zB).
The optical path length is the sum of the two straight lines AP and PB.
By expanding the optical path length as a power series in terms of the
grating pupil coordinates and applying Fermat's principle, the spectral
image formation and aberrations of the concave grating can be examined.
For a classical ruled grating the rulings are the intersections

- 16 - with the grating surface of planes spaced equally a distance d
apart parallel to the yz-plane. In order that rays from different
grooves reinforce one another, the optical path length for the two
rays can only differ by an integral number of wavelengths. There-
fore, following Beutler (56) and Namioka (57), the characteristic
light path function, F, can be defined:
F = <AP> + <BP> + (y/d) mA
According to Fermat's principle, point B is located so that
the light path function will have a stationary value for any point, P,
on the grating surface. For focussing of light from points along x on
the grating surface the partial derivative of F with respect to x must
be zero.
;F lax = 0
Similarly for perfect focussing of light from points on the
grating surface along y:
9F/3y = 0
For a spherical grating 3F/ax and aF,/ay are functions of x and y
and cannot be made zero for all points, P. The partial derivatives
of the light path function have the significance of the difference
in the direction cosines between the diffracted ray and the line from
P to B. Thus the partial derivatives can be directly related to the
aberrations observed.
The light path function, F. can in general be written as a
power series and each of the terms in the series can be associated
- 17 -
with a particular form of aberration. Since there is normally only
a plane of symmetry in spectrographs instead of the axial symmetry
encountered in lens design, the characteristic function is more
complex than that of centred systems. The most comprehensive des-
cription of the terms of the light path function for a concave grating
has been given by Werner (75). The treatment by Beutler and Namioka
was restricted to the Rowland circle and the vicinity of the meridian
plane because of certain approximations. By using a transformed pupil
coordinate system Werner was able to define a general focussing con-
dition in his more complete formulation of the concave grating theory.
Recently, Daniellsson and Lindblom (55) have extended Namioka's treat
ment of the light path function so that it is valid for all values of
x and valid to the fourth order in y and z.
The complete expression for the terms of the light path function
will not be reproduced here. Instead we will present only the first
few terms.
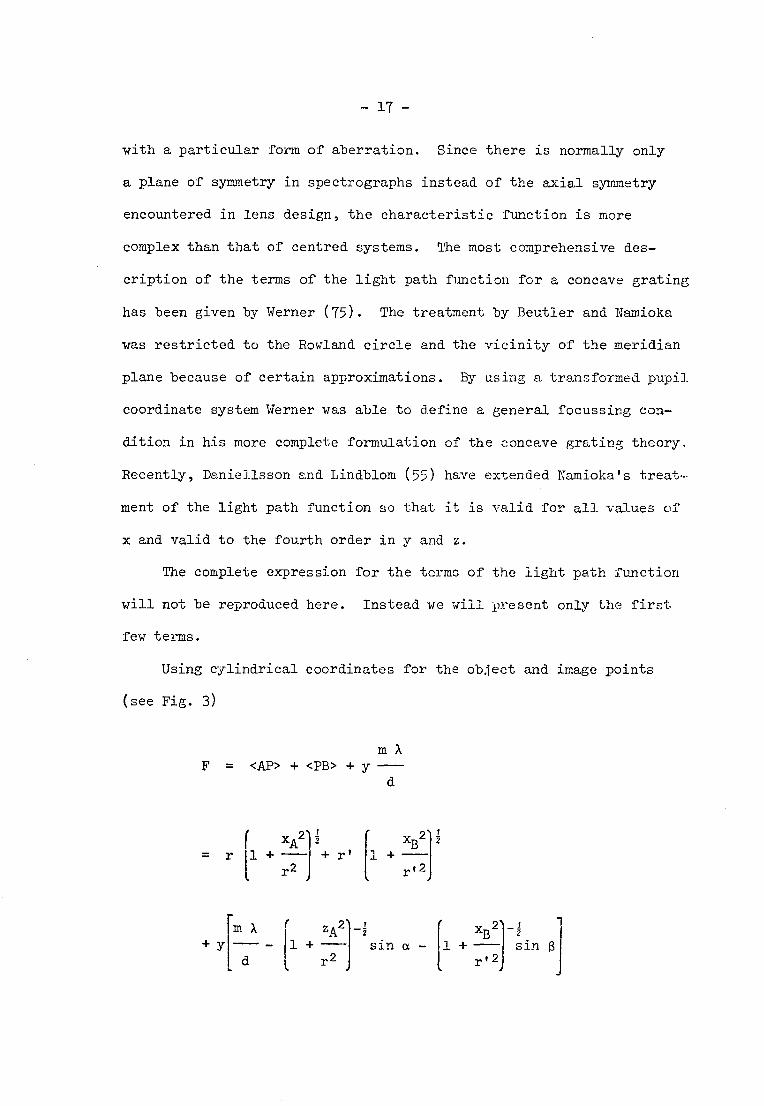
Using cylindrical coordinates for the object and image points
(see Fig. 3)
F
=
+ y
=
r
m
<AP> + <PB>
xA2 + r
, 2 ,,A
+
I _.2.
m A
1 XB2 +— r'2
-1 sin 13
J
y d
xB2 11 +
r
A
2
(
1 +
1 + — rt2
sin a - --- - d
--- r2

THE GRATING COORDINATE SYSTEM
X
costa_ cos 3 4. xB2 [1
( rl R r12 r r! -B
r2
4 COS
R
Asin a
[+ 1 +
2 3 - 2 xBsin R
r2 r'2 r'2
xA2 -
r2 j Y4.
- 19 -
XA XA -2 xB
1-2 1 + + — 1 +
r r2
xB { —
re r12
1 x 2 - -a- cos2a cos a xA
2 [1 cos al) 2
r2 r R r2
1 2 + -2 x
1 cos a xA 1 1 + -2=1
r2
x 2
1 + -
A._
r2
- -2-
x 2 - 1 cos + [1 + -.a-
rt 2 r' 1 +
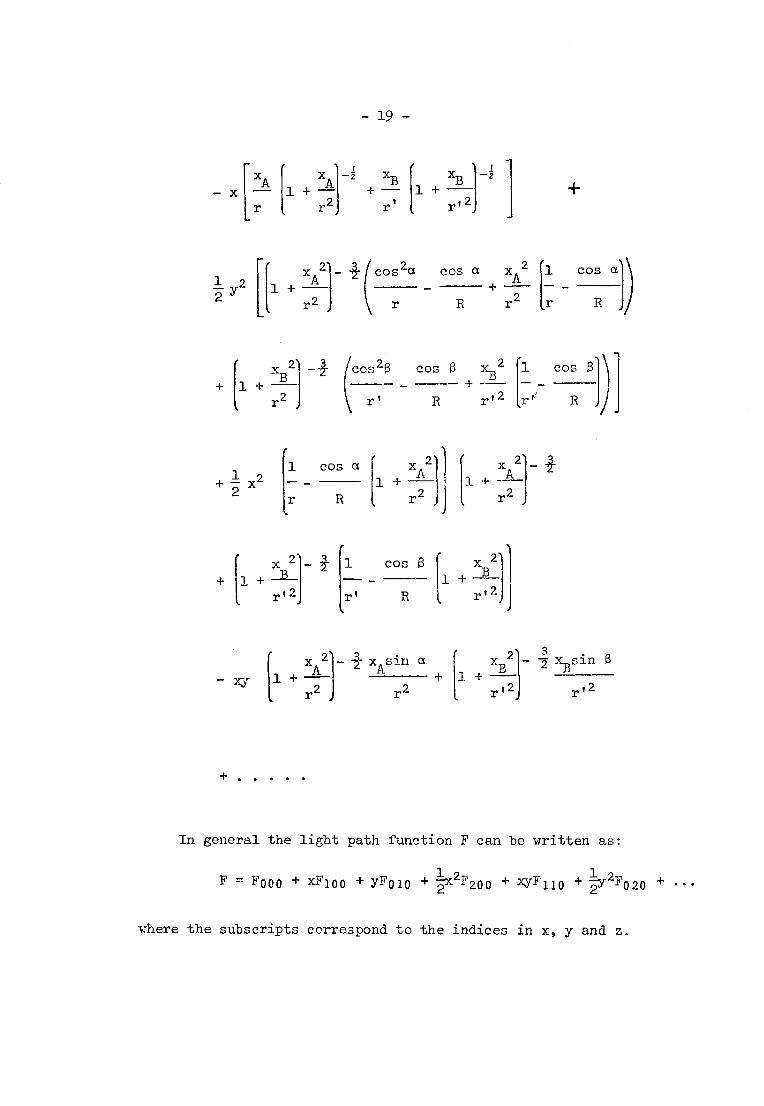
In general the light path function F can be written as:
1 1 F = F000 + xF100 YF010 2 2F200 xyF110 2
-3r F020 "I" 2
where the subscripts correspond to the indices in x, y and z.

-20-
Although the series expansions given by Beutler, Namioka and
Werner are somewhat cumbersome, it is convenient to examine them
term by term. Since the expressions contain successively higher
inverse powers of R, r, and r', which are normally large compared
to the grating dimensions, the terms rapidly decrease in magnitude.
Each term of the series expansion also has a physical significance
in that each can be associated with image formation or a particular
form of aberration.
Application of Fermat's principle to the first-order terms of
the expansion gives the well known grating equations. The second-
order terms yield the general image equation of a diffraction grating
which provides the Rowland Circle and Wadsworth mounting as solutions.
The higher order terms can be associated respectively with astigma-
tism, coma, spectrum line curvature and spherical aberration.
In the soft x-ray region it is usual to use spherical gratings
in the grazing incidence Rowland circle mounting. In this mounting
the terms, F020, F030 and F040 of the light path function become
identically zero and spherical aberration remains with some higher
order terms to limit resolution in the meridian plane.
For the Rowland circle mounting the spherical aberration term is
given by:
{
y4 cos2a costs +
8R3 sin a sin
Hence, as the width of the grating is increased the spherical
aberration rapidly becomes larger. Thus there exists an optimum
- 21-
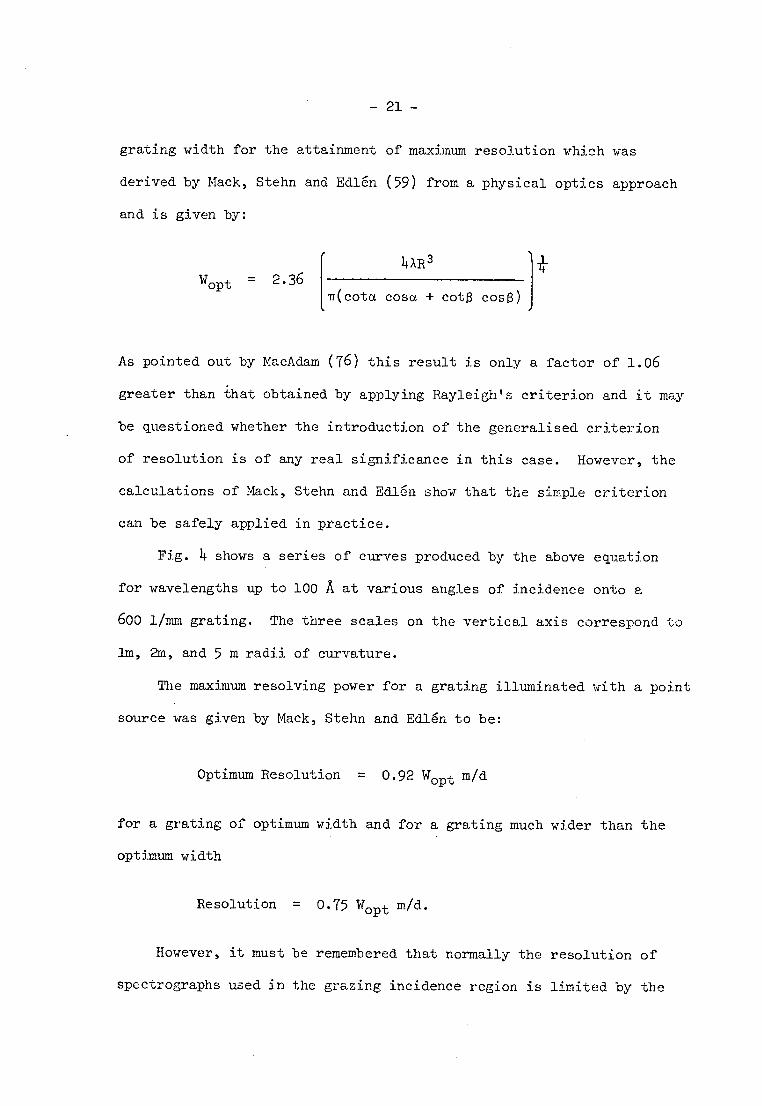
grating width for the attainment of maximum resolution which was
derived by Mack, Stehn and Edlen (59) from a physical optics approach
and is given by:
4AR 3 Wopt = 2.36
71.(cota cosa + cots cosy)
As pointed out by MacAdam (76) this result is only a factor of 1.06
greater than that obtained by applying Rayleigh's criterion and it may
be questioned whether the introduction of the generalised criterion
of resolution is of any real significance in this case. However, the
calculations of Mack, Stehn and Edlen show that the simple criterion
can be safely applied in practice.
Fig. 4 shows a series of curves produced by the above equation
for wavelengths up to 100 A at various angles of incidence onto a
600 1/mm grating. The three scales on the vertical axis correspond to
1m, 2m, and 5 m radii of curvature.
The maximum resolving power for a grating illuminated with a point
source was given by Mack, Stehn and Edlen to be:
Optimum Resolution = 0.92 Wopt m/d
for a grating of optimum width and for a grating much wider than the
optimum width
Resolution = 0.75 Wopt mid*
However, it must be remembered that normally the resolution of
spectrographs used in the grazing incidence region is limited by the

OPTIMUM WIDTH OF A CONCAVE GRATING AGAINST WAVELENGTH
-11 = 600mm-1]
GRATING RADIUS 5m 2m lm
60 30 18
16
50 _ 25 -1
OPTIMUM 14
WIDTH
40 20 12
H a 30 15 10
= 6°
- 40
a = 2°
a = 10
m = -1 a = 6°
20 10
m = -1
a = 4°
10
0
-,L.-_L-----L_,_J 1 t 1 10 20 30 40 50 60 To
80 90 100
WAVELENGTH ( A )
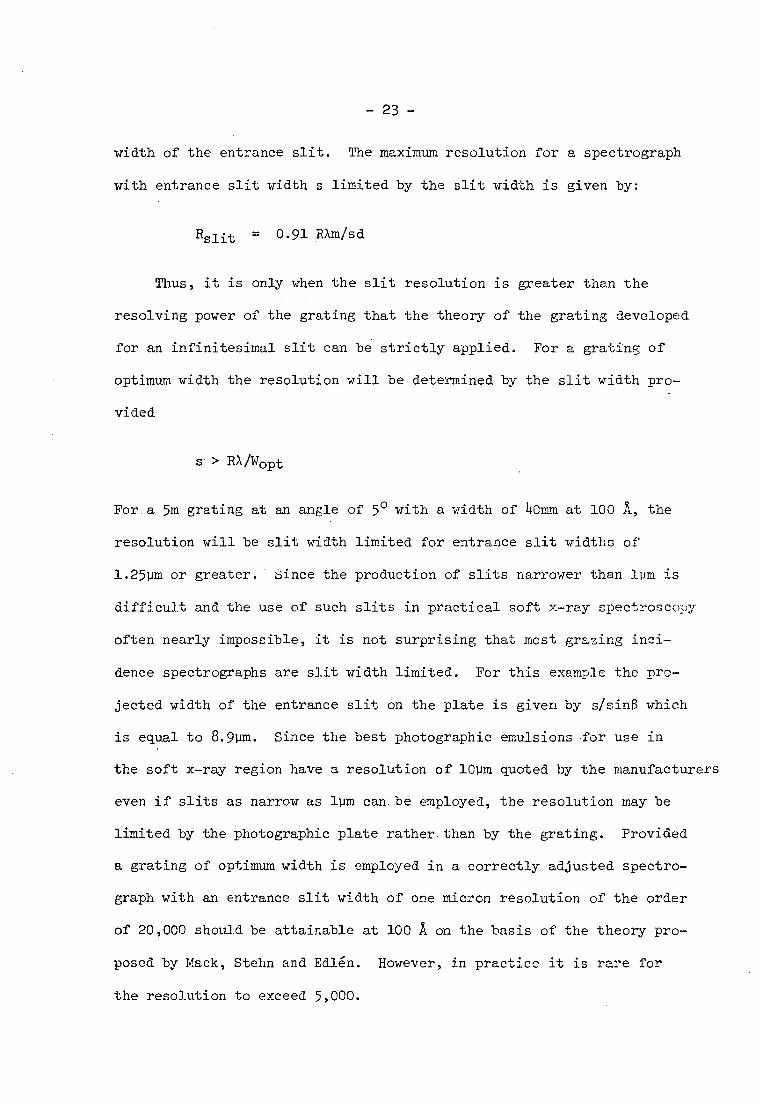
- 23 -
width of the entrance slit. The maximum resolution for a spectrograph
with entrance slit width s limited by the slit width is given by:
Rslit = 0.91 RAm/sd
Thus, it is only when the slit resolution is greater than the
resolving power of the grating that the theory of the grating developed
for an infinitesimal slit can be strictly applied. For a grating of
optimum width the resolution will be determined by the slit width pro-
vided
> R X /Wopt
For. a 5m grating at an angle of 5° with a width of 40mm at 100 A, the
resolution will be slit width limited for entrance slit widths of
1.25pm or greater. Since the production of slits narrower than 1pm is
difficult and the use of such slits in practical soft x-ray spectroscopy
often nearly impossible, it is not surprising that most grazing inci-
dence spectrographs are slit width limited. For this example the pro-
jected width of the entrance slit on the plate is given by sisinf3 which
is equal to 8.9pm. Since the best photographic emulsions-for use in
the soft x-ray region have a resolution of lOpm quoted by the manufacturers
even if slits as narrow as 1pm can be employed, the resolution may be
limited by the photographic plate rather.than by the grating. Provided
a grating of optimum width is employed in a correctly adjusted spectro-
graph with an entrance slit width of one micron resolution of the order
of 20,000 should be attainable at 100 A on the basis of the theory pro-
posed by Mack, Stehn and Edlen. However, in practice it is rare for
the resolution to exceed 5,000.
-214-
At shorter wavelengths when smaller angles of incidence also
have to be used to ensure sufficient reflectivity the optimum width
decreases rapidly. For example for a 600 1/mm 5m grating used at
a grazing angle of 10 the optimum width for 10 A radiation is only
15.5mm. Thus, the resolution and luminosity of the grating have
both decreased. For this example the resolution will be slit width
limited for all practical cases and for a 1pm slit the resolution will
be 2730.
Since the optimum width is determined by the spherical aberration
the optimum width can be increased if the spherical aberration is reduced.
In determining the optimum width Mack, Stehn and Edlen (59) effectively
applied the aberration tolerance that the spherical aberration should
not exceed 0.309A. This tolerance is only slightly greater than Ray-
leigh's quarter wavelength rule. Rayleigh (77) showed that for a system
with primary spherical aberration provided the wavefront in the exit
Pupil departs from the Gaussian reference sphere by less than X/11, the
intensity at the Gaussian focus is diminished by less than 20%. However,
it is well known (Born and Wolf 78) that in the presence of a small
amount of primary spherical aberration the diffraction focus is situated
midway between the paraxial and marginal foci. Under this condition the
required tolerance for primary spherical aberration is that the maximum
deviation of the wavefront from the Gaussian reference sphere must be
less than 0.94X.
Substituting this value in the aberration integral yields an
increase in the optimum width.
wht = 3.312 XR 3
1 + tcosa cota + cosh cots)
-25-
instead of
XR3
Wopt = 2.5069 /cosa cota + cosi?, cots
Bowen (65) first established that an increase in grating width
and resolution was possible by allowing either or both the slit or
plate to be slightly displaced from the Rowland Circle. In general
by allowing displacements of the entrance slit and plate terms in y2
and y3 are introduced into the aberration polynomical which were zero
for the Rowland circle case. By setting the y3 term to zero and for
a grating extending from y = -Y to +Y setting the coefficient of y2
to -Y2 times the coefficient of the y4 term, the maximum value of the
aberration is reduced to a quarter of its value without the offset
from the Rowland circle. Hence, Bowen determined that it was possible
to keep the aberration below a certain value over a range of y 1/5-
times as great as without the offset. Bowen gave the optimum grating
width to be
{
Wopt (Bowen) = 3.55 AR3 -4-
cosa cota + cos cots
Bowen also applied geometrical optics to determine the distances
of the ray intersections from the Rowland circle. He discovered that
the displacement of the entrance slit introduced a dissymmetry in the
image. However, he pointed out that this dissymmetry could materially
decrease the width of the image on the plate when the angle between
the extreme rays is comparable to the angle between the incident princi-
pal ray and the plane of the plate.
-26—
From geometrical optics (79) it is known that in the presence
of primary spherical aberration the position of sharpest focus, or
circle of least confusion, is located at three quarters the distance
from the Gaussian to marginal focus. At this position the image has
one quarter the width it would have at the Gaussian focus. Thus for
an entrance slit on the Rowland circle the best image is formed at a
distance Ar' beyond the Rowland circle given by:
3 cosa cota + cosf3 cots w2
where W is the grating width.
By differentiation of the focus term, F020, for small departures c
the entrance slit from the Rowland circle, Ar:
(sin2a/r2)Ar (s4n2p11.12)Arl 0
Hence, in the vicinity of the Rowland circle Ar = -hr'. Thus either the
entrance slit or the plate may be moved outside the Rowland circle to
improve focussing or the grating radius may be altered.
The limitation of plate resolution and its effect on the optimum
grating width was also considered by Bowen. He gave the width of the
lines on the photographic plate to be
(cosa cota + cosB cots) C -
Y3
4R2sia
Art 4 I 8R
[ cosa cota + cosa cota W opt (Plate)
32cR2sina
-27-
Thus, if c is the resolution of the plate then the optimum grating
width is given by
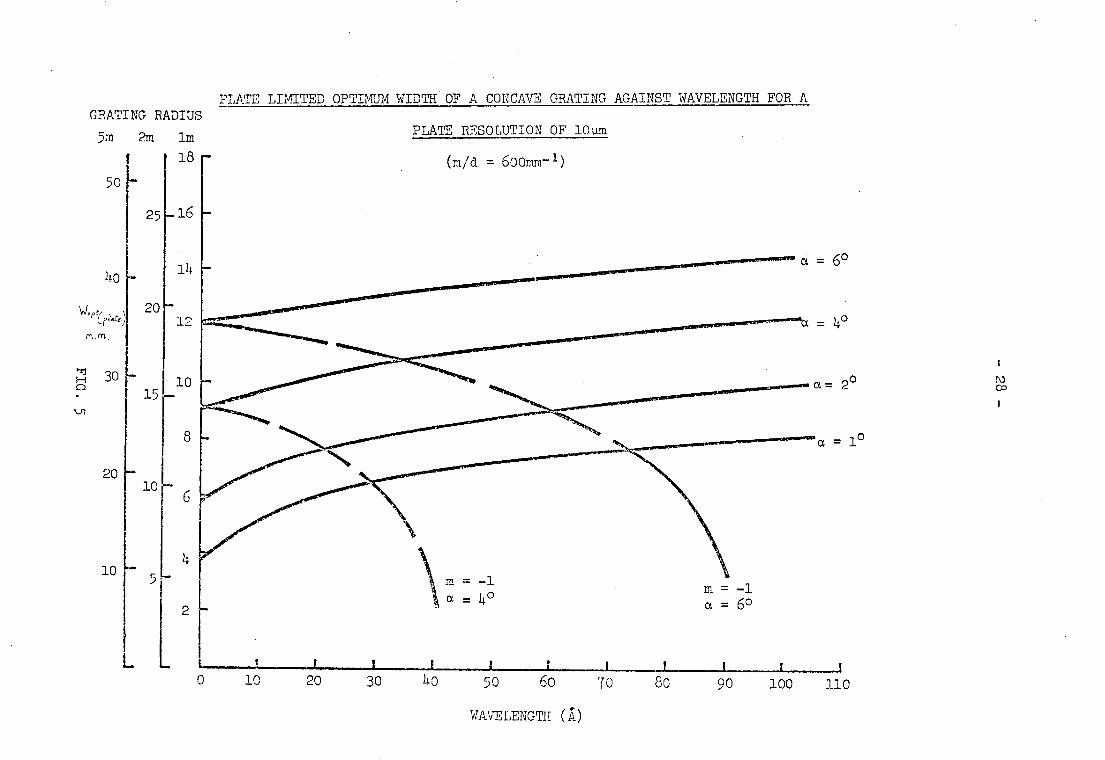
Fig. 5 shows a series of curves drawn from the above equation for
various angles of incidence for a. plate resolution of lOpm. For
practical cases it can be seen that there is little difference
between the optimum width as calculated by Mack, Stehn and Edlen
and the optimum width derived from the limitation of plate resolution.
Kozlenkov (61 ) used geometrical optics to establish the form of
the aberrations in a spectrograph in the presence of adjustment errors.
The errors considered were displacements of the entrance slit towards
the centre of the grating and displacement of the detector along the
diffracted chief ray. Kozlenkov essentially generalised and expanded
Bowen's earlier treatment dealing more comprehensively with displace-
ments of the entrance slit off the Rowland circle. He showed that the
gain in resolution by displacing the entrance slit off the Rowland
circle was practically the same as the gain in resolution by displacing
the detector. Kozlenkov also showed that corresponding to the maximum
optimum width there is a maximum permissible offset given by
[ A R dr' = — (cosa cota + cosa cots)
2
The maximui optimum width is )5. times the optimum width on the
Rowland circle. If the offset is increased beyond this value the
a= 2° op
'INCroffsonwrowlon..swernemp............."'""'IP.C. =
10
10
= -1
a = 4° m = -1 a = 60
Amp
0
GRATING RADIUS
5m 2m 1m
18
50
25_16
PLATE LIMITED OPTIMUM WIDTH OF A CONCAVE GRATING AGAINST WAVELENGTH FOR A
PLATE RESOLUTION OF 10pm
(m/d = 600mm-1 )
= 6° avvessemewirwe ssairsmorrwryworawarammrstrassmcwwsw.....osigwarares
20
emee..."*"
4".."1.1"."10r2PrOMerestoc 140
e
Mr. rn .
Q 30
■.r;
20
0 10 20 30 40 50 60 70 80 90 100 110
WAVELENGTH (A)
-29-
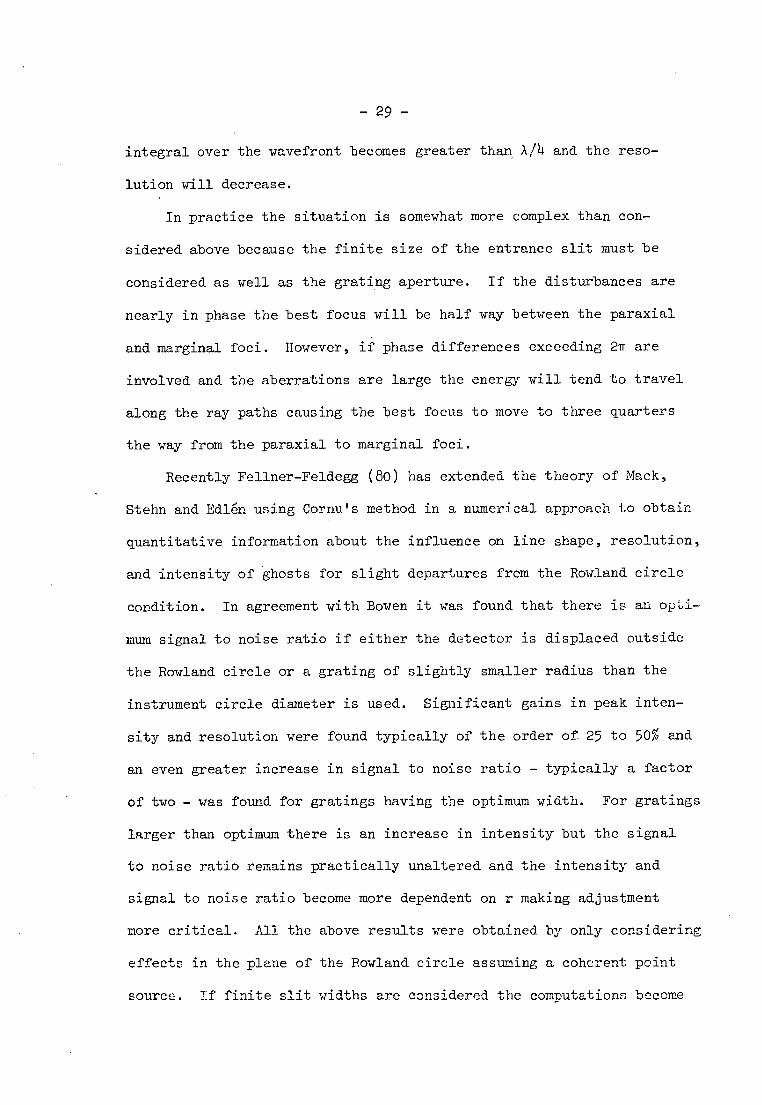
integral over the wavefront becomes greater than A/4 and the reso-
lution will decrease.
In practice the situation is somewhat more complex than con-
sidered above because the finite size of the entrance slit must be
considered as well as the grating aperture. If the disturbances are
nearly in phase the best focus will be half way between the paraxial
and marginal foci. However, if phase differences exceeding 211- are
involved and the aberrations are large the energy will tend to travel
along the ray paths causing the best focus to move to three quarters
the way from the paraxial to marginal foci.
Recently Feliner-Feldegg (80) has extended the theory of Mack,
Stehn and Edlen using Cornu's method in a numerical approach to obtain
quantitative information about the influence on line shape, resolution,
and intensity of ghosts for slight departures from the Rowland circle
condition. In agreement with Bowen it was found that there is an opti-
mum signal to noise ratio if either the detector is displaced outside
the Rowland circle or a grating of slightly smaller radius than the
instrument circle diameter is used. Significant gains in peak inten-
sity and resolution were found typically of the order of. 25 to 50% and
an even greater increase in signal to noise ratio - typically a factor
of two - was found for gratings having the optimum width. For gratings
larger than optimum there is an increase in intensity but the signal
to noise ratio remains practically unaltered and the intensity and
signal to noise ratio become more dependent on r making adjustment
more critical. All the above results were obtained by only considering
effects in the plane of the Rowland circle assuming a coherent point
source. If finite slit widths are considered the computations become
- 30-
much more complex because the phase distribution at each point on
the grating must be calculated for each point on the entrance slit.
It is interesting to note that the optimum radius for a 5m
grating in a spectrograph in which the entrance slit and detector
are accurately set on the Rowland circle is typically lmm less than
5m in order to obtain optimum signal to noise ratio. Since spherical
blanks are usually worked for a tolerance at best of A/20 it can be
easily calculated that for a typical grating blank of 50mm width the
radius can be in error by up to 2mm. Thus it is essential that some
adjustment is provided on a spectrograph to compensate for this uncer-
tain source of error.
It is clear that optimum focussing will only be obtained if
either or both the entrance slit and plate are adjusted to lie slightly
outside the Rowland circle. Since the adjustments are small - typically
less than a millimeter - the usual method of setting up a spectrograph
is to adjust photographically until the optimum focus is found. With
a new high resolution spectrograph used in this work the facility for
displacing the entrance slit from the Rowland circle in a controlled
way is incorporated. Experiments have been performed in an attempt to
determine the optimum offset correction, however, the spectral lines of
the source used were too broad to allow any precise determination to be
carried out. Further details of this work are described in Chapter 7
(Practical X-Ray Spectroscopy).
- 31-
The astigmatism of the grazing incidence mounting is determined
by the terms F200 and F400 in the light path function. As shown by
Kayser (54), and others (56, 60) for a concave grating in a Rowland
circle mounting the length of the astigmatic focal line divided by
the length of the rulings illuminated by a point source in the meri-
dian plane is given by:
icos2a cos2f3 sins
(sin a sin f3
For a typical lcm length of rulings of a 600 1/mm grating
illuminated with 100 A radiation at a grazing angle of 4° the length
of the astigmatic focal lines will be 2.83cm. For a cylindrical
grating the corresponding length of the focal lines would be 2.86cm.
Thus, it can be seen that the vertical focussing effect of the concave
grating is negligible at grazing incidence.
The astigmatism causes a large loss in light intensity and also
causes a broadening of the spectral lines because of spectrum line
curvature.
There are two forms of spectrum line curvature. The first occurs
when the entrance slit has a finite length because principal rays inci-
dent on the grating from outside the meridian plane are deviated by
different amounts to the chief ray in the meridian plane. This aber-
ration was called "enveloping curvature" by Beutler. The second form
of line curvature occurs for a point source in the meridian plane and
is due to the term F210 in the light path function. This aberration
- 32-
which becomes significant in the presence of large astigmatism was
termed "astigmatic curvature" by Beutler. The effects of astigmatic
curvature and enveloping curvature have been described by Welford
(60) and he concluded that sharp lines can only be obtained by using
a short slit to minimise the effect of enveloping curvature. In
this work the effect of using entrance slits of finite lengths on
the imaging of spectral lines has been analysed by exact ray tracing.
The results of this research are given in Chapter 3.
- 33 -
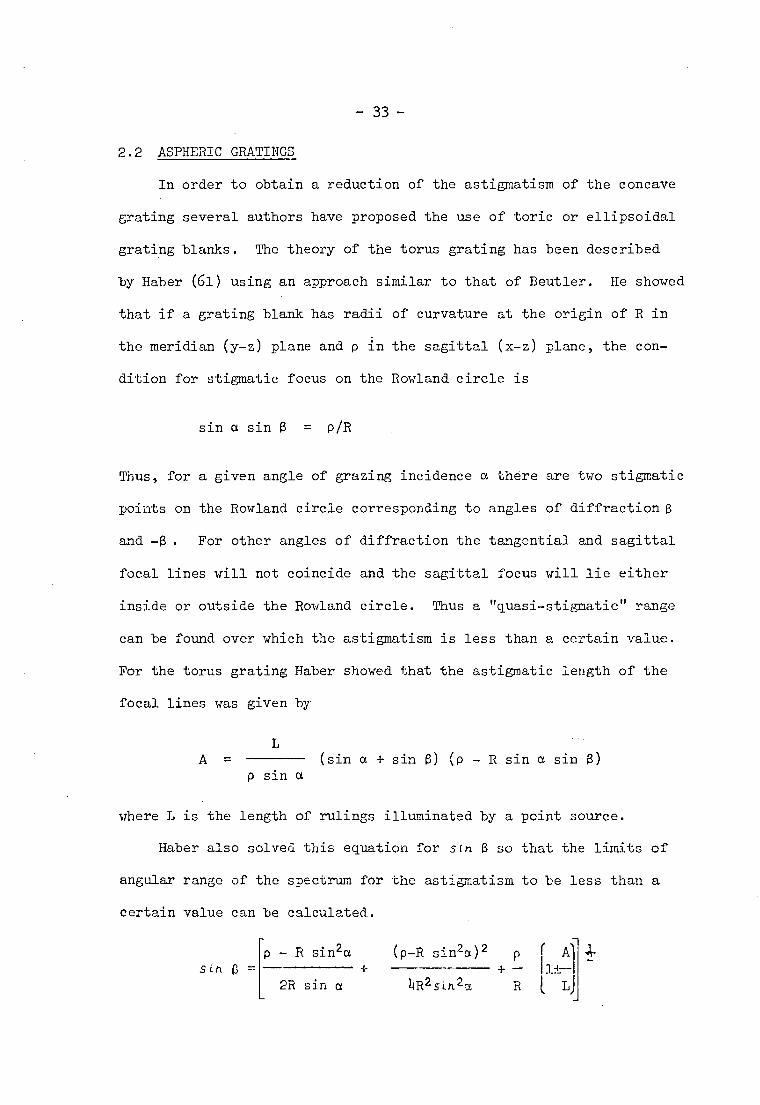
2.2 ASPHERIC GRATINGS
In order to obtain a reduction of the astigmatism of the concave
grating several authors have proposed the use of toric or ellipsoidal
grating blanks. The theory of the torus grating has been described
by Haber (61) using an approach similar to that of Beutler. He showed
that if a grating blank has radii of curvature at the origin of R in
the meridian (y-z) plane and p in the sagittal (x-z) plane, the con-
dition for stigmatic focus on the Rowland circle is
sin a sin 13 = p/R
Thus, for a given angle of grazing incidence a there are two stigmatic
points on the Rowland circle corresponding to angles of diffraction
and -0 . For other angles of diffraction the tangential and sagittal
focal lines will not coincide and the sagittal focus will lie either
inside or outside the Rowland circle. Thus a "quasi-stigmatic" range
can be found over which the astigmatism is less than a certain value.
For the torus grating Haber showed that the astigmatic length of the
focal lines was given by
L A - (sin a sin (p - R sin a sin
p sin a
where L is the length of rulings illuminated by a point source.
Haber also solved this equation for sin 13 so that the limits of
angular range of the spectrum for the astigmatism to be less than a
certain value can be calculated.
sin = p - R sin2a (p-R sin2a)2 p I A ; + + — il±-1 2R sin a 4R2sLn2a R i Li
-34-
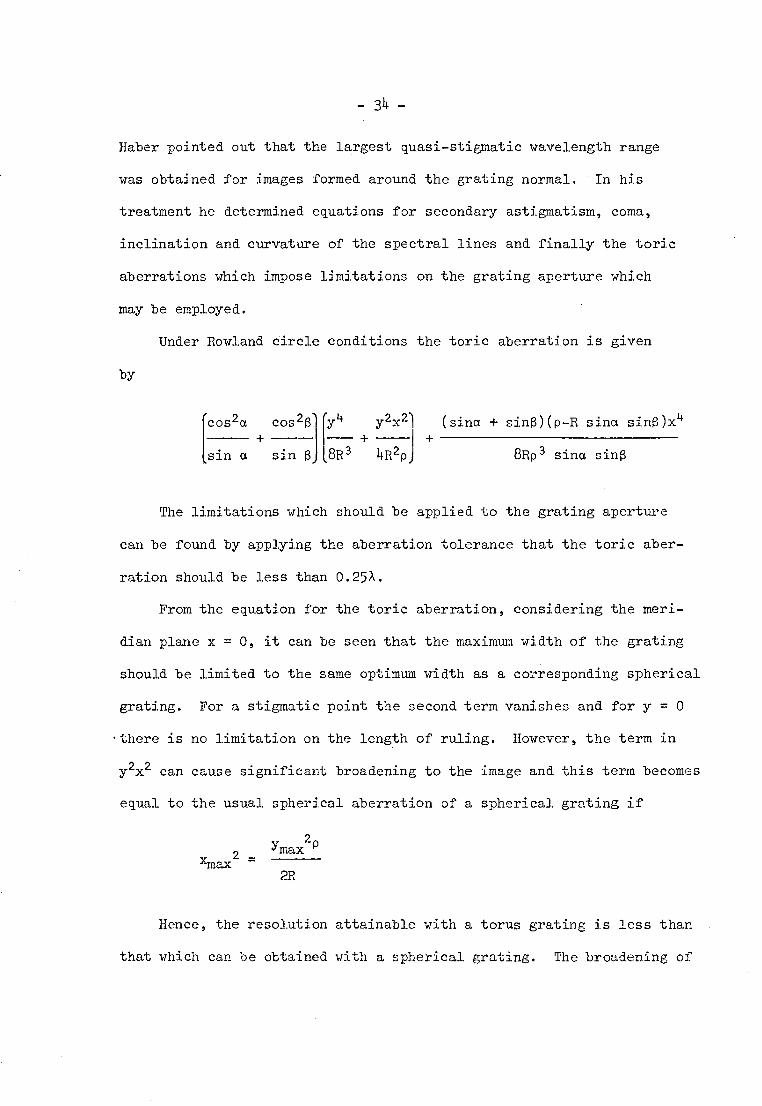
Haber pointed out that the largest quasi-stigmatic wavelength range
was obtained for images formed around the grating normal. In his
treatment he determined equations for secondary astigmatism, coma,
inclination and curvature of the spectral lines and finally the toric
aberrations which impose limitations on the grating aperture which
may be employed.
Under Rowland circle conditions the toric aberration is given
by
{
costa cos20y4 y2x2) (sina + sin0)(p-R sina sin0)x4
sin a sin 0 8R3 4R2pj 8Rp3 sina sine
The limitations which should be applied to the grating aperture
can be found by applying the aberration tolerance that the toric aber-
ration should be less than 0.25A.
From the equation for the tonic aberration, considering the meri-
dian plane x = 0, it can be seen that the maximum width of the grating
should be limited to the same optimum width as a corresponding spherical
grating. For a stigmatic point the second term vanishes and for y = 0
'there is no limitation on the length of ruling. However, the term in
y2x2 can cause significant broadening to the image and this term becomes
equal to the usual spherical aberration of a spherical grating if
xmax2 =
max
2R
Hence, the resolution attainable with a torus grating is less than
that which can be obtained with a spherical grating. The broadening of
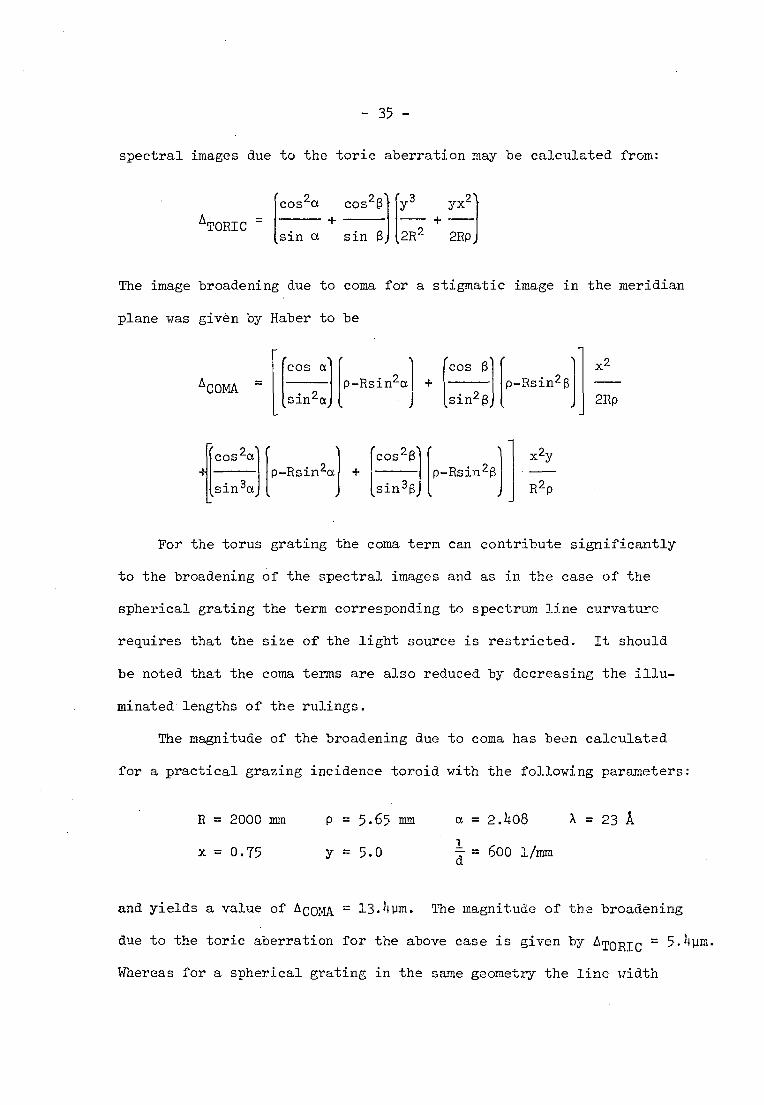
- 35 -
spectral images due to the tonic aberration may be calculated from:
costa cos261{y3 yx2 ATORIC +
sin a sin 13 2R2 2Rp
The image broadening due to coma for a stigmatic image in the meridian
plane was given by Haber to be
ACOMA =
[cos ail [cos 1[ p-Rsin2a
f3 + p-Rsin21
sin2a sin26
x2
2Rp
[costa1{ Icos21 2 f3
{ p-Rsin2a + I p-Rsin
sin3a Isin313
For the torus grating the coma term can contribute significantly
to the broadening of the spectral images and as in the case of the
spherical grating the term corresponding to spectrum line curvature
requires that the size of the light source is restricted. It should
be noted that the coma terms are also reduced by decreasing the illu-
minated lengths of the rulings.
The magnitude of the broadening due to coma has been calculated
for a practical grazing incidence toroid with the following parameters:
R = 2000 mm p = 5.65 mm a = 2.408 = 23 A
x = 0.75 y = 5.0 = 600 l/mm
and yields a value of AcomA = 13.4pm. The magnitude of the broadening
due to the tonic aberration for the above case is given by 6-TORIC = 5.141m.
Whereas for a spherical grating in the same geometry the line width
x2y
R2p
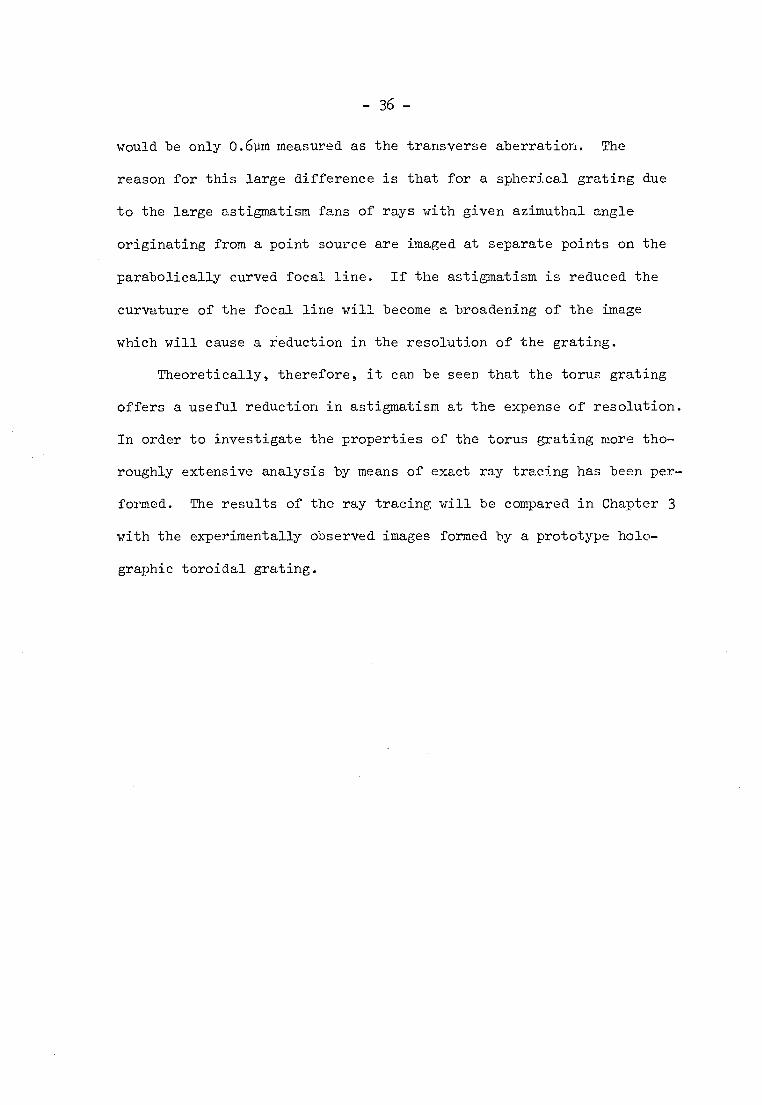
- 36 -
would be only 0.6pm measured as the transverse aberration. The
reason for this large difference is that for a spherical grating due
to the large astigmatism fans of rays with given azimuthal angle
originating from a point source are imaged at separate points on the
parabolically curved focal line. If the astigmatism is reduced the
curvature of the focal line will become a broadening of the image
which will cause a reduction in the resolution of the grating.
Theoretically, therefore, it can be seen that the torus grating
offers a useful reduction in astigmatism at the expense of resolution.
In order to investigate the properties of the torus grating more tho-
roughly extensive analysis by means of exact ray tracing has been per-
formed. The results of the ray tracing will be compared in Chapter 3
with the experimentally observed images formed by a prototype holo-
graphic toroidal grating.
- 37 -
Very few examples of the use of aspheric gratings have been
reported in the literature and this can be attributed to the technical
difficulty of optically working aspheric surfaces to sufficient accu-
racy and the problems of ruling gratings on such surfaces. Greiner
and Schaffer (81) in 1959 showed how the radii of the torus grating
should be chosen to minimise astigmatism over a given wavelength range
and described the design of a spectrograph using a torus grating. The
torus described by Greiner and Schaffer had only a slight difference
between the two radii since it was to be used at the usual angles of
incidence and diffraction for the Seya-Namioka type mountings.
More recently Schonheit (82) successfully used a toroidal grating
to reduce astigmatism in a Seya-Namioka monochromator. The grating
used in this case had 1150 1/mm ruled on a blank with primary and secon-
dary radii of curvature of 189 mm and 330 mm respectively. Similar work
has been described by Strezhev and Andreeva (83) who made several toroi-
dal gratings for a Seya-Namioka monochromator and a spectrograph to
cover several spectral ranges.
At grazing incidence it has been more popular to use a toroidal
mirror as a condenser in front of a grazing incidence spectrograph to
remove astigmatism at one wavelength and reduce it in the vicinity of
that wavelength. Rense and Violett (84) used such a system in a rocket-
borne spectrograph to perform solar spectroscopy and recorded wavelengths
down to 8411. A similar system has also been used by Cantil and Tondello
(85) to increase intensity when performing laboratory soft x-ray absorption
spectroscopy. The analysis of such systems has been described by Ishii
et al (86) and Shchepetkin (87). It should be noted that in the design
- 38 -
of such systems it is essential that the aberrations of the total
system are considered with respect to the geometry, source size and
slit widths employed in order to obtain optimum performance.
It is well known that an ellipsoidal mirror can theoretically
produce a perfect image of a point source located at one of the foci.
The general optical characteristics of concave gratings ruled on
ellipsoidal blanks has been described by Namioka (58), and he has
also applied the theory to the grazing incidence mounting (88). By
expanding the equation of the ellipsoid as a series Namioka derived
the light path function with terms up to the fourth degree in grating
aperture. Application of Fermat's principle yielded the locus of
minimum aberration for horizontal focus to be a circle in the y-z plane
with diameter b2/c analagous to the Rowland. circle (where a, b and c
are the semi-axes in respectively the x, y, and z directions). The
condition for vertical focus is the same as for a toroid and can be
written in terms of the semi-axes as
a2 = sin a • sin a
b2
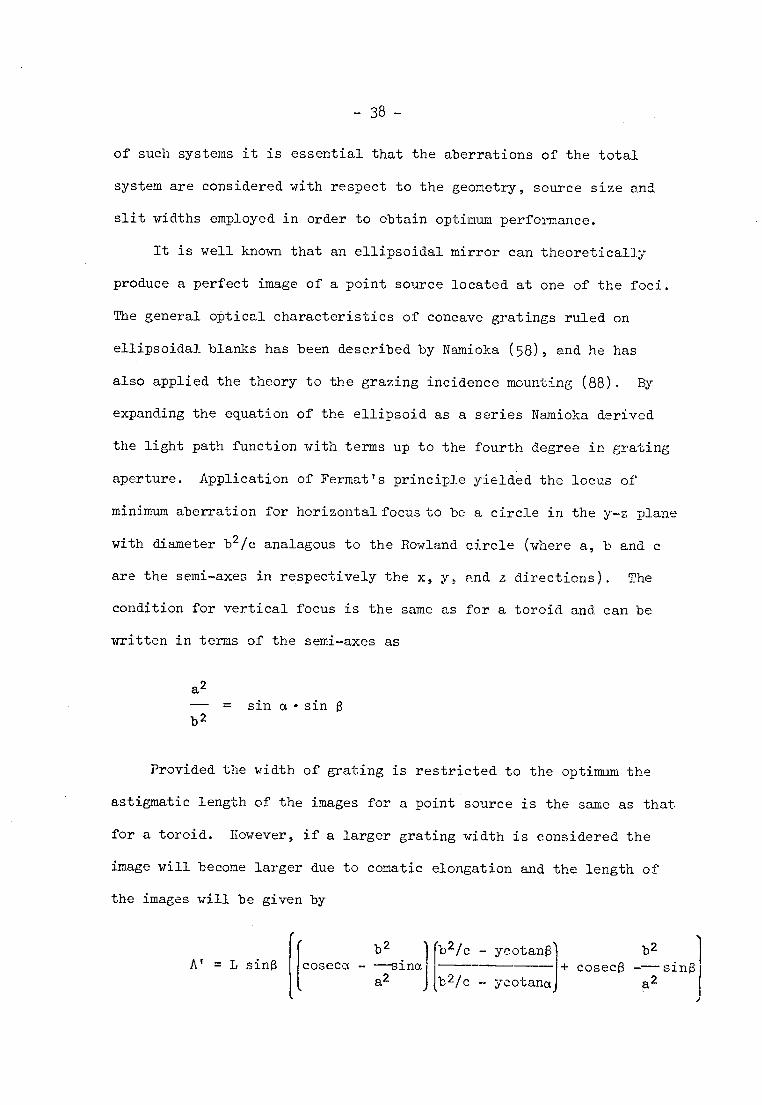
Provided the width of grating is restricted to the optimum the
astigmatic length of the images for a point source is the same as that
for a toroid. However, if a larger grating width is considered the
image will become larger due to comatic elongation and the length of
the images will be given by
A' = L sins b2
coseca ---sina a2
b2/c - ycotana b2 1 cosecs ----sina
a2 b2/c ycotana

-39-
provided yc/b2tane < 1 and yc/b2tana < 1
The optimum value of a/b can be calculated over a range of angles
of diffraction for a given angle of incidence by minimising the astig-
matic aberration term. The full equation for the optimum ratio given
by Namioka will not be given here; instead an approximate expression
is given:
a 1 {2(13142)+sin2f32-sin2131} = — [sina.
b 2 cos2-cos131
The grazing angle of incidence is a and the grazing angle of
diffraction lies between 13, and 132.
The width of an ellipsoidal grating must be restricted as in the
case of a spherical grating to limit the term corresponding to spheri-
cal aberration. For the ellipsoidal grating this term is given by:
y4c3 1 1
8 b6 [sina sine
b2 - — (sina + sine)
c2
From this expression it can be seen that by proper choice of the
semi-axes a larger optimum width may be employed than for a correspon-
ding spherical grating.
The optimum width considering only the first Huyghens zone on the
grating is given by:
Ab6 sina sine Wopt = 2 2 c
3 (sina+sin)(1--Isinc.sin
-4o-
For b = c the above equation yields the result for a spherical
grating but leaves the value of a to be chosen to reduce astigmatism.
In the spectral region where 11- (b2/a2)sinu sinSi<11-sina sin the
astigmatism can be reduced and also the optimum width increased by
using an ellipsoidal grating with semi-axes a and c equal.
Namioka gave an example for an angle of grazing incidence of 50
with angles of diffraction of 6.5° and 15° corresponding to the wave-
length range 44-505 A. With a ratio of semi-axes of a/b = 0.1344 the
astigmatism was reduced to about 25% of that of a spherical grating.
However, Namioka concluded that the combination of a toroidal mirror
and spherical grating is more efficient at reducing astigmatism than
the ellipsoidal grating.
Although the properties of the ellipsoidal grating look very
promising it should 1e remembered that the ellipsoidal mirror suffers
severely from coma for off-axis object points. This restricts the
applicability of ellipsoidal mirrors, however, a system using an ellip-
soid-hyperboloid mirror combination has been described by Chase and
Silk (89) for x-ray imaging of radiation from laser fusion pellets.
The configuration is a natural modification of the paraboloid-hyper-
boloid mirrors used for high resolution x-ray astronomy. It was shown
by ray tracing that this system would be capable of spatial resolution
1-311m over a field of a few hundred microns and would have a collecting
area greater than 103 times that of the pinhole cameras often used for
x-ray imaging. However, it was pointed out that the tolerance for
making such mirror systems for use with finite conjugates at sec of
arc resolution would be between one-half to one-tenth those for a
typical x-ray telescope. Thus the performance of the mirror system
will be limited by the accuracy with which the surfaces can be figured
and the degree of surface perfection which can be attained.
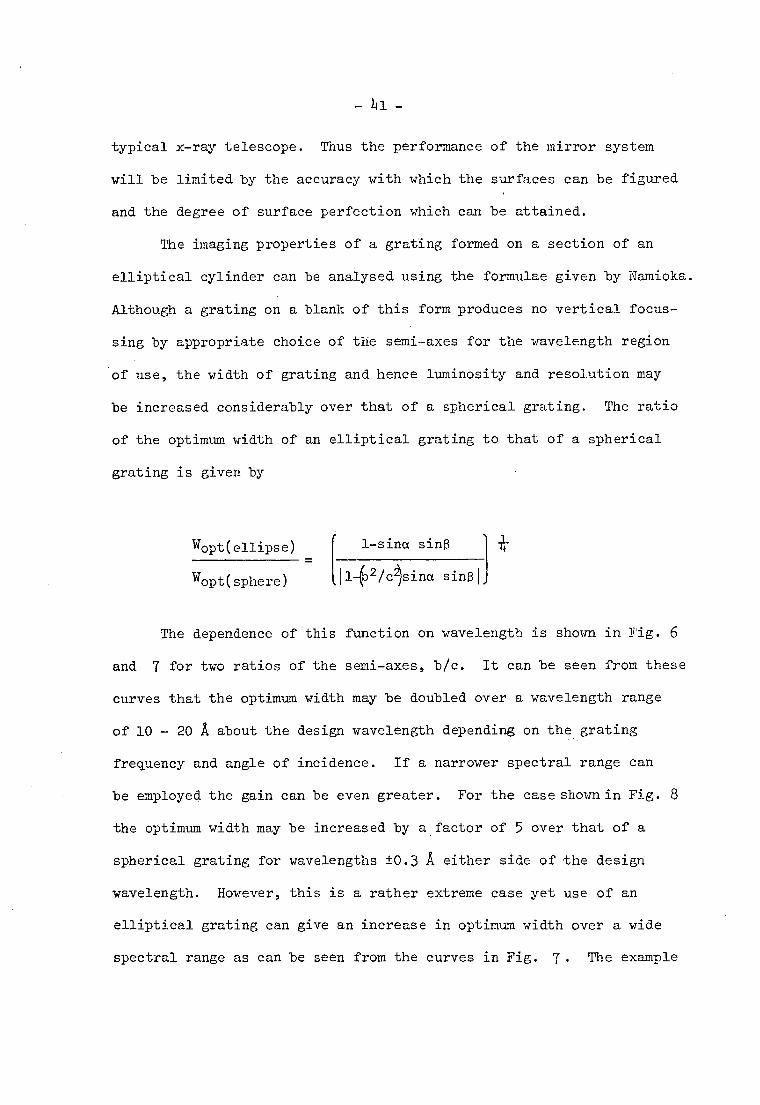
The imaging properties of a grating formed on a section of an
elliptical cylinder can be analysed using the formulae given by Namioka.
Although a grating on a blank of this form produces no vertical focus-
sing by appropriate choice of the semi-axes for the wavelength region
of use, the width of grating and hence luminosity and resolution may
be increased considerably over that of a spherical grating. The ratio
of the optimum width of an elliptical grating to that of a spherical
grating is given by
Wopt(ellipse) 1-sing sins
Wopt(sphere) 1142/csina sin131
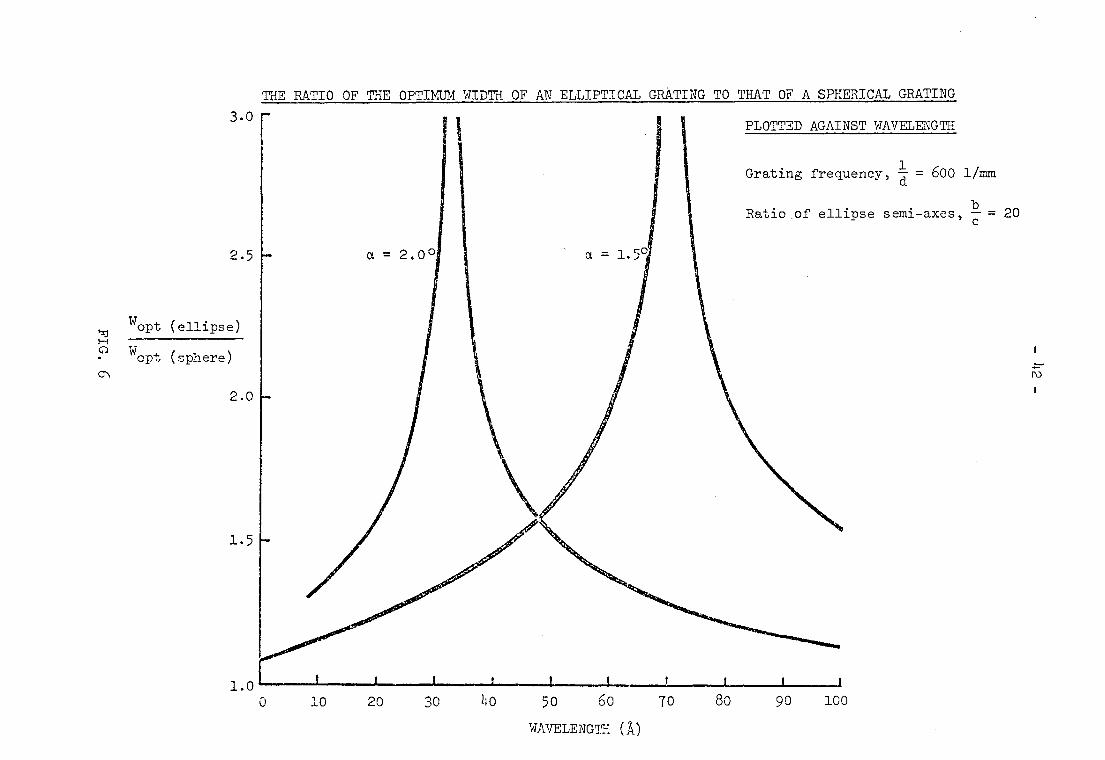
The dependence of this function on wavelength is shown in Fig. 6
and 7 for two ratios of the semi-axes, b/c. It can be seen from these
curves that the optimum width may be doubled over a wavelength range
of 10 - 20 A about the design wavelength depending on the grating
frequency and angle of incidence. If a narrower spectral range can
be employed the gain can be even greater. For the case shown in Fig. 8
the optimum width may be increased by a factor of 5 over that of a
spherical grating for wavelengths ±0.3 A either side of the design
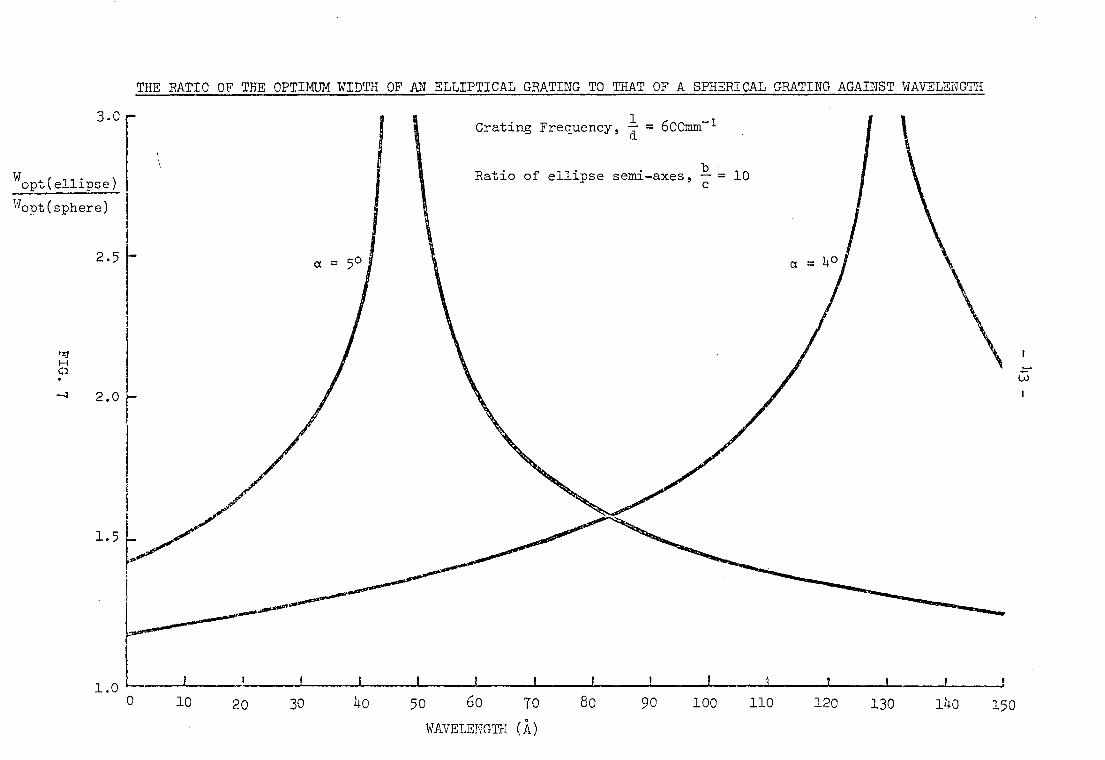
wavelength. However, this is a rather extreme case yet use of an
elliptical grating can give an increase in optimum width over a wide
spectral range as can be seen from the curves in Fig. 7. The example
3.o r
2.5
Wopt (ellipse)
wopt (sphere)
2.0
1.5
1.0
PLOTTED AGAINST WAVELENGTH
Grating frequency, - 1 = 600 1/mm
Ratio of ellipse semi-axes, !L = 20
N Q
THE RATIO OF THE OPTIMUM WIDTH OF AN ELLIPTICAL GRATING TO THAT OF A SPHERICAL GRATING
0 10 20 30 4o 5o 6o TO 80 go 100
WAVELENGTH (A)
20 30 40 50 60 70
WAVELENGTH (A)
0 80 90 100 110 10 120 130 140 150
THE RATIO OF THE OPTIMUM WIDTH OF AN ELLIPTICAL GRATING TO THAT OF A SPHERICAL GRATING AGAINST WAVELENGTH
1.5
1.0
Grating Frequency, - = 600mm-1
Ratio of ellipse semi-axes, b = 10
= 0
3.0
Wopt(ellipse)
Wopt(sphere)
2.5
2.0
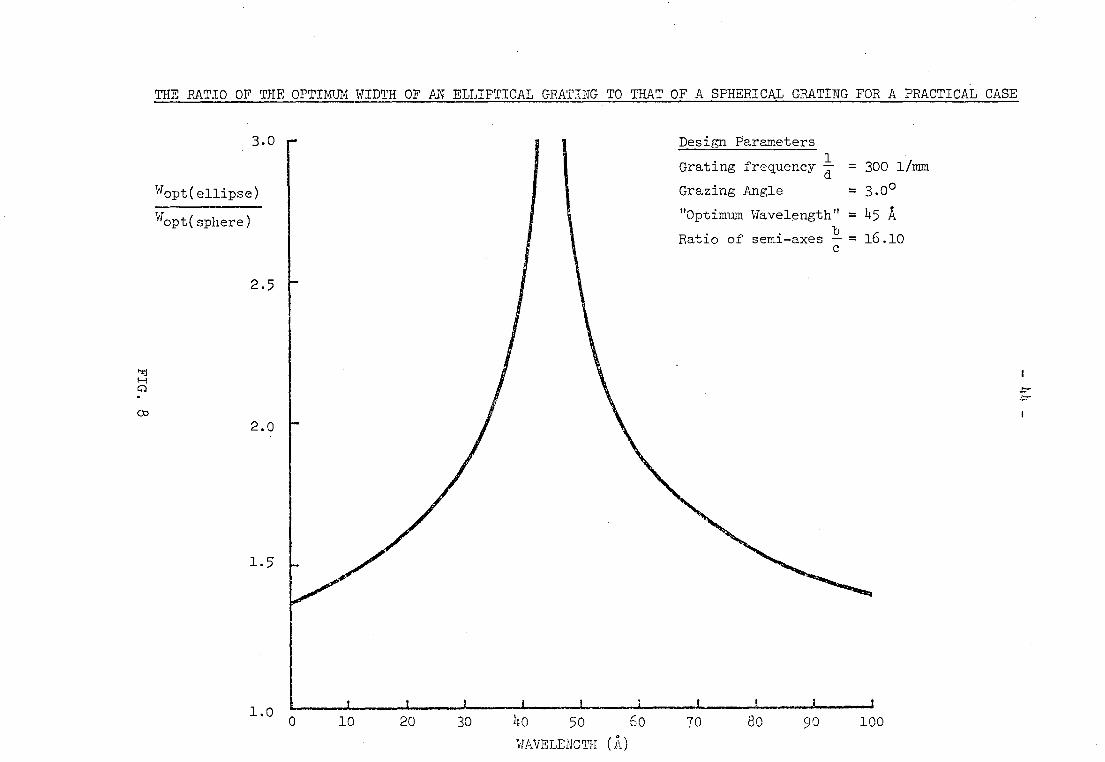
Design Parameters
Grating frequency 1 d
Grazing Angle
"Optimum Wavelength"
Ratio of semi-axes 11
3.0
Wopt(ellipse)
Wopt(sphere)
= 300 1/mm
=30°
= 45 A
= 16.10
J 0 10 20 30 4o 50 50 70
WAVELENGTH CO
80 90 100
THE RATIO OF THE OPTIMUM WIDTH OF AN ELLIPTICAL GRATING TO THAT OF A SPHERICAL GRATING FOR A PRACTICAL CASE
ELLIPTICAL GRATING
SPHERICAL GRATING
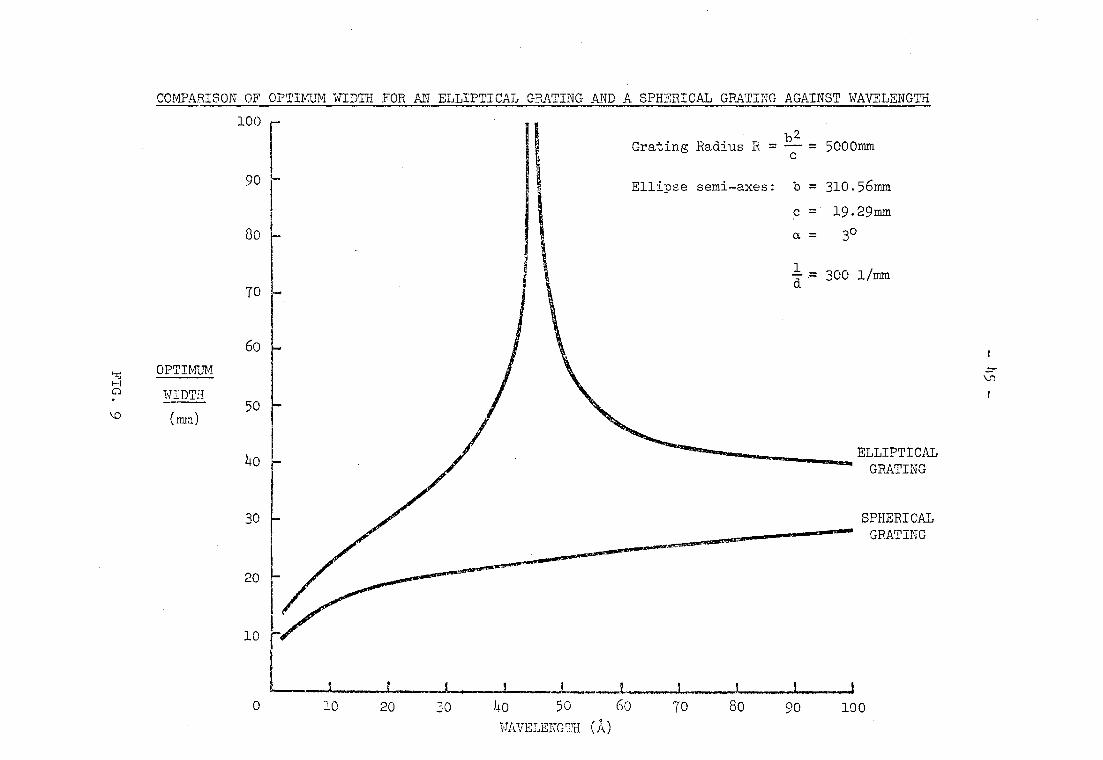
C0MPARISON OF OPTIMUM WIDTH FOR AN ELLIPTICAL GRATING AND A SPHERICAL GRATING AGAINST WAVELENGTH
100 —
Grating Radius R = hl
= 5000mm
90 Ellipse semi-axes: b = 310.56mm
c= 19.29mm a = 30
—a = 300 1/mm
60
OPTIMUM
WIDTH
(mm) 50
4o
30 F
20
10
0 10 20
30
40 50 Co 70 80 90 100 WAVELENGTH (A)
- 46 -
shown in Fig. 9 illustrates the improvement which can be gained
with an elliptical grating, compared to a spherical grating for a
practical case in the soft x-ray region. It can be seen that if one
is interested in spectra in the wavelength range 30 - 100 A, use of
an elliptical grating permits an increase in grating width from
about 20mm as required for a spherical grating to nearly 40mm.
Thus, elliptical gratings can be used in existing spectrographs
to enhance resolution over a restricted wavelength range and provide
improved performance over spherical gratings over a wide wavelength
range. The large possible gains in resolution and luminosity by
using elliptical gratings means that they are ideally suited to appli-
cations in monochromators.
In view of all the theoretical advantages in using elliptical
gratings, it is surprising that they are not widely used in the grazing
incidence region. However, it is generally thought that the production
of aspheric surfaCes to the required accuracy and surface finish is
very difficult and that the ruling of gratings on such surfaces is
also very difficult. Hence, as far as I am aware no successful ellip-
tical or ellipsoidal gratings have been made until recently.
It is well known that aspheric surfaces can be formed by deforming
a glass blank. Toroidal surfaces have been made in this way and Bennett
and Turner (71) have described the design procedure for making ellipti-
cal mirrors by bending suitably shaped flats. Since it is relatively
easy to obtain a good surface finish and flatness on a plane rather
than an aspheric surface, it is possible to satisfy the exacting require-
ments of soft x-ray reflection by this method. The effects of bending
the mirror to the desired curvature were e;:amined on a Twyman-Green
- 147-
interferometer and it was found that some astigmatism was intro-
duced. However, since the astigmatism of this system is already
large it should not cause image degradation.
The author has successfully produced several elliptical
mirrors of this type and elliptical diffraction gratings have been
formed on five of them holographically. A photograph of an ellipti-
cal mirror is shown in Fig. 10. All the elliptical gratings produced
so far have had a frequency of 300 limm on an area 5 cm long by 1 cm
wide which corresponds to the central area of the mirrors which has
the correct surface figure. The efficiency of the elliptical gra-
tings has been measured and as was to be expected it was the same as
that of typical plane and concave gratings produced by the holo-
graphic technique. The efficiency was typically about 10% at 145 A.
The visible light imaging properties of the elliptical mirrors
formed by bending have been investigated and no significant additional
aberrations were found. Similarly images in the zero order at 45 A
showed no excessive broadening or scattered light. Since an x-ray
tube with a graphite anode was used for the initial tests no definite
conclusions could be made about the resolution of the gratings because
the CK radiation from graphite has a rather large wavelength spread
about 44.8 A. However, it can be said that the results were most
encouraging and further tests are being performed with a more suitable
line source so that a true comparison between the resolution of ellip-
tical and spherical gratings can be made.
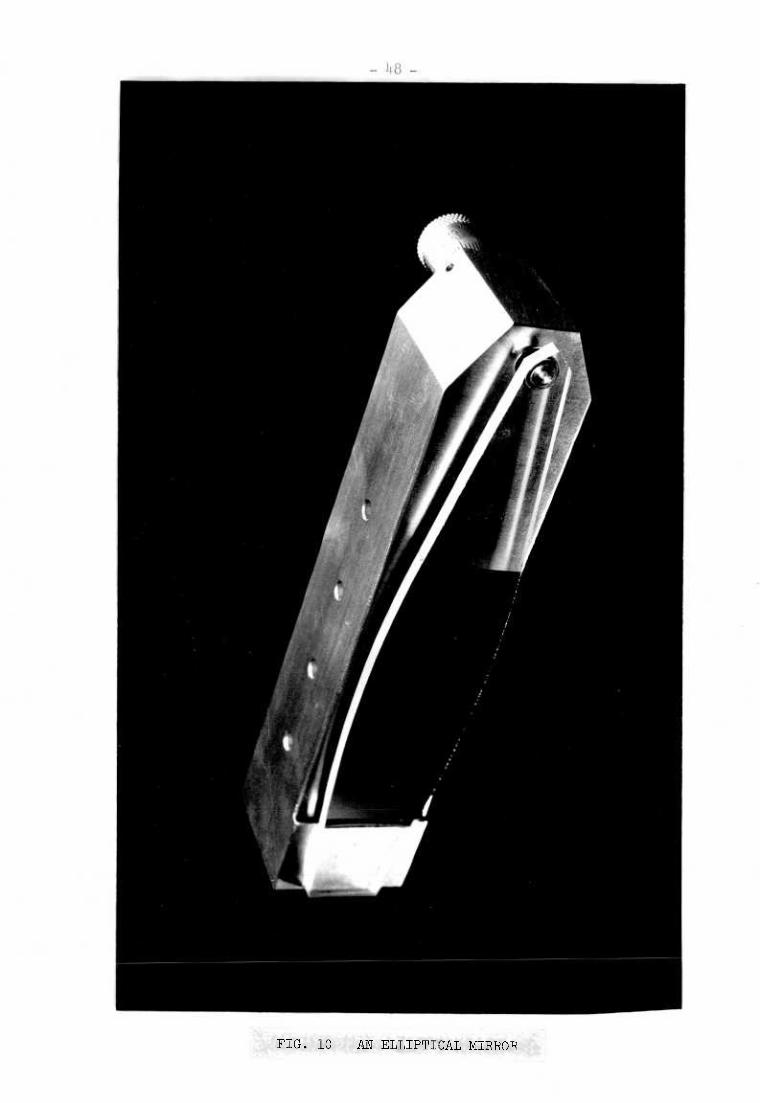
FIG. 10 AN ELLIPTICAL MIRROR
- 119-
2.3 THE VARTABL7 FREQUENCY GRATING
It has been known for a hundred years that a systematic
variation in the spacing of the lines on a grating can impart
focussing properties to a plane grating. In 1875 Cornu (68)
demonstrated the correspondence between the interference fringes
formed between two surfaces and the pattern of rulings on a
diffraction grating which gives.it focussing properties. It is
well known that if a shallow convex spherical surface is placed
in contact with an optical flat concentric interference fringes
called Newton's rings can be observed about the point of contact.
The interference fringes formed in this way are due to the super-
position of two spherical waves. If R is the radius of the
spherical surface and is large the thickness of the air gap, d,
at a distance r from the point of contact is
r2
d = -- 2R
Since there is a phase change of Tr on reflection at the lower
surface, when illuminated with monochromatic radiation of wave-
length X', dark fringes are formed at radii of
r2 =. nX'R
Thus the squares of the radii of successive dark rings are
proportional to the natural numbers.
By a geometrical approach Cornu was able to show that this
was also the law by which the rulings on a grating must be sepa-
rated in order to bring a cylindrical wave emanating from a slit
- 50-
parallel to the rulings to a focus. Cornu combined the equations
for imaging from a diffraction grating and the equation for inter-
ference fringes to yield
1 1 2 k X —+— = — u v R
which he realised was identical to the classical lens formula with
object and image distances u and v. Thus he was able to state that
for a plane grating, whose straight or circular rulings are separated
in the same law as the interference fringes formed at normal inci-
dence between a plane surface and a cylinder or a sphere of radius R,
has the properties of a cylindrical or a spherical lens. The grating
has a series of real or virtual foci lying on a straight line through
the centre of the grating at distances from the grating which are sub-
multiples of positive or negative integers corresponding to the
different orders of diffraction.
The first order primary focal length of the grating for mono-
chromatic light of wavelength X' used to produce the grating is equal
to half the radius R. For light of another wavelength A the focal
length is altered by the ratio A'/X.
Cornu noted that these focussing properties would remain if only
a part of the pattern were illuminated. Hence, if a grating were
ruled with a uniform systematic error over part of the area it would
have focussing properties. Such properties had been observed for
apparently good plane gratings by Mascart and it was found that, in
accordance with Cornu's theory, real foci were formed for positive
orders of diffraction and virtual foci for negative orders.

- 51-
Cornu verified his theoretical work experimentally by obtaining
photographs of interference fringes formed between a flat surface and
a quartz plate slightly curved with weights. He noted that elliptical
fringes were first formed which became straight lines before changing
to hyperbolic fringes. From two small photographs of the straight
fringes Cornu measured the spacing of the fringes and found that the
theoretical focal length was close to that measured directly using
sodium light.
Although earlier work had been performed on zone plates or
circular gratings (67), I believe Cornu's work to have been the first
to be published about the variable frequency grating and the first to
describe the formation of interference, or holographic gratings.
Rowland (66) included the case of the variable frequency grating
in his extensive analysis of the imaging properties of concave gratings.
He was able to show that the definition of a grating may be very good
even when the error of run is considerable provided it is linear.
Since gratings of spectroscopic value could only be produced on ruling
engines at that time, he did not consider the variable frequency grating
in great depth. However, he gave equations to calculate the distri-
bution of light intensity for gratings with lines at variable distances.
He pointed out that the effect of variable frequency would be to give
the grating a different focus according to the angle and order of dif-
fraction and that this effect often appeared in gratings. He noted
that at any given angle the same effect can be produced by variations
of the ruled surface from the ideal shape. He also stated that a theo-
retically perfect grating for one position of the slit and eyepiece can
be ruled on any surface.
- 52-
After the activity concerning diffraction gratings at the end
of the last century, no significant progress was made in the field
of variable frequency gratings until 1966 when Gale (73) communi-
cated "The theory of the variable spacing grating". In this paper
a physical optics approach is used to assess theoretically the
behaviour of plane and aspherical gratings in which the spacings of
the rulings are unequal. Since reference is made to the possible
use of such gratings for wavelengths from 50 - 500 A this paper is
particularly relevant to the present work.
Gale applied the Kirchhoff diffraction integral and obtained
an equation for the scattered amplitude in terms of the Fresnel
integrals. After applying several simplifying approximations it
was shown that to obtain maximum intensity the rulings must be
positioned so that the optical path length increases by mX from one
ruling to the next, i.e. the waves diffracted by all the rulings are
in phase at the focus. Once the ruling pattern has been chosen for
a given wavelength and geometry it is not possible to obtain the
maximum intensity for another wavelength. Instead it is necessary to
choose object and image coordinates such that the variation in maxi-
mum intensity is minimised for each new wavelength. Considering only
the meridian plane Gale expanded the optical path length as a power
series in grating width, y, up to the fourth power. He obtained
equations for the positions of the rulings in terms of the coefficients
of the power series and the optical path length for the coordinates
at a different wavelength. In the meridian plane there are four co-
ordinate parameters which means that three of the coefficients of the
- 53 -
expansion of the optical path length can be removed. However, since
this would entail two possibly complex motions, Gale does not consider
this case any further. Instead the locus of maximum diffracted
intensity is given for which the second order term is zero. Gale
then goes on to consider the optimum number of rulings for focussing
plane gratings. He points out that plane focussing gratings with a
large number of rulings produce a rapidly varying intensity for wave-
lengths in the vicinity of the design wavelength, A. Such behaviour
would make comparison of spectra difficult and Gale goes on to con-
sider a relaxation of the ideal focussing condition in which the
grating spacing increases linearly with y. He calls this grating a
quadratic plane grating and it has the same focal curve as the fo-
cussing plane grating but without the singularity in the optimum
number of rulings. The diffracted intensity distribution was calcu-
lated numerically and it was found to be asymmmetrical with a peak
displacement of typically 0.04 minutes of arc. If the number of
rulings was increased above the optimum the intensity profile became
much more complex and the maximum intensity decreased rapidly.
Finally, Gale derived an expression for the optical path length
function for unequally spaced rulings on a slightly aspherical
surface. Gale realised that the problem of increasing the optimum
number of rulings of a spherical grating could be solved by appro-
priate choice of ruling parameters and aspheric coefficients so that
the fourth and higher order terms of the optical path length function
would be made zero.
He analysed the expressions in the optical path length function
and showed that it was possible to obtain a focussing curve indepen-
dent of the angle of diffraction. The third order term could also
be made to vanish but the fourth order term could not be made zero
independent of the angle of diffraction. Hence, the fourth order
term can only be made zero for one particular wavelength for a given
ruling pattern and geometry. However, Gale concluded that no improve-
ment in the focussing properties of a concave spherical grating can
be obtained by any choice of ruling pattern or asphericity. It can
be seen that without further qualification this statement is obviously
incorrect. However, it is interesting to observe that although there
are theoretical advantages in using both aspheric and variable fre-
quency gratings for certain applications in the soft x-ray region, no
improvement in horizontal focussing over that of the concave spherical
grating has been demonstrated experimentally to date.
By means of the present research programme in the near future we
intend to show experimentally that not only resolution but also lumi-
nosity can be considerably increased by suitable design of diffraction
gratings for use in the soft x-ray region.
Gratings with unequal groove spacings have been successfully ruled
by Gerasimov et al (104) and Harada (105). There are many problems in
ruling such gratings; however, this method allows the possibility of
ruling patterns which cannot be achieved holographically and also allows
the high efficiency of present ruled blazed gratings in the visible
and UV regions to be retained.
However, for soft x-ray use holographic gratings now have a higher
efficiency than ruled gratings and the holographic method enables cer-

- 55 -
tain types of variable frequency grating to be easily produced.
Furthermore, the holographic method enables gratings to be formed
on steeply curved substrates upon which it would be exceedingly
difficult to rule a grating. Thus, although we accept that variable
frequency gratings can be made on a ruling engine we have attempted
to find holographic solutions applicable to the soft x-ray grazing
incidence geometry.
The aberrations of a grating with imaging properties can be
minimised in a given wavelength region by optimal choice of substrate
curvature and surface variation of spatial frequency.
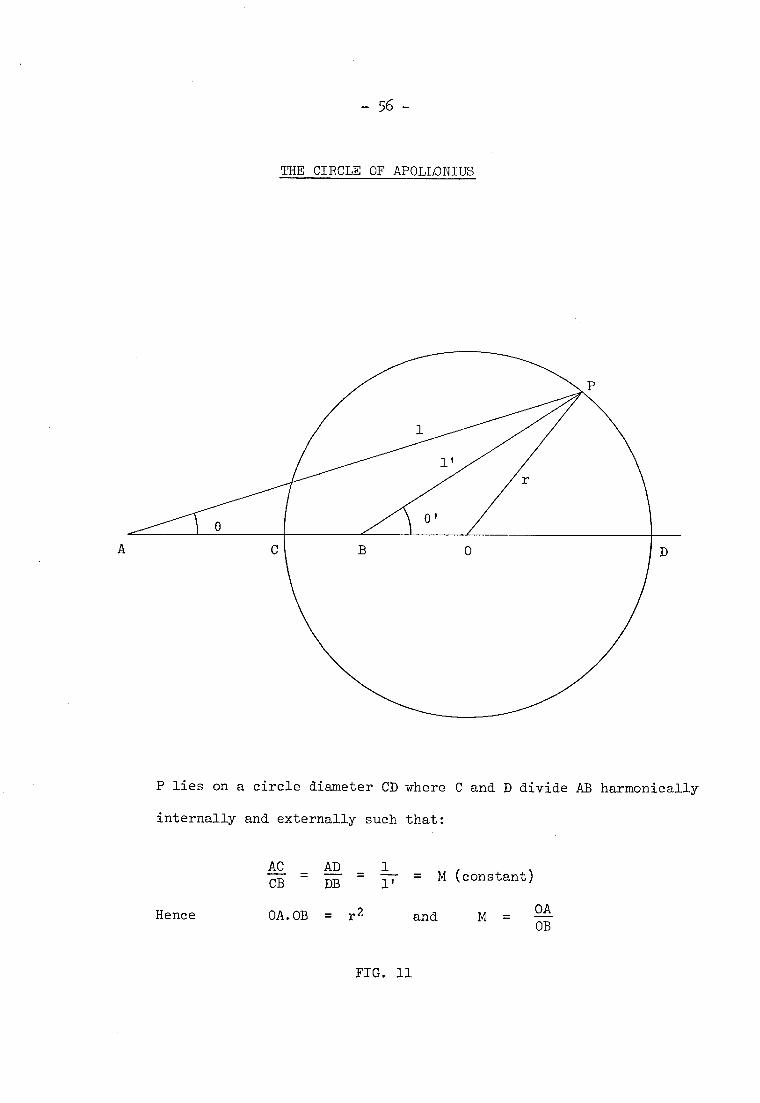
In 1960 Murty (90) showed that a zone plate imposed on a spheri-
cal surface forms an aplanatic system free from spherical aberration
and coma if the object and image points are inverse points with respect
to the circle which lies in the spherical surface. The line joining
the object and image points is divided harmonically internally and
externally by the circle and this circle is known as the circle of
Apollonius (see Fig. 11).
If a reflection hologram is formed on the spherical surface by
the interference of light wavelength X0 with one wave converging on
point B and a second coherent wave diverging from point A; when it is
reilluminated with polychromatic radiation from source point A, accor-
ding to the holographic principle, a perfect image will be formed at
B of light wavelength Ao. In addition it can be shown (91) that
radiation of wavelength Ao/(M+1) is focussed at the centre 0 of the
sphere and that radiation of wavelength 2A0/(M4.1) is focussed back at
A free from spherical aberration. Similarly if the polychromatic
- 56 -
THE CIRCLE OF APOLLONIUS
P lies on a circle diameter CD where C and D divide AB harmonically
internally and externally such that:
AC AD . 1 CB DB l' M (constant)
Hence OA.OB = r2 and OA
OB
FIG. 11

- 57 -
source is positioned at B wavelength Ao is focussed at A, wavelength
MA0/(M-1-1) is focussed at the centre and wavelength 2MA0/(M+l) is
focussed back at B. Thus to make a given grating there are three
points at which the two recording sources may be located. Once a
grating has been formed a source may be placed at any of the three
points to provide stigmatic images at the other two points.
It has been suggested (92) that the grating formed by the inter-
ference of waves from a point source located at the centre of curva-
ture of the grating and a point source located on the opposite side
of the grating could be used in the x-ray domain. For this case a
point source at A forms a stigmatic image with wavelength A0 at 0 and
a stigmatic image with wavelength (1-M)Ao at B. As M-41 the wavelength
imaged at B becomes small and points A and B come close to the grating
sphere. Murty and Das (91) have examined the spherical aberration
for this type of system and found that it varied considerably between
the zero aberration positions. They found that the variation was least
for M values of 2 or 0.5. Values of M from 0-1 signify that point A
is outside the circle and point B inside the circle; M-values from
1-.0 correspond to A inside and B outside the circle. Thus interchanging
A and B changes M to 1/M.
The general properties of stigmatic spherical gratings have been
described by Labeyrie (93). The locus of a spectrum from this type of
grating - which has been classified as "Type III" by Jobin-Yvon - is
obtained by setting the coefficient of Y2 to zero in the optical path
length function. The locus is a curve which has three intersections
with the revolution axis of the system. The three intersections are
- 58 -
the stigmatic points and the revolution axis is the locus of
sagittal focus. The aberrations of the zone plate type holographic
grating on a spherical surface have thus been extensively examined
in the literature. Recently, from general isoplanatism conside-
rations Welford (95) proposed a similar system for a hologram lens
(96) and showed how the ray tracing equation for holography and the
isoplanatism theorem enable the effect of a change in the recon-
struction geometry to be calculated.
The general method for calculating the aberrations of holo-
graphic gratings has been outlined by Cordelle et al (94). They
gave the basic expressions for the light path function for holo-
graphic gratings and obtained a series expansion up to third order
for a grating recorded on a spherical surface. They also mentioned
that because of the large number of possible combinations (including
the possible use of correcting lenses during recording) and the
many different needs, grating imaging would probably develop as a
distinct field in optical computing.
It is only in the last two years that the theory of the holo-
graphic grating has been established, with the same rigor as that of
the classical ruled grating, by Namioka, Noda and Seya (98, 100).
The theory of the holographic diffraction grating is the subject of
the thesis of Dr. H. Noda (99).
In this treatment of the theory of the holographic grating the
light path function for the classical grating is extended to include
terms containing the coordinates of the recording point sources. The
meridian plane is defined by the origin of the grating and the two
coherent point sources C and D. Points A, B and P are an object
-59-
point, the corresponding image point and a point on the grating
surface. Assuming the distances of C and D from the origin is an
integer number of wavelengths and positive-working photoresist is
used so that a groove is formed at the origin; using laser light
of wavelength A0 the nth groove will be formed according to:
n Ao = (<CP>-<DP>) (<Co>-<Do>)
This relation may be substituted in the usual expression for
the light path function and expanded as a power series. The series
expansion then contains terms corresponding to the classical ruled
grating plus additional terms which are unique to holographic gratings.
Application of Fermat's Principle to the power series yields
the grating equation, magnification, and horizontal and vertical
curves in a similar way as in the treatment of the classical ruled
grating.
In order to be able to choose the recording parameters to reduce
the residual aberrations over a given wavelength range the geometry
in which the grating is to be used must be determined. The most
widely used mountings are those based on the Rowland circle, hence,
it is convenient to design holographic gratings having a horizontal
focal curve which lies on the Rowland circle. The alternative is to
abandon the Rowland circle and to find another horizontal focal curve
of which the lemniscate focal curve of Jobiri-Yvon Type III stigmatic
gratings is a good example.
On the Rowland circle the first and third terms of the light
path function for a classical grating are zero thus the corresponding
-6o-
terms for the holographic grating must also be made zero. These
terms can be made zero for three possible recording geometries.
The first possibility is to set the recording point sources at
infinity so that plane waves are used to produce equispaced fringes
in the tangent plane to the grating surface. Gratings of this sort
have been classified as Type I by Jobin-Yvon and have a groove
pattern identical to classical ruled gratings.
The second possibility is to locate the point sources on the
Rowland circle. The Rowland circle conditions with the requirement
for a given frequency at the centre of the grating only leave one
degree of freedom in choosing the coordinates of the recording
sources. This degree of freedom may be used to make one of the
succeeding terms in aberration polynomial zero at a given wavelength
and so eliminate astigmatism or coma-type aberration. If the grating
frequency is also a free parameter• both astigmatism and coma-type
aberration may be eliminated for one wavelength.
The third possibility is to use the special solutions for
stigmatic imaging corresponding to the Jobin-Yvon type III gratings
which can have a similar ruling law to the variable frequency mechani-
cally ruled gratings proposed by Sakayanagi (103) and Gerasimov (l01 ).
Unfortunately, none of the well-known solutions can be applied to the
grazing incidence region since the grating efficiency decreases with
increasing frequency. The design options for holographic gratings
are also restricted by the usable range of available laser wavelengths.
Namioka et al have thoroughly investigated the design possibilities
for holographic gratings for use in the Seya-Namioka monochromator
(97, 98, 99, 101, 102). The results of this comprehensive research
programme have been to demonstrate that the performance of Seya-
Namioka monochromators can be improved by the use of aberration-
reduced holographic concave gratings. They found theoretically
that although reduction of astigmatism was possible rather large
coma-type terms were produced by this reduction. They concluded
that it was preferable to reduce the coma-type aberration and
verified this conclusion experimentally by producing both coma-
reduced and astigmatism-reduced holographic gratings. They also
produced spot diagrams by ray tracing in order to evaluate the
imaging characteristics of the holographic gratings designed and
found that they corresponded to the images obtained experimentally
Thus further gratings can be safely designed and tested using a
digital computer rather than producing and testing them experi-
mentally.
In the grazing incidence region the limitations on the design
parameters for holographic gratings are most severe. We have
already seen that the two most significant aberrations, astigmatism
and spherical aberration, severely limit the luminosity and reso-
lution of grazing incidence instruments. We have also seen that
the astigmatism may be greatly reduced over a small wavelength range
by using a toroidal substrate but that coma-type aberration tends
to dominate and cause a loss of resolution in this case. Alternatively
by employing an elliptically figured cylindrical substrate the spheri-
cal aberration may be reduced over a restricted wavelength range so
increasing usable grating width and resolution. Thus, we have two
conflicting recuirements which depend on wavelen gth. Either we can

-62-
reduce astigmatism and accept a loss in resolution or we can neglect
astigmatism and obtain an increase in resolution over that of a
spherical grating.
In order to be able to design a practical holographic grating
the application, requirements and physical constraints of use must
be known. These facts together with an understanding of the limi-
tations of the holographic process should enable the optimum grating
to be designed for the purpose. Unfortunately many grating users'
needs are of a general nature and they require gratings which have
a high efficiency and permit high resolution to be achieved over a
wide wavelength range. Such general requirements are incompatible
with the properties of aberration-corrected holographic gratings used
at grazing incidence. However, for certain specialised applications
it may be possible to find useful solutions.
Since the grating width and hence resolution of grazing inci-
dence spectrographs is limited by spherical aberration it would be
useful to investigate whether some particular variation of grating
frequency could be employed to reduce spherical aberration over a
useful wavelength range. By a geometrical approach it can be easily
understood that for a single wavelength in a given geometry the
variation of grating frequency can in theory be chosen in such a way
that all rays from the source point striking the grating are diffrac-
ted to the same image point. However, when such a grating is illu-
minated with a polychromatic source only one wavelength will be imaged
perfectly and the other wavelengths will be aberrated to varying
degrees. Thus in order to design gratings of this type it is necessary
- 63 -
to apply an aberration tolerance and calculate numerically the
aberrations of various systems. Since the phase errors for moderate
aperture grazing incidence systems are large the Strehl type of
tolerance (106) cannot be applied but instead a modified quality
factor, as suggested by Pouey (107), can be used. Rather than cal-
culate aberrations by using approximate series expansions we have
concentrated on using exact ray tracing to give numerical values
for the transverse aberrations and direction cosines of diffracted
rays. This work resulted from a natural extension of the ray tracing
prograr used for the classical grating to the variable frequency
case. The analysis we have performed is therefore not limited by
any holographic restrictions imposed by using two recording point
sources as in the approach suggested by Noda et al (46).
From the analysis performed it became clear that variable
frequency gratings are not suited for use in spectrographs but may
be usefully employed in scanning monochromators or spectrometers.
In Fig. 12 are shown curves of the frequency variation in the meri-
dian plane to give zero spherical aberration for the case (A) with
object point on the Rowland circle and (B) with the object point
outside the Rowland circle. These curves indicate that for a grating
whose frequency varies linearly with y there exists a locus for object
and image points which lies outside the Rowland circle. By expressing
the local angles of incidence and diffraction as power series in the
pupil coordinate, y, Speer (108) has sho;•.m that the object and image
points are located on the circle which is the continuation of the
grating surface. This result was checked by ray tracing and it was
noticed that there was a systematic discrepancy which increased with
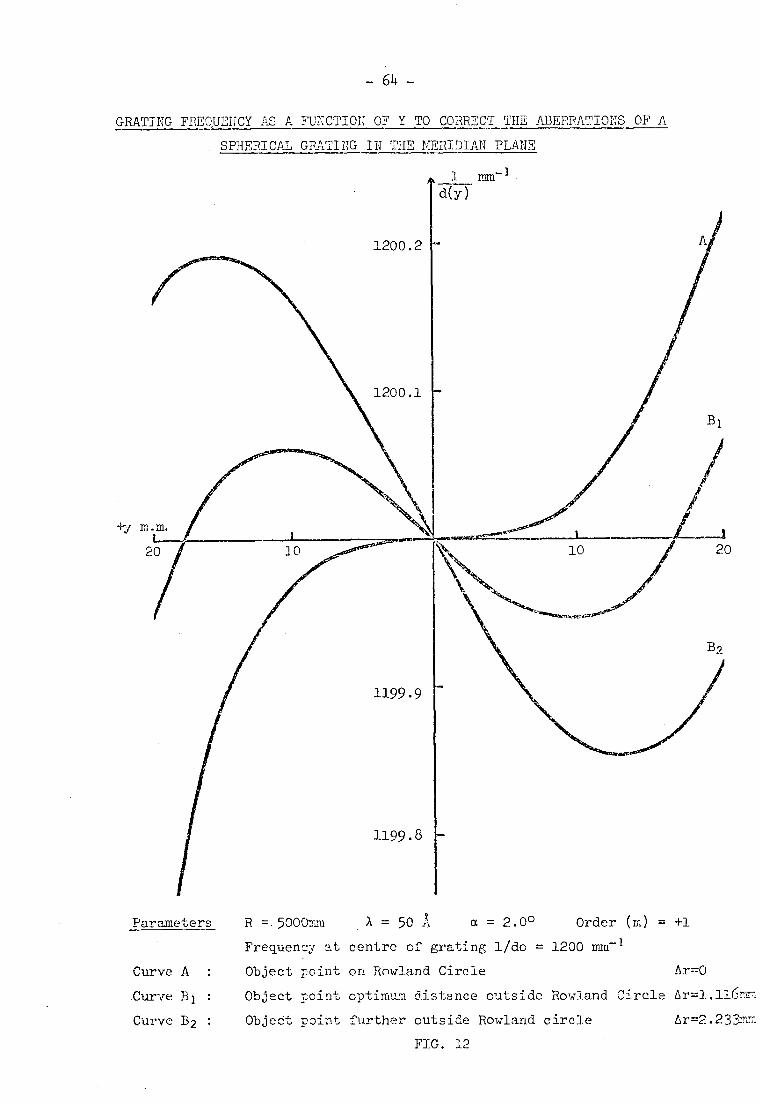
-64-
GRATING FREQUENCY AS A FUNCTION OF Y TO CORRECT THE ABERRATIONS OF A
SPHERICAL GRATING IN THE MERIDIAN PLANE
1 mm-1 d(y
Parameters R = 5000mm A = 50 A a = 2.0° Order (m) = +1
Frequency at centre of grating 1/do = 1200 mm-1
Curve A : Object point on Rowland Circle
Curve B1 : Object taint optimum distance outside Rowland Circle Ar:=1.116nn
Curve B2 : Objedt point further outside Rowland circle Ar=2.23=5,nm
FIG. 12
Ar=0
-65-
grating pupil coordinate.
In order to resolve this discrepancy it was decided to derive
the grating frequency law which would give zero spherical aberration
for object and image points located on the continuation of the gra-
ting surface. From general considerations it was evident that this
problem could best be treated using polar coordinates rather than
rectangular coordinates. The derivation of the grating frequency
law has been described by Turner (70) and the elements of this deri-
vation are described in the following section.
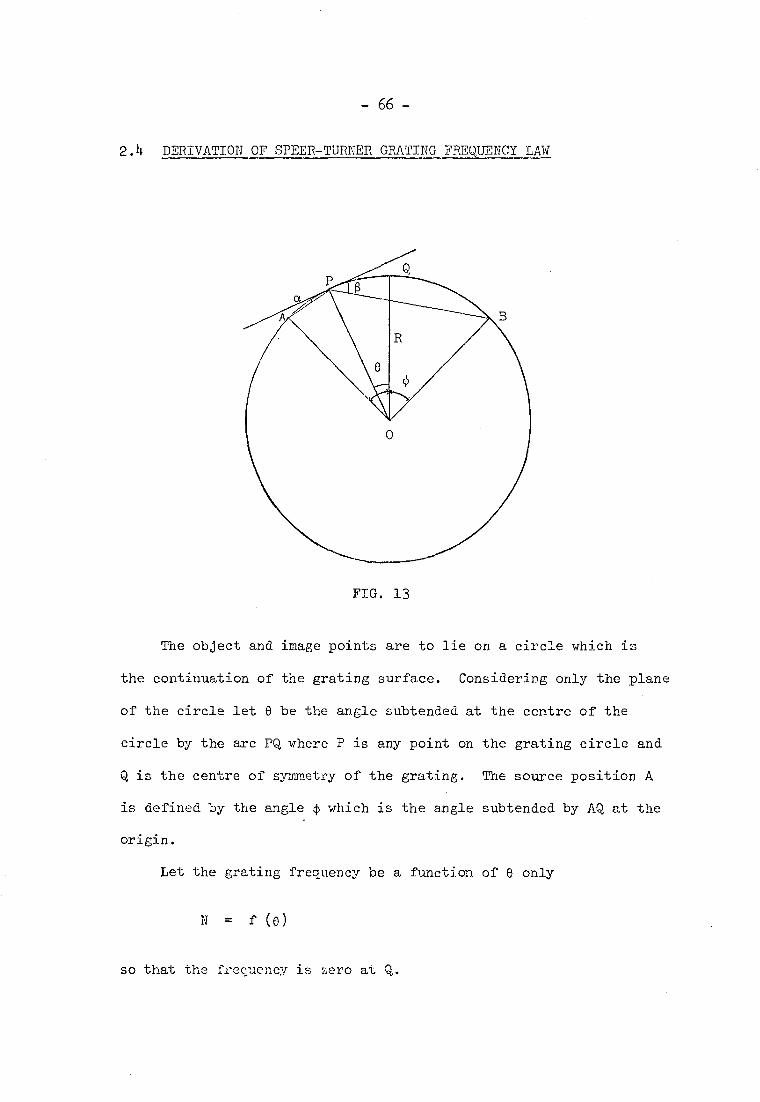
-66-
2.4 DERIVATION OF SPEER-TURNER GRATING FREQUENCY LAW
FIG. 13
The object and image points are to lie on a circle which is
the continuation of the grating surface. Considering only the plane
of the circle let 0 be the angle subtended at the centre of the
circle by the arc PQ where P is any point on the grating circle and
Q is the centre of symmetry of the grating. The source position A
is defined by the angle 4) which is the angle subtended by AQ at the
origin.
Let the grating frequency be a function of @ only
N = f (©)
so that the frequency is zero at Q.
- 67 -
By geometry:
c5-0 Grazing angle of incidence a -
2
For all diffracted rays to pass through B:
0-0 Grazing angle of diffraction =
2
Substitution of these values in the grating equation for grazing
incidence yields:
1 cos(4)/2-0/2)-cos(4)/2+0/2) N -
d m
2sin4)/2 sin0/2
m X
2sin4)/2 N = K sin0/2
where K = m A
The value of K is fixed when the grating is made. The wavelength
A focussed is chosen by calculating the angular position 4) of the
source from:
mAK = 2 sin-1
2
The image is then formed at the point on the circle given by the
angle -cp.
Thus by varying the angular position of the source a range of
wavelengths may be focussed. However, only one wavelength will be Per-
fectly focussed at the circle for each angular setting. The other
- 68 -
wavelengths are focussed with varying amounts of spherical aberration
on the line which joins the perfect focus B to the centre of symmetry
of the grating, Q.
If the grating surface includes the zero frequency position Q
radiation reflected from this point will also be present in the focus.
Since this is not normally wanted the grating length must be restricted
to exclude this point. The grating length is also limited by the
object position at the shortest wavelength to be focussed by the gra-
ting. The angle 8 must also be less than 90° otherwise the grating
frequency becomes too high for useful diffraction to take place.
A possible design for a grating of this type for use in the soft
x-ray region could be specified by the following typical parameters:
Minimum wavelength of use 23 A
Radius of curvature 2500 mm
Length of grating 200 mm
K-value 50846 mm-1
The grating frequency varies from 183 mm-1 at one end of the gra-
ting to 2217 mm-1 at the other end of the grating.
For such a grating the angle of incidence to the centre of the
grating for 23 A would be 2° and for 45 A it would be 5°. Thus the
angle of incidence increases with wavelength in a similar way to the
critical angle of reflection.
A grating whose frequency at each point on the surface varies
linearly with the sine of half the angle subtended at the centre of
the circle between the point and the centre of symmetry of the grating
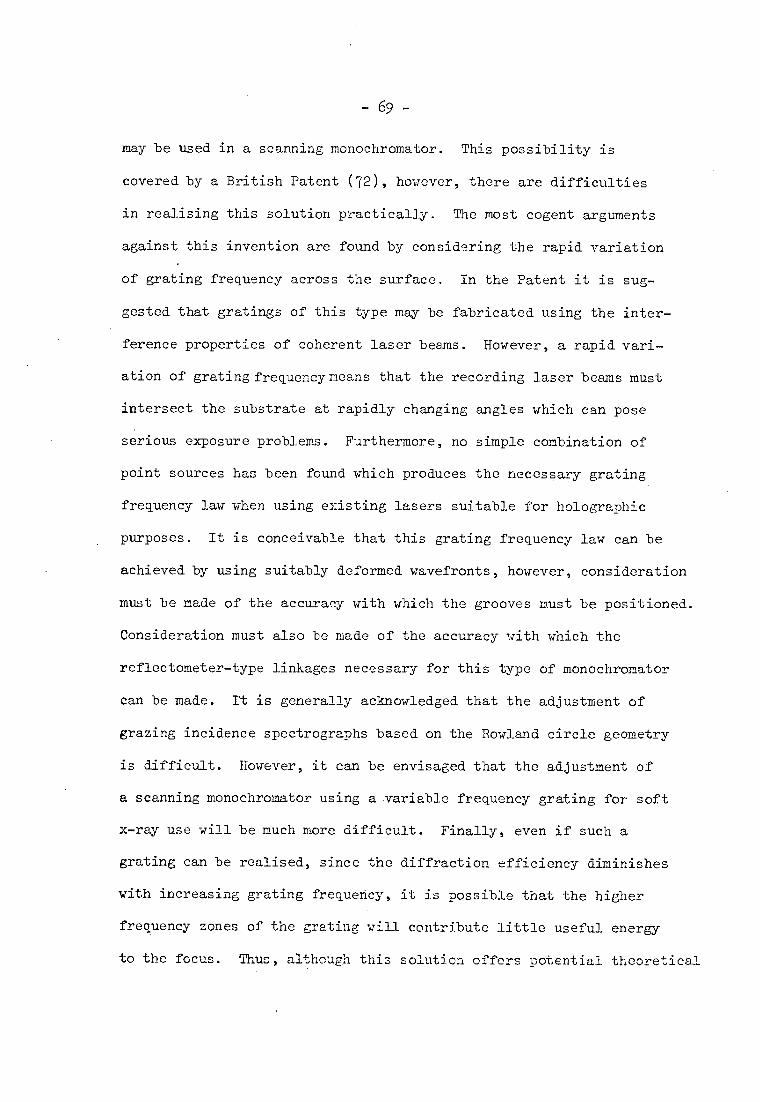
-69-
may be used in a scanning monochromator. This possibility is
covered by a British Patent (72), however, there are difficulties
in realising this solution practically. The most cogent arguments
against this invention are found by considering the rapid variation
of grating frequency across the surface. In the Patent it is sug-
gested that gratings of this type may be fabricated using the inter-
ference properties of coherent laser beams. However, a rapid vari-
ation of grating frequency means that the recording laser beams must
intersect the substrate at rapidly changing angles which can pose
serious exposure problems. Furthermore, no simple combination of
point sources has been found which produces the necessary grating
frequency law when using existing lasers suitable for holographic
purposes. It is conceivable that this grating frequency law can be
achieved by using suitably deformed wavefronts, however, consideration
must be made of the accuracy with which the grooves must be positioned.
Consideration must also be made of the accuracy with which the
reflectometer-type linkages necessary for this type of monochromator
can be made. Tt is generally acknowledged that the adjustment of
grazing incidence spectrographs based on the Rowland circle geometry
is difficult. However, it can be envisaged that the adjustment of
a scanning monochromator using a variable frequency grating for soft
x-ray use will be much more difficult. Finally, even if such a
grating can be realised, since the diffraction efficiency diminishes
with increasing grating frequency, it is possible that the higher
frequency zones of the grating will contribute little useful energy
to the focus. Thus, although this solution offers potential theoretical
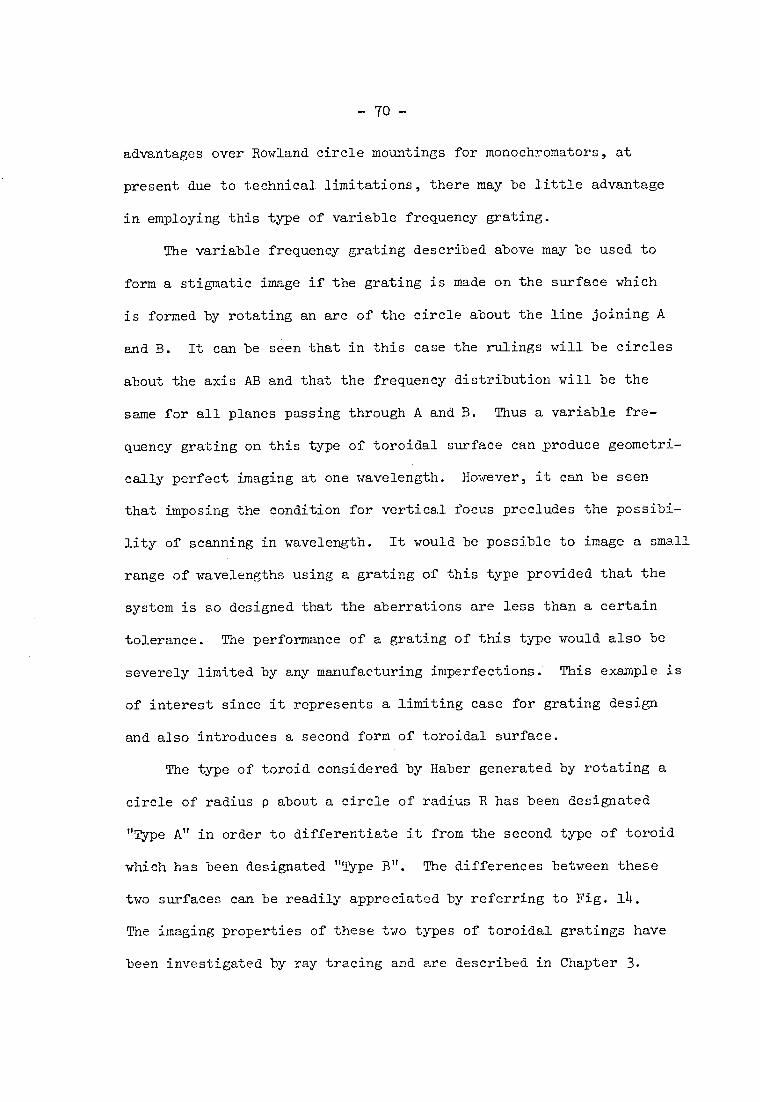
-70-
advantages over Rowland circle mountings for monochromators, at
present due to technical limitations, there may be little advantage
in employing this type of variable frequency grating.
The variable frequency grating described above may be used to
form a stigmatic image if the grating is made on the surface which
is formed by rotating an arc of the circle about the line joining A
and B. It can be seen that in this case the rulings will be circles
about the axis AB and that the frequency distribution will be the
same for all planes passing through A and B. Thus a variable fre-
quency grating on this type of toroidal surface can ,produce geometri-
cally perfect imaging at one wavelength. However, it can be seen
that imposing the condition for vertical focus precludes the possibi-
lity of scanning in wavelength. It would be possible to image a small
range of wavelengths using a grating of this type provided that the
system is so designed that the aberrations are less than a certain
tolerance. The performance of a grating of this type would also be
severely limited by any manufacturing imperfections. This example is
of interest since it represents a limiting case for grating design
and also introduces a second form of toroidal surface.
The type of toroid considered by Haber generated by rotating a
circle of radius p about a circle of radius R has been designated
"Type A" in order to differentiate it from the second type of toroid
which has been designated "Type B". The differences between these
two surfaces can be readily appreciated by referring to Fig. 14.
The imaging properties of these two types of toroidal gratings have
been investigated by ray tracing and are described in Chapter 3.
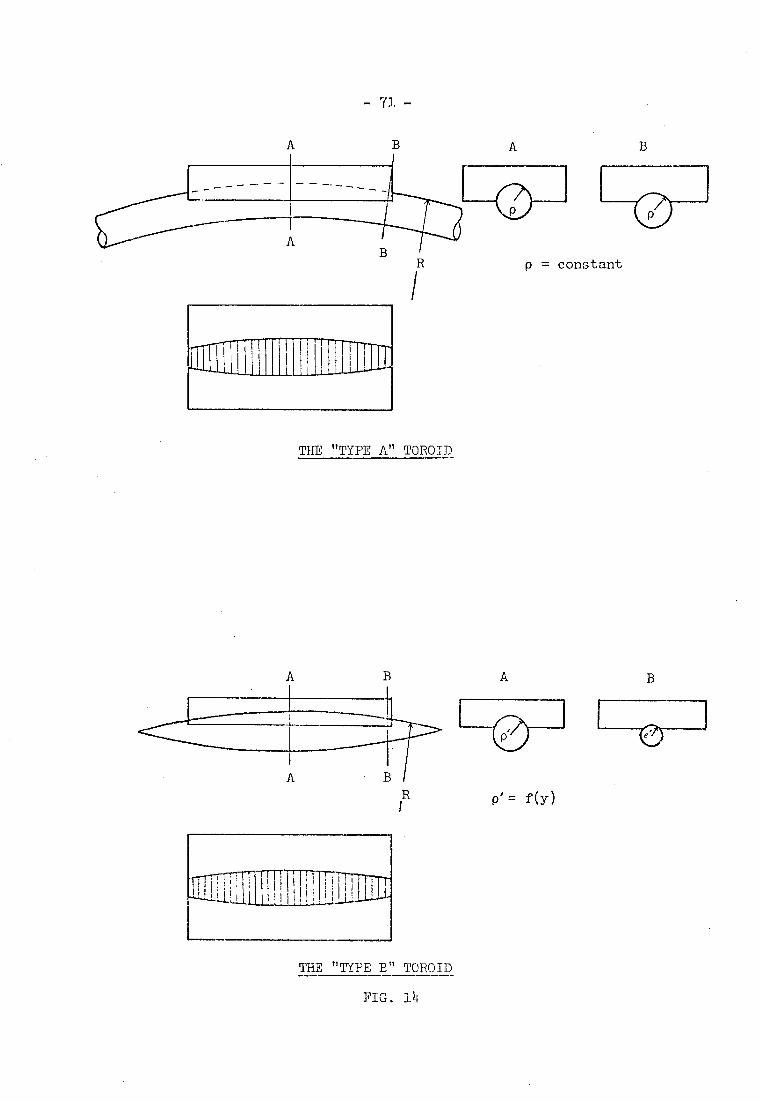
A
- 71
p = constant
r 7F-7-7777T711TT i---1 • ,
THE "TYPE A" TOROID
A
B
A
IR P` = f(Y)
THE "TYPE B" TOROID
FIG. 14
-72-
2.5 GRATING EFFICIENCY IN THE SOFT X-RAY REGION
It has long been known that the calculation of the diffraction
efficiency of gratings is one of the most important problems in
optics. However, it is only recently that this problem has been
rigorously solved for gratings having finite conductivity (109).
The present theory gives very good agreement with experiment.in the
visible and ultra-violet regions, but for wavelengths below 1000 A,
where Aid is generally small, the numerical computations require
large amounts of computer time. In order to formulate a satisfactory
approach for the soft x-ray region solutions of the integral equations
for the field and its normal derivative on the grating surface must
be found. The integral equations may be obtained by applying Green's
theorem (110). The problem is to find numerical methods of solution
which converge rapidly. Alternative solutions may be found by using
a differential method, or even semi-analytic methods. However, unless
the grating surface profile can be properly characterised and the
material constants known accurately, no exact numerical calculations
of grating efficiency can be performed.
Even though it is not rigorously or generally applicable, scalar
diffraction theory has been used for many years and can be applied to
the case of diffraction gratings in the soft x-ray region. Calculations
of grating efficiency were performed in 1955 by Sprague, Tomboulian and
Bedo (111) using a greatly simplified model for a grating. They also
performed experimental photometric determinations of grating efficiency
and obtained efficiency values of 5.4% and 1.5% in first and second
orders at. 110 A from a lightly-ruled glass grating with 1181 limn at.
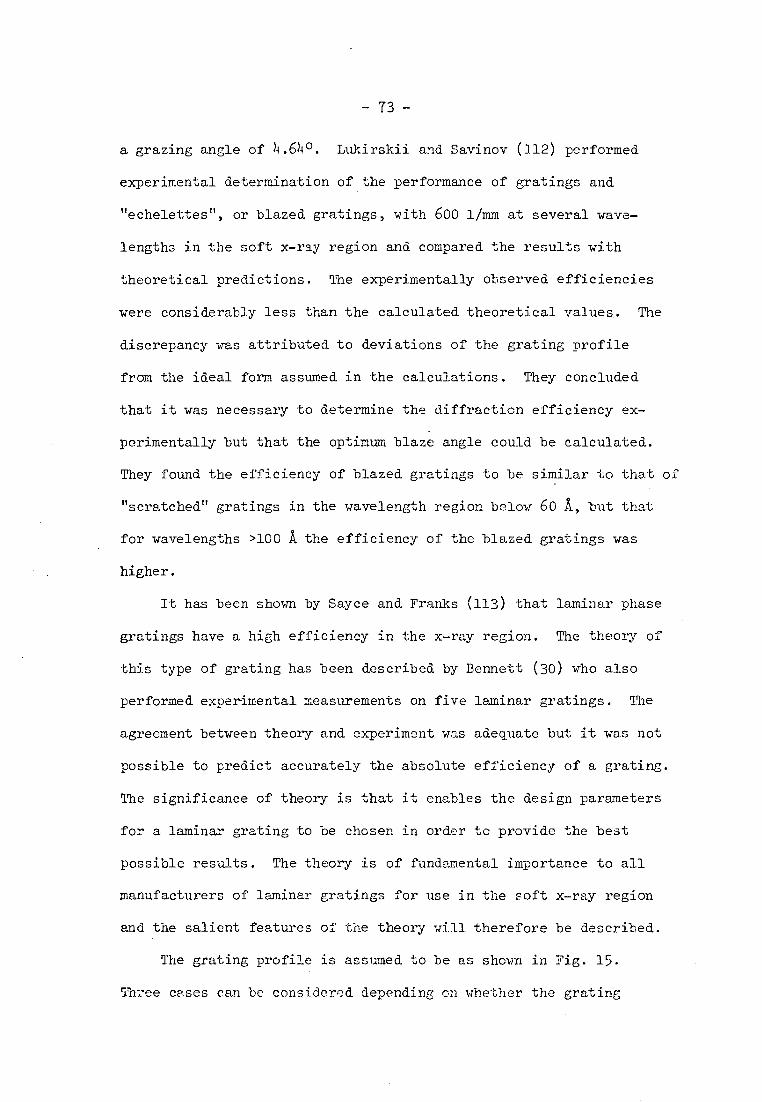
-73-
a grazing angle of 4.64°. Lukirskii and Savinov (112) performed
experimental determination of the performance of gratings and
"echelettes", or blazed gratings, with 600 1/mm at several wave-
lengths in the soft x-ray region and compared the results with
theoretical predictions. The experimentally observed efficiencies
were considerably less than the calculated theoretical values.. The
discrepancy was attributed to deviations of the grating profile
from the ideal form assumed in the calculations. They concluded
that it was necessary to determine the diffraction efficiency ex-
perimentally but that the optimum blaze angle could be calculated.
They found the efficiency of blazed gratings to be similar to that of
"scratched" gratings in the wavelength region below 60 A, but that
for wavelengths >100 A the efficiency of the blazed gratings was
higher.
It has been shown by Sayce and Franks (113) that laminar phase
gratings have a high efficiency in the x-ray region. The theory of
this type of grating has been described by Bennett (30) who also
performed experimental measurements on five laminar gratings. The
agreement between theory and experiment was adequate but it was not
possible to predict accurately the absolute efficiency of a grating.
The significance of theory is that it enables the design parameters
fora laminar grating to be chosen in order to provide the best
possible results. The theory is of fundamental importance to all
manufacturers of laminar gratings for use in the soft x-ray region
and the salient features of the theory will therefore be described.
The grating profile is assumed to be as shown in Fig. 15.
Three cases can be considered depending on whether the grating
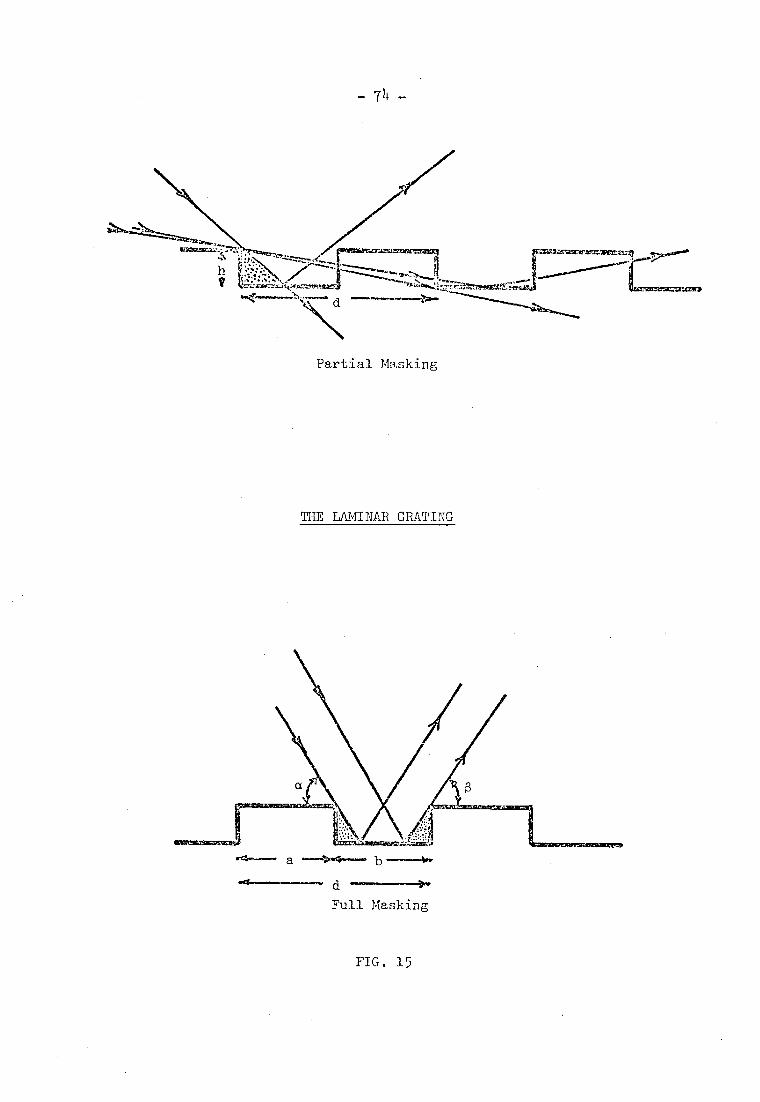
- 711
Partial Masking
THE LAMINAR GRATING
a
d
Pull Masking
FIG, 15
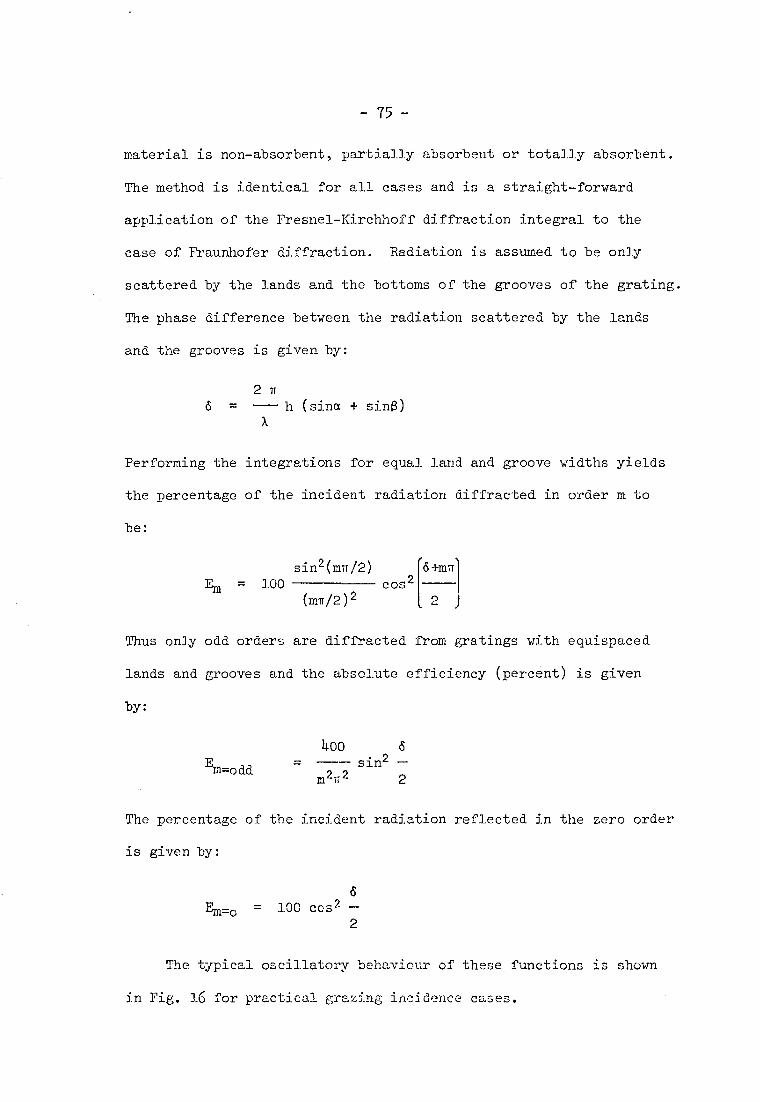
- 75 -
material is non-absorbent, partially absorbent or totally absorbent.
The method is identical for all cases and is a straight-forward
application of the Fresnel-Kirchhoff diffraction integral to the
case of Fraunhofer diffraction. Radiation is assumed to be only
scattered by the lands and the bottoms of the grooves of the grating.
The phase difference between the radiation scattered by the lands
and the grooves is given by:
2 1-1 6 = — h (sing sine)
X
Performing the integrations for equal land and groove widths yields
the percentage of the incident radiation diffracted in order m to
be:
sin2(mrr/2)
cost [15.4mTr
Em = 100
(mff/2)2
Thus only odd orders are diffracted from gratings with equispaced
lands and grooves and the absolute efficiency (percent) is given
by:
400 6 = sin2 Em=odd —
m2TI2 2
The percentage of the incident radiation reflected in the zero order
is given by:
6 Em=o = 100 ccs2
2
The typical oscillatory behaviour of these functions is shown
in Fig. 16 for practical grazing incidence cases.
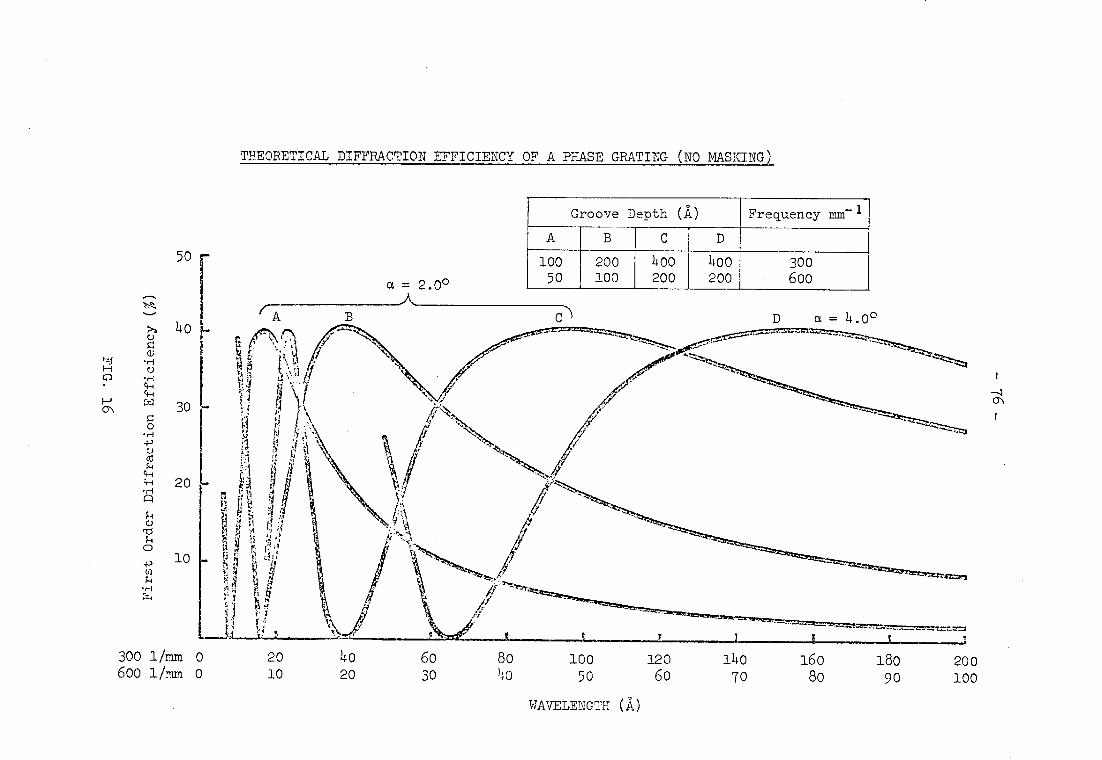
THEORETICAL DIFFRACTION EFFICIENCY OF A PHASE GRATING (NO MASKING)
Groove Depth (A) Frequency mm -1
A B C D
100 50
200 100
400 200
400 200
300 600
50
a = 2.0°
' A B C D a = 4.00
000,7c!:51
Y
tr
r"""""1"1"5 .=/•••
300 1/ram 0 20 4o 60 80 100 120 i4o 160 180 200 600 1/mm o 10 20 30 ?T0 50 60 70 8o 90 100
, , . WAVELENGTH (A)
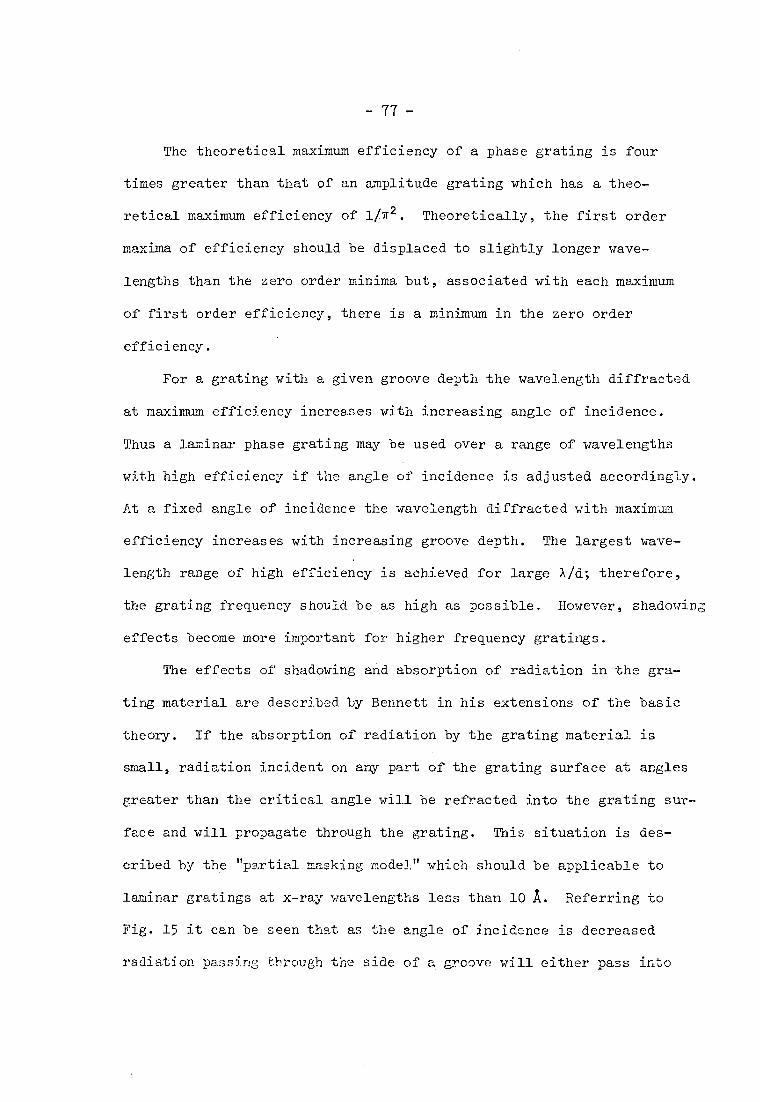
-TT-
The theoretical maximum efficiency of a phase grating is four
times greater than that of an amplitude grating which has a theo-
retical maximum efficiency of 1/7[2. Theoretically, the first order
maxima of efficiency should be displaced to slightly longer wave-
lengths than the zero order minima but, associated with each maximum
of first order efficiency, there is a minimum in the zero order
efficiency.
For a grating with a given groove depth the wavelength diffracted
at maximum efficiency increases with increasing angle of incidence.
Thus a laminar phase grating may be used over a range of wavelengths
with high efficiency if the angle of incidence is adjusted accordingly.
At a fixed angle of incidence the wavelength diffracted with maximum
efficiency increases with increasing groove depth. The largest wave-
length range of high efficiency is achieved for large X/d; therefore,
the grating frequency should be as high as possible. However, shadowing
effects become more important for higher frequency gratings.
The effects of shadowing and absorption of radiation in the gra-
ting material are described by Bennett in his extensions of the basic
theory. If the absorption of radiation by the grating material is
small, radiation incident on any part of the grating surface at angles
greater than the critical angle will be refracted into the grating sur-
face and will propagate through the grating. This situation is des-
cribed by the "partial masking model" which should be applicable to
laminar gratings at x-ray wavelengths less than 10 A. Referring to
Fig. 15 it can be seen that as the angle of incidence is decreased
radiation passing through the side of a groove will either pass into
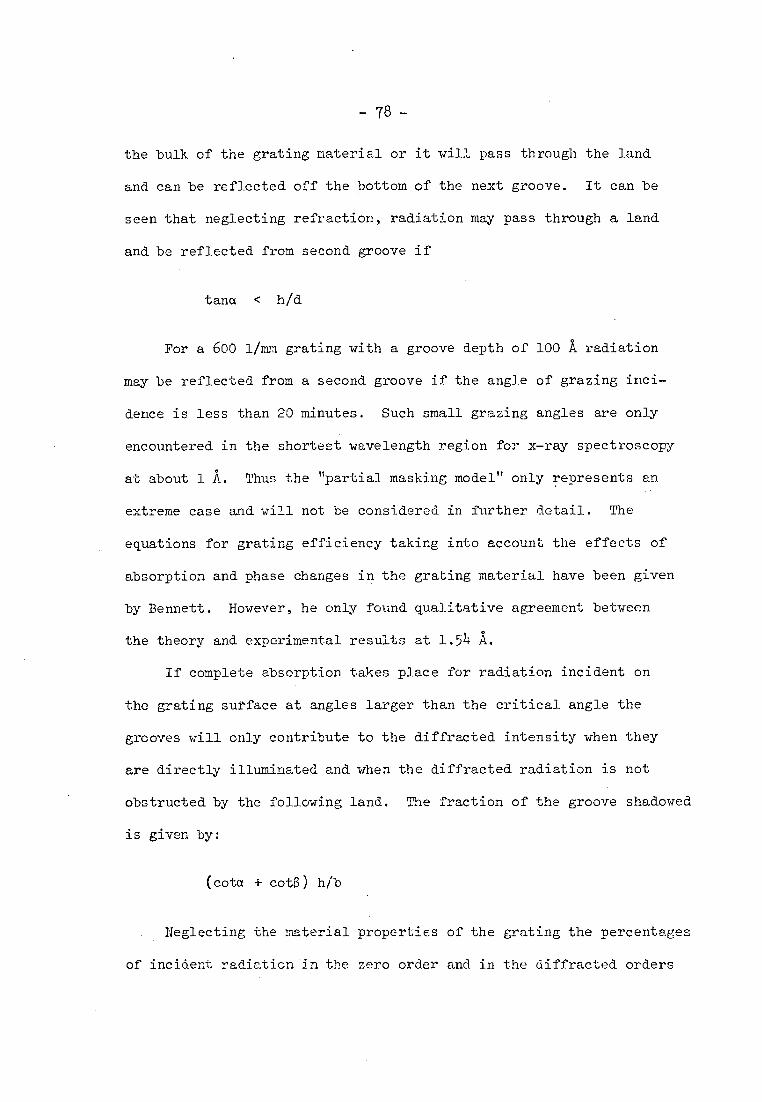
the bulk of the grating material or it will pass through the land
and can be reflected off the bottom of the next groove. It can be
seen that neglecting refraction, radiation may pass through a land
and be reflected from second groove if
tang < h/d
For a 600 1/mm grating with a groove depth of 100 A radiation
may be reflected from a second groove if the angle of grazing inci-
dence is less than 20 minutes. Such small grazing angles are only
encountered in the shortest wavelength region for x-ray spectroscopy
at about 1 A. Thus the "partial masking model" only represents an
extreme case and will not be considered in further detail. The
equations for grating efficiency taking into account the effects of
absorption and phase changes in the grating material have been given
by Bennett. However, he only found qualitative agreement between
the theory and experimental results at 1.54 A.
If complete absorption takes place for radiation incident on
the grating surface at angles larger than the critical angle the
grooves will only contribute to the diffracted intensity when they
are directly illuminated and when the diffracted radiation is not
obstructed by the following land. The fraction of the groove shadowed
is given by:
(cota cots) h/b
Neglecting the material properties of the grating the percentages
of incident radiation in the zero order and in the diffracted orders
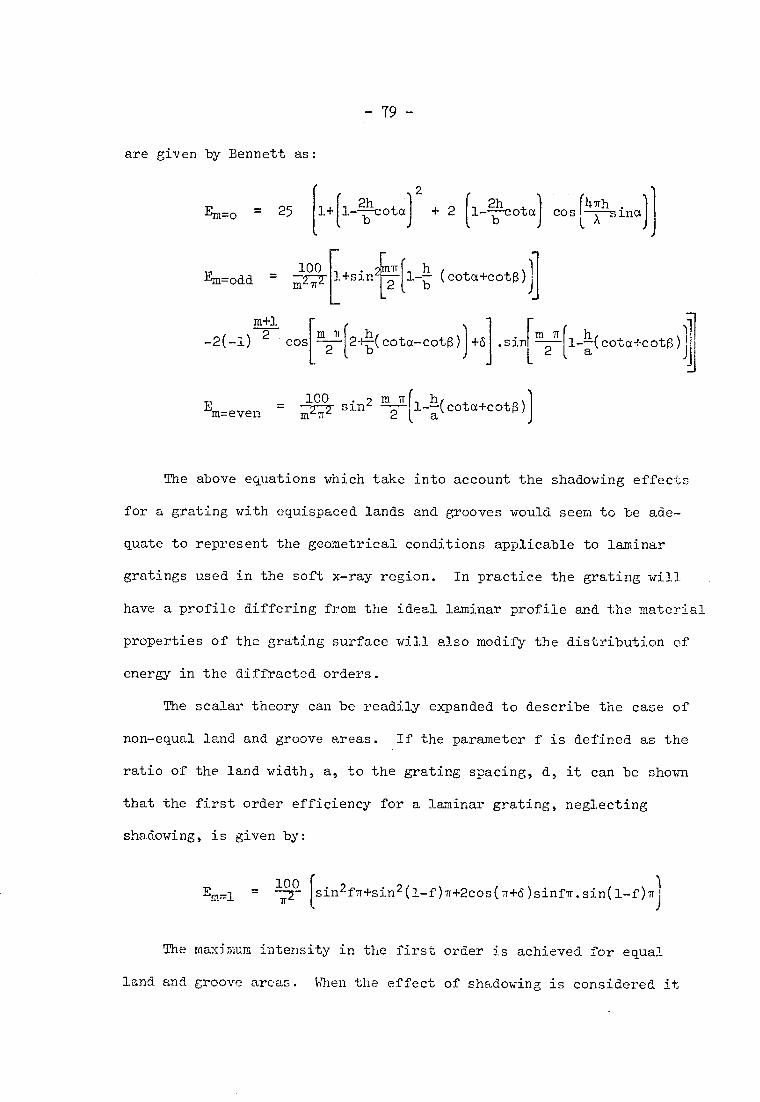
-79-
are given by Bennett
Em=o =
E.m=odd =
as:
25 [1141-?Ile
100
ota
2
+ 2
b [1.2-1 (cota+cot13)11
1-211cota
1
cos 4" • -x-sina
2 2 M TT l+sin
m+1 -
)
-2(-1) 2 cos 1112Lll 2 l'-(cota-cot(3) +6 .sin ll
m Tr[ h, 2 1-;Acota+cotO)
100 m h,cota+cotO - 2 2 sin2 -
2— 1--k Em=even M a
The above equations which take into account the shadowing effects
for a grating with equispaced lands and grooves would seem to be ade-
quate to represent the geometrical conditions applicable to laminar
gratings used in the soft x-ray region. In practice the grating will
have a profile differing from the ideal laminar profile and the material
properties of the grating surface will also modify the distribution of
energy in the diffracted orders.
The scalar theory can be readily expanded to describe the case of
non-equal land and groove areas. If the parameter f is defined as the
ratio of the land width, a, to the grating spacing, d, it can be shown
that the first order efficiency for a laminar grating, neglecting
shadowing, is given by:
100 [ sin 2 E„1 = fir+sin2(1-f).1T+2cos(17+6)sinfTr.sin(1-f)Trj
The maximum intensity in the first order is achieved for equal
land and groove areas. When the effect of shadowing is considered it
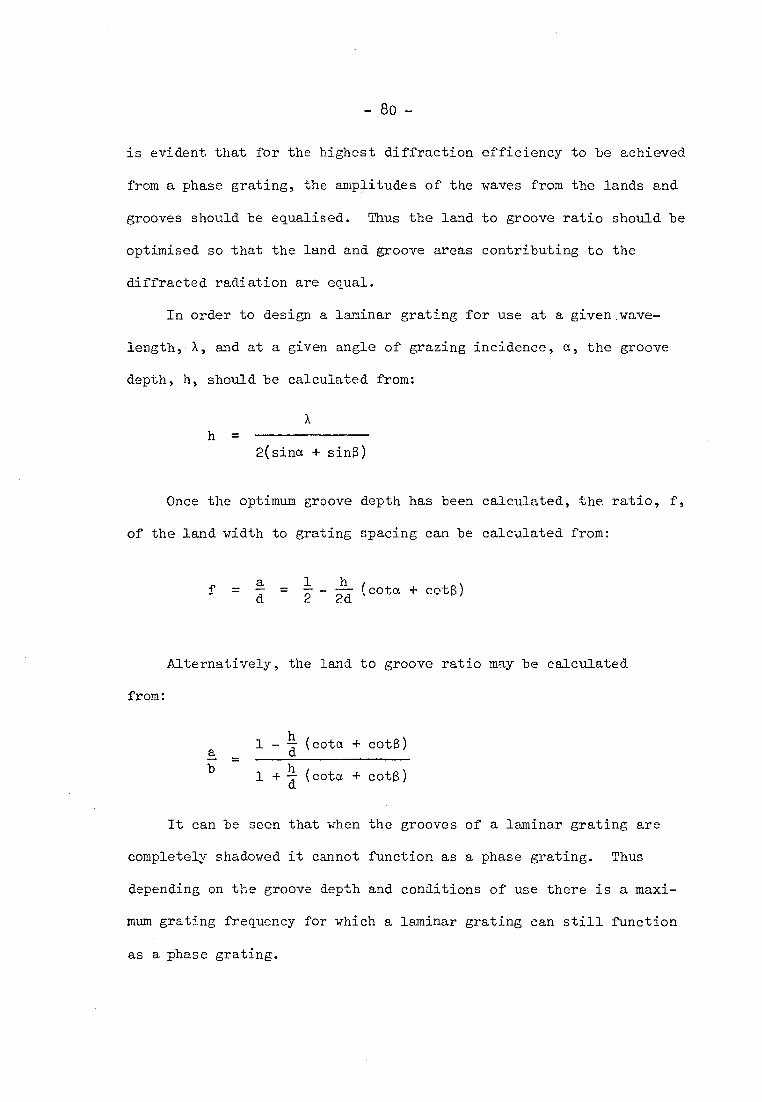
- 8o -
is evident that for the highest diffraction efficiency to be achieved
from a phase grating, the amplitudes of the waves from the lands and
grooves should be equalised. Thus the land to groove ratio should be
optimised so that the land and groove areas contributing to the
diffracted radiation are equal.
In order to design a laminar grating for use at a given wave-
length, X, and at a given angle of grazing incidence, a, the groove
depth, h, should be calculated from:
A h =
2(sina + sins)
Once the optimum groove depth has been calculated, the ratio, f,
of the land width to grating spacing can be calculated from:
▪ = - = — 2 1 - 2d h
(cota + cots) a d
Alternatively, the land to groove ratio may be calculated
from:
a cots) - (cota + cot b
1 + h (cota + cots)
It can be seen that when the grooves of a laminar grating are
completely shadowed it cannot function as a phase grating. Thus
depending on the groove depth and conditions of use there is a maxi-
mum grating frequency for which a laminar grating can still function
as a phase grating.
- 81 -
Complete shadowing of the grooves occurs for:
b = h (cota + cots)
Thus a laminar grating, having equal lands and groove widths,
with a groove depth of 150 A used at a grazing angle of 2° will no
longer function as a phase grating for radiation of wavelength 50 A
if the grating frequency is higher than 862 1/mm. The effect of
shadowing of the grooves must therefore be carefully considered
when designing laminar gratings and a reduction in grating efficiency
is to be expected for grating spacings, d, when:
hhcota > d > 2hcota
It is to be expected that the efficiency of laminar gratings
will decrease with increasing grating frequency simply due to the
effects of shadowing and absorption and that the efficiency will
become identical to a comparable amplitude grating. Since the
efficiency of an amplitude grating is a maximum for equal land and
groove widths it is to be expected that high frequency laminar gra-
tings will have maximum efficiency for equal land and groove areas.
The effects of these parameters on the performance of laminar
holographically-formed x-ray gratings with nominal frequencies of
300, boo and 1200 1/mm, with systematically varying land to groove
ratios, and groove depths, have been investigated experimentally.
The results of this work and a more complete discussion are
the subject of Chapter 7.
- 82 -
CHAP'T'ER 3
RAY TRACING
3.1 INTRODUCTION
Ray tracing is a well-established technique for examining the
performance of optical systems; however, until recently this method
has seldom been used in the grazing incidence region. With the ad-
vent of holographic gratings new design opportunities became possible
and a reliable means of image evaluation was essential. Hence, we
have been using exact computer ray tracing to explore some of the new
design possibilities opened up by the holographic method and also to
examine quantitatively the aberrations of complete grazing incidence
systems.
The computer programs used in this work are based on the method
proposed by Welford (40) for straight rulings but incorporating the
vector equations suggested by Spencer and Murty (41). This approach
enables rays to be traced through gratings on any surface and with
any variation of frequency provided the coordinates of the point of
incidence and the direction cosines of the normal and tangent to the
rulings and the frequency can be calculated. The method is equivalent
to that used by Kastner and Neupert (42) who considered elemental plane
gratings in the tangent plane at each point on the spherical grating
surface. Naturally, the results obtained from ray tracing are only
valid provided the conditions for the geometrical optics approxi-
mation are satisfied. Fortunately, this is generally the case in the
soft x-ray region.
- 83 -
3.2 DESCRIPTION OF THE RAY TRACING METHOD
The usual system to be analysed in the grazing incidence region
consists of three surfaces.
The first surface is the object plane which will usually contain
the entrance slit to a spectrograph and we can consider the object
point to be a self-luminous point on the entrance slit. The second
surface is the grating and the third surface the image surface which
will normally be the Rowland cylinder in the case of spectrographs
and will be a plane for spectrometers.
In order to trace a ray through the system we must calculate the
direction cosines of a ray from an object point to a point on the
grating surface. Then from the calculated direction cosines, the co-
ordinates of the point on the grating and the grating parameters at
that point the direction cosines of a ray of given wavelength diffrac-
ted in a given order must be calculated. This operation is analagous
to the "refraction process" used when ray tracing through lenses and
may be called the diffraction operation. When the direction cosines
of the diffracted ray have been calculated, the point at which the
ray meets the image surface must be found. This corresponds to the
transfer operation in ordinary ray tracing. Thus to trace a ray through
the complete system we must apply a transfer operation from the object
point to a point on the grating surface, then apply the diffraction
operation and finally apply a transfer operation to calculate the co-
ordinates of the ray intersection with the image surface. These three
operations are described in the following sections. However, we must
first define the coordinate systems to be used. It is often convenient
to associate a coordinate system with each surface.

- 84 -
Starting from the origin in the object coordinate system we
trace a reference, or chief ray, a distance, d, along the z-axis to
the centre of the grating where it makes a given angle of incidence,
i, with the normal at the pole of the grating. We then define a se-
cond coordinate system centred on the grating pole with the z-axis
along the normal. The diffraction operation to determine the direction
cosines of the diffracted chief ray is performed in this coordinate
system. Finally, we define a third coordinate system on the chief
diffracted ray, a distance d' from the grating pole in order to measure
the transverse aberrations with respect to the chief ray.
When the chief ray has been traced, a uniform mesh of skew rays
is generated over the surface of the grating from the object point. At
each point on the grating the normal to the surface and the direction
of the vector along the rulings are calculated. The direction cosines
of the diffracted rays are then calculated from given values of the
local grating frequency. The intersections of the diffracted rays with
the image plane are then calculated and a spot diagram is drawn. The
above process can be repeated for many object points to simulate a
finite sized object.
-85-
3.3 THE TRANSFER OPERATION FROM OBJECT COORDINATE SYSTEM TO
GRATING COORDINATE SYSTEM
To represent the physical situation it is required to generate
a set of rays emanating from a point A ' A
(x'A y'' A z') representing a
uniformly divergent pencil. Each ray is specified by the position
of A (a, d, h) and the direction cosines (al, q, a;) in the coordi-
nate systems O'X'Y'Z. See Fig. 17.
The coordinates of A in OXYZ are given by
xA h yA
= d cosa zA = d sing
AP = (x-h)2+(y-d cosa)I.+(z-d sina)2
The direction cosines of the incident ray are:
-(x-h) -(y-d cosa) -(z-d sing) al- <AP> a2-
<AP> a3- <AP>
The components of AP in O'X'Y'Z' are given by applying the rota-
tion matrix
1 0 0
0 cosi sink
0 -sink cowl) where 1p = 90+a
Since: cos(90+a) = -sina sin(90+a) = cosa
(AP)' = (x-h):1+(z cosa-y sina)2.+(d-y cosa-z sina)2
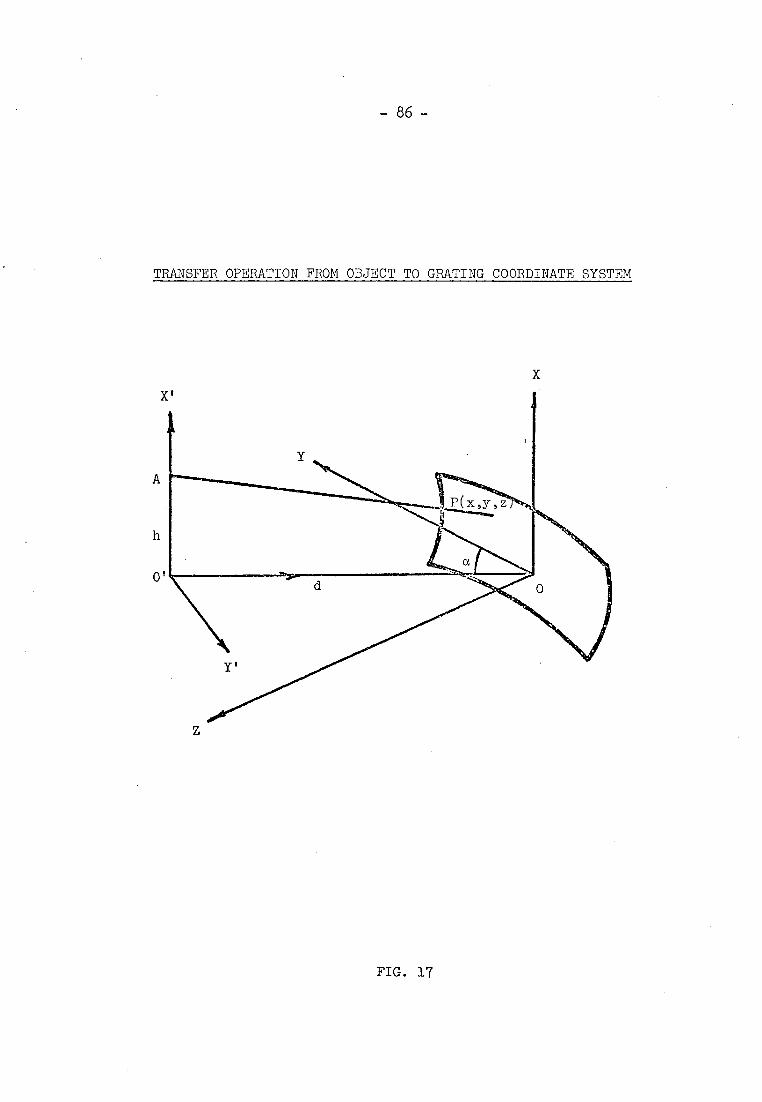
- 86 -
TRANSFER OPERATION FROM OBJECT TO GRATING COORDINATE SYSTEM
X
FIG. 17
- 87 -
a'1 x - h
Now a2
z cos a - y sin a - f
x - h a' 1 = = g
d - y cos a - z sin a a' 3
.% x-h=fzcosa-fysin a (1)
x - h = dg - g y cos a - g z sin a
Y = g cos a- f sin a
The coordinates of the point of intersection of the ray with the
surface can be found by iteration using equations (1) and (2) and the
equation of the surface. Choosing z, = 0 as a first approximation
equation (2) gives a value of y, which can be substituted in equation (2)
to give a value of x, which can be substituted in the equation of the
surface to give a new value of z, which can be used to repeat the pro-
cess until a sufficient accuracy is reached.
Alternatively, a mesh of points on the x-y tangent plane at the
centre of the grating may be specified and the values of the x and y
coordinates substituted in the equation for the surface to yield the
z coordinates and hence the direction cosines for the rays incident on
the surface.
The first method enables a uniformly divergent fan of rays to be
projected onto the grating which will normally resemble the physical
conditions of illimination closely. However, by careful choice of the
mesh of rays in the second method, an equally accurate representation
can be achieved and the iteration process avoided. Both methods have
been used in the programs employed in this work.
dg - z (f cos a - g sin a) (2)
-88-
3.4 NOTATION FOR GRATING COORDINATE SYSTEM
In the grating coordinate system with origin 0 in the grating
surface, the z-axis is normal to the grating surface and the x-axis
and y-axis are tangents to the surface. A point of incidence of a
ray on the grating surface is denoted by P (x, y, z), a point on the
incident ray is denoted by A (xA, yA, zA), and a point on the diffrac-
ted ray from P of wavelength A is denoted by B (x , y, z). We
associate with the grating at point P a right triple of unit vectors
g, 2_ and 2. where is a vector parallel to the rulings, 2- is a vector normal to the rulings and 2 is a vector normal to the grating surface.
The directions of the incident and diffracted rays are represented
by unit vectors a and T1.
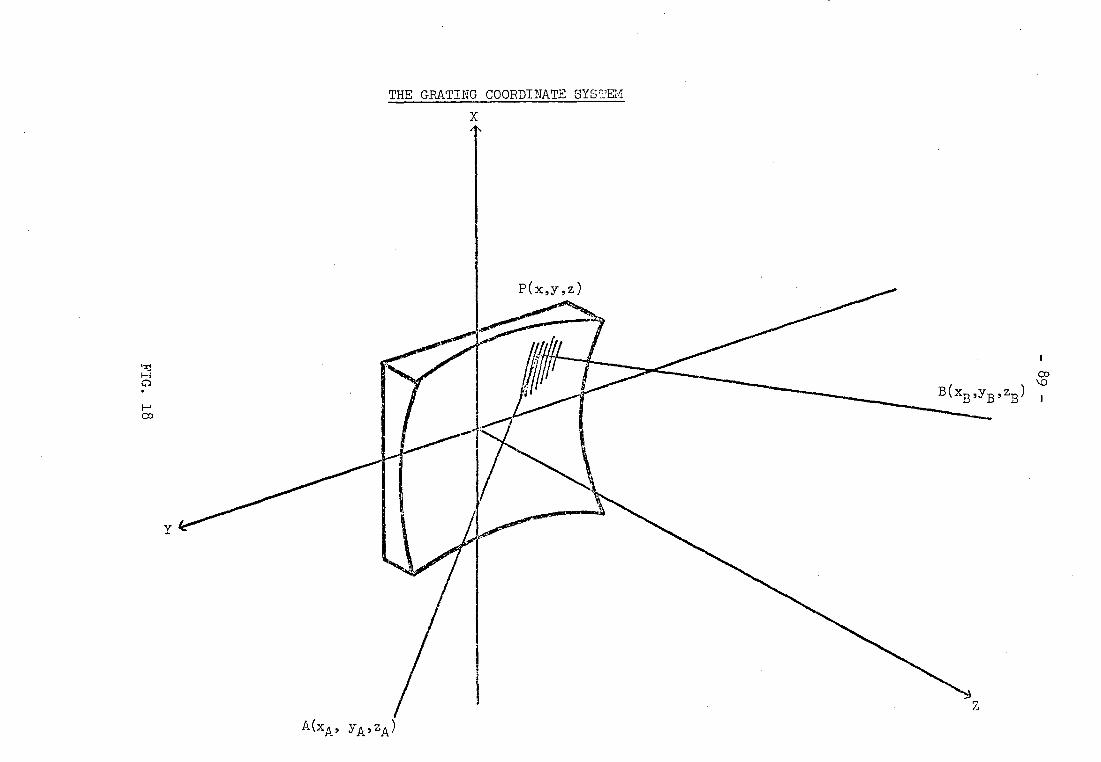
THE GRATING COORDINATE SYSTEM
X
11(x.A' YA,ZA)
- 90 -
3.5 THE DIFFRACTION OPERATION
The diffraction equation which gives the relation between the
directions of the incident and diffracted rays from a grating may be
written vectorially for the general case as:
n'Dx2=nax - + — si (1)
where n is the refractive index in the medium in which the ray is
incident and n' is the refractive index in the medium in which the
ray is diffracted. A is the vacuum wavelength of the incident
radiation.
In the soft x-ray region we are primarily interested in re-
flection gratings used in vacuum which allows the above equation to
be simplified to:
X -Dx2. = ftx2 +
m --d— a
when n = -1 as is conventional in optical design where no formal
distinction is made between formulae applying to reflecting and re-
fracting surfaces.
It can be seen that equation (2) becomes the familiar grating
equation in the meridian plane when 6 is perpendicular to the meridian
plane
sin i' + sin i m X
(2)

- 91-
where i and i' have equal signs when on the same side of the surface
normal and opposite sides when on opposite sides.
In this case the vectors a and B are directed towards the object
and image points respectively.
q
FIG. 19
The above equation is similar to that given by Spencer and Murty (41)
however, they have observed the convention that n' = 1 on reflection
which means that the image space behind a reflecting surface is repre-
sented as the mirror image of the actual image space. This technique
is useful since it enables complex mirror systems to be folded apart,
however, the standard convention will be observed in this work.
The method for solving the diffraction equation in order to find
the direction cosines of the diffracted ray was first outlined by
Spencer and Murty and all subsequent authors have followed their approach.
Substituting a = x E. in equation (2) gives
Trt x - dX = 0
- 92 -
which is satisfied by any vector of the form
= -a+ --dX k + Qr (5)
where Q is a scalar parameter; r need not have unit magnitude since
the multiplier Q will renormalise it.
The above equation is the same as that originally derived by
Welford (40) and recently derived by Noda (45) for holographic gratings
by application of Fermat's principle to the light path function.
The physical significance of the scalar parameter, Q, can be
understood by taking the vector product of (1) with P.
x (n'b x = Fx (nA x P)+ md! x
Hence:
n'b'-(P.n' 13)P = n8,-(P.W.P - X
cos i = P.E1 cos i' =
where i is the angle the incident ray makes with the normal and i'
is the angle between the diffracted ray and the normal.
n'T) = n& + (n' cos i' - n cos i) P - m
(6)
Thus, as pointed out by Welford, Q corresponds to the normalised
value of the generalised power. For the case of reflection at a mirror
Q becomes -2 cos 1.
The technique for solving eauation (5) is to square it which yields
- 93 -
a quadratic equation in Q
Q2 + 2Q I m d d X ) [ mdx ) 2m X
= °
since P.P = 0
X m X
d + ) 2
Q2
- 2Q - 2m
= 0
Hence
2 A 2
)1
/2Ii Q = a.f ± (a.2.) -
2m X d (8)
When m = 0 either Q = 0 or Q = 2 a.?. The first solution corresponds to
a transmission grating when the ray passes undeviated and the second
solution to a reflection grating. Thus the larger value of Q is the
solution we require and the direction cosines of the diffracted ray may
be found by substituting this value in equation (5).
An alternative method, which has been used in our computer programs,
for obtaining the direction cosines of the diffracted ray is to take the
scalar product of equation (6) with a and 2.
2
( 7)
= -
= - maa
= 1
= e 1
c2
uherec,andc,,4 are known scalar parameters.
- 94 -
Therefore we have three equations from which we can calculate the
three direction cosines of the diffracted ray. The following equations
were used to perform the diffraction operation in the computer programs.
Taking the component equations of (9), (10) and (11)
11 bl 12 b2 13 b3 = ci
b1 P1 + b2 p2 + b3 p3 = c2
b12
+ b22
+ b32 = 1
Eliminating b2 between (12) and (13)
(P2 11 - 12 P1) bl -I- (P2 13 - 12 P3) b3 = P2 cl 12 c2
Let - dl = p2 0 a n2 -1 -2 '1
d3 d2
d2 = p2 q3 - q2 p3
bl = - — 1)3
1
= a3 d2 f2
= dl
Then b = fl - f2 d3
Eliminating betweenn (12)and (13)
(P1 q2 PI P2) b2 (P1 q3 gl P3) b3 = PI c1 g1 c2
Let
el = pi (12 - q1 p2 e2 = pi q3 -- q1 p3 e3 = pi ci - q1 c2
Let f1
(15)
-95-
e3 e2 b2 = — - — b3
el el
Let:
e3 e2
f3 = — f4 =
e 1 el
b2 = f3 - f4 b3 (16)
Substituting (15) and (16) in (14) yields:
(14-f22 4-f 4 2 )b32-(2f1f24-2f3f4)b3+f 12+f32-1
We obtain a quadratic equation for b3. In order to decide upon
the required solution we consider the case when m 0 which must give
a solution which satisfies the law of reflection. Once b3 has been
calculated its value is substituted in equations (15) (16) to yield values
of bl and b2.
- 96 -
3.6 TRANSFER OPERATION FROM GRATING SURFACE TO IMAGE SURFACE
From the point P (x, y, z) on the grating surface we now know
the direction cosines of the diffracted ray and wish to calculate the
coordinates of the ray intersection with the image surface. There are
two image surfaces of importance in the grazing incidence region; the
first is a plane surface perpendicular to the chief ray a distance d'
from the grating pole and the second is a cylinder which touches the
grating surface tangentially at the grating pole and has a radius equal
to half the grating radius. The plane image surface is generally more
useful because the image is specified in terms of the familiar trans-
verse aberrations used by optical designers. However, specifying the
Rowland cylinder as the image plane can be most useful when evaluating
refocussing conditions for spectrographs. Hence both cases will be
treated.
In order to evaluate the transverse aberrations we define a new
coordinate system whose origin is a distance d' along the chief ray and
whose z-axis lies along the chief ray. Hence, the z-axis has been ro-
tated by an angle IP = 90 - P. and translated a distance d'.
Referring to the diagram the coordinates of P are defined by the
vector x, and the direction cosines of the diffracted ray by the unit
vector D. In the rotated coordinate system
x' = R (x) W = R
where R is the rotation matrix with q) = 90 - B.
In the image coordinate system after rotation and translation
the equation of the diffracted ray is
x11 = x'
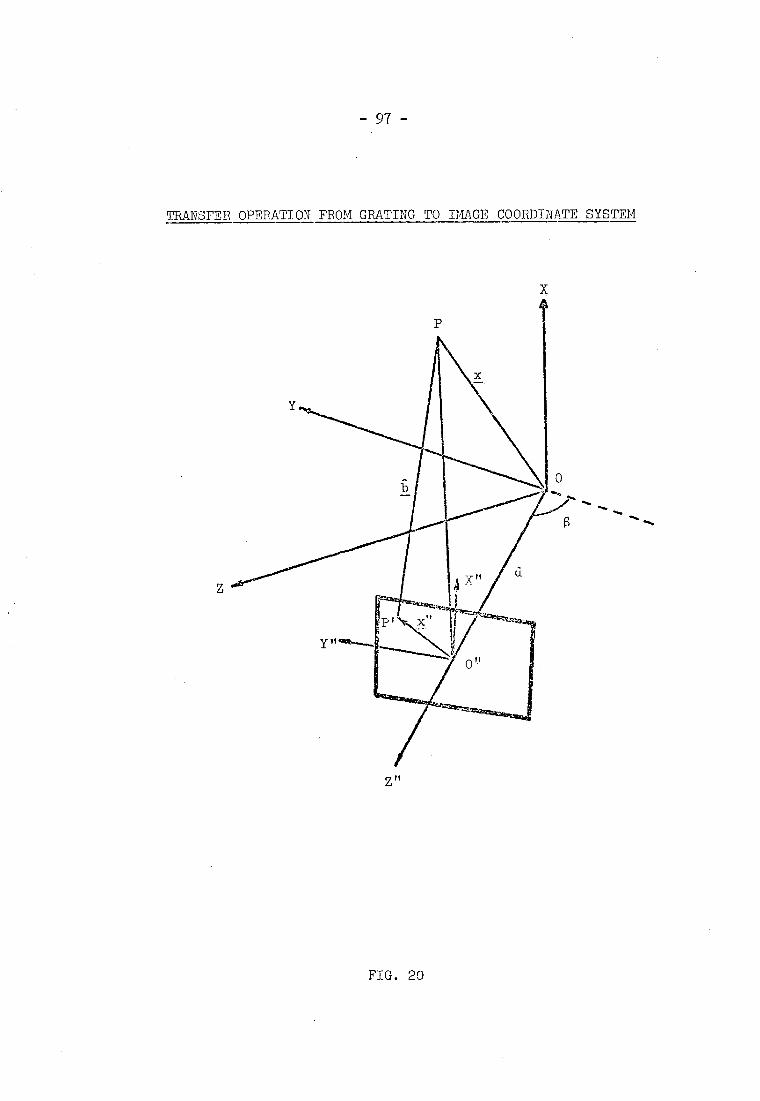
- 97 -
TRANSFER OPERATION FROM GRATING TO IMAGE COORDINATE SYSTEM
P
Z"
FIG. 20
-98-
where s is the distance from point P to a general point on the
image plane and x" = x' tr (0, 0, d) in matrix notation.
Since (x") = 0 on the image plane
b 3
Hence, the above equation gives the transverse aberrations
directly.
The following transformation equations were used in the
computer program:
x' x
yt = y sin 0 + z cos
z' = -y cos s + z sin d
bl = bi
b2 = b2 sin R + b3 cos
b'3 =-b,,4 cos + b3 sin 0
X" = x' s b'
y" = y' + s
-99-
3.7 TO FIND THE INTERSECTION OF THE DIFFRACTED RAY WITH THE
ROWLAND CYLINDER
The equation of the Rowland cylinder is:
y2 + z2 - Rz = 0 where R = grating radius
(1)
The equation of the diffracted ray is:
x = xl + (2)
which can be written in component form as:
x = xi + s bl (3)
Y = yi + s b2 ( 4 )
z = z i + s b3 (5)
Substituting equations (4) and (5) into equation (1) yields a
ouadratic equation in s:
s2(b22+b32)+s(2y1b2+2z1b3-Rb3)+y12+z12-Rz1 = 0
The value of s with the larger magnitude is the required value on
the Rowland circle since s is the distance from the point on the grating
to the image point. Substitution of the calculated value of s yields
the coordinates of the ray intersection with the Rowland cylinder.
In a spectrograph which uses photographic plates as the recording
medium the plates are bent to lie on the Rowland cylinder in order to
reccrd the images but the plates are subsequently measured flat.
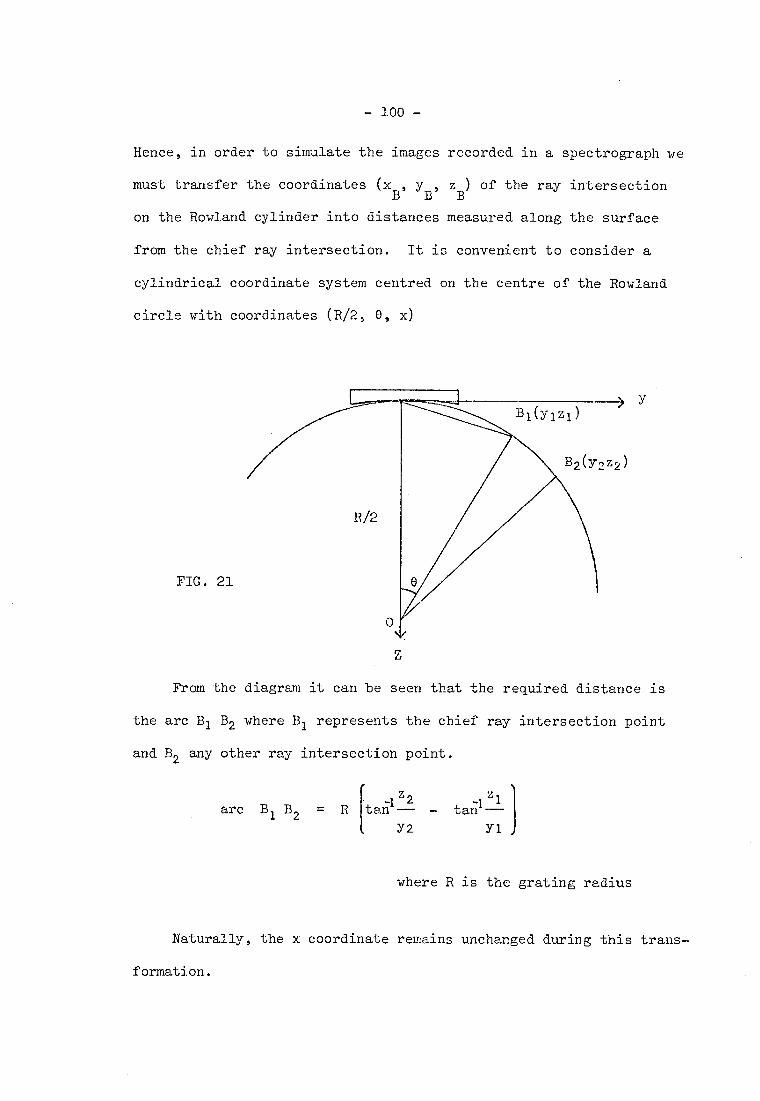
- 100 -
Hence, in order to simulate the images recorded in a spectrograph we
must transfer the coordinates (x B , yB
, z B) of the ray intersection
on the Rowland cylinder into distances measured along the surface
from the chief ray intersection. It is convenient to consider a
cylindrical coordinate system centred on the centre of the Rowland
circle with coordinates (R/2, 0, x)
FIG. 21
z
From the diagram it can be seen that the required distance is
the arc B1 B2 where B1 represents the chief ray intersection point
and B2 any other ray intersection point.
arc B1 B2 = - tan - Y2 Y1
where R is the grating radius
Naturally, the x coordinate remains unchanged during this trans-
formation.
- 101 -
The preceeding methods for obtaining the coordinates of the ray
intersections with the image plane have avoided the unnecessarily
powerful extended matrix method introduced by Kastner and Neupert (42)
and recently used by Noda (45, 46). Although the general matrix method
is valid for all surfaces, it is felt that for the simple image surfaces
generally encountered alternative computation methods are more efficient.
- 102 -
3.8 SPECIFICATION OF GRATING VECTORS FOR CLASSICAL GRATINGS
We can associate with each point on the grating surface three
unit vectors which specify the normal to the surface P, the direction
of the tangent to the rulings a and the normal to the rulings and
also a local value of the grating frequency. These quantities depend
on the grating surface and the method by which the rulings were gene-
rated.
Most gratings in use today were produced on ruling engines which
generate rulings which are the intersections of the grating surface
with essentially parallel planes. Hence, the rulings are straight and
equispaced on a plane surface neglecting any ruling errors. We shall
refer to these as classical-type gratings.
For the classical grating 1 has no component in the y direction
since it is directed along a line on the xz plane. Hence:
ql -(kcP)1 = r2103-r3P9 = 0
2:1", ' P1r14T2r24-P3P3 = 0
= P1P111.021021-P3P3 = 1
P1 = 1/11-1-r12/(r221-r32)11
P2 = -r1r2p1gr22+r32)
p3 = -r1r3p1gr22+r32)
Since the generating planes intersect the surface obliquely, the
local grating frequency is given by:
N = N where j is the unit normal to the
generating planes
- 103 -
where N = 1
where d = grating spacing
More generally following the method of Ludwig (44), we can
define a grating generation vector G which is normal to the parallel
planes ruled in the classical case. The grating ruling vector a is
given by:
= G x r
The grating ruling separation vector k normal to the rulings
on the surface is given by:

3.9 SPECIFICATION OF THE GRATING VECTORS AND SPATIAL FREQUENCY
OF HOLOGRAPHIC GRATINGS
Holographic gratings are produced by recording the interference
pattern from two coherent beams of light. In general the two beams
will originate from two point sources C and D. If points C and D
are located at infinity, the interference pattern is that of two plane
waves which are straight fringes corresponding to the classical ruling
case.
We define vector C as the vector from point P (x, y, z) on the
grating surface to source point C ()cc, yc, zc) and vector D as the
vector from the same point to source point D (xp, yp, zp).
x D
where L: is a vector analagous to g but not necessarily on the surface.
Then:
= x
defines the tangent plane along which the spatial frequency is calcu-
lated.
Since the geometrical optics approximation allows the laws
governing the propagation of a plane wave across an infinite plane
boundary to be applied to the propagation of a vanishingly thin pencil
of light across a local region of a nonplanar boundary, we can consider
two rays originating from the point sources C and D and intersecting
at point P to be plane waves incident upon a plane surface.

- 105-
The two waves can be represented by:
4'1 (x,Y) = al(x,y)e-i61 eiwt
4)2 (x,y) = a2(x,y)e-5-82 eiwt
where 61 and 62 are phase constants and for monochromatic waves eiwt
is a common factor and can be omitted.
Superposing the two coherent waves yields the resultant complex
amplitude:
= ale-161
a2e-i62
The resultant intensity is:
I = (pe a12 a22- + a1a2(1ei(62-61) e -1(62-611
- 2 , a22 - "1 • a2 + 2a1a2cos (62-61)
For al = a2 I = 40.2 cos2 [62-611 2
The intensity distribution will have maxima when 62 - 61 is an
even multiple of 7 and minima when an odd multiple of 7. The resultant
intensity is thus dependent upon the phase difference or the difference
in optical path length between the two beams and not upon any absolute
value of phase or optical path length provided the waves are truly
monochromatic.
-106-
Referring to Fig. 22 it can be seen that the optical path
difference between the rays C'P'D' and C P D is
27 (a + b)
a = d cos a
b = d cos 8
If the intensity at P is a maximum then the intensity at P'
will be a maximum if
27 T k, — a 4 b) = 27n
d (cos a + cos 8) = n A where d is the fringe spacing.
The above equation may be used to calculate the spatial frequency
at each point on the surface of the holographic grating provided the
fringe spacing is very small compared to the radius of curvature of the
surface and to the source distances. However, this will be true for
most practical cases.
The following equations were used in the computer program:
cos a = a
cos 8 = a •
Spatial frequency = 1 cos a + cos a
Xc
where Xc is the wavelength of the laser.
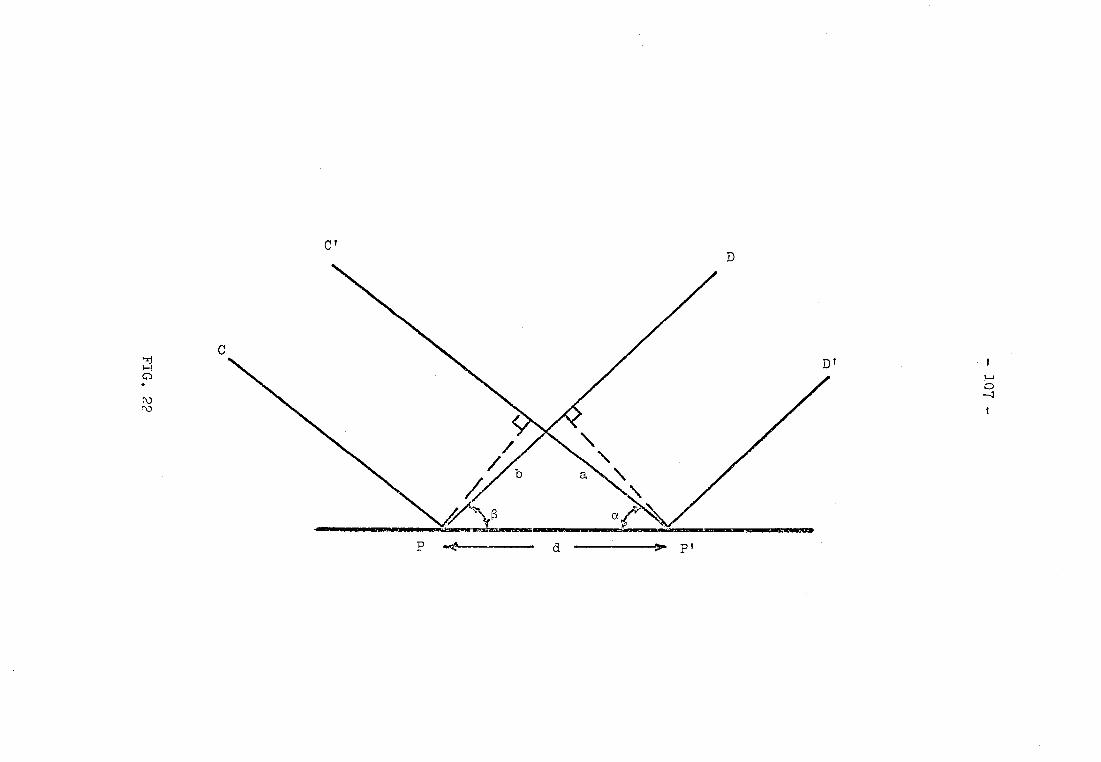
107
FIG
. 22
- 108-
The method proposed by Ludwig (44) to calculate the local
grating spacing by finding the point on the optical surface whose
optical path differs by one wavelength from the first point on the
surface, agrees with the method described above for the case of plane
waves incident upon an elemental plane grating. However, the iteration
equations described by Ludwig are unnecessary since if we apply the
geometrical optics approximation and treat each point on the grating
as an elemental plane grating and the incident rays as plane waves,
all the parameters are explicitly defined. If we do not apply the
geometrical optics approximation then the other equations given by
Ludwig are incorrect and we should not apply ray tracing methods. In
this light it is easy to understand how Ludwig can state: "One re-
calculation is usually sufficient to reduce the error to the computer
noise level." If one considers a plane grating with a linear variation
of frequency, it can be seen that the iteration method described by
Ludwig will yield different values for the grating spacing depending
on the direction of the iteration. However, if the grating spacing
is large compared to the change in grating spacing, this effect will be
insignificant.
We can define a grating generating vector G
G=CxD
directed from source point C to source point D.
For light diverging frcm C and D it can be seen that the intensity
will be a maximum for light of wavelength Ac at any point whose distan-
ces from C and D differ by nAc. The locus of the point of maximum in-
- 109 -
tensity is a hyperboloid of revolution having C and D as foci (since
a hyperboloid may be defined as the surface generated by a point
which moves in such a way that the difference between its distances
from two fixed points is a constant). The interference field produced
by two beams converging on C and D is naturally the same.
The superposition of one divergent beam with one convergent
beam yields an interference field which can be described as a family
of ellipsoids of revolution with foci C and D. In the plane perpendi-
cular to G the loci of the interference maximum are circles about G
in the familiar zone plate pattern.
This concludes the theoretical aspects of the ray tracing methods
used during this work.
- 110-
3.10 RAY TRACING RESULTS ANT) DISCUSSIONS
During the course of the present work the aberrations of nu-
merous grating systems have been examined by ray-tracing. It is
not possible to give the numerical results from all these calcu-
lations because they would take up too much space. Instead the
aberrations of several representative grating systems are presented
in the form of spot diagrams.
It is generally accepted that spot diagrams give a very use-
ful impression of the geometrical image quality of optical systems.
Line profiles may be derived from spot diagrams and these can yield
the optical transfer function (OTF) for the system by applying the
Fourier transformation. Thus the usual techniques of optical design
may be applied using aberration tolerances based on the OTF or some
geometrical criterion. However, it must be realised that the spot
diagram and OTF only give information about the image at one focal
position. In order to be able to determine the effects of refocus-
sing the directions of the rays must also be specified. To design a
grating system the designer must have a thorough understanding of the
aberrations and a flexible program to calculate numerically the
transverse aberrations and direction cosines in the image plane.
Once a system has been designed spot diagrams may then be used to
indicate the imaging properties.
Geometrically the light intensity in the image is determined
by the density of ray intersections in the image plane. However,
the recorded images will depend on the detector response which will
usually be non-linear as is the case for photographic emulsions.
It is not generally possible to include the effects of plate res-
ponse directly in the calculations of imaging in spectrographs
since the properties of plates for use in the soft x-ray region
are variable and depend strongly upon age, storage conditions
and development conditions. Little work has been performed on
the properties of soft x-ray plates, or films, although Niemann
(114) has described the properties of three films suitable for
use in zone plate experiments in the soft x-ray region. If the
characteristics of the photographic plates, or films, are deter-
mined experimentally, the spot diagrams may be interpreted to yield
the image expected in practice. If the efficiency of the grating
is also known in the spectral region concerned, the entire pro-
perties of a spectrograph may be calculated.
In order that the numerical calculations described in this
chapter are of practical significance, the geometrical conditions
have been chosen to correspond to two grazing incidence spectro-
graphs available commercially. The first is the popular 2m instru-
ment described by Gabriel (115) and the second is a new prefocussed
5m instrument as described by Speer and Turner (116). Since the
latter instrument has been designed specifically to be able to take
advantage of all the developments in soft x-ray gratings and optics,
most of the examples will be based on this instrument.
Spot diagrams showing the aberrations of a boo 1/mm 5m spherical
grating illuminated with 50 A radiation by a point source in the
meridian plane on the Rowland circle are given in Fig. 23. The
effect of increasing the illuminated grating width from lOmm to 40mm

•
•
10.000 10.000
0 100
10.000 10.000 -0.100 0 100 -0.100
w.
00.
1
• ...O.. •
. • oaf. • •
• • ••••• • •
. • •••••• • •
• ••••....
• . ...e• • • • •
- 112 -
ABERRATIONS OF A SPHERICAL GRATING
ON THE ROWLAND CIRCLE
R = 5000.0 RO = 5000.0
ALPHA . 4.0 ORDER = 1.0
WAVELENGTHS 50.00 0.00 0.00 0.00 0.00
OBJECT GIST = 348.73 IMAGE 01ST s 520.63
HALF-LENGTH = 5.00 HALF-WIDTH = 2.00
HEIGHTS 0.0 0.0 0.0 0.0 0.0
ABERRATIONS OF A SPHERICAL GRATING
ON THE ROWLAND CIRCLE
R = 5000.0 RO . 5000.0
ALPHA = 4.0 ORDER = 1.0
WAVELENGTHS 50.00 0.00 0.00 0.00
0.00
OBJECT DIST = 348.70 IMAGE 01ST . 520.63
HALF-LENGTH = 10.00 HALF-WIDTH = 2.00
HEIGHTS 0.0 0.0 0.0 0.0 0.0
ABERRATIONS OF A SPHERICAL GRATING
ON THE ROWLAND CIRCLE
R = 5000.0
ALPHA = 4.0
RO = 5000.0
ORDER . 1.0
WAVELENGTHS 50.00 o.00 0.c0 0.00 0.00
OBJECT 01ST = 348.78 IMAGE DIST = 520.63
HALF-LENGTH = 15.00 HALF-WIDTH . 2.00
HEIGHTS 0.0 0.0 0.0 0.0 0.0
-10.000 -0.100 0 100
ABERRATIONS OF A SPHERICAL GRATING
ON THE ROWLAND CIRCLE
H = 5000.0 80 = 5000.0 ALPHA . 4.0 ORDER = 1.0
WAVELENGTHS 50.00 0.00 0.00 0.00 0.00
OBJECT DIST = 348.78 IMAGE DIST = 520.63
HALF-LENGTH = 20.00 HALF-WIDTH = 2.00
HEIGHTS 0.0 0.0 0.0 0.0 0.0
-10.000 -0.100 0 100
10.000 10.000
FIG. 23
- 113-
is shown (i.e. the half-width of the grating increases from 5mm to
20mm). It should be noted that the dimensions on all the spot dia-
grams are in millimetres apart from the wavelengths which are ex-
pressed in Angstroms. The vertical scale on the spot diagrams is
100x greater than the horizontal scale. The large difference in
scales is necessary in order to show the image structure in the
presence of the large astigmatism of a spherical grating at grazing
incidence. The second largest aberration is the astigmatic curva-
ture which gives the characteristic parabolic shape to the spectral
lines. This curvature is not generally significant in grazing inci-
dence spectra since normally only the central section of the astig-
matic image is recorded on the photographic plate.
The most important observation to be made from this series of
spot diagrams is the dramatic increase in the line width as the
illuminated width of the grating is increased. The increase in line
width is due to spherical aberration which varies as the third power
of the pupil coordinate. For a spherical grating under the conditions
specified in the spot diagrams the optimum grating width as calculated
by Mack, Stehn and Edlen is 31.95mm which corresponds to the third
spot diagram. It is evident that under these conditions it is possible
to obtain a higher resolution on a geometrical basis by using a
slightly smaller optimum width than that recommended by Mack et al.
It is also clear that for a given detector resolution or exit slit
width in spectrometers and monochromators the grating width should be
optimised and that there is little to be gained from increasing the
optimum width above that recommended by Mack et al. However, the
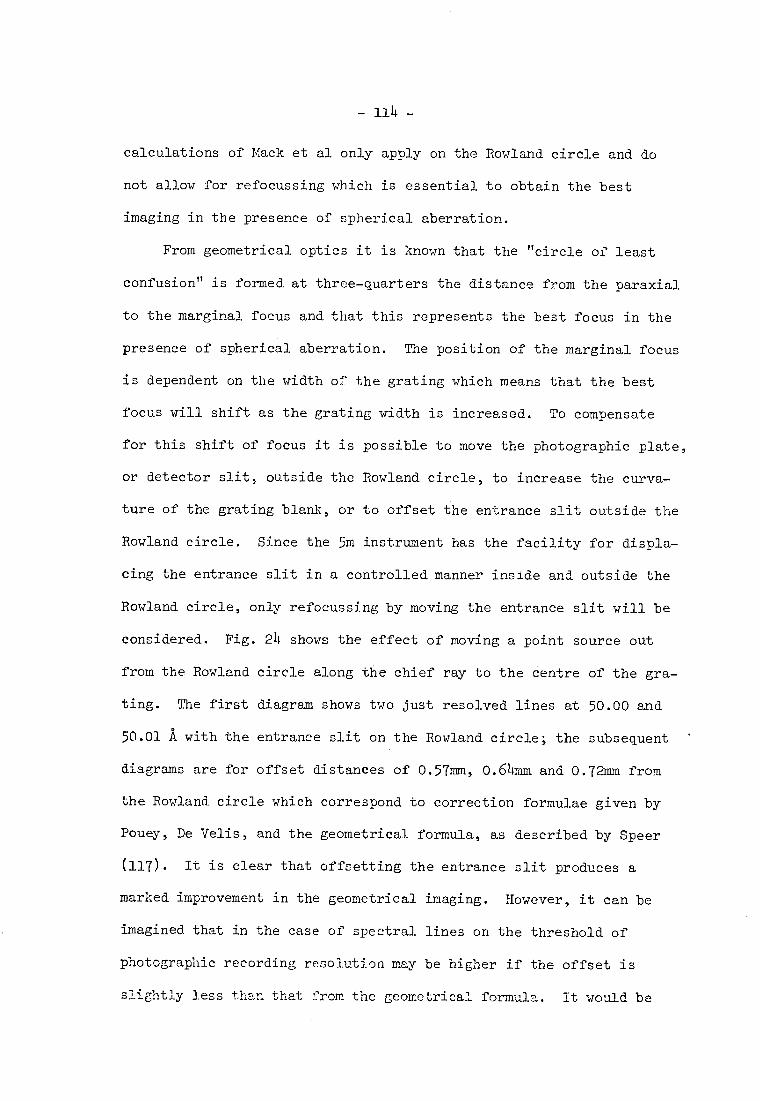
calculations of Mack et al only apply on the Rowland circle and do
not allow for refocussing which is essential to obtain the best
imaging in the presence of spherical aberration.
From geometrical optics it is known that the "circle of least
confusion" is formed at three-quarters the distance from the paraxial
to the marginal focus and that this represents the best focus in the
presence of spherical aberration. The position of the marginal focus
is dependent on the width of the grating which means that the best
focus will shift as the grating width is increased. To compensate
for this shift of focus it is possible to move the photographic plate,
or detector slit, outside the Rowland circle, to increase the curva-
ture of the grating blank, or to offset the entrance slit outside the
Rowland circle. Since the 5m instrument has the facility for displa-
cing the entrance slit in a controlled manner inside and outside the
Rowland circle, only refocussing by moving the entrance slit will be
considered. Fig. 24 shows the effect of moving a point source out
from the Rowland circle along the chief ray to the centre of the gra-
ting. The first diagram shows two just resolved lines at 50.00 and
50.01 A with the entrance slit on the Rowland circle; the subsequent •
diagrams are for offset distances of 0.57mm, 0.64mm and 0.72mm from
the Rowland circle which correspond to correction formulae given by
Pouey, De Velis, and the geometrical formula, as described by Speer
(117). It is clear that offsetting the entrance slit produces a
marked improvement in the geometrical imaging. However, it can be
imagined that in the case of spectral lines on the threshold of
photographic recording resolution may be higher if the offset is
slightly less than that from the geometrical formula. It would be
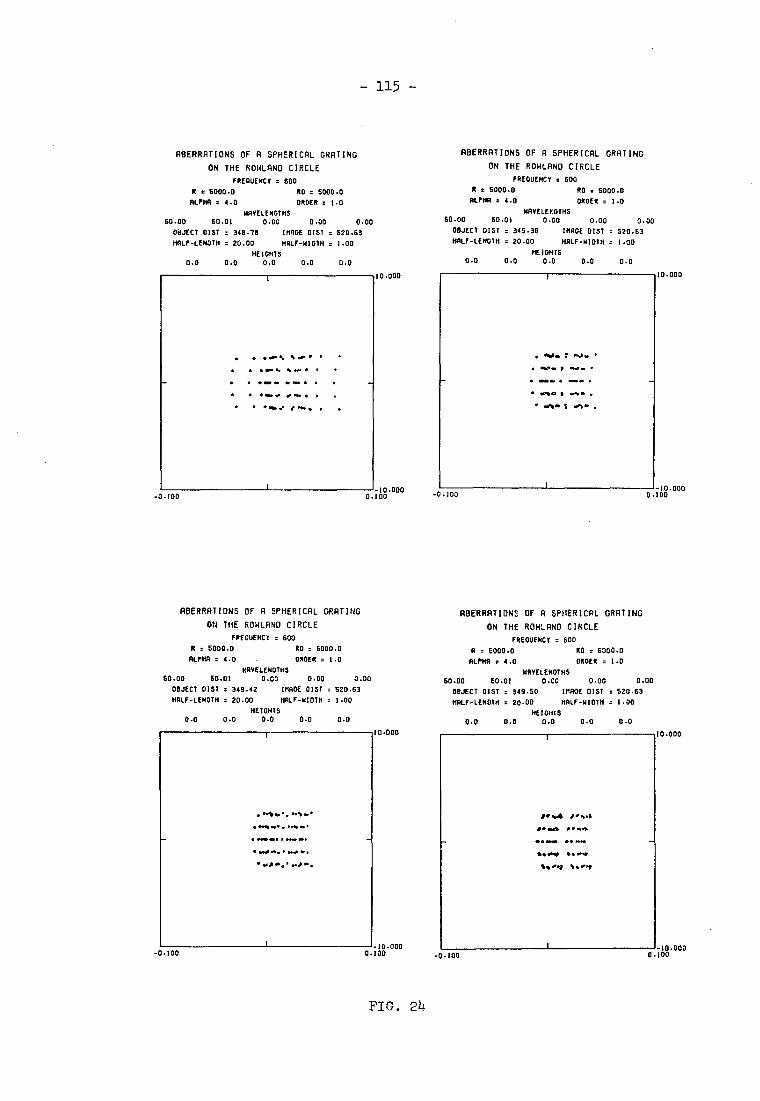
• . • ••• •• • ••• • • • • • ••• •• • ••• • • • • • • ••• •• ••• • • • • • • 41w •• ••• • • • • • ••• yr ••• • • •
••M • • ••••
•• •••• • •••• •0 IN/ • • ••••
Imo" 1,••••1
10.000
10.000 -0.100 0 100
- 115 -
10.000
10.000
ABERRATIONS OF A SPHERICAL GRATING
ON THE ROWLAND CIRCLE
FREQUENCY
R = 5000.0 RO = 5000.0
ALPHA . 4.0 ORDER . 1.0 WAVELENGTHS
50.00 50.01 0.00 0.00 0.00 OBJECT DIST = 346.76 IMAGE DIST . 520.63
HALF-LENGTH = 20.00 HALF-MOTH . 1.00 HEIGHTS
0.0 0.0 0.0 0.0 0.0
-0.100
0 100
ABERRATIONS OF A SPHERICAL GRATING
ON THE ROWLAND CIRCLE
FREQUENCY . 600
R = 5000.0 RO . 5000.0
ALPHA . 4.0 ORDER = 1.0 WAVE LEFGTHS
50.00 50.01 0.00 0.00 0.00 OBJECT DIST • 34S.36 IMAGE 01ST . 520.63 HALF-LENGTH . 20.00 HALF-WIDTH = 1.00
HEIGHTS 0.0 0.0 0.0 0.0 0.0
10.000 -0.100 0 100
10.000
ABERRATIONS OF A SPHERICAL GRATING
ON THE ROWLAND CIRCLE
FREQUENCY = 600
R t 5000.0 RO . 5000.0
ALPHA = 4.0 ORDER = 1.0 WAVELENGTHS
50.00 50.01 0.00 0.00 0.00 OBJECT 01ST . 349.42 IMAGE DIST . 520.63 HALF-LENGTH . 20.00 HALF-WIDTH . 1.00
HEIGHTS 0.0 0.0 0.0 0.0 0.0
ABERRATIONS OF A SPHERICAL GRATING
ON THE ROWLAND CIRCLE
FREQUENCY . 600
R = 5000.0 RO . 5000.0
ALPHA m 4.0 ORDER = 1.0
WAVELENGTHS 50.00 50.01 0.00 0.00 0.00
OBJECT DIST = 349.50 IMAGE DIST . 520.63
HALF-LENGTN . 20.00 HALF-WIDTH = 1.00
HEIGHTS 0.0 0.0 0.0 0.0 0.0
10.000
• .11.0.•., •••■••
•
• •
• ••••• a.. • Iwo. .• • v-41 ..•
10.000 -0.100 0 100
FIG. 21.
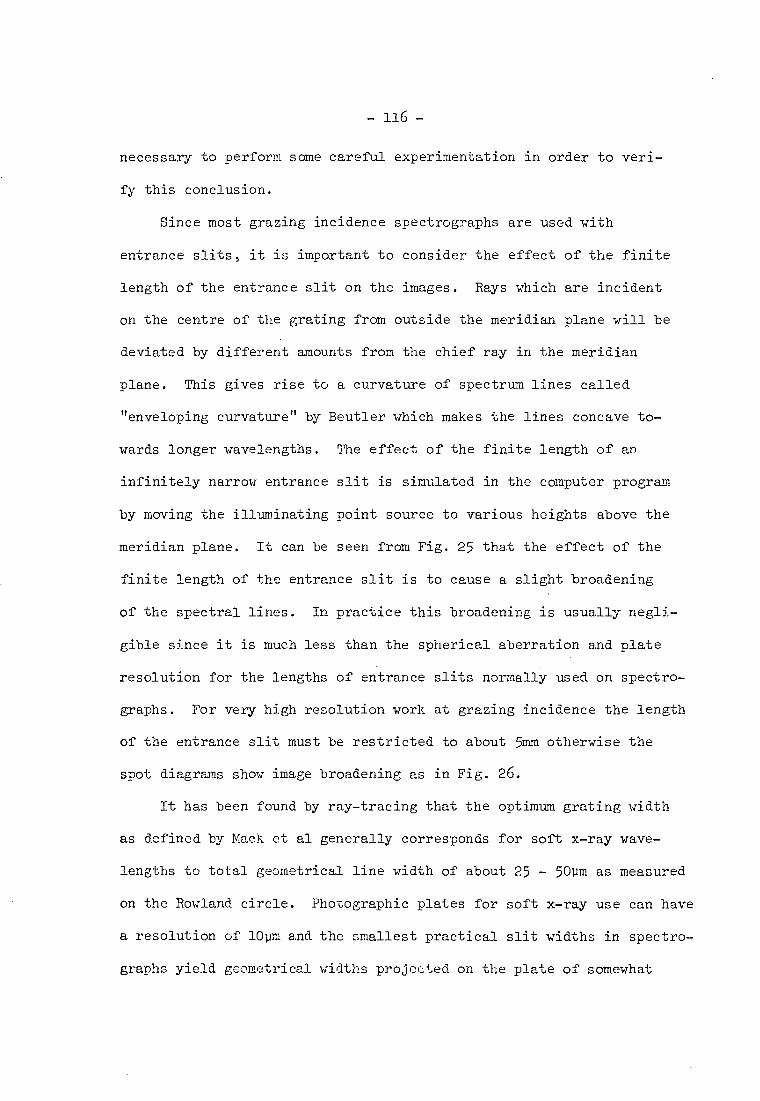
- 116-
necessary to perform some careful experimentation in order to veri-
fy this conclusion.
Since most grazing incidence spectrographs are used with
entrance slits, it is important to consider the effect of the finite
length of the entrance slit on the images. Rays which are incident
on the centre of the grating from outside the meridian plane will be
deviated by different amounts from the chief ray in the meridian
plane. This gives rise to a curvature of spectrum lines called
"enveloping curvature" by Beutler which makes the lines concave to-
wards longer wavelengths. The effect of the finite length of an
infinitely narrow entrance slit is simulated in the computer program
by moving the illuminating point source to various heights above the
meridian plane. It can be seen from Fig. 25 that the effect of the
finite length of the entrance slit is to cause a slight broadening
of the spectral lines. In practice this broadening is usually negli-
gible since it is much less than the spherical aberration and plate
resolution for the lengths of entrance slits normally used on spectro-
graphs. For very high resolution work at grazing incidence the length
of the entrance slit must be restricted to about 5mm otherwise the
spot diagrams show image broadening as in Fig. 26.
It has been found by ray-tracing that the optimum grating width
as defined by Mack et al generally corresponds for soft x-ray wave-
lengths to total geometrical line width of about 25 - 50pm as measured
on the Rowland circle. Photographic plates for soft x-ray use can have
a resolution of 10pm and the smallest practical slit widths in spectro-
graphs yield geometrical widths projected on the plate of somewhat

- 117 -
ABERRATIONS OF A SPHERICAL GRATING ON THE ROWLAND CIRCLE
FREQUENCY = 600
R = 5000.0 RO = 5000.0
ALPHA = 4.0 ORDER = 1.0
100.00
WAVELENGTHS
0.00 0.00 0.00 0.00
OBJECT DIST = 348.78 IMAGE DIST = 648.09
HALF-LENGTH = 20.00 HALF-WIDTH = 5.00
HEIGHTS
0.0 1.0 2.0 -1.0 -2.0
19.090
+ 0 +
►x 'x "?.< 4- op•
4ake
4ttx 15( px + + 4a+r3W +.°
M. 1/4 v,04 43-,440+.0 00
k k kkt t t
-40 *0400:0
• * ***
*4.3.403:3 * Att
• '0 • ".401r° :0 .4.0
x• XO
• 44,ittit:3 .0 +0
" "xa_e
0 •x
x• • •
19.090 0 240 -0.030
FIG. 25
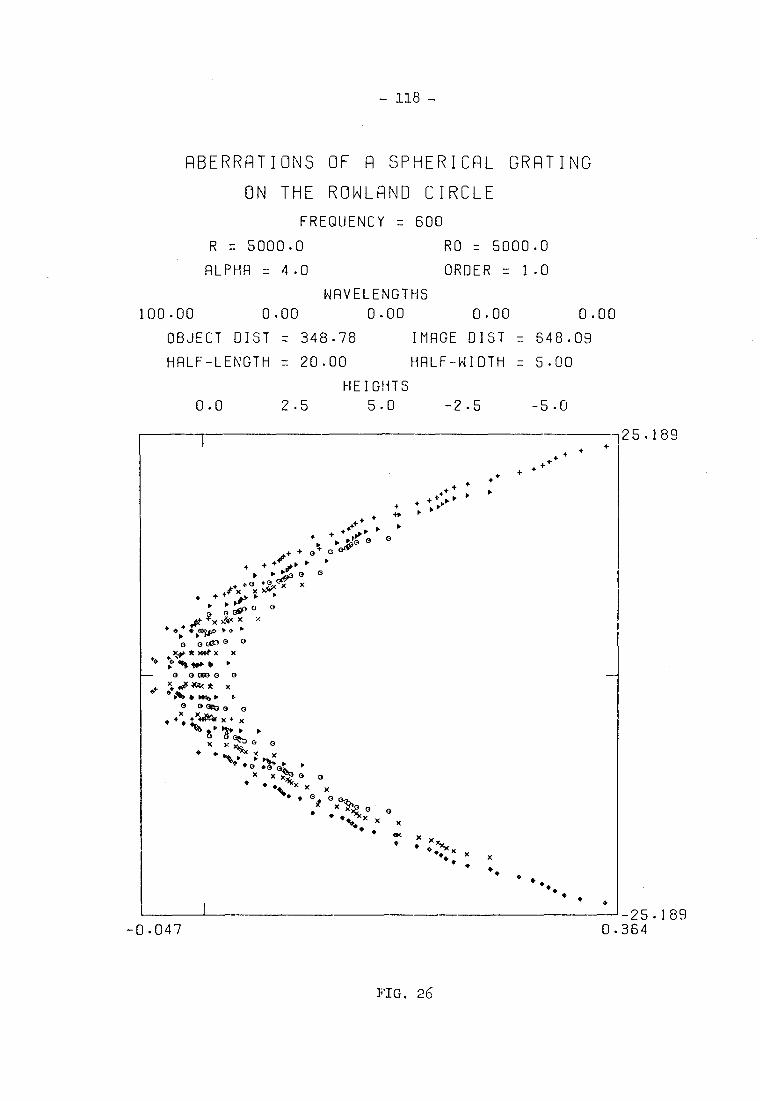
$000 0 — 0 0 060 0 0
4•14 46.< * X 0+
Vq. • 14% • •
• '380 0 0
• 4.X • +X441 x x 4% °
X 0 OX
• °
. GI ► 40
+ + 00, I
c). + • x
O 001 ° 3 + Wok X )006' X x
— 118 —
ABERRATIONS OF A SPHERICAL GRATING
ON THE ROWLAND CIRCLE
FREQUENCY = 600
R = 5000.0 RO = 5000.0
RLPHR = 4.0 ORDER = 1.0
WAVELENGTHS
100.00 0.00
0.00
0.00 0.00
OBJECT DIST = 348.78 IMAGE DIST = 648.09
HALF—LENGTH = 20.00 HALF—WIDTH = 5.00
HEIGHTS
0.0 2.5 5.0 —2.5 —5.0
25.189
‘4.
■ • ►
►
+0+
0
X
X o
•
_ x,ik 0 9 x
• )? • • . x
::x x x •
•
O • 25.189 0.364 —0.047
FIG. 26
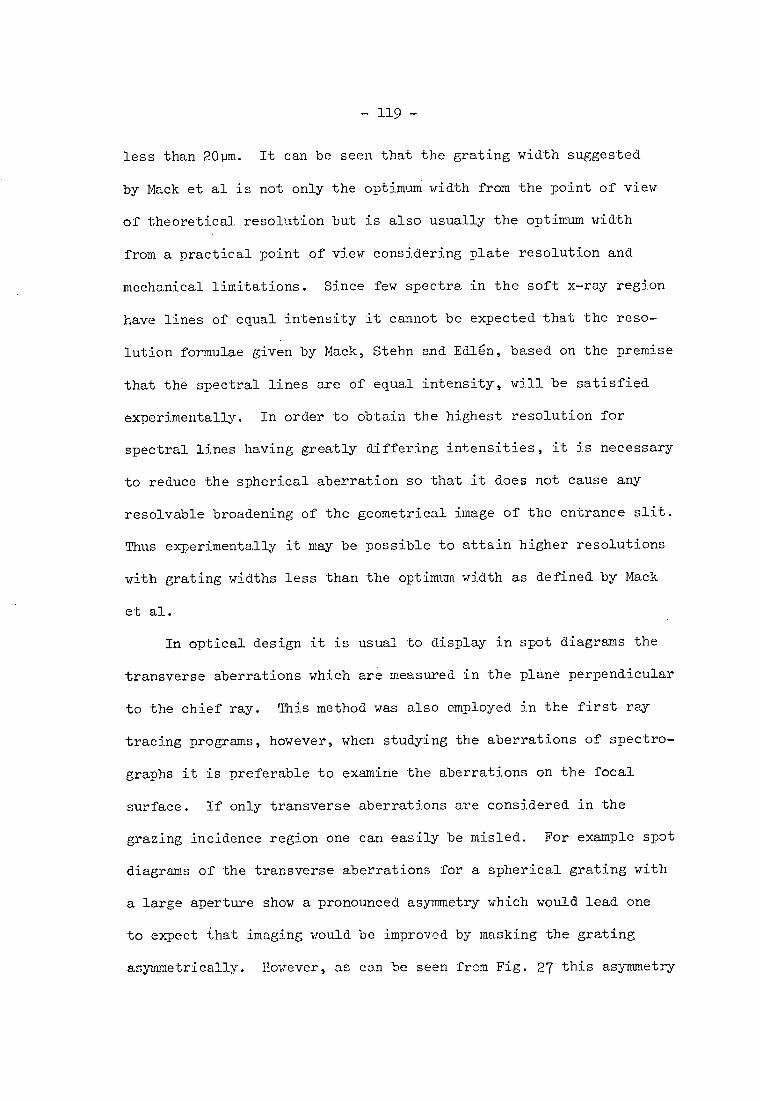
- 119 -
less than 20pm. It can be seen that the grating width suggested
by Mack et al is not only the optimum width from the point of view
of theoretical resolution but is also usually the optimum width
from a practical point of view considering plate resolution and
mechanical limitations. Since few spectra in the soft x-ray region
have lines of equal intensity it cannot be expected that the reso-
lution formulae given by Mack, Stehn and Ed14n, based on the premise
that the spectral lines are of equal intensity, will be satisfied
experimentally. In order to obtain the highest resolution for
spectral lines having greatly differing intensities, it is necessary
to reduce the spherical aberration so that it does not cause any
resolvable broadening of the geometrical image of the entrance slit.
Thus experimentally it may be possible to attain higher resolutions
with grating widths less than the optimum width as defined by Mack
et al.
In optical design it is usual to display in spot diagrams the
transverse aberrations which are measured in the plane perpendicular
to the chief ray. This method was also employed in the first ray
tracing programs, however, when studying the aberrations of spectro-
graphs it is preferable to examine the aberrations on the focal
surface. If only transverse aberrations are considered in the
grazing incidence region one can easily be misled. For example spot
diagrams of the transverse aberrations for a spherical grating with
a large aperture show a pronounced asymmetry which would lead one
to expect that imaging would be improved by masking the grating
asymmetrically. However, as can be seen from Fig. 27 this asymmetry
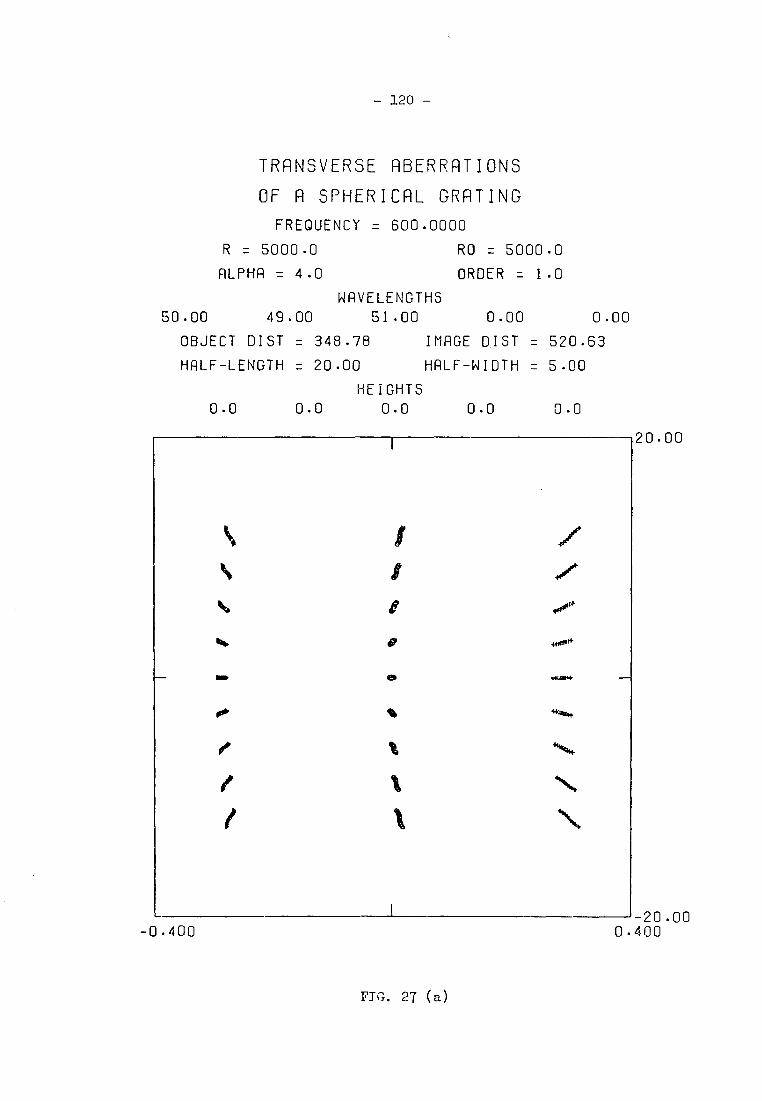
- 120 -
TRANSVERSE ABERRATIONS
OF A SPHERICAL GRATING
FREQUENCY = 600.0000
50.00 49.00
R = 5000.0 RO = 5000.0
ALPHA = 4.0 ORDER = 1.0
WAVELENGTHS
51.00 0.00 0.00
OBJECT DIST = 348.78 IMAGE DIST = 520.63
HALF-LENGTH = 20.00 HALF-WIDTH = 5.00
HEIGHTS
0.0 0.0 0.0 0.0 0.0
20.00
-0.400
k. I /
tt, 8 0.00
t. 0 4.00
. a .
.0 v. ftft.
e t ...t.
e I. *N..
/ 1, \
-20.00 0.400
FIG. 27 (a)

- 121 -
ABERRATIONS OF A SPHERICAL
GRATING ON THE ROWLAND CIRCLE
FREQUENCY = 600.0000
R = 5000.0 RO = 5000.0
RLPHR = 4.0 ORDER = 1.0
WAVELENGTHS
50.00 49.00 51.00 0.00 0.00
OBJECT DIST = 348.78 IMRGE DIST = 520.63
HALF-LENGTH = 20.00 HALF-WIDTH = 5.00
HEIGHTS
0.0 0.0 0.0 0.0 0.0
20.00
20.00 -4.000
4.000
FIG. 27 (b)
- 122-
disappears when the aberrations are measured on the Rowland circle.
The great difference in magnitude between the aberrations measured
transverse to the chief ray and along the focal curve means that
transverse aberrations which at first appear to be insignificant can
be large when projected on the Rowland cylinder. This effect is
illustrated in Fig. 28 which shows spot diagrams at wavelengths of
10.00 and 10.01 A with aberrations measured transversely and on the
Rowland cylinder from a 600 1/mm spherical grating in the upper
diagrams and a 1200 1/mm grating in the lower diagrams. It is impor-
tant to note the increase in the horizontal scale from 201Am for the
transverse aberrations to 200um for the aberrations measured along
the cylinder. Both methods for representing the aberrations have
advantages in certain cases and both methods have been employed in
this work.
A final example of the aberrations of a spherical grating as
measured along the Rowland cylinder is shown in Fig. 29. The upper
spot diagrams show images formed at wavelengths 50.00 and 50.01
incident at a grazing angle of 2.0° onto a 600 1/mm and a 1200 1/mm
grating. For the 600 1/mm case it can be seen that the marginal rays
from one side of the grating for one wavelength fall near the paraxial
focus for the other wavelength. Under these conditions it cannot be
said that the two lines will always be resolved but they may be de-
pending on the intensities of the lines and the characteristics of the
detector. The diagram for the 1200 1/mm grating shows that the two
lines are now separated but that they are considerably broadened by
spherical aberration. Hence, contrast could be increased by reducing
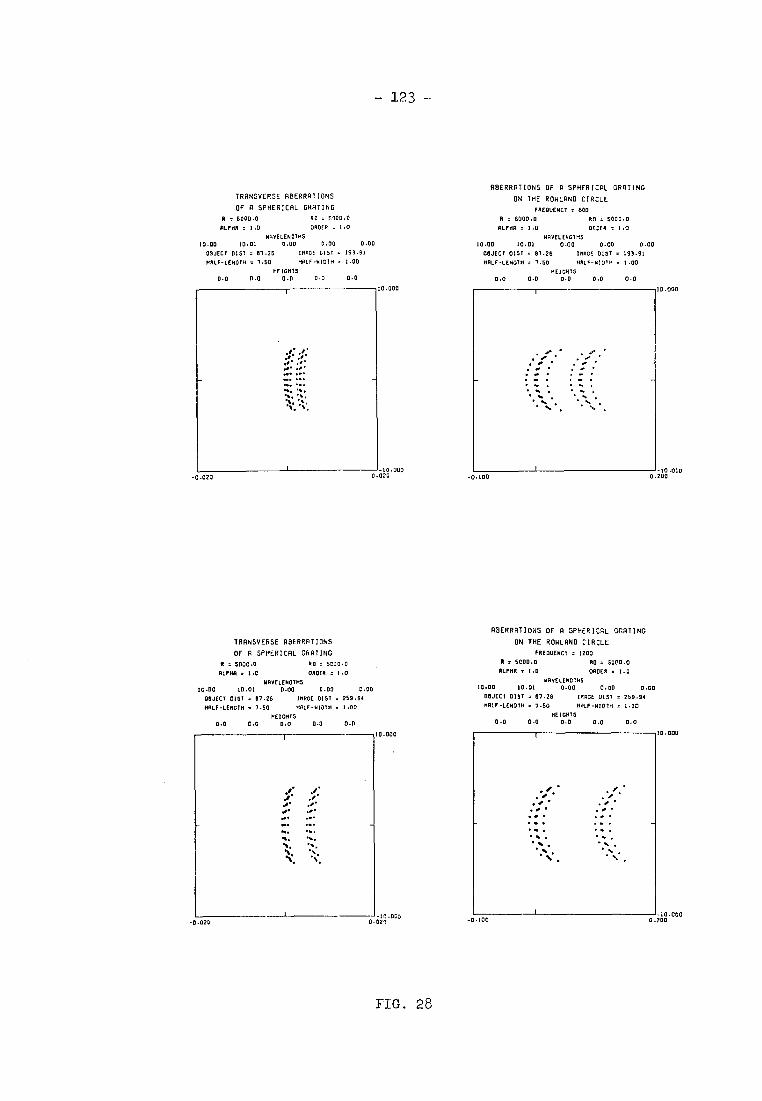
- 123 -
ABERRATIONS OF R SPHERICAL GRATING
TRANSVERSE ABERRATIONS ON THE ROWLAND CIRCLE OF A SPHERICAL GRATING FREQUENCY . 600
R . 6000.0 RO . 5000.0 R . 6000.D RO z 5000.0
ALPHA . 1.0 ORDER . 1.0 ALPHA . 1.0 ORDER . 1.0
WAVELENOTHS WAVELENGTHS 10.00 10.01 0.00 0.00 0.00 10.00 10.01 0.00 0.00 0.00
OBJECT DIST . 87.26 IMAGE GIST . 193.91 OBJECT DIST = 87.26 IMAGE OIST . 193.91
HALF-LENGTH . 7.5D HALF-WIDTH . 1.00 HALF-LENGTH . 7.50 HALF-WIDTH = 1.00
HEIGHTS HEIGHTS 0.0 0.0 0.0 0.0 0.0 0.0 0.0 0.0 0.0 0.0
10.000 10.000
oe ' 0. ' .9* ,o' 0• •••
.0 • • ••• ••• . . • . • . . •
. . . . • ... . • . • , • . • 5
'1.'5. • ' •
5. %.
••
10.000 I0.0J0 -0.020 0 0 020 -0.100 200
RSERRRTIONS OF A SPHERICAL GRATING
TRANSVERSE ABERRATIONS ON THE ROWLAND CIRCLE
OF R SPHERICAL GRATING FREDUENCY = 1200
R = 5000.0 R0 = 5000.0 R = 5000.0 RO = 5000.0
ALPHA . 1.1 ORDER . 1.0 ALPHA . 1.0 ORDER . 1.0
WAVELENGTHS 10.00 10.01 0.00 0.00 0.00
OBJECT OIST . 87.26 IMAGE DIST x 259.94
HALF-LENGTH r. 7.50 HALF-NIOTH z 1.00
HEIGHTS 0.0 0.0 0.0 0.0 0.0
10.000
10.000 -0.025 0 020
WAVELENGTHS 10.00 10.01 0.00 0.00 0.00 OBJECT DIST . 87.26 IMAGE DIST . 259.94
HALF-LENGTH = 7.50 HALF-WIDTH . 1.00
HEIGHTS 0.0 0.0 0.0 0.0 0.0
•• • •
•
. • • • - • • • • • • .%
• .
10.700 -0.100 0 200
10.000
FIG. 28
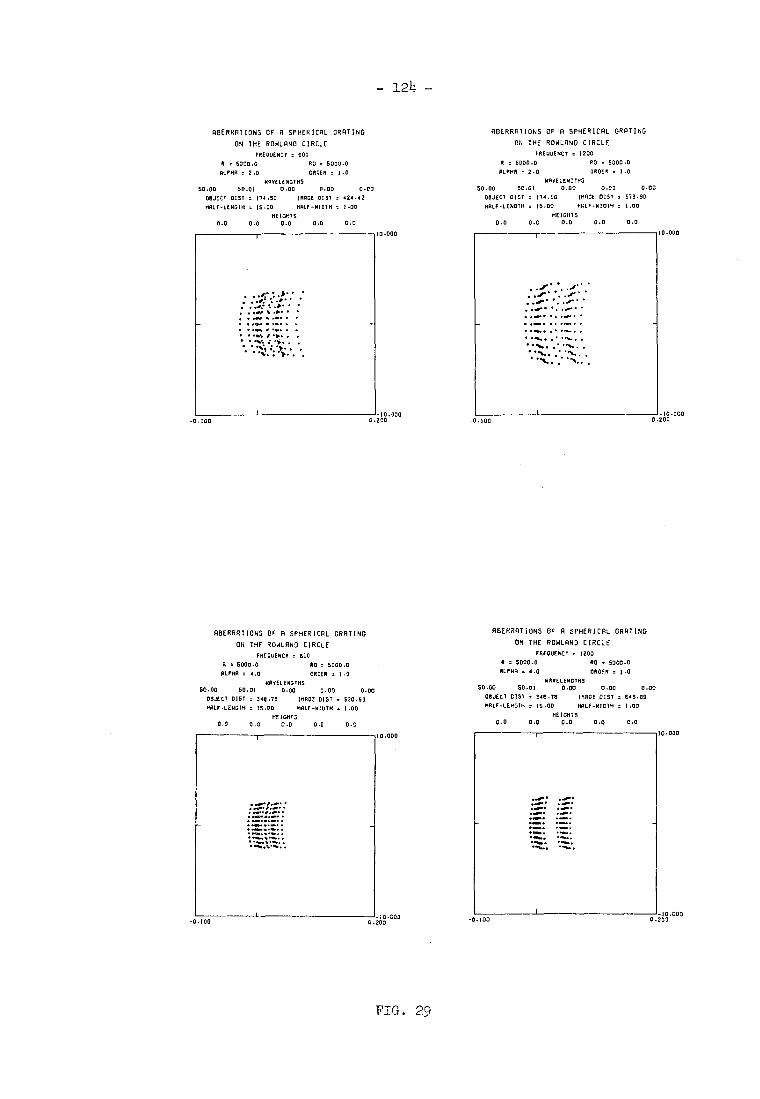
10.000
ABERRATIONS CF R SPHERICAL GRATING
ON THE ROWLAND CIRCLE
FREOUE808 . GOO
R 5000.0 RO . 5000.0
ALPHA = 2.0 ORDER t 1.0
WAVELENGTHS 50.00 50.01 0.00 0.00 0.00
OBJECT 0151 t 114.50 IMAGE 01ST . 424.42
HALF-LENGTH . 25.00 HALF-WIDIH . 1.00
HE101115
0.0 0.0 0-0 0.0 0.0
ABERRATIONS OF A SPHERICAL GRATING
ON THE ROWLAND CIRCLE
FREQUENCY . 1200
. 5000.0 PO = 5000.0
ALPHA = 2.0 ORDER . 1.0
WAVE1EN:183 50.00 50.01 0.00 0.00 0.00
OBJECT 0157 . 114.50 111000 GIST . 513.60
HALF-LENOTH . 15.00 HALF-1410TH . 1.00
HEIGH15 0.0 0.0 0.0 0.0 0.0
10.000
-0.100
• • ...I
• •
• • • • • • • •
%
•••••, •%.•
• •
••• • •
• •
•■• • •
.11, • • : 1.• •
"R• •
•
•
...e• • ....••• ..••• • ....••• •
• ....-• •
• - • • • - •
,* ••••• , • •••■■... .• • N. ,
-10.000 10.000 -0.100 0 200 0 200
ABERRATIONS OF A SPHERICAL GRATING
ON THE ROWLAND CIRCLE
FREQUENCY . 600
A t 5000.0 RD 5000.0
ALPHA a 4.0 OROER = 1.0
WAVELENGTHS 50.00 50.01 0.00 0.00 0.00
OBJECT 01ST 348.78 IMAGE DIST . 520.63
HALF-LENGTH t 15.00 HALF-W10TH . 1.00
HEIGHTS 0.0 0.0 0.0 0.0 0.1
ABERRATIONS OF A SPHERICAL GRATING
ON THE ROWLAND CIRCLE
FREQUENCY . 1200
5000.0 RO = 5000.0
ALPHA . 4.0 ORDER . 1.0
WAVELENGTHS 50.00 50.01 0.00 0.00 0.00
OBJECT GIST . 348.78 IMAGE C15T = 64E1.09
HALF-LENGTH . 15.00 HALF-6101H . 1.00
HEIGHTS 0.0 0.0 0.0 0.0 0.0
10.000
10.000 -0.100 0 200
10.000
-0•100
Cl 2084"
FIG. 29
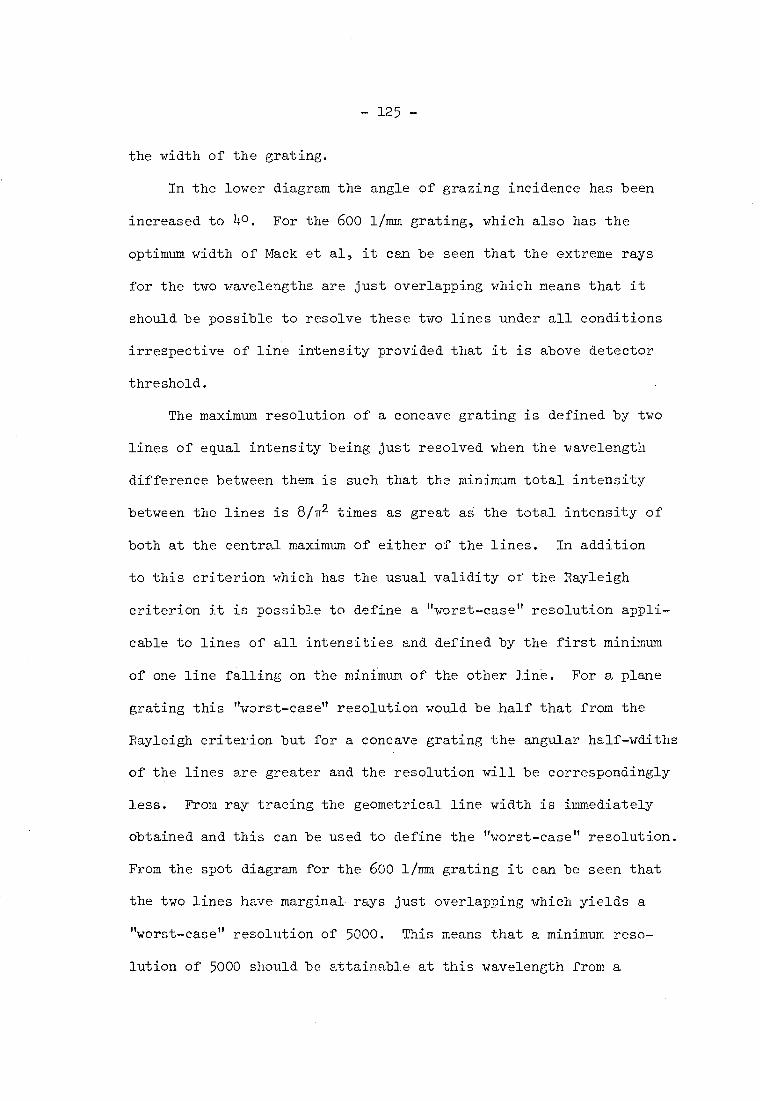
- 125 -
the width of the grating.
In the lower diagram the angle of grazing incidence has been
increased to 40. For the 600 1/mm grating, which also has the
optimum width of Mack et al, it can be seen that the extreme rays
for the two wavelengths are just overlapping which means that it
should be possible to resolve these two lines under all conditions
irrespective of line intensity provided that it is above detector
threshold.
The maximum resolution of a concave grating is defined by two
lines of equal intensity being just resolved when the wavelength
difference between them is such that the minimum total intensity
between the lines is 8/72 times as great as the total intensity of
both at the central maximum of either of the lines. In addition
to this criterion which has the usual validity of the Rayleigh
criterion it is possible to define a "worst-case" resolution appli-
cable to lines of all intensities and defined by the first minimum
of one line falling on the minimum of the other line. For a plane
grating this "worst-case" resolution would be half that from the
Rayleigh criterion but for a concave grating the angular half-wdiths
of the lines are greater and the resolution will be correspondingly
less. From ray tracing the geometrical line width is immediately
obtained and this can be used to define the "worst-case" resolution.
From the spot diagram for the 600 1/mm grating it can be seen that
the two lines have marginal rays just overlapping which yields a
"worst-case" resolution of 5000. This means that a minimum reso-
lution of 5000 should be attainable at this wavelength from a
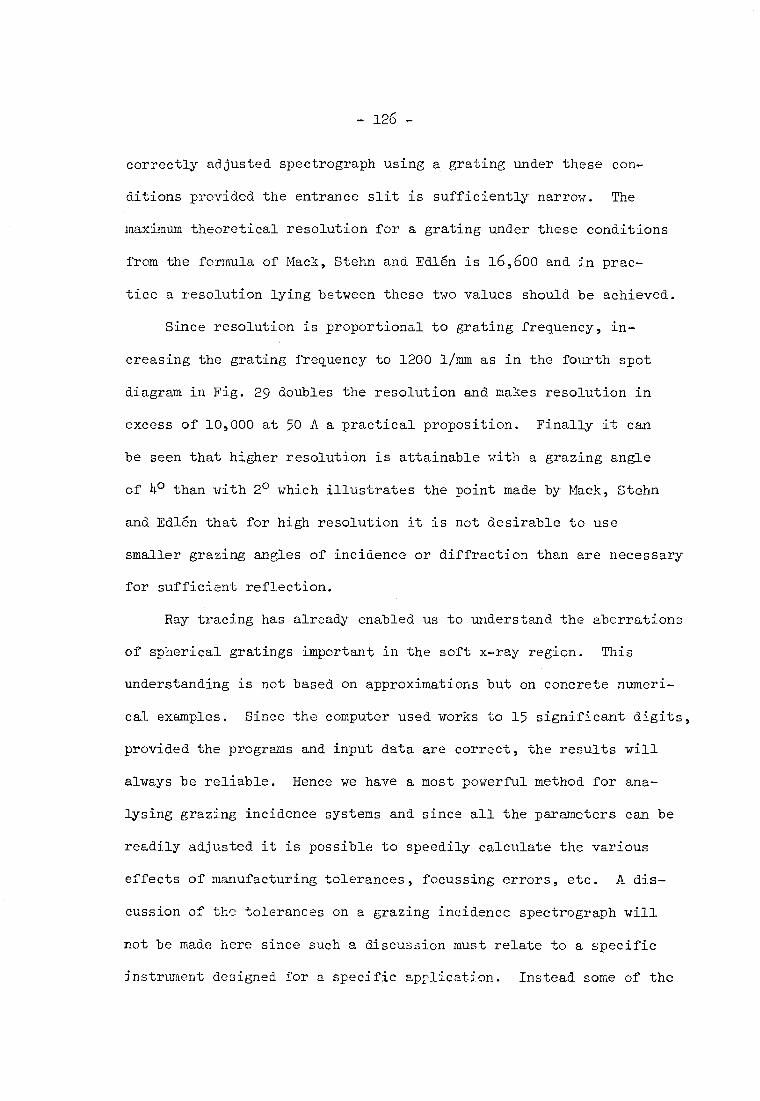
- 126 -
correctly adjusted spectrograph using a grating under these con-
ditions provided the entrance slit is sufficiently narrow. The
maximum theoretical resolution for a grating under these conditions
from the formula of Mack, Stehn and Edlen is 16,600 and in prac-
tice a resolution lying between these two values should be achieved.
Since resolution is proportional to grating frequency, in-
creasing the grating frequency to 1200 1/mm as in the fourth spot
diagram in Fig. 29 doubles the resolution and makes resolution in
excess of 10,000 at 50 A a practical proposition. Finally it can
be seen that higher resolution is attainable with a grazing angle
of 4° than with 2° which illustrates the point made by Mack, Stehn
and Edl6n that for high resolution it is not desirable to use
smaller grazing angles of incidence or diffraction than are necessary
for sufficient reflection.
Ray tracing has already enabled us to understand the aberrations
of spherical gratings important in the soft x-ray region. This
understanding is not based on approximations but on concrete numeri-
cal examples. Since the computer used works to 15 significant digits,
provided the programs and input data are correct, the results will
always be reliable. Hence we have a most powerful method for ana-
lysing grazing incidence systems and since all the parameters can be
readily adjusted it is possible to speedily calculate the various
effects of manufacturing tolerances, focussing errors, etc. A dis-
cussion of the tolerances on a grazing incidence spectrograph will
not be made here since such a discussion must relate to a specific
instrument designed for a specific application. Instead some of the
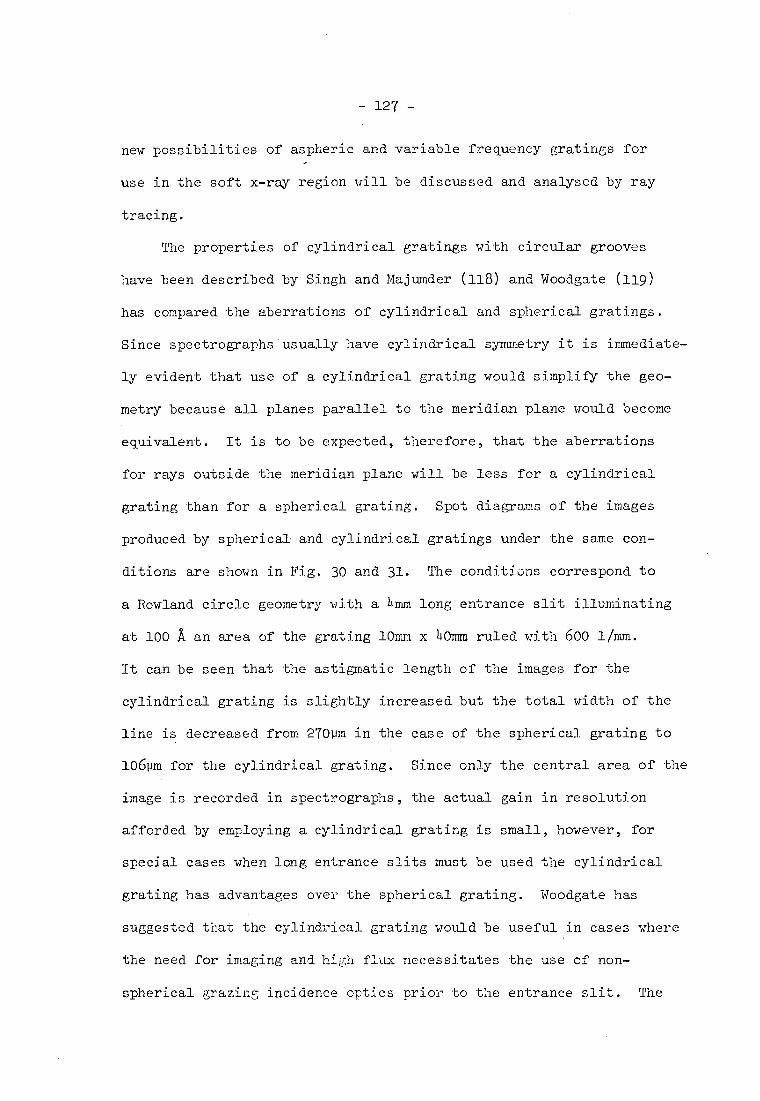
- 127-
new possibilities of aspheric and variable frequency gratings for
use in the soft x-ray region will be discussed and analysed by ray
tracing.
The properties of cylindrical gratings with circular grooves
have been described by Singh and Majumder (118) and Woodgate (119)
has compared the aberrations of cylindrical and spherical gratings.
Since spectrographs usually have cylindrical symmetry it is immediate-
ly evident that use of a cylindrical grating would simplify the geo-
metry because all planes parallel to the meridian plane would become
equivalent. It is to be expected, therefore, that the aberrations
for rays outside the meridian plane will be less for a cylindrical
grating than for a spherical grating. Spot diagrams of the images
produced by spherical and cylindrical gratings under the same con-
ditions are shown in Fig. 30 and 31. The conditions correspond to
a Rowland circle geometry with a 'mm long entrance slit illuminating
at 100 A an area of the grating 10mm x 40mm ruled with 600 1/mm.
It can be seen that the astigmatic length of the images for the
cylindrical grating is slightly increased but the total width of the
line is decreased from 270pm in the case of the spherical grating to
106pm for the cylindrical grating. Since only the central area of the
image is recorded in spectrographs, the actual gain in resolution
afforded by employing a cylindrical grating is small, however, for
special cases when long entrance slits must be used the cylindrical
grating has advantages over the spherical grating. Woodgate has
suggested that the cylindrical grating would be useful in cases where
the need for imaging and high flux necessitates the use of non-
spherical grazing incidence optics prior to the entrance slit. The
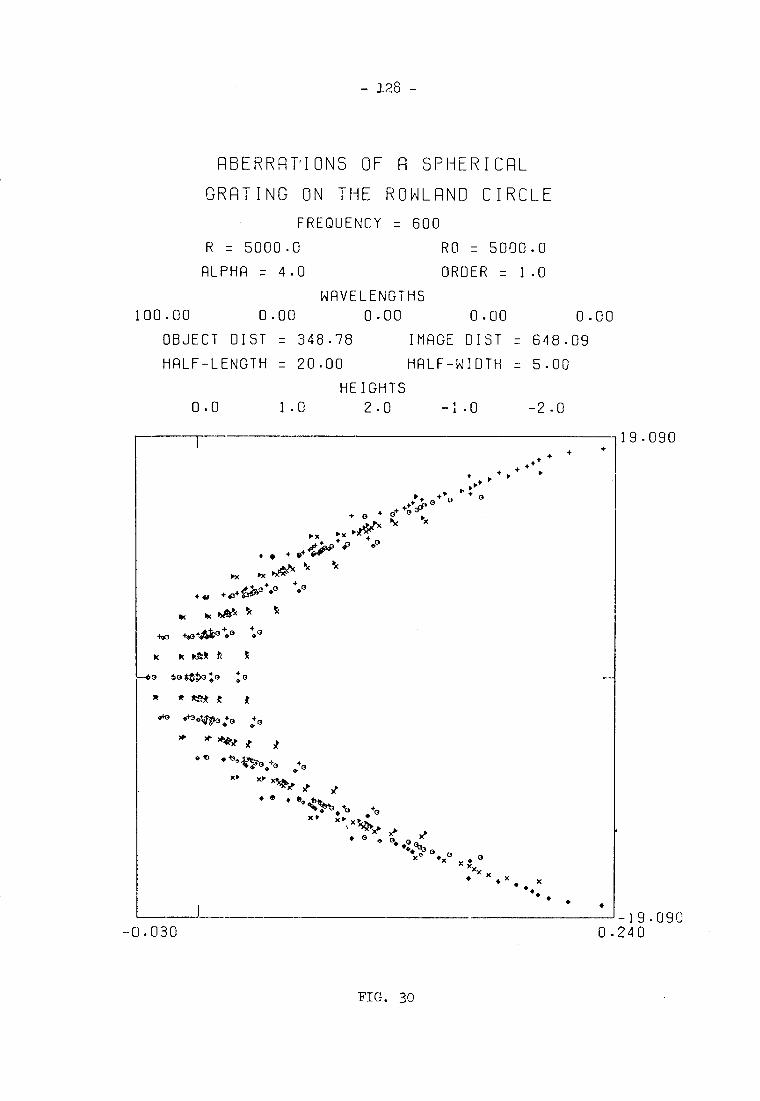
— 128 —
ABERRATIONS OF A SPHERICAL
GRATING ON THE ROWLAND CIRCLE
FREQUENCY = 600
R = 5000.0
ALPHA = 4.0
RO = 5000.0
ORDER = 1.0
WAVELENGTHS
100 00 0.00 0.00 0.00 0.00
OBJECT DIST = 348.78 IMAGE DIST = 648.09
HALF —LENGTH = 20.00 HALF — WIDTH = 5.00
0.0 1.0
HEIGHTS
2.0 —1.0 —2.0
19.090
++ +
-0.0 1. 4. 0 44:e°
" :x ► • + .+1;4+9D 43
.„ P„ ■AN 4.4a +0+00 +.0 +00
k PAN k +oo 4-oehkc'e° +.0
IC kltk
O 0 *SW:0 :0
* 31 t* k k
e+0 O
O 4r) • 4"' X )
xaltbje • 44 • 6. 4:ittot3 • +0 +3
• 0 ••:q33 9
x. •x 0 9 xxx • .x x •
•
+
• 19.090 0.240 —0.030
FIG. 30

► • 0 +o
00,3 + 00++ 40
- 129 -
ABERRATIONS OF A CYLINDRICAL
GRATING ON THE ROWLAND CIRCLE
FREQUENCY = 600.0000
R = 999999999.0
ALPHA = 4.0
RO = 5000.0
ORDER = 1.0
WAVELENGTHS
100.00 0.00 0.00 0.00 0.00
OBJECT DIST = 348.78 IMAGE DIST = 648.09
HALF-LENGTH = 20.00 HALF-WIDTH = 5.00
HEIGHTS
0.0 1.0 2.0 -1.0 -2.0
19.220 +
►
0
►
o " "► X X
O O o + • 0 • +4 8:13+ °•++.
• x •
x 16° x o 4-
X IX X x I. X •
+ +a 410103 o° oe + eo
e
O 044 et
nc ftctiftN N
40 0 +00 +011E1,40 0 +00 +0, ►X 0X ""X °)( ► X + o • + p • + ctzt, te *4.
► + 0 •
x ► x • .4 v14 x • • 11. x + 0 • + + • * cv cipt,s+ • 0
X x • 0 • xxx
•
x o X
• + • X •
•
• X 0 N0x „xxx x x
0 •
•
X•0 00 000 0 0.
x ►
• o +
x ►
+
• • • • •
19.220 0.080 -0.026
FIG. 31

- 130 -
optimal design of such multi-element systems cannot be achieved by
considering the aberrations of each element individually since the
aberrations tend to interact. Instead it is necessary to follow
modern optical design techniques and optimise the system with regard
to a specified quality factor. Even though a cylindrical surface
is a simple aspheric, it is not an easy matter to obtain the accuracy
of figuring and surface quality required in the soft x-ray region.
Careful consideration of the manufacturing tolerances and testing
procedures must be made when specifying design tolerances, otherwise
designs can become purely hypothetical. However, in recent years
significant advances in optical working and testing have taken place
which should enable grazing incidence optical systems, incorporating
aspheric elements, to be more readily fabricated.
During the course of the present work two types of aspheric
grating for use in the soft x-ray region have been made and tested
experimentally. Both types of grating have been formed holoqranhi-
cally with a laminar profile to yield an all-metallic structure.
The first type of aspheric grating has been formed on a toroidal
blank and the second type on an elliptical cylinder formed by bending
a suitably shaped optical flat.
The toroidal grating blanks were made with a primary radius
of 2000mm so that they are compatible with the 2m spectrograph
mentioned previously. The secondary radius was chosen to be 5.65mm
in order to pro-duce a stigmatic image under Rowland circle geometry
at 44.5 A with an angle of grazing incidence of 2° from a 600 1/mm
grating. On such a steeply curved blank it would. be practically
impossible to mechanically rule a grating, but the fabrication of
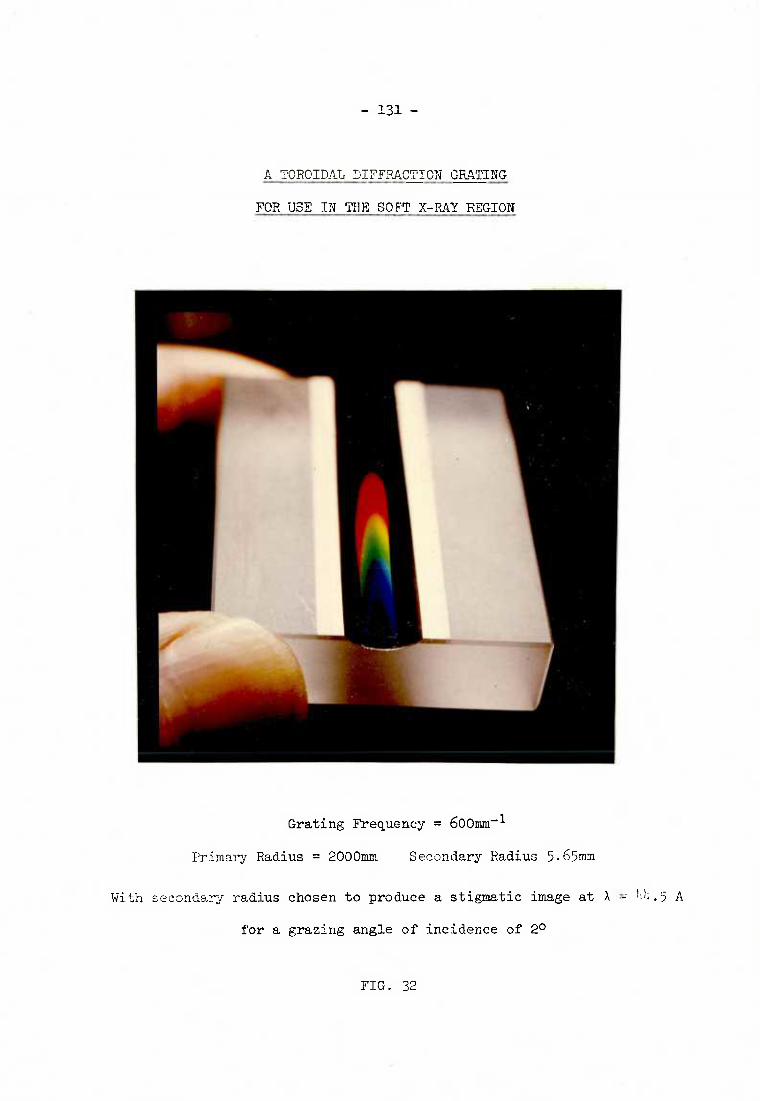
- 131-
A TOROIDAL DIFFRACTION GRATING
FOR USE IN THE SOFT X-RAY REGION
Grating Frequency = 600mm-1
Primary Radius = 2000mm Secondary Radius 5.65mm
With secondary radius chosen to produce a stigmatic image at X = 44.5 A
for a grazing angle of incidence of 20
FIG. 32
- 132 -
this grating was successfully accomplished using the holographic
technique. The production of the toroidal grating is not only
interesting from a theoretical point of view but it has demonstrated
that technically it is now possible to form efficient high-quality
diffraction gratings on almost any surface on which an interference
fringe system can be located. The design possibilities for grating
systems have therefore been enormously increased by the advent of the
holographic method for manufacturing gratings.
From the stigmatic equation for the toroidal grating a stigmatic
image in the zero order is obtained from a toroid with the above radii
if the angle of grazing incidence is 3.046° and the object and image
distances are those of the Rowland circle geometry. Thus it is
possible to examine the zero order aberrations of a toroidal grating,
designed for use at soft x-ray wavelengths, under grazing incidence
conditions using light of any wavelength. The aberrations of the
toroidal blanks were investigated using visible white light before
the gratings were formed on them. The optical system employed and
typical images obtained are shown in Fig. 33 and Fig. 34..
It was immediately apparent that the toroidal blanks produced
large aberrations which could only be reduced by restricting the
aperture. However, it was not known whether the aberrations were
intrinsic to tonic surfaces of this type or were due to manufacturing
imperfections. In order to establish the origin of the aberrations
found in the white light images from the toroidal blanks spot dia-
grams were produced to simulate the zero order images.
Spot diagrams showing the effect of increasing the illuminated
aperture of the toroid under the same conditions as used for the white

Off-axis displacement
Stop width
L)
LA) Pinhole
Diffracted
Zero order
Illuminated area

L (mm)
7·9
5·9
4·3 ~ H 0
w +:-
3-0 .... 2-4
1-5
-0
TOROIDAL GRATING SUBSTRATE.
WHITE LIGHT IMAGING CHARACTERISTICS.
L = maximum width of illuminated area_
Major radius 2 metres, minor radius 5·6mm_
I Pinhole, dia'" 0·1 mm. Film
.........
I
10·5 em ·1· 10'5em
Scale for images? 1 ~ mm_
0-1 0-2 0-3 . 0-4 0-5 0-6 mm_ Off-axis displacement
I-..J w +:-

-135-
light images in Fig. 34 are given in Fig. 35. The correlation
between the computed images and those obtained experimentally is
exceedingly high both in shape and magnitude. Since the experi-
mental results were obtained before the theoretical results, there
is no possibility of a psychological bias and it can be safely
stated that the aberrations observed are inherent to toric surfaces
of this type.
The effect of varying the secondary radius has been investi-
gated by ray tracing and it was found that, since the aberrations
are so large, errors in radius of several percent can be tolerated
without appreciably altering the aberrations. Thus the fabrication
of such toroidal gratings need not be accomplished with such high
precision as was initially thought necessary.
The off-axis aberrations for an illuminated area of 1.5mm x 40mm
on the back plane of the toroid (i.e. a rectangular entrance pupil
1.5in x 2.1mm) recorded using white light are shown in Fig. 34
and the corresponding computed spot diagrams are given in Fig. 36.
Again the correlation between the spot diagrams and actual images is
good when the effects of photographic recording and the ray densities
in the spot diagrams are considered. However, the magnitude of the
off-axis aberrations is such that it would not be possible to use
this type of toroid to produce images from extended objects. This
result was to have been expected because a single mirror used at
grazing incidence can never be aplanatic. If an aplanatic system
is required; that is one free from coma so that near axial points
will be focussed in the Airy disc, it is necessary to use two mirror
systems with asT)heric surfaces such as those given by Wolter. (120).
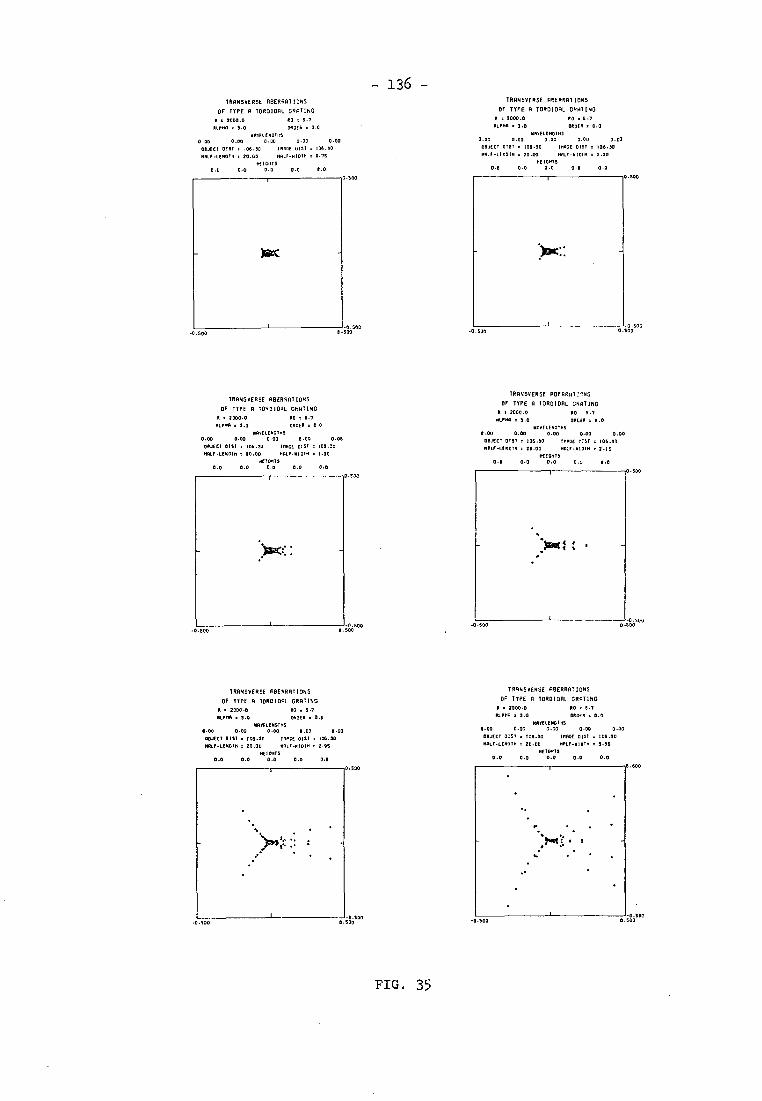
TRANSVERSE ABERRAT I DNS OF TYPE A TOROIDAL CRATING
R • 0000.0 RO E. 5.7
ALPHA • 3.0 OROS= • 0.0 00011.2R0465
0.00 0.00 0.00 0.00 0.00
00.10(1 OW • .06.30 10.2 LIST • 106.30
HALF-160010 2 20.00 HALT-610.0 . 0.05 KICEITS
- 136 - TRANSVERSE 05ERRA7 IONS
OF TYPE A TOROIDAL ORATING
R 0 2000.0 RO • 5.7
ALPHA • 3.0 OROIR E 0.0 003005601115
0.00 0.00 0.00 0.00 0.00 Ce0(01 01ST • 105.50 14000 GIST E 106.30 133.0-160010 . 70.00 13104-61010 E 1.20
00100,15
0.0 0.0 0.0 0.0 0.0 0.0 0.0 0.0 0.0 0.0
0 500 0.500
Yir(
-0.500 0 5s,.° -0.500
TRANSVERSE ABERRA7 IGNS TRANSVERSE ABERRAT IONS
OF TYPE A 106010AL GRATING OF TYPE A TOROIDAL GRAY INC R • 2000.0 00 6.7
R E 2000.0 00 E 5.7 Kn. 3.0 00100 ..: 0.0 ALP. = 3.0 ORDER E 0.0 110021050705
0001000105 0.00 0.00 0.00 0.00 0.00 0.00 0.00 0.00 0.00 0.00 110,3CT 0157 = 106.30 101100 0001 • 106.35 ORSECT 0156 E 106.30 IRAQ 0151 • 105.30 3011-160040 20.000005-111011 E 2.15 113sr-1.31111171 E 70.00 0010-01013 E 1.50 0610313
REMITS 0.0 0.0 0.0 0.0 0.0 0.0 0.0 0.0 0.0 0.0
0.400 0 500
)irg 1..
-0.500 0 sgO""' -0.500 0.4660°
TRANSVERSE ABEARAT TRANSVERSE ABERRATIONS
OF TYPE A TOROIDAL DRAT NG OF TYPE 0 TOROIDAL GRAY INC
R • 2000.0 00 • 5.7 R • 2000.0 00 • 5.7
ALPHA • 3.0 090211 • 0.0 NORA • 3.0 ORDER E 0.0
11116110110105 110611.ENCTOS
0.00 0.00 0.00 0.00 0.00 0.00 0.00 0.00 0.00 0.00
00.1a6 0151 • 000.30 TRITGE 01ST 106.30 011,T61 0161 • 105.30 13602 DISC E 105.30
1101=2,214013 E 20.00 00010-00010 2.35 HALP-1010714 E 20.00 111110-1110TH • 3.95
12100315 11210315
0.0 0.0 0.0 0.0 0.0 0.0 0-0 0.0 0.0 0.0
0 SOO 500
'TROT(:
0. -0.500 0, 5" -0.500
FIG. 35
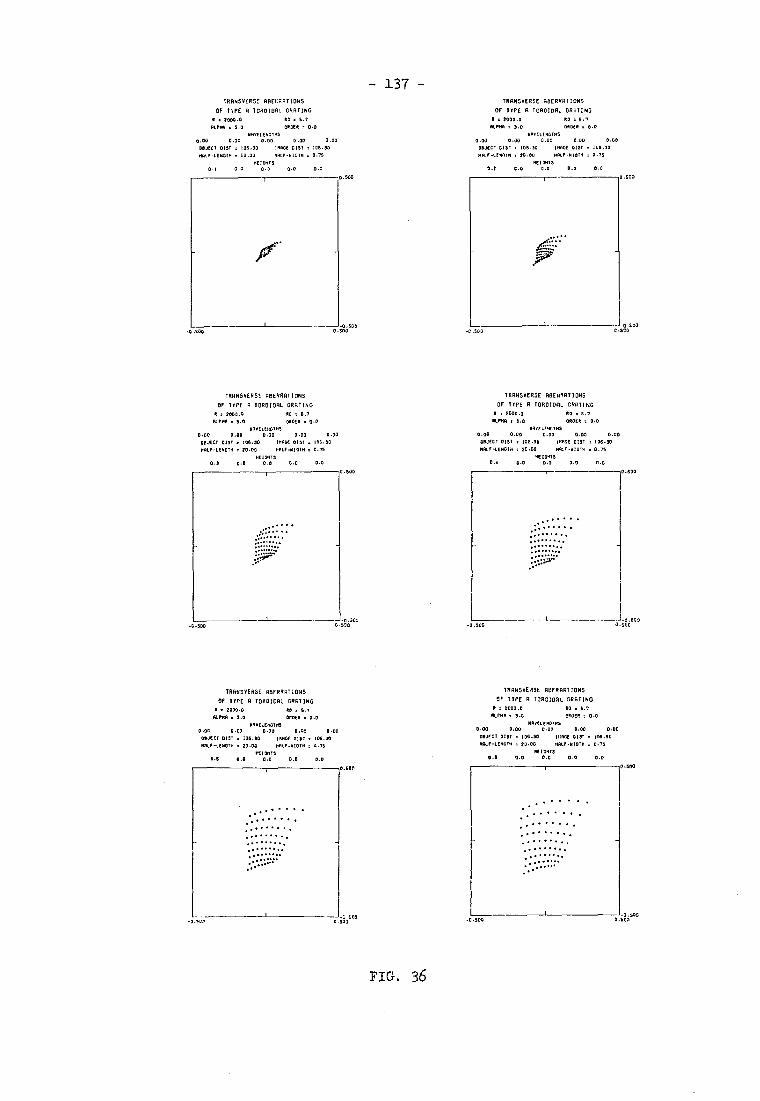
- 137 - TRANSVERSE ABERRATIONS TRANSVERSE ASERRAT IONS
OF T1PE A IDROIORL GRATING OF TYPE A TOROIDAL GRATING
A = 7000.0 An = 5.7 R s 2000.0 20 2 6.7 ALPHA • 3.0 02002 . 0.0
NovELENGTAS ALPHA z 3.0 06062 0.0
invEtENGTHS 0.00 0.00 0.00 0.00 0.00 0.00 0.00 0.00 0.00 0.00
WELT 015T . 106.30 MADE GIP = 105.30 011020! GIST . 105.30 MAGI DIST • 105.30
WALF-LEMON t 20.03 KALI-1115TH 0.05 MALI-LEMON 20.00 mALF-0101H . 0.75 HEIOHTS MEIOMIS
0.1 0.0 0.0 0.0 0.0 0.2 0.0 0.0 0.0 0.0
0 SC3 0.500
.....
p
dam .0.500 C -3.500
TRANSVERSE ABERRATIONS TRANSVERSE ABERRATIONS
OF TYPE R TOROIDAL GRATING OF TYPE A TOROIDAL GRATING
2000.0 MO t 6.7 = 2000.0 60 . 5.0
ALPHA = 3.0 MEN . 0.0 ALPHA s 3.0 ORM t 0.0 WAVELENGTHS WAVELN0553
0.00 0.00 0.00 0.00 0.00 0.00 0.00 0.00 0.00 0.00
COACT 01ST . 106.30 IHAGt 01St 135.30 00..:007 m5T = 105.30 10202 OIS• . 106.30 MALF-LENGTH 20.00 MALE-210TM . 0.05 TIALF-LEN014 a 20.00 WILE-01070 . 0.75
HEIGHTS H210475 0.3 0.0 0.0 G.0 0.0 0.6 0.0 0.0 0.0 0.0
0.500 $00
............. :.• . ........ ......... .........
-0.500 0.52.0500 -0.500 0 c2,"'
TRANSVERSE ASERPATIONS TRANSVERSE ABERRATIONS
OF TYPE A TOROIGAL GRATING
. 2000.0 20 • 5.7
OF TYPE A TOROIDAL GRATING ft . 2000.0 AO . 5.0
ALP. . 3.0 ORDER 0.0 ALMA . 3.0 011022 0.0
0.110000145 WAVELENGTHS 0.00 0.00 0.00 0.00 0.00 0.00 0.00 0.00 0.00 0.00
*PACT OIST = 100.30 InAGE 17250 105.30 OPJECT 0157 = 105.30 12:400 01ST . 100.30
MALF-LENOTH MOO HALF-210TH . 0.75 RALF-LAR0T0 . 20.00 MALE-WON m 0.75
2011315 MEMHTS 0.5 0.0 0.0 0.0 0.0 0.6 0.0 0.0 0.0 0.0
.500 0.500
..... ...... • • . ........ . • ........ • ....... ........ ........ ...... ......... .... ........ • ......... :"
.0.500 -0.500
FIG. 36
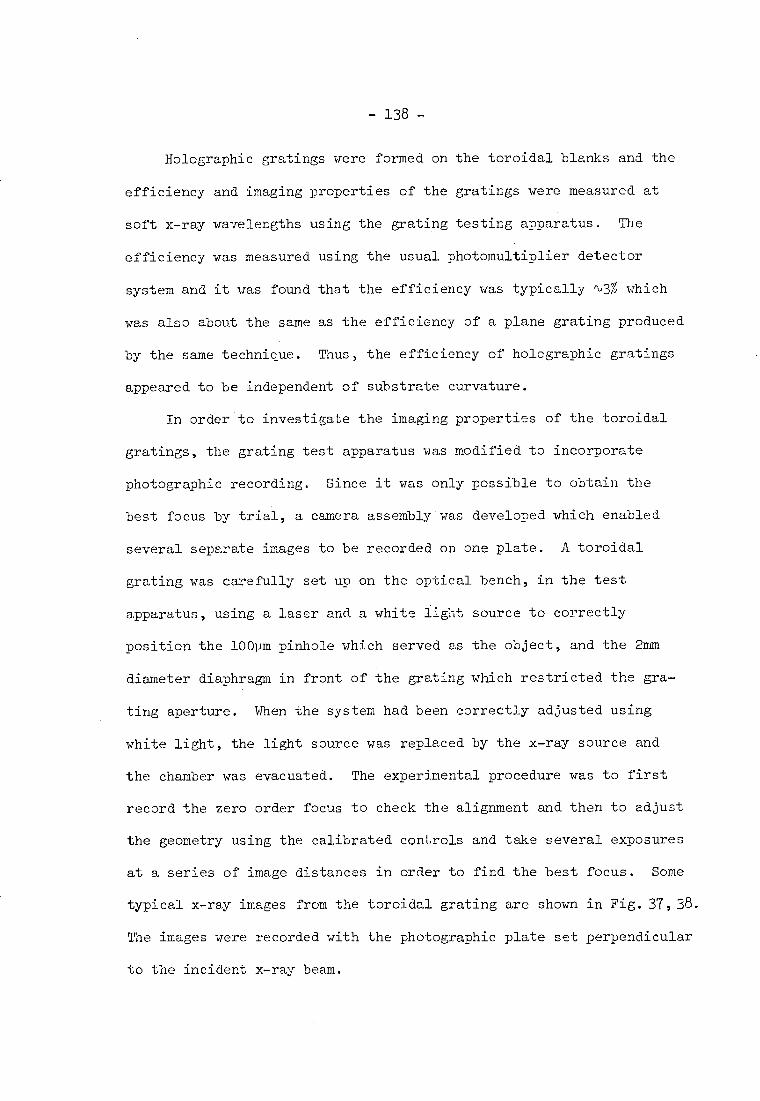
- 138 -
Holographic gratings were formed on the toroidal blanks and the
efficiency and imaging properties of the gratings were measured at
soft x-ray wavelengths using the grating testing apparatus. The
efficiency was measured using the usual photomultiplier detector
system and it was found that the efficiency was typically ',35 which
was also about the same as the efficiency of a plane grating produced
by the same technique. Thus, the efficiency of holographic gratings
appeared to be independent of substrate curvature.
In order to investigate the imaging properties of the toroidal
gratings, the grating test apparatus was modified to incorporate
photographic recording. Since it was only possible to obtain the
best focus by trial, a camera assembly was developed which enabled
several separate images to be recorded on one plate. A toroidal
grating was carefully set up on the optical bench, in the test
apparatus, using a laser and a white light source to correctly
position the 100pm pinhole which served as the object, and the 2mm
diameter diaphragm in front of the grating which restricted the gra-
ting aperture. When the system had been correctly adjusted using
white light, the light source was replaced by the x-ray source and
the chamber was evacuated. The experimental procedure was to first
record the zero order focus to check the alignment and then to adjust
the geometry using the calibrated controls and take several exposures
at a series of image distances in order to find the best focus. Some
typical x-ray images from the toroidal grating are shown in Fig. 37,38.
The images were recorded with the photographic plate set perpendicular
to the incident x-ray beam.
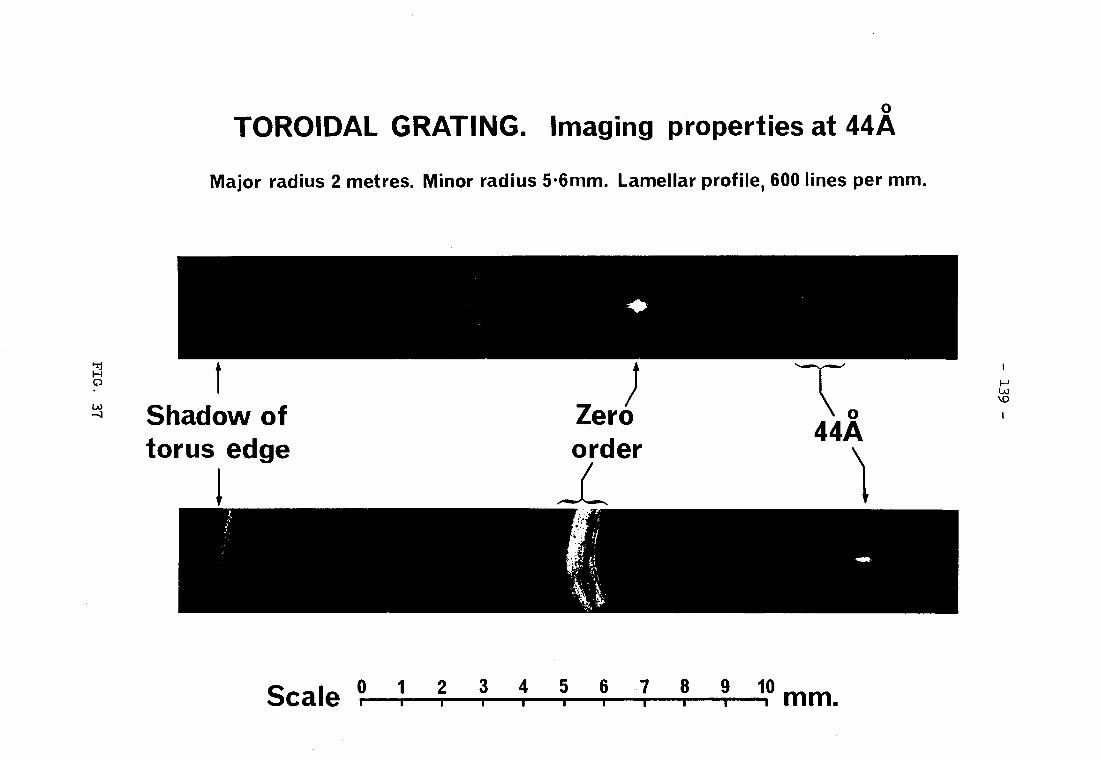
Zero order
H
Shadow of torus edge
To ■0 44A
O TOROIDAL GRATING. Imaging properties at 44A
Major radius 2 metres. Minor radius 5.6mm. Lamellar profile, 600 lines per mm.
Scale °
2 3 4 5 6 8 9 10 MM.
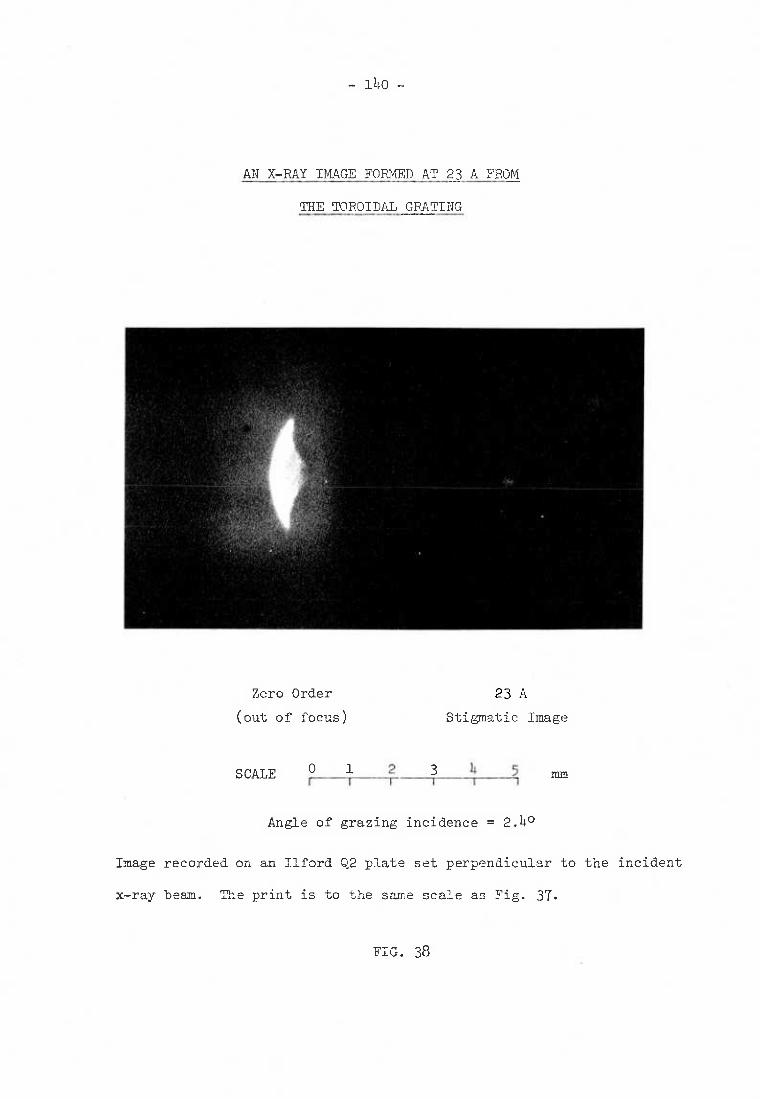
- 140 -
AN X-RAY IMAGE FORMED AT 23 A FROM
THE TOROIDAL GRATING
Zero Order
23 A
(out of focus)
Stigmatic Image
SCALE 0 1 2 3 4 5 I I I I I I
ram
Angle of grazing incidence = 2.40
Image recorded on an Ilford Q2 plate set perpendicular to the incident
x-ray beam. The print is to the same scale as Fig. 37.
FIG. 38
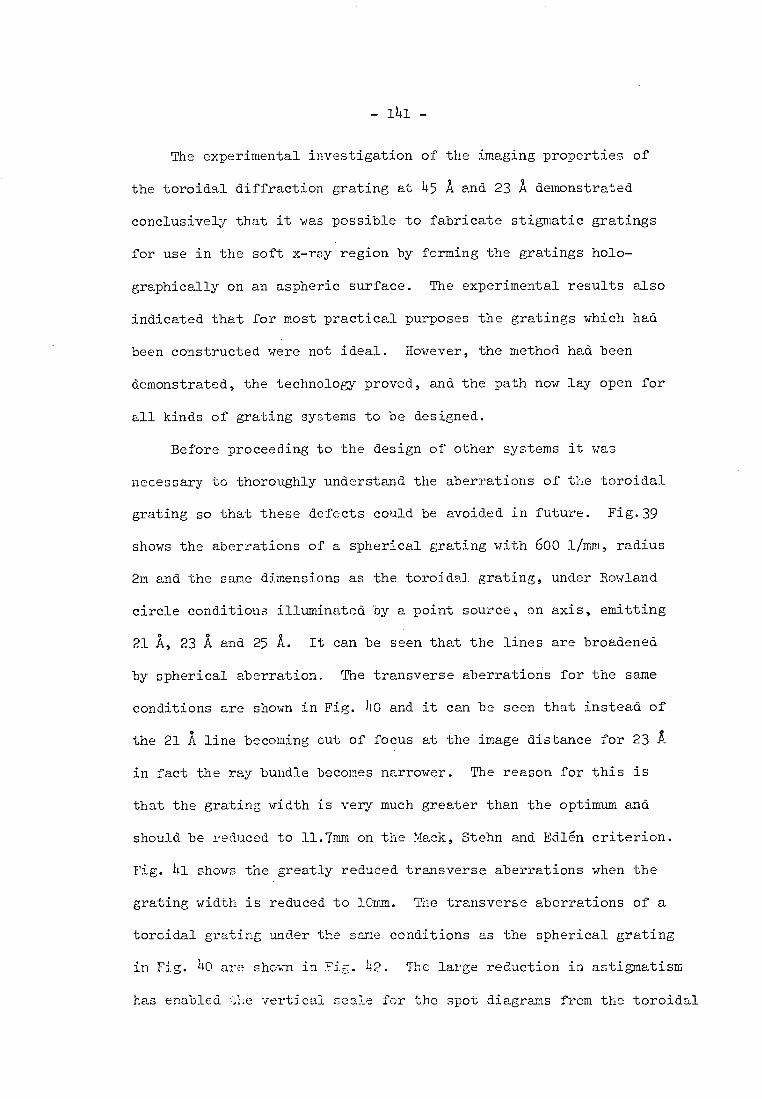
The experimental investigation of the imaging properties of
the toroidal diffraction grating at 45 A and 23 A demonstrated
conclusively that it was possible to fabricate stigmatic gratings
for use in the soft x-ray region by forming the gratings holo-
graphically on an aspheric surface. The experimental results also
indicated that for most practical purposes the gratings which had
been constructed were not ideal. However, the method had been
demonstrated, the technology proved, and the path now lay open for
all kinds of grating systems to be designed.
Before proceeding to the design of other systems it was
necessary to thoroughly understand the aberrations of the toroidal
grating so that these defects could be avoided in future. Fig.39
shows the aberrations of a spherical grating with 600 1/mm, radius
2m and the same dimensions as the toroidal grating, under Rowland
circle conditions illuminated by a point source, on axis, emitting
21 A, 23 A and 25 A. It can be seen that the lines are broadened
by spherical aberration. The transverse aberrations for the same
conditions are shown in Fig. 40 and it can be seen that instead of
the 21 A line becoming out of focus at the image distance for 23 A
in fact the ray bundle becomes narrower. The reason for this is
that the grating width is very much greater than the optimum and
should be reduced to 11.7mm on the Mack, Stehn and Edren criterion.
Fig. 41 shows the greatly reduced transverse aberrations when the
grating width is reduced to 10mm. The transverse aberrations of a
toroidal grating under the same conditions as the spherical grating
in Fig. 40 are shown in Fi;, 42. The large reduction in astigmatism
has enabled the vertical scale for the spot diagrams from the toroidal
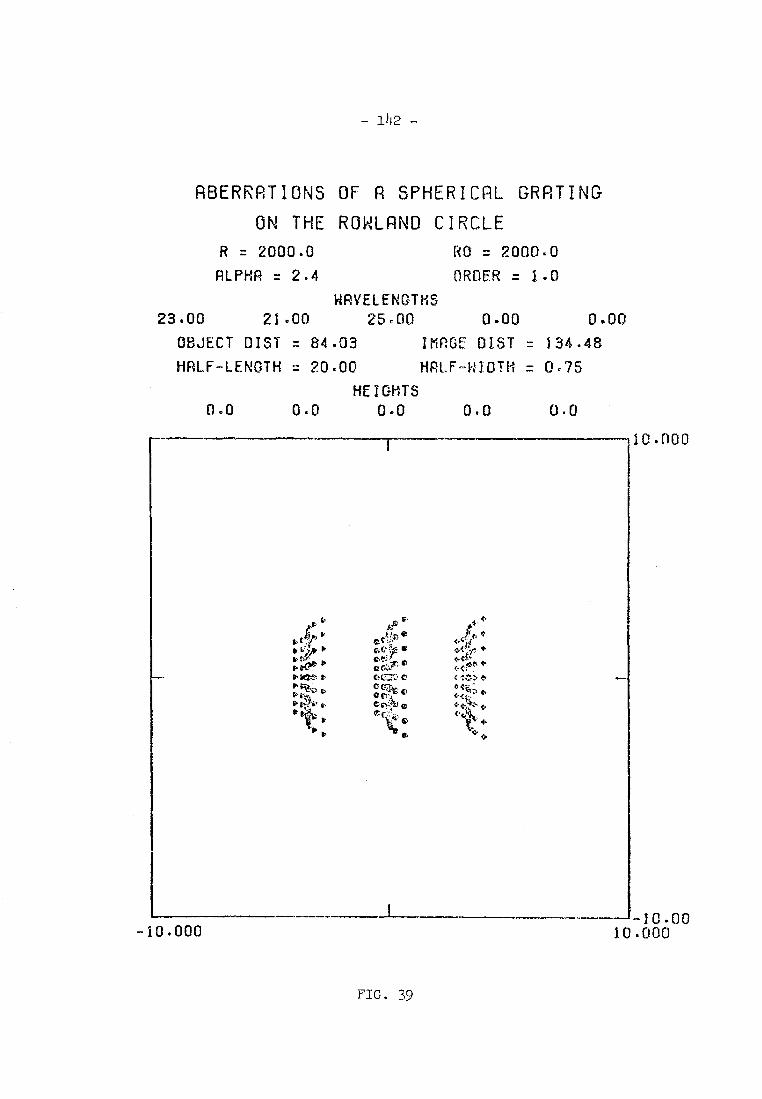
-10.000
- 1i2 -
ABERRATIONS OF R SPHERICAL GRATING
ON THE ROWLAND CIRCLE
R = 2000.0 RD = 2000.0
ALPHA = 2.4 ORDER = 1.0
WAVELENGTHS 23.00 21.00
25.00
0.00 0.00
OBJECT DIST = 84.03 IMAGE DIST = 134.48
HALF-LENGTH = 20.00 HALF-WIDTH = 0.75
HEIGHTS 0.0 0.0 0.0 0.0 0.0
FIG. 39
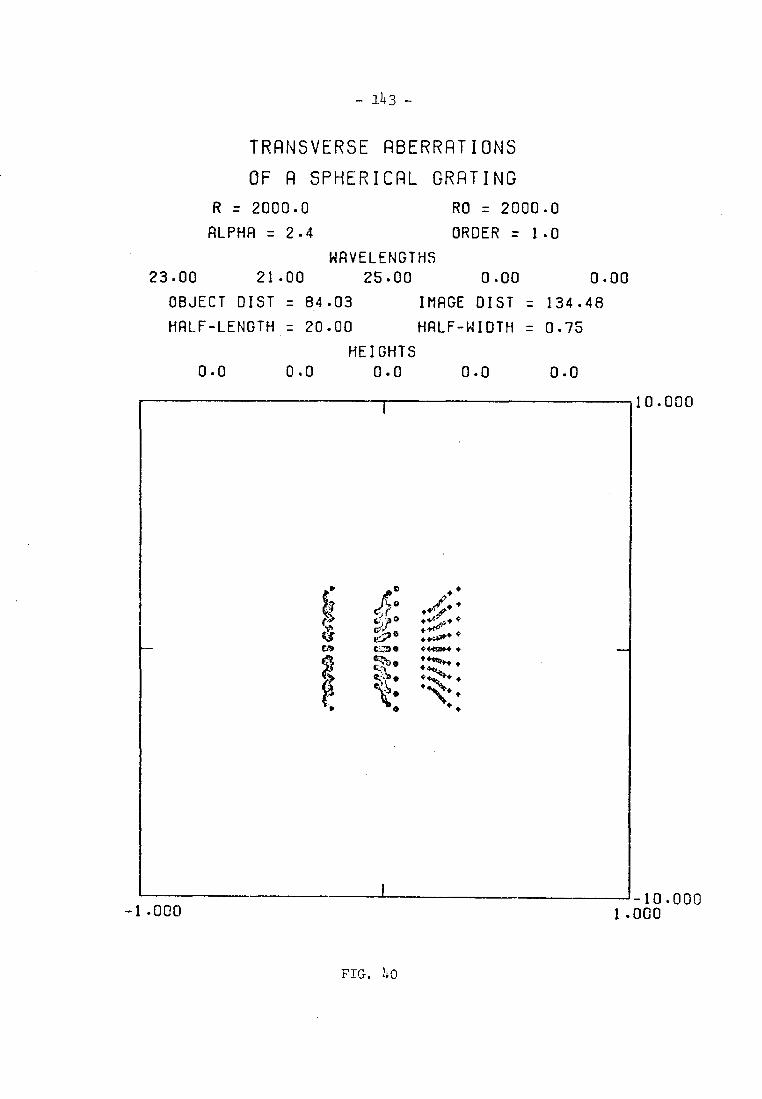
-11+3-
TRANSVERSE ABERRATIONS
OF A SPHERICAL GRATING
R = 2000.0 RO = 2000.0
ALPHA = 2.4 ORDER = 1.0
WAVELENGTHS 23.00 21.00 25.00 0.00 0.00
OBJECT DIST = 84.03 IMAGE DIST = 134.48
HALF-LENGTH = 20.00 HALF-WIDTH = 0.75
HEIGHTS 0.0 0.0 0.0 0.0 0.0
--T 10.000
-10.000 1 000 -1.000
FIG. ho
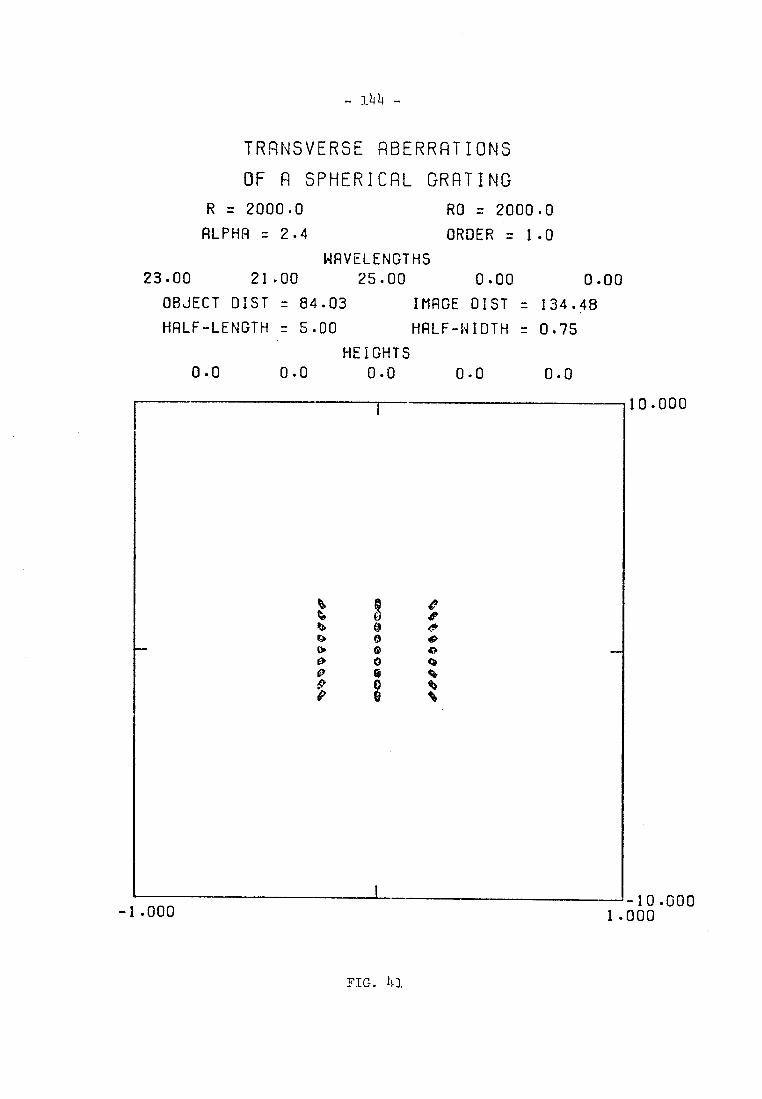
- 3_44 -
TRANSVERSE ABERRATIONS
OF A SPHERICAL GRATING
R = 2000.0
ALPHA = 2.4
RO = 2000.0
ORDER = 1.0
WAVELENGTHS 23.00 21.00 25.00 0.00 0.00
OBJECT DIST = 84.03 IMAGE DIST = 134.48
HALF-LENGTH = 5.00 HALF-WIDTH = 0.75
HEIGHTS 0.0 0.0 0.0 0.0 0.0
10.000
b 0 0
Vp. 0 0 0
00
00
0V
iia
ts
10.000 1.000 -1.000
FIG. 41
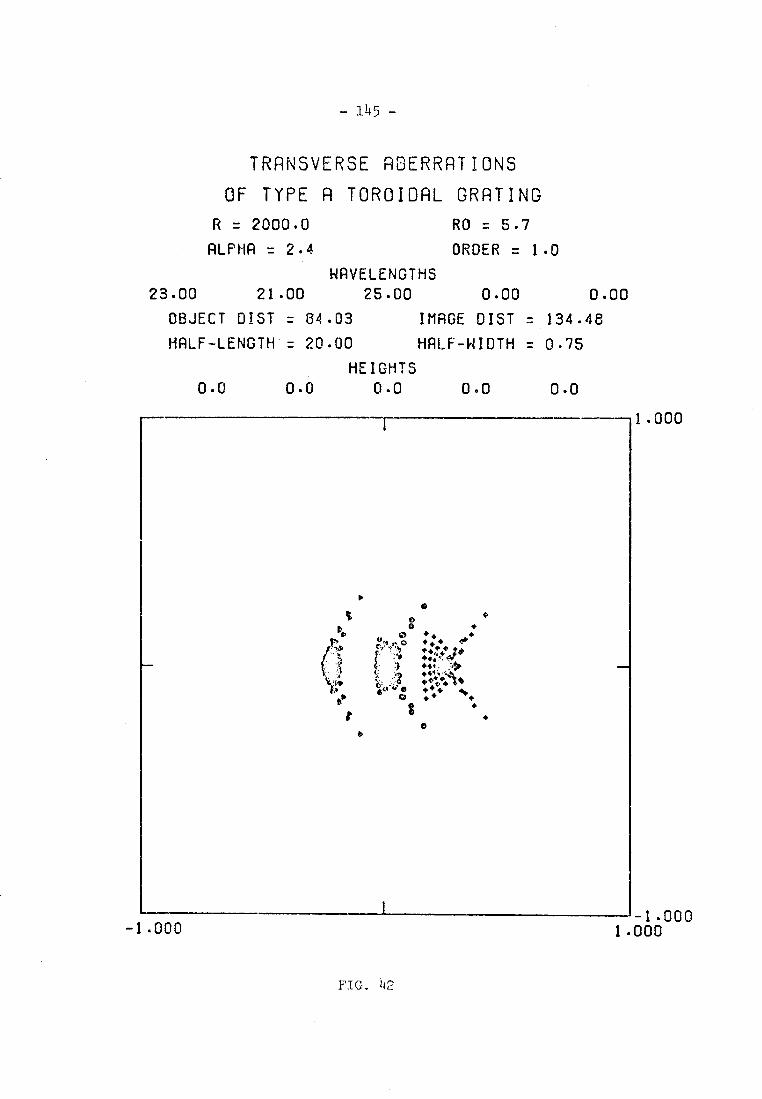
- 145 -
TRANSVERSE ABERRATIONS
OF TYPE A TOROIDAL GRATING
R = 2000.0 RO = 5.7
ALPHA = 2.4 ORDER = 1.0
WAVELENGTHS 23.00 21.00
25.00
0.00 0.00
OBJECT DIST = 64.03 IMAGE DIST r 134.48
HALF-LENGTH = 20.00 HALF-WIDTH 7. 0.75
HEIGHTS 0.0 0.0 0.0
0.0 0.0 1.000
C
Do
•
1.000 1.000 -1.000
FIG.
-1)46-
grating to be increased by a factor of 10 so that both horizontal
and vertical sides are equal. However, the images have become
broadened and "wings" have appeared. If the width of the toroid
is reduced to the optimum width for the spherical grating as in
Fig. 43, it can be seen that the 'wings" disappear and the images
become much more symmetrical in shape. However, it should be
noted that images from the toroidal grating are considerably broa-
der than those froth a corresponding spherical grating and that the
geometrical centre of the images from the toroid have been shifted
towards longer wavelengths by the coma-type aberration. Finally,
at these wavelengths, in Fig. 1414 are shown images produced by three
point sources; one on axis and one 0.2mm above and one 0.2mm below
the meridian plane (corresponding to a field angle of 16 arc minutes).
The off-axis points are afflicted with coma, however, it can be seen
that both spatial and spectral resolution can be achieved simulta-
neously by this system at x-ray wavelengths provided the field angle
and grating aperture are restricted.
The ray tracing analysis of the imaging from the toroidal
grating has also been performed at wavelengths of 40 A, 44.5 A and
49 A. The structure of the image is clearly shown in Fig. 45 in
which the whole width of the grating is illuminated and the improve-
ment obtained by reducing the grating width is shown in Fig. 46.
Similarly, the off-axis images for the full grating width and opti-
mum width are shown in Fig. 47 and Fig. 49. Finally the spot dia-
gram showing the aberration at three wavelengths - 140 A, 44.5 A
and 49 A - and for three object points - on axis, 0.2mm above and
0.2mm below the meridian Plane - is given in Fig. 49. This result.
again demonstrates that for a restricted wa-,Telength range and a
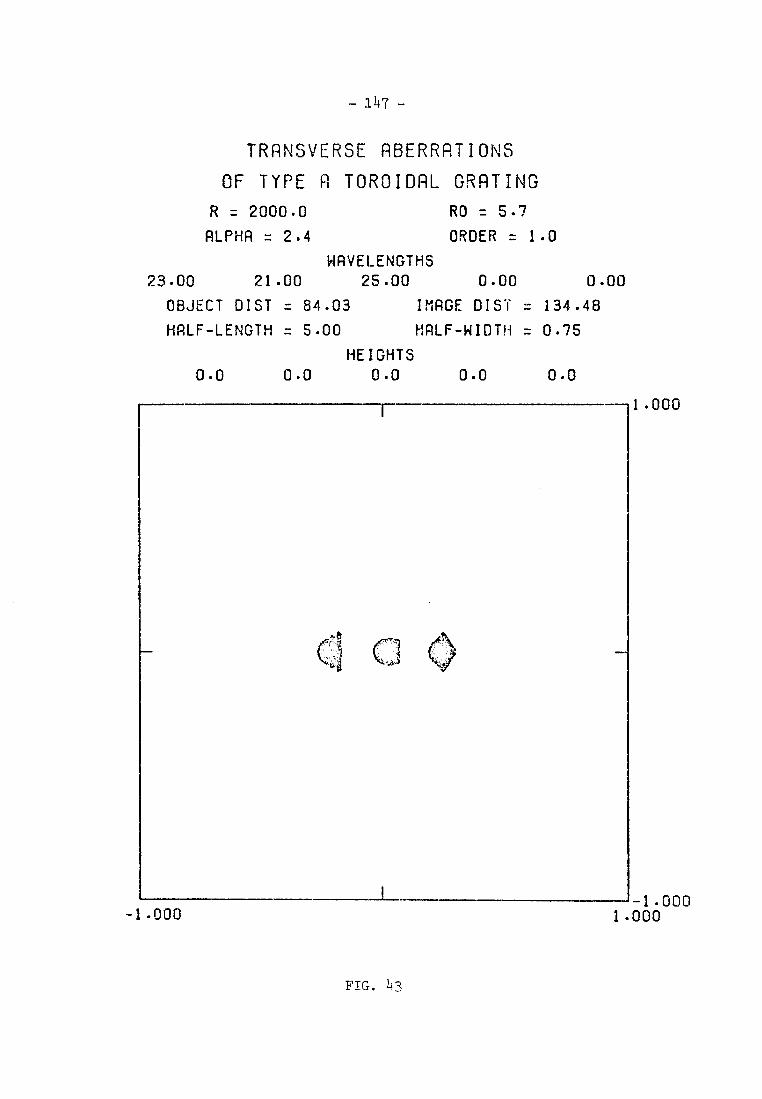
- 147 -
TRANSVERSE ABERRATIONS
OF TYPE A TOROIDAL GRATING
R :7 2000.0 RO = 5.7
ALPHA = 2.4 ORDER = 1.0
WAVELENGTHS 23.00 21.00 25.00 0.00 0.00
OBJECT DIST = 84.03 IMAGE DIST = 134.48
HALF-LENGTH r. 5.00 HALF-WIDTH 0.75
HEIGHTS
0.0 0.0 0.0 0.0 0.0
F- 1.000
-1.000
FIG.
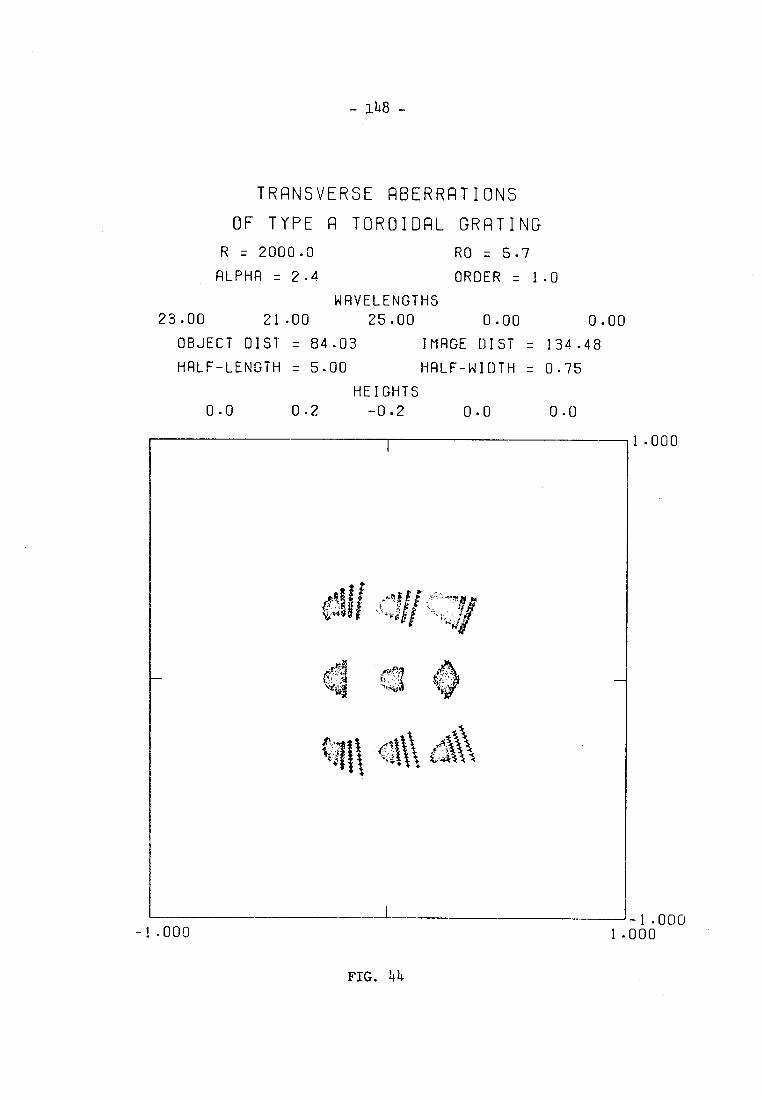
- 148 -
TRANSVERSE ABERRATIONS
OF TYPE R TOROIDAL GRATING
R = 2000.0 RO = 5.7
ALPHA = 2.4 ORDER = 1.0
WAVELENGTHS
23.00 21.00 25.00 0.00 0.00
OBJECT DIST = 84.03 IMAGE DIST = 134.48
HALF-LENGTH = 5.00 HALF-WIDTH = 0.75
HEIGHTS
0.0 0.2 -0.2 0.0 0.0
1.000
y
-1.000 1.000 -1.000
FIG. 144
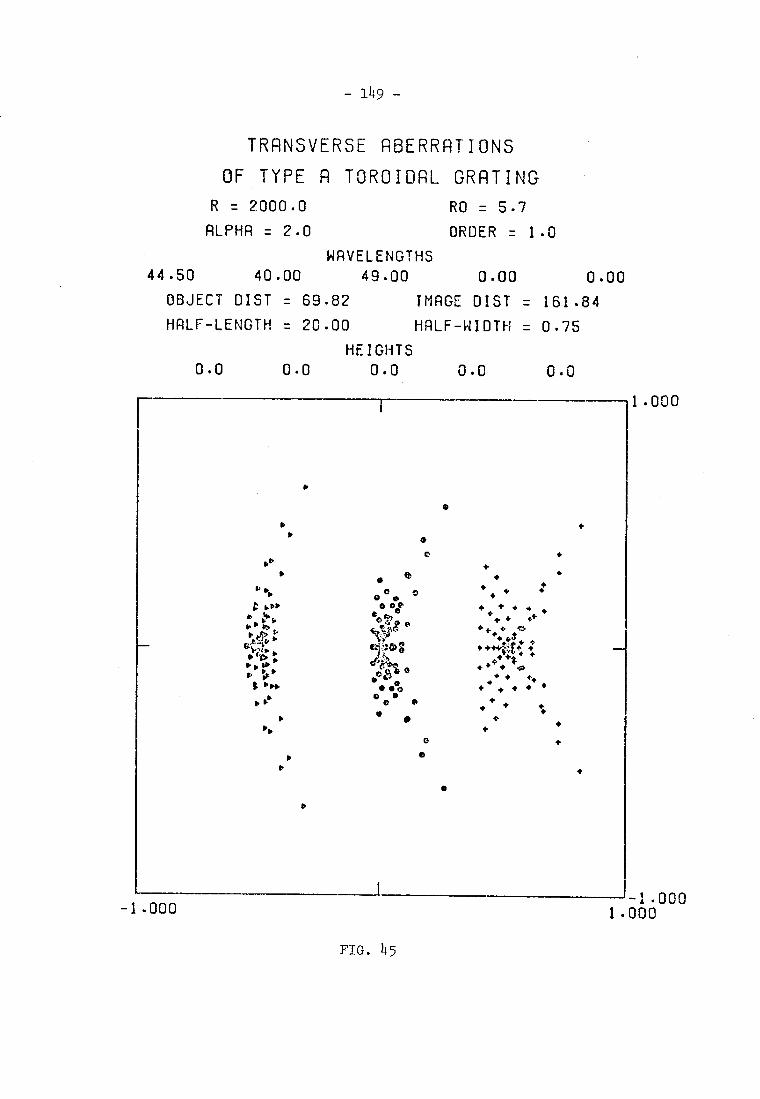
• •
o • •
0
0 •
Pr. • • • • • c•
IP ap 0 a • • 4, + 4 0 a
V 0.• 0 0 0 • * • • •
* :'5. 60 V 0 • 4. • o+
P
P P Pcp e..4) ♦a .4.• 4"`
sotEZ: V ,,,
4 i1g erpC) 4 • • • t • 4: •
•0 1/* Pltet CIO . f + • :44: .
P ire 60 0 • 44
PP 0 • 0 0 +•
•
4. + • * • 0 •
B> 1' 0 0 • + * # a • • • • • • • •
• • • •
•
•
— 149 -
TRANSVERSE ABERRATIONS
OF TYPE A TOROIDAL GRATING
R = 2000.0 RO .7. 5.7
ALPHA = 2.0 ORDER :.-.. 1.0
WAVELENGTHS 44.50 40.00
49.00
0.00 0.00
OBJECT DIST 69.82 IMAGE DIST = 161.84
HALF-LENGTH = 20.00 HALF-WIDTH = 0.75
HEIGHTS 0.0 0.0 0.0 0.0 0.0
1.000
1.000 1.000 -1.000
FIG. h5
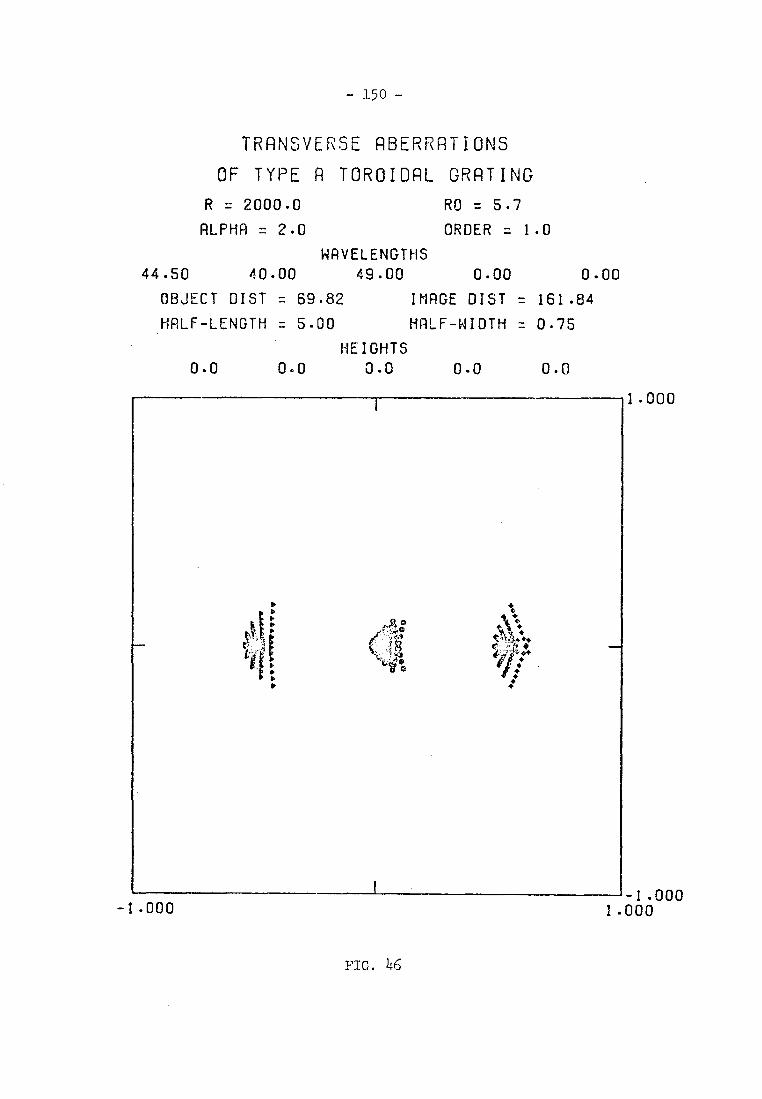
- 150 -
TRANSVERSE ABERRATIONS
OF TYPE R TOROIDAL GRATING
R = 2000.0 RO re 5.7
ALPHA = 2.0 ORDER = 1.0
WAVELENGTHS 44.50 40.00
49.00
0.00 0.00
OBJECT DIST = 69.82 IMAGE DIST = 161.84
HALF—LENGTH = 5.00 HALF—WIDTH = 0.75
HEIGHTS 0.0 0.0 0.0
0.0 0 .0 1.000
1.000 1.000 —1.000
FIG. 146
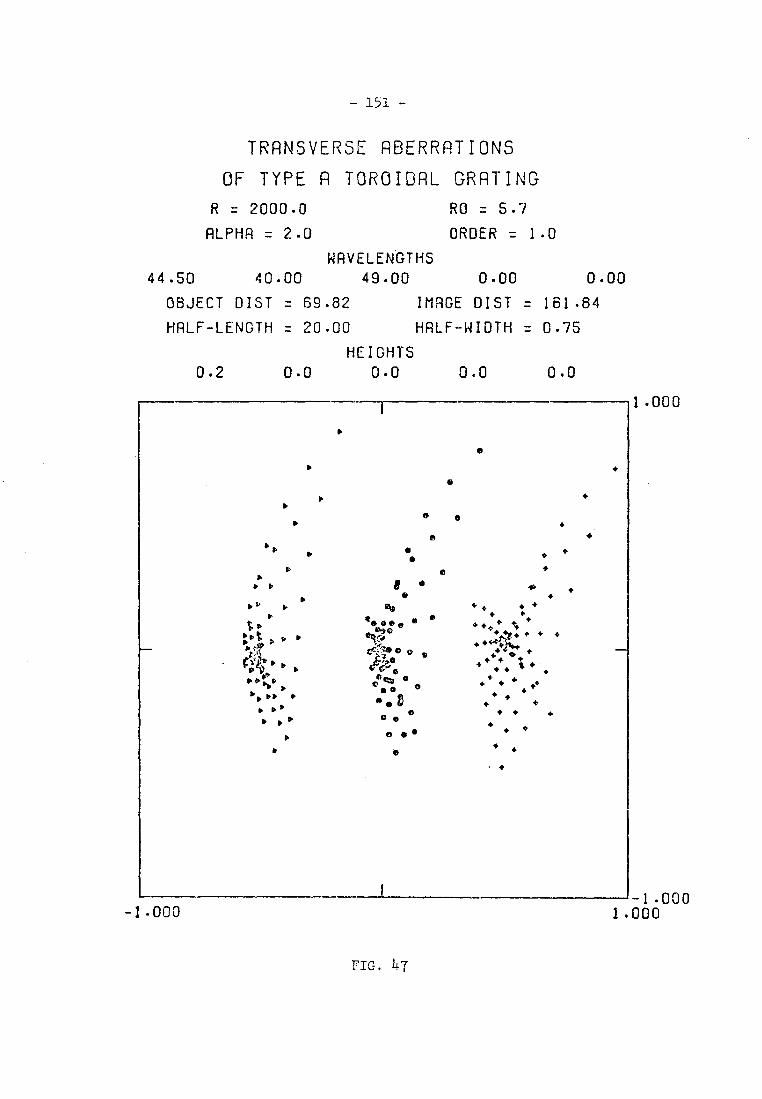
- 151 -
TRANSVERSE ABERRATIONS
OF TYPE A TOROIDAL GRATING
R = 2000.0 RO = 5.7
ALPHA = 2.0 ORDER = 1.0
WAVELENGTHS
44.50 40.00 49.00
0.00 0.00
OBJECT DIST = 69.82 IMAGE GIST = 161.84
HALF-LENGTH = 20.00 HALF-WIDTH = 0.75
HEIGHTS
0.2 0.0 0.0 0.0 0.0
1.000
• •
• • •
•
a • • a •
•
•
• a • + • e a
• 11. b 8 *
a • • D • ety
p e e a ts* •oee
: Doe
11, • a a ft,
4.);....
6
No• :4 (ta • • 0 • * 0 • • 0 • 0 • . :
• • • 0 0 • • • *
O 0 • •
• e
• 4 0 +0
•+ •00 4,41+ ,014+4
• •• •
•
4. .0 . •
• • • + • 0
• •
• •
1.000 1 000 -1.000
FIG. 47
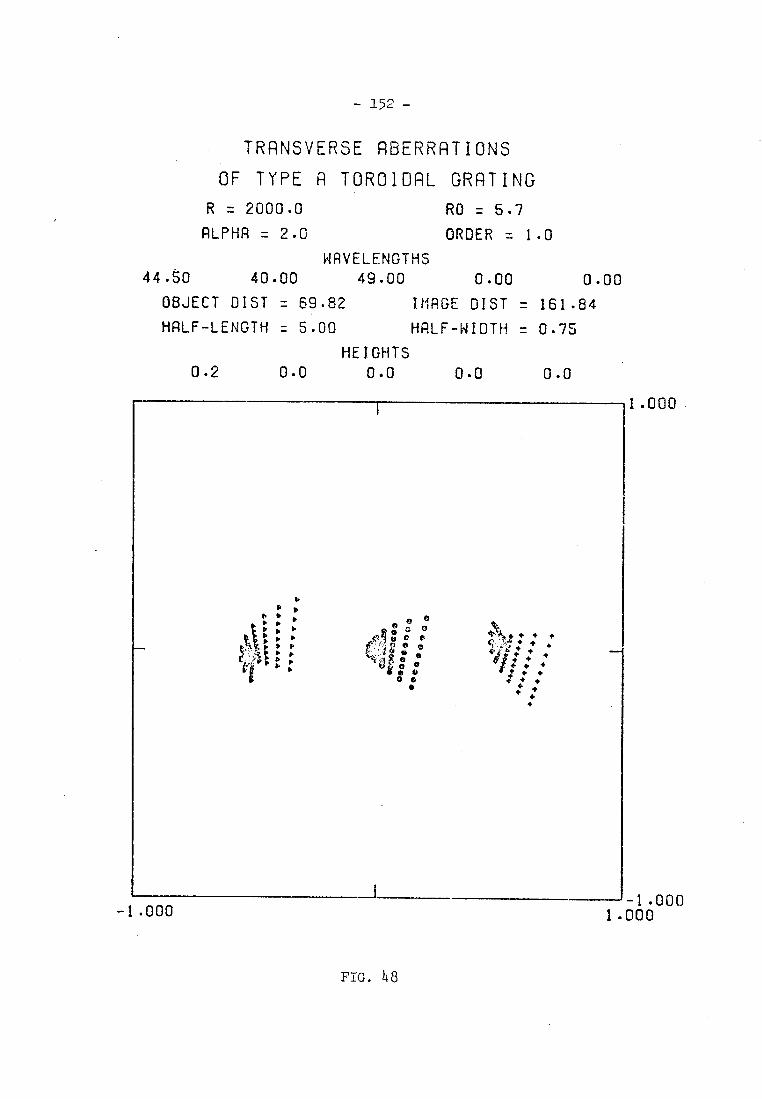
- 152 -
TRANSVERSE ABERRATIONS
OF TYPE A TOROIDAL GRATING
R = 2000.0 RO = 5.7
RLPHR = 2.0 ORDER = 1.0
WAVELENGTHS 44.50 40.00
49.00
0.00 0.00
OBJECT DIST = 69.82 IHRGE DIST = 161.84
HRLF-LENGTH = 5.00 HALF-WIDTH = 0.75
HEIGHTS 0.2 0.0 0.0 0.0 0.0
1.000
1.000 1 000 -1.000
FIG. 48
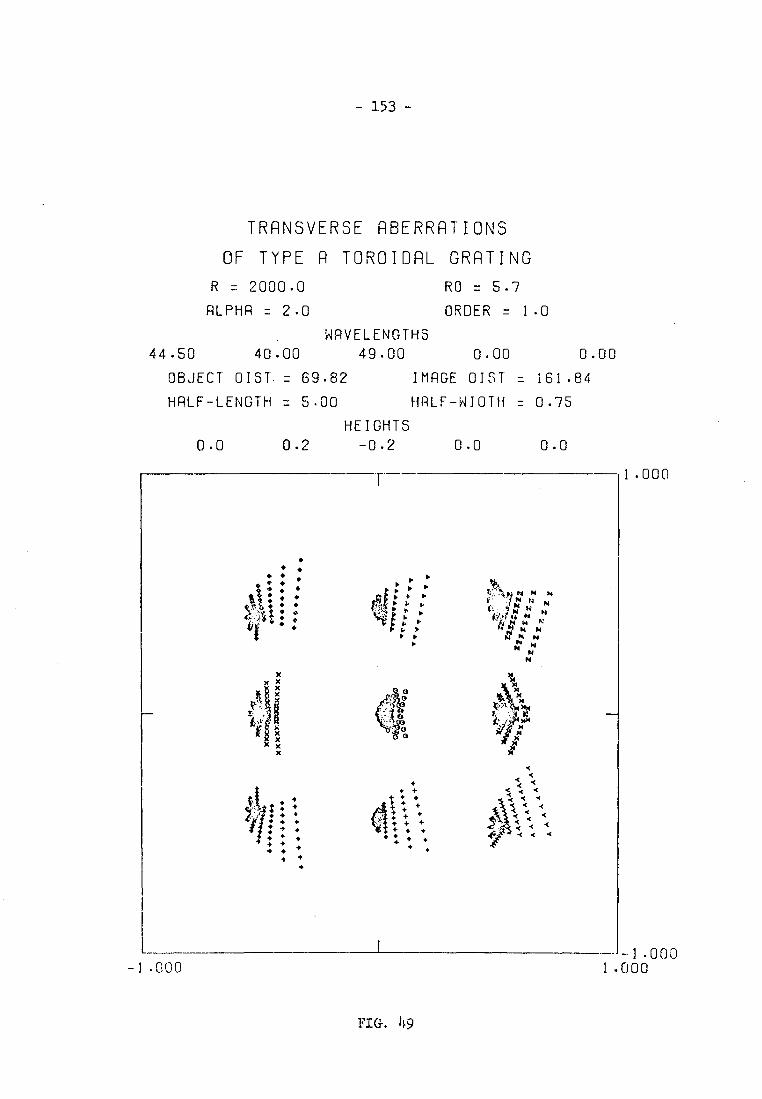
- 153 -
TRANSVERSE ABERRATIONS
OF TYPE A TOROIDAL GRATING
R = 2000.0
RO = 5.7
ALPHA = 2.0
ORDER = 1.0
44.50 WAVELENGTHS
40.00 49.00 0.00 0.00
OBJECT DIST. = 69.82 IMAGE DIST = 161.84
HALF-LENGTH = 5.00 HALF-WIDTH = 0.75
HEIGHTS
0.0 0.2 -0.2 0.0 0.0
1.000
• •
• • • 0 •
4 0.0 o 40 4. •
Ell • • •
e ►
r
r ►
1I: 4
4 * • 4 4 40
4 4 4
< < 4 4
.4 4 < -(
1 -1.000 1.000 -1.000
FIG. 10
-154-
restricted field angle it is possible to use a toroidal grating to
provide both spatial and spectral resolution.
Although the aberrations of the fabricated toroidal grating
are considerable, it is conceivable that they could be used for
certain experiments to provide some simultaneous spatial and spec-
tral information. The robust construction of grazing incidence
systems compared to the delicate structure of zone-plates and trans-
mission gratings means that it may be essential to use a grazing
incidence system for some applications on mechanical grounds. It is
possible to achieve a higher diffraction efficiency from grazing
incidence gratings than from transmission zone-plates and transmission
gratings in the soft x-ray region. The dispersion of grazing inci-
dence systems can also be much higher than normal incidence systems.
Therefore, it may be only possible to obtain the maximum useful data
in some ex.per.•iments by employing a correctly designed grazing inci-
dence system.
In order to design a system which covers an adequate field, it
will most probably be necessary to use a system with two or more
elements. However, a second form of toric surface, which has been
designated "Type B" to distinguish it from our first type of toroidal
x-ray grating (now called "Type A") Possesses superior zero-order
imaging properties to the type of toroidal grating fabricated. As
shown in Fig. 50 the "Type A" tonic surface is formed. by rotating a
circle of radius p to describe an arc of radius R whereas the "Type B"
torus is formed by rotating an arc of radius R about an axis through
the ends of the arc. Thus, the type A torus has the shape of an
internal section of a bicycle tyre and the type B toroid has the shape

- 155 -.
The "Type A" Toroid
This surface is generated by revolving a circle of radius p about a
straight line, lying in the plane of the circle, at a distance R-p
from its centre.
The "Type B" Toroid
This surface is generated by revolving a curve, f(y), in the y-z plane
about an axis parallel to the y-axis. The profiles of the surface in
planes parallel to the x-z plane are circles of radius p-f(y). X
FIG. 50
-156-
of the inside of a tapering cigar or barrel.
The difference in the zero-order imaging of the two forms of
toroid can be seen by comparing Fig. 51 and Fig. 52 which show spot
diagrams produced with identical parameters. The additional curva-
ture of the type B toroid has brought the extreme rays nearer the
correct focus; however, since the grating width is much greater
than the optimum, the image is broadened by spherical aberration.
Unlike the type A toroid the aberrations of the type B toroid
are only slightly altered by increasing the grating aperture as can
be seen from Fig. 53 which corresponds to Fig. 35 for the type A
toroid. However, the off-axis imaging of the type B toroid is no
better than the type A toroid, and by comparing Fig. 36 and Fig. 54
which show a series of spot diagrams for off-axis object points from
0.1 - 0.6mm for the type A and type B toroids respectively, it can
be seen that there are only slight differences between them.
Since the zero-order imaging properties from the type B toroid
were superior to those of the type A toroid, the next stage in the
design was to calculate the images produced by a classical grating
(i.e. one whose rulings are straight and equispaced in the tangent
plane at the pole of the grating) formed on the type B substrate.
Such a grating could be easily produced by utilising •the interference
field produced by two plane waves as used in the fabrication of the
type A toroidal gratings. The transverse aberrations of a type B
toroidal grating at wavelengths of 21 A, 23 A and 25 A are shown in
Fig. 55 which corresponds to Fig. 42 for the type A toroid. The
aberrations of the type B toroidal grating are oractically identical
to those of the type A toroidal grating. Fig. 56 shows the composite
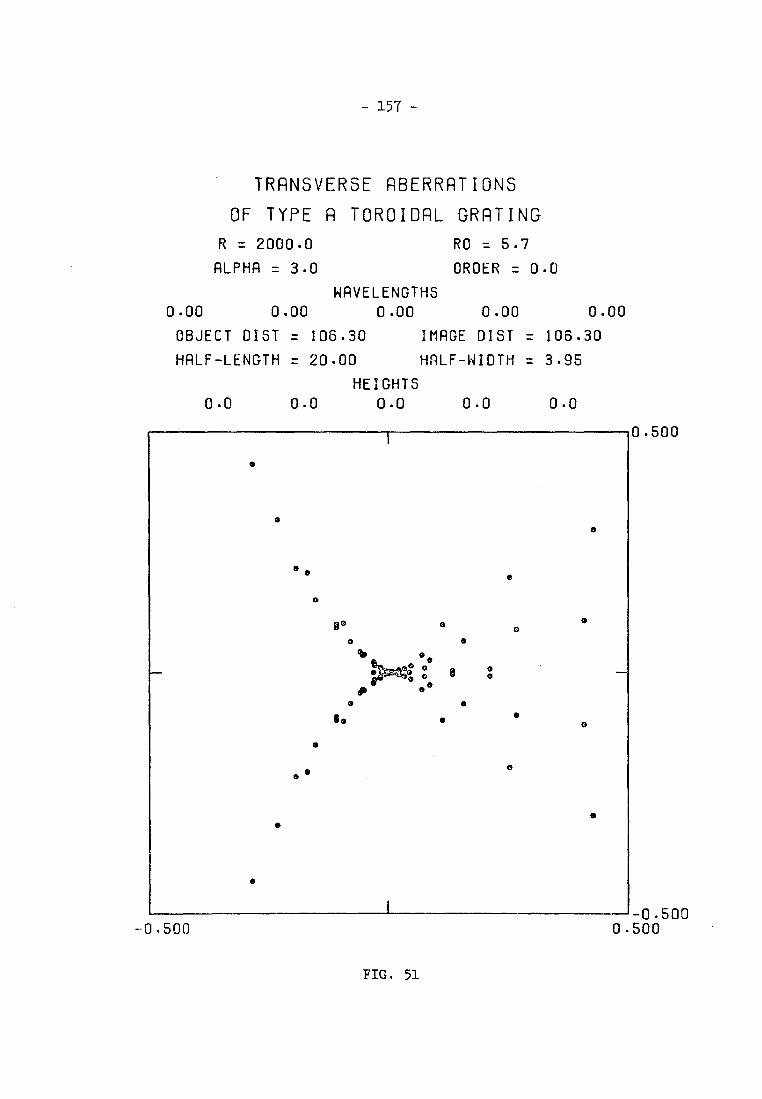
- 157 -
TRANSVERSE ABERRATIONS
OF TYPE A TOROIDAL GRATING
R = 2000.0 RO = 5.7
ALPHA = 3.0 ORDER = 0.0
WAVELENGTHS 0.00 0.00 0.00 0.00 0.00
OBJECT DIST = 106.30 IMAGE GIST = 106.30
HALF-LENGTH = 20.00 HALF-WIDTH = 3.95
HEIGHTS
0.0 0.0 0.0 0.0 0.0
0.500
•
0 0
0
O
O
®O O
0 00
•>z< 8 o
so •
0
•
0 0
e
O
0
O
0
0.500 0 500 -0.500
FIG. 51
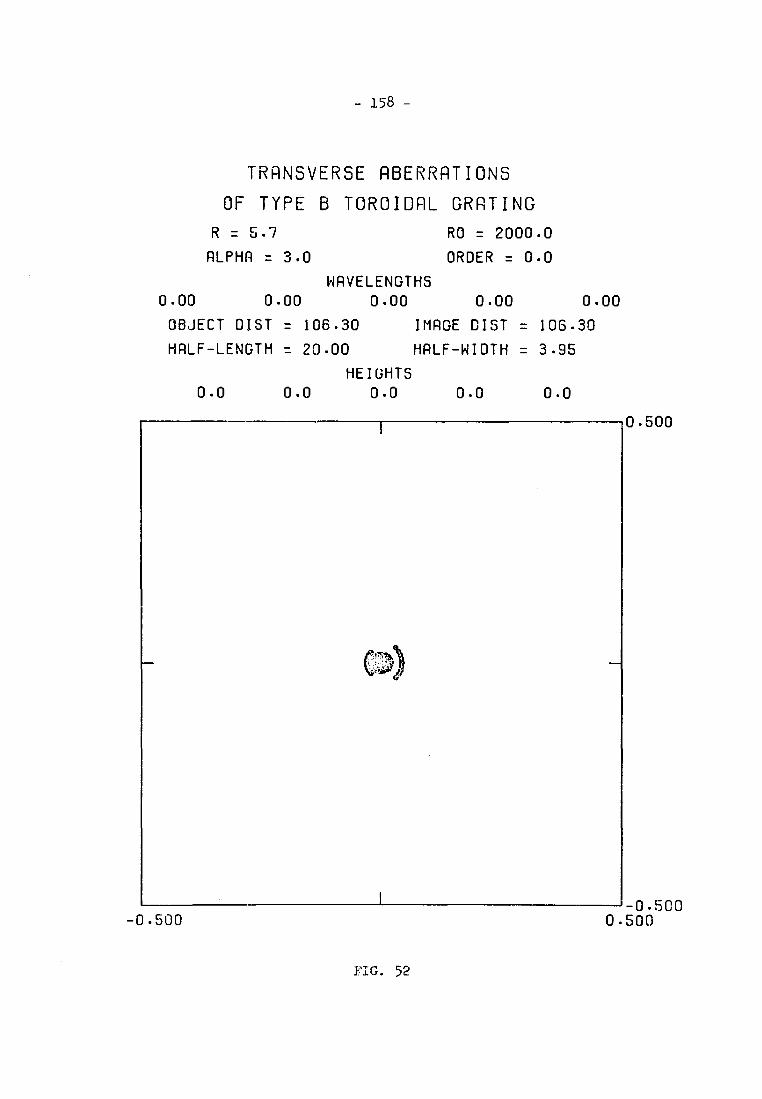
- 158 -
TRANSVERSE ABERRATIONS
OF TYPE B TOROIDAL GRATING
R = 5.7 RO = 2000.0
ALPHA = 3.0 ORDER = 0.0
WAVELENGTHS 0.00 0.00 0.00 0.00 0.00
OBJECT DIST = 106.30 IMAGE DIST = 106.30
HALF-LENGTH = 20.00 HALF-WIDTH = 3.95
HEIGHTS 0.0 0.0 0.0 0.0 0.0
0.500
0.500 0 500 -0.500
FIG. 52
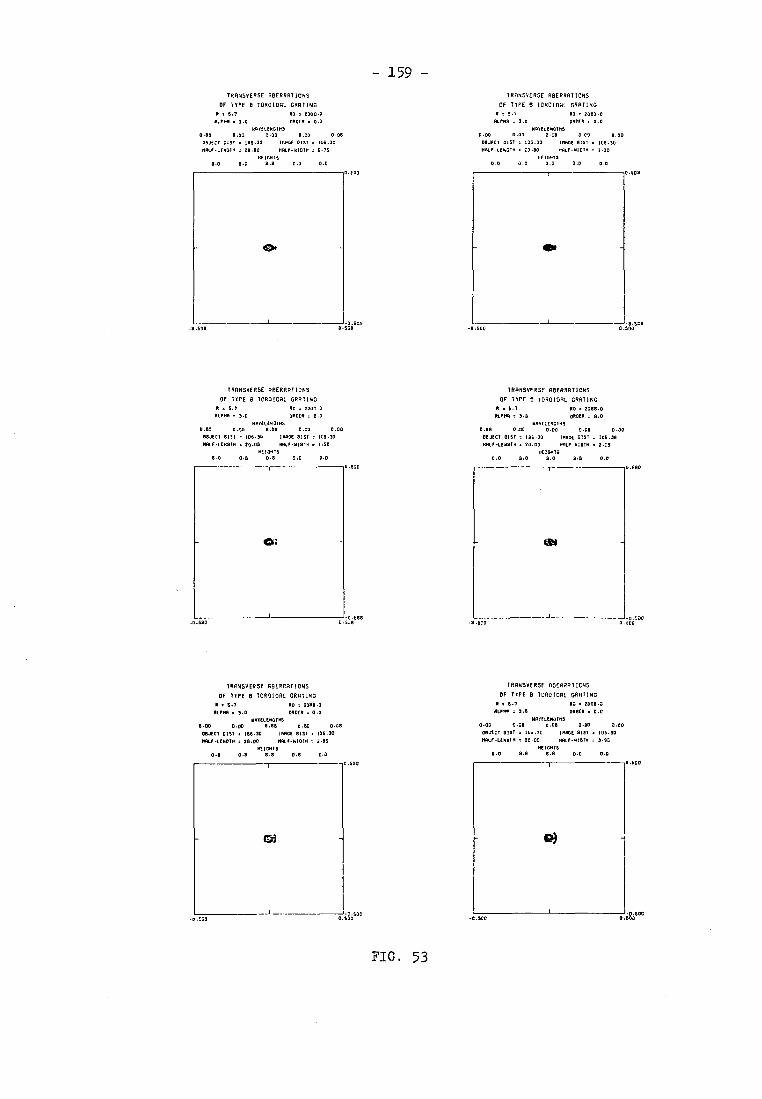
- 159 - TRANSVERSE ABERRATIONS
TRANSVERSE ABERRATIONS
OF TYPE B TOROIDAL GRATING
OF TYPE B TOROIDAL GRATING N . 6.7 NO . 2000.0
Rs 5.7 NO r 2000.0
1410701 z
0.00 0.00
3.0 00001 z 0.0 166116007115
0.00 0.00 0.00
61000 .
0.00 0.00
3.0 MEN 0.0 02601(50105
0.00 0.10 0.00 OBJECT 0151 = 106.30 InuGE 0157 . 106.30 00.1E1 0157 . 100.30 IMAGE 0151 m 106.30 0010.106012 . 20.00 HALF-10014 t 0.75 NFLF-LEATNI a £0.00 0616.01010 1.20
INIGNTS HEIONTS 0.0 0.0 0.0 0.0 0.0 0.0 0.0 0.0 0.0 0.0
TRANSVERSE ABERRATIONS
OF TYPE 6 TOROIDAL GRATING 6.7 NO 2000
NONA . 3.0 ORDER = 066E1E501x5
0.01 0:70 0.00 0.00
0 0.0
0.00
062007 OIST m 106.30 WOE OIST . 106.30 MILE-0060TP . 20.00 NALF-610TH . 1.50
RETORTS 0.0 0.0 0.0 0.0 0.0
0 6u
INFO
TRANSVERSE ABERRATIONS
OF TYPE 8 TOROIDAL ORATING R 2 6.1 60 r 2000.0
ROHR 3.0 060(6 . 0.0 WAvf7ENGITTS
0.00 0.00 0.00 0.00 0.00 CRUM DIST . 100.30 15506 DIST . 106.30 HALF-1E601N m 20.00 HALF-01010 . 2.15
NEIONIS 0.0 0.0 0.0 0.0 0.0
0.600
_0.500 -0.500
TRANSVERSE ABERRATIONS
OF TYPE 8 TOROIDAL GRATING
5.7 60 . 2000.0 NOM . 3.0 04DER 0.0
11000164:105 0.00 0.00 0.00 0.00 0.00
OBJECT DIST = 106.30 IMAGE DIST m 106.30 NRO-100010 . 20.00 ME-01DM . 2.95
0010015 0.0 0.0 0.0 0.0 0.0
TRANSVERSE ABERRATIONS
OF TYPE B TOROIDAL GRATING A . 6.7 NO m 2000.: ALCM . 3.0 ORDER . 0.0
MATE7600113 0.00 C.00 0.00 0.00 0.00 062E07 DIST . 106.30 10001 0151 m 106.10 NAL6-1600111 20.00 RALF-RIOT. = 3.55
REIONTS 0.0 0.0 0.0 0.0 0.0
t)
0.500
- .600 5. °
0.500
FIG. 53
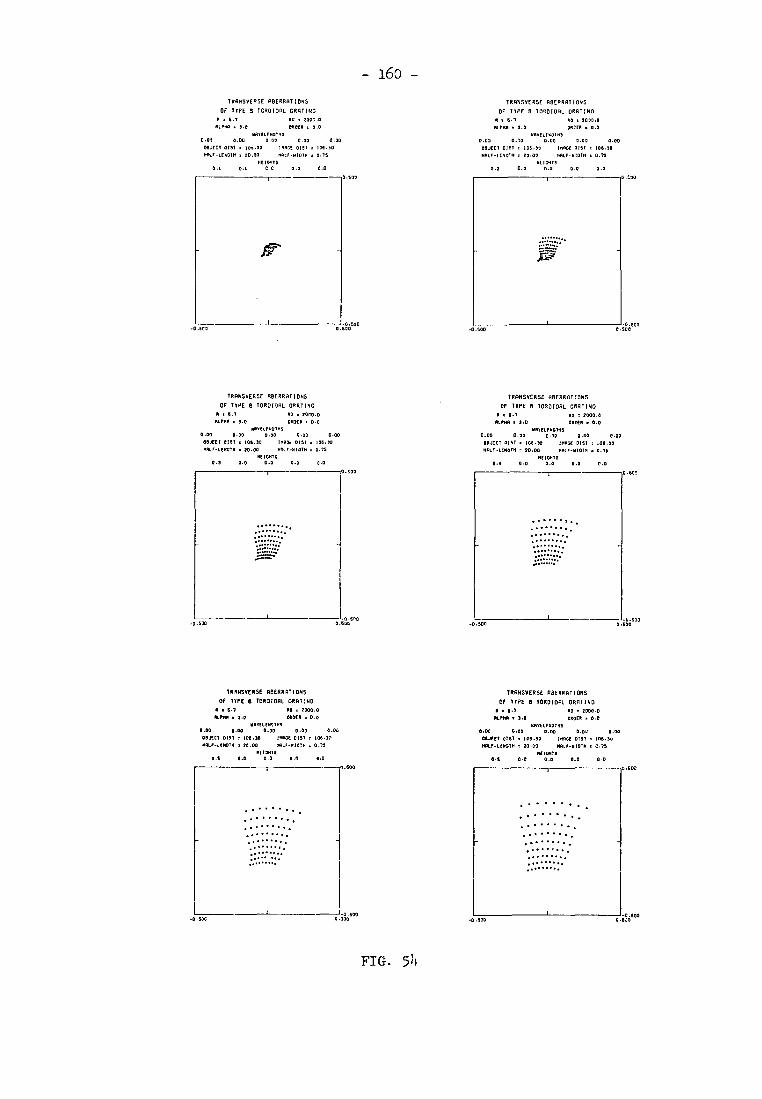
TRANSVERSE ABERRATIONS
OF TYPE I TOROIDAL GRATING
• 5.7 RO • 2001.0
lachact • 3.0 ORM . 0.0 RRYCLER/3115
0.00 0.00 0.00 0.00 0.00 OSJECT 0151 a 100.30 1/0135 0251 100.00 1A82-LEMBT1 a 20.00 0A82,1101m a 0.75
hEIORTS 0.1 0.0 0.0 0.0 0.0
- 3.6o
FIG.
-
51}
TRANSVERSE ABERRATIONS
OF TIPS B TOROIDAL GRATING
PI • 5.7 PO a 2000.0
1881103 • 3.0 03156 • 0.0 wAyELE.1m5
0.03 0.70 0.00 0.00 0.00
OBJECT DIST • 106.30 1700€ 0181 • 108.80
10186,10010 • 20.00 7082-1410711 • 0.7S BEIOBT3
0.2 0.0 0.0 0.0 0.0
•630
.8."0
.........
0..00
-0.500
TRANSVERSE ABERRATIONS
OF TYPE 0 TOROIDAL GRATING
R • 6.7 RO • 2000.0 31.750 S.0 ORDER . 0.0
OrELCROCR3 0.00 0.00 0.00 0.00 0.00 00JE11 DIST . 106.30 IRK, oist 105.60 mou-LCNoim • 20.00 1317-11001. 0.78
REIDRTS 0.3 0.0 0.0 0.0 0.0
-0.500
TRANSVERSE ABERRATIONS OF TYPE B TOROIOAL CRATING
5.7 co . 2000.0
ALPHA • 3.11 DR000 0.0 211101.5110T75
0.00 0.00 0.70 6.00 7.00 MUT OIST • 100.30 MAC( DIST . 106.30 R08.-8E0001, t 20.0001416,11014 • 0.75
HENNAS 0.0 0.0 0.0 0.0 0.0
......... ......... .........
0..00
.S.'"
0.500
........
........ ......... • . ....... ... . .........
0.600
-0.500 0
TRANSVERSE ABERRATIONS
OF TYPE 0 100010AL GRATING R.5.7 110. 2000.0 ROM. 3.0 DROCA .0.0
08051.1.5101 0.00 0.00 0.00 0.00 0.0C RUM DIST a. 106.30 111008 0151 = 106.30 10182-.00010 • 20.00 N011.I-010111 . 0.75
11131115 0.8 0.0 0.0 0.0 0.0
-0.500
TRANSVERSE ABERRATIONS
OF TYPE B TOROIDAL GRATING R • 5.1 00 S 2000.0
2101111 3.0 050E5 • 0.0 1011101fROT153
0.00 0.00 0.00 0.00 0.00 COACT DIST • 106.30 11101GE DIST . 106.30 ARL...LERGTM 20.03 R0LF-110111 • 0.75
BEIONTS 0.0 0.0 0.0 0.0 0.0
..... ...... ........ ........ ........ ....... .. ......
......... :::•
02.8"
....... ....... • ....... ........ ....... • ......... ....... .......... .........
0.500
-0-500 0 -0.500 0
0.500

- 161 -
TRANSVERSE ABERRATIONS
OF TYPE B TOROIDAL GRATING
R = 5.7 RO = 2000.0
ALPHA = 2.4 ORDER = 1.0
WAVELENGTHS 23.00 21.00 25.00 0.00 0.00
OBJECT DIST = 84.03 IMAGE DIST = 134.48
HALF-LENGTH = 20.00 HALF-WIDTH 7. 0.75
HEIGHTS 0.0 0.0 0.0
0.0 0.0
FIG. 55
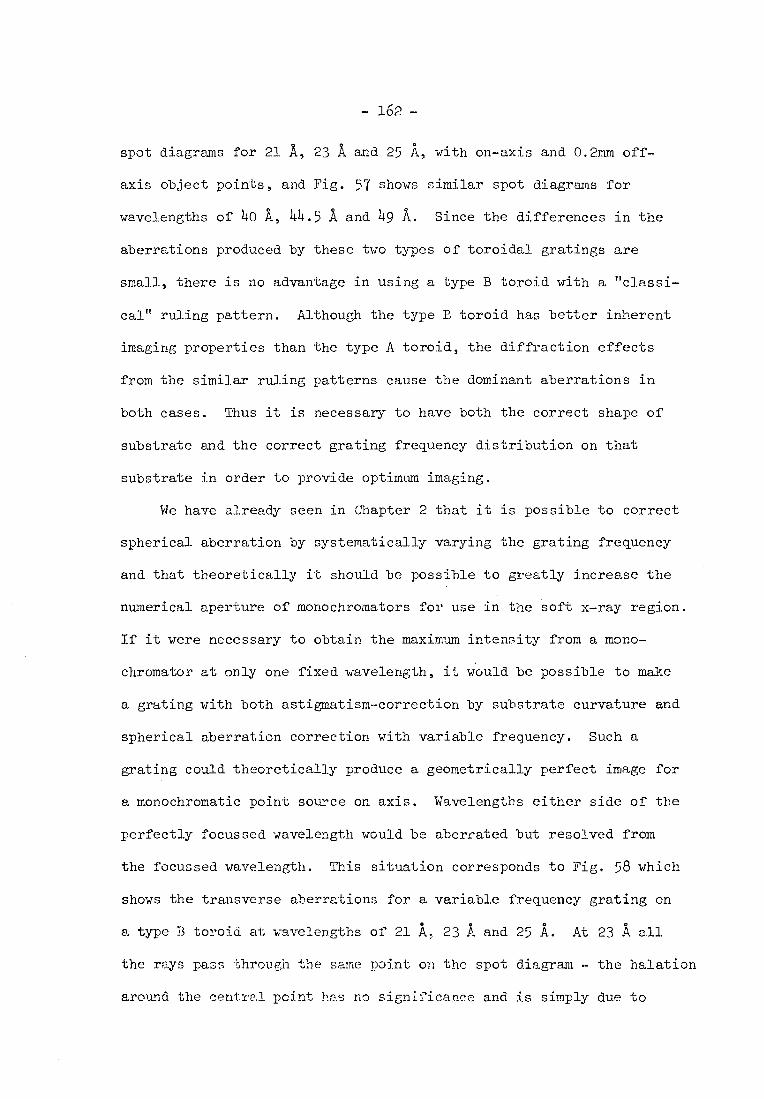
- 162-
spot diagrams for 21 A, 23 A and 25 A, with on-axis and 0.2mm off-
axis object points, and Fig. 57 shows similar spot diagrams for
wavelengths of 40 A, 44.5 A and 49 A. Since the differences in the
aberrations produced by these two types of toroidal gratings are
small, there is no advantage in using a type B toroid with a "classi-
cal" ruling pattern. Although the type B toroid has better inherent
imaging properties than the type A toroid, the diffraction effects
from the similar ruling patterns cause the dominant aberrations in
both cases. Thus it is necessary to have both the correct shape of
substrate and the correct grating frequency distribution on that
substrate in order to provide optimum imaging.
We have already seen in Chapter 2 that it is possible to correct
spherical aberration by systematically varying the grating frequency
and that theoretically it should be possible to greatly increase the
numerical aperture of monochromators for use in the soft x-ray region.
If it were necessary to obtain the maximum intensity from a mono-
chromator at only one fixed wavelength, it would be -possible to make
a grating with both astigmatism-correction by substrate curvature and
spherical aberration correction with variable frequency. Such a
grating could theoretically produce a geometrically perfect image for
a monochromatic point source on axis. Wavelengths either side of the
perfectly focussed wavelength would be aberrated but resolved from
the focussed wavelength. This situation corresponds to Fig. 58 which
shows the transverse aberrations for a variable frequency grating on
a type B toroid at wavelengths of 21 A. 23 A and 25 A. At 23 A all
the rays pass through the same point on the spot diagram - the halation
around. the central point has no significance and is simply due to
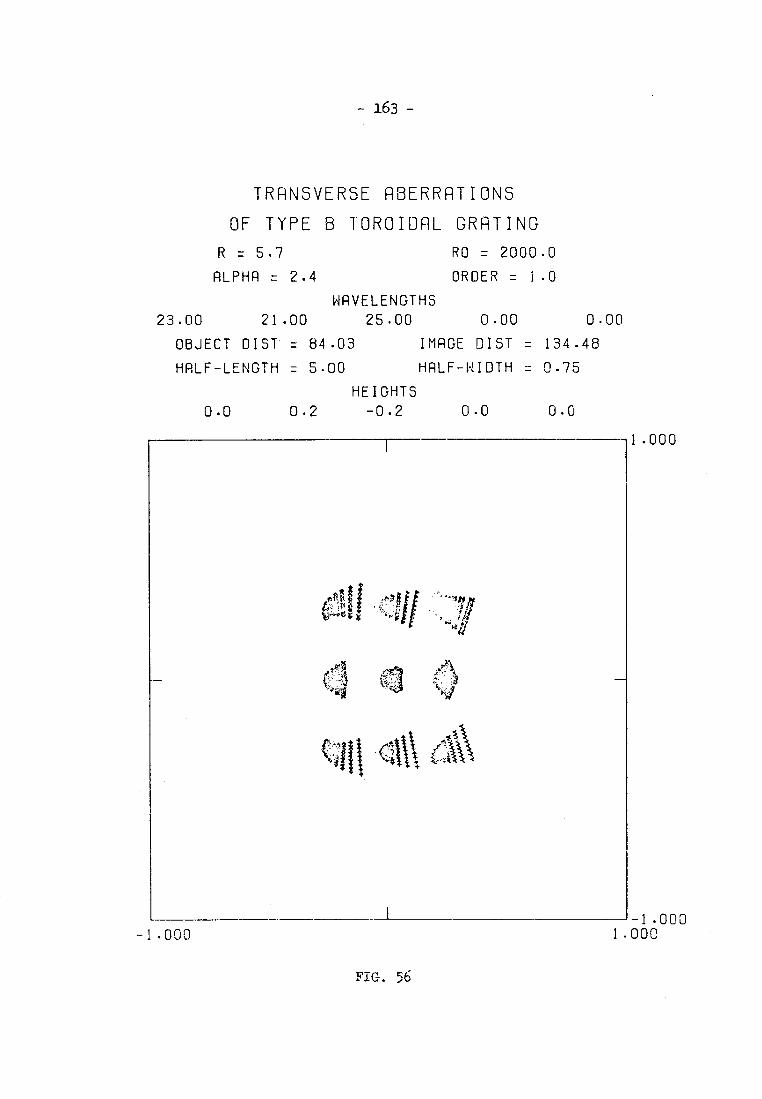
- 163 -
TRANSVERSE ABERRATIONS
OF TYPE B TOROIDAL GRATING
R = 5.7 RO = 2000.0
ALPHA = 2.4 ORDER = 1.0
WAVELENGTHS
23.00 21.00 25.00
0.00 0.00
OBJECT DIST = 84.03 IMAGE DIST = 134.48
HRLF-LENGTH = 5.00 HALF-WIDTH = 0.75
HEIGHTS
0.0 0.2 -0.2 0.0 0.0
1.000
-1.000 1.000 -1.000
FIG. 56

1.000
- 164 -
TRANSVERSE ABERRATIONS
OF TYPE B TOROIDAL GRATING
R = 5.7
ALPHA = 2.0
RO = 2000.0
ORDER = 1.0
WAVELENGTHS 44.50 40.00 49.00 0.00 0.00
OBJECT DIST = 69.82 IMAGE DIST = 161.84
HALF-LENGTH = 5.00 HALF-WIDTH = 0.75
HEIGHTS
0.0 0.2 -0.2 0.0 0.0
-I-1 .000 1.000 -1.000
FIG. 57

- 165 -
TRANSVERSE ABERRATIONS OF VARIABLE
FREQUENCY GRATING ON TYPE B TOROID
K-VALUE = 37929.9020
R = 9.5
ALPHA = 2.5
RO = 2500.0
ORDER = 1.0
WAVELENGTHS
23.00 21.00 25.00 0.00 0.00
OBJECT DIST . = 218.10 IMAGE DIST = 218.10
HALF-LENGTH = 50.00 HALF-WIDTH = 1.00
0.0 0.0
HEIGHTS
0.0 0.0 0.0
10.000
10.000 10.00D -10 .000
FIG. 58
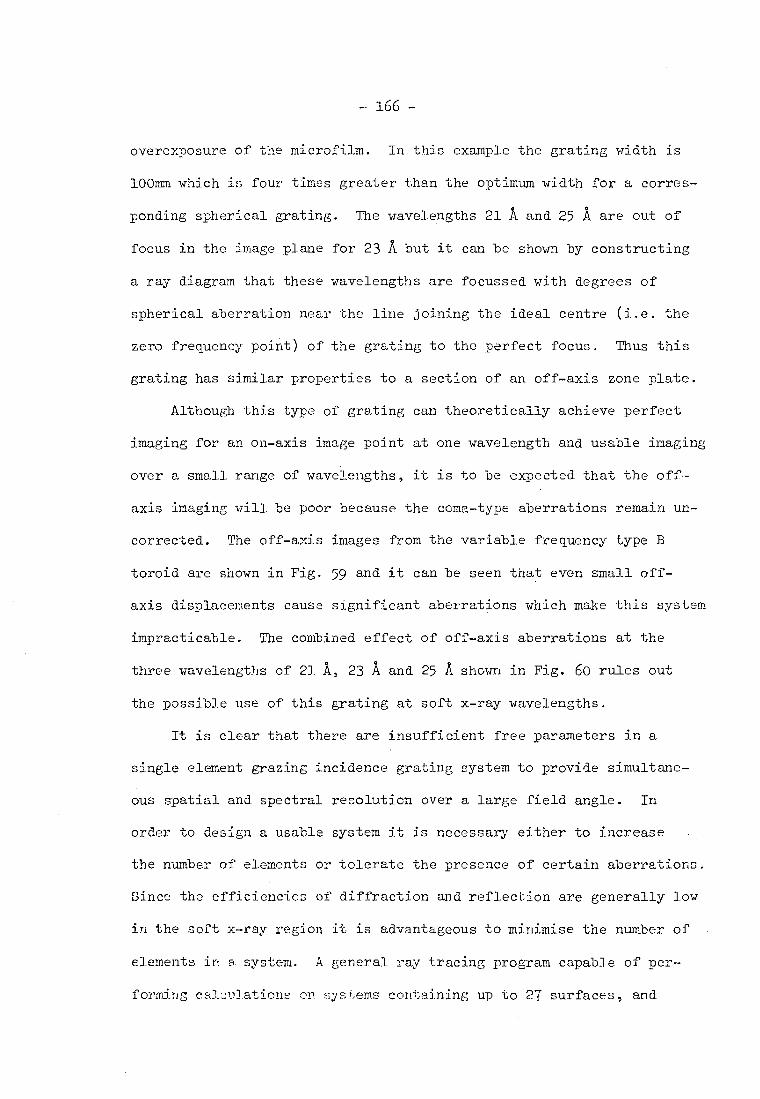
overexposure of the microfilm. In this example the grating width is
100mm which is four times greater than the optimum width for a corres-
ponding spherical grating. The wavelengths 21 A and 25 A are out of
focus in the image plane for 23 A but it can be shown by constructing
a ray diagram that these wavelengths are focussed with degrees of
spherical aberration near the line joining the ideal centre (i.e. the
zero frequency point) of the grating to the perfect focus. Thus this
grating has similar properties to a section of an off-axis zone plate.
Although this type of grating can theoretically achieve perfect
imaging for an on-axis image point at one wavelength and usable imaging
over a small range of wavelengths, it is to be expected that the off-
axis imaging will be poor because the coma-type aberrations remain un-
corrected. The off-axis images from the variable frequency type B
toroid are shown in Fig. 59 and it can be seen that even small off-
axis displacements cause significant aberrations which make this system
impracticable. The combined effect of off-axis aberrations at the
three wavelengths of 21 A, 23 A and 25 A shown in Fig. 60 rules out
the possible use of this grating at soft x-ray wavelengths.
It is clear that there are insufficient free parameters in a
single element grazing incidence grating system to provide simultane-
ous spatial and spectral resolution over a large field angle. In
order to design a usable system it is necessary either to increase
the number of elements or tolerate the presence of certain aberrations.
Since the efficiencies of diffraction and reflection are generally low
in the soft x-ray region it is advantageous to minimise the number of
elements in a. system. A general ray tracing program capable of per-
forming calatilations on systems containing up to 27 surfaces, and
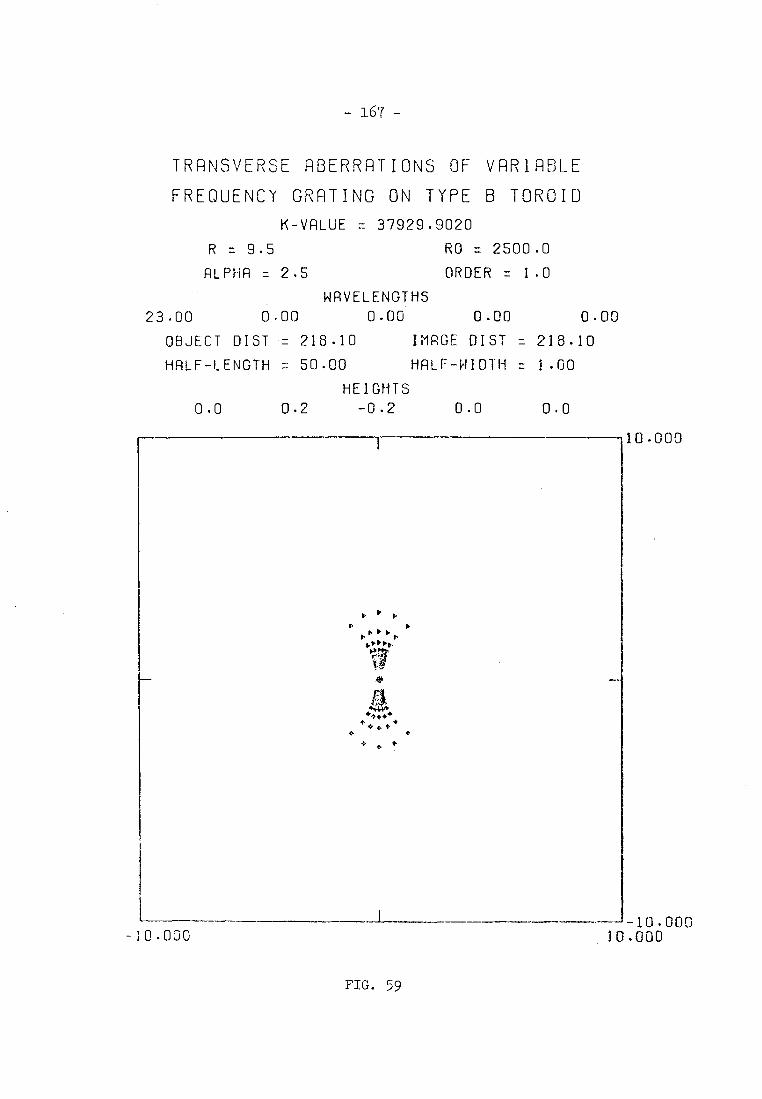
- 1.67 -
TRANSVERSE ABERRATIONS OF VARIABLE
FREQUENCY GRATING ON TYPE B TOROID
23.00 0.00
K-VALUE = 37929.9020
R = 9.5 RO = 2500.0
ALPHA = 2.5 ORDER = 1.0
WAVELENGTHS
0.00 0.00 0.00
OBJECT DIST = 218.10
HALF-LENGTH 7- 50.00
HEIGHTS
0.0 0.2 -0.2
IMAGE DIST a 218.10
HALF-WIDTH = 1.00
0.0 0.0
10.000
10.000 10.000 -10.000
FIG. 59
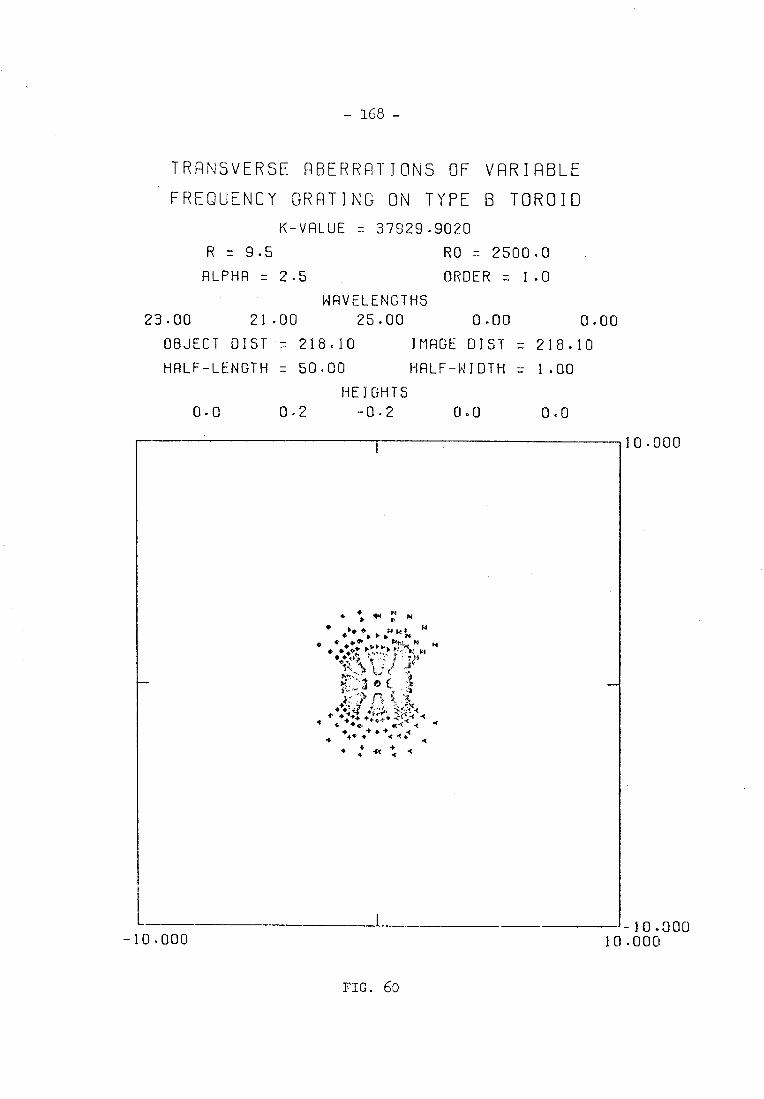
- 168 -
TRANSVERSE ABERRATIONS OF VARIABLE
FREQUENCY GRATING ON TYPE B TOROID
K-VALUE z 37929.9020
R = 9.5 RO 7 2500.0
ALPHA = 2.5 ORDER 7. 1.0
WAVELENGTHS
23.00 21.00 25.00 0.00 0.00
OBJECT DIST 7 218.10 IMAGE DIST = 218.10
HALF-LENGTH = 50.00 HALF-WIDTH = 1.00
HEIGHTS
0.0 0.2 -0.2 0.0 0.0
10.000
10.000 10.000 -10.000
FIG. 60
- 169 -
10 diffraction gratings (including holographic types) has been used
in this work and it would be a relatively easy matter to evaluate
any proposed multi-element grazing incidence system with this program.
However, such systems must be specialised solutions for particular
problems and as such would be out of place in this thesis which is
concerned more generally with holographic x-ray gratings.
Finally, in this chapter, the aberrations of a grating with
straight equispaced rulings formed on a right elliptical cylinder
will be analysed by ray tracing. For convenience these gratings will
be called "elliptical" gratings in the following text. The author
has made several holographic gratings of this type on thin optical
flats which have been shaped so that they adopt an elliptical figure
when deformed by bending. These gratings were initially designed
for use as monochromator gratings in the grating test apparatus; how-
ever, as indicated in Chapter 2, similar gratings may be advantage-
ously used for high resolution x-ray spectroscopy.
In order to design an elliptical grating for use in part of the
soft x-ray region, it is necessary to calculate values for the semi-
major axis, b, and semi-minor axis, c, using the formulae:
sin a sin = c2/b2 and R = b2/c
where R is the Rowland circle diameter of the spectrograph in which
the elliptical grating is to be used. Thus for a given instrument
the elliptical grating must be designed for a fixed angle of grazing
incidence and one wavelength but like the toroidal grating it is
possible to achieve a range of useful wavelengths over which sin a,
sin 13 is constant by allowing the angle of incidence to vary.
- 170 -
However, unlike the astigmatism correction provided by the toroidal
grating, the spherical aberration correction provided by the ellipti-
cal grating is only small and is not strongly parameter dependent.
Thus it is possible to use an elliptical grating over a wide wave-
length range.
The design of elliptical grating featured in the ray tracing
examples is based on the 5m spectrograph and an angle of grazing
incidence of 3.0° at a wavelength of 45 A and a grating frequency of
300 1/mm. These design conditions yield values for the semi-major
and semi-minor axes of 310.5565mm and 19.2891mm respectively. The
transverse aberrations for an elliptical grating with these para-
meters with a width of 50mm under these conditions are given in
Fig. 61. Spot diagrams for the same grating illuminated with 100 A
and 25 A are shown in Fig. 62 and Fig. 63 and it can be seen that
although the aberrations have increased they are still smaller than
those from a corresponding spherical grating.
It is most important to decide upon the necessary dimensional
tolerances in order to be able to fabricate the elliptical grating
blanks and this can be conveniently performed by ray tracing. Fig.64
shows the effects of increasing the semi-major and semi-minor axes
by 100pm. It can be seen from the relatively small increase in the
aberrations that it is definitely a practical proposition to fabri-
cate gratings on right-elliptical cylinders since the required
tolerance can be achieved and measured using standard optical tech-
niques and modern measuring methods.
The increase in grating width possible with the elliptical
grating, however, involves a limitation on the range of angles of
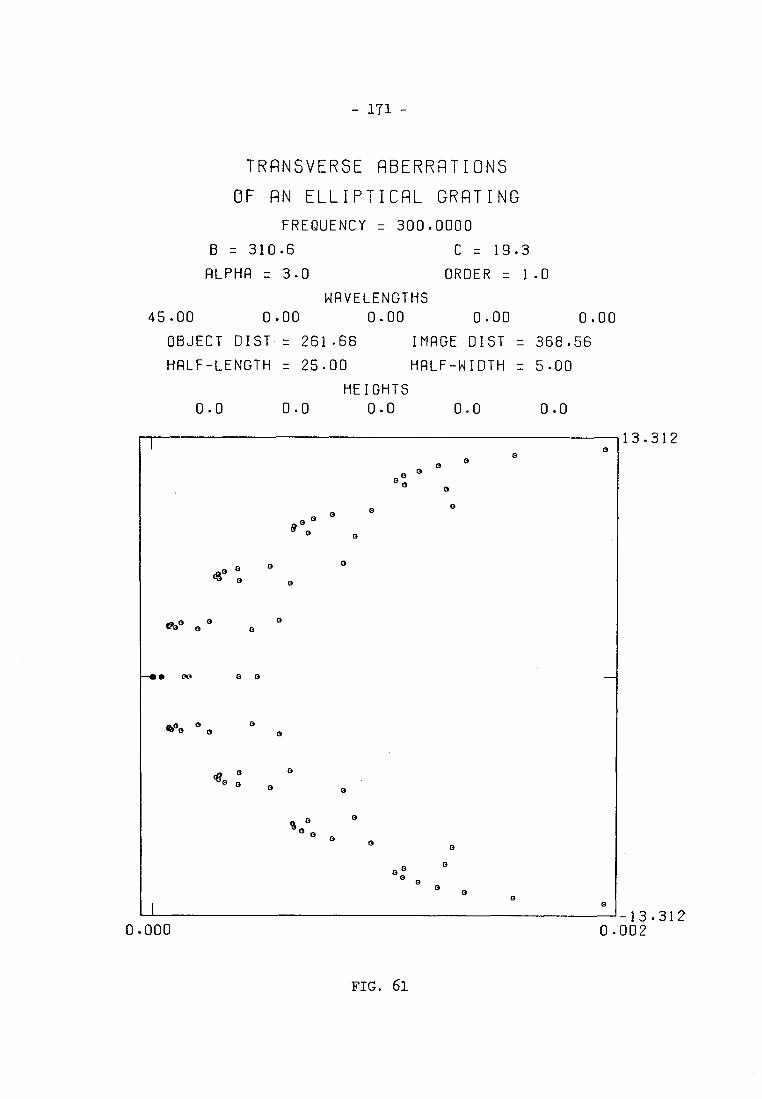
1
0° 0
0
8°
190° 0 0
-0 • 00 0 0
0. 0
0:
0.000 13.312
0.002
13.312
— 171 —
TRANSVERSE ABERRATIONS
OF RN ELLIPTICAL GRATING
FREQUENCY = 300.0000
B = 310.6 C = 19.3
ALPHA = 3.0 ORDER = 1.0
WAVELENGTHS
45.00 0.00
0.00
0.00 0.00
OBJECT DIST = 261.68 IMAGE DIST = 368.56
HALF—LENGTH = 25.00 HALF—WIDTH = 5.00
HEIGHTS
0.0 0.0 0.0
0 .0 0.0
FIG. 61
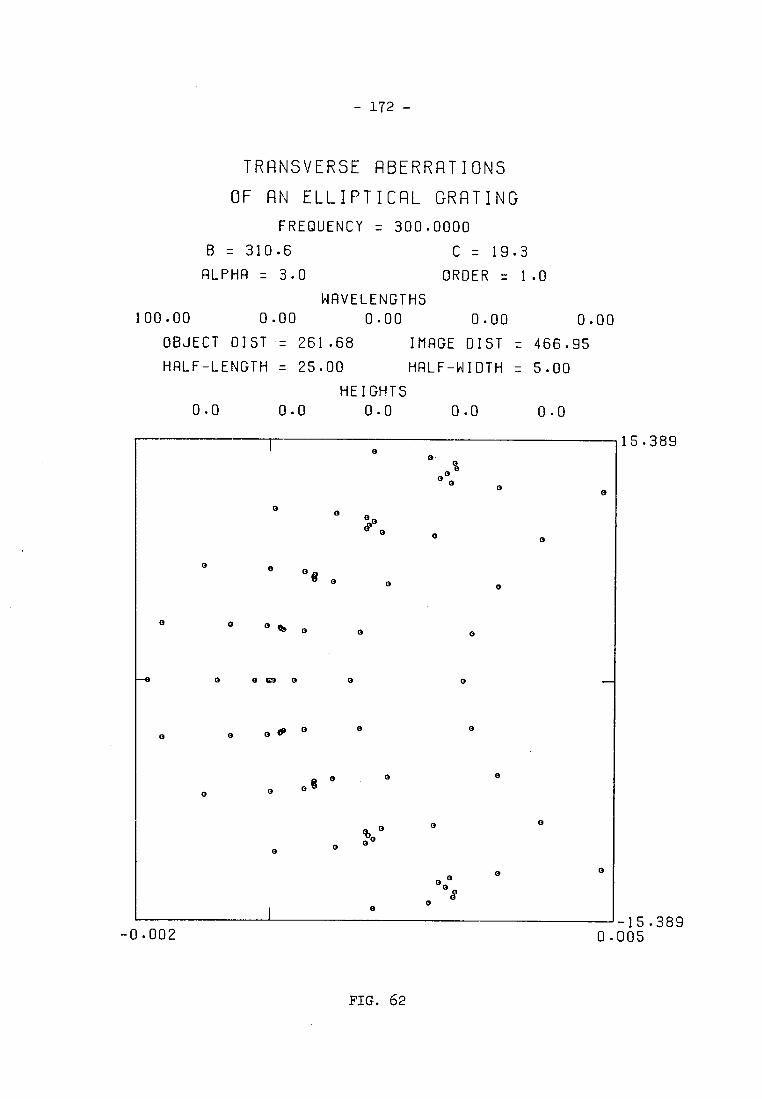
- 172 -
TRANSVERSE ABERRATIONS
OF AN ELLIPTICAL GRATING
FREQUENCY = 300.0000
B = 310.6 C = 19.3
RLPHR = 3.0 ORDER = 1.0
100.00
WRVELENGTHS
0.00 0.00 0.00 0.00
OBJECT DIST = 261.68 IMRGE DIST = 466.95
HRLF-LENGTH = 25.00 HRLF-WIDTH = 5.00
HEIGHTS
0.0 0.0 0.0 0.0 0.0
15.389 0
0
0 0
0
0 0
!9° 0 0 0
a
0
0 ea e
• 0 G9 0 O 0
0 o 0, O 0
eg ° a 0
a O
O
1 15.389 0.005 -0.002
FIG. 62

- 173 -
TRANSVERSE ABERRATIONS
OF AN ELLIPTICAL GRATING
FREQUENCY = 300.0000
B = 310.6 C = 19.3
ALPHA = 3.0 ORDER = 1.0
WAVELENGTHS
25.00 0.00 0.00 0.00 0.00
OBJECT DIST = 261.68 IMAGE DIST = 325.44
HALF-LENGTH = 25.00 HALF-WIDTH 7-- 5.00
HEIGHTS
0.0 0.0 0.0 0.0 0.0
12.401 o
o
o 0 0 00 ° o
o o a 0° 0 0 0
0 0 (Pcs ° 0 o
o
0 0
O 0 MB 0
O 0 0 qb 0
o O 0 ebe 0
o
O 0
O o
o o
0 o 0 00 o o 0 o
o 0 0 0. 0 0 o
-0.001
o
-12.401 0 003
FIG. 63
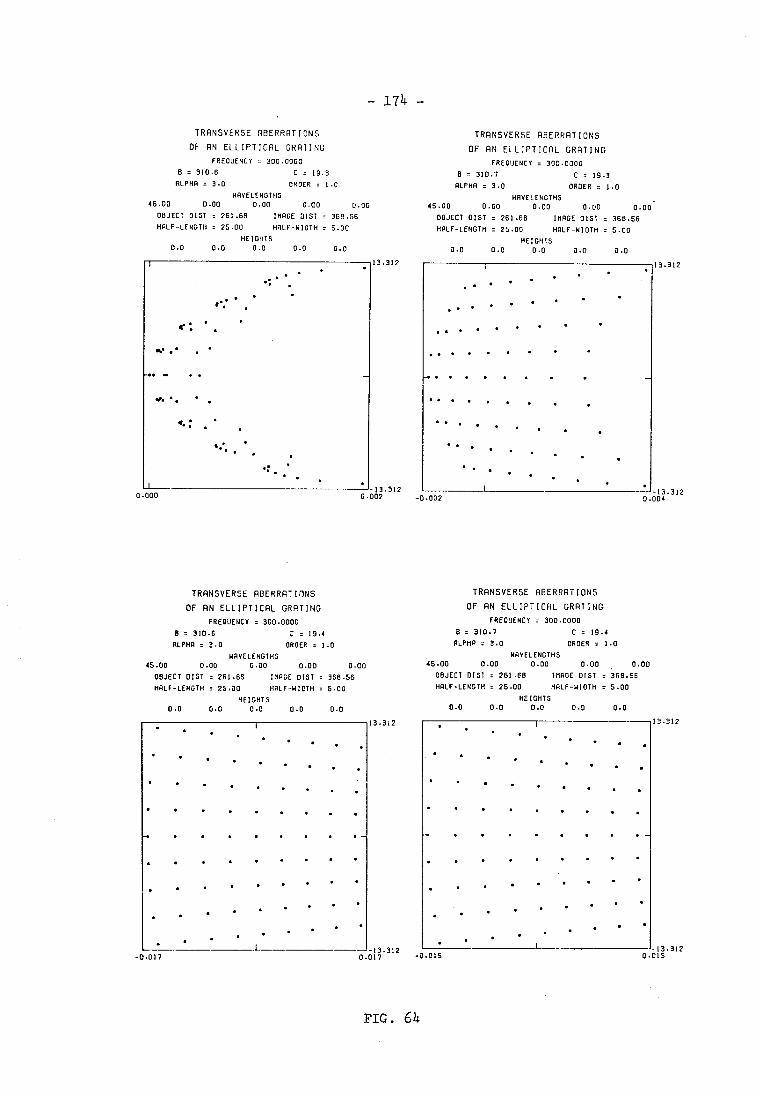
FIG. 64
ORDER = 1.0 ALPHA = 3.0
• • • • • •
• • • • • •
• • •
• • •
• • •
• •
0 004 -0.002
• •
• • • • • • • •
• •
•
•
• • •
• •
- 174 -
TRANSVERSE ABERRATIONS
OF RN ELLIPTICAL GRATING
FREQUENCY . 300.0000 B = 310.6 C = 19.3
WAVELENGTHS 45.00 0.00 0.00 0.00 0.00
OBJECT DIST = 261.68 IMAGE DIST = 368.56 HALF-LENGTH . 25.00 HALF-WIDTH = 5.00
HEIGHTS 0.0 0.0 0.0 0.0 0.0
TRANSVERSE ABERRATIONS
OF AN ELLIPTICAL GRATING
FREQUENCY = 300.0000 B . 310.7 C = 19.3 ALPHA = 3.0 ORDER = 1.0
WAVELENGTHS 45.00 0.00 0.00 0.00 0.00
OBJECT GIST . 261.68 IMAGE GIST . 368.56 HALF-LENGTH . 25.00 HALF-WIDTH = 5.00
HEIGHTS 0.0 0.0 0.0 0.0 0.0
1 • • :
13.312
;
v.* . • •
• •• • •
v. • . • •
• • •
•
•:. •
13.312 0 000 0 002
TRANSVERSE ABERRATIONS
OF AN ELLIPTICAL GRATING
FREQUENCY = 300.0000 B . 310.6 C = 19.4 ALPHA . 3.0 ORDER . 1.0
WAVELENGTHS 45.00 0.00 0.00 0.00 0.00
OBJECT DIST = 261.68 IMAGE DIST . 368.56 HALF-LENGTH . 25.00 HALF-WIDTH = 5.00
HEIGHTS 0.0 0.0 0.0 0.0 0.0
TRANSVERSE ABERRATIONS
OF AN ELLIPTICAL GRATING
FREQUENCY = 300.0000
8 . 310.7 C = 19.4
ALPHA . 3.0 ORDER :7. 1.0 WAVELENGTHS
45.00 0.00 0.00 0.00 0.00 OBJECT DIST . 261.68 IMAGE DIST = 368.56 HALF-LENGTH . 25.00 HALF-WIDTH . 5.00
HEIGHTS 0.0 0.0 0.0 0.0 0.0
13.312
13.312
•
-0.017 0 015
13.312 13.312
13.312 0 017 -0.015
13.312
• •
• • • • • •
•
•
•
• •
• • •
•
•
• • • • • •
•
• •
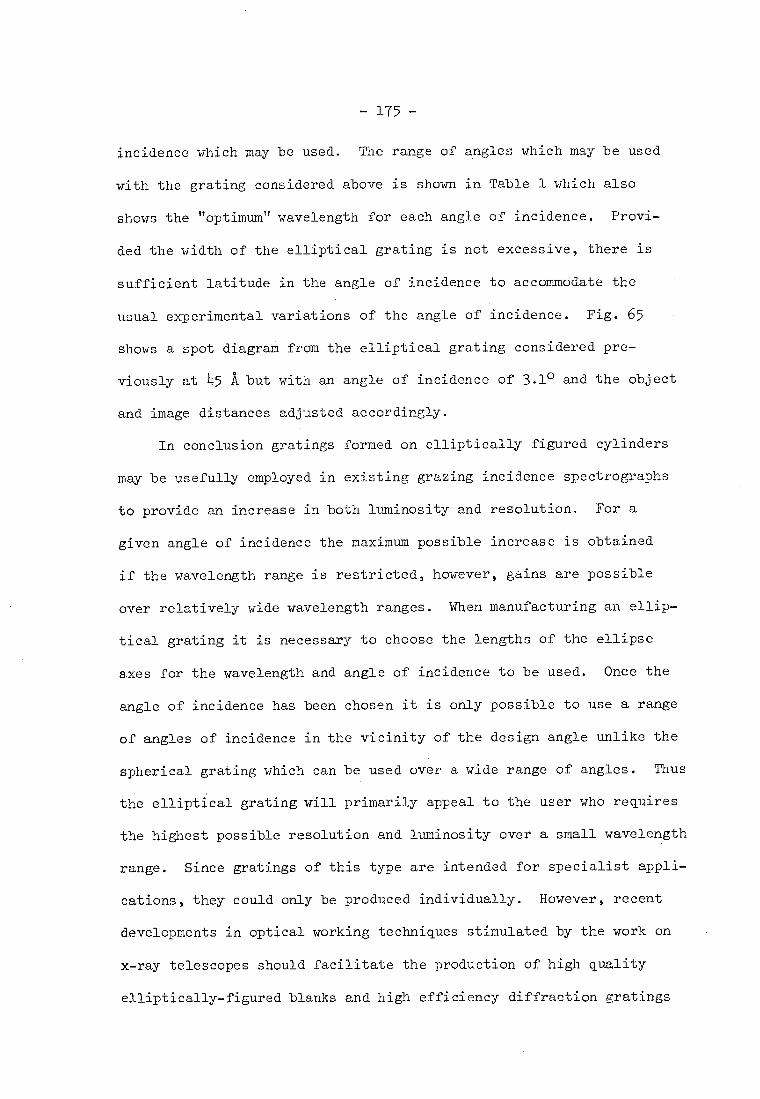
- 175 -
incidence which may be used. The range of angles which may be used
with the grating considered above is shown in Table 1 which also
shows the "optimum" wavelength for each angle of incidence. Provi-
ded the width of the elliptical grating is not excessive, there is
sufficient latitude in the angle of incidence to accommodate the
usual experimental variations of the angle of incidence. Fig. 65
shows a spot diagrath from the elliptical grating considered pre-
viously at 45 A but with an angle of incidence of 3.1° and the object
and image distances adjusted accordingly.
In conclusion gratings formed on elliptically figured cylinders
may be usefully employed in existing grazing incidence spectrographs
to provide an increase in both luminosity and resolution. For a
given angle of incidence the maximum possible increase is obtained
if the wavelength range is restricted, however, gains are possible
over relatively wide wavelength ranges. When manufacturing an ellip-
tical grating it is necessary to choose the lengths of the ellipse
axes for the wavelength and angle of incidence to be used. Once the
angle of incidence has been chosen it is only possible to use a range
of angles of incidence in the vicinity of the design angle unlike the
spherical grating which can be used over a wide range of angles. Thus
the elliptical grating will primarily appeal to the user who requires
the highest possible resolution and luminosity over a small wavelength
range. Since gratings of this type are intended for specialist appli-
cations, they could only be produced individually. However, recent
developments in optical working techniques stimulated by the work on
x-ray telescopes should facilitate the production of high quality
elliptically-figured blanks and high efficiency diffraction gratings
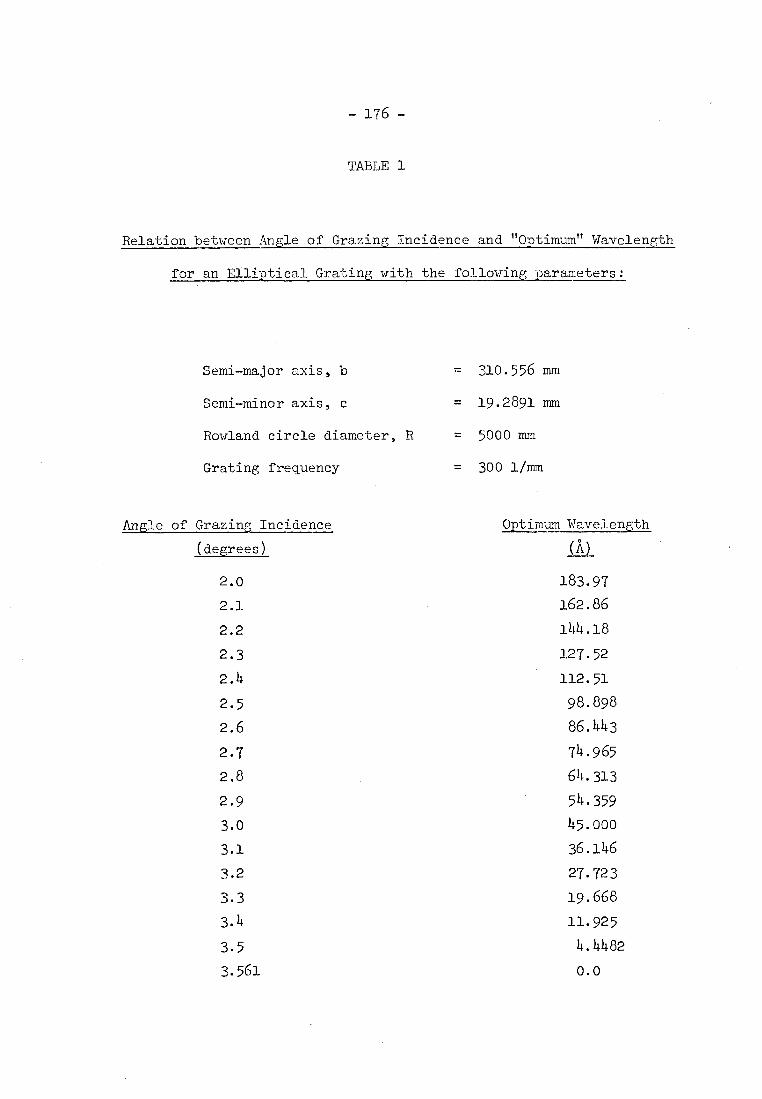
- 176 -
TABLE 1
Relation between Angle of Grazing Incidence and "Optimum" Wavelength
for an Elliptical Grating with the following parameters:
Semi-major axis, b
= 310.556 mm
Semi-minor axis, c = 19.2891 mm
Rowland circle diameter, R
= 5000 mm
Grating frequency = 300 1/mm
Angle of Grazing Incidence Optimum Wavelength
(degrees) ( A )
2.0 183.97
2.1 162.86
2.2 144.18
2.3 127.52
2.4 112.51
2.5 98.898
2.6 86.1l 1 3
2.7 74.965
2.8 64.313
2.9 54.359
3.0 45.000
3.1 36.146
3.2 27.723
3.3 19.668
3.4 11.925
3.5 4.4482
3.561 0.0
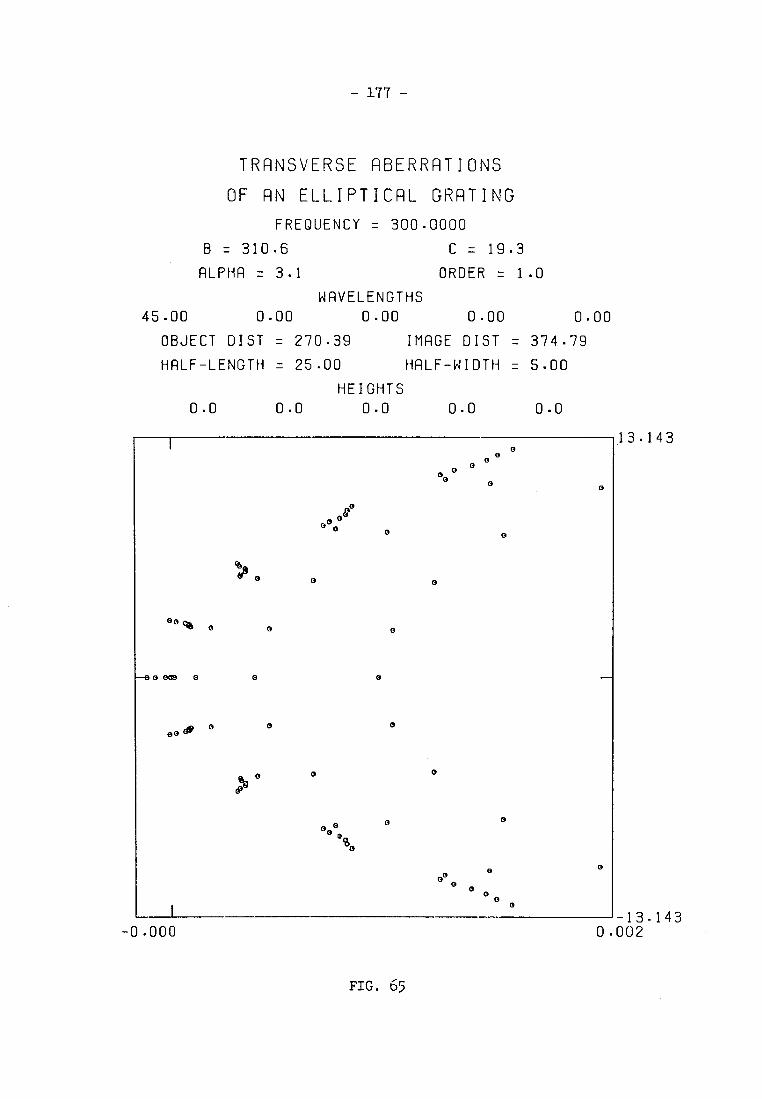
0 0
00 ea, 0 O 0
0
O 0
O 0
0
0 000
0 0
00
0 00
0
0 0 OS 0
.0 0 0
0
-0.000
- 177 -
TRANSVERSE ABERRATIONS
OF RN ELLIPTICAL GRATING
FREQUENCY = 300.0000
B = 310.6 C = 19.3
ALPHA = 3.1 ORDER = 1.0
WAVELENGTHS
45.00 0.00 0.00
0.00 0.00
OBJECT DIST = 270.39 IMAGE DIST = 374.79
HALF-LENGTH = 25.00 HALF-WIDTH = 5.00
HEIGHTS
0.0 0.0 0.0
0 .0
0.0
FIG. 65
-178-
can be readily formed on such blanks using the holographic process.
Thus it is to be expected that the increase in resolution made
possible by using an elliptical grating will be demonstrated experi-
mentally in the near future.
- 179 -
CHAPTER 1
THE MANUFACTURE OF HOLOGRAPHIC X-RAY GRATINGS
The basic process for making holographic diffraction gratings
is very simple. It is only necessary to accurately record the in-
tensity distribution of the interference fringe system made by the
superposition of two coherent monochromatic waves in order to make
an optical element which has dispersive and also imaging properties.
To produce high quality diffraction gratings is, however, not such
an easy matter because of certain physical and technological con-
straints. The nature of some of these limitations will be described
in this chapter together with a detailed account of the methods used
by the author for the production of holographic soft x-ray gratings.
In 1964 Sayce and Franks (113) described several possible
methods for producing efficient diffraction gratings for use in the
x-ray region including the use of photoresist for photographically
copying transmission gratings. They found a positive working photo-
resist; one rendered soluble in an aqueous alkaline solution after
exposure to ultra-violet light, to be the most effective. However,
only relatively coarse diffraction gratings with frequencies below
200 1/mm could be readily copied by this photographic method. The
difficulties experienced when copying higher frequency gratings were
attributed to limitations of the photoresist; however, it is more
likely that the problems were due to other aspects of the copying
process such as mask-substrate contact and collimation of the light
rather than intrinsic limitations of the photoresist. It was also
- 180 -
mentioned that the quality of the resist surface was not easily con-
trollable and depended upon the mode of application and "texture" of
the resist. The resist gratings were therefore only used as masters
from which x-ray gratings were prepared by subsequent processing.
Two techniques were used for making the x-ray gratings; the first was
to replicate the grating using epoxy resin and the second was to make
chromium phase gratings from the masters by the stripping process.
These techniques were applied to masters produced both by ruling in
aluminium and by copying photographically.
The stripping process is well-known in the semiconductor industry
and is used for high resolution applications when substrates present
special processing problems. In this technique the photoresist is
processed so as to leave exposed the areas of substrate which are to
be coated with chromium. The resist and substrate are then coated with
a uniform film of chromium of known thickness by vacuum evaporation.
Since thin chromium films prepared in this way are porous, by treating
the grating with organic solvents, it is possible to remove the un-
developed photoresist together with the overlying layer of unwanted
chromium to leave strips of chromium adhering to the substrate. The
steps of this process are shown in Fig. 66.
The development of the high-power continuous-wave Ar+ laser
enabled Rudolph and Schmahl in Germany to propose in 1967 the fabri-
cation of diffraction gratings with photoresist and laser light.
Although gratings had been produced earlier by photographing the
interference fringes of two coherent light waves from a laser, these
gratings were not suitable for spectroscopy because of their poor
optical quality and lo IT efficiency. Silver halide Photographic
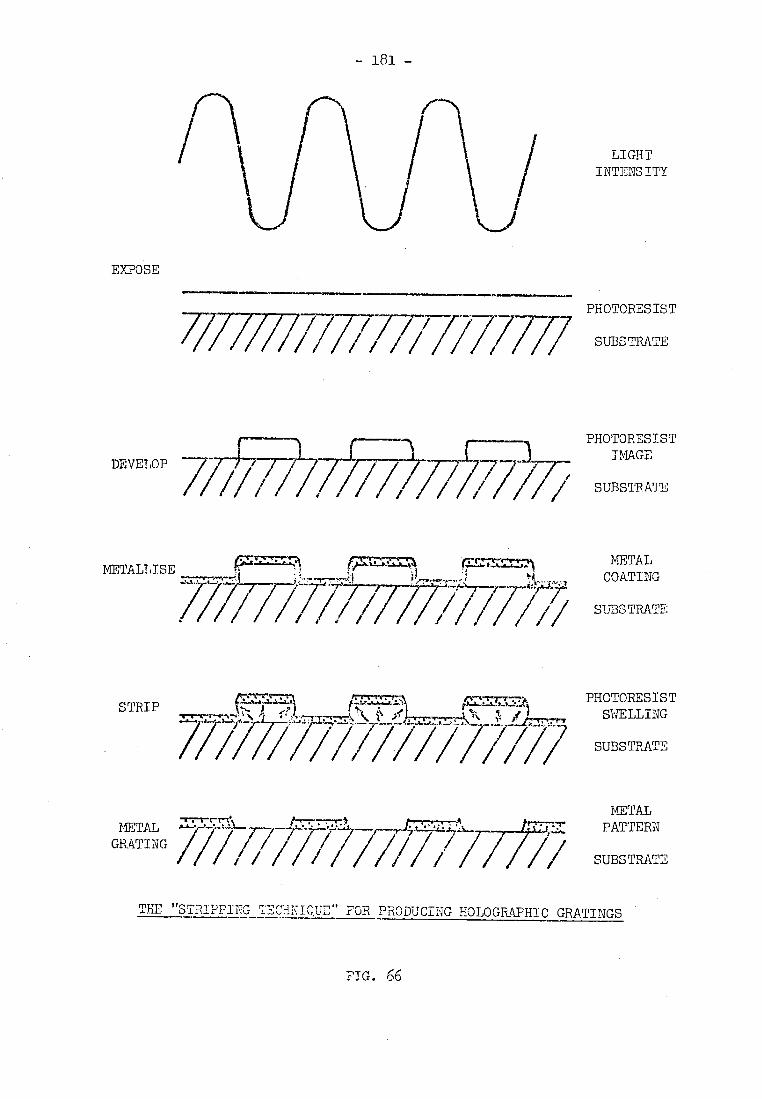
fir"VT.r7'77,1/4
/ STRIP
- 181-
LIGHT INTENSITY
EXPOSE 117.•■•■••■■■•■•••=111../VIAMX/e..■./.............
/77777/ 7/7/777 PHOTORESIST
SUBSTRATE
DEVELOP 7
PHOTORESIST IMAGE
SUBSTRATE
METALLISE 77A
METAL COATING
SUBSTRATE
PHOTORESIST SWELLING
SUBSTRATE
METAL GRATING
"2' 17-711/2-7 477
///777-/ METAL
PATTERN
//1// SUBSTRATE
THE "STRIPPING TEC'HNIQUE" FOR PRODUCING HOLOGRAPHIC GRATINGS
FIG. 66
- 182 -
emulsions were not suitable for making high-quality diffraction
gratings because of the granular nature of the process, and methods
involving gelatin (either in photographic emulsions or gelatin-
dichromate or similar materials) were also unsuitable because of
the dimensional changes which occurred during processing. The
necessary photosensitive medium was required to form a thin uniform
layer of great dimensional stability and be capable of very high
resolution. Fortunately, the photoresists used in the semiconductor
industry possessed just these properties.
The first holographic gratings were produced by coating an
optical flat with a thin uniform layer of photoresist and then ex-
posing it in the interference field produced by two coherent plane
waves from a laser. The exposed photoresist was subsequently deve-
loped to yield a grating with a periodically varying surface profile
which was nearly sinusoidal. To complete the process the photoresist
gratings were coated with aluminium in order to increase the reflec-
tivity.
In 1967 Labeyrie and Flamand also produced gratings by this
method at the firm of Jobin-Yvon in France. Although this firm has
several ruling engines and is committed to the production of ruled
gratings, they have become the major commercial suppliers of holo-
graphic gratings. The gratings supplied by Jobin-Yvon are mainly
coated resist gratings with a nearly sinusoidal profile formed on
plane or spherical blanks. They have designated three types of
holographic gratings. Type 1 formed using the interference system
of two plane waves and giving the same ruling pattern as a classi-
cal ruled grating; Type 2, using non-Parallel beams to provide
— 183 —
aberration correction; and Type 3, stigmatic gratings formed using
point sources.
In the visible and U.V. wavelength regions the properties of
holographic and ruled gratings are largely complementary and the
correct type of grating must be chosen for the particular appli-
cation. Holographic gratings usually have lower stray light levels
and are free from ghosts and can offer a higher signal to noise
ratio than mechanically ruled gratings. It is also possible to make
very large gratings which have uniform diffraction efficiency over
the whole surface using the holographic method; such gratings could
not be ruled mechanically because of diamond wear problems. However,
the efficiencies of holographic gratings are usually less than those
of ruled gratings because the optimum groove profile and blaze angle
can be more readily attained in the mechanical method. Holographic
gratings with sinusoidal profiles can have high efficiencies provided
0.8<X/d<1.7 which favours high grating frequencies. Thus the holo-
graphic method is best suited to making large high frequency gratings
and gratings for applications where the scattered light levels are
critical.
In the soft x-ray wavelength region the situation is completely
different. It is not possible to use large concave gratings at gra-
zing incidence because of the spherical aberration limitations and
plane gratings are rarely used in the soft x-ray region because of
the need for additional focussing optics which would reduce intensity.
Experimental determinations of grating efficiency in the soft x-ray
region show clearly that diffraction ,:fficiency decreases rapidly
with increasing grating frequency". 1', has also been found experi-
- 184 -
mentally that ruled gratings with a laminar profile have a higher
efficiency than echelette type gratings. Thus it would appear that
there would be no gain in using holographic gratings in the soft
x-ray region. However, the holographic method does offer possibilities
for aberration correction and the formation of gratings on surfaces
which could not normally be ruled, but it was first essential to be
able to make efficient holographic gratings for use in the soft x-ray
region. With this aim in view a collaborative research programme
was organised with Dr. Rudolph and Dr. Schmahl of the Universitats-
Sternwarte G3ttingen. The results of this research programme have
been most successful and by employing improvements to the holographic
method developed by the author, it is now possible to make holographic
diffraction gratings which have a very high efficiency in the soft
x-ray region.
-185-
4.2 EXPERIMENTAL CONDITIONS NECESSARY FOR PRODUCING HOLOGRAPHIC
GRATINGS
In order to produce a perfect plane holographic grating it is
necessary to be able to produce interference fringes with exactly
equal spacings, but such fringes can only be produced by perfectly
plane wavefronts. However, in practice such wavefronts cannot exist
because optical elements which introduce aberrations must be used to
produce the wavefronts and also apertures in the system introduce
divergence due to diffraction. Therefore, in practice holographic
gratings will have variations in the spacing which give aberrations
in the diffracted wavefronts and deviations from the ideal intensity
distribution in a spectrum. However, provided the wavefront aberra-
tions of low spatial frequency are <2V20 and there are no high spatial
frequency aberrations, a diffraction gratings is generally accepted
to be of high quality. In order to achieve this quality in holo-
graphic gratings, it is necessary to use optics of similar quality
when making the gratings for use in the first diffracted order and
of higher quality when making gratings for use in higher orders.
Therefore, high quality optical elements must be used for producing
holographic gratings.
It has been shown by Schmahl and Rudolph (121) that it is possible
to make high quality gratings from aberrated wavefronts provided the
aberrations are identical in both beams. With normal optical elements
this would be impossible but by using waves produced by holographic
reconstruction from two holograms it is possible to produce identical
waves. Superposition of the two waves produces an interference field
of improved accuracy and quality of the resultant gratin; becomes
- 186 -
nearly independant of the quality of the optical elements used.
Provided the aberrations of the optics are less than a few wave-
lengths, it is possible, in this way, to increase the ruling accu-
racy by about two orders of magnitude. Thus it is possible to make
holographic diffraction gratings whose quality is in practice only
limited by the quality of the blank and photoresist layer.
Although laser lines can be very nearly monochromatic, it is
necessary to consider the effect of the finite spectral bandwidth
of laser lines in the production of holographic gratings. The
contrast of the interference pattern depends on the width and pro-
file of the laser line and the path difference between the inter-
fering beams. In order that the contrast is uniform over the inter-
ference field, it is necessary that the path differences are small
compared to the coherence length of the laser. Since the coherence
length is given by L=c/Lv and the path difference by 1 = ;VT sina,
it can be seen that the necessary line widths are narrower for large
high frequency gratings and a typical value would be Av=109Hz. In
addition to a narrow line width it is essential that there is high
frequency and wavelength stability otherwise the interference fringes
will not remain stationary.
The frequency stability of a laser is dependant upon its design
and the environmental conditions. For the Coherent Radiation Model 53
high power argon ion laser, used by the author in G5ttingen, the
individual argon lines are selected using a prism in the resonator
and the design of the cavity and m5rrors is such that the laser
operates in TEM00. However, due to Doppler broadening and Zeeman
splitting, the ainzon lines are broadened and a number of axial modes

- 187 -
may be emitted separated by frequencies Av=c/2RL where RL is the
length of the laser cavity. The cavity length for the Model 53
laser is 1.45m which gives a frequency interval between axial
modes of 108Hz. By using an oven stabilized etalon it is possible
to select one axial mode and a frequency stability of ±75MHz was
measured experimentally over a period of 30 minutes for the 4579 A
line using a confocal scanning-interferometer. This stability is
adequate for all applications and since the line width is only a
small fraction of this value the coherence length is very large.
For many applications it is not essential to use an etalon since
the required stability can be achieved by optimising the operating
conditions of the laser. However, for large high frequency gratings
such frequency selection is essential.
Temperature, pressure and humidity changes ire the atmosphere
through which the laser beams pass will cause refractive index
variations which alter the laser wavelength. Normally, atmospheric
pressure changes and variations of humidity are only small during
typical exposure times and have little effect on the interference
field. However, thunderstorms can have a noticeable effect on
the stability of the interference fringes. Temperature changes
cause larger wavelength shifts and it is necessary to provide
temperature stabilisation to better than 0.1K for the interference
system and also to control the air temperature around the laser
to ±1K. When changes are made to the optical system it is necessary
to allow sufficient time for thermal transients to decay and for
the system to stabilise mechanically.
- 188 -
It is of course most important to provide adequate vibration
isolation for the optical system. In the Optical Laboratory of
GOttingen Observatory a 700 kg optical bench 3.5m x 1m x 0.1m is
supported by a combination of springs and damping elements on a
massive concrete block which has its foundations set deep in the
earth. The Optical Laboratory is separated from the other Ob-
servatory buildings and provides nearly ideal conditions. By
optical methods it has been shown that the amplitudes of the resi-
dual vibrations in the interference system are less than 20nm.
The optical bench is located in a well insulated double-
walled chamber with dimensions 5m x 1.8m x 2m which is inside a
slightly larger room in the Optical Laboratory. Fig. 67 shows a
view inside the interference chamber of an optical system set up
on the optical bench. Temperature stabilisation, is achieved by a
most comprehensive system employing four heat exchangers in the
interference chamber and one above the chamber and a temperature
stability of 0.01<AT<0.1K is attained. The laser is set 1110 in the
main Optical Laboratory to avoid thermal and mechanical disturbances
in the interference chamber and the whole outer laboratory is
air-conditioned to provide temperature control to ±1.5K. Thus, the
facilities at the Optical Laboratory of Gottingen Observatory are
such that holographic diffraction gratings of the highest quality
may be produced.
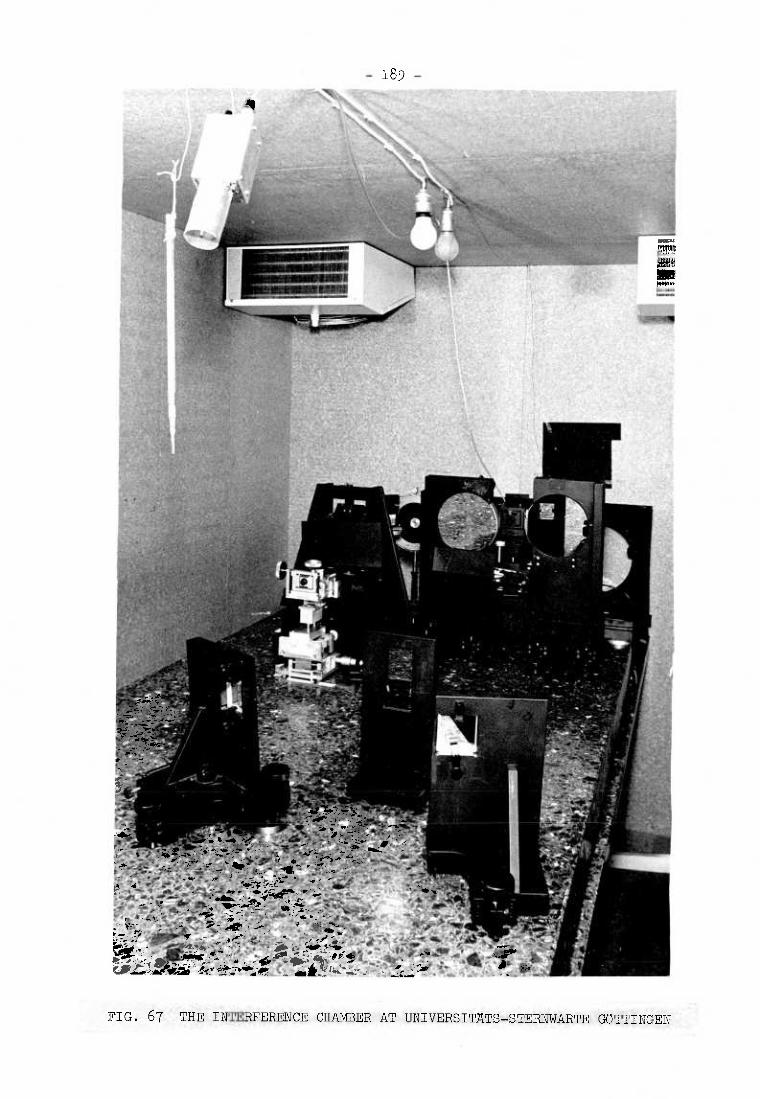
- 189 -
•
FIG. 67 THE INIERFERENCE CHAMBER AT UNIVERSITATS-STERNWARTE GOTTINGEN
- 190 -
1.3 THE PROPERTIES OF PHOTORESISTS
There are two basic types of photoresist: positive working
photoresist which is rendered soluble by the action of light and
negative working resist which becomes insoluble on exposure.
Numerous photoresists of both types are a:•ailable commercially
and all have different characteristics which make them more suitable
for certain applications. Photoresist systems have been used for
many years in the photomechanical industry, however, the require-
ments of the semiconductor industry have led to the development of
improved photoresist systems suitable for the fabrication of holo-
graphic diffraction gratings.
The action of light on negative photoresists causes photo-
crosslinking, or photopolymerisation, and the negative resist
developer is an organic solvent which dissolves away the unexposed
resist and tends to swell the exposed image. For positive materials
the incident energy causes a photochemical reaction which converts
the resist into a form which is soluble in an aqueous alkali deve-
loper. In this case the developer does not penetrate or swell the
unexposed material which contributes to the excellent dimensional
stability and sharp edge definition obtained with positive working
resists. With positive working resist it is also easier to obtain
an image which adheres well to the substrate because it is not neces-
sary for the photoresist to photolyse through the whole thickness
of the resist layer as in the case of negative working resists.
Furthermore, the high purity positive photoresist systems are gene-
rally more convenient to work with than negative resist systems.
However, by using a negative working resist sensitised in the blue

- 191 -
region (e.g. Kodak Ortho Resist), it is possible to use the strong
line at 4830 A from an Ar+ laser and obtain a significant reduction
in exposure time compared to positive working resists.
The photoresist used by the author to fabricate holographic
gratings was Shipley AZ-1350 developed in concentrated AZ Developer
which is highly alkaline (pH 12.7-12.8). AZ-1350 has a chemically
combined photosensitiser of diazoanhydrides (quinone diazides) with
a low molecular weight polymer of phenol-formaldehyde type. Exposure
to UV light causes progressive photochemical conversion from the
surface of the resist down to the substrate. The exact mechanism
of the conversion is not completely understood, however, the combined
action of the UV light and highly alkaline developer is to convert
the quinone diazides into soluble carboxylic acids.
The polymer molecules in AZ-1350 have an uncoiled length of
the order of 100 A (the chain length. of a typical negative working
resist is about 5000 A but tightly coiled structures can be formed).
Since the changes which occur when the photoresist is exposed take
place in the molecular structure, the resolution is extremely high.
Usually the resolution is not limited by the photoresist but by
some other experimental factors.
Photoresist films of optical quality with controlled thickness
in the range 0.01 - lum can be readily formed on optical blanks by
using the spinning technique. In this technique the blank is flooded
with photoresist and is then rapidly spun at 2000 - 5000 rpm.
Coating uniformity is achieved by an early high acceleration rate
and the combined effects of centrifugal force and surface tension.
The thickness of the resist layer depends• on the viscosity and solids
- 192 -
content of the resist, the acceleration and final speed of the
spinner, the substrate shape and preparation, the vapour pressure
in the spinner, and the total spin time. In Gottingen a commercial
spinner, as used in the semiconductor industry, is employed which
enables the acceleration, maximum speed, spinning time and decele-
ration to be controlled and easily reproduced. By varying the dilu-
tion of the photoreSist with photoresist thinners and by varying the
spinning speed it is possible to obtain a wide range of resist thick-
nesses as shown in Fig. 68. Once the correct conditions have been
determined to yield a uniform film of the required thickness, it is
important that the conditions can be easily reproduced so that all
the blanks coated for one session have identical properties. Blanks
of unusual shapes can pose problems when spin coating, however, with
ingenuity it is possible to achieve uniform coatings on very asymme-
trical blanks. With spin coating there is always a small increase in
resist thickness at the edge of the blank, however, this is usually
of no consequence for holographic gratings.
The peak spectral sensitivity of most photoresists is in the
region 3000 - 4500 A due to the energy required to cause the photo-
chemical reactions. In photoresists nearly all the energy for the
chemical changes must come from the incident light since the resist
developers act mainly as solvents whereas in normal photographic
processes most of the chemical energy comes from the developer.
Compared to normal photographic emulsions photoresists are extremely
insensitive and require energy densities 103-104 times higher than
slow; high resolution emulsions. Fortunately neither reciprocity-
law failure nor photo-oxidation takes place with positive photo-
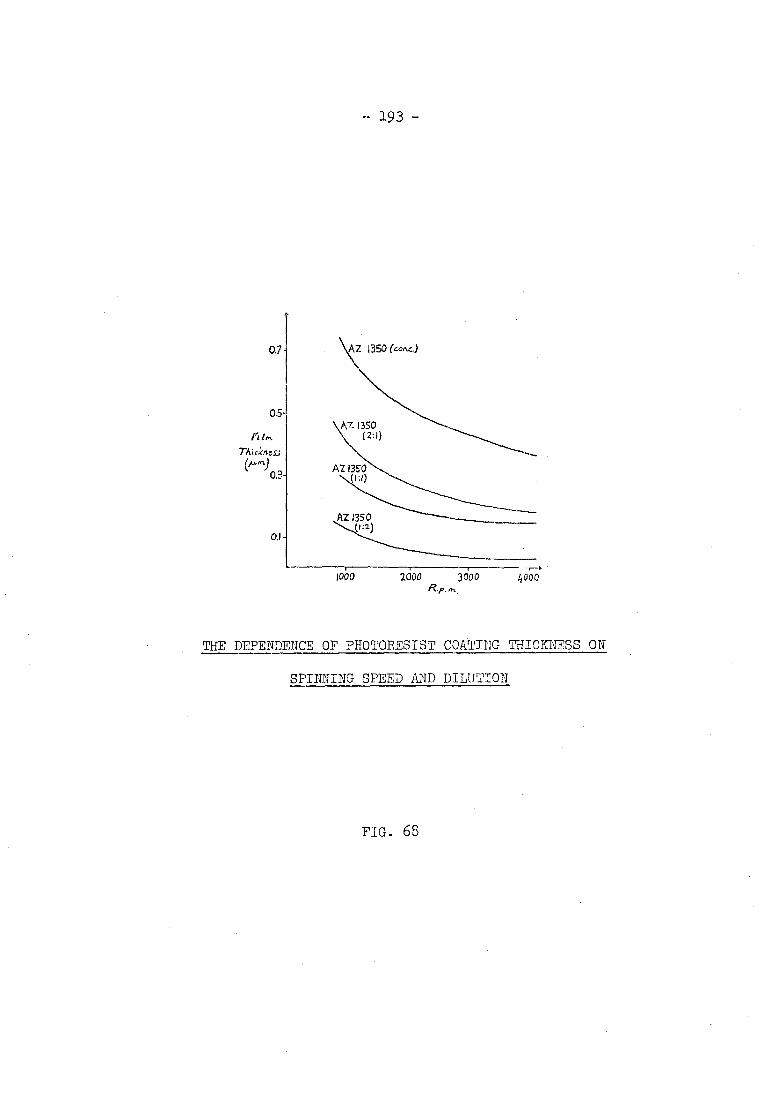
0.7 \Z 1350 (cont-)
05 Az 1350
(2:1)
AZ 1350
AZ 1350 .2)
1000 r-3
1000 3000 4000 AR p.m.
0.1
-.193-
THE DEPENDENCE OF PHOTORESIST COATING THICKNESS ON
SPINNING SPEED AND DILUTION
FIG. 68
- 194-
resists which means that very long exposure times can be used.
With AZ-1350 there is approximately an order of magnitude increase
in sensitivity from a wavelength of 5000 A to 4500 A and a further
order of magnitude increase from 4500 A to 3500 A. Thus it is
advantageous to use light sources which have a high intensity in
the UV region. However, there are very few high power coherent
light sources in the UV region and a more favourable combination
of laser power and resist sensitivity can be obtained by using
slightly longer wavelength lines in which much higher powers can
be attained.
The argon ion laser is particularly suitable for use in the
manufacture of holographic gratings, and the lines at 3511, 3638,
4579, 4880 and 5145 A may be used. Although higher powers are
obtainable from the 4880 and 5145 A lines with AZ, 1350 it is advan-
tageous to use the 4579 A line because of the photoresist response.
The lines of the Krypton-ion laser at 3507 A and 3564 A are suitable
when a shorter laser wavelength must be used and the lines of the
helium-cadmium laser at 3250 A and 4416 A can also be used. It has
been found that from the point of stability, process control and
ease of light intensity measurements, the Ar+ line at 4579 A is the
most suitable for use with AZ-1350.
A characteristic curve can be drawn for positive photoresists
showing the depth of resist removed against incident energy density.
However, the characteristic will depend on the method of preparation
of the film,its age and the drying technique used, the spatial
frequency of the image and the development conditions. Therefore,
it is necessary to perform individual evaluation of the process which
-195-
is normally achieved experimentally by making trial exposures. It
is possible to obtain an increase in sensitivity by prolonging the
development time or by using more concentrated developers, e.g. by
using AZ-303 developer with AZ-1350 resist, a gain in sensitivity
of about five can be achieved. However, when using thin photoresist
layers control of the process and adhesion can be critical if too
strong a developer is used. With concentrated AZ Developer unexposed
resist is dissolved with reported rates up to 300 A/sec whereas for
developer diluted 1:1 the unexposed resist is dissolved at only
r‘,2A/sec. Thus the development technique can greatly alter the
characteristics and generally more diluted developer increases the
exposure latitude but reduces sensitivity. Therefore, it is necessary
to optimise the development technique for all the exposure conditions
applicable.
An energy density of about 2.103J.m-2 is required to obtain a
modulation depth of 2000 A in AZ-1350 resist with 15 seconds develop-
ment time in concentrated AZ Developer for A = 4579 A. The output of
the Coherent Radiation Model 53A laser in GOttingen has been measured
as 450 mW at A = 4579 A with a plasma current of 35 A. Typical
enermv densities in the interference field would be up to about
5 W.m-2 depending on the system used. Therefore, exposure times range
from a few minutes for small gratings to 15 minutes for larger gra-
tings. Thus the inherent low sensitivity and spectral response of
present photoresist systems necessitate the use of high power, high
stability, lasers which means that only a few discrete wavelengths can
be used for the fabrication of holographic gratings.
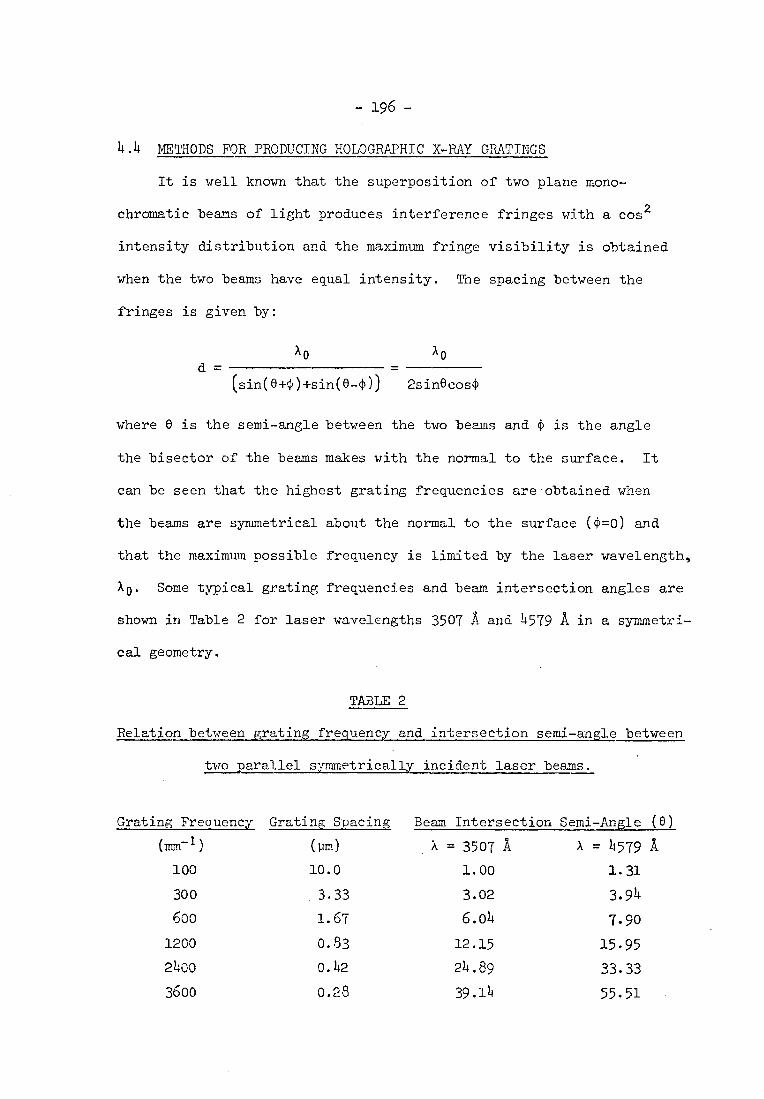
- 196 -
4.4 METHODS FOR PRODUCING HOLOGRAPHIC X-RAY GRATINGS
It is well known that the superposition of two plane mono-
chromatic beams of light produces interference fringes with a cost
intensity distribution and the maximum fringe visibility is obtained
when the two beams have equal intensity. The spacing between the
fringes is given by:
A0 d =
(sin(61-4)+sin(0-(0) 2sinecos40
where 0 is the semi-angle between the two beams and (I) is the angle
the bisector of the beams makes with the normal to the surface. It
can be seen that the highest grating frequencies are obtained when
the beams are symmetrical about the normal to the surface (4=0) and
that the maximum possible frequency is limited by the laser wavelength,
Ao. Some typical grating frequencies and beam intersection angles are
shown in Table 2 for laser wavelengths 3507 A and 4579 A in a symmetri-
cal geometry.
TABLE 2
Relation between grating frequency and intersection semi-angle between
two parallel symmetrically incident laser beams.
Grating Frequency Grating Spacing Beam intersection Semi-Angle (0) (nr-1)
100 (Pm)
10.0 X = 3507 A A = /1579 A
1.00 1.31
300 3.33 3.02 3.91
600 1.67 6.04 7.90
1200 0.83 12.15 15.95
2400 0.42 24.89 33.33
3600 0.28 39.14 55.51
A0
- 197 -
A standard optical system suitable for the production of holo-
graphic gratings of moderate size is shown diagrammatically in Fig. 69.
The laser beam which has an initial diameter of about 1.5mm and a
divergence of 0.610 is expanded by means of a high quality micros-
cope objective. The microscope objective and a lOpm spatial filter
are on an adjustable stage which enables the focus of the microscope
objective to be readily adjusted to the focus of the parabolic
mirror. When this has been performed a parallel beam of light is
produced by the parabolic mirror. The two high quality plane mirrors
on either side of the microscope objective are adjusted to reflect
two beams of equal intensity at the correct angle to produce the
required grating frequency and they are positioned so that the path
differences for both beams are nominally equal. The grating holder
is placed at the intersection of the two beams and is set symmetri-
cally. Final adjustment of the optical system can be most conveniently
performed by putting a reference grating in the grating holder to
produce a Moire pattern. By rotating the grating through 180° it is
easy to determine any residual aberrations in the system and make the
necessary corrections. Using this method also enables the fringe
stability and contrast to be readily examined. It has been found in
GOttingen that it takes about three days for an optical system to
become completely stable after it has been initially set up. For
minor adjustments it is only necessary to allow one day for the
system to stabilise before making any exposures.
The optical quality of a holographic grating is essentially
determined by the quality of the substrate provided the optics used
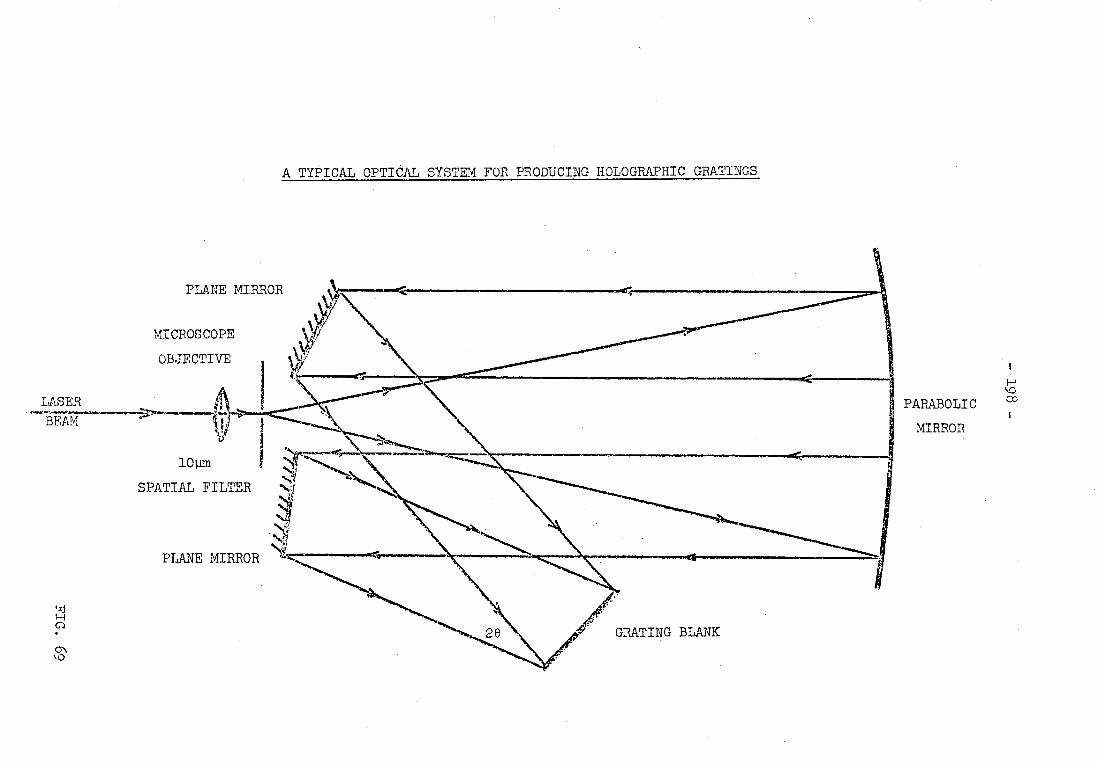
MICROSCOPE
OBJECTIVE
PLANE MIRROR
A TYPICAL OPTICAL SYSTEM FOR PRODUCING HOLOGRAPHIC GRATINGS
LASER 4 PARABOLIC .~..,-- BEAM ..,
ll MIRROR
10 pm 1
I
.*...,
SPATIAL FILTER NO N,,..
PLANE MIRROR
•
rn ko
2e GRATING BLANK
-199-
for making the grating are of the highest quality and the optical
system is correctly adjusted. The diffraction properties are largely
determined by the profile of the individual grooves and this is de-
termined by the technique used to produce the grating. The author
has used two techniques to produce holographic gratings and has deve-
loped a third method by which gratings with a high diffraction effi-
ciency in the soft x-ray region can be produced.
The basic method for making a holographic grating is to expose
a photoresist-coated blank in an interference fringe system using
light from a laser. By varying the thickness of the photoresist
layer, the exposure, and development, it is possible to obtain various
grating surface profiles. A symmetrical nearly sinusoidal profile
is the one most readily obtainable as a result of the non-linear
characteristic of the photoresist and also the possibly non-isotropic
development of high spatial frequency structures. If resist layers
are used which are thin compared to the grating spacing, it is possible
to obtain a laminar profile. The resist which has been exposed is
removed by development resulting in a grating consisting of strips of
photoresist adhering to the substrate. In order to make a laminar
phase grating for use in the soft x-ray region the groove depth must
be ru50 - 300 A. It would be difficult to use photoresist films of this
order of thickness; therefore, it is necessary to use some processing
technique to convert the resist grating into the required form.
The first method used in Gttingen to produce holographic gratings
suitable for the soft x-ray region was to vacuum coat a laminar resist
grating with a layer of metal and then remove the underlying photo-
resist by the stripping technique to produce a grating consisting of

- 200 -
strips of metal on the substrate. Subsequent coating of this gra-
ting to enhance the reflectivity resulted in a grating with a usable
diffraction efficiency in the soft x-ray region. In this technique
the groove depth could be accurately controlled since it is determined
by the thickness of the evaporated metal layer. The most suitable
metal for making the gratings was chromium because it adhered well to
glass, could be evaporated readily, and enabled the grating to be
stripped easily. Titanium, which has similar properties, may also be
used. The process of removing the unwanted metal and photoresist is
achieved by immersing the grating in a suitable resist solvent (e.g.
alcohol or acetone), the solvent passes through the thin porous
chromium film and swells the photoresist enabling the unwanted chromium
to be removed by gentle swabbing with - cotton wool. It is essential to
produce a clean break in the metal film where it leaves the substrate
and begins to form the bridge over the photoresist. This can only be
achieved if the photoresist has a sharp vertical profile and if the
metal deposition is performed so that the atoms impinge at near normal
incidence in order to obtain a thinner coating on the sides of the
grooves than on the substrate and on top of the photoresist. An under-
cut resist profile like that obtained because of electron scattering
in polymer film used in electron beam fabrication techniques would
enable the desired laminar profile to be achieved more easily.
The stripping techniaue has several advantages over other possible
methods. Firstly, this method is known to be able to produce high
resolution and good edge acuity. Secondly, since metalising is only
performed after the correct photoresist image is produced on the sub-
strate the photoresist can be easily removed from unsuccessful trials
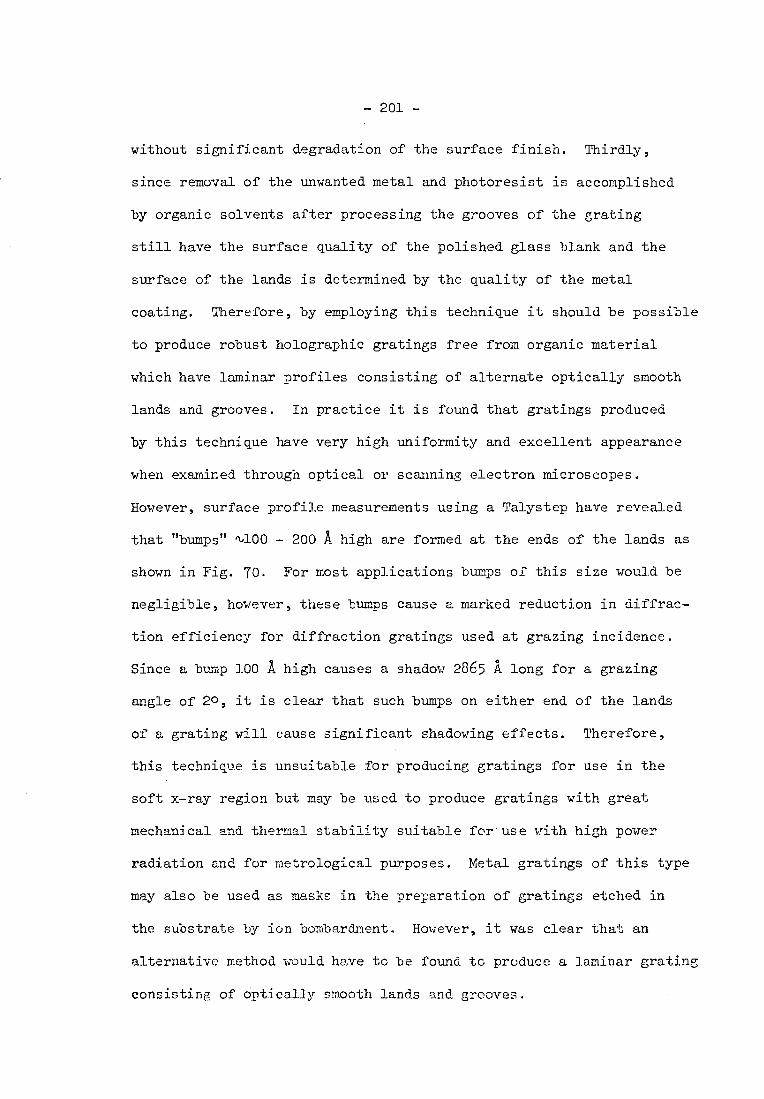
- 201 -
without significant degradation of the surface finish. Thirdly,
since removal of the unwanted metal and photoresist is accomplished
by organic solvents after processing the grooves of the grating
still have the surface quality of the polished glass blank and the
surface of the lands is determined by the quality of the metal
coating. Therefore, by employing this technique it should be possible
to produce robust holographic gratings free from organic material
which have laminar profiles consisting of alternate optically smooth
lands and grooves. In practice it is found that gratings produced
by this technique have very high uniformity and excellent appearance
when examined through optical or scanning electron microscopes.
However, surface profile measurements using a Talystep have revealed
that "bumps" '1,100 - 200 A high are formed at the ends of the lands as
shown in Fig. 70. For most applications bumps of this size would be
negligible, however, these bumps cause a marked reduction in diffrac-
tion efficiency for diffraction gratings used at grazing incidence.
Since a bump 100 A high causes a shadow 2865 A long for a grazing
angle of 20, it is clear that such bumps on either end of the lands
of a grating will cause significant shadowing effects. Therefore,
this technique is unsuitable for producing gratings for use in the
soft x-ray region but may be used to produce gratings with great
mechanical and thermal stability suitable for use with high power
radiation and for metrological purposes. Metal gratings of this type
may also be used as masks in the preparation of gratings etched in
the substrate by ion bombardment. However, it was clear that an
alternative method would have to be found to produce a laminar grating
consisting of optically smooth lands and grooves.
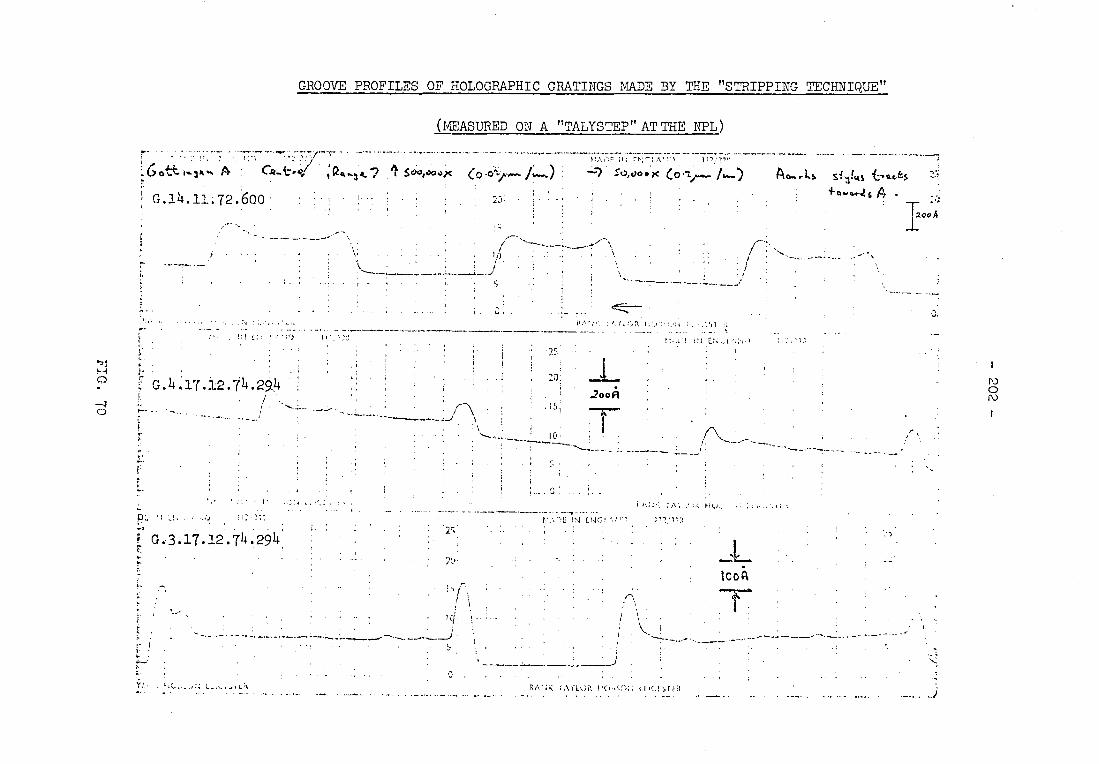
0 • I
<7; ' . , • " , N •.1
r4 )
.2oo •••••••••INB
II Q..
;
•
J
G.3.17.12.74.294
I. I 2'
• • • 2;
GROOVE PROFILES OP HOLOGRAPHIC GRATINGS MADE BY THE "STRIPPING TECHNIQUE"
(MEASURED ON A "TALYSTEP" AT THE NPL )
ott , 0■34 ,̀ A C.Q...t•ci ;a4.-;„4.7 so0,004x 50..00•x (0.1 h....) G.14.11.72.600 0.■ u+r-4 I,
' I.eoA
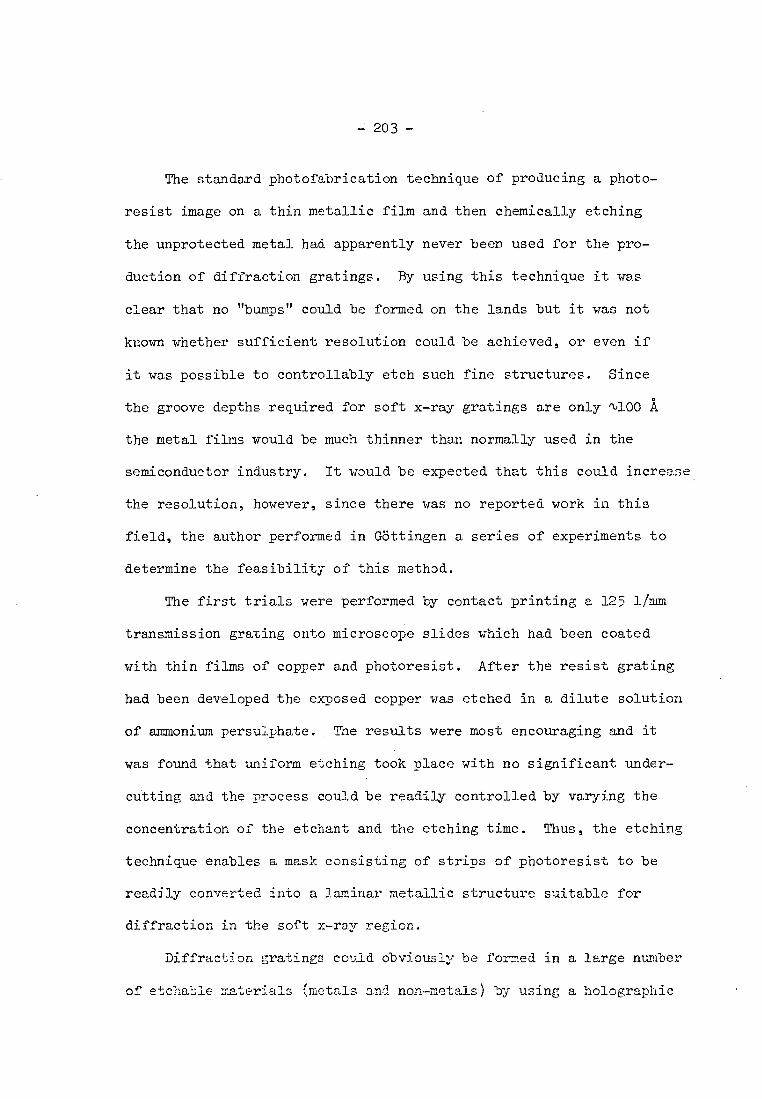
- 203 -
The standard photofabrication technique of producing a photo-
resist image on a thin metallic film and then chemically etching
the unprotected metal had apparently never been used for the pro-
duction of diffraction gratings. By using this technique it was
clear that no "bumps" could be formed on the lands but it was not
known whether sufficient resolution could be achieved, or even if
it was possible to controllably etch such fine structures. Since
the groove depths required for soft x-ray gratings are only 'l00 A
the metal films would be much thinner than normally used in the
semiconductor industry. It would be expected that this could increase,
the resolution, however, since there was no reported work in this
field, the author performed in Gottingen a series of experiments to
determine the feasibility of this method.
The first trials were performed by contact printing a 125 1/mm
transmission grating onto microscope slides which had been coated
with thin films of copper and photoresist. After the resist grating
had been developed the exposed copper was etched in a dilute solution
of ammonium persulphate. The results were most encouraging and it
was found that uniform etching took place with no significant under-
cutting and the process could be readily controlled by varying the
concentration of the etchant and the etching time. Thus, the etching
technique enables a mask consisting of strips of photoresist to be
readily converted into a laminar metallic structure suitable for
diffraction in the soft x-ray region.
Diffraction gratings could obviously be formed in a large number
of etchable materials (metals and non-metals) by using a holographic

- 904 -
mask. It is also evident that other methods besides chemical
etching, such as electrolytic etching and ionic bombardment, could
be used. However, it was essential to start somewhere and pursue
the method in order to discover any limitations. Copper was chosen
as the initial material in which to form the gratings for three
reasons. Firstly, thin copper films which adhered well to glass
could be readily produced by vacuum evaporation. Secondly, copper
can be etched easily in a number of dilute etchants without evolution
of gas. Thirdly, the photoresist was known to adhere well to cooper.
Silver, gold, platinum and magnesium fluoride were also considered
to be suitable materials for etching.
The next stage in the research programme was the production of
a series of 300 1/mm holographic gratings on plane optical blanks
by the etching technique. These gratings were immediately sent to
• London for profile measurements to be performed using the "Talystep"
at NPL Teddington and for subsequent soft x-ray efficiency measure-
ments to be performed at Imperial College. The results of the
Talystep measurements are shown in Fig. 71. It can be seen that the
required profile has been achieved. The efficiency measurements
confirmed the good profile because a maximum diffraction efficiency
in excess of 10% was measured in the first order at 45 A. By employing
the etching technique to fabricate laminar holographic soft x-ray gra-
tings, the efficiency was immediately increased by a factor of four.
Thus, it became possible to readily make holographic gratings which
had comparable efficiencies to the excellent NPL laminar x-ray gratings
which were made by ion etching from a mask produced by mechanical
ruling.
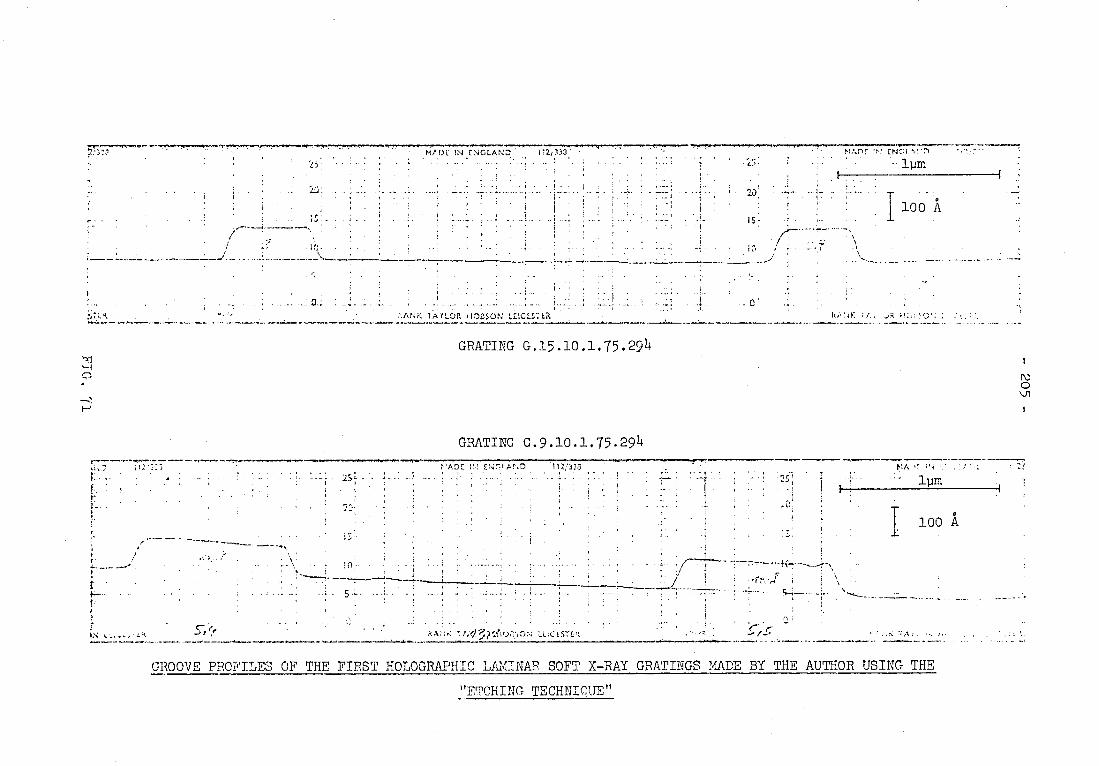
I loo A 15 :
tli.DE !N ENGLAND 172/733 • ..,..r.ear■••■■■•••••■■••••••••van.m...,,,,,,ww•••■••■•,,,
ENT.i 2:;: -
GRATING G.15.10.1.75.294
25
:
TAYLOR LEIGL.STO. .e '
lk;, :!•;
15
I 100 A
•
• -/ 1 • 'f r.r
0 ‘J1
is
GRATING G.9.10.1.75.294
• IN L_....,.... 51(e 1///??Ir..);•.' 0,4 'L .C.-STL 4
GROOVE PROFILES OF THE FIRST HOLOGRAPHIC LAMINAR SOFT X—RAY GRATINGS MADE BY THE AUTHOR USING THE
"ETCHING TECHNIQUE"
- 206-
In order to explore the process fully the author made a series
of 300 1/mm gratings with various groove depths and land to groove
ratios. Several 600 1/mm gratings were fabricated and a number of
1200 1/mm gratings were also made before the author had to return to
London. In total the author produced nearly forty high quality
diffraction gratings suitable for use in the soft x-ray region in a
period of two months. The number of gratings produced was primarily
limited by the availability of suitable optical blanks. Most of the
prototype gratings were made on plane blanks, however, a number of
gratings were made on 2m and 5m blanks and these gratings are already
being used in spectrographs to produce new spectroscopic data.
The efficiencies of all the gratings have been measured at 45 A
and some of the gratings have also been examined at 8.3 A. The results
of these examinations will be fully discussed in Chapter 7, however,
consistently high efficiencies have been measured for gratings pro-
duced by the etching technique. Typical maximum efficiency values at
45 A range from 18% for a 300 1/mm grating to about 8% for a 1200 1/mm
grating.
- 207 -
4.5 PREPARATION OF HOLOGRAPHIC GRATINGS BY THE "ETCHING TECHNIQUE"
The steps in the process used by the author to successfully
produce soft x-ray diffraction gratings will be briefly described in
this section.
The preparation of the grating blanks is the most important
stage in the production of a holographic grating using this technique.
It is essential that the substrate is free from molecular and parti-
culate contamination and that the substrate is also free from surface
defects. Freshly polished blanks require little cleaning apart from
degreasing using alcohol. More grossly contaminated blanks are
cleaned with hot detergents in an ultrasonic bath, and subsequently
rinsed in several changes of distilled water before final rinses in
alcohol. Contamination from dust particles is normally controlled
by using a "Class 100 clean-room environment" or better, however, in
G5ttingen Observatory the natural conditions are so favourable that
a "clean room" has been found unnecessary. The coating of the blanks
with copper is performed using thermal evaporation in a standard
vacuum coating plant with a source to substrate distance of about
20cm to ensure a uniform coating. The coating thickness and rate of
deposition are monitored using a quartz crystal. The blanks are
subjected to a glow discharge for five minutes to improve the adhesion
of the copper film. After the blanks have been coated with the re-
quired thickness of copper they are allowed to cool before being spin -
coated with photoresist. Although microelectronic grade photoresists
are filtered by the supplier the resist is filtered again by applying
it to the blank using a syringe with a 0.5pm filter. After coating
the blanks are placed in the interference room for 24 hours to thermally
- 208-
stabilise and to allow the resist to dry completely. Generally
photoresist films with thicknesses 2000 - 3000 E1 have been found
to be most suitable for this process.
The exposure would normally be controlled by using a light
integrator to measure the intensity in the interference field and to
terminate the exposure when the photoresist had received sufficient
energy. Since the photocell had aged the author was not able to
use this method and the correct exposure had to be determined by
trial. The optimum exposure time was usually obtained after three
or four trials and was generally about three minutes. No difficulty
was experienced with standing wave effects due to reflection from
the copper film but it was found that it was essential to keep the
mirrors of the optical system completely dust free to avoid stray
interference effects.
Development of the photoresist was performed in. concentrated
AZ Developer with a normal development time of about 30 seconds.
The rate of development was visually monitored by looking at the
diffraction from the grating and some latitude in the development
was introduced in this way. The action of the developer was
quenched by immersing the grating in flowing water. The trial
exposures were usually blown dry with filtered air after washing and
were inspected under a microscope to determine whether the exposure
was correct. . When the correct exposure had been determined after
washing the grating was etched for 30 seconds in 1% ammonium per-
sulphate solution to remove the exposed copper. The grating was then
washed thoroughly and the photoresist was dissolved with acetone.
The grating vas finally washed with alcohol and dried with filtered
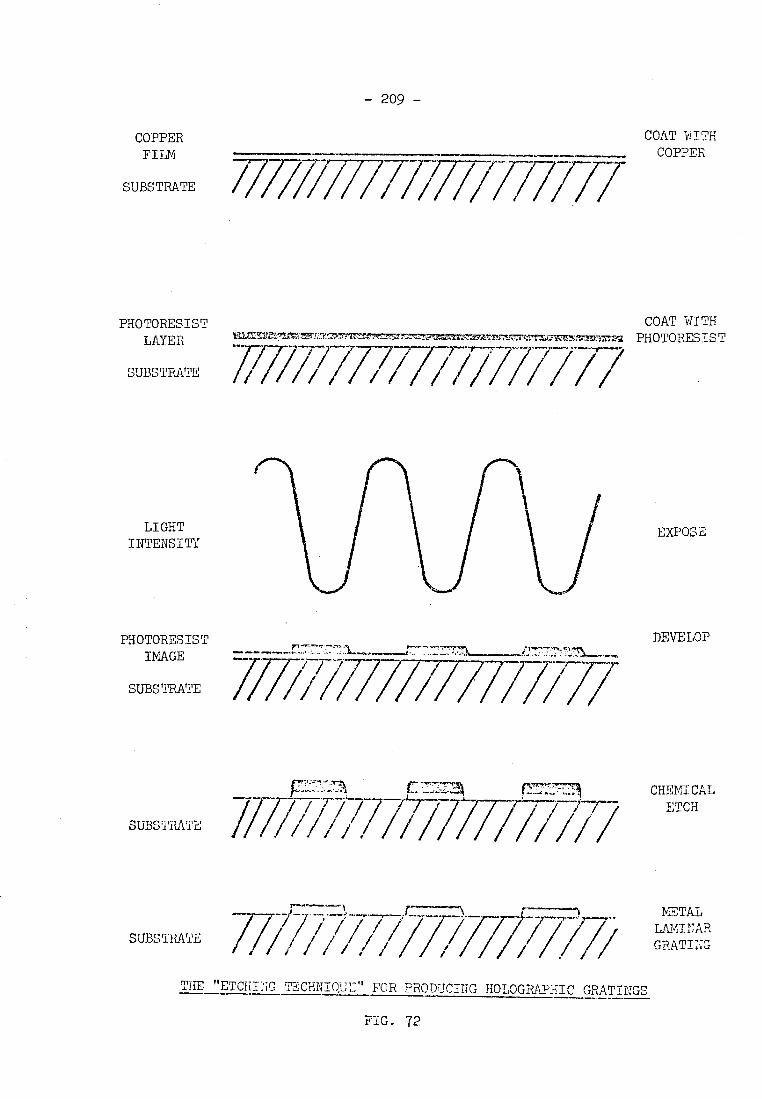
— 209 —
COPPER FILM
SUBSTRATE
COAT WITH COPPER
//////7777/7// /17/77
PHOTORESIST LAYER
SUBSTRATE
COAT WITH varocaln-v=m=m z4x11,7=n7zbx N -172=77.q PHOTORESIST
7771777777/118/
LIGHT INTENSITY
EXPOSE
PHOTORESIST IMAGE
SUBSTRATE
re.777
/7///7717777/2//177
DEVELOP
SUBSTRATE
CHEMICAL
77 —17; 7
ETCH
SUBSTRATE
METAL LAMINAR GRATING
THE "ETCHITG TECHNIQUE" FOR PRODUCING HOLOGRAPHIC GRATINGS
FIG. 72
- 210 -
air. The steps in the process are shown in Fig. 72.
Inspection of the grating was performed using light field and
dark field illumination in an optical microscope. It is possible
to measure the land to groove ratio of 300 1/mm and 600 1/mm gratings
with a measuring eyepiece and it is also possible for 1200 1/mm
gratings by using oil immersion. However, for gratings with fre-
quencies higher than 2000 1/mm the optical microscope is of little
use and the optimum exposure, development, and etch conditions cannot
be so readily determined. It would be possible to determine when
the correct profile had been achieved for high frequency gratings by
measuring the diffraction properties of the grating or by using
electron microscope examination. However, it is far more convenient
to make gratings with frequencies less than 2000 1/mm since examination
using an optical microscope is quick, simple and effective. If any
significant defects are detected, or the land to groove ratio is
unsuitable, the copper strips can be readily removed from the blank
by immersing it in the dilute etchant and the blank can be used again.
If there are no defects the grating consisting of strips of copper on
glass is overcoated with a layer of gold to enhance the reflectivity
and the production of the soft x-ray grating is completed.
- 211 -
4.6 FURTHER METHODS FOR THE PRODUCTION OF SOFT X-RAY GRATINGS
Theoretically it should be possible to obtain a higher diff-
raction efficiency from a grating with a sawtooth, or blazed, profile
than from a laminar grating. However, in the soft x-ray region it is
generally found experimentally that the diffraction efficiency is
lower for shallow blazed ruled gratings than for laminar gratings.
There are two main reasons for this: Firstly, the blaze angles
required in the soft x-ray region are generally small and must be
highly accurately controlled. Secondly, when a grating is ruled the
metal is not removed but is simply pushed outwards and forms uneven
ridges on either side of the groove. When a ruled blazed grating is
used at grazing incidence only the tips of the profile are illuminated
and it is this area over which there is least control during the
ruling process. For replica gratings where the profile is inverted
the situation is somewhat better, however, the technical difficulty
of obtaining small blaze angles and the random errors which inter-
ferometric control cannot remove limit the diffraction efficiency of
ruled blazed gratings in the soft x-ray region.
The limitations of the conventional ruling process have been
overcome in the NPL method for making laminar x-ray gratings asdes-
cribed by Franks et al (122). In this method a grating is lightly
ruled on an aluminium. coated blank, the grating is processed to form
an aluminium mask, and substrate is ion etched through the mask to
produce a grating with a rectangular profile in the vitreous silica
substrate. The lands and grooves of the NFL laminar gratings have
exceptionally high smoothness because of the "super-polishing" effect
of the ion etching process. These NPL gratings have been found to
- 212-
have excellent diffractive properties throughout the soft x-ray
region and even at wavelengths as short as 0.56 A (Agk). Since
the gratings are formed in the silica blanks they are very robust
and can be cleaned and recoated without significantly altering
their properties.
Laminar gratings have been made at NPL by using a grating
formed in photoresist as the starting point in a process similar
to that used for making an x-ray grating from a ruled master. The
gratings produced from the holographic masters have been found. to
be virtually indistinguishable from the best NPL ruled x-ray
gratings. The grooves were found to be well-defined and rectangular
and the smoothness of the surfaces and the edge straightness and
acuity were excellent (123, 124). Since it is generally quicker
and more convenient to produce holographic gratings than mechani-
cally ruled gratings, it is to be expected that most gratings for
use in the soft x-ray region will be made by processes involving
coherent photofabrication techniques. The holographic method will
enable gratings to be produced which have a more consistently high
performance and lower stray light levels than current ruled laminar
gratings and it will also be possible to make new types of diffrac-
tion gratings.
There are several methods for producing holographic gratings
with sawtooth profiles. The simplest method is that described by
Sheridon (11) in which the photoresist coated blank is placed at
an angle in the interference fringe system (see Fig. TR). The
blaze wavelength, kb, is determined by the distance between the
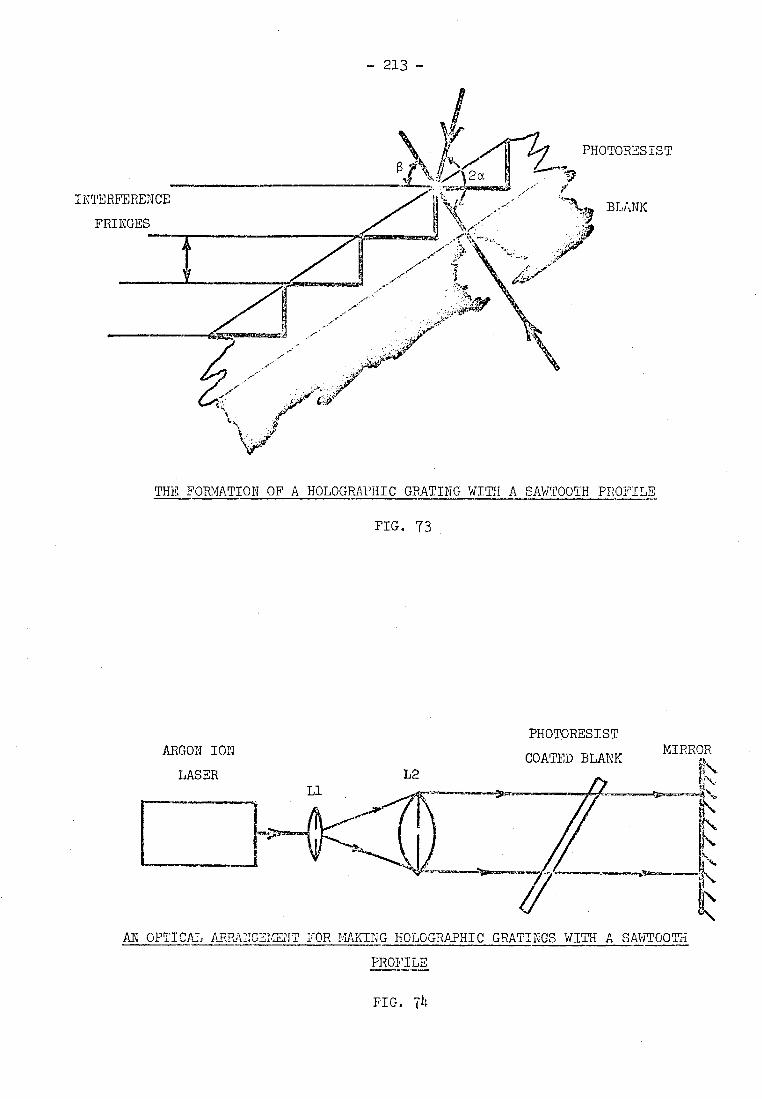
INTERFERENCE
FRINGES BLANK
L1
- 213 -
I \ PHOTORESIST
THE FORMATION OF A HOLOGRAPHIC GRATING WITH A SAWTOOTH PROFILE
FIG. 73
PHOTORESIST ARGON ION COATED BLANK
LASER
L2
MIRROR
AN OPTICAL ARPLANGEIUNT FOR MAKING HOLOGRAPHIC GRATINGS WITH A SAWTOOTH
PROFILE
FIG. 14

- 214-
interference fringes
Xo'
sina'
n sina'
where n is the refractive index of the photoresist. Nagata and
Kishi (725) have successfully made blazed diffraction gratings with
the optical system shown in Fig. 74. For this simple system the
grating spacing is given by
d = X0/2sinIP
where IP is the inclination of the blank to the mirror, the first
order blaze wavelength is given by
Xb = Xo/n
and the groove depth is given by
h = Vi-(kb/2d)2 . kb/2
They found that a good blazed profile was retained up to 2000 1/mm
and that it was possible to control the blaze wavelength and groove
depth to a certain extent by development. Hutley (19) at NPL has
also used similar methods for preparing blazed gratings for use in
the UV region.
It is clear that holographic gratings prepared in this way are
unsuitable for use in the soft x-ray region because the blaze angles
and groove depths are too large as a result of the laser wavelengths
which must be used. However, it has been discovered at NFL that it
is possible to transfer the sawtooth profile from a photoresist
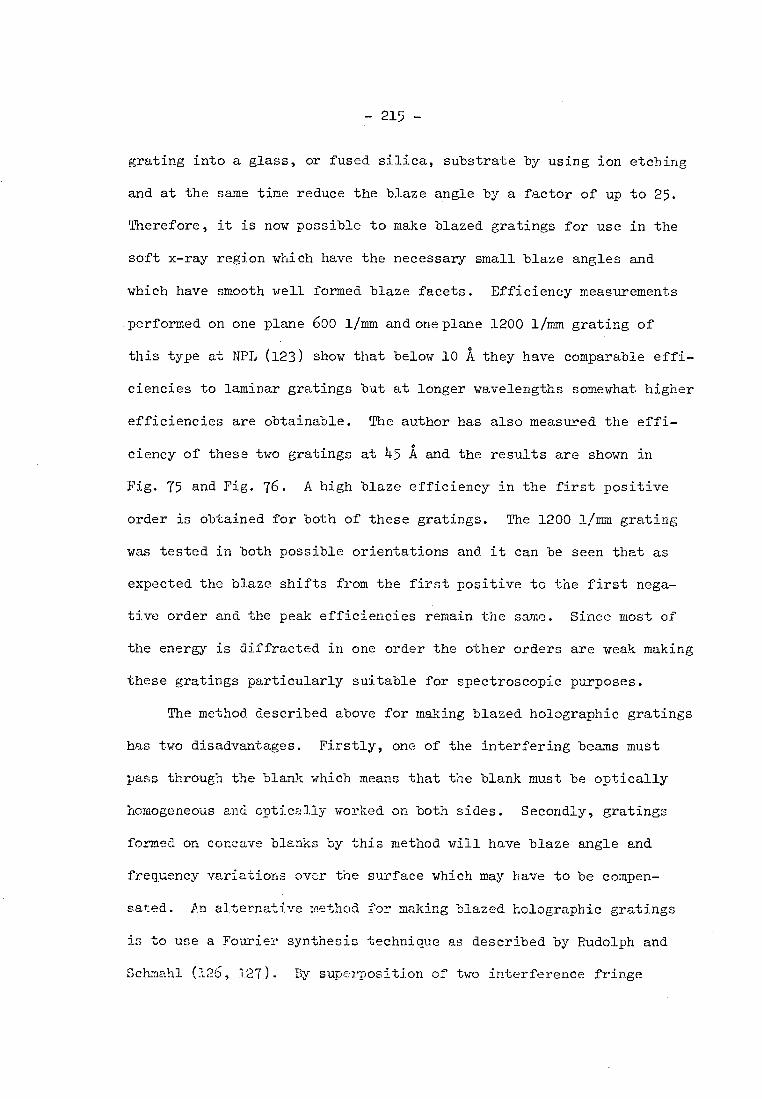
- 215 -
grating into a glass, or fused silica, substrate by using ion etching
and at the same time reduce the blaze angle by a factor of up to 25.
Therefore, it is now possible to make blazed gratings for use in the
soft x-ray region which have the necessary small blaze angles and
which have smooth well formed blaze facets. Efficiency measurements
performed on one plane 600 1/mm and one plane 1200 1/mm grating of
this type at NFL (123) show that below 10 A they have comparable effi-
ciencies to laminar gratings but at longer wavelengths somewhat higher
efficiencies are obtainable. The author has also measured the effi-
ciency of these two gratings at 1 5 A and the results are shown in
Fig. 75 and Fig. 76. A high blaze efficiency in the first positive
order is obtained for both of these gratings. The 1200 1/mm grating
was tested in both possible orientations and it can be seen that as
expected the blaze shifts from the first positive to the first nega-
tive order and the peak efficiencies remain the same. Since most of
the energy is diffracted in one order the other orders are weak making
these gratings particularly suitable for spectroscopic purposes.
The method described above for making blazed holographic gratings
has two disadvantages. Firstly, one of the interfering beams must
pass through the blank which means that the blank must be optically
homogeneous and optically worked on both sides. Secondly, gratings
formed on concave blanks by this method will have blaze angle and
frequency variations over the surface which may have to be compen-
sated. An alternative method for making blazed holographic gratings
is to use a Fourier synthesis technique as described by Rudolph and
Schmahl (126, 127). By superposition of two interference fringe
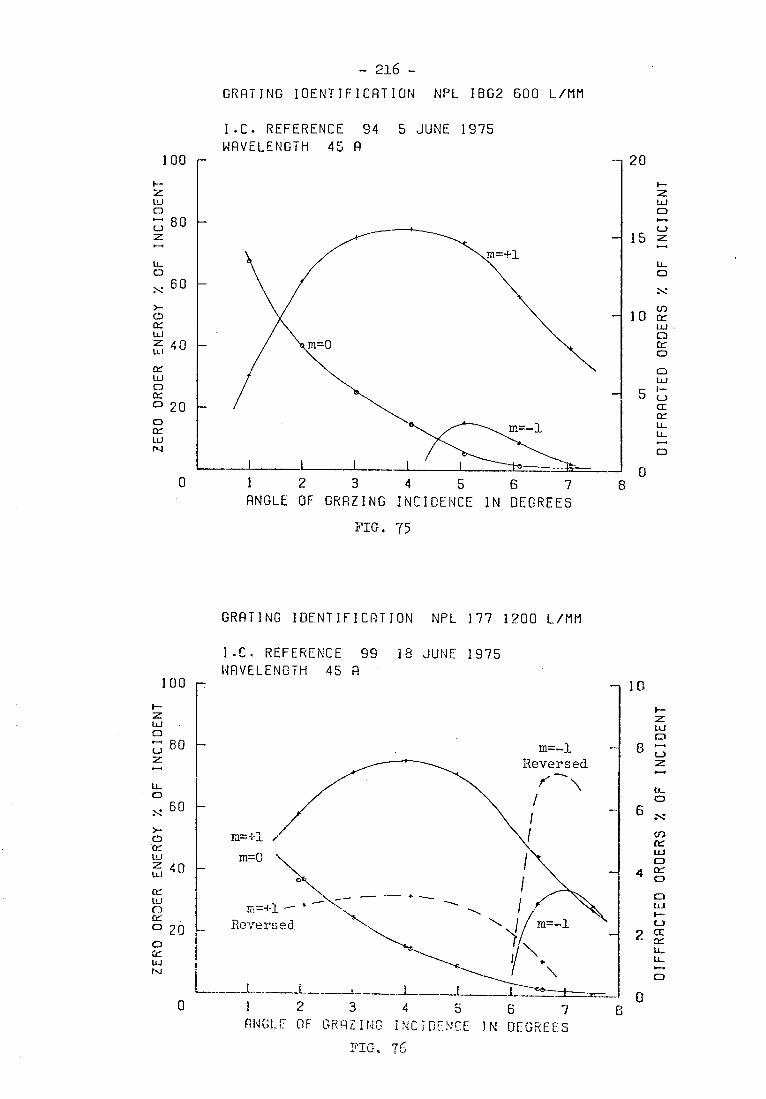
100 —
F-
13_1
E3 80 - m=-1 Reversed
U_
Cr
0
0 Cr
z
CrcD
° 20
CrO
tV
60
40
1-------------------, \
0 1 2 3 4 5 6 7 ANGLE OF GRHZING INCIDENCE IN DEGREES
FTG. 76
M=1-1 /
rt=4-1 — — Reversed
m=0
I
m=-1
- 216 -
GRATING IDENTIFICATION NPL 1802 600 L/MM
100
z
:3'60 z
tL
0
60
Cr 11J LT, 40
Cr
Cr
° 20
Cr UJ
I.C. REFERENCE 94 5 JUNE 1975
WAVELENGTH 45 R
20
m
15 0-4
U_ ID
10 Ct UD
U_I • CD Cr
CD U_I
5
Cr U- tL
CD
0 1 2 3 4 5 6 7
8
ANGLE OF GRAZING INCIDENCE IN DEGREES
FIG. 75
GRATING IDENTIFICATION NPL 177 1200 L/MM
I.C. REFERENCE 99 18 JUNE 1975
WAVELENGTH 45 A 10
z t. CD
8 t--■
•-•
(f_ O
6
U)
LU
4 CC
L.) 2 Cr
tL
O

- 217-
systems it is possible to obtain to a good approximation a sawtooth
profile. This method enables concave holographic gratings to be
produced with sawtooth profiles and uniform blaze over the whole
grating area. By subsequent processing of holographic gratings
produced in this way it is hoped to be able to produce high quality
gratings for soft x-ray spectroscopy with higher grating frequencies
and efficiencies than previously obtainable.
- 218-
CHAPTER 5
INSTRUMENTATION
5.1 GENERAL DESCRIPTION OF THE GRATING TEST APPARATUS
The grating test facility was originally designed by C. Green
and W. Waller in 1966 to 1969. In 1967 J. M. Bennett started working
on this project and in 1969 the original mechanical system was com-
pleted at A.W.R.E., Aldermaston, sponsored by UKAEA, Culham.
The original instrument as described by Bennett (30, pp 115-144)
was rather elaborate and incorporated many novel features. However,
it was found in practice that many of these features were definite
disadvantages. The electronic displacement transducers, limit switches
and remote controls have been removed because they caused electrical
noise problems. It was found that the mechanical stability of the
original system was insufficient for high precision measurements.
Hence, the optical axis of the apparatus was lowered and a modular
system was designed and constructed which allowed greatly increased
precision to be achieved.
In order to obtain accurate results from high frequency gratings
which usually have low efficiencies, it became evident that the sensi-
tivity of the apparatus would have to be increased. Although it was
possible to obtain measurements from the original apparatus which were
of great importance to grating users in deciding whether or nct a gra-
ting was suitable for a particular purpose, the original apparatus did
nct allow the maximum amount of useful information to be obtained. The
sensitivity of the system was increased by increasing the output of the
x-ray source, optimising the oPerating conditions of the detector and

- 219-
improving the signal to noise ratio.
Initially, data reduction was performed by hand, albeit with an
electronic calculator, and since for high accuracy high count rates
and long integration times had to be used, the production of a com-
plete grating calibration even at only one wavelength was a time-
consuming and laborious exercise. Therefore, it was evident that in
order to improve both accuracy and productivity a versatile computer
data processing system was essential. The Interdata 70 computer in
the Physics Department has been subsequently used for data reduction.
Hence, the grating test facility is now greatly improved and. we are
able to perform efficiency measurements faster and with more accuracy
than before.
The large vacuum chamber, which houses the tandem monochromator/
spectrometer, was constructed from welded aluminium alloy sections and
is 3.07 m long, 1.35m wide and 0.41 m high, with a volume of 1.7 m3.
Since the top and bottom of the chamber have areas of 4.14m2 atmospheric
pressure exerts some 40 tons when the chamber is evacuated which necessi-
tates a highly braced structure. Although the method of construction is
sufficiently rigid, the large number of welds in the chamber has caused
serious vacuum problems. Since the chamber is frequently evacuated, the
walls of the chamber flex causing microflaws, or porosity, in the welds
to be opened, producing small leaks. With perseverance and the use of
a leak-detector we managed to overcome the problems, and now we have a
Micromass 2 mass-spectrometer on the system which enables us to detect
and trace any leaks veal• quickly. The vacuum system is shown in Fig. Ti
A typical mass spectrum of the residual gases in the vacuum chamber
is shown in Fig. 78. The highest partial pressure is that of water
vapour, then nitrogen, oxygen., C07, and residuals from the rotary pump
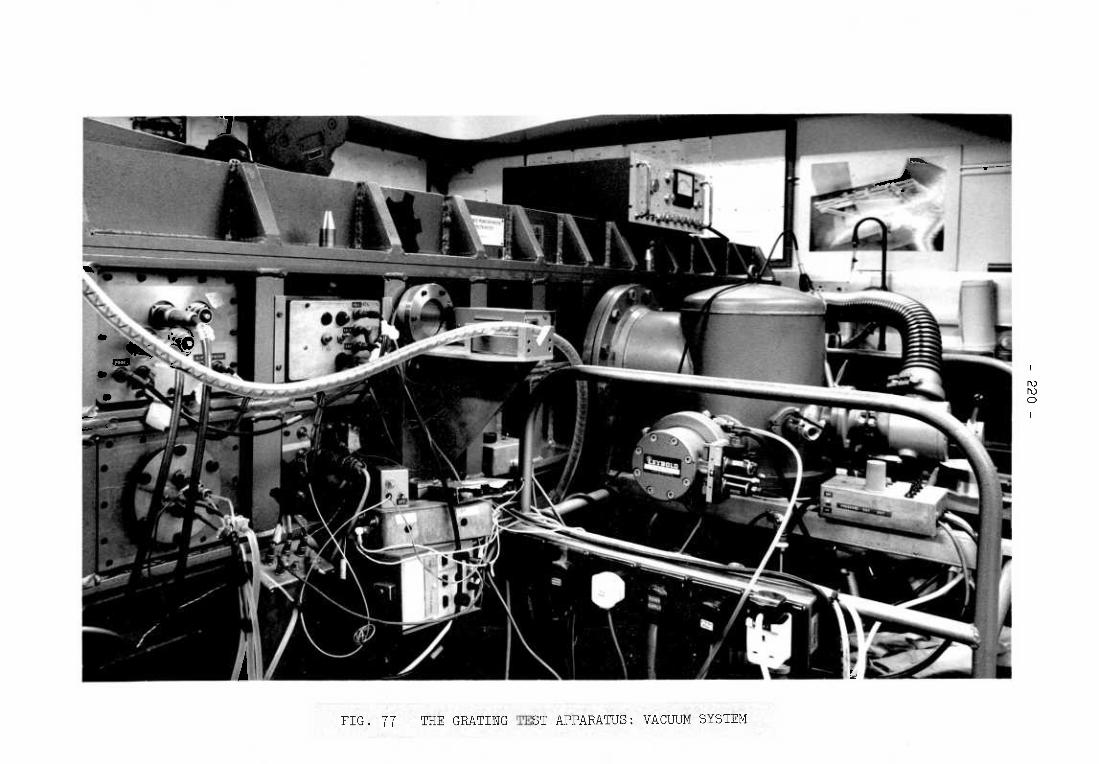
FIG. 77 THE GRATING IEST APPARATUS: VACUUM SYSTEM
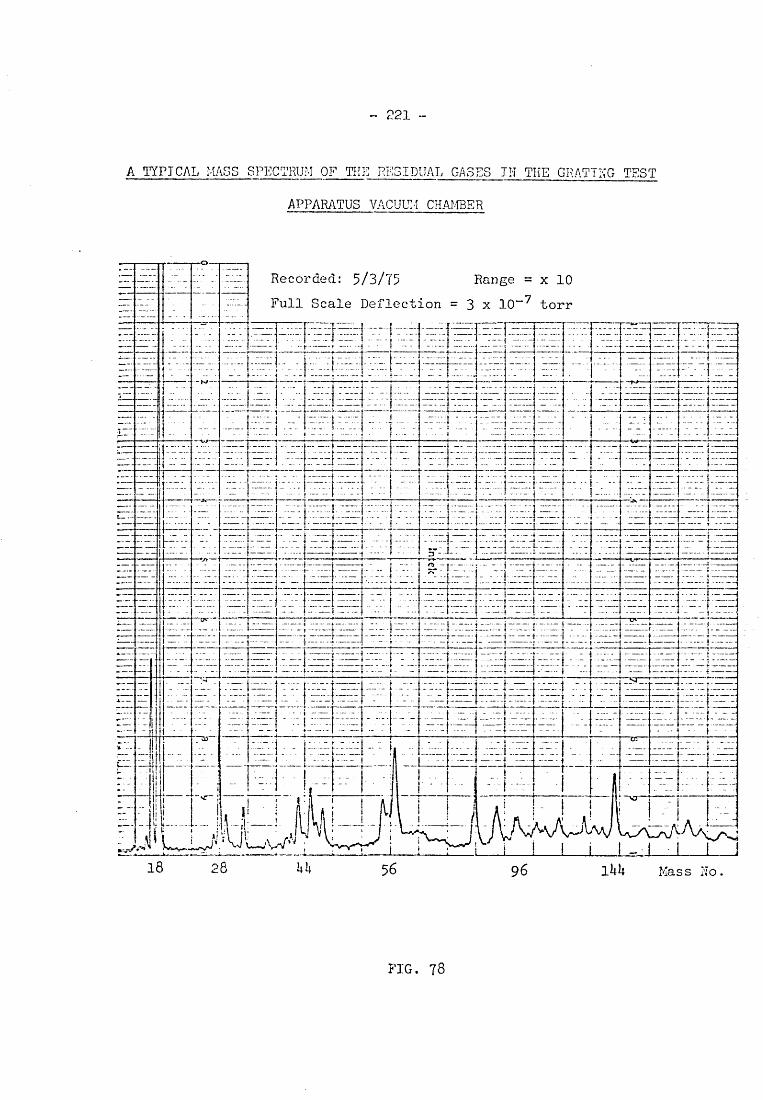
- 221 .-
A 'Il'fPICJ\L 1·11\88 SPEC~lHU?-1 .9F THE RESIDUAL Gf1SES IN THE GH.ti.Tl:';G TEST
APPARATUS VACUU:·! CHAt1BER
F'rG. 78

- 222-
oil and diffusion pump silicone oil. The most significant of these
gases from the point of view of contamination in an x-ray source are
water vapour and rotary pump oil. Fortunately these are pumped ex-
tremely well by liquid nitrogen cold-fingers. Hence, two cold-fingers
are used in the chamber; one of which is closeable and is used to
remove water vapour during the initial pump-down; the second is larger
and is used to reduce the ultimate pressure when operating the system
to approximately 10-6 torr.
The geometry of the grating test apparatus is shown in Fig. 79.
The system consists basically of a long optical bench made from two
ground stainless steel rods along which moves a second shorter optical
bench orientated perpendicular to the first. These two optical benches
define the X and Y directions along which the detector carriage is moved
by two associated precision lead-screws. The displacement of the
carriage is measured using counters to measure the rotation of the
lead-screws. There are two further lead-screws running down the centre
of the main optical bench which are normally used to move the grating
carriage in the X-direction and vary the angle of the grating respec-
tively but can also be used to move the source in the X-direction.
On this framework any desired system can rapidly be built up from a
number of components.
The central component is the carriage for the grating under test.
This consists of a slide which rotates about a precision pivot, located
centrally in a long L-shaped carriage which can be moved along the main
optical bench by a lead-screw. The slide is operated. by an electric
motor driving a cam and enables the grating under test to b retracted
from the incident x-ray beam and returned to its original position.

WOMNIARAA aaaaaaaaaaa aaaaaaaa
R) ry (A)
FIG. 79 THE GRATING TEST APPARATUS: OPTICAL SYSTEM
- 2211 -
The test grating is held in a readily interchangeable holder using
three point kinematic location. When concave gratings are tested
shims are placed under the locating pads so that the pole of the
grating is brought into the plane of the front of the grating holder.
When the grating is brought into the x-ray beam the front of the
grating holder contacts the centre of the pivot thus ensuring that
the pole of the grating lies over the pivot point. The slide and
grating holder are caused to rotate about the pivot via a mechanical
linkage connected to a small carriage driven by the lead-screw at the
end of the optical bench. This system enables angles to be set re-
produceably to better than 0.10 over a range of 200 and also enables
the source to grating distance to be varied without changing the angle
of incidence and without moving the x-ray source. Should. higher
precision angle settings be required, it is an easy matter to increase
the length of the lever arms. Similarly, should it ba desired to move
the source in the X-direction, the lead-screw can be coupled to the
source carriage and angle variation can be achieved by moving the
grating carriage in the X-direction.
The detector carriage is coupled to the grating carriage by a rod
pivoted above the pole of the .grating so that the detector always points
towards the grating. The detector is housed in a rectangular box which
is pivoted at one end and runs on ball races which allow it to rotate
freely on the carriage which is driven in the Y-direction by a lead-
screw. The entrance slit to the detector is located over the pivot
point and behind the slit the windowless Bendix M-310 MEM photomulti-
plier is mounted on a pivot so that the angle of incidence of the x-rays
- 225-
onto the cathode can be optimised. Also mounted in the detector
housing is a preamplifier for the Bendix Photomultiplier.
In order to limit the radiation falling on the grating to only
the ruled area of the grating or even a smaller area of interest, a
remotely-controlled motorised slit assembly is placed on a carriage
close to the grating. If a concave grating is being tested the next
components will be a slit and filter assembly the appropriate distance
from the pole of the grating and then the x-ray source. For testing
plane gratings an elliptical mirror is normally used and the mirror,
slit, and source are all mounted in the correct positions on a sepa-
rate carriage. When high performance gratings are being tested, the
x-ray source is replaced by a monochremator section coupled to the
x-ray tube.
The modular system outlined above permits great versatility
coupled with high precision. For example, in order to observe the
imaging properties of toroidal gratings the detector assembly was
removed and a Plate holder and shutter assembly were put in its place.
The Y lead-screw was used in this case to move the plate across behind
the shutter so that several exposures could be made on one plate.
Hence, it is envisaged that the versatility of this instrument will
enable it to cope with all possible developments in the field of
x-ray gratings.
-226-
5.2 THE X-RAY SOURCES
Much of the early work I performed in the laboratory was
directed towards producing an ideal x-ray source for use in the
grating test apparatus. Unfortunately such an ideal source does
not exist and a compromise solution has been found.
The CKu 45 A source
This source is shown in Fig. 80 and is a modified version
of the one which was originally employed in the grating test appa-
ratus when it was first commissioned in 1970.
The first modification was required because it was found that
the porosity of the PTFE tubing used to carry water to the anode of
the x-ray source was allowing water to seep into the vacuum chamber
considerably increasing the water partial pressure in the chamber.
This problem was solved by encasing the PTFE in a stainless steel
tube and using an insulator cast from epoxy resin to seal the tube
at the anode end.
The second modification was to reduce the contamination of the
target with barium emitted from the barium coated cathode. This was
achieved by allowing the graphite target to reach an elevated tempera-
ture by reducing conduction heat loss. In this way the anode remains
clean for long periods of time and an ample supply of photons are
produced with an anode current of typically 5 mA and a voltage of
1.5 KV.
By using the monochromator section and monitoring the intensity
in the 45 A monochromatised beam with a channeltron and employing the
x-ray tube power supply servo system, we have an exceptionally stable
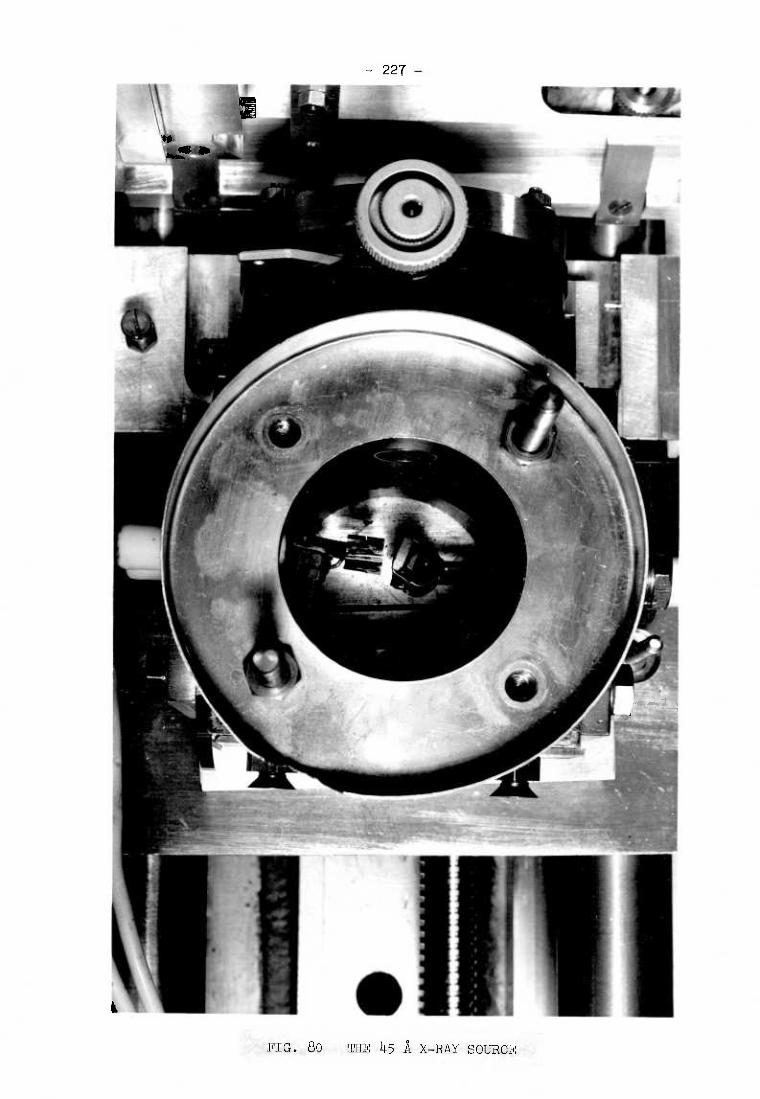
- 227 -
FIG. 80 THE )4 5 A X-RAY SOURCE
- 228 -
monochromatic x-ray source which gives a constant intensity output
over long periods of time, i.e. several hours. This system would
seem to be ideal for a number of interesting experiments besides the
current investigation of the properties of diffraction gratings.
The Henke Type Source (used mainly for 8.3 A AlKa)
This x-ray source is considerably more complex than that used
for CK radiation and can be seen from Fig. 81.
The design is based on that due to Henke and its most important
features are the use of a tungsten filament in a configuration which
hides it from the emitting areas of the target so that they are not
contaminated with tungsten and the use of an ion pump and gate value
which enables the x-ray source to be pumped to a lower pressure than
that in the rest of the chamber. These features enable a high x-ray
output with little contamination. The near ultra-high vacuum in this
x-ray source means that anode materials which would normally become ra-
pidly contaminated can be employed. Although this source can be used
with any anode material, we have found it most useful at 8.3 A AlKa
where oxide contamination of the anode can be a serious problem.
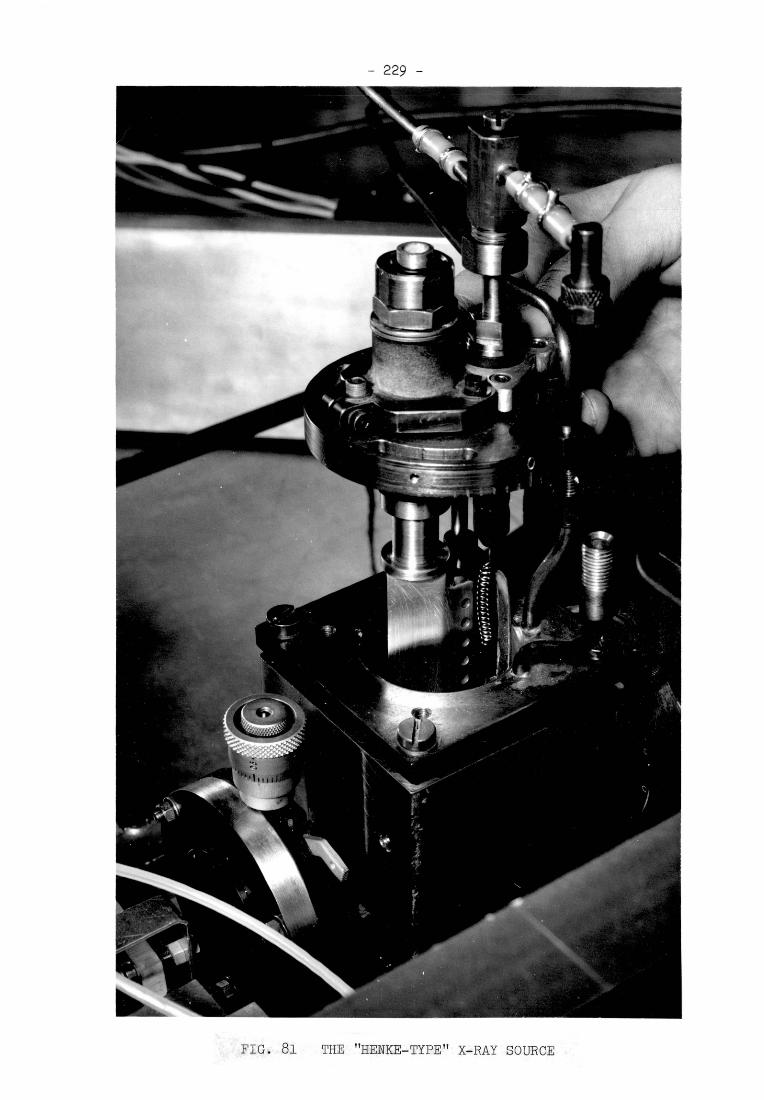
- 229 -
FIG. 81 THE "HENKE-TYPE" X-RAY SOURCE
- 230 -
5.3 EXPERIMENTAL METHOD
Alignment
The optical axis is defined by a He-Ne laser beam which is set
to be in the middle of the two rails which form the main optical bench.
By positioning the laser at either end of the bench alternately and
moving a reversible alignment aperture along the rails the laser can
be set accurately along the centre line of the bench. The pivot point
for the grating holder is next set on the optical axis by adjusting the
supporting pads.
With the laser in the source position the beam is sent onto a
plane blank in the grating holder and is reflected off the blank to
pass through the correctly positioned detector slit and onto the de-
tector photocathode. The blank is rotated and the detector simultane-
ously scanned and the position of the laser spot on the photocathode
is checked to be approximately half way along its length.
The laser is next placed at the detector end of the optical bench
and the entrance slit is positioned the correct distance away from the
pole of the grating. The slit is set on the optical axis and vertical
using a plumb-line and microscope .objective to project an image of the
slit. The moveable slits are placed as near to the grating under test
as possible and are also checked to be vertical by projecting their
image using a microscope objective. The source is positioned behind
the entrance slit so that the laser beam hits the centre of the anode.
This simple alignment method has been found to be completely ade-
auate for all purrosos and relies on the accurate kinematic location of
the grating and metrology rather than the multiple adjustments which
were provided on the original apparatus.
- 231-
Plane Gratings
There are two possible modes of operation:
1. The source is placed a large distance (typically 50 cm)
from the grating under test to illuminate the grating with a slightly
divergent beam. A slit with a width of 400pm is placed very close
to the anode in the x-ray source. When using a graphite anode a
2.2pm polypropylene filter is also mounted on the source to partially
monochroraate the radiation and prevent ions escaping into the chamber.
When using an aluminium anode a 5pm aluminium filter is used on the
source.
In this way a very uniform intensity distribution is obtainable
as observed in the direct beam. The radiation distributions in the
zero order and diffracted orders show the variations of reflectivity
and diffraction efficiency over the surface of the grating.
This method is particularly suitable for gratings showing high
diffraction efficiencies at angles of a few degrees. At small angles
of incidence the small but finite divergence of the beam cannot be
neglected and t'he variation in efficiency with angle of incidence must
be considered when interpreting the intensity distribution from the
grating as a map of its surface properties.
2. A convergent beam of radiation is produced by means of an
elliptical collimator mirror. Originally a cylindrical mirror was used
in the system to obtain separated focussed orders when testing plane
gratings. The mirror system has two main advantages: Firstly, the count
rates are increased and the peaks are narrower, and secondly, partial
monechromatisation of reflected beam is obtained by utilising the short
- 232 -
wavelength cut-off of the mirror which is determined by the coating
on the mirror and the angle of incidence. At 45 A there is very little
difference between the reflectivity of a gold-coated or glass mirror.
However, at 8.3 A there is a large difference, e.g. the reflectivity
of the glass surface has become =1% at 2° whereas that of the gold-
coated surface is =45%. Hence, at 45 A a glass elliptical mirror should
be used to enhance the short wavelength cut-off. At 8.3 A and 114 A
the significantly higher reflectivity of gold-coated surfaces means
that a gold-•coated elliptical mirror should be used.
The elliptical mirror is set up with the source slit at one of the
foci 4.6 cm from the end of the elliptical mirror; the radiation then
converges to the second focus near the detector plane. The grating is
positioned in the convergent beam close to the elliptical mirror,
(see Fig.82).
Spherical Gratings
When examining spherical gratings the source slit and detector slit
are positioned nominally according to the Rowland circle geometry. The
detector could be scanned along the Rowland circle by simultaneously
incrementing the detector X and Y coordinates. Since it is the absolute
efficiency of the grating which is measured it is unnecessary for the
detector to be scanned along the Rowland circle. Instead the detector
is simply traversed in the I-direction to record the data which is sub-
seouently numerically corrected for the vertical divergence of the
x-ray beam.
Because very few gratings are ruled over their entire surface,
when performing grating efficiency measurements it is essential to mask
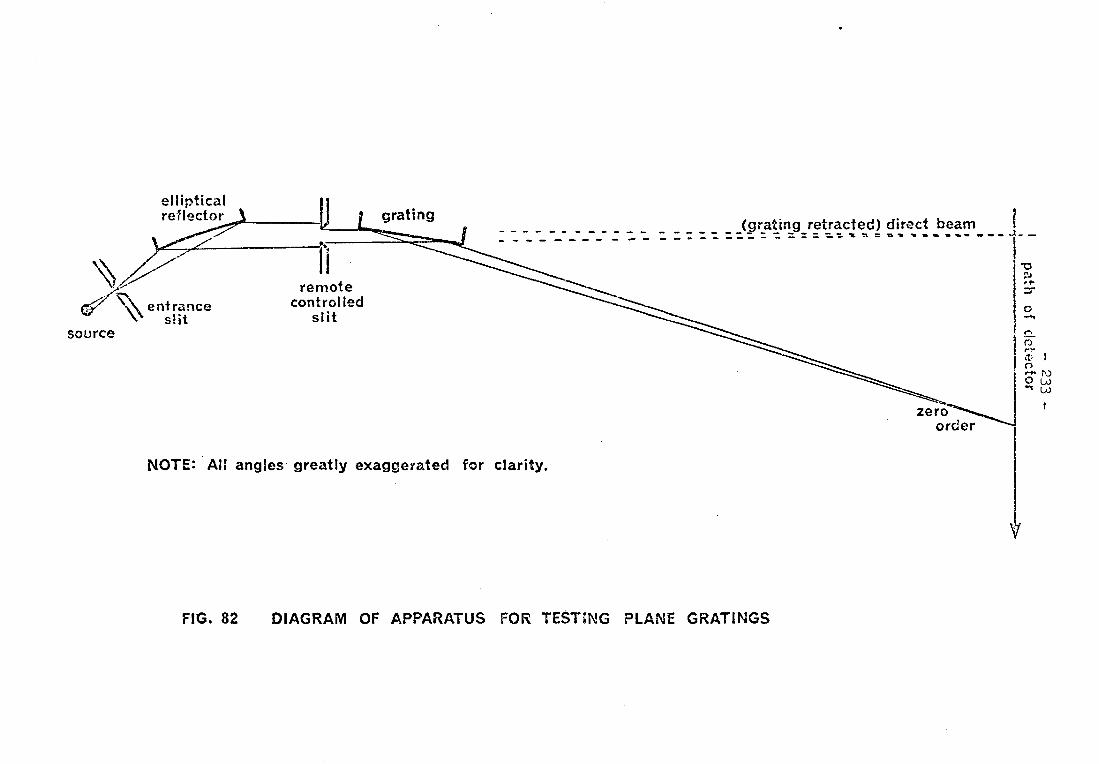
remote controlled
slit
(grating retracted) direct beam . - - ..... _
elliptical reflector grating
zero order
NOTE: All angles greatly exaggerated for clarity.
Nkl \\, entrance
slit source
FIG. 82 DIAGRAM OF APPARATUS FOR TESTMG PLANE GRATINGS
- 2311 -
the unruled area of the grating otherwise the zero order efficiency
would be enhanced and the diffraction efficiency reduced. In the
grating test apparatus the masking is performed by the remotely-
controlled motorised slit assembly adjacent to the test grating.
For spherical gratings the setting of the slits is achieved by moni-
toring a strong focussed diffracted order and closing the slits
until the count rate is reduced by 5% by each slit jaw. This method
ensures that the grating is adequately masked and enables accurate
data to be obtained from gratings which have uniform diffraction
properties. If the gratings are not homogeneous, or have low diff-
raction efficiencies, it can be difficult to set the movable slits
accurately, however, in such cases the highest accuracy is not
required.
After the grating has been masked it has been found that it
is generally advantageous to record the data under slightly defocussed
conditions. This has the combined effect of reducing the peak count
rates and broadening the peaks so that detector and statistical
errors are reduced and it is possible to obtain information about
efficiency variations over the surface of the grating.
Data Acquisiticn
Initial adjustments to the geometry of the system are made by
manually rotating the lead-screws associated with the components of
the system. All the adjustments can be performed with the chamber
evacuated since the lead-screws are fitted with Wilson seals. After
the mechanical adjustments have been completed and the operating
conditions of the x-ray source have been optimised, data acauisition
becomes a fully automated operation. A block diagram of the data

1 I NTER DATA 70 i
COMPUTER
PULSE SHAPING
AMPLIFIER
RECORDER RATEMETER
DETECTOR
PRE-AMPLIFIER
SCALER
PRINTOUT
CONTROL
PAPER TAPE I
FIG. 83
STEPPING MOTOR
CONTROL
STEPPING
MOTOR
- 235 -
DATA ACQUISITION
SYSTEM
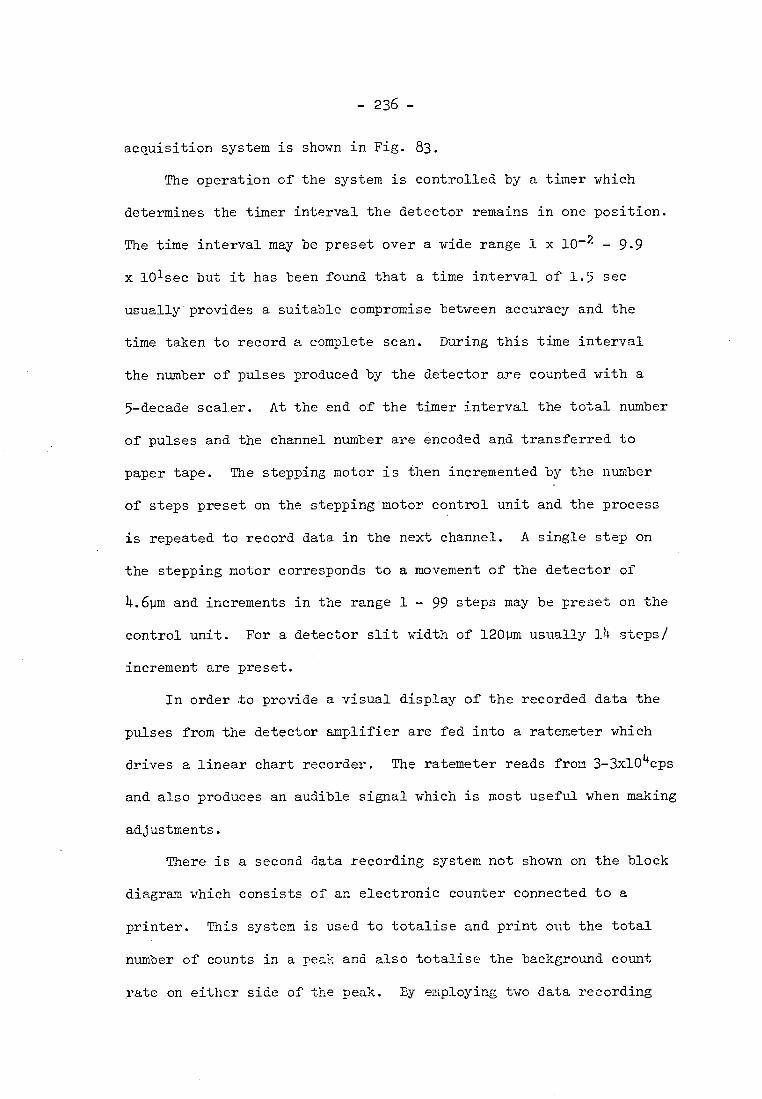
- 236 -
acquisition system is shown in Fig. 83.
The operation of the system is controlled by a timer which
determines the timer interval the detector remains in one position.
The time interval may be preset over a wide range 1 x 10⁻² - 9.9
x 101sec but it has been found that a time interval of 1.5 sec
usually provides a suitable compromise between accuracy and the
time taken to record a complete scan. During this time interval
the number of pulses produced by the detector are counted with a
5-decade scaler. At the end of the timer interval the total number
of pulses and the channel number are encoded and transferred to
paper tape. The stepping motor is then incremented by the number
of steps preset on the stepping motor control unit and the process
is repeated to record data in the next channel. A single step on
the stepping motor corresponds to a movement of the detector of
4.6pm and increments in the range 1 - 99 steps may be preset on the
control unit. For a detector slit width of 120pm usually 14 steps/
increment are preset.
In order to provide a visual display of the recorded data the
pulses from the detector amplifier are fed into a ratemeter which
drives a linear chart recorder. The ratemeter reads from 3-3x10⁴cps
and also produces an audible signal which is most useful when making
adjustments.
There is a second data recording system not shown on the block
diagram which consists of an electronic counter connected to a
printer. This system is used to totalise and print out the total
number of counts in a pea:: and also totalise the background count
rate on either side of the peak. By employing two data recording

-237--
systems reliability and versatility are considerably increased.
The counter and printer are satisfactory for rapdily obtaining
numerical data, however, the paper tape system allows more
information to be recorded in a form suitable for subsequent
data processing.
Fig. 8l shows a general view of the control console of the
soft x-ray grating test facility. On the left are the pressure
gauges for the vacuum system. In the centre, in front of the
author, are the main control systems with the universal counter
below and above are the printer and ratemeter. The paper tape
punch is located on the top right-hand side of the console and on
the extreme right of the picture the 100mA 10kV power supply for
the x-ray source can be seen.
The most significant improvement in the grating test facility
apart from the technical advances has been the development of a
comprehensive computer data processing system. A block diagram of
the system is shown in. Fig. 85. The Interdata 70 computer in the
Physics Department is used for routine data evaluation and enables
the absolute efficiency results for a complete grating examination
at one wavelength to be calculated in a few minutes. The large
computers in Imperial College Computer Centre are used to write the
data on magnetic tape, evaluate the data, and produce hardcopies on
microfilm of the spectra and plot the absolute efficiency curves
from the evaluated data. The data processing system has made the
routine examination of x-ray gratings much easier and has also faci-
litated the storage and retrieval of the experimental data.
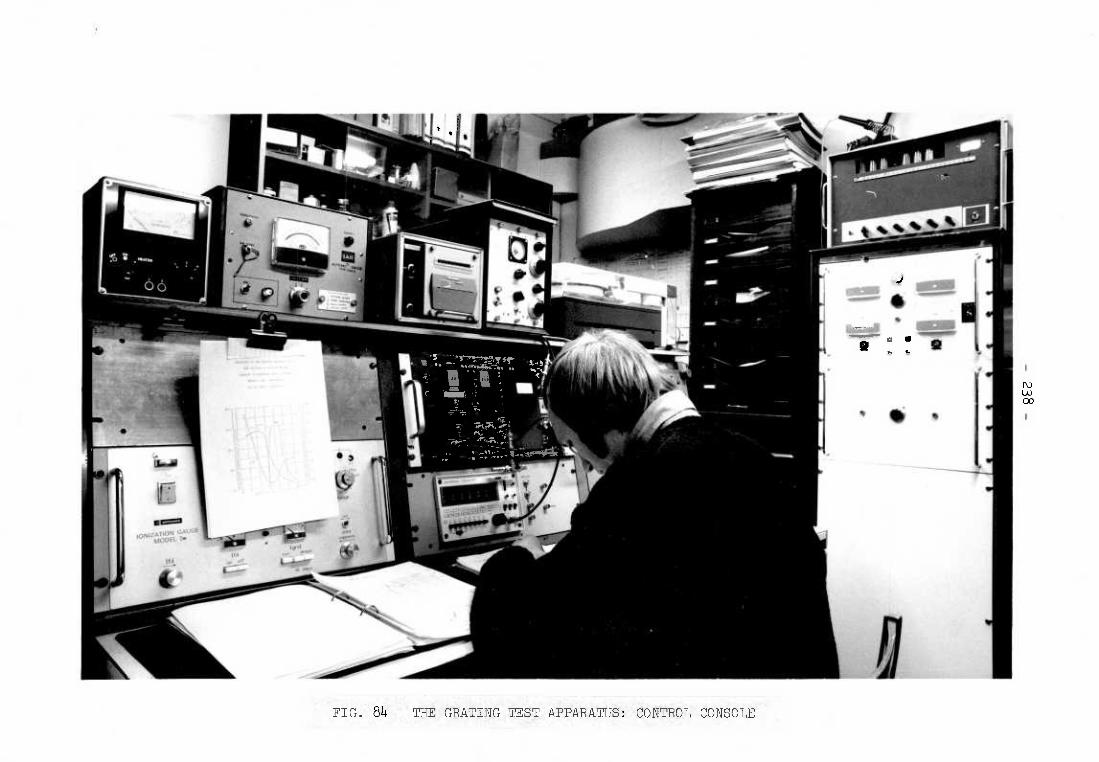
FIG. 84 THE GRATING TEST APPARATUS: CONTROL CONSOLE

-239-
COMPUTER PROCESSING
OF DATA
PAPER TAPE
INMRDATA 70
INTEGRATION OF PEAKS
BACKGROUND SUBTRACTION
OUTPUT
ABSOLUTE EFFICIENCY
RESULTS
IC COMPUTER CENTRE
cpc.6400
MICROFILM
OUTPUT
LOGARITHMIC ABSOLUTE EFFICIENCY
PRESENTATION CURVES PLOTTED AGAINST
OF SPECTRA GRAZING ANGLE
FIG. 85

-21+0-
Considerable effort has been expended in developing the soft
x-ray grating test facility at Imperial College. The size of the
vacuum chamber means that most gratings for use in the soft x-ray
region can be readily accommodated and the design of the apparatus
is such that high measuring accuracy can be attained. Since the
optical system is of modular design it is possible to rapidly set
up any required system and the apparatus can be easily used to
perform other experiments in the soft x-ray region. The improvements
to the apparatus and the data processing system have made it possible
to perform a complete soft x-ray grating examination at one wave-
length in one day. The data obtained from grating efficiency
measurements in the soft x-ray region has been largely responsible
for the rapid increase in the performance of soft x-ray gratings.
It is to be hoped that this trend continues in the future and that
grating users in the soft x-ray region will employ calibrated
gratings in order to gain the best advantages from the improved
diffractive properties of the new generation of x-ray diffraction
gratings.

-24+1-
CHAPTER 6
THE REFLECTION OF SOFT X-RAYS
6.1 PREVIOUS WORK AND GENERAL CONSIDERATIONS
Since the refractive index of all materials is slightly less
than unity in most of the x-ray region, x-rays incident upon a sur-
face at small angles of grazing incidence will be totally externally
reflected. Hence, it is possible to produce x-ray images by using
catoptric systems. Although a knowledge of the optical constants
and reflectivity of various materials is fundamental to the design
of optical systems for use in the soft x-ray region, there is still
a lack of accurate experimental data in this wavelength region.
The reflectivity of quartz at 45 A was reported by Dershem and
Schein (22), and Schon (23) also obtained data on a few substances
at wavelengths from 3 to 13 A. A complete list of these early works
was given by Compton and Allison (24), and more recently by Henke
and Dumond (25). Most of these experimenters, and also more recently
Groth (26), who measured the reflectivity of glass, gold and silver
films at about 9 A, used photographic recording and obtained the
intensities by photometry. A considerable gain in accuracy can be
achieved by employing photon-counting technioues as used by Hendrick
(27). Experimental data was obtained by Hendrick for glass, magnesium,
aluminium, copper, silver and gold surfaces using aluminium-K radiation
monoehromatised with a 15pm aluminium foil. The samples were medium
quality army-surplus optical windows from which the antireflection
coatings had been dissolved and were therefore not particularly smooth.
However, the samples were coated "in situ" in the reflectivity meau-
ring apparatus which avoided exposure of the ,,amples co air. The
- 242-
apparatus used by Hendrick did not allow the sample to be withdrawn
so that the direct beam could not be measured accurately in order
to normalise the reflectance curves. Instead it was assumed that
the reflectance approached unity at zero angle of grazing incidence.
Despite these criticisms, Hendrick's data remains the most compre-
hensive at 8.3 A. Wuerker (28) used Hendrick's apparatus to measure
the reflectance of polished quartz, glass, gold and aluminium films
at 45 A. Measurements were performed at Stanford by Johnson (28)
with beryllium -K (114 A) x-rays on aluminium, gold and quartz re-
flectors using a larger system which enabled the reflector to be
retracted to let the direct beam pass. In the above works filters
were used to partially monochromate the incident radiation.
In Britain Stewardson and Underwood (29) measured the reflecti-
vity of polished pyrex glass and stainless steel at a number of
wavelengths in the region 5 - 16 A, using a mica crystal monochroma-
tor. They came to the important conclusion that it is not possible
to predict accurately the efficiency of x-ray reflection of a material
at a given angle of incidence because real surfaces have a variable
degree of roughness which is dependant upon the method of preparation
and the extent of contamination. There is also an electron density
gradient at the surface which affects the reflectivity and can on2y
be determined, at present, by experiments on x-ray reflection. Thus,
they concluded, we must rely on experimental and semi-empirical re-
flection data when designing systems using x-ray mirrors.
Bennett (30) has measured the reflectivity of a "spectrosil"
blank coated with approximately 300 A of gold at 45 A (CKa) and
8. 3 A (Al Ka " Summaries of all the results are shown in Fig. 86 and 87. -
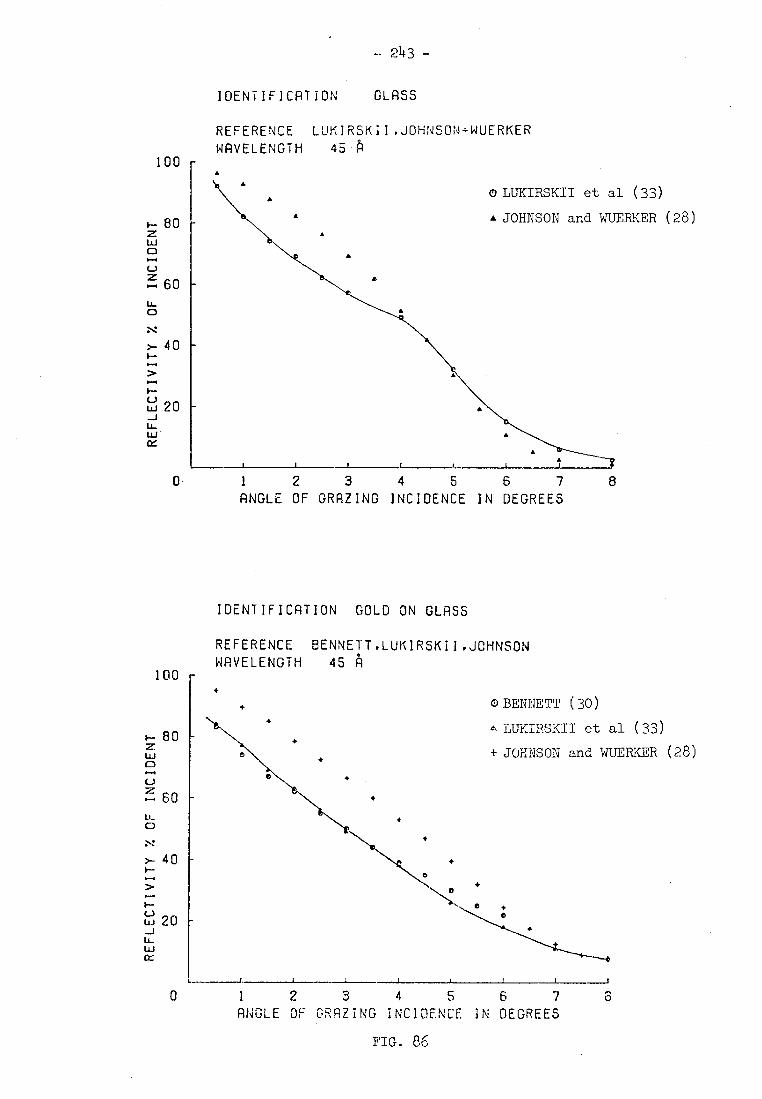
1-80 z
Z.... 60
O
40
220
4
•
•
- 243 -
100
1-80
IDENTIFICATION GLASS
REFERENCE LUKIRSKII.JOHNSON+WUERKER WAVELENGTH 45 - A
•
O LUKIRSKII et al (33)
• A JOHNSON and WUERKER (28) •
60
LL. O
40
20
0 1 2 3 4 5 6 7
ANGLE OF GRAZING INCIDENCE IN DEGREES
IDENTIFICATION GOLD ON GLASS
REFERENCE 8ENNETT.LUKIRSKII.JOHNSON
WAVELENGTH 45 A 100
O BENNETT (30)
A LUHIRSHIT et al (33)
+ JOHNSON and WUERKER (28)
0 1 2 3 4 5 6 7 3 ANGLE OF GRAZING INCIDENCE IN DEGREES
FIG. 86
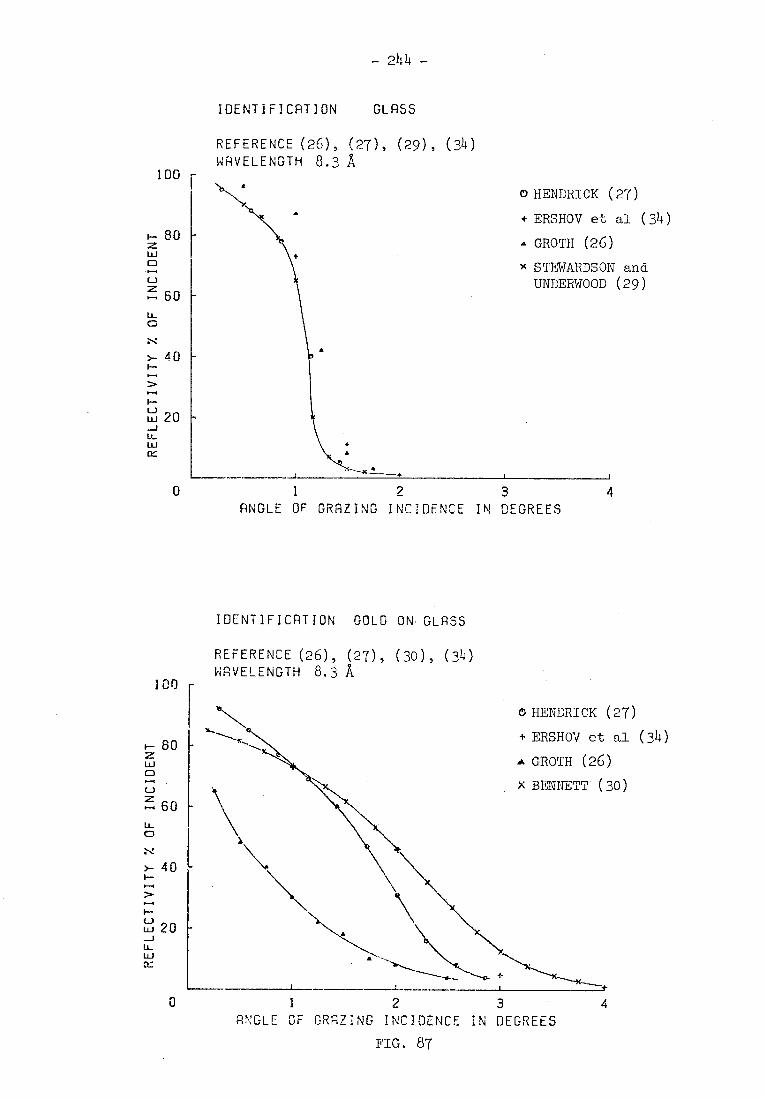
REFERENCE (26), (27), (30), (34) WAVELENGTH 8.3 A
O HENDRICK (27)
+ ERSHOV et al (34)
A GROTH (26)
• BENNETT- (30)
I
- 244 -
IDENTIFICATION GLASS
REFERENCE (26), (27), (29), (34) WAVELENGTH 8.3 A
100 o HENDRICK (27)
+ ERSHOV et al (34)
A GROTH (26)
• STEWARDSON and UNDERWOOD (29)
1 2 3
4 ANGLE OF GRAZING INCIDENCE IN DEGREES
IDENTIFICATION GOLD ON-GLASS
BO w
60 IL
>.; >- 40
20 -J tL
0
1 2 3
4
100
z BO LLI D F.4
60
>- 40
F-4
20
LL. tiJ a:
0 ANGLE OF GRAZING INCIDENCE IN DEGREES
FIG. 87
-245-
The most comprehensive determination of reflection coefficients
in the wavelength region 7 A to 190 A has been carried out by Lu-
kirskii et al (31, 32, 33, 34). They measured the angular dependence
of the reflection coefficient of Be, C, Al, Ti, V, Cr, Ni, Ag, Au,
LiF, MgF2, KC1, SrF2, Ge, F-1 glass and polystyrene, using a grating
monochromator to isolate many characteristic wavelengths. All the
metal samples were prepared in the form of films nominally 1000 A
thick by vacuum deposition on glass substrates. The non-metallic
films were deposited onto a conducting film of Al or Au on glass by
vacuum evaporation and the polythene film was deposited from solution
onto glass. Since the films were prepared in a separate coating
plant and then transferred to the test apparatus, it seems likely
that the samples may have been oxidised or have other surface conta-
mination. Hence the measured reflection curves may not be truly
characteristic of the elements but they can be taken to be character-
istic of vacuum-deposited films. Since diffraction gratings are nor-
mally exposed to air before use and are coated with vacuum-deposited
metallic films, a comparison of the results given by Lukirskii et al
would be useful to decide which materials are suitable for coating
diffraction gratings in order to enhance the reflectivity. When de-
ciding upon the most suitable coating material for a diffraction
grating, the wavelength region in which the grating is to be used
must be born in mind since the presence of an absorption edge may cause
a substantial reduction in the reflectivity of the coating material.
It is also essential that the material forms a completely stable
coating so that the properties of the grating do not change with time.
- 2146 -
Examination of Table 3 shows that at 113 A all the metallic
coatings except Al have usefully high reflectivities. At 67 A the
reflectivity of Au has decreased significantly compared to the
other coatings and continues to decrease at 45 A and 31 A. The
reflectivity of Al recovers to be equal to the reflectivity of Ti
and Cr at 31 A and the reflectivity of Au again reaches a useful
value at 23.6 A. This table shows clearly that from the point of
reflectivity in the wavelength region 30 - 100 A, gold is not
necessarily the optimum coating material.
Gold-coated diffraction gratings are normally used in the
soft x-ray region because gold is extremely stable and has a high
atomic number which means that the critical angle of grazing inci-
dence is large.
Since from the elementary theory of metals
where N = atomic number 2
= 2 N1/
sin 0 2 and the other symbols
me have their usual meaning.
Although gold coatings are easy to produce by vacuum evapo-
ration, it is well known that thin gold films made in this way on
glass substrate tend to form an island structure and not a continuous
homogeneous film. The conglomerate structure will absorb the inci-
dent radiation more than a homogeneous film and will also scatter
the radiation incoherently. The effects of absorption and incoherent
scattering are to reduce the maximum reflectivity and the slope of the
reflectivity curve against angle. This effect can be seen in the
measured reflectivity curves.
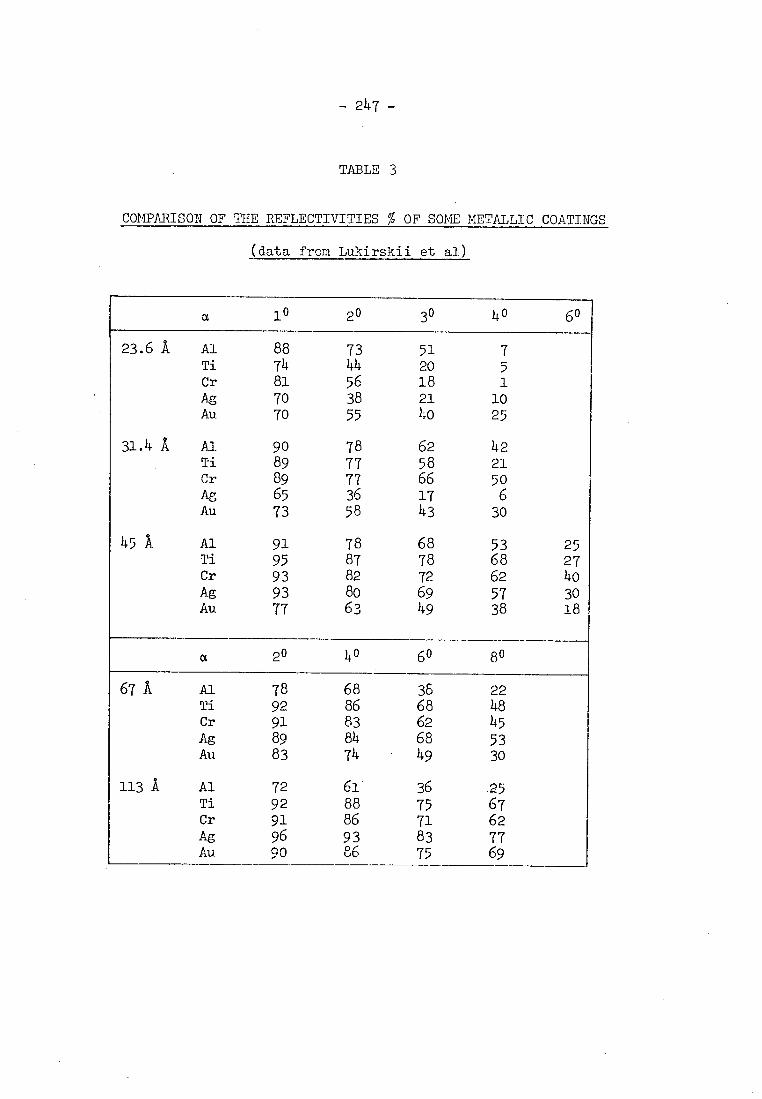
- 247-
TABLE 3
COMPARISON OF THE REFLECTIVITIES % OF SOME METALLIC COATINGS
(data from Lukirskii et al)
a 1° 2° 30 4° 6°
23.6 A Al Ti Cr Ag Au
88 74 81 70 70
73 44 56 38 55
51 20 18 21 40
7 5 1 10 25
31.4 A Al 90 78 62 42 Ti 89 77 58 21 Cr 89 77 66 50 Ag 65 36 17 6 Au 73 58 43 30
45 A Al 91 78 68 53 25 Ti 95 87 78 68 27 Cr 93 82 72 62 40 Ag 93 80 69 57 3o Au 77 63 49 38 18
a 2° 4° 6° 8°
67 A Al 78 68 38 22 Ti 92 86 68 48 Cr 91 83 62 45 Ag 89 84 68 53 Au 83 74 49 30
113 A Al 72 61' 36 .25 Ti 92 88 75 67 Cr 91 86 71 62 Ag 96 93 83 77 Au. 90 86 75 69

- 248 -
Platinum is also used as a coating material for gratings since
it has a high atomic number and forms stable films. It is not known
whether any electron microscope studies of the structure of vacuum-
deposited platinum films have been carried out. However, it is to
be imagined that platinum films will not form such pronounced island
structures as gold. Hence, platinum is most probably a more suitable
coating material than gold in many cases. However, it is known that
platinum films have high internal stresses the effects of which will
only be known when a complete study has been carried out. Since the
preparation of high-quality platinum films requires a high power
electron beam evaporator, we have not yet been able to obtain any
platinum-coated samples for examination. However, at both wavelengths
the reflectivity of platinum films may be significantly higher than
that of corresponding gold films.
It has been reported that chromium forms homogeneous smooth
films when deposited on glass by vacuum evaporation, even for films
only 20 A thick. Since chromium also forms stable films and has a
high reflectivity for• typical angles of incidence used in the soft x-ray
region at wavelengths above 25 A, it would seem that chromium could be
used advantageously as a coating material in place of gold. In
order to verify this conclusion, a grating was made with one half
of the grating coated with 300 A gold and the other half coated with
100 A chromium. Only in this way could it be guaranteed that the
differences observed arise only from differences in the properties
of the coating materials and not variations in the groove profile
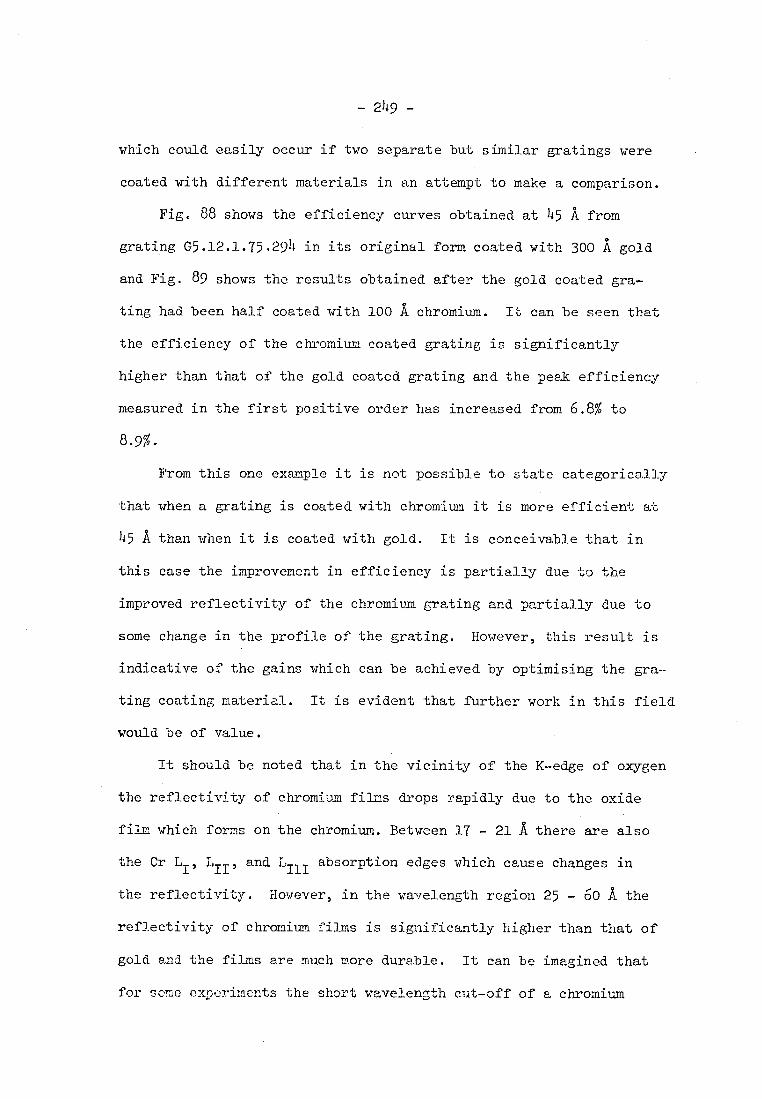
-249-
which could easily occur if two separate but similar gratings were
coated with different materials in an attempt to make a comparison.
Fig. 88 shows the efficiency curves obtained at 45 A from
grating 05.12.1.75.294 in its original form coated with 300 A gold
and Fig. 89 shows the results obtained after the gold coated gra-
ting had been half coated with 100 A chromium. It can be seen that
the efficiency of the chromium coated grating is significantly
higher than that of the gold coated grating and the peak efficiency
measured in the first positive order has increased from 6.8% to
8.9%.
From this one example it is not possible to state categorically
that when a grating is coated with chromium it is more efficient at
l5 A than when it is coated with gold. It is conceivable that in
this case the improvement in efficiency is partially due to the
improved reflectivity of the chromium grating and partially due to
some change in the profile of the grating. However, this result is
indicative of the gains which can be achieved by optimising the gra-
ting coating material. It is evident that further work in this field
would be of value.
It should be noted that in the vicinity of the K--edge of oxygen
the reflectivity of chromium films drops rapidly due to the oxide
film which forms on the chromium. Between 17 - 21 A there are also
the Cr LI, LII, and Lin absorption edges which cause changes in
the reflectivity. However, in the wavelength region 25 - 60 A the
reflectivity of chromium films is significantly higher than that of
gold and the films are much more durable. It can be imagined that
for some experiments the short wavelength cut-off of a chromium

^ 10
z W
- 8
U_ CO
Cf7 CC
CD
LL1
2 a Lr LL LL
O
0
6
4
-250 ,..
GRATING IDENTIFICATION G5.12.1.75.294 AU
I.C. REFERENCE 89/10 28 MAY 1975
WAVELENGTH 45A loo r
U-CD • 60
z 40 1.1_1
CC ty
CC C) 20 m cff U_1 ti
m=0
z
O E; 80 z
0 1 2 3 4 5 6 ANGLE OF GRAZING INCIDENCE IN DEGREES
FIG. 88
GRATING IDENTIFICATION G.5.12.1.75.294 CR
REFERENCE 125/10 16 OCTOBER 1975
WAVELENGTH 45A 100
1-
Lti
E 80
LL CD 60
Lr LtJ
z 4 0
ce 1:3 Lr ° 20 CD tL
10
8
6
z UJ
z
U_ O
(JD
1.1-1 CD
0
1.1.1
LL LL
O
a
4
2
0
0 1 2 3 4 5
ANGLE OF GRAZING INCIDENCE IN DEGREES
FIG. 89
6
- 251 -
mirror may be exploited to attenuate unwanted shorter wavelengths
or to remove overlapping orders in the case of diffraction gra-
tings.
Normally, it is required that a diffraction grating should
have a uniform efficiency over as wide a wavelength range as
possible. In a spectrograph the minimum wavelength to be recorded
determines the maximum angle of grazing incidence which may be
used. Hence, if it is desired to record spectra over the range
from 10 - 100 A, it would be necessary to use a gold or Platinum
coated grating at an angle of 2°. If the wavelength range to be
recorded was reduced, it would be possible to considerably improve
the efficiency of the system by employing a grating specifically
designed for the application. The grating would have an optimised
profile and coating material for the wavelength region of use and
the results could be guaranteed by calibrating the efficiency of
the grating.

- 252-.
6.2 THEORY
It has been shown that an approximate solution of the boundary
value problem for the reflection of plane waves at an absorbing
medium is adequate to obtain good fits between experimental x-ray
reflection curves and theoretical curves obtained from the Fresnel
equations and refractive indices derived from the quantum-mechanical
dispersion theory in the wavelength region below 10 A. In the wave-
length region above 50 A, the approximate solutions can introduce
significant errors and a more exact approach is required.
The methods used to derive Fresnel's equations are well known
and can be found in the standard textbooks on electromagnetic theory
and the theory of optics (38. 78).
Most subsequent authors have followed the method described by
Dershem and Schein (22) which enables the exact Fresnel equations to
be simplified by treating the unit decrements to the complex refrac-
tive index, (Sand 0, as small quantities so that their squares and
products can be neglected, and since the grazing angle is also small,
sin 0 may be set equal to 0. The resulting Fresnel equations have
two forms depending on whether the electric vector lies in the plane
of incidence or perpendicular to it. However, for small glancing
angles there is negligible difference between the intensities of the
two polarisations. Hence, it is usual to take the ratio of the inten-
sity of the incident beam polarised with the electric vector perpendi-
cular to the plane of incidence to that of the reflected beam as being
the reflectivity, R, of the surface.
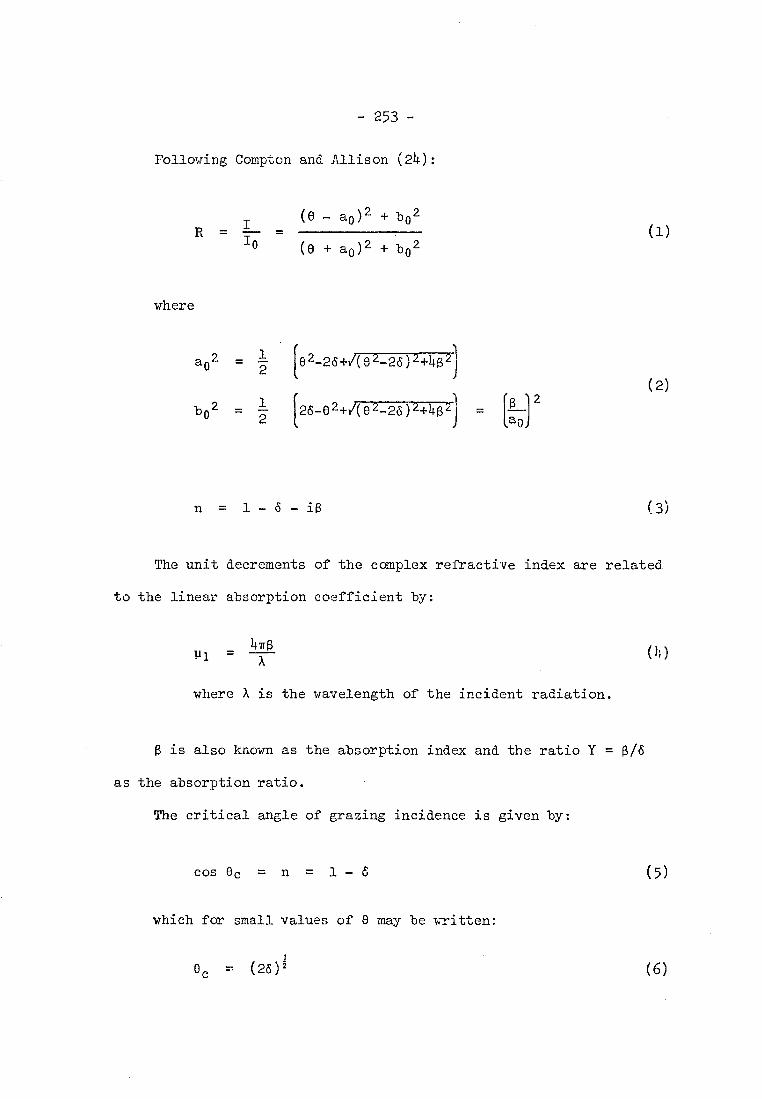
- 253 -
Following Compton and Allison (21):
= I = Io (8 + a0)2 + b02
where
R (6 - a0)2 bo2
(1)
0 2-264( 8 2-26 )44132)
ao2 = 2
(2)
b02 = 2 [26-024(02-202+Wi = la0
n = 1-S - it3
(3)
The unit decrements of the complex refractive index are related
to the linear absorption coefficient by:
p 1 471$ A (4)
where A is the wavelength of the incident radiation.
13. is also known as the absorption index and the ratio Y =
as the absorption ratio.
The critical angle of grazing incidence is given by:
cos ec = n = 1 - 6
(5)
which for small values of 8 may be written:
(2s)2 (6)
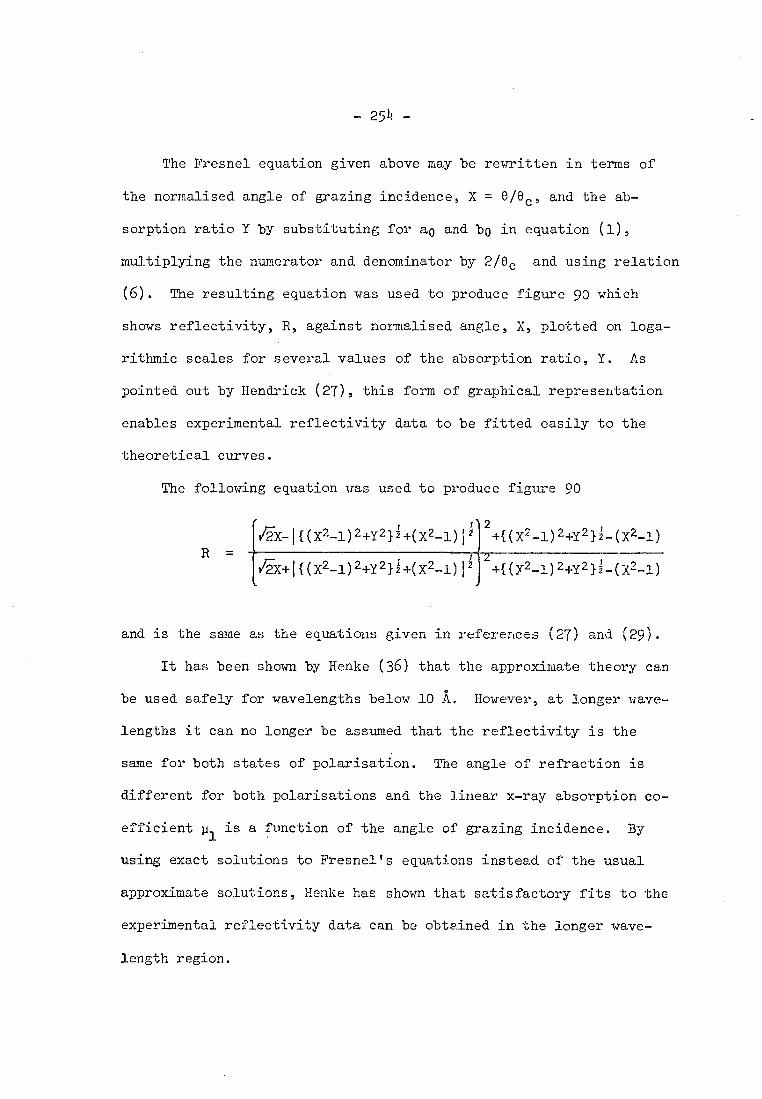
- 251;-
The Fresnel equation given above may be rewritten in terms of
the normalised angle of grazing incidence, X = 0/8c, and the ab-
sorption ratio Y by substituting for ao and by in equation (1),
multiplying the numerator and denominator by 2/8c and using relation
(6). The resulting equation was used to produce figure 90 which
shows reflectivity, R, against normalised angle, X, plotted on loga-
rithmic scales for several values of the absorption ratio, Y. As
pointed out by Hendrick (27), this form of graphical representation
enables experimental reflectivity data to be fitted easily to the
theoretical curves.
The following equation was used to produce figure 90
/2X-I {(x2_1)2.4.y2}4(x2_1)1 244(x2_1)24.y2121 _(x2_1) R -
1X+11(X2-1)2+Y 2 l +(X2-1)1 4.1 ( x2-1) 21-y 21;. -(x2-1)
and is the same as the equations given in references (27) and (29).
It has been shown by Henke (36) that the approximate theory can
be used safely for wavelengths below 10 A. However, at longer wave-
lengths it can no longer be assumed that the reflectivity is the
same for both states of polarisation. The angle of refraction is
different for both polarisations and the linear x-ray absorption co-
efficient p1 is a function of the angle of grazing incidence. By
using exact solutions to Fresnel's equations instead of the usual
approximate solutions, Henke has shown that satisfactory fits to the
experimental reflectivity data can be obtained in the longer wave-
length region.

RE
FLEC
TIVIT
Y
10 ,
- 255 -
THEORETICAL
REFLECTIVITY CURVES
FROM APPROXIMATE THEORY
SYMBOL Y-VALUE
0 0.010 e 0.100
+ 1.000
X 2.000 0 3.000 + 5.000 x 10.00
X
FIG. 90
- 256 -
Henke (36) has given a most useful summary of results from
the general solution of the boundary value problem of a plane electro-
magnetic wave at an absorbing interface. These results have been used
in this work to calculate the optical constants of gold and chromium
films from the experimental reflectivity curves. The results used
are quoted here without proof since the original derivations are rather
lengthy and can be found by the interested reader in references (37),
(38).
Since we are concerned with the interaction of x-rays incident
on a medium in vacuum, the material constants may be completely speci-
fied by the real and imaginary parts of a complex dielectric constant,
K. The dielectric constant will incorporate permittivity c, permea-
bility, p, conductivity, a, of the material and also frequency, v,
of the incident radiation.
K = K' + iK"
where K' = EV1
and K" 2pa
Throughout the x-ray region K' is only slightly less than unity
so that it is convenient to redefine the complex dielectric constant
in terms of its unit decrements which, following Henke, we denote by
a and y.
Thus:
K = 1 - a - iy
The results are expressed as functions of the angle of grazing
incidence 0, the material constants, a and y, and a characteristic
function, a. The function, a, measures the refraction angle and
- 257 -
approaches ao as defined in the approximate analysis for small
0, 6, and 0. The function a is defined by:
a2 = 2 (sin2e_a+V(sin20_0)24,y2
The Fresnel coefficient or the ratio of the reflected to inci-
dent intensity I/10, for the electric vector perpendicular to the
plane of incidence is given by:
4a2(sin¢-a)4y2 111
4a2(sincP+a)2-1-y2
The ratio of the Fresnel coefficients for the two states of
polarisation is:
R2 4a2(a-cosecot0)4y2
R1 4a2(a+cosOcot0)4y2
The reflection coefficient for an unpolarised incident beam is
therefore:
1+R2/R11
2 J R = R1
The extinction coefficient, k, is given by:
k 2icos20+a2
and becomes equal to R given in the approximate analysis.
- 258 -
The linear x-ray absorption coefficient 41 can be defined as
the limiting value as 0-4-7/2 of 47Tk/A.
Hence:
)47
111 A {21(1-a)+1/(1-a) 1-Yz
When the incident beam is polarised with its electric vector normal
to the plane of incidence, the depth at which the energy flow has dropped
to 1/e is:
as al
27y
In the vicinity of the total reflection cut-off, i.e. sinec =47:
the effective depth becomes:
A dlc =
147 iy72-
The results of the approximate theory may be obtained from the
exact theory by using the relations between the complex dielectric
constant and the complex refractive index and taking the limits of
small 0, (S, and 0.
n =
1 - a - iY = (1-6-i02
Therefore: a = 2S-S2+02
y = 2(l-(5)
-259-
6.3 EXPERIMENTAL RESULTS
The angular dependence of the reflectivity of gold films of
various thicknesses and chromium films on glass substrates have been
measured at wavelengths of 45 A and 8.3 A.
The reflectivities of a series of gold films with thicknesses
of 75, 100, 200, 300, 500 and 1000 A deposited on float glass is shown
in Fig. 91. These measurements were performed in 1.973 when the appa-
ratus was still being developed and the accuracy of the results is not
as high as in recent measurements. However, it can be seen, that the
maximum reflectivity increases with increasing film thickness up to
about 200 A and then decreases again for thicker films. The expla-
nation for this effect is that thin gold films deposited in vacuum have
an island structure which grows as the film thickness increased to be-
come a continuous film at between 100 and 200 A, depending on the
conditions of preparation. As the film thickness is increased above
200 A the surface becomes progressively less smooth as conglomerates
form. The results of an electron microscope study of the gold films are
shown in Fig. 92. The island structure of the thin gold films is clearly
visible and the high resistivity proves conclusively that the films are
discontinuous. At 200 A the resistivity has fallen and the electron
micrographs no longer show the island structure, i.e. the film has be-
come continuous, however, some granularity is apparent. As the film
thickness increases to 1000 A the size of the larger grains increases
as does the granular background structure. Measurements on the angular
dependence of reflectivity for gold films with thicknesses of 63, 131
and 590 A using CuKa (1.54 A) radiation by Lindsey (128) also indicate
an optimum gold coating thickness of 150 - 400 A.

- 260 -
100
BD
r.;
60
20
100
60
60
40 •-•
20
t5
IDENTIFICATION 75A GOLD FILM
I.C. REFERENCE 3/10/73
NPNELENGTH 45 A
•
• • •
100
50
GO
40
ti 20
0
100
ti BO
2-43
zo
IGENTIFICATIGN iCCA GILD FILM
I.C. F,EFEFEN:E 5/13/73
.nvELE%.;TH' 43 A
•
•
• •
• • • •
1 2 3 5 6 7
ANGLE OF GRAZING INCIDENCE IN DEGREES
IDENTIFICATION 20041 GOLD FILM
I.C. REFERENCE 9/10/73
WAVELENGTH 45 A
• •
• •
• • •
2 3 4
ANGLE OF GRAZING INCIDENCE IN CEGREES
IDENTIFICATION 300A COLD FILM
I.C. REFERENCE 10/10/73 WAVELENGTH 45 A
• • . • •
•
• •
•
0 2 3 4 5 7 0 ANGLE OF GRAZING INCIDENCE IN DEGREES
1 7 3 4 5 2 ANGLE OF GRAZING INCIDENCE IN CCGREES
IDENTIFICATICN 500 COLD FILM IDENTIFICATION 100041 GOLD FILM
I.C. REFERENCE 15/10/73 I.C. REFERENCE 16/10/73 WAVELENGTH 45 A WAVELENGTH 45 A too
60
= 60
40
ti 20
0
• • •
• • • •
•
• • . .
100
6-30
V •-• 60
O
Y AO
W 10
0
• •
•
•
•
•
• •
1 2 3 4 5
ANGLE OF GRAZING INCIDENCE
6 7
IN DEGREES
B I ANGLE
2 OF
3 GRAZING
4 5
INCICENCE
G 7
IN DEGREEE
FIG. 91
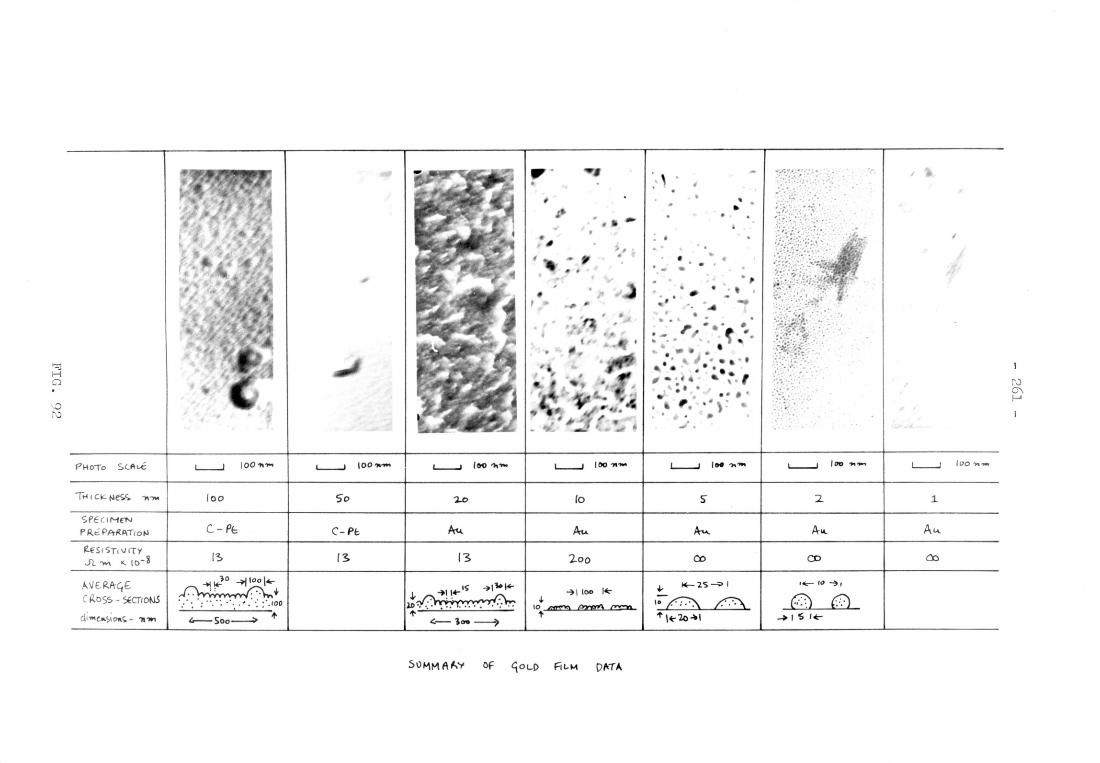
-2
61
-
:., ..•. '.
FIG.
92
J to o ] ~ ~
R
] J (.
I ] J ~
g ] ~ f ! ] 1 0 ~ ] ~ ~
0 ~
] 'IJ 5 <11
~ J: ~
N
:J c:t
VI 1:
.Q
J
~ 1. ..I)
0 Q
.
\n
I U
J!. 0
I 0
0
~ ,. "2-0
~ t ~ L ~
2-_ <t
~
vel.
U
III '1)
-~<:i.
~ \/I
a...
t~ ~ ~
8 ~
... --
.. ; ~
'l
1 8
VI
N
i
-< ~
~
c. 0
~ 0
C"'4 l'
::r ..)
u: 0.
.J 0
i <J""
~
T
~
u.. 0
('1\ g
foj\ ~
l q
:
~
l:'
~A~
':>
II)
(\1\
1 0
til 0 V
\
1 ~
~ 0
0
0 )-.1
l0~ F-
t-9. ,
? ""
'" .::
0",
~ <t
VI
~ ~ cl\J
'l .~
W
0 ~c)
-:::>""-~
-<\...J
'-.:s
- 262-
The differences in the experimentally determined reflectivities
of the mirrors coated with various thicknesses of gold can be more
clearly seen in Fig. 93 in which all the curves are superimposed.
Typical families of theoretical reflectivity curves as calculated
from the exact Fresnel theory are shown in Fig. 94 for a = 0.02 and
a = 0.025 for y-values 0.002, 0.004, 0.006, 0.008 and 0.01. By
fitting the theoretical curves to the experimental results it shouJ.d
be possible to accurately determine the material constants of the
mirrors. However, from Fig. 93 and Fig. 94 it is immediately apparent
that there are considerable discrepancies between the theoretical and
experimental results. The most obvious difference between the curves
is that instead of the experimental reflectivity becoming 100% as the
grazing angle tends to zero a somewhat smaller value is attained. A
similar effect for gold films has been observed by Groth (26) for
measurements at 8.3 A. Hendrick (27) found substantial agreement at
8.3 A between theory and experiment for the critical angles if the
films were assumed to have a density slightly less than the bulk metals
but absorption ratios averaged 28% higher than predicted by the linear
absorption ratios. Thus it is clear that a more sophisticated theore-
tical model is required to account for the reflectivity of gold films
in the soft x-ray region.
Verhaeghe (129) has performed a theoretical study of the re-
flection of x-rays by thin gold films. The model suggested had two
interfaces and the approximate electromagnetic field was calculated
by a perturbation method using the ratio of the height of the defects
to the wavelength as a parameter. The nature of substrates and gold
surfaces were examined by interference microscopy and with an electron

- 263 -
100
1- 80 z UJ
60
U_ O
r 40
L.) W 20 _J U-LLJ
IDENTIFICATION GOLD FILM
I.C. REFERENCE 3/10/73
WAVELENGTH 45 A
0 1 2 3 4
5 6 7
ANGLE OF GRAZING INCIDENCE IN DEGREES
SYMBOL THICKNESS 123 15
100 /7 A 200 A
300 A X 500 A
no° A
FIG. 93
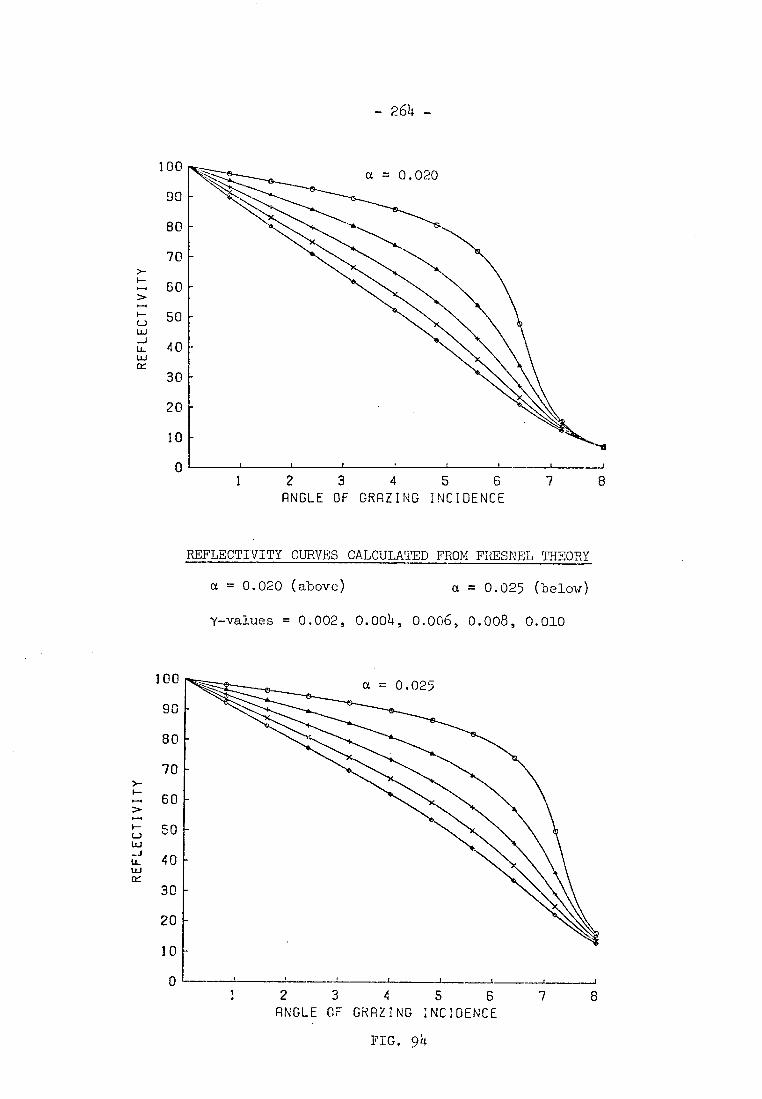
-264-
REFL
ECT
IVIT
Y
100
90
80
70
60
50
40
30
20
10
0 1
2 3 4 5 6
7
8 RNGLE OF GRRZING INCIDENCE
REFLECTIVITY CURVES CALCULATED FROM FRESNEL THEORY
a = 0.020 (above) a = 0.025 (below)
y-values = 0.002, 0.004, 0.006, 0.008, 0.010
REFL
ECT
IVIT
Y
100
90
80
70
60
50
40
30
20
10
0
1 2 3 4 5 6 7 8 RNGLE OF GRRZING INCIDENCE
FIG. 94

- 265-
microscope in order to provide numerical values for the theory. It
was found that the gold surfaces have two types of defects; firstly,
there are the polishing defects of the substrate which are mainly
broad (10-20um) with gentle slopes and rms heights 20-100 A which
are accurately contoured by thin films and secondly there are defects
due to the crystallic structure of the films which have heights of
one or two atomic dimensions (2.35 or 4.7 A) and are spaced at
'1,100-200 A. By incorporating suitable values in the theory it was
possible to obtain reasonable agreement with experimental results.
Thus it is essential to be able to completely specify the parameters
of a metal film and also measure the reflectivity accurately in order
to develop a suitable theory applicable to the soft x-ray region.
Since there are so many variable parameters it is questionable whether
such a refined theory would have a wide applicability. However, the
relationship between the techniques used for producing mirrors and
the reflectivity of the mirrors in the soft x-ray region is of great
practical importance.
A number of authors have investigated the relationship between
the scattering of x-rays and polishing techniques. Most of these
investigations have been performed with hard x-rays, usually CuKa
(1.54 A); the works of Ehrenberg (130), Elliott (131) and Schroeder
and Klimasewski (132) are particularly interesting. The latter
found. that fused silica surfaces had consistently lower scattering
than any of the other materials examined and that random polishing
techniques produced. least scattering. More recently Wriston and
Froechtenigt (133) reported scattering measurements performed on
telve samples at 8.34 A and 215 A. The apparatus used was over 10.5m

- 266 -
long and had an angular resolution capability of the order of one
arc second. The measurements on nine metal samples and three glass
samples showed that more scattering occurred at 45 A for both types
of samples than at 8.3 A when the glass samples produced the least
scattering. The greatest scattering was found at small angles of
incidence and the scattering increased again at angles larger than
the critical angle. From these results it would seem that there
may be an optimum angle of incidence at which scattering is minimised
for a given wavelength. It is particularly important to perform
repeated investigations under controlled conditions on numerous
samples in order to obtain representative data because the properties
of mirrors in the soft x-ray region are critically determined by the
surface layers and surface structure at the atomic level. Thus the
properties of mirrors produced under ostensibly the same conditions
can be different even when the greatest care is taken in their pro-
duction. Similarly variable results can be obtained from measurements
in the soft x-ray region if the samples become contaminated.
From the preceding paragraphs it is clear that there is a need
for accurate data on the reflectivity and relative scattering from
surfaces in the soft x-ray region. Such data would have direct
applicability in the design of soft x-ray optical systems and should
enable optical manufacturing techniques to be improved. When related
to surfaces of known structure such data would also enable a more
complete theory of reflectivity in the soft x-ray region to be deve-
loped. Although the grating test apparatus in its original form was
capable of ncasuring reflectivities in the soft x-ray region, the
reflectivity la-.asuremonts perfo rmed in 1973 indicated that the appa-
- 267 -
ratus had certain deficiencies. As described in Chapter 5 the appa-
ratus has now been redesigned and considerably improved. Although
these improvements have been made to facilitate grating efficiency
determinations, they also enable more accurate reflectivity measure-
ments to be made. The recent fabrication of a monochromator using
one of the new high-performance holographic gratings is probably the
most significant improvement to the test apparatus. It is now
possible to select a known bandwidth of radiation and all the possible
errors due to non-monochromatic radiation are eliminated. The mono-
chromator enables the x-ray source to be operated at higher powers
without contamination problems but, even so, the intensity of radiation
from the monochromator is about an order of magnitude less than that
from the usual x-ray source, depending on the bandwidth selected.
The reduction in intensity means that longer integration times are
required which necessitates high source stability. When the monochro-
mator is used the required stability is achieved by continuously
monitoring the output with a channeltron connected to an independent
counting system which is used to control the current supplied to the
x-ray source. Only preliminary trials of the monochromator have been
performed at the time of writing, however, it is clear that the mono-
chromator is most useful when examining high efficiency gratings when
high count rates are obtainable. If the efficiencies of the gratings
being tested are low (<1%) the integration times to obtain sufficient
statistical accuracy become excessive. Since reflectivities of <15
are rarely of importance in the soft x-ray region, the monochromator
system would appear to be ideal for performing reflectivity measure-
ments. If a research programme was set up to systematically investi-
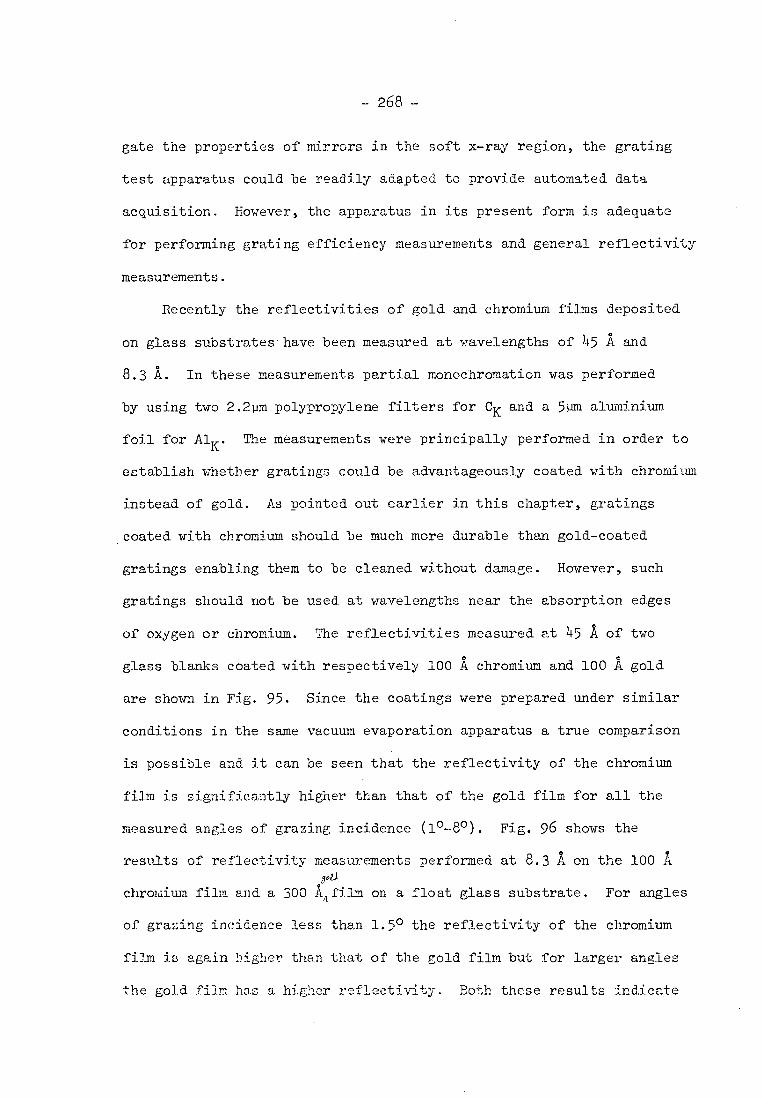
- 268 -
gate the properties of mirrors in the soft x-ray region, the grating
test apparatus could be readily adapted to provide automated data
acquisition. However, the apparatus in its present form is adequate
for performing grating efficiency measurements and general reflectivity
measurements.
Recently the reflectivities of gold and chromium films deposited
on glass substrates' have been measured at wavelengths of )45 A and
8.3 A. In these measurements partial monochromation was performed
by using two 2.2pm polypropylene filters for CK and a 5pm aluminium
foil for AlK. The measurements were principally performed in order to
establish whether gratings could be advantageously coated with chromium
instead of gold. As pointed out earlier in this chapter, gratings
coated with chromium should be much more durable than gold-coated
gratings enabling them to be cleaned without damage. However, such
gratings should riot be used at wavelengths near the absorption edges
of oxygen or chromium. The reflectivities measured at 45 A of two
glass blanks coated with respectively 100 A chromium and 100 A gold
are shown in Fig. 95. Since the coatings were prepared under similar
conditions in the same vacuum evaporation apparatus a true comparison
is possible and it can be seen that the reflectivity of the chromium
film is significantly higher than that of the gold film for all the
measured angles of grazing incidence (10-80). Fig. 96 shows the
results of reflectivity measurements performed at 8.3 A on the 100 A rtd
chromium film and a 300 Aafilm on a float glass substrate. For angles
of grazing incidence less than 1.5° the reflectivity of the chromium
film is again higher than that of the gold film but for larger angles
the gold film has a higher reflectivity. Both these results indicate
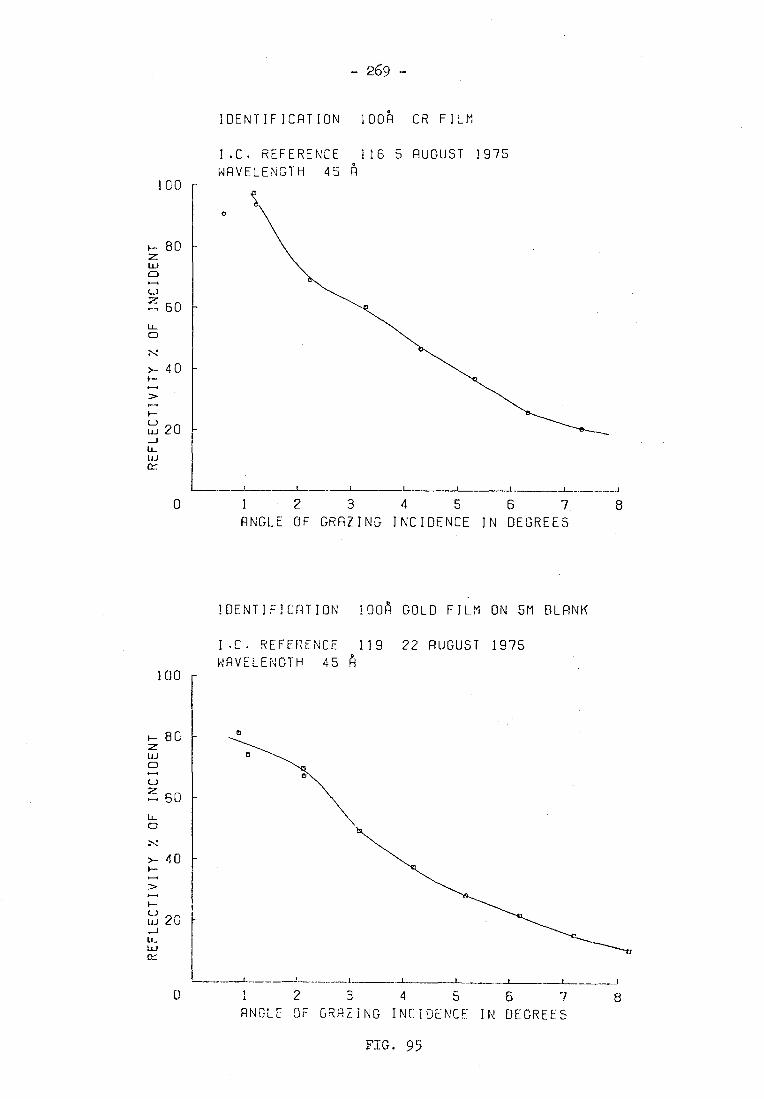
100
0
80 z LU
z 60
>-40 ■—•
>
1.■4
L12120
Li LL1
0
— 269 —
IDENTIFICATION 1008 CR FILM
I.C. REFERENCE 116 5 AUGUST 1975
WAVELENGTH 45 A
A
1 2 3 4 5 6 7 8
ANGLE OF GRAZING INCIDENCE IN DEGREES
IDENTIFICATION 100A GOLD FILM ON 5M BLANK
I.C. REFERENCE 119 22 AUGUST 1975
WAVELENGTH 45 A 100
80 z
60
LL CD
>- 40
20
LL LU
o
-L
0 1 2 3 4 5 6 7 8
FIG. 95
ANGLE OF GRAZING INCIDENCE IN DEGREES
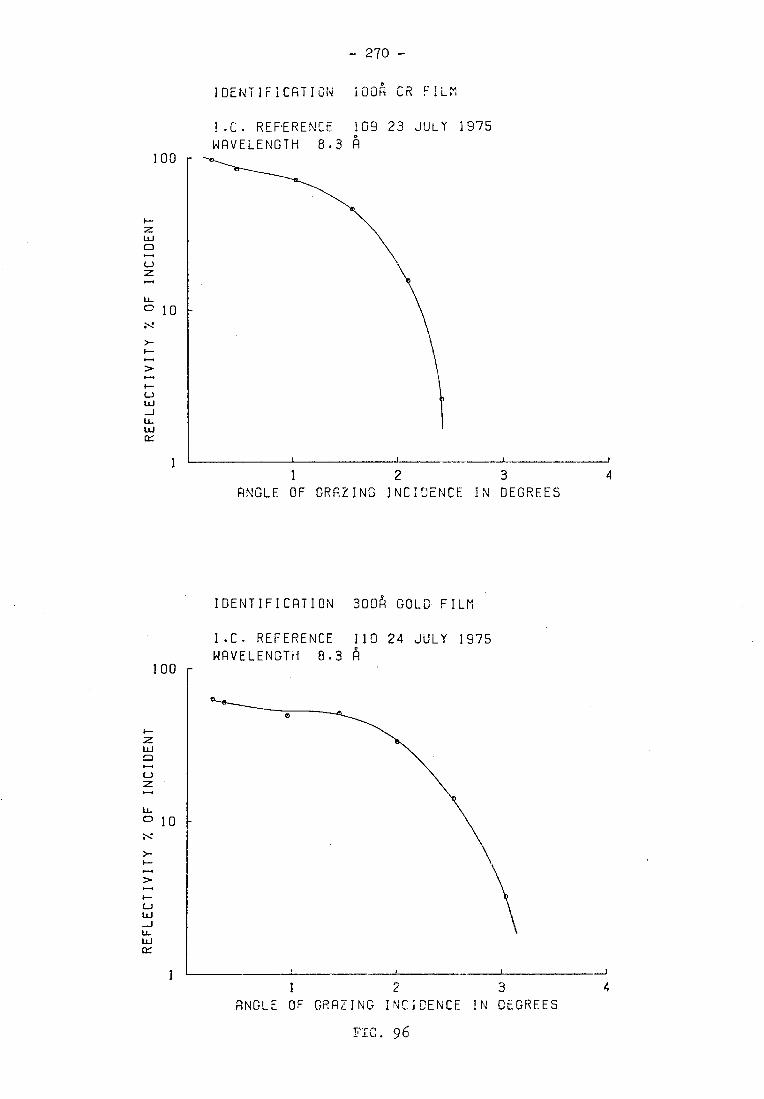
— 270 —
IDENTIFICATION 100A CR FILM
)00
1.C. REFERENCE 109 23 JULY 1975
WAVELENGTH 8.3 A
LEJ O t-1 Li z .I•■••
LL C 10
LLI -J CL LLJ
1 2 3
4 ANGLE OF GRAZING INCIDENCE IN DEGREES
IDENTIFICATION 3001 GOLD FILM
I.C. REFERENCE 110 24 JULY 1975
WAVELENGTH 8.3 A 100
1
1 2 3 4
FAG. 96
ANGLE OF GRAZING INCIDENCE IN DEGREES
- 271-
that the gold films have considerably higher absorption than the
chromium films at both 45 A and 8.3 A.
Since only a few samples have been examined it is not possible
to make any definite conclusions. The high absorption of the gold
films may be in part due to the conglomerate structures of the films.
The structure cf the films will depend upon the preparation of the
substrate, the conditions in the coating plant and the subsequent
treatment and age of the film. Thus by careful preparation of the
substrate and by optimising the coating conditions it is to be expec-
ted that the reflectivity of gold films could be improved. This idea
is substantiated by Fig. 97 which shows the reflectivity of a high
quality NPL laminar grating measured perpendicular to the rulings
(i.e. the grating has been rotated by 90° from the orientation in
which it would normally be used). The gold coating on this grating
is 300 A thick and even though the substrate is a grating, the
reflectivity measured at 8.3 A is higher than that of the 300 A gold
film on a float glass substrate. Normally it would be expected that
the reflectivity of a grating measured in this orientation would be
slightly less than that of a mirror, however, this result is indi-
cative of the very high quality of the surfaces and gold coatings
produced at NFL.
In this chapter theoretical and experimental aspects of the
reflection of soft x-rays have been examined. It has been found that
coating materials other than gold can be usefully employed on gratings
designed for specific purposes in the soft x-ray region. Furthermore,
by optimising the coating thickness and the conditions under which
the coatings are formed, a significant increase in reflectivity is

- 272 -
IDENTIFICATION 3008 GOLD FILM
I.C• REFERENCE 110 24 JULY 1975
WAVELENGTH 8.3 R 100 -
INC
IDE
NT
1
1 2 3
4
ANGLE OF GRAZING INCIDENCE IN DEGREES
IDENTIFICATION NPL 156 (ON SIDE)
I.C. REFERENCE 114 30 JULY 1975
WAVELENGTH 8.3 A 100
INC
IDEN
T
1 2 3 4 5 6
ANGLE OF GRAZING INCIDENCE IN DEGREES
FIG. 97
- 273 -
possible. The grating test apparatus in its present form can be
readily adapted to making high precision reflectivity measurements
which would be useful for optimising the coatings on diffraction
gratings and would also provide fundamental data about thin films.
In order to be able to obtain the maximum useful information, it
is necessary to produce the coatings under controlled conditions
on suitable substrates and to examine sufficient samples to obtain
representative data. Since the test apparatus has now been equipped
with a monochromator, it is possible for a comprehensive research
programme to be undertaken on the properties of grating coatings
suitable for use in the soft x-ray region.

- 27l -
CHAPTER 7
THE PERFORMANCE OF HOLOGRAPHIC X-RAY GRATINGS
7.1 THE EFFICIENCY OF DIFFRACTION GRATINGS IN THE SOFT X-RAY
REGION
Prior to 1970 very few measurements of the performance of diff-
raction gratings had been performed in the soft x-ray region. The
most comprehensive measurements published are those of Lukirskii et
al (112) performed on gratings prepared in the State Optical Labora-
tory. Because of the rapidly increasing importance of the soft x-ray
region, it became evident that a comprehensive soft.x-ray grating
calibration facility available to all manufacturers and grating users
would be highly desirable. The x-ray grating laboratory at Imperial
College was established in order to fulfil this need and the first
grating measurements were performed there in July 1970. Since that
time over eighty different gratings from five manufacturers have
been examined at wavelengths in the soft x-ray region. The results
of these examinations have enabled more efficient x-ray gratings to
be developed and have made it possible to calibrate grazing incidence
spectrographs for intensity measurements (135).
Many of the gratings have been tested at three wavelengths
using the characteristic radiation from aluminium (8.3 A), oxygen
(23.6 A) and. carbon (44.8 A). Some of the gratings have also been
tested in two orientations. Thus a wealth of data on gratings of all
types has been accumulated. Obviously, it is not possible to des-
cribe here the results of all the examinations; instead the data will
be summarised and general trends indicated by some specific examples.
- 275 -
Since diffraction efficiency depends on the grating surface
profile, it is convenient to categorise, according to profile,
three types of soft x-ray grating. The first category is the
shallow blazed, or echelette grating, which has a sawtooth profile.
The second category is the laminar grating which has a rectangular
profile, and the third type has a semi-sinusoidal profile. In
addition to these three categories, depending on the technique
used to produce the gratings, one can distinguish between mechani-
cally-ruled and holographically-formed gratings.
All of the gratings examined before September 1972 were mecha-
nically ruled. The majority of these gratings were shallow blazed
replica gratings produced by Bausch and Lomb, USA. To date, twenty
gratings of this type produced from ten masters with frequencies of
300, 600, 1200, 2400 and 3600 1/mm have been examined. The general
trend in the results is a decrease in efficiency with increase in
grating frequency, presumably due to a loss in control over the gra-
ting profile at higher frequencies. The highest efficiency measured
from a shallow blazed grating at 45 A was 7.4% obtained from a
600 1/mm grating. At 1200 1/mm the maximum recorded efficiency was
3.3% and at 2400 1/mm and 3600 1/mm the efficiencies were somewhat
lower. Curves showing the typical dependence of diffraction effi-
ciency on angle of incidence at 45 A for two shallow blazed gratings
with 600 1/mm and 1200 l/mm are given in Fig. 97 and Fig. 98. The
results show considerable variability between different masters and,
as can be seen from Fig. 99, there are differences between replicas
off the same master although these are not so great. The results in

Lu O
80
100 — 5
I.C. REFERENCE 101 8 JULY 1975
WAVELENGTH 45 A
LL. O
>- cD
Li
LLt
60
40
3
2
ZER
O OR
DER
20 m=0
1
2 3 4 5 6
ANGLE OF GRAZING INCIDENCE IN DEGREES
FIG. 98
0 0
L
- 276 -
GRATING IDENTIFICATION 84-1_ 2278.32.1.3
I.C. REFERENCE 25 NOVEMBER 1972
WAVELENGTH 45 Fl
- 10 100 r U-/
C)
8-4
80 8
6
U- O
60
CD >-
ce Lu
w 0 4 4
ZERO
ORD
ER
U-CD
(f) CC LL.1
O
LI J
2 CC CC U-IL-
O
20
0 0
1 2 3 4 5
6
ANGLE OF GRAZING INCIDENCE IN DEGREES
FIG. 97
GRATING IDENTIFICATION B+L 2517.2.6.3

U C
2617-2-6.3.P . 2517.2 .5 • 8. Pt.
1.
5-
2517.2.4- 5, Pt
2517 2 5.5,A
2517.2.3 13. Pt
1 ° 2° 3° 4° 5° 6° 7° effectivecx
ANGLE OF GRAZING INCIDENCE
w z w
0 it 0 0
L.)
LL LL
OJ 0*
\t\;\
\\ \-2517.1.1.1.Au.
COMPARISON OF EFFICIENCY vs GRAZING ANGLE FOR DIFFERENT REPLICAS OFF THE SAME MASTER (B&L,2517,12001/mm) WITH Pt & Au COATINGS AT 44A
c.
20- cry w cr
2517.2.5.5,Au. t1.1 517.2.4.5. Pt.
10-1° ••• /2517.1.1.1.Au.
J 0° 1° 2° 3° /: 5° 6* °
effect7ive c.-x
ANGLE OF GRAZING INCIDENCE
50
of in
c ide
nt
30-
2517. 2.3.13.Pt.
251 -2.5.8 Pt. (2 6 3, Pt .)
-- 278 -
Fig. 99 also indicate that platinum may be advantageously used as
a grating coating material. At wavelengths below 10 A the efficiency
of shallow blazed gratings diminishes and the highest efficiency
measured at 8.3 A was 2.6% from a 600 1/mm grating and typical effi-
ciency values for higher frequency gratings are q,1%. Since the blaze
angles required in the short wavelength region are less than one
degree, it is evident that standard mechanical ruling techniques will
not permit the necessary accuracy to be attained and alternative
methods must be used.
In order to overcome the limitations of the standard ruling
technique methods have been developed at the NPL for producing gra-
tings with laminar profiles, which are highly efficient at short
wavelengths (122). A total of sixteen gratings of this type have
been examined and the properties of five NPL laminar gratings have
been fully described by Bennett (30). Recently, gratings have been
produced from masks mechanically ruled at 316 1/mm and 632 1/mm.
Efficiencies of 12% at 45 A and 15% at 8.3 A have been measured from
gratings with 632 1/mm, and these gratings can have efficiencies of
up to 5% at wavelengths as short as 1.5 A. Typical curves showing
the dependence of efficiency on angle of grazing incidence at 8.3 A
for two laminar x-ray gratings are shown in Fig. 100 and Fig. 101.
To obtain the maximum efficiency from a laminar grating, it is
necessary to choose the correct groove depth for the wavelength
region and conditions of use as one would choose the blaze angle of
a blazed grating. The techniques for manufacturing laminar gratings
enable the groove depths to be controlled to high accuracy so that
it is possible to optimise gratings for use in specific wavelength
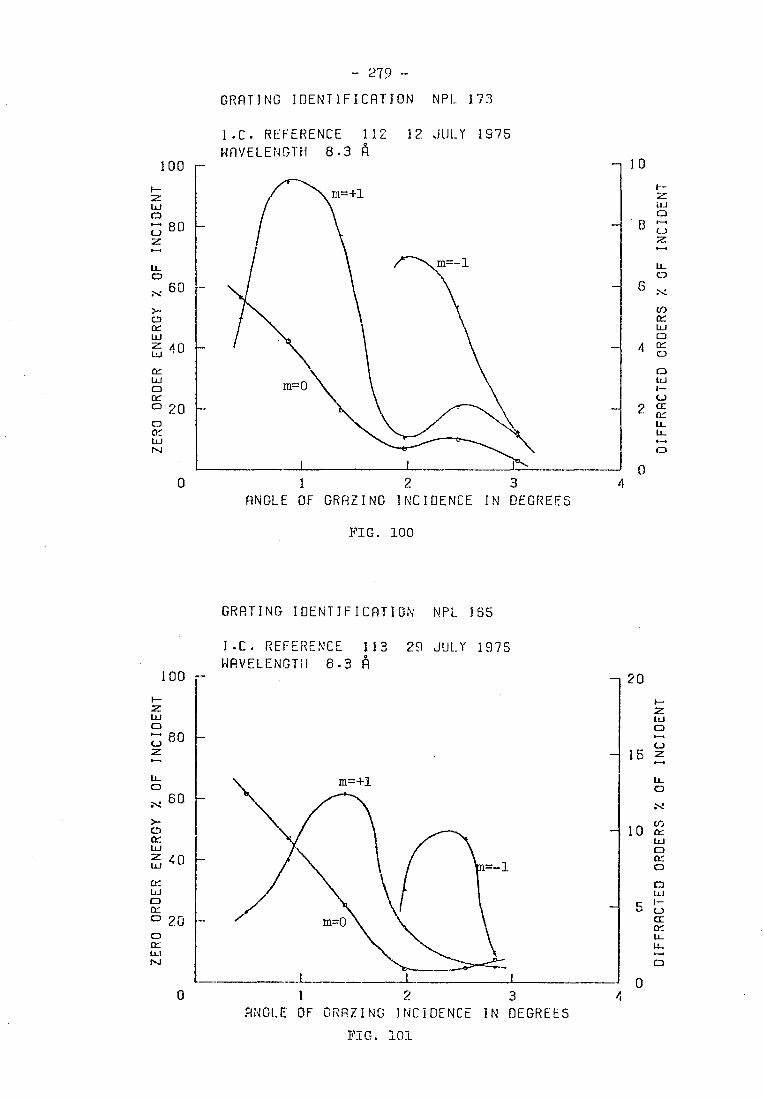
100
80
U- O 60
CC
• 40
c UJ CC CD 20
UJ ti
0
10
8
6
4
2
0 4
UJ
2:
tt_ CJ
UD CC LL1 CD
FL
CC
ZERO
ORD
ER
100
GJ
Z.7) 80 z u_
• 60
CD
z 40
20
0 1 2 3
ANGLE OF GRAZING INCIDENCE IN DEGREES
FIG. 101
- 20
F-LU
- 15 z
IL 0
0
- 279 -
GRATING IDENTIFICATION NPL 173
1.C. REFERENCE 112 12 JULY 1975
WAVELENGTH 8.3 A
ANGLE OF GRAZING INCIDENCE IN DEGREES
FIG. 100
GRATING IDENTIFICATION NPL 155
I.C. REFERENCE 113 29 JULY 1975
WAVELENGTH 8.3 A
- 280 -
regions. In the visible region it is generally accepted that blazed
gratings are efficient over about an octave and a rule of thumb for
coarse gratings is that the efficiency drops to half its maximum at
two-thirds the blaze wavelength and again at three-halves the blaze
wavelength. At soft x-ray wavelengths it is often necessary to
simultaneously record a wide. wavelength range but it is clear that
this is incompatible with the requirements for maximum efficiency
and resolution. For applications where the efficiency must be nearly
constant over as large a wavelength range as possible, an amplitude
grating is most suitable, however, the maximum theoretical diffraction
efficiency is only '1,10%. A higher efficiency is possible with a
laminar grating and theoretically it would be expected that a laminar
grating should be usable over a wider wavelength range than a. blazed
grating. Since x-ray gratings have until now only been tested at
discrete, rather widely separated, characteristic wavelengths, it is
not possible to directly compare the efficiencies of laminar and
blazed gratings as a function of wavelength. However, from the shapes
of the experimentally determined curves of diffraction efficiency
against angle of incidence it appears that in practice laminar gratings
and shallow blazed gratings have similar diffractive properties with
respect to wavelength. In order tc obtain the maximum useful wave-
length range from a laminar grating, it is essential to utilise the
"primary maximum of efficiency", i.e. to use the minimum groove depth
consistent with phase cancellation. Within the primary maximum the
efficiency only varies slowly with wavelength, however, at shorter
wavelengths the theor•eti_cal efficiency curves of a laminar grating
have an oscillatory form. This oscillatory behaviour could be misleading

282 -
when interpreting spectra and generally it is more favourable to
use a laminar grating about the design wavelength and at longer
wavelengths. One of the author's laminar holographic gratings has
been tested using synchrotron radiation and spectra have been
obtained which show smooth diffraction efficiency free from singu-
larities in the wavelength range 40 - 200 A. Although maximum
efficiency is only obtained over a limited wavelength range, it is
nevertheless possible to use laminar gratings to record a wide range
of wavelengths.
Diffraction gratings with a semi-sinusoidal profile can be most
easily made by recording interference fringes in photoresist. Only
three gratings of this type have been examined at soft x-ray wave-
lengths and they had frequencies of 1200 1/mm and 1800 1/mm. The
results of the examinations at l5 A from two of the gratings are
given in Fig. 1 and it can be seen that these gratings have a usable
diffraction efficiency in the soft x-ray region. Similar results
were obtained when the 1200 1/mm Jobin et Yvon grating was examined
at 23.6 A (OK). It should be noted that these gratings were not speci-
fically designed for soft x-ray use and it is remarkable that the
first holographic gratings should exhibit such high diffraction effi-
ciencies.
Because photoresist is an organic substance which is readily
degradable by high energy radiation and has relatively large molecules,
it would not appear to be the ideal material for making soft x-ray
diffraction gratings. From the experience gained from ruled gratings
it was clear that the laminar profile was most suitable for x-ray gra-
tings. In Germany Rudolph and Schmehl had devised a method for pro-
- 282 -
ducing gratings in all-metallic laminar form by using photoresist
and laser light. Since these gratings were free from photoresist
and had a laminar profile, it would appear that they should be most
suitable for use in the soft x-ray region. The efficiency at 45 A
of the first 600 1/mm grating made by this method is shown in
Fig. 2. Although the maximum efficiency is only 2.6%, it is an
encouraging result'from a prototype grating and the zero order curve
shows evidence of phase cancellation. In order to further explore the
properties of gratings made by this process, gratings with 1200 1/mm
and 2400 1/mm, and with different land to groove ratios at 600 1/mm
were examined.
The higher frequency gratings had markedly lower efficiencies
than the first 600 1/mm grating as can be seen from Fig. 102, and the
gratings with land to groove ratios other than unity also had lower
efficiencies. Examination of the grating profile with a "Talystep"
indicated that the low efficiency was most probably caused by "ridges"
at the edges of the lands produbed by the "stripping process". Hence,
it was necessary to devise a technique which produced completely smooth
lands and grooves in a laminar profile from a holographically-formed
photoresist grating. As described in Chapter 4, the author performed
a series of experiments in order to discover whether it was possible
to produce laminar gratings for use in the soft x-ray region by using
a holographic photoresist grating as a mask in a chemical etching
process. The author has successfully made forty-one diffraction gra-
tings using this Process and the properties of some of these gratings
will be descri-sed and discussed in the following section.

3
2
0
507
40
30
20
10-
0
— N 0
06 1 30 49 50
O
G)
C a)
0 CD
•
EFFICIENCY AT 44 ANGSTROMS vs GRAZING ANGLE
GOTTINGEN HOLOGRAPHIC GRATINGS 600,1200,2400 l/mm, PLANE, DEPTH 150-200A, Au COATED.
effective cx ANGLE OF GRAZING INCIDENCE
-281t-
7.2 THE PROPERTIES OF HOLOGRAPHIC X-RAY GRATINGS MADE BY THE
"ETCHING TECHNIQUE"
During the present research programme the author has made
27 gratings with a frequency of 291 1/mm, 8 gratings with 600 1/mm
and 6 gratings with 1160 1/mm. The number of 294 1/mm gratings
includes three uncoated trial gratings which were not tested at
x-ray wavelengths. The gratings were fabricated with nominal groove
depths of 100 A, 150 A and 200 A and with various land to groove
ratios. The efficiencies of all the gratings have been measured at
45 A and the results of most of these examinations are given in
Fig. 103 (a, b, c, d). A brief inspection of the results shows
three important features. Firstly, the gratings have consistently
high diffraction efficiencies. Secondly, the zero order efficiency
curves have pronounced minima indicating phase cancellation.
Thirdly, the shapes of the curves are similar with symmetrical
positive and negative diffracted orders of the same magnitude. All
these features show that the holographic gratings produced by the
etching technique are behaving as phase gratings.
Before proceeding to a more detailed analysis of the results,
it must be emphasised that these gratings were prototypes. The
substrates on which the gratings were formed had, in many cases,
been used in previous experiments and were therefore not of the
highest quality. The metal coatings were produced in a standard
commercial vacuum coating plant at pressures of q,10-5torr and better
quality coatings could be made using more sophisticated ecuipment.
Finally, the gratings were made with a wide range of parameters in
order to discover experimentally the effects of varying groove depth
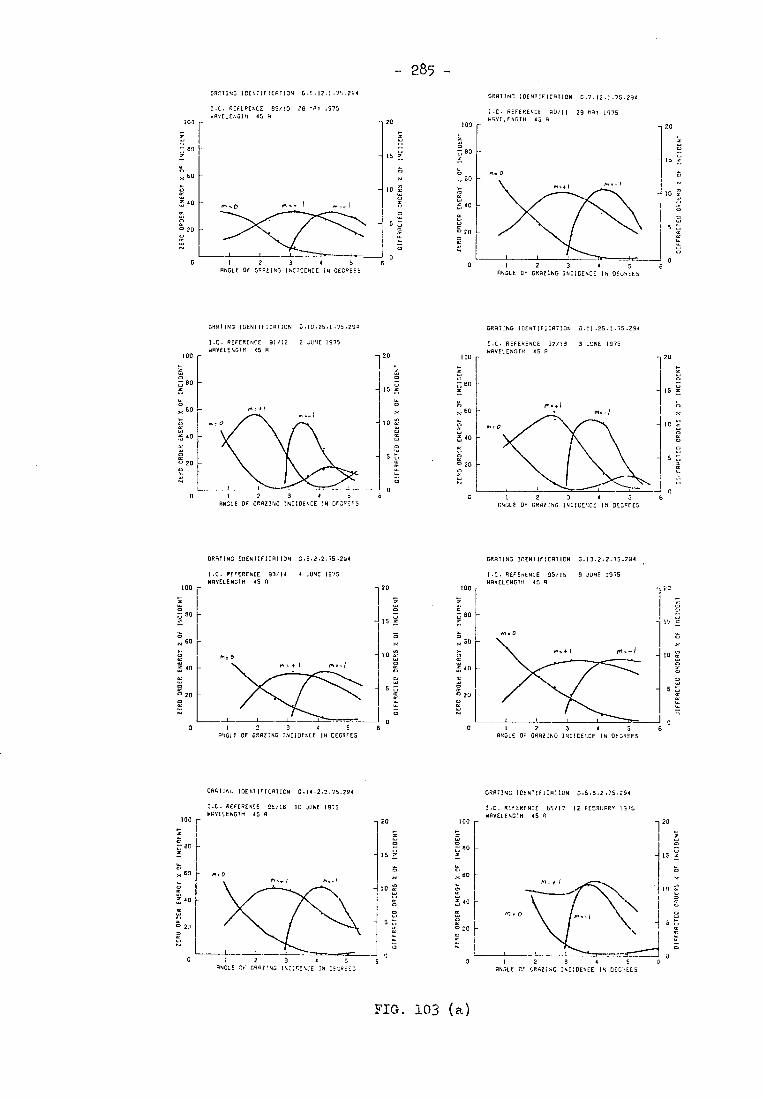
10 E
5
100 [
„NO
4 0
o Y0
- 285 - ORT1TING IDENTIFICATION 6•5. 12.1 .75 .254
I.C. REFERENCE 89/10 28 HAY 1975
wAvELENOTH 45 R
,()
ORATING IDENTIFICATION 6.7.12.1.75.294
1.C. REFERENCE 90/11 29 MAT 1975 WAVELENGTH 45 A
0 1 2 ANGLE OF GRAZING INCIDENCE I
70
I S
o
5
100
F; 80
„ 60
Y, 40
.20
O I 2 3 4 5
ANGLE OF GRAZING INCIDENCE IN DEGREES
GRATING IDENTIFICATION G.10.25.I.75.294 GRATING IDENT IF [CAT! ON G.11 .25 .1.75 .294
20
15 Y.
1 0
s
100
,71 80
0 60
„1, 40
° 20
G 2
OF GRAZING INCIDENCE IN ENGLE
100
,-; 80
60
40
20
O
ANGLE OF GRAZING INCIDENCE IN DECREES
I.C. REFERENCE 91/12 2 JUNE 1975
WAVELENGTH 45 A I.C. REFERENCE 92/13 3 JUNE 1975 WAVELENGTH 45 A
4.:0
GRATING ICENTIFICATION 0.6.2.2.75.294 ORATING IDENTIFICATION 6.I3.2.2.75.294
6 0 1 2 3 4 5
ANGLE OF GRAZING INCIDENCE IN DEGREES
0, 0
;7.
▪
60 r „, 40
.20 _
1 2 3 4 5 6
ANGLE OF GRAZING INCIDENCE IN DEGREES
IS
10 c
GO
LT, 40
20
0
ORATINu IDENTIFICATION 0.14.2.2.75.294
I.C. REFERENCE 9E/I6 10 JUNE 1975 WAVELENGTH 45 A
100 r
z,- 60
`Lk 60
W40
ta` 0 20
0
0 2 3 6 ANGLE OF GRAVNG INCIDENCE iN DECREED
ORATING IDENTIFICATION 0.5.3.2.75.294
I.C. REFERENCE 65/17 12 FEBRHARY 1975
WAVELENGTH 45 A 100
o 7, 00
60
40
.20
1___ ...73------" 0 2 3 4 5
ANGLE CF GRAZING INCIDENCE IN DE6'IEE5
FIG. 103 (a)
1 20
15
I.E. REFERENCE 93/14 4 JUNE 1975
WAVELEND1H 45 A 100 -
80
I.C. REFEntNLE 95/15 9 JUNE 1975 WAVELENGTH 45
100 F
; 1
E80
l 20
In /..1, 4. I
47. 0 RI: -I
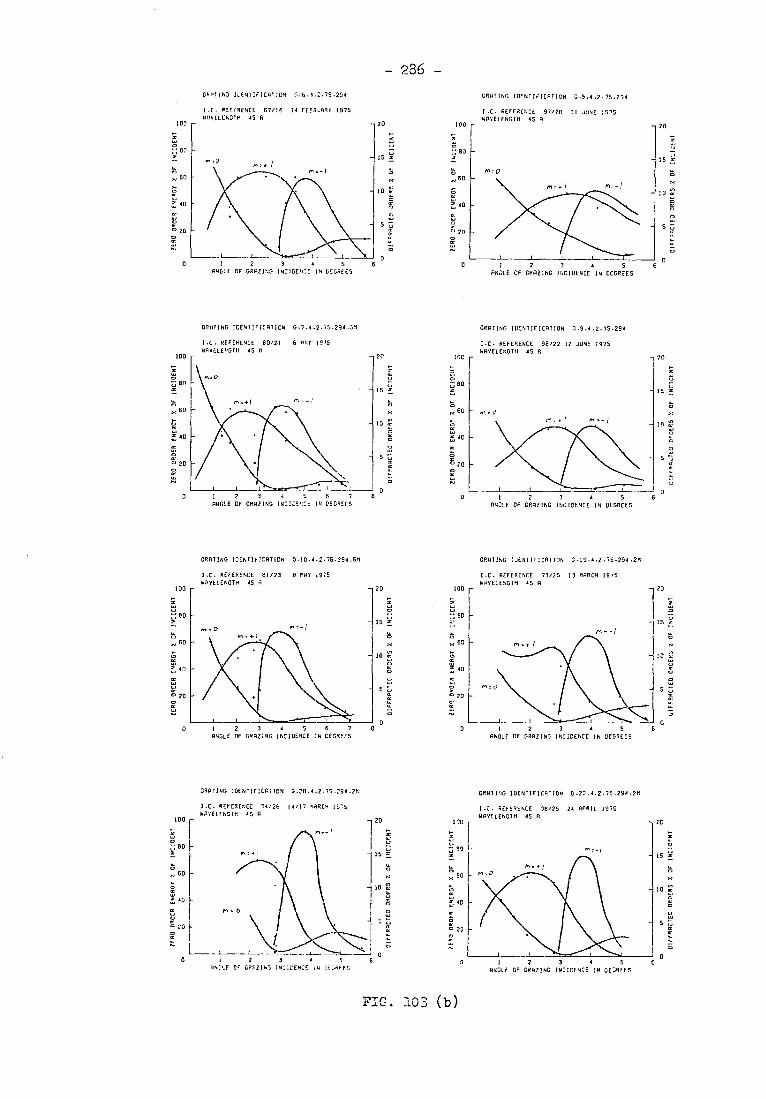
••••=.- 1
20 100
80
.6(1
o W
•,
0 20
1..3 1
1 t _1_ 2 3 4 5
ANGLE OF GRAZING INCIDENCE IN GEGREE5
/1= /
0
I.C. REFERENCE 80/21 6 MAT 1575
WAVELENGTH 45 A
m r.t
y, 10
0▪ 20
0 1 2 3 4 E. 6 7
ANGLE OF GRAZING INCIDENCE IN DEGREES
100
▪ [EH
0 60
20
15 ?,
10 V
s
IRO
:Tt
I:: 80
0 60
tl= m-1
?‘", 40
0 20
I.C. REFERENCE 98/22 12 JOIE 1975
WAVELENGTH 45 A
1 0 1 2 3 4 5 6
ANGLE Cr GRAZING INCIDENCE IN DEGREES
GRATING IDENTIFICATION 0.10.4.2.75.294.SM GRATING IDENTIFICATION 0.19.4.2.15.254.2M
20
10
I 2 3 4 5 6
ANGLE OF GRAZING INCIDENCE IN DEGREES
GRATING IDENTIFICATION 0.20.4.2.75.294.2M GRATING IDENTIFICATION 0.20.4.2.75.294.28
1.C. REFERENCE 78/25 24 APRIL 1975
WAVELENGTH 45 A
FIG. J.03 CO
20
15
10 V
5
I.C. REFERENCE 73/25 13 MARCH 1915
WAVELENGTH 45 A
Mr - I
M, tl
2 3 4
ANGLE OF GRAZING INCIDENCE IN
5
DEGREES
2 3 5
ANGLE OF GRAZING INCIDENCE IN DEGRE
I.C. REFERENCE 74/26 14/17 MARCH 1575
WAVELENGTH 45
100
H 6O
!0
g N
0
'71
1,0 r I
▪ 60 -
x 60 -
■• • 40 r-
Ci
6 o
2 3 5 ANGLE OR GRGZING INCIDENCE .N D•:DREEG
rn • •• 1
1.C. REFERENCE 81/23 B MAY 1675
WAvILENGTM 45 A 100
-286- GB211N3 ILJEN11FICATION G.6.1.2.75.254
GRATING 10ENTIRICATION G.5.4.2.75.2/4
I.E. REFERENCE 67/10 34 FE6RDARr 1975
WAVELENGTH 45 A I.C. REFERENCE 97/20 II JUNE 1675 NAvELENGTm 15 A
1 0
I 2 3 4
3LE OF GRAZING INCIDENCE IN DEGREES ANGLE
GRAVING ICENTIFICATION 0.7.4.2.75.294.3M
GRATING IDENTIFICATION 0.9.4.2.75.294

GRATING IDENTIFICATION 0.3.10.2.75.600 GRATING IDENTIFICATION 0.17.10.2.79.600.2n
GRATING IDENTIFICATION G.7.10.2.75.600
I.C. REFERENCE 66/31 13 FE8RUARY 1975
WAVELENGTH 45 A
GRATING IDENTIFICATION 0.8.10.2.75.600.58
I.C. REFERENCE 82/32 13 MAT 1975 WAVELENGTH 45 A
100
eo
„ 60
tor
40
0 M= 0
I 1 I , __I_
1 2 3 4 5 5 7
ANGLE OF GRAZING INCIDENCE IN DEGREES
L
1 2 3 • 5 6 7
ANGLE OF GRAZING INCIDENCE IN DEGREES
M:}
5
2g
[
1I 2 3 4 5 7
ANGLE OF GRAZING INCIDENCE IN DEGREES 1
81 l
I 2 3 4 6 7
ANGLE OF 6762Ix7. IN7ICENCE IN DEGREES
100
E:80
,0
+ 40 -
F1 t 20 F
0
- 287 - GRATING IDENIIFICATION 0.20.4.7.75.294.2M
I.C. REFERENCE 79/23 25 APRIL I975 WAVELENGTH 45 A
too
n„I
40
.20
O 2 3 ANGLE OF GRAZING INCIDENCE IN DEGREES
GRATING IDENTIFICATION 0.71.4.2.75.234.217
RLEEPENCE 77/27 12 MARCH 1975 WAVELENGTH 45
20 100 - 20
60 - L17 1.7
t t , 60 0
-M'42 IS - 10 f
8 i,
2. ,,
.1 :. (
8'
m 1 2 - 5 ,
20 r,
,. 0 re t: I__ I - 0
O 1 2 3 ■ 5
ANGLE CF GRAZING INCIDENCE IN DEGREES
I.C. REFERENCE 7E/34 19 MARCH 1975
WAVELENGTH 45 A 100 - 20 ICO -
• 80
r•• 4'I
n I _ 1 0 2
,f, 46 g .?: 48
.T, 5 E _
°20 .20
, 0 O 1 2 3 4 5 6 7 B 0
ANGLE OF GRAZING INCIDENCE IN DEGREES
1.C. REFERENCE 71/35 II MARCH 1975
WAVELENGTH 45 A
60
GRATING IDENTIFICATION G.8.23.2.75.600.5m
I.C. REFERENCE 53/35 15 MIT 1975 WA1.ELENGTH 45 A
GRATING IDENTIFICATION 0.11.24.2.75.600.5M
I.C. REFERENCE 84/37 19 MAT 1975 WAVELENGTH 45 A
100
80
„SO
40
° 20
O 1 2 3 4 5 6 7
ANGLE OF GRAZING INCIDENCE IN DEGREES
720
1 10 — :N.
J 5 E
M - 0
FIG. 103 (c)
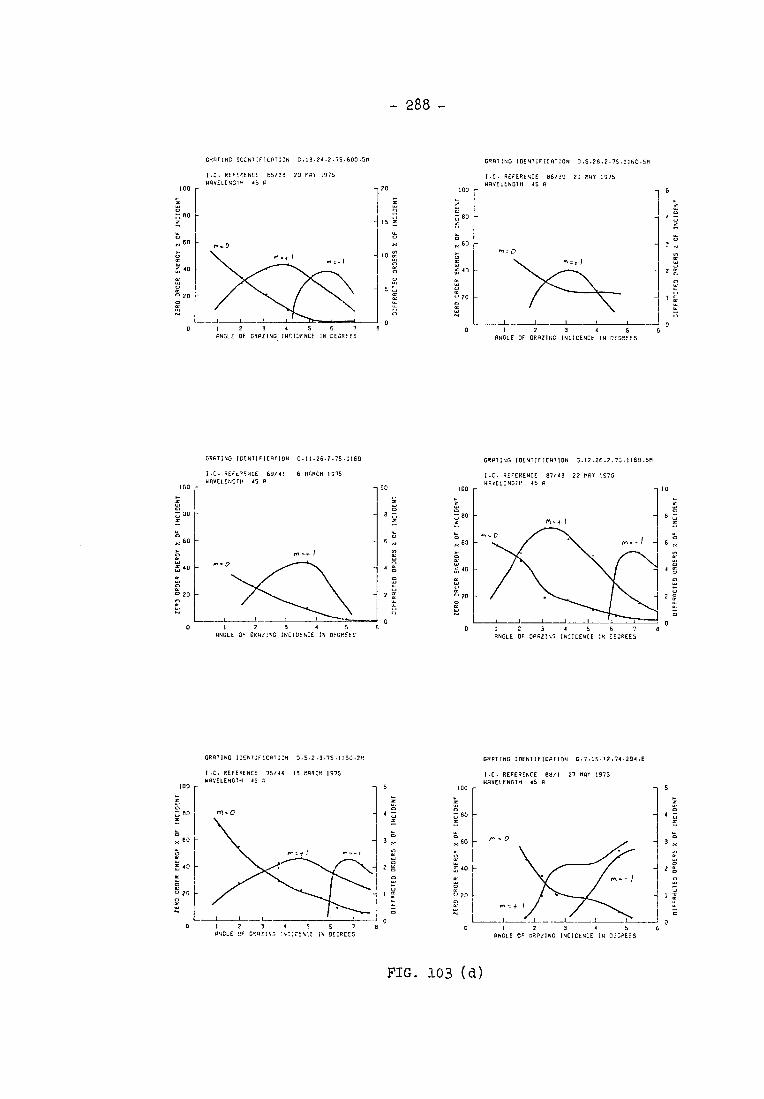
GRATING IDENTIFICATION G.5.28.2.75.1150.50
I.C. REFERENCE 86/39 21 TAY 1915
WAVELENGTH 45 A
441, 0
M41.1
GRATING IOCNI:FICPTION 0.13.24.2.75.600.58
I.C. REFERENCE 65/38 20 MAT 1975
W46E1E5016 45 P 100
80 -
O „ 60
240 -
.20 -
'42
20
- 15
- 10 W
mr0
M. I
100
80
60
w 40
F5 20
15
GRATING IDENTIFICATION 0.11.26.2.75.1160 GRATING IDENTIFICATION 0.12-26.2.10-1160-58
m 8 Fj,
Z 40
0 20
100 - - 5
- 4 u EH
tr-v 0
-
1
100
r; 80
e° 1- 8 I
40
74 r, 20
O 2 3 4 5 ANGLE CF GRAZING INCICENCE IN 0:26E55
, 0 O I 2 3 4 E. 5
ANGLE OF GRAZING :N:1165:0 IN DEGREES
GRA11NG !DEW:IF:Garin 0.5.2.3.75.1160.2m
I.C. REFERENCE 15/44 19 MARCH 1975 WAVELE9016 45 A
GRATING IDENTIFICATION 0.7.15.12.74.294.6
I.C. REFERENCE 88/1 27 MAT 1975
WAvELENGIN 45 A
FIG. 103 (d)
0 60 - 3 ,
I.C. REFERENCE 87/43 22 MAY 1971
WAVELENGTH 45
'EI: w
a 0
X 60 -
z z
O O
6 „ , 60
4 ff, '?, 40 -
LI' z
2 g .20 -
:t. W
10 100 r
O 2 3 4 56 7
ANGLE OF SOAPING IN:IGENCE IN INGRESS
I.C. REFE1NACE 69/4! 6 MARCH 1975
WAVELENGTH 45 A
-10
M.-
IGO
SO
0 60
40
.20
0
_ a
1 F. I 2 3 4 5
ANGLE OF GRAZING INCIDENCE IN DEGREES
- 288 -
O 1 2 3 4 5 6 7
ANGLE OF GRAZING INCIDENCE IN OEGREE5 I 2 3 4 5 6
ANGLE OF CRAZING INCIDENCE IN DEGREES

- 289 -
and land to groove ratio so that it could not be expected that all
of the gratings would have high efficiencies. However, it was a
pleasant surprise to find that most of the gratings had high diff-
raction efficiencies.
The 294 l/mm gratings form the most complete set and since
shadowing effects are least at low frequencies, data from these
gratings can be readily compared with results from the scalar theory
of the laminar grating.
From the equation for optical path length and the grating
equation relations for predicting the positions of efficiency maxima
and minima may be readily derived, as follows:
Optical path length h(sina + sine) =
nX sine = sina
2h
From the grating equation cose = cosa d
Squaring and adding yields:
n2A n 2m.cosa m2A - — sing - 0 (Li)
4h2 h d d2
Hence, maxima and minima in the efficiency curves occur when:
2mcosa/d + n.sina/h A -
n2/4h2 + m2/d2
Alternatively, Eq. 7.1 yields a quadratic in h.
(8mdcosa 2x)h2 4nhd2sina - n2Ad2 = 0
nX 2mh.cosa m2},h sina = - -------- + --
4h nd nd-
n X 2
-mA
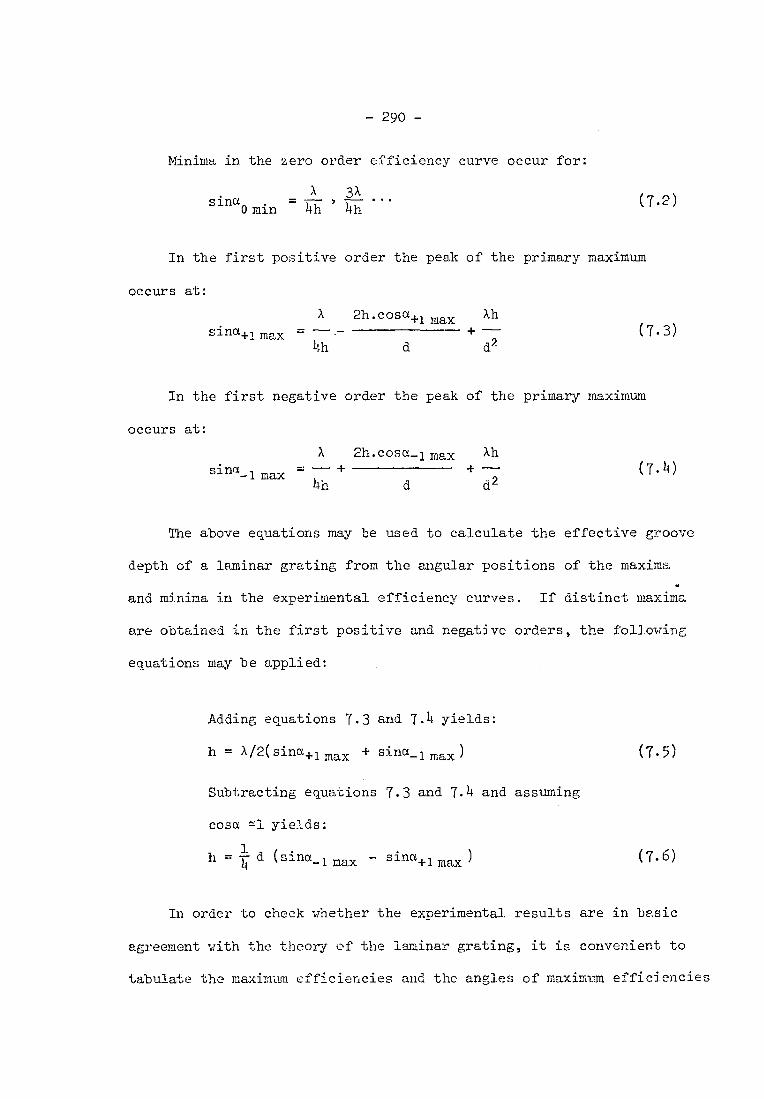
- 290-
Minima in the zero order efficiency curve occur for:
sinct0 min X 3X
= 4h ' 4h (7.2)
In the first positive order the peak of the primary maximum
occurs at:
XXh 2h.cosa+lmax sina+imax = +
4h d d2 ( 7 . 3 )
In the first negative order the peak of the primary maximum
occurs at:
X 2h.cosa_1 max Xh sina-lmax
— +
4h d d2 (7.4)
The above equations may be used to calculate the effective groove
depth of a laminar grating from the angular positions of the maxima
and minima in the experimental efficiency curves. If distinct maxima
are obtained in the first positive and negative orders, the following
equations may be applied:
Adding equations 7.3 and 7.4 yields:
h = X/2( sina+i max + sina_l max )
(7.5)
Subtracting equations 7.3 and 7.4 and assuming
cosa =1 yields:
h = d ( sina- 1 max sina+1 max )
(7.6)
In order to check whether the experimental results are in basic
agreement with the theory of the laminar grating, it is convenient to
tabulate the maximum efficiencies and the angles of maximum efficiencies

- 27,1
in the diffracted orders and also the minimum zero order efficiency
and the angle at which it occurs. The results for the 294 1/mm
gratings are tabulated, according to the nominal groove depths, in
Table 4. It can be seen that the angles at which the zero order
minima occur are consistent between the groups of gratings with
given nominal groove depths apart from one exception, grating no. 17
(this grating will be considered in greater detail later).
From equation 7.2 an angle ao Thin = 5° corresponds to a groove
depth h = 128 A, a0 min = 40 corresponds to h = 160 A, and ao =min
30 corresponds to 2l4 A. Thus, there is broad general agreement
between the nominal groove depths and those predicted by equation 7.2.
The positions of the maxima in the first positive and negative
orders are not as consistently defined as the zero order minima,
however, by taking averages it was hoped to obtain more significant
data. Application of equations 7.5 and 7.6 to the average in Table 4
yielded good agreement for the gratings with a nominal 20nm groove
depth but produced excessively large results for the other data.
Equation. 7.5 produced a groove depth of 21nm from the averaged 2Onm
data and equation 7.6 produced a groove depth of 22nm. Thus it
appears that equation 7.2 has.more general validity than equations
7.5 and 7.6.
From the sample of data given in Table 4 it is not possible to
find any direct correlation between grating efficiency and land to
groove ration although land to groove ratios of about unity seem to
be most favourable. The variations in the positions and magnitude
of the efficiency maxima indicate that there are some structural
differences between the gratings. If grating no. 24, which was made
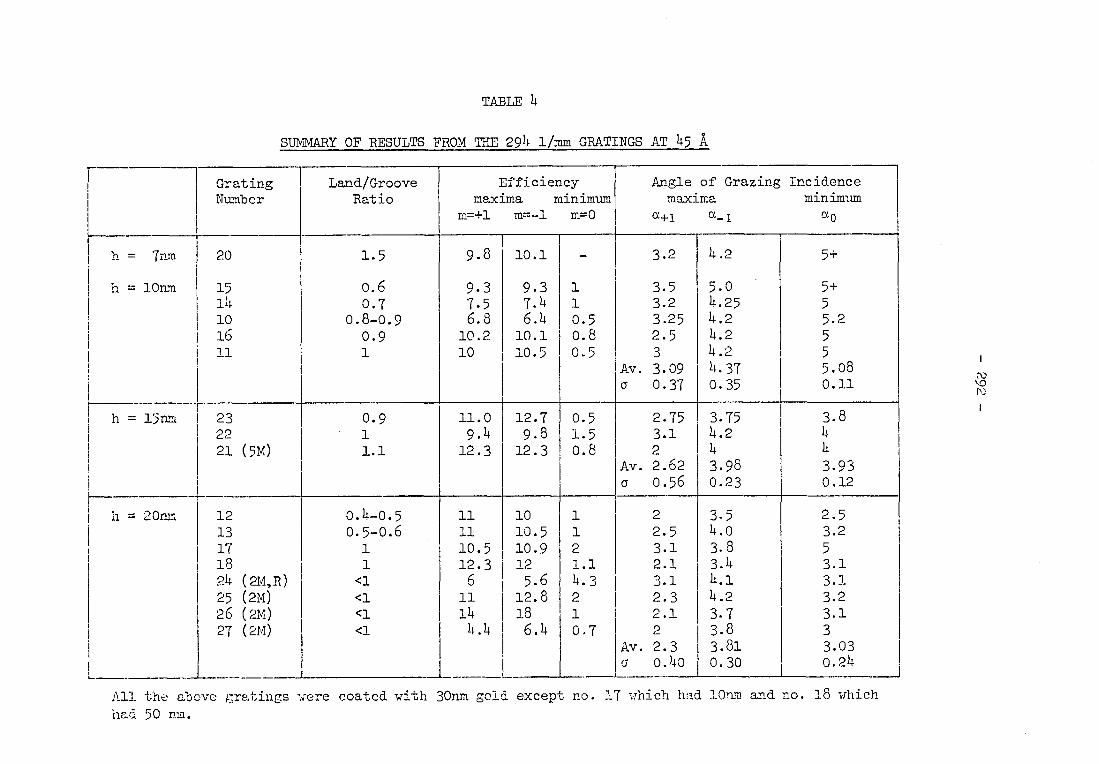
TABLE 4
SUMMARY OF RESULTS FROM THE 294 1/mm GRATINGS AT 45 A
r Grating Number
Land/Groove Ratio
Efficiency maxima minimum
m=+1 m=-1 m=0
Angle of Grazing Incidence maxima minimum
a+1 a-1 a0 1._____
h = 7rm 20 1.5 9.8 10.1 - 3.2 4.2 5+
h = lOnm 15 0.6 9.3 9.3 1 3.5 5.0 5+ 14 0.7 7.5 7.4 1 3.2 4.25 5 lo 0.8-0.9 6.8 6.4 0.5 3.25 4.2 5.2 16 0.9 10.2 10.1 0.8 2.5 4.2 5 11 1 10 10.5 0.5 3 4.2 5
Av. 3.09 4.37 5.08 a 0.37 0.35 0.11
h = 15nm 23 0.9 11.0 12.7 0.5 2.75 3.75 3.8 22 1 9.4 9.8 1.5 3.1 4.2 4 21 (5M) 1.1 12.3 12.3 0.8 2 4 4
Av. 2.62 3.98 3.93 a 0.56 0.23 0.12
H- h = 20nm 12 0.4-0.5 11 10 1 2
CO
u- \ 0 C
O ----
H CM
t- - CO
c0 Cr) i
01 .....1. Cr") Cr)
--t- --1- Cr) CO
Or) 0
2.5 13 0.5-0.6 11 10.5 1 2.5 3.2 17 1 10.5 10.9 2 3.1 5 18 1 12.3 12 1.1 2.1 3.1 24 (2M,R) <1 6 5.6 4.3 3.1 3.1 25 (2M) <1 11 12.8 2 2.3 3.2 26 (2M) <1 14 18 1 2.1 3.1 27 (2M) <1 4.4 6.4 0.7 2 3
Av. 2.3 3.03 a 0.40 0.24
All the above gratings were coated with 30nm gold except no. 17 which had lOnm and no. 18 which had 50'nm.
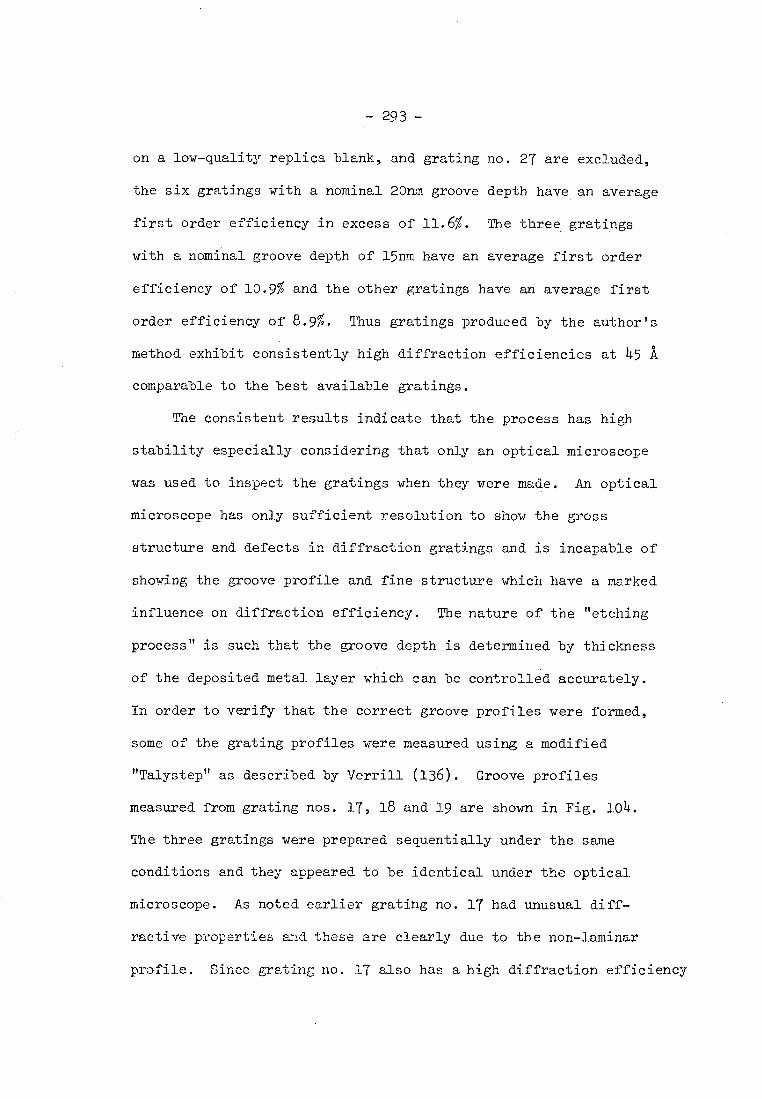
- 293 -
on a low-quality replica blank, and grating no. 27 are excluded,
the six gratings with a nominal 20nm groove depth have an average
first order efficiency in excess of 11.6%. The three gratings
with a nominal groove depth of 15nm have an average first order
efficiency of 10.9% and the other gratings have an average first
order efficiency of 8.9%. Thus gratings produced by the author's
method exhibit consistently high diffraction efficiencies at 45 A
comparable to the best available gratings.
The consistent results indicate that the process has high
stability especially considering that only an optical microscope
was used to inspect the gratings when they were made. An optical
microscope has only sufficient resolution to show the gross
structure and defects in diffraction gratings and is incapable of
showing the groove profile and fine structure which have a marked
influence on diffraction efficiency. The nature of the "etching
process" is such that the groove depth is determined by thickness
of the deposited metal layer which can be controlled accurately.
In order to verify that the correct groove profiles were formed,
some of the grating profiles were measured using a modified
"Talystep" as described by Verrill (136). Groove profiles
measured from grating nos. 17, 18 and 19 are shown in Fig. 104.
The three gratings were prepared sequentially under the same
conditions and they appeared to be identical under the optical
microscope. As noted earlier grating no. 17 had unusual diff-
ractive properties and these are clearly due to the non-laminar
profile. Since grating no. 17 also has a high diffraction efficiency
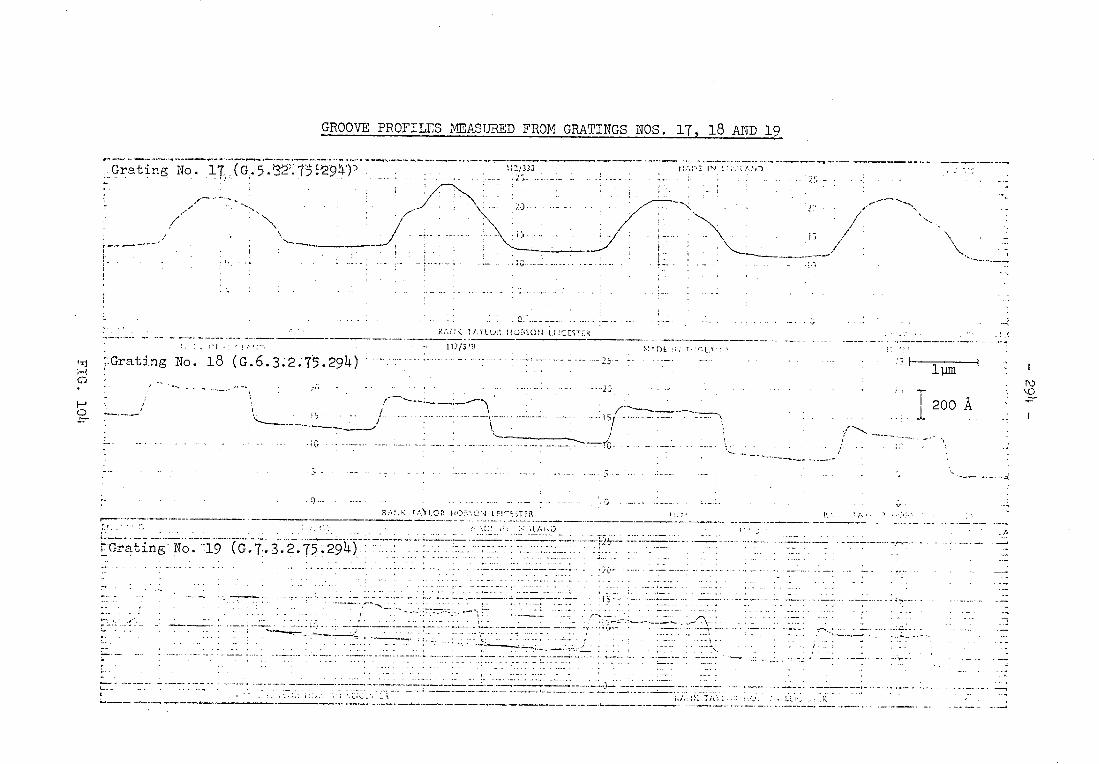
■ - 2 5 -
Grating No . 17 (G. . :294) t-
I! IMCCSTE.R
,,j :Grating No. 18 (G.6.3.2.75.294)
H 0 -----
•
1um
200 A
•
. .......
.3-
GROOVE PROFILES MEASURED FROM GRATINGS NOS. 17, 18 AND 19
- 295 -
it indicates that gratings with other than laminar profiles can
have high efficiencies in the soft x-ray region. It is conceivable
that gratings with profiles intermediate between laminar and blazed
gratings could provide high efficiencies over extended wavelength
ranges.
The 294 1/mm gratings were produced over a period of one
month, the 600 1/mm gratings in two weeks and the 1160 1/mm gratings
during the last few days of my stay in Germany. The results from
the 600 1/mm and 1160 1/mm gratings are summarised in Table 5 and
Table 6. The maximum efficiency recorded from the 600 1/mm gratings
was 11% and although the average efficiency is somewhat less than
that of the 294 1/mm gratings, four of the gratings have efficiencies
>8%. It is interesting to note that all the 600 1/nun gratings with
high efficiencies were formed on high-quality blanks (gratings nos.
31 and 35 were formed on old plane blanks and grating no. 33 was
formed on a replica blank). It is possible that surface roughness
on the blanks causes anisotropic etching and a consequent reduction
in. diffraction efficiency.
The few gratings made with 1160 1/mm do not form a represen-
tative sample since they were produced quickly using the few remaining
grating blanks. It was quite easy to control the processing of these
higher frequency gratings by visual observation with an oil-immersion
objective on the microscope. However, the efficiencies of these
gratings are considerably less than those of the lower frequency gra-
tings apart from one exception - grating no. 43. This grating had a
maximum efficiency of 7.1% in the first positive order which indicates
that high efficiencies may be obtained. from high frequency gratings
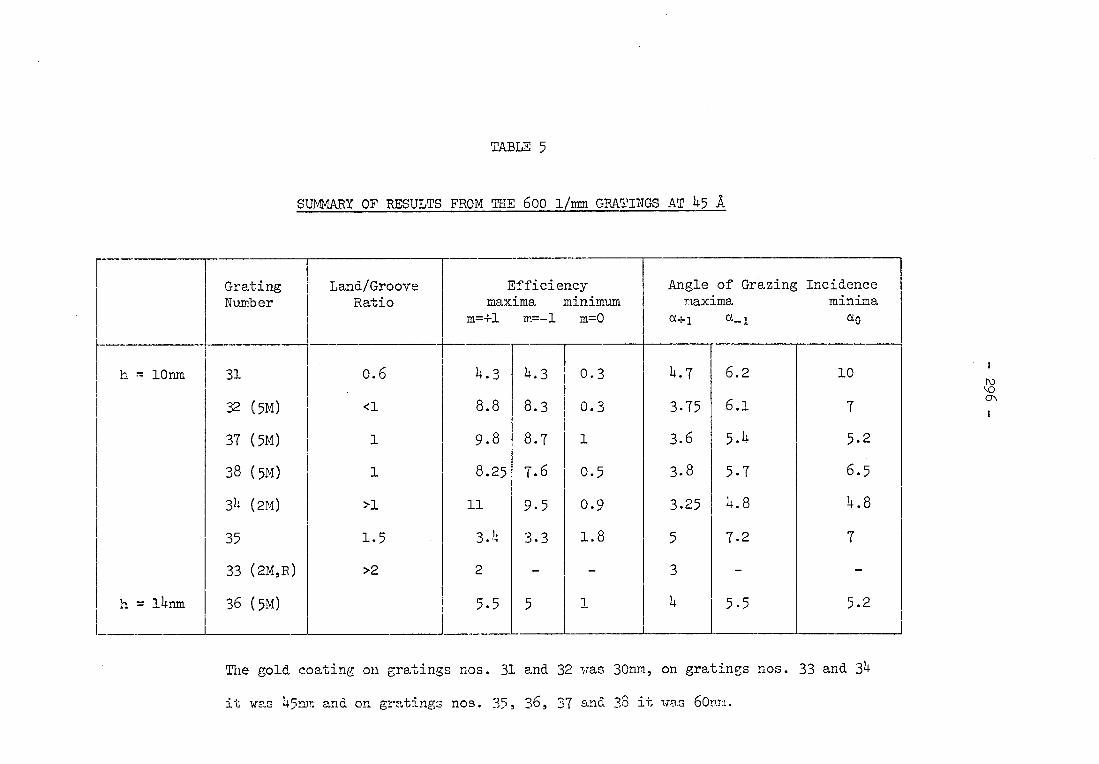
TABLES
SUMMARY OF RESULTS FROM THE 600 1/mm GRATINGS AT 45 A
Grating Number
Land/Groove Ratio
Efficiency maxima minimum
m=4-1 m=-1 m=0
Angle of Grazing Incidence maxima minima
a4-1 a-1 ao
h = lOnm 31 0.6 4.3 4.3 0.3 4.7 6.2 10
32 (5M) <1 8.8 8.3 0.3 3.75 6.1 7
37 (5M) 1 9.8 8.7 1 3.6 5.4 5.2
38 (5M) 1 8.25 7.6 0.5 3.8 5.7 6.5
3h (2M) >1 11 9.5 0.9 3.25 4.8 4.8
35 1.5 3.1 3.3 1.8 5 7.2 7
33 (2M,R) >2 2 - - 3 - -
h = 14nm 36 (5m) 5.5 5 1 4 5.5 5.2
The gold coating on gratings nos. 31 and 32 was 30nm, on gratings nos. 33 and 34
it was 45nm and on gratings nos. 35, 36, 37 and 38 it was 60nm.
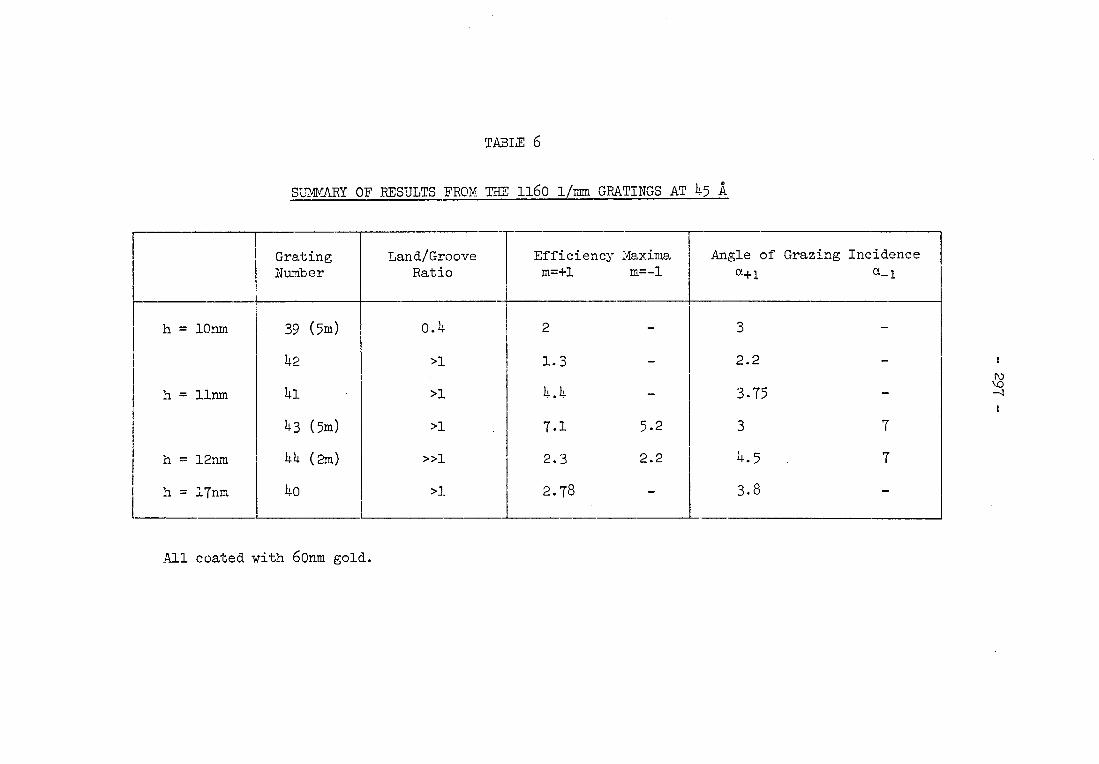
TABLE 6
SUMMARY OF RESULTS FROM THE 1160 1/mm GRATINGS AT 45 A
Grating Number
Land/Groove Ratio
Efficiency Maxima m=+1 m=-1
Angle of Grazing Incidence a+1 a-1
h = lOnm 39 (5m) 0.4 2 - 3 -
42 >1 1.3 - 2.2 -
h = llnm 41 >1 4.4 - 3.75 - 43 (5m) >1 7.1 5.2 3 7
h = 12nm 44 (2m) >>1 2.3 2.2 4.5 7
h = 17nm 40 >1 2.78 - 3.8 -
All coated with 60nm gold.
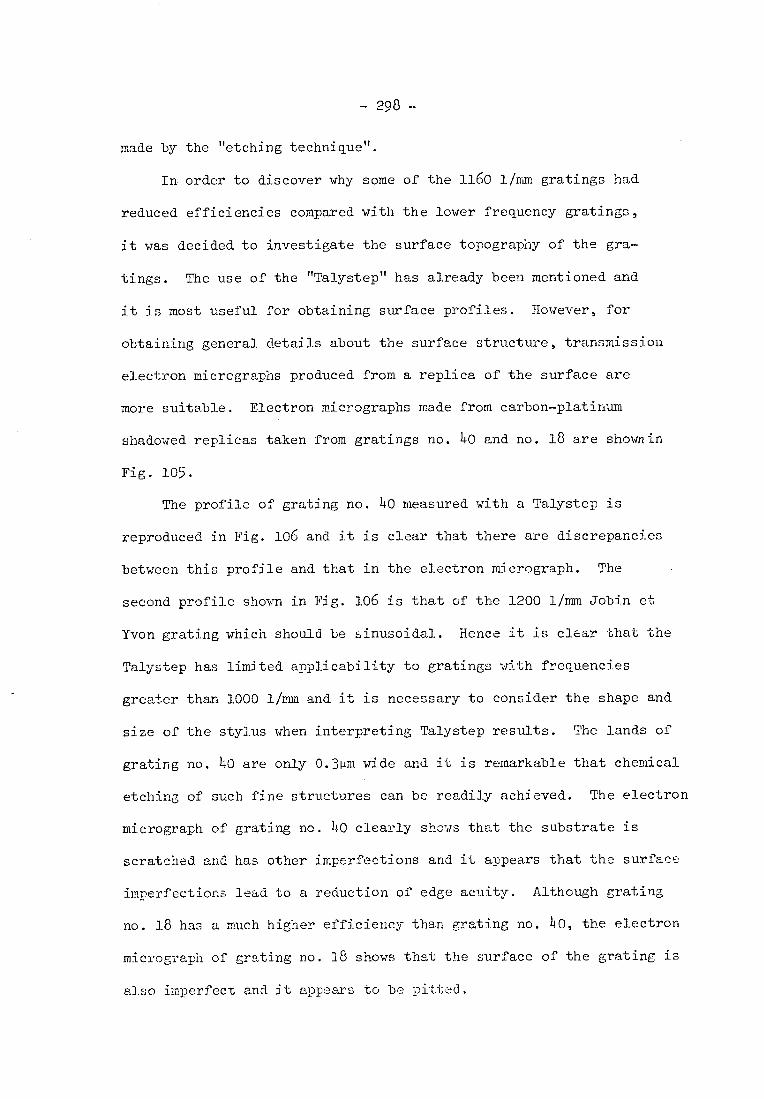
- 298 -
made by the "etching technique".
In order to discover why some of the 1160 1/mm gratings had
reduced efficiencies compared with the lower frequency gratings,
it was decided to investigate the surface topography of the gra-
tings. The use of the "Talystep" has already been mentioned and
it is most useful for obtaining surface profiles. However, for
obtaining general details about the surface structure, transmission
electron micrographs produced from a replica of the surface are
more suitable. Electron micrographs made from carbon-platinum
shadowed replicas taken from gratings no. 40 and no. 18 are shownin
Fig. 105.
The profile of grating no. 40 measured with a Talystep is
reproduced in Fig. 106 and it is clear that there are discrepancies
between this profile and that in the electron micrograph. The
second profile shown in Fig. 106 is that of the 1200 1/mm Jobin et
Yvon grating which should be sinusoidal. Hence it is clear that the
Talystep has limited applicability to gratings with frequencies
greater than 1000 1/mm and it is necessary to consider the shape and
size of the stylus when interpreting Talystep results. The lands of
grating no. 40 are only 0.3iim wide and it is remarkable that chemical
etching of such fine structures can be readily achieved. The electron
micrograph of grating no. 140 clearly shows that the substrate is
scratched and has other imperfections and it appears that the surface
imnerfections lead to a reduction of edge acuity. Although grating
no. 18 has a much higher efficiency than grating no. 110, the electron
micrograph of grating no. 18 shows that the surface of the grating is
also imperfect and it appears to be pitted
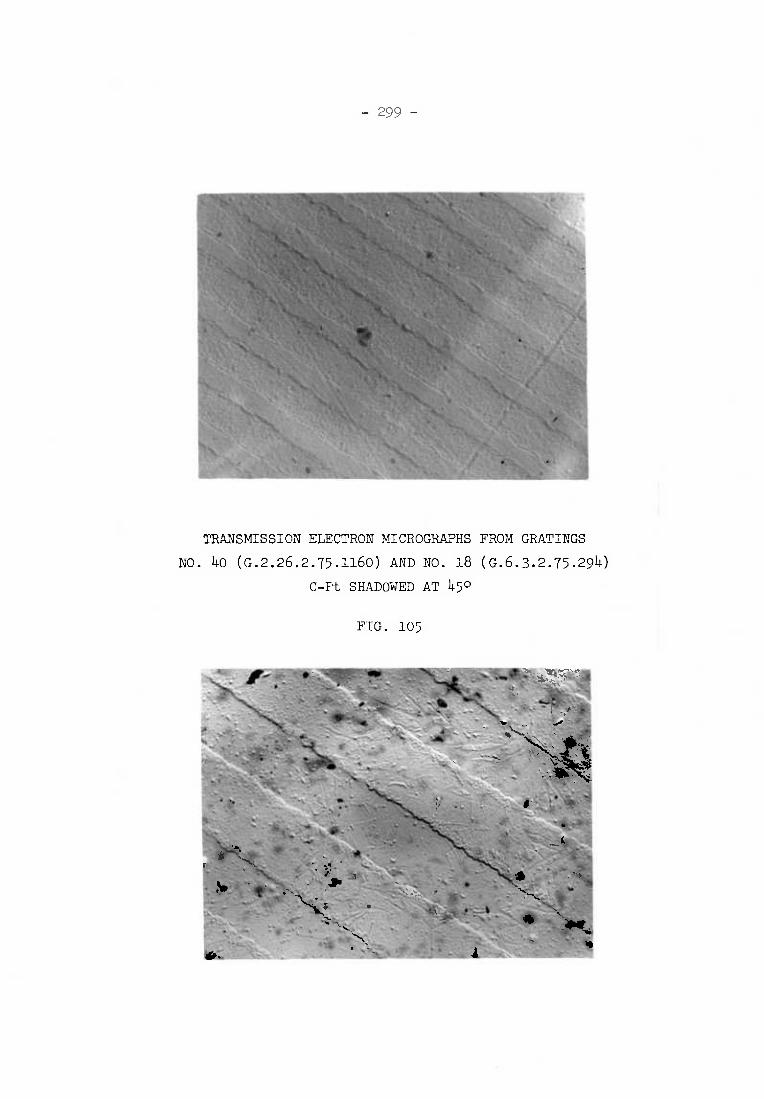
-299-
TRANSMISSION ELECTRON MICROGRAPHS FROM GRATINGS
NO. 40 (G.2.26.2.75.1160) AND NO. 18 (G.6.3.2.75.294)
C-Ft SHADOWED AT 450
FIG. 105
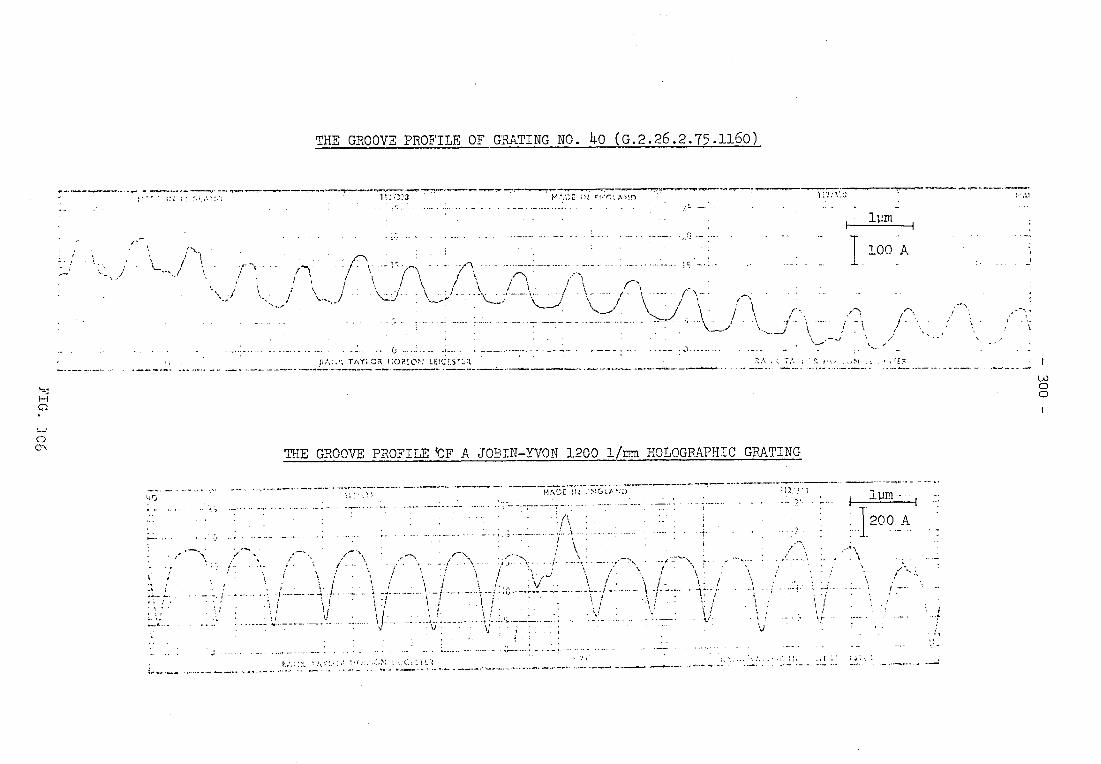
•
I '., ) • -
.
; V
7
't ■ t
' ;
1 I
\ I \ \ \_ ' '
\ l / /
t 1 I i I • \ i
THE GROOVE PROFILE OF GRATING NO. 40 (G.2.26.2.75.1160)
11 2 ;"2,:3 _ .
f):.•.,;',Z, Is; 1:2:P.13 AI
f'•""'( -- ( 1
21A2.2; TAY; OR 1:0V,ON
THE GROOVE PROFILE 'OF A JOBIN-YVON 1200 1/imn HOLOGRAPHIC GRATING
C
- 301-
The electron micrographs prepared from the two gratings do
not show the cause of the reduced efficiency of the higher frequency
gratings but they do show that the surface finish of the substrates
used for these prototype gratings is rather low. It is to be ex-
pected that the use of higher quality blanks will enable consistently
better results to be obtained.
A selection of'six of the gratings made by the etching technique
have been tested at 8.3 A. The peak efficiencies of these gratings
are summarised in Table 7 and the dependence of grating efficiency on
grazing angle for gratings nos. 11, 32, 37 and )43 are shown in Fig.
107 and Fig. 108. It can be seen that the gratings produced by the
author also have high efficiencies at 8.3 A. The maximum efficiencies
are somewhat less than those achieved by the N.P.L. laminar gratings
and this can be attributed to substrate imperfections of the author's
gratings. It is clear that the N.P.L. techniques are more suitable
for producing laminar gratings for use at very short wavelengths.
However, the author's technique - enables laminar holographic gratings,
which are highly efficient in the soft x-ray region, to be readily
fabricated without specialised equipment.
A summary of the best 22 results obtained at 115 A arranged
according to grating frequency is shown in Fig. 109 and the indivi-
dual gratings may be identified by referring to Table 8. As a result
of intensive research the efficiencies of gratings with 300 1/mm
and 600 1/mm have now reached satisfactory levels. The aim of future
research on soft x-ray gratings should be to increase the performance
of gratings with 1200 1/mm and higher frequencies so that higher
spectral resolution can be attained.
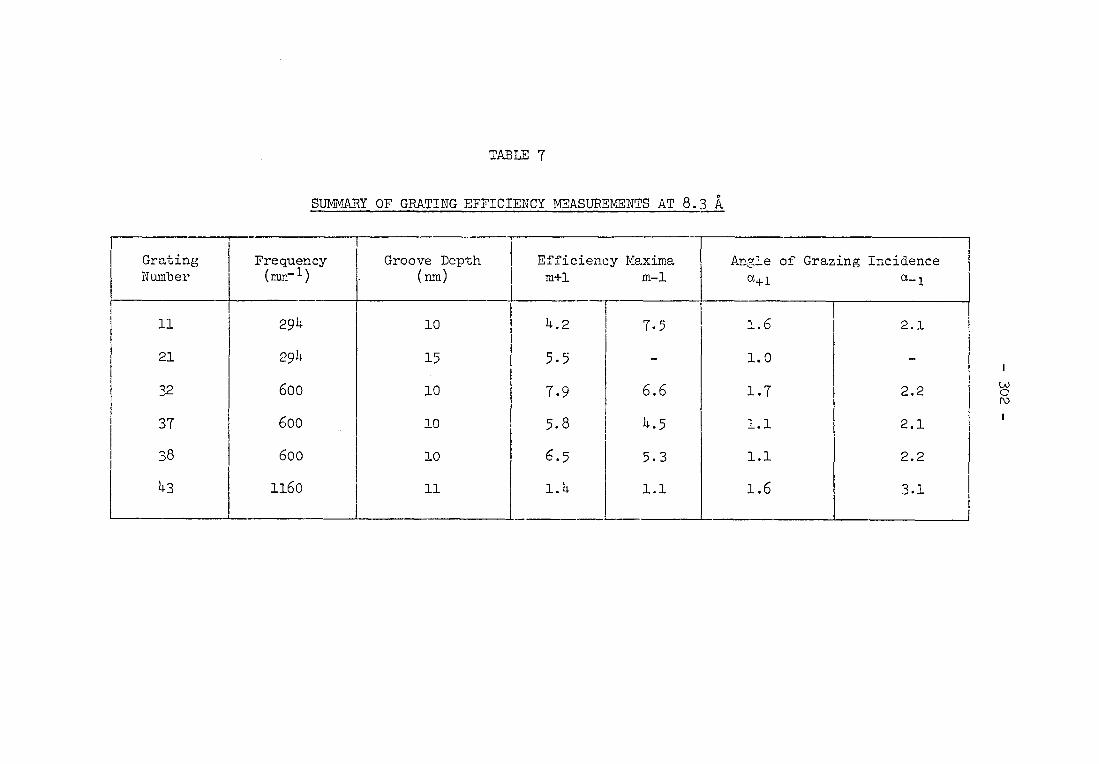
TABLE 7
SUMMARY OF GRATING EFFICIENCY MEASUREMENTS AT 8.3 A
Grating Number
Frequency (mm-1)
Groove Depth (nm)
Efficiency Maxima m+1 m-1
Angle of Grazing Incidence a+1 a-1
11 294 10 4.2 7.5 1.6 2.1
21 294 15 5.5 - 1.0 -
32 600 lo 7.9 6.6 1.7 2.2
37 600 lo 5.8 4.5 1.1 2.1
38 600 lo 6.5 5.3 1.1 2.2
43 1160 11 1.4 1.1 1.6 3.1
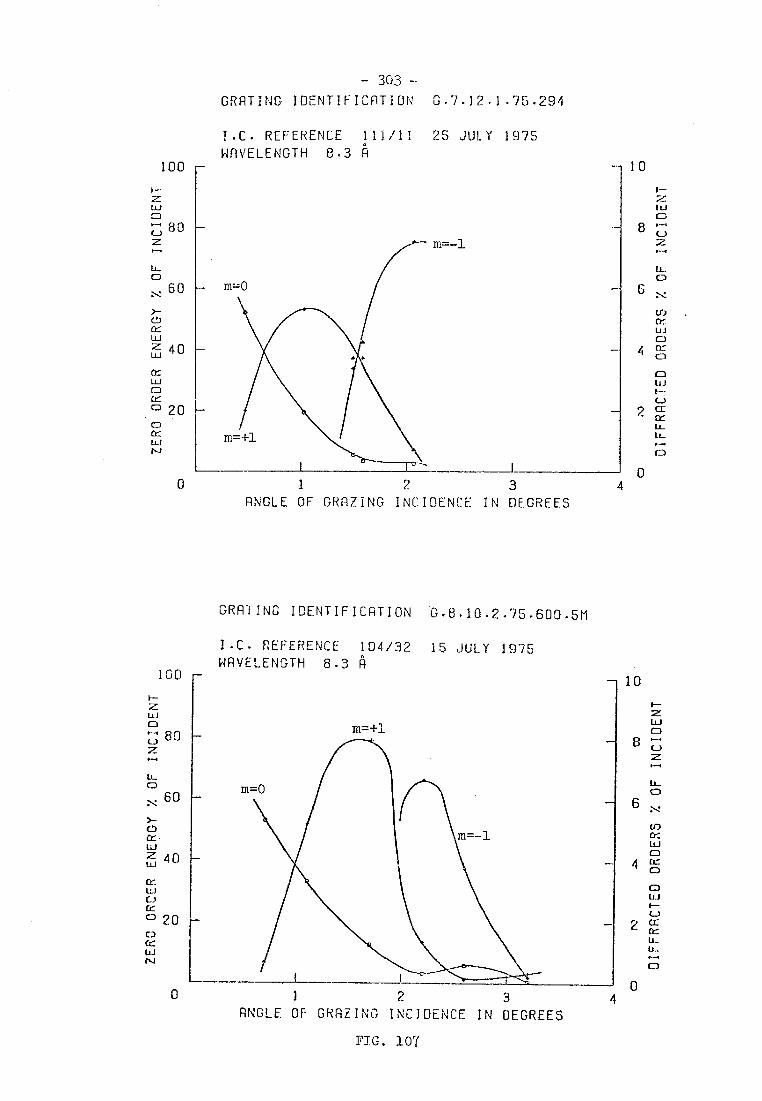
- 303 -
100
z Lu
80
GRATING IDENTIFICATION G.7.12.I.75.294
I.C. REFERENCE 111/11 25 JULY 1975
WAVELENGTH 8.3 A
m= -1
- 1 0
8
1-
t.1
z 1P-11
O 60 - m=0
CU
ujz 40
O
1:7) 20 F-
NJ
0
1 2 3
ANGLE OF GRAZING INCIDENCE IN DEGREES
C)
CO
LI .1
C4
C)
2 CL CC LL LL
C)
0
4
GRAZING IDENTIFICATION 0.8.10.2.75.600.5M
I.C. REFERENCE 104/32 15 JULY 1975 WAVELENGTH 8.3 A
100 - 10
11.:J
CG CD 20 CD Cr U-I
}--- j O 80
7.:
LL
60
cti
,T.1-▪ 40
0
m=+1
2
3
4 ANGLE OF GRAZING INCIDENCE IN DEGREES
1
O 8
2
LL CD
CO Cr:
O 4 Cr
CD
CD L1-1 1--
CC Cr
U.
O
6
0
FIG. 107
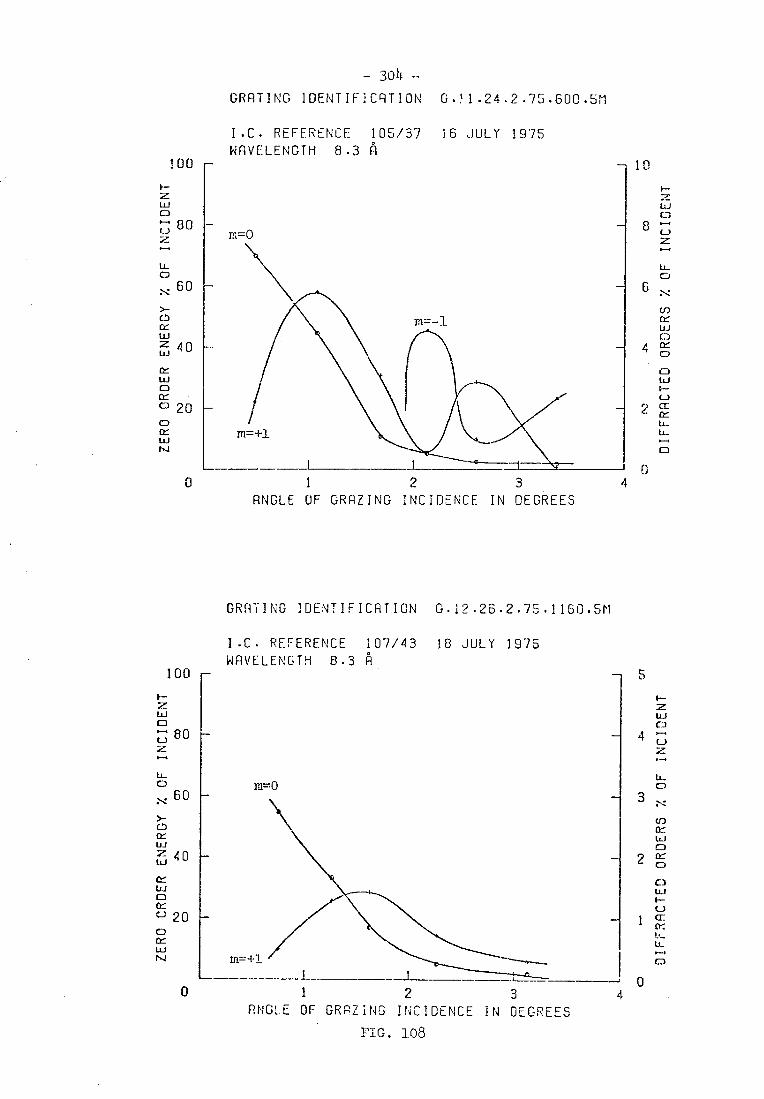
100
ri 80 z 11■4
U-
60
>-
ILJ
w W 40
O
20
0
100
I- 1..LJ
Z-1;80
60
IX UJ if,- 4 0
tr..1 CC 20
O tY
0
10
1 2 3
4 ANGLE OF GRAZING INCIDENCE IN DEGREES
m=0
m=4-1
I.C. REFERENCE 107/43 18 JULY 1975
WAVELENGTH 8.3 A 5
3
-I 2
1
0 4
- 304 -
GRATING IDENTIFICATION G.H.24.2.75.600.51.1
I.C. REFERENCE 105/37 16 JULY 1975
WAVELENGTH 8.3 A
GRATING IDENTIFICATION G.12.26.2.75.1160.5(1
1 2 ANGLE OF GRAZING INCIDENCE IN DEGREES
FIG. 108
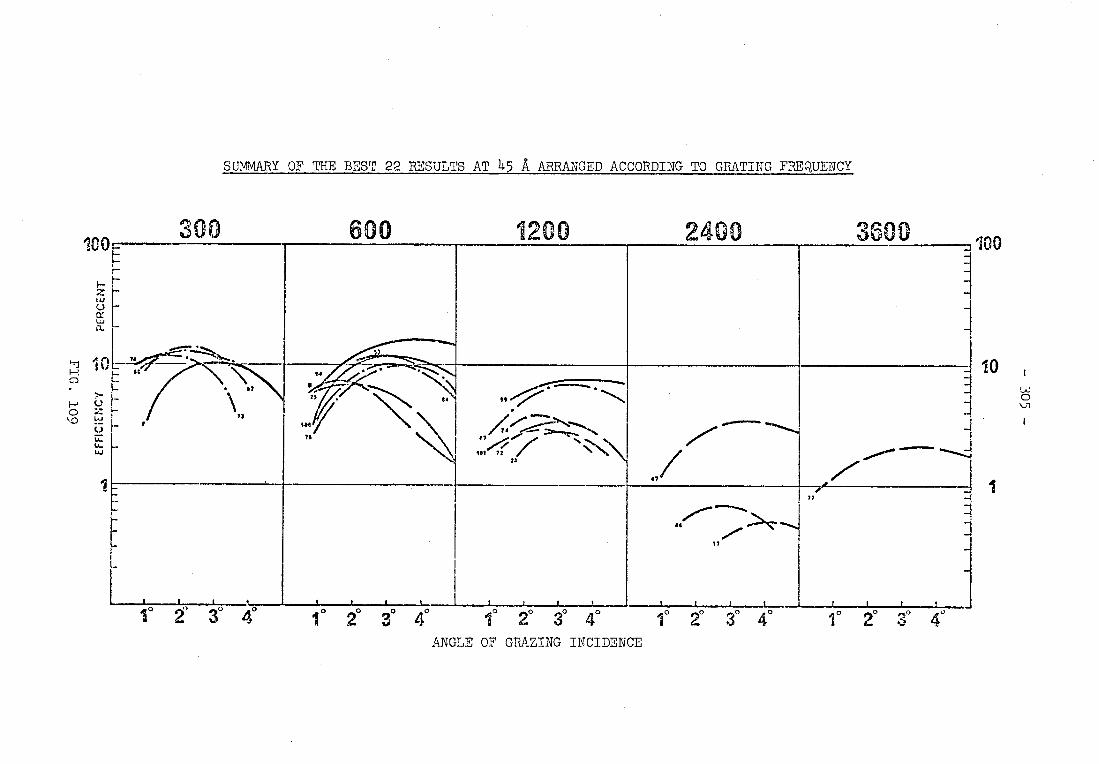
300 600 1200 2400 3600
1° 2 3° 4° 1° 2° 3° 4° 10
ANGLE OF GRAZING INCIDENCE
I 3° 4° 2° 2° 1° 3V 4
SUMMARY OF THE BEST 22 RESULTS AT 1i5 A ARRANGED ACCORDING TO GRATING FREQUENCY
r F [
_
..
r . .. _ _ _.
-1
• or
\ 73
. 2$
1441 / 711
84
N.
13
/: 87
101 t
47
—.
....
....
.7.....
. .."'''''''''.... . .............
..„0„.. ........ ..2....
."...<::"......' Z'...........
/ ......\"X 23
,..
I _ I
<
14
,,----,... ........
//'' 17
7?
t 1 1
-.. --, ...,
-,
...
100 100
H z LA.1 U
EFFI
CiE
NC
Y
0
I
10 O
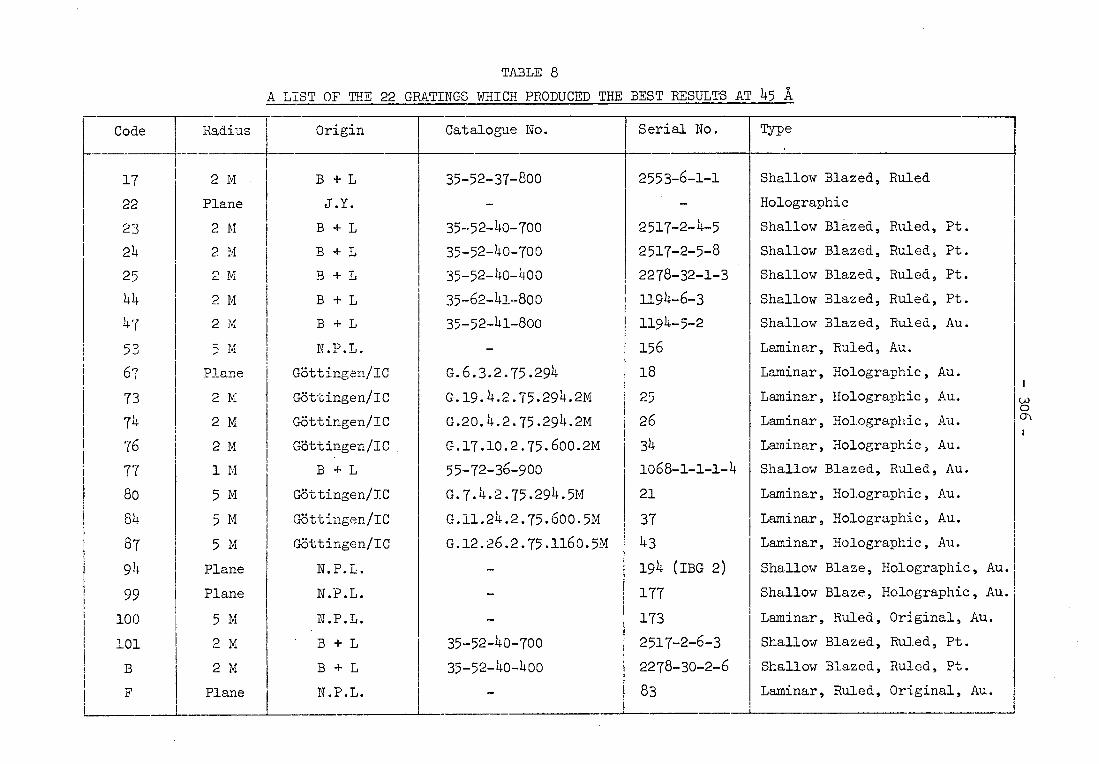
TABLE 8
A LIST OF THE 22 GRATINGS WHICH PRODUCED THE BEST RESULTS AT 45 A
Code Radius Origin Catalogue No. Serial No. Type
17 2 M B + L 35-52-37-800 2553-6-1-1 Shallow Blazed, Ruled
22 Plane J.Y. - - Holographic
23 2 M B + L 35-52-40-700 2517-2-4-5 Shallow Blazed, Baled, Pt.
24 2 M B + L 35-52-40-700 2517-2-5-8 Shallow Blazed, Ruled, Pt.
25 2 M B + L 35-52-40-400 2278-32-1-3 Shallow Blazed, Ruled, Pt.
44 2 M B + L 35-62-41-800 1194-6-3 Shallow Blazed, Ruled, Pt.
47 2 M B + L 35-52-41-800 1194-5-2 Shallow Blazed, Ruled, Au.
53 5 M N.P.L. - 156 Laminar, Ruled, Au.
67 Plane Gottingen/IC G.6.3.2.75.294 18 Laminar, Holographic, Au.
73 2 M Gottingen/IC G.19.4.2.75.294.2M 0- e_7 Laminar, Holographic, Au.
74 2 M GOttingen/IC G.20.4.2.75.294.2M 26 Laminar, Holographic, Au,
76 2 M Gottingen/IC . G.17.10.2.75.600.2M 34 Laminar, Holographic, Au.
77 1 M B + L 55-72-36-900 1068-1-1-1-4 Shallow Blazed, Ruled, Au.
80 5 M GOttingen/IC G.7.4.2.75.294.5M 21 Laminar, Holographic, Au.
84 5 M COttingen/IC G.11.24.2.75.600.5m 37 Laminar, Holographic, Au.
87 5 M GOttingen/IC G.12.26.2.75.1160.5M 43 Laminar, Holographic, Au.
94 Plane N.P.L. - 194 (IBG 2) Shallow Blaze, Holographic, Au.
99 Plane N.P.L. - 177 Shallow Blaze, Holographic, Au.
100 5 M N.P.L. - 173 Laminar, Ruled, Original, Au.
101 2 M B + L 35-52-40-700 2517-2-6-3 Shallow Blazed, Ruled, Pt.
B 2 M B + L 35-52-40-400 2278-30-2-6 Shallow Blazed, Ruled, Pt.
F Plane N.P.L. - 83 Laminar, Ruled, Original, Au.
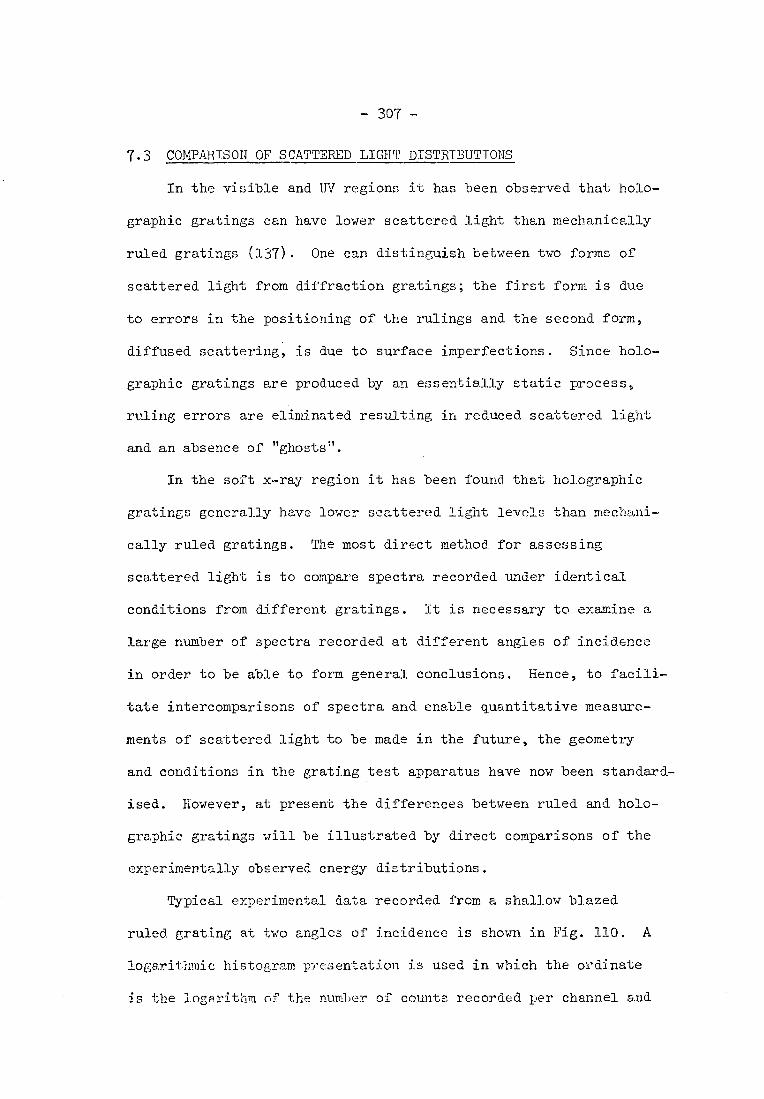
-307-
7.3 COMPARISON OF SCATTERED LIGHT DISTRIBUTIONS
In the visible and UV regions it has been observed that holo-
graphic gratings can have lower scattered light than mechanically
ruled gratings (137). One can distinguish between two forms of
scattered light from diffraction gratings; the first form is due
to errors in the positioning of the rulings and the second form,
diffused scattering, is due to surface imperfections. Since holo-
graphic gratings are produced by an essentially static process,
ruling errors are eliminated resulting in reduced scattered light
and an absence of "ghosts".
In the soft x-ray region it has been found. that holographic
gratings generally have lower scattered light levels than mechani-
cally ruled gratings. The most direct method for assessing
scattered light is to compare spectra recorded under identical
conditions from different gratings. It is necessary to examine a
large number of spectra recorded at different angles of incidence
in order to be able to form general conclusions. Hence, to facili-
tate intercomparisons of spectra and enable quantitative measure-
ments of scattered light to be made in the future, the geometry
and conditions in the grating test apparatus have now been standard-
ised. However, at present the differences between ruled and holo-
graphic gratings will be illustrated by direct comparisons of the
experimentally observed energy distributions.
Typical experimental data recorded from a shallow blazed
ruled grating at two angles of incidence is shown in Fig. 110. A
logarithmic histogram p.r•sentation is used in which the ordinate
is the logarithm of the number of counts recorded per channel and
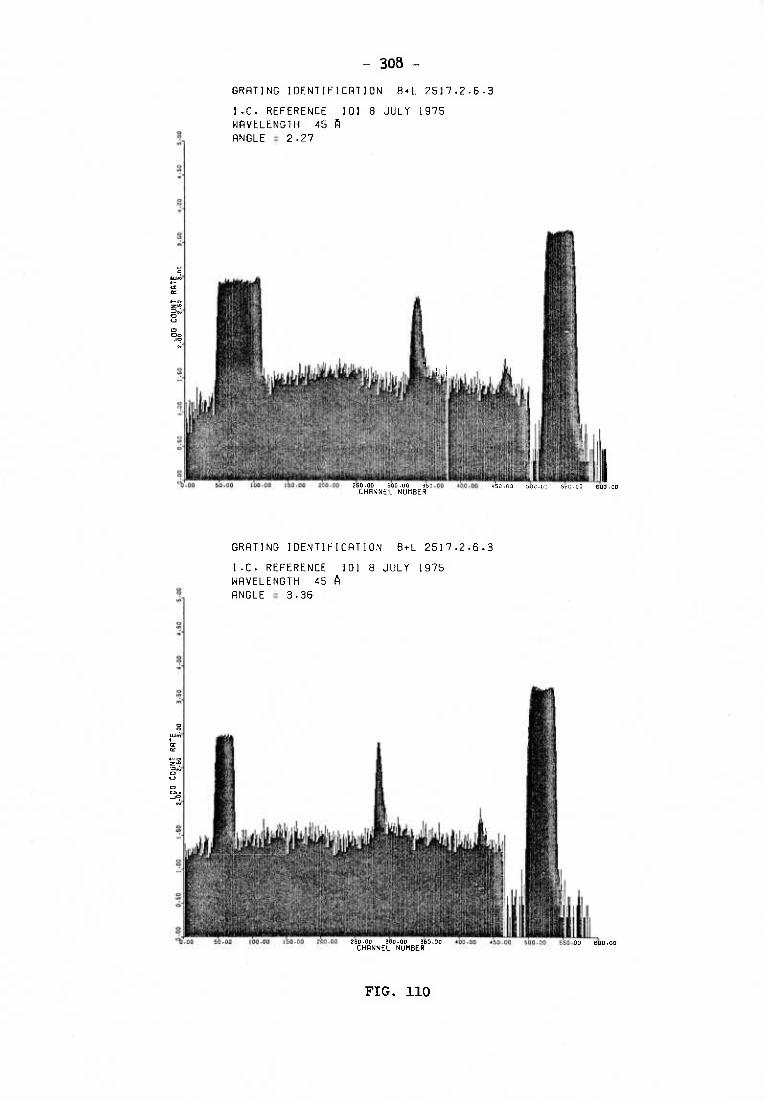
- 308 - GRATING IDENTIFICATION B+L 2517.2.6.3
I.C. REFERENCE 101 8 JULY 1975 WAVELENGTH 45 A RNGLE = 2.27
97.00 50.00 100.00 150.00 200.00 250.00 300.00 350 CHANNEL NUMBER
'50.00 500.00 5E0.00 600.00
GRATING IOENTIFICATION B+L 2517.2.6.3
I.C. REFERENCE 101 8 JULY 1975
WAVELENGTH 45 A ANGLE = 3.36
9o.00 so-o0 100.00 iso.00 250.00 300.00 350.00 400.00 450.00 500.00 5 0.00 600.00 CHANNEL NUMBER
FIG. 110

- 309 -
the abscissa is the channel number, which. corresponds to the detector
position. The peaks in Fig. 110 represent the zero order, first
positive order, second positive order and finally the direct beam
which is recorded after the grating has been retracted. The instru-
ment noise level can be seen in the portions of the spectra adjacent
to the direct beam (it is '1,2cps). It is clear from these spectra
that the ruled grating produces a significant level of scattered
radiation.
In Fig. 111 are shown a series of spectra recorded from a
shallow blazed grating with 3600 1/mm. The scattered radiation from
this grating has a different form from that shown in Fig. 110 but it
is clear that the grating is producing scattered light levels much
greater than the background.
A typical spectrum produced by one of the author's laminar
holographic gratings is shown in Fig. 112. It can be seen that the
count rates between the peaks are much lover than for the ruled gra-
tings and that they are closely approaching the background count
rates. A series of spectra in Fig. 113 shows the dependence of the
scattered light distributions on angle of grazing incidence for this
holographic grating. It can be seen that the low scattered light
levels from holographic x-ray gratings provides a marked increase in
signal to noise ratio.
In the visible and UV regions it appears that the scattered light
is reduced because of the increased ruling accuracy of holographic
gratings. However, in the soft x-ray region the principal cause of
stray light is surface imperfections. A spectrum produced from a
laminar grating made by processing a ruled mask is shown in Fig. 14

GRATING IDENTIFICATION 1•L 1059.1.1.1.4
I.C. REFERENCE 77 3 APRIL 1975 NAVELENGIN 45 A
ANGLE . 2.20
GRATING IDENTIFICATION O.L 1068.1.1.1.4
I.C. REFERENCE 17 3 APRIL 1975 WAVELENGIN 45 A ANGLE
GRATING IDENTIFICATION 1065.I./.1.4
I.C. REFERENCE 77 3 APRIL 1975 WAVELENGTH 45 A ANGLE = 3.95
GRATING IDENTIFICATION 8.0 1068.1.1.1.4
I.C. REFERENCE 77 3 APRIL 1975 WAVELENGTH 45 A ANGLE c 4.60
GRATING IDENTIFICATION 9.1 1069.1.14.4
I.C. REFERENCE 77 3 APRIL 1976 NAVELEN0TM 45 A ANGLE A 6.15
310
GRATING IDENTIFICATION 8.L 1068.1.1.1.4
I.C. REFERENCE 77 3 APRIL 1975 NOwELENGIN 45 A
ANGLE c 0.85
FIG. 111
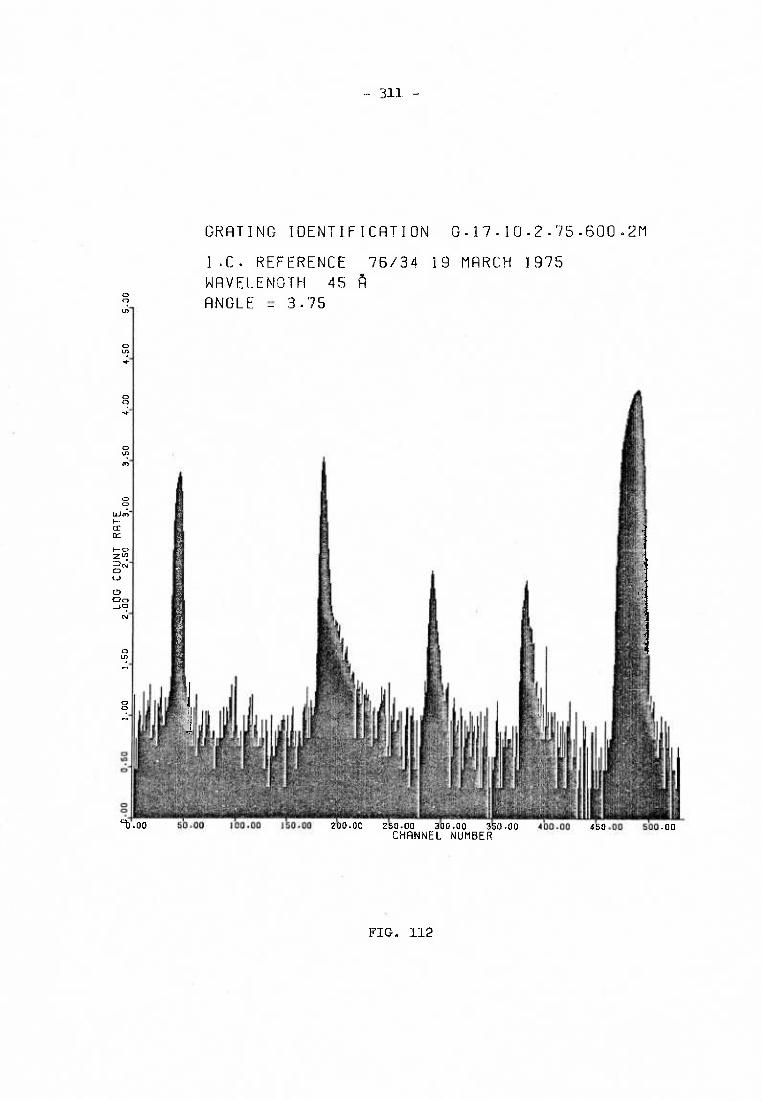
I.C. REFERENCE 76/34 19 MARCH 1975
WAVELENGTH 45 A ANGLE 1: 3.75
50.00 100.00 150.00 200.00 250.00 300.00 350.00 400.00 450.00 500.00 CHANNEL NUMBER
311 -.
GRATING IDENTIFICATION G. 17.10.2.75.600.2M
FIG. 112
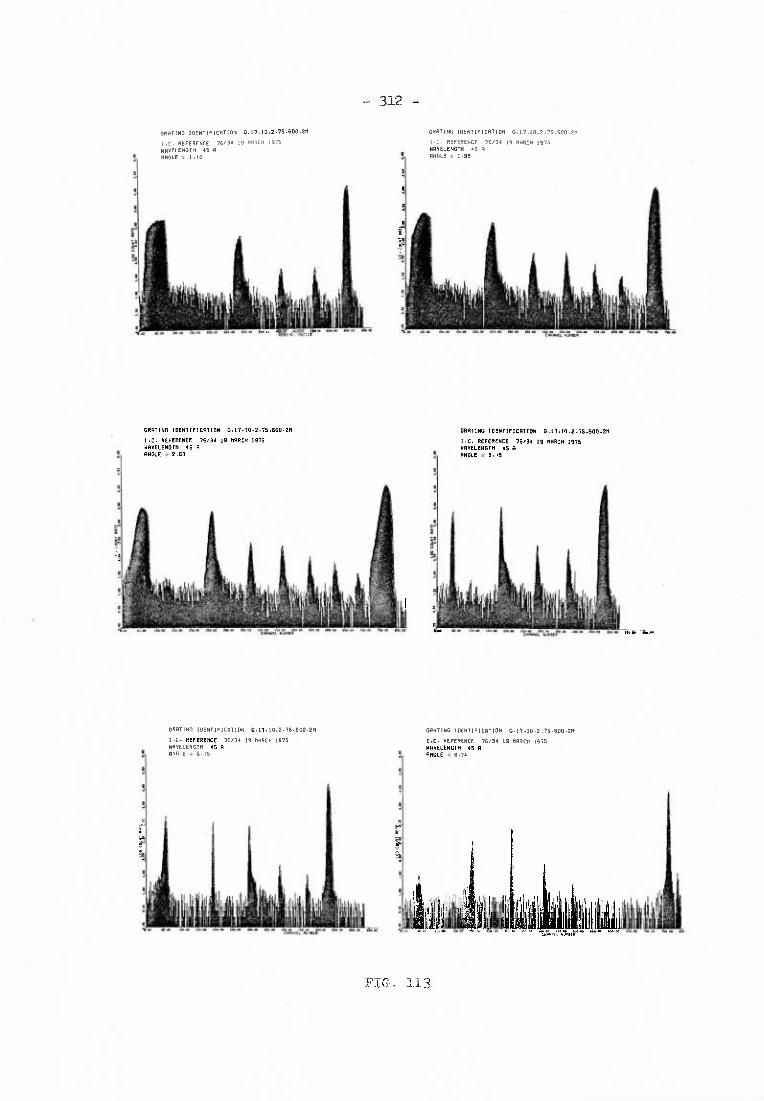
GRATING IDENTIFICATION 0.17.10.2.75.600.2M
I.C. REFERENCE 76/34 19 MARCH 1975 WAVELENGTH 45 A ANGLE . 2.63
GRATING IDENTIFICATION G.I7.10.2.75.600.2M
I.C. REFERENCE 76/34 19 MARCH 1975 RAVELENGTH 45 A ANGLE = 3.75
GRATING IDENTIFICATION 6.17.10.2.75.600.29
I.C. REFERENCE 76/34 19 MARCH 1975 NAVELENGTH 45 A ANGLE = 5.75
GRATING IDENTIFICATION 0.17.10.2.75.600.2M
I.C. REFERENCE 76/34 19 MARCH 1975 NAVELENGTH 45 A ANGLE = 6.74
113
- 312 -
a
GRATING IDENTIFICATION 0.17.10.2.75.600.2M
I.C. REFERENCE 76/34 19 MARCO 1975
WAVELENGTH 45 A ANGLE . 1.10
GRATING IDENTIFICATION 6.17.10.2.75.500.2M
I.C. REFERENCE 76/34 19 MARCH 1975 WAVELENGTH 45 A ANGLE m 1.98

— 313
GRATING IDENTIFICATION NPL 156 RECORTED
I .C. REFERENCE 64 7 JANUARY 1975 WAVELENGTH 45 A
O
ANGLE = 290 U,
0 1.0
O 0
Ul
0
UJ
CE
Z./ Dn O
0 Oo -Jo
O
O U,
O
b.00 50.00 100.00 0.00 200.00 250.00 300.00 350.00 400.00 450.00 500.00 CHANNEL NUMBER
FIG. 1124
- 314 -
and the scattered light level is close to background. Thus, it
appears that the technique for producing x-ray gratings is immaterial
provided the grating surface produced is adequately smooth. However,
by combining holographic techniques with the ion-etching process for
producing super-smooth surfaces, extremely low scattering levels can
be achieved as shown in Fig. 115 and Fig. 116. The gratings which
produced these spectra are plane holographic blazed gratings with
600 1/mm and 1200 1/mm and blaze angles of 0.65° and 1.5° respectively.
Spectra recorded at a number of angles of incidence from these gratings
are shown in Fig. 117 and Fig. 118. These two blazed holographic gra-
tings produced at the NPL are particularly interesting since they
have exceptionally high efficiencies and are the first blazed gratings
which are really suitable for use in the soft x-ray region. Since
these gratings have been made on plane blanks, unfortunately they have
little value for experimental spectroscopy.

I.C. REFERENCE 94 5 JUNE 1975
WAVELENGTH 45 A ANGLE = 4.07
50 00 100,00 150.00 200.00 250.00 300.00 350.00 40.00450.00 CHANNEL. NUMBER
FIG, 115
- 315 -
GRATING IDENTIFICATION NPL IBG2 600
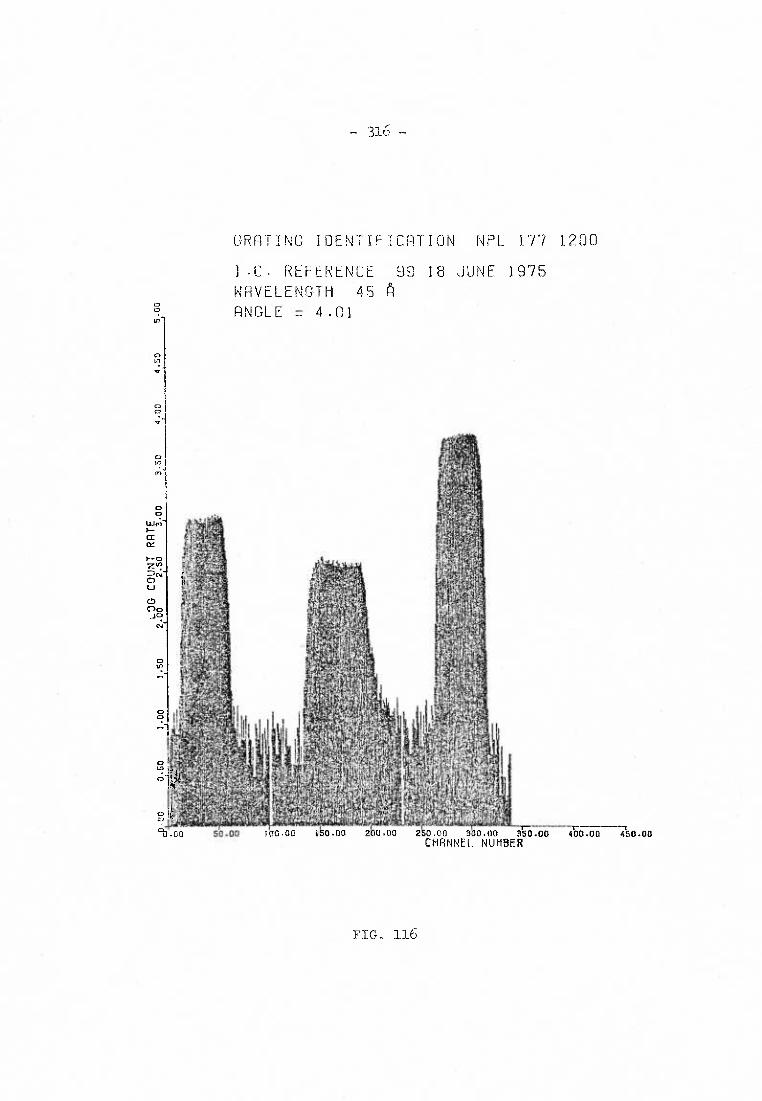
I REFERENCE 99 18 JUNE 1975
WAVELENGTH 45 1)
ANGLE 17 4.01
150.00 200.00
250.00 300.00 350.00 400.00 450.00 CHANNEL NUMBER
316
GRATING. IDENTIFICATION NFL 177 1.200
FIG, 116

GRATING 11/D411E1(.10N NPL 1502 600
I.C. REFERENCE 94 5 JUNE 1976 AREELENGT14 45 A ANGLE . 2.00
GROING IDEN7IFICATION NIL 1102 600
I.C. REFERENCE 94 5 JUNE 1975 NAAELENG7N 45 A ANGLE . 3.04
GRATING IDENTIFICATION NFL 1002 600
I.C. REFERENCE 54 5 JUNE 1975 5AvELENGTH 45 A ANGLE . 5.00
ORATING IDENTIFICATION NPL 1862 600
GRATING IDENTIFICATION NPL 1862 600
I.C. REFERENCE 94 5 JUNE 1975
I.C. REFERENCE 94 5 JUNE 1075
WAVELENGTH 45 R
wAvELENGIM 45 A
ANGLE . 7.06
ANGLE . 6.11
FIG. 117
® 317
GRATING IDENTIFICATION NPL 1602 600
I.C. REFERENCE 94 5 JUNE 1075 14AvELENGTR 45 A ANGLE a 4.01
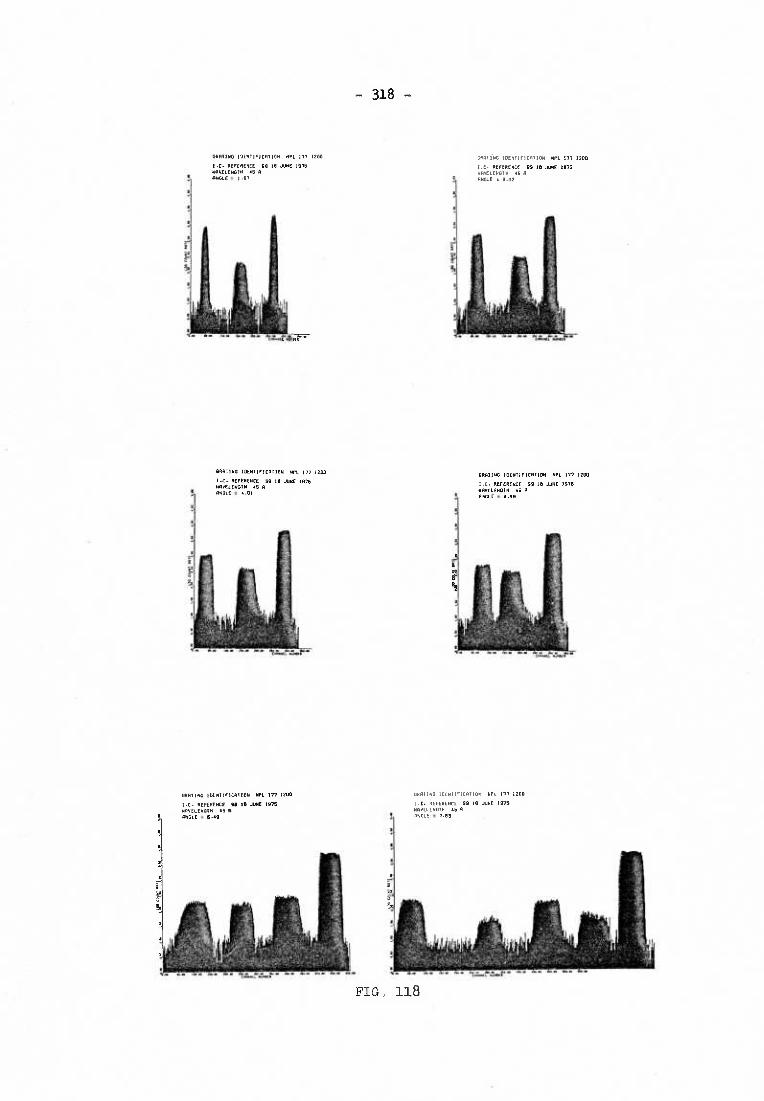
GRAEIND 10E1211E101110N NFL 177 1200
1.C. REFERENCE 99 II JUNE 1975 NAVETENGIN 45 A 224/010 . 2.57
.R1174 IDENTIFICRTION NFL 177 1200
I.C. REFERENCE 99 II JUNE 1976 NAVELE90111 45 A ANGLE 9 3.02
GRATING IDENTIFICATION NPL 111 1200
C.C. REFENENCE 99 IS JUNE 1915 NAFElENGTN 45 ANGLE . 4.01
01241140 IDENTIFICATION NFL 177 1200
I.C. REFERENCE 99 la JUNE 1975 NAvELENGTH 45 R ANGLE m 4.99
FIG 118
GRATING I0ENTIFICAI1ON NFL 177 1200
I.C. REFERENCE 99 18 JUNE 1975 9A0ELE0/016 45 A ANGLE t 6.49
GRATING 10E0TIFI1RII0N NFL 177 120D
I.C. REFERENCE 99 IN JUNE 1975 9R0ELEN0IN 45 4 ANGLE . 1.53
- 318 -
- 319 -
7.4 PRACTICAL SOFT X-RAY SPECTROSCOPY
The overall aim of the present research programme has been to
improve the performance of grazing incidence instruments and spectro-
graphs in the soft x-ray wavelength region. Since soft x-rays are
characteristic of plasmas in the 106-107K temperature range, soft
x-ray spectroscopy provides powerful diagnostic methods for the hot
plasmas produced in fusion research. Light element x-ray microanalysis
has become very popular and it is to be expected that soft x-ray
spectroscopy will find increasing applications in chemical analysis.
Recently advances have been made in x-ray astronomy and soft x-ray
spectroscopy will most probably be very important in this relatively
new field. Therefore it is clear that the improvements resulting from
the present research programme will have wide application. Naturally,
it will take some time for all the results of this research to be
applied, however, significant advances have already been made in
laboratory emission and absorption spectroscopy and these will be
briefly described in this section.
The most fundamental method for increasing the performance of a
spectrograph is to increase the efficiency of the diffraction grating
by using the most suitable type of grating under the optimum conditions
for the application. In many cases use of a better diffraction grating
in an existing spectrograph will enable superior spectra to be readily
obtained. However, for high resolution soft x-ray spectroscopy the
commercially available spectrographs do not provide the features
necessary to fully exploit the performance of current diffraction gra-
tings. A new pre-focussed modular 5m spectrograph has been designed
by Turner and Speer (116) to take advantage of all the developments in

- 320 -
grazing incidence optics, and this instrument has been used by the
author for soft x-ray spectroscopy.
It is difficult to find suitable sources in the soft x-ray
region for laboratory spectroscopy. The best source of continuum
radiation for absorption spectroscopy is a synchrotron. However,
even with such a bright source as a synchrotron inconveniently
long exposure times are required for certain applications when
using a conventional spectrograph equipped with a shallow blazed
grating. This has been found to be the case in the work performed
on the absorption spectroscopy of metal vapours at the Physikali-
sches Institut der Universita Bonn, in collaboration with Imperial
College. There have been reports of replica gratings being destroyed
when placed directly in a synchrotron radiation beam and usually the
vacuum requirements are stringent so that gratings must not out-gas
significantly. Since both NPL gratings and the author's gratings
are free from organic materials and have high efficiencies, they
are most suitable for use in synchrotron experiments.
One of the author's gratings (no. 34) was loaned to the Bonn
group to assist them in their work on atomic and molecular absorption
spectroscopy. Because of the superior properties of the author's
grating new spectra from manganese and chromium have been recorded
and will be described by Connerade (138). A typical example, the
3p spectrum of Mn I vapour, is shown in Fig. 119. This work is
particularly interesting since it has demonstrated that laminar
gratings can be used successfully over a wide wavelength range. The
excellent results obtained in this case are indicative of the gains
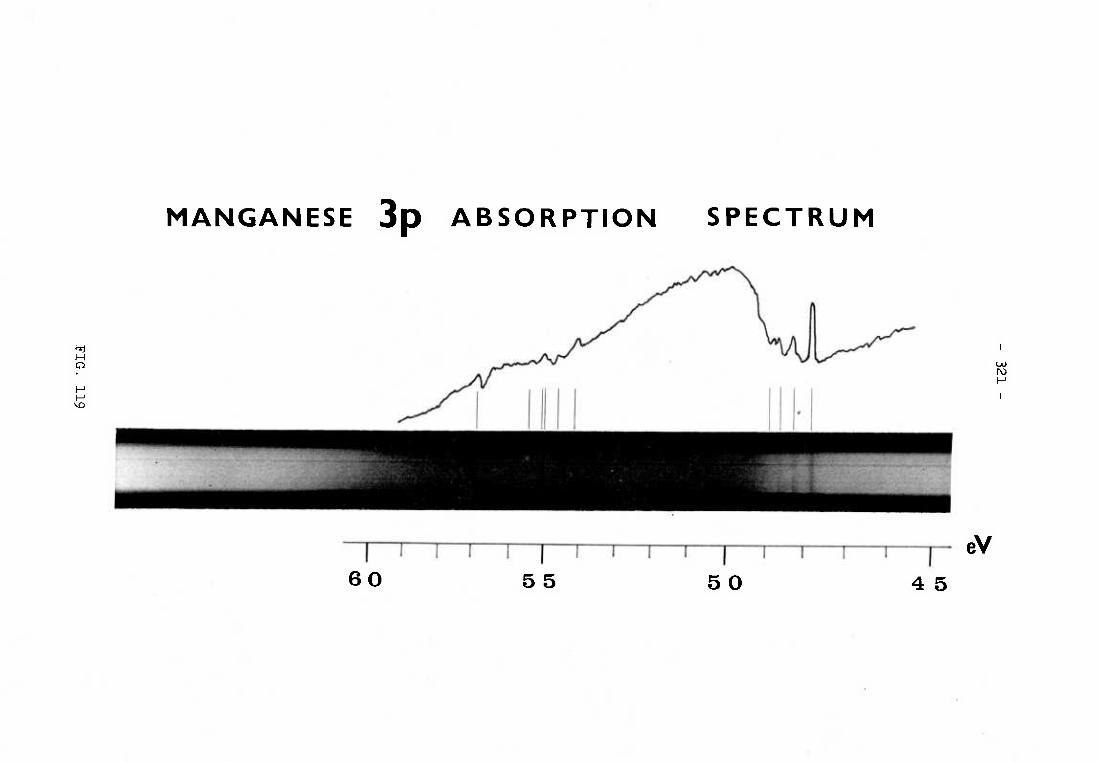
MANGANESE 3p ABSORPTION SPECTRUM
i
If III I I T 1 I 1 f 1 1 eV 60 55 50 4 5
- 322-
which can be obtained by using a "state of the art" grating in a
conventional spectrograph.
Another source which has been used for laboratory spectros-
copy is the BRV source (139) which is essentially a triggered
vacuum spark which acts in the same way as a small theta pinch.
Since the discharge is small and can move over the anode, align-
ment can be difficult. In this work a boron nitride capillary
was used over the anode to localise the discharge and a special
fixture was fabricated to facilitate alignment. The BRV source
does not produce a high intensity at short wavelengths so that it
is necessary to fire the source repeatedly. The intensity of the
source can be increased by employing a larger capacitor but it was
found that a 0.5pF capacitor destroyed the boron nitride capillary
immediately and better results were obtained with a 0.05pF capaci-
tor. When the source is fired a small quantity of the anode material
is ionised and is accelerated under the action of the electric field
through the hole in the cathode in the same direction as the electro-
magnetic radiation. The vaporised anode material can be most trouble-
some in a windowless system and filters placed directly in front of
the source are broken by the combined effects of heating and shock.
The use of the boron nitride capillary and a series of baffles in
the optical system have reduced the contamination to a satisfactory
level in the present system and magnets can also be used to deflect
the ionised material.
Two spectra from a BRV source with a Cu anode recorded under
identical conditions using a Givi 5M spectrograph are shown in
- 323-
Fig. 120. The upper spectrum was obtained from a ruled laminar
grating designed for short wavelength use and the lower spectrum
was recorded with one of the author's holographic laminar gra-
tings (no. 21). A complete analysis of these new spectra has
yet to be performed but lines from N VI (1s-2p, 28.19 A), B V
(1s-2p, 48.59 A), B IV (1s-2p, 60.31 A), Cu XII (56.332 A) and
associated lines can be readily identified. These results show
the advantages which can be obtained by using the most suitable
grating for the application and also illustrate the excellent
spectra which are produced by the GNI, 5M spectrograph.
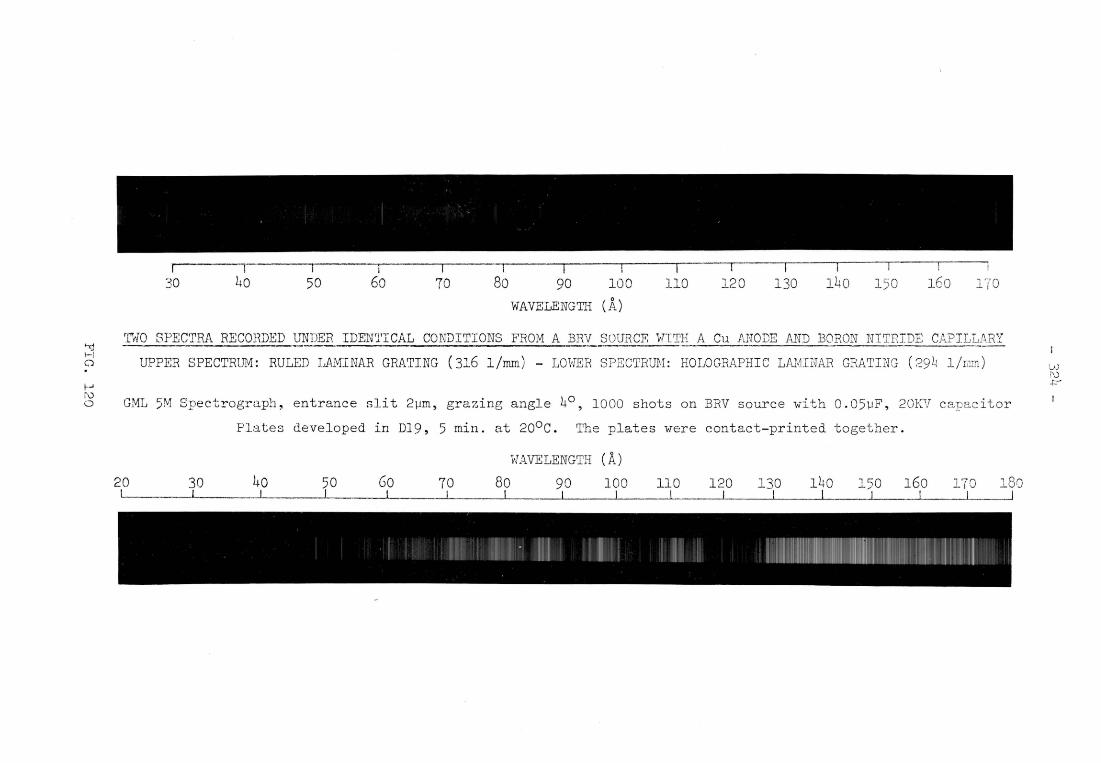
..,(~
1-1 o
j>-J I\) o
r----T I i I I I I - 1 - I
30 L~O 50 60 70 80 90 100 110 120 130 140 150 160 1(,0
WAVELENGTH (ft.)
rrviO SPECTRA RECOHDED UNDER IDENTICAL C01'DITIONS FROM A BRV SOUReR "nTH A eu ANODE AND BORON NITRIDE CAPILLJ\R~! ---_ .. - "
UPPER SPECTRUM: RULED LAMINAR GRPI.TING (316 l/rnm) - LOVIER SPECTRUM : HOLOGRAPHIC LAMINAR GRATING (29~ l/mm )
GML 5M Spectrograph, entrance slit 2~m, grazing angle 4°, 1000 shots on BRV source with 0.05~F, 20KV capac itor
Plates developed in D19, 5 min. at 20°C. The plates were contact-printed together.
20 I
30 40 1 I
'VJAVELENGTH ('A)
50 Go 70 80 90 100 I I __ J_ I I I
110 120 130 140 150 160 1('0 180 L ________ L I l I I I I
v ) [D ......

- 325 -
CONCLUSION
In this thesis the theory of gratings relevant to the soft
x-ray region has been reviewed and the properties of spherical,
cylindrical, toroidal and elliptical gratings have been analysed
by exact ray-tracing. It has been demonstrated for the first
time how the astigmatism of the spherical grating at grazing
incidence can be removed in practice by using a single toroidal
grating. Methods for increasing the resolution and luminosity
of spectrometers and monochromators by using elliptical and
variable frequency gratings have been described. Finally, an
improved simple technique for producing laminar holographic gra-
tings has been devised and this method has been used to make plane,
spherical and the first elliptical gratings for use in the soft
x-ray region.
The apparatus for measuring the performance of soft x-ray
gratings has been extensively redesigned, rebuilt, and partially
automated to increase the accuracy and speed of taking measure-
ments. A computer data handling system has been developed which
greatly facilitates data evaluation and storage. The apparatus
has been used for reflectivity measurements on gold and chromium
films and the performance of eighty gratings has been measured.
The results of this work have already been applied to current
problems in spectroscopy and have enabled previously unrecorded
phenomena to be discovered. Gratings produced by the author are
now being used in laboratories at Physikalisches Institut der
- 326-
Universitat Bonn; DESY, Hamburg; Stanford, USA; and in the
Spectroscopy Group at Imperial College. Thus, an original
contribution has been made in grating science and x-ray
instrumentation which is already yielding new results in
spectroscopy.
- 327
ACKNOWLEDGEMENTS
I should like to express my gratitude to Dr. R.J. Speer, my
supervisor over the past three years, for providing the facilities
and freedom to pursue the research described in this thesis, and
to Professor W.R.S. Garton for the opportunity of working in his
laboratory.
I am particularly indebted to Mr. P.W. Ruthven without whose
technical assistance it would not have been possible to undertake
such an ambitious research programme, and I am very grateful to
Mr. D. Turner for advising me on numerous matters.
Mr. H. Yates, Mr. C. Pataky and Mr. T. Dimes of IC Optical
Systems receive my special thanks for instructing me in some of the
mysteries of optical working.
I am very grateful to Dr. G. Schmahl, Dr. D. Rudolph and
Dr. B. Niemann for many interesting and productive discussions, and
to Frau Christ for some help in preparing gratings, during my stay
at the UniversitEts-Sternwarte, Gottingen.
I particularly wish to thank Mr. R. Gavison and Mr. A.P. Jarvis
for assistance with computing and the advice, in the early stages of
the work on ray-tracing, from Mrs. P.M.J.H. Wormell and Dr. R. Gostick
of the Optical Design Section in the Applied Optics Group at Imperial
College is gratefully acknowledged. I thank Professor W.T. Welford
for several most helpful conversations and Dr. R.C.M. Learner and
Mr. D. Turner for reading this thesis.
- 328 -
I am very grateful to Mr. J.F. Verrill and Mr. C.J. Robbie
of the NPL for producing the Talystep traces shown in Figs. 70,
71, 104 and 106. I should like to thank Dr. S.J. Peppiatt for
producing the transmission electron micrographs shown in Fig. 105,
Mr. S. Mrowka. and Mr. M.F. Hipkins (74) for Fig. 92, and
Dr. J.P. Connerade for Fig. 119.
Finally I should like to express my gratitude to the
following organisations: Science Research Council for providing
financial support; Bausch and Lomb, USA; National Physical
Laboratory, Teddington; and Jobin et Yvon, Paris, for providing
some of the gratings examined during this work and for allowing
the results to be published; Lockheed, USA, and Grating Measure-
ments Ltd. for providing grating blanks and IC Optical Systems
for providing optical working facilities and instruction.
-329-
REFERENCES
1. STROKE, G.W., "Diffraction Gratings", Handbuch der Physik,
(Springer, Berlin), Vo. XXIX, 426 (1967)
2. MICHELSON, A.A., "Studies in Optics, Phoenix Books, (The
University of Chicage Press), 104 (1927)
3. BURCH, J.M., Progress in Optics, Vol. II, 75 (1963)
BURCH, J.M., and PALMER, D.A., Optica Acta, 8, 73 (1961)
4. RITSCHL, R., and POLZE, S., Optik, 15, 127 (1958)
5. DENISYUK, Yu. N., Sov. Phys. Doklady 7, 543 (1962)
6. LABEYRIE, A., "Quelques Nouvelles Methodes en Holographie.
Memoire pour obtenir le Dipl3me d'Etude Sup6rieurs de Sciences
Physiques", (University of Paris/Orsay), (1966)
7. RUDOLPH, D., and SCHMAHL, G., Umschau in Wissenschaft and
Technik, 67, 225 (1967)
RUDOLPH, D., and SCHMAHL, G., Mitt. Astron. Ges. 23, 46 (1967)
Mitt. Astron. Ges. 24, 41 (1968)
8. HAYAT, G.S., and PIEUCHARD, G., Industrial Research, 40, (Aug.1973)
9. SHANKOFF, T.A., U.S. Patent 3,567,444
10. BROOKS, R.E., and HEFLINGER, L.O., U.S. Patent 3,578,845
11. SHERIDON, N.K., Appl. Phys. Letters 12, 316 (1968)
12. SCHMAHL, G., and RUDOLPH, D., Mitt. Astron. Ges. 27, 201-203 (1969)
13. LABEYRIE, A., and FLAMAND, J., Opt. Commun. 1, 5, (1969)
14. RUDOLPH, D., and SCHMAHL, G., Optik 30, 475 (1970)
RUDOLPH, D., and SCHMAHL, G., Applications of Holography, Proc.
International Symposium on Holography, (Universite de Besancon)
Paper 10-7 (1970)
-330-
15. PIEUCHARD, G., FLAMAND, J., CORDELLE, J., and LABEYRIE, A.,
Applications of Holography, Proc. International Symposium on
Holography, (University de Besangon), paper 10-8 (1970)
16. CORDELLE, J., LAUDE, J.P., PETIT, R., and PIEUCHARD, G.,
Nouv. Rev. Opt. Appl. 1, 149 (1970)
17. NAMIOKA, T., and HUNTER, W.R., Opt. Commun. 8, 229 (1973)
18. HUTLEY, M.C., Sci. Prog. Oxford, 61, 301 (1974)
19. HUTLEY, M.C., Optica Acta, 22, 1 (1975)
20. HUNTER, W.R., Journal of the Spectroscopical Society of Japan,
24, Suppl. No. 1 (1975)
21. PIEUCHARD, G., Journal of the Spectroscopical Society of Japan,
24, Suppl. No. 1 (1975)
22. DERSHEM, L., and SCHEIN, M., Phys. Rev. 37, 1246 (1931)
23. SCHON, M., Z Physik 58, 165 (1929)
24. COMPTON, A.H., and ALLISON, S.K., X-rays in Theory and Experiment
(Van Nostrand, New York), (1935)
25. HENKE, B.L., and DUMOND, J.W.M., J. Appl. Phys. 26, 903 (1955)
26. GROTH, R., Annalen der Physik 2, 380-386 (1959)
27. HENDRICK, R.W., J. Opt. Soc. Amer., 47, 165-71 (1957)
28. JOHNSON, G.L., and WUERKER, R.F., in Third International Symposium
on X-ray Optics and Microanalysis, H.H. Pattee, Jr., V.E. Cosslett,
and A. EngstrOm, Eds. (Academic Press Inc., New York), 229-239
(1963)
29. STEWARDSON, E.A., and UNDERWOOD, J.H., Brit. J. Appl. Phys., Vol. 16
1877-1884 (1965)
30. BENNETT, J.M., PhD. Thesis London University, 156-9 (1971)
- 331-
31. LUKIRSKII, A.P., and SAVINOV, E.P., Opt. i. Spektroskopiya 14,
295 (1963); Opt. Spectry. 14, 152 (1963)
32. LUKIRSKII, A.P., SAVINOV, E.P., ERSHOV, 0.A., and SHEPELEV, Yu.F.,
Opt. i Spektroskopiya 16, 310 (1964); Opt. Spectry. 16, 168 (1964)
33. LUKIRSKII, A.P., SAVINOV, E.P., ERSHOV, 0.A., FOMICHEV, V.A.,
and ZHUKOVA, I.I., Opt. i Spektroskopiya 19, 425 (1965); Opt.
Spectry 19, 237 (1965)
34. ERSHOV, 0.A., BRYTOV, I.A., LUKIRSKII, A.P., Opt. i. Spektroskopiya
22, 127 (1967); Opt. Spectry 22, 66 (1967)
35. SENNETT, R.S., and SCOTT, G.D., J. Opt. Soc. Amer. 40, 203 (1950)
36. HENKE, B.L., Physical Review A, Vol. 6 No. 1, Ultrasoft X-ray
Reflection, Refraction and Production of Photoelectrons (100 -
1000 eV Region), (July 1972)
37. MAHAN, I., J. Opt. Soc. Amer. 46, 913 (1956)
38. SMYTHE, W.R., Static and Dynamic Electricity, 3rd ed., (McGraw-
Hill Book Co., New York), (1968)
39. ROSENDAHL, G.R., "Contributions to the Optics of Mirror Systems
and Gratings with Oblique Incidence. I. Ray Tracing Formulas for
the Meridional Plane.", J. Opt. Soc. Am., 51, 1 (1959)
40. WELFORD, W.T., "Tracing Skew Rays Through Concave Diffraction
Gratings", Opt. Acta 9, 389 (1962)
41. SPENCER, G.H., and MURTY, M.V.R.K., "Genera] Ray-Tracing Procedure",
J. Opt. Soc. Am. 52, 672 (1962)
42. KASTNER, S.O., and NEUPERT, W.M., "Image Construction for. Concave
Gratings at Grazing Incidence, by Ray Tracing", J. Opt. Soc. Am. 53,
1180 (1963)
- 332 -
143. OFFNER, A., "Ray-Tracing Through a Holographic System",
J. Opt. Soc. Am. 56, 1509 (1966)
44. LUDWIG, U.W., "Generalised Grating Ray-Tracing Equations",
J. Opt. Soc. Am. 63, 1105 (1973)
145.
NODA, H., "The Theory of the Holographic Grating", PhD Thesis
Kyoiku University, Japan (19714)
146. NODA, H., NAMIOKA, T., and SEYA, M., "Ray-Tracing Through Holo-
graphic Gratings", J. Opt. Soc. Am. 614, 1037 (1974)
147. ROSE, H.W., "Holographic Lens Systems", (Technical Report
AFAL-TR-73-101, Wright-Patterson Air Force Base, Ohio 1451433,
USA), (1973)
148. WELFORD, W.T., "Isoplanatism and Holography", Opt. Commun. 8,
239 (1973)
4
,
9. WELFORD, W.T., "A Vector Ray-Tracing Equation for Hologram
Lenses of Arbitrary Shape", Opt. Commun. 14, 322 (1975)
50. LATTA, J.N., "Computer-Based Analysis of Holography Using Ray-
Tracing", Applied Optics 10, 2698-2710 (1971)
51. ABRAMOWITZ, I.A., Evaluation of Hologram Imaging by Ray-Tracing,
Applied Optics 8, 1403 (1969)
52. ROWLAND, H.A., Phil. Mag. 35, 397-419 (1893)
53. GLAZEBROOK, R.T., "On Curved Diffraction Gratings - II", Phil.
Mag. (1884)
54. KAYSER, H., "Handbuch der Spektroskopie", Vol. I, 450-482 (1900)
55. DANIELSSON, A., and LINDBLOM, P., "Focussing Conditions of the
Spherical Concave Grating", Optik 141, 441-451 (19714)
56. BEUTLER, "The Theory of the Concave Grating", J. Opt. Soc.
Am. 35, 311-350 (1945)
- 333 -
57. NAMIOKA, T., "Theory of the Concave Grating", J. Opt. Soc. Am.
49, 446-46o (1958)
58. NAMIOKA, T., "Theory of the Ellipsoidal Concave Grating", J. Opt.
Soc. Am. 51, 4-12 (1961)
59. MACK, J.E., STEEN, J.R., and EDLEN, B., "On the Concave Grating
Spectrograph, Especially at Large Angles of Incidence", J. Opt.
Soc. Am. 22, 245-261 (1932); Addendum. J. Opt. Soc. Am. 23, 184
(1933)
60. WELFORD, W.T., "Aberration Theory of Gratings and Grating Mountings"
in Progress in Optics, ed. E. Wolf (North-Holland, Amsterdam),
vol. 4, 243-280 (1965)
61. HABER, H., "The Torus Grating", J. Opt. Soc. Am. 40, 153-165 (1950)
62. SAMSON, J.A.R., "Techniques of Vacuum Ultraviolet Spectroscopy",
(John Wiley and Sons), (1967)
63. KOZLENKOV, A.I., "The Optics of Reflecting Mirrors"
64. KOZLENKOV, A.I., "Study of Aberrations of a Concave Grating under
Defocussing Conditions", Optics and Spectroscopy 8, 365-370 (1960)
65. BOWEN, I.S., "The Aberrations of the Concave Grating at Large
Angles of Incidence", J. Opt. Soc. Am. 23, 313-315 (1933)
66. ROWLAND, H.A., "The Physical Papers of Henry Augustus Rowland",
The John Hopkins Press, Baltimore, 485, 487, 506, 519, 525, 587
(1902)
67. SORET, J.L., "IV. Uber die durch Kreisgitter erzeugten Diffraktions-
phgnomene", Annalen der Physik and Chemie, Sechste Reihe J.C. Poggen-
dorff Sechster Band, Leipzig, 99-113, (1875)
-334-
68. CORNU, A., "V. nber die Diffraction, namentlich fiber Brenn-
punktseigenschaften der Gitter", Annalen der Physik and Chemie
Sechste Reihe, J.C. Poggendorff, Sechster Band, Leipzig, 114-119
(1875)
69. SIEGEL, B.M., "Studies on the Morphology and Structure of Copper
Films Deposited by Vacuum Evaporation", Technical Report No. 9,
Document No. AFOSR TN 59-7 ASTIA AD208 303 (December 15, 1958)
70. TURNER, D., "Wide Range High Aperture Scanning Monochrometer Using
Grating with Unequally Spaced Lines", to be published.
71. TURNER, D., and BENNETT, J.M., "An Elliptical Reflector Formed
by Bending a Cantilever", to be published.
72. TURNER, D., and SPEER, R.J., "Improvements in and Relating to
Spectrometers", Patent No. 23688/74 (1974)
73. GALE, B., "The Theory of Variable Spacing Gratings", Optica Acta
13, 41-54, (1966)
74. MROWKA, S., and HIPKINS, M.F., "The Preparation and Examination
of Thin Gold Films", unpublished.
75. WERNER, W., "The Geometrical Optical Aberration Theory of
Diffraction Gratings", Applied Optics 6, 1691 (1967)
76. MACADAM, D.L., "Focus of a Concave. Grating Spectrograph",
J. Opt. Soc. Am. 23, 178-181 (1933)
77. RAYLEIGH, Lord, Scientific Papers, (Cambridge University Press)
1, 432-435 (1899)
78. BORN, M. and WOLF, E., "Principles of Optics", (Pergamon 2nd Ed.)
(1964)
79. WELFORD, W.T., "Aberrations of the Symmetrical Optical System"
Academic Press, London, (1974)
- 335 -
80. FELLNER-FELDEGG, H., "Computer Simulation of the Concave
Grazing Incidence Monochromator", University of Uppsala
UUIP-857 (March 1974)
81. GREINER and SCHAFFER, 'uber den Astigmatismus des Konkavgitters
mit slphRrischer oder torischer OberflHche", Optik 16, 288 (1959)
82. SCHONHEIT, E., "Ein Seya-Namioka-Monochromator mit torischem
Gitter far Photoionisation-Messungen", Optik 23, 305 (1966)
83. STREZHEV, S.A. and ANDREEVA, A.I., "Toroidal Diffraction Gratings
for Seya-Namioka Monochromators", Opt. Spect. 28, 426 (1970)
84. RENSE, W.A., and VIOLETT, T., "Solar Emission Lines in the
Extreme Ultraviolet", Astrophy J. 130, 954 (1959)
85. CANTU, A.M., and TONDELLO, G., "Continuum Source and a Focussing
Technique for the 80-500A Spectral Range: Improvements", Applied
Optics 14, 996-998 (1975)
86. ISHII, AITA, ICHIKAWA, and SAGAWA, "Use of a Toroidal Mirror in
the Soft X-Ray Optical System", J. Appl. Phys. (Japan) 10,
637-642 (1971)
87. SHCHEPETKIN, Iu. P., Optika i Spectroskopiya 6, 822 (1959)
Opt. Spect. 6, 538 (1959)
88 NAM1OKA, T., "Theory of the Ellipsoidal Concave Grating II:
Application of the Theory to the Specific Grating Mountings",
J. Opt. Soc. Am. 51, 13 (1961)
89. CHASE, R.C., and SILK, J.K., "Ellipsoid-Hyperboloid X-Ray
Imaging Instrument for Laser Pellet Diagnostics", Applied
Optics 14, 2096-2098 (1975)
- 336 -
90. MURTY, M.V.R.K., "Spherical Zone-Plate Diffraction Grating",
J. Opt. Soc. Am. 50, 923 (1960)
91. MURTY, M.V.R.K., and DAS, N.C., "Theory of Certain Diffraction
Gratings Produced by the Holographic Method", J. Opt. Soc. Am. 61,
10001-1006 (1971)
92. "Handbook of Diffraction Gratings Ruled and Holographic",
JOBIN YVON Optical Systems (1973)
93. LABEYRIE, A., "Holo-Gratings - The New Diffractive Breed",
Electro-Optical Systems Design 3, 32-38 (1971)
94. CORDELLE, J., FLAMAND, J., PIEUCHARD, G., and LABEYRIE, A., Fj
"Aberration-Corrected Concave Gratings Made Holographically,
Optical Instruments and Techniques 1969, Ed. J. Home Dickson
(Oriel Press, 1970)
95. WELFORD, W.T., "The Most General Isoplanatism Theorem", Optics
Commun. 3, 1-6 (1971)
96. WELFORD, W.T., "Practical Design of an Aplanatic Hologram Lens
of Focal Length 50mm and Numerical Aperture 0.5", Optics
Commun. 15, 46-49 (1975)
97. NAMIOKA, T., and NODA, H., "Normal Incidence Monochromators
Equipped with a Holographic Concave Grating", in Proceedings of
International Symposium for Synchrotron Radiation Users, ed
G.V. Marr and I.H. Munro (Daresbury, England, 5-7 January, 1973)
Daresbury Nuclear Physics Laboratory Report No. 26, 51 (1973)
98. NAMIOKA, T., NODA, H., and SEYA, M., "Possibility of Using the
Holographic Concave Grating in Vacuum Monochromators", Sci.
Licht (Tokyo) 22, 77-99 (1973)
- 337 -
99. NODA, H., "The Theory of the Holographic Grating", Thesis,
Kyoiku University (1974)
100. NODA, H., NAMIOKA, T., and SEYA, M., "Geometric Theory of
the Grating", J. Opt. Soc. Am. 64, 1031 (1974)
101. NODA, H., NAMIOKA, T., and SEYA, M., "Design of. Holographic
Concave Gratings for Seya-Namioka Monochromators", J. Opt.
Soc. Am. 64, 1043 (1974)
102. NAMIOKA, T., NODA, H., and SEYA, M., "Performance of Aberration-
Reduced Holographic Concave Gratings Designed Specifically for
Seya-Namioka Monochromators", Proceedings of the Symposium on
Diffraction Gratings and Grating Instruments, Tokyo 1974, Journal
of the Spectroscopical Society of Japan, Vol. 23, Supplement
No. 1 (19714)
103. SAKAYANAGI, Y., "A Stigmatic Concave Grating with Varying
Spacing", Sci. Light (Tokyo), 16, 129-137 (1967)
104. GERASIMOV, F.M., YAKOVLEV, E.A., PEISAKHSON, I.V., and
KOSHELEV, B.V., "Concave Diffraction Gratings with Variable
Spacing", Optics and Spectroscopy 28, 423 (1970)
105. HARADA, T., "Mechanically Ruled Stigmatic Concave Gratings",
Preprint I.C.O. Conference on Optical Methods in Scientific
and Industrial Measurements Tokyo, 25-30 August 1974
106. WELFORD, W.T., "Aberration Tolerances for Spectrum Line Images",
Optica Acta 10, 121 (1963)
107. POUEY, M., "Comparison Between Far Ultraviolet Spectrometers",
Optics Commun. 2, 339-342 (1970)

- 338 -
108. SPEER, R.J., Private Communication (1974)
109. PETIT, R., "Electromagnetic Grating Theories: Limitations and
Successes", Preprint I.C.O. Conference on Optical Methods in
Scientific and Industrial Measurements Tokyo, 25-30 August 1974
110. VAN DEN BERG, P.M., "Diffraction Theory of a Reflection Grating"
Appl. Sci. Res. 24, 261-292 (1971)
111. SPRAGUE, G., TOMBOULIAN, D.H., and BEDO, D.E., "Calculations
of Grating Efficiency in the Soft X-Ray Region", J. Opt. Soc. Am.
45, 756-761 (1955)
112. LUKIRSKII, A.P., and SAVINOV, E.P., "Use of Diffraction Gratings
and Echelettes in the Ultra-Soft X-Ray Region", Opt. i. Spectros-
kopya, 285-294 (1963), Opt. Spect. 147-151 (1963)
113. SAYCE, L.A., and FRANKS, A., "N.P.L. Gratings for X-Ray Spectros-
copy", Proc. Roy. Soc. 282A, 353-357 (1964)
114. NIEMANN, B., "Untersuchungen fiber Zonenplattenteleskope zum
Einsatz fur nicht-solare Quellen im Bereich der weichen Röntgen-
strahlung", Dissertation, G6ttingen (1974)
115. GABRIEL, A.H., SWAIN, J.R., and WAILER, W.A., "A Two-Metre Grazing
Incidence Spectrometer for Use in the Range 5-950 A", J. Solent.
Inst. 42, 94 (1965)
116 TURNER, D., and SPEER, R.J., to be published; see also T7,
Physics Bulletin 26, 504 (1975)
117. SPEER, R.J., "The X-Ray Diffraction Grating", Space Science
Instrumentation, Vol. 2, (February 1976), in press
118 SINGH, M., and MAJUMDER, K., "Cylindrical Gratings with Circular
Grooves", Sci. LighL (Tokyo), 18, 57-71 (1969)
- 339 -
119. WOODGATE, B.E., "Cylindrical and Spherical Gratings", J. Opt.
Soc. Am. 64, 654-661 (1974)
120. WOLTER, H., "Spiegelsysteme streifenden Einfalls als abbildende
Qptiken fUr ROntgenstrahlen", Ann. Physik 6. Folge, Band 10,
91 (1952)
121. SCHMAHL, G., and RUDOLPH, D., "Holographische Erzeugung von
Gittern hoher Teilungsgenauigkeit mit Hilfe rekonstruierter
identischer Wellenfronten", Optik 30, 606-609 (1970)
122. -FRANKS, A., LINDSEY, K., BENNETT, J.M., SPEER, R.J., TURNER, D.,
and HUNT, D.J., "The Theory, Manufacture, Structure and Perfor-
mance of NPL X-Ray Gratings", Phil. Trans. Roy. Soc. 277A,
503-543 (1975)
123. STEDMAN, M., BUTLER, D.W., ENGLISH, T.H., FRANKS, A., GALE, B.,
HUTLEY, M.C., and STUART, P.R., "Recent Developments in X-Ray
Diffraction Gratings at NPL", Space Science Instrumentation
Vol. 2, (February 1976), in press
124. STEDMAN, M., and FRAMS, A., "Advances in NPL X-Ray Gratings
and Spectrometers", Advance in X-Ray Analysis, Vol. 18
Academic Press (1976)
125. NAGATA, H., and KISHI, M., "Production of Blazed Holographic
Gratings by a Simple Optical System", I.C.O. Conference in
Optical Methods, Tokyo, 25-30 August 1974
126. SCHMAHL, G., "Holographically Made Diffraction Gratings for the
Visible, UV and Soft X-Ray Region", Journal of the Spectros-
copical Society of Japan 23, Suppl. No. 1, 3-11 (1974)
127. SCHMAHL, G., and RUDOLPH, D., "Holographic Diffraction Gratings",
Progress in Optics (Ed. E. Wolf, Vol. XIV, in press, 1976)
- 34o-
128. LINDSEY, K., "The Production and Topography of X-Ray Optical
Components", Proc. X-Ray Optics Symposium, Mullard Space Science
Laboratory (April 1973)
129. VERHAEGHE, M.F., "Etude, des rugositgs des interfaces des
couches minches d'or par rgflexion diffuse de rayons X sous
incidence rasante", Optica Acta 19, 905-940 (1972)
130. EHRENBERG, W.', "X-Ray Optics: Imperfections of Optical Flats and
Their Effect on the Reflection of X-Rays", J. Opt. Soc. Am. 39,
746-751 (1949)
131. ELLIOTT, "Effects of Polishing Imperfections on Specular
Reflection of X-Rays", in Third. International Symposium on. X-Ray
Optics and Microanalysis, H.H. Pattee, V.E. Cosslett, and A. Eng-
strom, Eds. (Academic Press Inc., New York 1963), pp. 215-228
132. SCHROEDER, J.B., and KLIMASEWSKI, R.G., "Scatter from X-Ray
Reflecting Surfaces", Applied Optics 7, 1921-1927 (1968)
133. WRISTON, R.S., and FROECHTENIGT, J.F., "Soft X-Ray Scattering by
Optical Surfaces", Applied Optics 12, 25-28 (1973)
134. RAYLEIGH, Lord, Phil. Mag. 47, 81 (1874)
135. HOBBY, M.G., and PEACOCK, N.J., "Spectrograph Calibration at
Soft X-Ray Wavelengths 1: From Grating Diffraction Efficiency
and Plate Response Factors", J. Phys. E 6, 854-856 (1973)
136. VERRILL, J.F., "Use of the Talystep in Investigating Diffraction
Grating Groove Profiles", J. Phys. E 6, 1199-1201 (1973)
137. HUNTER, W.R., "Diffraction Gratings for the XUV - Conventional vs
Holographic", Journal of the Spectroscopical Society of Japan,
Vol. 23, Suppl. No. 1, 37-51 (1974)
7 31a-
138. CONNERADE, J.P., and MANSFIELD, M.W.D., "3d Wavefunction
Collapse in Inner Shell Absorption Spectra of Elements in
the First Long Period", to be presented at 2nd International
Conference on Inner Shell Ionization Phenomena, Universitat
Freiburg, March-April 1976
139. GARTON, W.R.S., CONNERADE, J.P., MANSFIELD, M.W.D., and
HEATON, J.E.G., "Atomic Absorption Spectroscopy in the
100 - 600 A Wavelength Range", Applied Optics 8, 919-9211
(1969)

Reprinted from APPLIED OPTICS, Vol. 12, page 1731, August 1973 Copyright 1973 by the Optical Society of America and reprinted by permission of the copyright owner
Soft X-Ray Performance of a Plane Reflection Hologram
D. Rudolph, G. Schmahl, R. L. Johnson, and R. J. Speer
The first two authors named are with Universitats-Sternwarte, G6ttingen, Germany; the other authors are with the Physics Department, Imperial College, London, SW7, England. Received 8 June 1973. Sponsored by W. R. Hunter, U. S. Naval Research Laboratory.
We have examined the x-ray performance of a plane reflection grating formed holographically. The grating was fabricated at the Universitats-Sternwarte, G6ttingen, and was initially recorded with 457.9-nm laser light in photoresist.1 •2 It was the first prototype designed to be used at grazing incidence and was constructed from interfering plane wave fronts giving 600 fringes/mm over an area of 4 cm x 4 cm. Subsequent development yielded a mask, which, after coating with chromium and subsequent stripping, closely approximated a laminar profile (square wave) of step-height 15.0 nm and grating space 1667 nm with equal land to groove. This profile has the additional scalar property of phase cancellation in the reflected (or zero order) beam at A ~ 4.4 nm at grazing angles of incidence within the critical angle for total external reflection of the grating supercoat (Au).
Figure 1 shows the absolute fractions of the incident monochromatic 4.4-nm radiation diffracted into the ±1 orders (right-hand scale). The variable parameter is a the angle of grazing incidence. A minimum is clearly evident in the zero order beam energy (left-hand scale) and correlates in position with the maximum for the sum of the ±1 diffracted energy.
We are able to show theoretically that the effective value of h, the groove height, is given to very good approxi~ation by
h = A/(2'£-a)
where '£-a = -laopt + +laopt in circular measure. A value of h = 14 ± 3 nm is derived.
The diffraction performance, shown in Fig. 1, has also been measured at 2.3 nm and at both wavelengths is comparable to the highest speed measured to date for gratings produced by classical ruling techniques at this groove frequency. 3 The level of incoherent scatter is also lower. Furthermore, the construction wavefronts need not be plane, and the final reflection hologram contains no photopolymer or other organic material.
We consider our result to have the following consequences:
(1) construction can proceed on spherical surfaces and aspnerics with primary focal conditions suited to correct astigmatism or other defects of soft x-ray imagery at grazing incidence; (2) larger areas may be fabricated limIted only by the size of the collimation optics. Such gratings may have applications in x-ray astronomy.
1.0
30
20
10
c GI 'U
u .~
'0
ci w
C r---r---.--...----r--.,----r----,r---.,~ I.
u c
15 C GI
~ --+--t--t--+----+---lf---+----I GI 3
>=-(!) a:: UJ z UJ
vi r---+---~L--r---+-+~--_4~--+_--~a:: 2
UJ o a:: o a w
0 a:: 0 r--~-~--~r--+--~r--~~-~-~0
0 a:: w N
<{ a:: LL LL ...-t o
0° 1° 6° 7° 8° effe c t ivecx
o
ANGLE OF GRAZING INCIDENCE
Fig. 1. Absolute fractions of the incident monochromatic 4.4-nm radiation diffracted into the ±1 orders (right-hand scale). The zero order curve (left-hand scale) shows modification due to phase
cancellation.
By contrast, the weil-known problems associated with diamond positioning, loading, and wear impose severe restrictions on ruled grating design and size for grazing incidence systems involving a single catoptric process.
This work was supported in part by the UKAEA Culham Laboratory and by the Deutsche Forschungsgemeinschaft.
References 1. D. Rudolph and G. Schmahl, Umschau in Wissenschaft und
Technik 67, 225 (1967). 2. D. Rudolph and G. Schmahl, Optik 30,475 (1970). 3. R. J. Speer and D. Turner, in Proceedings of the International
Symposium for Synchrotron Radiation Users (Daresbury Nuclear Physics Laboratory Report No. 26, January 1973, Warrington, Lancashire), pp. 106-114.
August 1973 / Vol. 12. No.8 / APPLIED OPTICS 1731

Reprinted from APPLIED OPTICS, Vol. 13, page 1258, June 1974 Copyright 1974 by the Optical Society of America and reprinted by permission of the copyright owner
Holographically Formed Grazing-Incidence Reflection Grating with Stigmatic Soft X-Ray Focal Isolation
R. J. Speer, D. Turner, R. L. Johnson, D. Rudolph, and G. Schmahl
The first three authors named are with the Physics De-partment, Imperial College, London SW7 2BZ, En-gland; the other authors are with the Universitats-Sternwarte, Gottingen, Germany. Received 28 March 1974. Sponsored by W. R. Hunter, U.S. Naval Research Lab-oratory. An analysis by Haberl has shown that primary astigma-
tism in Rowland circle mountings can be corrected by a suitable choice of toroidal grating blank radii. For the grazing incidence mounting, the astigmatic line length 1, for an in-plane point source at the entrance slit, is given by
1 = LsinORcos'aisina) + (cos2g/sin0)1
(1)
where L is the length of the rulings, and a and are the angles of grazing incidence and diffraction, respectively. 0 is determined for a given a by the usual grating equa-tion:
= d (cosa — cosg), (2)
where d is the grating constant and n is the order of dif-fraction. At soft x-ray wavelengths 1 is normally very large, lying between 1 cm and 20 cm.
A previous communication2 demonstrated that reflec-tion holograms can now be constructed with lamellar (square wave) profiles at 600 lines/mm in completely me-tallic form (i.e., without underlying photopolymer) and with absolute diffraction efficiencies at -Soft x-ray wave-lengths competitive with classical ruled gratings3 of simi-lar size and ruling frequency. The diffraction perfor-mances were measured and compared at 23 A and 44 A within the range of grazing incidence angles 1° < a < 7°. We refer to such reflection holograms in subsequent dis-cussion as Type I gratings.
We have now extended this result by forming, in an analogous manner to the Type I construction, a plane re-flection hologram on a toroidal substrate. We refer to this construction, in which astigmatism is corrected by substrate curvature, as a Type II grating.
If Ry is the radius of curvature of the grating in the Rowland plane, the orthonormal minor radius Rx of the toroidal substrate is determined from
Rx = sina sing Ry (3)
for stigmatism at 0(a, ), given a and d. For our first trial of Type II gratings we have chosen a
= 2°, X, = 44 A (Carbon-K), with n = +1 and d = 16667 A (600 lines/mm). For the major radius Ry of the sub-strate we chose 2 m. Equation (2) yielded g = 4.64°, giv-ing Rx = 5.65 mm from Eq. (3). This is a very strong curvature indeed, and a most severe test for our technique at the present state of development.
The toroidal substrate surface measured 45 mm x 8 mm after lapping, and was formed on glass blanks 45 mm x 35 mm x 10 mm to fit the Rank-Hilger E580 grazing incidence spectrograph.
1258 APPLIED OPTICS / Vol. 13, No. 6 / June 1974
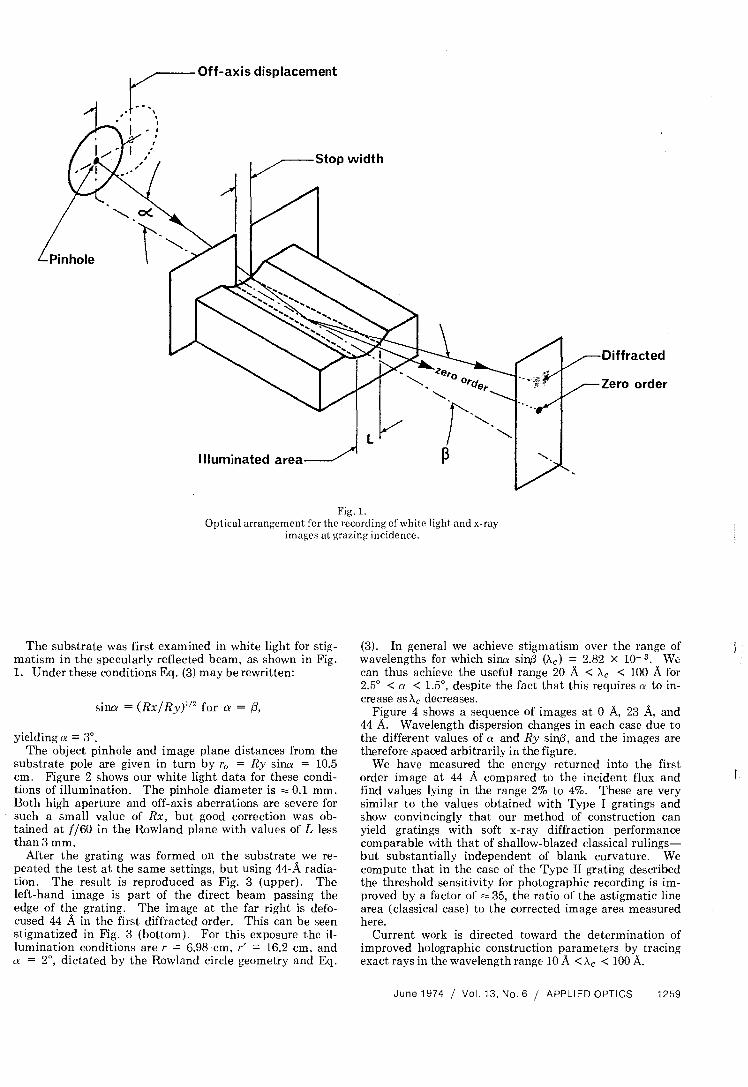
Off-axis displacement
Diffracted
Zero order
Illuminated area
Fig. 1. Optical arrangement for the recording of white light and x-ray
images at grazing incidence.
The substrate was first examined in white light for stig-matism in the specularly reflected beam, as shown in Fig. 1. Under these conditions Eq. (3) may be rewritten:
sina = (Rx/Ry)1" 2 for a =
yielding a = 3°. The object pinhole and image plane distances from the
substrate pole are given in turn by I-. = Ry sina = 10.5 cm. Figure 2 shows our white light data for these condi-tions of illumination. The pinhole diameter is 0.1 mm. Both high aperture and off-axis aberrations are severe for such a small value of /?x, but good correction was ob-tained at f/60 in the Rowland plane with values of L less than 3 mm.
After the grating was formed on the substrate we re-peated the test at the same settings, but using 44-A radia-tion. The result is reproduced as Fig. 3 (upper). The left-hand image is part of the direct beam passing the edge of the grating. The image at the far right is defo-cused 44 A in the first diffracted order. This can be seen stigmatized in Fig. 3 (bottom). For this exposure the il-lumination conditions are r = 6.98 cm, r' = 16.2 cm, and a = 2°, dictated by the Rowland circle geometry and Eq.
(3). In general we achieve stigmatism over the range of wavelengths for which sina sing (X) = 2.82 x 10⁻³. We can thus achieve the useful range 20 A < X, < 100 A for 2.5° < a < 1.5°, despite the fact that this requires a to in-crease as A, decreases.
Figure 4 shows a sequence of images at 0 A, 23 A, and 44 A. Wavelength dispersion changes in each case due to the different values of a and Ry sind3, and the images are therefore spaced arbitrarily in the figure.
We have measured the energy returned into the first order image at 44 A compared to the incident flux and find values lying in the range 2% to 4%. These are very similar to the values obtained with Type I gratings and show convincingly that our method of construction can yield gratings with soft x-ray diffraction performance comparable with that of shallow-blazed classical rulings—but substantially independent of blank curvature. We compute that in the case of the Type II grating described the threshold sensitivity for photographic recording is im-proved by a factor of 35, the ratio of the astigmatic line area (classical case) to the corrected image area measured here.
Current work is directed toward the determination of improved holographic construction parameters by tracing exact rays in the wavelength range 10 A < X, < 100 A.
June 1974 / Vol. 13, No. 6 / APPLIED OPTICS 1259
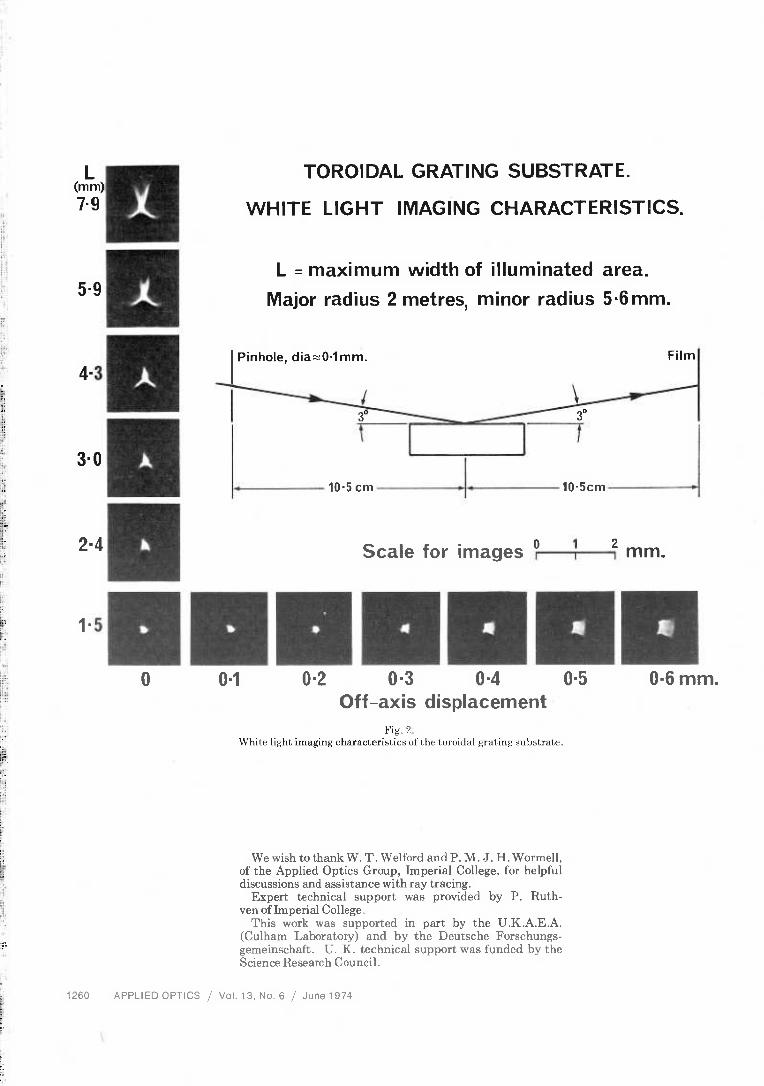
10.5cm 10-5 cm
TOROIDAL GRATING SUBSTRATE.
WHITE LIGHT IMAGING CHARACTERISTICS.
L = maximum width of illuminated area. Major radius 2 metres, minor radius 5-6mm.
Pinhole, diaz0-1rnm.
L (mm) 7.9
5.9
Film 4.3
3°
3-0
Scale for images0 I 2 mm. 2.4
1.5
3°
0.6 mm. 0 0.1 0.2 0.3 0.4 0.5 Off-axis displacement
Fig. 9 .
White light imaging characteristics of the toroidal grating substrate.
We wish to thank W. T. Welford and P. M. J. H. Wormell, of the Applied Optics Group, Imperial College, for helpful discussions and assistance with ray tracing.
Expert technical support was provided by P. Ruth-ven of Imperial College.
This work was supported in part by the U.K.A.E.A. (Culham Laboratory) and by the Deutsche Forschungs-gemeinschaft. U. K. technical support was funded by the Science Research Council.
1260 APPLIED OPTICS / Vol. 13, No. 6 / June 1974
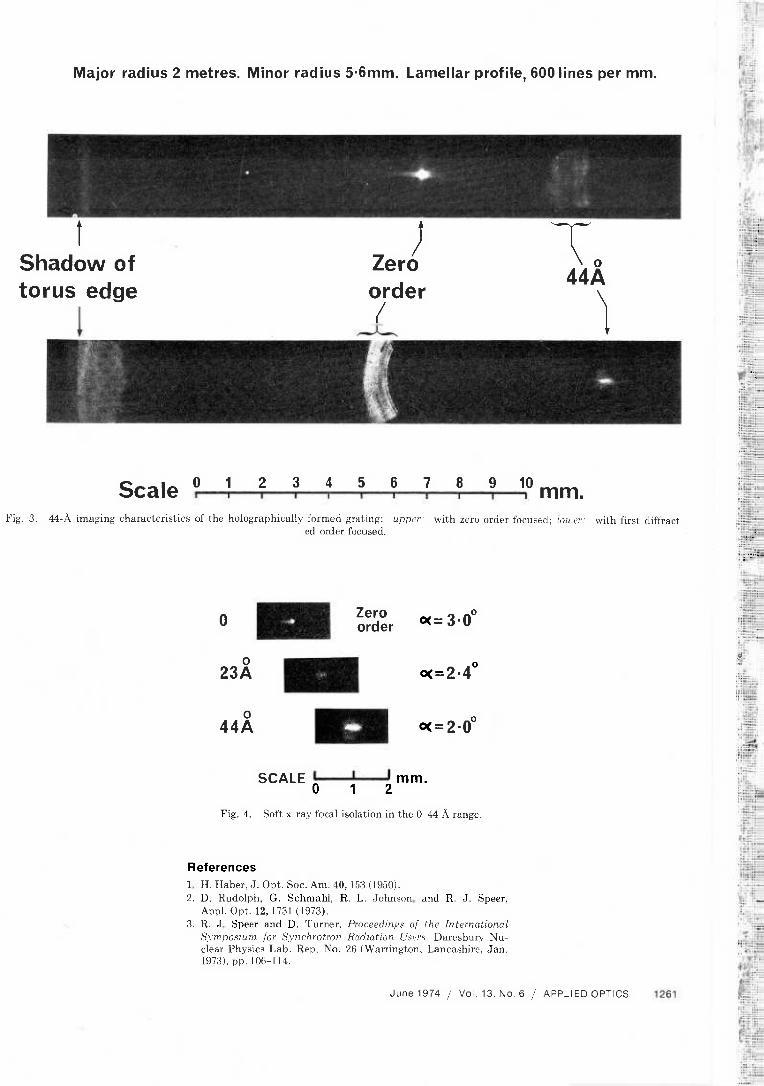
Shadow of torus edge
Scale 0 2 4
T2
44A
0 Zero order
0 23A
0 44A
Major radius 2 metres. Minor radius 5.6mm. Lamellar profile, 600 lines per mm.
8 9 10 mm.
Fig. 3. 44-A imaging characteristics of the holographically formed grating: upper: with zero order focused; lower: with first diffract- ed order focused.
c<= 3.00
c<=2.40
c<= 2.0°
SCALE1 2
mm.
Fig. 4. Soft x-ray focal isolation in the 0-44 A range.
References 1. H. Haber, J. Opt. Soc. Am. 40,153 (1950). 2. D. Rudolph, G. Schmahl, R. L. Johnson, and R. J. Speer,
Appl. Opt. 12,1731 (1973). 3. R. J. Speer and D. Turner, Proceedings of the International
Symposium for Synchrotron Radiation Users. Daresbury Nu-clear Physics Lab. Rep. No. 26 (Warrington, Lancashire, Jan. 1973), pp. 106-114.
June 1974 / Vol. 13. No. 6 / APPLIED OPTICS 1261


