Embed Size (px)
Citation preview
MAA Master Program in Advanced Analytics
Internship report presented as partial requirement for
obtaining the Master’s degree in Advanced Analytics
ANALYTICS IN STRATEGY CONSULTING
Lukas Hendrik Fahr (m2015001)
An experience-based reflection
NOVA Information Management School
Instituto Superior de Estatística e Gestão de Informação
Universidade Nova de Lisboa
ANALYTICS IN STRATEGY CONSULTING
by
Lukas Hendrik Fahr
Internship report presented as partial requirement for obtaining the Master’s degree in
Advanced Analytics
Advisor / Co Advisor: Fernando José Ferreira Lucas Bação
Co Advisor: n/a
June 2017
1
ABSTRACT
This report provides extensive insights into analytics-based work in strategy consulting. It draws
on first-hand experience gained during a 6-month internship at ABC Strategy Consultants Ltd
(hereafter ABC) in London from September 2016 until the end of February 2017. The report
starts by giving an introduction to the industry and how analytics is integrated within the
company. After, it provides an overview of the project work during the internship. The extensive
reflection on the internship experience discusses the value of analytics to strategy consulting,
elaborates on the effects of non-technical audiences, points out the most crucial factors that
help to build and retain a data science team within strategy consulting and finally trades off
whether analytics should be a core capability of strategy consultancies or if it should merely be
a support function.
KEYWORDS
Analytics; Strategy Consulting; Internship; Retail
2
INDEX
1. Introduction .............................................................................................................................. 5
2. Industry and Company ............................................................................................................. 6
2.1 Strategy Consulting............................................................................................................ 6
2.2 ABC Strategy Consultants .................................................................................................. 6
2.3 Introduction of Analytics at ABC ....................................................................................... 7
3. Analytics at ABC ........................................................................................................................ 8
3.1 Approach of ABC to the Role of Analytics in Strategy Consulting ..................................... 8
3.1.1 Key Principles ............................................................................................................. 9
3.1.2 Project Types ............................................................................................................. 9
3.2 Role and Setup of the Analytics Team ............................................................................. 11
3.2.1 Team Setup and Role Compared to Strategy Consultant ........................................ 11
3.2.2 Analytics Workflow .................................................................................................. 12
3.2.3 Author’s Role within the Team ................................................................................ 13
4. Project Experience .................................................................................................................. 14
4.1 Strategic Opportunities & Operational Optimisation for a Department Store ............... 14
4.1.1 Data Sources ............................................................................................................ 14
4.1.2 Analyses Performed ................................................................................................. 14
4.1.3 Project Takeaways ................................................................................................... 17
4.2 Determination of Store Roll-Out Potential for a British Gastronomy Chain ................... 17
4.2.1 Data Sources ............................................................................................................ 17
4.2.2 Analyses Performed ................................................................................................. 19
4.2.3 Project Takeaways ................................................................................................... 20
4.3 Modelling a Multi-Channel Retailer’s Cost to Serve across Categories & Channels ....... 21
4.3.1 Data Sources ............................................................................................................ 22
4.3.2 Analyses Performed ................................................................................................. 23
4.3.3 Project Takeaways ................................................................................................... 28
5. Reflection on Internship Experience ...................................................................................... 30
5.1 Value of Analytics to Strategy Consulting ....................................................................... 30
5.1.1 Value Added by Applying Analytics to Strategy Consulting .................................... 30
5.1.2 Analytical vs More Pragmatic Approaches .............................................................. 32
5.1.3 Marginal Impact of the Level of Technicality .......................................................... 32
5.1.4 Developing Analytical Models on Short Timelines .................................................. 33
3
5.2 Non-Technical Audiences ................................................................................................ 34
5.2.1 Conflicts due to Different Levels of Technical Expertise ......................................... 34
5.2.2 Obligation to Educate (non-technical) Senior Staff ................................................. 35
5.2.3 Communicating Quantitative Outputs to Clients .................................................... 36
5.3 Developing and Retaining a Data Science Team in Strategy Consulting ......................... 36
5.4 Analytics as a “Support Function” vs “Core Capability” .................................................. 37
6. Conclusion .............................................................................................................................. 39
6.1 Most Essential Areas of Improvement for Analytics in Strategy Consulting ................... 39
6.2 Impact of Internship on Personal and Professional Development ................................. 39
6.3 Final Remarks .................................................................................................................. 40
7. Appendix ................................................................................................................................. 41
7.1 Appendix 1: Reference Letter .......................................................................................... 41
7.2 Appendix 2: Curriculum Vitae .......................................................................................... 44
4
LIST OF FIGURES
Figure 1: ABC Analytics Expertise ................................................................................................. 8
Figure 2: Project Types ............................................................................................................... 10
Figure 3: Analytics Skill Set ......................................................................................................... 12
Figure 4: Typical Analytics Workflow ......................................................................................... 13
Figure 5: Sales Volume over Time with Highlighted Promotion Periods ................................... 15
Figure 6: Cross Shopping Matrix by Category ............................................................................ 15
Figure 7: Divisions Shopped per Trip by Service Type ................................................................ 16
Figure 8: Staffing Hours versus Sales by Department ................................................................ 16
Figure 9: Distribution of Sites by Affluence of Population ......................................................... 19
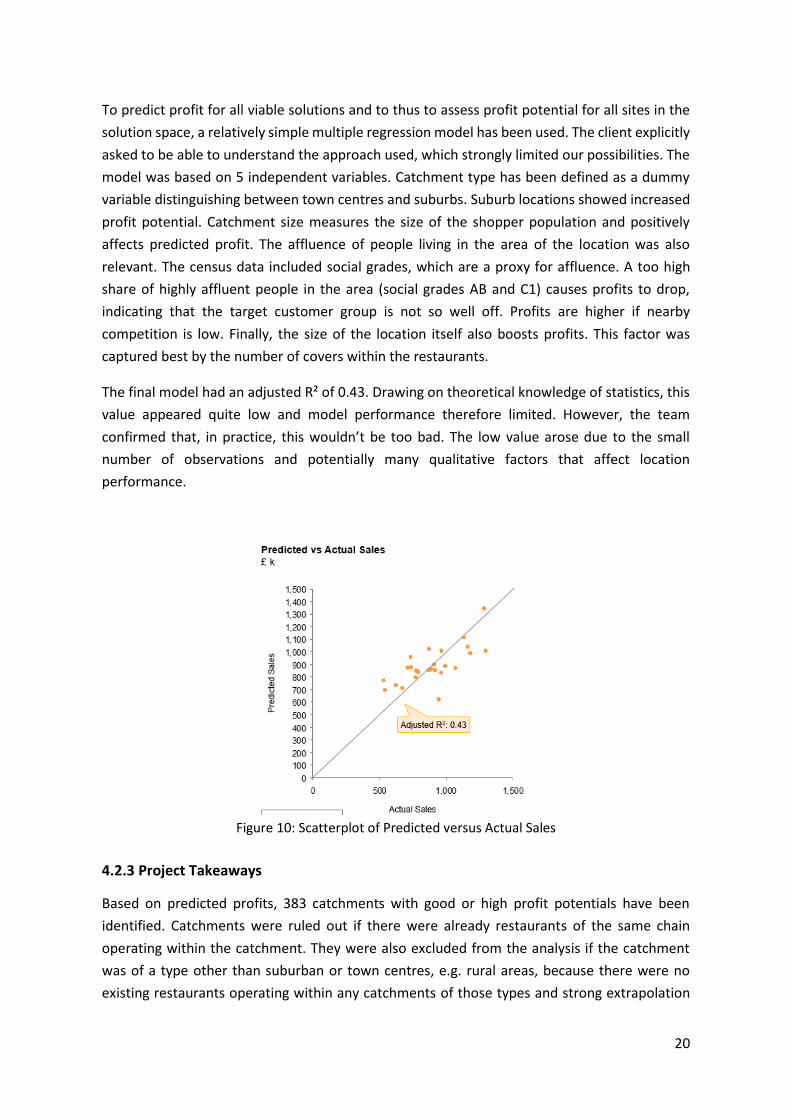
Figure 10: Scatterplot of Predicted versus Actual Sales ............................................................. 20
Figure 11: Potential Catchments for Rollout .............................................................................. 21
Figure 12: Sales Distribution per SKU ......................................................................................... 25
Figure 13: Distribution of Store Profits ...................................................................................... 26
Figure 14: Cost Curve for 1-man Delivery .................................................................................. 27
Figure 15: Cost Curve for 2-man Delivery .................................................................................. 27
5
1. INTRODUCTION
As the amounts of data collected by companies increase continuously and ever more
sophisticated ways to analyse these are being developed, companies need to incorporate
information from this data into decision making. “Data-driven decision making” is becoming a
buzz term and stakeholders increasingly find comfort in backing decisions with large amounts
of data and complex analyses.
This development also affects the service industries that support corporate decision making. As
companies have more data readily available and gain trust in its analyses, service providers must
react and adapt their offerings towards more data-driven methodologies. This is also true in the
field of strategy consulting. Clients can provide much more data than they used to, which cannot
be ignored in the strategic decision-making process. Large volumes of data, however, quickly
bust the limits of simple spreadsheets and impose the need for new tools and techniques to be
adopted by strategy consultancies. Therefore, strategy consultancies must improve their
technical capabilities to meet market demand and to stay competitive. The process of adapting
to the new environment is far from straight-forward. Strategy consulting firms face many
challenges as their historic ways solving problems stand in contrast to careful analytical
procedures.
This report provides extensive insights into analytics-based work in strategy consulting. It draws
on first-hand experience gained during a 6-month internship at ABC Strategy Consultants Ltd
(hereafter ABC) in London from September 2016 until the end of February 2017. Firstly, it
describes the role of strategy consulting in general, introduces ABC and outlines ABC’s approach
to the application of analytics. The report continues by providing details with respect to the
setup of the internship, of the analytics team and by describing the author’s role within the
team and the company. Subsequently, the projects worked on during the 6-month period will
be described. For each project, the section introduces the goals and strategic questions that
were to be pursued and answered. It also provides details on the methodologies applied,
problems encountered and results achieved. Next, the report reflects on the experiences,
learnings and takeaways during and from the internship. It critically assesses the value of
analytics in strategy consulting, debates the difficulties and implications that arise due to non-
technical audiences and attempts to answer the question whether analytics should be an
integral part of strategy consulting or if it should merely depict a support function.
The report concludes that incorporating analytics into strategy consulting projects is not ideal,
which is mainly due to the tight timelines that are typical for the industry. However, it provides
a roadmap for the integration of analytics by introducing a set of possible improvements to the
role of analytics. This piece of work is rounded off by pointing out the impact of the internship
on the personal and professional development of the author. It also outlines possible future
steps in his career and presents a set of reasons with respect to the author’s decision not to
pursue strategy consulting after finishing his studies.
6
2. INDUSTRY AND COMPANY
The general consulting services industry supports companies in performing specific tasks. These
are not bound to any specific fields, departments or missions. The contrary is the case:
consulting firms are being hired to assist with projects across a large variety of functions and for
many different purposes. These range from hands-on implementation projects to the support
of top-level strategic decision making. Consulting firms provide short- to medium-term
manpower, expertise and facilitating functions to the companies they are being hired by. Due
to the many different areas of application, many consulting firms target specific niches of the
market by focusing and specializing on certain industries and problem statements. For example,
a subset of the industry is strategy consulting.
2.1 STRATEGY CONSULTING
Strategy consulting firms operate within a subset of the consulting market. As the name
indicates, they specialize on strategic problem sets that guide top-level decision making. Among
many others, these include whether to enter or to exit product/geographical markets, which
consumers to target, how to set product prices, or which merger & acquisition strategies to
pursue.
Typically, these strategic projects are owned by high-level stakeholders and by senior managers.
Thus, the proper management of everyone involved and a good communication of results are
critical. Also, the decisions processes being supported tend to be highly time critical, which
causes project timelines to be scheduled tightly in order to deliver results as soon as possible.
The strategy consulting-specific audiences and timelines have important implications on how
analytical methodologies can be implemented for problem solving as both, non-technical
audiences and short tight timelines limit the degree of complexity that can be introduced to
models in the context of the projects.
2.2 ABC STRATEGY CONSULTANTS
ABC Strategy Consultants Ltd is one of many firms that have specialised in strategy consulting.
The company operates internationally with 14 offices across 10 countries, including the United
Kingdom, Germany, France, Poland and Turkey in continental Europe. The company focuses on
a subset of industries to concentrate their expertise and to compete effectively with larger
competitors. The industries targeted are mainly retail, consumer goods, technology, media,
industrial products and business services. The company claims a distinct corporate culture and
views itself as a boutique consulting firm that successfully competes with top tier consultancies
in their areas of focus.
7
2.3 INTRODUCTION OF ANALYTICS AT ABC
Historically, ABC has neither been involved in Analytics, nor did projects require analytical
capabilities. Consultants have mainly used Microsoft Excel (Excel) to analyse data based on an
“80/20”-approach that translated into correct but pragmatic and approximative analyses. To
save time, the last 20% of “correctness” are usually being neglected as they require a
disproportionally large amount of effort and tools other than Excel. In terms of data volumes,
ABC used to receive mostly spreadsheets that were of manageable size for Excel. I.e. most data
dumps included far less than a million rows, typically two-hundred thousand at most. In case
larger datasets were received, consultants would open them with Microsoft Access. However,
the program was only used to reduce dimensions, to roll up the data and to subsequently export
the data again in order to perform the actual analyses in Excel. Besides the simplicity of tools
used, the typical strategy consultant is neither proficient in statistical or analytical
methodologies, nor does he know anything about databases.
In recent years, project teams were confronted with larger amounts of data, with the market
demand to analyse more detailed layers of data and with increased technical expertise on the
side of the client. These developments conflicted with the historic limitations. Processing data
efficiently and analysing it correctly became a major challenge. Therefore, ABC invested in the
development of analytical capabilities in 2014. The company, led by the UK office, hired an
analytics expert to build a team of analytical consultants that would be capable of handling
substantial amounts of data and applying advanced analytical techniques.
8
3. ANALYTICS AT ABC
As analytics at ABC has solely been developed to meet market demands in the field of strategy
consulting, it’s not one of ABC’s core competencies. The firm put a lot of work and effort into
determining the right setup and value proposition of analytics as part of strategy consulting. For
analytics to function well within ABC, interests of the analytics team must be balanced against
the interest of the remainder of the firm. Also, the right degree of technicality has to be
determined, it must be specified how strategy consultants interact with the analytics team, and
the type of projects to be worked on by the team must be defined. Furthermore, ABC has to
develop an internal expertise that enables them to develop and preserve methodologies.
Finally, ABC must come up with a way to solve analytics tasks on short consulting timelines.
3.1 APPROACH OF ABC TO THE ROLE OF ANALYTICS IN STRATEGY CONSULTING
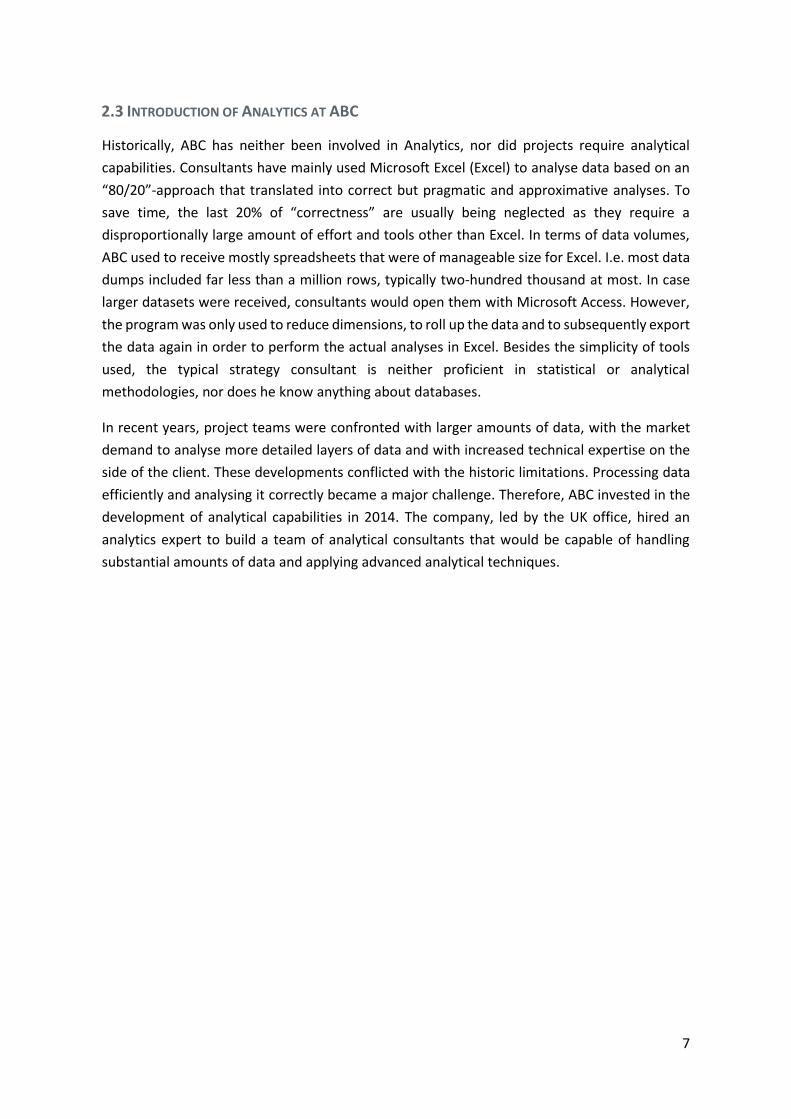
In contrast to many other players in the industry, ABC chose not to develop its analytical
expertise as a “back-office” function. Instead, they aim to develop a team of consultants that
does not only have a commercial understanding of business, but also knows how to handle big
and complex sets of data. These competencies include the elaborate statistical analysis of data.
Figure 1: ABC Analytics Expertise
9
3.1.1 Key Principles
The approach applied by ABC to “do” analytics is characterized by five key principles:
1. Commercial: the aim is to answer commercial questions, not to sell products or systems.
2. Fast: timescales are adapted to strategy projects and will last from 4 to 12 weeks.
3. Pragmatic: in order to work with messy real-world data, data quality is being assessed
at the beginning of the process and will be considered when designing approaches and
analyses.
4. Interactive: clients are taken through the entire decision-making process and must
understand how conclusions are being derived.
5. Advanced tools: the toolkit applied leverages advanced analytics techniques
(regressions, clustering, classification algorithms, …) and relies on the right tools (R,
Python, SQL).
These principles guide the analytics-based work of ABC. Essentially, they are designed to allow
analytics to work hand-in-hand with the regular strategy consulting process. For this
combination to work, the analytics work must match the pace of the other work streams and
must be understandable to non-technical stakeholders.
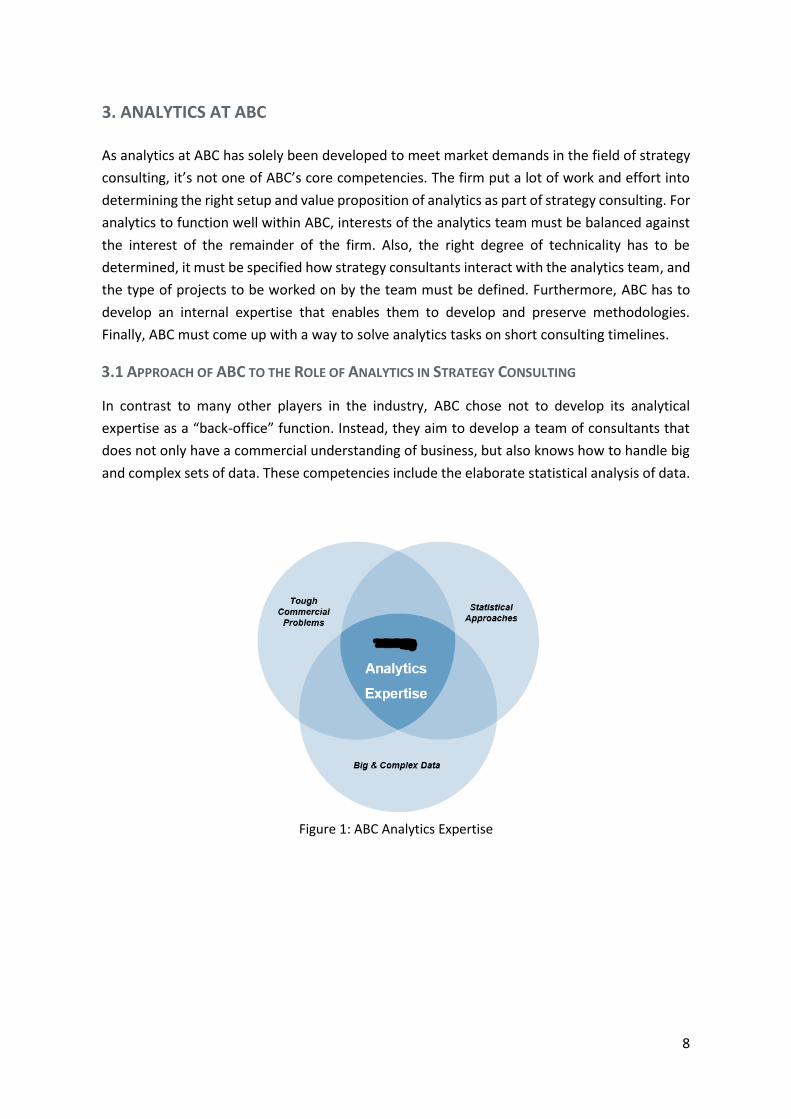
3.1.2 Project Types
Besides these principles, ABC has also closely defined the types of projects that will be carried
out with analytics as a supporting or as a key function. Tasks are being differentiated along two
dimensions: the role of analytics and the project type. Within all projects supported, the
analytics team is meant to take a front office role. I.e. they will be part of the client-facing team
rather than just providing analysis to the team from the back office. Analytics consultants will
hold end-to-end ownership of the problem and are responsible for deriving adequate
conclusions and communicating them. This property of the work demands commercial and
business skills from the analytics team members, as well as the capability to communicate
results well. The back-office role will only be performed in case of internal tasks that support
general operations. It involves supporting single bits of strategy projects without being exposed
to the problem in question.
With respect to the project types, ABC differentiates between three kinds:
1. Strategy Plus: projects where analytics is used to improve the problem-solving process
of traditional strategy projects. Analytics may allow for a more accurate solution to the
problem, or it may increase the speed with which the solution is derived. Possibly,
applying analytics may also generate higher fees or yield an advantage during the
pitching process.
2. Analytics Enabled: strategy projects that are heavily analytical and where analytics is
essential to solving the problem. The execution requires advanced analytical
10
techniques. Typically, these projects are deep dives into functional-level topics. For
example, these projects may involve analysing transactional data on a line item level.
3. Pure Analytics: projects where analytics is part of the final output, for example in the
format of a tool or an ongoing service. There is no strategy component involved. Usually,
these projects are only being carried out on client demand only, they are not being
pitched for.
Most projects for which analytics team members are staffed fall into the first category. Strategy
development is ABC’S core business and in most cases the firm simply wants to deliver state-of-
the-art solutions to strategic problem statements. In many cases the best solution requires the
analysis of enormous amounts of data or the application of complex methodologies.
The second focus type, despite its lower importance, consists of analytics enabled projects.
These move away from the company’s core business and allow for additional revenue. The
projects send a strong signal to the market that shows that ABC is capable of meeting analytical
industry demands. However, in most cases the methodology must be developed and timelines
have to be extended in order for proper analyses or modelling to take place.
Figure 2: Project Types
11
3.2 ROLE AND SETUP OF THE ANALYTICS TEAM
The analytics team at ABC is set up to match its underlying principles and to successfully tackle
its focus project types. These requirements dictate two main traits of the team: its client-facing
nature and its full integration with regular project teams. The former is required to develop full
problem ownership and to ensure an interactive interaction with the clients. It moves the
analytics role away from the back office. Team members are expected to work well with team
members as well as client representatives. The latter is also essential for an end-to-end problem
ownership, but is also important for timeliens to align with other work streams. It prevents the
team from solely providing on-demand services, such as rolling up data. Both traits have
massive implications on the way the team members work and on the profile of the ideal
candidate.
3.2.1 Team Setup and Role Compared to Strategy Consultant
The analytics team at ABC is led by two associate partners, one of which is the head of analytics.
The two are responsible for developing the team and for ensuring smooth interactions between
analytics and everything else. The head of analytics has been hired from an external company
and brings in much of ABC’s analytics expertise. He does not manage any projects and is fully
dedicated to supporting the analytics team. He acts as an important sparring partner to the
team members by giving advice with respect to methodologies and how to handle specific
project situations. Furthermore, the head of analytics promotes the team internally by
communicating its capabilities to partners, which enables them to sell projects based on the
existing expertise. Also, he is responsible for the analytics strategy and financial planning, while
also taking care of the resource management and recruitment. The second associate partner
involved also manages regular projects and mostly acts as a sparring partner to the head of
analytics. The remainder of the team is not involved in organizational tasks. They are simply
allocated to projects, taking into account their level of seniority and their technical expertise.
Essentially, members of the analytics team take on a role that is very similar to that of a
“regular” strategy consultant. Therefore, the team is integrated into the remainder of the firm,
being staffed as required. However, due to the differences in tasks compared to the strategy
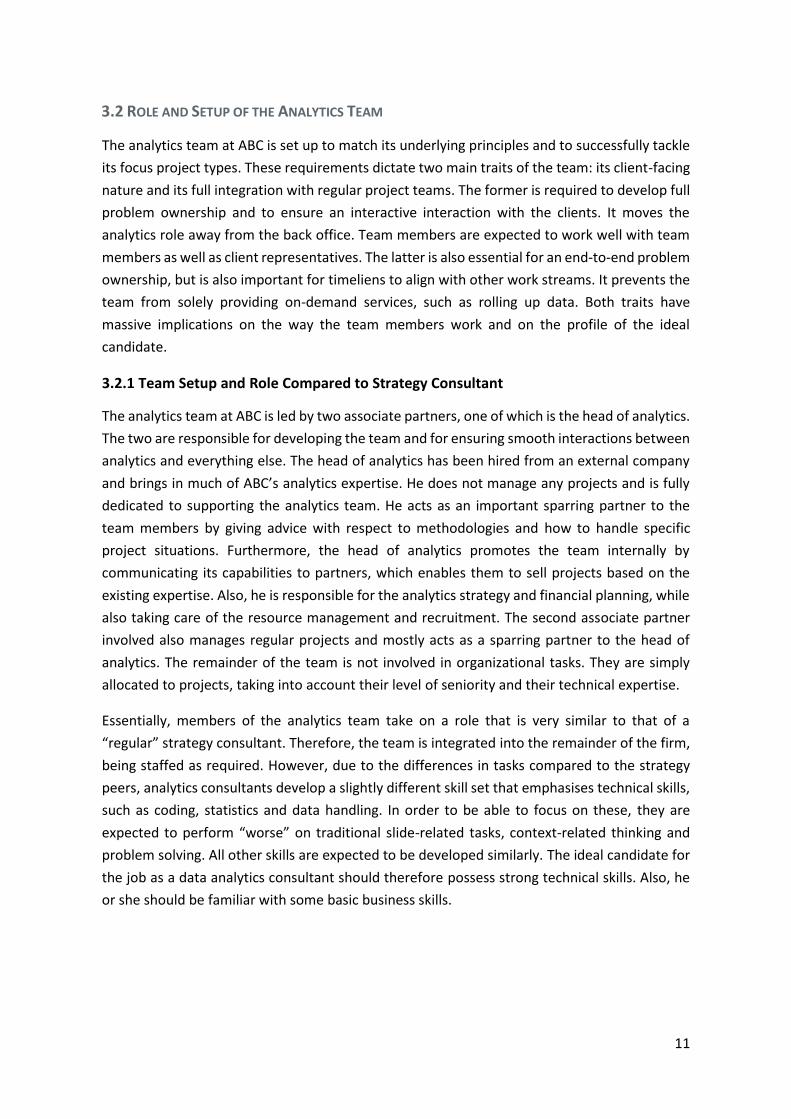
peers, analytics consultants develop a slightly different skill set that emphasises technical skills,
such as coding, statistics and data handling. In order to be able to focus on these, they are
expected to perform “worse” on traditional slide-related tasks, context-related thinking and
problem solving. All other skills are expected to be developed similarly. The ideal candidate for
the job as a data analytics consultant should therefore possess strong technical skills. Also, he
or she should be familiar with some basic business skills.
12
Figure 3: Analytics Skill Set
3.2.2 Analytics Workflow
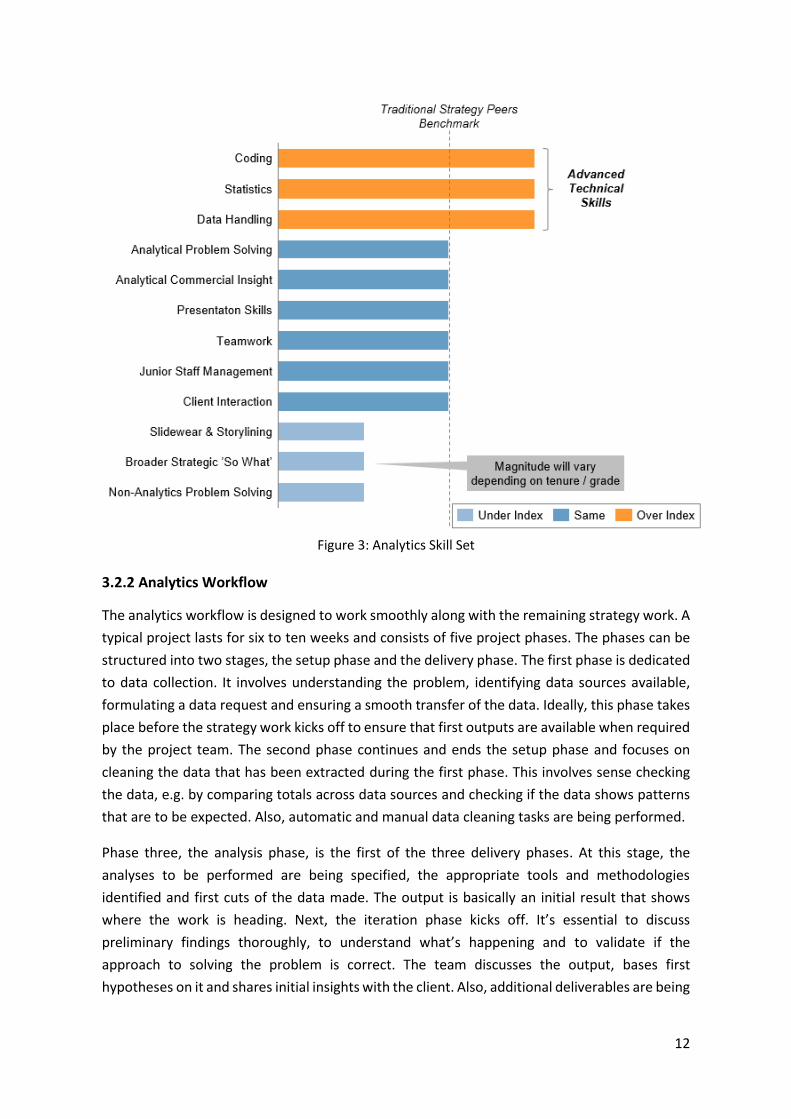
The analytics workflow is designed to work smoothly along with the remaining strategy work. A
typical project lasts for six to ten weeks and consists of five project phases. The phases can be
structured into two stages, the setup phase and the delivery phase. The first phase is dedicated
to data collection. It involves understanding the problem, identifying data sources available,
formulating a data request and ensuring a smooth transfer of the data. Ideally, this phase takes
place before the strategy work kicks off to ensure that first outputs are available when required
by the project team. The second phase continues and ends the setup phase and focuses on
cleaning the data that has been extracted during the first phase. This involves sense checking
the data, e.g. by comparing totals across data sources and checking if the data shows patterns
that are to be expected. Also, automatic and manual data cleaning tasks are being performed.
Phase three, the analysis phase, is the first of the three delivery phases. At this stage, the
analyses to be performed are being specified, the appropriate tools and methodologies
identified and first cuts of the data made. The output is basically an initial result that shows
where the work is heading. Next, the iteration phase kicks off. It’s essential to discuss
preliminary findings thoroughly, to understand what’s happening and to validate if the
approach to solving the problem is correct. The team discusses the output, bases first
hypotheses on it and shares initial insights with the client. Also, additional deliverables are being
13
discussed. Finally, during the last week of the project, commercial findings, backed by analytics,
are being condensed, visualised and presented to the client. The delivery stage of the project is
similar to the setup of a regular strategy project. The setup stage, however, must occur ahead
of time to avoid unrealistic deadlines later on.
Figure 4: Typical Analytics Workflow
3.2.3 Author’s Role within the Team
The author joined ABC for a six-months internship in the analytics team. Having worked as a
strategy consultant ahead of his Master’s degree, the commercial and slide-related skill set had
already been developed. Additionally, part of the required technical expertise had been
acquired throughout the first year of his Master’s degree in advanced analytics at Nova IMS in
Lisbon. This set of experience and technical knowledge allowed the author to join the team as
a full-fledged member from the very beginning of the internship.
Initially, as no project kicked off right away, the author got staffed “on top” to help out a fellow
team member. This setup ensured a smooth start of the internship as the author could gain first
insights into how the team works without being held fully responsible for any project outputs.
This introductory phase also freed some time to improve coding skills where required. After two
or three weeks, the author was taken off this project and got staffed on a separate project,
being fully responsible for the related analytics work stream.
Being integrated into the team as a full member was a terrific opportunity to maximize learning
throughout the internship. Owning the problems end-to-end encouraged involvement, critical
thinking and creative approaches to the tasks. Fellow team members were always keen to help
and to give advice when necessary.
14
4. PROJECT EXPERIENCE
Over the course of the six-months internship, the author worked on four different projects. The
first project for a UK department store lasted for about a month, followed by an intensive two-
months commercial due diligence for a restaurant chain. The final project took place over a
three-month period and supported the strategic planning of a multi-channel retailer by
determining its cost-to-serve across channels and categories. Any slack during the projects has
been used to develop an internal database that can be used for location-based analyses.
4.1 STRATEGIC OPPORTUNITIES & OPERATIONAL OPTIMISATION FOR A DEPARTMENT STORE
The internship kicked off with a project that assessed strategic opportunities and potential for
operational optimisation for a well-reputed UK department. The department store had never
engaged in an extensive piece of strategy work before and was keen to identify any type of
opportunities or threats to the business. The broad problem statement allowed for flexible
exploratory analyses of all datasets provided by the client, which was a very interesting task.
Linking up the different sets of data and identifying relationships was very rewarding,
particularly because many patterns discovered made intuitive sense.
4.1.1 Data Sources
Most analyses conducted were based on three sets of data. Most importantly, transactional
data on line item level provided a detailed purchasing history for any transaction processed in
2013 or later. This fact table contained quantitative purchasing details, such as date and time
information, transaction and line item IDs, purchasing volumes and values, discounts, as well as
taxes. Also, it included a variety of foreign keys that allowed linking it up with numerous
dimensions. They included product IDs, customer IDs and department IDs.
One of the main transformations applied to the data was the definition of shopping trips. They
were used as a basis for customer behaviour instead of analysing individual transactions. The
adjustment assured that transactions by the same customer on the same date were not
assessed separately. This was possible without sacrificing much data because the penetration
of customer data was high, customer IDs were recorded for most transactions.
4.1.2 Analyses Performed
At the very beginning of the project, the spending patterns by customers coming from different
loyalty tiers or demographic backgrounds were assessed. Overall, daily transaction volumes
stayed within a more or less equal band, but increased during promotional periods and before
holidays. The impact of promotions on transaction volumes had not been incorporated into
staffing considerations before. Additional analyses were performed in order to assess the need
for additional staff per department in greater detail. Also, sales volumes across the year were
determined by customer nationality. This indicated that customers from some regions,
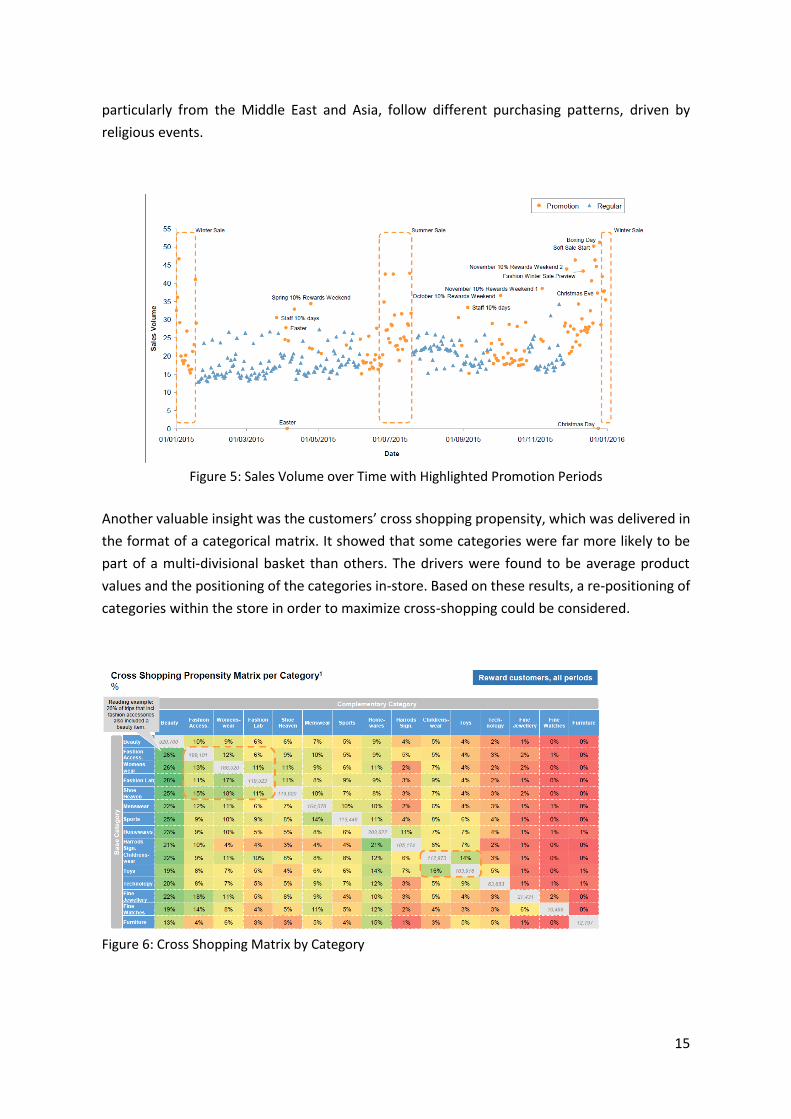
15
particularly from the Middle East and Asia, follow different purchasing patterns, driven by
religious events.
Figure 5: Sales Volume over Time with Highlighted Promotion Periods
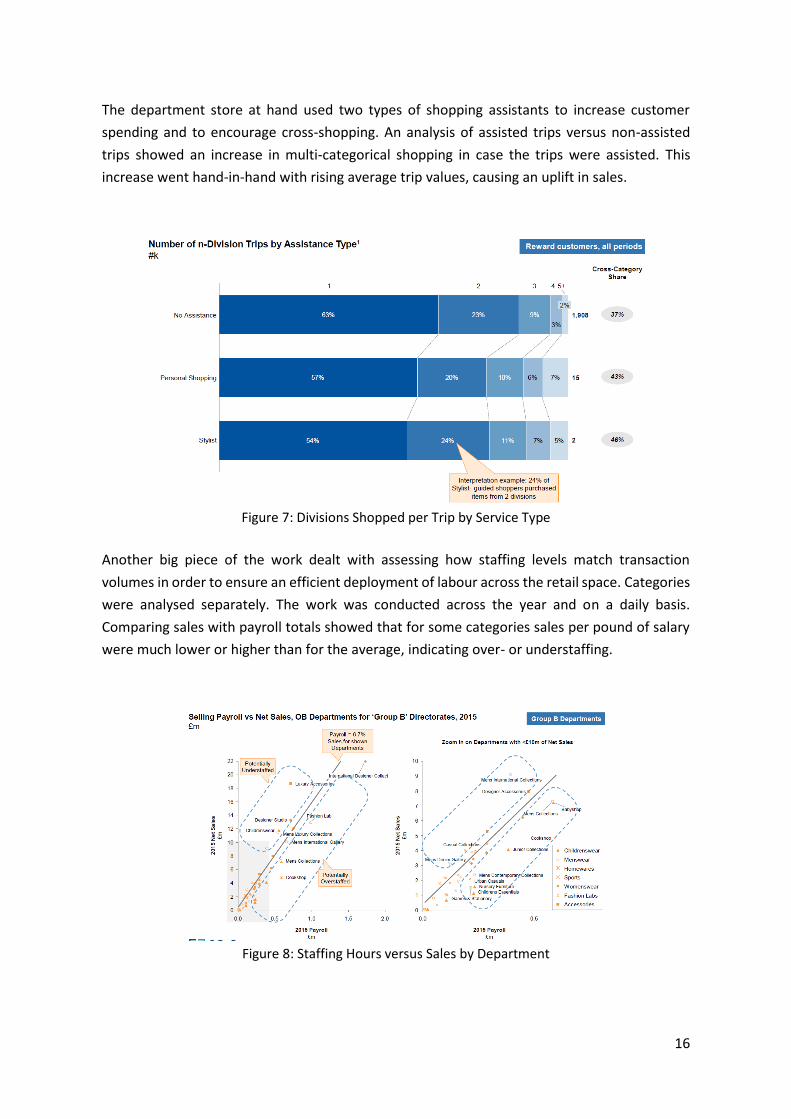
Another valuable insight was the customers’ cross shopping propensity, which was delivered in
the format of a categorical matrix. It showed that some categories were far more likely to be
part of a multi-divisional basket than others. The drivers were found to be average product
values and the positioning of the categories in-store. Based on these results, a re-positioning of
categories within the store in order to maximize cross-shopping could be considered.
Figure 6: Cross Shopping Matrix by Category
16
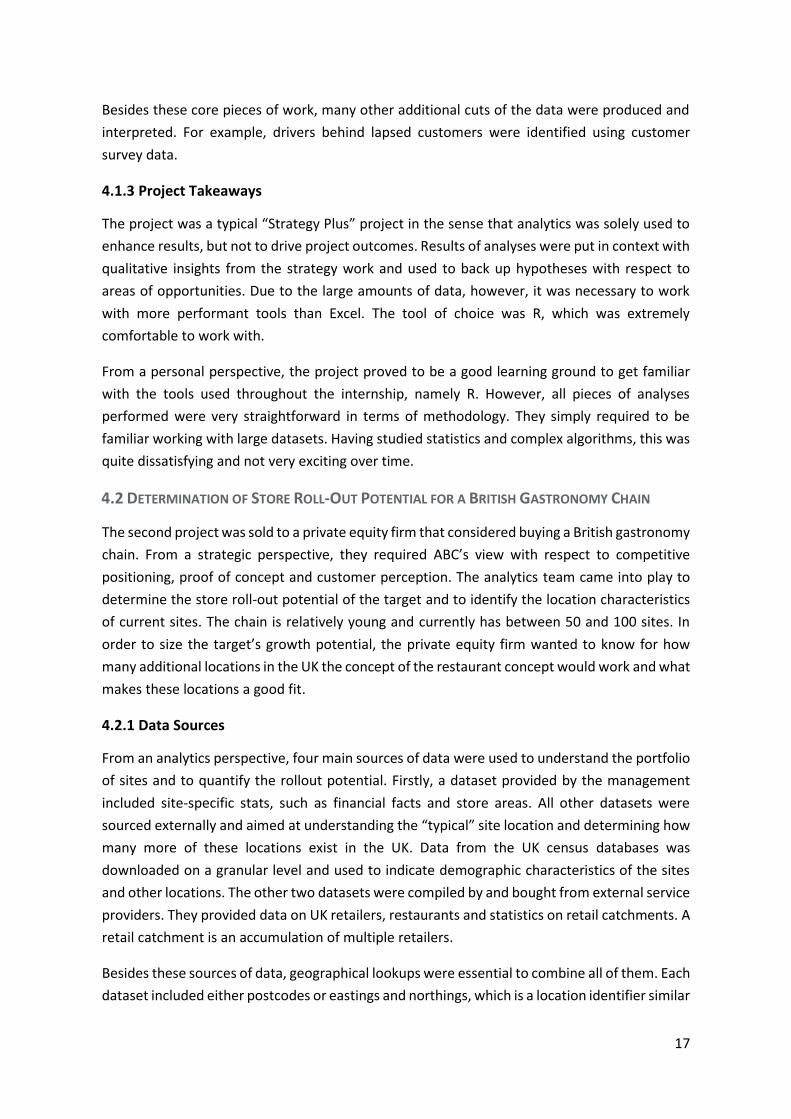
The department store at hand used two types of shopping assistants to increase customer
spending and to encourage cross-shopping. An analysis of assisted trips versus non-assisted
trips showed an increase in multi-categorical shopping in case the trips were assisted. This
increase went hand-in-hand with rising average trip values, causing an uplift in sales.
Figure 7: Divisions Shopped per Trip by Service Type
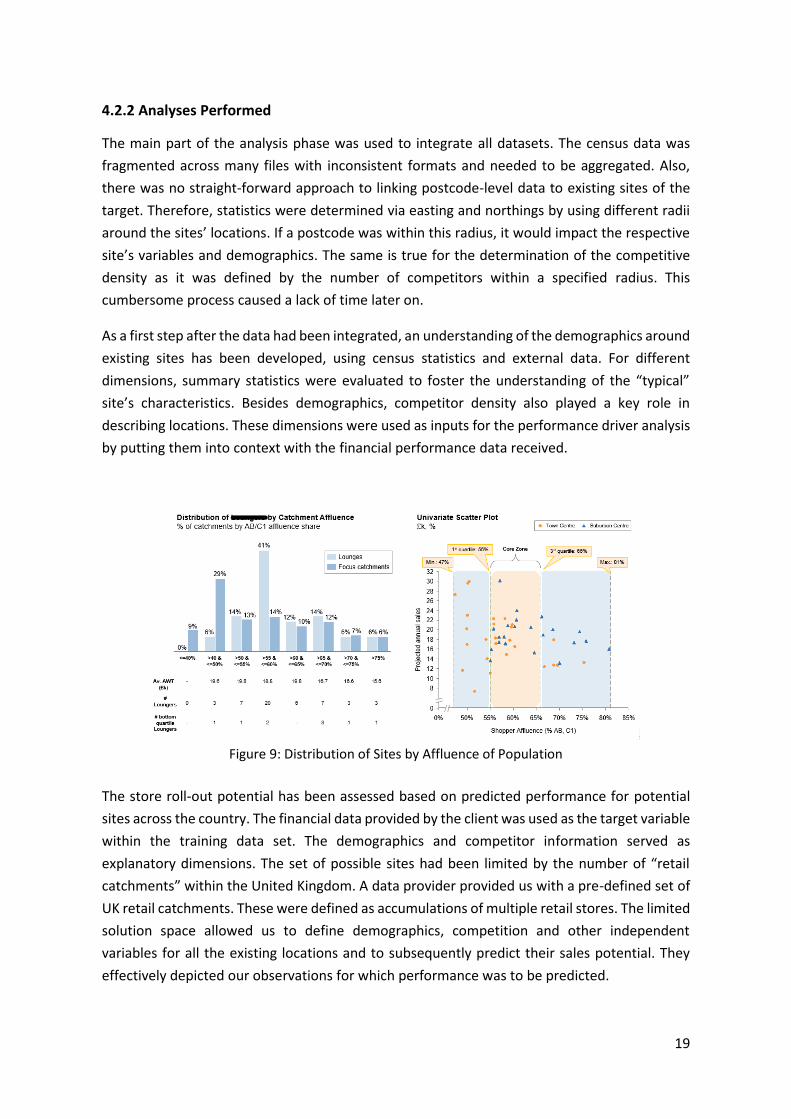
Another big piece of the work dealt with assessing how staffing levels match transaction
volumes in order to ensure an efficient deployment of labour across the retail space. Categories
were analysed separately. The work was conducted across the year and on a daily basis.
Comparing sales with payroll totals showed that for some categories sales per pound of salary
were much lower or higher than for the average, indicating over- or understaffing.
Figure 8: Staffing Hours versus Sales by Department
17
Besides these core pieces of work, many other additional cuts of the data were produced and
interpreted. For example, drivers behind lapsed customers were identified using customer
survey data.
4.1.3 Project Takeaways
The project was a typical “Strategy Plus” project in the sense that analytics was solely used to
enhance results, but not to drive project outcomes. Results of analyses were put in context with
qualitative insights from the strategy work and used to back up hypotheses with respect to
areas of opportunities. Due to the large amounts of data, however, it was necessary to work
with more performant tools than Excel. The tool of choice was R, which was extremely
comfortable to work with.
From a personal perspective, the project proved to be a good learning ground to get familiar
with the tools used throughout the internship, namely R. However, all pieces of analyses
performed were very straightforward in terms of methodology. They simply required to be
familiar working with large datasets. Having studied statistics and complex algorithms, this was
quite dissatisfying and not very exciting over time.
4.2 DETERMINATION OF STORE ROLL-OUT POTENTIAL FOR A BRITISH GASTRONOMY CHAIN
The second project was sold to a private equity firm that considered buying a British gastronomy
chain. From a strategic perspective, they required ABC’s view with respect to competitive
positioning, proof of concept and customer perception. The analytics team came into play to
determine the store roll-out potential of the target and to identify the location characteristics
of current sites. The chain is relatively young and currently has between 50 and 100 sites. In
order to size the target’s growth potential, the private equity firm wanted to know for how
many additional locations in the UK the concept of the restaurant concept would work and what
makes these locations a good fit.
4.2.1 Data Sources
From an analytics perspective, four main sources of data were used to understand the portfolio
of sites and to quantify the rollout potential. Firstly, a dataset provided by the management
included site-specific stats, such as financial facts and store areas. All other datasets were
sourced externally and aimed at understanding the “typical” site location and determining how
many more of these locations exist in the UK. Data from the UK census databases was
downloaded on a granular level and used to indicate demographic characteristics of the sites
and other locations. The other two datasets were compiled by and bought from external service
providers. They provided data on UK retailers, restaurants and statistics on retail catchments. A
retail catchment is an accumulation of multiple retailers.
Besides these sources of data, geographical lookups were essential to combine all of them. Each
dataset included either postcodes or eastings and northings, which is a location identifier similar

18
to altitudes and longitudes but without negative values. These are helpful to calculate absolute
distances. The analytics team has access to a huge lookup file that allocates eastings and
northings to every UK postcode. For example, this lookup has been used to define catchment-
specific demographics from the census data provided per postcode or to determine which
retailers or restaurant operate close to one of the sites.
19
4.2.2 Analyses Performed
The main part of the analysis phase was used to integrate all datasets. The census data was
fragmented across many files with inconsistent formats and needed to be aggregated. Also,
there was no straight-forward approach to linking postcode-level data to existing sites of the
target. Therefore, statistics were determined via easting and northings by using different radii
around the sites’ locations. If a postcode was within this radius, it would impact the respective
site’s variables and demographics. The same is true for the determination of the competitive
density as it was defined by the number of competitors within a specified radius. This
cumbersome process caused a lack of time later on.
As a first step after the data had been integrated, an understanding of the demographics around
existing sites has been developed, using census statistics and external data. For different
dimensions, summary statistics were evaluated to foster the understanding of the “typical”
site’s characteristics. Besides demographics, competitor density also played a key role in
describing locations. These dimensions were used as inputs for the performance driver analysis
by putting them into context with the financial performance data received.
Figure 9: Distribution of Sites by Affluence of Population
The store roll-out potential has been assessed based on predicted performance for potential
sites across the country. The financial data provided by the client was used as the target variable
within the training data set. The demographics and competitor information served as
explanatory dimensions. The set of possible sites had been limited by the number of “retail
catchments” within the United Kingdom. A data provider provided us with a pre-defined set of
UK retail catchments. These were defined as accumulations of multiple retail stores. The limited
solution space allowed us to define demographics, competition and other independent
variables for all the existing locations and to subsequently predict their sales potential. They
effectively depicted our observations for which performance was to be predicted.
20
To predict profit for all viable solutions and to thus to assess profit potential for all sites in the
solution space, a relatively simple multiple regression model has been used. The client explicitly
asked to be able to understand the approach used, which strongly limited our possibilities. The
model was based on 5 independent variables. Catchment type has been defined as a dummy
variable distinguishing between town centres and suburbs. Suburb locations showed increased
profit potential. Catchment size measures the size of the shopper population and positively
affects predicted profit. The affluence of people living in the area of the location was also
relevant. The census data included social grades, which are a proxy for affluence. A too high
share of highly affluent people in the area (social grades AB and C1) causes profits to drop,
indicating that the target customer group is not so well off. Profits are higher if nearby
competition is low. Finally, the size of the location itself also boosts profits. This factor was
captured best by the number of covers within the restaurants.
The final model had an adjusted R² of 0.43. Drawing on theoretical knowledge of statistics, this
value appeared quite low and model performance therefore limited. However, the team
confirmed that, in practice, this wouldn’t be too bad. The low value arose due to the small
number of observations and potentially many qualitative factors that affect location
performance.
Figure 10: Scatterplot of Predicted versus Actual Sales
4.2.3 Project Takeaways
Based on predicted profits, 383 catchments with good or high profit potentials have been
identified. Catchments were ruled out if there were already restaurants of the same chain
operating within the catchment. They were also excluded from the analysis if the catchment
was of a type other than suburban or town centres, e.g. rural areas, because there were no
existing restaurants operating within any catchments of those types and strong extrapolation
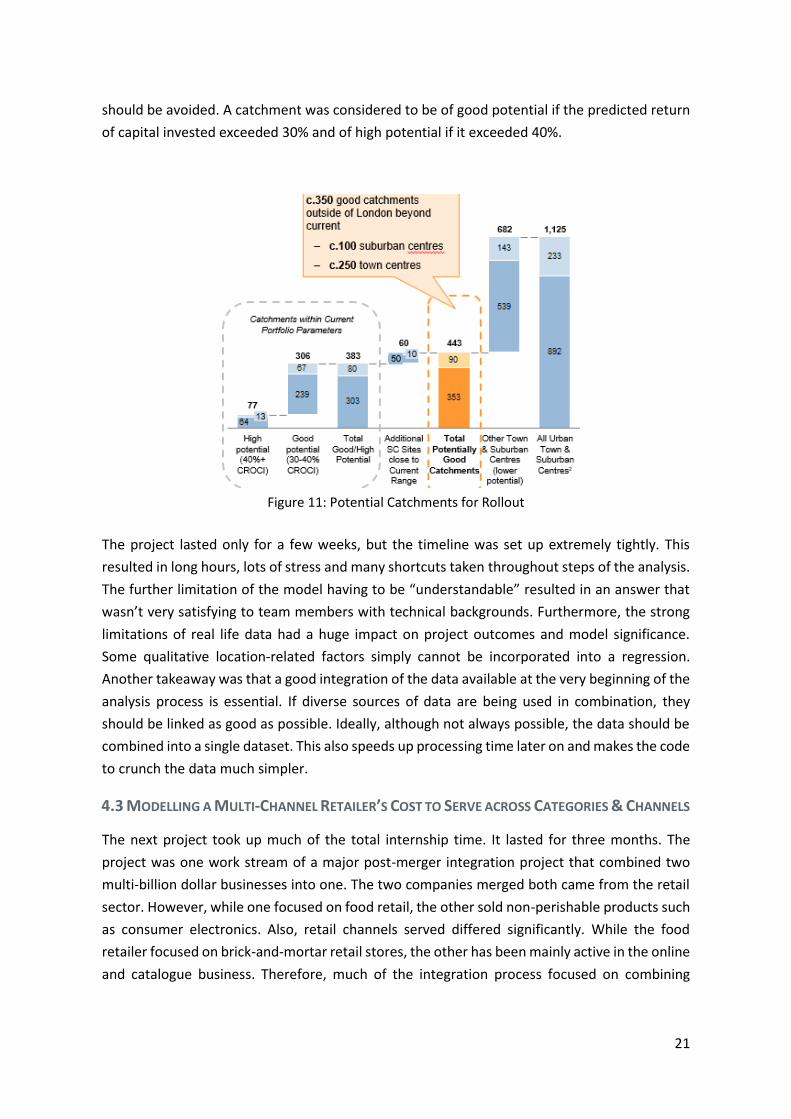
21
should be avoided. A catchment was considered to be of good potential if the predicted return
of capital invested exceeded 30% and of high potential if it exceeded 40%.
Figure 11: Potential Catchments for Rollout
The project lasted only for a few weeks, but the timeline was set up extremely tightly. This
resulted in long hours, lots of stress and many shortcuts taken throughout steps of the analysis.
The further limitation of the model having to be “understandable” resulted in an answer that
wasn’t very satisfying to team members with technical backgrounds. Furthermore, the strong
limitations of real life data had a huge impact on project outcomes and model significance.
Some qualitative location-related factors simply cannot be incorporated into a regression.
Another takeaway was that a good integration of the data available at the very beginning of the
analysis process is essential. If diverse sources of data are being used in combination, they
should be linked as good as possible. Ideally, although not always possible, the data should be
combined into a single dataset. This also speeds up processing time later on and makes the code
to crunch the data much simpler.
4.3 MODELLING A MULTI-CHANNEL RETAILER’S COST TO SERVE ACROSS CATEGORIES & CHANNELS
The next project took up much of the total internship time. It lasted for three months. The
project was one work stream of a major post-merger integration project that combined two
multi-billion dollar businesses into one. The two companies merged both came from the retail
sector. However, while one focused on food retail, the other sold non-perishable products such
as consumer electronics. Also, retail channels served differed significantly. While the food
retailer focused on brick-and-mortar retail stores, the other has been mainly active in the online
and catalogue business. Therefore, much of the integration process focused on combining
22
categories and channels in order to provide a coherent assortment, served via the right
channels.
The work stream at hand pursued the task to determine the cost to serve per category and
channel for the non-food retail business. To streamline the business, the management wanted
to know the actual costs associated with providing a product of a specific category via a
particular channel to the end customer. The task involved identifying relevant costs and
breaking them down across categories and channels. Given thousands of cost centres across
many levels of the business (management, operational, delivery, …), this turned out to be a
cumbersome exercise. Subsequently, the cost to serve has been modelled for various scenarios
that covered shifts in the market and operational changes, such as store closures or leveraging
efficiencies. The outcomes of this scenario analysis will guide the company’s category and
channel strategies. They will dictate alterations to the core business operations in the future
that depict the best response to expected market developments. Also, operational efficiencies
will be optimised based on modelled changes. The target output was a set of detailed P&L
statements across categories, channels and time that reflected the different scenarios assessed
throughout the project. The scenarios reflect market developments and operational changes.
4.3.1 Data Sources
The nature of the project was rather untypical for the analytics team to work on. The core
ingredient was a quantitative and extensive set of financial data that specified costs and
revenues from operations across many dimensions. They were provided on a daily basis per
category, cost centre, channel, store, delivery type and per line of the profit and loss statement
on a granular level. This database enabled the creation of historic and as-is P&L statements
across the dimensions desired.
These historic and as-is statements served as the building block for all further analyses. They
were extrapolated into the future to reflect the result of scenarios modelled. Most additional
inputs, however, were of more qualitative nature. Firstly, market forecasts were used to build
the “base scenario” for the future. Additionally, many semi-quantitative inputs were sourced
from across the business. A lot of analyses had already been conducted but never centralised
or put together in any way. In order not to duplicate efforts, the project at hand relied on these
outputs, which were incorporated into the model in a mostly simplified format. Many other
inputs were based on interviews with stakeholders across the business, reflecting best guesses
or experience-based values. The qualitative nature of many of these sources were not optimal.
However, the lack of relevant data forced the team to adopt a hypothesis-based approach to
the project.
23
4.3.2 Analyses Performed
The analyses performed during the project focused on two main parts: the forecasting of as-is
and historic P&L numbers and the modelling of scenarios to reflect potential future changes in
the operating model or other economics.
4.3.2.1 Forecasting Methodology
The entire project has been built around the base scenario that extrapolates historic and as-is
P&L statements five years into the future. The forecasting approach is based on historic
developments, as well on a coherent market forecast that has been put together by ABC. The
data provided by the client included historic values for each item of the P&L. These were
aggregated on a monthly basis and summarised per category and channel. Subsequently, the
figures have been forecasted based on a dual methodology.
Firstly, a few months of data were missing to complete the most recent financial year. In order
to complete these, two factors have been considered: the change versus the previous year and
the seasonal variation within the year. For each line of the P&L, these values have been
determined. A rolling 4-months average of the most recent months of the current financial year
has been divided by the corresponding time period of the previous year in order to construct a
relative performance indicator for the current year. The rolling averages limit the impact of
random behaviour in the previous or current year data. This indicator captures the performance
delta in-between the financial years. An estimation for the current year’s missing value has been
made by multiplying the relative performance indicator of the current year by the previous’ year
absolute value. This methodology has been applied in order to complete the missing data points
for the current financial year.
Thereafter, the forecasting methodology could be simplified. ABC put a lot of effort into the
construction of market forecasts of the retail sector by category and channel. These have been
adjusted for inflation and were subsequently used to forecast the data for the years ahead. The
market forecasts translated directly into the growth of sales. Other P&L lines behaved
differently. For anything above gross margin, the share of sales has been held constant. I.e.
gross margin did not change in relative terms over time for the base case. Most of variable costs
were also assumed to grow with sales. However, line-specific cost inflation rates were applied
in addition to the market growth rates. For example, wages were expected to rise with a rate
faster than sales. Semi-variable and fixed costs were held constant as a total and only changed
according to line-specific inflation rates. The semi-variable and fixed costs have been re-
distributed across categories and channels to reflect the shift in sales volumes. This has been
done on a sales volume basis causing costs to shift across category-channel combinations but
to stay constant on aggregate.
24
4.3.2.2 Scenario Modelling
This forecast of the P&L depicted the building block of the project. It was used as the basis for
any scenario modelled subsequently. The additional inputs, namely the specifications of
scenario changes and the scenario-based assumptions, were hard to collect and aggregate.
Within the organization, stakeholders first could not agree on what to model and subsequently
struggled to verify the assumptions underlying the agreed-upon scenario changes and impacts.
In the end, four scenarios have been modelled throughout the course of the project. They were
assessed by calculating incremental P&L line effects per channel and category. Using these
incremental effects, resulting P&Ls could be calculated by combining them with the base P&L.
The first assumed a heavy curation of the range offered by the retailer, the second modelled
changes to the store portfolio, the third determined the impacts of optimising the 1-man
delivery fleet and the fourth modelled the same for 2-man delivery economics.
The first scenario, reflecting the expected impacts of a heavily curated range, was motivated by
the fact that the client sold products across a very wide and deep range. Many of the SKUs in
stock had very little turnover, thus creating disproportionally high sourcing, storage and logistics
costs. While a smaller range would necessarily have a negative impact on sales, reducing the
range would also increase availability and immediacy, which are two service dimensions highly
valued by the customer. The service dimensions would improve as more stock could be held for
the remaining SKUs. The improved service could offset the negative sales impact created by
fewer SKUs in stock. Also, not all sales generated by these SKUs would be lost because some
customers would simply buy alternative products. Furthermore, a smaller range would
streamline the logistics and thereby effectively reduce costs. The scenario required a set of key
inputs. Firstly, an understanding of which SKUs should be dropped was required. These were
taken from the sales “tail” of SKUs per category. I.e. by taking out the slowest turning SKUs per
category but retaining those required to express range expertise. Secondly, the sales impact
from the smaller range needed to be derived and compared to the uplift expected from higher
service levels. Also, estimations of changes in supply chain and store costs were required. All of
these effects needed to be traded off against each other and were balanced out in order to
maximize the delta between benefits and costs. A smaller range would reposition the client with
a clear proposition promising a curated product portfolio that offers sufficient choice but no
overwhelming floods of “space holder SKUs”.
25
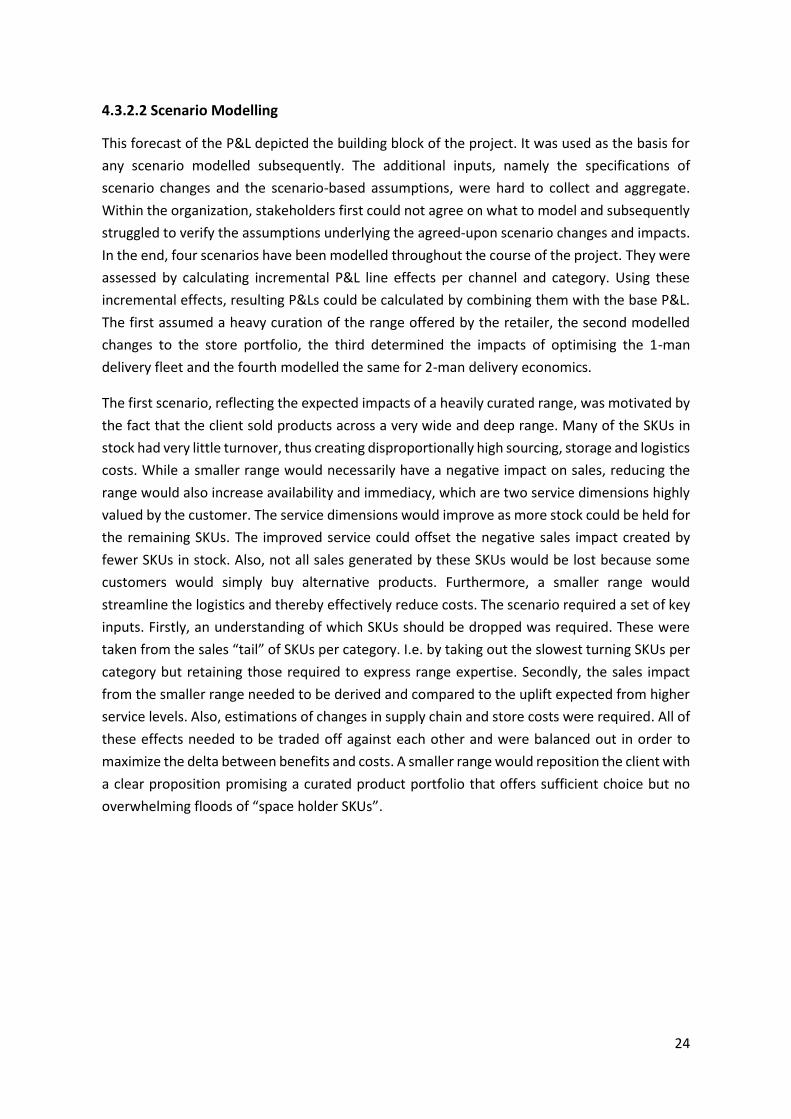
Figure 12: Sales Distribution per SKU
The second scenario modelled adaptations to the store portfolio. It was driven by the
hypothesis that the brick-and-mortar store channel is losing relevance and too costly to
maintain. Also, collection points for online orders could be incorporated into the stores of the
grocery retailer, providing part of the store benefits to end customers. Therefore, many stores
should be closed. The scenario assumed that only stores would be retained, that currently yield
exceptionally high profits. Also, stores would not be closed in case of no near-by option to create
a collection point. While some of the store sales would be lost in case of closure, others transfer
to close-by stores or the new collection points. A store-related side model has been created to
determine which stores to close, how many sales would be lost and how many costs would be
saved due to the closures. Store-based P&Ls by channel and category helped a lot to determine
the impacts.
26
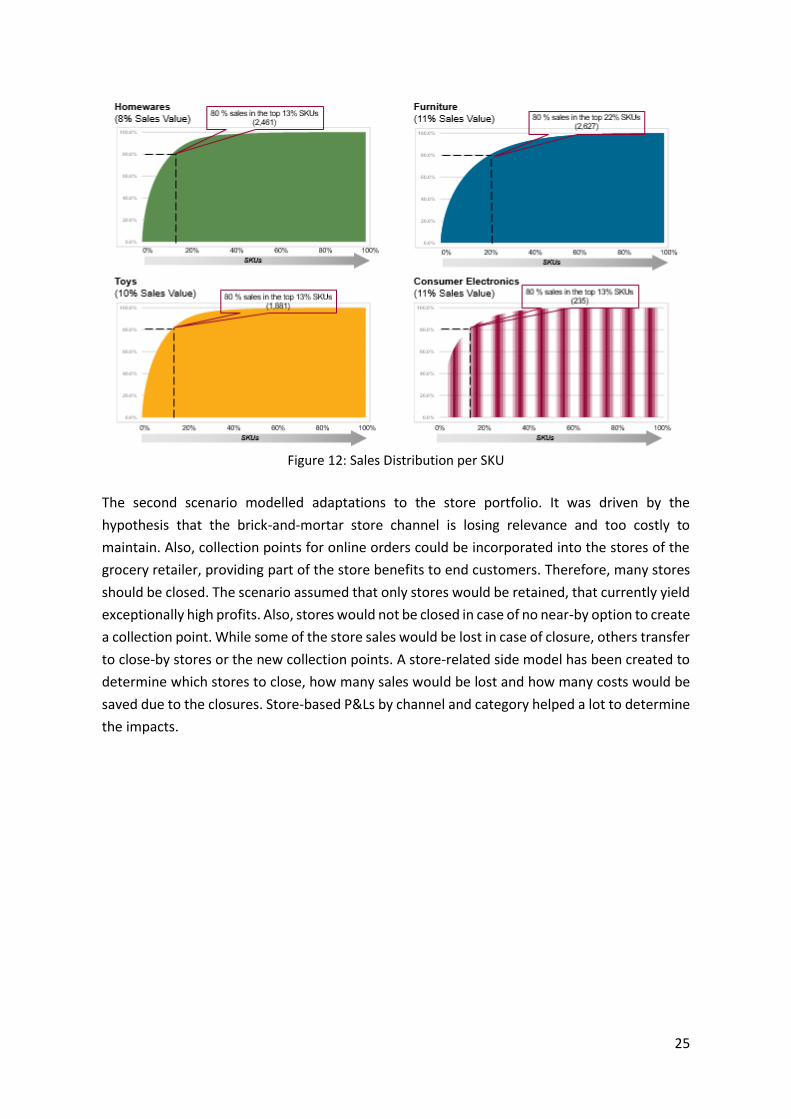
Figure 13: Distribution of Store Profits
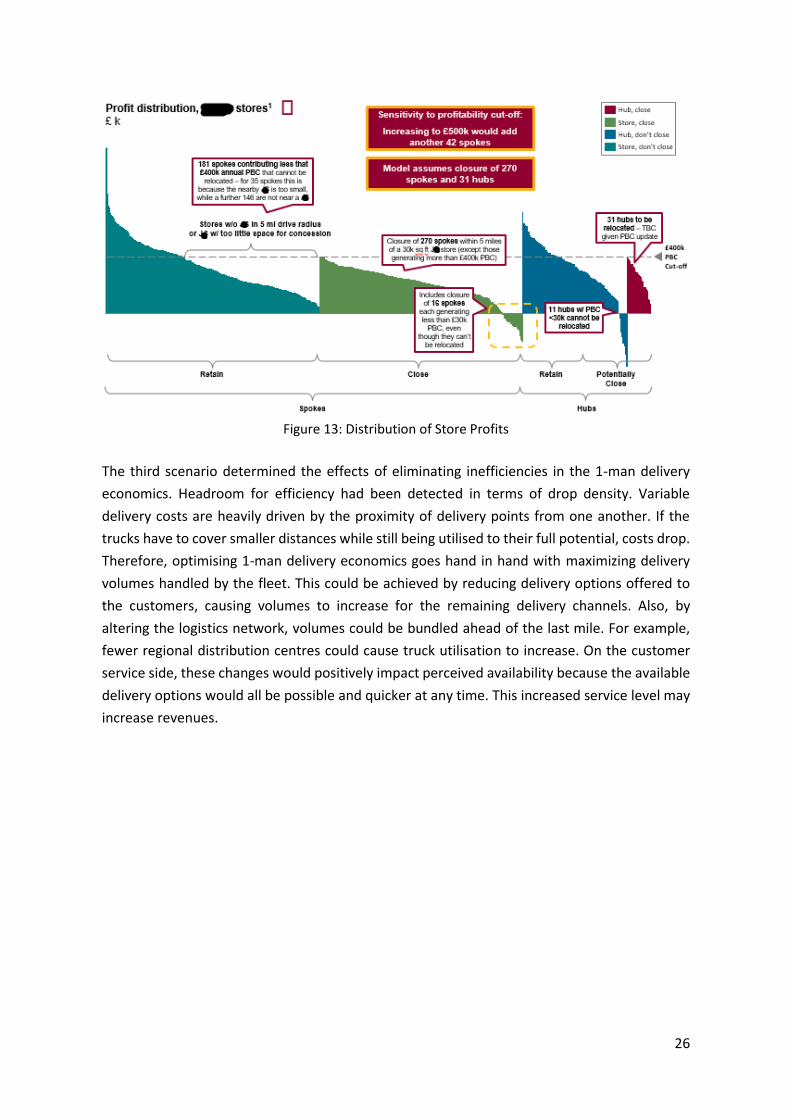
The third scenario determined the effects of eliminating inefficiencies in the 1-man delivery
economics. Headroom for efficiency had been detected in terms of drop density. Variable
delivery costs are heavily driven by the proximity of delivery points from one another. If the
trucks have to cover smaller distances while still being utilised to their full potential, costs drop.
Therefore, optimising 1-man delivery economics goes hand in hand with maximizing delivery
volumes handled by the fleet. This could be achieved by reducing delivery options offered to
the customers, causing volumes to increase for the remaining delivery channels. Also, by
altering the logistics network, volumes could be bundled ahead of the last mile. For example,
fewer regional distribution centres could cause truck utilisation to increase. On the customer
service side, these changes would positively impact perceived availability because the available
delivery options would all be possible and quicker at any time. This increased service level may
increase revenues.
27
Figure 14: Cost Curve for 1-man Delivery
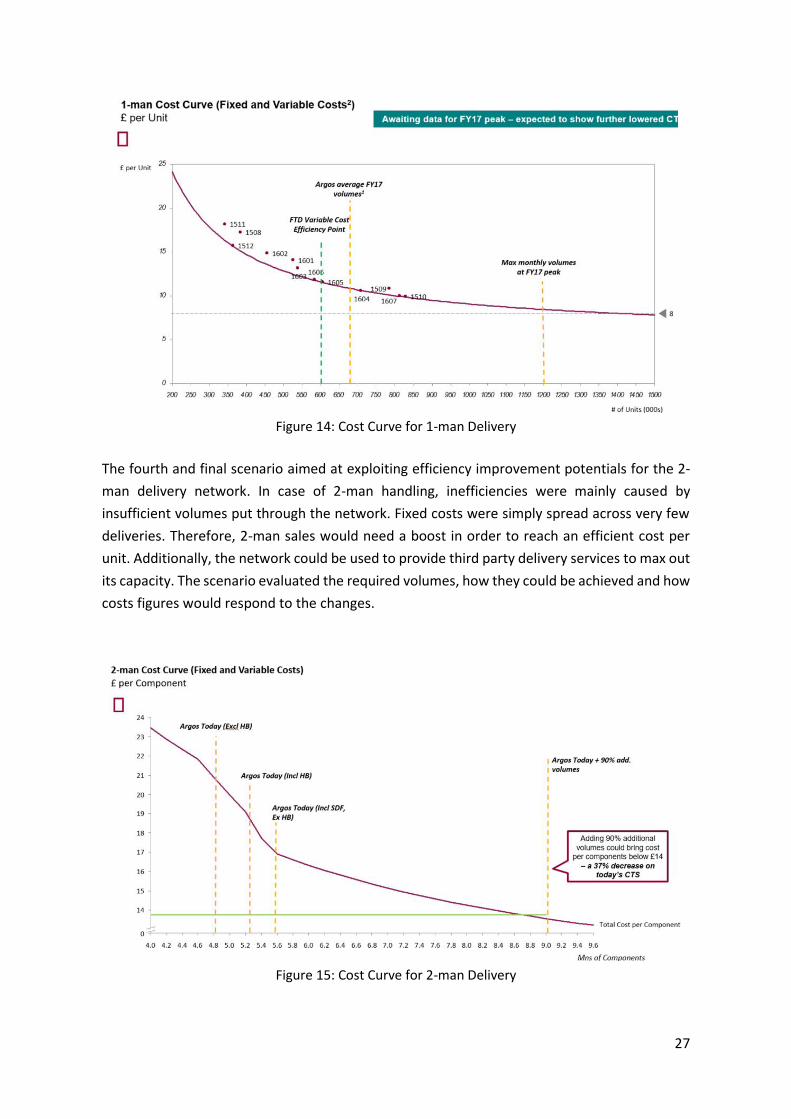
The fourth and final scenario aimed at exploiting efficiency improvement potentials for the 2-
man delivery network. In case of 2-man handling, inefficiencies were mainly caused by
insufficient volumes put through the network. Fixed costs were simply spread across very few
deliveries. Therefore, 2-man sales would need a boost in order to reach an efficient cost per
unit. Additionally, the network could be used to provide third party delivery services to max out
its capacity. The scenario evaluated the required volumes, how they could be achieved and how
costs figures would respond to the changes.
Figure 15: Cost Curve for 2-man Delivery
28
These four scenarios were considered most promising by the relevant stakeholders across the
business. They were modelled over a 5-year time period, assuming that all changes would take
effect immediately. For all scenarios, the incremental changes to the lines of the P&L were
modelled for the current financial year, ignoring the transformation process. This procedure
results in end-state P&Ls for the current financial year, assuming scenarios could be
implemented right away. Combining these incremental effects with the base scenario resulted
in the scenario-specific P&Ls. These were forecasted using the same methodology described
before. Besides the four main scenarios, different combinations of the scenario effects were
considered. Combining scenarios required a careful assessment of inter-correlations between
the different effects to minimize double counting or neglecting effects. Finally, in order to
evaluate the feasibility of the scenarios, the team determined the costs associated with the
transformation to the end-state scenarios. These were traded off against the scenario benefits.
4.3.3 Project Takeaways
The project at hand lasted much longer than the others. Also, many tasks were performed at
client site and there was a frequent personal interaction with the stakeholders involved. Hence,
the project’s mechanics differed significantly from prior projects. The project demanded an
efficient time management in order to deliver results on time. Instead of constantly being able
to focus on data-related tasks, client meetings and calls took up large parts of the days.
Furthermore, there were many qualitative inputs provided that needed to be included in the
model. This changed the modelling approach because in many cases the qualitative information
had to be incorporated in a pragmatic manner. This limited the degree to which the project was
truly driven by data.
Working with a large corporation unveiled many organizational inefficiencies. The client
struggled to meet requirements on a consulting timeline as stakeholders were busy, on holiday
or simply slow. Decisions had to be made in accordance with all stakeholders. Keeping everyone
informed and getting everyone to agree to the same thing was tough. One could feel that the
stakeholders did not only act in the interest within the organization, but also “played important”
and put their own interest first- for example to maximize their own powers and responsibilities.
A manager on the team concluded that many stakeholders cause many problems.
Besides the organizational difficulties, the approach to handling data and modelling was far
from being purely analytical. The combination of quantitative data with qualitative information
forced the team into pragmatic shortcuts and approximative approaches to data handling. This
attitude towards modelling raised doubt whether an analytical approach made sense at all. In
addition, much of the work was heavily hypothesis-led. The partners supervising the project had
their own ideas of what the project output should look like. In some cases, this resulted in a
very “goal-oriented” work attitude that involved adjusting the methodology for the output to
match the hypotheses. This further reduced the analytical credibility of the model.
29
The core model of the project has been built and executed in Microsoft Excel. Unsurprisingly,
the model turned out very bulky and time-inefficient. Excel simply has not been designed to
process substantial amounts of data. A lot of time has been invested into fixing up the model
and keeping it somewhat performant. Calculation runs took up to an hour despite comparably
small datasets. The file size of the core model quickly exceeded 100 megabytes, which caused
opening and saving the file to take a while.
With respect to personal working behaviour, the project was a fitting example for why it is
necessary to constantly sense-check analyses. The numbers popping out of the model need to
make sense and must match other sources. In case numbers do not add up, troubleshooting
may be cumbersome and time-intensive. But it is essential for others to gain trust in the analysis
and to believe the output of the models. Otherwise, if results are heavily off, other team
members or stakeholders will doubt the model and the analysts’ skills, making future
interaction even harder.
On the people side, handling (senior) team members and client stakeholders correctly has
proven to be important. In case of internal team managers and partners, one must defend the
own position. One needs to push back on irrational tasks that would cost disproportionally
much time. Also, if communicated in an adequate manner, senior team members value the
opinion and view of more junior employees. However, it’s important to argue rationally and in
a structured way to be heard. Last but not least, clients and internal senior team members have
absolutely no expertise in handling data. Therefore, they underestimate some tasks and ask for
analyses that don’t make much sense when trading off time invested against expected outputs.
A data analyst should actively position himself as the expert, allowing him to guide data-related
discussions. Doing so enables him to avoid irrational tasks and to share relevant expertise.
30
5. REFLECTION ON INTERNSHIP EXPERIENCE
The 6-months internship for the analytics team of ABC Strategy Consultants in London (UK) has
been a valuable experience from many perspectives. Firstly, working hands-on in a non-
academic setting contributed greatly to the improvement of technical skills. This is true for both,
finding creative approaches to problem solving and actual programming skills, allowing for an
implementation of the approaches. Furthermore, the internship provided valuable guidelines
for future career decisions. In many ways, the 6-months depicted an extreme working
environment, which was very useful to find out what’s really important in a job. Of course, this
importance is highly subjective. Most importantly, the internship allowed for an in-depth
assessment of how analytics can be applied and implemented in the context of strategy
consulting.
5.1 VALUE OF ANALYTICS TO STRATEGY CONSULTING
The value provided by analytics in the context of strategy consulting is hard to assess, context-
specific and depends on the specific project settings in many ways. However, the 6-months
internship experience enables a careful evaluation of the value created by analytics as a part of
the different projects worked on. This evaluation can be used as a basis to derive some generic
hypotheses about analytics in strategy consulting, its opportunities, its threats and other related
topics.
Generally speaking, the application of analytics to strategy consulting creates both,
opportunities and problems. While the extraction of information from data certainly creates
value and enables new types of projects, non-technical audiences and tight timelines cause
potentials for conflicts. Therefore, it is essential to define how and what analytics should
contribute to strategy projects. In order to do so, one needs to understand to what extent
analytics creates value for strategy consulting and what the limits to the value created are. This
trade-off has a range of implications on how an analytics team of a strategy consultancy should
be structured.
5.1.1 Value Added by Applying Analytics to Strategy Consulting
Applying analytics to strategy consulting projects yields enormous benefits and creates a lot of
value. The value is created across three core areas of opportunity: 1) the ability to process large
datasets that were previously not accessible using Microsoft Access or Excel, 2) the
opportunities for additional analysis to be performed using advanced methodologies that had
not been implemented before and 3) being able to work on additional projects that are enabled
by analytical techniques.
The ability to access and to work with much larger datasets is a huge advantage in strategy
consulting. Without the ability to load entire databases into memory and to dice and slice them
as required, consultants rely heavily on the client to provide aggregated datasets that are of an
31
appropriate size to access the with Microsoft Office products. In the case of transactional data
on line item basis, for example, this is a huge problem. Therefore, the analytics capabilities
reduce the reliance on client-side team members. Clients’ employees typically deliver outputs
much slower than the consulting side does- partially because they actually stick to human
working hours. Consequently, reducing the reliance on client outputs directly translates into the
ability to work more effectively and fluently. Moreover, the analytics team is able to
continuously provide new cuts of the data, which may not have been apparent in advance. Data
can also be crunched in much more detail when its most granular level is available. Adequate
tools for analysing large amounts of data yield another advantage, namely speed. Using Excel
to calculate complex transformations of the data takes a large amount of time due to the cell-
logic it applies. Tools such as R or SQL process data much more efficiently, which saves time.
Particularly if the calculations must be carried out multiple times.
While the tools used allow for the analysis of larger amounts of data, the new methodologies
that can be applied create additional sources of value. Typically, methodologies applied in
strategy consulting are very basic. As consultants come from diverse backgrounds (including,
for example, history and literature students), statistical knowledge is scarce and elaborate
methodologies are mostly being avoided. In many cases, even basic regression models are not
being understood and thus not being used. This lack of knowledge and skill extends from the
bottom of the hierarchy to the very top. Even if a consultant is able to build a regression model
correctly, his manager may be reluctant to use it as he cannot guarantee that it’s correct
because he simply does not have the required skills. The analytics team extends the
methodological skills far beyond regressive techniques, being able to apply basket analysis,
clustering and machine learning algorithms. Besides possessing the knowledge required, the
team also holds an “expert status” with respect to statistics, numbers, data and anything
related. Due to this status, managers and other high-tier colleagues become much more
comfortable relying on and using the output provided by the team. They feel comfortable
assuming that the expert is right despite not understanding the analysis as they know that they
will be held less accountable for any errors in the output. Therefore, new and more advanced
techniques and methodologies are being applied by the analytics team. These techniques may
increase predictive power, reveal additional patterns or characteristics, or even produce
entirely new outputs that were previously not being used but that are very helpful (for example
simple correlation matrices). All of these effects effectively create value.
Finally, the analytics team also delivers value by enabling the work on new types of projects.
Some strategic projects require specific techniques to “crack the case”. For example, exploring
opportunities for cross selling products requires basket analyses on a per-line-item level.
“Regular” consultants lack the methodological ability to apply these techniques. Also, they
simply aren’t equipped with the right tools. The task would not be possible to perform using
basic Microsoft Office applications. Therefore, a third source of value is the pool of projects that
require advanced analytical techniques.
32
5.1.2 Analytical vs More Pragmatic Approaches
In strategy consulting, any consultant always trades off accuracy against speed. This trade-off
lies at the root of consulting. While project outcomes need to be accurate, they also need to be
delivered quickly. Therefore, consultants aim for the best output possible, given their time
constraint. This is true for both, “regular” and analytics consultants. In case of the first aim, the
accuracy or correctness of the analyses, both new analytics tools and more advanced
techniques act in favour of the goal to be as accurate and correct as possible. This is true
because more data can be crunched using more efficient tools in a more sophisticated way.
Regarding the aim for speed, however, the analytics effect goes into both directions. While the
new tools increase speed by calculating more efficiently, more complex methodologies
decrease speed as they need to be calibrated more carefully.
Analytics consultants must trade off an additional constraint, namely understandability.
Understandability is key in consulting, but not relevant to “regular” consultants as techniques
applied by them are basic enough for everyone to understand them. In the case of the analytics
team, however, complexity is increased by more advanced techniques and by tools that are less
known. This increase in complexity causes the understandability of any analysis to decrease.
All in all, the analytics consultant must produce the most correct output given time constraints.
However, any methodologies applied need to be confirmed with the more senior members of
the team. They are the ones to judge if the approach is understandable and if it can be used for
problem solving. This is particularly important when presenting the work to the client as they
typically want to understand what has been done.
5.1.3 Marginal Impact of the Level of Technicality
The 3-sided trade-off between correctness, time and understandability already sets limits to the
level of technicality that an analysis can rely on in order to be performed quickly and to be
understood well. However, another consideration must be taken into account when selecting a
methodology: the marginal impact of the level of technicality.
Historically, analyses carried out in strategy consulting were simple and pragmatic. However,
they were sufficient to get the job done and to deliver a solution to the project. Increasing the
level of technicality does deliver additional value at first. As pointed out before, speed,
correctness and predictive powers may increase significantly when moving from very basic
analyses to slightly more technical and elaborate analyses. Increasing the technicality from zero
to a low level will improve results significantly. Nevertheless, the additional benefits from more
technicality will drop significantly at a certain point. When all relevant data has been included
into the analysis and a basic but correct statistical approach has been applied to derive a
solution, any additional improvements to the output may not change the results of the project.
While a better or more fine-tuned model may most certainly be achievable, the impact of the
improvement on the project outcome may be negligible or non-existent.
33
In order to use optimise the use of analytical capabilities, the right degree of technicality has to
be applied. The level applied must still improve the result significantly compared to a lower level
of technicality. If technicality was plotted on the x-axis of an xy-coordinate system and value
derived from the analysis was put on the y-axis, one would want to find the point of the curve
for which the slope lies above a certain benchmark. The value curve is characterized by
diminishing marginal returns on technicality.
5.1.4 Developing Analytical Models on Short Timelines
In a previous section, time has already been introduced as a limiting factor for the value created
from analytics. In strategy consulting, fees are high and timelines are short. Projects may only
be two or three weeks long on the low end. Typical projects are four to seven weeks long.
A strategy consulting project usually starts with a two- to four-week long analysis phase, which
is used for understanding the problem, collecting all relevant data and information and
analysing it. The exact structure of the phase is very project-dependent. The second phase lasts
for one to two weeks and is spent on iterations. Intermediate results are being presented to
and validated with the client. Additional analysis may be performed or existing ones may be
improved. Finally, the one-week presentation phase finalizes the project.
Such short timelines per phase leave little room for a data driven analysis process. Identifying
the relevant data, gaining access to it and getting it ready for analysis may already take two to
five weeks, depending on the project and the client. Therefore, it is necessary to get a head start
with the data-related tasks before the strategy side of the project kicks off. Ideally, the analytics
team is able to start those two to five weeks ahead of schedule. The first one to three weeks of
this pre-phase is used for data collection. Identifying the relevant data and receiving it from the
client or getting access from their system may take a while. In many cases, data is spread across
the client’s system and across many stakeholders, which makes an aggregated data request
impossible. Plenty of time must therefore be reserved for data collection. Subsequently, the
data collected must be cleaned within one or two weeks. The data needs to make sense and
must be saved in a sensible way that ensures good access later on. Also, different sources of
data may need to be integrated into a single database in order to improve usability and speed
at later stages.
All in all, developing analytical models on short timelines is subject to the three constraints of
correctness, time and understandability introduced earlier. Additionally, in order to ensure a
smooth execution of the project and to limit timeline conflicts, analytics team members should
get a head start in order to collect, to clean and to get familiar with the data required for the
project.
34
5.2 NON-TECHNICAL AUDIENCES
Besides the limitations imposed by short timelines and diminishing marginal returns of the level
of technicality on value derived, non-technical audiences are an additional hurdle when
performing analytical tasks in the context of strategy consulting. The lack of technical expertise
encountered when working with different stakeholders creates challenges throughout the
project work. This is true in external, as well as in internal environments. In most cases,
colleagues and clients that are not part of the analytics team itself do not have a background in
statistics or data analysis. Their experience is usually limited to small datasets, simple models
and Microsoft Excel. As a consequence, the members of the analytics team must actively
manage these potentials for conflict and must cope with additional responsibilities on a
theoretical and practical level.
5.2.1 Conflicts due to Different Levels of Technical Expertise
The first source for conflict identified stems from within the core project team. In the case of
traditional strategy consulting, the managers carry all responsibility related to estimating
timelines and to ensuring that deadlines are met. The skills to do so are based on having worked
as a consultant for years and knowing how long different tasks will take. These estimations are
mostly accurate as the manager performed the very same tasks before. Introducing data
analytics to strategy consulting projects adds a component to the workstreams that is new to
managers. They lack experience with respect to how long different tasks will take and have to
completely rely on the consultants’ estimation. Those, as many tasks are new to the consultants
as well, are often inaccurate. Therefore, meeting deadlines becomes a major challenge and
working hours have the tendency to become very long. As this conflict is present within the core
team, it carries through for the entire project duration. It’s a constant source of frustration for
both, the manager and the data analyst, because the manager receives inaccurate information
without knowing any better. At the same time, the analytics consultant is being inadequately
managed. The responsibility for estimating how long a task will take should be partially held by
the manager.
In order to deal with this set-up, actions by both, manager and consultant are required.
Managers must try to understand the methodology being used as well as possible. Also, they
need to be aware of the more cumbersome data management process associated with
collecting, cleaning and analysing the data. At the same time, the consultants have to ensure
transparency. They need to flag when they are behind with their work immediately in order to
empower the manager to re-prioritize. Furthermore, they must be as realistic as possible with
their estimations of working times. These must be communicated clearly.
The second source of conflict potential occurs on a more senior level when dealing with the
partners and directors of the consultancy that sold the project. Traditionally, strategy consulting
work is heavily hypotheses-driven. Partners tend to have a “solution” to the project in mind
before it even starts. This “solution”, however, is simply a hypothesis and must be supported
35
with arguments or have to be rejected. Partners, however, tend to really like their hypotheses.
It takes a lot of evidence to convince them that they are wrong while very limited proof is
sufficient for them to think they are right. Partners often try to make data and analyses fit their
hypothesis. Conflicts arise when a correctly performed analysis doesn’t match the hypothesis.
In those cases, partners argue that the methodology should be re-designed to create outputs
that match their opinions. As this process is far from data-driven, a typical analytics consultant
will not like this approach to problem solving and arguments pop up quickly. This can only be
avoided by either arguing well in favour of the analysis or by accepting that the results won’t be
as analytics-based as desired.
The third and last problem source is the hardest to manage as it’s the client. Clients may dislike
analysis for many reasons and therefore demand adjustments or simply may not believe the
results. This may occur if the client is unable to understand the methodology applied or if the
results do not meet expectations. To counter-act, it’s essential to gain the client’s trust. Clients
will build trust if analyses outputs are never wrong. One must always sense-check results before
presenting them to the client. If an answer is too obviously wrong, clients will doubt the
analyst’s common sense and remain sceptical later on. Also, it’s important to present the
analysis and its outputs in an understandable way. If the client understands what has been
done, he is more likely to believe it.
5.2.2 Obligation to Educate (non-technical) Senior Staff
As explained in many of the previous sections, senior staff’s lack of analytics expertise is the
root of many problems. Therefore, closing this knowledge gap provides benefits to both, the
senior staff members themselves and to the analytics professionals. However, senior staff
consists of three different levels of stakeholders: clients, partners and project managers. It’s
nearly impossible to educate clients as they are part of non-dynamic organisations and mostly
prone to learning. Also, they expect the consultants to “get the job done” without them having
to engage too much.
The partners of the consultancy are also hard to educate. They are very senior and already
shaped the picture of “their world”, which analytics is simply not a part of. Therefore, they are
also not very keen on learning and understanding the potentials of analytics. Of course,
exceptions exist. Some partners have faith in analytics and try to unlock its potential. However,
the limited size of this fraction of partners becomes apparent when realizing that all analytics-
related projects are being sold by a hand full of partners. Partners not having an understanding
of analytics and what can be done with it has huge effects on the scale of analytics within the
consultancy. A partner who has no idea of what type of projects can be tackled using the
analytics team will be unable to sell analytics-related projects. A salesman has to understand
the product being sold and sales activities are a large part of the partners’ job.
The final group of senior stakeholders is much easier to educate. Managers are still in the middle
of their career and keen to learn anything that improves their chances to rise within the
36
company. Understanding analytics will enable the managers to improve the management of
analytics-related projects and thereby improve their skill set. An improved skill set translates
into a competitive advantage compared to other managers. Also, educating managers is the
obvious starting point when building analytics expertise within the company. They depict the
next level in the hierarchy and work closely with the analytics staff. Also, clients and partners
are far more likely to trust a methodology or analysis if the manager understands and backs it.
During the time of the internship, the head of analytics at ABC started to provide training
sessions to managers. The training has been designed to enable the manager to understand
what makes analytics work different from traditional consulting work. It covers shifts in
timelines, differences in tools used and much more. The managers who received the training
reacted very positively and were able to implement the information well, resulting in a lot of
pressure being relieved from the analytics staff.
5.2.3 Communicating Quantitative Outputs to Clients
The presentation of project results to clients is an essential part of any strategy consulting
project. Traditional work has been much easier to understand as presentations were straight
forward and detailed questions could be answered easily. The application of analytics, however,
creates more abstract results and therefore potentials for more complicated presentations and
questions. Three key points are important when presenting such quantitative results. Firstly,
results must be presented at an output-only level. Diving into details or methodological issues
would create potentials for confusion. Secondly, assumptions must be communicated clearly.
The assumptions underlying an analysis drive results heavily, which is why they must be known
to anyone involved. Finally, the visualisation of results must be simple, easy to grasp and as
minimalistic a as possible. If these points are considered, clients receive all the information
required to develop an understanding without confusing them.
5.3 DEVELOPING AND RETAINING A DATA SCIENCE TEAM IN STRATEGY CONSULTING
Many problems related to developing a data analytics team within strategy consulting are
apparent within the analytics team at ABC. A lot of the pain points have already been touched
upon in previous sections and will only be revisited briefly. High churn within the team is a huge
problem as leaving team members translate directly into a loss of capabilities. Therefore,
keeping churn low should be a key objective. At the moment, this is not the case. First of all, the
long hours and tight timelines that are typical for strategy consulting are a problem to many of
the analytics team members. The problem is being amplified by the more cumbersome analysis
process within the analytics context. Secondly, the stressful environment resulting from short-
term project work is not the norm for technical jobs. Therefore, the environment does not
appear tempting to most of the people that are qualified for the job. This leads to problem
three, which is the simple fact that other jobs appear more tempting due to similar pay but
fewer hours. Furthermore, the large competition for data analytics talent creates an
37
environment in which employees frequently receive new and improved offers. If employees
have many options to leave the company, they may eventually do so.
Another problem is the lack of an established career trajectory for the members of the analytics
team. While the technical expertise is much needed at the consultant-level of the company, it’s
obsolete for managing positions. Of course, as argued above, some basic knowledge of analytics
will improve project management and will enable selling analytics projects later on. But the
technical focus of the skillset becomes less of an advantage as a manager and technical
employees may simply be outperformed by their non-analytics peers that were able to focus on
developing the required management and slide-related skills while working as a regular
consultant. Finally, the analytics team struggles to build a centralized knowledge base that
conserves expertise from previous projects. Not being able to replicate previous efforts in a
time-saving manner is a huge drawback and continuously forces analytics team members to
develop new methodologies. Of course, developing a methodology from scratch takes much
more time and efforts than simply re-using an existing methodology.
As a result of all these problems, it’s hard to attract qualified analytics talent that is willing to
work hard and long. Also, talent that joins the company is expensive as head hunters need to
be paid and it leaves quickly as their skills are in high demand. The resulting shortage of analytics
team members further amplifies the pain points. While regular consultants are often being
given “unstaffed weeks” after tough projects to recover, analytics consultants are immediately
being re-staffed onto new projects, making them more likely to leave.
Besides these difficulties to attract and retain talent, working as a data analytics consultant
yields the great advantage that it allows a technical data-focused employee to dive into the
business world. Some business thinking and skills complement a technical skillset perfectly. The
job provides a bigger picture to mostly detail-oriented talents. When building a data analytics
team, one should capitalize on this opportunity and effectively use it to appear more attractive.
5.4 ANALYTICS AS A “SUPPORT FUNCTION” VS “CORE CAPABILITY”
Earlier in this report, projects have been split into being solely supported by analytics versus
being enabled by analytics. Projects that merely require some analytics support to work with
large datasets are much more straight forward and only require the skills to use tools that are
able to process substantial amounts of data. These projects are not challenging on a
methodological level or require any relevant theoretical knowledge. As most people who join a
strategy consultancy are inexperienced university graduates, they are keen on applying what
they learned and developing additional skills. Consulting is often chosen as a starting point for
(one of) two reasons: learning and benefits. Most people who join a consultancy want to learn
as much as possible in a short period of time. They demand a steep learning curve in order to
remain motivated and to work well. Consulting is directly related to learning. When simply
supporting a strategy project, however, analytics consultants are not being challenged on a
methodological or theoretical level. Therefore, they miss out on any learning opportunities.
38
The problem with support projects described above fosters the discussion whether analytics
should be limited to being a supporting function or if it should be developed as a core capability
of strategy consultancies. Young talent capable of working on analytics-enabled projects cannot
be retained if most their work consists of support. Therefore, there is no compromise between
setting up analytics as a simple support function versus setting it up as a core capability. It has
to be one or the other. Setting up the team as a support function would translate into hiring
individuals that can help traditional consultants with processing large datasets. I.e. they would
not possess elaborate statistical skills. As a result, analytics-enabled projects could no longer be
sold, even if demanded by the client. This may create a shortage of relevant skills and may
empower competitors to gain a competitive advantage.
On the other hand, setting up analytics as a core capability requires the relevant talent, as well
as plenty of analytics-enabled projects being sold. While the right talent enables working on
more difficult problem statements, too much support work should be avoided. Too many basic
tasks cause the talent to be utilised inadequately. Instead the team must be challenged
continuously, which can be ensured by selling plenty of relevant projects that require elaborate
statistical methodologies.
All in all, the questions whether analytics should act as a support function or as a core capability
to a strategy consultancy must be answered from a top-level, strategic perspective. While the
support function could fulfil many of the minimum requirements, the consultancy would lack a
skill that many competitors possess. Therefore, despite currently being sufficient, the support
function could create a lack of skill in the long run. On the other hand, developing analytics as a
core capability requires a process of organizational change that involves educating non-
technical employees and moving away from hypotheses-driven methodologies.
39
6. CONCLUSION
The 6-months internship has been a great opportunity from many perspectives. Most
importantly, it allowed the author to apply theoretical knowledge of analytics in practice.
University projects quickly appear like a piece of cake when real life problems are being tackled
and must be solved using patchy data. The time at ABC provided great insights into strategy
consulting, as well as into the company’s clients. Therefore, additional insights into the
corporate world were accessible. Reflecting on the internship experience throughout the course
of writing this report has been valuable in order to re-visit the different facets of the internship
and in order to develop an opinion with respect to analytics in strategy consulting. The report
unveiled many areas with opportunities for improvement. Furthermore, looking back at the
time of the internship while writing this extensive report empowered the author to draw
conclusions with respect to his personal and professional development.
6.1 MOST ESSENTIAL AREAS OF IMPROVEMENT FOR ANALYTICS IN STRATEGY CONSULTING
Incorporating a technical function into a qualitatively-driven field like strategy consulting is a
tough task. It requires a deep understanding of both, technical and data analytics processes, as
well as styles of working. Therefore, it’s obvious that the process takes time and cannot start
off as a well-working model. Realizing the potential value that can be created by incorporating
analytics into strategy consulting is only the first step of the journey. Initiating the change is the
second. ABC has already managed to move ahead on this path and possesses a strong team.
However, the company has not yet reached the end of the ride, which is why some areas for
improvement remain.
Firstly, much of the pressure that is put on the analytics consultants must be taken off. This can
be done by setting up projects adequately and easing timelines. Secondly, the analytics talent
must be challenged sufficiently by having them work on demanding analytics-enabled projects.
Also, many problems can be solved by educating senior staff. An additional knowledge base
would facilitate the possibility to re-use methodologies. Finally, once these pain points have
been resolved, ABC could start hiring aggressively in order to employ a sufficient number of
analytics consultants that can cope with the large work load.
6.2 IMPACT OF INTERNSHIP ON PERSONAL AND PROFESSIONAL DEVELOPMENT
The 6-months internship has been a great boost for the author’s professional and personal
development. The skillset and experience grew on multiple dimensions. Technical skills,
interpersonal competencies and professional capabilities all got enhanced massively. On the
technical side, particularly the familiarity with the data analytics toolkit improved a lot. Working
with R and SQL on a daily basis helped to become “fluent” in these languages. Furthermore, one
became much more acquainted with typical data warehouse setups by simply being introduced
to some real-life examples. Also, developing methodologies became more intuitive over time.
40
With respect to interpersonal competencies, dealing with more senior and peer colleagues
became more casual and relaxed. As it turns out, British people are amazing small-talkers. Even
if they have absolutely no interest in a person, they still manage to find a common topic to talk
about. This is a valuable skill to possess. Connecting on a personal level is the key to working
together well on a professional level. A motivated workforce is also very important to ensure
high productivity. Therefore, social events are a huge boost for productivity as they pet the ego
and encourage employees to spend time together.
Professional skills also improved. While more senior team members should be respected, it’s
not wrong to push back in case of a disagreement. Many decisions are a matter of perspective
and opinion. One should therefore always present the own opinion to allow other team
members to take on another perspective. The importance of communicating clearly and
proactively also became apparent. Project managers cannot take things into account if they
don’t have the relevant information in a timely manner. Therefore, keeping senior staff
informed is key. This is also true for other team members. Often someone else already had a
look at the very same topic or task that one is working on. Hence, checking in with other team
members can be a great advantage. Usually someone will be able to help out. This may also be
true for colleagues that are not part of the core project team. Besides efficient communication,
a structured workflow is also important to stay on top of things. Having an overview of all to
dos permits efficient time management and prioritization of tasks.
6.3 FINAL REMARKS
All in all, the internship was a great opportunity and fostered the development and
improvement of important skills. Consulting is a great way to start the career as it allows the
employees to work for many companies, in different industries and on different problem
statements in a very short period of time. Therefore, the learning curve is steep, which is great
for young professionals. Analytics in consulting, however, could be optimised.
After the internship, the author received a good job offer from ABC Strategy Consultants.
Nevertheless, he turned it down. Having worked in strategy consulting prior to the Master in
Advanced Analytics and complementing this experience with the analytics-focused internship,
the author already moved along the learning curve. While one learns a lot in the first 12-18
months of strategy consulting, the slope of the learning curve decreases over time. Therefore,
working in strategy consulting becomes less tempting. The tough working hours and lack of
personal freedom are additional factors that encouraged the author not to take the job. Instead,
the author chose to fulfil his entrepreneurial aspirations. Along with 4 friends he founded a data
analytics start-up in early 2017. The company personalizes online shops based on elaborate
algorithms. It offers its cloud-based services to other businesses. Creating and growing this
business demands both, the technical data analytics skills and the business skills acquired prior
to the Masters in Advanced Analytics. Therefore, working on the project is challenging but
highly rewarding at the same time.

41
7. APPENDIX
7.1 APPENDIX 1: REFERENCE LETTER
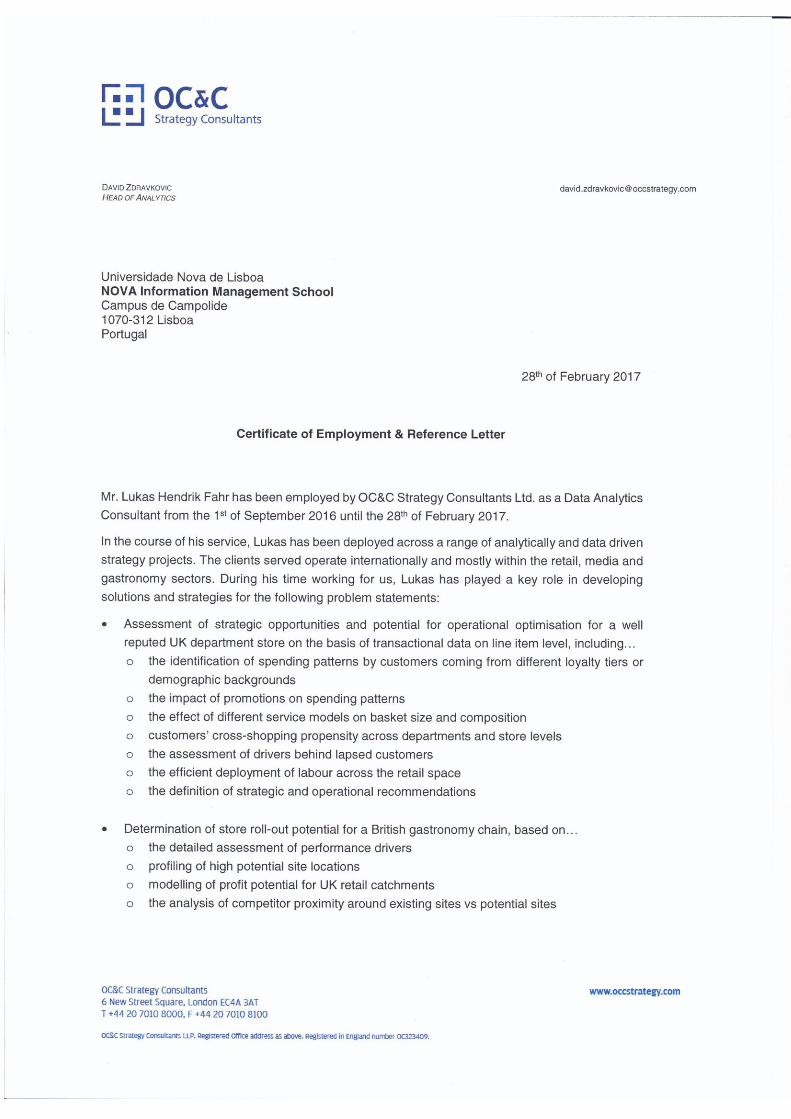
42
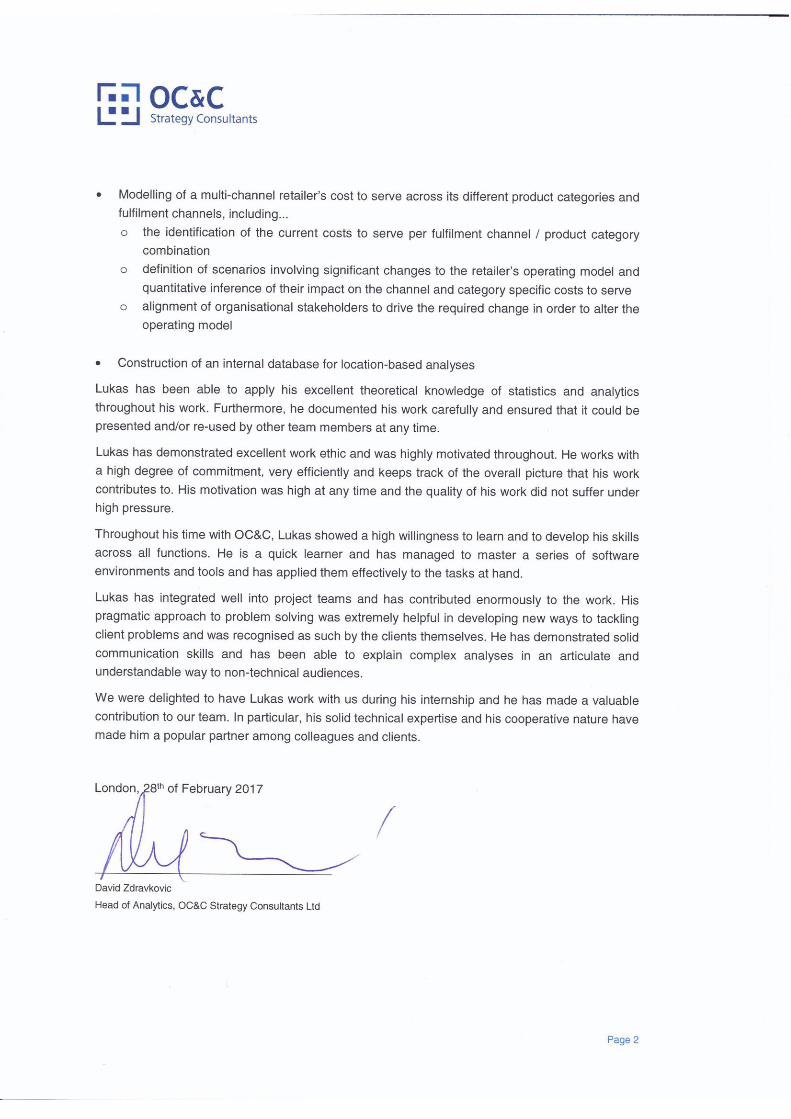
43

44
7.2 APPENDIX 2: CURRICULUM VITAE
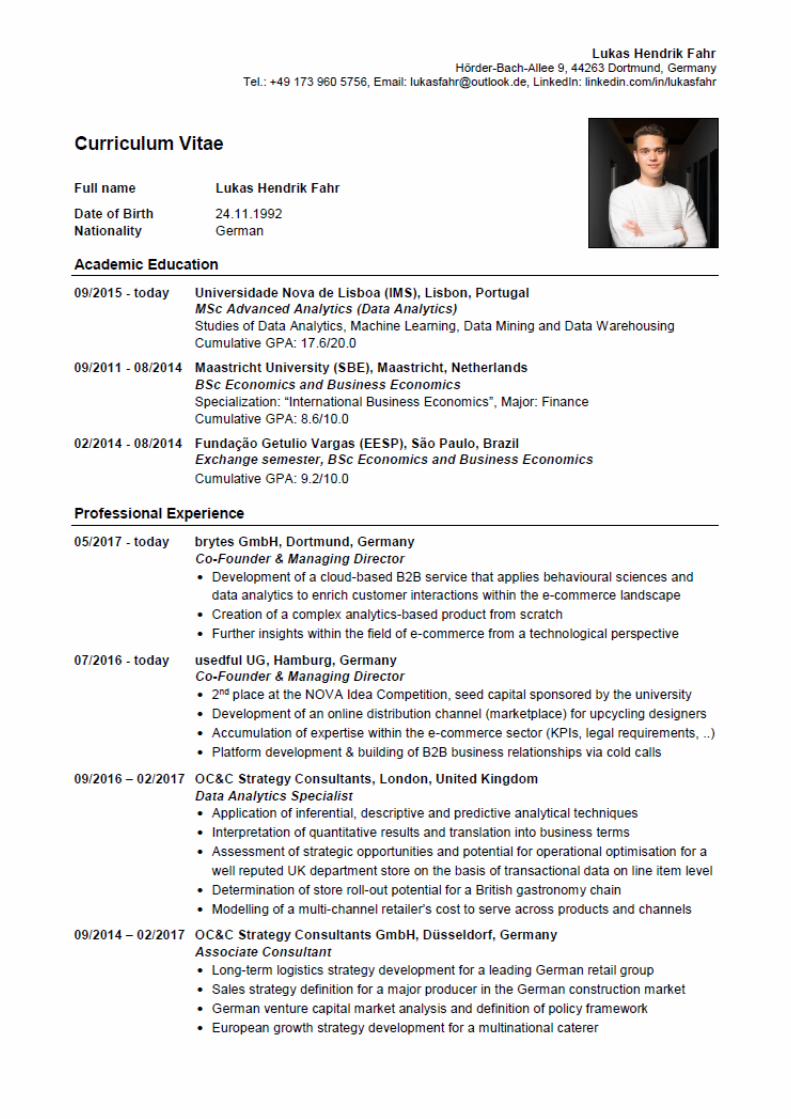
45
46


