Embed Size (px)
Citation preview
POPULATION DYNAMICS, MOLECULAR CHARACTERIZATION
AND MANAGEMENT OF APPLE CODLING MOTH, CYDIA
POMONELLA (LINNAEUS) (LEPIDOPTERA; TORTRICIDAE)
BY
HAYAT ZADA
A dissertation submitted to the University of Agriculture, Peshawar in partial
fulfillment of the requirements for the degree of
DOCTOR OF PHILOSOPHY IN AGRICULTURE
(PLANT PROTECTION)
DEPARTMENT OF PLANT PROTECTION
FACULTY OF CROP PROTECTION SCIENCES
THE UNIVERSITY OF AGRICULTURE
PESHAWAR-PAKISTAN
FEBRUARY, 2015
POPULATION DYNAMICS, MOLECULAR CHARACTERIZATION
AND MANAGEMENT OF APPLE CODLING MOTH, CYDIA
POMONELLA (LINNAEUS) (LEPIDOPTERA; TORTRICIDAE)
BY
HAYAT ZADA
A dissertation submitted to The University of Agriculture, Peshawar in partial
fulfillment of the requirements for the degree of
DOCTOR OF PHILOSOPHY IN AGRICULTURE
(PLANT PROTECTION)
Approved by:
__________________________ Supervisor/Chairman Supervisory Committee
Prof. Dr. Ahmad-Ur-Rahman Saljoqi
__________________________ Co-Supervisor
Prof. Dr. Abid Farid
University of Haripur
__________________________ Member (Major Field)
Prof. Dr. Farman Ullah
__________________________ Member (Minor Field)
Prof. Dr. Imtiaz Ali Khan
Department of Entomology
__________________________ Chairman & Convener Board of Studies
Prof. Dr. Farman Ullah
__________________________ Dean Faculty of Crop Protection Sciences
Prof. Dr. Saifullah
__________________________ Director Advanced Studies & Research
Prof. Dr. Muhammad Jamal Khan
DEPARTMENT OF PLANT PROTECTION
FACULTY OF CROP PROTECTION SCIENCES
THE UNIVERSITY OF AGRICULTURE, PESHAWAR-PAKISTAN
FEBRUARY, 2015
TABLE OF CONTENTS
ABBREVIATIONS.......................................................................................................i
LIST OF TABLES........................................................................................................ii
LIST OF FIGURES.....................................................................................................vi
LIST OF APPENDICES............................................................................................vii
ACKNOWLEDGEMENTS.........................................................................................x
ABSTRACT ...............................................................................................................xi
CHAPTER - 1: GENERAL INTRODUCTION.......................................................1
1.1. Insects and Plants Interaction.......................................................................... 1
1.2. Importance of Apple ....................................................................................... 1
1.3. World Apple Production ................................................................................. 2
1.4. Codling moth as a Serious Pest ....................................................................... 3
1.5. Population dynamics of C. pomonella ............................................................ 4
1.6. Molecular Studies of C. Pomonella ................................................................ 5
1.7. Chemical Control and Resistance of C. pomonella to Insecticides ................ 6
1.8. Habitat manipulation for the management of C. pomonella ........................... 7
1.9. Importance of the study .................................................................................. 8
1.10. OBJECTIVES ................................................................................................. 9
LITERATURE CITED............................................................................................ 10
CHAPTER - 2: POPULATION DYNAMICS OF CYDIA POMONELLA (L) IN
SWAT VALLEY.....................................................................................10
2.1. INTRODUCTION ........................................................................................ 15
2.2. REVIEW OF LITERATURE ....................................................................... 17
2.3. MATERIALS AND METHODS .................................................................. 21
2.3.1. Study parameters and location ............................................................. 21
2.3.2. Statistical Analysis ............................................................................... 22
2.4. RESULTS ..................................................................................................... 24
2.4.1. Meteorological parameters and C. pomonella population at Matta Swat
during years 2012 and 2013 ................................................................. 24
2.4.2. The correlation matrix of C. pomonella population with weather
parameters over a period of time at Matta during year 2012 .............. 26
2.4.3. The correlation matrix of C. pomonella population with weather
parameters over a period of time at Matta during year 2013 ............... 28
2.4.4. Meteorological parameters and C. pomonella population at Madyan
Swat during year 2012 and 2013 ........................................................ 29
2.4.5. The correlation matrix of C. pomonella population with weather
parameters over a period of time at Madyan during year 2012 ........... 32
2.4.6. The correlation matrix of C. pomonella population with weather
parameters over a period of time at Madyan during year 2013 .......... 33
2.4.7. Meteorological parameters and C. pomonella population at Kalam
Swat during year 2012 and 2013 ........................................................ 35
2.4.8. The correlation matrix of C. pomonella population with weather
parameters over a period of time at Kalam during year 2012 ............. 38
2.4.9. The correlation matrix of C. pomonella population with weather
parameters over a period of time at Kalam during year 2013 ............. 39
2.4.10. The correlation matrix of C. pomonella population with weather
parameters over a period of time in Swat during year 2012-13 .......... 41
2.5. DISCUSSION ............................................................................................... 44
2.5.1. Meteorological parameters and C. pomonella population at Matta,
Madyan and Kalam Swat during year 2012 and 2013 ........................ 44
2.5.2. The correlation matrix of codling moth C. Pomonella population with
weather parameters over a period of time in Swat during the years
2012 and 2013 ...................................................................................... 45
2.6. CONCLUSIONS........................................................................................... 48
2.7. RECOMMENDATIONS .............................................................................. 48
LITERATURE CITED............................................................................................ 49
CHAPTER -3: MOLECULAR CHARACTERIZATION OF THE CYDIA
POMONELLA IN SWAT VALLEY.................................................49
3.1. INTRODUCTION ........................................................................................ 52
3.2. REVIEW OF LITERATURE ....................................................................... 56
3.3. MATERIALS AND METHODS .................................................................. 61
3.3.1. C. pomonella Specimen collection ...................................................... 61
3.3.2. Genomic DNA Extraction.................................................................... 61
3.3.3. Polymerase Chain Reaction and Gel Electrophoresis .......................... 62
3.3.4. Statistical Analysis ............................................................................... 62
3.4. RESULTS ..................................................................................................... 64
3.4.1. Primer B12. .......................................................................................... 64
3.4.2. Primer D16 ........................................................................................... 65
3.4.3. Primer C04 ........................................................................................... 66
3.4.4. Primer C13 ........................................................................................... 67
3.4.5. Primer B04 ........................................................................................... 68
3.4.6. Primer H02 ........................................................................................... 69
3.4.7. Primer E09 ........................................................................................... 71
3.4.8. Primer F01 ........................................................................................... 72
3.4.9. Primer A19 ........................................................................................... 73
3.4.10. Primer D08 ........................................................................................... 74
3.4.11. Primer G11 ........................................................................................... 75
3.4.12. Primer F07 ........................................................................................... 76
3.4.13. Primer E18 ........................................................................................... 78
3.4.14. Primer H14 ........................................................................................... 78
3.4.15. Primer B15 ........................................................................................... 80
3.4.16. Primer C16 ........................................................................................... 81
3.4.17. Primer C02 ........................................................................................... 82
3.4.18. Primer H03 ........................................................................................... 83
3.4.19. Primer F04 ........................................................................................... 84
3.4.20. Primer H13 ........................................................................................... 85
3.4.21. Primer G02 ........................................................................................... 86
3.4.22. Nei’s unbiased measures of genetic identity and genetic distance ...... 88
3.4.23. RAPD primers used for molecular characterization of C. pomonella at
Swat during the year 2012-2013 .......................................................... 89
3.5. DISCUSSION ............................................................................................... 92
3.6. CONCLUSIONS........................................................................................... 96
3.7. RECOMMENDATIONS .............................................................................. 96
LITERATURE CITED............................................................................................ 97
CHAPTER-4: MANAGEMENT OF C. POMONELLA (LEPIDOPTERA;
TORTRICIDAE)..................................................................................97
4.1. INTRODUCTION ...................................................................................... 102
4.1.1. Use of Insecticides for the Management of Cydia pomonella ........... 102
4.1.2. Impact of Intercropping on Biological Control Agents and Pest ....... 104
4.1.3. Biological Control Agents of C. pomonella ...................................... 105
4.2. REVIEW OF LITERATURE ..................................................................... 108
4.2.1. Use of Insecticides for the Management of C. pomonella ................. 108
4.2.2. Impact of Intercropping on Biological Control Agents and Pest ....... 109
4.2.3. Biological Control Agents Associated with C. pomonella ................ 111
4.3. EXPERIMENT-1: MANAGEMENT OF C. POMONELLA THROUGH
SELECTED NOVEL PESTICIDES ........................................................ 114
4.3.1. MATERIALS AND METHODS ....................................................... 114
4.3.2. RESULTS .......................................................................................... 118
4.3.4. DISCUSSION .................................................................................... 127
4.3.5. CONCLUSIONS................................................................................ 133
4.3.6. RECOMMENDATIONS ................................................................... 133
4.4. EXPERIMENT-2: MANAGEMENT OF C. POMONELLA THROUGH
INTERCROPPING .................................................................................. 134
4.4.1. MATERIALS AND METHODS ....................................................... 134
4.4.2. RESULTS .......................................................................................... 137
4.4.3. DISCUSSION .................................................................................... 146
4.4.4. CONCLUSIONS................................................................................ 152
4.4.5. RECOMMENDATIONS ................................................................... 152
4.5. EXPERIMENT- 3: SYNCHRONIZED COMPARISON OF THE BEST
INSECTICIDE AND INTERCROP ........................................................ 153
4.5.1. MATERIALS AND METHODS ....................................................... 153
4.5.2. RESULTS .......................................................................................... 156
4.5.3. DISCUSSION .................................................................................... 162
4.5.4. CONCLUSIONS................................................................................ 167
4.5.5. RECOMMENDATIONS ................................................................... 168
OVERALL CONCLUSION & RECOMMENDATIONS .................................... 169
FUTURE CHALLENGES .................................................................................... 171
SUMMARY .......................................................................................................... 172
LITERATURE CITED.......................................................................................... 172
APPENDICES ....................................................................................................... 186
ABBREVIATIONS
AFLP Amplification Fragment Length Polymorphisms
ANOVA Analysis of Variance
Bt Bacillus thuringiensis
CM Codling Moth
CpGv Cydia pomonella Granular viruses
DBM Diamond Back Moth
DNA Deoxyribo Nucleic Acid
dNTP Deoxiribos Nucleotide Triphosphate
EDTA Ethylene Diamine Tetra Acetic acid
IBGE Institute of Bio-Technology and Genetic Engineering
IGR Insect Growth Regulator
IPM Integrated Pest Management
PCR Polymerase Chain Reaction
RAPD Randomly Amplified Polymorphic DNA
RCBD Randomized Complete Block Design
RF Rainfall
RFLP Randomly amplified Fragment Length Polymorphism
RH Relative Humidity
SE Standard Error
SMW Standard Meteorological Week
TB Tris Borate
TE Tris EDTA
UPGMA Unweighted Pair Group of Arithmetic Means
LIST OF TABLES
Table-2.1: Standard Meteorological Weeks (SMW)..........................................................23
Table-2.2: Weekly averaged weather parameters and C. pomonella population on apple at
Matta during 2012 & 2013................................................................................25
Table-2.3: The correlation matrix of Cydia pomonella population with weather parameters
over a period of time at Matta during year 2012...............................................27
Table-2.4: The correlation matrix of C. pomonella population with weather parameters
over a period of time at Matta during year 2013...............................................29
Table-2.5: Multiple regression equations for C. pomonella population at Matta during year
2012 & 2013......................................................................................................29
Table-2.6: Weekly averaged weather parameters and C. pomonella population on apple at
Madyan during year 2012 & 2013.....................................................................31
Table-2.7: The correlation matrix of C. pomonella population with weather parameters
over a period of time at Madyan during year 2012...........................................33
Table-2.8: The correlation matrix of C. pomonella population with weather parameters
over a period of time at Madyan during year 2013...........................................34
Table-2.9 Multiple regression equations for C. pomonella population at Madyan during
year 2012 and 2013............................................................................................35
Table-2.10: Weekly averaged weather parameters and C. pomonella population on apple at
Kalam during year 2012 & 2013.......................................................................37
Table-2.11: The correlation matrix of C. pomonella population with weather parameters
over a period of time at Kalam during year 2012..............................................39
Table-2.12: The correlation matrix of C. pomonella population with weather parameters
over a period of time at Kalam during year 2013..............................................41
Table-2.13: Multiple regression equations for C. pomonella population at Kalam during
year 2012 and 2013............................................................................................41
Table-2.14: The correlation matrix of C. pomonella population with weather parameters
over a period of time in Swat during year 2012 and 2013................................43
Table-3.1: Name, sequence, size and molecular weight of RAPD primer used for
molecular characterization of C. pomonella......................................................63
Table-3.2 Gene frequency, diversity and Shannon information index for RAPD primer
GLB-12..............................................................................................................64
Table-3.3 Gene frequency, diversity and Shannon information index for RAPD primer
D16....................................................................................................................65
Table-3.4 Gene frequency, diversity and Shannon information index for RAPD primer
C04.....................................................................................................................66
Table-3.5 Gene frequency, diversity and Shannon information index for RAPD primer
C13.....................................................................................................................68
Table-3.6 Gene frequency, diversity and Shannon information index for RAPD primer
B04.....................................................................................................................69
Table-3.7 Gene frequency, diversity and Shannon information index for RAPD primer
H02....................................................................................................................70
Table-3.8 Gene frequency, diversity and Shannon information index for RAPD primer
E09.....................................................................................................................71
Table-3.9 Gene frequency, diversity and Shannon information index for RAPD primer
F01.....................................................................................................................72
Table-3.10 Gene frequency, diversity and Shannon information index for RAPD primer
A19....................................................................................................................73
Table-3.11 Gene frequency, diversity and Shannon information index for RAPD primer
D08..................................................................................................................75
Table-3.12 Gene frequency, diversity and Shannon information index for RAPD primer
G11..................................................................................................................76
Table-3.13 Gene frequency, diversity and Shannon information index for RAPD primer
F07...................................................................................................................77
Table-3.14 Gene frequency, diversity and Shannon information index for RAPD primer
E18...................................................................................................................78
Table-3.15 Gene frequency, diversity and Shannon information index for RAPD primer
H14..................................................................................................................79
Table-3.16 Gene frequency, diversity and Shannon information index for RAPD primer
B15...................................................................................................................80
Table-3.17 Gene frequency, diversity and Shannon information index for RAPD primer
C16...................................................................................................................82
Table-3.18 Gene frequency, diversity and Shannon information index for RAPD primer
C02...................................................................................................................83
Table-3.19 Gene frequency, diversity and Shannon information index for RAPD primer
H03..................................................................................................................83
Table-3.20 Gene frequency, diversity and Shannon information index for RAPD primer
F04...................................................................................................................85
Table-3.21 Gene frequency, diversity and Shannon information index for RAPD primer
H13..................................................................................................................86
Table-3.22 Gene frequency, diversity and Shannon information index for RAPD primer
G02..................................................................................................................87
Table-3.23 Nei’s unbiased measures of genetic identity (Above diagonal) and genetic
distance (Below diagonal) for C. pomonella populations collected from three
geographically distant region Swat based on 21 RAPD primers analysis.......88
Table-3.24 Mean Gene frequency, diversity and Shannon information index for RAPD
primers used for molecular characterization of C. pomonella at Swat during the
year 2012-13....................................................................................................91
Table-4.1: Treatments applications with respective doses and active ingredients for C.
pomonella management during the year 2012 and 2013.................................117
Table-4.2: Mean fruit drop of apple after application of different insecticides during the
year 2012 and 2013..........................................................................................118
Table-4.3: Mean percent infestation of apple fruit caused by C. pomonella application of
different insecticides during the year 2012 and 2013......................................120
Table-4.4: Mean parasitism of Ascogester quadridentata after application of different
insecticides during the year 2012 and 2013.....................................................122
Table-4.5: Mean parasitism of Hyssopus pallidus after application of different insecticides
during the year 2012 and 2013........................................................................123
Table-4.6: Biological efficacy of different insecticides for the control of apple codling
moth Cydia pomonella during the year 2012 and 2013...................................124
Table-4.7: Comparison of the means values for the data regarding apple yield (kg/tree) at
the time of harvest after application of different insecticides during the year
2012 and 2013..................................................................................................125
Table-4.8: Treatment combinations for intercropping in the apple orchard during the year
2012 and 2013..................................................................................................136
Table-4.9: Mean dropped of apple fruit in apple orchard having different intercropping
during the year 2012 and 2013........................................................................138
Table-4.10: Mean percent infestation of apple fruit caused by C. pomonella in apple
orchard having different intercrops during the year 2012 and 2013...............139
Table-4.11: Mean C. pomonella catches in apple orchard having different intercrops during
the year 2012 and 2013....................................................................................141
Table-4.12: Mean percent parasitism of A. quadridentata in apple orchard having different
intercrops during the year 2012 and 2013.......................................................142
Table-4.13: Mean percent parasitism of H. pallidus in apple orchard having different
intercrops during the year 2012 and 2013.......................................................143
Table-4.14: Comparison of the mean values for the data regarding yield (kg/tree) at the
time of harvest in apple orchard having different intercrops during the year
2012 and 2013..................................................................................................144
Table-4.15: Treatments combinations of insecticide and intercropping for management of
C. pomonella during the year 2013..................................................................155
Table-4.16: Mean fruit drop in apple orchard for different treatments during the year
2013.................................................................................................................156
Table-4.17: Mean infestation of apple fruit caused by C. pomonella in apple orchard for
different treatments during the year 2013.......................................................157
Table-4.18: Mean C. pomonella catches through pheromone traps in apple orchard for
different treatments during the year 2013.......................................................158
Table-4.19: Mean percent parasitism of A. quadridentata in apple orchard for different
treatments during the year 2013......................................................................158
Table-4.20: Mean percent parasitism of H. pallidus in apple orchard having different
treatments during the year 2013......................................................................159
Table-4.21: Comparison of the mean values for the data regarding yield (kg/tree) at the
time of harvest in apple orchard having different treatments during the year
2013.................................................................................................................160
LIST OF FIGURES
Fig. 1.1. Worldwide distribution of C. pomonella (Courtisy: Published by Iowa State
University USA,
2001)......................................................................................Error! Bookmark
not defined.
Fig. 2.1. Population dynamics of C. pomonella in Swat during 2012 & 2013................26
Fig. 3.1: Electrophoreogrm showing PCR based amplification products of Codling moth
Cydia pomonella population collected from three regions (Matta, kalam and
Madyan) of District Swat by using RAPD primers B-12, D-16 and C-04........67
Fig.3.2. Electrophoreogrm showing PCR based amplification products of Codling moth
Cydia pomonella population collected from three regions (Matta, kalam and
Madyan) of District Swat by using RAPD primers C-13, B-04 and H-2..........70
Fig. 3.3: Electrophoreogrm showing PCR based amplification products of Codling moth
Cydia pomonella population collected from three regions (Matta, kalam and
Madyan) of District Swat by using RAPD primers E-19, F-01 and A-19.......74
Fig.3.4. Electrophoreogrm showing PCR based amplification products of Codling moth
C. pomonella population collected from three regions (Matta, kalam and
Madyan) of District Swat by using RAPD primers D-08, G-11 and F-07......77
Fig.3.5. Electrophoreogrm showing PCR based amplification products of C. pomonella
population collected from three regions (Matta, kalam and Madyan) of District
Swat by using RAPD primers E-18, H-14 and B-15.......................................81
Fig.3.6. Electrophoreogrm showing PCR based amplification products of C. pomonella
population collected from three regions (Matta, kalam and Madyan) of District
Swat by using RAPD primers C-16, C-02 and H-03.......................................84
Fig.3.7. Electrophoreogrm showing PCR based amplification products of C. pomonella
population collected from three regions (Matta, kalam and Madyan) of District
Swat by using RAPD primers F-04, H-13 and G-02.......................................88
Fig. 3.8. Dendrogram constructed on the basis of similarity index among three
populations of C. pomonella (Matta, Madyan and Kalam) based on RAPD data
using UPGMA and Nei’s genetic index..........................................................89
Fig.4.1: Experimental design/Layout of the Experiment in Matta Swat......................117
Fig. 4.2. Mean percent parasitism of A.quadridentata and H. pallidus after insecticides
application during 2012 and 2013...................................................................121
LIST OF APPENDICES
Appendix-1: Analysis of variance table for linear multiple regression of means for C.
pomonella at Matta Swat during the year 2012...............................................186
Appendix-2: Analysis of variance table for linear multiple regression of means for C.
pomonella at Matta Swat during the year 2013...............................................186
Appendix-3: Analysis of variance table for linear multiple regression of means for C.
pomonella at Madyan Swat during the year 2012...........................................186
Appendix-4: Analysis of variance table for linear multiple regression of means for C.
pomonella at Madyan Swat during the year 2013...........................................186
Appendix-5: Analysis of variance table for linear multiple regression of means for C.
pomonella at Kalam Swat during the year 2012..............................................186
Appendix-6: Analysis of variance table for linear multiple regression of means for C.
pomonella at Kalam Swat during the year 2013..............................................187
Appendix-7: Analysis of variance table for mean fruit drop after insecticides application
during year 2012..............................................................................................187
Appendix-8: Analysis of variance table for mean percent infestation after insecticides
application during year 2012...........................................................................187
Appendix-9: Analysis of variance table for mean percent parasitism of Ascogestor
quadridentata after insecticides application during year 2012........................187
Appendix-10: Analysis of variance table for mean percent parasitism of Hyssopus pallidus
after insecticides application during year 2012...............................................187
Appendix-11: Analysis of variance table for average yield of apple in kg/tree after
insecticides application during year 2012........................................................188
Appendix-12: Analysis of variance table for mean fruit drop after insecticides application
during year 2013..............................................................................................188
Appendix-13: Analysis of variance table for mean fruit infestation after insecticides
application during year 2013...........................................................................188
Appendix-14: Analysis of variance table for mean percent parasitism of Ascogestor
quadridentata after insecticides application during year 2013........................188
Appendix-15: Analysis of variance table for mean percent parasitism of Hyssopus pallidus
after insecticides application during year 2013...............................................188
Appendix-16: Analysis of variance table for average yield of apple in kg/tree after
insecticides application during year 2013........................................................189
Appendix-17: Combined analysis of variance table for mean fruit drop in apple orchard after
insecticides application during year 2012 & 2013..........................................189
Appendix-18: Combined analysis of variance table for mean percent infestation in apple
orchard after insecticides application during year 2012 & 2013.....................189
Appendix-19: Combined analysis of variance for mean percent parasiotism A. quadridentata
in apple orchard after insecticides application during year 2012 & 2013.......189
Appendix-20: Combined analysis of variance table for mean percent parasiotism H. pallidus
in apple orchard after insecticides application during year 2012 & 2013.......190
Appendix-21: Combined analysis of variance table for average yield of apple in kg/tree after
insecticides application during year 2012 & 2013..........................................190
Appendix-22: Analysis of variance table for mean fruit drop in apple orchard having different
intercrops during year 2012.............................................................................190
Appendix-23: Analysis of variance table for mean percent infestation in apple orchard having
different intercrops during year 2012..............................................................190
Appendix-24: Analysis of variance table for mean moth catches in apple orchard having
different intercrops during year 2012..............................................................190
Appendix-25: Analysis of variance table for mean percent parasitism of Ascogestor
quadridentata in apple orchard having different intercrops during year
2012.................................................................................................................191
Appendix-26: Analysis of variance table for mean percent parasitism of Hyssopus pallidus in
apple orchard having different intercrops during year 2012...........................191
Appendix-27: Analysis of variance table for average yield of apple in kg/tree having different
intercrops in apple orchard during year 2012..................................................191
Appendix-28: Analysis of variance table for mean fruit drop in apple orchard having different
intercrops during year 2013.............................................................................191
Appendix-29: Analysis of variance table for mean percent infestation in apple orchard having
different intercrops during year 2013..............................................................191
Appendix-30: Analysis of variance table for mean moth catches in apple orchard having
different intercrops during year 2013..............................................................192
Appendix-31: Analysis of variance table for mean percent parasitism of Ascogestor
quadridentata in apple orchard having different intercrops during year
2013.................................................................................................................192
Appendix-32: Analysis of variance table for mean percent arasitism of Hyssopus pallidus in
apple orchard having different intercrops during year 2013...........................192
Appendix-33: Analysis of variance table for average yield of apple in kg/tree having different
intercrops in apple orchard during year 2013..................................................192
Appendix-34: Combined analysis of variance table for mean fruit drop in apple orchard
different intercrops during year 2012 & 2013.................................................192
Appendix-35: Combined analysis of variance table for mean percent infestation in apple
orchard different intercrops during year 2012 & 2013....................................193
Appendix-36: Combined analysis of variance table for mean percent parastism of A.
quadridentata in apple orchard having different intercrops during year 2012 &
2013.................................................................................................................193
Appendix-37: Combined analysis of variance table for mean percent parasitism of H.
pallidus in apple orchard having different intercrops during year 2012 &
2013.................................................................................................................193
Appendix-38: Combined analysis of variance table for mean moth catches in apple orchard
having different intercrops during year 2012 & 2013.....................................193
Appendix-39: Combined analysis of variance table for yield (kg/tree) in apple orchard having
different intercrops during year 2012 & 2013.................................................194
Appendix-40: Analysis of variance table for mean fruit drop in apple orchard having different
treatments during year 2013............................................................................194
Appendix-41: Analysis of variance table for mean percent infestation in apple orchard having
different treatments during year 2013.............................................................194
Appendix-42: Analysis of variance table for mean moth catches in apple orchard having
different treatments during year 2013.............................................................194
Appendix-43: Analysis of variance table for mean percent parasitism of Ascogestor
quadridentata in apple orchard having different treatments during year
2013.................................................................................................................194
Appendix-44: Analysis of variance table for mean percent parasitism of Hyssopus pallidus in
apple orchard having different treatments during year 2013...........................195
Appendix-45: Analysis of variance table for average yield of apple in kg/tree having different
treatments in apple orchard during year 2013.................................................195
ACKNOWLEDGEMENTS
All praises to Almighty "ALLAH" alone, the most Merciful and the most Compassionate and
His Holy Prophet "Muhammad" (PBUH), the most perfect and exalted ever born on this earth, who
is, forever a symbol of guidance and knowledge for the humanity.
This whole study was sponsored by Higher Education Commission of Pakistan (HEC) under
indigenous Scholarship PIN Code 106-1703-Av6-084 and a six month foreign visit under IRSIP
scheme to the University of Queensland Australia, I appreciate and acknowledge the support and on
time response of HEC throughout the study period.
I wish to express my gratitude to my supervisor Prof. Dr. Ahmad -Ur- Rahman Saljoqi,
Professor, Department of Plant Protection, The University of Agriculture Peshawar, for his relevant
guidance, encouragement and cooperation during my research work.
Special thanks to Prof. Dr. Abid Farid, University of Haripur, who has provided his
considerable talent and ever present encouragement of this study. Heart felt thanks are expressed for
his painstaking efforts to improve the clarity and readability of the study.
I fell highly indebted to express my thanks to Prof. Dr. Imtiaz Ali Khan, Department of
Entomology, for his cooperation during this study, Prof. Dr. Yousaf Hayat for his help in statistical
analysis and Dr. Ijaz Ali (IBGE) who fully cooperate and assisted me in molecular studies.
Thanks are offered to Prof. Dr. Farman Ullah, Chairman, Department of Plant Protection, The
University of Agriculture, Peshawar for his affections and sincere help during the study.
I would like to express gratitude and thanks to my friends Dr. Bashir Ahmad, Dr. Hayat
Badshah, Dr. Muhammad Naeem (ARI-N) and Dr. Ahmad Khan who provide every support during
my research work and arrangements.
I also thank to my affectionate parents, family members, brothers and sisters for their moral
support which they extended to me during my study.
Hayat Zada
POPULATION DYNAMICS, MOLECULAR CHARACTERIZATION AND
MANAGEMENT OF APPLE CODLING MOTH, CYDIA POMONELLA (LINNAEUS)
(LEPIDOPTERA; TORTRICIDAE)
BY
Hayat Zada and Ahmad-Ur-Rahman Saljoqi
Department of Plant Protection, The University of Agriculture, Peshawar-Pakistan
ABSTRACT
The studies were carried out regarding population dynamics, molecular characterization
and management of apple codling moth (Cydia pomonella L.) (Lepidoptera; Tortricidae) at District
Swat during 2012-13. First adults of C. pomonella were trapped during 17th
to 18th
standard
meteorological week (SMW) at Matta, Madyan and Kalam. The first peak population was recorded
during 25th
to 30th
SMW and second peak population were observed during 31st to 35
th SMW, so
maximum two peak populations were observed during studies. The correlation matrix between C.
pomonella population and weather parameters disclosed that mean maximum and minimum
temperature exhibited a highly significant (p<0.01) positive correlation with C. pomonella
population build up. Total rainfall and relative humidity (morning and evening) had non-
significant negative effect on the population build up of C. pomonella. Regression analysis
explained 68.8-83.4% variability due to meteorological parameters in the population dynamics of
C. pomonella at all three areas. Molecular characterization of the C. pomonella through RAPD
markers explained higher genetic distances among the isolates from Kalam and Madyan (97.9%)
as compared to those from Matta and Madyan (35.6%). Likewise, higher genetic similarity
(70.1%) was resided by the C. pomonella population at Matta and Madyan, while the low level of
identity (37.6%) were examined in isolates from Madyan and Kalam. These studies about genetic
variation among C. pomonella populations may help for its efficient management. The efficacy of
different novel insecticides were tested against C. pomonella and Match insecticides proved very
effective for the management of C. pomonella during current studies in reducing the pest
infestation (23.1%). The said chemical proved safer for its two associated larval parasitoids
Ascogaster quadridentata (26.4%) and Hyssopus pallidus (27.6%) compared to other chemicals.
Maximum average yield (86.81±0.42 kg/tree) was also attributed to Match which was significantly
higher than all the treatments. Habitat manipulation through Trifolium (Trifolium alexandrinum)
(Fabacae) intercropped in the apple orchard had a profound effect on the fruit drop (2.87), percent
infestation (57.2%), biological control agents and yield of the orchard. The said treatment was
found comparatively the most appropriate combination of those tested for the attraction of its
associated parasitoids A. quadridentata (40.1%) and H. pallidus (30.1%) and increasing the yield
(76.62±1.11 kg/tree) of apple fruit. The combined effect of intercropping trifolium followed by
application of Match insecticide proved highly superior in reducing the occurrence of C.
pomonella and enhancing and sustaining the associated parasitoids A. quadridentata (32.8%) and
H. pallidus (34.7%). The said treatment was also having an insightful impact in curtailing mean
fruit drop (2.07), percent infestation (36.4%) and adult moth catches (1.30) through pheromone
traps. These findings further confirmed that the said treatment afforded high average yield
(94.75±0.62 kg/tree) and the losses avoided were 39.1% and gain in yield due to control measures
were 64.1%.
1
CHAPTER - 1: GENERAL INTRODUCTION
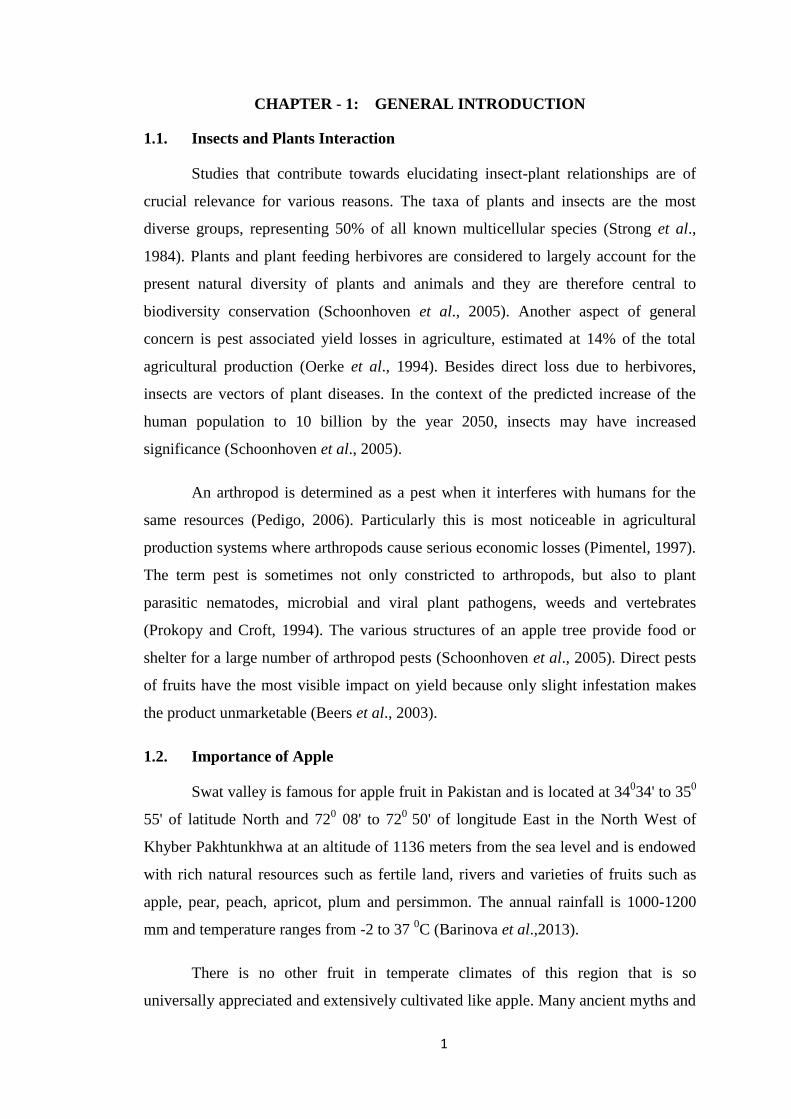
1.1. Insects and Plants Interaction
Studies that contribute towards elucidating insect-plant relationships are of
crucial relevance for various reasons. The taxa of plants and insects are the most
diverse groups, representing 50% of all known multicellular species (Strong et al.,
1984). Plants and plant feeding herbivores are considered to largely account for the
present natural diversity of plants and animals and they are therefore central to
biodiversity conservation (Schoonhoven et al., 2005). Another aspect of general
concern is pest associated yield losses in agriculture, estimated at 14% of the total
agricultural production (Oerke et al., 1994). Besides direct loss due to herbivores,
insects are vectors of plant diseases. In the context of the predicted increase of the
human population to 10 billion by the year 2050, insects may have increased
significance (Schoonhoven et al., 2005).
An arthropod is determined as a pest when it interferes with humans for the
same resources (Pedigo, 2006). Particularly this is most noticeable in agricultural
production systems where arthropods cause serious economic losses (Pimentel, 1997).
The term pest is sometimes not only constricted to arthropods, but also to plant
parasitic nematodes, microbial and viral plant pathogens, weeds and vertebrates
(Prokopy and Croft, 1994). The various structures of an apple tree provide food or
shelter for a large number of arthropod pests (Schoonhoven et al., 2005). Direct pests
of fruits have the most visible impact on yield because only slight infestation makes
the product unmarketable (Beers et al., 2003).
1.2. Importance of Apple
Swat valley is famous for apple fruit in Pakistan and is located at 34034' to 35
0
55' of latitude North and 720 08' to 72
0 50' of longitude East in the North West of
Khyber Pakhtunkhwa at an altitude of 1136 meters from the sea level and is endowed
with rich natural resources such as fertile land, rivers and varieties of fruits such as
apple, pear, peach, apricot, plum and persimmon. The annual rainfall is 1000-1200
mm and temperature ranges from -2 to 37 0C (Barinova et al.,2013).
There is no other fruit in temperate climates of this region that is so
universally appreciated and extensively cultivated like apple. Many ancient myths and
2
stories describe apple as a symbol of life, immortality, love and fertility (Laudert,
1998). In the middle ages, apple was used as a sign of terrestrial power for emperors
(Laudert, 1998). Nowadays, the symbol of apple has changed from this rather
mythological meaning to representing commercial product (Laudert, 1998). In
advertisements for cosmetics the apple stands for health. The city of New York is well
known as 'Big Apple'. The computer company Apple Macintosh uses apple as a
symbol for global networks.
Apples as fruit are admired by all humans because of the many ways that they
can be consumed (e.g. fruit, juice, vinegar, apple crumble and cake) and because of
their convenience and durability (Morgan and Richards, 1993). Last but not the least,
what would William tell (drama by Friedrich Schiller, 1804) be without apple, and
what would Switzerland be without William Tell? (Laudert, 1998). The common
domesticated apple is putatively an inter specific hybrid complex, usually designated
Malus domestica Borkh. (Luby, 2003). Apples are members of the genus Malus
Miller, which is placed in the subfamily Maloideae of the family Rosaceae. Pears,
quinces and hawthorns are further members of the Maloideae. The origin and ancestry
of the M. domestica complex remain unknown. However, Malus sieversii (Ledeb.) is
hypothesized as the key species at its origin (Juniper et al., 1999). M. sieversii is
widespread in the mountains of central Asia. (Brown, 1992).
According to Luby, (2003) apple is very important for health point of view
and comprised Potassium and Phosphorus in a large quantity that help in controlling
the blood pressure and ultimatley decreasing heart diseases. Further, it also contain
vitamin 'B' Complex which is useful for life.
1.3. World Apple Production
Pakistan is world’s 10th
largest country with 1.335 million tones of apple
production. World’s production is 64 million tons in which Belgium, France, Italy,
America and Chilly are prominent and has been increasing since the Second World
War (O'Rourke, 2003), mainly due to the expansion of production in China and the
successful spread into warmer climates (Luby, 2003).
The estimated world production of apples for the year 2006, was 64 million
tones (http://faostat.fao.org), ranking in 4th
position behind bananas (71 million
3
tones), grapes (69 million tones) and oranges (65 million tones). With 26 million tone,
China produces 40% of the world production. China is followed by the USA (4.6
million tones). China’s apple production rapidly increased with the introduction of the
cultivar 'Fuji'. It is believed that apple production in China could exceed 35 million
tones in 2010 as many of the trees are not yet at full bearing maturity (O'Rourke,
2003).
1.4. Codling moth as a Serious Pest
Many lepidopterans, especially tortricids, attack apple fruit. The codling moth
(Cydia pomonella Linnaeus.) is considered as the key species in apple orchards
worldwide and infestation levels have even increased within the last years (Blommers,
1994; Prokopy and Croft, 1994; Dorn et al., 1999). Besides apples, it attacks the fruits
of pears, quinces, apricots, peaches and walnuts (Alford, 2007). The damage which
may be up to 20 to 90% is caused by the larvae, which burrow into the fruit to feed on
the flesh and seeds. A small red-ringed cavity hole filled with dry frass is an
indication for larval penetration (Baggiolini et al., 1992). After few weeks, and
passing through five instars, the mature larvae leave the fruit to spin a cocoon for
pupation in the crackes and cravices (Geier, 1963). In northern Europe, usually the
last larval instar overwinters and pupation occurs in spring. Five to six generations
have been recorded in warmer regions (Audemard, 1991). The first moths appear in
spring (Beers et al., 1993). After mating, eggs are laid singly on leaves and fruits
during warm evenings (above 15°C). The new larvae hatch after 10-14 days.
C. pomonella is a severe pest of apple crops throughout the world. Originating
in Kazakhstan, the C. pomonella has spread to all temperate regions where apples are
grown except for Japan, parts of China, India, Pakistan and Western Australia (Fig.
1.1, Blue colour shows the presence of C. pomonella) (Pedigo, 2006). In 1750, C.
pomonella was first recorded in New England, USA. By 1868, it was present
throughout Ontario and by 1905, even it is present in the west coast of Canada.
C. pomonella commonly infesting apple and pear, but also observed in,
quince, plum, apricot, peach, hawthorm, walnut, cherry and crabapple. While not all
varieties of apple are equally susceptible to attack by C. pomonella, none is resistant
(Cutright and Morrison, 1935). C. pomonella is considered the "key" insect pest in
most apple-growing regions. Damage is inflicted as a larva burrows into the apple
4
fruit, eating seeds and vacating the fruit thereafter. The hits are left with holes
surrounded by frass, making them unmarketable and unacceptable for the consumers.
Even if first instar larvae begin but do not continue feeding on the fruit, they leave
superficial penetrations (stings), consequesntly apple will be downgraded. Damage to
the hit as a result of larval feeding also renders the apples more susceptible to
secondary infestation. Damage from C. pomonella can be extensive. In untreated
orchards with more than one generation of this moth 75-95% of the losses has been
recorded. Major efforts to exterminate C. pomonella using the sterile insect technique
(Dyck and Gardiner, 1992; Brown, 1992) or pheromone based mating disruption are
currently underway. Biological control agents could serve as important components in
an integrated management system for C. pomonella (Brown, 1992) when
organophosphates are replaced by more benign management techniques.
1.5. Population dynamics of C. pomonella
Population dynamics of C. pomonella has been studied by various authors e.g.
different aspects of the population dynamics of C. pomonella (Audemard, 1991).
Population dynamics of C. pomonella was simulated by using mathematical methods
(Lischke, 1990 and 1992). Other studies have been carried out to verify the fecundity
and mortality of the various life stages of the C. pomonella as an important part of the
modeling of the population (Ferro et al., 1975).
Pheromone traps are one of best effective monitoring and sampling tools for
flying adult lepidopterious insects. The use of sex pheromones for monitoring insect
pests is recently being used in many countries. Several entomologist and scientists has
been reported that pheromones are very helpful for determining seasonal adults moth
activity of pests species. (Tamhankar et al., 1989; Singh and Sachan, 1991; Patil et
al., 1992). Data/information taken through pheromone trap collections in any locality
for a long period of time can be used for development of models to predict the
seasonal pests incidence for the effective management of that pest.
Before the study of Shaffer and Gold (1985), no researcher worked recording
population dynamics and phenology of this pest. They presented a generalized model
of both numbers of moths and phenology corelating with temperature and other
environmental factors. They presented in their study a generalized models of insect
population dynamics, together with details of its parameterization and its evaluation
5
for C. pomonella in apple orchard with close relation to weather parameters (Shaffer
and Gold, 1985). The development and survival of C. pomonella in apple orchard was
tested to compare C. pomonella development in organic and traditionally managed
apples, and to determined the impact of abiotic factors on adults flights (Hansen,
2002).
1.6. Molecular Studies of C. Pomonella
It has been reported that C. pomonella populations differentiated in to many
strains with different characterictics of their biology and physiological relation due to
change in climatic conditions and indiscrimainate use of pesticides (Franck et al.,
2010). Bues et al. (1995) studies genetic structure of C. pomonella populations by
using allozyme markers. Further, Timm et al. (2006) used AFLP markers and found
out substaintail differences among population of C. pomonella at small and nearer
locations. Nonetheless, studies showed that isoenzyme polymorphism is low level as
molecular marker (Thaler et al., 2008).
Timm's et al. (2006) study was corroborated by Thaler et al. (2008) who also
used AFLP markers to study the molecular phylogeny and genetic structure of C.
pomonella. Franck et al. (2007) used these microsatellites to estimate the level of
genetic variation found among C. pomonella populations from France. The
application of mitochondrial genetic markers has led to identification of recent
evolutionary history of C. pomonella from the Pleistocenic splitting of the C.
pomonella into two refugial clades to the interbreeding of mitochondrial haplotypes in
the Holocene and finally to human-aided complete intermixing and splitting of
populations into many locally adapted populations (Thaler et al., 2008). Amazingly,
despite the high polymorphism of microsatellite loci, the results showed low genetic
variations among populations and a marginal effect of insecticide treatments on the
allelic richness of C. pomonella. Recently, Franck et al. (2005) and Zhou et al. (2005)
isolated more applicable co-dominant microsatellite markers from C. pomonella.
Likewise, low genetic variation was recorded among populations sampled in
neglected orchards and production orchards in Chile (Fuentes-Contreras et al., 2008).
Franck and Timm (2010) used male adult moths for genetic analyses collected
from pheromone traps from two locations of apple orchards situated at a distance of
30 km away from each other and low genetic distances among the population.
6
Pajac et al. (2011) also used microsatellite markersfor studying genetic
distances among the population of adults male moth in Croatia and found low level of
molecular variation among the population (70-96%). However, high level of genetic
variation was found among the adult male moth population sampled on the same host
within distance of 10 km using microsatellite markers as Franck et al. (2005) and
Zhou et al. (2005).
Deverno et al., (1998) used randomly amplified polymorphic DNA (RAPD)
technique to the genetic distances among the population by using PCR amplification
of genomic DNA. This technique offer no need of DNA sequences by using random
primers and one of the best method and easy method to find out diversity within and
between the population. Its cost is low and developing large number of DNA in a
small time (Bardakci, 2001; Delaat et al., 2005). This method can be used for insect
phylogeny like finding the genetic variation among the population of closely related
species of insects (Benecke, 1998; Lima et al., 2002).
1.7. Chemical Control and Resistance of C. pomonella to Insecticides
Many researchers worldwide have tried to control C. pomonella by a number
of pesticides, but effective control could not be achieved because of well known facts
using pesticides without considering proper time of application and their impact on
the non-target species resulting in many environmental problems. Recently, several
researchers have worked and reported that pheromone traps are an effective tool used
throughout the world to monitor its population dynamic and suppress the pest
population by applying insecticides at right time. Traps baited with synthetic female
sex pheromone are widely used to forecast the timing of insecticide sprays against C.
pomonella (Ledee et al., 1993).
Malik et al. (2002) provided a bibliographic review of the investigation about
C. pomonella control around the world. Control methods generally could be
categorized as biological control including mating disruption, sterile insect technique,
classical biological control, cultural control, conservational control, chemical control,
control based on the molecular studies, encouraging and enhancement of the natural
enemies through intercropping, options for the organic control and integrated pest
management system. Each technique has its own recompense and demerits (Falcon
and Huber, 1991).
7
Indiscriminate use of pesticides are not only harmful to the biotic and abiotic
factors of environment but also have adverse effect on biological control agents. So as
a result the C. pomonella has developed resistance to different group of chemicals
(Sauphanor et al., 2000; Boivin et al., 2001; Bouvier et al., 2001; Brun-Barale et al.,
2005). Resistance has also documented in C. pomonella populations from Italy
(Ioriatti et al., 2000, 2005).This problem can be overcome by introducing new and
safe insecticides for the effective management of this pest. Cross resistance has also
been recorded C. pomonella populations in South-Eastern France by Sauphanor and
Bouvier (1995) and Sauphanor et al. (2000).
Farming community mostely relying on the used of insecticides for the
management of C. pomonella and other pest (Lacey et al., 2008). IPM techiques
emphasis more on the use of safe and novel control strategies which is mostly
acceptable and feasible for the farmers (Ciglar, 1998; Maceljski, 2002). Different
methods of control such as intercropping, conservation biological control and
biological control C. pomonella though various biological agents such as spiders,
mites, birds, insects and particularly the parasitoids are very effective for the
management of this pest (i.e. parasitic wasps from the families Braconidae and
Ichneumonidae) (Lacely et al., 2003; Lacey and Unruh, 2005).
1.8. Habitat manipulation for the management of C. pomonella
Beneficial insect diversity can be increased within agro-ecosystem though
different methods such as habitat manipulation through intercropping for
conservational biological control and potential pest management (Vandermeer, 1989;
Theunissen, 1994). Different crops can be manipulated in apple orchard such as as
clovers, mustard, soybean, buckwheat etc for the survival of natural enemies and their
abundance in the agro-ecosystem (Theunissen, 1994). So polyculture have maximum
diversity of natural enemies and will be more stable for the pest and diseases
interaction (Altieri and Nicholls, 2004). Beizhou et al. (2011). They also reported that
intercroping the apple orchard can significantly cutailed the pest population and
natural enemies population will be enhanced. In the diverse system there is complex
food web for the pest and natural enemies providing maximum resourses for all the
organisms Hence, intercropping the apple orchard with aromatic plants led to
8
improved insect pest management by enhancing the activity of the insect natural
enemy community. (Pekaer and Kocourek, 2004; Simon et al., 2007).
1.9. Importance of the study
As no baseline studies was available regarding population dynamics and
molecular studies for this insect pest in Pakistan, particularly in Khyber Pakhtunkhwa,
this studies will provide basic information in future for researchers and entomologists.
In Pakistan, no research has been conducted regarding molecular variation in C.
pomonella. This study is the first step to collect genetic information and pattern of
genetic diversity and variation among the population of C. pomonella at various
altitude and different topographic condition of the major apple growing areas of
District Swat. It was expected that if this pest is not properly handled and managed, it
will not only caused huge economic losses to the apple growers but in near future,
apple orchard will be completely replaced by peach in Swat. Therefore, this research
will be of great importance for the farming community of Pakistan.
In view of above background, the current study focuses on to conduct a
detailed research work on the management of C. pomonella, using different IPM
techniques and their interactions to develop an IPM package for the effective
management of C. pomonella for the farming community of the area. The study will
determines the assessment of population dynamics, molecular characterization,
identification of C. pomonella associated parasitoids and management of C.
pomonella in Swat valley with the following main objectives:
9
1.10. OBJECTIVES
i. To study population dynamics of C. pomonella in three major apple growing
areas having different altitudes and climatic conditions including Matta,
Madyan and Kalam of Swat Valley.
ii. Molecular characterization of the C. pomonella collected from above target
areas having different altituds of Swat Valley.
iii. To know the effect of management techniques including safe insecticides and
intercropping individually and their interactions against the C. pomonella and
their associated available natural enemies.
iv. Evaluation of best insecticide and intercrop individually and their interaction
for the effective management of this pest to have a best IPM package.
10
LITERATURE CITED
Alford, D.V. 2007. Pests of Fruit Crops: A Colour Handbook. Manson Publishing Ltd.
London, UK.
Altieri, M.A. and C.I. Nicholls. 2004. Biodiversity and Pest Management in Agro
ecosystems (2nd), Food Products Press, ISBN 1560229255, New York.
Audemard, H. 1991. Population dynamics of the codling moth. In L. P. S. van der Geest
and H. H. Evenhuis, editors. Tortricid Pests: Their Biology, Natural Enemies and
Control. Elsevier, Amsterdam, NL. 329-338.
Baggiolini, M., E. Keller, H.G. Milaire and H. Steiner. 1992. Visuelle Kontrollen im
Apfelanbau. Schweizerische Zentrale für Obstbau, Oeschberg, Koppigen, CH.
Bardakci, F. 2001. Random amplified polymorphic DNA (RAPD) markers. Turk. J. Biol.
25: 185-196.
Barinova S., A. Naiz, U. Barkat and F.M. Sarim.2013.Ecological Adaptation to Altitude
of Algal Communities in the Swat Valley (Hindu CushMountains, Pakistan).
Expert Opinion. Environ. Biol. 2:2.
Beers, E.H., D.M. Suckling, R.J. Prokopy and J. Avilla. 2003. Ecology and management
of apple arthropod pests. In D. C. Ferree and I. J. Warrington, editors. Apples:
Botany, Production and Uses. CABI Publishing, Wallingford, UK. 489-514.
Beers, E.H., J.F. Brunner, M.J. Willett and G.M. Warner. 1993. Orchard Pest
Management: A Resource Book for the Pacific Northwest. Good Fruit Grower,
Yakima, WA.
Beizhou, S., Z. Jie, H. Jinghui, W. Hongying, K. Yun and Y. Yuncong. 2011. Temporal
dynamics of the arthropod community in pear orchards intercropped with aromatic
plants. Pest Manage. Sci. 67(9): 1107-1114.
Benecke, M. 1998. Random amplified polymorphic DNA (RAPD) typing of
necrophagous insects (Diptera & Coleoptera) in criminal forensic studies:
validation and use in practice. Forensic Sci. Intern. 98: 157-168.
Blommers, L.H.M. 1994. Integrated pest-management in European apple orchards. Annu.
Rev. Entomol. 39: 213-241.
Boivin, T., C. Chabert, J.C. d 'Hieres Bouvier, D. Beslay and B. Sauphanor. 2001.
Pleiotropy of insecticide resistance in the codling moth, Cydia pomonella.
Entomologia Experimentalis et Applicata. 99: 381-386
Bouvier, J.C., R. Bues, T. Boivin, L. Boudinhon, D. Beslay and B. Sauphanor. 2001.
Deltamethrin resistance in the C. pomonella (Lepidoptera: Tortricidae):
inheritance and number of genes involved. Heredity 87: 456-462.
Brown, S. K. 1992. Genetics of apple. Plant Breeding Rev. 9:333-366.
11
Brun-Barale, A., J.C. Bouvier, D. Pauron, J.B. Berge and B. Sauphanor. 2005.
Involvement of a sodium channel mutation in pyrethroid resistance in Cydia
pomonella L., and development of a diagnostic test. Pest Manage. Sci. 61: 549-
554
Bues, R., J.F. Toubon and H.S. Poitout. 1995. Variabilite ecophysiologique et
enzymatique de Cydia pomonella L. en fonction de l'origine geographique et de la
plante hote. Agronomie 15:221-231
Ciglar, I. 1998. Integrirana zaštita voćaka i vinove loze. Zrinski,Čakovec.
Delaat, D.M., M.R.S. Carvalho, M.D.P. Acedo and C.G. De Fonseca. 2005. Applicability of
RAPD markers on silver-stained polyacrylamide gels to ascertain genetic diversity in
Peripatus acacioi (Onychophora; Peripatidae). Gen. Mol. Res. 4: 716-725.
Deverno, L.L., G.A. Smith and K.J. Harrison. 1998. Randomly amplified polymorphic DNA
evidence of introgression in two closely related sympatric species of Coniferophagous
choristoneura (Lepidoptera: Tortricidae) in Atlantic Canada. Annu. Entomol. Soc.
Am. 91: 248-259.
Dorn, S., P. Schumacher, C. Abivardi and R. Meyhöfer. 1999. Global and regional pest
insects and their antagonists in orchards: spatial dynamics. Agric. Ecosyst.
Environ. 73:111-118.
Dyck, V.A. and M.G.T. Gardiner. 1992. Sterile-insect release programme to control the
codling moth Cydia pomonella (L.) (Lepidoptera: Olethreutidae) in British
Columbia, Canada. Acta Phytopathol. Entomol. Hungarica 27: 219-222
Falcon, L.A. and J. Huber. 1991. Biolgical control of codling moth in: Tortricid pests
their biology, natural enemies and control. Ed. by L. P. S. van der Geest and H. H.
Evenhuis, Elsevier, Amsterdam. 355-369.
Ferro, D.N., R.R. Sluss and T.P. Bogyo. 1975. Factors contributing to the biotic potential
of the codling moth in Washington. Environ. Entomol. 4(3):385-391.
Franck, P. and A.E. Timm. 2010. Population genetic structure of Cydia pomonella: a
review and case study comparing spatiotemporal variation. J. Appl. Entomol. 134:
191-200.
Franck, P., F. Guerin, A. Loiseau and B. Sauphanor. 2005. Isolation and characterization
of microsatellite loci in the codling moth Cydia pomonella L. (Lepidoptera,
Tortricidae). Molecular Ecology Notes 5: 99-102
Fuentes-Contreras, E., J.L. Espinoza, B. Lavandero and C.C. Ramirez. 2008. Population
genetic structure of codling moth (Lepidoptera: Tortricidae) from apple orchards
in central Chile. J. Econ. Entomol. 101(1): 190-198.
Geier, P.W. 1963. The life history of codling moth (Cydia pomonella) in the Australian
capital territory. Aust. J. Zool. 11: 323-367.
Hansen, J.D. 2002. Effect of cold treatment on survival and development of codling moth
(Lepidoptera: Tortricidae). Ecol. Entomol., 31:68-74.
12
Ioriatti, C., B. Saphanor, R. Cainelli, C. Rizzi and M. Tasin. 2000. Cydia pomonella L.:
Primo caso di resistenza a diflubenzuron in Trentino. Atti Giornate
Fitopatologiche 1: 319-325
Ioriatti, C., P.J. Charmillot, F. Forno, L. Mattedi, D. Pasquier and C. Rizzi. 2005. Control
of codling moth Cydia pomonella L. using insecticides: field efficacy in relation
to the susceptibility of the insect. IOBC WPRS Bull. 28: 259-264.
Juniper, B.E., R. Watkins and S.A. Harris. 1999. The origin of apple. Acta Horticulturae .
484: 27-33.
Lacey, L.A. and D.I. Shapiro-Ilan. 2008. Microbial control of insect pests in temperate
orchard systems: Mechanisms. Blackwell Scientific Publications, Oxford, UK.
Lacey, L.A and T.R. Unruh 2005. Biological control of codling moth (Cydia pomonella,
Lepidoptera: Tortricidae) and its role in integrated pest management, with
emphasis on entomopathogens. Vedalia. 12 (1): 33-60.
Lacey, L. A., D. Thomson, C. Vincent and S.P. Arthurs. 2008. Codling moth
granulovirus: a comprehensive review. Biocon. Sci. Technol. 18(7): 639-663.
Lacey, L. A., T.R. Unruh and H.L. Headrick. 2003. Interactions of two idiobiont
parasitoids (Hymenoptera: Ichneumonidae) of codling moth (Lepidoptera:
Tortricidae) with the entomopathogenic nematode Steinernema carpocapsae
(Rhabditida: Steinernematidae). J. Invert. Pathol. 83: 230-239.
Laudert, D. 1998. Mythos Baum: Was Bäume uns Menschen bedeuten. Bayerischer and
wirtschaftverlag, BLV, München.
Ledee, S., C. Trouve and J.P. Chmbon. 1993. Survey of Lepidoptera in apple orchard of
Northern France. In Quatrieme Conf. Int. Sur. Les Ravangeurs en Agric. 6.7.8 Janvier
1979, Le Corum,. Montpellier, France, Tom 2. Paris, France.
Lima, L.H.C., L. Campos, M.C. Moretzsohn and M.R.V. De Oliveira. 2002. Genetic diversity
of Bemesia tabaci (Genn.) populations in Brazil revealed by RAPD markers. Genet.
Mol. Biol. 25: 217-223.
Lischke, H. 1990. A mathematical model for simulating the population dynamics of codling
moth Cydia pomonella L. Mitt. D GaaE. 7(46):413-418.
Lischke, H. 1992. A model to simulate the population dynamics of codling moth Cydia
pomonella L. parameters estimation and sensitivity analysis. Acta Hortic. 313: 331-338.
Luby, J.J. 2003. Taxonomic classification and brief history. Pages 1-15 in D. C. Ferree
and I. J. Warrington, editors. Apples: Botany, Production and Uses. CABI
Publishing, Wallingford, UK.
Maceljski, M. 2002. Poljoprivredna entomologija. II. Edition, Zrinski, Čakovec.
Morgan, J. and A. Richards. 1993. The Book of Apples. Ebury Press, London.
13
Oerke, E.C., H. W. Dehne, F. Schonbeck and A. Weber. 1994. Crop Production and Crop
Protection: Estimated Losses in Major Food and Cash Crops. Elsevier, Amsterdan,
NL.
O'Rourke, D. 2003. World production, trade, consumption and economic outlook for
apples. In D. C. Ferree and I. J. Warrington, editors. Apples: Botany, Production
and Uses. CABI Publishing, Oxford, UK. 15-29.
Pajac, I., B. Baric, S. Simon, K.M. Mikac and I. Pejic. 2011. Low levels of population
genetic structure found in population of Cydia pomonella (Linnaeus) (Lepidoptera:
Tortricidae) from apple orchards in Croatia.
Patil, B.V., B.S. Nandihalli, P. Hugar and Somashekar. 1992. Influence of weather
parameters on pheromone trap catches of cotton bollworms. Karnataka J. Agric.
Sci. 5: 346-350.
Pedigo, L.P. 2006. Entomology and Pest Management. Prentice Hall, Saddle River, NY.
Pekaer, S. and M.M. Kocourek. 2004. Spiders (Araneae)in the biological and ingrated pest
management of apple in Czech Republic. J. Appl. Entomol. 128(8): 261-266.
Pimentel, D. 1997. Pest management in agriculture. Pages 1-11 in D. Pimentel, editor.
Techniques for Reducing Pesticide Use. John Wiley & Sons Ltd., New York.
Prokopy, R.J. and B.A. Croft. 1994. Apple insect pest management. In R. L. Metcalf and
W. H. Luckman, editors. Introduction to Insect Pest Management. John Wiley &
Sons Ltd., New York. 543-585.
Sauphanor, B. and J.C. Bouvier. 1995. Cross resistance between benzoylureas and
benzoylhydrazines in the codling moth, Cydia pomonella L. Pestic. Sci. 45: 369-
375.
Sauphanor, B., Brosse, J.C. Bouvier, P. Speich, A. Micoud and C. Martinet. 2000.
Monitoring resistance to diflubenzuron and deltamethrin in French codling moth
populations (Cydia pomonella). Pest Manage. Sci. 56: 74-82
Schoonhoven, L.M., J.J.A. van Loon, and M. Dicke. 2005. Insect-Plant Biology. Oxford
University Press, Wallingford, UK.
Shaffer, P.L. and H.L. Gold. 1985. A simulation model of population dynamics of the codling
moth, Cydia pomonella L. Ecol. Modell. 30: 247-274.
Simon, P.P., H. Defrance and B. Sauphanor. 2007. Effect of Codling moth management on
the orchard arthropods. Agric. Ecosyst. Environ.122: 340-348.
Singh, K.N. and G.C. Sachan. 1991. Assessment of the use of sex pheromone traps in the
management of Spodoptera litura. Indian J. Proc. 21(1): 7-13
Strong, D.R., J.H. Lawton and T.R.E. Southwood. 1984. Insects on Plants: Community
Patterns and potential for incorporation into IPM. Annu. Rev. Entomol. 53:121-
144.
14
Tamhankar, A.J., K.K. Guthi and G.W Rahalkar. 1989. Responsiveness of Earaias vitella and
Earias insulana males to their female sex pheromone. Insect Sci. Appl. 10(5): 625-
630.
Thaler, R., A. Brandstatter, A. Meraner, M. Chabicovski, W. Parson, R. Zelger, J. Dalla
Via and R. Dallinger. 2008. Molecular phylogeny and population structure of the
codling moth (Cydia pomonella) in Central Europe: II. AFLP analysis reflects
human-aided local adaptation of a global pest species. Mol. Phylogenet. Evol. 48:
838-849.
Theunissen, J. 1994. Intercropping in field vegetable crops: Pest management by agro system
diversification an overview. Pestic. Sci.42: 65-68.
Timm, A.E., H. Geertsema and L. Warnich. 2006. Gene flow among Cydia pomonella
(Lepidoptera: Tortricidae) geographic and host populations in South Africa. J.
Econ. Entomol. 99 (2): 341-348.
Vandermeer, J.H. 1989. The ecology of intercropping. Cambridge University Press, ISBN
9780521346894, Cambridge. pp. 237.
Zhou, Y., H. Gu and S. Dorn. 2005. Isolation of microsatellite loci in the codling moth,
Cydia pomonella (Lepidoptera: Tortricidae). Mol. Ecol. Notes 5: 226-227.
15
CHAPTER - 2: POPULATION DYNAMICS OF CYDIA POMONELLA (L) IN
SWAT VALLEY
2.1. INTRODUCTION
The C. pomonella is the most widely distributed pest of cultivated pome fruits and
walnuts in the world, except in Japan and in the western part of Australia where it has been
eliminated, being a key pest in most situations. Its origin is Eurasian. The most important C.
pomonella hosts are apple and even other Prunus species like sweet cherry and almonds
(Barnes, 1991).
Pheromone traps present one of the best and effective monitoring and sampling device
for flying adult male lepidopterious moth especially C. pomonella. The use of sex pheromones
for monitoring insect pests has been introduced recently. It has been reported by several
workers that pheromone traps can be very efficient for determining seasonal moth activity of
pest species (Tamhankar et al., 1989; Singh and Sachan, 1991; Patil et al., 1992). On the basis
of pheromone trap collections in any area for a fairly long period of time can be used for
development of models to predict the seasonal pests infestation. Trap catches may provide
meaningful index for estimating population densities of the pests. Trap catches in relation to
field infestation and environmental factors (such as temperature, relative humidity and
rainfall) are crucially important for decision making process. If a consistent coorelation exists
among the catch traps population of pest and environmental factors then the pheromone traps
could be used to specify when the apple orchard should apply control measures in IPM
program (Dent and Pawar, 1988).
A detailed understanding of the exact relationship between the change in
environmental factors and those in the pest population may not only help to predict the pest
losses to the in crop, but also help to avoid them through some well timed pest control
measure (Aasman, 2001). Abiotic factors like temperature, relative humidity and rainfall play
a vital role in the development of insect pests fluctuation of these causes variation in the
population of the insect pest.
Trans-8, trans-10-dodecadien-1-01 is a powerful sex attractant of the C. pomonella,
has been identified and proposed as the sex pheromone (Roelofs, 1971). This ribber septa
when placed in traps has been used for detecting moth emergence and timing pesticide
applications with comparable accuracy and less effort than was necessary with previously
available methods (Batiste, 1973). Paradis and Comeau (1972) also recorded a good
16
correlation between male captures and the number of damaged apples in orchards of
southwestern Quebec. By relating pheromone trap catches of male moths to subsequent larval
infestation levels in fruit, several workers studied the use of pheromone traps for estimating C.
pomonella population levels in fruit orchards (Wong, 1971) and successfully based seasonal
control programs on pheromone catch interpretation (Madsen and Vakenti, 1973).
Among abiotic factors relative humidity (Jindal and Brar, 2005) temperature and
rainfall (Singh and Sekhon, 1998) play an important role in population buildup or decline of
leaf hoppers. Besides, weather parameters, varietal preference also play significant role in
population sizing.
Currently, pheromone traps for monitoring are widely used and they allow an easy
pest monitoring for determining treatment need and timing. The most tolerance thresholds are
based on weekly and fortnightly male captures in the trap baited sex pheromone. These
threshold depends on the fruit species, geographical situation and time of the season.
Threshold in apple in Catalonia is 3 moths/trap/week, from petal falling to mid-June and 2
moths/trap/week, from mid June to harvest (Tora et al., 1995)
The current studies were therefore undertaken to know about the population dynamics
and trends of the C. pomonella in three major apple growing areas of Swat i.e. Matta, Madyan
and Kalam having different altitudes and climatic conditions by adults male moth catches
through pheromone traps and correlated them with temperature (maximum, minimum),
relative humidity (morning, evening) and total rainfall. Multiple regression models were
constructed to determine treatments needed and timing of their applications for its proper and
effective management.
17
2.2. REVIEW OF LITERATURE
Different sex pheromones as attractant baits containing insecticides but mostely used
for the population dynamic of some pest. This technique are used for so many years for the
management of pest. Those insects attracted to pheromones can be easly killed by this
methods. Commercial formulations of pheromones for both the pest and natural enemies are
now possible in all parts of the world. Most insect pheromones are very expensive due to
multy component and precise ratios of components. IPM is the best method for the effective
management of garden pest through pheromones traps (Riedl and Croft, 1974).
Ebesu (2003) studied sex pheromone trap as a quantitative sampling device in a
biological monitoring scheme for C. pomonella populations in Michigan apple orchards. By
correlating seasonal male moth catches to absolute infestation levels at harvest, it was possible
to indicate the density response of male moth catches in the pheromone trap. Factors
influencing trap efficiency and the relationship of trap catch to adult moth density and the
overall seasonal dynamics of C. pornonella. Catch response was non-linear and the trap
ceased to be indicative of higher infestation levels when accumulative catch exceeded about
100 moths/trap. Of many factors influencing trap catch size, the number of moth productive
trees serviced by a trap (trap/tree ratio) and temperature were shown to be of critical
importance.
Mandal et al. (2006) reported the effect of meteorological parameters on population
buildup of red spider mite, T. telarius in okra crop at Bhiar India during summer seasons of
2000-01. Results showed that the activity of the insect confirmed non-significant negative
correlation with maximum temperature and positive correlation with minimum
temperature. Morning and afternoon relative humidity explained a significant positive
correlation with the activity of mites. Regression analysis explained 78-85 percent
variability due to meterorological parameters in the population of red spider mite.
The effect of weather parameters were studies on the population dynamics of leaf
hopper on four cultivars of maize crop (Sultan, Sadaf, Neelam and Akbar) and the results
revealed that highest population was noticed when the temperature was 36.5 o
C and relative
humidity (R.H) was 68%. The population showed declined at temperature 31.5oC and R.H
at 75%. Highest infestation of Chilo partelous (Lepidoptera) was recorded when the
32.5oC R.H at 68% whilst its population was lowest when the temperature reached to
32.5oC and R.H at 50%. These findings confirmed that weather parameters (Temperature
18
and relative humidity) has a substantial effect on the population dynamics of insects pests
of maize, while total rainfall showed non significant effect (Zulfiqar et al., 2010).
The influence of weather parameters were also investigated on the incidence and
development of Spodoptera litura (Lepidoptera) at five different dates of sowing on three
varieties of cotton. The population of S. litura gradually built up from 1st week of April and
attained its peak in the 1st week of May. Highest population (25.46%) was noticed at
temperature ranges from 26.0°C to 35.1°C, R.H ranges from 62-89% and zero rainfall.
Population of S. litura explained positive correlation with R.H, sunshine hours and dewfall,
whereas wind velocity showed negative correlation with population build up. This study is
essential for the effective pest management of S. litura in cotton. The said research work
wil be use for forecasting outbreaks of S. litura and also for its effective management
(Selvaraj et al., 2010).
Laskar and Chatterjee (2010) examined pheromone sex attractant "Cue lure" for
trapping Bactrocera cucurbitae (Coq.) (Diptera : Tephritidae) round the year for the
effective management of this pest. A great variation regarding occurrence of the pest was
noticed during the period of studies. The pest population was highest and more active
during warm and rainy months (At 25-37oC), however its population was lowest in dry and
winter months. Weather parameters such temperature disclosed positive correlation (r) of
the fly incidence was noted with minimum (r = +0.7596) and maximum temperature (r =
+0.7376), and relative humidity (r = -0.5481). Rainfall showed positive (r = +0.4367)
correlation with the fly infestation. Results of the present survey may be utilized in
chalking out sustainable pest management strategy in the agro-ecological system under
consideration.
Prasannakumar et al. (2011) studied the influence of weather parameters on the
pheromone trap catches on different pest of different crops such as tomato fruit borer
Helicoverpa armigera (Hubner), okra shoot and fruit borer Earias insulana Boisduval, Brinjal
Shoot and fruit borer (BSFB) Leucinodes orbonalis Guenee, Potato cutworm Spodoptera
litura Fabricius and Diamond back moth (DBM) Plutella xylostella (L.) during rabi, 2007 at
Bangalore India. The tomato borer attained its peak population level during 47th
sandard
meteriological week (SMW) (7.10 moths/trap) and had a positive but non-significant
relationship with morning (r = 0.07) and afternoon relative humidity (r = 0.18). Okra shoot
and fruit borer attained their peak population (7.52 moths/trap) in 48th
SMW and Brinjal shoot
19
and fruit borer (44.13 moths/trap) in 41st SMW. These moth catches had a positive non
significant correlation with morning ((r = 0.18 and 0.44) and afternoon relative humidity (r =
0.45 and 0.45) respectively. However, maximum temperature showed statistically significant
(p<0.05) correlation with population built up for the siad pest. The population of S. litura was
47.21 moths/trap in 45th
SMW and combined effect of all the weather parameters influenced
trap catches. Maximum population (31.23 moths/trap) of P. xylostella (Lepidoptera) was
observed at 37th
SMW with postive correlation with minimum temperature (r = 0.21),
morning (r = 0.43) and afternoon relative humidity (r = 0.48) and rainfall (r = 0.32).
Karuppaiah and Sujayanad (2012) investigated that due to climate change, globle
average temperature and rainfall pattern has completely changed world wide. These kind of
changes definitely ultimatley effect the population dynamics of the insect pest. Among all
these abiotic factors, temperature greatly effect the population trend of the insect pest. Thus
temperature play an indispensable role for the population dynamics of the pests and as a result
change can occured in their population.
Anjali et al. (2012) observed find out the effect of weather parameters on the
incidence of major insect pest of brinjal crop. Maximum pest infestation of leaf hopper
(Amrasca biguttula Biguttula) was recorded during 52nd
SMW while its population was
lowest during 12th
SMW. Highest infestation of White fly (Bemisia tabaci) was recorded
during January (2nd
SMW) and lowest was during March (12th
SMW). These pests showed
significant negative correlation with both maximum and minimum temperature, whilst a
positive correlation was noticed with mean relative humidity and total rainfall. The first
peack population of shoot and fruit borer, Leucinodes orbonalis Guenee was observed
during 6th
and 7th
SMW and the percent shoot damage was positively related with
temperature, wind speed and rainfall whilst negetively effect was observed for relative
humidity. These studies showed that weather parameters has a profound effect on the insect
pest fluctuation. Thus management technique should be applied from November for the
effective management of brinjal pests.
Sharma and Singh (2012) recorded the population of leaf hopper (Amrasca
devastans Distant) on processing varieties of potato and its correlation with weather
parameters, studies were carried out at, Modipuram in early, main and spring crops.
Comparison of mean leaf hopper population during three different crop seasons revealed
that early crop planted during September favoured highest development of leaf hoppers
20
followed by main and spring crops. A distinctive varietal difference was observed in
appearance and flare up of leaf hoppers. Multiple regression equation based on
temperature, relative humidity, wind velocity, sunshine duration and rainfall could
explicate leaf hopper population variation from 50-96%.
Eight Bt and five non-Bt cotton genotypes were evaluated against thrips and
whitefly and correlated their population fluctuation with weather parameter at Multan
during 2010 and 2011. Maximum infestation were observed on Bt genotype whilst non Bt
genotype was resistance to the attack of whitefly and thirps. However, in the proceeding
year the effect of all these factors were non significant and parallel trend was recorded for
thrips population on Bt variety. Minimum temperature showed strong positive correlation
with thrips population builtup. Nonethless, whitefly showed significant change in their
population on Bt varieties in the experiment. Thus weather parameter play a great role in
the population dynamics on insect pest (Akram et al., 2013).
21
2.3. MATERIALS AND METHODS
2.3.1. Study parameters and location
These experiments were conducted at three main apple growing areas of Swat Pakistan (340
34' to 350 55' of latitude North and 72
0 08' to 72
0 50' of longitude East in the North West of
Khyber Pakhtunkhwa) i.e., Matta (350 55' 19.11" of latitude North and 72
0 30' 37.52" of
longitude East), Madyan (350 08' 0.00" of latitude North and 72
0 32' 0.00" of longitude East)
and Kalam (350 28' 41.66" of latitude North and 72
0 34' 18.61" of longitude East) which were
located at an altitude of 920.30, 1333.84 and 2092.30 meters respectively above the sea level.
Population dynamics of C. pomonella were studied throughout two consecutive
seasons during the years 2012 and 2013 in the above three areas. Four synthetic pheromone
traps were installed per field in four apple orchards of the red delicious variety in the farmer's
orchard at all the three places. The size of the apple orchard was 2.5 ha, comprised 250 apple
trees and were 12 years old. The experiments were carried out in randomized complete block
design (RCBD) and the adult moth catches replicated four times during both the seasons. The
plant to plant and row to row distance between apple trees were 5.53 x 5.53 square meters.
Ruber capsule (Septa) having 1 mg codlemone synthetic pheromone for attracting the
C. pomonella were suspended in the above upper plastic lid of the trap (Supplied by Shani
Enterprise Multan Pakistan). The traps were fixed in the apple orchard randomly in the centre
for attracting the male moth at four site in the field at height of 2.5 meters. Each time as traps
were checked, C. pomonella were counted and removed on weekly basis. Pheromone traps
were only attracting male moth of C. pomonella and attraction and capturing of other insect
were insignificant throughout the season. Codlemone-charged rubber septa were replaced
twice within a month with fresh septa to insure maximum attraction.
The observations on moth catches, weekly averaged maximum and minimum
temperature percent relative humidity (morning, 0300Z and evening 1200Z) and total rainfall
were taken on weekly basis. For this experiment Reidl and Croft (1974) procedures were
followed with some minor modification suitable to the prevailing conditions of the apple
orchard in Swat Pakistan.
Standard agricultural practices were used in the apple orchard i.e., normal weeding,
irrigation practices, application of fertilizers and sanitation etc. The apple orchard was allowed
with C. pomonella infestation and no control measures were applied. The Standard
22
The data regarding adult moth catches were taken with respect to the Standard
meteorological week (SMW) which starts from 1st January - 07
th January and so on, while the
traps were placed in the apple orchard in the 13th
SMW (Table-2.1). The data regarding
weather were starts from 14th
SMW (Start from April) to 38th
SMW (end of September) of
Tehsil Matta, Madyan and Kalam were taken from Pakistan meteorological department Swat
and was correlated with the trap catches.
2.3.2. Statistical Analysis
All the data regarding population fluctuation and dynamics of C. pomonella catches in
the pheromone traps with respect to weather parameters such as, temperature (maximum,
minimum), percent relative humidity (morning and evening) and total rainfall of the week
were subjected to correlation (Pearson) and linear multiple regression analysis through
computer statistical software Statistix (version 8.1.) The coefficient of determination (R2) was
also determined through multiple regression models (Bowden and Morris, 1995).
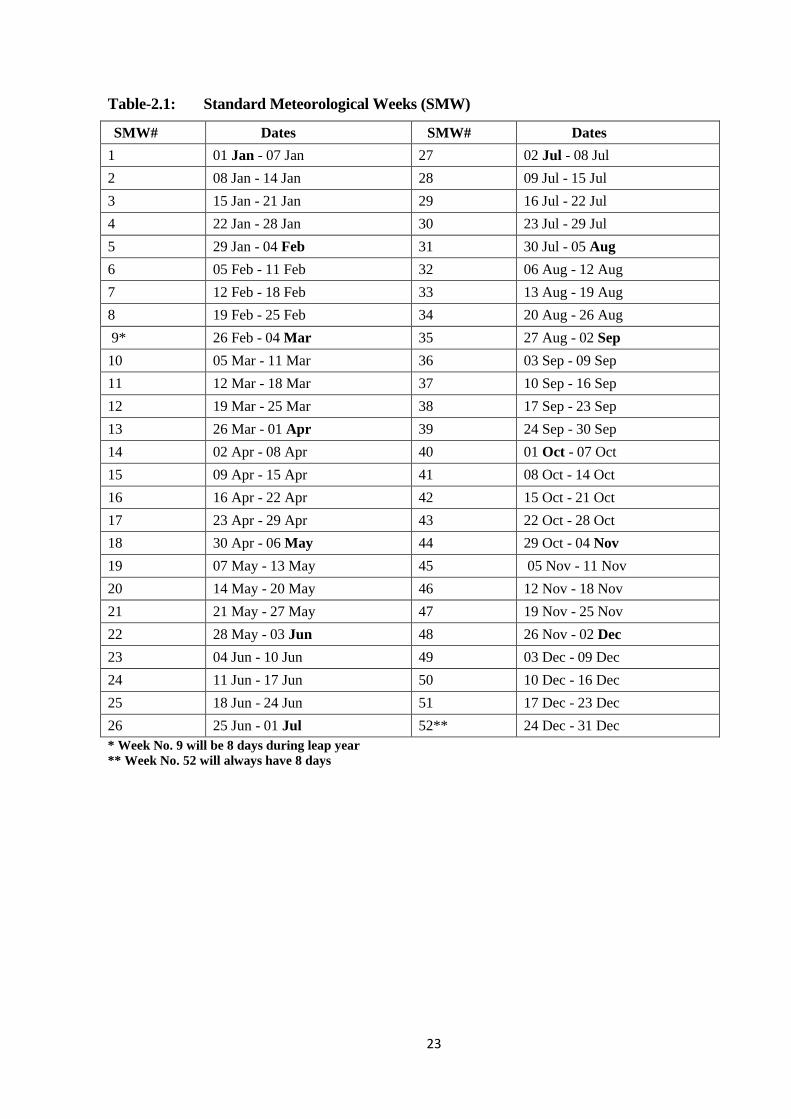
23
Table-2.1: Standard Meteorological Weeks (SMW)
SMW# Dates SMW# Dates
1 01 Jan - 07 Jan 27 02 Jul - 08 Jul
2 08 Jan - 14 Jan 28 09 Jul - 15 Jul
3 15 Jan - 21 Jan 29 16 Jul - 22 Jul
4 22 Jan - 28 Jan 30 23 Jul - 29 Jul
5 29 Jan - 04 Feb 31 30 Jul - 05 Aug
6 05 Feb - 11 Feb 32 06 Aug - 12 Aug
7 12 Feb - 18 Feb 33 13 Aug - 19 Aug
8 19 Feb - 25 Feb 34 20 Aug - 26 Aug
9* 26 Feb - 04 Mar 35 27 Aug - 02 Sep
10 05 Mar - 11 Mar 36 03 Sep - 09 Sep
11 12 Mar - 18 Mar 37 10 Sep - 16 Sep
12 19 Mar - 25 Mar 38 17 Sep - 23 Sep
13 26 Mar - 01 Apr 39 24 Sep - 30 Sep
14 02 Apr - 08 Apr 40 01 Oct - 07 Oct
15 09 Apr - 15 Apr 41 08 Oct - 14 Oct
16 16 Apr - 22 Apr 42 15 Oct - 21 Oct
17 23 Apr - 29 Apr 43 22 Oct - 28 Oct
18 30 Apr - 06 May 44 29 Oct - 04 Nov
19 07 May - 13 May 45 05 Nov - 11 Nov
20 14 May - 20 May 46 12 Nov - 18 Nov
21 21 May - 27 May 47 19 Nov - 25 Nov
22 28 May - 03 Jun 48 26 Nov - 02 Dec
23 04 Jun - 10 Jun 49 03 Dec - 09 Dec
24 11 Jun - 17 Jun 50 10 Dec - 16 Dec
25 18 Jun - 24 Jun 51 17 Dec - 23 Dec
26 25 Jun - 01 Jul 52** 24 Dec - 31 Dec
* Week No. 9 will be 8 days during leap year
** Week No. 52 will always have 8 days
24
2.4. RESULTS
2.4.1. Meteorological parameters and C. pomonella population at Matta Swat
during years 2012 and 2013
The data pertaining to the mean population of C. pomonella disclosed that the
population varied significantly in different weeks of cropping season during 2012 and 2013.
The pest population was observed significantly from 17th
standard meteorological week
(SMW) and increased progressively with sharp rise and fall at the subsequent interval up to
38th
(SMW) (Table 2.2). The data regarding mean adult moth catches in the traps with respect
to the weather parameters of the current season of the apple orchard during both the years of
studies disclosed that the first flight of C. pomonella population was observed in 17th
SMW
(Where mean population were 1.00±0.40 per trap) during 2012 and 2013, respectively. The
population of C. pomonella gradually showed increase in the 20th
SMW where it reached to
7.00±0.81 and 3.00±1.08 per trap respectively in both years of studies. Afterwards, mean
population of C. pomonella attained its maximum level during the 25th
SMW
(11.25±1.25/trap) during the year 2012 and 15.75±1.65 per trap in the 26th
SMW in the second
year. Then the mean population fluctuation of C. pomonella again gradually showed decline
and reached to 7.00±1.29 and 8.00±1.22 per trap during both the proceeding years in 29th
SMW. After sharp rise and fall in the population, again attained its maximum level
(12.00±0.81 and 13.00±0.81 per trap) in the 31st and 32
nd SMW during the years 2012 and
2013 respectively (Fig. 2.1). The lowest mean population of C. pomonella was recorded in the
38th
SMW (0.25±0.25 and 1.00±0.70/ trap) respectively during both the years of studies
(Table. 2.2). As it is evident from the results of this experiment that the change in the weather
parameters such as temperature, relative humidity and rainfall can substantialy effect the
population fluctuation of the this pest and can be concluded that this pest can complete two
generation per season of the apple orchard.
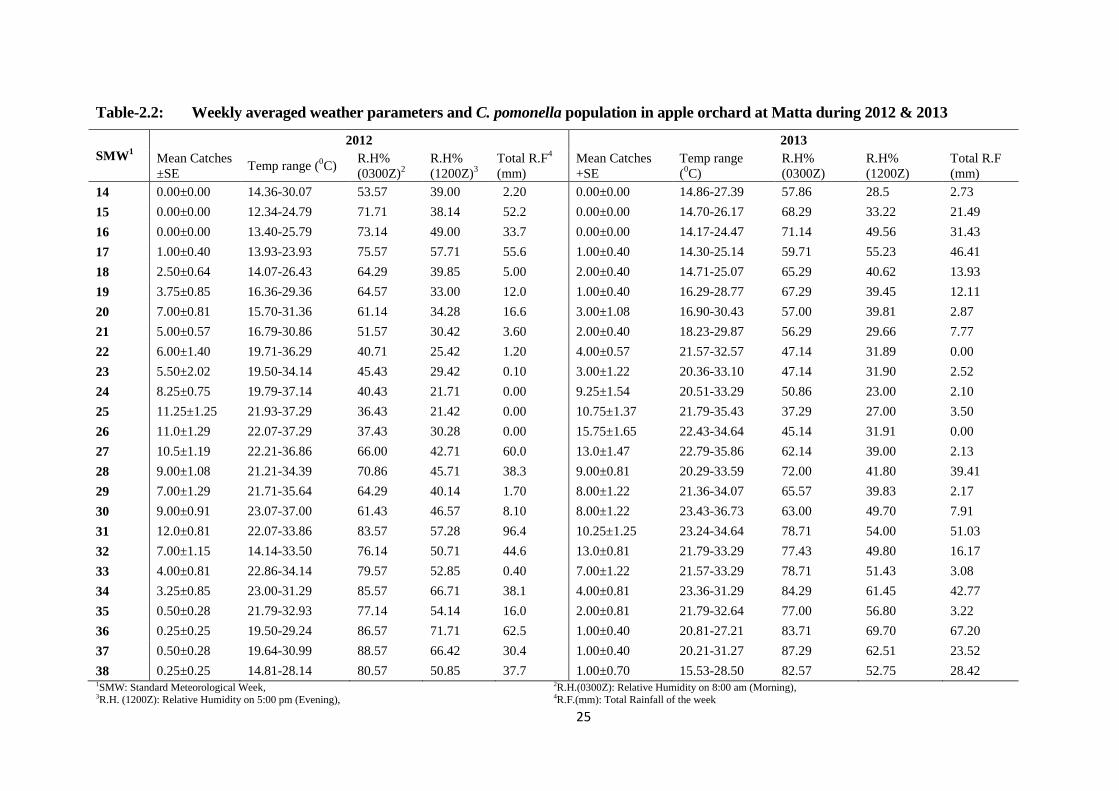
25
Table-2.2: Weekly averaged weather parameters and C. pomonella population in apple orchard at Matta during 2012 & 2013
SMW1
2012 2013
Mean Catches
±SE Temp range (
0C)
R.H%
(0300Z)2
R.H%
(1200Z)3
Total R.F4
(mm)
Mean Catches
+SE
Temp range
(0C)
R.H%
(0300Z)
R.H%
(1200Z)
Total R.F
(mm)
14 0.00±0.00 14.36-30.07 53.57 39.00 2.20 0.00±0.00 14.86-27.39 57.86 28.5 2.73
15 0.00±0.00 12.34-24.79 71.71 38.14 52.2 0.00±0.00 14.70-26.17 68.29 33.22 21.49
16 0.00±0.00 13.40-25.79 73.14 49.00 33.7 0.00±0.00 14.17-24.47 71.14 49.56 31.43
17 1.00±0.40 13.93-23.93 75.57 57.71 55.6 1.00±0.40 14.30-25.14 59.71 55.23 46.41
18 2.50±0.64 14.07-26.43 64.29 39.85 5.00 2.00±0.40 14.71-25.07 65.29 40.62 13.93
19 3.75±0.85 16.36-29.36 64.57 33.00 12.0 1.00±0.40 16.29-28.77 67.29 39.45 12.11
20 7.00±0.81 15.70-31.36 61.14 34.28 16.6 3.00±1.08 16.90-30.43 57.00 39.81 2.87
21 5.00±0.57 16.79-30.86 51.57 30.42 3.60 2.00±0.40 18.23-29.87 56.29 29.66 7.77
22 6.00±1.40 19.71-36.29 40.71 25.42 1.20 4.00±0.57 21.57-32.57 47.14 31.89 0.00
23 5.50±2.02 19.50-34.14 45.43 29.42 0.10 3.00±1.22 20.36-33.10 47.14 31.90 2.52
24 8.25±0.75 19.79-37.14 40.43 21.71 0.00 9.25±1.54 20.51-33.29 50.86 23.00 2.10
25 11.25±1.25 21.93-37.29 36.43 21.42 0.00 10.75±1.37 21.79-35.43 37.29 27.00 3.50
26 11.0±1.29 22.07-37.29 37.43 30.28 0.00 15.75±1.65 22.43-34.64 45.14 31.91 0.00
27 10.5±1.19 22.21-36.86 66.00 42.71 60.0 13.0±1.47 22.79-35.86 62.14 39.00 2.13
28 9.00±1.08 21.21-34.39 70.86 45.71 38.3 9.00±0.81 20.29-33.59 72.00 41.80 39.41
29 7.00±1.29 21.71-35.64 64.29 40.14 1.70 8.00±1.22 21.36-34.07 65.57 39.83 2.17
30 9.00±0.91 23.07-37.00 61.43 46.57 8.10 8.00±1.22 23.43-36.73 63.00 49.70 7.91
31 12.0±0.81 22.07-33.86 83.57 57.28 96.4 10.25±1.25 23.24-34.64 78.71 54.00 51.03
32 7.00±1.15 14.14-33.50 76.14 50.71 44.6 13.0±0.81 21.79-33.29 77.43 49.80 16.17
33 4.00±0.81 22.86-34.14 79.57 52.85 0.40 7.00±1.22 21.57-33.29 78.71 51.43 3.08
34 3.25±0.85 23.00-31.29 85.57 66.71 38.1 4.00±0.81 23.36-31.29 84.29 61.45 42.77
35 0.50±0.28 21.79-32.93 77.14 54.14 16.0 2.00±0.81 21.79-32.64 77.00 56.80 3.22
36 0.25±0.25 19.50-29.24 86.57 71.71 62.5 1.00±0.40 20.81-27.21 83.71 69.70 67.20
37 0.50±0.28 19.64-30.99 88.57 66.42 30.4 1.00±0.40 20.21-31.27 87.29 62.51 23.52
38 0.25±0.25 14.81-28.14 80.57 50.85 37.7 1.00±0.70 15.53-28.50 82.57 52.75 28.42 1SMW: Standard Meteorological Week, 2R.H.(0300Z): Relative Humidity on 8:00 am (Morning), 3R.H. (1200Z): Relative Humidity on 5:00 pm (Evening), 4R.F.(mm): Total Rainfall of the week
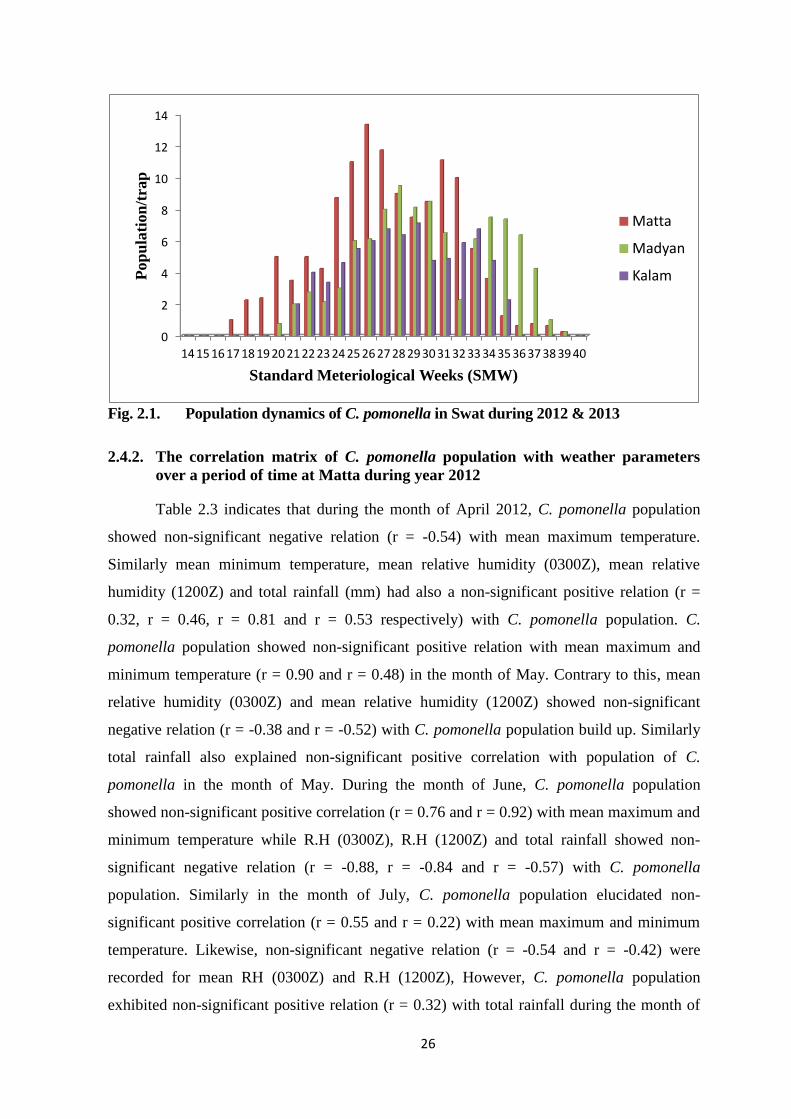
26
Fig. 2.1. Population dynamics of C. pomonella in Swat during 2012 & 2013
2.4.2. The correlation matrix of C. pomonella population with weather parameters
over a period of time at Matta during year 2012
Table 2.3 indicates that during the month of April 2012, C. pomonella population
showed non-significant negative relation (r = -0.54) with mean maximum temperature.
Similarly mean minimum temperature, mean relative humidity (0300Z), mean relative
humidity (1200Z) and total rainfall (mm) had also a non-significant positive relation (r =
0.32, r = 0.46, r = 0.81 and r = 0.53 respectively) with C. pomonella population. C.
pomonella population showed non-significant positive relation with mean maximum and
minimum temperature (r = 0.90 and r = 0.48) in the month of May. Contrary to this, mean
relative humidity (0300Z) and mean relative humidity (1200Z) showed non-significant
negative relation (r = -0.38 and r = -0.52) with C. pomonella population build up. Similarly
total rainfall also explained non-significant positive correlation with population of C.
pomonella in the month of May. During the month of June, C. pomonella population
showed non-significant positive correlation (r = 0.76 and r = 0.92) with mean maximum and
minimum temperature while R.H (0300Z), R.H (1200Z) and total rainfall showed non-
significant negative relation (r = -0.88, r = -0.84 and r = -0.57) with C. pomonella
population. Similarly in the month of July, C. pomonella population elucidated non-
significant positive correlation (r = 0.55 and r = 0.22) with mean maximum and minimum
temperature. Likewise, non-significant negative relation (r = -0.54 and r = -0.42) were
recorded for mean RH (0300Z) and R.H (1200Z), However, C. pomonella population
exhibited non-significant positive relation (r = 0.32) with total rainfall during the month of
0
2
4
6
8
10
12
14
14 15 16 17 18 19 20 21 22 23 24 25 26 27 28 29 30 31 32 33 34 35 36 37 38 39 40
Pop
ula
tion
/tra
p
Standard Meteriological Weeks (SMW)
Matta
Madyan
Kalam
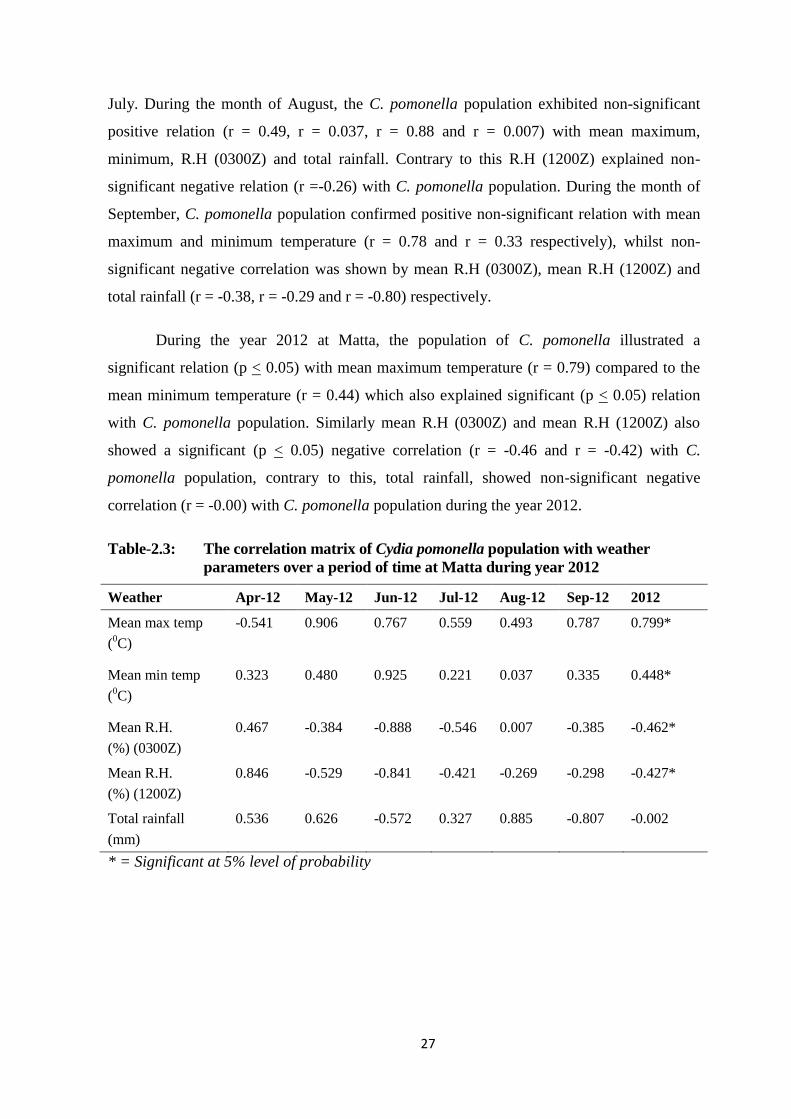
27
July. During the month of August, the C. pomonella population exhibited non-significant
positive relation (r = 0.49, r = 0.037, r = 0.88 and r = 0.007) with mean maximum,
minimum, R.H (0300Z) and total rainfall. Contrary to this R.H (1200Z) explained non-
significant negative relation (r =-0.26) with C. pomonella population. During the month of
September, C. pomonella population confirmed positive non-significant relation with mean
maximum and minimum temperature (r = 0.78 and r = 0.33 respectively), whilst non-
significant negative correlation was shown by mean R.H (0300Z), mean R.H (1200Z) and
total rainfall (r = -0.38, r = -0.29 and r = -0.80) respectively.
During the year 2012 at Matta, the population of C. pomonella illustrated a
significant relation (p < 0.05) with mean maximum temperature (r = 0.79) compared to the
mean minimum temperature (r = 0.44) which also explained significant (p < 0.05) relation
with C. pomonella population. Similarly mean R.H (0300Z) and mean R.H (1200Z) also
showed a significant (p < 0.05) negative correlation (r = -0.46 and r = -0.42) with C.
pomonella population, contrary to this, total rainfall, showed non-significant negative
correlation (r = -0.00) with C. pomonella population during the year 2012.
Table-2.3: The correlation matrix of Cydia pomonella population with weather
parameters over a period of time at Matta during year 2012
Weather Apr-12 May-12 Jun-12 Jul-12 Aug-12 Sep-12 2012
Mean max temp
(0C)
-0.541 0.906 0.767 0.559 0.493 0.787 0.799*
Mean min temp
(0C)
0.323 0.480 0.925 0.221 0.037 0.335 0.448*
Mean R.H.
(%) (0300Z)
0.467 -0.384 -0.888 -0.546 0.007 -0.385 -0.462*
Mean R.H.
(%) (1200Z)
0.846 -0.529 -0.841 -0.421 -0.269 -0.298 -0.427*
Total rainfall
(mm)
0.536 0.626 -0.572 0.327 0.885 -0.807 -0.002
* = Significant at 5% level of probability
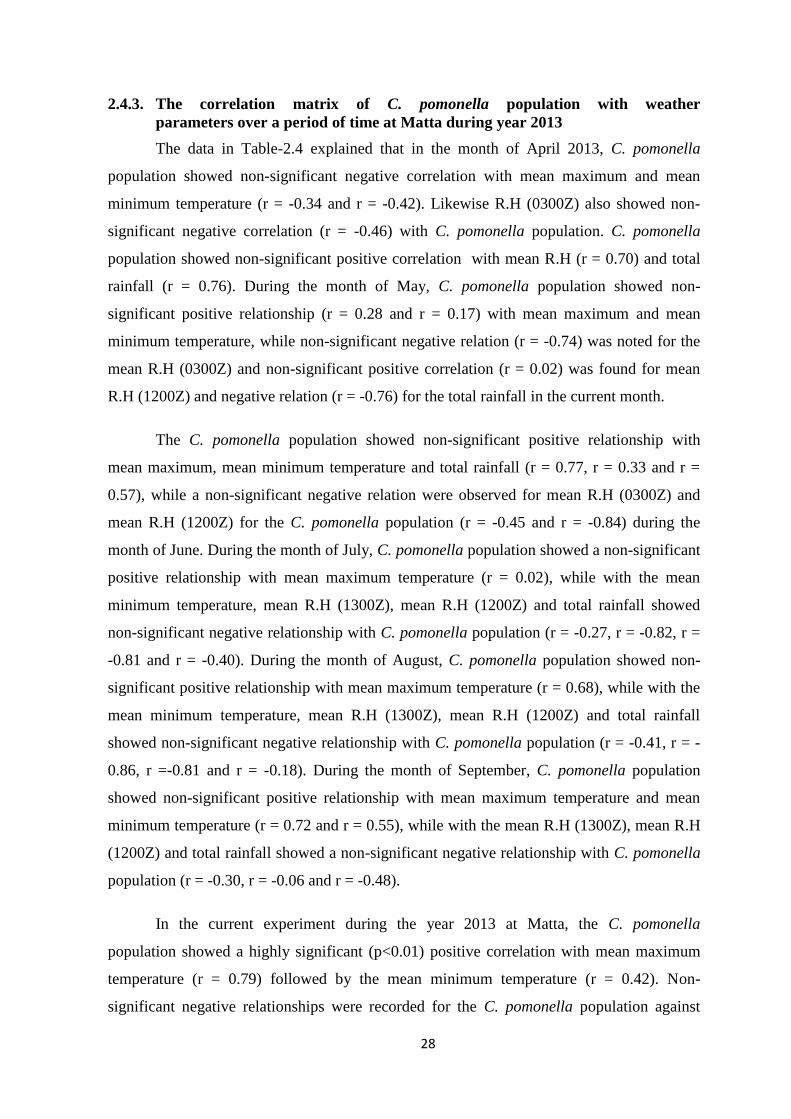
28
2.4.3. The correlation matrix of C. pomonella population with weather
parameters over a period of time at Matta during year 2013
The data in Table-2.4 explained that in the month of April 2013, C. pomonella
population showed non-significant negative correlation with mean maximum and mean
minimum temperature (r = -0.34 and r = -0.42). Likewise R.H (0300Z) also showed non-
significant negative correlation (r = -0.46) with C. pomonella population. C. pomonella
population showed non-significant positive correlation with mean R.H (r = 0.70) and total
rainfall (r = 0.76). During the month of May, C. pomonella population showed non-
significant positive relationship (r = 0.28 and r = 0.17) with mean maximum and mean
minimum temperature, while non-significant negative relation (r = -0.74) was noted for the
mean R.H (0300Z) and non-significant positive correlation (r = 0.02) was found for mean
R.H (1200Z) and negative relation (r = -0.76) for the total rainfall in the current month.
The C. pomonella population showed non-significant positive relationship with
mean maximum, mean minimum temperature and total rainfall (r = 0.77, r = 0.33 and r =
0.57), while a non-significant negative relation were observed for mean R.H (0300Z) and
mean R.H (1200Z) for the C. pomonella population (r = -0.45 and r = -0.84) during the
month of June. During the month of July, C. pomonella population showed a non-significant
positive relationship with mean maximum temperature (r = 0.02), while with the mean
minimum temperature, mean R.H (1300Z), mean R.H (1200Z) and total rainfall showed
non-significant negative relationship with C. pomonella population (r = -0.27, r = -0.82, r =
-0.81 and r = -0.40). During the month of August, C. pomonella population showed non-
significant positive relationship with mean maximum temperature (r = 0.68), while with the
mean minimum temperature, mean R.H (1300Z), mean R.H (1200Z) and total rainfall
showed non-significant negative relationship with C. pomonella population (r = -0.41, r = -
0.86, r =-0.81 and r = -0.18). During the month of September, C. pomonella population
showed non-significant positive relationship with mean maximum temperature and mean
minimum temperature (r = 0.72 and r = 0.55), while with the mean R.H (1300Z), mean R.H
(1200Z) and total rainfall showed a non-significant negative relationship with C. pomonella
population (r = -0.30, r = -0.06 and r = -0.48).
In the current experiment during the year 2013 at Matta, the C. pomonella
population showed a highly significant (p<0.01) positive correlation with mean maximum
temperature (r = 0.79) followed by the mean minimum temperature (r = 0.42). Non-
significant negative relationships were recorded for the C. pomonella population against
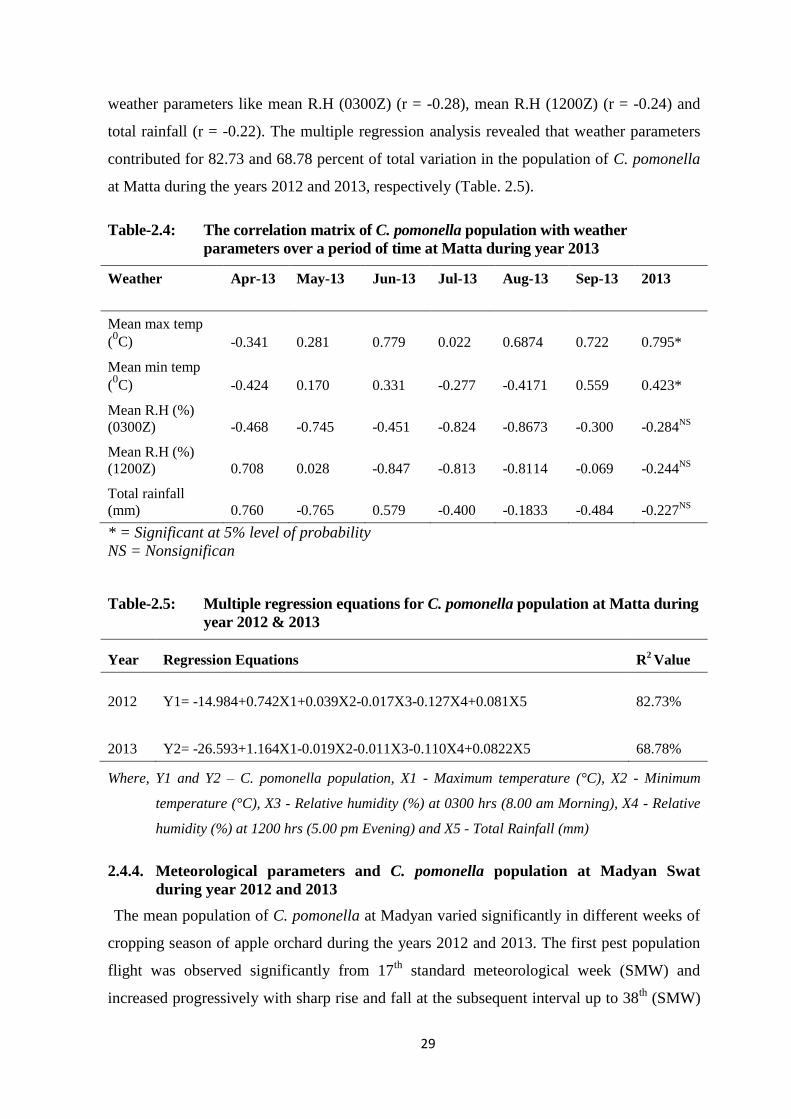
29
weather parameters like mean R.H (0300Z) (r = -0.28), mean R.H (1200Z) (r = -0.24) and
total rainfall (r = -0.22). The multiple regression analysis revealed that weather parameters
contributed for 82.73 and 68.78 percent of total variation in the population of C. pomonella
at Matta during the years 2012 and 2013, respectively (Table. 2.5).
Table-2.4: The correlation matrix of C. pomonella population with weather
parameters over a period of time at Matta during year 2013
Weather Apr-13 May-13 Jun-13 Jul-13 Aug-13 Sep-13 2013
Mean max temp
(0C) -0.341 0.281 0.779 0.022 0.6874 0.722 0.795*
Mean min temp
(0C) -0.424 0.170 0.331 -0.277 -0.4171 0.559 0.423*
Mean R.H (%)
(0300Z) -0.468 -0.745 -0.451 -0.824 -0.8673 -0.300 -0.284NS
Mean R.H (%)
(1200Z) 0.708 0.028 -0.847 -0.813 -0.8114 -0.069 -0.244NS
Total rainfall
(mm) 0.760 -0.765 0.579 -0.400 -0.1833 -0.484 -0.227NS
* = Significant at 5% level of probability
NS = Nonsignifican
Table-2.5: Multiple regression equations for C. pomonella population at Matta during
year 2012 & 2013
Year Regression Equations R2 Value
2012 Y1= -14.984+0.742X1+0.039X2-0.017X3-0.127X4+0.081X5 82.73%
2013 Y2= -26.593+1.164X1-0.019X2-0.011X3-0.110X4+0.0822X5 68.78%
Where, Y1 and Y2 – C. pomonella population, X1 - Maximum temperature (°C), X2 - Minimum
temperature (°C), X3 - Relative humidity (%) at 0300 hrs (8.00 am Morning), X4 - Relative
humidity (%) at 1200 hrs (5.00 pm Evening) and X5 - Total Rainfall (mm)
2.4.4. Meteorological parameters and C. pomonella population at Madyan Swat
during year 2012 and 2013
The mean population of C. pomonella at Madyan varied significantly in different weeks of
cropping season of apple orchard during the years 2012 and 2013. The first pest population
flight was observed significantly from 17th
standard meteorological week (SMW) and
increased progressively with sharp rise and fall at the subsequent interval up to 38th
(SMW)
30
(Table- 2.6). The data regarding population fluctuation of C. pomonella collected in the
traps with respect to the abiotic factors of environment during different SMWs disclosed
that the first adult male moth was observed in 17th
SMW (Where mean population were
0.25±0.25 per trap) during 2012 and 2013, in both the year of studies. The population of C.
pomonella gradually showed increase in the 26th
SMW where it reached to 8.00±1.25 each
mean C. pomonella population per trap respectively in both years of studies. Afterwards,
mean population of C. pomonella reached to its maximum level during the 27th
SMW
(11.00±1.03 moth/trap) and in 29th
SMW (10.25±0.8 moths/trap) during the years 2012 and
2013 respectively (Fig. 2.1). Then the mean population fluctuation of C. pomonella again
gradually showed decline and reached to 2.50±0.85 and 2.00±0.85 moths/ trap during both
the proceeding years in 31st SMW. After sharp rise and fall in the population, again reached
to its maximum level (10.25±0.9 and 9.00±0.7 moths/ trap) in the 33rd
and 35th
SMW during
the years 2012 and 2013 respectively. The lowest mean population of C. pomonella was
recorded in the 37th
SMW and 38th
SMW (0.00±0.00 and 0.50±0.7 moths/ trap) respectively
during both the years of studies (Table. 2.6). The change in the population dynamics of this
pest is definitely due to change in the abiotic factors of environment and has ultimatly effect
the adult male moth activities in the traps at Madyan. So it is concluded from the result of
this experiment that this pest can partially complete two generation in Madyan area.
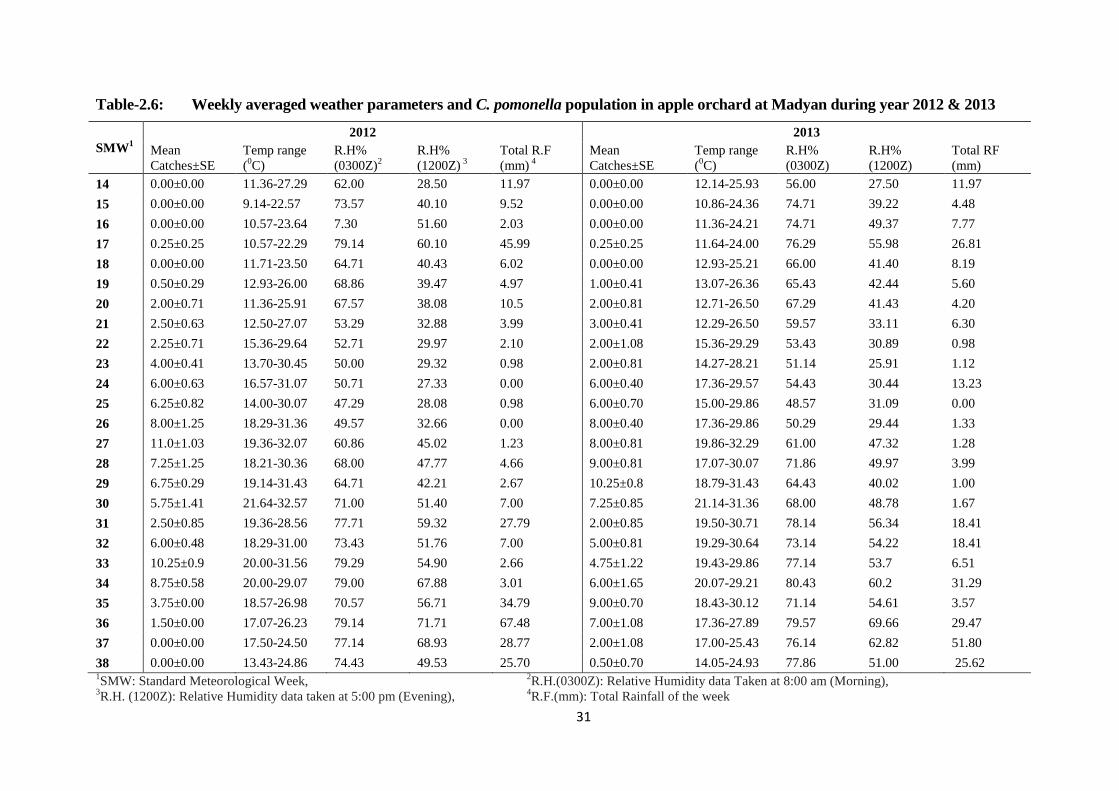
31
Table-2.6: Weekly averaged weather parameters and C. pomonella population in apple orchard at Madyan during year 2012 & 2013
SMW1
2012 2013
Mean
Catches±SE
Temp range
(0C)
R.H%
(0300Z)2
R.H%
(1200Z) 3
Total R.F
(mm) 4
Mean
Catches±SE
Temp range
(0C)
R.H%
(0300Z)
R.H%
(1200Z)
Total RF
(mm)
14 0.00±0.00 11.36-27.29 62.00 28.50 11.97 0.00±0.00 12.14-25.93 56.00 27.50 11.97
15 0.00±0.00 9.14-22.57 73.57 40.10 9.52 0.00±0.00 10.86-24.36 74.71 39.22 4.48
16 0.00±0.00 10.57-23.64 7.30 51.60 2.03 0.00±0.00 11.36-24.21 74.71 49.37 7.77
17 0.25±0.25 10.57-22.29 79.14 60.10 45.99 0.25±0.25 11.64-24.00 76.29 55.98 26.81
18 0.00±0.00 11.71-23.50 64.71 40.43 6.02 0.00±0.00 12.93-25.21 66.00 41.40 8.19
19 0.50±0.29 12.93-26.00 68.86 39.47 4.97 1.00±0.41 13.07-26.36 65.43 42.44 5.60
20 2.00±0.71 11.36-25.91 67.57 38.08 10.5 2.00±0.81 12.71-26.50 67.29 41.43 4.20
21 2.50±0.63 12.50-27.07 53.29 32.88 3.99 3.00±0.41 12.29-26.50 59.57 33.11 6.30
22 2.25±0.71 15.36-29.64 52.71 29.97 2.10 2.00±1.08 15.36-29.29 53.43 30.89 0.98
23 4.00±0.41 13.70-30.45 50.00 29.32 0.98 2.00±0.81 14.27-28.21 51.14 25.91 1.12
24 6.00±0.63 16.57-31.07 50.71 27.33 0.00 6.00±0.40 17.36-29.57 54.43 30.44 13.23
25 6.25±0.82 14.00-30.07 47.29 28.08 0.98 6.00±0.70 15.00-29.86 48.57 31.09 0.00
26 8.00±1.25 18.29-31.36 49.57 32.66 0.00 8.00±0.40 17.36-29.86 50.29 29.44 1.33
27 11.0±1.03 19.36-32.07 60.86 45.02 1.23 8.00±0.81 19.86-32.29 61.00 47.32 1.28
28 7.25±1.25 18.21-30.36 68.00 47.77 4.66 9.00±0.81 17.07-30.07 71.86 49.97 3.99
29 6.75±0.29 19.14-31.43 64.71 42.21 2.67 10.25±0.8 18.79-31.43 64.43 40.02 1.00
30 5.75±1.41 21.64-32.57 71.00 51.40 7.00 7.25±0.85 21.14-31.36 68.00 48.78 1.67
31 2.50±0.85 19.36-28.56 77.71 59.32 27.79 2.00±0.85 19.50-30.71 78.14 56.34 18.41
32 6.00±0.48 18.29-31.00 73.43 51.76 7.00 5.00±0.81 19.29-30.64 73.14 54.22 18.41
33 10.25±0.9 20.00-31.56 79.29 54.90 2.66 4.75±1.22 19.43-29.86 77.14 53.7 6.51
34 8.75±0.58 20.00-29.07 79.00 67.88 3.01 6.00±1.65 20.07-29.21 80.43 60.2 31.29
35 3.75±0.00 18.57-26.98 70.57 56.71 34.79 9.00±0.70 18.43-30.12 71.14 54.61 3.57
36 1.50±0.00 17.07-26.23 79.14 71.71 67.48 7.00±1.08 17.36-27.89 79.57 69.66 29.47
37 0.00±0.00 17.50-24.50 77.14 68.93 28.77 2.00±1.08 17.00-25.43 76.14 62.82 51.80
38 0.00±0.00 13.43-24.86 74.43 49.53 25.70 0.50±0.70 14.05-24.93 77.86 51.00 25.62 1SMW: Standard Meteorological Week,
2R.H.(0300Z): Relative Humidity data Taken at 8:00 am (Morning),
3R.H. (1200Z): Relative Humidity data taken at 5:00 pm (Evening),
4R.F.(mm): Total Rainfall of the week
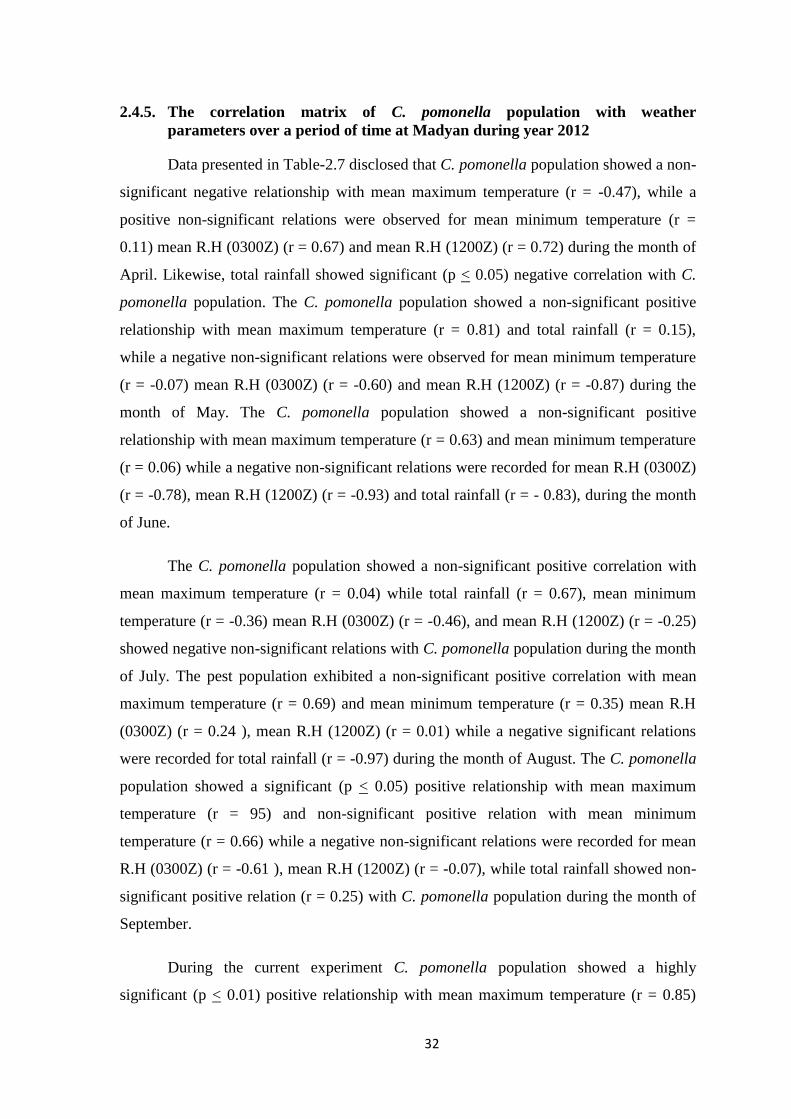
32
2.4.5. The correlation matrix of C. pomonella population with weather
parameters over a period of time at Madyan during year 2012
Data presented in Table-2.7 disclosed that C. pomonella population showed a non-
significant negative relationship with mean maximum temperature (r = -0.47), while a
positive non-significant relations were observed for mean minimum temperature (r =
0.11) mean R.H (0300Z) (r = 0.67) and mean R.H (1200Z) (r = 0.72) during the month of
April. Likewise, total rainfall showed significant (p < 0.05) negative correlation with C.
pomonella population. The C. pomonella population showed a non-significant positive
relationship with mean maximum temperature (r = 0.81) and total rainfall (r = 0.15),
while a negative non-significant relations were observed for mean minimum temperature
(r = -0.07) mean R.H (0300Z) (r = -0.60) and mean R.H (1200Z) (r = -0.87) during the
month of May. The C. pomonella population showed a non-significant positive
relationship with mean maximum temperature (r = 0.63) and mean minimum temperature
(r = 0.06) while a negative non-significant relations were recorded for mean R.H (0300Z)
(r = -0.78), mean R.H (1200Z) (r = -0.93) and total rainfall (r = - 0.83), during the month
of June.
The C. pomonella population showed a non-significant positive correlation with
mean maximum temperature (r = 0.04) while total rainfall (r = 0.67), mean minimum
temperature (r = -0.36) mean R.H (0300Z) (r = -0.46), and mean R.H (1200Z) (r = -0.25)
showed negative non-significant relations with C. pomonella population during the month
of July. The pest population exhibited a non-significant positive correlation with mean
maximum temperature (r = 0.69) and mean minimum temperature (r = 0.35) mean R.H
(0300Z) (r = 0.24 ), mean R.H (1200Z) (r = 0.01) while a negative significant relations
were recorded for total rainfall (r = -0.97) during the month of August. The C. pomonella
population showed a significant (p < 0.05) positive relationship with mean maximum
temperature (r = 95) and non-significant positive relation with mean minimum
temperature (r = 0.66) while a negative non-significant relations were recorded for mean
R.H (0300Z) (r = -0.61 ), mean R.H (1200Z) (r = -0.07), while total rainfall showed non-
significant positive relation (r = 0.25) with C. pomonella population during the month of
September.
During the current experiment C. pomonella population showed a highly
significant (p < 0.01) positive relationship with mean maximum temperature (r = 0.85)
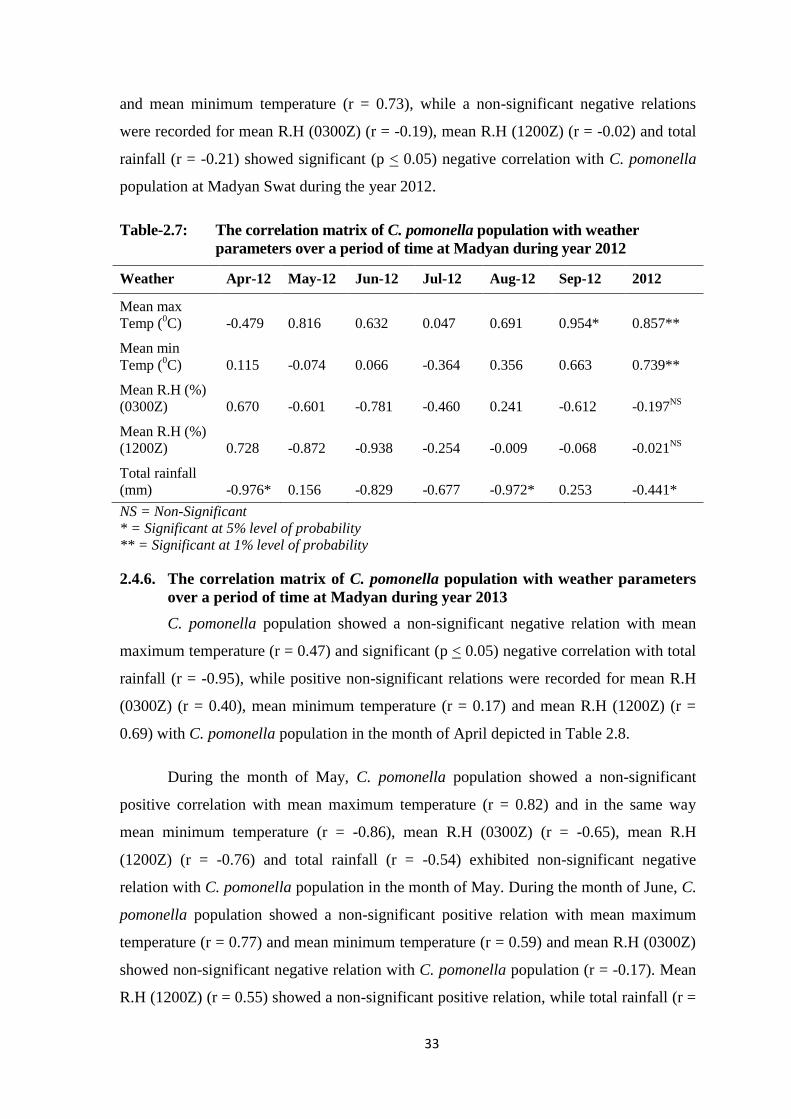
33
and mean minimum temperature (r = 0.73), while a non-significant negative relations
were recorded for mean R.H (0300Z) (r = -0.19), mean R.H (1200Z) (r = -0.02) and total
rainfall (r = -0.21) showed significant (p < 0.05) negative correlation with C. pomonella
population at Madyan Swat during the year 2012.
Table-2.7: The correlation matrix of C. pomonella population with weather
parameters over a period of time at Madyan during year 2012
Weather Apr-12 May-12 Jun-12 Jul-12 Aug-12 Sep-12 2012
Mean max
Temp (0C) -0.479 0.816 0.632 0.047 0.691 0.954* 0.857**
Mean min
Temp (0C) 0.115 -0.074 0.066 -0.364 0.356 0.663 0.739**
Mean R.H (%)
(0300Z) 0.670 -0.601 -0.781 -0.460 0.241 -0.612 -0.197NS
Mean R.H (%)
(1200Z) 0.728 -0.872 -0.938 -0.254 -0.009 -0.068 -0.021NS
Total rainfall
(mm) -0.976* 0.156 -0.829 -0.677 -0.972* 0.253 -0.441*
NS = Non-Significant
* = Significant at 5% level of probability
** = Significant at 1% level of probability
2.4.6. The correlation matrix of C. pomonella population with weather parameters
over a period of time at Madyan during year 2013
C. pomonella population showed a non-significant negative relation with mean
maximum temperature (r = 0.47) and significant (p < 0.05) negative correlation with total
rainfall (r = -0.95), while positive non-significant relations were recorded for mean R.H
(0300Z) (r = 0.40), mean minimum temperature (r = 0.17) and mean R.H (1200Z) (r =
0.69) with C. pomonella population in the month of April depicted in Table 2.8.
During the month of May, C. pomonella population showed a non-significant
positive correlation with mean maximum temperature (r = 0.82) and in the same way
mean minimum temperature (r = -0.86), mean R.H (0300Z) (r = -0.65), mean R.H
(1200Z) (r = -0.76) and total rainfall (r = -0.54) exhibited non-significant negative
relation with C. pomonella population in the month of May. During the month of June, C.
pomonella population showed a non-significant positive relation with mean maximum
temperature (r = 0.77) and mean minimum temperature (r = 0.59) and mean R.H (0300Z)
showed non-significant negative relation with C. pomonella population (r = -0.17). Mean
R.H (1200Z) (r = 0.55) showed a non-significant positive relation, while total rainfall (r =
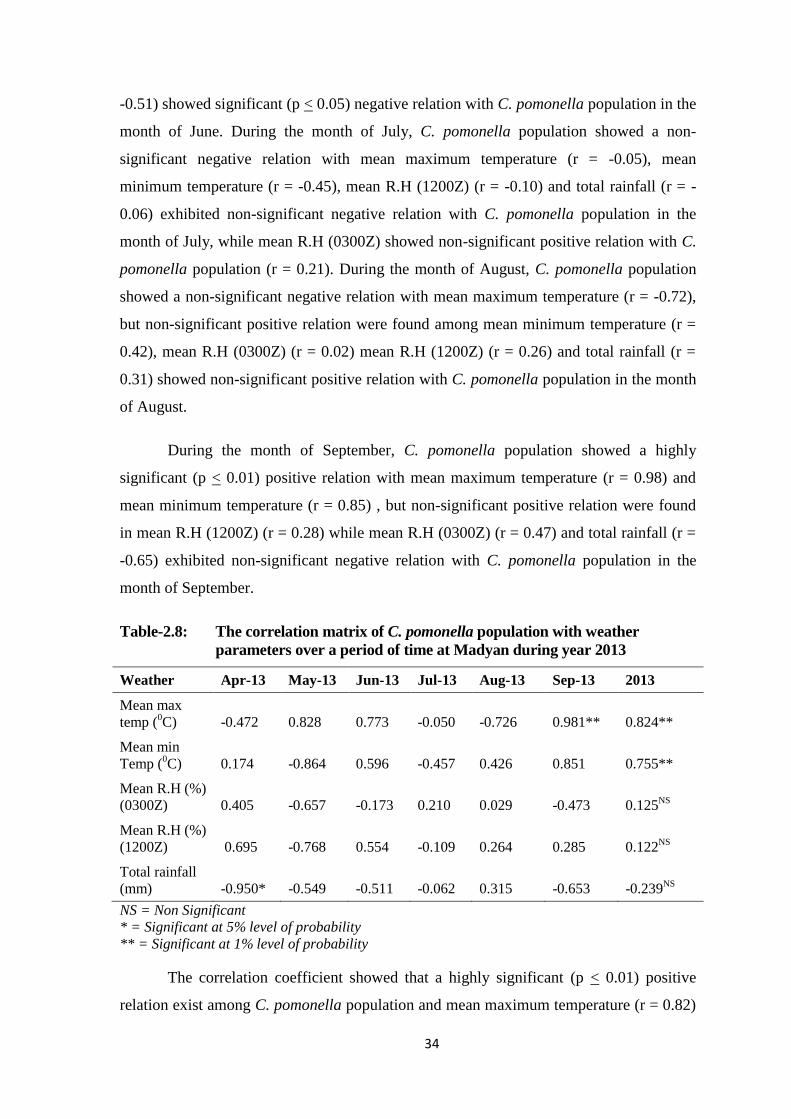
34
-0.51) showed significant (p < 0.05) negative relation with C. pomonella population in the
month of June. During the month of July, C. pomonella population showed a non-
significant negative relation with mean maximum temperature (r = -0.05), mean
minimum temperature (r = -0.45), mean R.H (1200Z) (r = -0.10) and total rainfall (r = -
0.06) exhibited non-significant negative relation with C. pomonella population in the
month of July, while mean R.H (0300Z) showed non-significant positive relation with C.
pomonella population (r = 0.21). During the month of August, C. pomonella population
showed a non-significant negative relation with mean maximum temperature (r = -0.72),
but non-significant positive relation were found among mean minimum temperature (r =
0.42), mean R.H (0300Z) (r = 0.02) mean R.H (1200Z) (r = 0.26) and total rainfall (r =
0.31) showed non-significant positive relation with C. pomonella population in the month
of August.
During the month of September, C. pomonella population showed a highly
significant (p < 0.01) positive relation with mean maximum temperature (r = 0.98) and
mean minimum temperature (r = 0.85) , but non-significant positive relation were found
in mean R.H (1200Z) (r = 0.28) while mean R.H (0300Z) (r = 0.47) and total rainfall (r =
-0.65) exhibited non-significant negative relation with C. pomonella population in the
month of September.
Table-2.8: The correlation matrix of C. pomonella population with weather
parameters over a period of time at Madyan during year 2013
Weather Apr-13 May-13 Jun-13 Jul-13 Aug-13 Sep-13 2013
Mean max
temp (0C) -0.472 0.828 0.773 -0.050 -0.726 0.981** 0.824**
Mean min
Temp (0C) 0.174 -0.864 0.596 -0.457 0.426 0.851 0.755**
Mean R.H (%)
(0300Z) 0.405 -0.657 -0.173 0.210 0.029 -0.473 0.125NS
Mean R.H (%)
(1200Z) 0.695 -0.768 0.554 -0.109 0.264 0.285 0.122NS
Total rainfall
(mm) -0.950* -0.549 -0.511 -0.062 0.315 -0.653 -0.239NS
NS = Non Significant
* = Significant at 5% level of probability
** = Significant at 1% level of probability
The correlation coefficient showed that a highly significant (p < 0.01) positive
relation exist among C. pomonella population and mean maximum temperature (r = 0.82)
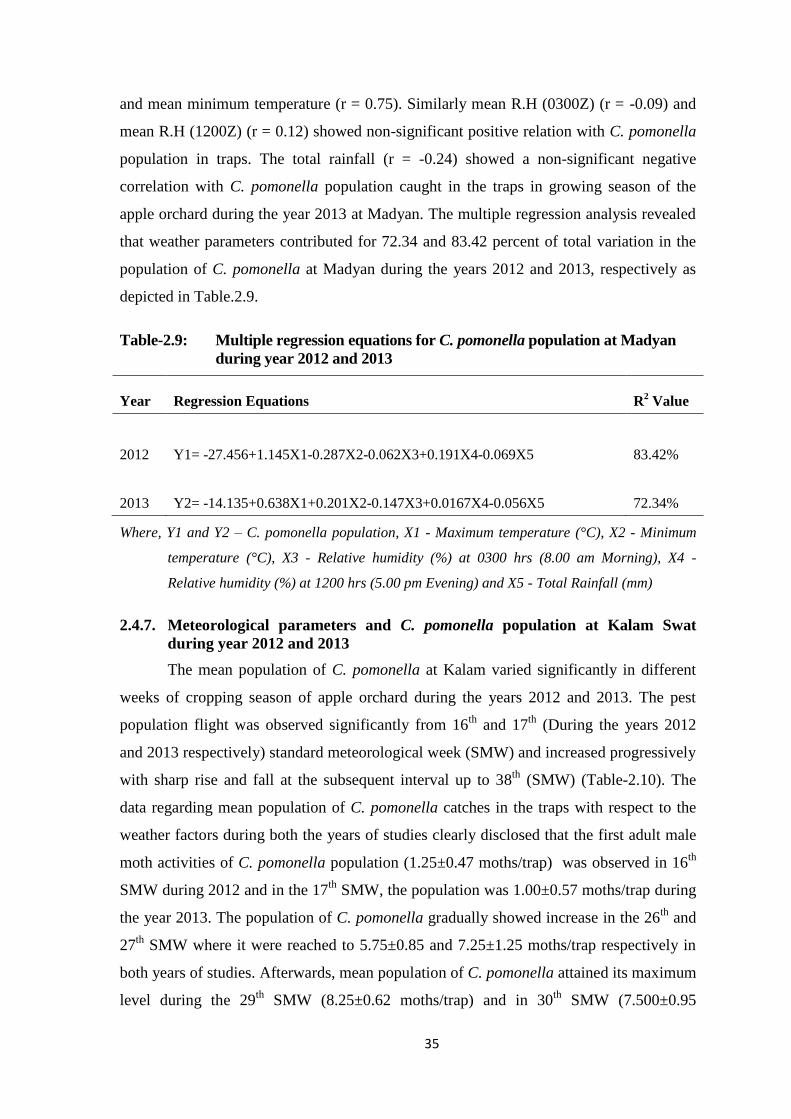
35
and mean minimum temperature (r = 0.75). Similarly mean R.H (0300Z) (r = -0.09) and
mean R.H (1200Z) (r = 0.12) showed non-significant positive relation with C. pomonella
population in traps. The total rainfall (r = -0.24) showed a non-significant negative
correlation with C. pomonella population caught in the traps in growing season of the
apple orchard during the year 2013 at Madyan. The multiple regression analysis revealed
that weather parameters contributed for 72.34 and 83.42 percent of total variation in the
population of C. pomonella at Madyan during the years 2012 and 2013, respectively as
depicted in Table.2.9.
Table-2.9: Multiple regression equations for C. pomonella population at Madyan
during year 2012 and 2013
Year Regression Equations R2 Value
2012 Y1= -27.456+1.145X1-0.287X2-0.062X3+0.191X4-0.069X5 83.42%
2013 Y2= -14.135+0.638X1+0.201X2-0.147X3+0.0167X4-0.056X5 72.34%
Where, Y1 and Y2 – C. pomonella population, X1 - Maximum temperature (°C), X2 - Minimum
temperature (°C), X3 - Relative humidity (%) at 0300 hrs (8.00 am Morning), X4 -
Relative humidity (%) at 1200 hrs (5.00 pm Evening) and X5 - Total Rainfall (mm)
2.4.7. Meteorological parameters and C. pomonella population at Kalam Swat
during year 2012 and 2013
The mean population of C. pomonella at Kalam varied significantly in different
weeks of cropping season of apple orchard during the years 2012 and 2013. The pest
population flight was observed significantly from 16th
and 17th
(During the years 2012
and 2013 respectively) standard meteorological week (SMW) and increased progressively
with sharp rise and fall at the subsequent interval up to 38th
(SMW) (Table-2.10). The
data regarding mean population of C. pomonella catches in the traps with respect to the
weather factors during both the years of studies clearly disclosed that the first adult male
moth activities of C. pomonella population (1.25±0.47 moths/trap) was observed in 16th
SMW during 2012 and in the 17th
SMW, the population was 1.00±0.57 moths/trap during
the year 2013. The population of C. pomonella gradually showed increase in the 26th
and
27th
SMW where it were reached to 5.75±0.85 and 7.25±1.25 moths/trap respectively in
both years of studies. Afterwards, mean population of C. pomonella attained its maximum
level during the 29th
SMW (8.25±0.62 moths/trap) and in 30th
SMW (7.500±0.95
36
moths/trap) during the years 2012 and 2013 respectively. Then the mean population
fluctuation of C. pomonella again gradually showed decline and reached to 2.00±1.08
moths/trap in 30th
SMW and 5.5±1.04 moth/trap in 32nd
SMW the both the proceeding
years. After sharp rise and fall in the population, again attained its maximum level
(9.25±0.86 and 5.00±1.78 moths/ trap) in the 33rd
SMW during the years 2012 and 2013
respectively (Fig. 2.1). The lowest mean population of C. pomonella was recorded in the
38th
SMW and 36th
SMW (0.00±0.00 and 0.00±0.00 moths/ trap) respectively during both
the years of studies. (Table-2.10). The results disclosed that variations in temperature,
relative humidity and rainfall during the crop growth and pest overlapping generations,
which showed that this pest can partially complete two generation in Kalam area.
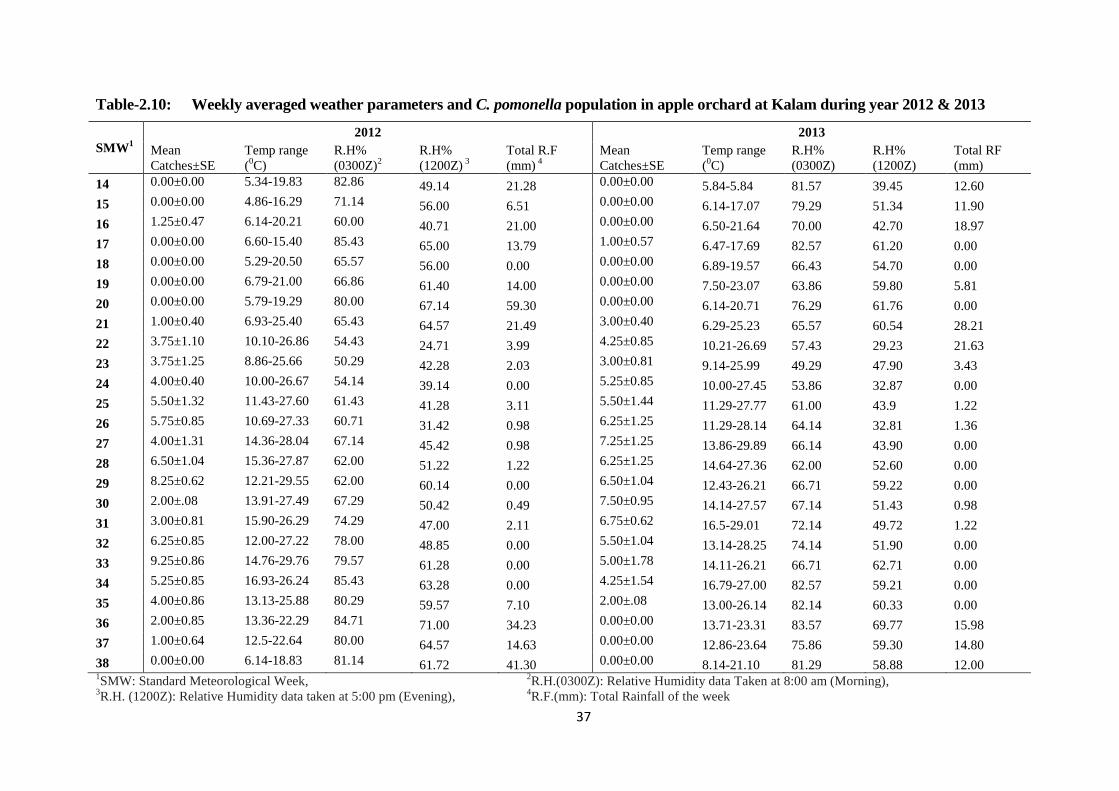
37
Table-2.10: Weekly averaged weather parameters and C. pomonella population in apple orchard at Kalam during year 2012 & 2013
SMW1
2012 2013
Mean
Catches±SE
Temp range
(0C)
R.H%
(0300Z)2
R.H%
(1200Z) 3
Total R.F
(mm) 4
Mean
Catches±SE
Temp range
(0C)
R.H%
(0300Z)
R.H%
(1200Z)
Total RF
(mm)
14 0.00±0.00 5.34-19.83 82.86 49.14 21.28 0.00±0.00 5.84-5.84 81.57 39.45 12.60
15 0.00±0.00 4.86-16.29 71.14 56.00 6.51 0.00±0.00 6.14-17.07 79.29 51.34 11.90
16 1.25±0.47 6.14-20.21 60.00 40.71 21.00 0.00±0.00 6.50-21.64 70.00 42.70 18.97
17 0.00±0.00 6.60-15.40 85.43 65.00 13.79 1.00±0.57 6.47-17.69 82.57 61.20 0.00
18 0.00±0.00 5.29-20.50 65.57 56.00 0.00 0.00±0.00 6.89-19.57 66.43 54.70 0.00
19 0.00±0.00 6.79-21.00 66.86 61.40 14.00 0.00±0.00 7.50-23.07 63.86 59.80 5.81
20 0.00±0.00 5.79-19.29 80.00 67.14 59.30 0.00±0.00 6.14-20.71 76.29 61.76 0.00
21 1.00±0.40 6.93-25.40 65.43 64.57 21.49 3.00±0.40 6.29-25.23 65.57 60.54 28.21
22 3.75±1.10 10.10-26.86 54.43 24.71 3.99 4.25±0.85 10.21-26.69 57.43 29.23 21.63
23 3.75±1.25 8.86-25.66 50.29 42.28 2.03 3.00±0.81 9.14-25.99 49.29 47.90 3.43
24 4.00±0.40 10.00-26.67 54.14 39.14 0.00 5.25±0.85 10.00-27.45 53.86 32.87 0.00
25 5.50±1.32 11.43-27.60 61.43 41.28 3.11 5.50±1.44 11.29-27.77 61.00 43.9 1.22
26 5.75±0.85 10.69-27.33 60.71 31.42 0.98 6.25±1.25 11.29-28.14 64.14 32.81 1.36
27 4.00±1.31 14.36-28.04 67.14 45.42 0.98 7.25±1.25 13.86-29.89 66.14 43.90 0.00
28 6.50±1.04 15.36-27.87 62.00 51.22 1.22 6.25±1.25 14.64-27.36 62.00 52.60 0.00
29 8.25±0.62 12.21-29.55 62.00 60.14 0.00 6.50±1.04 12.43-26.21 66.71 59.22 0.00
30 2.00±.08 13.91-27.49 67.29 50.42 0.49 7.50±0.95 14.14-27.57 67.14 51.43 0.98
31 3.00±0.81 15.90-26.29 74.29 47.00 2.11 6.75±0.62 16.5-29.01 72.14 49.72 1.22
32 6.25±0.85 12.00-27.22 78.00 48.85 0.00 5.50±1.04 13.14-28.25 74.14 51.90 0.00
33 9.25±0.86 14.76-29.76 79.57 61.28 0.00 5.00±1.78 14.11-26.21 66.71 62.71 0.00
34 5.25±0.85 16.93-26.24 85.43 63.28 0.00 4.25±1.54 16.79-27.00 82.57 59.21 0.00
35 4.00±0.86 13.13-25.88 80.29 59.57 7.10 2.00±.08 13.00-26.14 82.14 60.33 0.00
36 2.00±0.85 13.36-22.29 84.71 71.00 34.23 0.00±0.00 13.71-23.31 83.57 69.77 15.98
37 1.00±0.64 12.5-22.64 80.00 64.57 14.63 0.00±0.00 12.86-23.64 75.86 59.30 14.80
38 0.00±0.00 6.14-18.83 81.14 61.72 41.30 0.00±0.00 8.14-21.10 81.29 58.88 12.00 1SMW: Standard Meteorological Week,
2R.H.(0300Z): Relative Humidity data Taken at 8:00 am (Morning),
3R.H. (1200Z): Relative Humidity data taken at 5:00 pm (Evening),
4R.F.(mm): Total Rainfall of the week
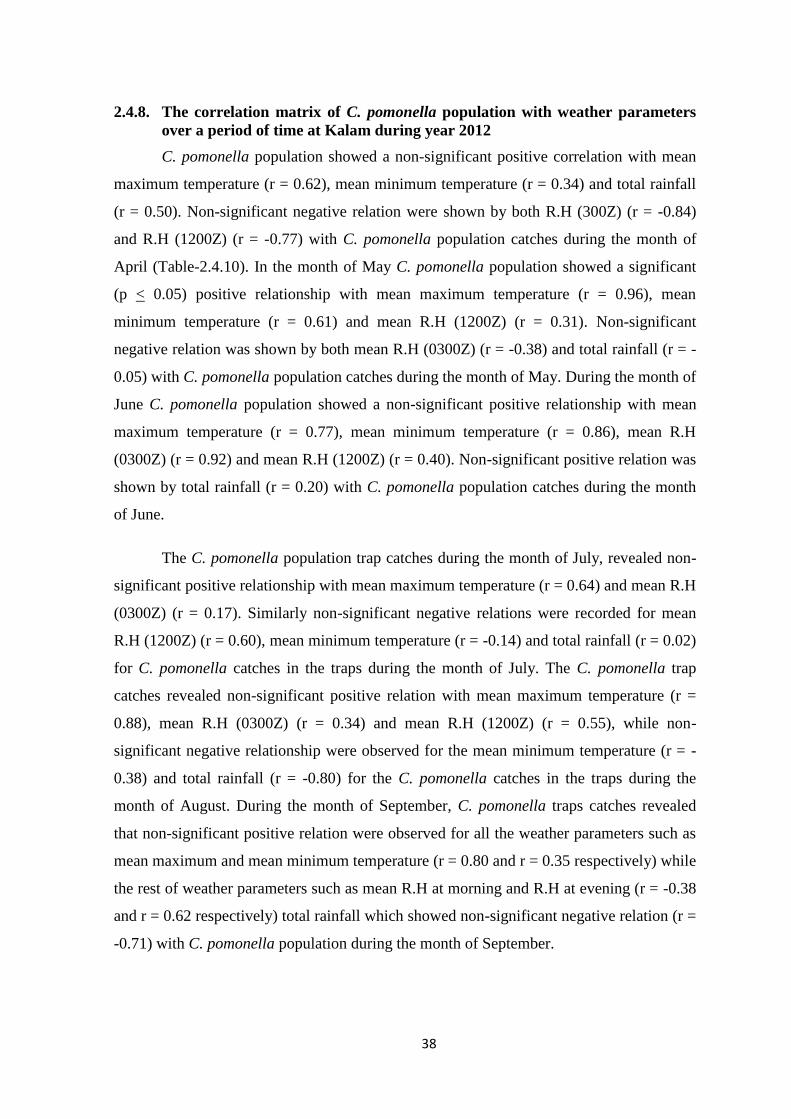
38
2.4.8. The correlation matrix of C. pomonella population with weather parameters
over a period of time at Kalam during year 2012
C. pomonella population showed a non-significant positive correlation with mean
maximum temperature (r = 0.62), mean minimum temperature (r = 0.34) and total rainfall
(r = 0.50). Non-significant negative relation were shown by both R.H (300Z) (r = -0.84)
and R.H (1200Z) (r = -0.77) with C. pomonella population catches during the month of
April (Table-2.4.10). In the month of May C. pomonella population showed a significant
(p < 0.05) positive relationship with mean maximum temperature (r = 0.96), mean
minimum temperature (r = 0.61) and mean R.H (1200Z) (r = 0.31). Non-significant
negative relation was shown by both mean R.H (0300Z) (r = -0.38) and total rainfall (r = -
0.05) with C. pomonella population catches during the month of May. During the month of
June C. pomonella population showed a non-significant positive relationship with mean
maximum temperature (r = 0.77), mean minimum temperature (r = 0.86), mean R.H
(0300Z) (r = 0.92) and mean R.H (1200Z) (r = 0.40). Non-significant positive relation was
shown by total rainfall (r = 0.20) with C. pomonella population catches during the month
of June.
The C. pomonella population trap catches during the month of July, revealed non-
significant positive relationship with mean maximum temperature (r = 0.64) and mean R.H
(0300Z) (r = 0.17). Similarly non-significant negative relations were recorded for mean
R.H (1200Z) (r = 0.60), mean minimum temperature (r = -0.14) and total rainfall (r = 0.02)
for C. pomonella catches in the traps during the month of July. The C. pomonella trap
catches revealed non-significant positive relation with mean maximum temperature (r =
0.88), mean R.H (0300Z) (r = 0.34) and mean R.H (1200Z) (r = 0.55), while non-
significant negative relationship were observed for the mean minimum temperature (r = -
0.38) and total rainfall (r = -0.80) for the C. pomonella catches in the traps during the
month of August. During the month of September, C. pomonella traps catches revealed
that non-significant positive relation were observed for all the weather parameters such as
mean maximum and mean minimum temperature (r = 0.80 and r = 0.35 respectively) while
the rest of weather parameters such as mean R.H at morning and R.H at evening (r = -0.38
and r = 0.62 respectively) total rainfall which showed non-significant negative relation (r =
-0.71) with C. pomonella population during the month of September.
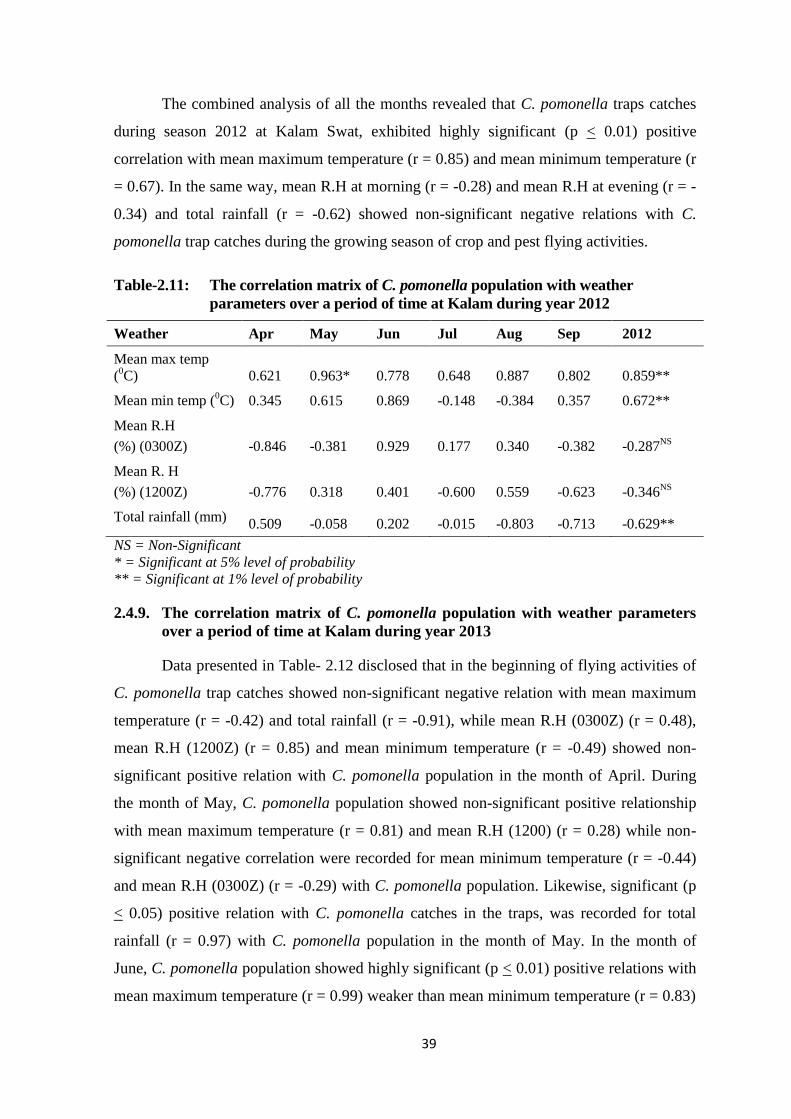
39
The combined analysis of all the months revealed that C. pomonella traps catches
during season 2012 at Kalam Swat, exhibited highly significant (p < 0.01) positive
correlation with mean maximum temperature (r = 0.85) and mean minimum temperature (r
= 0.67). In the same way, mean R.H at morning (r = -0.28) and mean R.H at evening (r = -
0.34) and total rainfall (r = -0.62) showed non-significant negative relations with C.
pomonella trap catches during the growing season of crop and pest flying activities.
Table-2.11: The correlation matrix of C. pomonella population with weather
parameters over a period of time at Kalam during year 2012
Weather Apr May Jun Jul Aug Sep 2012
Mean max temp
(0C) 0.621 0.963* 0.778 0.648 0.887 0.802 0.859**
Mean min temp (0C) 0.345 0.615 0.869 -0.148 -0.384 0.357 0.672**
Mean R.H
(%) (0300Z) -0.846 -0.381 0.929 0.177 0.340 -0.382 -0.287NS
Mean R. H
(%) (1200Z) -0.776 0.318 0.401 -0.600 0.559 -0.623 -0.346NS
Total rainfall (mm) 0.509 -0.058 0.202 -0.015 -0.803 -0.713 -0.629**
NS = Non-Significant
* = Significant at 5% level of probability
** = Significant at 1% level of probability
2.4.9. The correlation matrix of C. pomonella population with weather parameters
over a period of time at Kalam during year 2013
Data presented in Table- 2.12 disclosed that in the beginning of flying activities of
C. pomonella trap catches showed non-significant negative relation with mean maximum
temperature (r = -0.42) and total rainfall (r = -0.91), while mean R.H (0300Z) (r = 0.48),
mean R.H (1200Z) (r = 0.85) and mean minimum temperature (r = -0.49) showed non-
significant positive relation with C. pomonella population in the month of April. During
the month of May, C. pomonella population showed non-significant positive relationship
with mean maximum temperature (r = 0.81) and mean R.H (1200) (r = 0.28) while non-
significant negative correlation were recorded for mean minimum temperature (r = -0.44)
and mean R.H (0300Z) (r = -0.29) with C. pomonella population. Likewise, significant (p
< 0.05) positive relation with C. pomonella catches in the traps, was recorded for total
rainfall (r = 0.97) with C. pomonella population in the month of May. In the month of
June, C. pomonella population showed highly significant (p < 0.01) positive relations with
mean maximum temperature (r = 0.99) weaker than mean minimum temperature (r = 0.83)
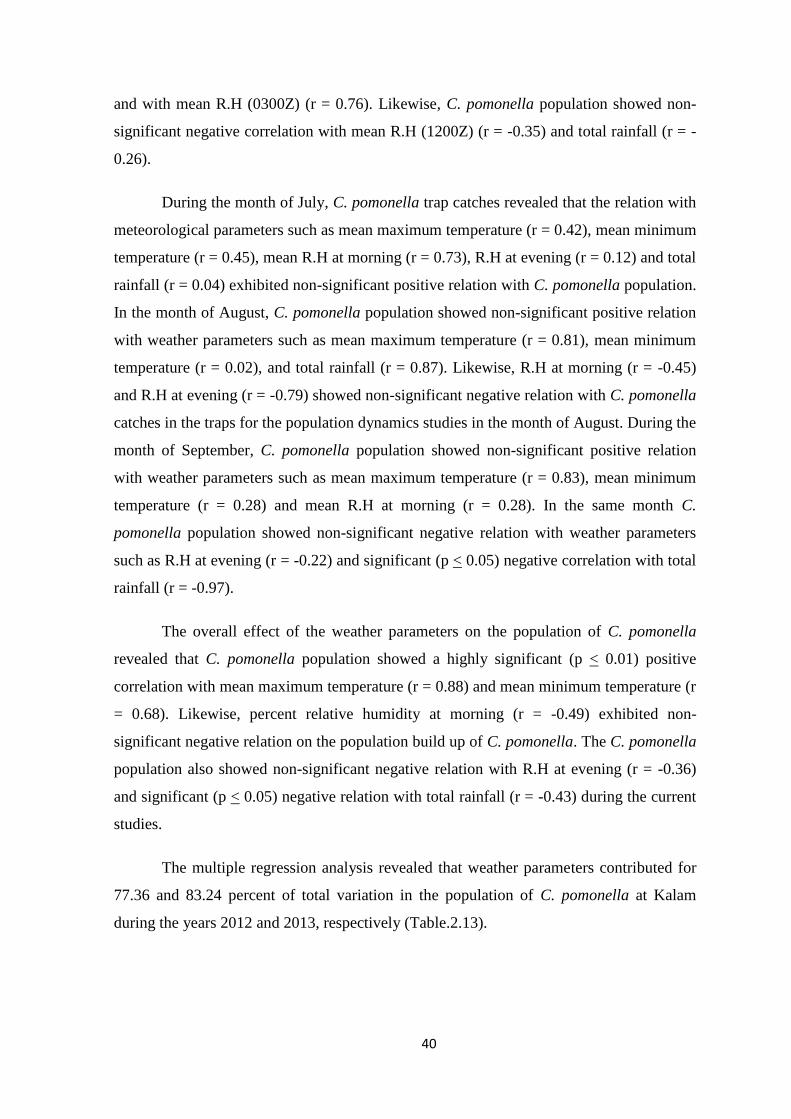
40
and with mean R.H (0300Z) (r = 0.76). Likewise, C. pomonella population showed non-
significant negative correlation with mean R.H (1200Z) (r = -0.35) and total rainfall (r = -
0.26).
During the month of July, C. pomonella trap catches revealed that the relation with
meteorological parameters such as mean maximum temperature (r = 0.42), mean minimum
temperature (r = 0.45), mean R.H at morning (r = 0.73), R.H at evening (r = 0.12) and total
rainfall (r = 0.04) exhibited non-significant positive relation with C. pomonella population.
In the month of August, C. pomonella population showed non-significant positive relation
with weather parameters such as mean maximum temperature (r = 0.81), mean minimum
temperature (r = 0.02), and total rainfall (r = 0.87). Likewise, R.H at morning (r = -0.45)
and R.H at evening (r = -0.79) showed non-significant negative relation with C. pomonella
catches in the traps for the population dynamics studies in the month of August. During the
month of September, C. pomonella population showed non-significant positive relation
with weather parameters such as mean maximum temperature (r = 0.83), mean minimum
temperature (r = 0.28) and mean R.H at morning (r = 0.28). In the same month C.
pomonella population showed non-significant negative relation with weather parameters
such as R.H at evening (r = -0.22) and significant (p < 0.05) negative correlation with total
rainfall (r = -0.97).
The overall effect of the weather parameters on the population of C. pomonella
revealed that C. pomonella population showed a highly significant (p < 0.01) positive
correlation with mean maximum temperature (r = 0.88) and mean minimum temperature (r
= 0.68). Likewise, percent relative humidity at morning (r = -0.49) exhibited non-
significant negative relation on the population build up of C. pomonella. The C. pomonella
population also showed non-significant negative relation with R.H at evening (r = -0.36)
and significant (p < 0.05) negative relation with total rainfall (r = -0.43) during the current
studies.
The multiple regression analysis revealed that weather parameters contributed for
77.36 and 83.24 percent of total variation in the population of C. pomonella at Kalam
during the years 2012 and 2013, respectively (Table.2.13).
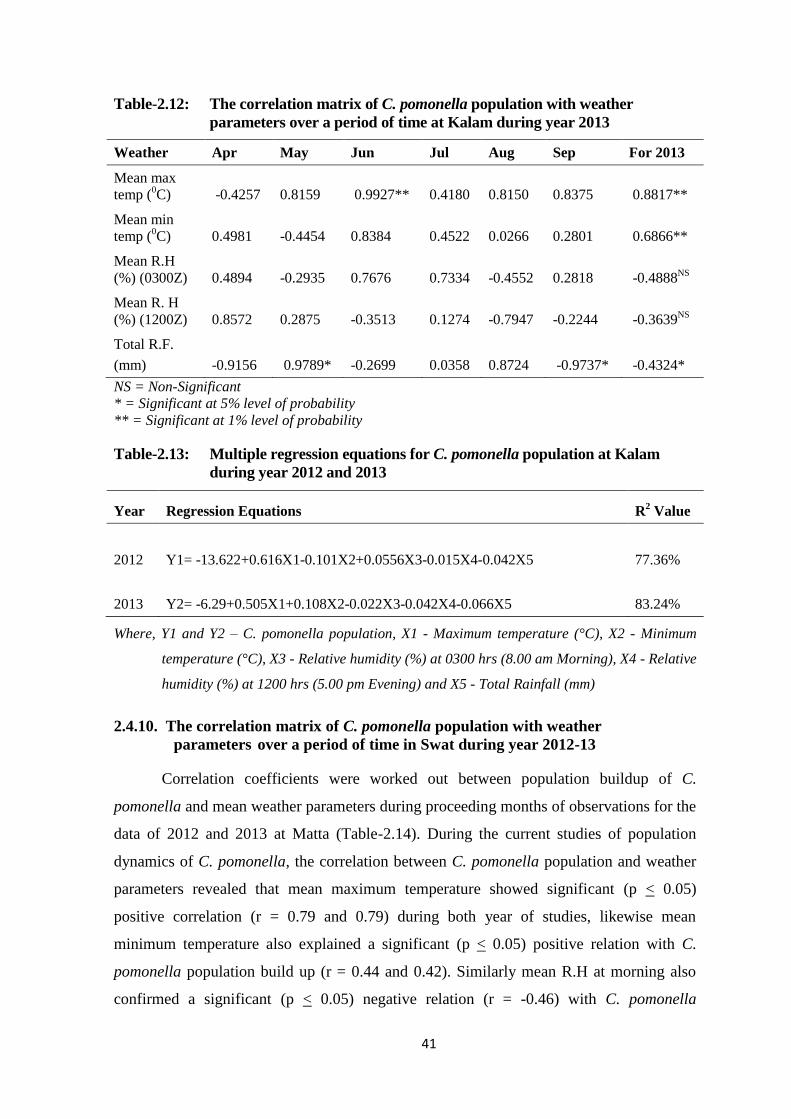
41
Table-2.12: The correlation matrix of C. pomonella population with weather
parameters over a period of time at Kalam during year 2013
Weather Apr May Jun Jul Aug Sep For 2013
Mean max
temp (0C) -0.4257 0.8159 0.9927** 0.4180 0.8150 0.8375 0.8817**
Mean min
temp (0C) 0.4981 -0.4454 0.8384 0.4522 0.0266 0.2801 0.6866**
Mean R.H
(%) (0300Z) 0.4894 -0.2935 0.7676 0.7334 -0.4552 0.2818 -0.4888NS
Mean R. H
(%) (1200Z) 0.8572 0.2875 -0.3513 0.1274 -0.7947 -0.2244 -0.3639NS
Total R.F.
(mm) -0.9156 0.9789* -0.2699 0.0358 0.8724 -0.9737* -0.4324*
NS = Non-Significant
* = Significant at 5% level of probability
** = Significant at 1% level of probability
Table-2.13: Multiple regression equations for C. pomonella population at Kalam
during year 2012 and 2013
Where, Y1 and Y2 – C. pomonella population, X1 - Maximum temperature (°C), X2 - Minimum
temperature (°C), X3 - Relative humidity (%) at 0300 hrs (8.00 am Morning), X4 - Relative
humidity (%) at 1200 hrs (5.00 pm Evening) and X5 - Total Rainfall (mm)
2.4.10. The correlation matrix of C. pomonella population with weather
parameters over a period of time in Swat during year 2012-13
Correlation coefficients were worked out between population buildup of C.
pomonella and mean weather parameters during proceeding months of observations for the
data of 2012 and 2013 at Matta (Table-2.14). During the current studies of population
dynamics of C. pomonella, the correlation between C. pomonella population and weather
parameters revealed that mean maximum temperature showed significant (p < 0.05)
positive correlation (r = 0.79 and 0.79) during both year of studies, likewise mean
minimum temperature also explained a significant (p < 0.05) positive relation with C.
pomonella population build up (r = 0.44 and 0.42). Similarly mean R.H at morning also
confirmed a significant (p < 0.05) negative relation (r = -0.46) with C. pomonella
Year Regression Equations R2 Value
2012 Y1= -13.622+0.616X1-0.101X2+0.0556X3-0.015X4-0.042X5 77.36%
2013 Y2= -6.29+0.505X1+0.108X2-0.022X3-0.042X4-0.066X5 83.24%
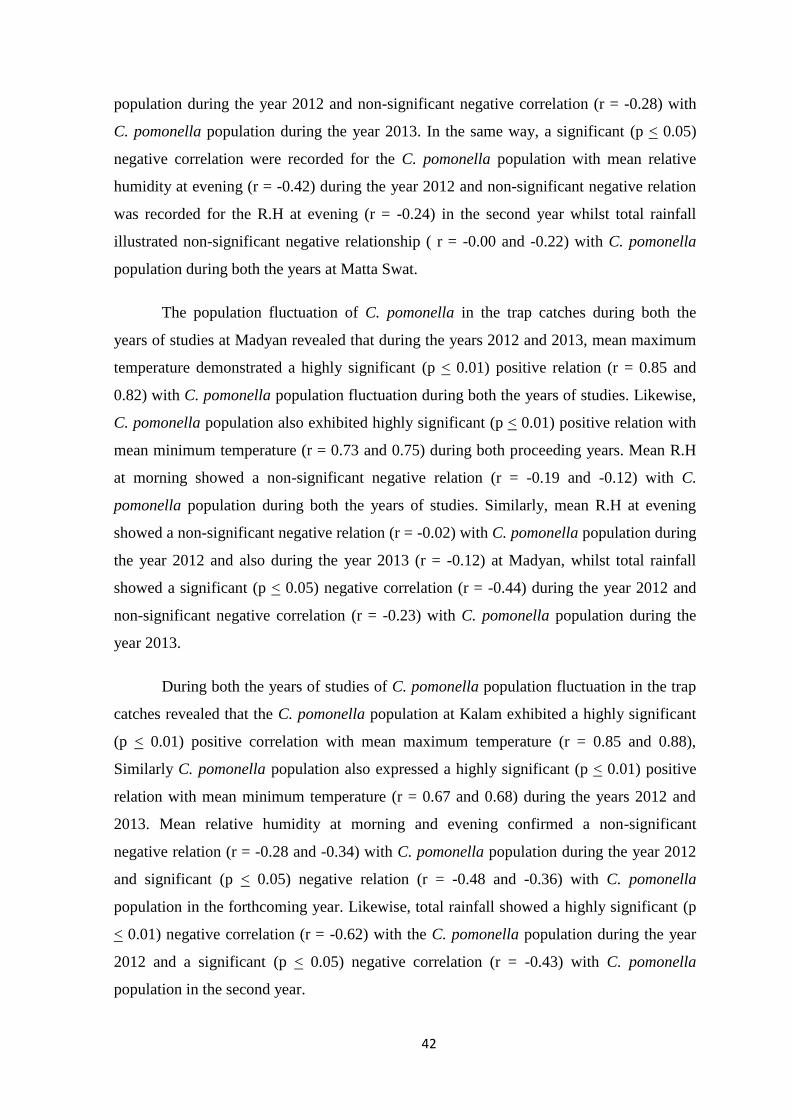
42
population during the year 2012 and non-significant negative correlation (r = -0.28) with
C. pomonella population during the year 2013. In the same way, a significant (p < 0.05)
negative correlation were recorded for the C. pomonella population with mean relative
humidity at evening (r = -0.42) during the year 2012 and non-significant negative relation
was recorded for the R.H at evening (r = -0.24) in the second year whilst total rainfall
illustrated non-significant negative relationship ( r = -0.00 and -0.22) with C. pomonella
population during both the years at Matta Swat.
The population fluctuation of C. pomonella in the trap catches during both the
years of studies at Madyan revealed that during the years 2012 and 2013, mean maximum
temperature demonstrated a highly significant (p < 0.01) positive relation (r = 0.85 and
0.82) with C. pomonella population fluctuation during both the years of studies. Likewise,
C. pomonella population also exhibited highly significant (p < 0.01) positive relation with
mean minimum temperature (r = 0.73 and 0.75) during both proceeding years. Mean R.H
at morning showed a non-significant negative relation (r = -0.19 and -0.12) with C.
pomonella population during both the years of studies. Similarly, mean R.H at evening
showed a non-significant negative relation (r = -0.02) with C. pomonella population during
the year 2012 and also during the year 2013 (r = -0.12) at Madyan, whilst total rainfall
showed a significant (p < 0.05) negative correlation (r = -0.44) during the year 2012 and
non-significant negative correlation (r = -0.23) with C. pomonella population during the
year 2013.
During both the years of studies of C. pomonella population fluctuation in the trap
catches revealed that the C. pomonella population at Kalam exhibited a highly significant
(p < 0.01) positive correlation with mean maximum temperature (r = 0.85 and 0.88),
Similarly C. pomonella population also expressed a highly significant (p < 0.01) positive
relation with mean minimum temperature (r = 0.67 and 0.68) during the years 2012 and
2013. Mean relative humidity at morning and evening confirmed a non-significant
negative relation (r = -0.28 and -0.34) with C. pomonella population during the year 2012
and significant (p < 0.05) negative relation (r = -0.48 and -0.36) with C. pomonella
population in the forthcoming year. Likewise, total rainfall showed a highly significant (p
< 0.01) negative correlation (r = -0.62) with the C. pomonella population during the year
2012 and a significant (p < 0.05) negative correlation (r = -0.43) with C. pomonella
population in the second year.
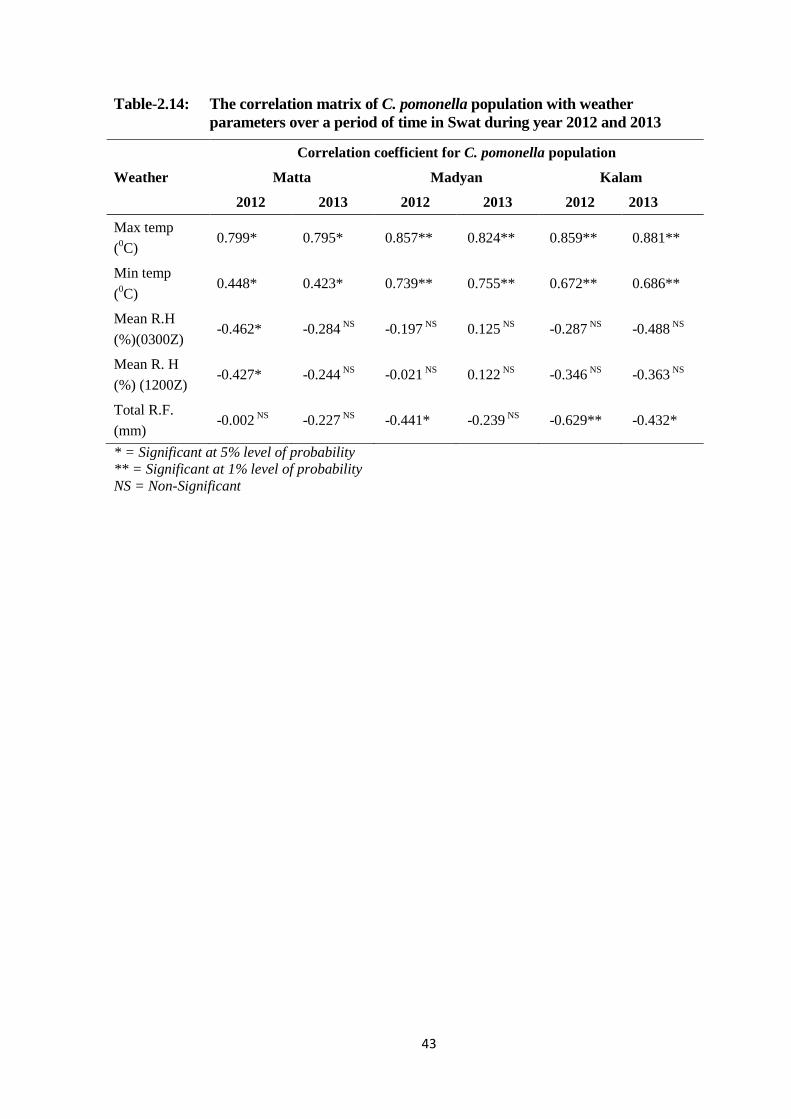
43
Table-2.14: The correlation matrix of C. pomonella population with weather
parameters over a period of time in Swat during year 2012 and 2013
Weather
Correlation coefficient for C. pomonella population
Matta Madyan Kalam
2012 2013 2012 2013 2012 2013
Max temp
(0C)
0.799* 0.795* 0.857** 0.824** 0.859** 0.881**
Min temp
(0C)
0.448* 0.423* 0.739** 0.755** 0.672** 0.686**
Mean R.H
(%)(0300Z) -0.462* -0.284
NS -0.197
NS 0.125
NS -0.287
NS -0.488
NS
Mean R. H
(%) (1200Z) -0.427* -0.244
NS -0.021
NS 0.122
NS -0.346
NS -0.363
NS
Total R.F.
(mm) -0.002
NS -0.227
NS -0.441* -0.239
NS -0.629** -0.432*
* = Significant at 5% level of probability
** = Significant at 1% level of probability
NS = Non-Significant
44
2.5. DISCUSSION
2.5.1. Meteorological parameters and C. pomonella population at Matta, Madyan
and Kalam Swat during year 2012 and 2013
The results pertaining to population dynamics of C. pomonella revealed that mean
population of C. pomonella varied significantly in different weeks of cropping season at
Matta, Madyan and Kalam during the years 2012 and 2013. The pest population was
observed significantly from 16th
to 17th
standard meteorological week (SMW) and
increased progressively with sharp rise and fall at the subsequent interval up to 38th
(SMW) at all the three locations in Swat.
The data regarding mean adult male moth population of C. Pomonella collected in
the pheromone traps with respect to weather abiotic factors during SMWs, in cropping
seasons of apple orchard during both the years of study disclosed that the first flight
activity of adult male moth of C. Pomonella population was observed in 14th
to 17th
SMWs
in Matta, Madyan and Kalam during 2012 and 2013. In Matta, the first flight of C.
Pomonella (1.00±0.40 moths/trap) was observed in 17th
SMW, whilst at Madyan the first
flight of C. Pomonella was noticed in 16th
and 14th
SMW in years 2012 and 2013
respectively, however at Kalam C. Pomonella first trapped in 16th
and 17th
SMW during
the years 2012 and 2013 respectively. Mean population of C. Pomonella (11.25±1.25
moths/trap) reached to its maximum level during the 25th
SMW during the year 2012 and
15.75±1.65 moths/ trap in the 26th
SMW in the second year at Matta, whilst at Madyan,
peak populations of C. Pomonella (11.00±1.03 and 10.25±0.80 moth/trap) were recorded
in 27th
and 29th
SMW during 2012 and 2013 respectively.
In case of Kalam, maximum population (8.25±0.62 and 9.0±0.95 moth/trap) were
observed in 29th
and 30th
SMW during both the years of studies. Then the mean population
fluctuation of C. Pomonella again gradually showed decline and then attained their
maximum levels again at all the three locations. After sharp rise and fall in the population,
maximum population levels (12.00±0.81 and 13.00±0.81 moths/ trap) were observed in the
31st and 32
nd SMW during the years 2012 and 2013 at Matta Swat, while in case of
Madyan, the slight increase in adult trap (10.25±0.92 and 9.00±0.70 moth /trap) was
noticed in 33rd
and 35th
SMW. But in case of Kalam, the second peak population of C.
Pomonella (9.25±0.86 and 6.25±1.25 moth/ trap) in the trap was noticed in 33rd
SMW
during both the years. The lowest mean population (0.25±0.25 and 0.00±0.00 moths/ trap)
45
of C. pomonella was recorded in the 38th
SMW during both the years of studies at Matta
Swat, while at Madyan the population (0.00±0.00 and 1.00±0.40 moth/trap) of C.
Pomonella declined in 37th
and 38th
SMW. Likewise, at Kalam the lowest mean population
(0.00±0.00 moth/ trap each) of C. Pomonella was recorded in 38th
and 36th
SMW in both
the year of studies. This population fluctuation of pest attributed to abiotic factors of
environment which ultimately influenced the change in the population dynamics of C.
pomonella in the pheromone traps which further confirmed that this pest can easily
complete two generation in this region. Tamhankar et al. (1989), Singh and Sachan (1991)
and Patil et al. (1992) reported that pheromone traps are an effective tools for monitoring
adults male moth activities of most of the lepidopterious pest in the orchards, vegetables
and other cearal crops for applying control strategy for their effective management.
Prasannakumar et al. (2011) also used standard meteorological weeks (SMW) for
monitoring the insect pests of tomato, Okra and brinjal. He reported that the tomato borer
attained peak during 47th
standard week (7.10 moths/trap), Okra shoot and fruit borer
attained peak (7.52 moths/trap) and Brinjal shoot and fruit borer (44.13 moths/trap) in 48th
standard week and 41st standard week, respectively. The results disclosed that moth
activity increased with the increase in temperature. As the temperature increased the
pheromonal compounds might have evaporated and hence, increase moth catches in the
traps. Besides female moths oviposit on fruits, hence the maximum male moth coming for
the mating with female catches in the traps during peak summer season. (Krishnakumar et
al., 2004). The results are not agreed with Gedia et al. (2007), who reported that besides
from temperature, relative humidity and rainfall, wind speed and dew drops on the plant
has a profound effect on the population dynamics of moths and their oviposition.
2.5.2. The correlation matrix of codling moth C. Pomonella population with weather
parameters over a period of time in Swat during the years 2012 and 2013
The study of Correlation coefficients were worked out between population buildup
of C. pomonella and mean weather parameters during observations for the data at Matta,
Madyan and Kalam during the years 2012 and 2013. During the current studies of
population dynamics of C. pomonella, the correlation between C. Pomonella population
and weather parameters revealed that mean maximum temperature showed significant
(p<0.05) positive correlation with C. pomonella population during both year of studies and
adults moth catches increases with raise in temperature at all the three locations, likewise
46
mean minimum temperature also showed a significant (p<0.01) positive relation with C.
pomonella population build up. These results are in agreement with findings of Agrawal et
al. (2004) who find out that population growth rates of insects may be higher where
temperatures are raising. However mean R.H at morning showed statistically significant
(p<0.05) negative relation with C. pomonella population at the study location. In the same
way, a significant (p<0.05) negative correlation were recorded for the C. pomonella
population with mean relative humidity at evening during the year 2012 and then did not
showed any significant negative correlation with C. pomonella population at Madyan and
Kalam. C. pomonella population exhibited non-significant negative correlation with total
rainfall at Matta during both the years of studies, but explained significantly (p<0.05)
negative correlation at Madyan during first year of studies and non-significant negative
relation during 2013. At Kalam during first year of studies C. pomonella population
showed highly significant (p<0.01) negative correlation during the first year and
significant negative relation during the second year. The multiple regression models
indicated that total rainfall, maximum temperature and relative humidity contributes
maximum towards the incidence of C. pomonella in the pheromone traps at all the three
locations. These analysis further revealed that weather parameters contributed for 82.73
(R2) and 68.78 (R
2) percent of total variation in the population of C. pomonella at Matta,
72.34 (R2) and 83.42 (R
2) percent at Madyan and 77.36 (R
2) and 83.24 (R
2) percent at
Kalam during the years 2012 and 2013, respectively.
Present findings of this experiment are comparable with the finding of Sabir et al.
(2006), who reported that rainfall, average temperature and relative humidity are vital
abiotic factors which greatly influenced the population dynamics of most of lepidopterious
pest in the field. Nonetheless, Calora and Ferino (1968) observed no clear-cut correlation
between a single climatic factor and the frequency of different lepidopterious pests, even
the populations fluctuation were usually higher during rainy months and at low
temperature of the prevailing season. Likewise, results regarding relative humidity are not
agreed to those presented by Emura and Kojima (1974) who reported that a relative
humidity of less than 60% caused high mortality of the larvae of rice pest insect.
Decisively, this feature needs more detailed, comprehensive and continued studies
involving different agro-ecological areas of apple orchard.
47
All abiotic factors of environment particularly temperature contribute significantly
toward population fluctuation of C. pomonella trapped with the help of sex attractant
pheromone. Lui and Yeh (1982) find out positive and highly significant correlation of
Dacus zonatus incidence with minimum and maximum temperature in different crops,
these results are in conformity with our studies. The results pertaining to the population
dynamics of C. pomonella are related to Hasyim et al. (2008), who reported that the
number of flies and moths captured with pheromones traps correlated positively with all
three abiotic factors, i.e. temperature, humidity and rainfall. Similar observations regarding
the influence of weather parameters on the occurrence of melon fly was also reported
earlier by different workers in different parts of the world (Gupta and Bhatia, 2000, Shukla
and Prasad, 1985 and Su, 1984, Mahmood et al., 2002).
48
2.6. CONCLUSIONS
The correlation matrix between C. pomonella population and weather parameters
disclosed that mean maximum and minimum temperature exhibited a highly significant
(p<0.01) positive correlation with C. pomonella population build up, whilst relative
humidity did not expressed any significant effect on adult moth catches in the traps.
Nonetheless, rainfall showed non-significant negative relationship in the current studies
except in Kalam. Regression analysis explained 68.78-83.42% change in the population of
this pest due to abiotic factors of environment in all three areas during both the years of
studies.
2.7. RECOMMENDATIONS
The above findings lead to the following recommendations.
1) Change in temperature might change population dynamics of insect pests
differently in different agro-ecosystem and ecological zones.
2) These studies may offer an insight on the possible impact of weather
parameters on population dynamics of this pest and insecticide applications
based on trap captures can significantly reduce the number of sprays needed for
C. pomonella management.
3) Nevertheless, further study should be carried out in this perspective to assess
the change in the population dynamics of C. pomonella due to other abiotic
factors of environment as well.
4) Developing prediction models and studying evolutionary changes under
modified environment would be useful to face the future challenges.
49
LITERATURE CITED
Aasman, K. 2001. Effect of temperature on development and activity of maize stem
borer Chilo partellus. Bull. Environ. Entomol. 1: 125-127.
Agrawal, A.A., N. Underwood and J. Stinchcombe. 2004. Intraspecific variation in
the strength of density dependence in aphid populations. Ecol. Entomol. 29:
521-526.
Akram, M., F. Hafeez, M. Farooq, M. Arshad, M. Hussain, S. Ahmed, K. Zia and
H.A.A. Khan. 2013. A case to study population dynamics of Bemisia tabaci
and Thrips tabaci on Bt and non-Bt cotton genotypes. Pak. J. Agri. Sci. 50(4):
617-623.
Anjali, M., N.P. Singh, M. Mahesh and S. Swaroop.2012. Seasonal incidence and
effect of abiotic factors on population dynamics of major insect pests on
brinjal crop. J. Environ. Res. Dev. 7(1): 431-435.
Barnes, M.M. 1991. Codling moth occurrence, host race formation, and damage.
Totricid Pests: their Biology, Natural Enemies and Control (ed. by L P S
van der Geest & E Evenhuis), Elsevier, Amsterdam. pp. 313-328.
Batiste, W.C. 1973. Codling moth: estimating time of first egg hatch in the field - a
supplement to sex-attractant traps in integrated control. Environ. Entomol. 2:
387-391.
Bowden, J. and M.G. Morris. 1995. The influence of moon light on catches of insects
in light traps in Africa. Part III. The effective radius of nursery vapour light
trap and the analysis of the trap catches using effective radius. Bull. Entomol.
Res. 65(2): 303-348.
Calora, F.B. and M.P. Ferino. 1968. Seasonal fluctuation of stem borers, thrips and leaf
folders of rice in the Philippines. Philipp. Entomol. 1(2): 149-160.
Dent, D.R. and C.S. Pawar. 1988. The influence of moon light and weather on catches
of Helicoverpa armigera (Hubner) in light and pheromone traps. Bull.
Entomol. Res. 78: 365-377.
Ebesu, R. 2003. Integrated Pest Management for Home Gardens: Insect
Identification and Control. Insect Pests 13: 1-11.
Emura, K. and A. Kojima. 1974. On some environmental factors for development of
rice green caterpillar Naranga aenescens Moore. In. Influence of humidity on
the occurrence (in Japanese, English summary). J. Niigata Agric. Exp. Stn. 23:
27-36.
Gedia, M.V., H.J Vyas and M.F. Acharya. 2007. Influence of weather on Spodoptera
litura male moth catches in pheromone trap and their ovipositional in castor.
Indian J. Plant. Prot. 35(1): 118-120.
50
Gupta, D. and R. Bhatia. 2000. Population fluctuation of Bactrocera spp. in sub
mountainous mango and guava orchards. J. Appl. Hort.1(2): 101-102.
Hasyim, A., W. Muryati and J. de Kogel. 2008. Population fluctuation of the adult
males of the fruit fly, Bactrocera tau Walker (Diptera: Tephritidae) in passion
fruit orchards in relation to abiotic factors and sanitation. Indonesian J. Agric.
Sci. 9 (1): 29-33.
Jindal, J. and D.S. Brar. 2005. Population dynamics of sucking pests on Hirsutum
cotton hybrids in relation to weather factors. Indian. J. Ecol. 32(1): 58-60.
Karuppaiah, V. and G.K. Sujayanad. 2012. Impact of Climate Change on Population
Dynamics of Insect Pests. World J. Agric. Sci. 8 (3): 240-246.
Krishnakumar, N.K., R. Venugopal, P.N. Krishna Moorthy, B. Shivakumara and H.R.
Ranganath. 2004. Influence of weather factors on the attraction of male
eggplant shoot and fruit borer, Leucinodes orbonalis Guenee to synthetic sex
pheromone in south India. Pest Manage. Hort. Ecosyst. 10(2): 161-167.
Laskar, N. and H. Chatterjee. 2010. The Effect of Meteorological Factors on the
Population dynamics of Melon fly, Bactrocera cucurbitae (Coq.) (Diptera:
Tephritidae) in the foot hills of Himalaya. J. Appl. Sci. Environ. 14(3) 53-58.
Lui, Y.C. and C.C. Yeh.1982. Population fluctuation of the oriental fruit fly, Dacus
dorsalis Hendel. in sterile fly release and control area. Chin. J. Entomol. 2:57-
70.
Madsen, H. F. and J.M. Vakenti. 1973. Codling moth: use of Codlemone baited traps
and visual detection of entries to determine need of sprays. Environ. Entomol.
2: 677-679.
Mahmood, T., S.I. Hussain, K.M. Khokhar and M.A. Hidayatullah. 2002. Studies on
methyl eugenol as a sex attractant for fruit fly, Dacus zonatus (Saund) in
relation to abiotic factors in peach orchard. Asian J. Plant Sci. 4: 401-402.
Mandal, S.K., A. Sattar and S. Banerjee.2006. Impact of Meteorlogical Parameters on
Population Build up of Red Spider Mite in okra, Abelmoschus esculentus L.
under North Bhiar condition. J. Agric. Phys. 6(1): 35-38.
Paradis, R.O. and A. Comeau. 1972. Pikgeage de la pyrale de la pomme, Lospeyresia
pornonella (L.), dans le vergers du sud-ouest du QuCbec au moyen d'une
pheromone sexuelle synth6tique. Annu. Soc. Entomol. Qu Pb. 17: 7-19.
Patil, B.V., Nandihalli, B.S. Hugar and P. Somashekar. 1992. Influence of weather
parameters on pheromone trap catches of cotton bollworms. Karnataka J.
Agric. Sci. 5: 46-350.
Prasannakumar, N.R., A.K. Chakravarthy, A.H. Naveen and N. Narasimhamurthy.
2011. Influence of weather parameters on pheromone traps catches of selected
lepidopterous insects pests on vegetable crops. J. Curr. Biotica. 4(4): ISSN:
0973-4031.
51
Riedl, H. and B.A. Croft. 1974. A study of pheromone trap catches in relation to
codling moth (Lepidoptera: Olethreutidae) damage. Can. Entomol. 106: 525-
537.
Roelofs, W.L.1971. Sex attractant of the codling moth: characterization with electro
antennogramm technique. J. Sci. 174: 297-299.
Sabir, A. M., S. Ahmad, M. Hassan and A. Qadir. 2006. Pest weather interaction of
major insect pests in rice ecosystem. SAARC. J. Agric. 4: 203-212.
Selvaraj, S., D. Adiroubane, V. Ramesh and A.L. Narayanan.2010. Impact of
ecological factors on incidence and development of tobacco cut worm,
Spodoptera litura Fabricius on cotton. J. Biopest. 3(1Special Issue) 043-046.
Sharma, V. and B.P. Singh. 2012. Effect of varieties, seasons and weather on
population buildup of leaf hopper (Amrasca devastans Distant) on potato crop.
Potato J. 39(1): 23-30.
Shukla, R.P. and V.G. Prasad. 1985. Population fluctuation of the oriental fruit fly,
Dacus dorsalis Hendel in relation to host and abiotic factors. Trop. Pest
Manage.31: 273-275.
Singh, J. and B.S. Sekhon. 1998. Population build up of cotton Jassid, Amrasca
biguttula (Ishida) on different varieties of cotton. J. Insect. Sci. 11: 53-55.
Singh, K.N. and G.C. Sachan. 1991. Assessment of the use of sex pheromone traps in
the management of Spodoptera litura. Indian J. Proc. 21(1): 7-13.
Su, C.Y. 1984. The study on the relationship between seasonal succession of male
adult of melon fly, D. cucurbitae and the meteorological factors. J. Agric.
Forensic. 32: 105-109.
Tamhankar, A.J., K.K. Guthi and G.W. Rahalkar. 1989. Responsiveness of Earaias
vitella and Earias insulana males to their female sex pheromone. Insect Sci.
Appl. 10(5): 625-630.
Tora, R., J. Sio, M.J. Sarasua and J. Avilla. 1995. Control integrado de plagas en
huertos d manzanoy de peral en Cataluna. Frut. Prof. 70: 36-51.
Wong, T.Y. 1971. Populations of codling moths on Washington Island, Wisconsin, in
1970. 1. Econ. Entomol. 64: 1410-1411.
Zulfiqar, M.A., M.A. Sabri, M.A. Raza, A. Hamza, A. Hayat and A. Khan. 2010.
Effect of Temperature and Relative Humidity on the Population Dynamics of
Some Insect Pests of Maize. Pak. J. life. soc. Sci. 8(1): 16-18.
52
CHAPTER -3: MOLECULAR CHARACTERIZATION OF THE CYDIA
POMONELLA IN SWAT VALLEY
3.1. INTRODUCTION
The C. pomonella is the major pest damaging apple, throughout the world.
Besides apple this pest cause serious infestation in different crops and causing a huge
economic losses in different fruit production (Ciglar, 1998). The pest was first
recorded in Eurasia, but now it is present in all parts of the world where the
cultivation of apples and pears practiced (Franck et al., 2007). It has achieved a
almost worldwide distribution, being one of the most unbeaten pest species known
today (Thaler et al., 2008). Currently, C. pomonella is present in Australia, South
America, South Africa, New Zealand, North America, India, Pakistan and
Afghanistan (Franck et al., 2007).
The C. pomonella is one of the important pests of apple orchards, introduced
as a key pest that causes direct damage. Acquaintance with genetic variation within C.
pomonella populations is necessary for their efficient control and management.
Molecular studies provide new methods and ways to study population variation to
differentiate closely related species and strains (Deverno et al., 1998; Williams et al.,
1990).
It has acclamatized itself effectively to different habitats by forming various
strains and ecotypes in its populations, which are not closely identical to each other in
several physiological features, developmental and morphology (Meraner et al., 2008).
The first scientific information on C. pomonella about its origin and description of the
damage it causes on fruit has been documented long time ago. Theophrastus portrayd
it 371 years before Christ (cit. Balachowsky and Mesnil, 1935).
Population genetic studies of agricultural pests have highlighted the
significance of migration and diversity in integrated pest management (Han and
Caprio, 2004; Endersby et al., 2006; Scott et al., 2005, 2006; Zhou et al., 2000;
Leniaud et al., 2006). Because populations of such pest species are mostely affected
by the application of phyto-protection measures, such as insecticides and transgenic
crops, genetic population structure of the insects are mostely affected due to
resistance against insecticides (Carriere et al., 2004; Caprio 1998, 2001).
53
C. pomonella is the most important pest of pome fruits in temperate areas
worldwide. Despite its economic importance, little research has been done on its
molecular aspect regarding genetic structure and patterns of gene flow at the local and
regional scale, which are important features for establishing an area wide control
strategy (Faust, 2003; Calkins and Dorn et al., 1999). Pest management strategies of
C. pomonella include regular insecticide treatments, which are known to select for
resistance to several insecticide groups (Knight et al., 1994, Sauphanor et al., 1998;
Dunley and Welter, 2000). Therefore, a comprehensive and detailed study of the
population molecular studies of this pest could be indispensable in its management
decisions (Timm et al., 2006).
Population variations of the insect pest may be influenced by different factors
within the landscape (Keyghobadi et al., 2005; Peterson and Denno, 1998). Hence,
inherent insect uniqueness such as adult flight capability, as well as biological factors
related to habitat, shape the genetic architecture of traits in insect populations. In
agroecosystems particularly, anthropogenic factors, for example, pest management,
can further add to insect population disturbance in different parts of the world (Dorn
et al., 1999).
According to Bardakci, (2001) and Delaat et al. (2005) polymerase chain
reaction (PCR) techniques propose increased understanding and speed for the
identification and characterization of species to find out variation in populations. The
randomly amplified polymorphic DNA (RAPD) technique has been developed to
detect genetic variation and diversity by PCR amplification of genomic DNA by using
short, random primers and thus does not require prior knowledge of a DNA sequence.
(Deverno et al., 1998). Molecular studies and research provide new methods to study
population diversity as well as to discriminate closely related species (Williams et al.,
1990; Deverno et al., 1998). RAPD primers are very well suited for use in insect
phylogeny areas like the detection of genetic diversity among populations as well as
the detection of closely related species and ecotypes (Benecke, 1998; Lima et al.,
2002). Thus it is low cost, efficient in developing a large number of DNA markers in
a less time and the less complicated equipment that it requires has made RAPD primer
a useful technique for findin out population variation among the insects.
54
By using allozyme markers, little genetic differentiation between C.
pomonella populations was reported from different parts of the world (Pashley, 1983).
Likewise, low variation was found between different location and different host plants
in France and Switzerland (Bues and Toubon 1992; Bues et al., 1995). Significant
differentiation between populations at the regional and local scales were obtained in
South Africa using amplified fragment length polymorphisms (AFLPs) (Timm et al.,
2006). More powerful markers (co-dominant), such as microsatellites, have been
introduced for C. pomonella (Franck et al., 2005; Zhou et al., 2005). These markers
have been applied by Franck et al. (2007) to evaluate the population structure of C.
pomonella from France. Low molecular variation were recorded in this later study,
whilst the insecticide applications were no pressure on the population variations
(Franck et al., 2007).
C. pomonella has been traditionally regarded as a rather inactive pest, likely to
develop genetic isolation between geographical regions. However, laboratory
evidence suggests that some ecotypes and strains of this pest have the ability to fly
several kilometers (Keil et al., 2001). Moreover, other means of mobility, such as
anthropogenic activities i.e. harvest bin and cartons containing the diapausing larvae
of C. pomonella between packing facilities and orchards, could signify an important
source of distribution for this pest (Higbee et al., 2001).
C. pomonella is regarded as a inactive species and different studies showed
that males can fly and disperse within range of 60-80 meters, but some of the adult
mnale moth can flight upto several kilometers. (Mani and Wildbolz, 1977; Keil et al.,
2001). Laboratory studies confirmed similar flight capacity for males and females
moths (Schumacher et al., 1997). This variation is may be adaptive, as it provides
chances for the adult moth for survival in cases of habitat destruction (Schumacher et
al., 1997; Keil et al., 2001) and along with transportation of infested fruit (Hibgee et
al., 2001), might have essential inferences of genetic variation between populations.
Studies with allozyme (Buès et al., 1995) and DNA (Timm et al., 2006; Franck et al.,
2007; Thaler et al., 2008; Chen and Dorn, 2010) primers studies on populations from
various regions of the world have disclosed inconsistent outcomes (Franck and Timm,
2010).
55
RAPD primers are very efficient and affective tools to find out the variability
among and between populations of C. pomonella in Italy (Gomez et al., 2004; Gomez
et al., 2005). Bayar et al. (2006) investigated population variation of Aeolothrips
intermedius, and found population-specific RAPD primers for their differentiation.
Deverno et al. (1998) distinguished two closely related sympatric species of
lepidopterious moths using seventeen species-specific RAPD primers. Previousely,
RAPD primers have used successfully for studying the population variation of the
Hessian fly, Mayetiola destructor and the wheat stem sawfly, Cephus cinctus, in Syria
and America, respectively (Lou et al., 1998; Naber et al., 2000).
The current studies were therefore undertaken to know about the molecular
variation among the population of C. pomonella collected from three major growing
apple areas of Swat i.e. Matta, Madyan and Kalam (Having different altitudes,
climatic conditions and geographical locations) through randomly amplified
polymorphic DNA (RAPD) in the Institute of Biotechnology, The University of
Agriculture, Peshawar, Pakistan.
56
3.2. REVIEW OF LITERATURE
Garner and Siavice (1996) reported that the Asian gypsy moth (Lymantria
dispar L.) brought into North America and genetic markers were used to differentiate
Asian moths from the established North American population. They used RAPD-PCR
to identify a DNA length polymorphism that is analytical for the two moth strains.
DNA sequence analyses showed that Asian and North American forms enabled
development of locus-specific primers so that this primers, designated FS-1, will be
useful for strain and various ecotypes detection under varying situations in different
laboratories.
Boivin et al. (2002) investigated that adaptive variation in populations
encountering a new environment are often constrained by deleterious pleiotropic
interactions with ancestral physiological functions. Some insecticides application on
repeated basis may cause variation in the population of various insects. The novel set
of selective forces after removal of insecticide pressure led to the decline of the
frequencies of resistant phenotypes over time, suggesting that the insecticide-adapted
genetic variants were selected against the absence of insecticide.
Timm et al. (2006) examined gene flow and genetic variation mong
geographic and host populations of C. pomonella (L.) in South Africa is lacking,
among gene flow in the population, the importance of control practices such
insecticides application and biological control, often influence the variation in the
population. Some results disclose that population from different host were not closely
related but some population showed differentiation collected from orchard situated at
adistance of 1 km apart. But due to limited moth flight extensive gene flow may be
noticed among the population from different host, however gene flow among local
species of C. pomonella may be limited.
Thaler et al. (2008) studied that AFLP markers elucidate the genetic structure
of C. pomonella strains collected from different apple orchard of Central European.
Individual genetic variation within population was low but ahigh degree of molecular
variation was recorded between the population even at a small distance. One of the
main reason was responsible for variation was limited gene flow among closely
related populations. Besides, ecological, microclimatic and geographic constraints
may favour developing C. pomonella into many local strains and populations. In
57
Central European fruit orchards C. pomonella is under great pressure due to
insecticides usage. As no evidence has been recorded for having a relation between
insecticide resistance and geographic or genetic distances among populations, AFLP
markers do not have a prophetic value for having an outbreak of pesticide resistance
in the field. The case of C. pomonella is a great example for having globally
successful pest species due to developing strain and ecotypes among its population.
Fuentes-contreras et al. (2008), reported that C. pomonella is the major pest of
apple orchard throughout the world. Molecular studies were carried out using
microsatellites for 11 C. pomonella populations in the two major apple cropping
regions in central Chile. Only 0.2% of the genetic variability was found among the
populations. Geographically structured genetic variation was independent of apple
orchard management. It can be concluded that a high genetic changes of C. pomonella
between orchards, possibly mediated by human activities attributed to fruit
production.
Razowski et al. (2010) examined DNA variation in a 606 bp fragment of COI
mtDNA obtained from 23 species of Tortricini and two representatives of other tribes
in Croatia. The position of Spatalistis, Tortrix, Aleimma and Acleris and some
groupings of species within Acleris were confirmed by molecular data, including the
synonymization of Croatia and Phylacophora were also confirmed by molecular data.
This studies confirmed the variation in population of all these species through
moecular COI DNA analysis.
Chen and Dorn (2010) also reported that little work has been carried out
regarding molecular studies in populations of insect species that have a high genetic
variability in dispersal. Larvae (5th
instar) of C. pomonella were collected from three
orchards of stone fruits, pome fruits and nut trees from Switzerland and from six other
orchards in the country. Significant genetic variation in the population was noted
among the populations from apple, apricot and walnut in the Valais region. Besides,
among the eight populations sampled from apple in different geographic regions
throughout Switzerland. These results showed that a discrete prevailing feature, in the
current study the sedentary behaviour of the moth, can form change in the population
of insect.
58
Frank and Timm (2010) reported that studying the population genetic structure
of the insect pest population dynamics is a key aspect for understanding in agriculture
scenario. They further described the role of hosts, time and geography in the genetic
structure of C. pomonella. However, level of molecular variation among the
population were not significant based on variation in the Na channel and
microsatellite loci. It is concluded that phytosanitary measures are held responsible
for creating variation among the population of C. pomonella geographical and
temporal scale. They further added the relative importance of natural and dispersal of
insect with respect to the anthropogenic activities affecting C. pomonella population
genetics and highlight population genetic research needs in order to design more
efficient and affective pest management programs in future.
Pajac and Baric (2011) reported that C. pomonella is a severe pest inmost of
apple producing areas of the world. He wrote a review regarding its biology, damages,
morphology, resistance to insecticides, genetic control though molecular ways and
population genetic structure of this pest. This has the capability to adopt itself to
diferent climatic and weather conditions and has developed resistance to different
groups of pesticides used against this pest. That's the reason that this has developed
man ecotypes in their population having various biological and physiological
conditions required for its development.
Khaghaninia et al. (2009) used RAPD primers for investagating population
genetic variation in the population of 13 geographically different population colleted
from northwestern Iran during 20113 and 2004. They found useful information
regarding genetic and geographic distance matrices through Mantel test. The banding
pattern in the Mughan and Zunuz populations were ranges from 169 to 206
respectively. However, AMOVA disclosed significant variation within and between
population of C. pomonella. Between different populations diversity was 14.44% and
within the population the total variation was 85.56%. Cluster analysis regarding
molecular data for C. pomonella populations assigned in to two groups. First group
was consisted Mughan population only and canonical correlation analysis disclosed
high significant relation between RAPD primers and the topographic condition of that
area. Further, analysis explained that high relation between geographic populations
and validated the outcome of the previous cluster analysis.
59
Kil (2011) examined the molecular variations among the various population of
C. pomonella by using three types of microsatellite loci and find out the genetic
variation indices. He also determined number of alleles per locus and heterozygosity,
etc. He recorded a substantial variations in the molecular structure in the population of
C. pomonella collected from Russia were completely different from the population
collected from Ukraine durin the studies.
Voudouris et al. (2012) reported that C. pomonella (L ) in the most destructive
and severe pest of apple orchard through Europe. They collected nine samples from
pear, apple, and wallnut for genetic analysis from various location of mainland Greece
by using 11 microsatellite loci. Some samples were also collected from southern
France for comparison. Genetic analysis revealed and seperated the C. pomonella
samples in to two groups. The genetic variation among the samples collected within
the population was low detected by FST statistics i.e 0.009 in Greek samples. While
in the French samples the variation in the population was 0.0150 compared to the
global value 0.050 among all the samples collected from all these regions having
different climatic comditions and topography. Nonetheless, climate and host species
has not so much effect on genetic structure of C. pomonella populations within each
country. But anthropogenic activities may play avital role in the gene flow even at a
long distances in a particular country.
Men et al. (2013) investigated that C. pomonella is the most dangerous among
the insect pest causing a huge economic losses in China to apple orchard. No research
has been conducted till now regarding molecular genetic structure of this pest in
China. They reported sequential loss of the genetic variation and the reason of its
distributions but no correlation was recorded between genetic diversity and
topographic conditions of northwestern populations. No variation on molecular basis
were recorded regarding its population. The results further explained that genetic
diversity might be due to repeated colonization of of the founder populations.
However, population of C. pomonella having week flight capacity and human added
dispersal disclosed high level of genetic variation in their population rather than
topographic conditions.
Chinnapandi et al. (2013) studied the variability of genetic structure within a
specific sampling site of tobacco armyworm moth, Spodoptera litura. Armyworm
60
moths were collected from castor fields on a ten sampling sites in India. A total of 82
scorable DNA fragments ranging from 0.25 kb to > 2.0 kb were amplified by Random
Amplification of Polymorphic DNA. The percentage of polymorphism detected in
RAPD analysis was as high as 90-100%, suggesting the existence of strong genetic
polymorphism among S. litura samples occurring on different geographical locations
in South India. Statistical analyses showed significant levels of genetic variations
among the ten geographically distinct populations. Jaccard similarity index, values
fell in a range of 0.17-0.83, 0.3-0.9 and 0.3-0.8. Their results about intrapopulational
genetics are therefore discussed in regards to variations of sensitivity to biocontrol
agents such as Bacillus thuringiensis and several common insecticides of S. litura.
Kil and Basedina (2013) observed the molecular genetic structure of C.
pomonella and pest populations was described and its variability under influence of
insecticides, varying climatic conditions and geographic location is studied. Genetic
diversity of C. pomonella populations was shown to depend mainly on genetic
features of the populations, but not on the insecticide load or weather conditions. The
intra-population genetic diversity by two microsatellite loci was estimated in pests
from the gardens with different insecticide press.
61
3.3. MATERIALS AND METHODS
3.3.1. C. pomonella Specimen collection
Female larvae trapped and collected by single face cardboard tie up around the
apple tree at a distance of 30 cm from the ground following the procedures of Fritsch
et al. (2005) with some modifications. In each population, 30 overwintering female
larvae were randomly selected for DNA isolation to minimize DNA
contamination by endoparasites (Landry et al., 1999) in autumn from Matta (350
55' 19.11" of latitude North and 720 30' 37.52" of longitude East) (920.30 meters),
Madyan (350 08' 0.00" of latitude North and 72
0 32' 0.00" of longitude East) (1333.84
meters) and Kalam (350 28' 41.66" of latitude North and 72
0 34' 18.61" of longitude
East) (2092.30 meters). To eliminate the effect of host association in
discrimination of populations, all of the specimens were collected from "Red
Delicious" apple orchards. The specimens were washed and stored in 96% alcohol
(Ethanol) prior to analysis in the Health laboratory of Institute of Bio-Technology and
Genetic Engineering (IBGE), The University of Agriculture, Peshawar Pakistan.
3.3.2. Genomic DNA Extraction
For Genomic DNA extraction, Spinklean Genomic DNA Extraction Kit
(Thermoscientific® USA) was used and the procedure of Zimmerman et al. (2000)
was followed with some necessary modifications. The specimens were crushed in
liquid nitrogen. DNA was extracted using manufacture’s manual. Briefly, TL Buffer
(250ul) was added to crushed larvae for tissue lysis. The samples were then vortexed
to properly mix. 199 units of enzyme was added and mixed thoroughly. Lysis buffer
of 220 µl was added to the solutions and mixed thoroughly. A volume of 560 µl
Buffer TB was then added to each eppendorf tube and mixed comprehensively
through vortex to get a homogeneous solution followed by incubation for 10 minutes
at 65oC. Then 200 µl absolute ethanol was added. Sample mixtures were passed
through column, assembled in clean collection tube by centrifuging at 8000 Xg for 1
minute. Column was washed twice with 750 µl wash buffer ‘PS’ and centrifuged at
8000 Xg for 1 minute. For removing traces of ethanol the column was centrifuged
again at 10000 Xg for another one minute.
62
About 200 ul of pre heated TE buffer was added to the column membrane in
new tubes, incubated at room temperature for 2min and centrifuged at 10000xg for
1min to get DNA which was then stored at -20C.
3.3.3. Polymerase Chain Reaction and Gel Electrophoresis
The entire polymerase chain reaction (PCR) reactions was carried out in 25 µl
reaction containing total genomic DNA (150 ng), 0.25 mM of RAPD primers
(Genlink, USA), 200 µM of each dNTP, 50 mM of KCL, 10 mM Tris, 1.5 mM MgCl2
and 2.5 unite of Taq polymerase (Thermoscientific). Optimized amplification
conditions were: initial denaturation step of 4 minutes at 94oC followed by 40 cycles
each consisting of a denaturation step of 50 second at 94oC, annealing step of 1 min
280C extension of 1 min at 72
0C, was followed by final extension of 10 min at 72
oC.
All the amplification reactions were performed using gene amp PCR system 2700
programmable thermo cycler. The amplification products were then detected on 2%
agarose gel and stained with Ethidium Bromide using UV transilluminator. Images
were recorded and stored in computer.
3.3.4. Statistical Analysis
For statistical analysis of randomly amplified polymorphic DNA (RAPD),
every scorable band was considered as a single locus/allele. The loci were scored as
present (1) or absent (0). Bivariate 1-0 matrix was generated. Genetic distances was
calculated using “Unweighted Pair Group of Arithmetic Means” (UPGMA) procedure
described by Nei and Lie (1979).
GD=1-dxy/dx+dy-dxy, where
GD=Genetic Distance between two Genotypes,
dxy = Total no. of common loci (bands) in two genotypes,
dx = Total no. of loci (bands) in genotype 1 and
dy = Total no. of loci (bands) in genotypes.
The DNA amplification profiles were analyzed using online software program for
genetic analysis (Pop Gene version 3.1) available on www.ncbi.org. RAPD Primers used in
this experiment are presented in Table.3.1.
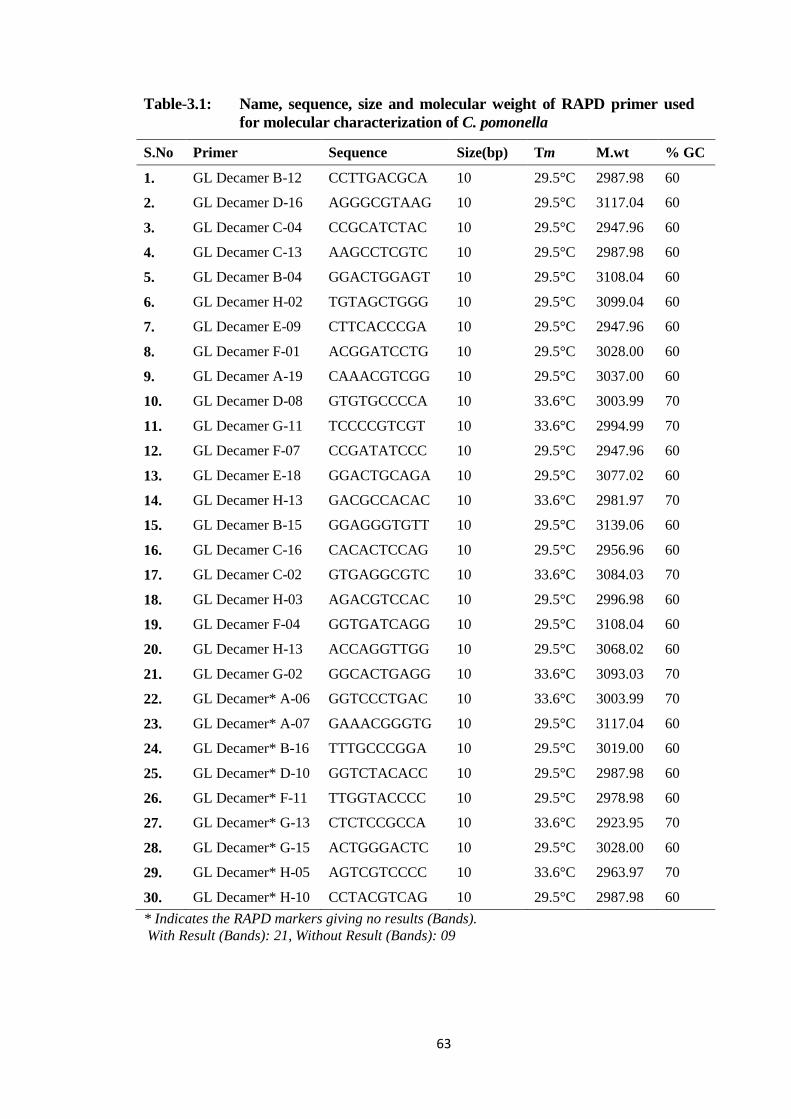
63
Table-3.1: Name, sequence, size and molecular weight of RAPD primer used
for molecular characterization of C. pomonella
S.No Primer Sequence Size(bp) Tm M.wt % GC
1. GL Decamer B-12 CCTTGACGCA 10 29.5°C 2987.98 60
2. GL Decamer D-16 AGGGCGTAAG 10 29.5°C 3117.04 60
3. GL Decamer C-04 CCGCATCTAC 10 29.5°C 2947.96 60
4. GL Decamer C-13 AAGCCTCGTC 10 29.5°C 2987.98 60
5. GL Decamer B-04 GGACTGGAGT 10 29.5°C 3108.04 60
6. GL Decamer H-02 TGTAGCTGGG 10 29.5°C 3099.04 60
7. GL Decamer E-09 CTTCACCCGA 10 29.5°C 2947.96 60
8. GL Decamer F-01 ACGGATCCTG 10 29.5°C 3028.00 60
9. GL Decamer A-19 CAAACGTCGG 10 29.5°C 3037.00 60
10. GL Decamer D-08 GTGTGCCCCA 10 33.6°C 3003.99 70
11. GL Decamer G-11 TCCCCGTCGT 10 33.6°C 2994.99 70
12. GL Decamer F-07 CCGATATCCC 10 29.5°C 2947.96 60
13. GL Decamer E-18 GGACTGCAGA 10 29.5°C 3077.02 60
14. GL Decamer H-13 GACGCCACAC 10 33.6°C 2981.97 70
15. GL Decamer B-15 GGAGGGTGTT 10 29.5°C 3139.06 60
16. GL Decamer C-16 CACACTCCAG 10 29.5°C 2956.96 60
17. GL Decamer C-02 GTGAGGCGTC 10 33.6°C 3084.03 70
18. GL Decamer H-03 AGACGTCCAC 10 29.5°C 2996.98 60
19. GL Decamer F-04 GGTGATCAGG 10 29.5°C 3108.04 60
20. GL Decamer H-13 ACCAGGTTGG 10 29.5°C 3068.02 60
21. GL Decamer G-02 GGCACTGAGG 10 33.6°C 3093.03 70
22. GL Decamer* A-06 GGTCCCTGAC 10 33.6°C 3003.99 70
23. GL Decamer* A-07 GAAACGGGTG 10 29.5°C 3117.04 60
24. GL Decamer* B-16 TTTGCCCGGA 10 29.5°C 3019.00 60
25. GL Decamer* D-10 GGTCTACACC 10 29.5°C 2987.98 60
26. GL Decamer* F-11 TTGGTACCCC 10 29.5°C 2978.98 60
27. GL Decamer* G-13 CTCTCCGCCA 10 33.6°C 2923.95 70
28. GL Decamer* G-15 ACTGGGACTC 10 29.5°C 3028.00 60
29. GL Decamer* H-05 AGTCGTCCCC 10 33.6°C 2963.97 70
30. GL Decamer* H-10 CCTACGTCAG 10 29.5°C 2987.98 60
* Indicates the RAPD markers giving no results (Bands).
With Result (Bands): 21, Without Result (Bands): 09
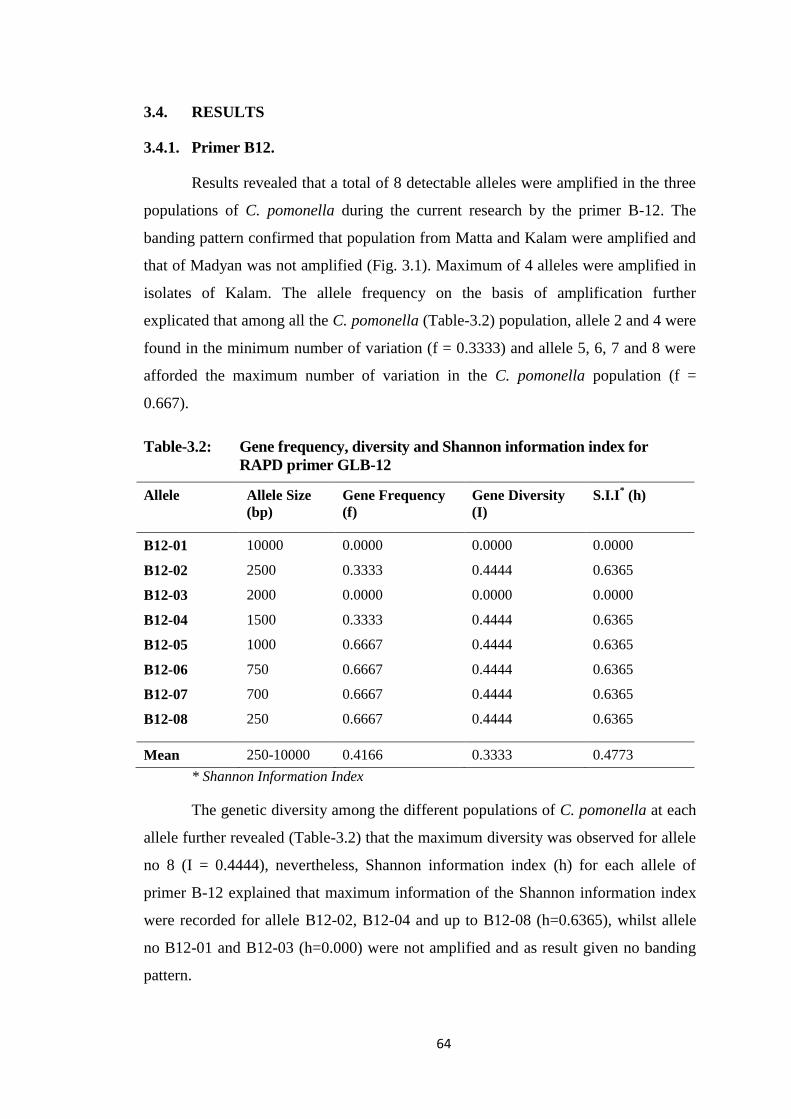
64
3.4. RESULTS
3.4.1. Primer B12.
Results revealed that a total of 8 detectable alleles were amplified in the three
populations of C. pomonella during the current research by the primer B-12. The
banding pattern confirmed that population from Matta and Kalam were amplified and
that of Madyan was not amplified (Fig. 3.1). Maximum of 4 alleles were amplified in
isolates of Kalam. The allele frequency on the basis of amplification further
explicated that among all the C. pomonella (Table-3.2) population, allele 2 and 4 were
found in the minimum number of variation (f = 0.3333) and allele 5, 6, 7 and 8 were
afforded the maximum number of variation in the C. pomonella population (f =
0.667).
Table-3.2: Gene frequency, diversity and Shannon information index for
RAPD primer GLB-12
Allele Allele Size
(bp)
Gene Frequency
(f)
Gene Diversity
(I)
S.I.I* (h)
B12-01 10000 0.0000 0.0000 0.0000
B12-02 2500 0.3333 0.4444 0.6365
B12-03 2000 0.0000 0.0000 0.0000
B12-04 1500 0.3333 0.4444 0.6365
B12-05 1000 0.6667 0.4444 0.6365
B12-06 750 0.6667 0.4444 0.6365
B12-07 700 0.6667 0.4444 0.6365
B12-08 250 0.6667 0.4444 0.6365
Mean 250-10000 0.4166 0.3333 0.4773
* Shannon Information Index
The genetic diversity among the different populations of C. pomonella at each
allele further revealed (Table-3.2) that the maximum diversity was observed for allele
no 8 (I = 0.4444), nevertheless, Shannon information index (h) for each allele of
primer B-12 explained that maximum information of the Shannon information index
were recorded for allele B12-02, B12-04 and up to B12-08 (h=0.6365), whilst allele
no B12-01 and B12-03 (h=0.000) were not amplified and as result given no banding
pattern.
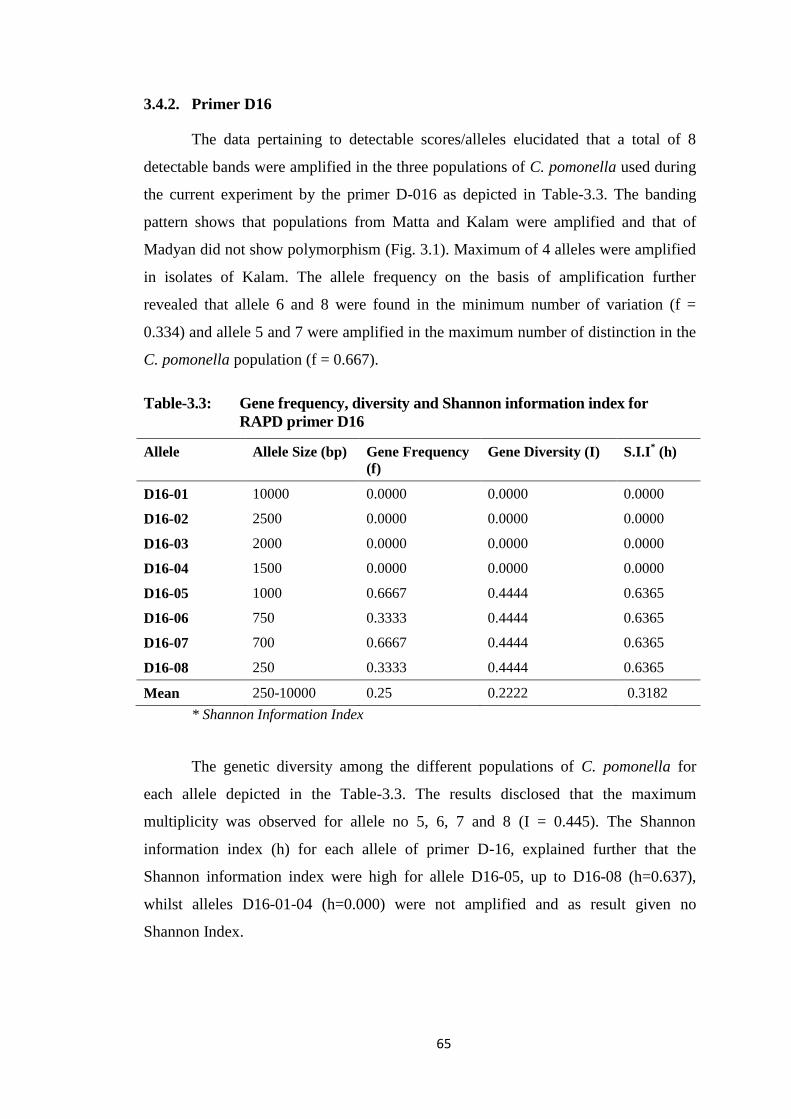
65
3.4.2. Primer D16
The data pertaining to detectable scores/alleles elucidated that a total of 8
detectable bands were amplified in the three populations of C. pomonella used during
the current experiment by the primer D-016 as depicted in Table-3.3. The banding
pattern shows that populations from Matta and Kalam were amplified and that of
Madyan did not show polymorphism (Fig. 3.1). Maximum of 4 alleles were amplified
in isolates of Kalam. The allele frequency on the basis of amplification further
revealed that allele 6 and 8 were found in the minimum number of variation (f =
0.334) and allele 5 and 7 were amplified in the maximum number of distinction in the
C. pomonella population (f = 0.667).
Table-3.3: Gene frequency, diversity and Shannon information index for
RAPD primer D16
Allele Allele Size (bp) Gene Frequency
(f)
Gene Diversity (I) S.I.I* (h)
D16-01 10000 0.0000 0.0000 0.0000
D16-02 2500 0.0000 0.0000 0.0000
D16-03 2000 0.0000 0.0000 0.0000
D16-04 1500 0.0000 0.0000 0.0000
D16-05 1000 0.6667 0.4444 0.6365
D16-06 750 0.3333 0.4444 0.6365
D16-07 700 0.6667 0.4444 0.6365
D16-08 250 0.3333 0.4444 0.6365
Mean 250-10000 0.25 0.2222 0.3182
* Shannon Information Index
The genetic diversity among the different populations of C. pomonella for
each allele depicted in the Table-3.3. The results disclosed that the maximum
multiplicity was observed for allele no 5, 6, 7 and 8 (I = 0.445). The Shannon
information index (h) for each allele of primer D-16, explained further that the
Shannon information index were high for allele D16-05, up to D16-08 (h=0.637),
whilst alleles D16-01-04 (h=0.000) were not amplified and as result given no
Shannon Index.
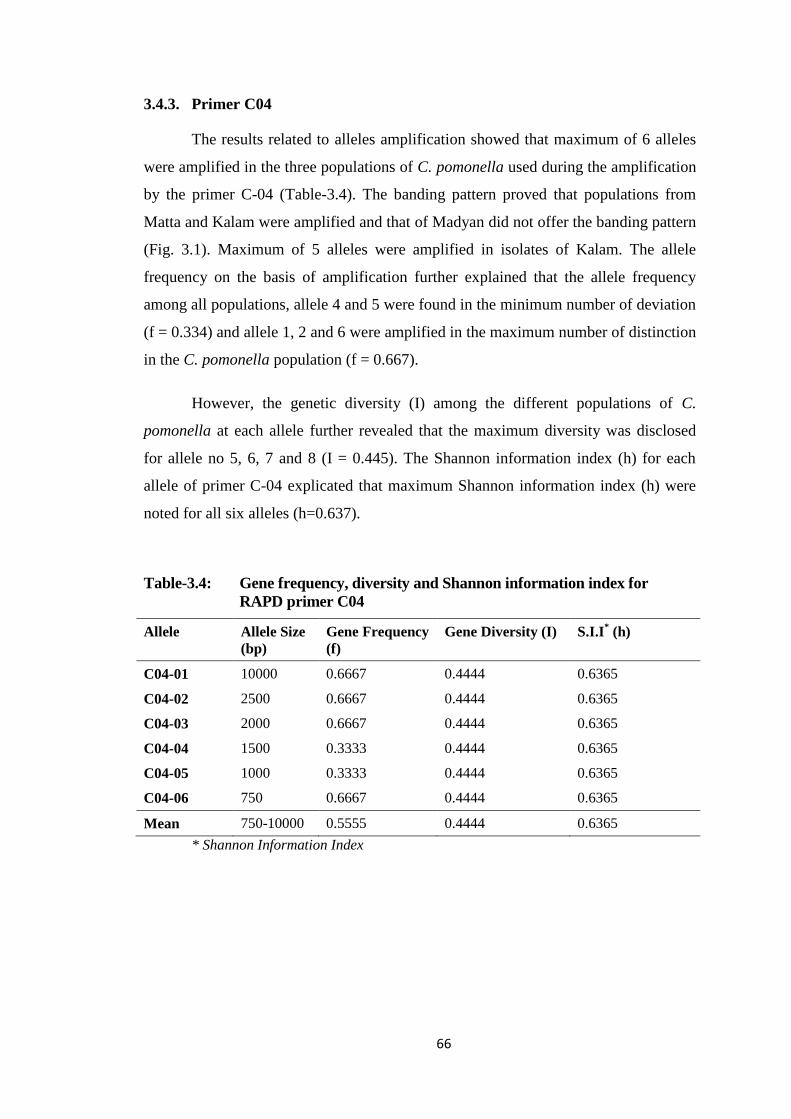
66
3.4.3. Primer C04
The results related to alleles amplification showed that maximum of 6 alleles
were amplified in the three populations of C. pomonella used during the amplification
by the primer C-04 (Table-3.4). The banding pattern proved that populations from
Matta and Kalam were amplified and that of Madyan did not offer the banding pattern
(Fig. 3.1). Maximum of 5 alleles were amplified in isolates of Kalam. The allele
frequency on the basis of amplification further explained that the allele frequency
among all populations, allele 4 and 5 were found in the minimum number of deviation
(f = 0.334) and allele 1, 2 and 6 were amplified in the maximum number of distinction
in the C. pomonella population (f = 0.667).
However, the genetic diversity (I) among the different populations of C.
pomonella at each allele further revealed that the maximum diversity was disclosed
for allele no 5, 6, 7 and 8 (I = 0.445). The Shannon information index (h) for each
allele of primer C-04 explicated that maximum Shannon information index (h) were
noted for all six alleles (h=0.637).
Table-3.4: Gene frequency, diversity and Shannon information index for
RAPD primer C04
Allele Allele Size
(bp)
Gene Frequency
(f)
Gene Diversity (I) S.I.I* (h)
C04-01 10000 0.6667 0.4444 0.6365
C04-02 2500 0.6667 0.4444 0.6365
C04-03 2000 0.6667 0.4444 0.6365
C04-04 1500 0.3333 0.4444 0.6365
C04-05 1000 0.3333 0.4444 0.6365
C04-06 750 0.6667 0.4444 0.6365
Mean 750-10000 0.5555 0.4444 0.6365
* Shannon Information Index
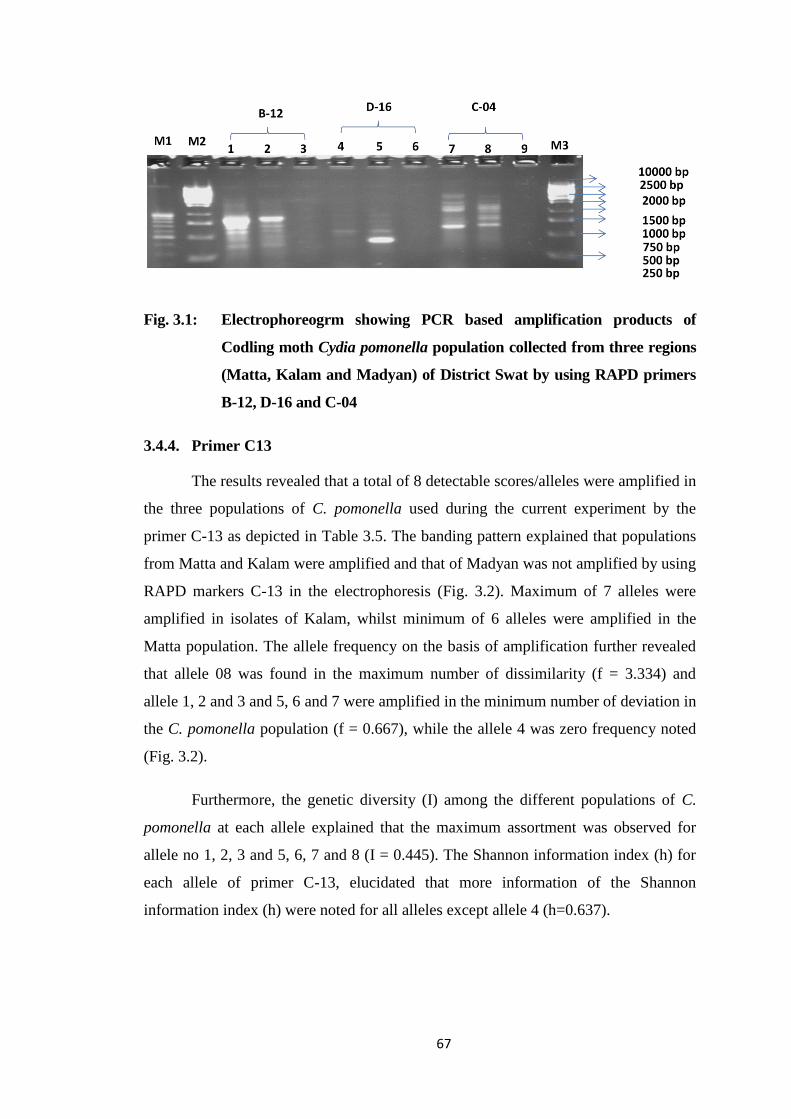
67
Fig. 3.1: Electrophoreogrm showing PCR based amplification products of
Codling moth Cydia pomonella population collected from three regions
(Matta, Kalam and Madyan) of District Swat by using RAPD primers
B-12, D-16 and C-04
3.4.4. Primer C13
The results revealed that a total of 8 detectable scores/alleles were amplified in
the three populations of C. pomonella used during the current experiment by the
primer C-13 as depicted in Table 3.5. The banding pattern explained that populations
from Matta and Kalam were amplified and that of Madyan was not amplified by using
RAPD markers C-13 in the electrophoresis (Fig. 3.2). Maximum of 7 alleles were
amplified in isolates of Kalam, whilst minimum of 6 alleles were amplified in the
Matta population. The allele frequency on the basis of amplification further revealed
that allele 08 was found in the maximum number of dissimilarity (f = 3.334) and
allele 1, 2 and 3 and 5, 6 and 7 were amplified in the minimum number of deviation in
the C. pomonella population (f = 0.667), while the allele 4 was zero frequency noted
(Fig. 3.2).
Furthermore, the genetic diversity (I) among the different populations of C.
pomonella at each allele explained that the maximum assortment was observed for
allele no 1, 2, 3 and 5, 6, 7 and 8 (I = 0.445). The Shannon information index (h) for
each allele of primer C-13, elucidated that more information of the Shannon
information index (h) were noted for all alleles except allele 4 (h=0.637).
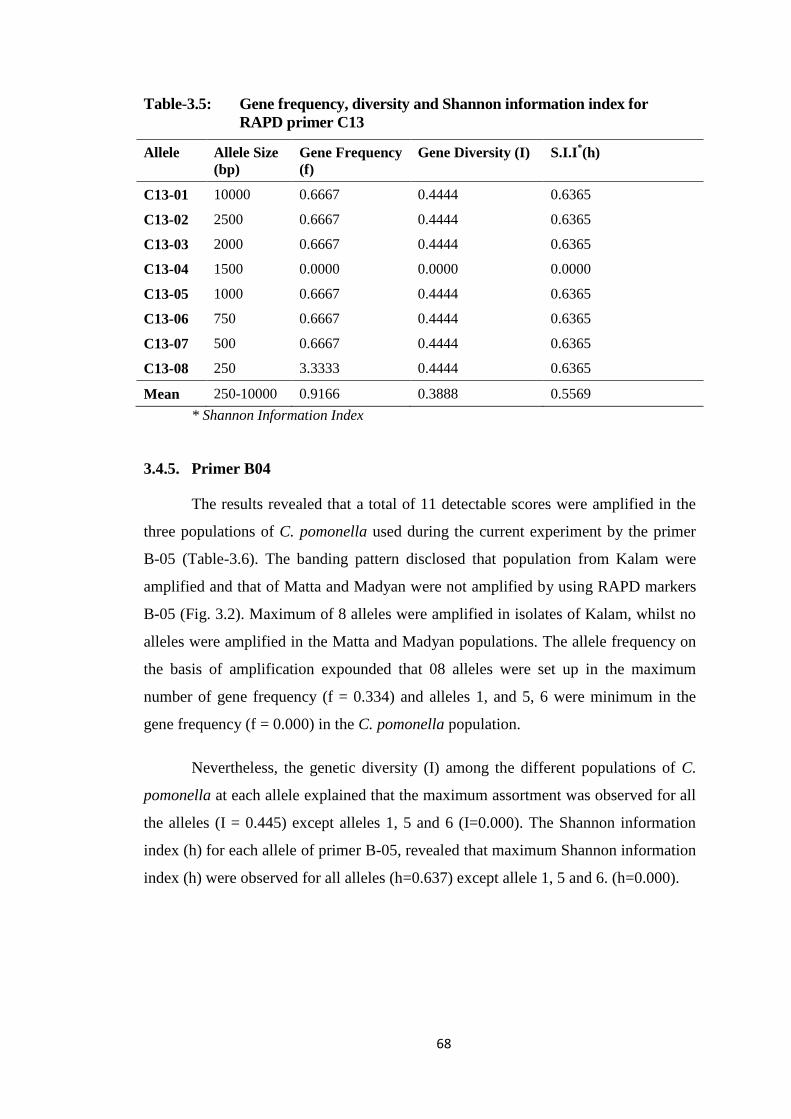
68
Table-3.5: Gene frequency, diversity and Shannon information index for
RAPD primer C13
Allele Allele Size
(bp)
Gene Frequency
(f)
Gene Diversity (I) S.I.I*(h)
C13-01 10000 0.6667 0.4444 0.6365
C13-02 2500 0.6667 0.4444 0.6365
C13-03 2000 0.6667 0.4444 0.6365
C13-04 1500 0.0000 0.0000 0.0000
C13-05 1000 0.6667 0.4444 0.6365
C13-06 750 0.6667 0.4444 0.6365
C13-07 500 0.6667 0.4444 0.6365
C13-08 250 3.3333 0.4444 0.6365
Mean 250-10000 0.9166 0.3888 0.5569
* Shannon Information Index
3.4.5. Primer B04
The results revealed that a total of 11 detectable scores were amplified in the
three populations of C. pomonella used during the current experiment by the primer
B-05 (Table-3.6). The banding pattern disclosed that population from Kalam were
amplified and that of Matta and Madyan were not amplified by using RAPD markers
B-05 (Fig. 3.2). Maximum of 8 alleles were amplified in isolates of Kalam, whilst no
alleles were amplified in the Matta and Madyan populations. The allele frequency on
the basis of amplification expounded that 08 alleles were set up in the maximum
number of gene frequency (f = 0.334) and alleles 1, and 5, 6 were minimum in the
gene frequency (f = 0.000) in the C. pomonella population.
Nevertheless, the genetic diversity (I) among the different populations of C.
pomonella at each allele explained that the maximum assortment was observed for all
the alleles (I = 0.445) except alleles 1, 5 and 6 (I=0.000). The Shannon information
index (h) for each allele of primer B-05, revealed that maximum Shannon information
index (h) were observed for all alleles (h=0.637) except allele 1, 5 and 6. (h=0.000).
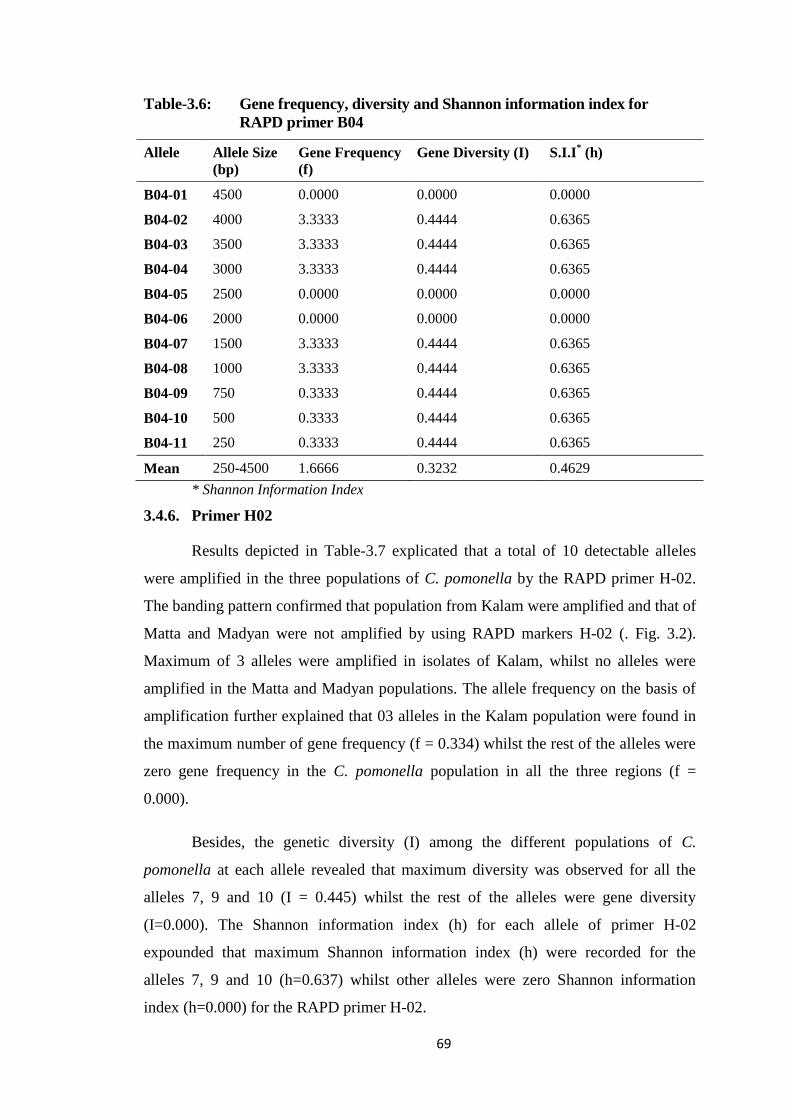
69
Table-3.6: Gene frequency, diversity and Shannon information index for
RAPD primer B04
Allele Allele Size
(bp)
Gene Frequency
(f)
Gene Diversity (I) S.I.I* (h)
B04-01 4500 0.0000 0.0000 0.0000
B04-02 4000 3.3333 0.4444 0.6365
B04-03 3500 3.3333 0.4444 0.6365
B04-04 3000 3.3333 0.4444 0.6365
B04-05 2500 0.0000 0.0000 0.0000
B04-06 2000 0.0000 0.0000 0.0000
B04-07 1500 3.3333 0.4444 0.6365
B04-08 1000 3.3333 0.4444 0.6365
B04-09 750 0.3333 0.4444 0.6365
B04-10 500 0.3333 0.4444 0.6365
B04-11 250 0.3333 0.4444 0.6365
Mean 250-4500 1.6666 0.3232 0.4629
* Shannon Information Index
3.4.6. Primer H02
Results depicted in Table-3.7 explicated that a total of 10 detectable alleles
were amplified in the three populations of C. pomonella by the RAPD primer H-02.
The banding pattern confirmed that population from Kalam were amplified and that of
Matta and Madyan were not amplified by using RAPD markers H-02 (. Fig. 3.2).
Maximum of 3 alleles were amplified in isolates of Kalam, whilst no alleles were
amplified in the Matta and Madyan populations. The allele frequency on the basis of
amplification further explained that 03 alleles in the Kalam population were found in
the maximum number of gene frequency (f = 0.334) whilst the rest of the alleles were
zero gene frequency in the C. pomonella population in all the three regions (f =
0.000).
Besides, the genetic diversity (I) among the different populations of C.
pomonella at each allele revealed that maximum diversity was observed for all the
alleles 7, 9 and 10 (I = 0.445) whilst the rest of the alleles were gene diversity
(I=0.000). The Shannon information index (h) for each allele of primer H-02
expounded that maximum Shannon information index (h) were recorded for the
alleles 7, 9 and 10 (h=0.637) whilst other alleles were zero Shannon information
index (h=0.000) for the RAPD primer H-02.
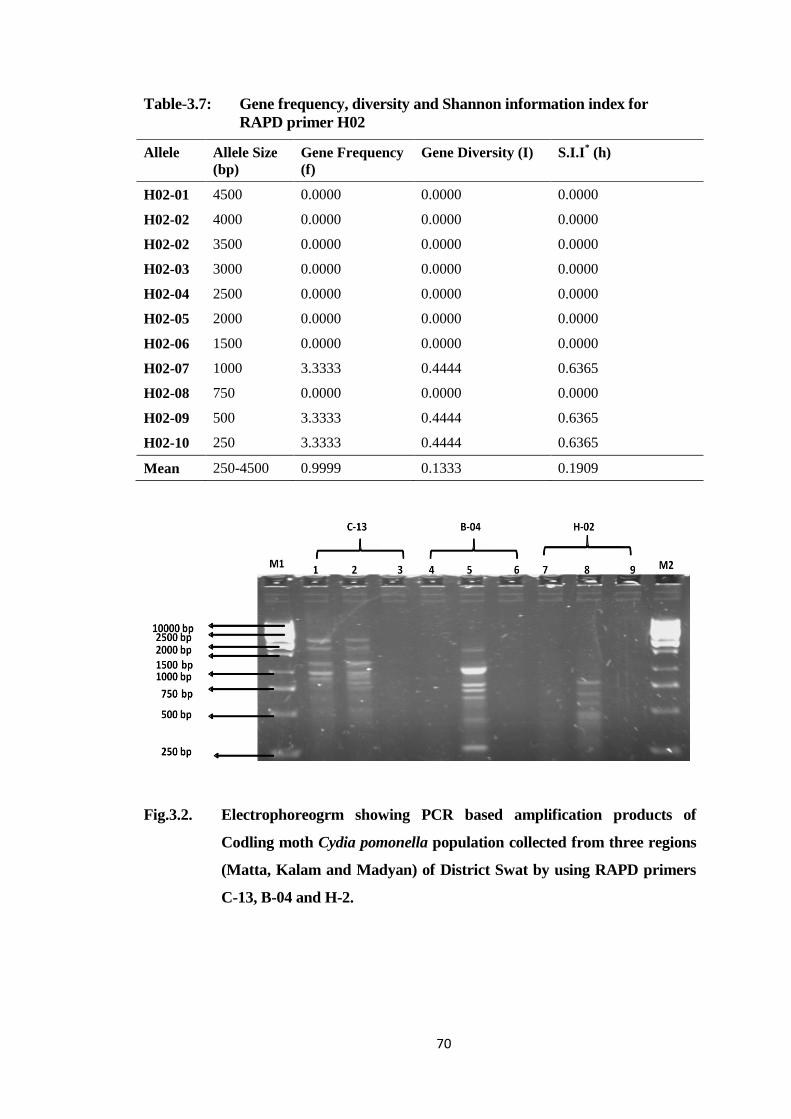
70
Table-3.7: Gene frequency, diversity and Shannon information index for
RAPD primer H02
Allele Allele Size
(bp)
Gene Frequency
(f)
Gene Diversity (I) S.I.I* (h)
H02-01 4500 0.0000 0.0000 0.0000
H02-02 4000 0.0000 0.0000 0.0000
H02-02 3500 0.0000 0.0000 0.0000
H02-03 3000 0.0000 0.0000 0.0000
H02-04 2500 0.0000 0.0000 0.0000
H02-05 2000 0.0000 0.0000 0.0000
H02-06 1500 0.0000 0.0000 0.0000
H02-07 1000 3.3333 0.4444 0.6365
H02-08 750 0.0000 0.0000 0.0000
H02-09 500 3.3333 0.4444 0.6365
H02-10 250 3.3333 0.4444 0.6365
Mean 250-4500 0.9999 0.1333 0.1909
Fig.3.2. Electrophoreogrm showing PCR based amplification products of
Codling moth Cydia pomonella population collected from three regions
(Matta, Kalam and Madyan) of District Swat by using RAPD primers
C-13, B-04 and H-2.
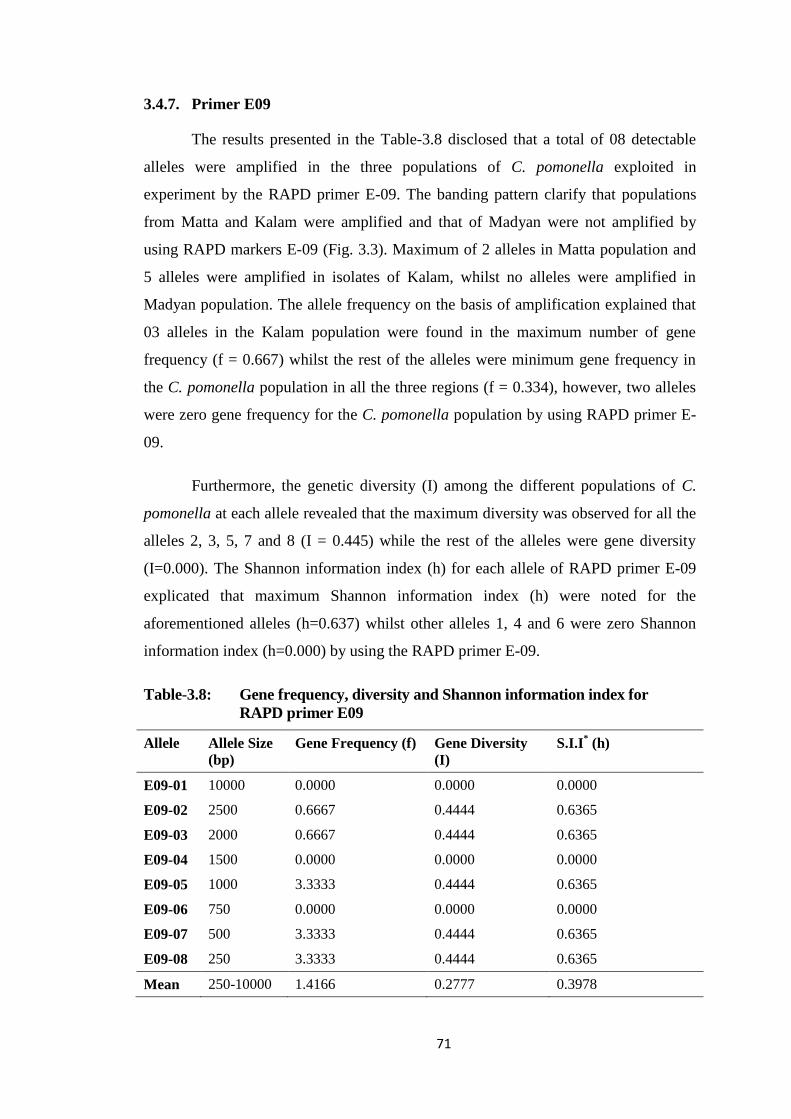
71
3.4.7. Primer E09
The results presented in the Table-3.8 disclosed that a total of 08 detectable
alleles were amplified in the three populations of C. pomonella exploited in
experiment by the RAPD primer E-09. The banding pattern clarify that populations
from Matta and Kalam were amplified and that of Madyan were not amplified by
using RAPD markers E-09 (Fig. 3.3). Maximum of 2 alleles in Matta population and
5 alleles were amplified in isolates of Kalam, whilst no alleles were amplified in
Madyan population. The allele frequency on the basis of amplification explained that
03 alleles in the Kalam population were found in the maximum number of gene
frequency (f = 0.667) whilst the rest of the alleles were minimum gene frequency in
the C. pomonella population in all the three regions (f = 0.334), however, two alleles
were zero gene frequency for the C. pomonella population by using RAPD primer E-
09.
Furthermore, the genetic diversity (I) among the different populations of C.
pomonella at each allele revealed that the maximum diversity was observed for all the
alleles 2, 3, 5, 7 and 8 (I = 0.445) while the rest of the alleles were gene diversity
(I=0.000). The Shannon information index (h) for each allele of RAPD primer E-09
explicated that maximum Shannon information index (h) were noted for the
aforementioned alleles (h=0.637) whilst other alleles 1, 4 and 6 were zero Shannon
information index (h=0.000) by using the RAPD primer E-09.
Table-3.8: Gene frequency, diversity and Shannon information index for
RAPD primer E09
Allele Allele Size
(bp)
Gene Frequency (f) Gene Diversity
(I)
S.I.I* (h)
E09-01 10000 0.0000 0.0000 0.0000
E09-02 2500 0.6667 0.4444 0.6365
E09-03 2000 0.6667 0.4444 0.6365
E09-04 1500 0.0000 0.0000 0.0000
E09-05 1000 3.3333 0.4444 0.6365
E09-06 750 0.0000 0.0000 0.0000
E09-07 500 3.3333 0.4444 0.6365
E09-08 250 3.3333 0.4444 0.6365
Mean 250-10000 1.4166 0.2777 0.3978
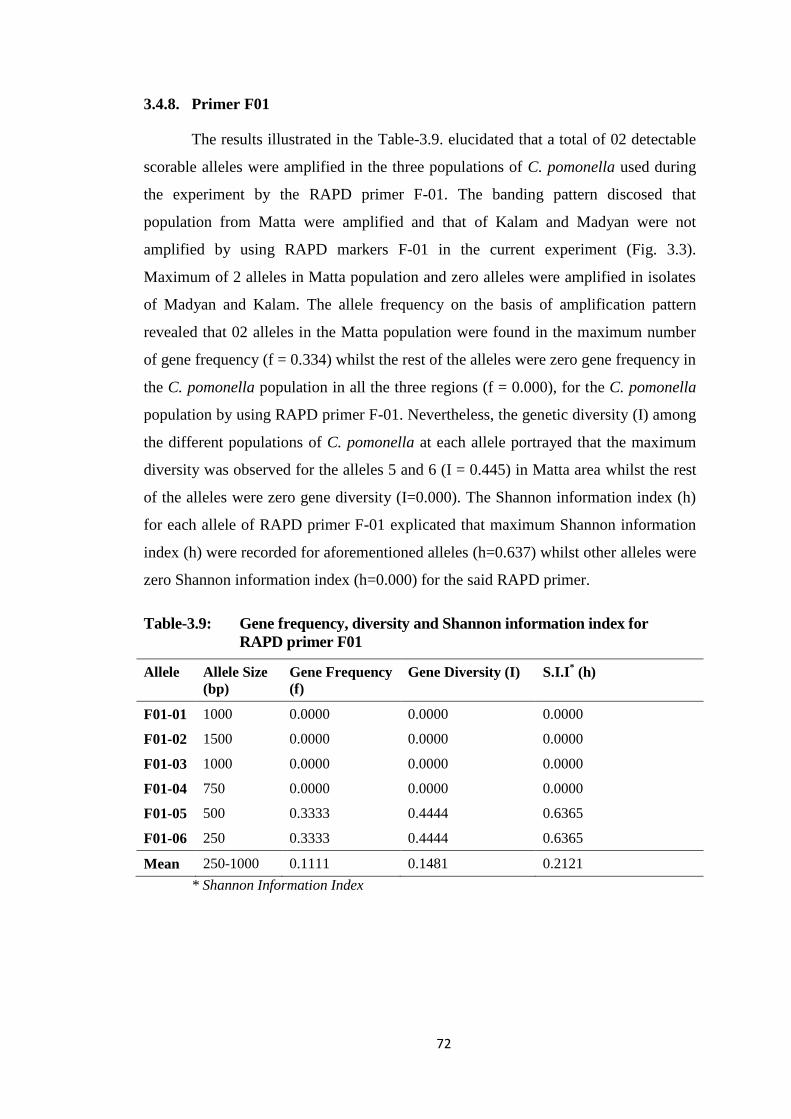
72
3.4.8. Primer F01
The results illustrated in the Table-3.9. elucidated that a total of 02 detectable
scorable alleles were amplified in the three populations of C. pomonella used during
the experiment by the RAPD primer F-01. The banding pattern discosed that
population from Matta were amplified and that of Kalam and Madyan were not
amplified by using RAPD markers F-01 in the current experiment (Fig. 3.3).
Maximum of 2 alleles in Matta population and zero alleles were amplified in isolates
of Madyan and Kalam. The allele frequency on the basis of amplification pattern
revealed that 02 alleles in the Matta population were found in the maximum number
of gene frequency (f = 0.334) whilst the rest of the alleles were zero gene frequency in
the C. pomonella population in all the three regions (f = 0.000), for the C. pomonella
population by using RAPD primer F-01. Nevertheless, the genetic diversity (I) among
the different populations of C. pomonella at each allele portrayed that the maximum
diversity was observed for the alleles 5 and 6 (I = 0.445) in Matta area whilst the rest
of the alleles were zero gene diversity (I=0.000). The Shannon information index (h)
for each allele of RAPD primer F-01 explicated that maximum Shannon information
index (h) were recorded for aforementioned alleles (h=0.637) whilst other alleles were
zero Shannon information index (h=0.000) for the said RAPD primer.
Table-3.9: Gene frequency, diversity and Shannon information index for
RAPD primer F01
Allele Allele Size
(bp)
Gene Frequency
(f)
Gene Diversity (I) S.I.I* (h)
F01-01 1000 0.0000 0.0000 0.0000
F01-02 1500 0.0000 0.0000 0.0000
F01-03 1000 0.0000 0.0000 0.0000
F01-04 750 0.0000 0.0000 0.0000
F01-05 500 0.3333 0.4444 0.6365
F01-06 250 0.3333 0.4444 0.6365
Mean 250-1000 0.1111 0.1481 0.2121
* Shannon Information Index
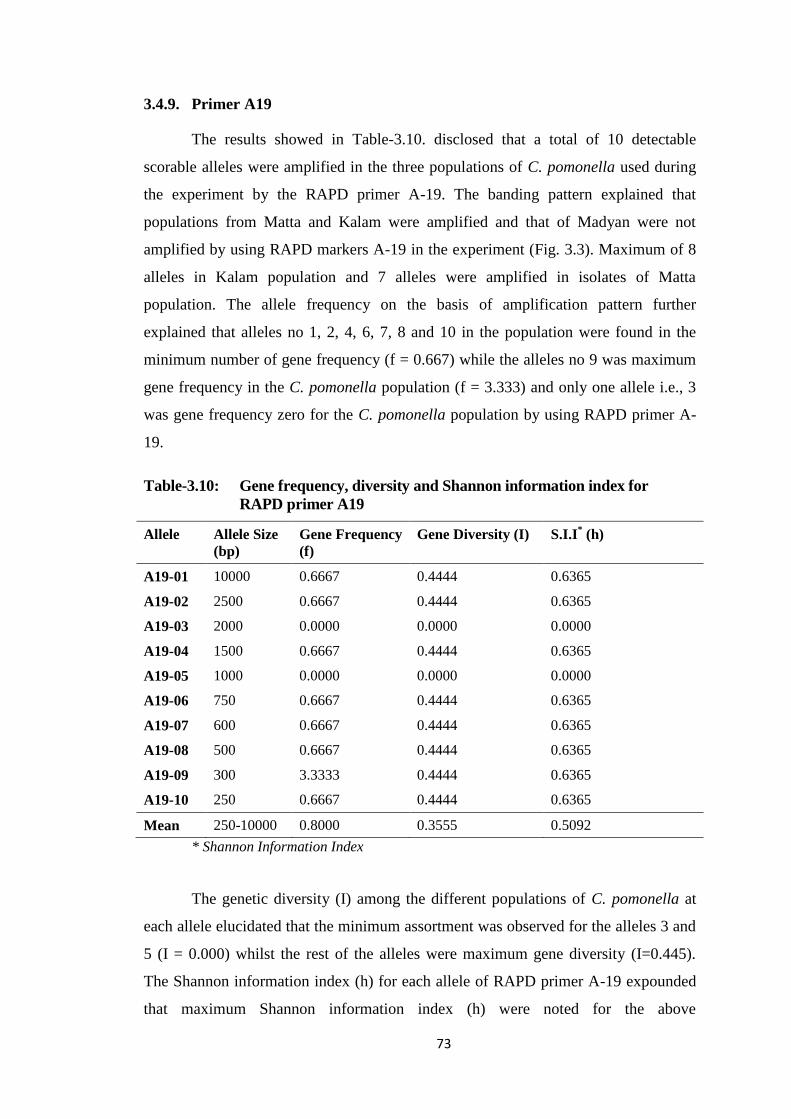
73
3.4.9. Primer A19
The results showed in Table-3.10. disclosed that a total of 10 detectable
scorable alleles were amplified in the three populations of C. pomonella used during
the experiment by the RAPD primer A-19. The banding pattern explained that
populations from Matta and Kalam were amplified and that of Madyan were not
amplified by using RAPD markers A-19 in the experiment (Fig. 3.3). Maximum of 8
alleles in Kalam population and 7 alleles were amplified in isolates of Matta
population. The allele frequency on the basis of amplification pattern further
explained that alleles no 1, 2, 4, 6, 7, 8 and 10 in the population were found in the
minimum number of gene frequency (f = 0.667) while the alleles no 9 was maximum
gene frequency in the C. pomonella population (f = 3.333) and only one allele i.e., 3
was gene frequency zero for the C. pomonella population by using RAPD primer A-
19.
Table-3.10: Gene frequency, diversity and Shannon information index for
RAPD primer A19
Allele Allele Size
(bp)
Gene Frequency
(f)
Gene Diversity (I) S.I.I* (h)
A19-01 10000 0.6667 0.4444 0.6365
A19-02 2500 0.6667 0.4444 0.6365
A19-03 2000 0.0000 0.0000 0.0000
A19-04 1500 0.6667 0.4444 0.6365
A19-05 1000 0.0000 0.0000 0.0000
A19-06 750 0.6667 0.4444 0.6365
A19-07 600 0.6667 0.4444 0.6365
A19-08 500 0.6667 0.4444 0.6365
A19-09 300 3.3333 0.4444 0.6365
A19-10 250 0.6667 0.4444 0.6365
Mean 250-10000 0.8000 0.3555 0.5092
* Shannon Information Index
The genetic diversity (I) among the different populations of C. pomonella at
each allele elucidated that the minimum assortment was observed for the alleles 3 and
5 (I = 0.000) whilst the rest of the alleles were maximum gene diversity (I=0.445).
The Shannon information index (h) for each allele of RAPD primer A-19 expounded
that maximum Shannon information index (h) were noted for the above
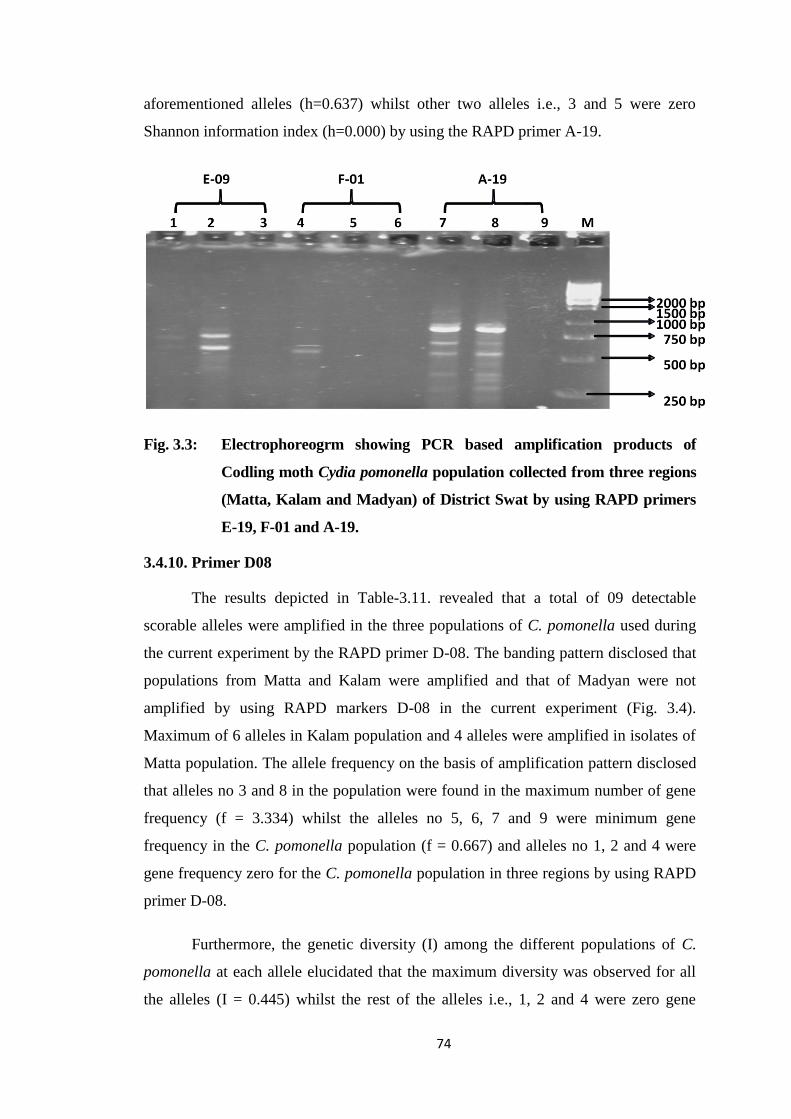
74
aforementioned alleles (h=0.637) whilst other two alleles i.e., 3 and 5 were zero
Shannon information index (h=0.000) by using the RAPD primer A-19.
Fig. 3.3: Electrophoreogrm showing PCR based amplification products of
Codling moth Cydia pomonella population collected from three regions
(Matta, Kalam and Madyan) of District Swat by using RAPD primers
E-19, F-01 and A-19.
3.4.10. Primer D08
The results depicted in Table-3.11. revealed that a total of 09 detectable
scorable alleles were amplified in the three populations of C. pomonella used during
the current experiment by the RAPD primer D-08. The banding pattern disclosed that
populations from Matta and Kalam were amplified and that of Madyan were not
amplified by using RAPD markers D-08 in the current experiment (Fig. 3.4).
Maximum of 6 alleles in Kalam population and 4 alleles were amplified in isolates of
Matta population. The allele frequency on the basis of amplification pattern disclosed
that alleles no 3 and 8 in the population were found in the maximum number of gene
frequency (f = 3.334) whilst the alleles no 5, 6, 7 and 9 were minimum gene
frequency in the C. pomonella population (f = 0.667) and alleles no 1, 2 and 4 were
gene frequency zero for the C. pomonella population in three regions by using RAPD
primer D-08.
Furthermore, the genetic diversity (I) among the different populations of C.
pomonella at each allele elucidated that the maximum diversity was observed for all
the alleles (I = 0.445) whilst the rest of the alleles i.e., 1, 2 and 4 were zero gene
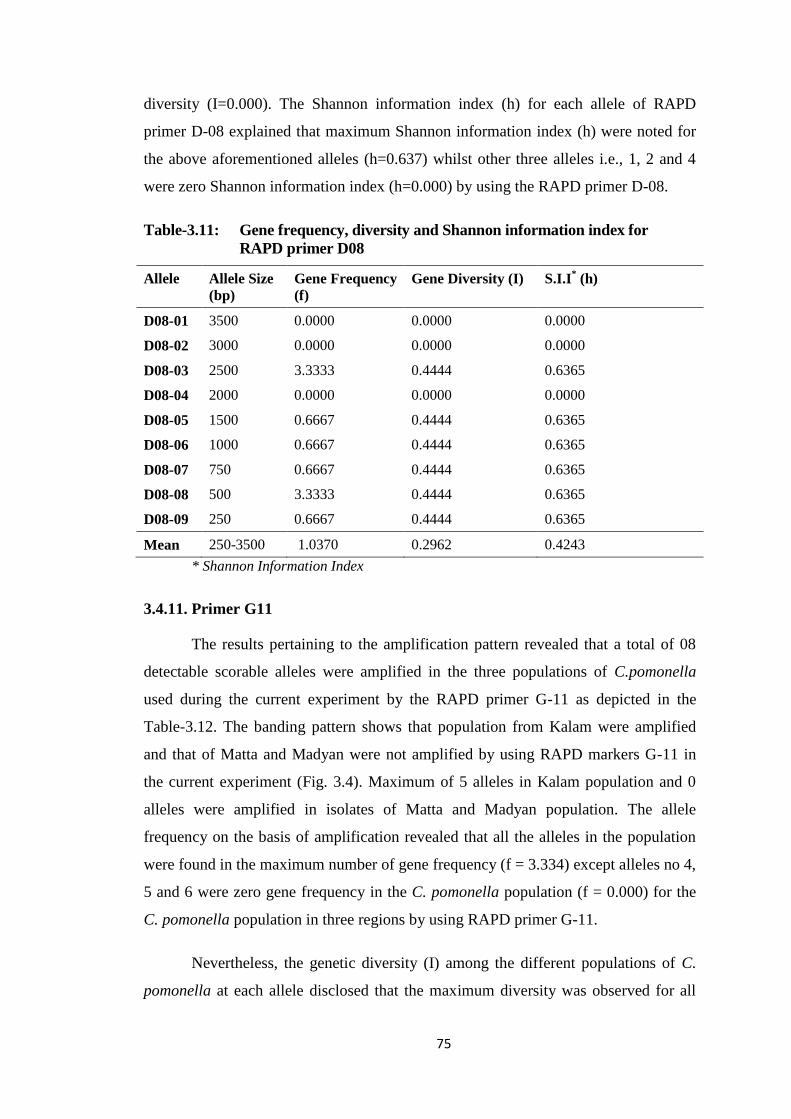
75
diversity (I=0.000). The Shannon information index (h) for each allele of RAPD
primer D-08 explained that maximum Shannon information index (h) were noted for
the above aforementioned alleles (h=0.637) whilst other three alleles i.e., 1, 2 and 4
were zero Shannon information index (h=0.000) by using the RAPD primer D-08.
Table-3.11: Gene frequency, diversity and Shannon information index for
RAPD primer D08
Allele Allele Size
(bp)
Gene Frequency
(f)
Gene Diversity (I) S.I.I* (h)
D08-01 3500 0.0000 0.0000 0.0000
D08-02 3000 0.0000 0.0000 0.0000
D08-03 2500 3.3333 0.4444 0.6365
D08-04 2000 0.0000 0.0000 0.0000
D08-05 1500 0.6667 0.4444 0.6365
D08-06 1000 0.6667 0.4444 0.6365
D08-07 750 0.6667 0.4444 0.6365
D08-08 500 3.3333 0.4444 0.6365
D08-09 250 0.6667 0.4444 0.6365
Mean 250-3500 1.0370 0.2962 0.4243
* Shannon Information Index
3.4.11. Primer G11
The results pertaining to the amplification pattern revealed that a total of 08
detectable scorable alleles were amplified in the three populations of C.pomonella
used during the current experiment by the RAPD primer G-11 as depicted in the
Table-3.12. The banding pattern shows that population from Kalam were amplified
and that of Matta and Madyan were not amplified by using RAPD markers G-11 in
the current experiment (Fig. 3.4). Maximum of 5 alleles in Kalam population and 0
alleles were amplified in isolates of Matta and Madyan population. The allele
frequency on the basis of amplification revealed that all the alleles in the population
were found in the maximum number of gene frequency (f = 3.334) except alleles no 4,
5 and 6 were zero gene frequency in the C. pomonella population (f = 0.000) for the
C. pomonella population in three regions by using RAPD primer G-11.
Nevertheless, the genetic diversity (I) among the different populations of C.
pomonella at each allele disclosed that the maximum diversity was observed for all
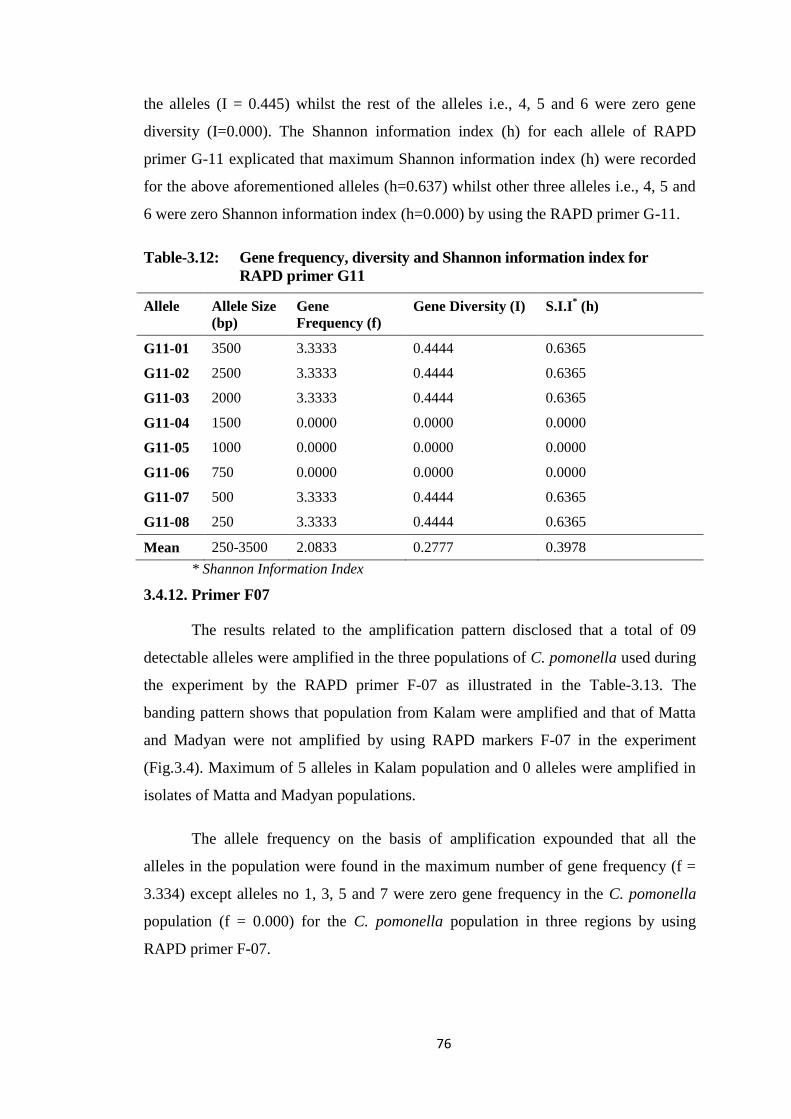
76
the alleles (I = 0.445) whilst the rest of the alleles i.e., 4, 5 and 6 were zero gene
diversity (I=0.000). The Shannon information index (h) for each allele of RAPD
primer G-11 explicated that maximum Shannon information index (h) were recorded
for the above aforementioned alleles (h=0.637) whilst other three alleles i.e., 4, 5 and
6 were zero Shannon information index (h=0.000) by using the RAPD primer G-11.
Table-3.12: Gene frequency, diversity and Shannon information index for
RAPD primer G11
Allele Allele Size
(bp)
Gene
Frequency (f)
Gene Diversity (I) S.I.I* (h)
G11-01 3500 3.3333 0.4444 0.6365
G11-02 2500 3.3333 0.4444 0.6365
G11-03 2000 3.3333 0.4444 0.6365
G11-04 1500 0.0000 0.0000 0.0000
G11-05 1000 0.0000 0.0000 0.0000
G11-06 750 0.0000 0.0000 0.0000
G11-07 500 3.3333 0.4444 0.6365
G11-08 250 3.3333 0.4444 0.6365
Mean 250-3500 2.0833 0.2777 0.3978
* Shannon Information Index
3.4.12. Primer F07
The results related to the amplification pattern disclosed that a total of 09
detectable alleles were amplified in the three populations of C. pomonella used during
the experiment by the RAPD primer F-07 as illustrated in the Table-3.13. The
banding pattern shows that population from Kalam were amplified and that of Matta
and Madyan were not amplified by using RAPD markers F-07 in the experiment
(Fig.3.4). Maximum of 5 alleles in Kalam population and 0 alleles were amplified in
isolates of Matta and Madyan populations.
The allele frequency on the basis of amplification expounded that all the
alleles in the population were found in the maximum number of gene frequency (f =
3.334) except alleles no 1, 3, 5 and 7 were zero gene frequency in the C. pomonella
population (f = 0.000) for the C. pomonella population in three regions by using
RAPD primer F-07.
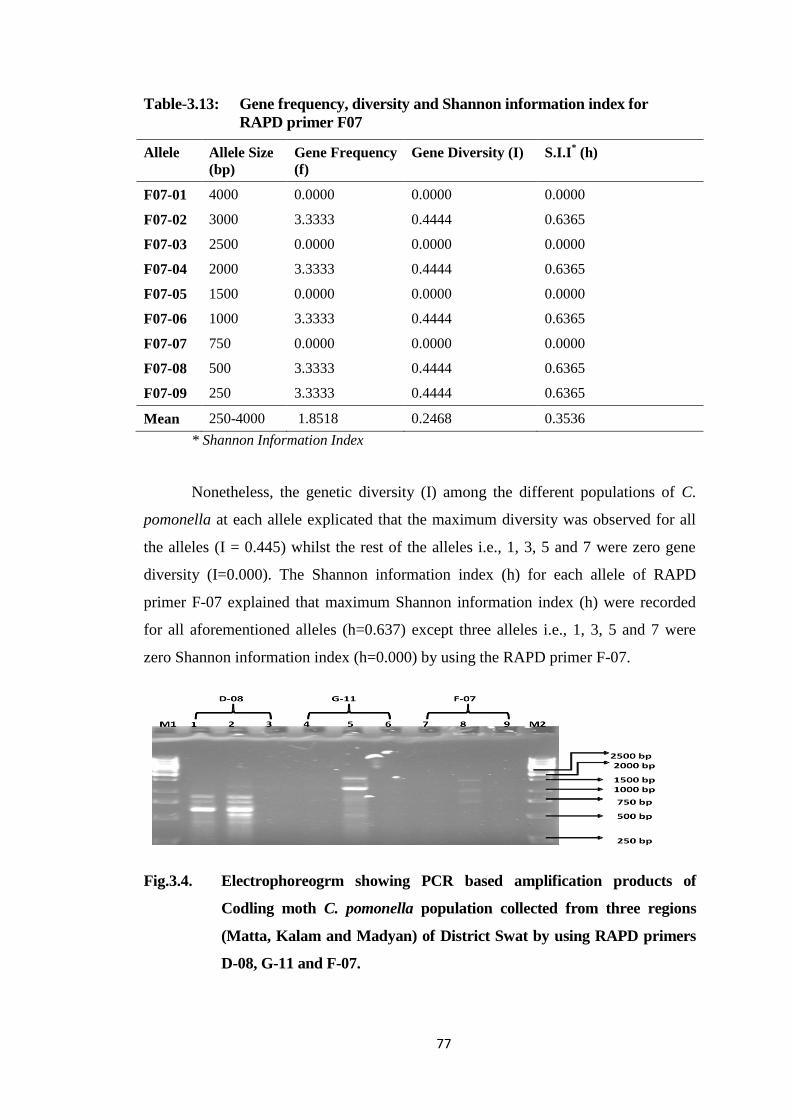
77
Table-3.13: Gene frequency, diversity and Shannon information index for
RAPD primer F07
Allele Allele Size
(bp)
Gene Frequency
(f)
Gene Diversity (I) S.I.I* (h)
F07-01 4000 0.0000 0.0000 0.0000
F07-02 3000 3.3333 0.4444 0.6365
F07-03 2500 0.0000 0.0000 0.0000
F07-04 2000 3.3333 0.4444 0.6365
F07-05 1500 0.0000 0.0000 0.0000
F07-06 1000 3.3333 0.4444 0.6365
F07-07 750 0.0000 0.0000 0.0000
F07-08 500 3.3333 0.4444 0.6365
F07-09 250 3.3333 0.4444 0.6365
Mean 250-4000 1.8518 0.2468 0.3536
* Shannon Information Index
Nonetheless, the genetic diversity (I) among the different populations of C.
pomonella at each allele explicated that the maximum diversity was observed for all
the alleles (I = 0.445) whilst the rest of the alleles i.e., 1, 3, 5 and 7 were zero gene
diversity (I=0.000). The Shannon information index (h) for each allele of RAPD
primer F-07 explained that maximum Shannon information index (h) were recorded
for all aforementioned alleles (h=0.637) except three alleles i.e., 1, 3, 5 and 7 were
zero Shannon information index (h=0.000) by using the RAPD primer F-07.
Fig.3.4. Electrophoreogrm showing PCR based amplification products of
Codling moth C. pomonella population collected from three regions
(Matta, Kalam and Madyan) of District Swat by using RAPD primers
D-08, G-11 and F-07.
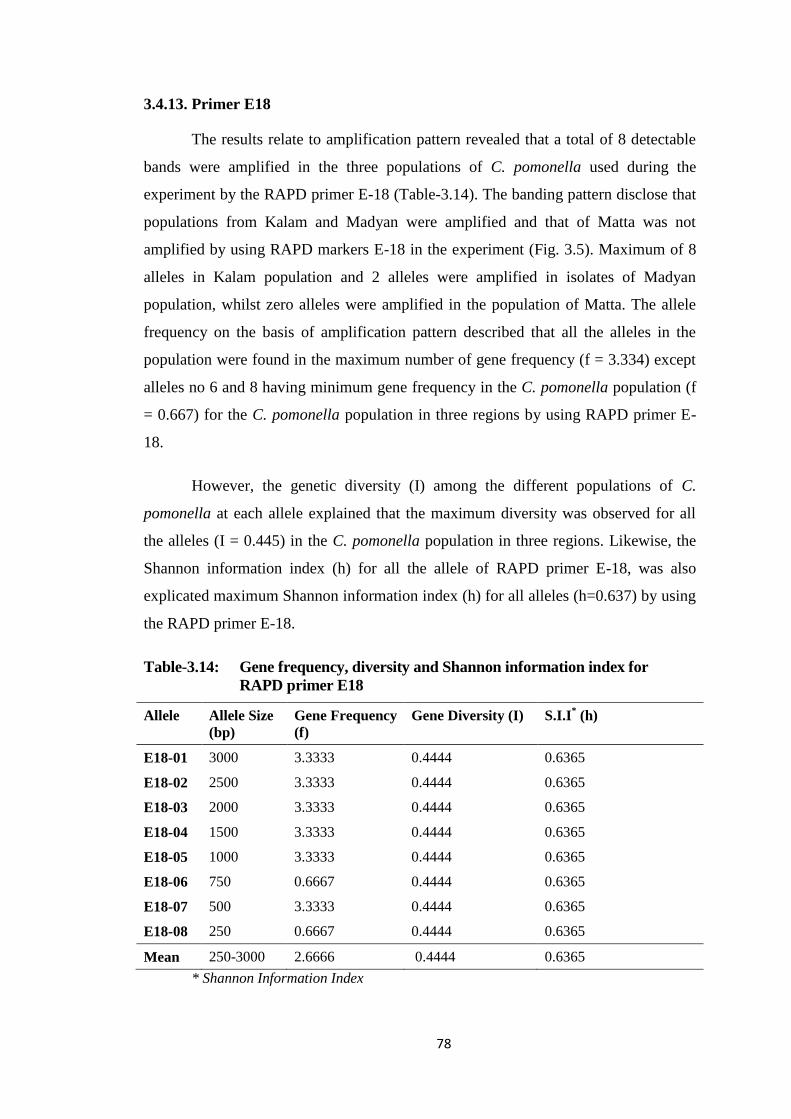
78
3.4.13. Primer E18
The results relate to amplification pattern revealed that a total of 8 detectable
bands were amplified in the three populations of C. pomonella used during the
experiment by the RAPD primer E-18 (Table-3.14). The banding pattern disclose that
populations from Kalam and Madyan were amplified and that of Matta was not
amplified by using RAPD markers E-18 in the experiment (Fig. 3.5). Maximum of 8
alleles in Kalam population and 2 alleles were amplified in isolates of Madyan
population, whilst zero alleles were amplified in the population of Matta. The allele
frequency on the basis of amplification pattern described that all the alleles in the
population were found in the maximum number of gene frequency (f = 3.334) except
alleles no 6 and 8 having minimum gene frequency in the C. pomonella population (f
= 0.667) for the C. pomonella population in three regions by using RAPD primer E-
18.
However, the genetic diversity (I) among the different populations of C.
pomonella at each allele explained that the maximum diversity was observed for all
the alleles (I = 0.445) in the C. pomonella population in three regions. Likewise, the
Shannon information index (h) for all the allele of RAPD primer E-18, was also
explicated maximum Shannon information index (h) for all alleles (h=0.637) by using
the RAPD primer E-18.
Table-3.14: Gene frequency, diversity and Shannon information index for
RAPD primer E18
Allele Allele Size
(bp)
Gene Frequency
(f)
Gene Diversity (I) S.I.I* (h)
E18-01 3000 3.3333 0.4444 0.6365
E18-02 2500 3.3333 0.4444 0.6365
E18-03 2000 3.3333 0.4444 0.6365
E18-04 1500 3.3333 0.4444 0.6365
E18-05 1000 3.3333 0.4444 0.6365
E18-06 750 0.6667 0.4444 0.6365
E18-07 500 3.3333 0.4444 0.6365
E18-08 250 0.6667 0.4444 0.6365
Mean 250-3000 2.6666 0.4444 0.6365
* Shannon Information Index
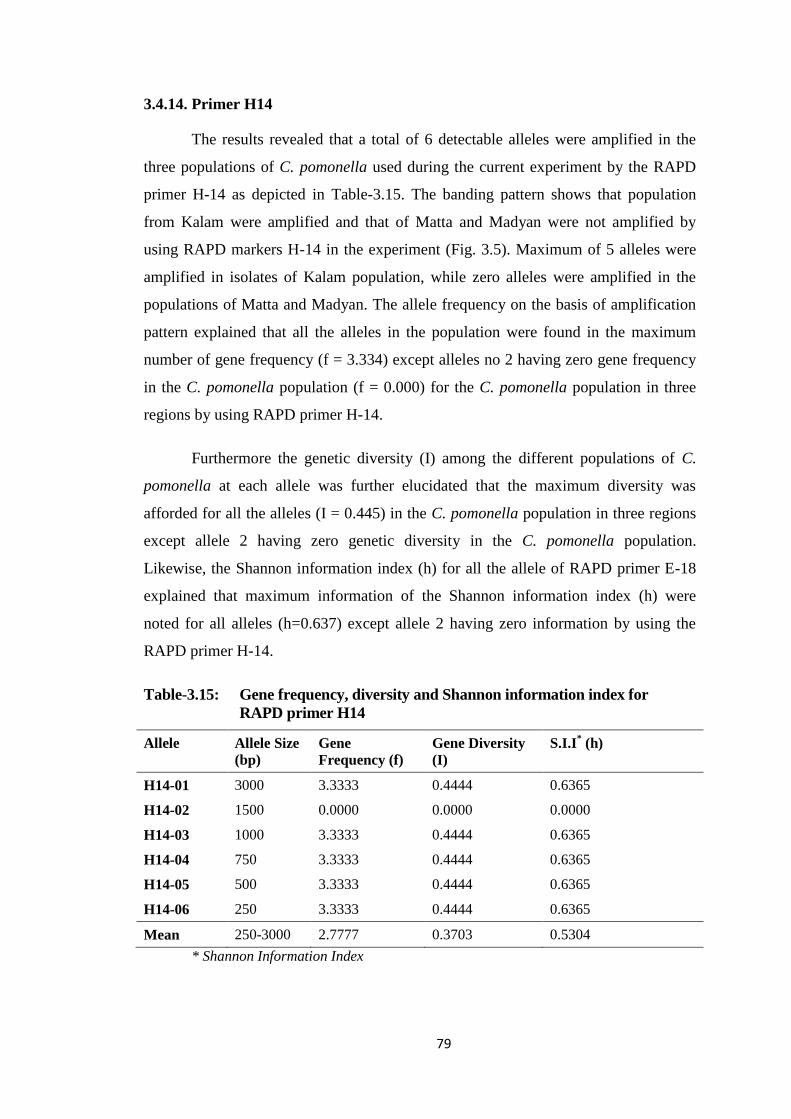
79
3.4.14. Primer H14
The results revealed that a total of 6 detectable alleles were amplified in the
three populations of C. pomonella used during the current experiment by the RAPD
primer H-14 as depicted in Table-3.15. The banding pattern shows that population
from Kalam were amplified and that of Matta and Madyan were not amplified by
using RAPD markers H-14 in the experiment (Fig. 3.5). Maximum of 5 alleles were
amplified in isolates of Kalam population, while zero alleles were amplified in the
populations of Matta and Madyan. The allele frequency on the basis of amplification
pattern explained that all the alleles in the population were found in the maximum
number of gene frequency (f = 3.334) except alleles no 2 having zero gene frequency
in the C. pomonella population (f = 0.000) for the C. pomonella population in three
regions by using RAPD primer H-14.
Furthermore the genetic diversity (I) among the different populations of C.
pomonella at each allele was further elucidated that the maximum diversity was
afforded for all the alleles (I = 0.445) in the C. pomonella population in three regions
except allele 2 having zero genetic diversity in the C. pomonella population.
Likewise, the Shannon information index (h) for all the allele of RAPD primer E-18
explained that maximum information of the Shannon information index (h) were
noted for all alleles (h=0.637) except allele 2 having zero information by using the
RAPD primer H-14.
Table-3.15: Gene frequency, diversity and Shannon information index for
RAPD primer H14
Allele Allele Size
(bp)
Gene
Frequency (f)
Gene Diversity
(I)
S.I.I* (h)
H14-01 3000 3.3333 0.4444 0.6365
H14-02 1500 0.0000 0.0000 0.0000
H14-03 1000 3.3333 0.4444 0.6365
H14-04 750 3.3333 0.4444 0.6365
H14-05 500 3.3333 0.4444 0.6365
H14-06 250 3.3333 0.4444 0.6365
Mean 250-3000 2.7777 0.3703 0.5304
* Shannon Information Index
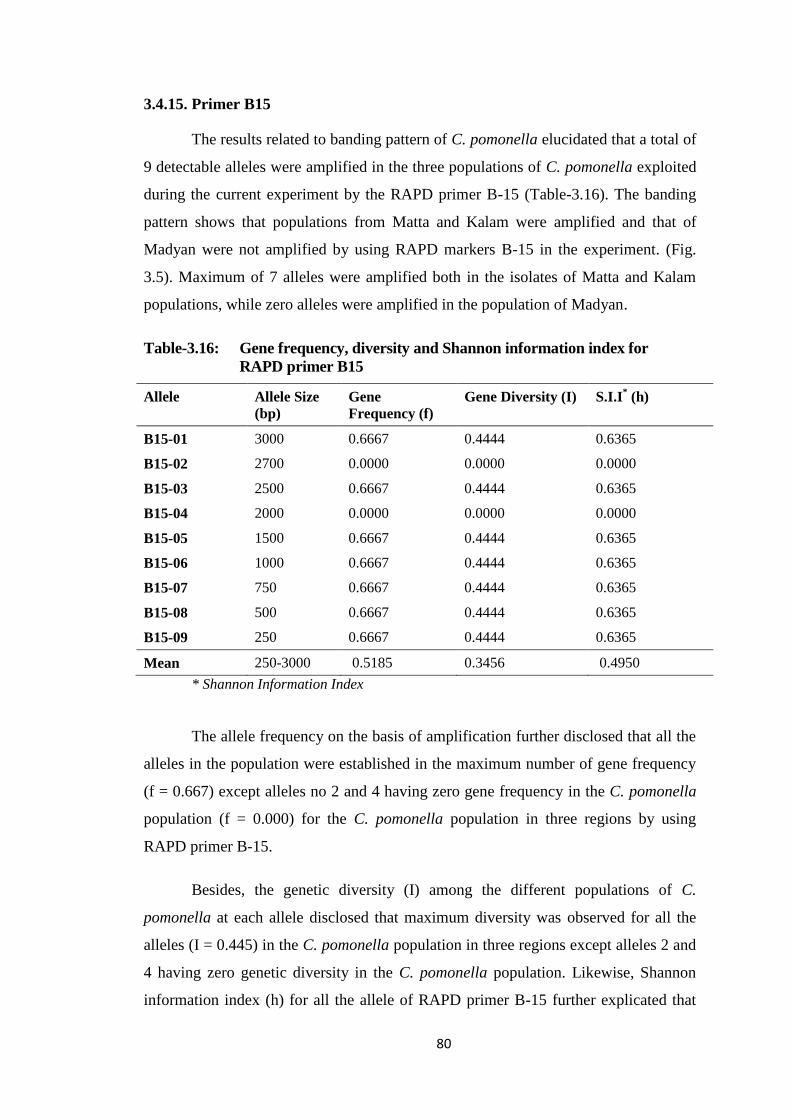
80
3.4.15. Primer B15
The results related to banding pattern of C. pomonella elucidated that a total of
9 detectable alleles were amplified in the three populations of C. pomonella exploited
during the current experiment by the RAPD primer B-15 (Table-3.16). The banding
pattern shows that populations from Matta and Kalam were amplified and that of
Madyan were not amplified by using RAPD markers B-15 in the experiment. (Fig.
3.5). Maximum of 7 alleles were amplified both in the isolates of Matta and Kalam
populations, while zero alleles were amplified in the population of Madyan.
Table-3.16: Gene frequency, diversity and Shannon information index for
RAPD primer B15
Allele Allele Size
(bp)
Gene
Frequency (f)
Gene Diversity (I) S.I.I* (h)
B15-01 3000 0.6667 0.4444 0.6365
B15-02 2700 0.0000 0.0000 0.0000
B15-03 2500 0.6667 0.4444 0.6365
B15-04 2000 0.0000 0.0000 0.0000
B15-05 1500 0.6667 0.4444 0.6365
B15-06 1000 0.6667 0.4444 0.6365
B15-07 750 0.6667 0.4444 0.6365
B15-08 500 0.6667 0.4444 0.6365
B15-09 250 0.6667 0.4444 0.6365
Mean 250-3000 0.5185 0.3456 0.4950
* Shannon Information Index
The allele frequency on the basis of amplification further disclosed that all the
alleles in the population were established in the maximum number of gene frequency
(f = 0.667) except alleles no 2 and 4 having zero gene frequency in the C. pomonella
population (f = 0.000) for the C. pomonella population in three regions by using
RAPD primer B-15.
Besides, the genetic diversity (I) among the different populations of C.
pomonella at each allele disclosed that maximum diversity was observed for all the
alleles (I = 0.445) in the C. pomonella population in three regions except alleles 2 and
4 having zero genetic diversity in the C. pomonella population. Likewise, Shannon
information index (h) for all the allele of RAPD primer B-15 further explicated that
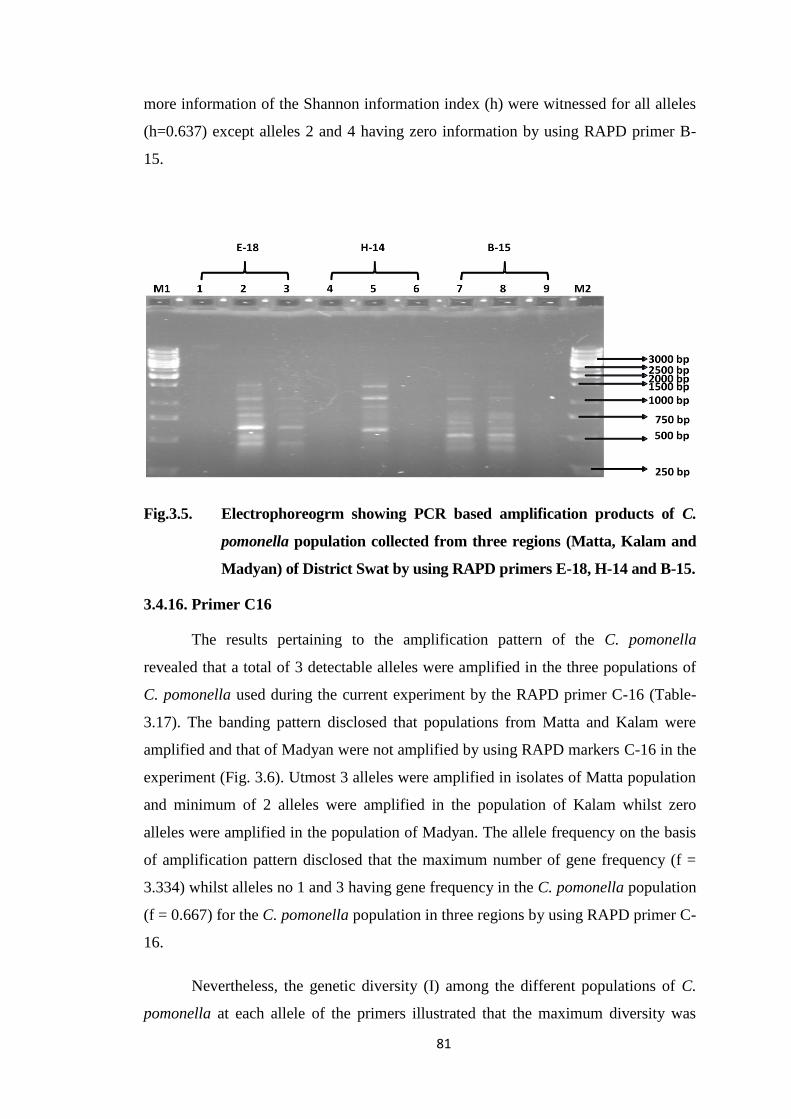
81
more information of the Shannon information index (h) were witnessed for all alleles
(h=0.637) except alleles 2 and 4 having zero information by using RAPD primer B-
15.
Fig.3.5. Electrophoreogrm showing PCR based amplification products of C.
pomonella population collected from three regions (Matta, Kalam and
Madyan) of District Swat by using RAPD primers E-18, H-14 and B-15.
3.4.16. Primer C16
The results pertaining to the amplification pattern of the C. pomonella
revealed that a total of 3 detectable alleles were amplified in the three populations of
C. pomonella used during the current experiment by the RAPD primer C-16 (Table-
3.17). The banding pattern disclosed that populations from Matta and Kalam were
amplified and that of Madyan were not amplified by using RAPD markers C-16 in the
experiment (Fig. 3.6). Utmost 3 alleles were amplified in isolates of Matta population
and minimum of 2 alleles were amplified in the population of Kalam whilst zero
alleles were amplified in the population of Madyan. The allele frequency on the basis
of amplification pattern disclosed that the maximum number of gene frequency (f =
3.334) whilst alleles no 1 and 3 having gene frequency in the C. pomonella population
(f = 0.667) for the C. pomonella population in three regions by using RAPD primer C-
16.
Nevertheless, the genetic diversity (I) among the different populations of C.
pomonella at each allele of the primers illustrated that the maximum diversity was
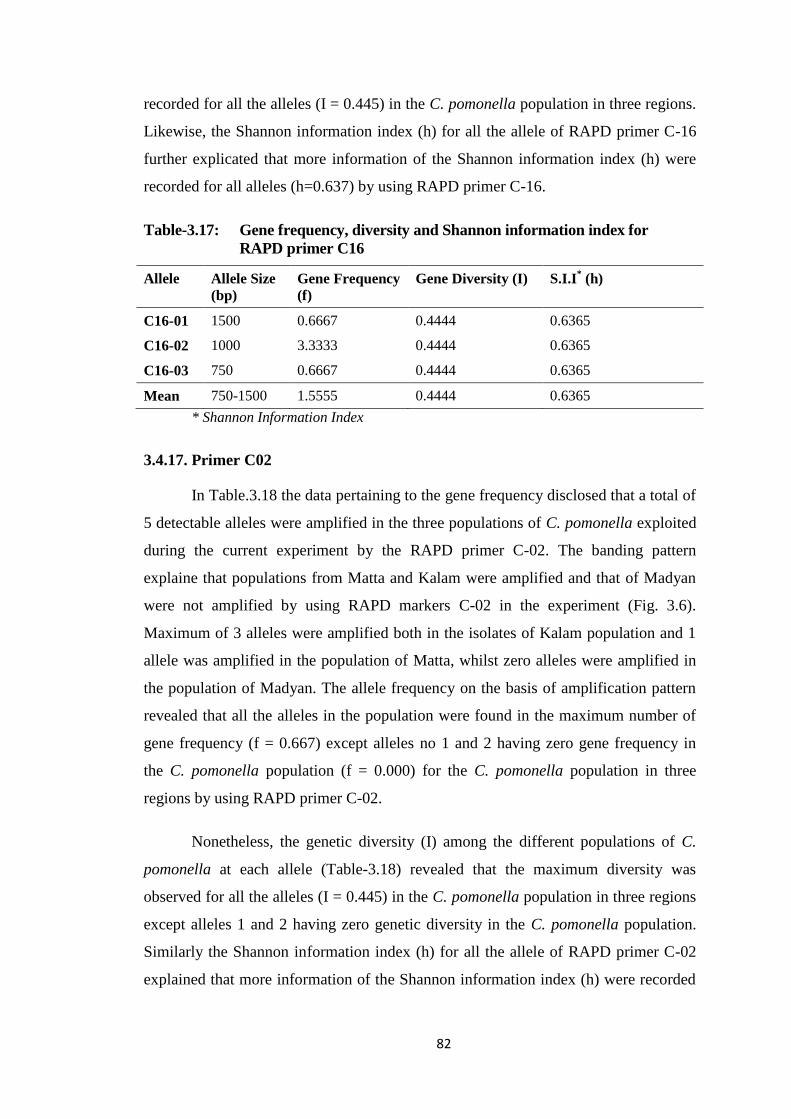
82
recorded for all the alleles (I = 0.445) in the C. pomonella population in three regions.
Likewise, the Shannon information index (h) for all the allele of RAPD primer C-16
further explicated that more information of the Shannon information index (h) were
recorded for all alleles (h=0.637) by using RAPD primer C-16.
Table-3.17: Gene frequency, diversity and Shannon information index for
RAPD primer C16
Allele Allele Size
(bp)
Gene Frequency
(f)
Gene Diversity (I) S.I.I* (h)
C16-01 1500 0.6667 0.4444 0.6365
C16-02 1000 3.3333 0.4444 0.6365
C16-03 750 0.6667 0.4444 0.6365
Mean 750-1500 1.5555 0.4444 0.6365
* Shannon Information Index
3.4.17. Primer C02
In Table.3.18 the data pertaining to the gene frequency disclosed that a total of
5 detectable alleles were amplified in the three populations of C. pomonella exploited
during the current experiment by the RAPD primer C-02. The banding pattern
explaine that populations from Matta and Kalam were amplified and that of Madyan
were not amplified by using RAPD markers C-02 in the experiment (Fig. 3.6).
Maximum of 3 alleles were amplified both in the isolates of Kalam population and 1
allele was amplified in the population of Matta, whilst zero alleles were amplified in
the population of Madyan. The allele frequency on the basis of amplification pattern
revealed that all the alleles in the population were found in the maximum number of
gene frequency (f = 0.667) except alleles no 1 and 2 having zero gene frequency in
the C. pomonella population (f = 0.000) for the C. pomonella population in three
regions by using RAPD primer C-02.
Nonetheless, the genetic diversity (I) among the different populations of C.
pomonella at each allele (Table-3.18) revealed that the maximum diversity was
observed for all the alleles (I = 0.445) in the C. pomonella population in three regions
except alleles 1 and 2 having zero genetic diversity in the C. pomonella population.
Similarly the Shannon information index (h) for all the allele of RAPD primer C-02
explained that more information of the Shannon information index (h) were recorded
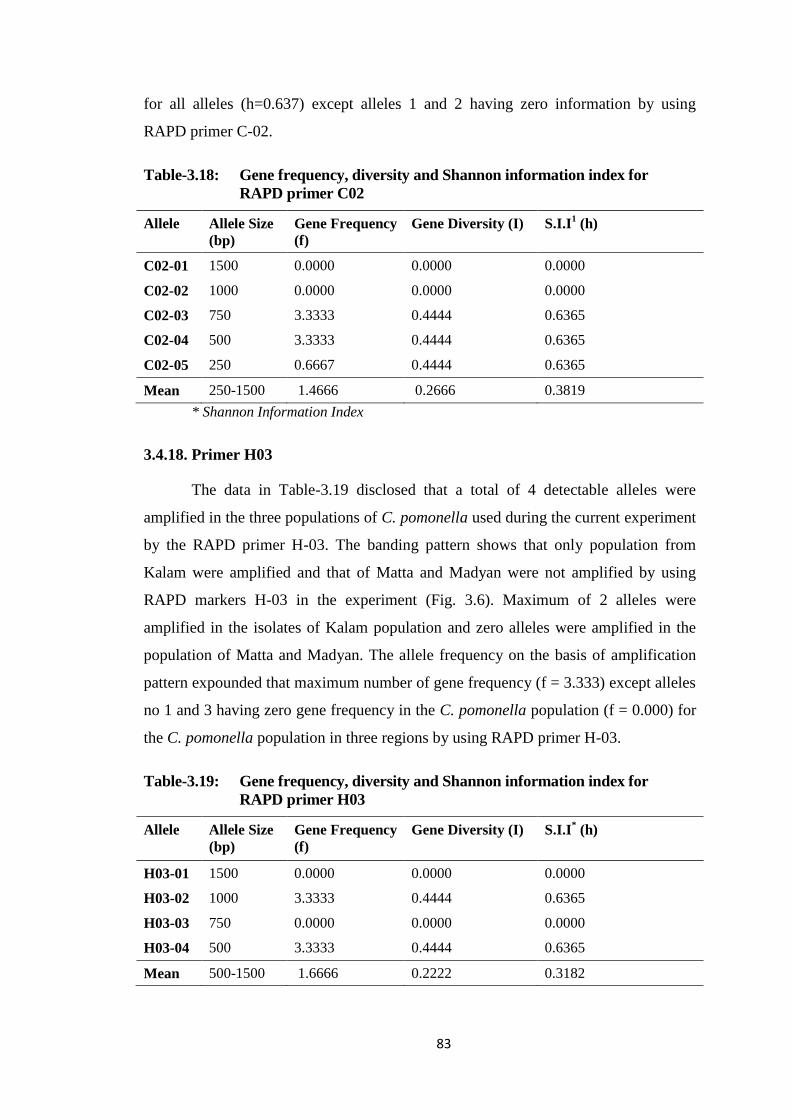
83
for all alleles (h=0.637) except alleles 1 and 2 having zero information by using
RAPD primer C-02.
Table-3.18: Gene frequency, diversity and Shannon information index for
RAPD primer C02
Allele Allele Size
(bp)
Gene Frequency
(f)
Gene Diversity (I) S.I.I1 (h)
C02-01 1500 0.0000 0.0000 0.0000
C02-02 1000 0.0000 0.0000 0.0000
C02-03 750 3.3333 0.4444 0.6365
C02-04 500 3.3333 0.4444 0.6365
C02-05 250 0.6667 0.4444 0.6365
Mean 250-1500 1.4666 0.2666 0.3819
* Shannon Information Index
3.4.18. Primer H03
The data in Table-3.19 disclosed that a total of 4 detectable alleles were
amplified in the three populations of C. pomonella used during the current experiment
by the RAPD primer H-03. The banding pattern shows that only population from
Kalam were amplified and that of Matta and Madyan were not amplified by using
RAPD markers H-03 in the experiment (Fig. 3.6). Maximum of 2 alleles were
amplified in the isolates of Kalam population and zero alleles were amplified in the
population of Matta and Madyan. The allele frequency on the basis of amplification
pattern expounded that maximum number of gene frequency (f = 3.333) except alleles
no 1 and 3 having zero gene frequency in the C. pomonella population (f = 0.000) for
the C. pomonella population in three regions by using RAPD primer H-03.
Table-3.19: Gene frequency, diversity and Shannon information index for
RAPD primer H03
Allele Allele Size
(bp)
Gene Frequency
(f)
Gene Diversity (I) S.I.I* (h)
H03-01 1500 0.0000 0.0000 0.0000
H03-02 1000 3.3333 0.4444 0.6365
H03-03 750 0.0000 0.0000 0.0000
H03-04 500 3.3333 0.4444 0.6365
Mean 500-1500 1.6666 0.2222 0.3182
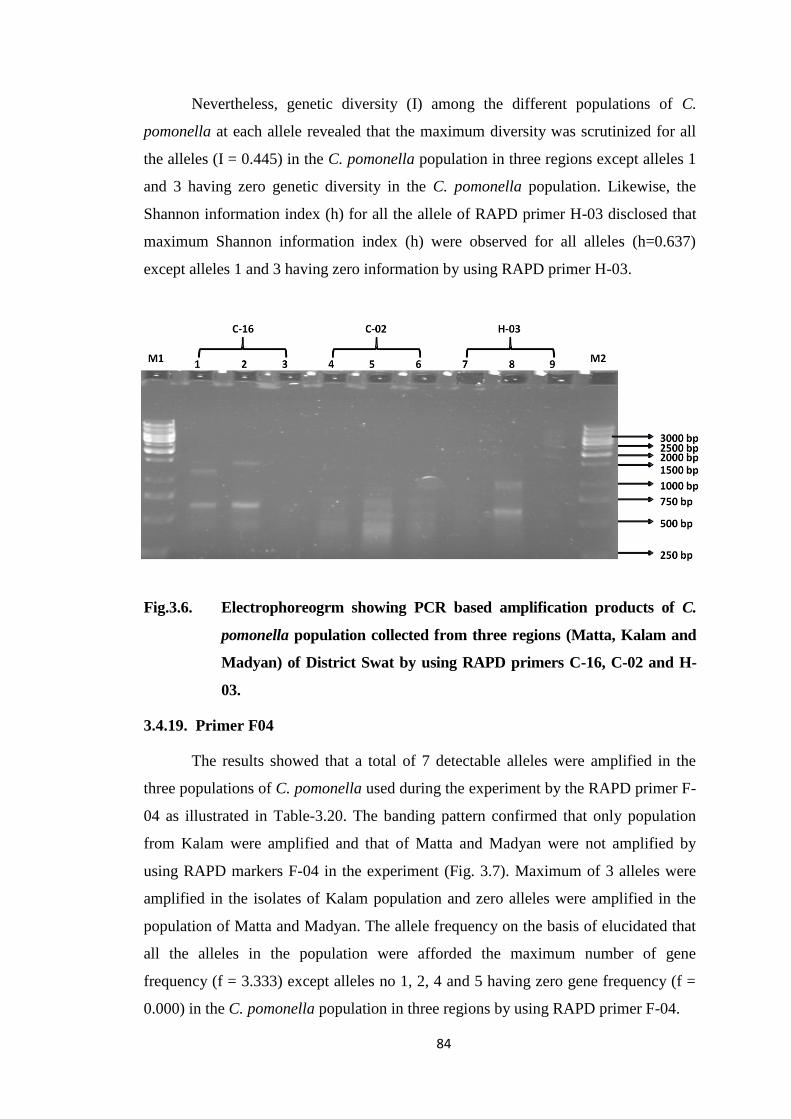
84
Nevertheless, genetic diversity (I) among the different populations of C.
pomonella at each allele revealed that the maximum diversity was scrutinized for all
the alleles (I = 0.445) in the C. pomonella population in three regions except alleles 1
and 3 having zero genetic diversity in the C. pomonella population. Likewise, the
Shannon information index (h) for all the allele of RAPD primer H-03 disclosed that
maximum Shannon information index (h) were observed for all alleles (h=0.637)
except alleles 1 and 3 having zero information by using RAPD primer H-03.
Fig.3.6. Electrophoreogrm showing PCR based amplification products of C.
pomonella population collected from three regions (Matta, Kalam and
Madyan) of District Swat by using RAPD primers C-16, C-02 and H-
03.
3.4.19. Primer F04
The results showed that a total of 7 detectable alleles were amplified in the
three populations of C. pomonella used during the experiment by the RAPD primer F-
04 as illustrated in Table-3.20. The banding pattern confirmed that only population
from Kalam were amplified and that of Matta and Madyan were not amplified by
using RAPD markers F-04 in the experiment (Fig. 3.7). Maximum of 3 alleles were
amplified in the isolates of Kalam population and zero alleles were amplified in the
population of Matta and Madyan. The allele frequency on the basis of elucidated that
all the alleles in the population were afforded the maximum number of gene
frequency (f = 3.333) except alleles no 1, 2, 4 and 5 having zero gene frequency (f =
0.000) in the C. pomonella population in three regions by using RAPD primer F-04.
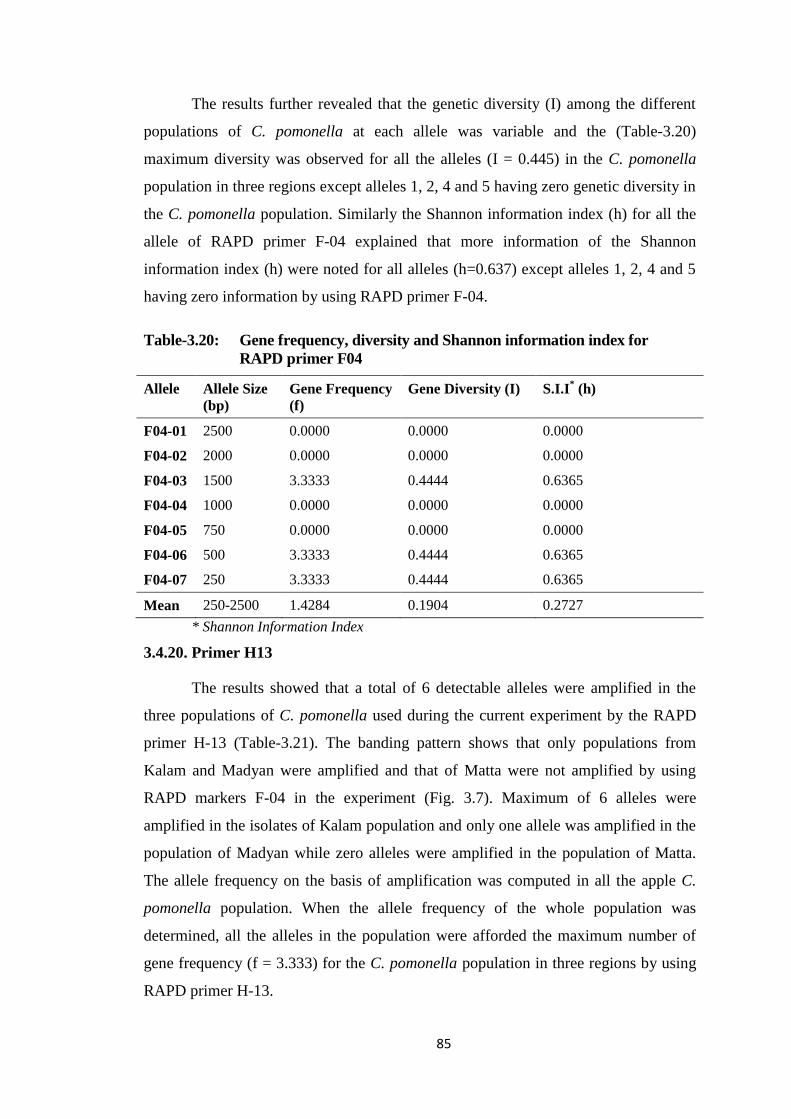
85
The results further revealed that the genetic diversity (I) among the different
populations of C. pomonella at each allele was variable and the (Table-3.20)
maximum diversity was observed for all the alleles (I = 0.445) in the C. pomonella
population in three regions except alleles 1, 2, 4 and 5 having zero genetic diversity in
the C. pomonella population. Similarly the Shannon information index (h) for all the
allele of RAPD primer F-04 explained that more information of the Shannon
information index (h) were noted for all alleles (h=0.637) except alleles 1, 2, 4 and 5
having zero information by using RAPD primer F-04.
Table-3.20: Gene frequency, diversity and Shannon information index for
RAPD primer F04
Allele Allele Size
(bp)
Gene Frequency
(f)
Gene Diversity (I) S.I.I* (h)
F04-01 2500 0.0000 0.0000 0.0000
F04-02 2000 0.0000 0.0000 0.0000
F04-03 1500 3.3333 0.4444 0.6365
F04-04 1000 0.0000 0.0000 0.0000
F04-05 750 0.0000 0.0000 0.0000
F04-06 500 3.3333 0.4444 0.6365
F04-07 250 3.3333 0.4444 0.6365
Mean 250-2500 1.4284 0.1904 0.2727
* Shannon Information Index
3.4.20. Primer H13
The results showed that a total of 6 detectable alleles were amplified in the
three populations of C. pomonella used during the current experiment by the RAPD
primer H-13 (Table-3.21). The banding pattern shows that only populations from
Kalam and Madyan were amplified and that of Matta were not amplified by using
RAPD markers F-04 in the experiment (Fig. 3.7). Maximum of 6 alleles were
amplified in the isolates of Kalam population and only one allele was amplified in the
population of Madyan while zero alleles were amplified in the population of Matta.
The allele frequency on the basis of amplification was computed in all the apple C.
pomonella population. When the allele frequency of the whole population was
determined, all the alleles in the population were afforded the maximum number of
gene frequency (f = 3.333) for the C. pomonella population in three regions by using
RAPD primer H-13.
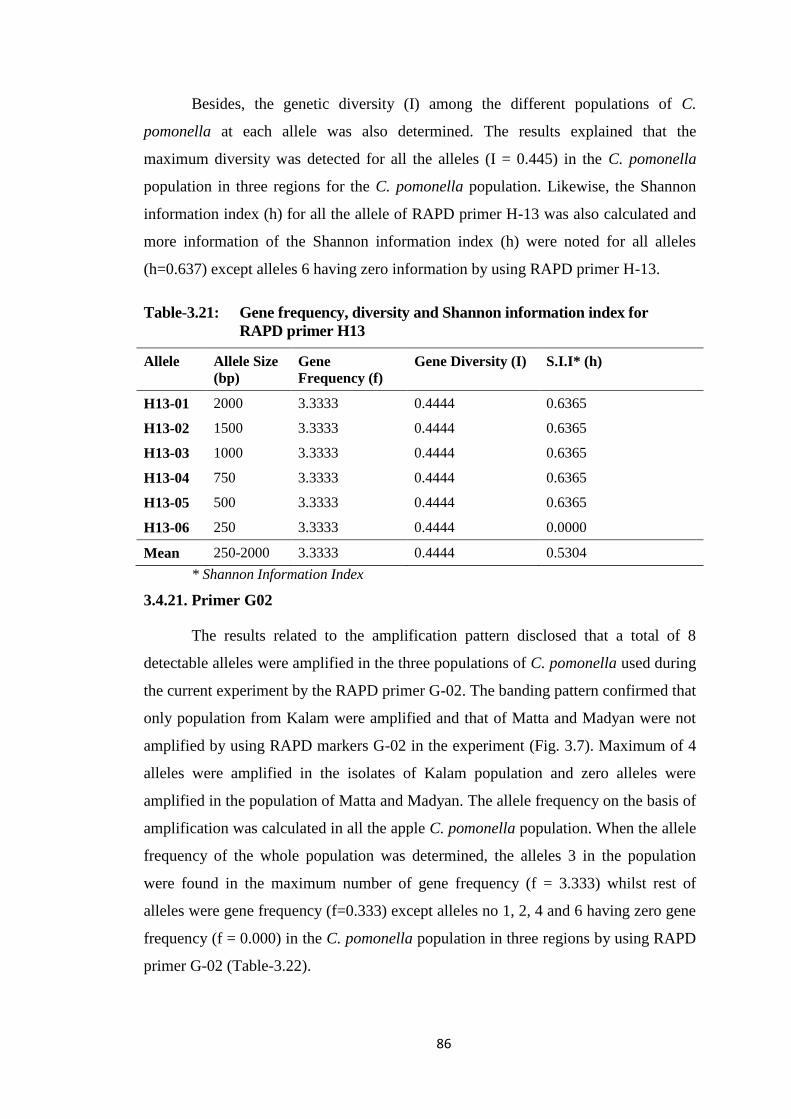
86
Besides, the genetic diversity (I) among the different populations of C.
pomonella at each allele was also determined. The results explained that the
maximum diversity was detected for all the alleles (I = 0.445) in the C. pomonella
population in three regions for the C. pomonella population. Likewise, the Shannon
information index (h) for all the allele of RAPD primer H-13 was also calculated and
more information of the Shannon information index (h) were noted for all alleles
(h=0.637) except alleles 6 having zero information by using RAPD primer H-13.
Table-3.21: Gene frequency, diversity and Shannon information index for
RAPD primer H13
Allele Allele Size
(bp)
Gene
Frequency (f)
Gene Diversity (I) S.I.I* (h)
H13-01 2000 3.3333 0.4444 0.6365
H13-02 1500 3.3333 0.4444 0.6365
H13-03 1000 3.3333 0.4444 0.6365
H13-04 750 3.3333 0.4444 0.6365
H13-05 500 3.3333 0.4444 0.6365
H13-06 250 3.3333 0.4444 0.0000
Mean 250-2000 3.3333 0.4444 0.5304
* Shannon Information Index
3.4.21. Primer G02
The results related to the amplification pattern disclosed that a total of 8
detectable alleles were amplified in the three populations of C. pomonella used during
the current experiment by the RAPD primer G-02. The banding pattern confirmed that
only population from Kalam were amplified and that of Matta and Madyan were not
amplified by using RAPD markers G-02 in the experiment (Fig. 3.7). Maximum of 4
alleles were amplified in the isolates of Kalam population and zero alleles were
amplified in the population of Matta and Madyan. The allele frequency on the basis of
amplification was calculated in all the apple C. pomonella population. When the allele
frequency of the whole population was determined, the alleles 3 in the population
were found in the maximum number of gene frequency (f = 3.333) whilst rest of
alleles were gene frequency (f=0.333) except alleles no 1, 2, 4 and 6 having zero gene
frequency (f = 0.000) in the C. pomonella population in three regions by using RAPD
primer G-02 (Table-3.22).
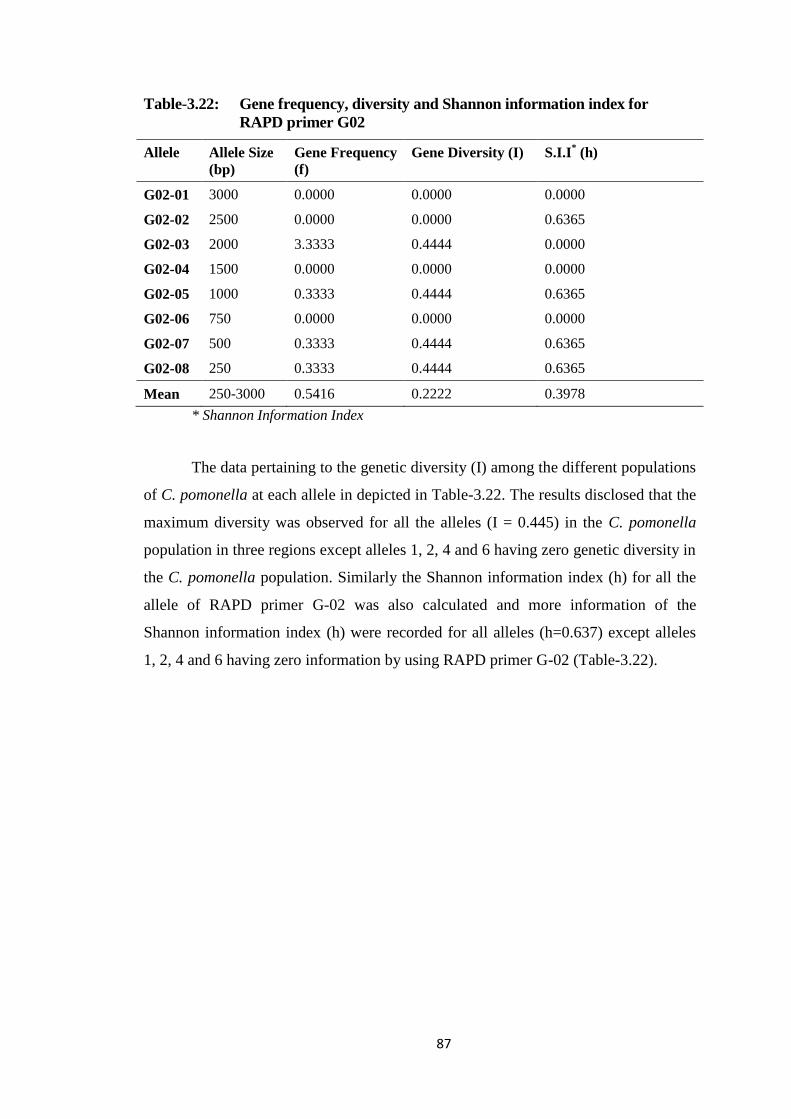
87
Table-3.22: Gene frequency, diversity and Shannon information index for
RAPD primer G02
Allele Allele Size
(bp)
Gene Frequency
(f)
Gene Diversity (I) S.I.I* (h)
G02-01 3000 0.0000 0.0000 0.0000
G02-02 2500 0.0000 0.0000 0.6365
G02-03 2000 3.3333 0.4444 0.0000
G02-04 1500 0.0000 0.0000 0.0000
G02-05 1000 0.3333 0.4444 0.6365
G02-06 750 0.0000 0.0000 0.0000
G02-07 500 0.3333 0.4444 0.6365
G02-08 250 0.3333 0.4444 0.6365
Mean 250-3000 0.5416 0.2222 0.3978
* Shannon Information Index
The data pertaining to the genetic diversity (I) among the different populations
of C. pomonella at each allele in depicted in Table-3.22. The results disclosed that the
maximum diversity was observed for all the alleles (I = 0.445) in the C. pomonella
population in three regions except alleles 1, 2, 4 and 6 having zero genetic diversity in
the C. pomonella population. Similarly the Shannon information index (h) for all the
allele of RAPD primer G-02 was also calculated and more information of the
Shannon information index (h) were recorded for all alleles (h=0.637) except alleles
1, 2, 4 and 6 having zero information by using RAPD primer G-02 (Table-3.22).
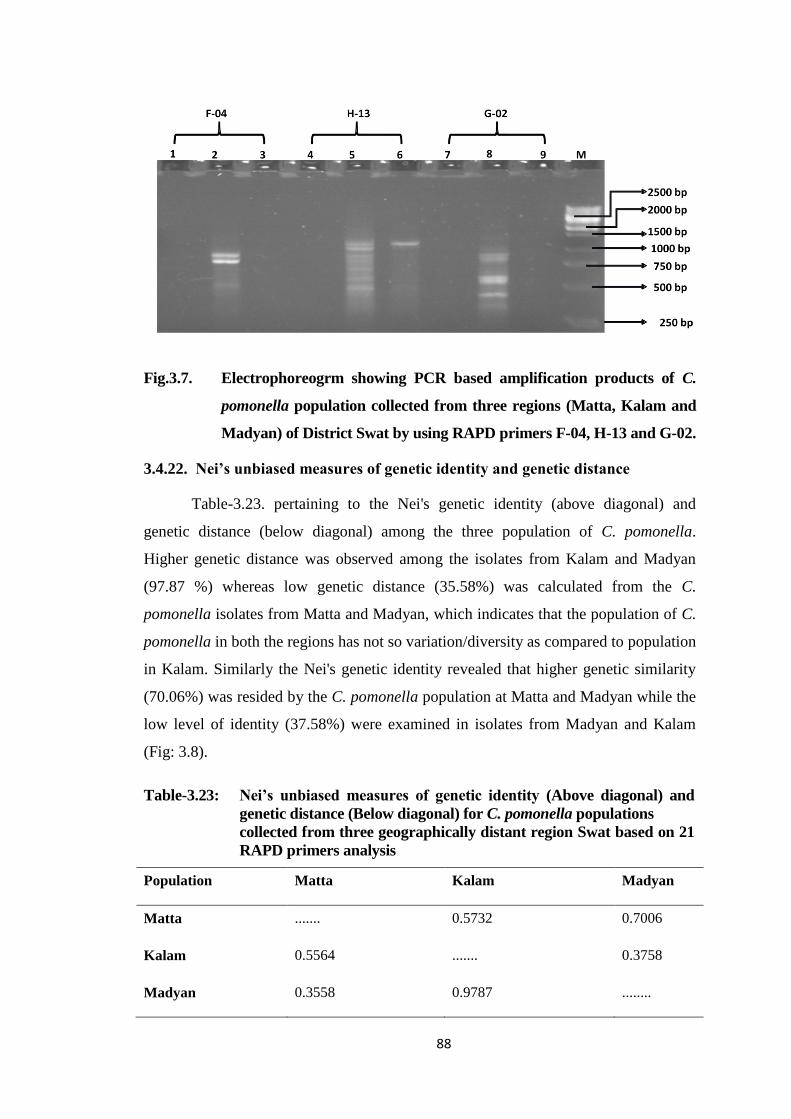
88
Fig.3.7. Electrophoreogrm showing PCR based amplification products of C.
pomonella population collected from three regions (Matta, Kalam and
Madyan) of District Swat by using RAPD primers F-04, H-13 and G-02.
3.4.22. Nei’s unbiased measures of genetic identity and genetic distance
Table-3.23. pertaining to the Nei's genetic identity (above diagonal) and
genetic distance (below diagonal) among the three population of C. pomonella.
Higher genetic distance was observed among the isolates from Kalam and Madyan
(97.87 %) whereas low genetic distance (35.58%) was calculated from the C.
pomonella isolates from Matta and Madyan, which indicates that the population of C.
pomonella in both the regions has not so variation/diversity as compared to population
in Kalam. Similarly the Nei's genetic identity revealed that higher genetic similarity
(70.06%) was resided by the C. pomonella population at Matta and Madyan while the
low level of identity (37.58%) were examined in isolates from Madyan and Kalam
(Fig: 3.8).
Table-3.23: Nei’s unbiased measures of genetic identity (Above diagonal) and
genetic distance (Below diagonal) for C. pomonella populations
collected from three geographically distant region Swat based on 21
RAPD primers analysis
Population Matta Kalam Madyan
Matta ....... 0.5732 0.7006
Kalam 0.5564 ....... 0.3758
Madyan 0.3558 0.9787 ........
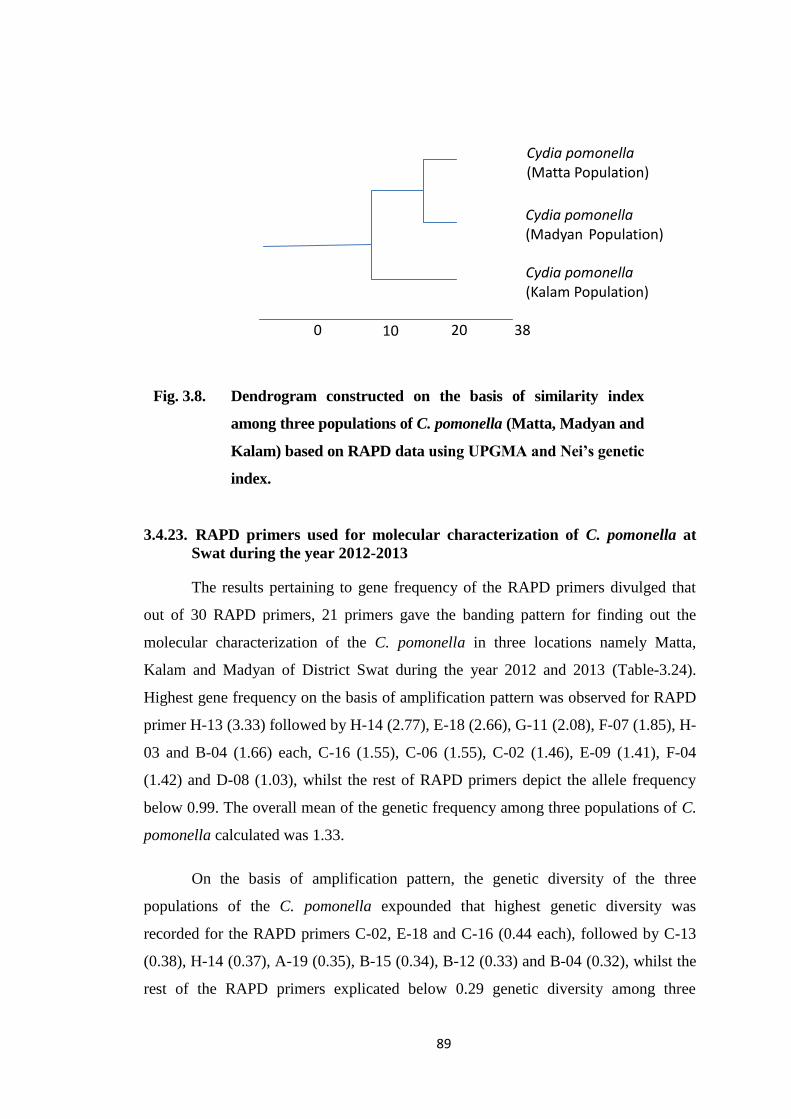
89
3.4.23. RAPD primers used for molecular characterization of C. pomonella at
Swat during the year 2012-2013
The results pertaining to gene frequency of the RAPD primers divulged that
out of 30 RAPD primers, 21 primers gave the banding pattern for finding out the
molecular characterization of the C. pomonella in three locations namely Matta,
Kalam and Madyan of District Swat during the year 2012 and 2013 (Table-3.24).
Highest gene frequency on the basis of amplification pattern was observed for RAPD
primer H-13 (3.33) followed by H-14 (2.77), E-18 (2.66), G-11 (2.08), F-07 (1.85), H-
03 and B-04 (1.66) each, C-16 (1.55), C-06 (1.55), C-02 (1.46), E-09 (1.41), F-04
(1.42) and D-08 (1.03), whilst the rest of RAPD primers depict the allele frequency
below 0.99. The overall mean of the genetic frequency among three populations of C.
pomonella calculated was 1.33.
On the basis of amplification pattern, the genetic diversity of the three
populations of the C. pomonella expounded that highest genetic diversity was
recorded for the RAPD primers C-02, E-18 and C-16 (0.44 each), followed by C-13
(0.38), H-14 (0.37), A-19 (0.35), B-15 (0.34), B-12 (0.33) and B-04 (0.32), whilst the
rest of the RAPD primers explicated below 0.29 genetic diversity among three
Cydia pomonella (Matta Population)
Cydia pomonella (Madyan Population)
Cydia pomonella (Kalam Population)
0 10 20 38
Fig. 3.8. Dendrogram constructed on the basis of similarity index
among three populations of C. pomonella (Matta, Madyan and
Kalam) based on RAPD data using UPGMA and Nei’s genetic
index.
90
populations of the C. pomonella. The overall mean of the genetic diversity of the three
populations was 0.29.
The results pertaining to Shannon's information index for each allele of the
primers revealed that maximum Shannon information index were observed for C-04,
E-18 and C-16 (0.63), followed by C-13 (0.55), H-13 (0.53) and A-19 (0.50), whilst
the rest of the primers were less than 0.49 Shannon's information index values. The
overall mean of the Shannon's information index was 0.44.
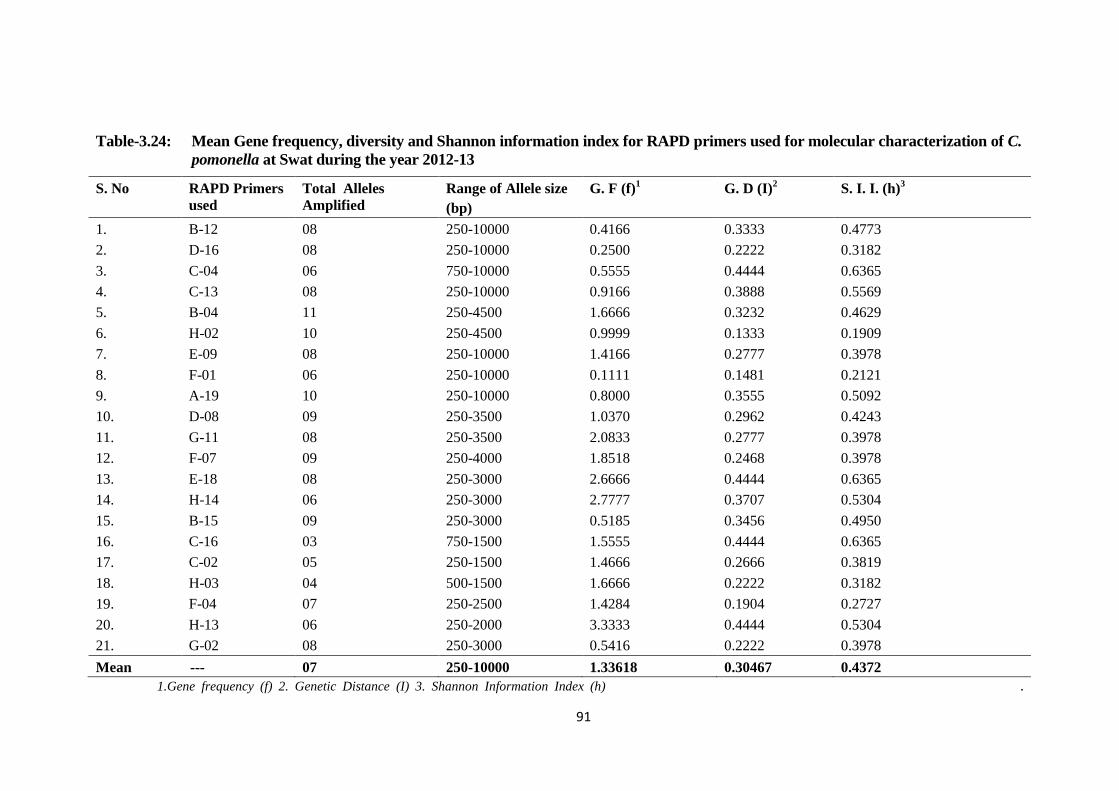
91
Table-3.24: Mean Gene frequency, diversity and Shannon information index for RAPD primers used for molecular characterization of C.
pomonella at Swat during the year 2012-13
S. No RAPD Primers
used
Total Alleles
Amplified
Range of Allele size
(bp)
G. F (f)1 G. D (I)
2 S. I. I. (h)
3
1. B-12 08 250-10000 0.4166 0.3333 0.4773
2. D-16 08 250-10000 0.2500 0.2222 0.3182
3. C-04 06 750-10000 0.5555 0.4444 0.6365
4. C-13 08 250-10000 0.9166 0.3888 0.5569
5. B-04 11 250-4500 1.6666 0.3232 0.4629
6. H-02 10 250-4500 0.9999 0.1333 0.1909
7. E-09 08 250-10000 1.4166 0.2777 0.3978
8. F-01 06 250-10000 0.1111 0.1481 0.2121
9. A-19 10 250-10000 0.8000 0.3555 0.5092
10. D-08 09 250-3500 1.0370 0.2962 0.4243
11. G-11 08 250-3500 2.0833 0.2777 0.3978
12. F-07 09 250-4000 1.8518 0.2468 0.3978
13. E-18 08 250-3000 2.6666 0.4444 0.6365
14. H-14 06 250-3000 2.7777 0.3707 0.5304
15. B-15 09 250-3000 0.5185 0.3456 0.4950
16. C-16 03 750-1500 1.5555 0.4444 0.6365
17. C-02 05 250-1500 1.4666 0.2666 0.3819
18. H-03 04 500-1500 1.6666 0.2222 0.3182
19. F-04 07 250-2500 1.4284 0.1904 0.2727
20. H-13 06 250-2000 3.3333 0.4444 0.5304
21. G-02 08 250-3000 0.5416 0.2222 0.3978
Mean --- 07 250-10000 1.33618 0.30467 0.4372
1.Gene frequency (f) 2. Genetic Distance (I) 3. Shannon Information Index (h) .
92
3.5. DISCUSSION
A very limited research work has been carried out regarding genetic
differentiation and molecular characterization of C. pomonella (Franck et al., 2007).
The current studies on molecular characterization of C. pomonella, was consequently
undertaken to know about the genetic differentiation and gene flow among C.
pomonella population through RAPD primers. The results disclosed that out of 30
randomly amplified polymorphic DNA (RAPD) primers used for the molecular
characterization of C. pomonella, 21 primers amplified the banding pattern for finding
out the molecular characterization and distinction in the population of C. pomonella in
three locations namely Matta, Kalam and Madyan of District Swat on the basis of
samples collected during the year 2012-13. On the basis of amplification pattern,
highest gene frequency (f) was evaluated for RAPD primer H-13 (f = 3.33) followed
by H-14 (f = 2.77), E-18 (f = 2.66), G-11 (f = 2.08), F-07 (f = 1.85), H-03 and B-04 (f
= 1.66) each, C-16 (f = 1.55), C-06 (f = 1.55), C-02 (f = 1.46), E-09 (f = 1.41), F-04 (f
= 1.42) and D-08 (f = 1.03), whereas the rest of RAPD primers depicted the allele
frequency below 0.99. The overall mean of the genetic frequency among three
populations of C. pomonella observed was 1.33. These results are in close conformity
with findings of Lei Men et al., (2012) who reported that the mean number of alleles
per locus ranged from f = 4.3 to f = 12.6 and two populations of C. pomonella from
Heilongjiang Province in northeastern China had the largest number of alleles (f =
12.6 and f = 10.6). Of populations from northwestern China, one population showed
the highest value of mean number of alleles (f = 9.6), followed by the second
population (f = 8.6) and third population (f = 8.4). Nevertheless, the gene frequency of
null alleles ranged from 0.010 to 0.203, values typical for lepidopterans (Megle'cz et
al., 2004; Dakin and Avise, 2004), which further confirmed these results.
On the basis of intensification pattern, the genetic diversity (I) of the three
populations of the C. pomonella disclosed that highest genetic variation was detected
for the RAPD primers C-02, E-18 and C-16 (I = 0.44 each), followed by C-13 (I =
0.38), H-14 (I = 0.37), A-19 (I = 0.35), B-15 (I = 0.34), B-12 (I = 0.33) and B-04 (I =
0.32), while the rest of the RAPD primers elucidated below 0.29 genetic diversity
among three populations of the C. pomonella. The overall mean of the genetic
diversity of the three populations was 0.29. These results are in close concordance
with findings of Khaghaninia et al. (2009). They found out that by using RAPD
93
primers genetic diversity within population of C. pomonella based on Nie's gene
index ranged from 0.228 to 0.281 at Shabestar and Zunuz populations, respectively.
They also observed the maximum (0.14) and minimum (0.04) genetic distances
between the population of C. pomonella at different geographical locations in Iran.
Contrary to our results regarding genetic diversity among the population of C.
pomonella, Bues et al. (1995), observed low genetic differentiation between sampled
populations of C. pomonella by using allozyme markers. Chen and Dorn (2010)
reported important genetic differentiation at local geographic scale (even less than 10
km), which they mostly attributed to the sedentary behaviour of C. pomonella through
microsatellite study on populations from Switzerland.
The highest Shannon's information index (h) for each allele of the primers C-
04, E-18 and C-16 were h = 0.63, followed by C-13 (h = 0.55), H-13 (h = 0.53) and
A-19 (h = 0.50), whereas the rest of the primers were less than 0.49 Shannon's
information index (h) values. The overall mean of the Shannon's information index
(h) was 0.44. These results are closely corroborated with findings of Timm et al.
(2006) who reported that genetic variation among the population of C. pomonella was
0.18 in South Africa. However, only three were monomorphic and resulting 98.60%
polymorphism in the population. They further concluded that genetic diversity within
C. pomonella population in England and Canada were variable which were ranges
from h =0.046 and 0.052 respectively.
The results pertaining to the Nei's genetic identity and genetic distance among
the three populations of C. pomonella was also worked out. Higher genetic distance
was resided among the isolates from Kalam and Madyan (97.87%) whereas low
genetic distance (35.58%) was observed in the C. pomonella isolates from Matta and
Madyan, which indicates that the population of C. pomonella in both the regions has
not so multiplicity as compared to population at Kalam. Khaghaninia et al. (2009)
observed the maximum and minimum genetic distances between the population of C.
pomonella at different geographical locations in Iran and significant correlation was
noticed between genetic and geographic distance matrices in the population of C.
pomonella revealed by Mantel test. It is assumed that due to chaange in the climatic
conditions and frequent application of insecticide, C. pomonella populations separated
into many strains and ecotypes having different biological and physiological
94
requirements related to their development (Thaler et al., 2008). These results contrast
with those obtained for C. pomonella populations from France and Switzerland, by
using allozyme analysis disclosed highly significant genetic similarity between and
among geographic populations (Bue's and Toubon, 1992).
Likewise, the Nei's genetic identity was also found. The higher genetic
similarity (70.06%) was dwelled by the C. pomonella population at Matta and
Madyan whilst the low level of identity (37.58%) was examined in isolates from
Madyan and Kalam. Timm et al. (2006) used AFLP markers and successfully
ascertained differences among sampled C. pomonella populations even at small
geographic distances. Besides, Timm's et al. (2006) study was back up by Thaler et al.
(2008) who also used AFLP markers to study the molecular phylogeny and genetic
diversity of C. pomonella population.
Different methods of C. pomonella control such as use of carbamate,
hydrocarbons, organophosphates, pyrethroids and even avermectin have created
history in fruit production for their expansion. Indiscriminate use of chemical has
created an alarming situation as the pest developed resistance to different groups of
chemical. But biotechnical and biological means of protection are indispensable for
pest management having limited approaches on mass field level. The changes in the
insect populations might be definitely associated with the change in the envirinmental
factor such as temperature and insecticides application. Now more emphasis are given
on the use of new ways and methods such as use of genetic studies on molecular level
of their population. It is evident from various research that the survival and expansion
of C. pomonella is mostely relate to maximum genetic variation of its population and
more resistance ecotypes and strains in their population. For effective methods of
control are dire need of the time for the management and control of C. pomonella,
otherwise pest will be out of control for ever as described by Boivin et al. (2001).
According to Hoy (2003) attractive alternative to chemical control in terms of safety,
specificity, and limited negative environmental impact is application of genetic
control (the sterile insect technique or SIT) and biological control.
According to Higbee et al. (2001) C. pomonella populations from South
Africa, collected from regions situated close together geographically were not
necessarily more closely related genetically than those situated further apart. This
95
pattern of genetic variation could be because of human intervention in the form of
fruit and seedling transport as well as the movement of bins, which may have played
an important role in the mixing of populations from distant geographic regions.
According to Frank et al. (2005) two populations suggest that C. pomonella
populations may vary over relatively short periods of time. The data add to a body of
evidence indicating that insecticide application is one important factor shaping
temporal genetic deviation among populations. Insecticide use has also been shown to
be a significant factor in structuring C. pomonella populations over local geographic
scales (Franck et al., 2007).
These results may have important implications for practices used for managing
population levels of C. pomonella, because tactics such as chemical control (IGR),
pheromone mating disruption, and Sterile Insect Technique (SIT) are affected by
insect dispersal and genetic diversity among populations.
96
3.6. CONCLUSIONS
RAPD markers are efficient tools for assessing the population variation in
insect pests and knowledge of the genetic variation within C. pomonella populations
is necessary for their efficient control and management, thus such studies may offer
an insight on the possible resistance to insecticides. Higher genetic distance was
observed among the isolates from Kalam and Madyan (97.87 %) whereas low genetic
distance (35.58%) was calculated from the C. pomonella isolates from Matta and
Madyan. Similarly higher genetic similarity (70.06%) was resided by the C.
pomonella population at Matta and Madyan, while the low level of identity (37.58%)
were examined in isolates from Madyan and Kalam. Higher genetic distances among
the populations of C. pomonella could be attributed to climatic conditions of the
studied areas, geographical locations and elevations.
3.7. RECOMMENDATIONS
The above findings lead to the following recommendations.
1) Knowledge of the genetic variation within C. pomonella populations is
necessary for their efficient control and management, RAPD markers are
therefore, can be efficiently used for assessing the population variation in
C. pomonella.
2) Besides RAPD primers, gene specific primers and methods like AFLP and
RFLP can also be used for molecular variation among the population of C.
pomonella and other lepidopterious pests.
3) Nonetheless, further study should be carried out in this perspective to
assess the molecular variation among the population of this pest more
effectively.
97
LITERATURE CITED
Balachowsky, A. and L. Mesnil. 1935. Les insectes nuisibles aux plantes cultivees.,
Ministere de L' Agriculture. Paris.
Bardakci, F. 2001. Random amplified polymorphic DNA (RAPD) markers. Turk.
J. Biol. 25: 185-196.
Bayar, K., O. Torjak, E. Kiss, G. Gyulai and L. Heszky. 2006. Genetic variation
within and among populations of Aeolothrips intermedius. J. Zool. 73: 67-
73.
Benecke, M. 1998. Random amplified polymorphic DNA (RAPD) typing of
necrophagous insects (Diptera and Coleoptera) in criminal forensic
studies: validation and use in practice. Forensic Sci. Intern. 98: 157-168.
Boivin, T., D. Chabert C. Hieres, J.C. Bouvier, D. Beslay and B. Sauphanor. 2001.
Pleiotropy of insecticide resistance in the codling moth, Cydia pomonella.
Entomologia Experimentalis et Applicata. 99: 381-386.
Buès, R., J.F Toubon and H.S . Poitout. 1995. Variabilité écophysiologique et
enzymatique de Cydia pomonella L. En fonction de l’origine géographique et
de la plante hôte. Agronomie 15: 221-231.
Bues, R. and J.F. Toubon. 1992. Polymorphisme enzymatique dans diffe´ rentes
populations de Cydia pomonella L. (Lep. Tortricidae). Acta Oecol. 13: 583-
591.
Calkins, C. O. and R.J. Faust. 2003. Overview of area wide programs and the program
for suppression of codling moth in the western USA directed by the United
States Dep. Agric. Res. Serv. Pest. Manage. Sci. 59: 601- 604.
Caprio, M.A. 1998. Evaluating resistance management strategies for multiple toxins
in the presence of external refuges. J. Econ. Entomol. 91: 1021-1031.
Caprio, M.A. 2001. Source-sink dynamics between transgenic and non-transgenic
habitats and their role in the evolution of resistance. J. Econ. Entomol. 94: 698
-705.
Carriere, Y., P. Dutilleul, C. Ellers-Kirk, B. Pedersen, S. Haller, L. Antilla, T.J.
Dennehy and B.E. Tabashnik.2004. Sources, sinks, and the zone of influence
of refuges for managing insect resistance to Bt crops. Ecol. Appl. 14: 1615-
1623.
Chen, M.H. and S. Dorn. 2010. Microsatellites reveal genetic differentiation among
populations in an insect species with high genetic variability in dispersal, the
codling moth, Cydia pomonella (L.) (Lepidoptera: Tortricidae). Bull. Entomol.
Res. Cambridge University 100: 75-85.
98
Chinnapandi, B.S., Raman, A. Sinnakaruppan, S. Kannan M. Sundaram, K.
Muthukalingan and J.F. Picimbon. 2013. Intra Populational Genetic Diversity
In The Tobacco Armyworm, Spodoptera Litura (Lepidoptera: Noctuidae).
Asian J. Biochem. Pharmacol. Res. 3(2): 80-86.
Ciglar, I. 1998. Integrirana zaštita voćaka i vinove loze. Zrinski,Čakovec.
Dakin, E.E. and J.C. Avise. 2004. Microsatellite null alleles in parentage analysis.
Heredity 93: 504-509
Delaat, D.M., M.R.S. Carvalho, M.D.P. Acedo and C.G. De Fonseca. 2005.
Applicability of RAPD markers on silver-stained polyacrylamide gels to
ascertain genetic diversity in Peripatus acacioi (Onychophora, Peripatidae).
Genet. Mol. Res. 4: 716-725.
Deverno, L.L., G.A. Smith and K.J. Harrison. 1998. Randomly amplified
polymorphic DNA evidence of introgression in two closely related sympatric
species of Coniferophagous choristoneura (Lepidoptera: Tortricidae) in
Atlantic Canada. Annu. Entomol. Soc. Am. 91: 248-259.
Dorn, S., P. Schumacher, C. Abivardi and R. Meyhofer.1999. Global and regional
pest insects and their antagonists in orchards: spatial dynamics. Agric.
Ecosyst. Environ. 73: 111-118.
Dunley, J. E. and S.C. Welter. 2000. Correlated insecticide cross-resistance in
azinphosmethyl resistant codling moth (Lepidoptera: Tortricidae). J. Econ.
Entomol. 93: 955-962.
Endersby, N.M., S.W. McKechnie, P.M. Ridland and A.R. Weeks. 2006.
Microsatellites reveal a lack of structure in Australian populations of the
diamondback moth, Plutella xylostella (L.). Mol. Ecol. 15: 107-118.
Franck, P., M. Reyes, J. Olivares and B. Sauphanor. 2007. Genetic architecture in
codling moth populations: comparison between microsatellite and insecticide
resistance markers. Mol. Ecol. 16: 3554-3564.
Franck, P., F. Gue´rin, A. Loiseau and B. Sauphanor. 2005. Isolation and
characterization of microsatellite loci in the codling moth Cydia pomonella L.
(Lepidoptera, Tortricidae). Mol. Ecol. 5: 99-102.
Franck, P. and A.E. Timm. 2010. Population genetic structure of Cydia pomonella: a
review and case study comparing spatiotemporal variation. J. Appl. Entomol.
134: 191-200.
Fritsch, E., K. Undorf-Spahn, J. Kienzle, C.P.W. Zebitz and J. Huber. 2005. Codling
moth granulovirus: First indications of variations in the susceptibility of local
codling moth populations. Nachrichtenbl. Deut. Pflanzenschutzd. 57: 29-34.
Garner, K.J. and J.M. Siavice .1996. Identification and characterization of a RAPD-
PCR marker for distinguishing Asian and North American gypsy moths..
Insect Mol. Biol. 5(2): 81-91.
99
Gomez, D.R., J. J. De Silva, F. Costa and E. Binneck. 2005. Population structure of
the Brazilian Southern green stink bug, Nezara viridula. J. Insect Sci. 36: 216-
227.
Gomez, D.R., K.E. Delpin, M.R. Almeida and E. Hirose. 2004. Genetic
differentiation among Brazilian populations of Euschistus heros (Fab.)
(Heteroptera: Pentatomidae) based on RAPD analysis. Neotrop. Entomol:33:
179-187.
Han, Q. and M.A. Caprio. 2004. Evidence from genetic markers suggests seasonal
variation in dispersal in Heliothis virescens (Lepidoptera: Noctuidae). J.
Environ. Entomol. 33: 1223-1231.
Higbee, B.S., C.O. Calkins and C.A. Temple. 2001. Overwintering of codling moth
(Lepidoptera: Tortricidae) larvae in apple harvest bins and subsequent moth
emergence. J. Econ. Entomol. 94: 1511-1517.
Hoy, M.A. 2003. Insect Molecular Genetics, An Introduction to Principles and
Applications. Second Edition, Academic Press, Elsevier Science, USA.
Keil, S., H.N. Gu and S. Dorn. 2001. Response of Cydia pomonella to selection on
mobility: laboratory evaluation and field verification. Ecol. Entomol. 26: 495-
501.
Keyghobadi, N., J. Roland and C . Strobeck. 2005. Genetic differentiation and gene
flow among populations of the alpine butterfly, Parnassius smintheus, vary
with landscape connectivity. Mol. Ecol.14: 1897-1909.
Khaghaninia, S., S.A. Mohamadi, A.M. Sarafrazi, H. Iraninejad and K.E. Ebrahimi.
2009. Analysis of Population Structure in Codling Moth, Cydia pomonella
(Lepidoptera: Tortricidae) From North West of Iran Using RAPD Markers.
Türkiye III. Bitki Koruma Kongresi, Temmuz, Van. 15-18.
Kil, V.I. 2011. PCR Analysis of Codling Moth (Cydia pomonella) Populations
Using SSR Markers1. Russ. Agric. Sci. 37 (3): 220-223.
Kil, V.I. and E.N. Besedina. 2013.Variability of molecular genetic structure in
codling moth Cydia pomonella (L.) Populations under the influence of
insecticides and environmental stresses. J. Agric. Biol. 1: 61-67.
Knight, A.L., J.F. Brunner and D. Alston. 1994. Survey of azinphosmethyl
resistance in codling moth (Lepidoptera: Tortricidae) in Washington and
Utah. J. Econ. Entomol. 87: 285-292.
Landry, B., J.A. Powell and F.A.H. Sperling. 1999. Systematics of the
Argyrotaenia franciscana (Lepidoptera: Tortricidae) species group:
evidence from mitochondrial DNA. Ann. Entomol. Soc. Am. 92: 40-46.
Lei Men, Q., M. H. Chen, Y. L. Zhang and J. N. Feng. 2012. Genetic structure and
diversity of a newly invasive species, the codling moth, Cydia pomonella (L.)
(Lepidoptera: Tortricidae) in China. Springer Science Business Media B.V.
Biol. Invasions 15:447-458.
100
Leniaud, L., P. Audiot, D. Bourguet, B. Frerot, G. Genestier, S.F. Lee, T. Malausa,
A.H. Le Pallec, M. C. Souqual and S. Ponsard. 2006. Genetic structure of
European and Mediterranean maize borer populations on several wild and
cultivated host plants. Entomol. Exp. Appl. 120: 51-U4.
Lima, L.H.C., L. Campos, M.C. Moretzsohn and M.R.V. De Oliveira. 2002. Genetic
diversity of Bemesia tabaci (Genn.) populations in Brazil revealed by RAPD
markers. Genet. Mol. Biol. 25: 217-223.
Lou, K.F., M.J. Weiss, P.L. Bruckner, L. Talbert and J.M. Martin, 1998. RAPD
variation within and among geographic populations of wheat stem sawfly
(Cephus cinctus Norton). J. Her. 89: 329- 335.
Mani, E. and T. Wildbolz. 1977. The dispersal of male codling moths (Laspeyresia
pomonella L.) in the Upper Rhine Valley. J. Appl. Entomol. 83, 161-168.
Men, Q. L., M.H. Chen, Y.L. Zhang and J.N. Feng. 2013. Genetic structure and
diversity of a newly invasive species, the codling moth, Cydia pomonella (L.)
(Lepidoptera: Tortricidae) in China. Biol. Invasions. 15: 447-458.
Meraner, A., A. Brandstatter, R.Thaler, B. Aray, M. Unterlechner, H. Niederstatter,
W. Parson, R.. Zelger, J. Dalla Via and R.. Dallinger. 2008. Molecular
phylogeny and population structure of the codling moth (Cydia pomonella) in
Central Europe: I. Ancient clade splitting revealed by mitochondrial haplotype
markers. Mol. Phylogenet. Evol. 48: 825–837.
Naber, N., M. El Bouhssini, M. Labhilili, S.M. Udupa and M.M. Nachit. 2000.
Genetic variation among populations of the Hessian fly Mayetiola
destructor (Diptera: Cecidomyiidae) in Morocco and Syria. Bull. Entomol.
Res. 90: 245-252.
Nei, M. and W.H.Li. 1979. Mathematical model for studying genetic variation in
terms of restriction endonucleases. Proc. Natl. Acad. Sct. 76(10): 5269-
5273.
Pajač, I., B. Pejić and Barić. 2011. Codling Moth, Cydia pomonella Lepidoptera:
Tortricidae) Major Pest in Apple Production: an Overview of its Biology,
Resistance, Genetic Structure and Control Strategies. Agric. Conspectus Sci.
76(2): 87-92.
Pashley, D.P. 1983. A biosystematic study in Tortricidae (Lepidoptera) with a
note on evolutionary rates of allozymes. Annu. Entomol. Soc. Am. 76:
139-148.
Peterson, M.A. and R.F . Denno. 1998. The influence of dispersal and diet breadth on
patterns of genetic isolation by distance in phytophagous insects. Am. Nat.
152: 428-446.
Sauphanor, B., V. Brosse, C. Monier and J.C. Bouvier. 1998. Differential ovicidal
and larvicidal resistance to benzoylureas in the codling moth, Cydia
pomonella. Entomol. Exp. Appl. 88: 247-253.
101
Schumacher, P., A. Weyeneth, D.C. Weber and S. Dorn,. 1997. Long flights in Cydia
pomonella L. (Lepidoptera: Tortricidae) measured by a flight mill: influence
of sex, mated status and age. Physiol. Entomol. 22: 149-160.
Scott, K.D., N. Lawrence, C. L. Lange, L. J. Scott, K.S. Wilkinson, M.A. Merritt, M.
Miles, D. Murray and G.C. Graham. 2005. Assessing moth migration and
population structuring in Helicoverpa armigera (Lepidoptera: Noctuidae) at
the regional scale: example from the Darling Downs, Aust. J. Econ. Entomol.
98: 2210-2219.
Thaler, R., A. Brandstatter, A. Meraner, M. Chabicovski, W. Parson, R. Zelger, J.
Dalla Via and R. Dallinger. 2008. Molecular phylogeny and population
structure of the codling moth (Cydia pomonella) in Central Europe: II.
AFLP analysis reflects human-aided local adaptation of a global pest
species. Mol. Phylogenet. Evol. 48: 838-849.
Timm, A.E., H. Geertsema and L. Warnich. 2006. Gene flow among Cydia pomonella
(Lepidoptera: Tortricidae) geographic and host populations in South Africa. J.
Econ. Entomol. 99(2): 341-348.
Voudouris, C.Ch., P. Franck, J. Olivares, B. Sauphanor. Z. Mamuris, J.A. Tsitsipis
and J.T. Margaritopoulos. 2012. Comparing the genetic structure of codling
moth Cydia pomonella (L.) from Greece and France: long distance gene-flow
in a sedentary pest species. Cambridge University Press, 2011. Bull. of
Entomol. Res. 102: 185-198.
Williams, J.G.K., A.R. Kubelik, K.J. Livak, J.A. Rafalski and S.V. Tingey. 1990.
DNA polymorphisms amplified by arbitrary primers are useful as genetic
markers. Nucleic Acids Res. 18(22): 6531-6535.
Zhou, X.F., O. Faktor, S.W. Applebaum and M. Coll. 2000. Population structure of
the pestiferous moth Helicoverpa armigera in the eastern Mediterranean using
RAPD analysis. Heredity 85: 251-256.
Zimmermann, M., N. Wahlberg and H. Descimon. 2000. Phylogeny of
Euphydryas Checkerspot Butterflies (Lepidoptera: Nymphalidae) based on
mitochondrial DNA sequence data. Annu. Entomol. Soc. Am. 93: 347-55.
102
CHAPTER - 4: MANAGEMENT OF C. POMONELLA (LEPIDOPTERA;
TORTRICIDAE)
4.1. INTRODUCTION
4.1.1. Use of Insecticides for the Management of Cydia pomonella
The C. pomonella is a serious pest of apple throughout the world (Bajwa, 1993)
including subcontinent (Croft and Penman, 1989). It is generally control with
prophylactic use of broad-spectrum insecticides. The superfluous and repeated use of
these insecticides has been alluded to many undesirable side effects namely
environmental pollution, destruction of useful predators and parasites, poison hazard to
man and livestock and consequently domination of secondary pests, development of
resistance to insecticides and increase expensis of the farming community. One frequent
consequence of chemical application against C. pomonella is the rapid elimination of
bioogical control agents allowing other pest species to resurge. It may lead to the need for
extra pesticide application. As a response to these flaws, over the past two decades,
alternate methodologies have been investigated (Croft and Penman,1989; Lacey and
Unrih, 2005). The alternate approach includes using selective, environment friendly and
safe pesticides and to enhance use of biological control agents (Croft and AliNiazee,
1996).
Permutation of microbial and chemical insecticides is a way of curtailing the
environmental contamination caused by using chemical insecticides alone while still
maintaining an effective pest control program. Most insecticides are compatible with
microbial insecticides with little or no adverse effect on biological control agents. Among
microbial insecticides, granular viruses is the most versatile use in pest management
systems mainly because of its selective activity against many lepidopterous pest insects
(Ignoffo and Gregory, 1972) and its compatibility with many chemical pesticides (Benz,
1971; Chen et al., 1974). However, information on toxicity and interaction of various
combination of these products and sub lethal dosages of chemical insecticide against C.
pomonella is limited. It is possible that the approach based on using low rates of
registered chemical insecticides with microbial insecticides may not only afford an
effective control of the C. pomonella but also prolong the effective life of insecticides and
ensure preservation of the key predatory insects.
103
Several research efforts to develop substitute control techniques providing both
pest suppression and reduction of the negative side effects of the pesticide approach have
been undertaken for the management of C. pomonella. The techniques which confirmed
some success include the use of reduced insecticide dosages (Bastiste, 1972; Barnett et
al., 1977), the use of insect growth regulators (Westigard, 1979; Burts, 1983; Westigard
and Gut 1986; Moffitt et al., 1988), mating disruption (Howell et al., 1992; Barnes et al.,
1992), biological control with viruses (Jaques and Morris, 1981; Glen and Payne, 1983),
release of sterile adults (Proverbs et al., 1966) and utilization of low dosage mixtures of
microbial and chemical insecticides (Tomova and Ragelova, 1977).
In spite of relatively large number of insecticides available for control of this pest,
the C. pomonella continues to facade a serious peril, especially because of development
of resistance to various groups of insecticides in many parts of the world (Pasquier and
Charmillot, 2003). Resistance is a relatively recent problem in Europe and appeared first
in the early nineties of the past century (Charmillot et al. 1999; 2000). The laboratory
studies carried out by Becid (1997) in France have confirmed the development of
resistance and cross-resistance to all insecticides used for conventional control. Eeven
though increase in use of insecticides, damage caused by C. pomonella in Bulgarian apple
orchards has steadily increased from 2002 till 2007.
Different methods of control have been used against the C. pomonella. Chemical
control has been the most broadened method for a long time. After appearing resistant to
DDT, the typical compounds used have been organophosphates and carbamates. But the
pest has been developed resistance to azinphomethyl and other organophosphates in
California and Washington (Croft and Riedl, 1991). Avermectin, a fermentation by
product from Streptomyces avermitilis, also can be effective, especially in the start of a
season against the neonates in the orchards (Croft and Riedl, 1991).
For the management of C. pomonella control farming community mostly rely on
use of of broad spectrum insecticides. This kind of control leads to many environmental
and health related issues. Nowadays, pheromone traps for monitoring of pest are widely
used and the most easy way to monitor the pest and time of application of management
strategies. The use of more selective insecticides such as insect growth regulator (IGR) is
recommended but still organophosphate are mostly used in diffeerent of the world.
Careful control strategies must be adopted to circumvent the appearance of resistant
104
population to insecticides, as it has already been reported (Charmillot et al., 1999). It is
essential to blend insecticides with different mode of action, or to combine insecticides
with intercrops and examine its impact on biological control agents and ultimately on the
yield (Avilla et al.,1996).
4.1.2. Impact of Intercropping on Biological Control Agents and Pest
Intercropping is the cultivation of more than one crop within the same field for the
attraction of natural enemies by providing more food and shelter for the insect diversity
within agro ecosystem (Vandermeer, 1989; Theunissen, 1994). Flowering species of
plants such as clovers, mustard, soybean etc can provide suitable environment for the
biological control agents to survive and reproduce compared to the field having single
crop within that agro ecosystem (Theunissen, 1994). Hence, the habitate having
polycultures will be more stable and will be less pest infestation and diseases attack
compared to monocroping environment (Altieri and Nicholls, 2004).
The biological, chemical, structural and climatic factors in fact representd
resistance which possibly reduce the pest infestation (Alteri et al., 1978). The reduction
of pest infestation was widely noted in early reviews on intercropping (Risch et al., 1983;
Vandermeer, 1989; Litsinger and Moody, 1976), avoidance of dispersal (Altieri, 1987)
production of adverse stimuli, olfactory stimuli camouflaged by main crop, presence of
natural enemies (Russell, 1989) and openness of food (Fukai and Trenbath, 1993).
Research in diversified agro-ecosystem articulateed that these systems tend to support
less herbivores load than in monoculture system (Altieri and Letourneau,1982).
The association between various climate uneven and insect pests and biological
control agent is significant and there is a need to enumerate them in a different cropping
systems. The research studies are to be conducted in a systematic way to come out with a
workable IPM strategy (Rao and Rao, 1996 and Srinivasa Rao et al., 1999). Intercropping
is one of the best and effective cultural practice in pest management, which is based on
the principle of curtailing insect pests by rising the diversity of an agro ecosystem
(Letourneau and Altieri, 1983; Risch et al., 1983).
Supplying food suplements and resources within crops will be very essential for
increasing natural enemies abundance especially the parasitoids and predators in the field
(Kruess and Tscharntke, 1994; Landis et al., 2000; Tscharntke et al., 2005). This
105
techniques can slo provide overwintering sites for the beneficial insects as well as to the
alternate host in the field (Tscharntke et al., 2005; Wackers et al., 2005). Majority of the
insect such as lacewings, beetles, spiders and parasiotoids are mostlt feeding on the plants
materials (Duso et al., 2004) and for some insects food materials are vital for their
survival during their life cycel (Sommaggio, 1999). Examples of such insect are from the
dipteran families Syrphidae (MacLeod,1999) and Tachinidae (Platt et al.,1999) which can
increase their population in the presence of flowering plants in the fieled which can
provide them pollen and nectors as source of food for their survival (Jervis et al., 1993;
Patt et al., 1997; Begum et al., 2006; Stephens et al., 2006).
Several scientists studied that in nthe presence of flowering plants biological
control of a particular pest can easly be achieved within an agro ecosystem (Hickman and
Wratten, 1996; Hooks and Johnson, 2003; Gurr et al., 2004; Ponti et al., 2007). Through
potential pest management techniques the infestation of cabbage aphids were reduced
(Hooks and Johnson, 2003). Likewise, intercropping corn and soybean enhanced the
occurance of carabid beetle predators and utilization of European corn borer Ostrinia
nubilalis (Hubner) (Lepidoptera; Crambidae) pupae used as sentinel prey (Tillman et al.,
2004; Prasifka et al., 2006). Nonetheless, when the parasitoid and predators ratio increase
in the field thtrough intercrops may not essentially control the pest if the both of then not
synchronized (Baggen and Gurr, 1998).
4.1.3. Biological Control Agents of C. pomonella
Natural enemies such as parasitoids are considered as the most effective
biological control agent for the management of different pest in thye apple orchard.
Several authors demonstrated the influence of flowering plants on beneficial insects
which provide them protein and carbohydrates food in the pollen and nectors for their
longivity, fertility and fecundity of the adults parasitoids in the field (Foster and Ruesink,
1984). Leius (1960). Some parasitoids mostly rely on the flowering plant species as
source of food for their survival. C. pomonella parasitization and their relation with
flowering plants in the unsprayed apple orchard was previously studied (Leius, 1960).
Ascogastor quadridentata (Wesmaels) (Hymenoptera: Braconidae) is a biological
control agent that shows promise for reducing C. pomonella populations. By ovipositing
into eggs of C. pomonella, A. quadridenata is able to circumvent the protection of larvae
received once they are inside the apple and are no longer accessible to attack. In Eurasia,
106
where C. pomonella is believed to have originated, A. quadridentata is one of the most
common parasitoids collected from overwintering C. pomonella larvae (Brown and
Reed-Larsen, 1991).
According to Clausen (1978) A. quadridentata was released in South Africa in the
1920s, and was recovered in selected locations as late as 1936. A. quadridentata was
released in New Zealand, Australia, Peru and West Pakistan between the 1930s and
1960s with undetermined or less success in some orchards (Rao et al., 1971; Clausen,
1978).
Hyssopus pallidus (Askew) (Hymenoptera: Eulophidae) is another gregarious
etoparasitoid of the late 5th
larval instars of C. pomonella, a widely distributed major fruit
pest (Brown, 1996). It can lower the infestation level of its host to a level that allows the
successful application of any safe control measure for the effective management of C.
pomonella. (Mattiacci et al., 1999). Judd et al. (1997) reported that good control of C.
pomonella was achieved in British Columbia with combination of mating disruption, tree
banding and post harvest fruit removal of infested fruit in the orchard. (Kyamanywa and
Tukahirwa, 1988; Ogenga-Latigo et al., 1993; Abate et al., 2000).
Natural enemies of C. pomonella play a key role in the effective pest control both
in organic or IPM regimes and their suppression by chemicals can be source of problems
in plant protection. One of the possibilities to enhance activity of predators and
parasitoids in crops is to increase diversity of plant species (Andow, 1991). Higher plant
species diversity influences nature enemies due to more favorable microclimate (Dyer
and Landis, 1996), owing to presence of alternative hosts or pray in polyphagous
parasitoids and due to production of nectar, pollen, shelter and honeydew (Winkler et al.,
2006). A positive influence of nectariferous plants on the fitness of beneficial in a lot of
studies has been reported by various authors (English-Loeb et al., 2003; Lee et al., 2004;
Berndt and Wratten, 2005).
The tremendous biodiversity of parasitoids in apple orchards has been observed
and wide research has been performed on their isolation, identification and significance
as biological control agents both in different countries of the world. (Atanassov et al.,
1997; Balevski, 2009; Pluciennik and Olszak, 2010). Astonishingly, there have been no
107
attempts to follow emergence of biological control agents and estimated their role for
suppression pest lepidopteran populations in new planted apple orchards.
The response of biological control agent populations to habitat exploitation
depends upon their ability to use or exploit one or more of the plant components of the
agro-ecosystem (Altieri and Nicholls, 2004). Crop systems that are dominated by a single
plant species only provide resources to those selected organisms that can exploit that
single plant species. (Altieri and Nicholls, 2004). Consequently, monocultures are an
example of agro-ecosystems with low diversity and may be more susceptible insect
infestation than the poyculture (Theunissen, 1994; Altieri and Nicholls, 2004).
The current studies were therefore undertaken to discern the efficacy of novel
insecticides against C. pomonella, impact of prevailed practices of different intercropping
on the management of C. pomonella, its associated available parasitoids, combination of
insecticide and intercropping and their ultimate impact on the yield of apple orchard in
Matta Swat Pakistan during the year 2012 and 2013.
108
4.2. REVIEW OF LITERATURE
4.2.1. Use of Insecticides for the Management of C. pomonella
Traditionally, insecticides have been employed to accomplish this, but the
development of resistance in C. pomonella to different groups of chemicals (Brown,
1993), the registration of many insecticides and the harmful impact of insecticides on
beneficial organisms and the environment (Putman, 1963; Dolstad, 1985; Brown, 1993)
have generated great interest in alternative controls for C. pomonella. Great efforts to
eradicate C. pomonella using the sterile male technique or pheromone-based mating
disruption, use of microbial insecticides (reviewed in Riddick and Mills, 1994) are
currently under way. Biological control agents could be important components in an
integrated pest management program for C. pomonella (Brown, 1993; Lacey et al., 2008)
when organophosphates are replaced by more benign alternative controls such as use of
microbial insecticides.
Lethmayer et al. (2009) studied that control of C. pomonella is not feasible in the
current situation due to development of resistance to different group of chemicals, change
in the climatic factors of environment and non availability of effective plant protection
measures for this pest. All the products gave up to biological efficacy of up to 64% and
not mnore than it. Different alternative controlo methods are been carried out in Australia
in 2007 and finally concluded that efficient control of this pest is still the dire need of the
time. More emphasis should be given on integrated management for this pest. The
products which were used during the experiments were accrording to the EPPO standard.
The total infestation rate in the control plots was 75%.
Doerr et al. (2012) reported that Azinphos-methyl (AZM) has been mostly used
for the management of pest in apple production in the United States since the late 1960s,
primarily as a control for the key pest of apple (Malus domestica Borkh.), C. pomonella
L. It was obvious that new insecticides could not provide fruit protection superior to
protection provided with AZM. The most successful techniques working insecticides that
targeted both eggs (ovicides) and larvae (larvicides). Field experiments were carried out
from 2004 to 2008 to inspect new application timings and strategies that integrated
insecticides with different modes of action and different life stages.
109
Pluciennik (2012) conducted a series of experiments aimed at testing the
usefulness of the new insecticide chlorantraniliprole in the control of C. pomonella L.
during the year 2006 and 2007. The product was applied in various doses for the
management of this pest. The control treatments were applied 2 or 3 times, depending on
pest threat. It was observed that there was a significant cutback in the amount of fruit the
C. pomonella larvae were able to damage in all the conducted experiments. Very good
results in C. pomonella control were obtained after application of the tested product at a
dose of more than 0.125 liter/ha.
4.2.2. Impact of Intercropping on Biological Control Agents and Pest
Cultivating two or more crop species within the same agro ecosystem is called
intercropping is a new method to enhance relative abundance and diversity of the natural
enemies for the management of pest (Vandermeer, 1989; Theunissen, 1994). This
technique can provide favourable environment for the various biological control agents
for their survival on flowering plants for the effective management of different pest in the
system (Theunissen, 1994). Hence, these methods are fantastics for increasing the ratio of
natural enemies and reducing the pest species in the prevailed field conditions (Altieri
and Nicholls, 2004; Beizhou et al.,2011). New research proved that by intercropping pear
orchards with aromatic plants can substantially reduced the pest species compared the
plots having natural grasses or with out grasses. Further, maximum number of the natural
enemies were recorded in the intercropped orchard.
Bhatnagar and Davies (1979) studied that pests are significant yield reducers in
various crops and hence pest management was widely addressed by researchers. Crop-
crop diversity is possible when crop plant species can be arranged in space by
intercropping, inter-planting and mixed-row cropping. The monocultures or sole cropping
systems, although highly productive and efficient, have been criticized because of their
genetic uniformity resulting into continuous pest susceptibility.
Altieri (1995) reported carrot family have small open flowers which more suitable
and attractive for the natural enemiesfor pollen and nectors having short probosci such as
hoverflies and parasitoids wasps in most of agro ecosystem. This practices can be applied
in the apple orchard for the efftive and efficient control of C. pomonella and leafroller
caterpillars through parasioids. Some time flower strips of other plants species such as
borage, clover, chamomile, yarrow and cornflower can be useful for attarcting the natural
110
enemies. Other plant species such as leaves and seed of nastutium limiting the activities
of C. pomonella through providing food for the bio control agents in the system.
.Kienzle et al. (1997) explored the population dynamics and fluctuation of
tortricid pest with respect to their parasitoids ratio in eight ecological apple orchard
having intercrops. Different parasitoids such as Cotesia xanthostigma Hal. or Meteorus
ictericus Nees were found relative in maximum number as compared to other species in
the apple orchard which were relative in small number for the effective management of
apple pest. Hence, polyculture environment is more favourable for the benefical insect as
compared to monoculture system of crop.
Srinivasa Rao, et al. (2002) investigated the percent population and relative
abundanc of several pest were reduced in the presence of crop-crop diversity through
intecropping in the field. Pulses are mostly intecropped in the crops which benefit the
selected crop. Natural enemies are often benefited from polyculture environment. So the
role of microclimatic cindition is more significant for increasing the beneficial insect
population in the agro ecosystem. However, more care should be taken regarding the
selection of crop to be cultivated as in the main crop for the attraction of natural enemies.
Srinivasa Rao et al. (2002) also reported that the successes of pest control by
intercropping/ crop-crop diversity techniques among the various possible factors which
are responsible for this pest reduction, the role of biological control agents and change in
microclimate is significant. These are the plausible and obvious reasons to explain the
lower incidence of pests in intercropping systems. It can be therefore wrap up that for
successful control of a given pest by crop- crop diversity the creation of the diversity
should match the condition of the pest. Besides, a clear understanding of change in crop
structure, microclimate change and associated entomo fauna should be considered.
Nonetheless, all attempts may not lead to successful restrain of insect pests at all cases.
Repetition through years and locations will add credibility and relevance to the results.
Nicole et al. (2009) examined that intercrops have the capability to attaract
maximum number of natural enemies for the effective management of pest and as result
chemical usage will be reduced. Appropriate plant species should be selected which will
not compete for food, water and shelter within main crop. The cover crops tested- Queen
Anne’s lace, chicory Cichorium intybus, fennel Foeniculum vulgare (Apiaceae),
111
Fagopyrum esculentum (Polygonaceae), white mustard Sinapis alba (Brassicaceae),
yarrow Achillea millefolium (Asteraceae), buckwheat and fenugreek Trigonella foenum-
graecum (Fabaceae). However, they recorded no evidence for suppressing the population
of pest in the apple orchard and as result pest activity were maximum in the field having
no intecrop.
Beizhou et al. (2011) recently reported that relative abundance and occurance of
natural enemies can be enhanced through intecropping which can curtailed the pest
infestation compared to the orchard having no intercrop or sole orchard. Hence aromatic
plants can attarct significant number of natural enemies for the management of C.
pomonella.
Wan et al. (2014) conducted two years field experiment at two sites in eastern
China, examining the effects of the ground cover by Trifolium repens L.on the biocontrol
services in peach orchards. The results indicated that compared to those in control areas,
the abundances of aphids and Grapholitha molesta decreased, respectively, by 31.4% and
33.3% in Shanghai and by 30.1% and 33.3% in Jiangsu, while the abundance of
generalist arthropod predators increased by 116.7% in Shanghai and by 115.8% in
Jiangsu in ground cover areas in China. Compared to that in control areas, the ratio of
generalist predator abundance to aphid abundance and to G. molesta abundance
increased, respectively by 260.0% and 384.2% in Shanghai and by 213.3% and 253.1% in
Jiangsu in ground cover areas. These studies revealed that the ecological engineering of
ground cover by T. repens promoted biological control services in peach orchards.
4.2.3. Biological Control Agents Associated with C. pomonella
Glen, (1982) reported new species of the parasitoids were introduce in to the pear
orchard in California from Central Asia, China and Europe. Three parasitoids species
such as Mastrus ridibundus, Hyssopus pallidus and Liotryphon caudatus were maintained
in the laboratory for further realease in to the field. H. pallidus is the larval parasitoid and
has the potential to management the pest, Microdus rufipes is a solatary larval parasitoid
that is mostly goes in to the overwintering in the cocoon of C. pomonella were also
released to field. Results showed that both of the natural enemies increased their
population in the pear orchard and were recoverd from the same field later on.
112
Charmillot et al. (1997) examined that Ascogaster quadridentata Wesmaels that
belong to the genus Trichogramma (Braconidae) is the most important parasitoid of C.
pomonella eggs and the natural enemy with a bigger potential in IPM programs. The
adult female laid the eggs in the C. pomonella egg and the larva develops during the egg
and larval stages of the host. With low population levels of the C. pomonella, it achieves
parasitism levels up to 5%, which shows its parasitism in searching behavior by the adult
female. Furthermore, as host levels increase, the percentage of parasitism also rises.
Charmillot et al. (1997) investigated that H. pallidus (Eulophidae) is a gregarious
ectoparasitoid of late instar C. pomonella. The small parasitoid adults enter infested fruit
to find their hosts and will attack all later larval instars of the C. pomonella. The host
larva is paralyzed and then a series of eggs are laid externally on the host. This parasitoid
species can readily be reared on larger C. pomonella larvae and does not require the
presence of the host plant to secure host attack in captivity. Development of the parasitoid
Trichomma enecator Rossi is completed inside the host pupa under the bark. Nonetheless,
success in rearing T. enecator on thinning apples infested with C. pomonella larvae has so
far been limited. It seems unlikely that this species can be reared in sufficient numbers to
secure field establishment for the effective management of C. pomonella.
MacLellan (1999) studied a maximum of 82.5% parasitism of A. quadridentata
Wesmaels. The intensity of parasitism by this egg parasitoid depends on the stage of
embryonic development of the eggs: he also observed, at 25°C and 70-80% RH, that the
maximum degree of parasitism was when eggs were 2-4 days old.
Mattiacci et al. (1999) reported that most of the parasitoid depends on the location
behavoiur of their host and H. pallidus (Askew) is a good example for host searaching is
regarded as a potential parasitoid. Female wasp is more active and efficient for their host
location and enter in to the fruit, parasitising the host inside. Some of the parasitoids are
more careful during parasitising the host that is already parasitised having frass around it.
Hence H. pallidus is more capable for searching it host and play more effective role for
the control and management of C. pomonella in different countries.
Velcheva et al. (2012) observed that the gradual increase in the rate of insect
parasitism on externally feeding lepidopterious larvae developing on buds, flowers,
leaves and fruits of young apple trees in an orchard located in West Bulgaria from 2005-
113
2009. During the five year survey, 19 parasitoid species belonging to 6 families were
identified. Species of family ichneumonidae were dominant (42.1%), followed by
braconidae (31.6%). Two tachinid flies were isolated, corresponding to 10.5% of the
complex. Dibrachys cavus (Walker) was the first parasitoid observed during the
investigation and was found as cocoons on the leaves. Scirtetes robustus (Woldstedt)
parasitized Orthosia cerasi (Fabricius) in the second year after planting of the orchard.
Hedya nubeferana (Haworth), The percentages of parasitism reached to 25% for the first
two pests and 22% for O.brumata. The rate of parasitism of C. pomonella collected in the
young orchard was low: 5.3% in 2008 and 0.9% in 2009. Liotryphon caudatus
(Ratzeburg) and A. quadridentata (Wesmael) were the first species ascertained to infest
the larvae of the pest.
114
4.3. EXPERIMENT-1: MANAGEMENT OF C. POMONELLA THROUGH
SELECTED NOVEL PESTICIDES
4.3.1. MATERIALS AND METHODS
The experiment was conducted in Matta, Swat during the year 2012 and 2013 and
was laid down in the randomized complete block design (RCBD) with single factor
having six treatments including control and were replicated four times. Blank spray was
done to determine the required amount of spray solution for each tree. All the orchard
were "Red Delicious" variety of the same size and age i.e. 12 years old in this experiment.
Four rows with six plants in each row having 5.53 x 5.53 meters row to row and plant to
plant distance were selecte for the treatments application. Five plant protection products
(Novel insecticides) Match® , Madex
® , Delegate
® , Assail
® and Timer
® with Lufenuran,
CpGv, Spinetoram, Acetamiprid and Abamectin as active ingredients respectively were
used in their respective doses for the spray application against C. pomonella (Table-4.1).
For this experiment Lethmayer et al. (2009) procedures were followed with some
necessary modifications.
The first spray of aforementioned insecticides were applied when 80 percent
petals fall (First week of May) and the second spray was applied 20 days after the first
spray for control of first generation of C. pomonella. A total of four sprays were applied
and the last two sprays were applied at the interval of 30 days each for the control of
second generation of C. pomonella through power spray machines. Four rows were
selected having six trees in each row for treatments application. The percent infestation
rate with C. pomonella larvae were assessed fortnightly by counting the number of all
infested and not infested dropped fruits per replicate and treatment by using the following
formula:
Percent infestation (%) = Infested fruit with C. pomonella larvae x 100
Total dropped fruit
The effect of these insecticides were evaluated on two associated biological
control agents i.e. egg-larval parasitoid Ascogastor quadridentata (Hymenoptera:
Braconidae) and gregarious ectoparasitoid Hyssopus pallidus (Hymenoptera:
Eulophidae).
115
4.3.1.1. Ascogaster quadridentata
All the treated trees in the block were banded with corrugated cardboard bands
having opening less than 1/20 inch (1.3 mm) with the folds facing down to collect
parasitized C. pomonella larvae migrating down the trunk to pupate in Mid July and at the
end of September during the year 2012 and 2013. Bands were wrap around the trees trunk
at a distance of 2-3 feet from the ground and were replaced weekly. Corrugated bands
along with overwintering larvae of C. pomonella were kept in a wooden rearing cages
(45x45x45cm3) at 25±2
0C and 60-70% relative humidity (R.H) (Tomkins, 1984). The
cages were checked weekly for possible emergence of pest and A. quadridentata and
percent parasitism of adult parasitoids were determined by using following formula:
Percent Parasitism (%) = No, of parasitoid emerged from parasitized larvae x 100
Total No, of overwintering larvae in cardboard bands
4.3.1.2. Hyssopus pallidus
The effect of these insecticides were also evaluated on another associated
biological control agent i.e. gregarious ectoparasitoid H. pallidus (Hymenoptera:
Eulophidae). For this purpose, the dropped infested fruits with C. pomonella larvae were
brought to the laboratory and were put them in the wooden rearing cages (45x45x45cm3)
on 25±2 0C and 60-70% relative humidity (R.H). The cages were checked weekly for the
possible emergence of this parasitoids and it's percent parasitism in the respective
treatments were computed by using the following formula:
Percent Parasitism (%) = No, of parasitoid emerged from infested fruit x 100
Total infested fruit by C. pomonella larvae
4.3.1.3. Biological Efficacy
To know the biological efficacy of each treatment, after completion of infestation
data and crop harvest, the percent decrease over control was calculated through following
formula in control and other sprayed plots for their biological efficacy (Abbott, 1925).
Percent (%) decrease over control (Biological Efficacy) = A-B/A * 100
where,
A= Pest infestation or damaged fruits in control plots
B= Pest infestation or damaged fruits in treated plots
116
4.3.1.4. Yield data and total gain in yield over control
Yield data (kg/tree) was taken in each replicate after harvest of fruits following
the procedures of Saljoqi et al. (2003) with some necessary modifications. The total gain
in yield over control due to insecticides application were calculated by the following
formula (Sathi et al., 2008).
Gain in Yield (%) =
Where,
T = Yield obtained from treated plot (protected plot)
C = Yield obtained from Control plot (Unprotected)
4.3.1.5. Statistical Analysis
All the replicated data were statistically analyzed by using analysis of variance
technique suitable for randomized complete block design (RCBD) by using Steel and
Torrie, (1980) procedures and via a statistical software “Statistics 8.1®” version. The
significant means were split by LSD test at α 0.05% level of probability. All the
replicated data regarding fruit drop, mean infestation and relative occurrence of the
parasitoids were square root transformed (√0.5+X) prior to statistical analysis.
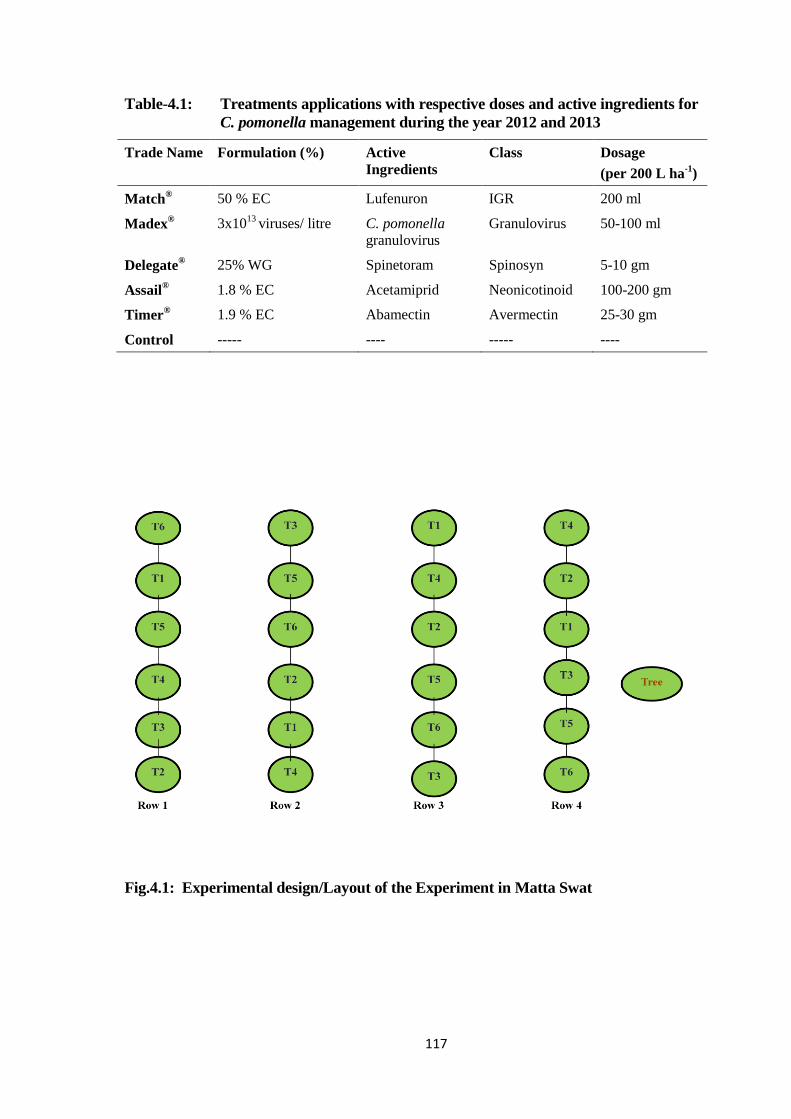
117
Table-4.1: Treatments applications with respective doses and active ingredients for
C. pomonella management during the year 2012 and 2013
Trade Name Formulation (%) Active
Ingredients
Class Dosage
(per 200 L ha-1
)
Match® 50 % EC Lufenuron IGR 200 ml
Madex® 3x10
13 viruses/ litre C. pomonella
granulovirus
Granulovirus 50-100 ml
Delegate® 25% WG Spinetoram Spinosyn 5-10 gm
Assail® 1.8 % EC Acetamiprid Neonicotinoid 100-200 gm
Timer® 1.9 % EC Abamectin Avermectin 25-30 gm
Control ----- ---- ----- ----
Fig.4.1: Experimental design/Layout of the Experiment in Matta Swat
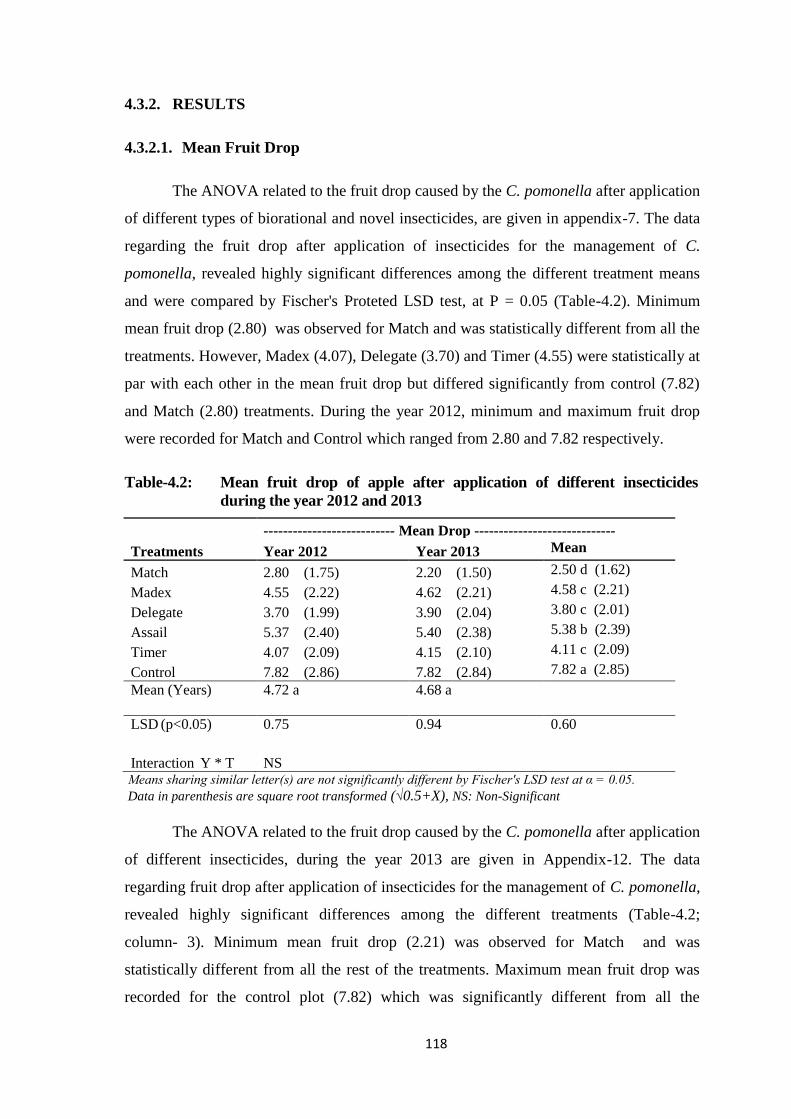
118
4.3.2. RESULTS
4.3.2.1. Mean Fruit Drop
The ANOVA related to the fruit drop caused by the C. pomonella after application
of different types of biorational and novel insecticides, are given in appendix-7. The data
regarding the fruit drop after application of insecticides for the management of C.
pomonella, revealed highly significant differences among the different treatment means
and were compared by Fischer's Proteted LSD test, at P = 0.05 (Table-4.2). Minimum
mean fruit drop (2.80) was observed for Match and was statistically different from all the
treatments. However, Madex (4.07), Delegate (3.70) and Timer (4.55) were statistically at
par with each other in the mean fruit drop but differed significantly from control (7.82)
and Match (2.80) treatments. During the year 2012, minimum and maximum fruit drop
were recorded for Match and Control which ranged from 2.80 and 7.82 respectively.
Table-4.2: Mean fruit drop of apple after application of different insecticides
during the year 2012 and 2013
--------------------------- Mean Drop -----------------------------
Treatments Year 2012 Year 2013 Mean
Match 2.80 (1.75) 2.20 (1.50) 2.50 d (1.62)
Madex 4.55 (2.22) 4.62 (2.21) 4.58 c (2.21)
Delegate 3.70 (1.99) 3.90 (2.04) 3.80 c (2.01)
Assail 5.37 (2.40) 5.40 (2.38) 5.38 b (2.39)
Timer 4.07 (2.09) 4.15 (2.10) 4.11 c (2.09)
Control 7.82 (2.86) 7.82 (2.84) 7.82 a (2.85)
Mean (Years) 4.72 a 4.68 a
LSD (p<0.05) 0.75 0.94 0.60
Interaction Y * T
NS
Means sharing similar letter(s) are not significantly different by Fischer's LSD test at α = 0.05.
Data in parenthesis are square root transformed (√0.5+X), NS: Non-Significant
The ANOVA related to the fruit drop caused by the C. pomonella after application
of different insecticides, during the year 2013 are given in Appendix-12. The data
regarding fruit drop after application of insecticides for the management of C. pomonella,
revealed highly significant differences among the different treatments (Table-4.2;
column- 3). Minimum mean fruit drop (2.21) was observed for Match and was
statistically different from all the rest of the treatments. Maximum mean fruit drop was
recorded for the control plot (7.82) which was significantly different from all the
119
treatment means. Mean fruit drop with Madex treated plants was 4.62 which was
statistically at par with that of Delegate (3.90), Assail (5.40) and Timer (4.15) but differed
significantly from treatments i.e., Match and control having mean fruit drop 2.21 and 7.82
respectively. During the year 2013, minimum fruit drop was observed for match treated
plants (2.20), while control had the maximum fruit drop (7.82). Combined data analysis
explained that minimum mean fruit drop (2.50) was observed for Match treated plants
which were significantly different from all other treatments including control. The data
further revealed that mean fruit drop of both the years were not statistically different from
each other and interaction between years and treatments were also non-significant.
4.3.2.2. Percent Infestation
The ANOVA pertaining to the percent infestation caused by the C. pomonella
during the year 2012, after application of different insecticides, are given in appendix-8.
The data regarding mean and percent infestation after application of insecticides for the
management of C. pomonella, revealed highly significant differences among the different
treatments and the percent means infestation compared by Fischer's LSD test at P = 0.05
(Table-4.3). Minimum mean percent infestation (24.83%) was observed for Match and
was statistically different from all the treatments. However, Madex, and Timer were not
statistically at par with each other having mean percent infestation 58.22 and 57.76%
respectively. The said treatments differed significantly from Match, Assail and control
having mean infestation 24.83, 57.76 and 76.32% respectively. During the year 2012,
minimum mean percent infestation were observed for Match followed by Delegate and
Timer and maximum mean percent infestation were recorded for control followed by
Assail and Madex.
The ANOVA regarding means percent infestation caused by the C. pomonella
during the year 2013, after application of different insecticides are given in Appendix-13.
The data regarding mean and percent infestation after application of insecticides for the
management of C. pomonella, revealed highly significant differences among the different
treatments (Table-4.3; Column- 3). Minimum mean percent infestation was observed for
Match having percent infestation 21.39% and was statistically different from all the
treatments. Nonetheless, mean percent infestation of Madex (63.37%) and Timer
(48.37%) and Delegate (37.67%) and were statistically at par with each other and differed
significantly from Match (21.39%) and control plots (80.44%). During the year 2013,
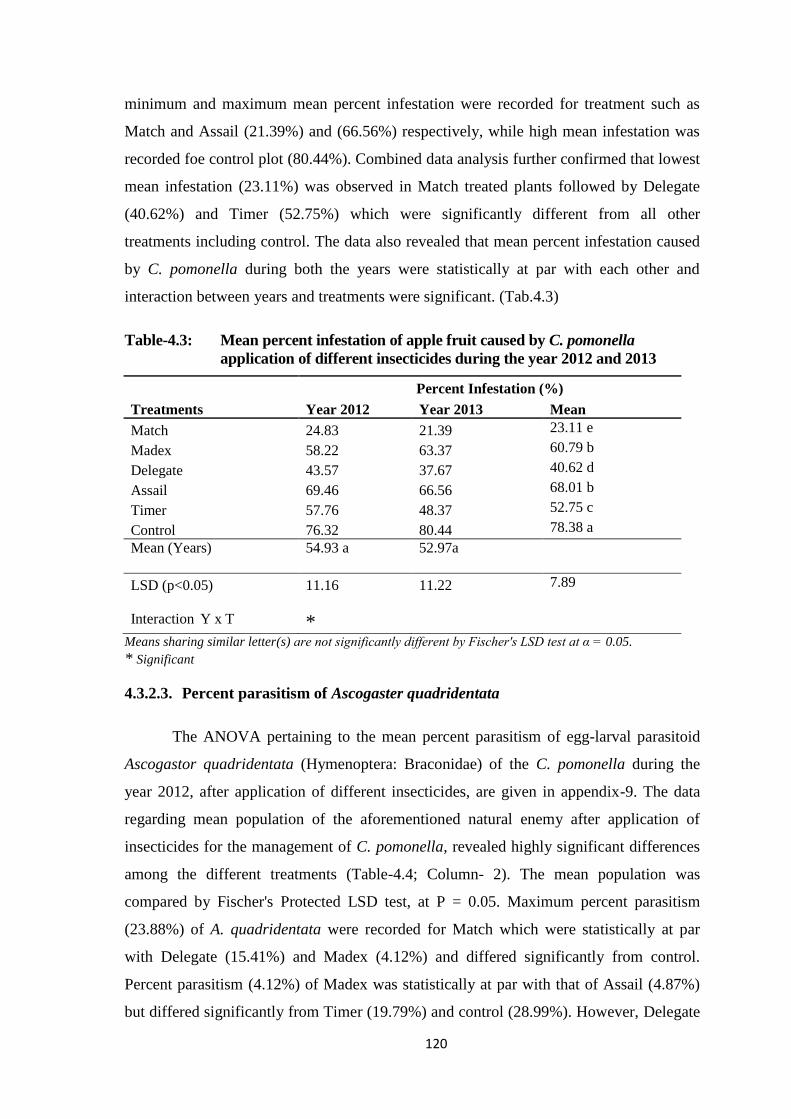
120
minimum and maximum mean percent infestation were recorded for treatment such as
Match and Assail (21.39%) and (66.56%) respectively, while high mean infestation was
recorded foe control plot (80.44%). Combined data analysis further confirmed that lowest
mean infestation (23.11%) was observed in Match treated plants followed by Delegate
(40.62%) and Timer (52.75%) which were significantly different from all other
treatments including control. The data also revealed that mean percent infestation caused
by C. pomonella during both the years were statistically at par with each other and
interaction between years and treatments were significant. (Tab.4.3)
Table-4.3: Mean percent infestation of apple fruit caused by C. pomonella
application of different insecticides during the year 2012 and 2013
Percent Infestation (%)
Treatments Year 2012 Year 2013 Mean
Match 24.83 21.39 23.11 e
Madex 58.22 63.37 60.79 b
Delegate 43.57 37.67 40.62 d
Assail 69.46 66.56 68.01 b
Timer 57.76 48.37 52.75 c
Control 76.32 80.44 78.38 a
Mean (Years)
54.93 a 52.97a
LSD (p<0.05) 11.16 11.22 7.89
Interaction Y x T
*
Means sharing similar letter(s) are not significantly different by Fischer's LSD test at α = 0.05.
* Significant
4.3.2.3. Percent parasitism of Ascogaster quadridentata
The ANOVA pertaining to the mean percent parasitism of egg-larval parasitoid
Ascogastor quadridentata (Hymenoptera: Braconidae) of the C. pomonella during the
year 2012, after application of different insecticides, are given in appendix-9. The data
regarding mean population of the aforementioned natural enemy after application of
insecticides for the management of C. pomonella, revealed highly significant differences
among the different treatments (Table-4.4; Column- 2). The mean population was
compared by Fischer's Protected LSD test, at P = 0.05. Maximum percent parasitism
(23.88%) of A. quadridentata were recorded for Match which were statistically at par
with Delegate (15.41%) and Madex (4.12%) and differed significantly from control.
Percent parasitism (4.12%) of Madex was statistically at par with that of Assail (4.87%)
but differed significantly from Timer (19.79%) and control (28.99%). However, Delegate
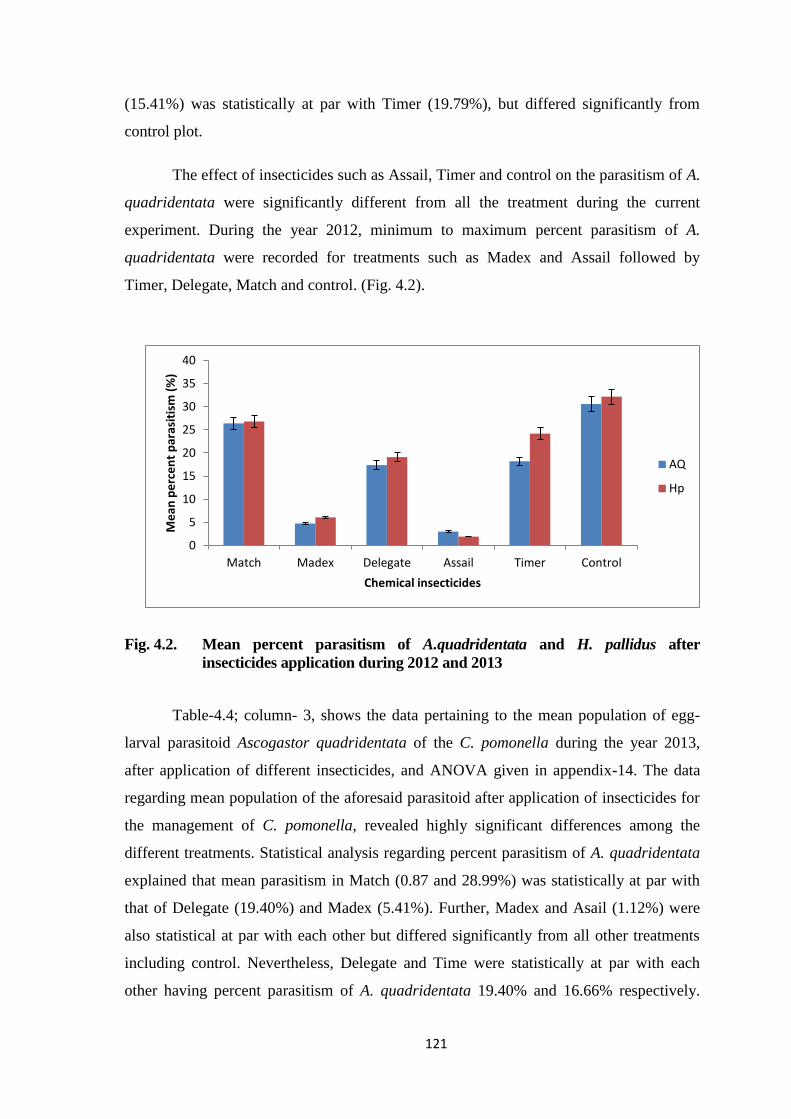
121
(15.41%) was statistically at par with Timer (19.79%), but differed significantly from
control plot.
The effect of insecticides such as Assail, Timer and control on the parasitism of A.
quadridentata were significantly different from all the treatment during the current
experiment. During the year 2012, minimum to maximum percent parasitism of A.
quadridentata were recorded for treatments such as Madex and Assail followed by
Timer, Delegate, Match and control. (Fig. 4.2).
Fig. 4.2. Mean percent parasitism of A.quadridentata and H. pallidus after
insecticides application during 2012 and 2013
Table-4.4; column- 3, shows the data pertaining to the mean population of egg-
larval parasitoid Ascogastor quadridentata of the C. pomonella during the year 2013,
after application of different insecticides, and ANOVA given in appendix-14. The data
regarding mean population of the aforesaid parasitoid after application of insecticides for
the management of C. pomonella, revealed highly significant differences among the
different treatments. Statistical analysis regarding percent parasitism of A. quadridentata
explained that mean parasitism in Match (0.87 and 28.99%) was statistically at par with
that of Delegate (19.40%) and Madex (5.41%). Further, Madex and Asail (1.12%) were
also statistical at par with each other but differed significantly from all other treatments
including control. Nevertheless, Delegate and Time were statistically at par with each
other having percent parasitism of A. quadridentata 19.40% and 16.66% respectively.
0
5
10
15
20
25
30
35
40
Match Madex Delegate Assail Timer Control
Me
an p
erc
en
t p
aras
itis
m (
%)
Chemical insecticides
AQ
Hp
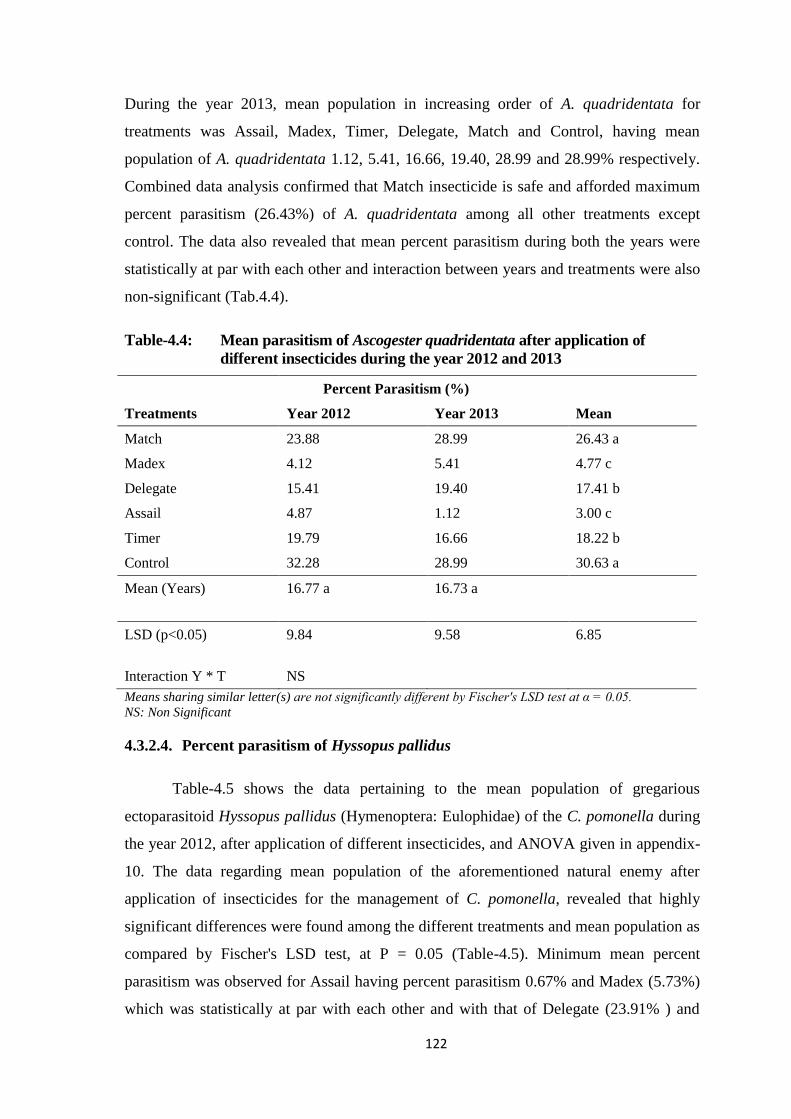
122
During the year 2013, mean population in increasing order of A. quadridentata for
treatments was Assail, Madex, Timer, Delegate, Match and Control, having mean
population of A. quadridentata 1.12, 5.41, 16.66, 19.40, 28.99 and 28.99% respectively.
Combined data analysis confirmed that Match insecticide is safe and afforded maximum
percent parasitism (26.43%) of A. quadridentata among all other treatments except
control. The data also revealed that mean percent parasitism during both the years were
statistically at par with each other and interaction between years and treatments were also
non-significant (Tab.4.4).
Table-4.4: Mean parasitism of Ascogester quadridentata after application of
different insecticides during the year 2012 and 2013
Percent Parasitism (%)
Treatments Year 2012 Year 2013 Mean
Match 23.88 28.99 26.43 a
Madex 4.12 5.41 4.77 c
Delegate 15.41 19.40 17.41 b
Assail 4.87 1.12 3.00 c
Timer 19.79 16.66 18.22 b
Control 32.28 28.99 30.63 a
Mean (Years)
16.77 a 16.73 a
LSD (p<0.05)
Interaction Y * T
9.84
NS
9.58 6.85
Means sharing similar letter(s) are not significantly different by Fischer's LSD test at α = 0.05.
NS: Non Significant
4.3.2.4. Percent parasitism of Hyssopus pallidus
Table-4.5 shows the data pertaining to the mean population of gregarious
ectoparasitoid Hyssopus pallidus (Hymenoptera: Eulophidae) of the C. pomonella during
the year 2012, after application of different insecticides, and ANOVA given in appendix-
10. The data regarding mean population of the aforementioned natural enemy after
application of insecticides for the management of C. pomonella, revealed that highly
significant differences were found among the different treatments and mean population as
compared by Fischer's LSD test, at P = 0.05 (Table-4.5). Minimum mean percent
parasitism was observed for Assail having percent parasitism 0.67% and Madex (5.73%)
which was statistically at par with each other and with that of Delegate (23.91% ) and
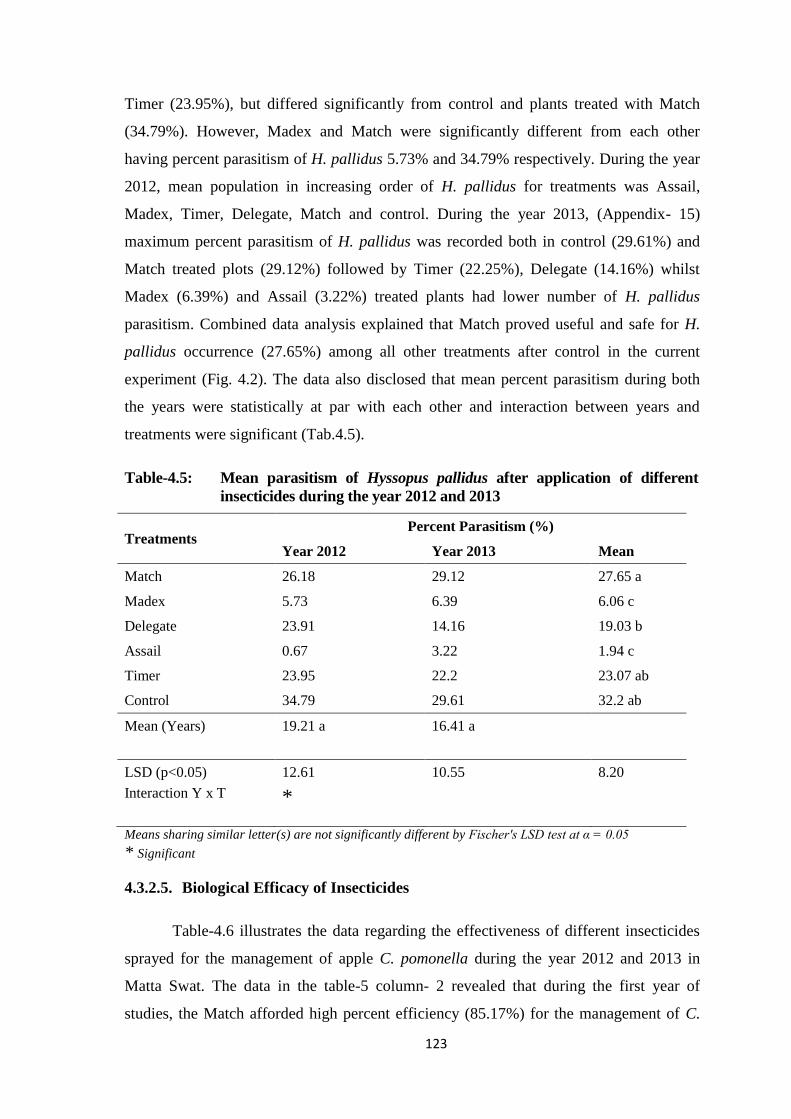
123
Timer (23.95%), but differed significantly from control and plants treated with Match
(34.79%). However, Madex and Match were significantly different from each other
having percent parasitism of H. pallidus 5.73% and 34.79% respectively. During the year
2012, mean population in increasing order of H. pallidus for treatments was Assail,
Madex, Timer, Delegate, Match and control. During the year 2013, (Appendix- 15)
maximum percent parasitism of H. pallidus was recorded both in control (29.61%) and
Match treated plots (29.12%) followed by Timer (22.25%), Delegate (14.16%) whilst
Madex (6.39%) and Assail (3.22%) treated plants had lower number of H. pallidus
parasitism. Combined data analysis explained that Match proved useful and safe for H.
pallidus occurrence (27.65%) among all other treatments after control in the current
experiment (Fig. 4.2). The data also disclosed that mean percent parasitism during both
the years were statistically at par with each other and interaction between years and
treatments were significant (Tab.4.5).
Table-4.5: Mean parasitism of Hyssopus pallidus after application of different
insecticides during the year 2012 and 2013
Treatments Percent Parasitism (%)
Year 2012 Year 2013 Mean
Match 26.18 29.12 27.65 a
Madex 5.73 6.39 6.06 c
Delegate 23.91 14.16 19.03 b
Assail 0.67 3.22 1.94 c
Timer 23.95 22.2 23.07 ab
Control 34.79 29.61 32.2 ab
Mean (Years)
19.21 a
16.41 a
LSD (p<0.05)
Interaction Y x T 12.61
*
10.55
8.20
Means sharing similar letter(s) are not significantly different by Fischer's LSD test at α = 0.05
* Significant
4.3.2.5. Biological Efficacy of Insecticides
Table-4.6 illustrates the data regarding the effectiveness of different insecticides
sprayed for the management of apple C. pomonella during the year 2012 and 2013 in
Matta Swat. The data in the table-5 column- 2 revealed that during the first year of
studies, the Match afforded high percent efficiency (85.17%) for the management of C.
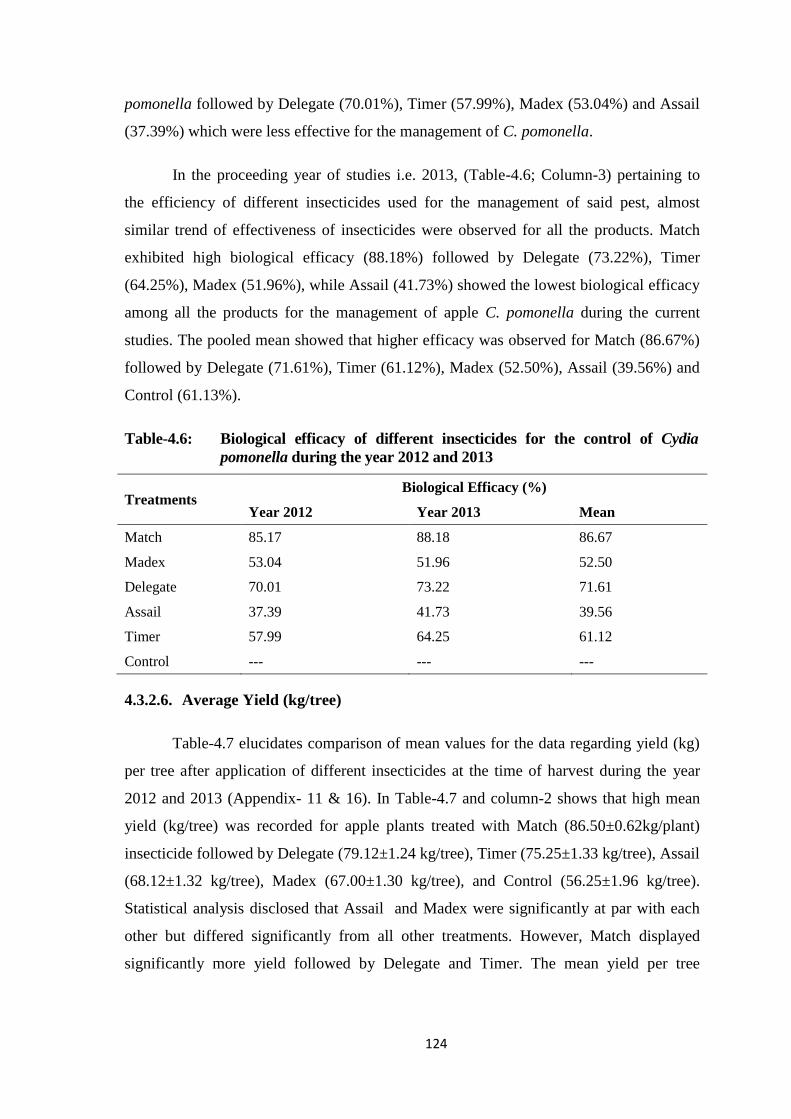
124
pomonella followed by Delegate (70.01%), Timer (57.99%), Madex (53.04%) and Assail
(37.39%) which were less effective for the management of C. pomonella.
In the proceeding year of studies i.e. 2013, (Table-4.6; Column-3) pertaining to
the efficiency of different insecticides used for the management of said pest, almost
similar trend of effectiveness of insecticides were observed for all the products. Match
exhibited high biological efficacy (88.18%) followed by Delegate (73.22%), Timer
(64.25%), Madex (51.96%), while Assail (41.73%) showed the lowest biological efficacy
among all the products for the management of apple C. pomonella during the current
studies. The pooled mean showed that higher efficacy was observed for Match (86.67%)
followed by Delegate (71.61%), Timer (61.12%), Madex (52.50%), Assail (39.56%) and
Control (61.13%).
Table-4.6: Biological efficacy of different insecticides for the control of Cydia
pomonella during the year 2012 and 2013
Treatments Biological Efficacy (%)
Year 2012 Year 2013 Mean
Match 85.17 88.18 86.67
Madex 53.04 51.96 52.50
Delegate 70.01 73.22 71.61
Assail 37.39 41.73 39.56
Timer 57.99 64.25 61.12
Control --- --- ---
4.3.2.6. Average Yield (kg/tree)
Table-4.7 elucidates comparison of mean values for the data regarding yield (kg)
per tree after application of different insecticides at the time of harvest during the year
2012 and 2013 (Appendix- 11 & 16). In Table-4.7 and column-2 shows that high mean
yield (kg/tree) was recorded for apple plants treated with Match (86.50±0.62kg/plant)
insecticide followed by Delegate (79.12±1.24 kg/tree), Timer (75.25±1.33 kg/tree), Assail
(68.12±1.32 kg/tree), Madex (67.00±1.30 kg/tree), and Control (56.25±1.96 kg/tree).
Statistical analysis disclosed that Assail and Madex were significantly at par with each
other but differed significantly from all other treatments. However, Match displayed
significantly more yield followed by Delegate and Timer. The mean yield per tree
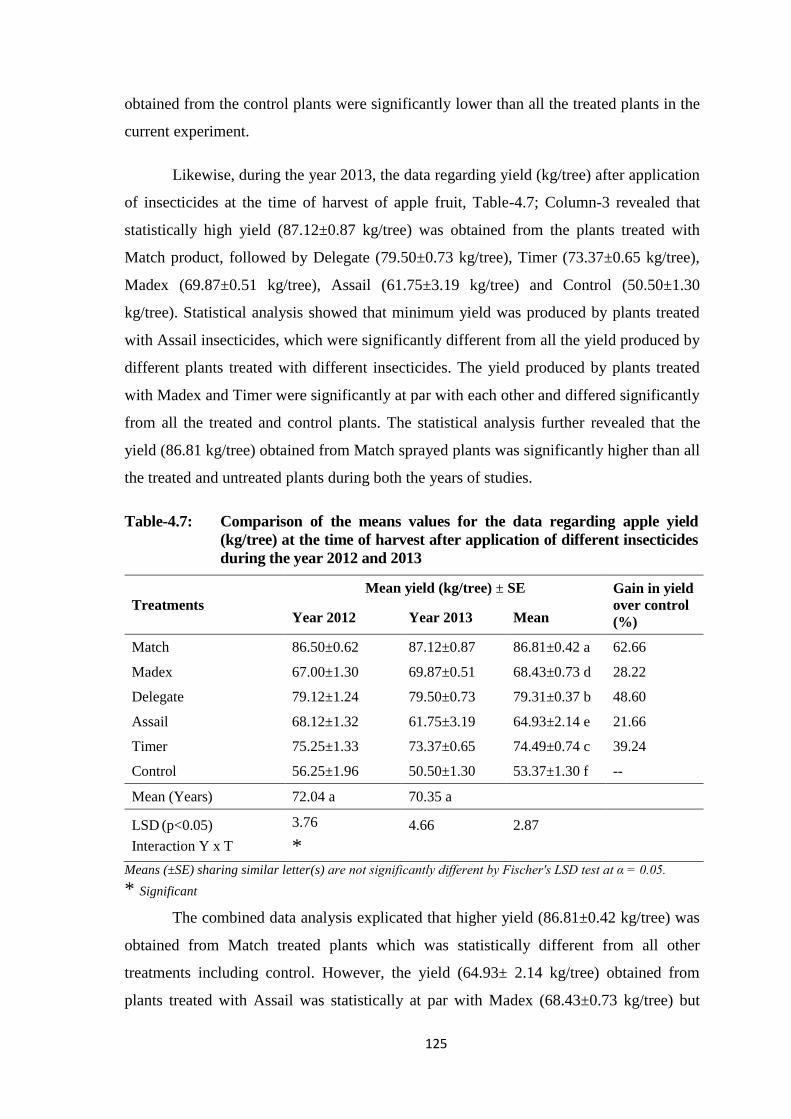
125
obtained from the control plants were significantly lower than all the treated plants in the
current experiment.
Likewise, during the year 2013, the data regarding yield (kg/tree) after application
of insecticides at the time of harvest of apple fruit, Table-4.7; Column-3 revealed that
statistically high yield (87.12±0.87 kg/tree) was obtained from the plants treated with
Match product, followed by Delegate (79.50±0.73 kg/tree), Timer (73.37±0.65 kg/tree),
Madex (69.87±0.51 kg/tree), Assail (61.75±3.19 kg/tree) and Control (50.50±1.30
kg/tree). Statistical analysis showed that minimum yield was produced by plants treated
with Assail insecticides, which were significantly different from all the yield produced by
different plants treated with different insecticides. The yield produced by plants treated
with Madex and Timer were significantly at par with each other and differed significantly
from all the treated and control plants. The statistical analysis further revealed that the
yield (86.81 kg/tree) obtained from Match sprayed plants was significantly higher than all
the treated and untreated plants during both the years of studies.
Table-4.7: Comparison of the means values for the data regarding apple yield
(kg/tree) at the time of harvest after application of different insecticides
during the year 2012 and 2013
Treatments
Mean yield (kg/tree) ± SE Gain in yield
over control
(%) Year 2012 Year 2013 Mean
Match 86.50±0.62 87.12±0.87 86.81±0.42 a 62.66
Madex 67.00±1.30 69.87±0.51 68.43±0.73 d 28.22
Delegate 79.12±1.24 79.50±0.73 79.31±0.37 b 48.60
Assail 68.12±1.32 61.75±3.19 64.93±2.14 e 21.66
Timer 75.25±1.33 73.37±0.65 74.49±0.74 c 39.24
Control 56.25±1.96 50.50±1.30 53.37±1.30 f --
Mean (Years) 72.04 a 70.35 a
LSD (p<0.05)
Interaction Y x T
3.76
*
4.66
2.87
Means (±SE) sharing similar letter(s) are not significantly different by Fischer's LSD test at α = 0.05.
* Significant
The combined data analysis explicated that higher yield (86.81±0.42 kg/tree) was
obtained from Match treated plants which was statistically different from all other
treatments including control. However, the yield (64.93± 2.14 kg/tree) obtained from
plants treated with Assail was statistically at par with Madex (68.43±0.73 kg/tree) but
126
differed significantly from Timer (64.93±2.14 kg/tree) and Delegate (79.31± 0.37
kg/tree). Lower yield (53.37±1.30 kg/tree) was recorded for the control plants. The gain
in yield over control were in the order of Match (62.66%) > Delegate (48.60%) > Timer
(39.24%) > Madex (28.22%) > Assail (21.66%). The data also divulged that mean yield
during both the years were statistically at par with each other and interaction between
years and treatments were significant (Tab.4.7).
127
4.3.3. DISCUSSION
4.3.3.1. Mean Fruit Drop
The data pertaining to mean fruit drop after application of different types of
biorational and novel insecticides revealed that minimum mean fruit drop (2.80 and 2.20)
were observed for the apple plants treated with Match insecticides during the year 2012
and 2013. Highest mean fruit drop (7.82 and 7.28) were recorded in the control plants
followed by Assail (5.37 and 5.40), Madex (4.55 and 4.62), Timer (4.07 and 4.15) and
Delegate (3.70 and 3.90) during the year 2012 and 2013 respectively. Consequently
among all other insecticides, Match insecticides show a good efficacy in reducing the
mean fruit drop (2.50) in apple orchard and was more effective in minimizing the mean
infestation of C. pomonella. Racette et al. (1992) reported that the damage of C.
pomonella is usually characterized by oviposition scars on the fruit surface, however it
also causes damage due to larval feeding and premature drop of internally damaged fruit
occurrence can be curtailed by the application of inset growth regulator. Saljoqi et al.
(2003) reported that insect growth regulators (IGRs) such as Match and Decis afforded
2.60% of fruit drop was due to C. pomonella infestation at two different altitudes in Swat
Pakistan. Geier (1999) reported that 12-98% of premature fruit drop in the apple orchard
was observed after spraying of different insecticides for the management of C. pomonella
in Australia. Holb (2004) also reported similar results regarding fruit drop and control
strategies through insect growth regulators.
4.3.3.2. Percent Infestation
Similarly minimum mean percent infested fruit among the dropped fruit were
observed in the plants sprayed with Match insecticide having percent infestation 24.83
and 21.39% in the year 2012 and 2013 respectively. According to previous workers
(Pollini, 2000; Tunaz and Uygun, 2004) who stated that insect growth regulator has high
level of efficiency in reducing the infestation of C. pomonella by affecting freshly laid
eggs. Highest percent infestation (76.32 and 80.44%) were noticed in the untreated plants
followed by Assail (69.46 and 66.56%), Madex (58.22 and 63.37%), Timer (57.76 and
48.37%) and Delegate (43.57 and 37.68%) in 2012 and 2013 respectively. Nonetheless,
Match afforded least infestation of the C. pomonella among all other insecticides used in
both the years of studies. According to Miletic et al. (2011) maximum infestation of C.
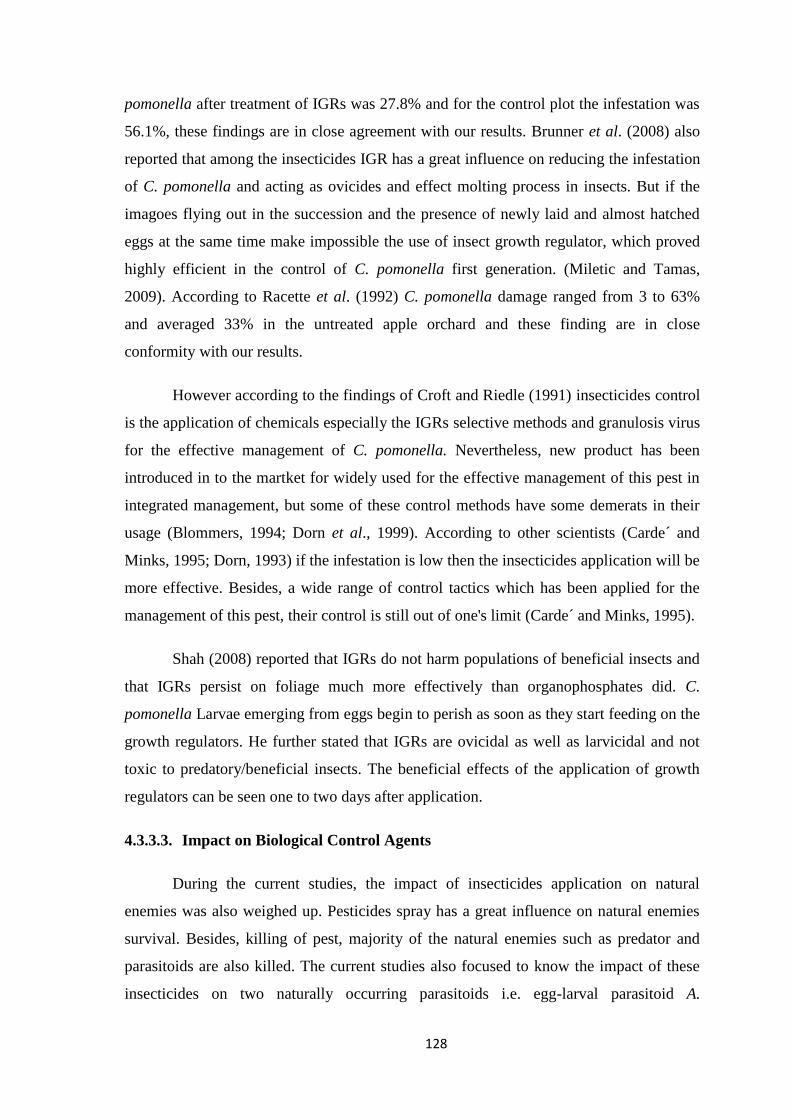
128
pomonella after treatment of IGRs was 27.8% and for the control plot the infestation was
56.1%, these findings are in close agreement with our results. Brunner et al. (2008) also
reported that among the insecticides IGR has a great influence on reducing the infestation
of C. pomonella and acting as ovicides and effect molting process in insects. But if the
imagoes flying out in the succession and the presence of newly laid and almost hatched
eggs at the same time make impossible the use of insect growth regulator, which proved
highly efficient in the control of C. pomonella first generation. (Miletic and Tamas,
2009). According to Racette et al. (1992) C. pomonella damage ranged from 3 to 63%
and averaged 33% in the untreated apple orchard and these finding are in close
conformity with our results.
However according to the findings of Croft and Riedle (1991) insecticides control
is the application of chemicals especially the IGRs selective methods and granulosis virus
for the effective management of C. pomonella. Nevertheless, new product has been
introduced in to the martket for widely used for the effective management of this pest in
integrated management, but some of these control methods have some demerats in their
usage (Blommers, 1994; Dorn et al., 1999). According to other scientists (Carde´ and
Minks, 1995; Dorn, 1993) if the infestation is low then the insecticides application will be
more effective. Besides, a wide range of control tactics which has been applied for the
management of this pest, their control is still out of one's limit (Carde´ and Minks, 1995).
Shah (2008) reported that IGRs do not harm populations of beneficial insects and
that IGRs persist on foliage much more effectively than organophosphates did. C.
pomonella Larvae emerging from eggs begin to perish as soon as they start feeding on the
growth regulators. He further stated that IGRs are ovicidal as well as larvicidal and not
toxic to predatory/beneficial insects. The beneficial effects of the application of growth
regulators can be seen one to two days after application.
4.3.3.3. Impact on Biological Control Agents
During the current studies, the impact of insecticides application on natural
enemies was also weighed up. Pesticides spray has a great influence on natural enemies
survival. Besides, killing of pest, majority of the natural enemies such as predator and
parasitoids are also killed. The current studies also focused to know the impact of these
insecticides on two naturally occurring parasitoids i.e. egg-larval parasitoid A.
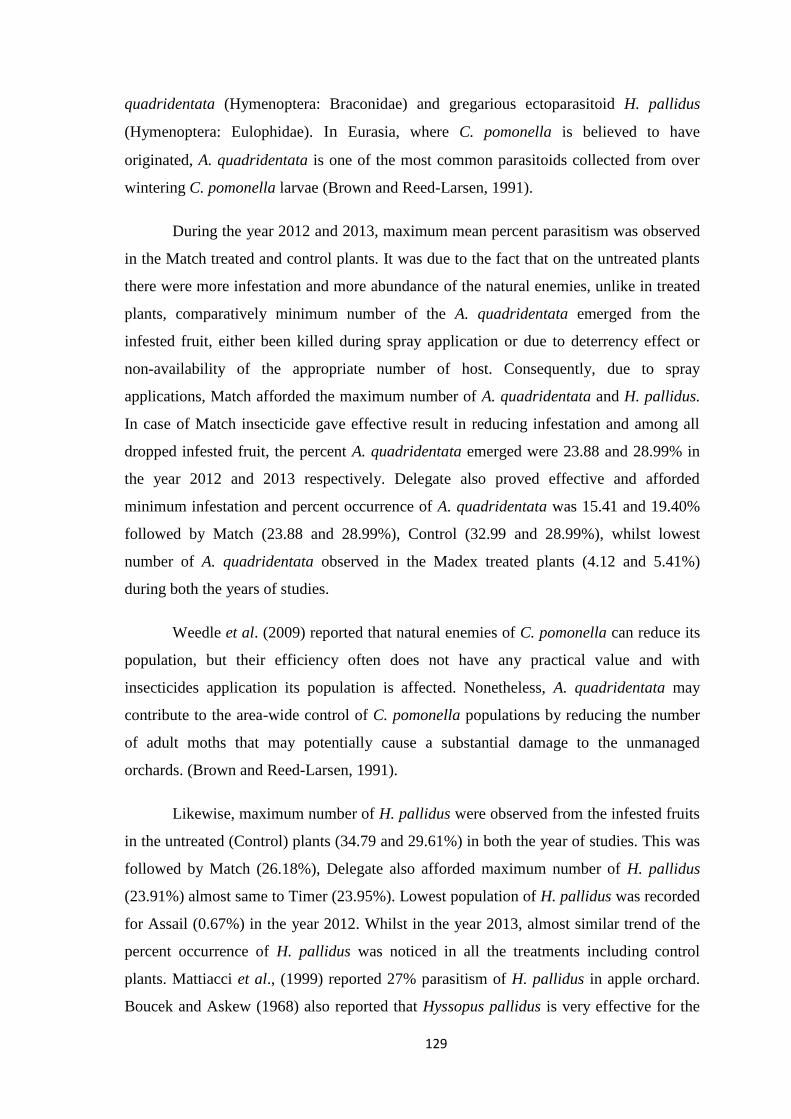
129
quadridentata (Hymenoptera: Braconidae) and gregarious ectoparasitoid H. pallidus
(Hymenoptera: Eulophidae). In Eurasia, where C. pomonella is believed to have
originated, A. quadridentata is one of the most common parasitoids collected from over
wintering C. pomonella larvae (Brown and Reed-Larsen, 1991).
During the year 2012 and 2013, maximum mean percent parasitism was observed
in the Match treated and control plants. It was due to the fact that on the untreated plants
there were more infestation and more abundance of the natural enemies, unlike in treated
plants, comparatively minimum number of the A. quadridentata emerged from the
infested fruit, either been killed during spray application or due to deterrency effect or
non-availability of the appropriate number of host. Consequently, due to spray
applications, Match afforded the maximum number of A. quadridentata and H. pallidus.
In case of Match insecticide gave effective result in reducing infestation and among all
dropped infested fruit, the percent A. quadridentata emerged were 23.88 and 28.99% in
the year 2012 and 2013 respectively. Delegate also proved effective and afforded
minimum infestation and percent occurrence of A. quadridentata was 15.41 and 19.40%
followed by Match (23.88 and 28.99%), Control (32.99 and 28.99%), whilst lowest
number of A. quadridentata observed in the Madex treated plants (4.12 and 5.41%)
during both the years of studies.
Weedle et al. (2009) reported that natural enemies of C. pomonella can reduce its
population, but their efficiency often does not have any practical value and with
insecticides application its population is affected. Nonetheless, A. quadridentata may
contribute to the area-wide control of C. pomonella populations by reducing the number
of adult moths that may potentially cause a substantial damage to the unmanaged
orchards. (Brown and Reed-Larsen, 1991).
Likewise, maximum number of H. pallidus were observed from the infested fruits
in the untreated (Control) plants (34.79 and 29.61%) in both the year of studies. This was
followed by Match (26.18%), Delegate also afforded maximum number of H. pallidus
(23.91%) almost same to Timer (23.95%). Lowest population of H. pallidus was recorded
for Assail (0.67%) in the year 2012. Whilst in the year 2013, almost similar trend of the
percent occurrence of H. pallidus was noticed in all the treatments including control
plants. Mattiacci et al., (1999) reported 27% parasitism of H. pallidus in apple orchard.
Boucek and Askew (1968) also reported that Hyssopus pallidus is very effective for the
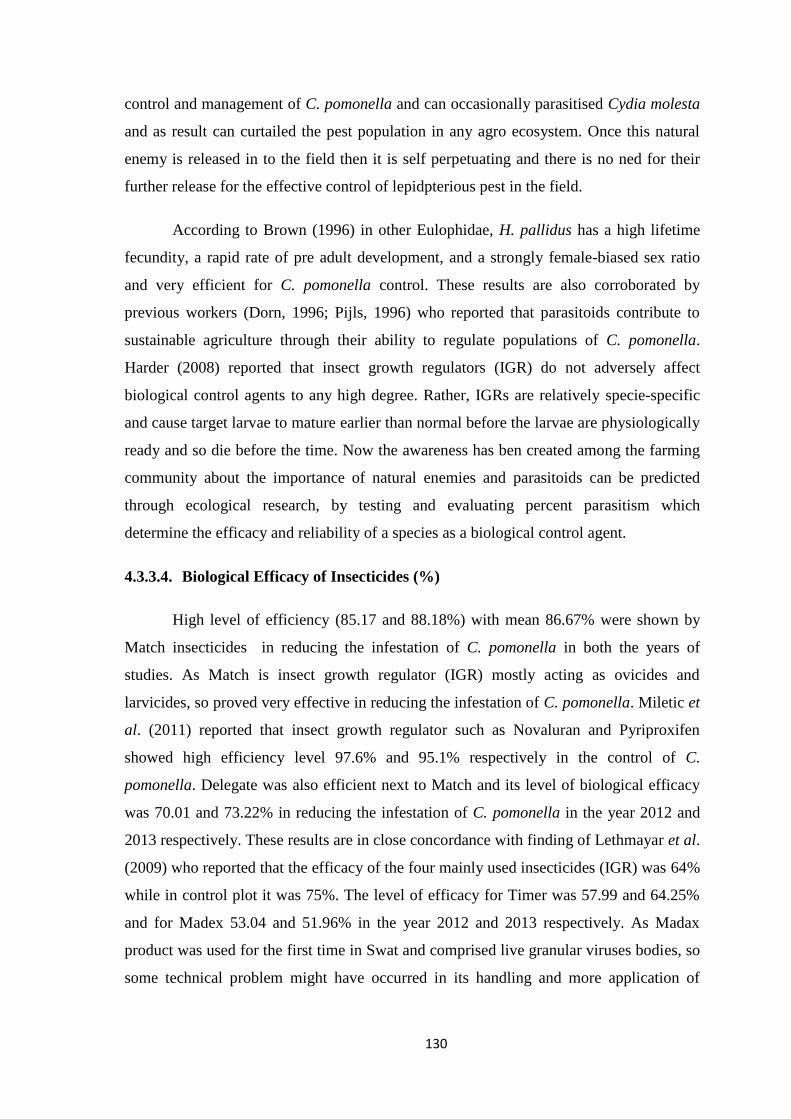
130
control and management of C. pomonella and can occasionally parasitised Cydia molesta
and as result can curtailed the pest population in any agro ecosystem. Once this natural
enemy is released in to the field then it is self perpetuating and there is no ned for their
further release for the effective control of lepidpterious pest in the field.
According to Brown (1996) in other Eulophidae, H. pallidus has a high lifetime
fecundity, a rapid rate of pre adult development, and a strongly female-biased sex ratio
and very efficient for C. pomonella control. These results are also corroborated by
previous workers (Dorn, 1996; Pijls, 1996) who reported that parasitoids contribute to
sustainable agriculture through their ability to regulate populations of C. pomonella.
Harder (2008) reported that insect growth regulators (IGR) do not adversely affect
biological control agents to any high degree. Rather, IGRs are relatively specie-specific
and cause target larvae to mature earlier than normal before the larvae are physiologically
ready and so die before the time. Now the awareness has ben created among the farming
community about the importance of natural enemies and parasitoids can be predicted
through ecological research, by testing and evaluating percent parasitism which
determine the efficacy and reliability of a species as a biological control agent.
4.3.3.4. Biological Efficacy of Insecticides (%)
High level of efficiency (85.17 and 88.18%) with mean 86.67% were shown by
Match insecticides in reducing the infestation of C. pomonella in both the years of
studies. As Match is insect growth regulator (IGR) mostly acting as ovicides and
larvicides, so proved very effective in reducing the infestation of C. pomonella. Miletic et
al. (2011) reported that insect growth regulator such as Novaluran and Pyriproxifen
showed high efficiency level 97.6% and 95.1% respectively in the control of C.
pomonella. Delegate was also efficient next to Match and its level of biological efficacy
was 70.01 and 73.22% in reducing the infestation of C. pomonella in the year 2012 and
2013 respectively. These results are in close concordance with finding of Lethmayar et al.
(2009) who reported that the efficacy of the four mainly used insecticides (IGR) was 64%
while in control plot it was 75%. The level of efficacy for Timer was 57.99 and 64.25%
and for Madex 53.04 and 51.96% in the year 2012 and 2013 respectively. As Madax
product was used for the first time in Swat and comprised live granular viruses bodies, so
some technical problem might have occurred in its handling and more application of
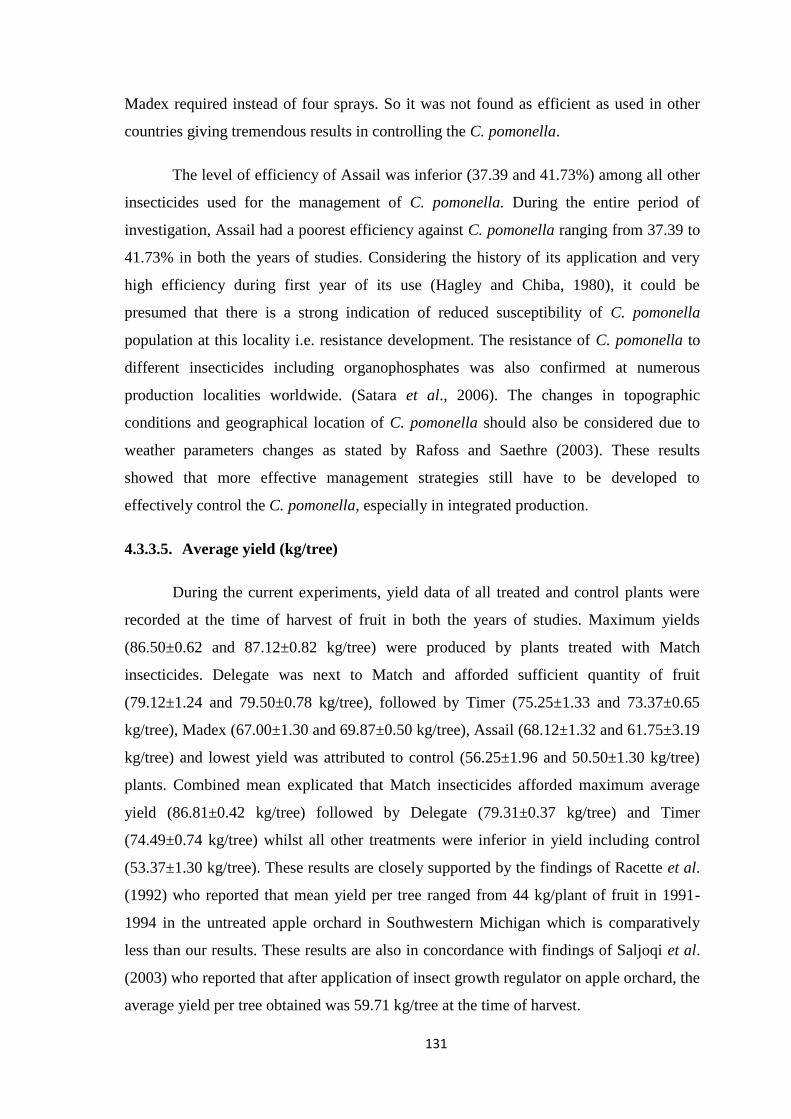
131
Madex required instead of four sprays. So it was not found as efficient as used in other
countries giving tremendous results in controlling the C. pomonella.
The level of efficiency of Assail was inferior (37.39 and 41.73%) among all other
insecticides used for the management of C. pomonella. During the entire period of
investigation, Assail had a poorest efficiency against C. pomonella ranging from 37.39 to
41.73% in both the years of studies. Considering the history of its application and very
high efficiency during first year of its use (Hagley and Chiba, 1980), it could be
presumed that there is a strong indication of reduced susceptibility of C. pomonella
population at this locality i.e. resistance development. The resistance of C. pomonella to
different insecticides including organophosphates was also confirmed at numerous
production localities worldwide. (Satara et al., 2006). The changes in topographic
conditions and geographical location of C. pomonella should also be considered due to
weather parameters changes as stated by Rafoss and Saethre (2003). These results
showed that more effective management strategies still have to be developed to
effectively control the C. pomonella, especially in integrated production.
4.3.3.5. Average yield (kg/tree)
During the current experiments, yield data of all treated and control plants were
recorded at the time of harvest of fruit in both the years of studies. Maximum yields
(86.50±0.62 and 87.12±0.82 kg/tree) were produced by plants treated with Match
insecticides. Delegate was next to Match and afforded sufficient quantity of fruit
(79.12±1.24 and 79.50±0.78 kg/tree), followed by Timer (75.25±1.33 and 73.37±0.65
kg/tree), Madex (67.00±1.30 and 69.87±0.50 kg/tree), Assail (68.12±1.32 and 61.75±3.19
kg/tree) and lowest yield was attributed to control (56.25±1.96 and 50.50±1.30 kg/tree)
plants. Combined mean explicated that Match insecticides afforded maximum average
yield (86.81±0.42 kg/tree) followed by Delegate (79.31±0.37 kg/tree) and Timer
(74.49±0.74 kg/tree) whilst all other treatments were inferior in yield including control
(53.37±1.30 kg/tree). These results are closely supported by the findings of Racette et al.
(1992) who reported that mean yield per tree ranged from 44 kg/plant of fruit in 1991-
1994 in the untreated apple orchard in Southwestern Michigan which is comparatively
less than our results. These results are also in concordance with findings of Saljoqi et al.
(2003) who reported that after application of insect growth regulator on apple orchard, the
average yield per tree obtained was 59.71 kg/tree at the time of harvest.
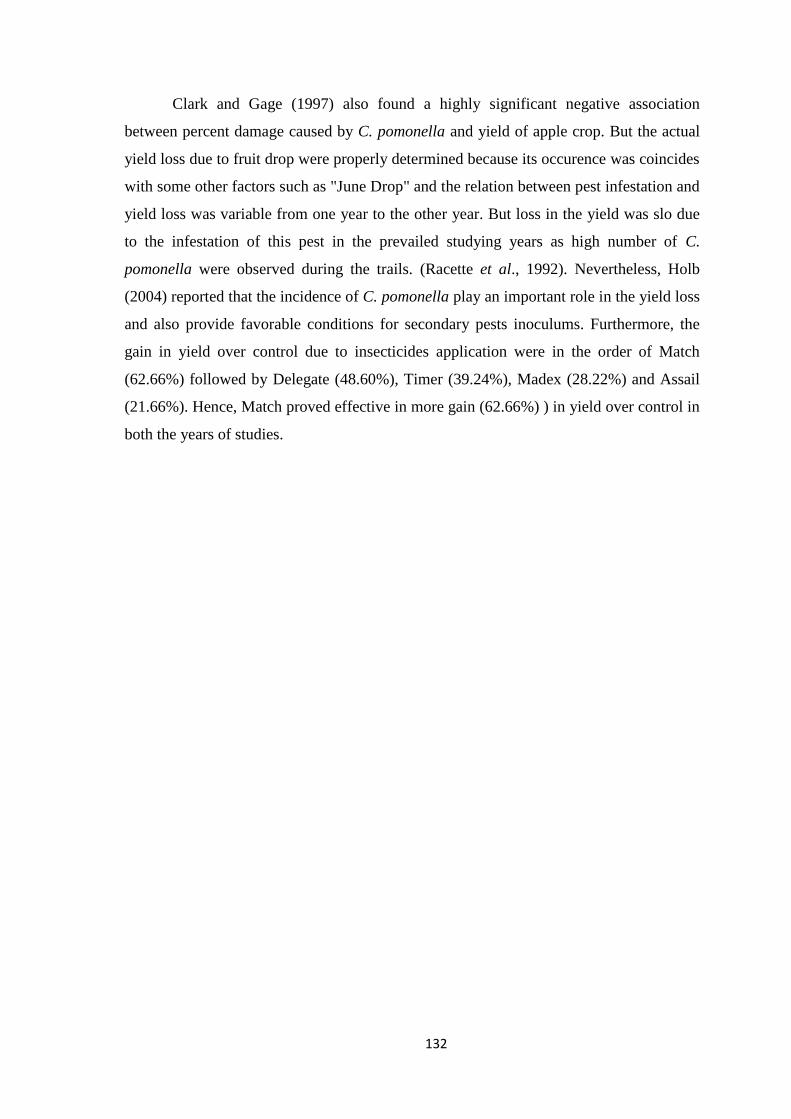
132
Clark and Gage (1997) also found a highly significant negative association
between percent damage caused by C. pomonella and yield of apple crop. But the actual
yield loss due to fruit drop were properly determined because its occurence was coincides
with some other factors such as "June Drop" and the relation between pest infestation and
yield loss was variable from one year to the other year. But loss in the yield was slo due
to the infestation of this pest in the prevailed studying years as high number of C.
pomonella were observed during the trails. (Racette et al., 1992). Nevertheless, Holb
(2004) reported that the incidence of C. pomonella play an important role in the yield loss
and also provide favorable conditions for secondary pests inoculums. Furthermore, the
gain in yield over control due to insecticides application were in the order of Match
(62.66%) followed by Delegate (48.60%), Timer (39.24%), Madex (28.22%) and Assail
(21.66%). Hence, Match proved effective in more gain (62.66%) ) in yield over control in
both the years of studies.
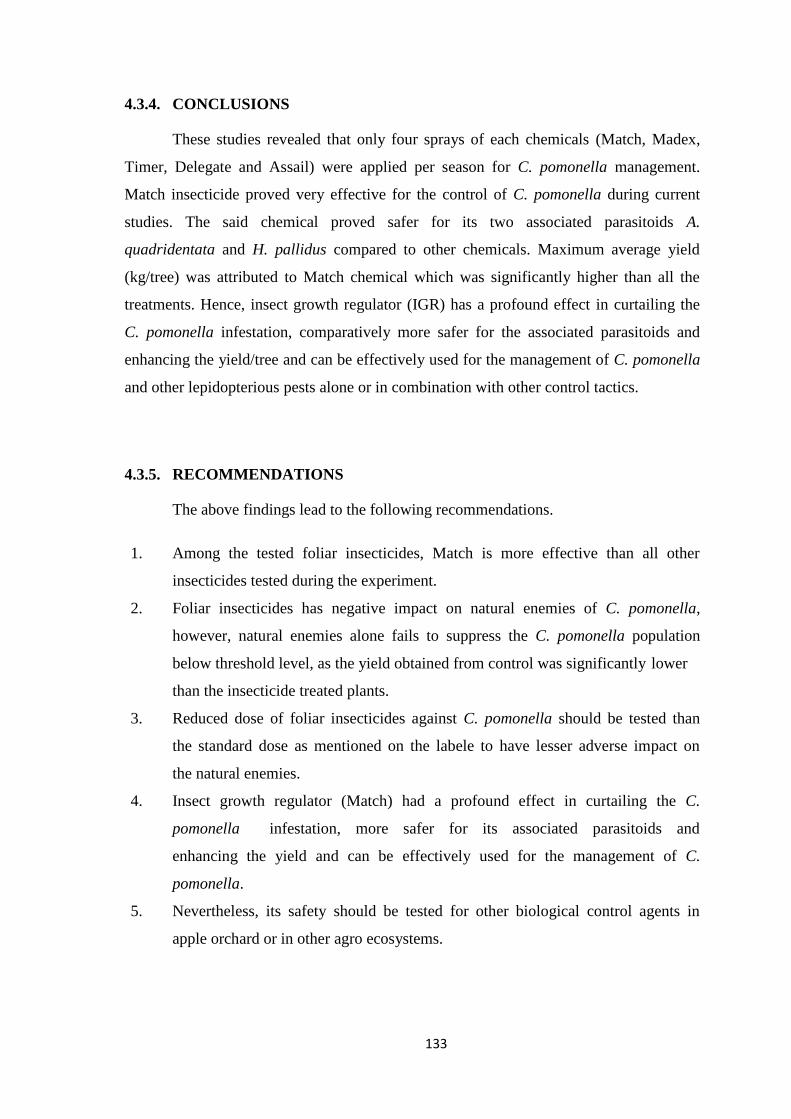
133
4.3.4. CONCLUSIONS
These studies revealed that only four sprays of each chemicals (Match, Madex,
Timer, Delegate and Assail) were applied per season for C. pomonella management.
Match insecticide proved very effective for the control of C. pomonella during current
studies. The said chemical proved safer for its two associated parasitoids A.
quadridentata and H. pallidus compared to other chemicals. Maximum average yield
(kg/tree) was attributed to Match chemical which was significantly higher than all the
treatments. Hence, insect growth regulator (IGR) has a profound effect in curtailing the
C. pomonella infestation, comparatively more safer for the associated parasitoids and
enhancing the yield/tree and can be effectively used for the management of C. pomonella
and other lepidopterious pests alone or in combination with other control tactics.
4.3.5. RECOMMENDATIONS
The above findings lead to the following recommendations.
1. Among the tested foliar insecticides, Match is more effective than all other
insecticides tested during the experiment.
2. Foliar insecticides has negative impact on natural enemies of C. pomonella,
however, natural enemies alone fails to suppress the C. pomonella population
below threshold level, as the yield obtained from control was significantly lower
than the insecticide treated plants.
3. Reduced dose of foliar insecticides against C. pomonella should be tested than
the standard dose as mentioned on the labele to have lesser adverse impact on
the natural enemies.
4. Insect growth regulator (Match) had a profound effect in curtailing the C.
pomonella infestation, more safer for its associated parasitoids and
enhancing the yield and can be effectively used for the management of C.
pomonella.
5. Nevertheless, its safety should be tested for other biological control agents in
apple orchard or in other agro ecosystems.
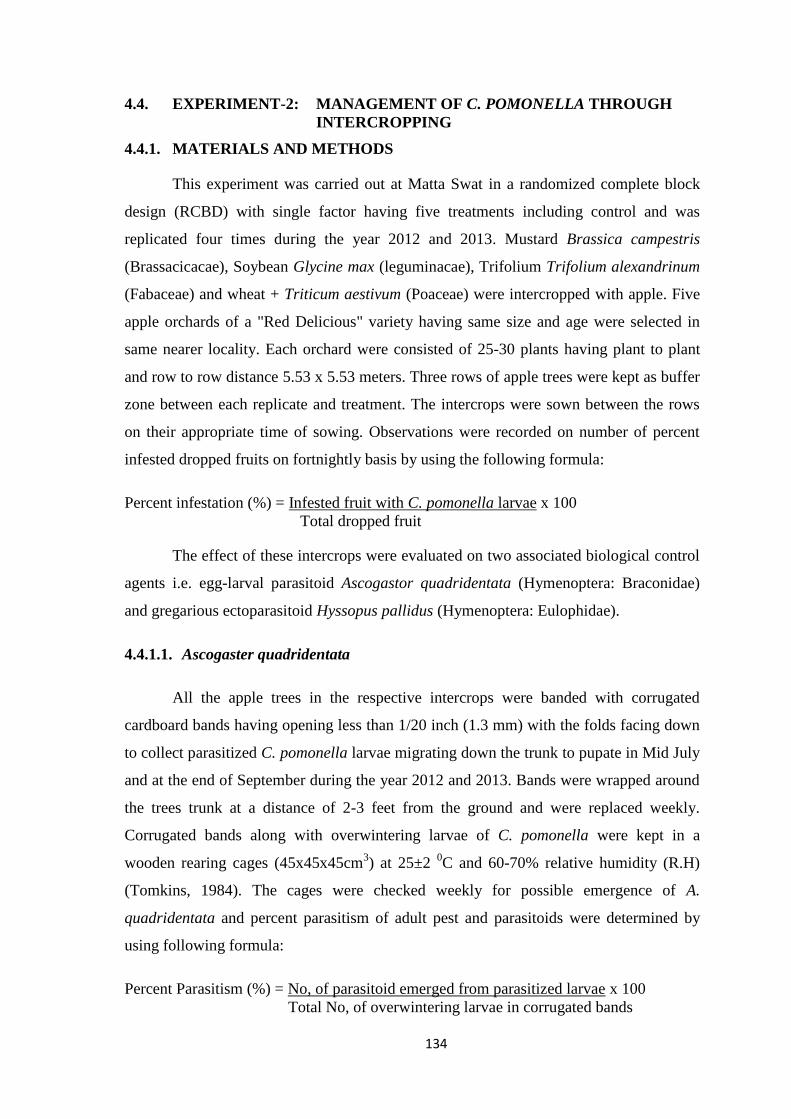
134
4.4. EXPERIMENT-2: MANAGEMENT OF C. POMONELLA THROUGH
INTERCROPPING
4.4.1. MATERIALS AND METHODS
This experiment was carried out at Matta Swat in a randomized complete block
design (RCBD) with single factor having five treatments including control and was
replicated four times during the year 2012 and 2013. Mustard Brassica campestris
(Brassacicacae), Soybean Glycine max (leguminacae), Trifolium Trifolium alexandrinum
(Fabaceae) and wheat + Triticum aestivum (Poaceae) were intercropped with apple. Five
apple orchards of a "Red Delicious" variety having same size and age were selected in
same nearer locality. Each orchard were consisted of 25-30 plants having plant to plant
and row to row distance 5.53 x 5.53 meters. Three rows of apple trees were kept as buffer
zone between each replicate and treatment. The intercrops were sown between the rows
on their appropriate time of sowing. Observations were recorded on number of percent
infested dropped fruits on fortnightly basis by using the following formula:
Percent infestation (%) = Infested fruit with C. pomonella larvae x 100
Total dropped fruit
The effect of these intercrops were evaluated on two associated biological control
agents i.e. egg-larval parasitoid Ascogastor quadridentata (Hymenoptera: Braconidae)
and gregarious ectoparasitoid Hyssopus pallidus (Hymenoptera: Eulophidae).
4.4.1.1. Ascogaster quadridentata
All the apple trees in the respective intercrops were banded with corrugated
cardboard bands having opening less than 1/20 inch (1.3 mm) with the folds facing down
to collect parasitized C. pomonella larvae migrating down the trunk to pupate in Mid July
and at the end of September during the year 2012 and 2013. Bands were wrapped around
the trees trunk at a distance of 2-3 feet from the ground and were replaced weekly.
Corrugated bands along with overwintering larvae of C. pomonella were kept in a
wooden rearing cages (45x45x45cm3) at 25±2
0C and 60-70% relative humidity (R.H)
(Tomkins, 1984). The cages were checked weekly for possible emergence of A.
quadridentata and percent parasitism of adult pest and parasitoids were determined by
using following formula:
Percent Parasitism (%) = No, of parasitoid emerged from parasitized larvae x 100
Total No, of overwintering larvae in corrugated bands
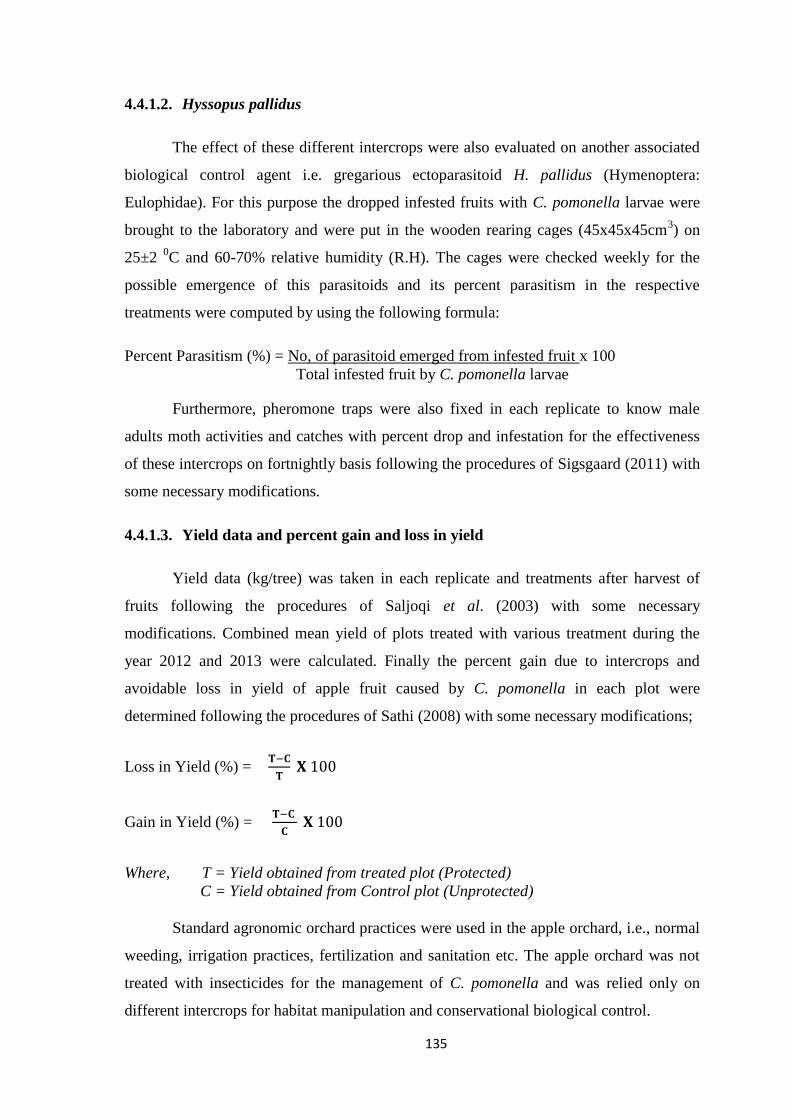
135
4.4.1.2. Hyssopus pallidus
The effect of these different intercrops were also evaluated on another associated
biological control agent i.e. gregarious ectoparasitoid H. pallidus (Hymenoptera:
Eulophidae). For this purpose the dropped infested fruits with C. pomonella larvae were
brought to the laboratory and were put in the wooden rearing cages (45x45x45cm3) on
25±2 0C and 60-70% relative humidity (R.H). The cages were checked weekly for the
possible emergence of this parasitoids and its percent parasitism in the respective
treatments were computed by using the following formula:
Percent Parasitism (%) = No, of parasitoid emerged from infested fruit x 100
Total infested fruit by C. pomonella larvae
Furthermore, pheromone traps were also fixed in each replicate to know male
adults moth activities and catches with percent drop and infestation for the effectiveness
of these intercrops on fortnightly basis following the procedures of Sigsgaard (2011) with
some necessary modifications.
4.4.1.3. Yield data and percent gain and loss in yield
Yield data (kg/tree) was taken in each replicate and treatments after harvest of
fruits following the procedures of Saljoqi et al. (2003) with some necessary
modifications. Combined mean yield of plots treated with various treatment during the
year 2012 and 2013 were calculated. Finally the percent gain due to intercrops and
avoidable loss in yield of apple fruit caused by C. pomonella in each plot were
determined following the procedures of Sathi (2008) with some necessary modifications;
Loss in Yield (%) =
Gain in Yield (%) =
Where, T = Yield obtained from treated plot (Protected)
C = Yield obtained from Control plot (Unprotected)
Standard agronomic orchard practices were used in the apple orchard, i.e., normal
weeding, irrigation practices, fertilization and sanitation etc. The apple orchard was not
treated with insecticides for the management of C. pomonella and was relied only on
different intercrops for habitat manipulation and conservational biological control.
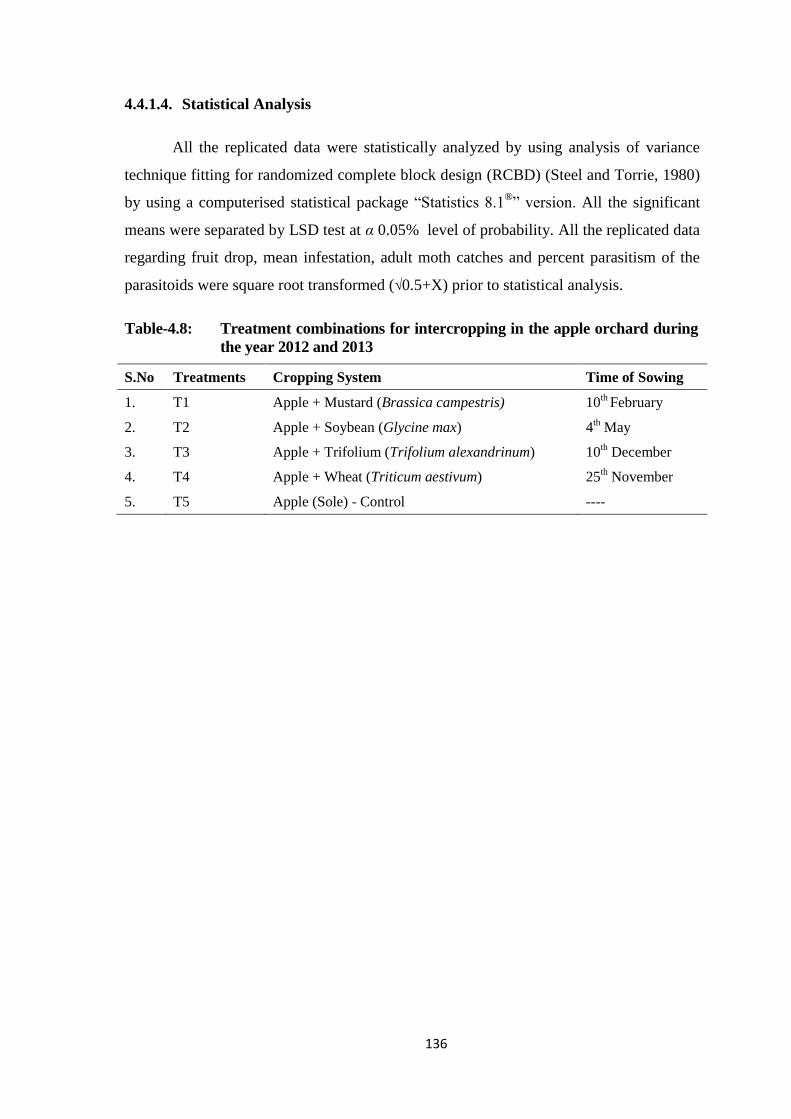
136
4.4.1.4. Statistical Analysis
All the replicated data were statistically analyzed by using analysis of variance
technique fitting for randomized complete block design (RCBD) (Steel and Torrie, 1980)
by using a computerised statistical package “Statistics 8.1®” version. All the significant
means were separated by LSD test at α 0.05% level of probability. All the replicated data
regarding fruit drop, mean infestation, adult moth catches and percent parasitism of the
parasitoids were square root transformed (√0.5+X) prior to statistical analysis.
Table-4.8: Treatment combinations for intercropping in the apple orchard during
the year 2012 and 2013
S.No Treatments Cropping System Time of Sowing
1. T1 Apple + Mustard (Brassica campestris) 10th
February
2. T2 Apple + Soybean (Glycine max) 4th May
3. T3 Apple + Trifolium (Trifolium alexandrinum) 10th December
4. T4 Apple + Wheat (Triticum aestivum) 25th November
5. T5 Apple (Sole) - Control ----
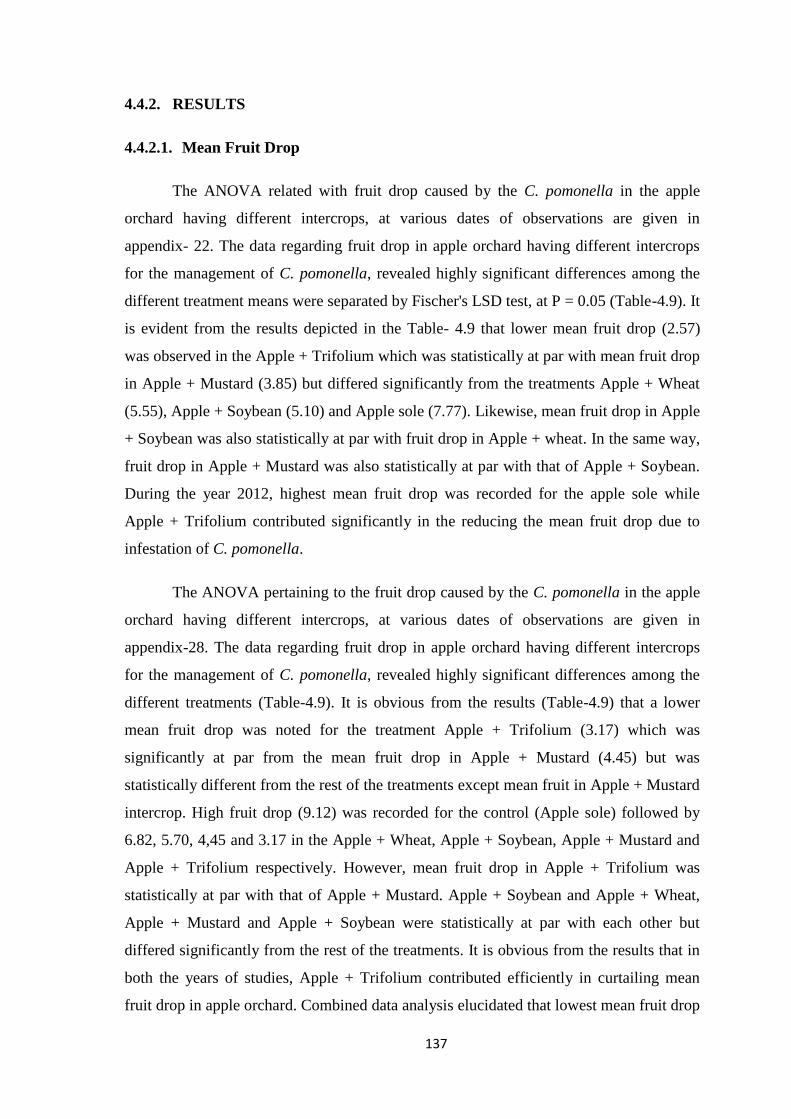
137
4.4.2. RESULTS
4.4.2.1. Mean Fruit Drop
The ANOVA related with fruit drop caused by the C. pomonella in the apple
orchard having different intercrops, at various dates of observations are given in
appendix- 22. The data regarding fruit drop in apple orchard having different intercrops
for the management of C. pomonella, revealed highly significant differences among the
different treatment means were separated by Fischer's LSD test, at P = 0.05 (Table-4.9). It
is evident from the results depicted in the Table- 4.9 that lower mean fruit drop (2.57)
was observed in the Apple + Trifolium which was statistically at par with mean fruit drop
in Apple + Mustard (3.85) but differed significantly from the treatments Apple + Wheat
(5.55), Apple + Soybean (5.10) and Apple sole (7.77). Likewise, mean fruit drop in Apple
+ Soybean was also statistically at par with fruit drop in Apple + wheat. In the same way,
fruit drop in Apple + Mustard was also statistically at par with that of Apple + Soybean.
During the year 2012, highest mean fruit drop was recorded for the apple sole while
Apple + Trifolium contributed significantly in the reducing the mean fruit drop due to
infestation of C. pomonella.
The ANOVA pertaining to the fruit drop caused by the C. pomonella in the apple
orchard having different intercrops, at various dates of observations are given in
appendix-28. The data regarding fruit drop in apple orchard having different intercrops
for the management of C. pomonella, revealed highly significant differences among the
different treatments (Table-4.9). It is obvious from the results (Table-4.9) that a lower
mean fruit drop was noted for the treatment Apple + Trifolium (3.17) which was
significantly at par from the mean fruit drop in Apple + Mustard (4.45) but was
statistically different from the rest of the treatments except mean fruit in Apple + Mustard
intercrop. High fruit drop (9.12) was recorded for the control (Apple sole) followed by
6.82, 5.70, 4,45 and 3.17 in the Apple + Wheat, Apple + Soybean, Apple + Mustard and
Apple + Trifolium respectively. However, mean fruit drop in Apple + Trifolium was
statistically at par with that of Apple + Mustard. Apple + Soybean and Apple + Wheat,
Apple + Mustard and Apple + Soybean were statistically at par with each other but
differed significantly from the rest of the treatments. It is obvious from the results that in
both the years of studies, Apple + Trifolium contributed efficiently in curtailing mean
fruit drop in apple orchard. Combined data analysis elucidated that lowest mean fruit drop
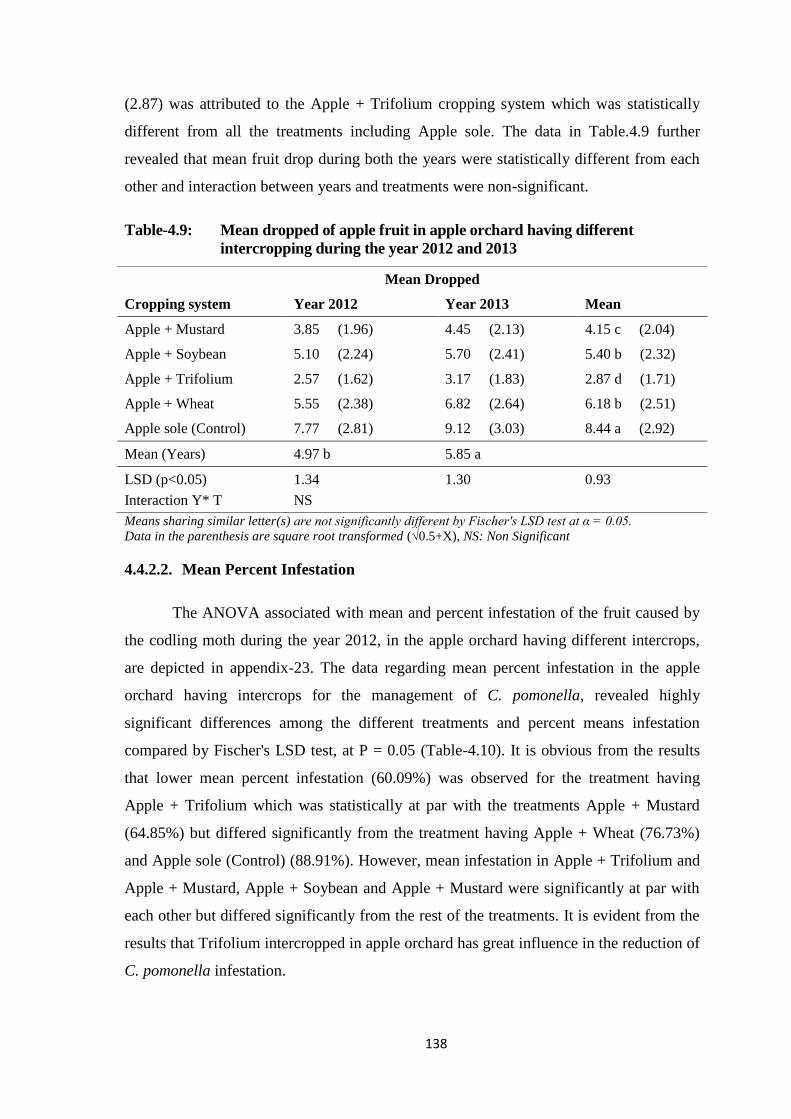
138
(2.87) was attributed to the Apple + Trifolium cropping system which was statistically
different from all the treatments including Apple sole. The data in Table.4.9 further
revealed that mean fruit drop during both the years were statistically different from each
other and interaction between years and treatments were non-significant.
Table-4.9: Mean dropped of apple fruit in apple orchard having different
intercropping during the year 2012 and 2013
Means sharing similar letter(s) are not significantly different by Fischer's LSD test at α = 0.05.
Data in the parenthesis are square root transformed (√0.5+X), NS: Non Significant
4.4.2.2. Mean Percent Infestation
The ANOVA associated with mean and percent infestation of the fruit caused by
the codling moth during the year 2012, in the apple orchard having different intercrops,
are depicted in appendix-23. The data regarding mean percent infestation in the apple
orchard having intercrops for the management of C. pomonella, revealed highly
significant differences among the different treatments and percent means infestation
compared by Fischer's LSD test, at P = 0.05 (Table-4.10). It is obvious from the results
that lower mean percent infestation (60.09%) was observed for the treatment having
Apple + Trifolium which was statistically at par with the treatments Apple + Mustard
(64.85%) but differed significantly from the treatment having Apple + Wheat (76.73%)
and Apple sole (Control) (88.91%). However, mean infestation in Apple + Trifolium and
Apple + Mustard, Apple + Soybean and Apple + Mustard were significantly at par with
each other but differed significantly from the rest of the treatments. It is evident from the
results that Trifolium intercropped in apple orchard has great influence in the reduction of
C. pomonella infestation.
Cropping system
Mean Dropped
Mean Year 2012 Year 2013
Apple + Mustard 3.85 (1.96) 4.45 (2.13) 4.15 c (2.04)
Apple + Soybean 5.10 (2.24) 5.70 (2.41) 5.40 b (2.32)
Apple + Trifolium 2.57 (1.62) 3.17 (1.83) 2.87 d (1.71)
Apple + Wheat 5.55 (2.38) 6.82 (2.64) 6.18 b (2.51)
Apple sole (Control) 7.77 (2.81) 9.12 (3.03) 8.44 a (2.92)
Mean (Years) 4.97 b 5.85 a
LSD (p<0.05)
Interaction Y* T
1.34
NS
1.30
0.93
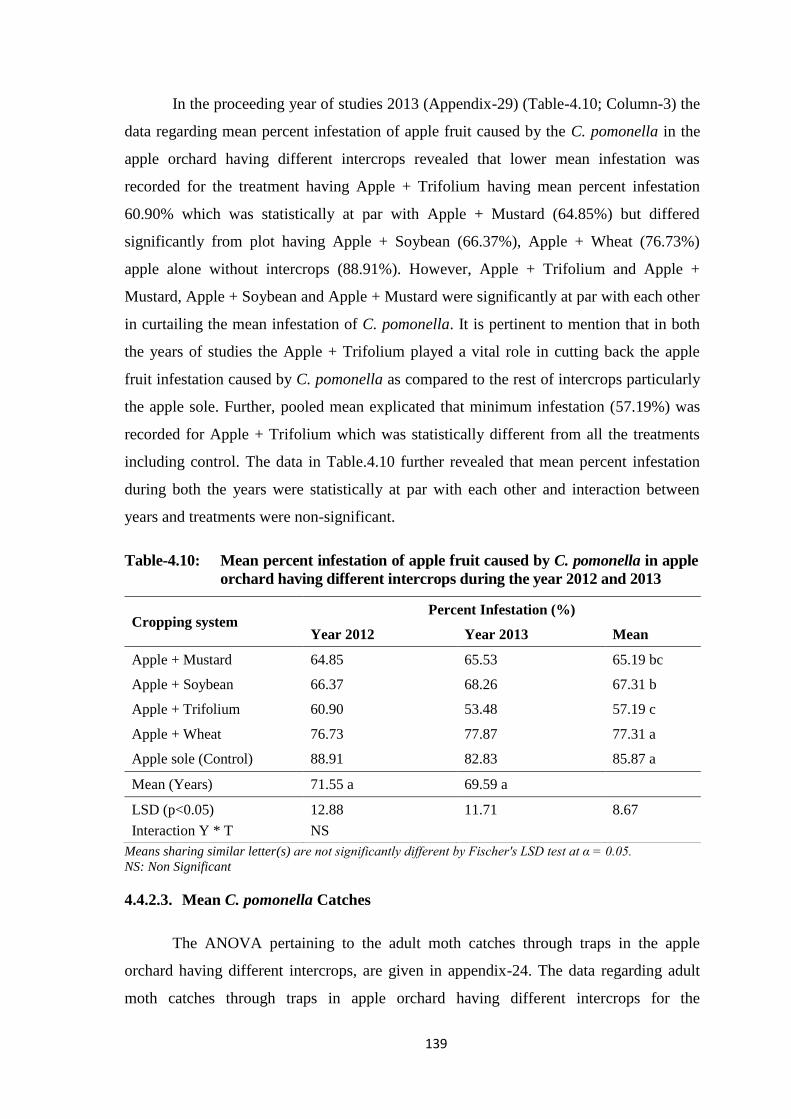
139
In the proceeding year of studies 2013 (Appendix-29) (Table-4.10; Column-3) the
data regarding mean percent infestation of apple fruit caused by the C. pomonella in the
apple orchard having different intercrops revealed that lower mean infestation was
recorded for the treatment having Apple + Trifolium having mean percent infestation
60.90% which was statistically at par with Apple + Mustard (64.85%) but differed
significantly from plot having Apple + Soybean (66.37%), Apple + Wheat (76.73%)
apple alone without intercrops (88.91%). However, Apple + Trifolium and Apple +
Mustard, Apple + Soybean and Apple + Mustard were significantly at par with each other
in curtailing the mean infestation of C. pomonella. It is pertinent to mention that in both
the years of studies the Apple + Trifolium played a vital role in cutting back the apple
fruit infestation caused by C. pomonella as compared to the rest of intercrops particularly
the apple sole. Further, pooled mean explicated that minimum infestation (57.19%) was
recorded for Apple + Trifolium which was statistically different from all the treatments
including control. The data in Table.4.10 further revealed that mean percent infestation
during both the years were statistically at par with each other and interaction between
years and treatments were non-significant.
Table-4.10: Mean percent infestation of apple fruit caused by C. pomonella in apple
orchard having different intercrops during the year 2012 and 2013
Means sharing similar letter(s) are not significantly different by Fischer's LSD test at α = 0.05.
NS: Non Significant
4.4.2.3. Mean C. pomonella Catches
The ANOVA pertaining to the adult moth catches through traps in the apple
orchard having different intercrops, are given in appendix-24. The data regarding adult
moth catches through traps in apple orchard having different intercrops for the
Cropping system Percent Infestation (%)
Year 2012 Year 2013 Mean
Apple + Mustard 64.85 65.53 65.19 bc
Apple + Soybean 66.37 68.26 67.31 b
Apple + Trifolium 60.90 53.48 57.19 c
Apple + Wheat 76.73 77.87 77.31 a
Apple sole (Control) 88.91 82.83 85.87 a
Mean (Years) 71.55 a 69.59 a
LSD (p<0.05)
Interaction Y * T
12.88
NS
11.71
8.67
140
management of C. pomonella, revealed significant differences among the different
treatment means, compared by Fischer's LSD test, at P = 0.05 for significance (Table-
4.11). The data depicted in the result table revealed that the lower mean moth population
(1.32) was trapped in the treatment having Apple + Trifolium which was statistically at
par with Apple + Mustard (2.42) but differed significantly from Apple + Wheat (4.40)
and Apple sole (Control) (6.60). However, mean moth catches in Apple + Mustard and
Apple + Soybean were statistically at par with each other. It is evident from the
experiment that more moth activities were observed in the apple orchard having no
intercrop, whereas Trifolium and Mustard intercrops in the apple orchard had a
significant influence on the mean moth population restrained by increasing biodiversity
for the natural enemies.
The ANOVA regarding adult moth catches through pheromones traps in the apple
orchard having different intercrops, during the year 2013 is given in Appendix-30. The
data regarding adult moth catches through traps in apple orchard having different
intercrops for the management of C. pomonella, revealed significant differences among
the different treatments (Table-4.11; column-3). The data concerning the adult moth
catches through pheromone traps in the apple orchard illustrated that lower moth catches
(1.60) were noticed for the treatment having Apple + Trifolium which was statistically at
par with Apple + Mustard (2.60) but differed significantly from the treatment having
Apple + Wheat (4.62) and apple sole (7.47). Apple + Wheat (4.62) was statistically at par
with Apple sole and all the rest of the treatments. However, mean moth catches in Apple
+ Soybean (3.62) and Apple Mustard (2.60) were statistically at par with each other and
differed significantly from all the treatments including control. It is evident from
combined means data analysis that comparatively lower numbers of adult moth (1.46)
were captured in the orchard through traps having Trifolium as intercrops with apple
while apple sole attracted maximum number of the adults moth (7.03) for infestation,
whilst all other treatments had comparatively higher number of adults moth catches.
The data in Table.4.11 further revealed that mean C. pomonella catches during
both the years were statistically at par with each other and interaction between years and
treatments were non-significant.
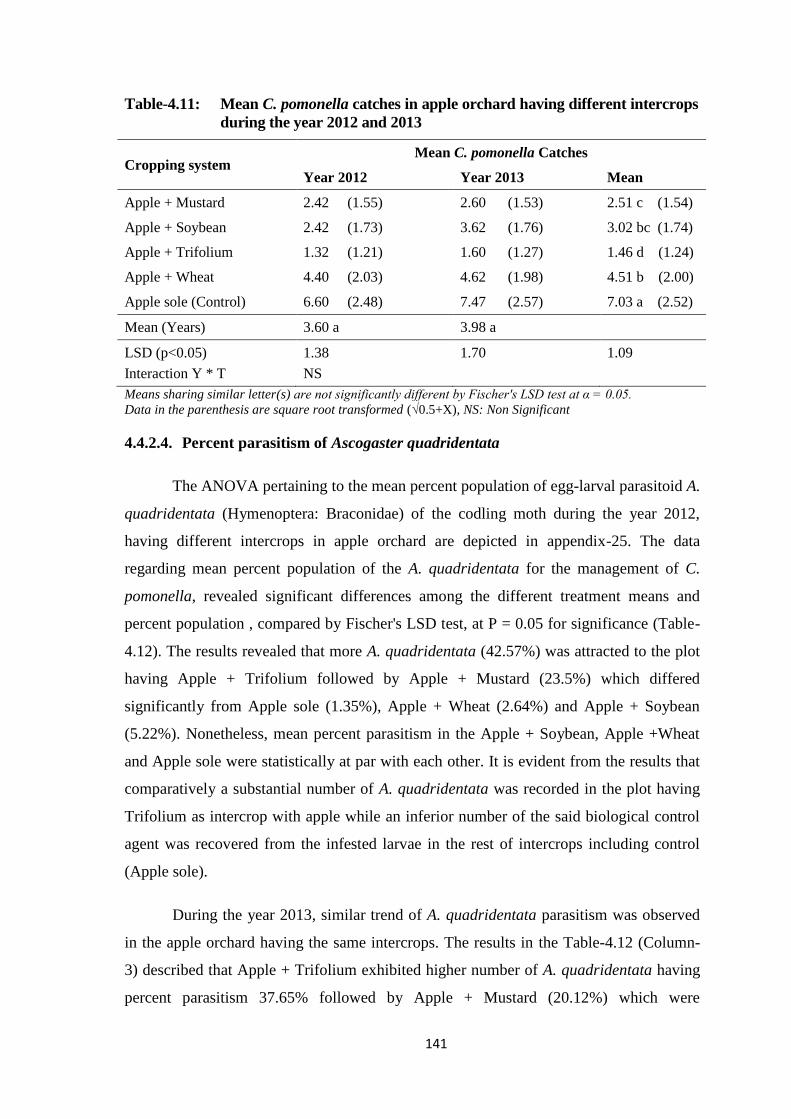
141
Table-4.11: Mean C. pomonella catches in apple orchard having different intercrops
during the year 2012 and 2013
Cropping system Mean C. pomonella Catches
Year 2012 Year 2013 Mean
Apple + Mustard 2.42 (1.55) 2.60 (1.53) 2.51 c (1.54)
Apple + Soybean 2.42 (1.73) 3.62 (1.76) 3.02 bc (1.74)
Apple + Trifolium 1.32 (1.21) 1.60 (1.27) 1.46 d (1.24)
Apple + Wheat 4.40 (2.03) 4.62 (1.98) 4.51 b (2.00)
Apple sole (Control) 6.60 (2.48) 7.47 (2.57) 7.03 a (2.52)
Mean (Years) 3.60 a 3.98 a
LSD (p<0.05)
Interaction Y * T
1.38
NS
1.70
1.09
Means sharing similar letter(s) are not significantly different by Fischer's LSD test at α = 0.05.
Data in the parenthesis are square root transformed (√0.5+X), NS: Non Significant
4.4.2.4. Percent parasitism of Ascogaster quadridentata
The ANOVA pertaining to the mean percent population of egg-larval parasitoid A.
quadridentata (Hymenoptera: Braconidae) of the codling moth during the year 2012,
having different intercrops in apple orchard are depicted in appendix-25. The data
regarding mean percent population of the A. quadridentata for the management of C.
pomonella, revealed significant differences among the different treatment means and
percent population , compared by Fischer's LSD test, at P = 0.05 for significance (Table-
4.12). The results revealed that more A. quadridentata (42.57%) was attracted to the plot
having Apple + Trifolium followed by Apple + Mustard (23.5%) which differed
significantly from Apple sole (1.35%), Apple + Wheat (2.64%) and Apple + Soybean
(5.22%). Nonetheless, mean percent parasitism in the Apple + Soybean, Apple +Wheat
and Apple sole were statistically at par with each other. It is evident from the results that
comparatively a substantial number of A. quadridentata was recorded in the plot having
Trifolium as intercrop with apple while an inferior number of the said biological control
agent was recovered from the infested larvae in the rest of intercrops including control
(Apple sole).
During the year 2013, similar trend of A. quadridentata parasitism was observed
in the apple orchard having the same intercrops. The results in the Table-4.12 (Column-
3) described that Apple + Trifolium exhibited higher number of A. quadridentata having
percent parasitism 37.65% followed by Apple + Mustard (20.12%) which were
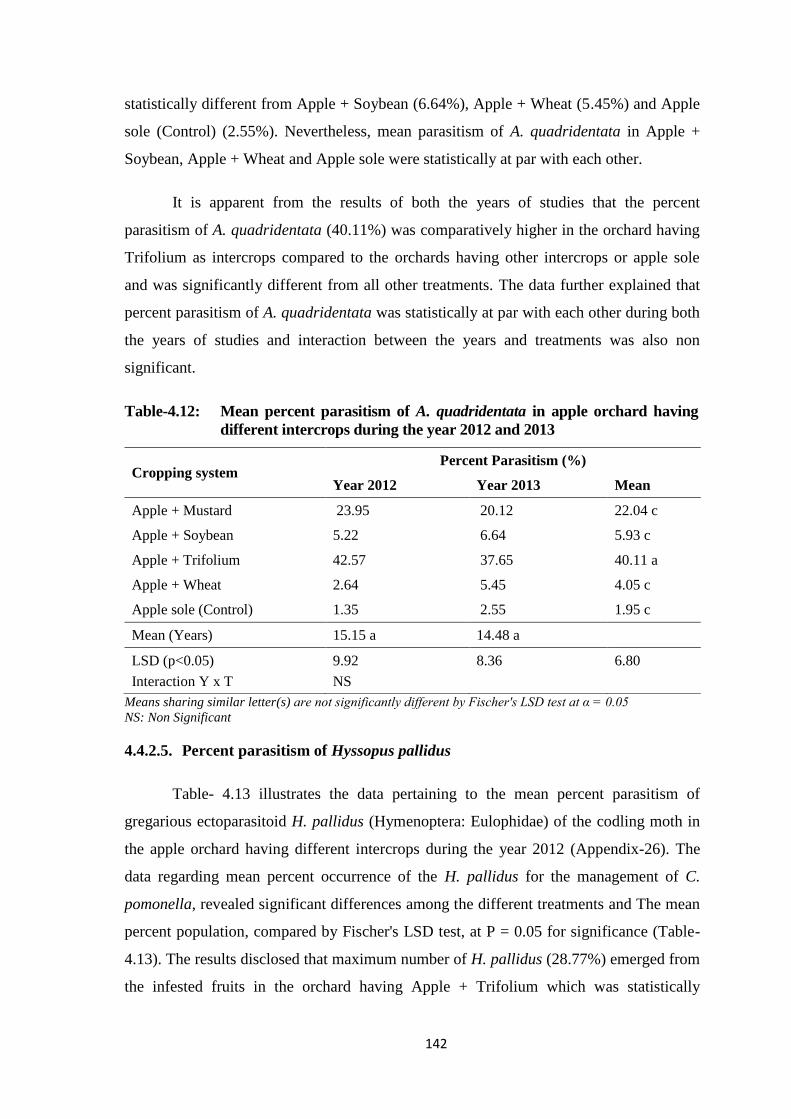
142
statistically different from Apple + Soybean (6.64%), Apple + Wheat (5.45%) and Apple
sole (Control) (2.55%). Nevertheless, mean parasitism of A. quadridentata in Apple +
Soybean, Apple + Wheat and Apple sole were statistically at par with each other.
It is apparent from the results of both the years of studies that the percent
parasitism of A. quadridentata (40.11%) was comparatively higher in the orchard having
Trifolium as intercrops compared to the orchards having other intercrops or apple sole
and was significantly different from all other treatments. The data further explained that
percent parasitism of A. quadridentata was statistically at par with each other during both
the years of studies and interaction between the years and treatments was also non
significant.
Table-4.12: Mean percent parasitism of A. quadridentata in apple orchard having
different intercrops during the year 2012 and 2013
Means sharing similar letter(s) are not significantly different by Fischer's LSD test at α = 0.05
NS: Non Significant
4.4.2.5. Percent parasitism of Hyssopus pallidus
Table- 4.13 illustrates the data pertaining to the mean percent parasitism of
gregarious ectoparasitoid H. pallidus (Hymenoptera: Eulophidae) of the codling moth in
the apple orchard having different intercrops during the year 2012 (Appendix-26). The
data regarding mean percent occurrence of the H. pallidus for the management of C.
pomonella, revealed significant differences among the different treatments and The mean
percent population, compared by Fischer's LSD test, at P = 0.05 for significance (Table-
4.13). The results disclosed that maximum number of H. pallidus (28.77%) emerged from
the infested fruits in the orchard having Apple + Trifolium which was statistically
Cropping system Percent Parasitism (%)
Year 2012 Year 2013 Mean
Apple + Mustard 23.95 20.12 22.04 c
Apple + Soybean 5.22 6.64 5.93 c
Apple + Trifolium 42.57 37.65 40.11 a
Apple + Wheat 2.64 5.45 4.05 c
Apple sole (Control) 1.35 2.55 1.95 c
Mean (Years) 15.15 a 14.48 a
LSD (p<0.05)
Interaction Y x T
9.92
NS
8.36
6.80
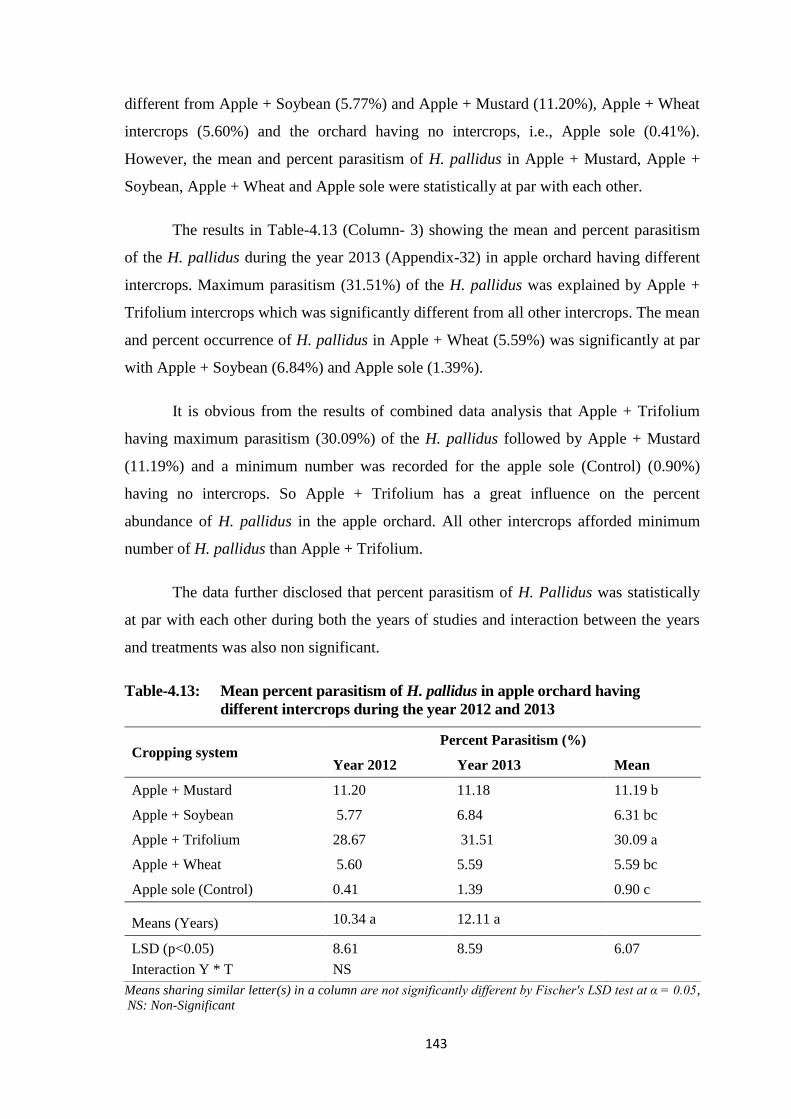
143
different from Apple + Soybean (5.77%) and Apple + Mustard (11.20%), Apple + Wheat
intercrops (5.60%) and the orchard having no intercrops, i.e., Apple sole (0.41%).
However, the mean and percent parasitism of H. pallidus in Apple + Mustard, Apple +
Soybean, Apple + Wheat and Apple sole were statistically at par with each other.
The results in Table-4.13 (Column- 3) showing the mean and percent parasitism
of the H. pallidus during the year 2013 (Appendix-32) in apple orchard having different
intercrops. Maximum parasitism (31.51%) of the H. pallidus was explained by Apple +
Trifolium intercrops which was significantly different from all other intercrops. The mean
and percent occurrence of H. pallidus in Apple + Wheat (5.59%) was significantly at par
with Apple + Soybean (6.84%) and Apple sole (1.39%).
It is obvious from the results of combined data analysis that Apple + Trifolium
having maximum parasitism (30.09%) of the H. pallidus followed by Apple + Mustard
(11.19%) and a minimum number was recorded for the apple sole (Control) (0.90%)
having no intercrops. So Apple + Trifolium has a great influence on the percent
abundance of H. pallidus in the apple orchard. All other intercrops afforded minimum
number of H. pallidus than Apple + Trifolium.
The data further disclosed that percent parasitism of H. Pallidus was statistically
at par with each other during both the years of studies and interaction between the years
and treatments was also non significant.
Table-4.13: Mean percent parasitism of H. pallidus in apple orchard having
different intercrops during the year 2012 and 2013
Means sharing similar letter(s) in a column are not significantly different by Fischer's LSD test at α = 0.05,
NS: Non-Significant
Cropping system Percent Parasitism (%)
Year 2012 Year 2013 Mean
Apple + Mustard 11.20 11.18 11.19 b
Apple + Soybean 5.77 6.84 6.31 bc
Apple + Trifolium 28.67 31.51 30.09 a
Apple + Wheat 5.60 5.59 5.59 bc
Apple sole (Control) 0.41 1.39 0.90 c
Means (Years) 10.34 a 12.11 a
LSD (p<0.05)
Interaction Y * T
8.61
NS
8.59
6.07
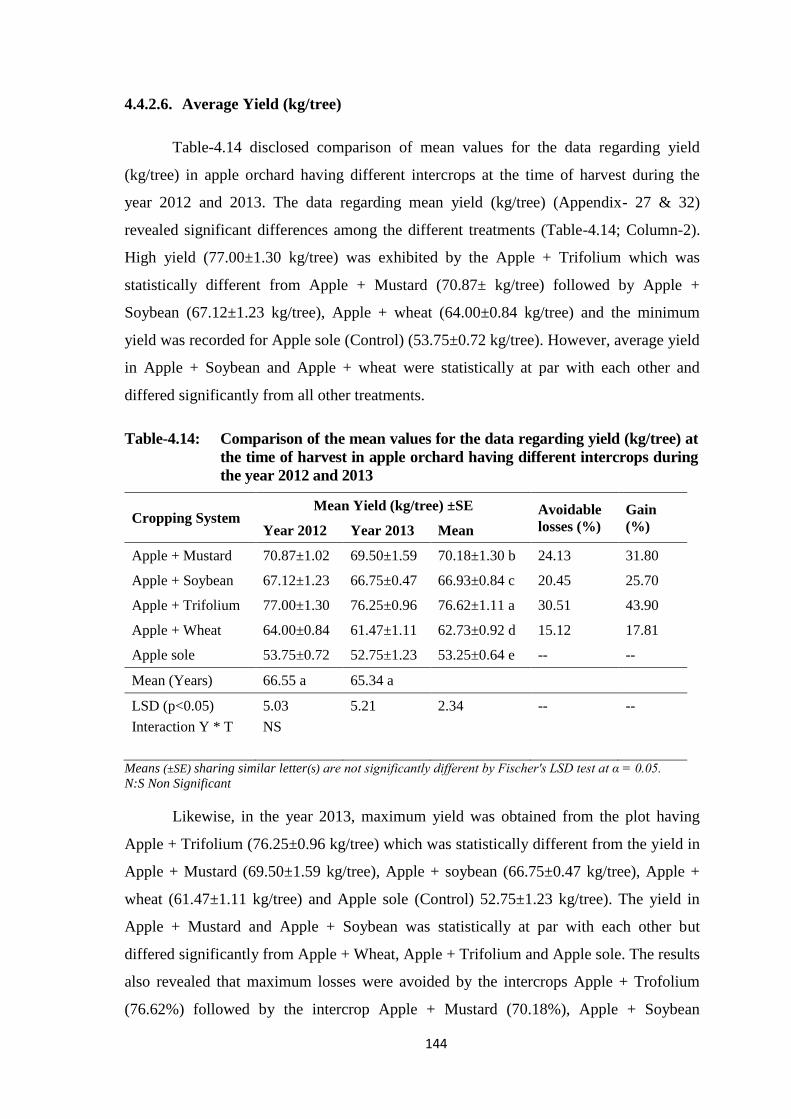
144
4.4.2.6. Average Yield (kg/tree)
Table-4.14 disclosed comparison of mean values for the data regarding yield
(kg/tree) in apple orchard having different intercrops at the time of harvest during the
year 2012 and 2013. The data regarding mean yield (kg/tree) (Appendix- 27 & 32)
revealed significant differences among the different treatments (Table-4.14; Column-2).
High yield (77.00±1.30 kg/tree) was exhibited by the Apple + Trifolium which was
statistically different from Apple + Mustard (70.87± kg/tree) followed by Apple +
Soybean (67.12±1.23 kg/tree), Apple + wheat (64.00±0.84 kg/tree) and the minimum
yield was recorded for Apple sole (Control) (53.75±0.72 kg/tree). However, average yield
in Apple + Soybean and Apple + wheat were statistically at par with each other and
differed significantly from all other treatments.
Table-4.14: Comparison of the mean values for the data regarding yield (kg/tree) at
the time of harvest in apple orchard having different intercrops during
the year 2012 and 2013
Cropping System Mean Yield (kg/tree) ±SE Avoidable
losses (%)
Gain
(%) Year 2012 Year 2013 Mean
Apple + Mustard 70.87±1.02 69.50±1.59 70.18±1.30 b 24.13 31.80
Apple + Soybean 67.12±1.23 66.75±0.47 66.93±0.84 c 20.45 25.70
Apple + Trifolium 77.00±1.30 76.25±0.96 76.62±1.11 a 30.51 43.90
Apple + Wheat 64.00±0.84 61.47±1.11 62.73±0.92 d 15.12 17.81
Apple sole 53.75±0.72 52.75±1.23 53.25±0.64 e -- --
Mean (Years) 66.55 a 65.34 a
LSD (p<0.05)
Interaction Y * T
5.03
NS
5.21
2.34
--
--
Means (±SE) sharing similar letter(s) are not significantly different by Fischer's LSD test at α = 0.05.
N:S Non Significant
Likewise, in the year 2013, maximum yield was obtained from the plot having
Apple + Trifolium (76.25±0.96 kg/tree) which was statistically different from the yield in
Apple + Mustard (69.50±1.59 kg/tree), Apple + soybean (66.75±0.47 kg/tree), Apple +
wheat (61.47±1.11 kg/tree) and Apple sole (Control) 52.75±1.23 kg/tree). The yield in
Apple + Mustard and Apple + Soybean was statistically at par with each other but
differed significantly from Apple + Wheat, Apple + Trifolium and Apple sole. The results
also revealed that maximum losses were avoided by the intercrops Apple + Trofolium
(76.62%) followed by the intercrop Apple + Mustard (70.18%), Apple + Soybean

145
(66.93%) and Apple + Wheat (62.73%). Highest gain in the yield (43.90%) due to
intercrops were noticed for the intercrop Apple + Trifolium followed by Apple + Mustard
(31.80%), Apple + Soybean (25.70%) and Apple + Wheat (17.81%). It is evident from
the results of both the years of studies that high yield (76.62±1.11 kg/tree) was obtained
from Apple + Trifolium which was significantly different from all other treatments.
The data further explained that mean yield was statistically at par with each other
during both the years of studies and interaction between the years and treatments was also
non significant.
146
4.4.3. DISCUSSION
4.4.3.1. Mean Fruit Drop
The results pertaining to the mean drop of apple fruit disclosed that maximum
mean fruit drop was recorded for apple sole (8.44), whilst the lowest mean fruit drop
(2.87) was observed for the intercrop Apple + Trifolium. Apple + Mustard also proved
effective in reducing the mean fruit drop of apple (4.15) and ranking second after Apple +
Trifolium in the current experiment. Nonetheless, intercrops such as Apple + Wheat and
Apple + Soybean demonstrated as inferior (6.18 and 5.40 respectively) among all other
intercrops in curtailing the mean fruit drop of apple fruit during the year 2012 and 2013.
These results are in close concordance with the findings of Abdel- Aziz et al. (2008) who
reported that the fruit drop was decreased with the cover crop such as clovers treatments
in the citrus orchard as compared to fallow orchard. These results are also corroborated
with the findings of Lovat (1990) who reported the reasons of flower and immature fruit
drop, including lack of pollination or fertilization, drought and frost, lack of sufficient
resources, defoliation, and seed and fruit loss due to insects infestation.
4.4.3.2. Mean Percent Infestation
The data related to mean percent infestation due to C. pomonella revealed that
maximum percent infestation of C. pomonella was observed in the Apple Sole (88.91 and
82.83%), whilst minimum percent infestation was noticed for the intercrop Apple +
Trifolium (60.90 and 53.48%) and consequently exhibited very effective in curtailing the
mean percent infestation of C. pomonella during the current experiments. Nevertheless,
the intercrops such as Apple + Wheat (76.73 and 77.87%) and Apple + Soybean (66.37
and 68.26%) proved comparatively less effective in reducing the mean percent infestation
of C. pomonella during the year 2012 and 2013. According to Thies and Tscharntke
(1999) who reported that in structurally complex landscapes, parasitism of the C.
pomonella larvae were higher and infestation due to pest was lower than in apple sole
having simple landscapes. Carlsen and Fomsgaard (2008) also reported that intercropping
with white clover in apple and peach orchards increased arthropod community diversity
and the numbers of natural enemies, reducing herbivore pest infestation incidence.
However, according to Shaw (2008), In California, IGRs should be used in May, but the
timing needs to be verified by phenological monitoring using pheromone traps for adult
147
males, so that the flare up and infestation of C. pomonella may be minimized. According
to Harcourt (1986) the monitoring of the pest can helpto find out the density of the pest
and percent parasitism of the natural enemies in agro ecosystem. But weather paly a vital
role in monitoring of the pest activity through pheromone traps and pest damage can be
redicated on the basis of this monitoring. In the hot weather conditions, majority of the
pests can developed faster and hence monitoring can be frequently done during warm
weather conditions. Hence, the results further clarified that minimum mean infestation
were afforded by intercrops Apple + Trifolium among all other intercrops including apple
sole in these studies.
4.4.3.3. Mean Catches of C. pomonella Adults
The results related to mean catches of C. pomonella disclosed that mean
maximum number of C. pomonella catches (6.60 and 7.47) were witnessed in Apple Sole
whilst the most effective intercrop was Apple + Trifolium where minimum number of C.
pomonella adults (1.32 and 1.60) were caught in the traps during both the years of
studies. Nonetheless, the intercrop such as Apple + Mustard was also efficient in
curtailing the adult moth catches in the trap (2.42 and 2.60). The intercrop such as Apple
+ Wheat and Apple + Soybean were least effective in the management of C. pomonella
and reducing the moth catches (4.40 and 4.62; 2.42 and 3.62 respectively) during both the
years of studies. According to Altieri (1995) intercropping of Trifoium in apple orchard
has a substantial effect on the incidence of C. pomonella and providing nectar and pollen
to beneficial insects with short probosci including parasitoid wasps and hoverflies.
Holmgren (2002) reported that intercropping legumes with apple has the potential to
attract natural enemies such as predators and parasitoid and consequently reducing the
target pest incidence in the apple orchard. It is further evident from the results that low
number of adults moth (1.46) were captured in the traps having Apple + Trifolium as
intercrop due to abundant number of its parasitoids available in the field for curtailing its
population.
4.4.3.4. Impact on the Biological Control Agents
The results pertaining to the percent parasitism of A. quadridentata disclosed that
maximum parasitism (42.57 and 37.65%) of A. quadridentata were noticed in the
intercrops such as Apple + Trifolium, whilst lower number (1.35 and 2.55%) of A.
148
quadridentata were noticed in Apple Sole. Apple + Mustard also showed good
performance in attracting good number of A. quadridentata (23.95 and 20.12%) during
the current experiment. However, other intercrops such as Apple + Wheat and Apple +
Soybean were inferior in attracting maximum number of A. quadridentata (2.64 and
5.45% ; 5.22 and 6.64% respectively) for the effective management of C. pomonella
during the year 2012 and 2013. These results are in close concordance with the findings
of Velcheva et al., (2012) who reported that percent occurrence of A. quadridentata from
the family Braconidae was 31.6% in Bulgaria having Trifolium as intercrop in the young
apple orchard. Haynes (1980) also reported that several legumes crops lana vetch,
Trifolium and Medicago spp and grasses such as brome, rye and barley have been
recommended to be sown annually in the orchard in the fall or early spring for attracting
natural enemies such as predators and parasitoid to feed on pollen and nectar and provide
them shelter for the effective management of C. pomonella. Sigsgaard (2014) reported
that there was increased predation activity and increased mortality of C. pomonella larvae
from near flower strips that could be predator or parasitoids induced. According to
previous workers (Jervis et al., 1993; Landis et al., 2000) considerations have combined
to produce an expectation that biological control can be improved by the incorporation of
flowering cover crops as intercrops or other sources of sugar to parasitoids in the apple
field for the effective management of C. pomonella. Wan et al. (2014) also reported that
when peach orchards were covered with Trifolium repens the abundances of aphids and
G. molesta decreased, respectively, by 31.4% and 33.3% and by 30.1% and 33.3% at two
different orchard. Moreover, the abundance of generalist predators increased by 116.7%
and by 115.8%. It is obvious from these results that Apple + Trifolium encouraged
maximum number of A. quadridentata (1.16) higher among all other intercrops including
Apple sole.
The data revealed that mean maximum (28.67 and 31.51%) parasitism of H.
pallidus occurred in the intercrop Apple + Trifolium and proved very effective in
parasitizing C. pomonella population during both the years of studies, whilst the lower
number (0.41 and 1.39%) of H. pallidus was observed in the Apple sole. Nevertheless,
the cropping system such as Apple + Wheat and Apple + Soybean demonstrated inferior
and attracted least mean percent number of H. pallidus (5.60 and 5.59% ; 5.77 and 6.84%
respectively) during both the years of studies. Leius (1967) found that the presence of
wild flower in the apple orchard resulted in five times increase in the parasitism of C.
149
pomonella larvae by different larval parasitoids. Rieux et al. (1999) reported that different
plants cover sown in the alleys provides a higher richness and diversity of the natural
enemies such as predators and parasitoids for the effective management of pests of apple
and pear compared with a bare ground. As for as natural enemies percent occurrence are
concerned, our results are also supported by natural enemies hypothesis which states that
predators and parasitoids are more diverse and abundant, and more effective at
controlling herbivore populations in the intercropped habitats compared with
monoculture habitats, because of the increased availability of alternate prey, nectar
sources, and suitable microhabitats (Root, 1973, Russell, 1989). Similar results were also
observed in other systems, for instance, the aphid abundance decreased and the
abundance of the major predator of aphids, Chrysoperla rufilabris increased in response
to ground cover in pecan orchards (Smith et al., 1996). Hence these results divulged that
maximum H. pallidus (0.91) were encouraged by Apple + Trifolium among all other
treatments in the current studies.
4.4.3.5. Average yield (kg/tree)
The data pertaining to the yield (kg/tree) of the apple orchard having different
intercrops revealed that maximum yield (77.00±1.30 and 76.25±0.96 kg/tree) was
obtained from the Apple + Trifolium during the year 2012 and 2013, whilst the lowest
yield (53.75±0.72 and 52.75±1.23 kg/tree) was recorded for the Apple Sole. However,
Apple + Mustard also showed maximum performance (70.87±1.02 and 69.50±1.59
kg/tree) and ranking second after Apple + Trifolium in increasing the yield of apple.
Nonetheless, the cropping system such as Apple + Wheat and Apple + Soybean were
inferior and comparatively gave less yield (64.00±0.84 and 61.47±1.11 ; 67.12±1.23 and
66.75±0.47 kg/tree respectively) during both the year of studies. However, influence of
intercropping in term of enhancement in yield of marketable apple fruit were found to be
in order of : Apple + Trifolium > Apple + Mustard > Apple + Soybean > Apple + Wheat
> Apple sole (Having no intercrop), which are amounting to be in order of: 77.00±1.30
and 76.25±0.96 > 70.87±1.02 and 69.50±1.59 > 67.12±1.23 and 66.75±0.47 >
64.00±0.84 and 61.47±1.11 > 53.75±0.72 and 52.75±1.23 kg/tree respectively in both the
years of studies. According to previous workers (Boller et al., 2004; Debras et al., 2007)
increasing plant biodiversity in the orchard may definitly influence insect communities
inside that habitate for wide range of resources such as habitate, food, water and shelter.
150
Such kind of multy dimensional and wide resources can benefite the orchard pest,
polyphagus and disease vector insects, predators and some potenstial parasitoid can
ultimatly enhanced the yield of that crop in aparticular agro ecosystem.
Agreda et al. (2006) also found out the importance of the leguminous crops in the
traditional fruit orchard by improving its ecological stability and performace. Soil
mulching with leguminous crops can enhanced the fertility of the soil and can further
benefit the beneficial insect population in the field.
Yield was highest in combination with Phaseolus acutifolius (9.13 t/ha) and
Cajanus cajan (7.42 t/ha). Additionally, more abundance and diversity of insect
population was observed when intercropping leguminous crops between the mango trees.
Abdel- Aziz et al. (2008) reported the impact of two legume cover crops (Egyptian
clover) plus the fallow as control. The results showed that fruit set and fruit yield were
enhanced and fruit drop was decreased with the cover crop treatments. Intercropping
cultivation methods with the Egyptian clover gave the best results regarding yield and
soil fertility in the citrus orchard. It is also apparent from the results that maximum yield
(76.62±1.11 kg/tree) was obtained from the Apple + Trifolium treatment, whilst all other
treatments were inferior in producing substantial yield.
The results further showed that maximum yield losses (31.51%) were avoided by
the intercrop Apple + Trifolium and gain in the yield (43.90%) over control was also
attributed to the same intercrop, while all other intercrops were inferior in avoiding the
yield loses and gain. According to Sathi et al. (2008) percent avoidable losses and gain in
the yield for the management of lepidopterus pest by habitat manipulation through
intercrops in India.
The results divulged that in all cropping system, adults moth catch were directly
proportional to the fruit drop and infestation and inverse relationship were observed for
the biological control agents and yield. Habitat manipulation through different prevailed
practice of intercropping in the apple orchard were a profound effect on the fruit drop,
infestation, biological control agents and yield of the orchard. Thus we conclude that
trifolium is the most appropriate plant species of those tested for the attraction of its
associated parasitoids A. quadridentata and H. pallidus. Mustard and soybean also
showed potential for attracting the said parasitoid. Different crops may be intercrop in the
151
apple orchard for the effective management of C. pomonella by increasing agricultural
biodiversity for the biological control agents until and unless they may not uphold the
pests. To increase natural enemies abundance early in the apple orchard, it may be
possible to plant trifolium alongside mustard and soybean; trifolium and mustard will
produce large amounts of flowers early in the crop cycle, while soybean will continue to
flower and attract the parasitoid and other biological control agents throughout the
season. Further studies are needed that look at the potential role of competition in
influencing the usefulness of flowering strips in attracting the parasitoids and other
natural enemies.
152
4.4.4. CONCLUSIONS
The results divulged that among all cropping system, adults moth catch were
directly proportional to the fruit drop and infestation while inverse relationship were
observed for the biological control agents and yield. Habitat manipulation through
different prevailed practice of intercropping in the apple orchard were a profound effect
on the fruit drop, infestation, biological control agents and yield of the orchard. Thus we
conclude that trifolium is the most appropriate plant species of those tested for the
attraction of its associated parasitoids A. quadridentata and H. pallidus. Mustard and
soybean also showed good potential for attracting the said parasitoids.
4.4.5. RECOMMENDATIONS
The above findings lead to the following recommendations.
1. Different crops may be intercrop in the apple orchard for the effective
management of C. pomonella by increasing agricultural biodiversity for the
biological control agents until and unless they may not uphold the pests.
2. To increase natural enemies abundance early in the apple orchard, it may be
possible to plant trifolium alongside mustard and soybean; trifolium and
mustard will produce large amounts of flowers early in the crop cycle, while
soybean will continue to flower and attract the parasitoid and other biological
control agents throughout the season.
3. Further studies are needed that look at the potential role of competition in
influencing the usefulness of flowering strips in attracting the parasitoids and
other natural enemies.
153
4.5. EXPERIMENT- 3: SYNCHRONIZED COMPARISON OF THE BEST
INSECTICIDE AND INTERCROP
4.5.1. MATERIALS AND METHODS
In the previous experiment, the effect of intercropping such as Apple + Mustard,
Apple + Soybean, Apple + Trifolium and Apple + Wheat were studied and the best
intercropping was identified on the basis of C. pomonella infestation, natural enemie's
abundance and yield of apple. Similarly the best biorational and novel insecticide was
also determined on same criteria. In this experiment synchronized comparison was made
of the best insecticide (Match), best intercrop (Apple + Trifolium), combined effect of
both treatments (apple + Trifolium + Match) and their interaction was compared with
control (Apple sole) at Matta Swat during the year 2013.
Four sprays of the Match insecticides were applied. First spray after 80% patal
fall, second spray after 20 days of the first spray for the management of first generation of
C. pomonella and the remaining two sprays were applied at the interval of 30 days each
for control of second generation of C. pomonella. Trifolum were sown on its respective
time of sowing in between the rows (5.53 x 5.53 m2) of the apple orchard. This
experiment was carried out in the apple orchard having "Red Delicious" variety of same
size and age i.e. 12 years old, in randomize complete block design (RCBD) and were
replicated in four apple orchards which were at a distance of 1 km from each other in the
same locality. The data recording mean fruit drop, percent infestation due to C.
pomonella, adult moth catche through pheromone traps and percent parasitism of the two
associated parasitoids in treated and control plots were taken on fortnightly basis
following the procedures of Prasad (2001) with some necessary modifications. Percent
infestation was determined by using the following formula:
Percent infestation (%) = Infested fruit with C. pomonella larvae x 100
Total dropped fruit
The effect of these intercrops and IGR were evaluated on two associated
biological control agents i.e. egg-larval parasitoid A. quadridentata (Hymenoptera:
Braconidae) and gregarious ectoparasitoid H. pallidus (Hymenoptera: Eulophidae).
154
4.5.1.1. Ascogaster quadridentata
All the apple trees in the respective intercrops and IGR treated were banded with
corrugated cardboard bands having opening less than 1/20 inch (1.3 mm) with the folds
facing down to collect parasitized C. pomonella larvae migrating down the trunk to
pupate in Mid July and at the end of September during the year 2013. Bands were
wrapped around the trees trunk at a distance of 2-3 feet from the ground and were
replaced weekly. Corrugated bands along with overwintering larvae of C. pomonella
were kept in a wooden rearing cages (45x45x45cm3) at 25±2
0C and 60-70% relative
humidity following the procedures of Tomkins, (1984) with some necessary
modifications. The cages were checked weekly for possible emergence of Ascogaster
quadridentata and percent parasitism of adult pest and parasitoids were determined by
using the following formula:
Percent Parasitism (%) = No, of parasitoid emerged from parasitized larvae x 100
Total No, of overwintering larvae in corrugated bands
4.5.1.2. Hyssopus pallidus
The effect of intercrops and IGR was also evaluated on another associated
biological control agent i.e. gregarious ectoparasitoid H. pallidus (Hymenoptera:
Eulophidae). For this purpose the dropped infested fruits with C. pomonella larvae were
brought to the laboratory and were put in the wooden rearing cages (45x45x45cm3) on
25±2 0C and 60-70% relative humidity (R.H). The cages were checked weekly for the
possible emergence of this parasitoids and its percent parasitism in the respective
treatments were computed by using the following formula:
Percent Parasitism (%) = No, of parasitoid emerged from infested fruit x 100
Total infested fruit by C. pomonella larvae
Furthermore, pheromone traps were also fixed in each replicate to know male
adult moths activities and catches with percent drop and infestation, for the effectiveness
of these intercrops on fortnightly basis, following the procedures of Sigsgaard (2011)
with some necessary modifications.
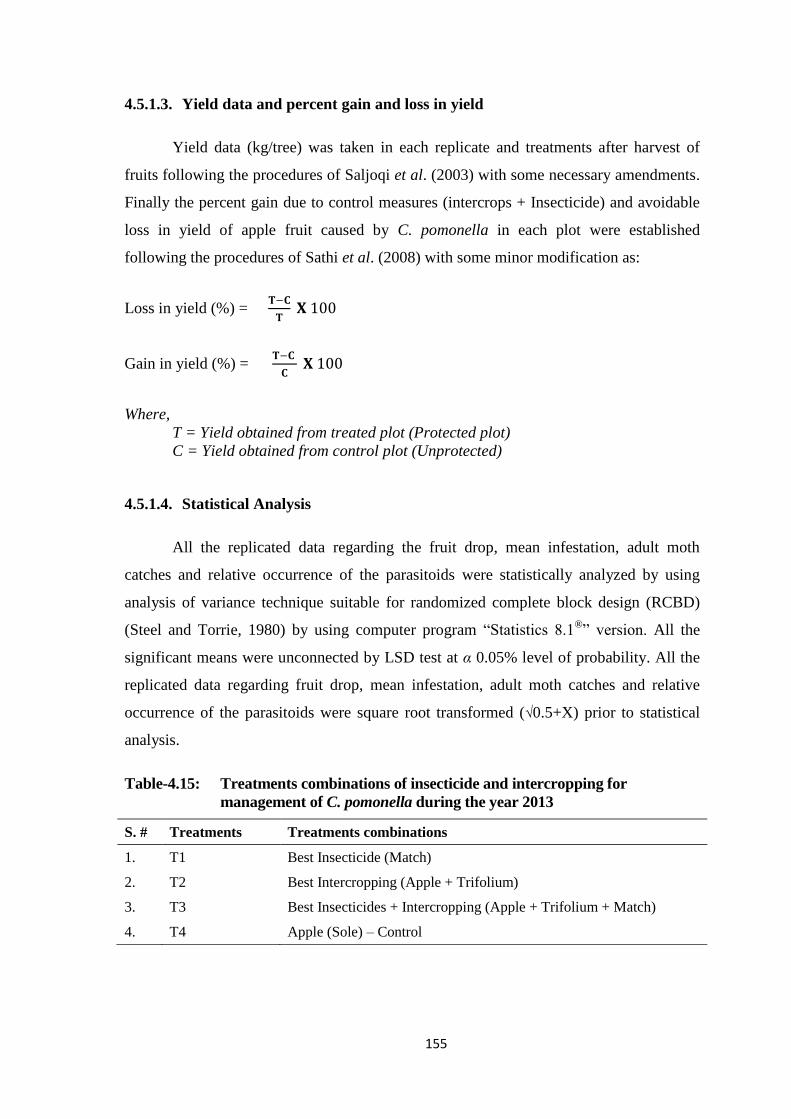
155
4.5.1.3. Yield data and percent gain and loss in yield
Yield data (kg/tree) was taken in each replicate and treatments after harvest of
fruits following the procedures of Saljoqi et al. (2003) with some necessary amendments.
Finally the percent gain due to control measures (intercrops + Insecticide) and avoidable
loss in yield of apple fruit caused by C. pomonella in each plot were established
following the procedures of Sathi et al. (2008) with some minor modification as:
Loss in yield (%) =
Gain in yield (%) =
Where,
T = Yield obtained from treated plot (Protected plot)
C = Yield obtained from control plot (Unprotected)
4.5.1.4. Statistical Analysis
All the replicated data regarding the fruit drop, mean infestation, adult moth
catches and relative occurrence of the parasitoids were statistically analyzed by using
analysis of variance technique suitable for randomized complete block design (RCBD)
(Steel and Torrie, 1980) by using computer program “Statistics 8.1®” version. All the
significant means were unconnected by LSD test at α 0.05% level of probability. All the
replicated data regarding fruit drop, mean infestation, adult moth catches and relative
occurrence of the parasitoids were square root transformed (√0.5+X) prior to statistical
analysis.
Table-4.15: Treatments combinations of insecticide and intercropping for
management of C. pomonella during the year 2013
S. # Treatments Treatments combinations
1. T1 Best Insecticide (Match)
2. T2 Best Intercropping (Apple + Trifolium)
3. T3 Best Insecticides + Intercropping (Apple + Trifolium + Match)
4. T4 Apple (Sole) – Control
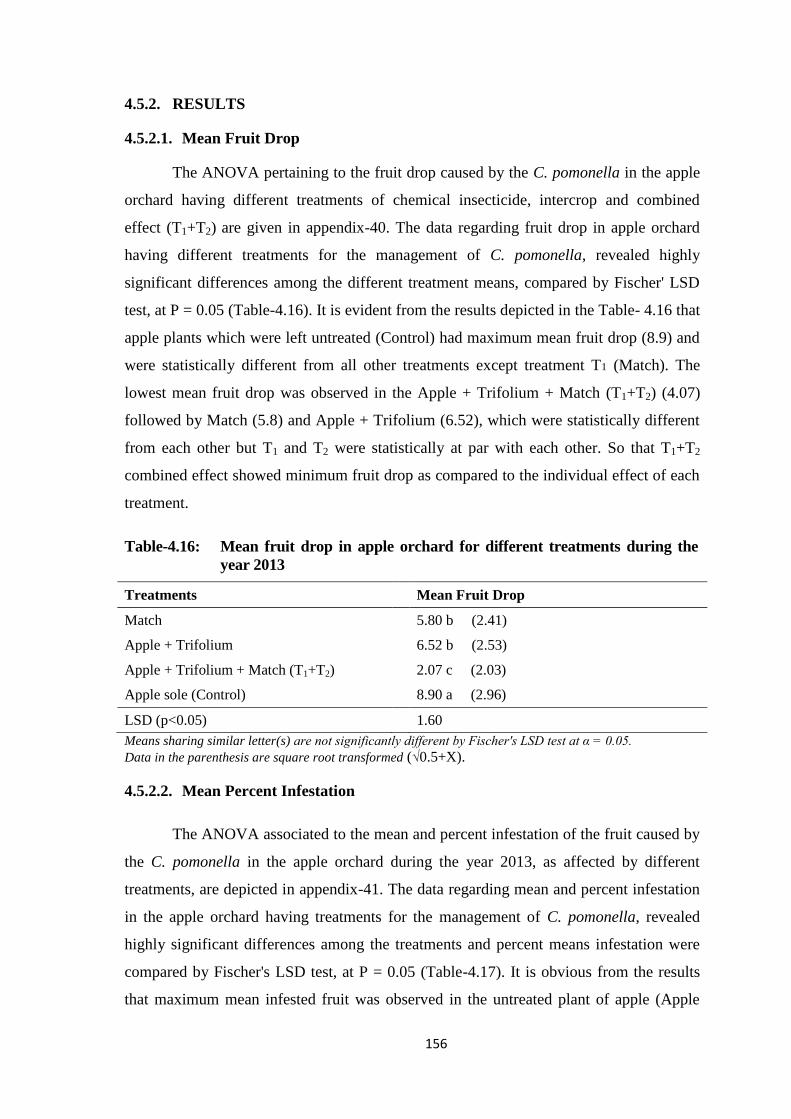
156
4.5.2. RESULTS
4.5.2.1. Mean Fruit Drop
The ANOVA pertaining to the fruit drop caused by the C. pomonella in the apple
orchard having different treatments of chemical insecticide, intercrop and combined
effect (T1+T2) are given in appendix-40. The data regarding fruit drop in apple orchard
having different treatments for the management of C. pomonella, revealed highly
significant differences among the different treatment means, compared by Fischer' LSD
test, at P = 0.05 (Table-4.16). It is evident from the results depicted in the Table- 4.16 that
apple plants which were left untreated (Control) had maximum mean fruit drop (8.9) and
were statistically different from all other treatments except treatment T1 (Match). The
lowest mean fruit drop was observed in the Apple + Trifolium + Match (T1+T2) (4.07)
followed by Match (5.8) and Apple + Trifolium (6.52), which were statistically different
from each other but T1 and T2 were statistically at par with each other. So that T1+T2
combined effect showed minimum fruit drop as compared to the individual effect of each
treatment.
Table-4.16: Mean fruit drop in apple orchard for different treatments during the
year 2013
Treatments
Mean Fruit Drop
Match 5.80 b (2.41)
Apple + Trifolium 6.52 b (2.53)
Apple + Trifolium + Match (T1+T2) 2.07 c (2.03)
Apple sole (Control) 8.90 a (2.96)
LSD (p<0.05)
1.60
Means sharing similar letter(s) are not significantly different by Fischer's LSD test at α = 0.05.
Data in the parenthesis are square root transformed (√0.5+X).
4.5.2.2. Mean Percent Infestation
The ANOVA associated to the mean and percent infestation of the fruit caused by
the C. pomonella in the apple orchard during the year 2013, as affected by different
treatments, are depicted in appendix-41. The data regarding mean and percent infestation
in the apple orchard having treatments for the management of C. pomonella, revealed
highly significant differences among the treatments and percent means infestation were
compared by Fischer's LSD test, at P = 0.05 (Table-4.17). It is obvious from the results
that maximum mean infested fruit was observed in the untreated plant of apple (Apple
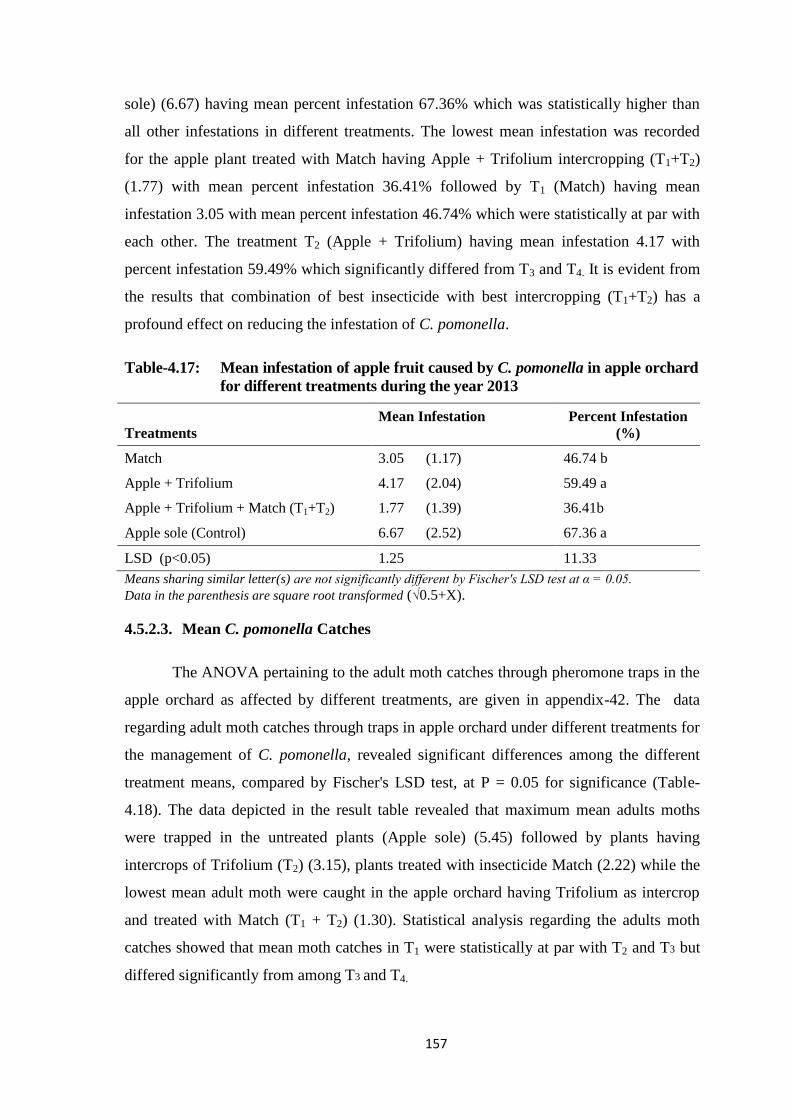
157
sole) (6.67) having mean percent infestation 67.36% which was statistically higher than
all other infestations in different treatments. The lowest mean infestation was recorded
for the apple plant treated with Match having Apple + Trifolium intercropping (T1+T2)
(1.77) with mean percent infestation 36.41% followed by T1 (Match) having mean
infestation 3.05 with mean percent infestation 46.74% which were statistically at par with
each other. The treatment T2 (Apple + Trifolium) having mean infestation 4.17 with
percent infestation 59.49% which significantly differed from T3 and T4. It is evident from
the results that combination of best insecticide with best intercropping (T1+T2) has a
profound effect on reducing the infestation of C. pomonella.
Table-4.17: Mean infestation of apple fruit caused by C. pomonella in apple orchard
for different treatments during the year 2013
Treatments
Mean Infestation Percent Infestation
(%)
Match 3.05 (1.17) 46.74 b
Apple + Trifolium 4.17 (2.04) 59.49 a
Apple + Trifolium + Match (T1+T2) 1.77 (1.39) 36.41b
Apple sole (Control) 6.67 (2.52) 67.36 a
LSD (p<0.05) 1.25 11.33
Means sharing similar letter(s) are not significantly different by Fischer's LSD test at α = 0.05.
Data in the parenthesis are square root transformed (√0.5+X).
4.5.2.3. Mean C. pomonella Catches
The ANOVA pertaining to the adult moth catches through pheromone traps in the
apple orchard as affected by different treatments, are given in appendix-42. The data
regarding adult moth catches through traps in apple orchard under different treatments for
the management of C. pomonella, revealed significant differences among the different
treatment means, compared by Fischer's LSD test, at P = 0.05 for significance (Table-
4.18). The data depicted in the result table revealed that maximum mean adults moths
were trapped in the untreated plants (Apple sole) (5.45) followed by plants having
intercrops of Trifolium (T2) (3.15), plants treated with insecticide Match (2.22) while the
lowest mean adult moth were caught in the apple orchard having Trifolium as intercrop
and treated with Match (T1 + T2) (1.30). Statistical analysis regarding the adults moth
catches showed that mean moth catches in T1 were statistically at par with T2 and T3 but
differed significantly from among T3 and T4.
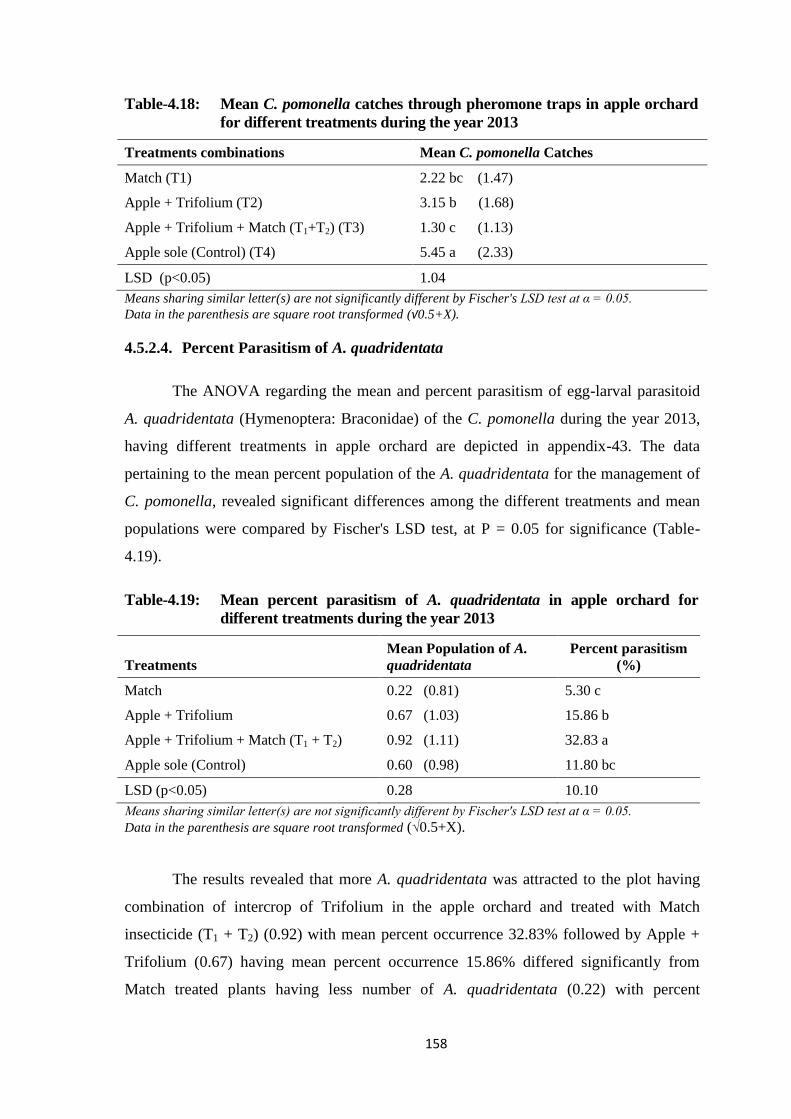
158
Table-4.18: Mean C. pomonella catches through pheromone traps in apple orchard
for different treatments during the year 2013
Treatments combinations Mean C. pomonella Catches
Match (T1) 2.22 bc (1.47)
Apple + Trifolium (T2) 3.15 b (1.68)
Apple + Trifolium + Match (T1+T2) (T3) 1.30 c (1.13)
Apple sole (Control) (T4) 5.45 a (2.33)
LSD (p<0.05) 1.04
Means sharing similar letter(s) are not significantly different by Fischer's LSD test at α = 0.05.
Data in the parenthesis are square root transformed (√0.5+X).
4.5.2.4. Percent Parasitism of A. quadridentata
The ANOVA regarding the mean and percent parasitism of egg-larval parasitoid
A. quadridentata (Hymenoptera: Braconidae) of the C. pomonella during the year 2013,
having different treatments in apple orchard are depicted in appendix-43. The data
pertaining to the mean percent population of the A. quadridentata for the management of
C. pomonella, revealed significant differences among the different treatments and mean
populations were compared by Fischer's LSD test, at P = 0.05 for significance (Table-
4.19).
Table-4.19: Mean percent parasitism of A. quadridentata in apple orchard for
different treatments during the year 2013
Treatments
Mean Population of A.
quadridentata
Percent parasitism
(%)
Match 0.22 (0.81) 5.30 c
Apple + Trifolium 0.67 (1.03) 15.86 b
Apple + Trifolium + Match (T1 + T2) 0.92 (1.11) 32.83 a
Apple sole (Control) 0.60 (0.98) 11.80 bc
LSD (p<0.05) 0.28 10.10
Means sharing similar letter(s) are not significantly different by Fischer's LSD test at α = 0.05.
Data in the parenthesis are square root transformed (√0.5+X).
The results revealed that more A. quadridentata was attracted to the plot having
combination of intercrop of Trifolium in the apple orchard and treated with Match
insecticide (T1 + T2) (0.92) with mean percent occurrence 32.83% followed by Apple +
Trifolium (0.67) having mean percent occurrence 15.86% differed significantly from
Match treated plants having less number of A. quadridentata (0.22) with percent
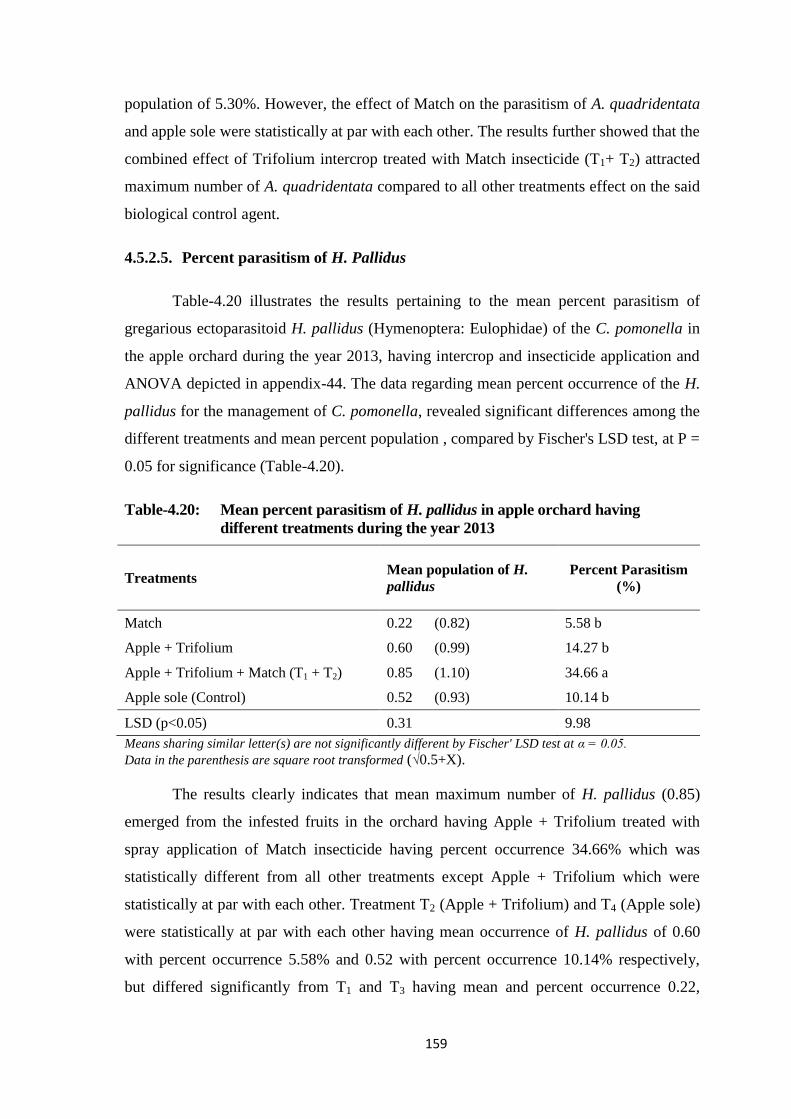
159
population of 5.30%. However, the effect of Match on the parasitism of A. quadridentata
and apple sole were statistically at par with each other. The results further showed that the
combined effect of Trifolium intercrop treated with Match insecticide (T1+ T2) attracted
maximum number of A. quadridentata compared to all other treatments effect on the said
biological control agent.
4.5.2.5. Percent parasitism of H. Pallidus
Table-4.20 illustrates the results pertaining to the mean percent parasitism of
gregarious ectoparasitoid H. pallidus (Hymenoptera: Eulophidae) of the C. pomonella in
the apple orchard during the year 2013, having intercrop and insecticide application and
ANOVA depicted in appendix-44. The data regarding mean percent occurrence of the H.
pallidus for the management of C. pomonella, revealed significant differences among the
different treatments and mean percent population , compared by Fischer's LSD test, at P =
0.05 for significance (Table-4.20).
Table-4.20: Mean percent parasitism of H. pallidus in apple orchard having
different treatments during the year 2013
Treatments Mean population of H.
pallidus
Percent Parasitism
(%)
Match 0.22 (0.82) 5.58 b
Apple + Trifolium 0.60 (0.99) 14.27 b
Apple + Trifolium + Match (T1 + T2) 0.85 (1.10) 34.66 a
Apple sole (Control) 0.52 (0.93) 10.14 b
LSD (p<0.05) 0.31 9.98
Means sharing similar letter(s) are not significantly different by Fischer' LSD test at α = 0.05.
Data in the parenthesis are square root transformed (√0.5+X).
The results clearly indicates that mean maximum number of H. pallidus (0.85)
emerged from the infested fruits in the orchard having Apple + Trifolium treated with
spray application of Match insecticide having percent occurrence 34.66% which was
statistically different from all other treatments except Apple + Trifolium which were
statistically at par with each other. Treatment T2 (Apple + Trifolium) and T4 (Apple sole)
were statistically at par with each other having mean occurrence of H. pallidus of 0.60
with percent occurrence 5.58% and 0.52 with percent occurrence 10.14% respectively,
but differed significantly from T1 and T3 having mean and percent occurrence 0.22,
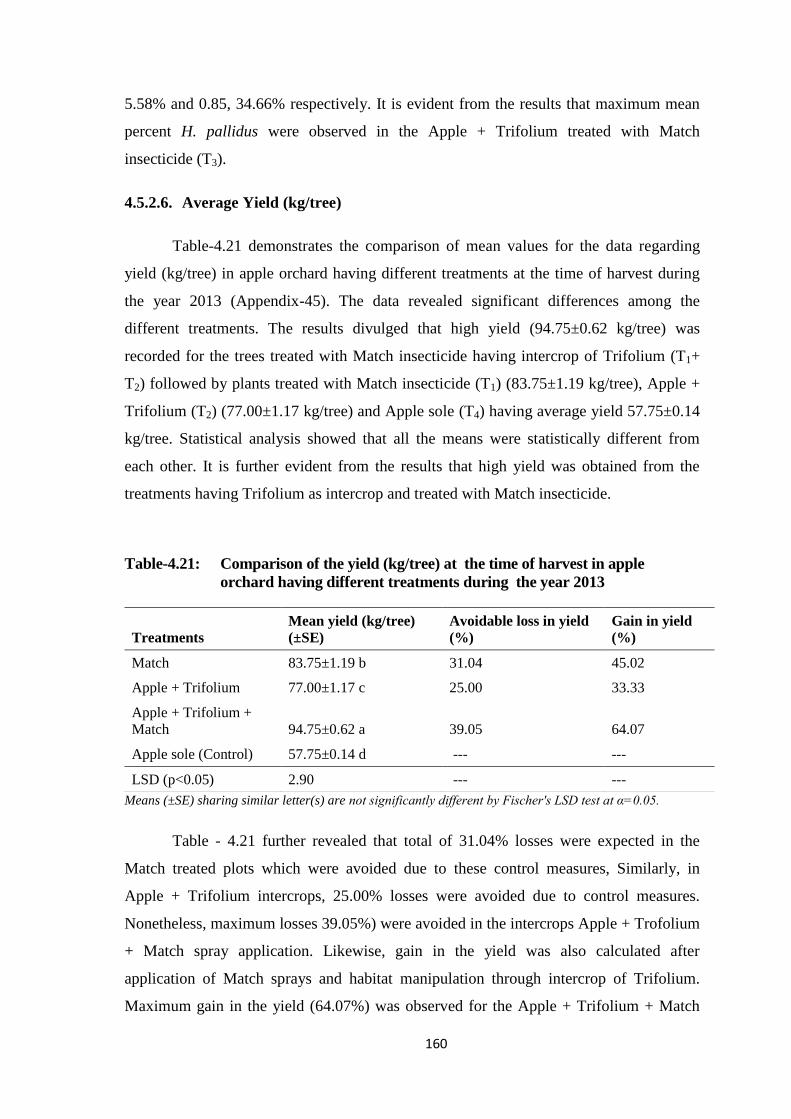
160
5.58% and 0.85, 34.66% respectively. It is evident from the results that maximum mean
percent H. pallidus were observed in the Apple + Trifolium treated with Match
insecticide (T3).
4.5.2.6. Average Yield (kg/tree)
Table-4.21 demonstrates the comparison of mean values for the data regarding
yield (kg/tree) in apple orchard having different treatments at the time of harvest during
the year 2013 (Appendix-45). The data revealed significant differences among the
different treatments. The results divulged that high yield (94.75±0.62 kg/tree) was
recorded for the trees treated with Match insecticide having intercrop of Trifolium (T1+
T2) followed by plants treated with Match insecticide (T1) (83.75±1.19 kg/tree), Apple +
Trifolium (T2) (77.00±1.17 kg/tree) and Apple sole (T4) having average yield 57.75±0.14
kg/tree. Statistical analysis showed that all the means were statistically different from
each other. It is further evident from the results that high yield was obtained from the
treatments having Trifolium as intercrop and treated with Match insecticide.
Table-4.21: Comparison of the yield (kg/tree) at the time of harvest in apple
orchard having different treatments during the year 2013
Means (±SE) sharing similar letter(s) are not significantly different by Fischer's LSD test at α=0.05.
Table - 4.21 further revealed that total of 31.04% losses were expected in the
Match treated plots which were avoided due to these control measures, Similarly, in
Apple + Trifolium intercrops, 25.00% losses were avoided due to control measures.
Nonetheless, maximum losses 39.05%) were avoided in the intercrops Apple + Trofolium
+ Match spray application. Likewise, gain in the yield was also calculated after
application of Match sprays and habitat manipulation through intercrop of Trifolium.
Maximum gain in the yield (64.07%) was observed for the Apple + Trifolium + Match
Treatments
Mean yield (kg/tree)
(±SE)
Avoidable loss in yield
(%)
Gain in yield
(%)
Match 83.75±1.19 b 31.04 45.02
Apple + Trifolium 77.00±1.17 c 25.00 33.33
Apple + Trifolium +
Match 94.75±0.62 a 39.05 64.07
Apple sole (Control) 57.75±0.14 d --- ---
LSD (p<0.05) 2.90 --- ---
161
combination over control plots, followed by Match spray applications having gain in the
yield 45.05% and Apple + Trifolium intercrops were 33.33%. However, influence of
intercropping and insecticides application in term of enhancement in yield of marketable
apple fruit were found to be in order of : Apple + Trifolium + Match > Match spray
Applications alone > Apple + Trifolium > Apple sole.
162
4.5.3. DISCUSSION
4.5.3.1. Mean Apple Fruit Drop
The results pertaining to the mean fruit drop disclosed that maximum mean fruit
drop (8.9) was observed in the apple sole (Control), whilst the lowest mean fruit drop
were noticed for Apple + Trifolium + Match (2.07). However, Match treated plots were
mean fruit drop 5.8 and did not curtailed the fruit drop alone comparatively in
combination with intercropping. Apple + Trifolium (6.52) were inferior in reducing the
fruit drop among all other treatments but was effective than apple sole. Consequently,
Apple + Trifolium + Match (IGR) was effective in reducing and minimizing the fruit drop
of apple fruit due to C. pomonella infestation. Shah (2008) reported that IGRs are
ovicidal as well as larvicidal and not toxic to predatory/beneficial insects in the
intercropping. The beneficial effects of the application of growth regulators can be seen
one to two days after application and help in minimizing the fruit drop of apple.
According to Abdel- Aziz et al. (2008) the fruit drop was substantially reduced with the
intercrops clovers treatments in the citrus orchard as compared to sole orchard.
4.5.3.2. Mean Percent Infestation of C. pomonella
The data pertaining to mean percent infestation of C. pomonella explicated that
highest mean percent infestation (67.36%) was witnessed in the control plot with mean,
whilst the lowest mean infestation (36.41%) was observed for Apple + Trifolium + Match
with. Nonetheless, in Match treated plot the mean infestation was 3.05 with mean percent
infestation 46.74% while in the Apple + Trifolium, mean infestation was 4.17 with
percent mean infestation 59.49% and were comparatively inferior in reducing the
infestation of C. pomonella. The combined effect of Apple + Trifolium + Match
treatment proved very effective among all other treatments in reducing the infestation of
C. pomonella. According to Irvin et al., (2008) that with no monitoring or treatments and
if C. pomonella and Epiphyas postvittana were uncontrolled other than by naturally
occurring Trichogramma or other beneficial insects and organisms, the maximum damage
caused by Epiphyas postvittana and C. pomonella would be more than one percent or less
of crops. Sathi et al. (2008) reported that the combination of intercropping with
insecticides reduces the pest incidence in cauliflower for the effective management of
Plutella xylostella. Almost similar findings were reported by Prasad (2001) who
163
investigated that intercropping in combination with safe insecticide has a great impact on
the insect pest incidence and play a vital role in curtailing their infestation.
4.5.3.3. Mean C. pomonella Catches
Harcourt (1986) investigated that monitoring pest density and incidence of the
parasitism by biological control agents can play effective role in the pest management
program. During monitoring of pest activity and the pest damage pheromone traps are
world wide used with respect to the weather factors. So during warm weather conditions,
insect population are developing faster as compared to cool weather condition, so in hot
days monitoring should be frequently carried out for determining pest activity. Hence, the
data pertaining to mean C. pomonella catches through pheromone traps elucidated that
maximum number of adult moths were trapped in the control plot (5.45) having no spray
application and intercrops, whilst the lower number of moths (1.30) were caught in the
Apple + Trifolium + Match spray applications in the pheromone trap. Nevertheless,
Apple + Trifolium treatment proved inferior and a substantial moth catches (2.22) were
observed followed by Match spray application proved effective in curtailing the C.
pomonella adult catches (3.15) in the pheromones traps. Consequently, best result were
offered by the combination of Apple + Trifolium + Match spray in reducing the adult
moth catches and reducing the flare up of the said pest. These results are corroborated
with findings of Harder (2008) who reported the researchers and extension workers are
mostly using the pheromone sticky traps for the monitoring of Light brown apple moth
(Epiphyas postvittana) and C. pomonella populations in New Zealand for the prevention
of pest flare up which was based on timely application of insect growth regulator (IGR)
and pest monitoring data. According to Shaw (2008), in California, IGRs should
probably be applied in May, but the timing needs to be verified by phenological
monitoring using pheromone traps for adult males.
4.5.3.4. Impact on the Biological Control Agents
During the current experiment, the percent occurrence of A. quadridentata
fluctuated with different treatments. Mean maximum number (0.92) of the A.
quadridentata were examined in the Apple + Trifolium + Match sprayed plots having
percent occurrence 32.83%. Besides, Apple + Trifolium also attracted substantial number
(0.67) of the A. quadridentata having percent occurrence 15.86% comparatively higher
164
than the control plot (0.60) with percent occurrence 11.30%, whilst Match spray
application proved inferior and the lowest number (0.22) of A. quadridentata were
noticed in the growing crop season having percent occurrence 5.30%. Nonetheless, in the
current experiment, the results revealed that Apple + Trifolium + Match spray application
demonstrated good results and encouraged A. quadridentata population in the
management of C. pomonella. Begaum et al. (2008) reported that it is worth noting that in
New Zealand, intercropping has shown to promote beneficial insect populations, resulting
in near-complete Epiphyas postvittana and C. pomonella population suppression to below
thresholds for use of control measures.
The results pertaining to the mean percent occurrence of H. pallidus revealed that
mean maximum number (0.85) of H. pallidus were discerned in the Apple + Trifolium +
Match spray application having mean percent occurrence 34.66%, whilst the lowest mean
number (0.22) of H. pallidus were recovered from the plots treated with Match IGR spray
applications having mean percent occurrence 5.58%. Nevertheless, Apple + Trifolium
also supported and encouraged maximum number (0.60) of H. pallidus with mean percent
occurrence 14.27%. H. pallidus were also observed in the Apple sole plots (0.52) with
mean percent occurrence 10.14%. Consequently, among all other treatments including
apple sole, Apple + Trifolium + Match spray applications established a good impact for
encouraging the natural enemies particularly H. pallidus in the current experiment.
Harder (2008) reported that beneficial insects are more effective for the
management of leaf rollers and C. pomonella if the floral sources are present inside the
filed for the survival of these natural enemies. Further, he added that insect growth
regulators (IGR) which are derived from natural resources are very effective for the
management of leaf roller and C. pomonella control in New Zealand orchards. These
results are also supported by the previous workers, (Jervis and Kidd, 1996). They
reported that floral and extrafloral nectar and pollen are essential sources of
carbohydrates and proteins for many parasitoids and are therefore crucial for their fitness.
Many studies have shown that access to these floral resources increases survival and
reproduction of parasitoids for effective management of particular pest in the field.
(Wackers et al., 2005; Wade and Wratten, 2007).
165
4.5.3.5. Average Yield (kg/tree)
The efficacy of respective intercropping combination and insecticides (Match)
were found to have mutually enhanced the yield of the marketable apple fruit particularly
when both the intercrop and Match (IGR) application were adopted together. The results
illustrated that maximum yield (kg/tree) of apple was obtained from the Apple +
Trifolium + Match spray applications (94.75±0.62 kg/tree), whilst the yield in control
plot were the lowest (57.57±0.14 kg/tree) among all other treatments. Nonetheless, Match
treated plots afforded comparatively higher yield (83.75±1.19 kg/tree) than Apple +
Trifolium treatment having mean yield 77.00±1.17 kg/tree. Consequently, Apple +
Trifolium + Match afforded good performance in boosting up the yield of apple fruit.
Further, it also avoided maximum percent yield losses (39.05%), leading to gain in the
yield (64.07%) among all other treatments. Sathi et al. (2008), reported that when
Cauliflower + Intercrop + Insecticides applied in combination, consequently reduced the
Plutella xylostella population and substantial enhancement in the yield were recorded as
compared to the control plot having no intercrops and insecticides applications. However,
influence of intercropping and insecticides application in term of enhancement in yield of
marketable apple fruit were found to be in order of : Apple + Trifolium + Match > Match
spray Applications alone > Apple + Trifolium > Apple sole (Having no intercrop and
insecticides application). Almost similar results were obtained by Prasad (1998 and 2001)
and Prasad et al. (2007) who found out significant interactive effect of the intercropping
and insecticides that resulted to reduction in pest incidence and enhancement in the yield.
It is also noteworthy to infer that the eco- friendly approach of management of C.
pomonella comprising of Trifolium grown as intercrop along with apple coupled with
Match spray applications emerged as highly effective insecticide which boosted yield of
apple as compared to unprotected apple sole.
The interactive effect of intercropping trifolium (T. alexandrinum) (Fabacae)
coupled with application of insecticide i.e. Match proved highly effective in minimizing
the incidence of C. pomonella and maximizing and upholding the associated parasitoids
A. quadridentata, H. pallidus. It is also note worthy to infer that the eco friendly approach
of management of C. pomonella comprising trifolium as intercrop along with apple
orchard coupled with four foliar sprays of Match emerged as highly effective
environment friendly insecticide which give rise to increase the yield of apple compared
166
to the untreated sole apple orchard. Habitat manipulation through intercropping of T.
alexandrinum (Fabacae) in the apple orchard accompanied by IGR spray application for
the management of C. pomonella were a profound impact in curtailing mean fruit drop,
percent infestation and adult moth catches through pheromone traps. Nevertheless,
positive relations were observed for percent parasitism of A. quadridentata, H. pallidus
and average yield of apple due to synchronized effect. Further research may be carried
out for other potential safe insecticides and intercrops for the effective management of C.
pomonella and its impact on associated natural enemies and ultimately on yield.
167
4.5.4. CONCLUSIONS
The interactive effect of intercropping trifolium (T. alexandrinum) (Fabacae)
coupled with application of insecticide i.e. Match proved highly effective in minimizing
the incidence of C. pomonella and maximizing and upholding the associated parasitoids
A. quadridentata and H. pallidus. It is also note worthy to infer that the eco friendly
approach of management of C. pomonella comprising trifolium as intercrop along with
apple orchard coupled with four foliar sprays of Match emerged as highly effective
environment friendly insecticide which give rise to increase the yield of apple compared
to the untreated sole apple orchard. Habitat manipulation through intercropping of T.
alexandrinum (Fabacae) in the apple orchard accompanied by IGR spray application for
the management of C. pomonella were a profound impact in curtailing mean fruit drop,
percent infestation and adult moth catches through pheromone traps. Nevertheless,
positive relations were observed on percent parasitism of A. quadridentata, H. pallidus
and average yield of apple due to synchronized effect.
168
4.5.5. RECOMMENDATIONS
The above findings lead to the following recommendations.
1. The interactive effect of intercropping trifolium (T. alexandrinum) (Fabacae)
coupled with application of insecticide i.e. Match proved highly effective in
minimizing the incidence of C. pomonella and maximizing and upholding the
associated parasitoids A. quadridentata and H. pallidus.
2. The said treatment was also having a profound impact in curtailing mean fruit
drop, percent infestation and adult moth catches through pheromone traps.
3. From the results of this research, it is recommended that farmers can use
Match and intercropping Trifolium in apple orchard to manage C. pomonella
infestation.
4. Further research may be carried out for other potential safe insecticides and
intercrops for the effective management of C. pomonella and its impact on
associated natural enemies and ultimately on yield.
5. This is the first kind of its research against this insect pest in Swat Khyber
Pakhtunkhwa, therefore, these basic informations regarding population
dynamics, genetic variations and various methods of management of this pest
will be of great importance for the farming community to manage C.
pomonella and to save the apple crop from extinction in Swat.
169
OVERALL CONCLUSION & RECOMMENDATIONS
1. First adults of C. pomonella trapped during 17th
to 18th
SMW in all the three
locations.
2. The first peak population recorded during 25th
to 30th
SMW, therefore, steps are
required in this month to minimize losses.
3. Second peak population were observed & trapped during 31st to 35
th SMW, so
maximum two peak populations were observed during studies.
4. Temperature had highly significant positive effect on C. pomonella catches.
5. Total rainfall & R.H (morning & evening) had non significant negative effect on
the population build up of C. pomonella.
6. Thus such studies may offer an insight on the possible impact of weather
parameters on population dynamics of this pest and insecticide applications based
on trap captures can significantly reduce the number of sprays needed for C.
pomonella management.
7. RAPD markers are efficient tools for assessing the population variation in insect
pests and knowledge of the genetic variation within C. pomonella populations is
necessary for their efficient control and management.
8. Higher genetic distances among the populations of C. pomonella could be
attributed to climatic conditions of the studied areas, geographical locations,
elevations and indiscriminate use of insecticides.
9. Besides, RAPD primers, gene specific primers and methods like AFLP and RFLP
can also be used for molecular variation among the population of C. pomonella
and other lepidopterious pests.
10. Insect growth regulator (Match) has a profound effect in curtailing the C.
pomonella infestation, more safer for its associated parasitoids and enhancing the
yield and can be effectively used for the management of C. pomonella.
11. Nevertheless, its safety should be tested for other biological control agents in
apple orchard or in other agro ecosystems.
170
12. Likewise, habitat manipulation through different prevailed practice of
intercropping particularly Trifolium in the apple orchard had a profound effect on
the fruit drop, infestation, biological control agents and yield of the orchard.
13. Trifolium is the most appropriate plant species of those tested for the attraction of
its associated parasitoids Asogaster quadridentata and Hyssopus pallidus.
14. Further studies are needed that look at the potential role of competition in
influencing the usefulness of this intercrop and other flowering strips in attracting
the parasitoids and other natural enemies.
15. It is also note worthy to infer that the eco friendly approach of management of C.
pomonella comprising Trifolium as intercrop in apple orchard coupled with foliar
sprays of Match emerged as highly effective environment friendly insecticide
which give rise to increase the yield of apple compared to other treatments.
16. Further research may be carried out for other potential safe insecticides and
intercrops for the effective management of C. pomonella and its impact on
associated natural enemies and ultimately on yield.
17. This is the first kind of its research against this insect pest in Swat Khyber
Pakhtunkhwa, therefore, these basic information regarding population dynamics,
genetic variations and various methods of management of this pest will be of great
importance for the farming community to manage C. pomonella and to save the
apple crop from extinction in Swat.
171
FUTURE CHALLENGES
1. Further studies are needed to discern the impact of meteorological parameters
on the population dynamics of C. pomonella in various geographical locations.
2. Degree Day (DD) methods needs to be used for population trends and
phenology of this pest.
3. Molecular studies are efficient tools for knowing genetics variations among the
population of this pest, so further studies are needed to find out biodiversity in
various populations in different geographical locations even countries.
4. Besides, RAPD primers, gene specific primers and methods like AFLP and
RFLP can also be used for molecular variation among the population of C.
pomonella and other lepidopterious pests.
5. Match insecticides (IGR) had a profound effect in curtailing the C. pomonella
infestation, safer for its associated parasitoids and enhancing the yield,
nevertheless, its safety needs be tested for other biological control agents in
apple orchard or other agro ecosystems.
6. Further studies are needed that look at the potential role of competition in
influencing the usefulness of Trifolium as intercrop and other flowering strips
in attracting the parasitoids and other natural enemies in the apple orchard.
7. Field research may further be carried out for other potential safe insecticides
and intercrops for the effective management of C. pomonella and its impact on
associated natural enemies and ultimately on yield.
8. The various management tools studied in this research study needs to be
measured for their negative impact on C. pomonella and its natural enemies
up to few generation levels.
9. The suitability, applicability and sustainability of findings/recommendations
of this research study needs to be assessed in joint teamwork with extension
field staff and research departments of the said province.
10. Feedback from the farming community about the impediments in launching the
new technologies is required and would enable us to design experiments as per
their approach, vision and ground realities.
172
LITERATURE CITED
Abate, T., A. van Huis and J.K.O. Ampofo. 2000. Pest management strategies in
traditional agriculture: an African perspective. Annu. Rev. Entomol. 45: 631-
659.
Abbott, W.W. 1925. A method of computing the effectiveness of an insecticide. J. Econ.
Entomol. 18: 265-267.
Abdel-Aziz, R.A., S.E. Salem and L. Al-Bitar. 2008. Effect of Intercropping Cover Crops
on Citrus Orchards Growth and Fruiting under Toshka Conditions. J. Agric. Vet.
Sci. 1(20): 101-110.
Agreda, F.M., J. Pohlan and M. J.J.J. Anssens. 2006. Effects of Legumes Intercropped in
Mango Orchards in the Soconusco, Chiapas, Mexico. Tropentag Conf. on Intern.
Agric. Res. Dev. Uni. of Bonn, October 11-13, 2006.
Altieri, M.A. 1987. Agroecology: The scientific basis of alternative agriculture.
Boulder/ Colorado London. West view press.
Altieri, M.A. 1995. Agroecology: the science of sustainable agriculture (2nd ed)..
Scientific approach to sustainable agriculture including intercropping systems and
traditional farming. West view Press, Boulder, CO.
Altieri, M.A. and C.I. Nicholls. 2004. Biodiversity and Pest Management in Agro
ecosystems (2nd), Food Products Press, ISBN 1560229255, New York.
Altieri, M.A., C.A. Francis, A. Van Schoonhoven and J.D. Doll. 1978. A review of
the insect prevalence in Maize (Zea Mayes L) and been (Phaseolus vulgarus
L) polyculture system Reid Crops Res. 1: 33-49.
Altieri, M.A. and D.K. Letourneau. 1982. Vegetation management and biological
control in agro ecosystem. Crop Prot. 1: 405-430.
Andow, D.A. 1991. Vegetational diversity and arthropod population response. Annu.
Rev. Entomol. 36: 561-586.
Atanassov, A., P.J. Charmillot and D. Jeanneret, 1997. The larval and pupal parasitoids of
codling moth Cydia pomonella. Revue suisse de viticulture, arboriculture,
horticulture. 29 (2) : 100-106.
Avilla, J., M. J. Sarasua, J. Garcia de Otaza, R. Tora, J. Vall and J.J. Roca. 1996. Control
integrado de plagas y enfermedades en huertos de peral en Lleida. Frut. Prof. 78:
69-89
Baggen, L.R. and G.M Gurr. 1998. The influence of food on Copidosoma koehleri
(Hymenoptera: Encyrtidae), and the use of flowering plants as a habitat
management tool to enhance biological control of potato moth, Phthorimaea
operculella (Lepidoptera: Gelechiidae). Biol. Control. 11: 9-17.
Bajwa, W.I. 1993. Effects of Bacillus thuringiensis Berliner on pests' natural enemies. pp.
67-68. In Proc. Grad. Conf. 93. Oreg. State Uni. Corvallis, Oregon.
173
Balevski, N. 2009. Biodiversity, host specialization and trophic relations of braconid
parasitoids (Hymenoptera: Braconidae) phytophagous insect pests - plants hosts.
Habilitation thesis, Plant Protection Institute, Bulgaria, 211 pp.
Barnes, M.M., J.G. Millar, P.A. Kirsch and D.C. Hawks. 1992. Codling moth
(Lepidoptera: Tortricidae) control by dissemination of synthetic female sex
hormone. J. Econ. Entomol. 85(4): 1274-1277.
Barnett, W.W., C.S. Davis and G.A. Rowe. 1977. The California integrated pest
management project for pears: summary and evaluation. 1973-1976. Uni. Calif
AESCE, 25 pp.
Batiste, W.C. 1972. Integrated control of codling moth on pears in California- effects of
varying dosage of azinphosmethyl and oil with individual cover sprays. Environ.
Entomol. 1(4): 503-508.
Becid, P. 1997. Mating disruption of the codling moth, Cydia pomonella: experiences
from the U.N.C.A.A. Arbotech Pool. IOBC/wprs Bull. 20(1): 79-82.
Begum, M., G.M. Gurr, S.D. Wratten, P.R. Hedberg and H.I. Nicol. 2008. Using selective
food plants to maximize biological control of vineyard pests. J. Appl. Ecol. 43:
547–554.
Beizhou, S., Z. Jie, H. Jinghui, W. Hongying, K. Yun and Y. Yuncong. 2011. Temporal
dynamics of the arthropod community in pear orchards intercropped with
aromatic plants. Pest Manage. Sci. 67(9): 1107-1114.
Benz, G. 1971. Synergism of micro-organism and chemical insecticides, pp. 327-355. In
H.D. Burges and N.W. Hussey [eds.], Microbial control of insects and mites.
Academic Press. London, New York. 861 pp.
Berndt, L.A. and S.D. Wratten. 2005. Effects of alyssum flowers on the longevity,
fecundity, and sex ratio of the leafroller parasitoid Dolichogenidea tasmanica.
Biol. Control. 32: 65-69.
Bhatnagar, V.S and Davies, J.C. 1979. ICRISAT, Patancheru, Andhra Pradesh India
31 pp.
Blommers, L.H.M. 1994. Integrated pest management in European apple orchards. Annu.
Rev. Entomol. 39: 213-241.
Boller, E.F, F. Häni and H.M. Poehling. 2004. Ecological infrastructures: idea book on
functional biodiversity at the farm level, Landwirtschaftliche Beratungszentrale
Lindau, Lindau, Suisse.
Boucek, Z. and R.R. Askew. 1968. Index of Palearctic Eulophidae. In ‘‘Index of
Entomophagous Insects’’ (V. Delucchi and G. Remaudie`re, Eds.), Vol. 254. Le
Franc¸ois, Paris.
Brown, J.J. 1993. Codling moth integrated pest management. Proc. Wash. Staie Hort.
Assoc. 89: 68-71.
174
Brown, J.J. 1996. The compatibility of tebufenozide with a laboratory lepidopteran
host/hymenopteran parasitoid population. Biol. Control. 6: 96-104.
Brown, J.J. and Reed-Larsend. 1991. Ecdysteroids and insect host/parasitoid interactions.
Biol. Cont. 1: 136-143.
Brunner, A., M. Doerr and K. Granger. 2008. Management of Apple pest: codling moth,
leafroller, lacanobia and stink bugs // Milton- Free water Horticulture, Soc. Annu.
Meeting, Washington, USA. p.10-15.
Burts, E.C. 1983. Effectiveness of a soft-pesticides program on pear pests. J. Econ.
Entomol. 76: 936-941.
Carde, R.T. and A.K. Minks. 1995. Control of moth pests by mating disruptions:
Successes and constraints. Annu. Rev. Entomol. 40: 559-585.
Carlsen, S.C.K. and I.S. Fomsgaard. 2008. Biologically active secondary metabolites in
white clover (Trifolium repens L.): a review focusing on contents in the plant,
plant-pest interactions and transformation. Chemoecol. 18: 129-170.
Charmillot, P.J. and W.H. Riedl. 2000. “The future of codling moth control with
conventional insecticides, insect growth regulators and microbials” (Proc. of the
XXI Intern. Cong. Entomol. Brazil, August in press.)
Charmillot, P.J., D. Pasquier, B. Sauphanor, J.C. Bouvier and R. Olivier. 1999.
Carpocapse des pommes: premier cas de resistance au diflubenzuron en Suisse.
Rev. Suisse Vit. Arbor. Hort. 31: 129-132.
Chen, K.S., B.R. Funke, J.T. Schulz , F.I. Carlson and I. Proshald. 1974. Effects of
certain organophosphate and carbamate insecticides on Bacillus thuringiensis. J.
Econ. Entomol. 67: 471-473.
Clark, M.S. and S.H. Gage. 1997. Relationship between fruit yield and damage by
codling moth and plum curculio in a biologically-managed apple orchard. The
great lacks Entomol. 30(4): 89-94.
Clausen, P.1978. Introduced parasites and predators of arthropod pests and weeds: A
world review. U.S. Dept. Agric. Handbook No. 480. Olethreutidae, pp. 21 1- 218,
in C.P.C lausen (ed).
Croft, B.A. and M.T. AliNiazee. 1996. Biological control in deciduous tree fruit crops. In
T. W. Fisher (Ed.), Principles and application of biological control. UC. Press (in
press).
Croft, B.A. and D.R. Penman. 1989. Evaluating the IPM implementation process. In
Pesticides: issues and options for New Zealand. Ministry for the Environment.
New Zealand: 159-165.
Croft, B.A. and H.W. Riedl. 1991. Chemical control and resistance to pesticides of the
codling moth. In: Van der Geest and Evenhuis (Editors). World Crop Pest.
Tortricid Pests: Their biology, natural enemies and control. 5: 453-472.
175
Debras, J.F., A. Dussaud, R. Rieux and T. Dutoit. 2007. Recherche prospective sur le rôle
“source” des haies en production fruitière intégrée. Le cas des perce-oreilles :
Forficula auricularia L. et Forficula pubescens Gené, C.R. Acad. Sci. Fr. 330:
664-673.
Doerr, M.D., J. F. Brunner and K.R. Granger. 2012. Incorporating Organophosphate
Alternative Insecticides Into Codling Moth Management Programs in Washington
Apple Orchards. J. Integ. pest. Mange.. 3(2): E1-E4.
Dolstad, K.D. 1985. Biology and control of the codling moth in the Pacific Northwest.
M.P.M. Professional Paper. Simon Fraser University, Burnaby.
Dorn, S. 1993. Role of transformation inhibitors in fruit ecosystems. Acta Hort. 347: 245-
252.
Dorn , S. 1996. Gekoppelte Einflussgr ssen im Pflanzenschutz. Agrarforschung. 3: 295-
296.
Dorn, S., P. Schumacher, C. Abivardi and R. Meyhofer. 1999. Global and regional pest
insects and their antagonists in orchards: Spatial dynamics. Agric. Ecosyst.
Environ.73: 111-118.
Duso, C., V. Malagnini, A. Paganelli, L. Aldegheri, M. Bottini and S. Otto. 2004. Pollen
availability and abundance of predatory phytoseiid mites on natural and secondary
hedgerows. Biocontrol. 49: 397-415.
Dyer, L.E. and D.A. Landis. 1996. Effects of habitat, temperature, and sugar availability
on longevity of Eriborus terebrans (Hymenoptera: Ichneumonidae). Environ.
Entomol. 25: 1192-1201.
English-Loeb, G., M. Rhainds, T. Martinson and T. Ugine. 2003. Influence of
flowering cover crops on Anagrus parasitoids (Hymenoptera: Myrmaridae)
and Erythroneura leafhoppers (Homoptera: Cicadellidae) in New York
vineyards. J. Agric. Entomol. 5: 173-181.
Foster, M.A. and W.O. Ruesink.1984. Influence of flowering weeds associated with
reduced tillagein com on a black cutworm parasitoid Meteorus rubens Nees von
Esenbeck. Environ. Entomol. 13: 664-668.
Fukai, S. and B.R. Trenbath. 1993. Processes determining intercrop productivity and
yield of component crops. Field Crops Res. 34: 247-271.
Geier, P.W.1999. Population dynamics of codling moth, Cydia pomonella (L.)
(Tortricidae), in the Australian capital territory . Appl. J. Zool. 12: 381-416.
Glen, D.M. and C.C. Payne. 1983. Production and field evaluation of codling moth
granulosis virus for control of Cydia pomonella in the United Kingdom. Annu.
Appl. Biol. 104: 87-98.
Glen, D.M. 1982. Syndemis musculana (Hubner) (Lepidoptera: Tortricidae), a new leaf
roller attacking apples in the United Kingdom. Plant. Pathol. 31(3): 269-271.
176
Gurr, G., S.D. Wratten and M.A. Alteri. 2004. Ecological Engineering for Pest
Management: Advances in Habitat Manipulation for Arthropods. CSIRO
Publishing, Canberra.
Hagley, E.A.C. and M. Chiba. 1980. Efficacy of Phosmet and Azinophosmethyl for the
control of major insect pest of apple in Ontario // The Can. Entomol. 112: 1075-
1083.
Harcourt, D.G. 1986. Population dynamics of the diamondback moth in Southern
Ontario. In: Diamondback moth management (eds NS Talekar and TD Griggs).
Proceedings of the First International Workshop, 11-15 March 1985, Tainan,
Taiwan, The Asian Vegetable Research and Development Center, Shanhua,
Taiwan, AVRDC Publication No. 86-248, pp. 3-15.
Harder, D. 2008. Integrated Pest Management Practices for the Light Brown Apple Moth
in New Zealand: Implications for California. The Arboretum, University of
California at Santa Cruz Jeff Rosendale, Grower, Horticultural Consultant
Watsonville CA.
Haynes, R.J. 1980. Influence of the soil management practices on the orchard
agroecosystem. Agro- ecosyst. 6: 3-32.
Hickman, J.M. and S.D. Wratten. 1996. Use of Phacelia tanacetifolia strips to enhance
biological control of aphids by hoverfly larvae in cereal fields. J. Econ. Entomol.
89, 832–840.
Holb, I. 2004. Yield loss and disease development of Monilinia fructigena (Aderh. &
Ruhl.) Honey in an Organic Apple Orchard. J. Agric. Sci. Debrecen, 2004/15.
Holmgren, D. 2002. Permaculture: principles and pathways beyond sustainability.
Holmgren Design Services, Hepburn, VIC, Australia – recent and well presented
practical guide to applying permaculture principles (going well beyond
intercropping).
Hooks, C.R.R. and M.W. Johnson. 2003. Impact of agricultural diversification on the
insect community of cruciferous crops. Crop Prot. 22: 223-238.
Howell, J. F., A. L. Knight, T.R. Unruth, D.F. Brown, J.L. Krysan, C. R. Sell and P. A.
Kirsch. 1992. Control of codling moth in apple and pear with sex pheromones-
mediated mating disruption. J. Econ. Entomol. 85(3): 918-925.
Ignoffo, C.M. and B. Gregory. 1972. Efforts of Bacillus thuringiensis B-exotoxin on
larval maturation, adult longevity, fecundity, and egg viability in several species
of Lepidoptera. Environ. Entomol. 1: 269-272.
Jaques, R.P. and O.N. Morris. 1981. Compatibility of insect pathogens with other
methods of pest control and with different crops. In H. D. Burges (ed.) Microbial
control of pests and plant diseases. 1970-1980. Academic Press , London. p. 695-
715.
Jervis, M.A. and N.A.C. Kidd. 1996. Insect natural enemies: Practical approaches to their
study and evaluation. London: Chapman and Hall.
177
Jervis, M. A., N.A.C. Kidd, M.G. Fitton, T. Huddleston and H. A. Dawah. 1993. Flower-
visiting by hymenopteran parasitoids. J. Nat. His. 27: 67–105.
Judd, G.J.R., M.G.T. Gardiner and D.R. Thomson.1997. Control of Codling moth in
organically managed apple orchard by combining pheromone mediating mating
disruption, post harvest fruit removal and tree banding. Entomol. Exp. Appl. 83:
137-146.
Kienzle, J., C.P.W. Zebitz1, S. Brass and A. Athanassov. 1997. Abundance of Different
Tortricid Species and Their Parasitoid Antagonists in Ecological Apple Orchards
in Southern Germany. Entomol. Res. Org. Agric. pp. 211-221.
Kienzle, J., J. Zimmer, F. Volk and C.P.W. Zebitz. 2008. Field tests with Madex Plus
against CpGV-resistant codling moth populations in organic orchards in 2006.
In: Boos, Markus (Ed.) Ecofruit - 13th International Conference on Cultivation
Technique and Phytopathological Problems in Organic Fruit-Growing: Proc.
Conf. 18-20 February, 2008 at Weinsberg/Germany, pp. 261-264.
Kruess, A. and T. Tscharntke. 1994. Habitat fragmentation, species loss and biological
control. Sci. Res. 264: 1581–1584.
Kyamanywa, S. and E.M. Tukahirwa. 1988. Effect of mixed cropping beans, cowpea
and maize on the population of bean flower thrips, Megalulothrips sjostedti
(Trybom) (Tripidae). Insect. Sci. appl. 9(2): 255-9.
Lacey, L.A. and R.T. Unruh. 2005. Biological control of Codling moth (Cydia
pomonella, lepidoptera: tortricidae) and its role in integrated pest
management, with emphasis on entomopathogens. Vedelia, 12(1):33-60.
Lacey, L.A., D. Thomson, C. Vincent and S. P. Arthurs. 2008. Codling moth
granulovirus: a comprehensive review. Biocont. Sci. Technol. 18(7): 639-663.
Landis, D.A., S.D. Wratten and G.M. Gurr. 2000. Habitat management to conserve
natural enemies of arthropod pests in agriculture. Annu. Rev. Entomol. 45: 175–
201.
Lee, J.C., G.E. Heimpel and G.L. Leibee. 2004. Comparing floral nectar and aphid
honey dew diets on the longevity and nutrient levels of a parasitoid wasp.
Entomol. Exp. Appl. 111: 189-199.
Leius, K. 1960. Attractiveness of different food and flowers to the adults of some
Hymenopterous parasites. Can. Entomol. 5: 369-375.
Leius, K. 1967. Influence of wild flowers on parasitism of tent caterpillar and codling
moth. Can. Entomol. 99: 444-446.
Lethmayer, C., H. Hausdorf, J. Altenburger and S. Blumel. 2009. Trials of Alternative
Codling Moth (Cydia pomonella) Control Strategies in Austria. Intern. J. Fruit.
Sci: 9: 385-393.
178
Letourneau, D.K. and M.A. Altieri. 1983. Abundance pattern of predators Orious
tristicolor and its prey Frankliniella occidentallis habitat attraction in polyculture
versus monoculture. Environ. Entomol. 12: 1464-1469.
Litsinger, J.A. and K. Moody. 1976. ASA Special Publication 27: 293-316.
Lovat, C.J. 1990. Factors affecting fruit set/early fruit drop in avocado. California
Avocado Source Year book 74: 193-199.
MacLellan, C.R. 1999. Trends of Codling moth (Lepidoptera: Tarticidae) population over
12 years on several cultivars in an insecticides for orchard. Can. Entomol. 109(12)
1555-1562.
MacLeod, A.1999. Attraction and retention of Episyrphus balteatus DeGeer (Diptera:
Syrphidae) at an arable field margin with rich and poor floral resources. Agric.
Ecosyst. Environ. 73: 237-244.
Mattiacci, L., E. Hutter and S. Dorn.1999. Host Location of Hyssopus pallidus, a Larval
Parasitoid of the Codling Moth, Cydia pomonella. Biol. Cont. 15: 241-251
Miletic, N. and N. Tamas. 2009. Integralna Zastita jabuke: zbornik radova II.,
savetovanja. Invacije u vocarstvu. Beograd, p. 95-106 (Serbian).
Miletic, N., N. Tamas and D. Graora. 2011. Control of codling moth (Cydia pomonella,
L) in apple tree. Zemdirbyste- Agric. 98(2): 213-218.
Moffitt, H.R., P.H. Westigard and K.D. Mantey. 1988. Resistance to diflubenzuron in the
codling moth (Lepidoptera: Tortricidae). J. Econ. Entomol. 81: 1511-1515.
Nicole, J.B., J. Linda Thomson, P.M. Ridland, P. Cole and A.A. Hoffmann.2009. Cover
crops in Victorian apple orchards: Effects on production, natural enemies and
pests across a season. J. Crop Prot. 28: 675-683
Ogenga-Latigo, M.W., C.W. Baliddwa and J.K.O. Ampofo. 1993. Factors
influencing the incidence of black bean aphid, Aphis fabae Scop., in common
bean intercropped with maize. Afr. Crop Sci. J. 1(1): 49-58.
Pasquier, D and P.J. Charmillot. 2003. Effectiveness of twelve insecticides applied
topically to diapausing larvae of the codling moth, Cydia pomonella L.
Pheromone trap height effect on field catch of codling moth. Trop. Pest Manage.
Sci. 60: 305-308.
Patt, J.M., G.C. Hamilton and J.H. Lashomb. 1997. Foraging success of parasitoid wasps
on flowers: interplay of insect morphology, floral architecture and searching
behaviour. Entomol. Exp. Appl. 83: 21-30.
Pijls, J.W.A.M. 1996. ‘‘Apoanagyrus diversicornis. The Ecology of a Natural Enemy.’’
Ph.D. dissertation, Wageningen Agricultural Univ., The Netherlands.
Platt, J.O., J.S. Caldwell and L.T. Kok. 1999. Effect of buckwheat as a flowering border
on populations of cucumber beetles and their natural enemies in cucumber and
squash. Crop Prot. 18: 305-313.
179
Pluciennik, Z. 2012. The modern insecticide (chlorantraniliprole) used to control codling
moth (Cydia pomonella L.) J. Fruit and Ornamental Plant. Res. 20(2): 85-89.
Pluciennik, Z. and R.W. Olszak. 2010. The role of parasitoids in limiting the harmfulness
of leaf rollers in apple orchards. J. Plant Prot. Res. 50 (1): 1-8.
Pollini, A. 2000. Insecticidal activities in the control of codling moth // Informatore
Agrario. 56: 91-94.
Ponti, L., M.A. Altieri and A.P. Gutierrez. 2007. Effects of crop diversification levels and
fertilization regimes on abundance of Brevicoryne brassicae (L.) and its
parasitization by Diaeretiella rapae (M’Intosh) in broccoli. Agric. Forensic
Entomol. 9: 209-214.
Prasad, R. 2001. Management of okra fruit borer (Erias vitella Fab.) through interaction
of intercropping and insecticides. Indian. J. Environ. & Ecoplan. 5(1): 125-129.
Prasad, R., S.K. Sathi, U.K. Prasad and R. Prasad. 2007. Management of Bihar Hairy
catterpiller (Spilisoma obliqua Walker) infesting cauliflower. J. Plant Prot.
Environ. 4 (1): 135-139.
Prasad, R. 1998. Management of the insect pest complex of cauliflower with interactive
effects of some granular insecticides and intercropping. In: Abstract Res. Papers.
Intern. Conf. Pest and pesticides management for sustainable agriculture, held at
C.S.A.U and T, Khanpur between 11-13 December, p. 267-268.
Prasifka, J.R., N.P. Schmidt, K.A. Kohler, M.E. O’Neal, R.L. Hellmich and J.W. Singer.
2006. Effects of living mulches on predator abundance and sentinel prey in a
corn–soybean-forage rotation. Environ. Entomol. 35: 1423-1431.
Proverbs, M.D., J.R. Newton and D.M. Logan. 1966. Orchard assessment of the sterile
male technique for control of the codling moth, Caipocapsa pomonella (L.)
(Lepidoptera: Olethreutidae). Can. Entomol. 98: 90-95.
Putman, W.L. 1963. The codling moth, Carpocapsa pomonella (L.) (Lepidoptera:
Toxtricidae): A review with special reference to Ontario. Proc. Entomol. Soc. Ont.
93: 22-60.
Racette, G., G. Chouinard, C. Vincent and S.B. Hill. 1992. Ecology and management of
the plum curculio, Conotrachelus nenuphar (Coleoptera: Curculionidae), in apple
orchards. Phytoprotection. 73: 85-100.
Rafoss, T. and M.G. Saethre. 2003. Spatial and temporal distribution of bioclimatic
potential for the codling moth and the Colorado potato beetle in Norway: Model
predictions versus climate and field data from the 1990s. Agric. For. Entomol.
5(1): 75-85.
Rao, Ramana, B.V and M. Rao Srinivasa. 1996. In: Climate Variability and
Agriculture. Narosa Pub. Hs. New Delhi, India. pp 281-294.
180
Rao, V.P., M.A. Ghani, T. Sankaran and K.C . Mathur. 1971. Codling moth - Cydia
pomonella (L.) (Lepidoptera, Olethreutidae), In Review of the biological control
of insects and other pests in South-East Asia and the Pacific region. Technical
communication no. 6. Commonwealth institute of biological control, Trinidad,
West Indies. Commonwealth Agricultural Bureaux, Faniham Royal, England. pp.
3-4.
Rieux, R., S. Simon and H. Defrance. 1999. Role of hedgerows and ground cover
management on arthropod populations in pear orchards. Agric. Ecosyst. Environ.
73: 129-140.
Risch, S.J., D. Andow and M.A. Altieri. 1983. Agroecosystem and biodiversity for
pest control: Data tentative conclusions and new research direction. Environ.
Entomol. 12: 625-629.
Root, R.B. 1973. Organization of a plant-arthropod association in simple and diverse
habitats: the fauna of collards (Brassica oleracea). Ecol. Monogr. 43: 95-118.
Russell, E. 1989. Enemies hypothesis: a review of the effect of vegetational diversity on
predatory insects and parasitoids. Environ. Entomol. 18: 590-599.
Saljoqi, A.U.R., Irfanullah, F. Maula and S. Sattar. 2003. Field efficacy of various
insecticides and insect growth regulator against codling moth (Cydia pomonella
L.) at two different altitudes in Swat Valley. Pak. J. Biol. Sci. 6(4): 394-396.
Satara, J., K. Nadova and F. Kocourek. 2006. Insecticides resistance in codling moth // J.
Fruit and ornamental plant Res. 14(3): 99-106.
Sathi, S.K., R. Prasad, D.K. Matho and D. Prasad. 2008. Integrated Management of
Diamond Back Moth infesting cauliflower through intercropping, insecticides and
their interaction. J. Appl. Biol. 18 (1-2): 26-33.
Shah, P. 2008. Entomologists Targeting Light Brown Apple Moth.” University of
California News. http://www.universityofcalifornia.edu/news/article/9323.
Sigsgaard, L. 2011. Conservation biological control of codling moth, Cydia pomonella.
Landscape Management for Functional Biodiversity IOBC-WPRS. Bull. 100:.
123-126.
Sigsgaard, L. 2014. Conservation biological control of codling moth, Cydia pomonella.
IOBC-WPRS Bull. 100: 123-126.
Smith, M.W., D.C. Arnold, R.D. Eikenbary, N.R. Rice, A. Shiferaw, B.S. Cheary and
B.L. Car-roll. 1996. Influence of ground cover on beneficial arthropods in pecan.
Biol. Control. 6: 164-176.
Sommaggio, D. 1999. Syrphidae: can they be used as environmental bioindicators?
Agric. Ecosyst. Environ. 74: 343-356.
Srinivasa Rao, M.D. Reddyl and T.V.K. Singh 1999. In: Fifty years of Dryland
Agricultural Research in India (Singh, H.P. et al., OOs.) CRIDA, Hyderabad
India. pp 163-178.
181
Srinivasa Rao, M., K.D. Reddyl, T.V.K. Singh and G.S. Reddy. 2002. Crop-Crop
diversity As a key component of IPM - A Rev. Agric. Res. 23(4): 272-280.
Steel, R.G.D. and J.H. Torrie. 1980. Principles and procedures of statistics, 2nd ed.
McGraw Hill Book Co, Singapore. p.172-177.
Stephens, C.J., N.A. Schellhorn, G.M. Wood and A.D. Austin. 2006. Parasitic wasp
assemblages associated with native and weedy plant species in an agricultural
landscape. Aust. J. Entomol. 45: 176-184.
Theunissen, J. 1994. Intercropping in field vegetable crops: Pest management by agro
system diversification an overview. Pest. Sci. 42: 65-68.
Thies, C. and T. Tscharntke. 1999. Landscape structure and biological control in agro
ecosystems. Pest Sci. 285: 893-895.
Tillman, G., H. Schomberg, S. Phatak, B. Mullinix, S. Lachnicht, P. Timper and D.
Olson. 2004. Influence of cover crops on insect pests and predators in
conservation tillage cotton. J. Econ. Entomol. 97: 1217-1232.
Tomkins, A.R. 1984. Tortricid pest management in Canterbury apple orchards. Ph.D.
dissertation, Lincoln College, Canterbury University.
Tomova, A. and I. Rangelova. 1977. Control of the codling moth by biological means.
Rastitelna Zashchita. 7: 25-26.
Tscharntke, T., A.M. Klein, A. Kruess, I. Steffan-Dewenter and C. Thies. 2005.
Landscape perspectives on agricultural intensification and biodiversity-ecosystem
service management. Ecol. Lett. 8: 857-874.
Tunaz, H. and N. Uygun. 2004. Insect growth regulator for the insect pest control // Turk.
J. Agric. For. 28: 377-387.
Vandermeer, J.H. 1989. The ecology of intercropping. Cambridge University Press, ISBN
9780521346894, Cambridge. pp. 237.
Velcheva, N., A. Atanassov, O. Karadjova and Z. Hubenov. 2012. Parasitoid assemblages
isolated from externally feeding lepidopterans and codling moth (Cydia
pomonella l., Tortricidae) in a young apple orchard in west Bulgaria. Bulgarian. J.
Agri. Sci. 18 (5): 675-681.
Wackers, F.L., P.C.J. van Rijn and J. Bruin. 2005. Plantprovided food and herbivore–
carnivore interactions: A protective mutualism and its applications. Cambridge:
Cambridge University Press.
Wade, M.R. and S.D. Wratten. 2007. Excised or intact inflorescences? Methodological
effects on parasitoid wasp longevity. Biol. Control. 40: 347-354.
Wan, N.F., Y.J. Xiang, X.J. Gua, J.X. Jianga, J.H. Wub and B. Li. 2014. Ecological
engineering of ground cover vegetation promotes biocontrol services in peach
orchards. Ecol. Eng. 64: 62-65.
182
Weddle, P.W., S.C. Welter and D. Thomson. 2009. History of the IPM in California
pears-50 Years of pesticides use and the transition to biologically intensive IPM //
Pest. Manage. Sci. 65: 1287-1292.
Westigard P.H. 1979. Codling moth: control on pears with diflubenzuron and effects on
non-target pest and beneficial species. J. Econ. Entomol. 72: 552-554.
Westigard P.H and L.J. Gut 1986. Codling moth ((Lepidoptera: Tortricidae) control on
pears with modified programs using growth regulators. J. Econ. Entomol. 79: 247-
249.
Winkler K., F. Wäckers, G. Bukovinszkine-Kissa and J. Lenteren. 2006. Sugar resources
are vital for Diadegma semiclausum fecundity under field conditions. Basic. Appl.
Ecol. 7: 133-140.
183
SUMMARY
The studies were carried out on the population dynamics, molecular
characterization and management of C. pomonella at District Swat during the year 2012
and 2013. The main objectives of the studies were to study the population dynamics of C.
pomonella in three main apple growing areas and also to find out the influence of abiotic
factors, like relative humidity (R.H) at morning (0300Z) and at evening (1200Z),
maximum and minimum temperature and total rainfall on the population fluctuations of
adults male C. pomonella catches in the pheromones traps by using Standard
Meteorological Weeks (SMW) through correlation and multivariate regression models.
Furthermore, molecular characterization of the C. pomonella was studied to detect
variation in the population of C. pomonella on molecular level in different samples
collected from aforementioned three locations, in addition to checking out the biological
efficacy of different insecticides against C. pomonella alone and in integration with
growing of different intercrops for a successful management of the C. pomonella and
their impact on its associated parasitoids such as egg larval parasitoid A. quadridentata
(Hymenoptera; Braconidae) and gregarious ectoparasitoid H. pallidus (Hymenoptera;
Eulophidae). In the synchronized effect, the results of best insecticide, intercrop and their
synchronized effect were evaluated for the management of C. pomonella and its impact
was studied on its associated parasitoids and yield of apple fruit. The data on post-
treatment regarding fruit drops and percent infestation were recorded fortnightly after the
application of various treatments. The data on yield in kg per plant were, however,
recorded at the time of harvest for each experiment and percent avoidable losses in yield
and gain in the yield due to protection measures were also calculated.
The first peak population of C. pomonella observed at Matta, Madyan and Kalam
were 11.25±1.25, 11.0±1.03 and 8.25±0.62 moths/trap in 25th
, 27th
and 29th
SMW
respectively, whilst the second peak population were 12.0±0.81, 10.25±0.9 and 9.25±0.86
moths/trap in all the three locations in 33rd
SMW during the year 2012. During the year
2013, the first and second peak population at Matta were 15.75±1.65 & 13.0±0.81
moths/trap in 26th
and 32nd
SMW, at Madyan, 10.25±0.81 & 9.00±0.70 moths/trap in 29th
and 35th
SMW and at Kalam were, 7.25±1.25 & 7.50±0.95 moths/trap in 27th
and 30th
SMW respectively. Correlation matrix revealed that C. pomonella showed positive
significant correlation with both maximum and minimum temperature, whilst
nonsignificant negative correlation with percent relative humidity (Morning and evening).
184
Nonetheless, C. pomonella showed significantly negative association with total rainfall
except in Matta. Multiple regression models explained 68.78 to 83.42% variability due to
meteorological factors in the population dynamics of C. pomonella at all the three
locations at Swat during the year 2012 and 2013.
Population variation in C. pomonella was studied by using RAPD markers on
three geographical populations i.e. Matta, Madyan and Kalam from Swat Pakistan.
Genomic DNA was extracted from 30 overwintering larvae of each population. Out of 30
tested primers, 21 amplified 157 polymorphic bands in three populations. The mean gene
frequency (f), gene diversity (I) and Shannon's information index (h) for three
populations were 1.33, 0.30 and 0.43 respectively. Nei’s unbiased measures of genetic
identity and genetic distance revealed that higher genetic distance (97.87%) was observed
among the isolates from Kalam and Madyan whereas low genetic distance (35.58%) was
calculated for C. pomonella isolates from Matta and Madyan. Similarly the Nei's genetic
identity divulged that higher genetic similarity (70.06%) was resided by the C. pomonella
population at Matta and Madyan whilst the low level of identity (37.58%) were examined
in isolates from Madyan and Kalam.
The results pertaining to the efficacy of different novel insecticides (Match®,
Madex®, Delegate
®, Timer
® and Assail
®) divulged that Match insecticides afforded less
mean fruit drop (2.50) and minimum percent infestation due to C. pomonella (21.39%)
compared to all other treatments including control. The said treatments also proved
effective and safe for the two associated parasitoids under studies i.e. A. quadridentata
(Hymenoptera: Braconidae) and H. pallidus (Hymenoptera: Eulophidae) having mean
percent parasitism 26.43% and 27.89% respectively, whilst the rest of the treatments were
encouraged minimum number of biological control agents. Higher biological efficacy
(86.67%) was recorded for the Match insecticide whilst the lowest were calculated for
Assail (39.56%). Similarly, highest yield (kg/tree) were obtained from Match treated
plots (86.81±0.42), which were significantly higher than all the treatments including
control plots during both the years of studies. Likewise, maximum gain in the yield
(62.66%) over control was attributed to Match insecticide which was significantly higher
than the rest of the treatments including control.
Habitat manipulation through intercropping [(Brassica campestris,
Brassacicacae), Glycine max, leguminacae), Trifolium alexandrinum, Fabaceae) and
185
Triticum aestivum, Poaceae)], had a substantial effect on all parameters studied in the
apple orchard for the management of C. pomonella. Minimum mean fruit drop (2.87)
were recorded for the intercrop Apple + Trifolium which were significantly lower than all
the other intercrops including control (Apple sole). Likewise, minimum percent
infestation (57.19%) was observed for the Apple + Trifolium, whilst maximum 85.86%
was noticed in the Apple sole. Same intercrop had also good impact not only on the C.
pomonella in curtailing its mean moth catch (1.46) through traps but also maximized
percent parasitism of A. quadridentata (Hymenoptera: Braconidae) (40.11%) and H.
pallidus (Hymenoptera: Eulophidae) (30.09%) in the same intercrop during both the years
of studies. Similarly, highest yield (kg/tree) were produced by the plots having Apple +
Trifolium intercrops (76.62±1.11), whilst minimum yield were recorded for Apple +
Wheat (61.47±1.11) followed by apple sole (52.75±1.23). The results further showed that
maximum yield losses (31.51%) were avoided by the intercrop Apple + Trifolium and
gain in the yield (43.90%) over control was also attributed to the same intercrop, whilst
all other intercrops were inferior in avoiding the loses and gain in the yield.
Studies regarding the synchronized effect of best insecticide and intercrops were
also evaluated during the year 2013. The results disclosed that Apple + Trifolium
(Trifolium alexandrinum) + Match® (T3) afforded minimum mean fruit drop (2.07) and
lower percent infestation (36.41%), followed by Match®
(T1) (46.74%), Apple +
Trifolium (T2) (59.49%) and maximum was in control plot (T4) (67.36%). Likewise,
minimum mean number of C. pomonella adults (1.30 moths/traps) was monitored in the
Apple + Trifolium + Match®
(T3), whilst all other treatments including control had the
maximum number of C. pomonella adults catch in the traps. The percent parasitism of A.
quadridentata and H. pallidus ` were significantly higher in T3 had 32.83 and 34.66%
respectively. Maximum yield were recorded by T3 (94.75±.62 kg/tree) followed by T1
(83.75±1.19 kg/tree), T2 (77.00±1.17 kg/tree) and Apple sole (T4) (57.75±0.14 kg/tree).
Maximum losses (39.05%) were avoided in T3, whilst the percent gain in yield (64.07%)
due to control measures was also attributed to T3.
It can be concluded from these studies that Match (IGR) can be used in integration
with intercrop in the apple orchard for the effective management of C. pomonella which
is safe for the natural enemies and has a profound effect on the yield. The use of these
techniques may play a more prominent role in integrated control of C. pomonella in
future.
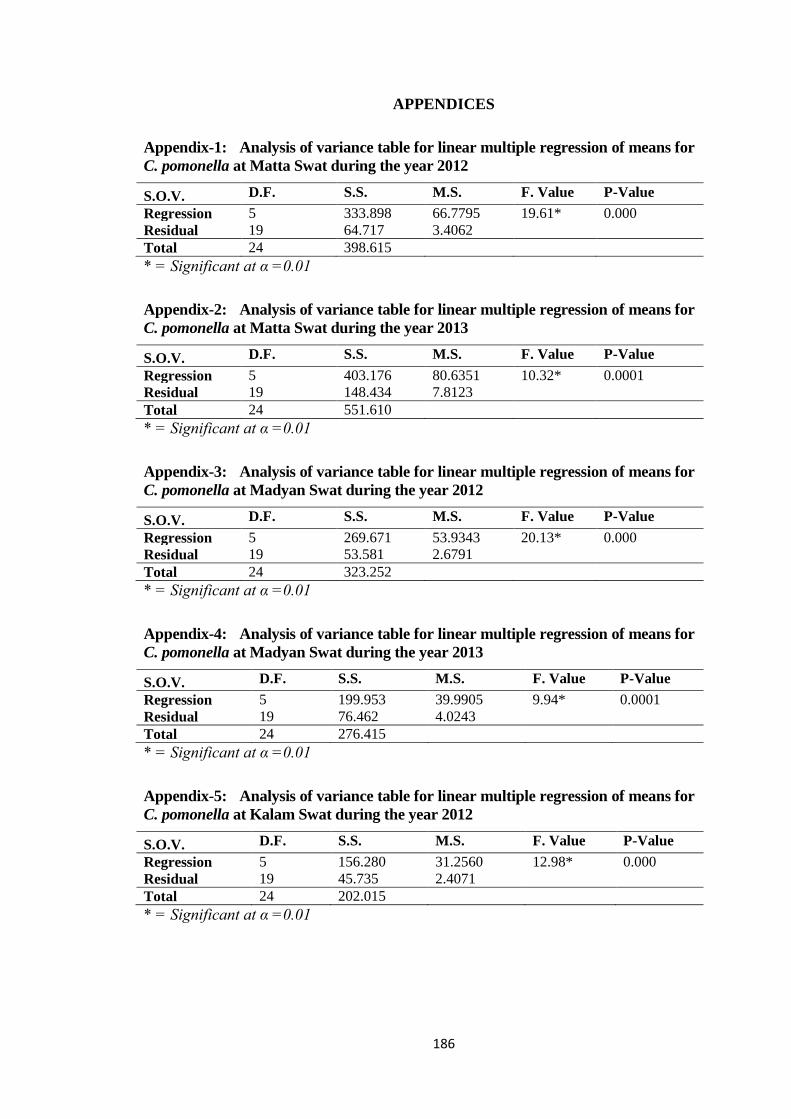
186
APPENDICES
Appendix-1: Analysis of variance table for linear multiple regression of means for
C. pomonella at Matta Swat during the year 2012
S.O.V. D.F. S.S. M.S. F. Value P-Value
Regression 5 333.898 66.7795 19.61* 0.000
Residual 19 64.717 3.4062
Total 24 398.615
* = Significant at α =0.01
Appendix-2: Analysis of variance table for linear multiple regression of means for
C. pomonella at Matta Swat during the year 2013
S.O.V. D.F. S.S. M.S. F. Value P-Value
Regression 5 403.176 80.6351 10.32* 0.0001
Residual 19 148.434 7.8123
Total 24 551.610
* = Significant at α =0.01
Appendix-3: Analysis of variance table for linear multiple regression of means for
C. pomonella at Madyan Swat during the year 2012
S.O.V. D.F. S.S. M.S. F. Value P-Value
Regression 5 269.671 53.9343 20.13* 0.000
Residual 19 53.581 2.6791
Total 24 323.252
* = Significant at α =0.01
Appendix-4: Analysis of variance table for linear multiple regression of means for
C. pomonella at Madyan Swat during the year 2013
S.O.V. D.F. S.S. M.S. F. Value P-Value
Regression 5 199.953 39.9905 9.94* 0.0001
Residual 19 76.462 4.0243
Total 24 276.415
* = Significant at α =0.01
Appendix-5: Analysis of variance table for linear multiple regression of means for
C. pomonella at Kalam Swat during the year 2012
S.O.V. D.F. S.S. M.S. F. Value P-Value
Regression 5 156.280 31.2560 12.98* 0.000
Residual 19 45.735 2.4071
Total 24 202.015
* = Significant at α =0.01
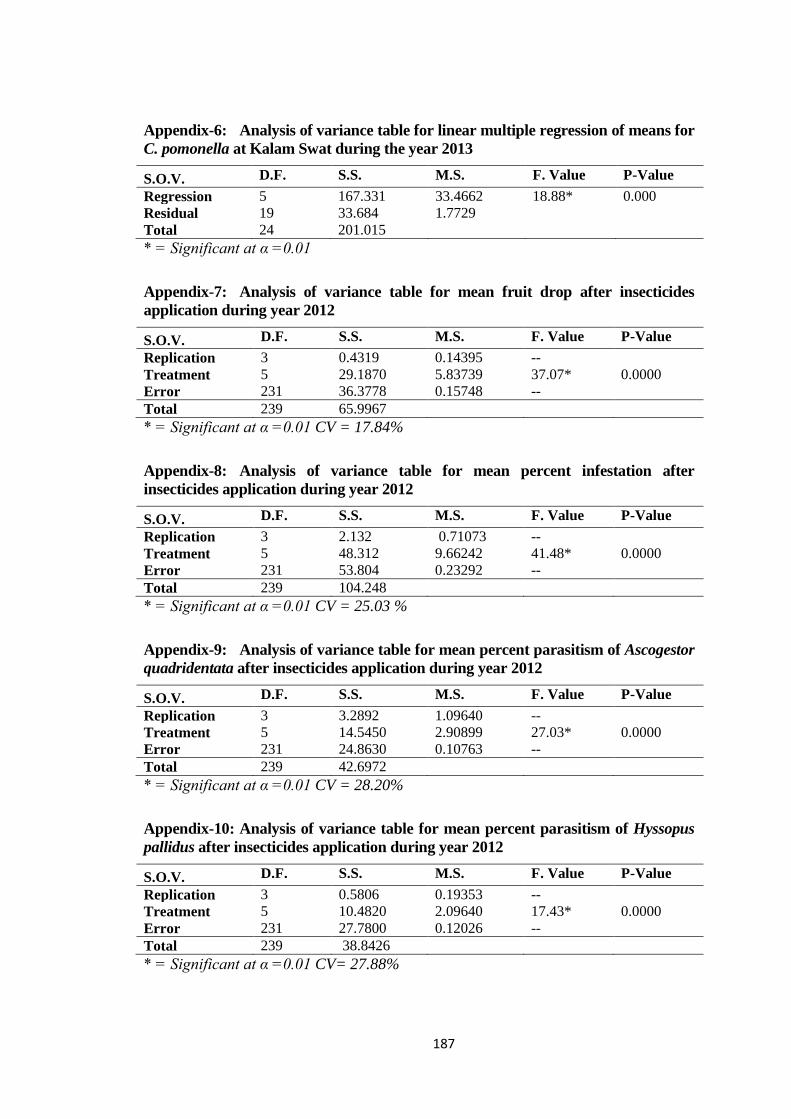
187
Appendix-6: Analysis of variance table for linear multiple regression of means for
C. pomonella at Kalam Swat during the year 2013
S.O.V. D.F. S.S. M.S. F. Value P-Value
Regression 5 167.331 33.4662 18.88* 0.000
Residual 19 33.684 1.7729
Total 24 201.015
* = Significant at α =0.01
Appendix-7: Analysis of variance table for mean fruit drop after insecticides
application during year 2012
S.O.V. D.F. S.S. M.S. F. Value P-Value
Replication 3 0.4319 0.14395 --
Treatment 5 29.1870 5.83739 37.07* 0.0000
Error 231 36.3778 0.15748 --
Total 239 65.9967
* = Significant at α =0.01 CV = 17.84%
Appendix-8: Analysis of variance table for mean percent infestation after
insecticides application during year 2012
S.O.V. D.F. S.S. M.S. F. Value P-Value
Replication 3 2.132 0.71073 --
Treatment 5 48.312 9.66242 41.48* 0.0000
Error 231 53.804 0.23292 --
Total 239 104.248
* = Significant at α =0.01 CV = 25.03 %
Appendix-9: Analysis of variance table for mean percent parasitism of Ascogestor
quadridentata after insecticides application during year 2012
S.O.V. D.F. S.S. M.S. F. Value P-Value
Replication 3 3.2892 1.09640 --
Treatment 5 14.5450 2.90899 27.03* 0.0000
Error 231 24.8630 0.10763 --
Total 239 42.6972
* = Significant at α =0.01 CV = 28.20%
Appendix-10: Analysis of variance table for mean percent parasitism of Hyssopus
pallidus after insecticides application during year 2012
S.O.V. D.F. S.S. M.S. F. Value P-Value
Replication 3 0.5806 0.19353 --
Treatment 5 10.4820 2.09640 17.43* 0.0000
Error 231 27.7800 0.12026 --
Total 239 38.8426
* = Significant at α =0.01 CV= 27.88%
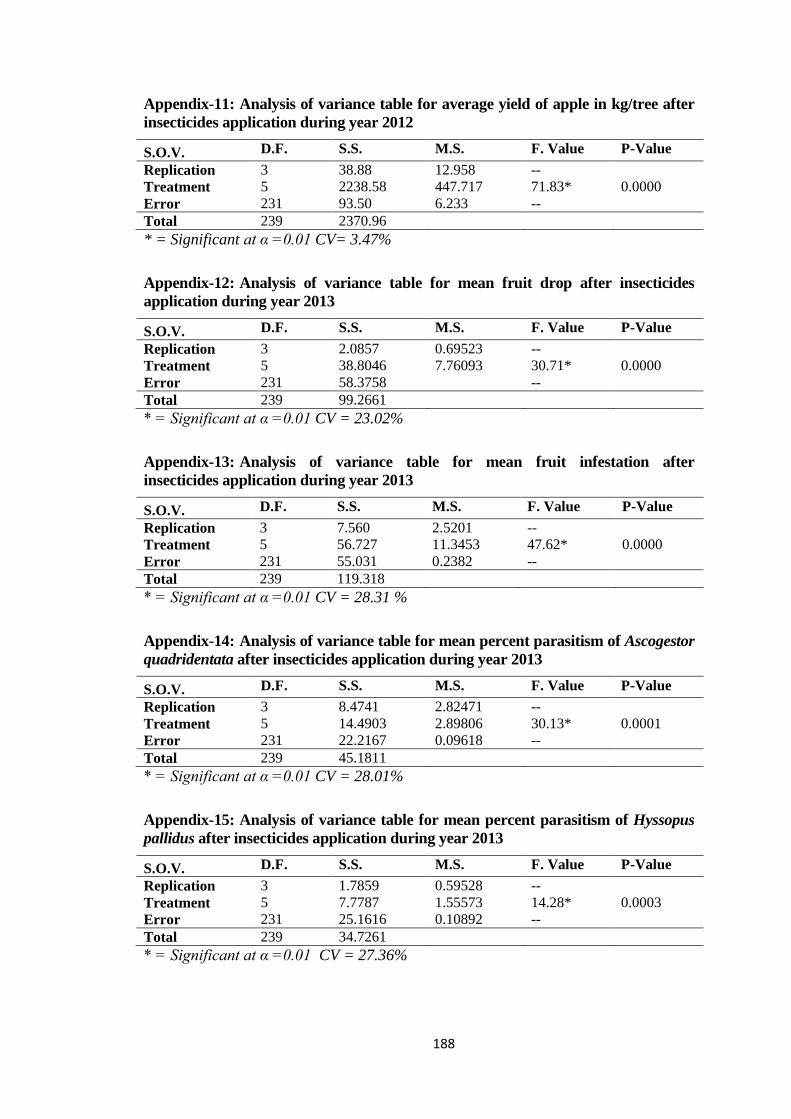
188
Appendix-11: Analysis of variance table for average yield of apple in kg/tree after
insecticides application during year 2012
S.O.V. D.F. S.S. M.S. F. Value P-Value
Replication 3 38.88 12.958 --
Treatment 5 2238.58 447.717 71.83* 0.0000
Error 231 93.50 6.233 --
Total 239 2370.96
* = Significant at α =0.01 CV= 3.47%
Appendix-12: Analysis of variance table for mean fruit drop after insecticides
application during year 2013
S.O.V. D.F. S.S. M.S. F. Value P-Value
Replication 3 2.0857 0.69523 --
Treatment 5 38.8046 7.76093 30.71* 0.0000
Error 231 58.3758 --
Total 239 99.2661
* = Significant at α =0.01 CV = 23.02%
Appendix-13: Analysis of variance table for mean fruit infestation after
insecticides application during year 2013
S.O.V. D.F. S.S. M.S. F. Value P-Value
Replication 3 7.560 2.5201 --
Treatment 5 56.727 11.3453 47.62* 0.0000
Error 231 55.031 0.2382 --
Total 239 119.318
* = Significant at α =0.01 CV = 28.31 %
Appendix-14: Analysis of variance table for mean percent parasitism of Ascogestor
quadridentata after insecticides application during year 2013
S.O.V. D.F. S.S. M.S. F. Value P-Value
Replication 3 8.4741 2.82471 --
Treatment 5 14.4903 2.89806 30.13* 0.0001
Error 231 22.2167 0.09618 --
Total 239 45.1811
* = Significant at α =0.01 CV = 28.01%
Appendix-15: Analysis of variance table for mean percent parasitism of Hyssopus
pallidus after insecticides application during year 2013
S.O.V. D.F. S.S. M.S. F. Value P-Value
Replication 3 1.7859 0.59528 --
Treatment 5 7.7787 1.55573 14.28* 0.0003
Error 231 25.1616 0.10892 --
Total 239 34.7261
* = Significant at α =0.01 CV = 27.36%
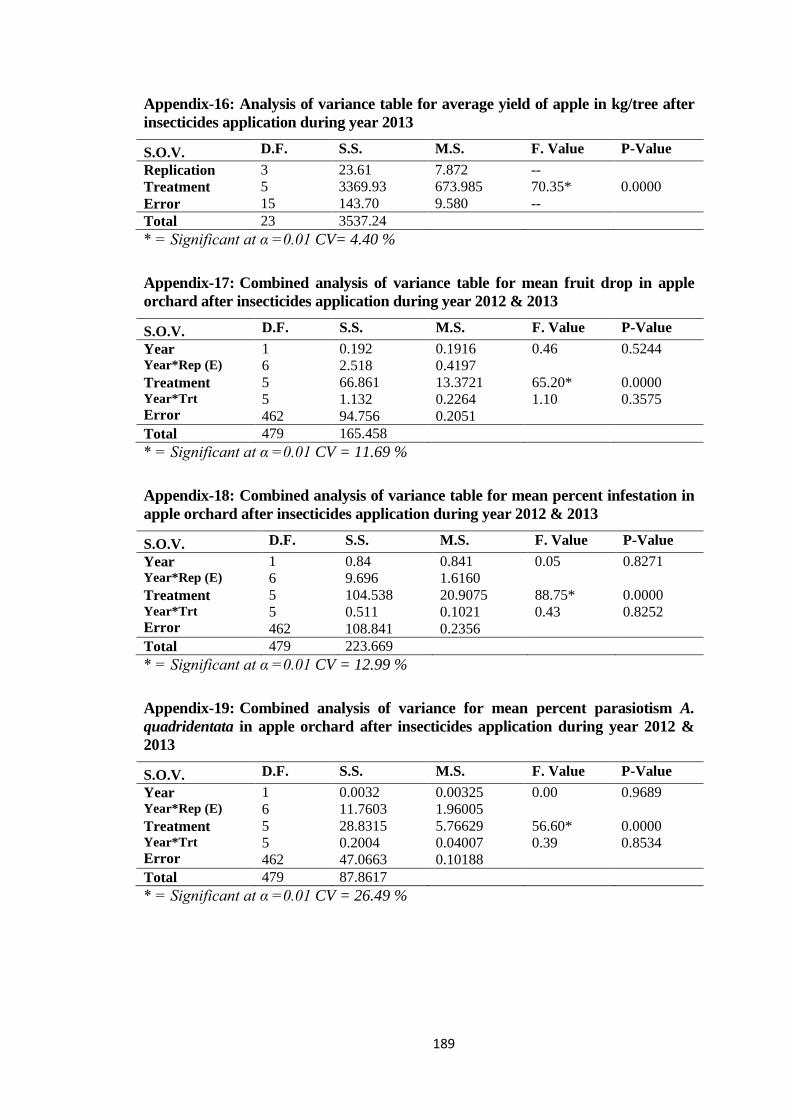
189
Appendix-16: Analysis of variance table for average yield of apple in kg/tree after
insecticides application during year 2013
S.O.V. D.F. S.S. M.S. F. Value P-Value
Replication 3 23.61 7.872 --
Treatment 5 3369.93 673.985 70.35* 0.0000
Error 15 143.70 9.580 --
Total 23 3537.24
* = Significant at α =0.01 CV= 4.40 %
Appendix-17: Combined analysis of variance table for mean fruit drop in apple
orchard after insecticides application during year 2012 & 2013
S.O.V. D.F. S.S. M.S. F. Value P-Value
Year Year*Rep (E)
1
6
0.192
2.518
0.1916
0.4197
0.46
0.5244
Treatment Year*Trt
Error
5
5
462
66.861
1.132
94.756
13.3721
0.2264
0.2051
65.20*
1.10
0.0000
0.3575
Total 479 165.458
* = Significant at α =0.01 CV = 11.69 %
Appendix-18: Combined analysis of variance table for mean percent infestation in
apple orchard after insecticides application during year 2012 & 2013
S.O.V. D.F. S.S. M.S. F. Value P-Value
Year Year*Rep (E)
1
6
0.84
9.696
0.841
1.6160
0.05
0.8271
Treatment Year*Trt
Error
5
5
462
104.538
0.511
108.841
20.9075
0.1021
0.2356
88.75*
0.43
0.0000
0.8252
Total 479 223.669
* = Significant at α =0.01 CV = 12.99 %
Appendix-19: Combined analysis of variance for mean percent parasiotism A.
quadridentata in apple orchard after insecticides application during year 2012 &
2013
S.O.V. D.F. S.S. M.S. F. Value P-Value
Year Year*Rep (E)
1
6
0.0032
11.7603
0.00325
1.96005
0.00
0.9689
Treatment Year*Trt
Error
5
5
462
28.8315
0.2004
47.0663
5.76629
0.04007
0.10188
56.60*
0.39
0.0000
0.8534
Total 479 87.8617
* = Significant at α =0.01 CV = 26.49 %
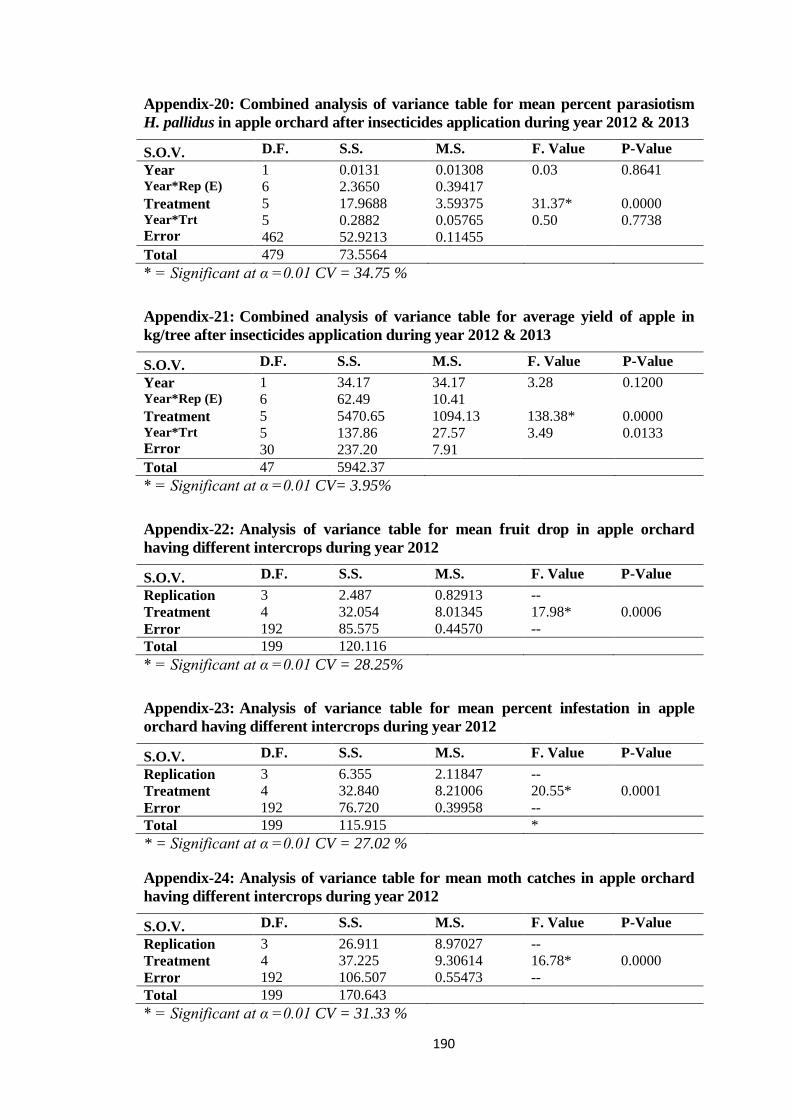
190
Appendix-20: Combined analysis of variance table for mean percent parasiotism
H. pallidus in apple orchard after insecticides application during year 2012 & 2013
S.O.V. D.F. S.S. M.S. F. Value P-Value
Year Year*Rep (E)
1
6
0.0131
2.3650
0.01308
0.39417
0.03
0.8641
Treatment Year*Trt
Error
5
5
462
17.9688
0.2882
52.9213
3.59375
0.05765
0.11455
31.37*
0.50
0.0000
0.7738
Total 479 73.5564
* = Significant at α =0.01 CV = 34.75 %
Appendix-21: Combined analysis of variance table for average yield of apple in
kg/tree after insecticides application during year 2012 & 2013
S.O.V. D.F. S.S. M.S. F. Value P-Value
Year Year*Rep (E)
1
6
34.17
62.49
34.17
10.41
3.28
0.1200
Treatment Year*Trt
Error
5
5
30
5470.65
137.86
237.20
1094.13
27.57
7.91
138.38*
3.49
0.0000
0.0133
Total 47 5942.37
* = Significant at α =0.01 CV= 3.95%
Appendix-22: Analysis of variance table for mean fruit drop in apple orchard
having different intercrops during year 2012
S.O.V. D.F. S.S. M.S. F. Value P-Value
Replication 3 2.487 0.82913 --
Treatment 4 32.054 8.01345 17.98* 0.0006
Error 192 85.575 0.44570 --
Total 199 120.116
* = Significant at α =0.01 CV = 28.25%
Appendix-23: Analysis of variance table for mean percent infestation in apple
orchard having different intercrops during year 2012
S.O.V. D.F. S.S. M.S. F. Value P-Value
Replication 3 6.355 2.11847 --
Treatment 4 32.840 8.21006 20.55* 0.0001
Error 192 76.720 0.39958 --
Total 199 115.915 *
* = Significant at α =0.01 CV = 27.02 %
Appendix-24: Analysis of variance table for mean moth catches in apple orchard
having different intercrops during year 2012
S.O.V. D.F. S.S. M.S. F. Value P-Value
Replication 3 26.911 8.97027 --
Treatment 4 37.225 9.30614 16.78* 0.0000
Error 192 106.507 0.55473 --
Total 199 170.643
* = Significant at α =0.01 CV = 31.33 %
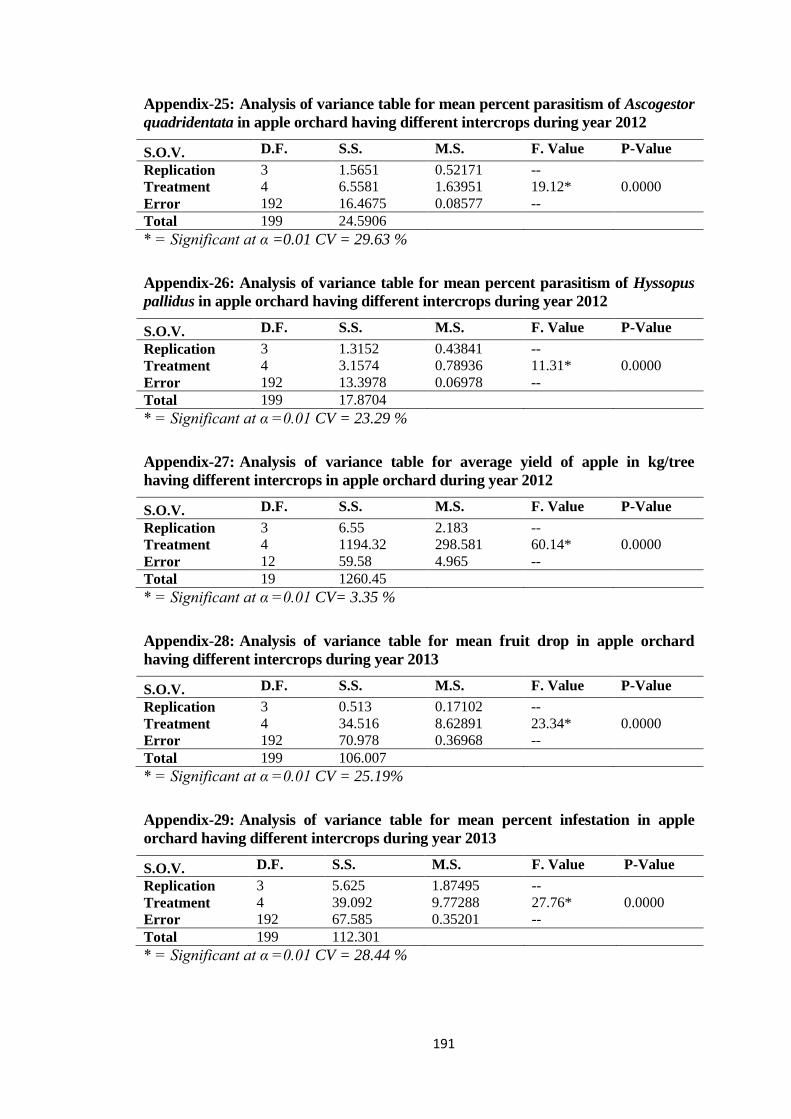
191
Appendix-25: Analysis of variance table for mean percent parasitism of Ascogestor
quadridentata in apple orchard having different intercrops during year 2012
S.O.V. D.F. S.S. M.S. F. Value P-Value
Replication 3 1.5651 0.52171 --
Treatment 4 6.5581 1.63951 19.12* 0.0000
Error 192 16.4675 0.08577 --
Total 199 24.5906
* = Significant at α =0.01 CV = 29.63 %
Appendix-26: Analysis of variance table for mean percent parasitism of Hyssopus
pallidus in apple orchard having different intercrops during year 2012
S.O.V. D.F. S.S. M.S. F. Value P-Value
Replication 3 1.3152 0.43841 --
Treatment 4 3.1574 0.78936 11.31* 0.0000
Error 192 13.3978 0.06978 --
Total 199 17.8704
* = Significant at α =0.01 CV = 23.29 %
Appendix-27: Analysis of variance table for average yield of apple in kg/tree
having different intercrops in apple orchard during year 2012
S.O.V. D.F. S.S. M.S. F. Value P-Value
Replication 3 6.55 2.183 --
Treatment 4 1194.32 298.581 60.14* 0.0000
Error 12 59.58 4.965 --
Total 19 1260.45
* = Significant at α =0.01 CV= 3.35 %
Appendix-28: Analysis of variance table for mean fruit drop in apple orchard
having different intercrops during year 2013
S.O.V. D.F. S.S. M.S. F. Value P-Value
Replication 3 0.513 0.17102 --
Treatment 4 34.516 8.62891 23.34* 0.0000
Error 192 70.978 0.36968 --
Total 199 106.007
* = Significant at α =0.01 CV = 25.19%
Appendix-29: Analysis of variance table for mean percent infestation in apple
orchard having different intercrops during year 2013
S.O.V. D.F. S.S. M.S. F. Value P-Value
Replication 3 5.625 1.87495 --
Treatment 4 39.092 9.77288 27.76* 0.0000
Error 192 67.585 0.35201 --
Total 199 112.301
* = Significant at α =0.01 CV = 28.44 %
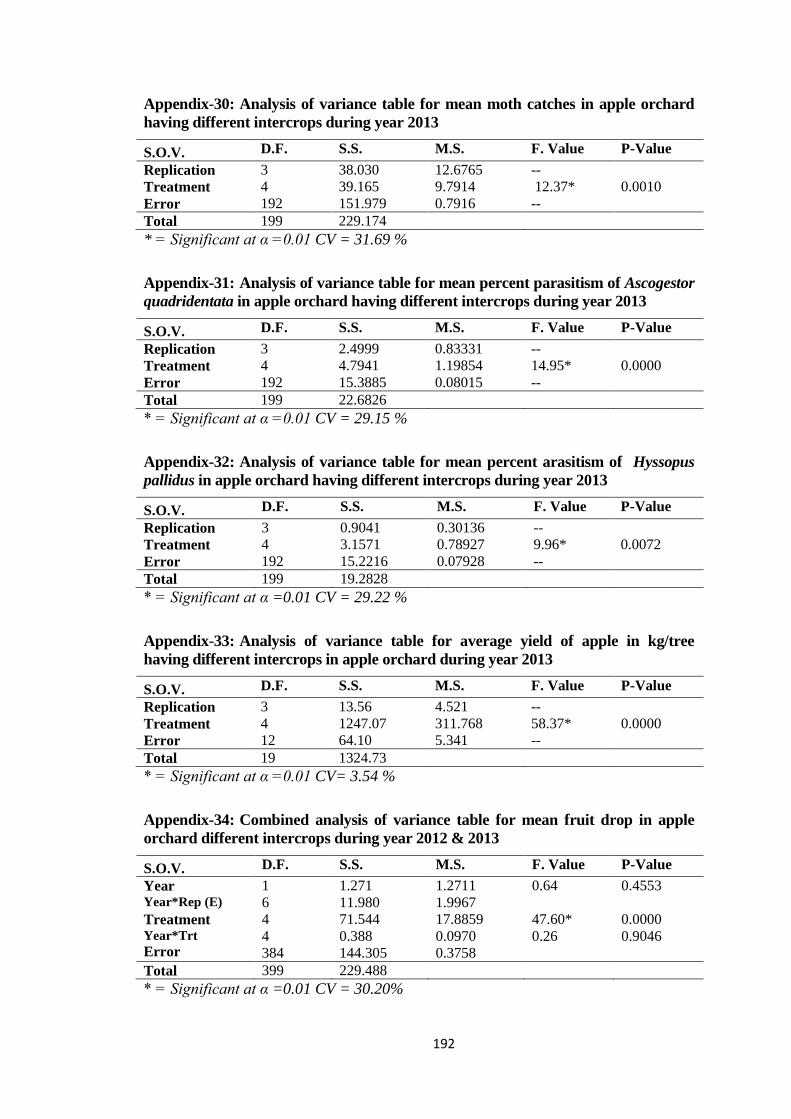
192
Appendix-30: Analysis of variance table for mean moth catches in apple orchard
having different intercrops during year 2013
S.O.V. D.F. S.S. M.S. F. Value P-Value
Replication 3 38.030 12.6765 --
Treatment 4 39.165 9.7914 12.37* 0.0010
Error 192 151.979 0.7916 --
Total 199 229.174
* = Significant at α =0.01 CV = 31.69 %
Appendix-31: Analysis of variance table for mean percent parasitism of Ascogestor
quadridentata in apple orchard having different intercrops during year 2013
S.O.V. D.F. S.S. M.S. F. Value P-Value
Replication 3 2.4999 0.83331 --
Treatment 4 4.7941 1.19854 14.95* 0.0000
Error 192 15.3885 0.08015 --
Total 199 22.6826
* = Significant at α =0.01 CV = 29.15 %
Appendix-32: Analysis of variance table for mean percent arasitism of Hyssopus
pallidus in apple orchard having different intercrops during year 2013
S.O.V. D.F. S.S. M.S. F. Value P-Value
Replication 3 0.9041 0.30136 --
Treatment 4 3.1571 0.78927 9.96* 0.0072
Error 192 15.2216 0.07928 --
Total 199 19.2828
* = Significant at α =0.01 CV = 29.22 %
Appendix-33: Analysis of variance table for average yield of apple in kg/tree
having different intercrops in apple orchard during year 2013
S.O.V. D.F. S.S. M.S. F. Value P-Value
Replication 3 13.56 4.521 --
Treatment 4 1247.07 311.768 58.37* 0.0000
Error 12 64.10 5.341 --
Total 19 1324.73
* = Significant at α =0.01 CV= 3.54 %
Appendix-34: Combined analysis of variance table for mean fruit drop in apple
orchard different intercrops during year 2012 & 2013
S.O.V. D.F. S.S. M.S. F. Value P-Value
Year Year*Rep (E)
1
6
1.271
11.980
1.2711
1.9967
0.64
0.4553
Treatment Year*Trt
Error
4
4
384
71.544
0.388
144.305
17.8859
0.0970
0.3758
47.60*
0.26
0.0000
0.9046
Total 399 229.488
* = Significant at α =0.01 CV = 30.20%
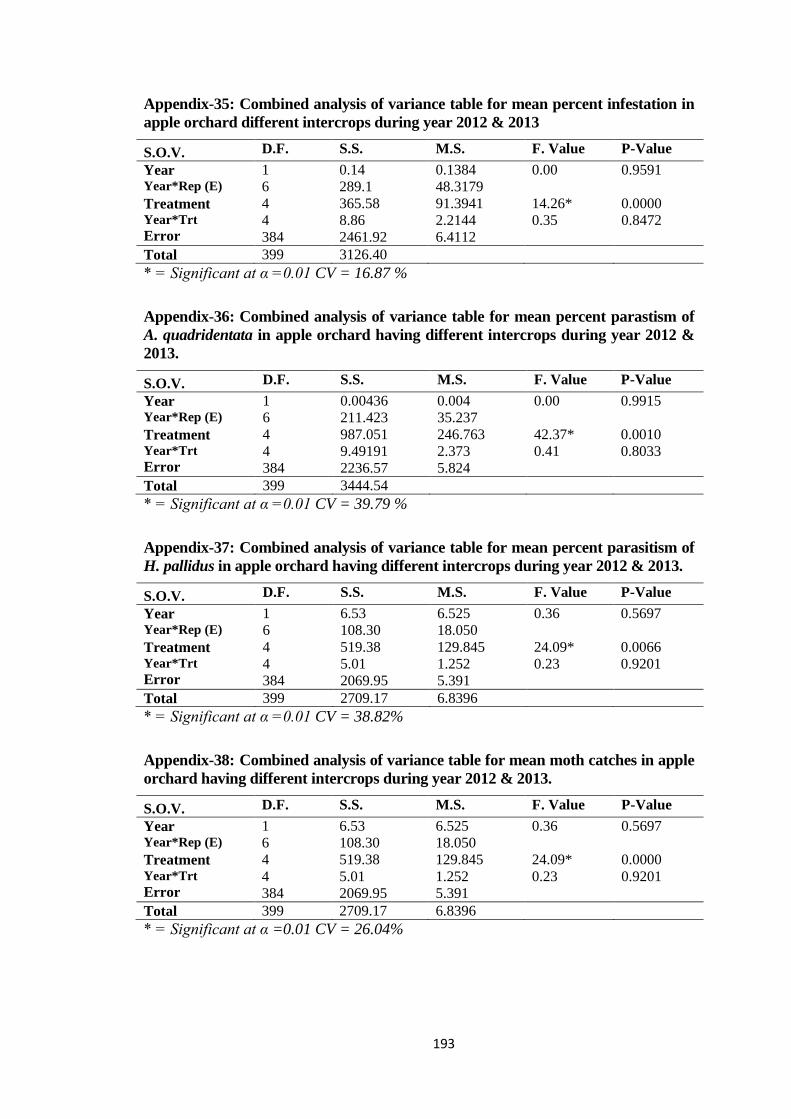
193
Appendix-35: Combined analysis of variance table for mean percent infestation in
apple orchard different intercrops during year 2012 & 2013
S.O.V. D.F. S.S. M.S. F. Value P-Value
Year Year*Rep (E)
1
6
0.14
289.1
0.1384
48.3179
0.00 0.9591
Treatment Year*Trt
Error
4
4
384
365.58
8.86
2461.92
91.3941
2.2144
6.4112
14.26*
0.35
0.0000
0.8472
Total 399 3126.40
* = Significant at α =0.01 CV = 16.87 %
Appendix-36: Combined analysis of variance table for mean percent parastism of
A. quadridentata in apple orchard having different intercrops during year 2012 &
2013.
S.O.V. D.F. S.S. M.S. F. Value P-Value
Year Year*Rep (E)
1
6
0.00436
211.423
0.004
35.237
0.00 0.9915
Treatment Year*Trt
Error
4
4
384
987.051
9.49191
2236.57
246.763
2.373
5.824
42.37*
0.41
0.0010
0.8033
Total 399 3444.54
* = Significant at α =0.01 CV = 39.79 %
Appendix-37: Combined analysis of variance table for mean percent parasitism of
H. pallidus in apple orchard having different intercrops during year 2012 & 2013.
S.O.V. D.F. S.S. M.S. F. Value P-Value
Year Year*Rep (E)
1
6
6.53
108.30
6.525
18.050
0.36 0.5697
Treatment Year*Trt
Error
4
4
384
519.38
5.01
2069.95
129.845
1.252
5.391
24.09*
0.23
0.0066
0.9201
Total 399 2709.17 6.8396
* = Significant at α =0.01 CV = 38.82%
Appendix-38: Combined analysis of variance table for mean moth catches in apple
orchard having different intercrops during year 2012 & 2013.
S.O.V. D.F. S.S. M.S. F. Value P-Value
Year Year*Rep (E)
1
6
6.53
108.30
6.525
18.050
0.36 0.5697
Treatment Year*Trt
Error
4
4
384
519.38
5.01
2069.95
129.845
1.252
5.391
24.09*
0.23
0.0000
0.9201
Total 399 2709.17 6.8396
* = Significant at α =0.01 CV = 26.04%
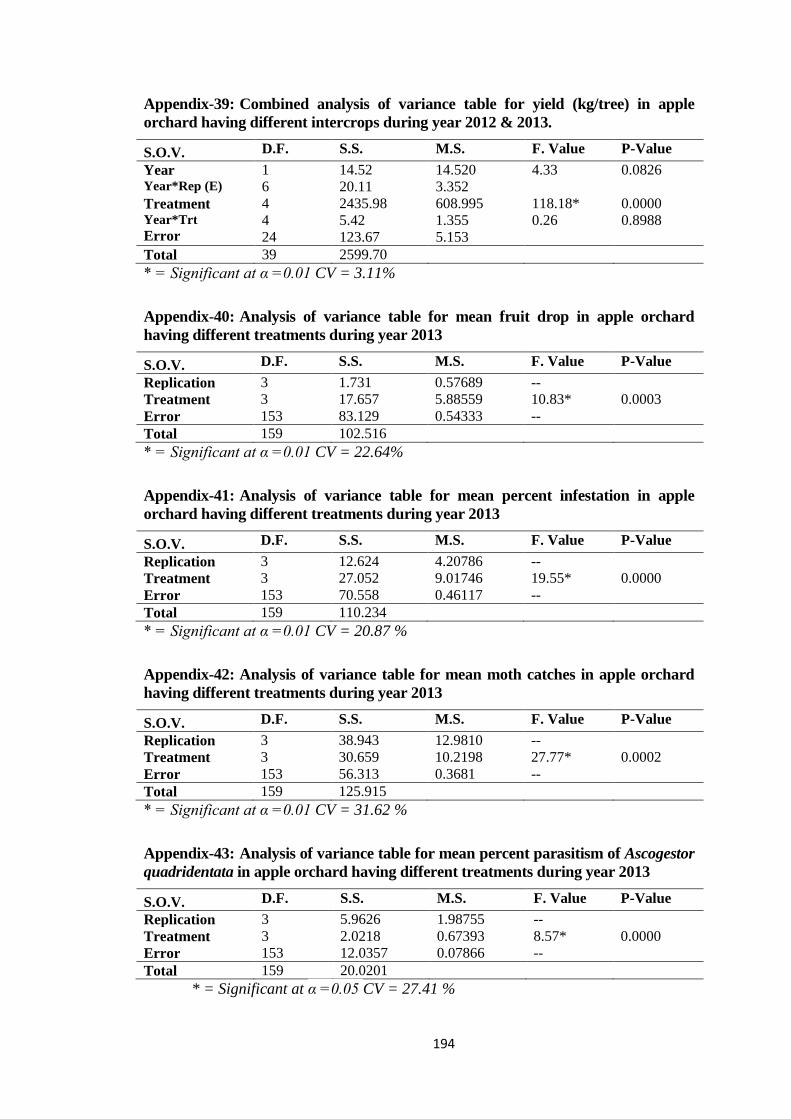
194
Appendix-39: Combined analysis of variance table for yield (kg/tree) in apple
orchard having different intercrops during year 2012 & 2013.
S.O.V. D.F. S.S. M.S. F. Value P-Value
Year Year*Rep (E)
1
6
14.52
20.11
14.520
3.352
4.33 0.0826
Treatment Year*Trt
Error
4
4
24
2435.98
5.42
123.67
608.995
1.355
5.153
118.18*
0.26
0.0000
0.8988
Total 39 2599.70
* = Significant at α =0.01 CV = 3.11%
Appendix-40: Analysis of variance table for mean fruit drop in apple orchard
having different treatments during year 2013
S.O.V. D.F. S.S. M.S. F. Value P-Value
Replication 3 1.731 0.57689 --
Treatment 3 17.657 5.88559 10.83* 0.0003
Error 153 83.129 0.54333 --
Total 159 102.516
* = Significant at α =0.01 CV = 22.64%
Appendix-41: Analysis of variance table for mean percent infestation in apple
orchard having different treatments during year 2013
S.O.V. D.F. S.S. M.S. F. Value P-Value
Replication 3 12.624 4.20786 --
Treatment 3 27.052 9.01746 19.55* 0.0000
Error 153 70.558 0.46117 --
Total 159 110.234
* = Significant at α =0.01 CV = 20.87 %
Appendix-42: Analysis of variance table for mean moth catches in apple orchard
having different treatments during year 2013
S.O.V. D.F. S.S. M.S. F. Value P-Value
Replication 3 38.943 12.9810 --
Treatment 3 30.659 10.2198 27.77* 0.0002
Error 153 56.313 0.3681 --
Total 159 125.915
* = Significant at α =0.01 CV = 31.62 %
Appendix-43: Analysis of variance table for mean percent parasitism of Ascogestor
quadridentata in apple orchard having different treatments during year 2013
S.O.V. D.F. S.S. M.S. F. Value P-Value
Replication 3 5.9626 1.98755 --
Treatment 3 2.0218 0.67393 8.57* 0.0000
Error 153 12.0357 0.07866 --
Total 159 20.0201
* = Significant at α =0.05 CV = 27.41 %
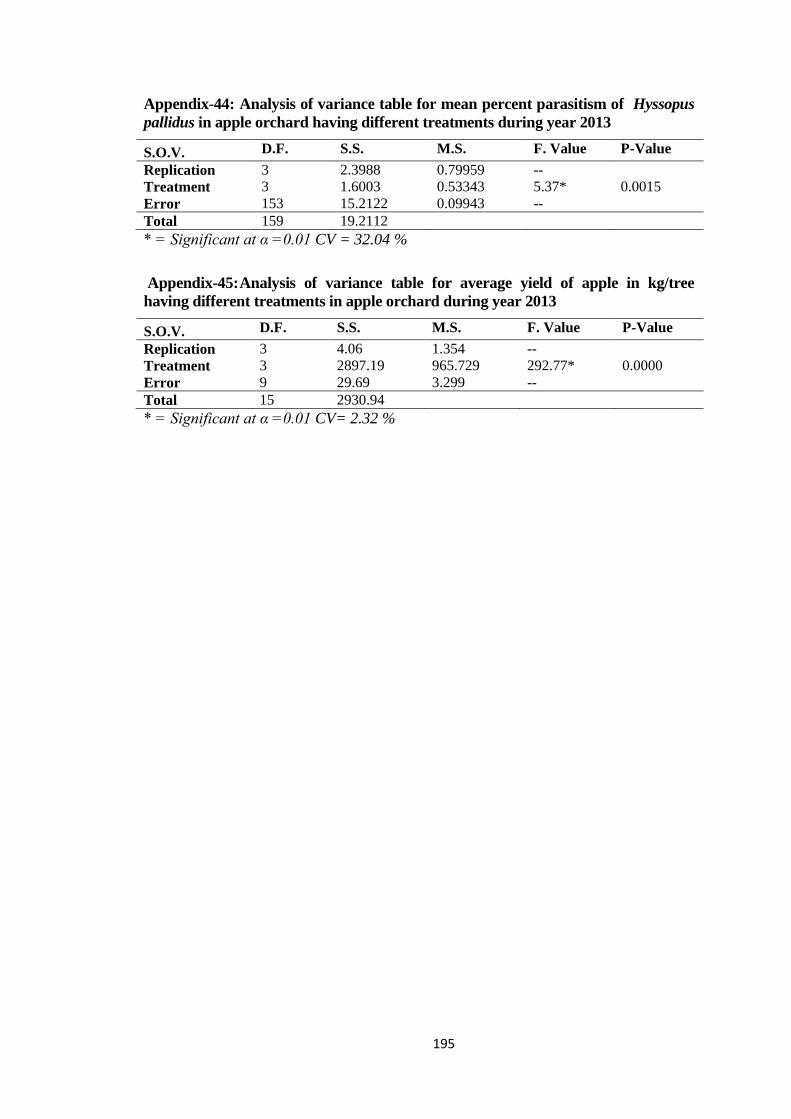
195
Appendix-44: Analysis of variance table for mean percent parasitism of Hyssopus
pallidus in apple orchard having different treatments during year 2013
S.O.V. D.F. S.S. M.S. F. Value P-Value
Replication 3 2.3988 0.79959 --
Treatment 3 1.6003 0.53343 5.37* 0.0015
Error 153 15.2122 0.09943 --
Total 159 19.2112
* = Significant at α =0.01 CV = 32.04 %
Appendix-45: Analysis of variance table for average yield of apple in kg/tree
having different treatments in apple orchard during year 2013
S.O.V. D.F. S.S. M.S. F. Value P-Value
Replication 3 4.06 1.354 --
Treatment 3 2897.19 965.729 292.77* 0.0000
Error 9 29.69 3.299 --
Total 15 2930.94
* = Significant at α =0.01 CV= 2.32 %


