Embed Size (px)
Citation preview
sustainability
Article
Integrated Multidimensional Sustainability Assessment ofEnergy System Transformation Pathways
Tobias Naegler 1,*, Lisa Becker 2, Jens Buchgeister 3 , Wolfgang Hauser 4, Heidi Hottenroth 5, Tobias Junne 1 ,Ulrike Lehr 2,6, Oliver Scheel 4, Ricarda Schmidt-Scheele 4, Sonja Simon 1 , Claudia Sutardhio 7, Ingela Tietze 5 ,Philip Ulrich 2, Tobias Viere 5 and Anke Weidlich 7
�����������������
Citation: Naegler, T.; Becker, L.;
Buchgeister, J.; Hauser, W.;
Hottenroth, H.; Junne, T.; Lehr, U.;
Scheel, O.; Schmidt-Scheele, R.;
Simon, S.; et al. Integrated
Multidimensional Sustainability
Assessment of Energy System
Transformation Pathways.
Sustainability 2021, 13, 5217.
https://doi.org/10.3390/
su13095199
Academic Editor: Eduardo Aguilera
Received: 12 April 2021
Accepted: 4 May 2021
Published: 7 May 2021
Publisher’s Note: MDPI stays neutral
with regard to jurisdictional claims in
published maps and institutional affil-
iations.
Copyright: © 2021 by the authors.
Licensee MDPI, Basel, Switzerland.
This article is an open access article
distributed under the terms and
conditions of the Creative Commons
Attribution (CC BY) license (https://
creativecommons.org/licenses/by/
4.0/).
1 Institute of Networked Energy Systems, German Aerospace Centre (DLR), 70563 Stuttgart, Germany;[email protected] (T.J.); [email protected] (S.S.)
2 Institute of Economic Structures Research (GWS), 49080 Osnabrück, Germany; [email protected] (L.B.);[email protected] (U.L.); [email protected] (P.U.)
3 Institute for Technology Assessment and Systems Analysis (ITAS), Karlsruhe Institute of Technology (KIT),76133 Karlsruhe, Germany; [email protected]
4 Center for Interdisciplinary Risk and Innovation Studies (ZIRIUS), University of Stuttgart,70174 Stuttgart, Germany; [email protected] (W.H.);[email protected] (O.S.); [email protected] (R.S.-S.)
5 Institute for Industrial Ecology (INEC), Pforzheim University of Applied Sciences,75175 Pforzheim, Germany; [email protected] (H.H.); [email protected] (I.T.);[email protected] (T.V.)
6 International Renewable Energy Agency (IRENA), Abu Dhabi P.O. Box 236, United Arab Emirates7 Department of Sustainable Systems Engineering (INATECH), University of Freiburg,
70910 Freiburg, Germany; [email protected] (C.S.);[email protected] (A.W.)
* Correspondence: [email protected]; Tel.: +49-711-6862-775
Abstract: Sustainable development embraces a broad spectrum of social, economic and ecologicalaspects. Thus, a sustainable transformation process of energy systems is inevitably multidimensionaland needs to go beyond climate impact and cost considerations. An approach for an integrated andinterdisciplinary sustainability assessment of energy system transformation pathways is presentedhere. It first integrates energy system modeling with a multidimensional impact assessment thatfocuses on life cycle-based environmental and macroeconomic impacts. Then, stakeholders’ pref-erences with respect to defined sustainability indicators are inquired, which are finally integratedinto a comparative scenario evaluation through a multi-criteria decision analysis (MCDA), all inone consistent assessment framework. As an illustrative example, this holistic approach is appliedto the sustainability assessment of ten different transformation strategies for Germany. Applyingmulti-criteria decision analysis reveals that both ambitious (80%) and highly ambitious (95%) car-bon reduction scenarios can achieve top sustainability ranks, depending on the underlying energytransformation pathways and respective scores in other sustainability dimensions. Furthermore, thisresearch highlights an increasingly dominant contribution of energy systems’ upstream chains ontotal environmental impacts, reveals rather small differences in macroeconomic effects between differ-ent scenarios and identifies the transition among societal segments and climate impact minimizationas the most important stakeholder preferences.
Keywords: energy scenario; energy system modeling; sustainability; impact assessment; life cy-cle assessment (LCA); macroeconomic modeling; focus group; conjoint analysis; discrete choiceexperiment; multi-criteria decision analysis (MCDA)
1. Introduction1.1. Background
From the Paris Agreement and the related Nationally Determined Contributions(NDCs), to the European Green Deal [1], national energy and climate plans [2], climate
Sustainability 2021, 13, 5217. https://doi.org/10.3390/su13095217 https://www.mdpi.com/journal/sustainability

Sustainability 2021, 13, 5217 2 of 28
protection is currently dominating the social debate on the sustainable development. Thetransformation of the energy sector, the largest emitter of CO2, is justifiably at the center ofattention. However, the political debate on sustainable development of energy supply islargely narrowed to achieving climate protection goals through renewable energy sourcesat reasonable costs for citizens and industry.
While climate protection is admittedly an important goal in the context of sustainabledevelopment, the massive focus on CO2 emissions is at odds with the extensive definitionof sustainability. Sustainability concepts and related indicator systems have, e.g., beendeveloped for the United Nations Sustainable Development Goals [3], the SustainabilityStrategy for Germany [4] or the Integrated Concept of Sustainability [5]. They acknowledgethat sustainable development must consider a broad spectrum of social, economic andenvironmental aspects (including climate change). Thus, the transformation process of theenergy system has to be regarded as a multidimensional challenge [6–11]. This needs to beconsidered in the assessment of transformation strategies of the energy system.
However, political debates, energy system-analytical research and scenario develop-ment often still focus on climate change, cost optimization and technical aspects. In energysystem modeling, sustainable development paths are often narrowed down to a focus ondirect CO2 emissions, energy costs, and security of supply (see, e.g., overviews in [12–14]).This approach ignores numerous sustainability aspects such as resource requirements,social acceptance or sustainable consumption. However, a transformation of the energysystem towards lower CO2 emissions goes hand in hand with a shift from technologies thatconsume fossil energy carriers towards “climate friendly” technologies. Those technologiescan have other positive or negative impacts on other sustainability aspects such as materialand land use, biodiversity, health, innovation and infrastructure, water quality and thequality of living space (see, e.g., [15,16] and references therein). Furthermore, the publicdebate on economic effects of the energy transition does not focus on the rather abstractconcept of system costs, but on aspects with a more concrete reference to the reality of lifeof those affected. These aspects comprise, e.g., energy costs for consumers and companies,employment effects, national value added, economic efficiency in an international context,innovation, structural change, etc. [5,17,18]. Aspects of social acceptance are difficult totake into account when developing or assessing energy scenarios. However, in reality,acceptance issues can pose a serious problem for large-scale transformation of the en-ergy system, as the discussion on minimum distances for wind power plants in Germanyshows [19,20]. These examples illustrate that a multidimensional assessment of energytransition strategies is still a challenge.
On the level of (energy) technologies, a comprehensive multidimensional sustainabil-ity assessment framework has been established with the concept of Life Cycle SustainabilityAssessment (LCSA) [21,22]. LCSA includes Life Cycle Assessment (LCA) for ecologic im-pacts, life cycle costing (LCC) for economic analysis and social life cycle assessment (S-LCA)for social performance evaluation [23]. Lin et al. [24] conclude that comprehensive LCSAresearch is still rather limited in number. They found studies mainly focused on specificstudy objects, such as specific industries [25] or cases [26] with a limited system boundaryallocating their upstream and downstream impact. However, while methods such as LCAand LCC are methodically well established, S-LCA is still at an earlier stage of methodicaldevelopment and harmonization [21,27,28].
LCSA has already been applied successfully to sectors of the energy system—specifically,the power sector ([23,29,30]). However, the LCSA of a complete energy system andits transformation scenarios have not yet been targeted, or are still under development(see [24]). Such a comprehensive target provides new challenges from the extended systemboundaries—sectoral, temporal and spatial. It is clear, however, that a multidimensionalsustainability assessment of entire scenarios is also an important task if transformationpathways, which are sustainable in a broader sense, are to be developed [31–34]. A numberof approaches to this have been developed and applied in the past:
Sustainability 2021, 13, 5217 3 of 28
Life cycle assessment (LCA) is increasingly combined with energy system models(see [15] for more references). This approach allows one to estimate the life cycle-basedenvironmental impacts of energy transition or to take ecological factors into accountwhen optimizing the expansion of the energy system [35]. Challenges of such integrationapproaches are discussed in [36].
On the other hand, the assessment of economic impacts of transformation strategiesrequires an integrated macroeconomic model with all relevant linkages between the energysystem and the economy. Transitional changes in the energy system lead to new constel-lations of prices, as well as structures of demand and supply. Relationships between thedecisions of companies and consumers, on the one hand, and changes in the energy sector,on the other, should be represented in an input–output context. Furthermore, it is impor-tant to consider that there is a path dependency in the economy which can be representedparticularly well in an empirically based, dynamic model with high disaggregation [37].For an overview of approaches and challenges for macro-economic models that have aspecial focus on energy economy, see, e.g., [38,39].
Another approach for a multidimensional development and assessment of transforma-tion strategies for the energy system are Integrated Assessment Models (IAM). They aim atintegrating main features of the energy system, economy, climate and environment in onemodeling framework (see, e.g., [40–44]). They play a central role in the development andevaluation of technologically and economically feasible strategies to meet climate goals,such as the Paris Agreement [45].
When aiming at a broad assessment framework, many aspects (i.e., ecological, eco-nomic, and social) come together that need to be systematically evaluated. This is wheremulti-criteria decision analysis (MCDA) methods come into play. MCDA methods havealready been applied in the context of energy system assessment [46,47]. According to [48],the most popular techniques for multi-criteria decision analysis for sustainable energyplanning are AHP, PROMETHEE, and ELECTRE. Other methods such as MAUT, weightedsum methods, weighted product methods and TOPSIS were mentioned as appropriatemethods in [49]. Multi-criteria decision analysis has already been applied in order todevelop and evaluate energy scenarios as, e.g., in [50].
1.2. Research Questions Addressed in This Paper
In this paper, we present new generic modeling and assessment approach for energyscenarios, in which technical–structural development paths of the energy system, as well astheir economic and ecologic consequences, can be analyzed and evaluated. The approachcombines energy system models, life cycle assessment databases and macroeconomicmodels. To deal with the complexity of the various sustainability dimensions, we applyMCDA methods using stakeholder preferences derived from a discrete choice experiment.Such an approach provides a powerful toolbox for an integrated assessment of the variousdimensions of sustainability for existing and future energy scenarios, and it might help todevelop and test this assessment approach on a variety of existing energy scenario studiesin Germany. On one hand, our research questions focus on the variety of these energytransformation pathways:
• How can strategies to transform an energy system towards low CO2 emissions, asformulated in variety of different studies, be compared in terms of their environmental,economic and social impacts? How can these strategies be harmonized to allow for afair comparison?
On the other hand, our research addresses the challenge of integrating various sus-tainability dimensions, setting the scene for a more genuine sustainability assessment:
• How do variations in technical solutions in these different CO2 reduction strategiesinfluence environmental and (macro-)economic impacts?
• How can stakeholder preferences be integrated into MCDA methods? What influencedo stakeholder preferences have on the ranking of scenarios? How can robust resultsbe achieved?
Sustainability 2021, 13, 5217 4 of 28
The paper here focuses on the presentation and discussion of the methodology ofan integrated scenario assessment. Results of the approach are presented primarily toillustrate the outcomes of the methodology developed here. The method is applied as an ex-emplary case for the sustainability assessment of 10 different energy system transformationstrategies for Germany.
2. Materials and Methods2.1. Overview of the Assessment Workflow
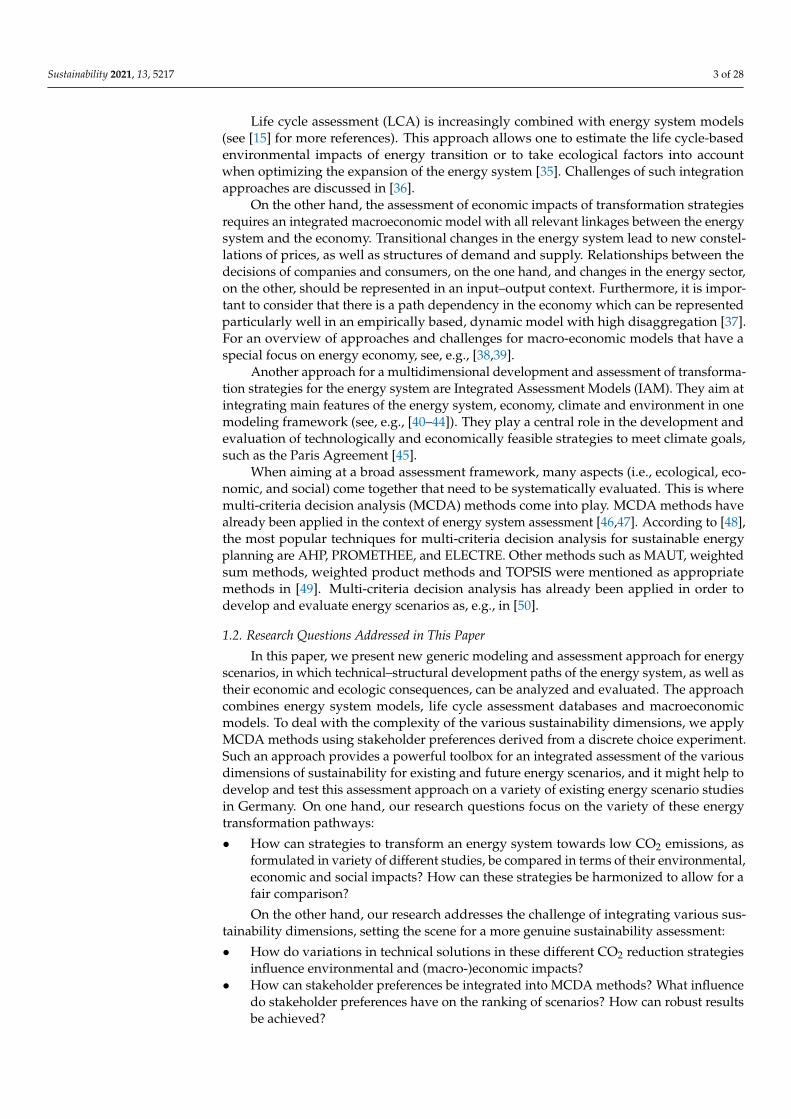
Figure 1 illustrates the main workflow of the approach presented here, as well asthe concepts of “multi-level scenario evaluation” and “multidimensional impact assess-ment”. The first step is the selection of scenarios, which describe socio-economic boundaryconditions and the main technical strategies for a defossilization of the different sectorsof the German energy system (see Section 2.2). Step 2 is the selection of sustainabilityindicators to be used in this study (Section 2.3). In the next step, step 3, the principaltechnical defossilization strategies identified in the different studies are used as input fordetailed energy system modeling. Other boundary conditions (demand, prices, and others)have been harmonized between all re-modelled scenarios (Section 2.4). The output of theenergy system models (ESMs) serves as the basis for the estimation of life cycle-basedenvironmental impacts (step 4, Section 2.5), macro-economic effects (step 5, Section 2.6)and an assessment of system diversity (Section 2.7). The preferences of stakeholders withrespect to chosen indicators are determined in step 6 in focus groups, and with the help ofa conjoint analysis and discrete choice-experiments (Section 2.8). Economic and ecologicimpacts, on the one hand, and stakeholder preferences derived from a discrete choiceexperiment (DCE), on the other hand, are input for a multi-criteria decision analysis instep 7 (Section 2.9).
Figure 1. Overview of the workflow for an integrated, multidimensional sustainability assessment oftransformation strategies for energy systems. The numbers in brackets refer to the methodologicalsteps described in the text.
The “core” of this approach is thus a three-fold integration effort:First, the multi-level scenario evaluation, which comprises the “classical” techno-economic
perspective based on energy system modeling, is performed. This is followed by an ex-
Sustainability 2021, 13, 5217 5 of 28
tensive multidimensional impact assessment and a subsequent comparative evaluationof different transformation strategies with an MCDA. The multi-level scenario evaluationthus integrates different assessment levels into one consistent approach.
Second, the multidimensional impact assessment of the different transformation strategiesconsiders both the ecologic and (socio-)economic dimensions of sustainability via the model-based assessment of ecologic and (socio-)economic impacts of the transformation pathways.However, it also integrates other aspects of the social dimension via stakeholder-basedpreference estimates. It thus integrates all “pillars” of sustainability.
Third, the different transformation strategies are integrated into a harmonized modelingapproach, which enables a systematic comparison of impacts of those strategies. Theharmonized modeling approach, in turn, comprises harmonized boundary conditions forthe scenarios (e.g., useful energy demand), data harmonization (e.g., technology costs andefficiencies) between the different models used.
A further asset of this approach is the fact that a wide range of different transforma-tion strategies have been included in the analysis. Of course, not all technically feasiblestrategies could be explored within this analysis. However, the results this study providea good insight into the range of impacts (and the corresponding benefits and challenges)that can be expected from energy system transformation in Germany.
2.2. Selection of Scenarios as “Inspiration”
The selection of technical transformation strategies for the German energy systemfor an in-depth analysis of ecologic and economic impacts followed a two-stage selectionprocess: in the first step, an extensive review of scenario studies of Germany was carriedout, and 40+ scenarios were selected which fulfilled the following criteria (see [51]):
• Coverage of the entire energy system (power, heat, transport);• Reduction of energy related direct CO2 emissions of at least 80%, until 2050;• Sufficiently detailed documentation of scenario results;• Study commissioned by a relevant stakeholder and/or study carried out by an estab-
lished research institution;• Study not older than 2012.
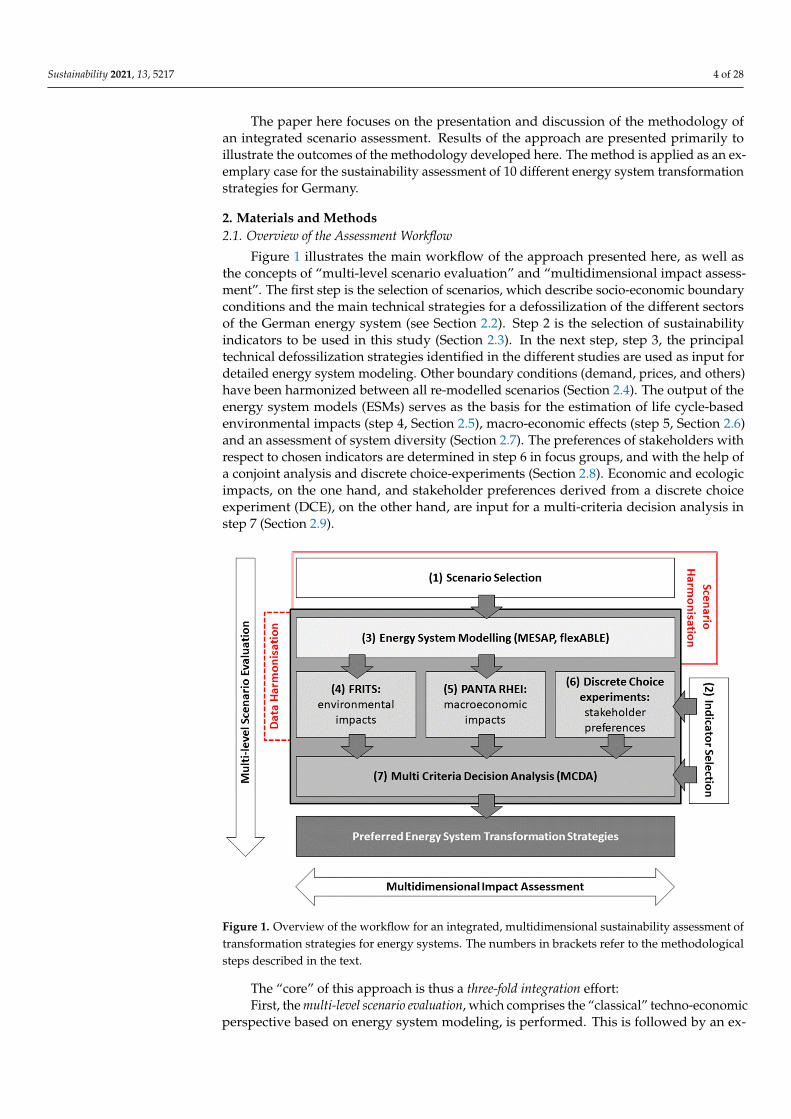
In a second step, out of these 40+ scenarios, 5 scenarios each with an emission re-duction of approximately 80% and 95% were selected for a detailed analysis within thisstudy. This second selection was based on the criterion that the scenarios should repre-sent the broadest possible spectrum of transformation strategies for the energy systemfulfilling a target of 80% and 95% emission reduction, respectively. Table 1 summarizes theselected scenarios.
Table 1. Overview of the selected transformation strategies. The reduction of direct CO2 emissions in scenarios I–V isbetween 80% and 90%, and more than 90% in scenarios VI–X.
Scenario Number inthis Study Involved Research Institution(s) Commissioner Year Scenario Name in Original Study Reference
Scen I GWS, Prognos, DIW, FhG ISI, DLR BMWi 2018 Energiewende- Szenario [52]
Scen II FhG ISI, ifeu, Consentec BMWi 2017 Basis [53]
Scen III DLR, FhG IWES, IfNE BMUB 2012 A [54]
Scen IV Öko-Institut, FhG ISI, H.-J. Ziesing BMUB 2015 Klimaschutz- Szenario 80 [55]
Scen V FhG ISE - 2015 80/gering/H2/nicht beschleunigt [56]
Scen VI Öko-Institut, FhG ISI, H.-J. Ziesing BMUB 2015 Klimaschutz- Szenario 95 [55]
Scen VII J. Nitsch BEE 2014 100% [57]
Scen VIII FhG IWES, ifeu, CONSIDEO, D. Karl SchoerSSG UBA 2017 GreenEE [58]
Scen IX enervis energy advisors GmbH INES, BWE 2017 Optimales System [59]
Scen X ewi Energy Research and Scenarios gGmbH dena 2018 Technologiemix 95% [60]
Sustainability 2021, 13, 5217 6 of 28
2.3. Selection of Indicators
The selection of sustainability indicators followed a three-step process: First, an exten-sive literature review (see Supplementary Material for details) resulted in a comprehensivelist of indicators that have been discussed in the national and international sustainabilitydebate in the past, especially with regard to energy technologies and systems. We thenselected indicators according to the following criteria:
• The indicator is relevant to the current sustainability discussion;• The indicator value depends significantly on the technology mix in the future en-
ergy system;• The future development of the indicator can be estimated satisfactorily with available
models and methods;• The full set of indicators addresses (if possible) the ecologic, economic and social
dimension of sustainability and, additionally, considers system related aspects;• The indicators describe causally independent impact mechanisms;• The preferred direction of the indicators’ development is clear.
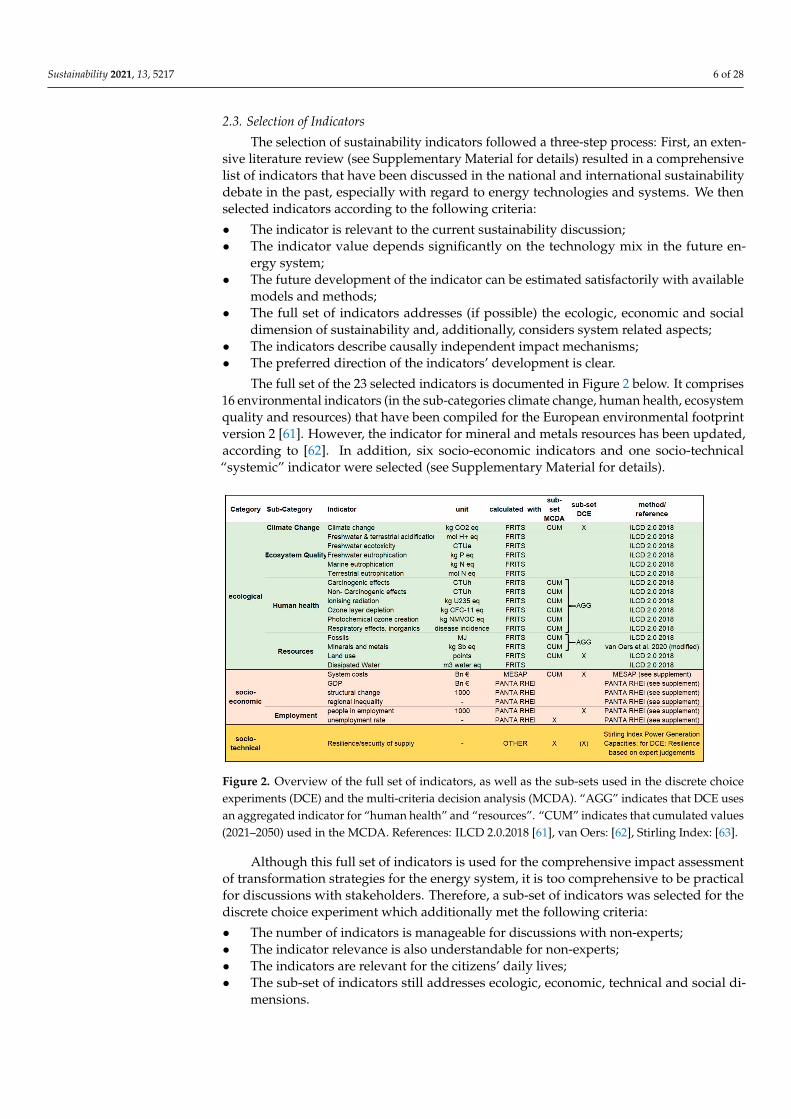
The full set of the 23 selected indicators is documented in Figure 2 below. It comprises16 environmental indicators (in the sub-categories climate change, human health, ecosystemquality and resources) that have been compiled for the European environmental footprintversion 2 [61]. However, the indicator for mineral and metals resources has been updated,according to [62]. In addition, six socio-economic indicators and one socio-technical“systemic” indicator were selected (see Supplementary Material for details).
Figure 2. Overview of the full set of indicators, as well as the sub-sets used in the discrete choiceexperiments (DCE) and the multi-criteria decision analysis (MCDA). “AGG” indicates that DCE usesan aggregated indicator for “human health” and “resources”. “CUM” indicates that cumulated values(2021–2050) used in the MCDA. References: ILCD 2.0.2018 [61], van Oers: [62], Stirling Index: [63].
Although this full set of indicators is used for the comprehensive impact assessmentof transformation strategies for the energy system, it is too comprehensive to be practicalfor discussions with stakeholders. Therefore, a sub-set of indicators was selected for thediscrete choice experiment which additionally met the following criteria:
• The number of indicators is manageable for discussions with non-experts;• The indicator relevance is also understandable for non-experts;• The indicators are relevant for the citizens’ daily lives;• The sub-set of indicators still addresses ecologic, economic, technical and social di-
mensions.
Sustainability 2021, 13, 5217 7 of 28
The sub-set of indicators used for the discrete choice experiment is depicted in Figure 2.It comprises the indicator “climate change”, the socio-economic indicators “system cost” (asa proxy for consumer prices) and “people in employment”, as well as the socio-technicalindicator “resilience/security of supply”. Finally, the indicators “human health” and“resources” are used in the DCE. Note that more detailed information on human healthand resource issues are available from the impact assessment (see column “Indicator” forboth sub-categories). However, for practical reasons, in the DCE, only preferences for theaggregated indicators are determined.
In contrast to the DCE sub-set, the MCDA sub-set uses six differentiated indicatorswithin the sub-category “human health” and two differentiated indicators within the sub-category “resources”, as provided under the environmental footprint life cycle impactassessment method 2.0. Disaggregation of the aggregated preferences for “human health”and “resources” from the DCE was performed using the weighting set provided under thisscheme [64]. The detailed procedure is laid out in Section 2.9.
There are two other minor differences between the two subsets: within the sub-category “employment”, the DCE subset uses number of employees as an indicator,whereas the MCDA subset uses unemployment rate. Finally, DCE uses the security ofsupply (see Section 2.7) as an indicator, whereas the MCDA uses the diversity of the energysystem as one aspect of its resilience (and, thus, of its security of supply).
Note that, for most indicators, low values are desirable. The only exceptions are the in-dicators “gross domestic product (GDP)”, “people in employment” and “resilience/securityof supply”.
2.4. Harmonised Techno-Economic Re-Modeling of the Selected Transformation Strategies
The selected original studies scenarios (Table 1) made different assumptions regardingthe future development of socio-economic drivers (such as population and GDP), thedemand for energy services, as well as on energy and technology prices, full load hours,etc. Since the approach presented here focuses on ecologic and macro-economic impactsof different supply side strategies to reduce greenhouse gas emissions, demand for energyservices was harmonized between the different transformation strategies. This was neces-sary because different demand estimates result in different magnitudes of environmentalimpacts, even if supply side technologies are identical. The same is true for assumptions oftechnology, energy carrier, and CO2 certificate prices, which were harmonized in order toavoid spurious macro-economic impacts that result only from different price assumptions.Finally, the original scenarios have been calculated using different models with differentdefinitions of sectors, different technology and energy carrier portfolios, etc.
The selected original studies were translated into a new set of scenarios, which were allmodeled in a harmonized manner using a unified set of boundary conditions. The principaltechnical supply side strategies for the decarbonization of the energy system, however,were taken from the original studies, i.e., the market shares of different technologies and/orfuels in each sector.
The scenarios were developed with the scenario generator MESAP/PlaNet [65,66],which was itself coupled with the power market simulation model flexABLE [67] (seeSupplementary Material for details on the models).
The core of MESAP/PlaNet is an accounting framework. This means that the mainmodel parameters that determine the development of the energy system are set by themodeler. MESAP/PlaNet, however, assures a consistent calculation of energy flows fromprimary energy to useful energy services. In contrast to energy system optimization models,MESAP/PlaNet is thus very flexible in developing consistent scenarios for fundamentallydifferent (technical) transformation strategies.
MESAP/PlaNet calculates annual energy demand and supply balances for the end-usesectors residential, industry, services and commerce, and transport (further differentiated byapplication type, different end-use technologies and energy carriers). In a similar manner,the conversion sector is considered, i.e., generation of power, district heat, synthetic and
Sustainability 2021, 13, 5217 8 of 28
biogenic fuels and gases, etc. MESAP further estimates the required capacities for power,heat, gas and fuel generation, as well as annual gross new installations (i.e., includingreplacement of old plants) based on external assumptions of full load hours of thesetechnologies. Finally, MESAP calculates economic quantities, such as annual investment inenergy technologies and the corresponding annuities, annual fixed and variable operationand maintenance costs (fuels and CO2), levelized costs of electricity and the total systemcosts. These quantities partly serve as input for the economic impact assessment (seeSection 2.6).
The model flexABLE is an agent-based electricity market simulation. The modelfollows a bottom-up approach and includes main types of generation assets, such asconventional power plants, variable renewable generators and storage units. These assets,represented as agents, can participate in both an energy exchange market and a controlreserve market. Agents formulate their bids based on several techno-economic parametersseparately for each market at each time-step. The model allows a simulation of the dispatchplans of single units and market outcomes. The simulation runs confirm the technicalfeasibility of the scenarios, as it is ensured that demand and supply for electricity is alwaysmatched. In some scenarios, this required setting or adapting installed generation andstorage capacities in order to map the energy balances assumed in MESAP/PlaNet.
MESAP/PlaNet was run from 2000 to 2050, with annual time steps. In the model,the years 2000–2017 were calibrated with available statistical data for Germany. The years2018–2020 were identical in all scenarios.
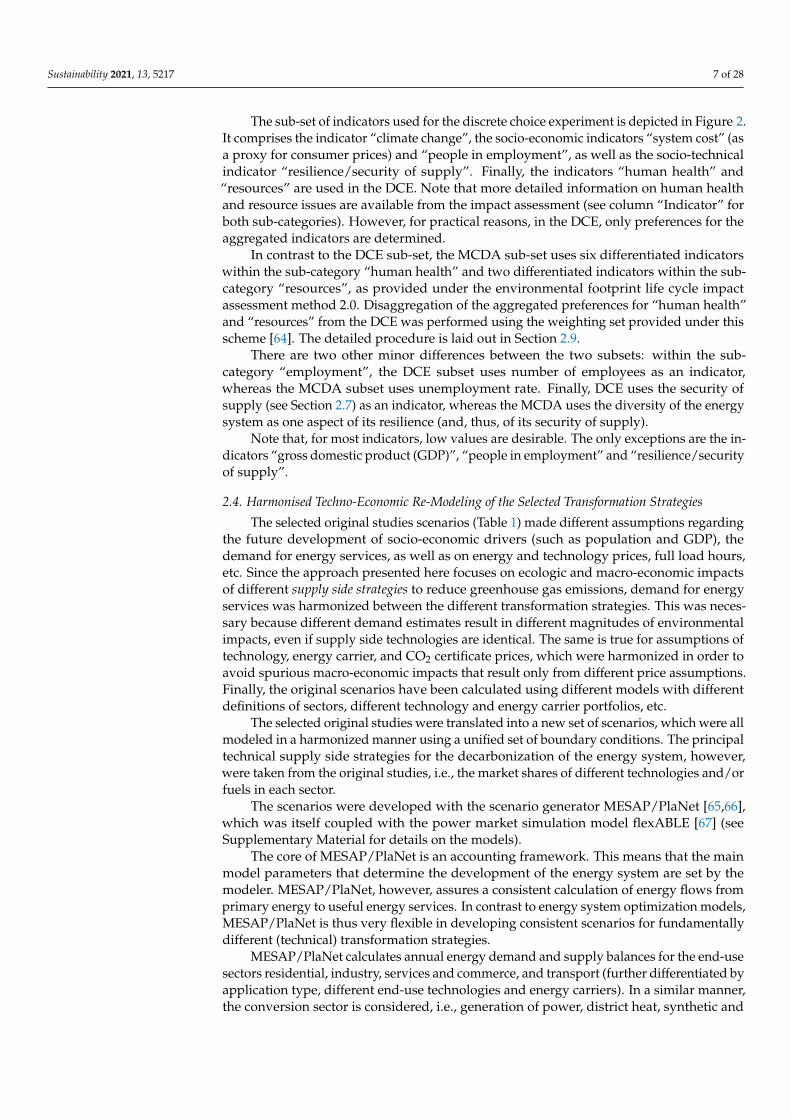
On the other hand, flexABLE calculated the hourly dispatch of power plants, elec-trolyzers and battery storages on the basis of the energy balances from MESAP. In turn,flexABLE results (full load hours, storage demand) for the year 2050 were fed back intoMESAP in order to obtain consistent energy balances and supply side infrastructure re-quirements (including power storage) for the entire energy system (see Figure 3).
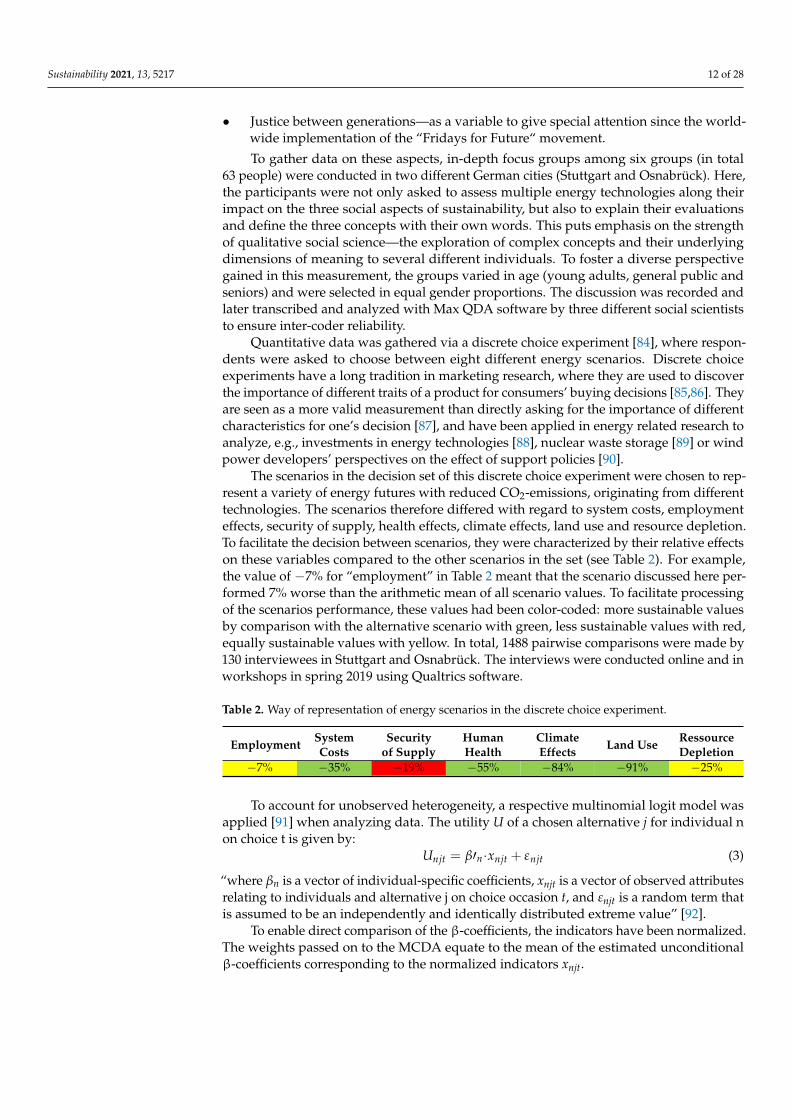
Figure 3. Coupling of the four models MESAP, flexABLE, PANTA RHEI and FRITS.
As mentioned above, all selected transformation strategies were re-modelled withMESAP/PlaNet and flexABLE using the same boundary conditions (also see Supplemen-tary Material):
• Estimates of population development and GDP from [52];• Estimates of energy services (useful energy demand and transport services) in all
sectors from [52];• Energy carrier and CO2 prices from [52];
Sustainability 2021, 13, 5217 9 of 28
• Technology efficiencies, investment costs and fixed operation and maintenance costsfrom the DLR techno-economic data base.
For each of the ten re-modelled energy transition concepts, the market shares ofdifferent technologies in the different sectors were kept as far as possible from the originalstudies. This means, for example, that while the development of the transport service byindividual passenger cars is identical in all re-modelled scenarios, the technology mix forpassenger cars is taken from the original studies. Similarly, the useful energy demandfor space heating in the residential sector was taken from [52], but the share of differenttechnologies/energy carriers which provide space heat in this sector was from the originalstudies. Other quantities, such as the gross power demand, in contrast, were calculatedindividually for each scenario from the assumptions of the demand for energy services(identical in all scenarios) and from the (scenario-specific) technology mixes in each sector.The technology shares in power generation were again taken from the original study. Inthis way, different supply side strategies could be made comparable. This was a basicprerequisite for a systematic, non-biased comparison of the economic and ecologic impactsof those strategies.
2.5. Assessment of Life Cycle-Based Ecological Impacts
The life cycle-based assessment of ecological impacts was performed using theFramework for the Assessment of Environmental Impacts of Transformation Scenarios(FRITS) [15]. FRITS is a Python-based tool that couples results from energy system models(ESM) with a life cycle inventory (LCI) database. It calculates a broad set of life cycle-based environmental impacts for entire transformation scenarios, while widely assuringconsistency between ESM and LCI assumptions.
The main ESM outputs (on an annual basis) required by FRITS were (see Figure 3):
• Gross new installed capacities of (i.e., including replacement after end of life) of alltechnologies in the end-use sectors (including transport) and conversion sectors;
• Heat, power, fuel, and gas generation of each ESM technology;• Transport services for each transport technology;• Technical characteristics (such as efficiency, heat-to-power-ratio for CHP, coefficients
of performance, etc.) of each ESM technology;• Blending quota of biogenic or synthetic fuels and gases in total fuel and gas supply, re-
spectively.
The core of FRITS is a life cycle inventory data base focusing on energy and transporttechnology. The FRITS data base is based on the ecoinvent 3.3 data base [68], but includesvarious additional LCI data sets for energy and transport technologies from other databases, e.g., from BioEnergeDat [69], UVEK [70], and SYSEET [71], from project partnersand from the literature. An illustration of the workflow of the FRITS framework can befound in the Supplementary Material.
The original LCI data sets in the data base are subject to several manipulations inFRITS. These manipulations were necessary in order to tailor the LCI data to the modelas accurately as possible: First, the LCI data sets were separated into the operation phaseand construction phase. This allowed a more correct temporal allocation of impacts fromthose life cycle phases on the scenario level, but also a (implicit) harmonization of bothtechnical lifetime and full load hours of all technologies in the ESM and LCI databases.Second, some scenario technologies require an energy carrier as input which is generatedby another technology considered by the ESM. This is the case, e.g., for electric heat pumps,hydrogen fuel cells or gas burners using synthetic gas. In this case, in the LCI data sets forthe operation phase of those technologies, the respective energy carrier input, had to bedeleted in order to avoid double counting of impacts. Third, the power mix in upstreamprocesses in the ecoinvent data base roughly represented the power mix today. In order totake into account the effect of (globally) changing power mixes in the future, the power mixin the upstream processes in the LCI database could be adjusted to regionally differentiated
Sustainability 2021, 13, 5217 10 of 28
scenarios with global coverage. In this study, power mix scenarios from [72] (2 ◦C scenario)were used.
After the manipulations described here, a Life Cycle Impact Assessment (LCIA) wasperformed. As a result, for each of the technologies represented in the data base, specificlife cycle impacts for the construction (impacts per kW) and operation phase (impacts perkWh) were calculated (see Section 2.3 for a list of impact categories considered here). Theoriginal LCI data make assumptions about, e.g., the efficiency of the technology considered,which might differ from the assumptions made in the ESM. In a last harmonization step,efficiencies in the LCI data were adjusted towards the ESM estimates by assuming a lineardependence of specific impacts with efficiency. As a result, efficiency-adjusted life cycle-based specific environmental impacts for the operation phase were obtained. Specificimpacts on the construction of energy technologies were reported per kW installed capacity,for the operation phase per kWh output. For vehicles, construction impacts were per car(passenger cars only) and operation impacts per passenger kilometer (pkm, for passengertransport) and per ton kilometer (tkm, for freight transport, respectively).
In the last step, the ESM output was multiplied with the following specific impacts:gross new capacities with specific impacts from the construction phase, and energy carrieroutput (or transport services) from the ESM with specific impacts from the operation phase.
Life cycle-based environmental impacts of the scenarios could thus be analyzed on ascenario level, on a sector level and on a technology level, and individually on the impactsdue to construction and operation of all technologies. Furthermore, impacts from theconversion sectors (e.g., power or H2 generation) could be allocated to the end-use sectorsaccording to the demand for those energy carriers for end-use applications.
2.6. Methdological Approach for the Assessment of Macro-Economic Impacts
Evaluating economic aspects is an important part of the sustainability assessmentand comparison of the scenarios. Each scenario setting results in changes in the Germaneconomic indicators, such as GDP, employment, value added or output, through a varietyof channels. The energy mix in the respective scenarios leads to a certain price level, whichhas economy-wide impacts on foreign trade balance and needs for investment along a pathover time. Collecting all effects requires a consistent framework, typically provided by aneconomic simulation model. Here, the macroeconometric modeling framework PANTARHEI was used; one which had been applied in energy policy assessments [37,73,74],especially in analyses of the German energy transition [52,75].
PANTA RHEI includes the System of National Accounts and Balances (SNAB) at itscore and time series-based estimated behavioral equations. An overview can be found inthe Supplementary Material. PANTA RHEI is consistent and fully interdependent (i.e.,the mutual impact of model variables is considered simultaneously), as well as open forbottom-up information and data. In the case of this study, details of the energy mix,investment pathways and estimates on certain cost parameters, such as costs for operationand maintenance of energy systems and levelized costs of electricity (LCOE), were providedby the MESAP model (see Figure 3 and Section 2.4). An interface was defined to matchdata output from MESAP and data requirements from PANTA RHEI. With the help ofthis interface, MESAP scenarios could automatically be linked with PANTA RHEI. Themacroeconomic scenario assessment could thus easily be adjusted or updated (Figure 3).
Both models are based on common framework data, which are assumed to be thesame for all scenarios examined. Therefore, data on, e.g., population development, numberof households, as well as prices for energy imports and CO2 emissions were taken from [52].The macroeconomic analysis was carried out both at a national level and at a federal statelevel. The temporal resolution of the input data from MESAP was five years, from 2020onwards. These values were interpolated linearly to fit the annual data framework inPANTA RHEI.
In PANTA RHEI, data for the energy system followed the systematic of the energybalance, with 30 energy sources, 20 final energy sectors and 11 conversion sectors. Fur-
Sustainability 2021, 13, 5217 11 of 28
thermore, new technologies (hydrogen, methane, PtX technologies) were part of the futureenergy system in some of the scenarios, which neither official statistics nor the modelhave covered so far. Hence, the energy balance and the related model variables weresupplemented by these new technologies. The proposal for the extension is documentedin [76].
PANTA RHEI was used to assess macroeconomic effects for ten scenarios (see Section 2.2).Economic impacts were assessed by comparing simulation runs obtained under differentenergy system scenarios, with respect to several economic quantities. By keeping everythingelse constant (ceteris paribus assumption), the results, which are described in Section 3.2,were obtained. Every scenario had its own pathway of investment, system costs and energyimports. These inputs were implemented in the interdependent macroeconomic frameworkin PANTA RHEI and results were calculated annually.
2.7. Power System Diversity as a Systemic Indicator
A criterion for the project’s MCDA model is required, which will consider the re-silience, robustness and security of supply for the various energy scenarios in 2050. Asthere is no obvious measurement corresponding to security for long-term scenarios, asubstitute measurement must be found which can stand in for security in all of its aspects.Several studies include increasing diversity as a primary means of increasing energy secu-rity [77–81]. In fact, diversity is often used as a singular substitute indicator of the long-termsecurity of an energy mix [82]. Diversity is quantified in this study with the Stirling Diver-sity Index (SDI), as it is robust to potentially subjective definitions and demarcations [63].It is defined as follows:
D = ∑ij (i 6=j)
dij·pi·pj (1)
where i, j are different power generation technologies, pi is the percentage of installedpower capacity delivered by technology i and dij is the disparity between technologies iand j. The disparity is calculated via the following formula [83]:
dij =
√√√√ N
∑n=1
wn(cni − cnj
)2 (2)
where N is the number of disparity criteria, wn is the weight assigned to each criterion andcni is the value that energy source i has for criterion n.
Here, 13 criteria were selected to calculate the disparity, namely average plant lifetime,average plant capacity, proportion of fuel imported, nations providing imported fuel,correlation between average daily generation with average demand, self-correlation ofthe generation data, ramping ability, minimum operable load, market concentration ofsuppliers and critical raw materials. These aspects cover technology characteristics thatare not considered in the larger MCDA, so there is no redundancy of information. Adetailed description of the criteria selection and the results of the SDI can be found in theSupplementary Material.
2.8. Determination of Stakeholder Preferences: Discrete Choice Experiments and Focus Groups
In order to gain insights into citizens’ preferences regarding future energy systems, amixed method approach was applied. Qualitative focus groups and a quantitative discretechoice experiment were conducted. While the quantitative analysis grants compatibility andserves as input to the MCDA, the qualitative data enhance the insight in the reasoning ofcitizens where necessary. The former focused on three core concepts of social sustainability:
• Quality of life—as a totalizing variable to include the degree of fulfillment of multiplediverging lifestyles and their goals found among different societal groups;
• Justice of distribution—as a variable to address the distribution of cost and benefitsconnected to any scenario to be debated within society;
Sustainability 2021, 13, 5217 12 of 28
• Justice between generations—as a variable to give special attention since the world-wide implementation of the “Fridays for Future“ movement.
To gather data on these aspects, in-depth focus groups among six groups (in total63 people) were conducted in two different German cities (Stuttgart and Osnabrück). Here,the participants were not only asked to assess multiple energy technologies along theirimpact on the three social aspects of sustainability, but also to explain their evaluationsand define the three concepts with their own words. This puts emphasis on the strengthof qualitative social science—the exploration of complex concepts and their underlyingdimensions of meaning to several different individuals. To foster a diverse perspectivegained in this measurement, the groups varied in age (young adults, general public andseniors) and were selected in equal gender proportions. The discussion was recorded andlater transcribed and analyzed with Max QDA software by three different social scientiststo ensure inter-coder reliability.
Quantitative data was gathered via a discrete choice experiment [84], where respon-dents were asked to choose between eight different energy scenarios. Discrete choiceexperiments have a long tradition in marketing research, where they are used to discoverthe importance of different traits of a product for consumers’ buying decisions [85,86]. Theyare seen as a more valid measurement than directly asking for the importance of differentcharacteristics for one’s decision [87], and have been applied in energy related research toanalyze, e.g., investments in energy technologies [88], nuclear waste storage [89] or windpower developers’ perspectives on the effect of support policies [90].
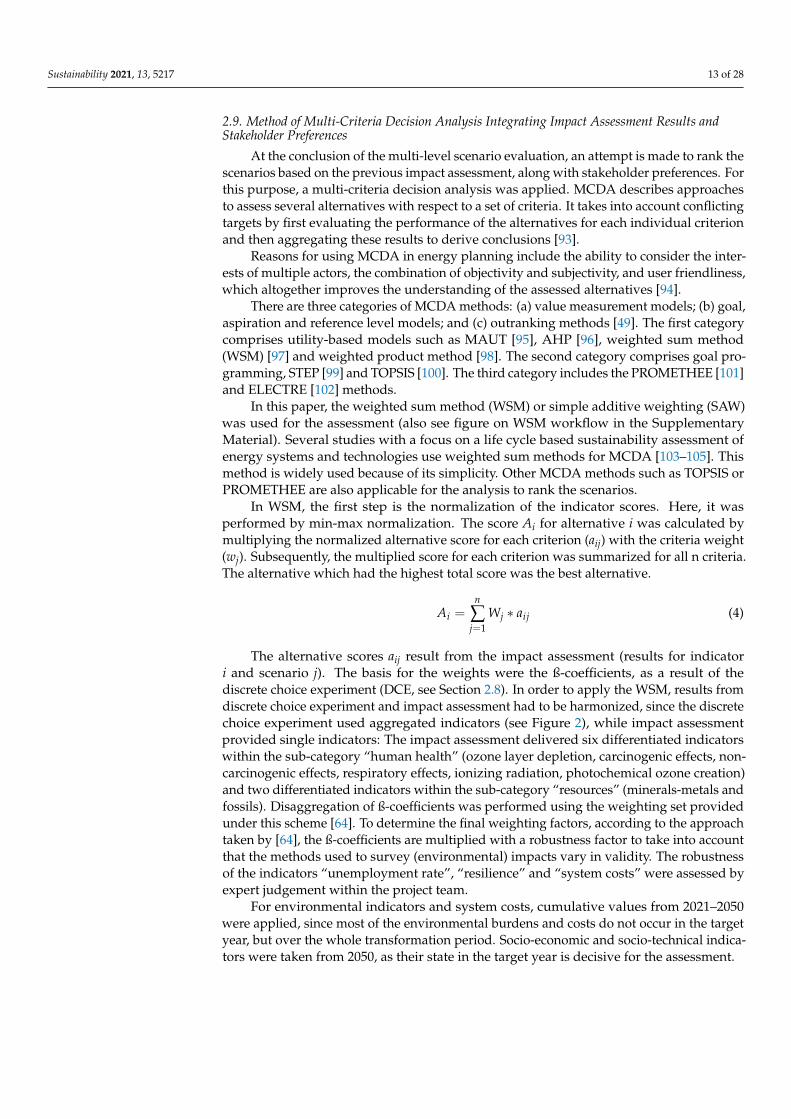
The scenarios in the decision set of this discrete choice experiment were chosen to rep-resent a variety of energy futures with reduced CO2-emissions, originating from differenttechnologies. The scenarios therefore differed with regard to system costs, employmenteffects, security of supply, health effects, climate effects, land use and resource depletion.To facilitate the decision between scenarios, they were characterized by their relative effectson these variables compared to the other scenarios in the set (see Table 2). For example,the value of −7% for “employment” in Table 2 meant that the scenario discussed here per-formed 7% worse than the arithmetic mean of all scenario values. To facilitate processingof the scenarios performance, these values had been color-coded: more sustainable valuesby comparison with the alternative scenario with green, less sustainable values with red,equally sustainable values with yellow. In total, 1488 pairwise comparisons were made by130 interviewees in Stuttgart and Osnabrück. The interviews were conducted online and inworkshops in spring 2019 using Qualtrics software.
Table 2. Way of representation of energy scenarios in the discrete choice experiment.
Employment SystemCosts
Securityof Supply
HumanHealth
ClimateEffects Land Use Ressource
Depletion−7% −35% −19% −55% −84% −91% −25%
To account for unobserved heterogeneity, a respective multinomial logit model wasapplied [91] when analyzing data. The utility U of a chosen alternative j for individual non choice t is given by:
Unjt = β′n·xnjt + εnjt (3)
“where βn is a vector of individual-specific coefficients, xnjt is a vector of observed attributesrelating to individuals and alternative j on choice occasion t, and εnjt is a random term thatis assumed to be an independently and identically distributed extreme value” [92].
To enable direct comparison of the β-coefficients, the indicators have been normalized.The weights passed on to the MCDA equate to the mean of the estimated unconditionalβ-coefficients corresponding to the normalized indicators xnjt.
Sustainability 2021, 13, 5217 13 of 28
2.9. Method of Multi-Criteria Decision Analysis Integrating Impact Assessment Results andStakeholder Preferences
At the conclusion of the multi-level scenario evaluation, an attempt is made to rank thescenarios based on the previous impact assessment, along with stakeholder preferences. Forthis purpose, a multi-criteria decision analysis was applied. MCDA describes approachesto assess several alternatives with respect to a set of criteria. It takes into account conflictingtargets by first evaluating the performance of the alternatives for each individual criterionand then aggregating these results to derive conclusions [93].
Reasons for using MCDA in energy planning include the ability to consider the inter-ests of multiple actors, the combination of objectivity and subjectivity, and user friendliness,which altogether improves the understanding of the assessed alternatives [94].
There are three categories of MCDA methods: (a) value measurement models; (b) goal,aspiration and reference level models; and (c) outranking methods [49]. The first categorycomprises utility-based models such as MAUT [95], AHP [96], weighted sum method(WSM) [97] and weighted product method [98]. The second category comprises goal pro-gramming, STEP [99] and TOPSIS [100]. The third category includes the PROMETHEE [101]and ELECTRE [102] methods.
In this paper, the weighted sum method (WSM) or simple additive weighting (SAW)was used for the assessment (also see figure on WSM workflow in the SupplementaryMaterial). Several studies with a focus on a life cycle based sustainability assessment ofenergy systems and technologies use weighted sum methods for MCDA [103–105]. Thismethod is widely used because of its simplicity. Other MCDA methods such as TOPSIS orPROMETHEE are also applicable for the analysis to rank the scenarios.
In WSM, the first step is the normalization of the indicator scores. Here, it wasperformed by min-max normalization. The score Ai for alternative i was calculated bymultiplying the normalized alternative score for each criterion (aij) with the criteria weight(wj). Subsequently, the multiplied score for each criterion was summarized for all n criteria.The alternative which had the highest total score was the best alternative.
Ai =n
∑j=1
Wj ∗ aij (4)
The alternative scores aij result from the impact assessment (results for indicatori and scenario j). The basis for the weights were the ß-coefficients, as a result of thediscrete choice experiment (DCE, see Section 2.8). In order to apply the WSM, results fromdiscrete choice experiment and impact assessment had to be harmonized, since the discretechoice experiment used aggregated indicators (see Figure 2), while impact assessmentprovided single indicators: The impact assessment delivered six differentiated indicatorswithin the sub-category “human health” (ozone layer depletion, carcinogenic effects, non-carcinogenic effects, respiratory effects, ionizing radiation, photochemical ozone creation)and two differentiated indicators within the sub-category “resources” (minerals-metals andfossils). Disaggregation of ß-coefficients was performed using the weighting set providedunder this scheme [64]. To determine the final weighting factors, according to the approachtaken by [64], the ß-coefficients are multiplied with a robustness factor to take into accountthat the methods used to survey (environmental) impacts vary in validity. The robustnessof the indicators “unemployment rate”, “resilience” and “system costs” were assessed byexpert judgement within the project team.
For environmental indicators and system costs, cumulative values from 2021–2050were applied, since most of the environmental burdens and costs do not occur in the targetyear, but over the whole transformation period. Socio-economic and socio-technical indica-tors were taken from 2050, as their state in the target year is decisive for the assessment.
Sustainability 2021, 13, 5217 14 of 28
3. Results
As mentioned above in Section 2, the impact assessment of the transformation scenar-ios can be performed on two levels:
On the first analysis level, the scenario performance with respect to individual impactsis determined. This allows an analysis of strengths and weaknesses of individual scenariosand a comparison of the performance of different scenarios with respect to individualimpacts. This level of analysis is illustrated by way of examples in Sections 3.1 and 3.2 forecological and socio-economic impacts. A detailed analysis, however, is beyond the scopeof this paper. Additional information, e.g., on results for the systemic indicator “diversity”and the total system costs can be found in the Supplementary Material.
On the second analysis level, a multi-criteria decision analysis using citizen’s prefer-ences allows us to rank the various scenarios in terms of their sustainability performances,as shown in Sections 3.3 and 3.4. Here, as well, only exemplary results are shown.
3.1. Ecologic Impacts
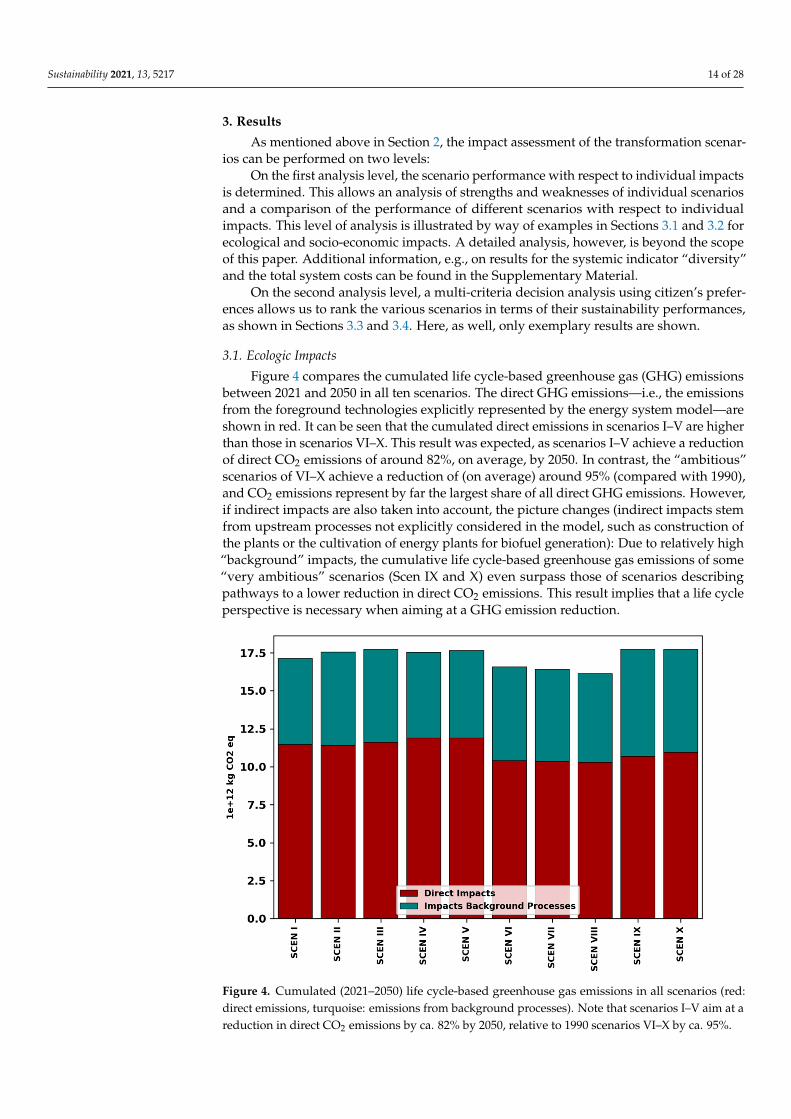
Figure 4 compares the cumulated life cycle-based greenhouse gas (GHG) emissionsbetween 2021 and 2050 in all ten scenarios. The direct GHG emissions—i.e., the emissionsfrom the foreground technologies explicitly represented by the energy system model—areshown in red. It can be seen that the cumulated direct emissions in scenarios I–V are higherthan those in scenarios VI–X. This result was expected, as scenarios I–V achieve a reductionof direct CO2 emissions of around 82%, on average, by 2050. In contrast, the “ambitious”scenarios of VI–X achieve a reduction of (on average) around 95% (compared with 1990),and CO2 emissions represent by far the largest share of all direct GHG emissions. However,if indirect impacts are also taken into account, the picture changes (indirect impacts stemfrom upstream processes not explicitly considered in the model, such as construction ofthe plants or the cultivation of energy plants for biofuel generation): Due to relatively high“background” impacts, the cumulative life cycle-based greenhouse gas emissions of some“very ambitious” scenarios (Scen IX and X) even surpass those of scenarios describingpathways to a lower reduction in direct CO2 emissions. This result implies that a life cycleperspective is necessary when aiming at a GHG emission reduction.
Figure 4. Cumulated (2021–2050) life cycle-based greenhouse gas emissions in all scenarios (red:direct emissions, turquoise: emissions from background processes). Note that scenarios I–V aim at areduction in direct CO2 emissions by ca. 82% by 2050, relative to 1990 scenarios VI–X by ca. 95%.
Sustainability 2021, 13, 5217 15 of 28
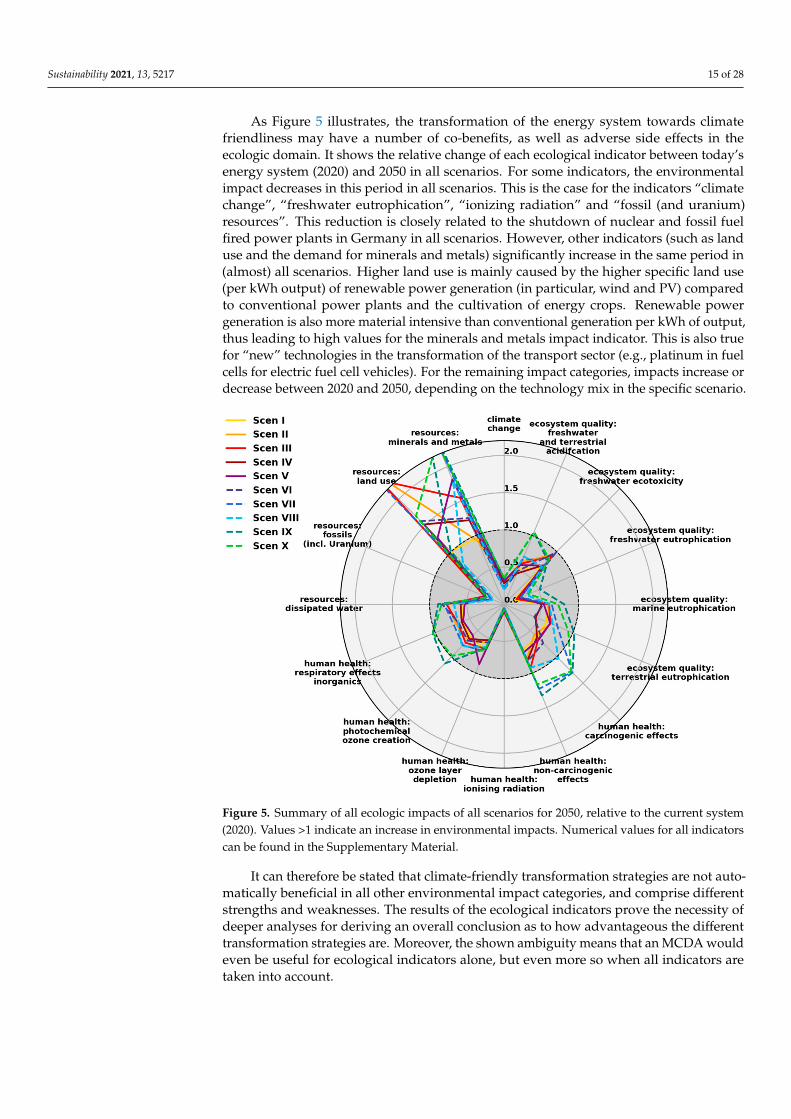
As Figure 5 illustrates, the transformation of the energy system towards climatefriendliness may have a number of co-benefits, as well as adverse side effects in theecologic domain. It shows the relative change of each ecological indicator between today’senergy system (2020) and 2050 in all scenarios. For some indicators, the environmentalimpact decreases in this period in all scenarios. This is the case for the indicators “climatechange”, “freshwater eutrophication”, “ionizing radiation” and “fossil (and uranium)resources”. This reduction is closely related to the shutdown of nuclear and fossil fuelfired power plants in Germany in all scenarios. However, other indicators (such as landuse and the demand for minerals and metals) significantly increase in the same period in(almost) all scenarios. Higher land use is mainly caused by the higher specific land use(per kWh output) of renewable power generation (in particular, wind and PV) comparedto conventional power plants and the cultivation of energy crops. Renewable powergeneration is also more material intensive than conventional generation per kWh of output,thus leading to high values for the minerals and metals impact indicator. This is also truefor “new” technologies in the transformation of the transport sector (e.g., platinum in fuelcells for electric fuel cell vehicles). For the remaining impact categories, impacts increase ordecrease between 2020 and 2050, depending on the technology mix in the specific scenario.
Figure 5. Summary of all ecologic impacts of all scenarios for 2050, relative to the current system(2020). Values >1 indicate an increase in environmental impacts. Numerical values for all indicatorscan be found in the Supplementary Material.
It can therefore be stated that climate-friendly transformation strategies are not auto-matically beneficial in all other environmental impact categories, and comprise differentstrengths and weaknesses. The results of the ecological indicators prove the necessity ofdeeper analyses for deriving an overall conclusion as to how advantageous the differenttransformation strategies are. Moreover, the shown ambiguity means that an MCDA wouldeven be useful for ecological indicators alone, but even more so when all indicators aretaken into account.
Sustainability 2021, 13, 5217 16 of 28
3.2. Macro-Economic Effects
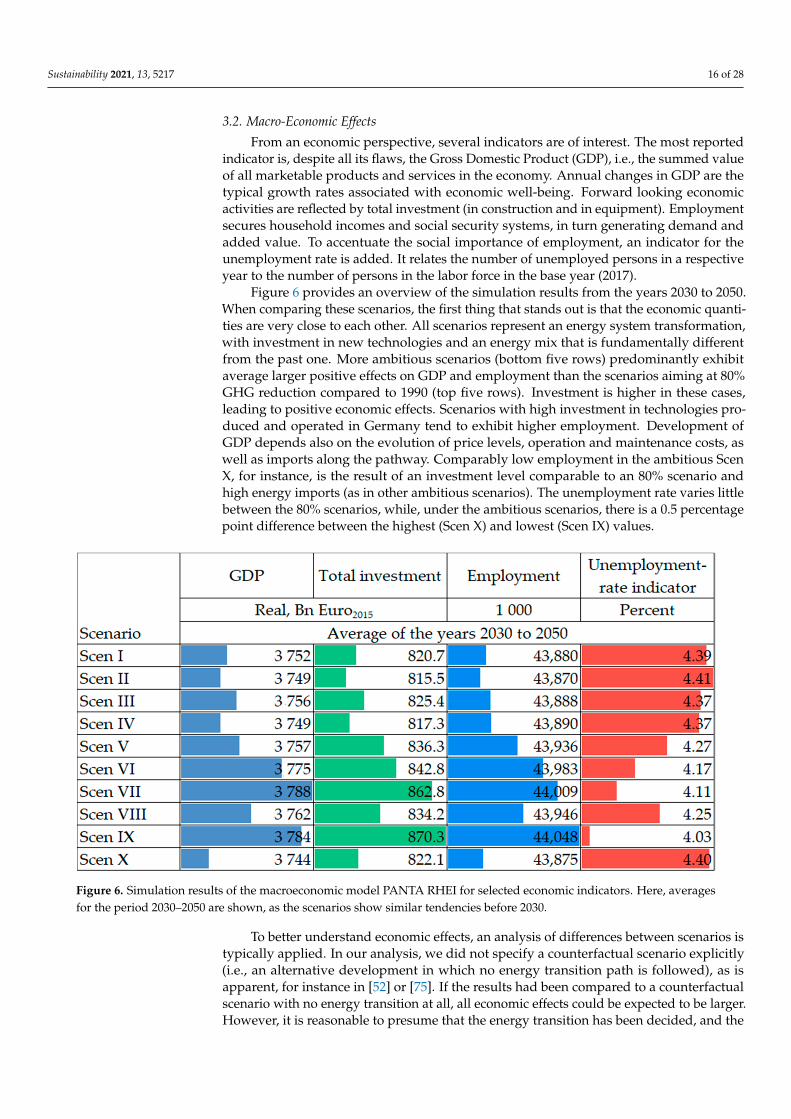
From an economic perspective, several indicators are of interest. The most reportedindicator is, despite all its flaws, the Gross Domestic Product (GDP), i.e., the summed valueof all marketable products and services in the economy. Annual changes in GDP are thetypical growth rates associated with economic well-being. Forward looking economicactivities are reflected by total investment (in construction and in equipment). Employmentsecures household incomes and social security systems, in turn generating demand andadded value. To accentuate the social importance of employment, an indicator for theunemployment rate is added. It relates the number of unemployed persons in a respectiveyear to the number of persons in the labor force in the base year (2017).
Figure 6 provides an overview of the simulation results from the years 2030 to 2050.When comparing these scenarios, the first thing that stands out is that the economic quanti-ties are very close to each other. All scenarios represent an energy system transformation,with investment in new technologies and an energy mix that is fundamentally differentfrom the past one. More ambitious scenarios (bottom five rows) predominantly exhibitaverage larger positive effects on GDP and employment than the scenarios aiming at 80%GHG reduction compared to 1990 (top five rows). Investment is higher in these cases,leading to positive economic effects. Scenarios with high investment in technologies pro-duced and operated in Germany tend to exhibit higher employment. Development ofGDP depends also on the evolution of price levels, operation and maintenance costs, aswell as imports along the pathway. Comparably low employment in the ambitious ScenX, for instance, is the result of an investment level comparable to an 80% scenario andhigh energy imports (as in other ambitious scenarios). The unemployment rate varies littlebetween the 80% scenarios, while, under the ambitious scenarios, there is a 0.5 percentagepoint difference between the highest (Scen X) and lowest (Scen IX) values.
Figure 6. Simulation results of the macroeconomic model PANTA RHEI for selected economic indicators. Here, averagesfor the period 2030–2050 are shown, as the scenarios show similar tendencies before 2030.
To better understand economic effects, an analysis of differences between scenarios istypically applied. In our analysis, we did not specify a counterfactual scenario explicitly(i.e., an alternative development in which no energy transition path is followed), as isapparent, for instance in [52] or [75]. If the results had been compared to a counterfactualscenario with no energy transition at all, all economic effects could be expected to be larger.However, it is reasonable to presume that the energy transition has been decided, and the
Sustainability 2021, 13, 5217 17 of 28
sustainability analysis only aims at comparing the different pathways to attain the targets.Instead, we have selected one of the 80% scenarios (Scenario I) as reference and comparethe simulation results from the other nine scenarios against the selected scenario. Relativedifferences in percent illustrate the size of the impact of a scenario, with all other factorsheld equal (ceteris paribus assumption). From relative differences, one observes whetherthe impact on a certain economic sector or quantity is large or small, compared to what it iswithout the respective scenario assumptions.
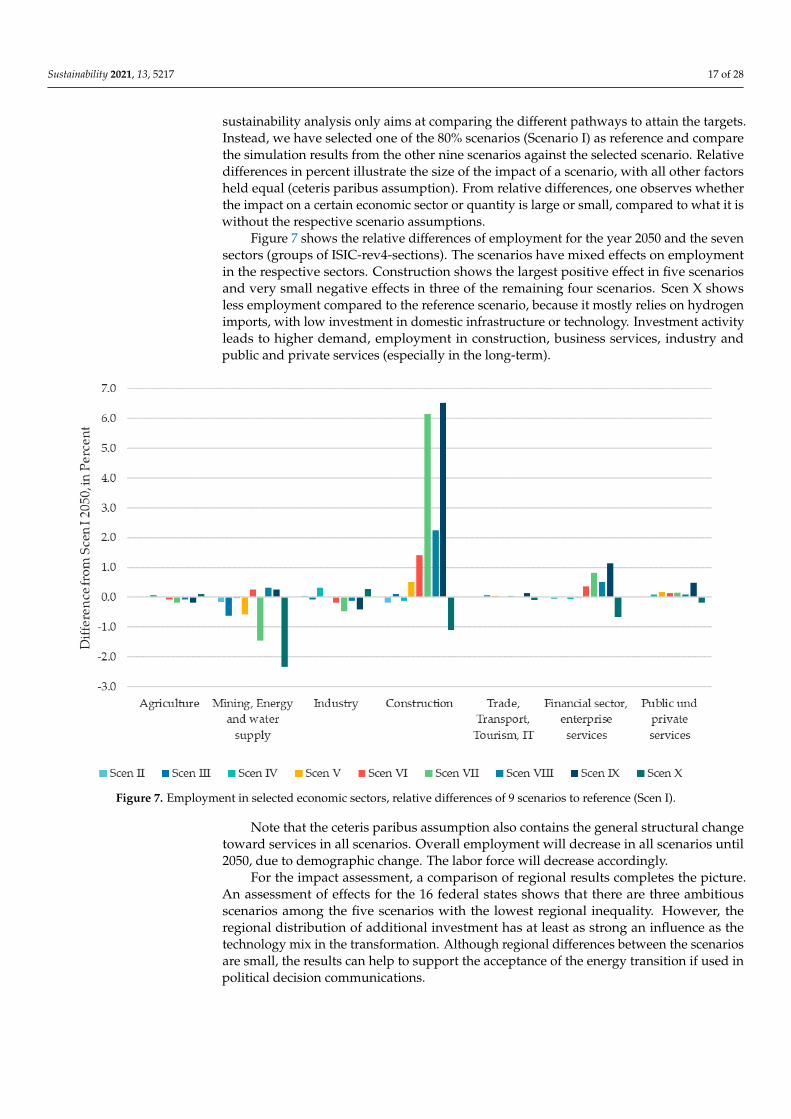
Figure 7 shows the relative differences of employment for the year 2050 and the sevensectors (groups of ISIC-rev4-sections). The scenarios have mixed effects on employmentin the respective sectors. Construction shows the largest positive effect in five scenariosand very small negative effects in three of the remaining four scenarios. Scen X showsless employment compared to the reference scenario, because it mostly relies on hydrogenimports, with low investment in domestic infrastructure or technology. Investment activityleads to higher demand, employment in construction, business services, industry andpublic and private services (especially in the long-term).
Figure 7. Employment in selected economic sectors, relative differences of 9 scenarios to reference (Scen I).
Note that the ceteris paribus assumption also contains the general structural changetoward services in all scenarios. Overall employment will decrease in all scenarios until2050, due to demographic change. The labor force will decrease accordingly.
For the impact assessment, a comparison of regional results completes the picture.An assessment of effects for the 16 federal states shows that there are three ambitiousscenarios among the five scenarios with the lowest regional inequality. However, theregional distribution of additional investment has at least as strong an influence as thetechnology mix in the transformation. Although regional differences between the scenariosare small, the results can help to support the acceptance of the energy transition if used inpolitical decision communications.
Sustainability 2021, 13, 5217 18 of 28
3.3. Stakeholders’ Preferences: Results from the Discrete Choice Experment and the Focus Groups
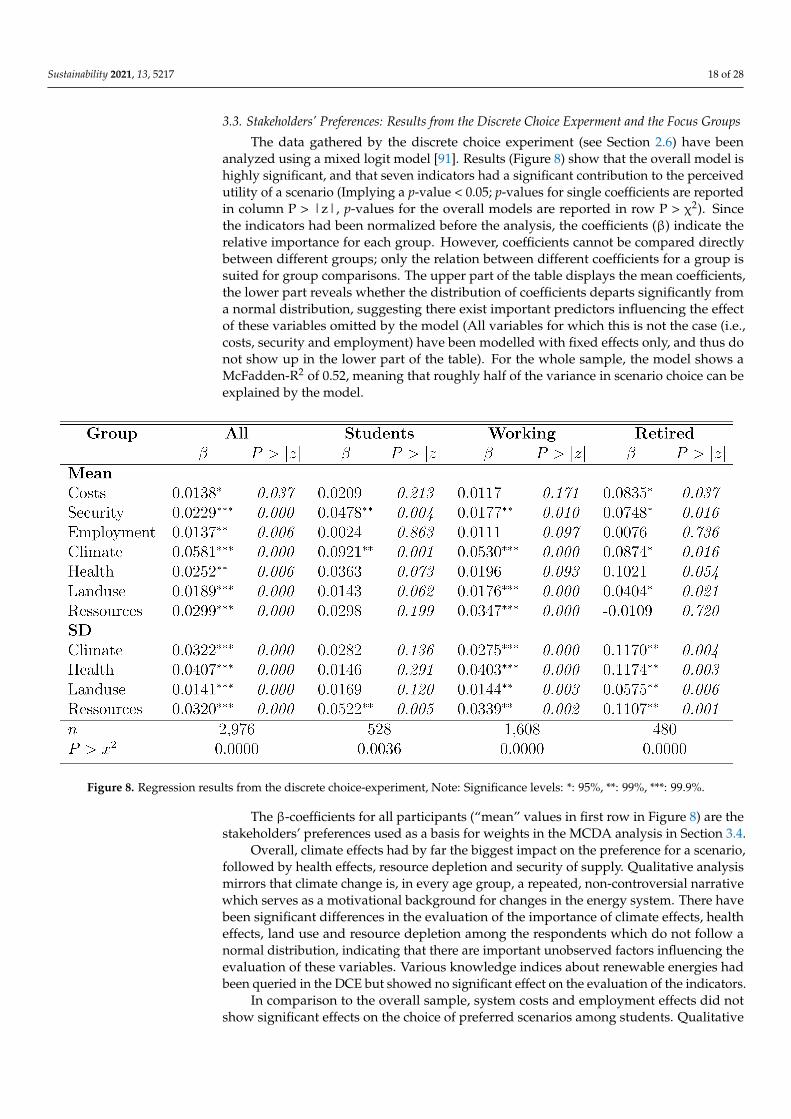
The data gathered by the discrete choice experiment (see Section 2.6) have beenanalyzed using a mixed logit model [91]. Results (Figure 8) show that the overall model ishighly significant, and that seven indicators had a significant contribution to the perceivedutility of a scenario (Implying a p-value < 0.05; p-values for single coefficients are reportedin column P > |z|, p-values for the overall models are reported in row P > χ2). Sincethe indicators had been normalized before the analysis, the coefficients (β) indicate therelative importance for each group. However, coefficients cannot be compared directlybetween different groups; only the relation between different coefficients for a group issuited for group comparisons. The upper part of the table displays the mean coefficients,the lower part reveals whether the distribution of coefficients departs significantly froma normal distribution, suggesting there exist important predictors influencing the effectof these variables omitted by the model (All variables for which this is not the case (i.e.,costs, security and employment) have been modelled with fixed effects only, and thus donot show up in the lower part of the table). For the whole sample, the model shows aMcFadden-R2 of 0.52, meaning that roughly half of the variance in scenario choice can beexplained by the model.
Sustainability 2021, 13, 5217 18 of 28
3.3. Stakeholders’ Preferences: Results from the Discrete Choice Experment and the Focus Groups
The data gathered by the discrete choice experiment (see Section 2.6) have beenanalyzed using a mixed logit model [91]. Results (Figure 8) show that the overall model ishighly significant, and that seven indicators had a significant contribution to the perceivedutility of a scenario (Implying a p-value < 0.05; p-values for single coefficients are reportedin column P > |z|, p-values for the overall models are reported in row P > χ2). Sincethe indicators had been normalized before the analysis, the coefficients (β) indicate therelative importance for each group. However, coefficients cannot be compared directlybetween different groups; only the relation between different coefficients for a group issuited for group comparisons. The upper part of the table displays the mean coefficients,the lower part reveals whether the distribution of coefficients departs significantly froma normal distribution, suggesting there exist important predictors influencing the effectof these variables omitted by the model (All variables for which this is not the case (i.e.,costs, security and employment) have been modelled with fixed effects only, and thus donot show up in the lower part of the table). For the whole sample, the model shows aMcFadden-R2 of 0.52, meaning that roughly half of the variance in scenario choice can beexplained by the model.
Figure 8. Regression results from the discrete choice-experiment.
The β-coefficients for all participants (“mean” values in first row in Figure 8) are thestakeholders’ preferences used as a basis for weights in the MCDA analysis in Section 3.4.
Overall, climate effects had by far the biggest impact on the preference for a scenario,followed by health effects, resource depletion and security of supply. Qualitative analysismirrors that climate change is, in every age group, a repeated, non-controversial narrativewhich serves as a motivational background for changes in the energy system. There havebeen significant differences in the evaluation of the importance of climate effects, healtheffects, land use and resource depletion among the respondents which do not follow anormal distribution, indicating that there are important unobserved factors influencing theevaluation of these variables. Various knowledge indices about renewable energies hadbeen queried in the DCE but showed no significant effect on the evaluation of the indicators.
In comparison to the overall sample, system costs and employment effects did notshow significant effects on the choice of preferred scenarios among students. Qualitativeanalysis of the arguments the students present shows a multitude of different attitudesamong the students when it comes to the costs: some emphasize them as they lack sufficientfinancial stability, others oppose this with the argument that health, climate and human
Figure 8. Regression results from the discrete choice-experiment, Note: Significance levels: *: 95%, **: 99%, ***: 99.9%.
The β-coefficients for all participants (“mean” values in first row in Figure 8) are thestakeholders’ preferences used as a basis for weights in the MCDA analysis in Section 3.4.
Overall, climate effects had by far the biggest impact on the preference for a scenario,followed by health effects, resource depletion and security of supply. Qualitative analysismirrors that climate change is, in every age group, a repeated, non-controversial narrativewhich serves as a motivational background for changes in the energy system. There havebeen significant differences in the evaluation of the importance of climate effects, healtheffects, land use and resource depletion among the respondents which do not follow anormal distribution, indicating that there are important unobserved factors influencing theevaluation of these variables. Various knowledge indices about renewable energies hadbeen queried in the DCE but showed no significant effect on the evaluation of the indicators.
In comparison to the overall sample, system costs and employment effects did notshow significant effects on the choice of preferred scenarios among students. Qualitative
Sustainability 2021, 13, 5217 19 of 28
analysis of the arguments the students present shows a multitude of different attitudesamong the students when it comes to the costs: some emphasize them as they lack sufficientfinancial stability, others oppose this with the argument that health, climate and humanwellbeing should never be compromised by money, even others do not want to rely on thefinancial numbers presented (see quotation at the end of this section). Security of supplyand health effects were more important for scenario choice among students—in relationto climate effects—than in other groups; land use and health effects seem less importantfor students.
Unsurprisingly, results for job holders resemble, more or less, those of the overall sam-ple, since this group makes up the biggest part of the sample. However, two divergencesattract attention: the effect of system costs on scenario choice is not significant for thisgroup, and resource depletion is valued as more important than in other groups. Retiredpersons seem to attribute far more importance to health effects, security of supply andsystem costs than other groups, though their arguments presented within the focus groupsdo not mirror the topic of cost sensitivity beyond the average level among all groups.
The results of the qualitative analysis of the focus groups mirror the quantitativeresults and enhance them with deeper insights into the participants’ reasoning regardingthe assessment of scenarios and energy technologies.
We observed that financial burdens and impacts on employment of the energy transi-tion is of more importance to younger people, as their socio-economic resources are limited(see quotations A1, A2, A3 in the Supplementary Material):
Retired people we asked not to fear financial insecurity for themselves to the samedegree as young people. They debate more about how frugality and renouncement add to asustainable lifestyle. They are also concerned about how to translate and compare the needsand definitions of quality of life among people to find fair solutions and arrangements (seequotations A4 and A5 in the Supplementary Material).
Results of the DC-experiment were integrated into a MCDA of the 10 re-modelledscenarios (see 2.2 for scenario selection, 3.5 for MCDA results). Additionally, these re-sults were supposed to identify preferred points on a pareto-front optimizing for climateeffects vs. system costs (see [35]). However, regarding the indicators captured by theDC-experiment and other social indicators (unemployment, GDP, regional disparity), theresults of different scenarios on the pareto-front show little variance; the biggest differencesbetween these scenarios are in terms of land use (5.7%), system costs (2.6%) and climateeffects (2.2%), and other indicators differ by less than 1%. Land use and climate effectshave shown a much bigger influence on scenario preference in the DC-experiment thansystem costs, and an increase of system costs by 2.6% equals a reduction in land use of5.7%, as well as a reduction in adverse climate effects of 2.2%. Thus, it seems reasonablethat citizens would prefer the scenario with the higher system costs, as they perform betteron the other aspects. In the qualitative analysis, this can be mirrored, though some doubtsabout the reliability of the numbers presents were also voiced. (see quotations A6 and A7in the Supplementary Material).
3.4. Integration of Impact Assessment and DCE into MCDA
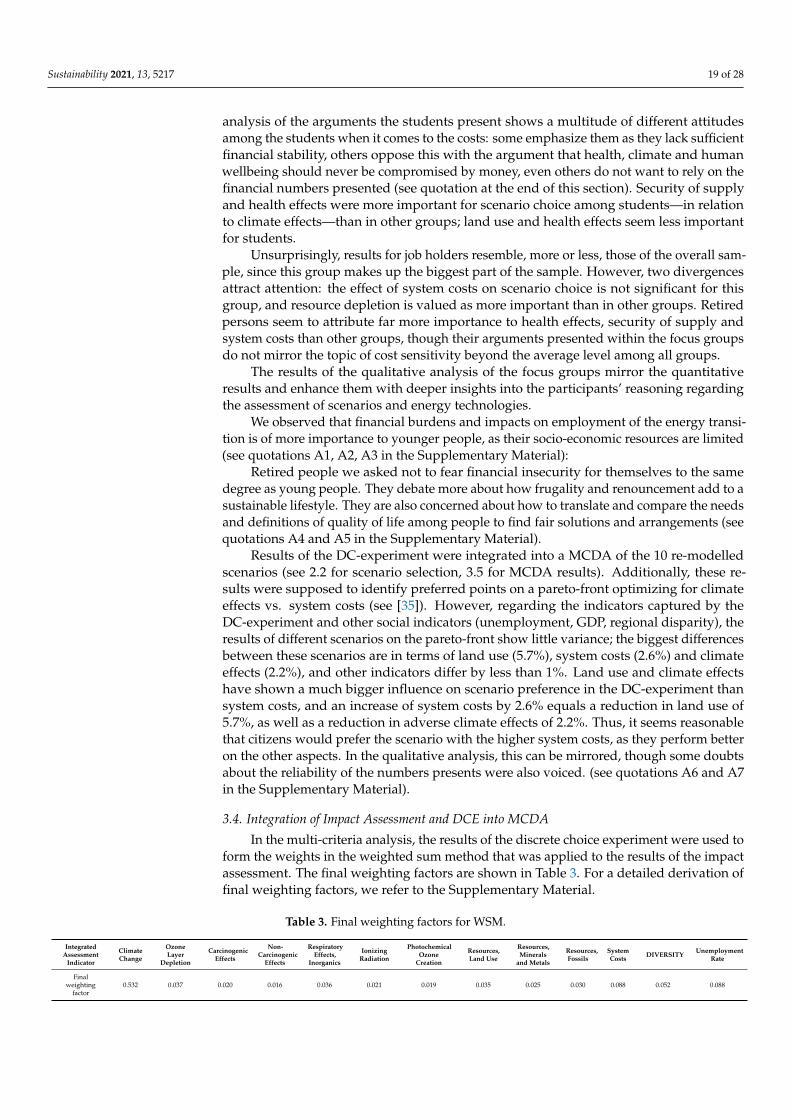
In the multi-criteria analysis, the results of the discrete choice experiment were used toform the weights in the weighted sum method that was applied to the results of the impactassessment. The final weighting factors are shown in Table 3. For a detailed derivation offinal weighting factors, we refer to the Supplementary Material.
Table 3. Final weighting factors for WSM.
IntegratedAssessment
Indicator
ClimateChange
OzoneLayer
Depletion
CarcinogenicEffects
Non-Carcinogenic
Effects
RespiratoryEffects,
Inorganics
IonizingRadiation
PhotochemicalOzone
Creation
Resources,Land Use
Resources,Minerals
and Metals
Resources,Fossils
SystemCosts DIVERSITY Unemployment
Rate
Finalweighting
factor0.532 0.037 0.020 0.016 0.036 0.021 0.019 0.035 0.025 0.030 0.088 0.052 0.088
Sustainability 2021, 13, 5217 20 of 28
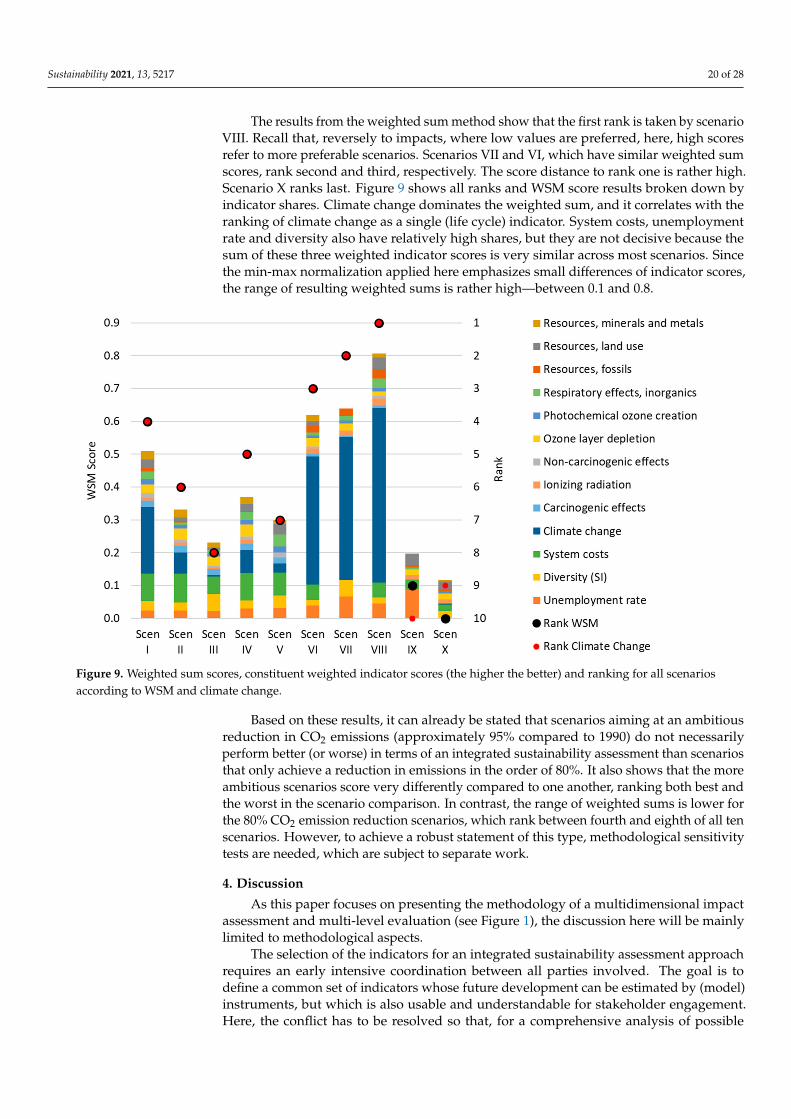
The results from the weighted sum method show that the first rank is taken by scenarioVIII. Recall that, reversely to impacts, where low values are preferred, here, high scoresrefer to more preferable scenarios. Scenarios VII and VI, which have similar weighted sumscores, rank second and third, respectively. The score distance to rank one is rather high.Scenario X ranks last. Figure 9 shows all ranks and WSM score results broken down byindicator shares. Climate change dominates the weighted sum, and it correlates with theranking of climate change as a single (life cycle) indicator. System costs, unemploymentrate and diversity also have relatively high shares, but they are not decisive because thesum of these three weighted indicator scores is very similar across most scenarios. Sincethe min-max normalization applied here emphasizes small differences of indicator scores,the range of resulting weighted sums is rather high—between 0.1 and 0.8.
Figure 9. Weighted sum scores, constituent weighted indicator scores (the higher the better) and ranking for all scenariosaccording to WSM and climate change.
Based on these results, it can already be stated that scenarios aiming at an ambitiousreduction in CO2 emissions (approximately 95% compared to 1990) do not necessarilyperform better (or worse) in terms of an integrated sustainability assessment than scenariosthat only achieve a reduction in emissions in the order of 80%. It also shows that the moreambitious scenarios score very differently compared to one another, ranking both best andthe worst in the scenario comparison. In contrast, the range of weighted sums is lower forthe 80% CO2 emission reduction scenarios, which rank between fourth and eighth of all tenscenarios. However, to achieve a robust statement of this type, methodological sensitivitytests are needed, which are subject to separate work.
4. Discussion
As this paper focuses on presenting the methodology of a multidimensional impactassessment and multi-level evaluation (see Figure 1), the discussion here will be mainlylimited to methodological aspects.
The selection of the indicators for an integrated sustainability assessment approachrequires an early intensive coordination between all parties involved. The goal is todefine a common set of indicators whose future development can be estimated by (model)instruments, but which is also usable and understandable for stakeholder engagement.Here, the conflict has to be resolved so that, for a comprehensive analysis of possible
Sustainability 2021, 13, 5217 21 of 28
impacts of a system, many relevant indicators as possible should be considered, however,for MCDA, the number of indicators should not become too large.
Although it is now clearly established that the transformation of the energy system isa socio-technical process, it is still a research task to identify and operationalize relevantsocial indicators beyond economic and health aspects that can reasonably be assessed in aprospective manner (i.e., time horizon from 2050 and beyond). Regarding systemic indica-tors, a first step was made here to use the Stirling Index for describing the diversity of thepower supply as an aspect of its potential resilience. However, a more elaborated approachto assessing the resilience of energy systems requires further methodological developmentsand a significantly expanded set of models (for example, power grid simulation models).This was beyond the scope of this study.
Standards for reporting scenario data would help to better compare scenarios fromdifferent sources. The same applies to harmonized boundary conditions and assumptions inthe studies (scenario frameworks). Since standardized and harmonized scenario data fromdifferent sources are generally not available, a harmonized re-modeling of transformationstrategies is necessary if one wants to avoid biases due to different boundary conditions.
Focusing on sustainability aspects of different supply side strategies, including trans-portation (as in this study), ignores that the demand side is a key lever to significantlyreducing energy-related greenhouse gas emissions. Eco-sufficiency strategies, and theresulting reduction of energy-related services and consumption, or the modal shift intransportation, could have been addressed within the set of models and competencesavailable here. However, the complexity and diversity of technologies on the consumptionside (building insulation, electrical appliances, industrial processes, etc.), as well as theavailability of LCI and cost data, are major barriers. Therefore, as a first step, it seemedreasonable to focus on an impact assessment for different technical strategies on the supplyside, knowing that this is only one side of the coin.
The focus on Germany makes it difficult to appropriately re-model the scenarios, sinceit is to be expected that, with higher renewable energy shares, Europe-wide electricityexchange will also play an increasingly important role in the German energy system.Thus, it is advisable to extend the geographical horizon of such an analysis to at least theEuropean level. However, with possibly increasing relevance of PtX imports from outsideEurope, even a European level might be too narrow.
An integrated, harmonized approach for a multidimensional impact assessment ofscenarios required the development of a harmonized framework comprising energy systemmodels, macroeconomic models and models assessing (life cycle-based) environmentalimpacts. The effort to couple the necessary models and harmonize the data is not low, butmanageable in the context of larger projects.
Within the approach presented here, impacts of transformation strategies for theentire energy system are assessed. A systematic comparison of different transformationstrategies for individual sectors would be interesting, but could not be implemented withinthe scope of the work due to the great variety of possible scenario variants and limitedavailable resources.
Coupling energy system models with LCI data makes it possible to determine lifecycle-based environmental impacts of entire transformation strategies. However, there area number of challenges to this, such as availability, quality and representativeness of LCIdata, prospectively, in the foreground technologies and in the background database, in theavoidance of double counting of impacts between foreground and background system andin uncertainties in impact assessment methods. Prospective adjustments of technologiesin the background LCI database are a major methodological challenge, the solution towhich could also benefit from increased cooperation between institutions and a move toopen-source solutions. It would be helpful if a shared prospective LCI database for energyand transportation technologies could be developed and maintained within the life cycleassessment community or LCI database providers. There is a need for harmonization andstandardization of prospective LCI data in the energy sector.
Sustainability 2021, 13, 5217 22 of 28
Coupling energy system models with macroeconomic models makes it possible todetermine macroeconomic consequences of different transformation pathways. However,a number of issues complicate this analysis. The long time horizon of the analysis and thefundamental change of the analyzed energy system require numerous exogenous assump-tions as boundary conditions for the macroeconomic model. The type of macroeconomicmodel used here is fundamentally based on historical contexts and behaviors. As a conse-quence, many further exogenous adjustments to macroeconomic interactions are usuallynecessary to adequately and comprehensively describe possible future developments.
Determining uncertainties for all selected indicators was not possible within the scopeof this project. Nevertheless, it would make sense to also include the uncertainty of theimpact assessment of indicators in an MCDA for transformation strategies in the future inorder to achieve more robust results.
The new approach of applying discrete choice experiments to energy scenarios ispromising, but it comes with challenges. The simultaneous complexity and high abstractionlevel of the future represented in the scenarios make it difficult to find an appropriate setof indicators and a condensed representation of the future that is suitable for a discretechoice experiment.
Indicator weights are crucial for MCDA results. This highlights the importance ofproviding a solid basis for determining the weights, which should ideally involve a varietyof stakeholders. On the other hand, the large number of criteria and their complexityrequire an extended understanding, which cannot be assumed by every stakeholder.
The integrated multidimensional sustainability assessments presented in this paperhighlight the importance of assessing energy transformation pathways in a holistic manner.They go beyond analyses focused exclusively on climate change and can be utilized byresearchers and practitioners to support and develop future energy policies and strategiesthat contribute to global sustainable development. Further results of this multidimen-sional assessment will be presented in separate publications, which also will focus on theimplications of the findings.
5. Conclusions and Outlook
In this paper, an approach for an integrated, multidimensional sustainability assess-ment of energy transformation scenarios was presented. The approach combines a detailedmodel-based assessment of (life cycle) environmental impacts and macroeconomic conse-quences of transformation strategies, with stakeholder-based indicator preferences and amulti-criteria impact assessment.
The strengths of the integrated approach for a sustainability assessment of energyscenarios presented here are manifold. First of all, the harmonized re-modeling of the sce-narios, as well as the extensive coupling of energy system, macroeconomic and LCA modelsallow a consistent and unbiased comparison of ecologic and macro-economic impacts ofdifferent (supply side) strategies for the transformation of the German energy system.
The multidimensional impact assessment, i.e., the explicit modeling of economic andecologic affects, including an extensive assessment of stakeholders’ preferences, enables theidentification of conflicting goals and co-benefits between sustainability dimensions. Theextensive consideration, in particular of ecologic and macro-economic aspects, nourishesthe hope that many (if not most) relevant aspects of sustainable transformation (at least ona national level) can be addressed by this approach. The detailed environmental impactassessment allows an analysis of underlying cause–effect relationships between scenariofeatures (transformation strategies) and related impacts, identifying possible future hotspot sectors and technologies.
On the other hand, the MCDA significantly reduces the complexity of the multidi-mensional impact assessment by aggregating and reducing the diversity of environmentaland economic analysis to a reasonable and more understandable level. It thus allows thedrawing of clear conclusions from a very complex analysis.
Sustainability 2021, 13, 5217 23 of 28
However, as discussed extensively above, a number of methodological challengesremain that have to be addressed in future research: This comprises (among others) acomprehensive and compelling (yet pragmatic) indicator selection (considering both thecapabilities of the models and the requirements for stakeholder engagement and MCDA),methodological challenges arising from prospective LCA, LCI data availability and quality,common system boundaries for all models, integration of demand side strategies in theassessment, the estimation of uncertainties of the analyzed impacts, etc. Furthermore, itwould be very helpful to better understand which scenario features are responsible for agood or bad performance in MCDA analysis. This would allow the use of insights fromprevious MCDA analyses for an iterative improvement of transformation strategies in afollow-up scenario development exercise. Along with approaches such as multi-objectiveoptimization, this could eventually lead to the development of transformation strategiesfor energy systems which are more sustainable (and, as a consequence, hopefully moreacceptable) in a broad sense of this term.
Supplementary Materials: The following are available online at https://www.mdpi.com/article/10.3390/su13095217/s1: InNOSys—an integrated approach for the sustainability assessment oftransformation pathways—supplement.docx.
Author Contributions: Conceptualization, T.N., I.T., T.V., A.W.; methodology, T.N., T.J., I.T., C.S.,T.V., P.U., L.B., U.L., A.W., O.S., W.H., H.H. and R.S.-S.; formal analysis, T.N., C.S., S.S., P.U., L.B.,U.L., O.S., T.J., W.H. and R.S.-S.; writing—original draft preparation J.B., T.N., H.H.; C.S., S.S., P.U.,L.B., U.L., O.S. and W.H.; writing—review and editing, T.N.; I.T., T.V., T.J. and A.W.; visualization,T.N. and H.H.; project administration, T.N.; funding acquisition, T.V., A.W. and T.N. All authors haveread and agreed to the published version of the manuscript.
Funding: This research was funded by the German Federal Ministry for Economic Affairs and Energy(BMWi) under the project number 03ET4058 as part of the project InNOSys—Integrated SustainabilityAssessment and Optimization of Energy Systems.
Institutional Review Board Statement: Not applicable.
Informed Consent Statement: Not applicable.
Data Availability Statement: More information and data can be found under https://www.innosys-projekt.de, accessed on 6 May 2021.
Acknowledgments: The authors wish to thank Thomas Pregger (DLR) for his support in the fundingacquisition, Paul Reggentin (INATECH) for his assessment of the diversity indicator and Nick Harderand Ramiz Qussous (INATECH) for their contributions to the flexABLE simulations, as well as FabianFrick (INATECH) for extracting quantitative values from the scenario studies.
Conflicts of Interest: The authors declare no conflict of interest.
List of Acronyms
AHP Analytic Hierarchy ProcessBEE Bundesverband Erneuerbare Energien (German Renewable Energy Federation)BMU Bundesministerium für Umwelt, Naturschutz und nukleare Sicherheit
(Federal Ministry of the Environment, Nature Conservation and Nuclear Safety)BMWi Bundesministerium für Wirtschaft und Energie
(Federal Ministry for Economic Affairs and Energy)BWE Bundesverband Windenergie (German Wind Energy Association)dena Deutsche Energieagentur (German Energy Agency)DCE Discrete Choice ExperimentDIW Deutsches Institut für Wirtschaftsforschung
(German Institute for Economic Research)DLR Deutsches Zentrum für Luft- und Raumfahrt (German Aerospace Center)ELECTRE Elimination et Choix Traduisaint la Realité
(Elimination and Choice Translating Reality)ESM Energy System Model
Sustainability 2021, 13, 5217 24 of 28
List of Acronyms
FhG ISI Fraunhofer-Institut für System- und Innovationsforschung(Fraunhofer Institute for Systems and Innovation Research)
GDP Gross Domestic ProductGHG Greenhouse gas emissionsGWS Gesellschaft für wirtschaftliche Strukturforschung
(Institute of Economic Structures Research)IAM Integrated Assessment ModelINES Initiative Erdgasspeicher (Association of German Gas Storage Operators)LCA Life Cycle AssessmentLCC Life Cycle CostingLCI Life Cycle InventoryLCIA Life Cycle Impact AssessmentLCOE Levelized Costs of ElectricityLCSA Life Cycle Sustainability AssessmentMCDA Multi-criteria Decision AnalysisMAUT Multi Attribute Utility TheoryNDC Nationally Determined Contributionpkm Person KilometerPROMETHEE Preference Ranking Organization Method for Enrichment EvaluationsSAW Simple Additive WeightingSDI Stirling Diversity IndexS-LCA Social Life Cycle AssessmentSNAB System of National Accounts and Balancestkm Ton KilometerTOPSIS Technique for Order Preference by Similarity to Ideal SolutionUBA Umweltbundesamt (German Environment Agency)WSM Weighted Sum Model
References1. EU Commission. The European Green Deal; EU Commission: Brussels, Belgium, 2019.2. EU Commission. National Energy Climate Plans; EU Commission: Brussels, Belgium, 2020.3. United Nations General Assembly. Transforming our World: The 2030 Agenda for Sustainable Development; United Nations General
Assembly: New York, NY, USA, 2015.4. Federal Government of Germany. German Sustainable Development Strategy—New Version 2016; Presse-und Informationsamt der
Bundesregierung: Berlin, Germany, 2018.5. Rösch, C.; Bräutigam, K.R.; Kopfmüller, J.; Stelzer, V.; Lichtner, P. Indicator system for the sustainability assessment of the German
energy system and its transition. Energy Sustain. Soc. 2017, 7, 1–13. [CrossRef]6. Quitzow, R.; Bangert, A.; Düber, D.; Fraune, C.; Fricke, A.; Gaschnig, H.; Gößling-Reisemann, S.; Kaltenegger, O.; Kemmerzell, J.;
Kopfmüller, J.; et al. Multikriterieller Bewertungsansatz für eine nachhaltige Energiewende—Von der Analyse zur Entscheidungsfindungmit ENavi; Institute for Advanced Sustainability Studies (IASS): Potsdam, Germany, 2018.
7. Gaschnig, H.; Quitzow, R.; Bangert, A.; Fahl, U.; Hofer, C.; Kaltenegger, O.; Kopfmüller, J.; Loos, C.; Löschel, A.; Pietzcker, R.; et al.Multikriterielle Bewertung der Energiewende, Nachhaltigkeitsprofile zum Kohleausstieg; Institute for Advanced Sustainability Studiese.V. (IASS): Potsdam, Germany, 2020.
8. Neofytou, H.; Nikas, A.; Doukas, H. Sustainable energy transition readiness: A multicriteria assessment index. Renew. Sustain.Energy Rev. 2020, 131, 109988. [CrossRef]
9. Uriarte, E.A. Multi-criteria methodology for the prioritisation of alternative energy transition scenarios of cities. In Department ofThermal Engineering; The University of the Basque Country: Bilbao, Spain, 2017.
10. Gawel, E.; Lehmann, P.; Korte, K.; Strunz, S.; Bovet, J.; Köck, W.; Massier, P.; Löschel, A.; Schober, D.; Ohlhorst, D. The future ofthe energy transition in Germany. Energy Sustain. Soc. 2014, 4, 15. [CrossRef]
11. Azapagic, A.; Stamford, L.; Youds, L.; Barteczko-Hibbert, C. Towards sustainable production and consumption: A novel DEcision-Support Framework IntegRating Economic, Environmental and Social Sustainability (DESIRES). Comput. Chem. Eng. 2016, 91,93–103. [CrossRef]
12. Ringkjøb, H.-K.; Haugan, P.M.; Solbrekke, I.M. A review of modelling tools for energy and electricity systems with large shares ofvariable renewables. Renew. Sustain. Energy Rev. 2018, 96, 440–459. [CrossRef]

Sustainability 2021, 13, 5217 25 of 28
13. Gils, H.-C.; Gardian, H.; Kittel, M.; Schill, W.-P.; Zerrahn, A.; Murmann, A.; Launer, J.; Fehler, A.; Gaumnitz, F.; van Ouwerkerk, J.;et al. Impacts of methodology and level of modeling detail of flexibility technologies on energy system model results. Renew.Sustain. Energy Rev.. (submitted).
14. Carramolino, R.F.-B.; Careri, F.; Kavvadias, K.; Hidalgo-Gonzalez, I.; Zucker, A.; Peteves, E. Systematic Mapping of Power SystemModels: Expert Survey; Joint Research Center (JRC): Publications Office of the European Union: Luxembourg, 2017.
15. Junne, T.; Simon, S.; Buchgeister, J.; Saiger, M.; Baumann, M.; Haase, M.; Wulf, C.; Naegler, T. Environmental SustainabilityAssessment of Multi-Sectoral Energy Transformation Pathways: Methodological Approach and Case Study for Germany.Sustainability 2020, 12, 8225. [CrossRef]
16. Junne, T.; Wulff, N.; Breyer, C.; Naegler, T. Critical materials in global low-carbon energy scenarios: The case for neodymium,dysprosium, lithium, and cobalt. Energy 2020, 211, 118532. [CrossRef]
17. Höfer, T.; Madlener, R. A participatory stakeholder process for evaluating sustainable energy transition scenarios. Energy Policy2020, 13, 111277. [CrossRef]
18. Graff, M.; Carley, S.; Konisky, D.M. Stakeholder perceptions of the United States energy transition: Local-level dynamics andcommunity responses to national politics and policy. Energy Res. Soc. Sci. 2018, 43, 144–157. [CrossRef]
19. Stede, J.; May, N. Way Off: The Effect of Minimum Distance Regulation on the Deployment of Wind Power. In DIW BerlinDiscussion Papers; Deutsches Institut für Wirtschaftsforschung (DIW): Berlin, Germany, 2020.
20. Sonnberger, M.; Ruddat, M. Local and socio-political acceptance of wind farms in Germany. Technol. Soc. 2017, 51,56–65. [CrossRef]
21. Ren, J.; Toniolo, S. Life Cycle Sustainability Assessment for Decision Making; Elsevier: Amsterdam, The Netherlands, 2020.22. Ciroth, A.; Finkbeiner, M.; Traverso, M.; Hildenbrand, J.; Kloepffer, W.; Mazijn, B.; Prakash, S.; Sonnemann, G.; Valdivia, S.;
Ugaya, C.M.L. Towards a Life Cycle Sustainability Assessment—Making Informed Choices on Products; United Nations EnvironmentalProgramm: Nairobi, Kenya, 2011.
23. Zanni, S.; Awere, E.; Bonoli, A. Life cycle sustainability assessment: An ongoing journey. In Life Cycle Sustainability Assessment forDecision-Making; Ren, J., Toniolo, S., Eds.; Elsevier: Amsterdam, The Netherlands, 2020; pp. 59–93.
24. Lin, R.; Man, Y.; Ren, J. Framework of life cycle sustainability assessment. In Life Cycle Sustainability Assessment for DecisionMaking; Ren, J., Toniolo, S., Eds.; Elsevier: Amsterdam, The Netherlands, 2020.
25. Keller, H.; Rettenmaier, N.; Reinhardt, G.A. Integrated life cycle sustainability assessment—A practical approach applied tobiorefineries. Appl. Energy 2015, 154, 1072–1081. [CrossRef]
26. Wulf, C.; Zapp, P.; Schreiber, A.; Marx, J.; Schlör, H. Lessons Learned from a Life Cycle Sustainability Assessment of Rare EarthPermanent Magnets. J. Ind. Ecol. 2017, 21, 1578–1590. [CrossRef]
27. Sala, S.; Vasta, A.; Mancini, L.; Dewulf, J.; Rosenbaum, E. Social Life Cycle Assessment—State of the Art and Challenges for SupportingProduct Policies; Joint Reserach Centre (JRC): Publications Office of the European Union: Luxembourg, 2015.
28. Yang, S.; Ma, K.; Liu, Z.; Ren, J.; Man, Y. Chapter 5—Development and applicability of life cycle impact assessment methodologies.In Life Cycle Sustainability Assessment for Decision-Making; Ren, J., Toniolo, S., Eds.; Elsevier: Amsterdam, The Netherlands, 2020;pp. 95–124.
29. Ren, J. Multi-criteria decision making for the prioritization of energy systems under uncertainties after life cycle sustainabilityassessment. Sustain. Prod. Consum. 2018, 16, 45–57. [CrossRef]
30. Santoyo-Castelazo, E.; Azapagic, A. Sustainability assessment of energy systems: Integrating environmental, economic and socialaspects. J. Clean. Prod. 2014, 80, 119–138. [CrossRef]
31. Fauré, E.; Arushanyan, Y.; Ekener, E.; Miliutenko, S.; Finnveden, G. Methods for assessing future scenarios from a sustainabilityperspective. Eur. J. Futures Res. 2017, 5, 17. [CrossRef]
32. Arushanyan, Y.; Ekener, E.; Moberg, Å. Sustainability assessment framework for scenarios—SAFS. Environ. Impact Assess. Rev.2017, 63, 23–34. [CrossRef]
33. Kopfmüller, J.; Weimer-Jehle, W.; Naegler, T.; Buchgeister, J.; Bräutigam, K.-R.; Stelzer, V. Integrative Scenario Assessment as aTool to Support Decisions in Energy Transition. Energies 2021, 14, 1580. [CrossRef]
34. Göhlich, D.; Nagel, K.; Syré, A.M.; Grahle, A.; Martins-Turner, K.; Ewert, R.; Miranda Jahn, R.; Jefferies, D. Integrated Approachfor the Assessment of Strategies for the Decarbonization of Urban Traffic. Sustainability 2021, 13, 839. [CrossRef]
35. Junne, T.; Cao, K.-K.; Miskiw, K.K.; Hottenroth, H.; Naegler, T. Considering Life Cycle Greenhouse Gas Emissions in PowerSystem Expansion Planning for Europe and North Africa Using Multi-Objective Optimization. Energies 2021, 14, 1301. [CrossRef]
36. Vandepaer, L.; Junne, T.; Gibon, T.; Astudillo, M.F.; Bauer, C.; Amor, B. The integration of life cycle assessment into energy systemmodels: Best practices, current challenges and aim for the next decade. Renew. Sustain. Energy Rev.. (Submitted).
37. Lutz, C.; Lehr, U.; Ulrich, P. Economic Evaluation of Climate Protection Measures in Germany. Int. J. Energy Econ. Policy 2014,4, 693–705.
38. Hafner, S.; Anger-Kraavi, A.; Monasterolo, I.; Jones, A. Emergence of New Economics Energy Transition Models: A Review. Ecol.Econ. 2020, 177, 106779. [CrossRef]
39. Fagiolo, G.; Roventini, A. Macroeconomic Policy in DSGE and Agent-Based Models Redux: New Developments and ChallengesAhead. SSRN 2016. [CrossRef]
Sustainability 2021, 13, 5217 26 of 28
40. Aboumahboub, T.; Auer, C.; Bauer, N.; Baumstark, L.; Bertram, C.; Bi, S.; Dirnaichner, A.; Giannousakis, A.; Haller, M.REMIND—REgional Model of INvestments and Development—Version 2.1.0; Potsdam Institute for Climate Impact Research:Potsdam, Germany, 2020.
41. Luderer, G.; Pehl, M.; Arvesen, A.; Gibon, T.; Bodirsky, B.L.; de Boer, H.S.; Fricko, O.; Hejazi, M.; Humpenöder, F.; Iyer, G.; et al.Environmental co-benefits and adverse side-effects of alternative power sector decarbonization strategies. Nature Commun. 2019,10, 5229. [CrossRef] [PubMed]
42. Stehfest, E.; van Vuuren, D.; Kram, T. Integrated Assessment of Global Environmental Change with IMAGE 3.0—Model Description andPolicy Applications; PBL Netherlands Environmental Assessment Agency: The Hague, The Netherlands, 2014.
43. Solé, J.; Samsó, R.; García-Ladona, E.; García-Olivares, A.; Ballabrera-Poy, J.; Madurell, T.; Turiel, A.; Osychenko, O.; Álvarez, D.;Bardi, U.; et al. Modelling the renewable transition: Scenarios and pathways for a decarbonized future using pymedeas, a newopen-source energy systems model. Renew. Sustain. Energy Rev. 2020, 132, 110105. [CrossRef]
44. Calvin, K.; Patel, P.; Clarke, L.; Asrar, G.; Bond-Lamberty, B.; Cui, R.Y.; Di Vittorio, A.; Dorheim, K.; Edmonds, J.; Hartin, C.; et al.GCAM v5.1: Representing the linkages between energy, water, land, climate, and economic systems. Geosci. Model Dev. 2019, 12,677–698. [CrossRef]
45. Masson-Delmotte, V.; Zhai, P.; Pörtner, H.-O.; Roberts, D.; Skea, J.; Shukla, P.R.; Pirani, A.; Moufouma-Okia, W.; Péan, C.; Pidcock,R.; et al. Global Warming of 1.5 ◦C. An IPCC Special Report on the Impacts of Global Warming of 1.5 ◦C above Pre-Industrial Levels andRelated Global Greenhouse Gas Emission Pathways, in the Context of Strengthening the Global Response to the Threat of Climate Change,Sustainable Development, and Efforts to Eradicate Poverty; IPCC: Geneva, Switzerland, 2018.
46. Brand, B.; Missaoui, R. Multi-criteria analysis of electricity generation mix scenarios in Tunisia. Renew. Sustain. Energy Rev. 2014,39, 251–261. [CrossRef]
47. Georgiou, D.; Mohammed, E.S.; Rozakis, S. Multi-criteria decision making on the energy supply configuration of autonomousdesalination units. Renew. Energy 2015, 75, 459–467. [CrossRef]
48. Pohekar, S.D.; Ramachandran, M. Application of multi-criteria decision making to sustainable energy planning—A review. Renew.Sustain. Energy Rev. 2004, 8, 365–381. [CrossRef]
49. Kumar, A.; Sah, B.; Singh, A.R.; Deng, Y.; He, X.; Kumar, P.; Bansal, R.C. A review of multi criteria decision making (MCDM)towards sustainable renewable energy development. Renew. Sustain. Energy Rev. 2017, 69, 596–609. [CrossRef]
50. Witt, T.; Dumeier, M.; Geldermann, J. Combining scenario planning, energy system analysis, and multi-criteria analysis to developand evaluate energy scenarios. J. Clean. Prod. 2020, 242, 118414. [CrossRef]
51. Naegler, T.; Weidlich, A.; Sutardhio, C.; Pregger, T. Exploring long-term strategies for the German Energy Transition—A Review oMulti-Sector Energy Scenarios. Renew. Sustain. Energy Transit.. (submitted).
52. Lutz, C.; Flaute, M.; Lehr, U.; Kemmler, A.; Kirchner, A.; Auf der Maur, A.; Ziegenhagen, I.; Wünsch, M.; Koziel, S.; Piégsa, A.;et al. Gesamtwirtschaftliche Effekte der Energiewende; GWS, DLR, Prognos, DIW Berlin: Osnabrück, Germany, 2018.
53. Pfluger, B.; Tersteegen, B.; Franke, B.; Bernath, C.; Boßmann, T.; Deac, G.; Elsland, R.; Fleiter, T.; Kühn, A.; Ragwitz, M.; et al.Langfristszenarien für die Transformation des Energiesystems in Deutschland; FhG ISI, Consentec, Ifeu, Karlsruhe: Aachen, Germany;Heidelberg, Germany, 2017.
54. Nitsch, J.; Pregger, T.; Naegler, T.; Heide, D.; de Tena, D.L.; Trieb, F.; Scholz, Y.; Nienhaus, K.; Gerhardt, N.; Sterner, M.; et al.Langfristszenarien und Strategien für den Ausbau der Erneuerbaren Energien in Deutschland bei Berücksichtigung der Entwicklung inEuropa und Global; DLR, FhG IWES, IFNE: Stuttgart, Germany; Kassel, Germany; Teltow, Germany, 2012.
55. Repenning, J.; Emele, L.; Blanck, R.; Böttcher, H.; Dehoust, G.; Förster, H.; Greiner, B.; Harthan, R.; Henneberg, K.; Her-mann, H.; et al. Klimaschutzszenario 2050—2, Endbericht; Öko-Institut, FhG ISI, Hans-Joachim Ziesing: Berlin, Germany;Karlsruhe, Germany, 2015.
56. Henning, H.-M.; Palzer, A. Was Kostet die Energiewende? Wege zur Transformation des Deutschen Energiesystems bis 2050; FhG ISE:Freiburg, Germany, 2015.
57. Nitsch, J. GROKO II—Szenarien der Deutschen Energieversorgung auf der Basis des EEG-Gesetzentwurfs—Insbesondere Auswirkungenauf den Wärmesektor; Bundesverband Erneuerbare Energie e.V. (BEE): Stuttgart, Germany, 2014.
58. Günther, J.; Lehmann, H.; Lorenz, U.; Purr, K. Den Weg zu einem treibhausgasneutralen Deutschland ressourcenschonend gestalten;German Environment Agency (Umweltbundesamt—UBA): Dessau-Roßlau, Germany, 2017.
59. Klein, S.; Klein, S.W.; Steinert, T.; Fricke, A.; Peschel, D. Erneuerbare Gase—Ein Systemupdate der Energiewende; Enervis EnergyAdvisors gmBH, Initiative Erdgasspeicher e.V. (INES), Bundesverband Windenergie e.V. (BWE): Berlin, Germany, 2017.
60. Bründlinger, T.; König, J.; Frank, O.; Gründig, D.; Jugel, C.; Kraft, P.; Krieger, O.; Mischinger, S.; Prein, P.; Seidl, H.; et al.Dena-Leitstudie integrierte Energiewende; EWI Energy Research and Scenarios gGmbH: Berlin, Germany, 2018.
61. Fazio, S. Supporting Information to the Characterisation Factors of the Recommended EF Life Cycle Impact Assessment method—New Models and Differences with ILCD. In JRC Technical Reports; JRC: Ispra, Italy, 2018.
62. Van Oers, L.; Guinée, J.B.; Heijungs, R. Abiotic resource depletion potentials (ADPs) for elements revisited—updating ultimatereserve estimates and introducing time series for production data. Int. J. Life Cycle Assess 2020, 25, 294–308. [CrossRef]
63. Stirling, A. Multicriteria diversity analysis: A novel heuristic framework for appraising energy portfolios. Energy Policy 2010, 38,1622–1634. [CrossRef]
64. Sala, S.; Cerutti, A.; Pant, R. Development of a weighting approach for the Environmental Footprint. In JRC Technical Reports; JRC:Ispra, Italy, 2018.
Sustainability 2021, 13, 5217 27 of 28
65. Schlenzig, C. Energy planning and environmental management with the information and decision support system MESAP. Int. J.Glob. Energy Issues 1999, 12, 81–91. [CrossRef]
66. Pregger, T.; Naegler, T.; Weimer-Jehle, W.; Prehofer, S.; Hauser, W. Moving towards socio-technical scenarios of the Germanenergy transition—Lessons learned from integrated energy scenario building. Clim. Chang. 2020, 162, 1743–1762. [CrossRef]
67. Qussous, R.; Künzel, T.; Weidlich, A. Effects of a Coal Phase-Out on Market Dynamics: Results from a Simulation Model forGermany. In Proceedings of the 16th International Conference on the European Energy Market (EEM), Ljubljana, Slovenia, 18–20September 2019.
68. Wernet, G.; Bauer, C.; Steubing, B.; Reinhard, J.; Moreno-Ruiz, E.; Weidema, B. The eco invent database version 3 (part I):Overview and methodology. Int. J. Life Cycle Assess 2016, 21, 1218–1230. [CrossRef]
69. Schebek, L.; Cikovani, Y.; Biermann, K.; Bulach, W.; Poganietz, W.-R.; Düpmeier, C.; Kusche, O.; Simon, S.; Ciroth, A.; Srocka, M.;et al. Bereitstellung einer aktuellen und harmonisierten Datenbasis als Beitrag zur Weiterentwicklung einer nachhaltigen Bioenergiestrategie;Karlsruhe Institute of Technology: Karlsruhe, Germany, 2013.
70. UVEK. UVEK LCI Data 2018; Bundesamt für Umwelt BAFU: Ittigen, Switzerland, 2018.71. Liebich, A.; Fröhlich, T.; Münter, D.; Fehrenbach, H.; Giegrich, J.; Köppen, S.; Dünnebeil, F.; Knörr, W.; Biemann, K.; Simon, S.; et al.
System Comparison of Storage Energy Carriers from Renewable Energies; German Environmental Agency: Dessau, Germany, 2021.72. Teske, S. Achieving the Paris Climate Agreement Goals—Global and Regional 100% Renewable Energy Scenarios with Non-Energy GHG
Pathways for + 1.5 ◦C and + 2 ◦C; Teske, S., Ed.; Springer: Berlin/Heideberg, Germany, 2019.73. Lutz, C.; Meyer, B.; Nathani, C.; Schleich, J. Endogenous innovation, economy and environment: Impacts of a technology based
modelling approach for energy-intensive industries in Germany. Energy Stud. Rev. 2007, 15, 2–18. [CrossRef]74. Ulrich, P.; Lehr, U. Economic effects of an E-mobility scenario—Input structure and energy consumption. Econ. Syst. Res. 2019, 32,
1–14. [CrossRef]75. Lehr, U.; Edler, D.; Ulrich, P.; Blazejczak, J.; Lutz, C. Beschäftigungschancen auf dem Weg zu Einer Green Economy—Szenarienbasierte
Analyse von (Netto-) Beschäftigungswirkungen; GWS, DIW Berlin: Berlin, Germany, 2019.76. Lehr, U.; Becker, L.; Ulrich, P. Zur Integration strombasierter Energieträger in die Energiebilanz Deutschlands. Et En-
ergiewirtschaftliche Tagesfragen 2020, 11, 59–72.77. Awerbuch, S.; Stirling, A.; Jansen, J.C.; Beurskens, L.W.M. Chapter 13—Full-Spectrum Portfolio and Diversity Analysis of Energy
Technologies, in Managing Enterprise Risk; Leggio, K.B., Bodde, D.L., Taylor, M.L., Eds.; Elsevier Science Ltd.: Oxford, UK, 2006;pp. 202–222.
78. Chuang, M.C.; Ma, H.W. Energy security and improvements in the function of diversity indices—Taiwan energy supply structurecase study. Renew. Sustain. Energy Rev. 2013, 24, 9–20. [CrossRef]
79. Cooke, H.; Keppo, I.; Wolf, S. Diversity in theory and practice: A review with application to the evolution of renewable energygeneration in the UK. Energy Policy 2013, 61, 88–95. [CrossRef]
80. Grubb, M.; Butler, L.; Twomey, P. Diversity and security in UK electricity generation: The influence of low-carbon objectives.Energy Policy 2006, 34, 4050–4062. [CrossRef]
81. Verrastro, F.; Ladislaw, S. Providing Energy Security in an Interdependent World. Wash. Q. 2010, 30, 95–104. [CrossRef]82. Skea, J. Valuing diversity in energy supply. Energy Policy 2010, 38, 3608–3621. [CrossRef]83. Yoshizawa, G.; Stirling, A.; Suzuki, T. Electricity System Diversity in the UK and Japan: A Multicriteria Diversity Analysis; University
of Tokyo (Graduate School of Public Policy): Tokyo, Japan; University of Susses (SPRU): Brighton, UK, 2008.84. Louviere, J.J.; Woodworth, G. Design and Analysis of Simulated Consumer Choice or Allocation Experiments: An Approach
Based on Aggregate Data. J. Mark. Res. 1983, 20, 350–367. [CrossRef]85. Fiedler, H.; Kaltenborn, T.; Lanwehr, R.; Melles, T. Conjoint Analysis Sozialwissenschaftliche Forschungsmethoden; Wenzel, M.S.M.,
Ed.; Rainer Hampp Verlag: Augsburg, Germany, 2017; Volume 7.86. Elshiewy, O.; Guhl, D.; Boztug, Y. Multinomial Logit Models in Marketing—From Fundamentals to State-of-the-Art. Mark. ZFP
2017, 39, 32–49. [CrossRef]87. Louviere, J.; Hensher, D.; Swait, J. Stated Choice Methods: Analysis and Applications; Cambridge University Press: Cambridge, UK, 2000.88. Bergmann, A.; Hanley, N.; Wright, R. Valuing the attributes of renewable energy investments. Energy Policy 2006, 34,
1004–1014. [CrossRef]89. Krütli, P.; Stauffacher, M.; Pedolin, D.; Moser, C.; Scholz, R.W. The Process Matters: Fairness in Repository Siting for Nuclear
Waste. Soc. Justice Res. 2012, 25, 79–101. [CrossRef]90. Präßler, T. Overcoming Barriers to Onshore and Offshore Wind Power Development—A Developers Perspective on the Effect of
Support Policies. In Fakultät VI—Planen Bauen Umwelt; TU Berlin: Berlin, Germany, 2014.91. Hole, A.R. Fitting Mixed Logit Models by Using Maximum Simulated Likelihood. Stata J. 2007, 7, 388–401. [CrossRef]92. Busch, J.; Dawson, D.; Roelich, K. Closing the low-carbon material loop using a dynamic whole system approach. J. Clean. Prod.
2017, 149, 751–761. [CrossRef]93. Dias, L.C.; Freire, F.; Geldermann, J. Perspectives on Multi-criteria Decision Analysis and Life-Cycle Assessment. In New
Perspectives in Multiple Criteria Decision Making: Innovative Applications and Case Studies; Doumpos, M., Figueira, J.R., Greco, S.,Zopounidis, C., Eds.; Springer International Publishing: Cham, Switzerland, 2019; pp. 315–329.
94. Tsoutsos, T.; Drandaki, M.; Frantzeskaki, N.; Iosifidis, E.; Kiosses, I. Sustainable energy planning by using multi-criteria analysisapplication in the island of Crete. Energy Policy 2009, 37, 1587–1600. [CrossRef]
Sustainability 2021, 13, 5217 28 of 28
95. Edwards, W.; Newman, J.R. Multiattribute evaluation. In Quantitative Applications in the Social Sciences; Sage University PapersSeries; Sage Publications: Beverly Hills, CA, USA, 1982; Volume 7–26, p. 96.
96. Saaty, T.L. The Analytic Hierarchy Process; McGraw-Hill: New York, NY, USA, 1980; p. 287.97. Fishburn, P.C. Additive Utilities with Incomplete Product Set: Applications to Priorities and Assignments; ORSA Publication M4—Citavi:
Baltimore, MD, USA, 1967.98. Bridgman, P.W. Dimensional Analysis; AMS Publication: New York, NY, USA, 1978; p. 113.99. Benayoun, R.; Montgolfier, J.; Tergny, J.; Laritchev, O. Linear Programming with Multiple Objective Functions. Math. Program
1971, 1, 366–375. [CrossRef]100. Hwang, C.-L.; Yoon, K. Multiple Attribute Decision Making. In Lecture Notes in Economics and Mathematical Systems; Springer:
Berlin/Heidelberg, Germany, 1981; Volume 186, p. 269.101. Brans, J.P.; Vincke, P. Note—A Preference Ranking Organization Method. Manag. Sci. 1985, 31, 647–656. [CrossRef]102. Benayoun, R.; Roy, B.; Sussman, B. ELECTRE: Une méthode pour guider le choix en en présence de points de vue multiples. In
Note de Travail; SEMA (Metra International): Paris, France, 1966.103. Volkart, K.; Weidmann, N.; Bauer, C.; Hirschberg, S. Multi-criteria decision analysis of energy system transformation pathways:
A case study for Switzerland. Energy Policy 2017, 106, 155–168. [CrossRef]104. Klein, S.J.W.; Whalley, S. Comparing the sustainability of U.S. electricity options through multi-criteria decision analysis. Energy
Policy 2015, 79, 127–149.105. Maxim, A. Sustainability assessment of electricity generation technologies using weighted multi-criteria decision analysis. Energy
Policy 2014, 65, 284–297. [CrossRef]


