Embed Size (px)
Citation preview

Induced pluripotent stem cells derived from rabbitsexhibit some characteristics of naıve pluripotency
Pierre Osteil1,2,3,4,*, Yann Tapponnier1,2,3,*, Suzy Markossian1,2,3,4,*, Murielle Godet1,2,3,4,Barbara Schmaltz-Panneau5, Luc Jouneau5, Cedric Cabau6, Thierry Joly3,7,8, Thierry Blachere1,2,3, Elen Gocza9,Agnieszka Bernat1,2,3,`, Martine Yerle10, Herve Acloque10, Sullivan Hidot1,2,3, Zsuzsanna Bosze9,Veronique Duranthon5, Pierre Savatier1,2,3,4,§ and Marielle Afanassieff1,2,3,4,§
1INSERM, U846, Stem Cell and Brain Institute, 18 Avenue du Doyen Jean Lepine, F-69500 Bron, France2Stem Cell and Brain Institute, F-69500 Bron, France3Universite de Lyon, F-69100 Villeurbanne, France4INRA, USC1361, F-69500 Bron, France5INRA, Biology of Development and Reproduction, F-78352 Jouy-en-Josas, France6INRA, SIGENAE, UR83 Recherches Avicoles, F-37380 Nouzilly, France7ISARA-Lyon, F-69007 Lyon, France8VetAgroSup, UPSP ICE, F-69280 Marcy l’Etoile, France9Institute of Animal Biotechnology, Agricultural Biotechnology Center, H-2100 Godollo, Hungary10INRA, UMR444, F-31326 Castanet Tolosan, France
*These authors contributed equally to this work`Present address: Laboratory of Molecular Diagnostics, Intercollegiate Faculty of Biotechnology, Medical University of Gdansk, Poland§Authors for correspondence ([email protected]; [email protected])
Biology Open 2, 613–628doi: 10.1242/bio.20134242Received 25th January 2013Accepted 2nd April 2013
SummaryNot much is known about the molecular and functional
features of pluripotent stem cells (PSCs) in rabbits. To
address this, we derived and characterized 2 types of rabbit
PSCs from the same breed of New Zealand White rabbits: 4
lines of embryonic stem cells (rbESCs), and 3 lines of
induced PSCs (rbiPSCs) that were obtained by
reprogramming adult skin fibroblasts. All cell lines
required fibroblast growth factor 2 for their growth and
proliferation. All rbESC lines showed molecular and
functional properties typically associated with primed
pluripotency. The cell cycle of rbESCs had a prolonged G1
phase and a DNA damage checkpoint before entry into the S
phase, which are the 2 features typically associated with the
somatic cell cycle. In contrast, the rbiPSC lines exhibited
some characteristics of naıve pluripotency, including
resistance to single-cell dissociation by trypsin, robust
activity of the distal enhancer of the mouse Oct4 gene, and
expression of naıve pluripotency-specific genes, as defined in
rodents. According to gene expression profiles, rbiPSCs were
closer to the rabbit inner cell mass (ICM) than rbESCs.
Furthermore, rbiPSCs were capable of colonizing the ICM
after aggregation with morulas. Therefore, we propose that
rbiPSCs self-renew in an intermediate state between naıve
and primed pluripotency, which represents a key step
toward the generation of bona fide naıve PSC lines in
rabbits.
� 2013. Published by The Company of Biologists Ltd. This is
an Open Access article distributed under the terms of the
Creative Commons Attribution Non-Commercial Share Alike
License (http://creativecommons.org/licenses/by-nc-sa/3.0).
Key words: Rabbit model, Embryonic stem cell, Induced pluripotent
stem cell, Pluripotency, Cell cycle
IntroductionPluripotent stem cells (PSCs) can exist in two morphologically,
molecularly and functionally distinct pluripotent states,
designated as the naıve and primed states (Nichols and Smith,
2009). The first rabbit pluripotent stem cell (PSC) lines were
produced from New Zealand White rabbit blastocysts in the form
of embryonic stem cells [rabbit ESCs (rbESCs)] (Fang et al.,
2006; Wang et al., 2007). In their undifferentiated state, rbESCs
required both fibroblast growth factor 2 (FGF2) and growth
factors of the transforming growth factor (TGF) b family (activin,
nodal) for self-renewal (Wang et al., 2008). These results were
confirmed in another study, which showed that activin/nodal
signaling through Smad2/3 activation was necessary for
maintaining the pluripotent status of rbESCs (Honda et al.,
2009). These rbESCs did not colonize rabbit embryos after being
injected into blastocysts (Honda et al., 2008). Honda et al. also
established rabbit induced PSC lines [rabbit iPSCs (rbiPSCs)]
from adult liver and stomach cells (Honda et al., 2010). Similar to
rbESCs, rbiPSCs are dependent on FGF2 for self-renewal.
Therefore, rbESCs and rbiPSCs seemed to exhibit the cardinal
feature of primed pluripotency. However, this conclusion should
be moderated because none of these studies evaluated these cell
lines for other criteria that demarcate naıve and primed
pluripotency; moreover, these studies did not compared these
cell lines with rabbit inner cell mass (ICM) cells and PSCs from
other species. Therefore, the status of rbESCs and rbiPSCs is yet
to be thoroughly evaluated. In our study, we compared rbESCs
and rbiPSCs at both molecular and functional levels and
Research Article 613
Bio
logy
Open

concluded that (i) rbESCs do not exhibit all the characteristicfeatures of pluripotency and (ii) rbiPSCs exhibit some
characteristic features of naıve pluripotency.
ResultsDerivation of FGF2-dependent rbESC lines
Twenty-four ICMs isolated from 52 blastocysts by immunosurgery
were plated on feeder cells in rbESC medium supplemented withFGF2. Twelve of these ICMs could form outgrowths, of which 4produced a population of highly proliferating cells that could be
routinely passaged more than 40 times. These rbESC lines –designated rbES-4, rbES-8, rbES-18 and rbES-19 – formedflattened colonies of compact cells (Fig. 1A; supplementarymaterial Fig. S1A). They were passaged every 3 days after
collagenase II treatment of the colonies, followed by gentledissociation into small clumps. All attempts to passage these celllines after trypsinization into single-cell suspensions resulted in
extensive differentiation and apoptosis (data not shown). All the 4lines were positive for alkaline phosphatase activity (Fig. 1B;supplementary material Fig. S1A) and were strictly dependent on
FGF2 for self-renewal, as determined by their altered morphologyafter FGF2 withdrawal for 24 h (Fig. 1C). Conventional Giemsastaining showed a normal chromosome number in all the selected
lines (.50 metaphase spreads analyzed: 42XY) (Fig. 1D;supplementary material Fig. S1A). For rbES-18 line, the cellswere karyotyped using G-banding, and normal chromosomecomplements were observed in the 4 analyzed metaphase spreads
(Fig. 1E). Immunolabeling showed that all the 4 lines expressedOct4 in virtually every cell in the respective populations (Fig. 1F;supplementary material Fig. S3). All the 4 cell lines could undergo
in vitro differentiation into embryoid bodies (EBs) (Fig. 1H).Differentiation was accompanied by the rapid loss of Nanog andOct4 expression and upregulation of the ectodermal marker Nestin
and endodermal marker Hnf3b. The mesodermal marker Flk1 wasexpressed at robust levels in undifferentiated cells (Fig. 1G). Allthe 4 rbESC lines could induce teratomas after being injectedunder the kidney capsules in SCID mice. All teratomas contained
derivatives of the 3 embryonic germ layers (Fig. 1I,J;supplementary material Fig. S2A). Therefore, these 4 rbESC linesappeared to exhibit the characteristics of PSCs.
Generation of iPSC lines from adult rabbit fibroblasts
Adult rabbit fibroblasts (rbF) were infected twice at a 48-h intervalwith a mixture of 4 retroviral vectors that expressed human Oct4,Sox2, Klf4 and c-Myc transcription factors. Three days after the
second infection, the rbFs were dissociated and replated on feedercells in an rbESC medium supplemented with 10 ng/ml FGF2. Theculture medium was changed every day thereafter until somecolonies with compact morphologies appeared (Fig. 2A). One
hundred and eleven clones were selected between the 15th and 29th
day after fibroblast infection. These 111 clones were passaged bytrypsin dissociation into single-cell suspensions. Twelve clones
expressing alkaline phosphatase and capable of rapid proliferationwere selected for further studies. At passage 6, 4 of these clonesexpressed rabbit Nanog and Oct4 at the same level as that in
rbESCs (Fig. 2B). For 3 clones – designated rbiPS-B19, rbiPS-B24and rbiPS-B29 – silencing of all the 4 transgenes was achieved atpassage 25 (Fig. 2C). Line rbiPS-B25 did not show suppressed hc-
MYC transgene expression even after 25 passages and wasexcluded from all subsequent analysis. Withdrawal of FGF2induced dramatic morphological changes within 48 h, suggesting
differentiation (Fig. 2D). A normal chromosome number was
observed in 2 lines – rbiPS-B19 and rbiPS-B29 (Fig. 2E;
supplementary material Fig. S1B). For the rbiPS-B19 cell line,
cells were karyotyped using G-banding, and normal chromosome
complements were observed in the 20 analyzed metaphase
spreads (Fig. 2F). The rbiPS-B24 cell line showed an abnormal
43XX karyotype. Immunolabelling showed that all the 3 cell
lines expressed Oct4 in virtually every cell in the respective
populations (Fig. 2G; supplementary material Fig. S3).
Differentiation induced by suspension culture resulted in the
rapid loss of Oct4 and Nanog expression (Fig. 2H). HNF3b,
Flk1 and Nestin were already expressed at robust levels in
undifferentiated rbiPS-B19 cells. All the 3 lines induced
teratomas containing cells that had differentiated into the 3
germ layers after being injected into SCID mice (Fig. 2I;
supplementary material Fig. S2B). Most importantly, all iPSC
lines could be routinely passaged every 2 days by trypsin
dissociation into single-cell suspensions.
Contrasting expression patterns of stage-specific embryonic
antigen (SSEAs) and cadherins
The patterns of stage-specific embryonic antigen (SSEA)
expression differed between cell types, and all showed
considerable heterogeneity. All the 3 rbiPSC lines showed
heterogeneous expression of SSEA1, SSEA4, and TRA-1-60,
whereas all the 4 rbESC lines expressed only SSEA1
(supplementary material Fig. S3). Distribution of SSEA1 and
SSEA4 expression in various cell populations was quantified
using flow cytometry (Fig. 3A). SSEA1 was expressed in 30–
60% rbESCs and rbiPSCs, compared with 94% mESCs (Fig. 3B).
SSEA4 was expressed in 10–40% rbiPSCs and the pattern was
complex with these lines, which comprised 4 cell subpopulations:
SSEA1+ (32–49%), SSEA4+ (5–12%), double-positive (7–26%),
and double-negative (29–37%) cells (Fig. 3C). The distributions
between these 4 sub-populations differed between lines and were
constant over time in culture (data not shown). We determined
whether these 4 populations represented 4 distinct cell types or
whether they were capable of converting into each other in
culture. To address this each subpopulation was sorted by FACS
and subsequently cultured for 1 week (secondary cultures) before
analysis by flow cytometry. The heterogeneity originally
observed in the unsorted cell population was restored from each
subpopulation (Fig. 3C). These results indicate that rbiPSCs
existed in 4 interchangeable states (SSEA1+/SSEA4+, SSEA12/
SSEA4+, SSEA1+/SSEA42, and SSEA12/SSEA42), and that the
distribution of the 4 populations was cell line specific.
E-cadherin expression is observed in all PSCs regardless of
species, whereas N-cadherin is expressed only in mouse Epiblast
Stem Cells (EpiSCs) (Tesar et al., 2007). rbESC and rbiPSC lines
had different patterns of E- and N-cadherin expression.
Immunolabeling showed that all rbESC lines expressed both E-
and N-cadherins similar to rhesus ESCs. In contrast, rbiPSC lines
expressed only E-cadherin similar to mouse ESCs (Fig. 3D). Each
SSEA subpopulation was sorted by FACS, and the expression of
E-and N-cadherins was analyzed by qPCR. All subpopulations of
rbiPSCs expressed Cdh1 (E-cadherin) at levels 10- to 100-fold
higher than those measured in rbESCs. In contrast, the same
subpopulations expressed Cdh2 (N-cadherin) at levels 10- to 100-
fold lower than those measured in rbESCs (Fig. 3E). Therefore,
differential expression of E- and N-cadherins was associated with
Rabbit pluripotent stem cells 614
Bio
logy
Open

the ESC vs iPSC status and not with the cell population
heterogeneity observed as the SSEA expression.
Cell cycle characteristics demarcate the SSEA1+ rbiPS cells
PSCs show an unusual cell cycle structure that is characterized by
a short G1 phase and a high proportion of cells in the S phase. In
addition, they do not undergo cell-cycle arrest at the G1
checkpoint in response to DNA damage. Instead, they undergo
growth arrest only at the G2 checkpoint (Aladjem et al., 1998;
Fluckiger et al., 2006; Filipczyk et al., 2007). Therefore, we
investigated whether rabbit PSCs displayed the same cell cycle
characteristics. For the 4 rbESC lines, the G1, S, and G2/M
phases were observed in 7462.7%, 2062.8%, and 662.9% cell
populations, respectively. For the 3 rbiPSC lines, the G1, S, and G2/
Fig. 1. Isolation and characterization of rbESC lines. (A) Phase-contrast image of rbES-18 cells at passage 28 (P28). (B) Alkaline phosphatase activity inrbES-18 cells. (C) Phase-contrast images of rbES-18 cells before and after FGF2 withdrawal for 24 h. (D) Histogram showing the distribution ofchromosome numbers in rbES-4 at P13, rbES-8 at P17, rbES-18 at P15, and rbES-19 at P21. (E) G-banding karyotype of the rbES-18 line at P15.(F) Immunolabeling of rabbit Oct4. (G) RT-PCR analysis of pluripotency (Nanog and Oct4) and germ layer-specific (Hnf3b, Flk1 and Nestin) geneexpression during differentiation of rbES-18 cells induced by EB formation (days 0–10). (H) EB produced from rbES-18 cells. (I) Teratoma 31 days after
injecting rbES-18 cells under the kidney capsule of SCID mice. (J) Histological section of the teratoma with tissue components of all 3 embryonic germ celllayers. Oil red O staining to detect adipocytes. Desmin and GFAP to detect muscle and glial cells, respectively. Gland structures could be identified afterHPS staining. Scale bars: 50 mm.
Rabbit pluripotent stem cells 615
Bio
logy
Open

Fig. 2. Generation and characterization of rbiPSC lines. (A) Phase-contrast images of rbFs before (a) and after (b–e) infection with retroviral vectorsexpressing human transgenes; (b,c) primary colonies (P0) observed after 20 days of infection; (d) colonies observed at P6; (e) alkaline phosphatase activity
at P6. (B) Expression of rabbit pluripotent genes Oct4 and Nanog analyzed by RT-PCR in 12 independent rbiPSC clones at P6. (C) Expression of human transgenesanalyzed by RT-PCR in 6 independent rbiPSC clones at P6 and P25. (D) Phase-contrast images of rbiPS-B19 cells before and after FGF2 withdrawal for 48 h.(E) Histogram showing the distribution of chromosome numbers in rbiPS-B19 at P37, rbiPS-B24 at P33, and rbiPS-B29 at P31. (F) G-banding karyotype ofrbiPS-B19 line at P37. (G) Immunolabeling of rabbit Oct4. (H) RT-PCR analysis of pluripotency (Nanog and Oct4) and germ layer-specific (Hnf3b, Flk1, andNestin) gene expression during differentiation of rbiPS-B19 cells induced by EB formation (days 0–14). (I) Teratoma at 30 days after injecting rbiPS-B19 cellsunder the kidney capsule of SCID mice, with tissue components of all the 3 embryonic germ cell layers. Histological section stained with HPS shows squamous
epithelial cells. Oil red O staining to detect adipocytes. Desmin, GFAP, and glucagon to detect muscle, glial, and pancreatic a-cells, respectively. Scale bars:50 mm.
Rabbit pluripotent stem cells 616
Bio
logy
Open

Fig. 3. Expression of SSEA antigens and cadherins. (A) Flow cytometry analysis of SSEA1 and SSEA4 marker expressions. (B) Histograms showing the percentages of SSEA1+
and SSEA4+ cells in various rbESC and rbiPSC lines. (C) Flow cytometry analysis of SSEA1 and SSEA4 marker expression in rbiPSC lines before and after FACS sorting of SSEA
subpopulations. Upper panels: Dot plots of SSEA1- and SSEA4-associated fluorescence in rbiPS-B19, rbiPS-B24, and rbiPS-B29 lines before cell sorting. Bottom panels:Histograms showing the percentages of SSEA1+/SSEA42 (1+/42 cells), SSEA1+/SSEA4+(1+/4+ cells), SSEA12/SSEA4+(12/4+ cells), and SSEA12/SSEA42(12/42 cells)populations; these cell populations were derived from cultures of rbiPS lines after sorting each cell population, replating in FGF2-supplemented medium, and subsequent culture for 7days. (D) Immunolabeling with antibodies for E- and N-cadherins. (E) Histograms showing mRNA levels (DCt) of the E-cadherin (Cdh1) and N-cadherin (Cdh2) as analyzed byqPCR for the entire cell population (total) and in various SSEA subpopulations, as indicated. mRNA levels were normalized to the mRNA level of Tbp. Scale bars: 50 mm.
Rabbit pluripotent stem cells 617
Bio
logy
Open

M phases were observed in 4362.4%, 3863.5%, and 1961.9% cellpopulations, respectively (supplementary material Table S3). Thus,
the percentage of rbPSCs in the S phase (20–38%) was higher thanthat in rbFs (7%) but lower than that in mESCs (68%), mEpiSCs(56%), and rhESCs (41%). The cell cycle distributions of theSSEA1+ and SSEA4+ subpopulations were also analyzed. Of all the
analyzed cell lines, the SSEA1+ subpopulations showed the lowestG1 and the highest S fractions than the SSEA12 and SSEA4+
subpopulations. However, no SSEA1+ subpopulation from any line
analyzed showed a cell cycle distribution similar to that observed forSSEA1+ mESCs (supplementary material Table S3).
To study the cell cycle response of rbPSCs to DNA damage,
we analyzed the effects of doxorubicin, a DNA intercalator thatinduces double-strand breaks (Fig. 4). The G1 fraction of rbFstreated with doxorubicin for 24 h decreased from 80% to 41%,whereas the G2 fraction increased from 12% to 58%, indicating
growth arrest in G1 and G2. In contrast, the G1 fraction ofdoxorubicin-treated mESCs decreased dramatically from 20% to1%, whereas its G2 fraction increased from 11% to 99%,
indicating a lack of G1 checkpoint in mouse PSCs andaccumulation of cells at the G2 checkpoint. Similar resultswere obtained with rhESCs and mEpiSCs for which the G1 and S
fractions virtually disappeared after doxorubicin treatment(Fig. 4A). The response of rbPSCs to doxorubicin treatmentwas more heterogeneous. They all showed moderate decreases in
their G1 fractions (rbESCs, from 74% to 70%; rbiPSCs, from43% to 20%) and significant increase in their G2 fractions(rbESCs, from 6% to 30%; rbiPSCs, from 19% to 80%). Weassumed that this might be a reflection of the heterogeneity of
rbPSC populations. Therefore, we analyzed the responses ofdifferent SSEA fractions to doxorubicin treatment. OnlySSEA1+/SSEA42 and SSEA1+/SSEA4+ subpopulations of
rbiPSCs showed complete growth arrest in the G2 phase anddid not show cell accumulation in the G1 phase; similar resultswere observed for mESCs, mEpiSCs, and rhESCs (Fig. 4A,B).
All other fractions showed variable accumulation of cells in theG1 and G2 phases, as observed previously in the entirepopulation. Of note, the SSEA1+ subpopulation of rbESCs stillshowed accumulation in the G1 and G2 phases after doxorubicin
treatment. Thus, these results indicate that only the SSEA1+
subpopulation of rbiPSCs showed the cell cycle features ofmESCs, mEpiSCs, and rhESCs (i.e. a shortened G1 phase, a high
proportion of cells in the S phase, and absence of DNA damagecheckpoint in G1). Neither the SSEA1+ subpopulation of rbESCsnor the other subpopulations of rbiPSCs showed the cell cycle
features of PSCs.
Mouse Oct4 promoter activity and DNA methylationdemarcates rbESC and rbiPSC lines
The distal element (DE) of Oct4 enhancer showed robust activityin ICM cells of mouse blastocyst, primordial germ cells, andmESCs. In contrast, it is minimally active in the epiblast of
mouse postimplantation embryo and its EpiSC derivatives (Yeomet al., 1996; Tesar et al., 2007). Thus, DE activity can be used todiscriminate between the naıve and primed states of pluripotency
(Nichols and Smith, 2009). To evaluate the DE activity in rabbitpreimplantation embryos, we used the L-SIN-EOS-C(3)-EiPlentiviral vector (designated EOS) that expressed GFP and the
puromycin resistance gene under the transcriptional control of theminimal early transposon promoter and trimer of the CR4enhancer (Hotta et al., 2009). The CR4 enhancer is a 146-bp
fragment of the mouse DE element that recruits the Oct4,
Sox2, and Sp1 transcription factors and recapitulates the
regulation of the DE element in pluripotent and differentiatedcell lines (Okumura-Nakanishi et al., 2005). A vector
expressing GFP from the ubiquitous CAG promoter [GAE-
CAG-eGFP/wpre, (Mangeot et al., 2002)] – designated GAE –
was used as a control. Both lentiviral vectors were
concentrated and injected under the zona pellucida of 8-cell-stage rabbit embryos. The embryos were then cultured to the
mid-blastocyst stage before analysis with confocal microscopy.
Fluorescent cells were observed in the trophoblast and ICM,
with both control and EOS lentivectors, indicating the activity
of the trimer of the CR4 enhancer in rabbit preimplantationembryos (Fig. 5A,B). DE activity in the trophoblast cells was
consistent with previous observations, indicating that Oct4 was
expressed in the trophoblast of the rabbit blastocyst (Kobolak
et al., 2009).
To evaluate the DE activity in rabbit PSCs, rbESC, and rbiPSC
lines were infected with EOS and GAE lentivectors and analyzed
using flow cytometry after 4 days (Fig. 5C; supplementarymaterial Fig. S4A). All cell lines infected with GAE showed
green fluorescence ranging from 12% to 54% of positive cells
according to the cell type (threshold set at 2.56102).
Approximately 60–95% of these GFP-positive cells showed
fluorescence levels of >103. In contrast, fluorescence levels inEOS-infected cells varied dramatically between cell types.
mESCs had the highest level (76% GFP-positive cells had
fluorescence levels of .103). mEpiSCs showed no expression
while rhESCs showed low expression (only 13% GFP-positive
cells had fluorescence levels of .103). This indicates thatrbESCs and iPSCs showed intermediate expression levels (rbES-
4, 32%; rbES-8, 33%; rbES-19, 30%; rbiPS-B19, 42%; rbiPS-
B24, 41%; and rbiPS-B29, 48%; Fig. 5C; supplementary material
Fig. S4A). This suggested that the trimer of the CR4 enhancer
was more active in rbPSCs than in mouse EpiSCs and primateESCs.
The GFP expression level in EOS-infected cells was
influenced by the infection rate. Therefore, to eliminate theconfounding effect of the variations in infection rates between
the cell lines, we calculated an expression index
(IE): IE~%GFPz
§103
%GFPzT
|%IR. %GFP+>103 is the percentage
of GFP+ cells with expression levels of >103; %GFP+T is the
percentage of all GFP+ cells; and IR is the percentage of infected
cells. Comparison of IE values between cell lines showed thatmESCs had the highest index, whereas rhESCs and EpiSCs had
the lowest index. As determined from previous calculations, IE of
all rabbit lines was between that of mESCs and rhESCs, with all
the 3 iPSCs lines showing higher IE indices than the 3 ESC lines
(Fig. 5D). From these experiments, we concluded that comparedwith rbESCs, rbiPSC lines could activate the mOct4 DE element
at a higher level.
This conclusion was strongly reinforced by the results of
puromycin selection of EOS-infected cells. All ESC and iPSC
lines infected with EOS were cultured for 7 days in a medium
supplemented with puromycin. Puromycin-resistant cells could
be readily selected and expanded from mESCs and the 3 rbiPSClines (designated rbiPS-B19-EOS, rbiPS-B24-EOS, and rbiPS-
B29-EOS) (Fig. 5E). In contrast, no puromycin-resistant cells
could be isolated from any of the rbESC lines infected with the
EOS lentivector. Therefore, we concluded that only iPSCs could
Rabbit pluripotent stem cells 618
Bio
logy
Open

Fig. 4. Cell cycle analysis of rabbit PSCs. (A) Cell cycle profiles of rbFs, EpiSCs, mESCs, rhESCs, rbES-4, and rbiPS-B19 assessed using flow cytometry afterstaining with propidium iodide. Cell cycle distributions are shown for the total cell population and different SSEA subpopulations. + DOXO indicates treatment with50 ng/ml doxorubicin for 24 h. (B) Histograms showing the percentage of cells in the G1, S, and G2/M phases of the cell cycle before and after doxorubicin treatmentfor different SSEA subpopulations. The percentages were calculated using ModFitLT.
Rabbit pluripotent stem cells 619
Bio
logy
Open

Fig. 5. Activity and methylation of mouse Oct4 promoter in rabbit PSCs. (A) GFP immunolabeling of rabbit mid-stage blastocysts after injecting GAE and EOS lentivectorsunder the zona pellucida of 8-cell-stage embryos. (B) Serial confocal images of a blastocyst expressing EOS lentivector after GFP immunolabeling and costaining withpropidium iodide. (C) Flow cytometry analysis of rbES-4, rbiPS-B19, mESCs, mEpiSCs, and rhESCs 4 days after infection with GAE and EOS lentivectors. For each dot plot,the numbers in green indicate the percentages of all GFP+ cells. Numbers in red indicate the percentages of GFP+ cells that had a fluorescence level of >103 and which were
normalized to the percentage of all GFP+ cells. (D) Histogram showing the results for GFP expression index: IE~%GFPz
§103
%GFPzT
|%IR. (E) Flow cytometry analysis of mESC-
EOS, rbiPS-B19-EOS, rbiPS-B24-EOS, and rbiPS-B29-EOS before (2 Puro) and after (+ Puro) selection with puromycin for 14 days. (F) Histogram showing the percentages ofmethylated CpG dinucleotides evaluated after bisulfite genomic sequencing of the Oct4 promoter regions (CR1 and CR4) in all rabbit PSC lines and REFs. (G) Histogramcomparing the percentages of methylated CpG dinucleotides between rbESCs and rbiPSCs in CR1 or CR4 region. Statistical analyses were conducted using analysis of variancefollowed by Fisher’s test. Differences were considered significant for P,0.01. Scale bars: 50 mm.
Rabbit pluripotent stem cells 620
Bio
logy
Open

activate the trimer of the CR4 enhancer at a level sufficient to
confer resistance to puromycin. This conclusion was supportedby the observation that the mean intensity of GFP fluorescenceincreased during puromycin selection of iPSCs infected with
EOS, suggesting that only some rare cells expressing GFP at highlevels were resistant to puromycin and expanded duringselection. These puromycin-resistant cells had notably higherpercentages of SSEA1+ and SSEA4+ cells than the original cells
(i.e. before puromycin selection) (supplementary material Fig.S4B).
Regions CR1 and CR4 were chosen for the methylation study.
Bisulfite genomic sequencing showed that both regions were 3–10 times more methylated in rabbit embryonic fibroblasts (REFs)than in rabbit PSCs (Fig. 5F; supplementary material Fig. S5).Regions CR1 and CR4 were less methylated in rbiPSCs than in
rbESCs [CR1: 3.1% methylated CpG dinucleotides in rbiPSCs vs
8.6% in rbESCs (P,0.01); CR4: 2.3% methylated CpGdinucleotides in rbiPSCs vs 7.6% in rbESCs (P,0.001)]
(Fig. 5G; supplementary material Fig. S5).
Gene expression profiling demarcates rbESC and rbiPSC lines
To further define the molecular properties of rbESCs and
rbiPSCs, we purified the SSEA1+/SSEA42, SSEA1+/SSEA4+,and SSEA12/SSEA42 subpopulations by FACS sorting in 4rbESC lines and 2 rbiPSC lines and performed a global analysis
of their expression profiles. For this, we used a rabbit-specificgene expression microarray containing approximately 13,000independent genes. For each cell line (rbES-4, rbES-8, rbES-18,
and rbES-19; rbiPS-B19 and rbiPS-B29) and SSEAsubpopulations, 3 biological replicates were hybridized to thecustomized rabbit array. Hierarchical clustering of thenormalized data showed that all subpopulations of rbESC lines
were clustered on one side and all subpopulations of rbiPSC lineswere clustered together on the other (Fig. 6A). This indicates thatdespite the heterogeneity observed in the cell lines, the variability
is mainly associated with the cell status (rbESC vs rbiPSC) andnot with the SSEA expression status.
To further examine the transcriptome of various rbESC andrbiPSC subpopulations, we examined the expression of rabbit
homologs of 22 mouse genes [Blimp1, Cdx2, Cdh1 (E-cadherin),Cdh2 (N-cadherin), Cldn6, Dax1 (NrOb1), Dazl, Essrb, Fbxo15,Fgf4, Gbx2, Klf4, Lefty2, Nanog, Oct4 (Pou5f1), Otx2, Pecam1,
Pitx2, Piwil2, Rex1 (Zfp42), Tbx3, and Tcfcp2l1], the mRNAlevels of which have been used to evaluate stemness anddemarcate the naıve and primed pluripotent states in rodent cells
(Tesar et al., 2007; Bao et al., 2009; Hanna et al., 2010; Tang etal., 2010; Wang et al., 2012). Of note, 12 genes (Klf4, Cldn6,Otx2, Nanog, Oct4, Cdx2, Dazl, Rex1, Fbxo15, Pitx2, Tbx3, andGbx2) were represented on the microarray. The expression levels
of these 22 genes were determined by qPCR for the SSEA1+/SSEA42, SSEA1+/SSEA4+, SSEA12/SSEA4+, and SSEA12/SSEA42 subpopulations purified from the 4 rbESC and 3 rbiPS
lines (supplementary material Table S4; Fig. S6; Fig. 3E). Inagreement with the microarray data, correlation clustering of theDCt values showed that the rbiPSC subpopulations showed fewer
differences between them than with the rbESC subpopulations(Fig. 6B). To determine which genes accounted for the variationsbetween rbESCs and rbiPSCs, PCA was performed from the
qPCR data obtained with the SSEA1+/SSEA42 and SSEA1+/SSEA4+ subpopulations (Fig. 6C). The first 2 principalcomponents had 78% of the total variation. The first axis that
represented 56% of the total variability distinguished between
rbESC and rbiPSC lines in accordance with correlation clusteringanalysis. The second axis represented 22% of the total variabilityand accounted for variability between cell lines. A graphical
representation of gene dispersion in a trigonometric circlehighlighted 2 clusters of genes: the first comprised Cdh2,Gbx2, and Dax1 and the second comprised Otx2, Pitx2, Cldn6,Cdh1, Essrb, Klf4, Dazl, Oct4, Piwil2, Nanog, and Pecam1
(Fig. 6D). Both clusters were clearly anticorrelated over the celllines, indicating that their relative expression levels weremutually exclusive. Both clusters appeared to be representative
because most of the distances between the origin and theprojected variables were globally close to the maximum distance(i.e. 1). Thus, these 14 genes explained most of the variability
observed between rbESCs and rbiPSCs (first axis in Fig. 6C).The other 8 genes (Fgf4, Cdx2, Rex1, Tcfcp2l1, Lefty2, Fbxo15,Tbx3, and Blimp1) mostly accounted for the variability observed
between lines in each group (2nd axis Fig. 6D).
rbiPSCs are closer to ICM cells
We next examined which cell types (rbESCs vs. rbiPSCs) andwhich subpopulations (SSEA1+ vs. SSEA4+ vs. SSEA2) showed
the closest proximity to ICM cells of the rabbit embryo. To thisend, the expression of the 22 genes was measured in the ICM ofthird-day rabbit mid-blastocysts (supplementary material Table
S4) and compared to the expression measured in the rbESC andrbiPSC subpopulations. Calculation of the Euclidean distancesbetween the ICM sample and each subpopulations showed that
SSEA1+ rbiPSCs were the closest to the ICM and the SSEA12
rbiPSCs were the farthest (Fig. 7A). Interestingly, all rbESCsubpopulations, irrespective of their SSEA1 status, were more
distantly related to the ICM than the SSEA1+ rbiPSCs. Therelative proximity of the SSEA1+ rbiPSCs with the ICM could befurther evidenced in a rank histogram of the relative expressionlevel of the 22 genes (Fig. 7B,C). The RNA level of each gene in
ICM cells were normalized to the mRNA level of Tbp, and theresultant DCt was ranked from the highest (Oct4: DCt537.5) tothe lowest (Dax1: DCt50.0013). Most genes that were strongly
expressed in rbiPSCs than in rbESCs (Oct4, Cdh1, Essrb, Cldn6,Nanog, Klf4, Otx2, Dazl, Pitx2, Piwil2, Pecam1; P,0.05) werehighly expressed in the ICM (DCt.1). In contrast, genes that
were strongly expressed in rbESCs (Cdh2, Gbx2, Dax1; P,0.05)were expressed at low levels in the ICM (DCt,0.1). Takentogether, these results indicate that the gene expression profile of
SSEA1+ rbiPSCs best matched that of the ICM cells of rabbitpreimplantation embryo.
Colonization of pre-implantation embryos by rbESCs andrbiPSCs
To evaluate the capacity of rbESCs to colonize pre-implantationembryos and contribute to the formation of ICM, 5–10 rbES-18cells that expressed GFP were injected under the zona pellucida
of 20 eight-cell-stage rabbit embryos. Of note rbES18 wasderived from a GFP transgenic embryo (Al-Gubory andHoudebine, 2006) and GFP was expressed by all cells in this
population (Fig. 8A). In a parallel experiment, rbES-18 SSEA1+
cells were sorted by FACS and then injected into 67 eight-cell-stage embryos. All embryos were cultured until they reached the
mid-blastocyst stage prior to GFP immunostaining and analysisby confocal microscopy (supplementary material Table S5;Fig. 8B). No GFP-expressing cells were observed in the 74
Rabbit pluripotent stem cells 621
Bio
logy
Open

embryos that had successfully developed to the blastocyst stage.
In contrast, when 5–10 mES GFP+ cells (line CGR8-GFP) were
injected into rabbit embryos at the same stage, all the resulting
blastocysts (15) exhibited extensive colonization of ICM
(Fig. 8C). Thus, rabbit early-cleavage-stage embryos were
permissive to colonization by naıve mESCs but not by rbESCs.
We performed a similar experiment with rbiPS-B19 line. First,
rbiPS-B19 cells were infected with the GAE lentivector that
expressed GFP under the CAG promoter. GFP+ cells were sorted
by FACS and then injected into 47 eight-cell-stage rabbit
embryos. All developed to the blastocyst stage, but only one
embryo exhibited GFP+ cells in the ICM and in the trophoblast.
Similarly, SSEA1+ rbiPS-B19-GFP cells were sorted prior to
injection into 65 eight-cell-stage embryos. Only one blastocyst
had GFP+ cells in the ICM after GFP immunostaining (Fig. 8D).
We thought that isolated rbiPSC survival would be very poor
after injecting them into eight-cell-stage embryos and that this
could explain the low rate of chimaeric blastocysts that was
observed. To bypass the dissociation step, we generated
aggregation chimaeras with 8-cell-stage embryos. Of note, this
Fig. 6. Gene expression analysis for rbESCs and rbiPSCs. (A) Hierarchical clustering of transcriptome data (mean values/cell category) using Pearson correlationcoefficient as a measure of distance between samples. (B) Correlation clustering for SSEA subpopulations of rbESCs and rbiPSCs (S1+: SSEA1+/SSEA42; S4+:SSEA12/SSEA4+; S1/S4+: SSEA1+/SSEA4+; NEG: SSEA12/SSEA42; TOT: total population) based on the RNA levels of the 22 genes (Blimp1, Cdx2, Cdh1, Cdh2,Cldn6, Dax1, Dazl, Essrb, Fbxo15, Fgf4, Gbx2, Klf4, Lefty2, Nanog, Oct4, Otx2, Pecam1, Pitx2, Piwil2, Rex1, Tbx3, and Tcfcp2l1) measured by qPCR. mRNA levelswere measured in 3 biological replicates and 3 technical repeats, and normalized to Tbp expression levels. (C) Graphical representation of the first principalcomponent of PCA for SSEA1+(S1+) and SSEA1+/SSEA4+(S1/S4+) subpopulations based on the RNA levels of the 22 genes that discriminated the 2 groups ofrelatively closer cell types. (D) Graphical representation of the first principal component of PCA for the 22 genes in a trigonometric circle that discriminated the 2
groups of anticorrelated genes (shown in dark blue and cyan).
Rabbit pluripotent stem cells 622
Bio
logy
Open

technique requires removal of the mucous coat, which prevents
embryo implantation into the uterus after transfer to surrogates
(Murakami and Imai, 1996). For this goal, rbiPS-B19 cells were
infected with ABP-RP-TLCLACZL, a lentiviral vector that
expressed the lacZ gene under the control of the EF1a
promoter. Viable b-galactosidase+ cells were isolated by
iterative FACS sorting until a population of rbiPS-B19 cells
that expressed b-galactosidase at a robust level could be stably
expanded. The rbiPSC-B19-LacZ cells were subsequently
infected with the EOS lentivector and selected with puromycin
Fig. 7. Gene expression profiling in rbESCs and rbiPSC vs. ICM cells. (A) Histogram showing the Euclidean distances between the ICM cells and eachsubpopulations, as determined from the expression profiles of the 22 genes. Euclidean distances correspond to the value of a vectorial distance in a multidimensionalorthonormal basis (the number of dimensions is the number of genes analyzed). An Euclidean distance D for a PSC subpopulation a was calculated using the following
formula: D~
ffiffiffiffiffiffiffiffiffiffiffiffiffiffiffiffiffiffiffiffiffiffiffiffiffiffiffiffiffiffiffiffiffiffiffiffiffiffiffiffiffiffiffiffiffiffiffiffiffiffiffiffiffiffiffiffiffiffiffiffiffiffiffiffiffiffiffiffiffiffiffiffiffiffixa{1ð Þ2z ya{1ð Þ2z . . . z na{1ð Þ2
h ir(1). xa, ya, and na represent the relative expression of each gene (x, y, and n) calculated by qPCR for the PSC
subpopulation line a. (B) Histogram showing the DCt values calculated for each of the 22 genes in the SSEA1+ rbESCs (dark blue bars) and SSEA1+ rbiPSCs (cyan bars).(C) Histogram showing the DCt values calculated for each of the 22 genes in the rabbit ICM, normalized to the mRNA level of Tbp gene (DCt51) and ranked from thehighest (left) to the lowest (right). Cyan bars: genes highly expressed in rbiPSCs, as calculated in panel B; dark blue bars: genes highly expressed in rbESCs; grey bars:genes equally expressed in rbiPSCs and rbESCs.
Rabbit pluripotent stem cells 623
Bio
logy
Open

to generate a homogenous population of mOct4 DE-positive cells
(not shown). Clumps of 20–25 resulting rbiPSC-B19-LacZ-EOS
cells were aggregated in the zona pellucida- and mucous
coat-free 8-cell-stage embryos and were subsequently cultured
to the mid-blastocyst stage. We obtained 62 blastocysts, of which
10 had b-galactosidase+ cells in the ICM. In one case, the ICM
Fig. 8. Colonization of pre-implantation embryos. (A) Flow cytometry analysis of GFP expression in rbES-18 and rbES-19 cells derived from GFP-transgenic andnon-transgenic blastocysts, respectively. (B) Microinjection of SSEA1+ rbES-18 cells into eight-cell-stage embryos and observation of developing embryos at theblastocyst stage. (C) Microinjection of mESCs (CGR8-GFP line) into rabbit eight-cell-stage embryos and observation of developing embryos at morula and blastocyststages. (D) Observation of blastocyst-stage embryos resulting from the microinjection of rbiPS-B19-GFP and rbiPS-B19-GFP SSEA1+ cells into eight-cell-stageembryos. (E) Left panels: Phase-contrast images showing aggregation of an eight-cell-stage embryo with a clump of rbiPS-B19-LacZ-EOS cells, and the resultingblastocyst after in vitro culture for 48 hours. Right panels: b-galactosidase activity in the ICM of the blastocyst. (F) b-galactosidase activity in blastocysts resultingfrom aggregation of eight-cell-stage embryos with a clump of rbiPS-B19-LacZ-EOS cells and subsequent in vitro culture for 48 hours. Scale bars: 50 mm.
Rabbit pluripotent stem cells 624
Bio
logy
Open

was heavily colonized by b-galactosidase+ cells (Fig. 8E,F;supplementary material Table S5).
DiscussionUsing the molecular and functional criteria that characterizepluripotency in rodents and primates, we demonstrated that
rbESCs and rbiPSCs show some key differences. First, similar tomECSs, rbiPSCs are resistant to trypsinization to single-cellsuspensions, a procedure that induces extensive cell death and
differentiation when applied to rbESCs, mouse EpiSCs (Tesar etal., 2007), and primate ESCs (Wianny et al., 2008). Second,similar to mESCs, rbiPSCs express elevated levels of E-cadherin,
whereas rbESCs express both E- and N-cadherins similar tomouse EpiSCs and primate ESCs (Tesar et al., 2007; Hawkins etal., 2012). Third, the cell cycle of rbESCs had a longer G1 phasethan the S and G2 phases and similar to somatic cells, they
undergo growth arrest in the G1 phase after DNA damage. This isin sharp contrast to the SSEA1+ rbiPSCs as well as to all mouseand primate PSCs examined until date, which have a relatively
short G1 phase and lack a DNA damage checkpoint in the G1phase (Aladjem et al., 1998; Hong and Stambrook, 2004;Fluckiger et al., 2006; Filipczyk et al., 2007; Momcilovic et al.,
2010). Fourth, the CR4 element of the mouse Oct4 DE exhibits amore robust activity in rbiPSCs than in rbESCs. High CR4element activity is observed in mESCs, whereas low activity isobserved in mouse EpiSCs (Tesar et al., 2007). Fifth, the Oct4
promoter is less methylated in the rbiPSCs than in the rbESCs.Sixth, rbESCs and rbiPSCs show distinct gene expressionprofiles. We identified 14 genes whose activity is different
between rbiPSCs and rbESCs. Similar to that in mESCs, Essrb,Klf4, Piwil2, Cdh1, Dazl, and Pecam1 are strongly expressed inrbiPSCs; however, they are expressed at low levels in rbESCs.
Last, based on the expression of the 22 selected genes, rbiPSClines are the closest to rabbit ICM, whereas the profiles of allrbESC lines are the farthest. Taken together, it can be concluded
that rbiPSCs show many characteristic features of naıvepluripotency as defined in rodents, i.e. resistance to single-celldissociation, no expression of N-cadherin, robust activity of thedistal enhancer of mouse Oct4, and robust expression of ICM-
specific markers. However, rbiPSCs do not show all the attributesof naıve pluripotency. For instance, they exploit FGF2 signalingfor self-renewal, an attribute of primed pluripotency (Nichols and
Smith, 2009). In addition, they do not express all the molecularmarkers of naıve pluripotency, including Rex1, Tbx3, Gbx2, Fgf4,and Dax1 (Tesar et al., 2007). Furthermore, they show a reduced
capacity to colonize the ICM after injection into rabbitblastocysts. Based on these observations, we propose thatrbiPSCs self-renew in an intermediate state between naıve andprimed pluripotency. Such an intermediate state may resemble
the intermediate epiblast stem cells (IESCs) recently described inthe mouse (Chang and Li, 2013). Like IESCs, rbiPSCs expressRex1 (naıve pluripotency marker) and Otx2 (primed pluripotency
marker) at low levels, and express Pecam1 (naıve pluripotencymarker) and Pitx2 (primed pluripotency marker) at high levels.Moreover, both rbiPSCs and IESCs can colonize the ICM after
aggregation with morulas. In the case of IESCs, the IESC-derivedICM cells failed to contribute to post-implantation development.In the case of rbiPSCs, we could not address this question
because the morula aggregation technique requires removal ofthe mucin coat, which prevents embryo implantation into theuterus after transfer to surrogates (Murakami and Imai, 1996).
However, the growth requirements of IESCs and rbiPSCs seemdifferent. IESCs, which grow on gelatin, respond either to LIF or
to activin to self-renew in the undifferentiate state. By contrastrbiPSCs grow on feeders and are strictly dependent on FGF2signalling. Nevertheless, the possibility remains that rbiPSCs
could also be dependent on LIF produced by feeder cells.
We have shown that rbESCs do not show all the attributes ofpluripotent stem cells. In particular, they have a DNA damagecheckpoint in the G1 phase like somatic cells. It is generallyassumed that shortening the G1 phase sustains the pluripotent
state by restricting the window of opportunity for differentiationcues (Mummery et al., 1987; Burdon et al., 2002; Sela et al.,2012; Coronado et al., 2013). In bona fide pluripotent stem cells,
the lack of a DNA damage checkpoint in G1 might further reducethis window by preventing growth arrest at a critical point forself-renewal. Thus, rbESCs lack some key features of the
pluripotent cell cycle, which might explain why they exhibitsuch a low proliferation rate and high spontaneous differentiationrate than rbiPSCs and primate ESCs.
To conclude, we have reported the first PSC lines in a non-rodent species that show characteristics of naıve pluripotency.
These cells represent a first step towards genome engineering andproduction of germline chimeras in rabbits.
Materials and MethodsRabbit breedingSexually mature New Zealand White rabbits were purchased from Hycole(Marcoing, France) or HyPharm (Roussay, France). Superovulations of femaleswere induced as described previously (Salvetti et al., 2010). Sixty hours afterartificial insemination, the fertilized embryos were flushed from explanted oviductsusing EuroflushH (IMV Technologies) and cultured in TCM199 medium (Sigma)supplemented with 10% new-born calf serum (Sigma) at 38 C in 5% CO2.
Cell cultureMouse embryonic fibroblasts (MEFs) were prepared from 12.5-day-old embryosfrom the OF1 strain (Charles River). Rabbit embryonic fibroblasts (REFs) wereprepared from 12-day-old embryos from the New Zealand White (Hycole). Rabbitfibroblasts (rbFs) were prepared from the ear skin of a 5-month-old New ZealandWhite female. MEFs, REFs, rbFs, the 293T cell line (ATCC, CRL 11268), the rhesusmonkey ESC (rhESC) line LyonES (Wianny et al., 2008), and mouse ESCs [mESCs,CGR8 line (Mountford et al., 1994)] were cultured as described elsewhere (Sandrinet al., 2002; Wianny et al., 2008; Savatier et al., 1996). EpiSCs were derived fromepiblasts of 6.5-day-old mouse embryos of the OF1 strain and cultured as describedpreviously (Brons et al., 2007). rbESCs and rbiPSCs were cultured on mitomycin C-treated MEFs (1.256104 MEF/cm2) in DMEM/F12 medium supplemented with 20%knockout serum replacement, 1% non-essential amino acids and 1% of a solution of10,000 U/ml penicillin + 10,000 U/ml streptomycin + 29.2 mg/ml L-glutamine,1 mM sodium pyruvate and 100 mM 2-mercaptoethanol (Invitrogen). For rbESC andrbiPSCs culture, the medium was supplemented with 13 ng/ml or 10 ng/ml FGF2,respectively. rbiPSCs were routinely dissociated into single-cell suspensions aftertreatment with 0.05% trypsin–EDTA. rbESCs were dissociated into small clumps ofcells after treatment with 1 mg/ml collagenase II (Sigma).
ImmunosurgeryThe mucin coat and the zona pellucida of rabbit blastocysts (70 to 72 h post-insemination; mid-blastocyst stage) were mechanically removed after briefexposure (2 min) to 5 mg/ml pronase (Sigma). ICMs were separated from thetrophectoderm by immunosurgery after incubation of hatched blastocysts in anti-rabbit whole goat serum (Sigma) at 37 C for 30 min and brief exposure (5 min) toguinea pig complement serum (Sigma). Isolated ICMs were transferred to four-well plates on mitomycin C-treated MEFs at a concentration of 3.56104 cells/cm2
in rbESC medium. After 5 to 6 days, the developing outgrowths were mechanicallydissociated into small clumps and transferred onto fresh feeder cells at 2.56104
cells/cm2. All subsequent passages were performed by mechanical dissociationafter treating colonies with collagenase II at 1 mg/ml, followed by plating cellclumps on feeder cells at a concentration of 1.256104 cells/cm2.
Virus production and cell infectionPlasmids used for producing retroviral and lentiviral vectors were either purchasedfrom Addgene [pMXs-hOCT3/4 (17217), pMXs-hSOX2 (17218), pMXs-hKLF4
Rabbit pluripotent stem cells 625
Bio
logy
Open

(17219), pMXs-hc-MYC (17220) (Takahashi et al., 2007) and pL-SIN-EOS-C(3+)-EiP (21313) (Hotta et al., 2009)] or obtained from Dr Cosset [pTG5349,phCMV-GP and pGAE-CAG-eGFP/wpre (Sandrin et al., 2002; Mangeot et al.,2002)] or Dr Suter [psPax2 and pMD2G (Suter et al., 2006)]. Virus production,concentration and titration were performed as previously described by transfectionof 293T cells (Sandrin et al., 2002). Concentrated LacZ-expressing lentiviralparticles were purchased from Allele Biotech (ABP-RP-TLCLACZL).
To generate rbiPSCs, 56105 rbFs were infected twice at a two-day interval with36106 of viral particles, which contained equal parts of the four freshly producedhOct4, hSox2, hKlf4 and hMyc retroviruses [multiplicity of infection (m.o.i.)58],in the presence of 4 mg/ml polybrene (Sigma). Three days after the secondinfection, rbFs were trypsinized into single cells and replated at low density (66102
cells/cm2) onto growth-inactivated MEFs in rbiPSC medium. The medium waschanged every other day for 2 to 3 weeks until iPSC-like colonies appeared. Toinfect ESCs and iPSCs, the cells were plated on Matrigel (Beckton Dickinson)prior to infection with L-SIN-EOS-C(3+)-EiP and GAE-CAG-eGFP/wprelentivectors at an m.o.i. of 5–10 in appropriate media supplemented with 6 mg/ml of polybrene. Rabbit eight-cell-stage embryos were infected by microinjectionof 1 nl L-SIN-EOS-C(3+)-EiP and GAE-CAG-eGFP/wpre lentivectors (26107
infectious particles/ml) under the mucous coat and zona pellucida.
Alkaline phosphatase and b-galactosidase detection,immunolabelling, flow cytometry and confocal microscopy analysisAlkaline phosphatase and b-galactosidase activities were assessed using a PAL86R-1KT kit (Sigma) and a GALS staining kit (Sigma), respectively, according tothe manufacturer’s instructions. To detect b-galactosidase activity in viable cells,LacZ-expressing cells were analysed by flow cytometry using a FluoReporterHlacZ flow cytometry kit (Molecular Probes) according to the manufacturer’sinstructions.
For immunolabelling, the cells were grown on cover slips pre-treated withgelatin and FBS and coated with feeder cells. The cells were fixed with 2%paraformaldehyde (PFA; Sigma) in phosphate-buffered saline (PBS) at 4 C for30 min, permeabilized in Tris-buffered saline (TBS, 50 mM Tris pH 7.6, 0.9%NaCl, 0.2% Triton X-100) and washed three times (10 min each) in TBS. Non-specific binding sites were blocked with TBS supplemented with 10% FBS and 1%bovine serum albumin (BSA) for 1 h and subsequently incubated overnight at 4 Cwith primary antibodies (supplementary material Table S1). After three rinses(10 min each) with TBS, the cells were incubated with fluorochrome-conjugatedsecondary antibodies (supplementary material Table S1) at room temperature (RT)for 1 h, followed by DNA staining with 0.5 mg/ml Hoechst 33342 for 3 min. Coverslips were mounted with mounting medium M1289 (Sigma), fixed with DPXmedium (Cell Path), examined under a conventional fluorescence microscope(Leica DMRE) and analysed with Mercator software (Exploranova). For flowcytometry analysis, the cells were immunolabelled using the same protocols andthe same antibodies used for immunostaining on coverslips, except that incubationwith antibodies was at RT for 30 min. The cells were analysed using a FACSCanto II cytometer and FACSDiva software (Becton Dickinson). The sameprotocol was used to detect GFP expression in rabbit blastocysts by immunolabel-ling, except that embryos were fixed with 2% PFA and permeabilized with 0.5%Triton X-100 in TBS. After DNA staining with 3 mg/ml of propidium iodide in 1%BSA, embryos were incubated sequentially in baths (30 min each) of 10%, 20%and 40% glycerol in TBS and then mounted on slides with mounting mediumM1289 (Sigma) containing 0.1% p-phenylene-diamine (w/v) (Sigma). Theembryos were observed by confocal microscopy (Leica TCS SP1 microscopewith LSM software) at 488 nm and 555 nm (serial slices of 4 mm).
Real-time RT-PCRTotal RNA was isolated from cell clumps, cell pellets and embryoid bodies (EBs)using an RNeasy mini kit (Qiagen) according to the manufacturer’s protocol andreverse-transcribed using 200 U of M-MLV retrotranscriptase (Promega) andrandom primer mix (MWG). Real-time PCR used the StepOnePlus real-time PCRsystem (Applied Biosystems) and Fast SBYRH Green Master Mix (AppliedBiosystems) according to the manufacturer’s instructions. Following 40amplification cycles, melt-curve analysis was used to verify that only thedesired PCR products had been amplified. PCR efficiency for both target andreference genes was determined from the relative quantitative values for calibrator-normalized target gene expression using StepOnePlus Software V2.1 (AppliedBiosystems). In all cases, expression of the target genes was normalized to those ofrabbit TATA-box binding protein (Tbp) gene. But the same results were obtainedwith a normalization with the mRNA level of rabbit Gapdh gene. All primers usedfor RT-PCR and qPCR are shown in supplementary material Table S2.
Karyotype analysisChromosome spreads were prepared according to standard procedures and stainedwith Giemsa solution (Sigma). Thirty to fifty metaphase spreads were counted foreach of the rbESC and rbiPSC lines. For karyotyping, G-banding was performedusing 0.045% trypsin in Ca2+- and Mg2+-free Tyrode (Sigma). For some rbESC
and rbiPSC line analysed, 4 to 20 banded karyotypes were evaluated forchromosomal rearrangements.
EB formation and teratoma productionFor EB formation, rbESCs and rbiPSCs were dissociated into single cells using0.05% trypsin, resuspended in rbESC medium without FGF2 and cultured inhanging drops. For teratoma formation, 2–56106 rbESCs or rbiPSCs were injectedunder the kidney capsules of 8-week-old severe combined immunodeficient(SCID) mice (CB17/SCID, Charles River). After 4–7 weeks, the mice wereeuthanized and lesions were surgically removed and fixed in 10% neutral bufferedformalin (Curtin Matheson Scientific, Inc.) for paraffin sections, or in 4% PFA forcryosections.
Cell cycle analysisCells were cultured for 24 h with 50 ng/ml of doxorubicin hydrochloride(AdriamycinH, Sigma). Single-cell suspensions were fixed with 70% ethanol at220 C, rehydrated with PBS at 4 C for 30 min, rinsed twice with PBS andincubated with 0.1 mg/ml of RNAse A at RT for 30 min. Propidium iodide(30 mg/ml) was added to the cells for 1 min before analysis with a FACS Canto IIcytometer (Becton Dickinson). Data were acquired using FACSDiva software(Becton Dickinson). The percentages of G1-, S- and G2-phase cells weredetermined using ModFitLT software (Verity Software House).
DNA methylation analysisThe methylation profile of the rabbit Oct4 promoter (GenBank: AC235550.2) wasdetermined by bisulfite mutagenesis and sequencing as previously described(Borghol et al., 2008). Two regions of the Oct4 promoter were subjected to duplex-nested PCR. Region 1 is situated between positions 2307 and +96 (25 CpG), andencompasses Conserved Region 1 (CR1) as defined by Kobolak et al. (Kobolak etal., 2009). Region 2 is situated between positions 22060 and 21626 (17 CpGsites), and encompasses Conserved Region 4 (CR4). Sequence of primers specificfor bisulfite-converted DNA are as follows: Region 1, external forward: 59-GTTTTTTTAGGGAGGGGGTAGAG-39, external reverse: 59-AAAACCTTAA-AAACTCAACCAAATCC-39, internal forward: 59-ATGGGGTGGAAGGGAT-TTTAG-39, internal reverse: 59-AAAATCCACCCAACCTAACTCC-39; Region2, external forward: 59-GTTGGTTGGGTAGGAGTTTAT-39, external reverse: 59-TAACCCTATCAAACTTCTAAAAAACT-39, internal forward: 59-ATAAGTT-AAAGAGTTTTGTTTTTGG-39, internal reverse: 59-AACTTCTAAAAAACTAAATAACCTAACTCT-39. The PCR products were cloned into the pNZY28-Aplasmid (Nzyteh; Portugal) and 24 PCR-positive colonies were sequenced for eachPCR product (Biofidal, Lyon, France).
Rabbit microarray and hybridizationA customized rabbit microarray was designed starting from the commerciallyavailable Agilent rabbit microarray (G2519F), and including genes expressedduring preimplantation development in the rabbit (B.S.-P., L.J. and V.D.,unpublished data). Briefly, rabbit embryonic ESTs obtained from foursuppressive subtractive cDNA hybridizations (SSH) were included in thecustom-made microarray. ESTs expressed during the first cleavage stages,blastocyst stage, and early gastrulation embryos were sequenced (Leandri et al.,2009), assembled into contigs and annotated through homology searches againstnucleic and proteic databases. Furthermore, candidate genes sourced fromEnsembl Genome Browser (oryCun2.0), and associated with pluripotency orembryonic development, were added to the design. The best quality probes fromthe commercially available Agilent transcriptome-wide rabbit microarray wasadded, resulting in a microarray with 62, 976 probes including positive andnegative controls. The 60-mer oligosequence probes were designed by eArray(https://earray.chem.agilent.com/earray), and were used for microarrays synthesisin situ using the Agilent SurePrintTM technology (Agilent Technologies,Mississauga, On, Canada) with a 8660 K format. The custom microarray designof the platform has been submitted to the NCBI GEO (Gene Expression Omnibus).The accession number of the platform is GSE43403.
For hybridization, cyanine-3 (Cy3) labeled cRNAs were prepared from 0.2 mgRNA using the One-Color Microarray-Based Gene Expression Analysis Low InputQuick Amp Labeling kit (Agilent) according to the manufacturer’s instructions.Dye incorporation and cRNA yield were checked with the NanoDrop ND-1000Spectrophotometer. 0.6 mg of Cy3-labelled cRNA (specific activity .6.0 pmolCy3/ug cRNA) was fragmented at 60 C for 30 minutes following themanufacturer’s instructions. Hybridizations were performed for 17 hours at 65 Cin a rotating Agilent hybridization oven. After hybridization, microarrays werewashed 1 minute at room temperature with GE Wash Buffer 1 (Agilent) and1 minute with 37 C GE Wash buffer 2 (Agilent), then dried immediately. Slideswere scanned immediately after washing on the Agilent DNA Microarray Scannerusing one color scan setting for 8660k array slides (Scan Area 61621.6 mm). Thescanned images were analyzed with Feature Extraction Software (Agilent,7.10.3.1). Features flagged in Feature Extraction as Feature Non-uniformoutliers were excluded. Normalization procedures were performed using R
Rabbit pluripotent stem cells 626
Bio
logy
Open

statistical software (R: A language and environment for statistical computing (RFoundation for Statistical Computing), Vienna, Austria; 2012, R-Core-Team;http://www.r-project.org) and data were normalized using intra-array mediansubstraction and log2 transformation.
Statistical analysisPrincipal component analysis (PCA) was performed on qRT-PCR data (centeredand reduced) using R statistical software (FactoMineR: Multivariate exploratory:data analysis and data mining with R; R package version 1.20, 2012, Husson et al.;http://cran.r-project.org/web/packages/FactoMineR/index.html). Other statisticalanalyses were done using the test of Kruskal–Wallis. Normalized transcriptomedata were analyzed by hierarchical clustering using the Pearson correlationcoefficient as a measure of distance.
Injection of cells into pre-implantation embryos and aggregationwith morulasFor microinjection, ESCs and iPSCs were dissociated into single-cell suspensions.Five to 10 cells were microinjected under the mucous coat and zona pellucida ofeight-cell-stage rabbit embryos. The embryos injected with GFP-expressing cellswere cultured in vitro until they reached the mid-blastocyst stage, fixed in 2% PFAand immunostained with anti-GFP antibody.
For morula aggregation, fertilized eggs were harvested 20 hours afterinsemination, and cultured in RDH medium (Invitrogen), as described elsewhere(Jin et al., 2000). When they reached the eight-cell stage, embryos were treatedwith pronase to eliminate the zona pellucida and placed with clumps of 20–25PSCs in microwells to induce aggregations, as described previously (Wood et al.,1993). Successful aggregates were cultured for 48 hours until they reached theblastocyst stage and subsequently analysed for b-galactosidase activity.
AcknowledgementsWe thank Nicolas Gadot and Jean-Yves Scoazec (ANIPATH, SFRSante Lyon-Est, Lyon, France) for teratoma histology, ThibaultAndrieu and Sebastien Dussurgey (SFR BioSciences Gerland–LyonSud) for technical assistance with flow cytometry and cell sorting,the INRA SIGENAE team (http://www.sigenae.org) for their help indesigning the customized rabbit array, and Jerome Lecardonnel fortechnical assistance in array hybridization. This work was supportedby research grants from ‘‘Agence Nationale de la Recherche’’ (ANR)(project PLURABBIT no. PCS-09-GEM-08), European Cooperationin Science and Technology (COST) Action (Rabbit Genome Biology(RGB)-Net no. TD1101), the HyPharm Company (PhD Grant INRA/HyPharm no. 04012010) and the ‘‘region Rhone-Alpes’’ (ADRCIBLE 2010 project no. R10065CC). This work was performedwithin the framework of (i) the LABEX DEVWECAN (ANR-10-LABX-0061) and the LABEX CORTEX (ANR-11-LABX-0042) ofUniversite de Lyon (‘‘Investissements d’Avenir’’ no. ANR-11-IDEX-0007), (ii) the Institute CESAME (‘‘Investissements d’Avenir’’ no.ANR-10-IBHU-003) and (iii) the ‘‘Infrastructure Nationale enBiologie et Sante’’ INGESTEM (‘‘Investissements d’Avenir’’ no.ANR-11-INBS-0009), operated by the ANR.
Competing InterestsThe authors have no competing interests to declare.
ReferencesAl-Gubory, K. H. and Houdebine, L. M. (2006). In vivo imaging of green fluorescent
protein-expressing cells in transgenic animals using fibred confocal fluorescence
microscopy. Eur. J. Cell Biol. 85, 837-845.
Aladjem, M. I., Spike, B. T., Rodewald, L. W., Hope, T. J., Klemm, M., Jaenisch,
R. and Wahl, G. M. (1998). ES cells do not activate p53-dependent stress responses
and undergo p53-independent apoptosis in response to DNA damage. Curr. Biol. 8,
145-155.
Bao, S., Tang, F., Li, X., Hayashi, K., Gillich, A., Lao, K. and Surani, M. A. (2009).
Epigenetic reversion of post-implantation epiblast to pluripotent embryonic stem
cells. Nature 461, 1292-1295.
Borghol, N., Blachere, T. and Lefevre, A. (2008). Transcriptional and epigenetic status
of protamine 1 and 2 genes following round spermatids injection into mouse oocytes.
Genomics 91, 415-422.
Brons, I. G., Smithers, L. E., Trotter, M. W., Rugg-Gunn, P., Sun, B., Chuva de
Sousa Lopes, S. M., Howlett, S. K., Clarkson, A., Ahrlund-Richter, L., Pedersen,
R. A. et al. (2007). Derivation of pluripotent epiblast stem cells from mammalian
embryos. Nature 448, 191-195.
Burdon, T., Smith, A. and Savatier, P. (2002). Signalling, cell cycle and pluripotencyin embryonic stem cells. Trends Cell Biol. 12, 432-438.
Chang, K. H. and Li, M. (2013). Clonal isolation of an intermediate pluripotent stemcell state. Stem Cells.
Coronado, D., Godet, M., Bourillot, P. Y., Tapponnier, Y., Bernat, A., Petit, M.,Afanassieff, M., Markossian, S., Malashicheva, A., Iacone, R. et al. (2013). A shortG1 phase is an intrinsic determinant of naıve embryonic stem cell pluripotency. Stem
Cell Res. 10, 118-131.
Fang, Z. F., Gai, H., Huang, Y. Z., Li, S. G., Chen, X. J., Shi, J. J., Wu, L., Liu, A.,Xu, P. and Sheng, H. Z. (2006). Rabbit embryonic stem cell lines derived fromfertilized, parthenogenetic or somatic cell nuclear transfer embryos. Exp. Cell Res.
312, 3669-3682.
Filipczyk, A. A., Laslett, A. L., Mummery, C. and Pera, M. F. (2007). Differentiationis coupled to changes in the cell cycle regulatory apparatus of human embryonic stemcells. Stem Cell Res. 1, 45-60.
Fluckiger, A. C., Marcy, G., Marchand, M., Negre, D., Cosset, F. L., Mitalipov, S.,Wolf, D., Savatier, P. and Dehay, C. (2006). Cell cycle features of primateembryonic stem cells. Stem Cells 24, 547-556.
Hanna, J., Cheng, A. W., Saha, K., Kim, J., Lengner, C. J., Soldner, F., Cassady,
J. P., Muffat, J., Carey, B. W. and Jaenisch, R. (2010). Human embryonic stemcells with biological and epigenetic characteristics similar to those of mouse ESCs.Proc. Natl. Acad. Sci. USA 107, 9222-9227.
Hawkins, K., Mohamet, L., Ritson, S., Merry, C. L. and Ward, C. M. (2012).E-cadherin and, in its absence, N-cadherin promotes Nanog expression in mouseembryonic stem cells via STAT3 phosphorylation. Stem Cells 30, 1842-1851.
Honda, A., Hirose, M., Inoue, K., Ogonuki, N., Miki, H., Shimozawa, N., Hatori, M.,
Shimizu, N., Murata, T., Hirose, M. et al. (2008). Stable embryonic stem cell linesin rabbits: potential small animal models for human research. Reprod. Biomed. Online
17, 706-715.
Honda, A., Hirose, M. and Ogura, A. (2009). Basic FGF and Activin/Nodal but notLIF signaling sustain undifferentiated status of rabbit embryonic stem cells. Exp. Cell
Res. 315, 2033-2042.
Honda, A., Hirose, M., Hatori, M., Matoba, S., Miyoshi, H., Inoue, K. and Ogura,
A. (2010). Generation of induced pluripotent stem cells in rabbits: potentialexperimental models for human regenerative medicine. J. Biol. Chem. 285, 31362-31369.
Hong, Y. and Stambrook, P. J. (2004). Restoration of an absent G1 arrest andprotection from apoptosis in embryonic stem cells after ionizing radiation. Proc. Natl.
Acad. Sci. USA 101, 14443-14448.
Hotta, A., Cheung, A. Y., Farra, N., Vijayaragavan, K., Seguin, C. A., Draper, J. S.,
Pasceri, P., Maksakova, I. A., Mager, D. L., Rossant, J. et al. (2009). Isolation ofhuman iPS cells using EOS lentiviral vectors to select for pluripotency. Nat. Methods
6, 370-376.
Jin, D. I., Kim, D. K., Im, K. S. and Choi, W. S. (2000). Successful pregnancy aftertransfer of rabbit blastocysts grown in vitro from single-cell zygotes. Theriogenology
54, 1109-1116.
Kobolak, J., Kiss, K., Polgar, Z., Mamo, S., Rogel-Gaillard, C., Tancos, Z., Bock, I.,
Baji, A. G., Tar, K., Pirity, M. K. et al. (2009). Promoter analysis of the rabbitPOU5F1 gene and its expression in preimplantation stage embryos. BMC Mol. Biol.
10, 88.
Leandri, R. D., Archilla, C., Bui, L. C., Peynot, N., Liu, Z., Cabau, C., Chastellier,
A., Renard, J. P. and Duranthon, V. (2009). Revealing the dynamics of geneexpression during embryonic genome activation and first differentiation in the rabbitembryo with a dedicated array screening. Physiol. Genomics 36, 98-113.
Mangeot, P. E., Duperrier, K., Negre, D., Boson, B., Rigal, D., Cosset, F. L. and
Darlix, J. L. (2002). High levels of transduction of human dendritic cells withoptimized SIV vectors. Mol. Ther. 5, 283-290.
Momcilovic, O., Knobloch, L., Fornsaglio, J., Varum, S., Easley, C. and Schatten,
G. (2010). DNA damage responses in human induced pluripotent stem cells andembryonic stem cells. PLoS ONE 5, e13410.
Mountford, P., Zevnik, B., Duwel, A., Nichols, J., Li, M., Dani, C., Robertson, M.,Chambers, I. and Smith, A. (1994). Dicistronic targeting constructs: reporters andmodifiers of mammalian gene expression. Proc. Natl. Acad. Sci. USA 91, 4303-4307.
Mummery, C. L., van den Brink, C. E. and de Laat, S. W. (1987). Commitment todifferentiation induced by retinoic acid in P19 embryonal carcinoma cells is cell cycledependent. Dev. Biol. 121, 10-19.
Murakami, H. and Imai, H. (1996). Successful implantation of in vitro cultured rabbitembryos after uterine transfer: a role for mucin. Mol. Reprod. Dev. 43, 167-170.
Nichols, J. and Smith, A. (2009). Naive and primed pluripotent states. Cell Stem Cell 4,487-492.
Okumura-Nakanishi, S., Saito, M., Niwa, H. and Ishikawa, F. (2005). Oct-3/4 andSox2 regulate Oct-3/4 gene in embryonic stem cells. J. Biol. Chem. 280, 5307-5317.
Salvetti, P., Buff, S., Afanassieff, M., Daniel, N., Guerin, P. and Joly, T. (2010).Structural, metabolic and developmental evaluation of ovulated rabbit oocytes beforeand after cryopreservation by vitrification and slow freezing. Theriogenology 74, 847-855.
Sandrin, V., Boson, B., Salmon, P., Gay, W., Negre, D., Le Grand, R., Trono, D. andCosset, F. L. (2002). Lentiviral vectors pseudotyped with a modified RD114envelope glycoprotein show increased stability in sera and augmented transduction ofprimary lymphocytes and CD34+ cells derived from human and nonhuman primates.Blood 100, 823-832.
Savatier, P., Lapillonne, H., van Grunsven, L. A., Rudkin, B. B. and Samarut,
J. (1996). Withdrawal of differentiation inhibitory activity/leukemia inhibitory factor
Rabbit pluripotent stem cells 627
Bio
logy
Open

up-regulates D-type cyclins and cyclin-dependent kinase inhibitors in mouse
embryonic stem cells. Oncogene 12, 309-322.
Sela, Y., Molotski, N., Golan, S., Itskovitz-Eldor, J. and Soen, Y. (2012). Human
embryonic stem cells exhibit increased propensity to differentiate during the G1
phase prior to phosphorylation of retinoblastoma protein. Stem Cells 30, 1097-
1108.
Suter, D. M., Cartier, L., Bettiol, E., Tirefort, D., Jaconi, M. E., Dubois-Dauphin,
M. and Krause, K. H. (2006). Rapid generation of stable transgenic embryonic stem
cell lines using modular lentivectors. Stem Cells 24, 615-623.
Takahashi, K., Tanabe, K., Ohnuki, M., Narita, M., Ichisaka, T., Tomoda, K. and
Yamanaka, S. (2007). Induction of pluripotent stem cells from adult human
fibroblasts by defined factors. Cell 131, 861-872.
Tang, F., Barbacioru, C., Bao, S., Lee, C., Nordman, E., Wang, X., Lao, K. and
Surani, M. A. (2010). Tracing the derivation of embryonic stem cells from the inner
cell mass by single-cell RNA-Seq analysis. Cell Stem Cell 6, 468-478.
Tesar, P. J., Chenoweth, J. G., Brook, F. A., Davies, T. J., Evans, E. P., Mack, D. L.,
Gardner, R. L. and McKay, R. D. (2007). New cell lines from mouse epiblast share
defining features with human embryonic stem cells. Nature 448, 196-199.
Wang, S., Tang, X., Niu, Y., Chen, H., Li, B., Li, T., Zhang, X., Hu, Z., Zhou, Q. andJi, W. (2007). Generation and characterization of rabbit embryonic stem cells. Stem
Cells 25, 481-489.Wang, S., Shen, Y., Yuan, X., Chen, K., Guo, X., Chen, Y., Niu, Y., Li, J.,
Xu, R. H., Yan, X. et al. (2008). Dissecting signaling pathways that govern self-renewal of rabbit embryonic stem cells. J. Biol. Chem. 283, 35929-35940.
Wang, L., Xue, Y., Shen, Y., Li, W., Cheng, Y., Yan, X., Shi, W., Wang, J., Gong, Z.,
Yang, G. et al. (2012). Claudin 6: a novel surface marker for characterizing mousepluripotent stem cells. Cell Res. 22, 1082-1085.
Wianny, F., Bernat, A., Huissoud, C., Marcy, G., Markossian, S., Cortay, V.,
Giroud, P., Leviel, V., Kennedy, H., Savatier, P. et al. (2008). Derivation andcloning of a novel rhesus embryonic stem cell line stably expressing tau-greenfluorescent protein. Stem Cells 26, 1444-1453.
Wood, S. A., Allen, N. D., Rossant, J., Auerbach, A. and Nagy, A. (1993). Non-injection methods for the production of embryonic stem cell-embryo chimaeras.Nature 365, 87-89.
Yeom, Y. I., Fuhrmann, G., Ovitt, C. E., Brehm, A., Ohbo, K., Gross, M., Hubner,
K. and Scholer, H. R. (1996). Germline regulatory element of Oct-4 specific for thetotipotent cycle of embryonal cells. Development 122, 881-894.
Rabbit pluripotent stem cells 628
Bio
logy
Open

Supplementary MaterialPierre Osteil et al. doi: 10.1242/bio.20134242
Fig. S1. Alkaline phosphatase activity and metaphase spreads in rabbit PSC lines. (A) rbESC lines. (B) rbiPSC lines. (a) Phase-contrast images. (b) Alkaline
phosphatase activity. (c) Spreads of metaphase chromosomes at P13 (rbES-4), P17 (rbES-8), P21 (rbES-19), P33 (rbiPS-B24), and P31 (rbiPS-B29) (P5passage).Scale bars: 50 mm.
Rabbit pluripotent stem cells S1
Bio
logy
Open

Fig. S2. Teratoma formation using rabbit PSC lines. (A) rbESC lines. (B) rbiPSC lines. (a) Images of teratomas 28–50 days after injecting 2–56106 cells under the
kidney capsule of SCID mice (note: for rbES-4 cells, teratomas were evaluated after 140 days after injecting 0.5–16106 cells into each testis of SCID mice).(b) Staining of teratoma sections with HPS, which shows skin structures (f), neuronal cells (g,i), gland structures (c,h,i,k,l,p), muscle cells (e,j,k,m,n,p), squamousepithelia cells (j,n,q), and cartilage and bone structures (d,o). Scale bars: 50 mm.
Rabbit pluripotent stem cells S2
Bio
logy
Open
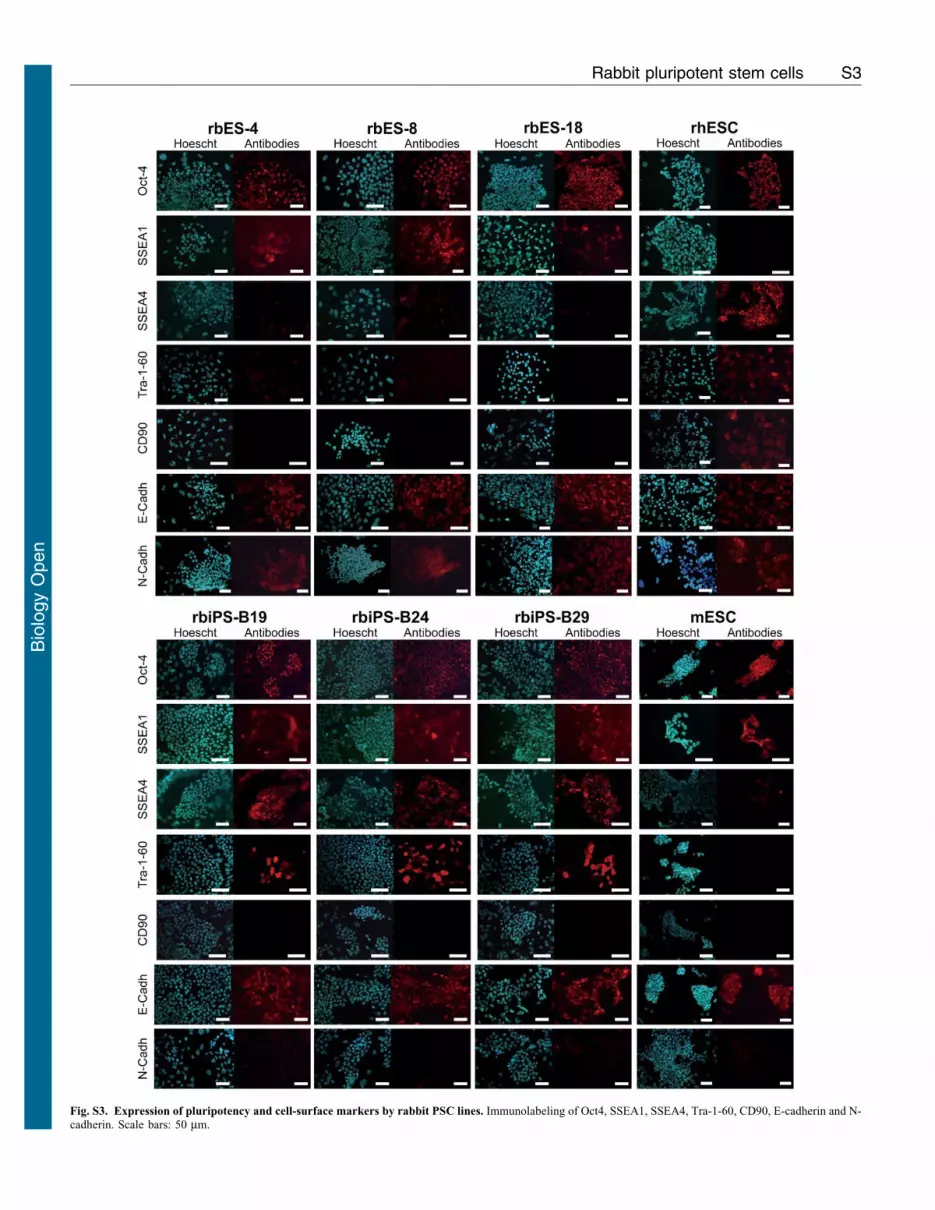
Fig. S3. Expression of pluripotency and cell-surface markers by rabbit PSC lines. Immunolabeling of Oct4, SSEA1, SSEA4, Tra-1-60, CD90, E-cadherin and N-cadherin. Scale bars: 50 mm.
Rabbit pluripotent stem cells S3
Bio
logy
Open

Fig. S4. Mouse Oct4 promoter activities and expressions of cell-surface markers in rabbit PSC lines. (A) Flow cytometry analysis of rbES-8, rbES-19, rbiPS-B24, and rbES-B29 4 days after infection with the GAE and EOS lentivectors. For each dot plot, the numbers in green indicate the percentages of all GFP+ cells.Numbers in red indicate the percentages of GFP+ cells that had a fluorescence level of >103, normalized to the percentage of all GFP+ cells. (B) Flow cytometry
analysis of SSEA1 and SSEA4 marker expression by rbiPS-B19-EOS, rbiPS-B24-EOS, and rbiPS-B29-EOS lines before (left panels) and after (right panels)puromycin selection. Of note, immunolabeling and flow cytometry analysis were performed after cell fixation to eliminate GFP fluorescence resulting from EOSlentivector expression.
Rabbit pluripotent stem cells S4
Bio
logy
Open

Fig. S5. Bisulfite genomic sequencing of the CR1 and CR4 promoter regions of Oct4 in rbESCs, rbiPSCs, and rabbit embryonic fibroblasts (REF). (A) CR1promoter region. (B) CR4 promoter region. Open circles indicate unmethylated CpG dinucleotides while closed circles indicate methylated CpGs.
Rabbit pluripotent stem cells S5
Bio
logy
Open

Fig. S6. Expression of pluripotency markers by rbESC and rbiPSC lines.
Rabbit pluripotent stem cells S6
Bio
logy
Open

Table S1. List of antibodies.
Molecule Antibodies Dilution Manufacturer Reference Method
GFP AF488a Anti-GFP Rabbit IgG 1/1000 Invitrogen A21311 IFc
OCT-4 1 : Anti-Oct-4 Rabbit IgG 1/300 Santa Cruz SC-9081 IF2 : AF555b Goat Anti-Rabbit IgG 1/1000 Invitrogen A21429
SSEA1 PE Anti-SSEA1 Mouse IgM 1/50 R&D Systems FAB2155P IFAF647 Anti-SSEA1 Mouse IgM 1/100 Santa Cruz SC-21702 FCd
SSEA4 1 : Anti-SSEA4 Mouse IgG 1/100 Millipore MAB4304 IF2 : AF555 Goat Anti-Mouse IgG 1/100 Invitrogen A21422
1 : Anti-SSEA4 Mouse IgG 1/200 Santa Cruz SC-21704 FC2 : AF488 Goat anti-Mouse IgG 1/1000 Invitrogen A11017
Tra-1-60 1 : Anti-Tra-1-60 Mouse IgM 1/50 Millipore MAB4360 IF2 : AF555 Goat Anti-Mouse IgM 1/500 Invitrogen A21426
E-Cadh PE Anti-E-Cadherin Rat IgG2A 1/50 R&D Systems FAB7481P IFN-Cadh 1 : Anti-N-Cadherin Rabbit IgG 1/200 Santa Cruz SC-7939 IF
2 : Rhodamine Goat anti-Rabbit IgG 1/1000 Molecular Probes RG314Desmin 1 : Anti-Desmin Mouse IgG1 1/50 DakoCytomation M0760 IF
2 : AF555 Goat Anti-Mouse IgG 1/800 Invitrogen A21422GFAP 1 : Anti-GFAP Rabbit IgG 1/1000 DakoCytomation Z0334 IF
2 : AF555 Goat Anti-Rabbit IgG 1/800 Invitrogen A21429Glucagon 1 : Anti-Glucagon Mouse IgG1 1/500 Sigma G2654 IF
2 : AF555 Goat Anti-Mouse IgG 1/800 Invitrogen A21422CD90 1 : Anti-CD90 Mouse IGG 1/50 PharmingenTM 550402 IF
2 : AF555 Goat Anti-Mouse IgM 1/500 Invitrogen A21426
aAlexaFluor 488;bAlexaFluor 555;cImmunostaining;dFlow cytometry.
Rabbit pluripotent stem cells S7
Bio
logy
Open

Table S2. List of primers used for RT-PCR and Q-PCR analysis.
Gene Origin Primers Annealing temperature Method
Tbp Rabbit Forward: CTTGGCTCCTGTGCACACCATT 60 C qPCRReverse: ATCCCAAGCGGTTTGCTGCTGT
Gadph Rabbit Forward: GAGCTGAACGGGAAACTCAC 56 C RT-PCRReverse: CCCTGTTGCTGTAGCCAAAT
Gadph Rabbit Forward: TTCCACGGCACGGTCAAGGC 60 C qPCRReverse: GGGCACCAGCATCACCCCAC
Nanog Rabbit Forward: CCTCAGCCTTCAGCAGATGCAAGAACTC 58 C RT-PCRReverse: GGCAGTGGTGTAGGCAGCCCC
Nanog Rabbit Forward: CACTGATGCCCGTGGTGCCC 60 C qPCRReverse: AGCGGAGAGGCGGTGTCTGT
Oct4 Rabbit Forward: GCAGATCAGCCACATCGCCCAGC 60 C RT-PCRReverse: GCGTCTCCCCTGACCTCTGCCTC
Oct4 Rabbit Forward: CCTGCTCTGGGCTCCCCCAT 60 C qPCRReverse: TGACCTCTGCCTCCACCCCG
OCT4 Human Forward: CAGGGCCCCATTTTGGTACC 60 C RT-PCRReverse: TTATCGTCGACCACTGTGCTGGCG
SOX2 Human Forward: CCTCCGGGACATGATCAGC 60 C RT-PCRReverse: TTATCGTCGACCACTGTGCTGGCG
KLF4 Human Forward: TTCGCCCGCTCAGATGAACTG 60 C RT-PCRReverse: TTATCGTCGACCACTGTGCTGGCG
Klf4 Rabbit Forward: TCCGGCAGGTGCCCCGAATA 60 C qPCRReverse: CTCCGCCGCTCTCCAGGTCT
C-MYC Human Forward: CAGCATACATCCTGTCCGTCC 60 C RT-PCRReverse: TTATCGTCGACCACTGTGCTGGCG
Dazl Rabbit Forward: CACAGTGGCCTACTGGGGAACA 60 C qPCRReverse:TTCGGCGCCTGGGTCAACTT
Hnf3b Rabbit Forward: GTACGCCAACATGAACTCCA 55 C RT-PCRReverse: GAGGAAGCAGTCGTTGAAGG
Tbx3 Rabbit Forward: TGGATTCGGGCTCGGAACTGA 60 C qPCRReverse: AGCCGCTGGATGCTCTGAAGT
Blimp1 Rabbit Forward: AGCGGCGAACGGCCTTTCAAAT 60 C qPCRReverse: GACCTGGCATTCATGCGGCTTT
Lefty2 Rabbit Forward: ACTGCCGCATTGCCCATGAT 60 C qPCRReverse: AGCTGCACTGCTTCACCCTCAT
Dax1 Rabbit Forward: GCCTGCAGTGCGTGAAGTACA 60 C qPCRReverse: CGGTGCGTCATCCTGACGTG
Nestin Rabbit Forward: AGAATTCCCGGCTTCAGACA 55 C RT-PCRReverse: TCTTCAGAAAGGCTGGCACA
Fbxo15 Rabbit Forward: AGGCTCGGCCACTGTTCCTT 60 C qPCRReverse: CACGTGGAGCTGGTAGCCATGT
Flk1 Rabbit Forward: GTATATCTGTGCGGCGTCCA 59 C RT-PCRReverse: ATGGGGTTGGTGAGGATGAC
Pecam1 Rabbit Forward: AGAGGAGCTGGAGCAGGTGTTAAT 60 C qPCRReverse: GCTGATGTGGAACTTCGGAACAGA
Piwil2 Rabbit Forward: TGACCTTTCCGGATCCTTCAGTGT 60 C qPCRReverse: TCCGAACTCCCTCTTCCAAGCATT
Gbx2 Rabbit Forward: AACGCGTGAAGGCGGGCAAT 60 C qPCRReverse: TGCTGGTGCTGGCTCCGAAT
Rex1 Rabbit Forward: AGCCCAGCAGGCAGAAATGGAA 60 C qPCRReverse: TGGTCAGTCTCACAGGGCACAT
Fgf4 Rabbit Forward: ACGCAGACACGAGCGACAGC 60 C qPCRReverse: CGGCTGGCCACGCCAAAGAT
Otx2 Rabbit Forward: TCCGGCTCGGGAAGTGAGTT 60 C qPCRReverse: GGAGCACTGCTGCTCGCAAT
Cldn6 Rabbit Forward: GCAGCCTCGGGCCTTTTGTTG 60 C qPCRReverse: TCGGGCCAGACGCTGAGTAG
Pitx2 Rabbit Forward: ACTAGCGCGCAGCTCAAGGA 60 C qPCRReverse:CAGCTCCTCGCGCGTGTAAA
Cdx2 Rabbit Forward: CTCAACCTGGCGCCGCAGAA 60 C qPCRReverse: GCGCGCTGTCCAAGTTCGC
Cdh1 Rabbit Forward: TGCACAGGCCGGAAACCAGT 60 C qPCRReverse: ACGGCCTTCAGCGTGACCTT
Cdh2 Rabbit Forward: CCGTGGCAGCTGGACTGGAT 60 C qPCRReverse: GATGACGGCCGTGGCTGTGT
Essrb Rabbit Forward: CGTGGAGGCCGCCAGAAGTA 60 C qPCRReverse: TCTGGCTCGGCCACCAAGAG
Tcfcp2 Rabbit Forward: AGAAAAGGGCGTGCCGTTCC 60 C qPCRReverse: TGGCAGCTGGCTGAGTGCAA
Rabbit pluripotent stem cells S8
Bio
logy
Open

Table S3. Percentages of pluripotent stem cells in G1-, S-, and G2/M phases.
Percentages of cells in G1-, S-, and G2/M phases
Pluripotentstem cells Lines
Cell-cyclephases
Whole cellpopulations
SSEA1+ SSEA42
cellsSSEA1+
SSEA4+ cellsSSEA12SSEA4+
cellsSSEA12
SSEA42 cells
Control- rbF G1 80.6 – – – –S 6.7
G2/M 12.7
mESCs CGR8 G1 20.7 16.6 – – 28.0S 68.3 71.3 63.8
G2/M 11.0 12.1 8.2
mEpiSCs – G1 28.5 – – – –S 56.6
G2/M 14.9
rhESCs LyonES G1 41.3 – – 41.1 40.4S 41.4 40.7 40.5
G2/M 17.3 18.2 19.1
rbESCs rbES-4 G1 70.6 57.0 – – 75.3S 19.2 35.0 16.7
G2/M 10.2 8.0 8.0rbES-8 G1 76.8 65.9 – – 78.2
S 15.3 22.1 14.6G2/M 7.9 12.0 7.2
rbES-18 G1 76.9 56.6 – – 80.4S 20.2 27.2 19.3
G2/M 2.9 16.2 0.3rbES-19 G1 72.7 55.5 – – 75.0
S 23.0 28.0 21.5G2/M 4.3 16.5 3.5
rbiPSCs rbiPS-B19 G1 40.8 36.0 30.8 42.9 45.8S 39.4 39.6 40.9 39.1 38.1
G2/M 19.8 24.4 28.3 18.0 16.1rbiPS-B24 G1 46.5 41.4 35.5 39.8 49.0
S 33.8 32.4 26.4 38.1 33.8G2/M 19.7 26.2 38.1 22.1 17.2
rbiPS-B29 G1 42.2 39.0 33.9 32.8 49.6S 42.1 45.9 37.6 51.9 39.0
G2/M 15.7 15.1 28.5 15.2 11.4
Table S5. Colonization of rabbit pre-implantation embryos by rbESCs, mESCs, and rbiPSCs.
Technique Marker gene LineNumber of
embryosNumber of blasto-cysts (percentage)
Number of positiveembryos (percentage)
Microinjection of5–10 cells into8-cell stage embryos
GFP rbES-18 20 16 (80%) 0
rbES-18 SSEA1+ 67 58 (87%) 0mESC CGR8-GFP 15 15 (100%) 15 (100%)
rbiPS-B19-GFP 47 47 (100%) 1 (2.1%)rbiPS-B19-GFP SSEA1+ 65 64 (98%) 1 (1.5%)
Aggregationbetween clumps of20–25 cells and8-cell stage embryos
LacZ rbiPS-B19-LacZ-EOS 114 62 (54%) 10 (16.1%)
Rabbit pluripotent stem cells S9
Bio
logy
Open


