Embed Size (px)
Citation preview
LETTERdoi:10.1038/nature12942
Citrullination regulates pluripotency and histone H1binding to chromatinMaria A. Christophorou1*, Gonçalo Castelo-Branco1,2*, Richard P. Halley-Stott1,3, Clara Slade Oliveira1,4,5, Remco Loos6,Aliaksandra Radzisheuskaya7,8, Kerri A. Mowen9, Paul Bertone6,7,10, Jose C. R. Silva7,8, Magdalena Zernicka-Goetz1,5,Michael L. Nielsen11, John B. Gurdon1,3 & Tony Kouzarides1,12
Citrullination is the post-translational conversion of an arginineresidue within a protein to the non-coded amino acid citrulline1.This modification leads to the loss of a positive charge and reduc-tion in hydrogen-bonding ability. It is carried out by a small familyof tissue-specific vertebrate enzymes called peptidylarginine deimi-nases (PADIs)2 and is associated with the development of diversepathological states such as autoimmunity, cancer, neurodegenera-tive disorders, prion diseases and thrombosis2,3. Nevertheless, thephysiological functions of citrullination remain ill-defined, althoughcitrullination of core histones has been linked to transcriptionalregulation and the DNA damage response4–8. PADI4 (also calledPAD4 or PADV), the only PADI with a nuclear localization signal9,was previously shown to act in myeloid cells where it mediates pro-found chromatin decondensation during the innate immune res-ponse to infection10. Here we show that the expression and enzymaticactivity of Padi4 are also induced under conditions of ground-statepluripotency and during reprogramming in mouse. Padi4 is part ofthe pluripotency transcriptional network, binding to regulatoryelements of key stem-cell genes and activating their expression. Itsinhibition lowers the percentage of pluripotent cells in the earlymouse embryo and significantly reduces reprogramming efficiency.Using an unbiased proteomic approach we identify linker histoneH1 variants, which are involved in the generation of compact chro-matin11, as novel PADI4 substrates. Citrullination of a single argi-nine residue within the DNA-binding site of H1 results in its dis-placement from chromatin and global chromatin decondensation.Together, these results uncover a role for citrullination in the regu-lation of pluripotency and provide new mechanistic insights intohow citrullination regulates chromatin compaction.
Pluripotent cells have the capacity to self-renew and differentiateinto all somatic and germ-cell lineages and, hence, possess therapeuticpotential for a multitude of medical conditions. Their generation byreprogramming of differentiated somatic cells has been achieved bynuclear transfer, cell fusion and transduction of transcription factors,such as Oct4 (also called Pou5f1), Sox2, Klf4 and c-Myc12. Pluripotentcells have a distinctly open chromatin structure that is essential forunrestricted developmental potential13,14, and reprogramming involvesan almost complete epigenetic resetting of somatic cells13. The ability ofPADI4-mediated histone citrullination to induce chromatin decon-densation in neutrophils10 prompted us to ask whether it can have arole in pluripotency, where chromatin decondensation is also neces-sary. To investigate this we first assessed the expression of Padi4 in themouse embryonic stem-cell line ES Oct4-GIP (ES), the mouse neural
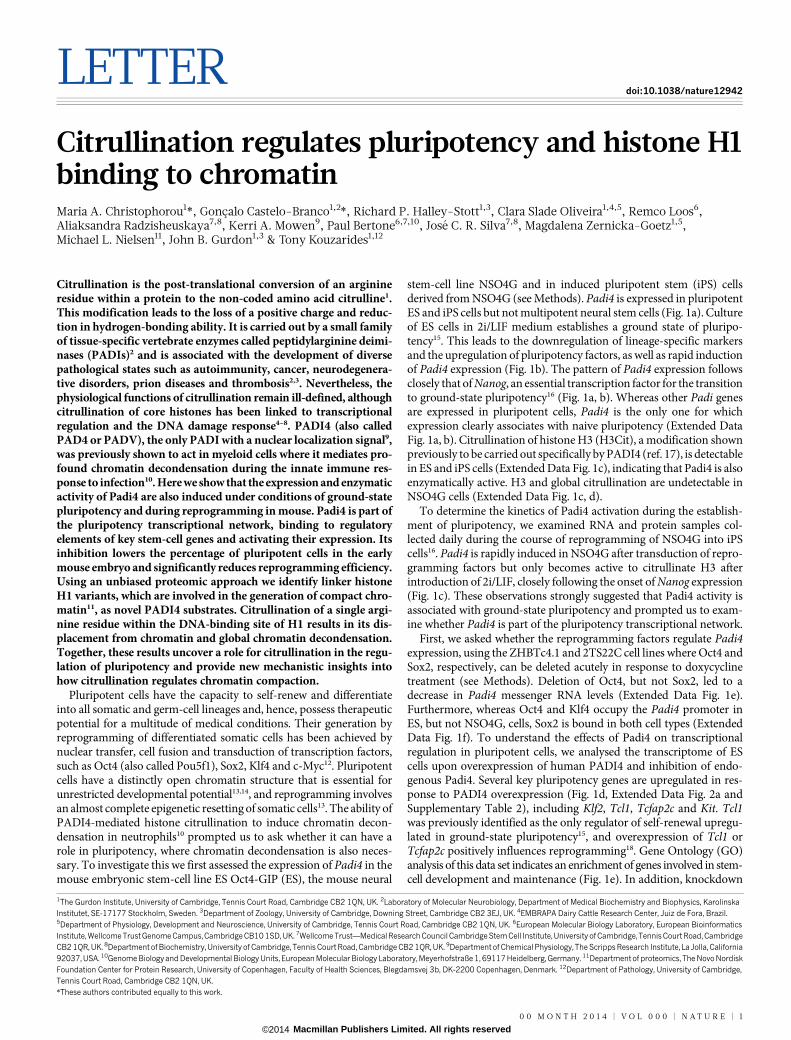
stem-cell line NSO4G and in induced pluripotent stem (iPS) cellsderived from NSO4G (see Methods). Padi4 is expressed in pluripotentES and iPS cells but not multipotent neural stem cells (Fig. 1a). Cultureof ES cells in 2i/LIF medium establishes a ground state of pluripo-tency15. This leads to the downregulation of lineage-specific markersand the upregulation of pluripotency factors, as well as rapid inductionof Padi4 expression (Fig. 1b). The pattern of Padi4 expression followsclosely that of Nanog, an essential transcription factor for the transitionto ground-state pluripotency16 (Fig. 1a, b). Whereas other Padi genesare expressed in pluripotent cells, Padi4 is the only one for whichexpression clearly associates with naive pluripotency (Extended DataFig. 1a, b). Citrullination of histone H3 (H3Cit), a modification shownpreviously to be carried out specifically by PADI4 (ref. 17), is detectablein ES and iPS cells (Extended Data Fig. 1c), indicating that Padi4 is alsoenzymatically active. H3 and global citrullination are undetectable inNSO4G cells (Extended Data Fig. 1c, d).
To determine the kinetics of Padi4 activation during the establish-ment of pluripotency, we examined RNA and protein samples col-lected daily during the course of reprogramming of NSO4G into iPScells16. Padi4 is rapidly induced in NSO4G after transduction of repro-gramming factors but only becomes active to citrullinate H3 afterintroduction of 2i/LIF, closely following the onset of Nanog expression(Fig. 1c). These observations strongly suggested that Padi4 activity isassociated with ground-state pluripotency and prompted us to exam-ine whether Padi4 is part of the pluripotency transcriptional network.
First, we asked whether the reprogramming factors regulate Padi4expression, using the ZHBTc4.1 and 2TS22C cell lines where Oct4 andSox2, respectively, can be deleted acutely in response to doxycyclinetreatment (see Methods). Deletion of Oct4, but not Sox2, led to adecrease in Padi4 messenger RNA levels (Extended Data Fig. 1e).Furthermore, whereas Oct4 and Klf4 occupy the Padi4 promoter inES, but not NSO4G, cells, Sox2 is bound in both cell types (ExtendedData Fig. 1f). To understand the effects of Padi4 on transcriptionalregulation in pluripotent cells, we analysed the transcriptome of EScells upon overexpression of human PADI4 and inhibition of endo-genous Padi4. Several key pluripotency genes are upregulated in res-ponse to PADI4 overexpression (Fig. 1d, Extended Data Fig. 2a andSupplementary Table 2), including Klf2, Tcl1, Tcfap2c and Kit. Tcl1was previously identified as the only regulator of self-renewal upregu-lated in ground-state pluripotency15, and overexpression of Tcl1 orTcfap2c positively influences reprogramming18. Gene Ontology (GO)analysis of this data set indicates an enrichment of genes involved in stem-cell development and maintenance (Fig. 1e). In addition, knockdown
*These authors contributed equally to this work.
1The Gurdon Institute, University of Cambridge, Tennis Court Road, Cambridge CB2 1QN, UK. 2Laboratory of Molecular Neurobiology, Department of Medical Biochemistry and Biophysics, KarolinskaInstitutet, SE-17177 Stockholm, Sweden. 3Department of Zoology, University of Cambridge, Downing Street, Cambridge CB2 3EJ, UK. 4EMBRAPA Dairy Cattle Research Center, Juiz de Fora, Brazil.5Department of Physiology, Development and Neuroscience, University of Cambridge, Tennis Court Road, Cambridge CB2 1QN, UK. 6European Molecular Biology Laboratory, European BioinformaticsInstitute, Wellcome Trust Genome Campus,Cambridge CB10 1SD, UK. 7Wellcome Trust—MedicalResearch Council Cambridge Stem Cell Institute, University of Cambridge, Tennis Court Road, CambridgeCB2 1QR, UK. 8Department of Biochemistry, University of Cambridge, Tennis Court Road, Cambridge CB2 1QR, UK. 9Department of Chemical Physiology, The Scripps Research Institute, La Jolla, California92037, USA. 10Genome Biology and Developmental Biology Units, European Molecular Biology Laboratory, Meyerhofstraße 1, 69117 Heidelberg, Germany. 11Department of proteomics, The Novo NordiskFoundation Center for Protein Research, University of Copenhagen, Faculty of Health Sciences, Blegdamsvej 3b, DK-2200 Copenhagen, Denmark. 12Department of Pathology, University of Cambridge,Tennis Court Road, Cambridge CB2 1QN, UK.
0 0 M O N T H 2 0 1 4 | V O L 0 0 0 | N A T U R E | 1
Macmillan Publishers Limited. All rights reserved©2014
of Padi4 in mouse ES cells leads to decreased expression of Tcl1 andNanog, which is rescued by exogenous expression of RNA interference(RNAi)-resistant human PADI4 (Fig. 1f and Extended Data Fig. 2b, c).These genes are under the control of PADI4 enzymatic activity, astreatment with the chemical inhibitor Cl-amidine, which disruptscitrullination by PADI4 (ref. 19), downregulates their expression(Fig. 1g). Chromatin immunoprecipitation (ChIP) analysis indicatedthat H3Cit is present on regulatory regions of Tcl1 and Nanog in ESand iPS cells, but not NSO4G (Fig. 1h and Extended Data Fig. 3a).Accordingly, exogenously expressed human PADI4 localizes to and isenzymatically active on these regions, as well as regulatory regions ofKlf2 and Kit in ES cells (Extended Data Fig. 3b, c). In contrast toPADI4 overexpression, treatment of ES cells with Cl-amidine led toupregulation of differentiation markers such as Prickle1, Epha1 andWnt8a and downregulation of pluripotency markers such as Klf5(Extended Data Fig. 4a, b and Supplementary Table 3), in additionto Nanog and Tcl1 (Fig. 1g). GO analysis of this data set indicatedenrichment in genes involved in cell differentiation (Extended DataFig. 4c). Pou5f1, Klf4, Sox2 and c-Myc were not affected by PADI4modulation (Extended Data Fig. 2a and Supplementary Tables 2 and3). Cumulatively, the above results place Padi4 within the pluripotency
transcriptional network, indicating that it acts downstream of some ofthe cardinal reprogramming factors to regulate a specific subset ofpluripotency genes.
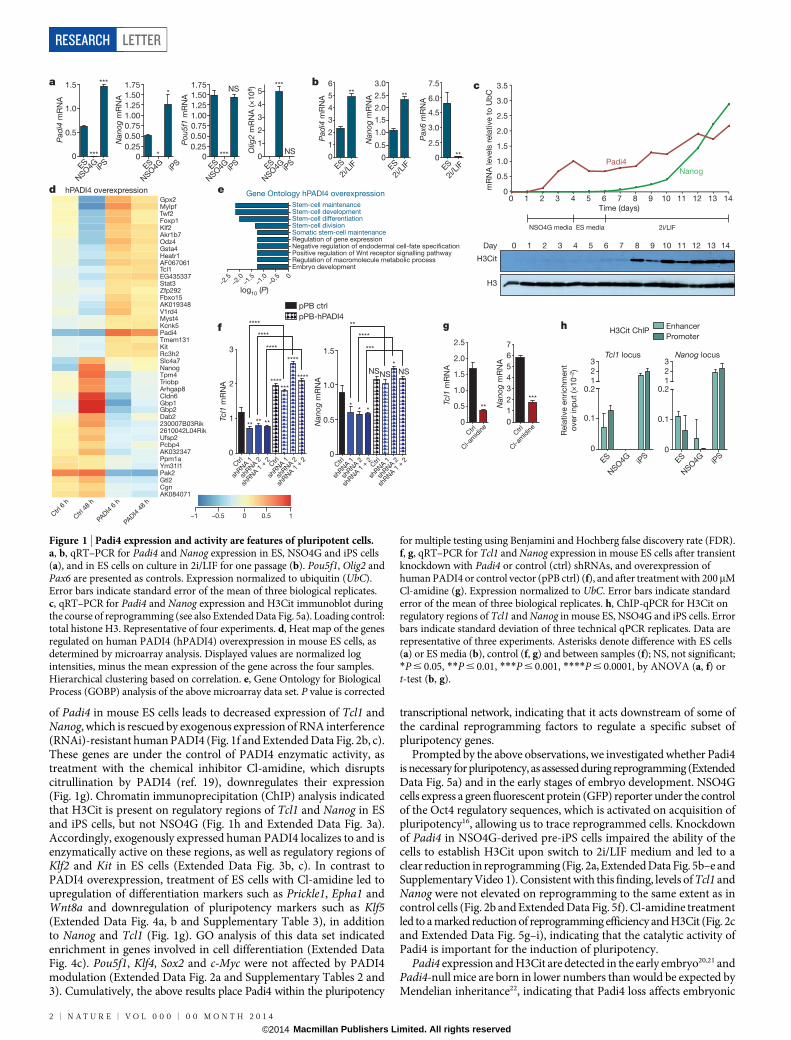
Prompted by the above observations, we investigated whether Padi4is necessary for pluripotency, as assessed during reprogramming (ExtendedData Fig. 5a) and in the early stages of embryo development. NSO4Gcells express a green fluorescent protein (GFP) reporter under the controlof the Oct4 regulatory sequences, which is activated on acquisition ofpluripotency16, allowing us to trace reprogrammed cells. Knockdownof Padi4 in NSO4G-derived pre-iPS cells impaired the ability of thecells to establish H3Cit upon switch to 2i/LIF medium and led to aclear reduction in reprogramming (Fig. 2a, Extended Data Fig. 5b–e andSupplementary Video 1). Consistent with this finding, levels of Tcl1 andNanog were not elevated on reprogramming to the same extent as incontrol cells (Fig. 2b and Extended Data Fig. 5f). Cl-amidine treatmentled to a marked reduction of reprogramming efficiency and H3Cit (Fig. 2cand Extended Data Fig. 5g–i), indicating that the catalytic activity ofPadi4 is important for the induction of pluripotency.
Padi4 expression and H3Cit are detected in the early embryo20,21 andPadi4-null mice are born in lower numbers than would be expected byMendelian inheritance22, indicating that Padi4 loss affects embryonic
1.5 1.75
1.505
4
3
2
1
0
1.25
1.00
0.75
0.50
0.25
0
1.75
1.50
1.25
1.00
0.75
0.50
0.25
0
0–0
.5–1
.0–1
.5–2
.0–2
.5
0
1
2
Tcl1
mR
NA
Tcl1
mR
NA
Nano
g m
RN
A
Nano
g m
RN
A
3
log10
(P)
7
Enhancer
Promoter
6
5
4
321
0.2
0.1
0
ES
NSO
4G iPS
ES
NSO
4G iPS
0.1
0
0.2
321
2
3
1
0
2.5
2.0
1.5
1.0
0.5
0
0
0.5
1.0
1.5
pPB ctrl
Tcl1 locus
H3Cit ChlP
Nanog locus
pPB-hPADI4
6 3.5
3.0
2.5
2.0
1.5
1.0
0.5
00
Day
H3Cit
H3
1 2 3
NSO4G media ES media 2i/LIF
4 5 6 7
Time (days)
8 9 10 11 12 13 14
0 1 2 3 4 5 6 7 8 9 10 11 12 13 14
5
4
3
2
1
0
3.0 7.5
6.0
4.5
3.0
2.5
0
2.5
2.0
1.5
1.0
0.5
0
1.0
0.5
0
hPADI4 overexpression
Pad
i4 m
RN
A
Nano
g m
RN
A
Po
u5f1
mR
NA
Olig
2 m
RN
A (×
10
8)
Pad
i4 m
RN
A
mR
NA
levels
rela
tive t
o U
bC
Nano
g m
RN
A
Pax6 m
RN
A
ES
NSO
4G iPS
ES
NSO
4G iPS ES
NSO
4G iPS ES ES
2i/L
IF ES
2i/L
IF ES
2i/L
IF
NSO
4G iPS
a b c
d e
f g h
*** ***
****
** *
*
**
**
** **
**** ****
**** ***
*****
****
****
****
***
* ****
**
NS
NS*** * ***
Gpx2Stem-cell maintenance
Gene Ontology hPADI4 overexpression
Stem-cell developmentStem-cell differentiationStem-cell divisionSomatic stem-cell maintenanceRegulation of gene expressionNegative regulation of endodermal cell-fate specificationPositive regulation of Wnt receptor signalling pathwayRegulation of macromolecule metabolic processEmbryo development
MylpfTwf2Foxp1Klf2Akr1b7Odz4Gsta4Heatr1AF067061Tcl1EG435337Stat3Zfp292Fbxo15AK019348V1rd4Myst4Kcnk5Padi4Tmem131KitRc3h2Slc4a7NanogTpm4TriobpArhgap8Cldn6Gbp1Gbp2Dab2230007B03Rik2610042L04RikUfsp2Pcbp4AK032347Ppm1aYm31l1Pak2Gtl2CgnAK084071
–1 –0.5 0 0.5 1Ctrl
6 h
Ctrl
shRNA 1
shRNA 2
shRNA 1
+ 2
Ctrl
shRNA 1
shRNA 2
shRNA 1
+ 2
Ctrl
Ctrl
Cl-a
mid
ine
Ctrl
Cl-a
mid
ine
shRNA 1
shRNA 2
shRNA 1
+ 2
Ctrl
shRNA 1
shRNA 2
shRNA 1
+ 2
Ctrl
48
h
PADI4
6 h
PADI4
48
h
Padi4Nanog
Rela
tive e
nrichm
ent
over
inp
ut
(×10
–2)NSNSNS
Figure 1 | Padi4 expression and activity are features of pluripotent cells.a, b, qRT–PCR for Padi4 and Nanog expression in ES, NSO4G and iPS cells(a), and in ES cells on culture in 2i/LIF for one passage (b). Pou5f1, Olig2 andPax6 are presented as controls. Expression normalized to ubiquitin (UbC).Error bars indicate standard error of the mean of three biological replicates.c, qRT–PCR for Padi4 and Nanog expression and H3Cit immunoblot duringthe course of reprogramming (see also Extended Data Fig. 5a). Loading control:total histone H3. Representative of four experiments. d, Heat map of the genesregulated on human PADI4 (hPADI4) overexpression in mouse ES cells, asdetermined by microarray analysis. Displayed values are normalized logintensities, minus the mean expression of the gene across the four samples.Hierarchical clustering based on correlation. e, Gene Ontology for BiologicalProcess (GOBP) analysis of the above microarray data set. P value is corrected
for multiple testing using Benjamini and Hochberg false discovery rate (FDR).f, g, qRT–PCR for Tcl1 and Nanog expression in mouse ES cells after transientknockdown with Padi4 or control (ctrl) shRNAs, and overexpression ofhuman PADI4 or control vector (pPB ctrl) (f), and after treatment with 200mMCl-amidine (g). Expression normalized to UbC. Error bars indicate standarderror of the mean of three biological replicates. h, ChIP-qPCR for H3Cit onregulatory regions of Tcl1 and Nanog in mouse ES, NSO4G and iPS cells. Errorbars indicate standard deviation of three technical qPCR replicates. Data arerepresentative of three experiments. Asterisks denote difference with ES cells(a) or ES media (b), control (f, g) and between samples (f); NS, not significant;*P # 0.05, **P # 0.01, ***P # 0.001, ****P # 0.0001, by ANOVA (a, f) ort-test (b, g).
RESEARCH LETTER
2 | N A T U R E | V O L 0 0 0 | 0 0 M O N T H 2 0 1 4
Macmillan Publishers Limited. All rights reserved©2014
development. To assess the role of Padi4 in early development, we cul-tured mouse embryos in Cl-amidine-containing medium from the 2-cellstage and throughout pre-implantation development (see Methodsand Extended Data Fig. 6a–c). Using 200mM Cl-amidine resulted ina complete developmental arrest of the embryos at the 8-cell stage(Extended Data Fig. 6a). We therefore used the maximum dose ofCl-amidine that reduced H3Cit (Extended Data Fig. 6b, c) but didnot induce arrest (10mM). This led to a reduced percentage of plur-ipotent Nanog-positive epiblast cells and an increased percentage ofdifferentiated trophectoderm cells at the blastocyst stage (Fig. 2d, e andExtended Data Fig. 6d, e). Time-course analyses of the cleavage patternsand cell-fate decisions in early embryos showed that Cl-amidine increasedthe number of symmetric cell divisions at the expense of asymmetricaldivisions at the 8–16- and 16–32-cell transitions (Fig. 2f, g). This resultedin 16-cell-stage embryos with fewer inner cells (destined for pluripo-tency) and greater numbers of outer cells (destined for differentiationinto trophectoderm; reviewed in ref. 23) (Extended Data Fig. 6f).Treatment with another Padi4 inhibitor, Thr-Asp-F-amidine (TDFA)24,but not the HDAC inhibitor trichostatin A (TSA), had similar effects(Extended Data Figs 7 and 8). These results indicate that Padi4 activityalso promotes the maintenance of pluripotent cells in the early mouseembryo.
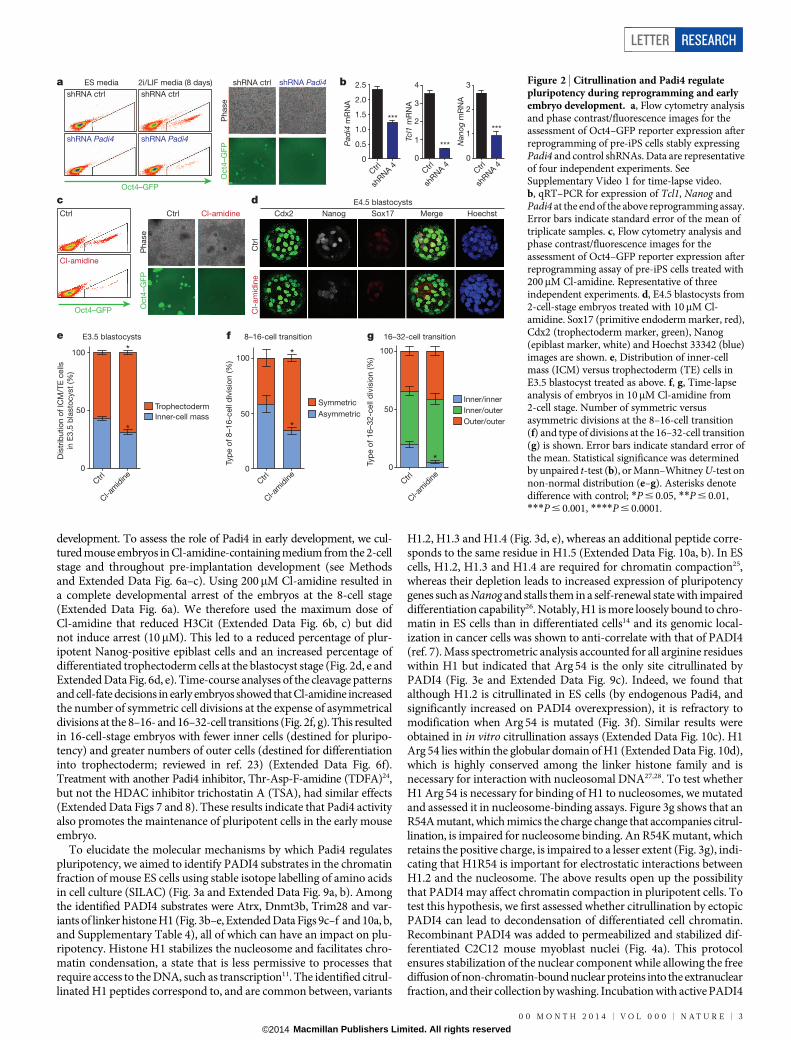
To elucidate the molecular mechanisms by which Padi4 regulatespluripotency, we aimed to identify PADI4 substrates in the chromatinfraction of mouse ES cells using stable isotope labelling of amino acidsin cell culture (SILAC) (Fig. 3a and Extended Data Fig. 9a, b). Amongthe identified PADI4 substrates were Atrx, Dnmt3b, Trim28 and var-iants of linker histone H1 (Fig. 3b–e, Extended Data Figs 9c–f and 10a, b,and Supplementary Table 4), all of which can have an impact on plu-ripotency. Histone H1 stabilizes the nucleosome and facilitates chro-matin condensation, a state that is less permissive to processes thatrequire access to the DNA, such as transcription11. The identified citrul-linated H1 peptides correspond to, and are common between, variants
H1.2, H1.3 and H1.4 (Fig. 3d, e), whereas an additional peptide corre-sponds to the same residue in H1.5 (Extended Data Fig. 10a, b). In EScells, H1.2, H1.3 and H1.4 are required for chromatin compaction25,whereas their depletion leads to increased expression of pluripotencygenes such as Nanog and stalls them in a self-renewal state with impaireddifferentiation capability26. Notably, H1 is more loosely bound to chro-matin in ES cells than in differentiated cells14 and its genomic local-ization in cancer cells was shown to anti-correlate with that of PADI4(ref. 7). Mass spectrometric analysis accounted for all arginine residueswithin H1 but indicated that Arg 54 is the only site citrullinated byPADI4 (Fig. 3e and Extended Data Fig. 9c). Indeed, we found thatalthough H1.2 is citrullinated in ES cells (by endogenous Padi4, andsignificantly increased on PADI4 overexpression), it is refractory tomodification when Arg 54 is mutated (Fig. 3f). Similar results wereobtained in in vitro citrullination assays (Extended Data Fig. 10c). H1Arg 54 lies within the globular domain of H1 (Extended Data Fig. 10d),which is highly conserved among the linker histone family and isnecessary for interaction with nucleosomal DNA27,28. To test whetherH1 Arg 54 is necessary for binding of H1 to nucleosomes, we mutatedand assessed it in nucleosome-binding assays. Figure 3g shows that anR54A mutant, which mimics the charge change that accompanies citrul-lination, is impaired for nucleosome binding. An R54K mutant, whichretains the positive charge, is impaired to a lesser extent (Fig. 3g), indi-cating that H1R54 is important for electrostatic interactions betweenH1.2 and the nucleosome. The above results open up the possibilitythat PADI4 may affect chromatin compaction in pluripotent cells. Totest this hypothesis, we first assessed whether citrullination by ectopicPADI4 can lead to decondensation of differentiated cell chromatin.Recombinant PADI4 was added to permeabilized and stabilized dif-ferentiated C2C12 mouse myoblast nuclei (Fig. 4a). This protocolensures stabilization of the nuclear component while allowing the freediffusion of non-chromatin-bound nuclear proteins into the extranuclearfraction, and their collection by washing. Incubation with active PADI4
a bES media
shRNA ctrl
shRNA Padi4
shRNA ctrl
shRNA Padi4
2i/LIF media (8 days)
Oct4–GFP
Cdx2 Nanog Sox17 Merge Hoechst
E4.5 blastocystsdc
* *
*
*
e f g
0
0.5
1.0
1.5
2.0
2.5 4
***
***
***
3
2
1
0
3
2
1
0
Pad
i4 m
RN
A
Tcl1
mR
NA
Nano
g m
RN
A
Oct4–GFP
Oct4
–G
FP
Phase
shRNA ctrl shRNA Padi4
Oct4
–G
FP
Phase
Ctrl Cl-amidine
Ctrl
shRNA 4
Ctrl
shRNA 4
Ctrl
shRNA 4
Ctrl
Cl-amidineC
trl
Cl-
am
idin
e
100
50
E3.5 blastocysts 8–16-cell transition 16–32-cell transition
Inner-cell mass
SymmetricTrophectoderm
Inner/inner
Inner/outer
Outer/outerAsymmetric
0
100
50
0
100
50
0
Ctrl
Cl-a
mid
ine
Ctrl
Cl-a
mid
ine
Ctrl
Cl-a
mid
ine
Dis
trib
utio
n o
f IC
M/T
E c
ells
in E
3.5
bla
sto
cyst
(%)
Typ
e o
f 8–16-c
ell
div
isio
n (%
)
Typ
e o
f 16–32-c
ell
div
isio
n (%
)
*
Figure 2 | Citrullination and Padi4 regulatepluripotency during reprogramming and earlyembryo development. a, Flow cytometry analysisand phase contrast/fluorescence images for theassessment of Oct4–GFP reporter expression afterreprogramming of pre-iPS cells stably expressingPadi4 and control shRNAs. Data are representativeof four independent experiments. SeeSupplementary Video 1 for time-lapse video.b, qRT–PCR for expression of Tcl1, Nanog andPadi4 at the end of the above reprogramming assay.Error bars indicate standard error of the mean oftriplicate samples. c, Flow cytometry analysis andphase contrast/fluorescence images for theassessment of Oct4–GFP reporter expression afterreprogramming assay of pre-iPS cells treated with200mM Cl-amidine. Representative of threeindependent experiments. d, E4.5 blastocysts from2-cell-stage embryos treated with 10mM Cl-amidine. Sox17 (primitive endoderm marker, red),Cdx2 (trophectoderm marker, green), Nanog(epiblast marker, white) and Hoechst 33342 (blue)images are shown. e, Distribution of inner-cellmass (ICM) versus trophectoderm (TE) cells inE3.5 blastocyst treated as above. f, g, Time-lapseanalysis of embryos in 10mM Cl-amidine from2-cell stage. Number of symmetric versusasymmetric divisions at the 8–16-cell transition(f) and type of divisions at the 16–32-cell transition(g) is shown. Error bars indicate standard error ofthe mean. Statistical significance was determinedby unpaired t-test (b), or Mann–Whitney U-test onnon-normal distribution (e–g). Asterisks denotedifference with control; *P # 0.05, **P # 0.01,***P # 0.001, ****P # 0.0001.
LETTER RESEARCH
0 0 M O N T H 2 0 1 4 | V O L 0 0 0 | N A T U R E | 3
Macmillan Publishers Limited. All rights reserved©2014
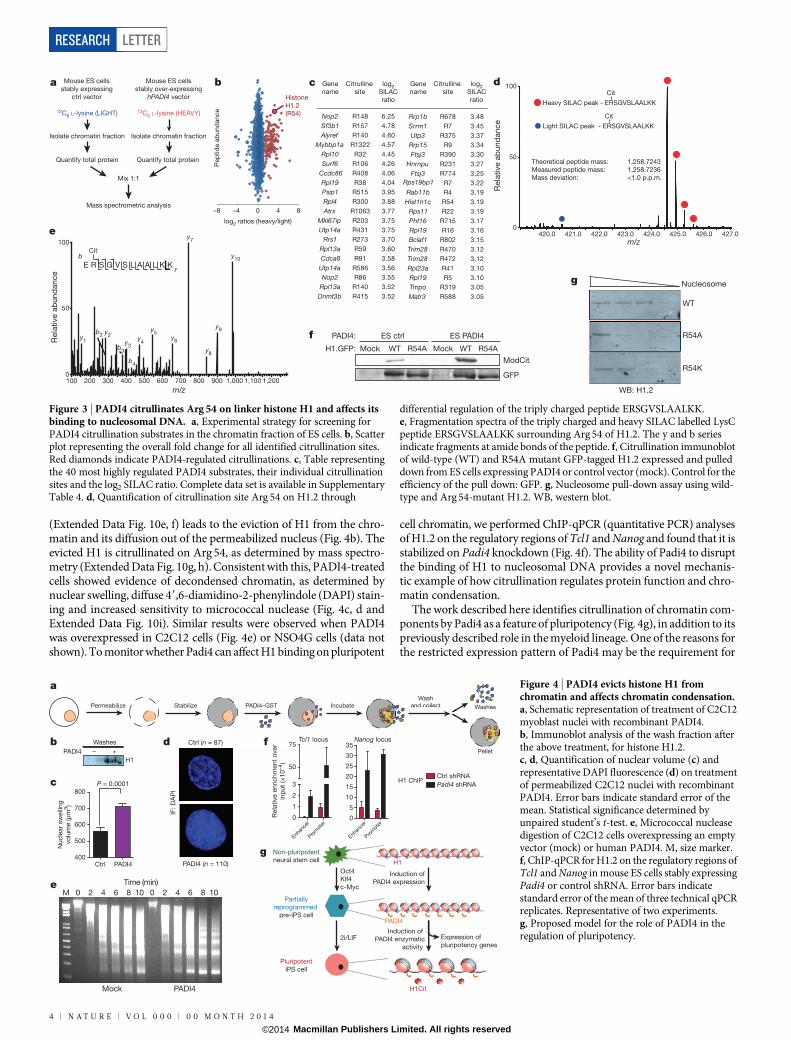
(Extended Data Fig. 10e, f) leads to the eviction of H1 from the chro-matin and its diffusion out of the permeabilized nucleus (Fig. 4b). Theevicted H1 is citrullinated on Arg 54, as determined by mass spectro-metry (Extended Data Fig. 10g, h). Consistent with this, PADI4-treatedcells showed evidence of decondensed chromatin, as determined bynuclear swelling, diffuse 49,6-diamidino-2-phenylindole (DAPI) stain-ing and increased sensitivity to micrococcal nuclease (Fig. 4c, d andExtended Data Fig. 10i). Similar results were observed when PADI4was overexpressed in C2C12 cells (Fig. 4e) or NSO4G cells (data notshown). To monitor whether Padi4 can affect H1 binding on pluripotent
cell chromatin, we performed ChIP-qPCR (quantitative PCR) analysesof H1.2 on the regulatory regions of Tcl1 and Nanog and found that it isstabilized on Padi4 knockdown (Fig. 4f). The ability of Padi4 to disruptthe binding of H1 to nucleosomal DNA provides a novel mechanis-tic example of how citrullination regulates protein function and chro-matin condensation.
The work described here identifies citrullination of chromatin com-ponents by Padi4 as a feature of pluripotency (Fig. 4g), in addition to itspreviously described role in the myeloid lineage. One of the reasons forthe restricted expression pattern of Padi4 may be the requirement for
a
log2 ratios (heavy/light)
0 4–8 –4 8P
ep
tid
e a
bu
nd
an
ce
Histone
H1.2
(R54)
g
b
ModCit
GFP
Mock WT R54A Mock WT R54AH1.GFP:
PADI4: ES ctrl ES PADI4f
WT
R54A
R54K
Nucleosome
WB: H1.2
Mouse ES cells
stably expressing
ctrl vector
12C6 L-lysine (LIGHT)
Isolate chromatin fraction
Quantify total protein
13C6 L-lysine (HEAVY)
Isolate chromatin fraction
Mix 1:1
Mass spectrometric analysis
Mouse ES cells
stably over-expressing
hPADI4 vector
Quantify total protein
Gene
name
Citrulline
site
Nop2 R148 6.25
Sf3b1 R157 4.78
Alyref R140 4.60
Mybbp1a R1322 4.57
Rpl10 R32 4.45
Surf6 R106 4.26
Ccdc86 R408 4.06
Rpl19 R38 4.04
Psip1 R515 3.95
Rpl4 R300 3.88
Atrx R1063 3.77
Mki67ip R203 3.75
Utp14a R431 3.75
Rrs1 R273 3.70
Rpl13a R59 3.60
Cdca8 R91 3.58
Utp14a R586 3.56
Nop2 R86 3.55
Rpl13a R140 3.52
Dnmt3b R415 3.52
Rrp1b R678 3.48
Srrm1 R7 3.45
Utp3 R375 3.37
Rrp15 R9 3.34
Ftsj3 R390 3.30
Hnrnpu R231 3.27
Ftsj3 R774 3.25
R7 3.22
Rab11b R4 3.19
Hist1h1c R54 3.19
Rps11 R22 3.19
Phf16 R715 3.17
Rpl19 R16 3.16
Bclaf1 R802 3.15
Trim28 R470 3.12
Trim28 R472 3.12
Rpl23a R41 3.10
Rpl19 R5 3.10
Tmpo R319 3.05
Matr3 R588 3.05
log2
SILAC
ratio
Gene
name
Citrulline
site
log2
SILAC
ratio
c
Rps19bp1
100 200 300 400 500 600 700 800 900 1,000 1,100 1,200
m/z
0
50
100
Rela
tive a
bu
nd
an
ce
y1
y2
y3
y4
y5
y6
y7
y8
b2
y9
y10
b3
b4
E R S G V S L A A L K Kb
y
Cit
e 420.0 421.0 422.0 423.0 424.0 425.0 426.0 427.0
m/z
0
50
100
Rela
tive a
bu
nd
an
ce
Heavy SILAC peak - ERSGVSLAALKK
Light SILAC peak - ERSGVSLAALKK
Cit
Cit
Theoretical peptide mass: 1,258.7243
Measured peptide mass: 1,258.7236
Mass deviation: <1.0 p.p.m.
d
Figure 3 | PADI4 citrullinates Arg 54 on linker histone H1 and affects itsbinding to nucleosomal DNA. a, Experimental strategy for screening forPADI4 citrullination substrates in the chromatin fraction of ES cells. b, Scatterplot representing the overall fold change for all identified citrullination sites.Red diamonds indicate PADI4-regulated citrullinations. c, Table representingthe 40 most highly regulated PADI4 substrates, their individual citrullinationsites and the log2 SILAC ratio. Complete data set is available in SupplementaryTable 4. d, Quantification of citrullination site Arg 54 on H1.2 through
differential regulation of the triply charged peptide ERSGVSLAALKK.e, Fragmentation spectra of the triply charged and heavy SILAC labelled LysCpeptide ERSGVSLAALKK surrounding Arg 54 of H1.2. The y and b seriesindicate fragments at amide bonds of the peptide. f, Citrullination immunoblotof wild-type (WT) and R54A mutant GFP-tagged H1.2 expressed and pulleddown from ES cells expressing PADI4 or control vector (mock). Control for theefficiency of the pull down: GFP. g, Nucleosome pull-down assay using wild-type and Arg 54-mutant H1.2. WB, western blot.
Tcl1 locus Nanog locus
H1 ChIP
Enhan
cer
Prom
oter
0
1
2
3
50
75
Rela
tive e
nrichm
ent
over
inp
ut
(×10
–4)
Enhan
cer
Prom
oter
0
5
10
15
20
25
30
35
Ctrl shRNA
Padi4 shRNA
Ctrl PADI4400
500
600
700
800P = 0.0001
d
c
a
b
Permeabilize Stabilize PADI4–GST Incubate
Wash
and collect
Pellet
and collect Washes
e
H1
PADI4 – +
Washes f
IF: D
AP
I
Ctrl (n = 87)
PADI4 (n = 110)
g
Mock
M 0 2 4 6 8 10 0 2 4 6 8 10
PADI4
Time (min)
Non-pluripotent
neural stem cell
Partially
reprogrammed
pre-iPS cell
Pluripotent
iPS cell
Oct4
Klf4
c-Myc
2i/LIF
Induction of
PADI4 expression
Induction of
PADI4 enzymatic
activity
H1
PADI4
H1Cit
2 Expression of
pluripotency genes
Nucle
ar
sw
elli
ng
vo
lum
e (μm
3)
Rela
tive e
nrichm
ent
ove
inp
ut
(×10
–4)
g Non-
Figure 4 | PADI4 evicts histone H1 fromchromatin and affects chromatin condensation.a, Schematic representation of treatment of C2C12myoblast nuclei with recombinant PADI4.b, Immunoblot analysis of the wash fraction afterthe above treatment, for histone H1.2.c, d, Quantification of nuclear volume (c) andrepresentative DAPI fluorescence (d) on treatmentof permeabilized C2C12 nuclei with recombinantPADI4. Error bars indicate standard error of themean. Statistical significance determined byunpaired student’s t-test. e, Micrococcal nucleasedigestion of C2C12 cells overexpressing an emptyvector (mock) or human PADI4. M, size marker.f, ChIP-qPCR for H1.2 on the regulatory regions ofTcl1 and Nanog in mouse ES cells stably expressingPadi4 or control shRNA. Error bars indicatestandard error of the mean of three technical qPCRreplicates. Representative of two experiments.g, Proposed model for the role of PADI4 in theregulation of pluripotency.
RESEARCH LETTER
4 | N A T U R E | V O L 0 0 0 | 0 0 M O N T H 2 0 1 4
Macmillan Publishers Limited. All rights reserved©2014
an open chromatin state in these cell types. The selective expressioncharacteristics and the inducible nature of the catalytic activity of Padi4indicate that it is under tight spatial and temporal regulation, giving it aunique status among chromatin-modifying enzymes. As such, inap-propriate Padi4 activity may have deleterious consequences, whichmay explain its activation in cancers of varying origin during progres-sion to malignancy29. Indeed, citrullination is a common feature of severalunrelated diseases, suggesting that strict regulation is probably a require-ment for the physiological function of all PADIs. During review ofthis manuscript, a study suggested that PADI2, thought to be mainlycytoplasmic, can also citrullinate histones and lead to transcriptionalactivation30. This opens up the possibility that other PADIs may medi-ate nuclear events in specific contexts, including in pluripotent cells.Further research into the function and targets of PADIs is likely toilluminate the aetiology of several pathologies.
METHODS SUMMARYInformation regarding cell lines, antibodies, plasmids and chemical inhibitors usedin this study, as well as detailed protocols for reprogramming and cell culture,overexpression and knockdown, gene expression analysis (qRT–PCR and micro-array), chromatin immunoprecipitation, embryo collection, culture, immuno-fluorescence staining and analysis, immunoblot analysis, SILAC labelling, massspectrometry and identification of citrullinated peptides and proteins, native puri-fication of wild-type and mutant linker histone H1.2, H1–GFP and nucleosomepull-down assays, purification of recombinant PADI4–GST and in vitro deimina-tion assays, treatment of permeabilized cells with recombinant PADI4, and micro-coccal nuclease digestion are provided in the Methods.
Online Content Any additional Methods, Extended Data display items and SourceData are available in the online version of the paper; references unique to thesesections appear only in the online paper.
Received 6 September 2012; accepted 6 December 2013.
Published online 26 January 2014.
1. Vossenaar, E. R., Zendman, A. J., van Venrooij, W. J. & Pruijn, G. J. PAD, a growingfamily of citrullinating enzymes: genes, features and involvement in disease.BioEssays 25, 1106–1118 (2003).
2. Wang, S. & Wang, Y. Peptidylarginine deiminases in citrullination, generegulation, health and pathogenesis. Biochim. Biophys. Acta 1829, 1126–1135(2013).
3. Martinod, K. et al. Neutrophil histone modification by peptidylarginine deiminase4 is critical for deep vein thrombosis in mice. Proc. Natl Acad. Sci. USA 110,8674–8679 (2013).
4. Hagiwara, T., Nakashima, K., Hirano, H., Senshu, T. & Yamada, M. Deimination ofarginine residues in nucleophosmin/B23 and histones in HL-60 granulocytes.Biochem. Biophys. Res. Commun. 290, 979–983 (2002).
5. Cuthbert, G. L. et al. Histone deimination antagonizes arginine methylation. Cell118, 545–553 (2004).
6. Wang, Y. et al. Human PAD4 regulates histone arginine methylation levels viademethylimination. Science 306, 279–283 (2004).
7. Zhang, X. et al. Genome-wide analysis reveals PADI4 cooperates with Elk-1to activate c-Fos expression in breast cancer cells. PLoS Genet. 7, e1002112(2011).
8. Tanikawa, C. et al. Regulation of histone modification and chromatin structure bythe p53-PADI4 pathway. Nature Commun. 3, 676 (2012).
9. Asaga, H., Nakashima, K., Senshu, T., Ishigami, A. & Yamada, M.Immunocytochemical localization of peptidylarginine deiminase in humaneosinophils and neutrophils. J. Leukoc. Biol. 70, 46–51 (2001).
10. Neeli, I., Khan, S. N. & Radic, M.Histone deimination as a response to inflammatorystimuli in neutrophils. J. Immunol. 180, 1895–1902 (2008).
11. Buttinelli, M., Panetta, G., Rhodes, D. & Travers, A. The role of histone H1 inchromatin condensation and transcriptional repression. Genetica 106, 117–124(1999).
12. Yamanaka, S. & Blau, H. M. Nuclear reprogramming to a pluripotent state by threeapproaches. Nature 465, 704–712 (2010).
13. Gaspar-Maia, A., Alajem, A., Meshorer, E. & Ramalho-Santos, M. Open chromatinin pluripotency and reprogramming. Nature Rev. Mol. Cell Biol. 12, 36–47(2011).
14. Meshorer, E. et al. Hyperdynamic plasticity of chromatin proteins in pluripotentembryonic stem cells. Dev. Cell 10, 105–116 (2006).
15. Marks, H. et al. The transcriptional and epigenomic foundations of ground statepluripotency. Cell 149, 590–604 (2012).
16. Theunissen, T. W. et al. Nanog overcomes reprogramming barriers and inducespluripotency in minimal conditions. Curr. Biol. 21, 65–71 (2011).
17. Darrah, E., Rosen,A.,Giles, J. T.&Andrade, F.Peptidylargininedeiminase 2, 3 and4have distinct specificities against cellular substrates: novel insights intoautoantigen selection in rheumatoid arthritis. Ann. Rheum. Dis. 71, 92–98(2012).
18. Polo, J. M. et al. A molecular roadmap of reprogramming somatic cells into iPScells. Cell 151, 1617–1632 (2012).
19. Luo, Y. et al. Inhibitors and inactivators of protein arginine deiminase 4:functional and structural characterization. Biochemistry 45, 11727–11736(2006).
20. Brahmajosyula, M. & Miyake, M. Localization and expression of peptidylargininedeiminase 4 (PAD4) in mammalian oocytes and preimplantation embryos. Zygote21, 314–324 (2013).
21. Kan, R. et al. Potential role for PADI-mediated histone citrullination inpreimplantation development. BMC Dev. Biol. 12, 19 (2012).
22. Li, P. et al. PAD4 is essential for antibacterial innate immunity mediated byneutrophil extracellular traps. J. Exp. Med. 207, 1853–1862 (2010).
23. Zernicka-Goetz, M.,Morris, S.A.&Bruce,A.W.Makinga firmdecision:multifacetedregulation of cell fate in the early mouse embryo. Nature Rev. Genet. 10, 467–477(2009).
24. Jones, J. E.et al.Synthesisandscreening ofa haloacetamidinecontaining library toidentify PAD4 selective inhibitors. ACS Chem. Biol. 7, 160–165 (2012).
25. Fan, Y. et al. Histone H1 depletion in mammals alters global chromatinstructure but causes specific changes in gene regulation. Cell 123, 1199–1212(2005).
26. Zhang, Y. et al. Histone H1 depletion impairs embryonic stem cell differentiation.PLoS Genet. 8, e1002691 (2012).
27. Goytisolo, F. A. et al. Identification of two DNA-binding sites on the globular domainof histone H5. EMBO J. 15, 3421–3429 (1996).
28. Brown, D. T., Izard, T. & Misteli, T. Mapping the interaction surface of linker histoneH1(0) with the nucleosome of native chromatin in vivo. Nature Struct. Mol. Biol. 13,250–255 (2006).
29. Chang, X. et al. Increased PADI4 expression in blood and tissues of patients withmalignant tumors. BMC Cancer 9, 40 (2009).
30. Zhang, X. et al. Peptidylarginine deiminase 2-catalyzed histone H3 arginine 26citrullination facilitates estrogen receptor a target gene activation. Proc. Natl Acad.Sci. USA 109, 13331–13336 (2012).
Supplementary Information is available in the online version of the paper.
Acknowledgements This work was funded by programme grants from CancerResearch UK (T.K.) and EMBL (P.B., R.L.). R.P.H.-S. and J.B.G. are supported by theMedical Research Council (G1001690) and the Wellcome Trust. G.C.-B. was funded byEMBO (Long-Term Post-Doctoral Fellowship), European Union (FP7 Marie CurieIntra-European Fellowship for Career Development) and Swedish Research Council.M.A.C. was funded by an EMBO Long-Term Post-Doctoral Fellowship and a HumanFrontier Science Programme Long-Term Post-Doctoral Fellowship. C.S.O. wassupported by FAPESP (Foundation for Research Support of the State of Sao Paulo) andmouse embryoworkwas supportedby the WellcomeTrust programmegrant toM.Z.-G.M.L.N. was partly supported by the Novo Nordisk Foundation Center for ProteinResearch, the Lundbeck Foundation, and by and the European Commission’s 7thFramework Programme HEALTH-F7-2010-242129/SYBOSS. K.A.M. was funded byNIH grant AI099728. We would like to thank S. Lestari, A. Cook and C. Hill for technicalassistance; P. Thompson for providing the TDFA compound; GSK Epinova forCl-amidine; T. Bartke for the gift of histone octamers and help with nucleosomepull-down assays; A. Finch for help with FPLC chromatography; A. Jedrusik for helpwith embryo work; R. Walker at the Flow Cytometry Core Facility at Wellcome TrustCentre for Stem Cell Research, University of Cambridge andT. Theunissen for helpwiththe flow cytometry; and members of the Kouzarides laboratory for critical discussionsof the work. 2TS22C cells were provided by H. Niwa. The ChIP grade H1.2 antibody wasa gift from A. Skoultchi.
Author Contributions M.A.C., G.C.-B. and T.K. conceived the idea for this project,designed experiments and wrote the manuscript with the helpof all the authors. G.C.-B.and M.A.C. performedES-cell transductions, established transgenic pre-iPS and EScelllines and performed gene expression analyses. M.A.C. carried out mutagenesis, proteinisolation, biochemical and chromatin immunoprecipitation experiments, andperformed citrullination analyses with the help of K.A.M.; G.C.-B. performedreprogramming experiments, with the help of J.S. and A.R.; M.A.C. prepared proteomicsamples and M.L.N. performed mass spectrometric analyses. R.P.H.-S. and M.A.C.performed PADI4 treatments of permeabilized cells and subsequent chromatincompactionanalyses,with thehelpof J.B.G. C.S.O. andM.Z.-G. designedandperformedmouse embryo experiments. R.L. and P.B. performed bioinformatic analyses ofmicroarray data. T.K. supervised the study.
Author Information Microarray data have been deposited in the ArrayExpressrepository (http://www.ebi.ac.uk/arrayexpress/) under accession E-MTAB-1975.Reprints and permissions information is available at www.nature.com/reprints. Theauthors declare competing financial interests: details are available in the online versionof the paper. Readers are welcome to comment on the online version of the paper.Correspondence and requests for materials should be addressed toT.K. ([email protected]).
LETTER RESEARCH
0 0 M O N T H 2 0 1 4 | V O L 0 0 0 | N A T U R E | 5
Macmillan Publishers Limited. All rights reserved©2014

METHODSCell culture. NSO4G neural stem cells31 were cultured in RHB-A media (Stem CellSciences), supplemented with penicillin/streptomycin (Life Technologies) and10 ng ml21 bFGF and EGF (PeproTech). ES Oct4–GIP cells32 and E14 ES cellswere cultured in GMEM supplemented with 10% fetal calf serum (FCS) for EScells (Biosera), 0.1 mM non-essential amino acids, penicillin/streptomycin, 2 mML-glutamine, 1 mM sodium pyruvate, 0.1 mM b-mercaptoethanol and 106 units l21
leukaemia inhibitory factor (LIF) (ESGRO, Millipore), or in 2i/LIF media, based onGMEM and containing 10% knockout serum replacement (Life Technologies), 1%FCS for ES cells (Biosera), 0.1 mM non-essential amino acids, penicillin/streptomycin,L-glutamine, sodium pyruvate, 0.1 mM b-mercaptoethanol, 1mM PD0325901(AxonMedChem), 3mM CHIR99021 (AxonMedChem) and 106 units l21 LIF(ESGRO, Millipore). Plat-E packaging cells were grown in DMEM media (LifeTechnologies) supplemented with 10% FCS, 1 mg ml21 puromycin, 10mg ml21
blasticidin and penicillin/streptomycin. iPS cells were maintained in 2i/LIF media.1mg ml21 puromycin was added to iPS and ES Oct4–GIP cultures during expan-sion. ZHBTc4.1 (ref. 33) and 2TS22C (ref. 34) ES cell lines were expanded in ES cellmedia and treated with 1mg ml21 doxycycline for 48 h before RNA extraction andqRT–PCR analysis. Complete knockdown of Oct4 in the ZHBTc4.1 cell line and ofSox2 in the 2TS22C ES cell line was confirmed by western blot analysis (data notshown). All cells were grown at 37 uC with 5% (Biostation) or 7.5% CO2.Overexpression of human PADI4 or shRNA against mouse Padi4 in mouse EScells. Human PADI4 was inserted into ES E14 cells using the piggyBac transposonsystem35. The Gateway system was used to clone human PADI4 into the piggyBacvector using the following primers: PADI4_AttB1_F, 59-GGGGACAAGTTTGTACAAAAAAGCAGGCTTCACCATGGCCCAGGGGACATTGATCCG-39; PADI4_AttB2_R, 59-GGGGACCACTTTGTACAAGAAAGCTGGGTCTCAGGGCACCATGTTCCACC-39.
pB-CAG-Ctrl or pB-CAG-hPADI4 vectors (1mg) were transfected with piggyBactransposase (pPBase) expression vector, pCAGPBase (2mg) , by nucleofection accord-ing to the manufacturer’s instructions (Lonza). ES E14 cells constitutively expressingthe hygromycin resistance gene and human PADI4 were selected and expanded inmedia containing 200mg ml21 hygromycin.
For mouse Padi4 knockdown experiments, ES E14 cells were transfected withLipofectamine 2000 (Life Technologies) or by nucleofection with pRFP-C-RSHuSH shRNA RFP vectors (Origene) containing either the scrambled shRNAcassette TR30015 (ctrl), mouse Padi4 targeting shRNAs FI516326 (shRNA 1) orFI516328 (shRNA 2), or with Mission RNAi pLKO.1-puro vectors (Sigma), con-taining either the non-targeting shRNA SHC002 (ctrl) or mouse Padi4 targetingshRNA TRCN000101833 (shRNA 3). Where applicable, ES cell lines were gener-ated after selection with 1mg ml21 puromycin.Reprogramming. Reprogramming was performed as described previously36,37.For retroviral supernatant preparation, 9mg of pMXs-Oct4, pMX-Klf4 and pMXs-c-Myc were transfected with FuGENE 6 into 1–2 3 106 Plat-E cells in separate10 cm dishes. After 24 h incubation, the media was replaced with DMEM 1 10%FCS and penicillin/streptomycin. Virus-containing supernatants from Plat-E cul-tures were filtered through a 0.22-mm cellulose acetate filter, mixed in equal ratios,and 4mg ml21 polybrene was added. 2 ml of the final viral mix was then added topreviously plated 1.2 3 105 NSO4G cells, in 6-well plates coated with gelatin. After1 day, the media was replaced with NSO4G cell culture medium. After 3 daysincubation, the media was changed to ES cell serum-containing media (see above).At this stage, pre-iPS colony formation was evident, but none of the colonies waspositive for GFP expression (GFP1). After 2 days and to complete reprogram-ming, medium was replaced with 2i/LIF. Cells were maintained in 2i/LIF for8 days, with media change every 2 days. Oct4–GFP1 colonies were counted atday 7 in 5–9 selected fields per well, either at the microscope or after time-lapseimage acquisition on the Biostation CT (Nikon). The percentage of GFP1 cells wasdetermined by flow cytometry at day 8, using a Dako Cytomation CyAN ADPhigh-performance cytometer and Summit software, as described previously36,37.Statistical significance was determined by two-tailed unpaired t-test. For the timecourse experiments, cells were collected with 350ml RLT buffer (Qiagen) or 23
Laemmli buffer, from individual wells in consecutive days and after a PBS wash.Cl-amidine (200mM) was added at the time of media exchange to 2i/LIF and
replenished every 2 days. For Padi4 knockdown experiments, pre-iPS cells weremaintained in ES-cell-serum-containing media and cell lines were generated aftertransfection with lipofectamine 2000 with the Mission RNAi pLKO.1-puro vec-tors, containing either a non-targeting shRNA (SHC002) or mouse Padi4 targetingshRNAs TRCN000101833 (shRNA 3) or TRCN000101834 (shRNA 4). Afterpuromycin selection, control and Padi4 knockdown pre-iPS cell lines were gen-erated. Notably, puromycin treatment abolished all non-transfected pre-iPS cells,and control and shPadi4 pre-iPS cell lines were Oct4–GFP negative (Fig. 2a). Forreprogramming experiments, 1 3 105 cells were plated in individual wells (6-wellplates) in triplicate and without puromycin, and media was changed to 2i/LIF after
day 1. Cells were maintained in 2i/LIF for 8 days, with media change every 2 days,and assessed for Oct4–GFP as previously described.qRT–PCR primer design. GenBank and Ensembl cDNA sequences were used todesign gene-specific primers in Primer 3 (ref. 38) or in the Universal ProbeLibraryAssay Design Center (Roche Applied Science). The specificity of PCR primers wasdetermined via the in-Silico PCR (UCSC Genome Browser) and Primer-BLAST(NCBI) web-based tools. Oligonucleotides were obtained from Sigma. Primersequences can be found in Supplementary Table 1.Reverse transcription. Total RNA was isolated from ES cells, NSO4G and cellsduring reprogramming, using the RNeasy extraction kit with in-column DNasetreatment (Qiagen). Total RNA was reverse transcribed with the High-CapacitycDNA Reverse Transcription kit for 1 h (Applied Biosystems). Samples were ali-quoted equally into positive and negative (RT2) reactions. Before qPCR analysis,samples were diluted five- or tenfold with DNase/RNase free dH2O (Ambion).qPCR. qPCR reactions were performed in duplicate or triplicate for each sample.Each PCR reaction had a final volume of 10–20ml and 2.5–5ml of diluted cDNA orChIP DNA. RT2 samples were assayed to discount genomic DNA amplification.Fast SYBR green Master Mix or TaqMan Fast Universal PCR Master Mix (AppliedBiosystems) was used according to the manufacturer’s instructions. A meltingcurve was obtained for each PCR product after each run, to confirm that theSYBR green signal corresponded to a unique and specific amplicon. RandomPCR products were also run in a 2–3% agarose gel to verify the size of the ampli-con. Standard curves were generated for each real-time PCR run using serialthreefold dilutions of a sample containing the sequence of interest. Their plotswere used to convert CT values (number of PCR cycles needed for a given templateto be amplified to an established fluorescence threshold) into arbitrary quantitiesof initial template per sample. Expression levels were then obtained by dividing thequantity by the value of housekeeping genes, such as ubiquitin (UbC). UbC assayswere run every time samples were frozen/thawed. Statistical analysis was per-formed in Prism 6 using one-way ANOVA analysis of variance with Holm-Sidak’s multiple comparisons test or two-tailed unpaired t-test.Gene expression analysis. Mouse WG-6 Expression BeadChip microarrays (Illumina)were processed at the Cambridge Genomic Services, Department of Pathology,University of Cambridge. Three biological replicates were assayed for each con-dition. Illumina microarray probes were matched to gene identifiers according tothe re-annotation of the microarray platform39. For both the PADI4 overexpres-sion and the Cl-amidine inhibition experiments, normalization was performedusing the lumi40 R package. Limma41 was used for differential expression analysis,with Benjamini–Hochberg (FDR) adjusted P-values ,0.05 considered significant.Gene ontology (GO) enrichment analysis was performed using GOstats42, andresults adjusted for multiple testing using the Benjamini–Hochberg procedure(FDR).Immunoblot analysis. For immunoblot analysis, cell monolayers or pellets werere-suspended in 23 Laemmli buffer, incubated for 5 min at 95 uC and passed 10times through a 21G needle to shear genomic DNA. In the case of trichloroaceticacid precipitated proteins, pellets were re-suspended in buffer and boiled as above.Proteins were separated by SDS–PAGE, transferred to nitrocellulose membrane(Millipore) using wet transfer and incubated in blocking solution (5% BSA in TBScontaining 0.1% Tween) for 1 h at room temperature. Membranes were incubatedwith primary antibody at 4 uC overnight and appropriate HRP-conjugated sec-ondary antibody for 2 h at room temperature. Membranes were then incubated forenhanced chemiluminescence (ECLH; GE Healthcare) and proteins were detectedby exposure to X-ray film. Primary antibodies, diluted in blocking solution, wereused against citrullinated histone H3 (anti-H3Cit, Abcam, ab5103 at 1:50,000dilution), unmodified histone H3 (anti-H3, Abcam, ab10799 at 1:2,000), linkerhistone H1 (anti-H1, Santa Cruz Biotechnology, sc-34464 at 1:200), GFP (anti-GFP,Abcam, ab290 at 1:5,000) and Gapdh (anti-Gapdh, Abcam, ab9485 at 1:2,500).Citrulline-containing proteins were modified on the membrane and detected usingthe anti-modified citrulline detection kit (Millipore) as per manufacturer’s instructions.Chromatin immunoprecipitation. ChIP-IT Express (Active Motif) was usedaccording to the supplier’s recommendations. Cells were crosslinked using 1%formaldehyde for 10 min at room temperature. Formaldehyde was quenched by a5-min incubation with glycine, cells were rinsed twice with cold PBS, collected byscraping and pelleted at 2,500 r.p.m. for 10 min at 4 uC. Frozen pelleted cells werethawed and re-suspended in lysis buffer, rotated for 30 min at 4 uC, dounced andcentrifuged at 5,000 r.p.m. for 10 min at 4 uC. Pelleted nuclei were re-suspended inshearing buffer. Chromatin was then sonicated using a Bioruptor 200 (Diagenode),high frequency, 0.5 min/0.5 min, for 10 min twice. Sonicated chromatin was ana-lysed in 1% agarose gel, to confirm efficient sonication. Input was collected forfurther analysis. 5–15mg of chromatin was incubated with 2mg of rabbit IgG ascontrol (Abcam, ab6742), anti-PADI4 (Sigma, P4749), anti-Klf4 (R&D Systems,AF3158), anti-Oct4 (Santa Cruz Biotechnology, sc-5279X (mouse) or sc-8628X(goat)), anti-Sox2 (Santa Cruz Biotechnology, sc-17320), anti-H3Cit (Abcam,
RESEARCH LETTER
Macmillan Publishers Limited. All rights reserved©2014
ab5103), anti-H2A (Abcam, ab18255), anti-H3K4me3 (Millipore, 17-614), anti-RNA polymerase II (Millipore, clone CTD4H8, 05-623) or anti-H1.2 (anti-H1C, agift from A. Skoultchi) for 1 h at 4 uC and subsequently with protein G magneticbeads. After overnight immunoprecipitation at 4 uC, beads were washed threetimes with ChIP buffer 1 and two times with ChIP buffer 2. After elution andreverse crosslink (95 uC for 15 min), samples were treated with proteinase K for 1 h.Purified DNA and 1% input were analysed by Fast SYBR green Master Mix qPCR,using serial fourfold dilutions of the concentrated input for standard curves andtriplicates per sample. Occupancy is plotted as fold enrichment over input and aftersubtracting background signal from the beads. Primers are listed in SupplementaryTable 1.Embryo collection and culture. Embryos were collected into M2 medium(including 4 mg ml21 BSA) from superovulated C57BL/6 3 CBA females matedwith C57BL/6 3 CBA or H2B–EGFP43 males as previously described44. Embryoswere cultured in KSOM (including 4 mg ml21 BSA) under paraffin oil in 5% CO2
at 37.5 uC. PADI4 inhibitors (Cl-amidine, 10 mM or 200mM, and TDFA, 100mM)and HDAC inhibitor (TSA, Sigma, 10 nM) were added to final KSOM from 2-cell-stage embryos (44 h after hCG) onwards. The concentration for inhibitors wasdetermined by titration, and was set as the lowest dose that leads to inhibition ofenzyme activity and allowed embryonic development to blastocyst stage. No ran-domization was performed and there was no blinding. Animals were maintainedin the Animal Facility of the Gurdon Institute at a 12:12 light cycle and providedwith food and water ad libitum. All experiments were conducted in compliancewith Home Office regulations.Immunofluorescence staining and analysis of embryos. Embryos were fixed in4% PFA for Nanog, Sox17, Cdx2 and H3K9 acetylated staining, and in methanolfor H3Cit staining. Immunofluorescence staining was carried out as describedpreviously45. Primary antibodies used were as follows: rabbit anti-H3Cit (Abcam,1:100), rabbit anti-H3K9ac (Upstate, 1:100), rabbit anti-Nanog (Cosmo Bio Co.,1:200), goat anti-Sox17 (R&D systems, 1:200), mouse anti-Cdx2 (Cdx2-88) (Biogenex,1:200). Secondary antibodies used were AlexaFluor 568-conjugated donkey anti-goat,AlexaFluor 488-conjugated donkey anti-mouse and AlexaFluor 633-conjugateddonkey anti-rabbit, and AlexaFluor 488-conjugated anti-rabbit and Texas red-conjugated goat anti-rabbit (Invitrogen), at 1:400. Collection of 4-cell embryosand E4.5 blastocysts was performed 56 h and 106 h after hCG, respectively. Confocalmicroscopy was performed and images analysed using a 40/1.4 NA oil DIC Plan-Apochromatic lens on an inverted Zeiss 510 Meta confocal microscope. Confocalsections were taken every 2mm through the whole embryo. To measure the fluor-escence levels of H3Cit objectively, individual cells were outlined manually inImage J, and the intensity of the fluorescent signal was recorded for each z-stack(three measurements per nucleus). Only cells in the same z-stacks were compared.Statistical analysis was performed with two-tailed unpaired t-test or Mann–Whitney U-test (for non-normal distributions). Fluorescence and DIC z-stacksof embryos from late 2-cell (52 h after hCG) to blastocyst stage were collected on 15focal planes every 15 min for 72 h of continuous embryo culture. The images wereprocessed as described previously44. All cells were followed in 4D using SIMI Biocellsoftware (http://www.simi.com/en/products/cell-research/simi-biocell.html/)46 aspreviously described44.SILAC labelling and mass spectrometry. ES cells were labelled in culture usingthe Mouse Embryonic Stem Cell SILAC Protein Quantitation kit (Pierce) for atleast six passages. Extracted proteins were re-suspended in Laemmli sample buffer,and resolved on a 4–20% SDS–PAGE (NuPAGE, Life Technologies). The gel wasstained with Coomassie blue, cut into 20 slices and processed for mass spectro-metric analysis using standard in gel procedure47. Briefly, cysteines were reducedwith dithiothreitol (DTT), alkylated using chloroacetamide (CAA)48, and finallythe proteins were digested overnight with endoproteinase LysC and loaded ontoC18 StageTips before mass spectrometric analysis.
All MS experiments were performed on a nanoscale HPLC system (EASY-nLCfrom Thermo Scientific) connected to a hybrid LTQ–Orbitrap Velos49 equippedwith a nanoelectrospray source (Thermo Scientific). Each peptide sample wasauto-sampled and separated on a 15-cm analytical column (75-cm inner diameter)in-house packed with 3mm C18 beads (Reprosil Pur-AQ, Dr. Maisch) with a 2 hgradient from 5% to 40% acetonitrile in 0.5% acetic acid. The effluent from theHPLC was directly electrosprayed into the mass spectrometer.
The MS instrument was operated in data-dependent mode to switch betweenfull-scan MS and MS/MS acquisition automatically. Survey full-scan MS spectra(from m/z 300–1,700) were acquired in the Orbitrap mass analyser with resolutionR 5 30,000 at m/z 400 (after accumulation to a ‘target value’ of 1,000,000 in thelinear ion trap). The ten most intense peptide ions with charge states $2 weresubsequently isolated to a target value of 50,000 using predictive automatic gaincontrol (pAGC) and fragmented by higher-energy collisional dissociation (HCD)in the octopole collision cell using normalized collision energy of 40%. The ionselection threshold was set to 5,000 counts for HCD and the maximum allowed ion
accumulation times was set to 500 ms for full scans and 250 ms for HCD. All HCDfragment ion spectra were recorded in the Orbitrap mass analyser with a resolutionof 7,500 at m/z 400. For all full-scan measurements, a lock-mass ion from ambientair (m/z 445.120025) was used for internal calibration when present, as described50.Identification of peptides and proteins. Mass spectrometry data analysis wasperformed with the MaxQuant software suite (version 1.2.6.20) as described51
supported by Andromeda (http://www.maxquant.org) as the database searchengine for peptide identifications52. We followed the step-by-step protocol ofthe MaxQuant software suite53 to generate MS/MS peak lists that were filteredto contain at most six peaks per 100 Da interval and searched by Andromeda againsta concatenated target/decoy54 (forward and reversed) version of the Uniprothuman database version (70.101 forward protein entries). Protein sequences ofcommon contaminants such as human keratins and proteases used were added tothe database. The initial mass tolerance in MS mode was set to 7 p.p.m. and MS/MSmass tolerance was set to 20 p.p.m. Cysteine carbamidomethylation was searchedas a fixed modification, whereas protein N-acetylation, oxidized methionine, dea-midation of asparagine and glutamine, and citrullination of arginines were searchedas variable modifications. A maximum of two mis-cleavages was allowed whereaswe required strict LysC specificity. Peptide assignments were statistically evaluatedin a Bayesian model on the basis of sequence length and Andromeda score. Weonly accepted peptides and proteins with a false discovery rate of less than 1%,estimated on the basis of the number of accepted reverse hits.Native purification of wild-type and mutant linker histone H1.2. Linker his-tone H1.2 was expressed from a pET 28b(1) vector, provided by the laboratory ofR. Schneider. The vector was mutated using Quickchange site-directed mutagen-esis protocol (Stratagene) for the expression of R54A and R54K mutants. Aftertransformation into expression strain BL21(DE3)-RIL, pre-cultures were diluted1:100 into 3 l of LB medium containing kanamycin and camptothecin and grownat 37 uC, 200 r.p.m. At an optical density at 600 nm of 0.6, 0.2 mM IPTG was addedand the bacteria grown for another 2 h under the same conditions. Bacterial pelletswere collected by centrifugation (15 min, 4,000g, 4 uC), frozen in liquid nitrogenand stored at 280 uC. Linker histone expression was assessed by SDS–PAGE andCoomassie blue stain. Pellets were thawed on ice, re-suspended in 25 ml lysisbuffer (20 mM HEPES, pH 7.6; 100 mM NaCl; 5 mM EDTA; 13 complete prote-ase inhibitors (Roche); 1 mM DTT; 0.2 mM PMSF) per litre of culture and lysedthrough an Avestin high-pressure homogenizer. Lysates were cleared by centrifu-gation (20,000g, 40 min, 4 uC) and 4 M ammonium sulphate added slowly to thesupernatant to a final concentration of 2 M. The mixture was incubated on an end-to-end rotator at 4 uC for 20 min before the precipitated proteins were removed bycentrifugation (20,000g, 40 min, 4 uC). The supernatant was filtered through a0.2mm syringe filter and loaded onto a 20 ml HiPrep 16/10 Phenyl FF (low sub)hydrophobic interaction column (Amersham Biosciences), equilibrated in HEMGbuffer (20 mM HEPES, pH 7.6; 50mM EDTA; 6.25 mM MgCl2; 0.5 mM DTT; 10%glycerol) containing 2 M ammonium sulphate. The sample was injected via a 50-mlsuper loop at a flow rate of 0.5 ml min21, while the flow through, which containedH1.2, was collected in 5-ml fractions. Ten column volumes of HEMG buffer wereused to flush the remaining H1.2 from the column. Fractions were analysed bySDS–PAGE and H1.2-containing fractions were pooled and dialysed overnightinto HEG buffer (20 mM HEPES, pH 7.6; 50mM EDTA; 10% glycerol) containing100 mM NaCl, using 6–8 kDa MWCO dialysis tubing. The protein solution wascentrifuged (20,000g, 40 min, 4 uC) to remove precipitated proteins and filtered asabove. The solution was loaded onto a 6 ml Resource S column, pre-equilibratedwith HEG buffer, and proteins eluted with a gradient of 100 mM to 1 M NaCl-containing HEG buffer (0.5 ml min21, 20CV) in 500ml fractions. Protein fractionswere analysed for the presence of H1.2, pooled as above and dialysed in HEG bufferwith 100 mM NaCl using dialysis tubing with 10 kDa MWCO. Samples werefiltered as above and loaded onto a Mono S column (Amersham Biosciences) equili-brated with HEG buffer containing 100 ml NaCl. 500ml fractions were collectedwith a gradient of 100 mM to 1 M NaCl-containing HEG buffer (0.5 ml min21,20CV) and analysed on a 15% SDS–PAGE. Fractions containing H1.2 were pooled,dialysed as above into 50% glycerol and stored at 220 uC.H1–GFP and nucleosome pull-down assays. GFP-tagged linker histone H1.2(H1.GFP) was expressed in ES cells stably overexpressing human PADI4 or con-trol vector by transfection (Lipofectamine 2000) of a pEGFP-H1.2 vector, contain-ing either the wild-type or the R54A mutant sequence, or with empty pEGFPvector. Transfection efficiency was assessed by visualization of GFP using fluor-escence microscopy and determined to be .90%. 24 h after transfection, cells werecollected and H1–GFP was pulled down using GFP-TRAP conjugated magneticbeads (Chromotek) as per the manufacturer’s instructions, and subjected toimmunoblot analysis.
For in vitro nucleosome pull down, nucleosomes containing purified andrefolded histone octamers and biotinylated 601 DNA were assembled as describedpreviously55 and immobilized on Dynabeads Streptavidin MyOne T1 (Invitrogen)
LETTER RESEARCH
Macmillan Publishers Limited. All rights reserved©2014

for 2 h at 4 uC. Nucleosome-loaded beads in varying amounts were incubated onan end-to-end rotator with wild-type or mutant linker histone H1.2 in bindingbuffer (20 mM HEPES, pH 7.9; 150 mM NaCl; 0.2 mM EDTA, 20% glycerol; 0.1%NP40; 1 mM DTT, and complete protease inhibitors (Roche)) for 4 h at 4 uC. Afterfive washes in binding buffer, the beads were collected and bound proteins wereeluted in sample buffer and subjected to immunoblot analysis.Purification of recombinant PADI4–GST and in vitro deimination assays.Recombinant human PADI4–GST was expressed from pGEX6p constructs inLBKan media, induced with 0.1 mM IPTG at 25 uC, purified using glutathione-sepharose resin, eluted using a 25 mM glutathione solution and stored in 50%glycerol at 220 uC. In vitro deimination of linker histone H1.2 was carried out indeimination buffer (50 mM HEPES, pH 7.5; 2 mM DTT; in the presence orabsence of 10 mM CaCl2) at 37 uC for 1 h, using the active enzyme. Samples werere-suspended in sample buffer for immunoblot analysis.Treatment of permeabilized cells with recombinant PADI4. Cells were re-suspended in a cold solution of 80mg ml21 digitonin in SuNaSP56, mixed gentlybut thoroughly and incubated on ice for 3 min. Complete permeabilization waschecked by Trypan blue uptake of sub-aliquots of the suspension and the reactionwas stopped by addition of SuNaSP containing 3% BSA. Permeabilized cells werethen pre-incubated in wash buffer (20 mM HEPES-KOH, 75 mM KCl, 1.5 mMMgCl2, 5 mM CaCl2) with 0.2% Triton X-100 for 30 min at 37 uC. Nuclei werewashed in wash buffer and incubated in reaction buffer (20 mM HEPES-KOH,75 mM KCl, 1.5 mM MgCl2, 5 mM CaCl2, 2 mM DTT) with or without recom-binant PADI4 for 1.5 h at 37 uC. The nuclei were washed several times in washbuffer to remove excess PADI4 and released proteins that were not stably boundwithin the nucleus. The ‘Washes’ fraction contains all proteins that are no longerstably bound, including recombinant human PADI4. The ‘Pellet’ contains all othernuclear-retained proteins. The wash supernatants were concentrated by trichloro-acetic acid protein precipitation and subjected to immunoblot analysis. Thewashed nuclei were washed a further time in PBS for immunoblot analysis or inMNase buffer and used for DNA compaction assays.Micrococcal nuclease digestion. Cell pellets were washed twice and re-suspendedin micrococcal nuclease (MNase) buffer (15 mM Tris, pH 7.5; 15 mM NaCl;60 mM KCl; 0.34 M sucrose; 0.5 mM spermidine; 0.15 mM spermine; 0.25 mMPMSF; 0.1% b-mercaptoethanol). 1 mM of CaCl2 was added and the suspensionwas divided into equal aliquots, which were kept on ice. MNase was added to afinal concentration of 0.5 U ml21 and samples were incubated at 25 uC in a heatblock for varying amounts of time. The reaction was stopped by addition of 0.5 MEDTA and 0.5 M EGTA and DNA purified using a QIAGEN PCR purification kit.DNA was quantified and 1,500 ng of each sample was loaded on a 1.5% agarose gelcontaining ethidium bromide.
31. Silva, J., Chambers, I., Pollard, S. & Smith, A. Nanog promotes transfer ofpluripotency after cell fusion. Nature 441, 997–1001 (2006).
32. Ying, Q. L., Nichols, J., Evans, E. P. & Smith, A. G. Changing potency by spontaneousfusion. Nature 416, 545–548 (2002).
33. Niwa, H., Miyazaki, J. & Smith, A. G. Quantitative expression of Oct-3/4 definesdifferentiation, dedifferentiation or self-renewal of ES cells. Nature Genet. 24,372–376 (2000).
34. Masui, S. et al. Pluripotency governed by Sox2 via regulation of Oct3/4 expressionin mouse embryonic stem cells. Nature Cell Biol. 9, 625–635 (2007).
35. Ding, S. et al. Efficient transposition of the piggyBac (PB) transposon inmammalian cells and mice. Cell 122, 473–483 (2005).
36. Silva, J. et al. Nanog is the gateway to the pluripotent ground state. Cell 138,722–737 (2009).
37. Theunissen, T. W. et al. Nanog overcomes reprogramming barriers and inducespluripotency in minimal conditions. Curr. Biol. 21, 65–71 (2011).
38. Rozen, S. & Skaletsky, H. Primer3 on the WWW for general users and for biologistprogrammers. Methods Mol. Biol. 132, 365–386 (2000).
39. Barbosa-Morais, N. L. et al. A re-annotation pipeline for Illumina BeadArrays:improving the interpretation of gene expression data. Nucleic Acids Res. 38, e17(2010).
40. Du, P., Kibbe, W. A. & Lin, S. M. lumi: a pipeline for processing Illumina microarray.Bioinformatics 24, 1547–1548 (2008).
41. Smyth, G. K. In Bioinformatics and Computational Biology Solutions using R andBioconductor (eds Carey, V., Gentleman, R., Dudoit, S., Irizarry, R. & Huber, W.)397–420 (Springer, 2005).
42. Falcon, S. & Gentleman, R. Using GOstats to test gene lists for GO term association.Bioinformatics 23, 257–258 (2007).
43. Hadjantonakis, A. K.&Papaioannou,V. E.Dynamic in vivo imagingandcell trackingusing a histone fluorescent protein fusion in mice. BMC Biotechnol. 4, 33 (2004).
44. Bischoff, M., Parfitt, D. E. & Zernicka-Goetz, M. Formation of the embryonic-abembryonic axis of the mouse blastocyst: relationships between orientation ofearly cleavage divisions and pattern of symmetric/asymmetric divisions.Development 135, 953–962 (2008).
45. Jedrusik, A. et al.Roleof Cdx2 and cell polarity in cell allocation and specification oftrophectoderm and inner cell mass in the mouse embryo. Genes Dev. 22,2692–2706 (2008).
46. Schnabel, R., Hutter, H., Moerman, D. & Schnabel, H. Assessing normalembryogenesis in Caenorhabditis elegans using a 4D microscope: variability ofdevelopment and regional specification. Dev. Biol. 184, 234–265 (1997).
47. Shevchenko, A., Tomas, H., Havlis, J., Olsen, J. V. & Mann, M. In-gel digestion formass spectrometric characterization of proteins and proteomes. Nature Protocols1, 2856–2860 (2006).
48. Nielsen, M. L. et al. Iodoacetamide-induced artifact mimics ubiquitination in massspectrometry. Nature Methods 5, 459–460 (2008).
49. Olsen, J. V. et al. A dual pressure linear ion trap Orbitrap instrument with very highsequencing speed. Mol. Cell. Proteomics 8, 2759–2769 (2009).
50. Olsen, J. V. et al. Parts per million mass accuracy on an Orbitrap massspectrometer via lock mass injection into a C-trap. Mol. Cell. Proteomics 4,2010–2021 (2005).
51. Cox, J. & Mann, M. MaxQuant enables high peptide identification rates,individualized p.p.b.-range mass accuracies and proteome-wide proteinquantification. Nature Biotechnol. 26, 1367–1372 (2008).
52. Cox, J. et al. Andromeda: a peptide search engine integrated into the MaxQuantenvironment. J. Proteome Res. 10, 1794–1805 (2011).
53. Cox, J. et al. A practical guide to the MaxQuant computational platform for SILAC-based quantitative proteomics. Nature Protoc. 4, 698–705 (2009).
54. Elias, J. E. & Gygi, S. P. Target-decoy search strategy for increased confidence inlarge-scale protein identifications by mass spectrometry. Nature Methods 4,207–214 (2007).
55. Bartke, T. et al. Nucleosome-interacting proteins regulated by DNA and histonemethylation. Cell 143, 470–484 (2010).
56. Halley-Stott, R. P. et al. Mammalian nuclear transplantation to germinal vesiclestage Xenopus oocytes—a method for quantitative transcriptionalreprogramming. Methods 51, 56–65 (2010).
RESEARCH LETTER
Macmillan Publishers Limited. All rights reserved©2014

ES NSC iPS0
1
2
3
4
Pad
i1 m
RN
A (x
10-1
1)
**
NS
ES NSC iPS0.0
0.1
0.2
0.3
0.4
0.5
0.6
0.7
Pad
i2 m
RN
A
******
ES NSC iPS0.00
0.25
0.50
0.75
1.00
1.25
1.50
1.75
Pad
i3 m
RN
A
**
**
a c
ModCit
NSO4G ES iPS
H3
H3Cit
H3
ES iPSNSO4G
d
Padi4 mRNA
0h 48h 48h-1.5
-0.5
0.5
1.5
Doxycycline
Pad
i4 m
RN
A(lo
g2) ZHBTc4.1 (Oct4 depletion)
2TS22C (Sox2 depletion)
** NS
0h
Oct4 mRNA
0h 48h-4.5
-3.0
-1.5
0.0
1.5
3.0
4.5
Doxycycline
Oct
4 m
RN
A(lo
g10
)
**** NS
48h0h
e
Oct4
Sox2 Klf40.0
0.1
0.2
0.3
0.4
0.51.01.52.02.5
Rel
ativ
e en
rich
men
tov
er in
put (
x10
-2 )
Pol II
H3K4m
e3H2A
0.0
0.5
1.0
1.53.55.57.59.5
Rel
ativ
e en
rich
men
tov
er in
put (
x10
-2 )
ESNSO4G
Padi4 promoterf
ES2i
LIF0.0
0.5
1.0
1.5
Pad
i1 m
RN
A (
x10
-11) *
ES2i
LIF0
1
2
3
4
5
6
Pad
i2 m
RN
A
NS
ES2i
LIF0
1
2
3
4
5
6
Pad
i3 m
RN
A
NSb
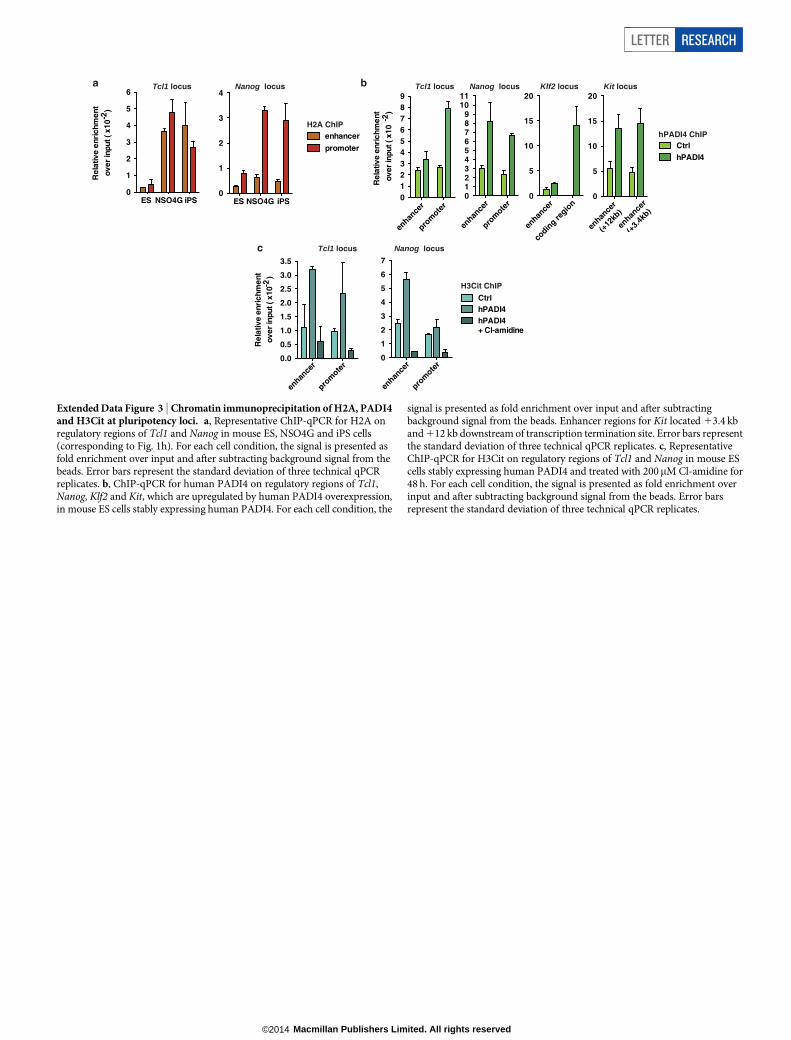
Extended Data Figure 1 | Citrullination and Padi expression profiles in ES,NSO4G and iPS cells; regulation of Padi4 by pluripotency factors in ES cells.a, Transcript levels for Padi1, Padi2 and Padi3 in ES, NSO4G (NSC) and iPScells, as assessed by qRT–PCR. Padi6 was undetectable in all three cell types.Expression is normalized to endogenous levels of ubiquitin (UbC). Error barsrepresent the standard error of the mean of three biological replicates.b, Transcript levels of Padi1, Padi2 and Padi3 in ES cells on switch to 2icontaining medium for one passage, as assessed by qRT–PCR. Padi6 wasundetectable in both conditions. Expression normalized to UbC. Error barsrepresent the standard error of the mean of three biological replicates.c, Immunoblot analysis of H3Cit levels in ES, NSO4G and iPS cells. Total H3 ispresented as a loading control. d, Immunoblot analysis of total citrullinationlevels in ES, NSO4G and iPS cells, using an antibody against modified citrulline
(ModCit), which recognizes peptidylcitrulline irrespective of amino acidsequence. Total H3 is presented as a loading control. e, ZHBTc4.1 and 2TS22CES cell lines were treated with 1mg ml21 doxycycline for 48 h, resulting indepletion of Oct4 or Sox2 (data not shown). Padi4 mRNA was significantlyreduced on Oct4, but not Sox2 knockdown, as assessed by qPCR. Error barsrepresent standard error of the mean of four biological replicates. f, ChIP-qPCRfor Oct4, Sox2, Klf4, RNA polymerase II (PolII), H3K4me3 and H2A on thepromoter of Padi4 in mouse ES and NSO4G cells. For each cell condition, thesignal is presented as fold enrichment over input and after subtractingbackground signal from the beads. Error bars represent the standard deviationof three technical qPCR replicates. Asterisks denote difference with ES cells(a) or ES media (b), and 0 h time point (e); NS, not significant, *P # 0.05,**P # 0.01, ***P # 0.001, ****P # 0.0001 by ANOVA (a) or t-test (b, e).
LETTER RESEARCH
Macmillan Publishers Limited. All rights reserved©2014

Ctrl
shRNA 1
shRNA 2
shRNA 1
+ 2 Ctrl
shRNA 1
shRNA 2
0.0
0.5
1.0
1.5
mP
AD
I4 m
RN
A
pPB CTRL
pPB-hPADI4
NS
******** ****
NS
NS
**
******** ****
shRNA 1
+ 2Ctrl
shRNA 1
shRNA 2
shRNA 1
+ 2 Ctrl
shRNA 1
shRNA 2
0.0
0.5
1.0
1.5
2.0
2.5
3.0
3.5
hPA
DI4
mR
NA
NS
****
****
****
NS NS
****
********
****
shRNA 1
+ 2
b c
Ctrl
shRNA 3
0
1
2
3
4
5
6
7
8
Pad
i4 m
RN
A
**
Ctrl
shRNA 3
0
1
2
3
4
5
6
7
Tcl
1 m
RN
A
**
Ctrl
shRNA 3
0
1
2
3
4
5
6
Nan
og
mR
NA
**
Ctrl
hPADI40
30
60
90
120
c-M
yc m
RN
A
pPB
NS
Ctrl
hPADI40.0
0.5
1.0
Fo
xp1
mR
NA
pPB
NS
Ctrl
hPADI40
1
2
3
4
Kit
mR
NA
pPB
*
Ctrl
hPADI40
1
2
3
Klf
2 m
RN
A
pPB
**
Ctrl
hPADI40
50
100
150
200
250
300
350
Oct
4 m
RN
A
pPB
NS
Ctrl
hPADI40
50
100
150
200
So
x2 m
RN
A
pPB
NS
Ctrl
hPADI40
1
2
3
Sta
t3 m
RN
A
pPB
*
Ctrl
hPADI40
2
4
6
8
10
12
14
Tcf
ap2c
mR
NA
pPB
*
Ctrl
hPADI40
1
2
3
4
5
6
7
Tcl
1 m
RN
A
pPB
**
a
Ctrl
hPADI40
10
20
30
Klf
4 m
RN
A
pPB
NS
Extended Data Figure 2 | PADI4 overexpression or knockdown in ES cellsmodulates expression of pluripotency genes. a, Validation of selected targetsfrom the PADI4 overexpression microarray data set by qRT–PCR. Expressionof Pou5f1, Sox2, Klf4 and c-Myc is not affected by PADI4 overexpression.Expression is normalized to UbC. Error bars are presented as standard error ofthe mean of three biological replicates. b, Transcript levels of mouse Padi4 andhuman PADI4 in mouse ES cells after transient knockdown with Padi4 orcontrol (ctrl) shRNA, and overexpression of human PADI4 or control vector
(pPB ctrl), as assessed by qRT–PCR. Expression normalized to UbC. Error barsrepresent the standard error of the mean of three biological replicates.c, Transcript levels of mouse Padi4, Tcl1 and Nanog in a mouse ES cell clonestably expressing Padi4 or control (ctrl) shRNA, as assessed by qRT–PCR.Expression is normalized to UbC. Error bars represent the standard error of themean of three biological replicates. Asterisks denote difference with ctrl(a, b, c) and between samples (b); NS, not significant, *P # 0.05, **P # 0.01,***P # 0.001, ****P # 0.0001 by ANOVA (b) or t-test (a, c).
RESEARCH LETTER
Macmillan Publishers Limited. All rights reserved©2014
ES NSO4G iPS0
1
2
3
4
promoter
enhancer
ES NSO4G iPS0
1
2
3
4
5
6R
elat
ive
enri
chm
ent
over
inpu
t ( x
10-2
)
H2A ChIP
Tcl1 locus Nanog locusa
c
enhan
cer
prom
oter
0
1
2
3
4
5
6
7
CtrlhPADI4hPADI4 + Cl-amidine
Nanog locusTcl1 locus
H3Cit ChIP
enhan
cer
prom
oter
0.0
0.5
1.0
1.5
2.0
2.5
3.0
3.5R
elat
ive
enri
chm
ent
over
inpu
t ( x
10-2
)
enhan
cer
prom
oter
0123456789
Rel
ativ
e en
rich
men
t
over
inpu
t ( x
10-2
)
enhan
cer
(+12
kb)
enhan
cer
(+3.
4kb)
0
5
10
15
20
CtrlhPADI4
enhan
cer
codin
g regio
n0
5
10
15
20
enhan
cer
prom
oter
0123456789
1011
b Klf2 locus Kit locus
hPADI4 ChIP
Nanog locusTcl1 locus
Extended Data Figure 3 | Chromatin immunoprecipitation of H2A, PADI4and H3Cit at pluripotency loci. a, Representative ChIP-qPCR for H2A onregulatory regions of Tcl1 and Nanog in mouse ES, NSO4G and iPS cells(corresponding to Fig. 1h). For each cell condition, the signal is presented asfold enrichment over input and after subtracting background signal from thebeads. Error bars represent the standard deviation of three technical qPCRreplicates. b, ChIP-qPCR for human PADI4 on regulatory regions of Tcl1,Nanog, Klf2 and Kit, which are upregulated by human PADI4 overexpression,in mouse ES cells stably expressing human PADI4. For each cell condition, the
signal is presented as fold enrichment over input and after subtractingbackground signal from the beads. Enhancer regions for Kit located 13.4 kband 112 kb downstream of transcription termination site. Error bars representthe standard deviation of three technical qPCR replicates. c, RepresentativeChIP-qPCR for H3Cit on regulatory regions of Tcl1 and Nanog in mouse EScells stably expressing human PADI4 and treated with 200mM Cl-amidine for48 h. For each cell condition, the signal is presented as fold enrichment overinput and after subtracting background signal from the beads. Error barsrepresent the standard deviation of three technical qPCR replicates.
LETTER RESEARCH
Macmillan Publishers Limited. All rights reserved©2014
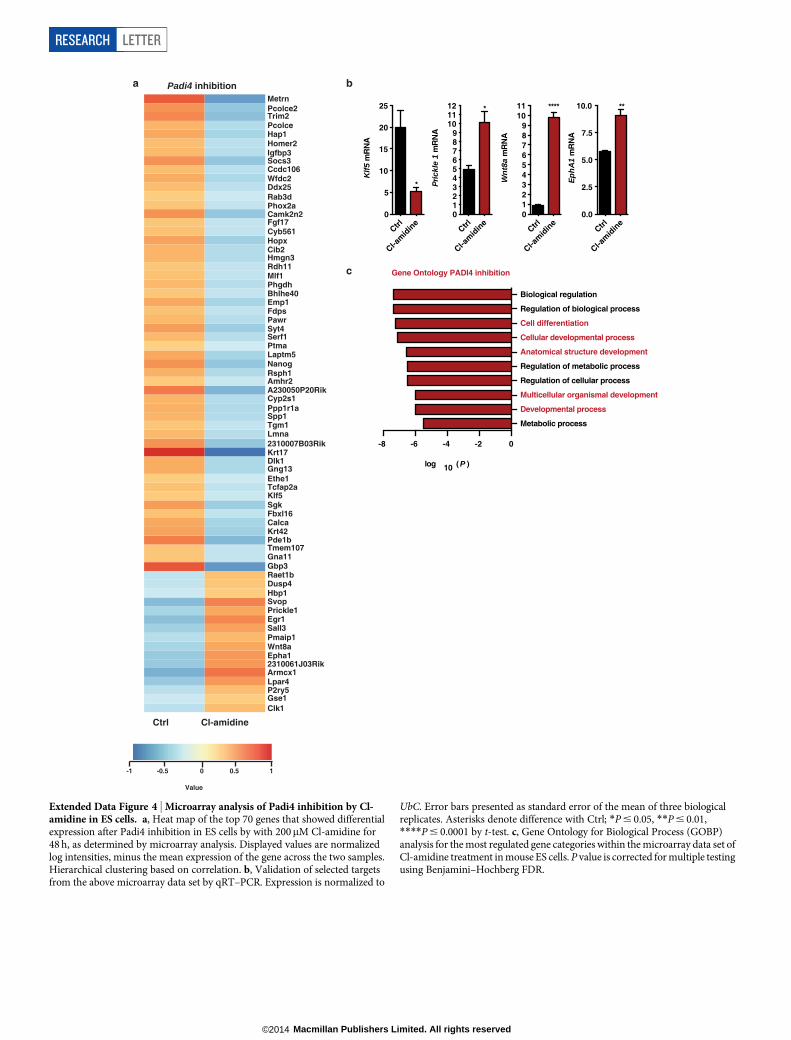
a bPadi4 inhibitionMetrnPcolce2
Wfdc2Ccdc106Socs3Igfbp3Homer2Hap1PcolceTrim2
Bhlhe40PhgdhMlf1Rdh11Hmgn3Cib2HopxCyb561Fgf17Camk2n2Phox2aRab3dDdx25
Emp1
Amhr2Rsph1NanogLaptm5PtmaSerf1Syt4PawrFdps
Krt172310007B03RikLmnaTgm1Spp1Ppp1r1aCyp2s1A230050P20Rik
Dlk1
Gna11Tmem107Pde1bKrt42CalcaFbxl16SgkKlf5Tcfap2aEthe1Gng13
Epha1Wnt8aPmaip1Sall3Egr1Prickle1SvopHbp1Dusp4Raet1bGbp3
Clk1Gse1P2ry5Lpar4Armcx12310061J03Rik
Ctrl Cl-amidine
-1 0-0.5 0.5 1
Value
Gene Ontology PADI4 inhibition
-8 -6 -4 -2 0
Metabolic process
Developmental process
Multicellular organismal development
Regulation of cellular process
Regulation of metabolic process
Anatomical structure development
Cellular developmental process
Cell differentiation
Regulation of biological process
Biological regulation
log 10 ( P )
Ctrl
Cl-am
idin
e0123456789
1011
Wn
t8a
mR
NA
****
Ctrl
Cl-am
idin
e0123456789
101112
Pri
ckle
1 m
RN
A
*
Ctrl
Cl-am
idin
e0
5
10
15
20
25
Klf
5 m
RN
A
*
Ctrl
Cl-am
idin
e0.0
2.5
5.0
7.5
10.0
Ep
hA
1 m
RN
A
**
c
Extended Data Figure 4 | Microarray analysis of Padi4 inhibition by Cl-amidine in ES cells. a, Heat map of the top 70 genes that showed differentialexpression after Padi4 inhibition in ES cells by with 200mM Cl-amidine for48 h, as determined by microarray analysis. Displayed values are normalizedlog intensities, minus the mean expression of the gene across the two samples.Hierarchical clustering based on correlation. b, Validation of selected targetsfrom the above microarray data set by qRT–PCR. Expression is normalized to
UbC. Error bars presented as standard error of the mean of three biologicalreplicates. Asterisks denote difference with Ctrl; *P # 0.05, **P # 0.01,****P # 0.0001 by t-test. c, Gene Ontology for Biological Process (GOBP)analysis for the most regulated gene categories within the microarray data set ofCl-amidine treatment in mouse ES cells. P value is corrected for multiple testingusing Benjamini–Hochberg FDR.
RESEARCH LETTER
Macmillan Publishers Limited. All rights reserved©2014
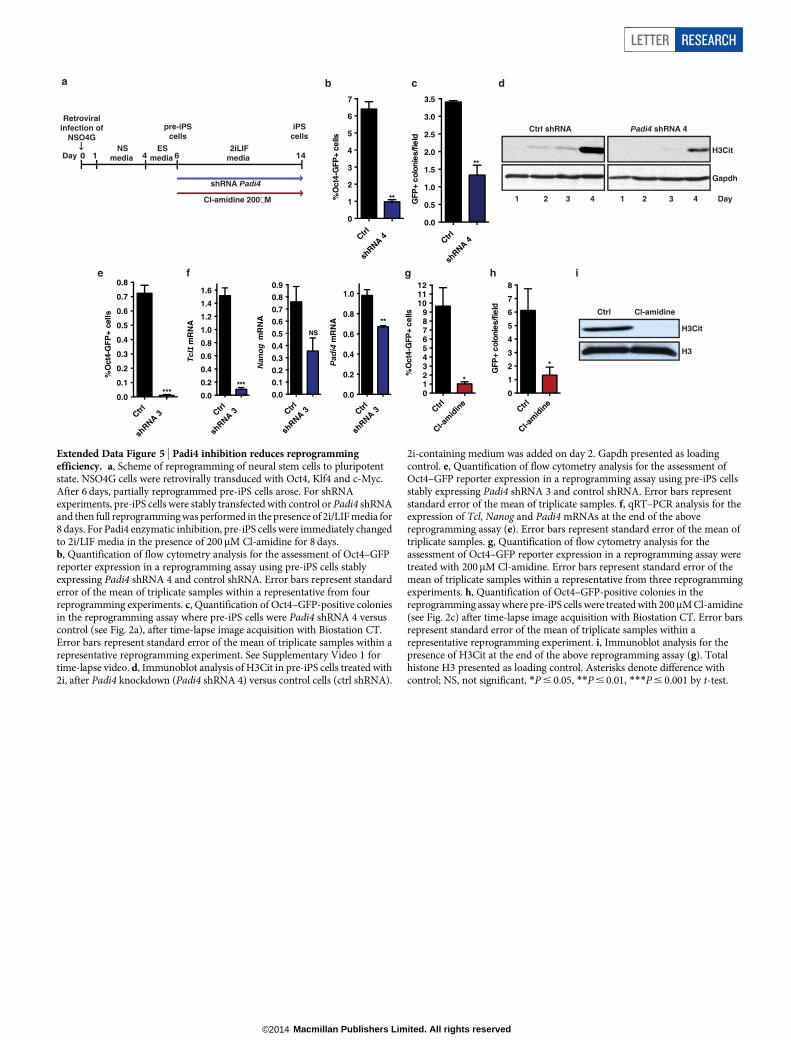
H3Cit
H3
Ctrl Cl-amidine
Ctrl
shRNA 3
0.0
0.1
0.2
0.3
0.4
0.5
0.6
0.7
0.8
%O
ct4-
GF
P+
cel
ls
***
Ctrl
Cl-am
idin
e0
1
2
3
4
5
6
7
8
GFP
+ co
loni
es/fi
eld
*
Ctrl
shRNA 3
0.0
0.1
0.2
0.3
0.4
0.5
0.6
0.7
0.8
0.9
Nan
og
mR
NA
NS
Ctrl
shRNA 3
0.0
0.2
0.4
0.6
0.8
1.0
Pad
i4 m
RN
A **
Ctrl
shRNA 3
0.0
0.2
0.4
0.6
0.8
1.0
1.2
1.4
1.6
Tcl
1 m
RN
A
***
Ctrl
Cl-am
idin
e0123456789
101112
%O
ct4-
GFP
+ ce
lls
*
ba
Retroviralinfection of
NSO4G
0 1 4 6 14 Day NS
media ES
media
pre-iPScells
2iLIFmedia
iPScells
Cl-amidine 200µM
shRNA Padi4
d
f ih
c
Ctrl shRNA Padi4 shRNA 4
1 2 3 4 1 2 3 4 Day
H3Cit
Gapdh
Ctrl
shRNA 4
0.0
0.5
1.0
1.5
2.0
2.5
3.0
3.5
GFP
+ co
loni
es/fi
eld
**
Ctrl
shRNA 4
0
1
2
3
4
5
6
7
%O
ct4-
GFP
+ ce
lls
**
e g
Extended Data Figure 5 | Padi4 inhibition reduces reprogrammingefficiency. a, Scheme of reprogramming of neural stem cells to pluripotentstate. NSO4G cells were retrovirally transduced with Oct4, Klf4 and c-Myc.After 6 days, partially reprogrammed pre-iPS cells arose. For shRNAexperiments, pre-iPS cells were stably transfected with control or Padi4 shRNAand then full reprogramming was performed in the presence of 2i/LIF media for8 days. For Padi4 enzymatic inhibition, pre-iPS cells were immediately changedto 2i/LIF media in the presence of 200mM Cl-amidine for 8 days.b, Quantification of flow cytometry analysis for the assessment of Oct4–GFPreporter expression in a reprogramming assay using pre-iPS cells stablyexpressing Padi4 shRNA 4 and control shRNA. Error bars represent standarderror of the mean of triplicate samples within a representative from fourreprogramming experiments. c, Quantification of Oct4–GFP-positive coloniesin the reprogramming assay where pre-iPS cells were Padi4 shRNA 4 versuscontrol (see Fig. 2a), after time-lapse image acquisition with Biostation CT.Error bars represent standard error of the mean of triplicate samples within arepresentative reprogramming experiment. See Supplementary Video 1 fortime-lapse video. d, Immunoblot analysis of H3Cit in pre-iPS cells treated with2i, after Padi4 knockdown (Padi4 shRNA 4) versus control cells (ctrl shRNA).
2i-containing medium was added on day 2. Gapdh presented as loadingcontrol. e, Quantification of flow cytometry analysis for the assessment ofOct4–GFP reporter expression in a reprogramming assay using pre-iPS cellsstably expressing Padi4 shRNA 3 and control shRNA. Error bars representstandard error of the mean of triplicate samples. f, qRT–PCR analysis for theexpression of Tcl, Nanog and Padi4 mRNAs at the end of the abovereprogramming assay (e). Error bars represent standard error of the mean oftriplicate samples. g, Quantification of flow cytometry analysis for theassessment of Oct4–GFP reporter expression in a reprogramming assay weretreated with 200mM Cl-amidine. Error bars represent standard error of themean of triplicate samples within a representative from three reprogrammingexperiments. h, Quantification of Oct4–GFP-positive colonies in thereprogramming assay where pre-iPS cells were treated with 200mM Cl-amidine(see Fig. 2c) after time-lapse image acquisition with Biostation CT. Error barsrepresent standard error of the mean of triplicate samples within arepresentative reprogramming experiment. i, Immunoblot analysis for thepresence of H3Cit at the end of the above reprogramming assay (g). Totalhistone H3 presented as loading control. Asterisks denote difference withcontrol; NS, not significant, *P # 0.05, **P # 0.01, ***P # 0.001 by t-test.
LETTER RESEARCH
Macmillan Publishers Limited. All rights reserved©2014
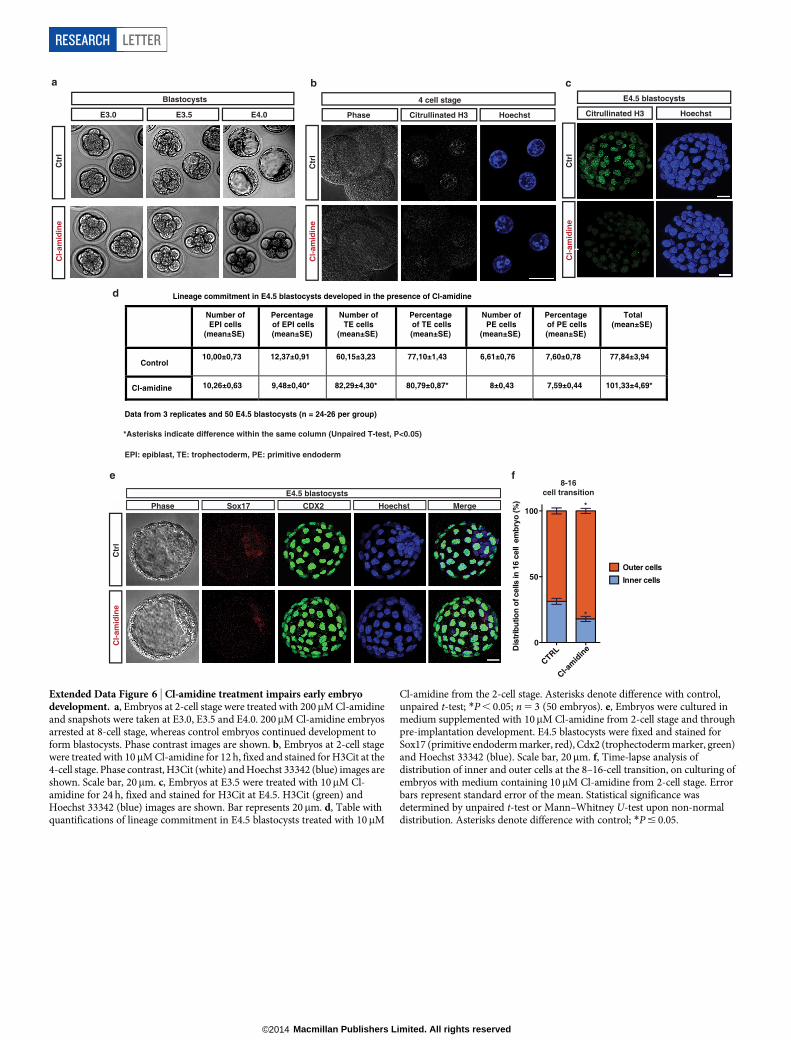
ba c
Ctr
lC
l-am
idin
e
Citrullinated H3 Hoechst
E4.5 blastocysts
d
Ctr
lC
l-am
idin
e
Phase Citrullinated H3 Hoechst
4 cell stage Blastocysts
E3.0
Ctr
lC
l-am
idin
e
E3.5 E4.0
e
Lineage commitment in E4.5 blastocysts developed in the presence of Cl-amidine
10,00±0,73 12,37±0,91 60,15±3,23 77,10±1,43 6,61±0,76 7,60±0,78 77,84±3,94
10,26±0,63 9,48±0,40* 82,29±4,30* 80,79±0,87* 8±0,43 7,59±0,44 101,33±4,69*
Cl-amidine
Control
Number ofEPI cells
(mean±SE)
Percentage of EPI cells(mean±SE)
Number ofTE cells
(mean±SE)
Percentage of TE cells(mean±SE)
Number ofPE cells
(mean±SE)
Percentage of PE cells(mean±SE)
Total(mean±SE)
*Asterisks indicate difference within the same column (Unpaired T-test, P<0.05)
EPI: epiblast, TE: trophectoderm, PE: primitive endoderm
Data from 3 replicates and 50 E4.5 blastocysts (n = 24-26 per group)
CTRL
Cl-am
idin
e0
50
100D
istr
ibu
tion
of c
ells
in 1
6 ce
ll e
mb
ryo
(%)
Inner cells
Outer cells
*
*
8-16cell transition
f
Phase
E4.5 blastocysts
Sox17 CDX2 Hoechst Merge
Ctr
lC
l-am
idin
e
Extended Data Figure 6 | Cl-amidine treatment impairs early embryodevelopment. a, Embryos at 2-cell stage were treated with 200mM Cl-amidineand snapshots were taken at E3.0, E3.5 and E4.0. 200mM Cl-amidine embryosarrested at 8-cell stage, whereas control embryos continued development toform blastocysts. Phase contrast images are shown. b, Embryos at 2-cell stagewere treated with 10mM Cl-amidine for 12 h, fixed and stained for H3Cit at the4-cell stage. Phase contrast, H3Cit (white) and Hoechst 33342 (blue) images areshown. Scale bar, 20mm. c, Embryos at E3.5 were treated with 10mM Cl-amidine for 24 h, fixed and stained for H3Cit at E4.5. H3Cit (green) andHoechst 33342 (blue) images are shown. Bar represents 20mm. d, Table withquantifications of lineage commitment in E4.5 blastocysts treated with 10mM
Cl-amidine from the 2-cell stage. Asterisks denote difference with control,unpaired t-test; *P , 0.05; n 5 3 (50 embryos). e, Embryos were cultured inmedium supplemented with 10mM Cl-amidine from 2-cell stage and throughpre-implantation development. E4.5 blastocysts were fixed and stained forSox17 (primitive endoderm marker, red), Cdx2 (trophectoderm marker, green)and Hoechst 33342 (blue). Scale bar, 20mm. f, Time-lapse analysis ofdistribution of inner and outer cells at the 8–16-cell transition, on culturing ofembryos with medium containing 10mM Cl-amidine from 2-cell stage. Errorbars represent standard error of the mean. Statistical significance wasdetermined by unpaired t-test or Mann–Whitney U-test upon non-normaldistribution. Asterisks denote difference with control; *P # 0.05.
RESEARCH LETTER
Macmillan Publishers Limited. All rights reserved©2014

a b
c
Ctr
lT
DF
A
Phase Nanog Sox17 Cdx2 Hoechst
E4.5 blastocysts
merge
Ctr
lT
DF
A
H3 Cit HoechstPhase
4 cell stage Lineage commitment in E4.5 blastocysts developed in the presence of TDFA
Percentage of EPI cells
(mean±SE)
Percentage of TE cells
(mean±SE)
Percentage of PE cells
(mean±SE)
Control 12,60±0,79 77,02±0,94 10,38±0,60
TDFA 10,43±0,62* 78,70±0,68 10,87±0,62
Data from 3 replicates and 60 E4.5 embryos (n=28-32 per group)
* Asterisks indicate difference within the same column (Mann Whitney test, P<0.05)
EPI: epiblast, TE: trophoectoderm , PE: primitive endoderm
Extended Data Figure 7 | TDFA treatment reduces percentage ofpluripotent cells in the early embryo. a, Embryos at 2-cell stage were treatedwith 100mM TDFA for 12 h and fixed and stained for H3Cit at 4-cell stage.H3Cit and Hoechst 33342 images are shown. b, Table representing thepercentage of cells committed to each embryonic lineage in E4.5 blastocysts ontreatment of embryos at 2-cell stage with 100mM TDFA. Scale bars represent
mean percentage (6s.e.m.). Asterisks denote difference with control, Mann–Whitney U-test, *P , 0.05; n 5 3 (60 embryos). c, Embryos at 2-cell stage weretreated with 100mM TDFA and fixed at embryonic day E4.5. Phase contrast,Nanog (green), Sox17 (purple), Cdx2 (red) and Hoechst 33342 (blue) imagesare shown.
LETTER RESEARCH
Macmillan Publishers Limited. All rights reserved©2014
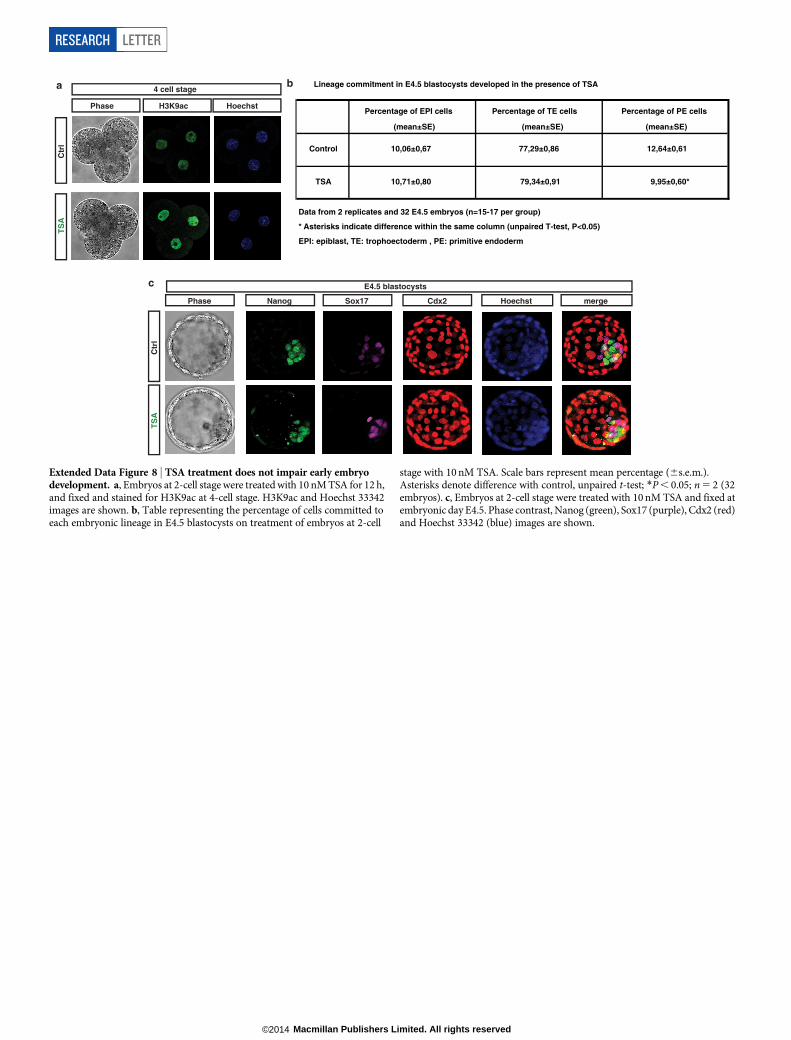
a b
c
Ctr
lT
SA
Phase Nanog Sox17 Cdx2 Hoechst
E4.5 blastocysts
merge
H3K9ac HoechstPhase
4 cell stage
Ctr
lT
SA
Lineage commitment in E4.5 blastocysts developed in the presence of TSA
Percentage of EPI cells
(mean±SE)
Percentage of TE cells
(mean±SE)
Percentage of PE cells
(mean±SE)
Control 10,06±0,67 77,29±0,86 12,64±0,61
TSA 10,71±0,80 79,34±0,91 9,95±0,60*
Data from 2 replicates and 32 E4.5 embryos (n=15-17 per group)
* Asterisks indicate difference within the same column (unpaired T-test, P<0.05)
EPI: epiblast, TE: trophoectoderm , PE: primitive endoderm
Extended Data Figure 8 | TSA treatment does not impair early embryodevelopment. a, Embryos at 2-cell stage were treated with 10 nM TSA for 12 h,and fixed and stained for H3K9ac at 4-cell stage. H3K9ac and Hoechst 33342images are shown. b, Table representing the percentage of cells committed toeach embryonic lineage in E4.5 blastocysts on treatment of embryos at 2-cell
stage with 10 nM TSA. Scale bars represent mean percentage (6s.e.m.).Asterisks denote difference with control, unpaired t-test; *P , 0.05; n 5 2 (32embryos). c, Embryos at 2-cell stage were treated with 10 nM TSA and fixed atembryonic day E4.5. Phase contrast, Nanog (green), Sox17 (purple), Cdx2 (red)and Hoechst 33342 (blue) images are shown.
RESEARCH LETTER
Macmillan Publishers Limited. All rights reserved©2014
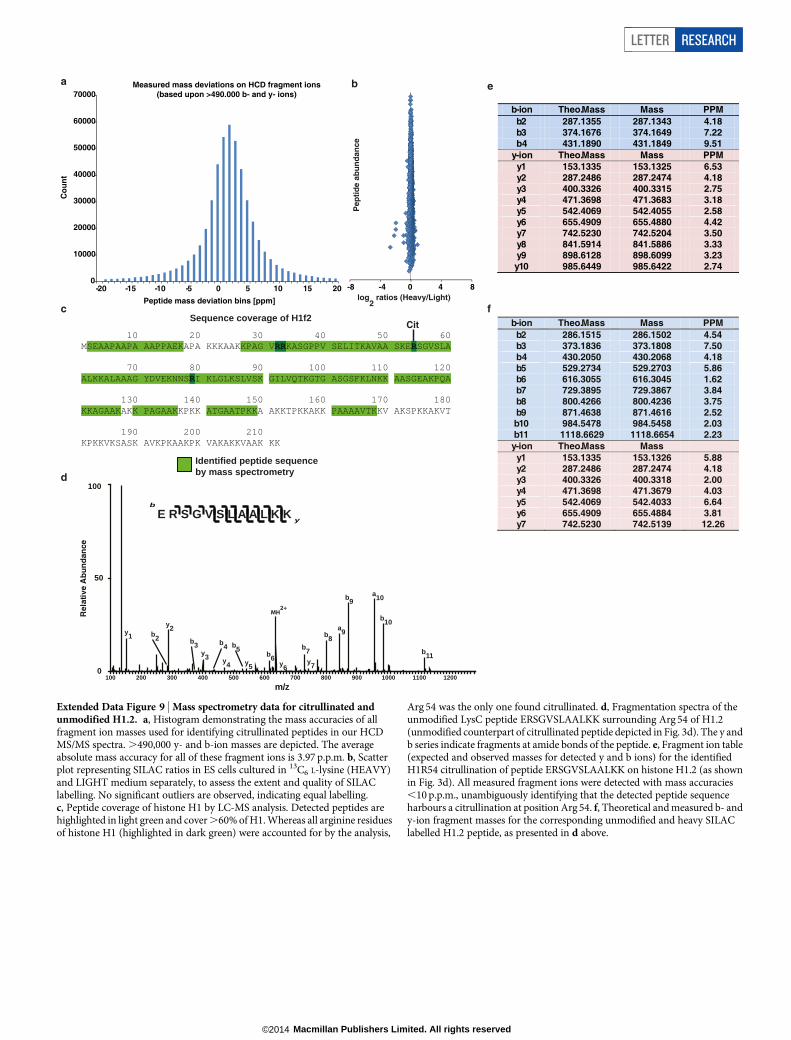
d
b
-4 0 4 8-8log
2 ratios (Heavy/Light)
Pep
tid
e ab
un
dan
ce
AASGEAKPQA
Cit
Identified peptide sequence by mass spectrometry
Sequence coverage of H1f2
10 20 30 40 50 60 MSEAAPAAPA AAPPAEKAPA KKKAAKKPAG VRRKASGPPV SELITKAVAA SKERSGVSLA 70 80 90 100 110 120 ALKKALAAAG YDVEKNNSRI KLGLKSLVSK GILVQTKGTG ASGSFKLNKK 130 140 150 160 170 180 KKAGAAKAKK PAGAAKKPKK ATGAATPKKA AKKTPKKAKK PAAAAVTKKV AKSPKKAKVT 190 200 210 KPKKVKSASK AVKPKAAKPK VAKAKKVAAK KK
e
c f
a
0
10000
20000
30000
40000
50000
60000
70000
-20 -15 -10 -5 0 5 10 15 20
Co
un
t
Peptide mass deviation bins [ppm]
Measured mass deviations on HCD fragment ions(based upon >490.000 b- and y- ions)
100 200 300 400 500 600 700 800 900 1000 1100 1200
m/z
0
50
100
Rel
ativ
e A
bu
nd
ance
E R S G V S L A A L K Kb
y
y1
y2
y3 y4 y5 y6y7
b3 b4b11
b10
b9
b8b7b6
b5
b2
MH2+
a10
a9
b-ion Theo. Mass Mass PPM b2 286.1515 286.1502 4.54 b3 373.1836 373.1808 7.50 b4 430.2050 430.2068 4.18 b5 529.2734 529.2703 5.86 b6 616.3055 616.3045 1.62 b7 729.3895 729.3867 3.84 b8 800.4266 800.4236 3.75 b9 871.4638 871.4616 2.52 b10 984.5478 984.5458 2.03 b11 1118.6629 1118.6654 2.23 y-ion Theo. Mass Mass y1 153.1335 153.1326 5.88 y2 287.2486 287.2474 4.18 y3 400.3326 400.3318 2.00 y4 471.3698 471.3679 4.03 y5 542.4069 542.4033 6.64 y6 655.4909 655.4884 3.81 y7 742.5230 742.5139 12.26
b-ion Theo. Mass Mass PPM b2 287.1355 287.1343 4.18 b3 374.1676 374.1649 7.22 b4 431.1890 431.1849 9.51
y-ion Theo. Mass Mass PPM y1 153.1335 153.1325 6.53 y2 287.2486 287.2474 4.18 y3 400.3326 400.3315 2.75 y4 471.3698 471.3683 3.18 y5 542.4069 542.4055 2.58 y6 655.4909 655.4880 4.42 y7 742.5230 742.5204 3.50 y8 841.5914 841.5886 3.33 y9 898.6128 898.6099 3.23 y10 985.6449 985.6422 2.74
Extended Data Figure 9 | Mass spectrometry data for citrullinated andunmodified H1.2. a, Histogram demonstrating the mass accuracies of allfragment ion masses used for identifying citrullinated peptides in our HCDMS/MS spectra. .490,000 y- and b-ion masses are depicted. The averageabsolute mass accuracy for all of these fragment ions is 3.97 p.p.m. b, Scatterplot representing SILAC ratios in ES cells cultured in 13C6 L-lysine (HEAVY)and LIGHT medium separately, to assess the extent and quality of SILAClabelling. No significant outliers are observed, indicating equal labelling.c, Peptide coverage of histone H1 by LC-MS analysis. Detected peptides arehighlighted in light green and cover .60% of H1. Whereas all arginine residuesof histone H1 (highlighted in dark green) were accounted for by the analysis,
Arg 54 was the only one found citrullinated. d, Fragmentation spectra of theunmodified LysC peptide ERSGVSLAALKK surrounding Arg 54 of H1.2(unmodified counterpart of citrullinated peptide depicted in Fig. 3d). The y andb series indicate fragments at amide bonds of the peptide. e, Fragment ion table(expected and observed masses for detected y and b ions) for the identifiedH1R54 citrullination of peptide ERSGVSLAALKK on histone H1.2 (as shownin Fig. 3d). All measured fragment ions were detected with mass accuracies,10 p.p.m., unambiguously identifying that the detected peptide sequenceharbours a citrullination at position Arg 54. f, Theoretical and measured b- andy-ion fragment masses for the corresponding unmodified and heavy SILAClabelled H1.2 peptide, as presented in d above.
LETTER RESEARCH
Macmillan Publishers Limited. All rights reserved©2014
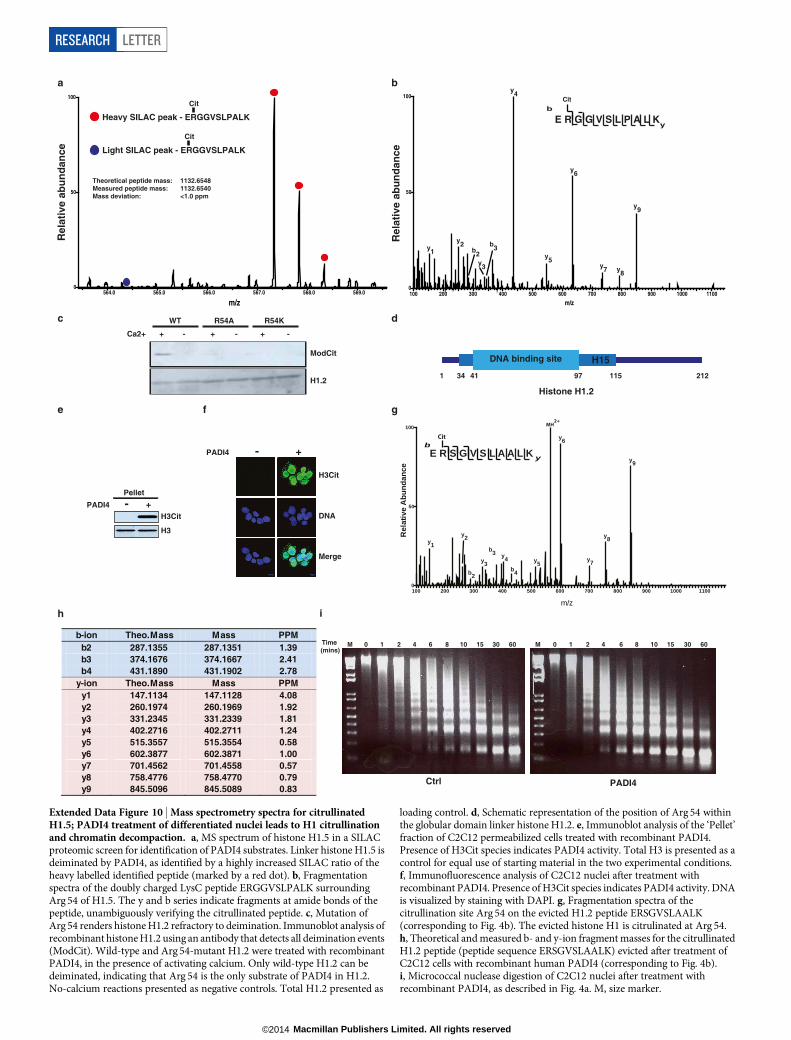
a b
564.0 565.0 566.0 567.0 568.0 569.0
m/z
0
50
100
Heavy SILAC peak - ERGGVSLPALK
Light SILAC peak - ERGGVSLPALK
Theoretical peptide mass: 1132.6548Measured peptide mass: 1132.6540Mass deviation: <1.0 ppm
Cit
Cit
Rel
ativ
e ab
un
dan
ce
100 200 300 400 500 600 700 800 900 1000 1100
m/z
0
50
100
E R G G V S L P A L Kb
y
Cit
y1
y2
y3
y4
y5
y6
y7 y8
y9
b2b3
Rel
ativ
e ab
un
dan
ce
c dWT R54A R54K
Ca2+ + + +- --
ModCit
H1.2Histone H1.2
DNA binding site H15
1 212115974134
e f
Merge
DNA
H3Cit
PADI4 - +
PADI4 - +
Pellet
H3Cit
H3
g
M 60301510864210
Ctrl
M 60301510864210
PADI4
Time (mins)
b-ion Theo. Mass Mass PPM b2 287.1355 287.1351 1.39 b3 374.1676 374.1667 2.41 b4 431.1890 431.1902 2.78
y-ion Theo. Mass Mass PPM y1 147.1134 147.1128 4.08 y2 260.1974 260.1969 1.92 y3 331.2345 331.2339 1.81 y4 402.2716 402.2711 1.24 y5 515.3557 515.3554 0.58 y6 602.3877 602.3871 1.00 y7 701.4562 701.4558 0.57 y8 758.4776 758.4770 0.79 y9 845.5096 845.5089 0.83
h
100 200 300 400 500 600 700 800 900 1000 1100
m/z
0
50
100
Rel
ativ
e A
bu
nd
ance
E R S G V S L A A L K b
y
Cit
y1
y2
y3y4 y5
y6
y7
y8
y9
MH2+
b2
b3
b4
i
Extended Data Figure 10 | Mass spectrometry spectra for citrullinatedH1.5; PADI4 treatment of differentiated nuclei leads to H1 citrullinationand chromatin decompaction. a, MS spectrum of histone H1.5 in a SILACproteomic screen for identification of PADI4 substrates. Linker histone H1.5 isdeiminated by PADI4, as identified by a highly increased SILAC ratio of theheavy labelled identified peptide (marked by a red dot). b, Fragmentationspectra of the doubly charged LysC peptide ERGGVSLPALK surroundingArg 54 of H1.5. The y and b series indicate fragments at amide bonds of thepeptide, unambiguously verifying the citrullinated peptide. c, Mutation ofArg 54 renders histone H1.2 refractory to deimination. Immunoblot analysis ofrecombinant histone H1.2 using an antibody that detects all deimination events(ModCit). Wild-type and Arg 54-mutant H1.2 were treated with recombinantPADI4, in the presence of activating calcium. Only wild-type H1.2 can bedeiminated, indicating that Arg 54 is the only substrate of PADI4 in H1.2.No-calcium reactions presented as negative controls. Total H1.2 presented as
loading control. d, Schematic representation of the position of Arg 54 withinthe globular domain linker histone H1.2. e, Immunoblot analysis of the ‘Pellet’fraction of C2C12 permeabilized cells treated with recombinant PADI4.Presence of H3Cit species indicates PADI4 activity. Total H3 is presented as acontrol for equal use of starting material in the two experimental conditions.f, Immunofluorescence analysis of C2C12 nuclei after treatment withrecombinant PADI4. Presence of H3Cit species indicates PADI4 activity. DNAis visualized by staining with DAPI. g, Fragmentation spectra of thecitrullination site Arg 54 on the evicted H1.2 peptide ERSGVSLAALK(corresponding to Fig. 4b). The evicted histone H1 is citrulinated at Arg 54.h, Theoretical and measured b- and y-ion fragment masses for the citrullinatedH1.2 peptide (peptide sequence ERSGVSLAALK) evicted after treatment ofC2C12 cells with recombinant human PADI4 (corresponding to Fig. 4b).i, Micrococcal nuclease digestion of C2C12 nuclei after treatment withrecombinant PADI4, as described in Fig. 4a. M, size marker.
RESEARCH LETTER
Macmillan Publishers Limited. All rights reserved©2014


