Embed Size (px)
Citation preview
AD-R126 377 PROCEEDINGS: INTERNATIONAL CONFERENCE ON FIXED-FILM 1/7BIOLOGICAL PROCESSES (..(U) PITTSBURGH UNIV PR DEPT OFCIVIL ENGINEERING Y C WdU ET AL. 1982 DACWBB-B±-R-005
UNCLRSSIFIED F/G 13/2 NE h h h h hh-h1 _ --_-,.. -IEm7EhhhhhhhhhhhhEhhhhhhhhhhhhIEhhhhhhhhhhhhEsmhhhhhhhhhhhEhhhhhhhhhhhhIEhhhhhhhhmhhhE
r
~~~~~~~~~~~. ........ . .o. . .... ......... . . . .. •.., .....o
.'.
1.0 li-0 11' W5 L
1B11 1.8IIIL25 ILA 1
MICROCOPY RESOLUTION TEST CHART
NATIONAL 8UREAU OF STANDARDS-I 963-A
p.-
Q-
. . . . . . . . . . . . . . . . . . . . . .I I -. . .... . . .. * - " . , .. .. . --- o -,
AA 1 26 3 o 7 sponsor -
' University of Pittsburgh
In Cooperation With
US Army Corpsp of EngineersCftruct Engineenng U.S. Environmental U.S. NationalResearch Laboratory Protection Agency Science Foundation
- , Proceedings:
*FIRST INTERNATIONAL CONFERENCEON FIXED-FILM BIOLOGICAL PROCESSES
April 20-25, 1982 TIKings Island, Ohio LECTE
MARt 2 4 1983
Edited by Y.C. Wu, Ed D. Smith,l VolII3 03 24 057
DSTUumB oN SrATEMENT AApproved fog public reIaeug
Distributon Unlimited
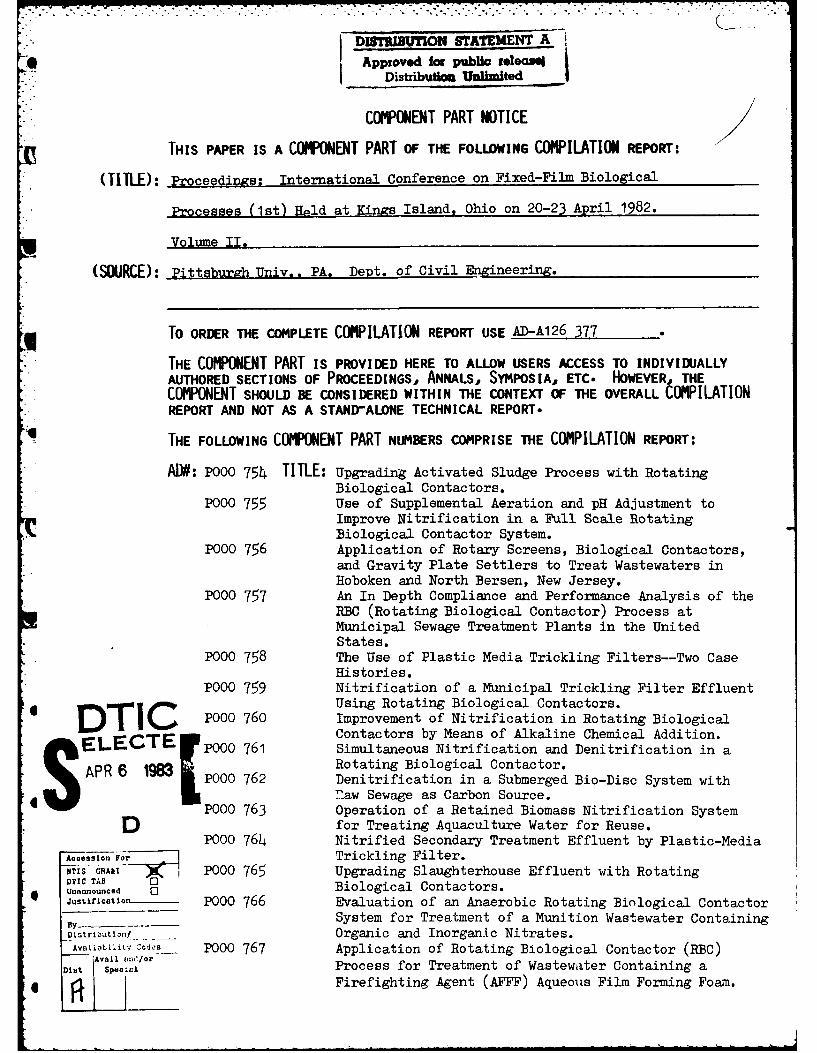
COMPONENT PART NOTICE
THIS PAPER IS A COMPONENT PART OF THE FOLLOWING COMPILATION REPORT:
(TITLE): Proceedings: International Conference on Fixed-Film Biological
Processes (1st) Hpld at Kings Island, Ohio on 20-23 April 1982.
Volume II.
(SOURCE): Pittsburgh Univ.. PA. Dept. of Civil Engineering.
To ORDER THE COMPLETE COMPILATION REPORT USE AD-A126 377
THE COMPONENT PART IS PROVIDED HERE TO ALLOW USERS ACCESS TO INDIVIDUALLYAUTHORED SECTIONS OF PROCEEDINGS, ANNALS, SYMPOSIA, ETC. HOWEVER, THECOMPONENT SHOULD BE CONSIDERED WITHIN THE CONTEXT OF THE OVERALL COMPILATIONREPORT AND NOT AS A STAND-ALONE TECHNICAL REPORT.
THE FOLLOWING COMPONENT PART NUMBERS COMPRISE THE COMPILATION REPORT:
AN: POOO 754 TITLE: Upgrading Activated Sludge Process with RotatingBiological Contactors.
PO00 755 Use of Supplemental Aeration and pH Adjustment toImprove Nitrification in a Full Scale RotatingBiological Contactor System.
PO00 756 Application of Rotary Screens, Biological Contactors,and Gravity Plate Settlers to Treat Wastewaters inHoboken and North Bersen, New Jersey.
P00 757 An In Depth Compliance and Performance Analysis of theRBC (Rotating Biological Contactor) Process atMunicipal Sewage Treatment Plants in the UnitedStates.
PO00 758 The Use of Plastic Media Trickling Filters--Two CaseHistories.
P00 759 Nitrification of a Municipal Trickling Filter Effluent* CUsing Rotating Biological Contactors.• P00 760 Improvement of Nitrification in Rotating Biologicalr Contactors by Means of Alkaline Chemical Addition.ELECTE ~ooo 761 Simultaneous Nitrification and Denitrification in a
6 18 Rotating Biological Contactor.APR 6 083 Po~o 762 Denitrification in a Submerged Bio-Disc System with
4aw Sewage as Carbon Source.PO00 763 Operation of a Retained Biomass Nitrification System
D for Treating Aquaculture Water for Reuse.PO00 764 Nitrified Secondary Treatment Effluent by Plastic-Media
Acoesson Fo f Trickling Filter.-TIS-- A& P000 765 Upgrading Slaughterhouse Effluent with RotatingDTIC TAB
Uuaon.ouced 0 Biological Contactors.Justifiction - PO00 766 Evaluation of an Anaerobic Rotating Biological Contactor
______System for Treatment of a Munition Wastewater ContainingD I-1.t Io/ Organic and Inorganic Nitrates.
Aa.. l tt o - PO00 767 Application of Rotating Biological Contactor (RBC)Dijt Secp.O1 Process for Treatment of Wastewater Containing a
Firefighting Agent (AFFF) Aqueous Film Forming Foam.
4!
OCPO ENT PART NOTICE (CON' T)
AD#: PO00 768 TITLE: Operation of a RBC (Rotating Biological Contactor)Facility for the Treatment of MunitionManufacturing Plant Wastewater.
POOO 769 Treatment of Starch Industrial Waste by RBCs(Rotating Biological Contactors).
PO00 770 Inhibition of Nitrification by Chromium in aBiodisc System.
PO00 771 Scale-Up and Process Analysis Techniques forPlastic Media Trickling Filtration.
PO00 772 Treatment of Coke Plant Wastewaters in PackedBed Reactors.
PO00 773 Trickling Filter Expansion of POTW (Publicly OwnedTreatment Work) by Snack Food Manufacturer.
PO00 774 The Evaluation of a Biological Tower for TreatingAquaculture Wastewater for Reuse.
PO00 775 Biofiltration of Tannery Wastewater.PO00 776 Effect of Periodic Flow Reversal upon RBC (Rotating
Biological Contactor) Performance.PO00 777 An Assessment of Dissolved Oxygen Limitations and
Interstage Design in Rotating Biological Contactor(RBS) Systems.
P000 778 Combined Biological/Chemical Treatment in RBC(Rotating Biological Contactors) Plants.
P00 779 Treatment of Domestic Sewage by Aquatic RibbonSystem.
PO00 780 Activated Fixed Film Biosystems in WastewaterTreatment.
PO00 781 Comparison of Fixed-Film Reactors with a ModifiedSludge Blanket Reactor.
PO00 782 Treatment of High-Strength Organic Wastes by SubmergedMedia Anaerobic Reactors State-of-the-Art Review.
I ! .. . ... . ... .4..
Acer-Sion Fror
iTIS CtA&I
DTIC TAB
U announced i
Distrjbi i 1/Avallabili
(2 Dit Aail
UPGRADING ACTIVATED SLUDGE PROCESS WITHI r ROTATING BIOLOGICAL CONTACTORS
C Roger C. Ward. Project Manager, Howard Needles Tammen
and Bergendoff, Indianapolis, Indiana.
James F. Goble. Superintendent, Crawfordsville Waste-water Treatment Plant, Crawfordsville, Indiana.
INTRODUCTION
The City of Crawfordsville, Indiana, is a community ofapproximately 13,000 residents and has a diverse industrialbase. The major industrial wastewater sources are metalplating, printing, and wire fabrication operations. Waste-water flow from industry constitutes approximately 25% of thetotal plant flow.
The original wastewater treatment plant, constructed in1940, was a 1.0 million gallon per day (MGD) primary and con-ventional activated sludge facility. Expansion projectsthrough 1970 increased plant treatment capacity to 1.8 MGD byexpansion of the primary and secondary tankage and aerationblower system capacity.
In 1977, with Federal and State financial assistance, thedesign of yet another improvement project commenced. Facilityplanning recommended the expansion of the average daily treat-ment capacity of the plant to 3.4 MGD and the incorporation ofadvanced wastewater treatment facilities (i.e., tertiary fil-tration). The most cost-effective approach for upgrading theexisting activated sludge process to accommodate the increased
I . , 617
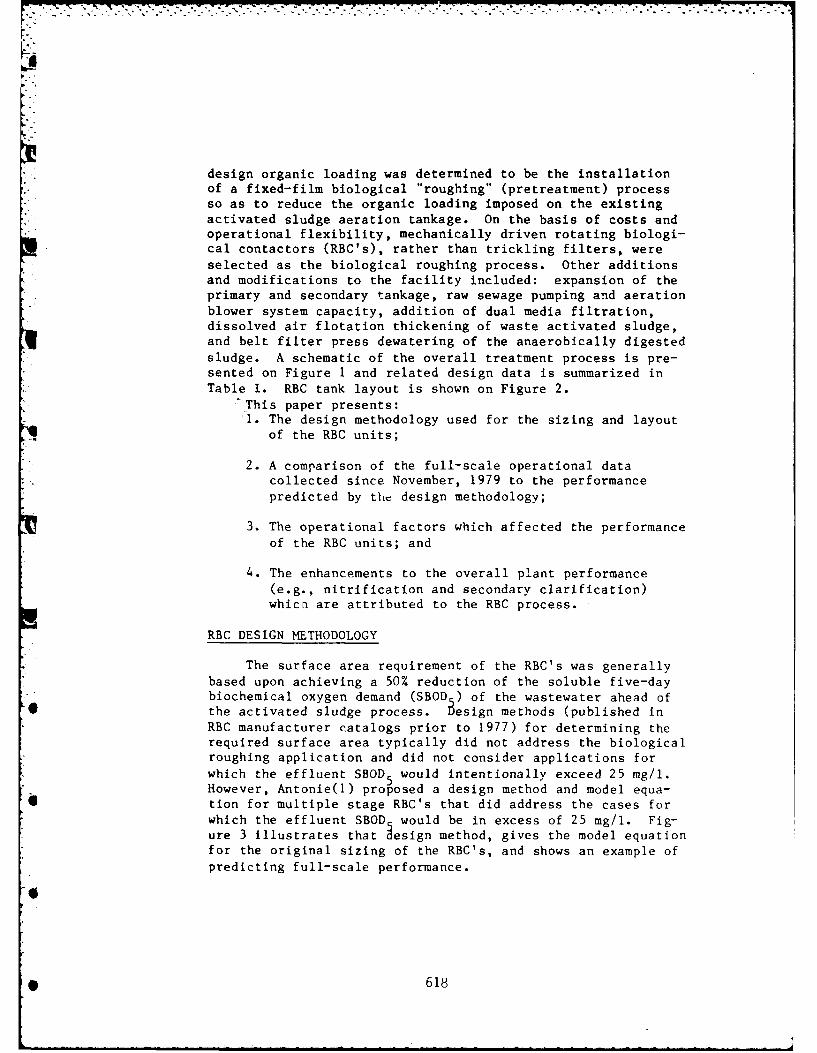
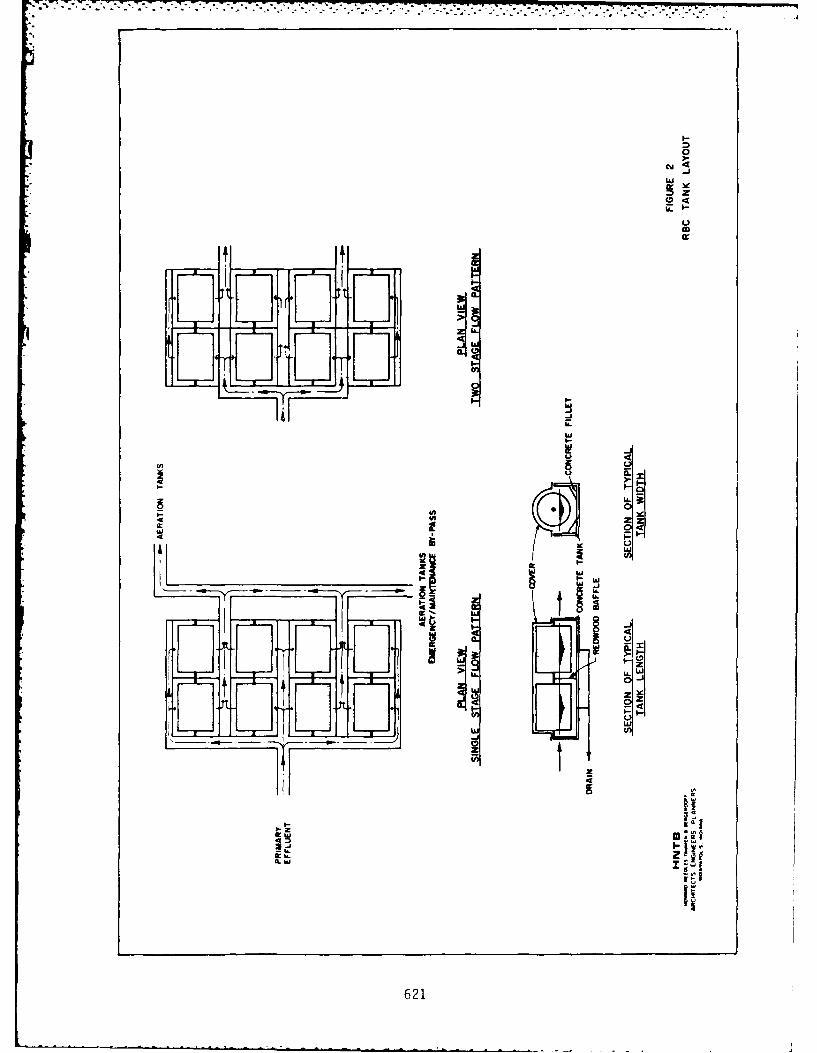
design organic loading was determined to be the installationof a fixed-film biological "roughing" (pretreatment) processso as to reduce the organic loading imposed on the existingactivated sludge aeration tankage. On the basis of costs andoperational flexibility, mechanically driven rotating biologi-cal contactors (RBC's), rather than trickling filters, wereselected as the biological roughing process. Other additionsand modifications to the facility included: expansion of theprimary and secondary tankage, raw sewage pumping and aerationblower system capacity, addition of dual media filtration,dissolved air flotation thickening of waste activated sludge,and belt filter press dewatering of the anaerobically digestedsludge. A schematic of the overall treatment process is pre-sented on Figure 1 and related design data is summarized inTable I. RBC tank layout is shown on Figure 2.
This paper presents:1. The design methodology used for the sizing and layout
of the RBC units;
2. A comparison of the full-scale operational datacollected since November, 1979 to the performancepredicted by the design methodology;
3. The operational factors which affected the performanceof the RBC units; and
4. The enhancements to the overall plant performance(e.g., nitrification and secondary clarification)which are attributed to the RBC process.
RBC DESIGN METHODOLOGY
The surface area requirement of the RBC's was generallybased upon achieving a 50% reduction of the soluble five-daybiochemical oxygen demand (SBOD ) of the wastewater ahead of
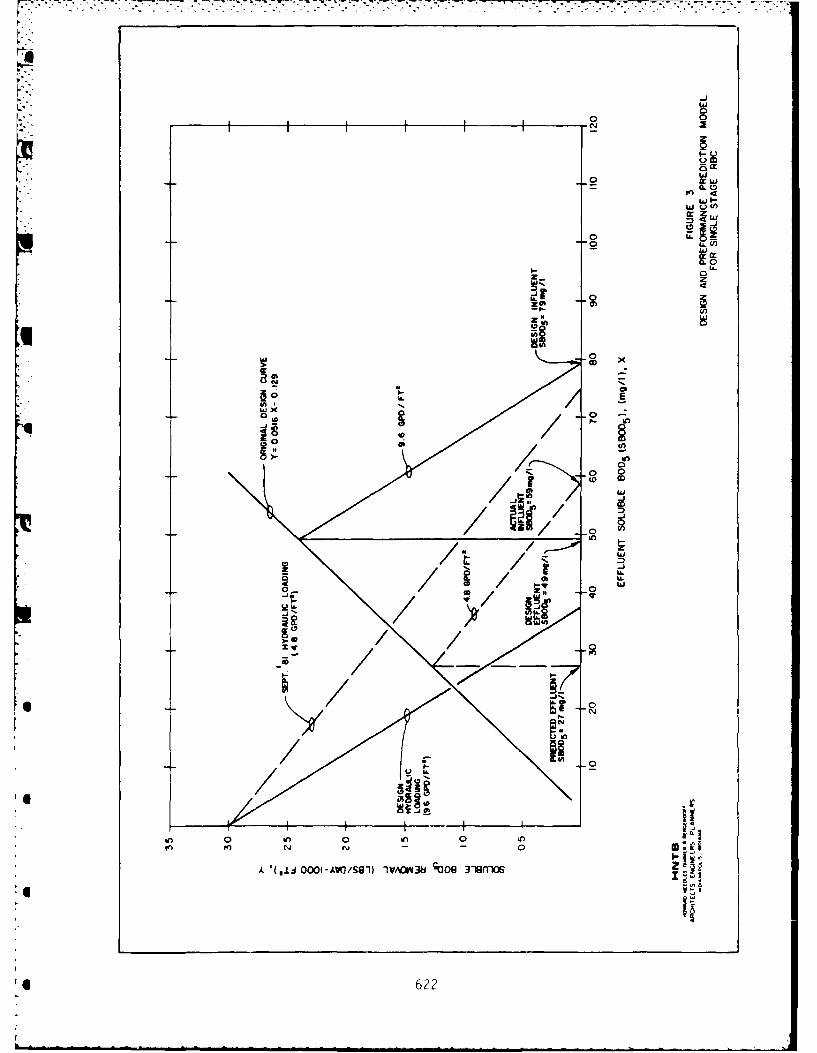
* the activated sludge process. Design methods (published inRBC manufacturer catalogs prior to 1977) for determining therequired surface area typically did not address the biologicalroughing application and did not consider applications forwhich the effluent SBOD 5 would intentionally exceed 25 mg/l.However, Antonie(1) proposed a design method and model equa-
*tion for multiple stage RBC's that did address the cases forwhich the effluent SBOD would be in excess of 25 mg/l. Fig-ure 3 illustrates that esign method, gives the model equationfor the original sizing of the RBC's, and shows an example ofpredicting full-scale performance.
* 618
RUr
biL-
ct-
L~4
tow
LnUjU
Ln,
619U
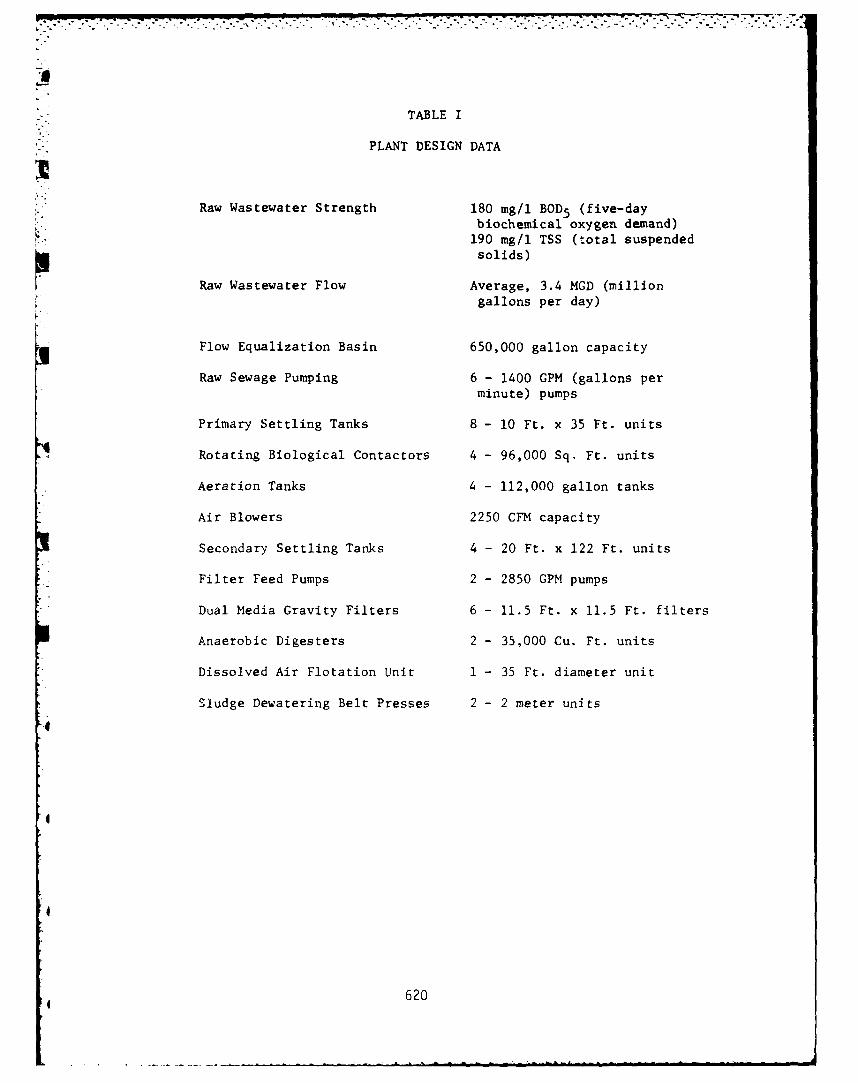
TABLE I
PLANT DESIGN DATA
Raw Wastewater Strength 180 mg/l BOD 5 (five-day
biochemical oxygen demand)190 mg/l TSS (total suspendedsolids)
Raw Wastewater Flow Average, 3.4 MGD (million
gallons per day)
Flow Equalization Basin 650,000 gallon capacity
Raw Sewage Pumping 6 - 1400 GPM (gallons per
minute) pumps
Primary Settling Tanks 8 - 10 Ft. x 35 Ft. units
Rotating Biological Contactors 4 - 96,000 Sq. Ft. units
Aeration Tanks 4 - 112,000 gallon tanks
Air Blowers 2250 CFM capacity
Secondary Settling Tanks 4 - 20 Ft. x 122 Ft. units
Filter Feed Pumps 2 - 2850 GPM pumps
Dual Media Gravity Filters 6 - 11.5 Ft. x 11.5 Ft. filters
Anaerobic Digesters 2 - 35,000 Cu. Ft. units
Dissolved Air Flotation Unit 1 - 35 Ft. diameter unit
Sludge Dewatering Belt Presses 2 - 2 meter units
62
620
T 'T
O-
7i4-)
0
I.1c
-J-
LL
441
IIt
4 U621
w
0 w0~4
I-
o
10
mOm
ww
Ch U
z w-
62
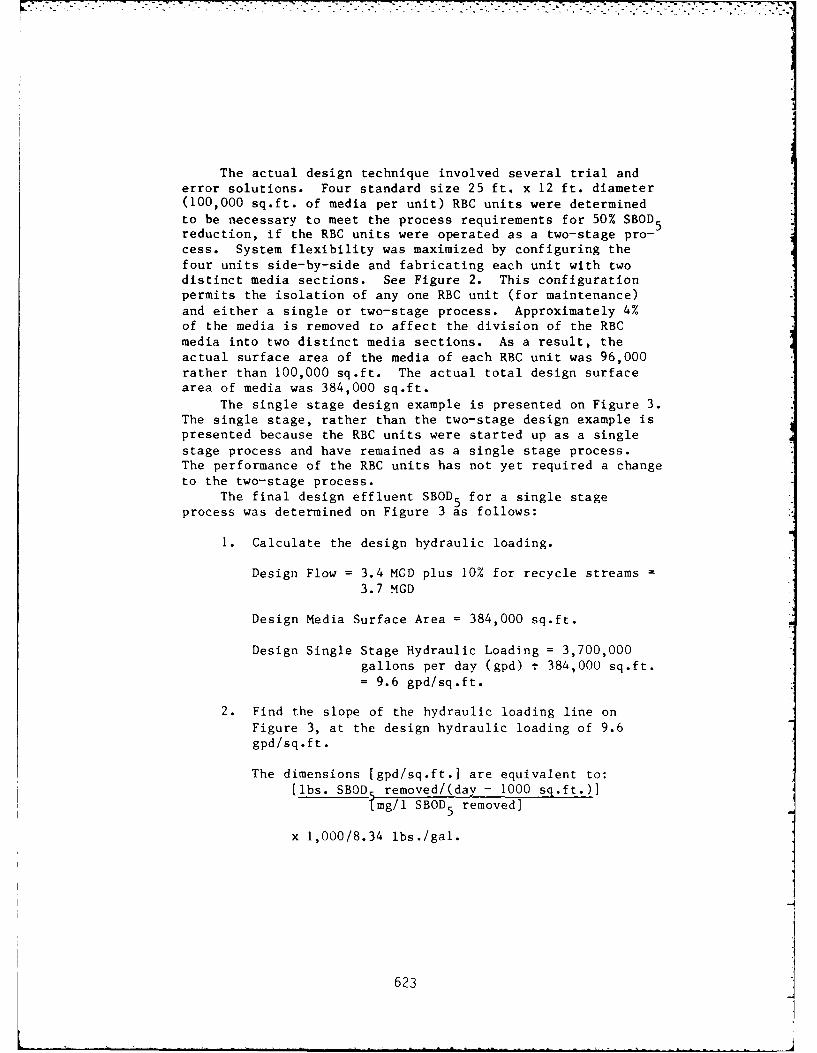
The actual design technique involved several trial anderror solutions. Four standard size 25 ft. x 12 ft. diameter(100,000 sq.ft. of media per unit) RBC units were determined
to be necessary to meet the process requirements for 50% SBOD 5reduction, if the RBC units were operated as a two-stage pro-cess. System flexibility was maximized by configuring thefour units side-by-side and fabricating each unit with twodistinct media sections. See Figure 2. This configurationpermits the isolation of any one RBC unit (for maintenance)
and either a single or two-stage process. Approximately 4%of the media is removed to affect the division of the RBCmedia into two distinct media sections. As a result, theactual surface area of the media of each RBC unit was 96,000rather than 100,000 sq.ft. The actual total design surfacearea of media was 384,000 sq.ft.
The single stage design example is presented on Figure 3.The single stage, rather than the two-stage design example ispresented because the RBC units were started up as a single
stage process and have remained as a single stage process.The performance of the RBC units has not yet required a change
to the two-stage process.The final design effluent SBOD 5 for a single stage
process was determined on Figure 3 as follows:
1. Calculate the design hydraulic loading.
Design Flow = 3.4 MGD plus 10% for recycle streams =
3.7 MGD
Design Media Surface Area = 384,000 sq.ft.
Design Single Stage Hydraulic Loading = 3,700,000
gallons per day (gpd) t 384,000 sq.ft.
= 9.6 gpd/sq.ft.
2. Find the slope of the hydraulic loading line on
Figure 3, at the design hydraulic loading of 9.6gpd/sq.ft.
The dimensions [gpd/sq.ft.] are equivalent to:
Jlbs. SBOD5 removed/(day - 1000 sg.ft.)](mg/l SBOD5 removed]
x 1,000/8.34 lbs./gal.
623
Therefore, to express the design hydraulic loadingof 9.6 gpd/sq.ft. in terms of the slope dimensionson Figure 3, the hydraulic loading is multiplied by8.34 lbs. per gal./1,000.
9.6 gpd/sq.ft. , 8.34 lbs.gal.-1,000
0.08 lbs. SBOD, Removed/(Day-1,000 sq.ft)mg/l SBOD 5 Removed
A simple graphical display of the calculated slopeis determined by arbitrarily selecting the Y-co-ordinate as 3.0 and computing the X-coordinate:
X-coordinate Y-coordinateslope
3.0 30.08
Therefore, the slope of the design hydraulicloading line is arbitrarily shown on Figure 3 asintersecting the Y-axis at 3.0 and X-axis at 37.
3. Find the single stage design effluent SBOD , giventhe designed hydraulic loading rate of 9.6 gpd/sq.ft. and the design influent SBOD5 as 79 mg/l.
Shift the hydraulic loading line so that itintersects the X-axis at 79 mg/l. The X-coor-dinate of the point of intersection of theshifted hydraulic loading line with the designcurve is the design effluent SBOD 5 which isshown as 49 mg/l.
6 Although a single stage configuration did not predict a50% reduction in SBOD5 at the design single stage hydraulicand organic loading, the two-stage configuration did predict aconformance with the basic design requirement.
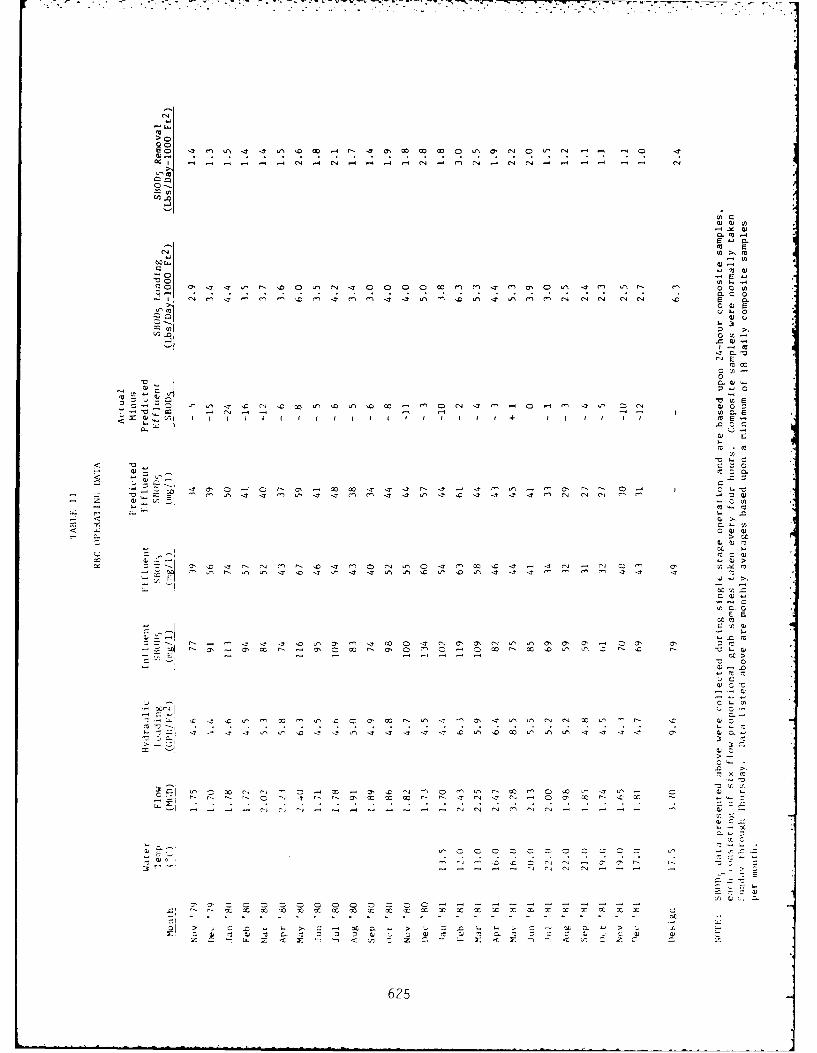
- EVALUATION OF DESIGN METHODOLOGY
Table 1I lists the monthly operating data of the RBCunits, and contains two columns which readily indicate the
624
00
- - - - - - aN - 4 a -4 f .4 - -
C14
0 fn
u 0
Z) 2
.0CC
-" 00 00
c- 0n
24. 0l -T. -7c c Z
aEE
(71~' o.0l
I - c
c COO
2-o 20 20-x0c x
C m :3L! icn
62
validity of the design technique: predicted effluent SBODand actual minus predicted effluent SBOD 5. An example of howthe predicted effluent SBOD values were obtained is illus-trated on Figure 3 for the September, 1981 data set. Theslope of the hydraulic loading line was graphically depictedas follows:
1. Express the monthly average hydraulic loading of 4.8gpd/sq.ft. in terms of the slope dimensions on Figure3.
S4.8 gpd/sq.ft, x 8.4-s.gl8.34 ibs./gal.-1,000
0.04 lbs. SBODS Removed/(Day - 1,000 sq.ft)mg/l SBOD 5 Removed
2. Arbitrarily select the Y-coordinate as 3.0 and computethe X-coordinate.
3.0X-coordinate = .0 750.04
3. Draw a line with a slope equal to the hydraulicloading as intersecting the Y-axis at 3.0 and the X-axis at 75.
The predicted effluent SBOD 5 value of 27 mg/l wasfound by shifting the hydraulic loading line sothat it intersects the X-axis at the monthlyaverage influent SBOD 5 value of 59 mg/l. The X-coordinate of the point of intersection of theshifted hydraulic loading line with the designcurve is the predicted effluent SBOD 5 value,which is shown as 27 mg/l.
In general, the actual performance of the RBC units hasbeen reasonably close to performance predicted by the designmethodology. The predicted effluent SBOD 5 values of the 1981data set averaged approximately 90% of the actual effluentSBOD 5 values. December, 1979 to February, 1980, data are notconsidered representative of normal performance because theplant received industrial cyanide spills during December, 1979and January, 1980.
626
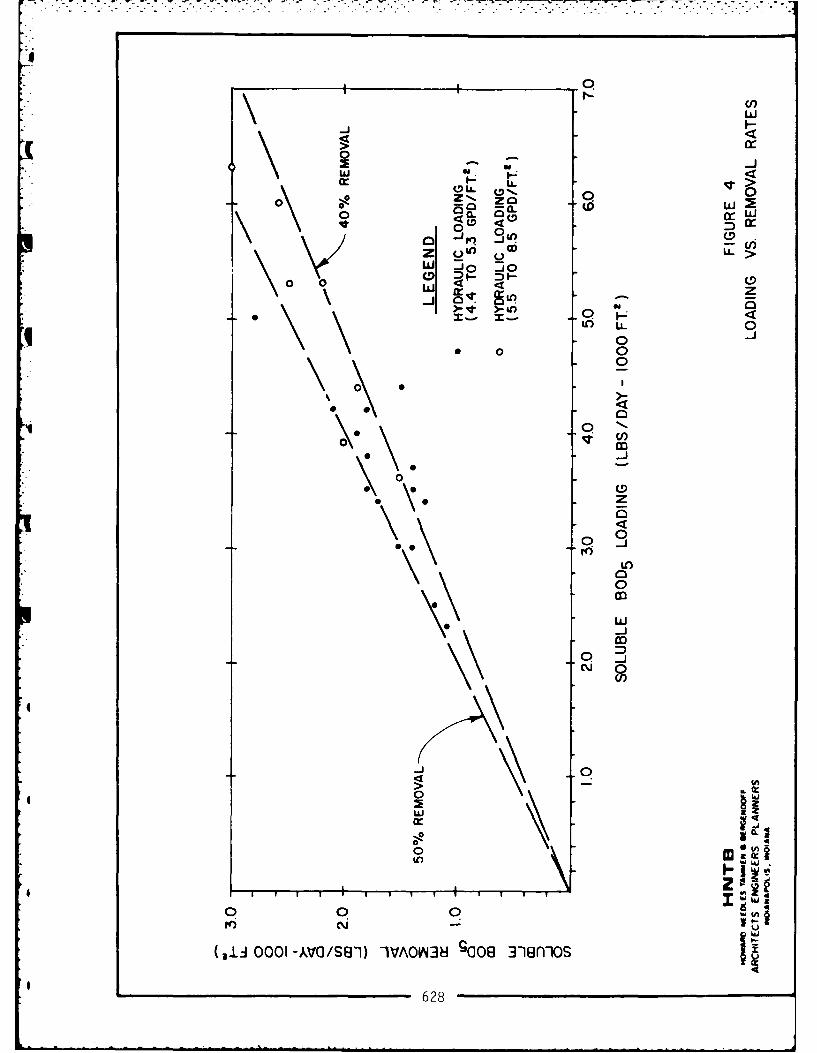
RBC PERFORMANCE AND OPERATION
Figure 4 illustrates that the RBC units consistentlyremoved 40 to 50% of the influent SBOD5 . The removal ratesdid not appear to be significantly affected by hydraulic ororganic loading rates. For example: The average hydraulicloading rate in May, 1981, was 8.5 gpd/sq.ft. and the percent
SBOD removal for that month was 41%; whereas, the average hy-draulic loading rate in November, 1981, was 4.3 gpd/sq.ft. and
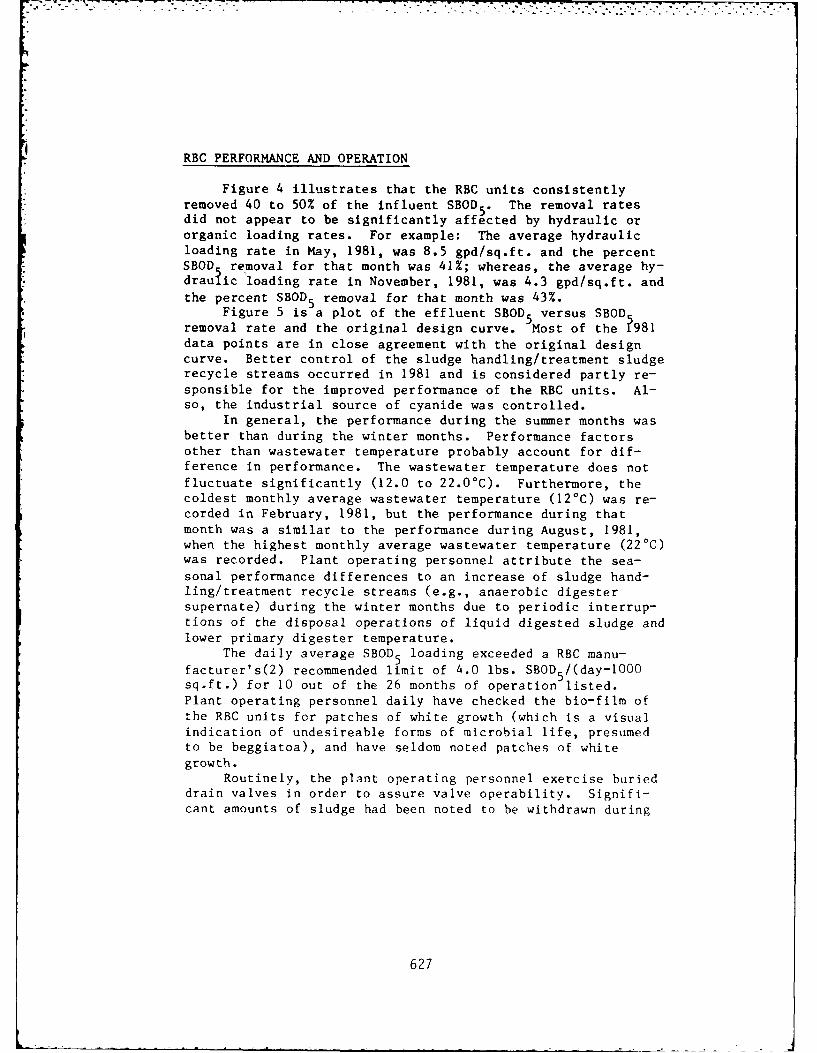
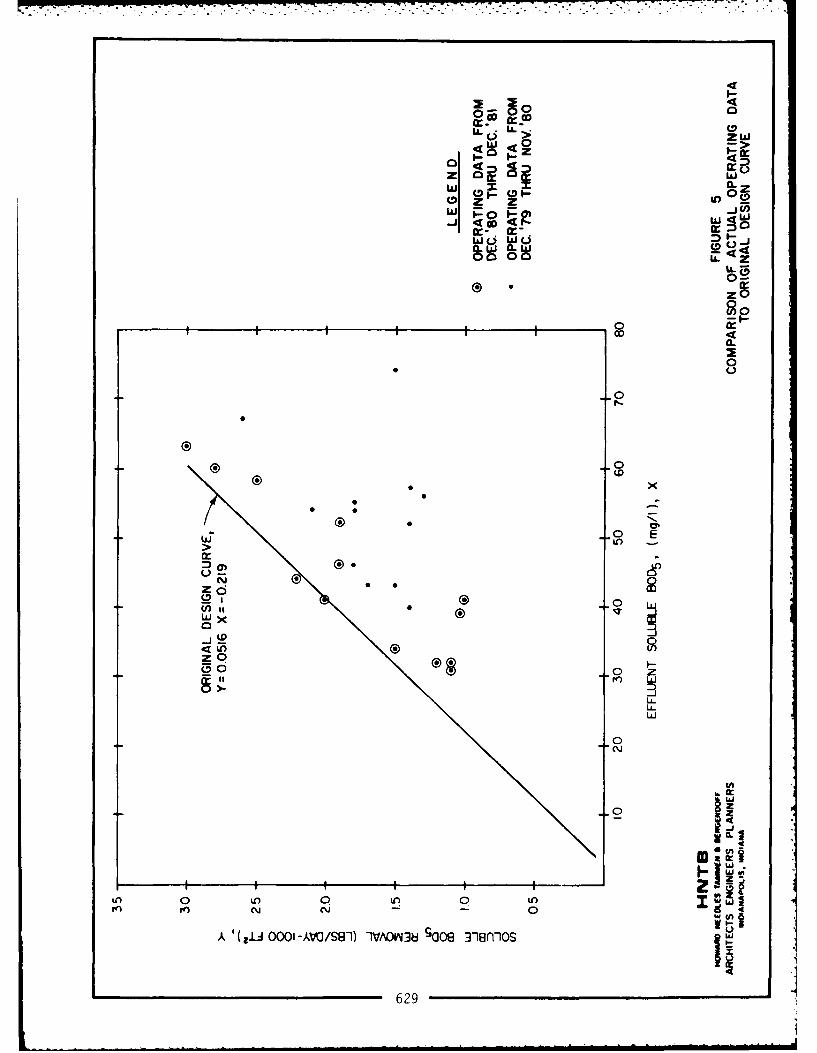
the percent SBOD5 removal for that month was 43%.Figure 5 is a plot of the effluent SBOD5 versus SBOD
removal rate and the original design curve. Most of the 81data points are in close agreement with the original designcurve. Better control of the sludge handling/treatment sludgerecycle streams occurred in 1981 and is considered partly re-sponsible for the improved performance of the RBC units. Al-so, the industrial source of cyanide was controlled.
In general, the performance during the summer months wasbetter than during the winter months. Performance factorsother than wastewater temperature probably account for dif-ference in performance. The wastewater temperature does notfluctuate significantly (12.0 to 22.0'C). Furthermore, thecoldest monthly average wastewater temperature (12'C) was re-corded in February, 1981, but the performance during thatmonth was a similar to the performance during August, 1981,when the highest monthly average wastewater temperature (22C)was recorded. Plant operating personnel attribute the sea-
sonal performance differences to an increase of sludge hand-ling/treatment recycle streams (e.g., anaerobic digestersupernate) during the winter months due to periodic interrup-tions of the disposal operations of liquid digested sludge andlower primary digester temperature.
The daily average SBOD 5 loading exceeded a RBC manu-
facturer's(2) recommended limit of 4.0 lbs. SBOD 5 /(day-1000sq.ft.) for 10 out of the 26 months of operation listed.Plant operating personnel daily have checked the bio-film ofthe RBC units for patches of white growth (which is a visualindication of undesireable forms of microbial life, presumedto be beggiatoa), and have seldom noted patches of whitegrowth.
Routinely, the plant operating personnel exercise burieddrain valves in order to assure valve operability. Signifi-cant amounts of sludge had been noted to be withdrawn during
627
-7iJ
-J
crrLLJ
Z'*- zo -
w aw CZ
su 0
w :io(DI :)1--
40
00
IdC)
9 0 0F') N4U
(,.U0001-AV/SS1 1VAkN3 ~O0 312l10
620
900
w3
m rz
(D I. (D 1. 0
w 0 0
0
00
0 0
L C)
0-0
-.
> 0)M
~J2 1j
ZO 0
LAL
wC
C.'))
41
0 o 0 CC 0 LO
A (si- 0001 -AVO/SQS1) 1VN)IN38 'CJ08 3-ln-0s
629
the routine exercise of the RBC tank drain valves. Impressedby the amount of sludge withdrawn, the operating personnel de-cided to withdraw sludge from the RBC tanks on a regularbasis. Coincidental with the decision to periodically with-draw sludge from the RBC tanks, the plant operating personnelalso noticed that the white patchy growth on the bio-filmappeared less frequently. Sludge is withdrawn routinely 2 to3 times per week and more often if white patchy growthdevelops.
An attempt was made to correlate SBOD removalefficiency with the practice of routine sludge withdrawal fromthe RBC tanks. Sludge was withdrawn from only two of the four
RBC tanks during the period of November, 1981 throughFebruary, 1982. The daily average effluent SBOD5 of thedrained and undrained tanks was nearly identical during thetrial period. Even though the data generated during thetrial period did not support the assumption that periodicsludge withdrawal has a beneficial impact upon SBOD 5 removal,the plant operating personnel have maintained their periodicsludge withdrawal operation and have seldom observed whitepatchy growth.
AFFECT OF THE RBC PROCESS ON OVERALL PLANT PERFORMANCE
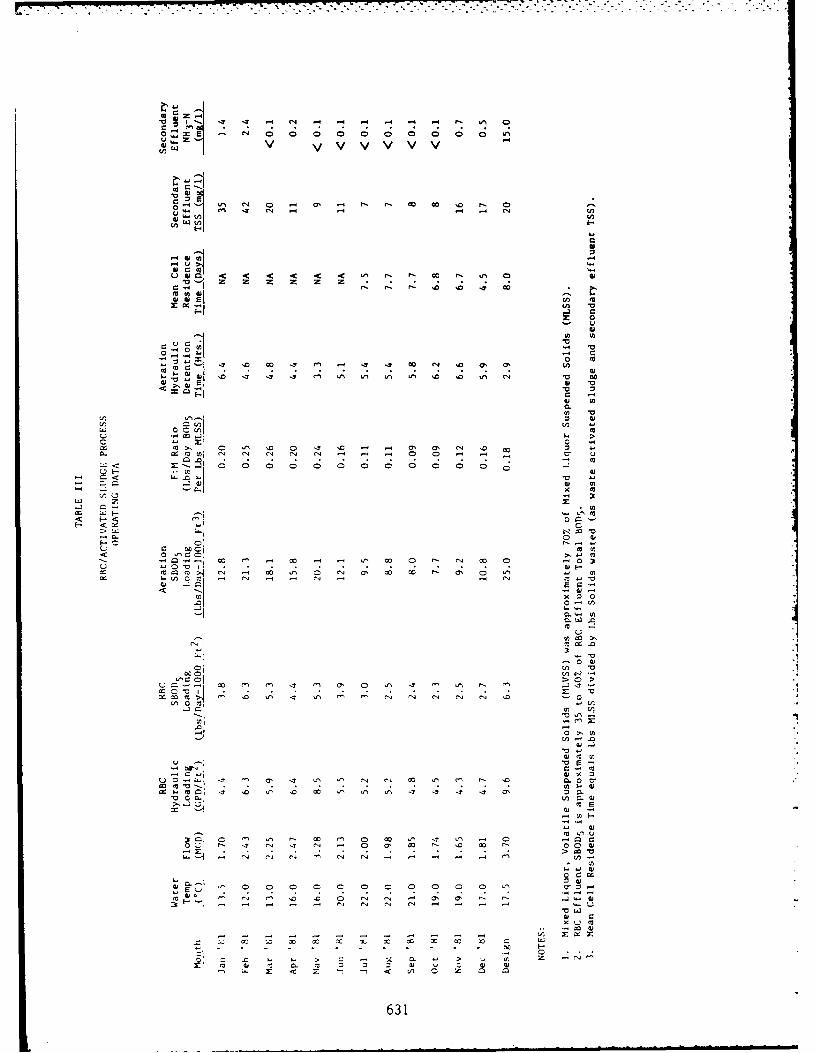
Table III lists the 1981 monthly operational data of theRBC and activated sludge processes. The secondary effluenttypically was nitrified and had a total suspended solids con-centration less than 20 mg/l. The biological roughing of theRBC process not only reduced the SBOD 5 load to the activatedsludge process, but was also likely responsible for the excel-lent quality of the secondary effluent. Both the nitrifica-tion and the excellent secondary clarification that occurredwould not have been anticipated for an activated sludge pro-cess which operated at an F/M ratio greater than 0.20/days,mean cell residence time less than 4.5 days, and a hydraulic
* detention time less than 4 hours.In addition to SBOD removal, the RBC process converted
the form of the suspended solids entering the RBC's from avery non-descriptive particle type to noticeably long, dark,stringy biological solids. This formulation of biologicalsolids ahead of aeration may be one of the enhancement factors
* that an RBC process lends to the activated sludge process.
6
fg 630
uz
V) VV V V
(0,
o (o Cf0
0 c m.4 a, (4?m
z z z U,
m w
ou,A (4 (4
o. 0
0 -
xA 'Am %D CD 'a, l13 (Al 'A " -
_jE-.~ 0 0 0 0 C 0 0 0 0 C -
m DCo- a, (4aDC
4)4 3< a, 3
00
-0.0
0i 0 w4.U~> cc - N
e-a,r4~
C. u'A'a 4)
0.' 22 (4
6.31 .
CONCLUSIONS
The design method for RBC sizing proposed by Antonie(l)and as presented on Figure 3 is a valid design method forsizing a RBC process as a biological roughing process ahead ofan activated sludge process.
Using a RBC process as a biological roughing processahead of an activated sludge process is a workable and cost-effective method for upgrading an existing activated sludgeprocess.
Periodic sludge withdrawal from RBC tanks may helpprevent white patchy growth on the RBC bio-film.
Sludge handling/treatment recycle streams adverselyaffect RBC performance.
The RBC biological roughing process enhances overallplant performance by producing biological solids which en-courage nitrification within the activated sludge process andaid in secondary effluent clarification.
REFERENCES
1. Antonie, R. L., "Rotating Biological Contactor forSecondary Wastewater Treatment," presented at the Gulp!Wesner/Culp WWT Seminar on October 27-28, 1976, held atSouth Lake Tahoe, Stateline, Nevada.
2. Autotrol Wastewater Treatment Systems Design Manual,dated 1979, by Autotrol Corporation Bio-systems Division,Milwaukee, Wisconsin.
I
I
4 63
USE OF SUPPLEMENTAL AERATION AND PH ADJUSTMENT
TO IMPROVE NITRIFICATIONIN A FULL SCALE ROTATING BIOLOGICAL CONTACTOR SYSTEM
James L. Albert. U.S. Army Environmental Hygiene Agency,
Aberdeen Proving Ground, Maryland.
INTRODUCTION
Nitrification was substantially improved following the
0installation of supplemental aeration in a full scale rotatingbiological contactor (RBC) system designed to treat domesticwastewater to an effluent level of 10 mg/L of 5-day totalbiochemical oxygen demand (BOD 5 ) and 2 mg/L ammonia-nitrogen
(NH3-N). A slight improvement in nitrification was alsoobserved when the pH of the wastewater was adjusted from 6.6 to3.4 with soda ash for an extended period. This RBC system is
the biological treatment portion of a 6 MGD wastewater treatmentplant (!TvP) serving a major U.S Army installation with aneffective population of 40,000. The RBC units are arranged in6 treatment banks of 6 stages each with the first 3 stages in
each bank intended for BOD_ removal and the last 3 stages for
NH 3-N removal. Performance of the RBC system was evaluatedduring summer conditions (wastewater temperature of 260 C andsystem flow of 4.5 MGD) before and after the addition of 8 cfmof supplemental aeration per lineal foot of RBC shaft in thefirst 2 stages of each bank. The effect of pH adjustment was
evaluated by comparing a control bank to a parallel bank inwhich up to 1200 pounds per day of soda ash was added to the
third stage for 7 weeks.
" The opinions or assertions contained herein are tneprivate views of the author and arp not to be construed asofficial or as reflectin, the views of the Department of theArmy or the Department of Defense."
033
I
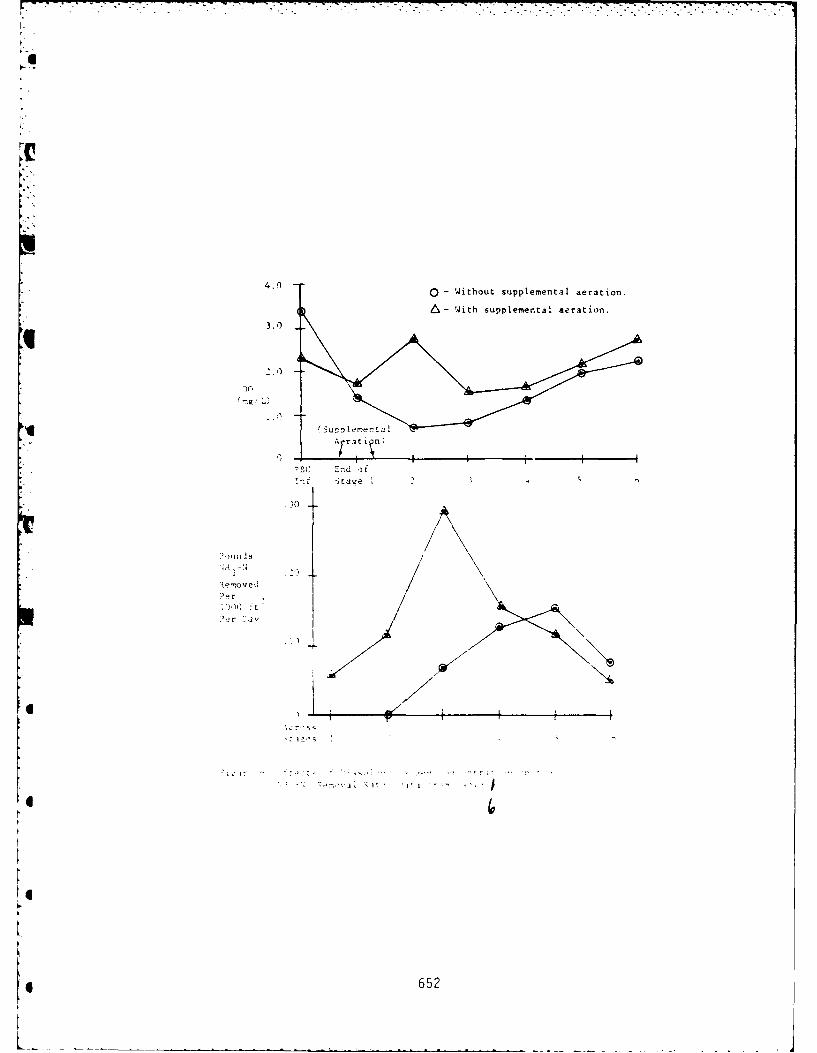
Prior to the aeration of the wastewater, dissolvedoxygen (DO) limiting conditions (1.0 mg/L or less) existedin the first 4 stages, the white sulfur bacteria, Beggiatoa,predominated on the media, 75% of the BOD 5-S (soluble) re-moval occurred in the first 3 stages, and 59% of the appliedNH 3-N was oxidized. With the supplemental aeration, DO wasnever less than 1.5 mg/L, Beggiatoa was sparsely present ononly the first stage media, 96% of the BOD5 -S removaloccurred in the first 3 stages, and 86% of the NH3-N wasoxidized yielding an effluent concentration of 2.1 mg/L.The design nitrification rate of 0.3 pounds of NH3-N removedper 1000 ft2 per day existed only when the DO level was above2.5 mg/L. Although adjustment of pH produced questionableresults, an 11% improvement in NH3-N removal was brieflyobserved as compared to the control bank with just supple-mental aeration.
Conclusions are that NH3-N removal is dependent onprior BOD 5-S removal so that there is not competition be-tween 3OD 5 and NH3-N removal organisms for space in thelacter stages. Low DO spread BOD_-S removal into stages where
nitrification was to occur. More importantly, the nitrifi-cation rate was limited by low DO levels. The need to pro-vide at least 2.5 mg/L of DO in the stages where maximumnitrification is expected was clearly shown. Some benefitmay be gained through operation in higher pH ranges; however,the design nitrification rate was achieved in the 6.6 pHrange.
SACKGROUND
Treatment Plant
The NTP was upgraded in 977 from a trickLing fit ersystem to a RBC system in order tD ?rovide botn seconuarvtreatment and nitrification. rthe upgraded plant was
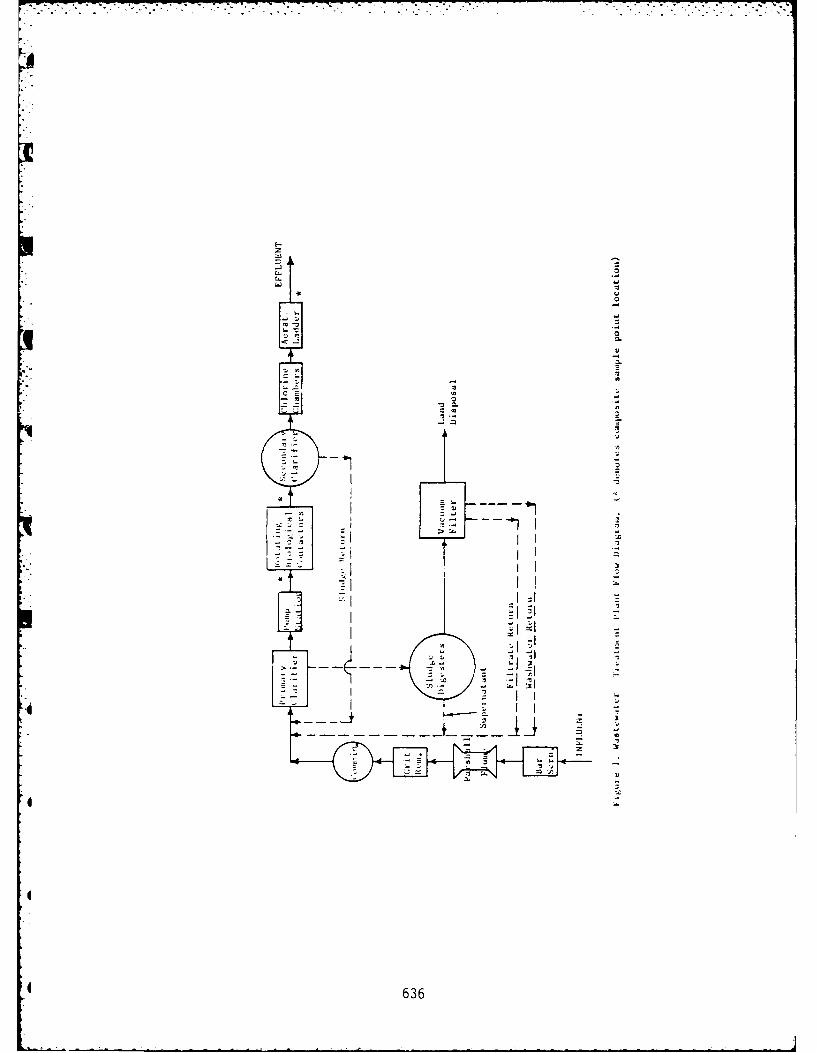
-esidned to meet the National Pollutant Discharge ilimina-tion Svstem (NPDES) permit limitations snown in Table I. Ascaiematic diazram of the unit processes is srnown in Figurei. Design capacity of the .WTP is r MGD, while maximumhvdraulic caoacitv is i MGD.
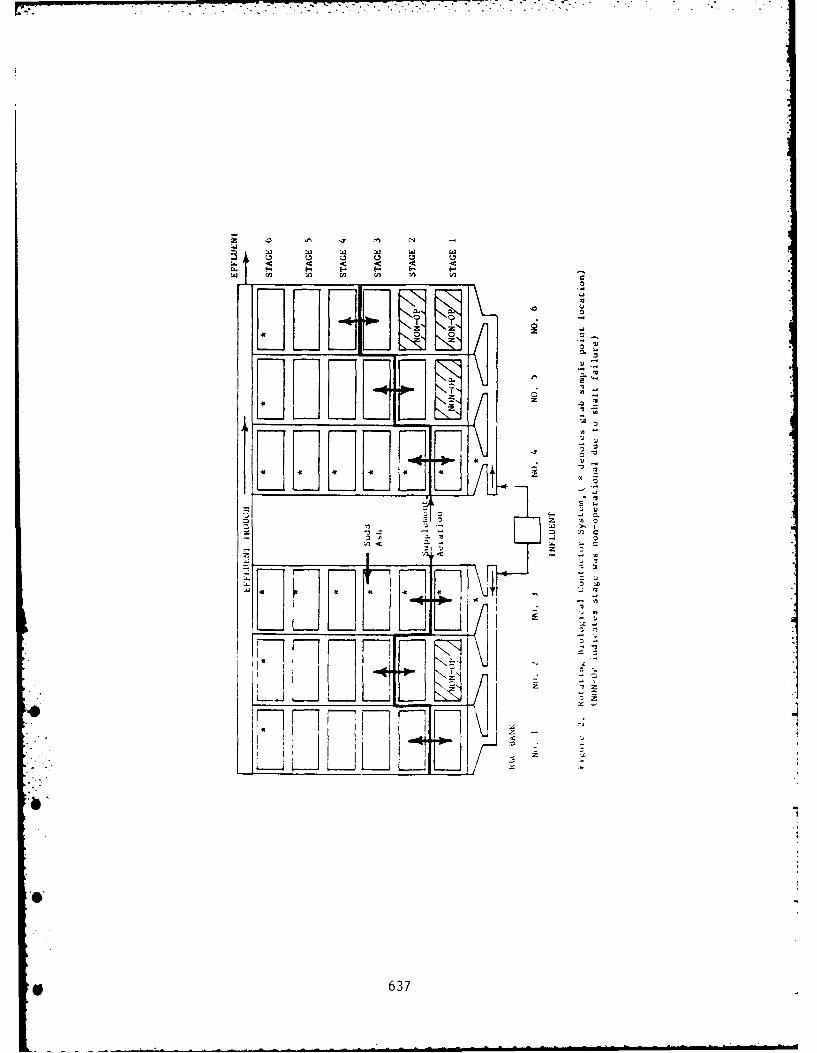
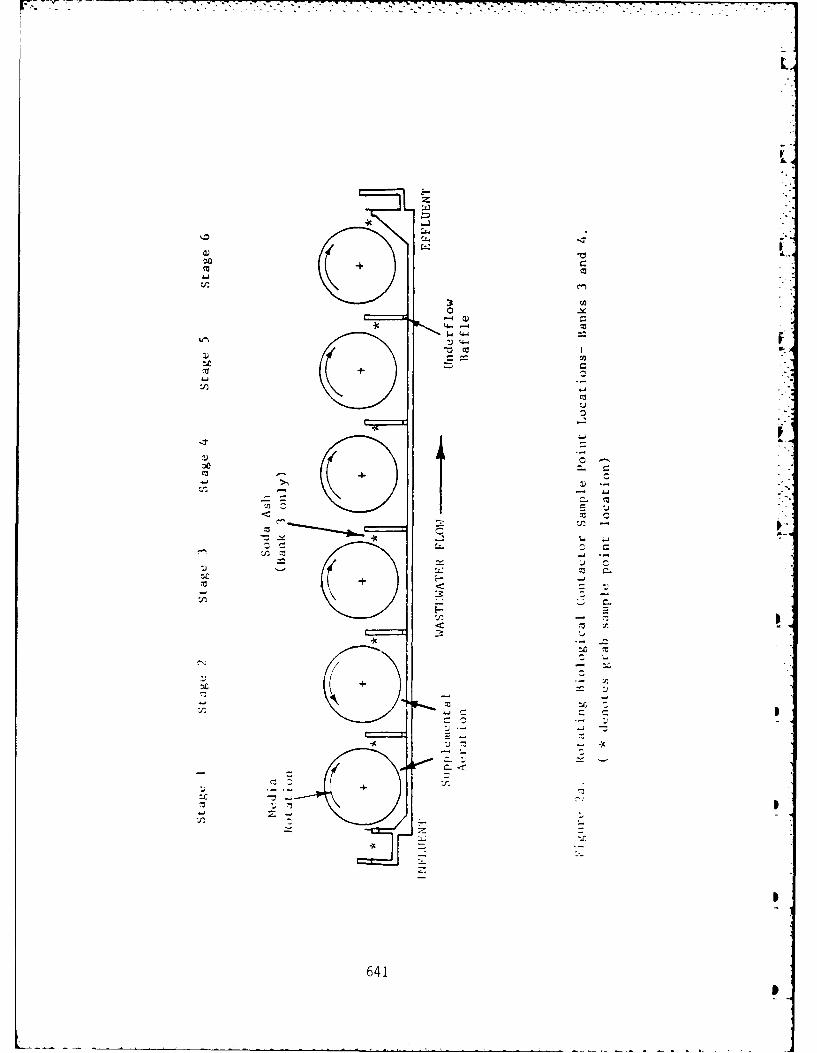
The RBC system, shown in Figure 2, consists of 36mechanically driven R3C units arranged in a maLri:: o: 'treatment banks, each with 6 stages. The :irs: C stages
634
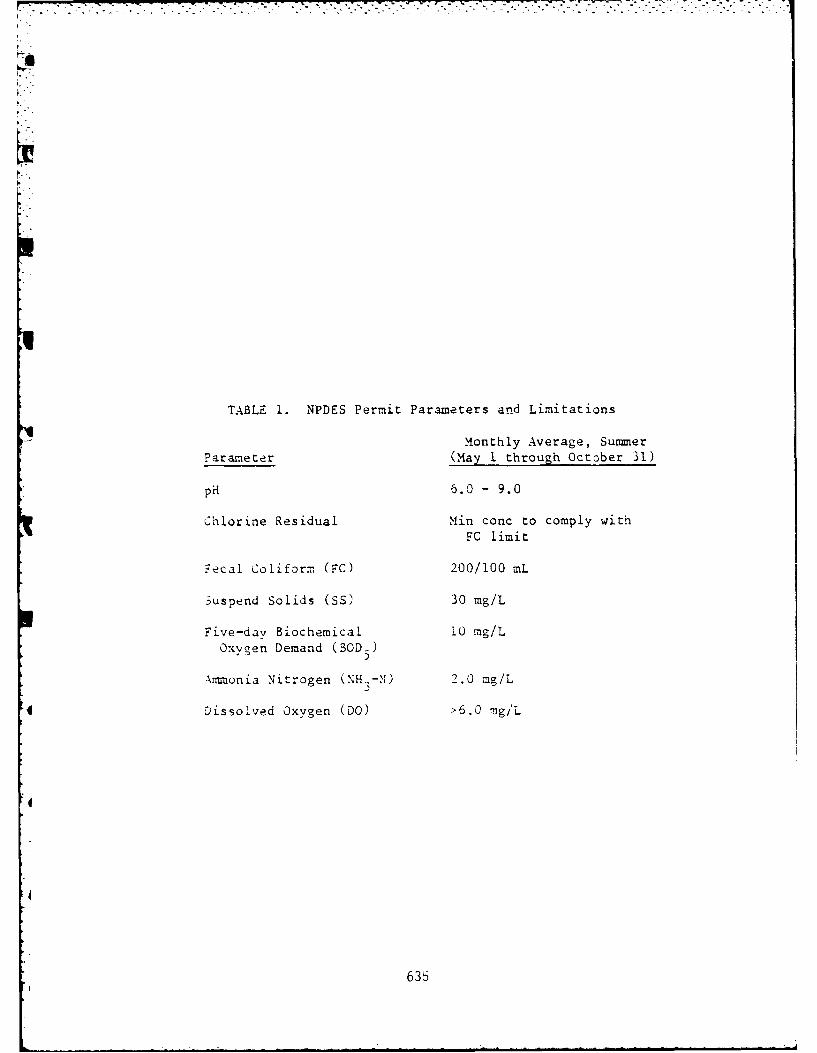
TABLE 1. NPDES Permit Parameters and Limitations
Monthly Average, SummerParameter (May I through October 31)
pH 6.0 - 9.0
Chlorine Residual Min conc to comply with
FC limit
7ecal Coliform (FC) 200/100 mL
Suspend Solids (SS) 30 mg/L
Five-day Biochemical 10 mg/LOxygen Demand (SOD)
Ammonia Nitrogen (NH--N) 2.0 mg/L
Dissolved Oxygen (DO) >6.0 mgi'L
635
z
0
L.JU0
~ *0-~ ~ 0.
0
0~0 0.
0*- 0.
- I-.
I -~ -~
0*~ 0
II
.1-' - 41 ii
:1
j. I-. I
I ..'
4~ Al
4
I
4 636
- -.- j
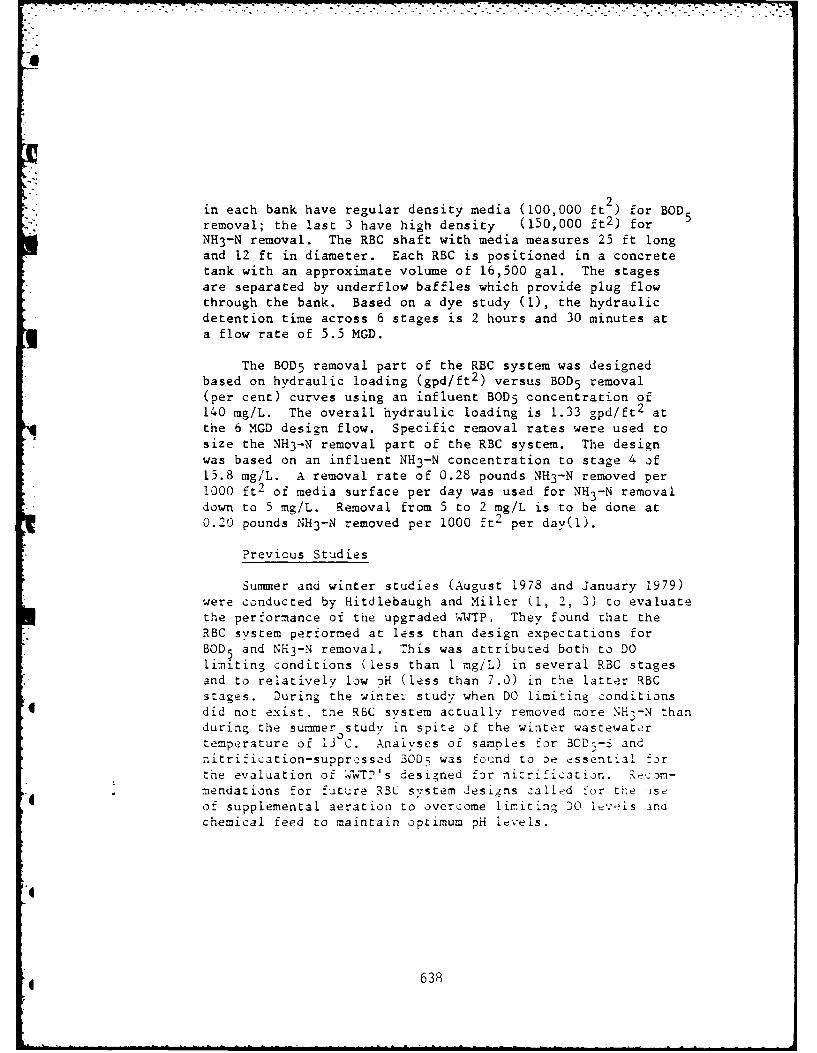
2in each bank have regular density media (100,000 ft2 ) for BODremoval; the last 3 have high density (150,000 ft2 ) for
NH3-N removal. The RBC shaft with media measures 25 ft longand 12 ft in diameter. Each RBC is positioned in a concretetank with an approximate volume of 16,500 gal. The stagesare separated by underflow baffles which provide plug flowthrough the bank. Based on a dye study (1), the hydraulicdetention time across 6 stages is 2 hours and 30 minutes ata flow rate of 5.5 MGD.
The BOD 5 removal part of the RBC system was designedbased on hydraulic loading (gpd/ft2 ) versus BOD 5 removal(per cent) curves using an influent BOD 5 concentration of140 mg/L. The overall hydraulic loading is 1.33 gpd/ft 2 atthe 6 MGD design flow. Specific removal rates were used tosize the NH3-N removal part of the RBC system. The designwas based on an influent NH3-N concentration to stage 4 of15.8 mg/L. A removal rate of 0.28 pounds NH3-N removed per1000 ft2 of media surface per day was used for NH3-N removaldown to 5 mg/L. Removal from 5 to 2 mg/L is to be done at0.20 pounds NH3-N removed per 1000 ft
2 per day(l).
Previous Studies
Summer and winter studies (August 1978 and January 1979)were conducted by Hitdlebaugh and Miller (1, 2, 3) to evaluatethe performance of the upgraded WWTP. They found that theRBC system performed at less than design expectations forBOD5 and NH3-N removal. This was attributed both to DOlimiting conditions (less than I mg/L) in several R3C stagesand to relatively low oH (less than 7.0) in the latter RBCstages. During the winter study when DO limiting conditions
4did not exist, the RSC system actually removed more NH3-N thanduring the summer study in spite of the winter wastewatertemperature of 13 C. Anaivses of samples for 3OD;-S andnitrification-suppressed 3OD 5 was found to oe essential :orthe evaluation of 'WWT?'s designed for nizrification. R ecom-mendations for future RBC system designs zalled for tre -iseof supplemental aeration to overcome limiting DO leveis -ndchemical feed to maintain optimum pH levels.
6
4 638
.. jL L. 7.
IWI
4 z
iL
637
- - - -
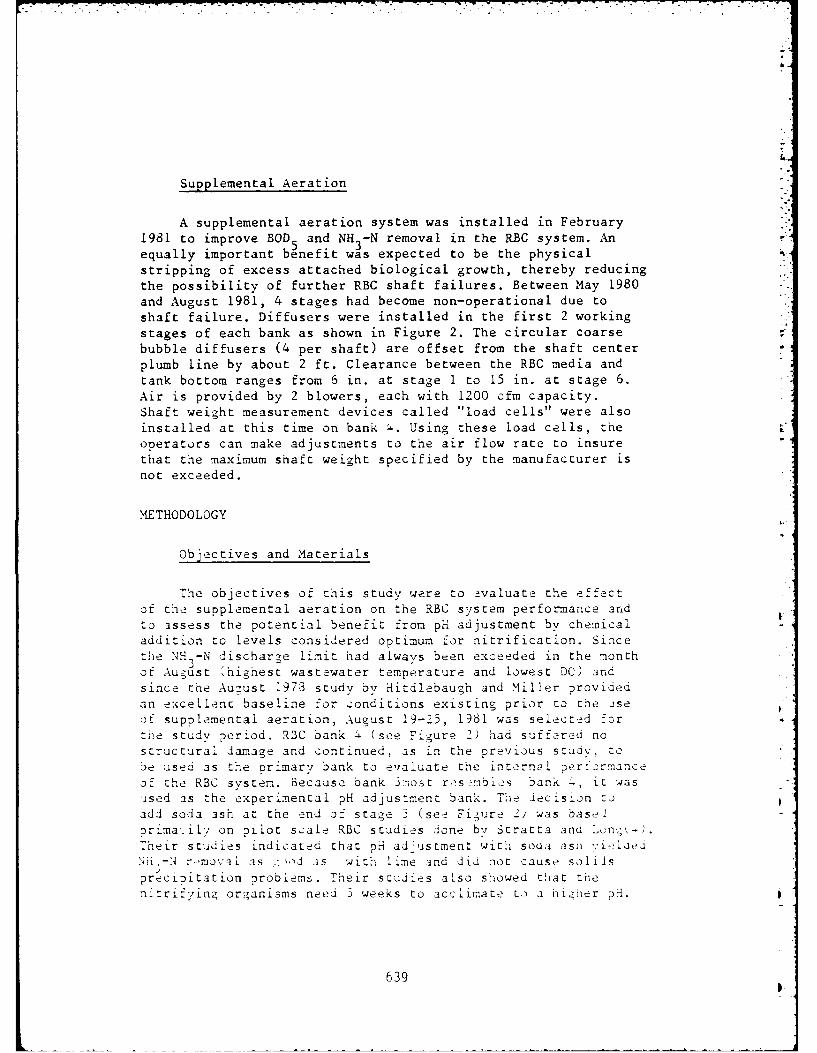
Supplemental Aeration
A supplemental aeration system was installed in February1981 to improve BOD and NH3-N removal in the RBC system. An
equally important benefit was expected to be the physical
stripping of excess attached biological growth, thereby reducingthe possibility of further RBC shaft failures. Between May 1980
and August 1981, 4 stages had become non-operational due to
shaft failure. Diffusers were installed in the first 2 working
stages of each bank as shown in Figure 2. The circular coarsebubble diffusers (4 per shaft) are offset from the shaft center
plumb line by about 2 ft. Clearance between the RBC media and
tank bottom ranges from 6 in. at stage 1 to 15 in. at stage 6.Air is provided by 2 blowers, each with 1200 cfm capacity.
Shaft weight measurement devices called "load cells" were also
installed at this time on bank 4. Using these load cells, theoperators can make adjustments to the air flow rate to insure
that the maximum shaft weight specified by the manufacturer is
not exceeded.
METHODOLOGY
Objectives and Materials
The objectives of this study were to evaluate the effectof the supplemental aeration on the RBC system performance and
to assess the potential benefit from pH adjustment by chemicaladdition to levels considered optimum for nitrification. Since
the NH -N discharze limit had always been exceeded in the month3of August 'highest wastewater temperature and lowest DCJ and
since the Auqust 1973 study by Hitdlebaugh and Miller provided
an excellenc baseline for conditions existing prior Co the iseof supplemental aeration, August 19-25, 1981 was selected for
the study period. RBC bank 4 (see Figure 2) had suffered nostructural damage and continued, as in the previous studv, to
be used as the primary bank to evaluate the internal performanceof the RBC system. Because bank omost resembles bank -, it Wasused as the experimental pH adjustment bank. The decision toadd soda ash at the end of stage 3 (see Figure 21 was baseJ
nrima.ilv on pilot scale RBC studies done by Stratta and Lcngt-.
Their studies indicated that pH adjustment with soda ash vicliedNI~i,- r-movoi as ,d as with lime and did not cause solids
precipitation nroblem6. Their studies also showed that tiienitrifying organisms need 5 weeks to acclimate L,) a hi4iher DH.
639
A chemical feed system consisting of a 500 gal. tank withflash mixer and a 30 gpm capacity centrifugal pump was operatedfor 7 weeks before the August sampling period. Soda ash solu-tions were made 4 times per day using either 300 lbs. (7.2 %
solution) or 400 lbs. (9.6 % solution) of dry soda ash. The
solution was pumped at a constant 1 gpm rate to 2 pointsahead of the effluent baffle in stage 3. The higher concentra-
tion solution was used during the times of the day when peakwastewater flows occurred. An automatic pH control system,
later seen to be essential, was outside the scope of this
study. Despite equipment probloms and washout by rain inducedhigh flows, the pH in stage 3 was maintained between 8.1 and
9.3 for 4 of the 7 weeks.
Sampling and Analyses
The sampling and analytical program from the 1973 studywas duplicated as closely as possible to permit accurate
comparison of results from both studies. Twenty-four hourflow proportioned composite samples were collected for 7 daysat the RBC system influent and effluent, and at the WWTP
effluent. Grab samples of the RBC bank influent and waste-water in each of the 6 stages of banks 3 and 4 were collected
at D times during the study to determine changes in waste-
water characteristics through the RBC system. Sampling timeswere selected to correspond to those used in the previous
study. Grab samols of the wastewater in stage 6 of the other4 banks were also collected. Temperature, DO. and DH data were
taken during each sample period using portable instruments.
Sample point locations are shown on Figures 1, 2. and Li.
All sample anal''ses were conducted onsite by ciie Environ-* mental Chemistry Division of the U.S. Army Environmertal
Hygiene Agency. A mobile laboratory was set up at tne ',vT? r
Doch studies. Nitrification was suppressed usinc the a rmonium*:Lorice method (5) in order to ietermine the relative 30D-axerted oy carbonaccous ant i:r,-.rjnus :bsmans. T-sts fcrsoluble 30D- and TOC were conducted on the filtrate Dassin-
* through a 0. 4 micron filter. All samolln; and anal-ses were
conducted in accordance with "Standard Methods for the Zxam-
ination of Water and Wastewater" -o) or "'!ethods for ChemicalAnalysis of Water and w;astes" '7).
640
o -j-c 0)
.1,
I f7
czU
6410-
FINDINGS
The sulfur oxidizing bacteria, Beggiatoa, which had beenabundant during low DO conditions, was sparsely present on onlythe first stage media under the new aerated conditions. Thebiomass growth was much thinner and more uniform in the aeratedstages, possibly due to physical stripping action of the air.
Hydraulic and organic loading rates are shown in Table 2.Wastewater characteristics (from composite samples), in and out
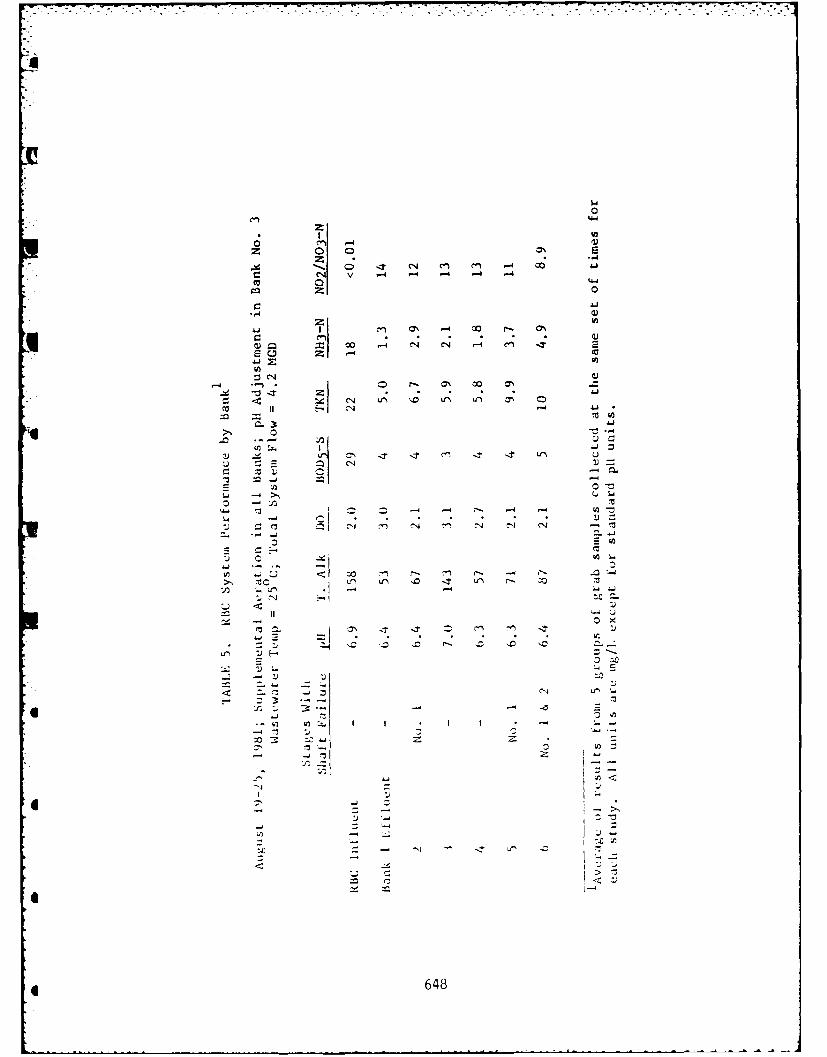
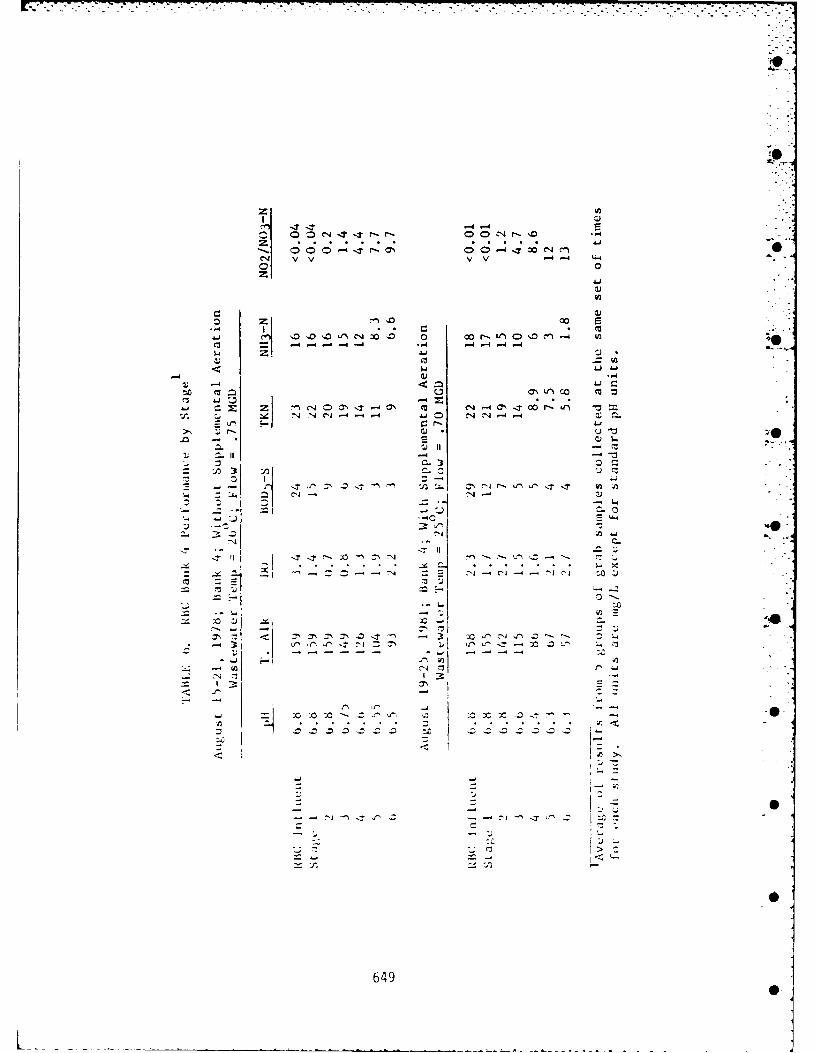
of the RBC system, and at the WWTP effluent are shown in Tables3 and 4. The performance (from grab samples) of individualbanks is shown in Table 5. Changes in wastewater characteristics(from grab samples) as it passes through each RBC stage are
shown in Tables 6-8 and Figures 3 and 4. BOD--S and NH -
removal ratEs in each stage are shown in Figures 5 and 6.
Loading and operating conditions were essentially the samefor both studies (Tables 2 and 3). The RBC system effiuentNH,-N concentrations were improved from 6.2 mg/L in 1978 to 2.1mgkL in 1981 because DO limiting conditions were eliminated bythe supplemental aeration (Tables 3 and 6, Figure 3). Had all36 RBC stages been operational, RBC system effluent NH 3-Nconcentrations would have been in the 1.3 to 1.8 mg/L rangeachieved by indivdual banks I and 4 (Table 5). As predicted byHitdlebaugh and Miller (2,3), the impact of the aeration on
BOD--S removal was not to increase the amount r moved (Table 3),but to concentrate removal in the first 2 stages Table 6,Figure 3) at a higher rate (Figure 5). Because BOD-5 removalwas occurring more efficiently, more space for aitrifyingorganisms was available in the early stages and nitrificationactually began in stage I (Table o, Figure 3) with tne peak
nitrification rate occurring in stage (Figure 5). AlthoughSBCD- and NH.-N removal organisms do compete for space, the
major facto limiting nitrification was the low wastewater DOlevels (Figure 1)). A minimum DO level of 2.0 mg/L ava'iable ac
the location where nitrifization is expected to occur has beensuggested by others i8). The design nitrification rate I9)was observed at the 2.5 ma/L DO level (Figures 5 and 6). Thelargest DO drop across any of the stages was across the stagewith the maximum nitrification rate (Figure 0). This is expectedsince NH -N removal requires 4.6 times as much DO as BoD--Sremoval E3). Mechanical reaeration from turning RBC mecia doesnot bring the DO level back up to 2.6 mgiL until 2 stages later
(Figure 5); therefore, supylemental aeration provided to stage 3
* would improve nitrification rates and ov-rall. N.- removal.
642
The improved NH -N removal by the RBC system can be seen3in the components of total BOD in the WWTP effluent (Table 4).
Before aeration, the nitrificagion process was continuing outthe end of the plant indicated by a total BOD of 11 mg/L and
5nitrogenous BOD of 7 mg/L (total minus carbonaceous). Withaeration, nitriiication shifted back up into the RBC systemindicated by a total BOD5 of 5 mg/L and nitrogenous BOD 5 of2 mg/L. 5
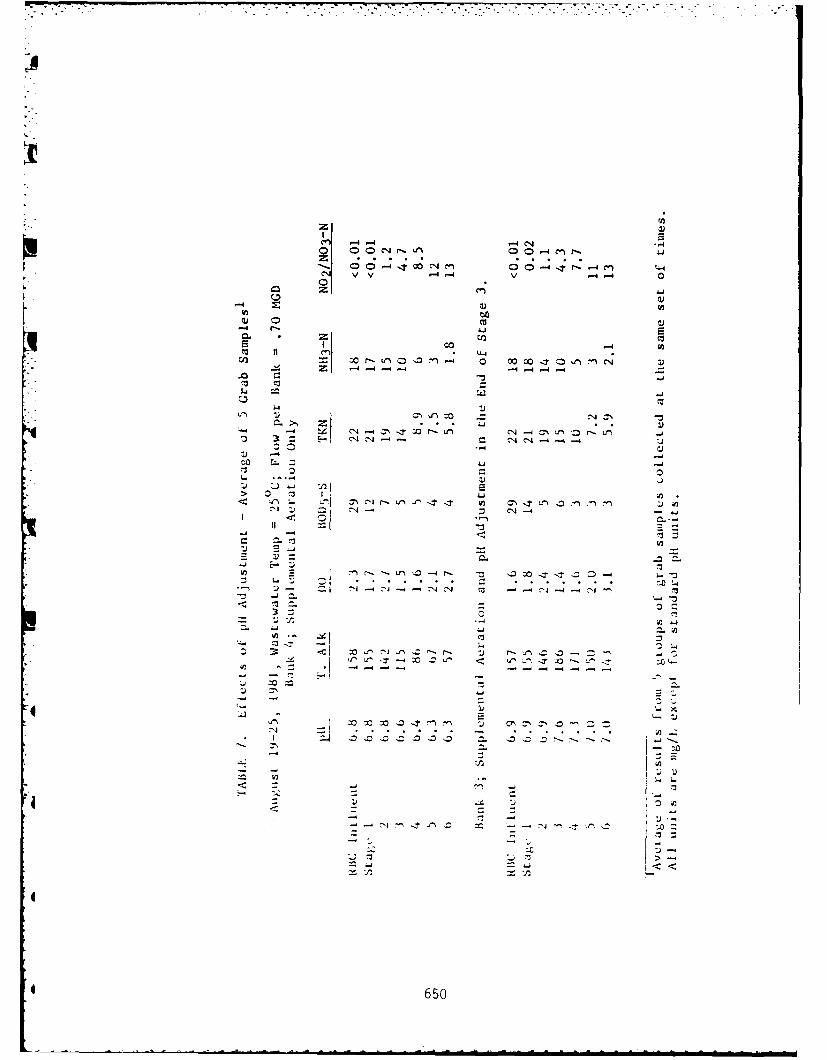
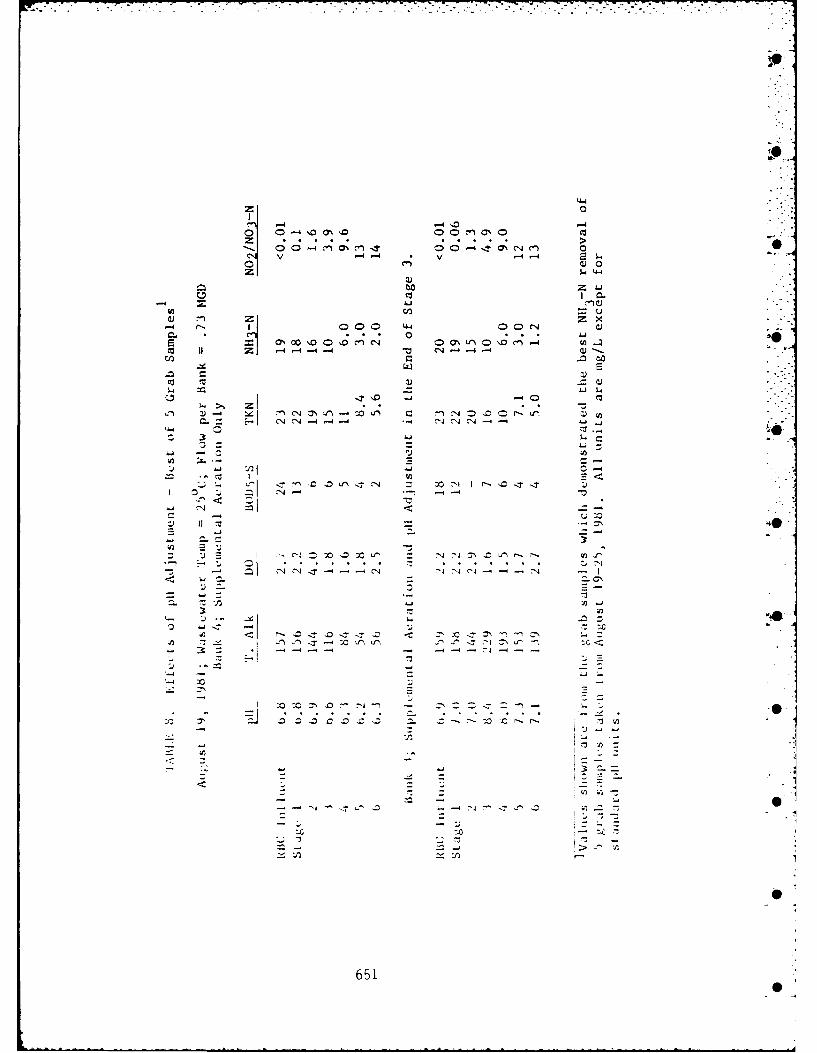
The effects of pH adjustment were disappointing becauseit is well documented that higher pH levels (8.0 to 8.5) areoptimum for nitrification (4). A side by side comparison ofbanks 3 and 4, showed no improvement in total NH -N removed(Table 7), although a different removal rate pattern wasobserved. The set of grab samples on August 19 did show an 11%improvement (Table 8); however, this was questionable becauseNO/INC -N levels did not support the NH -N levels. The majorreason for the poor performance was progably the wide pH fluct-uations (3.1 to 9.3) inherent in the chemical feed systemwhich did not let the nitrifying organisms acclimate to aconstant pH.
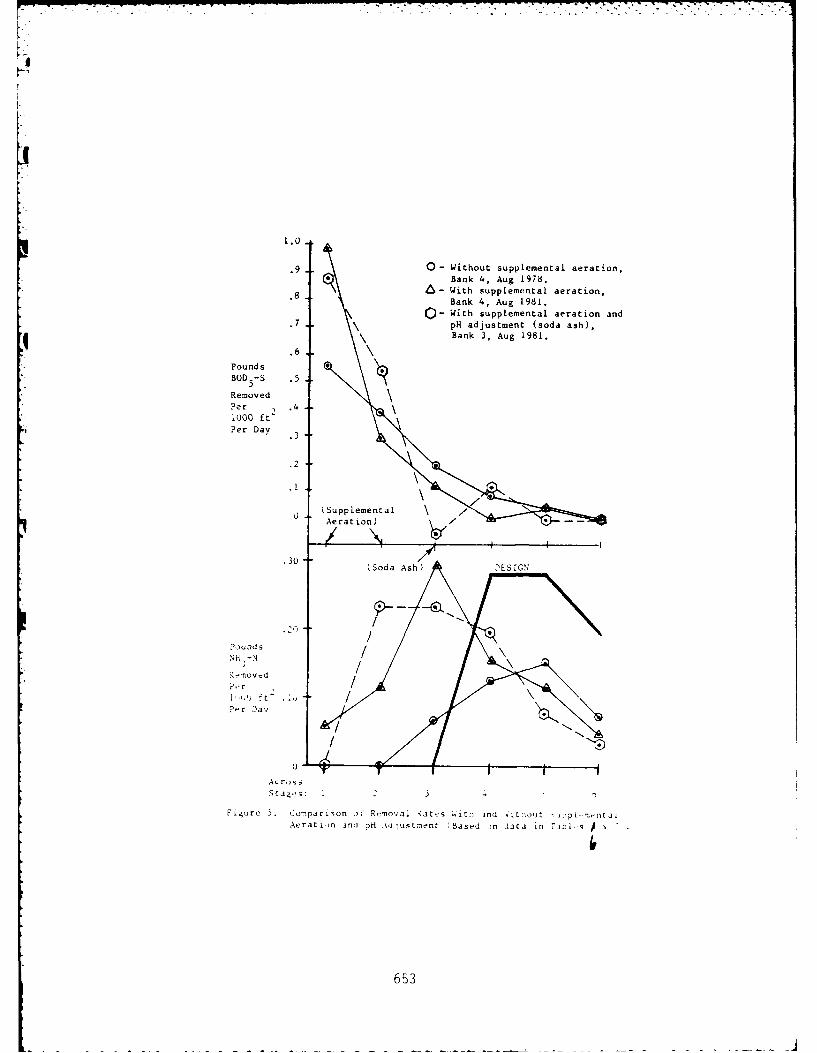
Amazingly, the maximum dqsign nitrification rate of 0.3lbs NH -N removed per 1000 ft' per day was observed at a PH of6.6 (Figures 4 and 5). The overall NH3-N removal of 86. was thesame as that found by Stratta and Long (4), but the maximumremoval rate was less than half of their observed value. Underdesign load conditions (6 MGD), pH adjustment may be needed toachieve the desired NH -N removal with existing media area.-
3
SU MARY
The supplemental aeratiop of the RBC system eliminated "nuisance organisms, enhanced'BOD -S and NH -N removal, and
t h3provided the operational flexibilty to control the thicknessof biomass growth on the media. Placement of air diffusers innot only BOD,-S removal stages, but also in NH -N removalstages should be considered. DO levels should ge maintained at2.5 mg/L in stages where maximum nitrification rates areexpected.
643
m 0
ACKNOWLEDGEMENT
The author would like to thank Mr. John A. Hitdlebaughand Major Roy D. Miller for their helpful advice in the design
of this study. A special thanks is extended to Mr. Charles I.Noss, Mr. Kenneth A. Bartgis, and Captain Edmund Kobylinskifrom the US Army Medical Bioengineering Research and Develop-
ment Laboratory for their efforts in support of the study.
U
The data shown in the following Tables and Figuresfrom the August 15-21, 1978 study (without supple-mental aeration) was extracted from the paperentitled "Full-Scale Rotating Biological Contactor
for Secondary Treatment," by John A. Hitdlebaughand Roy D. Miller, presented at the first National
Symposium/Workshop on Rotating Biological ContactorTechnology, Champion, PA (1980).
6
• 644
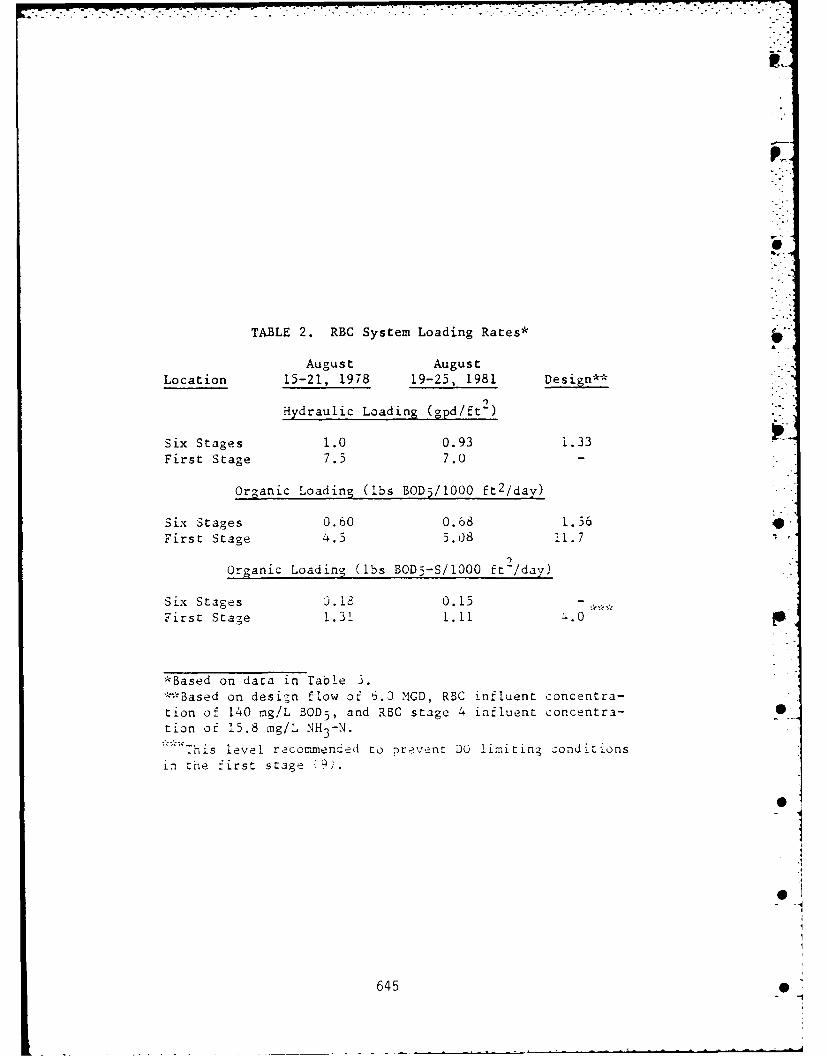
TABLE 2. RBC System Loading Rates*
August AugustLocation 15-21, 1978 19-25, 1981 Design**
Hydraulic Loading (gpd/ft-)
0 *. - ,
Six Stages 1.0 0.93 1.33First Stage 7.5 7.0
Organic Loading (lbs BOD5/10OO ft2/day)
Six Stages 0.60 0.68 1.56First Stage 4.5 5.08 11.7
2
organic Loading (lbs BOD-5-S/1000 ft /day)
Six Stages ).18 0.15First Stage 1.31 1.11 4.0
*Based on data in Table 3.
~3sdon desig-n flow of 6.3 MGD, RBG influent concentra-
- ,-
tnf 4 gLE 2. ad S st geL4ainuates onnra 0
Ltion 15.8rg/ -N98 1-2,18 ess* '
Fnti irst tage 7.5 .
Si645e .6 .8 .60"Firs Stge 45 508 1.7 ,.
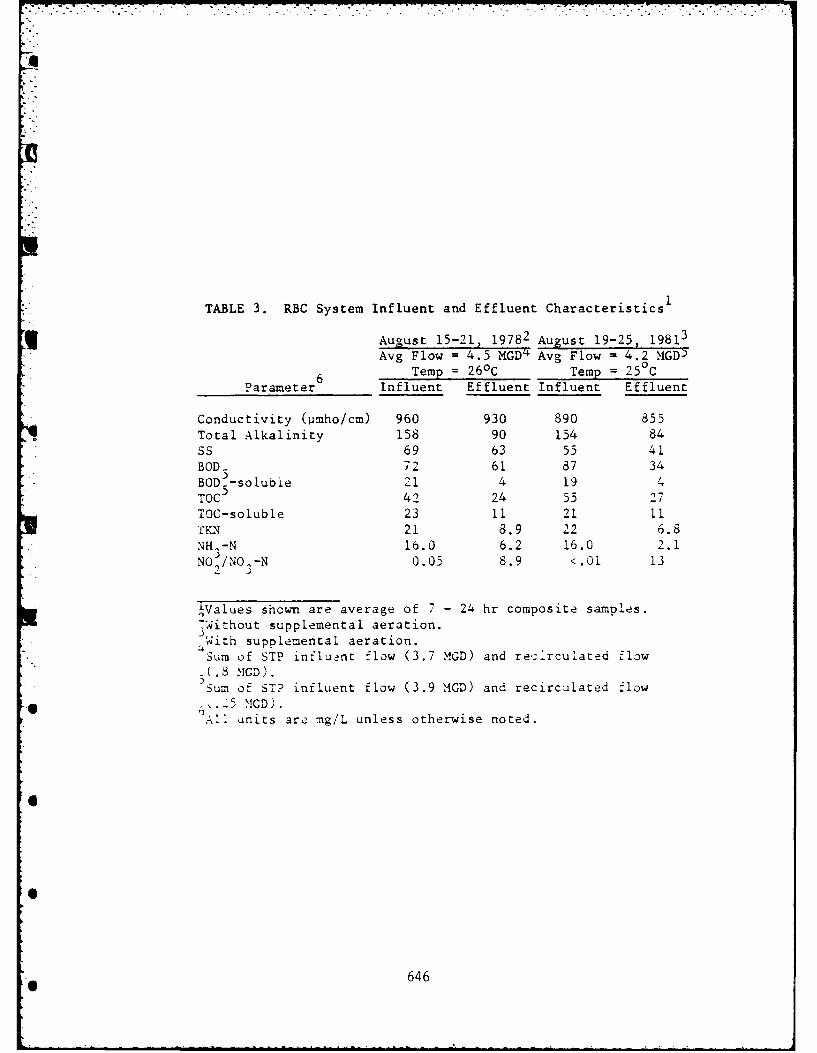
TABLE 3. RBC System Influent and Effluent Characteristics
August 15-21, 19782 August 19-25, 19813
Avg Flow = 4.5 MGD4 Avg Flow 04.2 MGD
Temp = 260 C Temp = 25°C
Parameter Influent Effluent Influent Effluent
Conductivity (Pmho/cm) 960 930 890 855Total Alkalinity 158 90 154 84
SS 69 63 55 41BOD_ 72 61 87 34
BOD -solubie 21 4 19 4
TOC5 42 24 55 27TOC-soluble 23 11 21 11
TFN 21 8.9 22 6.8NH--N 16.0 6.2 16.0 2.1
NO/NO3-N 0.05 8.9 <.01 13
lValues shown are average of 7 - 24 hr composite samples.
3Without supplemental aeration.With supplemental aeration.
Sum of STP influnt flow (3.7 MGD) and re:ilrculated flow
.8 MGD) .)Sum of ST? influent flow (3.9 MGD) and recirculated flow
S.25 MCD).DAll anits are mg/'L unless otherwise noted.
646
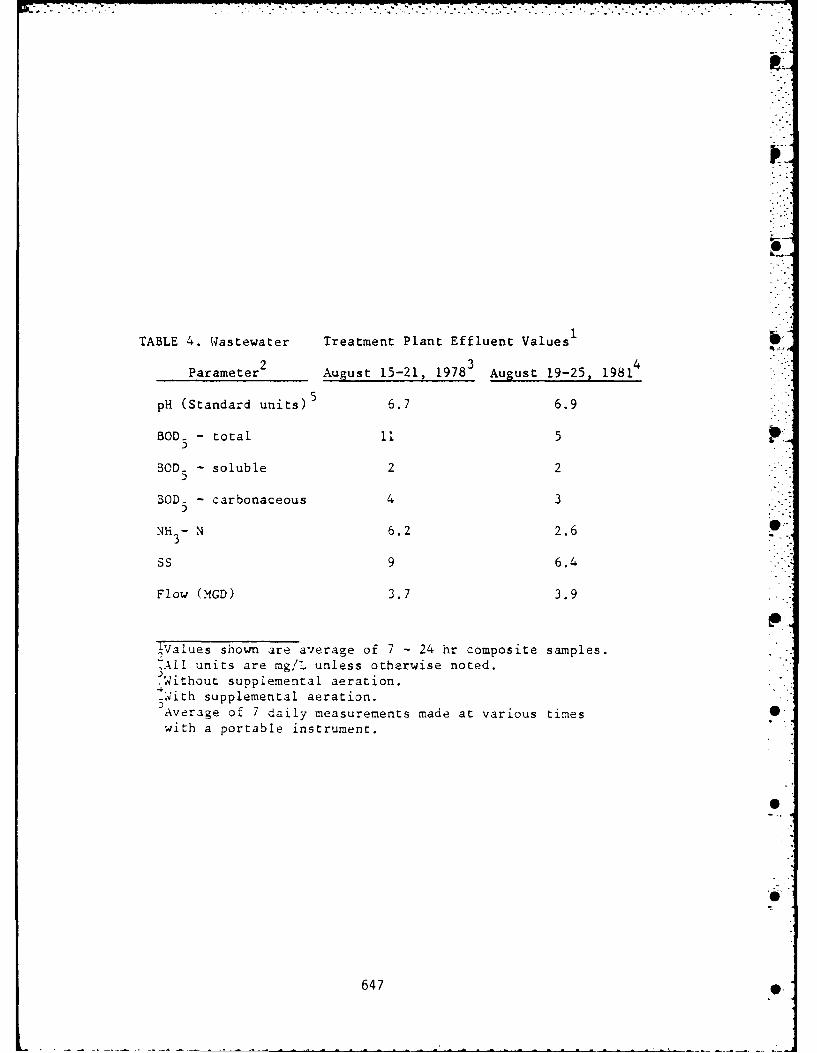
TABLE 4. Wastewater Treatment Plant Effluent Values1
23 4Parameter2 August 15-21, 1978 August 19-25, 1981
PH (Standard units) 5 6.7 6.9
BOD. - total 11 5
BCD.- soluble 2 2
30D.- carbonaceous 4 3
NH- 6.2 2.603
SS 9 6.4
Flow (MGD) 3. 7 3.9
p4values shown are average of 7 - 24 hr composite samples.
3 All units are rag!L unless otherwise noted.~Without suplemental aeration.-iith supplemental aeration.Average of 7 daily measurements made at various times0with a portable instrument.
647
00
z 0
o1 00 f
s u~ ZI --
V4 C -4 .4 -T% -4
03 0zi
U
C...'
'6648
~~~NI~- vVV V-4-4-
CC
Cu I'- v v- "4.4 -4-
-4-4-4-
-do
CI C... CI C 4 ;
47 Lr- *l I V
-1 - Scad~
-'0
649' -- NN 0Z
~4 ~4 ~4 N.'
04 On c 0 m 1-%
v v v - 1-V -4 0
0)
'- co 4 U
.z. -4 -. ' 2
c, zCr z 1
c-j% C- z r- -) Jo--- 0T W) O
1.4C1 CO
Qt
c. -Z
Cl 0 0
0650
C4 -4 -44-400
QJ
CtCL
-4 r, coo L C 'J
S ,. oC 0 a,
cjcu
C-4 ~ 4-J --- 4C ~
0 Z)-7 -
4-D -Z -7 c I
I~: 0n Ul < , -
~ -= -
ii651
IA
4.1- Without supplemental aeration.~-With supplemental aeration.
3.0
I ra tyo
B;,' End .)f
30
2 -r -av
I . Kii>;i652
!
.9 0- Without supplemental aeration,Bank 4, Aug 1978.
.- With supplemental aeration,
Bank 4, Aug 1981.I- With supplemental aeration and
.7 pH adjustment (soda ash),"o s .6 Bank 3, Aug 1981.
PoundsBOD5-S .5
RemovedPer .4
1000 ft-Per Day
.3
.2
( iSupplemental \Aeration)
.30(Soda Ash) DESIGN
?ounds /
Remov d? ,r, r
?or D\ay "
Ac rs 5Stages: 1 2 3 4
Fi.ure i. 0'pdrison o- R~moval ates 4itn and .i iut :p-n
Aeration 3nd pH AuIustfment (Based )n Jata in 7imDi--s
653
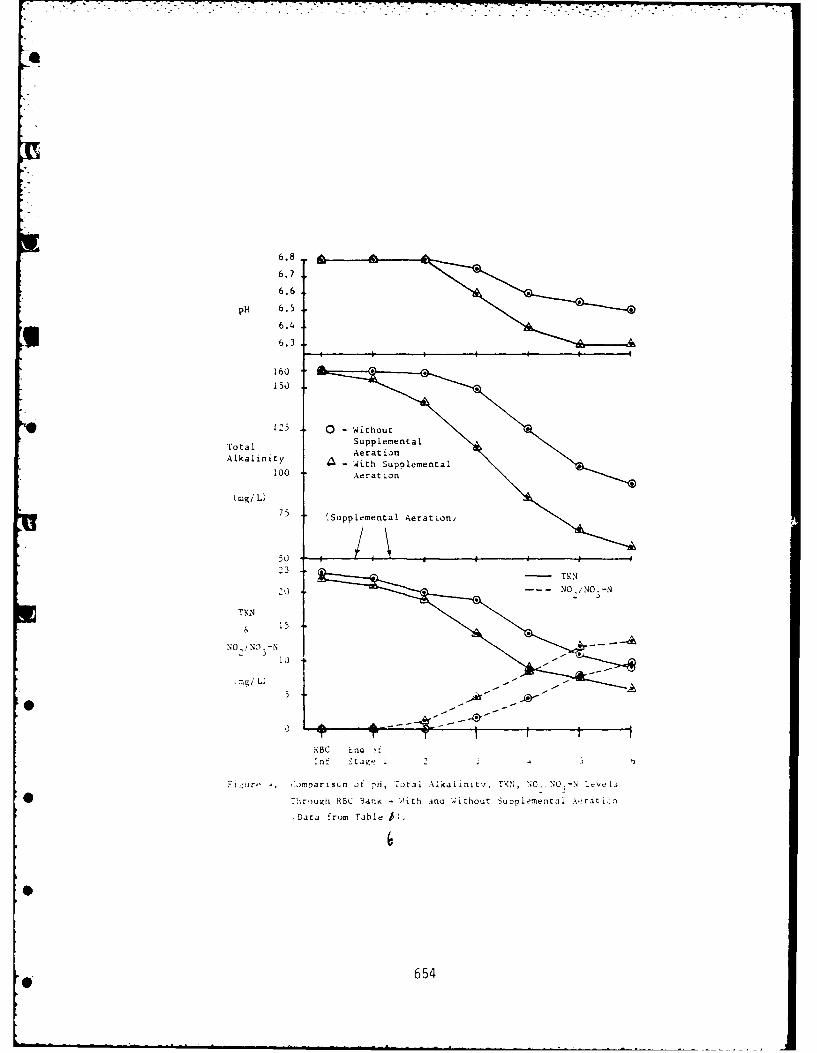
6.7
6.6
PH 6.5
6.4
6.3
Total Supplemental
Alkalinity A- With Supolemental
100 Aeration
(mog/ L
75 Supplemental Aeration,
23 T
,0~ NO I NO 3 -N
i5
NO, ,NO3-N
mgL)
0 0
RBC no 'E
F., ro' -.. )flDaisc fl -fl 7.)tai ,AkI.nitv, DXNO. NO;-N Leve Is
0Through RBC 3ank li 4th ana ;ichout Sutple'netmtal i rt~
Data nrm Table tK).
0 654
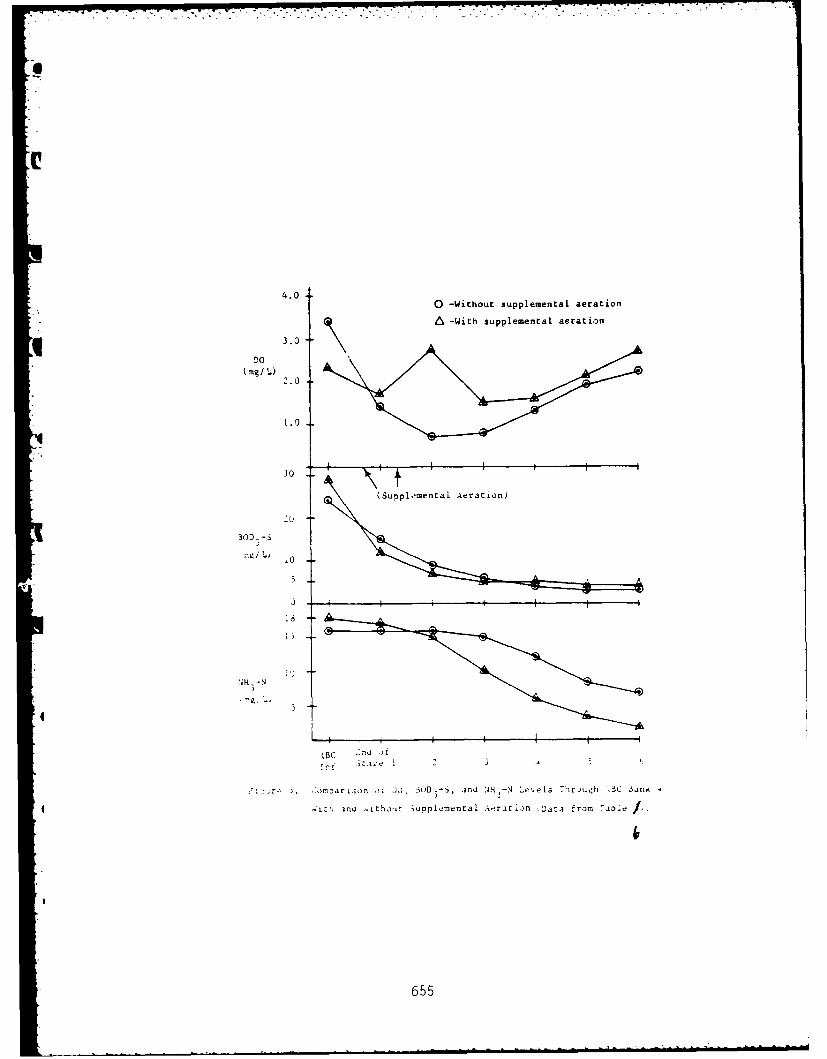
4.00 -Without supplemental aeration
3.0 ~-With supplemental aeration
(Mg/i.2.0
1.0
30
10 (Supple~mental Aeration)
30DX--i
' rf
3o. Sad-HN'4:e l rj~i .C 3n
-i5w -Ji h u u p ,me c l A r c o ~j a f o a I
65
ABBREVIATIONS
BOD- 5-day total biochemical oxygen demand
BOD -S Soluble BOD.5
CaCO 3 Calcium carbonate
cfm Cubic feet per minute
DO Dissolved oxygen
Eff Effluent
FC Fecal coliform
ft2 Square feet
gal Gallon~2
gpd/ft Gallons per day per square foot
gpm Gallons per minute
in Inch
Inf Influent
lbs Pounds
mg/L Milligram per liter
MGD Million gallons per day
ml Milliliter
gmho/cm Micromhos per centimeter
N Nitrogen
NH,-N A onia expressed as nitrogen
NOiNO -N Nitrite plus nitrate expressed as nitrogen3
pH Negativ-e logarithm of hydrogen ion concentration
SS Susoended solids
T Aik Total alkalinity
Temp jC Temperature in degrees centigrade
TK, Total Kjeldahl nitrogen
TCC Total organic carbon
ToC-S Soluble TOC
656
REFERENCES
1. Hitdlebaugh, J.A., "Phase I, Water Quality EngineeringSpecial Study No. 32-24-0116-79, Sewage Treatment PlantEvaluation, Summer Conditions, 14-24 August and 25-29September, 1978", U.S. Army Environmental Hygiene Agency(1979).
2. Hitdlebaugh, J.A. and Miller, R.D., "Full-Scale RotatingBiological Contactor for Secondary Treatment and Nitrifi-cation", Proceedings: First National Symposium/Workshop onRotating Biological Contactor Technology, Champion, PA(1980).
3. Hitdlebaugh, J.A. and Miller, R.D., "Operating Problemswith Rotating Biological Contactors", Jour. Water Poll.Control Fed., 53, 1283 (1981).
4. Stratta, J.M. and Long, D.A., "Nitrification EnhancementThrough pH Control with Rotating Biological Contactors",
Final Report, Institute for Research on Land and WaterResources, The Pennsylvania State University (1981).Siddigi, R.H., et al., "Elimination of Nitrification in theBOD Determination with 0.1 M Ammonia Nitrogen", Jour. WaterPoll. Control Fed., 39, 579 (1967).
6. "Standard Methods for the Examination of Water and Waste-water", 15th Edition, American Public Health Association,Washington, D.C. (1980).
7. "Methods for Chemical Analysis of Water and Wastes", U.S.Environ. Protection Agency, EPA-625-16-74-003 (1974).
S. "Process Design Manual for Nitrogen Control", U.S. Environ.Protection Agency Tech. Transfer (1975).
. Autotrol Corporation, "Wastewater Treatment Systen DesignManual", Milwaukee, W! (1979).
657
APIQICATL .)N OF ROTAR~Y SCREENS, RIOLOGICAI,CU'4PACIORS, AND GAVITY PLATE 5 ETTLERS To
TrREAT 6NASr~vATERS IN HOBOKEN AND) NORTHBERGFIN, NE~W JERSEY
Jo3;c. h M'. Lyrncn, P. E.0 Pr esi dentM~a* ,', Lvrynn and 1A-;soc)iates, Inc. Hloboken, N.J.
.S .A.
Ji,,nrn Min Huani, ?.L.P r cje.c t 11ana ye r>iayo, Lvrn.Thj arid Az-sociate.,, Inc. ioboken, NJU . S . A.
C.I.). jtD..e.,Pn.YanaSenior nv: ormenra1 Engineer
'4Vo , L,,rich arnd AssociZAte!, Ic. Hoin-oken, N.J.;j. S . A.
At flow-throuqil copc C)I" - 5lr L syste--, cz)mpoS#?d ofrotary screons, uioloq ical c- ntactors, and gravityplate settlers was tested -v Ma o, Lync:h and Asso-cl.ates at a tull-scale- ipilot plant in Hobokern, NewJemfr wastewat .r treatment.e o T1hi'2 results of
c!he pilot plant study was applied to tre North Ber-gen Central Sfnwer-3,e TreaCment Plant , ;,iorth B~ergen,New Jersey which was- ais.) cs i gsei, h", Mayu, LynchAnd Asisociates. The Ut it -1 t iunr of th is1f low-tfirough b y;t- er m ro0r .11n j 1i w1)vII wastewat-ert rjatment hd., b een dfoimvurist rati'd '1CCeSc fil . at t! e-Nojr th Bergn SP'I. Tfni ,is 1the" - f ir St f llI-sFCal epl ant, adopt i ny the conicept of r. Low--th roughn crnkpact.;ystem :.n the world.
K 658
'['ne f low-th rough systein is composed ofrotoscceen, biological contactors and gravity platesettlers. vnen wastewater flows into this system,particles greater than 0.02 inch are reinoved byrotoscreen first. The rotoscreen, wnich replacesof grit cnamber and primary settling tank inconventional treatment system, has the function ofprimary treatment. The effluent froin the roto-screen then flows tihrouyh tne biological contactorswhich could be either rotating biologicalcontactors (RBC) or trickling filters. Theevaluation of treatment levels at various rates ofhydraulic loadings And biological contactor stageswas also conducted during the course of this study.The results of the tests were used to establishguidelines for the design of the North BergenCentral Sewage Treat,nent Plant.
Some advantages of a flow-through systemconsisting of rotoscreens, biological contactor andgravity plate settlers to wastewater treatmentinclude: reduced land requirements, reducedcapital costs as well as a reduction in operationand maintenance costs when compared to aconiventional activated sludge process facilities;ability to meet secondary treatment requirements;ability to withstand hydraulic ana organic surges;compatibility in goou settling characteristics ofslougned sludge with the gravity plate settlers;ease of operation and elimination of wind andthermal disturbances. These and ot niercharacteristics of the systm were examined duringour evaluation of pilot the plant study, theoperation of the full scale North Bergen CentralSewage Treatment Plant demonstrated it.
659
Tne object o tiiis paper is to present theresults o[ an investigation into the feasibilitystudy ot a E low-through systeem for wastewatertreat ment as ihown by results from the HoookenPilot Plant. The operation data of North BergenCentrdil Sewage Treatntnt Plant, which was designedand incorporates the results of the Hoboken PilotPlant study, were collected to support the conceptof tiie fLow-through system. Reluctant dataconcern ing ()oth, the pilot plant study andtuL-scale treatmtent plant operation, are presentedin tuis paper.
L
660
. . .
I.
PLANT OPERATION
Hoboken Pilot Plant
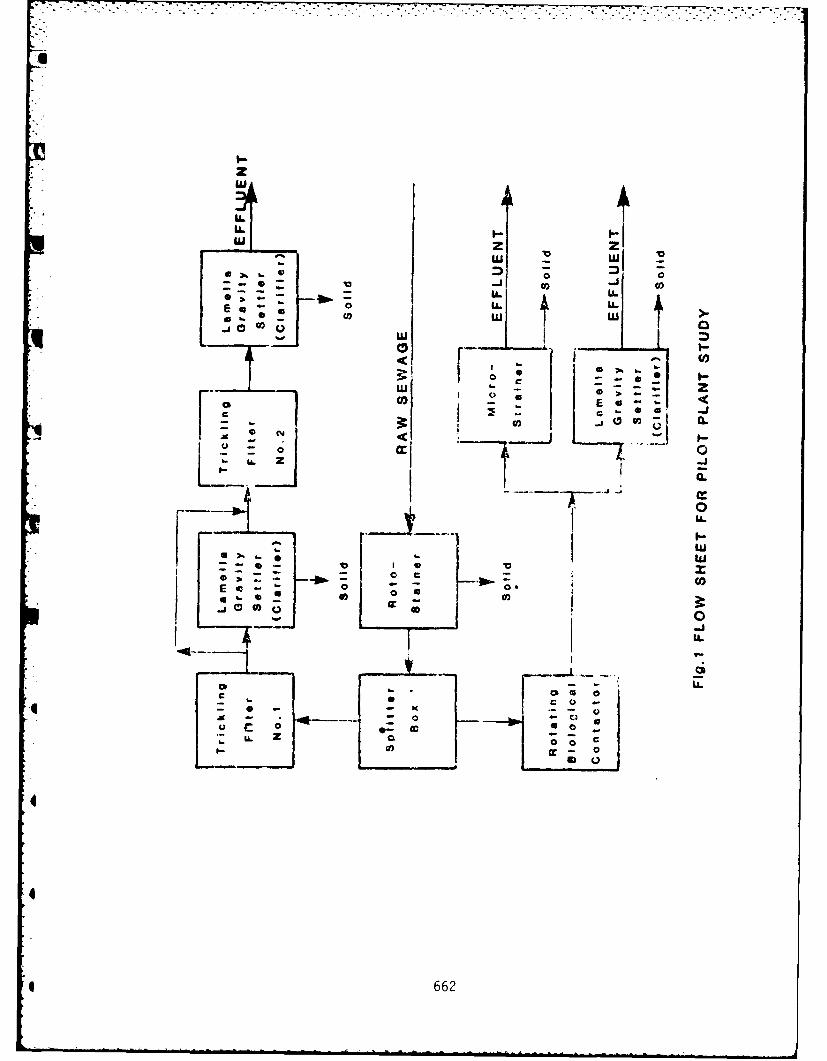
The pilot plant was established within thesite of the Hoboken Treatment Flant, Hoboken, NewJersey. There were two flow-throcah treatment con-figurations in 'ne pilot plant tested in full scaleope,. ations to establish treatability. The firstconfiguration consisted of a rotoscreen, two-stagetrickling filter and a gravity plate settler. Thesecond configuration was essentially the sameexcepL that the two-stage trickling filter wasreplaced by a rotating biological contactor. Theraw wastewater, which flowed to the full-scalepiLot plants by a splitter box shown in Fig I, waspumped from the head end of the treatment plantjust ahead ot grit chamoers. In this way no solidswould be removed prior to the rotoscreen. Therotoscreen is a stainless steel drum of which theperiphery is covered with a stainless steel meshwith 0.02 inch openings. The unit is so designedthat the sewage passes through the screen and thesolid particles larger than 0.02 inches becomeimpinged upon the screen. As the drum rotates thesolids are scraped off the screen thereby cleaningthe screen. The cleaned portion of screen is Lhenrotated until it again comes into contact with theraw sewage.
The sewage passing through the rotoscreen wasdivided between the trickling filters and therotating biological contactor. The trickling fil-ter was constructed of steel containing four sec-tions. Each section has eight foot depth packedwitti B.t. Goodrich vinyl core media. In order todisperse the sewage evenly across the top of thetrickling filter, 16 evenly spaced nozzles wereinstalled. The gravity of flow of sewage ovr themedia forms a biological slime which provides themedium for the biological treatment. The biologi-cally treated sewage then flowed into the LAMELLAgravity settler manufactured by the Parkson Cor-pordtion. This unit separates the biologicalsolids and other solids from the sewage by means ofsedimentation between inclined plates within theunit.
661
zw w
w) VLL LL.
LL-lu~l* - h0 0.0J 0;:: zL
0 * *
_j CD 0) O
- - 0- s~ Z
I-. L .
662~
The second means of biological treatmenttested was the rotating biological contactor (orbio-disc). The bio-disc consists of circularpiastic sheets revolving within a hemi-cylindricaltanK, through the sewage flows. The plastic sheetsor disks rotate through the sewage growing thebiological slime for treatment. The disk used forthis pilot plant was 11'-8" long, 12'-10" wide.The unit was divided into five equal stages eachcontaining 8,190 ft2 of media surface. Thecircular media sheets were 1'-9" in diameter. Therotating bio-disc unit was manufactured by EPCO-Hormel Co. During the study various stages - two,three, tour and five - RBC's were utilized.
The effLuent from the rotating bio-disc thenflowed by gravity to the microstrainer or LAMELLAgravity settler. The microstrainer was tested tosee if tne biological solids produced by the rota-ting oio-disc could be removed or not. The mirco-strainer has a drum covered with a fine mesh havingan opening of 35 microns. The microstrainer wasmanufactured by ZURN.
The rotating bio-disc, microstrainer and elec-trical controls were contained within a 24' by 16'oy 16' wood building to protect them from the ele-ments.
24 hour composite samples were analyzed forBUD 5 , dissolved oxygen, settlable solids and sus-pended solids. Temperature and pH were taken fromplant records and grab samples. Those analyseswere performed in accordance with Standard Methods(2).
North Bergen Central Sewage Treatment Plant
Tne Central Sewage Treatment Plant in NorthBergen, New Jersey is an application of rotaryscreens, biological contactors, and gravity platesettlers as a process for treatment of wastewater.
663
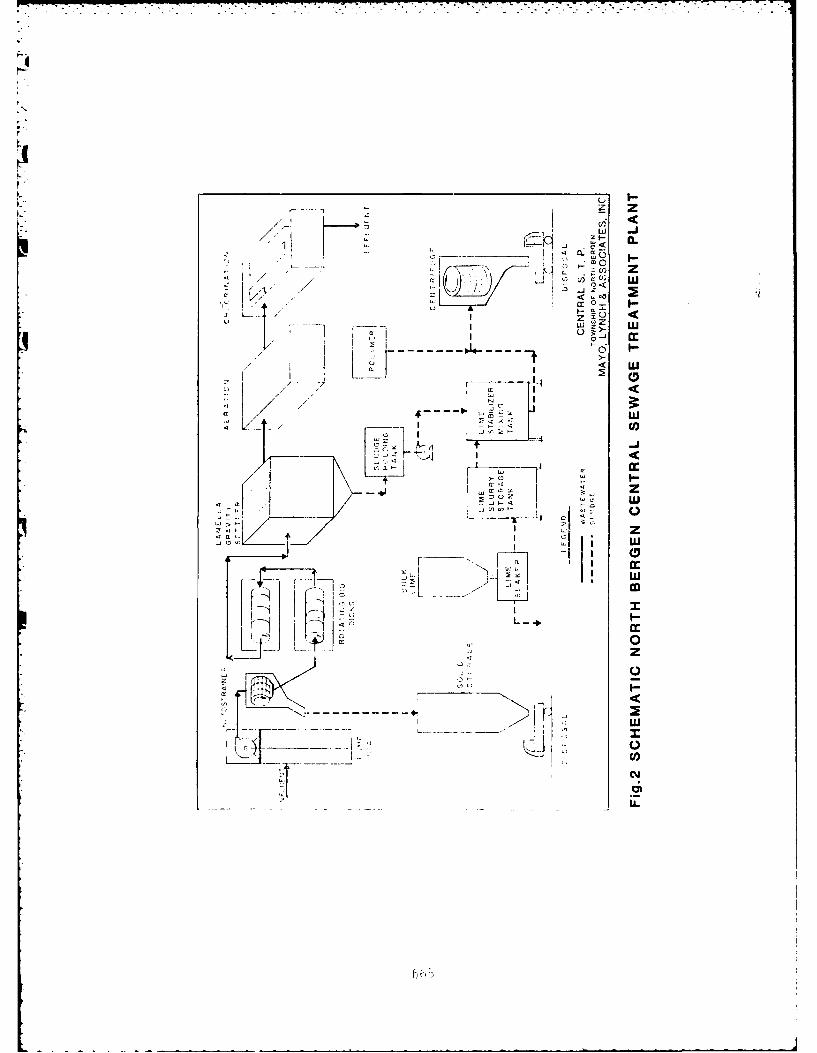
The treatment plant consists of the followingmajor treatment units: bar screens, lift station,self cleaning fine rotary screen for primary gritand suspended solids reduction; rotating bio-discsystem for biological treatment; gravity platesettlers for separation of the biomass andsuspended solids from the rotating bio-disc systeineffluent; post aeration to increase dissolvedoxygen concentration in the stream; andchlorination system for the final effluentdisinfection. This whole process is shown in Fig.2.
The plant uses a rotary self-cleaning screenin place of the conventional grit chamber andprimary clarifiers. The HydrocyclonicsCorporation's Model RSA-36120 with 0.02" openingwas selected for design because it will pass moreflow and give an effluent with almost identicallevels of suspended solids.
The rotating bio-disc system was designed tolower the soluble BOO to 10 mq/l. A hydraulicapplication rate of 2.4 gpd/ft . is expected toaccomplish this, using a two stage arrangement toassure that the system be kept aerobic. At thedesign flow rate, a minimum of 4.16 million squarefeet of media surface area is expected to providethis degree of treatment. This amount of surfacearea can be provided by using 32 units arranged as16 flow streams of two stages in which the area oftne first stage is 104,000 ft 2 per shaft and thearea ot the second stage is 156,000 ft2 pershaft. Each shaft of discs is installed in a steel
0 tank with each such unit serving as a stage oftreatment. The shafts will be rotated at a speedof 1.6 rpm.
The rotating bio-disc system installed inthe North Bergen Central Treatment Plant can be
O summarized as follows:
6
664
// <1 _ _.._ _
'
/iI-/ // LN5
L5 L
, , . I-
I L . . ... --. 'w
<4 -
- ~II
-F. - - - -
--------
Li
EU)N
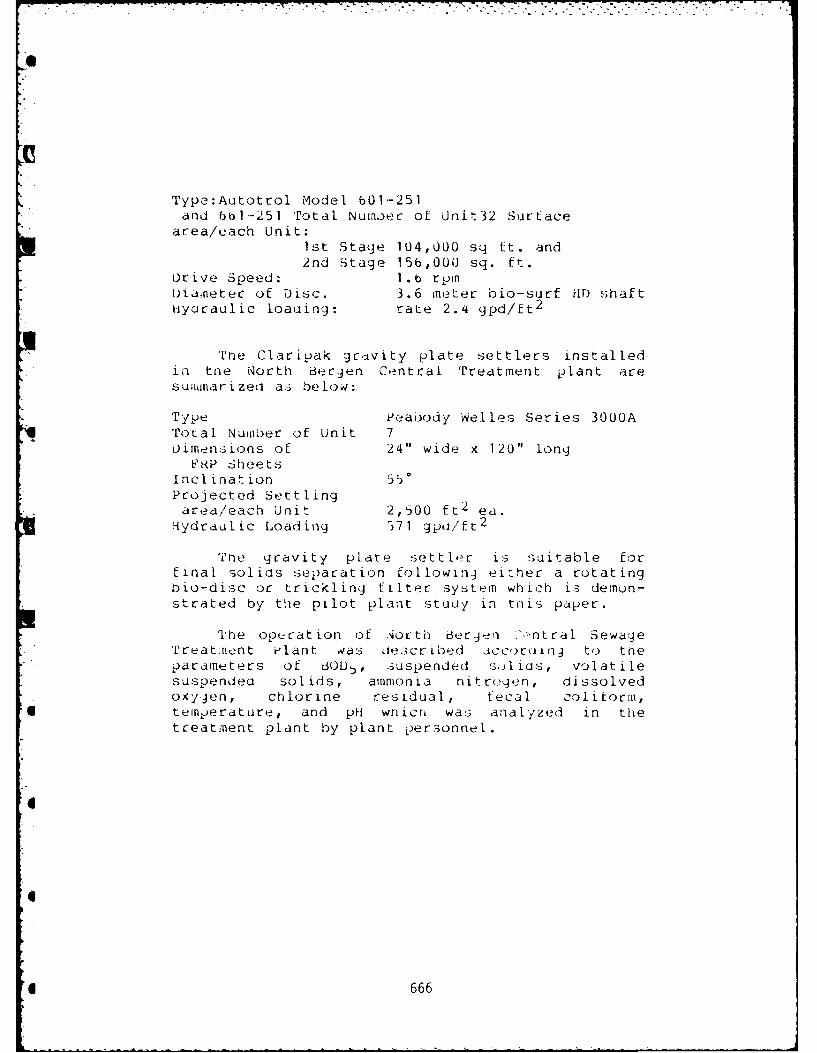
Type:Autotrol Model b01-251and 6bl.-251 Total Numoer of Unit32 Surface
area/each Unit:Ist Stage 104,000 sq ft. and2nd Stage 156,000 sq. ft.
Drive Speed: 1.b r pinDianeter of Disc. 3.6 meter bio-surf HD shafthyaraulic loauing: rate 2.4 gpd/ft 2
The Claripak gcivity plate settlers installedin tne North Bergen Central Treatment plant aresummarized as below:
Type Peaoody Welles Series 3000ATotal Number of Unit 7[Dimnensions of 24" wide x 120" long
FRP SheetsInclination 550Projected Settlingarea/each Unit 2,500 ft2 ed.
Hydraulic Loading 371 gpd/ft 2
Tne gravity pLate settler is suitable forfinal solids separation followinj either a rotatingbio-disc or trickling filter system which i3 demon-strated by the pilot plant study i:n tnis paper.
The opucation of .orth Berg#n -'ntral SewageTreatment lant 4as described Ac r( 1 n j to theparameters of BOD 5 , suspended ;,ul ids, volatilesuspendeo solids, ammonia nitrogen, dissolvedoxyjen, chlorine residual, fecal coliform,
* temperature, and pH wnich was analyzed in thetreatment plant by plant personnel.
6
* 666
RIBSUTS AND DISCUSSIONS
Hioook,2n Pilot Plant Study
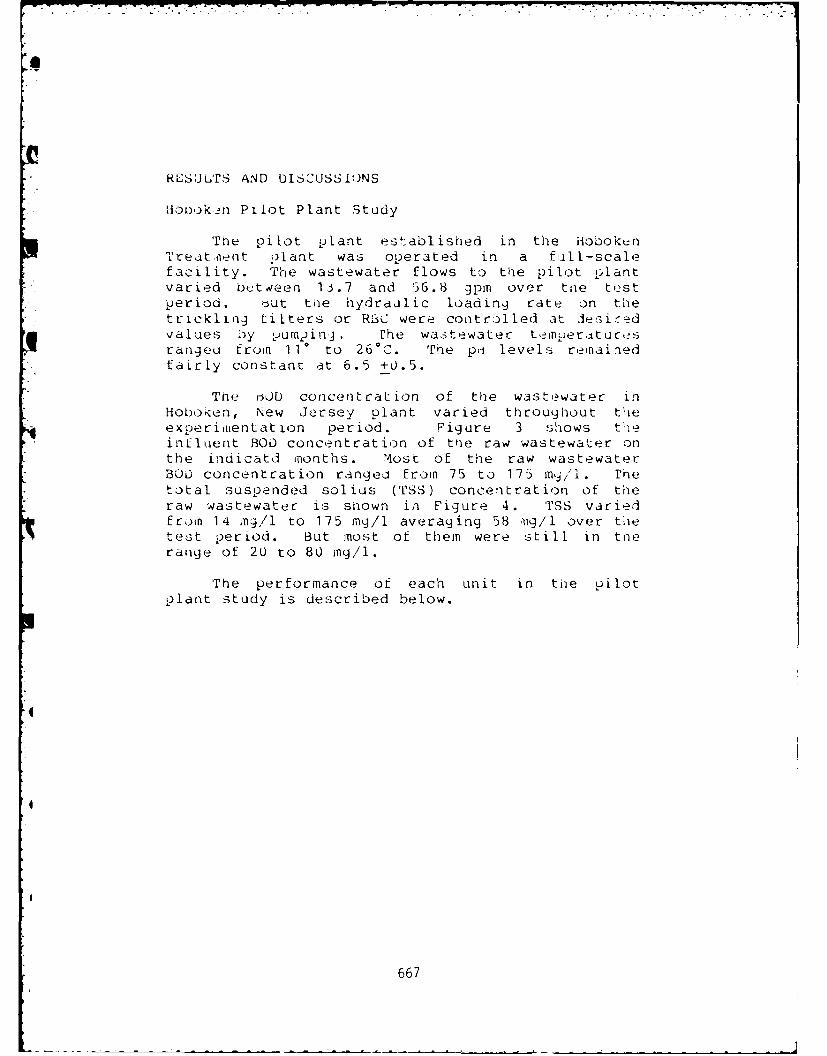
Tne pilot plant established in th e HobokenTrea t -ie(It plIan t was operated in a f iIlI-scale
facility. The wastewater flows to the pilot plantvaried btteen 1 3.7 and G6.8 gpin ov er tcie testper iod . out tvie hydraulic load ing rat e on thetcicklinj tiLters or RI C were controlled at les3iredv al1ies by p u ;-)in3 j he waste-watec t einue rAtuLcc, sr aij e u tfroi 1 10 to 2 600'. Thre pii levels remai.-ldfairly constant at 6.5 +0.5.
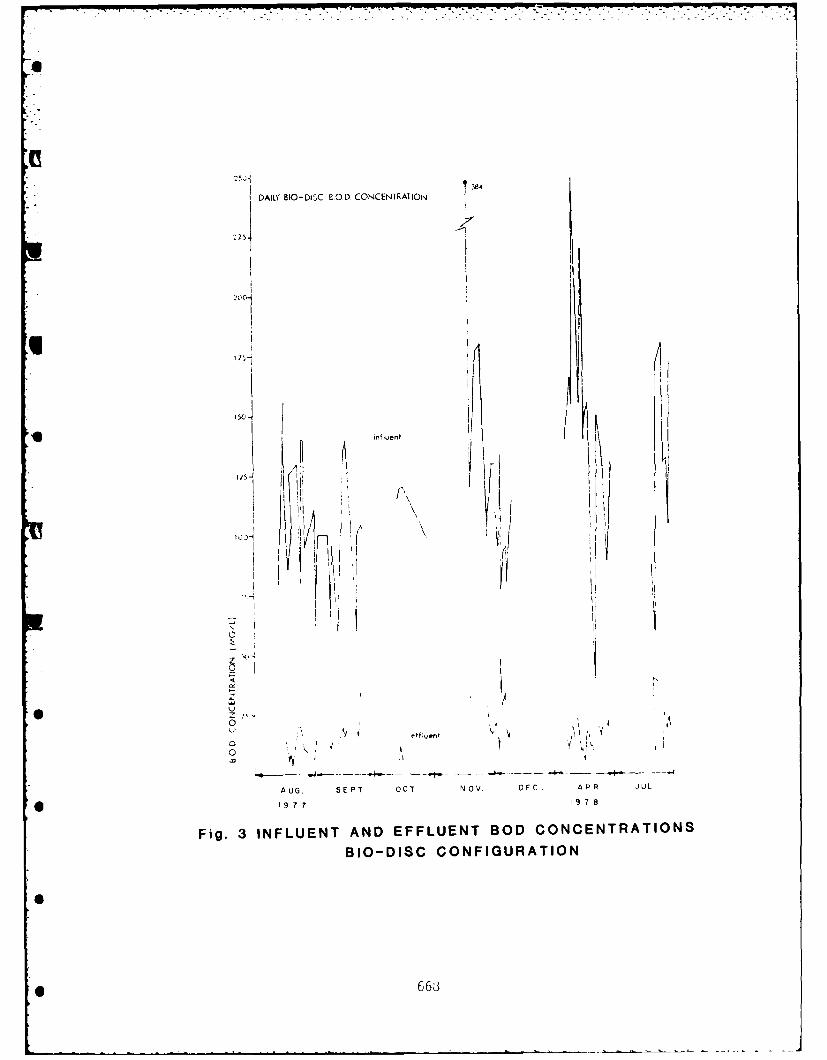
The riQU) concentration of the wastewaterc inHobo~aen, New Jersey plant varied throughout theexperiidmentatlon period. Figure 3 shows t!"einfluent BOD concentration of tthe raw wastewater onthe inuicattd i-torits. Most of the raw wastewaterBOO) conicentration rangedl froin 75 to 175 %1T1'. rhetotal suspended solicis ('VSS) concentration of theraw wastewater is shown ia Figure 4. TUSS variedfrom 14 mq/i to 175 mg/l averaging 58 iig/l over thietest period. But most of themn were still in ti-erange of 20 to 80 my/i.
The performance of each uin it i n the pilotplant study is described below.
667
DAILY 81O-DISC EO.D CONCENrRA1 ION
4
2L
Oti.An
A UG E T. o./.NO , 4 U191 7197-
Fi. IF U N ANDI~n EF L E T B O C NT A I N
BIO-DSC CNFIGUATIO

-I
DAILY BIO- DISC T S S. CONCENTRArION
140"
120
I "I
A f I ,, , ,
I O
Lf
A UG,. S E PT. OC T. NO0V. D E C. A P R. JUL.1977 197
Fig.4 INFLUENT AND EFFLUENT TSS CONCENTRATIONS
BIO-DISC CONFIGURATION
669
Rotoscreen (Rotostrainer)
The openings in the rotoscreen were 0.02inches against a flow ranging from 13.7 to 56.6gpin. All solids larger than 0.02 inches were re-moved. The influent suspended solids concentrationranged from 12 to 162 my/l, averaging 75 mg/l overthe testing period in April, 1978. The effluentreadings from the rotoscreen for suspended solidsranged from 5 to 149 mg/l, averaging 65.6 mg/l.The average percentage removal for suspended solidsis 7.7%. The actual levels for the influent sus-
*[ pended solids should be somewhat higher than thevalues indicated in the report. This conditionstens froin the fact that the samp±ing devices usedto record the data were not capable of acceptinggross vegetable and fecal matter found in the rawsewage influent samples. This restriction in thesize of particles accepted by the sampler wouldproduce lower than actual results in the influentbut would have little effect on the effluent re-sults. Actual suspended solids removal of 15 to2U% nave been documented elsewhere (3). It isanticipated that the actual removals were higherthan the pilot plant test data indicated. TheNorth Bergen treatment plant design was based on
20% suspended solids removal by the rotoscreen.The actual operations of rotoscreen in the NorthBergen Central Sewage Treatment Plant fron October,1981 to January 1982 are shown in Taole 9 in whichit snows average suspended solids removal was28.9%.
Compared to the primary settling tank, the ro-* toscreen can remove less suspended solids. How-
ever, it does not significantly affect theper formance of trickling filter or rotatingbio-disc. The BOD load applied to a tricklingfilter or rotating bio-disc does not include toefraction which is included in a settleable solids.
* Therefore, the rotoscreen removes less suspendedsolids than does a primary settling tank, triis willnot signficantly increase the BOD loading to the
670
tvickling filter or rotating bio-disc process. Allinfluent settleable BOD is not required to be re-moved in tne primary treatment unit as long as itis not solids which can plug the media and inter-fere with the biological activity. The settleablesolicis wnich are not removed by rotoscreen will besettled in tne secondary clarifier.
Trickling Filter
A plastic media trickling filter was used inthis study. The effluent from the rotoscreen wasfed to the trickling filter. The BOD and SS re-movals by the trickling filter are shown in Tables3 and 4. The. trickling filter effluent sample wastreated to simulate a final clarifier. The com-posit sample of the trickling filter was settled ina one-liter graduated cylinder for 60 or 30 minutesdepending on BOD or SS analyses. It was found dur-ing S testing with the LAMELLA gravity settlerthat the 30 minute settling test more closely siinu-latej toe LAMELLA gravity settler, then the 60minute settling was used to simulate the finalclarifier. 'herefore, 30 minute settling was usedfor SS analyses, and 60 minutes settling for BODanalyses.
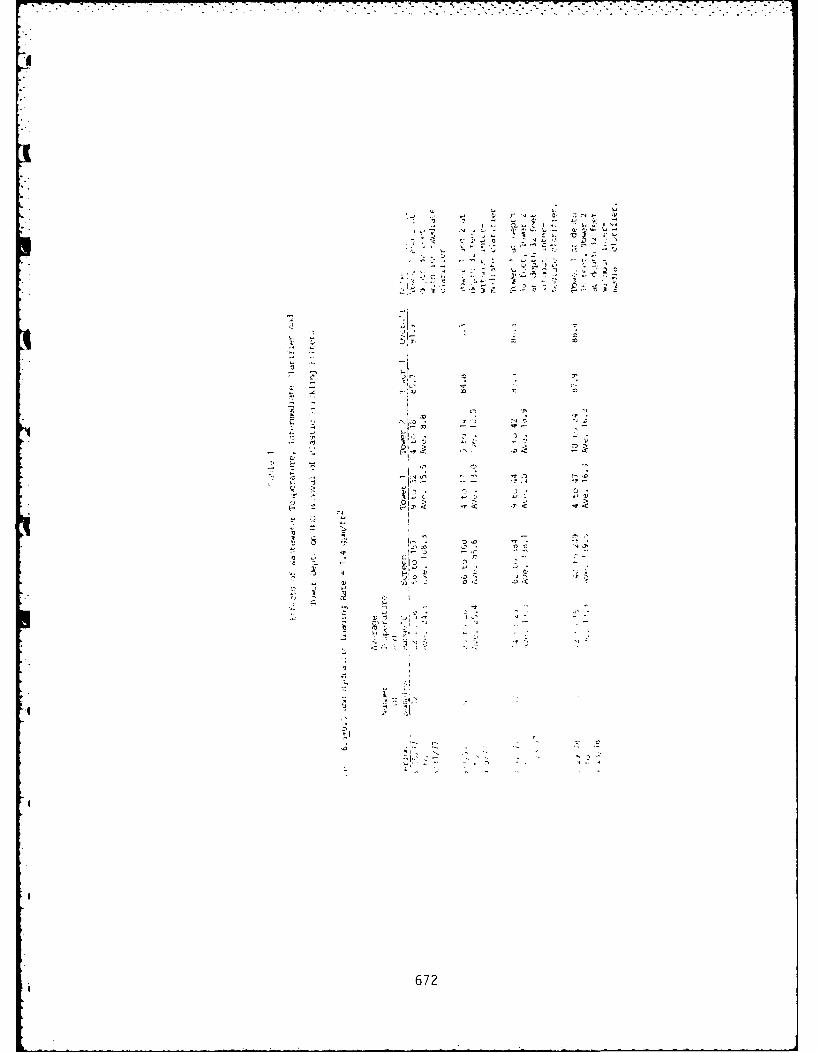
As shown in Taole 1, at tne hydraulic loadingrate of 1.4 gpm/ft 2 tne overall BOD removals were;nore than 8b6. It can be concluded that the trick-ling filter provides excellent removals under theaLkLicat ion of rotoscreen for the primary treat-ment. The various BOD concentration of 8.b, 10.0,18.9, and 10.2 mg/1 from the tower 2 shown in Table1 exnioits the lower limit with biological treat-ment. The pilot plant test result has shown thatthe biological reaction in toe tricKling filter issimilar to the first order kenietic reaction. Thisimplied that the rate of 30D removal will increaseas tne influent BOD concentration increases. Thisphenomenon has been demonstrated on wastewater atspecific hydraulic loadings for a BOD 5 concentra-
671
S . S 4 - * h a t S
*55*4 **555 5 4, 5 5 5 ,, 44 *S *S . S
a
I-, - 9? -. -a- -V
' C'
2
~0
'7
1-41
'0 0,
7-' "4-4 F,, --
~Iz~ .iKt tj~ 2
IIzr 2:4-4~~ S -, -.
r,3''C -rC
-St i ~ .~ 2* -o c -'434
* S '--'4- "~ -,
~Io 2 - 2-
1~ 0 '21-2. 4>0< -04(
1 2
-. -7'.
'1
.4 45
-. "~~2 . -
N -
- . 4 .4 2 -~
.4
672
tions ranging from dd to 6U0 mg/1 (4). So the BUDremovals were nore than 85% in the Hoboken pilotplant study by using the rotoscreen as a primarytreacment.
Due to river inflow and infiltration, a highchloride concentration, 50 to 770 my/1 is found intne influent to toe Hoboken Treatment Plant. how-ever, no aeleterious effect on the process wasooserved during the pilot test period.
The effect of NaCl on biological film has beenreported by Lawton (5). Ae found that a step in-crease in salt concentration to 20,000 mg/1 had adeleterious effects on the film growth, but thefilm growth recovered in one day.
As shown in Table 1, the effluent BOD concen-tration from Tower 2 was lower than from Tower 1,but with two towers, the trickling filter did notsignificantly further reduce the BUD concentration.This was becaase some of influent BOD concentrationwere lower and the ef fLuent BOO from Tower 1 hadreached the equilibrium BOD. Therefore, the BODremoval efficiency was improved a little byincreasing the number of towers, under this,wastewater characteristics and hydraulic loadingrate. The provision of the additional tower to thetreatment can secure toe quality of the effluentBUD concentration. In case the influent BODconcentration is higher, the eifluent of the firsttower can be treated by the second tower.
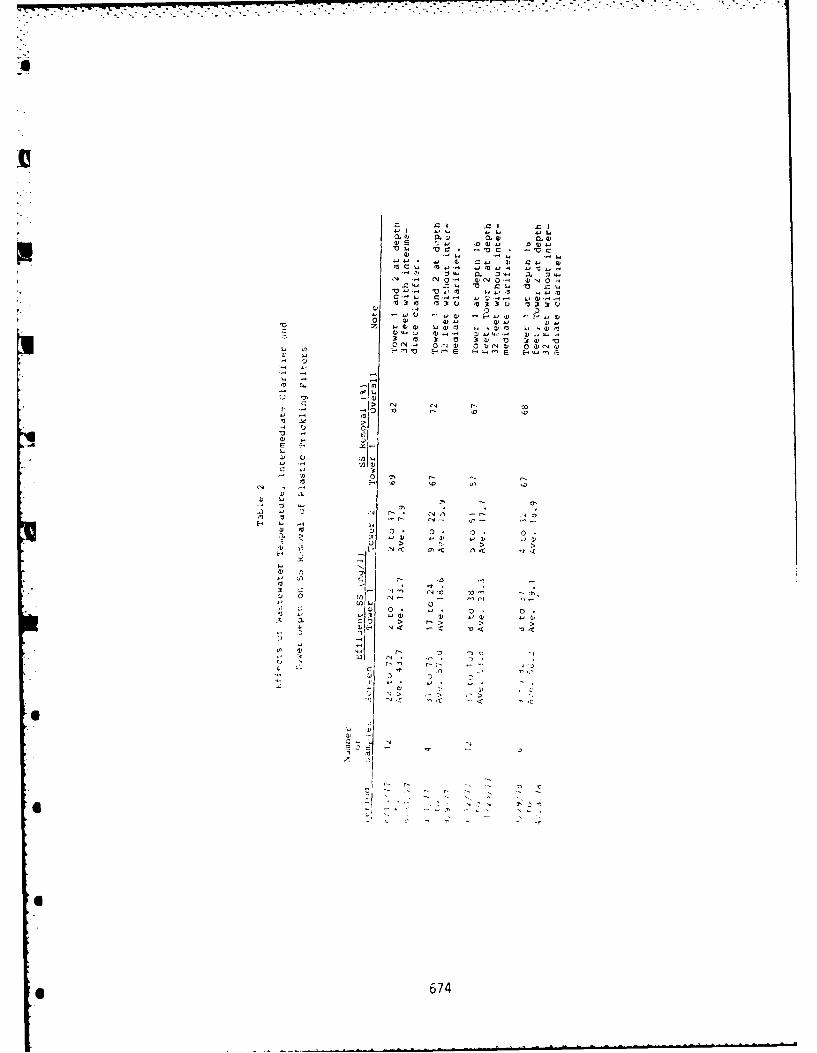
The overall suspended solids removals in thisstudy ranged from 67 to 82w as shown in Table 2.The ettluent suspendeu solids concentration frotatwo-stage trickling filter was less than 20 mg/lafter 30 minute settling.
673
rrrrrw rr.7w '. . . -- . -- . . -t - - -. *.. . .- -7.-~ . - - -' '- -
A
LI
I ~i ~L ~i 'C,
OE 3).j 344.4 04)44'CL. 'CC * '-'CC. -'Cc
4, ~ ~ .444* 4.4 0 C.., 3) Ci., 4'
OC)., 3)44'.4 )§.4*..4 443)'.44)
N -'-4 ~'JQ--4 4,04Q- QJr.,0..C'.-4 CL. 'C C'.. 'C fl~..
'C'*''- V.4 444.,) ).,443)~ gsz z~;z -
4. *2) 0 3)33')44 '-44U '-.444 -E-'.~wo 3) ~~-4 4)44
'C Z 4.04) &.~,3) -.. 3)3) 4-0t'3§W,*., *2)44.4 3)*44*4-*..4 4),,t.4.3 3) 3) 'C 34' 'C 34, 4)
44 CC').-. 0.NQ) 02**NO 03)C'44'4' )..
2
4'. .-. -2 ~'-34) '3'.I' -~ *N )N N 'C
)) N '0
'3 .V--4 '4,-3)*2) '4F ~-
4) C.
- /) 0 'C .' '4- N*3) '.Z' '.0 .4
2) .3,3) 44 .4 0'4 3) '4' 3'.'.2 J4 .3 N N. ~4 .~.. .44)
3) '-N "4- p.-C-' L ..43) 4 3) 3). 0. 3). 0.:2 > .4 44)) 44)' .43) .43)- ' a , '.. >
N< 0''C C4.C .rC
44
4'I'4 -0 ". -
N'- ~'3 'n'-'.0' ~ ~. 0.
a. '4~ ,-4 .4~ '43)I&. Nt .- 0< '0<~I, N 3)
N. .n. 3)*
4 U- '? -fl ..' 0*r'
4- 3) 3) 3) 4'
4- 4 *2' t -
3) '4> .- > .>
* N
'4 -- :- 4) i~4C - -4 4- -4 4-
-4 - - - 4<4 -- .: N'. 4 3)~'3.1 -. -.
6
* 674
Rotating Biological Contactor
In this study, another configuration was madeby using a rotating biological contact)r (RBC)i n place of tfie tCicKling filter to treatwastewater Which was primarily screened by a
t rotoscreen. Tne treated effluent froif the RBC,tnien, was .3ettlea by LAMEibLA gravity settler. RBCslli.<e tricklinj filters are a fixed-film biologicaltreateient I)rocess. The settlfeable solids wliichp.assed through the r,)toscreen would not effect theR BC. The r-asons are explained in tiie section ontricklinij filters. The incoming settleaole solids,which will not plug the in _dia, may be removed in afitiat clarifier or LAMfEiIA gravity settler. Thelow 60D and 33 effluent concent cat ion shown inT ales 3, 4 and 5 implied the feasibility off low-tnirougi system oy using a rotoscreen forpr inary treatent and an RIC for secondaryt r-atsnent. LhQrfore, using an RBC or a tricklingtilter id the flow-tnrough system resulted the2 sameeLticiency on both BOO ano S3 removal.
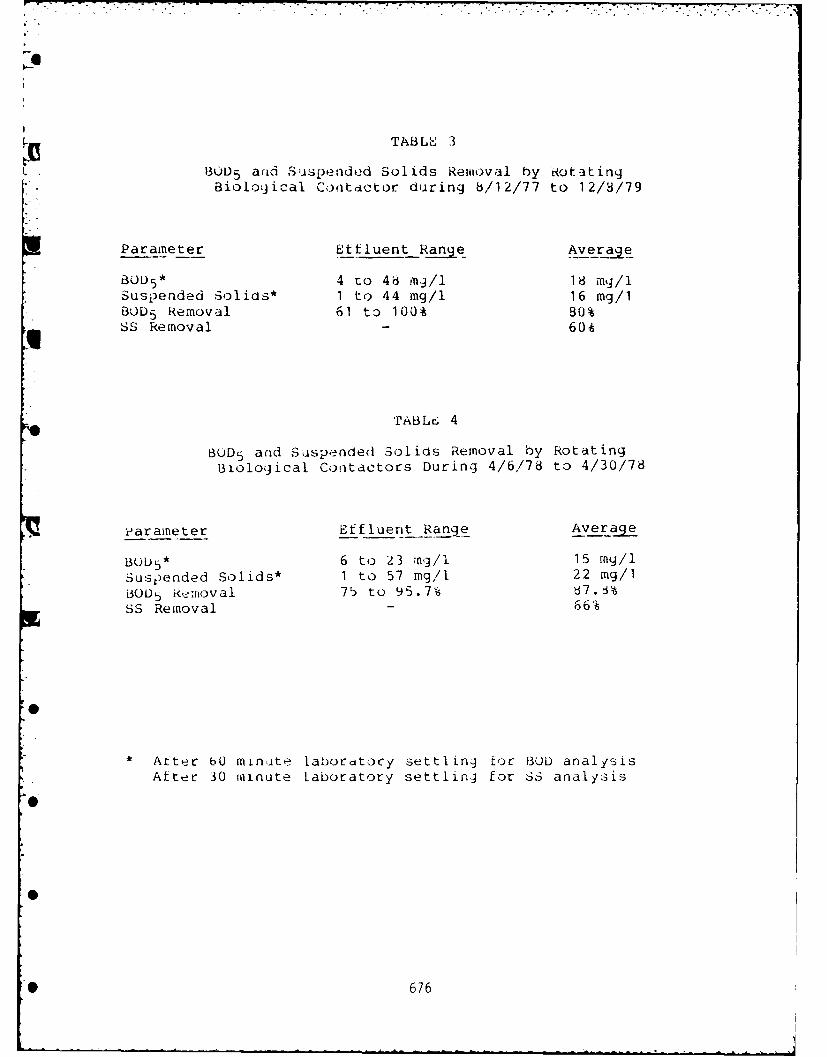
TPne rotating bio-disc (or RKC) was arrangedfor two-stage operation at a hydraulic loading rate2.5 gpd/ t2 initially. The bio-disc was operateduurinj two periods. One was from 3/12/77 tolz/d/17. The other was from 4/b/78 to 4/30/78.Trie result of the two periods are shown in Tables 3and 4. The wastewate- temperatures in the firstperiod rarged from 120 to 26 0 C averaging 19. 0 °C.The major difference ia the second period was thewast _water temperature ranged from 120 to 15°Caveraging 140C. The results from these two testingperiods indicates that at a hydraulic loading of2.5 gp)d'tt 2 with-, a rotation rate of 1 .6 rpn thetwo-staj c bio-disc woulu obtain 84% WOD 5 removaland an expected BOL)5 effluent of 17 .5 mg/I.Susp2nded so I ids levels in the etffluent areexpected to oe id g/1 .
675
FTABLE 3
B30 5 aid Suspended Solids Removal by RotatingBiological CotdCtor during 8,/12/77 to 12/8/79
Parameter Ettluent Range Averae
BO3D 5 * 4 to 4 g /l 18 mg/lSuspended Solics* 1 to 44 mg/l 16 mg/1BOD 5 Removal 61 to 100% 80%SS Removal - 60-
TABL6 4
BUD 5 arid Suspended Solids Removal by RotatingB3iological Contactors During 4/6/78 to 4/30/78
Parameter Effluent Range Averae
BU 5* 6 to 23 7n,3/l 15 my/lSuspended Solids* 1 to 57 mg/l 22 mg/iBOO 5 K<emoval 75 to 95.7% )7.!%SS Removal 66%
- Atter bO minuite labordtocy settling tor BUD analysis
Atter 30 minute Laboratory settling for 5. analysis
* 676
-. -. S -. -* * S*' SS****.**
114
~N 'N 2 r N
rCA4
C 0 0
Z>~. I N $5
Ksz I
*-.1o 0 0 054 C). C). 0'
fl>.t d'>r- 0'c>- .D3'>.-
50412'.- 5')
Or" .7 0' ~5 >4 3' ~ > N
0'~0r - .- -o
72C -v 5. a, 0 '5.
C r C- 5'- 1' C- N
r r- 0
677
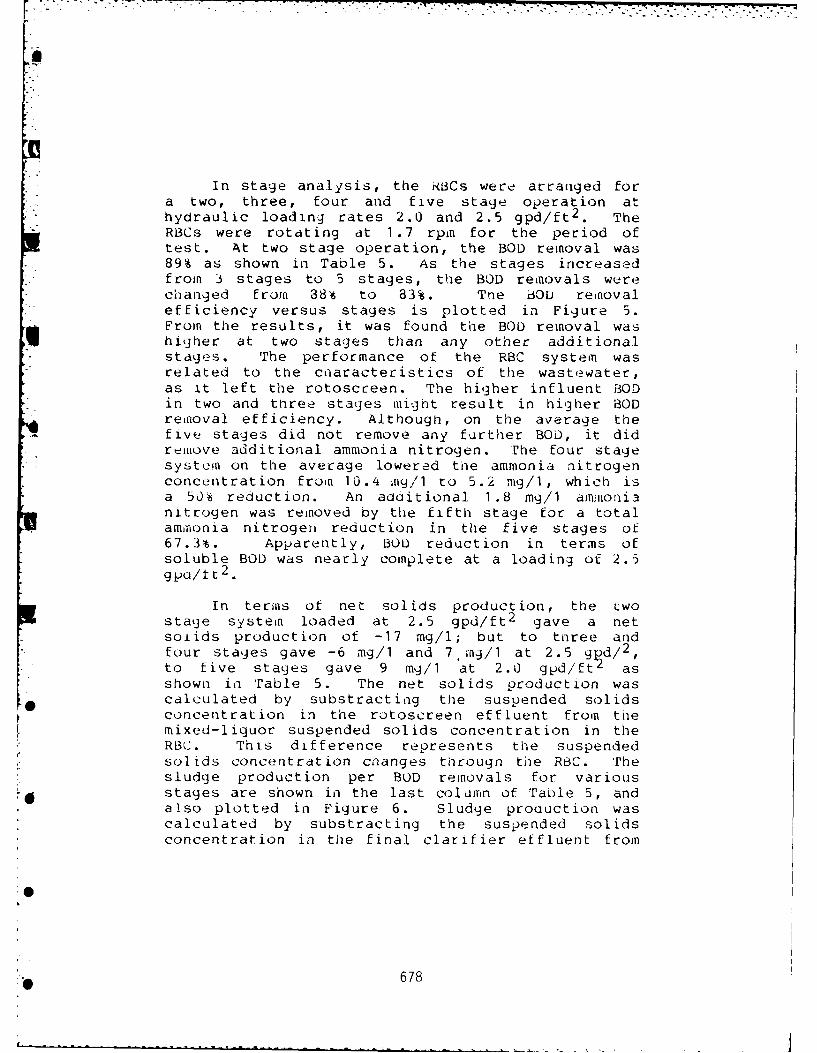
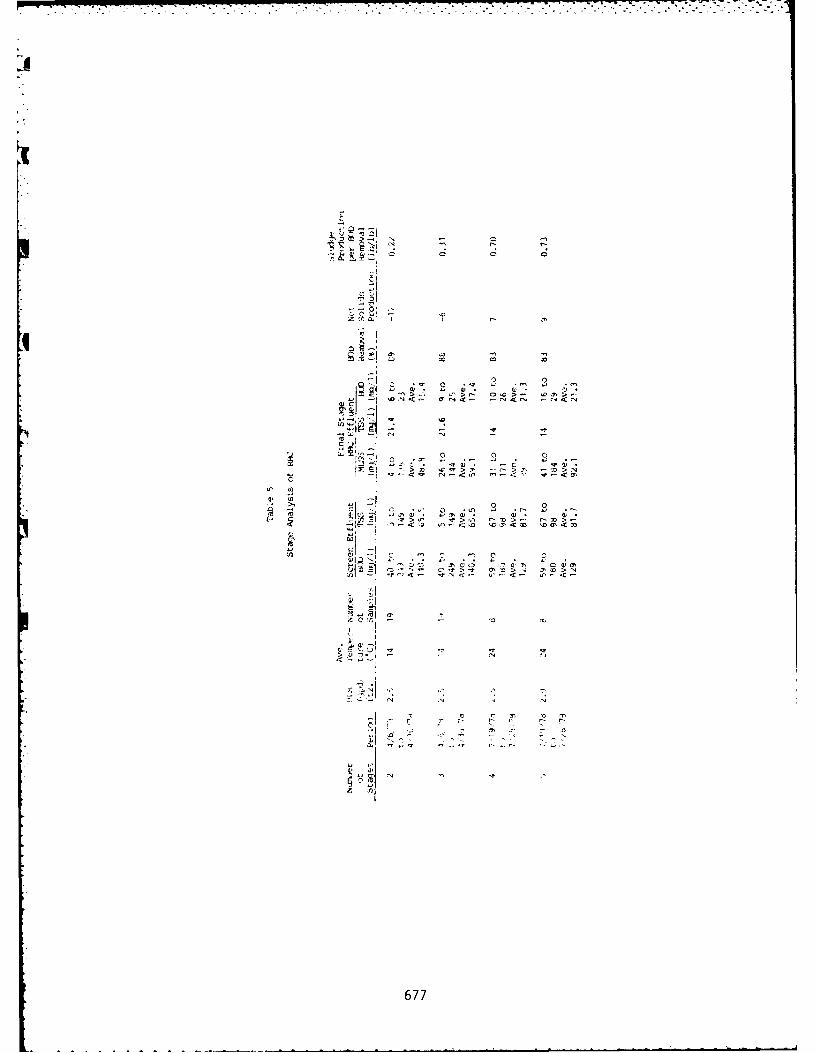
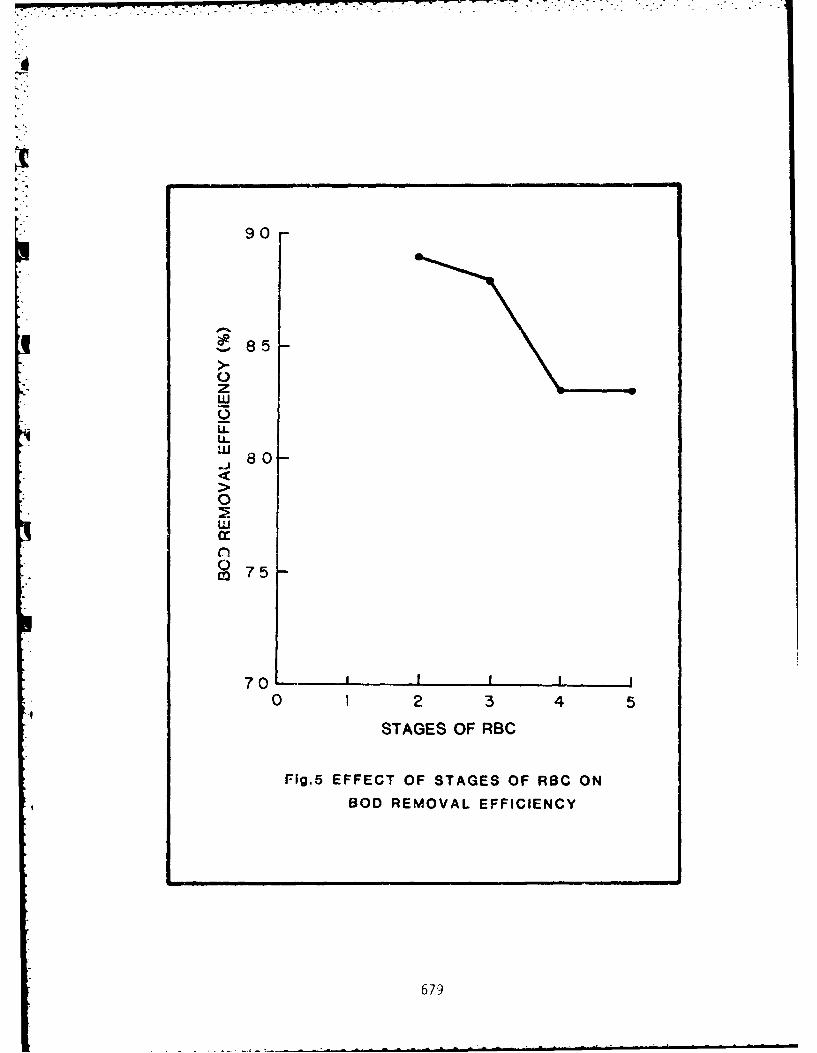
In stage analysis, the RBCs were arranged fora two, three, four and five stage operation athydraulic loading rates 2.0 and 2.5 gpd/ft 2 . TheRBCs were rotating at 1.7 rpin for the period oftest. At two stage operation, the BOD removal was89% as shown in Table 5. As the stages increasedfrom 3 stages to 5 stages, the BOD removals werechanged from 38 to 83%. The BOD renovalefficiency versus stages is plotted in Figure 5.From the results, it was found the BOD removal washigher at two stages than any other additionalstages. The performance of the RBC system wasrelated to the characteristics of the wastewater,as it left the rotoscreen. The higher influent BODin two and three stages might result in higher BODremoval efficiency. Although, on the average thefive stages did not remove any further BOD, it didremove additional ammonia nitrogen. The four stagesystem on the average lowered the ammonia nitrogenconcentration from 10.4 mg/1 to 5.2 mig/l, which isa 50 reduction. An adaitional 1.8 mg/i ammonianitrogen was removed by the fifth stage for a totalammonia nitrogen reduction in the five stages of67.3*. Apparently, BOD reduction in terms ofsoluble BOD was nearly complete at a loading of 2.5gpo/ t 2.
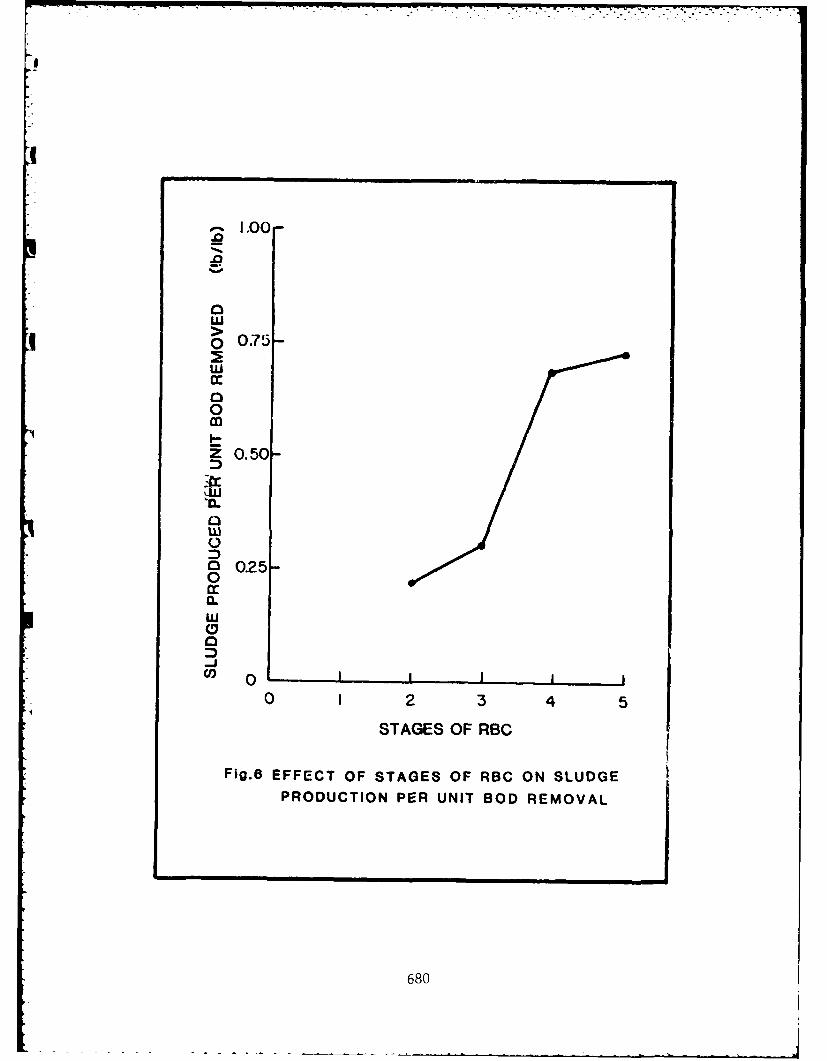
In terms of net solids production, the cwostage system loaded at 2.5 gpd/ft 2 gave a netsolids production of -17 mg/l; but to three andfour stages gave -6 mg/i and 7,mg/i at 2.5 g&d/ 2 ,to five stages gave 9 my/1 at 2.0 gpd/ft asshown in Table 5. The net solids production wascalculated by substracting the suspended solidsconcentration in the rotoscreen effluent from themixed-liquor suspended solids concentration in theRBC. This difference represents the suspendedsolids concentration changes tirougn tie RBC. Thesludge production per BOD removals for variousstages are shown in the last column of Table 5, andalso plotted in Figure 6. Sludge proauction wascalculated by substracting the suspended solidsconcentration in the final clarifier effluent from
6
:'O 678
~85
zwLLU-
~80
0
70 J- 1
0 1 2 3 4 5
STAGES OF RBC
r-Ig.5 EFFECT OF STAGES OF ROC ONBOD REMOVAL EFFICIENCY
679
.%1.00-
Z0
wo 0.75wcc00
Z 0.50-
w
O 0.25-0ir
w
CI0
0 I 2 3 4 5
STAGES OF RBC
Fig.6 EFFECT OF STAGES OF RBC ON SLUDGE
PRODUCTION PER UNIT BOD REMOVAL
680
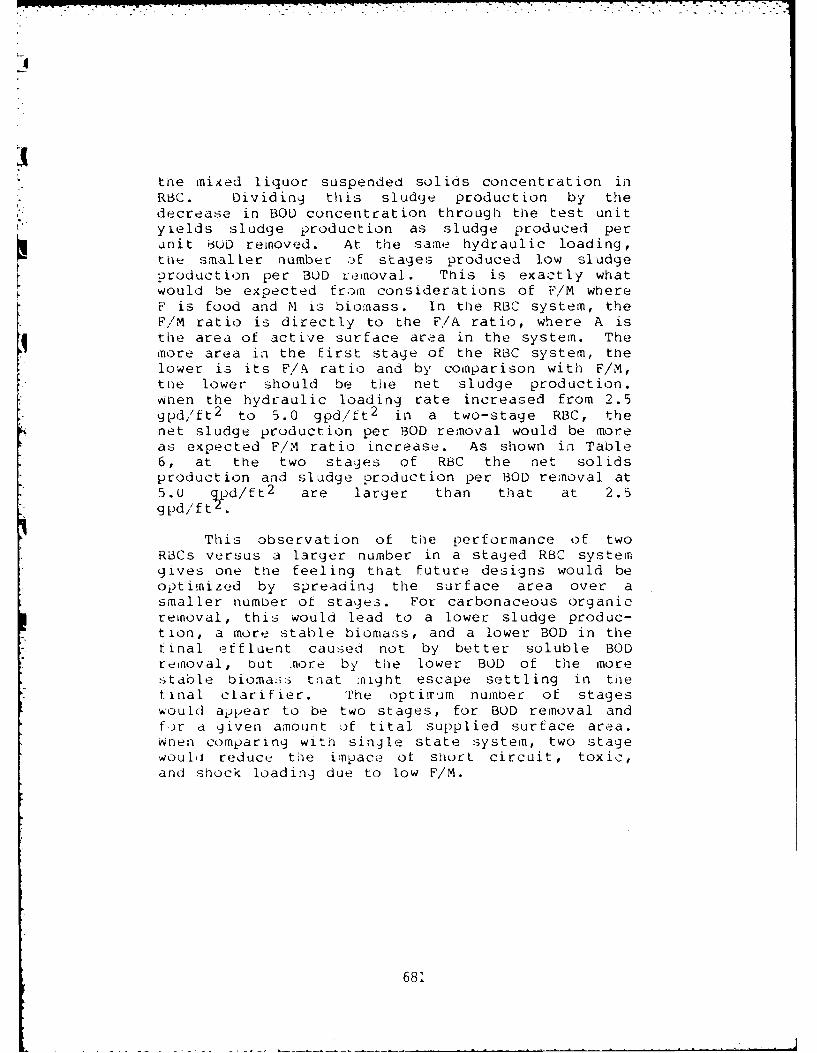
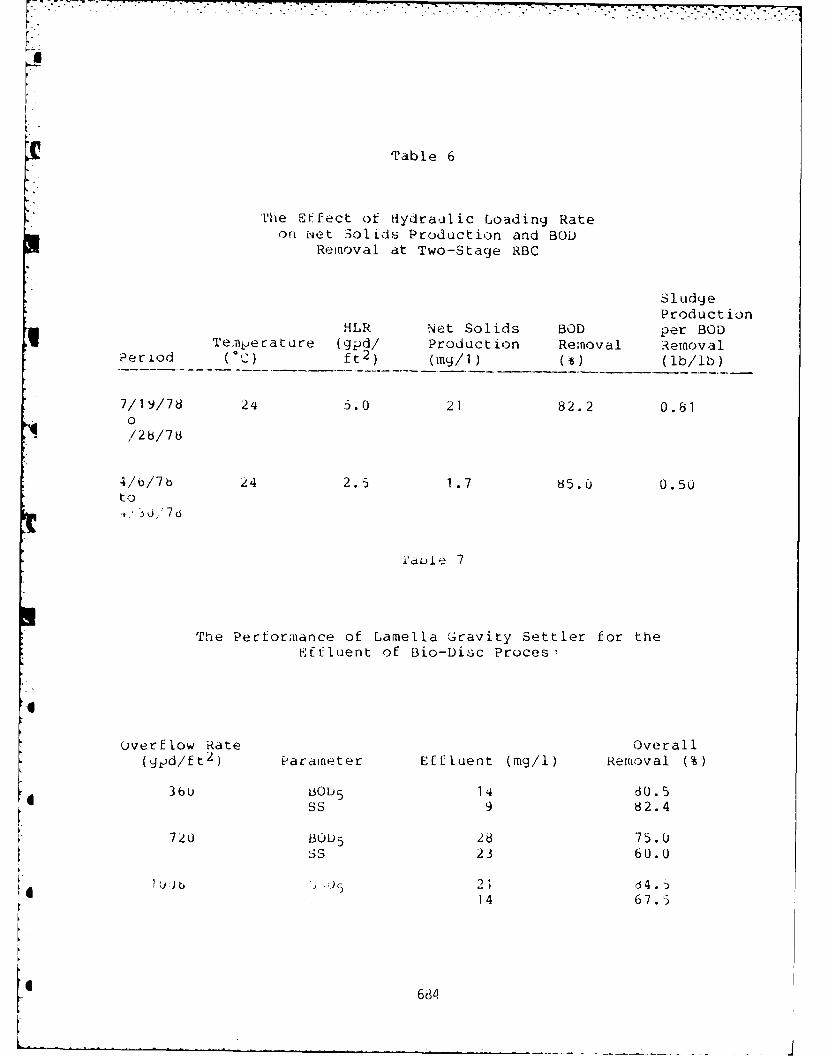
tne mixed liquor suspended solids concentration inRBC. Dividing this sludge production by thedecrease in BOD concentration through the test unityields sludge production as sludge produced perunit 6UD removed. At the same hydraulic loading,tkie smaller number -f stages produced low sludgeproduction per BUD Lremoval. This is exactly whatwould be expected froih considerations of F/M whereF is food and M is bionass. In the RBC system, theF/M ratio is directly to the F/A ratio, where A isthe area of active surface area in the system. Themore area in the first stage of the RBC system, thelower is its F/A ratio and by comparison with F/M,tte lower should be the net sludge production.4nen the hydraulic loading rate increased from 2.5gpd,/ft 2 to 5.0 gpd/ft 2 in a two-stage RBC, thenet sludge production per BOD removal would be moreas expected F!M ratio increase. As shown in Table6, at the two stages of RBC the net solidsproduction and sludge production per BOD removal at5. g f d/f t2 are larger than that at 2.5gpd/f .
This observation of the performance of twoRBCs versus a larger number in a staged RBC systemgives one the feeling that future designs would beoptimized by spreading the surface area over asmaller number of stages. For carbonaceous organicremoval, this would lead to a lower sludge produc-tion, a more stable biomass, and a lower BOD in thefinal effluent caused not by better soluble BODremoval, but nore by the lower BUD of the morestable biomass tiiat :night escape settling in thefinal clarifier. The optitrum number of stageswould appear to be two stages, for BOD removal andtWr a given amount of tital supplied surface area.When comparing with single state system, two stagewould reduce the impace of shorLt circuit, toxic,and shock loading due to low F/M.
681
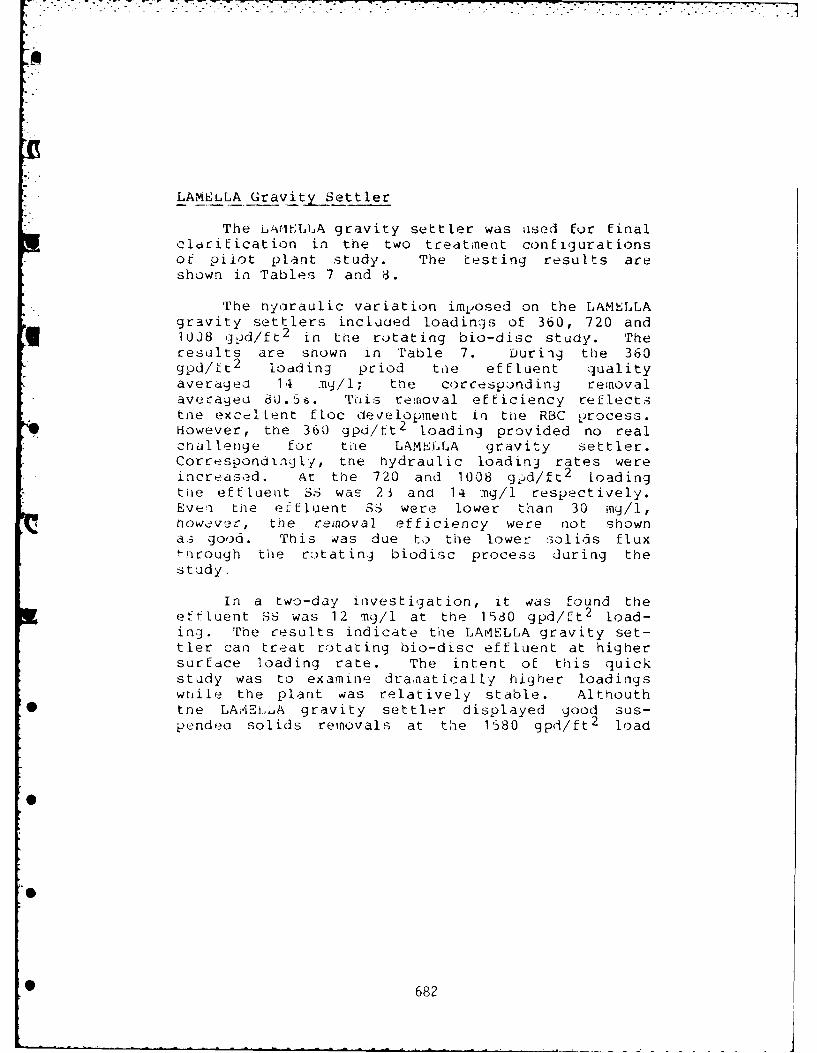
* LAMELLA r avit Settler
The uLL'V.E,, gravity settler was used for finalclarification in the two treatment confiqurationsof pilot plant study. The testing results areshown in Tables 7 and 8.
The nyoIraulic variation imposed on the LAMELLAgravity settlers inclucled loadings of 360, 720 and1038 gq,_d/ft 2 in tihe ritating bio-disc study. Theresults are snown in Table 7. Duri-ig the 3609gDd/j-t2 loading priod tnie effluent qual ityavleraged 141 nkj/l; the corcesponding removalavec-ageu 80.5,6. Tis; removal efficiency reflect.sitne excel rent floc developmnent in the RBC process.H-owever, thie 360 gpd/tt 2 loading provided no realChallenge fo r tiie L A M,'] jfA gravity settler.Correspondingly, tne hydraulic loading rates wereincreasedA. At the 720 and 1008 gpd/ft 2 loadingtiie effLuent SS was 2.3 and 14 m-g/i respectively.Everi the effluent SS were lower than 30 my/l ,now&2v ?f, thIIe removal efficiency were no t showna.3 goo:(,d. This was due to the lower solids flux-lrough the ro,-tating biodisc process during the
study.
In a two-day investigation, it was found theeff Luent SS was 12 mng/l at the 1580 gpd/ft 2 load-ing . The results indicate the LAM~ELLA gravity set-tler can treat rrotacing bio-disc effluent at highersurface loading rate. The intent oE this quickstudy was to examine dra.,iatically higher loadingswrnile the plant was relatively stable. Altrhouth
*the LA,'AEim'A gravity settler displayed good sus-pendea solids removals at the 1,580 gpcd/ft 2 load
682
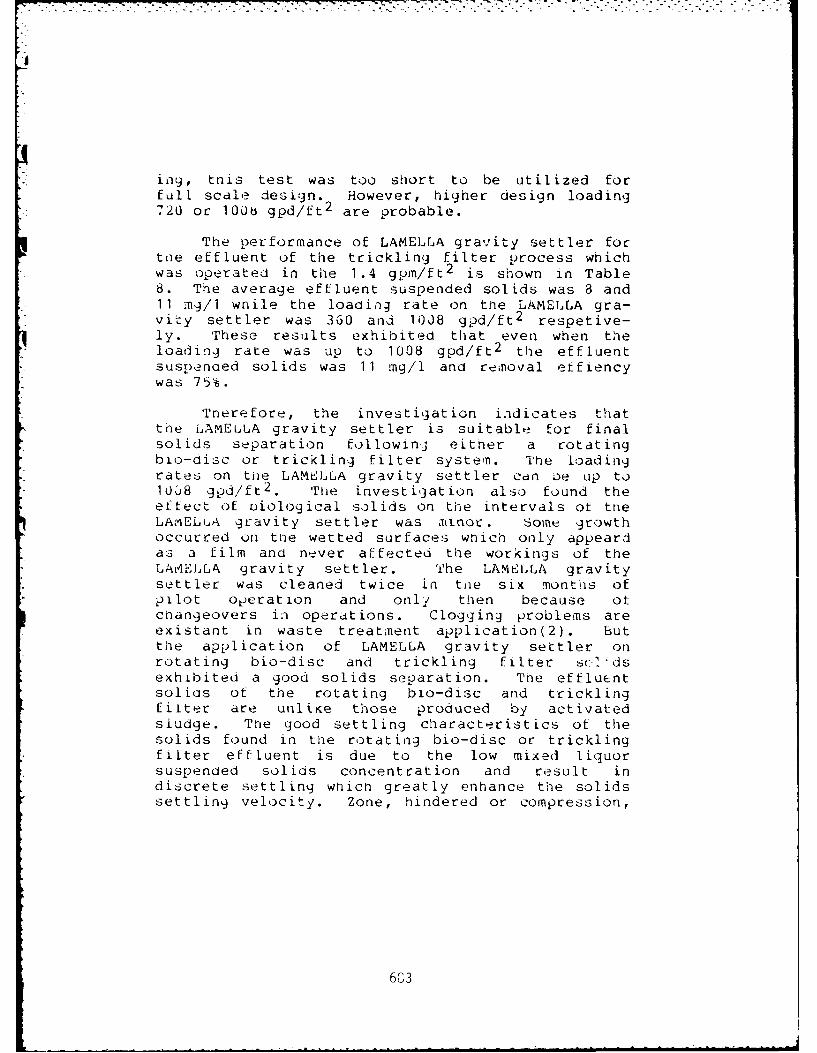
Sn, tnis test was too short to be utilized forfull scale design. However, higher design loading720 or 100b gpd/ft 2 are probable.
The performance of LAMELLA gravity settler fortne effluent of the trickling filter process whichwas operated in the 1.4 gpm/ft2 is sihown in Table8. The average effluent suspended solids was 8 and11 mg/1 wnile the loading rate on the LAMELLA gra-vity settler was 360 and 1038 gpd/ft 2 respetive-ly. These results exhibited that even when theloading rate was up to 1008 gpd/ft 2 the effluentsuspenoed solids was 11 mg/l and removal erfiencywas 751.
Therefore, the investigation indicates thattne LAmEuLA gravity settler is suitable for finalsolids separation followinj either a rotatingbio-disc or trickling filter system. The loadingrates on tie LAMELLA gravity settler can oe up to1008 gpd/ft 2 . Te investigation also found theeffect of oiological solids on the intervals of theLAVIELuA gravity settler was ainor. Some growthoccurred on the wetted surfaces which only appeardas a film and never affected the workings of theLAAE1LA gravity settler. The LAMELLA gravitysettler was cleaned twice in tue six months ofpIlot operation and only then because otchangeovers in operations. Clogging problems areexistant in waste treatment application(2). butthe application of LAMELLA gravity settler onrotating bio-disc and trickling filter sC "dsexhibited a good solids separation. The effluentsolias of the rotating blo-disc and tricklingfilter are unliKe those produced by activatedsludge. The good settling characteristics ot thesolids found in the rotating bio-disc or tricklingfilter effluent is due to the low mixed liquorsuspended solids concentration and result indiscrete settling which greatly enhance the solidssettling velocity. Zone, hindered or compression,
6G3
r.
Table 6
T'he Effect of Hydraulic Loading Rateon et .3olids Production and BOO
Removal at Two-Stage RBC
SludgeProduction
HLR Net Solids BOD per BODTernperature (gpd/ Production Removal Removal
Period (02) ft 2) (mg/1) (t) (ib/Ib)
7/19/78 24 5.0 21 82.2 0.810,/28/78
4/t/7b 24 2.5 1.7 85.0 0.50to
Iaule 7
The Performance of Lamella G;cavity Settler for theEffluent of Bio-Disc Procesl
4
Overflow Rate Overall
(ypd/ft 2 ) Parameter Effluent (mg/i) Removal (%)
4 3bu 30 u 5 1 60.5; SS 9 82.4
720 BOD 5 28 75.0ss 23 60.0
V VJit., ' :21 r4.5
14 67.5
6
IJ
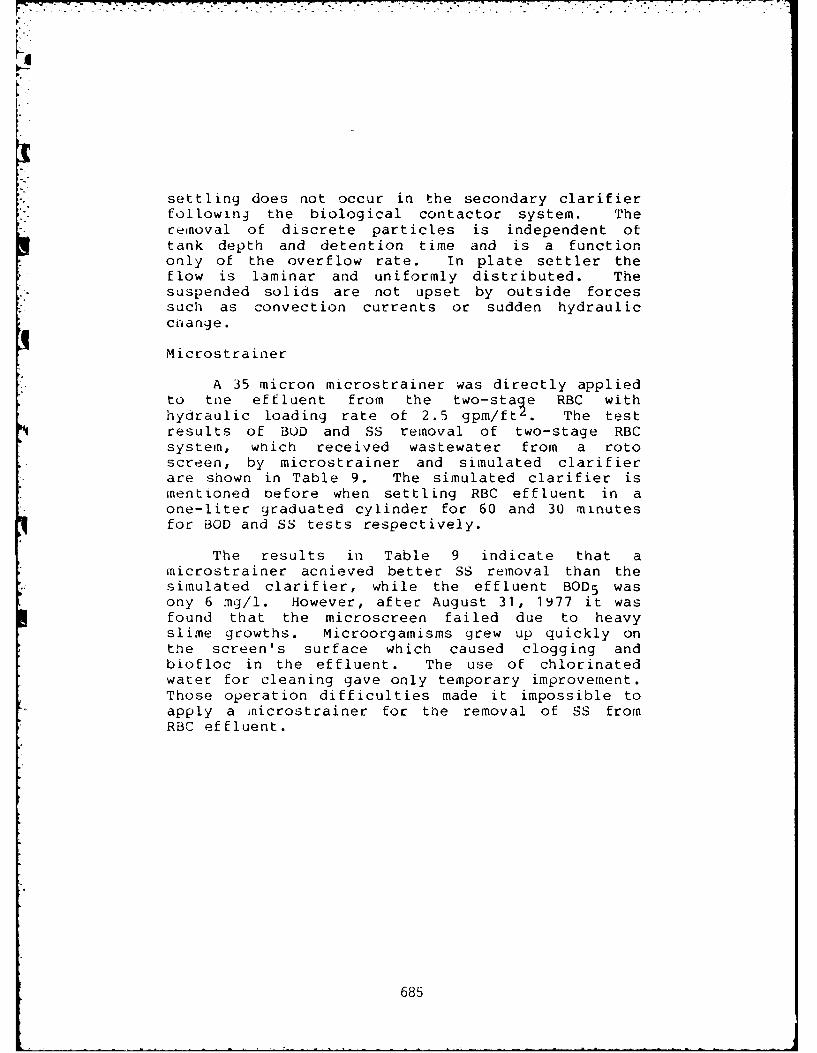
settling does not occur in the secondary clarifierfollowing the biological contactor system. Thecemnoval of discrete particles is independent oftank depth and detention time and is a functiononly of the overflow rate. In plate settler theflow is laminar and uniformly distributed. Thesuspended solids are not upset by outside forcessuch as convection currents or sudden hydraulicchange.
Microstrainer
A 35 micron microstrainer was directly appliedto tne effluent from the two-sta e RBC withhydraulic loading rate ot 2.5 gpm/fti. The testresults of BOD and SS removal of two-stage RBCsystem, which received wastewater from a rotoscreen, by microstrainer and simulated clarifierare shown in Table 9. The simulated clarifier ismentioned oefore when settling RBC effluent in aone-liter graduated cylinder for 60 and 30 minutesfor BOD and SS tests respectively.
The results in Table 9 indicate that airticrostrainer achieved better SS removal than thesimulated clarifier, while the effluent BOD 5 wasony 6 mg/l. However, after August 31, 1977 it wasfound that the microscreen failed due to heavyslime growths. Microorgamisms grew up quickly onthe screen's surface which caused clogging andbiofloc in the effluent. The use of chlorinatedwater for cleaning gave only temporary improvement.Those operation difficulties made it impossible toapply a inicrostrainer for the removal of SS fromRBC effluent.
685
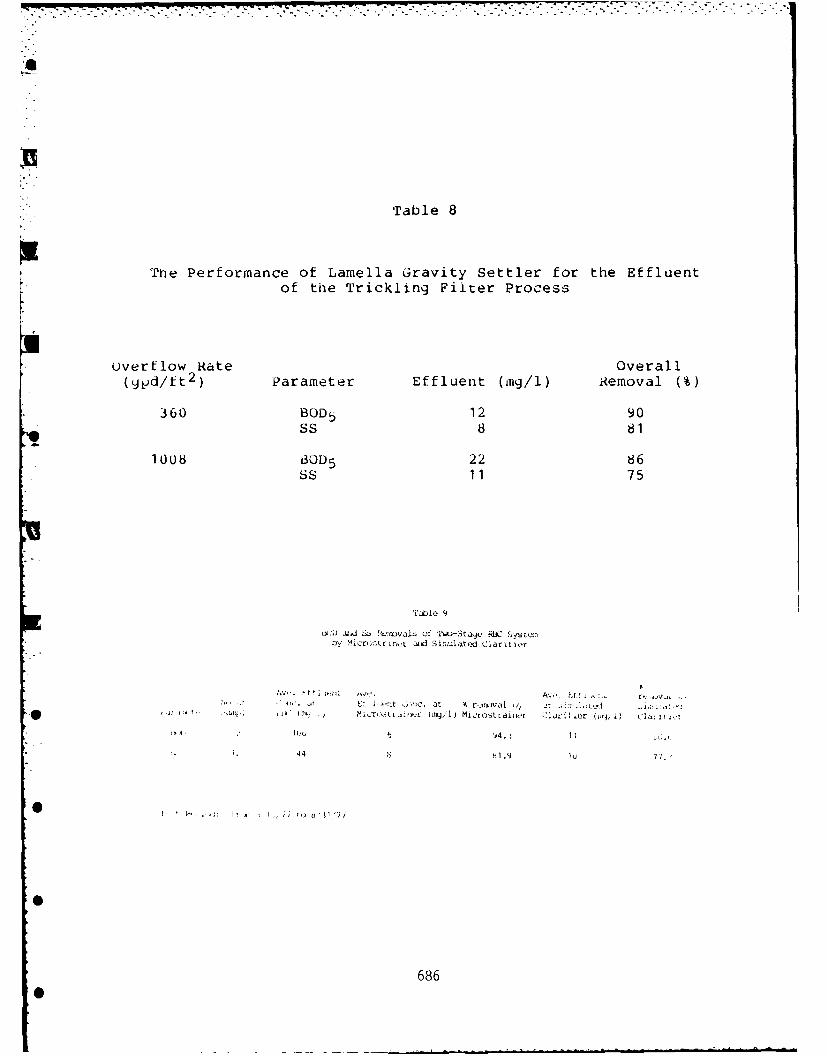
Table 8
The Performance of Lamella Gravity Settler for the Effluentof the Trickling Filter Process
overflow Rate Overall(ypjd/ft 2 ) Parameter Effluent (rag/l) Removal (%)
360 BOD 5 12 90SS 8 81
1008 BOD 5 22 86SS 11 75
ibtle 9
L%:L mJ~d S., ! L':u Al u I -itaye REC ,yb~tziy micrcn.trmnt aid Sin.,uated Clarkter
2, .... , ,l ,. ,iT El l~ler~ ,iouc, at A r,.tloval tj Jt .. :. L | .i: :.
, , !j * ; 1icrtI tL.i),f Imhil Mic ' ailnler. aj Cl il.er (ovj, i Ca i ILr
I 44 l. 7i.
], ' ' ;: ir n: I., /686
6860
North Bergen Treatment Plant
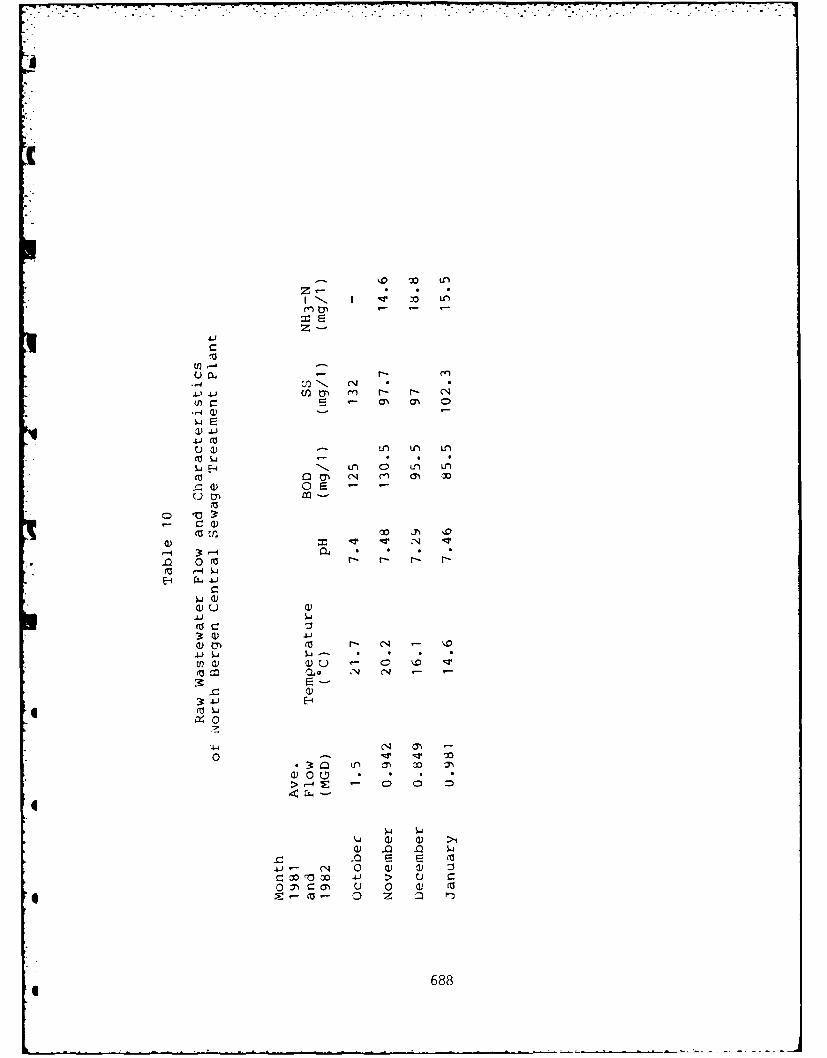
The concept of design for the North BergenCentral Sewage Treatment Plant was based on theresults of Hoboken pilot plant study which wasproven to be a reliable technology. This 10 MGDtreatment plant was finished in 1981. According tothe operation report of North Bergen TreatmentPlant, the average data for the first 4 months,October, November, and December of 1981 and Januaryof 1982 are summarized in Tables 10, 11 and 12.The numbers shown on Tables 10, 11 and 12 are theaverages of data, based on daily sampling. Table10 shows the flow rates and characteristics of rawwastewater. The actual average flow was from 0.85to 1.5 MGD which is much less than the design flowrate 10 MGD. This is because all areas have notbeen hooked up the sewer line yet. Therefore, partot the facilities at North Bergen Central SludgeTreatment Plant are not in operation.
Toe application of rotoscreens, in the NorthBergen Central Sewage Treatment Plant, was forprimary treatment. The results of the operationare shown in Table 11. The suspended solidsremovals were from 24.9 to 33.6% averaging 28.9%juring the first four month operation. Themanufacturer's information showed about 15 to 20%SS removal when applying rotoscreening to municipalsewage. Therefore, 20% SS removal by applyingrotoscreens for preliminary treatment can beexpected. Two advantages of rotoscreens are highdry weight of solids produced and small floor
4 requiremi2nts, associated with low operation andcapital costs. The maintenance costs are alsolower due to fewer moving parts when compared withprimary clarifiers.
Two-stage rotating biological contactors were4 applied to remove BOD in the North Bergen Central
Sewage Treatment Plant. The BOD removal efficiencyranged from 64.1 to 89.7% averaging 86.8% duringthe first four months. Compared with the data in
687
-- 4 (2N.
w E
a) 41
4~ J r *
u ) LC) L U,
C, .74 a%
(00 r4
C a))
4.)
(0 r- N -
co~ C' N -
00
Iz
'4-4 N4 m~
o~ - ~
4-J - aNa ~ ~ 0 0) >1 0 --) > u C
0 0n a 0) 0
688
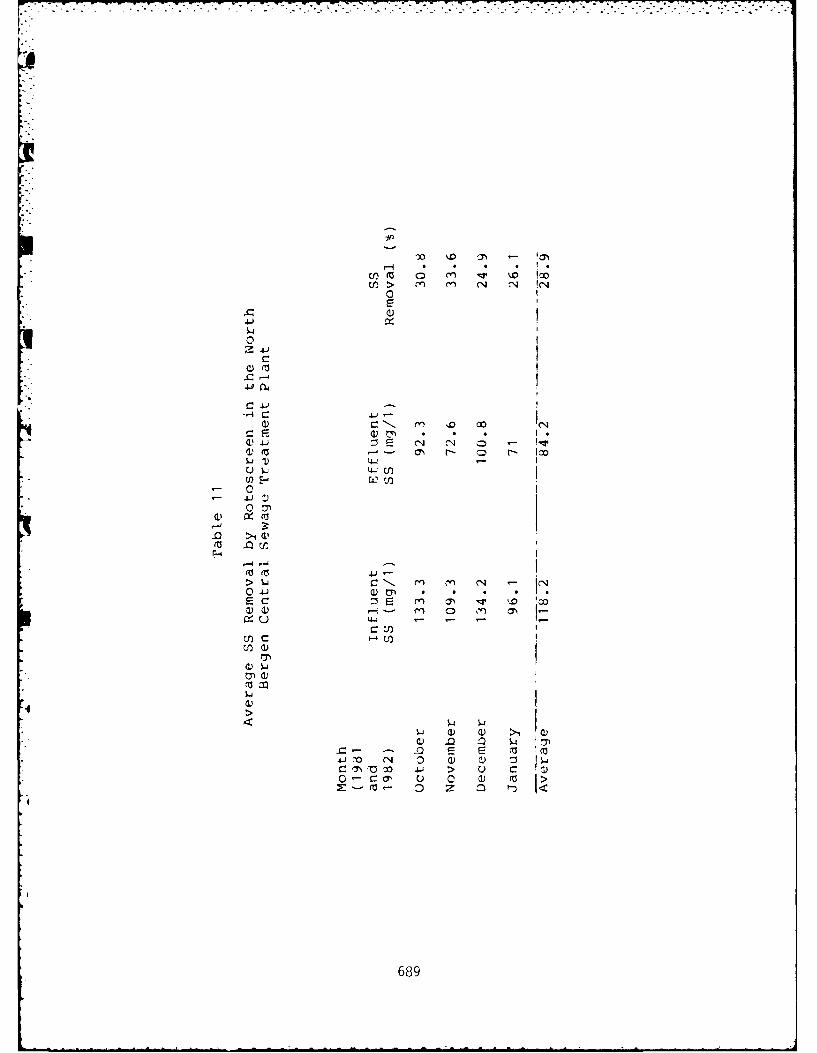
r-4uo( (a, 114 " loCI > (14 -4 ( 4
0
.4-
0
-4-
- - lo
W E
00 4ic
4J
~ L44 - - -
41 w q
C: ( N) r. ) )
689
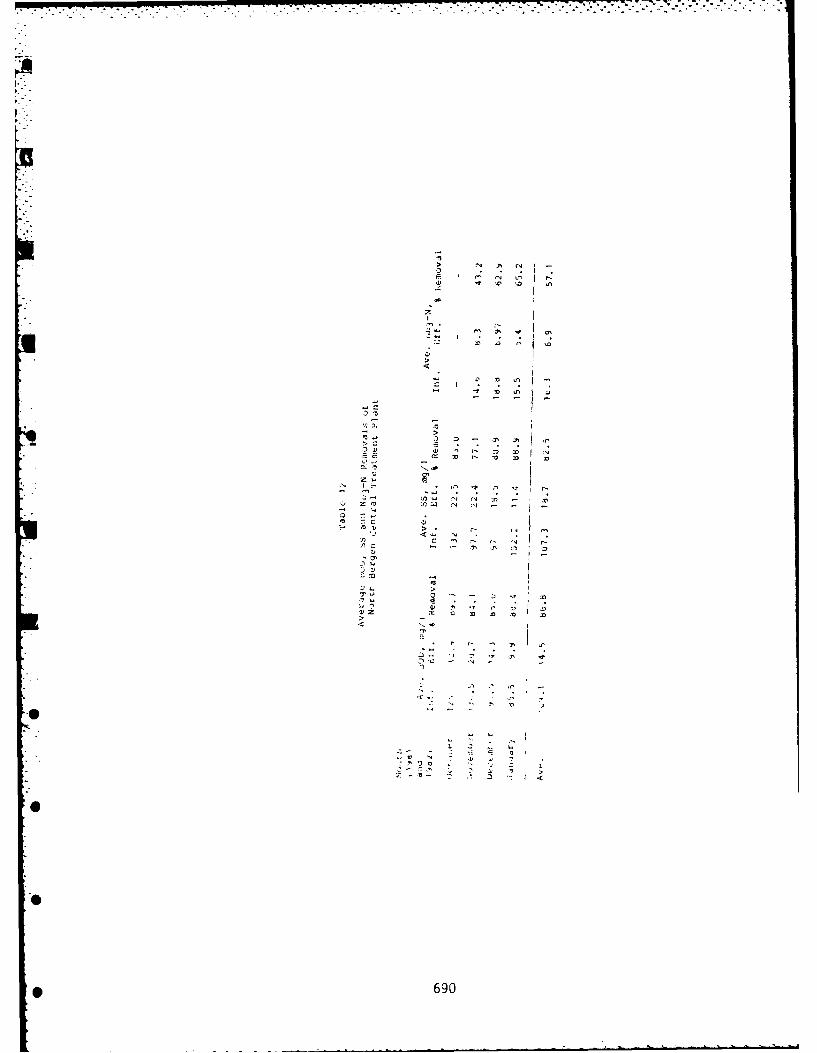
> N .~ ~N -j I
-~ 'N r.? *~' *3
z
2~ ~, 3~ ~
3'
C,
- Q C,
C,
3 - 3'
~2) " r- z~ ~
3' r- ~C, 3'
I-. * a~ .~ r, 'i
~fl'-&J N 'N U~ *- 3''N ~ - - -
C)1~- t~4
N .. ;~ I
C, - .- 3' .,~ C, -~I -
2:3:'
'UC,0 - 2 ~ 3'
4) ~' *r ,, ~x ~ ~ ~ 3'
C,
'I"3- -~ 3' 'U~
- N *- --I
* .<~ 2' .1' -
0
1. 2 *.U
''U N - -- :- 2 4:3 , 3~ I
2 3 ..~
0
S
* 690
Hoboken pilot plant study, the average influent BODconcentration was 109.1 mg/i which is about thesame influent BOD concentration at the Hobokenpilot Plant st' dy. The average effluent BODconcentration was 14.5 mg/i which is close to or alittle lower than that in the Hoboken pilot plantstudy. However, nitrification was already ocurringin the North Bergen treatment plant. In Table 12,it shows the averaging ammonia nitrogen removal was57.1%. The average ammonia nitrogen concentrationwas reduced from 16.3 mg/l to 6.9 mg/l.
Suspended solids removal ranged from 77.1 to88.9% averaging 82.5%. The average effluent,suspended Solids concentration of 18.7 ing/l fromLAMELLA gravity clarifier implied that thesettlability of biological slime sloughed from RBCwas good. After four months operation thebiological solids did not grow on the surfaces ofLAMELLA gravity plate which also implied that thecharacteristics of biological solids from RBC wassuitable to the use of LAMELLA gravity settler forthe final liquid solids separation.
Some advantages of LAMELLA gravity settlersincludes low space requirements, low installedcosts, low maintenance, due to fewer moving partsto wear, replace and adjust, and high efficiency.In a well designed and properly sized LAMELLAgravity settler, the flow is laminar, therefore,the suspended solids are not upset by outsideforces such as convention currents or suddenhydraulic change.
The successful operations in the North BergenCentral Sewage Treatment Plant during the last fourmonths implied that the application of flow-throughsystem to municipal sewage is feasible. The short
I9
691
detention time of rotoscreening in the system pro-vides the great advantage to the biological treat-
aient system. Usually, the hydraulic detention intne primary clarifier is two hours. But the deten-tion in the rotoscreen is only 2 to 3 minutes.Therefore, tie difference between the influent tem-perature arid the effluent temperature is not toomucil. 'Phis is very important for biological acti-vity during the winter time. The higher water tem-pcratire iakes the biological activity in the reac-tor tigher. Tne comparison of rotoscreen versusprimary settling tank and LAmILLA gravity settlerversus !iecondary settling tanK to their detentiontines arid lano requirements are listed in Table 13.*The detention time in the entire system includingrotoscreen, R1C, and LAMELLA gravity settler takesless than an hour, compared with the detention timeof 6 nours in conventional activated sludge. Thiscompact system also provides another benefit, aueto its compactness, the treatment system in theNorth Bergen treatment plant is housed in a build-ing which protects the rotoscreen, RBC, and LAMELLAgravity settler equipment from extreme temperature,viariation, neavy rain and high wind. The con-struction cost of RBC using shallow tanks (6 ft.above ground) versus activated sludge tank with 15foot deptn underground is relatively lower as thewater in the activated sludge tank exerts consider-aole pressure on the soil, thereby requiring costlypile foundation and dewatering, especially, if thesoil conditions on site are bad. Tne total con-struction cost of the North Bergen Central SewageTreatment Plant in 1960 was 9.5 million dollars.
* An equivalent secondary treatment plant would havecost at least 22 million dollars, (figures obtainedby using data on the Constructions Costs forMunicipal Wastewater Treatment Plants (1978) (6)updated to 198U dollars) . The low operation andmaintenance costs, minimum land requirements and
* reduced capital cost inherent in this flow-throughsystem show great potential in the treatmnent ofmunicipal sewage, in the near future.
692
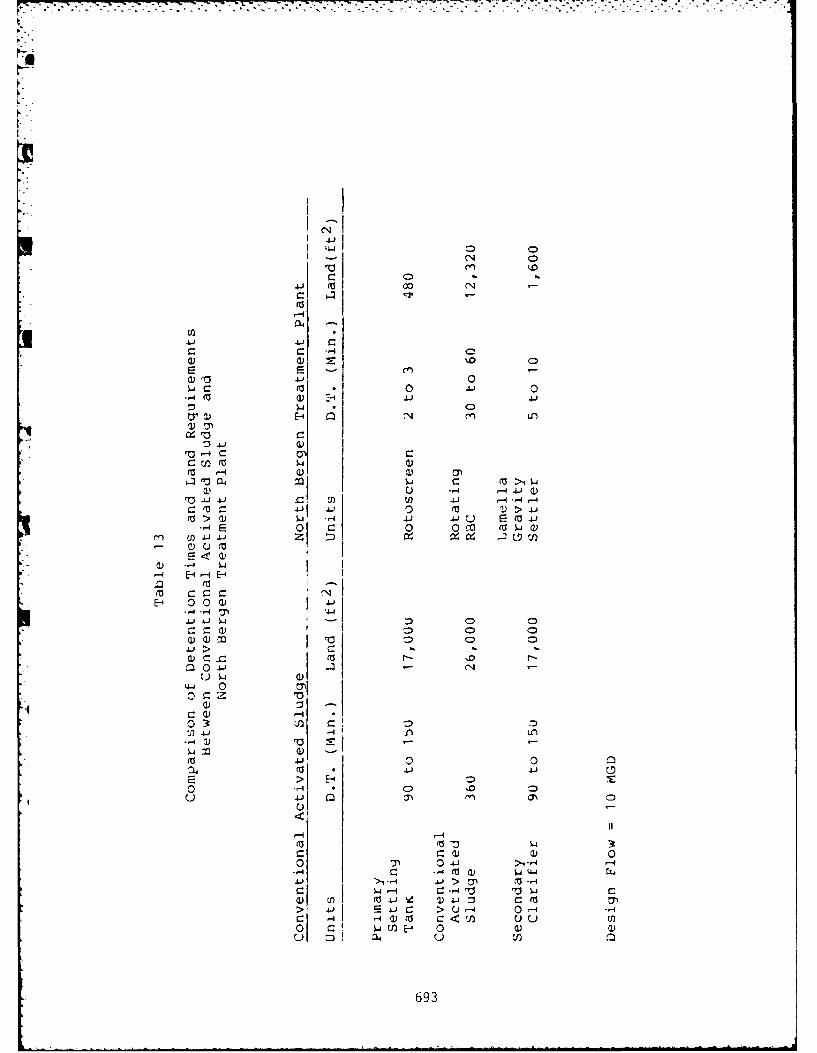
. 4.
C
a-4
C Ia - C0)a)' %.0
a 04-" 0S- c( 0 4-' 0
,4~- 4-1 4*4 C
ry)E-4 Q (V
0)1)vr-4 r-C-
w) U) 4J -I--4J 4-1 0 m 1 -
'o >0 4 .- 4 4i-J 4-JC E (04JE- ol C 0 0 c (f ~)
E- 0 ) I-0) ) 41 Sj CI
.0 0 -W
4 00
-4-J 03*
0 ) .1 )1
0- 0 4.)gi4.J > )'aa0 -4'o$
a) -W I>- u0- 0 -
(0 * J M -P- 0
> E-693
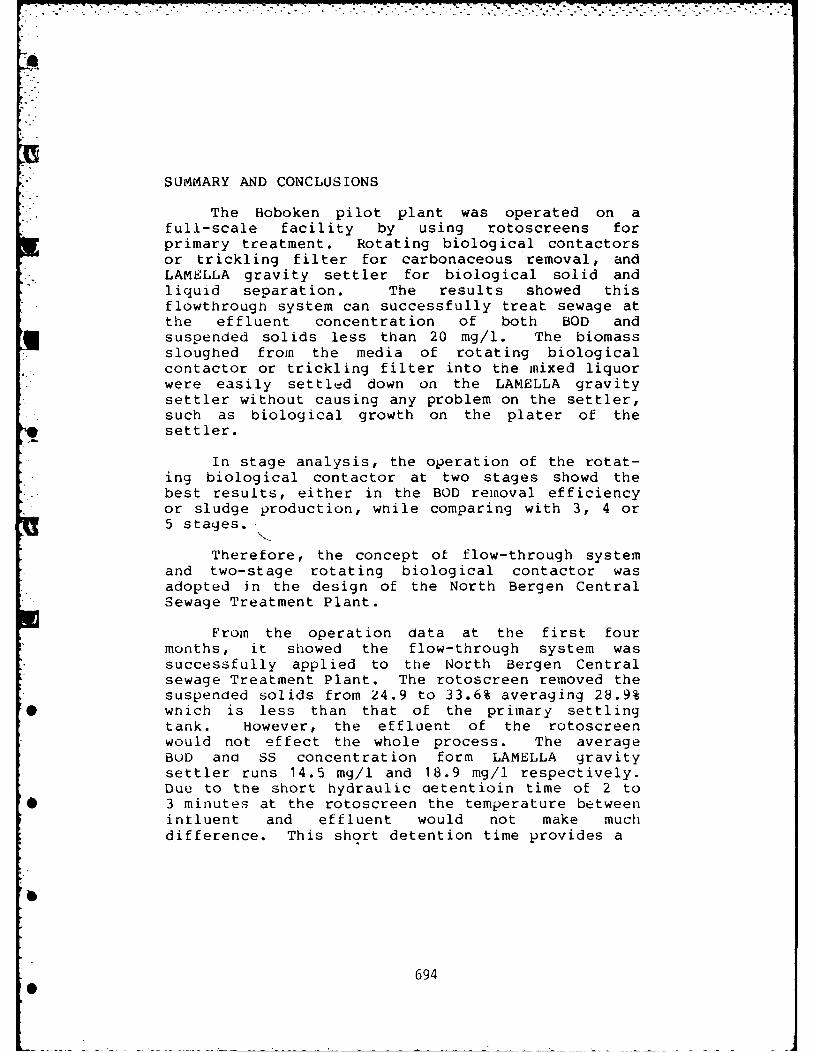
SUMMARY AND CONCLUSIONS
The Hoboken pilot plant was operated on afull-scale facility by using rotoscreens forprimary treatment. Rotating biological contactorsor trickling filter for carbonaceous removal, andLAMELLA gravity settler for biological solid andliquid separation. The results showed thisflowthrough system can successfully treat sewage atthe effluent concentration of both BOD andsuspended solids less than 20 mg/l. The biomasssloughed from the media of rotating biologicalcontactor or trickling filter into the mixed liquorwere easily settled down on the LAMELLA gravitysettler without causing any problem on the settler,such as biological growth on the plater of thesettler.
In stage analysis, the operation of the rotat-ing biological contactor at two stages showd thebest results, either in the BOD removal efficiencyor sludge production, while comparing with 3, 4 or5 stages..
Therefore, the concept of flow-through systemand two-stage rotating biological contactor wasadopted in the design of the North Bergen CentralSewage Treatment Plant.
From the operation data at the first fourmonths, it showed the flow-through system wassuccessfully applied to the North Bergen Centralsewage Treatment Plant. The rotoscreen removed thesuspended solids from 24.9 to 33.6% averaging 28.9%
* which is less than that of the primary settlingtank. However, the effluent of the rotoscreenwould not effect the whole process. The averageBUD and SS concentration form LAMELLA gravitysettler runs 14.5 mg/l and 18.9 mg/l respectively.Due to the short hydraulic aetentioin time of 2 to
* 3 minutes at the rotoscreen the temperature betweenintluent and effluent would not make muchdifference. This short detention time provides a
694
great advanta(.e in biological treatment, in whichtne biological activity is temperature relative,during the winter weather. The low constructioncost of 11 million dollars versus 22 milliondollars for the equivalent secondary treatmentplant, low operation and maintenance cost, low landrequirements and low energy cost implied theflow-through system a great potential to thetreatment or municipal sewage in the near future.When the physical conditions are limited byavailable land size, poor soil conditions, and highgroundwater levels, the authors recommend that youshould consider the application of thisflow-through system for municipal wastewatertreatment.
ACKNOWLEDGEMENTS
vie wish to extend special thanks to SeamusCunningham, Vice President of Mayo, Lynch andAssociates. His administrative assistance has beeninstrumental in the conduct of this work. WJe wouldalso like to thank Robert Androsiglio, Peter Lynchandl Anna Lynch, Engineers of Mayo, Lynch andAssociates for their technical and laboratory helpfor the duration of the project.
695
I
REFERENCE:
1. Germain, J.E. "Economical Treatment of Domestic Waste byPlastic - Medium Trickling Filters "JWFCF Vol. 38, No. 2,February, 196b, PP. 192-203.
2. "Standard Methods for the Examination of Water and
Wastewater." 14tn Ed., Amer. Puu. Health Assn., New YorK,N.Y., 1975.
3. "Rctoscreen" oy hycor Corporation, Bulletin No. 1101 1077,1977.
4. Autotrol Corp., "Application of Rotating Disc Process toMunicipal Wastewater Treatment, U.S. Environmental ProtectionAgerncy Water Pollution Control Research Series, Project No.17050 Dam, Nov. 1971.
5. Lawton, G.W. and Eggert, C.V., "Effect of High Sodium FilterShines." Sew. and Ind. Wastes, 29, 1226 (1956).
6. u.b. tPA Technical Report "Construction Costs for Municipal
Wastewater Treatment Plants: 1973-1977" EPA 430/9-77-J13,January, 1978.
6
6966
AN IN DEPTH COMPLIANCE AND PERFORMANCEANALYSIS OF THE RBC PROCESS AT MUNICIPAL
SEWAGE TREAT4ENT PLANTS IN THE UNITED STATES
Robert J. Hynek. Manager of Process Verification,
Autotrol Corporation, Milwaukee, Wisconsin
R4ichard A. Sullivan. Manager of Process Engineering,Autotrol Corporation, Milwaukee, Wisconsin
INTRODUCTION
A number of recent governmental reports, most notably theGovernment Accounting Office (G.A.O.) report entitled, "Costly
V'astewater Treatment Plants Fail ro Perform As Expected", haveseverely criticized the performance efficiency of existing
wastewater treatment plants. The plants evaluated by the
G.A.O. were reported to employ either activated sludge, trick-
ling filter or lagoon unit operations for biological waste-
water treatment. Autotroy Corporation, as part of a routinecustomer service, regularly checks the operational performanice
efficiency ot Rotating Biological Contactor (RBC) plants whereit has supplied equipment. This paper statistically compares
the performance efficiency of those treatment plants evalu-ated by the G.A.O. with RBC plants supplied by Autotrol Corpor-
ation. This report was originally written earlv in 1981 and
further modified alter evaluating an additional 22 plants
earl\ in 1982. It shjoul( b(e noted that the data from 1980 and
1981 was stat istiallv similar and 1981 data verified originalconclisions presented in the initial report.
In general, while the ;. A. U. report stated that "E.P.A st.atis-
ti(al report on pLant perforrmance show that hetv'een 50 and 757
697
!
of the treatment plants in operation are violating their per-
mits in any given time", Autotrol's study on performance of
existing RBC plants revealed that these RBC plants were meet-
ing their discharge requirements for BOD removal 89% of the
time and were meeting their discharge requirements for suspend
ed solids 92.5% of the time. The data further suggests that
long term process failures (violations occurring more than six
months per year) is 500% more likely in alternative technology
evaluated by G.A.O. as compared to RBC plants evaluated by
Autotrol.
When discharge violations did exist in RBC facilities, the
vast majority of the violations were minor excursions from
standards. Where major violations occurred, the prime cause
was equipment deficiency, not treatment reliability.
DESCRIPTION OF THiE STUDY
In November of 1980, the General Accounting Office reportedback to '.A- (oCngress the results of its investigation into the
operation of Publicly owned Treatment Works (POTW) that weredesigned, built, and funded under the authority of the grantsprogram. The report st~ited that at any given time 50% to 75%of the plants are in v% lation of their National Pollutant
Discharge Elimination System (NPDES) permits. The report con-tinues that a random sample of 242 plants in 10 states found877 of the plants in violation of their permits at least nne
month per year with 27% in "serious" violation.
Autotrol Corporation decided to statistically analyze and com-pare the results of its RBC facilities to those analyzed by thtG.A.O. Important to the confidence of the reader is the knowl-
edge that all the data displayed and the only data we would usEis that gathered by the municipality and reported to its appro-priate state agency.
Althou;,h every attempt was made to make the comparison as simi-
lar as possible, i.e.,
* Autotrol and G.A.O. evaluated plants classifiad byE.P.A. as capable of providing secondary or better
levels of treatment.
Autotrol and the G.A.O. evaluated plants based onthe issued NPDES permit.
698
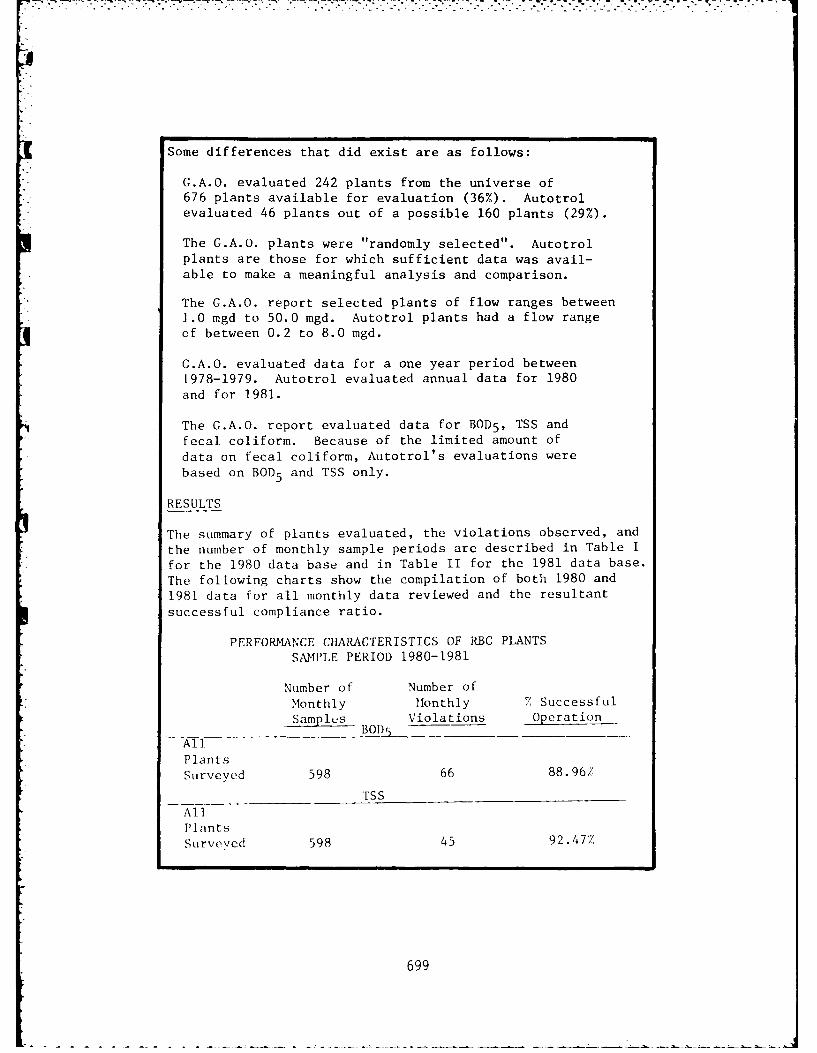
7. i 7 T 7. 7
Some differences that did exist are as follows:
G.A.O. evaluated 242 plants from the universe of676 plants available for evaluation (36%). Autotrolevaluated 46 plants out of a possible 160 plants (29%).
The G.A.O. plants were "randomly selected". Autotrolplants are those for which sufficient data was avail-able to make a meaningful analysis and comparison.
The G.A.O. report selected plants of flow ranges between1.0 mgd to 50.0 mgd. Autotrol plants had a flow rangeof between 0.2 to 8.0 mgd.
G.A.O. evaluated data for a one year period between1978-1979. Autotrol evaluated annual data for 1980and for 1981.
The G.A.O. report evaluated data for BOD 5 , TSS andfecal coliform. Because of the limited amount ofdata on fecal coliform, Autotrol's evaluations werebased on BOD 5 and TSS only.
RESULTS
The summary of plants evaluated, the violations observed, andthe number of monthly sample periods are described in Table I
for the 1980 data base and in Table II for the 1981 data base.
The following charts show the compilation of both 1980 and1981 data for all monthly data reviewed and the resultantsuccessful compliance ratio.
PERFORMANCE CHARACTERISTICS OF RBC PLANTSSAMPLE PERIOD 1980-1981
Number of Number ofMonthly Monthly % SuccessfulSamplus Violations Operation
BOI5 ___
AllPlantsSurveyed 598 66 88.96/
TSAll
P1 antsSurveyed 598 45 92.47%
699
67
The results indicate that regardless of load and flow condi-tions, plant operation, or potential lab analysis error, theRBC plants evaluated were meeting discharge requirements 89%of the time for BOD removal and 92.5% of the time for TSS re-moval. This high degree of compliance is considered very goodparticularly in light of the G.A.O. report statement, "E.P.A. 'sstatistical reports on plant performance show that between 50and 75 percent of the treatment plants in operation are viola-ting their permit at any given time".
In an attempt to directly correlate the G.A.O. report on thenumber of plants with discharge violations with the Autotrolreport on RBC facilities, Tables III, IV and V were developed.Table III reports the number of plants evaluated in variousregions by the G.A.O., the total number of plants in violationand the number of these violations per year of operation.Autotrol developed similar comparisons for the 1980 sampleperiod (Table IV) and for the 1981 sample period (Table V).In addition, because certain plants (#3, 18, 33, 44, 15) haddata for both 1980 and 1981, worst year data for duplicateplants were used to develop - composite summary of RBC facili-ties. The composite RBC plant performance is shown in TableV I.
The following conclusions can be drawn from a comparison ofTables ill, IV, V and VI:
1. The plants evaluated by G.A.O. demonstrated that 49.27of the plants vio]ated discharge permits for morethan 6 months out of the year. Less than 117 ofAutotrot RB(C plants had these extended violations ofmore than 6 months per year. (Table TII versus TableVI).
2. While 25.67 of the plants evaluated by G.A.O failedto achieve successful operation for more than 3 monthsper year, only 47 of the RBC plants surveyed performedthis poorly. (Table ITT versus VI).
While i excess of 877" of the C.A.O. plants experienced* at least minor violations, only 37' of the RBC plants
experienced similar difficulties. That is, 63" of allRKC plants continually met discharge limits month inand month out. (Tab]e IiI versus VI).
700
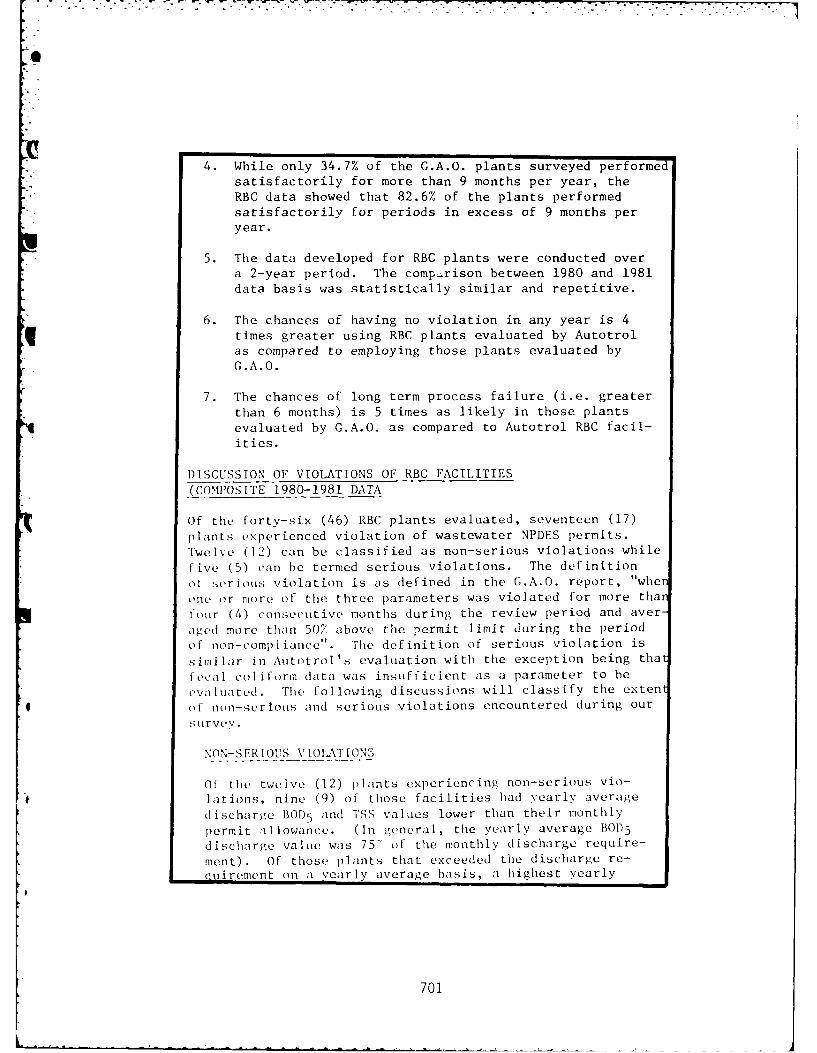
.3 . 9- W/. .
4. While only 34.7% of the G.A.O. plants surveyed performedsatisfactorily for more than 9 months per year, theRBC data showed that 82.6% of the plants performedsatisfactorily for periods in excess of 9 months peryear.
5. The data developed for RBC plants were conducted overa 2-year period. The comprison between 1980 and 1981data basis was statistically similar and repetitive.
6. The chances of having no violation in any year is 4
times greater using RBC plants evaluated by Autotrolas compared to employing those plants evaluated byG.A.O.
7. The chances of long term process failure (i.e. greaterthan 6 months) is 5 times as likely in those plantsevaluated by G.A.O. as compared to Autotrol RBC facil-ities.
DISCUSSION OF VIOLATIONS OF RBC FACILITIES(COMPOSITE 1980-1981 DATA
Of the forty-six (46) RBC plants evaluated, seventeen (17)plants experienced violation of wastewater NPDES permits.Twelve (12) can be classified as non-serious violations whilefive (5) can be termed serious violations. The definitionof serious violation is as defined in the G.A.O. report, "wheone or more of the three parameters was violated for more that
four (4) consecutive months during the review period and aver-aged more than 50/ above the permit limit during the periodof non-compliance". The definition of serious violation is
similar in Autotrol's evaluation with the exception being thatfecal coliform data was insufficient as a parameter to be
evaluated. The following discussions will classify the extent
of non-serious and serious violations encountered during our
sulrvev.
NON-SERIOUS VIOLkTIONS
Of the twelve (12) plants experiencing non-serious vio-
lations, nine (9) of those facilities had yearly average
discharge BOD 5 and TSS values lower than their monthly
permit allowance. (In general, the yearly average BOD 5discharge value was 75"' of the monthly discharge require-
ment). Of those plants that exceeded the discharge re-
ouirement on a yearly average basis, a highest yearly
701
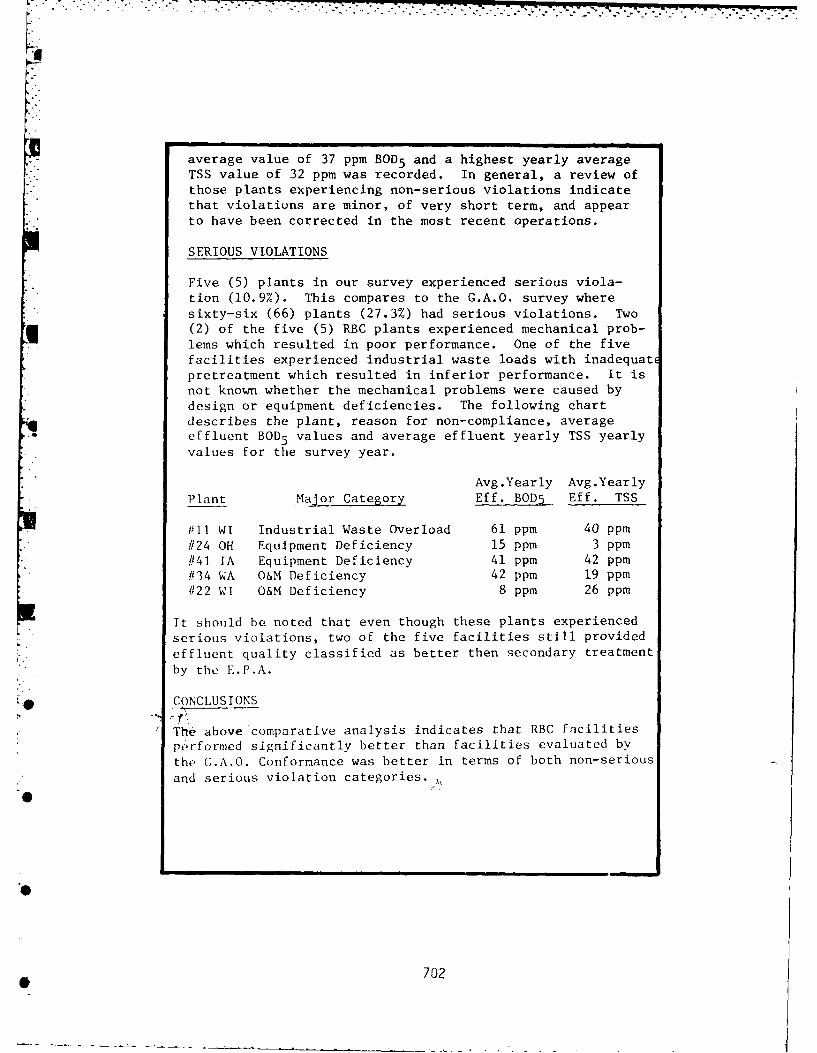
pv 1
- average value of 37 ppm BOD 5 and a highest yearly averageTSS value of 32 ppm was recorded. In general, a review ofthose plants experiencing non-serious violations indicatethat violations are minor, of very short term, and appearto have been corrected in the most recent operations.
SERIOUS VIOLATIONS
Five (5) plants in our survey experienced serious viola-tion (10.9%). This compares to the G.A.O. survey wheresixty-six (66) plants (27.3%) had serious violations. Two(2) of the five (5) RBC plants experienced mechanical prob-lems which resulted in poor performance. One of the fivefacilities experienced industrial waste loads with inadequatEpretreatment which resulted in inferior performance. It isnot known whether the mechanical problems were caused bydesign or equipment deficiencies. The following chartdescribes the plant, reason for non-compliance, averageeffluent BOD5 values and average effluent yearly TSS yearly
values for the survey year.
Avg.Yearly Avg.Yearly
Plant Major Category Eff. BOD5 Eff. TSS
#11 WI Industrial Waste Overload 61 ppm 40 ppm#24 OH Equipment Deficiency 15 ppm 3 ppm#41 1A Equipment Deficiency 41 ppm 42 ppm#34 WA O&M Deficiency 42 ppm 19 ppm#22 WI O&M Deficiency 8 ppm 26 ppm
It should be noted that even though these plants experiencedserious violations, two of the five facilities still providedeffluent quality classified as better then secondary treatment
by the E.P.A.
I 4 CONCLUSIONS
The above'comparative analysis indicates that RBC facilitiesperformed significantly better than facilities evaluated bythe G.A.O. Conformance was better in terms of both non-serious
and serious violation categories.
702
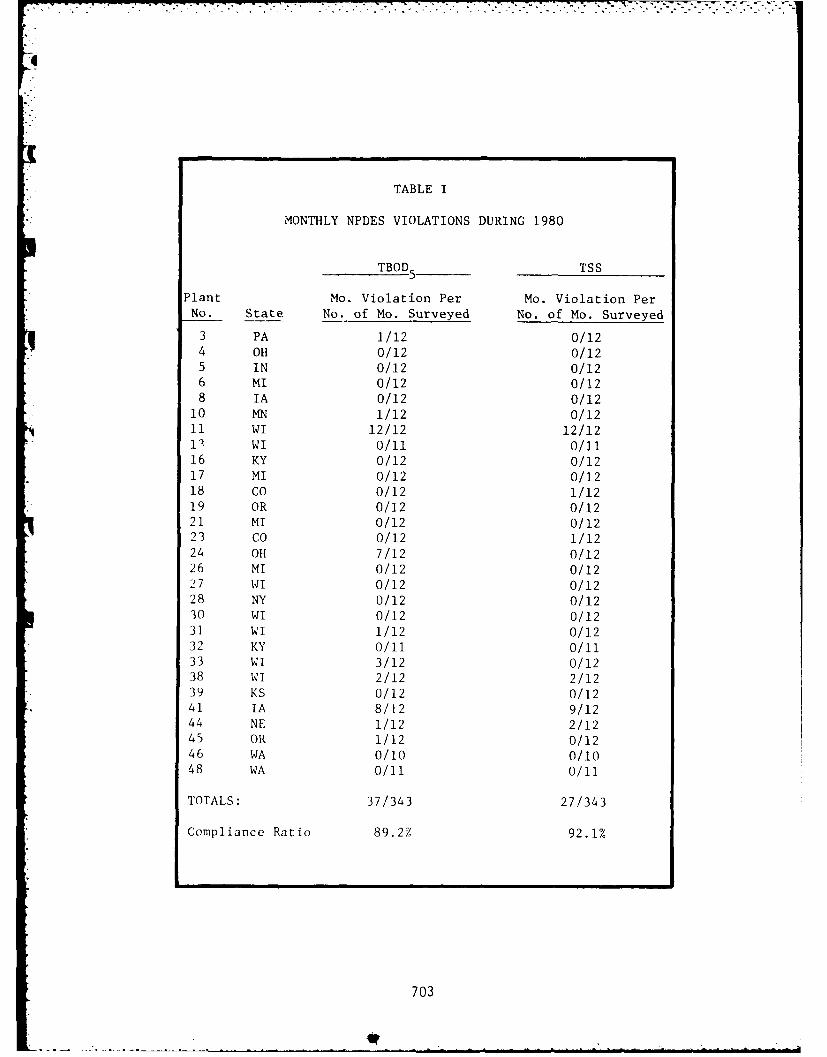
TABLE I
MONTHLY NPDES VIOLATIONS DURING 1980
TBOD 5 TSS
Plant Mo. Violation Per Mo. Violation PerNo. State No. of Mo. Surveyed No. of Mo. Surveyed
3 PA 1/12 0/124 OH 0/12 0/125 IN 0/12 0/126 MI 0/12 0/128 IA 0/12 0/12
10 MN 1/12 0/12
11 WI 12/12 12/1211 WI 0/11 0/1116 KY 0/12 0/1217 MI 0/12 0/1218 CO 0/12 1/1219 OR 0/12 0/1221 MI 0/12 0/1223 CO 0/12 1/1224 OH 7/12 0/1226 MI 0/12 0/1227 WI 0/12 0/1228 NY 0/12 0/1230 WI 0/12 0/1231 WI 1/12 0/1232 KY 0/11 0/1133 WI 3/12 0/1238 WI 2/12 2/1239 KS 0/12 0/1241 IA 8/12 9/1244 NE 1/12 2/1245 OR 1/12 0/1246 WA 0/10 0/1048 WA 0/11 0/11
TOTALS: 37/343 27/343
Compliance Ratio 89.2% 92.1%
703
4i
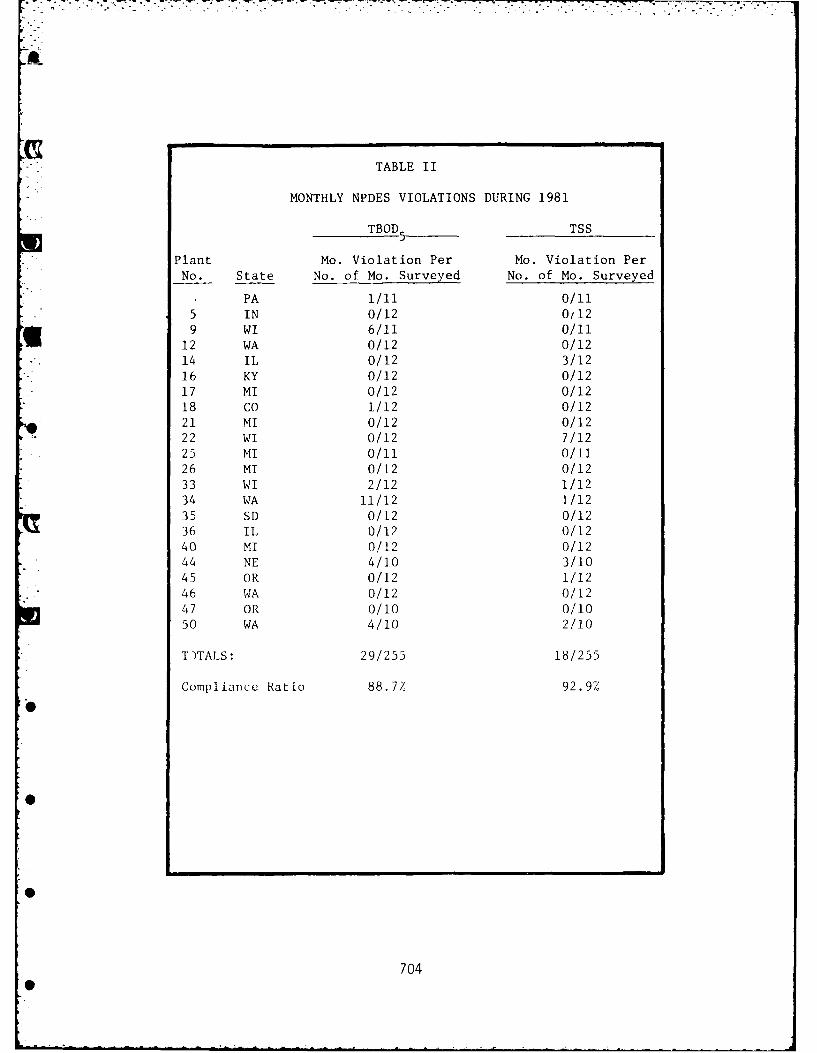
TABLE II
MONTHLY NPDES VIOLATIONS DURING 1981
TBOD5 TSS
Plant Mo. Violation Per Mo. Violation PerNo. State No. of Mo. Surveyed No. of Mo. Surveyed
PA 1/11 0/115 IN 0/12 0/129 WI 6/11 0/11
12 WA 0/12 0/1214 IL 0/12 3/12
16 KY 0/12 0/1217 MI 0/12 0/1218 CO 1/12 0/1221 MI 0/12 0/1222 WI 0/12 7/12
25 MI 0/11 0/1126 MI 0/12 0/1233 WI 2/12 1/1234 WA 11/12 1/12
35 SD 0/12 0/1236 IL 0/12 0/12
40 MI 0/12 0/1244 NE 4/10 3/1045 OR 0/12 1/12
46 WA 0/12 0/1247 OR 0/10 0/1050 WA 4/10 2/10
T)TALS: 29/255 18/255
Compliance Ratio 88.77 92.9%
7
0
70
Se
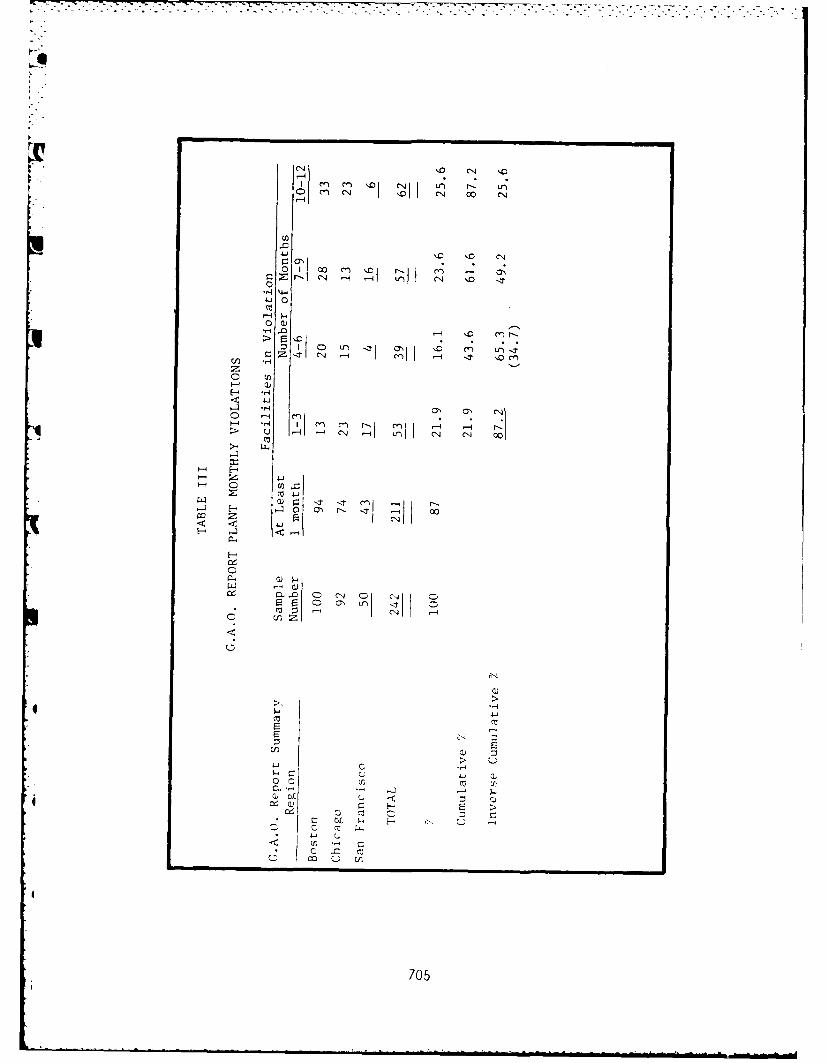
'0 0 CN
I 0
u0.
zI- Q)
H *3H
0 -1
-34
z CNJ1
C)
E- E0 C ; r
0.. 0 alo Lt.,
705
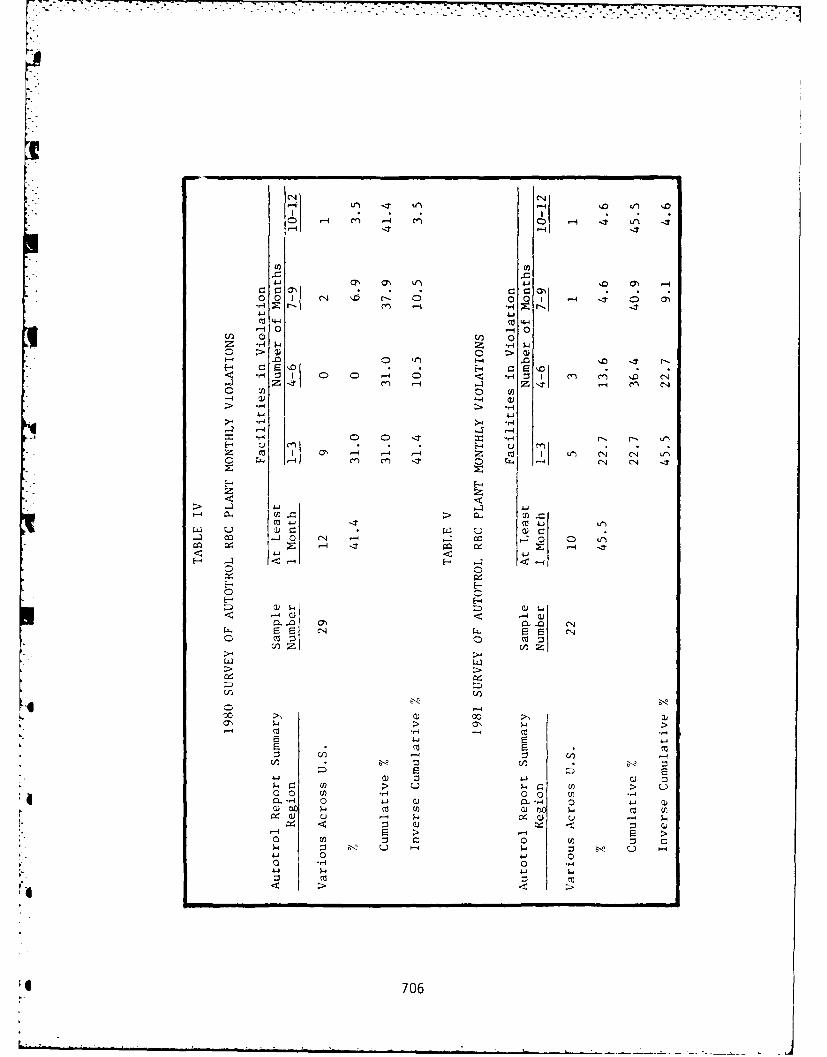
.0 Ch -*4
CCY4
co 4-4 0
0 "~ 0' L0U '
C0'~~~~~ -H 00 1- -t
~II
(Y) 0 l) 0N C1
ot -r- >SJU 4.4 cc
an 0 Lr
C'Cl-4:3- i 0 ci)
> >
0-) -4 - .4 - . -
> >
.4 j.. $. :
o 0
706
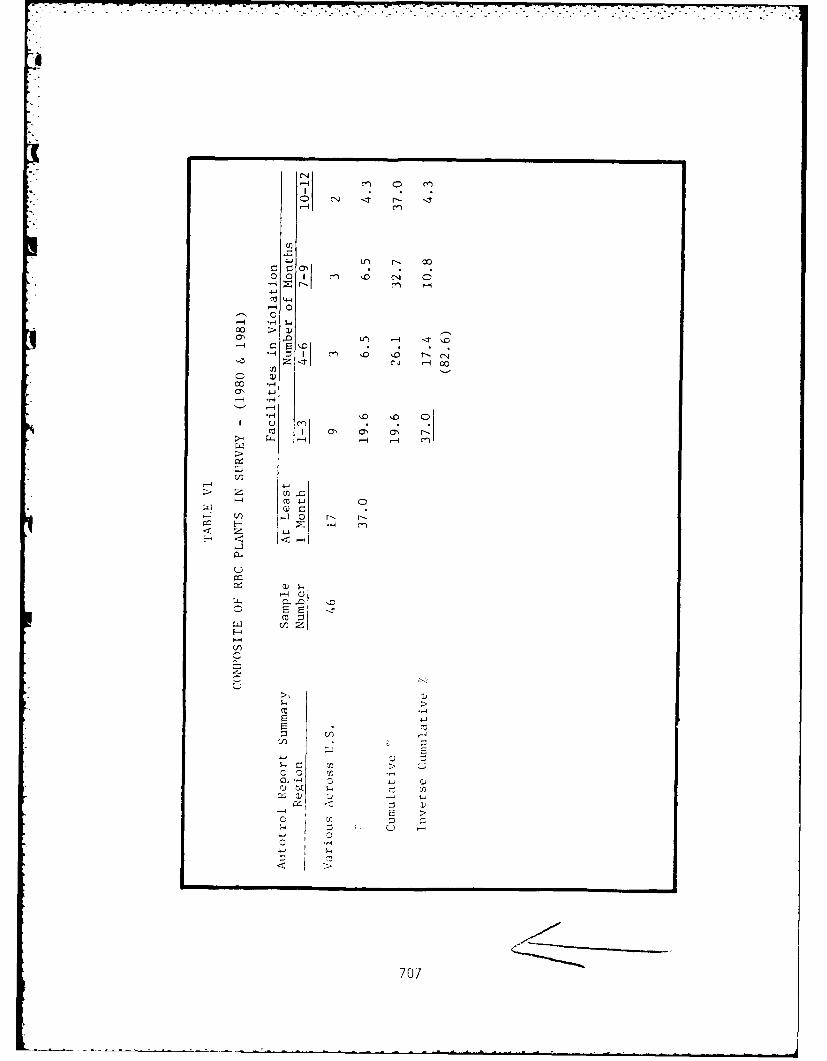
-4) c l 0 0-
-4I
0000 0 CN
44 00C)
00 .,10-1
0 W 1
cn ~
-44
0' CL)r
-44
- 4-0
~4 ri-i ~ 0 r- r
70
7%777-
THE USE OF PLASTIC MEDIA TRICKLING FILTERS- -
TWO) CASE HISTORIES
0 Felix F. Sampayo, Jones & Henry Engineers, Limited
0 Toledo, Ohio
INTRODUCTION
Over the last ten years, Jones & Henry Engineers hasinvestigated the use of fixed film biological processes ata number of locations in the Great Lakes area.Approximately half of these studies have been directedtoward the treatment of high stren~gth waste and halftoward the production of nitrified effluents. In some
'I cases, the investigations have included rotatingbiological contactors and trickling filters.
708
This paper discusses two case histories on the use ofplastic media trickling filters. One of the casehistories deals with the treatment of high strength wastesat Kalamazoo, Michigan and the other with nitrification ofthe Lima, Ohio secondary effluent.
THE KALAMAZOO CASE HISTORY
The City of Kalamazoo, Michig~an conditions sludge bywet air oxidation.1 The conditioned sludge is thickenedin decant tanks, dewatered by vacuum filters, andincinerated. The residue ash is landfilled. The decanttank supernatant and the vacuum filter filtrate arerecycled to the head of the plant. Although the recyclestreams represent less than 1 percent of the plant flow,they constitute 24 percent )f the total organic load.
An alternative to direct recycling is treating thesupernatant separately. Jones & Henry Engineers testedseveral processes for possible separate treatment of thewet air oxidation recycle streams as part of the designfor advanced wastewater treatment. The practicality ofvarious separate treatment processes was ascertainedthrough desk top, bench scale, and pilot studies. Processeffectiveness was judged on BOD reductions. Processviability was determined using additional paramatersincluding color removal, odor control, processreliability, operational simplic-ty, space requirements,and economics. Bench scale studies of activated sludgeand physical-chemical methods showed these processes to beineffective. Pilot plant investigations demonstrated tk itattached growth reactors would best be used forpretreatment of the recycle streams. Design informationwas developed during the tests that substantiated andexpanded previous research.
709
-A126 377 PROCEEDINGS: INTERNATIONAL CONFERENCE ON FIXED-FILM 9/7
BIOLOGICAL PROCESSES (..(U) PITTSBURGH UNIV PA DEPT OF4SS CIVIL ENGINEERING V C WU ET AL. 1982 DRCROB-Bi-R-005
UNCLASSIFIED F/G 13/2 N
I I II LI 3 2 6-
IIIIL2 1 311 .4 J6
MICROCOPY RESOLUTION TEST CHART
NATIONAL BUREAU OF STANDARDS -I963-A
CHARACTERISTICS OF RECYCLE STREAMS
The supernatant and filtrate have essentially thesame physical and chemical properties. The coffee-coloredliquors have an average temperature of 12O (490C), anoticeable odor, and strong frothing tendencies.
Standard chemical analysis of wet air oxidationby-product samples showed the liquor is acidic andextremely rich in nitrogen, with substantial amounts ofchloride and sulfate and low levels of phosphorus andsuspended solids. The waste has high BOD, COD, and TOC.Specific chemical characteristics are detailed in Table I.
THE STUDY
A plastic media trickling filter was pilot tested onthe supernatant of the wet air oxidation decant tank. Theunit was operated for nearly six months (December 17, 1974to June 2, 1975). The temperature and oxygen demand ofthe supernatant were controlled by dilution with groundwater. This was necessary as the temperature of therecycle stream was too high for biological treatment.
The test parameters for the pilot program were totaland soluble BOD and COD, and total and volatile suspendedsolids. Color and odor were noted but not measured. Theparameters were monitored on the influent and effluent todetermine process efficiency at various organic andhydraulic loadings, and dilution ratios. Samples werecollected seven days per week; one sample every twohours. Analyses were performed on daily composites ofgrab samples.
.4 Figure 1 is a diagram of the pilot facility. Thesupernatant was diluted with ground water at the top ofthe tower. This mixture flowed through a funnel to arotary distributor that controlled the hydraulic loadingto the filter. The effluent was collected in therecycling reservoir at the bottom of the filter, and a
4 portion of it was returned to a tank at the top of thetower. The constant level feed and recycle tanks wereequipped with outlets to ensure constant discharge. Thefeed, recycle rates, and dilution ratio were varied tostudy the filter's efficiency under different conditions.
710
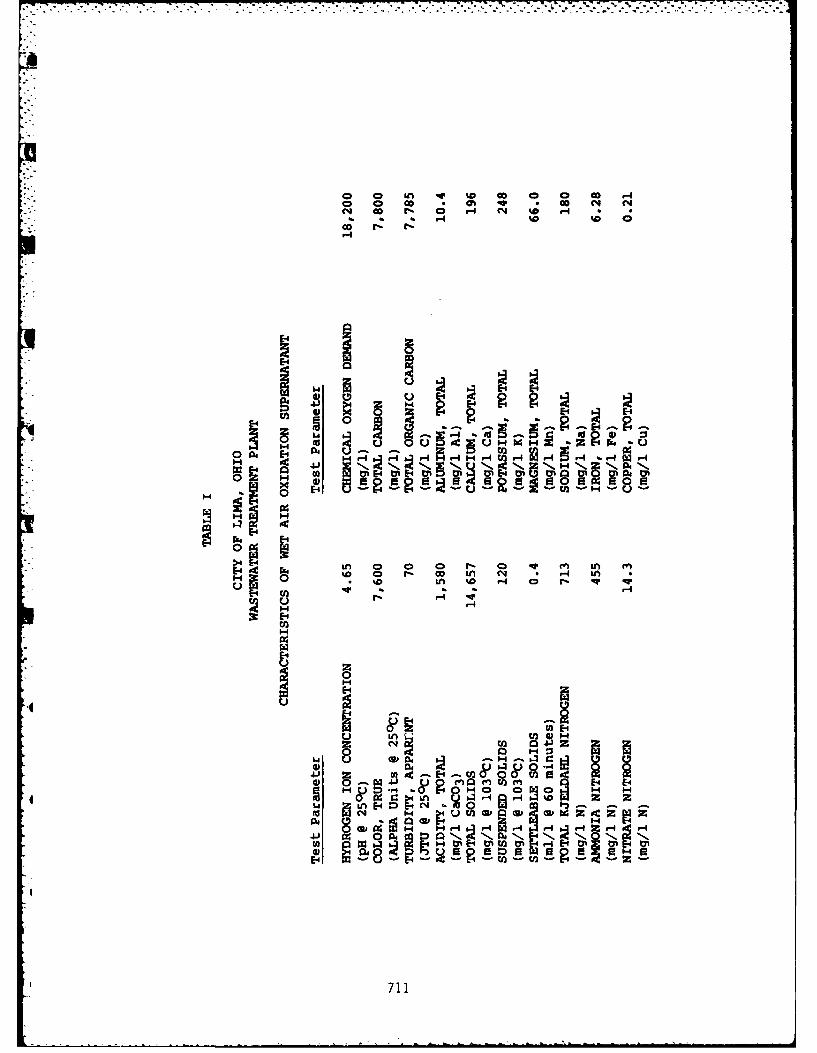
o C2 an -0 %D c 0 0 Go00 co 0 q 0 Go N 0NN Go - 0- r4 C D r D 0
O0 N r
E-4
Sr 0 E4
0 04 E-1 t
0r4 '4 r4 r r4 '
14)
E-0 0 04~c f
0D C4ID H 0
%n 0 0 0 r- a% 10 M Ln e
r4 14
-0
z
.4-
LO W1
14 14H
(711
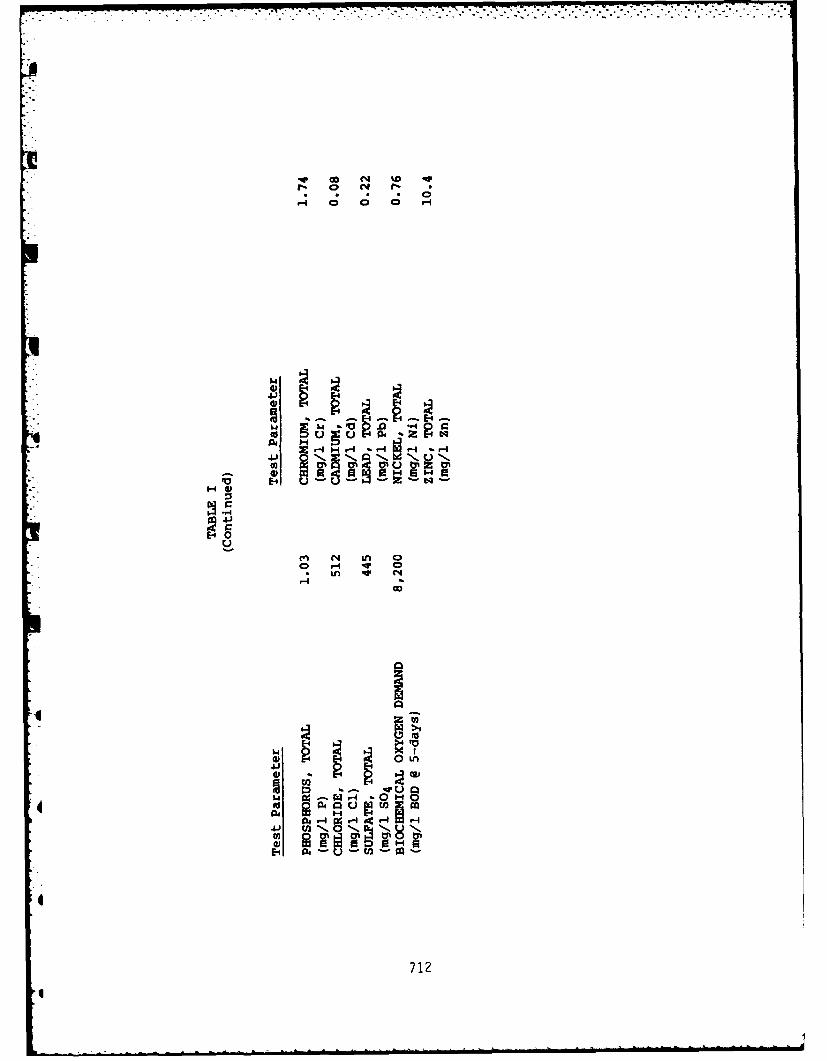
%0* 0
H- 0
g-I 0 0 0 4
S r -4 0
V E4 U E
71
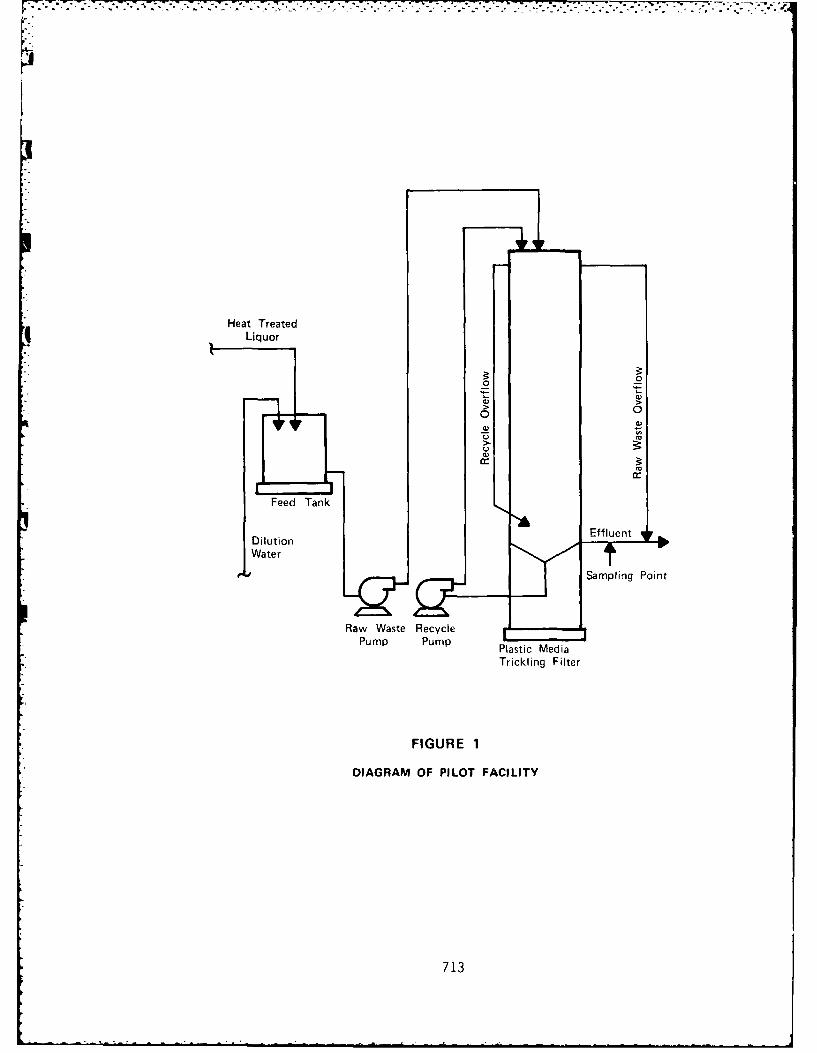
Heat TreatedLiquor
0 0
> 075 M
c) 4
Feed Tank
Di lut ion Efun
Water
Raw Waste Recycle
Pump Pump Plastic Media
Trickling Filter
FIGURE 1
DIAGRAM OF PILOT FACILITY
713
The pilot equipment included:Pilot Tower Steel shell - 3 feet in diameter
- 30 feet highMedia - 21.5 feet high Surfpac
MediaSurface area - 7.07 sf
Volume - 153 cf2 - 0.5 HP pumps for influent and recycle1 - 1.5 HP pump for dilution
RESULTS
The filter removed less than 60 percent of the BODunder all test conditions (Table 1I). The highest removalof soluble 8OD was 59 percent, achieved with low organicand hydraulic loadings (85 lbs/l,000 cf/day and 407gpd/sf) with a recycle ratio of 2.5. BOD removals inexcess of 45 percent were attained at the same hydraulicload, but with higher organic loadings (282 and 469lbs/l,000 cf/day) and a recycle ratio of 5.25. Ingeneral, BOD removal percentages were reduced as the loadincreased.
The highest BOD removals per unit volume of mediaoccurred at low levels of dilution with recycle ratios inexcess of 5.0. The low dilution levels had a highertemperature which improved treatment efficiency andminimized freezing problems; however, high recycle ratioslowered the temperature. Therefore, if the process wereto be used, it would be necessary to achieve a balancebetween recycling and dilution.
6 gThe performance of the pilot plant was characterized
by a mathematical expression similar to one proposed bythe National Research Council.4 The expression may beused to predict the effectiveness of the unit under a widerange of operating conditions or applied to full-scalesystems with varied loads and recycle rates. The formulawas not verified for high levels of treatment as removalsof BOD in excess of 60 percent were not attained.
714
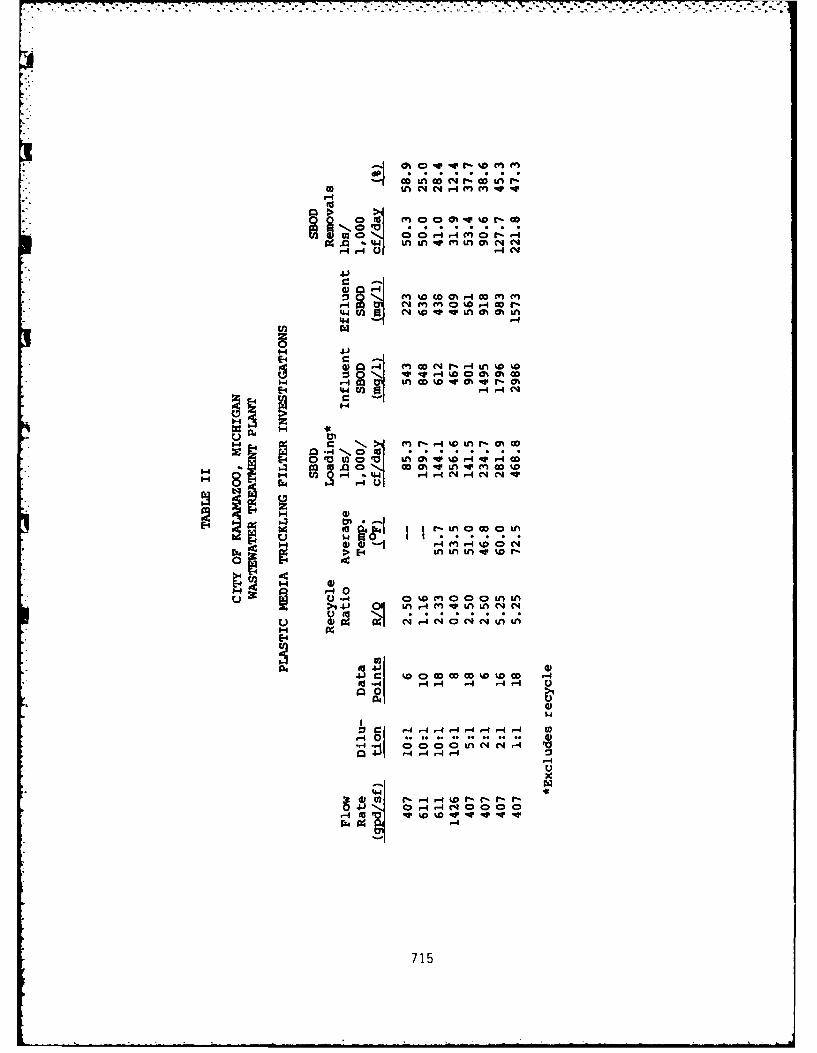
I- .- (
4JC
P4
E-4 r.OH r.
0104-
0- Co to0- h 0F4 4IG
E411 N.U,
I r r N rL! H 0N. N0
.a a wI0O .u M 0
U *0 ~ C0~(JfUts ()W4C 4 4 IL
H0E-4H -H >
00
~~CI HH,-4H H e
N, 0 I- 00 0~N 0004g - D%0V V-0V-
rZ4 H
715
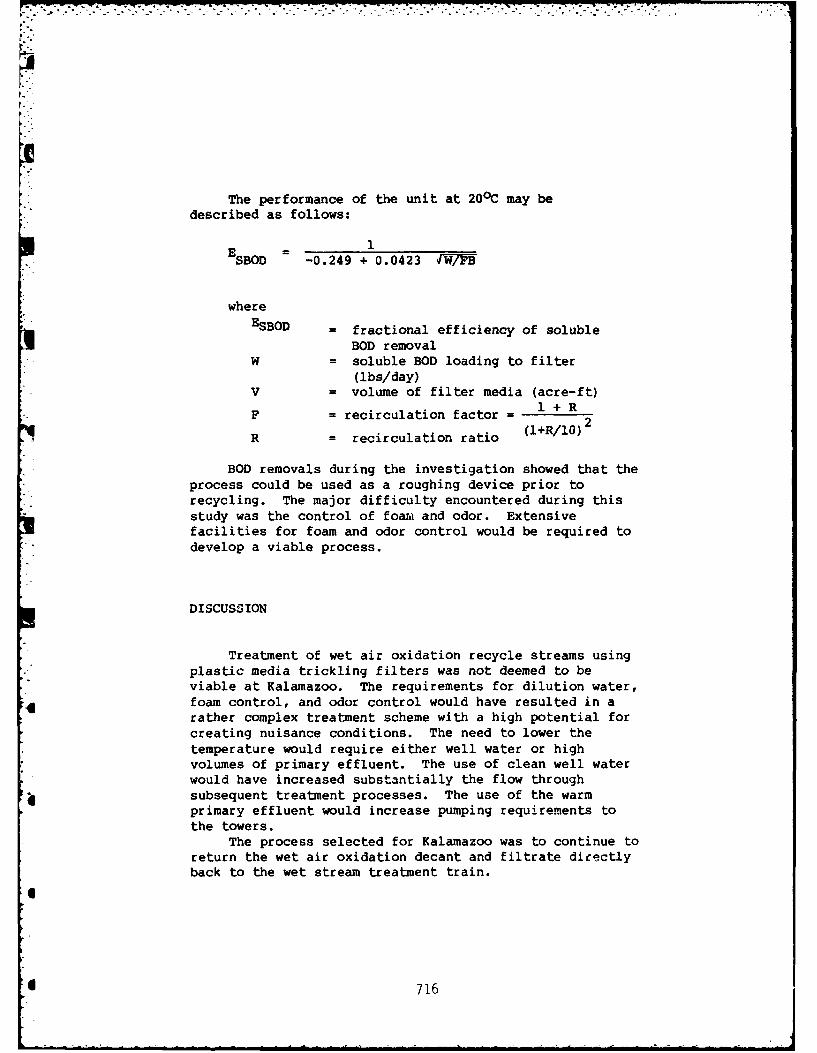
The performance of the unit at 200 C may bedescribed as follows:
ESBOD =-0.249 + 0.0423 (W7B
whereESBOD = fractional efficiency of soluble
BOD removalW = soluble BOD loading to filter
(lbs/day)V = volume of filter media (acre-f t)
F = recirculation factor = 1 + R2
6R = recirculation ratio (l+R/10)2
BOD removals during the investigation showed that theprocess could be used as a roughing device prior torecycling. The major difficulty encountered during thisstudy was the control of foari and odor. Extensivefacilities for foam and odor control would be required todevelop a viable process.
DISCUSSION
Treatment of wet air oxidation recycle streams usingplastic media trickling filters was not deemed to beviable at Kalamazoo. The requirements for dilution water,
4 foam control, and odor control would have resulted in arather complex treatment scheme with a high potential forcreating nuisance conditions. The need to lower thetemperature would require either well water or highvolumes of primary effluent. The use of clean well waterwould have increased substantially the flow through
* subsequent treatment processes. The use of the warmprimary effluent would increase pumping requirements tothe towers.
The process selected for Kalamazoo was to continue toreturn the wet air oxidation decant and filtrate directlyback to the wet stream treatment train.
d 716
CONCLUS IONS
The following conclusions may be derived from the study.
1. Plastic media filters can be used to remove asubstantial portion of the soluble BOD in wet airoxidation recycle streams.
2. The process could be used for pretreatment of wastesbefore they are returned to the wet stream treatmentprocess.
3. The effluent from the process has high BOD and colorand is not suitable for direct discharge.
4. The use of plastic media trickling filters wouldrequire a significant investment in temperature, foam,and odor control facilities.
5. Treatment of waste oxidation recycle streams usingplastic media filters was found to be undesirable dueto the high potential for odor, extreme foamingcharacteristics, and added complexity to the overallwaste treatment schemo.
THE LIMA CASE HISTORY
The second case history deals with the use of plasticmedia trickling filters for nitrification at the City ofLima, Ohio Wastewater Treatment Plant. The pilot studiesleading to the design of these facilities have beenreported elsewhere2'3. The description of the plant andearly operating experience also have been reportedpreviously4. This paper summarizes the plant designcriteria and discusses operating experience for the fiveyears the complete plant has been in operation.
THE PLANT
The improvements to the wet stream facilities wereessentially completed in the fall of 1976. Upgrading ofthe sludge treatment/disposal facilities was completed inmid-1979.
717
The plant is designed for an average dry weather f lowof 18.5 mgd and a peak of 53 mgd. The original designconcept called for the secondary and advanced treatmentportions of the plant to operate at a peak rate of 33 mgdwith the remaining flow receiving primary settling andchlorination.
The upgraded plant includes screening, grit removal,primary settling, aeration, final settling, nitrificationtowers, chlorination, and phosphorus removal. Ferricchloride and anionic polymer are used for phosphorusremoval. Sludge treatment and disposal includes gravitythickening, anaerobic digestion, vacuum filtration, sludgecake storage, and land spreading. Normal sludgetreatment/disposal uses thickening, digestion, and landspreading of liquid sludge. vacuum filtration and sludgestorage followed by landfilling is used as backup to landspreading. The design also includes a centralizedcomputer control system. The plant discharges to theAuglaize River.
The design of the two 106 ft. diameter nitrificationtowers was based on the results of pilot studies. Themedia for the full-scale facility was supplied byGoodrich. The basis of design, description of theindividual treatment units, and projected plant effluentare shown in Table III.
718
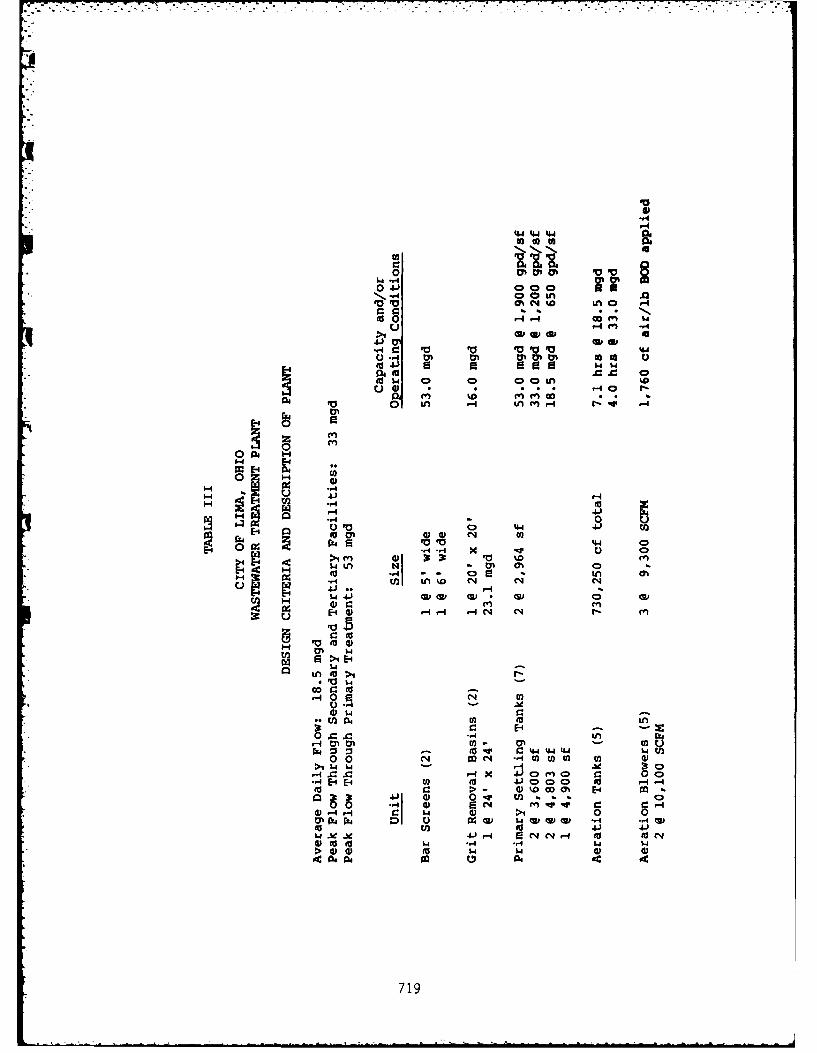
0% No L o -4
go 0 A dtW 0
0 4 tpvl O ylv4 Q o o EU
ON O -4 Oc -i f -WO '4
O0N- W ~ L
.- (z en0)
0 N H.pq~V V '.
o~L If - U .4 t- -
004 S a44 C
00t
4)
14-Ca bdL
LA
00 '4l 0-A *.UWW C
P'4 :3 :3 (to co 44~0 0440 0 N mC>- ,IV 0~ WO E-.
-4 C~ C) -1 x0-4 w. to >i o 00 g 04-
0 ) 0 En. .4.10 -4 i 4)4 m.- "41.
r-0 c w 4 >4 0 0
> 00w
719
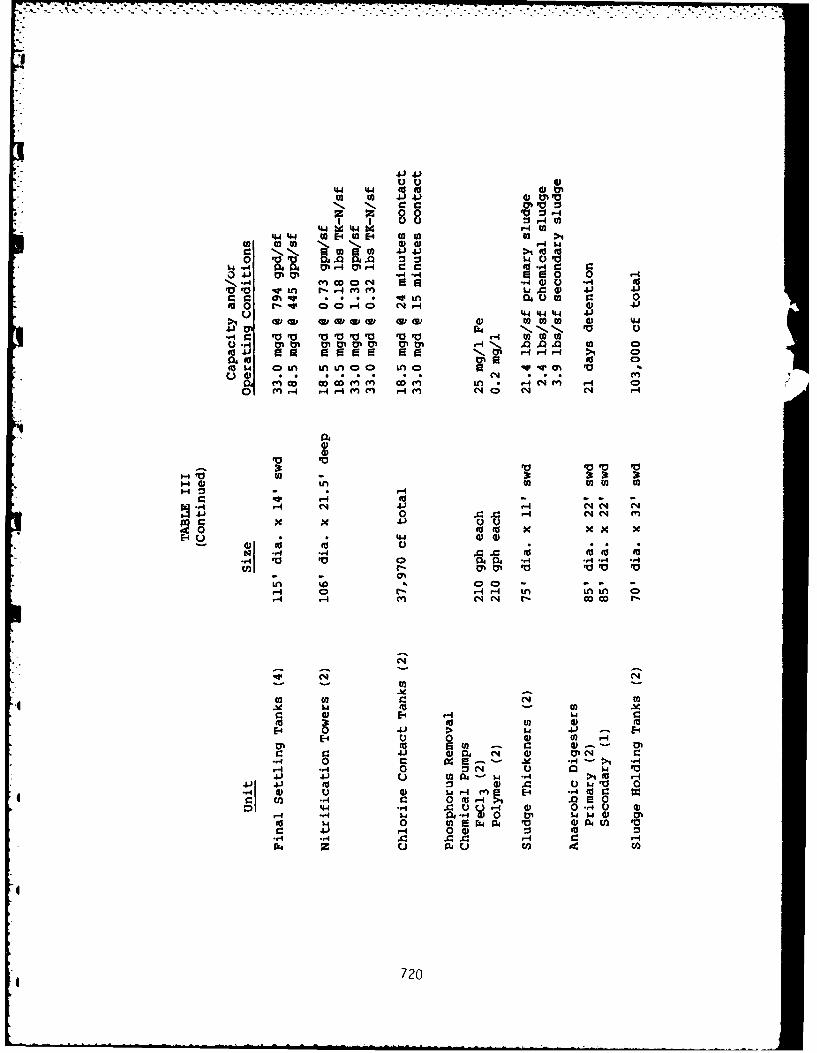
441 44 0 40
z z 0 0zI 1 0 0 r04
4-4 4 A 0 w 00 to >1
0 74% JJJ 0 0
a-. 41 0 0.4 s0 0- 0qV In f- -4 fnM WaC ) .4-) 4-(n V . ... qrt 0400 U m
4020 0 -4~ C'J N ..4v I44 4W 44
Wi ap02 w1010~2 w 0~ W w2 0 0) v t 444r 4 N ' 'a L> V VV~~V ~ H000
ON01 Im.4a m al a%2 -N .0 .0.0 02 0go~. 4J 0O Ls 0a0La 1 -4 - H >1 0
0 #aI cc* 8*140 A
C r0 a; a; .a 4 * * . (4 .4 -. '(Inr- 4r- (I r4 CA Q C4 N 04
o~~ ~ ~ t VHHM -M 4 ~
0
4-40~~ 1* 2022 0I--I .0r4P4 L
On C1 02 f- c c -
Je W00
c- a)4 E-.C 024 w 22IV go W.4*- *4 *
E-4 41 4-
02 0 N 4 r20 r. 1-a E2 02 e 4 1 -r. 0 :) H 4 V 4 In $4
4)1- U -n0n 0 04 .0 H
w2 C 4 0 -4 Er4 A 34. 00 4 0 Cm w4) V%
0- 0) (D 0-*- to 13~i0 go w V
4~~~ r.1 H ~ E4 *.2 -4-4.z u 002 ci to ~ 0
072
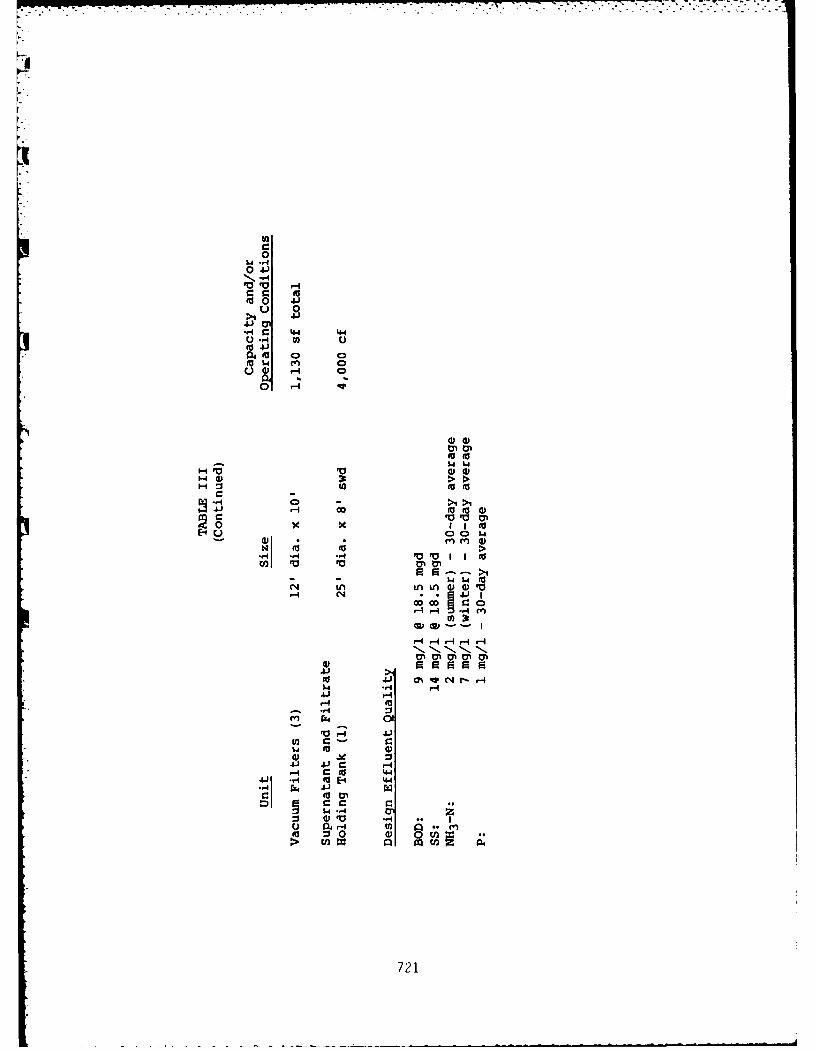
I-
0 4)
!0
1.4 t.- 4 0
i .r
4.)
1 0
it 0
to 4 m) 0
014 (l 0
0
-14I4) > 00
01 >1 >q
,-4 .",I
OD c
?21
N V NN N.
41a -4
C.) rN4 01
to) C:
.&) 4J
-4 4 4j
0 0
721
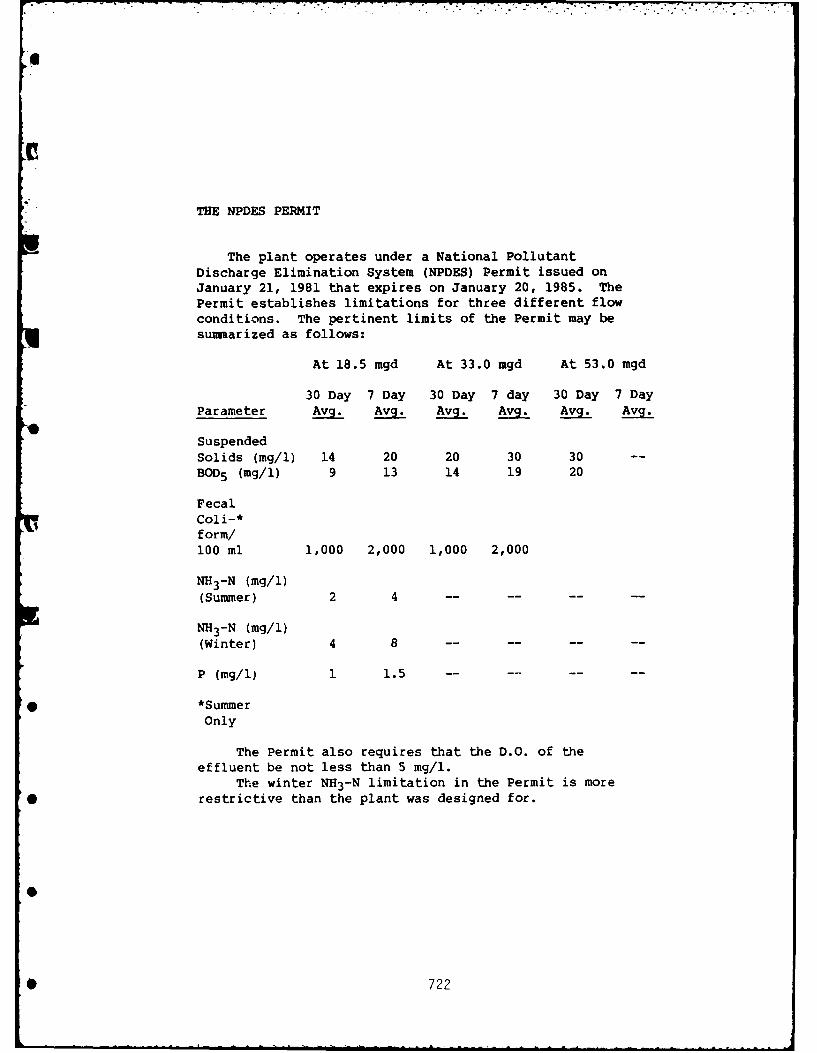
THE NPDES PERMIT
The plant operates under a National PollutantDischarge Elimination System (NPDES) Permit issued onJanuary 21, 1981 that expires on January 20, 1985. ThePermit establishes limitations for three different flowconditions. The pertinent limits of the Permit may besummarized as follows:
At 18.5 mgd At 33.0 mgd At 53.0 mgd
30 Day 7 Day 30 Day 7 day 30 Day 7 DayParameter Avg. Avg. Avg- Avg. Avg- Avg-
Suspended
Solids (mg/l) 14 20 20 30 30
BOD5 (mg/l) 9 13 14 19 20
Fecal
Coli-*form/100 ml 1,000 2,000 1,000 2,000
NH 3 -N (mg/l)
(Summer) 2 4 -- --
NH 3 -N (mg/l)
(Winter) 4 8
P (mg/l) 1 1.5 --
* *Summer
Only
The Permit also requires that the D.O. of the
effluent be not less than 5 mg/l.
The winter NH 3-N limitation in the Permit is more
* restrictive than the plant was designed for.
* 722
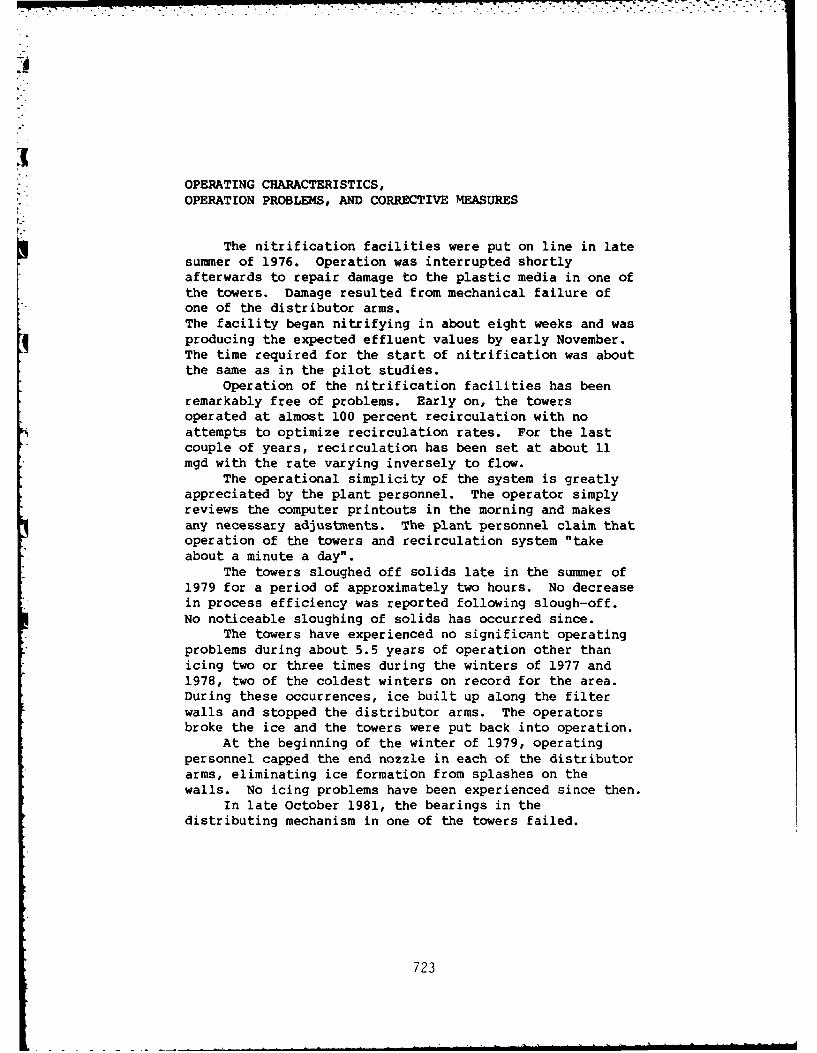
OPERATING CHARACTERISTICS,OPERATION PROBLEMS, AND CORRECTIVE MEASURES
The nitrification facilities were put on line in late
suimmer of 1976. Operation was interrupted shortlyafterwards to repair damage to the plastic media in one ofthe towers. Damage resulted from mechanical failure ofone of the distributor arms.The facility began nitrifying in about eight weeks and wasproducing the expected effluent values by early November.The time required for the start of nitrification was aboutthe same as in the pilot studies.
Operation of the nitrification facilities has beenremarkably free of problems. Early on, the towersoperated at almost 100 percent recirculation with noattempts to optimize recirculation rates. For the lastcouple of years, recirculation has been set at about 11mgd with the rate varying inversely to flow.
The operational simplicity of the system is greatlyappreciated by the plant personnel. The operator simplyreviews the computer printouts in the morning and makesany necessary adjustments. The plant personnel claim thatoperation of the towers and recirculation system "takeabout a minute a day".
The towers sloughed of f solids late in the summer of1979 for a period of approximately two hours. No decreasein process efficiency was reported following slough-off.No noticeable sloughing of solids has occurred since.
The towers have experienced no significant operatingproblems during about 5.5 years of operation other thanicing two or three times during the winters of 1977 and1978, two of the coldest winters on record for the area.During these occurrences, ice built up along the filterwalls and stopped the distributor arms. The operatorsbroke the ice and the towers were put back into operation.
At the beginning of the winter of 1979, operatingpersonnel capped the end nozzle in each of the distributorarms, eliminating ice formation from splashes on thewalls. No icing problems have been experienced since then.
In late October 1981, the bearings in thedistributing mechanism in one of the towers failed.
723
RESULTS
The results for BOD, suspended solids, ammonia, anddissolved oxygen during the first three full years oftreatment facilities operation have been reportedpreviously and are suimmarized in Table IV. The resultsfor 1980 and 1981 are presented in Tables V and VI. Rawwastewater and air temperatures for the same period areshown in Table VII.
The tables show that the quality of the effluent isconsistent and generally better than required by the NPDESPermit. The one instance of high NH3-N in February 1980has been attributed to analytical error. At the time theplant was experimenting with different analyticalmethods. The high suspended solids during January,February, March, and April of 1980 were due to the plant'sinability to dispose of sludge with the consequent highsludge inventory in the aeration system.
The flows shown in Table V are total flows to theplant and include a small portion of the flow thatreceived primary treatment only during January, February,March, and April of 1980. The actual average flow throughsecondary treatment and nitrification for these months are:
January 13.14 mgdFebruary 10.64 mgdMarch 22.98 mgdApril 18.80 mgd
Beginning with May of 1980, the computer programgoverning storage in the sewage system began operatingproperly. Storage in the system has reduced peak flows tothe plant and practically eliminated the need to bypasspartially treated wastes.
From 1979 through early 1981, plant personnel tookapproximately four measurements per month of TK-N in thenitrification towers influent and effluent. The averagefor these values is shown in Table VIII. Also shown inthe table are the loading to the tower (lbs TK-N/sf/day)and the resulting effluent NH3-N concentration for theyears 1979, 1980, and part of 1981.
724
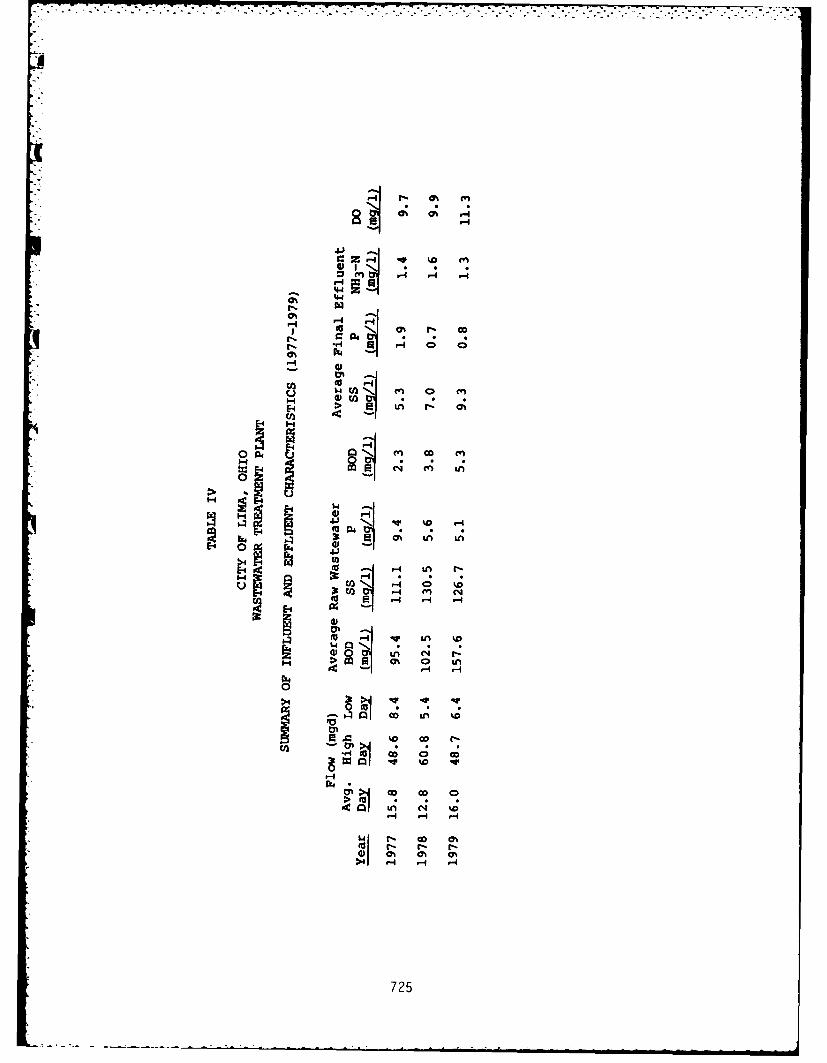
41O
44-
44
14HH
000'n
14
to I.CfL'4
mA NN
> >
Ho LA
S co ('H H
041 - 0 olHo H-t-
725.*
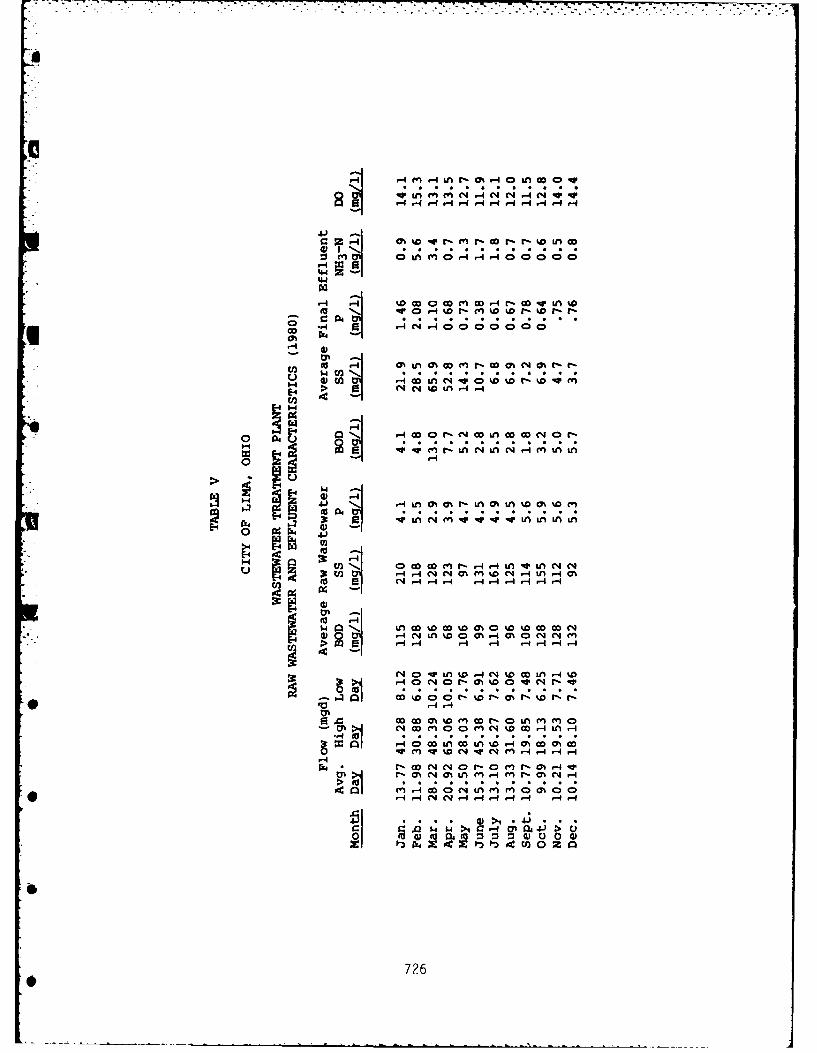
75.. . . . . .
r:a C r C
OD A C C C;C 8C
> c c % L Ar- o n
m0 0 r. o H r r-i rn tfn '
0 ................................................................)tVH nV" V- nL nL
oo r -Ir- -4r e4 r-4 w c.4 r-
w HnL D% 0WM D% 0O %
- 4 I4L 0C %r- %0 iN f
H -nJC4O ' C I c-4 rA 4
Ho %D iA 0 O'- %D r 0 f 4 %D r-
OD CD 0 M OD r, H I LO MD 0 0,H
H*d 8 C 0 0L-0-O H w
4O~(4 r, W H a C r - IM (4 H
r Lq -4 (4 Of rI- >4 C) 4
0-)4u 0G)U0a
726
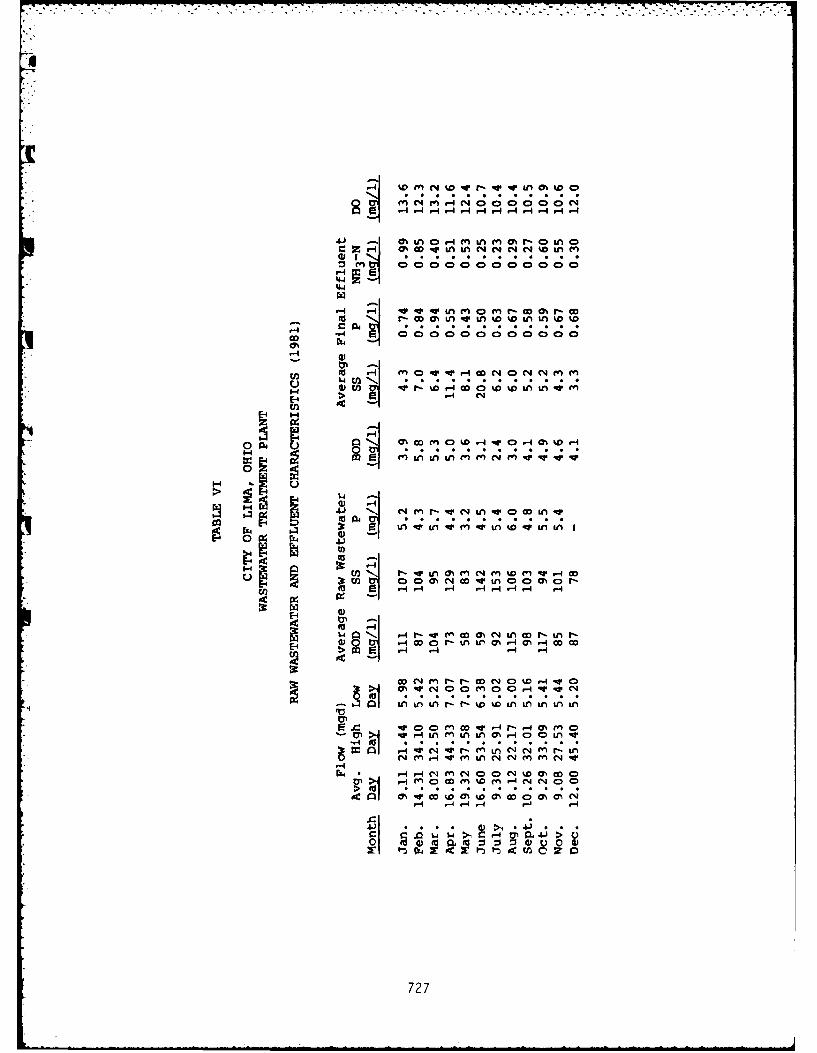
fn 4 n014C 00 0 00 C4H4 -4 4 - r4r- 4 4-4r4 -
m n 40mIA(m mN a o~CN %D Ln e
000000000000 C;C; C C
44I
r4w-o- tn en 0 M% r- CD 0'0A - OD
.. ooooooooooooC; ;
Un Lit Mr n-w-
-
ci -W Ln v m -Wl tn wW tn in
0 4.)
U g Nn 0 LA 4M C4 OD -0tn 0 M o Hf-
E.4 0
H4 - V M W M% " 0 W - Ln N-
5.4 * 1H 0NLA r0%H .H
W> M rl r0 W (D0 4 V
.4~Ln Ln Ln N- N'0 w 0 w A L Ln Ln Ln
V 400C M CD 4 H, N"H 0% 1" 0
H -4 LO~ M L A C*n cr r- N Ln -
CN m H- V m Ln N N m m eq V
0% - W O %0 0% 00% 0 O NC
.4r_ > . > E 4
o0
727
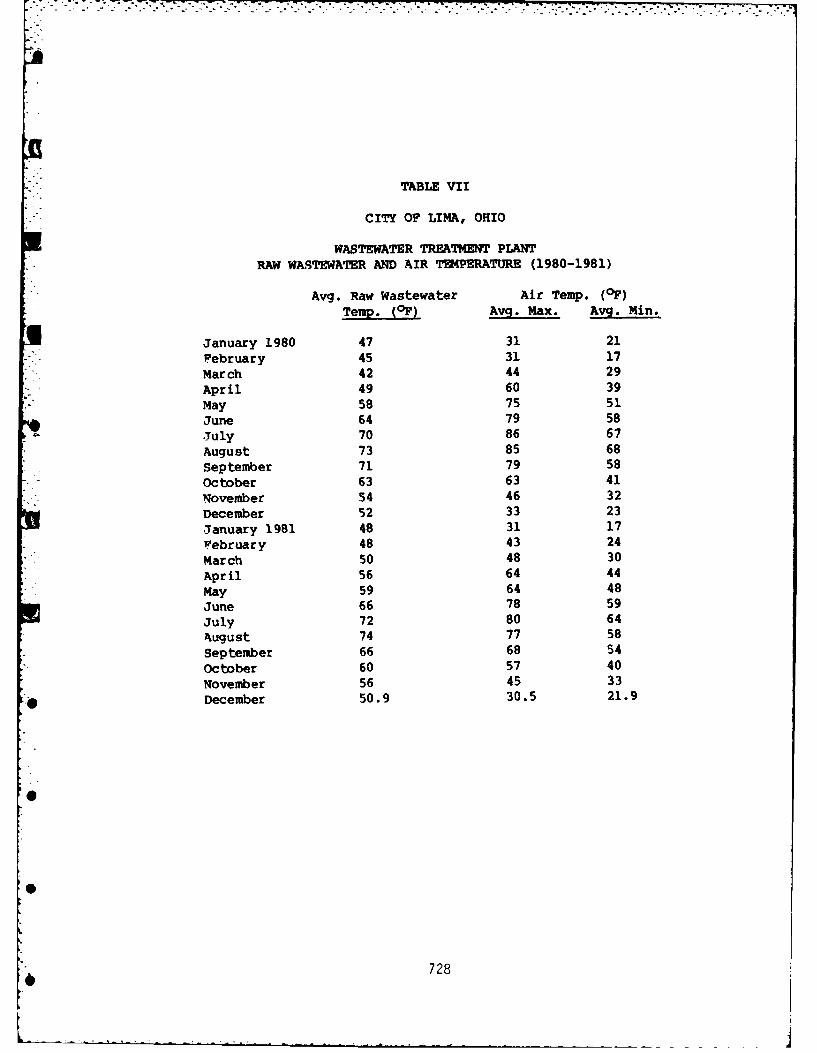
TABLE VII
CITY OF LIMA, OHIO
WASTEWATER TREATMENT PLANTRAW WASTEWATER AND AIR TEMPERATURE (1980-1981)
Avg. Ray Wastewater Air Temp. (OF)Temp. (OF) Avg. Max., Avg. Min.
January 1980 47 31 21February 45 31 17March 42 44 29April 49 60 39
May 58 75 51
June 64 79 58
July 70 86 67
August 73 85 68
September 71 79 58
October 63 63 41
November 54 46 32
December 52 33 23
January 1981 48 31 17February 48 43 24
March 50 48 30
April 56 64 44
May 59 64 48
June 66 78 59
July 72 80 64August 74 77 58
September 66 68 54
October 60 57 40
November 56 45 33
*o December 50.9 30.5 21.9
728
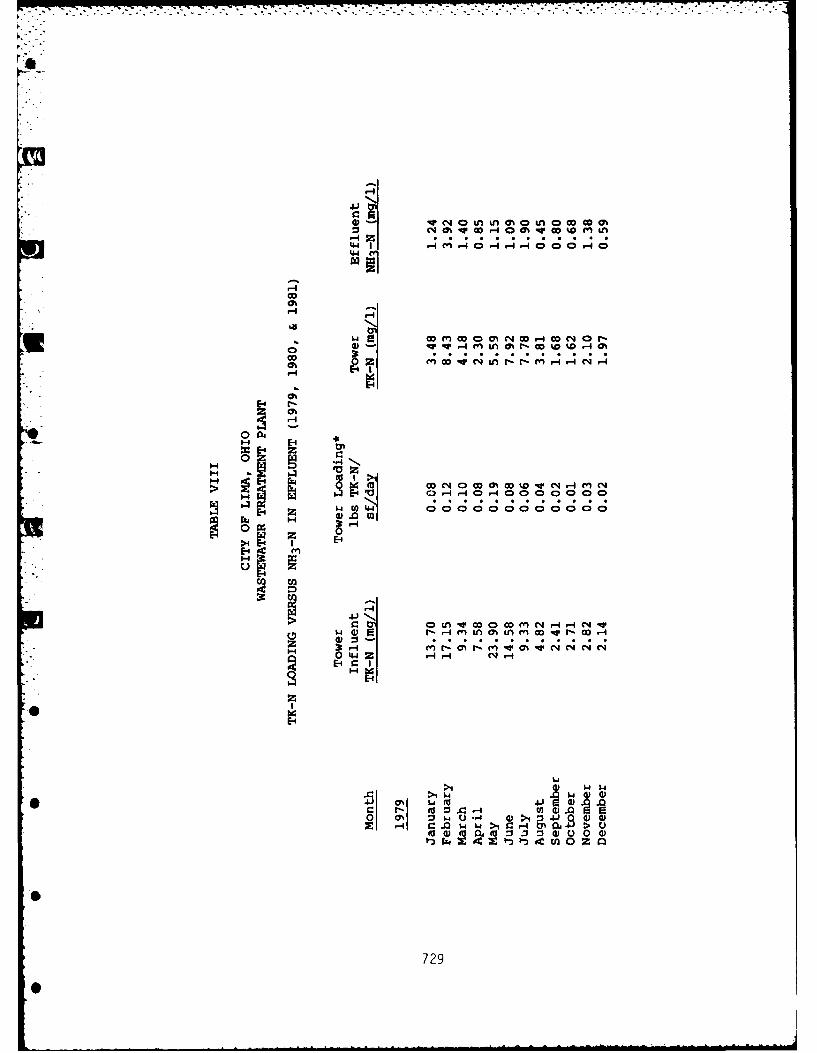
r*A
.I1
44I44' tCIylL Os~fO0
GoH O~' MI0%c~
54r
4)-V V - Mr 4OOD 2H
U% 9Ac ;4c
W'-40
E'4~0 11~oA44
c 9 (0 L RV co 0 (1~4 H- H- C4 V$4I r IM nI L nGo- H o-
4):
E-4~
0 H
0 00 0 0 0) 0
729
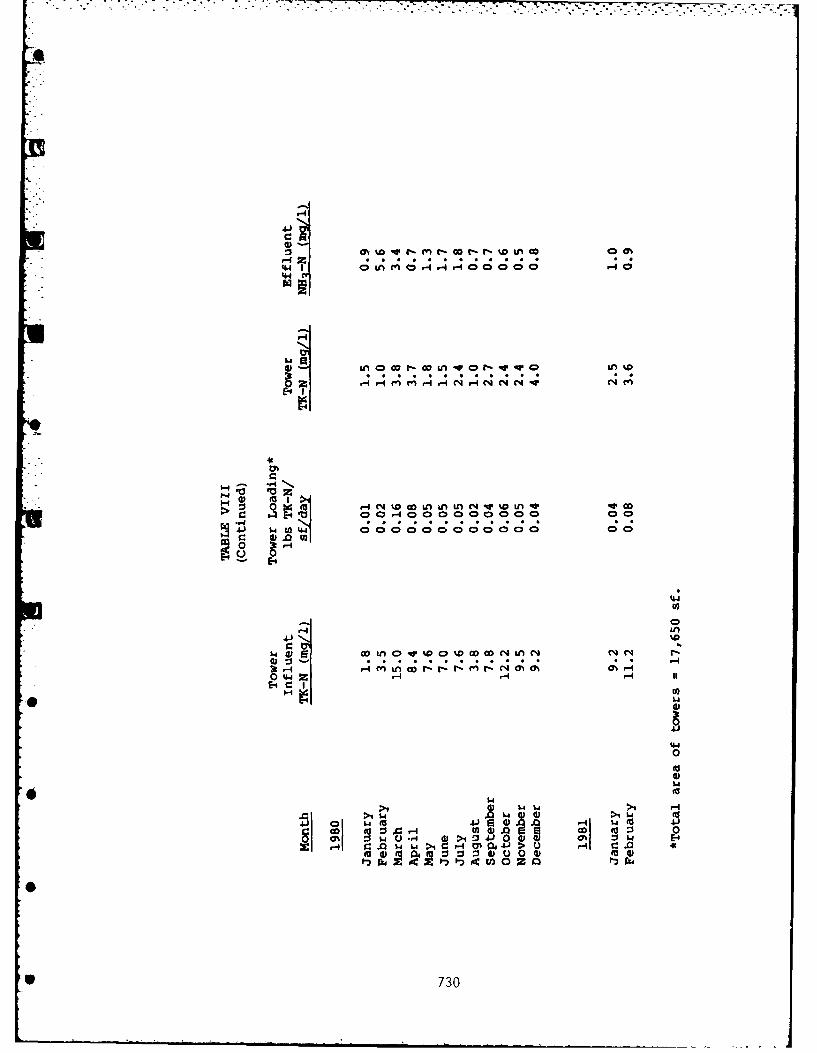
w t- .w n 0 0%
. . . . . . . . .
-44
OE4U I 00.400 0000000 00N
00 00 00 00 00
4-4
0
41-
-I r4 t
0 1.4 1-
440
1.4
01 4 (
OD :3 r~4 tro 4 4:0 0 0 - >i -J0 % ~w
r4 C 4WI>4 ,C -4j 4 J> c4 4
* 730
SLUDGE PRO)DUCTION
The nitrification towers are not followed by settlingtanks, therefore no sludge is collected. The pilotstudies leading to the design showed a sludge collectionsystem would not be required. The findings of the pilotstudies have been largely confirmed during operation. Thetowers have sloughed off solids noticably only once for aperiod of about two hours during about five and one-halfyears of operation.
IMPACT ON RIVER WATER QUALITY
Table IX shows the BOD and D.O. concentrationsmeasured upstream and downstream from the plant in 1980and 1981. Downstream measurements are taken approximately400 yards below the plant discharge. It is evident fromthe table that the plant effluent has essentially noimpact on the Auglaize River water quality.
OPERATION AND MAINTENANCE COST
Operation and maintenance costs averaged $142.55 permillion gallons in 1978, $138.93 per million gallons in1979, $178.50 in 1980, and $244.82 in 1981. itemiizedoperation and maintenance costs for the last two years areshown in Table X.
4 The plant operator reports that practically nomanpower is required to operate the nitrification towersand appurtenant pumping station. For all practicalpurposes power and maintenance are the only operatingexpenses associated with the towers.
731
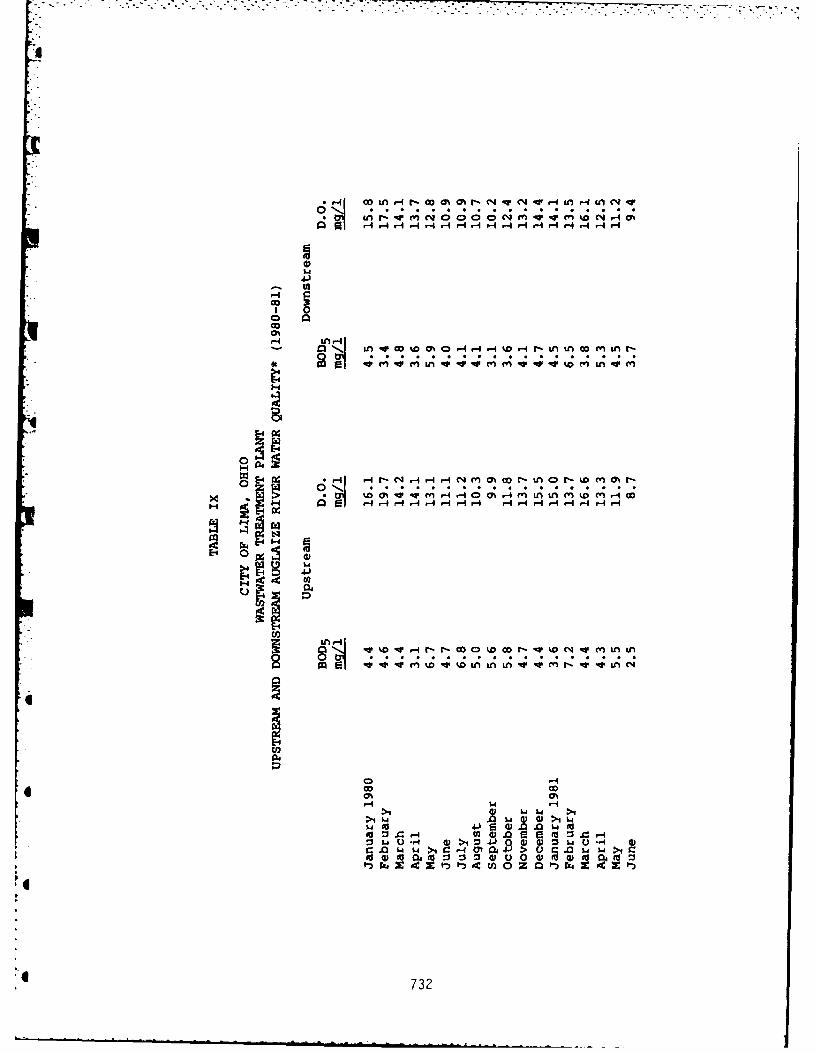
*H I4 LArE~. 4 H 4 r4r- VEr- '
co0%H- LAHI-
-w enJ Ln v -ww t" m-v -w - % enL - c
r-4
0
4l -
OD(3ON 0
$4 0-4
4)W1d >
-4 ~0 Z~- >10 J 04
AWP3O tA 00 Z 0-) r24z
732
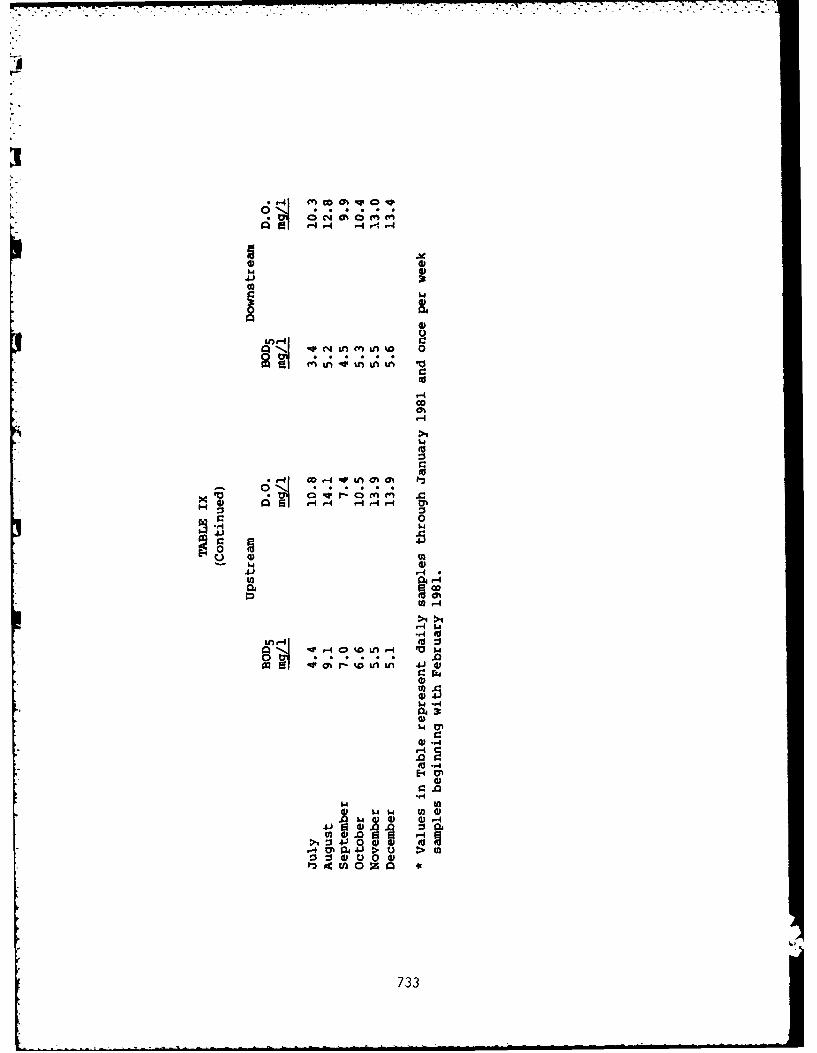
UU
An*, 1 M n .o 0
sel ' . ;U
Go
0
2 ol:
Ln LI
0)
0 -
Ir-4 ONI H 3 H 0
= u
0
H7LI
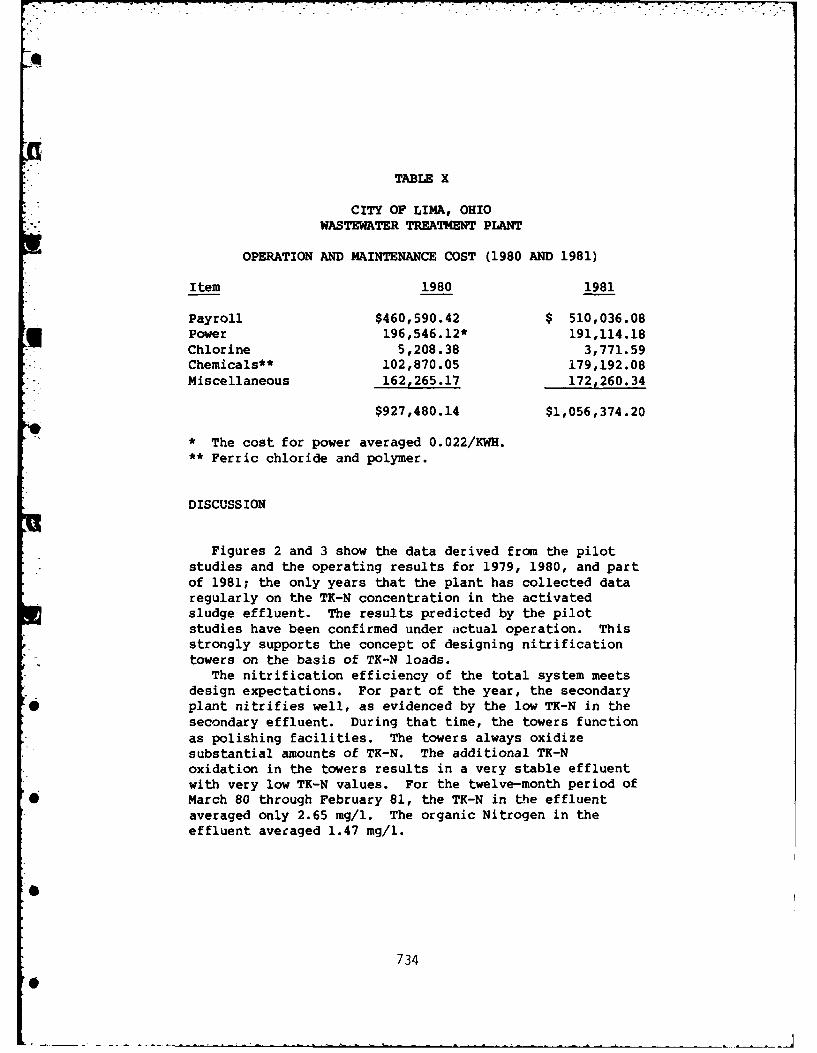
- .
TABLE X
CITY OF LIMA, OHIOWASTEWATER TREATMENT PLANT
OPERATION AND MAINTENANCE COST (1980 AND 1981)
Item 1980 1981
Payroll $460,590.42 $ 510,036.08Power 196,546.12* 191,114.18Chlorine 5,208.38 3,771.59Chemicals** 102,870.05 179,192.08Miscellaneous 162,265.17 172,260.34
$927,480.14 $1,056,374.20
* The cost for power averaged 0.022/KWH.** Ferric chloride and polymer.
DISCUSSION
Figures 2 and 3 show the data derived from the pilotstudies and the operating results for 1979, 1980, and partof 1981; the only years that the plant has collected dataregularly on the TK-N concentration in the activatedsludge effluent. The results predicted by the pilotstudies have been confirmed under actual operation. Thisstrongly supports the concept of designing nitrificationtowers on the basis of TK-N loads.
The nitrification efficiency of the total system meetsdesign expectations. For part of the year, the secondary
0 plant nitrifies well, as evidenced by the low TK-N in thesecondary effluent. During that time, the towers functionas polishing facilities. The towers always oxidizesubstantial amounts of TK-N. The additional TK-Noxidation in the towers results in a very stable effluentwith very low TK-N values. For the twelve-month period of
*March 80 through February 81, the TK-N in the effluentaveraged only 2.65 mg/l. The organic Nitrogen in theeffluent averaged 1.47 mg/l.
734
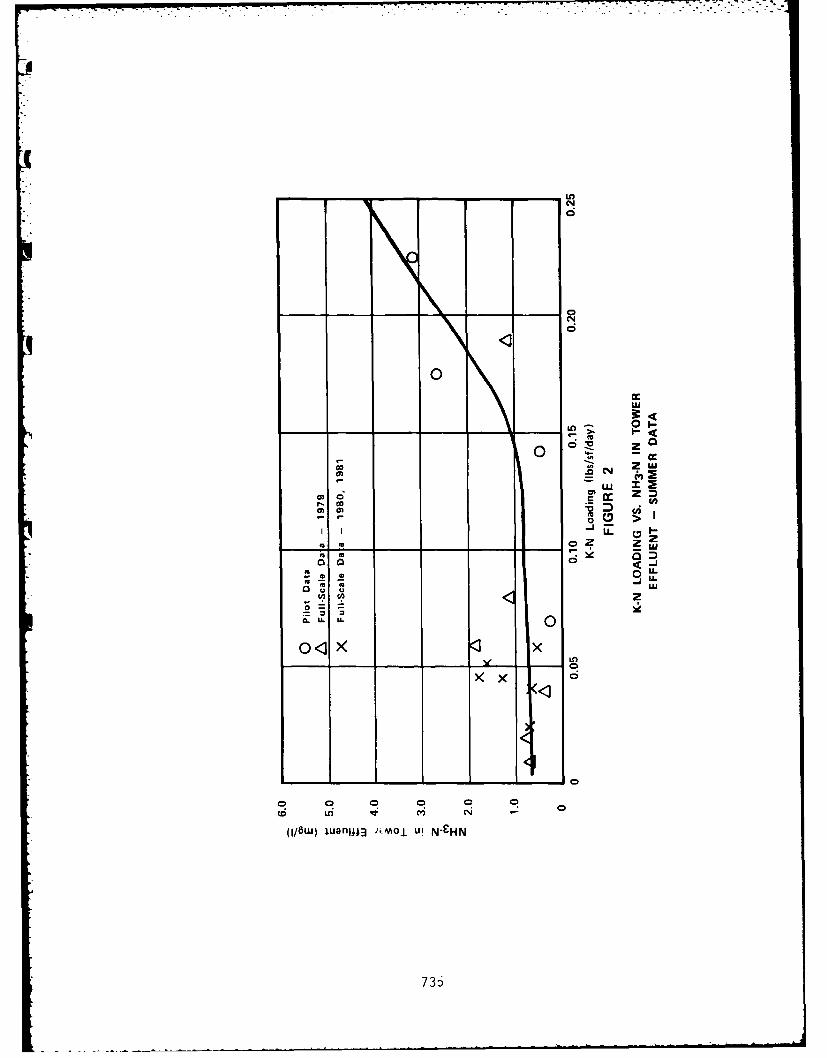
- - - LfD
Lu
0 n
r, 00 U.
U - L
o0 0
(1/6w CflnW zi O l -
0-30
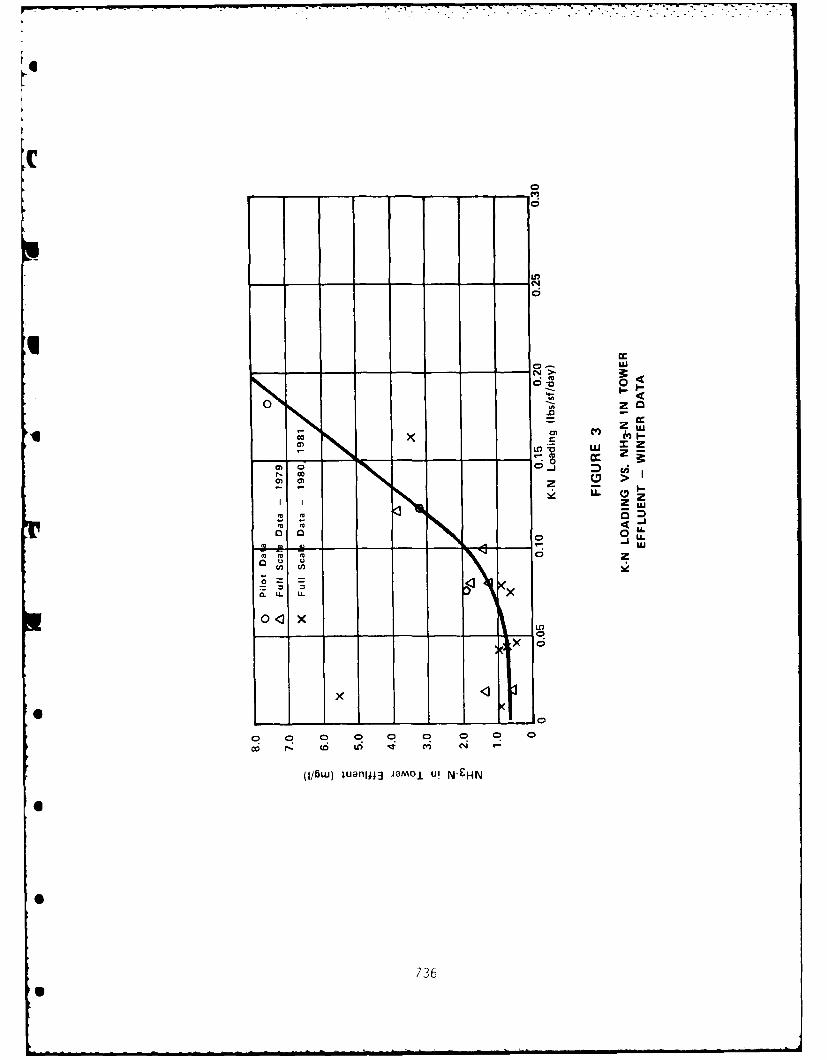
CC0
0- e
00
z Lco x i
M cr
oci 0I.- 6 D C4
zuo U
CL LL UL
0 x U0
Xo
1x KI t
00 0 o 0 f 0 0 0 0 0
(1/6w) juanfl13 JOmOJL U! N-CHN
736
at ,
The tower effluent is always better than theinfluent. Even though substantial nitrification occurs insecondary treatment, the towers are needed to consistentlymeet NH3-N effluent requirements.
The towers are not generally loaded to their designcapacity. Plots of TK-N applied (lbs/sf/day) vs. TK-Noxidized (lbs/sf/day) show a straight line relationshipindicating that loadings have not been the limiting factorin TK-N oxidation.
During the summer months, the NH3-N concentrationin the plant effluent is about the same as for loadingsranging from 0.01 to 0.15 lbs TK-N/sf/day. During thewinter months, and over the same loading range, theeffluent NH3-N concentration increases substantially asthe TK-N load increases.
The plant has produced the desired results whiletreating the highly variable wastewaters generated by apartially combined sewerage system. In any single month,the flow can range from one third to almost three timesthe design average. The monthly average for BOD in theraw sewage has ranged from 53 mg/l to 246 mg/l. Themonthly average for suspended solids in the raw sewage hasranged from 81 mg/l to 210 mg/l. It is unlikely thatsingle or two-stage activated sludge systems could provideas reliable a treatment level under such adverseconditions.
Stable performance is achieved with a minimum ofoperational adjustment to the nitrification facility.During 1981, the operators simply kept the recycle flow at11 mgd.
CONCLUSIONS
The following conclusions may be derived from thefirst five years of operation of the activatedsludge/nitrification tower process used at Lima:
1. Nitrification towers following activated sludgeconsistently produce a high quality effluent with lowBOD, suspended solids, TK-N, and NH3-N, and veryhigh dissolved oxygen concentration.
737
2. The treatment process is extremely reliable and ableto withstand shocks.
* 3. The plant effluent is normally saturated or supersaturated with oxygen. The combination of high D.O.and BOD results in an effluent that exerts little orno oxygen demand on the receiving stream.
4. The towers are easy to operate.5. The performance of the full-scale facility has
confirmed the design criteria derived from pilotstudies. Very low ammonia concentrations can beobtained even during the cold winters experienced inmidwestern United States.
6. Final settling following the towers has not beet,necessary as the effluent contains very low suspended
*solids.
0 738
REFERENCES
1 Sampayo, Felix F., Hollopeter, Dail C., "Treatment ofWet Air Oxidation Recycle Streams", Proceedings 7th AnnualWWEMA Industrial Pollution Conference, June 1979.
2 Sampayo, Felix F., "Nitrification Studies at Lima,Ohio", 47th Annual Meeting of the Ohio Water PollutionControl Conference, Columbus, Ohio, June 1973 (Conference
q Reprint).
3 Sampayo, Felix F., "The Use of Nitrification Towers atLima, Ohio", Second Annual Conference, Water ManagementAssociation of Ohio, Columbus, Ohio, November 1973(Conference Reprint).
4 Sampayo, Felix F., "Nitrification at Lima, Ohio",Proceedings International Seminar on Control of Nutrientsin Wastewater Effluents, September 1980.
739
PART VII: NITRIFICATION AND DENITRIFICATION
NITRIFICATION OF A MUNICIPAL TRICKLING FILTEREFFLUENT USING ROTATING BIOLOGICAL CONTACTORS
Frederic C. Blanc. Professor, Department of Civil*--Engineering, Northeastern University, Boston, Mass.
James C. O'Shaughnessy. Associate Professor, Depart-ment of Civil Engineering, Northeastern University,Boston, Massachusetts.
Charles H. Miller. President, Haley and Ward, Inc.,Waltham, Massachusetts
John E. O'Connell. Project Manager, lHaley and Ward,lnc.Waltham, Massachusetts.
INTRODUCT ION
This paper presents the results of a pilot plant inves-tigation and design for achieving seasonal nitrification ofa secondary trickling filter effluent. The municipal treat-ment plant in Milford, Massachusetts discharges into theheadwaters of the Charles River, a Class B stream. Conse-quently, the Conmonwealth of Massachusetts has required anitrified effluent, phosphorus removal, and effluent filtra-tion. Table I lists the present and proposed dischargelimitations formulated by the U.S.E.P.A. and the Massachu-setts Division of Water Pollution Control.
"
S 7
* 4
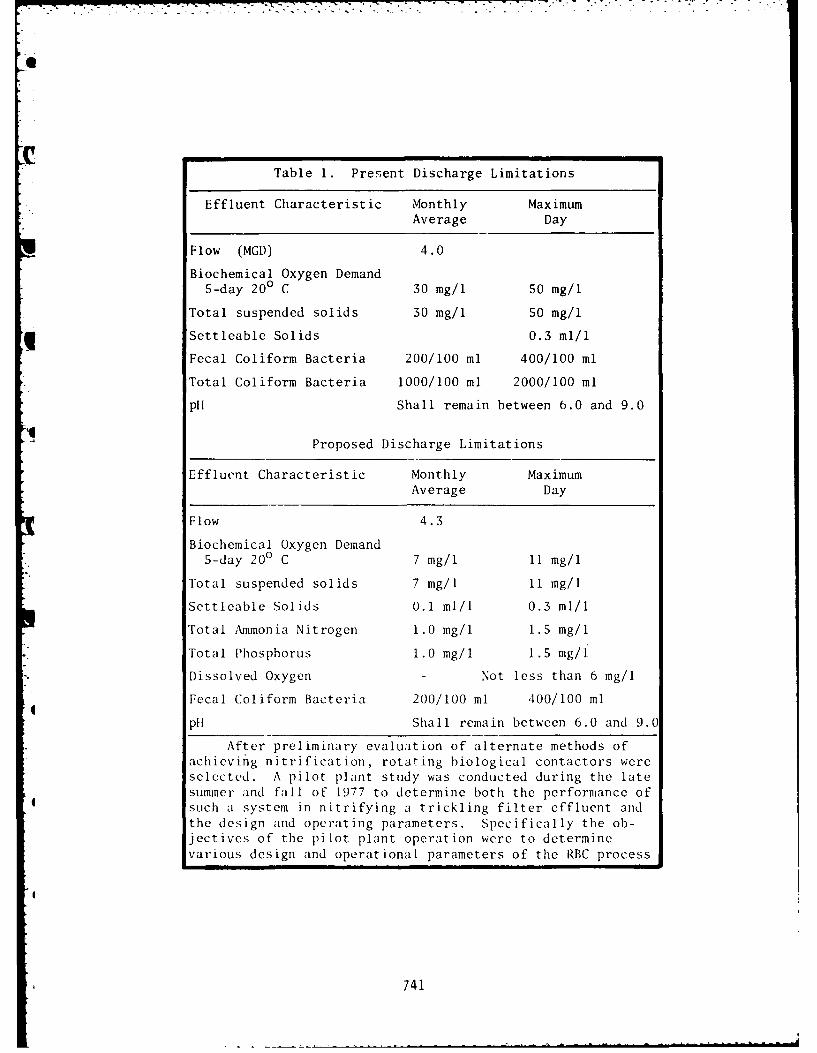
0
Table 1. Present Discharge Limitations
FEffluent Characteristic Monthly Maximum
Average Day
Flow (MGD) 4.0
Biochemical Oxygen Demand5-day 200 C 30 mg/i 50 mg/i
Total suspended solids 30 mg/l 50 mg/i
Settleable Solids 0.3 mi/i
Fecai Coliform Bacteria 200/i00 ml 400/100 ml
Total Coiiform Bacteria i000/100 mi 2000/100 ml
PH1 Shall remain between 6.0 and 9.0
Proposed Discharge Limitations
Effluent Characteristic Monthiy MaximumAverage Day
Flow 4.3
Biochemical Oxygen Demand
5-day 200 C 7 mg/i i1 mg/i
Totai suspended solids 7 mg/l 11 mg/l
Settleable Solids 0.1 ml/l 0.3 ml/i
Total Ammonia Nitrogen 1.0 mg/l 1.5 mg/l
Total Phosphorus 1.0 mg/l 1.5 mg/i
Dissolved Oxygen - Not less than 6 mg/l
Fecal Coliform Bacteria 200/100 ml 400/100 ml
I.
PH1 Shall remain between 6.0 and 9.0
After preliminary evaluation of alternate methods ofachieving nitrification, rotating biological contactors wereselected. A pilot plant study was conducted during the latesummer and fall of 1977 to determine both the performance ofsuch a system in nitrifying a trickling filter effluent andthe design and operating parameters. Specifically the ob-jectives of the pilot plant operation were to determinevarious design and operational parameters of the RBC process
741

with regard to nitrification, including loading rates,removal rates, removal efficiencies, solids production, and
solids settling characteristics.
Existing Wastewater Treatment Plant
The existing sewage treatment plant consists of primarysedimentation, raw sludge dewatering, secondary treatment byhigh rate trickling filters with a varying degree of recir-culation, final clarification, and chlorination of the efflu-ent before discharge to the Charles River. Flow enters theplant through two pipe lines, each equipped with a Parshallflume and its attendent flow recording equipment. One linereceives the discharge from the Charles Street pumping sta-tion through variable speed pumping equipment, and that dis-charge is therefore responsive to inflow variations. Theother line is the main gravity flow outfall from that portiof the-collection system not draining to the Charles Streetpumping station, and is equipped with a comminutor in addi-tion to the flow meter.
Grit removal is accomplished in the primary settlingtanks along with scum and settled sludge removal. The com-bined grit and raw sludge are then dewatered by vacuum fil-tration, with the aid of lime and ferric chloride as sludgeconditioners. Dried sludge, with a pH of 11 to 12, is dis-posed of as land fill in the discontinued sand filter beds.The effluent from the primary settling tanks flows through aflow control chamber to 3 trickling filter rotary distribu-tors which uniformly disperse the wastewater onto stonemedia filters.
Trickling filter effluent is pumped to the final clari-fier and a proportionate amount of this effluent is. recircu-lated to the trickling filter inflow, in order to providethe hydraulic quantity necessary for proper operation of thefilter distributors during periods of low flow. Effluentfrom the final clarifier is subsequently chlorinated in achlorine contact chamber before discharge.
The wastewater flow at NiLford is predominately domesticin character, and presently contains very little so-called
" "industrial" wastewater. Analyses of the raw wastewaterv" reinforce this conviction. It is anticipated that this
situation will not substantially change in the future. Fur-thermore, any future industrial wastes, which might affectproper treatment plant operation will be required to rvce1'ladequate pretreatment at the point of origin prior to theiracceptance by the municipal treatment facility.
67
711?
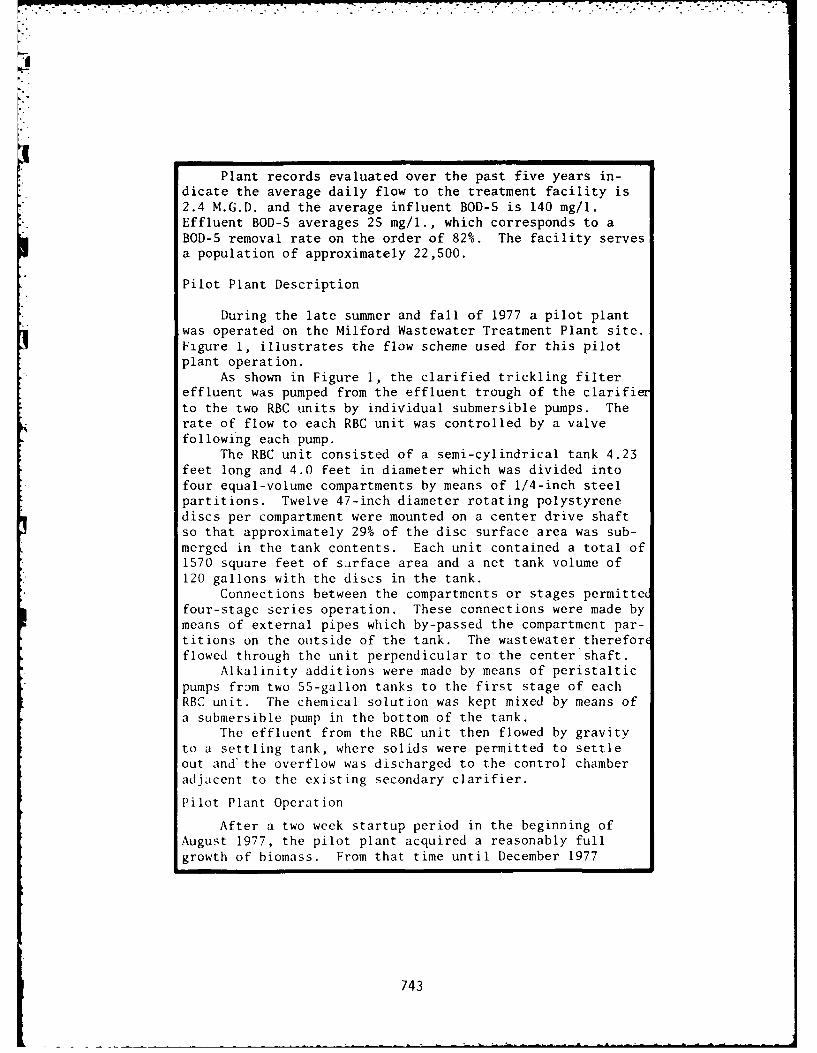
!: - i : :- . - . - .' * . - . . . . .. . . . -. . . -. ... . - - - : . :'Y.I
Plant records evaluated over the past five years in-dicate the average daily flow to the treatment facility is2.4 M.G.D. and the average influent BOD-5 is 140 mg/i.Effluent BOD-S averages 25 mg/i., which corresponds to aBOD-5 removal rate on the order of 82%. The facility servesa population of approximately 22,500.
Pilot Plant Description
During the late summer and fall of 1977 a pilot plantwas operated on the Milford Wastewater Treatment Plant site.Figure 1, illustrates the flow scheme used for this pilotplant operation.
As shown in Figure 1, the clarified trickling filtereffluent was pumped from the effluent trough of the clarifito the two RBC units by individual submersible pumps. Therate of flow to each RBC unit was controlled by a valvefollowing each pump.
The RBC unit consisted of a semi-cylindrical tank 4.23feet long and 4.0 feet in diameter which was divided intofour equal-volume compartments by means of 1/4-inch steelpartitions. Twelve 47-inch diameter rotating polystyrenediscs per compartment were mounted on a center drive shaftso that approximately 29% of the disc surface area was sub-merged in the tank contents. Each unit contained a total of1570 square feet of sarface area and a net tank volume of120 gallons with the discs in the tank.
Connections between the compartments or stages permittefour-stage series operation. These connections were made bymeans of external pipes which by-passed the compartment par-titions on the outside of the tank. The wastewater thereforeflowed through the unit perpendicular to the center shaft.
Alkalinity additions were made by means of peristalticpumps from two 55-gallon tanks to the first stage of eachRBC unit. The chemical solution was kept mixed by means ofa submersible pump in the bottom of the tank.
The effluent from the RBC unit then flowed by gravityto a settling tank, where solids were permitted to settleout and'the overflow was discharged to the control chamberadjacent to the existing secondary clarifier.
Pilot Plant Operation
After a two week startup period in the beginning ofAugust 1977, the pilot plant acquired a reasonably fullgrowth of biomass. From that time until December 1977
743
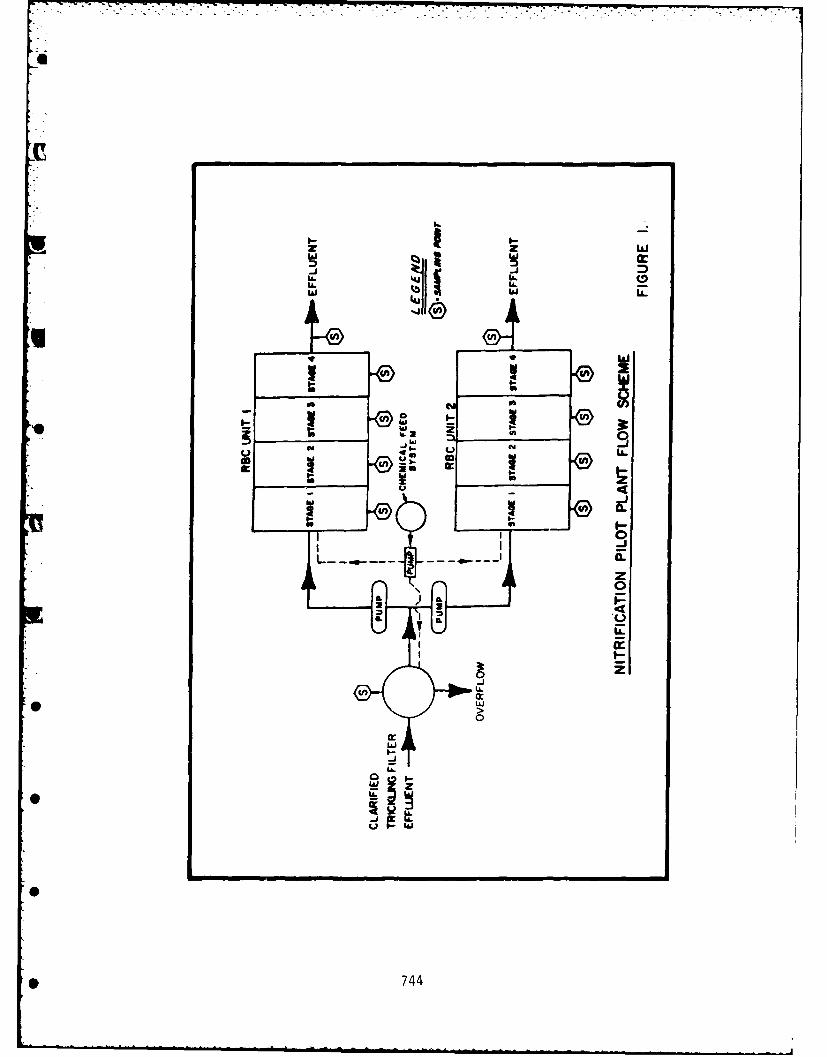
w wj
IL IL
Ih6 Ii
06
cIn
744 I.
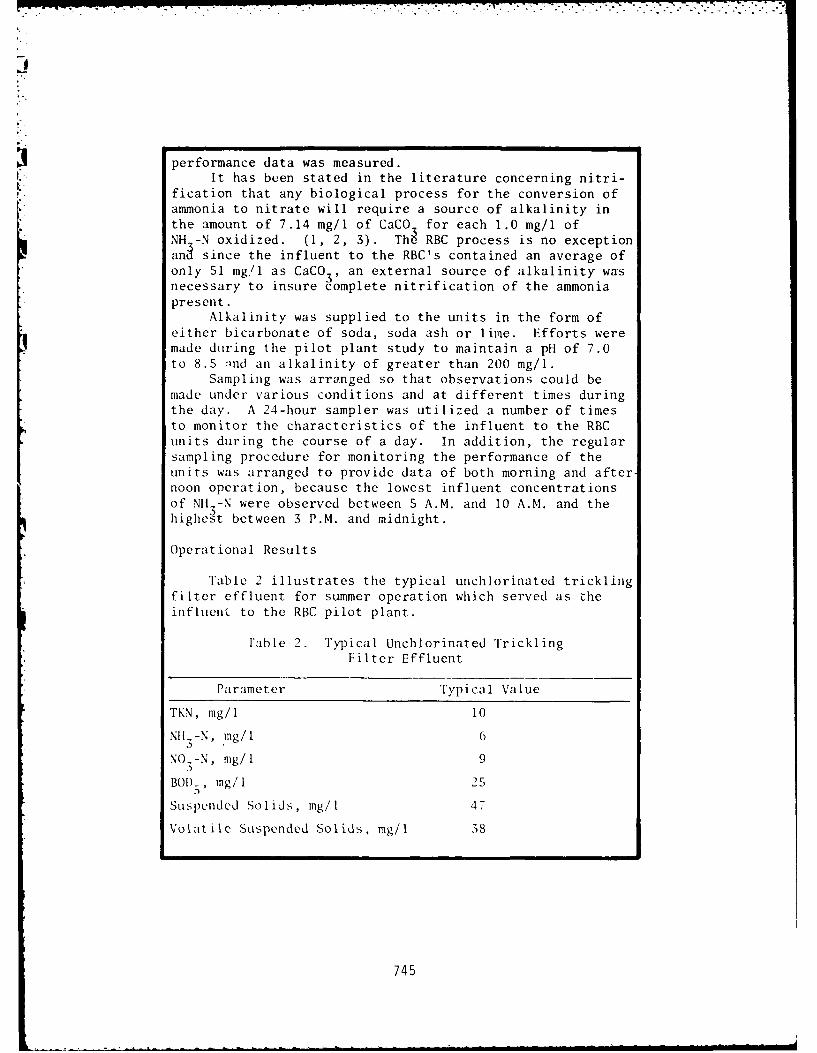
performance data was measured.It has been stated in the literature concerning nitri-
fication that any biological process for the conversion of
ammonia to nitrate will require a source of alkalinity inthe amount of 7.14 mg/l of CaCO for each 1.0 mg/l ofNH -N oxidized. (1, 2, 3). Th RBC process is no exceptionan since the influent to the RBC's contained an average ofonly 51 mg/i as CaCO an external source of alkalinity wasnecessary to insure complete nitrification of the ammoniapresent.
Alkalinity was supplied to the units in the form ofeither bicarbonate of soda, soda ash or lime. Efforts weremade during the pilot plant study to maintain a pH of 7.0to 8.5 ,nd an alkalinity of greater than 200 mg/l.
Sampling was arranged so that observations could bemade under various conditions and at different times duringthe day. A 24-hour sampler was utilized a number of timesto monitor the characteristics of the influent to the RBCunits during the course of a day. In addition, the regularsampling procedure for monitoring the performance of theunits was arranged to provide data of both morning and afternoon operation, because the lowest influent concentrationsof NH--N were observed between 5 A.M. and 10 A.M. and thehighest between 3 P.M. and midnight.
Operational Results
Table 2 illustrates the typical unchlorinated tricklingfilter effluent for summer operation which served as theinfluentL to the RBC pilot plant.
Table 2. Typical Unchlorinated TricklingFilter Effluent
Parameter Typical Value
TKN, mg/i 10
Nils-N, mg/l 6
NO_-N, mg/I 9
BO)5, Ing/lI 2Suspended Solids, rag/1 47
Vola tile Suspended Solids, rag/1 38
745
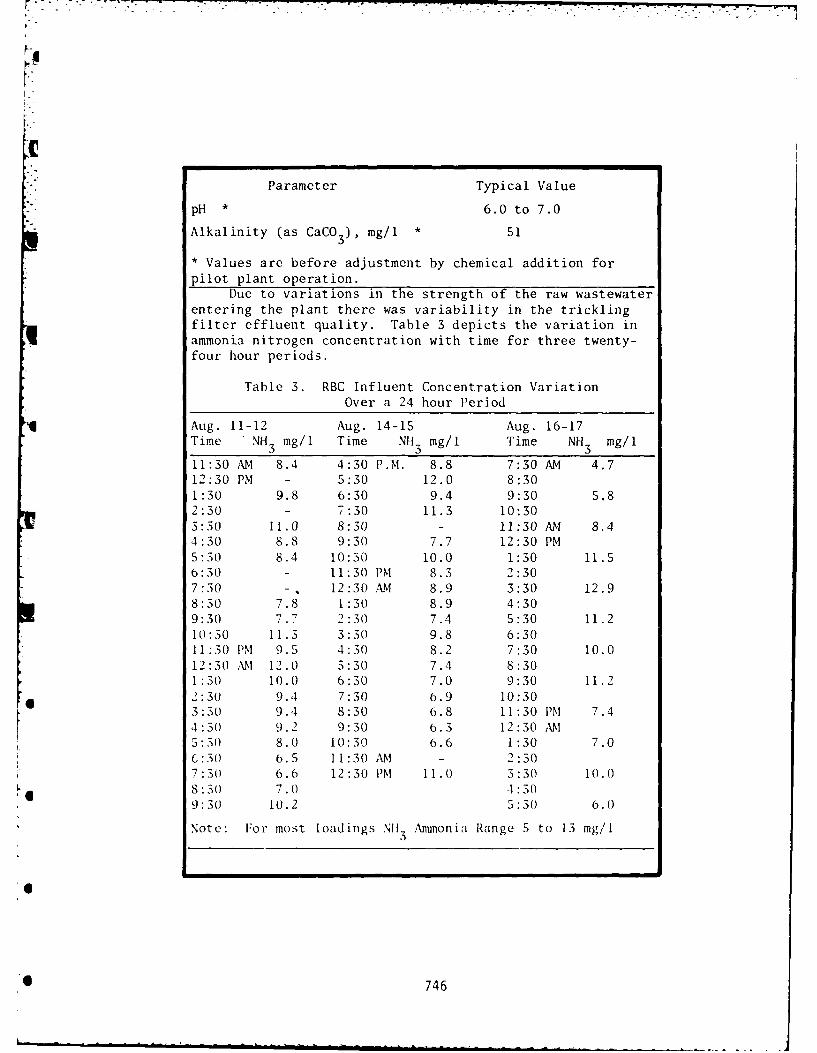
Parameter Typical Value
pH * 6.0 to 7.0
Alkalinity (as CaCO3), mg/l * 51
* Values are before adjustment by chemical addition for
pilot plant operation.Due to variations in the strength of the raw wastewater
entering the plant there was variability in the tricklingfilter effluent quality. Table 3 depicts the variation inammonia nitrogen concentration with time for three twenty-four hour periods.
Table 3. RBC Influent Concentration VariationOver a 24 hour Period
Aug. 11-12 Aug. 14-15 Aug. 16-17Time NH3 mg/l Time NH.3 mg/I Time NH3 mg/l
11:30 AM 8.4 4:30 P.M. 8.8 7:30 AM 4.712:30 PM - 5:30 12.0 8:301:30 9.8 6:30 9.4 9:30 5.82:30 - 7:30 11.3 10:303:30 11.0 8:30 - 11:30 AM 8.44:30 8.8 9:30 7.7 12:30 PM5:30 8.4 10:30 10.0 1:30 11.56:30 - 11:30 PM 8.3 2:307:30 - 12:30 AM 8.9 3:30 12.98:30 7.8 1:30 8.9 4:309:30 7.7 2:30 7.4 5:30 11.210:30 11.3 3:30 9.8 6:3011:30 PM 9.5 4:30 8.2 7:30 10.012:30 AM 12.0 5:30 7.4 8:301:30 10.0 6:30 7.0 9:30 11.22:30 9.4 7:30 6.9 10:303:30 9.4 8:30 6.8 11:30 PM 7.44:30 9.2 9:30 6.3 12:30 AM5:30 8.0 10:30 6.6 1:30 7.06:30 6.5 11:30 AM - 2:307:30 6.6 12:30 PM 11.0 3:30 10.08:30 7.0 4:309:3(0 10.2 5:30 6.0
Note: For most loadings Nil Ammonia Range 5 to 13 mg/I
6 746
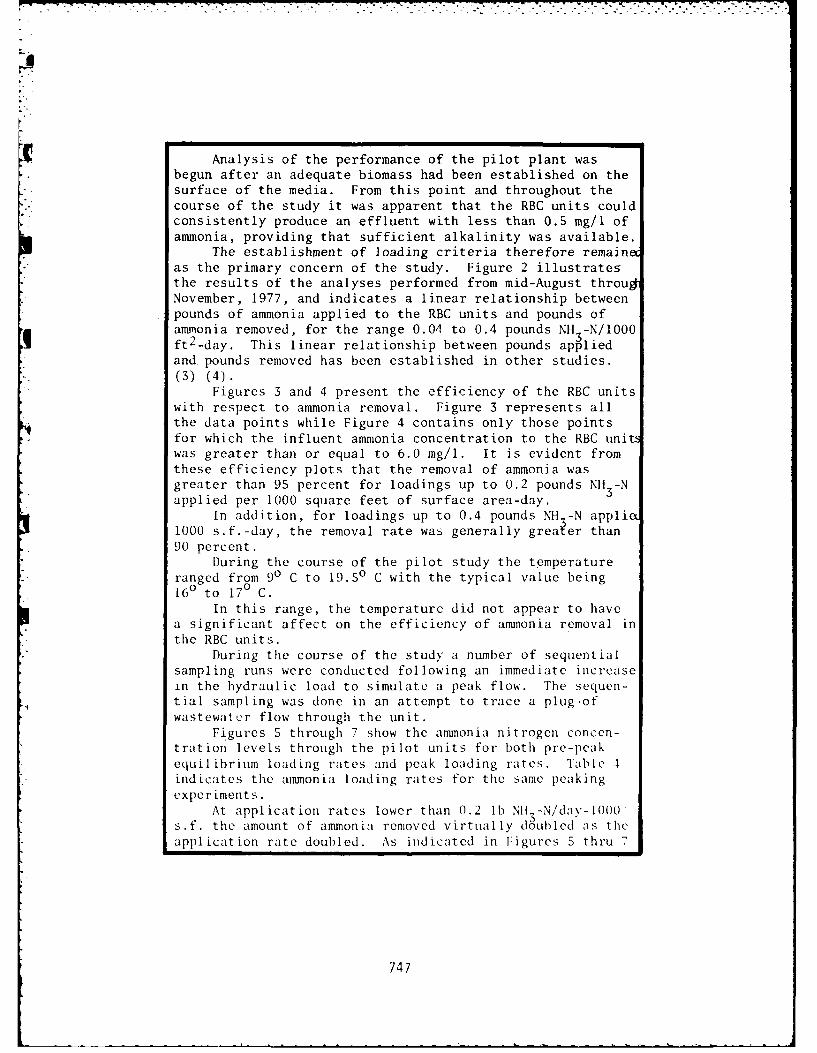
F-i
F Analysis of the performance of the pilot plant wasbegun after an adequate biomass had been established on thesurface of the media. From this point and throughout thecourse of the study it was apparent that the RBC units couldconsistently produce an effluent with less than 0.5 mg/l ofammonia, providing that sufficient alkalinity was available.
The establishment of loading criteria therefore remaineas the primary concern of the study. Figure 2 illustratesthe results of the analyses performed from mid-August througNovember, 1977, and indicates a linear relationship betweenpounds of ammonia applied to the RBC units and pounds ofammonia removed, for the range 0.04 to 0.4 pounds NH -N/1000
ft2 3ft2 -day. This linear relationship between pounds appliedand pounds removed has been established in other studies.(3) (4).
Figures 3 and 4 present the efficiency of the RBC unitswith respect to ammonia removal. Figure 3 represents allthe data points while Figure 4 contains only those pointsfor which the influent ammonia concentration to the RBC uniwas greater than or equal to 6.0 mg/l. It is evident fromthese efficiency plots that the removal of ammonia wasgreater than 95 percent for loadings up to 0.2 pounds Nil 3-Napplied per 1000 square feet of surface area-day.
In addition, for loadings up to 0.4 pounds NH -N appli1000 s.f.-day, the removal rate was generally grea~er than90 percent.
During the course of the pilot study the temperatureranged from 90 C to 19.50 C with the typical value being160 to 170 C.
In this range, the temperature did not appear to havea significant affect on the efficiency of ammonia removal inthe RBC units.
During the course of the study a number of sequentialsampling runs were conducted following an immediate increasein the hydraulic load to simulate a peak flow. The sequen-tial sampling was done in an attempt to trace a plug.ofwastewater flow through the unit.
Figures 5 through 7 show the ammonia nitrogen concen-tration levels through the pilot units for both pre-peakequilibrium loading rates and peak loading rates. Table Iindicates the ammonia loading rates for the same peakingexperiments.
At application rates lower than 0.2 lb Nil,-N/day-1000s.f. the amount of ammonia removed virtually doubled as theapplication rate doubled. As indicated in Figures 5 thru 7
747
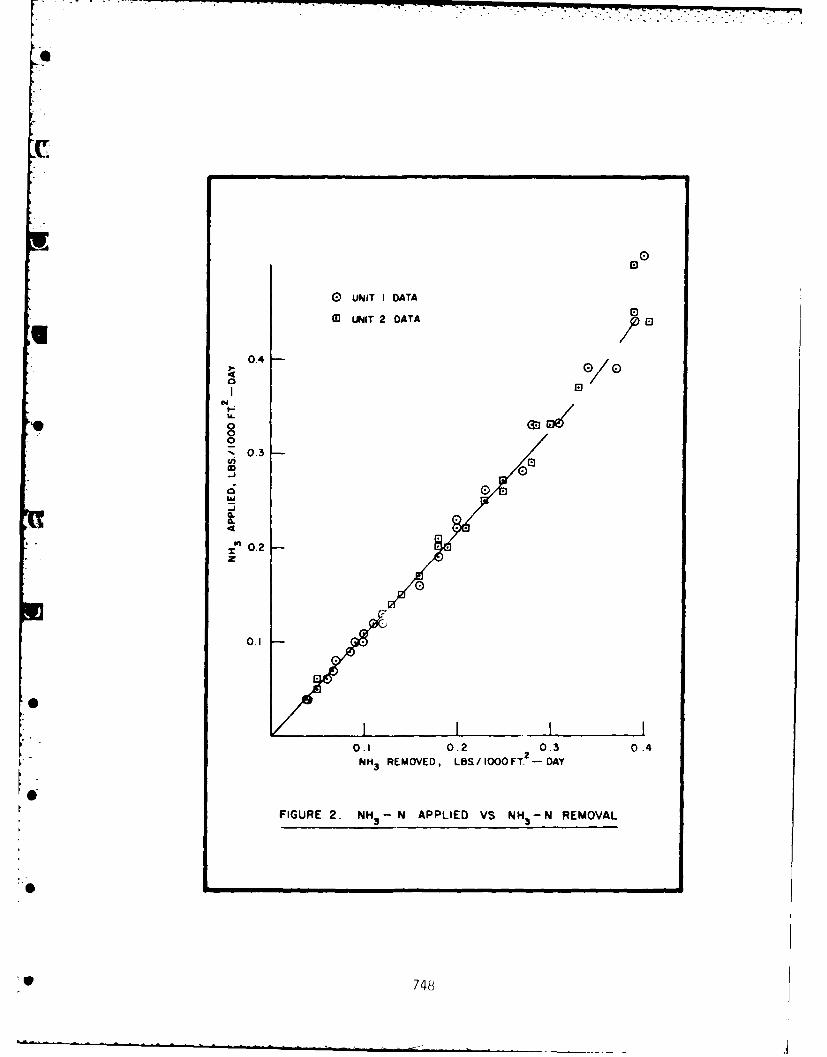
0 UNIT I DATA
M UINIT 2 DATA E-'0
0.400
.
-t 0.3
cn 0
i 0.2
0.1 /
0.1 0.2 0.3 0.4
NH3 REMOVED, LOS/IO0 FT. -DAY
FIGURE 2. NH 3 - N APPLIED VS NH 3 - N REMOVAL
*e 748
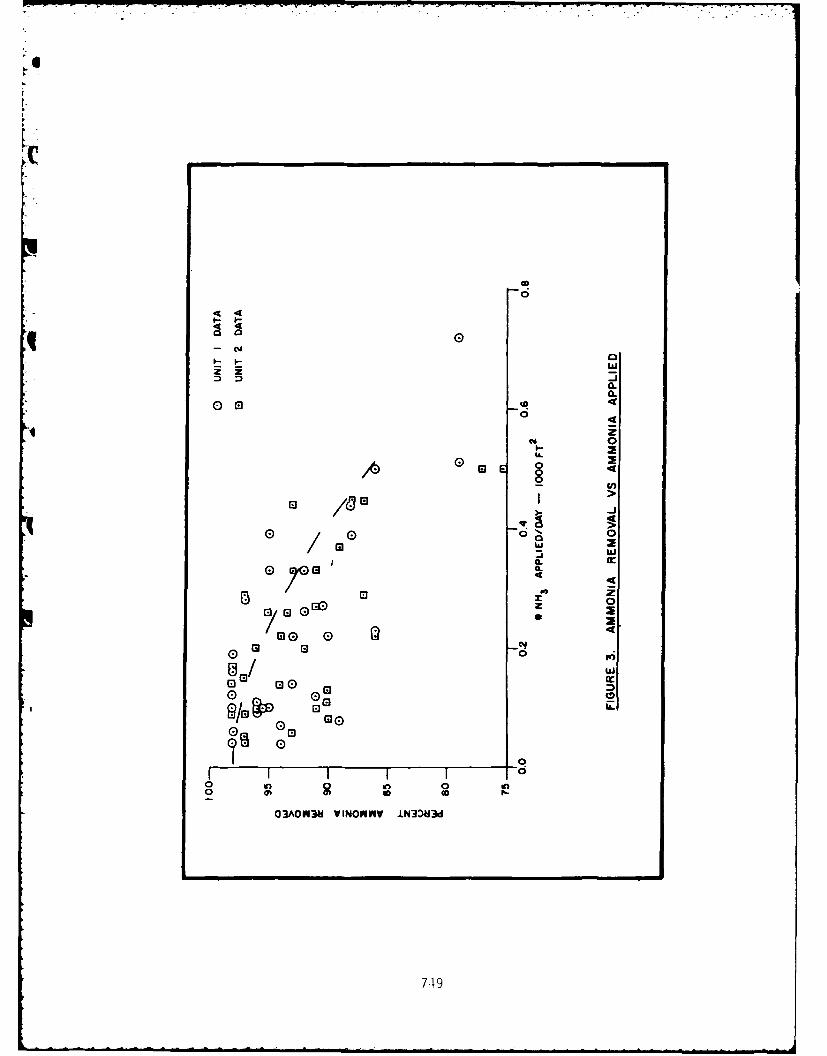
00444
044
0
m >A0
0d 0I-
-~ IL.
00
/ 440O 0
ow -'
G El
0Q 0
0 0
a3AON3ki VINOWEKY ±N3 NM
7419
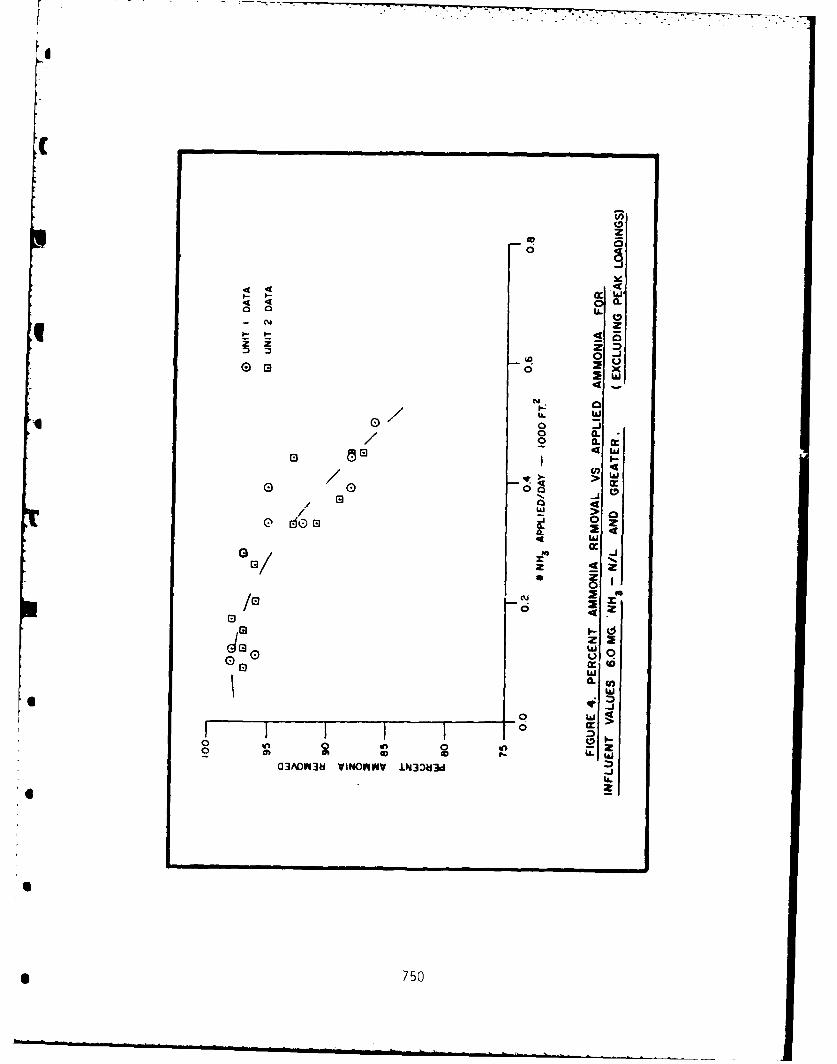
CC
02
fr w44 0.
z z0 -
ED 0Nw
4 -10 C
40 a.
E- 4 w
> W
0. N
4 w
El cu 7,
0 4. 6-C
0 -0
@0 w26 w
0 0
a3AOFA3H VINOnVAV IN~3d 3c
* 750
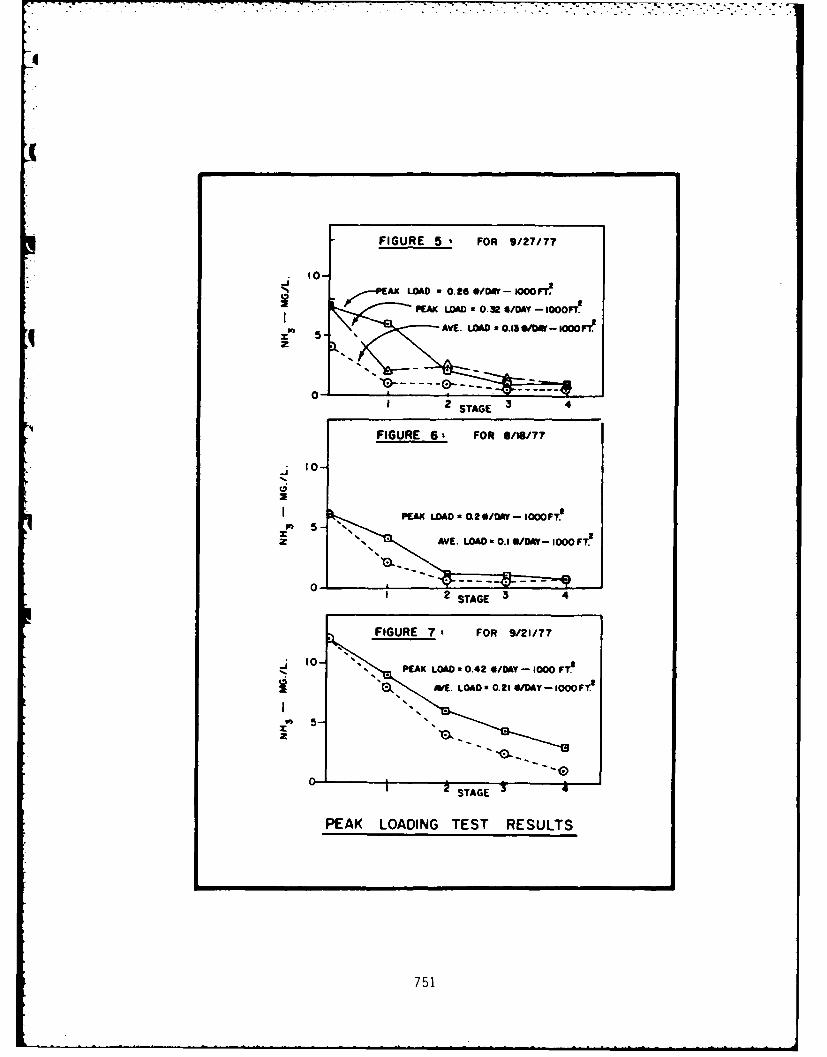
FIGURE 5 FOR 9/27/7
I0-PAX LOAD w 0.2 ES OarV- 100 m
P K PEAK LOAD a 0.R32 G/OAL -T1000I AVE. LOAD - 0.13 *At- 000W1
x 5-qz
0-1 2 STAGE 3
FIGURE 6' FOR 8/18/77
10-
0
FIUR 71 RS/1T
rN
PEAK LOAD - 0.2 WDAY - 1000OFe~
2O M.AE. LOAD a 0.21 WSDAY - 1000 FT.2
5-
I 2 STAGE 4
.PA LOAIN L EST RE.4 SULA -0 TS
751
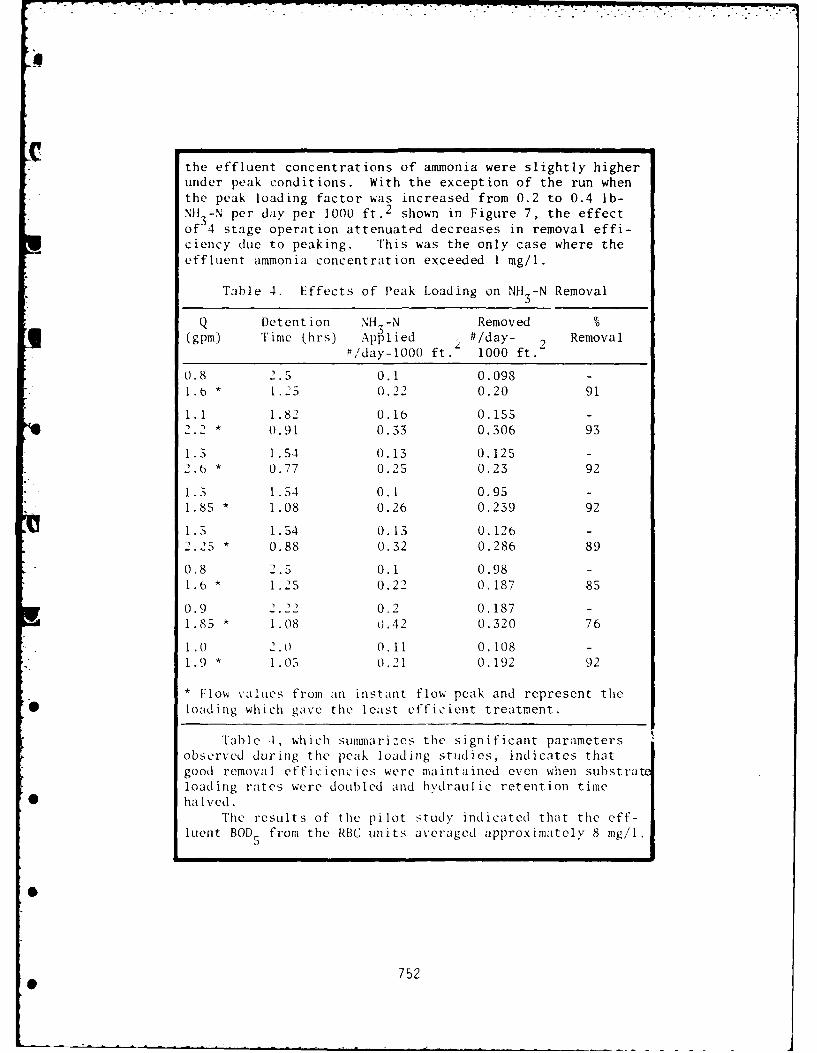
the effluent concentrations of ammonia were slightly higherunder peak conditions. With the exception of the run whenthe peak loading factor was increased from 0.2 to 0.4 Ib-NH3 -N per day per 1000 ft. 2 shown in Figure 7, the effectof 4 stage operation attenuated decreases in removal effi-ciency due to peaking. This was the only case where theeffluent ammonia concentration exceeded 1 mg/l.
Table 4. Eiffects of Peak Loading on NI 3-N Removal
Q Detention NIL-N Removed.5
(gpm) Time (hrs) Applied 2 #/day- . Removal#,/day-1000 ft. 1000 ft.-
0.8 2.5 0.1 0.098 -1.6 * 1.2 0.22 0.20 91
1.1 1.82 0.16 0.155 -2.2 * 0.91 0.33 0.306 93
1.3 1.54 0.13 0.125 -2.6 * 0.77 0.25 0.23 92
1.3 1.54 0.1 0.95 -1.85 * 1.08 0.26 0.239 92
1.3 1.54 0.13 0.126 -2.25 * 0.88 0.32 0.286 89
0.8 2.5 0.1 0.98 -1.6 * 1.25 0.22 0.187 85
0.9 2.22 0.2 0.1871.85 * 1.08 0.42 0.320 76
I.0 2.0 0.11 0.108 -1.9 * 1.05 0.21 0.192 92
* Flow values from an instant flow peak and represent tile
0 loading which gave the least efficient treatment.
Table 4, which summarizes the significant parametersobserved during the peak loading studies, indicates thatgood removal efficiencies were maintained even when substraloading rates were doubled and hydraulic retention time
* halved.The results of the pilot study indicated that the eff-
luent BOD 5 from the RBC units averaged approximately 8 mg/1.
752
CThese samples were either collected from the 55 gal. drum
clarifiers, or samples collected from stage 4 of the RBC'sand allowed to settle for 30 minutes. The soluble portionof the effluent was approximately 56% and averaged 4 to 5mg/i of BOD The addition of alum to the last stage ofthe pilot RBC units further reduced the effluent five dayBOD to an average value of less than 2 mg/l.
The average suspended solids content of the influentwas 47 mg/l, the fourth stage of the RBC contained about
53 mg/l, whereas the effluent from the units averaged 32mg/i., of which approximately 80 percent were volatile.
For hydraulic loadings up to 1.80 gpm/s.f. (2.0 gpm)there appeared to be little to no net solids production. Thesettled effluent averaged 16 mg/i of suspended solids and itwould appear that the suspended solids in the effluent froma clarifier following the RBC can be maintained at under 20to 30 mg/l for low hydraulic loading rates. The solidsdeterminations during the pilot studies included suspendedsolids from the existing trickling filters which contributeda relatively high percentage of colloidal matter.
Processes Selection and Design of the Wastewater TreatmentFacility
Four processes for the removal or conversion of ammoniawere investigated to determine their cost-effectiveness, inaccordance with EPA criteria. The four processes were asfollows: (a) nitrification using Rotating Biological Con-tactors (RBC); (b) nitrification by aeration in a plug flowreactor; (c) ammonia removal by breakpoint chlorination; and(d) ammonia removal by selective ion-exchange.
Nitrification using RBC was selected as the lowesttotal life-cycle cost process, although its capital costsare somewhat higher than the other processes. In addition,the overall advantages of process stability and flexibilityas well as substantially lower operation and maintenanceother than occasional lubrication of the drives and itrequires significantly less attention during operation thandoes the aeration system.
In order to utilize the existing facilities to the mosteconomical degree, and to keep the operation and maintenancecosts as low as practical, the present method of treatmentby primary sedimentation followed by trickling filters willbe retained. As shown previously, the performance of theplant as of late has been of the highest quality to be
753
expected of that type of process. In addition, the plantpersonnel is thoroughly familiar with the operation of theexisting treatment facility and could therefore maintainthe present standards of quality with little difficulty.
The proposed additions to the plant will provide ter-tiary treatment to reduce the levels of phosphorus andammonia-nitrogen in the effluent. This secondary stage inthe treatment process ideally complements the trickling fil-ter operation because trickling filters will produce aneffluent with sufficient BOD to maintain the nitrifying or-ganisms (See Figure 8).
The pilot plant study established that the RBC processis capable of achieving greater than 95 percent removal ofammonia up to an ammonia loading rate of 0.2 pounds NtIL-Nper 1000 square feet of surface area per day, provided thatsufficient alkalinity is available in the wastewater. At
* the projected ammonia load for the year 2000, some 3,200,000square feet of surface area would be required for this load-ing rate. In order to provide this amount of surface area,it was decided that four (4) trains consisting of six (6)shafts, each 25 feet long, would be utilized. It was feltthat the four separate trains would provide the desired deg-ree of flexibility in the system and six shafts per trainwould insure that sufficient surface area was provided toprevent ammonia breakthrough due to peak flow loadings.The first two (2) shafts of media in each train will be fab-ricated of so-called "standard density" media, that is,approximately 100,000 s.f. per shaft. The remaining four (4)shafts in each train will be fabricated of "high density"media or about 1SO,000 s.f. per shaft. In this manner,problems associated with "bridging" of the media due to over-loading in the first and second stages can be avoided. Inaddition, the six stages of media provide sufficient surfacearea for carbonaceous BO removal in the first two stages
* of each unit.Flexibility in each train will be provided through the
util ization of removable wooden baffles between shafts. The_.mount pf surface area per stage and the number of stagesper train can then be varied to suit operating conditions.Alkalinity will be provided immediately before the RBCprocess in the form of hydrated lime. Hydrated lime waschosen as the source of alkalinity due to its lower cost andlocal availability. It is anticipated that the alkalinitywill be a minimum of 200 mg/I in the influent to the ROC.
* 754
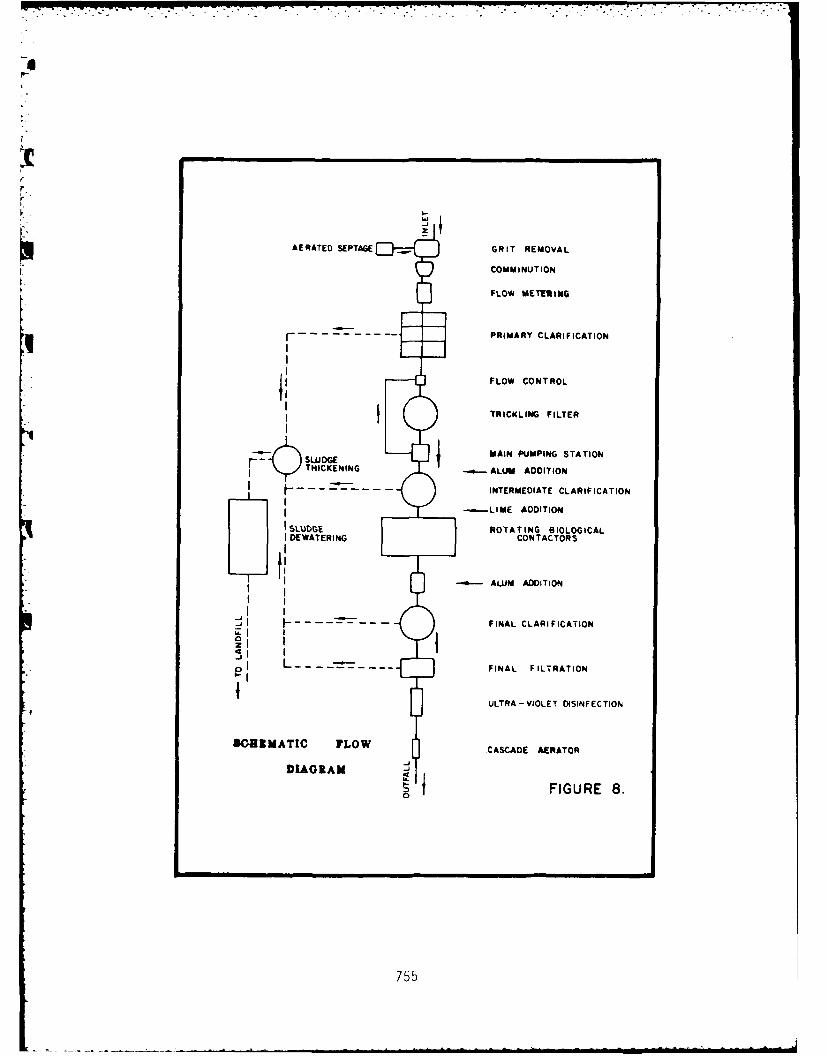
AERATED SEPTAGE ~.GRIT REMOVAL
COMMINUT ION
FLOW METEIIIING
r - PRIMARY CLARIFICATION
FLOW CONTROL
I TRICKLING FILTER
SLTUDGENG MAIN PUMPING STATIONL..~AM ADDITION
INTERMEDIATE CLARIFICATION
-LINE ADDITION
1SL%)DGE ROTATING BIOLOGICALKDElfWATERING CONTACTORS
--- ALUM ADDITIO04
~ FINAL CLARIFICATION
01 L.... - -- FINAL FILTRATION
ULTRA -VIOLET DISINFECTION
WCHZMATIC FLOW CASCADE AERATOR
DIAGRAM
0 FIGURE 8.
755
-i" Flexibility was also designed into the phosphorus
removal system, in that two different chemicals for theremoval of phosphorus can be stored and fed at one time, andchemicals can be added and mixed with the wastewater at thrseparate locations. Laboratory treatability studies estab-lished that alum would provide sufficient removal of phos-phorus to meet the discharge limitation of 1.0 mg/i consis-tently. In addition, the study established that the additioof alum immediately following the trickling filters would bethe least costly method. This is due to the low pH (5.8 to6.2) of the trickling filter effluent. Removal of phosphorwith alum after the RBC process would require substantiallymore chemical due to the elevated p1 of the wastewater atthis point. However, chemical addition and mixing facilitieswill be provided after the RBC process for removal of phos-phorus in the final clarifiers. In addition, chemical
• additions can be made to the headworks at the aerated gritchamber for phosphorus removal in the primary clarifiers.
SULMARY AND CONCLUSIONS
1. A linear relationship between pounds of ammoniaapplied versus pounds of ammonia removed existed for ammonialoadings ranging from 0.04 to 0.4 pounds NI3-N per 1000 s.f-day.
2. That the removal of ammonia was greater than 95
percent for loadings up to 0.2 pounds Nil 3 -N applied/1000 s.fday, and generally above 90 percent removal for loadings upto 0.4 pounds Nil 3 -N applied/lO00 s.f.-day.
3. That the RBC units were able to respond well to
peak hydraulic loading.4. That there is little to no net production of solids
within the RBC units. The solids which were produced didnot exhibit good settling characteristics.
756
References
1. "Process Design Manual for Nitrogen Control", U.S.
Environmental Protection Agency - Technology Transfer.2. Saunders, F.C. and Pope, R.L., "Nitrification with
Rotating Biological Contactor Systems", Env. ResourcesCenter Technical Report (ERC 06-78), Georgia Instituteof Technology, Atlanta, Georgia, October 1978.
3. O'Shaughnessy,J.C., Blanc, F.C., Brooks, P.,Silbovitz, A. and Stanton, R. "Nitrification of
Municipal Wastewater Using Rotating BiologicalContactors", Proceedings First National Symposium/Workshop on Rotating Biological Contactor Technology,University of Pittsburg, Vol. II, pp. 1193-1219,
June 1980.4. Odegaard, H. and Rusten, B., "Nitrogen Removal in
Rotating Biological Contactors Without the Use of
External Carbon Source", Proc. First National Symposiumon RBC Technology, University of Pittsburg, Vol. II,pp. 1301-1317, June 1980.
757
IMPROVEMENT OF NITRIFICATION IN ROTATING BIOLOGICALCONTACTORS BY MEANS OF ALKALINE CHEMICAL ADDITION
James M. Stratta, U. S. Army Environmental Hygiene* Agency, Aberdeen Proving Ground, Maryland.
David A. Long, Department of Civil Engineering, ThePennsylvania State University, University Park,Pennsylvania
Michael C. Doherty, U. S. Army Environmental HygieneAgency, Aberdeen Proving Ground, Maryland.
INTRODUCTION
The need to achieve compliance with ammonia-nitrogendischarge limitations and the current emphasis on energyconservation have resulted in the utilization of RBC tech-nology for the nitrification of secondary wastewatereffluents. By the end of the 1970s, four pilot scaleefforts, independent of the RBC industry, had been completedwhich demonstrated that the RBC could nitrify successfullysecondary wastewater effluent (1, 2, 3, 4). In 1979,
* approximately 70 percent of the RBC systems in the United
The opinions or assertions contained herein are the privateviews of the authors and are not to be construed as reflect-
* ing the views of the Department of the Army or the Depart-ment of Defense.
758
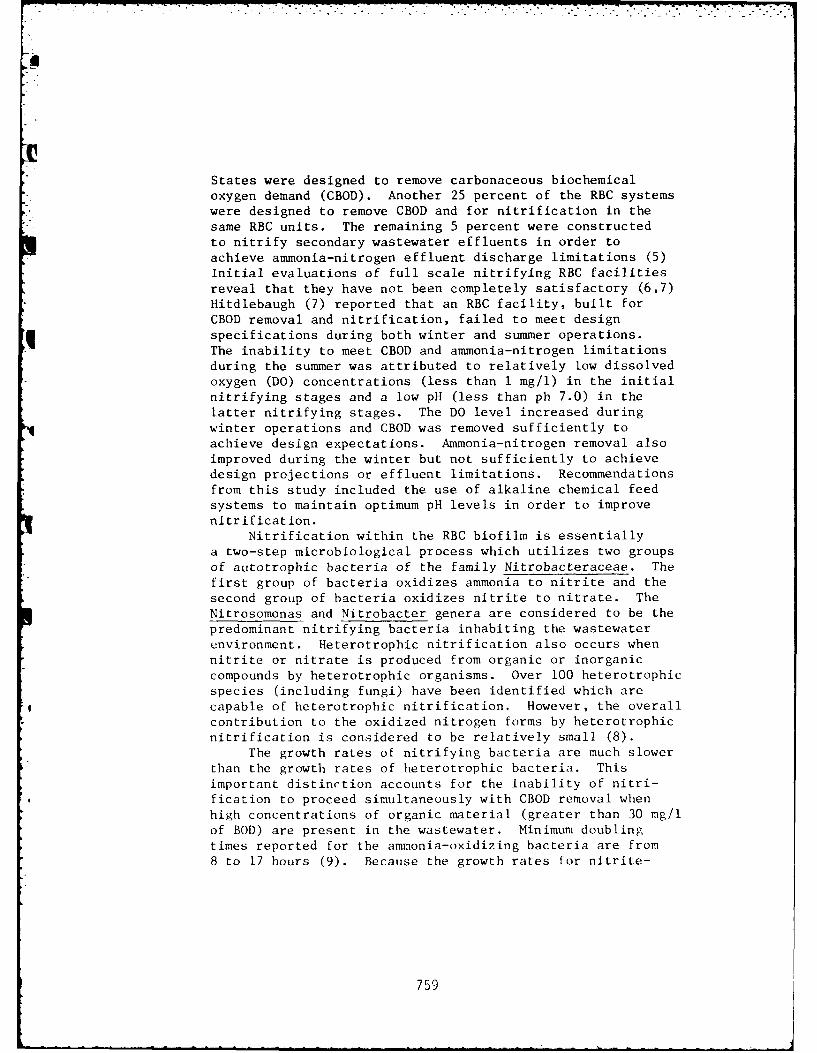
States were designed to remove carbonaceous biochemicaloxygen demand (CBOD). Another 25 percent of the RBC systemswere designed to remove CBOD and for nitrification in thesame RBC units. The remaining 5 percent were constructedto nitrify secondary wastewater effluents in order toachieve ammonia-nitrogen effluent discharge limitations (5)Initial evaluations of full scale nitrifying RBC facilitiesreveal that they have not been completely satisfactory (6,7)Hitdlebaugh (7) reported that an RBC facility, built forCBOD removal and nitrification, failed to meet designspecifications during both winter and summer operations.The inability to meet CBOD and ammonia-nitrogen limitationsduring the summer was attributed to relatively low dissolvedoxygen (DO) concentrations (less than 1 mg/l) in the initialnitrifying stages and a low pH (less than ph 7.0) in thelatter nitrifying stages. The DO level increased duringwinter operations and CBOD was removed sufficiently toachieve design expectations. Ammonia-nitrogen removal alsoimproved during the winter but not sufficiently to achievedesign projections or effluent limitations. Recommendationsfrom this study included the use of alkaline chemical feedsystems to maintain optimum pH levels in order to improvenitrification.
Nitrification within the RBC biofilm is essentiallya two-step microbiological process which utilizes two groupsof autotrophic bacteria of the family Nitrobacteraceae. Thefirst group of bacteria oxidizes ammonia to nitrite and thesecond group of bacteria oxidizes nitrite to nitrate. TheNitrosomonas and Nitrobacter genera are considered to be thepredominant nitrifying bacteria inhabiting the wastewaterenvironment. Heterotrophic nitrification also occurs whennitrite or nitrate is produced from organic or inorganiccompounds by heterotrophic organisms. Over 100 heterotrophicspecies (including fungi) have been identified which arecapable of heterotrophic nitrification. However, the overallcontribution to the oxidized nitrogen forms by heterotrophicnitrification is considered to be relatively small (8).
The growth rates of nitrifying bacteria are much slowerthan the growth rates of heterotrophic bacteria. Thisimportant distinction accounts for the inability of nitri-fication to proceed simultaneously with CBOD removal whenhigh concentrations of organic material (greater than 30 mg/lof BOD) are present in the wastewater. Minimum doublingtimes reported for the ammonia-oxidizing bacteria are from8 to 17 hours (9). Because the growth rates for nitrite-
759
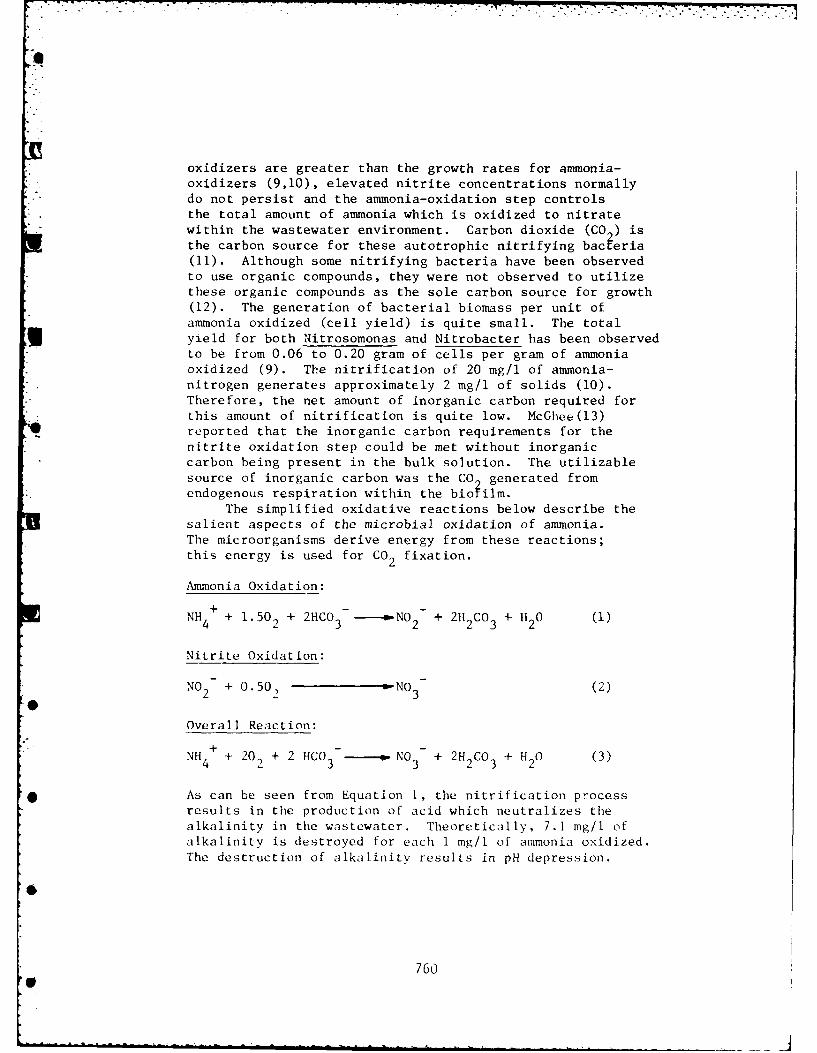
oxidizers are greater than the growth rates for ammonia-oxidizers (9,10), elevated nitrite concentrations normallydo not persist and the ammonia-oxidation step controlsthe total amount of ammonia which is oxidized to nitratewithin the wastewater environment. Carbon dioxide (CO ) isthe carbon source for these autotrophic nitrifying bacieria(11). Although some nitrifying bacteria have been observedto use organic compounds, they were not observed to utilizethese organic compounds as the sole carbon source for growth(12). The generation of bacterial biomass per unit of
ammonia oxidized (cell yield) is quite small. The totalyield for both Nitrosomonas and Nitrobacter has been observedto be from 0.06 to 0.20 gram of cells per gram of ammoniaoxidized (9). The nitrification of 20 mg/l of ammonia-nitrogen generates approximately 2 mg/l of solids (10).Therefore, the net amount of inorganic carbon required forthis amount of nitrification is quite low. McGhee(13)reported that the inorganic carbon requirements for the
nitrite oxidation step could be met without inorganiccarbon being present in the bulk solution. The utilizablesource of inorganic carbon was the CO generated fromendogenous respiration within the bio~ilm.
The simplified oxidative reactions below describe thesalient aspects of the microbial oxidation of ammonia.The microorganisms derive energy from these reactions;this energy is used for CO2 fixation.
Ammonia Oxidation:
NH4 + 1.502 + 2HCO 3- NO2 - + 2H2CO3 + H20 (1)
Nitrite Oxidation:
NO2 + 0.50, 3NO3 (2)
Overall Reaction:
NH4 + 202 + 2 HCO 3 NO3- + 2H2CO 3 + H20 (3)
* As can be seen from Equation 1, the nitrification processresults in the production of acid which neutralizes thealkalinity in the wastewater. Theoretically, 7.1 mg/l of
alkalinity is destroyed for each 1 mg/l of ammonia oxidized.
The destruction of alkalinity results in pH depression.
760p
The actual pH depression is mitigated somewhat by theremoval of carbonic acid through the stripping of CO 2 fromthe wastewater surface (10). However, under low alkalinityconditions, pH depression is enhanced due to the reducedbuffer capacity of the wastewater. The level of alkalinitywithin wastewaters varies widely. The major factor influenc-ing the amount of alkalinity present is the source of thecarriage water, or the drinking water supply. Highalkalinities normally are associated with ground watersupplies and much lower alkalinities are associated withsurface supplies. Domestic wastewater contributes from50 to 200 mg CaCO /1 to the natural alkalinity of thecarriage water (l. ). Therefore, the amount of alkalinityin a domestic wastewater may range from less than 100 mgCaCO /1 to several hundred mg CaCO /1. The net effect of
3 3such variations in alkalinity is to provide a differentbuffering capacity for each wastewater treatment system.Domestic wastewaters normally contain from 12 to 25 mg/l ofammonia-nitrogen. The range of alkalinity destroyed duringthe nitrification of these concentrations of ammonia is85 mg CaCO /1 to 178 mg CaCO /1. Obviously, the pH depress-ion resulting from nitrifica~ion can be slight for lowammonia-high alkalinity wastewaters or significant forhigh ammonia-low alkalinity wastewaters. Wastewater pHlevels are typically around pH 7.5. However, pH depressionto below pH 7.0 is common for low alkalinity wastewaters.
The level of pH has an important effect on the nitri-fication process. There have been a number of researcherssince the turn of the century who have addressed thesubject of the effect of pH on nitrification. Thoseresearchers who have made contributions pertinent tothis study are listed in reverse chronological order inTable 1. It is interesting to note the large variation inthe effect of pHi on biological nitrification that isreported in the literature. The variation in the effect
4 of pH on nitrification is due in large measure to thenature of the experiments undertaken, i.e., the homogenietyof culture involved (pure versus mixed culture); scale ofthe experiment (laboratory to full scale); nature of thebiofilm (suspended versus fixed film) and a variety of(and frequently unspecified) acclimation times utilized inthe experiments.
Several investigators (1, 3, 15, 16) within recent yearshave attempted to provide more information on nitrificationwithin a fixed film mode. Haug and McCarty (15) utilized
761
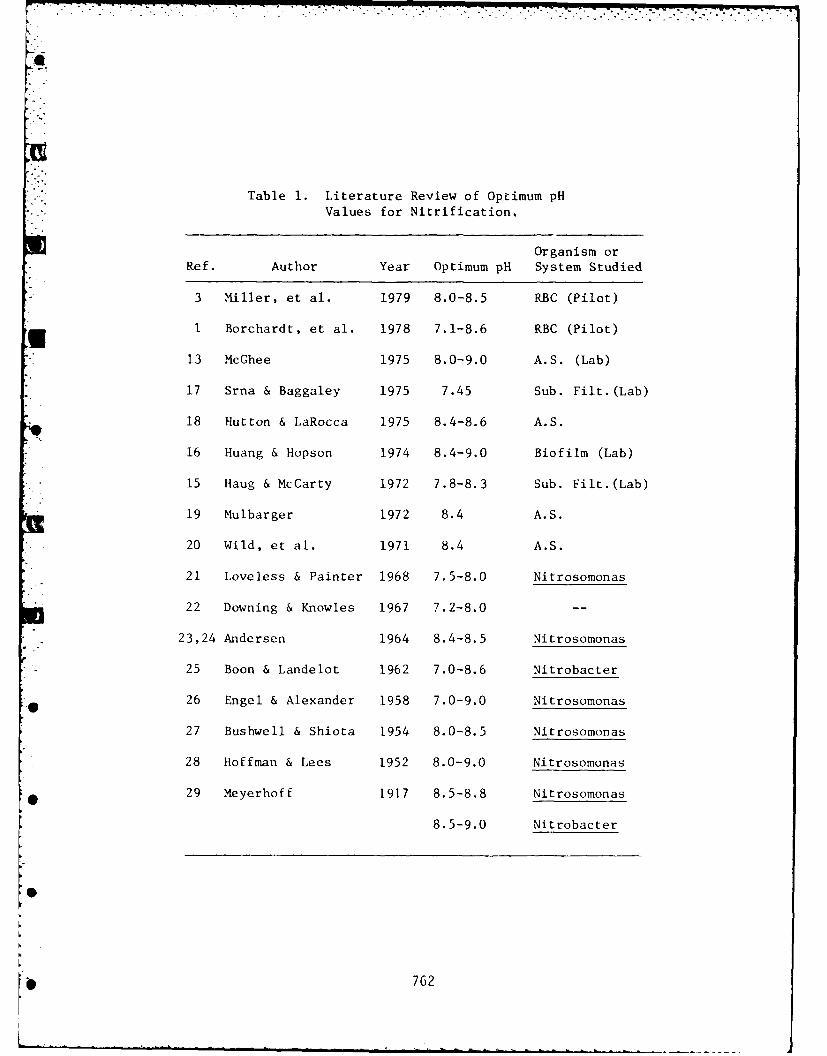
9
Table 1. Literature Review of Optimum pHValues for Nitrification.
Organism orRef. Author Year Optimum pH System Studied
3 Miller, et al. 1979 8.0-8.5 RBC (Pilot)
1 Borchardt, et al. 1978 7.1-8.6 RBC (Pilot)
13 McGhee 1975 8.0-9.0 A.S. (Lab)
17 Srna & Baggaley 1975 7.45 Sub. Filt.(Lab)
18 Hutton & LaRocca 1975 8.4-8.6 A.S.
16 Huang & Hopson 1974 8.4-9.0 Biofilm (Lab)
15 Haug & McCarty 1972 7.8-8.3 Sub. Filt.(Lab)
19 Mulbarger 1972 8.4 A.S.
20 Wild, et al. 1971 8.4 A.S.
21 Loveless & Painter 1968 7.5-8.0 Nitrosomonas
22 Downing & Knowles 1967 7.2-8.0 --
23,24 Andersen 1964 8.4-8.5 Nitrosomonas
25 Boon & Landelot 1962 7.0-8.6 Nitrobacter
26 Engel & Alexander 1958 7.0-9.0 Nitrosomonas
27 Bushwell & Shiota 1954 8.0-8.5 Nitrosomonas
28 Hoffman & Lees 1952 8.0-9.0 Nitrosomonas
29 Meyerhoff 1917 8.5-8.8 Nitrosomonas
8.5-9.0 Nitrobacter
6
762
I
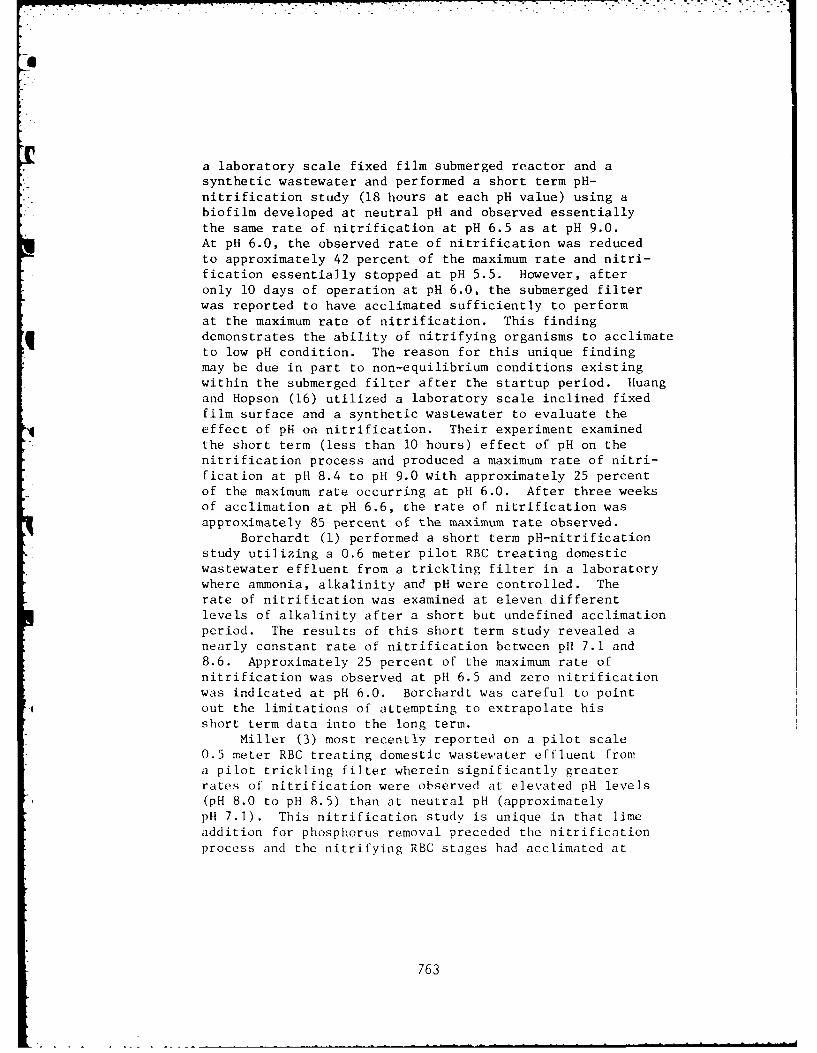
a laboratory scale fixed film submerged reactor and asynthetic wastewater and performed a short term pH-nitrification study (18 hours at each pH value) using a
* biofilm developed at neutral pH and observed essentiallythe same rate of nitrification at pH 6.5 as at pH 9.0.At pH 6.0, the observed rate of nitrification was reducedto approximately 42 percent of the maximum rate and nitri-fication essentially stopped at pH- 5.5. However, afteronly 10 days of operation at pH 6.0, the submerged filterwas reported to have acclimated sufficiently to performat the maximum rate of nitrification. This findingq demonstrates the ability of nitrifying organisms to acclimateto low pH condition. The reason for this unique findingmay be due in part to non-equilibrium conditions existingwithin the submerged filter after the startup period. Huangand Hopson (16) utilized a laboratory scale inclined fixedfilm surface and a synthetic wastewater to evaluate theeffect of pH on nitrification. Their experiment examinedthe short term (less than 10 hours) effect of pH on thenitrification process and produced a maximum rate of nitri-fication at pH 8.4 to pH 9.0 with approximately 25 percentof the maximum rate occurring at pH 6.0. After three weeksof acclimation at pH 6.6, the rate of nitrification wasapproximately 85 percent of the maximum rate observed.
Borchardt (1) performed a short term pH-nitrificationstudy utilizing a 0.6 meter pilot RBC treating domesticwastewater effluent from a trickling filter in a laboratorywhere ammonia, alkalinity and pH were controlled. Therate of nitrification was examined at eleven differentlevels of alkalinity after a short but undefined acclimationperiod. The results of this short term study revealed anearly constant rate of nitrification between pH 7.1 and8.6. Approximately 25 percent of the maximum rate ofnitrification was observed at pH 6.5 and zero nitrificationwas indicated at pH 6.0. Borchardt was careful to pointout the limitations of attempting to extrapolate hisshort term data into the long term.
Miller (3) most recently reported on a pilot scale0.5 meter RBC treating domestic wastewater effluent froma pilot trickling filter wherein significantly greaterrates of nitrification were observed at elevated pH levels(pH 8.0 to pH 8.5) than at neutral pH (approximatelypH 7.1). This nitrification study is unique in that limeaddition for phosphorus removal preceded the nitrificationprocess and the nitrifying RBC stages had acclimated at
763
the elevated pH levels. A transition in biofilm performancewas observed when the elevated pH of the wastewater wasreduced to the neutral pH range. Nitrification performance
Winitially remained unchanged. After approximately fourdays, the performance level started to deteriorate. Innine days, the performance had reverted to a lower nitri-fication level. This latter finding was not discussedfully by Miller; however, it is important because ithelps to establish potential physical differences betweenthe biofilms developed at neutral and elevated p11 levels.This situation was not observed by the other investigatorsusing fixed films mentioned above because none everattempted to acclimate biofilms at the elevated pH levels.Such differences cannot be assumed to be purely indicativeof only the pH dependent rates of microbial nitrification.
*O These differences also are reflective of the entire hetero-genous population developed within each biofilm whichdictate film development, cohesion, and retentioncharacteristics (sludge age). There is essentially noinformation within these wastewater nitrification studieswhich addresses changes in biofilm and microbial popula-tions under various pH conditions. In general, thisimportant consideration has been ignored in such waste-water research studies. However, current research effortssuch as those by Olem (30), LaMotta (31) and Characklis (32)are starting to examine more closely the mechanics ofbiofilm development and the characterization of microbialpopulations.
The addition of alkaline chemicals to wastewatertreatment systems to increase pH and provide added buffercapacity has been attempted with varying degrees of success.Heidman (33) conducted a pilot study at the Blue Plains',%VTP using an activated sludge system which incorporated
* p!1 controlled nitrification. This study was inconclusivebhcause it failed to demonstrate the relative nitrificationwithout chemical addition. Hutton (18) demonstratedthe feasibility of optimizing the nitrification of high,ilnnionia strength industrial wastewaters with alkalinechemical addition. Lue-Ling (34) reported success in
* using alkaline chemical addition to nitrify high ammoniastrength lagoon supernatant with RBCs. Hitdlebaugh (35)attempted to enhance the nitrification of domestic waste-water with RBCs through alkaline chemical addition; however,the results were inconclusive. The literature fails toaddress the efficacy of optimizing domestic wastewater
* 764
9i .. .' ? . .' .- .
[a
V
nitrification within the RBC system through pH control aswell as the use of alternative pH control schemes.
OBJECTIVES AND SCOPE
The objectives of this research were to:
1. Establish the relative rates of nitrification
for domestic wastewater treatment within anacclimated RBC fixed film system as a functionof pH.
2. Observe and characterize the relative changes inthe RBC biofilm as a function of pH.
3. Evaluate the efficacy of chemical addition toimprove nitrification within an RBC fixed filmsystem through the maintenance of an optimum pH.
4. Evaluate alternative alkaline chemicals for pH
controlled nitrification for the RBC.5. Develop design criteria, as appropriate, for pH
controlled nitrification for the RBC.
EXPERIMENTAL PROCEDURES
Pilot scale 0.5 meter diameter RBC systems were used
in this research to nitrify high rate trickling filtereffluent from the Pennsylvania State University (PSU)wastewater treatment plant (WWTP). The effect of pHon nitrification within an RBC was evaluated using foursingle stage RBCs operating in parallel (Figure 1). ThepH of the RBC systems treating the PSU WWTP tricklingfilter effluent was varied first from pH 6.3 to pH 7.5and then from pH 7.6 to pH 8.8 and the relative levels ofnitrification at the various p11's then were observed.High pH and low pH environments were created by addingsodium hydroxide and sulfuric acid, respectively, to thewastewater streams after clarification (Figure 1). Eachobservation period was started with no biofilm on theRBC discs and lasted approximately ten weeks.
The effect of alkaline chemical addition was evaluatedutilizing five 2-stage RBCs operating in parallel (Figure2). The level of nitrification of a low pH 2-stagecontrol RBC system (control) was compared against thenitrification level of four other 2-stage RBC systems
receiving four different alkaline chemicals. The fouralkaline chemicals used were calcium hydroxidL, sodiumcarbonate, sodium hydroxide, and sodium bicarbonate.
765
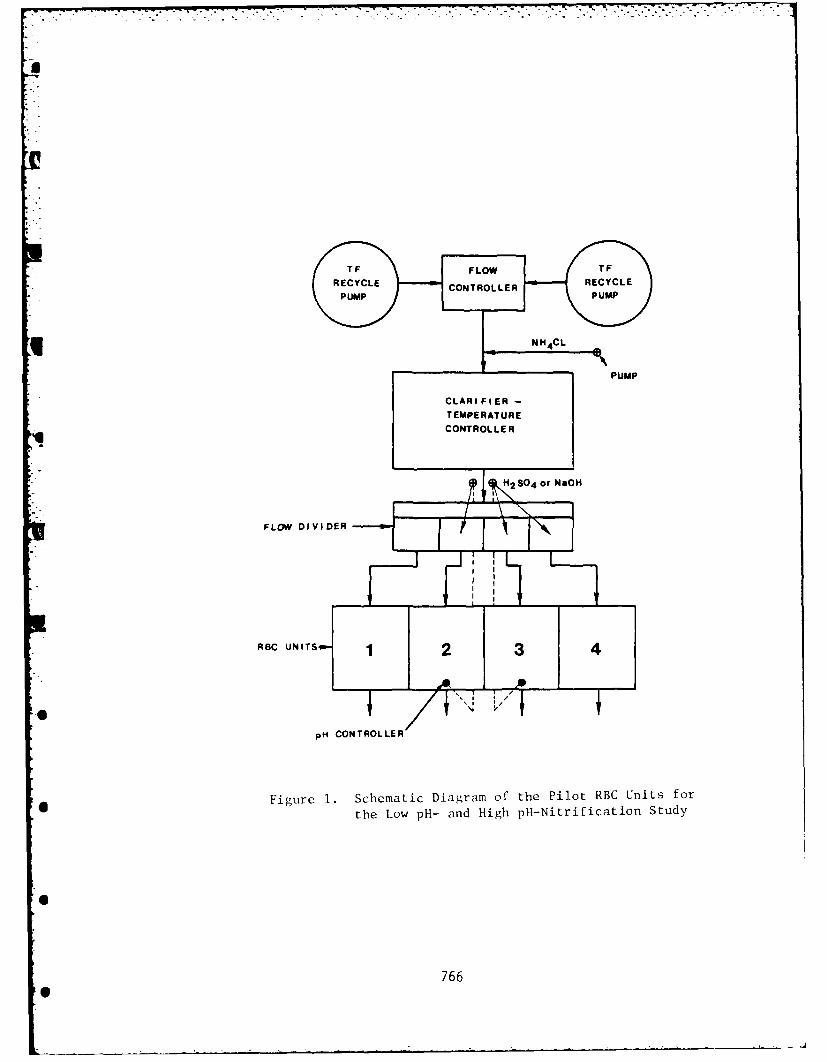
REC CL CONTROLLER
- (
Figur 1. chemtic Dagra of h PloRBUntfr
the ow H- ad Hgh H-NirifcatifPU tud
CLRFE
766EATRCOTOLE
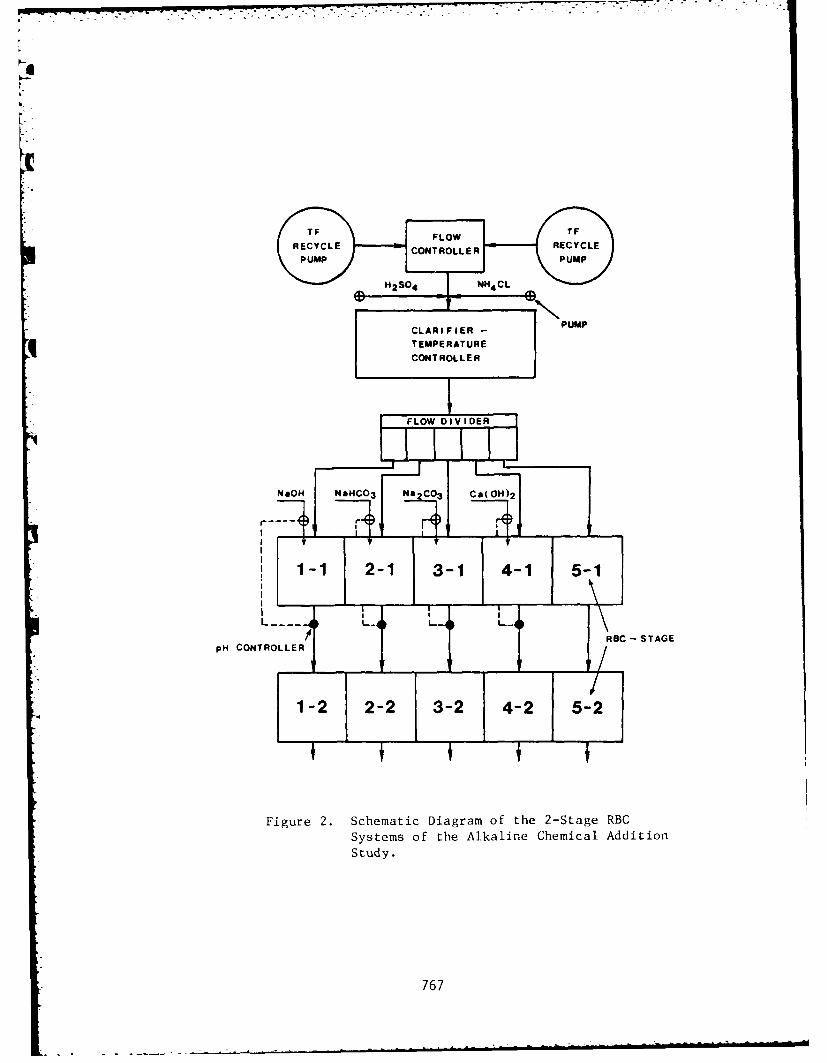
RECYCLE CON4TROLLER REYL
NaO N HCO3 NH14CL
CLRFE -- UM
pHCONT 0~E~j~ jCO§T1OLSTAG
1 -2 2-2 3-2 4-2 5-2
Figure 2. Schematic Diagram of the 2-Stage RBCSystems of the Alkaline Chemical AdditionStudy.
767
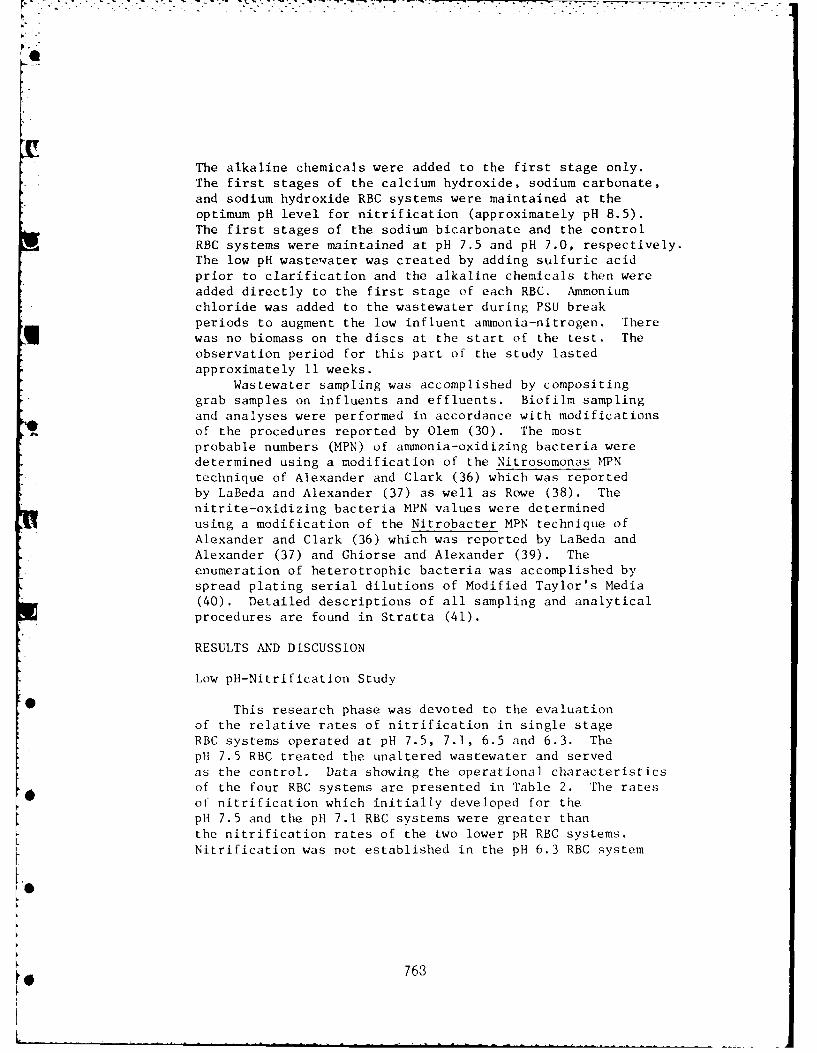
The alkaline chemicals were added to the first stage only.The first stages of the calcium hydroxide, sodium carbonate,and sodium hydroxide RBC systems were maintained at theoptimum pH level for nitrification (approximately pH 8.5).The first stages of the sodium bicarbonate and the controlRBC systems were maintained at pH 7.5 and pH 7.0, respectively.The low pH wastewater was created by adding sulfuric acidprior to clarification and the alkaline chemicals then were
added directly to the first stage of each RBC. Ammoniumchloride was added to the wastewater during PSU breakperiods to augment the low influent ammonia-nitrogen. There
U was no biomass on the discs at the start of the test. Theobservation period for this part of the study lastedapproximately 11 weeks.
Wastewater sampling was accomplished by compositinggrab samples on influents and effluents. Biofilm sampling
and analyses were performed in accordance with modificationsof the procedures reported by Olem (30). The mostprobable numbers (MPN) of ammonia-oxidizing bacteria weredetermined using a modification of the Nitrosomonas MPN
technique of Alexander and Clark (36) which was reportedby LaBeda and Alexander (37) as well as Rowe (38). Thenitrite-oxidizing bacteria MPN values were determined
using a modification of the Nitrobacter MPN technique ofAlexander and Clark (36) which was reported by LaBeda andAlexander (37) and Ghiorse and Alexander (39). The
enumeration of heterotrophic bacteria was accomplished byspread plating serial dilutions of Modified Taylor's Media(40). Detailed descriptions of all sampling and analyticalprocedures are found in Stratta (41).
RESULTS AND DISCUSSION
Low pH-Nitrification Study
This research phase was devoted to the evaluationof the relative rates of nitrification in single stageRBC systems operated at pH 7.5, 7.1, 6.5 and 6.3. The
pH 7.5 RBC treated the unaltered wastewater and served
as the control. Data showing the operational characteristicsof the four RBC systems are presented in Table 2. The ratesof nitrification which initially developed for the
pH 7.5 and the pH 7.1 RBC systems were greater thanthe nitrification rates of the two lower pH RBC systems.Nitrification was not established in the pH 6.3 RBC system
763
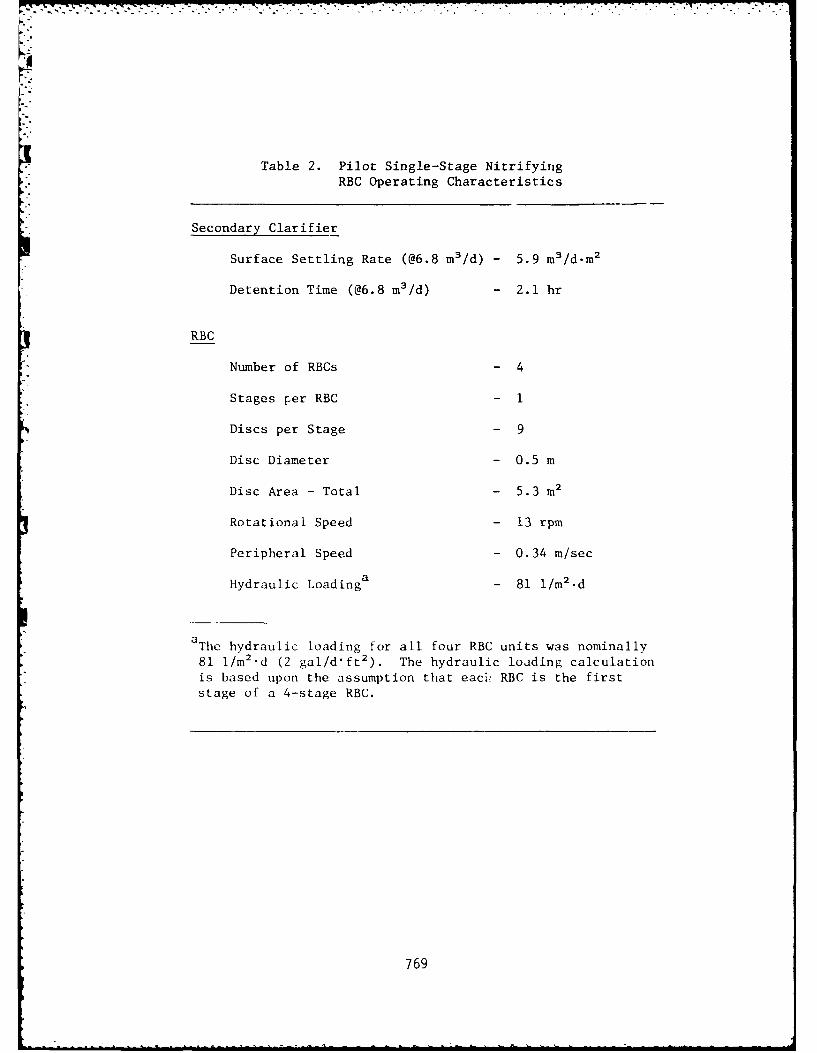
Table 2. Pilot Single-Stage NitrifyingRBC Operating Characteristics
Secondary Clarifier
Surface Settling Rate (@6.8 m 3 /d) - 5.9 m 3 /d.m2
Detention Time (@6.8 m 3 /d) - 2.1 hr
RBC
Number of RBCs - 4
Stages per RBC - 1
Discs per Stage - 9
Disc Diameter - 0.5 m
Disc Area - Total - 5.3 M 2
Rotational Speed - 13 rpm
Peripheral Speed - 0.34 m/sec
Hydraulic Loadinga - 81 1/m2.d
aThe hydraulic loading for all four RBC units was nominally
81 i/m2 "d (2 gal/d'ft2 ). The hydraulic loading calculationis based upon the assumption that eaci- RBC is the firststage of a 4-stage RBC.
769
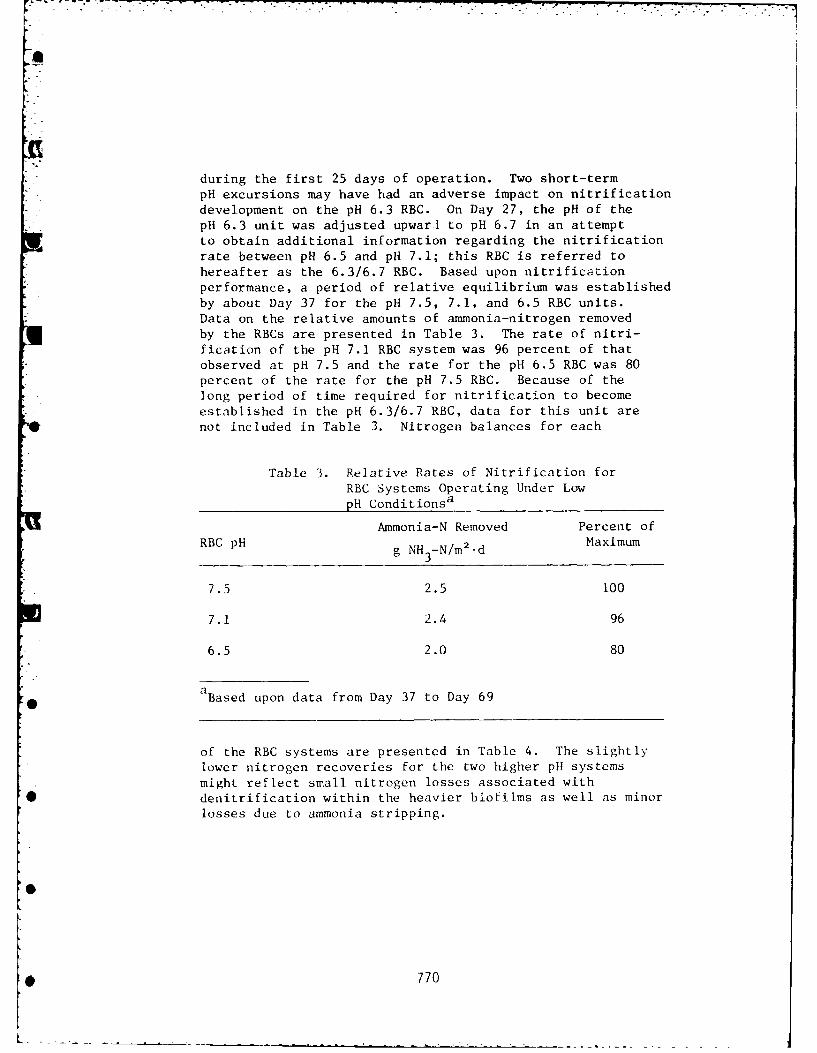
during the first 25 days of operation. Two short-termpH excursions may have had an adverse impact on nitrificationdevelopment on the pH 6.3 RBC. On Day 27, the pH of thepH 6.3 unit was adjusted upwarl to pH 6.7 in an attemptto obtain additional information regarding the nitrificationrate between pH 6.5 and pH 7.1; this RBC is referred tohereafter as the 6.3/6.7 RBC. Based upon nitrificationperformance, a period of relative equilibrium was establishedby about Day 37 for the pH 7.5, 7.1, and 6.5 RBC units.Data on the relative amounts of ammonia-nitrogen removedby the RBCs are presented in Table 3. The rate of nitri-fication of the pH 7.1 RBC system was 96 percent of thatobserved at pH 7.5 and the rate for the pH 6.5 RBC was 80percent of the rate for the pH 7.5 RBC. Because of thelong period of time required for nitrification to becomeestablished in the pH 6.3/6.7 RBC, data for this unit arenot included in Table 3. Nitrogen balances for each
Table 3. Relative Rates of Nitrification forRBC Systems Operating Under LowpH Conditionsa
Ammonia-N Removed Percent ofRBC pH g NH3-N/m2.d Maximum
7.5 2.5 100
7.1 2.4 96
6.5 2.0 80
Based upon data from Day 37 to Day 69
of the RBC systems are presented in Table 4. The slightlylower nitrogen recoveries for the two higher pH systemsmight reflect small nitrogen losses associated with
* denitrification within the heavier biofilms as well as minorlosses due to ammonia stripping.
7
L
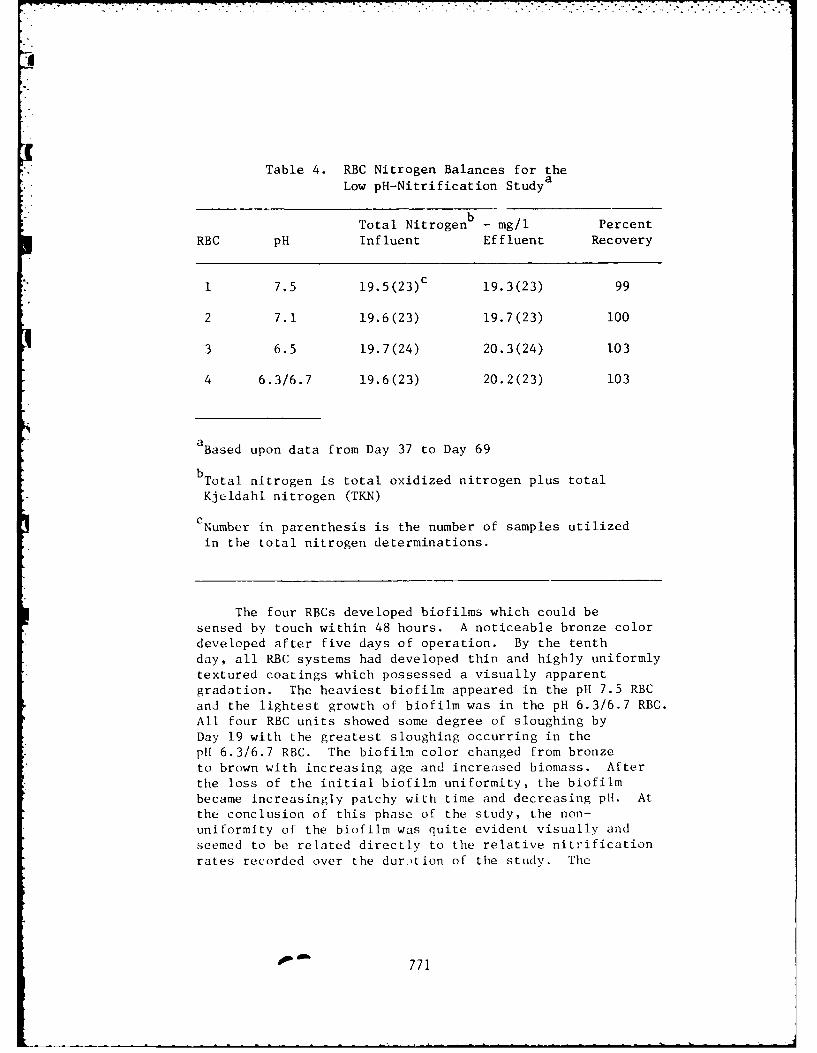
Table 4. RBC Nitrogen Balances for the
Low pH-Nitrification Studya
Total Nitrogenb - mg/i Percent
RBC pH Influent Effluent Recovery
1 7.5 19.5(23)c 19.3(23) 99
2 7.1 19.6(23) 19.7(23) 100
3 6.5 19.7(24) 20.3(24) 103
4 6.3/6.7 19.6(23) 20.2(23) 103
aBased upon data from Day 37 to Day 69
bTotal nitrogen is total oxidized nitrogen plus total
Kjeldahl nitrogen (TKN)
C Number in parenthesis is the number of samples utilized
in the total nitrogen determinations.
The four RBCs developed biofilms which could besensed by touch within 48 hours. A noticeable bronze color
developed after five days of operation. By the tenthday, all RBC systems had developed thin and highly uniformly
textured coatings which possessed a visually apparentgradation. The heaviest biofilm appeared in the pH 7.5 RBC
and the lightest growth of biofilm was in the pH 6.3/6.7 RBC.
All four RBC units showed some degree of sloughing byDay 19 with the greatest sloughing occurring in the
pH 6.3/6.7 RBC. The biofilm color changed from bronze
to brown with increasing age and increased biomass. After
the loss of the initial biofilm uniformity, the biofilmbecame increasingly patchy with time and decreasing pH. Atthe conclusion of this phase of the study, the non-uniformity of the biofilm was quite evident visually andseemed to be related directly to the relative nitrificationrates recorded over the dur:,tion of the study. The
SOf771
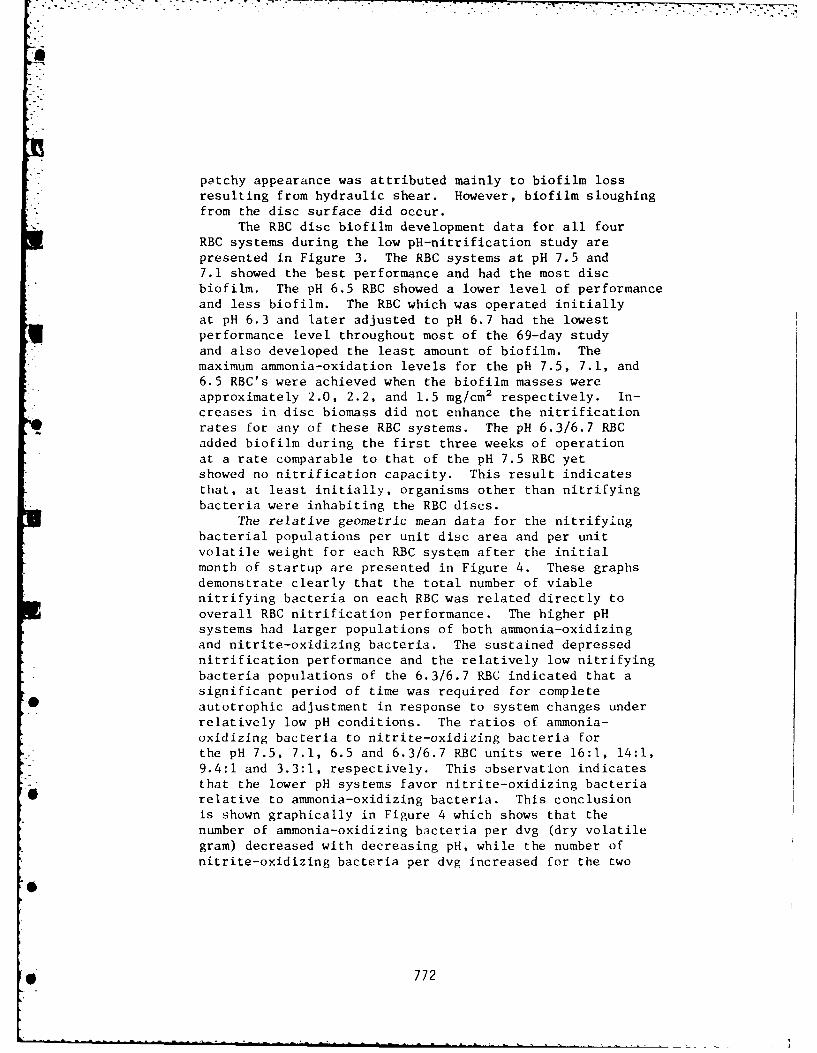
oS
patchy appearance was attributed mainly to biofilm lossresulting from hydraulic shear. However, biofilm sloughingfrom the disc surface did occur.
The RBC disc biofilm development data for all fourRBC systems during the low pH-nitrification study arepresented in Figure 3. The RBC systems at pH 7.5 and7.1 showed the best performance and had the most discbiofilm. The pH 6.5 RBC showed a lower level of performanceand less biofilm. The RBC which was operated initially
at pH 6.3 and later adjusted to pH 6.7 had the lowestperformance level throughout most of the 69-day study
and also developed the least amount of biofilm. Themaximum ammonia-oxidation levels for the pH 7.5, 7.1, and6.5 RBC's were achieved when the biofilm masses wereapproximately 2.0, 2.2, and 1.5 mg/cm 2 respectively. In-creases in disc biomass did not enhance the nitrificationrates for any of these RBC systems. The pH 6.3/6.7 RBCadded biofilm during the first three weeks of operationat a rate comparable to that of the pH 7.5 RBC yetshowed no nitrification capacity. This result indicatesthat, at least initially, organisms other than nitrifyingbacteria were inhabiting the RBC discs.
The relative geometric mean data for the nitrifyingbacterial populations per unit disc area and per unitvolatile weight for each RBC system after the initialmonth of startup are presented in Figure 4. These graphsdemonstrate clearly that the total number of viablenitrifying bacteria on each RBC was related directly tooverall RBC nitrification performance. The higher pHsystems had larger populations of both ammonia-oxidizingand nitrite-oxidizing bacteria. The sustained depressednitrification performance and the relatively low nitrifying
bacteria populations of the 6.3/6.7 RBC indicated that asignificant period of time was required for complete
O autotrophic adjustment in response to system changes underrelatively low pH conditions. The ratios of ammonia-oxidizing bacteria to nitrite-oxidizing bacteria forthe pH 7.5, 7.1, 6.5 and 6.3/6.7 RBC units were 16:1, 14:1,9.4:1 and 3.3:1, respectively. This observation indicatesthat the lower pH systems favor nitrite-oxidizing bacteria
*relative to ammonia-oxidizing bacteria. This conclusion
is shown graphically in Figure 4 which shows that thenumber of ammonia-oxidizing bacteria per dvg (dry volatilegram) decreased with decreasing pH, while the number of
nitrite-oxidizing bacteria per dvg increased for the two
*772
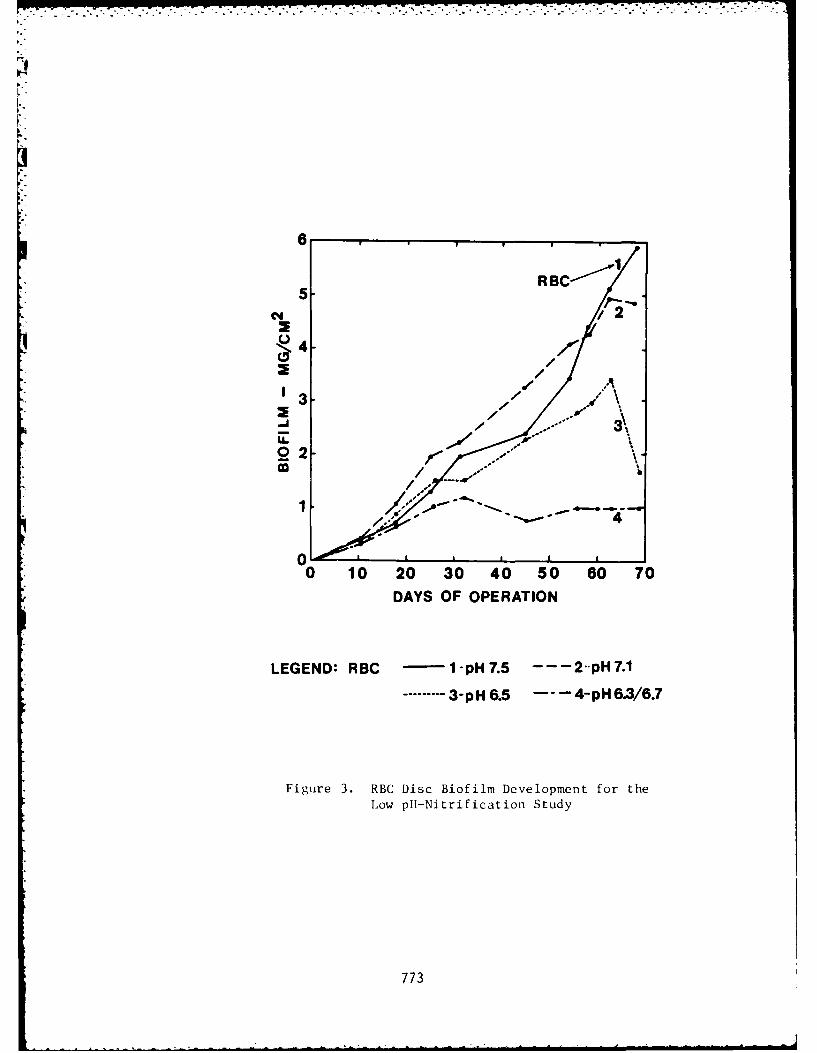
6
RB
C4 2
C,3\,
23 2
0
4
o 10 20 30 40 50 60 70
DAYS OF OPERATION
LEGEND: RBC -1-pH7.5 - - - 2pH7.1
------3-pH6.5 --- 4-pH6.3/6.7
Figure 3. RBC Disc Biofilm Development for theLow pHf-Nitrification Study
773
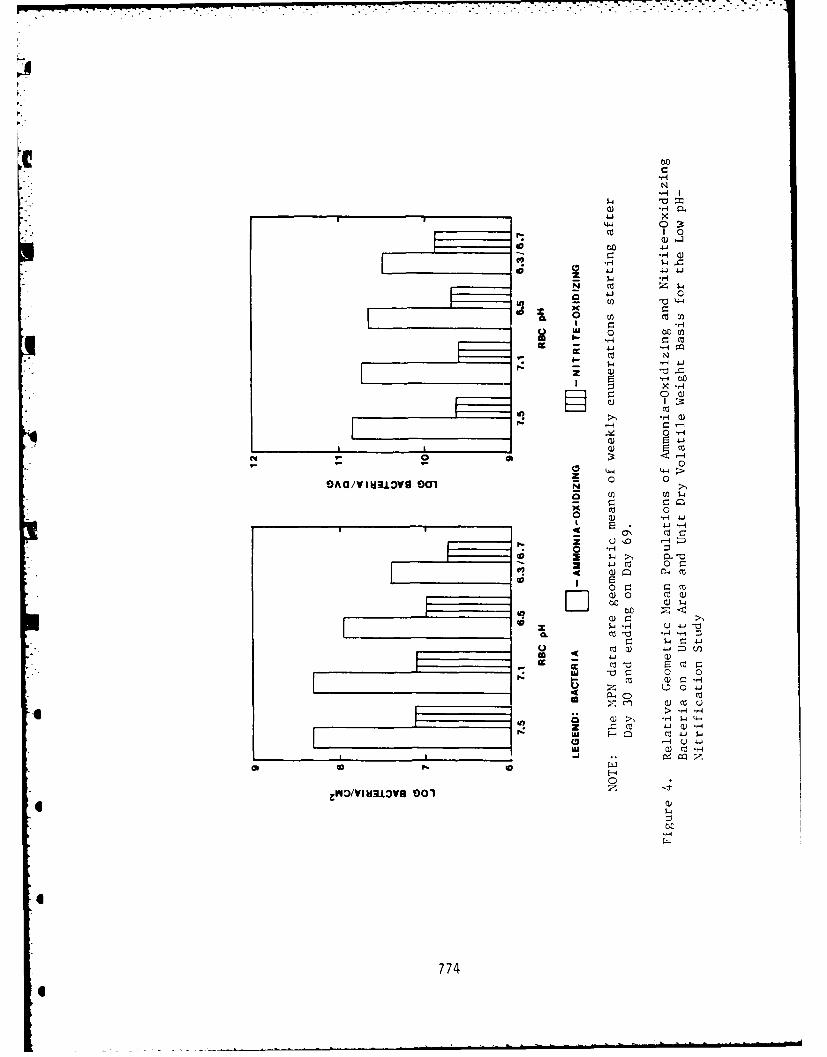
:11
00
4.,x z
CL 0 00caE
0 'oU
.1. 0 u ~ coC
Fe -H HJco 0
F- 0
3 0 0
0 0u 04
* 0 H
(000
0 C: ca
Q) C0 ECOOQ
x w0 01 U 0-
*( 0- CO
Il ;F Zcn Q)coHu
0U -A U J-C, 0) Uil-H
-J4
4774
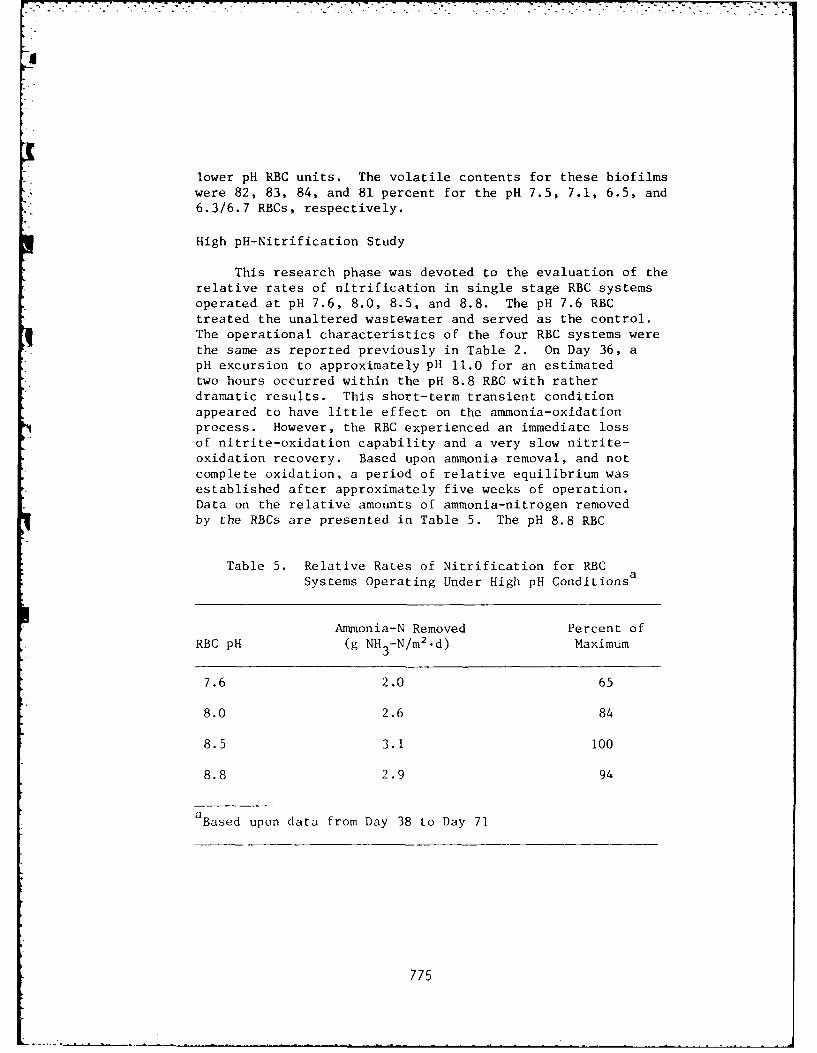
q
lower pH RBC units. The volatile contents for these biofilmswere 82, 83, 84, and 81 percent for the pH 7.5, 7.1, 6.5, and
6.3/6.7 RBCs, respectively.
High pH-Nitrification Study
This research phase was devoted to the evaluation of therelative rates of nitrification in single stage RBC systemsoperated at pH 7.6, 8.0, 8.5, and 8.8. The pH 7.6 RBC
treated the unaltered wastewater and served as the control.The operational characteristics of the four RBC systems were
the same as reported previously in Table 2. On Day 36, apH excursion to approximately pH 11.0 for an estimatedtwo hours occurred within the pH 8.8 RBC with ratherdramatic results. This short-term transient condition
appeared to have little effect on the ammonia-oxidationprocess. However, the RBC experienced an immediate lossof nitrite-oxidation capability and a very slow nitrite-oxidation recovery. Based upon ammonia removal, and notcomplete oxidation, a period of relative equilibrium wasestablished after approximately five weeks of operation.Data on the relative amounts of ammonia-nitrogen removed
by the RBCs are presented in Table 5. The pH 8.8 RBC
Table 5. Relative Rates of Nitrification for RBC
Systems Operating Under High pH Conditions a
Ammonia-N Removed Percent of
RBC pH (g NH3-N/m2.d) Maximum
7.6 2.0 65
8.0 2.6 84
8.5 3.1 100
8.8 2.9 94
aBased upon data from Day 38 to Day 71
775
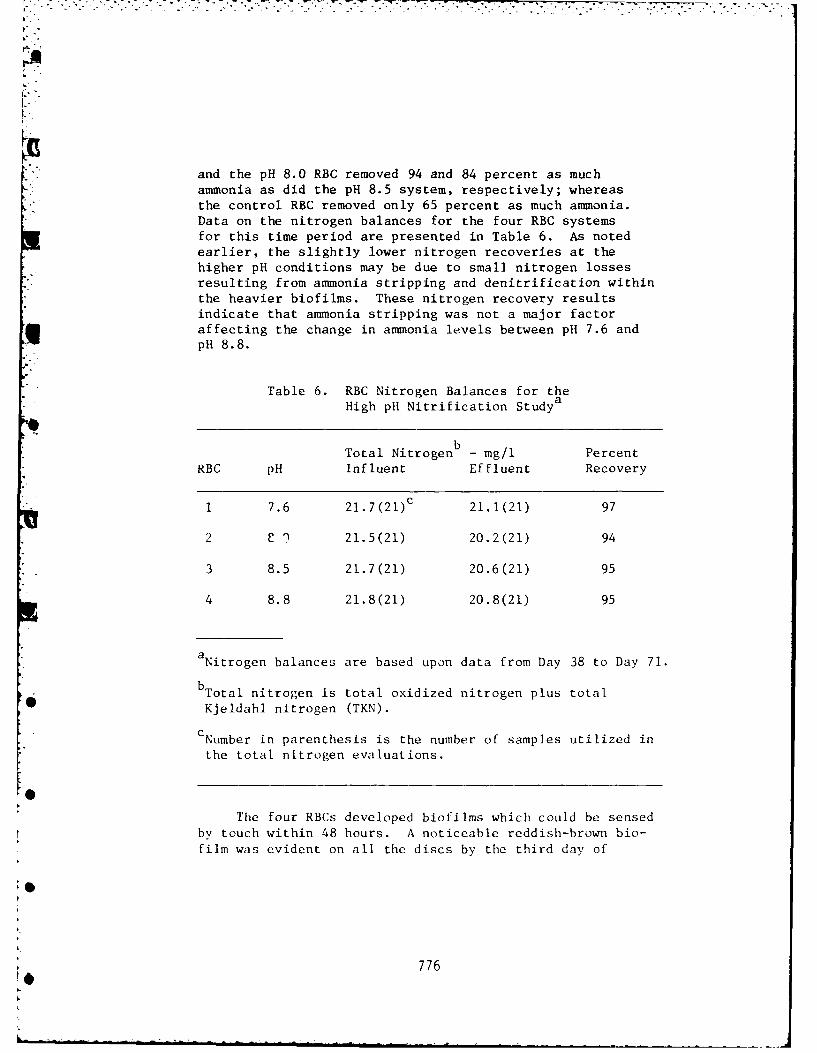
and the pH 8.0 RBC removed 94 and 84 percent as much
ammonia as did the pH 8.5 system, respectively; whereasthe control RBC removed only 65 percent as much ammonia.Data on the nitrogen balances for the four RBC systemsfor this time period are presented in Table 6. As notedearlier, the slightly lower nitrogen recoveries at thehigher pH conditions may be due to small nitrogen lossesresulting from ammonia stripping and denitrification withinthe heavier biofilms. These nitrogen recovery resultsindicate that ammonia stripping was not a major factoraffecting the change in ammonia levels between pH 7.6 andpH 8.8.
Table 6. RBC Nitrogen Balances for theHigh pH Nitrification Studya
bTotal Nitrogen - mg/l Percent
RBC pH Influent Effluent Recovery
1 7.6 21.7(21) c 21.1(21) 97
2 C e 21.5(21) 20.2(21) 94
3 8.5 21.7(21) 20.6(21) 95
4 8.8 21.8(21) 20.8(21) 95
aNitrogen balances are based upon data from Day 38 to Day 71.
bTotal nitrogen is total oxidized nitrogen plus total
O Kjeldahl nitrogen (TKN).
CNumber in parenthesis is the number of samples utilized in
the total nitrogen evaluations.
F.The four RBCs developed biofilms which could be sensed
by touch within 48 hours. A noticeable reddish-brown bio-film was evident on all the discs by the third day of
776
6-
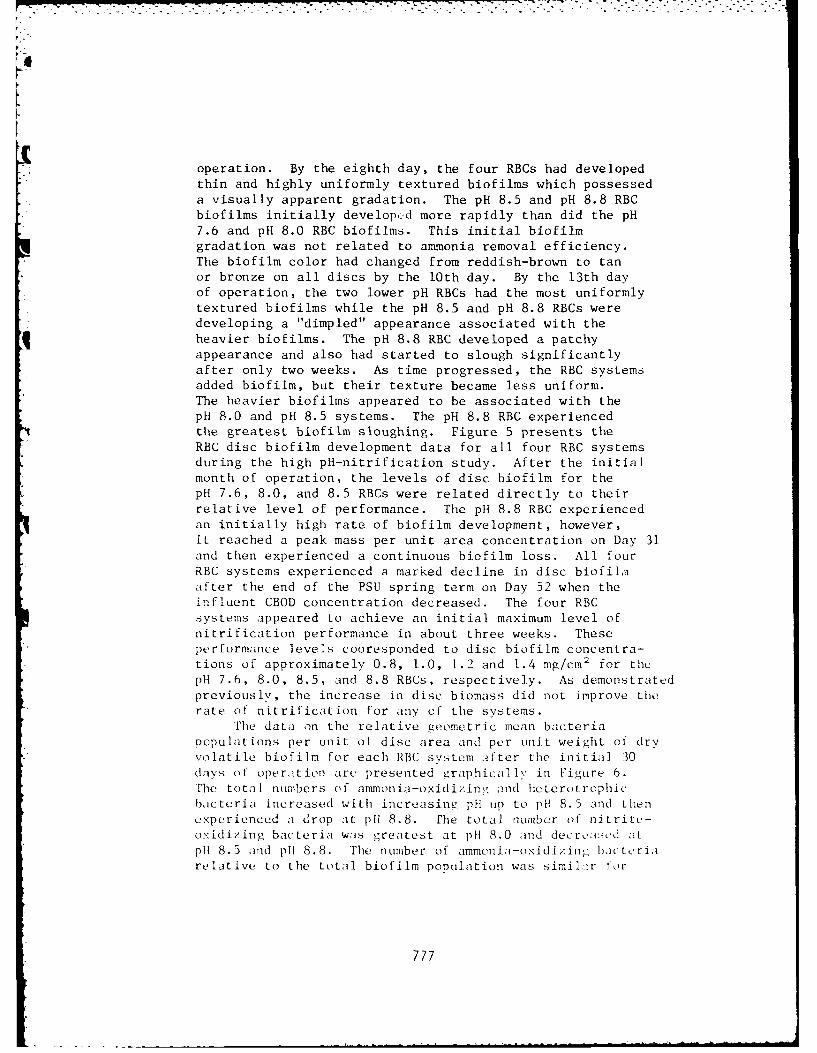
operation. By the eighth day, the four RBCs had developedthin and highly uniformly textured biofilms which possesseda visually apparent gradation. The pH 8.5 and pH 8.8 RBCbiofilms initially developd more rapidly than did the pH7.6 and pH 8.0 RBC biofilms. This initial biofilmgradation was not related to ammonia removal efficiency.The biofilm. color had changed from reddish-brown to tanor bronze on all discs by the 10th day. By the 13th dayof operation, the two lower pH RBCs had the most uniformlytextured biofilms while the pH 8.5 and pH- 8.8 RBCs weredeveloping a "dimpled" appearance associated with the
q heavier biofilms. The pH 8.8 RBC developed a patchyappearance and also had started to slough significantlyafter only two weeks. As time progressed, the RBC systemsadded biofilm, but their texture became less uniform.The heavier biofilms appeared to be associated with thepH 8.0 and pH 8.5 systems. The pH 8.8 RBG experiencedthe greatest biofilm sloughing. Figure 5 presents theRBC disc biofilm development data for all four RBC systemsduring the high pil-nitrification study. After the initialmonth of operation, the levels of disc biofilm for thepH 7.6, 8.0, and 8.5 RBCs were related directly to theirrelative level of performance. The pH 8.8 RBC experiencedan initially high rate of biofilm development, however,it reached a peak mass per unit area concentration on Day 31and then experienced a continuous biofilm loss. All fourRBC systems experienced a marked decline in disc biofil.dafter the end of the PSU spring term on Day 52 when the
inflentCBOD concentration decreased. The four RBCsystems appeared to achieve an initial maximum level ofnitrification performance in about three weeks. Theseperformance levels cooresponded to disc biofilm concentra-tions of approximately 0.8, 1.0, 1.2 and 1.4 mg/cm 2 for thepH 7.6, 8.0, 8.5, and 8.8 RBCs, respectively. As demonstratedpreviously, the increase in disc biomass did not improve therate of nitrification for any of the systems.
The data on the relative geometric mean bacteriapopulations per unit of disc area and per unit weight of dryvolatile bioflm for each RBC system after the initial 30days of operit ion are presented graphicalv i- El gre 6.The total numbers of ammoni-oxidizing and hcterotrophicbaicteria increased with increasing pHl up to pH 8. 5 and thenexperienced a drop ait p!11 8.8. file t0tal number of ni trite-ox:idizing bacteria wa-s greatest at pH 8.0 and decroased atpHl 8.5 and p1l 8.8. The number of ammnia-oxidizing bacteriare latilve to the total biofi lm population was similair for
777
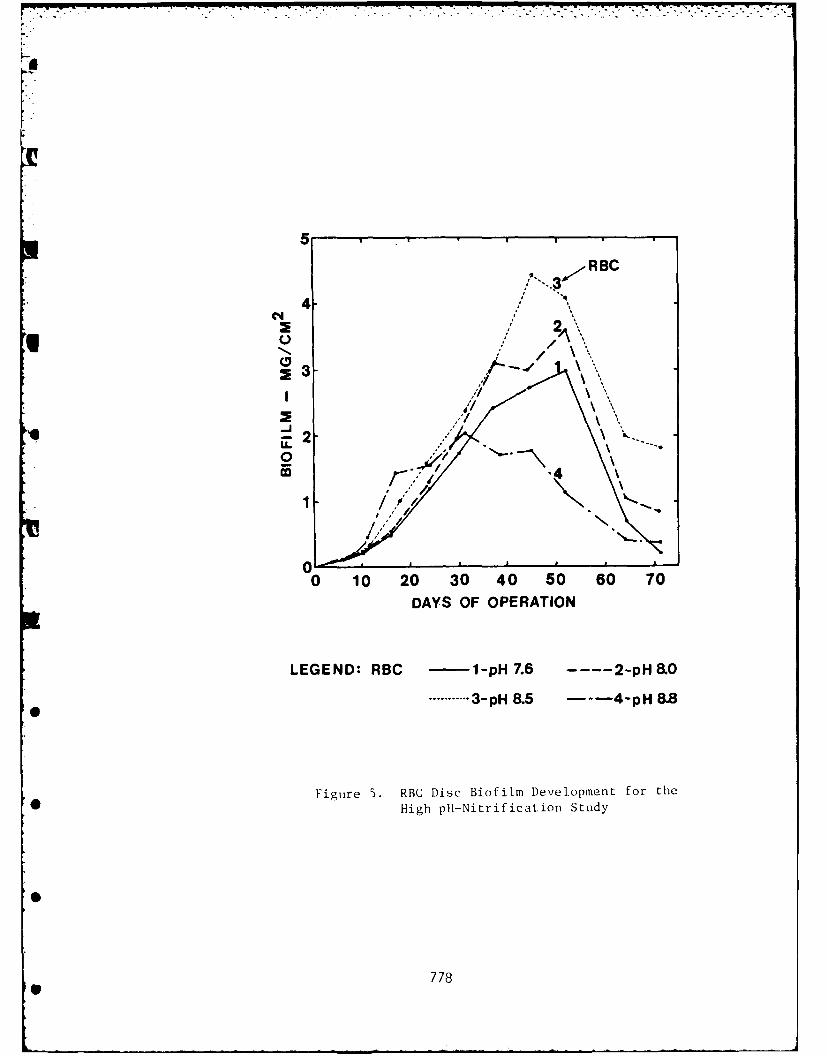
.. . . .. . . . .. .. . .. ..... . . .
5
i; RBC
C,o,.,, 3..',
1t I"""'
0
"I ~~~ ~ I A1 . \\" ..
o 10 20 30 40 50 60 70DAYS OF OPERATION
LEGEND: RBC - 1-pH 7.6 ---- 2-pH 8.0
........ 3-pH 8.5 --- 4-pH 8.80
Figure 5. RBC Disc Biofiim Development for the0 High pH-Nitrification Study
778
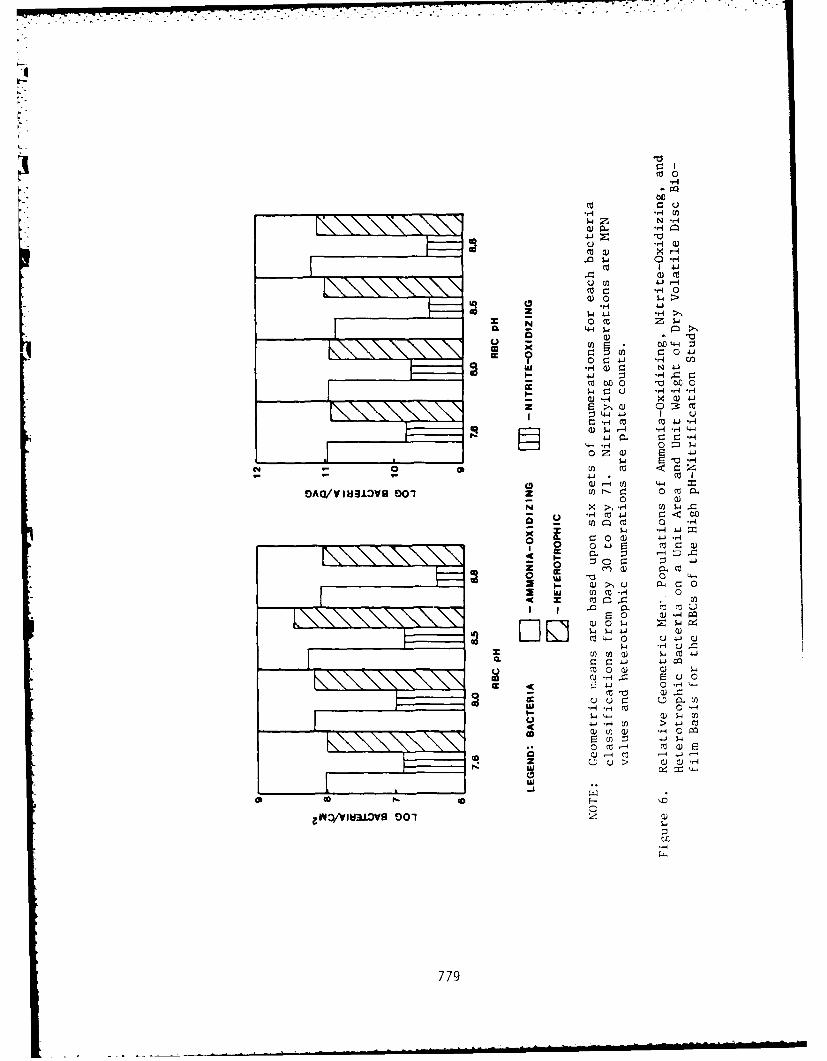
NH
c ~ -4 U)
00zo 4 1
- i -,q
I 4 4J
-;4 0 o Z 4
a Q) "o
0 r* -4C 1 4
ccozw 0 o.1- $4 0 u -H H
a) - -D 4-i *
DAU/VIi3L~V 0~ -30 W-cl z
-4 ACjJ I
o- CL z -~d
0 (3 E 4
.0 Cl .cac~
14DAa.UlV 0012 z C 0c M.
0~ Q) E~
0 02
:I C11 > 41
0 "a W O
002'ct-'- 0Wac40 -Cl (--x,
DO~v~LV DCl 4z 0 .1
04.4u r
779 () 4c
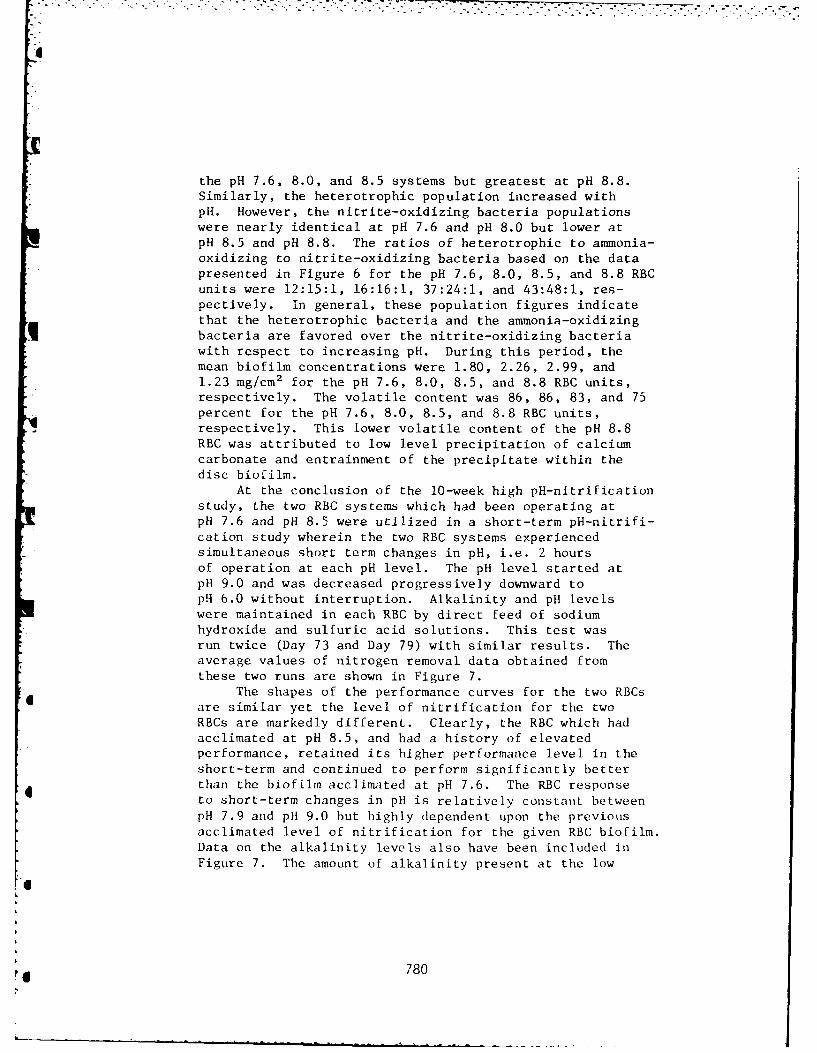
the pH 7.6, 8.0, and 8.5 systems but greatest at pH 8.8.Similarly, the heterotrophic population increased withpH. However, the nitrite-oxidizing bacteria populationswere nearly identical at pH 7.6 and pH 8.0 but lower atpH 8.5 and pH 8.8. The ratios of heterotrophic to ammonia-oxidizing to nitrite-oxidizing bacteria based on the datapresented in Figure 6 for the pH 7.6, 8.0, 8.5, and 8.8 RBCunits were 12:15:1, 16:16:1, 37:24:1, and 43:48:1, res-pectively. In general, these population figures indicatethat the heterotrophic bacteria and the ammonia-oxidizingbacteria are favored over the nitrite-oxidizing bacteriawith respect to increasing pH. During this period, themean biofilm concentrations were 1.80, 2.26, 2.99, and1.23 mg/cm 2 for the pH 7.6, 8.0, 8.5, and 8.8 RBC units,respectively. The volatile content was 86, 86, 83, and 75percent for the pH 7.6, 8.0, 8.5, and 8.8 RBC units,respectively. This lower volatile content of the pH 8.8RBC was attributed to low level precipitation of calciumcarbonate and entrainment of the precipitate within thedisc biofilm.
At the conclusion of the 10-week high pH-nitrificationstudy, the two RBC systems which had been operating atpH 7.6 and pH 8.5 were utilized in a short-term pH-nitrifi-cation study wherein the two RBC systems experiencedsimultaneous short term changes in pH, i.e. 2 hoursof operation at each pH level. The pH level started atpH 9.0 and was decreased progressively downward topH 6.0 without interruption. Alkalinity and pH levelswere maintained in each RBC by direct feed of sodiumhydroxide and sulfuric acid solutions. This test wasrun twice (Day 73 and Day 79) with similar results. Theaverage values of nitrogen removal data obtained fromthese two runs are shown in Figure 7.
The shapes of the performance curves for the two RBCsare similar yet the level of nitrification for the twoRBCs are markedly different. Clearly, the RBC which hadacclimated at pH 8.5, and had a history of elevatedperformance, retained its higher performance level in theshort-term and continued to perform significantly betterthan the biofilm acclimated at pH 7.6. The RBC responseto short-term changes in pH is relatively constant betweenpH 7.9 and pH 9.0 but highly dependent upon the previousacclimated level of nitrification for the given RBC biofilm.Data on the alkalinity levels also have been included inFigure 7. The amount of alkalinity present at the low
780
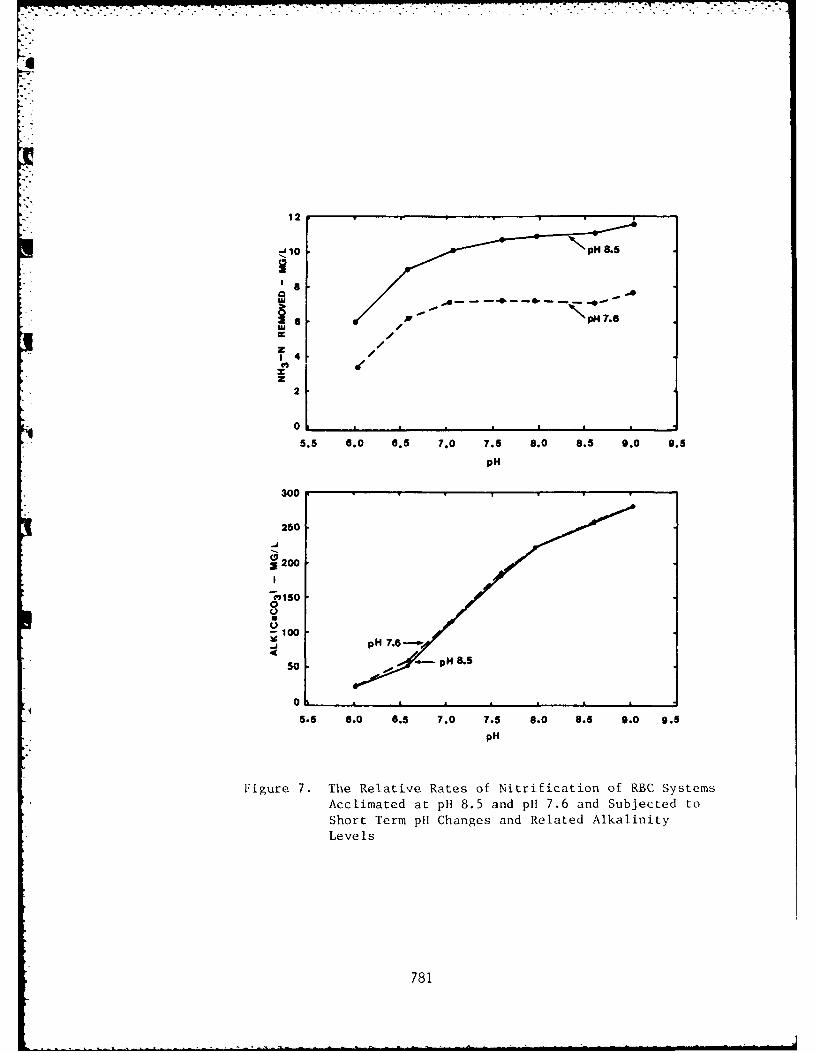
12
_10pH&
6 H .aucc
16
20
3200
0
-100
0
5.5 6.0 6 .5 7.0 7.5 8.0 9.5 9.0 9.5
pH
Figure 7. The Relative Rates of Nitrification of RBC SystemsAcclimated at pH 8.5 and pH 7.6 and Subjected toShort Term pH Changes and Related AlkalinityLevels
781
pH levels demonstrates that even at 20 mg/i of CaCO 3significant amounts of nitrification were achieved. Theresponse of the lower pH system closely resembles thedata of Borchardt (1) and similarly reveals good nitrifica-tion at very low alkalinity levels. This result tends toreinforce the observation that the pH level is much moreimportant than the alkalinity level per se in terms ofeffect on nitrification. The amount of time required foran RBC system to adjust to an altered pH condition isdiscussed further in Stratta (41).
Alkaline Chemical Addition Study
This phase of the research was devoted to the evaluationof the rates of nitrification of 2-stage RBC systems main-tained at elevated pH- levels through alkaline chemical
-. . addition. The pH and alkalinity levels within the firststages of four RBC systems were adjusted upward andmaintained artificially with four different alkalinechemicals. Calcium hydroxide, sodium carbonate, and
* sodium hydroxide were used to maintain approximatelypH 8.5, the optimum pH, in the first stage of threedifferent RBCs. Sodium bicarbonate was used to maintainpH 7.5 in the first stage of the fourth RBC. A fifthRBC which treated low pH-low alkalinity wastewaterwas used as a control. Data on the operational character-istics of the five RBC systems are presented in Table 7.
The overall nitrification capacity of the 2-stageRBC control system developed more slowly than did thatof the higher pH systems. However, the control RBC andthe alkaline chemical feed RBC systems were operating atapproximately the same level of nitrification performanceafter a little more than three weeks of operation. Thelevels of performance for all five systems were verysimilar for about the next ten days. The overall per-formance of the control system, operating at the lowerpH level, started to deteriorate after approximately 35days of operation.
Based upon the overall nitrification performanceof the five 2-stage RBC systems, a period of relativeequilibrium was established by about Day 38. The data
0 on the relative amounts of total ammonia-nitrogen removedby the five RBCs from Day 38 to Day 75 are presented inTable 8. These data show that the everall ammonia-nitrogenremovals for the sodium hydroxide, sodium carbonate, and
782
,.S I. / LT " -. . i . - - ' i i T ~ 7 -" : ! i . " - . T . " ' " - " ' . ' - - . " " ' " ] T . L
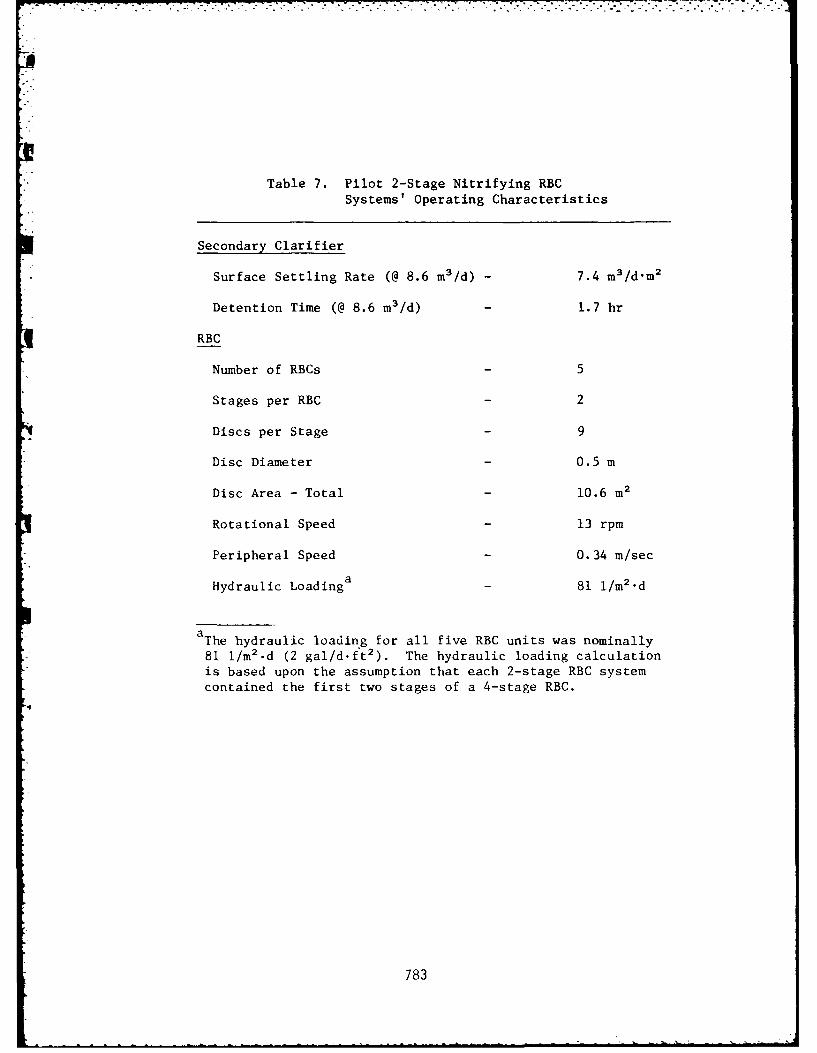
illI~~~~~~~~~ ~~~~ ~ ... .. .-. .. .......... L k '::"
Table 7. Pilot 2-Stage Nitrifying RBC
Systems' Operating Characteristics
Secondary Clarifier
Surface Settling Rate (@ 8.6 m 3 /d) - 7.4 m 3 /dm 2
Detention Time (@ 8.6 m 3 /d) - 1.7 hr
RBC
Number of RBCs - 5
Stages per RBC - 2
Discs per Stage - 9
Disc Diameter - 0.5 m
Disc Area - Total - 10.6 m 2
Rotational Speed - 13 rpm
Peripheral Speed - 0.34 m/sec
Hydraulic Loadinga - 81 i/m2 .d
aThe hydraulic loading for all five RBC units was nominally
81 i/m 2.d (2 gal/d.ft 2 ). The hydraulic loading calculation
is based upon the assumption that each 2-stage RBC systemcontained the first two stages of a 4-stage RBC.
783
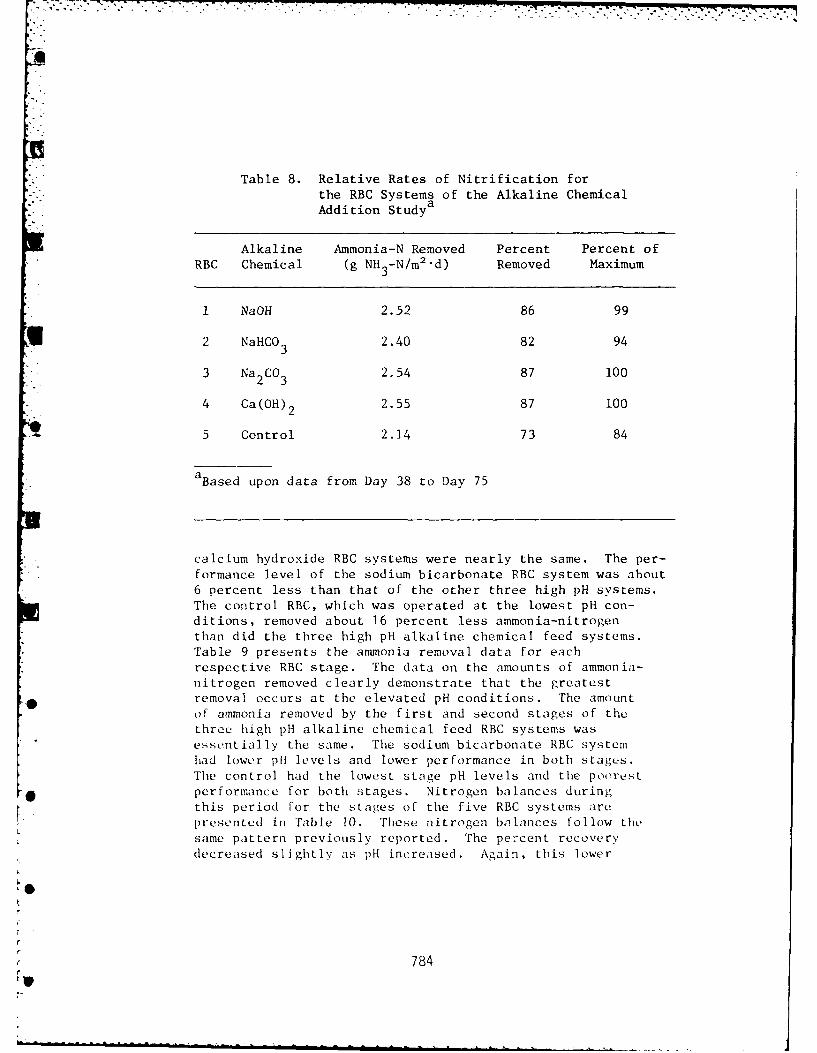
Table 8. Relative Rates of Nitrification forthe RBC Systems of the Alkaline Chemical
aAddition Study
Alkaline Ammonia-N Removed Percent Percent ofRBC Chemical (g NH 3-N/M 2 -d) Removed Maximum
I NaOH 2.52 86 99
2 NaHCO 3 2.40 82 94
3 Na2CO3 2.54 87 100
4 Ca(OH)2 2.55 87 100
5 Control 2.14 73 84
aBased upon data from Day 38 to Day 75
calcium hydroxide RBC systems were nearly the same. The per-formance level of the sodium bicarbonate RBC system was about
6 percent less than that of the other three high pH systems.The control RBC, which was operated at the lowest pH con-ditions, removed about 16 percent less ammonia-nitrogen
than did the three high pH alkaline chemical feed systems.Table 9 presents the ammonia removal data for each
respective RBC stage. The data on the amounts of ammonia-nitrogen removed clearly demonstrate that the greatestremoval occurs at the elevated pH conditions. The amountof ammonia removed by the first and second stages of thethree high pH alkaline chemical feed RBC systems wasessentially the same. The sodium bicarbonate RBC systemhad lower pH levels and lower performance in both stages.The control had the lowest stage pH levels and the poorest
* performance for both stages. Nitrogen balances duringthis period for the stages of the five RBC systems arepresented in Table 10. These nitrogen bz.lances follow the
I L same pattern previously reported. The percent recoverydecreased slightly as pH increased. Again, this lower
784
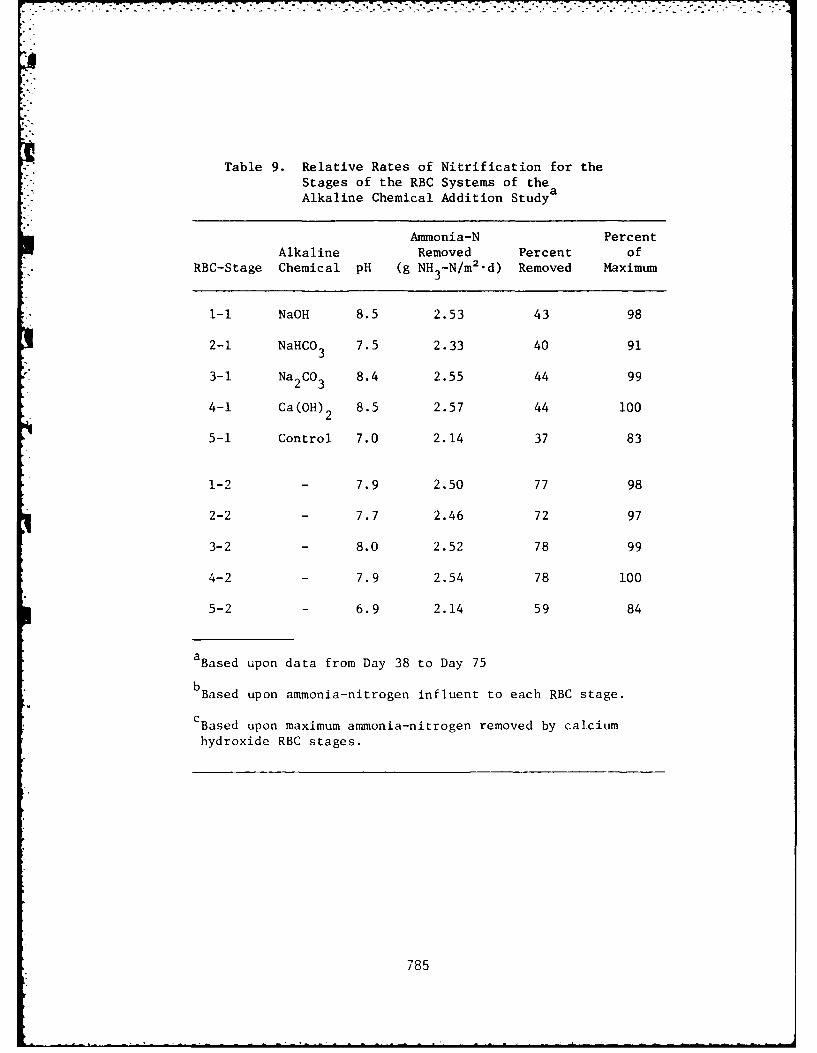
Table 9. Relative Rates of Nitrification for theStages of the RBC Systems of theAlkaline Chemical Addition Studya
Ammonia-N PercentAlkaline Removed Percent of
RBC-Stage Chemical pH (g NH3 -N/m2 .d) Removed Maximum
1-1 NaOH 8.5 2.53 43 98
2-1 NaHCO 3 7.5 2.33 40 91
3-1 Na2CO3 8.4 2.55 44 99
4-1 Ca(OH)2 8.5 2.57 44 100
5-1 Control 7.0 2.14 37 83
1-2 - 7.9 2.50 77 98
2-2 - 7.7 2.46 72 97
3-2 - 8.0 2.52 78 99
4-2 - 7.9 2.54 78 100
5-2 - 6.9 2.14 59 84
aBased upon data from Day 38 to Day 75
bBased upon ammonia-nitrogen influent to each RBC stage.
CBased upon maximum ammonia-nitrogen removed by calcium
hydroxide RBC stages.
785
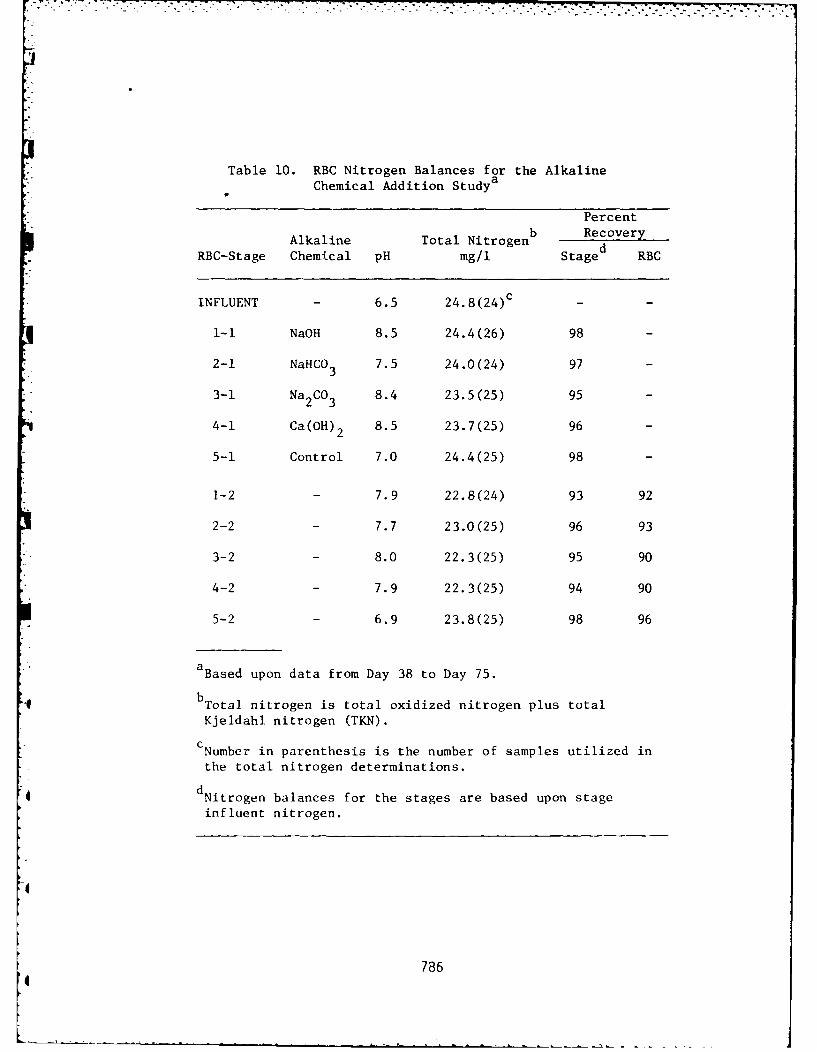
Table 10. RBC Nitrogen Balances for the Alkalinef" aChemical Addition Study
Percent
Alkaline Total Nitrogenb Recovery
RBC-Stage Chemical pH mg/l Staged RBC
INFLUENT - 6.5 2 4 .8 (2 4 )c - -
1-1 NaOH 8.5 24.4(26) 98 -
2-1 NaHCO 3 7.5 24.0(24) 97 -b3
3-1 Na 2CO 3 8.4 23.5(25) 95 -
4-1 Ca(OH)2 8.5 23.7(25) 96 -
5-1 Control 7.0 24.4(25) 98 -
1-2 - 7.9 22.8(24) 93 92
2-2 - 7.7 23.0(25) 96 93
3-2 - 8.0 22.3(25) 95 90
4-2 - 7.9 22.3(25) 94 90
5-2 - 6.9 23.8(25) 98 96
a Based upon data from Day 38 to Day 75.
bTotal nitrogen is total oxidized nitrogen plus total
Kjeldahl nitrogen (TKN).
c Number in parenthesis is the number of samples utilized in
the total nitrogen determinations.
dNitrogen balances for the stages are based upon stageinfluent nitrogen.
786
a
recovery is attributed to small ammonia losses due toammonia stripping and denitrification within the thickerbiofilms associated with the higher pH levels.
Biofilm which could be sensed by touch had developedon the discs of all stages within 36 hours. Within72 hours from startup, all first stage discs had developedbiofilms which were noticeably heavier than the secondstage biofilms. The characteristic tan color associatedwith nitrifying biofilms had developed by Day 4 andwas more apparent in the first stage biofilns. All of thebiofilms were very uniform in texture. This initialbiofilm growth appeared to be heavier than the biofilmsdeveloped during the previous research phases. By Day 6,the trough walls also had developed noticeable amounts ofbiofilm. Although both stage biofilms got heavier anddarker with time, the heavier and darker biofilms were onthe first stage discs. The first stage biofilms becamebrown while those on the second stage discs remained tanto bronze in color. By Day 16, discs in all the firststages had experienced some sloughing while those in thesecond stages retained their uniformity. The loss ofuniformity in the second stages commenced about Day 21. Astime progressed, the loss of biofilm uniformity was greatestfor the control and the sodium bicarbonate RBC systems. Thefirst stages of the calcium hydroxide, sodium carbonate,and the sodium hydroxide RBC systems had the heaviest andmost uniform biofilm coatings. The biofilm uniformityrelated directly to the ammonia removal performance levelsof the RBC systems. The loss of biofilm during the 75-dayperiod was attributed mainly to hydraulic shear startingon the surface of the biofilm and progressing inward.Biofilm sloughing from the bare disc outward did not occurcontinuously. The former method of sloughing appeared tobe associated with relatively low and steady CBOD loadings,while the latter form of sloughing appeared to be associatedwith relatively high and fluctuating CBOD loadings.
The data for the RBC biofilm concentrations, pe. itvolatile matter, and percent nitrogen are preserted in Table11. These data show that the highest biofilm concentrationswere associated with the higher pH levels. Only theaddition of calcium hydroxide resulted in an increase ininert matter entrained within both tie first and secondstage biofilms and a significant increase in effluent sus-pended solids. Sodium hydroxide, sodium carbonate, 1idsodium bicarbonate additions did not affect u hi jof ill i
787
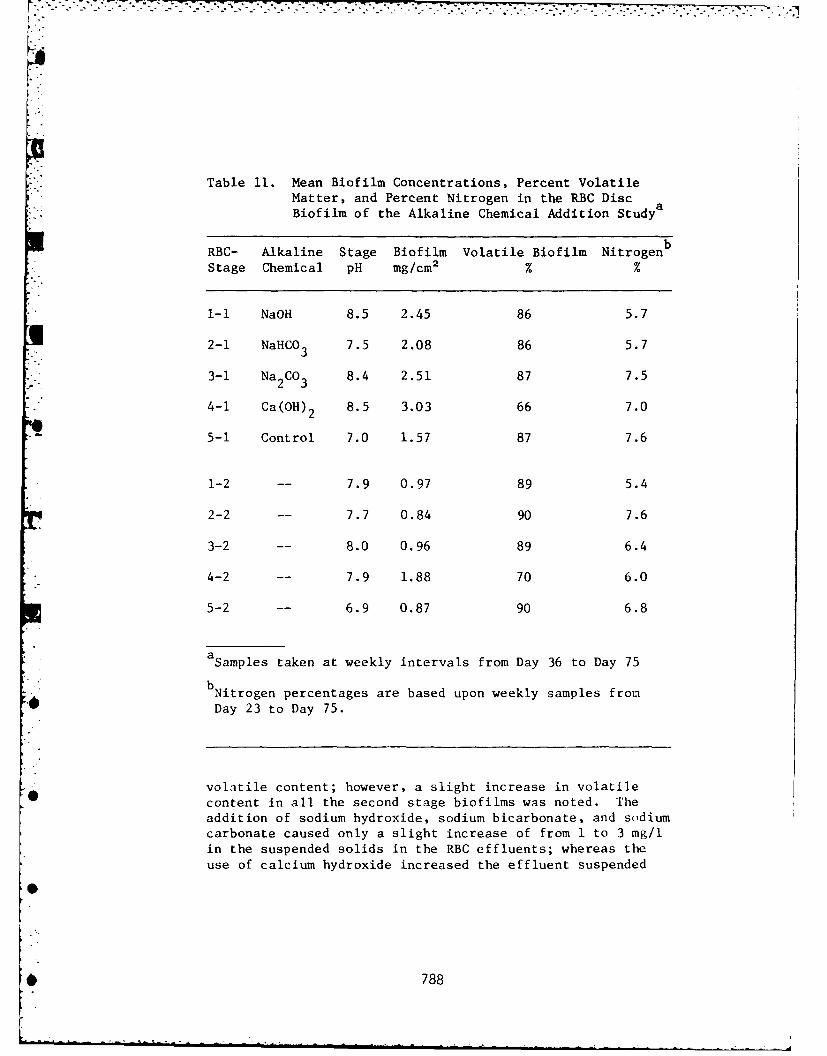
Table 11. Mean Biofilm Concentrations, Percent VolatileMatter, and Percent Nitrogen in the RBC DiscBiofilm of the Alkaline Chemical Addition Study
RBC- Alkaline Stage Biofilm Volatile Biofilm Nitrogenb
Stage Chemical pH mg/cm 2 % %
i-I NaOH 8.5 2.45 86 5.7
2-1 NaHCO 7.5 2.08 86 5.73
3-1 Na2 CO3 8.4 2.51 87 7.5
4-1 Ca(OH)2 8.5 3.03 66 7.0
- 5-1 Control 7.0 1.57 87 7.6
1-2 -- 7.9 0.97 89 5.4
2-2 -- 7.7 0.84 90 7.6
3-2 -- 8.0 0.96 89 6.4
4-2 -- 7.9 1.88 70 6.0
5-2 -- 6.9 0.87 90 6.8
asamples taken at weekly intervals from Day 36 to Day 75
bNitrogen percentages are based upon weekly samples from
Day 23 to Day 75.
volatile content; however, a slight increase in volatilecontent in all the second stage biofilms was noted. Theaddition of sodium hydroxide, sodium bicarbonate, and sodiumcarbonate caused only a slight increase of from 1 to 3 mg/lin the suspended solids in the RBC effluents; whereas theuse of calcium hydroxide increased the effluent suspended
* 788
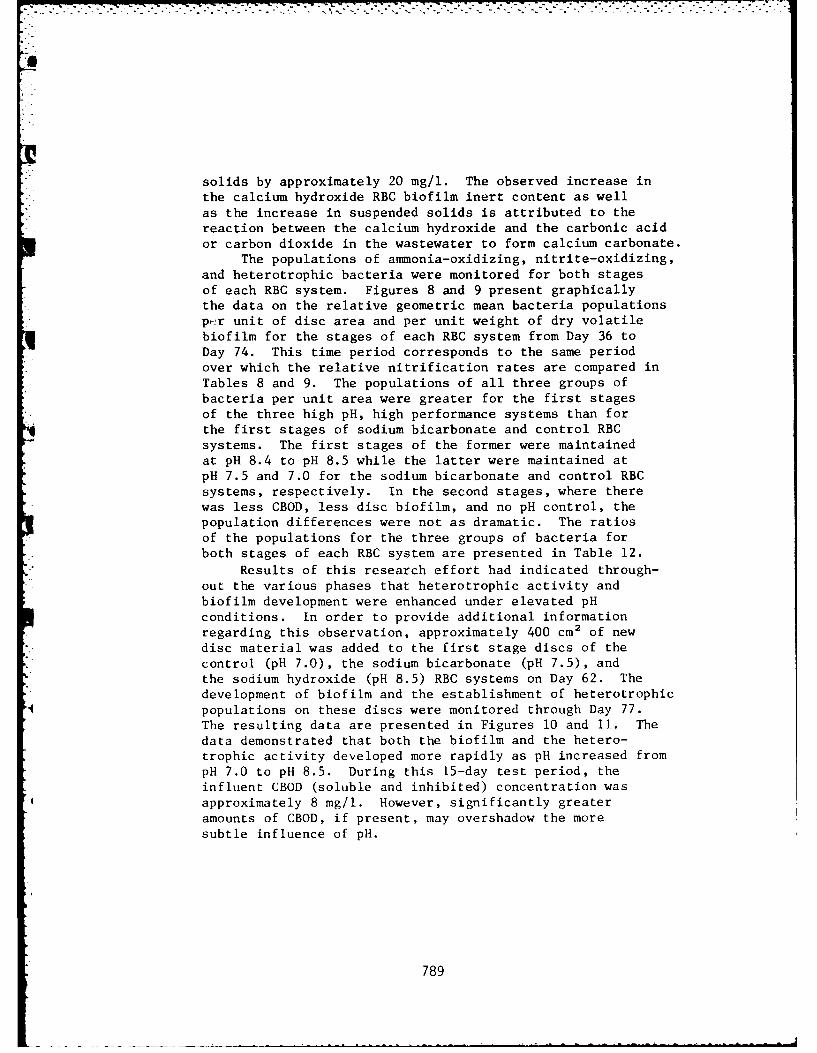
solids by approximately 20 mg/l. The observed increase inthe calcium hydroxide RBC biofilm inert content as wellas the increase in suspended solids is attributed to thereaction between the calcium hydroxide and the carbonic acidor carbon dioxide in the wastewater to form calcium carbonate.
The populations of ammonia-oxidizing, nitrite-oxidizing,
and heterotrophic bacteria were monitored for both stages
of each RBC system. Figures 8 and 9 present graphicallythe data on the relative geometric mean bacteria populationspsr unit of disc area and per unit weight of dry volatile
biofilm for the stages of each RBC system from Day 36 toDay 74. This time period corresponds to the same periodover which the relative nitrification rates are compared in
Tables 8 and 9. The populations of all three groups ofbacteria per unit area were greater for the first stages
of the three high pH, high performance systems than forthe first stages of sodium bicarbonate and control RBC
systems. The first stages of the former were maintainedat pH 8.4 to pH 8.5 while the latter were maintained atpH 7.5 and 7.0 for the sodium bicarbonate and control RBCsystems, respectively. In the second stages, where therewas less CBOD, less disc biofilm, and no pH control, the
population differences were not as dramatic. The ratiosof the populations for the three groups of bacteria for
both stages of each RBC system are presented in Table 12.
Results of this research effort had indicated through-out the various phases that heterotrophic activity and
biofilm development were enhanced under elevated pHconditions. In order to provide additional informationregarding this observation, approximately 400 cm2 of new
disc material was added to the first stage discs of the
control (pH 7.0), the sodium bicarbonate (pH 7.5), andthe sodium hydroxide (pH 8.5) RBC systems on Day 62. Thedevelopment of biofilm and the establishment of heterotrophic
4 populations on these discs were monitored through Day 77.
The resulting data are presented in Figures 10 and 11. Thedata demonstrated that both the biofilm and the hetero-trophic activity developed more rapidly as pH increased frompH 7.0 to pH 8.5. During this 15-day test period, theinfluent CBOD (soluble and inhibited) concentration wasapproximately 8 mg/l. However, significantly greater
amounts of CBOD, if present, may overshadow the more
subtle influence of pH.
789
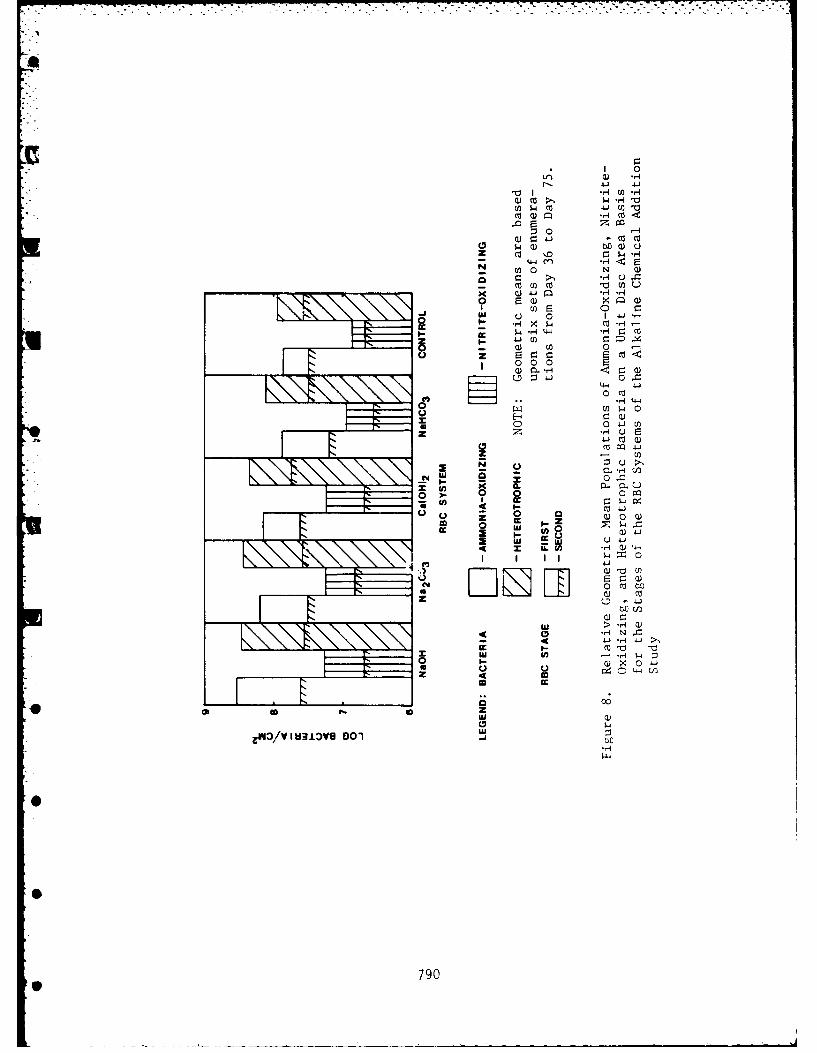
1 0
Q)~ cz W di'cz 41 E
c0Wo
0 $.0 bOW(JZ 0
o ) 0w 4- ccoo e
x ) 1C:)
1 0
z r=r:c
00
z (z .ri
z. (n2
u :>,J
EA 0
rz4 Ux
0 0 0
001
0
790 U
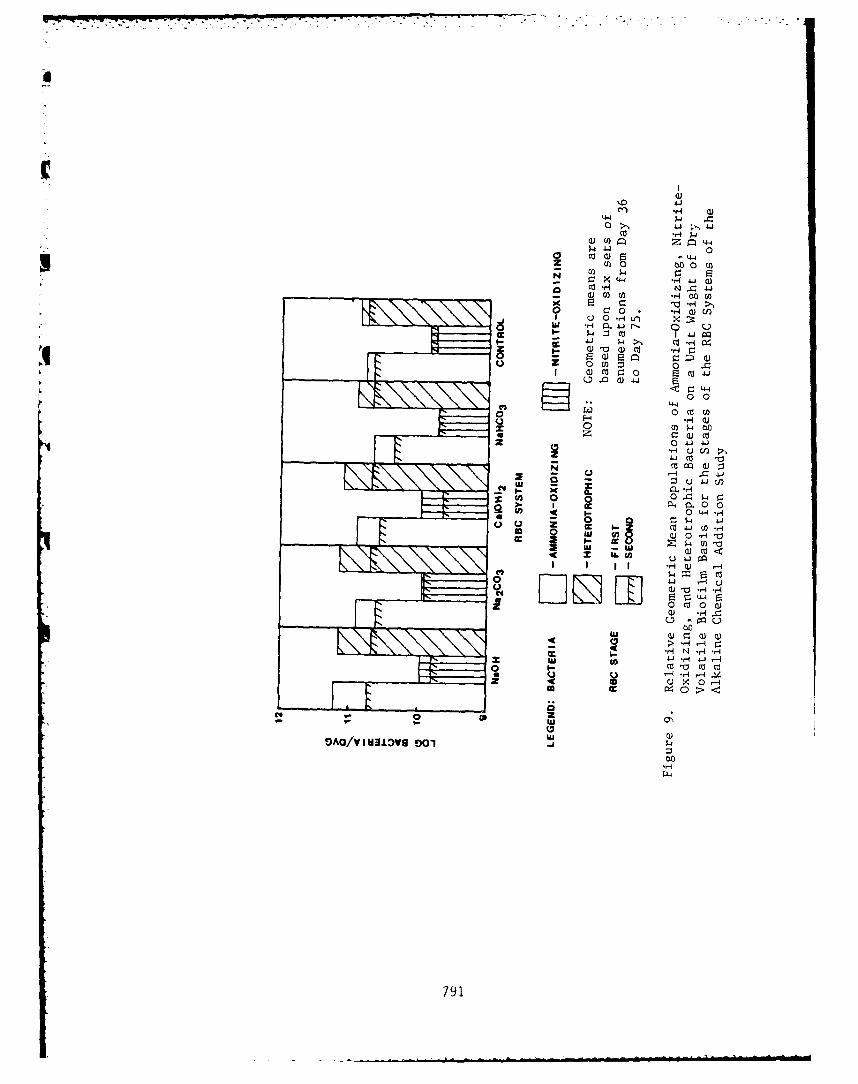
4-4J
..- 4-
0ca a) LW
ca r=4~
(v 0 ()cC: 0 Q0 ~ . Lr) x~
I.- 4-J $l 4 C
ca P: 0CU 4
0 0** 4-4
0
U V)
0-u 1 UJ)
I cP CL ~0 .0
cc 'l 0 H
u 41
F-10 M OJF-d0 -~ Z 0 w~
0 "a uzc
UlVAC*/ I U13H 00
791~0Q
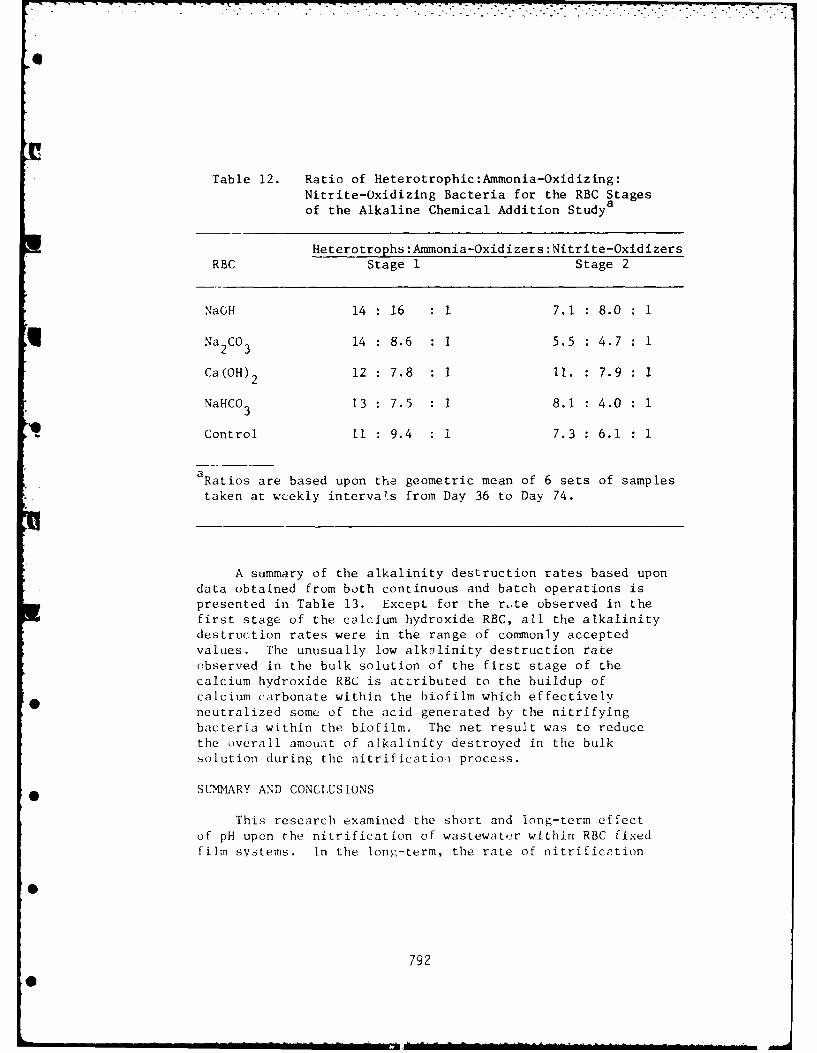
Table 12. Ratio of Heterotrophic:Ammonia-Oxidizing:Nitrite-Oxidizing Bacteria for the RBC Stages
of the Alkaline Chemical Addition Studya
Heterotrophs :Ammonia-Oxidizers :Nitrite-OxidizersRBC Stage 1 Stage 2
NaGH 14 16 1 7.1 8.0 1
Na CO 14 8.6 1 5.5 4.7 1*2 3
Ca(OH) 2 12 : 7.8 : 1 11. 7.9 1
NaHCO3 13 : 7.5 : 1 8.1 4.0 1
- Control 11 : 9.4 . 1 7.3 6.1 1
aRatios are based upon the geometric mean of 6 sets of samplestaken at weekly intervals from Day 36 to Day 74.
A summary of the alkalinity destruction rates based upondata obtained from both continuous and batch operations ispresented in Table 13. Except for the r,,te observed in thefirst stage of the calcium hydroxide RBC, all the alkalinitydestruction rates were in the range of commonly accepted
values. The unusually low alk-linity destruction race
observed in the bulk solution of the first stage of thecalcium hydroxide RBC is atLributed to the buildup ofcalcium carbonate within the biofilm which effectivelyneutralized some of the acid generated by the nitrifyingbacteria within the biofilm. The net result was to reducethe overall amount of alkalinity destroyed in the bulksolution during the nitrificatio-a process.
hSUMMARY AND CONCLUSIONS
This research examined the short and long-term effectof pH upon the nitrification of wastewater within RBC fixedfilm svstems. In the long-term, the rate of nitrificition
792
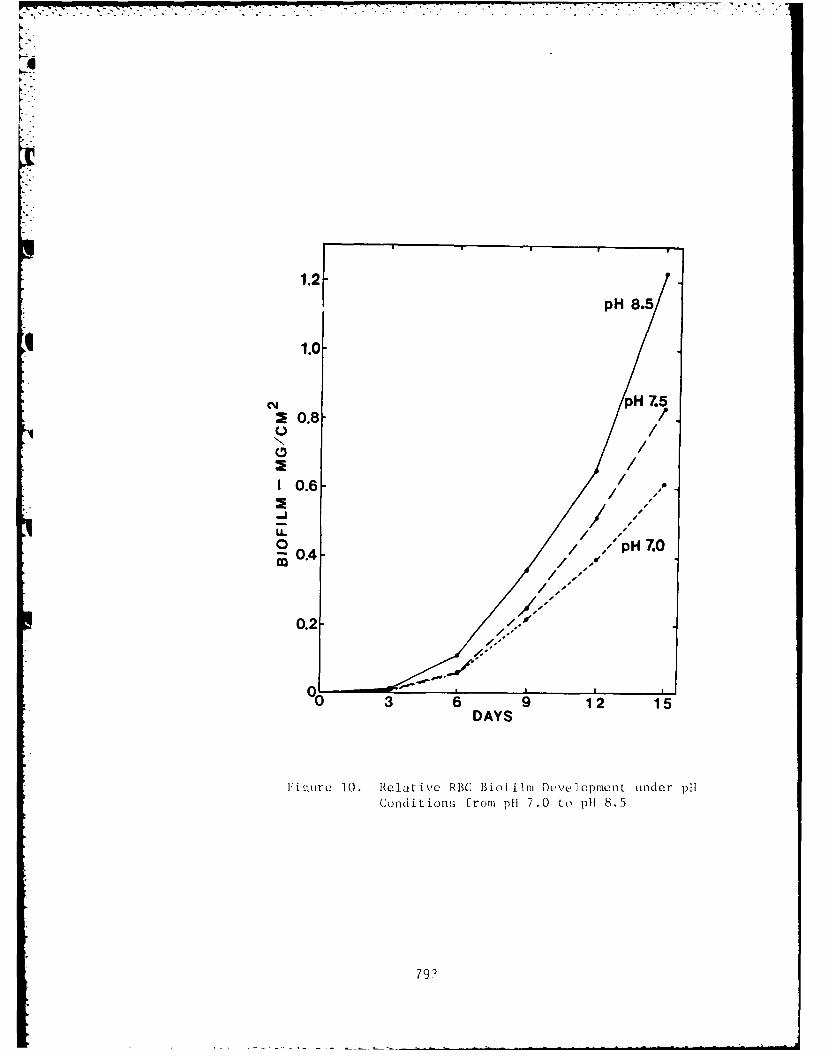
1.2
1pH 8.5
1.0
0PH 7.5O0.8C)/
N /
/i0.6 7
o/ ," p 7.0
0.4 / , H7.
/ sS
/.
0.2/,•
03 6 9 12 15DAYS
IEi ';ure T0. Relative RBC Bio Film Dtx elopment under p11
Condit ions From p11 7.0 to p11 8.5
79?
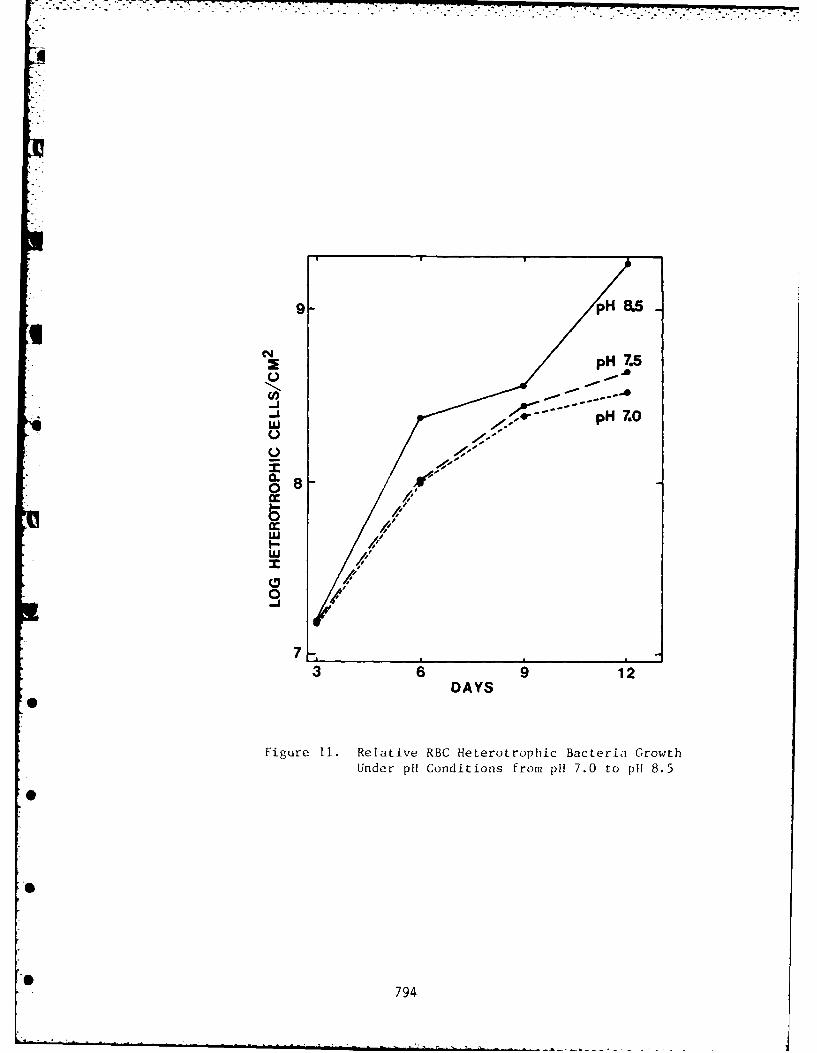
9- pH 8.5
C)
a pH 7.0
e.'0.
p
0
7
! -wp
/i
3 6 9 12DAYS
Figure 11. Relative RBC Heterotrophic Bacteria GrowthUnder pH Conditions from pli 7.0 to pH 8.5
794
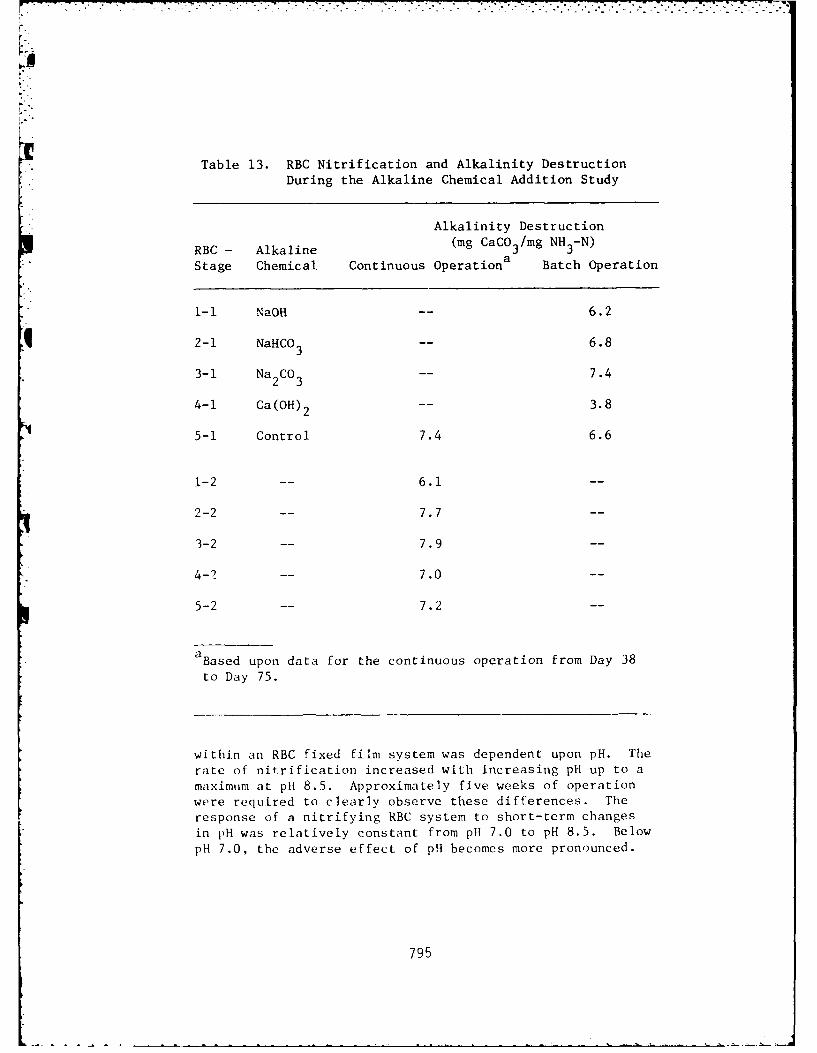
Table 13. RBC Nitrification and Alkalinity Destruction
During the Alkaline Chemical Addition Study
Alkalinity Destruction
RBC - Alkaline (mg CaCO3 /mg NH3 -N)
Stage Chemical Continuous Operation a Batch Operation
1-1 NaOH 6.2
2-1 NaHCO 3 6.8
3-1 Na 2CO 3 7.4
4-1 Ca(OH)2 -- 3.8
5-1 Control 7.4 6.6
1-2 -- 6.1
2-2 -- 7.7
3-2 -- 7.9
4-2 -- 7.0
5-2 -- 7.2
a Based upon data for the continuous operation from Day 38
to Day 75.
within an RBC fixed film system was dependent upon pH. The
rate of nitrification increased with increasing pH up to a
maximum at p11 8.5. Approximately five weeks of operationwere required to clearly observe these differences. The
response of a nitrifying RBC system to short-term changes
in pH was relatively constant from pH 7.0 to pH 8.5. Below
pH 7.0, the adverse effect of pH becomes more pronounced.
795
.. .-. - . - -. . > >5 1
-A
However, the absolute level of nitrification was dictatedby the biofilm's previous history of nitrificationperformance. RBC systems continued to nitrify at arelatively high rate after the pH had been reduced suddenly.The nitrogen balances for the various research phases re-vealed that the relative amount of nitrogen recovered for
each RBC system generally was slightly less for the higherpH systems. This result was attributed to low level ammoniastripping as well as the loss of nitrate due to denitrifica-
tion within the biofilm.There was no significant difference in the performance
of the 2-stage nitrifying RBC systems which received calciumhydroxide, sodium carbonate and sodium hydroxide..) Theperformance levels of the sodium bicarbonate and ,the controlRBC systems were 6 and 16 percent less, respectively, thanthose of the other three systems. The use of alkalinechemicals to maintain approximately pH 8.5 in the firststage of a 2-stage nitrifying RBC resulted in the removalof approximately 19 percent more ammonia than in the controlRBC system. Except for the first stage of the RBC receivingcalcium hydroxide for pH adjustment, the range of alkalinitydestruction for all RBC systems in the alkaline chemicaladdition study was from 6.2 to 7.9 mg CaCO 3 /mg NH3 -N. Thisresult was attributed to a neutralization capacity whichdeveloped within the RBC biofilm due to the entrainment ofCaCO3. The production of significant amounts of inertmaterial and suspended solids when calcium hydroxide is used,favors the use of sodium carbonate and sodium hydroxide whenthe nitrification is not followed by secondary clarification.
Higher levels of nitrification for the RBC systems were
associated with greater disc biofilm uniformity. In allcases, except for the pH 8.8 RBC of the high pH study,the higher pH RBC systems maintained greater concentrationsof volatile biofilm per unit of RBC disc area. -The loss
* of biofilm from the RBC disc surface did not follow the
traditionally accepted sloughing pattern. Biofilm did notslough from the disc surface outward. The dominant
pattern of biofilm loss was from the biofilm surface inward.This loss was due to hydraulic shear at the biofilm surface.The RBC disc biofilm characteristics changed with time. The
*initial biofilm was uniform in texture and tan to bronze incolor. The biofilm went through an aging process whereinthe biofilm became darker and the texture became lessuniform; the lower the pH, the less uniform the biofilm.The disc biofilm was affected greatly by low level changes
* 796
in CBOD. The maximum rates of nitrification for individualRBC stages were not associated with the maximum biofilm
concentrations on the discs. Disc binfilm continued todevelop after the individual RBC stages achieved theirmaximum rate of nitrification. The elevated pH RBC biofilms,which had enhanced nitrification capacities, had highernitrifying bacterial populations than the lower pH RBCbiofilms. The ammonia-oxidizing bacteria generally werefavored over the nitrite-oxidizing bacteria with respect toincreasing pH. Greater heterotrophic growth and morerapid biofilm development was observed to occur at elevatedpH levels.
ACKNOWLEDGEMENT
This research was supported by the U. S. Army MedicalResearch and Development Command under Contract No. DAMDI7-79-C-9110.
797
LITERATURE CITED
1. Borchardt, J. A., et al., Nitrification of SecondaryMunicipal Waste Effluents by Rotating Bio-Discs, USEPAGrant No. R803407, Cincinnati, Ohio, 1978.
2. Hewitt, T., Nitrification of a Secondary MunicipalEffluent Using a Rotating Biological Contactor, ResearchPublication No. 71, Ontario Ministry of the Environment,
1978.3. Miller, Roy D., et al, Rotating Biological Contactor
Process for Secondary Treatment and Nitrification
Following a Trickling Filter, Technical Report 7805,
U.S. Army Medical Bioengineering Research and Develop-ment Laboratory, 1979.
4. O'Shaughnessy, James C. and Blanc, Frederic C., Bio-
logical Nitrification and Denitrification Using Rotating
Biological Contactors, Publication No. 97, Water ResourcesResearch Center, University of Massachusetts, Amherst,
1978.5. Hynek, Robert J. and lemura, Hiroshi, "Nitrogen and
Phosphorus Removal with Rotating Biological Contactors,"Proceedings: First National Symposium/Workshop on
Rotating Biological Contactor Technology, Champion,
PA, 1980, pp. 295-324.6. Crawford, Paul M., "Use of Rotating Biological Contactors
for Nitrification at the City of Guelph Water PollutionControl Plant, Guelph, Ontario, Canada," Proceedings:First National Symposium/Workshop on Rotating BiologicalContactor Technology, Champion, PA, 1980, pp. 1247-1274.
7. Hitdlebaugh, J. A. and Miller, R. D., 'Full-Scale Rotat-ing Biological Contactor for Secondary Treatment and
Nitrification," Proceedings: First National Symposium/Workshop in Rotating Biological Contactor Technology,Champion, PA, 1980.
O 8. Painter, H. A., "Microbial Transformations of InorganicNitrogen," Proceedings: Conference on Nitrogen as aWastewater Pollutant, Copenhagen, Denmark, August, 1975.
9. Painter, H. A., "A Review of Literature on InorganicNitrogen Metabolism," Water Research, 4, 1970, pp. 393-
450.O 10. USEPA, Process Design Manual for Nitrogen Control, 1975.
11. Watson, Stanley R., "Part 12 - Gram-Negative Chemo-
lithotrophic Bacteria," Bergy's Manual of Determinative
Bacteriology, 8th Edition, 1974, pp. 450-456.
7
D 798
K,- .:. ..
12. Delwiche, C. C. and Finstein, M. S., "Carbon andEnergy Sources for the Nitrifying Autotrophic Nitrobacter,"Jour. Bact., 90, 1965, pp. 102-107.
13. McGhee, Mary Frances, Fundamental Studies of the Nitri-fication Process, Ph.D. Thesis, Department of Civil Eng-ineering, University of Kansas, 1975.
14. Metcalf and Eddy Inc., Wastewater Engineering: Treatment,Disposal, Reuse, McGraw-Hill, New York, 1979.
15. Haug, Robert T. and McCarty, Perry L., "Nitrificationwith Submerged Filters," Jour. Water Poll. Control Fed.,44, 1972, p. 2086.
16. Huang, C. S. and Hopson, N. E., "Temperature and pHEffect on the Biological Nitrification Process," PaperPresented at N. Y. Water Poll. Control Ass'n WinterMeeting, N.Y. City, 1974.
17. Srna, Richard F. and Bagley, Anne, "Kinetic Responseof Perturbed Marine Nitrification Systems," Jour. WaterPoll. Control Fed. 47, 1975, p. 473.
18. Hutton, W. C. and LaRocca, S. A., "Biological Treatmentof Concentrated Ammonia Wastewaters," Jour. Water Poll.Control Fed., 47, 1975, p. 989.
19. Mulbarger, M. C., The Three Sludge System for Nitrogenand Phosphate Removal, Advanced Waste Treatment ResearchLaboratory, Office of Research and Monitoring, Environ-mental Protection Agency, 1972.
20. Wild, Harry E., et al., "Factors Affecting NitrificationKinetics," Jour. Water Poll. Control Fed. 43, 1971,p. 1845.
21. Loveless, J. E. and Painter, H. A., "The Influence ofMetal Ion Concentrations and pH Value on the Growth ofa Nitrosomonas Strain Isolated from Activated Sludge,"Jour. Gen. Microb., 52, 1968, pp. 1-14.
22. Downing, A. L. and Knowles, G., "Population Dynamics inBiological Treatment Plants," Advances in Water Pollu-tion Research: Proceedings of 3rd International Con-ference in Munich, Germany, Vol. 2, 1966.
23. Anderson, J. H., "Oxidation of Ammonia by Nitrosomonas,"Biochemical Jour., 95, 1965, pp. 688-698.
24. Anderson, J. H., "The Metabolism of Hydroxylamine toNitrite by Nitrosomonas," Biochemical Jour., 91, 1964,pp. 8-17.
25. Boon, B. and Laudelot, H., "Kinetics of Nitrite Oxida-tion by Nitrobacter Winogradski," J. Biochem., 85, 1962,pp. 440-447.
799
* -.- . . . . . . . . . . . r " " - - - ..-r-v .- - - -- --..,' . . o
-* 26. Engel, M. S. and Alexander, M., "Growth and AutotrophicMetabolism of Nitrosomonas Europaea," Jour. Bact.,76,1958, pp. 217-222.
27. Buswell, A. M., et al., "Laboratory Studies on theKinetics of the Growth of Nitrosomonas with Relation tothe Nitrification Phase of the BOD Test, Appl. Microb.,2, 1954, pp. 21-25.
28. Hoffman, T. and Lee, H., "The Biochemistry of theNitrifying Organisms, Part 4. The Respiration andIntermediary Metabolism of Nitrosomonas," Jour. of Bio-chem., 54, 1953, pp. 579-583.
29. Meyerhof, 0., "Untersuchungen uber den AtmungsvorganyNitrifizferenden Bakterien," Pflugers Archges Physiol.,166, 1917, pp. 240-280.
30. Olem, Harvey, Rotating-Disc Biological Oxidation ofFerrous Iron in Acid Mine Drainage Treatment, Ph.D.Thesis, Department of Civil Engineering, The PennsylvaniaState University, 1978.
31. LaMotta, E. J. and Hickey, R. F., "Factors AffectingAttachment and Development of Biological Films on SolidMedia," Proceedings: First National Symposium/Workshopon Rotating Biological Contactor Technology, Champion,PA, 1980, pp. 803-828.
32. Characklis, W. G. and Trulear, M. G., "Dynamics ofMicrobial Film Processes," Proceedings: First NationalSymposium/Workshop on Rotating Biological ContactorT'chnology, Champion, PA, 1980, pp. 365-408.
33. Hidman, James A., et al., Carbon, Nitrogen, and Phos-phlrus Removal in Staged Nitrification - DenitrificationTreatment, USEPA 670/2-75-052, 1975.
34. Lue-Ling, Cecil, et al., "Biological Nitrification ofSludge Supernatant by Rotating Discs," Jour. Water Poll.Control Fed., 48, 1976, pp. 25-39.
35. Hitdlebaugh, John A., Phase 1, Water Quality EngineeringSpecial Study No. 32-24-0116-79, Sewage Treatment PlantEvaluation, Summer Conditions, Fort Knox, Kentucky, 14-24August and 25-29 September, 1978, U.S. Army Envir.Hygiene Agency, 1979.
36. Alexander, Martin and Clark Francis E., "NitrifyingBacteria," Methods of Soil Analysis - Part 2, C. A. Clark
4 (ed.), Am. Soc. Agron., Madison, W1, 1965.37. LaBeda, David P. and Alexander, Martin, "Effects of
SO2 and NO, on Nitrification in Soil," Jour. Environ.Qual., 7, 978, pp. 523-526.
38. Rowe, R., et al., "Microtechnique for Most-Probable-Number Analysis," Appl. and Environ. Microb., 33, 1978,
800
pp. 625-680.39. Ghiorse, William C. and Alexander, Martin, "Nitrifying
Populations and the Destruction of Nitrogen Dioxidein Soil," Microb. Ecol., 4, 1978, pp. 233-240.
40. Taylor, C. B., "The Nutritional Requirements of thePredominate Bacterial Flora of Soil," Proc. Soc. Appl.Bact., 14, 1951, pp. 101-111.
41. Stratta, James M. and Long, David A., "NitrificationEnhancement Through pH Control with Rotating BiologicalContactors," Final Report, Institute for Research onLand and Water Resources, The Pennsylvania StateUniversity, 1981.
801
SIMULTANEOUS NITRIFICATION AND DENITRIFICATIONIN A ROTATING BIOLOGICAL CONTACTORt"
Sumio MASUDA, Yoshimasa WATANABE and Masayoshi ISHIGURO
Department of Civil Engineering, Miyazaki University,Miyazaki 880, Japan
I NTRODUCTION
In a Rotating Biological Contactor (RBC) process using afixed biological film, oxygen gas selAom penetrates into thedeepest part of the biofilm. Therefore, denitrifying bacteriausually exist in the anaerobic and inner portions within the
biofilm of the RBC process. Denitrifying bacteria existinjin the inner anaerobic portion within the biofilm utilizeorganic matter in the waste water as a source of organic car-bon. Nitrite or nitrate nitrogen produced within the aerobicbiofilm is partially converted to gaseous nitrogen (N2 or N20)by the denitrifying bacteria.
This phenomenon of simultaneous nitrification and denit-rification (referred to as SND) sometimes undoubtedly occursin the RBC nitrification process. The authors have already
observed and reported this phenomenon in RBC pilot plants aswell as in a proto-type HBC system(l,2,3). However, it hasnot yet been verified whether or not gaseous nitrogen is pro-duced in the biofilm. Therefore, the authors have carried outa series of experiments using a completely closed RBC unit toinvestigate SND. The experimental variables were ammonialoading, organic loading, ammonia concentration and mean resi-
802
i~~i <: . : "-Y < u % " '..'. ' ".'-" >L:. . . . ... - - "......" .... . -., . , .. . . ..
dence time. In this paper, the experimental results concern-ing SND in an RBC are presented and discussed.
MATERIALS AND METHODS
The experimental apparatus consisted of closed-type reac-tor and disks made of waterproof veneer boards. Fig.l showsthe single-stage RBC unit used in this experiment. The resi-dence time distribution of water in the reactor without a bio-film perfectly coincided with that of a single completely mix-ed-flow reactor. In order to develope nitrifying bacteria onthe disk surface, artificial waste water (Table.l) containingammonia and inorganic carbon was fed into the RBC unit. Watertemperature and pH were fixed at 30C and 8.0, respectively.When the nitrifying biofilm developed, the artificial wastewater containing methanol as a carbon source for the denitri-fying bacteria was added. After a week, the outer layer ofthe biofilm consisted of heterotrophic bacteria, and a bio-film consisting of the heterotrophic bacteria layer, a nitri-fying bacteria layer, and a denitrifying bacteria layer wasformed.
At this point, an experiment was started to measure theconcentration of inorganic nitrogen (N03-N, N02-N and NH3-N)in the effluent and the composition of the gas in the airphase. After one Run was completed, the heterotrophic bacte-ria layer was washed out by water jet. Then the same proce-dure was repeated by adding the artificial waste water,depending on the experimental co ditions shown in Table.2.The nitrogen removal rate due to simaltaneous nitrificationand denitrification includes nitrogen utilized for the cellsynthesis of all bacteria concerned in the reaction.
RESULTS AND DISCUSSION
Conposition of the Gas in the Air PhaseFig. 2(a), (b), (c) show the relationship between the
amount of gas in the air phase and the elapsed time after thevent holes were closed. Fig. 2(a) shows the relationship bet-ween the reduction rate of oxygen gas in the air phase and theconcentration of ammonia in the bulk water. The reductionrate of oxygen gas was influenced by organic loading.
In Run 3-1, when the amount of oxygen in the air phasedecreased to 500cc, ammonia appeared in the effulent water.In this case, it is believed that the oxygen gas was not suf-ficiently supplied to the nitrifying bacterial film, because
803
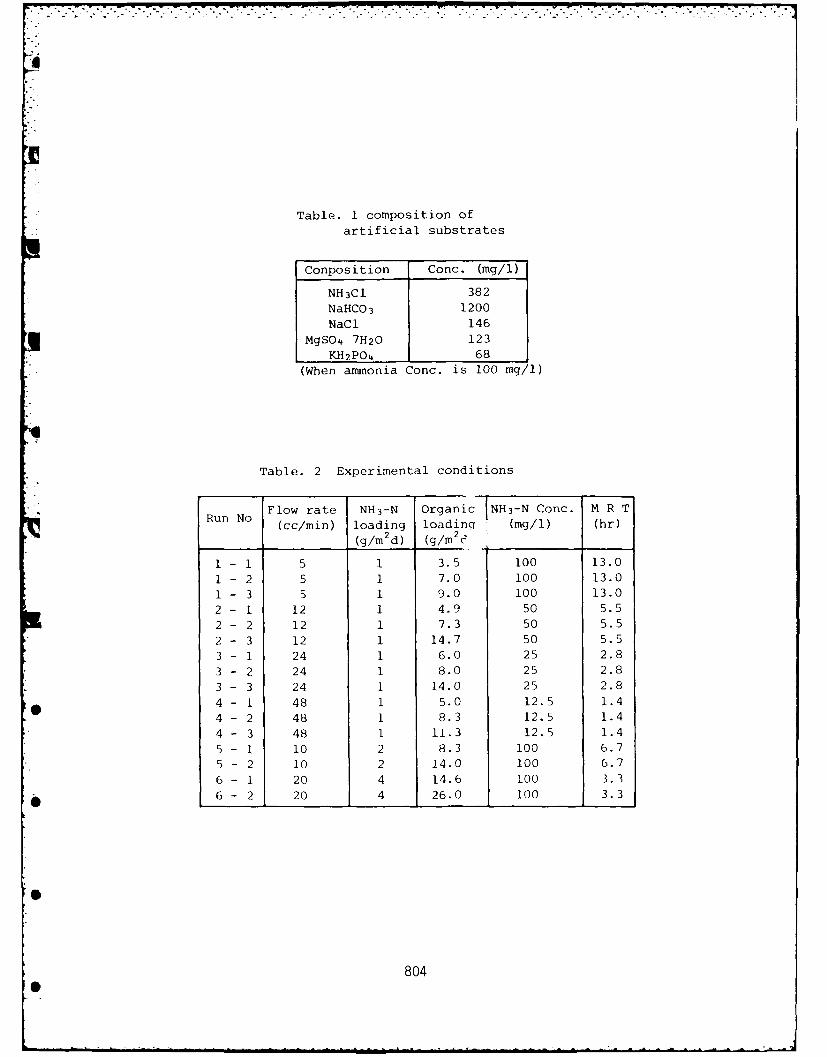
Table. 1 composition of
artificial substrates
Cnpammonia Conc. (mg/l)
NH3CI 382NaHC1 3 1200NaCI 146
MgS1 2 7H20 123KH2PO4 68
(When ammonia Conc. is 100 mg/l)
Table. 2 Experimental conditions
Ru No Flow rate NH3-N organic INH3-N Conc. M R T ]
(cc/min) loading loadinq (mg/l) (hr)(g/m2 d) (g/m2C
I - 1 5 1 3.5 100 13.0
1 - 2 5 1 7.0 100 13.0
1 - 3 5 1 9.0 100 13.0
2 - 1 12 1 4.9 50 5.5
2 - 2 12 1 7.3 50 5.5
2 - 3 12 1 14.7 50 5.5
3 - 1 24 1 6.0 25 2.8
3 - 2 24 1 8.0 25 2.8
3 - 3 24 1 14.0 25 2.8
4 - 1 48 1 5.0 12.5 1.4
4 - 2 48 1 8.3 12.5 1.4
4 - 3 48 1 11.3 12.5 1.4
5 - 1 10 2 8.3 100 6.7
5 - 2 10 2 14.0 100 6.7
6 - 1 20 4 14.6 100 3.3
* 6 - 2 20 4 26.0 100 3.3
804
S i mi i | a - - "
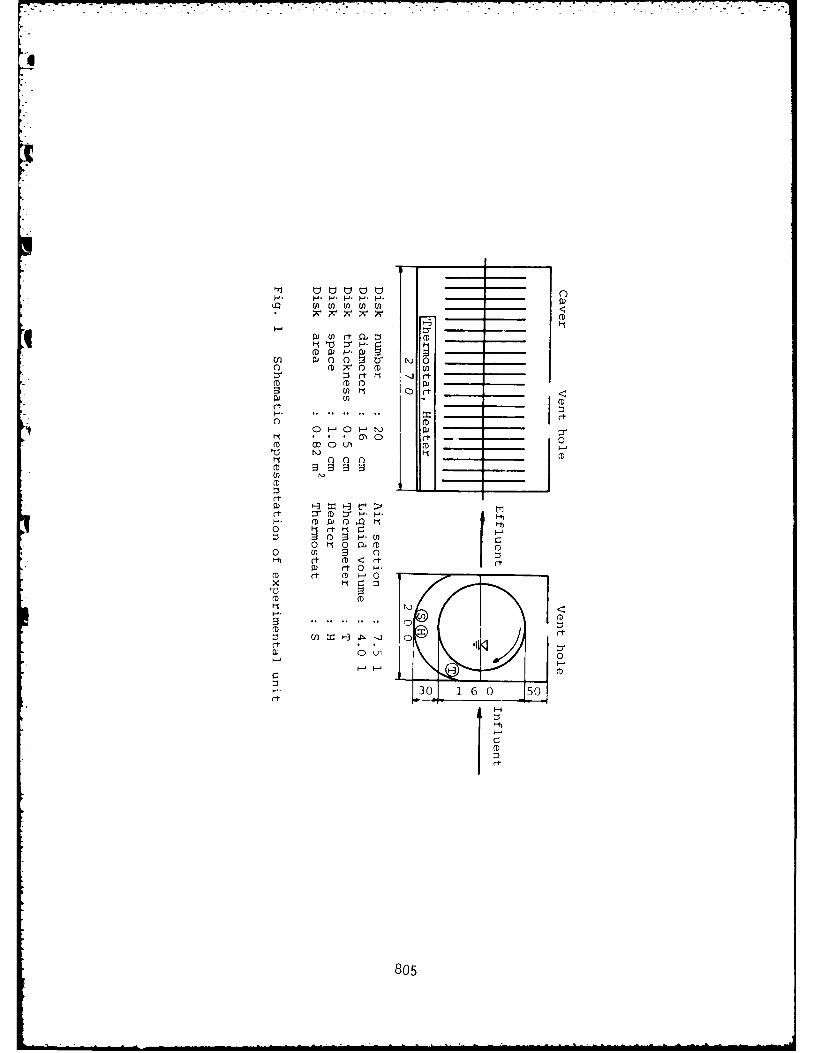
(DF-
0 m rt Q (DCD IV H. Pi
En w D0 0 5U r'0 (D PV(D D cn
(D (D(D p
xOct
10 NJ O-~' (D
(DD
(D
0t rC "-c
0 (ni 0 n~CCD rt -(D < tr
w1t ri , - 0~r
(D (DNJ <N
C(D
n cnZ-3 x.--j (1
30] 160 J50
805
D-RUG 377 PROCEEDINGS: INTERNTIONRL CONFERENCE ON FIXED-FILM- 3/7
BIOLOGICRL PROCESSES (..(U) PITTSBURGH UNIV PA DEPT OFU LR CIVIL ENGINEERING Y C WU ET RI. 1982 DACNOS-Si-R-885
UNCLASSIFIED F/0 03/2 N
Ji|~L.0
_.2.2
'1" I 11.02.0
Ill- 1.8
1111.25 11II111_L4 11.
MICROCOPY RESOLUTION TEST CHART
NATIONAL BUREAU OF STANDARS- 1963-0.
, .
k" I
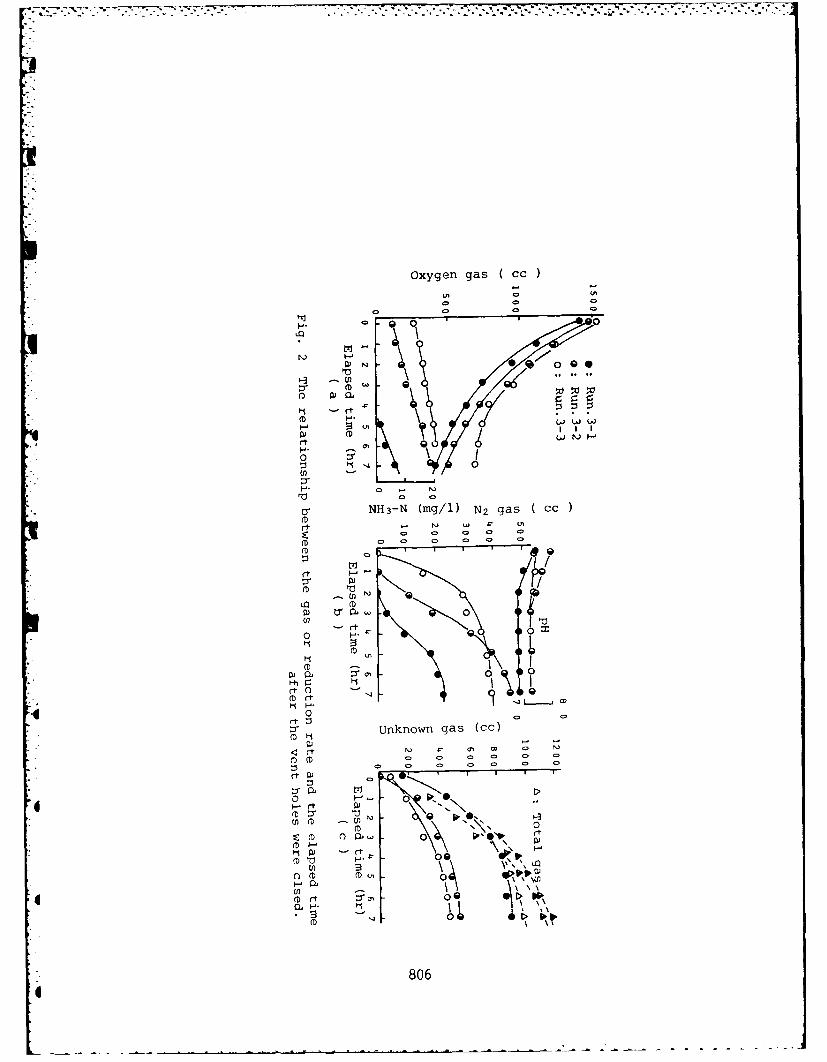
Oxygen gas ( cc
0. 0 0
a- 0
0,
(D 090a
e --
n0
(D
rt
0 I-
- C ,- 0 i
NH3unnow (gi) N2casc c
(D
::0 0 0
CD 0
(D r
00I
tzl
(D (D
0 i.l '-Ft 0" ' u
00r-O 0 0
(D
(D0 0 0 0, P.
~806
('
*- - - - - -2 ~ -*- -
of the reduction in the partial pressure of oxygen. As theorganic loading increased in Runs 3-2 and.3-3, the oxygen fedto nitrification was not considered to be enough even when thevent holes were opened. Fig. 2(b) shows the relationship bet-ween the cumulative amount of nitrogen gas and elapsed time.
Fig. 2(c) shows the relationship between elapsed time andthe cumulative amount of unknown gas, which could be nitrousoxide (N20). The cumulative amounts of the total gas (sum ofnitrogen and unknown gas) were almost equal, but the composi-tion of the gas was different in each Run. R.N.Dawson andK.L.Marphy (4) argued that elemental nitrogen was the endproduct of denitrification above a pH of 7.3, while below apH of 7.3 nitrous oxide production increases. As pH was lessthan 7.0 in Run 3-1, it seems that the predominant gas wasnitrous oxide.
Changes in the Water QualityFig. 3(a), (b), (c) show the relationship between inorga-
nic nitrogens and elapsed time. Fig 3(a) shows the changesin the water quality at an ammonia loadings of 1 g/m2d and anorganic loading of 3.5 g/m2 d. The concentration of nitratedecreased with the elapsed time. On the other hand, the rateof simultaneous nitrification and denitrification increasedwith the elapsed time. It seems oxygen fed into the biofilmfor nitrification became insufficient to accomplish completenitrification. The relationship between the partial pressureof oxygen in the air phase and the nitrogen removal rate dueto SND under the same conditions is shown in Fig. 4(a).
Fig. 3(b) shows the relationship at an ammonia loading of2 g/m2d and an organic loading of 8.3 g/m2d. The concent-ration of ammonia in the bulk water increased linearly withthe elapsed time. Before the experiment began (i.e., duringthe time the vent holes were open), The partial pressure ofoxygen in the gas phase was 21%. Enough oxygen gas was supp-lied to the biofilm to accomplish complete nitrification. Astime elapsed, the nitrogen removal rate decreased, becausethere was a shortage of oxygen in the biofilm for nitrifi-cation.
Fig. 3(c) shows the same relationship at an ammonia load-ing of 4.0 g/m2d and an organic loading of 14.6 g/m2d. Thebulk ammonia concentration increased with the elapsed time,because the bioflIm for organic oxidation became thicker com-pered with that shown in Fig. 3(b). When the MRT was longenough (i.e. 13 hr) and the concentrations of ammonia andorganic matter were low, the nitrogen removal due to SND in-
807
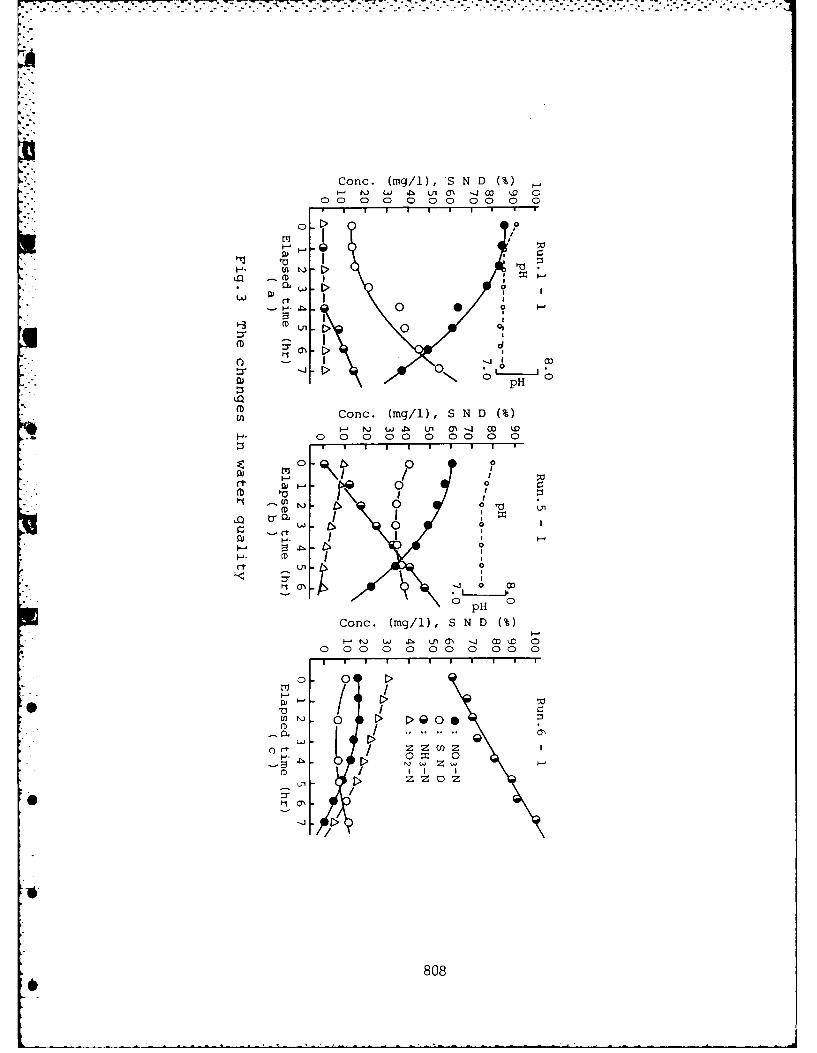
I." ------- ----
Conc. (mg/i), S N D(%I-c' Ln (n UO -4Wc kD 0
00 0 0 0 0 0 00 0 0
0 0
t
:3'I
0L 0
- HpH
Coc (mDU,) S '
HD- 0 000
rt , 0d
En tQ00
rt t.
(D 0(D 0n 0~O u
'- t 0 0
J-.J
0pH 0
Conc. (mg/i), S N D M%Ct4i w L n M U -,j 00 C 0
0 0 0 0 0 00 0 00 0
IT.
En rr >Ort z d om~ 0
z-M in, ~ ~
808
F-
creased with the elapsed time. On the other hand, when theconcentrations of ammonia and organic matter were high andthe MRT was rather short, no change could be seen in the nit-rogen removal rate due to SND. The removal rate of nitrogendue to SND depended upon ammonia loading, organic loading,MRT, and the pressure of oxygen in the gas phase.
The Relationship Between a Partial Pressure of Oxygen and SNDFig. 4 shows the relationship between a partial pressure
of oxygen in the gas phase and the nitrgen removal rate dueto SND. The experimental results shown in Fig. 4 can bequalitatively explained by the biofilm models shown in Fig. 5.The biofilm consists of a heterotrophic bacteria film fororganic oxidation, an autotrophic bacteria film for nitrifi-cation, and an anaerobic bacteria film for denitrification.An aerobic biofilm can be considered to be much thicker thanthe biofilm for nitrification or organic oxidation.
In the case of the attached biofilm shown in Fig. 5(b),the biofilm for organic oxidation was so thick that both theorganic matter and DO were mostly consumed within it. Thenthe biofilm dominant for nitrification became very thin. Onthe other hand, in Fig. 5(c), the biofilm for organic oxida-tion was not so thick, therfore, DO penetrated more deeplyinto the biofilm for nitrification. Therefore, the biofilmfor nitrification became thicker than that in 5(b).
Fig. 5(c) shows the case in which the biofilm for organicoxidation slightly covered the biofilm for nitrification. Inthis case, DO completely penetrated into the biofilm for nit-rification. Fig. 4(a) shows the case in which bacteria fororganic oxidation slightly covered the biofilm for nitrifica-tion at an ammonia loading of 1 g/m2d and an organic loadingof 3.5 g/m2d. The nitrification rate was sharply reduced atthese loadings of ammonia and organics, when the partialpressure of oxygen in the air phase reached less than 10%.On the other hand, when the partial pressure of oxygen increa-sed to more than 10%, the nitrification rate became indepen-dent of the partial pressure. However, the nitrogen removalrate due to SND increased with the decrease in the partialpressure of oxygen in the air phase. This can be qualitai-tively explained by the biofilm model shown in Fig. 5(c). Asthe partial pressure of oxygen in the air phase decreased, apart of nitrification biofilm became anaerobic.
In the case of Fig. 4(b), at an ammonia loading of P g/m2
d and an organic loading of 8.3 g/m'd, the biofilm for nitri-fication became thicker than that in b(a). At these loadings
809
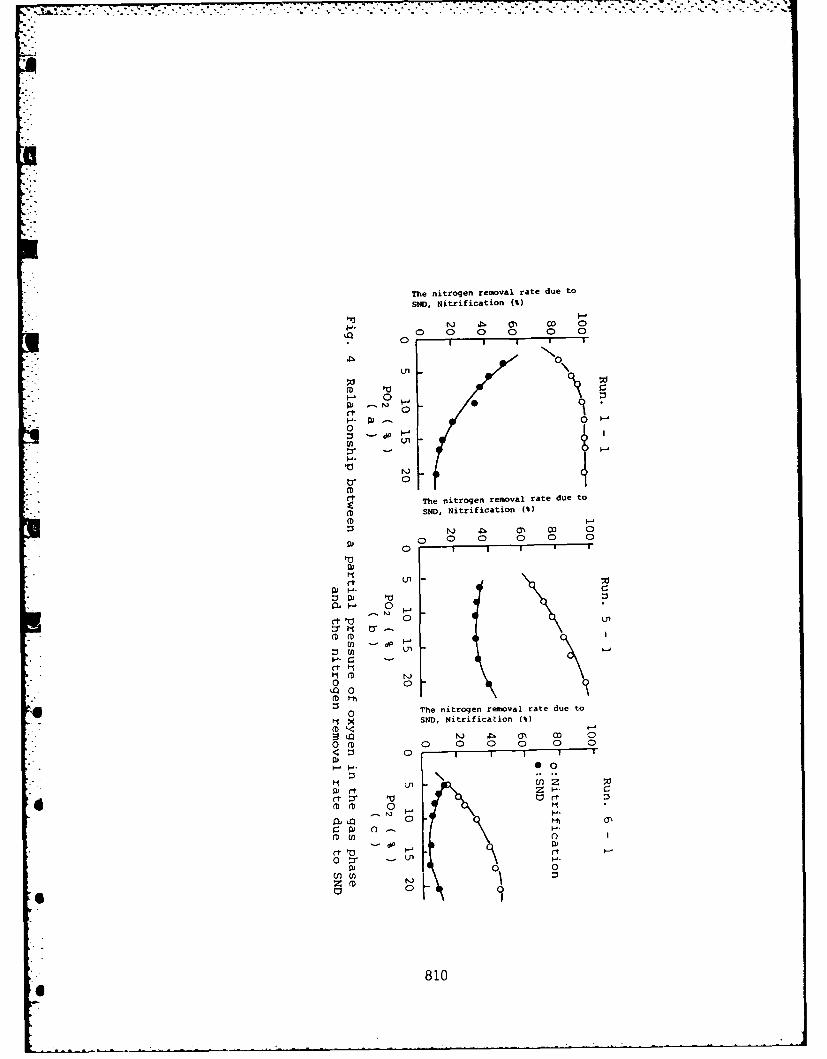
The nitrogen removal rate due to
SND, Nitrification C')
f" Ab 0 0 0 D 00 ! , I , '
H-- S N, N itrfi ao (%}
a0 0 0 0 0 0
- 0I I I K
0
.'
00:3 'dP HIn U,
t'
*0
(D
The nitrogen removal rate due to
MD SkID, Nitrification (%)
tQ Pi. Cr" 00
. Om0 0 0 0 0 0
0 I I I *
VI~
01, 0
rt 810
(1) ~dP L
rt'
o 0
0 The nitrogen removal rate due to
IQ D. O' CO0 (D 0 0 0 0 0 0
0z
I=H 00
r1' '0 Or
4z (D
0810
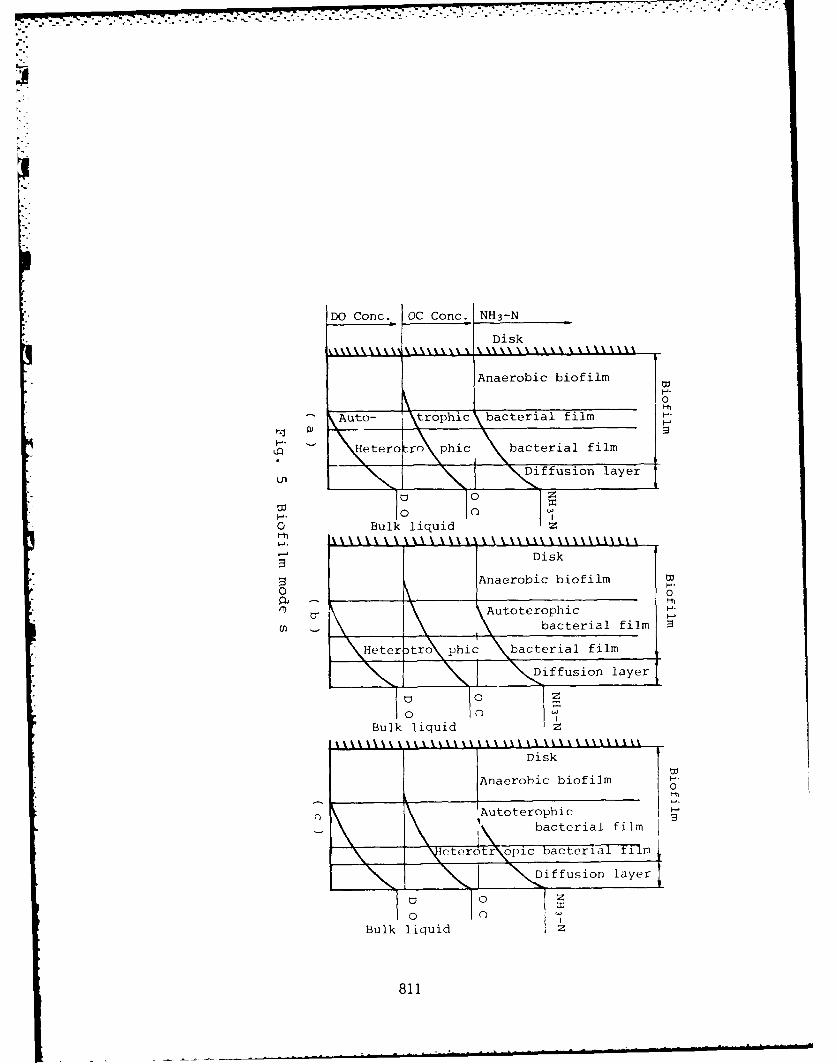
DO Conc. OC Conc. NH3 -N
Disk
Anaerobic biofilm
0
Auto- trophic bacterial filmH
lietert phic bacterial film
LnDiffusion layer
0
0- n0 Bulk liquid
Disk
Anaerobic biofilm0 0_ _
AutoterophicEn bacterial film
\Heter tro\ phic bacterial film
\Diffusion layer
Disk
Anaerobic biofilm0)
Autoterophic fl
ieterotr opi1c FacteriaT 1m
NDiffusion layer
o Co
Bulk liquid
811
of ammonia and organic, the nitrification rate became 100%,when the pressure of oxygen in the air phase equaled 21%.The nitrification rate decreased sharply because the penetra-
tion depth of oxygen became shallower as the partial pressureof oxygen in the air phased decreased. This is explained bythe biofilm model shown in 5(b). The biofilm for organic ox-idation became thicker and the biofilm for nitrification be-came thinner compared with the biofilm shown in Fig. 5(a), sothat the penetration depth of oxygen became shallower thanthat in 5(a). The partial pressure of oxygen in the air phasedecreased, DO did not penetrate deeply into the biofilm fornitrification; and, therefore sufficient nitrification did notoccur.
Fig. 4(c) is the case at an ammonia loading of h.3 g/m2dand an organic loading of l.6 g/m2d. The biofilm attached tothe disks for organic oxidation became considerably thicker incomparison with 5(b) or (c), while the biofilm for nitrifica-tion became very thin. As a result, the nitrification rateequaled 40%, which was an extremly low value. This experimen-tal result can be explained by the biofilm model shown in Fig.5(a). Both organic carbon and DO were mostly consumed withinthe biofilm for organic oxidation, because the high concent-ration of organic carbon the biofilm for organic oxidation be-came quite thick. Therefore, the nitrogen removal rate due toSND also decreased, because of the amount of nitrate or nit-rite diffusing to the anaerobic bioflim decreased.
Fig. 6 shows one of the experimental results obtained inthe batch experiment using heterotrophic bacteria scraped fromthe outer biofilm layer. This shows that the amount of thenitrifying bacteria contained in the scraped biofilm can beneglected,i.e. only organic oxidation will occuer in theouter biofilm.
Fig. 7(Runs 1,2,3) shows the cases in which MRT and orga-nic loading were changed at a fixed ammonia loading of 1 g/m2d.Fig. 7(Run 1) shows the case in which two organic loadings of3.5 and 7.0 g/m2d were used in the experiment with a fixed in-fluent ammonia concentrationof 100 mg/l and MRT of 13 hrs.The nitrogen removal due to SND became 100%, when the ventholes were opened. It decreased with the elapsed time afterthe vent holes were closed. The nitrogen removal rate due toSND was sharply reduced, when the partial pressure of oxygenin the gas phase decreased to less thRn 10%. On the otherhand, in the condition in which the partial pressure of oxygenincreased to more than 10%, the nitrogen removal rate due toSND became independent of the partial pressure of oxygen.
6 812
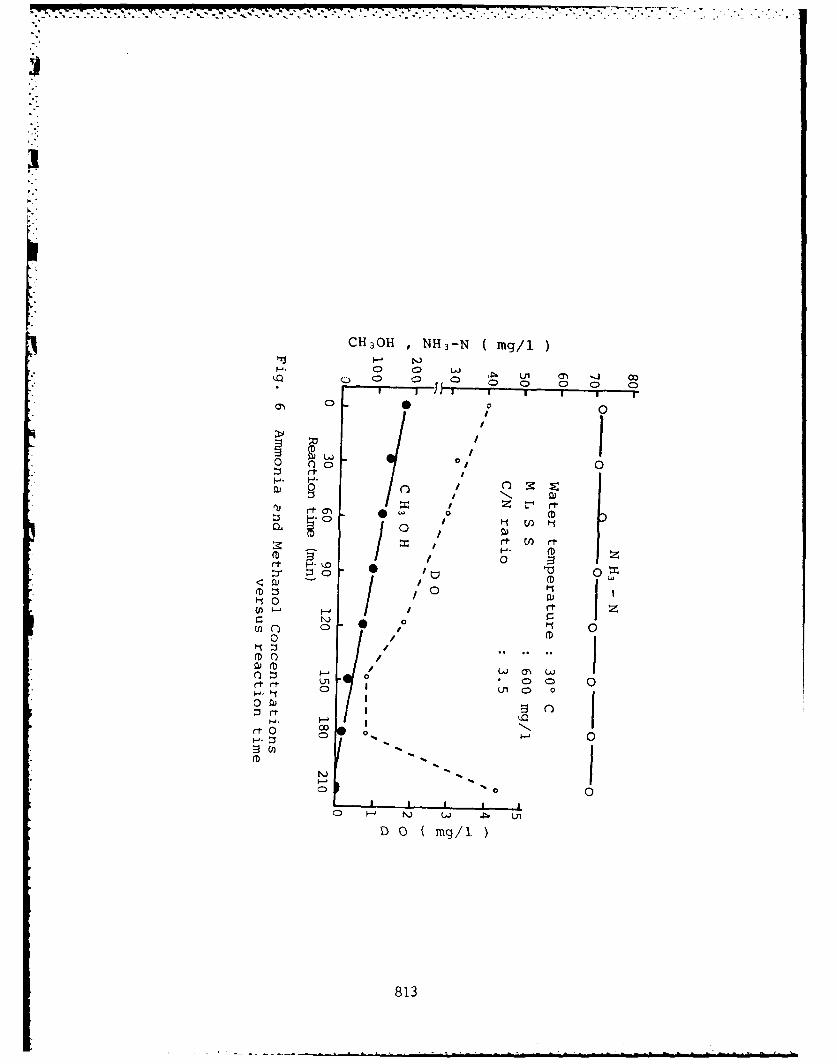
CH 30H ,NH 3 -N ( mg/i
0n 01 wj 0, u 0
m CD 0 0
> l
00
0 (D
C3C
I*, rt-I, (D
/ 0(~ D
w C:
(7/ C) C)D(Dt t 0 . .. .
a) D W
0-. 0
:3 0 tmg/
081
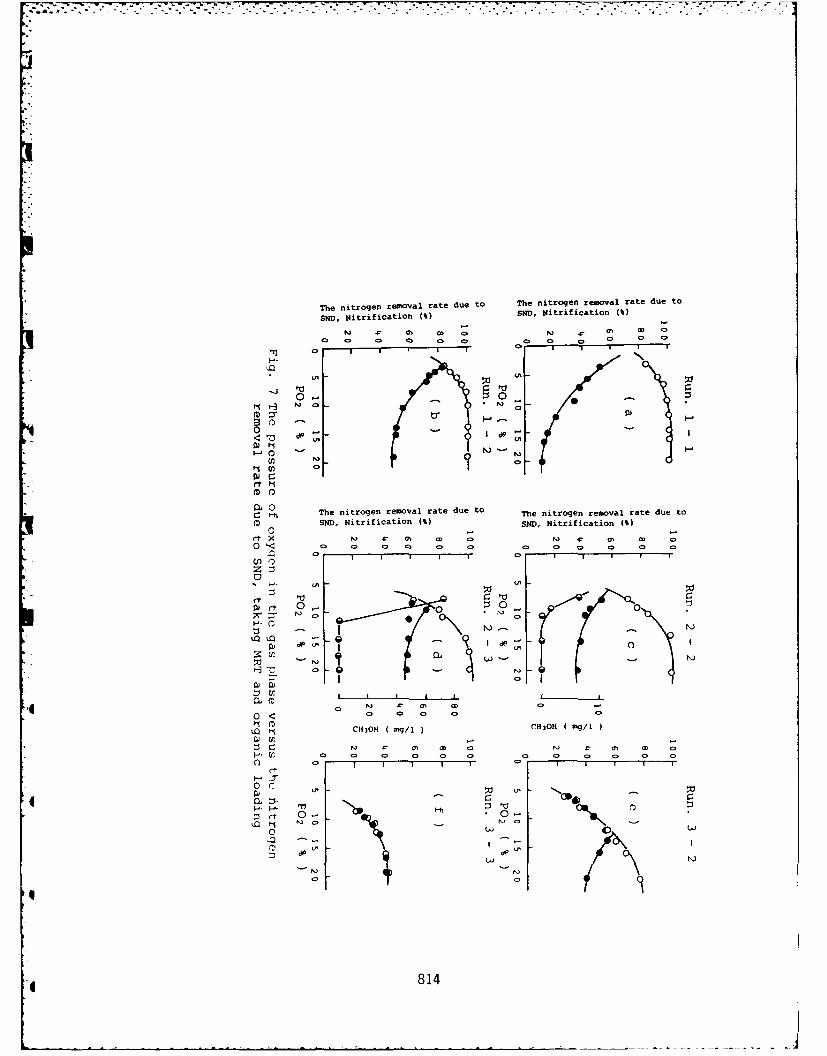
The nitrogen removal rate due to The nitrogen removal rate due to
SND, Nitrification (%) SND, Nitrification (M)
0 , r - , 0 0 0 0 o, 0 0
0 z 0O~ o I-' --- .-
5-" (') F -) o '-
00
S o dP
The nitrogen removal rate due to The nitrogen removal rate due to
(D SND, Nitrification (t) SND, Nitrification (%o V M
0 1< CD C)< o o-n 0 0 I
Eno
Qj d I °P
. . r. "
0 <
0 C C C
" DC3H m/ CHIOH (Mg/l)
(.
o- CC: C M 0 NOD C
ICoo
814
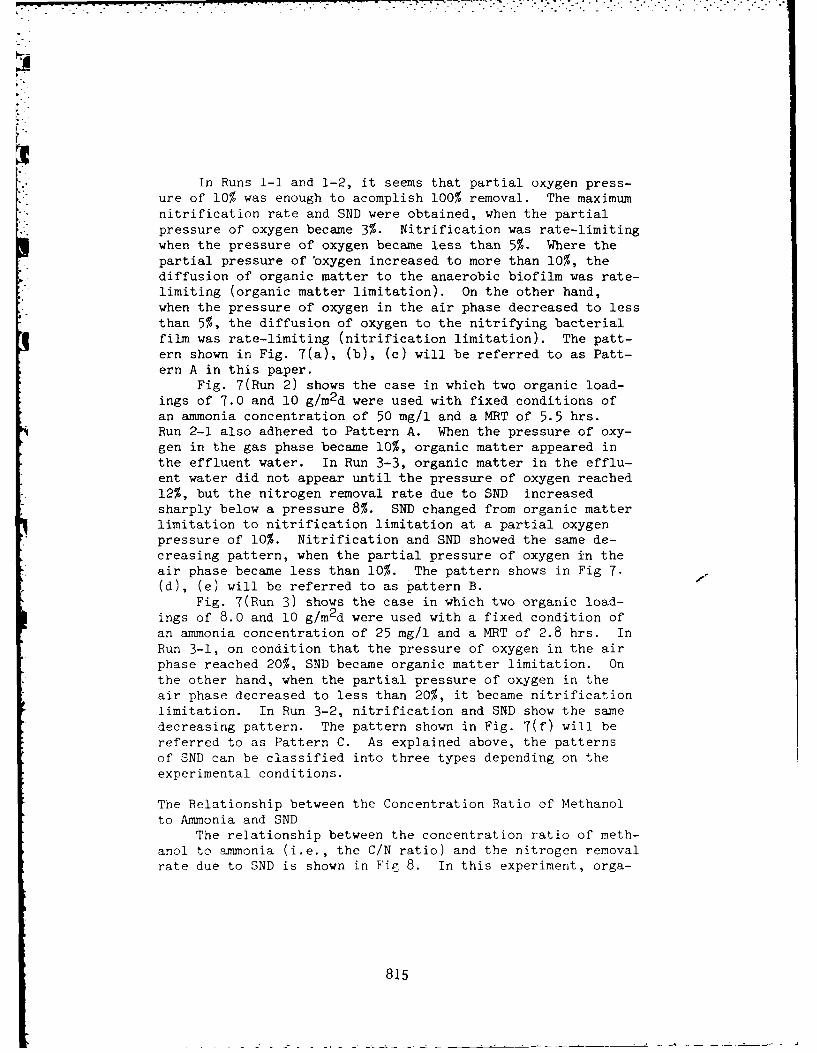
In Runs 1-1 and 1-2, it seems that partial oxygen press-
ure of 10% was enough to acomplish 100% removal. The maximum
nitrification rate and SND were obtained, when the partialpressure of oxygen became 3%. Nitrification was rate-limiting
when the pressure of oxygen became less than 5%. Where the
partial pressure of 'oxygen increased to more than 10%, thediffusion of organic matter to the anaerobic biofilm was rate-
limiting (organic matter limitation). On the other hand,
when the pressure of oxygen in the air phase decreased to less
than 5%, the diffusion of oxygen to the nitrifying bacterialfilm was rate-limiting (nitrification limitation). The patt-
ern shown in Fig. 7(a), (b), (c) will be referred to as Patt-
ern A in this paper.Fig. 7(Run 2) shows the case in which two organic load-
ings of 7.0 and 10 g/m 2 d were used with fixed conditions of
an ammonia concentration of 50 mg/l and a MRT of 5.5 hrs.Run 2-1 also adhered to Pattern A. When the pressure of oxy-gen in the gas phase became 10%, organic matter appeared in
the effluent water. In Run 3-3, organic matter in the efflu-ent water did not appear until the pressure of oxygen reached12%, but the nitrogen removal rate due to SND increasedsharply below a pressure 8%. SND changed from organic matterlimitation to nitrification limitation at a partial oxygenpressure of 10%. Nitrification and SND showed the same de-creasing pattern, when the partial pressure of oxygen in theair phase became less than 10%. The pattern shows in Fig 7.(d), (e) will be referred to as pattern B.
Fig. 7(Run 3) shows the case in which two organic load-ings of 8.0 and 10 g/m2d were used with a fixed condition ofan ammonia concentration of 25 mg/1 and a MRT of 2.8 hrs. InRun 3-1, on condition that the pressure of oxygen in the airphase reached 20%, SND became organic matter limitation. Onthe other hand, when the partial pressure of oxygen in theair phase decreased to less than 20%, it became nitrificationlimitation. In Run 3-2, nitrification and SND show the samedecreasing pattern. The pattern shown in Fig. 7(f) will bereferred to as Pattern C. As explained above, the patternsof SND can be classified into three types depending on theexperimental conditions.
The Relationship between the Concentration Ratio of Methanol
to Ammonia and SNDThe relationship between the concentration ratio of meth-
anol to ammonia (i.e., the C/N ratio) and the nitrogen removal
rate due to SND is shown in Fig 8. In this experiment, orga-
815
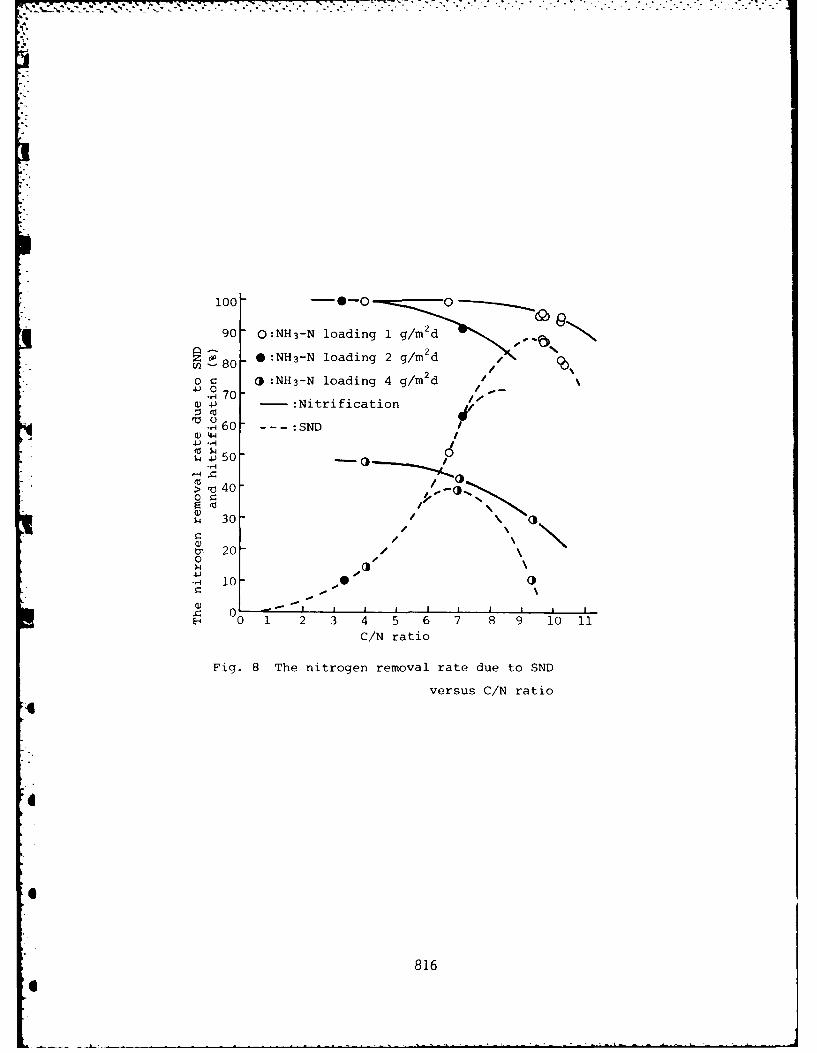
100-00
90- Q:NH3-N loading 1 g/m 2d
O 20 :NH3-N loading 2 g/m dEn 800 C: (:NH3-N loading 4 g/m d /
a) 70 : Nitrification
. 60 -- :SND
44J
> 400
S30- 0
o~20-00
10 00
0)
.c
0 1 2 3 4 5 6 7 8 9 101
C/N ratio
Fig. 8 The nitrogen removal rate due to SND
versus C/N ratio
816
90 ON4NlaigIgmd s'
nic loading ranged from 3.5 to 36 g/m2 d. Organic loadings of3.5, 7, 9, and 10 g/m 2 d were used in the experiment with anammonia loading of 1 g/m2 d. At these loading rates of ammonia
and organic matter, a nitrification rate equal to 100% was ob-
tained, even when the C/N ratio was changed from 4 to 7. How-ever, when the C/N ratio became more than 7, the nitrificationrate became lower. At the same loading rate, the nitrogen re-
moval rate due to SND increased significantly with an increasein the C/N ratio. The maximum nitrogen removal rate due toSND was ofbtained at a C/N ratio equal to about 9. Organic
loadings of 8.3, 14 and 18g/m2 d were used in the experiment atan ammonia loading of 2 g/m2 d. The nitrification rate sharplydecreased. The nitrogen removal rate due to SND increased
significantly with the increase in the organic loading and themaximum nitrogen removal rate due to SND was obtained at C/Nratio of around 8. Organic loadings of 14.6, 28 and 36 g/m2dwere used in the experiment with a fixed ammonia loading of4.3 g/m2d. The nitrification rate decreased with the increaseof C/N ratio. The nitrogen removal rate due to SND became veryhigh as the C/N ratio increased and the maximum nitrogen remo-val rate due to SND was obtained at a C/N ratio of 7.
Fig. 9 and 10 show the relationship between the C/N ratioand SND, when sodium formic acid and ethylene glycol wereadded as organic carbons. A nirtogen removal rate of 20% dueto SND was obtained even at a C/N ratio of zero, because alandfill leachate (Haginodai) was used for the raw waste water.When sodium formic acid was added as an organic carbon, thenitrogen removal rate of 80% due to SND was obtained at a highC/N ratio of 35.
These results demonstrate it was difficult for the hete-rotrophic and anaerobic bacteria to use the sodium formicacid. On the other hand, in the case where ethylene glycolwas added as organic carbon, a nitrogen removal rate of 90%due to SND was obtained at the low C/N ratio of 4. Based onthe experimental data, the authors belive the effectiveness ofthe organic carbon as the carbon source of S?'7 depends on thediffusivity and biodegradibility of the organics which influ-ence the distributions of heterotrophic, nitrifying, and de-nitrifying bacteria concentrations in the biofilm.
.,imultaneous Nitrification and Denitrification in a Proto-typeRBC Plant
Since No-ienber 1976, a Rotating Biological Contactor hasben treating leachate from the Miyazaki Citiy Haginodai ,and-fill (5). The concentration of total nitrogen in the effluent
817
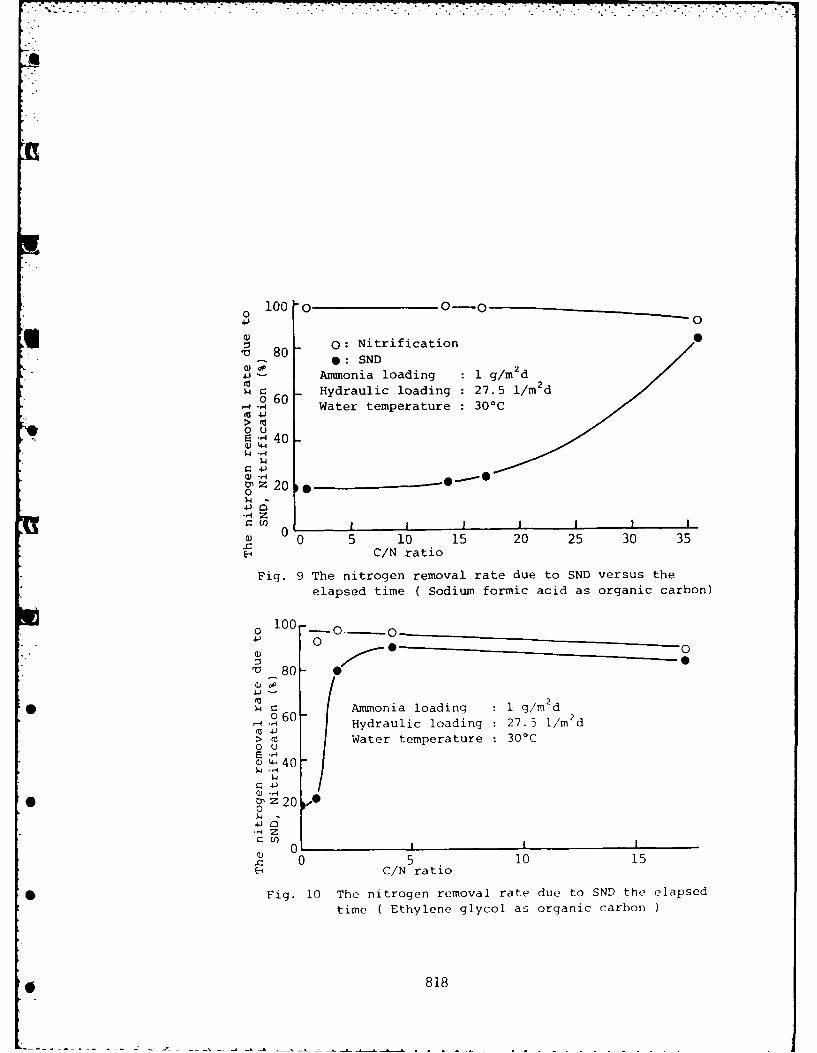
1 00 -0 0-001~ 0-4-,
O 80 Q: Nitrification ,V 80* : SND
4 Ammonia loading : 1 g/m2 d0 2
60 Hydraulic loading : 27.5 1/m d0 60• Water temperature : 300C
0E -,' 40W-4$4 -4
$4
0Z0$4-
V Zct0i I I |! I
00 5 / 0 15 20 25 30 35E-4C/N ratio
Fig. 9 The nitrogen removal rate due to SND versus the
elapsed time ( Sodium formic acid as organic carbon)
i00,0 0...--- 0 _
80
2S$ c Ammonia loading 1 g/m d
- Hydraulic loading 27.5 1/m2 d
> (0 Water temperature: 300C0U0Q) -40$4 -1
$4
1 Dz 200
4
40! Q I I
0 5 10 15EC/N ratio
* Fig. 10 The nitrogen removal rate due to SND the elapsed
time ( Ethylene glycol as organic carbon
* 818
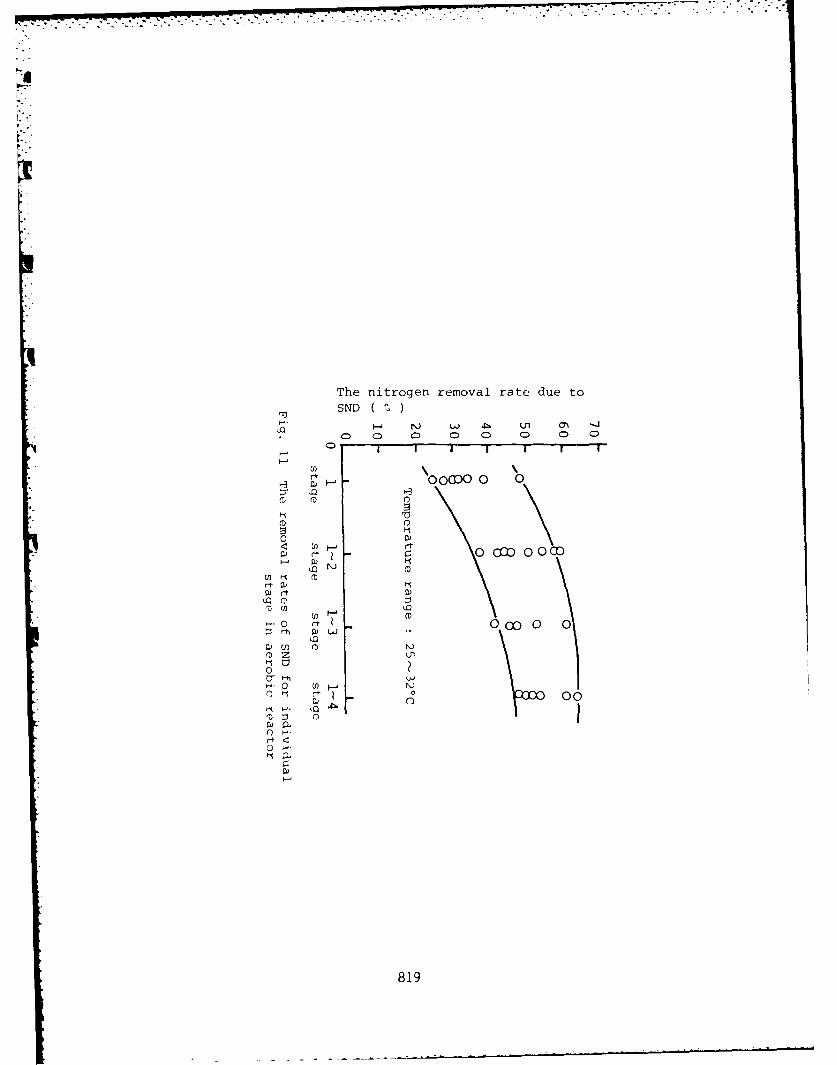
r.
The nitrogen removal rate due to
Mi SND ( '
0D C 0 0 0 0)
.0
0 0OD 0
0j 0t00D00O
ww
La D (D
(D1
io.
H. 0 0t 0 0 0 0
~o
0'o-t 0 0 0
Qa,ID -1 (DnQ)CL0
0 H
o 9
819
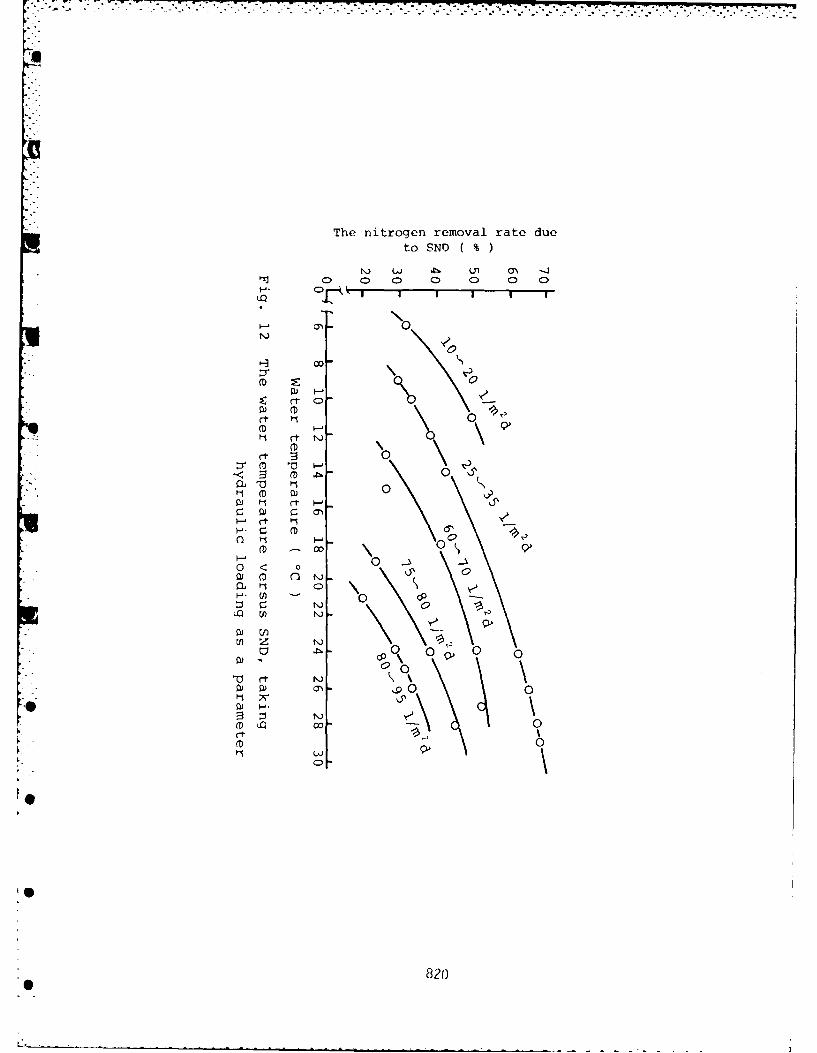
The nitrogen removal rate dueto SNI) ( %
C)L . L, 0i -3
oC. 0 03 C D 0 C
0
cv
(t C) 0\0rt 0(DV
rt I~'5
D -cv 0~0< I 0 -
tI (D wl )0
00
0 0
cvp
aj n820
water has constantly been less than 10 mg/l. In this experi-ment, the nitrogen removal rate due to SND was obtained fromaerobic RBC.
Fig. 11 shows the cumulative nitrogen removal rate due toSND. The nitrogen removal rate due to SND increased at highertemperatures. SND occurred significantly in the first twostages but hardly occurred at all in the latter stages.
Fig. 12 shows the relationship between SND and water temp-erature, with hydraulic loading as a parameter. SND becamesignificant at higher temperatures and lower hydraulic load-ings. Hydraulic loadings of less than 60 to 70 l/m2d shouldbe used in this plant to obtain a nitrgen removal rate due toSND greater than 40% at 20 C..
SUMMvARY AND CONCLUSIONS .-
*~Tephenomenon ofISND~in a RBC process was confirmed by
measuring nitrogen gas production. The SND in a RBC was ex-perimentally studied in terms of mean residence time, organicloading, water temperature, and the partial pressure of oxygenin the air phase. Most of the conventional biological proce-sses for nitrogen removal consist of a series of unit pro-cesses which perform organic oxidation, nitrification, and de-nitrification separately. On the other hand, in the case ofnitrogen removal using the RBC nitrification process, all theorganic oxidation, nitrification, and denitrification could beaccomulished in the same reactor. The obtained results aresummarized as follows:
I. In a closed RBC for nitrification, nitrogen gas in-creased in the air phase, while oxygen gas decreased.
2. The nitrogen removal rate due to SND depended uponthe MRT, C/N ratio, water temperature, partial pre-ssure of oxygen, and ammonia concentration. Whenthe other parameters were fixed, the optimum C/Nratio existed for the maximum nitrogen removal rate,;ue to SliD.
2.The SND patterns were classified into three types4epending on the experimental conditions.
Refer .-e-. ilIGURQ, M., WATANABE, Y. and MASUDA, S. "AdvancedWastewater Treatment by Rotating Biological DiskT -nit (11)" Journal of Japan Sewage Works Association,.:ol.ll4,No.l52,pp.32-4l,Jan. (1977)
821
.............................
2. MASUDA, S., ISHIGURO, M. and WATANABE, Y., "Nitro-gen Removal in a Rotating Biological Contactor (1)"Journal of Japan Sewage Works Association,Vol.16,No.187,pp24-32,Dec.(1979)
3. ISHIGURO, M., WATANABE, Y. and MASUDA, S., "An
Basic Investigation of Aerobic Denitrification byRotating Biological Disk Unit" Presented at the 33rdAnual Conference of JSCE.,pp213-214,Oct.(1978)
4. D~wson R. N. and Murphy K. L., "The TemperatureDependency of Biological Denitrification" WaterResearch Pergrame Press.,Vol.6 ,pp.71-83 (1972)
5. ISHIGURO, M., WATANABE, Y. and MASUDA, S., "Treat-ment of Leachate from Sanitary Landfill by RotatingBiological Contactor", Environmental ConservationEngineering,Vol.7,No.6,PP.513-521, June.(1978)
8226
2i
DENITRIFICATION IN A SUBMERGED BIO-DISC SYSTEMWITH RAW SEWAGE AS CARBON SOURCE
Bjorn Rusten. Division of Hydraulic & SanitaryEngineering, The University of Trondheim, Norway.
SHallvard Odegaard. Division of Hydraulic & Sanitaryrngineering, The University of Trondheim, Norway.
INTRODUCTION
An investigation of denitrification by biofilms hasbeen performed in two submerged bio-disc units with municipalsewage as carbon source. The project is based upon the pro-cess that the authors presented in the Proceedings of TheFirst National Symposium on Rotating Biological ContactorTechnology (1). The flow sheet of the process is shown inFigure 1. Nitrate-rich effluent is recycled to the inlet ofan anoxic tank where denitrification takes place with rawmunicipal sewage as carbon source.
In this paper results are presented from a later morethorough study of the denitrification part, in order to esta-blish the basic design.criteria for the process. The goalwas to find the denitrification rate, - temperature dependency,- pH dependency, - energy consumption and - alkalinity pro-duction.
EXPERIMENTAL ARRANGEMENT
The experiments were carried out in two plexi-glass bio-disc units arranged in parallel . The units called RBC A
823
• " ' N |-
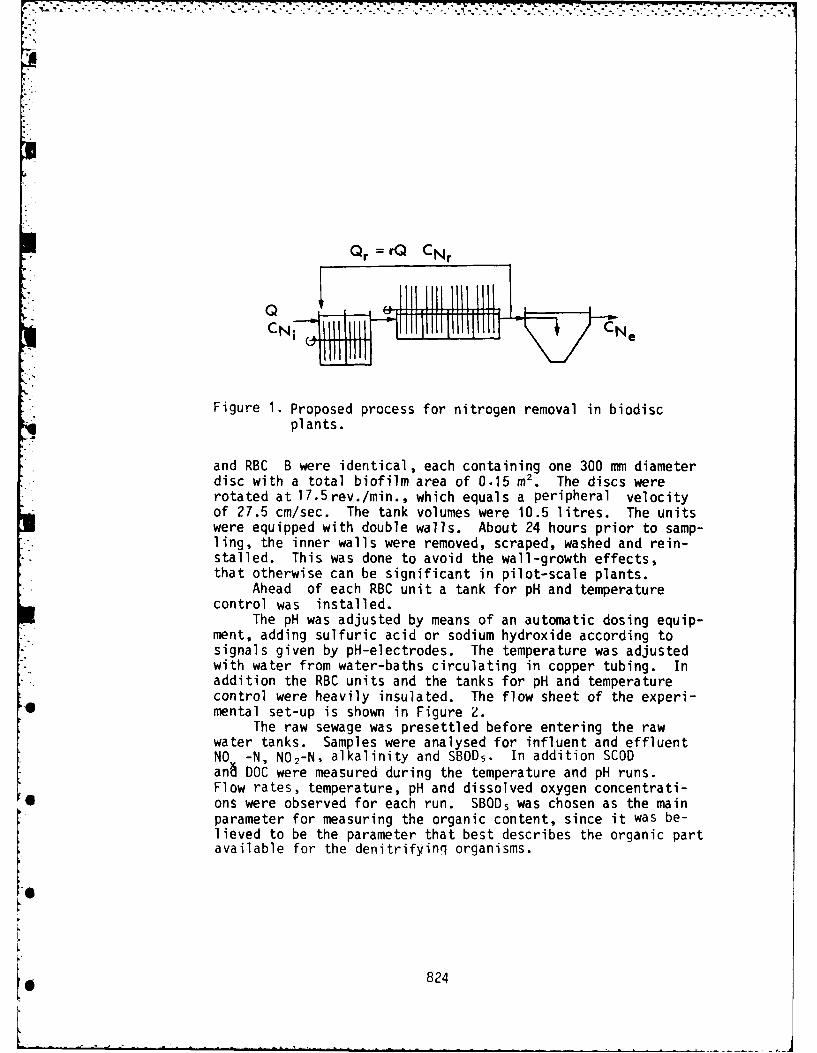
QJ
! Qr = rQ CNr
)-Figure 1. Proposed process for nitrogen removal in biodisc
plants.
and RBC B were identical, each containing one 300 mm diameterdisc with a total biofilm area of 0.15 M 2 . The discs wererotated at 17 .5rev./min., which equals a peripheral velocityof 27.5 cm/sec. The tank volumes were 10.5 litres. The unitswere equipped with double walls. About 24 hours prior to samp-ling, the inner walls were removed, scraped, washed and rein-stalled. This was done to avoid the wall-growth effects,that otherwise can be significant in pilot-scale plants.
Ahead of each RBC unit a tank for pH and temperaturecontrol was installed.
The pH was adjusted by means of an automatic dosing equip-ment, adding sulfuric acid or sodium hydroxide according tosignals given by pH-electrodes. The temperature was adjustedwith water from water-baths circulating in copper tubing. Inaddition the RBC units and the tanks for pH and temperaturecontrol were heavily insulated. The flow sheet of the experi-
* mental set-up is shown in Figure 2.The raw sewage was presettled before entering the raw
water tanks. Samples were analysed for influent and effluentNO -N, N02-N, alkalinity and SBOD5 . In addition SCODan DOC were measured during the temperature and pH runs.Flow rates, temperature, pH and dissolved oxygen concentrati-
* ons were observed for each run. SBOD 5 was chosen as the mainparameter for measuring the organic content, since it was be-lieved to be the parameter that best describes the organic partavailable for the denitrifying organisms.
8
g 824
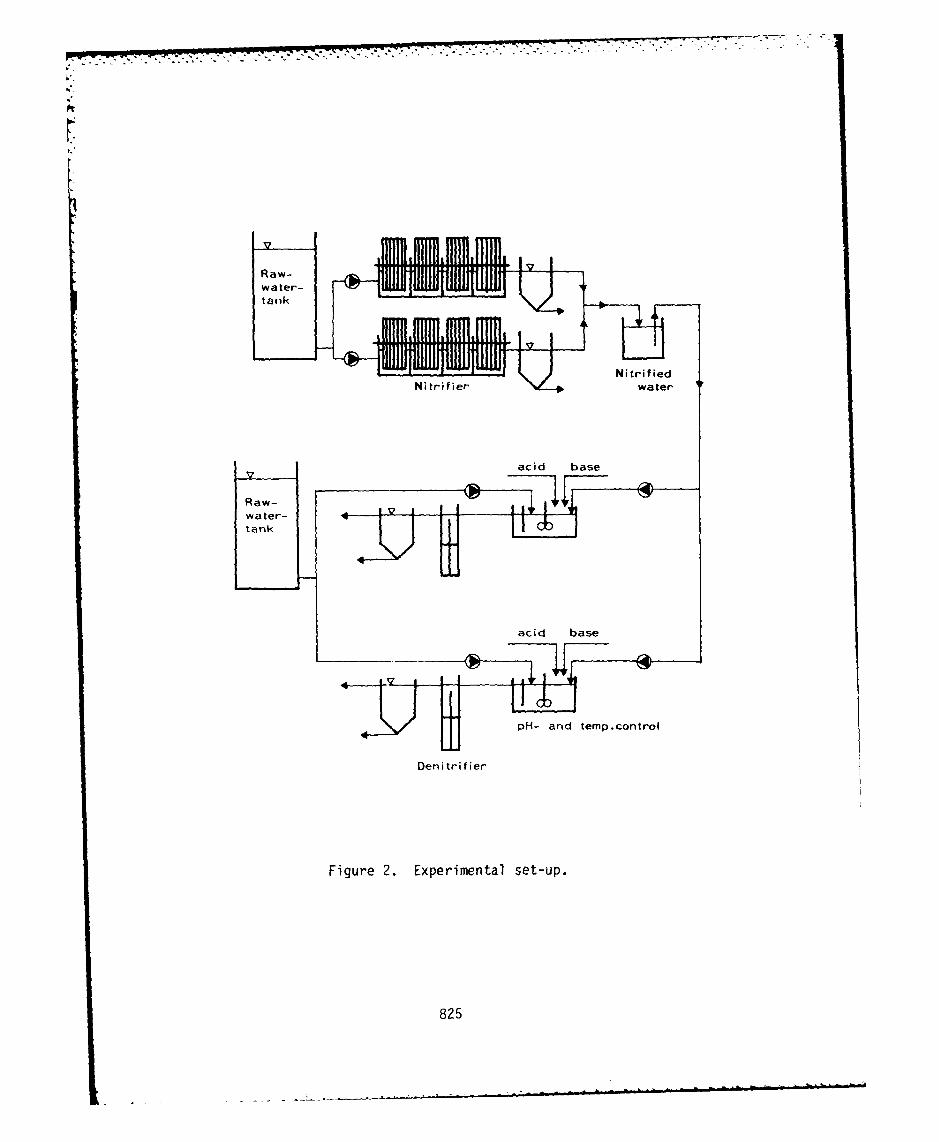
DenNitrified
Figure 2. Epr iena set-up.
82d5as
Initially both RBC units were run at 150C and pH 7. Inthe temperature- and pH dependency experiments, temperature andpH in RBC A were varied. RBC B acted as a reference unit atconstant temperature and pH.
RESULTS AND DISCUSSION
Denitrification rates
Several factors are influencing the denitrification rate,such as oxygen concentration, pH, temperature, carbon source,nitrate IQading and organic loading.
Denitrification has to be carried out at anoxic conditions.It seems as if true anaerobic conditions in the liquid is notnecessary, and that 1-2 mg 02/Z does not influence denitrifica-tion in biofilms (2,3). In this experiment the oxygen concen-trations were usually below 0.4 mg 02/Z, and never exceeded1.0 mg 0,/z . Thus oxygen is not considered to be a limitingfactor for the denitrification rates found in this study.
Temperature and pH were held constant. (15C and pH 7).Various proportions and amounts of raw water and nitrifiedwater were fed to the denitrifiers, in order to cover a broadrange of hydraulic, organic and nitrate loadings.
When modelling a denitrification system many researchersuse a Monod relation, applying excess methanol and taking nit-rate as the limiting substrate. Our experiments showed thatthe denitrification rates were very dependent upon the SBOD 5concentration. Supposing that the RBC units are complete-mixreactors, the denitrification rates should be a function ofeffluent NO -N and SBOD5 concentrations. Adding a "Monod"term to the x steady-state removal equation given by Kornegayand Andrews (4) gives:
826
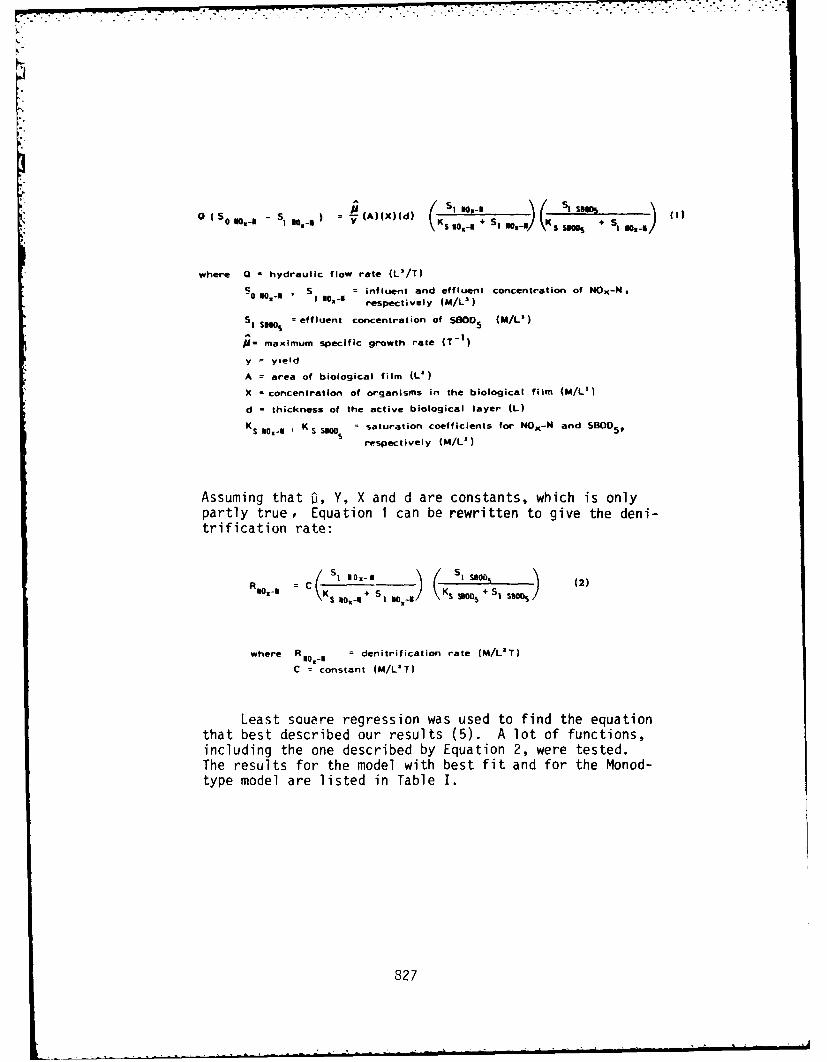
-.....: i.-+.,~ ~~~ -- + -. .+ . ..-. .,' .. . .
L.
- ss OX- + +,.o(.S S@S , 10._)
where 0 hydraulic flow rate (L'/T)
S 0 S influent and effluent concentration of NOX-N,0 0 I
0x-I# respectively (M/L')
S, Sil, =effluent concentration of S30D 5 (M/L')
;= maximum specific growth rate (T- 1
)
y = yield
A = area of biological film (L)
X = concentration of organisms in the biological film (M/L'I
d =
thickness of the active biological layer (L)
KS 40'-1 - K S SB00 S = saturation coefficients for NO-N and SBOD.,
respectively (M/L')
Assuming that f, Y, X and d are constants, which is onlypartly true, Equation 1 can be rewritten to give the deni-trification rate:
R 0
- / KS I 0-11 1K SOON ) (2)
0'o;-m IW 1 / S SBOD I Sams~
where R No,-* denitrification rate (M/L'T)
C = constant (M/L'T)
Least sQuare regression was used to find the equationthat best described our results (5). A lot of functions,including the one described by Equation 2, were tested.The results for the model with best fit and for the Monod-type model are listed in Table I.
827
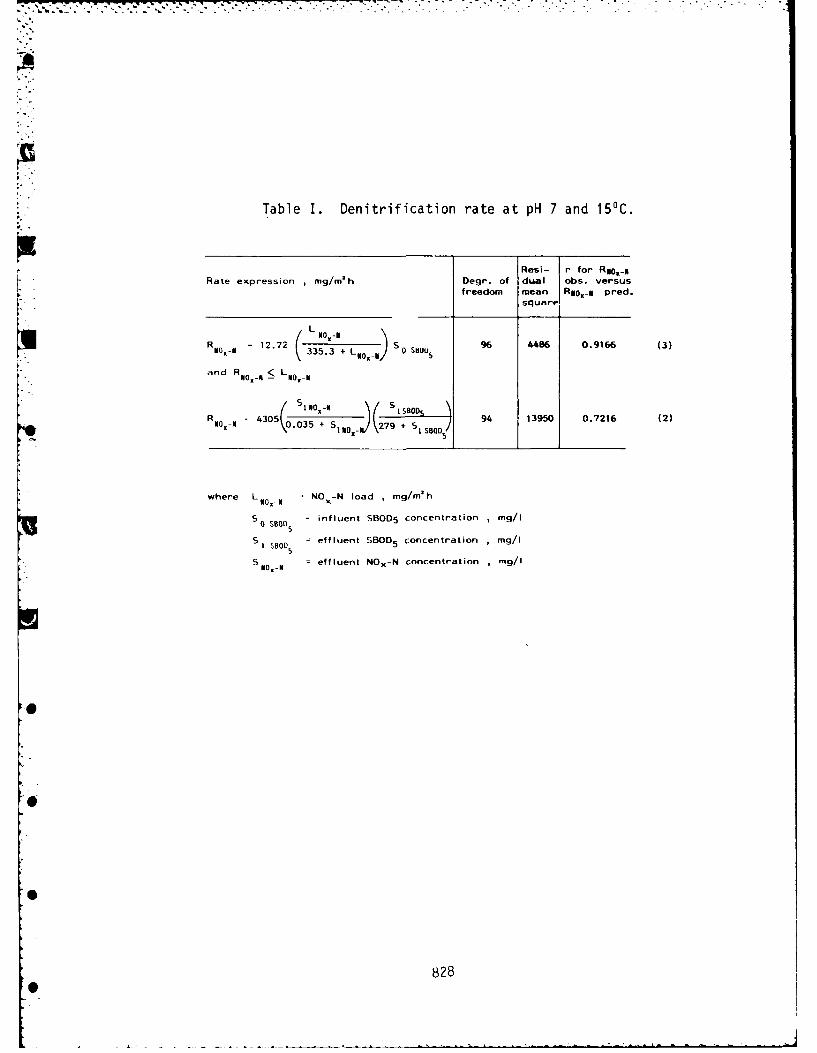
Table I. Denitrification rate at pH 7 and 15'C.
Resi- r for R*0 .- NRate expression mg/m~h Oegr. of dual abs. versus
freedom mean ANOx.. pred.
R 12.72 ) oN S 0"U5 96 4486 0.9166 (3)anNO N<N 33. LNXI~eo ~~0 2
and NOXM ! L NO -N
where L OX NOx-N load , mg/m~h
SO BOO =influent SBOD5 concentration ,mg/I
5SO effluent SBODS Concentration ,mg/I
S O- effluent N05 -N concentration , g/I
0
828
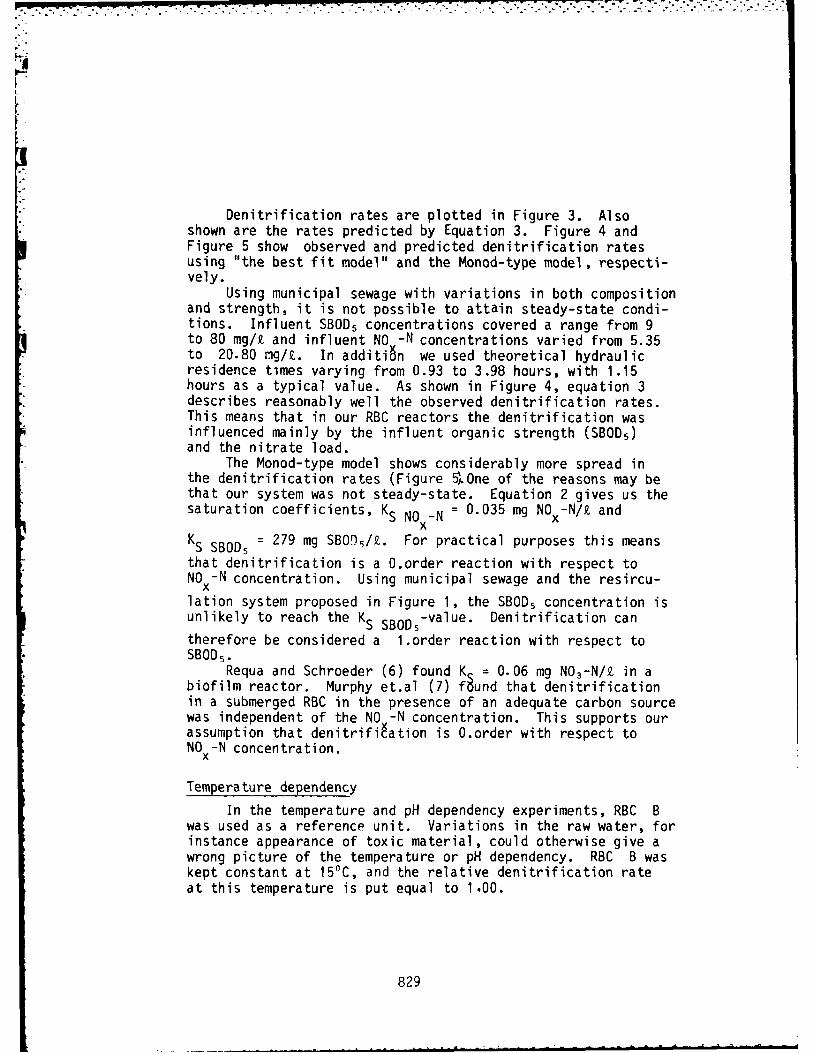
Denitrification rates are plotted in Figure 3. Alsoshown are the rates predicted by Equation 3. Figure 4 andFigure 5 show observed and predicted denitrification ratesusing "the best fit model" and the Monod-type model, respecti-vely.
Using municipal sewage with variations in both compositionand strength, it is not possible to attain steady-state condi-tions. Influent SBOOS concentrations covered a range from 9to 80 mg/k and influent NO -N concentrations varied from 5.35to 20.80 rmg/z. In add iti 6n we used theoretical hydraulicresidence times varying from 0.93 to 3.98 hours, with 1.15hours as a typical value. As shown in Figure 4, equation 3describes reasonably well the observed denitrification rates.This means that in our RBC reactors the denitrification wasinfluenced mainly by the influent organic strength (SBOD5)and the nitrate load.
The Monod-type model shows considerably more spread inthe denitrification rates (Figure %)One of the reasons may bethat our system was not steady-state. Equation 2 gives us thesaturation coefficients, K S NO -N = 0.035 mg NO -_N/9. and
ix
K S SBOD 5 = 279 mg SBOfl5/Z. For practical purposes this means
that denitrification is a O.order reaction with respect toNO -N concentration. Using municipal sewage and the resircu-xlation system proposed in Figure 1, the SBOO5 concentration isunlikely to reach the K S SB00 5 _ value. Denitrification cantherefore be considered a 1.order reaction with respect toSB00 5.
Requa and Schroeder (6) found K = 0.06 mg NO3-N/Z. in abiofilm reactor. Murphy et.al (7) f~und that denitrificationin a submerged RBC in the presence of an adequate carbon sourcewas independent of the NO~ -N concentration. This supports ourassumption that denitrification is 0.order with respect toNO -_N concentration.
Temperature dependency
In the temperature and pH dependency experiments, RBC Bwas used as a reference unit. Variations in the raw water, forinstance appearance of toxic material, could otherwise give awrong picture of the temperature or pH dependency. RBC B waskept constant at 150C, and the relative denitrification rateat this temperature is put equal to 1.00.
829
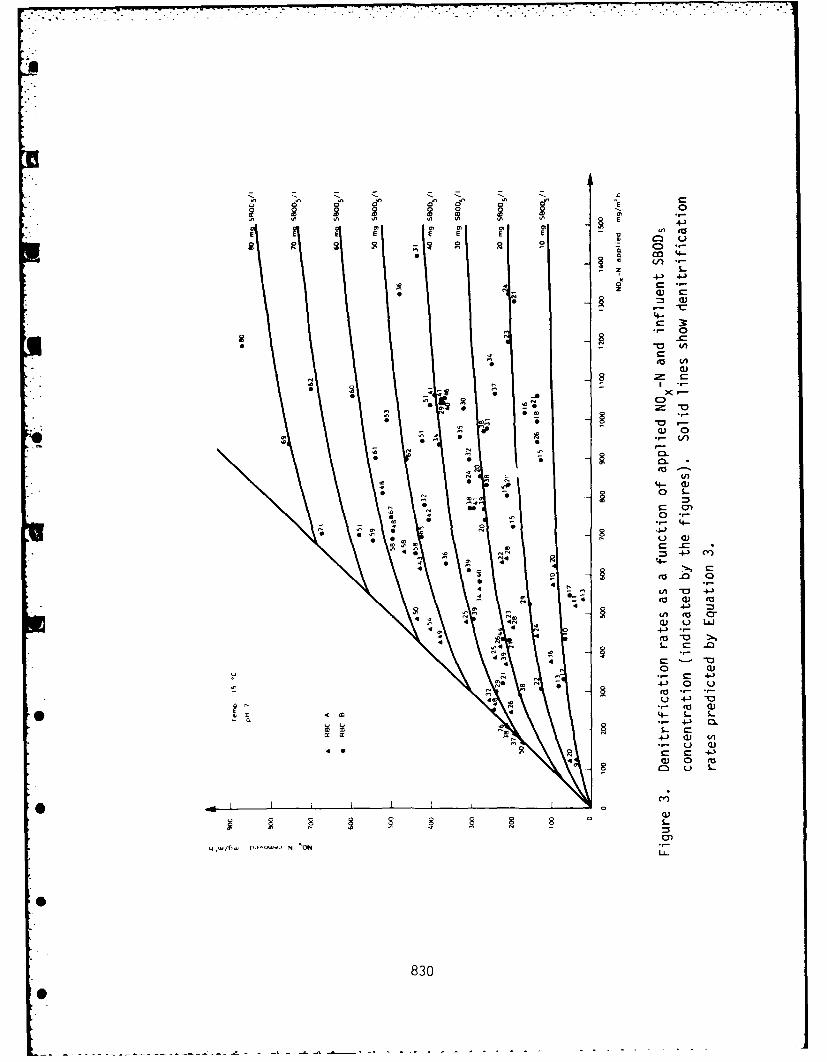
N cN oN Nr N r N l Kr E0 0 00 -0
In E 4-)
°m
E l EE E E 10- S C..-0-
* 0' 4-) 4,-- z .41) 4-
4 z
4-C 3or- O
-0'
." 0 5-
C)
* 0 N
4- Q)-
S-,
4 0 -0
4 -- 4-J0
t NW (a
4- M
4-)
- 4- CL
i (A
0 u
N N00
*N0
* 0 UL.
83N0'
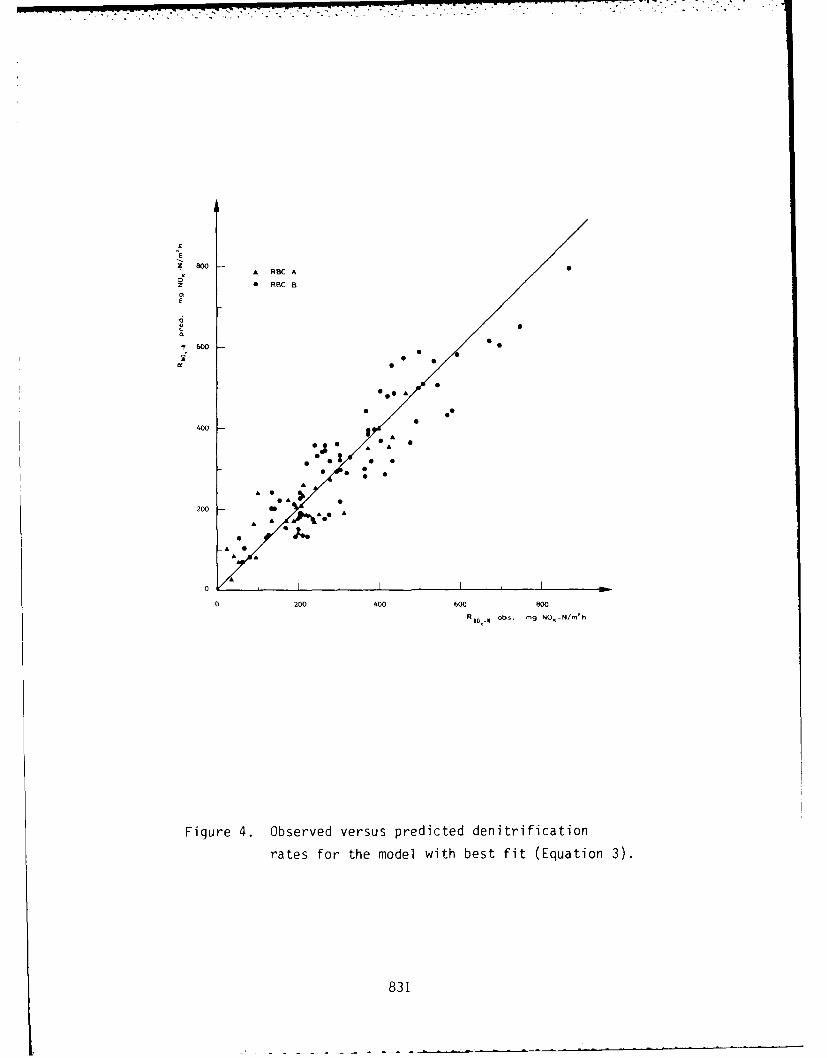
x Soo A RBC A0 a RBC B
z
00
4000200 O
00
00, 0, I0
0 200 000 600 Soo
Rilo,-i . -g NO,-N/ 'h
Figure 4. Observed versus predicted denitrification
rates for the model with best fit (Equation 3).
831
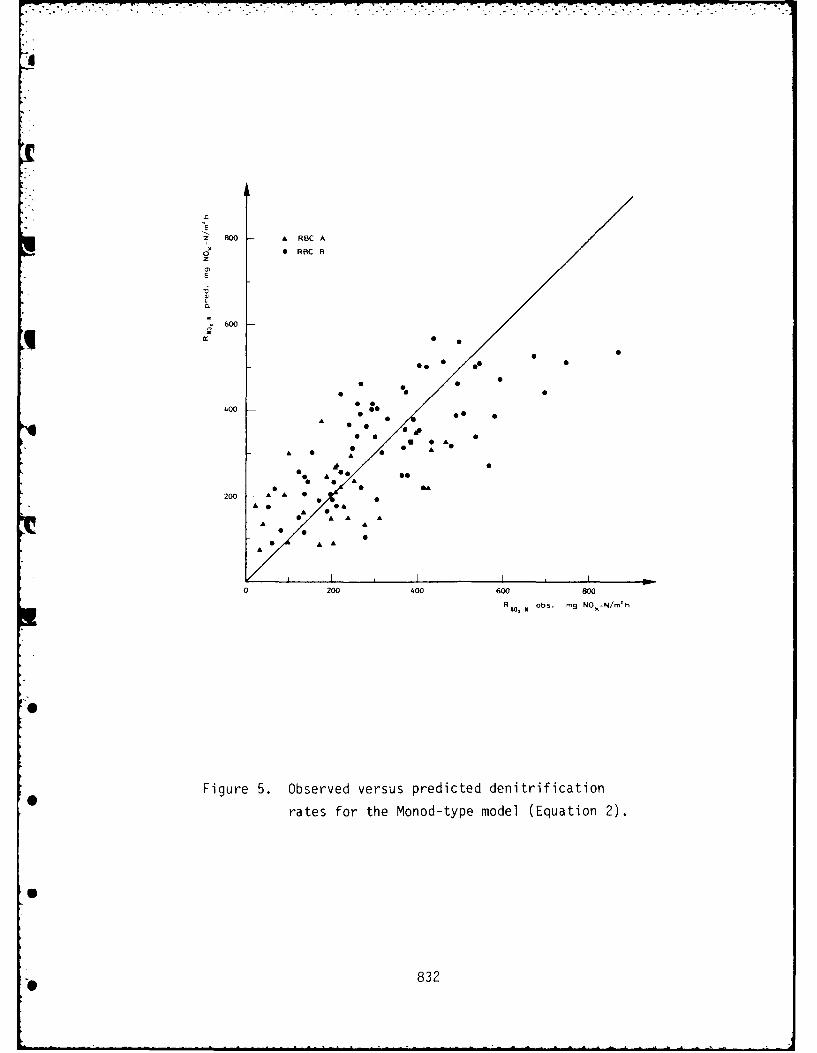
AE
0 x
0 RBC BzZ
60
600
00
o 200 400 600 0
Rmo_ obs. m9
NO.-N/m' h
00
Figure 5. Observed versus predicted denitrification
rates for the Monod-type model (Equation 2).
~832
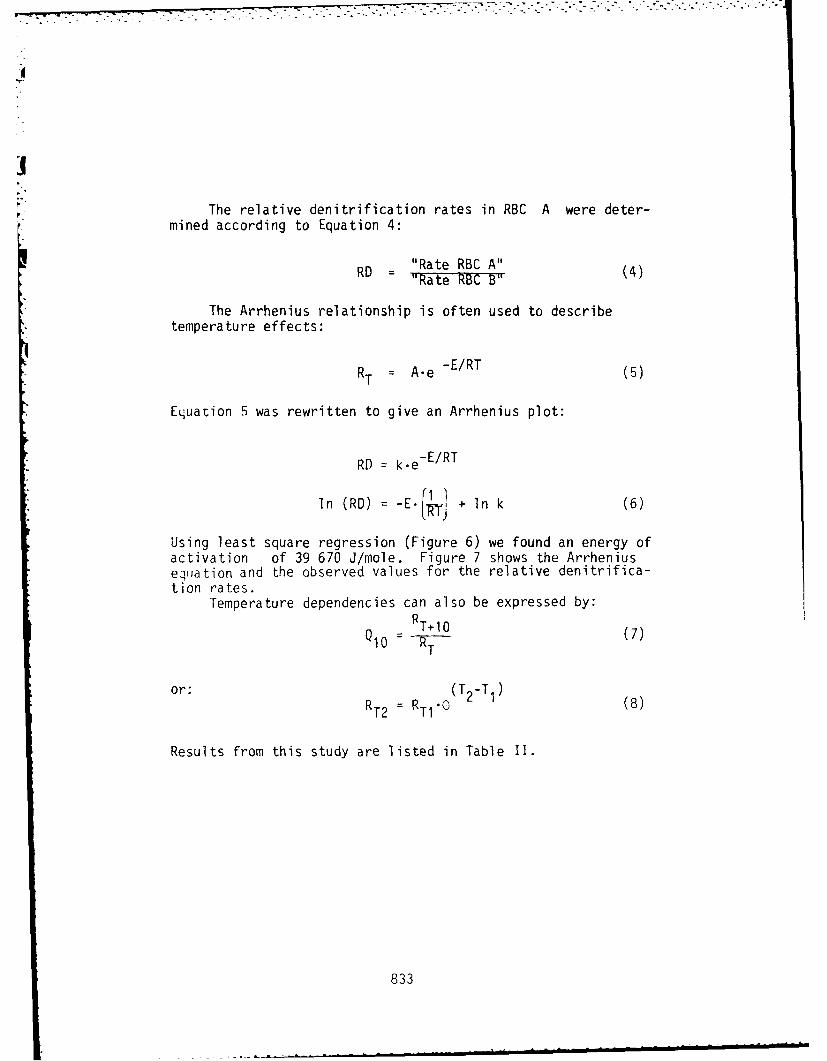
I'I
The relative denitrification rates in RBC A were deter-mined according to Equation 4:
"Rate RBC A"
RD = "Rate RBC B" (4)
The Arrhenius relationship is often used to describetemperature effects:
RT = A-e -E/RT (5)
Equation 5 was rewritten to give an Arrhenius plot:
RD = k.e-E/RT
in (RD) = - + In k (6)
Using least square regression (Figure 6) we found an energy ofactivation of 39 670 J/mole. Figure 7 shows the Arrheniusequlation and the observed values for the relative denitrifica-tion rates.
Temperature dependencies can also be expressed by:
Q10 T= 10 (7)
or: (T2-T 1)RT2 =RTl. l (8)
Results from this study are listed in Table I.
833
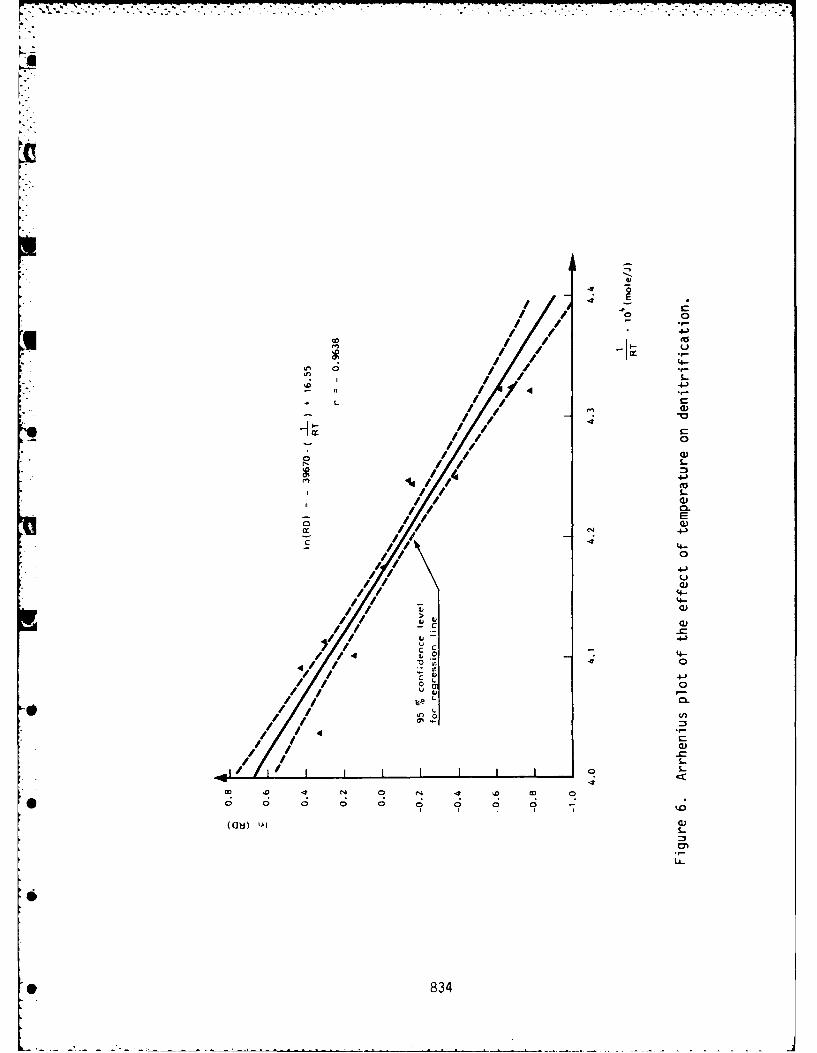
4e
/ .
/ / .-.oi'
/ /In
I-/ ,// 4-
a #a)4o
> o)
u c
v / 44--u "'I 0
Lp
,//
'4 4-)
0t L.a 0
4--:3
cm
S834
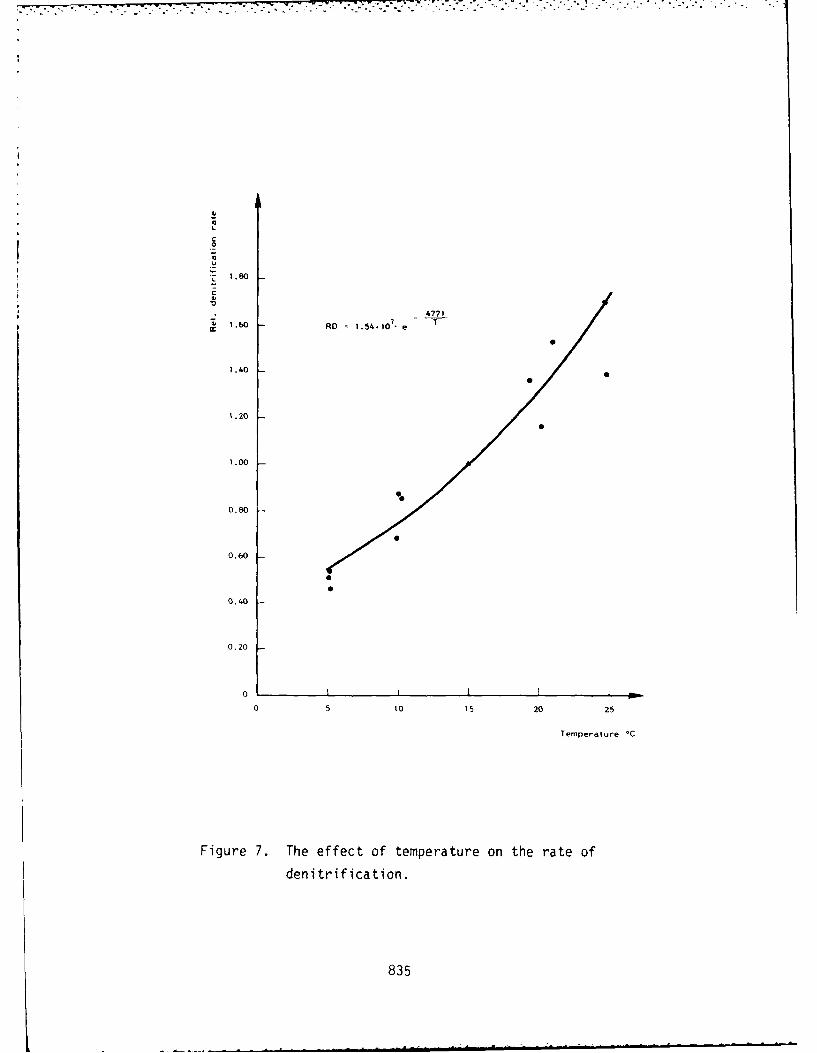
S 1.60 -RD 1.54 107_ e
1 .40
1 .20
1.00
0.80
0.60
0.40
0.20
o
0 5 to 15 20 25
Temperature OC
Figure 7. The effect of temperature on the rate of
den itrification.
835
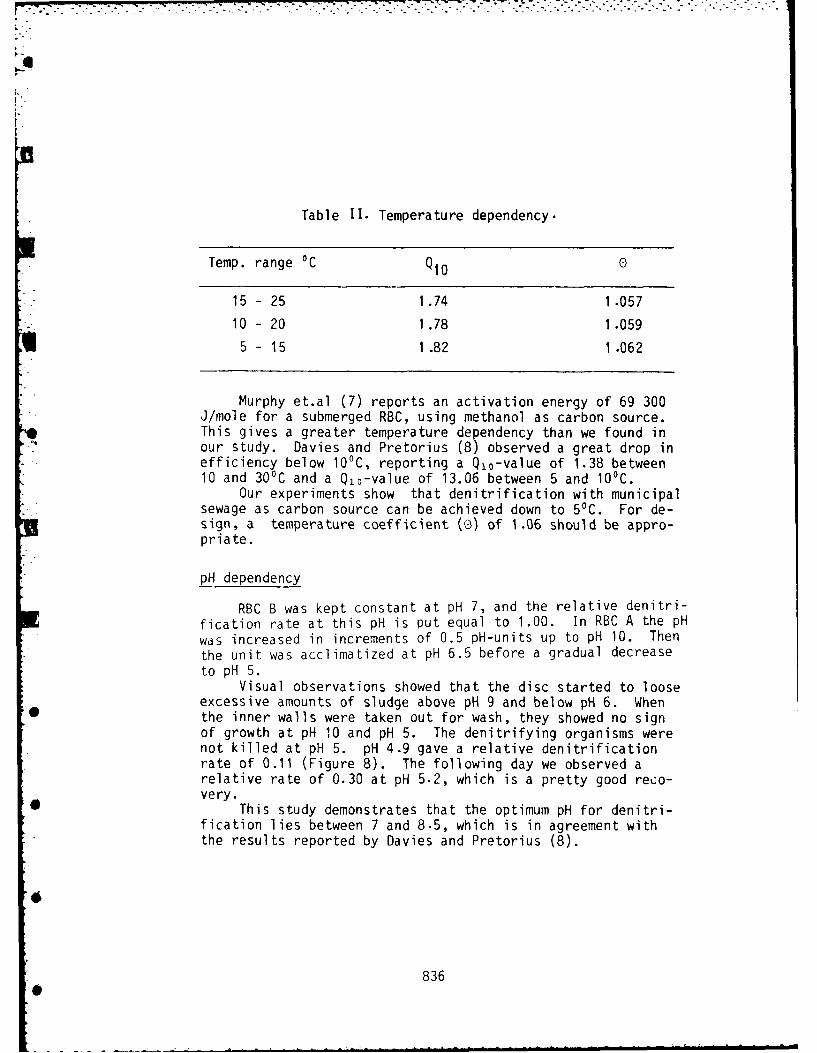
Table I.Temperature dependency.
Temp. range 'C Q10 0
15 - 25 1.74 1.057
10 - 20 1.78 1.059
5 - 15 1 .82 1 .062
Murphy et.al (7) reports an activation energy of 69 300J/mole for a submerged RBC, using methanol as carbon source.
V This gives a greater temperature dependency than we found inour study. Davies and Pretorius (8) observed a great drop inefficiency below 100C, reporting a Qjo-value of 1.38 between10 and 30'C and a Ql0-value of 13.06 between 5 and 10'C.
Our experiments show that denitrification with municipalsewage as carbon source can be achieved down to 50C. For de-sign, a temiperature coefficient (0) of 1.06 should be appro-priate.
pH dependency
RBC B was kept constant at pH 7, and the relative denitri-fication rate at this pH is put equal to 1.00. In RBC A the pHwas increased in increments of 0.5 pH-units up to pH 10. Thenthe unit was acclimatized at pH 6.5 before a gradual decreaseto pH 5.
Visual observations showed that the disc started to looseexcessive amounts of sludge above pH 9 and below pH 6. When
* the inner walls were taken out for wash, they showed no signof growth at pH 10 and pH 5. The denitrifying organisms werenot killed at pH 5. pH 4.9 gave a relative denitrificationrate of 0.11 (Figure 8). The following day we observed arelative rate of 0.30 at pH 5.2, which is a pretty good reco-very.
This study demonstrates that the optimum pH for denitri-fication lies between 7 and 8.5, which is in agreement withthe results reported by Davies and Pretorius (8).
836
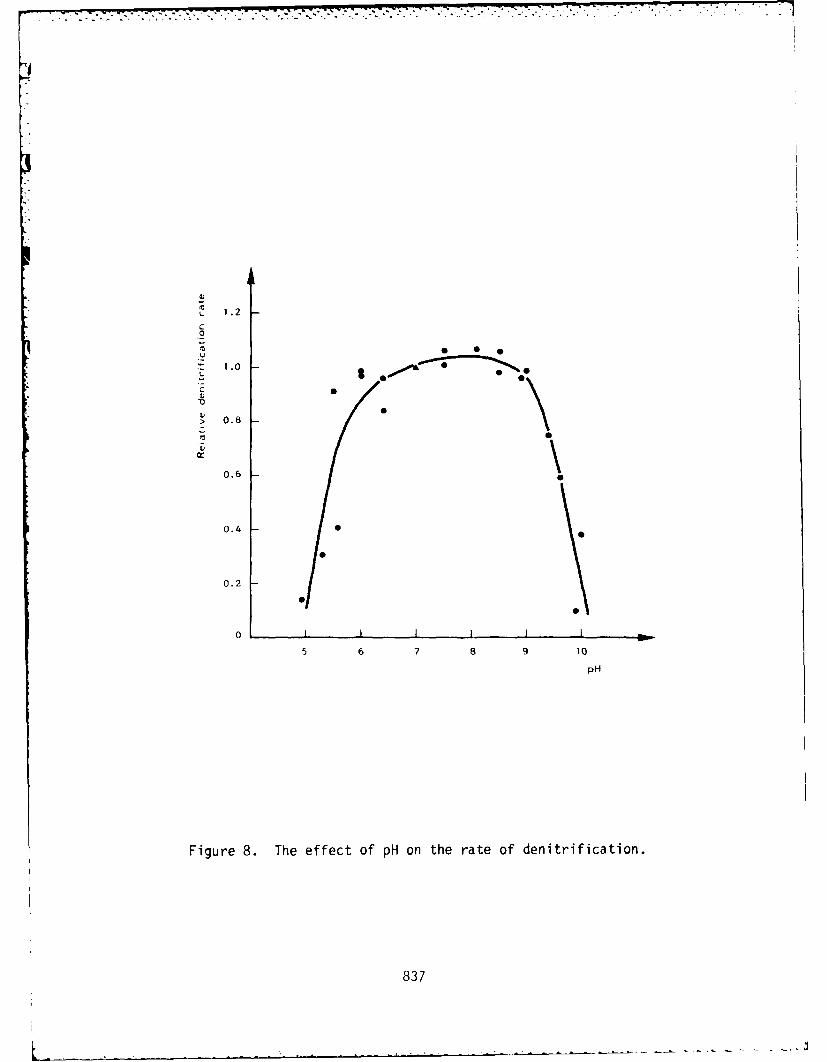
S1.2
1.0
S0.8
0.6
0.4
0.2
0S
5 6 7 8 9 10
pH
Figure 8. The effect of pH on the rate of denitrification.
837
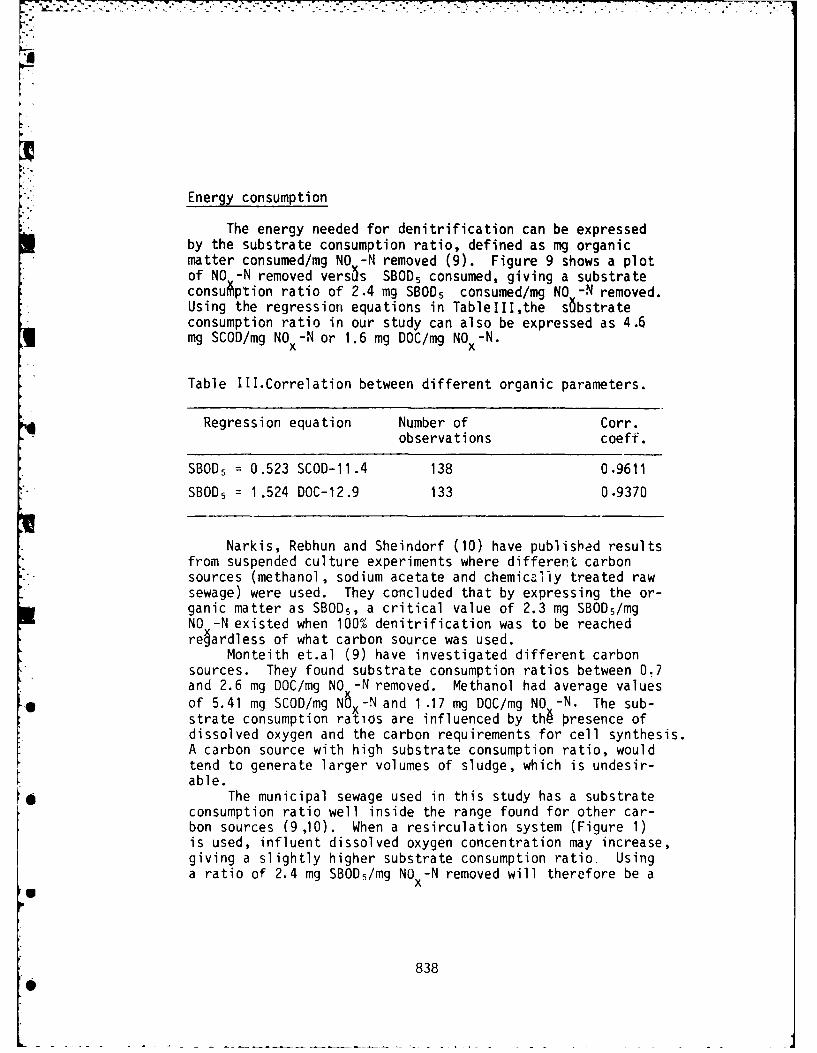
Energy consumption
The energy needed for denitrification can be expressedby the substrate consumption ratio, defined as mg organicmatter consumed/mg NO -N removed (9). Figure 9 shows a plotof NO -N removed vers6s SBOD 5 consumed, giving a substrateconsuption ratio of 2.4 mg SBODs consumed/mg NO -N removed.Using the regression equations in TableIII,the sbstrateconsumption ratio in our study can also be expressed as 4.6mg SCOD/mg NO x-N or 1.6 mg DOC/mg NOx -N.
Table III.Correlation between different organic parameters.
Regression equation Number of Corr.observations coeff.
SBOD5 = 0.523 SCOD-11.4 138 0.9611
SBOD5 = 1.524 DOC-12.9 133 0.9370
Narkis, Rebhun and Sheindorf (10) have published resultsfrom suspended culture experiments where different carbonsources (methanol, sodium acetate and chemically treated rawsewage) were used. They concluded that by expressing the or-ganic matter as SBOD5 , a critical value of 2.3 mg SBOD5/mgNO -N existed when 100% denitrification was to be reachedregardless of what carbon source was used.
Monteith et.al (9) have investigated different carbonsources. They found substrate consumption ratios between 0.7and 2.6 mg DOC/mg NO -N removed. Methanol had average values
A of 5.41 mg SCOD/mg N.-N and 1.17 mg DOC/mg NO -N. The sub-strate consumption ratios are influenced by th6 presence ofdissolved oxygen and the carbon requirements for cell synthesis.A carbon source with high substrate consumption ratio, wouldtend to generate larger volumes of sludge, which is undesir-able.
* The municipal sewage used in this study has a substrateconsumption ratio well inside the range found for other car-bon sources (9,10). When a resirculation system (Figure 1)is used, influent dissolved oxygen concentration may increase,giving a slightly higher substrate consumption ratio. Usinga ratio of 2.4 mg SBOD 5/mg NO x-N removed will therefore be a
x
838
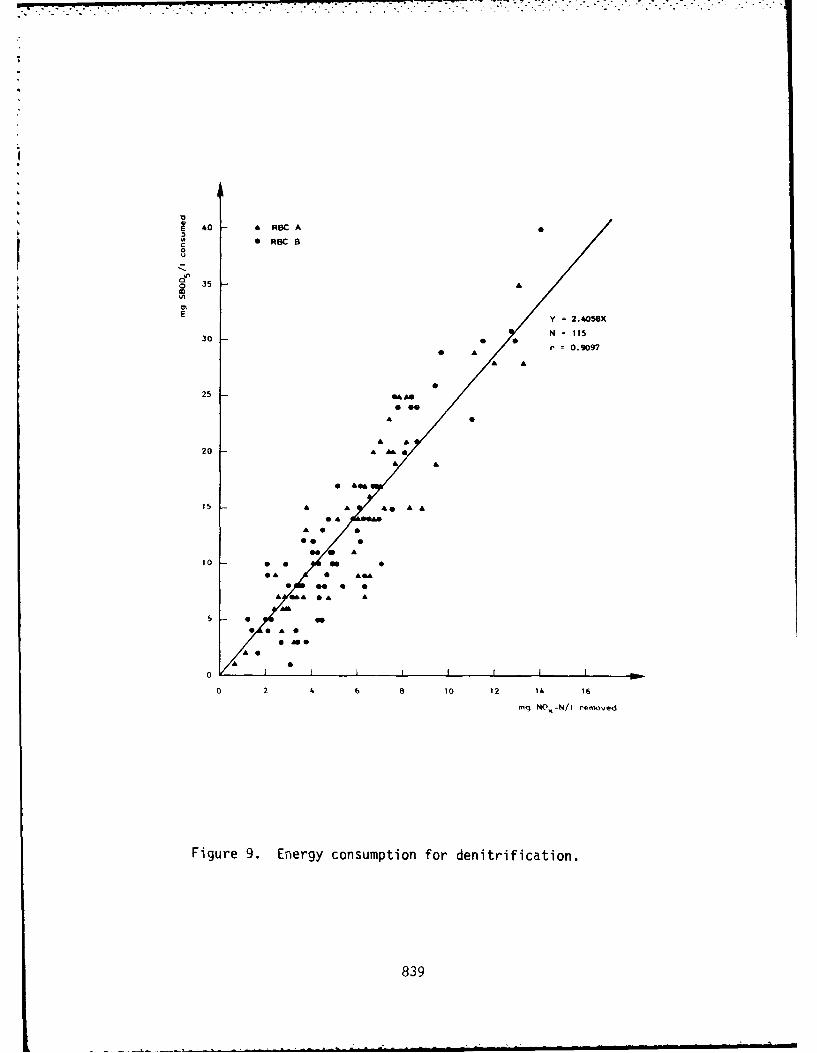
E 40 A SC A'o~o • ROC B
0A
35
E Y =2.4050X
30 N =115
A r 0.9097
25A AAA
A
25 e~
A oe
20 A
20A A A
A A
10 A O
0
A00 A
0 0
0 26 10 12 14 16
mgN(I-N/t en~e
Figure 9. Energy consumption for denitrification.
839
A 6?
K.
safe assumption when calculating the organic load on thenitrifier.
Alkalinity production
Denitrification produces alkalinity. Theoretically 1mole NO-N removed gives 1 mole OH . This corresponds to anincrease of 0.0714 meq/mg NO3 -N removed.
Figure 10 shows the alkalinity production. It is foundto be 0.0713 meq/mg NO -N removed, which is very close to thetheoretical value. Using a R3C pilot-plant with methanol ascarbon source, Smith and Khettry (11) observed a gain in al-kalinity of 0.074 meq/mg N03-N removed (3.7 mg CaCO 3/mgN03-N).
SUMMARY AND CONCLUSIONS
Denitrification studies have been performed in two sub-merged bio-disc units, using presettled sewage as carbonsource.
The conclusions are as follows:
1. The denitrification rate at 15'C and pH 7 could be de-scribed by the equation:FLNOx-NRNO -N = 12.72 335 .LNON S SBOD5' adding the limit
xx
RNO xN < LNO -N
where
SRNO -N = denitrification rate, mg/m2 .hx
LNO -N = NO -N load, mg/m 2 .hx
4 0 SBOD influent SBOD5 concentration, mg/
2. For the system shown in Figure 1, denitrification can beregarded a O.order reaction with respect to NO -N concen-tration, and a 1.order reaction with respect t SBOD,concentration.
6
840
--6
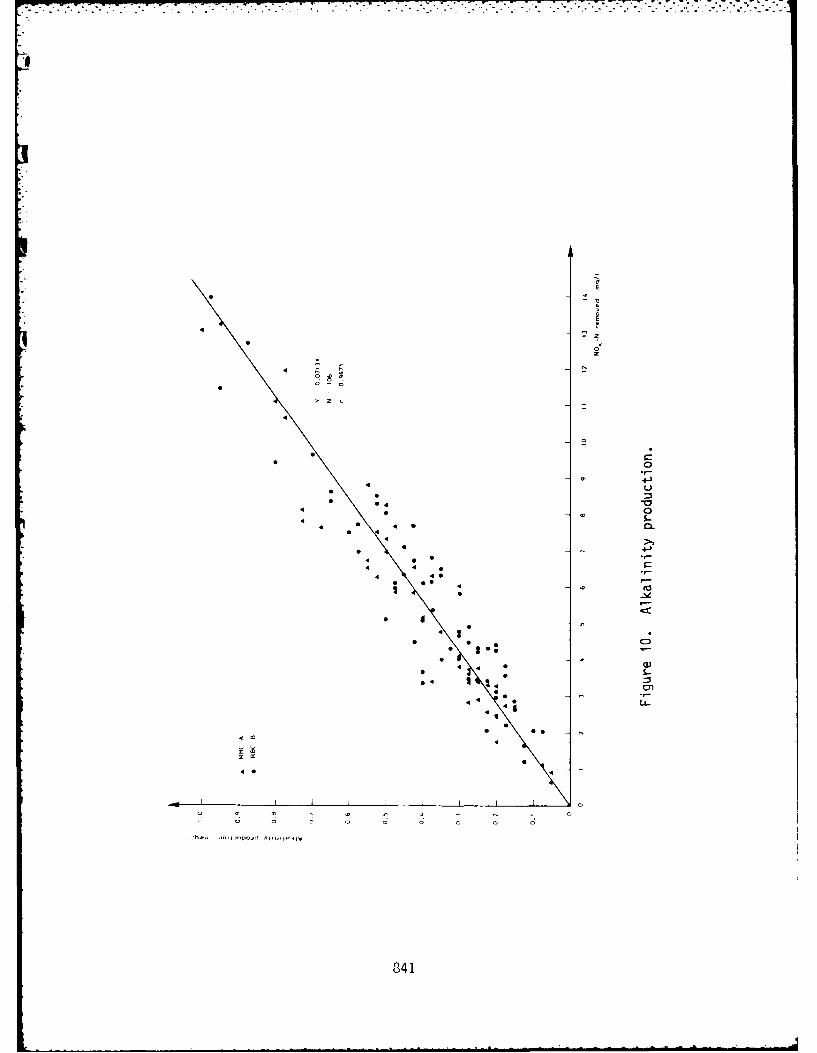
* r .-
|--
|.4
|S
4 0
4 -
4 4 -!4 • • 4 45
4 -r0
S I"
441
- .- , • . .-- 4- - - " " '- " " - -. : - - " - " r . . ... ' " i "
: b - . '-.. -. . , . . "
3. Temperature dependency was modelled using an Arrheniusequation. This gave an activation energy of 39670 J/mole,corresponding to a temperature coefficient (0) of about 1.06.
4. Optimum pH lies between 7 and 8.5.
5. The energy consumption for denitrification has been foundto be 2.4 mg SBOD5/mg NOx -N removed.
6. The alkalinity production has been found to be 0.0713 meq/mg NO -N.x
eACKNOWLEDGMENT
The authors wish to thank The Royal Norwegian Council forScientific and Industrial Research for financial support.Also we want to thank Goril Thorvaldsen for assisting in someof the analytical work.
5 842
LIST OF SYMBOLS
0 = temperature coefficient= maximum specific growth rate
d = thickness of the active biological layerk = constantr = correlation coefficientA = area of biological filmA = frequency factor in the Arrhenius equationC = constantDOC = dissolved organic carbonE = activation energyKs = saturation coefficientLNO x -N = NO x -N load
NO2 -N = nitrite nitrogen
NO 3-N = nitrate nitrogen
NO x-N = Z N02-N + N03-NQ = hydraulic flow rateR = gas constant (8.314 J/mole.0 K)RNO -N = denitrification ratex
RT = denitrification rate at temperature TRD = relative denitrification rateS = influent substrate concentrationS, = effluent substrate concentrationSBODs = soluble 5-day biochemical oxygen demandSCOD = soluble chemical oxygen demand (Cr)T = absolute temperatureX = concentration of organisms in the biological filmY = yield
843
RE FERE NCE S
1. Odegaard, H.,and Rusten, B., "Nitrogen Removal in RotatingBiological Contactors Without the Use of External CarbonSource", Proceedings of the First National Symposium onRotating Biological Contactor Technology, Champion,Pennsylvania, Feb. 4-6, 1980, pp. 1301-1317.
2. Christensen, M.H., and Harremo~s, P., "Biological Denitri-fication of Sewage: A Literature Review", Progress of WaterTechnology, Vol. 8, No. 4/5, pp. 509-555, 1977.
3. Cheung, P.S.,"Biological Denitrification in the Rotating-Disc System", Water Pollution Control, Vol.79, No.3,pp. 395-408,1979.
4. Kornegay, B.H., and Andrews, J,F., "Kinetics of Fixed-FilmBiological Reactors", Journal of Water Pollution ControlFederation, Vol.40, No. 11, Part 2, pp. R 460-R 468,1968.
5. Dixon, W.J., and Brown, M.B., "Biomedical Computer Programs,P-Series,1977", Health Sciences Computing Facility, Depart-ment of Biomathematics, School of Medicine, University ofCalifornia, Los Angeles, 1977.
6. Requa, D.A., and Schroeder, E.D., "Kinetics of Packed-BedDenitrification", Journal of Water Pollution Control Feder-ation, Vol. 45, No. 8, pp. 1696-1707, 1973.
7. Murphy, K.L., et.al., "Nitrogen Control: Desiqn Consider-ations For Supported Growth Systems", Journal of Water Pol-lution Control Federation, Vol. 49, pp. 549-557, 1977.
8. Davys, T.R., and Pretorius, W.A., "Denitrification With aBacterial Disc Unit", Water Research, Vol.9, pp.459-463,1975.
9. Monteith, H.D., Bridle, T.R., and Sutton, P.M., "IndustrialWaste Carbon Sources For Biological Denitrification",
4 Progress of Water Technology,Vol.12. Toronto,pp.127-141,1980.
10. Narkis,N., Rebhun,M.,aid Sheindorf,Ch., "Denitrificationat Various Carbon to Nitrogen Ratios'", Water Research,Vol.13, No.1, pp.93-98, 1979.
11. Smith,A.G., and Khettry,R.K., "Nitrification/Denitrifica-* tion Studies With Rotating Biological Cor.tactors",Proceed-
ings of the First National Symposium on Rotating BiologicalContactor Technology,Champion,Pennsylvania,Feb.4-6,1980,pp.1319-1341.
844
OPERATION OF A RETAINED BIOMASS NITRIFICATION SYSTEM FORTREATING AQUACJLTURE WATER FOR REUSE
D. E. Brune - Department of Agricultural Engineering,C The Pennsylvania State University, University Park,
Pennsylvania.
R. Piedrahita - Department of Agricultural Engineering,University of Calilfornia, Davis, California.
ABSTRACT
A series of experimental trials were conducted in which* - a variety of polyurethane materials of differing pore size
MC were evaluated as a media for nitrifying filters used in
treating water in a trout hatchery. These filters were foundto be capable of ammonia oxidation rates ranging from 80-180mg-N/day/liter of filter volumes. These rates represent anorder of magnitude increase over removal rates in conventionalrock filters operating at influent ammonia levels at or below0.5 mg/liter. These rates were, however, 50 to 100% lowerthan the rates observed for a similar filter design operatingunder laboratory conditions. The difference was attributedto increased heterotropic fouling experienced during thefield operations. The optimum design for the field unit wasfound to be an initial stage of open pore media to accept theheterotropic loading followed by a second stage of fine porematerial to allow for complete nitrification. Such filtersmay be operated at detention times less than four minutes
achieving well over 90% ammonia removal.
845
INTRODUCTION
In the majority of cases in which low levels of ammoniaor nitrite must be removed from water supply systems, one of
two techniques have been utilized, either biological nitrifi-cation or breakpoint chlorination. Gauntlet (1) comparedbiological nitrification to breakpoint chlorination as a meansof treating water for potable supply. He suggests that thedisadvantages of relatively long contact time required for
chlorination, compounded by interferences from organic compoundsand potential production of dichloramines, trihalomethanes andother organochlorine compounds, makes nitrification a more
desirable means of low level ammonia removal from potable watersupply. Short (2) suggests that the fluidized bed nitrifi-cation process is cheaper than breakpoint chlorination when theammonia levels to be removed exceed 0.2 mg/l.
Brune and Gunther (3) suggest that biological nitrifi-cation could, in fact, be used to economically remove lowlevels of ammonia from recirculating aquatic animal culturefacilities. Studies conducted by Gunther et. al (4) indicatethat ammonia levels ranging from 0.05 to 0.50 mg/l could beexpected in such systems. The lower limit on these concen-
rtrations appear to favor breakpoint chlorination.
Unfortunately, however, the dangers of chronic toxicity tofish from dichloramines or the possibility of acute toxicity
from accidental chlorine overdose makes this an undesirable
system for treating aquaculture reuse water.
In spite of the reduced rate of biological nitrificationat these low ammonia levels, these sytems can be made tooperate at high efficiency if the lower bacterial growth ratecan be compensated for by carrying much higher levels of totalbiomass within the filter units, and at the same tinie, usinga filter media which permits high water passage rates. Bruneand Gunther (3) proposed the use of a "Retained Biomass Filter"for such systems. These filters consist of submerged, downflow
columns of polyurethane cubes or sheets contained within ridgecells of plastic netting. When tested under laboratoryconditions, such filters were capable of oxidizing ammonia atrates of 100-400 mg-N/day/liter of filter volume as compared
to 10-30 mg-N/day/liter for conventional aquaculture filter
designs.
846
74
The purpose of this study was:t further examine ti-e*behavior of teertie ims itr.I atclr
this study was directed at examining the success of threesuch filter units under actual field conditions and to selectthe appropriate media pore size yielding optimum performance.
1METHODS AND MATERIALS
This study consisted of three separate trial runs with abank of filter units installed at the University of California-Davis trout hatchery previously described (4). Figure 1illustrates the three filter units and the containment building.Figure 2 shows the placement of the filter units in relation tothe trout culture and water storage tanks and rapid sandfilters.
Each of the filter units consisted of a plexiglass tube 2ft. deep by 1 ft. in diameter, sealed at each end with aremovable plywood section. During the runs, the tubes werefilled with varying types and configurations of polyurethanematerial.
Water exiting from the trout culture tanks would firstpass through the solids settling tank (with approximately 2minute detention time) and then be distributed to each ofthe three filter units. Flow rates to the individual filterunits were controlled by 1/2 inch plastic valves and rangedfrom 3-7 liters/minutes giving filter detention times averag-ing 3-4 minutes. Each of the filters units was equipped with7 sample ports at 2 inch intervals for sampling purposes.Total pressure drop across the filters was limited to 4 inches.
In the first experimental trial, each of the 3 units wasfilled with a different media type consisting of: 1) 1/2 inch~square cubes cut from a dense polyurethane material with poresize of 0.1 mm. The cubes were loosely packed in six two inchdeep ridge cells fabricated from "conwed" plastic nettingmaterial, 2) 1/2 inch square cubes in a similar arrangement butcut from a lighter polyurethane material of approximately 0.15mm pore size, 3) a similar arrangement except the light poly-urethane material (0.15 mm) was arranged as uncut circularsheets I inch thick stacked 24 deerp. These filter units wereoperated for approximately three months. Inlet ammonia levelsranged from 0.25 to 0.40 mg/l depending on fish loading andwater flow rates.
847
In the second experimental run, three different pore sizeswere evaluated. These were a 2.0 mm, 1.3 mm, and 0.5 mm poresize in an open mesh polyurethane material ("Scott" brandindustrial foam obtained from Wilshire Foam Products, Inc.,
Carson, California). In all cases, the material was distri-buted in the columns as 12 inch uncut circular disks 1 inch
thick with 2 disks per ridge cell with a total of 24 disks.The ridge plastic screen was designed to prevent compactionof the filter media during operation. These filters were also
operated for a period of 3 months with inlet ammonia levels
ranging from 0.25 to 0.50 mg/l.
In the last experimental run, the three filter units wereoperated with a mixture of pore sizes: 1) arrangement Aconsisted of 100% 2 mm pore size, 2) arrangement B consisted
of one half 2 mm pore size with one half of the 0.5 mm poresize, 3) arrangement C consisted of one third 2 mm, one third1.3 mm, and one third 0.5 mm pore sizes. In all cases, thefilter media were arranged with largest pore sizes toward thetop of the column. This last run lasted 2 months and ammonia
concentrated ranged from 0.10 to 0.35 mg/l.
During each run, water samples were routinely taken frominlet, outlet, and across the columns. Samples were takenevery 3 to 7 days depending on operating conditions. Filterperformance was evaluated by monitoring ammonia removal ratesacross the columns. Ammonia concentrations were determined bythe phenolhypochlorite method of Solorzano (5) with modifi-cation of Liddicoat et. al (6). Reagent grade hypochloritesolution was used to make up the oxidizating solution as out-lined by Solorzano. Liddicoat et. al (6) suggested that more
consistent reagent blanks could be obtained by substitutingpotassium ferrocyanide as the catalyst in place of sodiumnitroprusside. This modification of the phenolhypochloritemethod was used in the present study.
Water samples were assayed within one hour of sampling.Preliminary tests showed that they lose about 1% of theirammonia per hour when stored at 180 C. No correc n factorwas used, however, in the calculation of ammonia concentration.
* Samples were simply assayed as soon as possible. A calibrationcurve was made for determining the ammonia concentration.
The standard deviation of a 25 x 10-6 molar (0.35 mg NH3-N/l)ammonia sample was + 9% using one centimeter round curvettesand a B & L Spec 20 spectrophotometer. Nitrite was measuredcolorimetrically by the method of Strickland and Parsons (7).
848
RESULTS AND DISCUSSION
Figure 3 and Table 1 give data previously presented byBrune and Gunther (3) obtained from a laboratory nitrifyingfilwr Fi.1gu pre 3sostathsie mdias wereg cabl iconflfilter Fir 3 shows tha thresie uni using cabl icown
ammniaoxiatin rtesashigh as 250 mg-N/day/liter, and thatthese removal rates could be correlated reasonably well to theinfluent average ammonia concentration, if separated intodetention time groups. In contrast, typical field filters usedin aquaculture operation (Kramer, Chin, & Mayo; Table 1)operated at rates aa order of magnitude lower. In fact, theprevious laboratory results represented removal rates moreclosely approaching rates observed by Hlaug & McCarty (9) infilters operating at high ammonia input levels.
In comparison, the removal rates observed for the firstseries of field units (Figure 4) in this study averaged onlyaround 40 mg-N/day/liter with total ammonia removal of 60-70%across the entire length of the column. The reason for thislower removal was obvious from visual inspection of thefilters. The retained bimass filter operates on the princi-ple that essentially 100% of the accumulated bacterial hiomassis retained within the filter media. When these bacteriallevels become restrictive to the water flow rate, the filterbed is washed, thus the biomass levels in the filter areexternally controlled, rather than depending on sloughingrate, as in the case of conventional rock filters. Althoughthe low pore size material permitted high nitrificationrates and high flow rates in the laboratory, this was notthe case in the field operation. The smaller pore operatingunder field conditions rapidly became clogged from hetero-trophic growth as a result of the low levels of dissolvedorganics (- 10 mg/l) and finely divided particulates presentin the trout water. As a result, frequent washing of thefilter media was required, drastically reducing the totalnitrifying biomass. The 0.5-1.3 mm, pore was judged in-appropriate for field use and the run was abandoned after3 months operation. However, the data (Figure 3) does givea good indication of the length of time required for filterstart-up. ks can he seen, approximately two months wereneeded to establish a completely nitrifying filter. Thefilters would typically rise to a high rate of nitrifi-
849
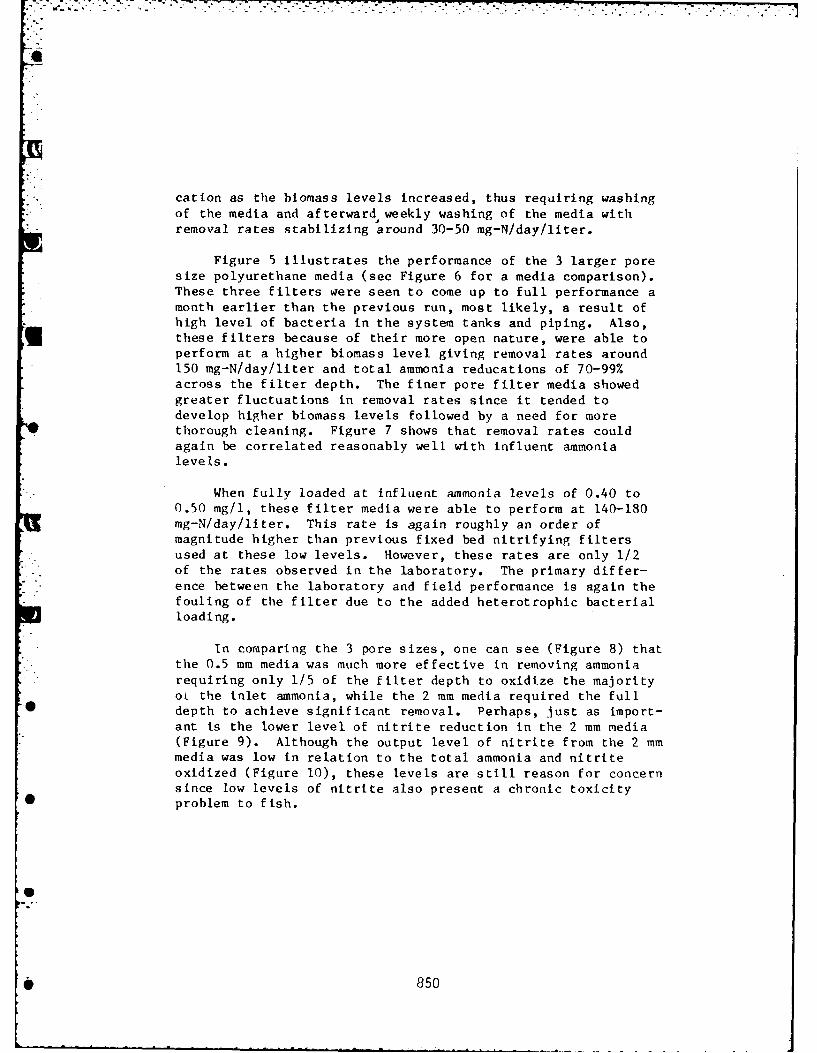
cation as the biomass levels increased, thus requiring washingof the media and afterward weekly washing of the media with
* * removal rates stabilizing around 30-50 mg-N/day/liter.
Figure 5 illustrates the performance of the 3 larger poresize polyurethane media (see Figure 6 for a media comparison).These three filters were seen to come up to full performance amonth earlier than the previous run, most likely, a result ofhigh level of bacteria in the system tanks and piping. Also,these filters because of their more open nature, were able toperform at a higher biomass level giving removal rates around150 mg-N/day/liter and total ammonia reducations of 70-99%across the filter depth. The finer pore filter media showedgreater fluctuations in removal rates since it tended todevelop higher biomass levels followed by a need for morethorough cleaning. Figure 7 shows that removal rates couldagain be correlated reasonably well with influent ammonialevelIs.
When fully loaded at influent ammonia levels of 0.40 to0.50 mg/l, these filter media were able to perform at 140-180mg-N/day/liter. This rate is again roughly an order ofmagnitude higher than previous fixed bed nitrifying filtersused at these low levels. However, these rates are only 1/2of the rates observed in the laboratory. The primary differ-ence between the laboratory and field performance is again thefouling of the filter due to the added heterotrophic bacterialloading.
in comparing the 3 pore sizes, one can see (Figure 8) thatthe 0.5 mm media was much more effective in removing ammoniarequiring only 1/5 of the filter depth to oxidize the majorityop the inlet ammonia, while the 2 mm media required the full
*depth to achieve significant removal. Perhaps, just as import-ant is the lower level of nitrite reduction in the 2 mm media(Figure 9). Although the output level of nitrite from the 2 mmmedia was low in relation to the total ammonia and nitriteoxidized (Figure 10), these levels are still reason for concernsince low levels of nitrite also present a chronic toxicity
" problem to fish.
* 850
Finally, Figures 11, 12, and 13 show data taken from runthree in which the media types were mixed. Filters B and Crepresent the most successful modification. As seen in
K'., Figure 11, removals ranged from 80 to 120 mg-N/day/liter.This removal efficiency is at the same level as the previousruns when consideration is given to the reduced influentammonia levels experienced during these trials as a result oflower fish loading during this period (Figure 14). Figure 12shows the same correlation between filter performance andaverage influent ammonia levels as previously demonstrated.
The important advantage of the combination of pore sizesin the filter were: 1) the filter could be maintained athigh flow rates with only a weekly or biweekly washing of thefilter media since the heterotrophic biomass was carried inthe upper, more open pored layers and 2) a high level of nitri-fication including more complete nitrite removal could bemaintained in the lower, smaller pored media.
851
*17
SUMMARY AND CONCLUSIONS
As a result of a series of pilot tests conducted in atypical trout culturing facility, a more optimum design ofa biological nitrifying filter for treatment of low levelammonia laden water has been achieved. The data obtainedin this study indicates that a reasonably high rate ofammonia and nitrite oxidation (140-180 mg-N/day/liter) canbe achieved with an approximately 3-4 minute detention timewhen u-sing a filter design consisting of 6-10 inches of 2mm open polyurethane followed by 6-10 inches of 0.5 mmpolyurethane filter media. These filters act as completebiomass capture systems and require weekly to biweekly solidsremoval for optimum performance.
- The initial larger pore section of this filter acts as apartial nitrifying and complete organic reduction unit, whilethe second smaller pore section allows for more completenitrification. The two stage design allows for a sustainedhigh water passage rate requiring a minimum of filter washing.
Additional work should be conducted to develop a low cost,automatic design for controlling the biomass washing of thesefilter media in large scale units. Secondly, a filter mediamaterial is needed that is more resistant to degradation.After one year of operation all polyurethane media used inthis study had undergone severe degradation, so much so, thatthey would have needed replacement had the ex-eriments con-tinued for a longer period of time.
* 852
ACKNOWLEDGEMENTS
This research was made possible by funds provided by theUniversity of California - Davis Aquaculture Program. At thetime of t',Is study D. E. Brune was Assistant Professor ofAgricultural Engineering at UCD. R. Piedrahita was a ResearchAssistant in Agricultural Engineering at UCD.
853
9
REFERENCES
1. Gauntlett, R. B., "Removal of Ammonia and Nitrate in theTreatment of Potable Water," In Biological Fluidized BedTreatment of Water and Wastewater, Edited by P. F. Cooperand B. Atkinson, Ellis Horwood Limited, 1981.
2. Short, C. S., "Removal of Ammonia from River Water,"Technical Report, Medmenham, Water Research Centre, 1975,52 pages.
3. Brune, D. E., and Gunther, D. C., "The Design of a New HighRate Nitrification Filter for Aquaculture Water Reuse,"Journal of the World Mariculture Society, In press, 1981Edition.
4. Gunther, D. C., Brune, D. E., and Gall, G. A. E., "AmmoniaProduction and Removal in a Trout Rearing Facility,"Transactions of the American Society of AgriculturalEngineers, Vol. 24, No. 5, pp. 1376-1380, 1981.
5. Solorzano, L., "Determination of Ammonia in Natural Watersby the Phenol Hypochlorite Method," Limmol. Oceanogr.,14:799-801, 1969.
6. Liddicoat, M. I., Tibbitts, S., and Butler, E. I., "TheDetermination of Ammonia in Sea Water," Limmol. Oceanogr.,20:131-132, 1975.
7. Strickland, J. D. 11., and Parsons, T. R., "A PracticalHandbook of Sea Water Analysis," Fisheries Research Boardof Canada, Ottawa., 310 pp., 1972.
8. Kramer, C. and Mayo, R. D., "A Study for Developing ofFish Hatchery Water Treatment Systems," ', report preparedfor the Walla Walla District Corps of Engineers, 1972.
9. Haug, R. T. and McCarty, P. L., "Nitrification withSubmerged Filter," Journal WPCF, 44(1l):2086-2103, 1972.
F
To 854
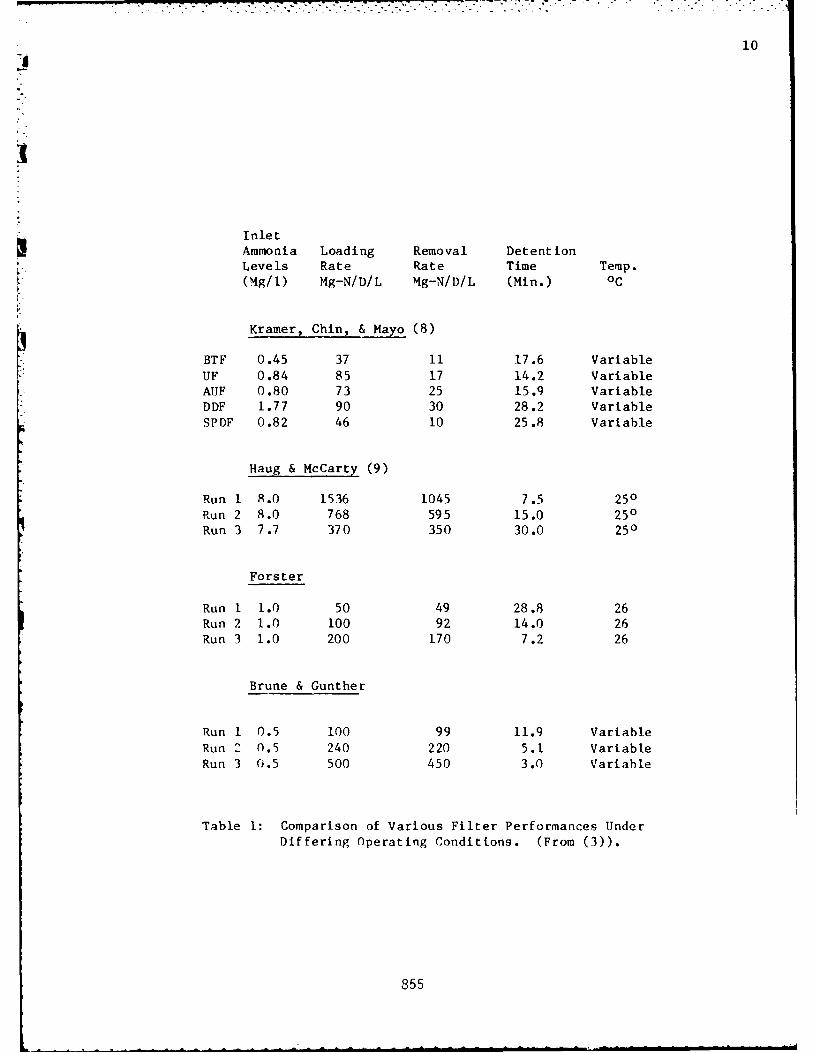
10
InletAmmonia Loading Removal DetentionLevels Rate Rate Time Temp.(Mg/I) Mg-N/D/L Mg-N/D/L (Min.) °C
Kramer, Chin, & Mayo (8)
BTF 0.45 37 11 17.6 VariableUF 0.84 85 17 14.2 VariableAUF 0.80 73 25 15.9 VariableDDF 1.77 90 30 28.2 VariableSPDF 0.82 46 10 25.8 Variable
Haug & McCarty (9)
Run 1 8.0 1536 1045 7.5 250Run 2 8.0 768 595 15.0 250Run 3 7.7 370 350 30.0 250
Forster
Run 1 1.0 50 49 28.8 26Run 2 1.0 100 92 14.0 26Run 3 1.0 200 170 7.2 26
Brune & Gunther
Run 1 0.5 100 99 11.9 VariableRun 2 0.5 240 220 5.1 VariableRun 3 0.5 500 450 3.0 Variable
Table 1: Comparison of Various Filter Performances UnderDiffering Operating Conditions. (From (3)).
855
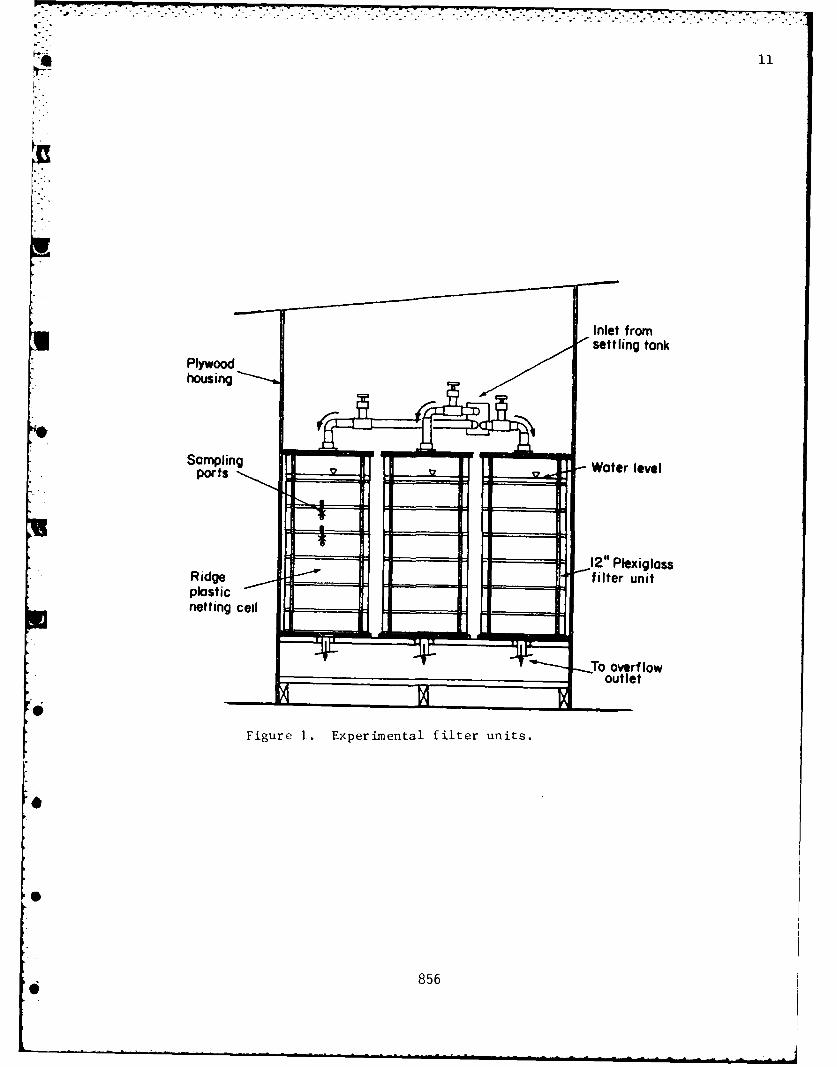
IN
Inlet fromsettling tank
Plywoodhousing
Sampling Watlr.levelports Water level
2" PlexiglassRidge filter unitplasticnetting cell
0T overf lowoutlet
Figure 1. Experimental filter units.
856
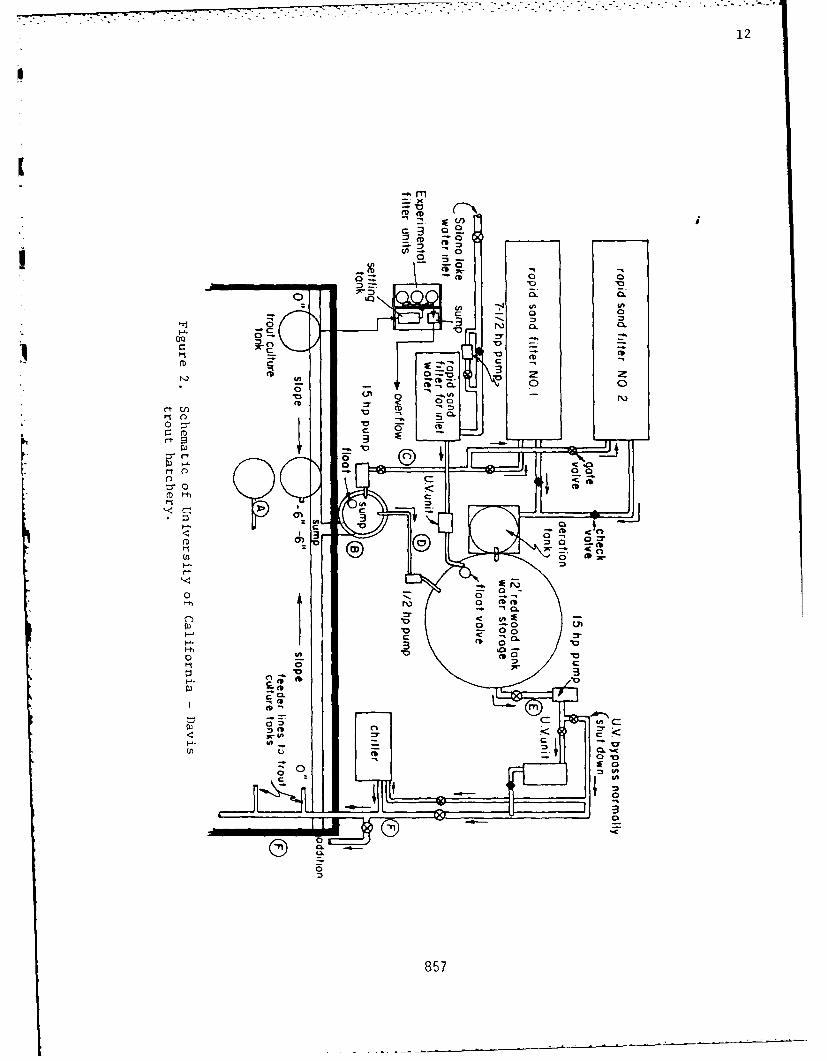
12
SM
x
0n -0
0 CL
cc3 c C
-
H-c
r-tw
0
r-
H-
CC
4Acn 3
8575
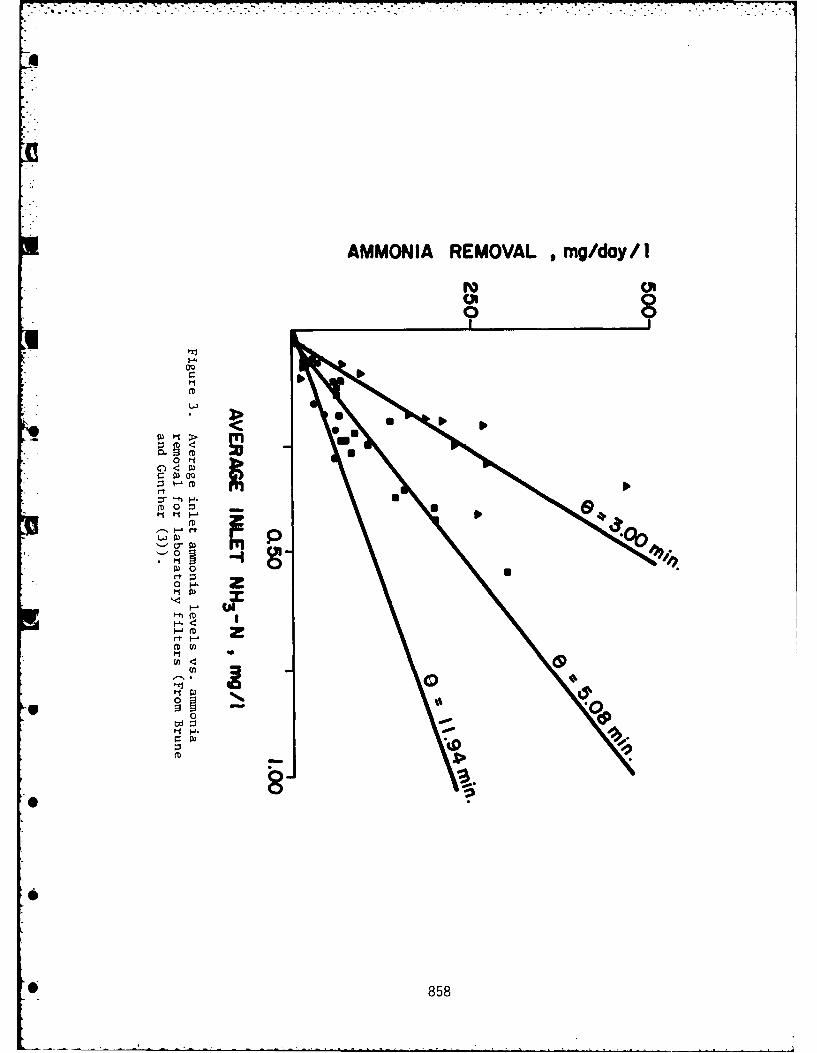
A
AMMONIA REMOVAL ,mg/doy/ I
r_0OQ
: mrt
'- 0 :
P1 zCD
C,) _
0
01
0 0
H 858
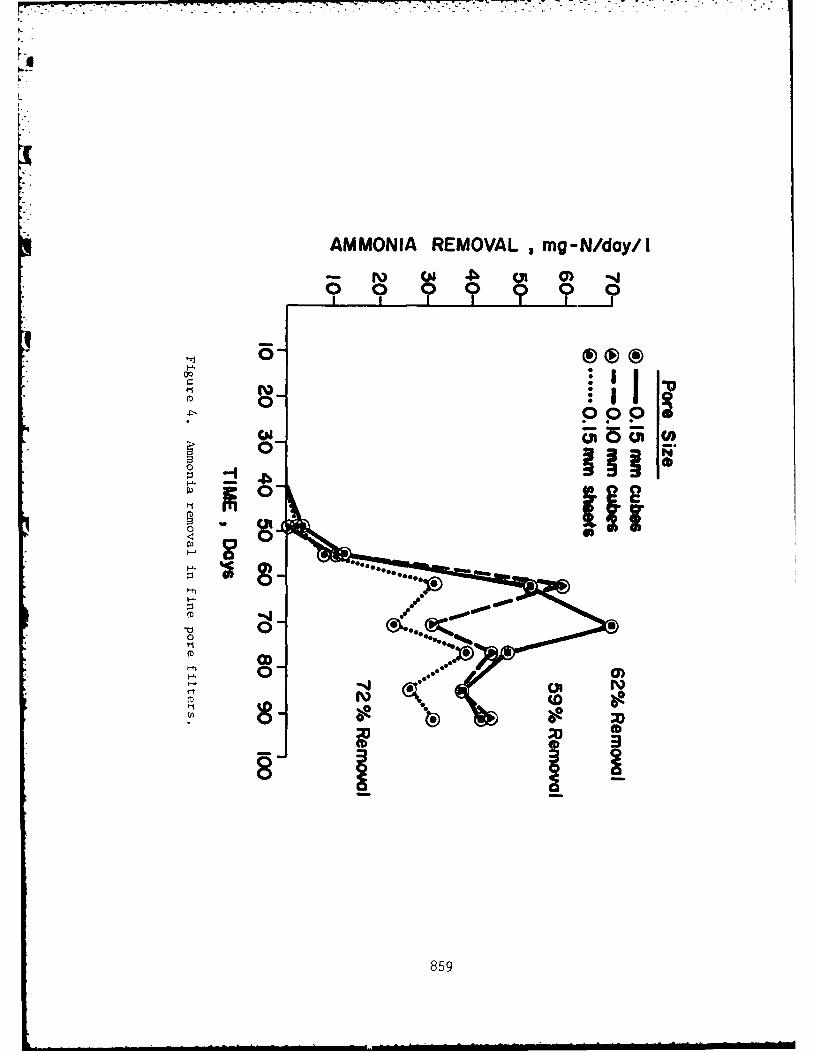
AMMONIA REMOVAL , mg-N/day/i
o 0
000
'*%b
F-'4
859
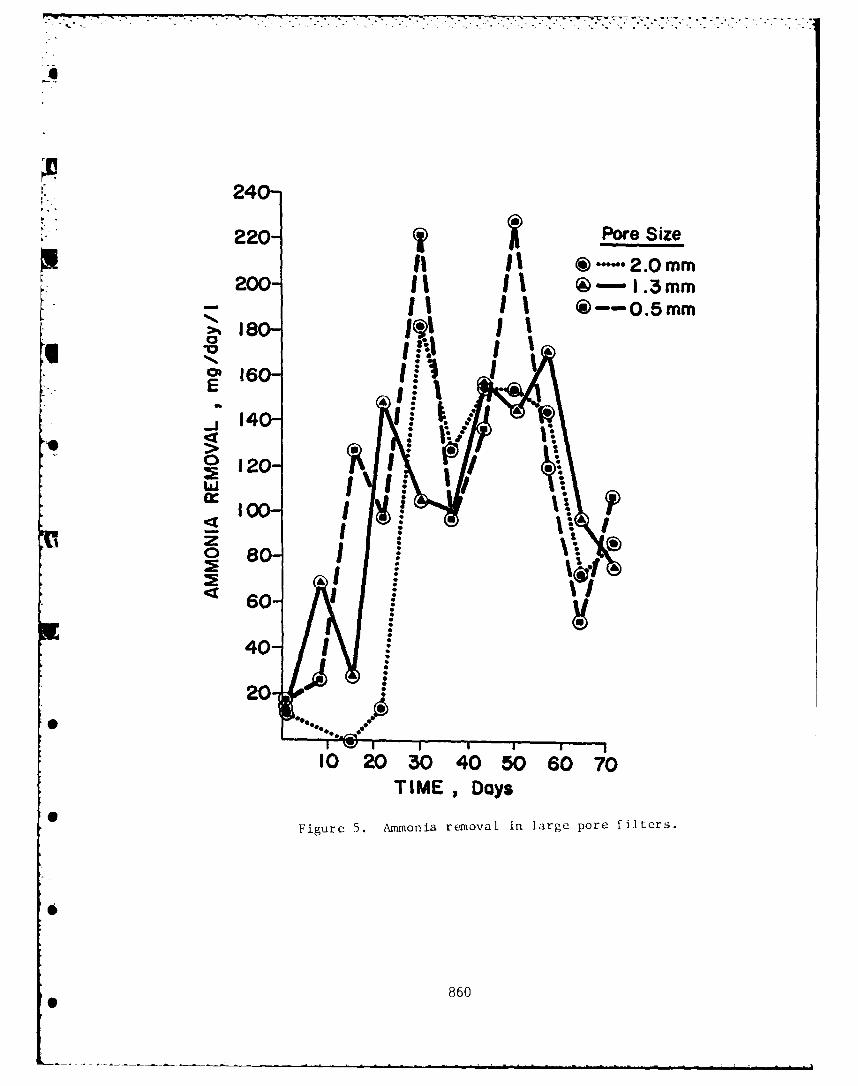
• ,- - * -. . . . . , - -. ' - - -.. -h f - .' - . .- .' : - - - -. - " .. -"
240-220- Pore Size
1| | -2.0 mm200- 11.3mm
1' 1~ @ --- 0.5mm
01 60-,Uo- .!S
., 14 I,
120- ~ :~
IJ 6C)- 'I!480 1
T IME , Days
Figure 5. Ammonia removal in large pore filters.
860
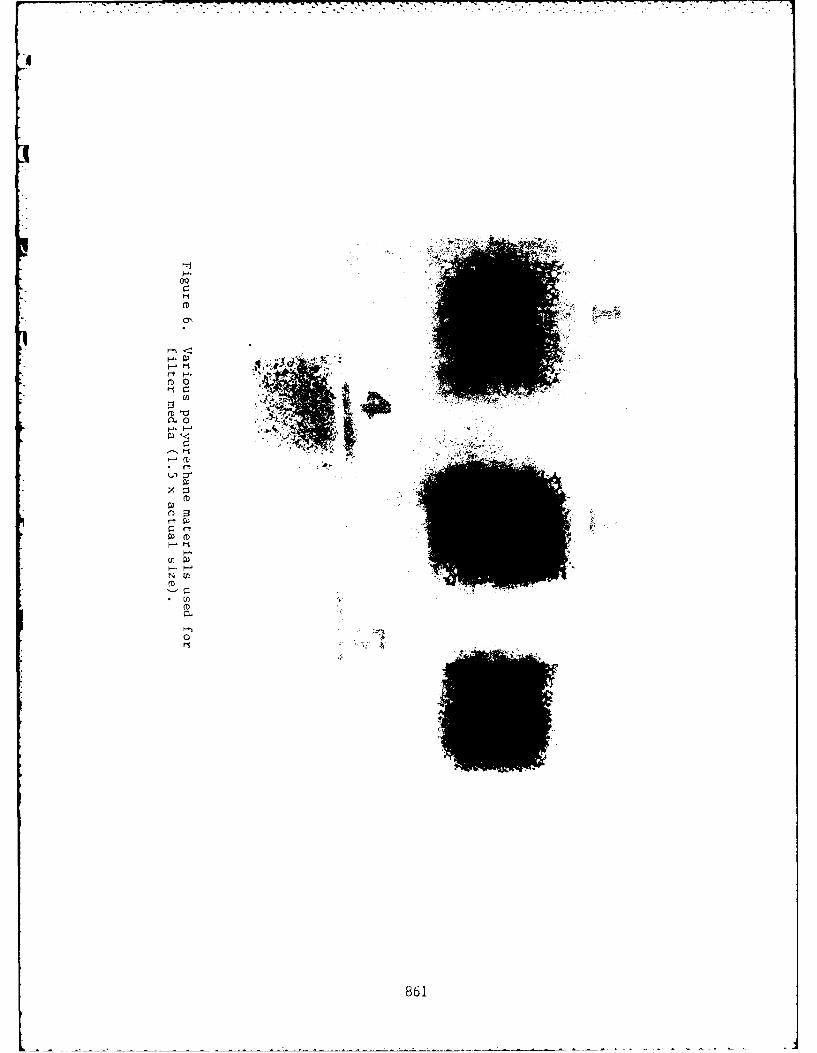
"rT
H86
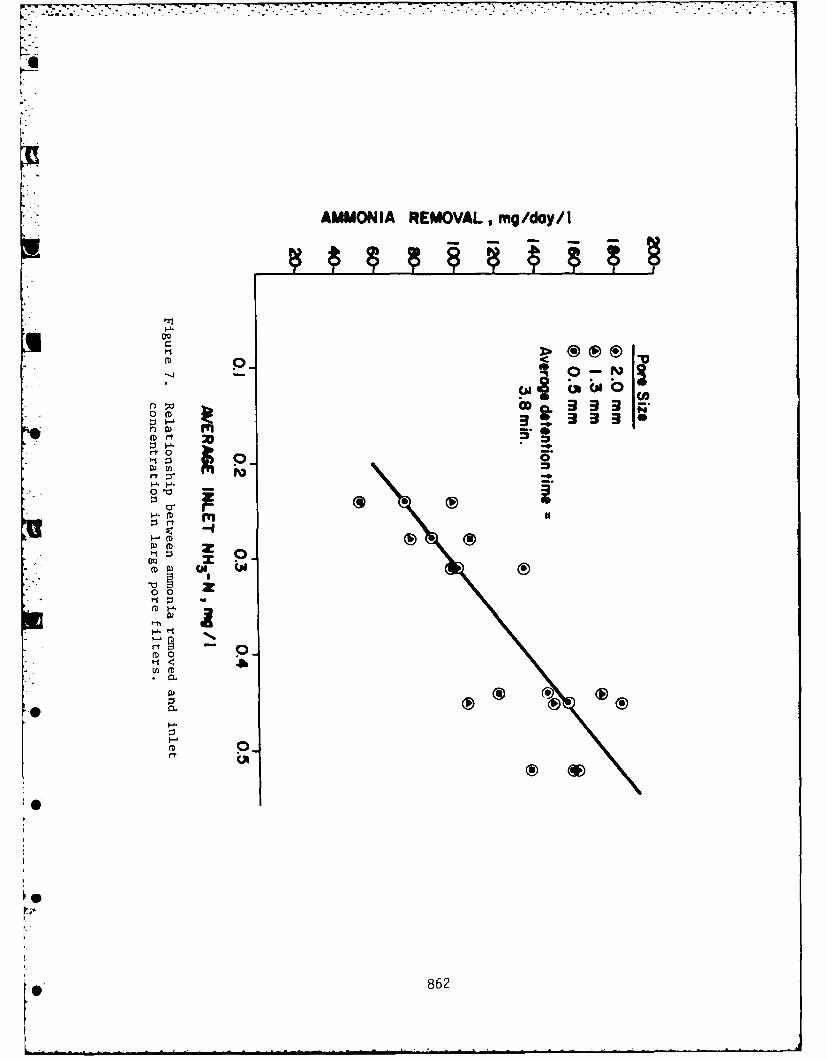
AMMONIA REMOVAL, mg/day/I
OQ
pr? to-r
0 .0I
0 0
(-D 0 7
~rt
q-f
D862
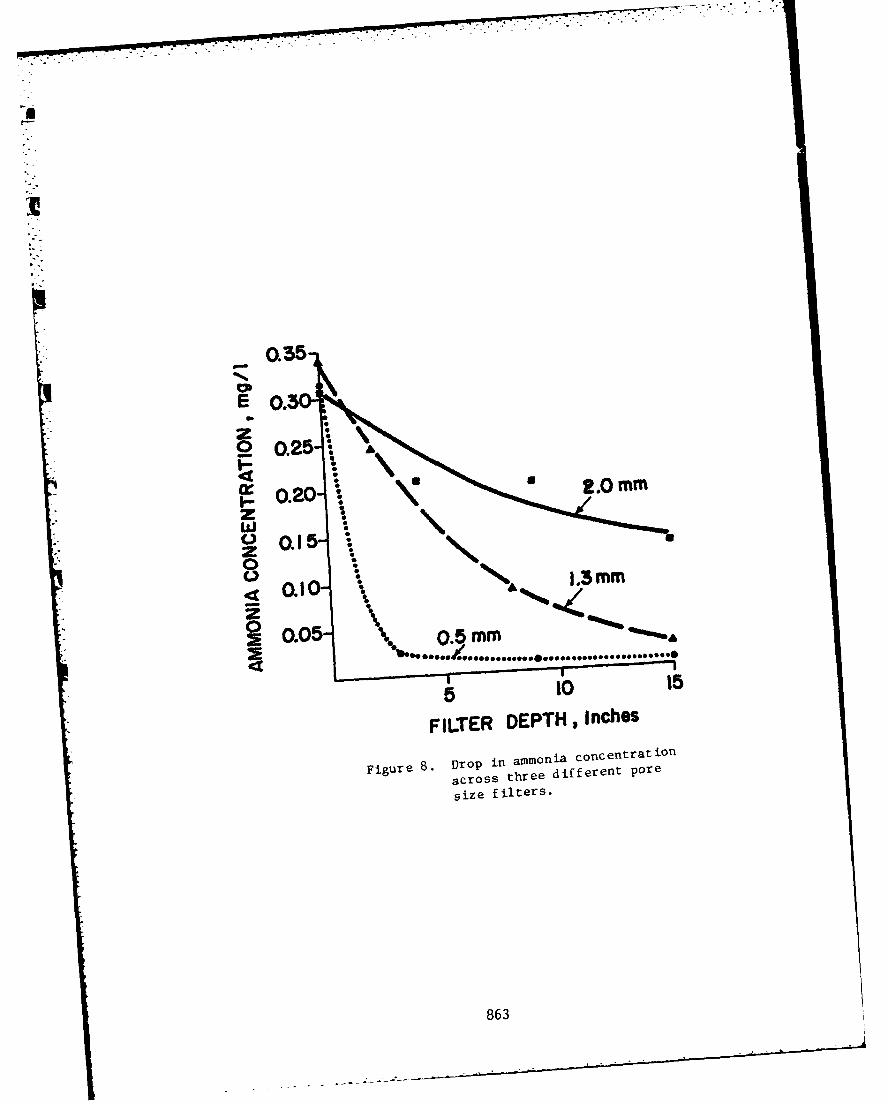
0.35
EO.3
20.25:
U .*mm0.20
U 0.1
0 .10 1.3mm
S0.05 05M
510 15
FILTER DEPTH,. inches
Figure 8. Drop in aMMonia concentration
across three different pore
size filters.
863
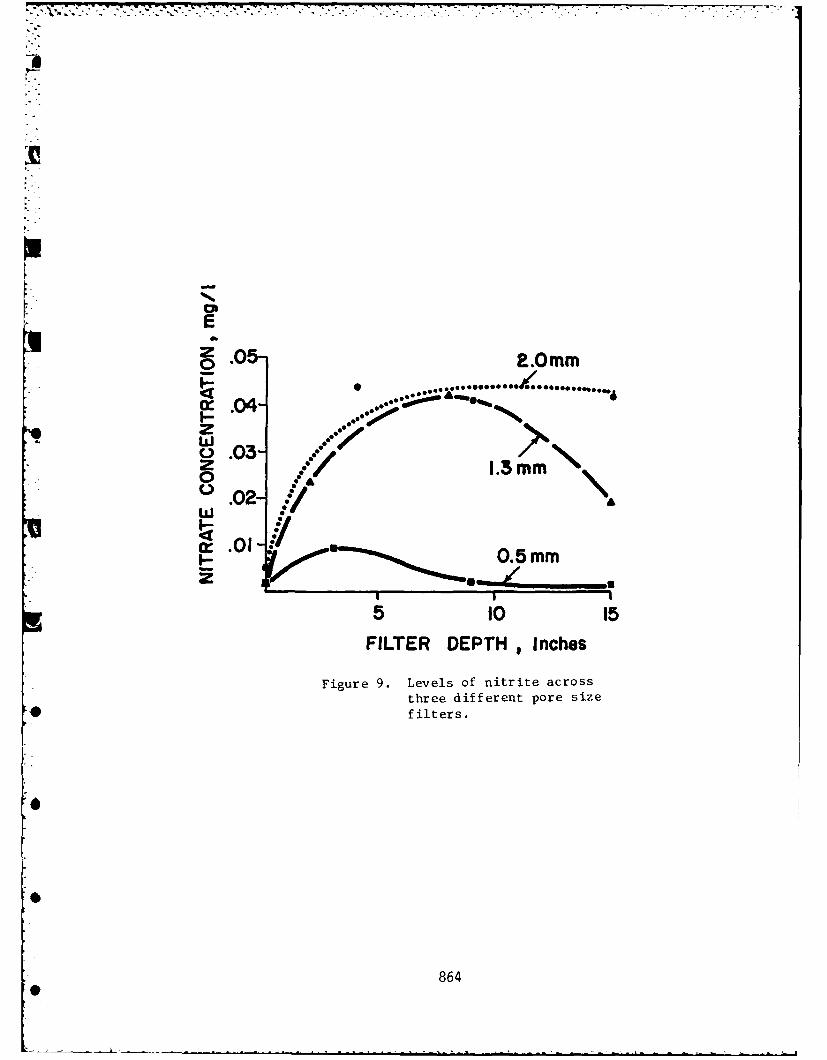
Oh
0 .05- -. 0 mm
02
O~~1.3 5mm
I 0
.....1-- -Y
510 15FILTER DEPTH, Inches
Figure 9. Levels of nitrite acrossthree different pore size
* filters.
8
864
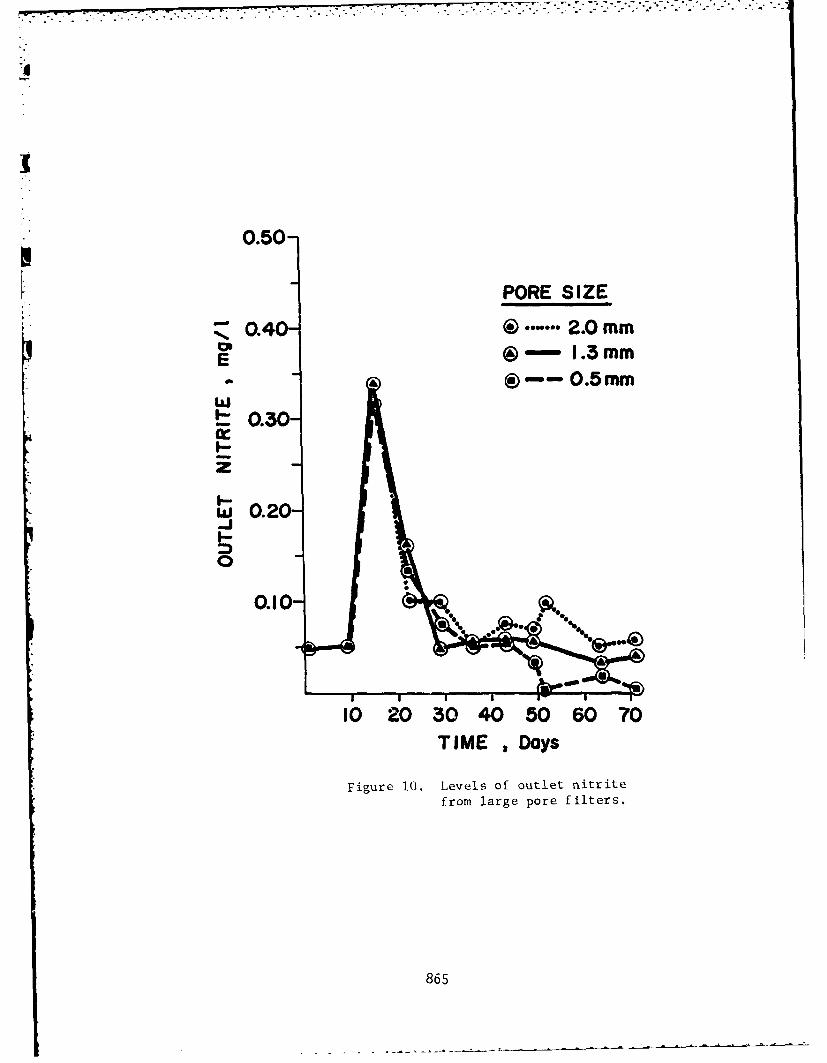
0.50-
PORE SIZE
Z0.40**** 2.0 MM
E ®- 1.3mm* & )-~0.5 m
LU'0.30-
w 0.20-
0
0.10-
10 20 30 4050 6070TIME . Days
Figure 10. Levels of outlet nitritefrom large pore filters.
865
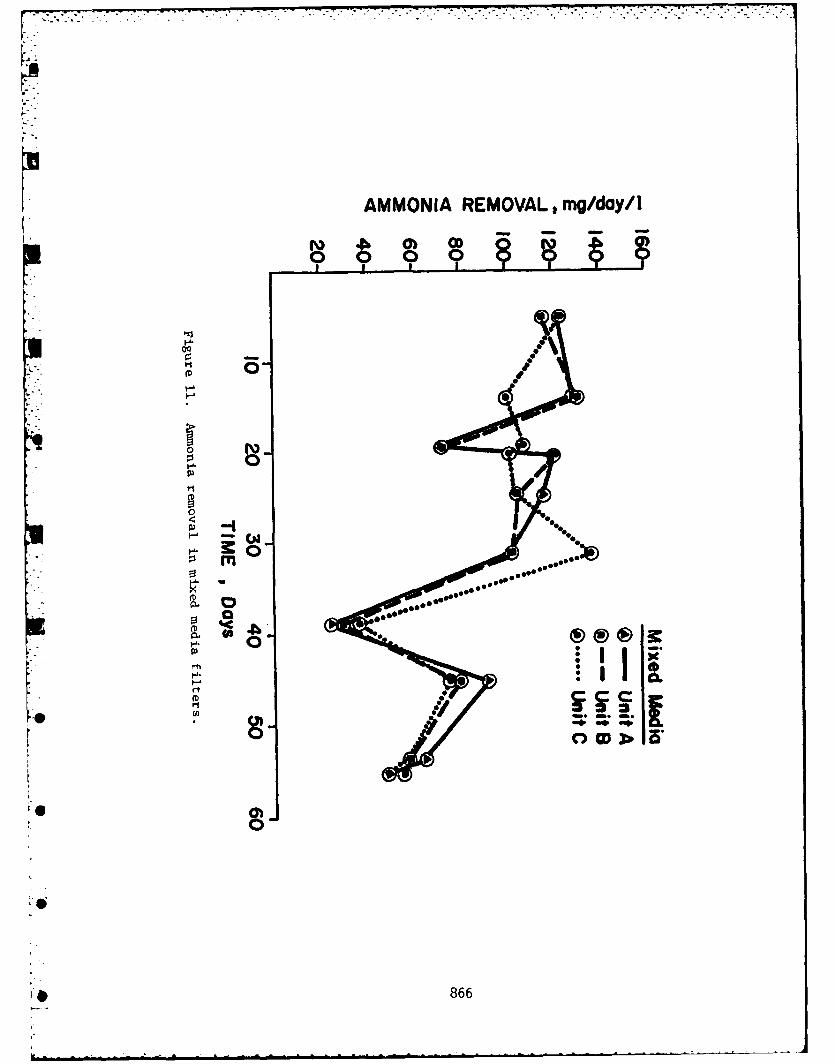
AMMONIA REMOVAL, mgldoyI
".3.
o: w ID100
866
- - - - - -
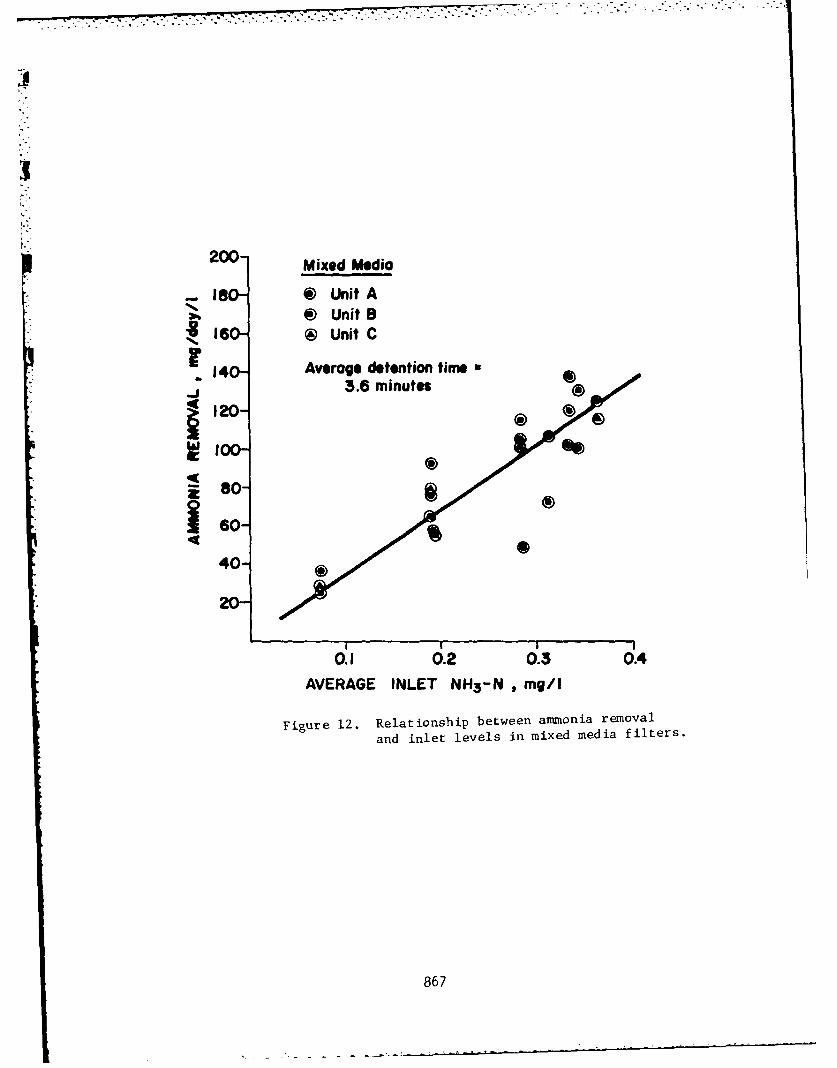
2o
200 Mixed Media
-ISO- 0 Unit A@ UnitB8
160 @ Unit C
140- Average detention time3.6 minutes
120-
1I00
so-
160-
40-
, o,j-.-
0.1 0.2 0.3 0.4
AVERAGE INLET NH 3 -N ,mg/I
Figure 12. Relationship between ammonia removal
and inlet levels in mixed media filters.
867
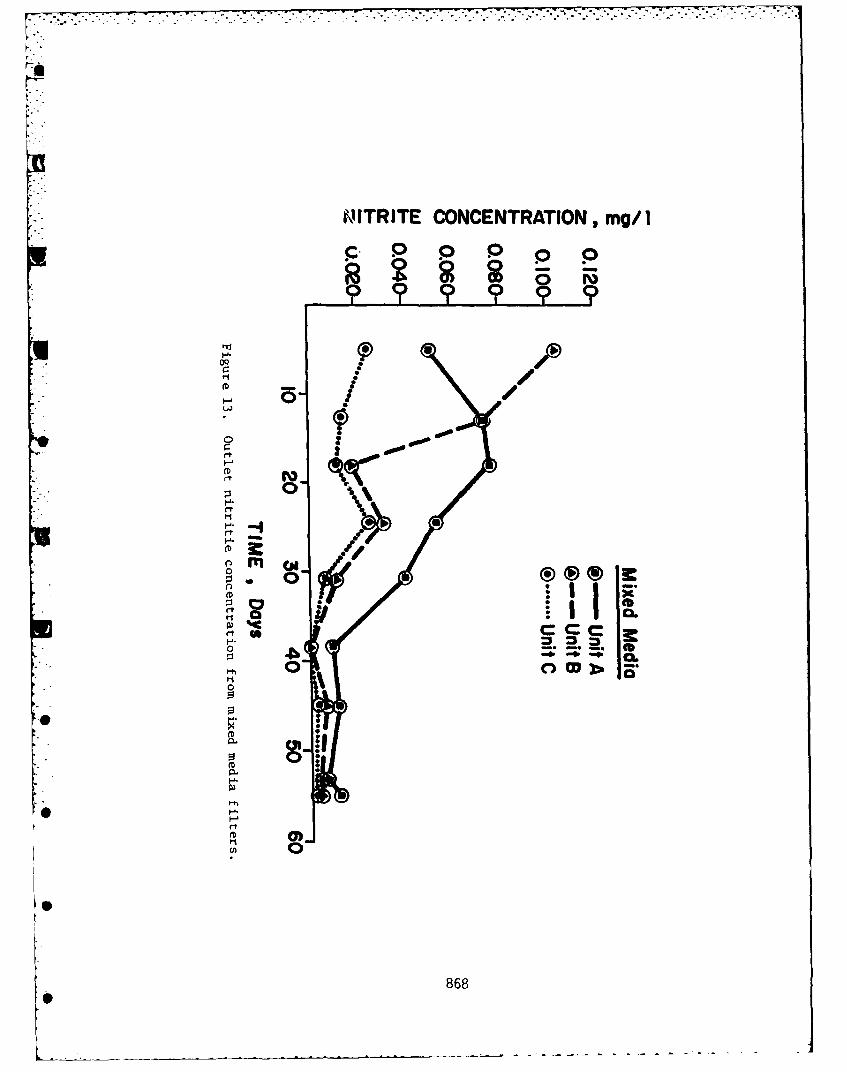
0ITRITE CONCENTRATION, mg/ I
00
t
S* I
rlm M
0
*86
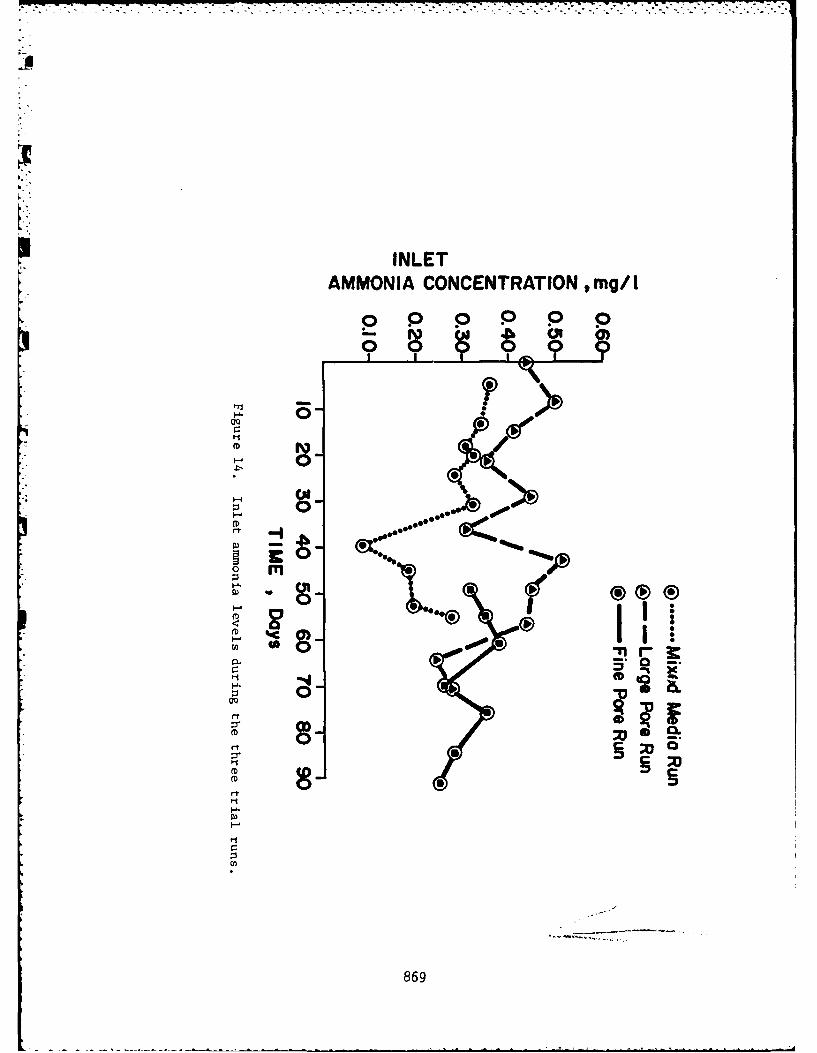
INLETAMMONIA CONCENTRATION mg/ I
p . p P Pp
00
oQ
CD
89.
0 r8I-'°
fII
I!+,
869
Nitrified Secondary TreatmentEffluent by Plastic-Media Trickling Filter
Jiumm Min Huang and Yeun C. WuDepartment of Civil EngineeringPolytechnic Institute of New York
& University of Pittsburgh
Alan MolofDepartment of Civil Engineering
Polytechnic Institute of New York
INTRODUCTION
Ammonia nitrogen plays a vital role in the synthesis ofmicroorganisms in the secondary treatment of wastewater.Generally, there is abundant ammonia nitrogen present in muni-cipal effluent streams. Through the process of nitrification,this excess nitrogen in the wastewater treatment plant effluentconsumes the dissolved oxygen in the receiving water. This,along with the ammonia toxicity, creates unhealthy conditionsfor aquatic life.
Nitrification is a two-step biological process in whichammonia nitrogen is oxidized to nitrite and further to nitrateas shown below:
0 NH3 Step one - NO2 Step two NO3Nitrosomonas Nitrobacter
Nitrosomonas and nitrobacter are commonly the most responsiblefor either of the two oxidation steps. These organisms areclassified as autotrophic or chemolithotrophic because they
870
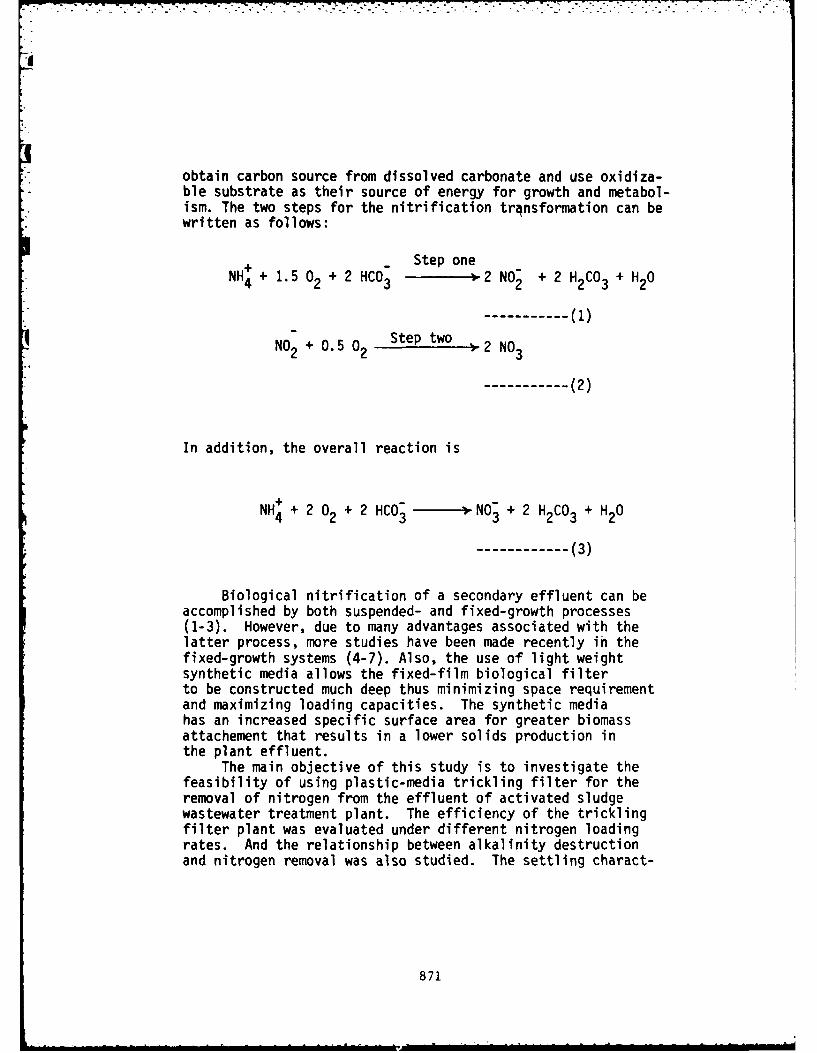
obtain carbon source from dissolved carbonate and use oxidiza-ble substrate as their source of energy for growth and metabol-ism. The two steps for the nitrification trqnsformation can bewritten as follows:
+ - Step oneNH + 1.5 0 + 2HC03 -2 NO- + 2H CO + H 0
--------------------------------(1)
NO2 + 0.5 02 Step two 2 NO 3
---------------------- ----------(2)
In addition, the overall reaction is
NH + + 2 02 + 2 HCO_ - . N0 + 2 H CO3 + H 0
--------------------- -----------(3)
Biological nitrification of a secondary effluent can beaccomplished by both suspended- and fixed-growth processes(1-3). However, due to many advantages associated with thelatter process, more studies have been made recently in thefixed-growth systems (4-7). Also, the use of light weightsynthetic media allows the fixed-film biological filterto be constructed much deep thus minimizing space requirementand maximizing loading capacities. The synthetic mediahas an increased specific surface area for greater biomassattachement that results in a lower solids production inthe plant effluent.
The main objective of this study is to investigate thefeasibility of using plastic-media trickling filter for theremoval of nitrogen from the effluent of activated sludgewastewater treatment plant. The efficiency of the tricklingfilter plant was evaluated under different nitrogen loadingrates. And the relationship between alkalinity destructionand nitrogen removal was also studied. The settling charact-
871
-7-5 -. > --,
eristics of the nitrified sludge was determined by sludgevolume index (SVI).
EXPERIEMNTAL PROCEDURE
Two laboratory-scale trickling filter towers were construct-ed in the Environmental Engineering Research Center at the Univ-ersity of Pittsburgh. The filters were 6" squares and 8' long.A synthetic plastic media manufactured by Munters was employedfor the study. The media model is Munter Biodek 19060, whichhas a surface area 140 m2/m3 or 44 ft2/ft3 and a void ratio ofgreater than 95%. Plant specifications and media structureare shown in Table 1.
The influent for twin towers, connected in series, wasstored in a 250 gallons tank. The influent feed solution wastaken from the effluent of an existing activated sludge pilot plantlocated in the same laboratory. The desired amounts of ammonianitrogen (NH Cl) and sodium bicarbonate (NaHCO3) were addedto the solution and mixed in the feed tank.
The wastewater was pumped to the plastic-media tricklingfilters by two variable speed pumps. The wastewater was firstfed to the top of filter No.1 and the effluent was discharged toclarifier No. 1. And then a second pump taken the feed fromthe above mentioned clarifier, continuously pumped the waste-water up to the top of filter No. 2 where it traveled downand into clarifier No. 2.
Effluent samples were collected twice each week. Samplingports were located 2 ft, 4 ft, 5.5 ft, and 7 ft from the topof filter media in each tower. Controlling parameters includedNH 3-N, NO , NO 3, alkalinity, pH, dissolved oxygen (DO), suspend-ed solids, BOD, and SVI. NH3-N, NO2, and NO3 were measured by anOrion Digital Ionalyzer. Other parameters such as TSS and VSS,alkalinity, BOD were performed in accordance with "StandardMethod" (8). The pH and DO were measured by Orion pH meter and
.O YSI DO meter.
RESULTS AND DISCUSSION
1. Influent Wastewater Characteristics. Table 2 is a listof influent feed conditions proceeding into first filter. Therange of flow rates tested varied from 45 to 115 gallons per day.The highest NH3-N concentration was 109.4 mg/l while the lowestconcentration was 43,6 mg/l. The influent nitrite and nitrateconcentration ranged from 3.2 to 12.4 mg/l and the alkalinityfluctutated between 315.7 mg/l and 750 mg/l as CaC03. The pHrange was small and it varied between 7.7 and 8.3. The dissolved
872
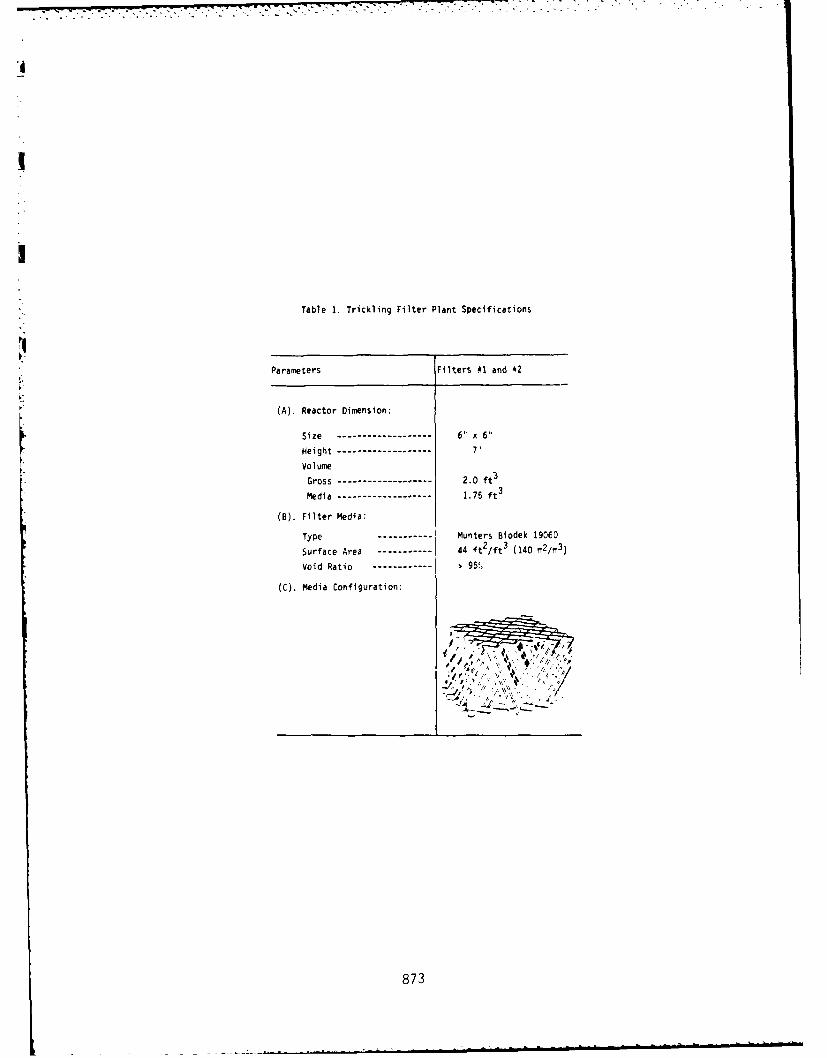
Table 1. Trickling Filter Plant Specifications
Parameters Filters #1 and 42
(A). Reactor Dimension:
Size----------------------61x 61
H~eight ----------------- 7
Volume
Gross-------------------- 2.0 ft 3
Medi a-------------- ------- 1.75 ft 3
(B). Filter Media:
Type ------ Munters Biodek 19060
Surface Area---------------44 ft2 /ft 3 (140 ,s2/m3)
void Ratio--------------- 95!;
(C). Media Configuration:
873
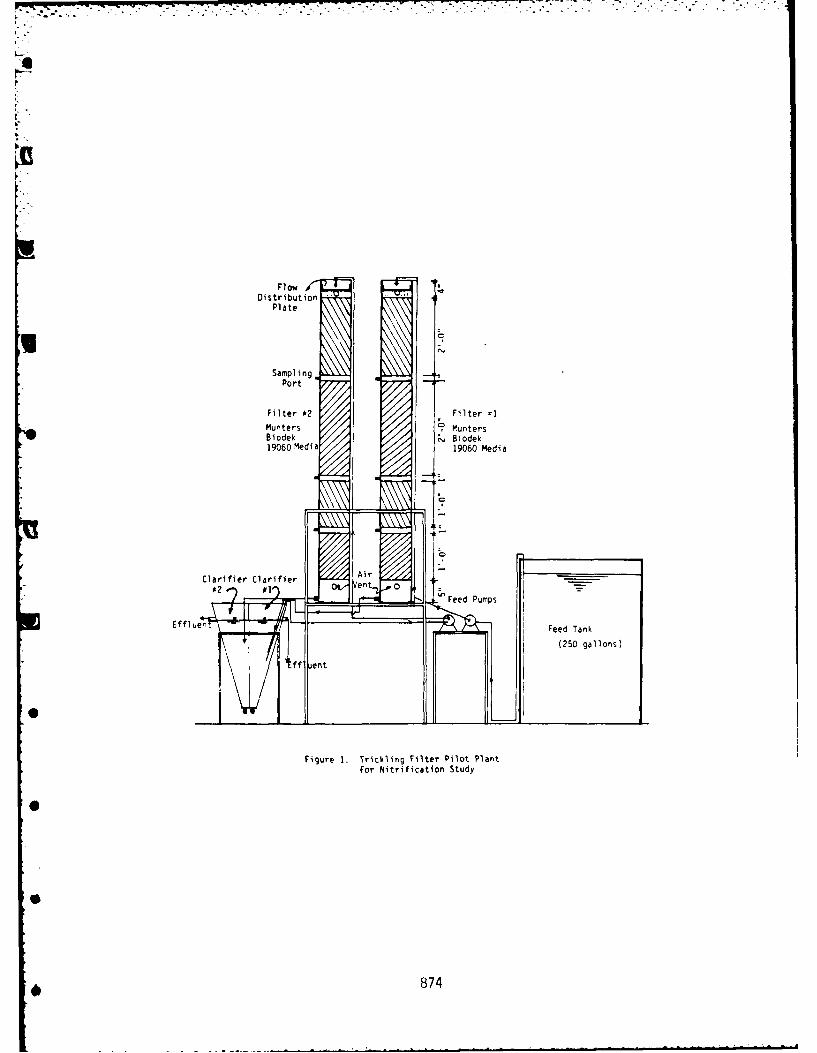
FlowDistribution
I Plate
Sampl ingPort
Filter *2 Filter -1Munters MuntersBiodek c Biodek19060 Med ia 19060 Media
Clarifier Clarifier Air____
#2 # 1) - n1 o YFedPup
EflIe Feed Tank
f ient f
(250 gallons)
* _ _ _ _J
Figure 1. Trickling Filter Pilot PlantFor Nitrification Study
874
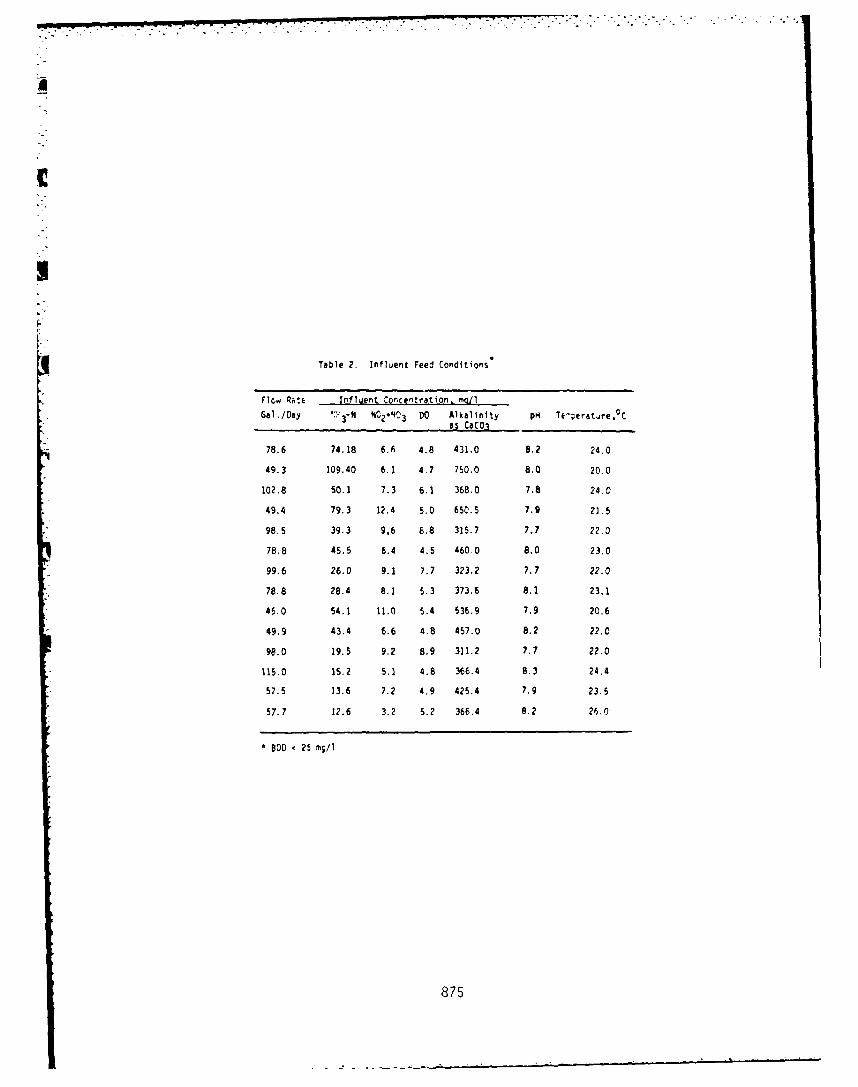
Table 2. In'fluent Feed Conditions
Flowv Ra Inflijent Concentration. mg/lGal./Day *.34 04 3 00 Alkalinity PH 1'e-perat.4re,0C
3-N NC2NC3 DO as Cac0.3
78.6 74.18 6.6 4.8 431.0 8.? 24.0
49.3 109.40 6.1 4.7 750.0 8.0 20.0
102.8 50.1 7.3 6.1 368.0 7. 8 24.0
49.4 79.3 12.4 5.0 650.5 7.9 21.5
98.5 39.3 9,6 8.8 315.7 7.7 22.0
78.8 45.5 6.4 4.5 460.0 8.0 23.0
99.6 26.0 9.1 7.7 323,? 7.7 22.0
78.8 28,4 8.1 5.3 373.6 8.1 23.1
45.0 54.1 11.0 5.4 536.9 7.9 20.6
49.9 43.4 6.6 4.8 457.0 8.? 22.0
98.0 19.5 9.2 8.9 311.2 7.7 22.0
115.0 15.2 5.1 4.8 366.4 8.3 24.4
57.5 13.6 7.2 4.9 425.4 7.9 23.5
57.7 12.6 3.2 5.2 366.4 8.2 26.0
800O 25 mg/1
875
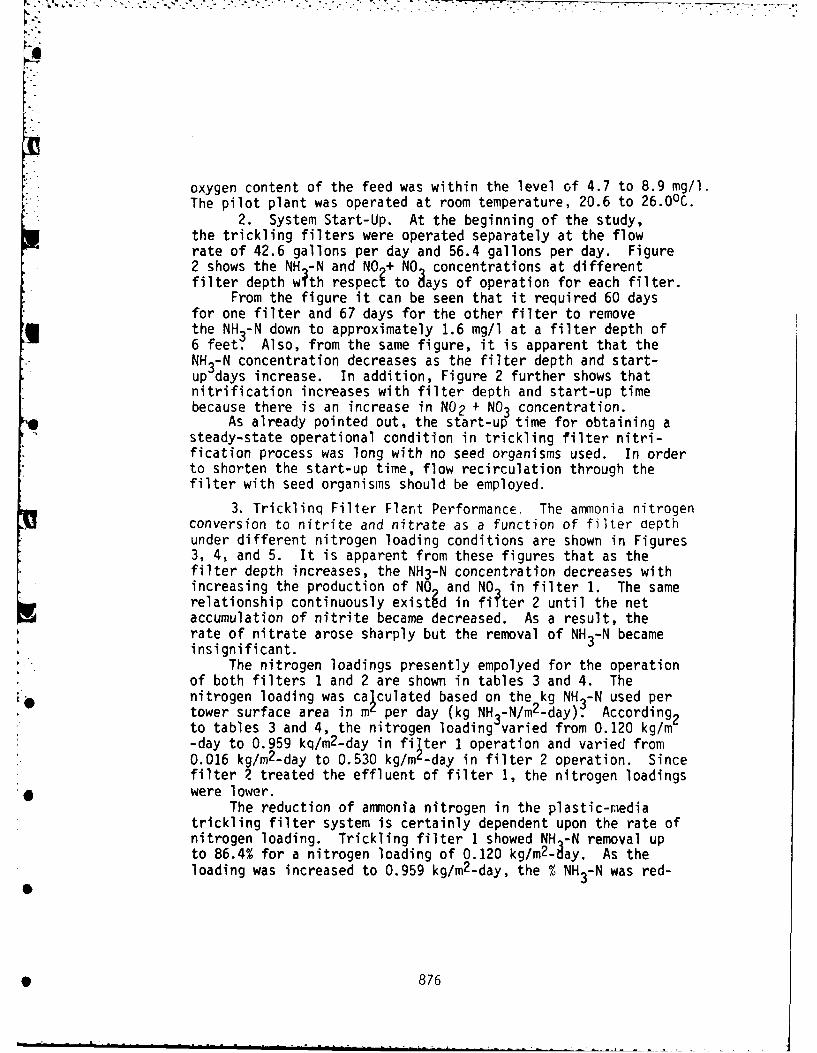
oxygen content of the feed was within the level of 4.7 to 8.9 mg/i.The pilot plant was operated at room temperature, 20.6 to 26.0°C.
2. System Start-Up. At the beginning of the study,the trickling filters were operated separately at the flowrate of 42.6 gallons per day and 56.4 gallons per day. Figure2 shows the NH -N and NO + NO concentrations at differentfilter depth w~th respeci to Aays of operation for each filter.
From the figure it can be seen that it required 60 daysfor one filter and 67 days for the other filter to removethe NH -N down to approximately 1.6 mg/l at a filter depth of6 feet. Also, from the same figure, it is apparent that theNH3-N concentration decreases as the filter depth and start-up days increase. In addition, Figure 2 further shows thatnitrification increases with filter depth and start-up timebecause there is an increase in NO2 + NO3 concentration.
As already pointed out, the start-up time for obtaining asteady-state operational condition in trickling filter nitri-fication process was long with no seed organisms used. In orderto shorten the start-up time, flow recirculation through thefilter with seed organisms should be employed.
3. Tricklinq Filter Flat Performance. The ammonia nitrogenconversion to nitrite and nitrate as a function of filter aepthunder different nitrogen loading conditions are shown in Figures3, 4, and 5. It is apparent from these figures that as thefilter depth increases, the NH3-N concentration decreases withincreasing the production of NO and NO in filter 1. The samerelationship continuously existed in fiter 2 until the netaccumulation of nitrite became decreased. As a result, therate of nitrate arose sharply but the removal of NH3-N becameinsignificant.
The nitrogen loadings presently empolyed for the operationof both filters 1 and 2 are shown in tables 3 and 4. The
lip nitrogen loading was calculated based on the kg NH3 -N used pertower surface area in m' per day (kg NH3-N/m
2-day). According2to tables 3 and 4, the nitrogen loading varied from 0.120 kg/m-day to 0.959 kq/m 2-day in filter I operation and varied from0.016 kg/m2-day to 0.530 kg/m -day in filter 2 operation. Sincefilter 2 treated the effluent of filter 1, the nitrogen loadings
* were lower.The reduction of ammonia nitrogen in the plastic-nedia
trickling filter system is certainly dependent upon the rate ofnitrogen loading. Trickling filter 1 showed NH -N removal upto 86.4% for a nitrogen loading of 0.120 kg/m2-ay. As theloading was increased to 0.959 kg/m 2-day, the % NH3-N was red-
* 876
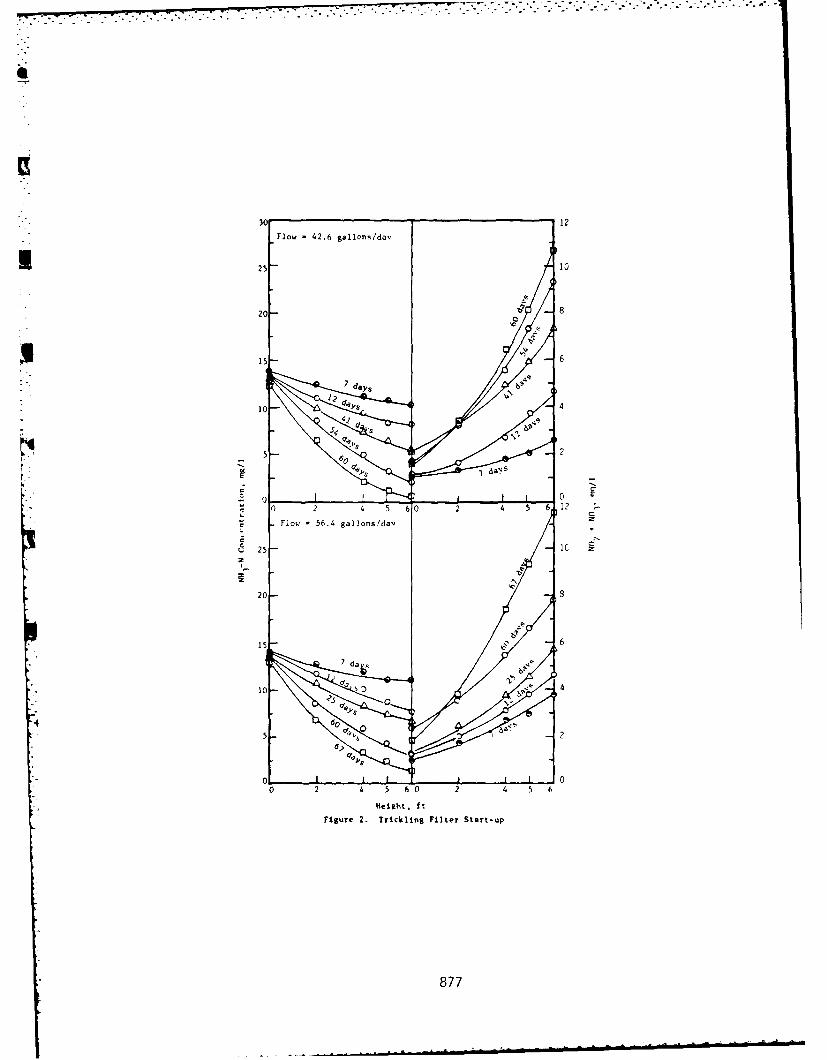
Flow -42.6 gallons/dav
25 1
20 -
ICC
.41
5e~t 60t
Fiur 2. Trcln it S art-u
87
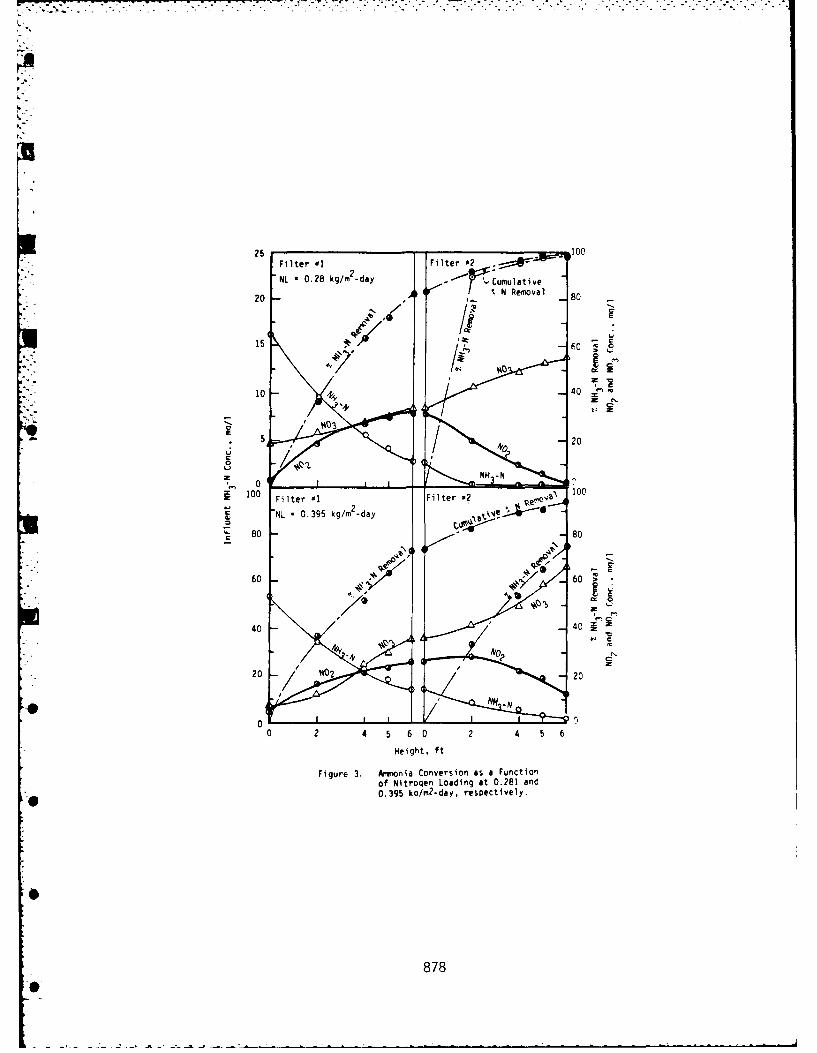
. . . . . . . . .
25 100Filter #1 Filter *2 zz-?-
NL * 0.28 kg/m2-day Cumulative
20 4 N Removal 80
/ /.
15 -60
cz z
10 . 40
5. 20
0 N22
NL
60 8060 60
40 40 -Z
b0
SC
20 / 02 20
0 2 4 5 6 0 2 4 5 6
Height. ft
Figure 3. Ammonia Conversion as a Functionof Nitroqen Loading at 0.281 and0.395 ko/m2-day, respectively.
0
878O
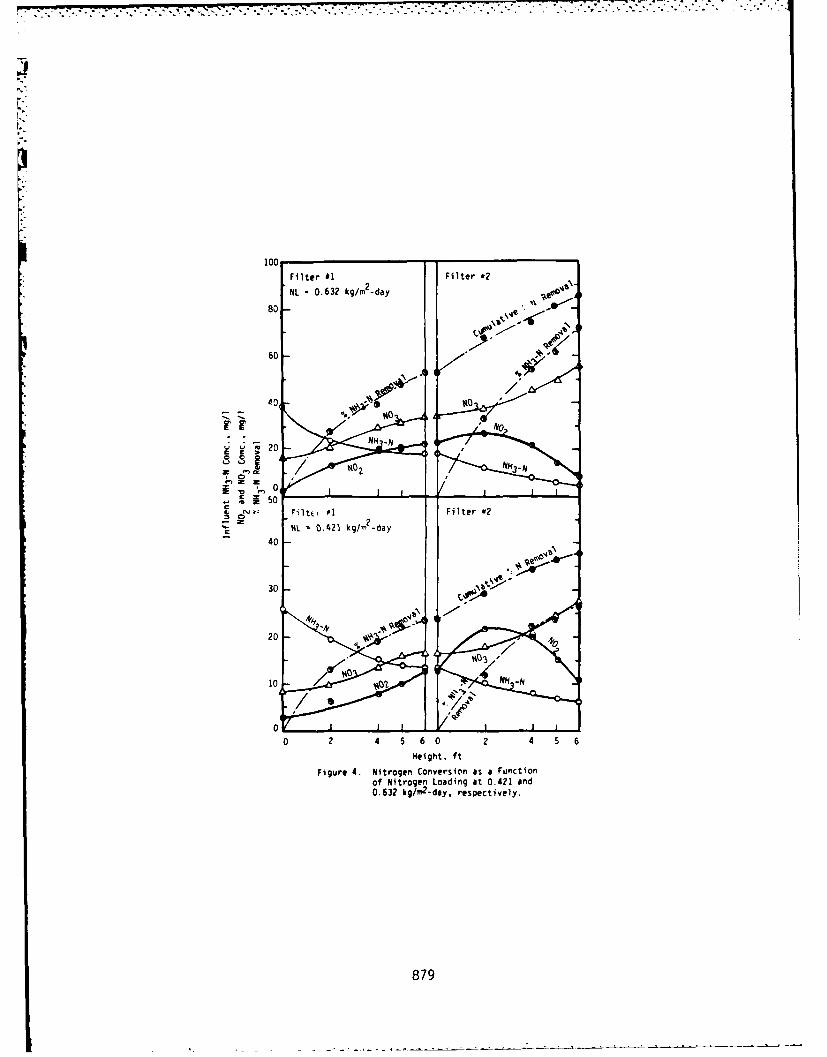
~~~~~~~~~~~~.. . m . ,. . . .. . ,. .. ,- . .,' , .,.. ... . . - . - - ,-.. .. .. .. -"-. " .... .. " .-. "..... .. ._."..
100Filter #1
Filter 2
0 NL 0.632 kg/m -day
60 - .A/ t
N
600 -/
C 20
€> ~~~~~
Nito
IFlt
r
4020 N-
2 4 5 0
02
Filt H1 Filter #2
%1 0.421 di t0n2
nday
30
20
062 .gv-e ,repciey
7879
0 -0
0 2 4 5 60 2 4 5 6
Height. ft
Figure 4. Nitrogen Conversio~n as a Functionof Nitrogen Loading at 0.421 and0.632 kg/m 2-day. respectively.
879
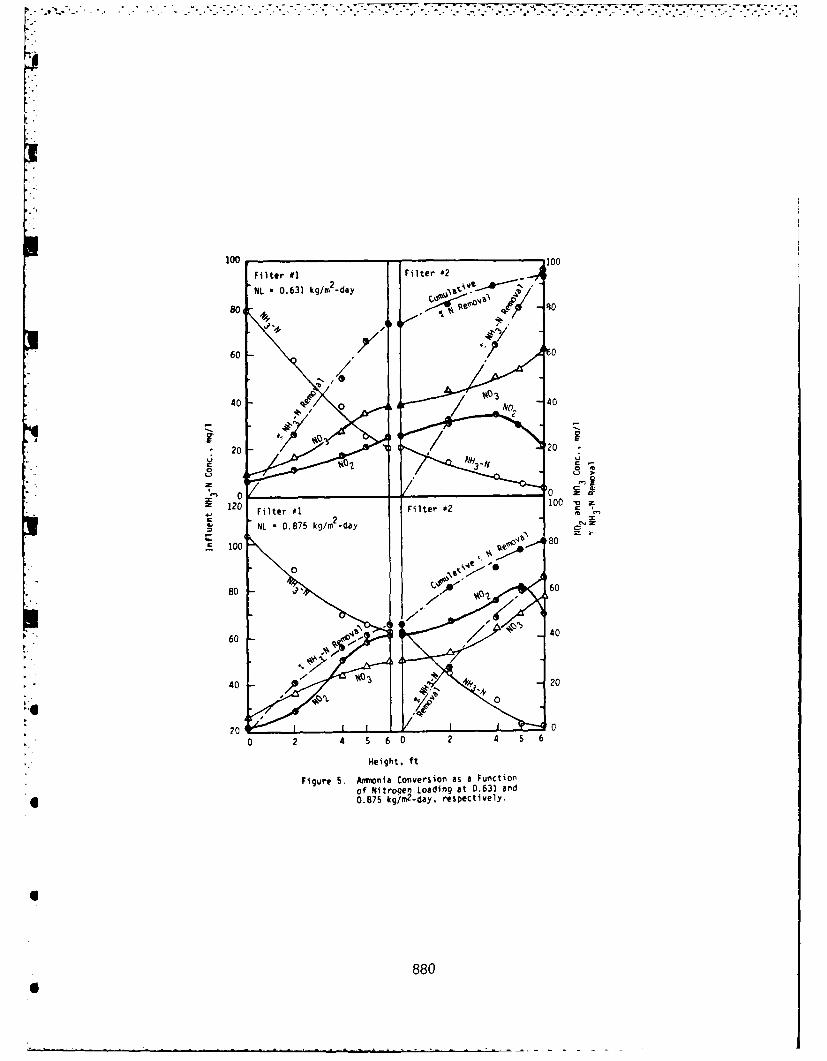
100 oFilter 01 Filter *2
NL 0.631 kgfm -day
60 to
40 0 / NO, 40
20 /20
S0 0__ __ _ _ 0
Z120 o
C Filter #1 Filter 0210 Z
NI 0.875 kg/rn day
'E 100 "gAb\ 80
80 *Z' 60
"°."
_4
60 /40
40 ~t~20
i0
20 60
0 2 4 60 2 4 5 6
Height. ft
Figure 5. A Fonia Conversion as a Function
of NitropenLoading at 0.631 and'N0.875 kg/m
2 day,. respectively.
880
._ I" ,- )
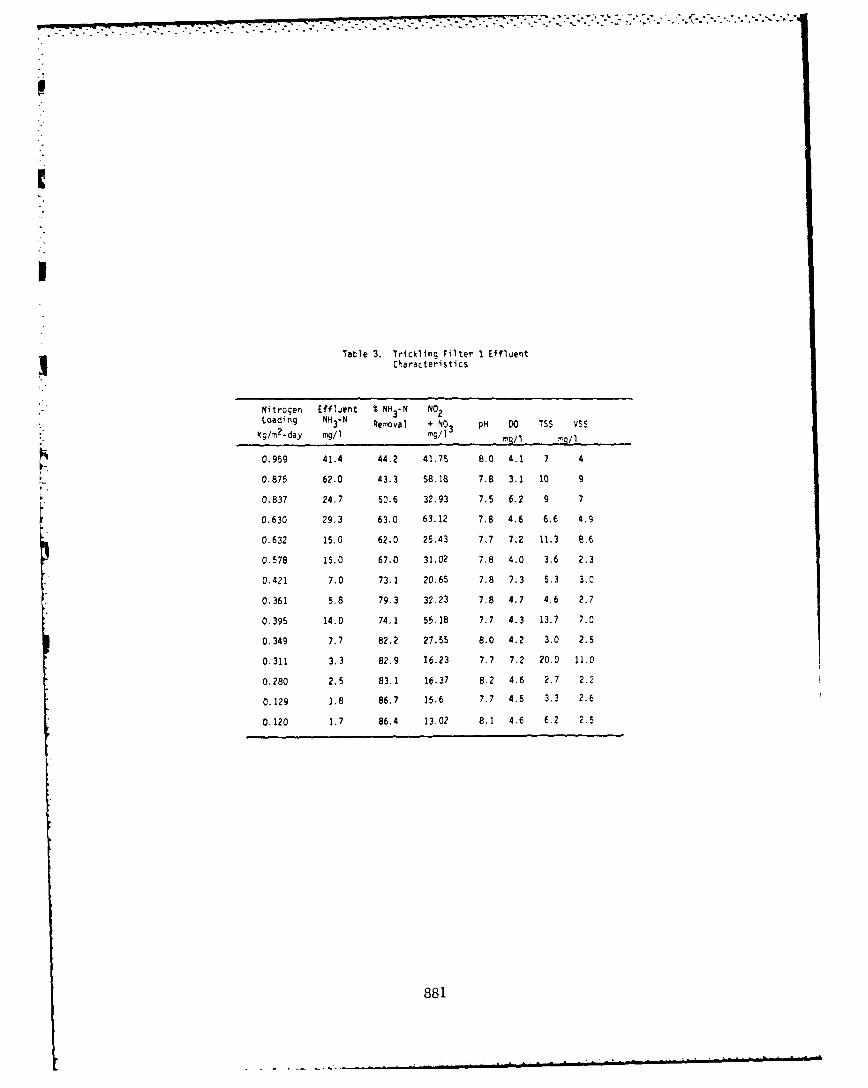
Tatle 3. Trickling Filter I Effl~entCharacteristics
Nitrogen Effl.ient % NH 3-N NO2Loading NH3-N Removal + NO3 pH DO TSS VSS
"kglm2.day mg/l mg/I mg//
0.959 41.4 44.2 41.75 8.0 4.1 7 4
0.875 62.0 43.3 58.18 7.8 3.1 10 9
0.837 24.7 50.6 32.93 7.5 6.2 9 7
0.630 293 63.0 63.12 7.8 4.6 6.6 4.9
0.632 15.0 62.0 25.43 7,7 7.2 11,3 8.6
0.578 15.0 67.0 31.02 7.8 4.0 3.6 2.3
0.421 7,0 73.1 20.65 7.8 7.3 5.3 3.0
0.361 5.8 79.3 32.23 7.8 4.7 4.6 2.7
0,395 14.0 74,1 55.18 7.7 4.3 13.7 7.0
0.349 7.7 82,2 27.55 8.0 4.2 3.0 2.5
0.311 3.3 82,9 16.23 7.7 7.2 20.0 11.0
0.280 2.5 83.1 16.37 8.2 4.6 2.7 2.2
0.129 1.8 86.7 15.6 7.7 4.5 3.3 2.6
0.120 1.7 86.4 13.02 8.1 4.6 6.2 2.5
881
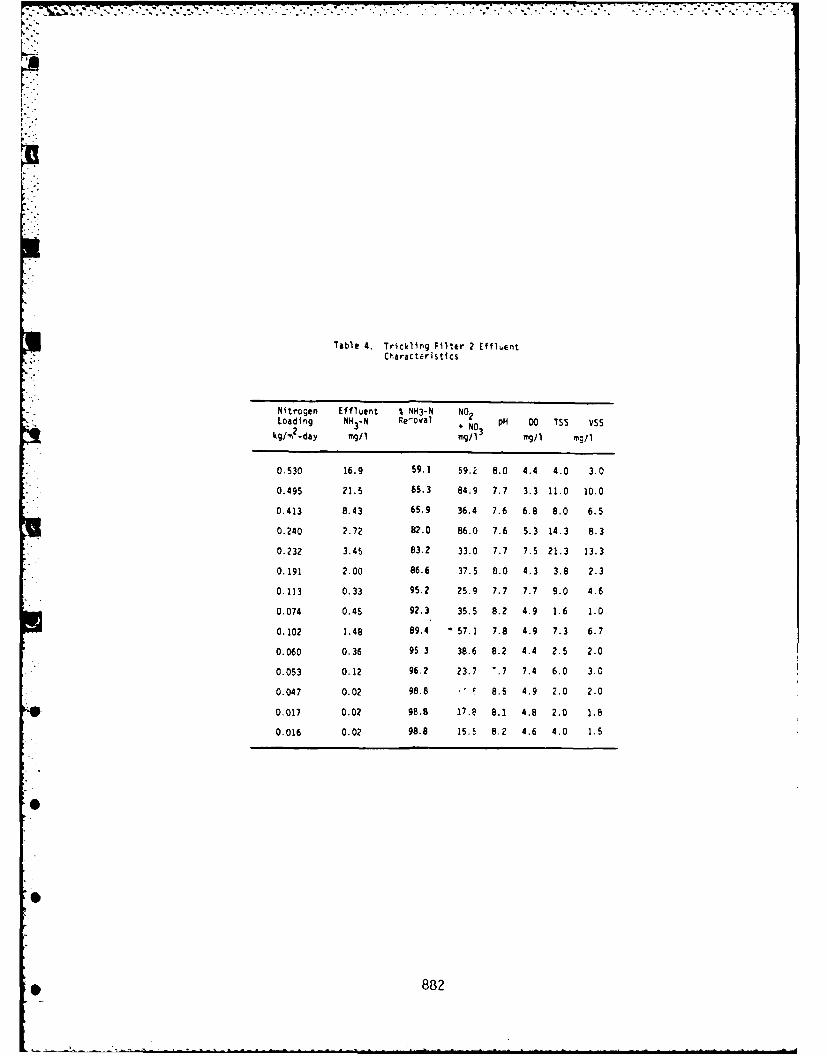
I. "
Table 4. Trickling Filter 2 EflLentCharacteristics
Nitroen Effluent I NH3-N NO2Loading NH3-N Re-Oval + NO pH DO TSS VSS
kg/'2
-day rgl mg/i3
mg/ mg/l
0.530 16.9 59.1 59.2 8.0 4.4 4.0 3.0
0.495 21.5 65.3 84.9 7.7 3.3 11.0 10.0
0.413 8.43 65.9 36.4 7.6 6.8 8.0 6.5
0.240 2.72 82.0 86.0 7.6 5.3 14.3 8.3
0.232 3.45 83.2 33.0 7.7 7.5 21.3 13.3
0.191 2.00 86.6 37.5 8.0 4.3 3.8 2.3
0.113 0.33 95.2 25.9 7.7 7.7 9.0 4.6
0.074 0.45 92.3 35.5 8.2 4.9 1.6 1.0
0.102 1.48 89.4 57.1 7.8 4.9 7.3 6.7
0.060 0.36 95.3 38.6 8.2 4.4 2.5 2.0
0.053 0.12 96.2 23.7 ".7 7.4 6.0 3.0
0.047 0.02 98.8 8.5 4.9 2.0 2.0
O 0.017 0.02 98.8 17.8 8.1 4.8 2.0 1.8
0.016 0.02 98.8 15.5 8.2 4.6 4.0 1.5
0
* 88
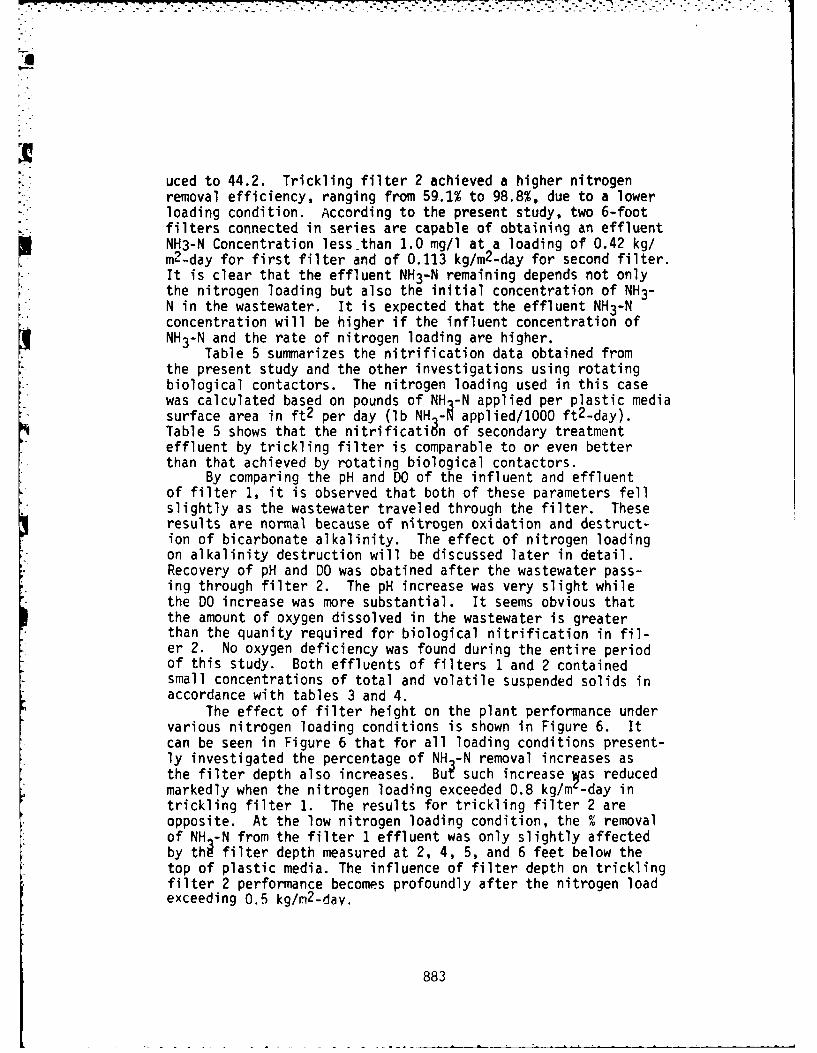
a
uced to 44.2. Trickling filter 2 achieved a higher nitrogenremoval efficiency, ranging from 59.1% to 98.8%, due to a lowerloading condition. According to the present study, two 6-footfilters connected in series are capable of obtaining an effluentNH3-N Concentration less.than 1.0 mg/l at a loading of 0.42 kg/m2_-day for first filter and of 0. 13 kg/m2-day for second filter.It is clear that the effluent NH3-N remaining depends not only
the nitrogen loading but also the initial concentration of NH3-N in the wastewater. It is expected that the effluent NH3-Nconcentration will be higher if the influent concentration ofNH3-N and the rate of nitrogen loading are higher.
Table 5 summarizes the nitrification data obtained fromthe present study and the other investigations using rotatingbiological contactors. The nitrogen loading used in this casewas calculated based on pounds of NH -N applied per plastic mediasurface area in ft2 per day (lb NH -R applied/lO00 ft2-day).
,Table 5 shows that the nitrification of secondary treatmenteffluent by trickling filter is comparable to or even betterthan that achieved by rotating biological contactors.
By comparing the pH and DO of the influent and effluentof filter 1, it is observed that both of these parameters fellslightly as the wastewater traveled through the filter. Theseresults are normal because of nitrogen oxidation and destruct-ion of bicarbonate alkalinity. The effect of nitrogen loadingon alkalinity destruction will be discussed later in detail.Recovery of pH and DO was obatined after the wastewater pass-ing through filter 2. The pH increase was very slight whilethe DO increase was more substantial. It seems obvious thatthe amount of oxygen dissolved in the wastewater is greaterthan the quanity required for biological nitrification in fil-er 2. No oxygen deficiency was found during the entire periodof this study. Both effluents of filters 1 and 2 containedsmall concentrations of total and volatile suspended solids inaccordance with tables 3 and 4.
The effect of filter height on the plant performance undervarious nitrogen loading conditions is shown in Figure 6. Itcan be seen in Figure 6 that for all loading conditions present-ly investigated the percentage of NH -N removal increases asthe filter depth also increases. Bu such increase as reducedmarkedly when the nitrogen loading exceeded 0.8 kg/n-day intrickling filter 1. The results for trickling filter 2 areopposite. At the low nitrogen loading condition, the % removalof NH -N from the filter 1 effluent was only slightly affectedby thi filter depth measured at 2, 4, 5, and 6 feet below thetop of plastic media. The influence of filter depth on tricklingfilter 2 performance becomes profoundly after the nitrogen loadexceeding 0.5 kg/n 2-dav.
883
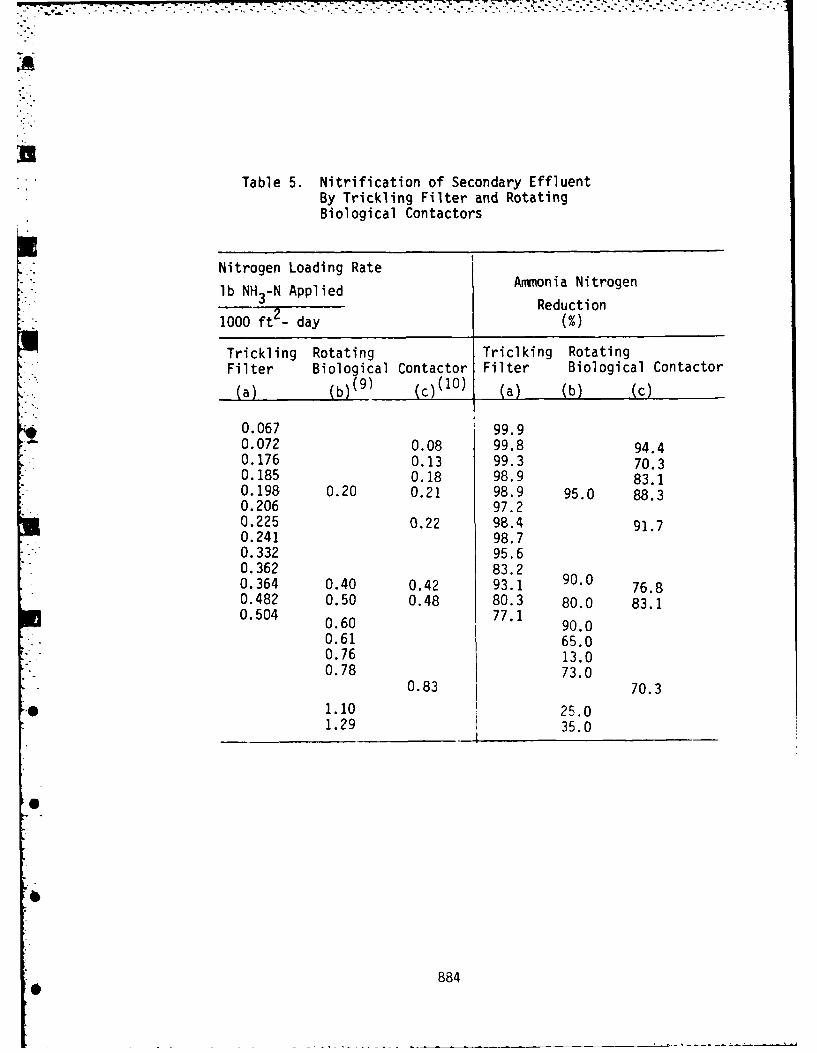
Table 5. Nitrification of Secondary EffluentBy Trickling Filter and RotatingBiological Contactors
Nitrogen Loading Rate
lb NH3-NAppliedAnoiaNtgeReduction
- -1000 Mt-da %
Trickling Rotating Triclking RotatingFilter Biological Contactor Filter Biological Contactor
(a) (b c (a) (b) (c)
0.067 99.90.072 0.08 99.894
0760.13 99.3 70.30.185 0.18 98.9 83.10.198 0.20 0.21 98.9 95.0 88.30.206 97.20.225 0.22 98.4 91.70.241 98.70.332 95.60.362 83.20.364 0.40 0.42 93.1 90.0 76.80.482 0.50 0.48 80.3 80.0 83.10.504 0.60 77.1 90.0
0.61 65.00.76 13.00.78 73.0
0.83 70.3* 1.10 I25.0
1.29 35.0
884
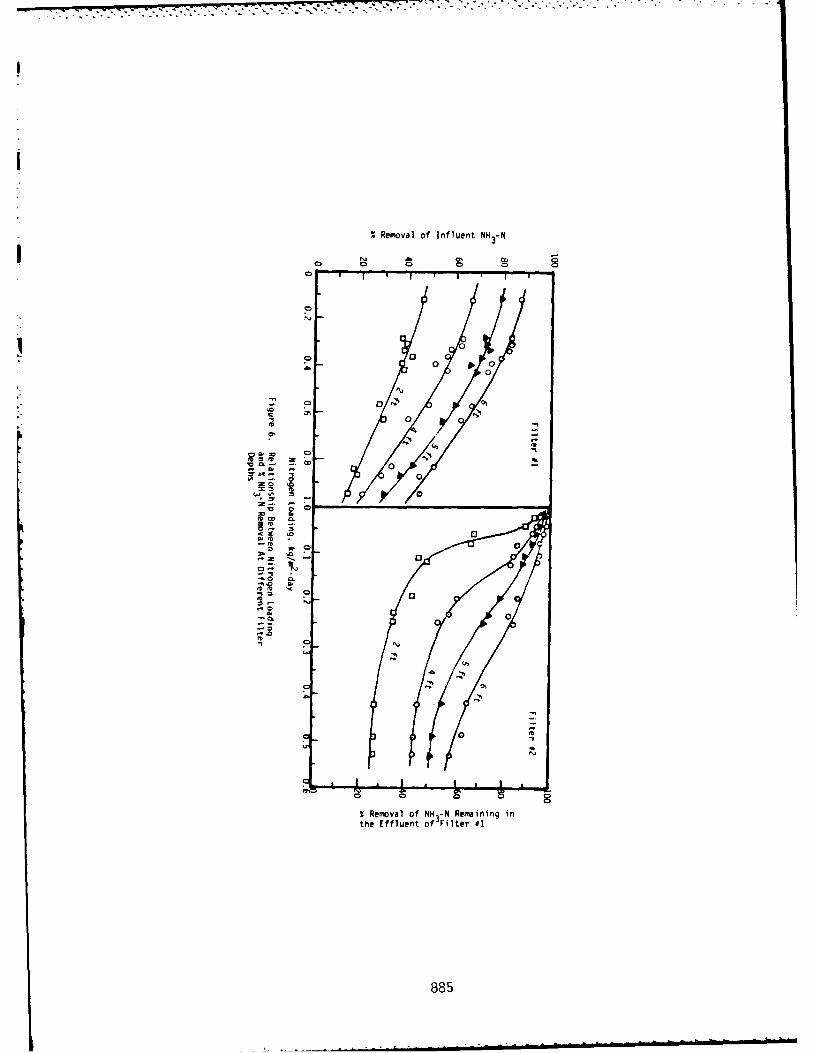
i
% Removal of influent NH3-N
C o ' ' o o
00
N4)
0o
f
00
0
0
-Remval of NH3-N Remining in
the Effluent of Filter #1
885
2 ' ' ; ' d' . . . n " " " u n0an. u
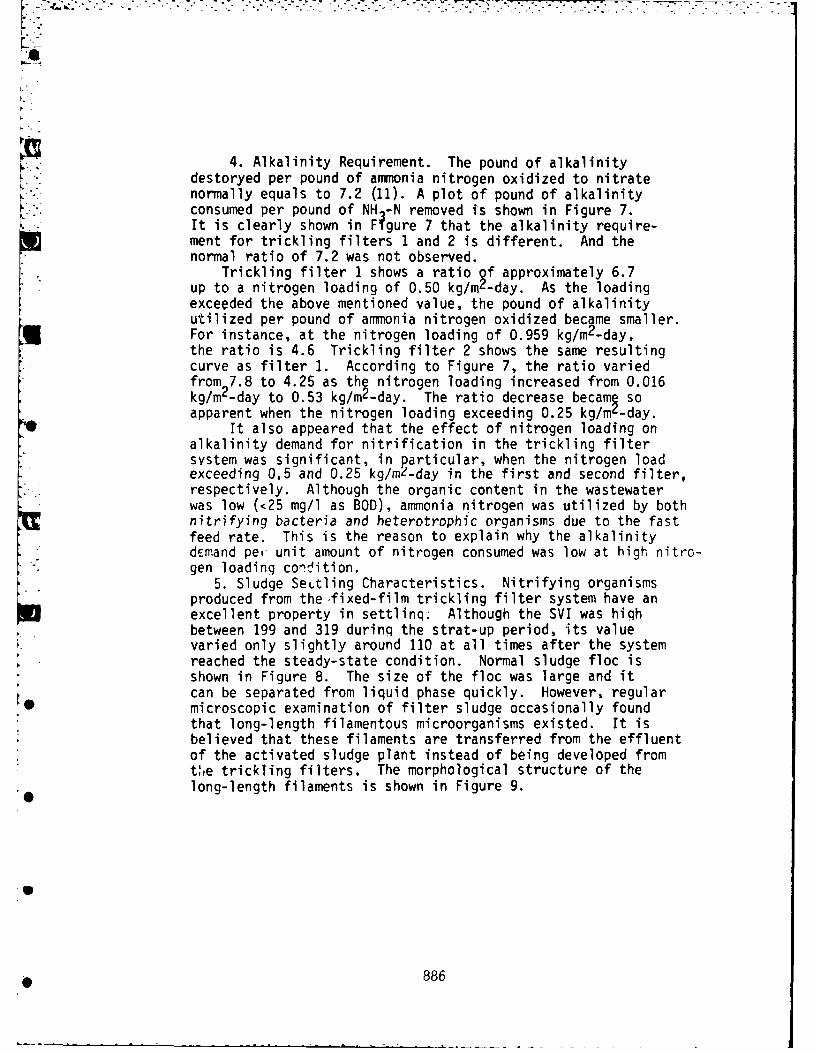
- " ' " --- " - - " . , i " . - - . - , - -- - ---. - -.- -v--w -- , -- - ,. . - '- . - ., .- - -. ° -
L
4. Alkalinity Requirement. The pound of alkalinitydestoryed per pound of ammonia nitrogen oxidized to nitratenormally equals to 7.2 (11). A plot of pound of alkalinityconsumed per pound of NH -N removed is shown in Figure 7.It is clearly shown in F~gure 7 that the alkalinity require-ment for trickling filters I and 2 is different. And thenormal ratio of 7.2 was not observed.
Trickling filter I shows a ratio of approximately 6.7up to a nitrogen loading of 0.50 kg/m 2-day. As the loadingexceeded the above mentioned value, the pound of alkalinityutilized per pound of ammonia nitrogen oxidized became smaller.For instance, at the nitrogen loading of 0.959 kg/m 2-day,the ratio is 4.6 Trickling filter 2 shows the same resultingcurve as filter 1. According to Figure 7, the ratio variedfrom 7.8 to 4.25 as the nitrogen loading increased from 0.016kg/m2 -day to 0.53 kg/m 2-day. The ratio decrease becamR soapparent when the nitrogen loading exceeding 0.25 kg/m-day.
It also appeared that the effect of nitrogen loading onalkalinity demand for nitrification in the trickling filtersystem was significant, in particular, when the nitrogen loadexceeding 0,5 and 0.25 kg/m2-day in the first and second filter,respectively. Although the organic content in the wastewaterwas low (<25 mg/l as BOD), ammonia nitrogen was utilized by bothnitrifying bacteria and heterotrophic organisms due to the fastfeed rate. This is the reason to explain why the alkalinitydcmand per unit amount of nitrogen consumed was low at high nitro-
" gen loadinq coneition.5. Sludge SeLtling Characteristics. Nitrifying organisms
produced from the-fixed-film trickling filter system have anexcellent property in settling. Although the SVI was highbetween 199 and 319 during the strat-up period, its valuevaried only slightly around 110 at all times after the systemreached the steady-state condition. Normal sludge floc isshown in Figure 8. The size of the floc was large and itcan be separated from liquid phase quickly. However, regularmicroscopic examination of filter sludge occasionally foundthat long-length filamentous microorganisms existed. It isbelieved that these filaments are transferred from the effluentof the activated sludge plant instead of being developed fromthe trickling filters, The morphological structure of the
40 long-length filaments is shown in Figure 9.
886
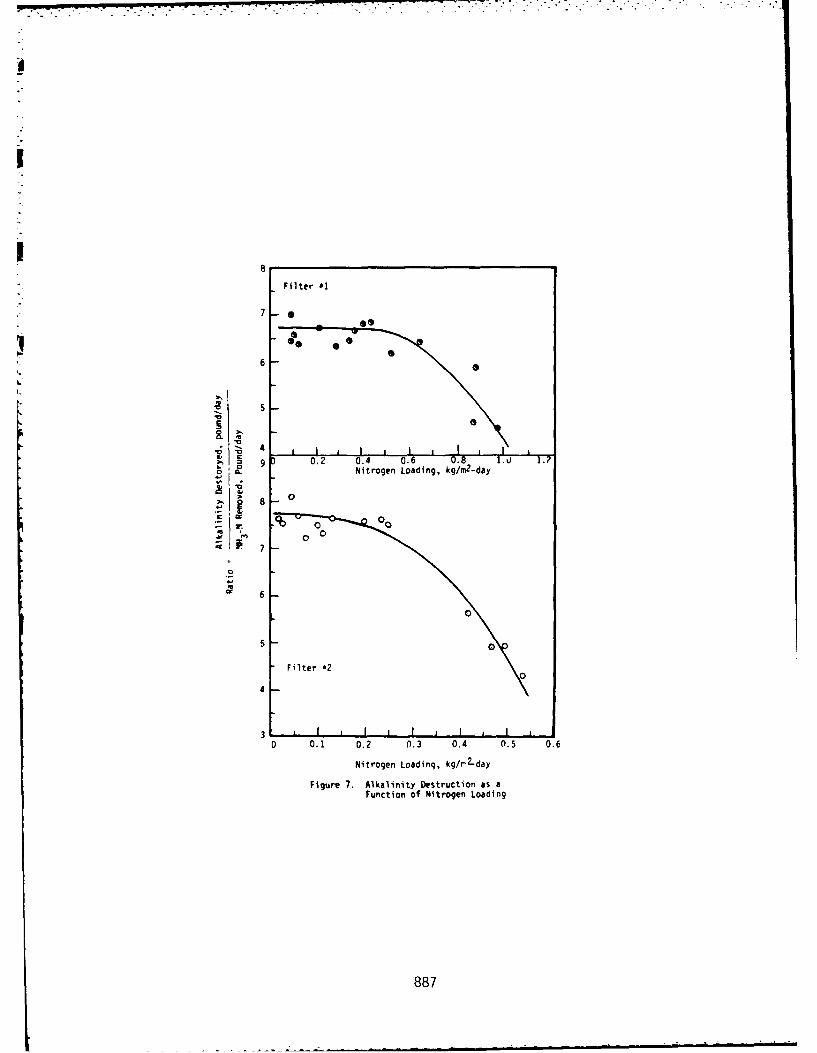
.-
Filter *1
7 S
6
L"
5
.. 4
9 D 0.2 0.4 0.6 0.* Nitrogen Loading, kg/m2-day
8 0
- 7Ioo7
Ci
o 6
50
Filter *2
4
3
0 0.1 0.2 0.3 0.4 0.5 0.6
Nitrogen Loading, kg/r 2-day
Figure 7. Alkalinity Destruction as aFunction of Nitrogen Loading
887
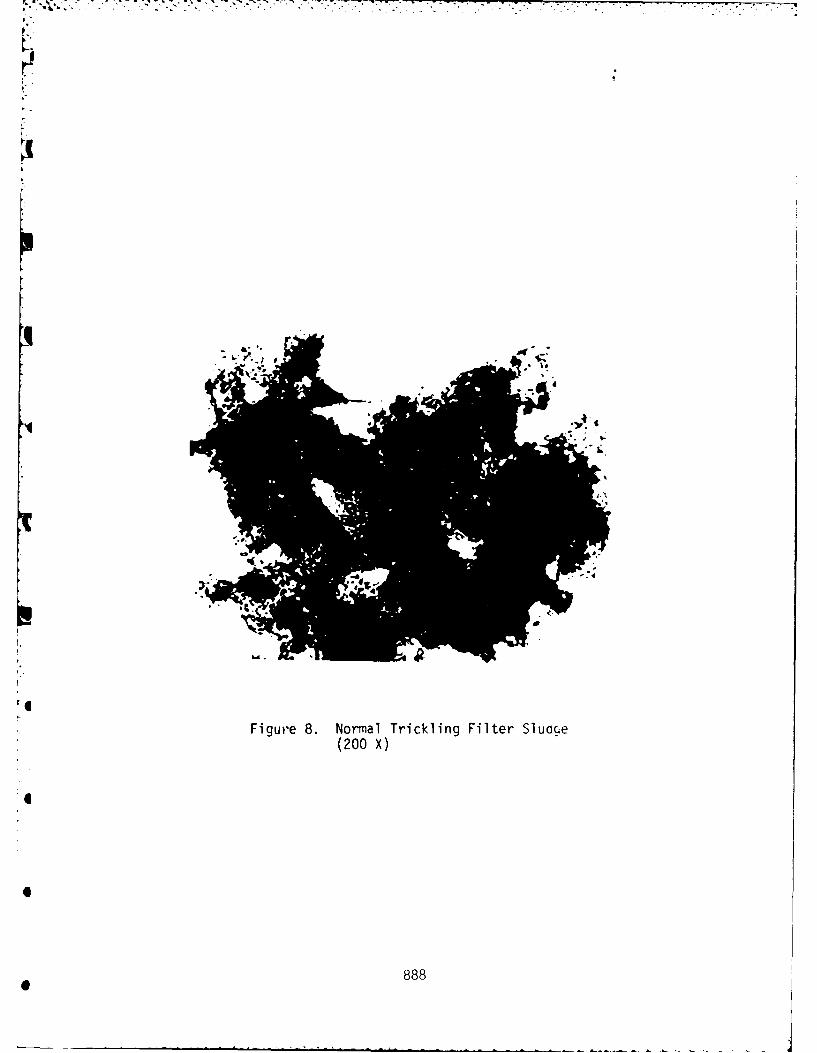
Figure 8. Normal Trickling Filter Sluace(200 X)
888
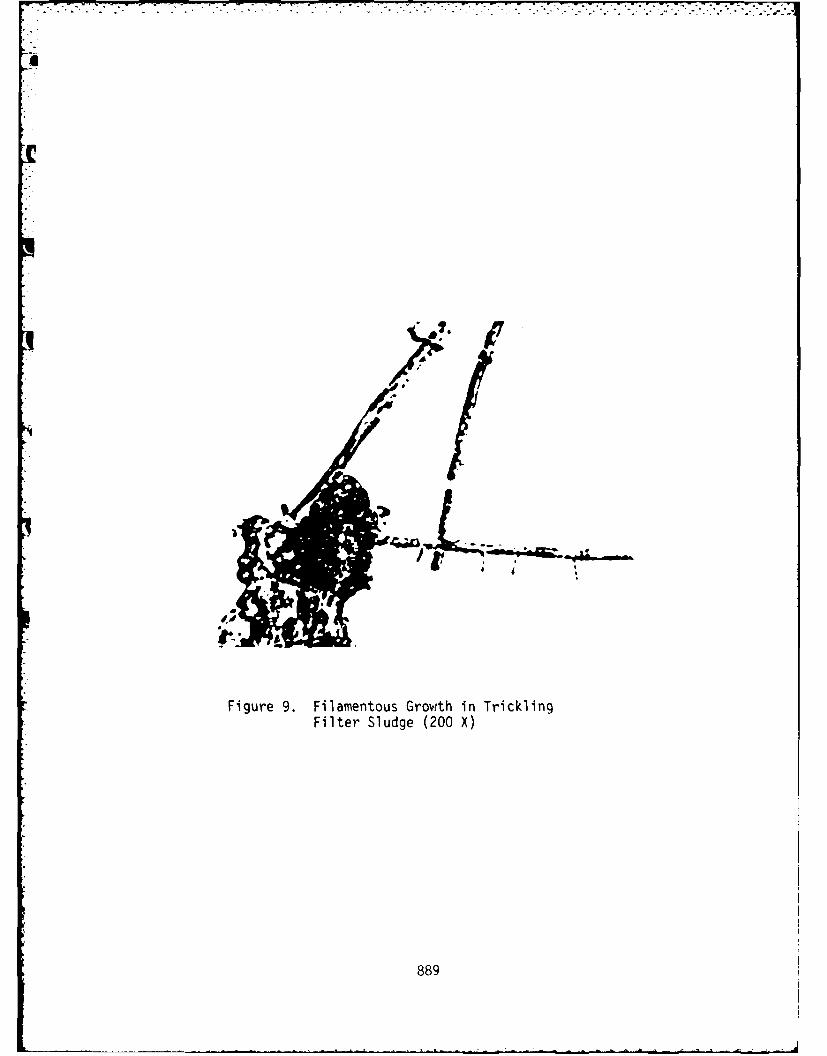
Figure 9. Filamentous Growth in TricklingFilter Sludge (200 X)
889
CONCLUSIONS
;Biological nitrification of secondary effluent by atwo-stage trickling filter was throughly investigated under
the optimum pH and temperature conditions. It was foundthat the efficiency of the trickling filter plant was afunction of influent nitrogen concentration, nitrogen loading,and filter depth. The quantity of ammonia nitrogen removedwas higher in filter 1 than filter 2. The continuouslyoxidized ammonia nitrogen resulted in the accumulation ofnitrite and nitrate in the system, however, the productionof nitrite started to decrease with increasing the nitratewhen ammonia nitrogen remaining in the wastewater approachedto its lowest level. More than 93% of ammonia nitrogen can beremoved by passing it through two six-foot plastic media trickl-filters, operated 'at the nitrogen loading equal to 0.63 kg/m 2
-day in the first filter and 0.24 kg/m 2-day in the secondfilter.
Both pH and DO decreased and increased after the waste-water traveled through filter 1 and filter 2, respectively.Dissolved oxygen never became the growth-limitina factor becauseits concentration was over 3.0 mg/l., The effluent total andsuspended solids were extremely low And the sludge settle-ablity was very high with an averaged SVI = 110. Fila-mentous microorgansims was seldom found in the sludge and theywere probably transferred to the filter from the effluent ofthe activated sludge plant. That is why the outgrowth of fila-mentous microorganisms never occurred.
AThe alkalinity requirement for fixed-film biologicalnitrification is somewhat different from that observed fromsuspended growth systems. The quantity of alkalinity destory-ed per unit of ammonia nit ogen removed is always below normalvalue of 7.2 in both filter presently investigated if thenitrogen loading was kept to' exceed 0.25 kg/m 2-day. Bothnitrifiers and heterotrophic microrganisms play an important
* role in nitrogen assimilation when the feed rate and thenitrogen load are high. This explains why the alkalinitydemand for biological nitrification is lower under the abovementioned condition.
REFERENCE
1. Poduska, R. A., and Andrews, J. F., "Dynamics of Nitrifi-cation in the Activated Sludge Process," Jour. of WaterPoll. Control Federation, Vol. 47. pp.2599, 1975
:0
890
.A-
2. Downing, A. L., et al., "Nitrification in the ActivatedSludge Process," Jour. Inst. Sew. Purif., Vol. 2, pp.130,1964.
3. Lijklema, L., "Model for Nitrification in Activated SludgeProcess," Environ. Sci. & Technol., Vol. 7, pp. 428, 1973.
4. Stenquist, R., J,, Parker, D. S., and Dosh, T. J., "CarbonOxidation-Nitrification In Synthetic Media Trickling Filter,"Jour. of Water Poll. Control Federation, Vol. 46, pp. 2327,1974.
5. Ito, K., and Matsuo, T., "The Effect of Organic Loading onNitrification In RBC Wastewater Treatment Processes,"Proceedings of the First National Symposium/Workshop onRotating Biological Contactor Technology, Vol. 2, pp. 1165,February 2-4, 1980.
6. O'Shaughnessy, J. C., et al., "Nitrification of MunicipalWastewater Using Rotating Biological Contactors," Proceed-ings of the first National Symposium/Workshop on RotatingBiological Contactor Technology, Vol. 2, pp. 1193, February2-4, 1980.
7. Zenz, D. R., et al., "Pilot Scale Studies On the Nitrificationof Primary and Secondary Effluents Using Rotating BiologicalDiscs at the Metropolitan Sanitary District Of GreaterChicago," Proceedings of the First National Syposium/Workshopon Rotating Biological Contactor Technology, Vol. 2 pp. 1221,February 2-4, 1980.
8. Standard Method for the Examination of Water and Wastewater,14 th Edition, APHA-AWWA-WPCF, 1975
9. Zenz, D. R., et al., "Pilot.Scale Studies On the Nitrificationof Primary and Secondary Effluents Using Rotating BiologicalDiscs at Metropolitan Sanitary District of Greater Chicago,"Proceedings of the First National Symposium/Workshop onRotating Biological Contactor Technology, Volume II, pp. 1221,Champion, Pennsylvania, 1980
10. O'Shaughnessy, J. C., et al., "Nitrification of MunicipalWastewater Using Rotating Biological Contactors," Proceedingsof the First National Symposium/Workshop on Rotating BiologicalContactor Technology, Volume II, pp.1193, Champion, Pennsylvania,1980.
11. Clark, J. !I1., et al., "'later Supply and Pollution Control, pp.743, Harper & Row Publishers, New York, 1977.
891
PART VIII: INDUSTRIAL WASTEWATER TREATMENT
UPGRADING SLAUGHTERHOUSE EFFLUENT WITH ROTATINGBIOLOGICAL CONTACTORS
. 0Torleiv Bilstad, Department of Environmental
Engineering, University of Rogaland,N-4001 Stavanger, Norway
INTRODUCTION
The purpose of this work was to extend the potentiallyattractive rotating biological contactor (RBC) process toupgrade treated slaughterhouse wastewater effluent from abiological tower. The research was primarily concerned withdemonstrating the RBC potential for removing biochemicaloxygen demand (BOD) from low-temperature wastewater.Attention was concentrated on the time to reach process
* stability and treatment performance with low-temperaturewastewater.
The RBC-pilot plant, described more completely below,receives a constant wastewater flow of 1.6 I/min. of settledeffluent from a tower trickling filter (bio-tower). Theorganic loading to the pilot plant varies over time; from asoluble BODof 50 mg/l to as high as 700 mg/l. The higherorganic loading does not negatively affect RBC-treatmentperformance. In fact, percent removal of BOD increaseswith increasing organic loading.
Process stability measured as percent BOD removed in10°C wastewater, was reached in approximately three weeksafter start-up. The bio-tower preceeding the RBC is
m 892
considered a "roughing" process as it reduces the organicloading on the RBC to a level that allows "optimal" removal.This combination, bio-tower and RBC, therefore, enables thetreatment plant to neet new .econdary treatment requirementsand other possibly more stringent requirements adoptable inthe future.
According to the literature, the number of treatmentflowsheets that can be derived by combining various biologi-cal treatment processes is nearly endless. Combinations oftrickling-filter and activated-sludge processes are the morecommon flowsheets. These processes have be used successfullyfor a number of years for the treatment of all types ofwastewater, especially combined domestic and industrialwastewater (1).
The process microbiology for combined biological treat-ment processes is essentially the same as for the individualprocesses. The biological activity in the bio-tower, the"roughing" filter in this research, will be somewhat diffe-rent from the RBC because of the higher shearing actionresulting from the hydraulic flowrates applied to the tower.The bio-tower moreover acts to reduce the organic loading onthe RBC, making nitrification a possibility, expeciallyduring periods with higher wastewater temperatures, i.e.;above 10 C.
The bio-tower effluent is piped to an adjoining fjordwith the outfall-pipe extending to a depth of 43 m. Thefjord is showing signs of deterioration with algae growthand anoxic zones due to the total communal load of domesticand industrial wastewater. It is therefore encouraging thatthe RBC-pilot plant performs well as this process maybe the future mode of "polishing" the existing bio-towereffluent.
INSTALLATION AND START-UP
Figure 1 shows the location of the plant. The presenteffluent is piped through two 0.16 m diameter pipes, alength of 240 m along the side-slope of the fjord, to adepth of 43 m. A schematic of the treatment plant isshown in Figure 2.
893
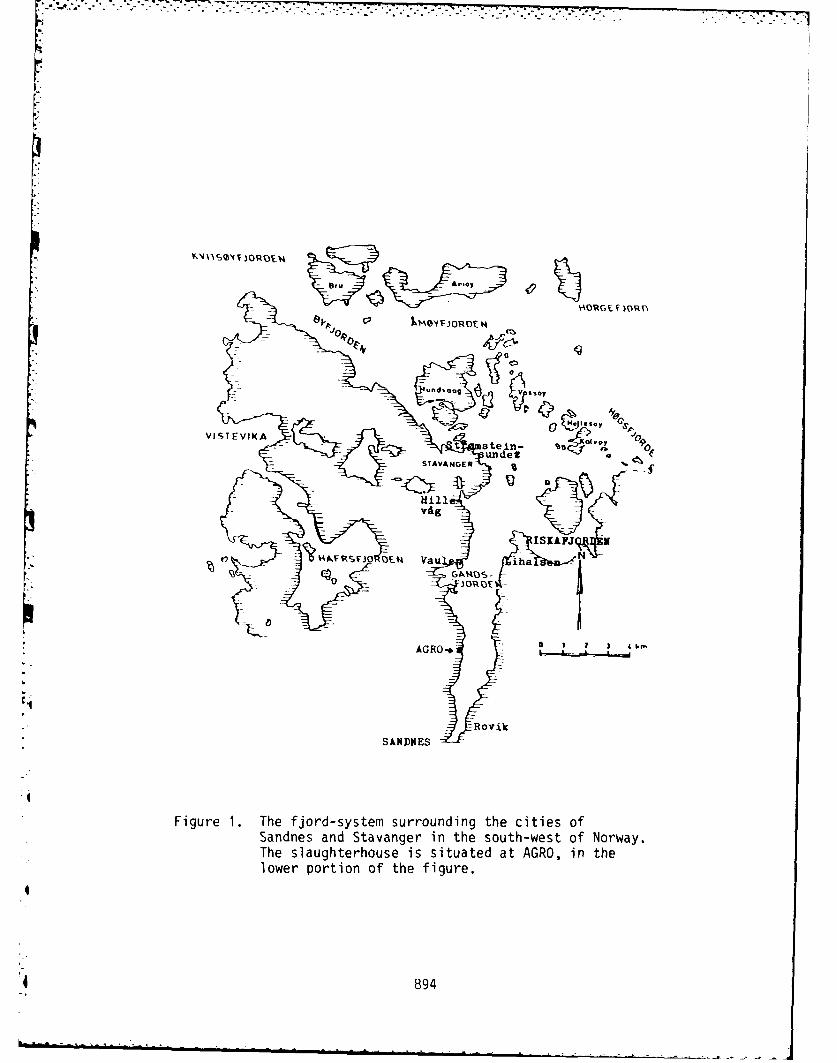
o-o
br-
"
,soy
"- .Ji ' 0 ge '*soy p-09
vstv stein It stin Eundet f%
STAVANGER
VAg
ISLAFJ N
0 "kFRFJO DEA Vau ha -N
AG RO4 S ______
SRovik
SANDX ES
Figure 1. The fjord-system surrounding the cities ofSandnes and Stavanger in the south-west of Norway.The slaughterhouse is situated at AGRO, in thelower portion of the figure.
4| 894
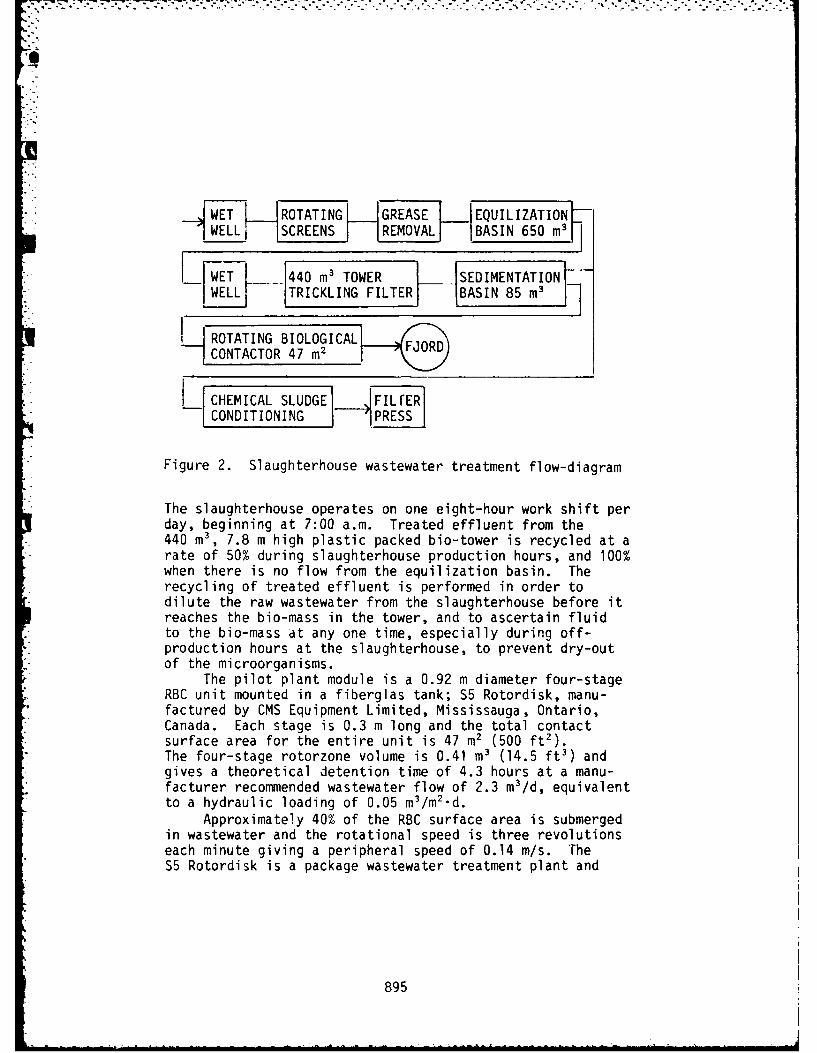
WET ROTATING GREASE EQUILIZATIONWELL SCREENS REMOVAL BASIN 650 m3
L nT ____440 m 3 TOWER SEDIMENTATIONWELL TRICKLING FILTER BASIN 85 M 3
ROTATING BIOLOGICALCONTACTOR 47 m
2 FJORD
L CHEMICAL SLUDGE FLRCONDITIONING PRESS
Figure 2. Slaughterhouse wastewater treatment flow-diagram
The slaughterhouse operates on one eight-hour work shift perday, beginning at 7:00 a.m. Treated effluent from the440 m3 , 7.8 m high plastic packed bio-tower is recycled at arate of 50% during slaughterhouse production hours, and 100%when there is no flow from the equilization basin. Therecycling of treated effluent is performed in order todilute the raw wastewater from the slaughterhouse before itreaches the bio-mass in the tower, and to ascertain fluidto the bio-mass at any one time, especially during off-production hours at the slaughterhouse, to prevent dry-outof the microorganisms.
The pilot plant module is a 0.92 m diameter four-stageRBC unit mounted in a fiberglas tank; S5 Rotordisk, manu-factured by CMS Equipment Limited, Mississauga, Ontario,Canada. Each stage is 0.3 m long and the total contactsurface area for the entire unit is 47 M2 (500 ft2).The four-stage rotorzone volume is 0.41 m3 (14.5 ft3) andgives a theoretical detention time of 4.3 hours at a manu-facturer recommended wastewater flow of 2.3 m3/d, equivalentto a hydraulic loading of 0.05 m3/m2'd.
Approximately 40% of the RBC surface area is submergedin wastewater and the rotational speed is three revolutionseach minute giving a peripheral speed of 0.14 m/s. TheS5 Rotordisk is a package wastewater treatment plant and
895
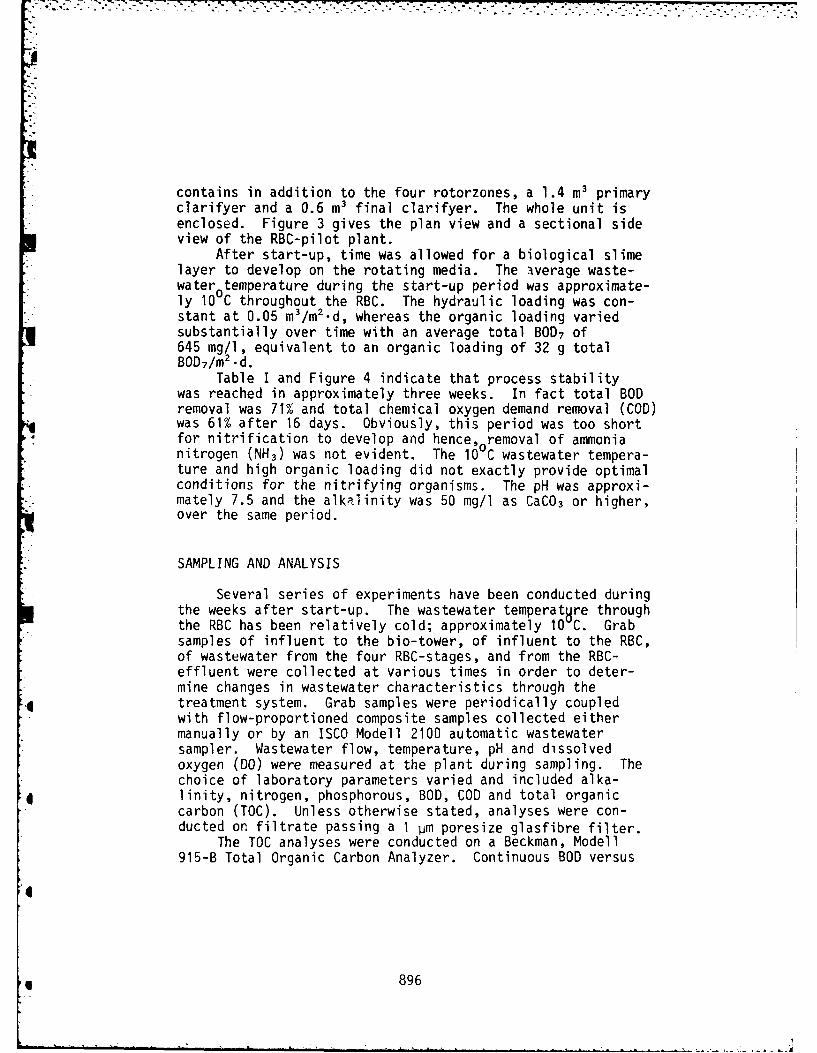
contains in addition to the four rotorzones, a 1.4 m3 primaryclarifyer and a 0.6 m3 final clarifyer. The whole unit isenclosed. Figure 3 gives the plan view and a sectional sideview of the RBC-pilot plant.
After start-up, time was allowed for a biological slimelayer to develop on the rotating media. The iverage waste-water0 temperature during the start-up period was approximate-ly 10 C throughout the RBC. The hydraulic loading was con-stant at 0.05 m3/m2 .d, whereas the organic loading variedsubstantially over time with an average total BOD 7 of645 mg/l, equivalent to an organic loading of 32 g totalBOD7 /m
2 .d.Table I and Figure 4 indicate that process stability
was reached in approximately three weeks. In fact total BODremoval was 71% and total chemical oxygen demand removal (COD)was 61% after 16 days. Obviously, this period was too shortfor nitrification to develop and hence, removal of ammonianitrogen (NH3) was not evident. The 10 C wastewater tempera-ture and high organic loading did not exactly provide optimalconditions for the nitrifying organisms. The pH was approxi-
*- . mately 7.5 and the alkalinity was 50 mg/l as CaC0 3 or higher,over the same period.
SAMPLING AND ANALYSIS
Several series of experiments have been conducted duringthe weeks after start-up. The wastewater temperat8 re throughthe RBC has been relatively cold; approximately 10 C. Grabsamples of influent to the bio-tower, of influent to the RBC,of wastewater from the four RBC-stages, and from the RBC-effluent were collected at various times in order to deter-mine changes in wastewater characteristics through thetreatment system. Grab samples were periodically coupledwith flow-proportioned composite samples collected eithermanually or by an ISCO Modell 2100 automatic wastewatersampler. Wastewater flow, temperature, pH and dissolvedoxygen (DO) were measured at the plant during sampling. Thechoice of laboratory parameters varied and included alka-linity, nitrogen, phosphorous, BOD, COD and total organiccarbon (TOC). Unless otherwise stated, analyses were con-ducted on filtrate passing a 1 pm poresize glasfibre filter.
The TOC analyses were conducted on a Beckman, Modell915-B Total Organic Carbon Analyzer. Continuous BOD versus
896
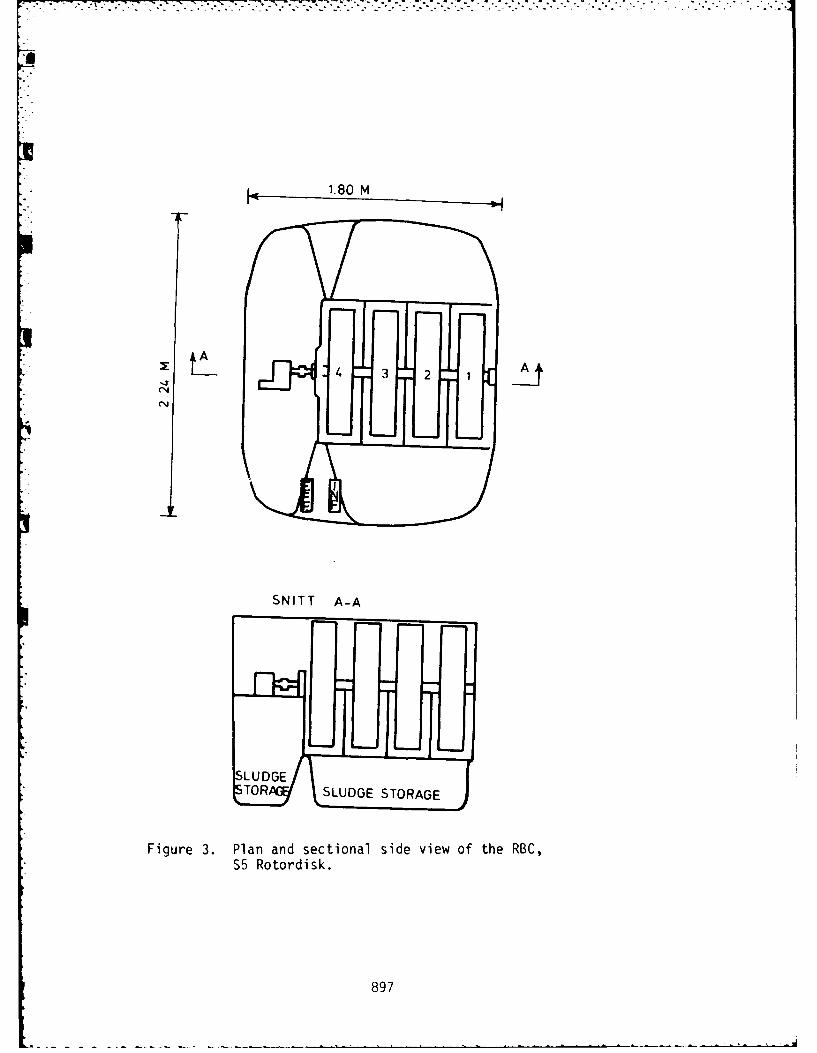
SNITT A-A
Figure 3. Plan and sectional side view of the RBC,S5 Rotordisk.
897
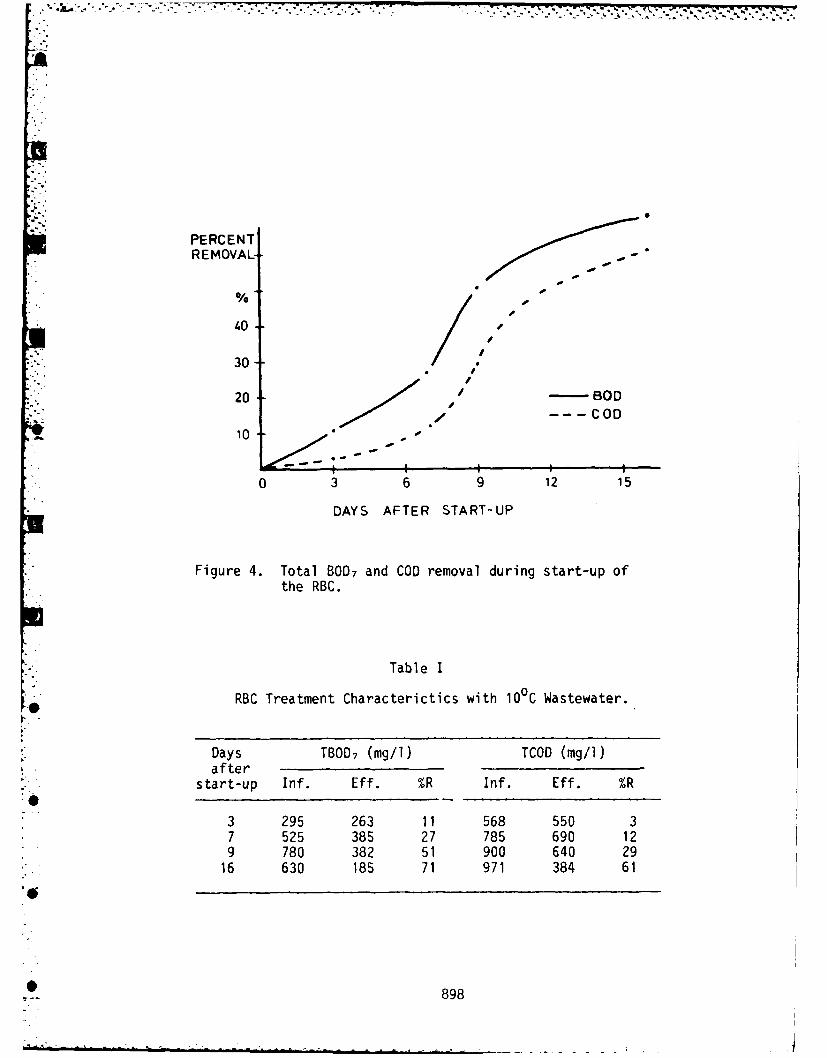
PERCENTREMOVAL -
30--
20 - BOO
10 -- - - -COD
0 3 6 9 12 15
DAYS AFTER START-UP
Figure 4. Total B007 and COD removal during start-up ofthe RBC.
Table I
RBC Treatment Characterictics with 10 C Wastewater.
Days TBOD7 (Mg/l) TCOD (mg/l)start-up Inf. Eff. %R Inf. Eff. %R
3 295 263 11 568 550 37 525 385 27 785 690 12
*.9 780 382 51 900 640 29*.16 630 185 71 971 384 61
898
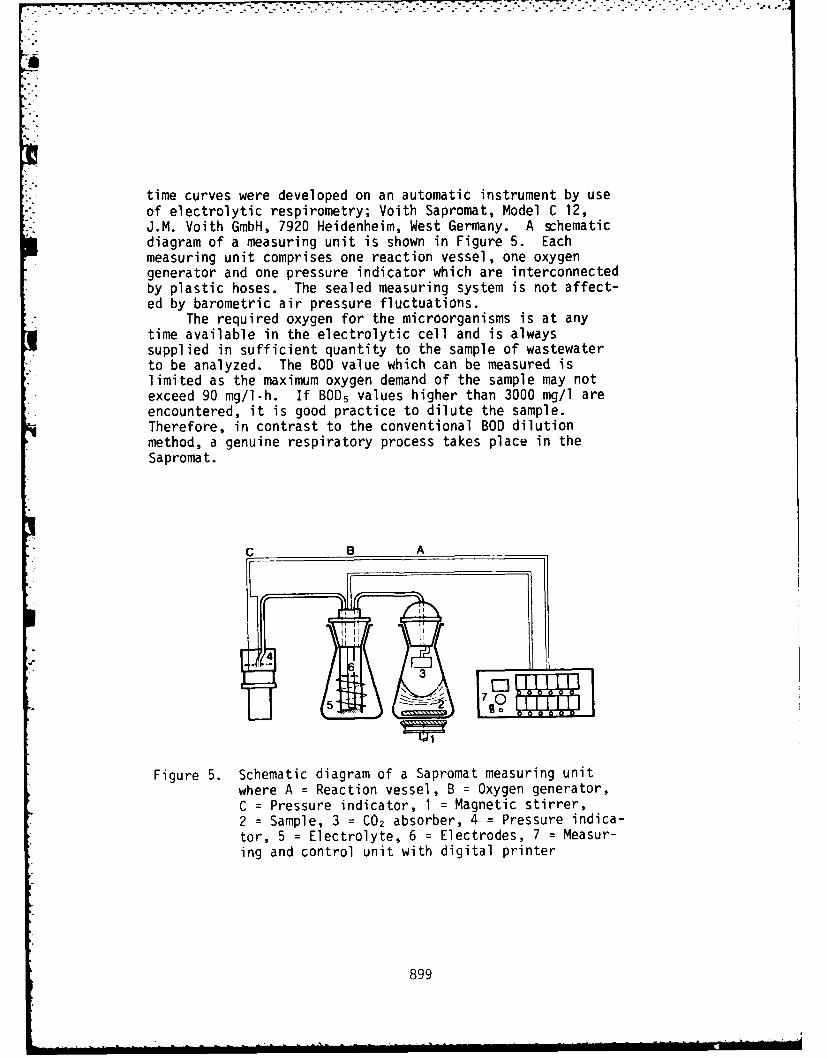
time curves were developed on an automatic instrument by useof electrolytic respirometry; Voith Sapromat, Model C 12,J.M. Voith GmbH, 7920 Heidenheim, West Germany. A shematicdiagram of a measuring unit is shown in Figure 5. Eachmeasuring unit comprises one reaction vessel, one oxygengenerator and one pressure indicator which are interconnectedby plastic hoses. The sealed measuring system is not affect-ed by barometric air pressure fluctuations.
The required oxygen for the microorganisms is at anytime available in the electrolytic cell and is alwayssupplied in sufficient quantity to the sample of wastewaterto be analyzed. The BOD value which can be measured islimited as the maximum oxygen demand of the sample may notexceed 90 mg/l.h. If BOD5 values higher than 3000 mg/l areencountered, it is good practice to dilute the sample.Therefore, in contrast to the conventional BOD dilutionmethod, a genuine respiratory process takes place in theSapromat.
C B A
4
70
Figure 5. Schematic diagram of a Sapromat measuring unitwhere A = Reaction vessel, B = Oxygen generator,C = Pressure indicator, 1 = Magnetic stirrer,2 = Sample, 3 = C02 absorber, 4 = Pressure indica-tor, 5 = Electrolyte, 6 = Electrodes, 7 = Measur-ing and control unit with digital printer
899
RESULTS AND DISCUSSION
A typical treatment performance of the bio-tower and RBC
system, four and five weeks after start-up, is summarized inTables II and III respectively. The RBC pilot plant reachesequilibrium with respect to organic removal approximatelythree eeks after start-up. However, as would be expected for
the 10 C wastewater, nitrification was not apparent until the
fifth week of operation. Impending nitrification is illu-
strated by a small production of nitrites (N02) and nitrates
(N03) as in Figure 6. The RBC pilot plant has not experienced
problems with low concentrations of dissolved oxygen (DO).
Figure 7 is typical in this respect, indicating adequateoxygen mass transfer in all four RBC-stages.
Four Weeks After Start-up
The soluble (filtered) long-term BOD concentrations ob-
tained from the bio-tower and RBC pilot plant during a typical
slaughterhouse production day are illustrated in Figure 8.The analyses were performed on composite afternoon samples,
each comprised of five half-hourly grab samples. These long-
term BOD curves are espec'-'ly illustrative in the case of
the RBC-effluent where t effect of nitrification showed up
very clearly for the non-inhibited nitrogenous BOD. The
Sapromat oxygen uptake reaction was performed on non-diluted
wastewater which, no doubt, was of great importance for the
slow-growing nitrifiers. The standard dilution BOD-method
often retards nitrification because of a population decreaseof the nitrifying bacteria (2).
The rate of nitrification, and therefore the rate of
growth and length of generation times of the nitrifying
organisms, is affected by several environmental factors
4 including temperature, pH and dissolved oxygen. Borchardt
(3) estimated the rat 8 of nitrification at 9 C to be about
50% of the rate at 20 C. The RBC did not provide a long
enough sludge-age gfter four seeks of operation to provide
nitrification at 9 C. The 20 C water-bath in the Sapromat
coupled with six days of incubation provided such a sludge-
age for the RBC-effluent sample (Figure 8). The pH of the
wastewater was normally above 7.0.Successful removal if carbonaceous material expressed as
BOD, COD or TOC is apparent from Figure 9 and TableII. The
hydraulic loading was constant at 0.05 m3 /m2-d which yielded
9i| 900
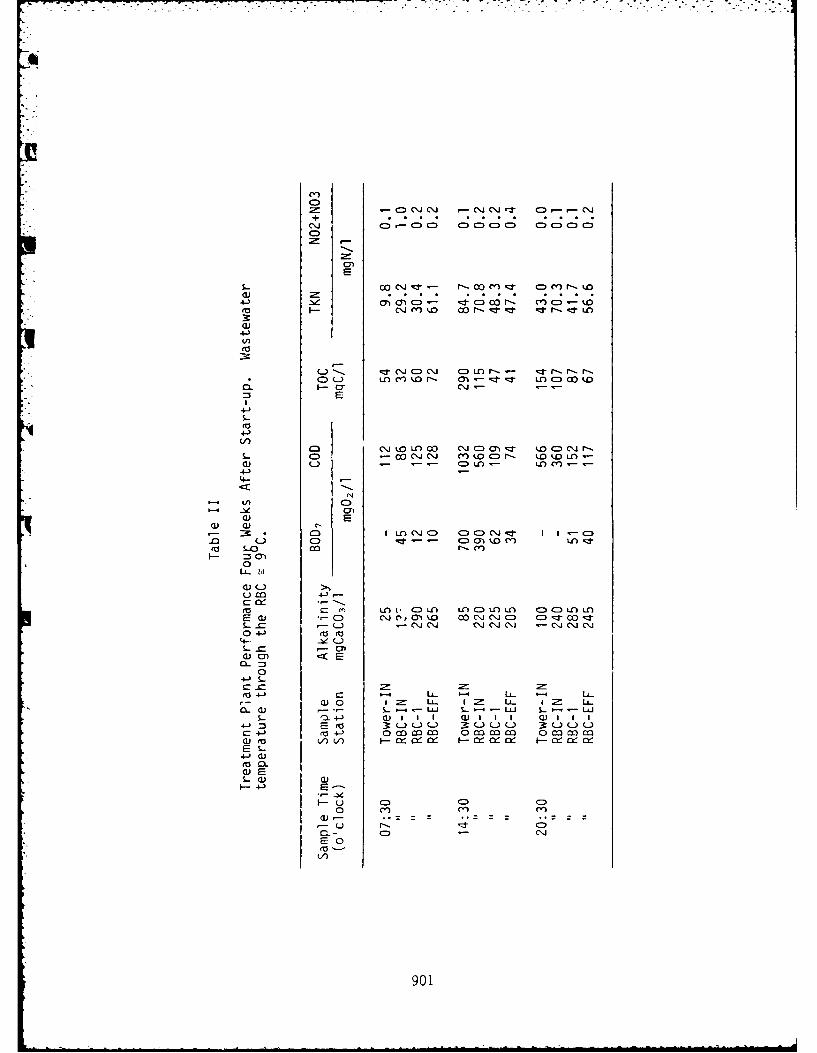
C)0C C J - (\j C'J -,t C -C'
E
I-i CC)'f kD cr- -: I, rr--1
4-)
C-) -. .- CZ) C~j CD c I.) r~- - z -t r - r-.
0. Ci- -
I2
4-
4-)(I)
C)i U:) LO 0o C\J C) m-l k ~.C) C~i-L-C 00 -Q C'J M 1.0 C)r- k .0 ~Lla) C.) - - CifLO- L
4-
-C-4
I C) IL (\I C) C)C=) C\J-Z I 1-CZ),00 .L.)-C C=)OC kD LO Zj
F- = a0
2W a *C)-0 C 11c0' co \j iC)C=)c'-T00-JL- -9- L- .) .- C'. 'J (J (\ J l C"j . CJ ~4-'L.
0-~
CO4-) c - LL- U- - LiW Li- Z: U- I Z LL-
S- W -- LW-U L--L L W.L- 0l4--) a I a) I I I 1 WI) 1 1 I
4- -ra-' 3: 0cicc C-) a: . ()Cn
4-3 W)
a)E
s-~ .a) G
u )C CD0 C') m' m'
E 0
901
7-126 377 PROCEEDINGS: INTERNTIONL CONFERENCE ON FIXED-FILM
4/7BIOLOGICAL PROCESSES (..(U) PITTSBURGH UNIY PR DEPT OF
UNCL S JE CIVIL ENGINEERING V C WU ET AL. 1982 DACUSS-SI-R-005
UNCLASSIFIED F/G 3/2 N
smills 11 soniEEhhhmhEEohEohIsmhhhhhhhhhhhImhhImhhhhhhIoEhhhhhhonh
4%
111.013.2
[ LIIIN III16 L3.'11111 '1112.0L
1.25 LA4 11111.6 .
MICROCOPY RESOLUTION TEST CHART
NATIONAL BUREAU OF STANDARDS- 1963-A
IF
b"
.4-,1-
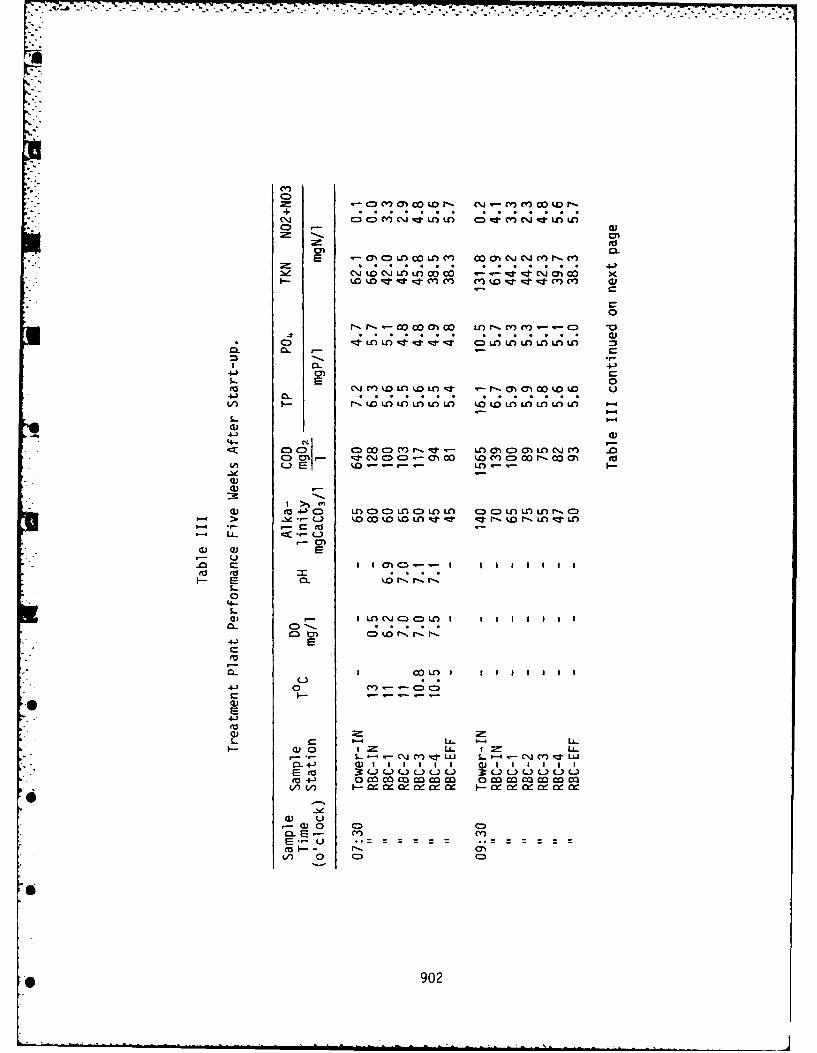
+ ... . . . . . . . . . . .C~jC:)CD n "-4-Lo Lo )K n Ac J LO LOo -
(m CL
oo% K t -mm m% d d tlmAmA )
L. E 0
VL.-CZ c ) C>O DMP a L)()= T , N V
C) cm"DD O 0m D0 "0 n t
0U 9 -) D U)C iU+2 LAOOLOLOLO CDCLO LOLO Nl C
i4 LL.
S-Uo) I I O C) CD LO II I I I I I I
ol C=; . r r.
'4-)
0)~0 U-)C.0~f I I I I I i I I
4-)E
CL 4-)fl 1 ()I I I lI II
4-0 4-0 oc zc 1 c ac ac
) 0 C
90
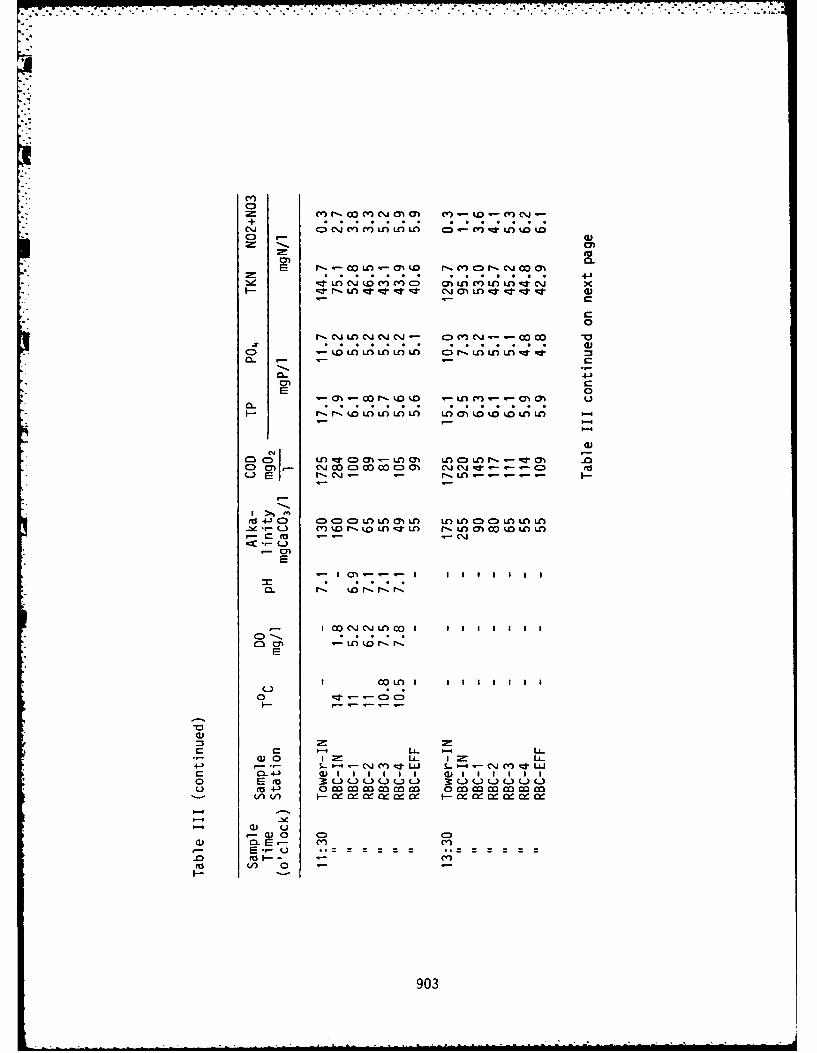
.C4
C)C
0
4-)cn r_
E 0
0._ koL .C O L)O . o% OL
a-0l koO - n0 n---o .0
IO >n I I I I
w 40 00LfL O -L UOA -l
-I C 4-4- I I II I I I
V) (n F - N- ixwQ-0
(V - LC) C=)N N
oU Ca. -- 00m-
-90
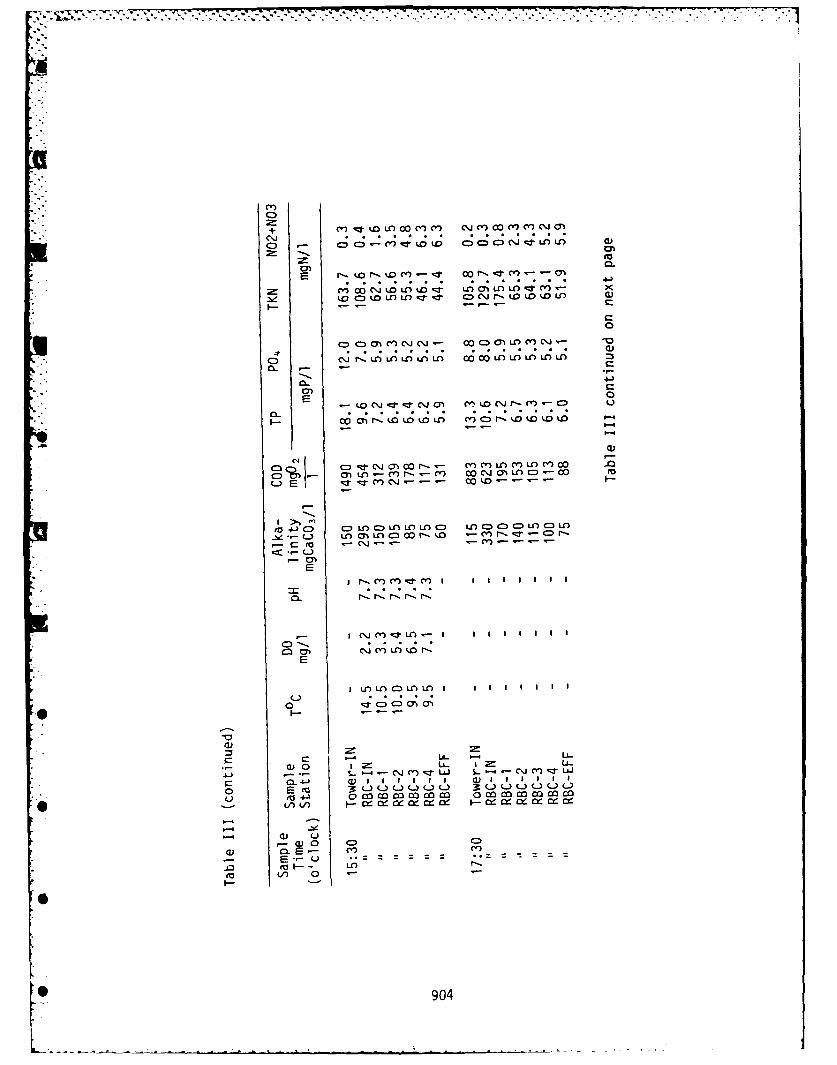
o~ .. . .~ .AL .
C))
+ c .0LAL 00 LOV) m0)
C~C
C ;CC)c; CC'J- LACJ
o4 6 'J kALLLL coLLAAL
a! CCC C l 7 C C
4-)
CLC
'4.,
C- ,rq C' - O %0 -o - '- '-
'a -6.0 C)l Ln C=) LA LA Ln a) LA 000) C LA CD LA-3) LA O'LAN.O (D - o cn r-
I,- L) :r
0L r.N.N.N.N
I C'i C.rLO - I I I I I I I
EnCM (V LA lA N.E
I LALO O ULL I I I I I I
-o-
0 Is0 I a, ~ .
0 .a- m) co cc Io Ia 0) ca co co Do m
) V) ,
..00 C:) C)
* 904
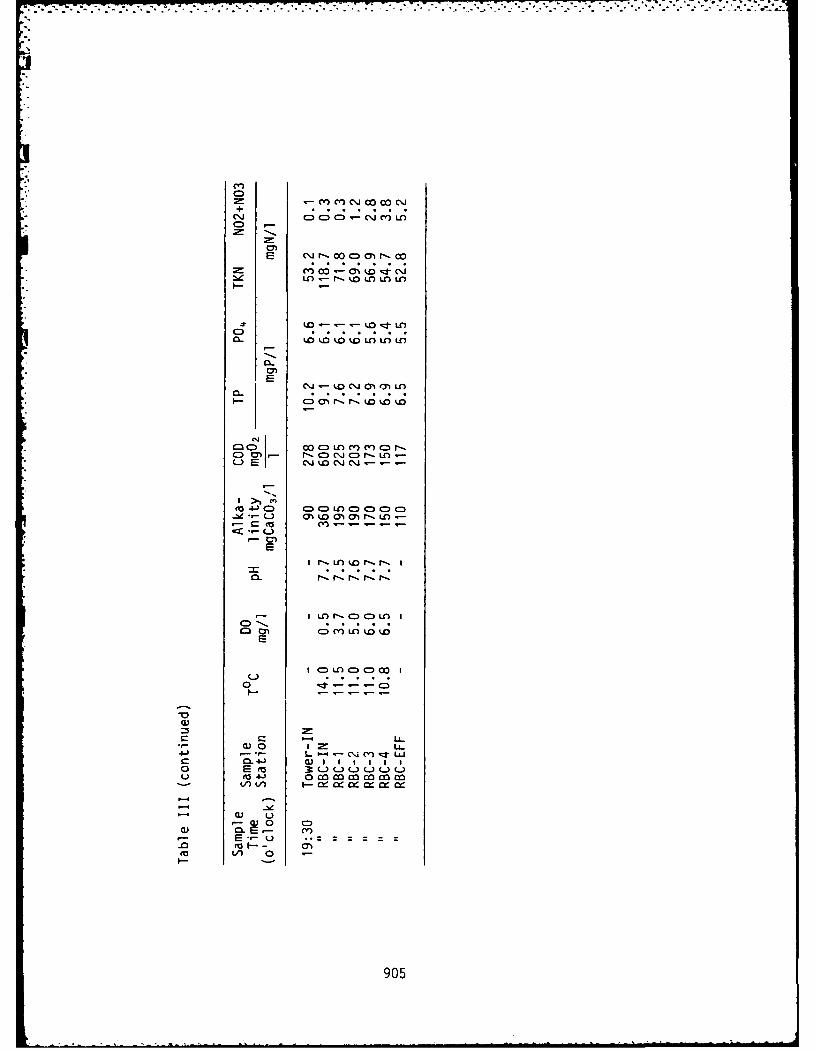
t ~ .. dCV.
0lC 9C
E CN -0 oi r- 0
LO - r DLA LO LO
C-
E
C3C 0c 0 )rCo 0) r - C) CD~ r N LO
- ~ . C\ 0 -- -9
'a - C) C)C C ) )C)C
0. r- LO % r-. - I
I LO C ) LA '.01 I
E-
I C=)LO ) 0 0 1
0)
4C S- clAC)trU.0) U
to +.).)
CJV) -ww0
0 C
M Lin 0 -I.-
905
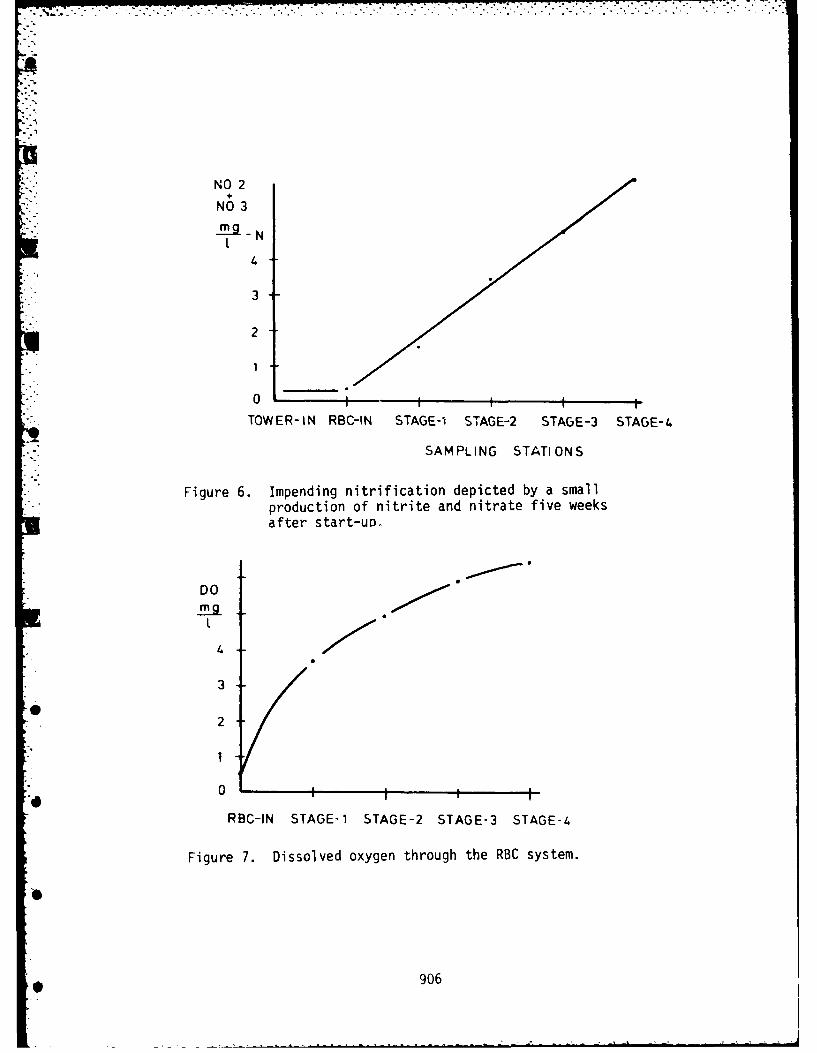
NO 2
NO 3
4
3
2
"0 I I I I
TOWER-IN RBC-IN STAGE-1 STAGE-2 STAGE-3 STAGE-4
SAMPLING STATIONS
Figure 6. Impending nitrification depicted by a smallproduction of nitrite and nitrate five weeksafter start-u.
L 4
3
2
00 I I I
RBC-IN STAGE-i STAGE-2 STAGE-3 STAGE-4
Figure 7. Dissolved oxygen through the RBC system.
906
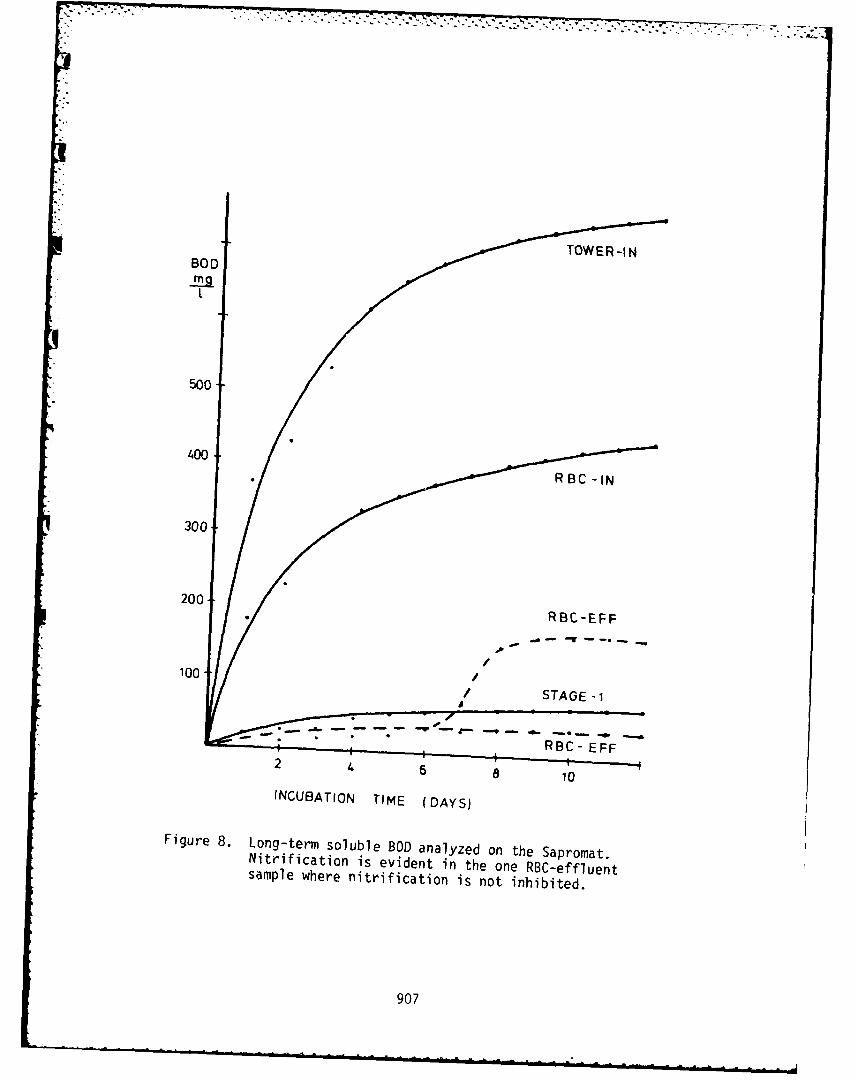
BOOITWRI
500
400
300
RBC-EFF
100 // STAGE- I
RBC- EFF2 4 6 81
fNCUBATION TIME (DAYS)
Figure 8. Long-term soluble BOD analyzed on the Sapromat.Nitrification is evident in the one RBC-effluentsample where nitrification is not inhibited.
907
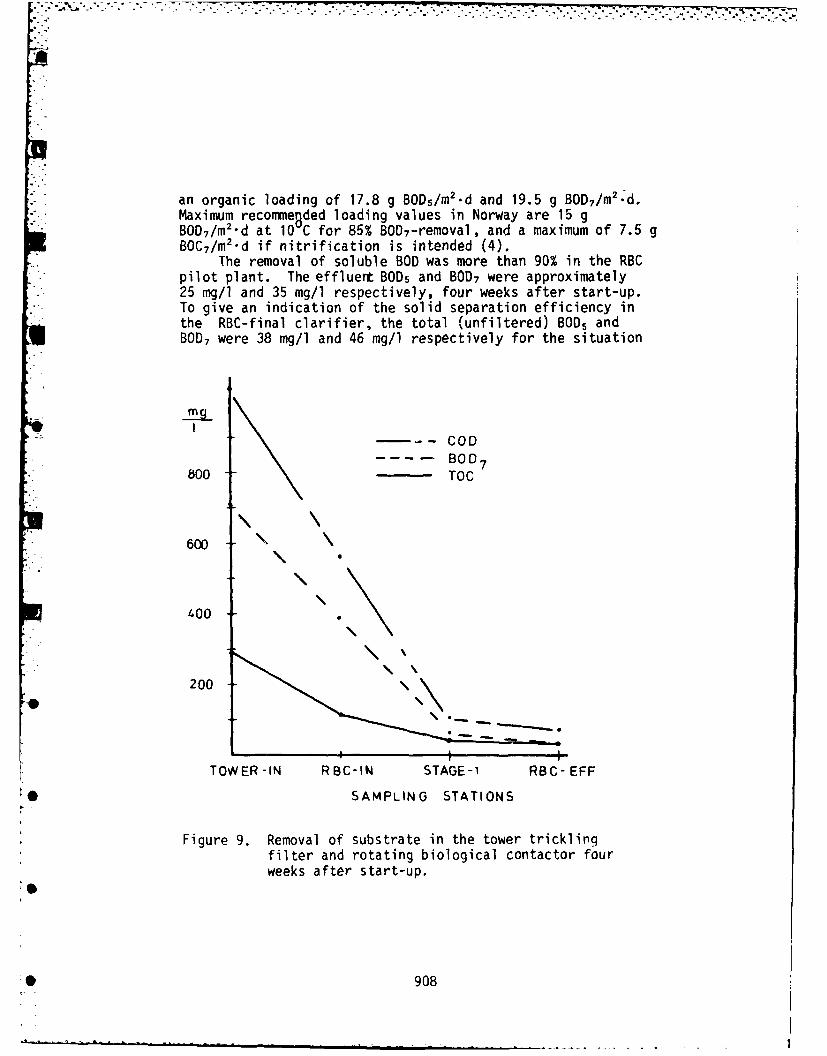
7,q* . - ,.. . .. . . . ..>"--.. . . . . .
an organic loading of 17.8 g BODs/m 2-d and 19.5 g BOD?/m 2-d.Maximum recomme8ded loading values in Norway are 15 gBOD7 /M2-d at 10 C for 85% BOD7-removal, and a maximum of 7.5 gBOC,/m2-d if nitrification is intended (4).
The removal of soluble BOD was more than 90% in the RBCpilot plant. The effluert BOD5 and BOD7 were approximately25 mg/l and 35 mg/l respectively, four weeks after start-up.To give an indication of the solid separation efficiency inthe RBC-final clarifier, the total (unfiltered) BOD5 andBOD 7 were 38 mg/i and 46 mg/l respectively for the situation
-, -.-. COD,..BO D 7
800 TOC
500
400\\
I I\200 - \\
TOWER-IN RBC-IN STAGE-i RBC-EFF
0O SAMPLING STATIONS
Figure 9. Removal of substrate in the tower tricklingfilter and rotating biological contactor fourweeks after start-up,
9
0 908
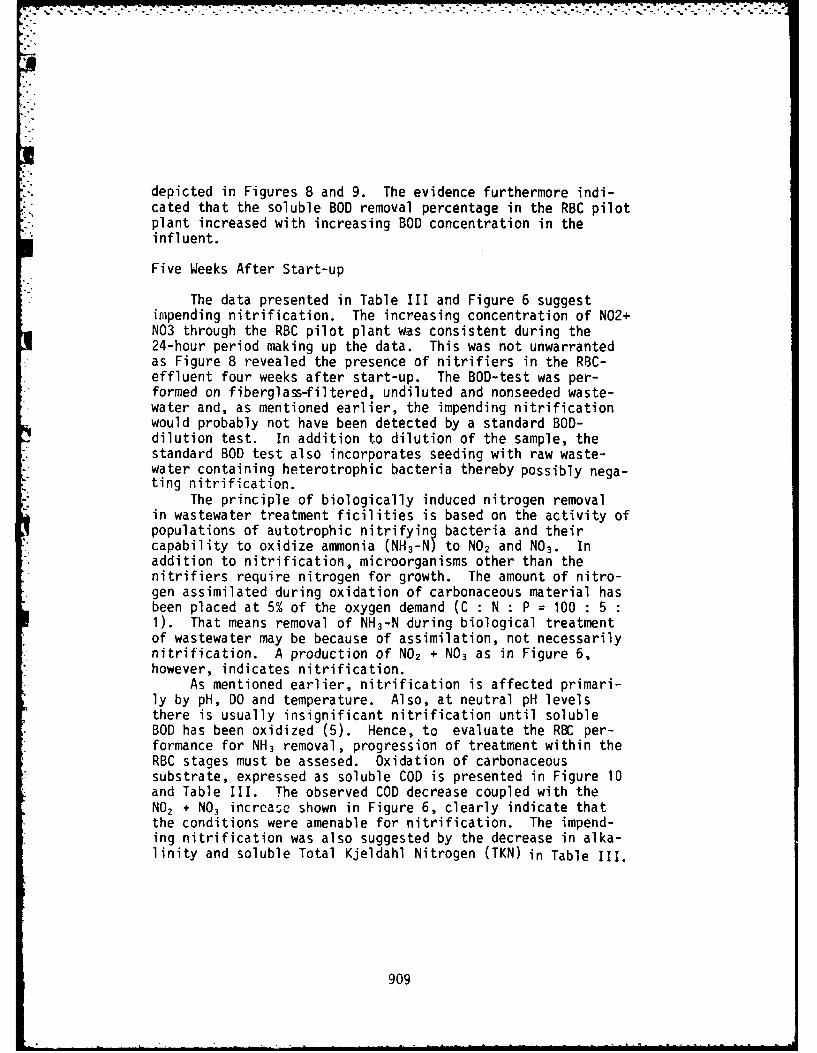
depicted in Figures 8 and 9. The evidence furthermore indi-cated that the soluble BOD removal percentage in the RBC pilotplant increased with increasing BOD concentration in theinfluent.
Five Weeks After Start-up
The data presented in Table III and Figure 6 suggestimpending nitrification. The increasing concentration of N02+N03 through the RBC pilot plant was consistent during the24-hour period making up the data. This was not unwarrantedas Figure 8 revealed the presence of nitrifiers in the RBC-effluent four weeks after start-up. The BOD-test was per-formed on fiberglas-filtered, undiluted and nonseeded waste-water and, as mentioned earlier, the impending nitrificationwould probably not have been detected by a standard BOD-dilution test. In addition to dilution of the sample, thestandard BOD test also incorporates seeding with raw waste-water containing heterotrophic bacteria thereby possibly nega-ting nitrification.
The principle of biologically induced nitrogen removalin wastewater treatment ficilities is based on the activity ofpopulations of autotrophic nitrifying bacteria and theircapability to oxidize ammonia (NH3-N) to NO2 and NO3. Inaddition to nitrification, microorganisms other than thenitrifiers require nitrogen for growth. The amount of nitro-gen assimilated during oxidation of carbonaceous material hasbeen placed at 5% of the oxygen demand (C : N : P = 100 : 51). That means removal of NH3-N during biological treatmentof wastewater may be because of assimilation, not necessarilynitrification. A production of NO2 + NO3 as in Figure 6,however, indicates nitrification.
As mentioned earlier, nitrification is affected primari-ly by pH, DO and temperature. Also, at neutral pH levelsthere is usually insignificant nitrification until solubleBOD has been oxidized (5). Hence, to evaluate the RBC per-formance for NH3 removal, progression of treatment within theRBC stages must be assesed. Oxidation of carbonaceoussubstrate, expressed as soluble COD is presented in Figure 10and Table III. The observed COD decrease coupled with theNO2 + NO3 incrcasc shown in Figure 6, clearly indicate thatthe conditions were amenable for nitrification. The impend-ing nitrification was also suggested by the decrease in alka-linity and soluble Total Kjeldahl Nitrogen (TKN) in Table III.
909
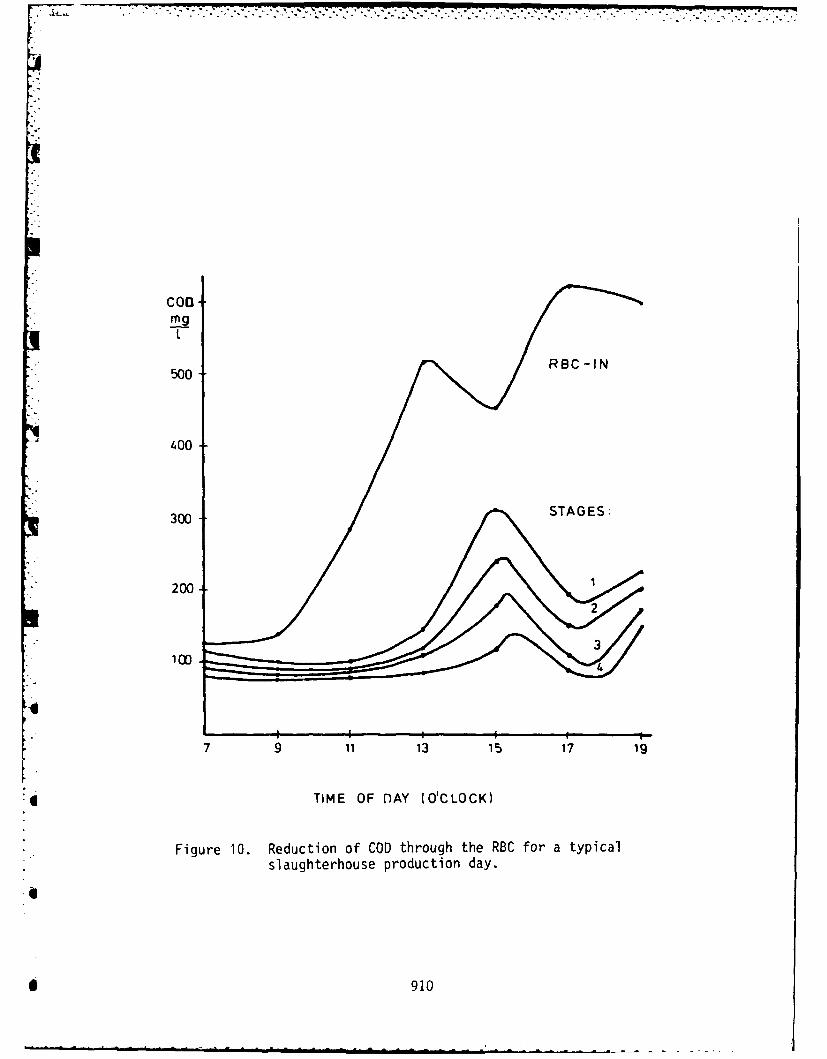
coomg
500RC-N
300
200-
100
64
7 9 11 13 15 17 1
TIME OF nAY (O'CLO CK)
Figure 10. Reduction of COD through the RBC for a typicalslaughterhouse production day.
0 910
There is no doubt that the BOD removed by the bio-towerwas the more readily biodegradable fraction of the wastewater.The soluble COD in the RBC-effluent was approximately 100 mg/land probably would not decrease much more if further biologi-cal treatment was provided. This study supports the evidencethat when wastewater is sent through a series of tricklingfilters, or recycled several times through the same filter,the removability of wastewater organics decreases as thenumber of passes increases (6).
CONCLUSIONS
The application and start-up performance of a RBC pilotplant unit for upgrading clarified trickling filter effluenthas been described. Although the operational experience hasbeen very short, 4_% following remarks can be made fromtreatment of a 10 C slaughterhouse wastewater:1. RBC process stability with respect to BOD removal was
reached in approximately three weeks after start-up.The RBC-biofilm became mature relatively fast due toseeding of microorganisms from the bio-tower.
2. The hydraulic loading to the RBC was constant at0.05 A 3/m2.d whereas the organic loading varied fromapproximately 2 g soluble BOD 7/m2-d to 35 g solubleBOD7 /
2-d. A typical slaughterhouse production dayorganic loading is approximately 20 g solubleBOD7 /m
2 -d, resulting in a soluble carbonaceous BOD7effluent concentration of approximately 35 mg/l.
3. The Sapromat analysis for soluble BOD did not requireseeding or dilution of the wastewater to be tested.The nitrifiers present will therefore perform immediate-ly if other environmental conditions are satisfactory.
4. The effect of low temperature wastewater on NH3-removalcould not be verified in the short time after start-up.This will be a question to answer after prolonged RBCoperation.
ACKNOWLEDGEMENTS
This study was supported by funds provided by theNorwegian Environmental Protection Agency (SFT), The authorwish to thank Damann Anderson, Patti Hantz, Arild Lohne,Olav Nordgulen and Sissel Roine for assistance.
911
.. . . .. . . . . . . . ............. . .... .| | .
REFERENCES
1. Metcalf & Eddy, Inc., "Wastewater Engineering: Treatment,Disposal, Reuse", McGraw-Hill, Chapter 9, 1979.
2. Dague, R.E., "Inhibition of Nitrogenous BOD and Treat-ment Plant Performance Evaluation", Journal of the WaterPollution Control Federation, Vol. 53, No. 12, December1981, pp 1738-1741.
3. Borchardt, J.A., "Nitrification in the Activated SludgeProcess", Division of Sanitary and Water ResourcesEngineering, University of Michigan, Ann Arbor, 1966.
4. Statens Forurensingstilsyn, "Retningslinjer for Dimen- 2sionering av Avlopsrenseanlegg", p 42, Oslo, 1978.
5. Miller, R.D., et al., "Rotating Biological ContactorProcess for Secondary Treatment and NitrificationFollowing a Trickling Filter", Techn. Report 7905,U.S. Army Med. Bioeng. R & D Lab., June 1979.
6. Poon, P.C., et al., "Upgrading with Rotating BiologicalContactors for BOD Removal", Journal of the WaterPollution Control Federation, Vol. 53, No. 4, April 1981,pp 474-481.
912
EVALUATION OF AN ANAEROBIC ROTATING BIOLOGICALCONTACTOR SYSTEM FOR TREATMENT OF A MUNITION
WASTEWATER CONTAINING ORGANIC ANDINORGANIC NITRATES
Leonard L. Smith, Hercules Aerospace Division,Hercules Incorporated, Radford Army Ammunition
Plant, Radford, Virginia.
INTRODUCTION
Radford Army Ammunition Plant (RAAP), like most of the
Army propellant and explosive manufacturing plants, was builtin the early 1940s to supply munitions for World War II. In1970, the Army initiated modernization programs at its ammu-nition plants to replace obsolete facilities and improve thesafety of operations. As part of this modernization programa continuous automated multi-base line (CAMBL) manufacturingfacility was planned for construction at RAAP to augment thepresent labor intensive batch process. This paper descrTbes
the studies that were conducted to develop design criteriafor a facility to treat the wastewate . that will be gener-
ated in the CAMBL.
WASTEWATER CHARACTERIZATION
A wastewater characterization study was conducted for
the CAMBL manufacturing facilities. Samples of the waste-waters were collected and analyzed during the evaluation of aprototype CAMBL manufacturing line. These data were compiled,and the expected characterization of the full-scale facili-ties were determined. The quantity of water requiring
913
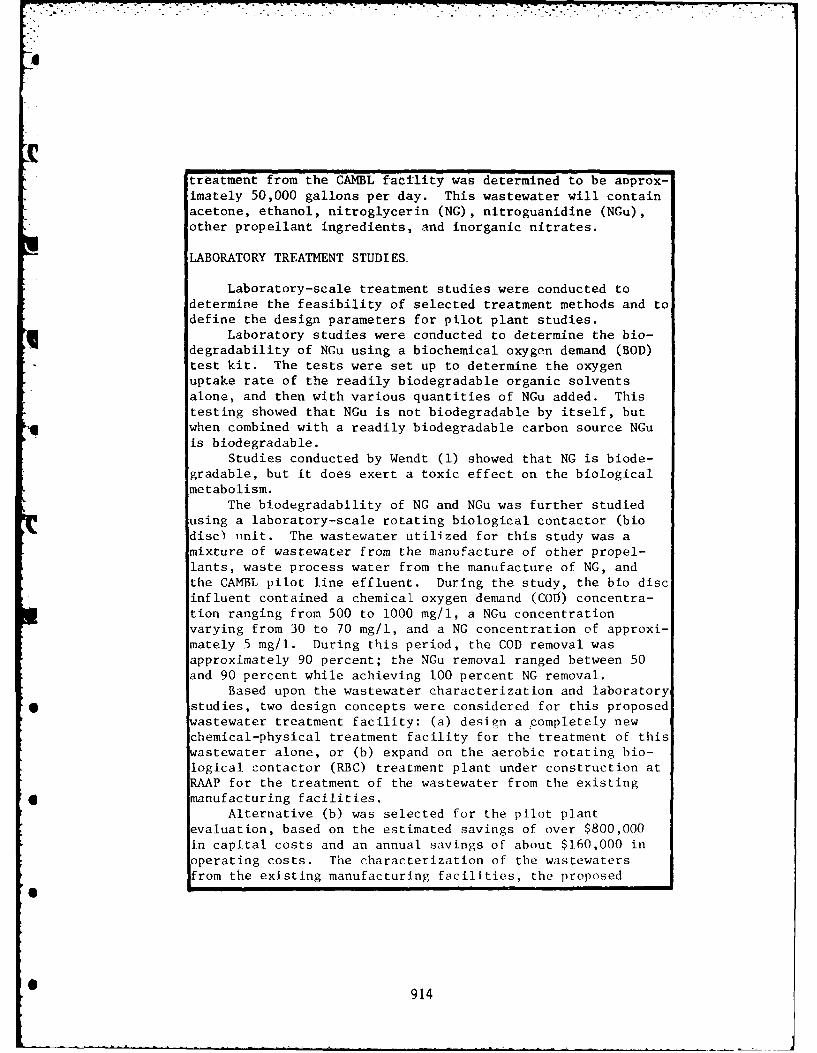
treatment from the CAMBL facility was determined to be anprox-imately 50,000 gallons per day. This wastewater will containacetone, ethanol, nitroglycerin (NG), nitroguanidine (NGu),other propellant ingredients, and inorganic nitrates.
LABORATORY TREATMENT STUDIES.
Laboratory-scale treatment studies were conducted todetermine the feasibility of selected treatment methods and todefine the design parameters for pilot plant studies.
q Laboratory studies were conducted to determine the bio-degradability of NGu using a biochemical oxygen demand (BOD)test kit. The tests were set up to determine the oxygenuptake rate of the readily biodegradable organic solventsalone, and then with various quantities of NGu added. Thistesting showed that NGu is not biodegradable by itself, butwhen combined with a readily biodegradable carbon source NGuis biodegradable.
Studies conducted by Wendt (1) showed that NG is biode-gradable, but it does exert a toxic effect on the biologicalmetabolism.
The biodegradability of NG and NGu was further studiedusing a laboratory-scale rotating biological contactor (biodisc) unit. The wastewater utilized for this study was amixture of wastewater from the manufacture of other propel-lants, waste process water from the manufacture of NG, andthe CAMBL pilot line effluent. During the study, the bio discinfluent contained a chemical oxygen demand (COD) concentra-tion ranging from 500 to 1000 mg/l, a NGu concentrationvarying from 30 to 70 mg/l, and a NG concentration of approxi-mately 5 mg/l. During this period, the COD removal wasapproximately 90 percent; the NGu removal ranged between 50and 90 percent while achieving 100 percent NG removal.
Based upon the wastewater characterization and laboratory* studies, two design concepts were considered for this proposed
astewater treatment facility: (a) design a completely newchemical-physical treatment facility for the treatment of thiswastewater alone, or (b) expand on the aerobic rotating bio-logical contactor (RBC) treatment plant under construction atRAAP for the treatment of the wastewater from the existing
Smanufacturing facilities.Alternative (b) was selected for the pilot plant
evaluation, based on the estimated savings of over $800,000in capital costs and an annual savings of about $160,000 inoperating costs. The characterization of the wastewatersfrom the existing manufacturing facilities, the proposed
0 914
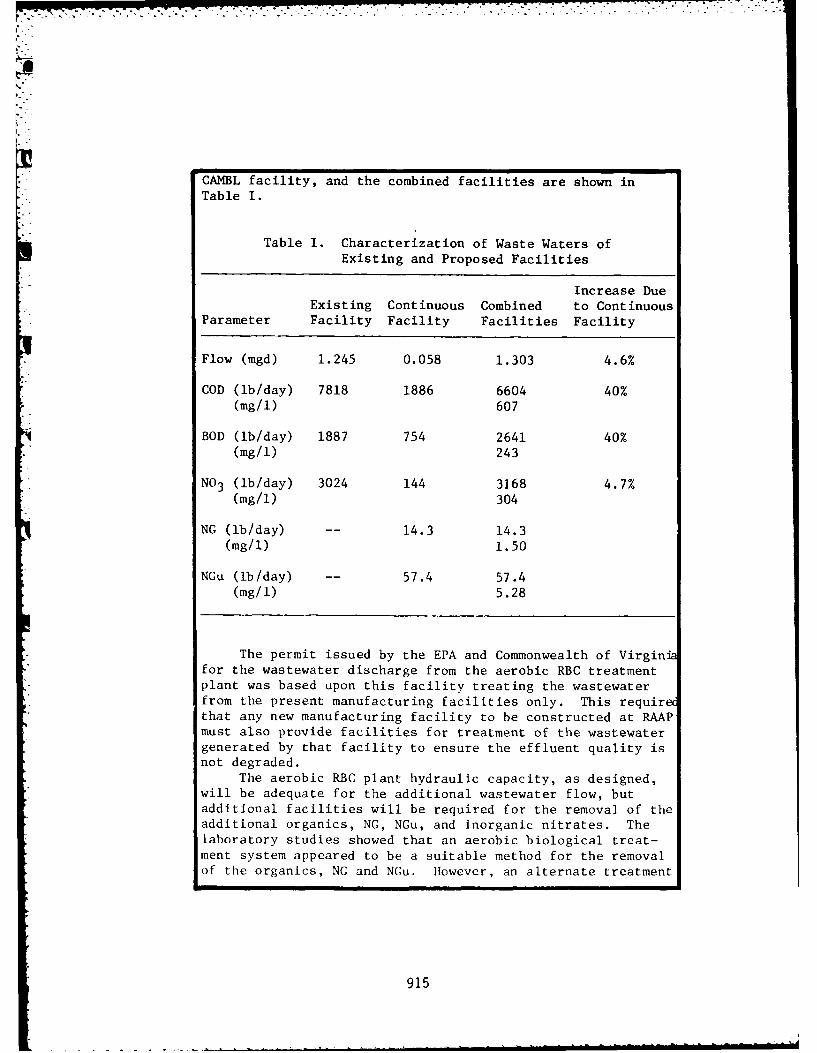
Tabe I
CAMBL facility, and the combined facilities are shown in[" Table I.
7Table I. Characterization of Waste Waters ofExisting and Proposed Facilities
Increase DueExisting Continuous Combined to Continuous
Parameter Facility Facility Facilities Facility
Flow (mgd) 1.245 0.058 1.303 4.6%
COD (lb/day) 7818 1886 6604 40%(mg/1) 607
BOD (lb/day) 1887 754 2641 40%(mg/1) 243
NO3 (lb/day) 3024 144 3168 4.7%(mg/i) 304
NG (lb/day) -- 14.3 14.3(mg/1) 1.50
NGu (lb/day) -- 57.4 57.4(mg/1) 5.28
The permit issued by the EPA and Commonwealth of Virginifor the wastewater discharge from the aerobic RBC treatmentplant was based upon this facility treating the wastewaterfrom the present manufacturing facilities only. This requirethat any new manufacturing facility to be constructed at RAAPmust also provide facilities for treatment of the wastewatergenerated by that facility to ensure the effluent quality isnot degraded.
The aerobic RBC plant hydraulic capacity, as designed,will be adequate for the additional wastewater flow, butadditional facilities will be required for the removal of theadditional organics, NG, NGu, and inorganic nitrates. Thelaboratory studies showed that an aerobic biological treat-ment system appeared to be a suitable method for the removalof the organics, NG and NGu. However, an alternate treatment
915
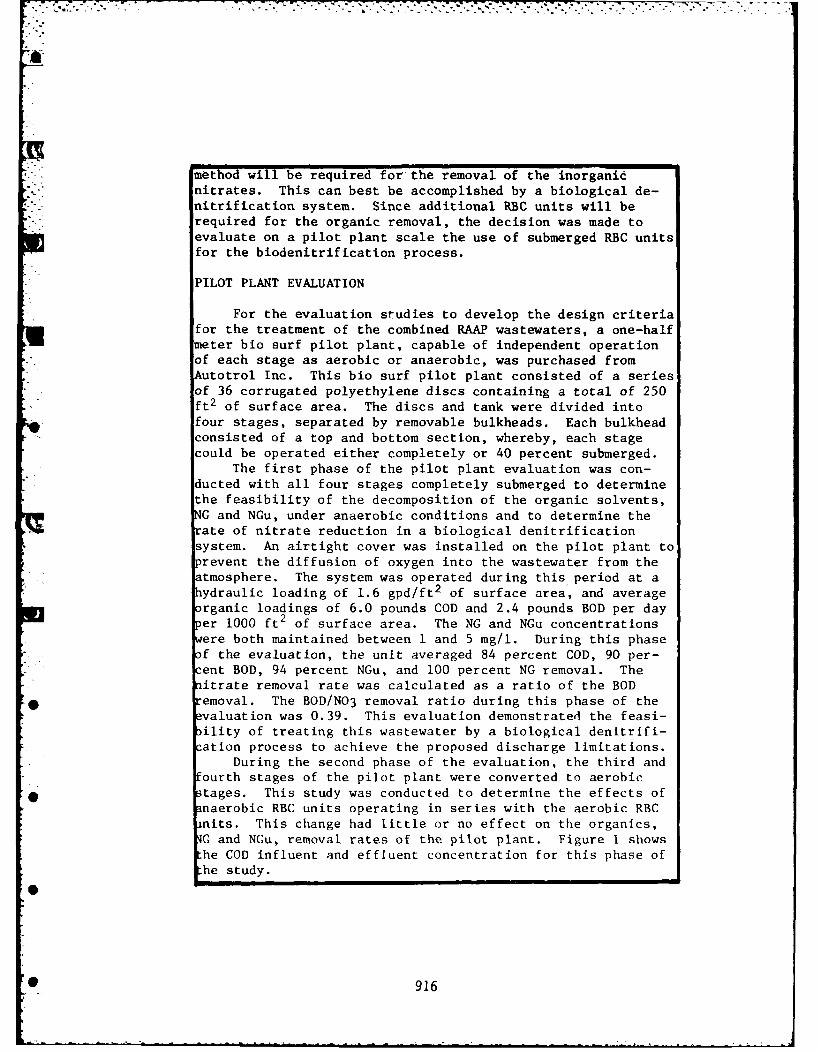
method will be required for the removal of the inorganicnitrates. This can best be accomplished by a biological de-nitrification system. Since additional RBC units will berequired for the organic removal, the decision was made toevaluate on a pilot plant scale the use of submerged RBC unitsfor the biodenitrification process.
PILOT PLANT EVALUATION
For the evaluation studies to develop the design criteriafor the treatment of the combined RAAP wastewaters, a one-halfmeter bio surf pilot plant, capable of independent operationof each stage as aerobic or anaerobic, was purchased fromAutotrol Inc. This bio surf pilot plant consisted of a seriesof 36 corrugated polyethylene discs containing a total of 250ft2 of surface area. The discs and tank were divided intofour stages, separated by removable bulkheads. Each bulkheadconsisted of a top and bottom section, whereby, each stagecould be operated either completely or 40 percent submerged.
The first phase of the pilot plant evaluation was con-ducted with all four stages completely submerged to determinethe feasibility of the decomposition of the organic solvents,NG and NGu, under anaerobic conditions and to determine therate of nitrate reduction in a biological denitrificationsystem. An airtight cover was installed on the pilot plant toprevent the diffusion of oxygen into the wastewater from theatmosphere. The system was operated during this period at a
ydraulic loading of 1.6 gpd/ft 2 of surface area, and averagerganic loadings of 6.0 pounds COD and 2.4 pounds BOD per dayer 1000 ft2 of surface area. The NG and NGu concentrationsere both maintained between I and 5 mg/l. During this phasef the evaluation, the unit averaged 84 percent COD, 90 per-ent BOD, 94 percent NGu, and 100 percent NG removal. Theitrate removal rate was calculated as a ratio of the BOD
* removal. The BOD/NO3 removal ratio during this phase of thevaluation was 0.39. This evaluation demonstrated the feasi-ility of treating this wastewater by a biological denitrifi-ation process to achieve the proposed discharge limitations.
During the second phase of the evaluation, the third andourth stages of the pilot plant were converted to aerobic
* stages. This study was conducted to determine the effects ofanaerobic RBC units operating in series with the aerobic RBCinits. This change had little or no effect on the organics,iG and NGu, removal rates of the pilot plant. Figure I showshe COD influent and effluent concentration for this phase ofhe study.
9
* 916
mC3
m
* rrco zcc Ci - JI@ m
I917
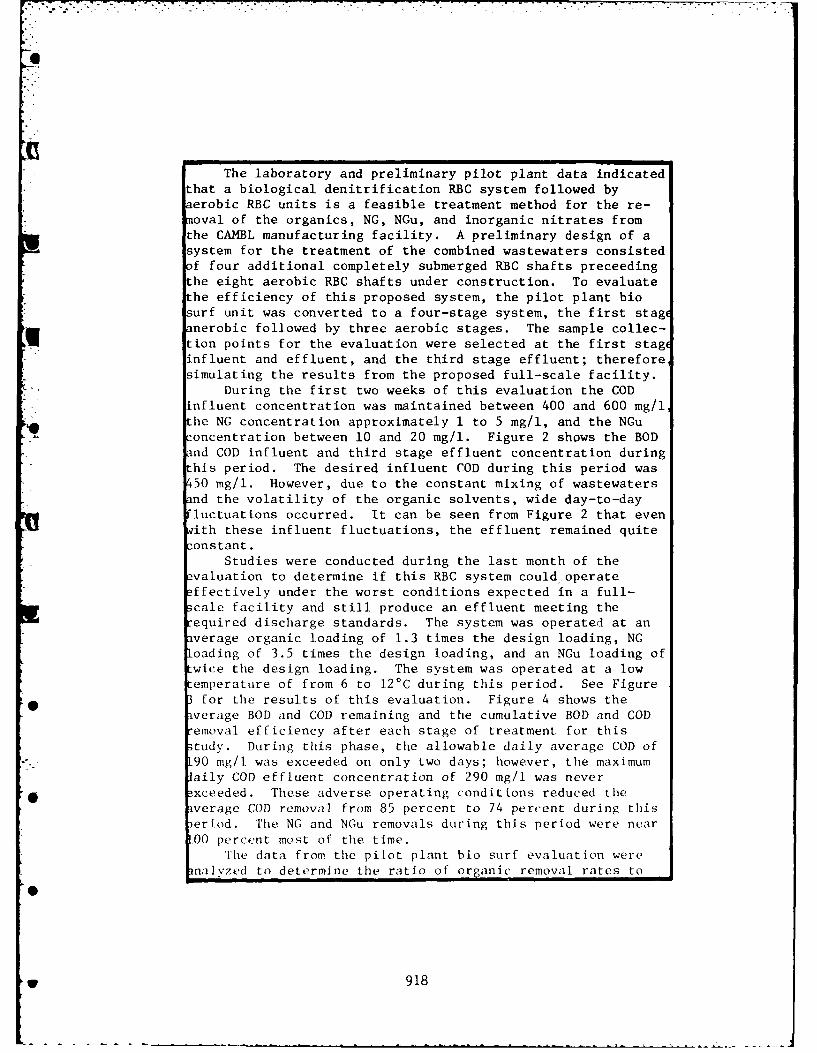
The laboratory and preliminary pilot plant data indicated
that a biological denitrification RBC system followed byaerobic RBC units is a feasible treatment method for the re-moval of the organics, NG, NGu, and inorganic nitrates from
the CAMBL manufacturing facility. A preliminary design of asystem for the treatment of the combined wastewaters consisted
f four additional completely submerged RBC shafts preceedingthe eight aerobic RBC shafts under construction. To evaluatethe efficiency of this proposed system, the pilot plant biosurf unit was converted to a four-stage system, the first stageanerobic followed by three aerobic stages. The sample collec-
Ution points for the evaluation were selected at the first stageinfluent and effluent, and the third stage effluent; thereforesimulating the results from the proposed full-scale facility.
During the first two weeks of this evaluation the CODinfluent concentration was maintained between 400 and 600 mg/lhe NG concentration approximately 1 to 5 mg/l, and the NGuconcentration between 10 and 20 mg/l. Figure 2 shows the BODand COD influent and third stage effluent concentration duringthis period. The desired influent COD during this period was450 mg/l. However, due to the constant mixing of wastewatersand the volatility of the organic solvents, wide day-to-dayluctuations occurred. It can be seen from Figure 2 that evenwith these influent fluctuations, the effluent remained quite
constant.Studies were conducted during the last month of the
:valuation to determine if this RBC system could operate:ffectively under the worst conditions expected in a full-3cale facility and still produce an effluent meeting therequired discharge standards. The system was operated at anaverage organic loading of 1.3 times the design loading, NGoading of 3.5 times the design loading, and an NGu loading ofwice the design loading. The system was operated at a lowemperature of from 6 to 12'C during this period. See Figurefor the results of this evaluation. Figure 4 shows the
iverage BOD and COD remaining and the cumulative BOD and COD
emoval efficiency after each stage of treatment for thistudy. During this phase, the allowable daily average COD of90 mg/l was exceeded on only two days; however, the maximumaily COD effluent concentration of 290 mg/l was never
* xceeded. These adverse operating conditions reduced theiverage COD removal from 85 percent to 74 percent during this)eriod. The NG and NGu removals during this period were near00 percent most of the time.
The data from the pilot plant bio surf evaluation werenalvzed to determine the ratio of organic removal rates to
918
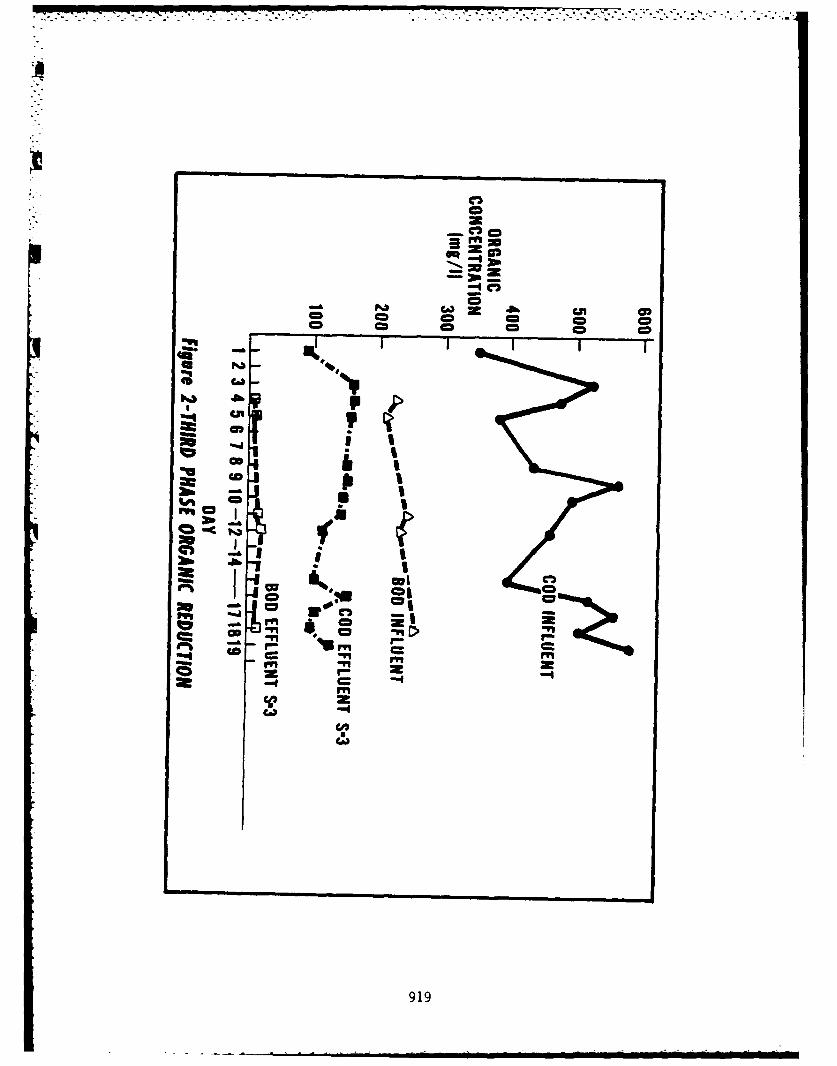
C2
0Q 3
"o 0
.lilI_ I I 1"/in
Ka
go p0n t
CD
z Ime A mD
I- ~ r 2i ,,-
919
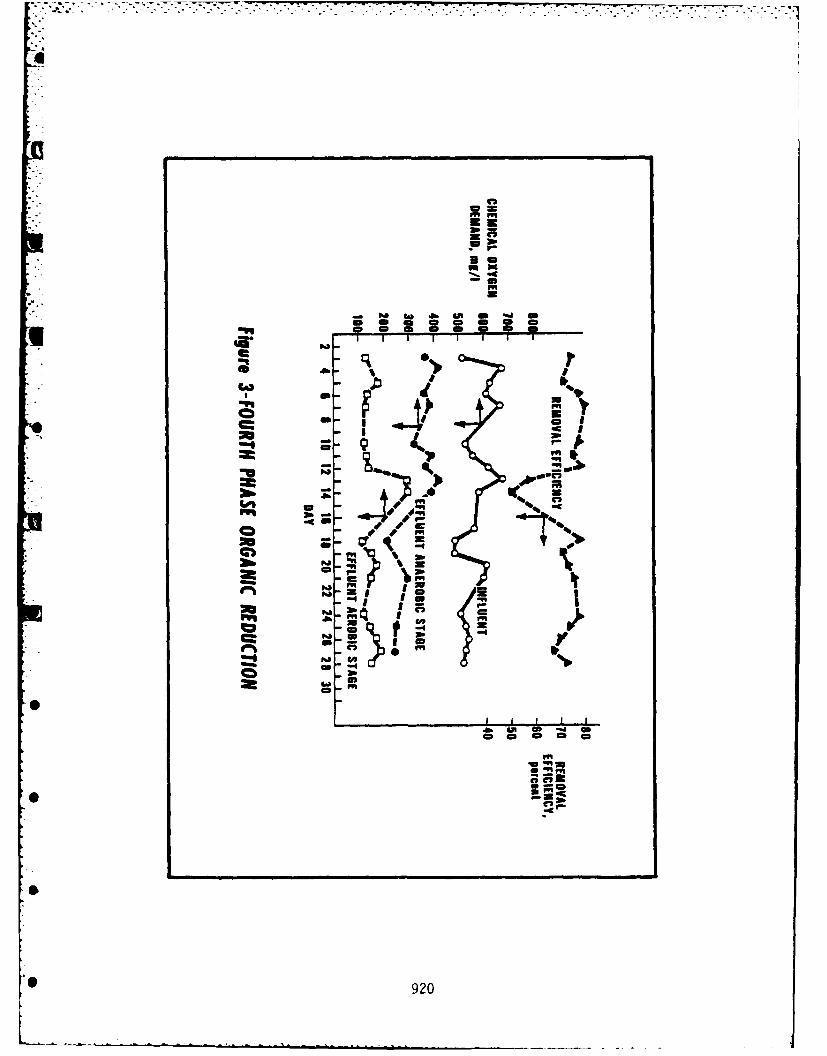
mmc
3.
CD-m
mm -
cm a a
a4 a a C ca CD
-q "* C%At 3'
92
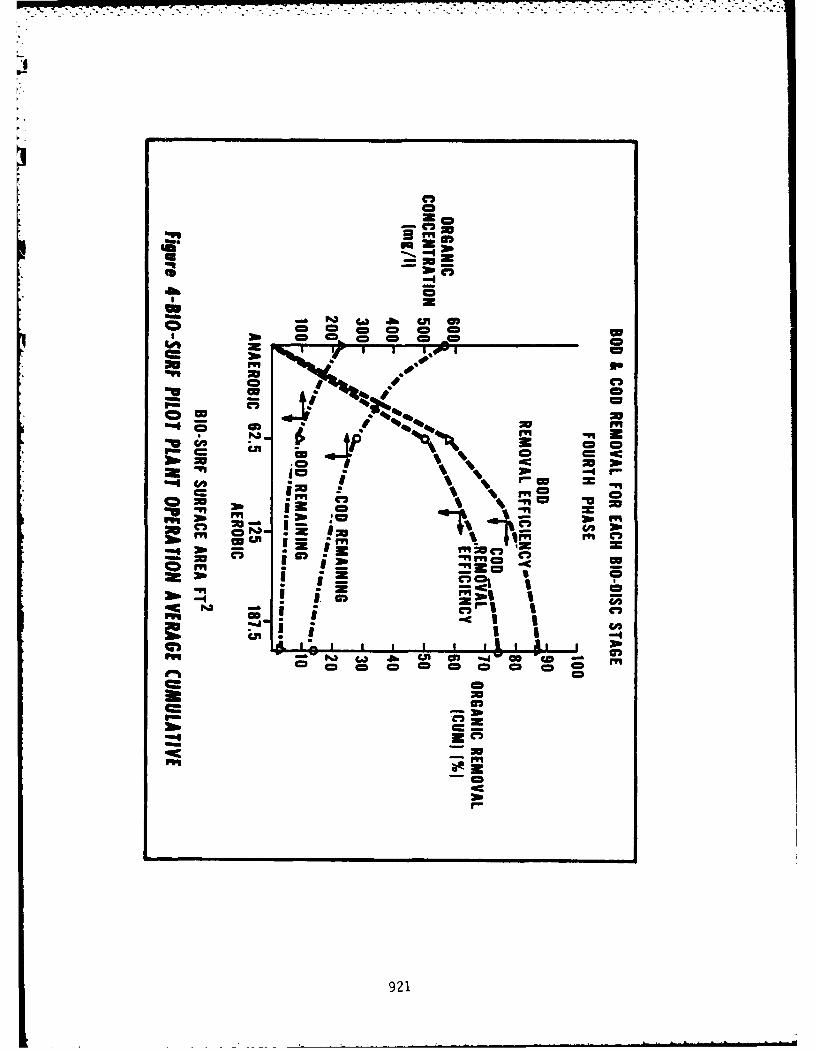
. .. . . . . . . . - -.-
hi
p..
a
U-a
40b
6i!,
cwo o o CD Dtoo a a CD CD m mea
m
* a
a% 4$
Co -cm m % A
CA cmI CD' r= I"
I = % _D cz ,Z
L* " _'_ , , t±, l ,w =,
310 m . 0 C2 30 m
9211
w -% *YrwM4~~' m .~~~ C)'
3cw
W wu Sn--C
VIM-
* -Z
_ Do
I * C,-I 921
.~~~~~7 7, -7 -..
a
the inorganic nitrates removal rates under various operatingconditions. As stated above, during the first phase of theevaluation the pilot plant cover was installed to provide acompletely anaerobic system. This evaluation showed the BOD/N03 removal ratio to be 0.39, which would calculate to providean average nitrate removal rate of 13.6 lb/day/1000 ft2 forthe full-scale system. During the later evaluations, the biosurf coier was removed and the wastewater in the anaerobicstage was exposed to the atmosphere, allowing oxygen to dif-
* fuse into the wastewater, greatly reducing the nitrate removalrate (see Figure 5). Based on the results of this phase, theitrate removal rate was calculated to be 3.4 ib N03/day/1000ft2 for the full-scale system. The great differences in theitrate removal rate between a covered and uncovered system
can provide a method to control the nitrate utilization of thesubmerged RBC stage in the full-scale facility. The systemcan be designed with removable cover section to provide aflexibility to compensate for low or high nitrate concentra-tions in the facilities influent.
The results from these evaluations were analyzed to pro-ide the data necessary for the preparation of the design
criteria for the proposed facility. The organic load appliedas plotted versus the organic ioad removed for the pilotplant anaerobiz system (see Figure 6). A similar graph wasalso prepared for the first two aerobic stages (Figure 7).'hese graphs can be used to predict the efficiencies of thefull-scale facility at various organic and hydraulic loading.The design of the expanded system at RAAP was inalyzed, usingthese graphs.
Based upon the data from this evaluation, the designcriteria for an addition to the RAAP RBC treatment facilitywere prepared. Figure 8 shows the flow diagram of the pro-osed RAAP facility for the treatment of combined wastewater.These design criteria were submitted to the Corps of Engineers
* for the design of the addition to the facility. The finaldesign was completed and construction of the facility at RAAPhas been initiated.
REFERENCES
* i. Wendt, T. M., Cornell, J. H., and Kaplan, A. M.,"Microbial Degradation of Glycerol Nitrates," Applied andEnvironmental Microbiology, Nov. 1978, pp 693-699.
9
* 922
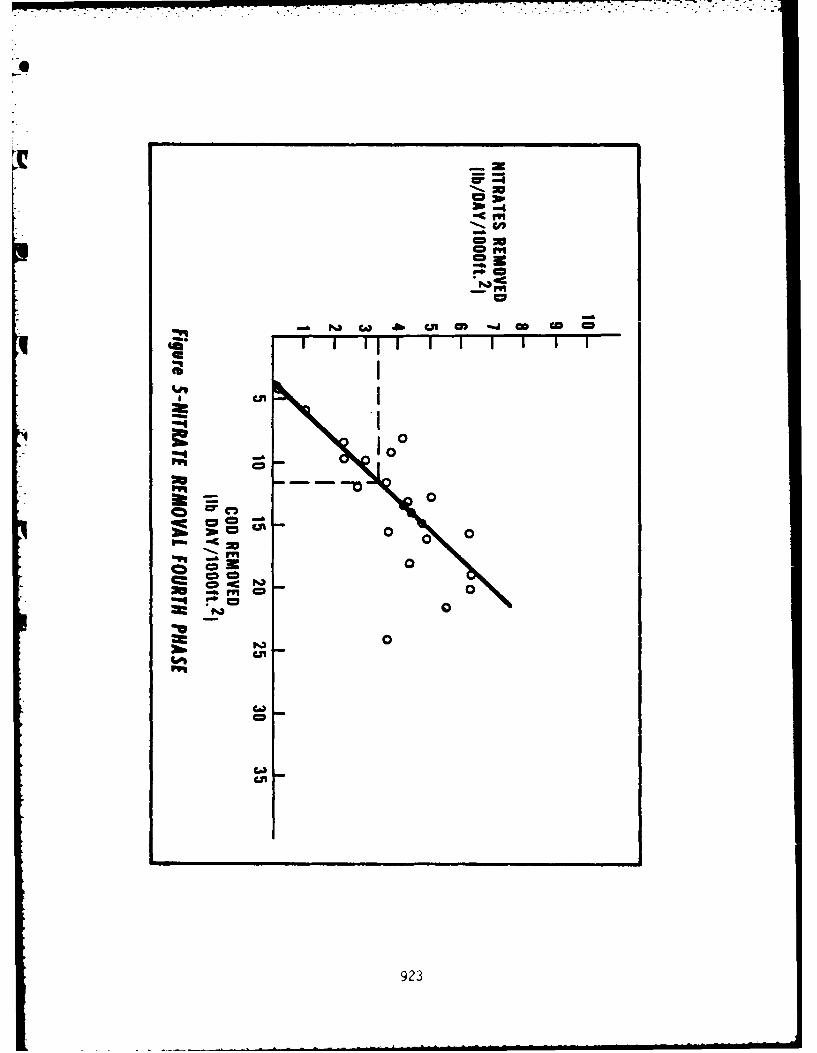
-:
-C
a,,
M -amfa
C-"U
Cm
= 3c 0
ft 0
0
'92
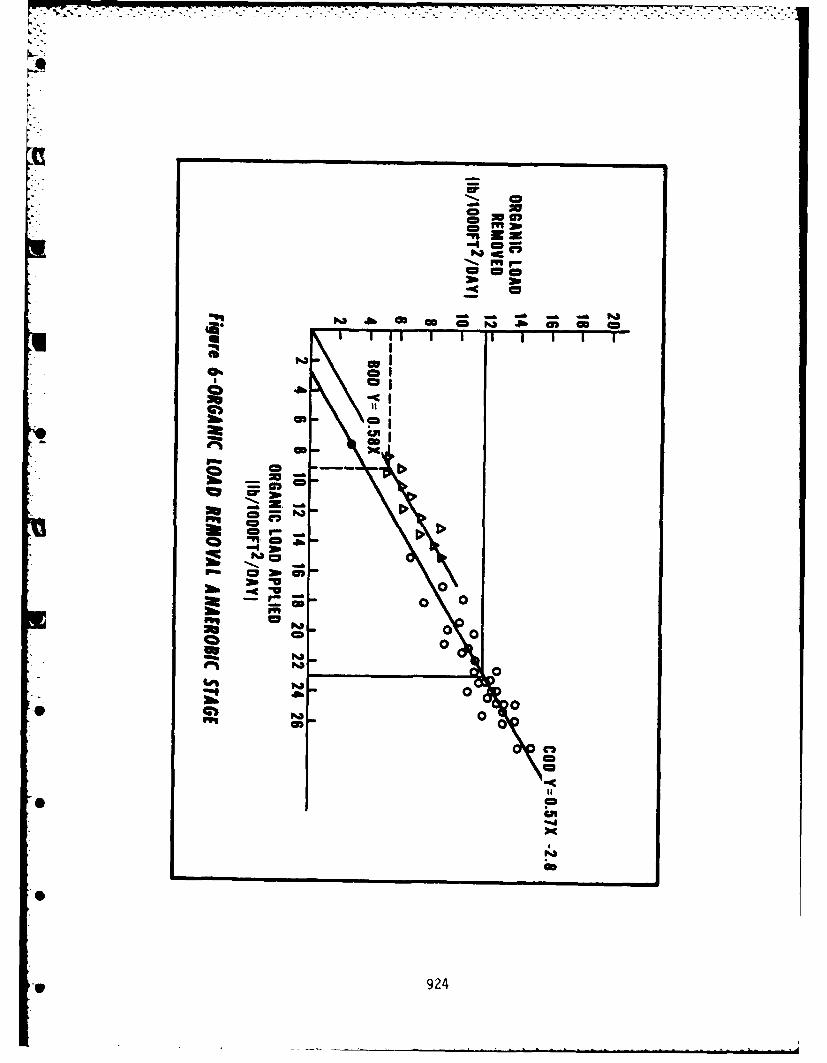
co
CD w
cic
4 I
41b1Co c
0 CD304
roCD
C,~InJ
co
* CDha'
pow C2 3M@
3b 9240
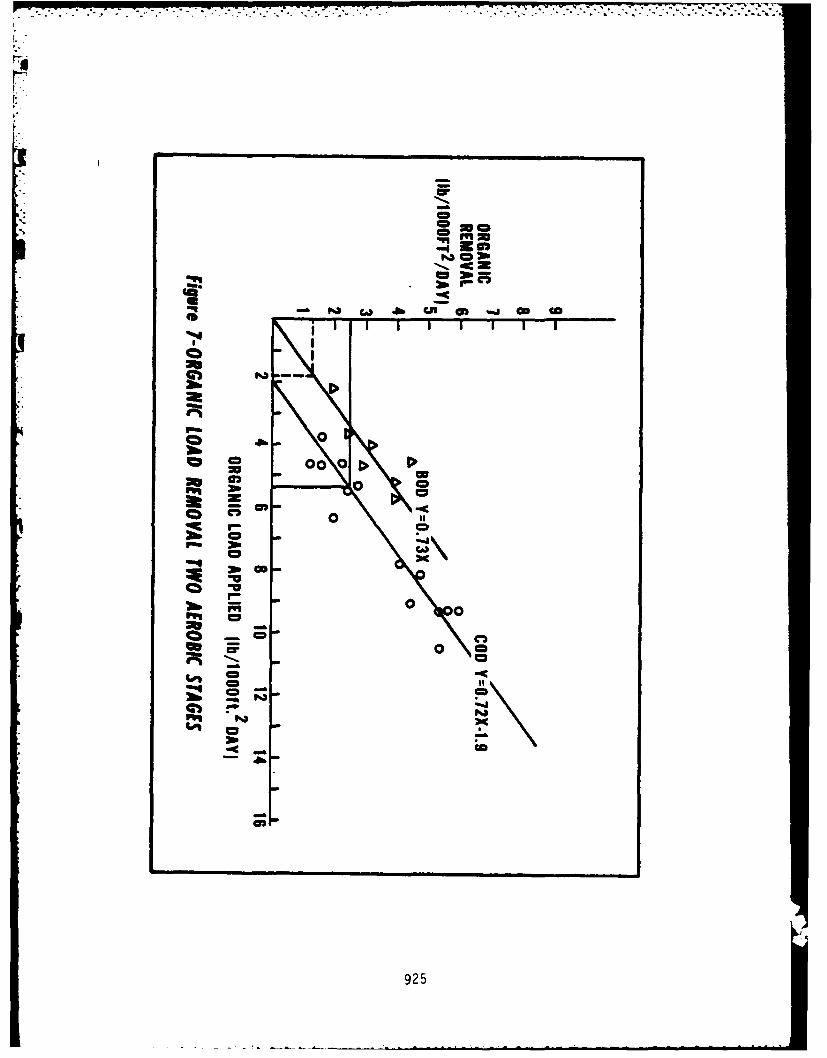
I,.
mpg
Ii. - €'%a ca3
6
S I
raft 00
CD 00 0
0 %0 C
mm
50 1CC
C D j
ru 30 U
311 CO
0R 00
C.ca
925
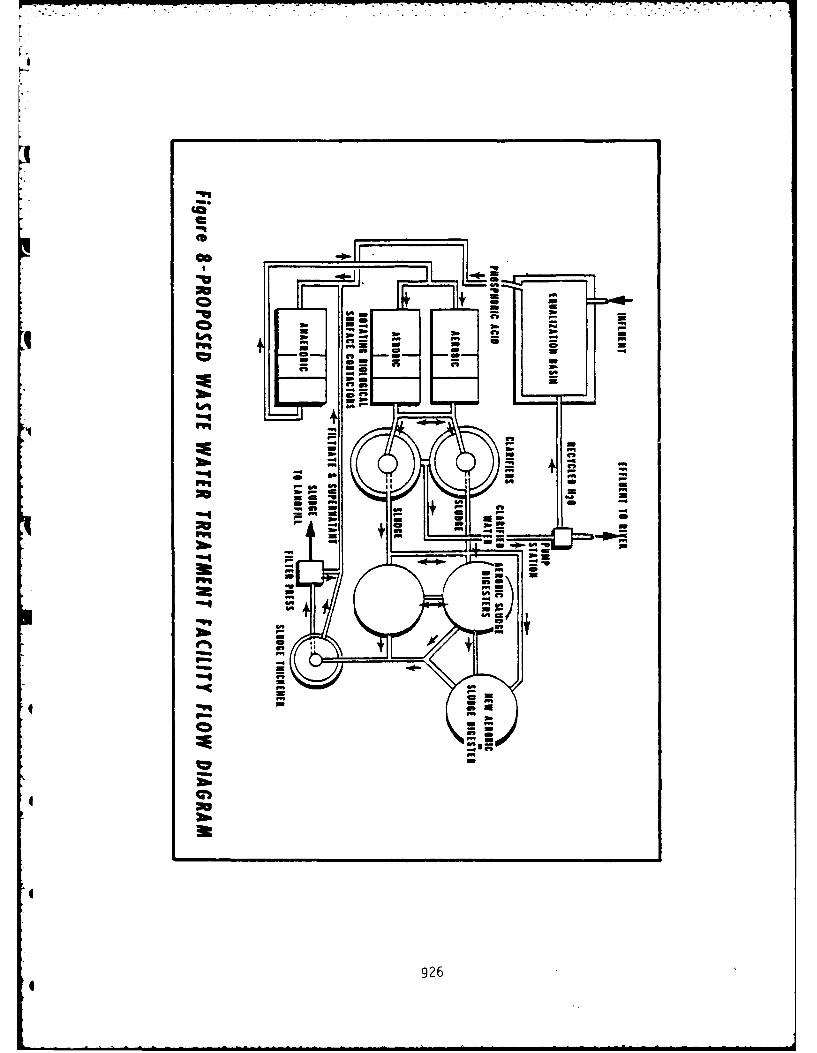
,4,
rlr)C --J -
•9" "9
m =;m m
•I ,- -i
p m 4
a -
9269
-4A* U' II n-"9 -
MR L A U
U' 1 = IWO
= m U ,.Lo
"'926
APPLICATION OF ROTATING BIOLOGICAL CONTACTOR (RBC)
1PROCESS FOR TREATMENT OF WASTEWATER CONTAININGA FIREFIGHTING AGENT (AFFF)
Susan Landon-Arnold, MS, R.M., Visiting Scientist,
University of Oklahoma, Norman, Oklahoma
Deh Bin Chan, PhD., P.E., Research Civil Engineer,
Naval Civil Engineering Laboratory, Port Hueneme, CA
INTRODUCTION
A firefighting agent, Aqueous Film Forming Foam (AFFF),
has been used for fuel/oil fire extinguishment at airports
and on shipboard since 1970's. AFFF has been found to be themost effective fuel/oil firefighting agent ever to beformulated. In accordance with firefighting performance
specifications used by the manufacturers, a 28-square footfuel fire can be extinguished within 45 seconds with a 6%
AFFF solution (by volume).AFFF consists of fluorochemical surfactants, hydro-
carbon surfactants, ethylene glycol and its derivatives, andabout 70% water (by weight). In a firefighting operation,the AFFF concentrate is diluted to a 3-6% solution (by
volume), -nd sprayed under pressure onto the fire. The foam
created during the spray covers and extinguishes the fire.
AFFF concentrate (FC-780) contains an organic load ofapproximately 380,000 mg/[ COD, or 110,000 mg!L TOC or325,000 mg/L BOD (Ref 1). A toxicity test with fathead
minnows indicated that the 48-hour TLm (LCo) concentration
was about 1800 ppm (FC-206, by volume) (Ref 2). A maximum
927
]7
loading rate to an activated sludge treatment process (with
acclimation) was found to be 250 ppm (FC-206 by volume)without the addition of an antifoam agent (Ref 2).
The Rotating Biological Contactor (RBC) is consideredto be a most cost-effective wastewater treatment process dueto it being simple in operation, low in capital investment
and low in energy requirements. The RBC will fit well withtrickling filter systems, which constitute approximately 95%
of the sewage treatment systems on military bases, and willupgrade the effluent water quality to meet the NationalPollutant Discharge Elimination System (NPDES) permit
standards.Increased popularity in the use of the RBC on military
bases is anticipated. This, in part, is due to the successesexperienced by other researchers for using the RBC to treatvarious organic compounds, such as formaldehyde and formic
* acid as well as the explosives RDX, HMX and TNT (Ref 3).Such research prompted the following experimentation fordetermining the RBC's feasibility (technically and economi-cally) for treating AFFF containing wastewater. The re-
search effort initially began with a chemostat study of theparameters and microorganisms that were amenable to AFFFbioconversion. This was followed by experimentation with afour-stage bench top RBC system. The percent (%) conversionin COD, BOD and TOC was monitored as a means of determining
removal of AFFF.
MATERIALS AND METHODS
fwo types of experimental systems were used in thisstudy. One was an aerobic chemostat used as an approach to
determine initial feasibility, the other was a bench topmodel of an RBC.
* Chemostat
Physical Set-Up: A diagram of the chemostat physicalset-up is given in Figure 1. Influent was sterilized in a
two-liter reservoir and put on line aseptically. The flowrate of sterile medium into the reaction vessel was I
* ml/min. The reaction vessel was a 4-liter aspirator bottle(Kimax), which was continuously agitated via a stir bar/stir
motor arrangement (Corning Hot Plate Stirrer, PC-351).Aeration was accomplished via filtered air (Acropore 0.45-Im
filter) bubbled into the bottom of the reaction vessel. A
* 928
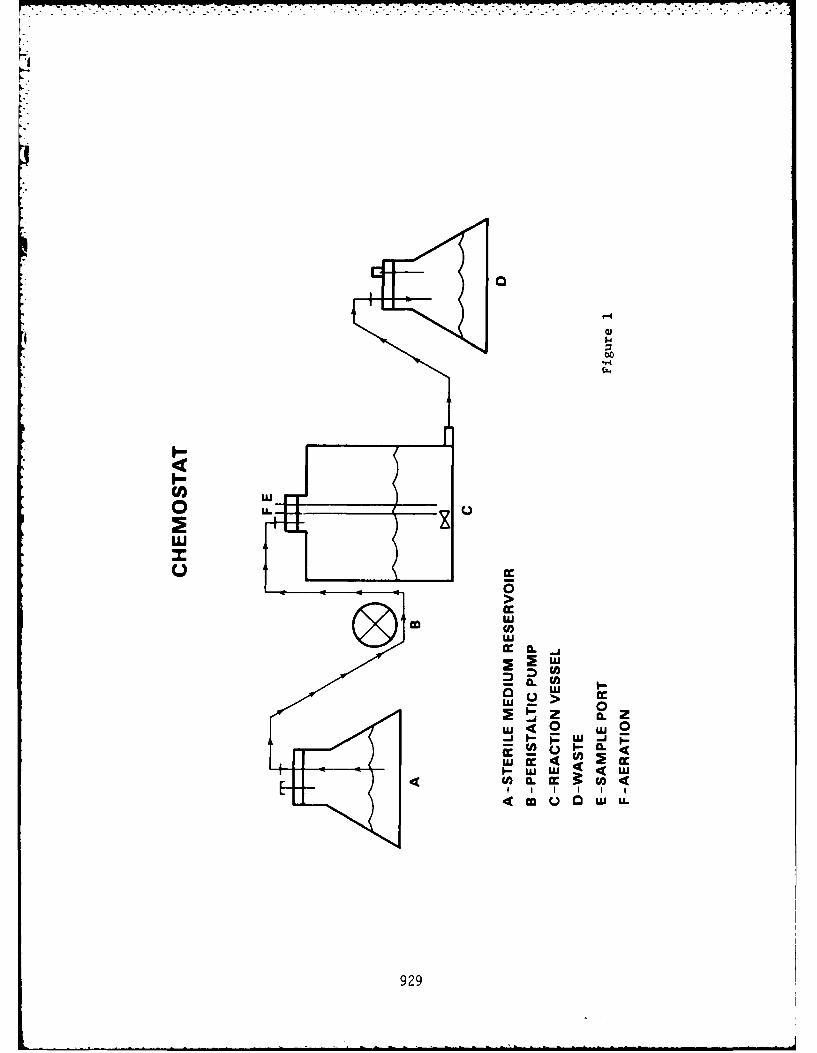
H 9 L
III
wwwm tz )
ww
929
constant volume of 2 liters was maintained within the reac-tion vessel by a siphon overflow tube into a waste recept-acle which was replaced and autoclaved when full. Sampleswere taken by suction-draw from the sampling port.
Inoculum: The inoculum or seed for the start up of thechemostat was 0.05 gm each of the following: dried bacteriaculture (Horizon Ecology Company) for degrading fats, oilsand greases (#245-40), for hydrocarbon degradation in freshwater (#245-60), and 5 ml of activated sludge from the BuenaVentura County Water Treatment Plant.
Media: Bushnell Haas Broth (Difco) was used as aminimal salts medium to which specific amounts of knowncarbon could be added. The carbon used in this experimentwere D-Glucose (Difco) and/or the aqueous film forming foamdesignated FC-780 (3M). This then comprised the sterileinfluent.
Growth conditions: The chemostat experiment wasconducted at ambient temperature, under mild aeration andagitation. pH was monitored but no attempt at adjustmentwas made.
Procedure: The system start-up was as follows. Thereaction vessel containing two liters of sterile BushnellHaas Broth (BHB), 0.05% Glucose and 0.5% FC-780 was seededwith the inoculum and allowed to grow as a batch system.After 48 hours and an increase to 0.60 optical density,sterile influent containing 0.05% Glucose and 0.5% FC-780was put on line. On day 8, the influent was changed tocontain 0.5% FC-780 (approximately 2000 ppm COD) as the onlycarbon source. Samples from influent & effluent concur-rently, were taken three (3) times per week and analyzed asfollows:
A. Turbidity. Utilizing the sterile influent as astandard or blank, turbidity of the effluent wasdetermined at 460 nm, utilizing a Beckman Spec-tronic 88.
B. pH. The pH of the influent and the effluent weredetermined immediately after sample withdrawal,using an Orion Research Model 701A/Digitallonalyzer.
• 930
C. Biochemical Oxygen Demend (BOD). The 5 day BODdetermination was used as outlined in Section 507in Standard Methods (Ref 4), utilizing an OrionResearch Model 701A/Digital ionalyzer and Mode97-08-00 02 electrode.
D. Chemical Oxygen Demand (COD). COD was performedaccording to the method outlined in Section 508 of
Standard Methods (Ref 4) and modified by Technicon(Ref 5).
E. Total Organic Carbon (TOC). A variation on the
proceduLe given in Section 505 of Standard Methods(Ref 4) was used. The variation, the acid spargetechnique, was performed with the Beckman 915B TOC
analyzer, and is outlined in the operation manual(Ref 6). All samples used for TOC, COD and/or BODdetermination were filtered prior to analysis
through a series of graded membrane filters, i.e. 5
im, 1.2 pm, 0.8 pm and 0.45 Pm (Gelman). Eachfilter was washed prior to use with 30 ml of doubledeionized water to remove any organic wetting agenton the filter.
F. Microorganism Identification. Bacterial and fungalpopulations were identified and enumerated utiliz-ing Nalgene Nutrient Pad Kits, of the followingmedia: Standard TTC - for total counts, Azide -
for enterococci and fecal streptococcus, Wort - forfungi, filamentous and non-filamentous, Weman - forslime forming mesophilic bacteria (e.g. Leuconostoc
mesenteroides).
Rotating Biological Contactor (RBC)
Physical Set-Up: A diagram of the RBC physical set-upis given in Figure 2. Influent was sterilized and asepti-cally added to a 20-liter reservoir (5 gal. bottle, Kimax).
The reservoir was then put on line aseptically. The flowrate of sterile influent into the aerobic RBC was 3.5ml/min, and was controlled by a peristaltic pump (ColeParmer). The RBC was on loan from the U.S. Army MobilityEquipment Research and Development Command (USAMERDC), Ft.Belvoir, VA., and has been described in detail by them (Ref
3). Basically, it was a five chambered unit constructed ofPlexiglass. Each of the first four chambers contained six
931
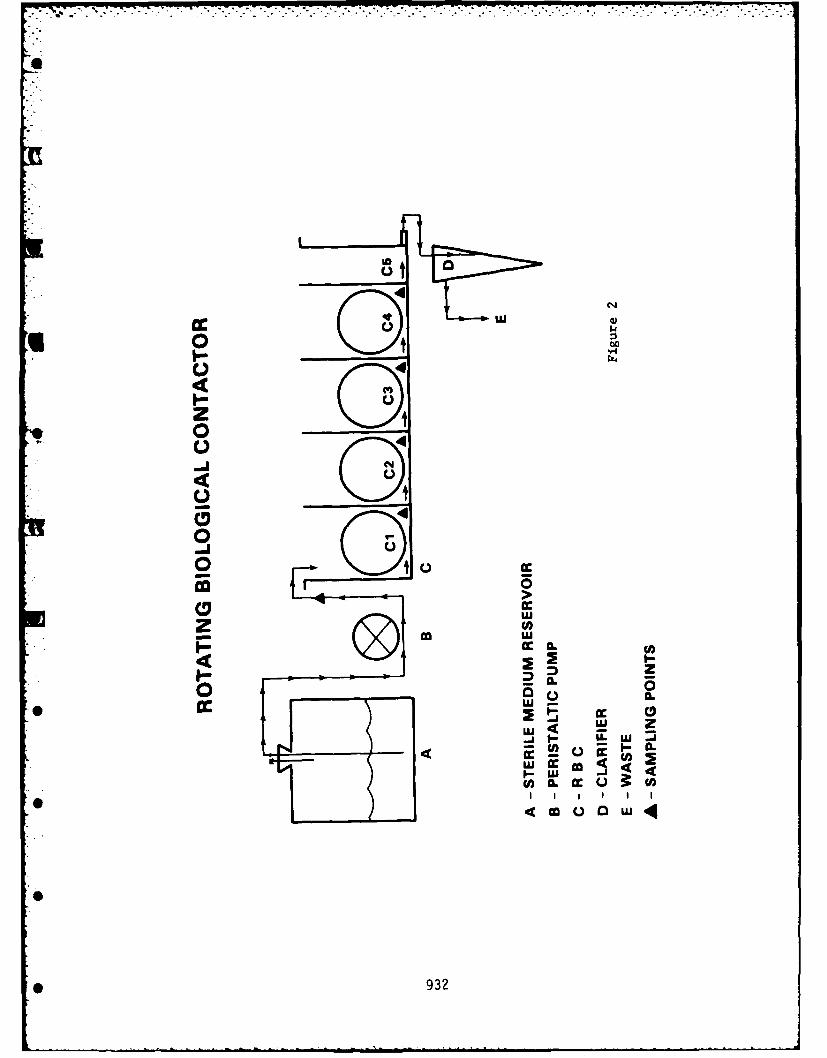
o C44
ww-
zz0L
00o I-
oU Cuj
93
;20
1/4-inch (0.6 cm) thick plexiglass discs, 9-1/2 inches (24cm) in diameter mounted on a shaft 1/2 inch (1.27 cm) indiameter. One hundred and twelve (112) holes, 1/4 inch (0.6cm) in diameter, were bored into each disc to aid in microb-ial attachment. The total disc area was 23.55 ft2 (2.188m 2
). The last chamber was void of discs, acting as a Iliter capacity reservoir-clarifier. The total liquidcapacity of the unit was 14.5 liters. The discs wererotated at 17.5 rpm, thus being equivalent to an edgevelocity of 0.73 ft/s (0.22 m/s). An additional clarifierwas added in the form of a modified Imhoff cone, which wasused to visually measure the amount of sedimentation pro-duced in a 24 hour period. Samples were taken from withinall four stages and from the influent.
Inoculum: The seed for the start-up of the RBC was oneliter of activated sludge obtained from the Buena VenturaCounty Water Treatment Plant, and was inoculated within onehour of acquisition.
Media: BHB was used. Varying concentrations ofFC-780, D-glucose, and Nutrient Broth (Difco) were added asoutlined in the procedure.
Growth Conditions: The RBC experiment was conducted atambient temperature. Aeration was accomplished by therevolution of the discs through the wastewater. pH wasmonitored and adjustments were made, using IN NaOH or INHCL, when necessary.
Procedure: Fhe system start-up was as follows. TheRBC was filled with 14.5 liters of BHB plus 0.1% glucose,inoculated with activated sludge and allowed to run as astatic system for 24 hours. Sterile influent containing0.1% glucose was fed into the unit at a rate of 3.5 ml/min.After 2 days it was determined that this mode of addition ofthe carbon source was inadequate to maximize colonization ofthe discs and so glucose and/or nutrient broth was added toeach stage once daily to a total concentration of 0.1%carbon. On day 29, FC-780 was added to the influent at aconcentration of 100 ppm in terms of COD. The concentrationof FC-780 was gradually increased until a level of 1000 ppmCOD was achieved. Samples were taken three times per week.BOD, COD, TOC and pH analysis were performed as describedunder the chemostat procedure. Other parameters measuredwere:
933
A. Temperature. Readings were taken three times perweek, utilizing a Wahl digital heat-prober ther-
mometer. The thermometer was placed directly into
each of the four stages of the RBC.
B. Microorganism Identification. Bacterial and fungal
populations were identified and enumerated utiliz-ing: Nalgene Nutrient Pad Kits -- TTC and Wort,Bio Stix and Myco Stix test strips (Ames Company)and/or Total Count Water Tester (Millipore Corp).Microscopic qualitative observations were doneevery 14 days to visually monitor changes inpredominant populations, i.e. protozoal, fungal,
and nematodal.
RESULTS AND DISCUSSION
Chemostat
After 7 days of continuous operation, an apparentsteady state condition was achieved within the chemostat interms of COD, TOC and BOD conversion or percent (%) removal
from the supernate. Approximately 70% COD conversion, 80%BOD conversion and 60% TOC conversion were consistently
observed from day 11 onward to day 43 (Figure 3). From day40 until shut down of the chemostat on day 63, the percent(L) conversion dropped to approximately 45% COD, 50% BOD and40% TOC. This was in part correlated with a rise in the pHof the reaction vessel to a pH of 7.1 or greater. The
microbial populations observed in the chemostat changeddrastically with the increase in pH. That is, a greater
number of yeast and slime-forming bacteria were noted. Noeffort was made to readjust the pH of the chemostat and sotile percent conversion in all three dropped to a level of
*O 40-50% conversion. It was decided for future experimenta-tion to adjust the pH of the RBC to 7.00.
As seen in Figure 3, the percent (%) conversion valuesexhibited some variance. This is partially due to technicalerrors and machine failure. That is dilution and samplingerrors were committed during a turnover of technical assis-
O tance. Equipment failure would occur and no new influentwould enter the reactor vessel for a 12 to 16 hour period.
This would result in microbial back contamination from the
reactor vessel into the influent reservoir, which wouldresult in an increase in the pH and a decrease in available
* 934
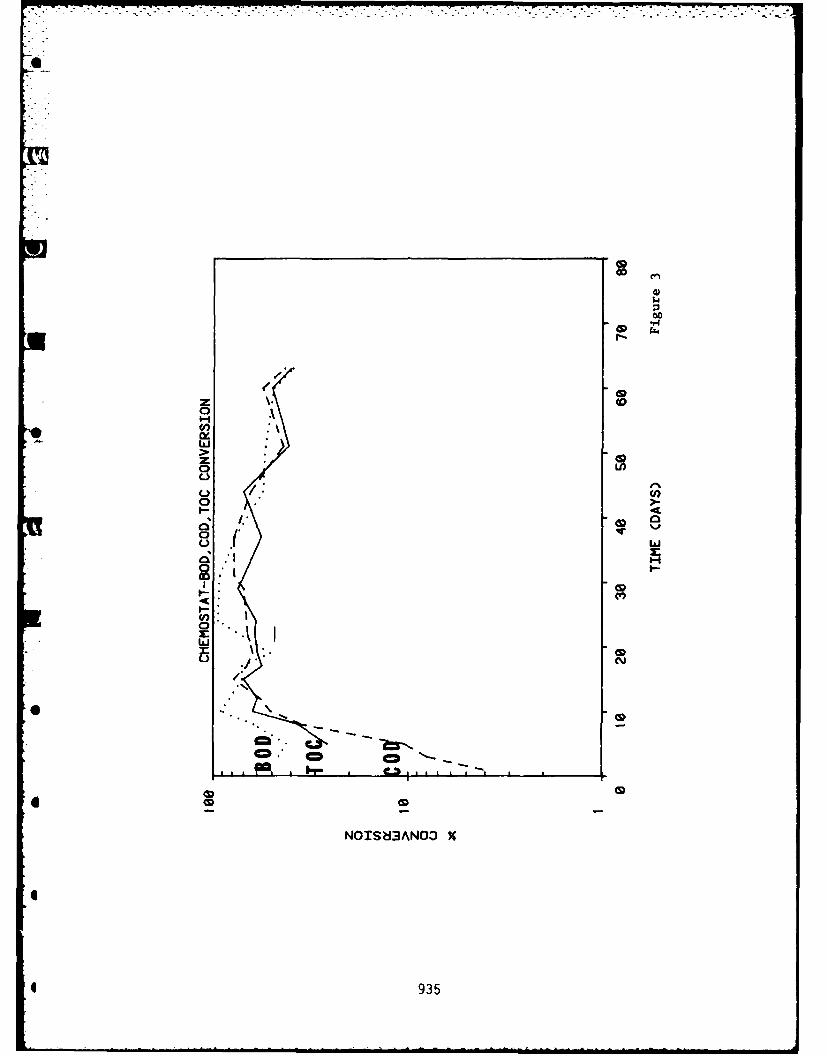
4
z ~W
LUJ
z
0
o co
---
CY
cm
1= . 4..
• H
I. , .
CcD
- - .- . - - - - -
CD" C D ..
NOISNIAN03 g
4I 935
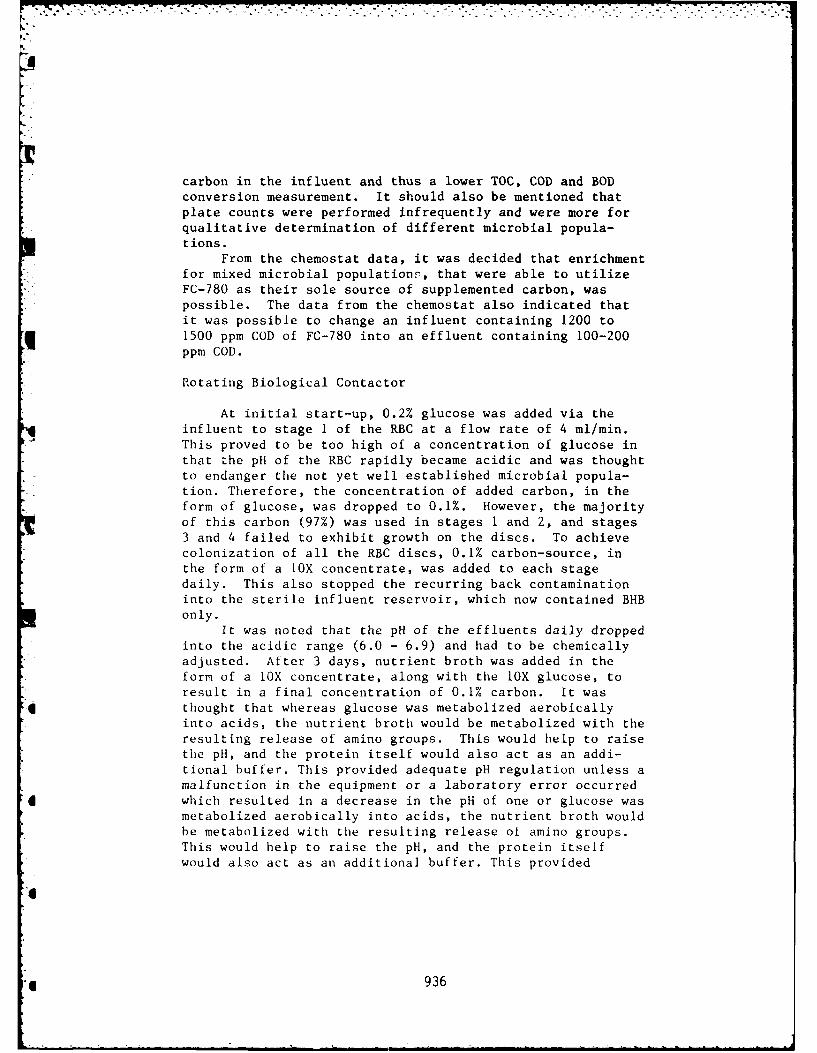
carbon in the influent and thus a lower TOC, COD and BODconversion measurement. It should also be mentioned thatplate counts were performed infrequently and were more forqualitative determination of different microbial popula-tions.
From the chemostat data, it was decided that enrichmentfor mixed microbial population-, that were able to utilizeFC-780 as their sole source of supplemented carbon, waspossible. The data from the chemostat also indicated thatit was possible to change an influent containing 1200 to
1500 ppm COD of FC-780 into an effluent containing 100-200ppm COD.
Rotating Biological Contactor
At initial start-up, 0.2% glucose was added via theinfluent to stage 1 of the RBG at a flow rate of 4 ml/min.This proved to be too high of a concentration of glucose inthat L-he pH of the RBC rapidly became acidic and was thoughtto endanger the not yet well established microbial popula-tion. Therefore, the concentration of added carbon, in theform of glucose, was dropped to 0.1%. However, the majorityof this carbon (97%) was used in stages 1 and 2, and stages3 and 4 failed to exhibit growth on the discs. To achievecolonization of all the RBC discs, 0.1% carbon-source, inthe form of a lox concentrate, was added to each stagedaily. This also stopped the recurring back contaminationinto the sterile influent reservoir, which now contained BHBonly.
It was noted that the pH of the effluents daily droppedinto the acidic range (6.0 - 6.9) and had to be chemicallyadjusted. After 3 days, nutrient broth was added in theform of a lOX concentrate, along with the lOX glucose, toresult in a final concentration of 0.1% carbon. It was
* thought that whereas glucose was metabolized aerobicallyinto acids, the nutrient broth would be metabolized with theresulting release of amino groups. This would help to raisethe pH, and the protein itself would also act as an addi-tional buffer. This provided adequate pH regulation unless amalfunction in the equipment or a laboratory error occurred
4 which resulted in a decrease in the pH of one or glucose wasmetabolized aerobically into acids, the nutrient broth wouldbe metabolized with the resulting release of amino groups.This would help to raise the pH, and the protein itselfwould also act as an additional buffer. This provided
A4
A6 936
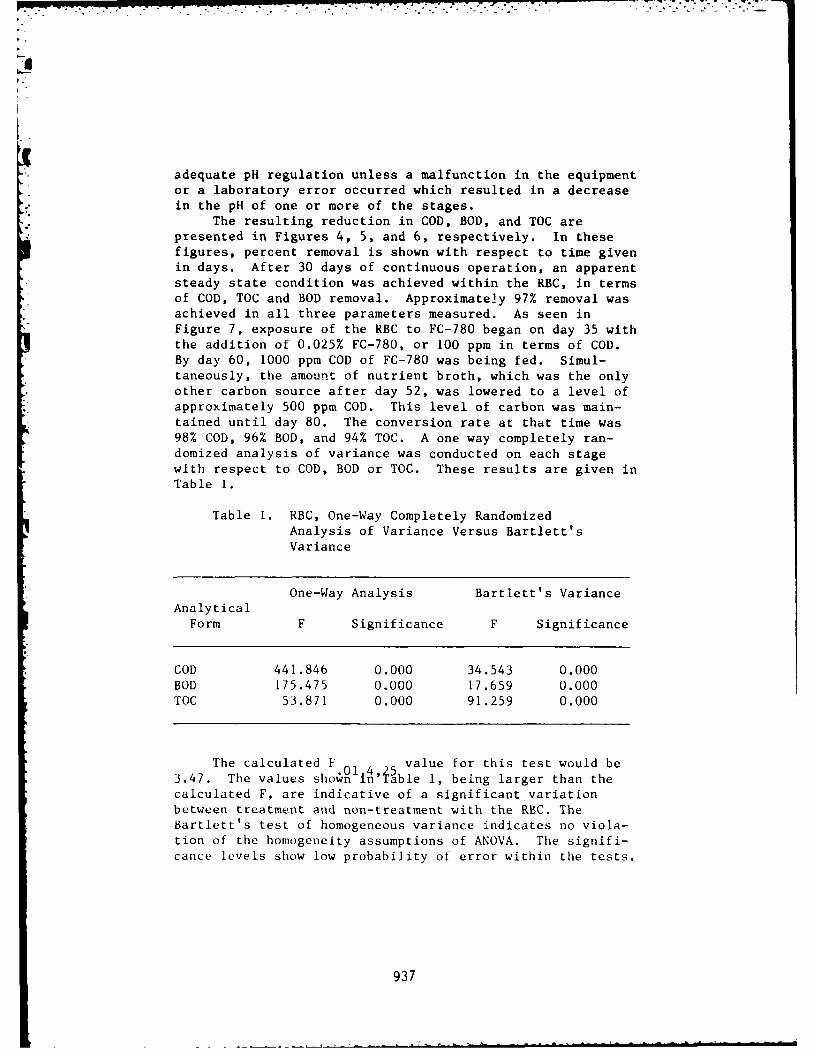
adequate pH regulation unless a malfunction in the equipmentor a laboratory error occurred which resulted in a decrease
in the pH of one or more of the stages.The resulting reduction in COD, BOD, and TOC are
presented in Figures 4, 5, and 6, respectively. In thesefigures, percent removal is shown with respect to time givenin days. After 30 days of continuous operation, an apparentsteady state condition was achieved within the RBC, in termsof COD, TOC and BOD removal. Approximately 97% removal wasachieved in all three parameters measured. As seen inFigure 7, exposure of the RBC to FC-780 began on day 35 withthe addition of 0.025% FC-780, or 100 ppm in terms of COD.
By day 60, 1000 ppm COD of FC-780 was being fed. Simul-taneously, the amount of nutrient broth, which was the onlyother carbon source after day 52, was lowered to a level ofapproximately 500 ppm COD. This level of carbon was main-tained until day 80. The conversion rate at that time was98% COD, 96% BOD, and 94% TOC. A one way completely ran-domized analysis of variance was conducted on each stagewith respect to COD, BOD or TOC. These results are given inTable 1.
Table I. RBC, One-Way Completely RandomizedAnalysis of Variance Versus Bartlett'sVariance
One-Way Analysis Bartlett's VarianceAnalytical
Form F Significance F Significance
COD 441.846 0.000 34.543 0.000BOD 175.475 0.000 17.659 0.000TOC 53.871 0.000 91.259 0.000
The calculated F value for this test would be3.47. The values shown In able I, being larger than thecalculated F, are indicative of a significant variationbetween treatment and non-treatment with the RBC. TheBartlett's test of homogeneous variance indicates no viola-tion of the homogeneity assumptions of ANOVA. The signifi-cance levels show low probability of error within the tests.
937
a))
938
I.-n
0)
-H
LO
z0
L)~co
HL
co-
0D O r- CD in v m N
NOISdANO3 X
939
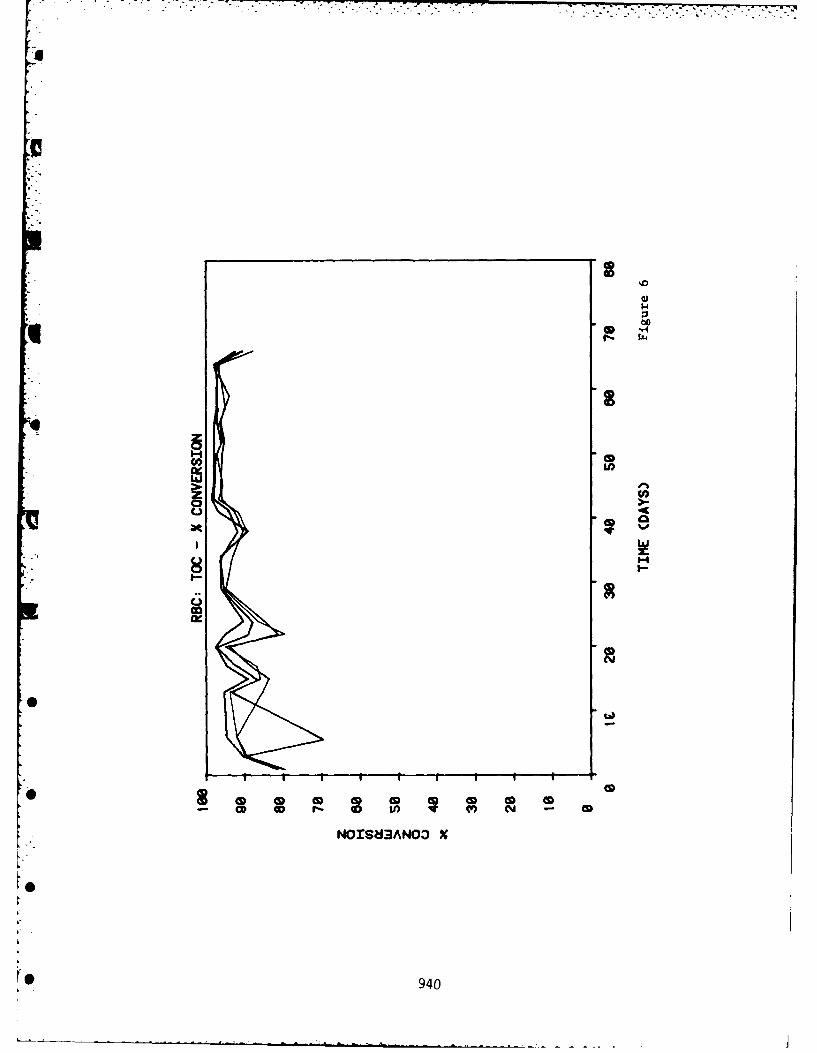
. . .
'CU
00
094
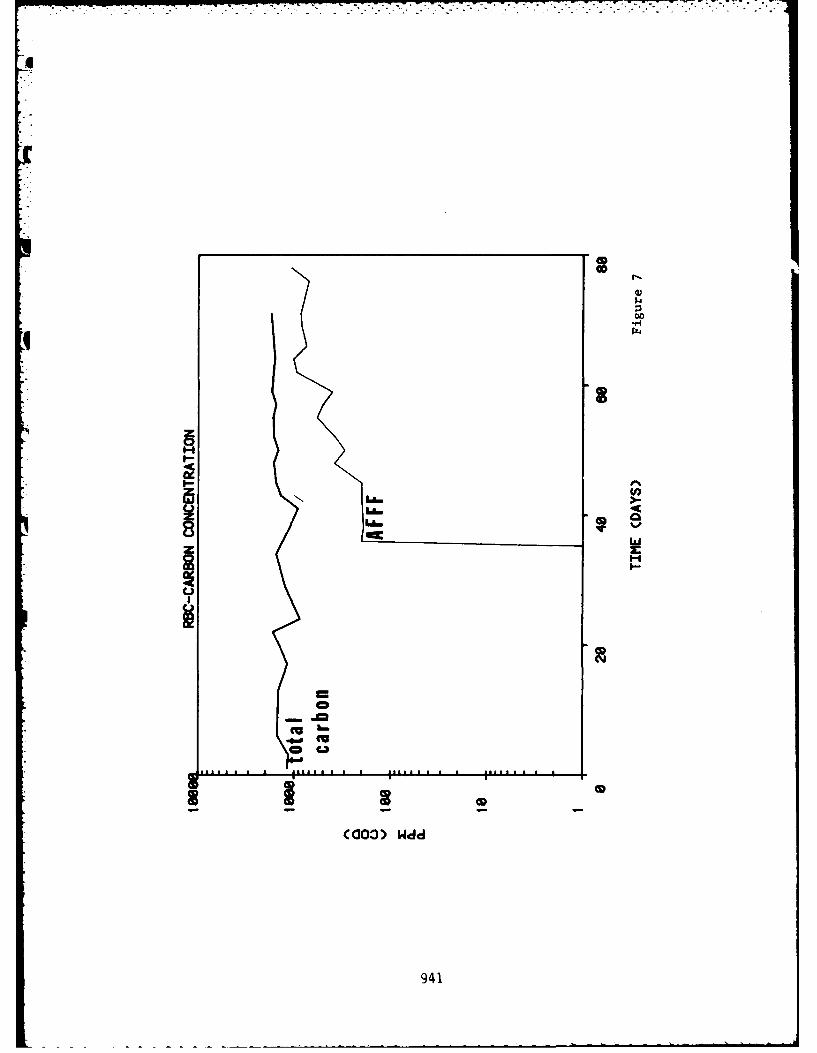
.74
H
I-
IQCa0
CC03) WdcI
941
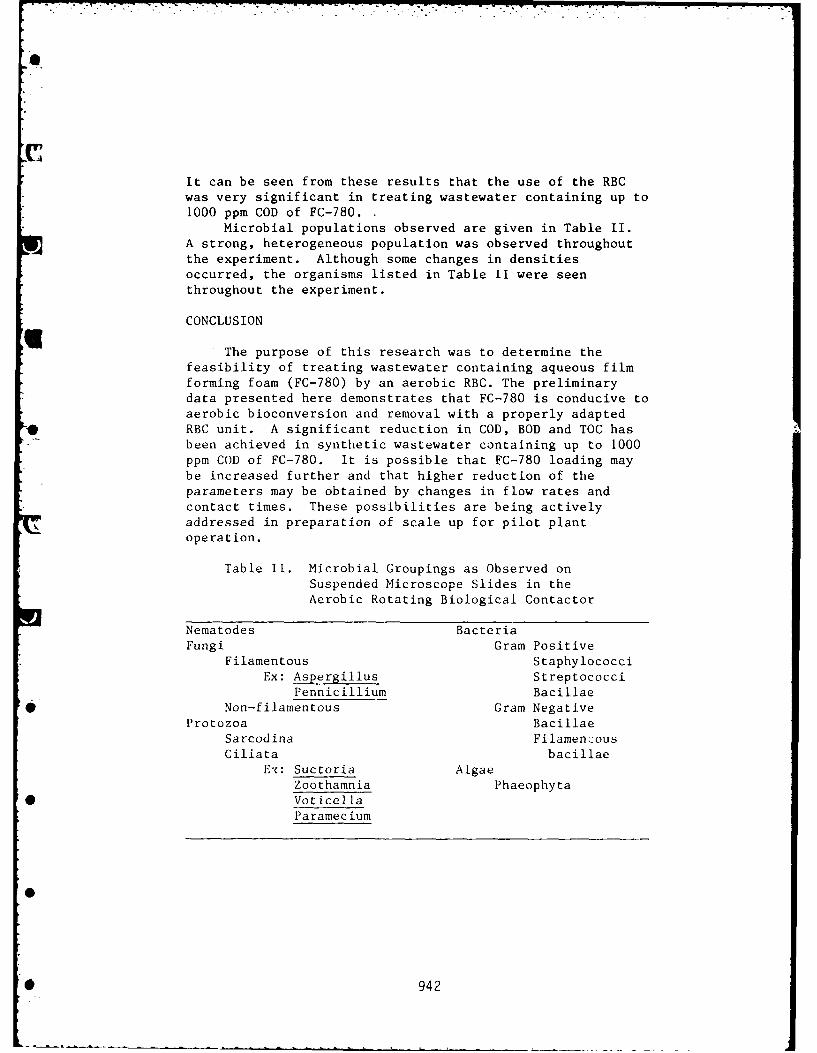
It can be seen from these results that the use of the RBCwas very significant in treating wastewater containing up to1000 ppm COD of FC-780.
Microbial populations observed are given in Table II.A strong, heterogeneous population was observed throughoutthe experiment. Although some changes in densitiesoccurred, the organisms listed in Table II were seen
throughout the experiment.
CONCLUSION
The purpose of this research was to determine thefeasibility of treating wastewater containing aqueous filmforming foam (FC-780) by an aerobic RBC. The preliminarydata presented here demonstrates that FC-780 is conducive toaerobic bioconversion and removal with a properly adapted
* RBC unit. A significant reduction in COD, BOD and TOC hasbeen achieved in synthetic wastewater containing up to 1000ppm COD of FC-780. It is possible that FC-780 loading maybe increased further and that higher reduction of the
parameters may be obtained by changes in flow rates andcontact times. These possibilities are being activelyaddressed in preparation of scale up for pilot plantoperation.
Table II. Microbial Groupings as Observed onSuspended Microscope Slides in the
Aerobic Rotating Biological Contactor
Nematodes BacteriaFungi Gram Positive
Filamentous StaphylococciEx: Aspergillus Streptococci
Pennicillium Bacillae
* Non-filamentous Gram NegativeProtozoa Bacillae
Sarcodina Filamen.:ousCiliata bacillae
Ex: Suctoria AlgaeZoothamnia Phaeophyta
* Voticella
Paramecium
942
REFERENCES
1. Chian, E.S.K., Wu, T.P., and Rowland, R.W.; "MembraneTreatment of Aqueous Film Forming Foam (AFFF) Wastes forRecovery of AFFF Active Ingredients", Final Report, GeorgiaInstitute of Technology, October 1980.
2. LeFebvre, E. E., and INMAN, R. C., "Biodegradability and
Toxicity of Lightwater FC-206 Aqueous Film Foaming Foam",
Report No. EHL (K) 74-26, USAF Environmental HealthLaboratory, Kelly Air Force Base, Texas, November 1974.
3. Chesler, G., and Eskelund, G.R., "Rotating BiologicalContactors for Munitions Wastewater Treatment", Report 2319,U.S. Army Mobility Equipment Research and Develpment
Command, Fort Belvoir, Virginia, February 1981.
4. American Public Health Association, "Standard Methods
for the Examination of Water and Wastewater", 14th edition,APHA, Washington, D.C.
5. Technicon Industrial Systems. 1976. "TIS EducationDepartment. Customer Training Manual." Technicon
Instruments Corporation, Tarrytown, N.Y.
6. Beckman. 1979. "Model 915B Total Organic CarbonAnalyzer." Beckman Instruments, Inc., Fullerton, CA.
943
I
OPERATION OF A RBC FACILITY FOR THE TREATMENTOF MUNITION MANUFACTURING PLANT WASTEWATER
Leonard L. Smith, Senior Technical Engineer, andWayne C. Greene, Water and Wastewater Engineer,Hercules Aerospace Division, Hercules Incorporated,Radford Army Ammunition Plant, Radford, Virginia
INTRODUCTION
In 1970, the Army initiated an extensive pollution abate-ment program at all of its ammunition plants. The treatmentof waste process waters from these plants required developmentof new or modifications of _-xisting technology because of theunique nature of the pollutants in the wastewater. This waste-water contains ether, alcohol, acetone, inorganic nitrates,traces of nitroglycerin (NG), and other propellant ingredients.
The initial wastewater treatment studies (I) were conduc-ted using an activated sludge process. This study demonstrated
6 that the activated sludge process was not a feasible treatmer'method for the RAAP wastewater due to the high variability inflow and organic concentrations. A successful rotating bio-logical contactor (RBC) pilot plant evaluation(1 ) was
conducted to define the design parameters and develop thedesign criteria for a full-scale facility.
tREATMENT PLANT DESIGN
A RBC wastewater treatment facility was constructed atLAP for the treatment of the process wastewater based upon
9
0 944
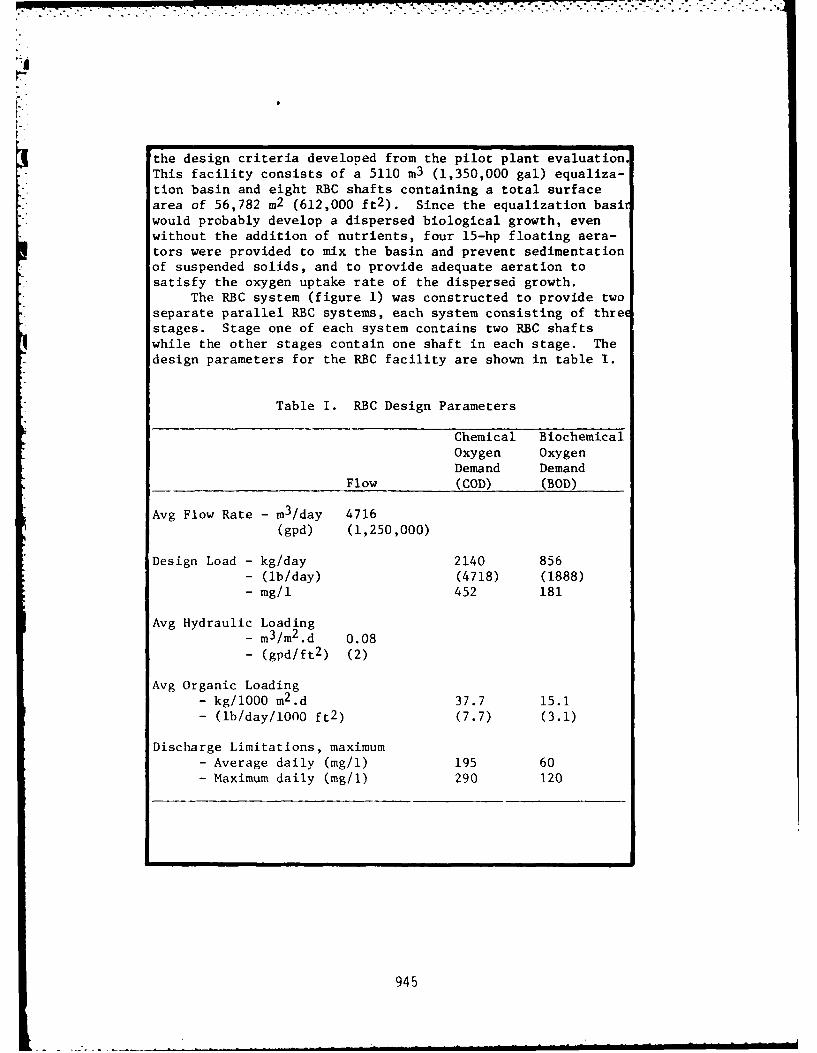
the design criteria developed from the pilot plant evaluationThis facility consists of a 5110 m3 (1,350,000 gal) equaliza-
tion basin and eight RBC shafts containing a total surfacearea of 56,782 m2 (612,000 ft2 ). Since the equalization basiwould probably develop a dispersed biological growth, even
without the addition of nutrients, four 15-hp floating aera-tors were provided to mix the basin and prevent sedimentationof suspended solids, and to provide adequate aeration tosatisfy the oxygen uptake rate of the dispersed growth.
The RBC system (figure 1) was constructed to provide twoseparate parallel RBC systems, each system consisting of thre
stages. Stage one of each system contains two RBC shaftswhile the other stages contain one shaft in each stage. The
design parameters for the RBC facility are shown in table I.
Table I. RBC Design Parameters
Chemical BiochemicalOxygen Oxygen
Demand Demand
Flow (COD) (BOD)
Avg Flow Rate - m 3/day 4716
(gpd) (1,250,000)
Design Load - kg/day 2140 856- (lb/day) (4718) (1888)
- mg/l 452 181
Avg Hydraulic Loading- m3/m 2 .d 0.08
- (gpd/ft2 ) (2)
Avg Organic Loading- kg/1000 m2 .d 37.7 15.1- (lb/day/1000 ft2 ) (7.7) (3.1)
Discharge Limitations, maximum- Average daily (mg/b) 195 60
- Maximum daily (mg/b) 290 120
945
.. . .. o l &m ambo
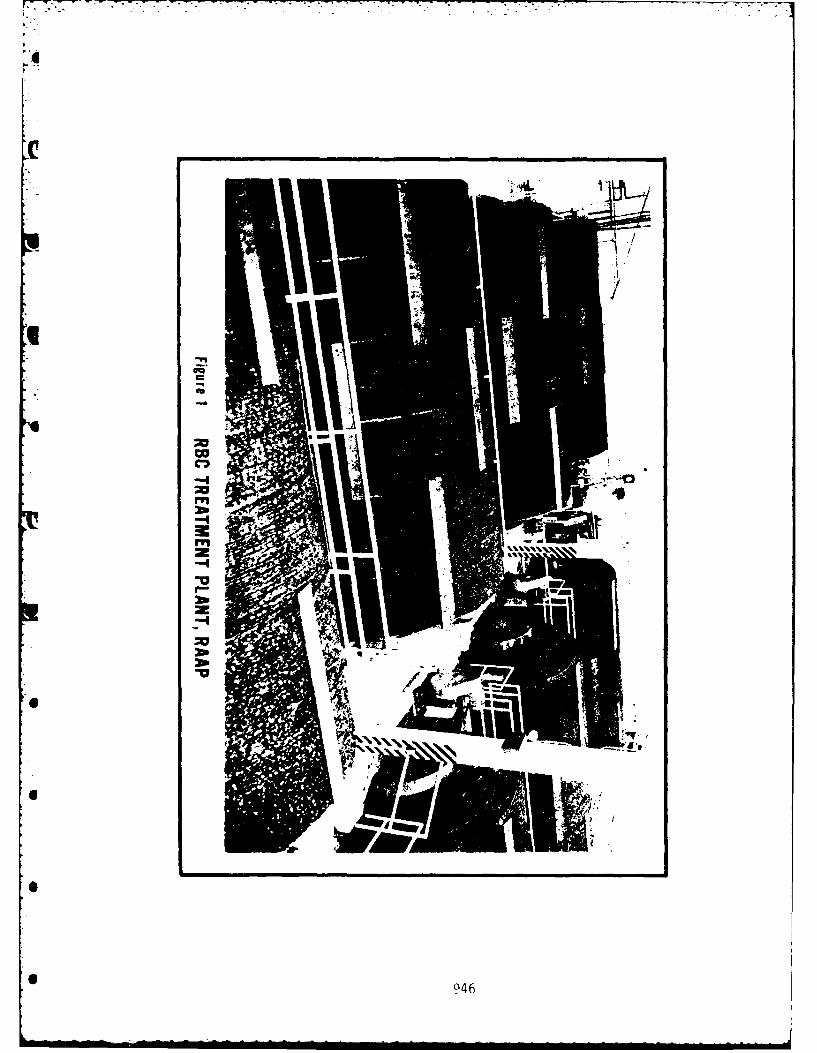
K 4 o
-AI
MR,
94
FACILITY START-UP
The facility was placed into operation during December1980. The RBC basins were filled with process wastewater fromthe equalization basin, 3.8'm 3 (1000 gallons) of waste sludgefrom a local municipal activated sludge wastewater treatmentplant, and one liter of phosphoric acid. The RBC system wasoperated in a batch mode for eight days to allow a biomassgrowth to develop on the. RBC media. During this time ethylalcohol, potassium nitrate, and phosphoric acid weie addedeach day as nutrients. Soda ash was added as required to con-trol the wastewater pH. The initial wastewater parametersfollowing start-up were: pH 8.1, temperature 8°C (47°F),dissolved oxygen (DO) 10.8 mg/l, nitrates (N) 14 mg/l, andphosphates (P) 4 mg/l. The biomass growth on the RBC mediadeveloped very slowly due to the low temperature. Sufficientalcohol, nutrients, and soda ash were added each shift tomaintain the chemical oxygen demand (COD) between 100 to 200mg/l, nitrates (N) 5 to 30 mg/l, phosphates (P) 1 to 5 mg/l,and the pH between 6.5 and 7.8. On the fourth day of operatiothe wastewater temperature increased to 12*C (53'F) and a veryoticeable acceleration of biomass growth was observed.
The RBC operation continued in the batch mode until theeighth day, at which time an influent flow of 1.14 m 3/min (300gpm) was started. The flow rate to the RBC units was steadilyincreased over the next few days tn to 3 m 3 /min (800 gpm).
pH FLUCTUATIONS
Shortly after start-up the facility encountered a periodf pH fluctuations. During this period, the influent pH
varied from 5.3 to 10.7 (figure 2). The variations in theinfluent pH were the result of a new pretreatment facilitybeing unable to accurately control the acid feed rate for thepH control system. Until this problem was corrected, anttempt was made to adjust the pH in the equalization basin by
the addition of soda ash; however, due to the absence of rapidmix equipment, this method was not completely successful.
As a result of these pH excursions, most of the biomasson the RBCs sloughed off. However, the biomass recoveredwithout reseeding.
INITIAL OPERATION
During the next month of operation, despite the cold
water temperature, additional pH excursions, and a highly
947
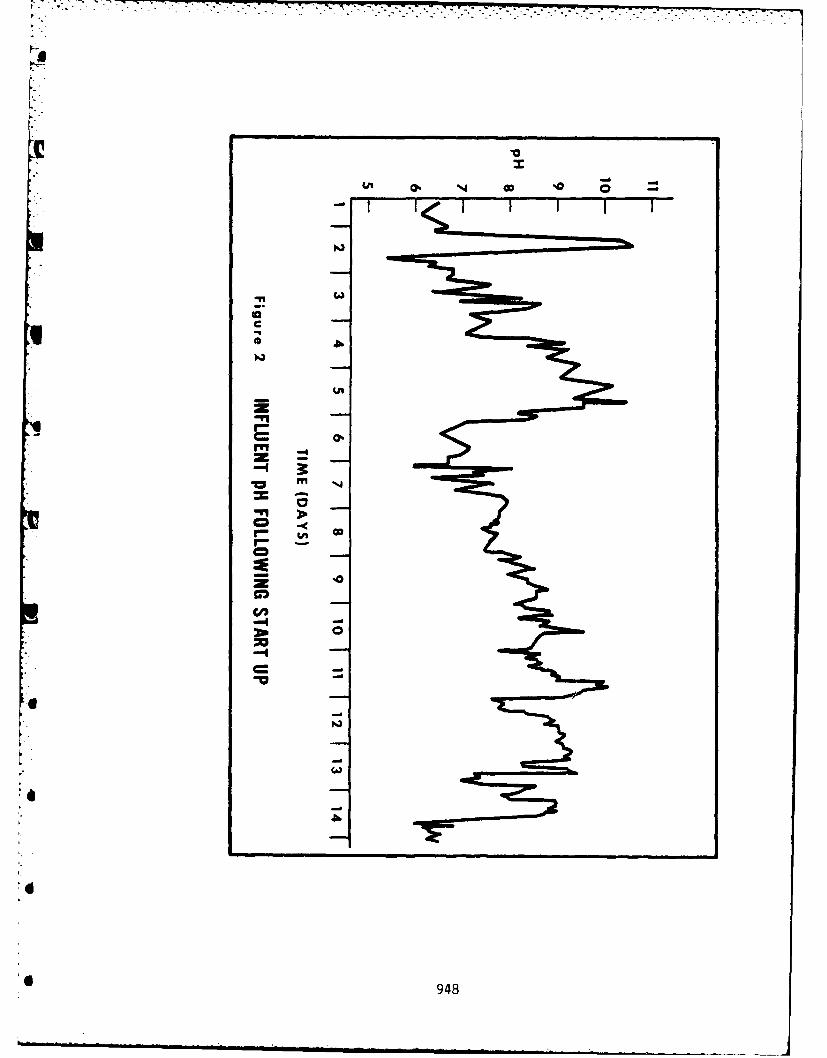
F 8 c
CD
3E2cCAN
94
variable organic load, the biomass growth continued to improve.The hydraulic loading to the REC units was maintained constantexcept for adjustments necessary to maintain the equalizationbasin becween the 60 to 90 percent level. However, widevariations in the organic concentration of the wastewatercaused the COD removal ei±Acciency to consistently fluctuatebetween 40 and 80 percent Grab samples of the 1tnfluent andeffluent were collected each morning, five days a week.Figure 3 shows the COD of these samples collected during thesecond month of operation. The low influent CODs on Monday ofeach week were due to no manufacturing operations on weekends.
FULL FACILITY OPERATION
In an effort to provide better control of the organicloading to the RBCs, an on-line total organic carbon (TOG)analyzer was installed to monitor the RBC influent. The on-line TOG analyzer verified that, even with a one-day retentiontime in the equalization basin, sharp fluctuations in theorganic concentrations of the RBC influent were occurring. Atypical shock load caused an increase in TOG of 330 percent inless than three hours (figure 4). The results of the TOGanalyses over a 23-day period are shown in figure 5. It wasobvious from these data that a method of controlling theorganic loading to the RBC was needed. The equalization basinwas designed to be operated at between 60 and 90 percentcapacity. Therefore, by maintaining the level of the basin atthe low level when high organic loadings were expected and atthe high level when low organic loadings were expected, theinfluent flow rate could be varied to minimize these fluctua-tions. A chart was prepared for use by the plant operatorsto control the organic loading to the RBC, based upon theinfluent flow rate and TOG value (figure 6). The instructionsprovided with the chart were as follows:
1. Keep the loading to the RBCs in the same loading zonewhenever possible. Change the flow rate in small steps when-ever it is necessary to change zones.
2. Decrease the basin level during periods of loworganic loadings. Decrease the level to 60 percent on Sundayof each week.
3. Increase the basin level during periods of highorganic loadings. Increase the level to 90 percent on Fridayof each week.
4. The operators should maintain a record of theinfluent loadings by plotting the changes on the chart, using
anew chart each day, and recording the time of changes.
949
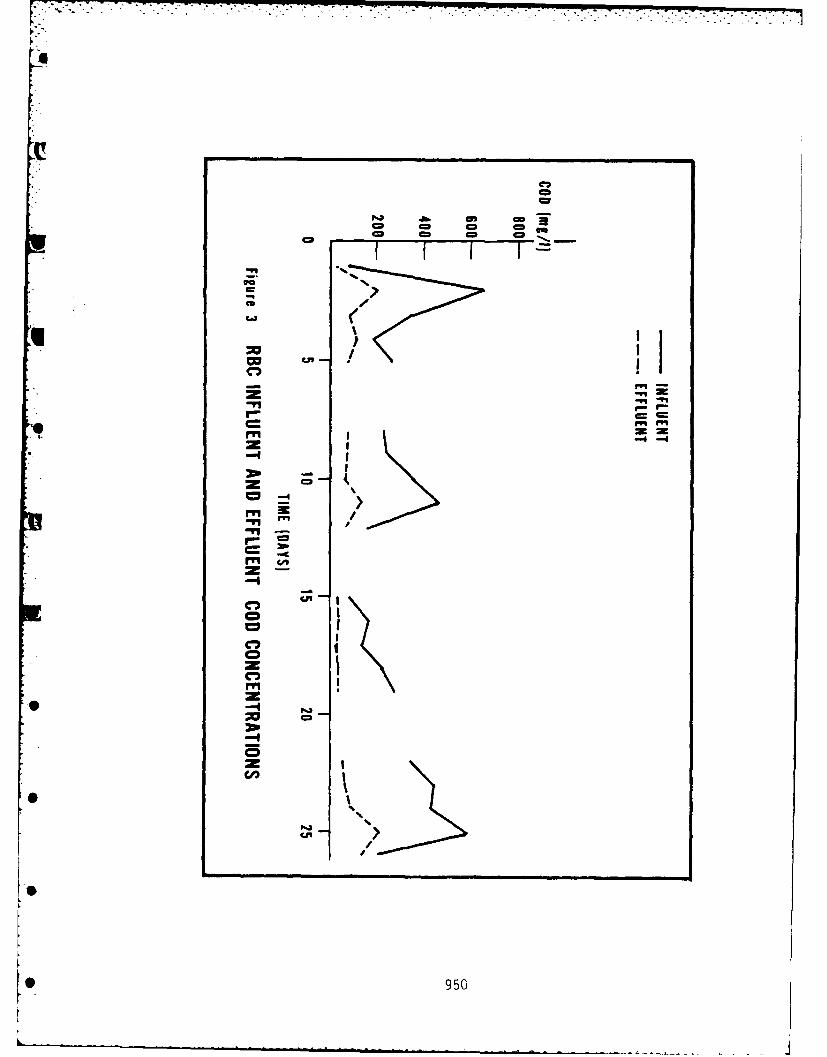
CD
aaa
U01
CD
.240~
P.'aqcm I'-
CA -
C ' .
CA =
z I950
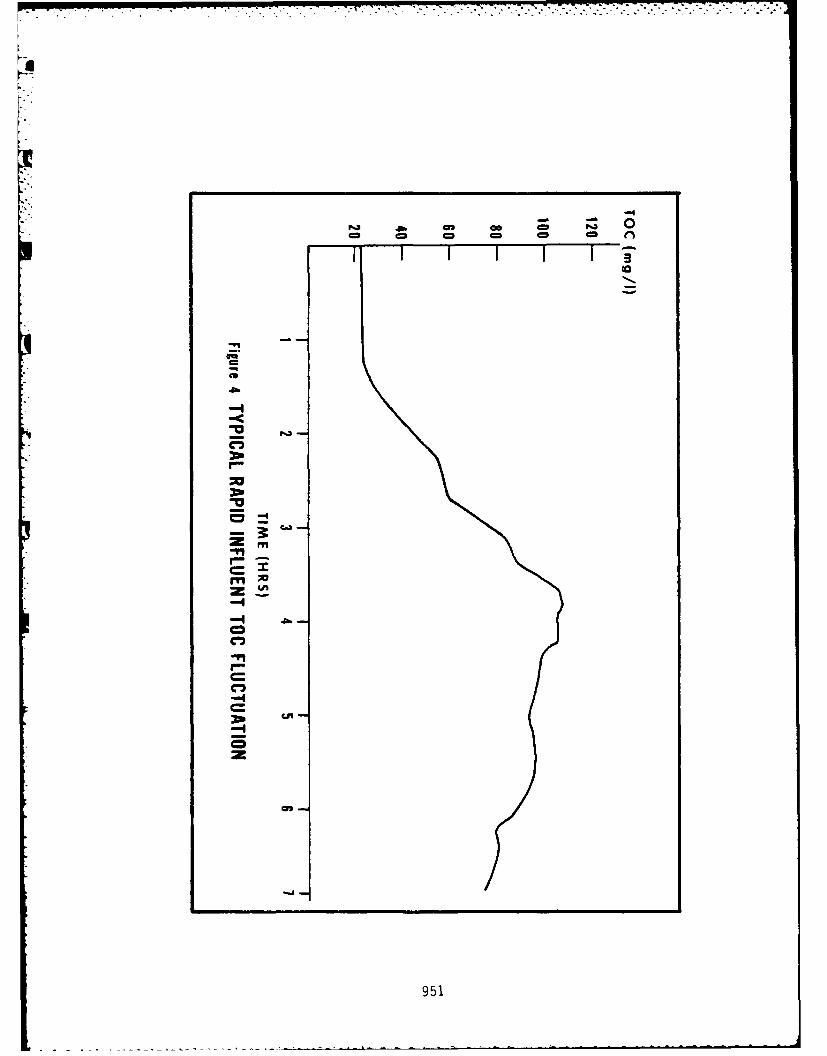
I. . .. . .. . . .
ca cm C =c
ow
aM
,4
P 91 0
C)~
1951
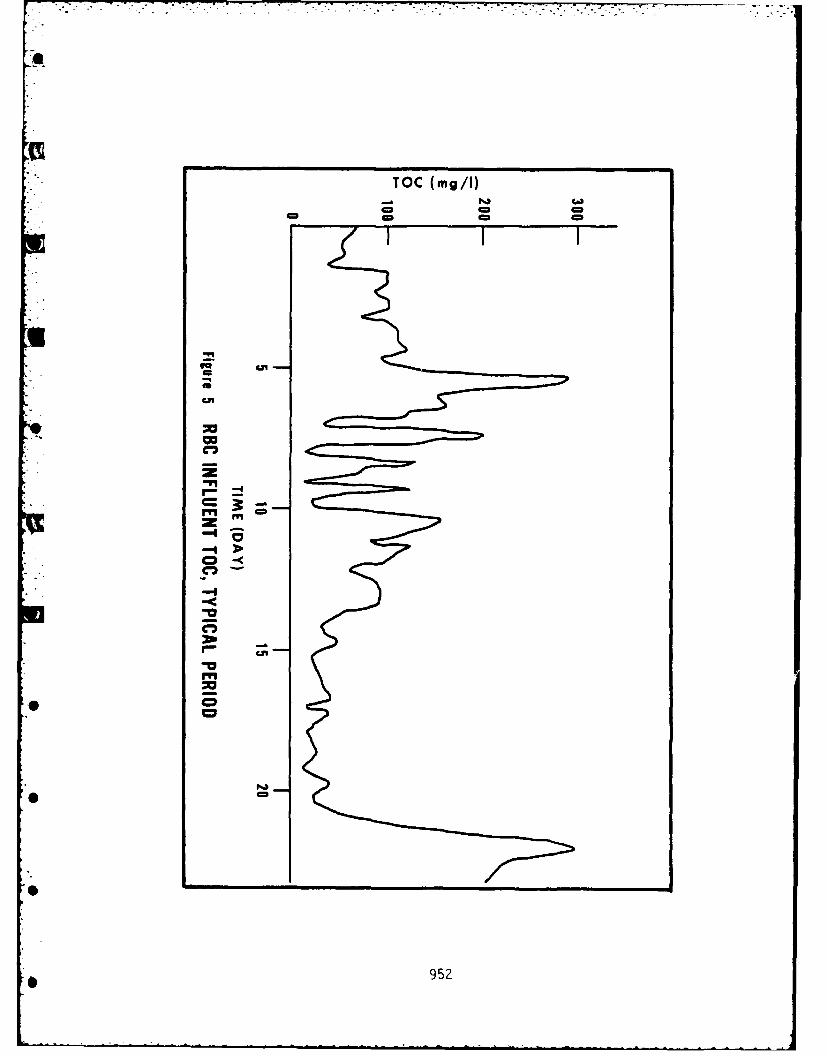
TOC (mg/I)
_ '
is
CD
-- I
CA~rm
C-
-95
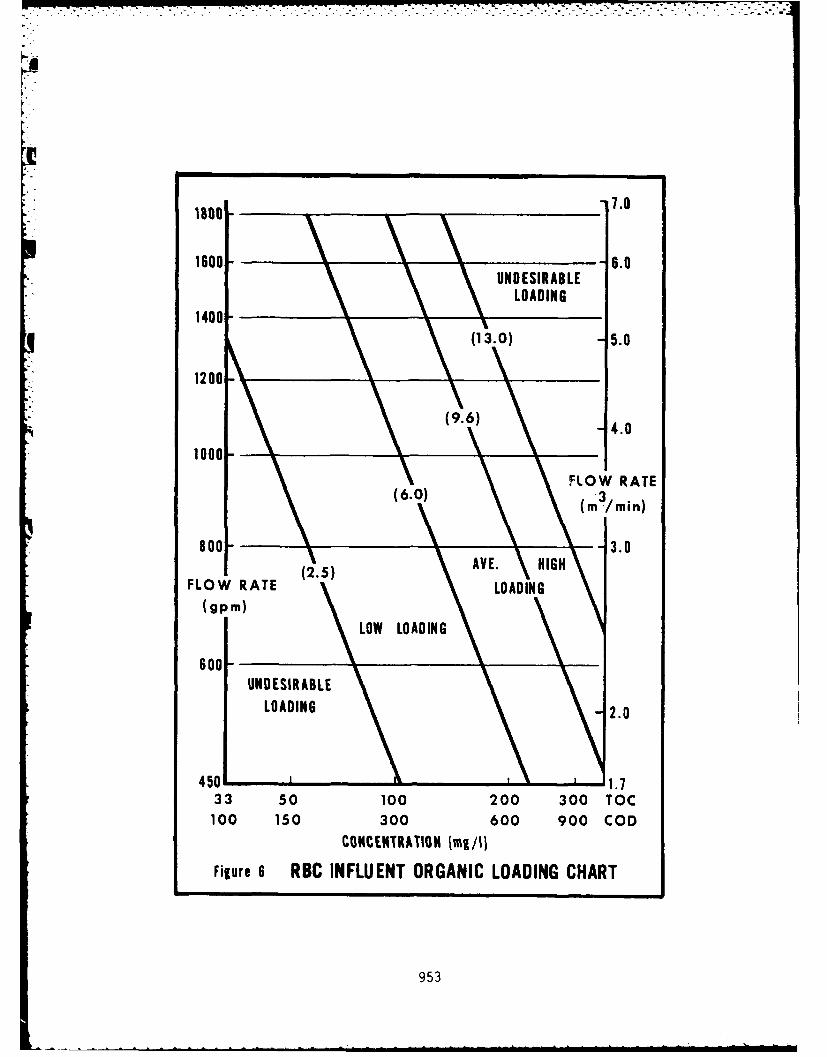
1o- 7.0
1600 - 6.0UNDESIRABLE
LOADING
(13.0)5.0
4.0
450 1.
33 50 100 200 300 TO(C100 150 300 600 900 COD
CONCENTRATION lmF/R
Fiure 6 ABC INFLUENT ORGANIC LOADING CHART
953
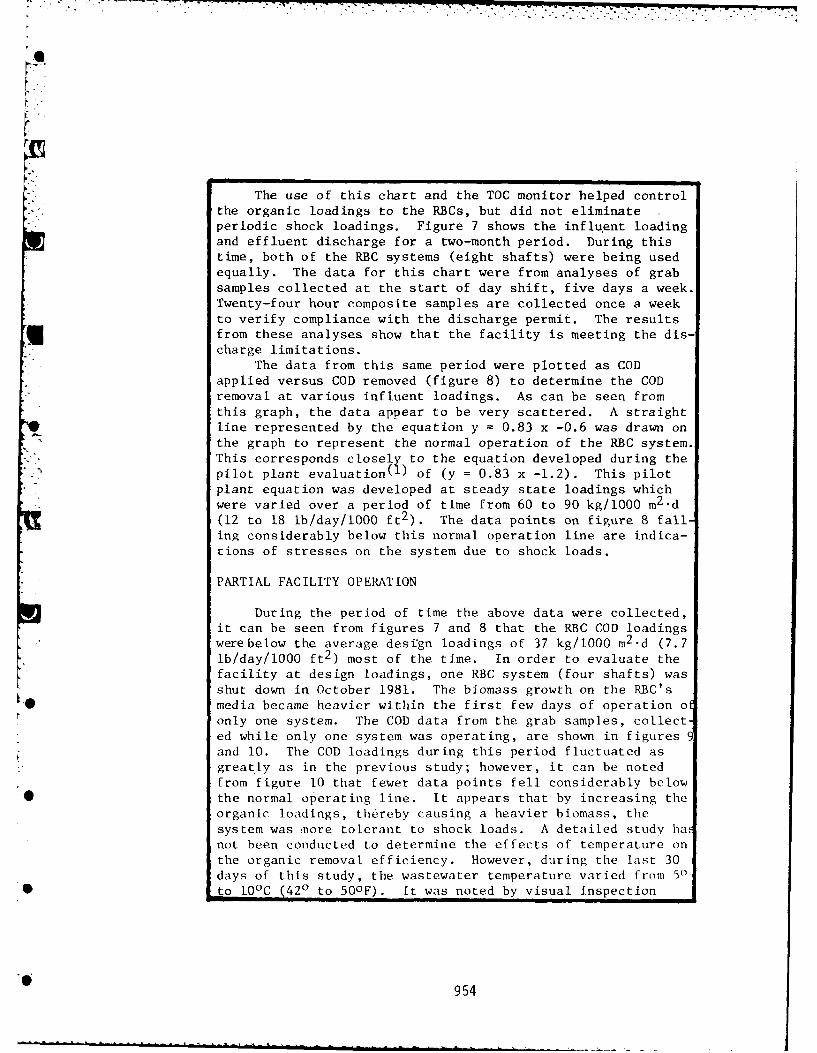
~~~~~~~~~~~~. . .. . . . . . . ....... '- - - '. ".., '. -- . -, -.--- , -. -.- ' .- , -- -.-
F The use of this chart and the TOC monitor helped controlthe organic loadings to the RBCs, but did not eliminateperiodic shock loadings. Figure 7 shows the influent loadingand effluent discharge for a two-month period. During thistime, both of the RBC systems (eight shafts) were being usedequally. The data for this chart were from analyses of grabsamples collected at the start of day shift, five days a week.Twenty-four hour composite samples are collected once a weekto verify compliance with the discharge permit. The resultsfrom these analyses show that the facility is meeting the dis-charge limitations.
The data from this same period were plotted as COD* applied versus COD removed (figure 8) to determine the COD
removal at various influent loadings. As can be seen fromthis graph, the data appear to be very scattered. A straightline represented by the equation y = 0.83 x -0.6 was drawn onthe graph to represent the normal operation of the RBC system.
-- This corresponds closely to the equation developed during thepilot plant evaluation(b) of (y = 0.83 x -1.2). This pilotplant equation was developed at steady state loadings whichwere varied over a period of time from 60 to 90 kg/1000 m2 "d(12 to 18 lb/day/1000 ft2). The data points on figure 8 falling considerably below this normal operation line are indica-cions of stresses on the system due to shock loads.
PARTIAL FACILITY OPERATION
During the period of time the above data were collected,it can be seen from figures 7 and 8 that the RBC COD loadingswere below the average design loadings of 37 kg/l00 m2 .d (7.7lb/day/1000 ft2 ) most of the time. In order to evaluate thefacility at design loadings, one RBC system (four shafts) wasshut down in October 1981. The biomass growth on the RBC's
• media became heavier within the first few days of operation oonly one system. The COD data from the grab samples, collected while only one system was operating, are shown in figures 9and 10. The COD loadings during this period fluctuated asgreatly as in the previous study; however, it can be notedfrom figure 10 that fewer data points fell considerably below
* the normal operating line. It appears that by increasing theorganic loadings, thereby causing a heavier biomass, thesystem was more tolerant to shock loads. A detailed study ha.not been conducted to determine the effects of temperature onthe organic removal efficiency. However, during the last 30days of this study, the wastewater temperature varied from 50
* to 100C (420 to 50OF). It was noted by visual inspection
954
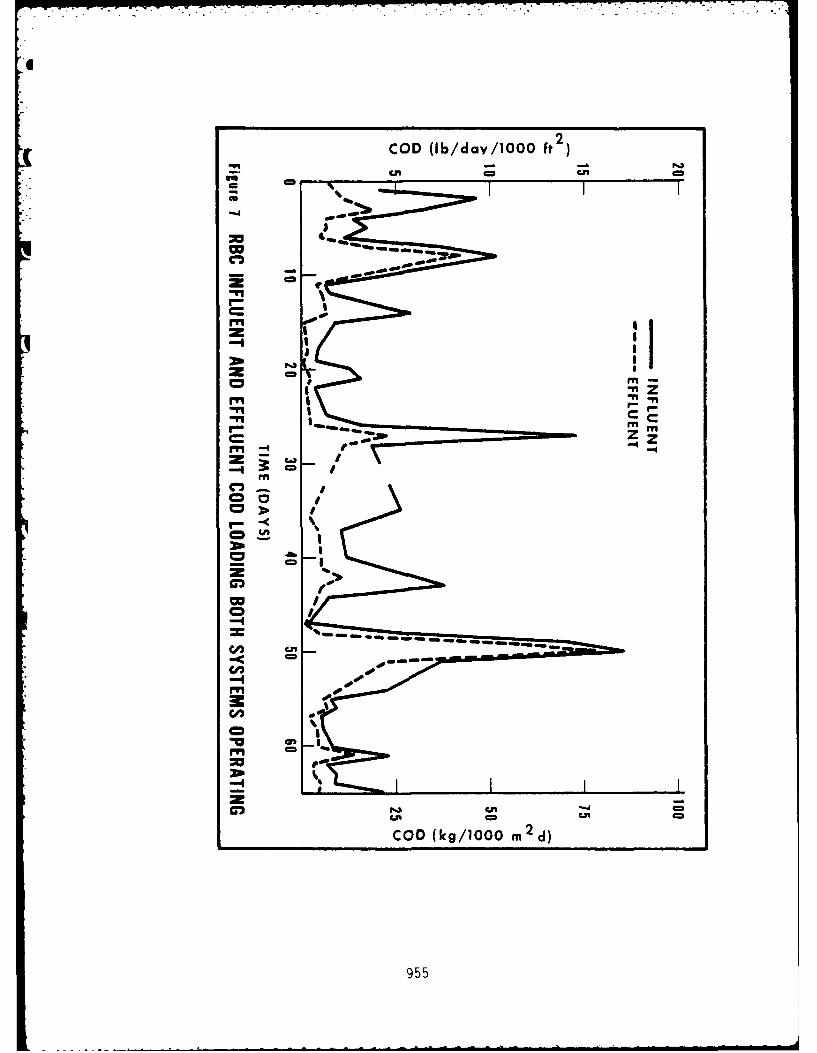
2COD (Ib/dav/1000 ft
-. 1
m S2cI
-n Z
I- mmCC
191 4
mm
CD
m
CD- -
cm
Kn
COD (k/% mId
955
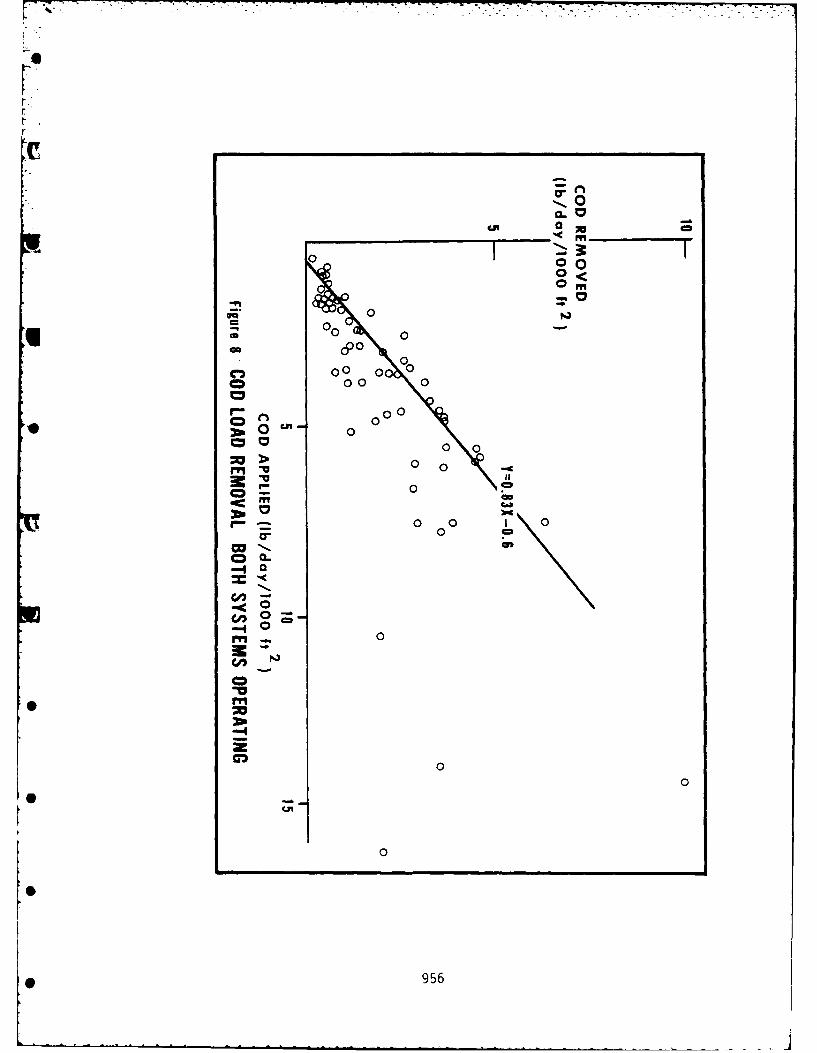
K*
VI
0'.C4 0 1:
000 <
06.
0Y 0cc C90
- _40 I. 0
0C, 0 0oooo
0 P0 0 1 0
0 0 CD6,,
0-I 0
ac
-,-
0~0
0
a95
0*
• 956
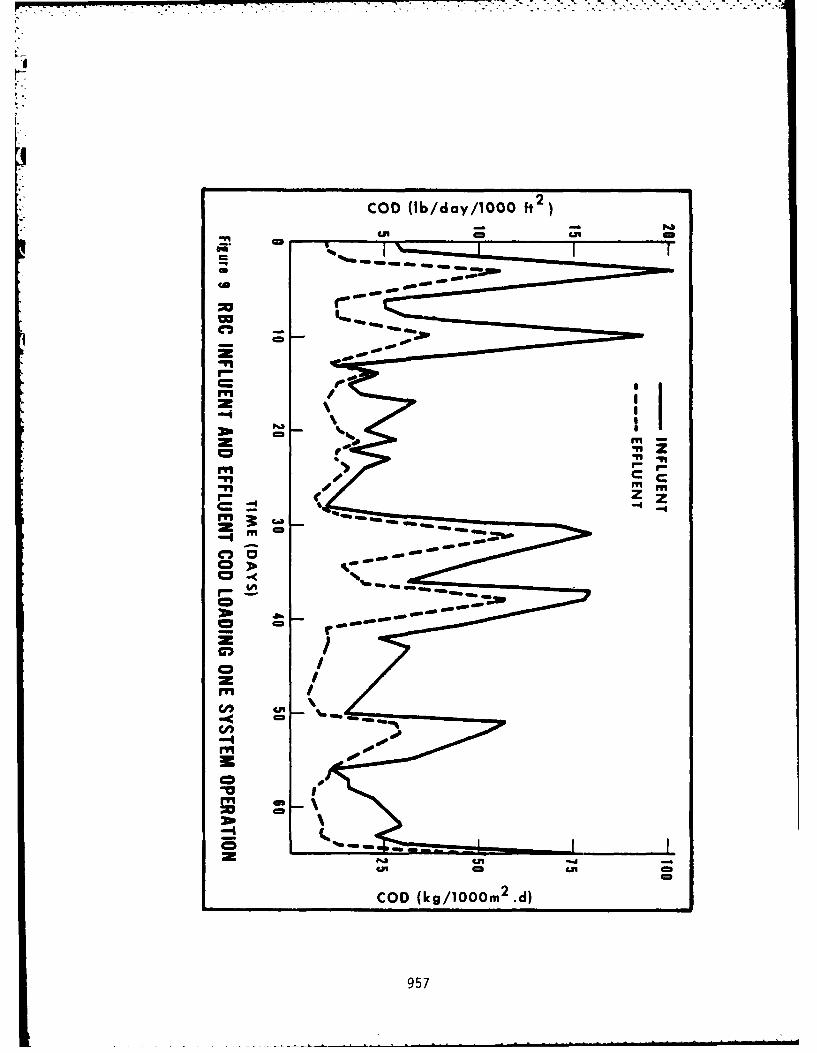
2 :'- . - - -
COD (tb/day/1000 ft)
gago
moC CD
zo o I
-Oro
%FYa zm
=- 4 4 -
Co
r- (-CD
cCA
oo
mc
COD (kg/lbO0m2 .d)
957
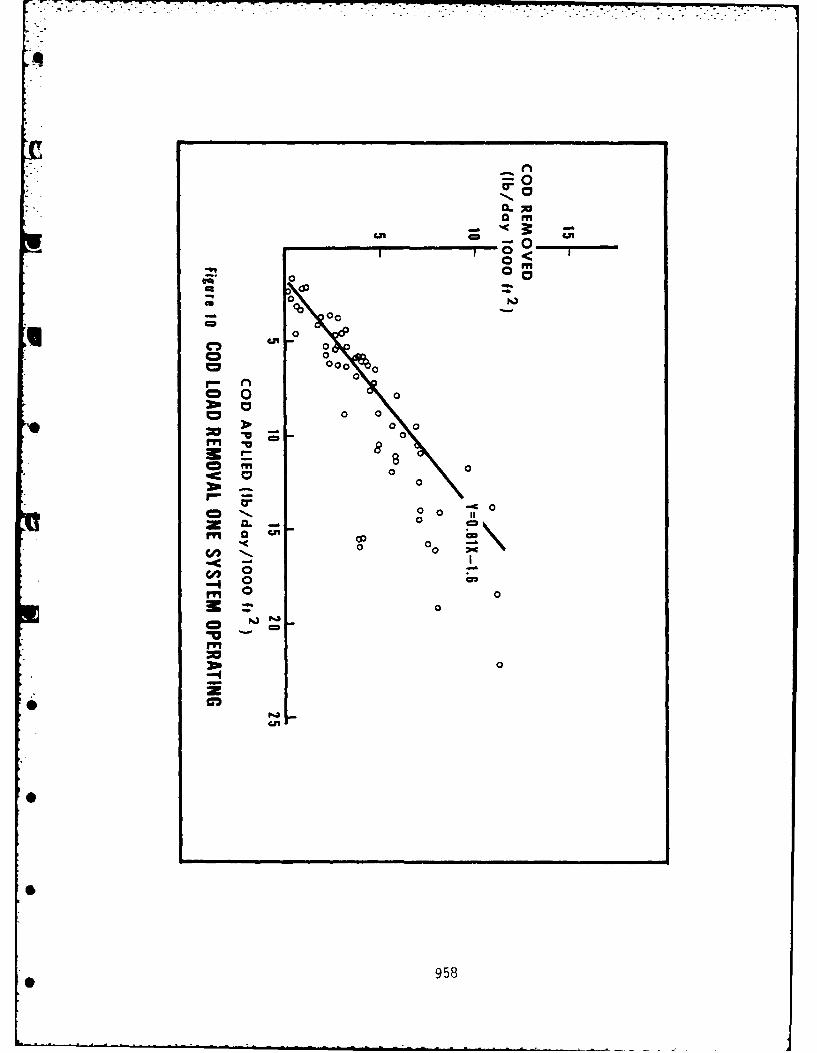
-..,-. - -- .. . -I .il - i .,
40
o
0'00 0
0
£0
CD0 0
.o
C2 000 0r- 0
0 00 0
- 0M
C2m 00c 0 0- 0
F~. -- 0
00
C o I-c -
-- 0 CK: 0
ac0v.v
M0
00
958
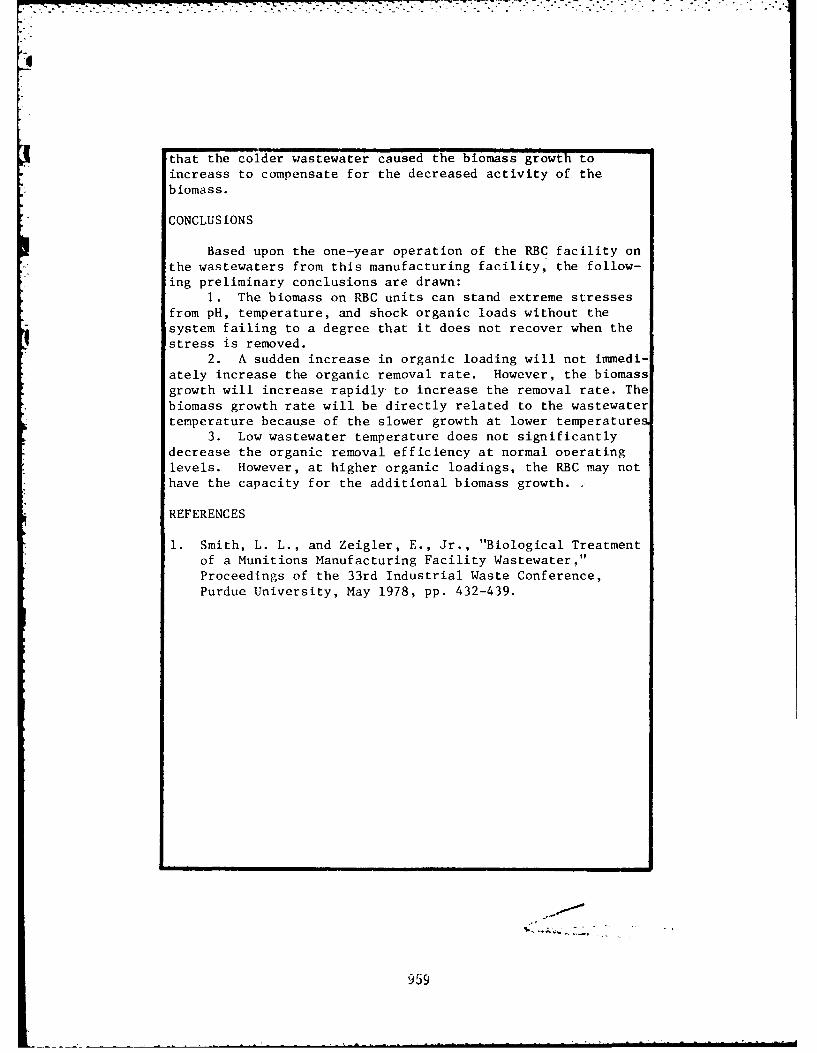
I I l
that the colder wastewater caused the biomass growth toincreass to compensate for the decreased activity of thebiomass.
CONCLUSIONS
Based upon the one-year operation of the RBC facility onthe wastewaters from this manufacturing facility, the follow-ing preliminary conclusions are drawn:
1. The biomass on RBC units can stand extreme stressesfrom pH, temperature, and shock organic loads without thesystem failing to a degree that it does not recover when thestress is removed.
2. A sudden increase in organic loading will not immedi-
ately increase the organic removal rate. However, the biomassgrowth will increase rapidly to increase the removal rate. Thebiomass growth rate will be directly related to the wastewatertemperature because of the slower growth at lower temperatures
3. Low wastewater temperature does not significantlydecrease the organic removal efficiency at normal oneratinglevels. However, at higher organic loadings, the RBC may nothave the capacity for the additional biomass growth.
REFERENCES
1. Smith, L. L., and Zeigler, E., Jr., "Biological Treatmentof a Munitions Manufacturing Facility Wastewater,"Proceedings of the 33rd Industrial Waste Conference,Purdue University, May 1978, pp. 432-439.
959
TREATMENT OF STARCH INDUSTRIAL WASTEBY RBCs
*. 0
Chun Teh Li and Huoo Tein Chen, Department Of* Environmental Engineering, National Chorng Kung
University, Tainan, Taiwan, R.O.C.
Veun C. Wu, Department of Civil Engineering,University of Pittsburgh, Pittsburgh, Pa.
INTRODUCTION
Although successful treatment of industrial wastewatersby rotating biological contactors (RBC) has been earlier re-ported by many researchers, one important factor limiting theplant performance is the availability of oxygen in the system,in particular, when treating a high-strength organic waste(1-7). Oxygen transfer can become more effective by increasingthe disc rotational speed but this application, however, isnot practical because of: (a) high power consumption, and (b)high biomass slough-off induced by a high hydraulic shearingforce on the surface of biodisc that reduces the overall treat-
K ment efficiency.One alternative that may be able to treat high-strength
'O organic wastes successfully under the normal operating cond-itions, is to replace the source of conventional air by pureoxygen. Bintaja et al. first employed oxygen in RBC systemfor treatment of Cheese waste (8). Later, Huang successfullytreated synthetic milk waste by oxygen-enriched RBC system.
960
They concluded that use of pure oxygen in sufficient amountnot only was able to improve COD removal satisfactorily butalso increased sludge settleability(9).
The present study was aimed to investigate the feasibilityof using pure oxygen and conventional air RBC systems for thetreatment of starch processing wastewater and also to study theeffects of wastewater property, organic loading, pH, and dis-solved oxygen concentration on RBC plant performance. The finalgoal of this research was to determine the kinetic data forfuture design of both RBC systems. _
Starch Industry Wastewater. Starch consumption in theRepublic of China (Taiwan) now reaches one hundred thousandtons annually, of which one half of this demand is supplied bylocal manufacturers and the other half is imported from theoutside producers. As a result, Taiwan government has decidedto assist private daily food industry in expanding the existingstarch processing plants prior to 1984, so that the futuredomestic starch demand can be met.
The raw materials used presently for starch production inTaiwan are sweet potato and corn. Approximately 70% of thetotal starch is made of sweet potato because it is availablelocally. However, corn starch is more perferably used byconsumers even the cost is higher. It is predicted that theuse of corn for starch-manufacturing will increase consider-ably due to the current market demand.
An expansion of the existing starch processsing facilitiesis greatly concerned by environmental scientists and engineersin Taiwan. Because normally each ton of corn used for strach-making could produce 13.5 - 15.1 kg BOD and, more importantly,most of the starch manufacturing plants located in Tainan andChiayi directly discharged their effluents into the smallreceiving streams. Purification of the plant effluent waste-waters is essentially necessary. The present study was initiatedto investigate the treatment of corn strach manufacturer planteffluent by RBC systems. The flow diagram as presented laterexplains the process employed for corn starch manufacturing.
It can be seen in the flow diagram that although a closed-loop system is designed for the purpose of eliminating the dis-charge of process water, a considerable amount of wastewateris preduced due to leakage, overflowing, and accidential spill.Normally, a 0.4 - 3.0 m3 wastewater generated per ton of cornused was found in a corn-starch manufacturing plant.
961
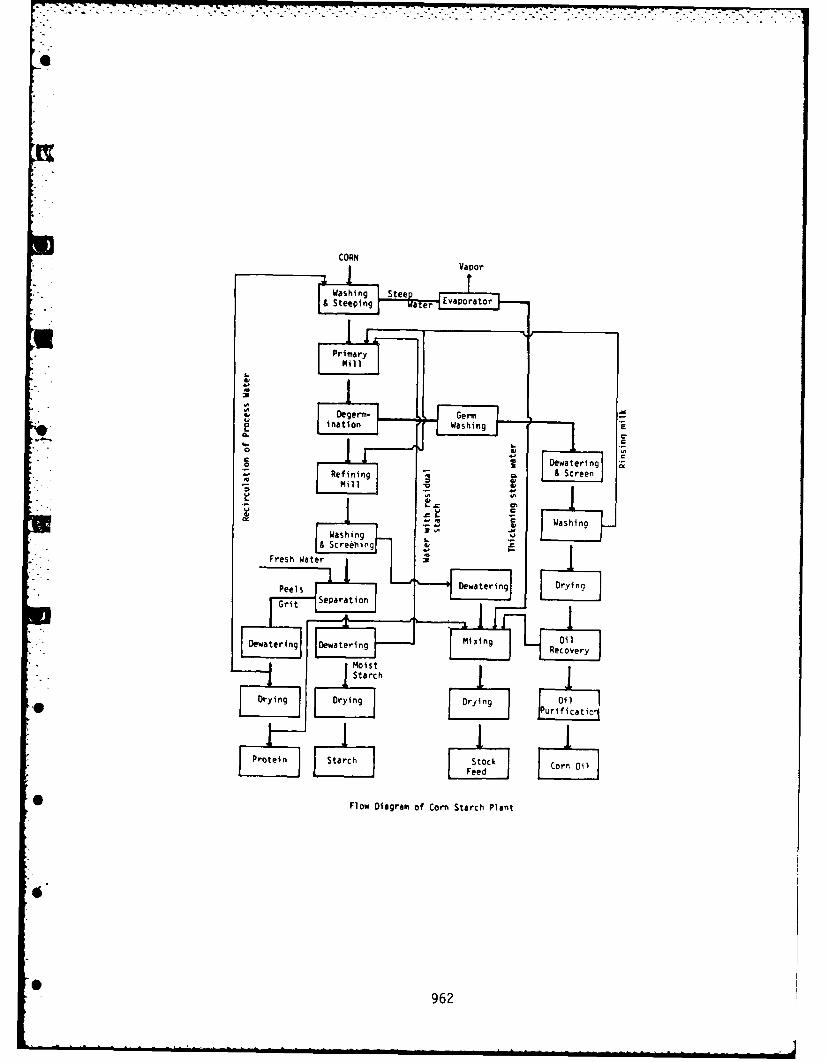
CORN
& Steping a e DEoatorin
* PurPrimary
MillCrnOi
Flatow DWga onSarh n t
Refin962
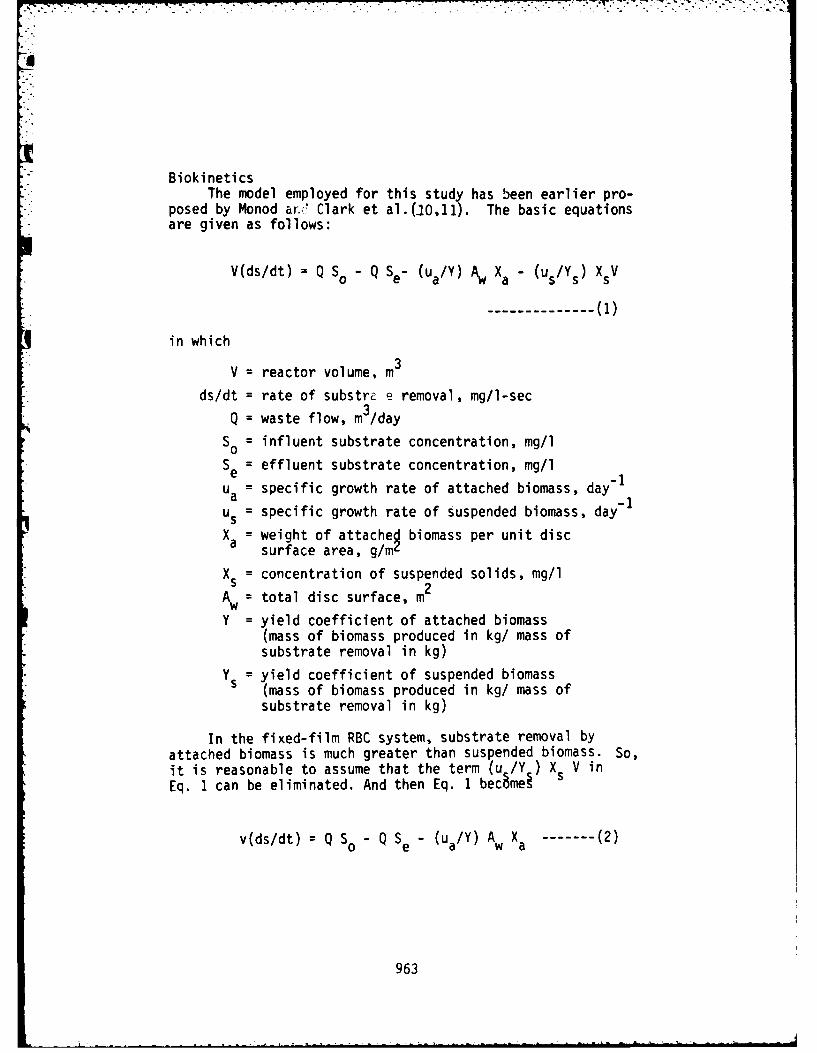
BiokineticsThe model employed for this study has been earlier pro-
posed by Monod ar.,. Clark et al.(i0,11). The basic equationsare given as follows:
V(ds/dt) = Q So - Q Se- (Ua/Y) Aw Xa - (us/Y s ) XsV
----------------------------------(1)
in which
V = reactor volume, m3
ds/dt = rate of substra e removal, mg/l-sec3
Q = waste flow, m /day
so = influent substrate concentration, mg/l
Se = effluent substrate concentration, mg/l
ua = specific growth rate of attached biomass, day 1
us = specific growth rate of suspended biomass, day
Xa = weight of attached biomass per unit discsurface area, g/m
Xs = concentration of suspended solids, mg/l
A = total disc surface, m2
wY = yield coefficient of attached biomass
(mass of biomass produced in kg/ mass ofsubstrate removal in kg)
Ys = yield coefficient of suspended biomass(mass of biomass produced in kg/ mass ofsubstrate removal in kg)
In the fixed-film RBC system, substrate removal byattached biomass is much greater than suspended biomass. So,it is reasonable to assume that the term (u /Y ) X V inEq. 1 can be eliminated. And then Eq. I bec~mei s
v(ds/dt)= Q S 0 Q Se - (ua/Y) Aw Xa ------- (2)
963
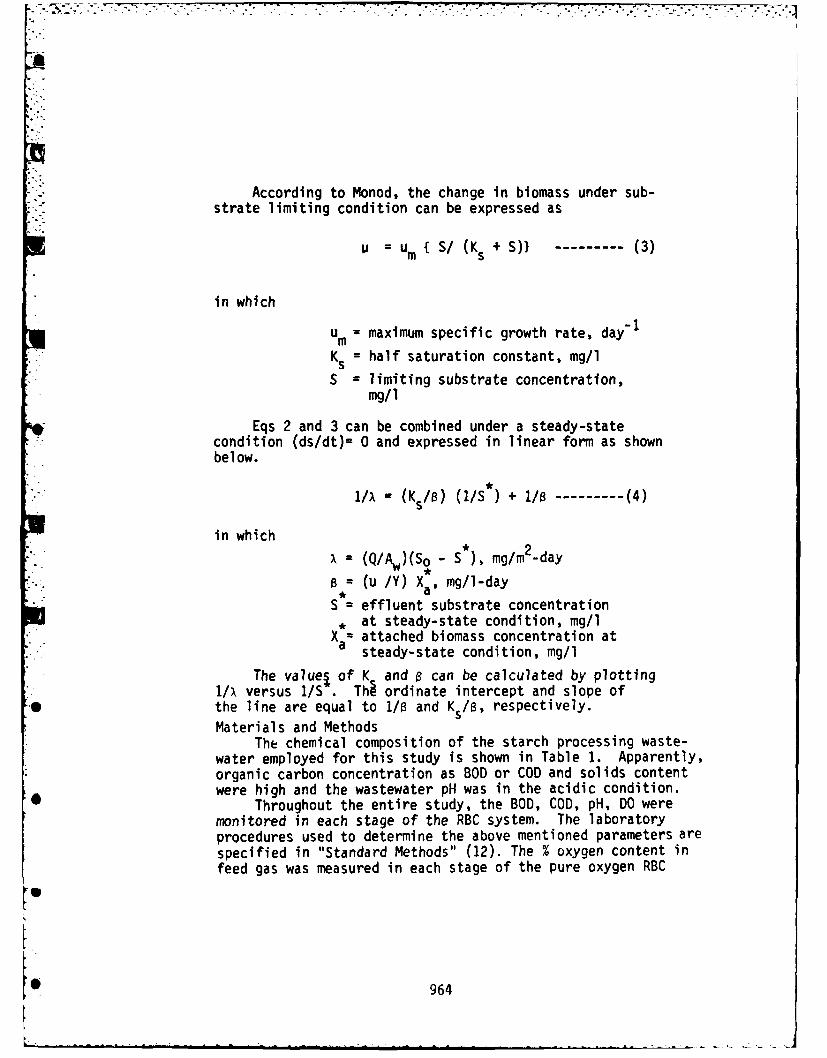
According to Monod, the change in biomass under sub-strate limiting condition can be expressed as
Su =um {S/ (Ks + S)) --------- (3)
in which
U= maximum specific growth rate, day -
Ks = half saturation constant, mg/l
S = limiting substrate concentration,mg/1
Eqs 2 and 3 can be combined under a steady-statecondition (ds/dt)= 0 and expressed in linear form as shownbelow.
IA= (KlS/6) (I/S*) + 1/ -------- (4)
in which
(Q/Aw)(So - S) mg/m 2-day
(B = u /Y) Xa, mg/i-day
S = effluent substrate concentrationat steady-state condition, mg/l
X attached biomass concentration atsteady-state condition, mg/l
The values of K and a can be calculated by plotting1/x versus /S . Thi ordinate intercept and slope ofthe line are equal to 1/8 and Ks/B, respectively.Materials and Methods
The chemical composition of the starch processing waste-water employed for this study is shown in Table 1. Apparently,organic carbon concentration as BOD or COD and solids contentwere high and the wastewater pH was in the acidic condition.
Throughout the entire study, the BOD, COD, pH, DO weremonitored in each stage of the RBC system. The laboratoryprocedures used to determine the above mentioned parameters arespecified in "Standard Methods" (12). The % oxygen content infeed gas was measured in each stage of the pure oxygen RBC
9
5 964
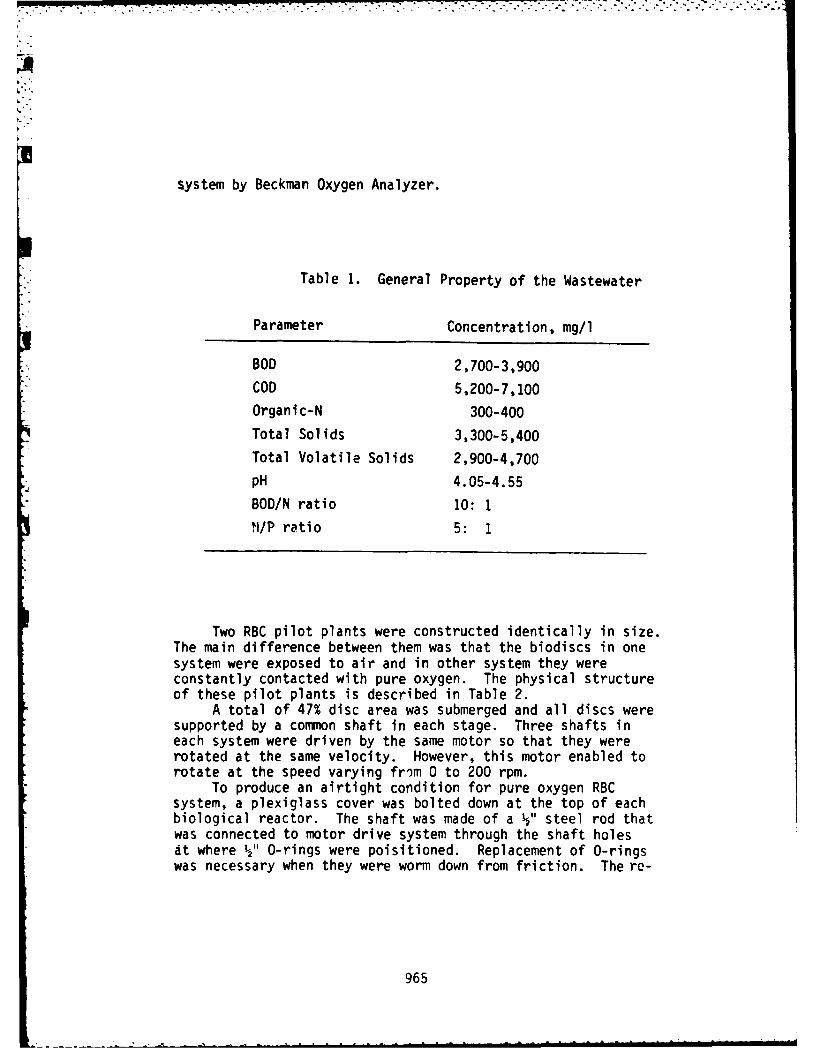
system by Beckman Oxygen Analyzer.
Table 1. General Property of the Wastewater
Parameter Concentration, mg/l
BOD 2,700-3,900
COD 5,200-7,100
Organic-N 300-400
Total Solids 3,300-5,400
Total Volatile Solids 2,900-4,700
pH 4.05-4.55
BOD/N ratio 10: 1
M Il ratio 5: 1
Two RBC pilot plants were constructed identically in size.The main difference between them was that the biodiscs in onesystem were exposed to air and in other system they wereconstantly contacted with pure oxygen. The physical structureof these pilot plants is described in Table 2.
A total of 47% disc area was submerged and all discs weresupported by a common shaft in each stage. Three shafts ineach system were driven by the same motor so that they wererotated at the same velocity. However, this motor enabled torotate at the speed varying from 0 to 200 rpm.
To produce an airtight condition for pure oxygen RBCsystem, a plexiglass cover was bolted down at the top of eachbiological reactor. The shaft was made of a " steel rod thatwas connected to motor drive system through the shaft holesat where " O-rings were poisitioned. Replacement of O-ringswas necessary when they were worm down from friction. The re-
965
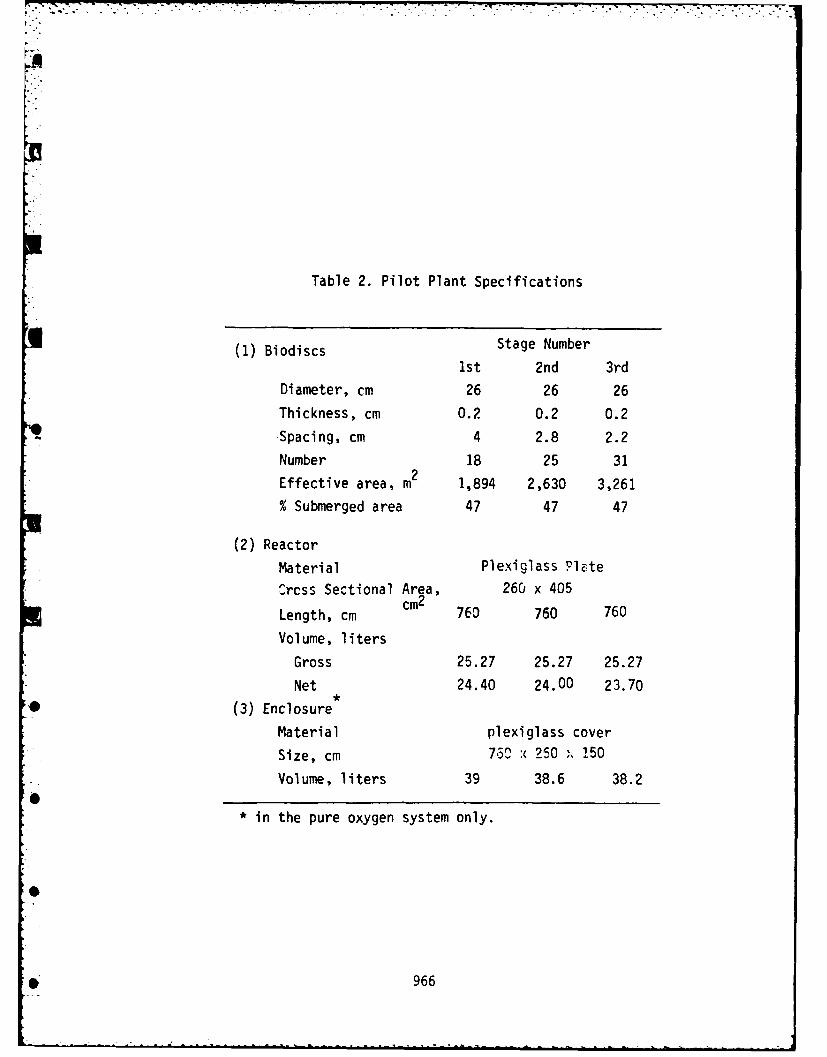
Table 2. Pilot Plant Specifications
(1) Biodiscs Stage Number1st 2nd 3rd
Diameter, cm 26 26 26
Thickness, cm 0.2 0.2 0.2
' Spacing, cm 4 2.8 2.2Number 18 25 31
Effective area, m 1,894 2,630 3,261% Submerged area 47 47 47
(2) Reactor
Material Plexiglass P I a te
orcss SeCtional ArSa 260 x 405
Length, cm C 760 760 760Volume, liters
Gross 25.27 25.27 25.27
Net 24.40 24.00 23.70
(3) Enclosure
Material plexiglass cover
Size, cm 76 250 1.50
Volume, liters 39 38.6 38.2
Net___ _24.40__ ___24.00___ __2__.__ _0
* in the pure oxygen system only.
9
* 966
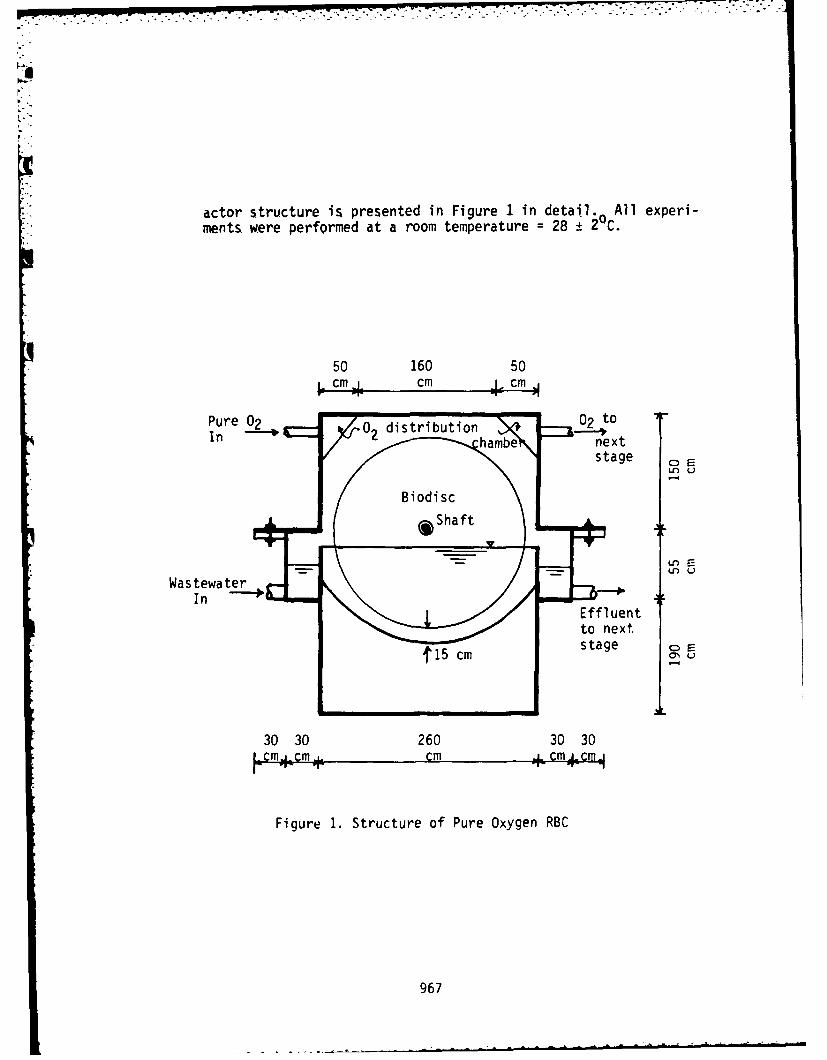
L
actr srucureis presented in Figure 1 in detail. l xei
ments were performed at a room temperature =28 ±2C.
50 160 50~cm 4 cm 4.CMj
In 02 distribution 1
stage A CD r
LO ELO U..
Was tewa ter
15~ cm
30 30 260 30 30I cmcm~cm cm 4cmJ1
Figure~ 1. Structure of Pure Oxygen RBC
967
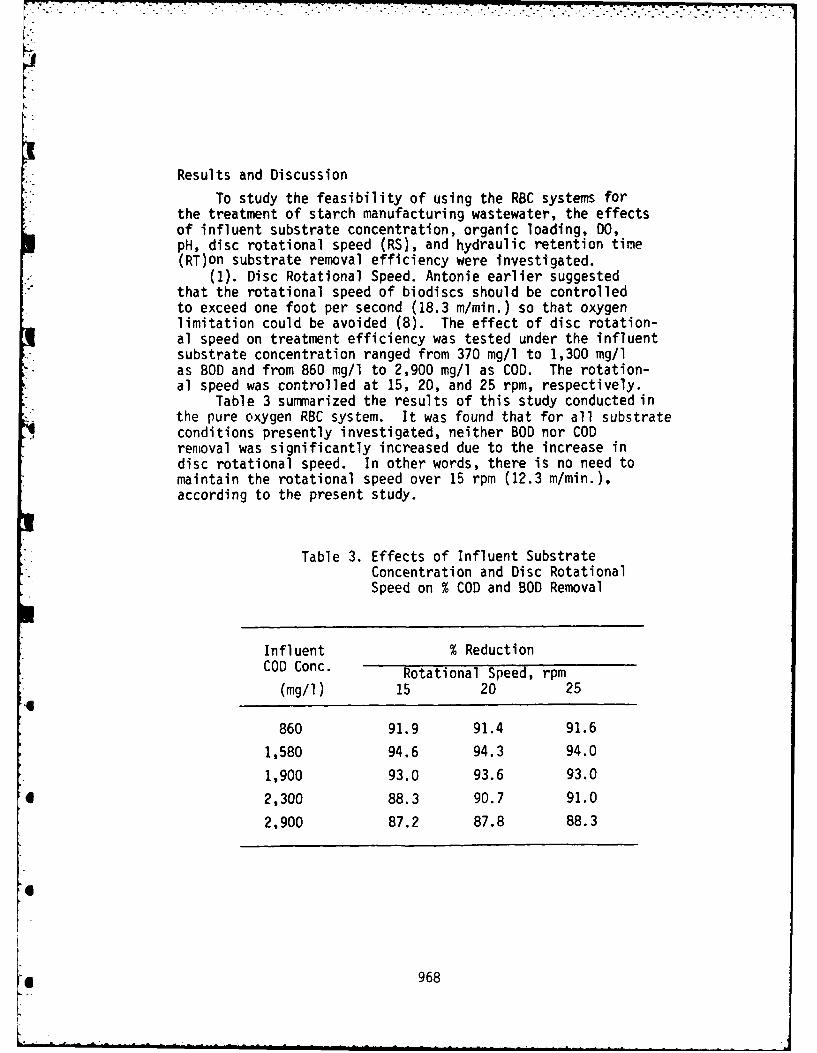
Results and Discussion
To study the feasibility of using the RBC systems forthe treatment of starch manufacturing wastewater, the effectsof influent substrate concentration, organic loading, DO,pH, disc rotational speed (RS), and hydraulic retention time(RT)on substrate removal efficiency were investigated.
(1). Disc Rotational Speed. Antonie earlier suggestedthat the rotational speed of biodiscs should be controlledto exceed one foot per second (18.3 m/min.) so that oxygenlimitation could be avoided (8). The effect of disc rotation-al speed on treatment efficiency was tested under the influentsubstrate concentration ranged from 370 mg/l to 1,300 mg/las BOD and from 860 mg/l to 2,900 mg/l as COD. The rotation-al speed was controlled at 15, 20, and 25 rpm, respectively.
Table 3 summarized the results of this study conducted inthe pure oxygen RBC system. It was found that for all substrateconditions presently investigated, neither BOD nor CODremoval was significantly increased due to the increase indisc rotational speed. In other words, there is no need tomaintain the rotational speed over 15 rpm (12.3 m/min.),according to the present study.
Table 3. Effects of Influent SubstrateConcentration and Disc RotationalSpeed on % COD and BOD Removal
Influent % ReductionCOD Conc. Rotational Speed, rpm
(mg/l) 15 20 25
860 91.9 91.4 91.6
1,580 94.6 94.3 94.0
1,900 93.0 93.6 93.0
* 2,300 88.3 90.7 91.0
2,900 87.2 87.8 88.3
9
*~ 968
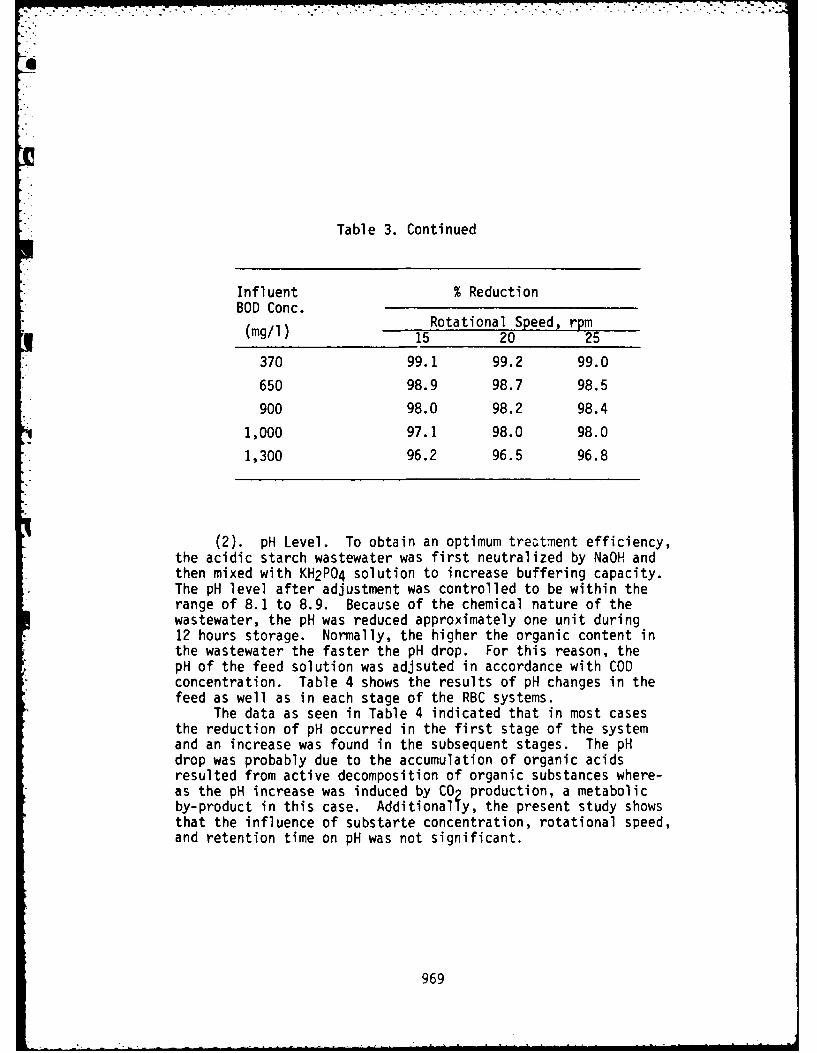
Table 3. Continued
Influent % ReductionBOD Conc.
(mg/ion) Speed, rpm
370 99.1 99.2 99.0
650 98.9 98.7 98.5
900 98.0 98.2 98.4
1,000 97.1 98.0 98.0
1,300 96.2 96.5 96.8
(2). pH Level. To obtain an optimum trea~tment efficiency,the acidic starch wastewater was first neutralized by NaOH andthen mixed with KH2PO4 solution to increase buffering capacity.The pH level after adjustment was controlled to be within therange of 8.1 to 8.9. Because of the chemical nature of thewastewater, the pH was reduced approximately one unit during12 hours storage. Normally, the higher the organic content inthe wastewater the faster the pH drop. For this reason, thepH of the feed solution was adjsuted in accordance with CODconcentration. Table 4 shows the results of pH changes in thefeed as well as in each stage of the RBC systems.
The data as seen in Table 4 indicated that in most casesthe reduction of pH occurred in the first stage of the systemand an increase was found in the subsequent stages. The pHdrop was probably due to the accumulation of organic acidsresulted from active decomposition of organic substances where-as the pH increase was induced by CO2 production, a metabolicby-product in this case. Additional Iy, the present study showsthat the influence of substarte concentration, rotational speed,and retention time on pH was not significant.
969
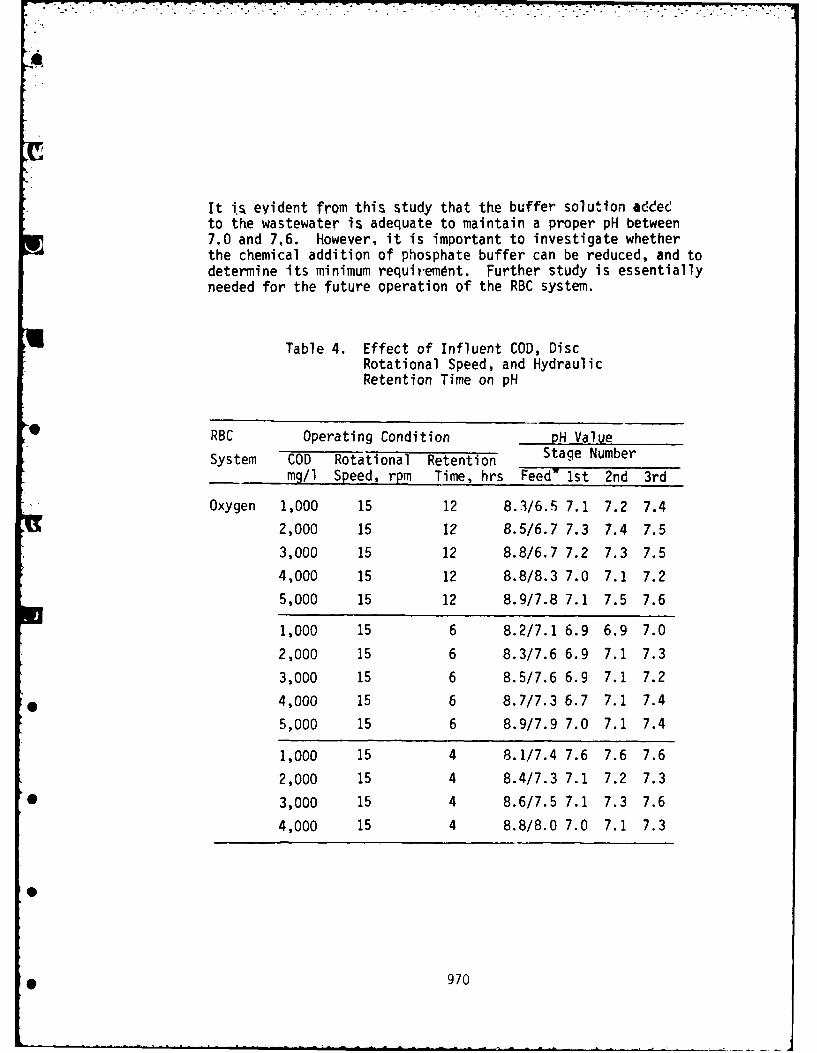
It i s evident from this study that the buffer solution aeeto the wastewater is adequate to maintain a proper pH between7.0 and 7,6. However, it is important to investigate whetherthe chemical addition of phosphate buffer can be reduced, and todetermine its minimum requirement. Further study is essentiallyneeded for the future operation of the RBC system.
Table 4. Effect of Influent COD, DiscRotational Speed, and HydraulicRetention Time on pH
RBC Operating Condition PH Value
System COD Rotational Retention Stage Numbermg/l Speed, rpm Time, hrs Feed' 1st 2nd 3rd
Oxygen 1,000 15 12 8.3/6.5i 7.1 7.2 7.4
2,000 15 12 8.5/6.7 7.3 7.4 7.5
3,000 15 12 8.8/6.7 7.2 7.3 7.5
4,000 15 12 8.8/8.3 7.0 7.1 7.2
5,000 15 12 8.9/7.8 7.1 7.5 7.6
1,000 15 6 8.2/7.1 6.9 6.9 7.0
2,000 15 6 8.3/7.6 6.9 7.1 7.3
3,000 15 6 8.5/7.6 6.9 7.1 7.2
*4,000 15 6 8.7/7.3 6.7 7.1 7.4
5,000 15 6 8.9/7.9 7.0 7.1 7.4
1,000 15 4 8.1/7.4 7.6 7.6 7.6
2,000 15 4 8.4/7.3 7.1 7.2 7.3
*3,000 15 4 8.6/7.5 7.1 7.3 7.6
4,000 15 4 8.8/8.0 7.0 7.1 7.3
* 970
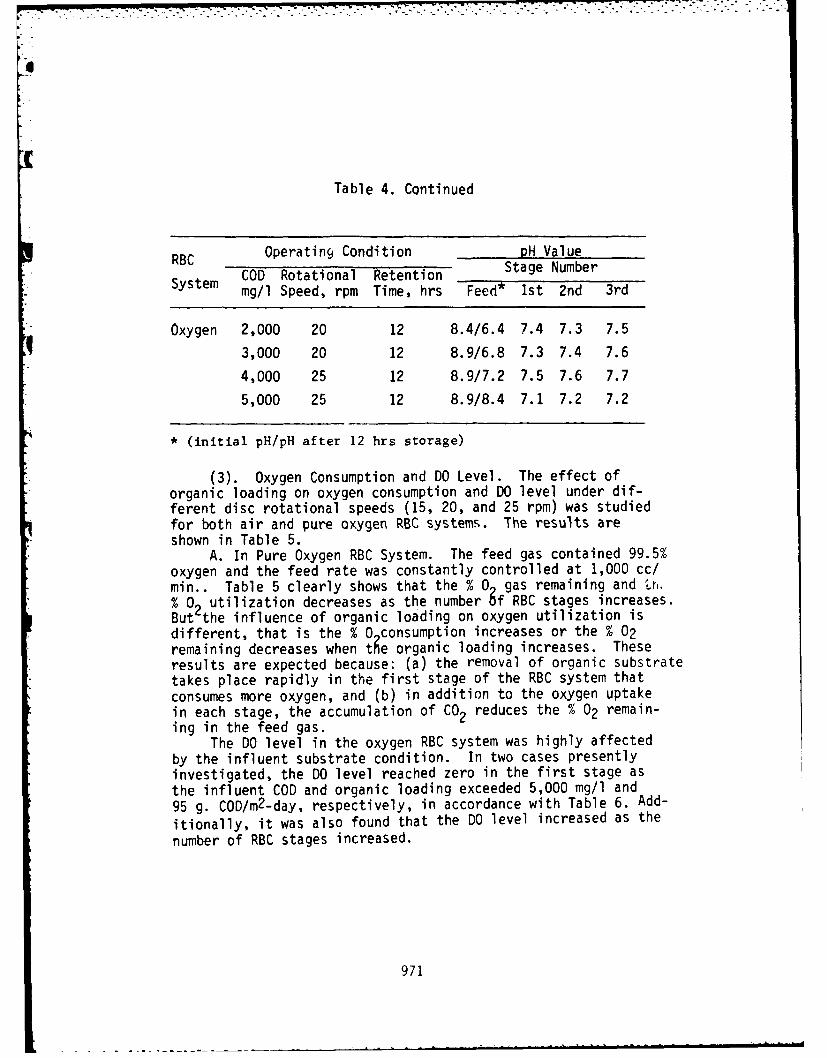
Table 4. Continued
RBC Operating Condition PH Value
System COD Rotational Retention Stage Numbermg/l Speed, rpm Time, hrs Feed* 1st 2nd 3rd
Oxygen 2,000 20 12 8.4/6.4 7.4 7.3 7.5
3,000 20 12 8.9/6.8 7.3 7.4 7.6
4,000 25 12 8.9/7.2 7.5 7.6 7.7
5,000 25 12 8.9/8.4 7.1 7.2 7.2
*(initial pH/pH after 12 hrs storage)
(3). Oxygen Consumption and DO Level. The effect oforganic loading on oxygen consumption and DO level under dif-ferent disc rotational speeds (15, 20, and 25 rpm) was studiedfor both air and pure oxygen RBC systems. The results areshown in Table 5.
A. In Pure Oxygen RBC System. The feed gas contained 99.5%oxygen and the feed rate was constantly controlled at 1,000 cc/min.. Table 5 clearly shows that the % 0 gas remaining and tr,.% 02 utilization decreases as the number 9f RBC stages increases.But the influence of organic loading on oxygen utilization isdifferent, that is the % 0 consumption increases or the % 02remaining decreases when t~e organic loading increases. Theseresults are expected because: (a) the removal of organic substratetakes place rapidly in the first stage of the RBC system thatconsumes more oxygen, and (b) in addition to the oxygen uptakein each stage, the accumulation of CO2 reduces the % 02 remain-ing in the feed gas.
The DO level in the oxygen RBC system was highly affectedby the influent substrate condition. In two cases presentlyinvestigated, the DO level reached zero in the first stage asthe influent COD and organic loading exceeded 5,000 mg/l and95 g. COD/m2-day, respectively, in accordance with Table 6. Add-
itionally, it was also found that the DO level increased as the
number of RBC stages increased.
971
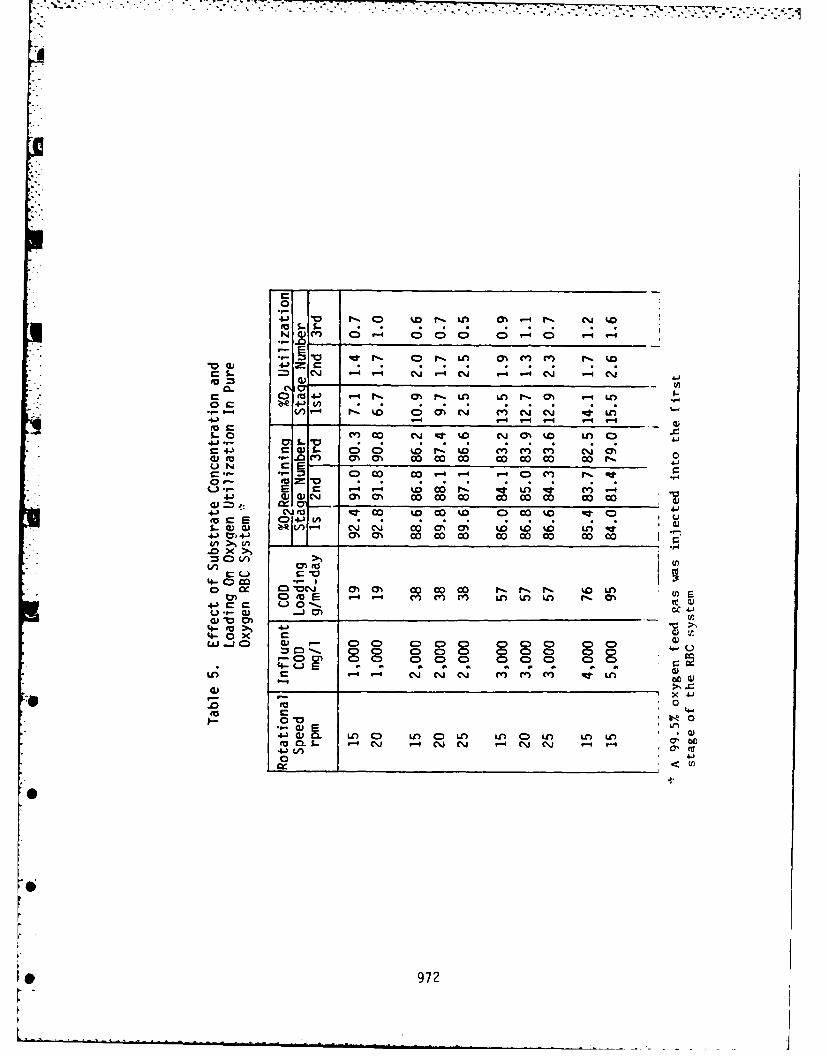
NG) 0w4 0 0 -0 i -4
Rcr~ r-.. r- LA O m ' cr) m - %DV 0) 4 = rr- S. = " a)r C j w- C' CJ C
0 Z 4-) .- 4t O r t L0 Lo Ir= OCh LC)a/'- I"-R 4.0 0(AC~J C . CJ
P.-4 C C C'..J ; CJ O C L cO4- CGJ' 0 04 '.0 V-4 V-1~ ~ ( C
S- C E0-
0'0
rJL CD c i V
-) 0 ) 1(1) .' 0 C'J 00 00 co o0 co00c
cn >1Cf
V mfc4L) r_
4l- 0CO ='~ '-o cx "ON 0oC,~ co 00 co TI O - V~. r" t 4 ) LA WEM9- 0 o CV) CY LA LA) LA r. 0'm41IC rc -0--.Q
4- to>, 4-' >1r'4-o, 0X CLLJ -j 0 C~ 00 000 00C 0 00
e-0 00 000 0 0 00-1L04Li 0) 0 a) 0 a) a a a O aC8
-* *0
4-) () Q. Lo LAO LA LAO LA LA) UL ;to~ - (*j V-4 C.) cj - C") C~j - 0
4.) V)I o. .
972
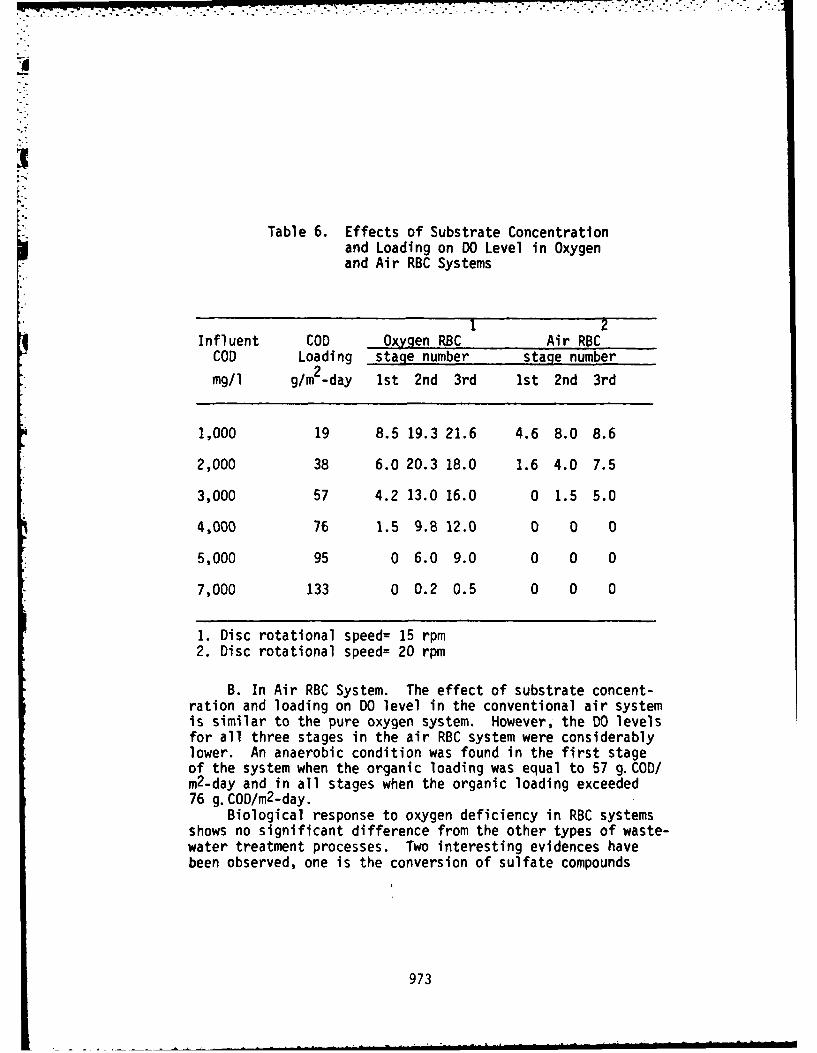
-7 -~ --_1 -. -, -- -...-.-IL I .. . . . ... ,..... .. " .... ... . . ,- " _.....-.. . - _ . . , - -. -, . - . -.
Table 6. Effects of Substrate Concentrationand Loading on DO Level in Oxygenand Air RBC Systems
1 2Influent COD Oxygen RBC Air RBCCOD Loading stage number stage number
2_mg/l g/m -day 1st 2nd 3rd Ist 2nd 3rd
1,000 19 8.5 19.3 21.6 4.6 8.0 8.6
2,000 38 6.0 20.3 18.0 1.6 4.0 7.5
3,000 57 4.2 13.0 16.0 0 1.5 5.0
4,000 76 1.5 9.8 12.0 0 0 0
5,000 95 0 6.0 9.0 0 0 0
7,000 133 0 0.2 0.5 0 0 0
1. Disc rotational speed= 15 rpm2. Disc rotational speed= 20 rpm
B. In Air RBC System. The effect of substrate concent-ration and loading on DO level in the conventional air systemis similar to the pure oxygen system. However, the DO levelsfor all three stages in the air RBC system were considerablylower. An anaerobic condition was found in the first stageof the system when the organic loading was equal to 57 g. COD/m2-day and in all stages when the organic loading exceeded76 g.COD/m2-day.
Biological response to oxygen deficiency in RBC systemsshows no significant difference from the other types of waste-water treatment processes. Two interesting evidences havebeen observed, one is the conversion of sulfate compounds
973
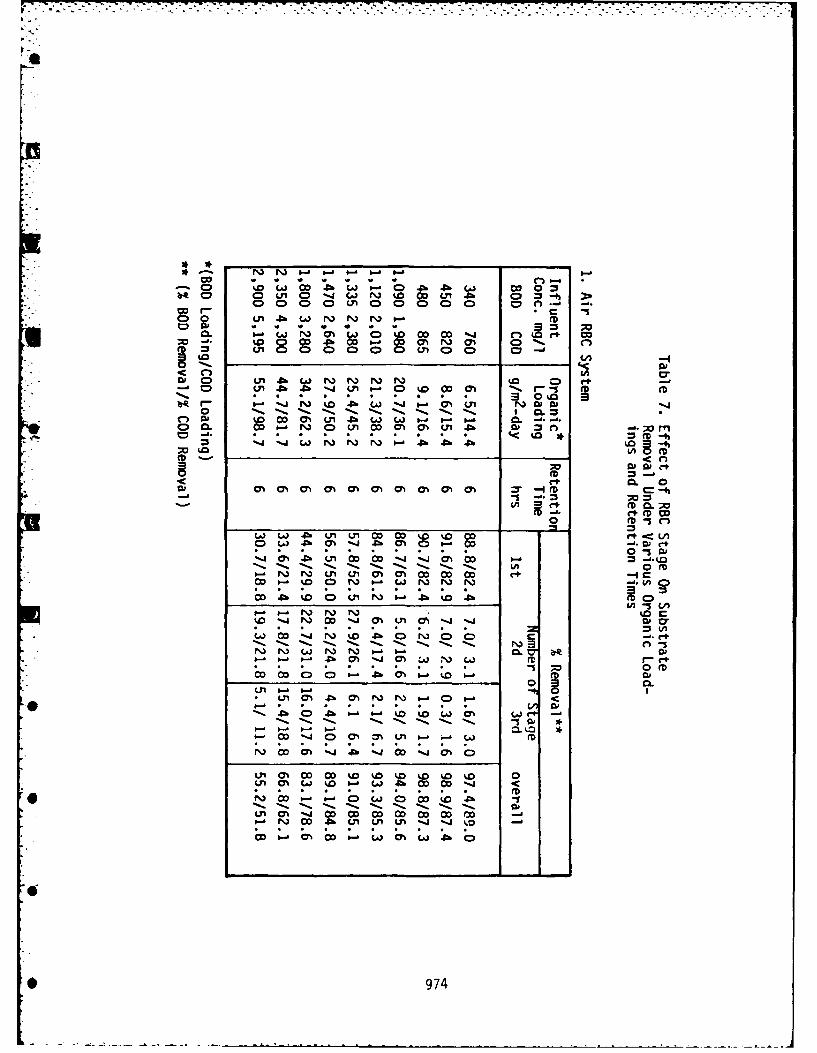
* "__ _ _ _ _ _ _ _ _ * C)
w 00 '41 w~ o -P. p.w-4 w 0l% 4D w L" V 0 = -h
0. OL 0 (D 0 DC 2c
"W "6 000 L 7 00 j 0 ( c
4c C )'Q1 (A~ 4 rAr r r*- (M q r+-
0 m L* *o 0 ko'. *O C
010 0 0 0 0 0 0 0 0 -tD m -. %
=r=
o wA Pb m1 -.i .b m0C10- M '. 0) C'*0 0-5
0 m
r~~~~~u r_~ %~~.- .~0
PO. -Q W.- CL Up -..u 01
0 0
4h C> 0 9 Ia- 1-- %.0 %DC4 1 ( ~
6 61J 001 01 ;D 61 6
P- W CO 4h L A 0 t ' -4 -4-k
-~ ~ ~ L f%36. '1(1 1 5.5 %5 I
* 974
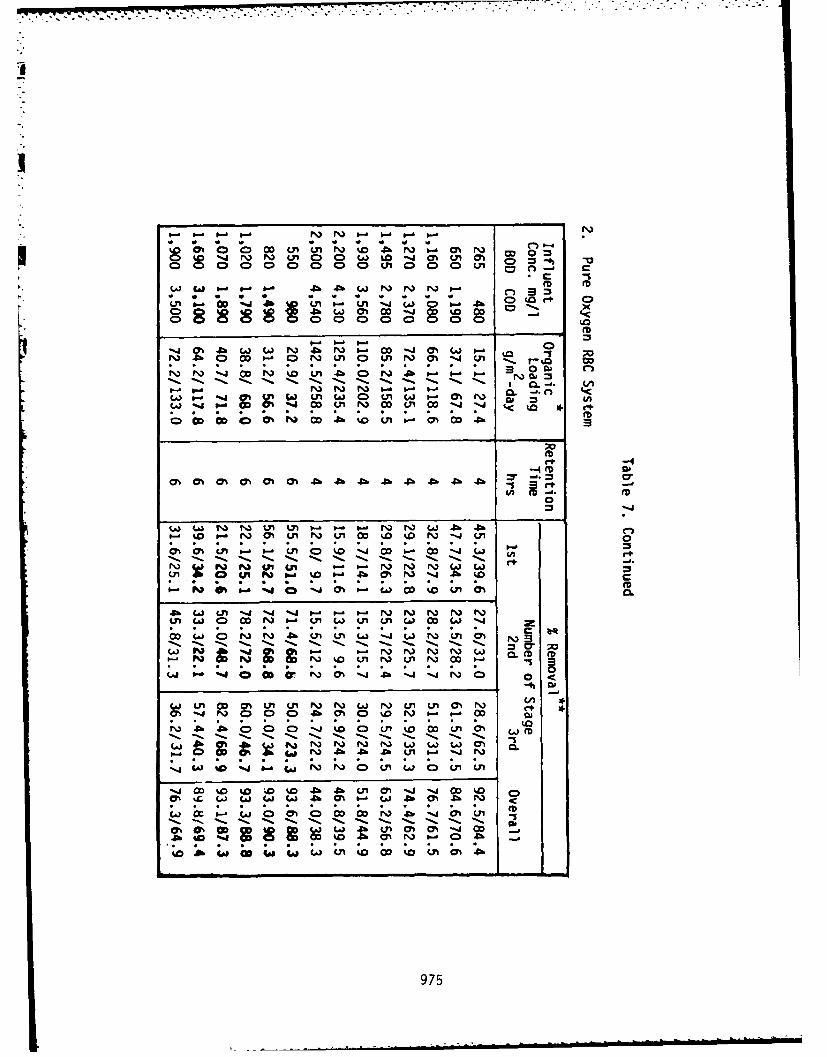
.- . .- . . . . . .-
*0 Q D 0 40 Co W (D 01 0D .
. . 4 .C) o C
c.il3 (D Q~ .0 0~ Q CD C r- 6 6 6 - 6 6 6 6
M~~~ ~~ 4b l)-bP) 0 JC
0 . I.. U% 0l CAN0% % '
Ps)~~a -'. $- .- C%4 NoF N po -. * PD'
(D 0 W D 00 PO M 4b % Ln i NM 4
=r -'= C7
W NN % Ut - N W J~ 40P-'O NO% U NU' i ~ N - U' o-
wL) -4's % i - - N) N No
n w CD 0 NN L" w'U L.nS L N ' cowI
L.J 6~~ 6 0 SJ % %. 0
w.. U' co 0% U' U' N N) w. No L" L" m% N rm - aCDpOM 0 W " - M i
-~ ~ ~ . .% ~ .~ '. . U' .- . N
Oc CD ON N O 00 U'J .A0 U' U'
0% GO M.) CiC) C. % 0 ~ 0% -4 00
w. C.". %00 00 %a Ln ON 4b
975
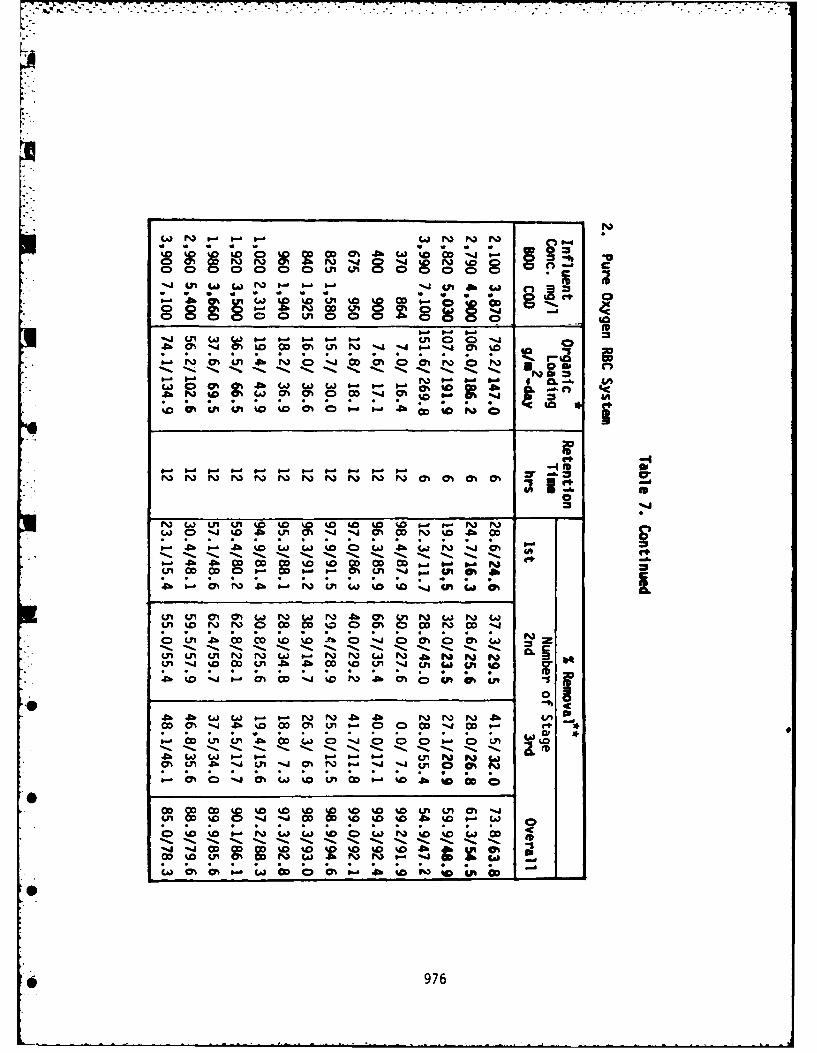
CCDNQ CD (D a Co CD L
-4 WWW~
%1~ Un (A) ( 4 W O %
cn r,3 -.4 r4
r . * . . .0
*b - . - , , - - - -4m
-4 M
'ab4
b pb OD O* M M .- P
mf W iN .4 - A m &A m~ N ~ l wN
. . . . . . . 0 .
-Ob %j OD Q %DN) A M C ut bEC00
Ln o 6 0 Q . Z.wa
*n 0
CA ( -. jON W %0 L OD a 6w ko 0 %D 0 Ln 7% -
.14* .P. !c-0 P
976
7..
to an offensive H2S gas and the other is the overgrowth offilamentous microorganisms that reduces the sludge settle-ability. Unfortunately, no identification of thread-likei organisms was obtained from the present study.
(4) COD and BOD Removal As a Function of Substrate andLoading Conditions. The effect of influent substrate con-centration and organic loading on RBC plant performance wasinvestigated at the disc rotational speed equal to 15 and 20rpm, respectively, for the conventional air and pure oxygensystem. The results of the study were summarized in Table7.
It is apparent from Table 7 that the % COD or BOD removalis highly dependent upon the system operating conditions.In general, the lower the influent COD or BOD concentrationand orqanic loadinq the higher the % substrate removal. Thepermissible organic loading and retention time for 90% BOD and80% COD removal are estimated for both RBC systems as follows:
System % Removal Retention Organic LoadingTime, hrs g./m -day
BOD COD BOD CODOxygen 90 80 4 19.0 49.0
90 80 6 31.0 70.090 80 12 38.0 110.0
Air 90 80 6 28.0 62.3
To meet the above requirements, the oxygen RBC systemwas perferably operated under a retention time between 6and 12 hours. At the retention time of 6 hours, the oxygenRBC system can be loaded at approximately 9.6% on COD basisand 11% on BOD basis higher than the conventional air system.Additionally, it was also found that in the oxygen system, theorganic loading rate at 6 hours retention time was 30% and38 higher than at 4 hours, respectively, for 80% COD and 9nBOD removals.
The net % reduction of COD and BOD from each stage ofthe RBC systems were also reported in table 7. It wasobserved that when the organic laoding was low (i.e., BODload < 19.6 g./m 2-day and COD load<43.9 g./m 2-day), effective
977
b. •
.
removal of BOD and COD was obtianed in the first stage of RBC.The subsequent stages become important as a result of increasingthe organic loading or shortening the hydraulic retentiontime. The overall treatment efficiency as a function of BODor COD loading is illustrated in Figures 2 and 3.
The relationship between organic loading and substrateremoval per unit surface area per time is shown in Figures 4and 5. A linear relationship was found for the conventionalair system when the organic loading was below 60 g. BOD orCOD! m -day, and for the pure oxygen system as the loading wasnot in excess of 70 g. BOD or COD/m2-day. The equations usedto describe the above mentioned relationship are given as
Air RBC System:
= 0.8 + 0.82 w, if w < 60 g/m 2-day ------- (5)
Oxygen RBC System:
= 2.8 + 0.79 w if w < 70 g/m2-day ------- (6)
in which
,= Organic Removal in g COD or BOD removed/m2-day
Sri OD or BOD/2-day
=Organic Loading in CO r O/mn-a
Figures 4 and 5 also show that the predicted orainirremoval efficiency 4 calculated from Eqs. 5 anid 6 exceeds theobserved values when the organic laoding was grcatEr thanthe limits already mentioned.
(5) Foaming and Brdiging. Throughout the entire study,foaming never occurred in the pure oxygen RBC system but itwas a serious problem in the conventional air RBC system(see Figures 6 and 7). It was found that the first stageof the conventional air system was covered by foam at theorganic loading equal to 38 gCOD/m2 -dpy. When the loadingwas increased to exceed 50.2 g. COD/m-day, the operationof both first and second stages of the RBC system was inter-ferenced. The low efficiency of the conventional air RBCsystem could be partially caused due to the foaming thatresulted in a low oxygen transfer to attached biomass.
The maximum thickness of the biofilm was approximatelyequal to 2.5 cm on the first-stage biodiscs of the pure oxygen
978
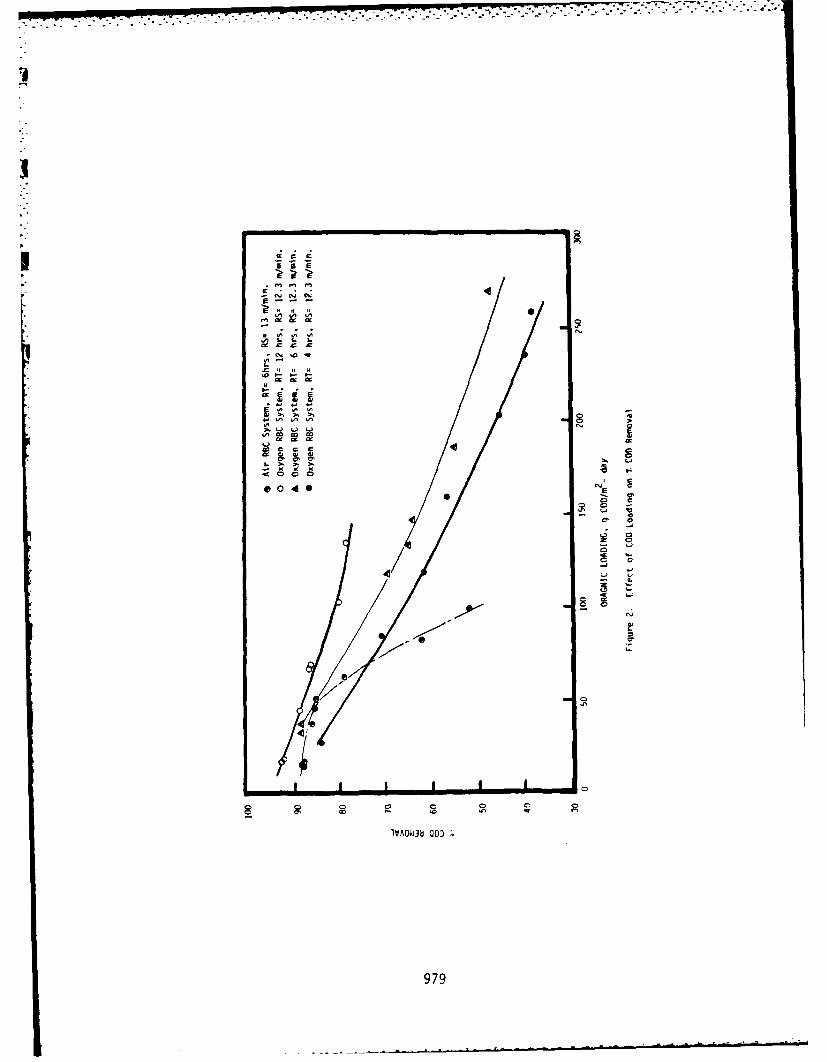
A 64 IM
It.
I vLj 4-)
C7
x x V o
0 0 0 0CP
0 D
CD
coo w
IVAOW38 00
797
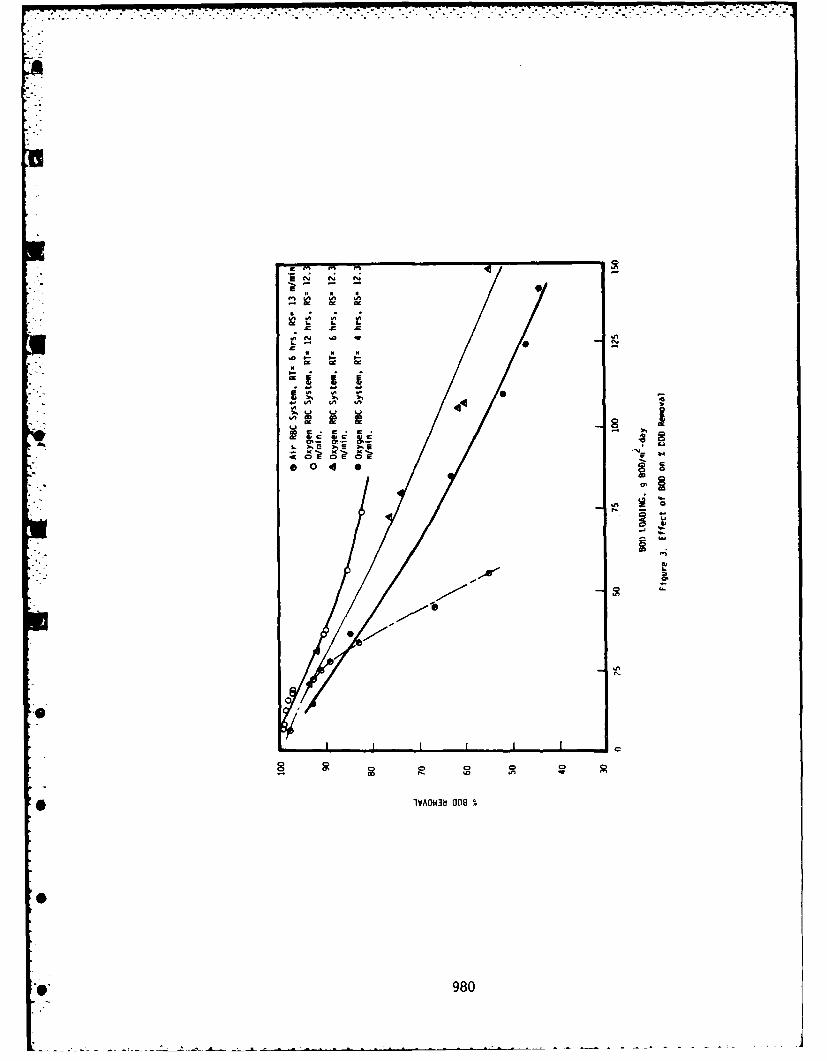
. ...
.,,
II
~~10
, a
,
*IA0I3b 004
980
[-0
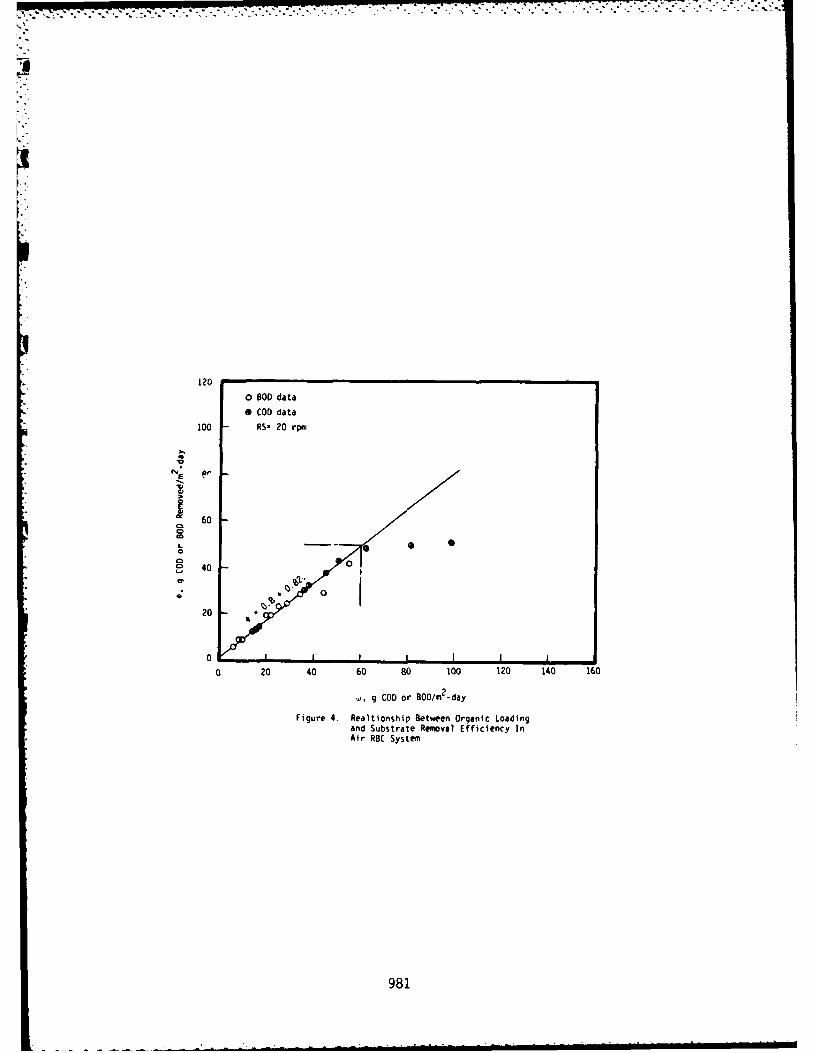
P.
120
0 ODD data
a COD data
100 RS- 20 rpgn
60
40
o% 0
20
00
0 I I I
0 20 40 60 80 100 120 140 160
., g COD or BOO/m2-day
Figure 4. Realtionship Between Organic Loadingand Substrate Removal Efficiency InAir RBC System
981
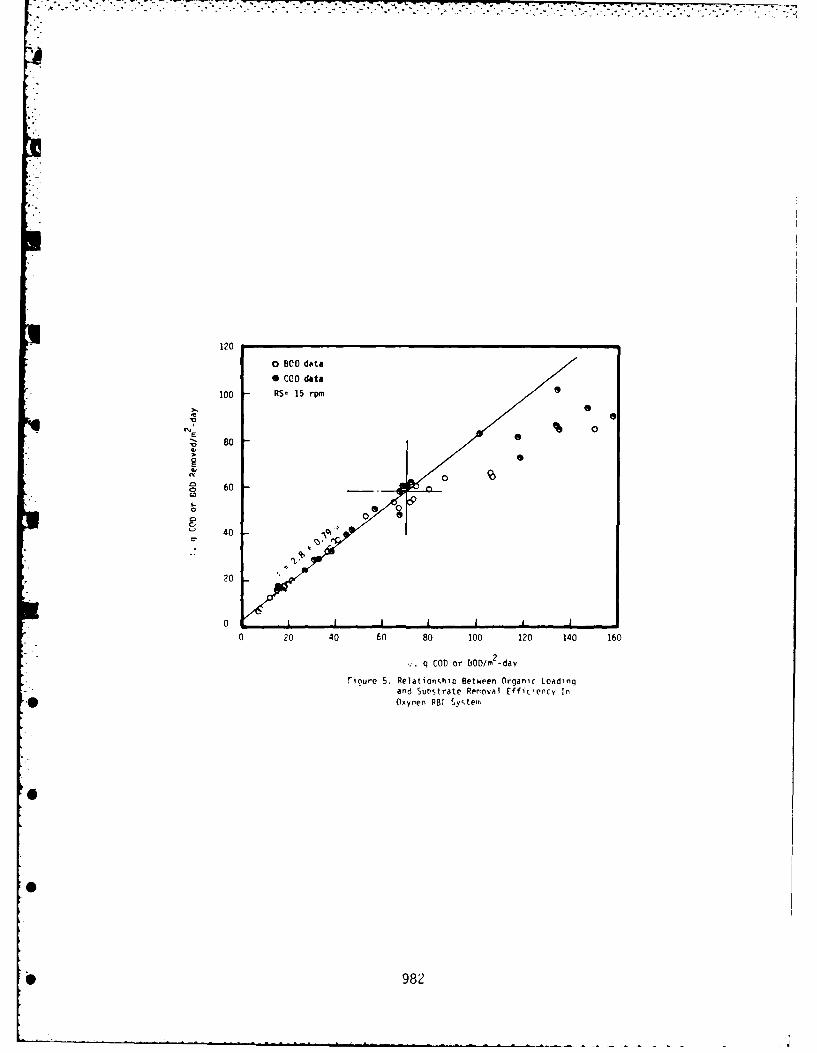
120
* BCD data* CCD data
100 RS- 15 rpm
0
80 o
0CD 60 0 Z
o 0
40
20
0 00I I
0 20 40 60 80 100 120 140 160
qCOD or 5OO/m 2 -day
rioure 5. Relationship Between Organic Loadinqand Substrate Remioval Effit'encv In
* Oxyqen PB( Systell,
* 982
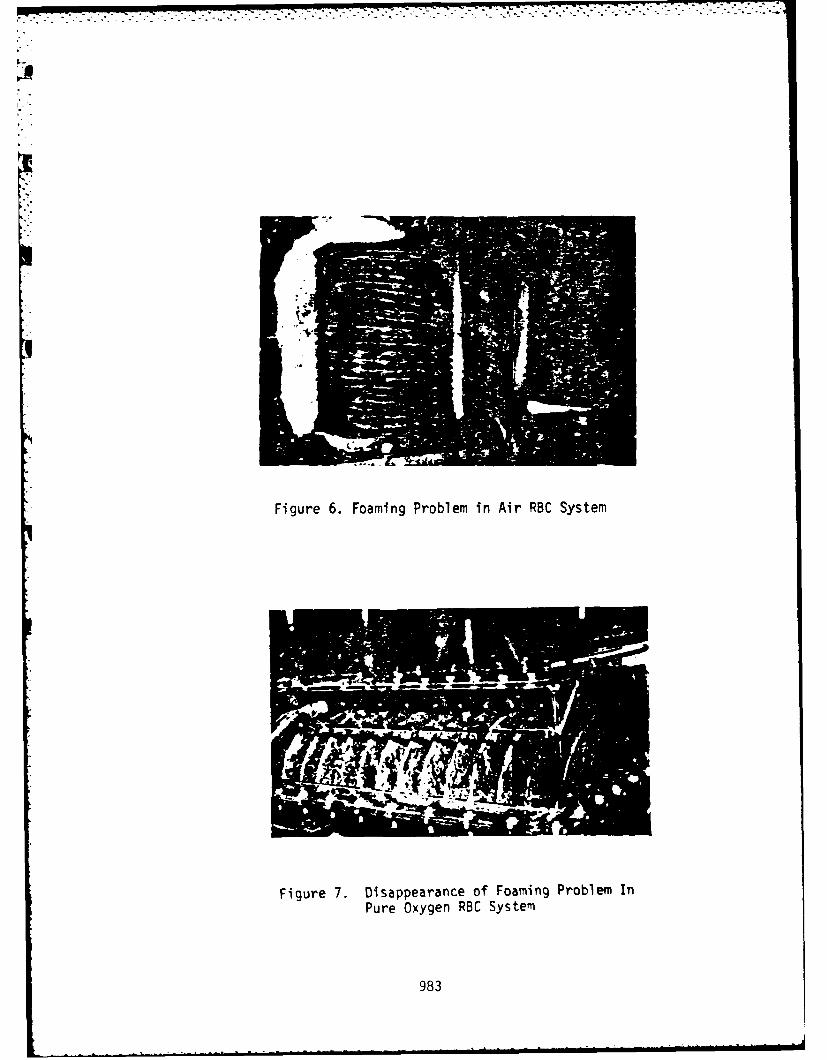
Figure 6. Foaming Problem in Air RBC System
Figure 7. Disappearance of Foaming Problem InPure Oxygen RBC System
983
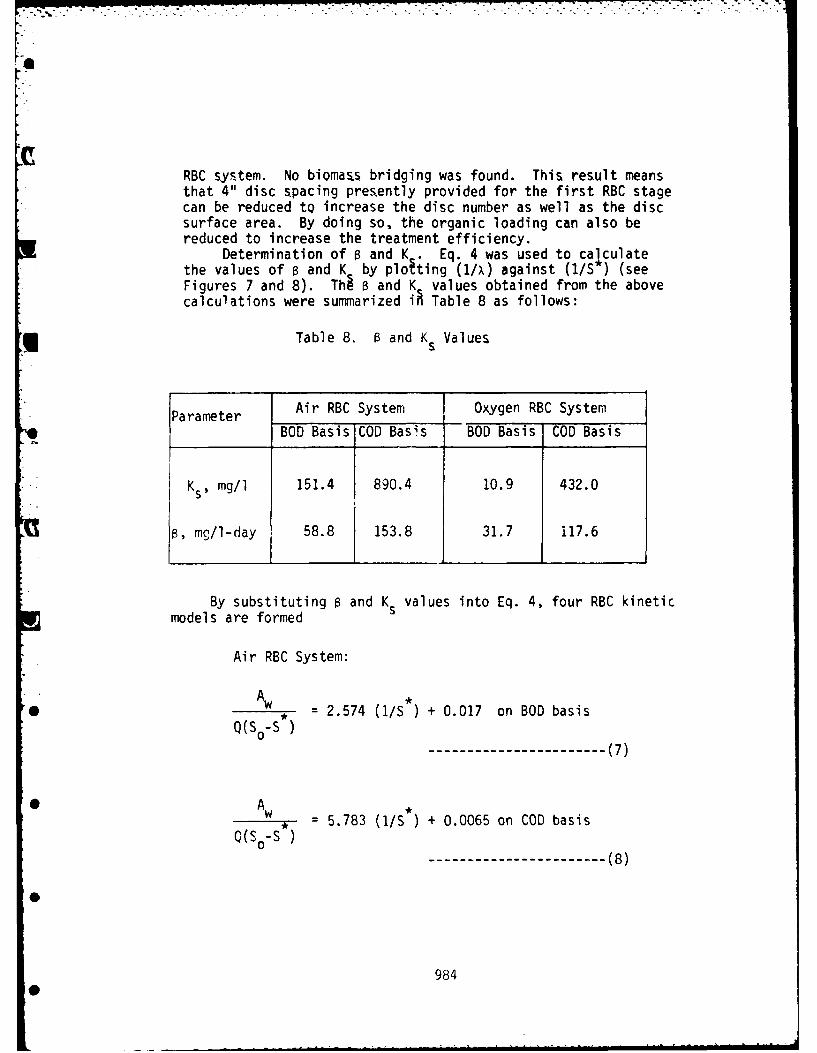
[,.., 7§ -.- ... . . _
ra
RBC system. No biomaus bridging was found. This result meansthat 4" disc spacing presently provided for the first RBC stagecan be reduced tQ increase the disc number as well as the discsurface area. By doing so, the organic loading can also bereduced to increase the treatment efficiency.
Determination of 0 and K .E.4 was used to calculatethe values of s and K by ploiting (1/x) against (1/S*) (seeFigures 7 and 8). Thi a and K values obtained from the abovecalculations were summarized iATable 8 as follows:
*Table 8. a and KsValues
Parameter Air RBC System Oxygen RBC SystemBOD Basis COD Basis BOD Basis COD Basis
KS mg/i 151.4 890.4 10.9 432.0
B, mg/1-day 58. 153.8 31.7 117.6
By substituting a and KSvalues into Eq. 4, four RBC kineticmodels are formed
Air RBC System:
A-
Q(0S 2.574 (1/S) + 0.017 on BOO basis
-------------------- ----------------------- (7)
A A5.783 (i/S + 0.0065 on COD basis
Q(S -S)
984
tht40icsaigpeetypoie o h is B tg
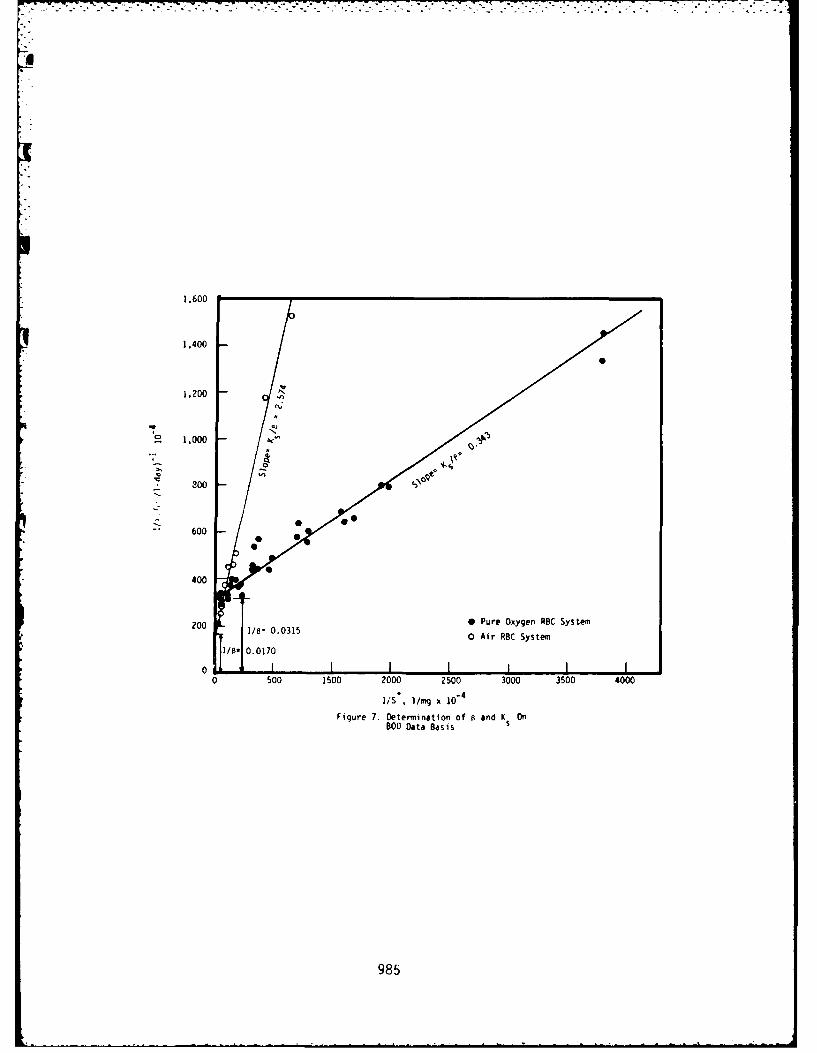
1,600
1,400
1,200
2 1,000
600
400
200 18- 003150 Pure Oxygen RBC Systeme= 003150 Air RBC System
01500 1500j~~ 2000 X:~ and0 :oo0 3500 4000
600 Data Basis S
985
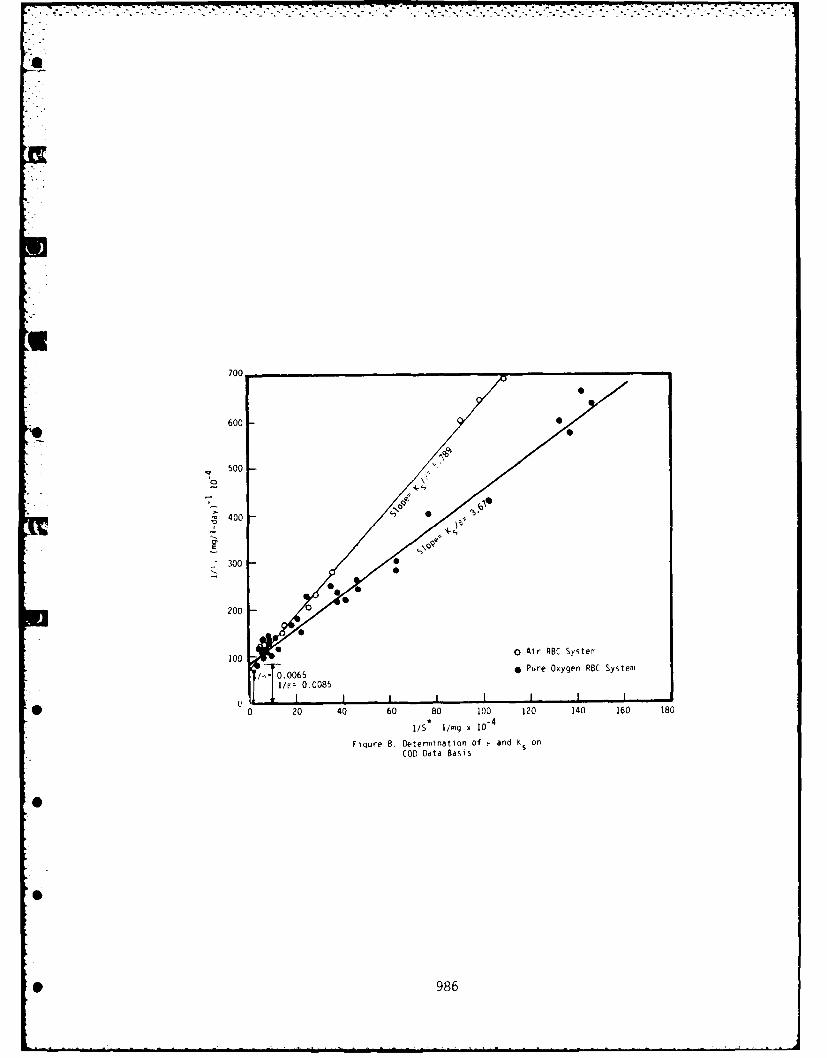
700
500 -
0300
200
)D 0 Air RBC System
O b.0O065 0 Pure Oxygen RBC System
llV= 0.0085
0 20 40 60 80 100 120 140 160 180
to
1/S* I/mg x l0-"4
040
F r . ti0086
• CODDataBasS
>S
• 986
m m= - • "~ 20 0"" " m m . . . .. •- -" -
Oxygen RBC System:
Ai A~w.
WS ) - 0.344 (I/S*) + 0.0315 on BOD basisQ(so-
-------------------- (9)
. = 3.673 (1/S*) + 0.0085 on COD basisQ(So- S )
--------------------------- (10)
ConclusionsThe following conclusions were formulated as a result of
this study:1. Proper pH control is essentially required for the
treatment of this acidic wastewater. By adjusting the waste-water pH to nearly 9.0, the final effluent pH after passingthrouih three RBC stages would be within the range of 7.0-7.6. The PH control was made by the addition of NaOH alongwith phosphate buffer.
2. In the pure oxygen RBC system, the disc rotationalspeed did not significantly affect the results of % COD orBOD removal, oxygen consumption, pH and DO level in eachRBC stage. At the constant rotational speed of 15 rpm ('2.3m/min.), the RBC plant performance was closely related tothe influent substrate concentration and organic loading aswell.
3. Both air and pure oxygen RBC systems are capable ofremoving COD and BOD sufficiently. The COD and BOD removalswere more than 90% when the organic loading in the conventionalair system was below 28 g. BOD/T2 -day and 62.3 g. COD/m, -dayor it was less than 38 g. BOD/m -day and 110 g. COD/m2 -day inthe pure oxygen system. From the present study, it was foundthat the latter system was possible to be operated at theorganic loading 1.7 times higher than the former system ifthe efficiency of the RBC plant in terms of BOD removal equaled80%. In general, the reduction of organic substrate washigh in the f rst RBC stage when the organic loading was below19.4 g. BOD/m -day in both systems. However, the subsequent
987
stages become important after the organic loading conditionexceeding the above value.
4. The values of B and K in Eq. 4 are obatinable. Itis apparent from the present stddy that the pure oxygen RBCsystem has lower B and K as compared to the conventional airRBC system on both BOD a~d COD data basis.
5. Two serious problems which may occur during the operationof RBC systems are: (a) foaming and (b)septic environment. Thefoaming problem started at the organic loading = 38 g. COD/m2-dayand the anaerobic suitation was developed at the loading equal orgreater than 57 g. COD/m2-day in the conventional air RBC system.Although no foaming problem was found in the pure oxygen RBCsystem, the septic condition occurred in the first stage at theorganic loading = 95 g. COD/m2-day. Poor sludge settling charact-eristics was resulted from the overgrowth of thread-like organismsunder anaerobic condition.
References
1. Birks, C. W., and Hynek, R. J., " Treatment of Cheese ProcessingWastes by the Bio-disc Process", in Proceedings of 26th PurdueIndustrial Waste Conference, Purdue University, pp. 89, 1971.
2. MaAliley, J. E., "A Pilot Plant Study of a Rotating BiologicalContactor for Secondary Treatment of Unbleached Kraft MillWaste", Tappi, vol. 57, No. 9, 1974.
3. Labella, S. A., Thaker, I. H., and Tahan, J. H.,"Treatment ofof Winey Wastes by Aerated Lagoon, Activated Sludge, and RotatingBiological Contactors", In Proceedings of 27th Purdue IndustrialWaste Conference, Purdue University, pp. 803, 1972.
4. Watt, J. C., and Cahill, C. J., "Wasteater Treatability Studiesfor a Grassroots Chemical Complex Using Bench Scale Rotating
• Biological Contactors", In Proceedings of the First NationalSymposium/Workshop on Rotating Biological Contactor Technology,Vol. 1, pp. 661, 1980.
5. Chesler, G. P., and Eskeland, G. R., "RBC for Munitions Waste-water Treatment", in Proceedings of the First National Symposium/
* Workshop on Rotating Biological Contactor Technology, Vol. 1,pp. 711, 1980.
0 988
6. Tanacredi T, "Removal of Waste Petroleum DerivedPolynuclear Arratic Hydrocarbons by Rotating BiologicalContactors", in Proceedings of the first National Sympo-sium/Workshop on Rotating Biological Contactor Technology,Vol. 1, pp.725, 1980.
7. Bracewell, L. W., and Jenkins, D., "Treatment of Phenol-Formaldehyde Resin Wastewater Using Rotating BiologicalContactors', in Proceedings of the First National Symposium/Workshop on Rotating Biological Contactor Technology, Vol.1, pp. 733, 1980.
8. Bintaja, H. H., et al., "The Use of Oxygen In A RotatingDisc Process", Water Research, Vol. 10, pp. 561, 1976.
9. Huang, J. C., "Operational Experience of Oxygen-EnrichedRotating Biological Contactors", in Proceedings of theFirst National Symposium/Workshop on Rotating BiologicalContactors, Vol. 1, pp. 637, 1980.
10. Monod, J., "Recherches sur la croissance des cutluresbacterbacteriennes", Hermann & Cie. Paris. pp.211, 1942.
11. Clark, J. H., et al., "Performance of a Rotating BiologicalContactor Under Varying Wastewater Flow", Jour. Water Poll.Control Federation, Vol. 50, pp.891, 1978.
12. Standard Methods for the, Examination of Water and Waste-water, 14th Edition, APHA-AWWA-WPCF, 1975.
989
b'7.7
-:-
INHIBITION OF NITRIFICATION BY CHROMIUMIN-A BIODISC SYSTEM
0Shin Joh Kang, McNamee, Porter and Seeley
0Ann Arbor, Michigan 48104
Jack A. Borchardt, Department of Civil Engineering
The University of Michigan, Ann Arbor, Michigan 48109
INTRODUCTION
A series of investigations was undertaken to determine
the acceptability of certain industrial wastes containinghexavalent chromium by a biodisc system providing both secon-dary treatment and biological nitrification.
The initial objectives of the study were: to determinethe extent to which a biodisc system can tolerate chromium(VI) without losing efficiency in either BOD removal or in
i . nitrification; to establish mechanisms of chromium removaland the benefits of staging, and to understand differencesin short and long-term effects and steady state or shock loadconditions.
These objectives were established to serve a number ofpurposes. The data gathered will assist municipalities in
* determining the quantity and characteristics of chromium
containing waste that may he accepted without causing inter-ference in operation. The data gathered will also assistdesign engineers in understanding and better defining theprocess reliability between an activated sludge and a bio-disc system and finally the benefits of staging in an RBC.
9
• 990
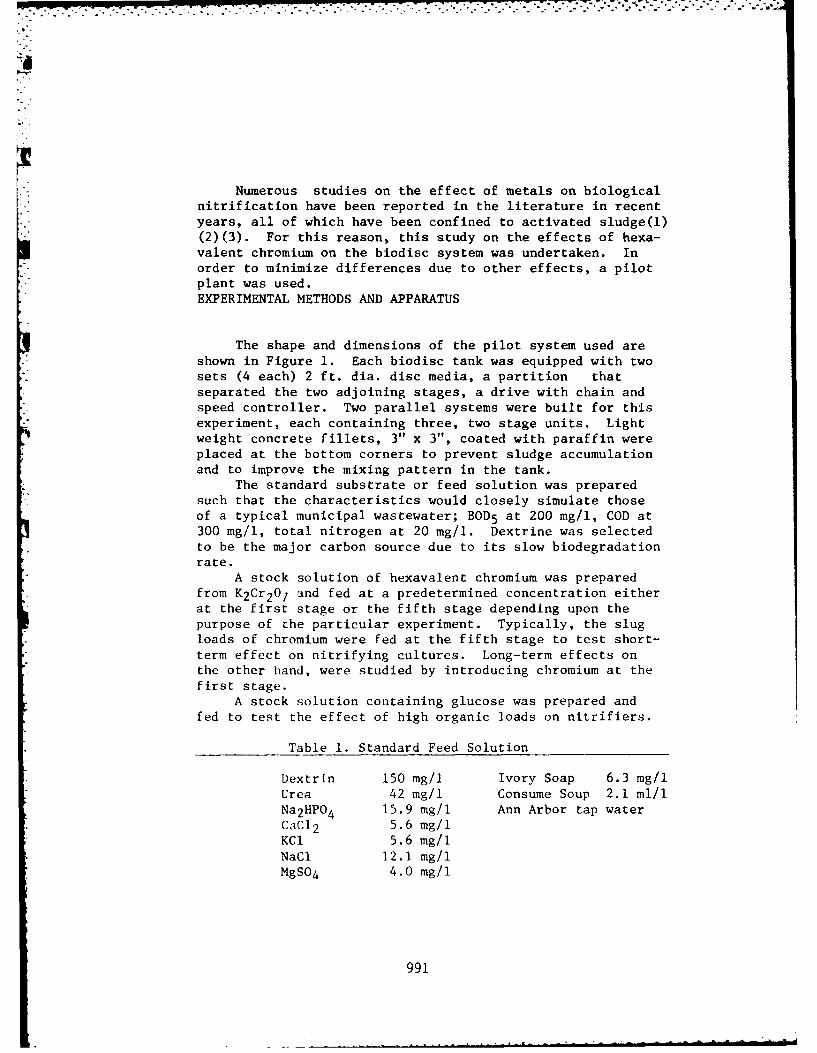
n. , . .. ... ... . . ... . . . - ,. . -.... , . . .. ..... .. - - , . .
Numerous studies on the effect of metals on biological%: nitrification have been reported in the literature in recent
years, all of which have been confined to activated sludge(l)(2)(3). For this reason, this study on the effects of hexa-valent chromium on the biodisc system was undertaken. Inorder to minimize differences due to other effects, a pilotplant was used.EXPERIMENTAL METHODS AND APPARATUS
The shape and dimensions of the pilot system used areshown in Figure 1. Each biodisc tank was equipped with twosets (4 each) 2 ft. dia. disc media, a partition thatseparated the two adjoining stages, a drive with chain andspeed controller. Two parallel systems were built for thisexperiment, each containing three, two stage units. Lightweight concrete fillets, 3" x 3", coated with paraffin wereplaced at the bottom corners to prevent sludge accumulationand to improve the mixing pattern in the tank.
The standard substrate or feed solution was preparedsuch that the characteristics would closely simulate thoseof a typical municipal wastewater; BOD 5 at 200 mg/l, COD at300 mg/l, total nitrogen at 20 mg/l. Dextrine was selectedto be the major carbon source due to its slow biodegradationrate.
A stock solution of hexavalent chromium was preparedfrom K2Cr207 and fed at a predetermined concentration eitherat the first stage or the fifth stage depending upon thepurpose of the particular experiment. Typically, the slugloads of chromium were fed at the fifth stage to test short-term effect on nitrifying cultures. Long-term effects onthe other hand, were studied by introducing chromium at thefirst stage.
A stock solution containing glucose was prepared andfed to test the effect of high organic loads on nitrifiers.
Table 1. Standard Feed Solution
Dextrin 150 mg/l Ivory Soap 6.3 mg/lUrea 42 mg/l Consume Soup 2.1 ml/lNa2HPO 4 15.9 mg/l Ann Arbor tap waterCaC12 5.6 mg/lKCI 5.6 mg/lNaCi 12.1 mg/lMgSO 4 4.0 mg/i
991
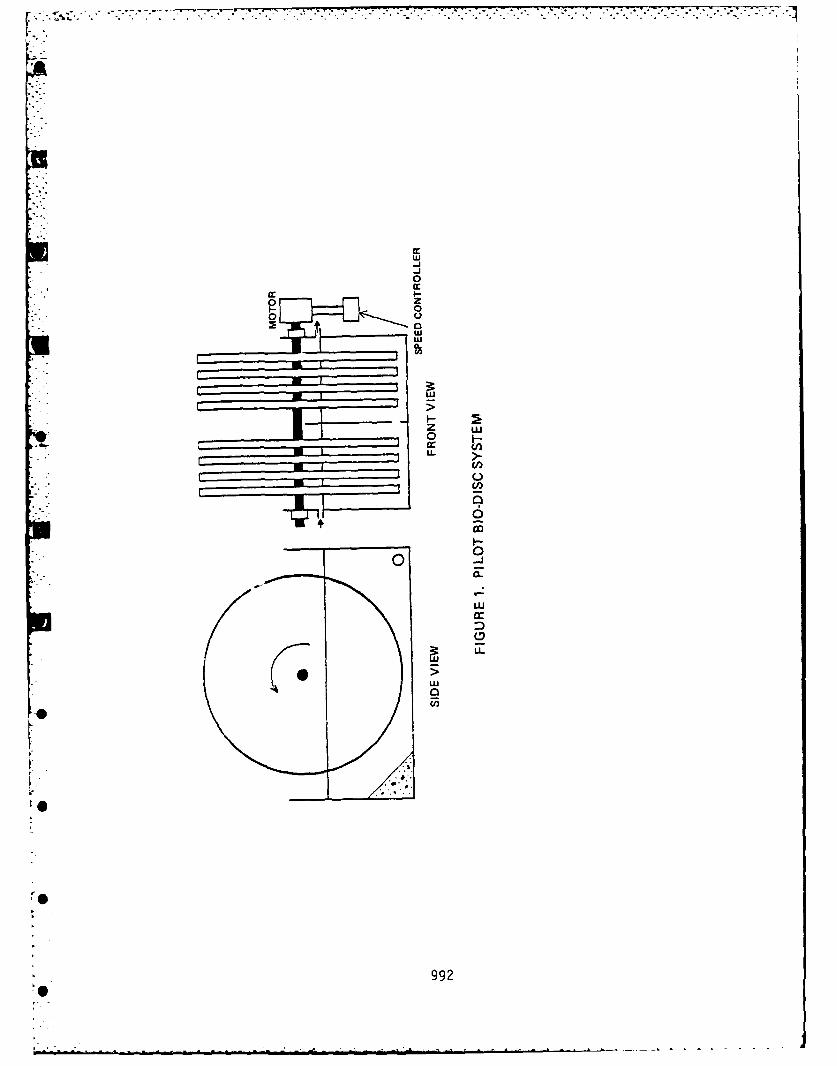
-j0
CL)
f0
U)
U
99
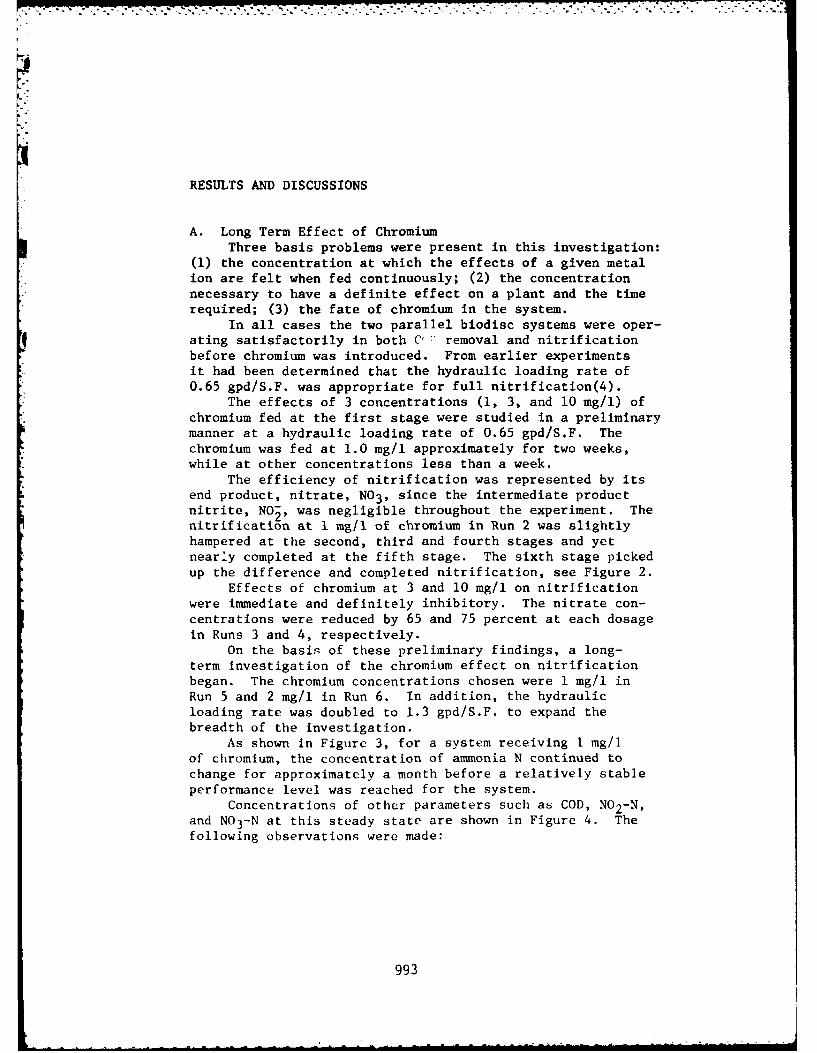
RESULTS AND DISCUSSIONS
A. Long Term Effect of ChromiumThree basis problems were present in this investigation:
(1) the concentration at which the effects of a given metalion are felt when fed continuously; (2) the concentrationnecessary to have a definite effect on a plant and the timerequired; (3) the fate of chromium in the system.
In all cases the two parallel biodisc systems were oper-ating satisfactorily in both C" removal and nitrificationbefore chromium was introduced. From earlier experiments
:1 it had been determined that the hydraulic loading rate of0.65 gpd/S.F. was appropriate for full nitrification(4).
The effects of 3 concentrations (1, 3, and 10 mg/l) ofchromium fed at the first stage were studied in a preliminarymanner at a hydraulic loading rate of 0.65 gpd/S.F. Thechromium was fed at 1.0 mg/l approximately for two weeks,while at other concentrations less than a week.
The efficiency of nitrification was represented by itsend product, nitrate, NO3, since the intermediate productnitrite, NO 2' was negligible throughout the experiment. Thenitrification at 1 mg/I of chromium in Run 2 was slightlyhampered at the second, third and fourth stages and yetnearly completed at the fifth stage. The sixth stage pickedup the difference and completed nitrification, see Figure 2.
Effects of chromium at 3 and 10 mg/l on nitrificationwere immediate and definitely inhibitory. The nitrate con-centrations were reduced by 65 and 75 percent at each dosagein Runs 3 and 4, respectively.
On the basis of these preliminary findings, a long-term investigation of the chromium effect on nitrificationbegan. The chromium concentrations chosen were 1 mg/l inRun 5 and 2 mg/l in Run 6. In addition, the hydraulicloading rate was doubled to 1.3 gpd/S.F. to expand thebreadth of the investigation.
As shown in Figure 3, for a system receiving 1 mg/lof chromium, the concentration of ammonia N continued tochange for approximately a month before a relatively stableperformance level was reached for the system.
Concentrations of other parameters such as COD, N02-N,and N03-N at this steady state are shown in Figure 4. Thefollowing observations were made:
993
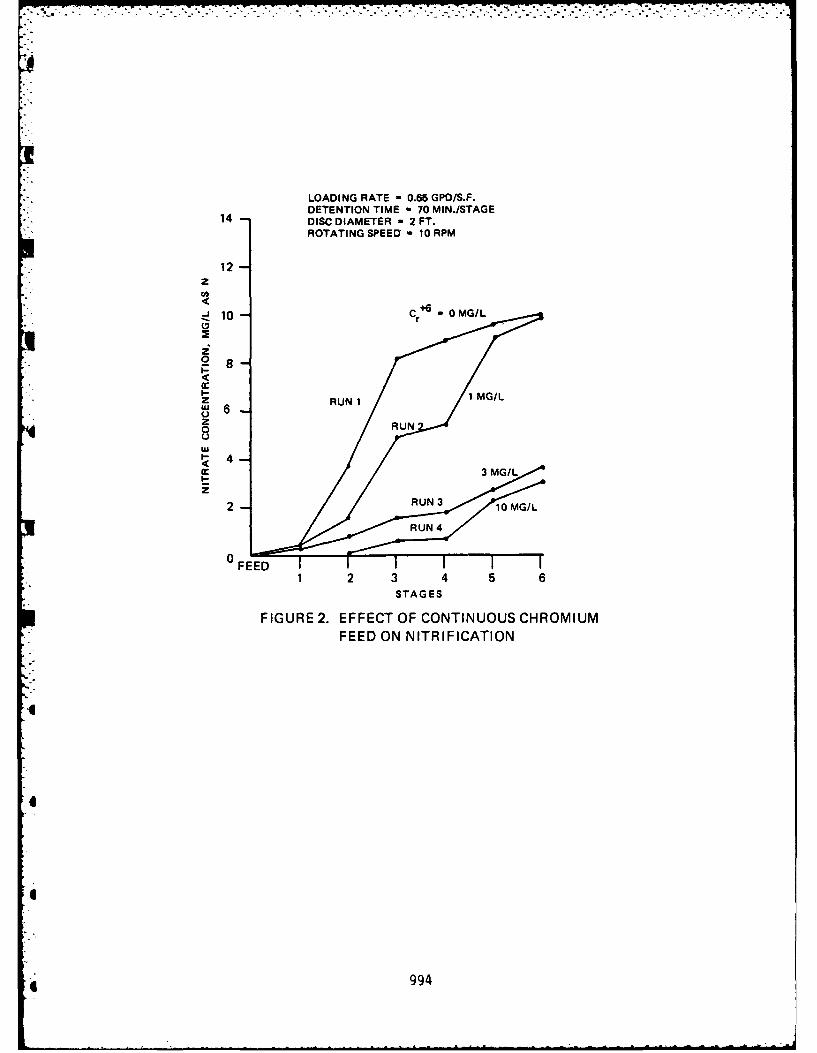
LOADING RATE = 0.65 GPD/S.F.DETENTION TIME - 70 MIN./STAGE
14 DISC DIAMETER - 2 FT.ROTATING SPEED - 10 RPM
12-
S10 r 60M/0 8
z
I-
0 6RUN~Uw
m 3 MG/L
2 RN3 10 MG/L
0 FEED1 2 3 4 5 6
STAGES
FIGURE 2. EFFECT OF CONTINUOUS CHROMIUMFEED ON NITRIFICATION
i
4 994
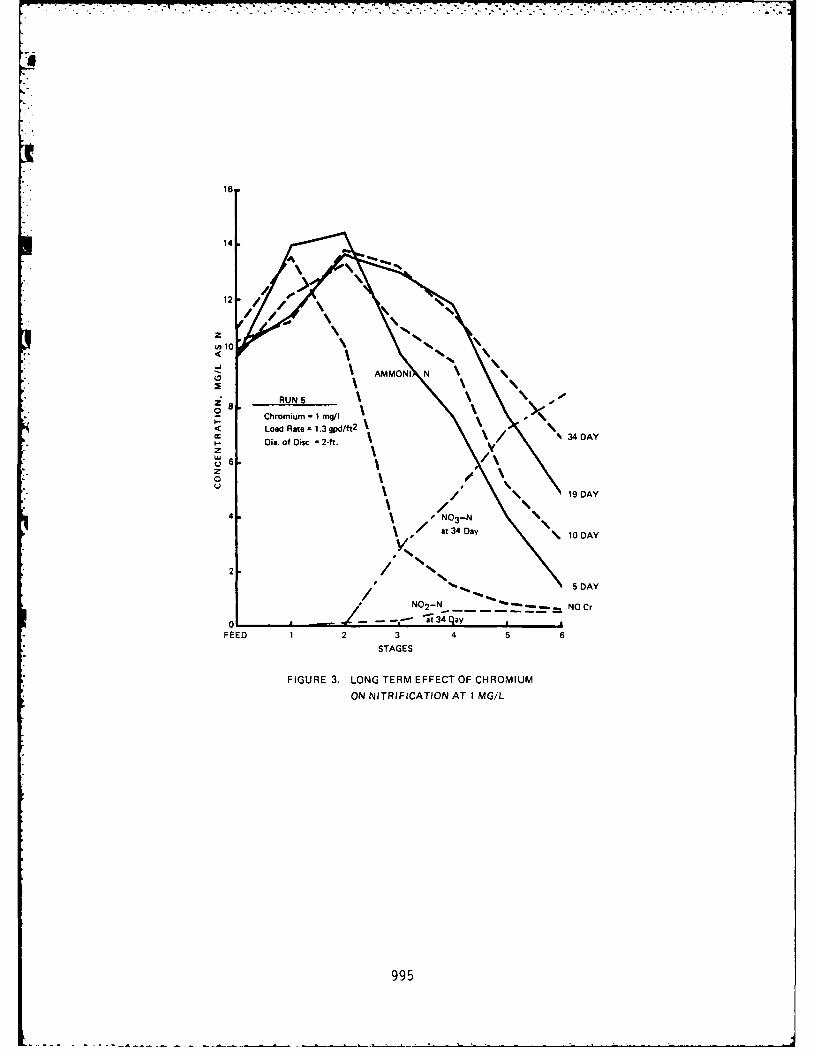
w-. .7.
16
14
2
Chromium-i mg/I
Load Rate - 1.3 gpd/ft2
I- Dia. of Disc -2-ft.z2u
~~~~1 at4Dy\iDAY
% %% 5 DAY
- - N0 2 N -_ NO Cr
0* -at34 qay
FEED 1 2 3 4 5 6STAGES
FIGURE 3. LONG TERM EFFECT OF CHROMIUM
ON NITRIFICATION AT 1 MG/L
995
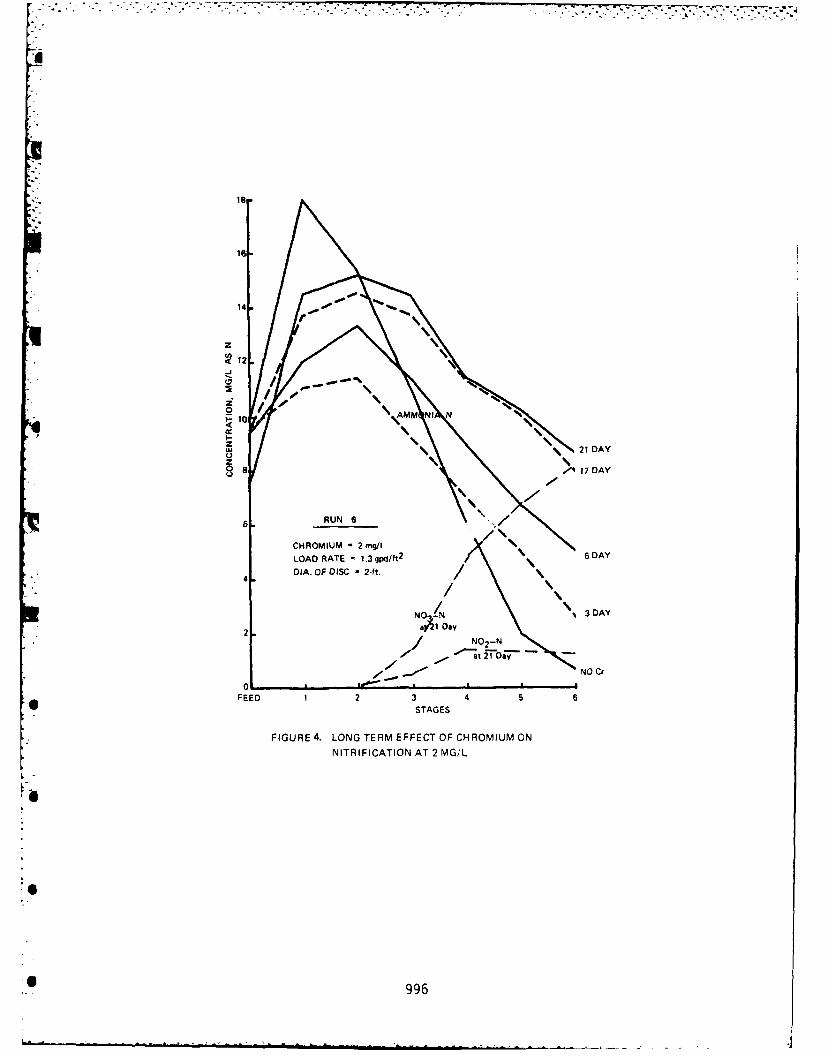
14.
z
z
6. RUN 6
CHROMIUM - 2mg/ILOAD RATE 1.3 gpd/ft
2 6DA
DIA. OF DISC -ft.
4/NO N ~3DAY
2 aXIDay
NO Cr
FEED 1 2 3 4 5 6STAGES
FIGURE 4. LONG TERM EFFECT OF CHROMIUM ONNITRIFICATION AT 2 MG/L
0 996
- Most of the COD was removed in the first two stages.- Ammonification of organic nitrogen became complete
at the third stage, compared to the first stage in
Run 1.
- Nitrification of ammonia began at the third stage andcontinued in the subsequent stages
- No accumulation of nitrite was observed, indicatingthat the Nitrobacter group of organisms were notinhibited. Only Nitrosomonas was inhibited by
chromium.
- Chromium concentrations in the liquid decreasedrapidly in the first two stages (1.1 to 0.6 mg/l)
and slowly in the subsequent stages (to 0.4 mg/l).
- The major mechanism of chromium removal from theliquid appeared to be adsorption to the biomass. Thechromium content in the bionlass layer closely approxi-mated the COD profile throughout the treatment system.In the first stage for example, the chromium consti-tuted approximately 2 per cent of biomass on a dryweight basis. In the following stages, the chromium
content ranged between 0.6 and 1.0 percent.- Staging definitely worked in favor of organisms in
the later stages. While organisms initial stages were
exposed to chromium, those in the later stages werenot.
For the parallel system receiving 2 mg/l of chromium,Run 6, similar observations were made, s-e Figures 4 and 5.The time required to reach a steady state operating condition
however, appeared shortened; 21 days. The following observa-tions were made:
- COD was being removed substantially in the initialtwo stages but slowly in the middle two stages.Overallremoval was satisfactory.
- Ammonification of organic nitrogen also took thr2estages to complete.
- Nitrification began at the third stage and continued
in the subsequent stages.- Chromium concentration in the liquid decreased rapidly
from 1.9 to 1.2 mg/l in the first stage and remained
between 1.2 and 1.1 mg/l in the subsequent stages.
997
RD-i 377 PROCEEDINGS:'INTERNTIONAlL CONFERENCE ON FIXED-FILM -
5/7BIOLOGICAL PROCESSES (..(U) PITTSBURGH UNIV PA DEPT OFCIVIL ENGINEERING Y C WU ET AL. ±982 DACW88-8i-R-885
UNCLASSIFIED F/G 13/2 N
l lii .~332 2.2I liii -
,;[
MICROCOPY RESOLUTION TEST CHART
NATIONAL BUREAU OF STANDARDS-1963-A
S"'S
I:'
_____ _____ ____ I*
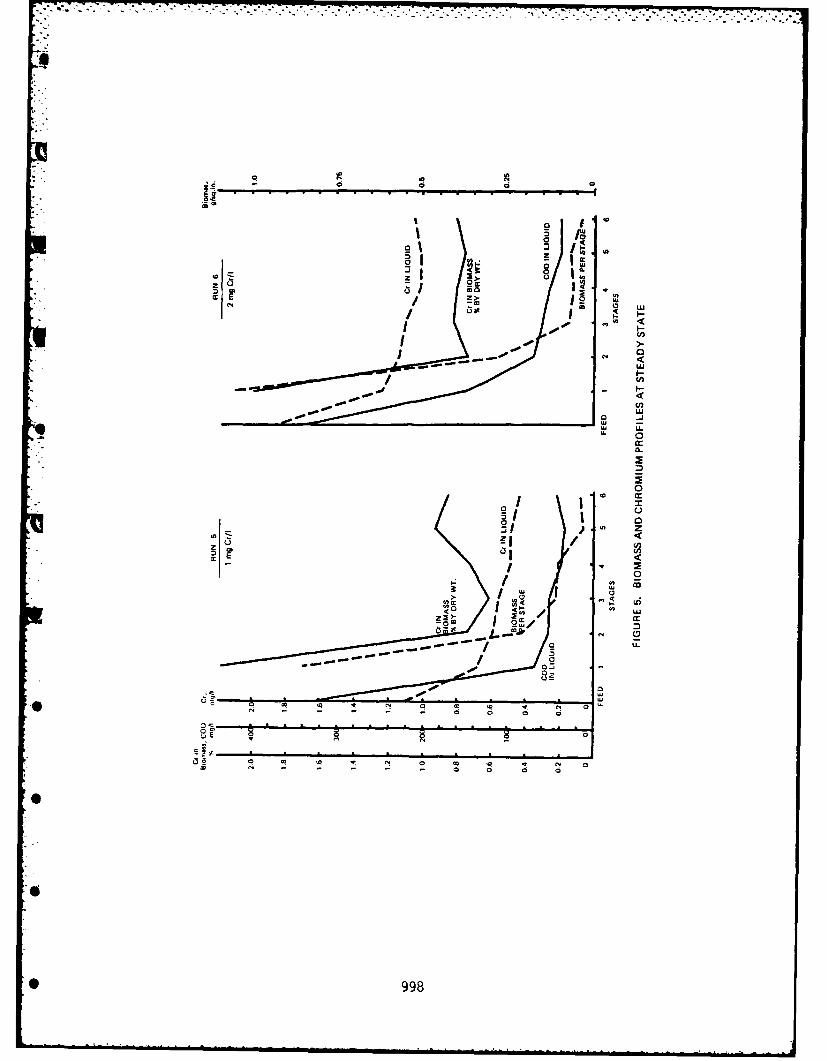
. . .. . . . . . . . . . .
04
0 1
w LL
I -L00
C - w I-
998:
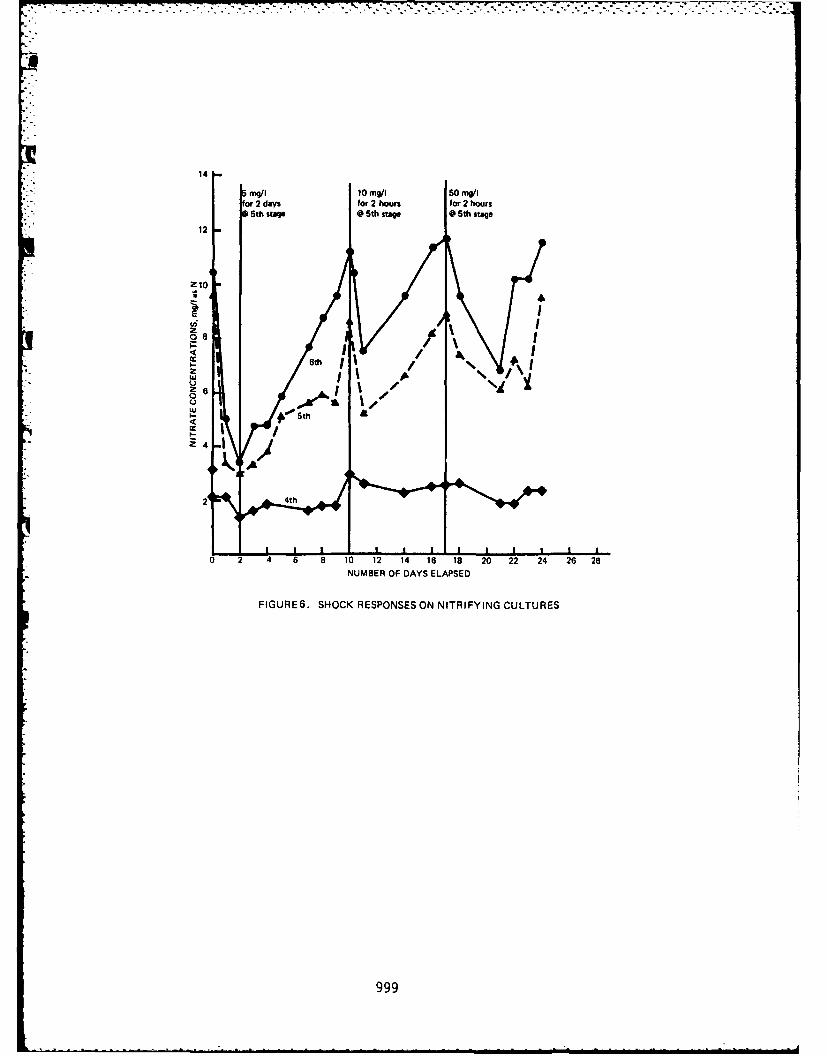
14
5mg/I 10 mg/I so0mg/Ifr2 days for 2 hours for 2hours
0 th stag @6th stage @05th stage
12
210
E2 8
6th ~ /Iz\
o I,
5th
24
0 2 4 6 8 10 12 14 16 18 20 22 24 26 28NUMBER OF DAYS ELAPSED
FIGURE6. SHOCK RESPONSES ON NITRIFYING CULTURES
999
- The major mechanism of chromium removal is byadsorption to the biomass. The chromium content inthe biomass was approximately 2 per cent in the firststage and 0.8 per cent on a dry weight basis in thelast stage.Since the organic strength of the feed solution wasthe same between these two systems, the resultantbiomass characteristics and quantity should be similar.It was then not surprising to observe that theadsorption of chromium by the biomass at steady stateexhibited a similar mass relationship. Due to a higherconcentration gradient in the more highly loaded systemhowever, steady state appeared to have been reachedsooner in the latter system (Run 6) than in the formerwhere 1 mg/l of chromium (Run 5) was used.
- Among the organisms involved, it may be concludedagain that the more sensitive of the two groups ofnitrifiers is Nitrosomonas. Nitrobacter appeared tobe less sensitive to chromium and thus to oxidizenitrite without much accumulation of nitrite.
- Benefits of staging were again observed in that inhi-bition took effect by stage. When a load came, thelate stages would not be affected, even if the initialstages were adversely affected.
From the data presented in the section, one couldsummarize that:
Hexavalent chromium could be adsorbed to the biomassupon contact up to its adsorptive capacity (2 per cent forheterotrophic organisms and less for a mixture of heterotro-phic and autotrophic organisms). This is a higher level than0.8 percent as reported on activated sludge(3). Since thebiomass density of biofilm is higher than activated sludgefloc, it appears that the adsorptive capacity improves in abiodisc system.
Inhibition was controlled more by what was in the bio-mass layer than in the bulk liquid. Even though the bulkliquid carried chromium at or above 0.6 mg/l, the effect wasnot immediate.
Staging helped the process as a whole. Benefits could* be achieved in two ways: While an upstream stage received
and removed chromium, the downstream stages were spared fromthe inhibitory impact or received a minimal quantity, allof which increased the overall process reliability.
S
1000
[ <.-.* **°**
Since the chromium concentration in the initial stageswould be higher than the case where staging was not practiced,the rate of adsorption to the biofilm would be faster. Undera slug load, the chromium would concentrate in one stageand upon sloughing, could be removed from the system in anefficient manner.
Nitrosomonas showed a greater degree of inhibition bychromium than Nitrobacter, which was consistent with observa-tions elsewhere(2).B. Short Term Effect of Chromium
The problems generated in this phase of the study wereto investigate: (1) that concentration which would producedefinite inhibition and the resulting reaction time.(2) the rate of recovery, if any, once the slug is passed.(3) acclimation effect under repeated slug doses.(4) the impacts of heterotrophic organisms on nitrifiers.
In this study concerned with the effect of slug dosesof hexavalent chromium on the nitrification process, concen-trations of chromium at 5 mg/l for 2 days (Run 7), 10 mg/lfor 2 hours (Run 8) and 50 mg/l for 2 hours (Run 9) wereused in succession. Approximately a week of recovery wasallowed between runs. These concentrations were fed at thefifth stage since at this point the system was supportingfull nitrification. The efficiency as measured by the reac-tion product, or nitrate, NO3, dropped immediately as shownin Figure 6. As soon as tile chromium feed was removed fromthe system however, the nitrification was shown to resumeand within approximately a week had returned to its originallevel. The degree of inhibition appeared to be inverselyproportional to the mass loading. It was postulated thatthis rapid resumption of nitrification was made possible bythree contributing factors: (1) the adsorption of chromiumto the biomass layer which appeared to have caused aninunediate inhibition of the existing culture and vet remainedwithin the biomass layer, where its presence caused no fur-ther inhibition of new growth. The dcsorption of chromiumdid not appear to he significant; (2) continuous seedingfrom the' fourth stage which contained nitrifying cultures;(3) acclimat ior of cultures to chromium was a definite con-dition which minimized the degree of inhibition in Run 8(with 50 mg/l chromium). In this cast inhibition was notas severe as in Run 7 where 10 mg/I chromium was fed.
1001
...7- .7..-t
C. Impact of Presence of Heterotrophs on NitrificationIn an effort to investigate nitrifying organisms compe-
tetiveness in the presence of heterotrophic organisms,50 mg/l of glucose was fed to the fifth stage for three daysin a similar manner as chromium had been previously intro-duced.
Results are shown in Figure 7 that indicate with chegrowth of heterotrophs on the surface, nitrification
efficiency starts to decline. Once the glucose feed wasremoved, there is no immediate increase in nitrificationactivity.
It appears that nitrifying cultures are outgrown by
heterotrophs on the same surface, thereby they become buriedamong the heterotrophs. With the increased oxygen demandexerted by heterotrophs, the dissolved oxygen concentrationin the bulk liquid decreased to 1.0 mg/l and as a resultwas limited for nitrifiers. This data confirms a theory thatunder a d.o. suppressed environment, nitrifiers cannot func-tion properly and therefore a nitrogenous oxygen demand can-not exist.
SUMMARY AND CONCLUSIONS
Chromium may enter municipal waste treatment plantsin many different ways. Perhaps most frequently it occurs
in plating wast-, although it may have its source in tanningoperations, in waters given corrosion inhibition treatmentwith chromate, )r in aluminum-anodizing wastes.
Concentrations of hexavalent chromium up to 10 mg/lwere fed up to four months on a continuous basis to two six-stage biodisc systems treating synthetic sewage, with con-
-. centrations of 300 mg/l of COD and 20 mg/i of nitrogen.Initial stages of the discs were supporting heterotrophicorganisms, while the biological nitrification was achieved
by autotrophs in the later stages.
Concentrations of hexavalent chromium up to 50 mg/lwere also fed as slugs to the biodisc system to test the
effects of such doses.
In addition, the effects of the presence of heterotro-phic organisms on nitrifiers was examined by feeding glucosedirectly into a nitrifying stage.
"6 1o02
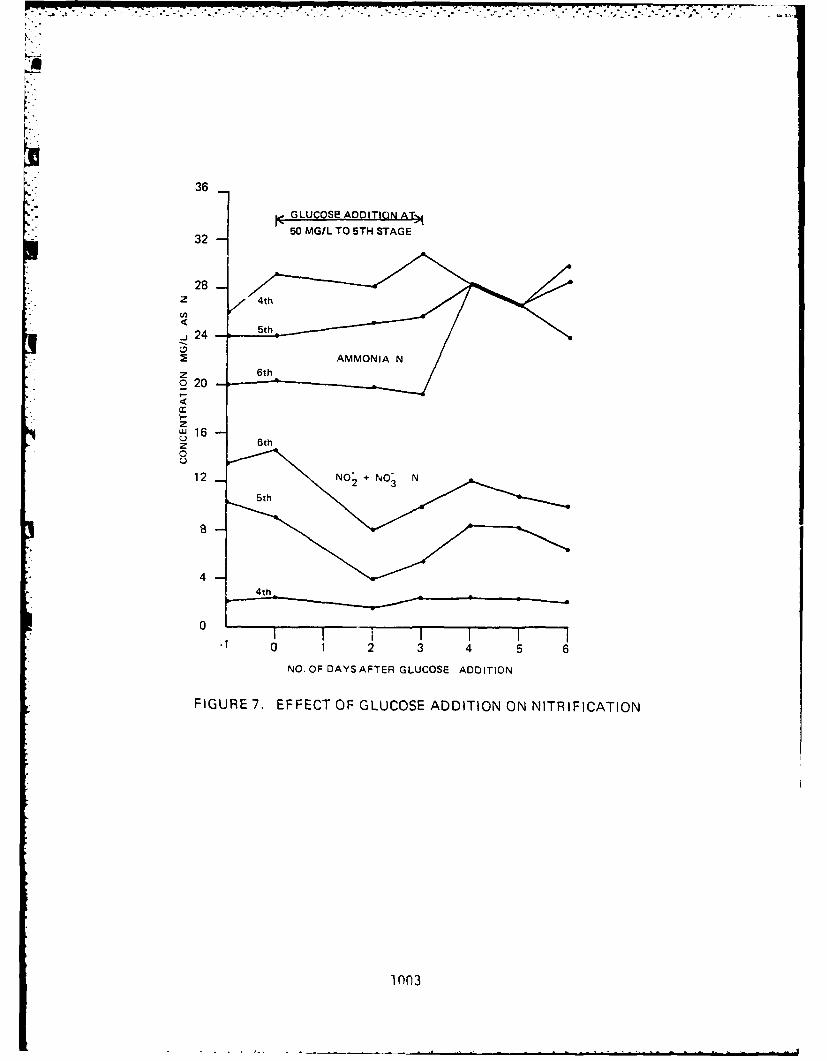
36
GLUCOSE ADDITION AT>1t50 MG/L TO 5TH STAGE
32
28
24 524
20 6th
20
w16z 6th
12 NO+ No' N
5th
4
0-1 0 1 2 3 45 6
NO. OF DAYS AFTER GLUCOSE ADDITION
FIGURE 7. EFFECT OF GLUCOSE ADDITION ON NITRIFICATION
1003
From the observations made in this investigation, thefollowing conclusions may be drawn.
On a continuous basis, 1 mg/l of hexavalent chromiumexhibited a consistently inhibitory effect onnitrifying cultures.
The major mechanism of hexavalent chromium inhi-bition to microorganisms appeared to be by adsorp-tion. When chromium is adsorbed to a discrete
active microorganism, the inhibitory effect setsin quickly. Chromium also may be adsorbed to non-
active biological film or flocs, thereby becomingimmobilized. The degree of adsorption or affinity
however, depends on the characteristics of the filmor flocs in the system. For example, heterotrophic
cultures established in the initial stages, oxidizingprimarily carbonaceous materials exhibited chromium
retention of approximately 2 per cent, while themixture of nitrifying cultures containing a limitedquantity of heterotrophic organisms established in
the later stages, exhibited a concentration of approxi-mately 0.8 per cent on a dry weight basis.As previously indicated data gathered in this inves-
tigation showed that the rates of adsorption andthe resulting inhibition to microorganism were
fast.In a matter of hours the inhibition at a stage was
well defined. When the adsorptive capacity of theentire biomass film in a stage was reached, theimpact was shown by reduced COD removal for heterotrophsand reduced nitrate generation by nitrifiers.
Data also indicated that between two major groupsof nitrifiers, Nitrosomonas was more sensitive tochromium and thus ammonia oxidation was decreased,while the nitrite oxidation to nitrate remained
unchanged.Data further indicated that staging offered advan-tages in process reliability and also in isolation
and efficient removal of affected sludge from the* •system.
• 1004
II
The impact of slug loads of chromium on nitrifica-tion was tested at concentrations up to 50 mg/l.Since the biofilm at the fifth stage composedmostly of nitrifying cultures, the chromium addi-tion at that stage resulted in immediate reductionin nitrification, even at 5 mg/l. The completerecovery of the system however was rapid, taking placewithin approximately a week, indicating that the
chromium retained in the film and flocs did notadversely affect the newly developing cells beingestablished. Desorption of these chromium compounds
appeared not to have generated a problem. TheRBC system also showed a benefit due to continuousseeding from the upstream stage.An advantage due to previous exposure to chromiumwas also shown. Acclimation was evidenced from thestudies of slug doses.
The fact was likewise confirmed that when hetero-trophs start to grow on the same support surface,nitrifiers cannot compete for either surface oroxygen and thus become overgrown.
1 n05
REFERENCES
1. Tomlinson, T., Boon, A., and Trotman, u., "Inhibition
of Nitrification in the Activated Sludge Process ofSewage Disposal," J. Applied Bacteriology, 29, (2),1966, pp. 266-291.
2. Painter, H., "Review of Literature on Inorganic Nitrogen
Metabolism in Microorganisms," Water Research, Vol. 4,
1970, pp. 393-450.3. Anon, Interaction of Heavy Metals and Biological Sewage
Treatment Processes, U.S. Public Health Service Publi-
cation No. 999-wp-22, Environmental Health series,
May, 1965.4. Borchardt, J., Kang, S., and Chung T., Nitrification
of Secondary Municipal Waste Effluents by Rotating
Bio-discs, U.S. EPA 600/2-78-061, June, 1978.
ACKNUWLEDGEMENTS
The support of Capital Consultants of Lansing, Michigan
*.. in this research is acknowledged.
This research was conducted at the Sanitary Engineering
Laboratory, the University of Michigan. At the time,
S. J. Kang was a graduate student in the Department of Civil
Engitieering.
0O000
.- . , ........ ... .-. . .. . . . .•-... _. _..,. _. .............
A
PART IX: INDUSTRIAL WASTEWATER TREATMENT
SCALE-UP AND PROCESS ANALYSIS TECHNIQUES FORPLASTIC MEDIA TRIC.(LING FILTRATION
0. Thomas P. Quirk, P.E. Department of Civil andEnvironmental Engineering, Vanderbilt University,
Nashville, Tennessee.
W. Wesley Eckenfelder, Jr. Department of Civil
and Environmental Engineering, Vanderbilt Univer-sity, Nashville, Tennessee.
ABSTRACT
/ Reaction models for bio-oxidation using a sheet flow re-actor with a fixed biological film similar to that used inplastic media trickling filtration are developed. The modelsutilize plug flow hydraulics and accept various descriptionsof BOD removal kinetics includiL'g: zero order, first order,retardant and concentration dependent mechanisms. Hydraulics,kinetics and film geometry are individually incorporated.
System model equations are arranged into linear expres-sions which allow graphical determination of model applicabil-ity and rate constants from plots of experimental data.
The design and operating characteristics of laboratorysimulation equipment are presented. Simulation equipment con-sists of continuously fed inclined planes with effluent sedi-mentation and recirculation. Effluents can be fed from andreturned to coldroom storage. Heating tapes control tempera-ture above ambient levels. System location in a cold-roomprovides temperature control at below ambient levels.
Applicability of the models is verified using operatingdata from laboratory and full scale studies of a number ofeffluents including: municipal sewage, whey wastewater, kraft
1 ln7
.°,I
A'..
mill effluent, sulfite mill discharges, hard-board mill ef-fluent, yeast fermentation effluents, pharmaceutical dischar-gu.s and meat processing wastes. Additional verification ispresented from literature data utilizing a glucose substrate.Scale-up calculations are developed to utilize laboratorydata to determine full scale performance for various packinggeometries. Design calculations are also presented includingdetermination of the influence of recirculation.
INTRODUCTION
The trickling filter is comprised of a bed of media onwhich biological film growths develop. Removal of BOD is ob-tained by aerobic processes at the film surface and by anaer-obic processes within the film interior. Modifications to
* the classic rock trickling filter introduced plastic geometricmedia to obtain increased surface area and porosity. Currentpractice generally employs a lattice type structure of verti-cally oriented media which induces a sheet flow regimen.
Reactor operation is such that laboratory scale simula-tion can be used for rate .constant determination and in para-llel operation with pilot plant equipment to reduce datacollection requirements and extend interpretation of pilotscale results. Simulation equipment utilize& an inclinedplane of up to 18' in length operating with thermal regulatorsand evaporator control systems.
The theory of BOD removal by trickling filter slime overa reaction surface similar to that of an inclined plane hasnot been formulated in the existing engineering literature.Full scale design equations in current use have been fre-quently developed by emperical methods or by analogy to for-mulations used to describe BOD exertion in general. The work
*O presented herein describes development and verification ofreaction models suitable both for laboratory studies and forscale-up to prototype conditions.
Consideration is given to the analysis of laboratoryscale data, the interpretation of pilot and full scale resultsand the design of prototype systems for each reaction model.
*O The theoretical development is presented in the following se-quence:
o General reaction modcl for inclined planc6
o Specific models for alternative bio-kineticrate processes
o Influence of recirculation and temperature
' lnnp
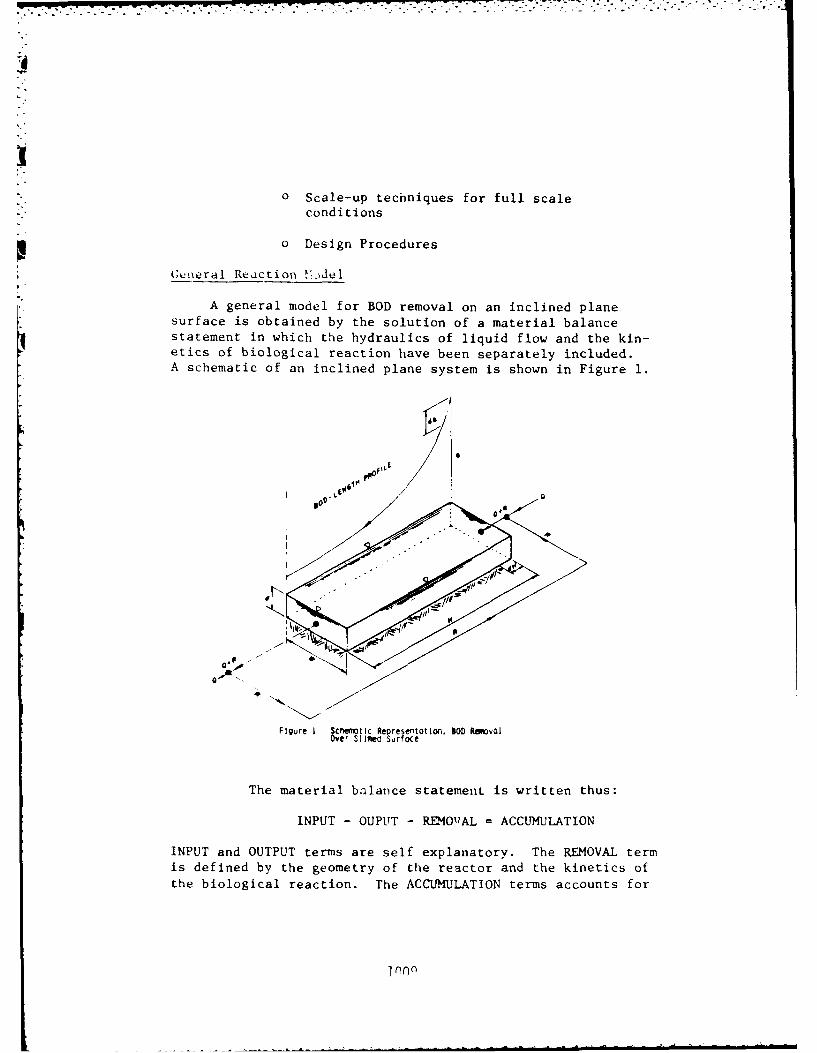
0 Scale-up techniques for full scale
conditions
p 0 Design Procedures
(knieral Reaction Midel
A general model for BOD removal on an inclined planesurface is obtained by the solution of a material balancestatement in which the hydraulics of liquid flow and the kin-etics of biological reaction have been separately included.A schematic of an inclined plane system is shown in Figure 1.
000JJ
0 A~A
Figure I Scr"=tic Representotlio, BOD RumvOlover Slimed Surfoce
The material balance statement is written thus:
INPUT - OUPUT - REMO7AL = ACCUMULATION
INPUT and OUTPUT terms are self explanatory. The REMOVAL termis defined by the geometry of the reactor and the kinetics ofthe biological reaction. The ACCUMULATION terms accounts for
ln00
the change in the quantity of BOD stored in the reactor vol-ume. For both inclined plane surfaces and trickling filters
this storage is negligible. The terms of the material balance
statement are mathematically defined as follows:
INPUT = (Q+R)Sa
OUTPUT = (Q+R)Se
REMOVAL = KrVr
ACCUMULATION = 0
where:Q = Untreated flow (gal min -1 )
* R = Recirculation flow (gal min-1 )
Sa= BOD concentration as applied toreactor (mg/i)
Se= BOD effluent concentration-mg/l
Vr=VOlume of reactor (gal)
Kr= A generalized BOD removal rate constant
for the reactor volume (mg/i min-l)
The reactor is examined over a differential element of
plane height (dH) to define reactor volume:
dVr = (d) (W) (dH) (1)
The material balance for BOD input and removal is then
stated as follows:
(dS) (Q+R) = (Kr) (d) (W) (d)
which when rearranged into a differential statement becomes:
dS = Kr(d) (W) (2)dH (Q + R)
The term, (Q + R)/W is conveniently grouped as a hydraulic
loading per unit of plane width (U) as follows:
!dS _ (Kr) (d) (3)
dH
Equation (3) then is the general statement for BOD removalover a slimed surface.
First Order Reaction Kinetics
At this juncture biological reaction kinetics may be in-
troduced to develop a specific reaction model, e.g., firstorder, retardant etc. A first order reaction model has beenfound in practice to apply most frequently to trickling fil-
ter performance.The generalized rate constant (Kr) for a first order re-
action is expressed as the product of a specific velocityconstant and the amount of substrate present. The relation-ship in generalized terms is:
I!K r = (k) (S) (4)
The units used for k and S are dependent on the way in whichthe reaction is described e.g. in activated sludge work S hasthe units of concentration and k is expressed as a substrateconcentration change, per unit of substrate and organisms pre-sent, per unit of time. Kr then has the net units of time- 1
In fixed film reactors the specific velocity constant isexpressed in terms of the unit weight of substrate removed, perunit weight of film present, per unit of time.
k = dMs
dt Mf
where:
dMs = substrate weight changedt = time changeMf = film weight present
By expressing substrate weight in terms of concentration, i.c. dMs=VrdS, kthen becomes:
k VrdS JdS 1dtMf d M f (5)
Vr/
Mf/Vr can then be termed the equivalent concentration of or-ganisms in the elemental reactor volume being analyzed. Forthe inclined plane:
( Il) (gf)
V1011
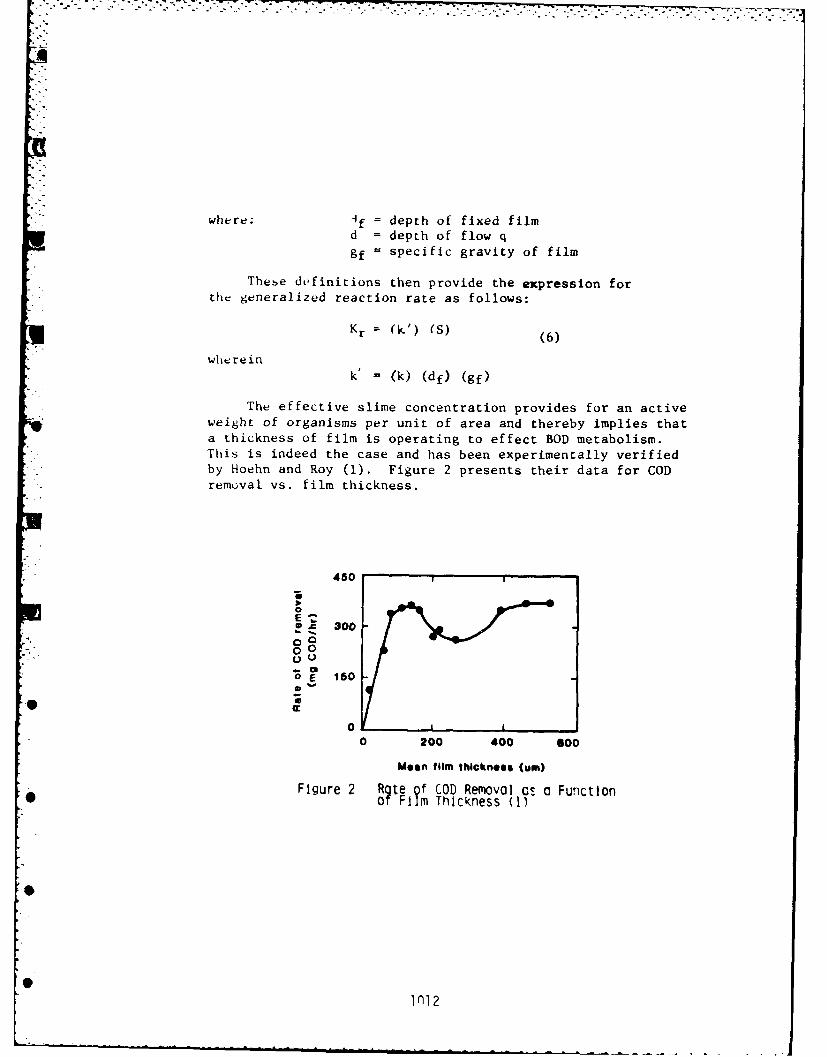
- - . -r'.- --. -
where: if = depth of fixed filmd depth of flow q
gf = specific gravity of film
These definitions then provide the expression forthe generalized reaction rate as follows:
Kr = (k') (S) (6)
whereink' = (k) (df) (gf)
The effective slime concentration provides for an activeweight of organisms per unit of area and thereby implies thata thickness of film is operating to effect BOD metabolism.This is indeed the case and has been experimentally verifiedby Hoehn and Roy (1). Figure 2 presents their data for CODremoval vs. film thickness.
450
300
0 0
oE 150
00 200 400 oo
Mean film thickness (um)
Figure 2 Rteof COD Removal as a FunctionOf Film Thickness (1)
SIn12?
The description of a first order reaction may then becompleted as follows:
dS k'S (7)dH U
It is worthwhile to note that the derivation of Kr pro-ceded in such a way as to eliminate flow depth (d) from thefinal expression. This in turn results in an exponent of 1.0for the flow term (U). If depth remained in the final equa-tion then the fact that depth over an unslimed plane varieswith (U)-1/3 would result in an exponent of 2/3 for the flowterm U. The elimination of depth also tacity implies thatthe reaction at the slime/water interface controls ratherthan the transport of substrate through the liquid depth toreach the interface. Equation (7) thus describes a reactioncontrolled model. The description of the active organism con-centration(Mf/Vr)interms of a ratio of slime specific weightdivided by liquid depth also results in an averaging processfor the amount of biomass effectively operating to remove andmetabolize BOD. The definition of the amount of biomass rep-
resentedthe first half of the analysis. The balance of the
(Kr) breakdown used kinetic expressions which are independentof organism concentration i.e. Kr - k'S. The effect of thistwo part definition is to effectively insert a linear aver-aging technique into the overall rate constant Kr.
* Thus, any other BOD removal and metabolism mechanism which
can be reasonably described by a linear average of a combina-tion of liquid depth and bio-mass amount will be approximatedby equation (7). This may help to explain why the first or-der formulation has been found to apply to performance dataover a wide range of process conditions. Integration of ex-pression (7) provides the basic analytical relationship for
"4 BOD removal over an inclined surface:
S -k'H/U (8)Sa
In the application of equation (8) to laboratory analysisan incline of up to 450 from the horizontal may be used with-out concern for the non-formulated depth effects caused byangle of inclination.
Incorporation of Recirculatlon and Temperature
SThe ratio describes the change in BOD as applied to
1013
?a
the film and, therefore, implicitly includes the effects ofrecirculation. For design purposes BOD changes relative tothe undiluted wastewater are required. The change in reactorBOD's is related to the undiluted wastewater by a materialbalance around the plane as follows:
Sa 1 + r (1-E) = f (9)
S-e (l+r) (l-E)whecre:
r = recirculation ratio R/Q
E = BOD removal efficiency based onraw wastewater
The factor (f) is introduced for topographical simplicity.The effect of temperature on reaction rate is introduced
using the Arrhenius relationship.k'= k' AT (10).- t 200 ( 0
where:k'= reaction constant at temperature t
k0 reaction constant at standardtemperature, 200C
At = reaction temperature differential0C-20
6 = constant, usually taken as 1.035
ANALYSIS OF LABORATORY PLANE PERFORMANCE
The analysis equation for first order performance is* Ocompleted as follows:
f = e k'20 At H/U (11)
A graphical solution to equation (11) is obtained by takingdouble logarithms as follows:
l 0_p log U + log(l/k'20) (12)
log L2.3log (f) lA plot of data on log paper will provide a linear correlationwith slope equal to 1.0 and an intercept of log (1/k'2 0o) at
Im
. . . ., .- .'. ' . . ..- ' . ... . _ .. .- , ..: . -. --. . .. . .. . - .- , _ ,_
-g
U 1. 0.It is important to note that the variable H, height of
plane, is portrayed as having a linear effect on plane per-formance. This is so in that laboratory planes are short andreceive a controlled, uniform discharge. Both of these char-acteristics support a linear relationship between height,flow pathway, film presence and thickness etc. This conditiondoes not necessarily apply to full scale towers.
An application of first order kinetics to inclined planetreatment of whey plus sewage, Quirk (2), is shown on Figure 3.Test results were obtained using plane lengths of 9 and 18 ft.operated at hydraulic loadings from 0.02 to 0.15gpm/ft. Re-cycle ratios ranged from 0. to 6.0. Film areas of 0.375 and0.750 SF provided the data shown operating over a range oforganic loadings of 0.08 to 0.95 lbs BOD/day/SF Slime. An hy-draulic coefficient of n = 1.0 and k20
0 = 1.8 x 10- 3 gpm/SFwere determined. Shultze (3) also experimented with a mixtureof whey plus sewage using vertical meshed screens 3' x 6' indimension as a fixed film reactor. His data correlated usinga first order reaction as shown in Figure 4. Hydraulic ef-fects produced an n = 1.0with a reaction rate constant ofk280 = 2.5 x 10- 3 gpm/SF. Hydraulic loadings ranged from0.08 to 0.45 gpm/SF and were about three times the hydraulic
loadings used by Quirk (2).
Additional Kinetic Models
Kinetic models other than a first order reaction havebeen employed to describe biological oxidation. While lesspopular than the first order assumption, these additional mo-dels have been found to correlate bio-oxidation data in asuccessful manner. Because of a cumbersome mathematicalstructure when used for fixed film reactorsthese models havebeen applied primarily to fluid bed reactors such as activatedsludge, aerated stabilization basins, etc.
The relationships for laboratory planes have been extend-
ed to include:
i. Linear and exponentially retardant reactions
2. Concentration dependent reaction
3. Zero order or constant rate reaction
1015
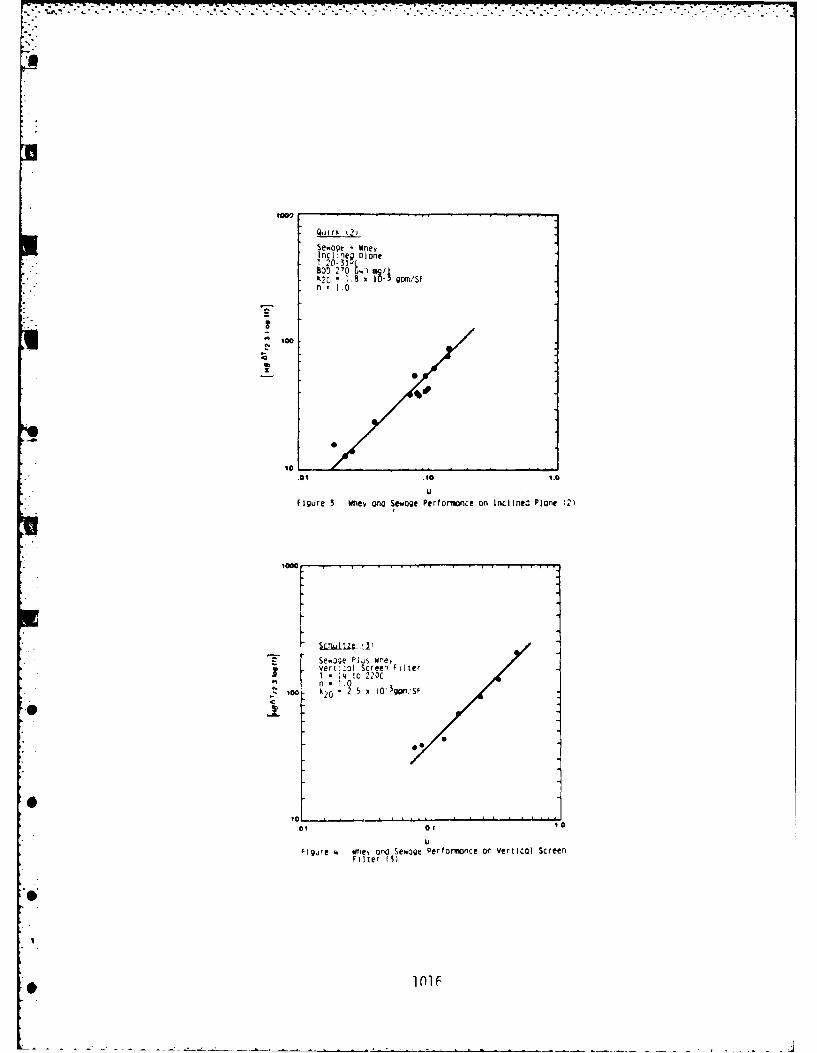
a
- Quirk (2'Sewogt Wnev
* Incli'ieQ Diane* 120- 3I
D0 £70- a m wnS- n. .0
to
10.
UFigure 3 whley aria Sewage Perfoncrce on lncilnecl Plane (2)
1000
z Sew3Qe li~s wne,vert:col Screen Filter
200
01
U
Figure k. whe1 and Sewage Performwnce on Vertical ScreenFil1ter ii;
Retardant Reaction Models
In a simple retardant reaction the rate of BOD removalpL'r unit weight of organism is proportional not only to the
BOD concentration remaining but also to the fraction of BODremaining. Rates of removal decrease, or retard, rapidly ashigh efficiencies of removal are approached and the relativelyassimilable organics havebeen metabolized. The kinetic state-ment is written as:
Kr = (k)(Mf/Vr) (S) (S/Sa) (13)
After integration the completed equation for slimed plane
analysis is written as:
f = 1+ (k) (H) (14)U
An exponantially retardant reaction can be described by therelationship: l
Mf +[ +_.L!! (15)
Concentration Dependent Model
A concentration dependent reaction assumes a linear reac-tion of all substrate elements with the percent remaining asthe expression of retardancy. Unlike the retardant reaction,the concentration dependent formulation does not relate remo-val rate to concentration remaining but rather to a maximumrate which would occur at zero removal. The equation for aslimed plane operating with concentration dependency becomes:
k'H/us~a
f = e (16)
The combined parameters of H, U, and Sa represent the or-ganic loading or F/M ratio per unit area of film. Thus:
f = e k/F/M (17)
a linear plot is obtained by relating log(f) to k'/(F/M).
Inclined plane Btudies using glucose were foud to becorrelated by a concentration dependent reaction. The Maier(4)data is correlated by a concentration dependent model as shownon Figure (5). The separation of the 37.3 0 C data is apparentwhile the balance of the results fit a single model. The re-action rate for these glucose experiments was found from the
In17
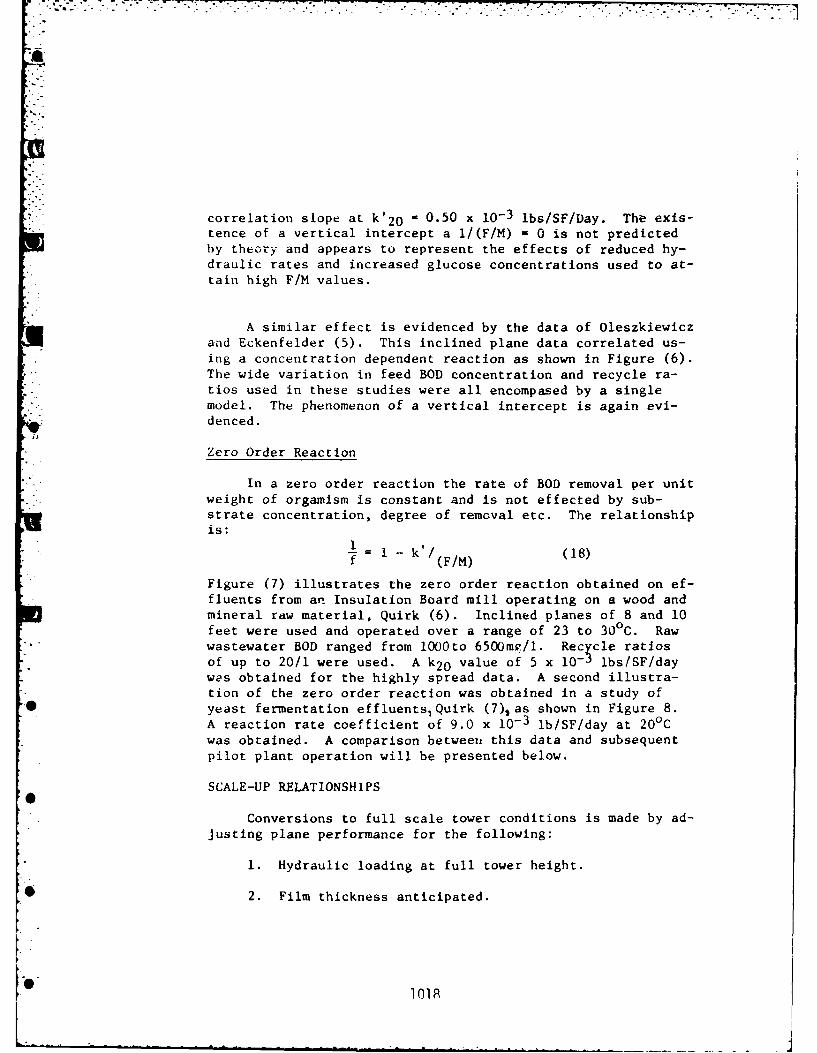
r r f l . . . -. .. - - - ' " -. -'- - " - . . ". .
correlation slope at k'20 0.50 x 10- 3 lbs/SF/Day. The exis-tence of a vertical intercept a l/(F/M) = 0 is not predictedby theory and appears to represent the effects of reduced hy-draulic rates and increased glucose concentrations used to at-tain high F/M values.
A similar effect is evidenced by the data of Oleszkiewiczand Eckenfelder (5). This inclined plane data correlated us-
" ing a concentration dependent reaction as shown in Figure (6).* The wide variation in feed BOD concentration and recycle ra-
tios used in these studies were all encompased by a singlemodel. The phenomenon of a vertical intercept is again evi-denced.
Zero Order Reaction
In a zero order reaction the rate of BOD removal per unit* " weight of orgamism is constant and is not effected by sub-
strate concentration, degree of removal etc. The relationshipis:
1 k'Y (F/M) (18)
Figure (7) illustrates the zero order reaction obtained on ef-fluents from an Insulation Board mill operating on a wood andmineral raw material, Quirk (6). Inclined planes of 8 and 10feet were used and operated over a range of 23 to 300C. Rawwastewater BOD ranged from lO00to 6500mg/l. Recycle ratiosof up to 20/1 were used. A k20 value of 5 x 10- lbs/SF/daywes obtained for the highly spread data. A second illustra-tion of the zero order reaction was obtained in a study of
* yeast fermentation effluentsQuirk (7)jas shown in Figure 8.A reaction rate coefficient of 9.0 x 10- 3 lb/SF/day at 200Cwas obtained. A comparison betweexi this data and subsequentpilot plant operation will be presented below.
SCALE-UP RELATIONSHIPS
Conversions to full scale tower conditions is made by ad-justing plane performance for the following:
1. Hydraulic loading at full tower height.
* 2. Film thickness anticipated.
101P
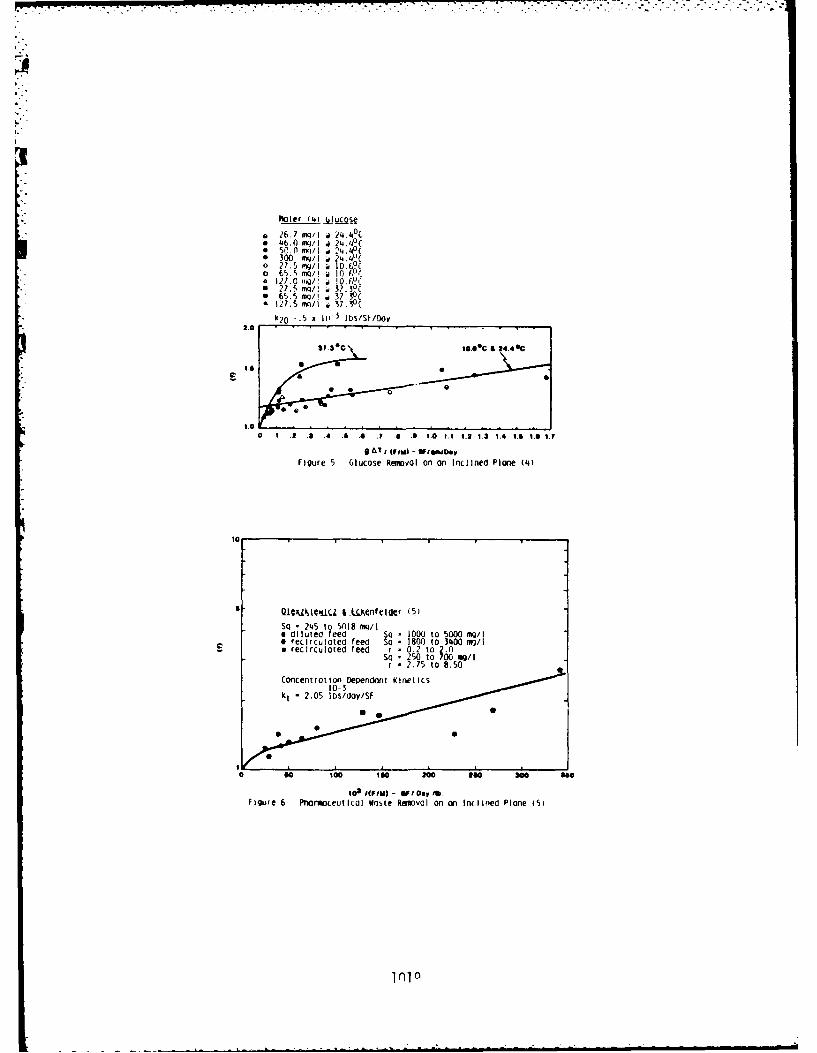
Maier (4I) jGjuCo~g
a 26.7 mug/I il 24.4 Oc* 46.0 lg/ I a '
0
0 27.5 rn%4/I ;1 10.(o 65.~ m MW 10. $-C
a127.0 'IQ 1 0. ,U C* 27.5' ma/; 7.3
0(
1467.5 rug/i 37 3PCk2 -2.5 xo/IW lbs/S13C
2.0
1.0
0 1 .2 .3 .4 .8 .0 .1 .8 .0 1.0 1.1 1.2 1.3 1.4 1.0 1.6 1.?
* 0 (FIMS - WigomIDv
Figure 5 Glucose Rem~oa on on Inclined Plane (4)
0 Q~~L~1~1~-I.L~nfelqer (5)
So - 245 to 5(118 rug/ia di luted feed So -000 to 5000 jug/I* reclrculdred feed So 1800 to 3(400 lvj/lm recirculated reed r * .2 to 2.0
So 2 20 to 700 rug/I
0 00 0r 1 .75 to0 8.00 0 0
Concenrotio P Dau~ eutlclonate RKwiaaiclndslae
onen""O e~ndn mbelc
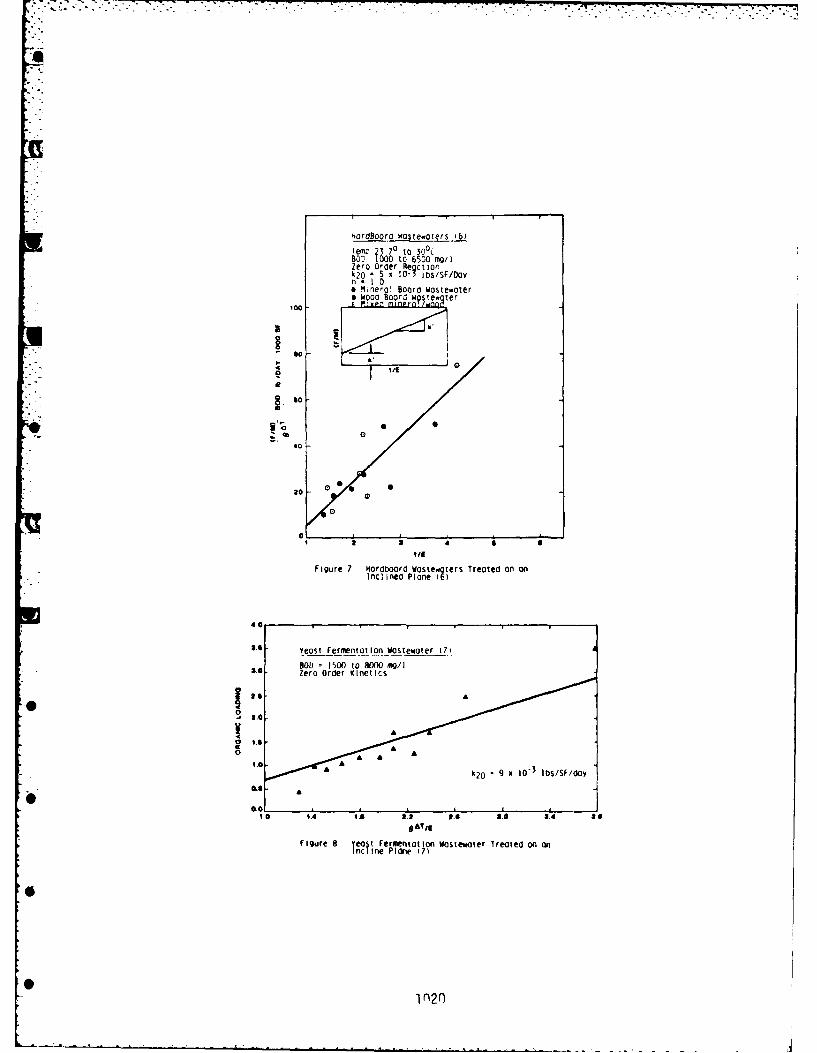
moraboora woste.oters 16
Temo J370 to ;00(800 000 to 6 00 mg/IZero Or'derRecok20 ' x 10- 10/SF/Doyn - 1.0* Mineral Board woste-otere wood BoQr w~stewpter
0
00
00a
2.0
0 0
10 S1 IS 11.1 1. A s
figure 7 le rdod Femnatoastewa Treated o n onncined Pne 6
102
L~~~- .2..0.
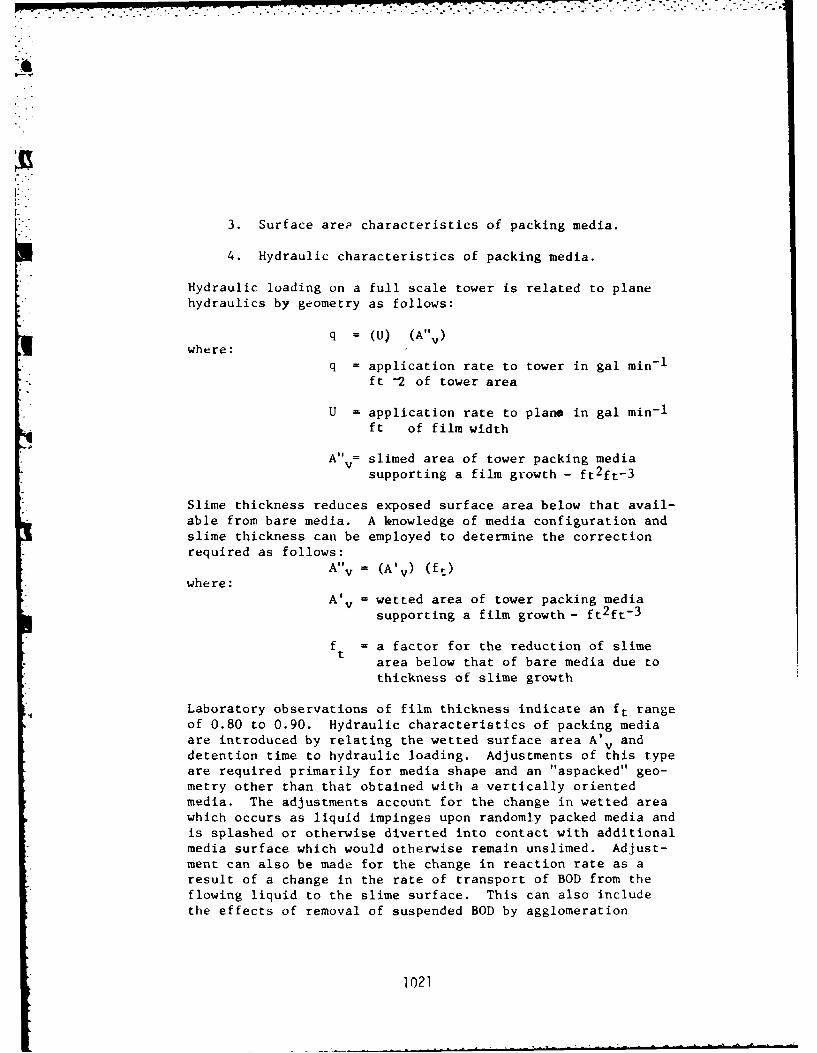
I..
3. Surface area characteristics of packing media.
4. Hydraulic characteristics of packing media.
Hydraulic loading on a full scale tower is related to planehydraulics by geometry as follows:
q = (U) (A"v)I_ where :
q = application rate to tower in gal min -1
ft -2 of tower area
U = application rate to plane in gal min -1
ft of film width
A"v = slimed area of tower packing mediasupporting a film growth - ft2ft-3
Slime thickness reduces exposed surface area below that avail-able from bare media. A knowledge of media configuration andslime thickness can be employed to determine the correctionrequired as follows:
A"v = (A'v) (fi)where:
A'v = wetted area of tower packing mediasupporting a film growth - ft2ft- 3
f = a factor for the reduction of slimetarea below that of bare media due tothickness of slime growth
Laboratory observations of film thickness indicate an ft rangeof 0.80 to 0.90. Hydraulic characteristics of packing mediaare introduced by relating the wetted surface area A' anddetention time to hydraulic loading. Adjustments of this typeare required primarily for media shape and an "aspacked" geo-metry other than that obtained with a vertically orientedmedia. The adjustments account for the change in wetted areawhich occurs as liquid impinges upon randomly packed media andis splashed or otherwise diverted into contact with additionalmedia surface which would otherwise remain unslimed. Adjust-ment can also be made for the change in reaction rate as aresult of a change in the rate of transport of BOD from theflowing liquid to the slime surface. This can also includethe effects of removal of suspended BOD by agglomeration
1021
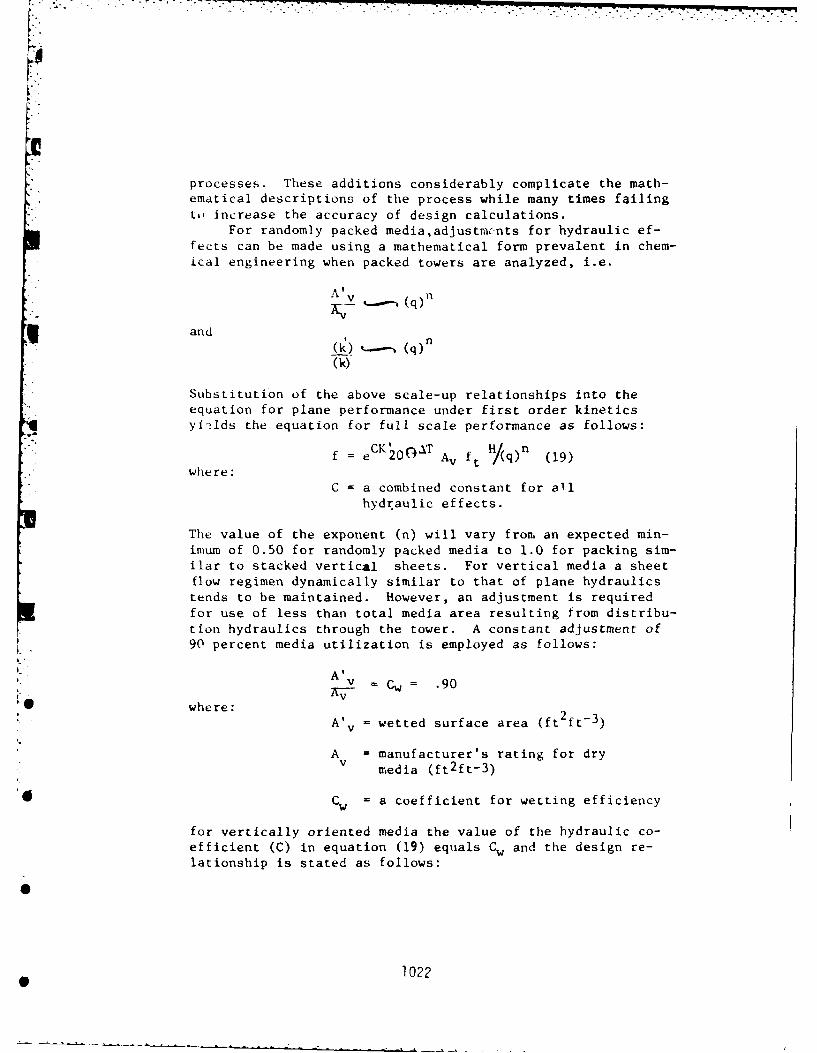
processes. These additions considerably complicate the math-ematical descriptions of the process while many times failingL" increase the accuracy of design calculations.
For randomly packed media,adjustmcnts for hydraulic ef-fects can be made using a mathematical form prevalent in chem-ical engineering when packed towers are analyzed, i.e.
A 1 ( q )
and
(k)
Substitution of the above scale-up relationships into theequation for plane performance under first order kineticsyi' Ids the equation for full scale performance as follows:
3""CK' 11f = e ( 20 T AV ft /(q)n (19)
where:
C = a combined constant for allhydraulic effects.
The value of the exponent (n) will vary fron, an expected min-imum of 0.50 for randomly packed media to 1.0 for packing sim-ilar to stacked vertical sheets. For vertical media a sheetflow regimen dynamically similar to that of plane hydraulics
tends to be maintained. However, an adjustment is requiredfor use of less than total media area resulting from distribu-tion hydraulics through the tower. A constant adjustment of90 percent media utilization is employed as follows:
- v = Cw = .90
6 •where:A'v = wetted surface area (ft ft3)
A = manufacturer's rating for dryV media (ft2 ft-3)
* Cw = a coefficient for wetting efficiency
for vertically oriented media the value of the hydraulic co-efficient (C) in equation (19) equals Cw and the design re-lationship is stated as follows:
1022
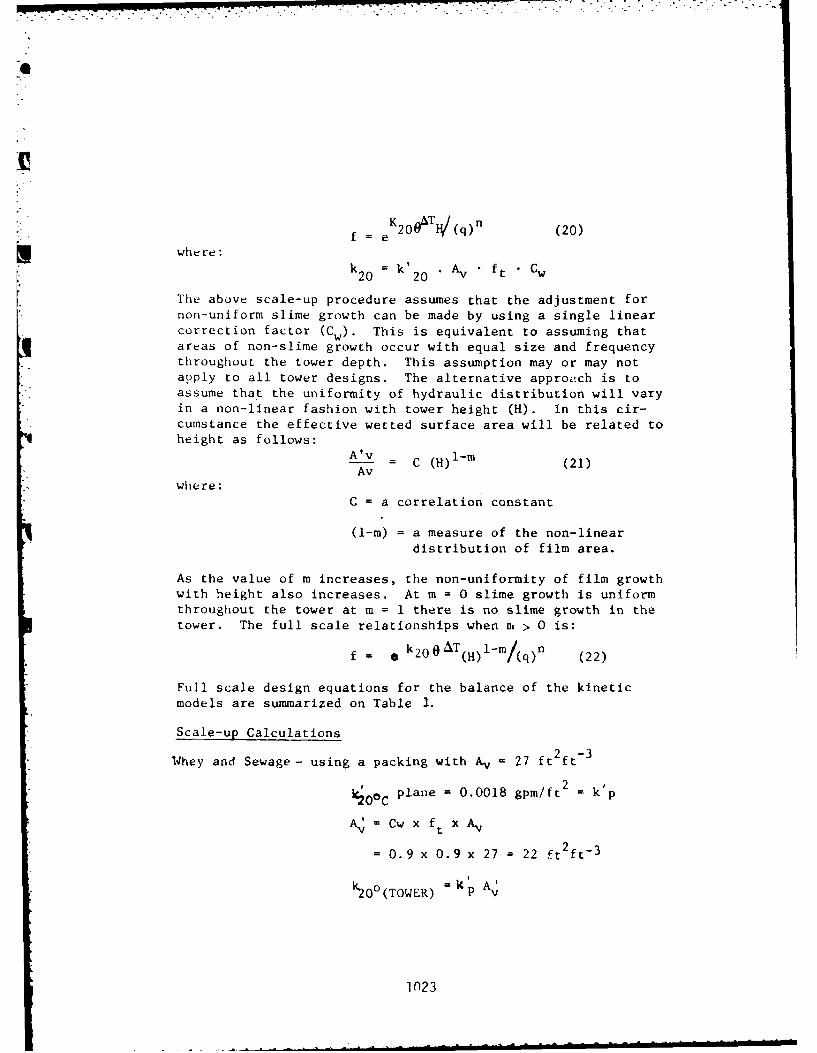
f K2 0 T 0 (q)n (20)
I where:20 20 v ft Cw
The above scale-up procedure assumes that the adjustment fornon-uniform slime growth can be made by using a single linearcorrection factor (Cw). This is equivalent to assuming thatq areas of non-slime growth occur with equal size and frequencythroughout the tower depth. This assumption may or may notapply to all tower designs. The alternative approach is toassume that the uniformity of hydraulic distribution will varyin a non-linear fashion with tower height (H). In this cir-cumstance the effective wetted surface area will be related toheight as follows:
A'v - C (H)l-M (21)Av
whe re:
C = a correlation constant
(1-m) = a measure of the non-lineardistribution of film area.
As the value of m increases, the non-uniformity of film growthwith height also increases. At m = 0 slime growth is uniformthroughout the tower at m = I there is no slime growth in thetower. The full scale relationships when at > 0 is:
f k2 0 OAT(H) 1-m/(q)n (22)
Full scale design equations for the balance of the kineticmodels are summarized on Table 1.
Scale-up Calculations
Whey and Sewage- using a packing with Av = 27 ft 2ft -3
F0. plane = 0.0018 gpm/ft = k p
A = Cw x ftxA
2= 0.9 x 0.9 x 27 = 22 ft ft- 3
= 1 A'
k20o(TOWER) k Av
1023
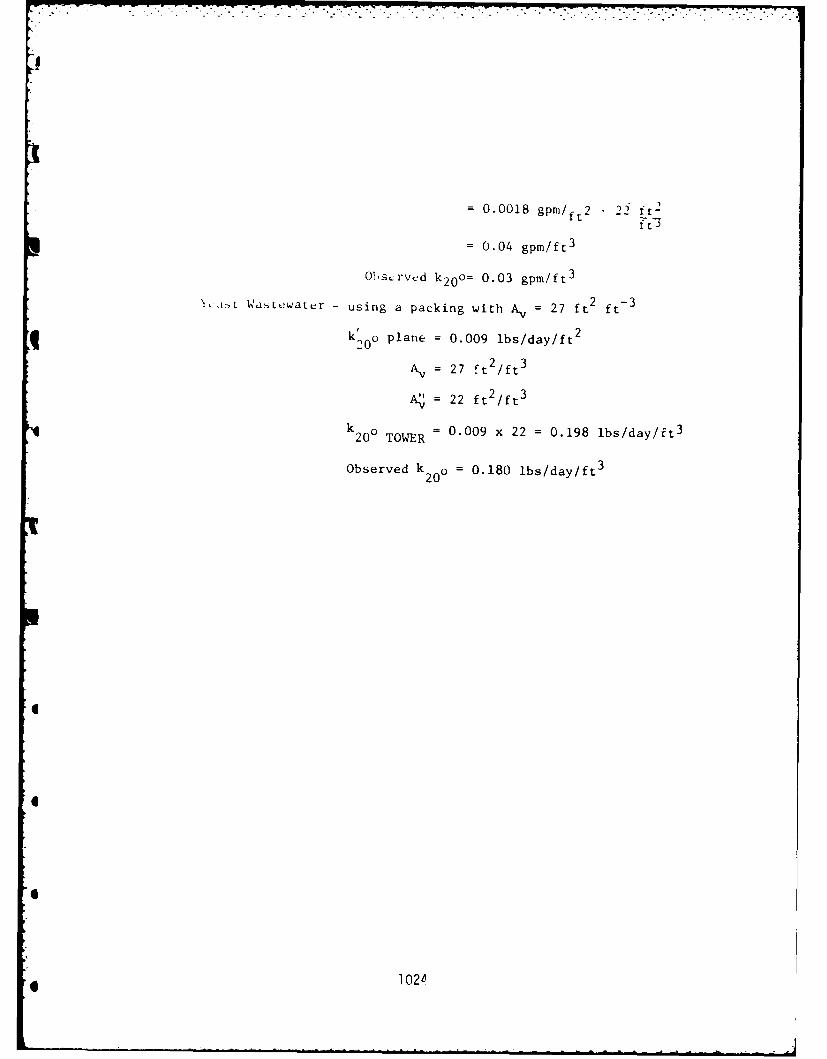
= 0.0018 gpm/ft2 22 it2
ft.
= 0.04 gpm/ft3
O1s-rved k 20 o= 0.03 gpm/ft3
\ ,isL Wastewatur - using a packing with Av = 27 ft2 ft- 3
k',oo plane = 0.009 lbs/day/ft2
A = 27 ft2/ft3
A = 22 ft2 /ft3
k 200 TOWER = 0.009 x 22 = 0.198 lbs/day/ft 3
Observed k20 = 0.180 lbs/day/ft3
4
1020
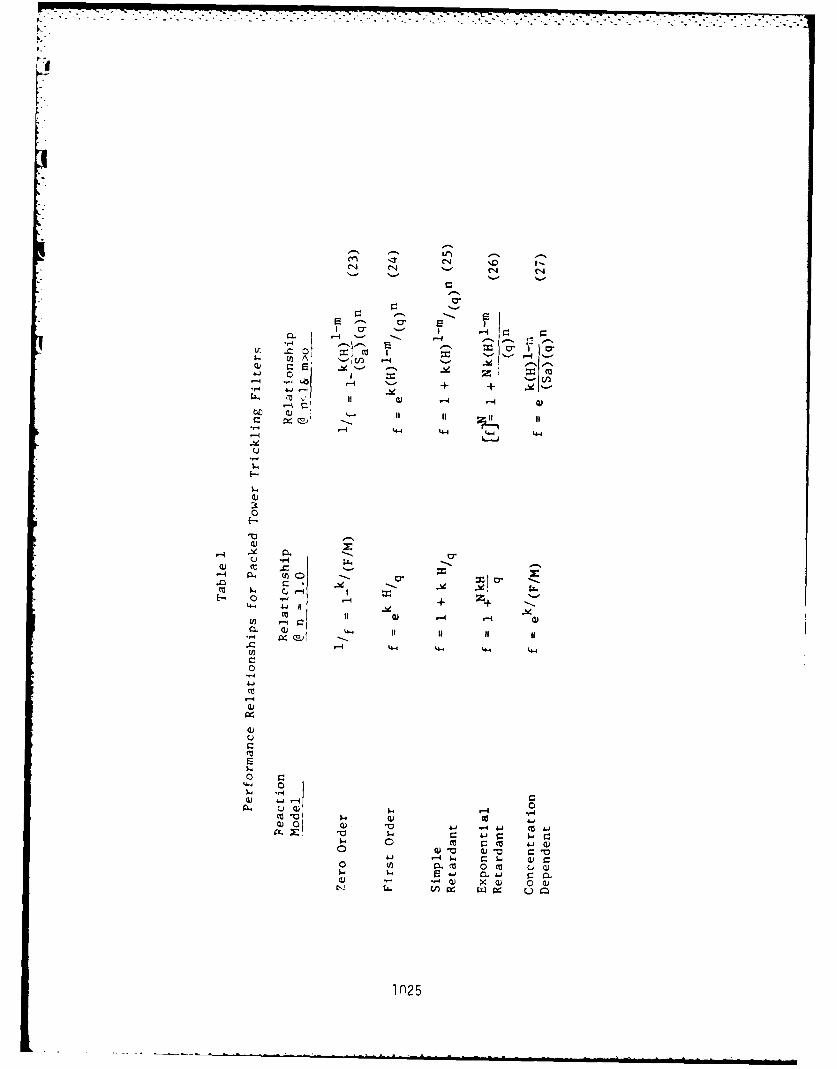
14 C14 N ~ -
u ~ ~ ~ 1 Ad-n - .-
g~i *-.
*0-4 -4 4-4 44 - 44
J-4
E.)
I-r
I.
0l)
$-
u 0-4 1-4 .14
C.) 4-4
I0 C~-l "a
U)L)
0. 44-4 ii I
U) -4 4-4 4-4 '.4-
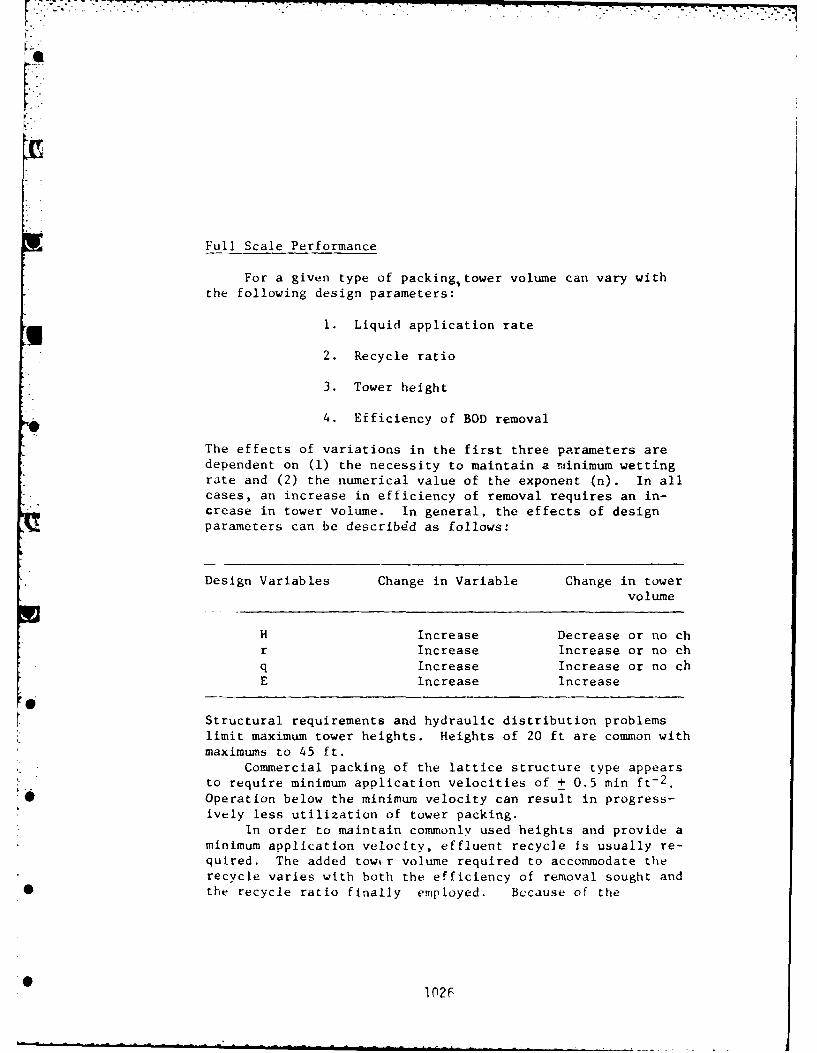
Full Scale Performance
For a given type of packing1 tower volume can vary withthe following design parameters:
1. Liquid application rate
2. Recycle ratio
3. Tower height
4. Efficiency of BOD removal
The effects of variations in the first three parameters aredependent on (1) the necessity to maintain a mlinimum. wettingrate and (2) the numerical value of the exponent (n). In allcases, an increase in efficiency of removal requires an in-crease in tower volume. In general, the effects of designparameters can be describidd as follows:
Design Variables Change in Variable Change in towervolutme
H Increase Decrease or no chr Increase Increase or no chq Increase Increase or no chE Increase Increase
Structural requirements and hydraulic distribution problemslimit maximum tower heights. Heights of 20 ft are common withmaximums to 45 ft.
Commercial packing of the lattice structure type appearsto require minimum application velocities of + 0.5 min ft-2
Operation below the minimum velocity can result in progress-ively less utilization of tower packing.
In order to maintain commonly used heights and provide aminimum application velocity, effluent recycle is usually re-quired. The added Lowt-r volume required to accommodate therecycle varies with both the efficiency of removal sought and
*the recycle ratio finally employed. Because of the
102
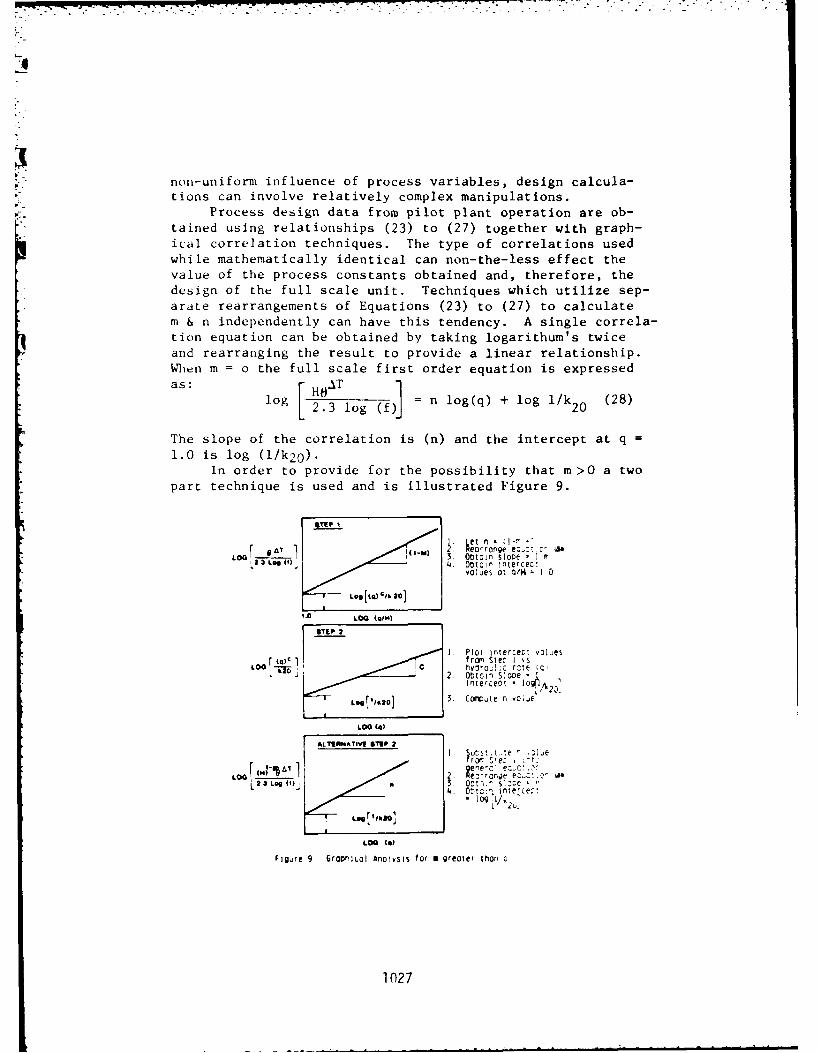
U
non-uniform influence of process variables, design calcula-tions can involve relatively complex manipulations.
Process design data from pilot plant operation are ob-
- tained using relationships (23) to (27) together with graph-
ical correlation techniques. The type of correlations usedwhile mathematically identical can non-the-less effect the
value of the process constants obtained and, therefore, thedesign of the full scale unit. Techniques which utilize sep-
arate rearrangements of Equations (23) to (27) to calculatem & n independently can have this tendency. A single correla-
tion equation can be obtained by taking logarithum's twiceand rearranging the result to provide a linear relationship.When m = o the full scale first order equation is expressedas: r H .T
log L23 log (fj = n log(q) + log I/k20 (28)
The slope of the correlation is (n) and the intercept at q =
1.0 is log (1/k2 0 ).In order to provide for the possibility that m>O a two
part technique is used and is illustrated Figure 9.
et 0b___n 4O___-'n
3 O2 3 LOG (1) 4. ObtOin interceo:volues ot 0/H- 1 0
-STP0 LOG (aim)
i. Plot interce;: v-1 jesLOG fro Ste: I s
C2. Obtoi Slo DeInterceP! - Io A .
gl/k2] 3. Cornute n v~o;e
LOG (a)
II02
LOG 2 . -:ronie e: c: .o-t 23 Log M I. 3. Ootv-' s!)e
LOG (a)
Figure 9 GrOONLcOl Anal~ysis for M greater tha~n 0
1027
A correlation is first obtained for variable tower heightat constant hydraulic rate (q). Double logarithums of equa-tion (24) are used together with a mathematical substitutiondesigned to eliminate the effects of the hydraulic coefficient(n) from the correlation. With the influence of (n) thuseliminated, the value of m may be determined. The elimina-
tion of (n) is obtained by making the following substitution,
g n = (1-m) + C (29)
where C = a constant whose valuedetermined from test data,will be such as to make the above statement valid.Using this substitution with equation (24) the following lin-ear equation is obtained after logarithums are taken twice:
log log (f= (1-m) log (q/H) + log (CONSTANT)(30)
where : Constant = (q) c/k20
Using variable height data with constant hydraulic rate a plotof equation (30) will yield (1-m) as a slope. At this junc-ture, no use of the correlation intercept is made as the pur-pose of the substitution was to remove (n) from the slope andrelocate it in a constant value intercept as part of C. Theintercept value has no other use in this part of the correla-t ion.
If data are taken over a range of hydraulic rates then aplotmay be made separately for each (q) value. This will pro-vide a number of intercept values. These intercept valuesmay then be related to hydraulic rate in such a way as toyield the numerical value of C.
log [ 2)c C log(q) + log 1/k 2 0 (31)
Log (q)c/k20 is obtained as the intercept value from prioruse of equation (30). Tower performance on the treatment ofblack liquor from Eckenfelder (8) is shown in Figure 10. Datafor an integrated kraft mill effluent, Quirk (9), is shown onFigure 11. Again n - 1.0 and a k2 0 = 0.056 gpm/CF is deter-
mined.Experience of the authors has shown that unless tower
* operation is below a minimum wetting rate or there is a
S 102P
- - - . . . . ..
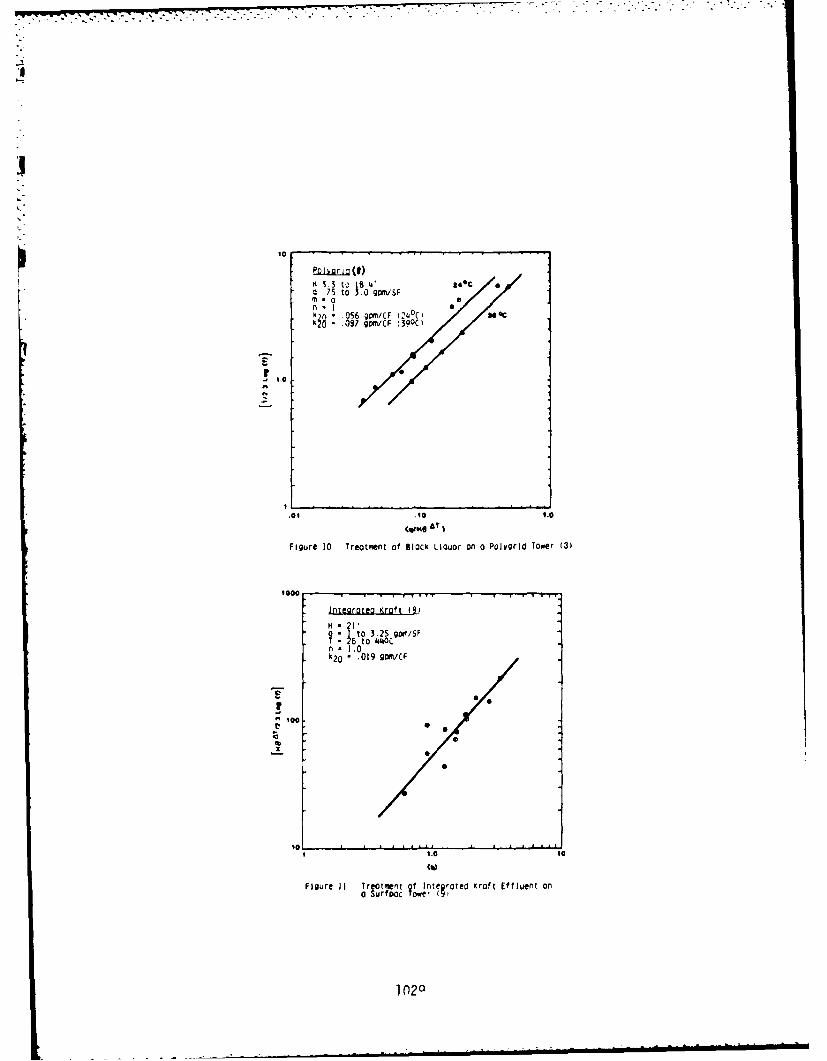
*11
CI
0 .73 t0 3.0 QP1uSFm.0
.0!5O6 g~/FQ0c 0O
-...
.01 .1" 0 l=/ ,/
Figure 10 Treatment of Block LiQuor onl a Polygrid Tower (3)
1000.
lntegratea K(raft a)
H *21!
L t.0
k20 .019 gm/CF
C
0 1
Figure 11 Tretment f l Iegre Kraf Eflun Podr~ one 3
sO00
n-}.0
.1 1.0 10
(0)
Figure Ii Treotment of integ rotec Krnft Effiuent on0 Surfooc Tower (9
1 fl29
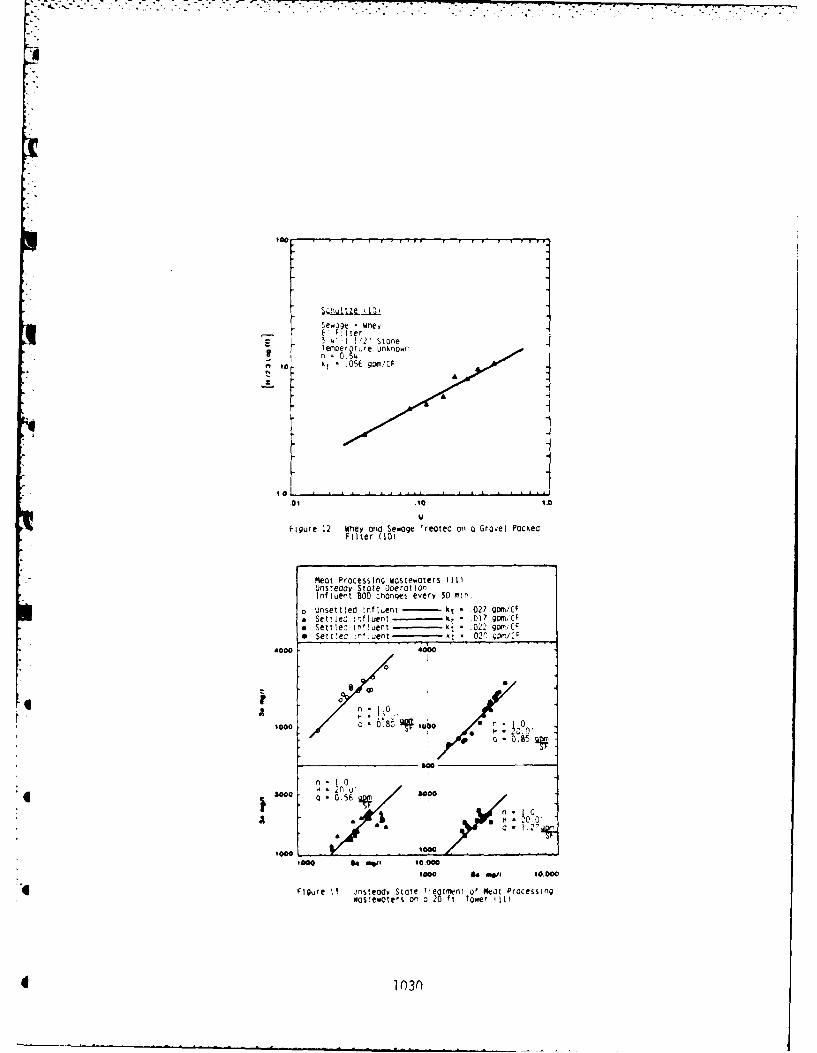
Se *q, whey-6' Fjter-3 , '-I ' 2" Stone
Ufigure 12 Whey oa Sewage Treotedi on a Grove( PocKed;
Filter (10)
Meat Processing WcstewaterS tillUnsteady State DoerotiaflInfluent BOD changes every 30 minf.
o unsettledl influent - t .027 gait/CF* Sett lec intfluent r C(f17 gp,CF* Settled in'luent kt *.021 gai,C1* Seuea, :nljaent *.02', q~li
0
08.8
*0S60
100000 e /a #.0
4Figure i5 vnsteady State !'eatlIwrM of Peat Processingwastewoters on a 20 ft lower ill)
4 1030
-.
malfunction in the hydraulic distribution, the value of m willequal 0 and n = 1.0 when dealing with vertical sheet flowpacking.
When working with random packing, values of n<l.O will
be obtained. The data of Schultze (10) treating sewage pluswhey on a 6'deep gravel packed filter are shown on Figure 12.The 3/4 to 1 1/2" stone media provided a specific surfacearea computed at 36 SF/CF. Filter operation covered a rangein hydraulic loading of from 0.0375 to .375 gpm/SF. An (n)value less than 1.0 is evident. A reaction rate of.056 gpm/CF was determined.
The doctoral thesis data of Moodie (11) allows an exam-ination of the correlation technique when applied to unsteadystate performance. Using a 3 sq/ft tower, 20' high, Moodieexperimented with meat processing wastewaters with a COD ofup to 5000 mg/l. Hydraulic rates varied from 0.56 to 1.27gpm/SF and an intermediate effluent sampling point at 12' wasused. Every 30 minutes the COD of the influent was changedwhile the hydraulic rate remained constant. The response ofthe tower to these variations in loading is shown in Figure13. Effluent concentration (Se) is related to influent concen-tration (Sa) using a First Order Reaction and equation (24).Even though there is considerable scatter in some of the data,the general applicability of the correlation is evident.
A comparison of unsteady state reaction rates with hy-draulic loading and influent concentration variations is pro-ivded in Table 2 and demonstrates that with careful samplingtechnique, stable performance data can be obtained fromunsteady-state operation. Where such control can not be ob-tained, as in a field installation which is not used for aPh.D. thesis, much more variation in unsteady-state perfor-mance can be expected. This is illustrated in Figure 14 foryeast fermentation effluent treated in a 21pilot tower re-ceiving continuously variable flows and influent concentra-tions, Quirk (7). The inclined plane data previously refer-enced on Figure 8 were superimposed on the pilot plant data.The scale-up calculations described above were used. The lab-oratory k'of 9 x 10- 3 scaled-up to 0.180 lbs/CF/day. Figure14 illustrates that on the average the unsteady-state fielddata group around the scale-up line from the laboratory plane.
An additional aspect of hydraulic loading is illustratedin studies of Eckenfelder (15). Eckenfelder utilized a pilotplant equipped with a vertically oriented asbestos packing,operating over 7 to 1 height change, and 3 to 1 variation inhydraulic loading. His data are presented in Figure 15.
1n3'
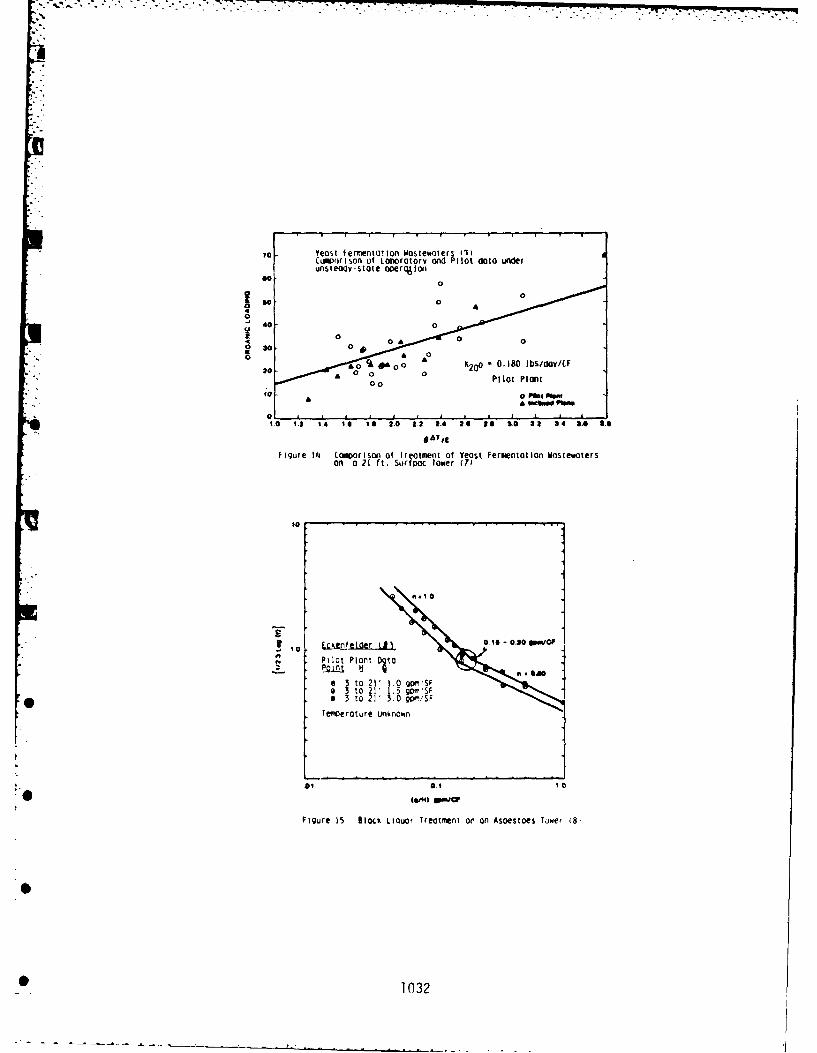
To veast Fernenitat Ion Wastewaters (1)(imrsnof Laorartory and Pilot data under
unsteoay-state operol600
00
.0-
30 - 0 O &(0 . 8 l s d y C
Pilot Plant
to a Pilo. p...w
1.0 1.2 IA to is 2.0 2.2 11.4 2.6 2641 3.0 3.2 34 8.6 6.6
Figure Ili LC1marlson of treatment of Yeast Fermentation wastewatersOn a 21 ft. Surfvac rawer (7)
* 3 to21: jpMS
Terw'erature Unknown
W0 0.I I
Figure 15 Block Liouor Treatmyent on an Asoestoes Taser (8
5 1032
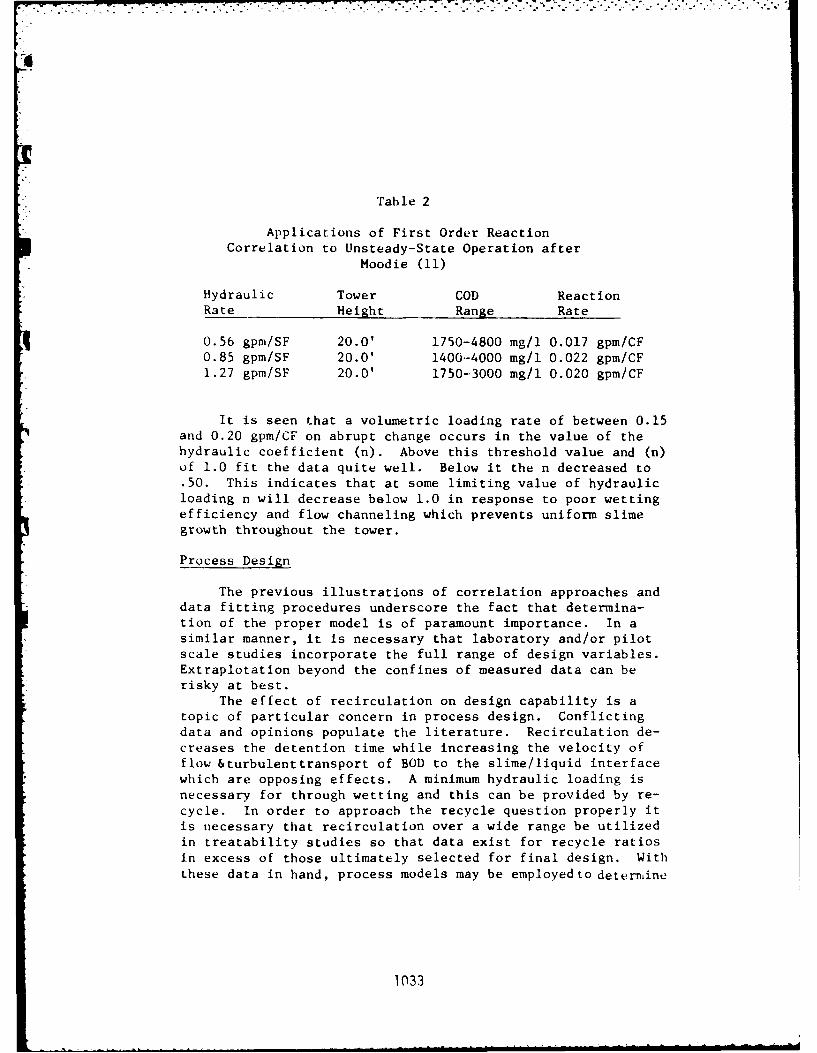
Table 2
Applications of First Order ReactionCorrelation to Unsteady-State Operation after
Moodie (11)
Hydraulic Tower COD ReactionRate Height Range Rate
0.56 gpm/SF 20.0' 1750-4800 mg/l 0.017 gpm/CF0.85 gpm/SF 20.0' 1400-4000 mg/i 0.022 gpm/CF1.27 gpm/SF 20.0' 1750-3000 mg/i 0.020 gpm/CF
It is seen that a volumetric loading rate of between 0.15and 0.20 gpm/CF on abrupt change occurs in the value of thehydraulic coefficient (n). Above this threshold value and (n)of 1.0 fit the data quite well. Below it the n decreased to
.50. This indicates that at some limiting value of hydraulicloading n will decrease below 1.0 in response to poor wettingefficiency and flow channeling which prevents uniform slimegrowth throughout the tower.
Process Design
The previous illustrations of correlation approaches anddata fitting procedures underscore the fact that determina-tion of the proper model is of paramount importance. In asimilar manner, it is necessary that laboratory and/or pilotscale studies incorporate the full range of design variables.Extraplotation beyond the confines of measured data can berisky at best.
The effect of recirculation on design capability is atopic of particular concern in process design. Conflictingdata and opinions populate the literature. Recirculation de-creases the detention time while increasing the velocity offlow &turbulenttransport of BOD to the slime/liquid interfacewhich are opposing effects. A minimum hydraulic loading isnecessary for through wetting and this can be provided by re-cycle. In order to approach the recycle question properly itis necessary that recirculation over a wide range be utilizedin treatability studies so that data exist for recycle ratiosin excess of those ultimately selected for final design. Withthese data in hand, process models may be employedto determine
1033
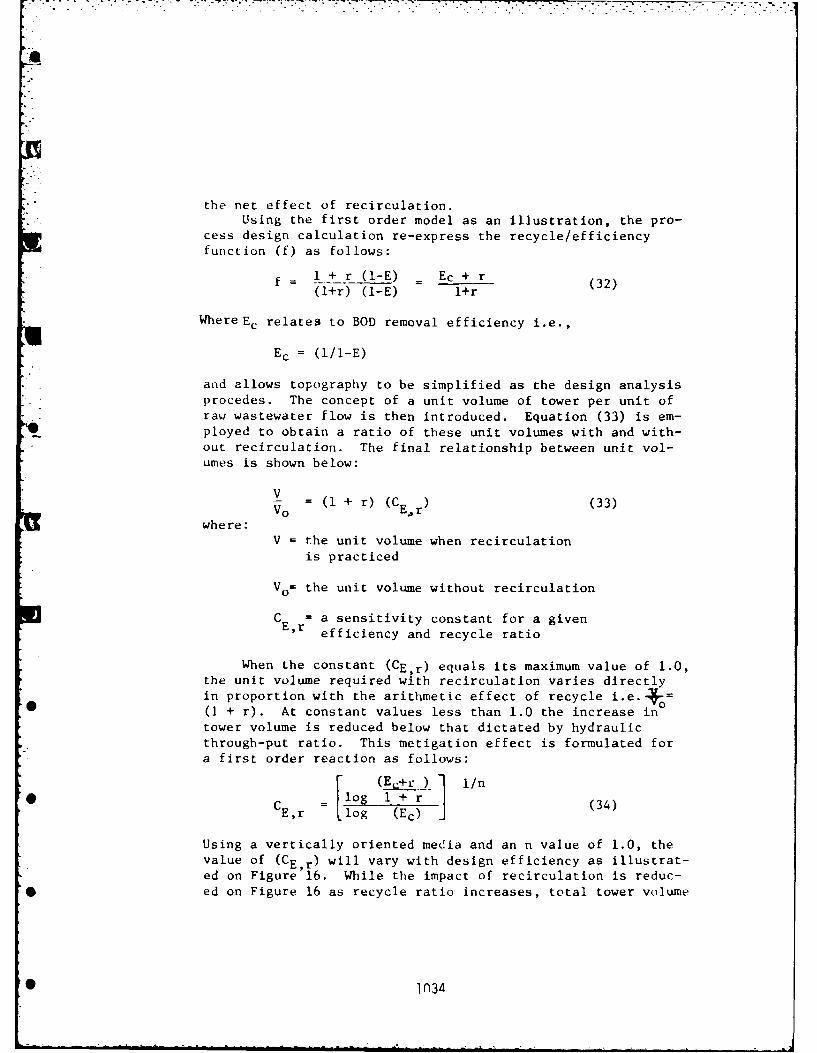
the net effect of recirculation.Using the first order model as an illustration, the pro-
cess design calculation re-express the recycle/efficiencyfunction (f) as follows:
f = 1 + r (l-E) _ Ec + r(l+r) (l-E) l+r
WhereE c relates to BOD removal efficiency i.e.,
Ec = (l/l-E)
and allows topography to be simplified as the design analysisprocedes. The concept of a unit volume of tower per unit ofraw wastewater flow is then introduced. Equation (33) is em-ployed to obtain a ratio of these unit volumes with and with-out recirculation. The final relationship between unit vol-umes is shown below:
V_
V = (I + r) (CE.r) (33)
where:V = the unit volume when recirculation
is practiced
Vo= the unit volume without recirculation
CE = a sensitivity constant for a given
,r efficiency and recycle ratio
When the constant (CE,r) equals its maximum value of 1.0,the unit volume required with recirculation varies directlyin proportion with the arithmetic effect of recycle i.e.- =
* (I + r). At constant values less than 1.0 the increase in
tower volume is reduced below that dictated by hydraulicthrough-put ratio. This metigation effect is formulated fora first order reaction as follows:
(Ec+r 1 /n
- log 1+ r (34)E,r = [log (Ec)
Using a vertically oriented media and an n value of 1.0, thevalue of (CE,r) will vary with design efficiency as illustrat-ed on Figure 16. While the impact of recirculation is reduc-
* ed on Figure 16 as recycle ratio increases, total tower volume
* 1034
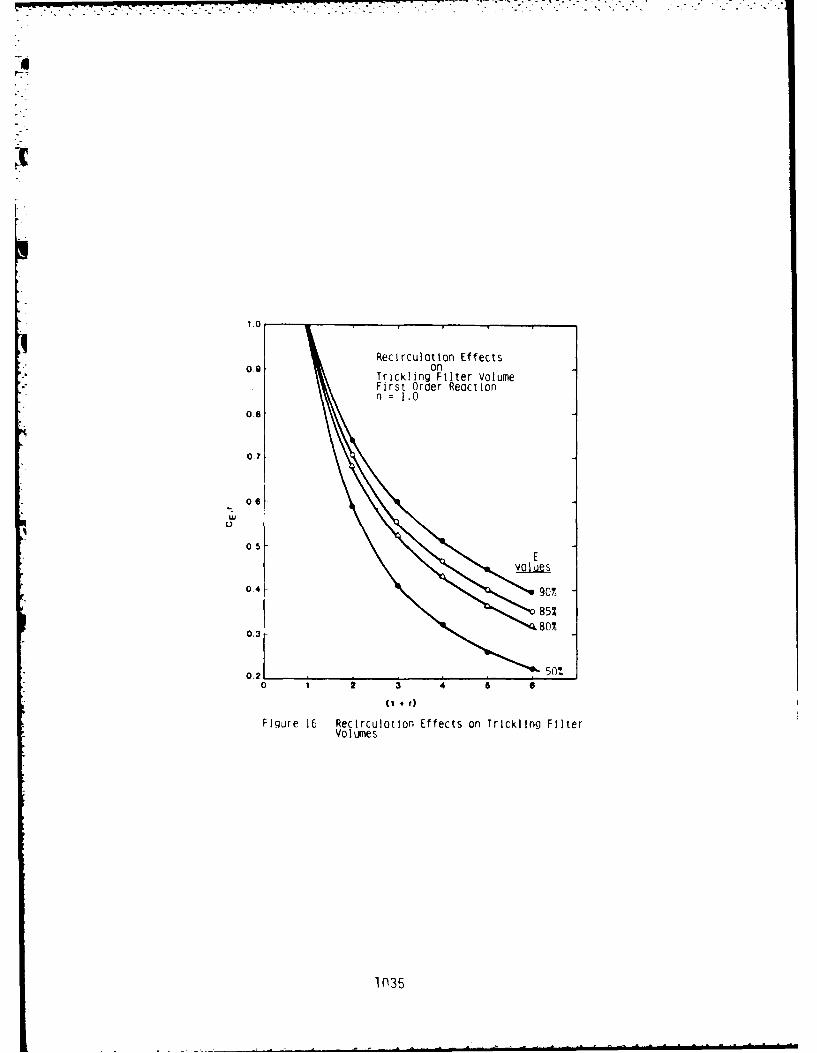
1.0
Recirculation Effects09 on
Trickling Filter VolumeFirst Order Reactionn =1.0
0 8
0.7
06
0 5E
values
0A4 90%
85%
0.3-80
0.21 511%0 1 2 3 4 6 6
Figure 16 Recirculatian Effects on Trickling FilterVolIume s
1035
p .7
- - experiences a net increase. Unit volume ratios are comparedwith design efficiency requirements and recycle ratios in ageneral manner on Table 3. The analysis shows that recircu-lation effects are moderate only for low removal efficiencyor tower performance as a pretreaLiaent or roughing unit.
At (n) values less than 1.0 the effects of recycle aremuch reduced over these shown on Table 5. For example, atn = 0.50 the unit volume ratio approaches 1.0 even though ef-ficiency is 90% and a recycle ratio of 2.0 is used. This maybe compared with a volume ratio of 1.7 under comparable con-ditions when n = 1.0. However, this can be only an apparantvolume reduction in that at n values less than 1.0 towermedia is not being used effectively and the value of k20 will
be reduced. This can offset the reduced effects of recycleusage.
A similar process design approach is used for the alter-native reaction models. Unit volume relationships for thesemodels are shown on Table 4.
A summary of reaction rates and reaction models for in-dustrial effluents is presented on Table 5. In each casesited, tower media was of.the vertically oriented type.
1
0
0O
0 03
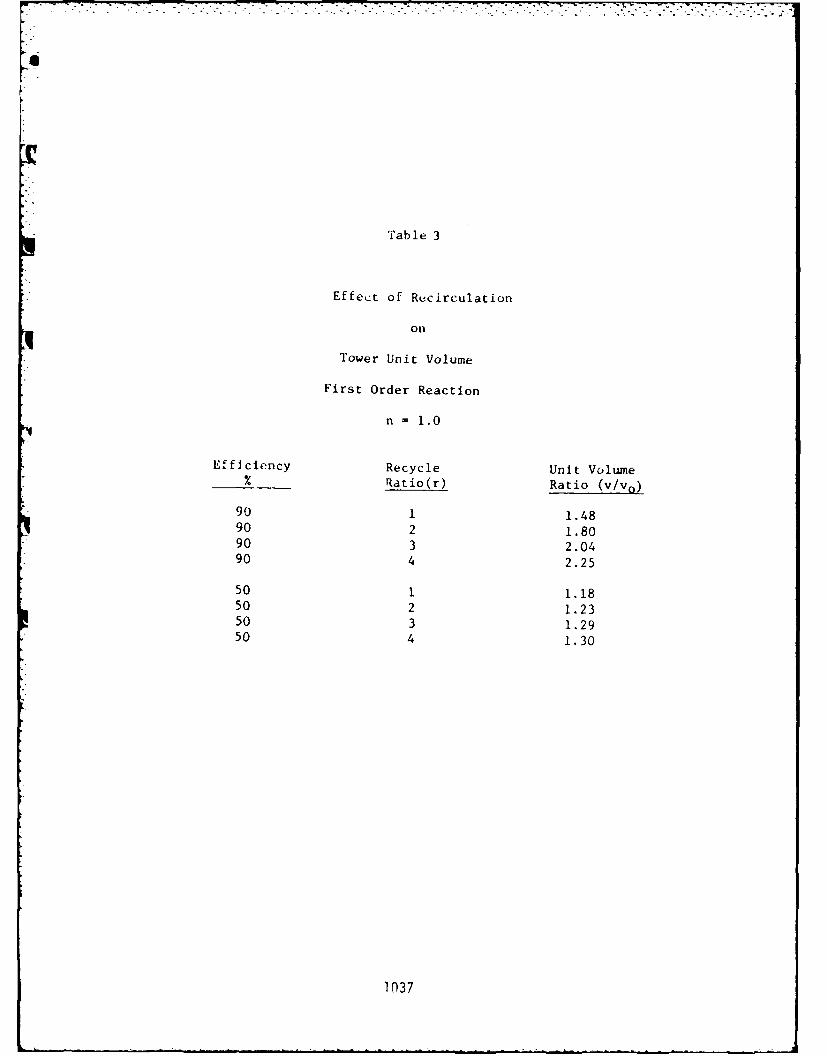
Table 3
Effect of Recirculation
on
Tower Unit Volume
First Order Reaction
n = 1.0
Efficiency Recycle Unit Volume%_____ Ratio(r) Ratio (v/v,)
90 1 1.4890 2 1.8090 3 2.0490 4 2.25
50 1 1.1850 2 1.2350 3 1.2950 4 1.30
1037
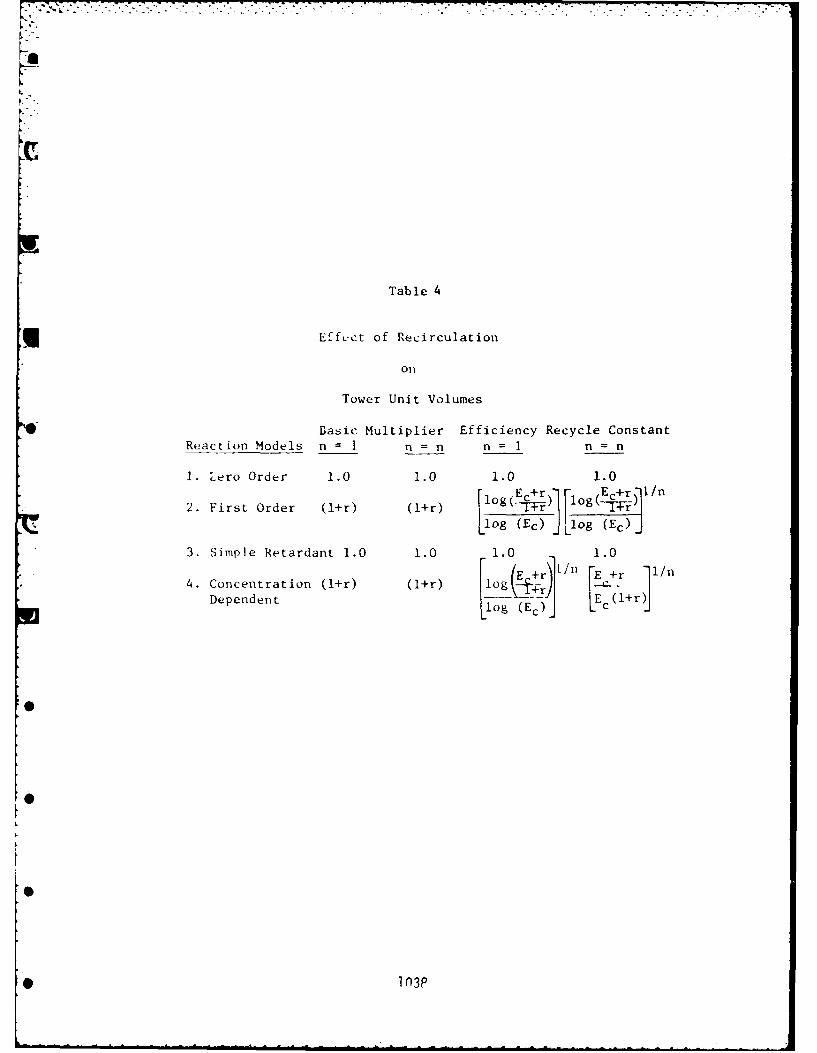
Table 4
Effvct of Recirculation
Oil
Tower Unit Volumes
Basic Multiplier Efficiency Recycle ConstantReaction Models n = 1 n = n n =1n n
1. Lero Order 1.0 1.0 1.0 1.0
2. First Order (1+r) (l+r) L lg -r) log(Ecr)1/log (Ec) o og( (E c)
3. Simple Retardant 1.0 1.0 101.0i1/11 ]1/n
4. Concentration (1+r) (1+r) log : rJI ~Dependent - og (TEc)j LEc (l+rj
S ~Inf3P
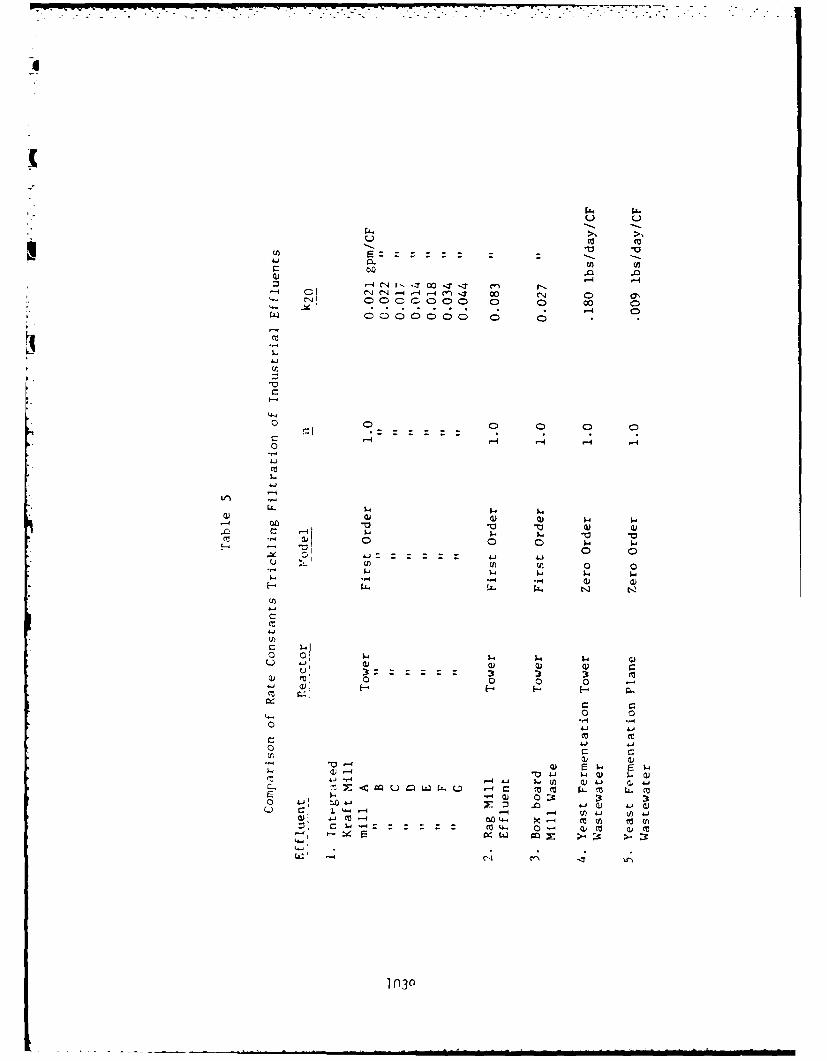
Z)C. -- C 1 0
(-4 t4 - r-4 en 'T - 0 C' 4 04 a,r 0 - ~- C) 0o C) 0 C
0Q0 0 0 0
'-4.j
-44
Lf:Ct4
H 1 o cc
4--4
'-4 .,-4
.1-V 4 c 1 0) Q)m )onl
i- W30
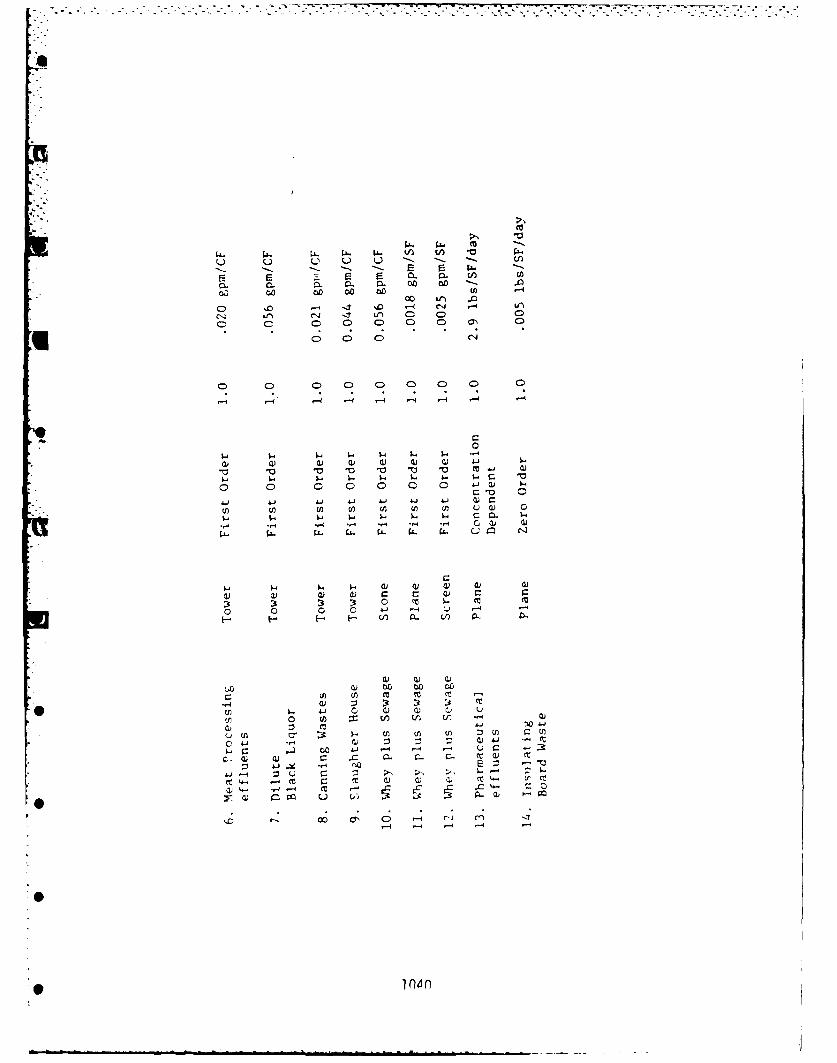
00. Li- C
q Ln C) 0 ~ - l
C) C; . ~ . d) U
C'4 c. (C 0
0) C0 (0
0) 0) 0 0 ) 0. L) J-
U) U) U) U) U) U) U)n0
i-j cc' 0)) 4
4. -1k 0 :3~
-4 cz w Gj CV
Cl u-- Q)-
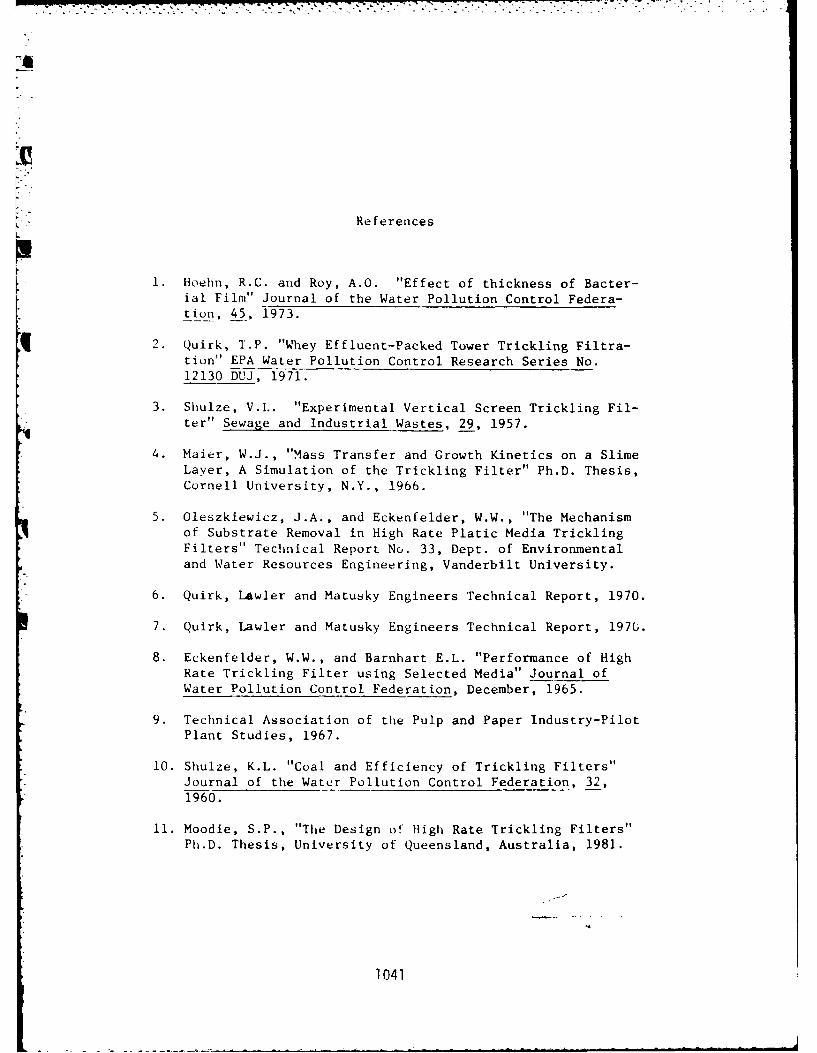
[.
References
1. Hoehn, R.C. and Roy, A.0. "Effect of thickness of Bacter-ial Film" Journal of the Water Pollution Control Federa-tion, 45, 1973.
q 2. Quirk, T.P. "Whey Effluent-Packed Tower Trickling Filtra-tion" EPA Water Pollution Control Research Series No.12130 DUJ, 1971.
3. Shulze, V.L. "Experimental Vertical Screen Trickling Fil-ter" Sewage and Industrial Wastes, 29, 1957.
4. Maier, W.J., "Mass Transfer and Growth Kinetics on a SlimeLayer, A Simulation of the Trickling Filter" Ph.D. Thesis,Cornell University, N.Y., 1966.
5. Oleszkiewicz, J.A., and Eckenfelder, W.W., "The Mechanismof Substrate Removal in High Rate Platic Media TricklingFilters" Technical Report No. 33, Dept. of Environmentaland Water Resources Engineering, Vanderbilt University.
6. Quirk, lAwler and Matusky Engineers Technical Report, 1970.
7. Quirk, Lawler and Matusky Engineers Technical Report, 1976.
8. Eckenfelder, W.W., and Barnhart E.L. "Performance of HighRate Trickling Filter using Selected Media" Journal ofWater Pollution Control Federation, December, 1965.
9. Technical Association of the Pulp and Paper Industry-PilotPlant Studies, 1967.
10. Shulze, K.L. "Coal and Efficiency of Trickling Filters"Journal of the Water Pollution Control Federation, 32,1960.
11. Moodie, S.P., "The Design of High Rate Trickling Filters"Ph.D. Thesis, University of Queensland, Australia, 1981.
1041
a7
TREATMENT OF COKE PLANT WASTEWATERS
IN PACKED BED REACTORS
1>" MEINT OLTHOF. INDUSTRIAL WASTE SECTIONDUNCAN, LAGNESE AND ASSOCIATES, INC.
JAN OLESZKIEWICZ. INDUSTRIAL WASTE SECTIONDUNCAN, LAGNESE AND ASSOCIATES, INC.
WILLIAM R. O'DONNELL. LEOPOLD COMPANY
The treatment of wastewaters originating from cokeoven operations has been studied in a wide variety ofbiological treatment operations. Most of these studieshave shown that this wastewater is biodegradable to alarge extent and that given enough acclimation, thebacteria can develop to fully treat compounds like phenol,cyanides and thiocyanates. .The work that- will bepresented in this paper describes the results of atreatability study of wastewaters originating from abenzol plant in an upflow biotower (UBT). The wastewater
* c)nstituents are the same as for coke oven wastewater,except that most of the constituents are present in some-what lower concentrations. The biotower used in thisstudy is a biological treatment process developed by theLeopold Company and operates more or less like a reversedflow trickling filter. The tower is packed with random
* plastic medium, the influent flows upward and air issupplied by aeration through a filter underdrain system.This paper will present the results of the treatability ofbenzol plant wastewater in this reactor. The main pur-pose of this study was to determine the loading at whichthe phenol was virtually completely removed from the
[• influent. The data obtained in this study will be
r -1042
L
i
compared with studies performed by other researchers withsimilar wastewater in activated sludge and with othertypes of fixed film reactors.,' In this way, it will bepossible to compare the performance of the differentbiological treatment reactors available.
EXPERIMENTAL SET-UP
The work conducted in this project was done with apilot unit of the upflow biotower (UBT). Figure 1 is aschematic diagram of the pilot plant set-up. The towerhad dimensions of 2 x 3 x 10 ft. high and was filled with39 ft. of raydom~plastic medium with a specific surfacearea of 30 ft /ft . The air was distributed through afilter underdrain at a rate of 2-5 scfm/ft . The waste-water was fed at varying flow rates (0.5-2 gpm) throughthe tower. The waste characteristics of the influent tothe UBT are shown in Table I. It shows that the averagesoluble organic carbon (SOC) concentration is 435 mg/l.The COD is about 1500 mg/l. This strength is about halfof waste ammonia liquor. The average phenol concen-tration was only 36 mg/l, which is significantly less thanin waste ammonia liquor. The fact that the ratio betweenCOD and phenol in this waste is so much higher than innormal waste ammonium liquor, indicates that the wastefrom the benzol plant contains many more organics inaddition to phenol, while waste ammonia liquor primarilycontains phenols as the organic material. Other specificorganics analyzed to be present in this waste are benzene,toluene and napthalene. The concentrations from grabsamples for these specific organics during this study arealso shown in Table I. The pilot plant was started up byfeeding activated sludge from an existing wastewatertreatment plant treating coke oven wastewater. The phenolremoval was virtually complete a few days after addingseed to the tower. During the pilot study, the reactorwas fed hydraulically with 0.5, 1 and 2 gpm of wastewater.The influent values fluctuated throughout this period sothat the organic load also fluctuated from day to day.
RESULTS OF THIS STUDY
The results of this study showed that the organicspresent in this wastewater are very well biodegradable andthat it is possible to treat this wastewater biologically
1043
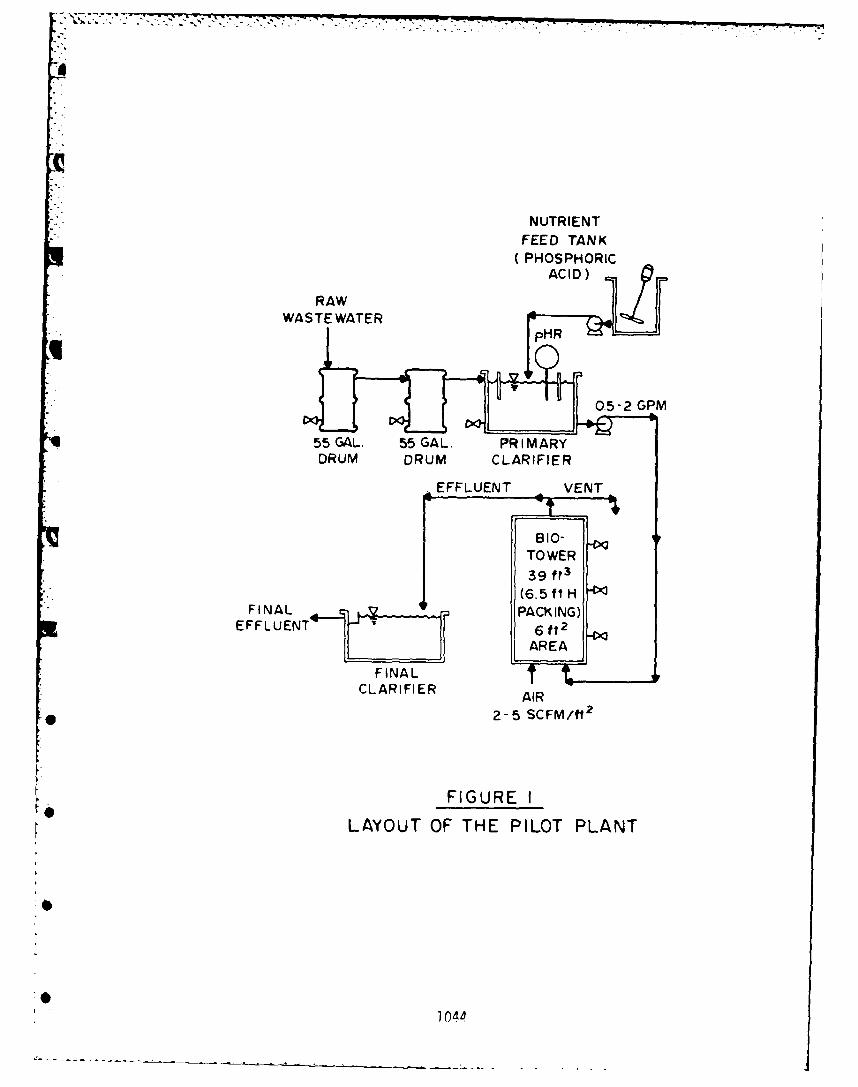
NUTRIENTFEED TANK(PHOSPHORIC
ACID)
RAWWASTE WATER
pH
55 GAL. 55 GAL. PRIMARYDRUM DRUM CLARIFIER
EFFLUENT VENT
TOWER
39 ft3
. (6.5 ft H
FINAL PACKINGEFFLUENT 6 f12J
FINALCLARIFIER AIR
* 2-5 SCFM/ft 2
FIGURE I
LAYOUT OF THE PILOT PLANT
*1O:L
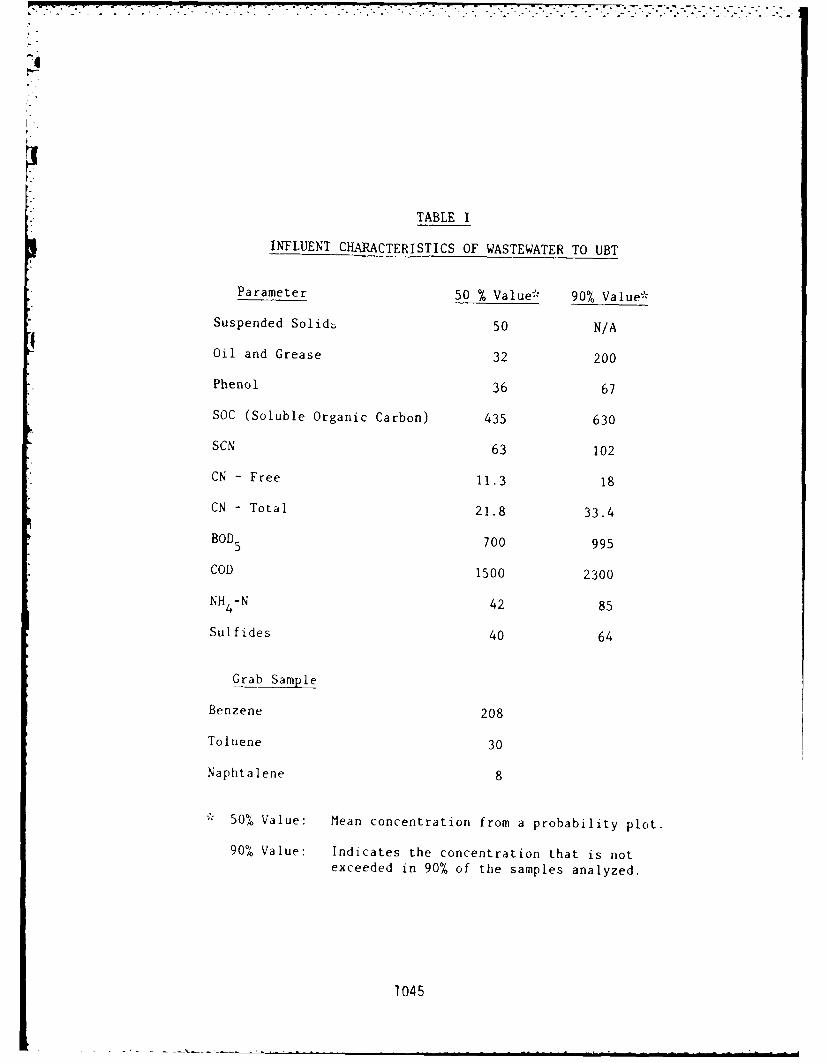
TABLE I
INFLUENT CHARACTERISTICS OF WASTEWATER TO UBT
Parameter 50 % Value* 90% Value*
Suspended SolidL 50 N/A
Oil and Grease 32 200
Phenol 36 67
SOC (Soluble Organic Carbon) 435 630
SCN 63 102
CN - Free 11.3 18
CN - Total 21.8 33.4
BOD 5 700 995
COD 1500 2300
NH -N 42 854Sulfides 40 64
Grab Sam le
Benzene 208
Toluene 30
Naphtalene 8
50% Value: Mean concentration from a probability plot.
90% Value: Indicates the concentration that is notexceeded in 90% of the samples analyzed.
1045
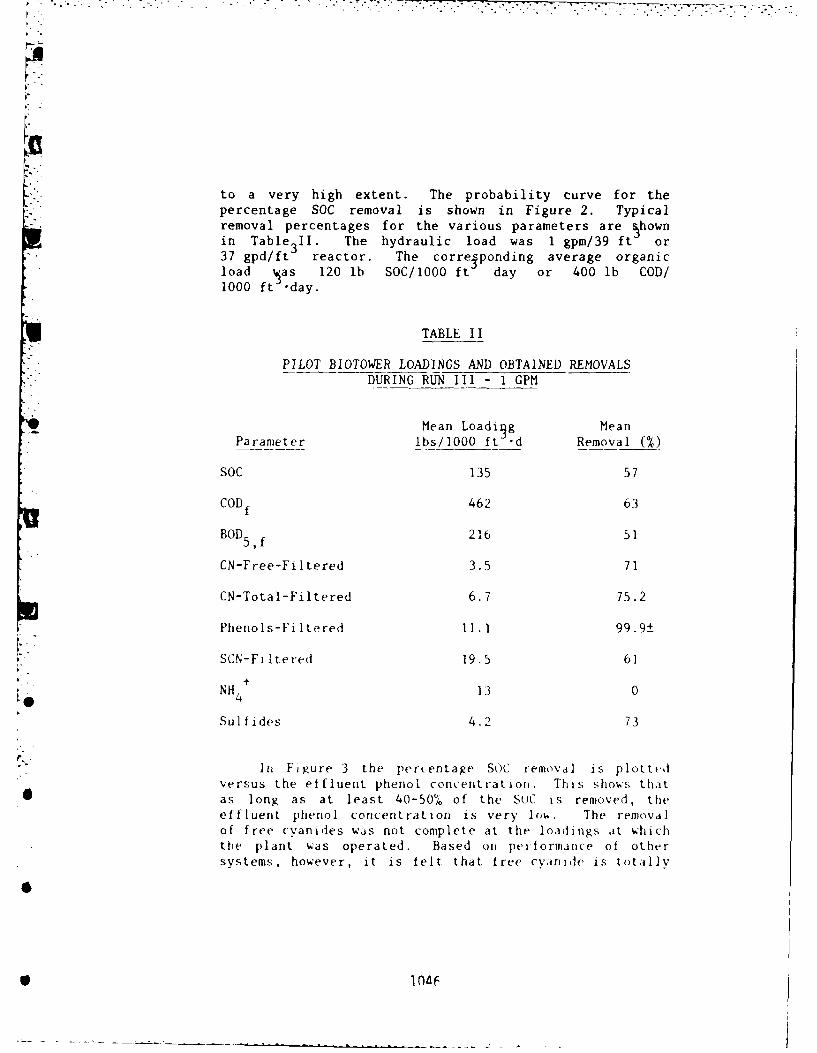
to a very high extent. The probability curve for thepercentage Soc removal is shown in Figure 2. Typicalremoval percentages for the various parameters are 5hownin Table 3 1. The hydraulic load was 1 gpm/39 ft or37 gpd/ft reactor. The correiponding average organicload ~as 120 lb SOC/lOOO ft day or 400 lb COD/1000 ft -day.
TABLE 1I
PILOT BIOTOWER LOADINGS AND OBTAINED REMOVALSDURING RUN III - I GPM
Mean Loading Mean
Parameter lbs/10OO ft' d Removal WO~
SOC 135 57
COD f462 63
BOD 5 ,f 216 51
CN-Free-Filtered 3.5 71
CN-Total-Filtered 6.7 75.2
Phenols-Filtered 11.1 99.9±
LSCN-Fii'tered 19.5 61
* - '
NH4 13 0
¢4
Sulfides 4.2 73
In Figure 3 the pert entage SOC renwva i is plottdversus the effluent phenol. concentration. This shows that
0 as long as at least 40-50% of the SUC is removed, theeffluent phenol concentration is very lovw. The removalof free c-vanides was not complete at the loadings at whichthe plant was operated. Based on performance of othersystems, however, it is felt that free cyanide is totally
S1 t104F
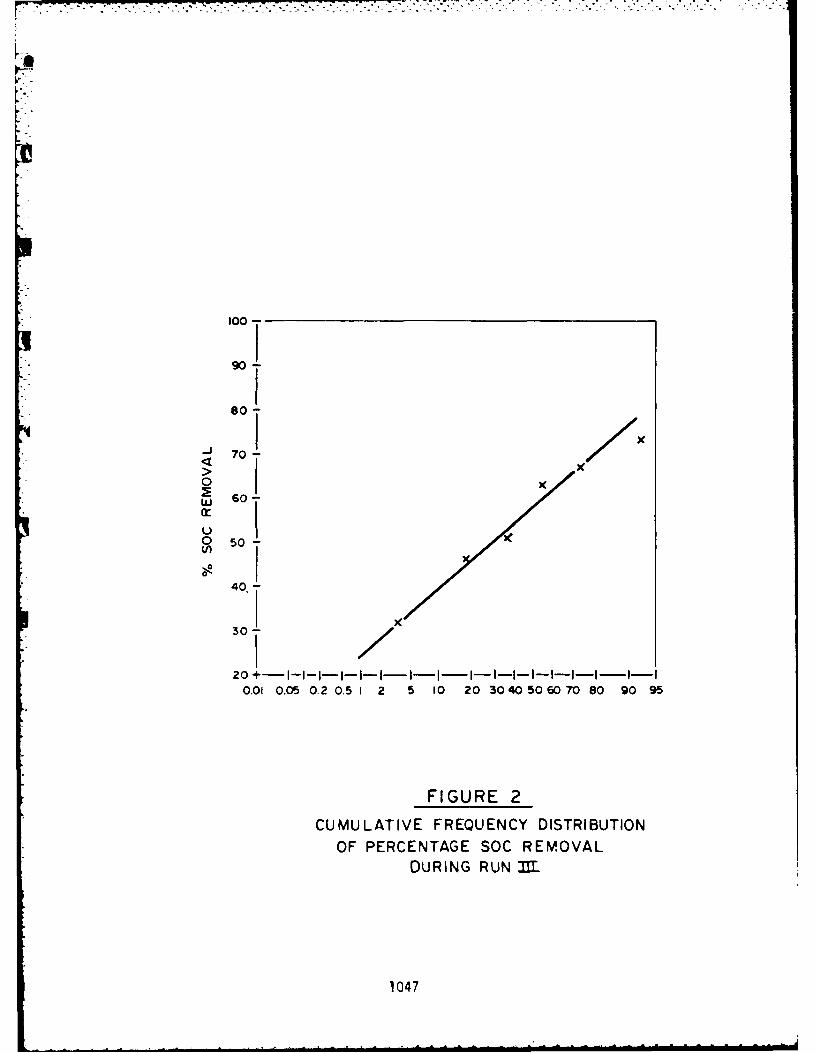
1001
7 )o
!"i
0
40,
30120 4- IIIIIIII -----
0.01 0.50.2 0.5 1 2 5 10 20 30 40 50 070 80 90 95
FIGURE 2
CUMULATIVE FREQUENCY DISTRIBUTIONOF PERCENTAGE SOC REMOVAL
DURING RUN
1047
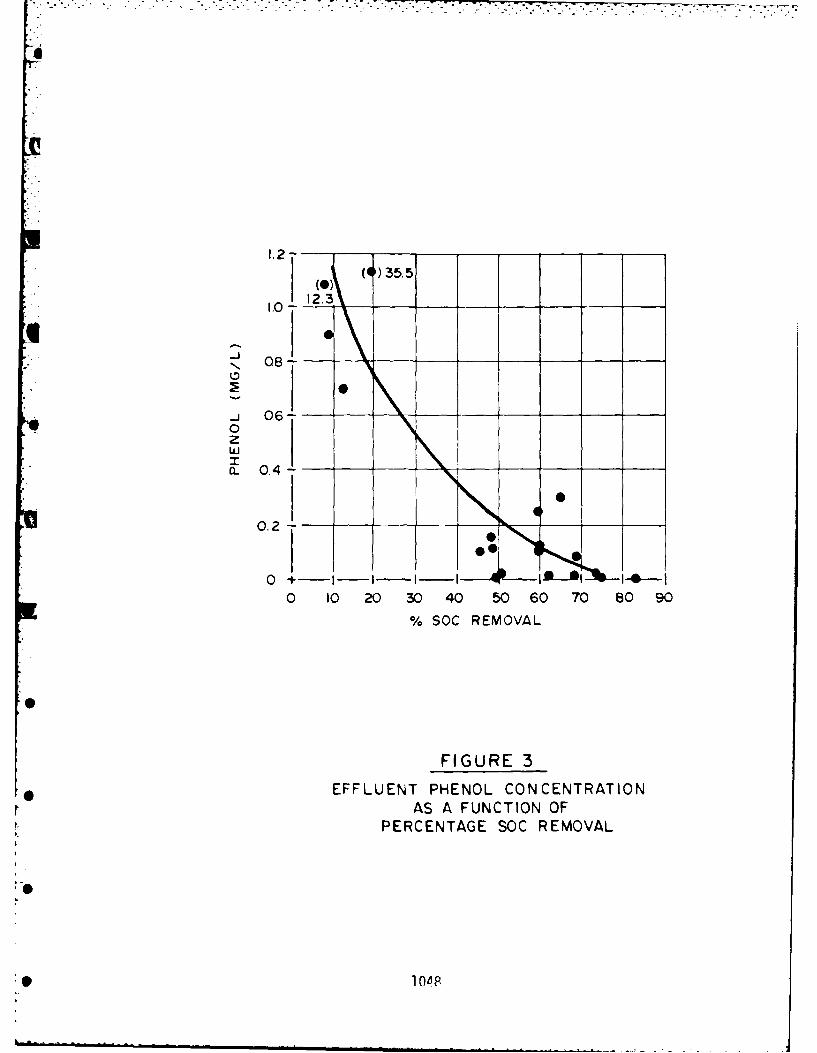
I
1.2")35.5• (O)
1.0- 123_ _ _
0'0
-J 0.60
uim.. 0.4
0.2 -
0 +----I----I
0 10 20 30 40 50 60 70 80 90
% SOC REMOVAL
!
FIGURE 3
EFFLUENT PHENOL CONCENTRATIONAS A FUNCTION OF
PERCENTAGE SOC REMOVAL
1
0 10 P
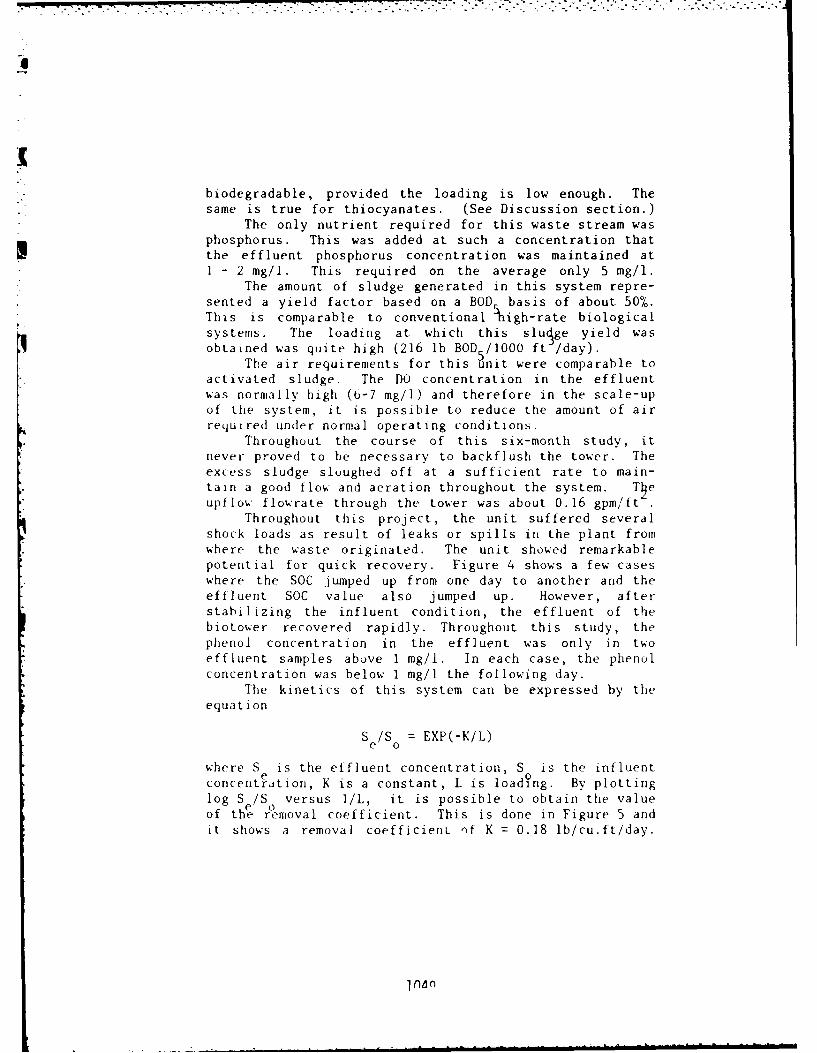
biodegradable, provided the loading is low enough. Thesame is true for thiocyanates. (See Discussion section.)
The only nutrient required for this waste stream wasphosphorus. This was added at such a concentration that
Ithe effluent phosphorus concentration was maintained at- 2 mg/l. This required on the average only 5 mg/l.
The amount of sludge generated in this system repre-sented a yield factor based on a BOD basis of about 50%.This is comparable to conventional high-rate biologicalsystems. The loading at which this sludge yield wasobtained was quite high (216 lb BOD /1000 ft /day).
The air requirements for this unit were comparable toactivated sludge. The DO concentration in the effluentwas normally high (6-7 mg/i) and therefore in the scale-upof the system, it is possible to reduce the amount of airrequired under normal operating conditions.
Throughout the course of this six-month study, itnever proved to be necessary to backflush the tower. Theexcess sludge sloughed off at a sufficient rate to main-tain a good flow and aeration throughout the system. T~eupflow flowrate through the tower was about 0.16 gpm/ft
Throughout this project, the unit suffered severalshock loads as result of leaks or spills in the plant fromwhere the waste originated. The unit showed remarkablepotential for quick recovery. Figure 4 shows a few caseswhere the SOC jumped up from one day to another and theeffluent SOC value also jumped up. However, afterstabilizing the influent condition, the effluent of thebiotower recovered rapidly. Throughout this study, thephenol concentration in the effluent was only in twoeffluent samples above 1 mg/l. In each case, the phenolconcentration was below 1 mg/l the following day.
The kinetics of this system can be expressed by theequation
S e = EXP(-K/L)
where S is the effluent concentration, S is the influentconcentration, K is a constant, L is loading. By plottinglog S /S versus I/L, it is possible to obtain the valueof the removal coefficient. This is done in Figure 5 andit shows a removal coefficient of K = 0.18 lb/cu.ft/day.
lnO
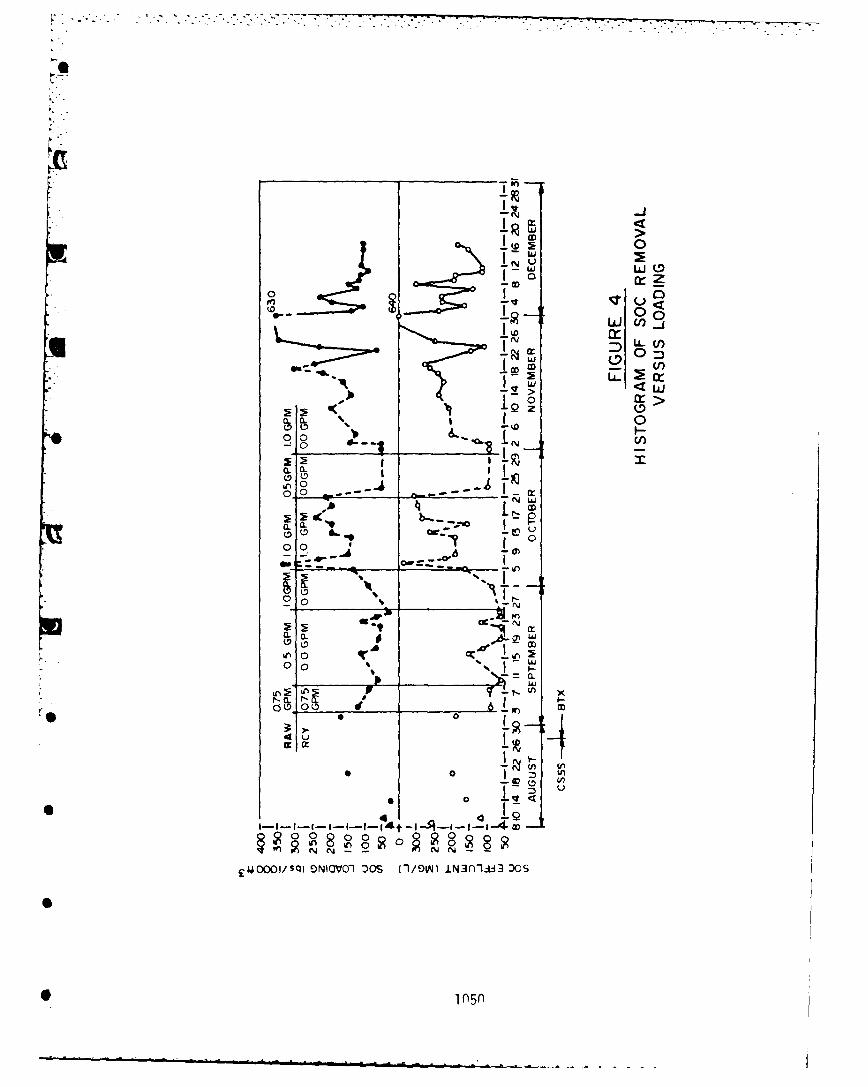
CD .r Z
00(n(
0 0
ODU (n
~ Lz 0~ 0
Q.-
~0 N____ -
rl CD.dc -
0 0. "0
to-0I Q.
Fn
g L0* L~ 0' 6 .CC
W
5 ~05
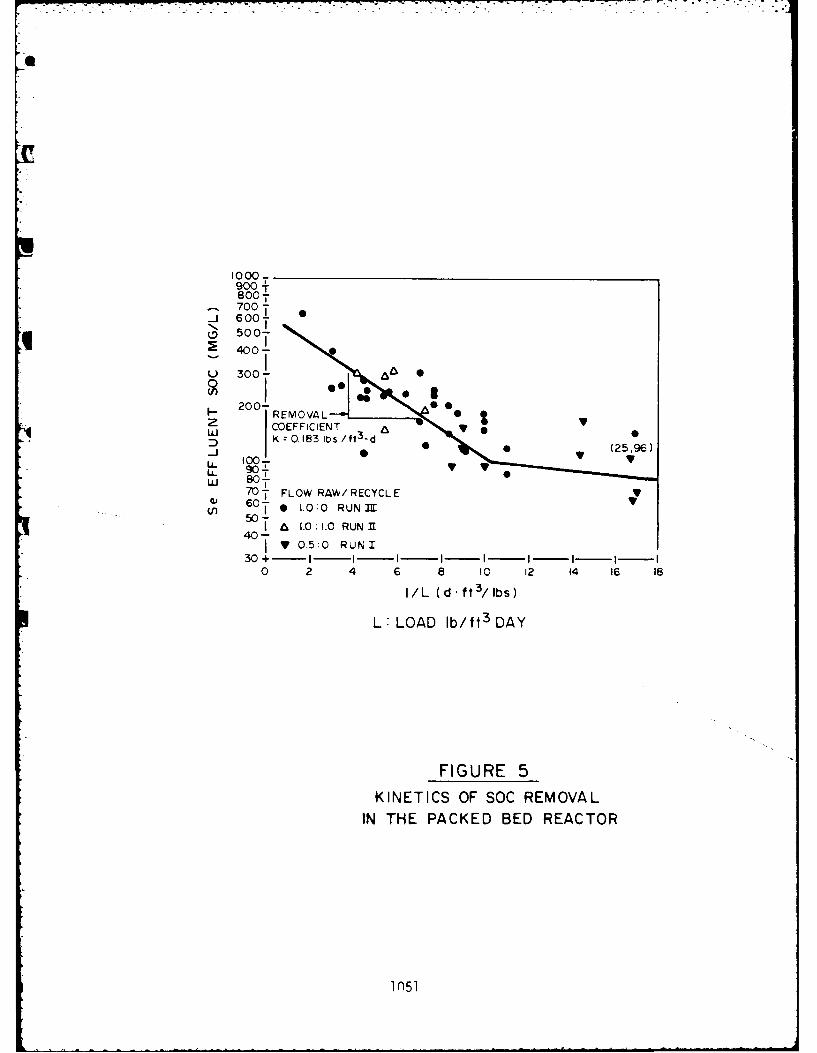
1000-900-800-T700-
L9500-
U 300-a
L 2 00-
U- 90 -LU 0
707 FLOW RAW/ RECYCLE60j * 1.0:0 RUJN M
U) 50-
40 A LO:.1.0 RUN 1
V 0.5:0 RUN I30D +~I
0 2 4 6 8 10 12 14 16 18
I/L (d-ft 3 /bs)
L: LOAD Ib/ft 3 DAY
FIGURE 5KINETICS OF SOC REMOVAL
IN THE PACKED BED REACTOR
10l51
DISCUSSION
It is possible to compare the performance of thisupflow biotower with results reported by other investi-gators of other biological systems. Since the mainobjective of various biological systems is to have thehighest organic loading and the smallest possible volumeand still provide a stable operation, the results of alldata that will be discussed in this paper are expressed interms of performance versus volumetric organic load.Activated sludge data can be converted to this by assumingthat the activated sludge concentration is 3 g/l of activebiomass. The results for COD removal are plotted inFigure 6 and it shows that the performance of the UBT isquite favorable. The performance of activated sludge isvery close to the packed bed reactor, b' t one of thedisadvantages of activated sludge, i.e. the sludgesettling, has been avoided. Also, for an industrial typeof operation, it is felt that a fixed film bioreactor ismore suitable to handle shock loads.
The removal of CN and SCN was only partial at theorganic loadings the plant was operated. Generally, thesecomponents are biodegradable at lower loadings. Figures 7and 8 show the percentages removal and the effluent con-centrations for these parameters as a function of loadingsfor several types of systems. These data show quite afluctuation between thu various reported data. Ingeneral, the breakdown of CN and SCN are thought to betotally 3 degradable at lower loadings ((200 lb COD/1000 ft /day). The CN removal data are more scattercd
L than the SCN data because of inconsistency in reporting CNSas total or free. Only the free cyanide is biodegradable
and therefore in cases with a large fraction of fixedcyanide, the percentage removal will be low. Why in somecases SCN is not totally removed at low loadings isuncertain. Some research conducted in this area seems todirect the focus to certain environmental conditions (pH,
* phenol, ammonia concentration) but no total picture is yetavailable on SCN oxidation (refence 17).
The effluent phenol concentration is of importancesince BAT guidelines require very low limits (0.02S mg/l).This is not easily met with a biological system. Figure 9shows the effluent phenol concentration for various
1052
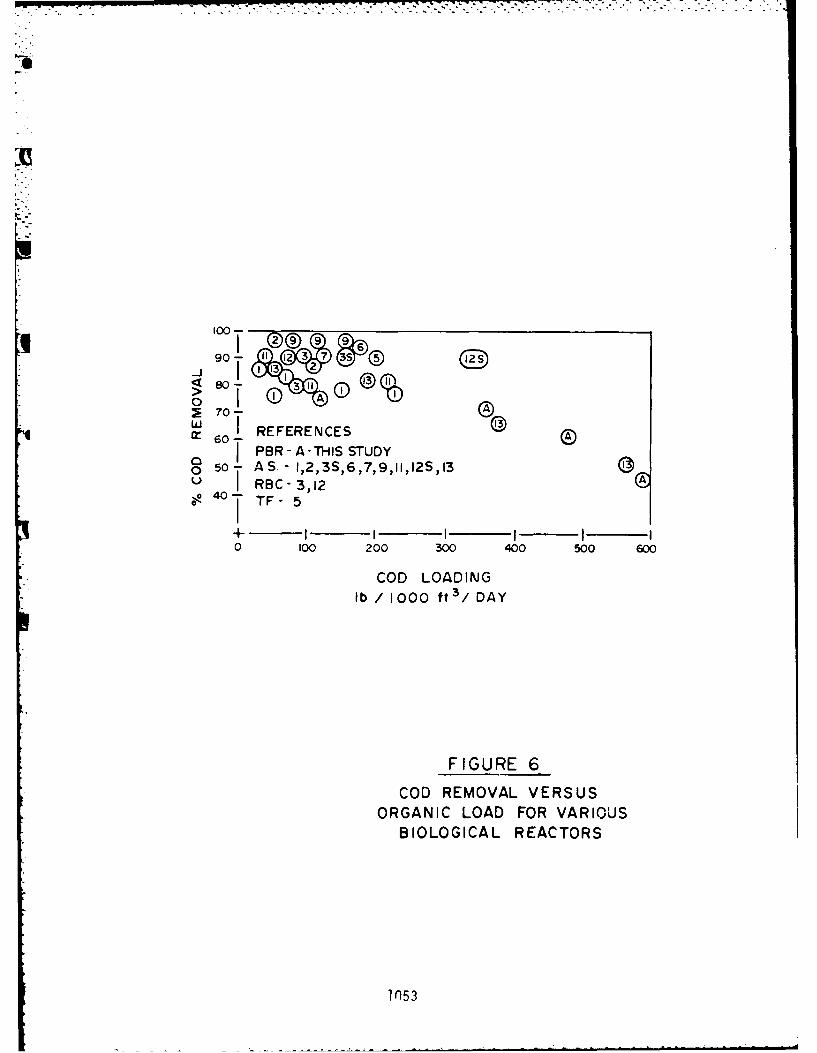
100-
,,-9 9
90 T,.> 0(A)(.. o I3 ®
7 0- 3G1 )
J IREFERENCES0 I PBR- A--THIS STUDY
0 50- AS.- 1,2,3S,6,7,911,12S,13u RBC -3,12 A
o °T TF- 5
4- +t I I I0 100 200 300 400 500 600
COD LOADINGIb / 1000 ft 3 / DAY
FIGURE 6
COD REMOVAL VERSUSORGANIC LOAD FOR VARIOUS
BIOLOGICAL REACTORS
In53
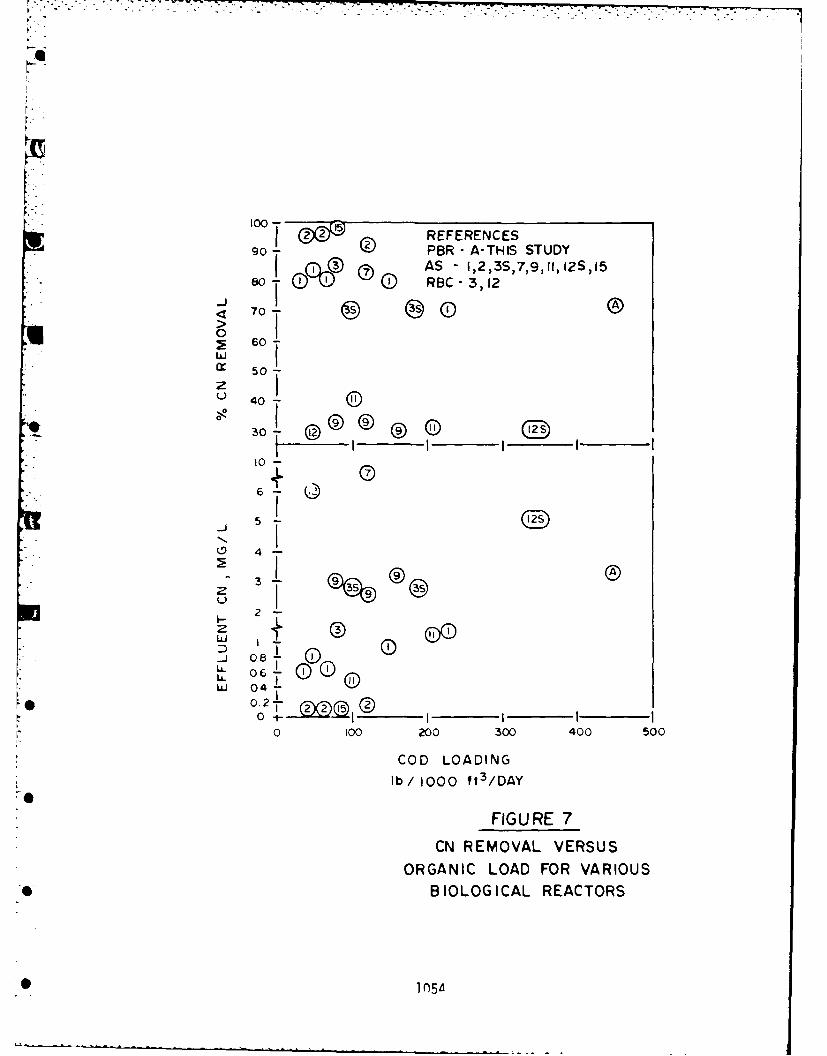
tool j~J~~REFERENCESgo- PBR - A-THIS STUDY
(Z)V (D AS - 1,2,3S,7,9 II, 12S)15.o-RBC-3112
-J ,
< 0 0-
0 5
u 40
,soT @ I I I
10 -
-. 0
2
z
" ~j o8T ~
- 04-
o0 t. IX)~ I
r 0 100 200 300 400 500
COD LOADING
lb / 1000 ft 3 /DAY
FIGURE 7
CN REMOVAL VERSUS
ORGANIC LOAD FOR VARIOUS* BIOLOGICAL REACTORS
1 n5A
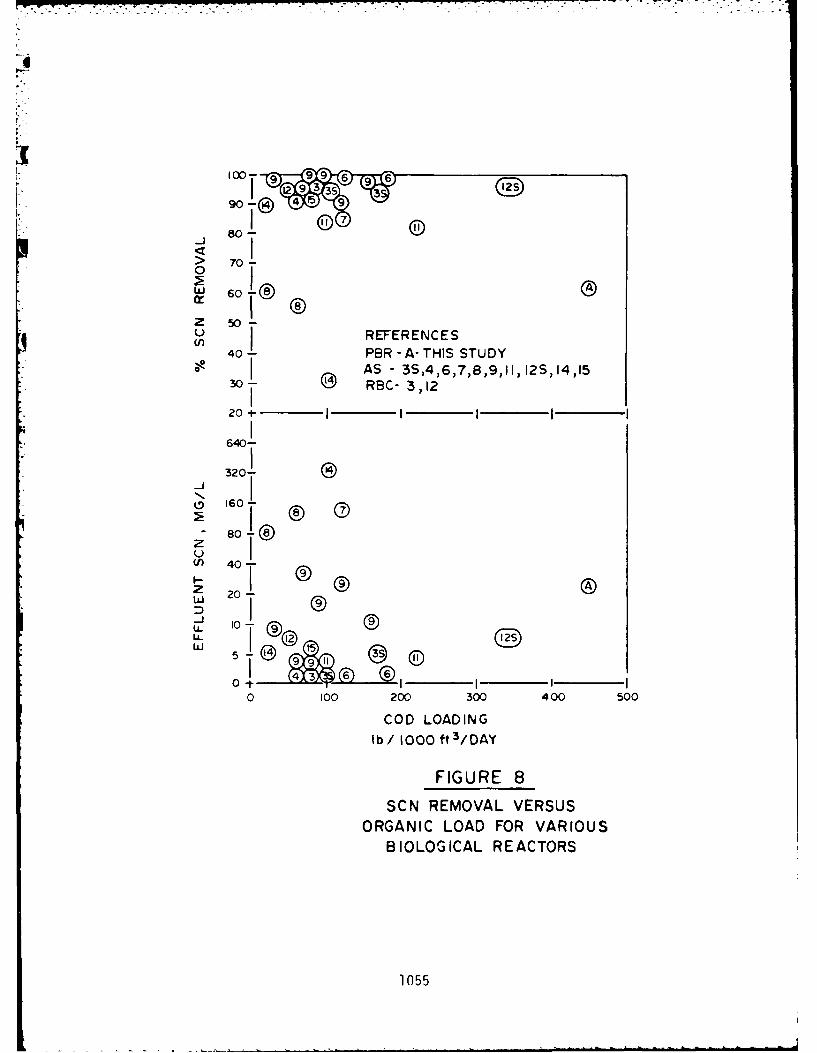
80 -® 4 Q49
7O--7
> 70f0
LW 60-®
- z 50 -
REFERENCES40- PBR - A- THIS STUDY
N AS - 3S,4,6,7,8,9,11 12S,14,1530 RBC- 3,12
20 I
640-
320-
i., 160 -
- 80-®z
(11 40-
w 20-
LL 10u_ oo CD
0 100 200 300 400 500
COD LOADINGIb/ I000 ft 3/DAY
FIGURE 8
SCN REMOVAL VERSUSORGANIC LOAD FOR VARIOUS
BIOLOGICAL REACTORS
1055
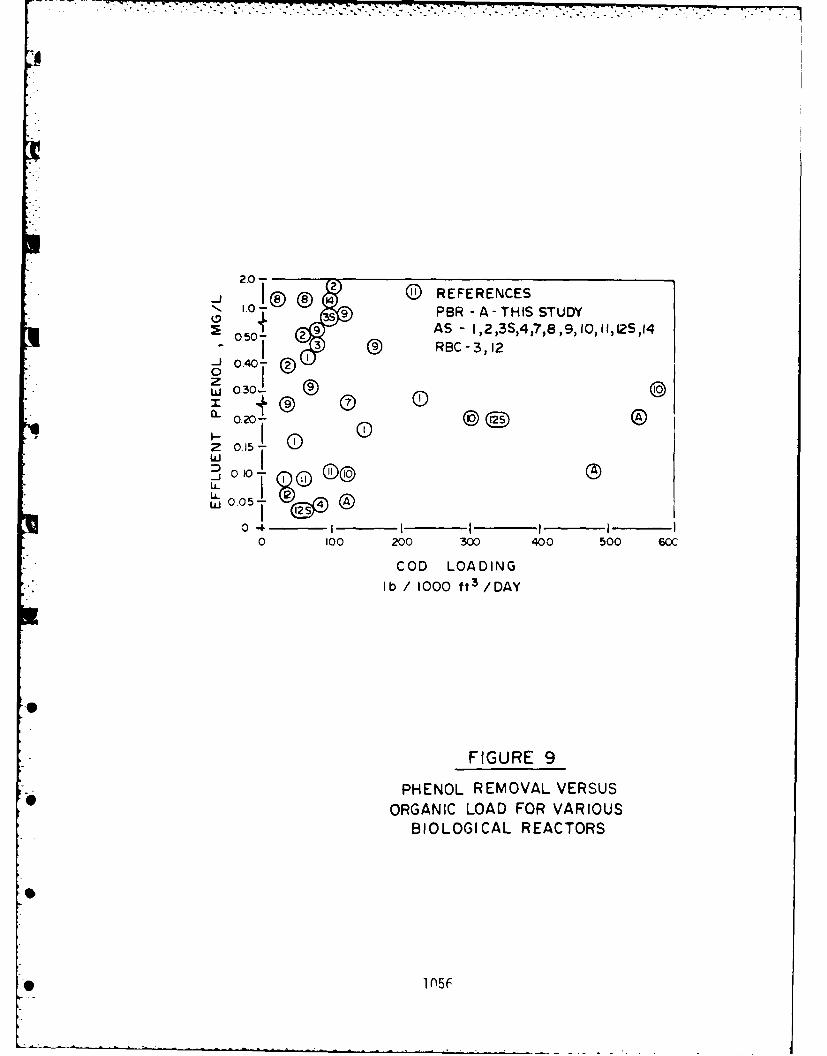
2.0- 2R F R N E
j 1.0 ® 1
3S 9- PBR - A- THIS STUDY
2 9 AS - I,2,3S,4,7,8,9,IO,II, 2S,14
SRBC -3,12-J 010
W 0.30!
+ 0D0.20- ~2
WO SI_" ® ___ __ __®__
0-4I I I I0 100 200 30oo 4o0 500 GoC;
COD LOADING• lb / 1000 ft 3 /DAY
FIGURE 9
' PHENOL REMOVAL VERSUSF ORGANIC LOAD FOR VARIOUS
BIOLOGICAL REACTORS
Z 0.56
I ,. .. .......--
studies. The figure shows only 3 effluent values below0.05 mg/l. It is difficult to predict what will berequired to get these very low effluent phenol concen-trations. Low loadings is obviously a prerequisite butthis seems to be no guarantee for low phenol effluent con-
K centration. The analytical techniques used for analyzingphenol could have a large implication at these lowresidual values.
One factor that requires some additional study is theanticipated improvement in overall performance by stagingUBT reactors. As with plug flow versus completely mixedit is felt that by operating 2 reactors in series, theeffluent quality will be better than with 1 reactor withthe same volume as the 2 reactors combined. With fixedfilm reactors, there is more of an opportunity for specialgroups of bacteria to be growing in certain sections ofthe reactors. In batch tests, it has been shown(reference 16) that the sequence of bio-oxidation of thepollutants in coke oven wastewater is phenol-cyanide-thiocyanate. By staging reactors, it is possible tosimulate this type of operation.
Another factor that shows promise for optimizing theperformance of the UBT is by reducing the energy require-merit per pound of COD removed by increasing the height ofthe tower. By increasing the height, the air has a longerdetention time and the packing should ensure a tortuouspath of the air. Both factors seem to work toward anenergy efficient reactor. No data are yet available onthis but intuitively this approach should be advantageous.
CONCLUSIONS
1. The UBT proved to be an efficient reactor forbiological degradation of benzol wastewlter. Organicloadings as high as 300 lb COD/100 ft /day resultedin 70% or higher COD removal.
2. The percentage removal of CN and SCN was about 60-70%at the loadings at which the reactor was operated.
3. Phenol is virtually completely oxidized as long asthe percentage COD or SOC removal was above 50%.This does not necessarily mean that the phenol iscompletely oxidized but at least the ring is brokenand the resulting organic does not register as phenol.
1057
REFERENCES
1. Adams, C.A., R.N. Stein, W. W. Eckenfelder.Treatment of two coke plant wastewaters to meetguideline criteria. Proceedings 29th PurdueIndustrial Waste Conference, 1974, 864.
2. Adams, C.A. Treatment of high strength phenolic andammonia wastestream by single and multi-stageactivated sludge processes. Proceedings 29th PurdueIndustrial Waste Conference, 1974, 617.
3. Bauer, G.E Biophysical treatment of coke plantwastewaters. Zimpro, Technical Bulletin 3250-T.
4. Bridle, T.R., W.K. Bedford and B.E. Jank. Bio-logical treatment of coke plant wastewaters forcontrol of nitrogen and trace organics. 53rd AnnualWater Pollution Contr)l Federation, September 1980.
5. British Coke Research Association. The biologicaltreatment of coke oven effluent. Laboratory andpilot plant studies using packed towers, CokeResearch Report 52, May 1969.
6. Cooper, R.L. and J. R. Catchpole. Biological treat-ment of phenolic wastes. Iron and Steel Institute1. lication No. 128, 1970.
7. usins, W.G., A.B. Mindler. Tertiary treatment of,k ammonia liquor. Journal Water Pollution Control
rederation, Vol. 44, No. 4, April 1972, p. 607.8. Gdlnczarczyk, J., D. Elion. Extended aeration of
coke plant effluents. 33rd Purdue Industrial WasteConference, 1978, p. 895.
9. Jones, L. Experimental investigations on biologicaltreatment of coke plant ammonia still effluent. M.S.Thesis, Carnegie-MIellon University, 1978.
10. Kostenbader, P.D. , J.W. Flecksteiner. Biologicaloxidation of coke plant weak ammonia liquor. JournalWater Pollution Control Federation, Vol. 41, No. 2,February 1969, p. 199.
11. Luthy, R.G. and J.T. Tallon. Experimental analysisof biological oxidation characteristics of hygas coalgasification wastewater. Department of Energy,FE-2496-27.
12. Medwith, B.W., J.F. Lefelhocz. Single stage bio-logical treatment of coke plant wastewaters with ahybrid suspended growth fixed film reactor. 36thPurdue Industrial Waste Conference, 1981.
4
4 In5P
L
13. Olthof, M., E. Pearson, N. Mancuso, I. Wittmann.Biological treatment of coke oven wastewaterincluding provisions for nitrification. Iron andSteel Engineer, June 1980.
14. Osantowski, R., et.al. Tu stage biological treat-ment of coke plant wastewater. EPA 600/2-81-052,April 1981.
15. Wong-Chong, G., S. Caruso. Advanced biologicaloxidation of coke plant wastewaters for the removalof nitrogen compounds. Carnegie-Mellon Institute,April 1977.
16. Wong Chong, G. Design and operation of biologicaltreatment for coke plant wastewaters. Carnegie-Mellon Institute, 1978.
17. Neufeld, R.D. Thiocyanate bio-oxidation kinetics.ASCE, Journal Environmental Engineering Division,Vol. 107, No. 5, October 1981, p. 1035.
1fno
TRICKLING FILTER EXPANSION OF POV BYSNACK FOOD MANUFACTURER
Michael R Morlino, P.E., GroupManager, Wastewater Development,Fri to-Lay, Inc.
Samuel M Frenkil, P.E. TechnicalManager, Environmental Systems,
Frito-Lay, Inc.
Paul Trahan, Superintendent, KillinglyWater Pollution Control Plant.
INTRODUCTION
One of Frito-Lay, Inc.'s largest corn and potato snackfood manufacturing plants was recently opened inKillingly, Connecticut, about halfway between Hartford,Connecticut and Providence, Rhode Island. The decision tolocate this plant in Killingly required the company toinstall on-site primary treatment as well as an expansionof the publicly owned treatment work's (POTW's) secondarytreatment system. This expansion consisted ofconstructing a $1.6 million trickling filter and pumpingstation. This paper describes the joint effort betweenthe town of Killingly and Frito-Lay to design thesefacilities and obtain State approval to construct them,and reports on system performance to date.
The construction of a trickling filter or a POTW
expansion is not unusual. The uniqueness of this plan
stems from the fact that this project was the firstindustrially designed and constructed expansion of a POThin the State of Connecticut, and would essentially double
* the capacity of the secondary system without acomprehensive plant expansion.
1 f
- 7-
There was initial doubt on the part of the regulatory
agencies concerning the success of this project since aventure of this kind had not previously occurred in theState of Connecticut. After careful analysis of theproject, all agencies and parties approved this plan andthe facilities were constructed. This paper will discuss
some of the unique features of this cooperative project.First, these facilities were generally designed toindustrial standards. Second, the contractor was selectedas a result of a public bid. Third, all the processingequipment was purchased by Frito-Lay. Fourth, thefacilities were designed, constructed and placed intooperation under the supervision of Frito-Lay. Fifth, nofederal funds were involved. Sixth, the POTW expansionwas financed be industrial revenue bonds.
4Project Scoping & Negotiations
The town of Killingly, Connecticut is located inWindham County in the northeast corner of the state. Inspring 1978, Frito-Lay selected Killingly as the site ofone of its new plants. Killingly offered convenientaccess to the major Connecticut, Massachusetts, RhodeIsland and New York markets, a solid work force,acceptable environmental costs, and strong interest by thetown leadership in the project.
One of the more complex issues to resolve wastreatment of Frito-Lay's I million gallon per day highstrength wasteloads. A number of options were studied
separately by Frito-Lay, and jointly with the KillinglySewer Authority. Ultimately, a decision was made forFrito-Lay to construct a full primary treatment plant
on-site, discharge the effluent to the sewer system, andbuild an expansion to the POTW. The back-up alternativewas for Frito-Lay to build on-site secondary treatment anddischarge to the sewer. This would be done if Frito-Layand Killingly could not reach agreement, unexpectedtechnical problems arose, or if costs becameuncontrollable.
1061
The Killingly Sewer Authority operates an 8 milliongallon per day secondary treatment plant. The POTW was
completed in 1976 with the intent of providing substantialreserve capacity in order to provide for future populationgrowth and to attract industry. This plant has a rawsewage lift station, primary settling tanks, a
conventional activated sludge system, secondary settlingtanks, and chlorine contact tanks. Solids handling
consists of thickening both primary and secondary solidsprior to dewatering on rotary vacuum filters. Sludge is
lime treated, then landfilled. An on-site sludgeincinerator will be used as back-up, or when incinerationof large sludge volumes becomes economical. Frito-Lay'sdischarge to the POTW would consist primarily of soluble
BOD, and some solids. However, even with full primarytreatment of Frito-Lay's wastewater, the POW could nothandle the wasteload. Secondary BOD was the problem. Anexpansion to the BOD capacity might provide adequate
capacity. A study was initiated to investigate such anexpansion.
If a full secondary treatment system were to beinstalled on-site by Frito-Lay, not only might it cost
more than an expansion of the POTW but it would result inthe duplication of equipment already installed at the
POTW. In addition, Frito-Lay would have to cope withsecondary sludge disposal. Costs were believed to becompatable or significantly lower, if the POTW was
expanded. Therefore, Frito-Lay agreed to design andconstruct a secondary pump station, a biofilter tower,instruments and controls, sludge piping and related pumps,valves, necessary appurtenances, and modifications toappropriate existing components at the PON.
The proposal to take an essentially new and under-utilized POTW, expand it, and change the process concepts
was received with some skepticism by both the KillinglySewer Authority and Frito-Lay's management. Major
negotiating and paperwork nightmares were envisioned.
Project delays would impact Frito-Lay's start-up.
-a"1062
. . . . . . . . . . . . . . . . fl-"ri ;L • . ; .- "- " -w - -o . - -" i ' i " :
Regulatory authorities were expected to question theproject, even though no change in the NPDES permit limits
or requests for federal funds were involved.
POTW Inprovements
Parallel to examining these procedural questions, theKillingly Sewer Authority, the town's consultants, andFrito-Lay's engineers began unit-by-unit analyses of thePOW. Numerous meetings and iterations were involved.The final result was a decision to expand the POTW byadding a pump station, a packed media trickling filtertower, and assorted controls. The POTW would be convertedfrom activated sludge to a trickling filter/roughingfilter process. The BOD capacity would be almostdoubled. All other systems were analyzed to be adequate.
Long term marginal capacity in clarifiers and flotationunits might be a problem if the city and Frito-Lay bothreached ultimate capacity. However, since this event isanticipated to be at least 10 years in the future, work onthese systems was deferred.
The selected option called for converting the POTWfrom a conventional activated sludge system to abiofilter/activated sludge system. These improvements tothe Killingly POTW almost doubled the BOD capacity of thesecondary system (from 8,000 to 15,700 lb/day) andretained its current peak hydraulic capacity of 24 mgd.These benefits were achieved by constructing a minimumnumber of units. However, because the original plant wasnot designed with this type of expansion in mind, many ofthe connections and modifications were difficult andexpensive.
The pump station utilizes five constant speed,submersible pumps to lift the primary effluent to the topof the biofilter tower. Capacity of the pump stationvaries 4,700 gpm with one pump running, to 17,000 gpmunder peak flow conditions. This allows hydraulic wettingrate to be varied from 1.2 to 4.2 gpm/sf of surface area
1063
of the biofilter. The pump station utilizes simplecontrols consisting of On/Off switches coupled to low-level and high-level sensors. One of the five pumps willbe connected to the treatment plant's standby generator sothat process integrity is maintained in the event of poweroutage. The number of pumps in operation will varyaccording to flow conditions, but under peak design flowsonly four pumps will operate with the remaining pump heldin reserve to comply with State regulations.
The discharge manifold, gate valves and check valvesare contained in a vault adjacent to the pump station.Access to this vault is via two large doors. The pumpstation was constructed of reinforced concrete. The wetwell and effluent channel are open but are protected byhandrails. An overhead electric hoist was provided tofacilitate pump maintenance. All the pump starters and
controls are located in a NEMA 14 enclosure installedbetween the pump station and the biotower.
The biofilter tower is approximately 70 feet indiameter and 28 feet tall. The biological growth media
consists of horizontal redwood slats. The media issupported by pressure treated fir stringers which aresupported by a concrete underdrain system. Media depth is21.5 feet resulting in a net media volume of 80,000 cubicfeet The tower walls were constructed of precastconcrete panels trimmed with face brick to match theexisting plant structures. The design loading is 200pounds BOD per 1000 cubic feet and 65% removal efficiencyis projected. In sizing the tower, it was assumed that noadditional BOD from Frito-Lay would be removed across theexisting POTW primary treatment system.
* Wastewater is uniformly distributed over the media bya four-arm rotating distributor. As the wastewatersplashes through the biofilter, bio-solids (microbes andbacteria) form on the media and reduce the BOD of theprimary effluent. Bio-tower effluent is returned via the
0I0
p " " . . - .o .- .. . - . . , . . . . . . ' . - . - 'Co " . % . . ' • . " . °- . " -
underdrain system to the pump station. A broad-crestedweir divides this flow with a portion being recycledthrough the tower to "seed" the process at a Lypicalinternal recycle rate of 3:1 to 5:1. This serves toincrease removal efficiency and dampen shock loads. Theremainder of the bio-tower effluent flows by gravity tothe aeration basin (existing) for further treatment.
In order to convert the Killingly POTW from anactivated sludge to a biofilter/activated sludge system,substantial improvements, additions, and renovations were
made to existing components. More than half the cost ofthe expansion project involved such "remodeling" items as:
O Removal and relocation of major slide gates,valves, and piping connections (30 and 36-inch).
O Removal of existing primary to aeration basinpiping, and routing a 24" pipe to the new pump
station. Several other pipes were rerouted toachieve this.
0 Core bore gallery walls to allow for 36" pipingextensions to the new pump station, and thenreconstruct the walls.
0 Route 36" return pipe from biofilter throughexisting pipe gallery to two aeration basindivision boxes, including 36" valves and othermiscellaneous connections. Stainless steel pipe
was used to facilitate installation in very tightquarters where future maintenance would be
difficult.
O Extend and reroute various sludge piping systems tothe new pump station. Stainless steel pipe wasalso used here.
O Repair all damaged or modified basin and tunnelwalls to be fully watertight.
InlF5
O Upgrade electrical system to handle the increasedmotor load and install such conduit runs, starters,controls, etc. as were required for the new systems.
0 Remove and extend existing flood plain retainingwall, drainage system, paving, fencing, and rip-rapto provide space to install biofilter and pump
station.
O Place 5,000 cubic yards of select structural fillon which the biotower and pump station wereconstructed.
CONSTRUCTION OF THE EXPANSION
Since construction required difficult tie-ins and thePOTW had to continue in operation, contractor selectionwas critical. During the design period, approximately 75contractors were interviewed. From these, 25 contractorsprequalified and were invited to bid. Many of thecontractors were concerned about the risks of working fora private company (Frito-Lay) to construct facilities onpublic (Authority) property. Two actions were taken toaddress these risks. First, the specifications werewritten in the Construction Specification Institute
format. They explicitly set-forth the General Conditionswhich related to this project, especially as to how thecontractor was to interface with Authority personnel andFrito-Lay. In addition, the specifications contained thecontract to be executed between the successful contractorand Frito-Lay. These details allowed many questions to beanswered about the contract before bids were received.
Secondly, a comprehensive pre-bid meeting wasconducted on-site. The plans, specifications, and sitewere thoroughly reviewed. All present reached agreementon the best way to handle specification addenda. Finally,it was announced that the contract would be awarded to the
qualifying low bidder at the bid opening if all paperwork
* was in order and the bids contained no exceptions. There
.OFF
t ' . - - -. . i . . . .. - -. . . - ., . . . . .. . . ..
would be no lengthy delays, "backroom negotiations" orpressure to lower bids. We hoped to eliminatecontingencies, padding of the bids, and project delays.
These actions resulted in the receipt of 12 lump-sumbids. Four of them were under the engineer's estimate.Otte contractor was disqualified for failure to provide aDid bond. Within 30 minutes after the last bid was openedand qualified, the contract was awarded to the low bidder,
R.H. White Construction Company of Auburn, Massachusetts.
Frito-Lay and Killingly were committed to making thesefacilities work as designed and on schedule. Thisrequired the pre-selection and pre-purchase, and expediteddelivery of all the process equipment. Frito-Lay directly
purchased the biotower media, rotary distributor,submersible pumps and controls, all valves over 12 inches,and the flow meter and instrumentation. The detaiLeddesign and specifications were completed after thesepurchases were made so that more exact details were workedinto the plans. There would be no "or equals" orsubstitutions that might cost more to install, lead tocontractor bid contingencies, or not meet the process
requirements. As a result the contractor knew beforesubmitting a bid exactly what equipment had to be
installed and when it would arrive on-site. Finally, allconstruction was supervised under the direction of
Frito-Lay, utilizing the field engineer on-site at theproduction plant (4 miles away) and a representative ofthe consulting engineer.
These actions resulted in a high quality project t, atwas completed on time and within budget. Killingly Sewer
Authority personnel participated in every phase of theprocess design, equipment specification and selection, and
in construction coordination. Their involvement from an
operating standpoint was vital. Although designed toindustrial standards, the facilities augment the
architecture of the POTW and they are completely
acceptable to the Authority.
10F7
- . ° .: '. • * . , . - .-
- -.-. ' - - . - .- .. ' -. --' .'
-
PROJECT FINANCING
The final unusual feature of this project is the
method of financing the improvements. Due to funding
priorities and the industrial nature of the POTW capacity
expansion, federal funds were not available. A decisionwas made to obtain pollution control industrial revenue
bonds (IRB's) through the Connecticut DevelopmentAuthority. In total, $6 million in bonds were obtained to
pay for various pollution expenditures associated with the
new plant project. The $2 million allocated to the POTWexpansion could only be approved if Frito-Lay, Inc.
continued to own the improvements for the twenty-five yearlife of the bonds. After considerable negotiations and
legal opinions, a contract was executed that allowed
Frito-Lay to own the facilities and depreciate them. TheKillingly Sewer Authority is totally responsible foroeration maintenance and repair. By utilizing IRB's,
Frito-Lay reduced the annual interest rate to 6.3% fromthe 10-11% rate prevailing at the time of the closing onthe bonds. Abailability of IRB financing encouraged
Frito-Lay to proceed forward with the POTW expansion
program in Killingly.
SYSTEM PERFORMANCE
The trickling filter was placed in operation duringApril, 1981. The biotower acclimated quickly, even though
it was started in the roughing filter mode with no seedaddition. In mid-August, the decision to convert to the
"AB:" mode was made in order to obtain warm weatheroperating data before the onset of winter. A license to
operate the Activated Bio-Filter (ABF) process was issuedby Neptune - Microfloc, Inc. when the redwood media was
puchased. Table 1 summarizes system performance to date.
The roughing filter performed as expected. However,the biotower was designed to operate in the ABF mode.Starting in August, the removal efficiencies increaseddramatically from 65 percent to a high of 75 percent inJanuary, 1982. Also in January, the removal rate reached
52.8 pounds BOD per 1000 cubic feet. Average wastewater
OA0 InFP
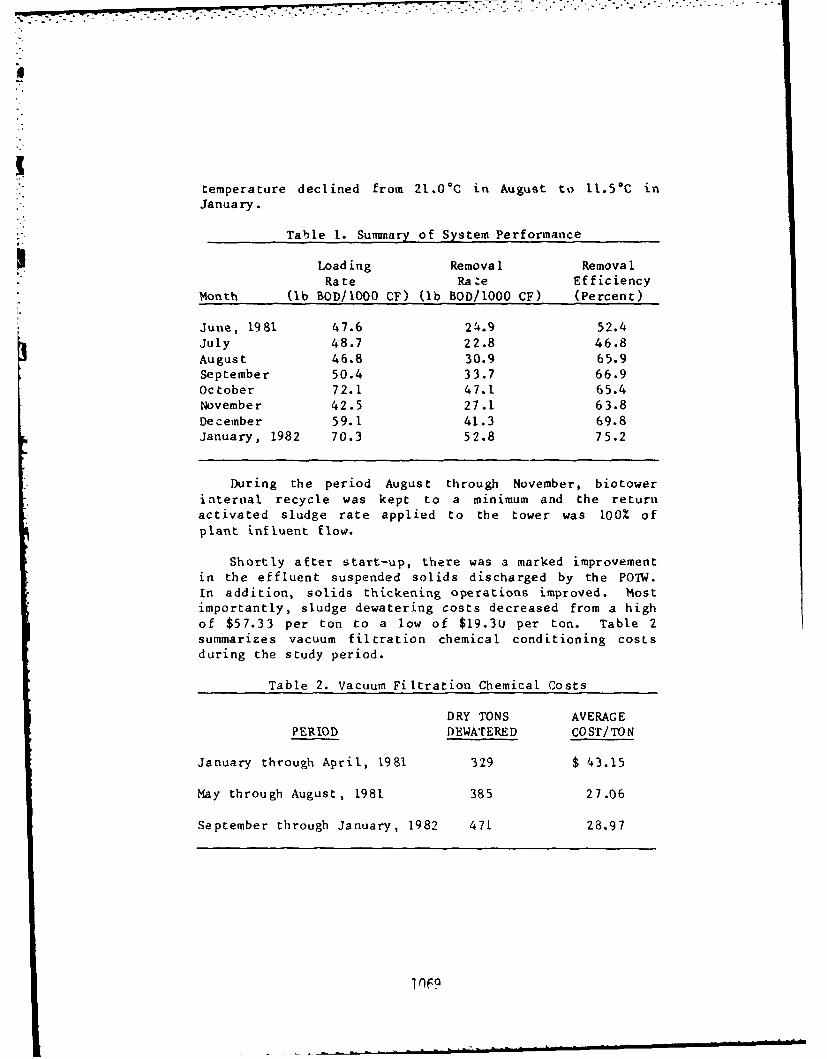
. . . . .. . ° .. °. w-.'-. .. . . . .. " " o " "
. . . .
I
temperature declined from 21.0*C in August to 11.5C inJanuary.
Table 1. Summary of System Performance
Loading Removal Removal
Rate Ra .e EfficiencyMonth (lb BOD/lO00 CF) (lb BOD/1000 CF) (Percent)
Jule, 1981 47.6 24.9 52.4July 48.7 22.8 46.8
August 46.8 30.9 65.9September 50.4 33.7 66.9October 72.1 47.1 65.4
November 42.5 27.1 63.8December 59.1 41.3 69.8
January, 1982 70.3 52.8 75.2
During the period August through November, biotowerinternal recycle was kept to a minimum and the returnactivated sludge rate applied to the tower was 100% ofplant influent flow.
Shortly after start-up, there was a marked improvementin the effluent suspended solids discharged by the POW.
In addition, solids thickening operations improved. Mostimportantly, sludge dewatering costs decreased from a highof $57.33 per ton to a low of $19.3U per ton. Table 2summarizes vacuum filtration chemical conditioning costsduring the study period.
Table 2. Vacuum Filtration Chemical Costs
DRY TONS AVERAGE
PERIOD DEWATERED COST/TON
January through April, 1981 329 $ 43.15
May through August, 1981 385 27.06
September through January, 1982 471 28.97
ln'iF
During this time, there was a 15 percent increase in
the quantity of dry solids dewatered but a 33 percentdecrease in the chemical conditioning costs per ton of dry
solids. These cost savings amount to $15,500 annually.
Less time is required to process thesp solids. Labor and
power savings are also substantial.
Conclusion
Based on operation to date, the biotower is achieving
the design removal efficiency. Overall, the POTW
operation has improved. Average effluent TSS and BOD
* values are lower now than before Frito-Lay started
production. There have been few permit violations, these
being minor suspended solids excursions above the 30 mg/llevel. Settling characteristics of the secondary solids
have improved. In fact, it costs substantially less now
to dewater sludge than two years ago in spite of inflation
and even though sludge quantities have increased
* substantially.
The Authority is sufficiently pleased with the
biotower facility that Frito-Lay, Inc. was able to
negotiate an expansion of production. In fact, this
expansion is currently underway and will make the
Killingly plant Frito-Lay's largest.
1070SU
THE EVALUATION OF A BIOLOGICAL TOWER FOR TREATINGAQUACULTURE WASTEWATER FOR REUSE
Gary L. Rogers. Department of Civil Engineering0 Brigham Young University, Provo, 1tah
Stanley L. Klernetson. Department of Civil EngineeringBrigham Young University, Provo, Utah
INTRODUCTION
During the 19 50's, Dr. Shao-wen Ling was sent toSoutheast Asia by the Food and Agriculture Organization (FAO)as a fisheries specialist. He became tnterested in a largeMalaysian prawn which he first observed in the marketplace.Since that time there have been many species of freshwaterprawns identified that are distributed over the tropical andsemi-tropical waters of the world. Most are limited towaters that maintain annual temperatures of 22 to 30 C. Themost popular species for culture is Macrobrachium rosenbergili(1).
Adult prawns are capable of living in freshwater and naybe either intensively cultured in tanks or raceways at highstocking density or extensively cultured in earthen ponds ata lower density. Marketable size prawns may be harvested infi to six months tinder optimal conditions. Glude (2)presented an overview of freshwater prawn culture thatdescribes rearing requirements and technques. Figure I
illustrates the adult prawn showing characteristic parts.
1071
The development of prawn larvae to metamorphasisrequires temperatures of between 24 and 32 C with preferredtemperatures around 28 C. These temperatures also apply forcommercial growth of adults in ponds.
Adults and broodstock may be maintained easily in eitherfreshwater or brackish water. The larvae require brackishwater of between 8 and 17 ppt salinity. .Juveniles requiresalinities of about 5 to 8 ppt decreasing to freshwater asthey grow to adults.
The toxicity of ammonia to aquatic life has been fairlywell documented. The EPA criterion of unionized ammonia forfish and aquatic life is less than 0.02 mg/l (3). The 144hour LC 50 for Macrobrachium rosenbergli was determined byArmstrong (4), to be 0.80 mg/l ammonia at a pH of 7.6.Additional work is necessary to verify and establish thesetoxic limits of unionized ammonia for the Malaysian prawn.
Nitrite has also been shown to be toxic to freshwaterprawns (5). LC 50 values ranged from 500 mg/l for the first12-hour exposure to 5 mg/l during a 168-hour exposure. Themaximum level of nitrite tested with no deaths, ranged from9.7 mg/l for 24 hours to 1.8 mg/l at 168 hours.
There is a paucity of data concerning the concentrationand nature of wastes produced in intensively culturedsystems. Little has been presented about water quality ofeffluents from culture systems. The problem is complexed bythe fact that organics and nitrogen in the water may be dueto metabolic products of prawns and other secondary feedersin the culture ponds as well as unused feed added daily to
1 the water. A summary of the reported water quality valuesand the proposed levels for design of new productio:1facilities is shown in Table 1.
Several investigators have described water recirculatingsystems using biofilters for intensive cultivation of salmonsmolts (6,7,8), catfish (9), trout (10,11,12,13), shrimp(14,15,16), tilapia (17,18), polyculture (19), carp (20),and the combination of fish culture with hydroponics in asingle recirculation system (21). Few of the authors,
* - however, discuss the basis for their choice of biofilterdesign parameters. There is little indication that thedesigns conform either to economic or to resource minima fortheir declared purposes. Spotte recommends that surface areaof the filter be made at least equal to the surface area ofthe culture. This rule of thumb may favor successfulrecirculation water quality but says little about keeping theinvestment minimal (22).
1072
Removal of the toxic hazard from nitrogenous waste is
the most important task of the blofilter. The predominant
form of waste nitrogen from aquatic animals is ammonia,excreted mostly from the gills or in the ,rine, or produced
by mineralization of organic nitrogenous substances bybacteria. Invertebrates also excrete nitrogen in the form ofammonia. Bacteria of the Nitrosomonas group oxidize ammonia
to nitrate;
+ -+ -
N!1 + Oil + 1.5 0 =2 H + NO + H 04 2 2 2
the reaction is rate limiting in the overall process ofnitrogen control. For this reason, nitrites seldomaccumulate in biofiltered recirculation water. Nitrite isreadily oxidized to nitrate by Nitrobacter ssp.;
NO + 1/2 0 = NO2 2 3
and the nitrate is then available either for assimilation bygreen plants or bacteria, or for reduction to nitrous oxideand free nitrogen, usually by anaerobic denitrifyingbacteria.
The microbial population activity in the filter isessentially ubiquitous in distribution, spontaneously
coloniing new filters, although inoculation can be expeditedby addition of gravel from preexisting filters (8). Thebacterial species which predomin-te at various depths of thefilter are presumably self-selecting, in response to
environmental factors, such as the nutrient content,hydraulic flow, and aeration of the filter bed, although
their respective numbers are known to fluctuate until anequilibrium is established (Kawai, et al., 1964).
Few approaches to analysis of design standards for
biofilters in aquacultural applications are given in theliterature. Hirayama reported on filter carrying capacityfor a 300 liter marine aquarium containing one or two seabreams, Chrysophrys major (23). Spotte cautions thatHimavama's results need verification before accepting theirvalidity in freshwater, but there is reason to exercise a
certain amount of skepticism in generalizing them even formarine aquaria (22). One should keep in mind the smallnumbers of fish on which they are based.
1073
. : . .. -. N . . .* . .. . . . . . . . , . . - . : : .. . -
Harris considered use of biological filters in hatchery* water reuse systems. Submerged filters (F'1exring and Flocor)
were tested and Found satisfactory in control of fish wastes.
The basis for design of the blofilters used was Speece'smethod for finding substrate volume based on ammoniaproduction rate divided by the nitrification rate (10).
A major limiting factor in intensification ofaquaculture is water quality. Biofilters need to be includedin aquaculture systems to insure pollution removal and good
quality water for use and reuse. Work is being done on
optimizing treatment systems for aquatic animals andS.i developing accurate design specifications for treatment.
More research is needed in this area.Management of the filter is an important consideration
in obtaining nitrification and ROD removal from either freshor saline aquaculture wastewater. Removal rates may beenhanced by increased temperature, recirculating effluentback over the filter media, dosing the filter, ventilatingthe filter, adding additional media and surface area, andmaintaining environmental requirements by careful monitoring.
Wheaton (24) describes in depth design criteria forsubmerged filters with varied filter media. The equationspresented for design are restricted to cold-water
applications and care is advised in extending to treatmentsystems for treating wastewater produced in warmwater fish
culture facilities.The types of media that have been applied to aquaculture
include oyster shell, rock and gravel, plastic rings, polybeads, sand, and styrofoam. A new possibility is the Tri-Pack spherical media available from Jaeger Tr-Packs inCosta Mesa, Calif (technical bulletin, 1981).
Trickling filters and upflow submerged filters may be
designed according to a simplified procedure presented by*0 Soderberg and Quigley (25). Their data is for perch culture
and probably should not be generalized fot :jlture of allwarmwater species of fish and invertebrates.
This study is a joint effort between Dr. Stanley L.
Klemetson currently at Brigham Young University and Dr. DanCohen of the Hebrew University. The U.S. portion of the study
O deals mostly with engineering problems while the Israel
portion deals with production of the animals. It has beenimportant to coordinate efforts and share information toimprove each study.
* 1074
% 7.
METHODOLOGY
The filters used in this study were laboratory-scaleunits having a capacity (,Z 1.4 cu. ft. each. Each filterswas filled with 1 to 1.5 inch slag with a total surface areaof 82.0 sq.ft., and a specific surface area of 60.0
sq.ft./cu.ft.Figure 2 presents a schematic of the two filters used in
this study. The Facilities at Brigham Young University wereused to construct the columns. Both filters were fabricatedfrom a section of 10 inch PVC pipe. The end discs were cutfromn plexiglass.
The two filters were fed a uniform flow from a 4.5 cu.ft. plexiglass constant head tank with overflow weir (Figure3). Two 4.0 ft (0.11 m ) storage tanks filled withsynthetic wastewater was used to feed the constant head tank.
The two storage tanks were used to hold the syntheticwastewater to be treated by the system. The syntheticwastewater was compounded as needed from a balanced minimal
media which approximates actual wastewater produced byprawns. Table 2 presents the composition of the syntheticfeedstock solution. Diffused air was introduced to insureadequate mixing within the storage tanks. Tap water was used
to fill the tank to its desired level.The studies done at the Hebrew University in Israel
utilized 900-liter aquaria and submerged filters. Thesubmerged filters were filled with 20-30 cm gravel in a 700 1tank. The Flowrate was controlled at 0.5 cu. m./ hr.Salinity of the rearing tank was maintained at 1.2% sea water
for growth of freshwater prawn larvae.Water quality sampling was done prior to feeding and
drainage of sediments for the Israel study. Standard Methods(26) were used to determine dissolved oxygen, biochemicaloxygen demand, pH, alkalinity, salinity, ammonia, nitrate,andnitrite both at the Hebrew University and at Brigham YoungUniversity. Water samples were taken at both the influentand effluent of the biofilters.
RE STLTS
The results of work done at Irigham Young University arepresented in Table 3. After acclimation of the biofilters,data was collected to evaluate their performance. Profiles
of the parameters monitored are presented in Figures 4
1075
through 7 for the Subner-ved and Trickling filters. Pigure 4presents a profile iF ammonia levels. The average value ofammonia removal for the trickling filter was 78%. In thecase of the submerged anaerobic filter, there was an averageIncrease of ammonia by 8% through the filter.
Figure 5 presents the nitrate profile [or the twofilters. The nitrate concentrations decreased by 97% in thesubmerged filter while there was an increase observed in thetrickling filter. The length of time required for start-up
of the filters was 3-4 weeks. At three weeks, the tricklingFilter was effectively nitrifying the synthetic wastewater.
The submerged filter was anaerobic and functioning as adenitrifying filter in about the same length of time. Other
parameter profiles are presented in Figures 6 and 7.Data describing the results of the Israel study are
presented in Table 4 and 5. The data indicates that thenitrification efficiency of freshwater prawn wastewater was
59% ammonia removal and 55% nitrite removal. Figure 8* presents the nitrogen profiles for a tank and biofilter
system in Israel. The filters were capable of maintaining astable environment, though further study is necessary todetermine sizing criteria for filter design.
The results of these studies are being reviewed as partof an ongoing study to develop design criteria for
application to treatment of warmwater aquaculture wastewater.The data obtained in this portion of the study suggests thatnitrifiction efficiency can approach 80% when the syntheticwastewater is lightly loaded. The optimum hydraulic loadinghas not been determined. The efficiency of ammonia removal
in brackish water is about 60%.
An important consideration in maintenance oF thebiofilter is aeration. If aquaculturists are interested onlyin nitrification, careful monitoring and addition ofdissolved oxygen is important. Denitrification is ananaerobic process that requires little maintenance.
Aquaculturists should consider the coupling of the twoprocesses, especially where the recontioned water is returned
to the culture vessel.
* DISCUSSiON
The design and sizing of bofilters for application toaquaculture is more of an art than a science. If Facilitiesare to be developed for intensification of fish culture, agreat deal of research needs to he done. Design criteria are
* 107F
. available for fe' .ties that r.a" cold-water fish anlinvertebrates but is limited to water temperatures up to 15I . C. Since operating temperatures are high (27 to 30 C),
organic loadings are small, and flowrates are high, standarddesign tables are not adequate. To complicate matters more,the actual waste production rates lor the live aquaculturesystems are variable and iLl-defined. Optimization of designwill require the continued evaluation of equipment andprocesses under a variety of conditions.
ACKNOWLEI) GEMENT
The authors wish to express their thanks to the Bi-National Agricultural Research and Development Fund grant No.US-60-80, for providing a research grant, for support of thisproject, and to Aquaculture Production Technology (Israel),Ltd.
REFERENCES
1. Hanson, J.A., Goodwin, H.L., Shrimp and Prawn Farming InThe Western Hemisphere, Dowden, Hutchinson, and Ross,Inc., Stroudsburg, Pennsylvannia, p.19 8 (1977).
2. Glude, J.8., The Freshwater Prawn Macrobrachiumrosenbergii, consulting report, Jan1978.
3. United States Environmental Protection Agency, QualityCriteria for Water, USEPA, Washi-igton, D.C.,.Tuly (1976).
4. Armstrong, D.A., Chippendale, D., Knight, A.W., and Colt,J.E., Interaction of Ionized and Unionized Ammonia onShort-term Survival and Growth of Prawn Larvae,Macrobrachium rosenbergii, The Biological Bulletin, Vol154, p. 15-31, Feb 1978.
5. Kawaratani, R.K., State of the Art: Waste TeatUtilization for Agriculture and Aquaculture, TennesseeValley Authority, August (1978).
6. Birrows, R.E., Controlled Environments for SalmonPropagation, Prog. wish Culture, 30(3):123-136, 1964.
7. Meade,T.L. The Technology of Closed System Culture ofSalmonids, Animal Science/NOAA Sea Grant University ofRhode Island, Mar. Technol. Rep. 30.
8. Risa, S. and H. Skjervold, Water Reuse System For SmoltProduction, Aquaculture, 6:191-195, 1975.
1077
. o,
a
9. Broussard, M.C. and B.A. Sumco, High Density Culture of
Channel Catfish in a Recirculating System, Prog. FishCult., 38:138-141,1976.
10. Harris, L.E., Nitrifying Requirements of Water ReuseSystems for Rainbow Trout, Colorado Division of WildlifeSpecial Report, No. 41, Feb 1977.
Il. Fyock,O.L., Nitrifiction Requirements of Water Reuse
Systems for Rainbow Trout, Colorado Division of WildlifeSpecial Report, No.41, Feb 1971.
12. Mayo, R.D.,A Technical and Economic Review of the Use ofReconditioned Water in Aquaculture, Aquaculture, pp. 50 8-
520,1976.13. Speece,R.E., Trout Metabolism Characteristics and the
Rattonal Design of Nitrifiction Facilities for WaterReuse in fHatcheries,Trans. Amer. Fish. Soc.,102(2):323-
* 334,1973.14. McSweeny,D.S., Intensive Cultare Systems, "dited by J.A.
Hansen and H.L. Goodwin, In Shrimp and Prawn Farming inthe Western Hemisphere, Dowden, Hutchinson, and Ross,
Inc. Stroudsburg, Penn. pp.255-272,197 7 .15. Mock,C.R., Ross, L.R., and Salser,B.R.,Design and
Evaluation of Waste Removal Systems for Shrimp Culture in
Closed Raceways,World Mariculture Society 6th Ann.Workshop, Jan 1975.
16. Siddal,J.,Studies of Closed Marine Culture Systems, Prog.- - Fish. Cult.,36(l):8-15,1974.
17. Otte,C. and Rosenthial,H., Management of a Closed BrackishWater System for Aiph Density Fish Culture by MiologicalanI Chemical Water -,eatinent,Aquactilture,18:169-181,1979.
18. Allison,R., Rakocy, J.E.,and Moss,O.O.,A Comparison of'rwo Closed Systems for the Culture of Tilapia,Presented
* at the International Symposium for Advance in FoodProducing Systems for Arid and Semi-arid Lands, Kuwait
City, Kuwait,April 1980.1 -9. VanCorder,S., Small Scale Fish Culture Systems, Rodale
Press Research Report 80-12, May 1980.
20. Meske,C.1., Fish Culture in a Recirculating System withWater Treatment by Activated Sludge, Aquaculture,pp.527-
532,1976.21. Lewis, W.H.,Yopp,.J.H., Schramm, and Brandenberg,A.M., Use
*of Hydroponics to Maintain Quality of Recirculated Waterin a Fish Culture System, Trans. Am. Fish. Soc., 107:92-
99,1978.
22. Spotte,S.H., Fish and Invertebrate Culture, WaterManagement in Closed Systems,Wiley, London, 145 pg, 1970.
23. Hirayatna,K., Studies on Water Control by FiltrationThrough Sand 9-. in a Marlne Aquarium with ClosedCirculating Systein,IV. Rate of Pollution of Water by Fishand the Possible Number and Weight of Fish Kept in anAquarium,Rul. Japan Soc.Sci. Fish., 32:27-30,1966.
24. Wheaton, F.W., Agricultural Engineering, WileyInterscience, New York, 1977.
25. Soderburg, R.W. and Quigley, J.T., The Technology ofPerch Aquacltare, University of Wisconsin Sea CrantProgram, WIS-SC-77-416, 1977.
26. APHA,AWWA,WPCF,Standard Methods for the Examination ofWater and Jastewater, 14th edition, Washington, D.C.,1976.
In70
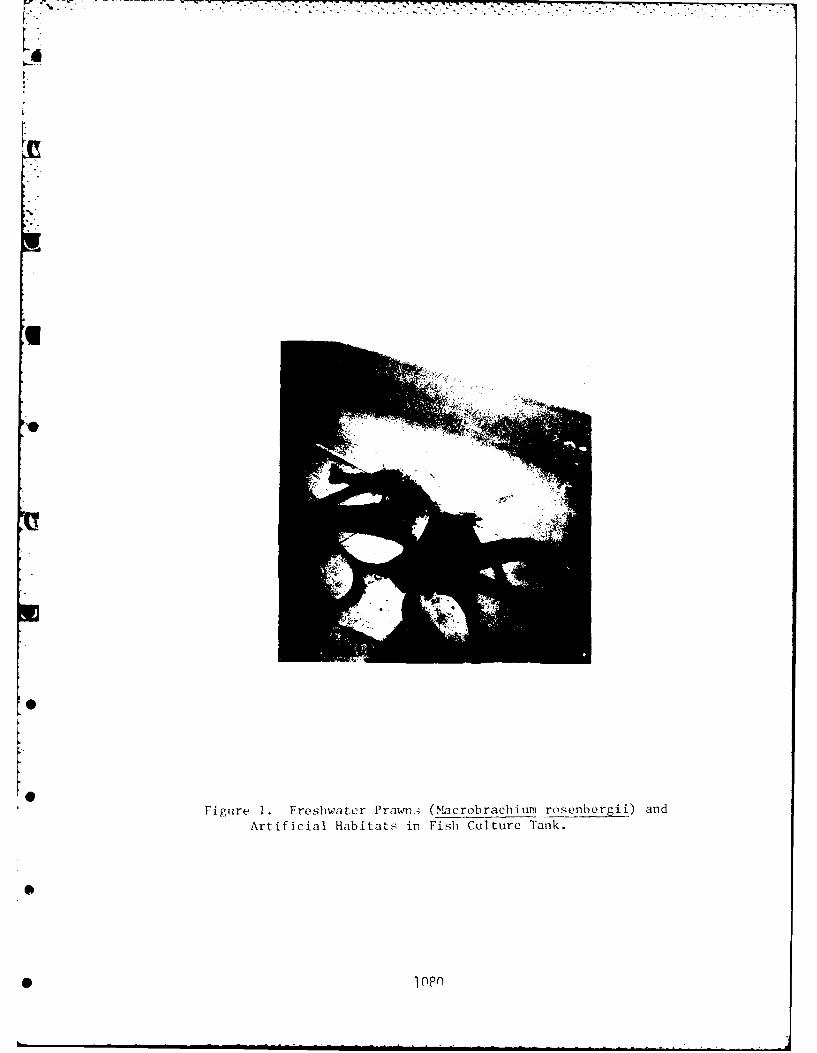
Fiue1 Frswae Prawn.4 LMarbr..u roener i and
p.Artificial Hait. - in Fis Cutr T. UU.
. . .
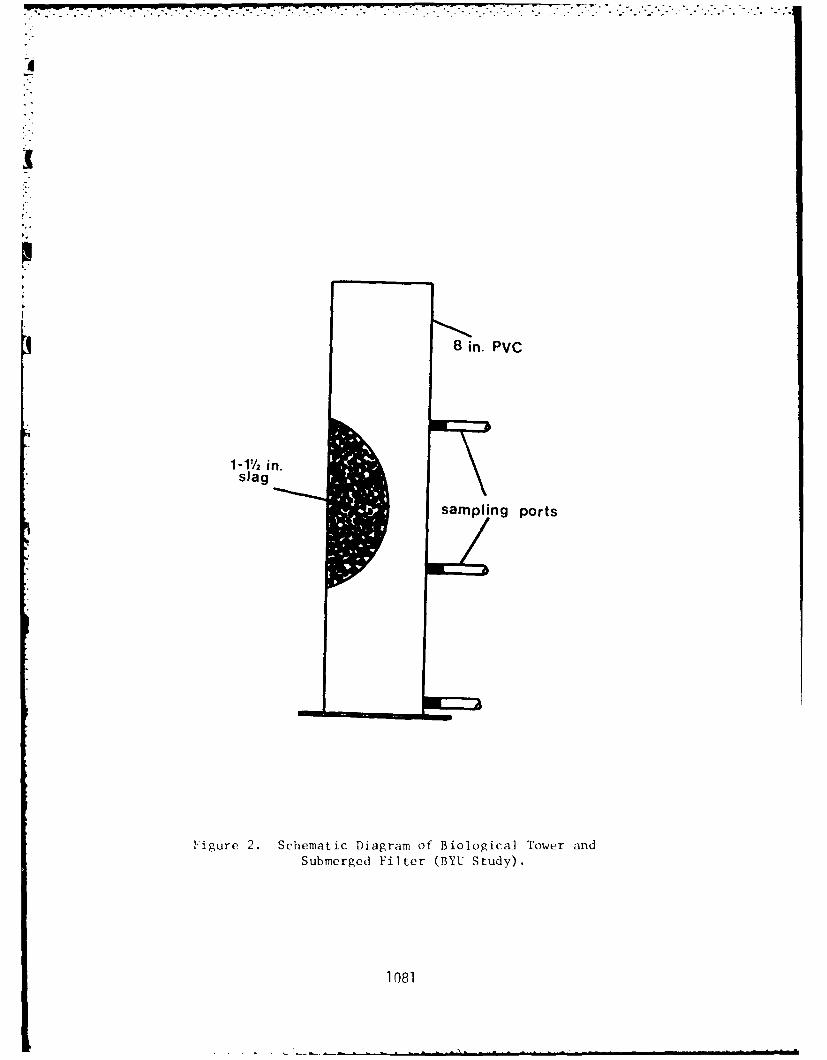
8 in. PVC
1 -12 in.slag
sampling ports
Figure 2. Schematic Diagram of Biological Tower andSubmerged Filter (BYll Study).
1081
.. I v j . II .
Figure 3. Constant Head Tank Used to Dose Biological
Tower and Submerged Filter (BYU Study).
• 1n82
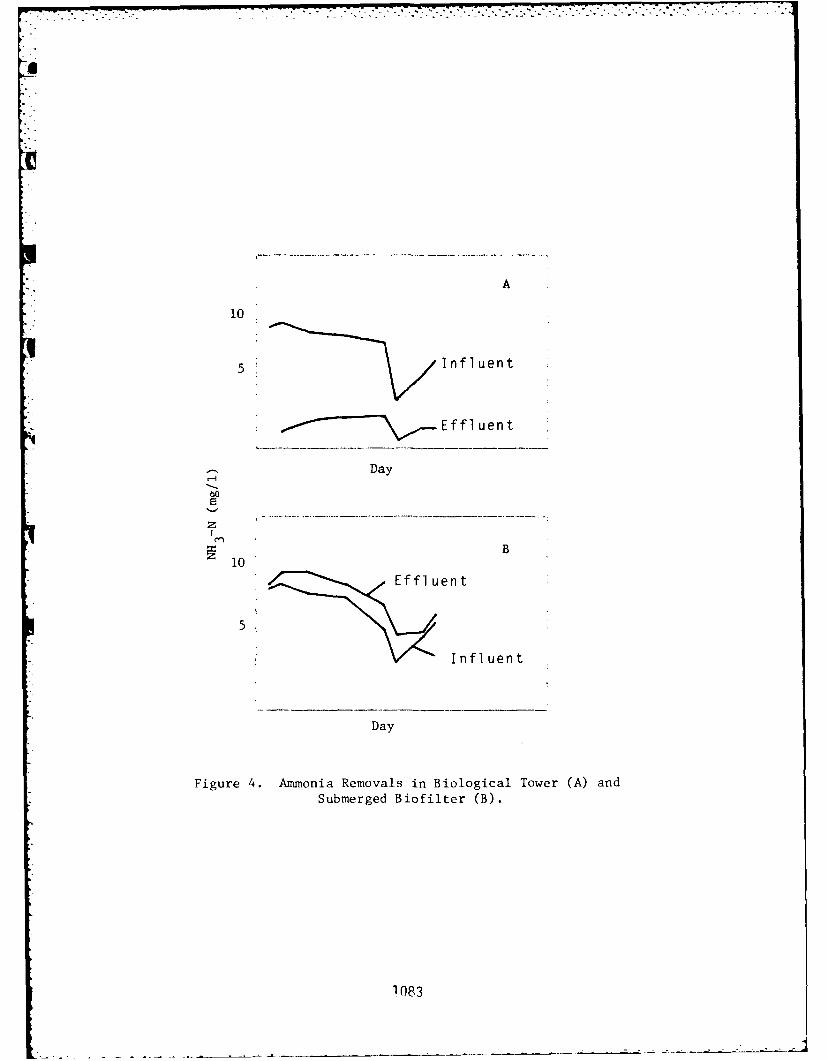
77
A
10
5 Influent
-X----Effl uent
Day
B
10
5
Influent
Day
Figure 4. Ammonia Removals in Biological Tower (A) andSubmerged Biofilter (B).
1083
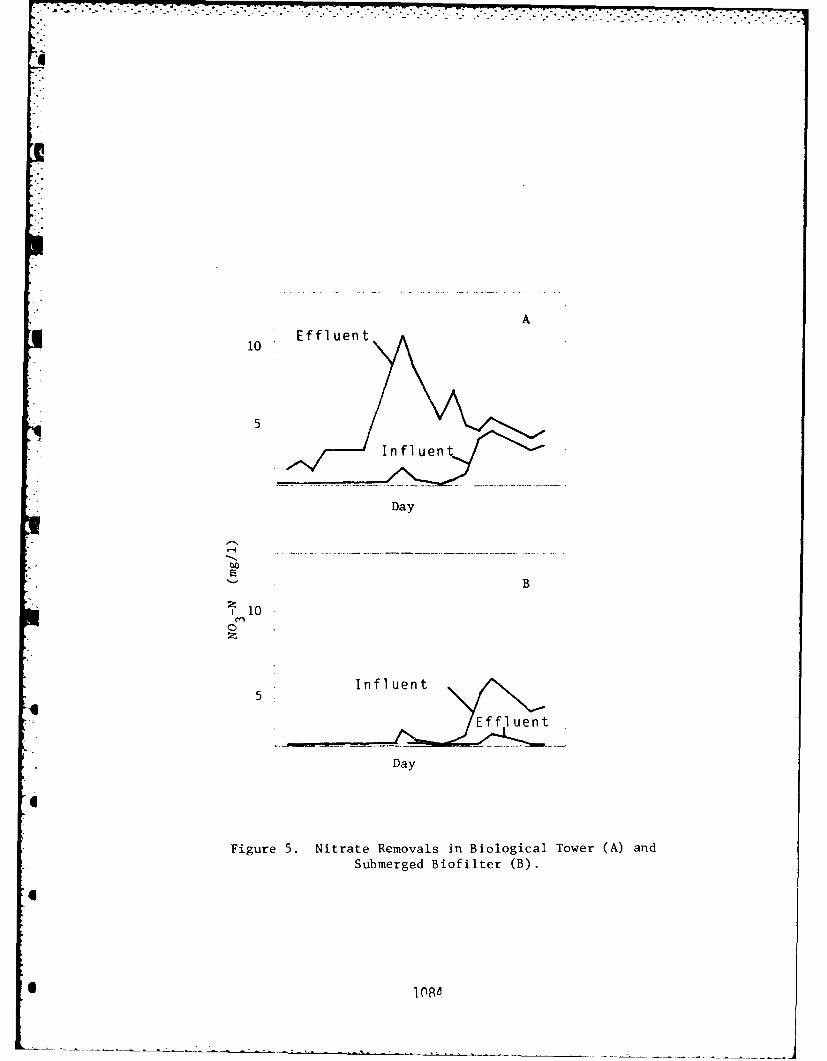
. . . .
A
10 Efun
5
Day
B
0
Effl uent
Day
Figure 5. Nitrate Removals in Biological Tower (A) andSubmerged Biofilter (B).
IOP
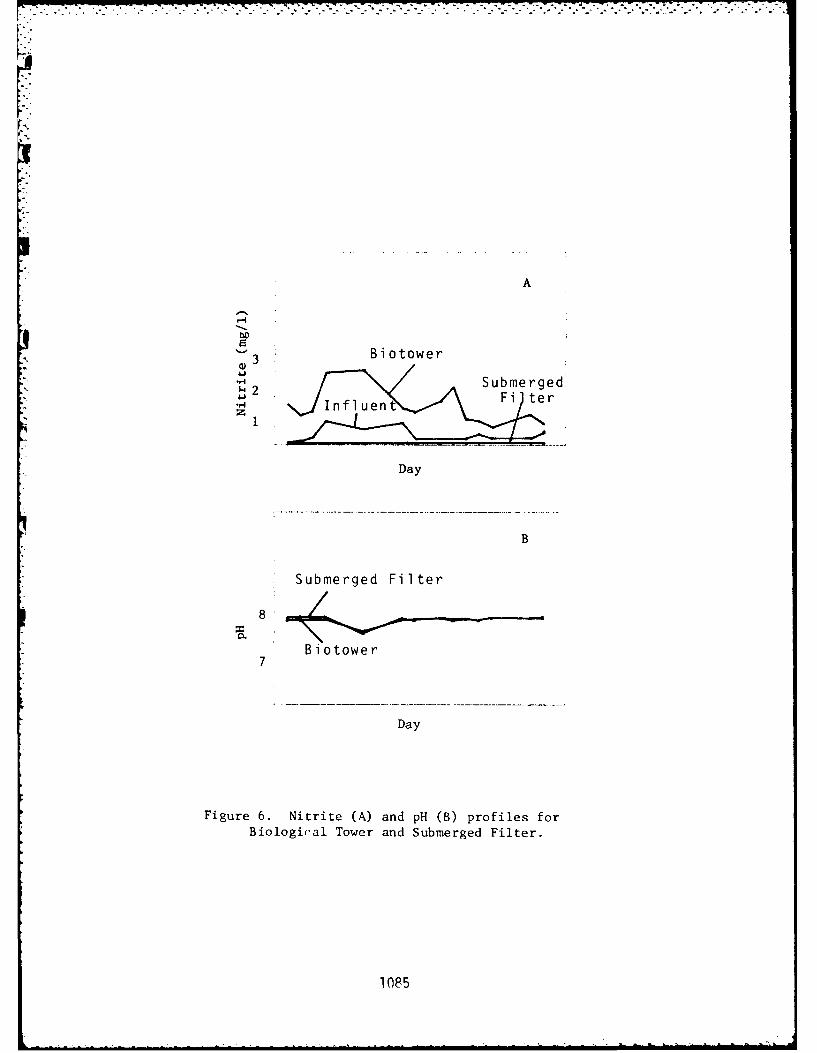
A
3 Biotower
Submerged
InfluentFi ter
Day
B
Submerged Filter
8'
Biotower7
Day
Figure 6. Nitrite (A) and pH (B) profiles for
Biological Tower and Submerged Filter.
1085
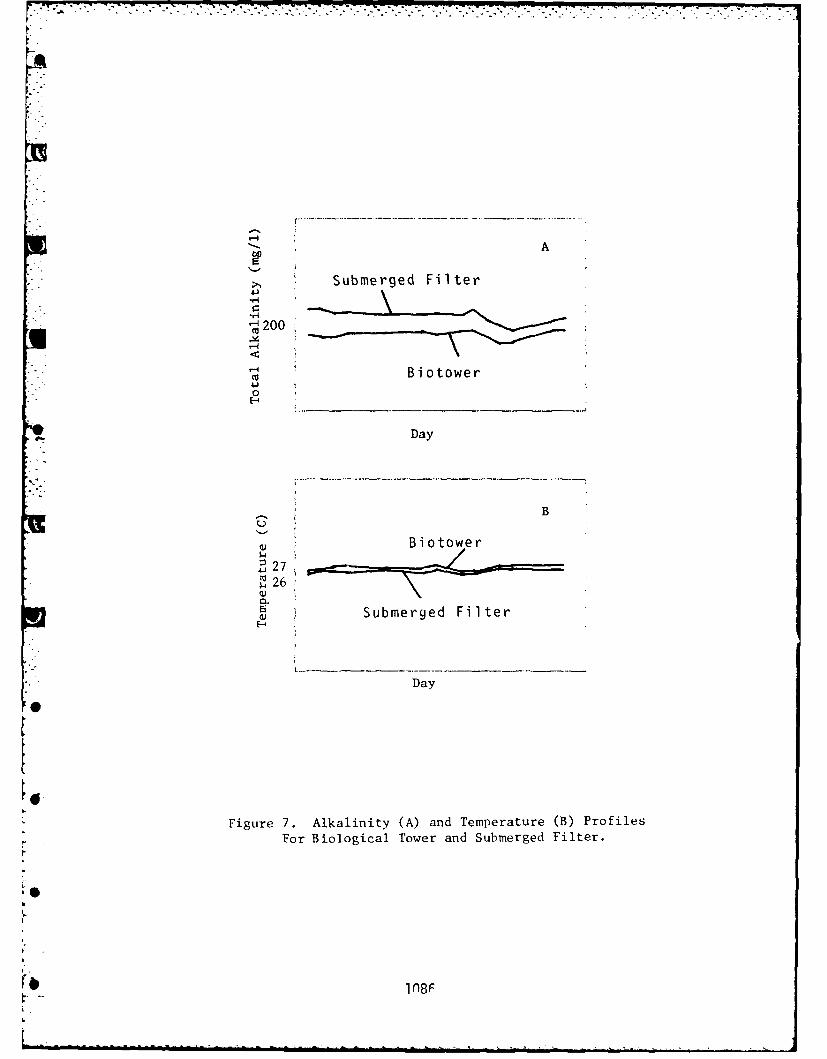
AA
Submerged Filter
-1 200
Biotower
Day
B
Biotower
S27 __________ _
~267
Submerged Filter
Day
K Figure 7. Alkalinity (A) and Temperature (B) ProfilesFor Biological Tower and Submerged Filter.
4.8
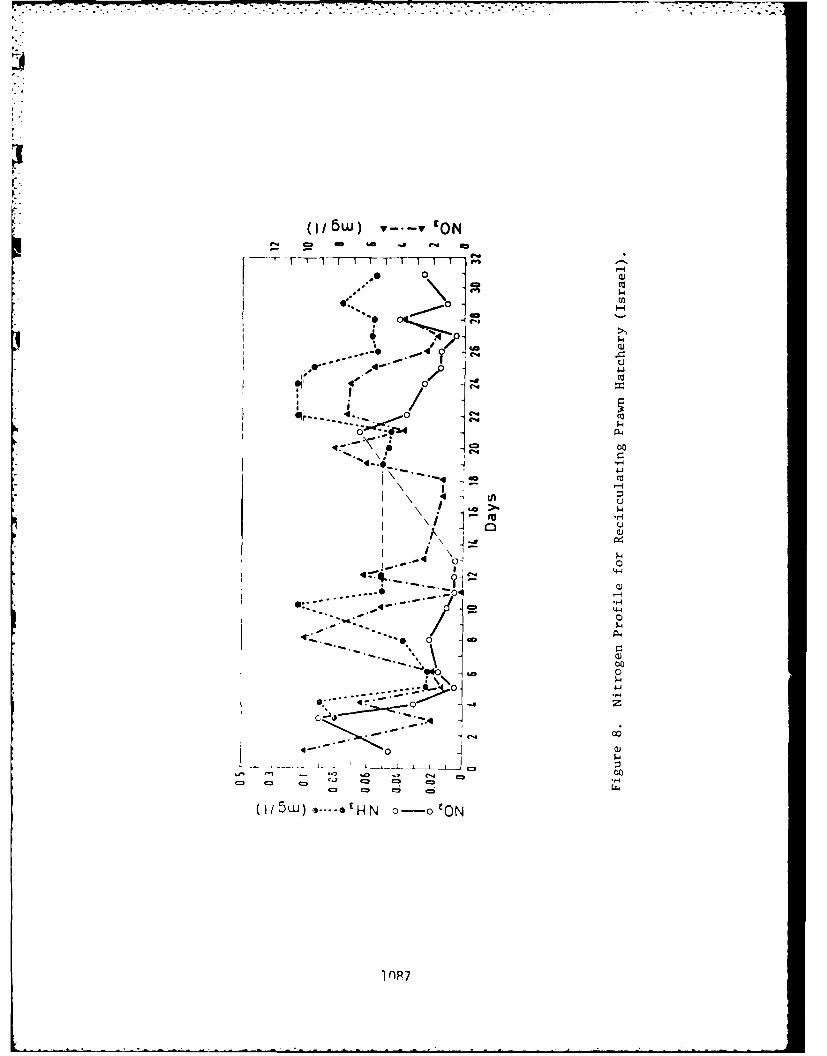
zjN
or'. 0 I-
a Ia
4
44- 0? a
060 0
K0
00C=))
1 I \ I-
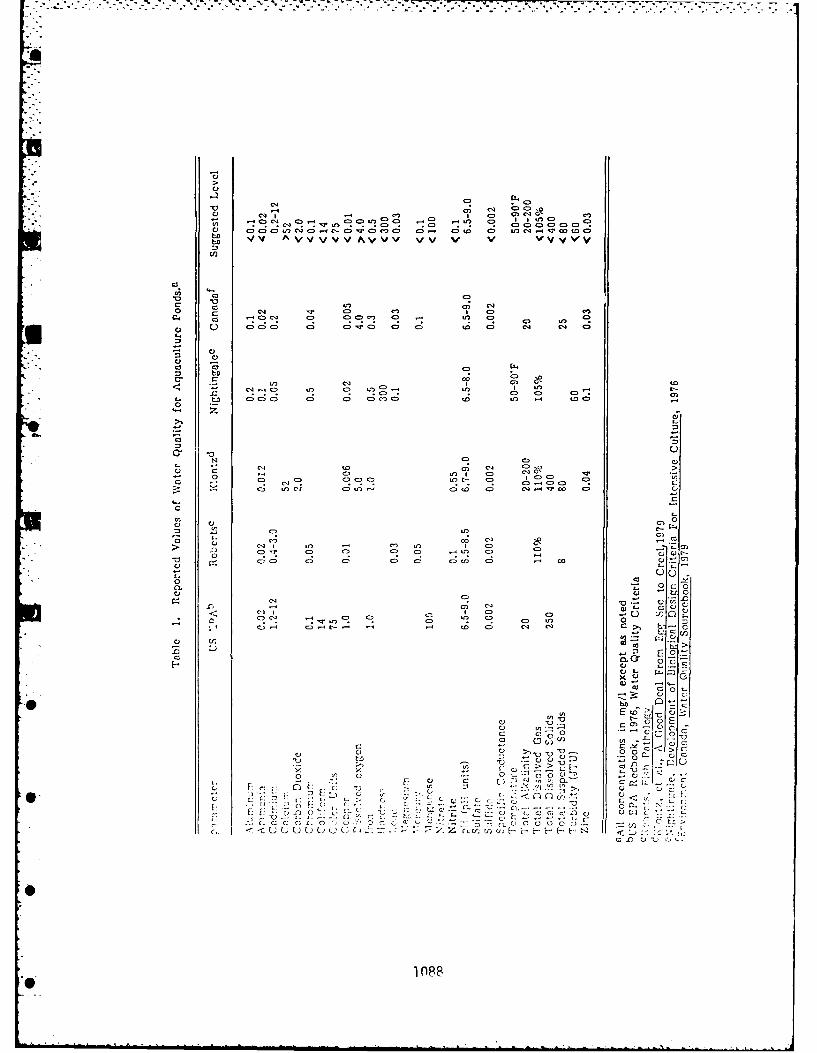
C) C
0:
'n I c" 0D LnI9 .89 . . . . J6 000000cD D
~~~~ vl vVVVV VVV V VsVV
al
Vo
c "o 1") M
C3' . . C)V0C. 6 00 0> c 0 0T 6 c; 0 0) C;c
.9 .
-D C)C)= , ocn ; ' o
Cs 0l
IfS C') 9 99"1IfS ID to C) c, q.Go
0
f). C') CDcs C) ~
o C) 9-c,c C. C> c D Coc,
I I) - C f I 0D
00 0 ) c0 0D 0) 015 0 oC)) 9 C-. -r
U Cs
C')~c 0 0~~fl - s CU
v~ lou c, E)
o~ c)
CCL
c, cl - - C
CS 0c)U Q 3 ECL cC
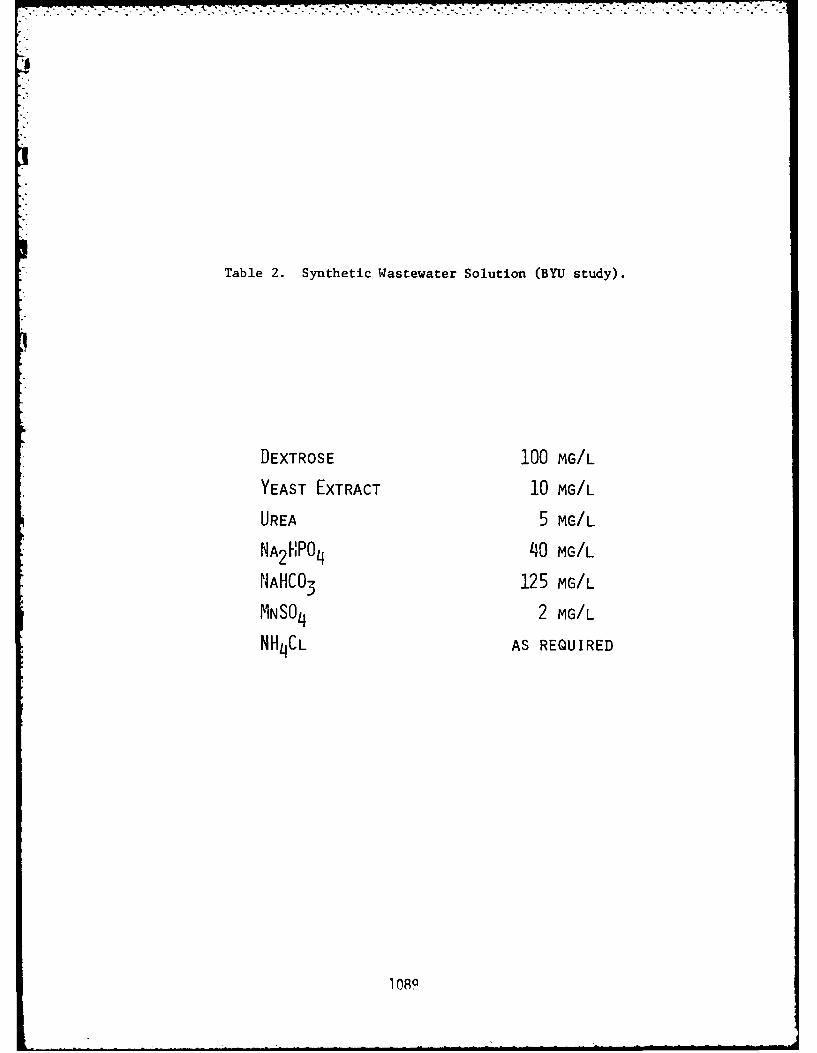
Table 2. Synthetic Wastewater Solution (BYU study).
DEXTROSE 100 MG/L
YEAST EXTRACT 10 MG/L
U REA 5 MG/LNA 2 :PO4 40 MG/LNA HC 0- 125 MG/L
MN SO4 2 MG/L
NH4 CL AS REQUIRED
1 089
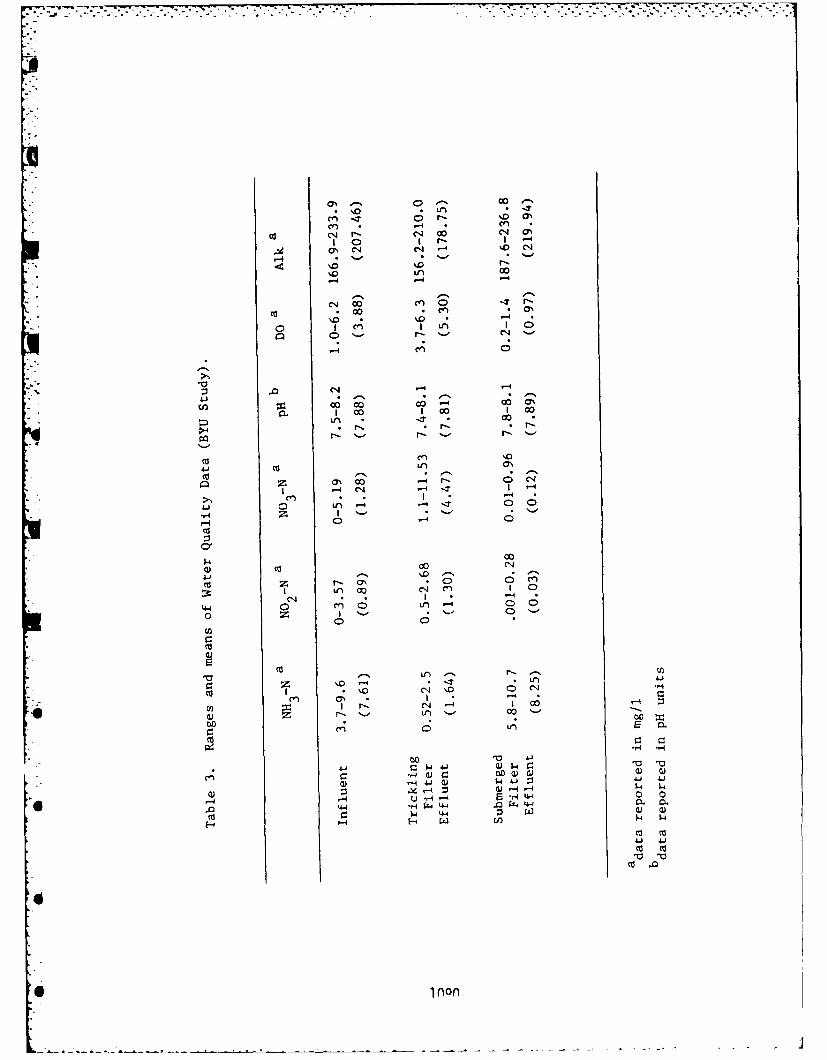
e'j C 00 ~ c4 a%
m' C14 C,4 -4 '0 C14
-4 -4 -
C,4 00 c'n 0- r
0g cn I I1fI
(n00I 00 O
Ln -.T 00
Cd c c c
41J Cd LA 0
z' 00 . C14I -4 C1~ 4 -T
-4 *-
ccc
CCa 0 - '* 0 0 C '
44 ~~~C 0 1~ A '0
0N 0
Ci))
Cdi
_d LA) r. E 4
Z0 A. * L
Ip . %10 0 C14
-4 1 06 -
C4, 0 Ln CLQ
C4 a) 0)00 Q) a
0)~~4- .0).4- -
* -0 "a
Cd .
non4.
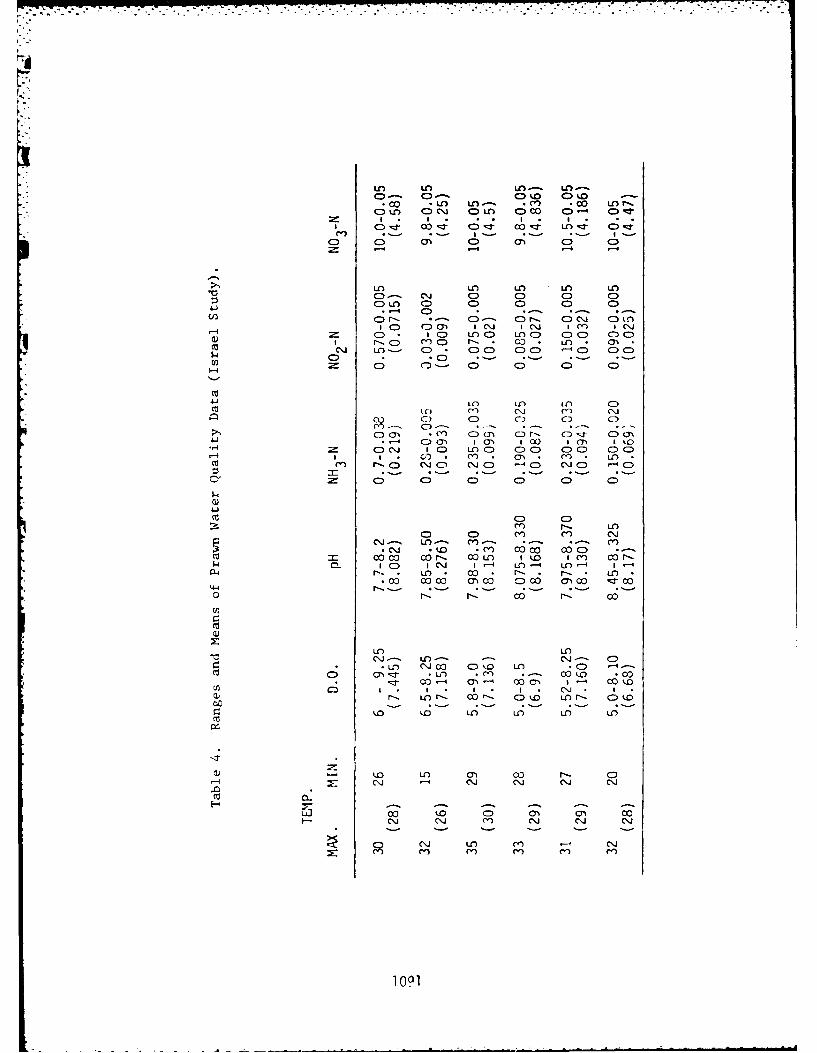
V) LA) LA ) LA -0- C 0C. 0 C)O t*C)o *LA L) MC .0 LAN. r
LO Ln LA LAI LA
C)A CC C0 C C0
CCor C) 0-. 0r- C CC\ OLf(D mC I Cl IC' "N I v) I*C\J
2= .0: -) C DLA LAO C 0 C 00 C :Q) I I-.o c C) r-. 0 C)) M LAmN LA 0 * 0 0 -O 0
U3 C
LA) LO in~ 0Dca CC) NJ ( C..jC) C) CD C-)
C)O0 N (~ ol a cj r- c)-J 0G---- 4 (n~ IO m (X 1 0 1 I t-H ~ C) C\J 9 LAOC)C)C CO C) COC
m -'
CD o co i
141 C C, C') (N.0J co LA m- 00) C) 00 a) 00 - C)
0 C6c Cor- CoL l~ C) Co
IC I'LO' L- LA
,- C- *) LA C r r-1 21L
LO CY. 00 C r- C
Ca \j Ci C~ ~ao
0~ m~ C~ 2Coi -co
C~ if *n I * I * NW~~ ~ ~ m- LAn- mo- in ~- C
1o 001 C
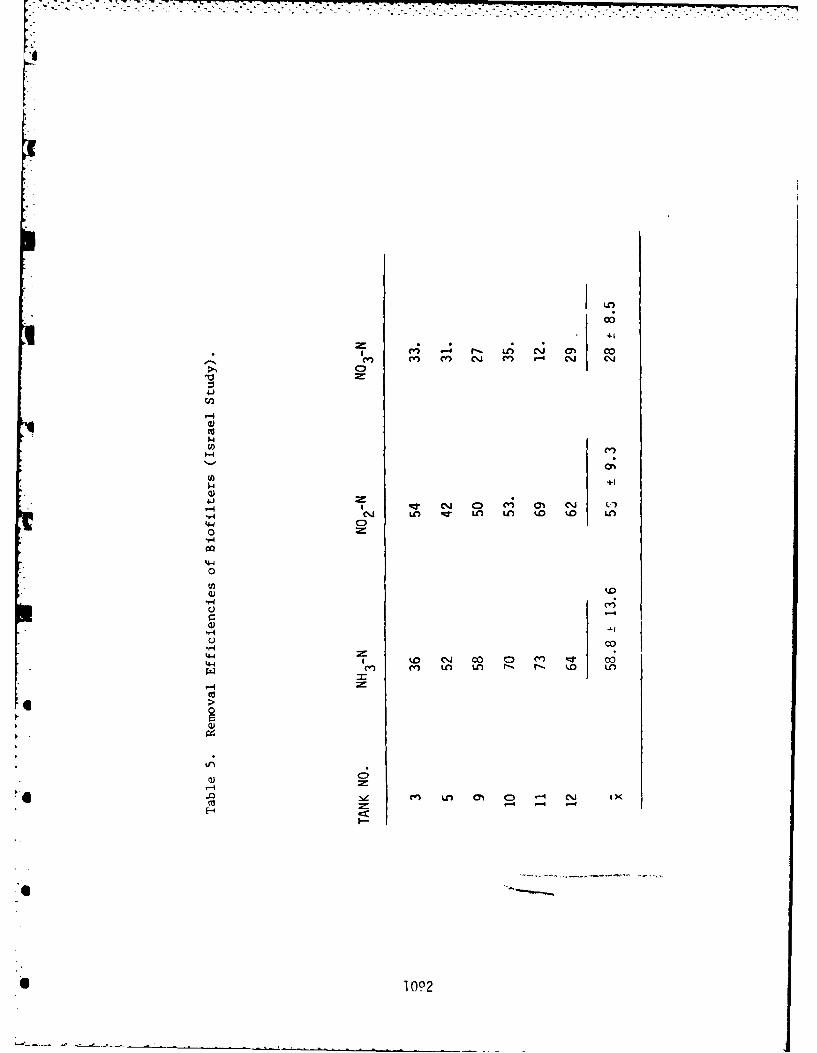
CC
coo
+1
4' .-f C) A %
00
4-4
co
+(
tw CJ 0o CC O %JW% LA L LA LO fl % LO
co
109
- .- .. . .. .. ' .... ............. -: r: .:' " 7i i
[-4
K
BIOFILTRATION OF TANNERY WASTEWATER
0 Ahmed A. Hamza,
Fahmy M. Ei-Sharkawi,0Mohamed A, Younig,
0Department of Environmental Health,High Institute of Public Health,Alexandria University, Egypt
INTRODUCTION
Industrial pollution on an unprecedented scale has emergedas one of the most pressing problems throughout the world.While governments have been grappling with a pernicious combi-nation of economic, social and political problems, they havenot paid equal attention to issues rel-ted to environmentalprotection, Improving the quality of the environment is nolonger a luxury measure; it is one which, in the long run,will generate immeasurable benefits in terms of protecting
public health and natural resources, and indirectly contribut-
ing to economic growth-Alexandria is the principal port of Egypt, the country's
largest industrial center and its prime resort, The ever-increasing dischirge of heavily polluted industrial effluentsfrom tanneries of the Mex Industrial Complex (MIC) into the Me-
diterranean has had an adverse effect on public health, fishproduction, navigation and the environmental quality of the
area, The combined effluent of MIC averages 2 mil lion cubicmeters annually,with an estimated population equivalent of
400,000,
1093
7 D-Fl2g 377 PROCEEDINGS: INTERNATIONAL CONFERENCE ON FIXED-FILM /
BIOLOGICAL PROCESSES (..(U) PITTSBURGH UNIV PR DEPT OF
U hS CIVIL ENGINEERING Y C NU ET AL. 1982 DACNBS-8i-R-805
UNCLASSIFIED F/G 13/2 N
J&3 11.2f.
11111 1.0112.
IIII III1 II~a !1IL25~ MO 111 .
MICROCOPY RESOLUTION TEST CHART
NANiONAL BUREAU Of STANDARDS 1963-A
pb.-
!
(-*
Biofiltration has been widely recognized as a reliabletreatment process, which suits the needs of small to medium-size industries, due to its versatility, ability to take shockloads and relative ease of operation. Decreased popularity ofbiofiltration in comparison to other treatment processes hasbeen attributed to inability of existing installations to meetemission limitations and the ineffectiveness of biofilters fortreatment of concentrated industrial effluents.
Renewed interest in biofiltration in Egypt is due to rela-tively low power requirements, system flexibility, and theneed for considerably less technical know-how for effectiveoperation compared to other treatment technologies.
High-rate biofiltration was shown by Smith and Kates( I )to be cost-effective and capable of reducing organic loadingSeveral plastic media were tested in the high-rate biofilterunits and each medium supported an adequate level of microbialorganisms,
Problems with odor were encountered because of the sludgeproduction of the high organic strength wastewaters.
Hosono and Kubota(2 ) reported that the BOD removal rateper unit of power consumption was shown to decrease with in-creasing BOD loadings, High-rate filters gave higher powereconomy values at higher BOD loadings, whereas standard-ratetrickling filters were limited to low BOD loadings.
Bailey et al(3) have shown that high rate biofiltrationcan relieve overloaded conventional filters by removing about40% of BOD from leather processing wastewater,. Plastic mediawere used in the roughing filters which were dosed with tanneryeffluents containing vegetable tanneries at rates of 3.3 to6b9 lb BOD/yd3 /do
Pierce(4 ) reported that removal of BOD at two-stage filterplants is significantly higher than at single-stage plants.Chemical treatment with metal salts and polymers upgradedsingle-stage filter effluents from an average of 36 mg/l BODto 21 mg/l, Similarly, effluent suspended solids were reduced
*g from 32 mg/l to 19 mg/l. The cost of chemicals is not prohi-
bitively expensive,Previous research has indicated the need to assess high-
rate biofiltration at various loadings and flow patterns fortreatment of specific industrial wastes, in order to accuratelyevaluate system performance. It is particularly important to
• compare the performance of biofilters with other competing bio-logical processes for treatment of tannery wastes and evaluationof cost-effective modifications to improve effluent quality.Recognition of these needs prompted the undertaking of thisstudy,
1 lnne
BACKGROUND
The MIC tanneries are located east and west of the muni-cipal slaughterhouse, as shown in Figure 1. At present, the
slaughterhouse and tannery wastes (including organic particles
and toxic chemicals) are collected in public sewers and dis-
charged directly into the western harbour through three sepa-
rate outfalls, without pre-treatment. Sewer clogging is fre-quently experienced due to large residues discharged with tan-
nery effluents.The General Organization for Industrialization (GOFI) is
placing MIC tanneries on the top priority list of the most pol-
luting industries which require Government technical and finan-
cial support for installation of waste treatment facilities.The available options being studied are: (a) primary treatment
of combined effluent before discharge into public sewers forfurther treatment with domestic wastes or (b) biological treat-ment to meet Egyptian effluent limitations for direct disposalinto water bodies,
According to prevalent practices in MIC tanneries, about28-36 cubic meters of wastewater are generated per ton of hide
processed(5 ).
Studies performed on the six major tanneries during 1980-
1981 indicated that clean water pools of the beam house contri-
bute 24.8% of the total effluent and only 028% of the BOD load,
while vegetable tannery generates 1.4% of the liquid wastes
and 43.3% of the BOD load (Table I), This suggests that ju-
dicious segregation of relatively clean process waters may ap-preciably reduce the size and costs of treatment facilities.
The pollutional loads of tannery processes shown in Table IIindicate that both beam house and tan-yard generate higher
loadings than those originated from retin, color and fat liquor
processes.
Chrometan mixed wastes comply with EPA guidelines (6 ) while
BOD, COD and Oil Lad Grease (0 & G) loadings of the vegetable
tan mixed wastes were higher than those suggested in the guide-
lines. A summary of the physico-chemical characteristics and
trace metal constituents of various process effluents are shown
in Tables III and IV respectively.
MATERIALS AND METHODS
The experimental system consists of two biofilters, recy-
cling pumps and clarifiers, as shown in Figure 2. Each filter
10Q5
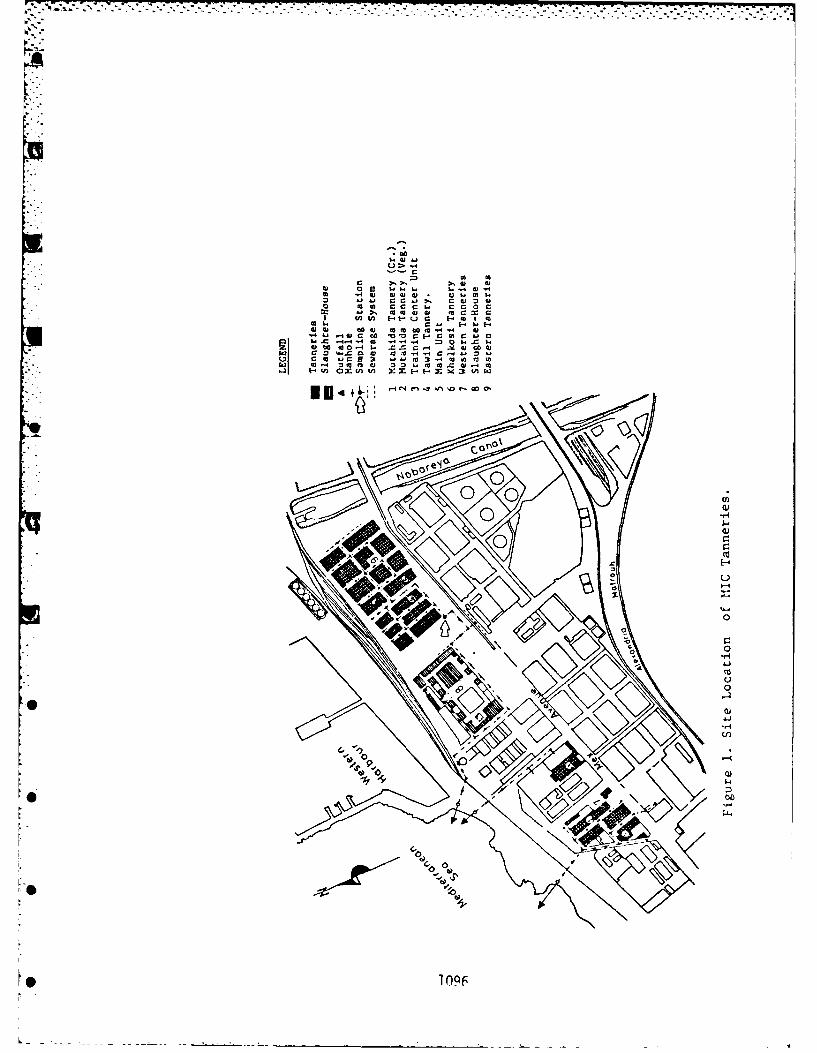
4j r~~ --- - -- . c . 0 w
10 .r -
w = e - :!J! ,41 o 4 " I r- 0 t
a .c a 4, mC 7v
I IV & ErtL W 1 m- 1 11V) x ( 1 1:m -m 4 3 C 9
41W 041 W10OU~~4el
'-4~~~ 0J.4JC
C ~ C- C -
-if4
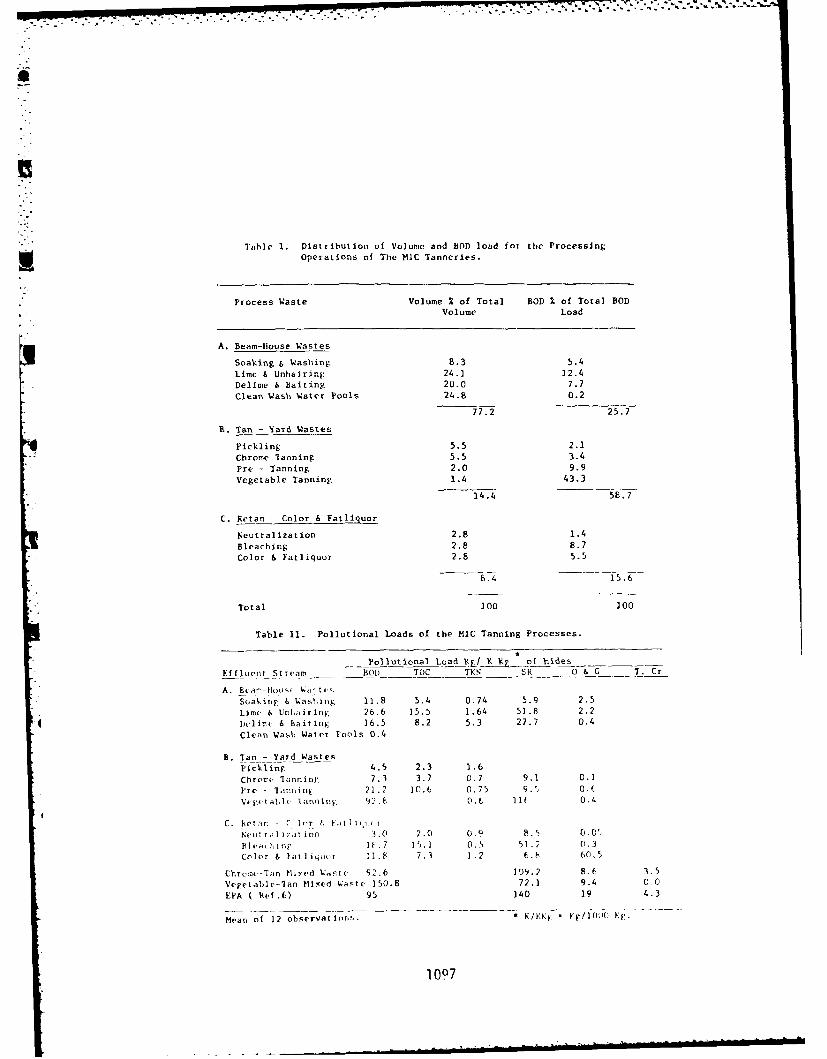
-- 7
a
Table 1. Distribution of Volume and BOD load for the ProcessingOperations of The MIC 7anneries.
Process Waste Volume % of Total BOD 2 of Total BODVolume Load
A. Beam-House Wastes
Soaking & Washing 8.3 5.4Limc 1 Unhairing 24.1 12.4
Delime & Baiting 20.0 7.7Clean Wash Water Pools 24.8 0.2
77.2 25.7
B. Tan - Xard astes
Pickling 5.5 2.1Chrome lanning 5.5 3.4
Pre - Tanning 2.0 9.9
Vegetable Tanning 1.4 43.3
14.4 58.7
C. Retan - Color 6 Fatliguor
Neutralization 2.8 1.4
Bleaching 2.8 8.7Color & Fatliquor 2.8 5.5
8.4 15.6
Total 100 100
Table 11. Pollutlonal Loads of the MIC Tanning Processes.
Pollutional Load Y,/ Y __p of hides
Effluent Stream BO) T0C TKN SR 0 6 C T. Cr
A. Buar, --tH)oos ; a tc-
Soa6in w Washing 11.8 5.4 0.74 5.9 2.5
Lietr & Un luiring 26.6 15.5 1.64 51.8 2.2
'4 Dcllt, 6 Baitin 16.5 8.2 5.3 27.7 0.4
Clean Wash Water Pools 0.4
B. Tan - Yard WastesP klinF. 4.5 2.3 1.6
Chrome lanning 7.3 3.7 0.7 9.1 0.1
Pre - 1lnniiq 21.2 10.6 0.75 9.5 0.6Weget at, l aniinne', 2 .E, 0.6 f ]]6 0.4
C. -eh an e C Ir, r , .t yN (u r II .Itiofl 3.0 2.0 0. 8.5 0.05
BI.a h i yn 11.7 15.] 0.5 51.2 0.3Color 6 1
'atIiquot 11.8 7.3 1.2 6.f 60.5
Chruruc-T;n Miyed Waqte 92.6 ]99.2 8.6 3.5
Vegetable-lan Mixed Waste 150.8 72.1 9.4 0,0
EPA ( Re.6) 95 140 19 4.3
Mean of 12 observations. //KK --V010( -Rg.
1097
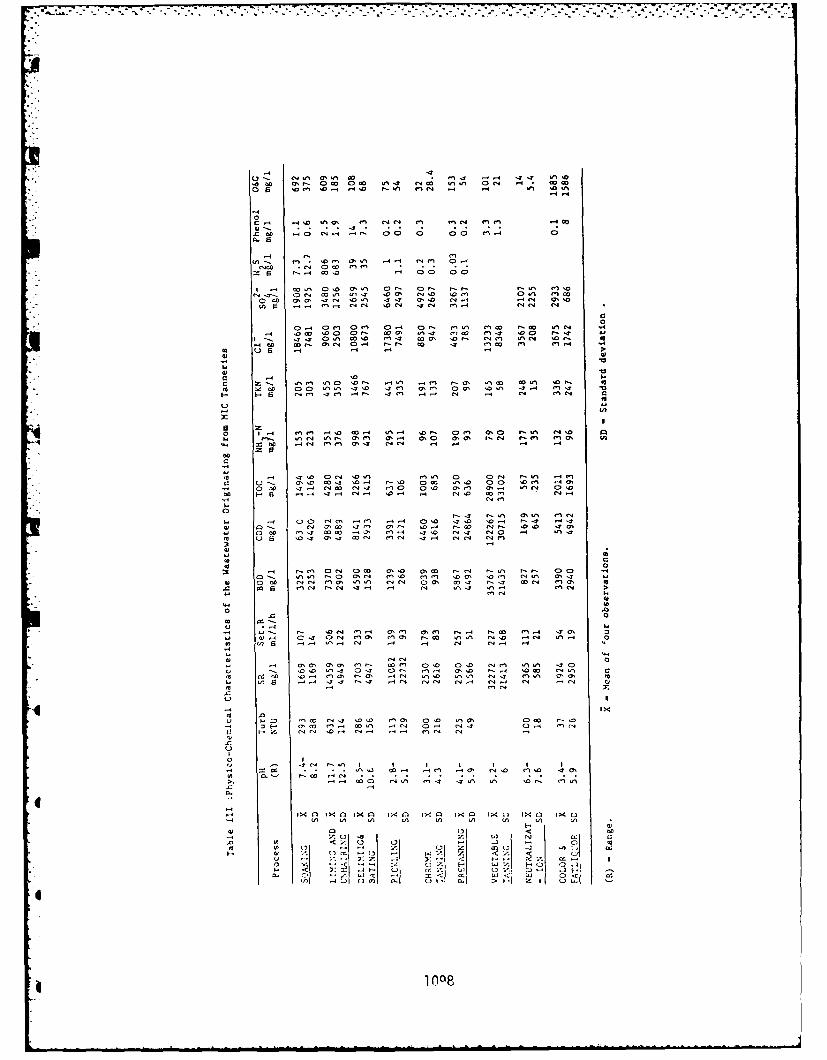
-4 -0.-. 40 04, 0 CD V.% .. Go 00
0 D
a.) .4 4.4%0 '0 " 0 IDCn*4 00 -
V)0 .. 4 4-.c .- ' 0 0r04.-
C:> 4- D 0naCN 0 C 11G o10 co 0 4 0 0- co 04 co In4 0r 00 Cp
1-0 .44 00 OD10 - coa D- m-00 OD.- 40. 0 .4 00 00m n
r 00 03 04 04--D 00' .4 Ln. %0 0
os oa -0 C00 43 N.71 .- N 5
40 1 m- 4'0. .0A s044 .3D- 44-4. N4
LA a
C) -. 0 m4 0 00 0 04 40 N /N c
40 US E-3 .0 C4 4m
m " 0 m01
w 0 01)0a, m.
.4 L1
-MI
405
00
C, Q4 m4 Lo .4000 0 ON 04 4
>0"el. z4 u441 O
I..~ ~~~ ~~~~~~ O4 0 -40 4 4.4 03 .73 '.) . 4
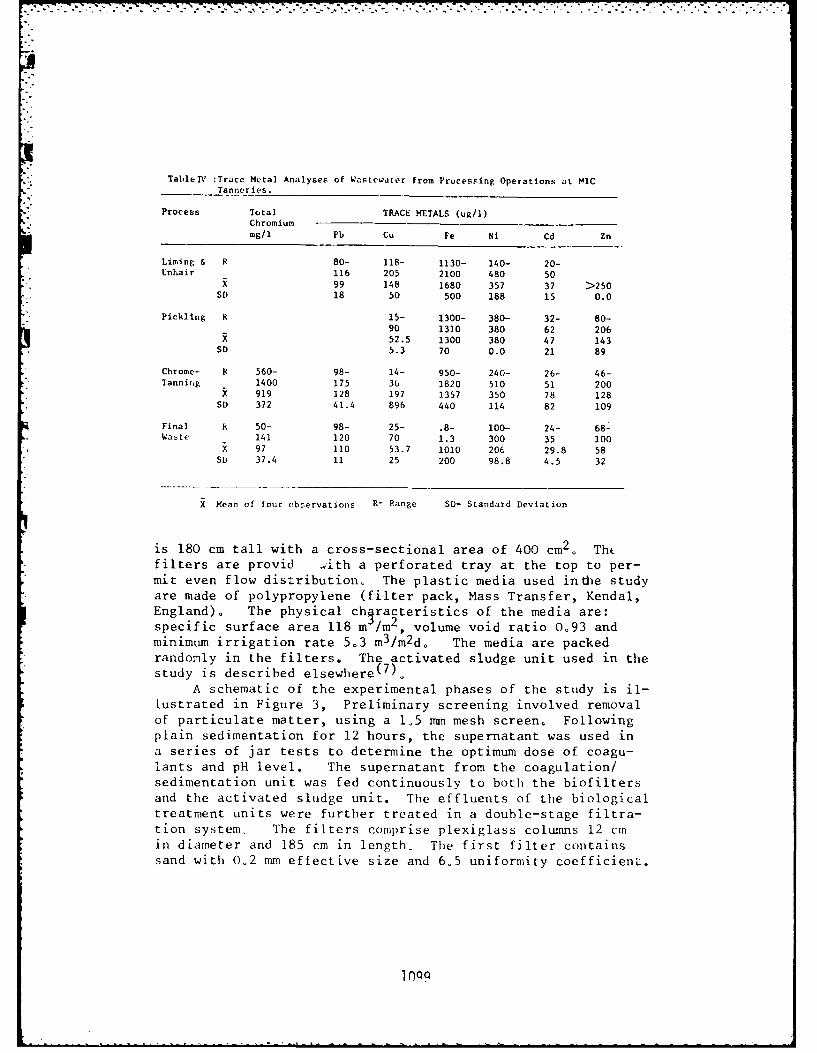
Table]V :Trace Metal Analyses Of WaStewater from Pro~cessing Operations at 141CTannerie's.
Process To~tal TRACE. METALS (ug/1)Chromiummg/i Pb Cu Fe Ni Cd Zn
Liming & R 80- 118- 1130- 140- 20-linhair 116 205 2100 480 50
X 99 148 1680 357 37 >250
SD 18 50 500 188 15 0.0
Pickling R 15- 1300- 380- 32- 80-90 1310 380 62 206
IC52.5 1300 380 47 143SO 5.3 70 0.0 21 89
Chrome- . 560- 98- 14- 950- 240- 26- 46-Tanning 1400 175 3U 1820 510 51 200
IC 919 128 197 1357 350 78 128SD 372 41.4 896 440 114 82 109
Final R 50- 98- 25- .8- 100- 24- 68-Wabte 141 120 70 1.3 300 35 100
X 97 110 53.7 1010 206 29.8 58SD) 37.4 11 25 200 98.8 4.5 32
X Mean of four (,bnervations R= Range SD= Standard Deviation
is 180 cm tall with a cross-sectional area of 400 cm2. Th,filters are provid Iiith a perforated tray at the top to per-mit even flow distribution, The plastic media used inthe studyare made of polypropylene (filter pack, Mass Transfer, Kendal,England). The physical ch racteristics of the media are:specific surface area 118 m I /m2, volume void ratio 0.93 andminimum irrigation rate 5.3 m3/m2d. The media are packedrandomly in the filters. The activated sludge unit used in thestudy is described elsewhere(7).
A schematic of the experimental phases of the study is il-lustrated in Figure 3, Preliminary screening involved removalof particulate matter, using a 1,~5 mm mesh screen, Followingplain sedimentation for 12 hours, the supernatant was used ina series of jar tests to determine the optimum dose of coagu-lants and pH level. Thie supernatant from the coagulation!sedimentation unit was fed continuously to both the biofiltersand the activated sludge unit. The effluents of the biologicaltreatment units were further treated in a double-stage filtra-tion system. The filters comprise plexiglass columns 12 cmin diameter and 185 cm in length- The first filter containssand with 0.2 mm effective size and 6.5 uniformity coefficienL.
inQo
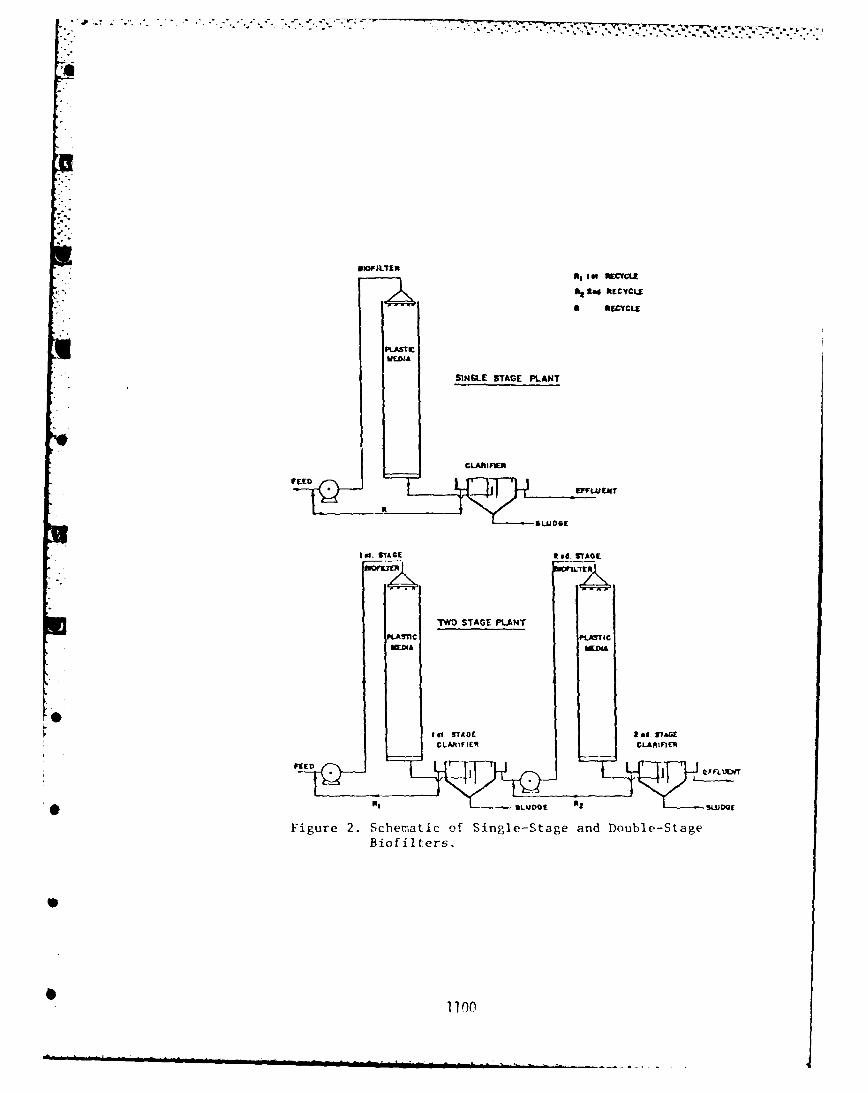
%&ad RECYCLE
a RECYCLE
PLtASTIC
SINGLE STAGE PLANT
CLARIIER
ItQ jEFFLUENT
I o. STAGE #ad. STAGE
T"O STAGE PLANTMLASTIC PLASTIC
wIi STAGE 2 ad STAGECLARIIERL CLAIFPIERI
IED
L FFLLINT
NJ .... 0,G SLUDG
Figure 2. Schematic of Single-Stage and Double-StageBiofilters.
1100
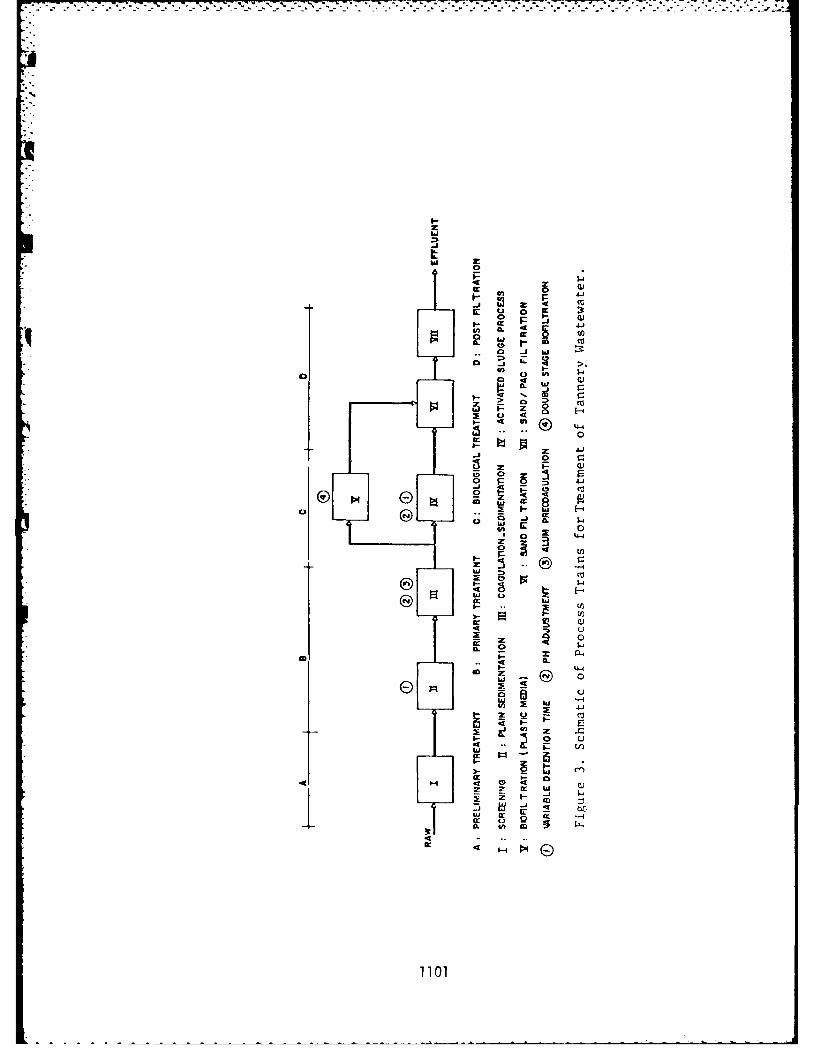
z -
in c
00
0
4-
Cu
0J
In IL
G- . 4-40.0
0 j
u~J .4 ~ - U)
0 H
0 w. 04
a:.4 n
1100
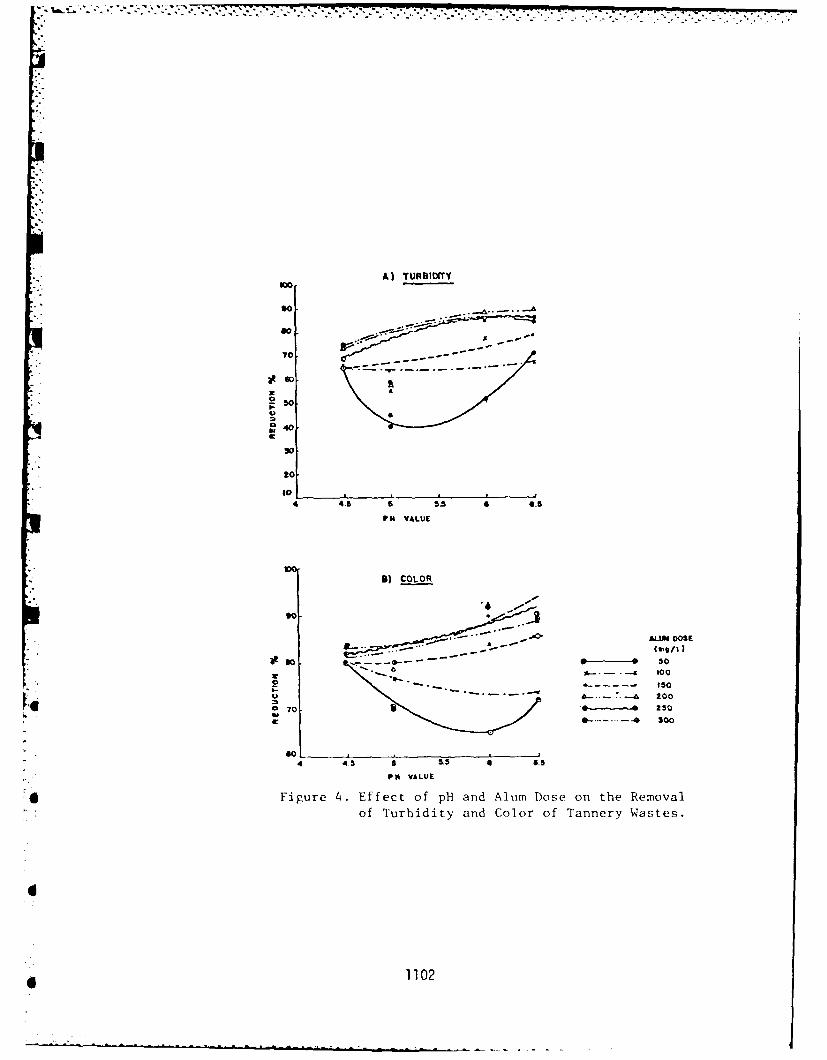
A) TURBIDTY
K50
40
Do,
p * ... . ... '.
t a
4 44.t s 51 a 4.5
W 11'PH VALUE
-100
-I
!-I t -. .-, oo
105
-- A 20
1 o TO3 - a-,--------- 0 15
00 _- .30,0__ _
4 4.1 6 5-5 6 6.6
PH VALUE
aFigure 4. Effect of pli and Aluim Dose on the Removal
" ' of Turbidity and Color of Tannery Wastes.
4- 1102
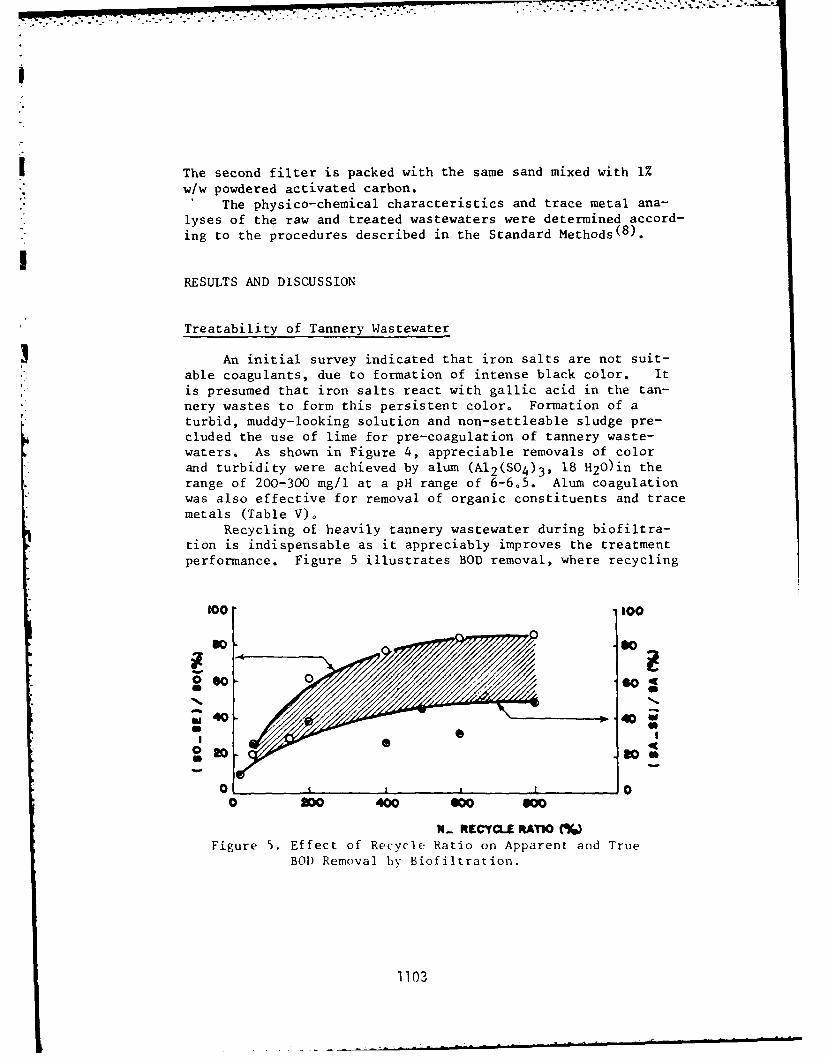
The second filter is packed with the same sand mixed with 1%
w/w powdered activated carbon.The physico-chemical characteristics and trace metal ana-
lyses of the raw and treated wastewaters were determined accord-ing to the procedures described in the Standard Methods(8) .
RESULTS AND DISCUSSION
Treatability of Tannery Wastewater
An initial survey indicated that iron salts are not suit-able coagulants, due to formation of intense black color. Itis presumed that iron salts react with gallic acid in the tan-nery wastes to form this persistent color. Formation of aturbid, muddy-looking solution and non-settleable sludge pre-cluded the use of lime for pre-coagulation of tannery waste-waters, As shown in Figure 4, appreciable removals of colorand turbidity were achieved by alum (A12 (SO4)3 , 18 H20)in therange of 200-300 mg/l at a pH range of 6-6°5. Alum coagulationwas also effective for removal of organic constituents and tracemetals (Table V).
Recycling of heavily tannery wastewater during biofiltra-tion is indispensable as it appreciably improves the treatmentperformance. Figure 5 illustrates BOD removal, where recycling
100[ '1O
so so.0
w 4 0 40W
a t0 0
0 sI I ,oI
0 MDO 400 Go0
N_ RECYCLE RATIOFigure 5. Effect of Recycle Ratio on Apparent and True
BOD Removal by Biofiltration.
1103
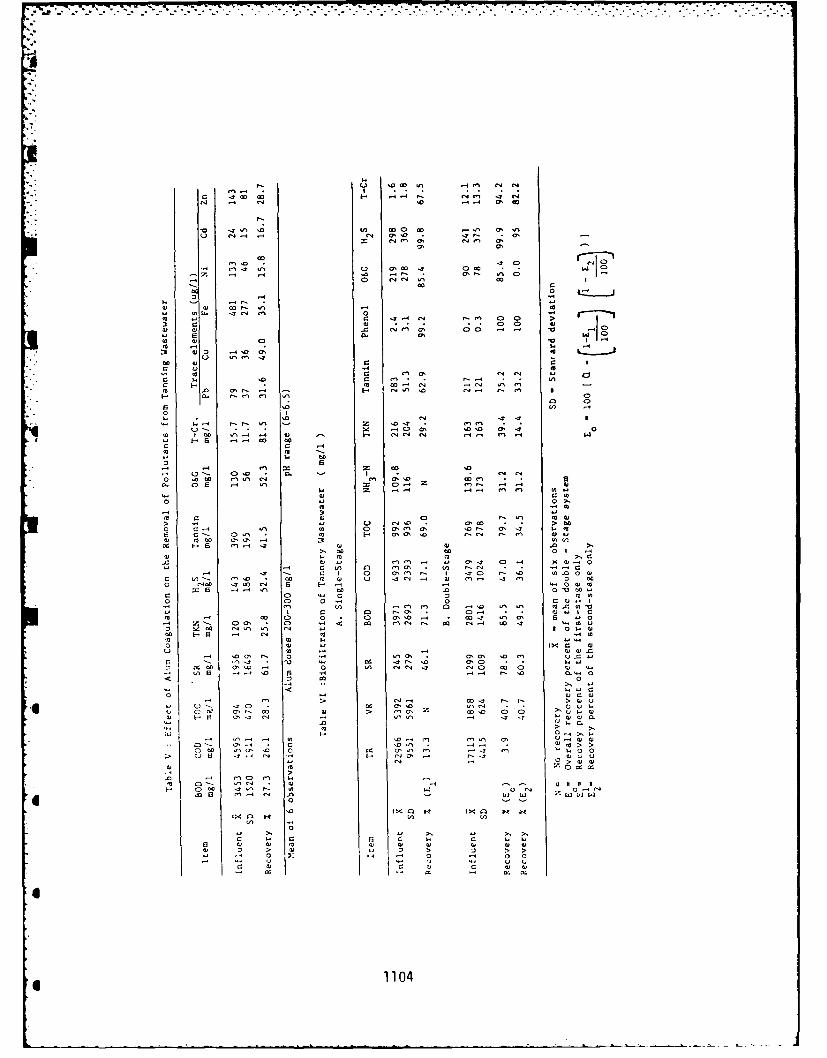
co g
0% c
LA co0 a~ coI e 'u n. IN a, D
C) 0'
InIL C> '. 0
CDI. n( 00- 0 I
01 40 034. In -IIn
40 .t 40 a. 4 e . I
030:o 0 0 14
:3 40
0o 0 C, 4:o4: (7, z .0
0 0
0,
C
r 10 wl a, 03
0 I- "O 'sI 00..0 0 .
40 C0 -r4.. 00
'.4 OD InI 03mC, 01- 0. a, o l (
LI 0 3 - 1, co 0'N Z0 In4 .o .-1 E 0
00 4:4"
u 4.4 0 )0 0 0.4
F4 . 4: 4004 - 4 4
n3 W.'- O n .0 H a,1. e CeD - I ).
'o 000004 .
a, eo00 >. 0 C)a > 0 u
4: 0 '4. 4:4 1
o n 0 l. 0 4: 0 ) 4
40 4 0 0 0 110Ix In 11 01 4 4.. 4 ~~~-.. 01 0 4 < 0 nN 4- 0 .,4 0- 4.
0~~~ >0 4 4< : 4
:0 03
W . .. u4 4
W4-N-w4:0~ - 044
In C-~11 4 37 C. I- 4
increases both true removal (So-Se) and apparent removal (So-Se),where So, Se and Sa are the influent, effluent and applied BODafter mixing with recycled flow, respectively. An optimum re-cycling ratio of 600% was selected for the biofiltration study.Recycling of the precoagulated tannery wastewaters in the single-stage biofilter produced moderate recovery of BOD, TOC,tannin,phenol and trace metals (Table VI). However, the recovery ofTKN was comparatively low. The effluent of the single-stagebiofilter constitutes high levels of organics and chromiumwhich exceed the emission limitations for discharge into public
sewers and the sea. Improved recoveries of various pollutantswere achieved in the double-stage system as shown in Table VIand Figure 6, The low recovery of TKN during biofiltrationis attributed to the presence of a high concentration of nitri-fying NH3 -N in the influent (100-136 mg/l) which is toxic tobacteria and hence retards the nitrification process. Theaverage hydraulic rate in the biofilters was 0.02 1/m2 whichis much lower than the adequate rate for wetting (0.062 1/m
2 ,S)
as recommended by the manufacturer . The high organic loadingand the low hydraulic rate contributed to the observed lowrecoveries of the biofilters even when using the double-stagesystem. Application of a higher hydraulic rate in larger ins-tallations is expected to enhance wetting and consequently im-prove the overall treatment efficiency,
To compare the performance of biofiltration with othertreatment processes, a concurrent study using the Complete-MixActivated Sludge (CMAS) system was performed, Table VII showsthe results of treatment of tannery effluent by the CMAS systemusing 24 and 48 hours detention periods, The CMAS operated atBOD loadings of 2.5-4.9 kg/m3 ,d, while maintaining an averageMixed Liquor Suspended Solids (MLSS) of 2300 mg/l and SludgeVolume Index (SVI) of 67 mg/l
Aeration for 24 hours resulted in moderate recovery ofBOD and TOC; high recovery of tannin, chromium aiJ H2 S; whilethe TKN removal was low. Extended aeration for 48 hours pro-duced a slight improvement in removal of most pollutants,Doubling the aeration time will result in significant increasesin capital and operating costs which are not justified by theminor improvement in treatment efficiency, Figure 7 illustra-tes the comparative effects of the biofiltration and the CMASprocesses, With the exception of COD,both processes producedmore or less similar recoveries of pollutants associated withtannery wastewater,
An approach to the evaluation of removal of soluble orga-nics from industrial effluents based on molecular size
1105
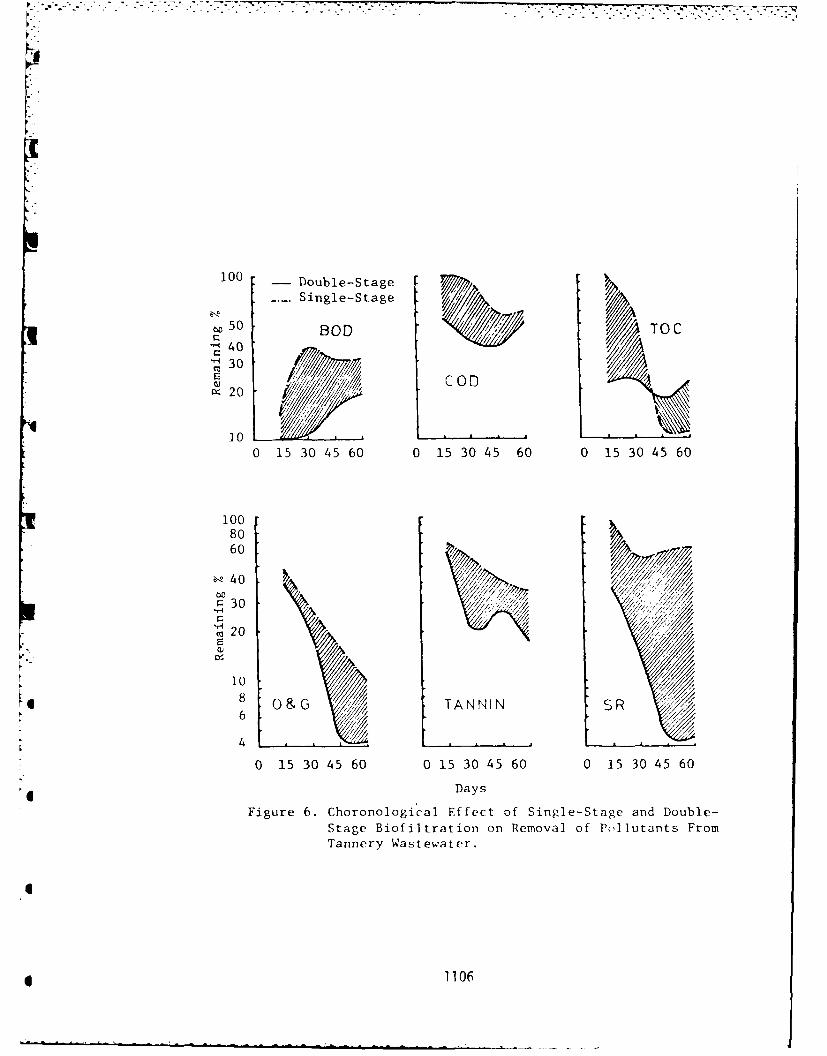
100 -Double-Stage
Single-Stage
E30D TOC.40
30
10
60
~40
O.NO
10
0 8 &G //TANNIN S R6X
4
0 15 30 45 60 0 15 30 45 60 0 15 30 45 60
Days
Figure 6. Choronological Effect of Single-Stage and Double-Stage Biofiltration on Removal of Pollutants FromTannery Wastewater.
* 1106
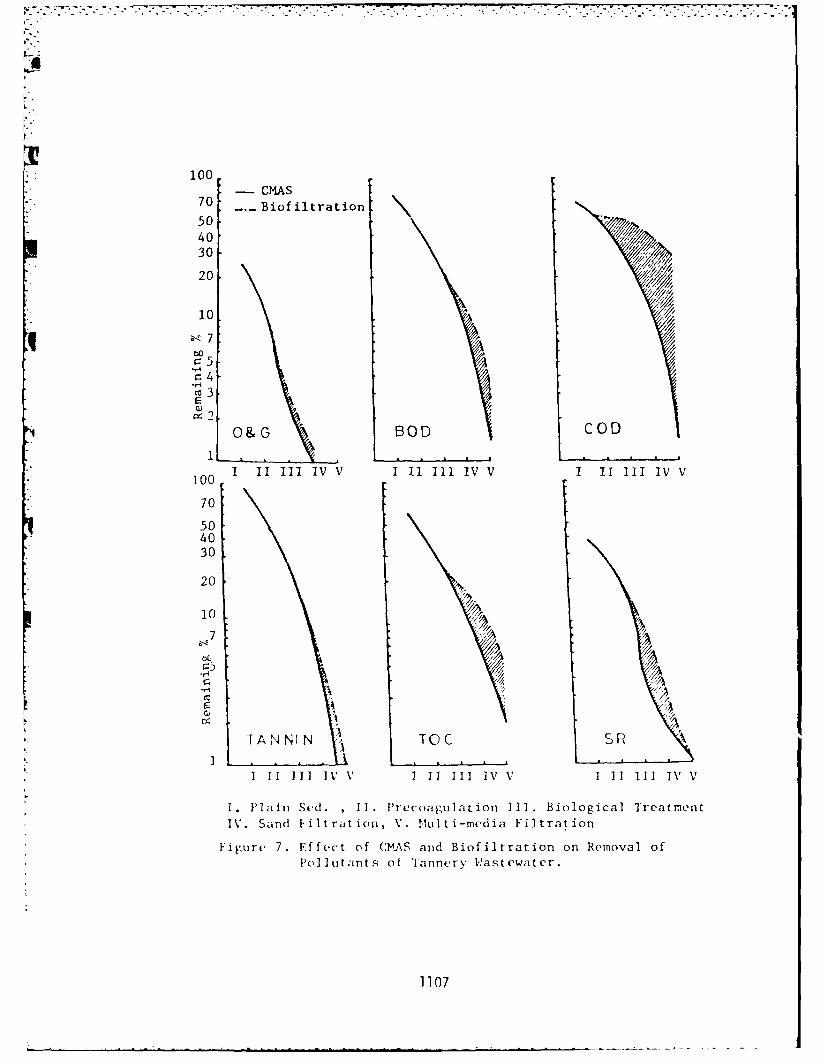
100-CIIAS
70 .. Biofiltration
50140130
20
77
c3
2/
O&G B 0)D COD
1
100 1 11 11 IV V 1 11 111 IV V 1 11 111 IV V
70
504030L
20
10
<7
T AN N IN TOC S R
1 11]IV V 1 11 111 IV V 1 11 111 IN, V
1. Pliin Sed. ,11. Precoagulation 111. Biological Treatment
IV. Sand f-iltration, V. MUlti-media Filtration
Fipure 7. E f fvct of CMAS and Biofiltration on Removal of
Pol lutants of Tannery Vast ewater.
1107
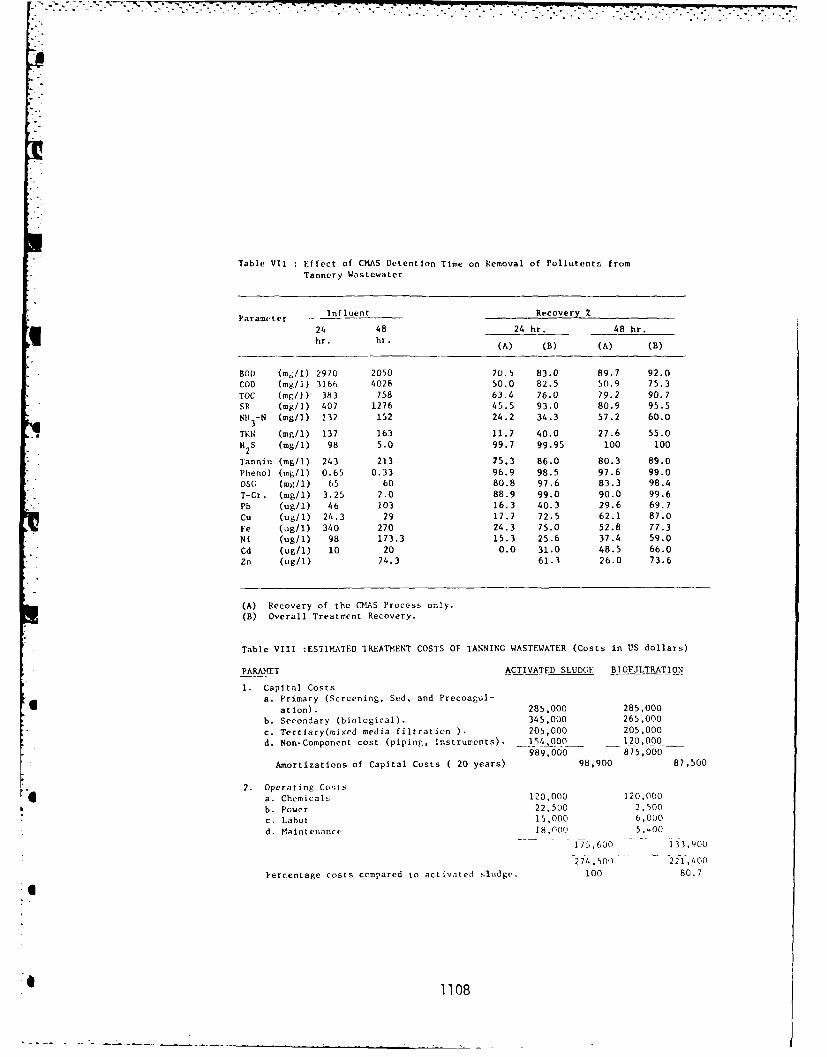
Table VIl E~ffect of CKAS Detention Time on Removal of Pollutents from
Tannery Wastewater
Parameter influent Recovery%
24 48 24 hr. 48 hr.
hr. hr. (A) (B) (A) (B)
BOO (m,;/l) 2970 2050 70.5 83.0 89.7 92.0
COD (mg/lI ) 3166 4028 50.0 82.5 50.9 75.3TOC (mg/1) 383 758 63.4 76.0 79.2 90.7
SR (mg/1) 407 1276 45.5 93.0 80.9 95.5NHI 3- (mg/i) 132 152 24.2 34.3 57.2 60.0
TKN (mg/i) 137 163 11.7 40.0 27.6 55.0
H 2 S (mg/i) 98 5.0 99.7 99.95 100 100
Tannin (mg/i) 243 213 75.3 86.0 80.3 89.0Phenol (mg/i) 0.65 0.33 96.9 98.5 97.6 99.001.0 (mg/i) 65 60 80.8 97.6 83.3 98.4
T-Cr. (mg/i) 3.25 2.0 88.9 99.0 90.0 99.6Pb (ug/1) 46 103 16.3 40.3 29.6 69.7
Cu (ug/1) 24.3 29 17.7 72.5 62.1 87.0
Fe (ug/1) 340 270 24.3 75.0 52.8 77.3Ni (ug/1) 98 173.3 15.3 25.6 37.4 59.0
Cd (ug/h) 10 20 0.0 31.0 48.5 66.0
Zn (ugh1) 74.3 61.3 26.0 73.6
(A) Recovery of the CMAS Process only.(B) Overall Treatment Recovery.
Table VIII :ESTIMATED TREATMENT COSTS OF TAINNING W4ASTEWATER (Costs in US5 dollars)
PARAMET ACTIVATED SLUDGE BIOFJLTRATION
1. Cap~tal Costsa. Primary (Screening, Sed. and Precoagul-
ation). 285,000 285,000
b. Secondary (biological). 345,000 265,000
c. Tertiary(mixed media filtration ).205,000 205,000d. Non-Component cost (piping, Instruments). _154,000 120,000
989,000 875,000Amortizations of Capital Costs (20 years) 98,900 87,500
2. Operating Costs*a. Chemicals 120,000 120,000
b. Power 22,500 2,500c. Labor 15,000) 6,000d. Maintenance 18,000 5,400
17 5, 600 13 3, L00
274,50 221,400
Percentage costs compared to activated sludge. 100 80.7
1108
distribution using Gel Chromatographic (GC) technique has beendetailed by Hamza and Tambo(9). The organic constituentswhich are easily eluted by water (Group I) are amenable to bio-
K logical treatment, while organics with high affinity with thegel (Group II) require elution by NH4OH. This portion can beeffectively removed by tertiary treatment. Schematic GC pat-terns of raw wastewater and the effluent of the CMAS and bio-filtration are illustrated in Figure 8. The GC patterns indi-cate the presence of relatively high Group II constituents whichrequire further treatment for complete treatment. Mixed mediafiltration removed 80-85% of the residual Group II constituents.
Treatment Costs
The cost estimates given in Table VIII reflect costs appli-cable to centralized treatment of tannery effluent to producewater suitable to discharge into the sea. The estimates arebased on the projected discharge of 2.5 million cubic metersannually after implementation of the renovation and expansionplan of GOFI, Cost estimates assume 20 years' service life and5% low interest rate provided by the Egyptian Govovernment forpublic sector industries. Operating costs were based on pricesof 1982, and cost analyses were performed according to EPAGuidelines(lO)o As shown in Table 9 the estimated cost ofbiofiltration is less than that of the CMAS process. Furthersavings are expected if the clean water pool can be segregatedand discharged without treatment,
In case of lack of sufficient financial support, it is pro-posed to install pre-treatment and biofilters first, while ad-ding the post-filters at later stage.
Toxicity of Raw and Treated Tannery Effluents
The effect of raw wastewater on the survival of Cyprimuscarpio and Mugil capito has been investigated as a complementarypart of the study - The mean survival time was 5 minutesfor hatched embryo, 1.4 hour for larval stage and 17,2 hoursfor juvenile stage of Cyprimus carpio and 16.4 hours for juve-nile stage of Mugil capito, The high toxicity is attributedto the presence of high concentrations of trace metals, orga-nic constituents, H2S salts and ammonia, The 96 hours LC50of the hatched embryo and larval and juvenile stages of Cyprimuscarpio exposed to the biofiltration effluent was achieved intreated effluent diluted with water to 3,1%, 5,2% and 8,3%, res-pectively. Although the treated waste was less toxic than theraw waste, it is estimated that treated tannery waste must be
1109
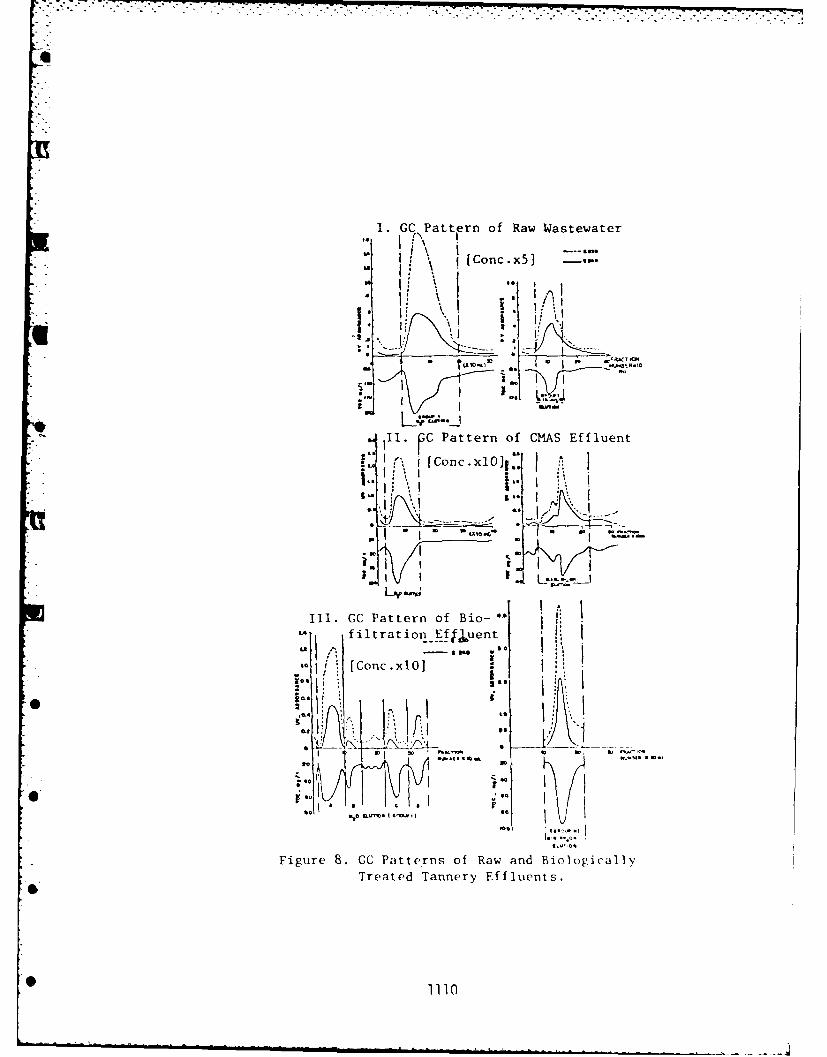
1. GC \Pattern of Raw Wastewater
[Conc.x51 .:
I- .
+--
Ill. FC Pattern of CIA-AS Effluent
P-ll. CC CPattern of Rawiatewt
te [ConccxlOO
,I i* i ., -*- -/
I, L L-.J
Ill. 4 G.C Pattern of CBioEffuen: .r', filtrat on fI 0,.'.en"t
U1, - .a.m U
NO - ° Iio [Conc.xlO]I
* of £i . il.
I I A
,, _ Figure 8. CC Patterns of Raw and Biologically!8' Treated Tannery Effluents,
1110Fiur CCPatensofRwadBogily
Trae Tanriffuns
w_: 1.
diluted 40 times to reduce the fish toxicity to an acceptablelevel. The toxicity of the treated effluent is attributed tothe high concentration of NH3 (77 mg/l) which causes severehistopathological changes in gill structure. Armonia strippingis being investigated as an option to reduce fish toxicity.
CONCLUSIONS
A centralized treatment system is proposed for the MICtanneries0 The treatment train encompasses precoagulations, bio-filtration and post-filtration0 Among the treatment alternatives,biofiltration is the most adequate due to lower operating costs,suitability for intermittent flow, versatility and relative easeof operation0 The proposed treatment train complies with thelimitations for emission into the sea (except for NH 3 ). Reduc-tion of the toxicity of the treated effluent can be achievedby ammonia stripping or by dilution when mixed with sea water0Segregation of non-polluted effluents, originated in clean waterpools, from polluted wastes is expected to reduce treatmentcosts, Government subsidization of the centralized treatmentfacility is necessary to encourage MIC tanneries to institute
the proposed treatment system0
ACKNOWLEDGEMENTS
This study was partially sponsored by the USEPA under GrantNo. PL-3-542-4o The authors wish to express appreciation to thestaff of the IWRC at the High Institute of Public Health,Alexandria, Egypt, for their valuable help0
1111
,... - . , ' * *
REFERENCES
1. Smith, P. , and Yates, 1., "Experience of high Rate Biological Filtration
at Derby Sewage Treatment Workers." Water Poll. Control (0.B) 79,198o,87.
2. Rosono, Y., and Kubota, U., "Characteristic Evolution of Trickling Filter
Process." Water Res. (G.B.) 14,1980,581.
3. Bailey, D., Robinson, K., Collins, S. and Clarke, J., " The Treatment of
Effluents From a Chrome Sid. Leather Tannery on a Conventional Biological
Filter ", J. Water Poll. Control Fed., 71, 1972,202.
4. Pierce, D., " Upgrading Trickling Filters." Environmental Protection
Agency, EPA 4309-78-004,1978.
5. Younis, M., " Study of Methods of Industrial Waste Treatment of Tannery.
Wastes." MPil Thesis, Ah.xandria University, 1982.
6. EPA, " Document for Effluent Limitations Guidelines and New Sources
Performance Standard for Leather Tanning and Finishing Point Source
Category." EVA, 440/1-74 -016 a, 1974.
7. Hamza A., and Hamouda, F. " Multl-process Treatment of Textile Wastewater"
Proceedins of the 35th Annual Purdue Industrial Waste Conference,
Ann Arbor Science Publishing, 198o-152.
8. "Standard Methods for Examination of Water and Wastewater". Amer Pub.
Health Assn., Washinrton, D.C., 15th ed., 1890.
9. Hamza, A. and lambo, N., " Evluation of Dairy 'aste Treatability by Gel
Chromotography". Memorics of the Faculty of Enij[lneering, Hokkaido Univ.,
Japan, Vol XIV,4, 1977,44.
10. EPA Guideling " Inovative and Alternative Technology Guidelines" EPA
930/9-78.009,1980.
11. Zaki, M. and Saad, S., " Toxicity Assessment of Raw and Treated Tannery
Wastes Using Fish Bloassy." Symposium on Acute Aquatic EcotoxicologicalTest. Methodology, Standardization and Significance CERTIA, France,
Nov. 1981.
6
Kp.
• 1112
PART X: INNOVATIVn RESEARCh
Effect of Periodic Flow ReversalUpon RBC Performance
John T. Bandy. U.S. Army Construction Engineering
Research Laboratory, Champaign, Illinois.
Manette C. Messenger. U.S. Army Construction Engineer-ing Research Laboratory, Champaign, Illinois.
Introduction
Rotating Biological Contactors are traditionallyoperated as a series of units through which water alwaysflows the same direction. After the microbial film isestablished on the RBC's, a characteristic pattern of growthis seen across the stages: growth is heaviest on the firststages and diminishes with each sucessive stage once the
organic concentration falls to the level below which removalis a function of.organic concentration. The biological com-munities on each stage change in response to their differingenvironments. The total growth on a stage is roughly pro-portional to the organic concentrations which normally occurwithin it.
When shock loadings occur across multistage RBC units,downstream stages receive higher organic loadings than
usual. Studies of RBC response to shock loadings haverevealed that downstream stages have only a limited capacity
to treat these short duration excess loadings. Much of a
shock load passes through an RBC untreated.
1113
The purpose of this research was to explore the feasi-bility of increasing an RBC's capacity to treat shock loadsby periodically reversing the direction of flow across twoor more successive stages of an RBC installation.) This con-cept was first suggested by Borchardt, et al., in June of1978 as a result of their studies of RBC nitrification.
1
RBC biofilms have been observed to grow more rapidly inresponse to an incremental organic concentration than theydecay in response to an equal decrement. This characteris-
tic of biofilms suggests the possibility of increasing thetotal inventory of film within several stages of an RBC byperiodically reversing the direction of flow across those
-. stages. The period of reversal would be sufficiently long
to permit the concentration gradient across the stages tore-establish itself in each direction but not so long thatthe biofilm could adjust fully through growth and decay tothe new distribution of nutrients. Under average flow con-ditions, the RBC's performance shouldn't be significantlyaffected. The former earliest stage would see a lower aver-age concentration than under conventional flow and wouldpresumably perform less removaleaowever, the former latter
stages would see higher average concentrations and due tothe advantage of growth over decay they would developheavier growth which would remove those organics now passedby the first stage. Far more reserve capacity would existto treat shock loads due to the greater inventory and moreeven distribution of biofilm created by periodic reversal.
An analogous mode of operation was explored for trick-ling filters in England forty years ago.2 Flow was reversedperiodically across two filters in series in order toprevent ponding on the more heavily loaded filter. Thealternate heavy feeding and comparative starvation experi-enced by the slime encouraged first growth and thenendogenous respiration and sloughing. Under the "alternat-
ing double filtration" mode of operation, much less buildupof slime and consequent ponding was observed. When slowlyrotating distributer arms came into vogue, alternate feedingand starvation became feasible within one filter. Pondingwas seldom a problem and the alternating doubie filtrationmode of operation died out. Its implications for treatmentefficiency and effluent variability were never explored.
0 1114
This research will evaluate the flow reversal concept
in RBC's. Today we will report our preliminary results.More elaborate follow-up experimentation is now underway.
Materials and Methods
A Clow pilot scale RBC was used in this research. The13 foot (4 m) diameter disks had a total area of 11000 sq.ft. (1022 m2 ). The media was set in a 2000 gallon (7.6 m3 )
tank divided into four equal compartments to allow staging.The media rotated at about 1.6 rpm.
For purposes of this experiment, the plant was config-ured as two 2-stage RBC's in parallel. Only one pair was
actually sampled.
We assumed that for flow reversal to have a significant
effect, organic concentrations in the reversed stages wouldhave to be low enough so that removals achieved depend ontheir fluctuations. In some plants, the first stage or two
is saturated with respect to organics. Higher organic con-centrations do not produce appreciably higher removals on amass basis. Percent removals fall. At these high organicconcentrations, the mass transport of oxygen into or wasteproducts out of the film is controlling. The source ofwastewater for this experimentation was chosen to be the
partially treated effluent of an Imhoff tank. This moderatestrength wastewater (BOD 5 of approximately 100 mg/i) neversaturated the first stage of the Clow Corporation pilot
scale RBC plant used for the reversal experiments.
Wastewater was pumped through the pilot RBC at flow
rates between 28,800 and 72,000 gpd (272 m3/ day). The flowwas measured with an in-pipe flow sensor. Hydraulic load-ings varied from 2.6 to 6.5 gpd/ft 2 (.107 to .267m 3/m2 /day). The corresponding organic loadings were 1.67 to4.17 lb SCOD/1000 ft2 /day. The soluble ultimate BOD tosoluble COD ratio was variable but averaged .6.
The influert and effluent wastestreams were sampledevery hour with ISCO automatic samplers. Two ml of sulfuricacid were added to each sample bottle before sample collec-tion to stabilize the sample. No sample was more than 26hours old when it was analyzed.
1115
The Hach Reactor Digestion COD method was used toassess the RBC's performance. This is an EPA approvedmethod which is convenient for the rapid analysis of largenumbers of samples. All samples were filtered through What-man No. 5 before analysis. ThepH and temperature were meas-ured daily while experimentation was underway. Dissolvedoxygen rose from about 4 mg/l in the influent to nearsaturation in the effluent at the lowest organic loadings.The dissolved oxygen profile across the system was essen-Lially flat at the highest loadings.
Experimentation was performed in three phases. First* the RBC was operated in the conventional manner for a period
of almost two months. The flow rate during this period offilm establishment and maturation and base-line data collec-
* tion was 28,800 gpd (109 m3/day). Good removals (about 60percent of the influent COD) were obtained by three weeksafter startup. A severe thunderstorm then scoured off muchof the growth requiring us to install a cover and allow someregrowth prior to experimental data collection.
The second phase of the experiment involved daily flowreversal. During this phase, valves were opened and closedimmediately after the noon sampling to make the first stagethe second, and the second, the first. Flow rates of 28,800gpd (109 mA/day), 57600 gpd (218 m3/day) and 72,000 gpd (273m3 /day) were employed during this phase to allow the iden-tification of any interactions between hydraulic loading andflow reversal. Reversal experiments continued for sevenweeks.
The final phase of experimentation involved a return toconventional one way flow. During this phase, the higherflow rates used for reversed flow studies were also applied
* with conventional flow.
Results and Discussion
The results of the experiments performed are presented* in Figure 1 and summarized in Table 1. Flow reversal was
initiated after almost 2 months of consistent COD removalswith conventional flow. Percent removals rose steadily dur-ing the first 5 weeks of reversal despite greatly increasedhydraulic loadings. This was a striking result since
L
hydraulic loading and percent removal are normally either
constant or inversely related in a moderately loaded RBC.3
When the hydraulic loading was reduced to the pre-reversallevel for the purpose of obtaining reversed flow performancedata directly comparable to the conventional flow baseline,sloughing increased markedly. Percent removals fell shar-ply. The earlier higher flow rate was restored and conven-tional flow operation was resumed when this trend becameapparent so that the expected gradual return of the systemto baseline performance might be observed. Performance wasfalling at approximately the same rate as it had earlierincreased when a violent thunderstorm blew the unit's canvascover into the tank and broke the coupling between thedriven gear and the RBC shaft. Before repairs could be madeand a suitable replacement cover procured, the unit froze upfor the winter, prematurely terminating experimentation.
Table 1
Results of Experimentation
Fraction Removed
Type Data # Observations x sd.
one way, 20 gpm 64 .473 .132reversal, 20 gpm 55 .575 .149reversal, 40 gpm 40 .625 .086reversal, 50 gpm 71 .636 .045reversal, 40 gpm 54 .722 .053reversal, 20 gpm 42 .488 .095one way, 40 gpm 36 .641 .082one way, 50 gpm 72 .574 .073
During these preliminary experiments, an average of 55percent of the applied COD was removed under conventionalflow operation and 62 percent was removed with reversal.The difference in the means was significant at the 1 percentlevel based on 436 influent/effluent sample pairs. Influentconcentrations showed no correlation with percent removals.
The reversed flow effluents were less variable thanwere the conventional flow effluents, especially when the
1117
4
initial conventional flow baseline data were compared to thereversed flow data. However, the experiments were ter-minated before the higher flow rate conventional flow
effluents reached a steady state. Therefore, these data donot establish a difference in effluent variability.
Experiments are underway now in which two compartmentsof the Clow pilot plant are operated as a conventional two-stage RBC and the remaining two are reversed daily. The
conventional flow control and the reversal experiment willreceive an identical influent and will operate under identi-cal climatic conditions for several months. An unequivocal
comparison of the two modes of operation will then be possi-ble. If the benefits of flow reversal suggested by theearly research are confirmed by this follow-up work, optimal
reversal periods can be identified and economic feasibilityanalyses can be performed.
References
1. Borchardt, J. A., Kang, S. J., and T. H. Chung, Nitrifi-cation of Secondary Municipal Waste Effluents by Rotat-
ing Bio-Discs, EPA-600/2-78-061, June 1978.
2. Hawkes, 11. A., The Ecology of Wastewater Treatment, Per-
gamon Press, Inc., New York, 1963.
3. Banerji, S. K., ASCE Water Pollution Management Task
Committee Report on "Rotation Biological Contactor forSecondary Treatment," Proceedings: First NationalSymposium/Workshop on Rotating Biological ContactorTechnology held at Champion, PA, Feb 4-6, 1980.
S
* 1118
• " -m k " I - l -]
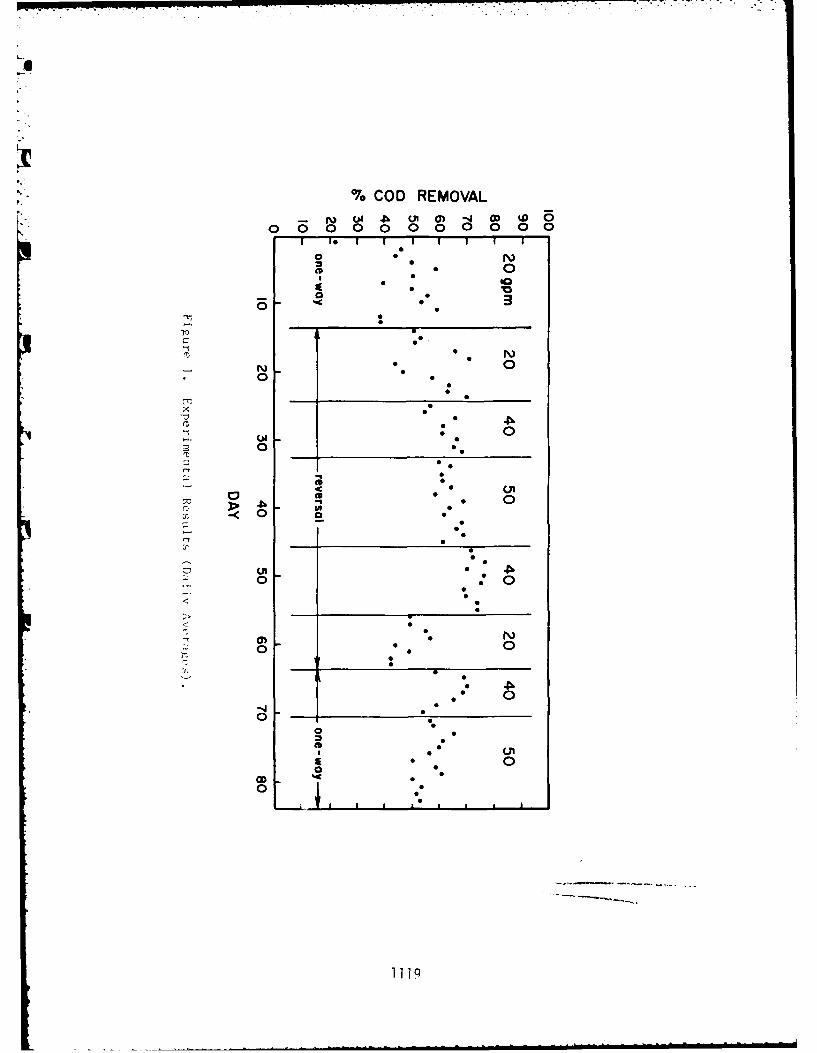
-4
% COD REMOVAL
N L~ ~ U' 0 -~J 0 ~D 000000000000S
So N0
0 5 0I S
** 0
o0 * 0
00
p0
S
0 r~)N ** 00 0
0
S
x 00
CII * 00 S
0
S
S~6 S0 0
* (JI0 5.~ *~ 5 0- P-<0 a 0 0
6S
S0
(.13 go. *~
0SS
SS
0 * N0 * * 0
r. SS
S*
0.5
0 - 65
o 50
* S* (~1~
* 0SS
P
I I * * I *
1119
.
AN ASSESSMENT OF.* DISSOLVED OXYGEN LIMITATIONS AND INTERSTAGE DESIGN IN
ROTATING BIOLOGICAL CONTACTOR (RBC) SYSTEMS
Warren H. Chesner, Engineering Consultants & Associates,Commack, New York
John J. lannone, Roy F. Weston, Roslyn, New York
Jeremiah J. McCarthy, U.S. Army 1Oth Medical Laboratory,West Germany
INTRODUCTION
Over 260 RBC systems are presently in operation in thiscountry, with flowrates ranging from less than 0.1 to 54MGD (1).RBC systems have received much attention in recent years, in-ciuding investigations by EPA of process, power, and equipmentperformance (2), and a National RBC Symposium in 1980 (3).
Numerous reports in the literature and RBC facility surveys(i, 4, 5, 6, 7, 8) have reported difficulties with the initialstages of RBC systems reflected by heavy biofilm growth, thepresence of nuisance organisms (beggiotoa), and a reductionin organic removal rates. These problems have been attributedto excessive organic loadings which result in dissolved oxygendeficiencies in the biofilm. Recent unpublished surveys havereported results (9) which indicate that nuisance organismgrowth may be precipitated exclusively by high sulfide concen-trations.
Empirical design approaches proposed by RBC vendors arepresently used almost exclusively by engineers for RBC municipalwastewater treatment design. Only one vendor design presentlymakes reference to the aforementioned organic overload condition(10). A loading limitation is recommended and defined in terms
1121
K.
of a limiting organic loading (e.g, for a mechanical drive RBCsystem, 4.0 lbs/day/l00 sf of soluble BOD loading on the firststage).
Recent literature (11, 12) have stressed the need for de-sign techniques based upon fundamental principles of substrateand oxygen, transport and utilization to help define oxygenlimitations and stagewise kinetic parameters. The developmentof a mechanistically sound kinetic model for RBC's or any fixed-film biological process, however, is extremely difficult due tothe complex relationships among transport and other kineticphenomenon which must account for both substrate and oxygentransport and utilization. The use of these complex models bydesign engineers is not practical.
The empirical vendor approaches are simple to use, re-quiring the input of flowrate and organic concentration toestablish a given design surface area, They are limited, how-ever, in that they have no fundamental basis to account fororganic removal, oxygen limitations, staging requirements, stepfeeding or recycle, and do not address interstage removal.
On the basis of a review of available design method-ologies, it is apparent that a simplified approach is desireableto define RBC performance on the basis of rational kinetics.The aporoach described by Clarke et. a). (11) is a reasonablemethod which defines interstage removal on the basis of Monodgrowth functions, and a mass balance with respect to substrateacross a completely mixed reactor. No simple model, however,can account for the interaction between oxygen requirements andsubstrate utilization, The design of RBC systems at the presenttime, then, is best undertaken in a simplified two-step approach:
Step 1, Define limiting design conditions to pre-vent organic overloading and dissolvedoxygen limitation.
Step 2, Utilization of a rational design methodto define the substrate removal capacityof the RBC surface area under conditionswhich are not oxygen limiting.
Under an ongoing contract with the Municipal Er,vironmentalResearch Laboratory of the U.S. Environmental Protection Agency,data which define organic overload (oxygen limiting) conditionswere sought and an interstage model calibrated from field datacollected from several operating facilities.
1122
ORGANIC OVERLOAD CONDITIONS1
Optimu- RBC process design requires that the microbial sub-strate utilization rate represent the rate limiting condition.Under this condition, the process achieves maximum use of sur-face area because substrate removal is limited by the ability ofthe biomass to assimilate the waste and no extraneous factors(e.q. lack cf dissolved oxygen) limit the rate of substrate re-moval.
Except for the aforementioned vendor recommendations con-cerning organic loading limitations, little data is available todefine the conditions which induce dissolved oxygen limitations.Williamson and McCarty (12), utilizing their fixed film model,predicted that dissolved oxygen limitations would occur atsoluble BOD (SBOD) concentrations of 40 mg/l, adjacent to thebiofilm. This would correspond to a mixed liquor RBC reactorconcentration somewhat greater than 40 mg/l SBOD. Field obser-vations, literature reviews, and telephone interviews were madeto determine influent conditions which result in organic over-loads. Overloaded conditions on an RBC were identified by thecharacteristic colonization of the media by nuisance organismswhich gain a competitive advantage over other organisms underoxygen deficient conditions. For each of the facilities sur-veyed, information concerning nuisance organisms, influentorganic concentrations, and hydraulic loading were recorded todetermine wastewater characteristics which could be associatedwith these conditions. The survey included a total of twenty-three facilities, Results are tabulated in Table I.
A graphic presentation of these results is presented inFigure 1, which depicts a plot of total influent BOD on theordinate and first-stage hydraulic loading on the abscissa.The graph presents a demarcation line that separates facilitieswhich experienced first-stage overloading problems from thosewhich did nc: (i.e. by the presence or absence of nuisance or-
The relationship is depicted as a hyperbolic function,where the product of the variables is a constant:
(BOD)(Hydraulic Loading) = Constant Organic Loading
From the graoh, it can be seen that the organic loading thatseparates peants with overloaded conditions from plants without(:-h r - : 6.4 bPounds OD,/dyIO00 sf.
1Organic overload and oxygen limitations are used interchangeably.
1123
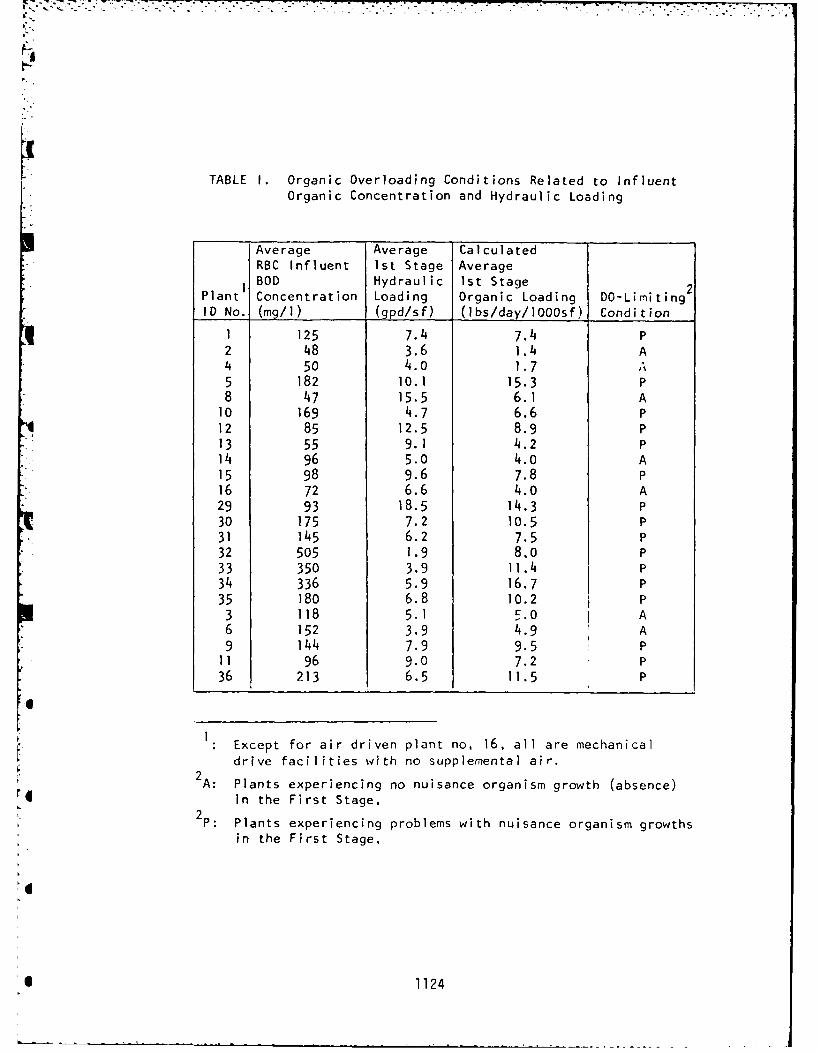
I'.
TABLE I. Organic Overloading Conditions Related to InfluentOrganic Concentration and Hydraulic Loading
Average Average CalculatedRBC Influent 1st Stage Average
I BOD Hydraulic Ist Stage 2Plant Concentration Loading Organic Loading DO-LimitingID No. (mg/) (gpd/sf) (lbs/day/lOOOsf) Condition
1 125 7.4 7.4 P2 48 3.6 1.4 A4 50 4.0 1.7 A5 182 10.1 15.3 P8 47 15.5 6.1 A10 169 4.7 6.6 P12 85 12.5 8.9 P13 55 9.1 4.2 P14 96 5.0 4.0 A15 98 9.6 7.8 P16 72 6.6 4.0 A29 93 18.5 14.3 P30 175 7.2 10.5 P31 145 6.2 7.5 P32 505 1.9 8.0 P33 350 3.9 11.4 P34 336 5.9 16.7 P35 180 6.8 10.2 P
3 118 5.1 5.0 A6 152 3.9 4.9 A9 144 7.9 9.5 P
11 96 9.0 7.2 P36 213 6.5 11.5 P
I Except for air driven plant no, 16, all are mechanicaldrive facilities with no supplemental air.
A: Plants experiencing no nuisance organism growth (absence)r4I in the First Stage,
P: Plants experiencing problems with nuisance organism growthsin the First Stage,
6I 1124
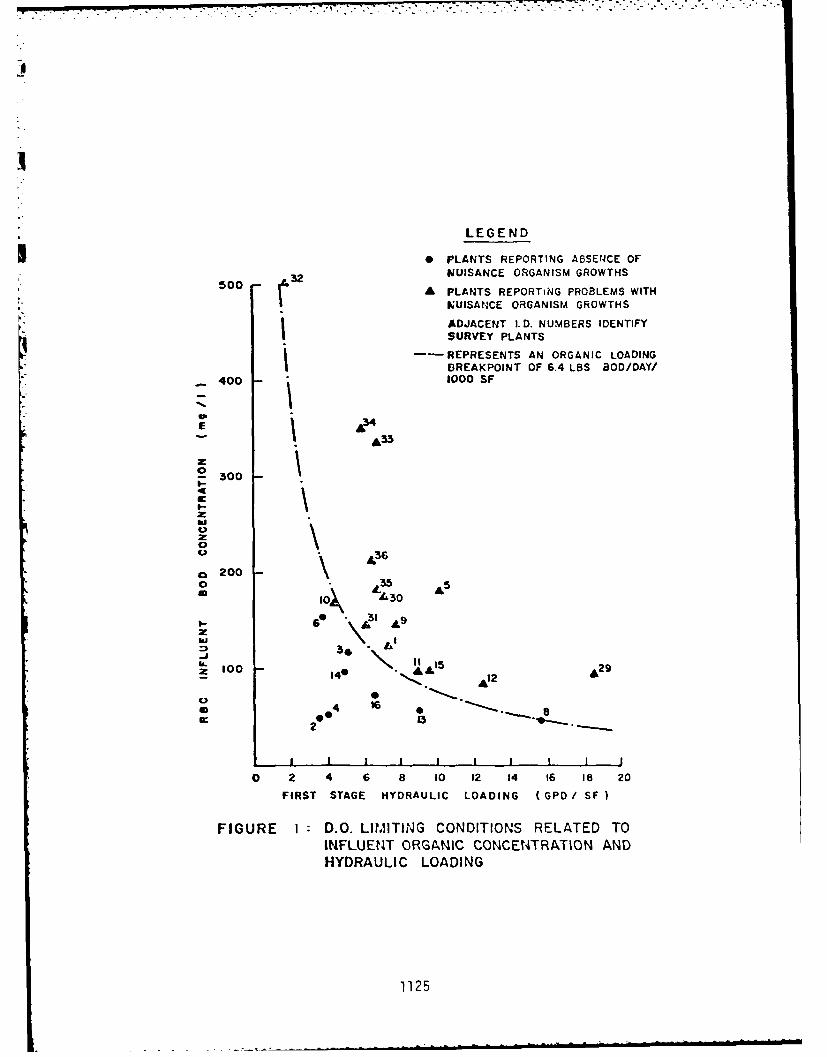
LEGEND
0 PLANTS REPORTING ABSE14CE OFNUISANCE ORGANISM GROWTHS
50 •A PLANTS REPORTING PROBLEMS WITH2NUISANCE ORGANISM GROWTHS
KADJACENT I.D. NUMBERS IDENTIFY
SURVEY PLANTS
~-REPRESENTS AN ORGANIC LOADINGI" DREAKPOINT OF 6.4 LBS BOD/DAY/400 1000 SF
E/
300
I-\
z0
o 200o 35 5
SI0 &30 A
IA.-
k.15I29
z100 140 A AL
E 2 13
0 2 4 6 8 10 12 14 16 18 20
FIRST STAGE HYDRAULIC LOADING (GPD/ SF
FIGURE 1 : D.O. LIMITING CONDITIONS RELATED TOINFLUENT ORGANIC CONCENTRATION ANDHYDRAULIC LOADING
1125
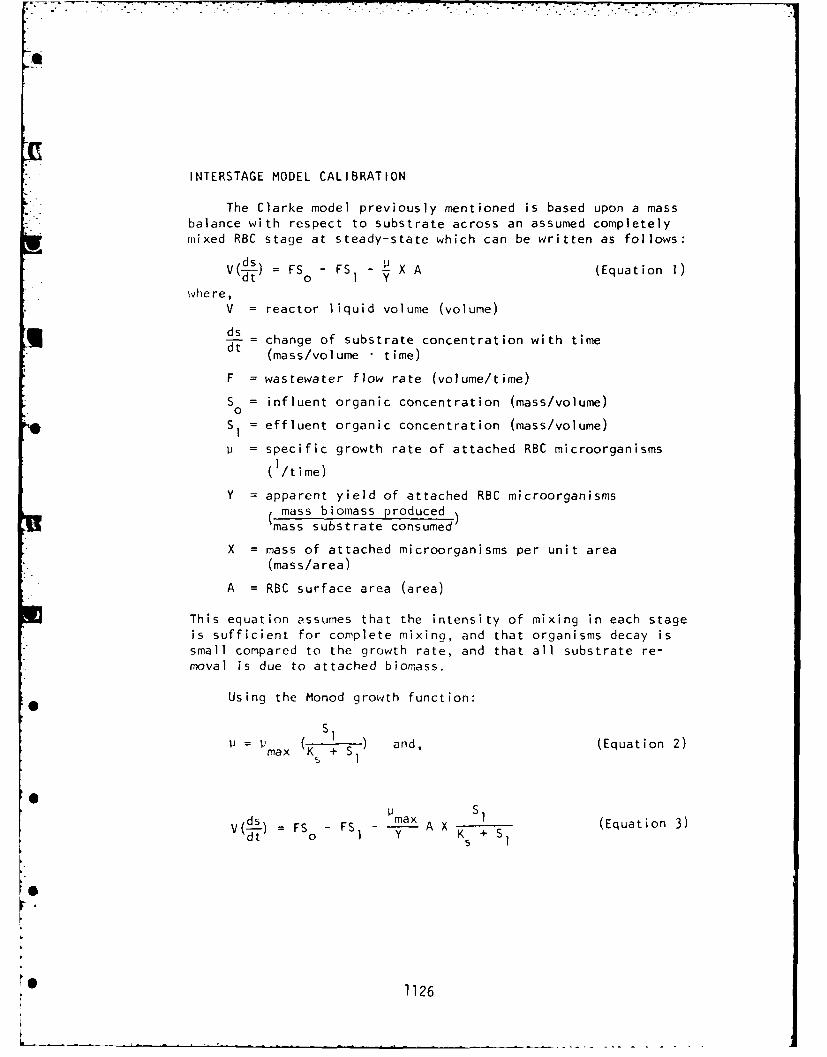
a
INTERSTAGE MODEL CALIBRATION
The Clarke model previously mentioned is based upon a massbalance with respect to substrate across an assumed completelyimixed RBC stage at steady-state which can be written as follows:
FS - FS - X A (Equation 1)dt o 1 Y
whe re,V = reactor liquid volume (volume)
t change of substrate concentration with time(mass/volume time)
F = wastewater flow rate (volume/time)
S = influent organic concentration (mass/volume)o
S = effluent organic concentration (mass/volume)
u = specific growth rate of attached RBC microorganisms
( I/time)
Y = apparent yield of attached RBC microorganismsmass biomass produced
mass substrate consumed )
X = mass of attached microorganisms per unit area(mass/area)
A = RBC surface area (area)
This equation assumes that the intensity of mixing in each stageis sufficient for complete mixing, and that organisms decay issmall compared to the growth rate, and that all substrate re-moval is due to attached biomass.
Using the Monod growth function:
x ) and, (Equation 2)max K + Ss l
iS I
() max K X (Equation 3)ot 0 Y K + SI
s
h 1126
)
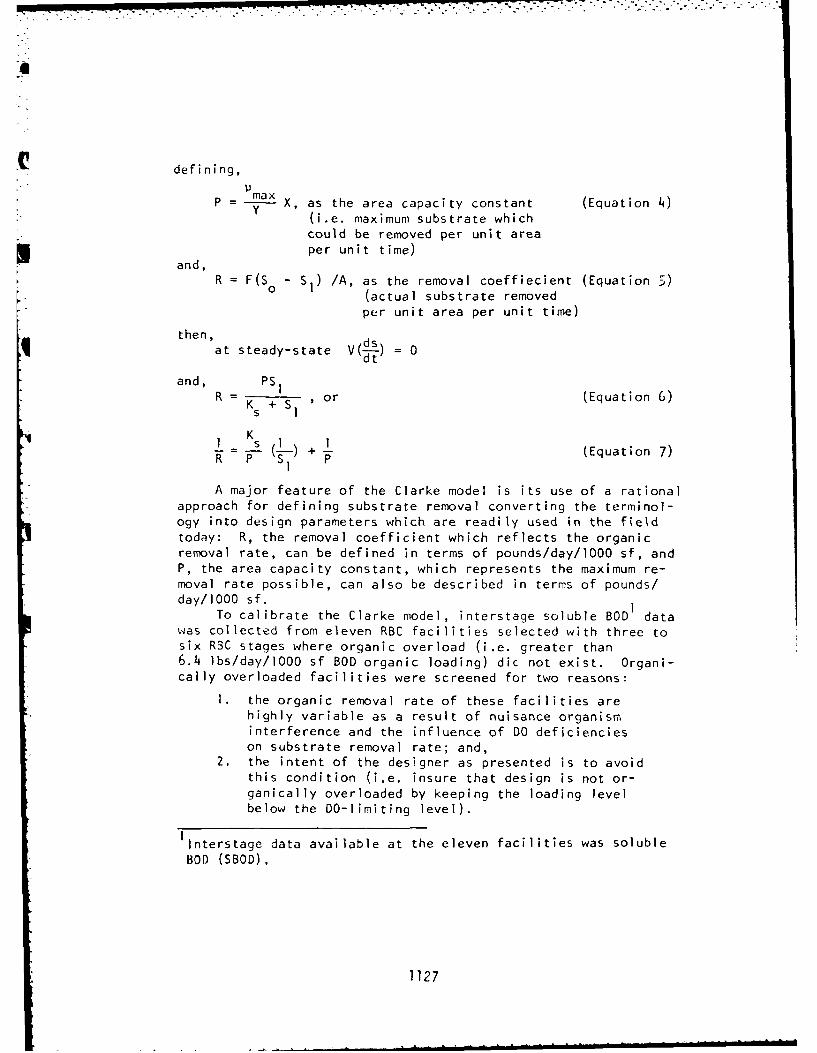
defining,
P max X, as the area capacity constant (Equation 4)(i.e. maximum substrate whichcould be removed per unit area
I per unit time)and,
R = F(S - SI) /A, as the removal coeffiecient (Equation 5)(actual substrate removed
per unit area per unit time)
then, dsat steady-state V(--) 0
and, PS
R = or (Equation 6)s
K ( T I
R P + (Equation 7)
A major feature of the Clarke model is its use of a rationalapproach for defining substrate removal converting the terminol-ogy into design parameters which are readily used in the fieldtoday: R, the removal coefficient which reflects the organicremoval rate, can be defined in terms of pounds/day/lO00 sf, andP, the area capacity constant, which represents the maximum re-moval rate possible, can also be described in terms of pounds/day/lO00 sf.
To calibrate the Clarke model, interstage soluble BOD datawas collected from eleven RBC facilities selected with three tosix RBC stages where organic overload (i.e. greater than6.4 lbs/day/l00 sf BOD organic loading) dic not exist. Organi-cally overloaded facilities were screened for two reasons:
I. the organic removal rate of these facilities arehighly variable as a result of nuisance organisminterference and the influence of DO deficiencieson substrate removal rate; and,
2. the intent of the designer as presented is to avoidthis condition (i.e. insure that design is not or-ganically overloaded by keeping the loading levelbelow the DO-limiting level).
IInterstage data available at the eleven facilities was solubleBOD (SBOD).
1127
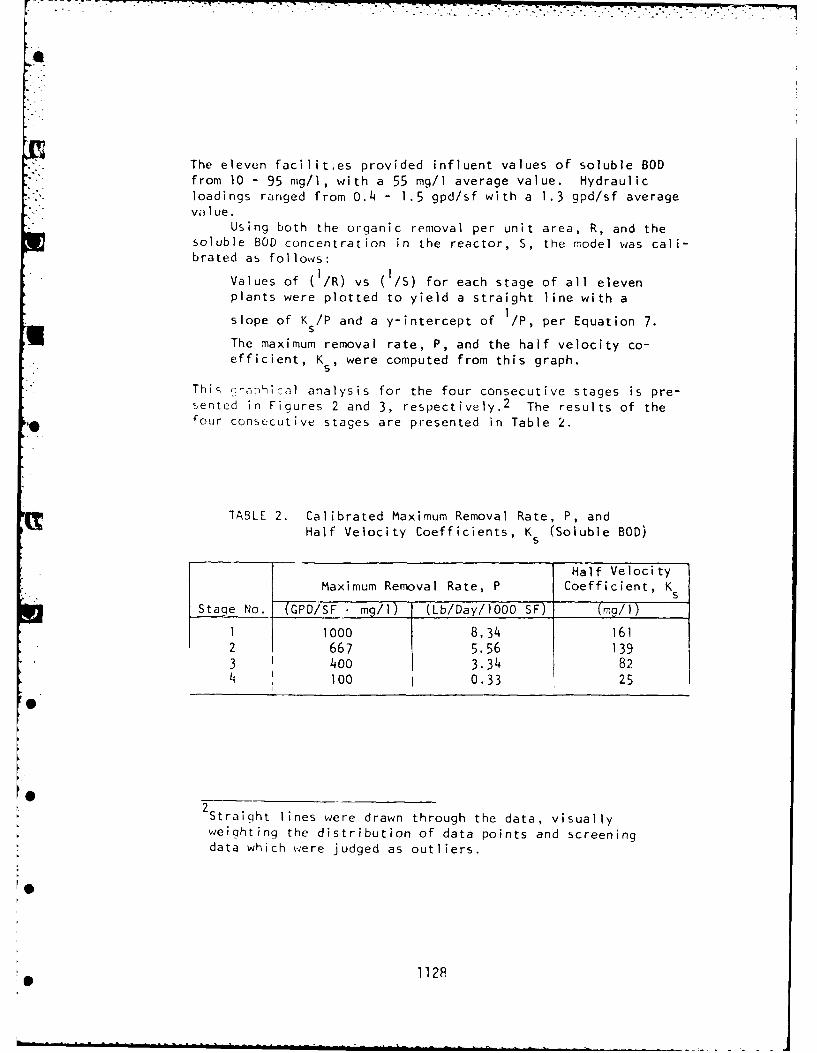
• , ~~~ ~~. - - - - -- I. I I I ! In -q I t ! 4-- I
The eleven facilitles provided influent values of soluble BODfrom 10 - 95 mg/l, with a 55 mg/l average value. Hydraulicloadings ranged from 0.4 - 1.5 gpd/sf with a 1.3 gpd/sf averageva 1 ue.
Using both the organic removal per unit area, R, and thesoluble BOO concentration in the reactor, S, the model was cali-brated as follows:
Values of ( /R) vs ( I/S) for each stage of all elevenplants were plotted to yield a straight line with a
slope of K s/P and a y-intercept of /P, per Equation 7.
The maximum removal rate, P, and the half velocity co-
efficient, K, were computed from this graph.
This c-aphical analysis for the four consecutive stages is pre-sented in Figures 2 and 3, respectively. 2 The results of thefour consecutive stages are presented in Table 2.
TABLE 2. Calibrated Maximum Removal Rate, P, andHalf Velocity Coefficients, K (Soluble BOD)
Half Velocity
Maximum Removal Rate, P Coefficient, Ks
Stage No. (GPD/SF - mg/1) (Lb/Day/1000 SF) (mg/I)
S1000 8.34 1612 667 5.56 1393 1 400 3.34 824 100 I 0.33 25
2Straiqht lines were drawn through the data, visuallyweighting the distribution of data points and screeningdata which were judged as outliers.
1128
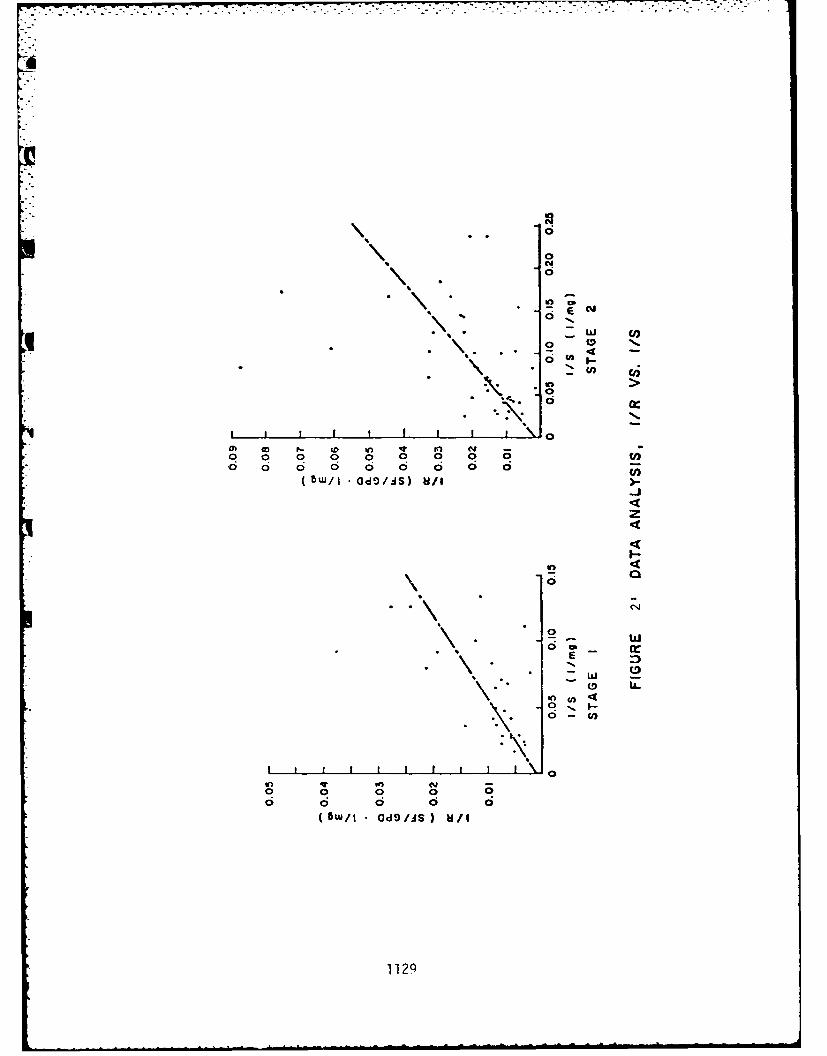
0
ccn
CD P.- N n q ~ co 0 0 0 0 0 0 0
o a a 0 0 0 0 0i
bw/I d /AS) /
1129
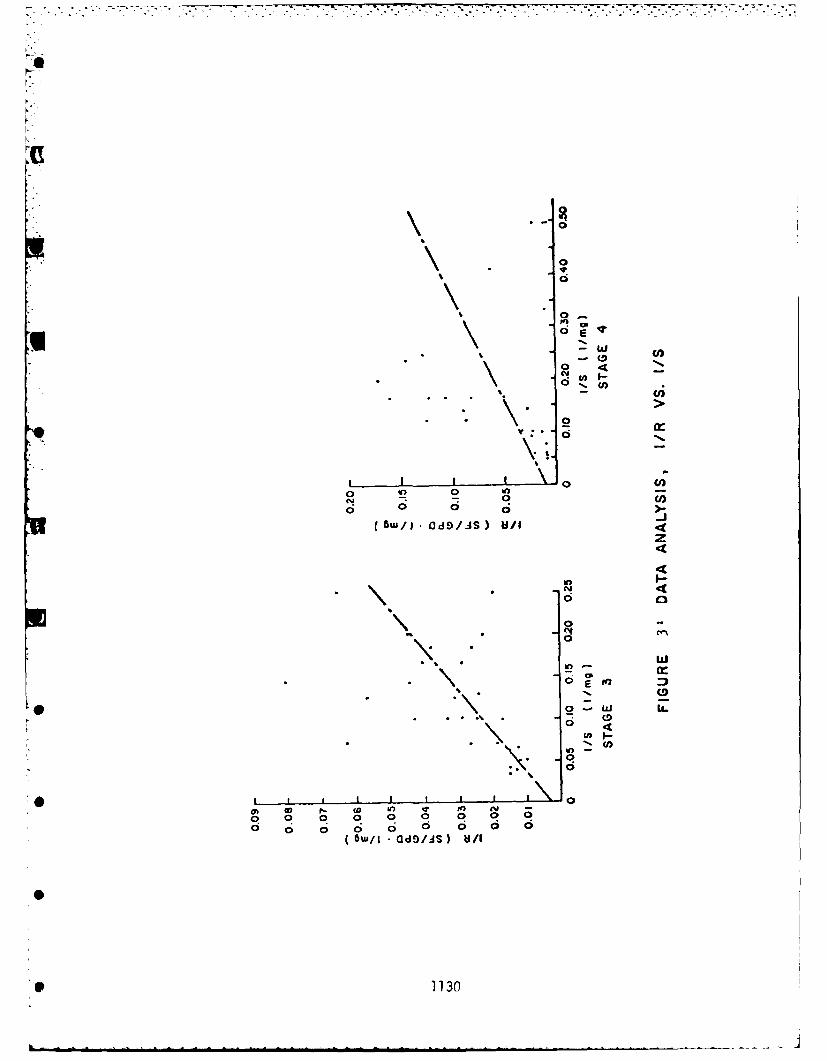
Y - C*i **. 0
o 0
0 0 0
Gdw/j ~.4 s) U/I/
1130
- - - - - - - --4
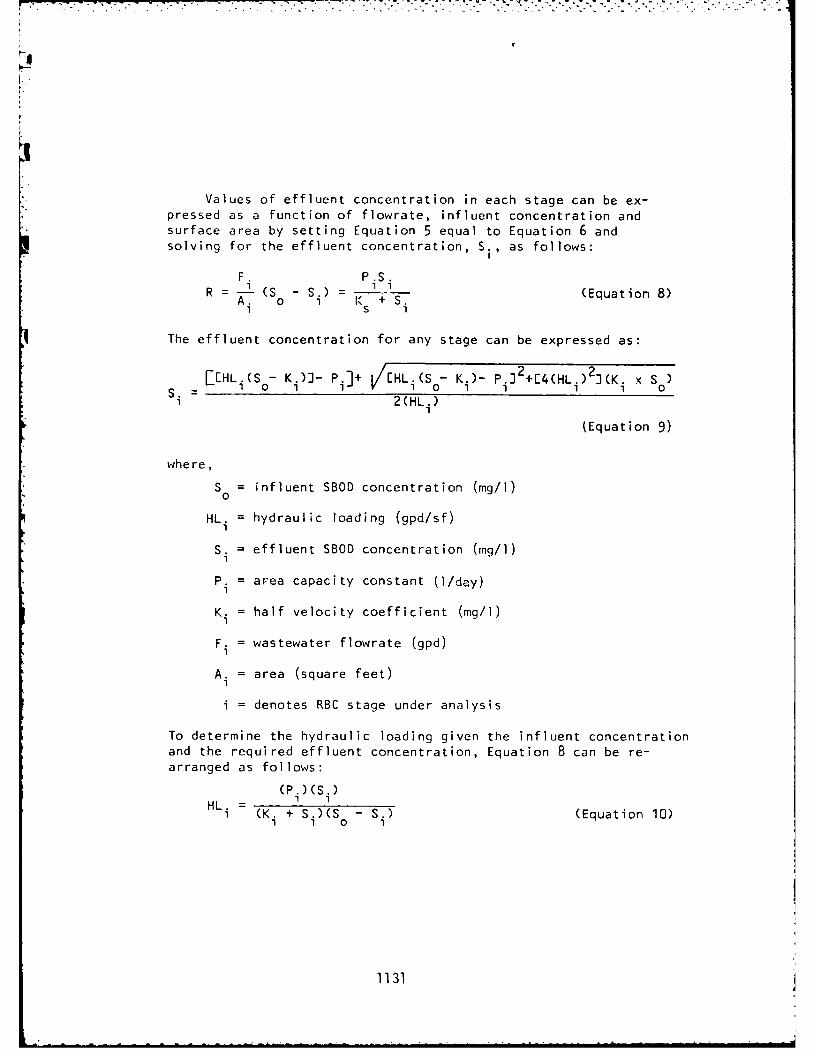
Values of effluent concentration in each stage can be ex-pressed as a function of flowrate, influent concentration andsurface area by setting Equation 5 equal to Equation 6 andsolving for the effluent concentration, S., as follows:
F. P.S.R (S - S.) - I + (Equation 8)
A. o 1 - K -1 1
The effluent concentration for any stage can be expressed as:
[C[HL.(S - K.)]- Pi]+ V/HL.(S - K.)- P.32+[4(HL.)2](K. x SS. 1 0 1 0 1 4 ) 1 01 2(HL.)
1
(Equation 9)
where,
S = influent SBOD concentration (mg/l)0
HL. = hydraulic loading (gpd/sf)1
S. = effluent SBOD concentration (mg/l)1
P. = area capacity constant (1/day)1
K. = half velocity coefficient (mg/l)1
F. = wastewater flowrate (gpd)1
A. = area (square feet)1
i = denotes RBC stage under analysis
To determine the hydraulic loading given the influent concentrationand the required effluent concentration, Equation 8 can be re-arranged as follows:
(P.)(S.)HL. -= 1_H (K. + S.( - S.) (Equation 10)
1 1 0 1
1131
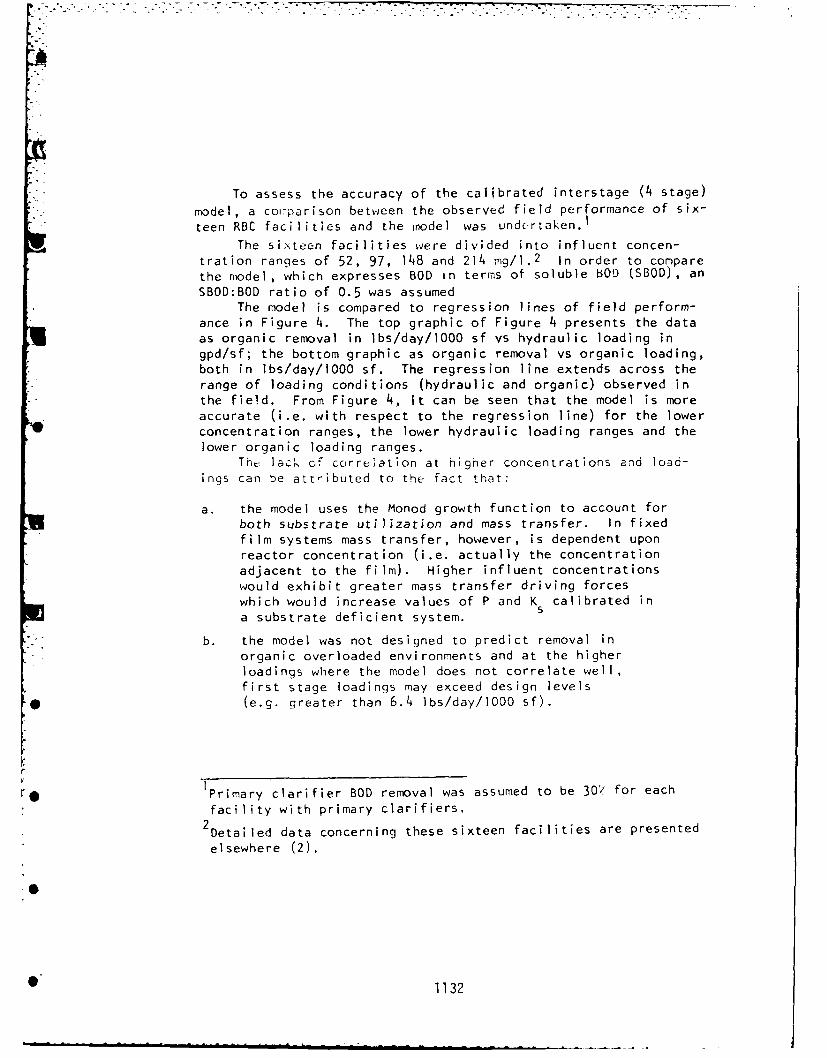
To assess the accuracy of the calibrated interstage (4 stage)model, a corparison between the observed field performance of six-
teen RBC facilities and the model was undcertaken. l
The sixteen facilities were divided into influent concen-tration ranges of 52, 97, 148 and 214 mg/. 2 In order to comparethe model, which expresses BOD in terms of soluble BOD (SBOD), an
SBOD:BOD ratio of 0.5 was assumedThe model is compared to regression lines of field perform-
ance in Figure 4. The top graphic of Figure 4 presents the dataas organic removal in lbs/day/IOO0 sf vs hydraulic loading ingpd/sf; the bottom graphic as organic removal vs organic loading,both in lbs/day/l000 sf. The regression line extends across therange of loading conditions (hydraulic and organic) observed inthe field. From Figure 4, it can be seen that the model is moreaccurate (i.e. with respect to the regression line) for the lowerconcentration ranges, the lower hydraulic loading ranges and thelower organic loading ranges.
The lack of correlation at higher concentrations and load-inqs can be attributed to the fact that:
a. the model uses the Monod growth function to account forboth substrate utilization and mass transfer. In fixedfilm systems mass transfer, however, is dependent uponreactor concentration (i.e. actually the concentrationadjacent to the film). Higher influent concentrationswould exhibit greater mass transfer driving forceswhich would increase values of P and K calibrated ina substrate deficient system.
* b. the model was not designed to predict removal in
organic overloaded environments and at the higherloadings where the model does not correlate well,first stage loadings may exceed design levels
* (e.g. greater than 6.4 Ibs/day/lO00 sf).
q 1Primary clarifier BOD removal was assumed to be 3V for each
facility with primary clarifiers,2Detailed data concerning these sixteen facilities are presented
elsewhere (2).
5 1132
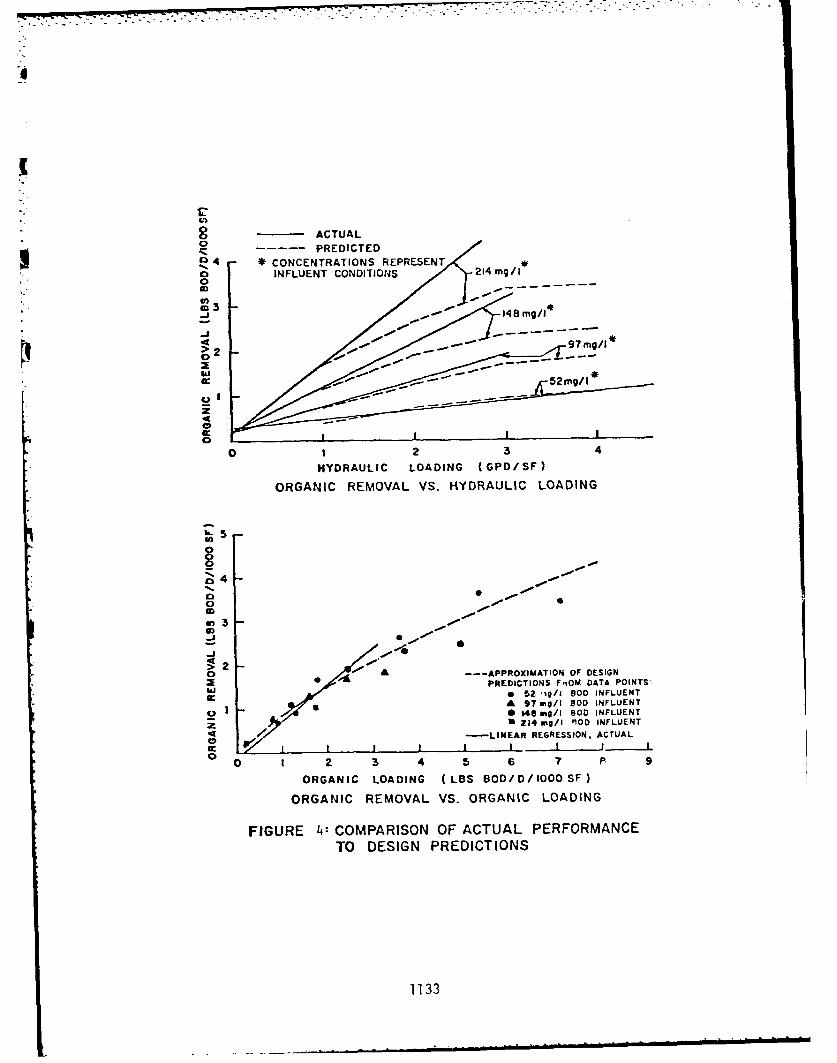
8 ACTUAL0
;l_ PREDICTED04 CONCENTRATIONS REPRESENT
oINFLUENT CONDITIONS 214 mng/I0
_j
0
0 I2 34
HYDRAULIC LOADING (GPD/SF)
ORGANIC REMOVAL VS. HYDRAULIC LOADING
k5
4n
§ -
-J
§ 20 'A ~ APOIAONOF DESIGN
hi PREDICTIONS F40M DATA POINTS:* 52 iag/i gOD INFLUENTA 97mg/I SOD INFLUENT0 *e 148g/I SOD INFLUENT
U 214 mng/I 'nOD INFLUENT-LINEAR REGRESSION, ACTUAL
I 2 3 4 5 6 7 p 9
ORGANIC LOADING (LBS BOD/D/IOOO SF)
ORGANIC REMOVAL VS. ORGANIC LOADING
FIGURE 4: COMPARISON OF ACTUAL PERFORMANCETO DESIGN PREDICTIONS
1133
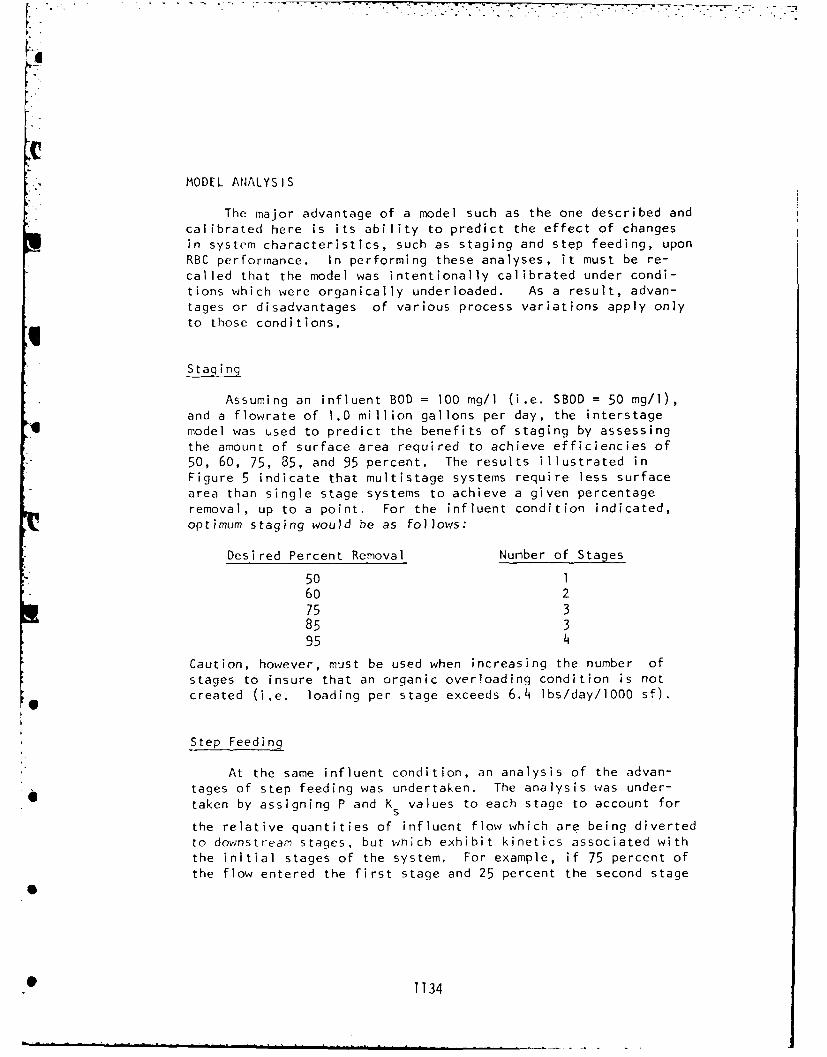
MODEL ANALYSIS
The major advantage of a model such as the one described andcalibrated here is its ability to predict the effect of changesin system characteristics, such as staging and step feeding, uponRBC performance. In performing these analyses, it must be re-called that the model was intentionally calibrated under condi-tions which were organically underloaded. As a result, advan-tages or disadvantages of various process variations apply only
to those conditions.
Staging
Assuming an influent BOD = 100 mg/l (i.e. SBOD = 50 mg/l),and a flowrate of 1,0 million gallons per day, the interstagemodel was used to predict the benefits of staging by assessing
the amount of surface area required to achieve efficiencies of50, 60, 75, 85, and 95 percent. The results illustrated inFigure 5 indicate that multistage systems require less surfacearea than single stage systems to achieve a given percentageremoval, up to a point. For the influent condition indicated,
optimum staging would be as follows:
Desired Percent Removal Number of Stages
50 160 275 3
85 395 4
Caution, however, must be used when increasing the number ofstages to insure that an organic over!oading condition is not
created (ie. loading per stage exceeds 6.4 lbs/day/lOO0 sf).
Step Feeding
At the same influent condition, an analysis of the advan-* tages of step feeding was undertaken. The analysis was under-
taken by assigning P and Ks values to each stage to account for
the relative quantities of influent flow which are being divertedto downstream stages, but whihch exhibit kinetics associated withthe initial stages of the system. For example, if 75 percent of
the flow entered the first stage and 25 percent the second stage
T134
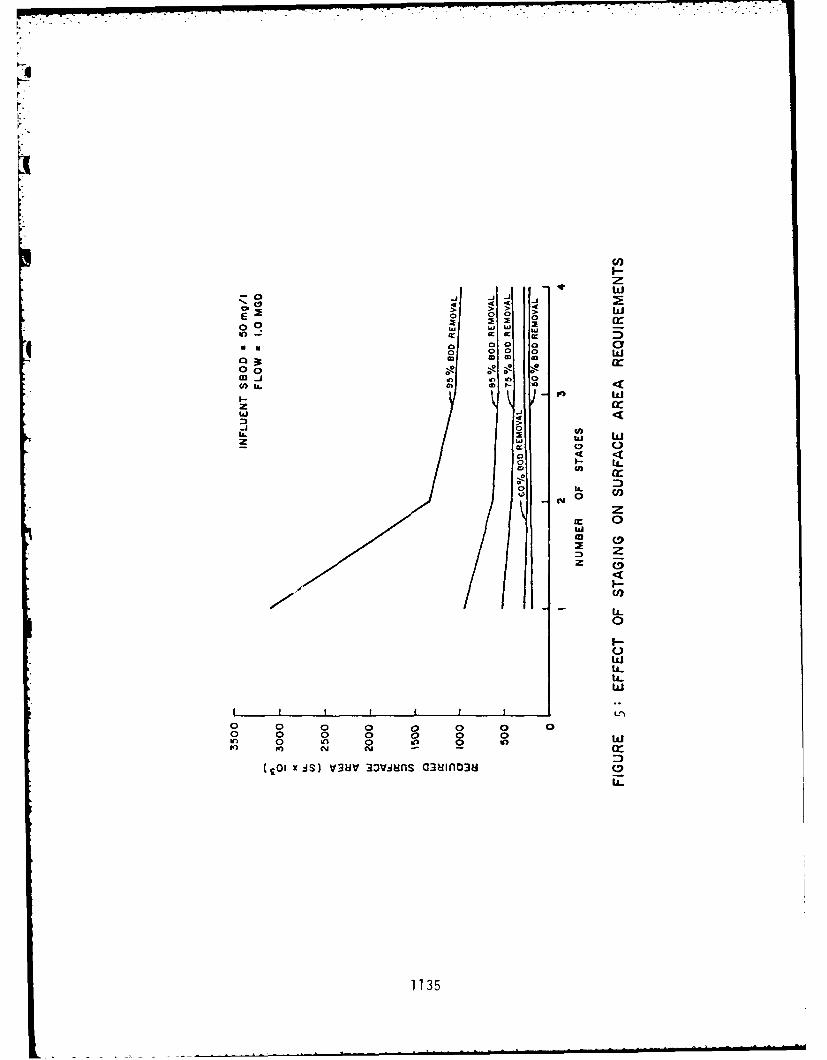
_j -J
>C
E 0 > > 4
a0 o 0C
MM0 0 0 0 w0 00 3
m mmpo w
I-- k' )zLaJ -J
IL 0
0 4 400
0 C
zit 0
0
Szz C-
L0
wL.
0 0 0 0 0 0 00 00 0 0 0 0
0 kl 0 0 witO in (J As - -
LOI JiS) V3UiV 3Z3V~S C3iflnO3H C-
1135
of a 4 stage system, then 75 percent of the flow would experienceremoval on the basis of running the model consecutively throughfour stages, with values of PI KI P2K2, P3K3 and P4K4 for the
four stages. Twenty-five percent of the flow would experiencethe removal associated with a three stage system with values ofP I]Kit P2K2 and P3K3 for the three stages. The final effluent was
calculated as a material balance of the two flows. A schematicrepresentation of this analyses is presented in Figure 6. Vari-ous combinations of step feeding were examined, with no advantageindicated under any conditions and decreasing efficiencies notedif too great a percentage of flow was diverted to the latterstages.
CONCLUSIONS
1. A limiting organic loading to the first stage of6.4 Ibs/day/lO00 sf of BOD (total BOD) was foundto be the organic loading beyond which nuisanceorganism growth and corresponding process per-formance problems occur.
2. An interstage model was calibrated at organicconcentration in a range of 50 - 100 mg/l BODfor systems which were not overloaded, Themodel illustrates the advantages of stagingwhen high efficiencies are desired. The modeldid not indicate any advantage to step feedingin systems that are organically underloaded.
3. The design of RBC systems is best undertakenwith two independent criteria. The first toestablish the desired surface area and staging
* arrangements, and the second to ensure that nostage is organically overloaded, The organicloading limitation presented here is considereda good design criteria to prevent oxygen limi-tations. Additional data is required toestablish an accurate rational interstage modelto predict RBC performance.
• 13
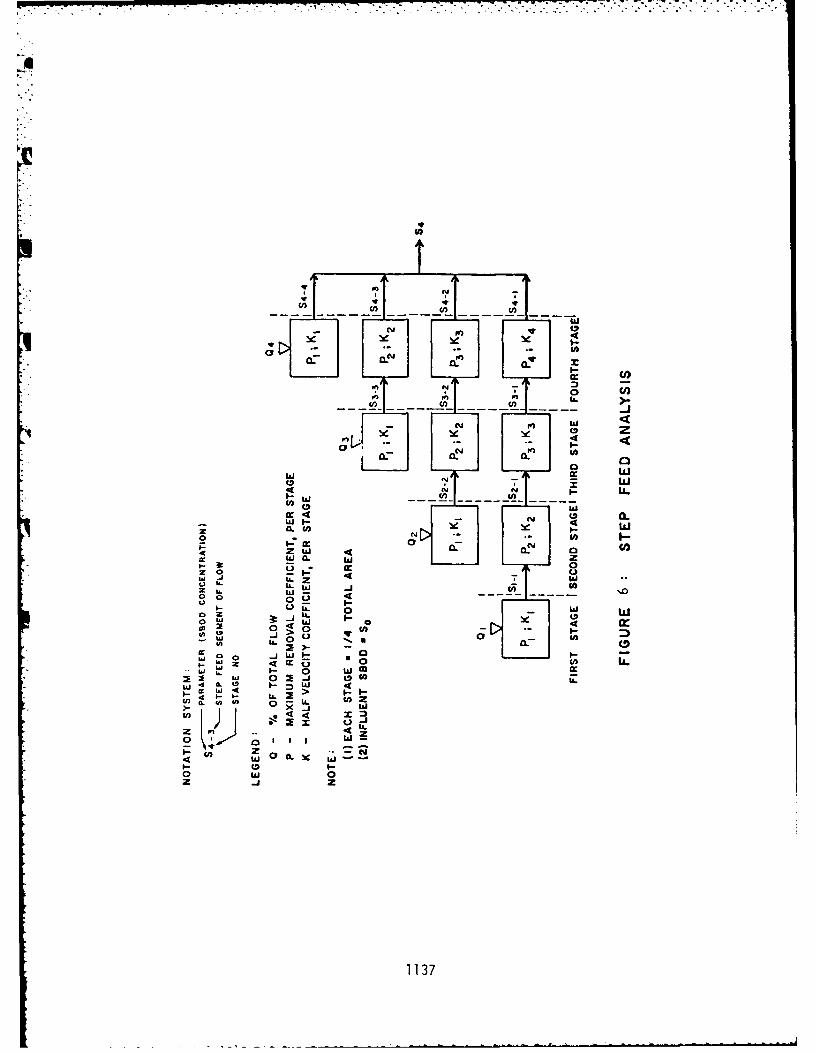
I.-x
0)0
0
(0 A
4 1 F w
Wa. w 0 C
w .- 4co I.-~~ w
020ow 0
~0 jW 4 0- -L). izz~ 0 U, IL
8. W 3:: w 4
0 LbJ I-
00d
0 >
z -J
1137
REFERENCES:
(1) Chesner, W.H., and lannone, J,J,, "Current Status ofMunicipal Wastewater Treatment with RBC Technology inthe US," presented at the Feb. 4-6, 1980, First NationalSymposium on RBC Technology, held at Champion, PA.
(2) Chesner, W.H., and lannone, J,J., "Review of RBC DesignProcedures and Process, O&M, Equipment and Power Perform-ance," Municipal Environmental Research Laboratory, U.S.Environmental Protection Agency, unpublished.
(3) Smith, E.D., Miller, R.D., and Wu, Y.C., Editors, "Pro-ceedings of the First National Workshop on Rotating Bio-logical Contactor Technology," held at Champion, PA,February 4-6, 1980.
(4) Lagnese, J.F., "Use of Supplemental Air to Correct anOxygen Limitation Condition of an Operating RBC System,"presented at the February 4-6, 1980, First NationalSymposium on RBC Technology, held at Champion, PA.
(5) Selden Sanitary Corporation, "Report on Nitrification,"prepared by Henderson and Bowdwell, Plainview, NY,December 1977.
(6) Hitdlebaugh, J.A., and Miller, R.D,, "Full Scale RBC forSecondary Treatment and Nitrification," presented at theFebruary 4-6, 1980, First National Symposium on RBCTechnology, held at Champion, PA,
(7) Wood, Paul K., "Report: Survey of Sewage Treatment Plant,Winchester, KY," State Compliance Report, Kentucky Bureauof Environmental Protection, August 3-4, 1976.
(8) Dobrowolski, FJ., Brown, J.M., and Bradley, F.M., "TestingRotating Biological Contactors for Secondary Treatment in aConverted Primary Tank," presented at the Water PollutionControl Association of Pennsylvania, August 8, 1974.
(9) Personal communication, Richard Phillips, State of Vermont,Environmental Conservation Agency.
(lo) ALtotloZ Du4igb1 1anuatz, 1979.* (11) Clark, JH., Moseng, E.M,, and Asano, T., "Performance of
a Rotating Biological Contactor under Varying WJastewaterFlow," Jou naI WPCF 50, (5), 896, 1978.
(12) Williamson, K. and McCarty, P.L., "Verification Studiesof the Biofilm Model for Bacterial Substrate Utilization,"Jow tAn WPCF, 48, (2), 281, 1976.
1138
- COMBINED BIOLOGICAL/CHEMICAL TREATMENT IN RBCP-PLANTS.
* 0 Hallvard Odegaard, Division of Hydraulic & Sanitary
Engineering, University of Trondheim, NTH, Norway.
INTRODUCTION
Over the last 5 years, there has been an increased use ofrotating biological contactors (RBC's) in Norway. Out of atotal of about 500 sewage treatment plants in the country, 52(- 10%) are RBC-plants.
Since eutrophication is a major pollution problem in theNorwegian waterways, chemical treatment to remove phosphorousis extensively used. Of the 52 RBC-plants, 48 of them are com-bined biological/chemical plants.
The main objective for establishing chemical treatment incombination with biological treatment in RBC's is of courseto remove phosphorous. In addition it is experienced,however,that the addition of a chemical precipitant (normally alum orferric iron) will improve the effluent quality by coagulationof the fine fraction of biofilm that often is difficult tosettle. Therefore the chemical treatment serves a dual pur-pose.
Chemical tread ient may be achieved in combination withRBC's by principally three process designs (fig.1), hereafternamed:
- Simultaneous precipitation- Combined precipitation- Post precipitation
1130
| - | .|
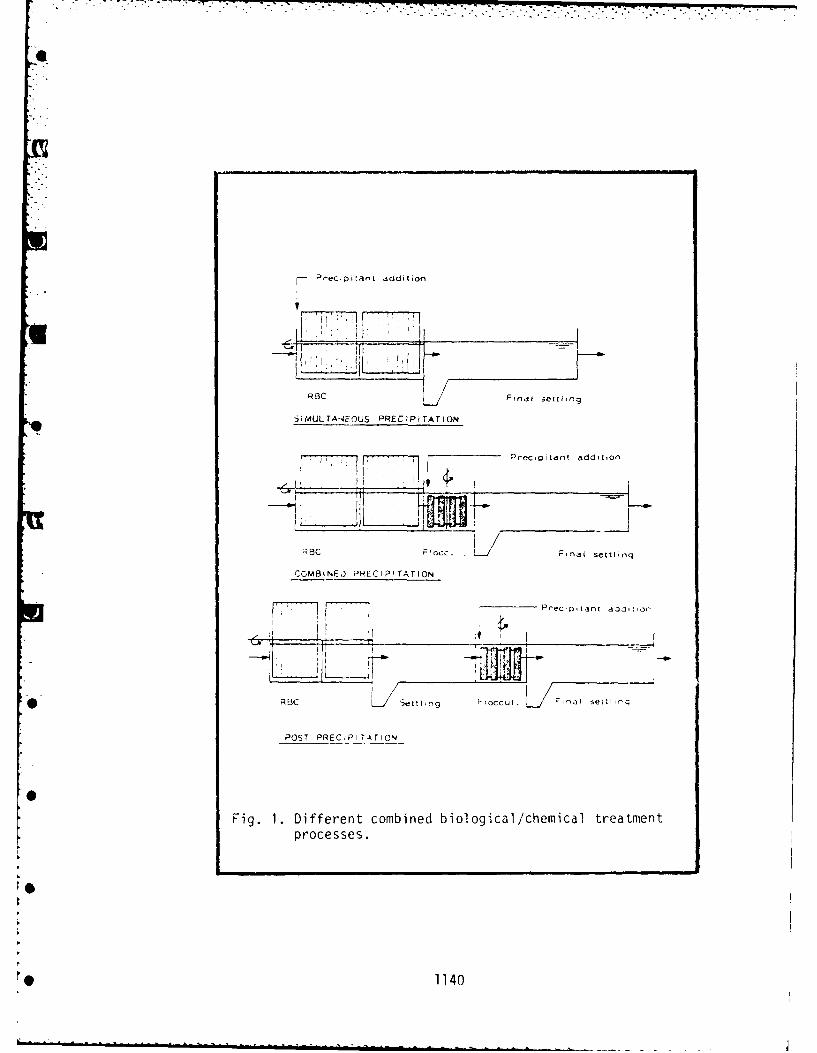
-P eco tnt dditionl
SIMULT'ANEOUS PREC!PITATION
Prec~jpitanl additaon
COMBINED .'RECIP-TATION
Pr-ec Dtant ai~i.tor
RE3C Setti lIn ,occuL. L~ . 3 ieLw-
POST PREC;PITATICN-
Fig. 1. Different combined biological/chemical treatmentprocesses.
1140
In simultaneous precipitation the precipitant is added to theRBC tank, the precipitation occurs here and the precipitatedmatter is removed together with the biofilm suspended matterin the following separation unit, normally a sedimentationtank. Since flocculation occurs in the RBC-tank,a floccula-tion tank between the RBC and the settling unit is normallynot included.
Post-precipitation plants consist of biological and chemi-cal treatment completely separated from each other. The RBChas its own settlingtank followed by the chemical step,consis-ting of chemical mixingflocculation and separation of flocs.
As will be shown later, the major part of the combinedbiological/chemical RBC-plants in Norway are designed forcombined precipitation. Compared to the traditional post-precipitation plant, the settling unit for the RBC-sludge ishere omitted. The precipitant is added to the RBC effluentand the whole suspension (biological and chemical sludge) isthen flocculated before combined sludge removal in settlingunits.
In this paper, an overview over the Norwegian experienceswith combined biological/chemical treatment in RBC plants willbe given first, and thereafter a special project concerningthe comparison of simultaneous precipitation and combined pre-cipitation will be reported.
THE USE OF RBS PLANTS IN NORWAY - AN OVERVIEW.
The general picture of sewage treatment in Norway inNorway is as follows:
- Most of the plants are small. About 50% of the totalnumber of plants (about 500 plants) has a connection ofless than 500 personequivalents, and about 93, of theplants are for less than 10.000 person equivalents.
- Chemical precipitation is extensiviely used either aloneof in combination with biological processes.
- All :he plants are built-in, either in houses (most ofthe plants) or in halls blasted into the rocky mountains(the bigger plants). This is so because of the strictlabour environment rules and the cold climate duringwinter.
Based on a questionnaire to the environmental protectionauthorities in all the counties, information about the RBCplants was gathered.
1141
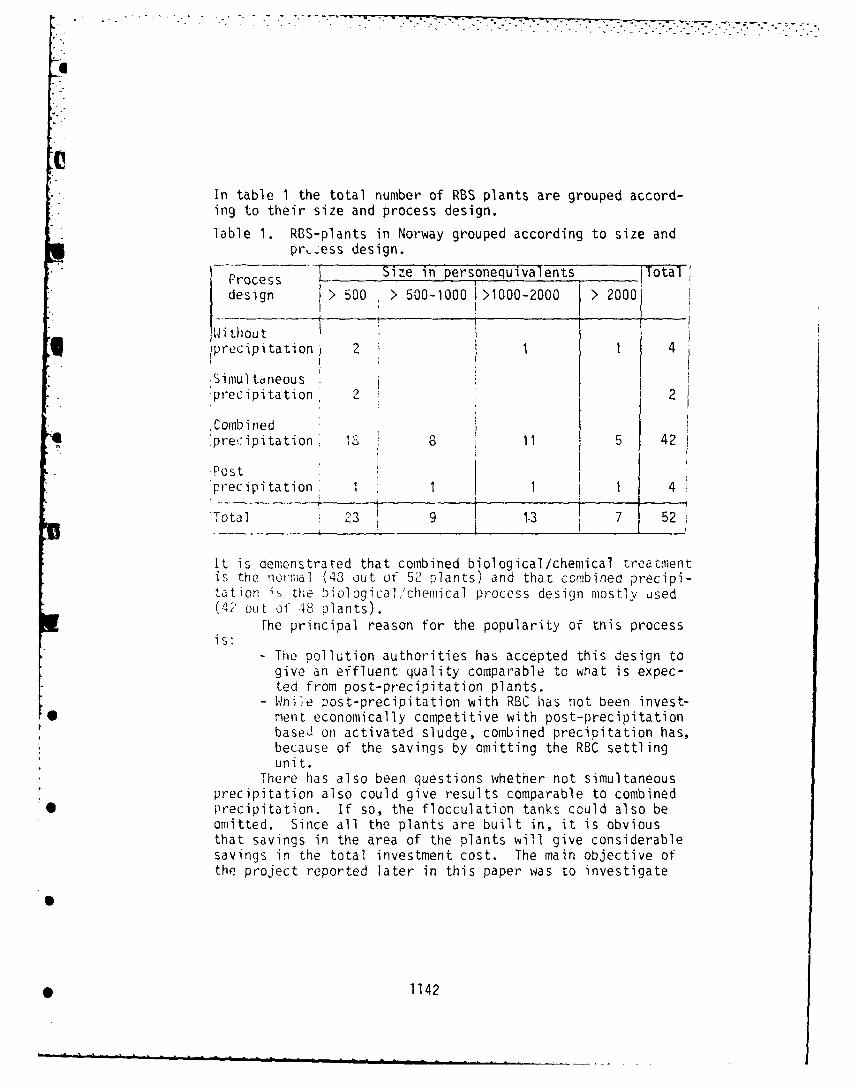
7, .7 .. . V ---
In table 1 the total number of RBS plants are grouped accord-ing to their size and process design.
lable 1. RBS-plants in Norway grouped according to size andpr, ess design.
" Process Size in personequivalents .. Total
design > 500 > 500-1000 1 >1000-2000 > 2000 i
;W4 i thou tprecipitation 2 1
Simul taneous
precipitation 2
Comb i nedprecipitation' , 8 11 5 42
'Postprecipitation 11 1 1 4
'Total 39 1.3 7 52
It is demonstrated that combined biological/chemical treatmentis the nirvmal (43 out of 52 plants) and that combined precipi-tation is the biological,;chemical process design mostly used(4 out of 48 plants).
rhe principal reason for the popularity of tnis process
The pollution authorities has accepted this design togive an effluent quality comparable to what is expec-ted from post-precipitation plants.
- While post-precipitation with RBC has not been invest-0 ment economically competitive with post-precipitation
based on activated sludge, combined precipitation has,because of the savings by omitting the RBC settlingunit.
There has also been questions whether not simultaneousprecipitation also could give results comparable to combined
* Precipitation. If so, the flocculation tanks could also beomitted. Since all the plants are built in, it is obviousthat savings in the area of the plants will give considerablesavings in the total investment cost. The main objective ofthe project reported later in this paper was to investigate
* 1142
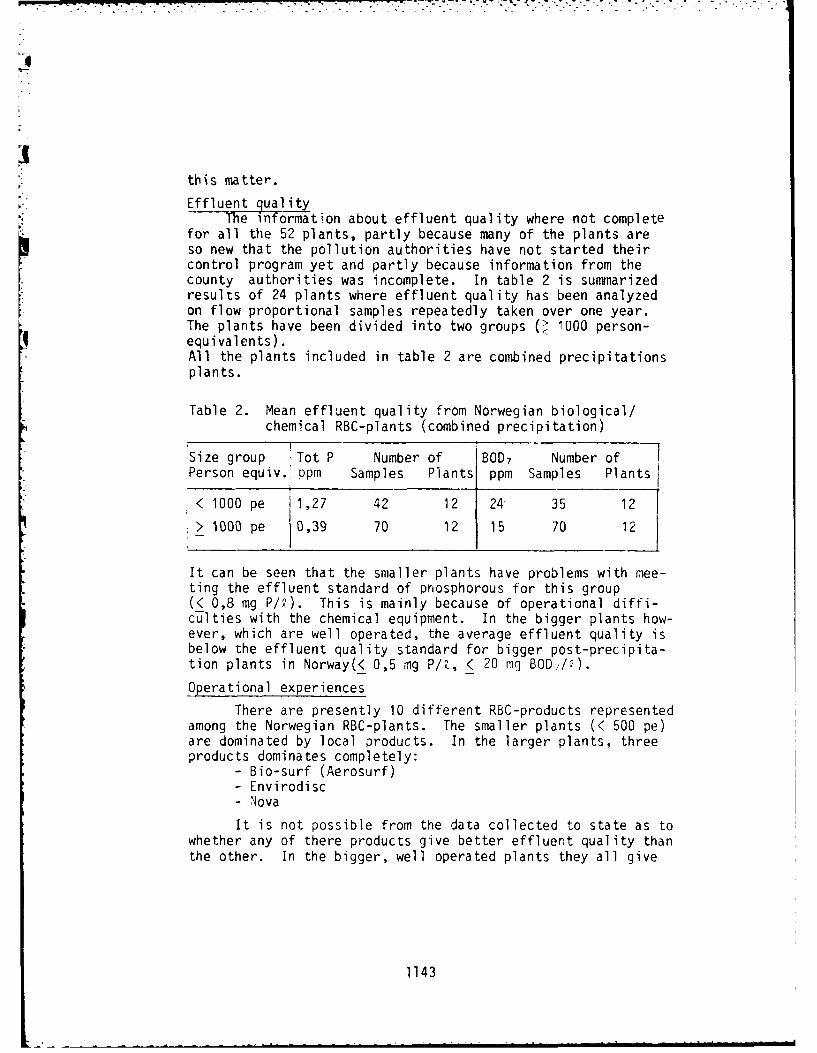
this matter.
Effluent qualityMe information about effluent quality where not complete
for all the 52 plants, partly because many of the plants areso new that the pollution authorities have not started theircontrol program yet and partly because information from thecounty authorities was incomplete. In table 2 is summarizedresults of 24 plants where effluent quality has been analyzedon flow proportional samples repeatedly taken over one year.The plants have been divided into two groups (Q 1000 person-equivalents).All the plants included in table 2 are combined precipitationsplants.
Table 2. Mean effluent quality from Norwegian biological/chemical RBC-plants (combined precipitation)
Size group -Tot P Number of BOD 7 Number ofPerson equiv. ppm Samples Plants ppm Samples Plants
< 1000 pe 1,27 42 12 24 35 12
> 1000 pe 0,39 70 12 15 70 12
It can be seen that the smaller plants have problems with mee-ting the effluent standard of phosphorous for this group(< 0,8 mg P/Q). This is mainly because of operational diffi-culties with the chemical equipment. In the bigger plants how-ever, which are well operated, the average effluent quality isbelow the effluent quality standard for bigger post-precipita-tion plants in Norway(< 0,5 mg P/Z, < 20 mg BOD7/2).
Operational experiencesThere are presently 10 different RBC-products represented
among the Norwegian RBC-plants. The smaller plants (< 500 pe)are dominated by local products. In the larger plants, threeproducts dominates completely:
- Bio-surf (Aerosurf)- Envirodisc- Nova
It is not possible from the data collected to state as towhether any of there products give better effluent quality thanthe other. In the bigger, well operated plants they all give
1143
effluents quality results that is expected from post-precipi-tation plant , (< 0,5 ng P/t, < 20 mg BOF7 /Z).
We have in Norway, as in most countries, I guess, exper-ionced mechanical failures with the RBC plants, and because ofthis,I can say that the popularity of the RBC's has faded some-whaL lately.
Another problem that is experienced,is that nitrificationin the RBC reduces the alkalinity so much that it is difficultto maintain sufficiently high pH for chemical precipitation.P lum is normally used as precipitant and pH is then normally6,-6 ,5 in the precipitation step.
iLJL FROM A RGC-PLANT WITH COMBINED PRECIPITATION
For a period of over two years the influent and effluentquONlity cr flow proportional samples have been monitored at;,i'stra !-3C sewage treatment plant which is operating accord-in,: to thc comuineO Precipitation mode.
The plant is designeo for 5100 personequivalents with as r]n flow. of 140 mi/d. The flow diagram for the plant is
sfhown in fic..The plant receives municipal and dairy wastewater and in
addition,external septic sludge is cewatered at the plant.K cj.c£ watetr rom this septic handling contributes signifi-.arly to the composition of the raw water. The precipita-Lion chcmlica7 is aluminium-sulphate of the AVR-quali ty, aedish product consisting of a combination of al um- andcw~c sul.h ,. L). The dosage of 130-110 mg AVR/': (about
11-1? mg l/ ) is fed flow proport-ona, to the water down-5reai the bicoi sc units.
As will be shown later, the average SOD7 - concentrationn the raw water is about 320 q O.'m7 and the average daily
flow 1200 i'i/d. Presupposed that a BOD-reduction of 30' willoccur ir the presettling units, the organic area loading is19 g 5O0-/im.d, which is about the Norwegian design criteriafor combiriu biological/chemical i ' C p2ants. (< 20 g BOD 7,/m.d)
The average treatment results from this plant over thelast two years is shown in table 2.
The data in table 2 clearly demonstrate that a well oper-ated combined precipitation RBC-plant can give an effluent qual-ity of at least the same quality as traditional post precipi-tation plants based on activated sludge can.
" 1144
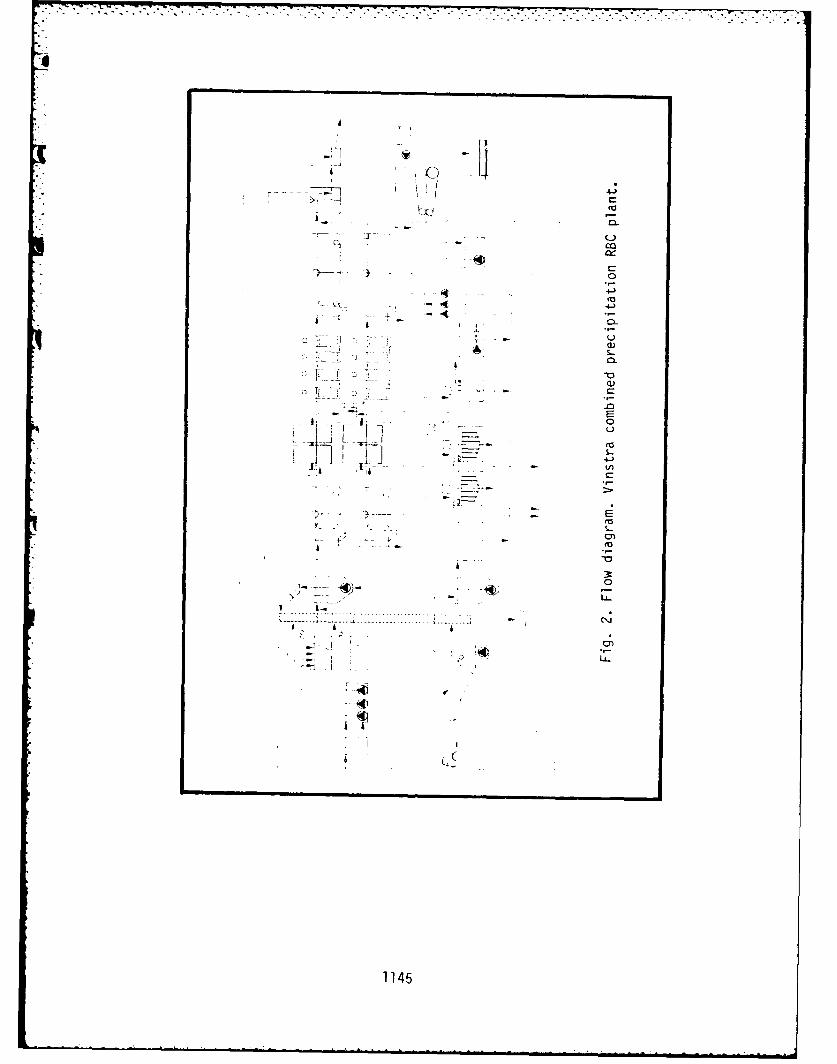
-1r
0
-CD
L
L-o
1145..
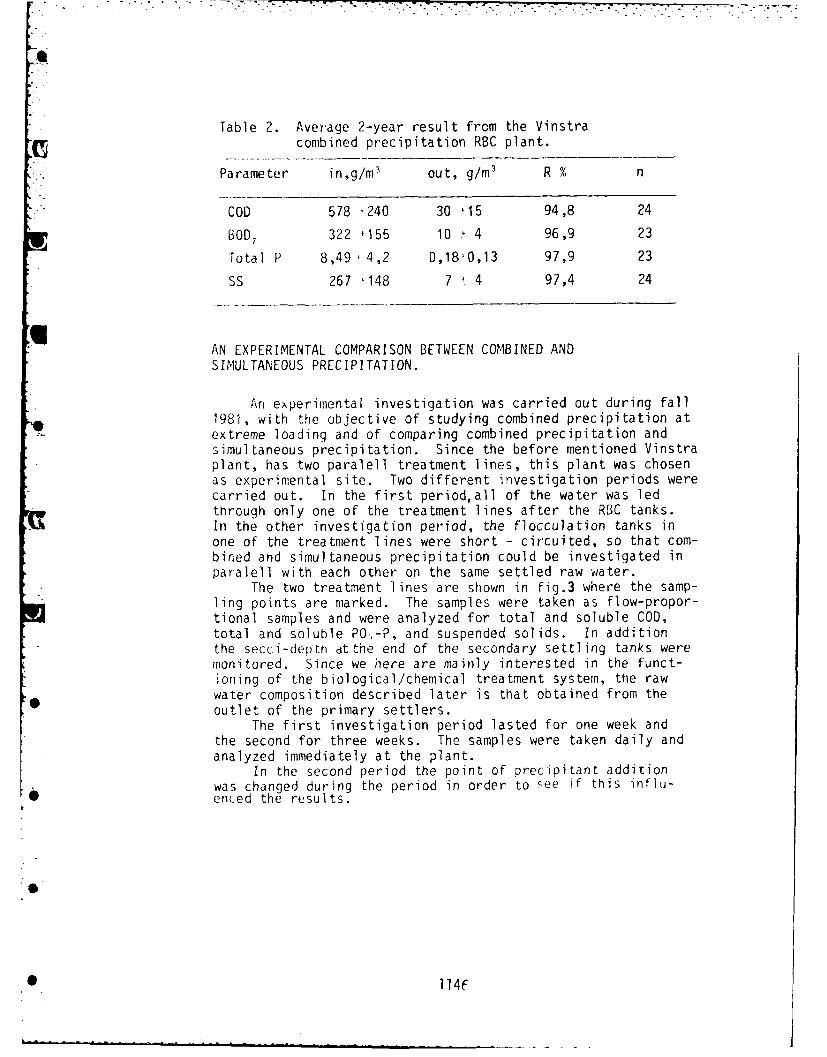
Table 2. Average 2-year result from the Vinstracombined precipitation RBC plant.
Parameter in,g/m 3 out, g/m3 R % n
COD 578 '240 30 15 94,8 24
BOD 7 322 +155 10 , 4 96,9 23
Total P 8,49 t4,2 0,18;0,13 97,9 23
SS 267 148 7 ' 4 97,4 24
I AN EXPERIMENTAL COMPARISON BETWEEN COMBINED ANDSIMULTANEOUS PRECIPITATION.
An experimental investigation was carried out during fall1981, with the objective of studying combined precipitation atextreme loading and of comparing combined precipitation andsimultaneous precipitation. Since the before mentioned Vinstraplant, has two paraleli treatment lines, this plant was chosenas experimental site. Two different investigation periods werecarried out. In the first period,all of the water was ledthrough only one of the treatment lines after the RBC tanks.In the other investigation period, the flocculation tanks inone of the treatment lines were short - circuited, so that com-bined and simultaneous precipitation could be investigated inparalell with each other on the same settled raw water.
The two treatment lines are shown in fig.3 where the samp-ling points are marked. The samples were taken as flow-propor-tional samples and were analyzed for total and soluble COD,total and soluble PO:,-P, and suspended solids. In additionthe secci-de'rh at the end of the secondary settling tanks weremonitored. Since we here are mainly interested in the funct-ioning of the biological/chemical treatment system, the raw
0 water composition described later is that obtained from the0 outlet of the primary settlers.
The first investigation period lasted for one week andthe second for three weeks. The samples were taken daily andanalyzed immediately at the plant.
In the second period the point of precipitant additionwas changed during the period in order to see if this influ-enced the results.
ll4F
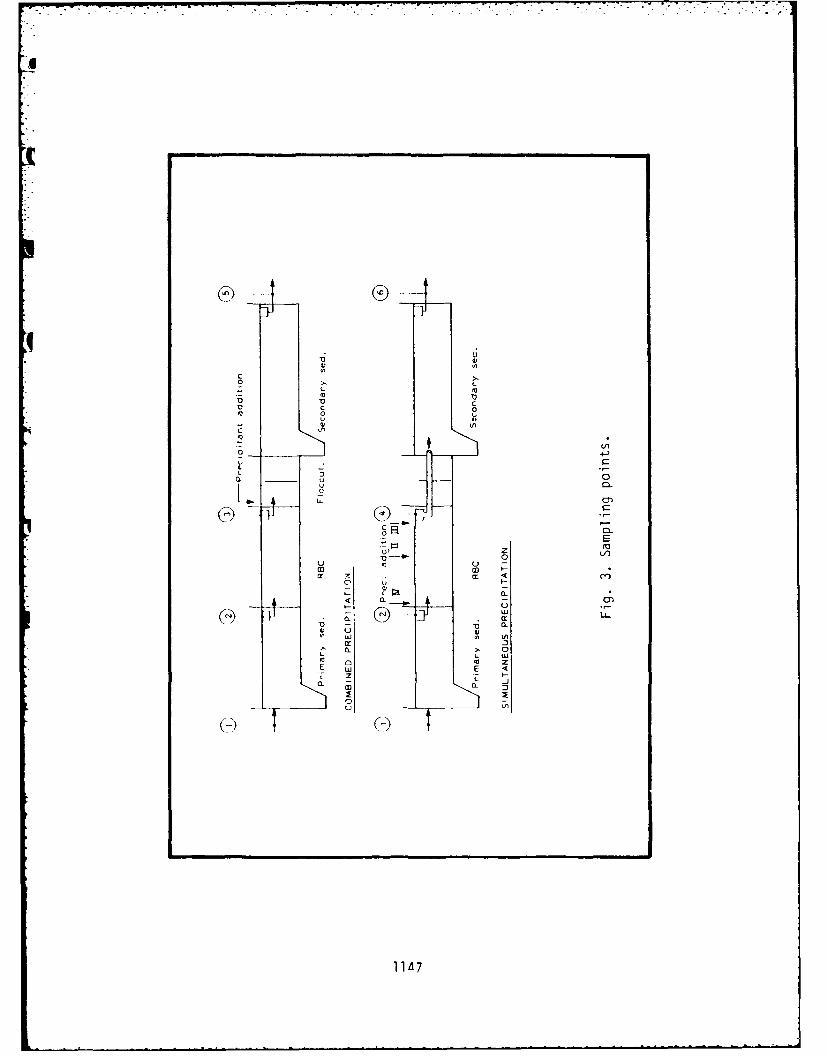
c} -
V C 0o00 in
C) E,
Q 4-0U M
I. fl Q
u VI
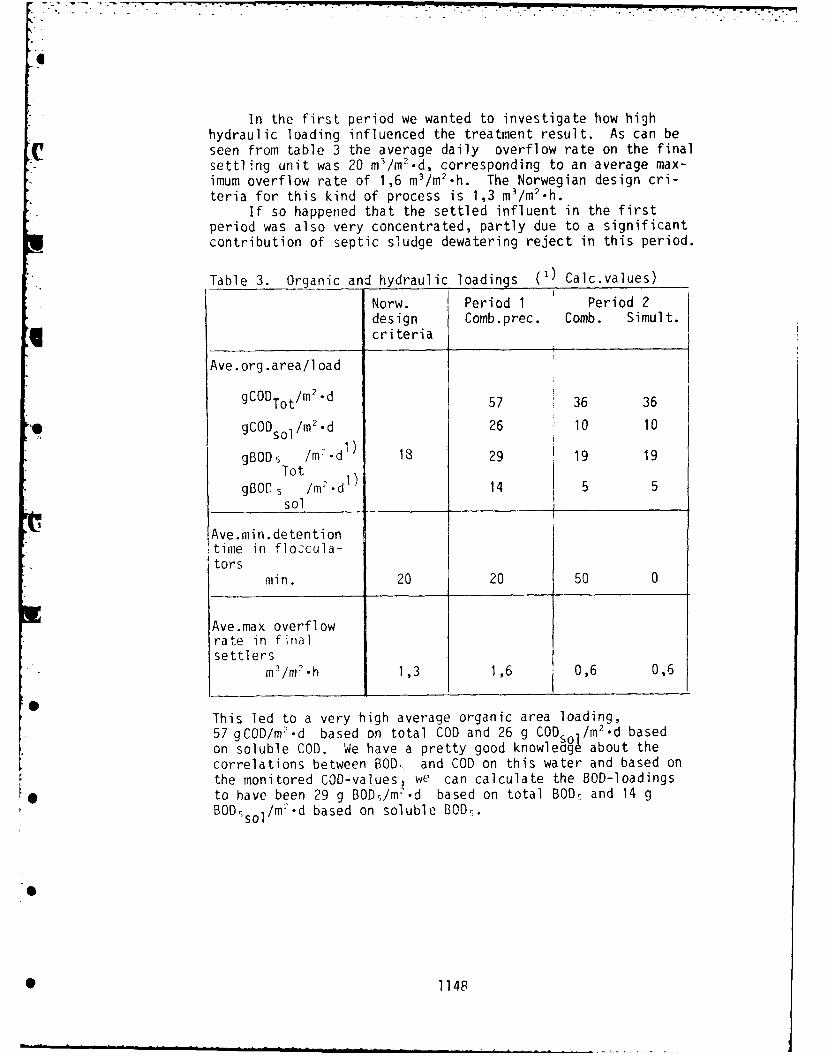
In the first period we wanted to investigate how highhydraulic loading influenced the treatment result. As can be
C seen from table 3 the average daily overflow rate on the finalsettling unit was 20 m3 /m2-d, corresponding to an average max-imum overflow rate of 1,6 m3/m2 .h. The Norwegian design cri-teria for this kind of process is 1,3 m3/m2 h.
If so happened that the settled influent in the firstperiod was also very concentrated, partly due to a significantcontribution of septic sludge dewatering reject in this period.
Table 3. Organic and hydraulic loadings (P) Calc.values)I
Norw. Period 1 Period 2design Comb.prec. Comb. Simult.cri teria
Ave.org .area/l oad
gCODTot/m2.d 57 36 36
gCODso /m 'd 26 10 10
gBOD5 /m"-d 18 29 . 19 19Tot
gBOC5 /mr'dl) 14 5sol _
Ave.min.detentiontime in flo:cula-~tors
min. 20 20 50 0
Ave.max overflowrate in finalsettlers
m3/m 2 .h 1,3 1,6 0,6 0,6
This led to a very high average organic area loading,57 gCOD/m:'.d based on total COD and 26 g CODs /m2 -d basedon soluble COD. We have a pretty good knowledg about thecorrelations between BOD, and COD on this water and based onthe monitored COD-values, we can calculate the BOD-loadingsto have been 29 g BOD,/m2.d based on total BOD and 14 gBOD Sol/m"-d based on soluble BOD5 .
S 1148
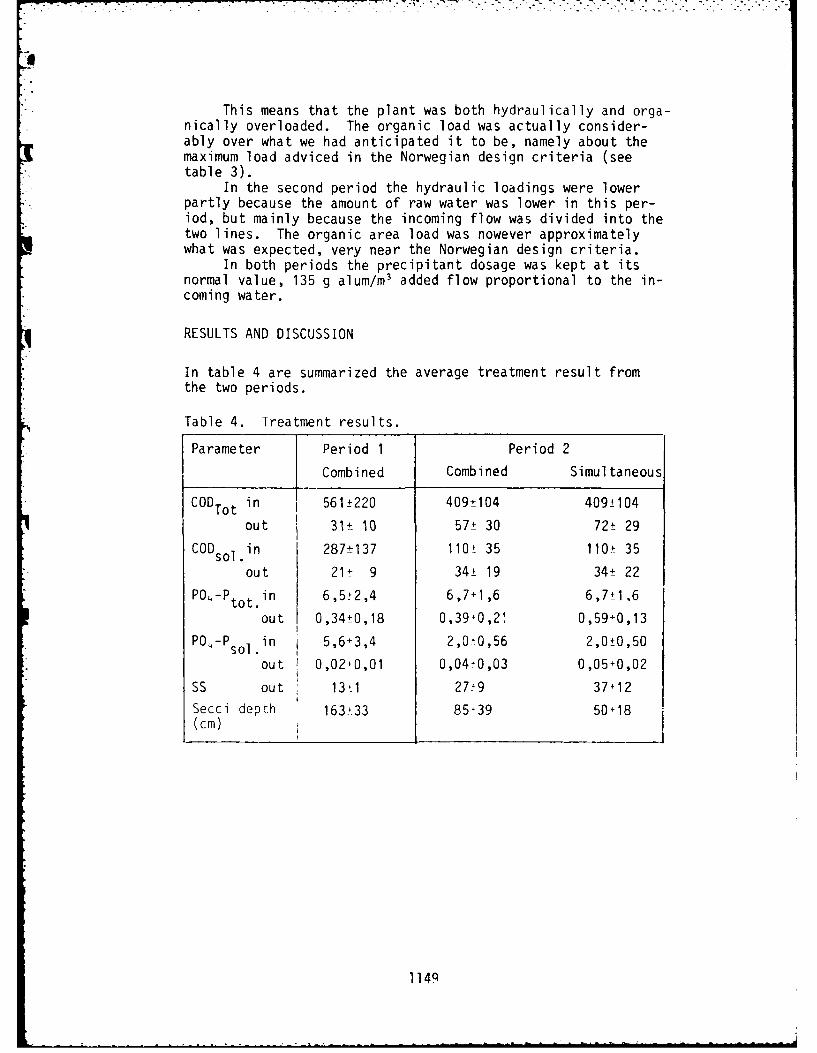
This means that the plant was both hydraulically and orga-nically overloaded. The organic load was actually consider-ably over what we had anticipated it to be, namely about themaximum load adviced in the Norwegian design criteria (seetable 3).
In the second period the hydraulic loadings were lowerpartly because the amount of raw water was lower in this per-iod, but mainly because the incoming flow was divided into thetwo lines. The organic area load was nowever approximatelywhat was expected, very near the Norwegian design criteria.
In both periods the precipitant dosage was kept at itsnormal value, 135 g alum/m3 added flow proportional to the in-coming water.
RESULTS AND DISCUSSION
In table 4 are summarized the average treatment result fromthe two periods.
Table 4. Treatment results.
Parameter Period 1 Period 2
Combined Combined Simultaneous
CODTot in 1 561±220 409+104 409±104
out 31± 10 57± 30 72± 29
CODSo l. in 287±137 110± 35 110- 35
out 21± 9 34± 19 34± 22
PO4-Ptot. in 6,5+2,4 6,7+1,6 6,7+1,6
out 0,34+0,18 0,39 0,21 0,59±0,13
PO-so in 5,6+3,4 2,0,0,56 2,0±0,50
out 0,02+0,01 0,04,0,03 0,05+0,02
SS out 131 27+9 37±12
Secci depth 163 33 85+39 50+18(cm)
l149
In spite of the exLremely high loading in the combined preci-pitation line in investigation period 1,the plant gave stillvery good effluent quality similar to what normally was achi-vied at hydraulically only half the load previously. The COD-values in the effluent corresponds to BODs-values of less than5 g BODsol/m3 and less than 10 g BODstot/m3.
The phosphate precipitation was also good, precipitationwas complete (PO,-P = 0,02 ppm) and even with an averagemaximum overflow railas high as 1,6 m/h, the separation offlocs was good, leaving total PO-P = 0,34 ppm and suspendedsolids = 13ppm in the effluent. The effluent was very clearwith secci-depth of 163 cm.
As may be seen from table 4 the effluent guality in per-iod 2 was not so good as in period 1 in either of the treat-ment lines.Why the concentration of both total and solubleorganic matter went up also in the combined precipitationline, we don't know. It is probably however that the extremeorganic loading in period 1 had some impact on the biofilm insuch a way that the high loading resulted in a thick biofilTthat stripped of to a greater extent in period 2 resulting
* in a decrease in total active biomass.However, since the main objective in period 2 was to com-
pare the two different processes the absolute treatment resultis not so important.
The effluent quality in the combined precipitation linewas not bad, however, with average COD-values in the effluentcorresponding to BOD,-values of less than 10 BOD 55so/M
3 andless than 20 g BOD, tot/M.
it was obvious, however, that separation of flocs wasworse than in period 1,leavinq 27 ppm of suspended solids inthe effluent and the se .ci-depth had fallen to 85 cm. Phos-phute removal was still good.
When we compare the results from the two treatment lines,two things are clear:
- The removal of soluble organic matter was equally goodin the two lines.
- Separation of flocs was better in the combined precipi-tation line.
* The difference between the two processes lies in the flocseparation aspectas one might 2xpect. This demonstrates theusefulness of the flocculation tanks.
It must be said, however, that the results in the simul-taneous precipitation line may have been influenced by:
1150
- the fact that the precipitant addition point was chan-ged over the period.
- the fact that the precipitant dosing equipment for this( line was a provisorium which may have given a dosingrate not as reliable as in the other line.
An other investigation period was actually also performedin which all water was led through the simultaneous precipita-tion line giving a relatively high hydraulic load (ave. maxoverflow rate 1,2 in/h). The organic loading in this periodwas relatively low and therefore the results are not includedin detail. The results where very similar to the ones obtai-ned in period 2. Towards the end of the hydraulically highloaded simultaneous precipitation perioi the sludge separationwas, however, very good (SS < 10 PPM, P04 - P tot < 0,3 ppm and
V BOO3 tot < 20 ppm). This proved to us that good treatment mayalso be obtained by the simultaneous precipitation process.
Based on the results we would, however, advocate thatflocculation tanks are used with a detention time of 15-20 min.It is very important that these are constructed so that biofilmsettling is avoided.
With regard to precipitation addition point it cannot bestated from this investigation whether this should be done be-fore or after the RBC-tank with combined precipitation. Sinceonly the normal point of addition, after the RBC's was testedhere. it may be argued however that precipitant addition be-fore or into the RBC-tank would precipitate some of the solu-ble organic matter and thus actually reducing the organic loadon the RBC. The comparison between simultaneous and combinedprecipitation did not, however, confirm this, since solubleCOD in the effluent was the same in the two lines.
It may also be argued that precipitant addition beforethe RBC would give less precipitant consumption because thesuspended solids concentration are lower here and consequent-ly less precipitant would be consumed in coagulating suspendedmatter.
:n simultaneous precipitation we feel therefore that themost correct precipitant adding point is before the RBC, main-ly because~ this is the point where thorough mixing is easiestto obtain. In the investigation, we did not see much differ-ence in the results, for the different dosing points. Butthen we kept the dosage constant.
1151
CONCLUSIONS
1.1Combined biological/chemical treatment can be obtained inRBC plants by adding precipitant before or into the RBC-tank (simultaneous precipitation), after the RBC-tank andbefore a flocculation/sedimentation system (combined preci-pitation)or with separate chemical step downstream the RBC-settling tank (post-precipitation).
2. The experiences from Norwegian combined precipitation plantsand from the project reported in this paper,is that excellenttreatment results may be obtained by combined precipitation.Since this process has one sludge separation unit less thanpost-precipitation, combined precipitation is economicallyfavourable compared to post-precipitation.
3. Simultaneous precipitation may also give acceptable effluentquality, but it seems that separation of flocs is better ina combined precipitation system as a result of better floc-culation.
4. Adding precipitant (alum) directly to the RBC-tank in simul-taneous precipitation does not give any adverse effect onthe capability of the biofilm to remove organic matter whenpH is kept above pH = 6,0.
5. Good removal of both organic matter and phosphate was ob-tained with combined precipitation at high organic and hyd-raulic loadings. A design criteria of average organic loa-ding < 20 g BODY tot/m d, average max overflow rate infinal settler < 1,3 mn/m-h and 20 min detention time inflocculators seem to be acceptable. This is a consider-ably higher organic loading than can be accepted when chem-ical treatment is not included.
11..
0
1152
0j
TREATMENT O' DOMESTIC SEWAGE BY AQUATIC RIBBON SYSTEM
Chun-Teh Li. Department of EnvironmentalEngineering, National Cheng-Kung University, Tainan,Taiwan
0
James S. Whang. AEPCO, Inc., Rockville, Maryland
T.N. Chiang. Department of Environmental Engineering,
National Cheng-Kung University, Tainan, Taiwan
INTRODUCTION
Fixed-film biological processes have become popularfor treating organic wastewaters during the past decadebecause of their low energy, and possibly low manpowerrequirements. There are many types of fixed-film biologicaltreatment processes including trickling filters; bio-towers,which are basically trickling filters that use light-weightplastic media instead of gravel as a substrate; rotatingbiological contactors (RBCs); packed-bed reactors (PBRs);and fluidized-bed reactors (FBRs). The latter three typesof fixed-film processes have been successfully implementedfor: (1) removal of soluble BOD from wastewaters; (2)nitrification, and (3) denitrification of variouswastewaters. These processes generally consist of afixed-film reactor followed by a liquid-solids separationunit such as a clarifier, a filter, or other specialliquid-solids separation unit.
The fixed-film biological processing system reportedin this study represents a new concept which combines thefixed-film reactor and the liquid-solids separator intoone physical unit. In this new fixed-film system (AquaticBio-Ribbon Treatment System), specially designed syntheticribbons are used as a substrate for microorganisms in a
1153
reactor system to achieve removal of 5-day soluble BOD,nitrification, and denitrification.
SYSTEM DESCRIPTION AND THEORETICAL CONSIDERATIONS
The aquatic ribbon reactor system (Figure 1) consistsof a secondary treatment chamber, a nitrification chamber,and a denitrification chamber
in series. In the secondary treatment chamber, zones fordistinctly different unit processes are maintained. Theupper zone is aerated minimally just to meet all oxygentransfer requirements. The lower zone, which is designedto facilitate sedimentation of sludge particles, is notaerated. Similar to other fixed-film systems, there isno sludge return. The dissolved oxygen (D.O.) level inthe secondary treatment chamber is kept above 2.8 mg/l atall times by artificial aeration. Heterotrophicmicroorganisms are grown on the ribbon surface. Theheterotrophs metabolize the organic matter present in thesewage and available oxygen to achieve the conversion ofsoluble BOD to suspended BOD. Exess biomass growth on theribbon surface eventually sloughs off and settles into thelower zone of the secondary chamber where it is periodically
removed.
The second and the third chambers have an arrangementsimilar to the first chamber. Both chambers are dividedinto two zones: the upper zone provides the actualbiological treatment process; the lower zone facilitates
sludge removal.S
The upper zone of the second chamber is aerated toencourage growth of autotrophic nitrifying bacteria(Nitrosomonas and Nitrobactor) on the ribbon surface,but activated nitrifying sludge is not recirculated.Ammonia-nitrogen present in the wastewater becomes the
0 electron donor in the bio-nitrification process and is
oxidized to nitrite and eventually nitrate. The D.O. levelin the nitrification chamber is maintained at, or above,1.35 mg/I to promote the necessary nitrification process.
The third chamber is isolated from the outside* atmosphere to promote anoxic conditions. This facilitates
* 1154
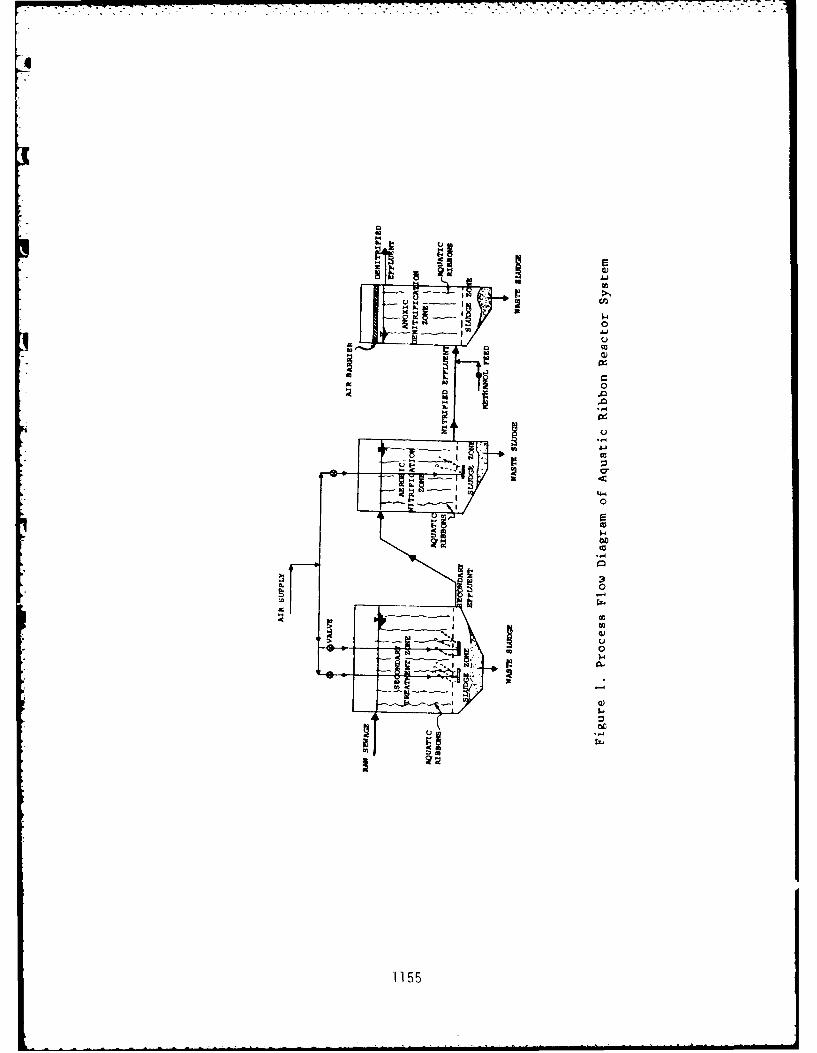
cj
0Z -!m .j
ac
39 <-
0
O-C
-440w
growth of denitrifying bacteria on the ribbon surface andthus biological denitrification processes. Denitrifyingbacteria which include the genera Pseudomonas, Bacillus,and Achromobactor are responsible for the denitrificationprocess. Nitrate- and nitrite- nitrogen under anoxic
conditions become the electron acceptors in thebio-denitrification process.
In the denitrification process, the denitrifiers needsoluble carbon to meet the metabolic requirements. As thedenitrification process occurs, the carbon source in thewastewater is depleted and becomes a limiting factor.Supplemental carbon is always necessary to enable the
denitrification process to continue. In this experiment,carbon was supplemented by adding methanol to the inletof the denitrification chamber so that thecarbon-to-nitrogen ratio was maintained at, or slightlyabove, 1.10. The empirical methanol feed concentrationor requirement can be computed by the following equation:
[CH 3OH] = 2.47x[NO3 -N] + 1.53x[NO 2-N] + 0.87x[D.O.]
where, [CH OH] = methanol conc. in wastewater (mg/l)
[NO 3 -N] = nitrate nitrogen conc. (mg N03-N/I)[NO 3-N] = nitrite nitrogen conc. (mg N02 -N/I)
and [D.6. = dissolved oxygen conc. (mg/l)
In this study, methanol was manually fed to the thirdchamber to satisfy the carbon requirement of thedenitrification process. A reactor system, which uses partof the influent-soluble BOD as a carbon source for the thirdchamber, is being studied.
The removal and conversion mechanisms involved in BODremoval, nitrification, and denitrification in an aquaticribbon system are depicted in Figure 2.
The.sewage used in testing the reactor system was* primarily of domestic origin. Table I summarizes the
composition of the wastewater used in this study. Theaquatic ribbon system is currently being studied for itscapability to treat tannery wastewater.
-O 1156
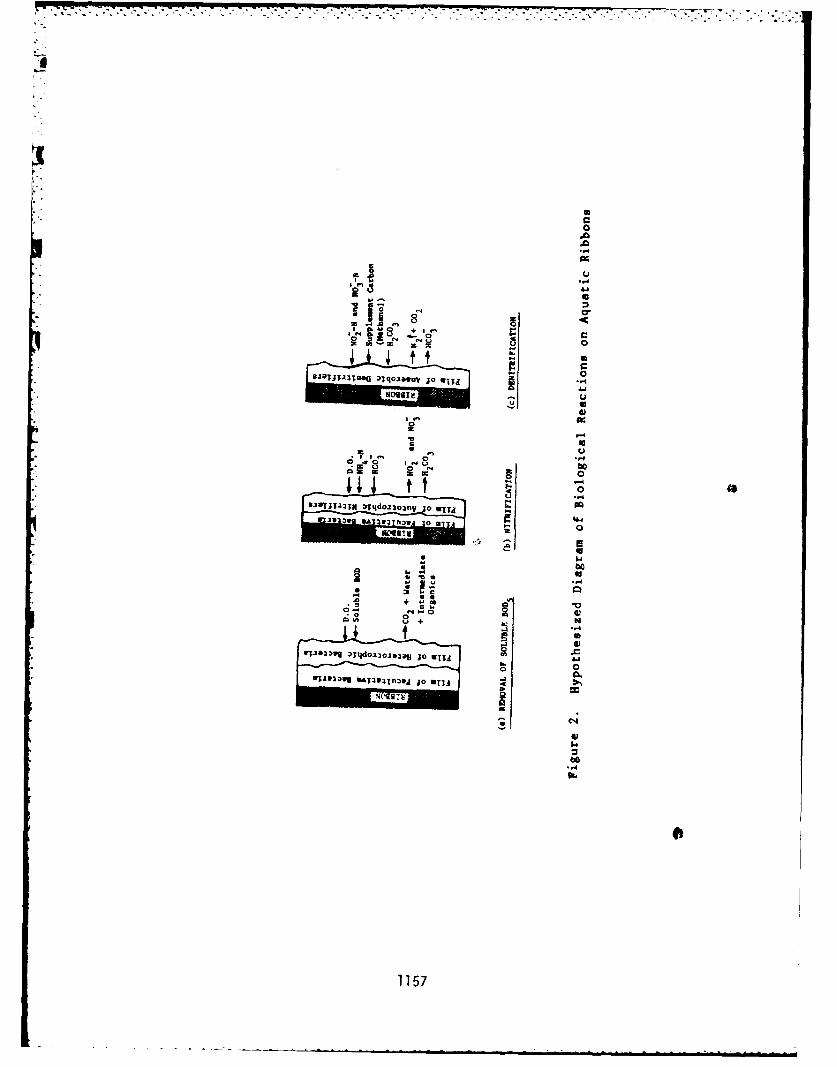
0-0
.0
920173T 3Tdlon TAk 0
n... 00
NITA
*I Tbe
1157u 3 *;
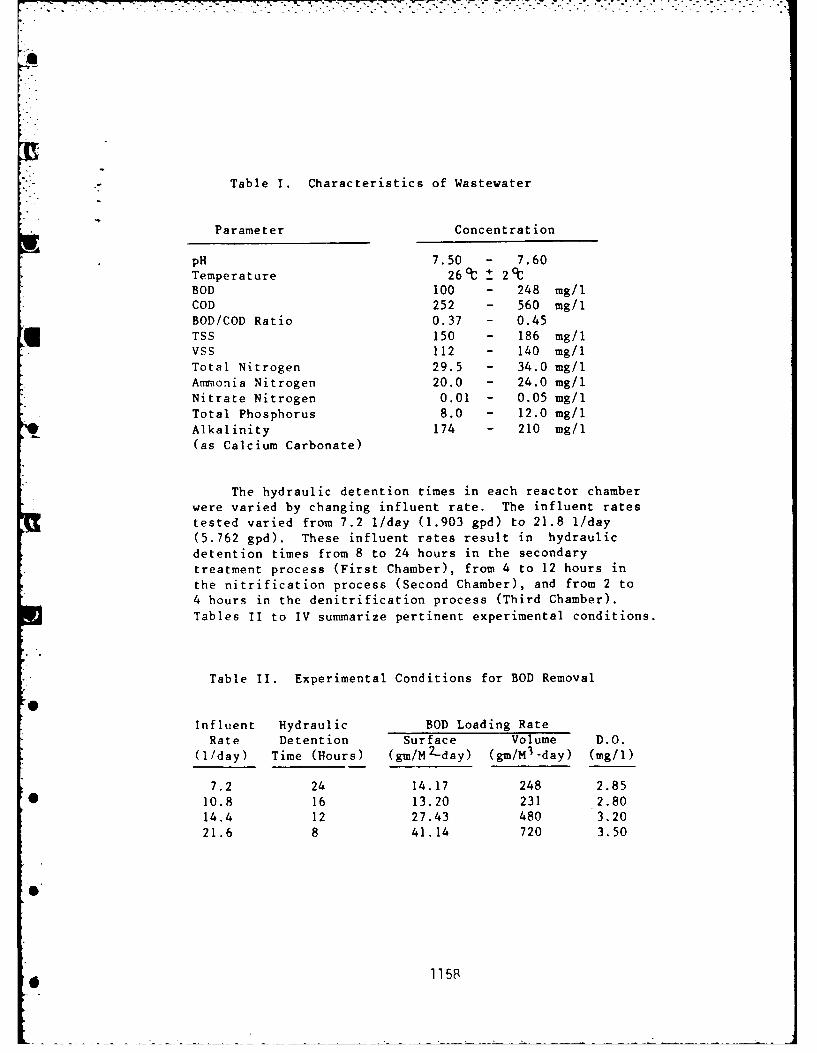
Table I. Characteristics of Wastewater
Parameter Concentration
pH 7.50 - 7.60Temperature 26 C 2BOD 100 - 248 mg/iCOD 252 - 560 mg/iBOD/COD Ratio 0.37 - 0.45
TSS 150 - 186 mg/i
VSS 112 - 140 mg/iTotal Nitrogen 29.5 - 34.0 mg/iAmmonia Nitrogen 20.0 - 24.0 mg/iNitrate Nitrogen 0.01 - 0.05 mg/iTotal Phosphorus 8.0 - 12.0 mg/i
Alkalinity 174 - 210 mg/i
(as Calcium Carbonate)
The hydraulic detention times in each reactor chamberwere varied by changing influent rate. The influent ratestested varied from 7.2 1/day (1.903 gpd) to 21.8 I/day(5.762 gpd). These influent rates result in hydraulic
detention times from 8 to 24 hours in the secondarytreatment process (First Chamber), from 4 to 12 hours in
the nitrification process (Second Chamber), and from 2 to4 hours in the denitrification process (Third Chamber).
Tables II to IV summarize pertinent experimental conditions.
Table 1I. Experimental Conditions for BOD Removal
Influent Hydraulic BOD Loading RateRate Detention Surface Volume D.O.
(1/day) Time (Hours) (gm/M2-day) (gm/M 3 -day) (mg/i)
7.2 24 14.17 248 2.85* 10.8 16 13.20 231 2.80
14.4 12 27.43 480 3.2021.6 8 41.14 720 3.50
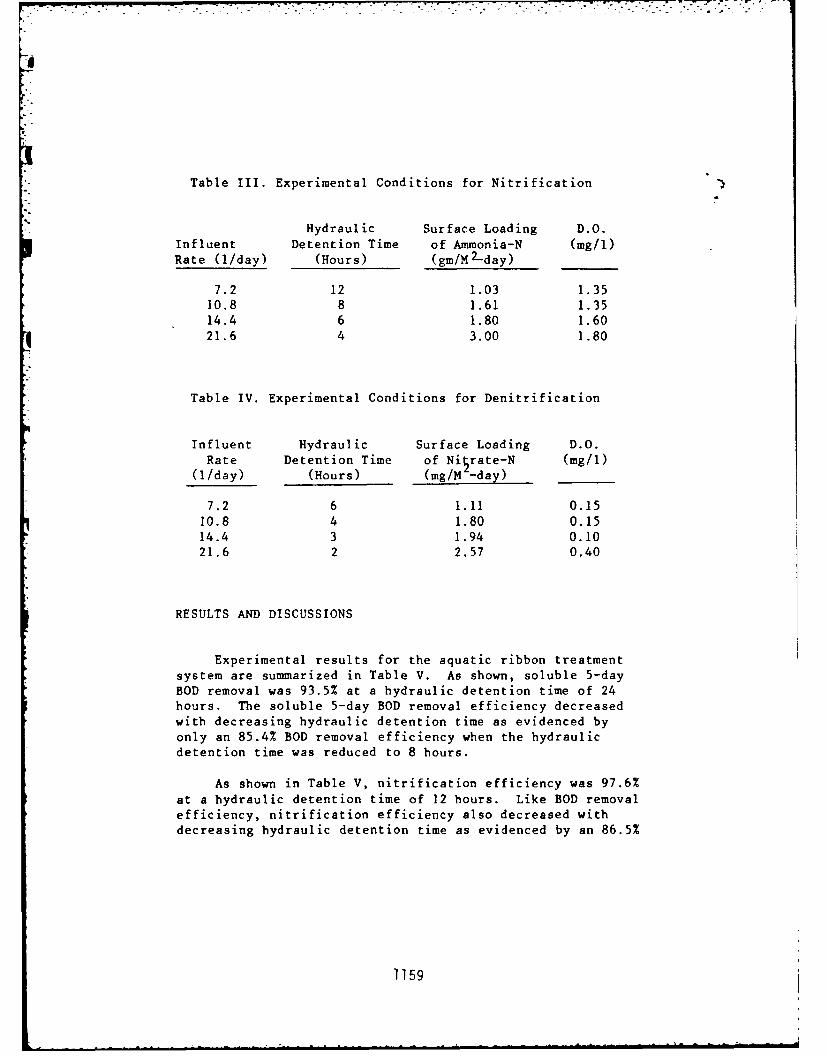
Table III. Experimental Conditions for Nitrification
Hydraulic Surface Loading D.O.
Influent Detention Time of Ammonia-N (mg/I)
Rate (1/day) (Hours) (gm/M 2-day)
7.2 12 1.03 1.3510.8 8 1.61 1.35
14.4 6 1.80 1.6021.6 4 3.00 1.80
Table IV. Experimental Conditions for Denitrification
Influent Hydraulic Surface Loading D.O.
Rate Detention Time of Nivrate-N (mg/i)(1/day) (Hours) (mg/M -day)
7.2 6 1.11 0.15
10.8 4 1.80 0.1514.4 3 1.94 0.1021.6 2 2.57 0.40
RESULTS AND DISCUSSIONS
Experimental results for the aquatic ribbon treatmentsystem are summarized in Table V. As shown, soluble 5-day
BOD removal was 93.5% at a hydraulic detention time of 24hours. The soluble 5-day BOD removal efficiency decreased
with decreasing hydraulic detention time as evidenced by
only an 85.4% BOD removal efficiency when the hydraulicdetention time was reduced to 8 hours.
As shown in Table V, nitrification efficiency was 97.6%
at a hydraulic detention time of 12 hours. Like BOD removalefficiency, nitrification efficiency also decreased withdecreasing hydraulic detention time as evidenced by an 86.5%
1159
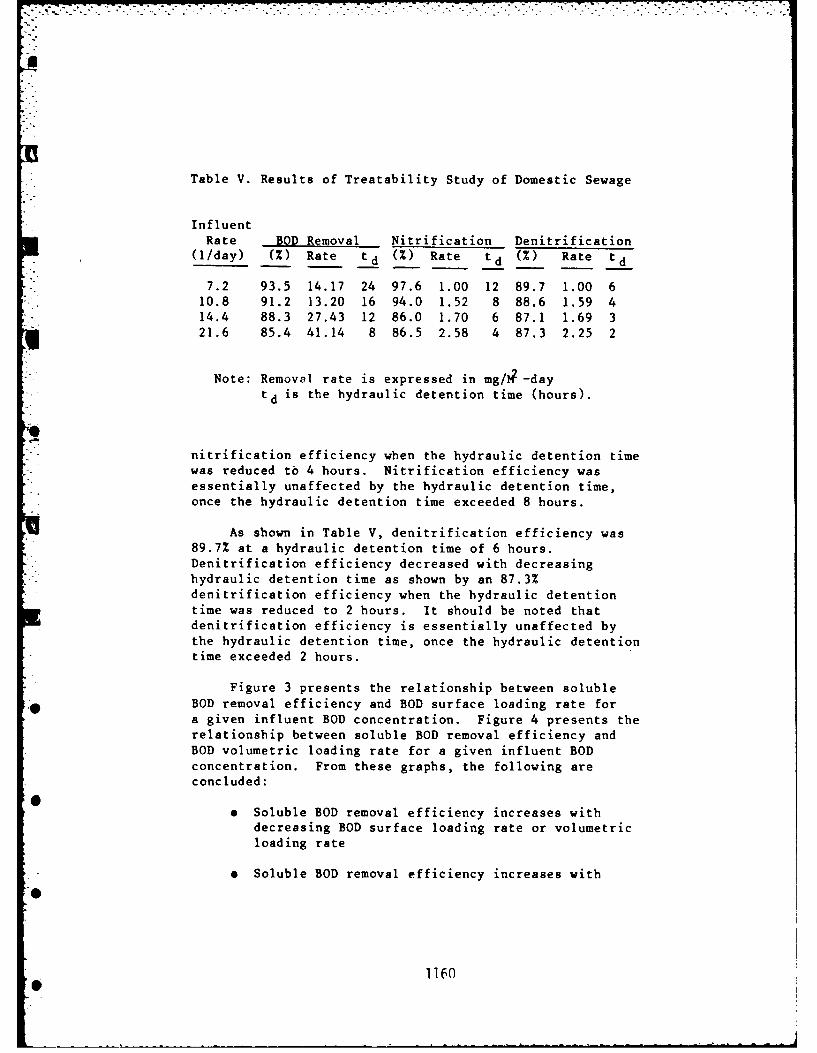
Table V. Results of Treatability Study of Domestic Sewage
InfluentRate BOD Removal Nitrification Denitrification
(1/day) (M) Rate td (%) Rate td (Z) Rate td
7.2 93.5 14.17 24 97.6 1.00 12 89.7 1.00 6*10.8 91.2 13.20 16 94.0 1.52 8 88.6 1.59 4
14.4 88.3 27.43 12 86.0 1.70 6 87.1 1.69 321.6 85.4 41.14 8 86.5 2.58 4 87.3 2.25 2
Note: Removal rate is expressed in mg/i -daytd is the hydraulic detention time (hours).
nitrification efficiency when the hydraulic detention timewas reduced to 4 hours. Nitrification efficiency wasessentially unaffected by the hydraulic detention time,once the hydraulic detention time exceeded 8 hours.
As shown in Table V, denitrification efficiency was89.7% at a hydraulic detention time of 6 hours.Denitrification efficiency decreased with decreasinghydraulic detention time as shown by an 87.3%denitrification efficiency when the hydraulic detentiontime was reduced to 2 hours. It should be noted thatdenitrification efficiency is essentially unaffected by
the hydraulic detention time, once the hydraulic detentiontime exceeded 2 hours.
Figure 3 presents the relationship between soluble
BOD removal efficiency and BOD surface loading rate fora given influent BOD concentration. Figure 4 presents therelationship between soluble BOD removal efficiency andBOD volumetric loading rate for a given influent BODconcentration. From these graphs, the following areconcluded:
0e Soluble BOD removal efficiency increases with
decreasing BOD surface loading rate or volumetricloading rate
e Soluble BOD removal efficiency increases with
1
0 1160
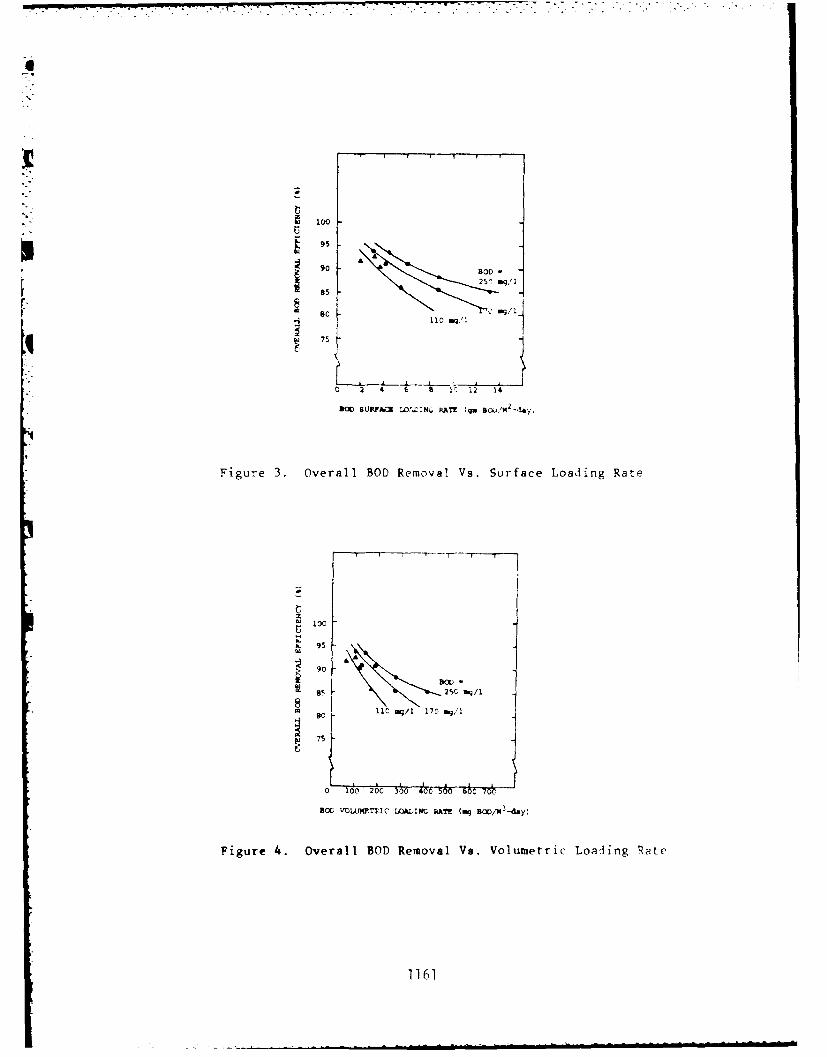
a!
95
" A
90 BOW.
85
S so 'o.g/1
75
110. 1
0 2 4 6 a 1- 12 14
. c 8URtA .. L .. 'N. PA TE (go B ,'M2-30..
Figure 3. Overall BOD Removal Vs. Surface Loading Rate
zk~100
, 91
9095
2C ag/1, I11C0 ./ 170 s/1
0 100 200 300 0 500 66o 7o
901) VOLLWTTI C LOADING P .T (ni BOD/N3-day)
Figure 4. Overall BOD Removal Vs. Volumetric Loading Rate
1161
increasing influent BOD concentration at a givensurface, or volumetric loading rate, especiallywhen the loading rates are relatively high.
9 The aquatic ribbon treatment system is moreefficient at higher influent BOD concentrations,with an upper limit not yet defined.
The overall system BOD removal efficiency, expressedas a function of hydraulic detention time, is presentedin Figure 5.
The experimental results related to the nitrificationchamber are presented in Figure 6. Nitification processefficiency increases with a decreasing surface loading rateof ammonia-nitrogen. However, the actual nitrificationrate (unit mass of ammonia-nitrogen removed per unit surfacearea and unit time) increases with an increasingammonia-nitrogen loading rate, and seemingly reaches anassymptotic level. This assymptotic value can not beclearly defined, because it exists beyond the range of theexperimental conditions.
The experimental results related to the denitrificationchamber are presented in Figure 7. Similar to thenitrification process, the denitrification efficiency isshown to increase with a decreasing surface loading rateof nitrate-nitrogen. The actual denitrification rate (unitmass of nitrate-nitrogen removed per unit surface area andunit time) increases with increasing surface loading ratesof nitrate-nitrogen. It is believed that there is anassymptotic value, which again, can not be determinedbecause it lies beyond the range of the experimental
conditions.
* The nitrification and denitrification efficienciesas a function of hydraulic detention time are presentedin Figures 8 and 9, respectively. Figures 8 and 9 alsoshow the actual nitrification and denitrification ratesas a function of hydraulic detention time. In brief, theactual nitrification and denitrification rates increase
* with decreasing hydraulic detention time. The reaction
efficiency (whether nitrification or denitrification)increases with decreasing hydraulic detention time.However, the nitrification efficiency drops sharply whenthe hydraulic detention time is shorter than 4 hours.
1162
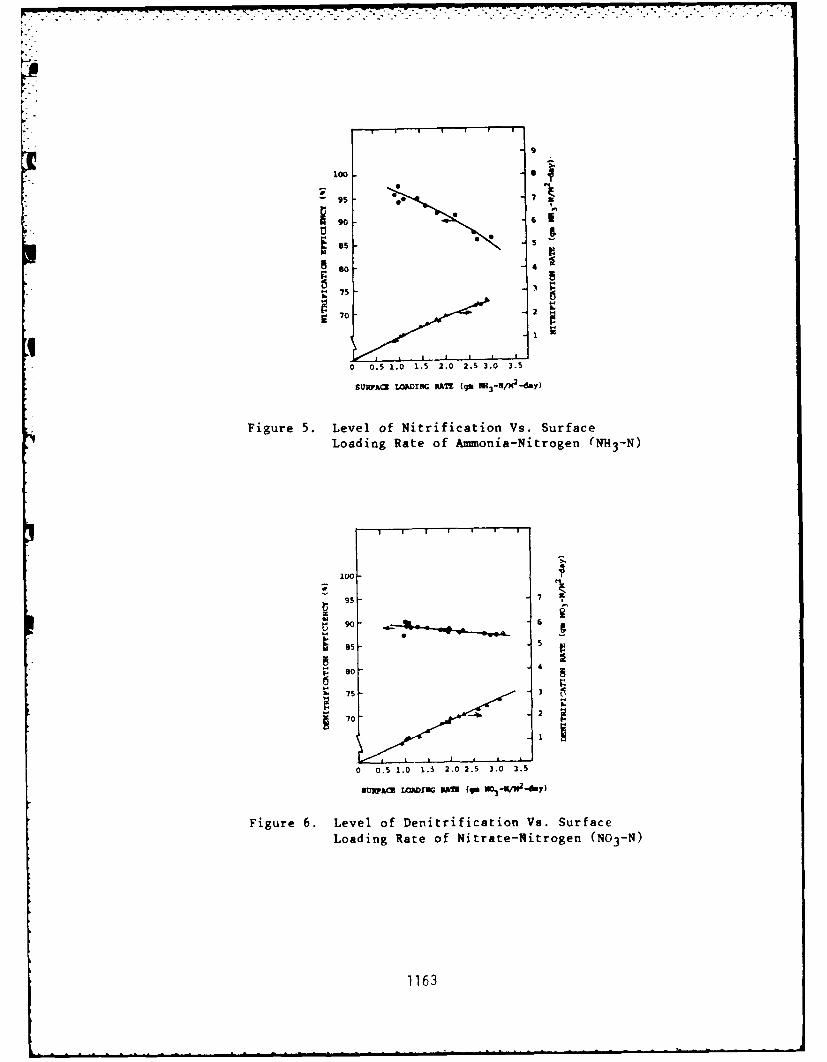
7 7. 7
100
95 7 3
61850 * 5!
so
II
0 0.5 1.0 1.5 2.0 2.5 3.0 3.5
svwh(m LOADrw. PATE (go 1U3-R/N2-dy)
Figure 5. Level of Nitrification Vs. Surface
Loading Rate of Ammonia-Nitrogen (NH3-N)
90 - 6
75 -
70 - - 2
0 0.5 1.0 1.5 2.0 2.5 3.0 3.5
suwkAz LOADIU mmU (qu HC/K2-y)
Figure 6. Level of Denitrification Vs. SurfaceLoading Rate of Nitrate-Nitrogen (N03-N)
1163
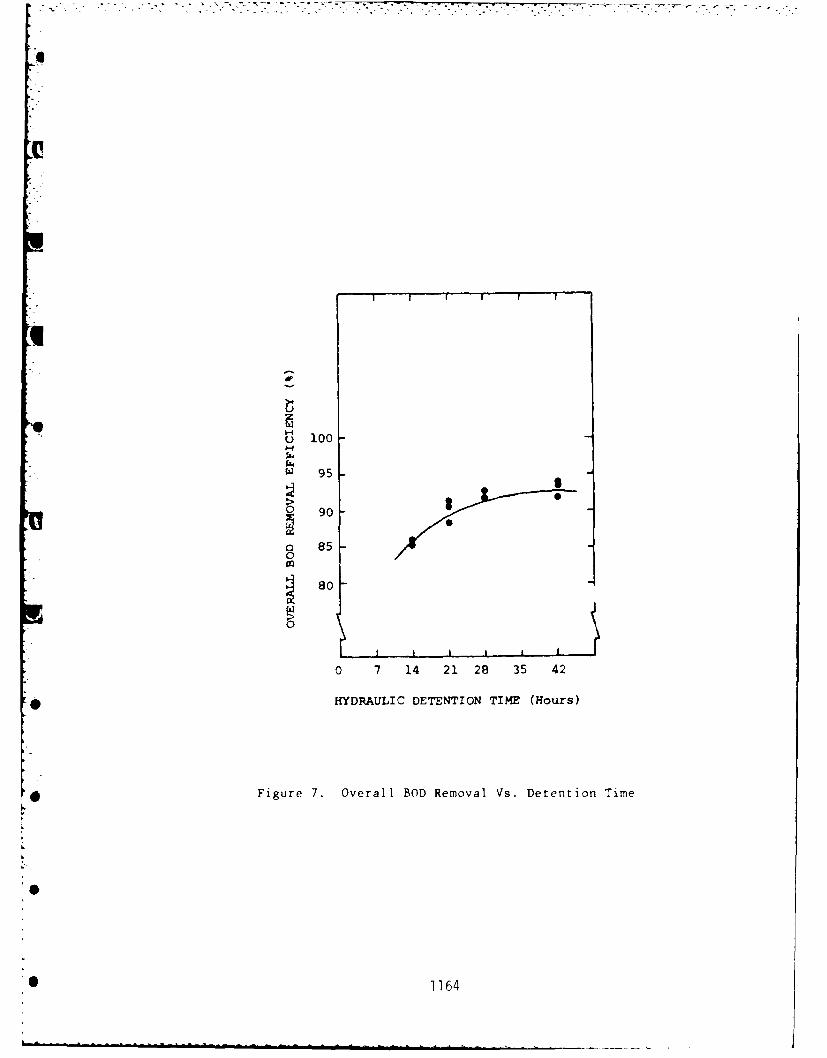
fzrZCt) 100
w 95
00
o
so8
0
0 7 14 21 28 35 42
* HYDRAULIC DETENTION TIME (Hours)
*Figure 7. Overall BOD Removal Vs. Detention Time
* 1164
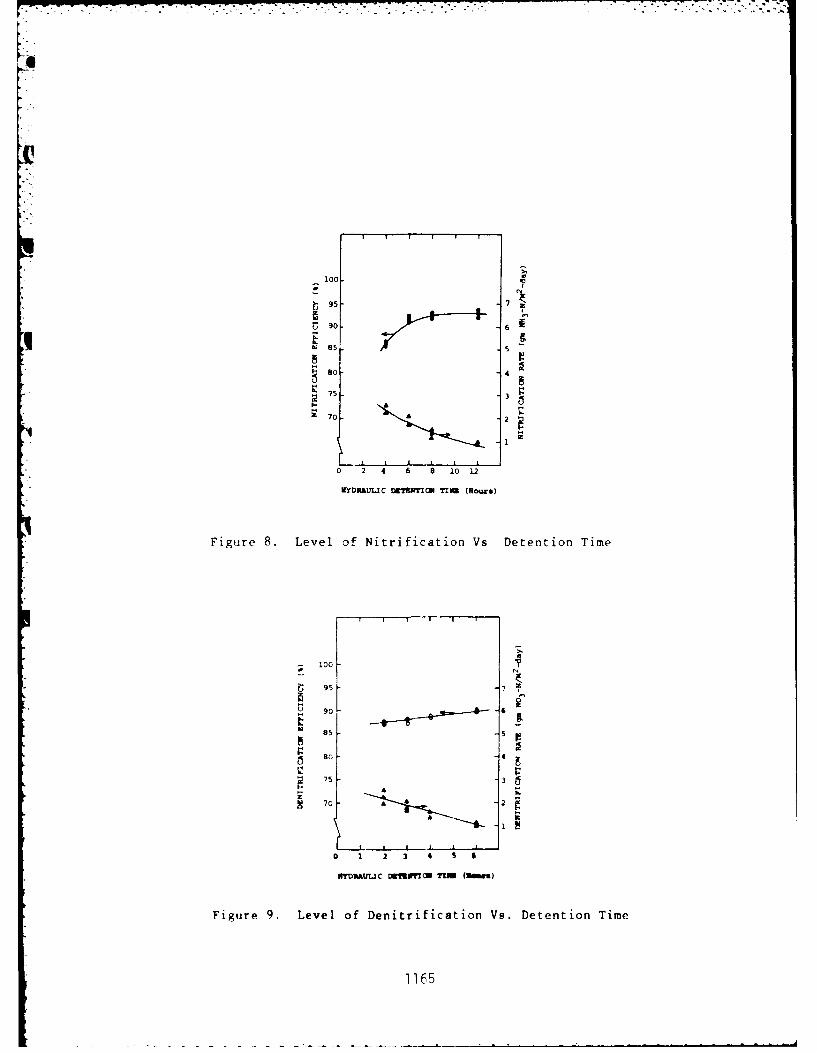
--.
100
S906
I85 5
80 4
s
2
1
0 2 4 6 8 10 12
LYDIULI C DCETUMO TIM (Hours)
Figure 8. Level of Nitrification Vs Detention Time
I r
-. 100
t95 ,2
N 85 - 56 90
-5 3
70 2
0 1 2 3 4 5 IS
NYDAtInC mwwmai nnI (meu)
Figure 9. Level of Denitrification Vs. Detention Time
1165
The amount of alkalinity expressed as calcium carbonate
consumed per mg/l of ammonia-nitrogen nitrified is presentedin Figure 10. The amount of alkalinity generated per mg/lof nitrate-nitrogen denitrified is presented in Figure 11.The net effect on the system chemistry is that every mg/i
of nitrogen removed from the wastewater results in an
approximately 4.2 mg/l reduction of alkalinity. Fordomestic sewage, which normally contains 150 to 220 mg/l
'of alkalinity and 15 to 25 mg/l of ammonia-nitrogen,
nitrification and denitrification are not limited byalkalinity availability. If alkalinity availability is
anticipated to be a problem, manual addition of alkalinity
using lime or calcium carbonate should be considered.
With regard to supplemeitary carbon for the
denitrification process, it was demonstrated that a methanolconcentration of approximately 46 mg/l in the wastewater
before the denitrification chamber was sufficient for
denitrification to take plac:e at 90% efficiency.
It is possible to increase the total surface area of
the aquatic ribbons within each chamber of the reactorsystem to increase the reaction rate, and thus somehow
proportionally reduce the hydraulic detention timerequired. The specific surface area values (i.e., ratio
of total surface area and effective liquid volume for eachchamber) for the pilot system used in this study aresummarized in Table VI along with specific surface areasreported by other researchers (Ref. 1,2,3) using RBC systems
for treating domestic or municipal wastewater. It can be
seen that the specific surface area used in this study isapproximately 5 to 15 times less than those reported byothers. Therefore, it appears that the total ribbon surface
area could be increased to considerably increase the system* capacity and/or reduce the hydraulic detention time
required.
COMPARISON WITF OTHER STUDIES
Because an aquatic ribbon fixed-film treatment processis a new concept, no comparable data are available for acomparison study. One can only attemp to make a generic
comparison study using the data obtained from RBC systems.
' A number of researchers (Ref. 2,4,5,6) have tried to
0 1166
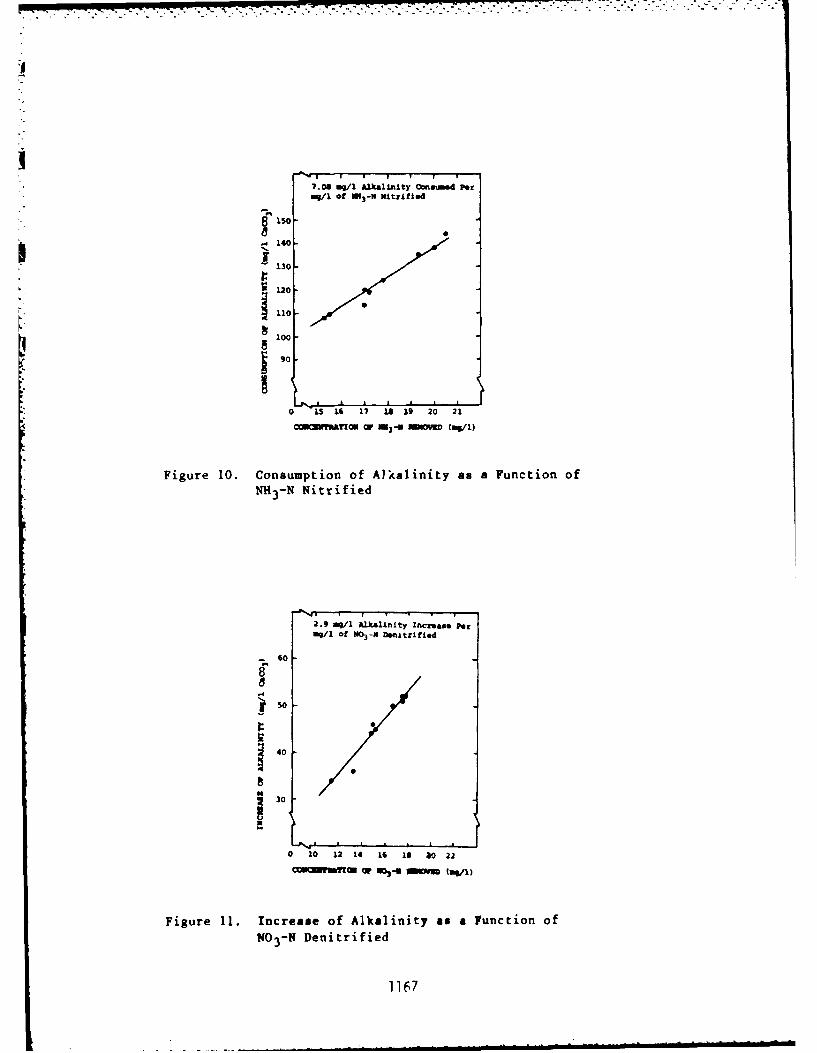
7.06 /I A I kli"ity nameid Per.E/ of U1 3 -N Nitrifled
- 140
120110
100
0 IS 16 17 10 3,9 20 21
CONuaMlttlO0 or 00-0 3 (mg/1)
Figure 10. Consumption of A1kalinity as a Function ofNH 3-N Nitrified
2.9 iq/1 A21uallnity Incz~afe Per
Eq/1 Of NO.3-N Denltrified
-60
s o
30
o 10 12 14 16 1 a 22
COMMOMqwMO or N01-6 NOM (aw)
Figure 11. Increase of Alkalinity as a Function of
N0 3 -N Denitrified
1167
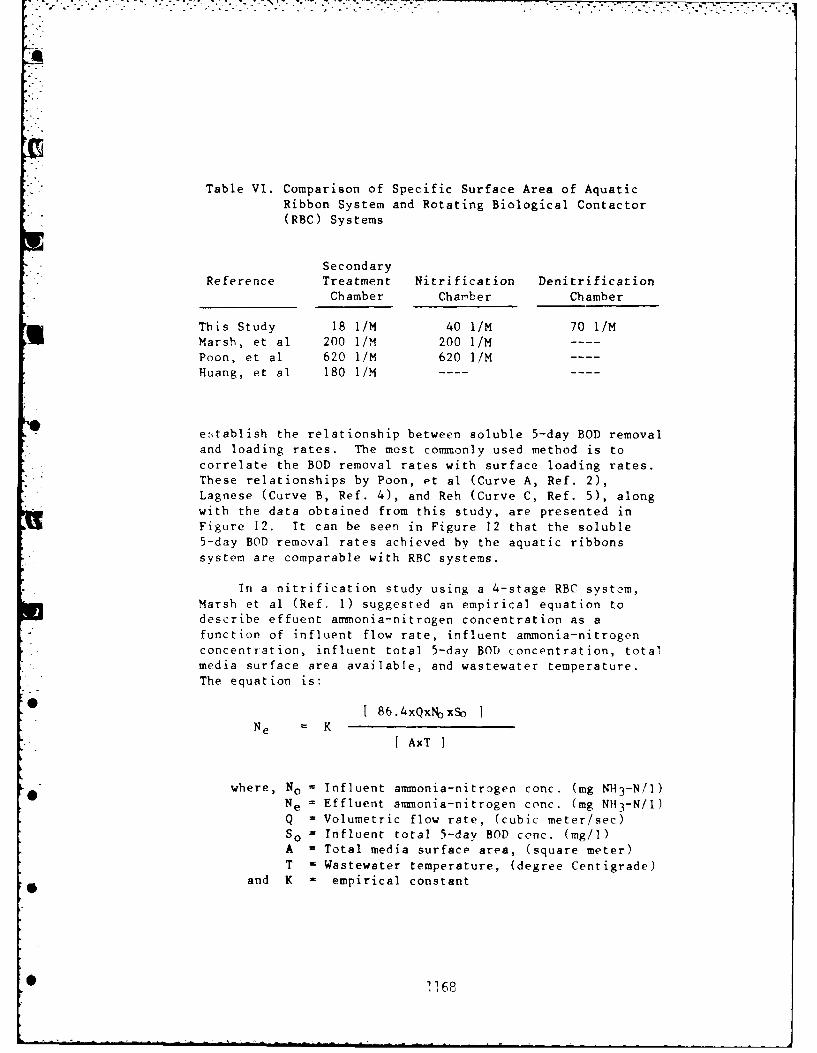
.. . . . . ." - . . . . -% . - . - L . .. i, . - . . . - -
Table VI. Comparison of Specific Surface Area of AquaticRibbon System and Rotating Biological Contactor(RBC) Systems
Secondary* Reference Treatment Nitrification Denitrification
Chamber Chamber Chamber
This Study 18 I/M 40 1/M 70 I/MMarsh, et al 200 1/M 200 1/M
Poon, et al 620 1/M 620 I/M
Huang, et al 180 1/M
establish the relationship between soluble 5-day BOD removal
and loading rates. The most commonly used method is tocorrelate the BOD removal rates with surface loading rates.These relationships by Poon, et al (Curve A, Ref. 2),Lagnese (Curve B, Ref. 4), and Reh (Curve C, Ref. 5), alongwith the data obtained from this study, are presented inFigure 12. It can be seen in Figure 12 that the soluble5-day BOD removal rates achieved by the aquatic ribbonssystem are comparable with RBC systems.
In a nitrification study using a 4-stage RBC systom,Marsh et al (Ref. 1) suggested an empirical equation todescribe effuent ammonia-nitrogen concentration as a
function of influent flow rate, influent ammonia-nitrogenconcentration, influent total 5-day BOD concentration, totalmedia surface area available, and wastewater temperature.
The equation is:
[ 86.4xQx% xSo ]Ne K
AxT ]
where, No = Influent ammonia-nitrogen conc. (mg NH 3-N/I)Ne = Effluent ammonia-nitrogen conc. (mg NH 3-N/1)Q = Volumetric flow rate, (cubic meter/sec)
so = Influent total 5-day BOD cenc. (mg/I)A = Total media surface area, (square meter)T = Wastewater temperature, (degree Centigrade)
and K - empirical constant
• !268
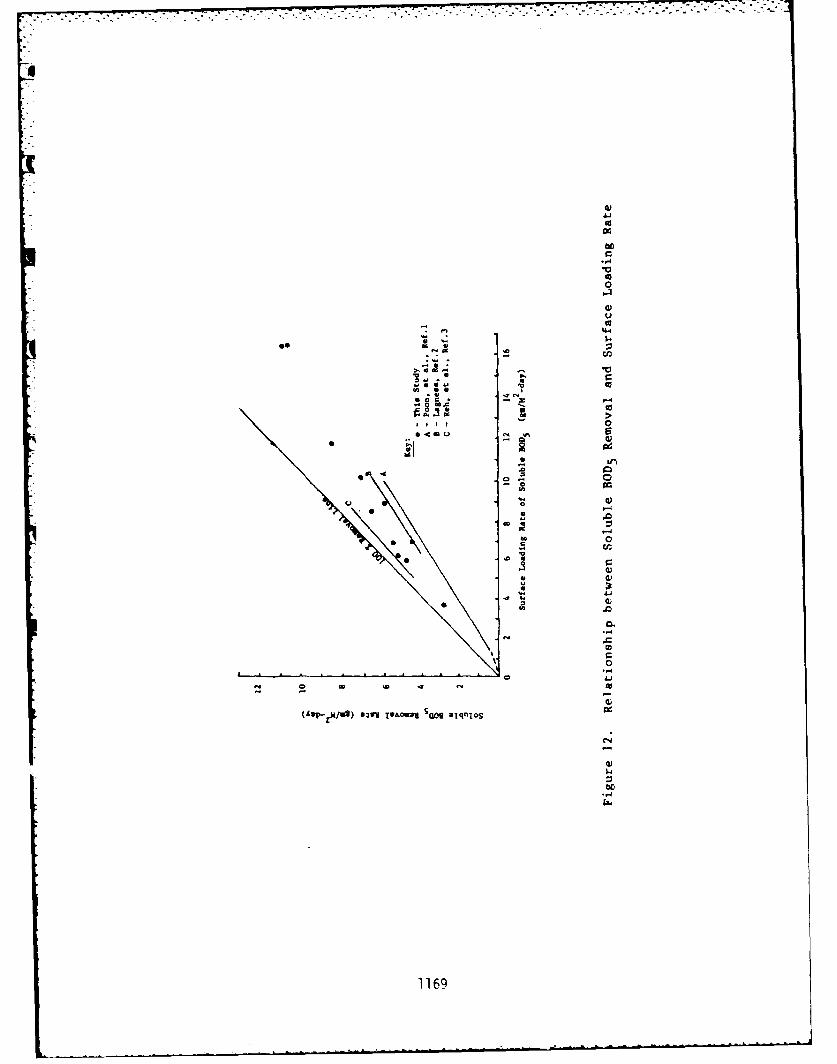
000
to
0o
.40
'-4 44.
0
in 7e(Lw-rmus)*Iv TOC-1SMpqlSI
inca *
1169C
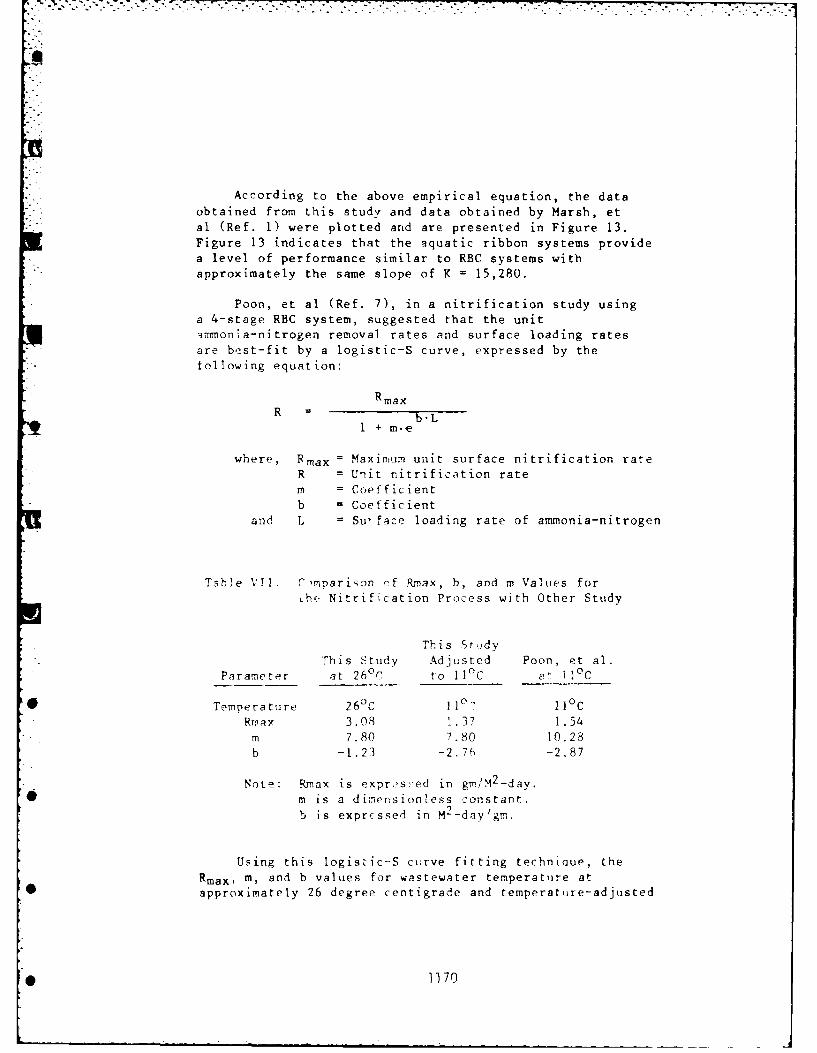
. . .. " - . ."- -. " - - '. -- - - " . .' -
According to the above empirical equation, the data
obtained from this study and data obtained by Marsh, etal (Ref. 1) were plotted and are presented in Figure 13.Figure 13 indicates that the aquatic ribbon systems providea level of performance similar to RBC systems withapproximately the same slope of K = 15,280.
Poon, et al (Ref. 7), in a nitrification study using
a 4-stage RBC system, suggested that the unitnmmonia-nitrogen removal rates and surface loading rates
are best-fit by a logistic-S curve, expressed by the
tollowing equation:
RmaxR =b-L
1 + m-e
where, Rmax = Maximum unit surface nitrification rateR = Unit nitrification rate
m = Coefficient
b = Coefficientand L = Su, face loading rate of ammonia-nitrogen
Table VII. Cmparison r¢f Rmax, b, and m Values forLhe Nitrification Process with Other Study
This Srudy
This Study Adjusted Poon, et al.
Parameter at 260 r., to 11C e- 110 C
Temperature 26°C 110° 110 C
RmaY 3.08 1.37 1.54m 7.80 7.80 10.28
b -1.23 -2.7 , -2.87
Note: Rmax is expres:ed in g,/M 2 -day.* m is a dimensionless constant.
b is exprrssed in M2-day/gm.
Using this logistic--S curve fitting technique, the
Rmax, m, and b values for wastewater temperature at* approximately 26 degree centigrade and temperature-adjusted
* 1170
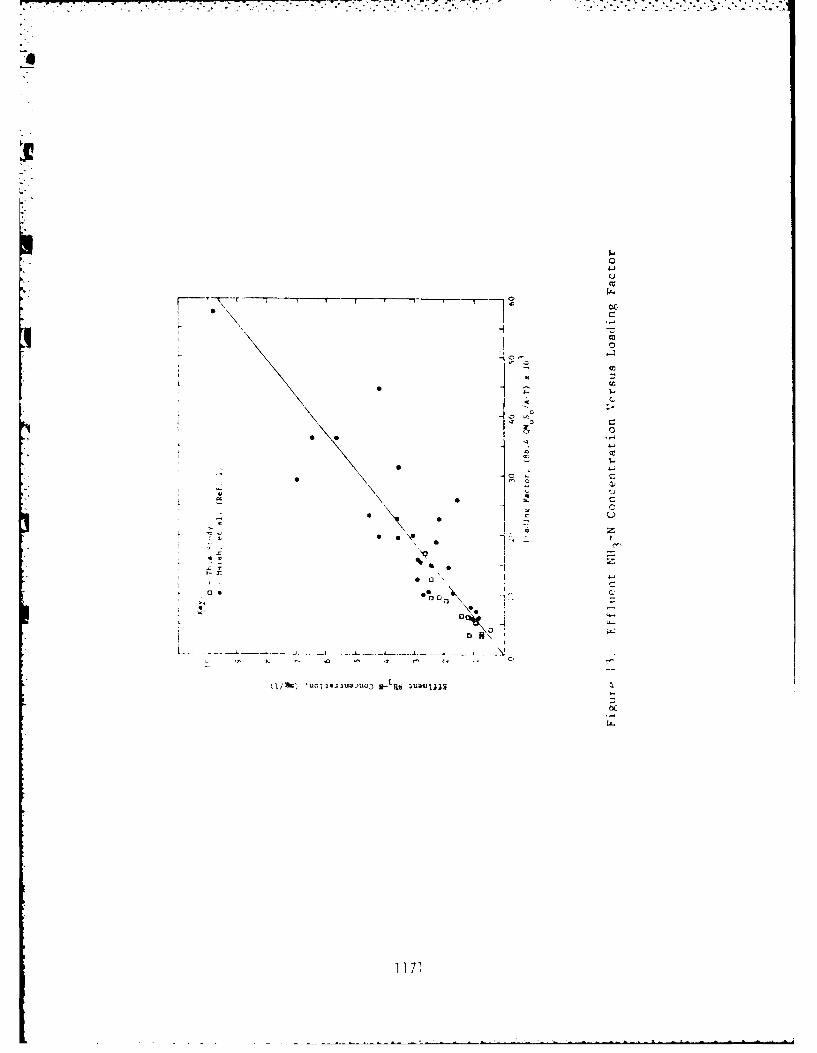
-74'
0 .
00
2rc
4 0
0 0
CIW-
'u(T~-lu.,U3 *ca IwuS~
0 171
Rmax, m, and b values from the data obtained from this studyare presented in Table VII. Values reported by Poon, etal are also listed in Table VII. From Table VII, it canbe seen that the aquatic ribbon fixed-film treatment processis similar to RBC systems in level of treatment performance,and can be predicted fairly accurately by the logistic-Scurve as suggested for RBC systems.
CONCLUSIONS
The aquatic-ribbon fixed-film biological treatmentprocess discussed in this paper is a newly developedtreatment technology, which is capable of achieving removalof soluble BOD, nitrification, and denitrification fromdomestic or municpal wastewaters at a level similar toconventional rotating biological contactors (RBCs). Underthe experimental conditions in this study, the pilot aquaticribbon treatment system was capable of removing more than91% of the total 5-day BOD at a hydraulic detention of 16hours; providing 94% nitrification at a hydraulic detentiontime of 8 hours; and achieving 87% denitrification at ahydraulic detention time of 2 hours.
The combination of the liquid-solids separation processwith the aquatic ribbon reactor into one physical unit isa unique feature of the aquatic ribbon fixed-film biologicaltreatment system. This feature effectively eliminates theneed for a separate clarifier and thus should result ina cost-savings for aquatic-ribbon systems compared toconventional RBC systems., Because the liquid-solidsseparation zones in the secondary treatment andnitrification chambers are connected to the upper reactionzones, aerobic conditions can be maintained at all times.This reduces the potential of rising sludge and bulkingproblems which are commonly encountered, when septicconditions occur in the bottom sludge of a conv, _ionalclarifier.
There are areas for further improvements to the aquatic
ribbon treatment system. The pilot system used in thisstudy has an effecive specific surface area of approximately5 to 15 times less than typical values for conventionalRBC systems. Consequently, there appears to Ie a greatpotential for aquatic ribbon systems to achieve a level
[. 1172
MT .. 1. .
of performance equal to or better than conventional RECsystems cost-effectively.
Aquatic ribbon biological treatment systems are alow-technology, low-energy alternative to other conventionaltreatment technologies. Aquatic-ribbon systems can beeasily incorporated into existing lagoons and activatedsludge treatment plants without significant processmodifications to improve levels of treatment and reduceenergy consumption.
1173
.
REFERENCES
1. Marsh, D., et al., "Coupled Trickling Filter- Rotating* .Biological Contactor Nitrification Process", Jour. of
Water Pollution Control Federation, Vol. 53, No. 10,pp. 1469-1480, October, 1981
2. Poon, C.P.C., H.K. Chin, E.D. Smith, and W.J. Mikucki,"Upgrading with Rotating Biological Contactors for BODRemoval", Jour. of Water Pollution Control Federation,Vol. 53, No. 4, pp.4 74-48 1, April, 1981
3. Huang, J.C., and V.T. Bates, "Comparative Performance* of Rotating Biological Contactors Using Air and Pure
Oxygen", Jour. of Water Pollution Control Federation,
Vol. 52, No. 11, pp. 2686-2703, November, 1980
4. Lagnese, J.F., "Evaluation of RBC Used to UpgradeMunicipal Plant to Secondary Standards", Paper presentedat the Technical Conference, Water Pollution ControlA.sociation of Pennsylvania, Pittsburgh, Pennsylvania,Apr'l, 1978
5. Roh, C.W., et al., "An Approach to Design of RBCs forTreatment of Municipal Wastewater", Paper presented atThe ASCE National Environmental Engineering Conference,Nashville, Tenn., July, 1977
6. Ha 0, 0., ,nd G.F. Hendricks, "Rotating BiologicalReactozs R.ie;ove Nitrients", Water & Sewage Works, 121,Parts I and 11, 44, November-Decembrr, 1974
Pc on, C. P.C , H.K. Chin, E.D. Smith, and W.J. Mikucki,l"Vpgradin? with Rotating Biological Contactors forAmmnia Nitrogen Removal", Jour..ef Water Pollution
n -tr l F.-o er-ati n, Vc,l. 53, No. 7, pp. iiS -1165,July. 1981
1174
ACTIVATED FIXED FILM BIOSYSTEMSTN WASTEW.ATER T REATMENT
JTohn W . Smith. Prcfessor. Memtphis State Un iversi ty,Memph is, Tennessee.
HrjA._Karar~iaui. Professor. University of
P'etrolIeumi and Mine ralis, Dhahran , Saudi Arah i a
T. OVILRV!I EW
Hi&torica1liv, wast, conLlinin; organic material. hivebcon subjecoted to hLoluo'ical treaitment proce4Kv to rujuc&.
the inp:'t of the waneo on rc~ vLf,; euilruilm at. hvn!
Ut del uqdoncept iq urban areas haA been the divaiv
siudge process, a tiliid beod s;ystemx. W'ith wate of in K
c'omlexity from nunkipalities due to indlitri K-
anda uliiniging life to k Lhe'jn t bi'-ic Liiolo ital W-11 t r. t
nwnt pi'w-io has beon svverely. stressad in mm'.' 1-ci.~7
performr otisfatcilv.. TEhe astivdtc >10lo Kv-.
Pncot"Aud1. in thb 1970- day to its efficev ofLOtC A"A r' %n.'
a, compaircd to tho fixedi filn hioloqc rwa. I 1>5Ky.,
t riukiing f i itt Th futuare of MW COH-rru~toio
sat ivated sludn xvsto or wancito, r tin; Lic i5m1
min 1 in Was inntof . V'l th rient for mi o Scr iI t .i,1I :' 1 , ilat1 i-, 'I t r .1 : i. i so S I ml , f' k1 ci. ' if I-,
1175
of toxic materials, the fixed film biological system againappears to have certain advantages over the activated sludgeprocess.
The traditional fixed film reactor has been the"trickling filter" with either a stone or plastic media.These units were originally installed due to their simplicityof operation and their low energy requirements. Theirlimited removal efficiency and susceptibility to shock load-ing were accepted as trade-off s for their advantages. Theintroduction of the synthetic or plastic medium greatly
* improved the efficiency of operation of the tricklingfilter but at the sacrifice of more sophisticated operationand more energy input. Directionally, advances were made infixed film reactors with the development of rotating
* biological contactors to provide a low energy input systembut also a system which has improved operationalcharacteristics. As indicated by Benjes (1), themanufacturers of rotating biological disks claim that thesystem offers the following advantages as compared to
conventional fluid bed systems.1. Simpler operations2. Capability of meeting a 10/10 effluent standard
without subsequent treatment3. Fiaal clarifier under flow concentration from
2 to 3 percent4. Lower energy requirements per pound BOD removed
The standard rotating disk operation is a once through flowprocess with no recycling involved. Obviously, thispresents a significant operational advantage c r otherprocesses. The capability of the biological ;.. tem to meetoxygen demand requirements in the first stages of theprocess has been questioned. Zero dissolved oxygen willprobably occur and potential odors will result. The claimof achieving medium arid low effluent standards without
* additional treatment is probably true only of lightly loadedsystems. Excellent quality has been shown to be achievableof operating plants; however, the ability of the system toreach extremely low levels of effluent BOD and suspendedsolids is questionable. The final underflow concentrationdoes reach the 2 to 3 percent level which offers anadvantage in the sludge handling facilities. The primaryadvantage claimed for the system is the lower power require-ment. Although this is probably true, based upon pilotplant and operating studies, for reasonable effluentcriteria (30/30), this does not appear to he a valid claim
* 117F
as the effluent concentrations become lower. The powerrequirements appear to approach those for activated sludgesystems as these lower effluent concentrations are required.
A second type of fixed film system has also beenadvocated by certain manufacturers and engineers as acompetitor for the conventional activated sludge system. Asdescribed by Richter (2), the activated bio filter (ABF)system is actually a combination of a fixed film reactor anda fluid bed system. Biological solids which have beenclarified from the fluid bed system are recycled back to thetop of a fixed film reactor and allowed to flow through thereactor into the fluid bed unit. This combination ofreactors has been utilized in potato processing waste inIdaho with very satisfactory results. The combination ofthe two processes is reported to provide a very stable systemwhen receiving highly variable influent loads and toprovide a very rapidly settling biological floc. Benjes (1)also evaluated the ABF systeu. as a competitor to thetraditional activated sludge unit. Although this analysis(1) was not based upon any one location or operation, thesame general advantages were discussed, i.e., for reliableoperation under vairying loads, lower capital and operatingcosts, and simpler operation. It was suggested that each ofthe claims had to be evaluated on a site specific basisand should not be accepted as generalizations.
Research performed at Memphis State University over thepast several years has advanced the information availabl.efor both rotating biological conta'-tors and the ABF processwith not only city of Memphis municipal wastewater but alsosynthetic wastewater utilizing glucose substrate. Theresults of the MSU investigations will be presented in thefollowing paragraphs for Doth pilot plant field studies andlaboratory studies. Under a research grant from the city ofMemphis, Division Public Works, pilot plant studies wereconducted over a one-year period at the T.E. Maxson waste-water facility in Memphis. Comparable results were obtainedon an ABE system, a trickling filter utilizing plastic media,and a conventional contact stabilization activated sludgesystems. A cost effective analysis of the proposedexpansion of the T.E. M,"axson facility prepared by Black andVetch engineering consultants in Kansas City, Missouri,indicated that not only would the ABE system present a lowercapital cost alternative hut would also be less energyintensive and actually reduce the energy consumption of theexisting plant. The laboratory studies utilizing rotating
1177
p.-
contactors constructed of wood followed by a fluid bed
aeration system have indicated that the process can beoperated at high F/M ratios with reasonably consistentperformance. The activated RBC system has also been shown
to be resistant to toxic loads through the development of a
balanced eco system to degrade resistant pesticides.
II. ABF PILOT STUDIES
The ABF pilot plant, as shown in Figure 1, receivedwastewater from the aerated grit chamber of the T.E. Maxsonwastewater treatment plant. The degrited wastewater passed
through a circular primary clarification basin then into a
mixing sump where the clarified effluent was mixed withreturn sludge from the secondary clarifier and bottoms fromthe biotower and pumped to the top of the biotower itself.From the biotower, a portion of the flow which was not
I recirculated was transferred to a short term complete mixedaeration basin and then through a secondary clarifer wherethe biomass was separated and either recycled or wasted toan aerobic digestor. A similar unit was operated at the
city of Memphis North Wastewater Treatment Plant. Thebiofilter was obtained from the Neptune Microfloc Company on
a loan basis for the pilot plant evaluation. The filter, a24-foot high, 4-foot square unit, contained 21 feet of
horizontal wood medium consisting of wooden slats on one-inch horizontal spacing with flights arranged every six inches.The operation in the biotower was controlled by the organicloading (pounds of BOD per cubic foot of medium) as well ashydraulic loading (gallons per square foot of medium). Theeffluent from the biotower contained high concentrations ofbiological solids, both those entering the tower and thosewhich had fallen from the horizontal wooden medium. Theaeration basin was also provided by Neptune Microfloc andwas considered as an integral part of the fixed film treatment
concept. The flow from the biotower was subjected to anaeration period of approximately two to four hours in orderto stablize the biological solids and allow for any
additional removal of soluble BOD. Air was supplied to thesystem from the main air supply of the treatment plantthrough diffusers (coarse bubble) located in the bottom ofthe aeration basin. The effluent from the aeration basin was
clarified in a seven-foot diameter secondary clarifer. Thisunit was not adequate for the flows placed through thesystem as indicated by the surface over flow rate exceeding
* 1178
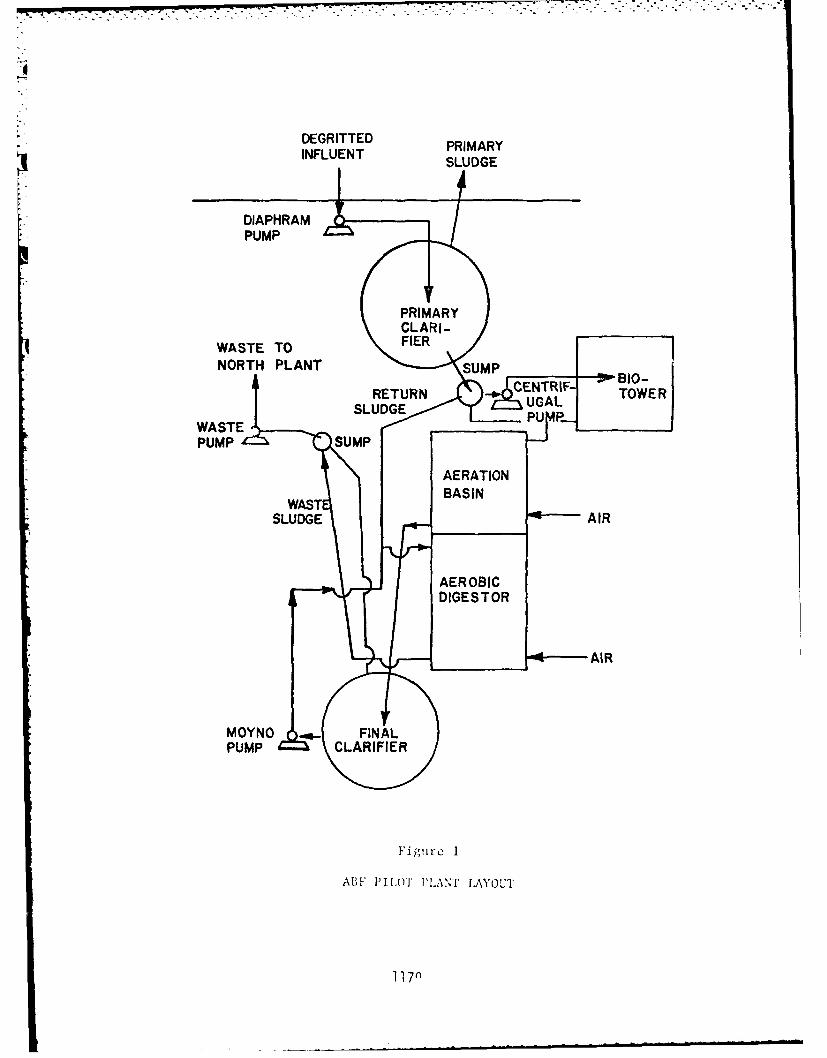
DEGRITTEDPRMYINFLUENT PRIMARY
PUMP
WASYENO FIFENA
PUMP SM
AigRATI
SLUDG AIR1 LN LYU
AEROBI
1700 gallons per day per square foot at times. The higherthan reasonable overflow rates caused the lower qualityeffluent than would have been realized through an adequatelydesigned and sized clarifier.
The operational theory of the ABF system is relativelysimple but yet not normally experienced in waste treatmentsystems. By recycling the underf low from the secondaryclarifier to the top of the biotower, a high microbialsolids level is achieved within the tower itself. The ABFsystem utilizes a wooden horizontal medium as opposed to aplastic medium. The horizontal medium not only allows themicrobial solids growing on the media to remain activelonger because of the moisture content of the wood medium,but also provides finer droplet formation within the towerdue to the flow pattern around the horizontal wooden boards.The flow rate through the system was initially set at 1.5gallons per minute per square foot wetting rate on thetower. This proved to be an unstable operation condition dueto uneven sloughing of solids from the tower. The unit wasoperated slightly over three weeks in this mode and thenthe wetting rate increased to 2 gallons per minute persquare foot at which point a uniform, constant sloughingrate was achieved. At this wetting rate the raw wastewaterflow into the tower was 16 gallons per minute with a recycleof return activated sludge of 7 gallons per minute and arecycle from the tower of 9 gallons per minute providing the2 gallon per minute per square foot wetting rate. Hourlygrab samples and 24 hour composite samples were utilized toevaluate the performance of the system. The evaluationparamater in the biotower was the loading in terms of poundsof BOD per 1000 cubic feet. It is believed that the fixedfilm reactor (ABF tower) operated as both an absorptionmedium for collodial solids and colloidal BOD a-id as abiological oxidation region due to the high surface area to
* which the wastewater is exposed. The aeration basin isutilized to allow time for microbial stabilization of theremaining BOD coming from the bottom of the biotower. Thed4ssolved oxygen level and detention time in the aerationbasin were varied in this study to evaluate the minimum andmaximum values which could be utilized. Also, the loadingrate across the system in terms of a system food to micro-organism ratio was observed and correlated with percentremoval as will be discussed in later paragraphs. Theconcept of a system F/M ratio is a valid one for this typeof a biological system.
1180
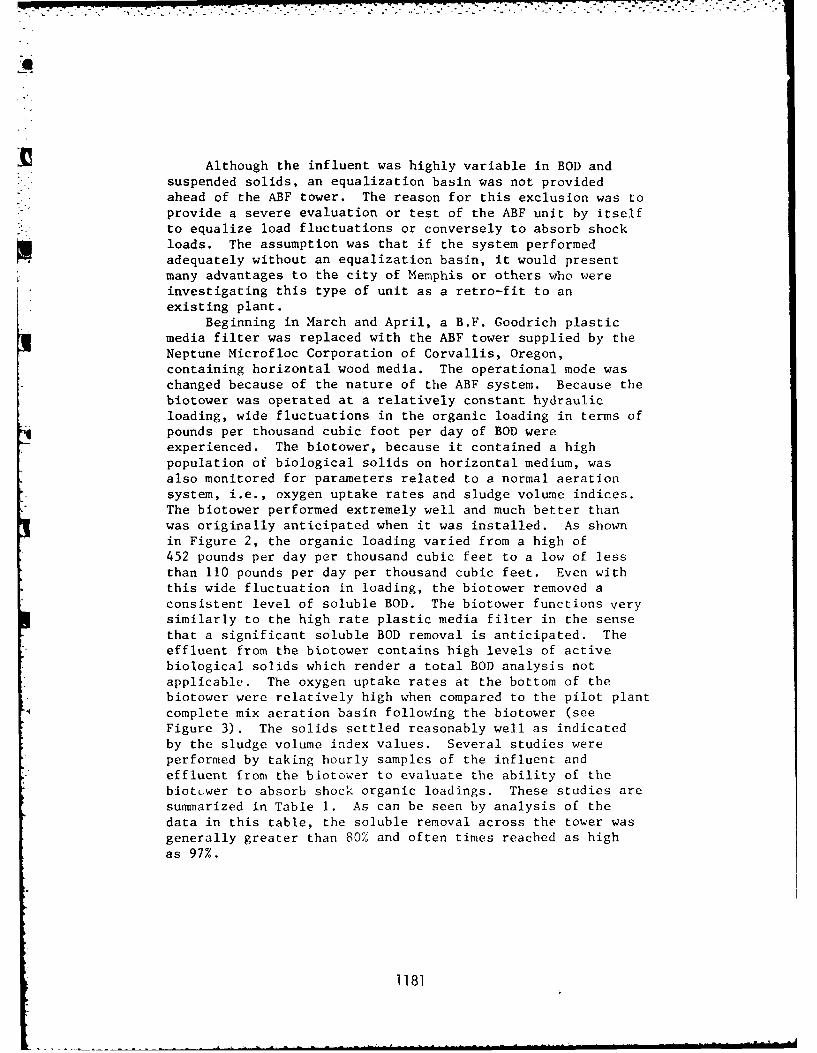
I _ !, .. .. .. . I. .. . . ,-. -,.. .. . :% . . . ' r ',"" . '. " -, . . ' ; L ' ' ' . .
/
Although the influent was highly variable in BOD and
* . suspended solids, an equalization basin was not provided- ahead of the ABF tower. The reason for this exclusion was to
provide a severe evaluation or test of the ABF unit by itselfto equalize load fluctuations or conversely to absorb shockloads. The assumption was that if the system performed
adequately without an equalization basin, it would presentmany advantages to the city of Memphis or others who wereinvestigating this type of unit as a retro-fit to an
existing plant.Beginning in March and April, a B.F. Goodrich plastic
media filter was replaced with the ABF tower supplied by the
Neptune Microfloc Corporation of Corvallis, Oregon,containing horizontal wood media. The operational mode was
changed because of the nature of the ABF system. Because the
biotower was operated at a relatively constant hydraulicloading, wide fluctuations in the organic loading in terms ofpounds per thousand cubic foot per day of BOD wereexperienced. The biotower, because it contained a high
population of biological solids on horizontal medium, wasalso monitored for parameters related to a normal aeration
system, i.e., oxygen uptake rates and sludge volume indices.The biotower performed extremely well and much better thanwas originally anticipated when it was installed. As shownin Figure 2, the organic loading varied from a high of452 pounds per day per thousand cubic feet to a low of less
than 110 pounds per day per thousand cubic feet. Even withthis wide fluctuation in loading, the biotower removed aconsistent level of soluble BOD. The biotower functions verysimilarly to the high rate plastic media filter in the sense
that a significant soluble BOD removal is anticipated. Theeffluent from the biotower contains high levels of activebiological solids which render a total BOD analysis notapplicable. The oxygen uptake rates at the bottom of thebiotower were relatively high when compared to the pilot plantcomplete mix aeration basin following the biotower (seeFigure 3). The solids settled reasonably well as indicated
by the sludge volume index values. Several studies wereperformed by taking hourly samples of the influent and
effluent from the biotower to evaluate the ability of the
biottwer to absorb shock organic loadings. These studies aresummarized in Table 1. As can be seen by analysis of the
data in this table, the soluble removal across the tower wasgenerally greater than 80% and often times reached as high
as 97%.
1181
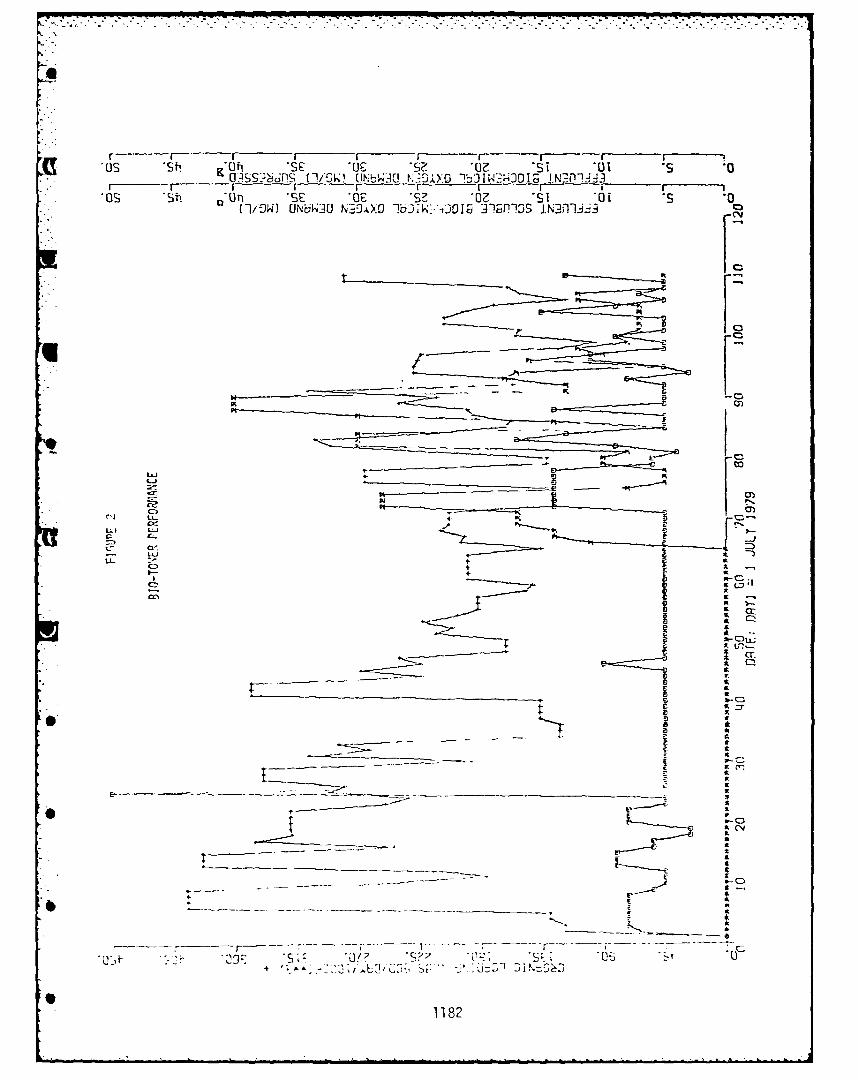
'OS Sti, DUu 'SE 'G 01QZ s O
__ KCF
C) a )
4.r
~C
-*Clj
A' A' JU>-i%:
_ _ _ _ _ _ _ _ _ _1182
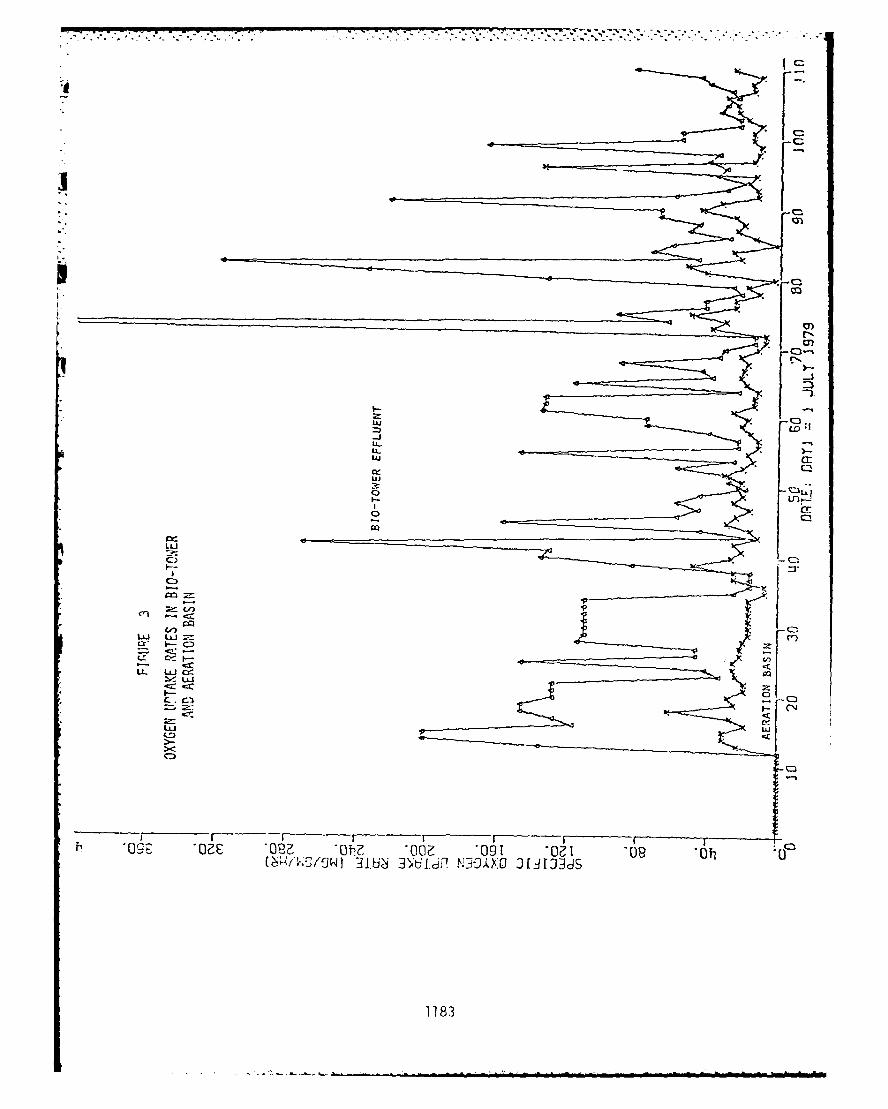
UUC
__ _ _ __ _ _
L0n
LLL-
wLU
I, w
1~ 0LC-
LEi LLtx
1183
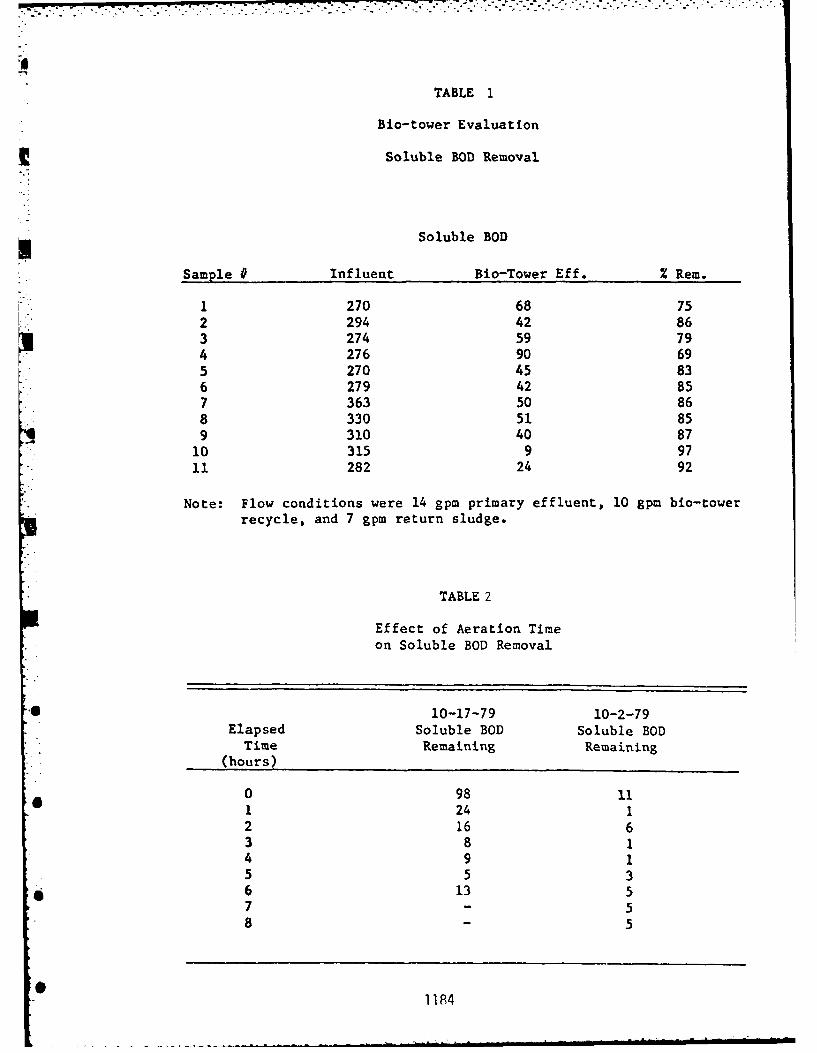
TABLE 1
Bio-tower Evaluation
Soluble BOD Removal
Soluble BOD
Sample # Influent Bio-Tower Eff. % Rem.
1 270 68 752 294 42 863 274 59 794 276 90 695 270 45 836 279 42 857 363 50 868 330 51 859 310 40 87
10 315 9 9711 282 24 92
Note: Flow conditions were 14 gpm primary effluent, 10 gpm bio-towerrecycle, and 7 gpm return sludge.
TABLE 2
Effect of Aeration Timeon Soluble BOD Removal
10-17-79 10-2-79Elapsed Soluble BOD Soluble BODTime Remaining Remaining
(hours)
0 98 111 24 1
2 16 63 8 1
4 9 15 5 3
* 6 13 57 58 5
1184
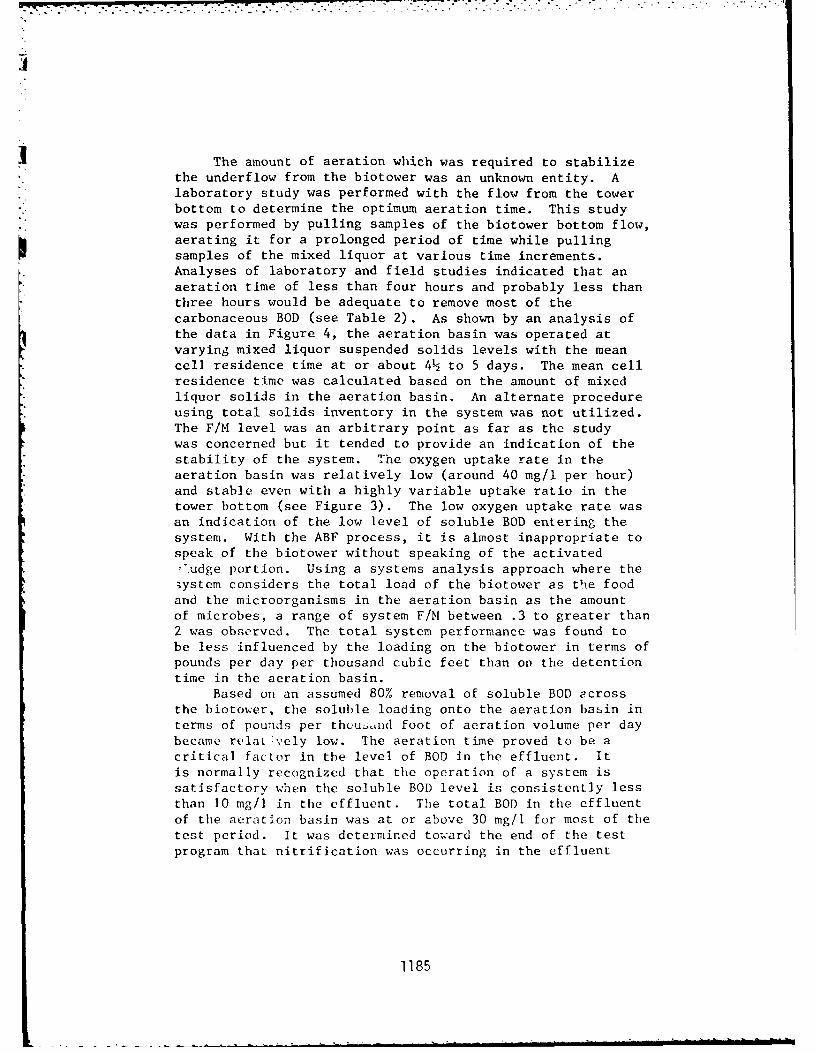
j
The amount of aeration which was required to stabilizethe underflow from the biotower was an unknown entity. Alaboratory study was performed with the flow from the towerbottom to determine the optimum aeration time. This studywas performed by pulling samples of the biotower bottom flow,aerating it for a prolonged period of time while pullingsamples of the mixed liquor at various time increments.Analyses of laboratory and field studies indicated that anaeration time of less than four hours and probably less thanthree hours would be adequate to remove most of thecarbonaceous BOD (see Table 2). As shown by an analysis ofthe data in Figure 4, the aeration basin was operated atvarying mixed liquor suspended solids levels with the meancell residence time at or about 4 to 5 days. The mean cellresidence time was calculated based on the amount of mixedliquor solids in the aeration basin. An alternate procedureusing total solids inventory in the system was not utilized.The F/M level was an arbitrary point as far as the studywas concerned but it tended to provide an indication of thestability of the system. The oxygen uptake rate in theaeration basin was relatively low (around 40 mg/l per hour)and stable even with a highly variable uptake ratio in thetower bottom (see Figure 3). The low oxygen uptake rate wasan indication of the low level of soluble BOD entering thesystem. With the ABF process, it is almost inappropriate tospeak of the biotower without speaking of the activated• udge portion. Using a systems analysis approach where the3ystem considers the total load of the biotower as the foodand the microorganisms in the aeration basin as the amountof microbes, a range of system F/M between .3 to greater than2 was observed. The total system performance was found tobe less influenced by the loading on the biotower in terms ofpounds per day per thousand cubic feet than on the detentiontime in the aeration basin.
Based on an assumed 80% removal of soluble BOD acrossthe biotower, the soluble loading onto the aeration basin interms of pounds per thuuiand foot of aeration volume per daybecame relat vely low. The aeration time proved to be acritical factor in the level of BOD in the effluent. Itis normally recognized that the operation of a system issatisfactory when the soluble BOD level is consistently lessthan 10 mg/i in the effluent. The total BOD in the effluentof the aeration basin was at or above 30 mg/i for most of thetest period. It was determined toward the end of the testprogram that nitrification was occurring in the effluent
1185
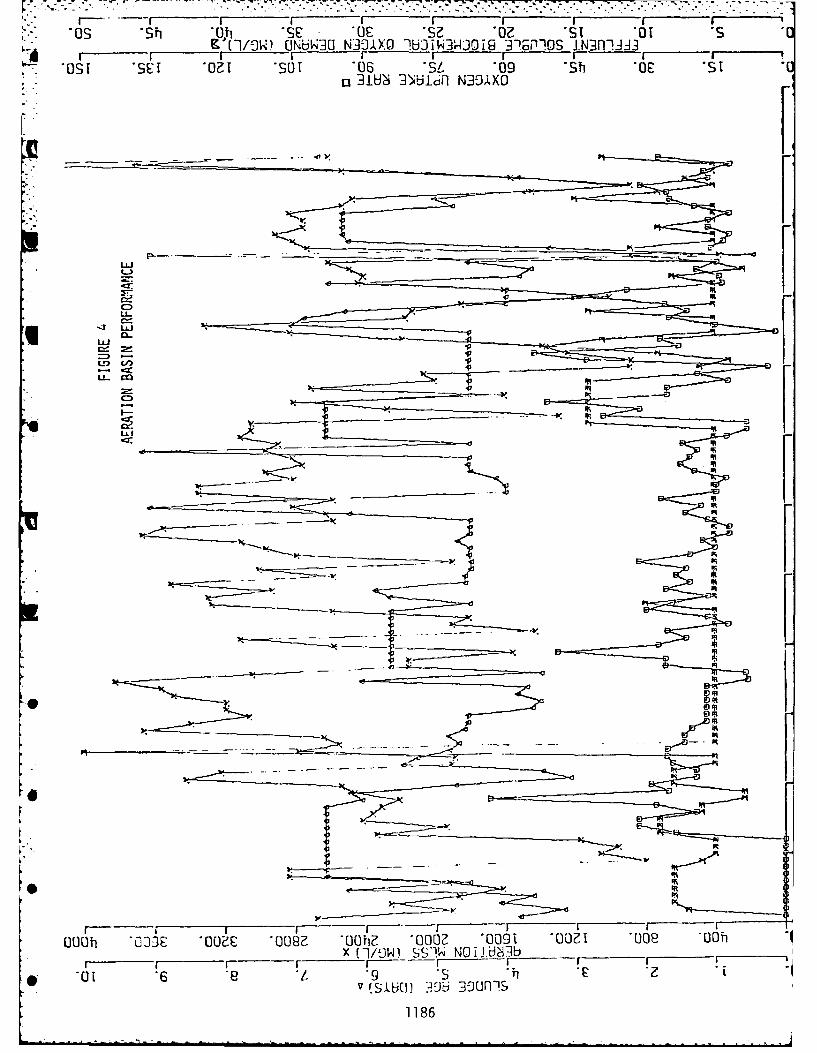
VOW -!AA
_ -
_- __ F
LL I FFOU~l ~XJ~ O~ 0)8? U~h~OQO 001 OO1 U8 UiI
x (1/W) S1W W~!U i* 0E 6 /. iiOR
'~ (St~bU Th~1 3-ufin
1186
samples and steps were taken to alter laboratory proceduresto compensate for the nitrogenous BOD. When thiscompensation was made, the pilot plant unit achieved thedesired effluent quality of less than 30 mg/i BOD andsuspended solids.
III. LABORATORY ARBC STUDIES
To advance further the observations made with the ABFsystem, a laboratory fixed film unit was developed as shownin Figure 5. Using wooden dowels for the support media, therotating contactors were exposed to a mixture of wastedaterand underflow solids from the secondary clarifier. Normaltreatment parameters (BOD, COD, SS) were measured on theinfluent and effluent of the system. Mixed liquor suspendedsolids were also determined for each wheel and the aerationbasin. Influent to the North Treatment Plant as well as asynthetic wastewater using glucose as a carbon source wereused in the laboratory studies. Shock load conditions(organic and pesticides) were evaluated as well as normaloperating conditions. The pesticide shock load condition wasevaluated since the North Treatment Plant frequently receivesvariable amounts of pesticide type compounds from oneindustry.
The results obtained to this point are preliminary innature; however, they do tend to confirm several aspects ofthe field studies. Detail comparisons are difficult to makeat this time due to the different waste materials anddifference in size of units. Directionally, the laboratorystudies tend to confirm the following observations made in thefield studies.
1. Oxygen uptake rate. The oxygen uptake rate in theaeration basin in both studies was below 50 mg/l/hr.Analysis of data from respirometor studiesperformed with biofilm removed from the aerationbasin and the wheels indicated a stabilizationphenomenon as opposed to a rapid growth condition ofa fluid bed system. This substantially lower uptakerate represents a significant savings in operationalcosts over a fluid bed system. Supplementalaeration in the first contactor was necessary in thelaboratory unit to prevent anaerobic conditionsfrom developing on the first contactor. Therecycling of high concentrations of settled MLSSresulted in a high uptake in the first contactor.
1187
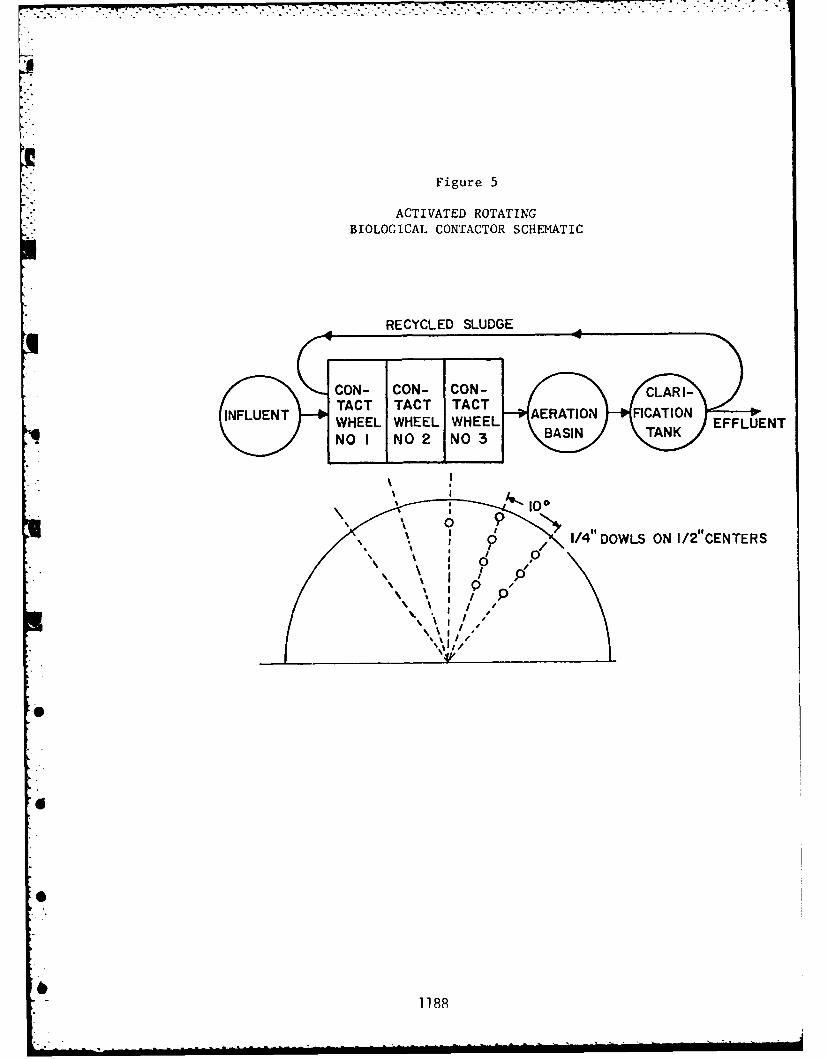
• m • - ~ - .c c 1 . 7 7 . . . .. . . . . . . .- . mT
Figure 5
ACTIVATED ROTATINGBIOLOGICAL CONTACTOR SCHEMATIC
RECYCLED SLUDGE_
CON- CON- CON- CLARI-
TACT TACT TACT CATIONWHEEL WHEEL WHEEL ASIN TANK EFFLUENT
4 NO I NO 2 NO 3 B
1/4" DOWLS ON I/2"CENTERS
; .
/ /
18 //
- 1188
2. Stability Under Variable Loads. Using the syntheticfeed, the organic load on the system was varied toproduce a F/M ratio of 0.2 up to 5.0 based on CODinto the system and MLSS in the aeration basin. Thesystem consistantly achieved better than a 90%organic removal with F/M ratios greater than 0.8while at lower ratios, the effluent deterioratedmarkedly as shown in Figure 6.
3. Resistance to toxic loads. During the field studies,the Maxson plant and the ABF pilot plant bothreceived a shock load of a phosphate basedpesticide. The fluid bed system exhibited a decreasein performance efficiency as was expected; however,the performance of the pilot plant was not affected.To evaluate further this phenomena under controlledconditions, a series of shock load studies usingchloro-carbon intermediates from the manufacture ofendrin was performed with the laboratory (3). Notonly were the pesticide-type compounds absorbed ontothe biofilm and thus removed from the liquid phasebut biodegradation took place due to the hetrogenousgrowth in the biofilm. q, destinctly differentgram negative bacilli a iarious yeasts wereidentified through enrichment culture studies usingthe chloro-carbon compounds as the sole carbonsource. Neither pure cultures isolated from theprimary enrichment media nor various reconstitutedmixed cultures would use the chlorinated carboncompounds as a carbon source. However, foursuccessive transfers of mixed cultures from theprimary enrichment media resulted in heavy growthand chlorinated compound breakdown.
IV. SUMMARY
.fThe results to date, both laboratory and field pilotplant, indicate that the activated biological contactor (ABC)concept offers several advantages over fluid bed systems inwastewater treatment. Considerable energy savings appearpossible due to the lower oxygen uptake rate of the biomass.Although the oxygen uptake rate of the ABF tower bottoms wasrelatively high (-200 mg/l/hr.), the rate in the aerationbasin following the tower was less than 50 mgl/hr. All ofthe reactors (contactors and aeration basin) in thelaboratory study exhibit uptake rates less than 50 mg/i/hr.:,
~118?
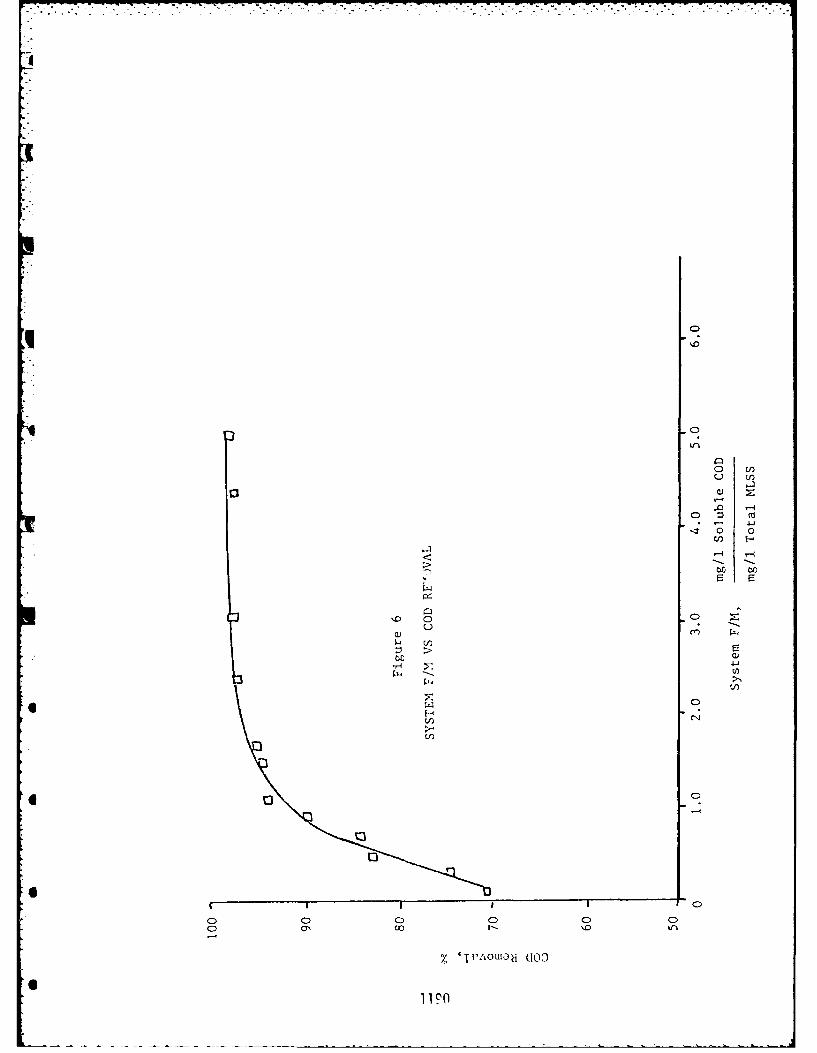
4
4-J
>.44
0 0 -
CD C) CD 0 C0
0 00
11 CIO'
RD-RI26 377 PROCEEDINGS: INTERNRTIONRL CONFERENCE ON FIXED-FILM' 7/7I BILOGCAL ROCSSESC () PTTSBRGHUNIVPR EPTOF
I CIVIL ENGINEERING V C NIU ET AL. 1982 DACNBS-Si-R-85
UCSSIFIED F/G 03/2mhhhhhhS NiE h h h h h hPRCSSS h.(U PTBRH h h h hER EPmhhhhhhhhhhhhE
1.0 W.,
Mao 12.0
lul
111.25 111111
MICROCOPY RESOLUTION TEST CHART
NATIONAL BUREAU OF STANDARDS-1963-A
bP
S.o
j"i-'
-.A
- .-
The hetrogenous biomass developed in the ABC system providessignificant operational stability to shock loads of organic ortoxic orgin. Several chlorinated compounds normally considerednonbiogradable and somewhat toxic were assimilated by thebiofilm in the laboratory unit. Similar results were observedwith a phosphate based pesticide shock load on the pilot plantsystem.
Work is presently continuing of Memphis State Universityto define further the mechanisms involved in the ABC.;.Additional data will be developed to explore the applicationof a mass transfer model to the system similar to thatevaluated by Famularo (4).
REFERENCES
1. Benjes, H., "Evaluation of Biological Wastewater Treat-ment Process," Waste Water Treatment and Reuse Seminar,South Lake Tahoe, California, 1976.
2. Richter, G. A. and Guthrie, M. D., "ADF/Activated SludgeProcess Control," 42nd Pacific Northwest PollutionControl Federation, 1975.
3. Redfield, J.; Smith, J. W.; Khararjian, U.; and Peterson,G., "Pesticide Addition to Wastewaters Treated in PilotActivated Sludge, Activated Carbon, and Wood RotatingBiological Contactor (RBC) Systems," Submitted toDevelopments in Industrial Microbiology, 1981.
4. Famuloro, J.; Mueller, J. A.; and Mulligan, T. "Appli-cation of Mass Transfer to Rotating Biological Contactors,"JWPCF 50, 653, 1978.
1191
.. ..
* COMPARISON OF FIXED-FILM REACTORS WITH A
MODIFIED SLUDGE BLANKET REACTOR
- 0 Andrd Bachmann, Virginia L. Beard, and Perry L. McCarty,
Department of Civil Engineering, Stanford University,Stanford, California 94305
INTRODUCTION
Over the last one hundred years, the anaerobic treatment
process has been developed beginning with "Moura's AutomaticScavenger" and progressing to the conventional complete mixed
* and fixed-film anaerobic reactors (1). The conventionalprocess is generally used for treatment of municipal sludgesand other concentrated wastes. The advantage of this processis its simplicity in design and operation. The disadvantagesare that a long hydraulic detention time is required forprocess efficiency and that reduced effluent quality resultsfrom a high concentration of suspended solids unless somemeans of effluent solids separation is provided.
To avoid some of these potential problems, the anaerobiccontact process has been developed (2) where effluentsuspended solids are settled and recycled back into rhereactor. This leads to a longer solids retention time andtherefore permits a significant volume reduction for a giventreatment efficiencv.
To be able to treat relatively dilute organic wastes,care must be taken to obtain a sufficiently long microorgan-ism retention time within the system. Several alternativeshave been proposed, such as the "anaerobic filter" by Youngand McCartv (31), the "anaerobic attached-film expanded bed"
1192
reactor by Switzenbaum and Jewell (4), the "upflow anaerobicsludge blanket" reactor by Lettinga (5), and the "anaerobicrotating biological disc" reactor.
Excellent results have been achieved with the "anaerobicfilter" in laboratory investigations (3,6-7). The advantageof the system is its high reliability combined with highloading capacity and efficiency. However, the reactorrequires filling material which influences the economics of
K the process. Furthermore, clogging problems may arise withthe filter which can influence its reliability if run over along period of time.
The "anaerobic attached-film expanded bed" reactor hasthe advantage of being relatively free of clogging, as thewaste passes in an upward direction through a hed of suspend-ed media to which the bacteria attach. However, thedisadvantage is the rate of recycling generally required tokeep the media in suspension.
The "upflow anaerobic sludge blanket" reactor is amodified version of the contact process and is based on anupward movement of the waste through a dense blanket ofanaerobic sludge. This provides a greater surface areabetween the gas and the liquid which is advantageous inkeeping the floating solids from clogging gas ports.Nevertheless, a large risk with this reactor is thepossibility of further bed expansion and excessive loss ofmicroorganisms to the effluent. The sludge blanket processalso requires special granular sludge, which is difficult todevelop.
The "anaerobic rotating disc" reactor has also beenDroposed for anaerobic treatment of wastewater (8). In thisstudy, it proved to be a reliable and st~ible operating react-or with little potential for clogging while providing a highvoid volume. Its major disadvantage is high capital cost dueto its relatively complicated construction.
Perhaps the major obstacles to wider application of theanaerobic process for industrial waste treatment are therelative difficulty in operation and the absence of a simipleand cost-effective design.
The objective of this oaper is to present a new processtermed the "anaerobic baffled reactor" which is simple inform and may offer an economical solution to the treatment ofintermediate and low strength industrial wastewater.Furthermore, a unified model for the mathematical descriptionof fixed-film reactors and sludge blanket reactors will bepresented.
1193
BAFFLED REACTOR CONCEPT
The baffled reactor (BR) for anaerobic treatment isessentially a series of upflow sludge blanket reactors, butbecause of its unique characteristics, it requires no specialgranular growth of bacteria which is difficult to obtain.The baffled reactor's construction allows a high void volume
*and, therefore, clogging problems are essentially elimi-*nated. A schematic diagram of an anaerobic baffled reactor
is shown in Figure 1. This process evolved from initialstudies with an '"anaerobic rotating biological disc"' reactorfrom which it was found that no rotation of the discs wasnecessary to obtain reliable reactor performance.
MATERIALS AND METHODS
Reactors. A comparison was made between the performance of*three laboratory-scale anaerobic reactors: the anaerobic
filter, the rotating biological contactor, and the baffledreactor. All reactors were constructed from plexiglas. Theanaerobic baffled reactor (Figure 1) was 19.3 cm in lengthand ha~ a total volume of 1040 cm3 and an effective volume of680 cm . The liquid passed horizontally and around baffleswhich served to maintain micoorganisms within the reactor.Sample ports were placed at ? .5 cm intervals along thereactor with an additional tav near the effluent port. Thebaffled reactor effluent was passed through an invertedsiphon to separate the gas from the liquid. A low speedperistaltic pump fed the reactor. After the comparitivereactor evaluation, the anaerobic baffled reactor was scaled-up to a 6.3 liter liquid volume (Figure 2). Severalmodifications were made. The downflow chambers werenarrowed, thus widening the upflow chambers where most of thecell mass had been found to collect. The lower edges of thebaffles were slanted to route the flow to the center of theupflow chamber to achieve greater mixing of feed andsolids. The number of ports was increased to facilitatesampling and wasting of solids should clogging occur.
The anaerobic filter (Figure 3) consisted of a bed ofstones with average diameter of 12 mmn through which theliquor was passed continuously in an upward direction. The
O filter had a porosity of 0.42 and a liquid void volume of 400Ml.
The anaerobic rotating biological contactor (Figure 4)consisted of circular plates connected to a slowly rotatinghorizontal shaft. Organisms attached to the surfaces of the
1194
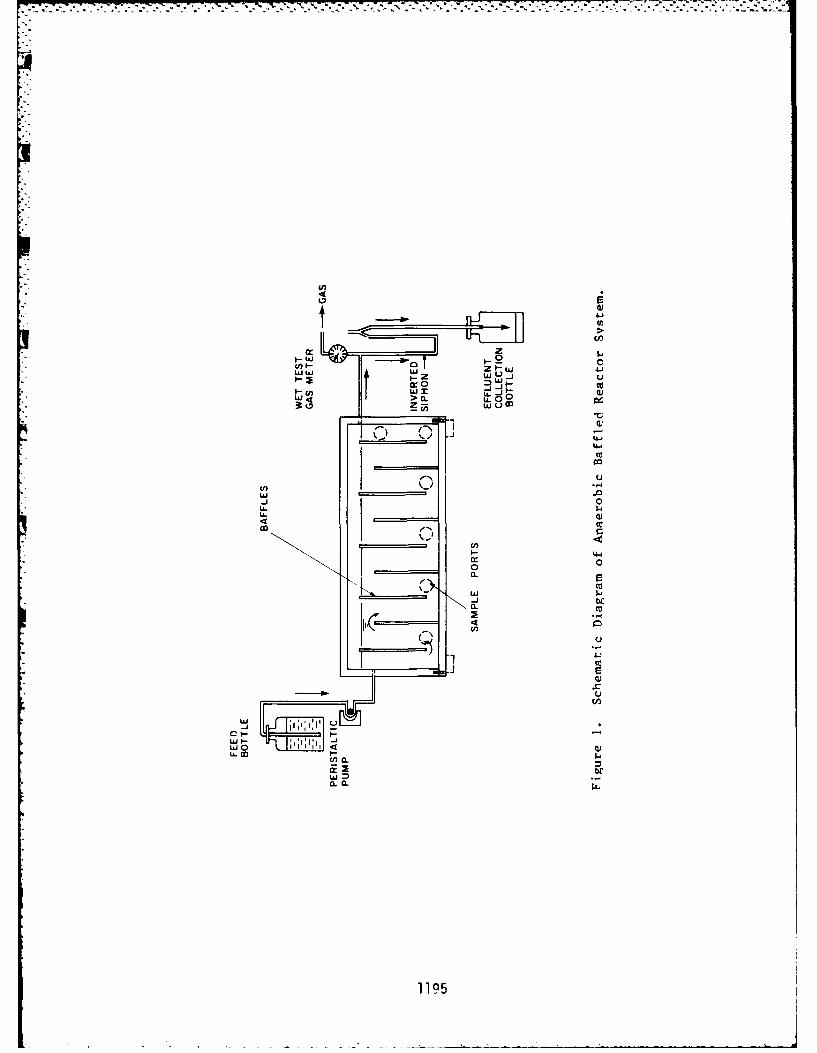
I-w 0
w 4 4
3to
LI.
U. 4)
cnr-J 0LA. S-I
LA. to4w
4-1
w 0
LL Co
UJU
0. 0.
1195
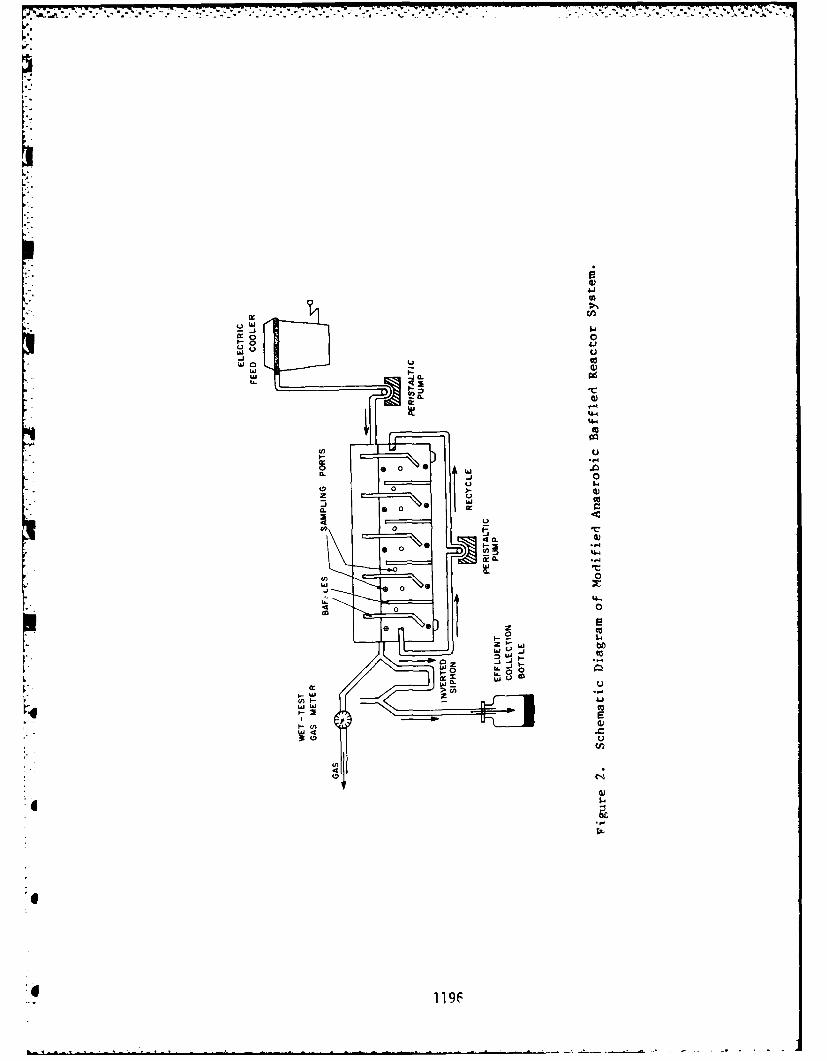
UJU
U-1.4 ~94.4
U0)
o 0 0
CL 0
00
a. 0
00
02Cc
V bU. -J~ 4.0
cr uA w
it W
Lj LU
1 1-'
ccc
a 1196
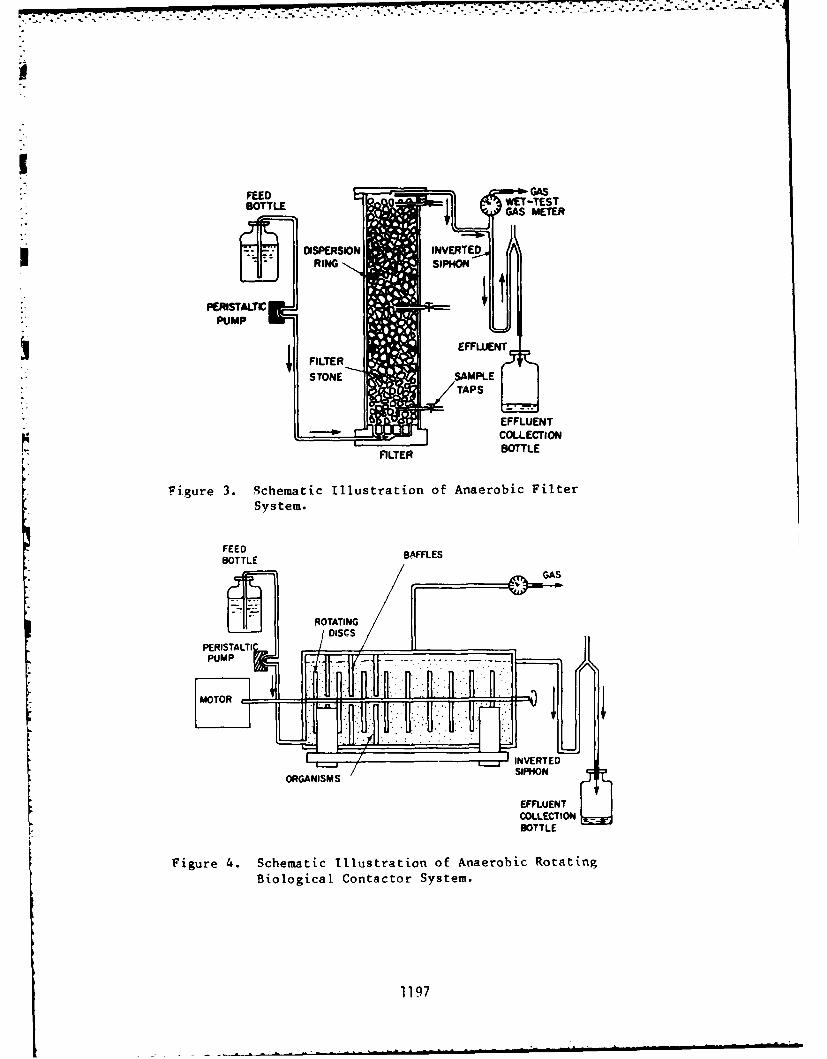
BOTTLE WTTS
D.: ISPERSION INVERTED
PERISTALTICPUMP
FILTER EF OLTLE
STOEE B SFFLES
EFFLUENT
FILTERBOTTLE
Figure 4. Schematic Illustraion of Anaerobic RoltatinBiloiclsotaeomSstm
FEED BA11L7
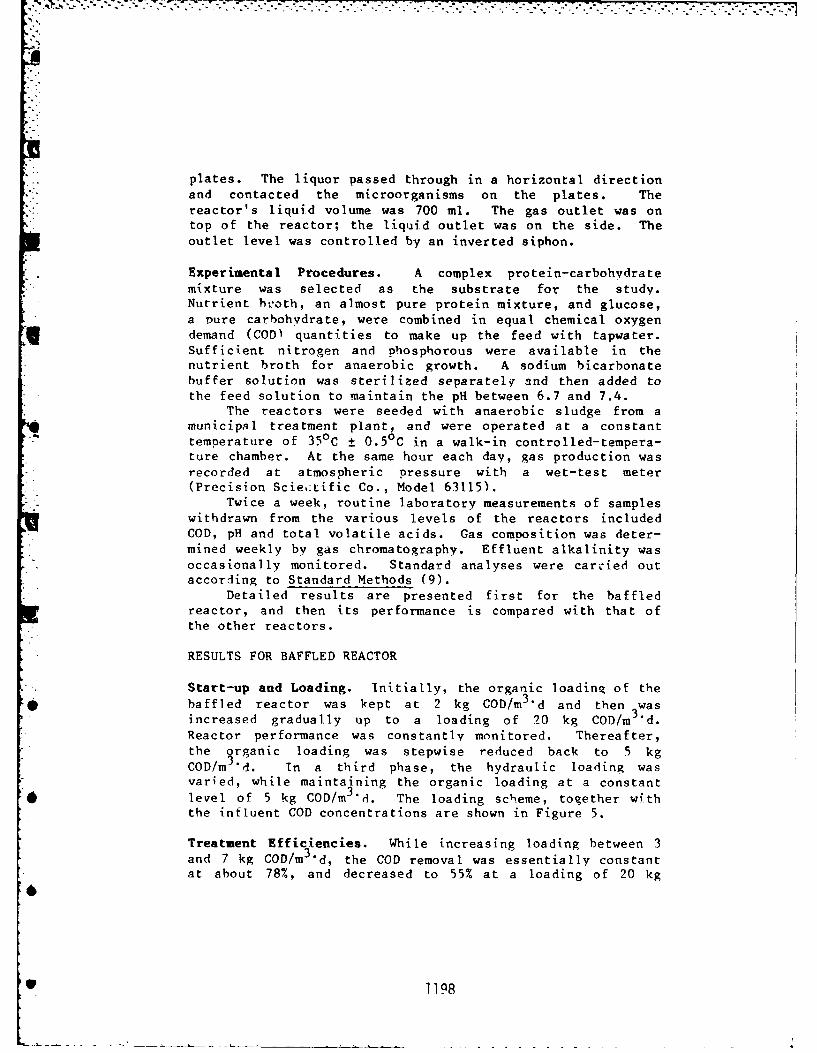
7777
plates. The liquor passed through in a horizontal directionand contacted the microorganisms on the plates. Thereactor's liquid volume was 700 ml. The gas outlet was ontop of the reactor; the liquid outlet was on the side. Theoutlet level was controlled by an inverted siphon.
Experimental Procedures. A complex protein-carbohydratemixture was selected as the substrate for the study.Nutrient hboth, an almost pure protein mixture, and glucose,a pure carbohydrate, were combined in equal chemical oxygendemand (COD) quantities to make up the feed with tapwater.Sufficient nitrogen and phosphorous were available in thenutrient broth for anaerobic growth. A sodium bicarbonatebuffer solution was sterilized separately and then added tothe feed solution to maintain the pH between 6.7 and 7.4.
The reactors were seeded with anaerobic sludge from amunicipal treatment plant, and were operated at a constant
- temperature of 350C ± 0.50C in a walk-in controlled-tempera-ture chamber. At the same hour each day, gas production wasrecorded at atmospheric pressure with a wet-test meter(Precision Scie,-tific Co., Model 63115).
Twice a week, routine laboratory measurements of sampleswithdrawn from the various levels of the reactors includedCOD, pH and total volatile acids. Gas composition was deter-mined weekly by gas chromatography. Effluent alkalinity wasoccasionally monitored. Standard analyses were carried outaccording to Standard Methods (9).
Detailed results are presented first for the baffledreactor, and then its performance is compared with that ofthe other reactors.
RESULTS FOR BAFFLED REACTOR
Start-up and Loading. Initially, the organic loading of thebaffled reactor was kept at 2 kg COD/m3 d and then wasincreased gradually up to a loading of 20 kg COD/m 3 "d.Reactor performance was constantly monitored. Thereafter,the 9rganic loading was stepwise reduced back to 5 kgCOD/m Id. In a third phase, the hydraulic loading wasvaried, while maintaining the organic loading at a constantlevel of 5 kg COD/m3 d. The loading scheme, together withthe influent COD concentrations are shown in Figure 5.
Treatment Efficiencies. While increasing loading between 3and 7 kg COD/m 3 "d, the COD removal was essentially constantat about 78%, and decreased to 55% at a loading of 20 kg
--1198
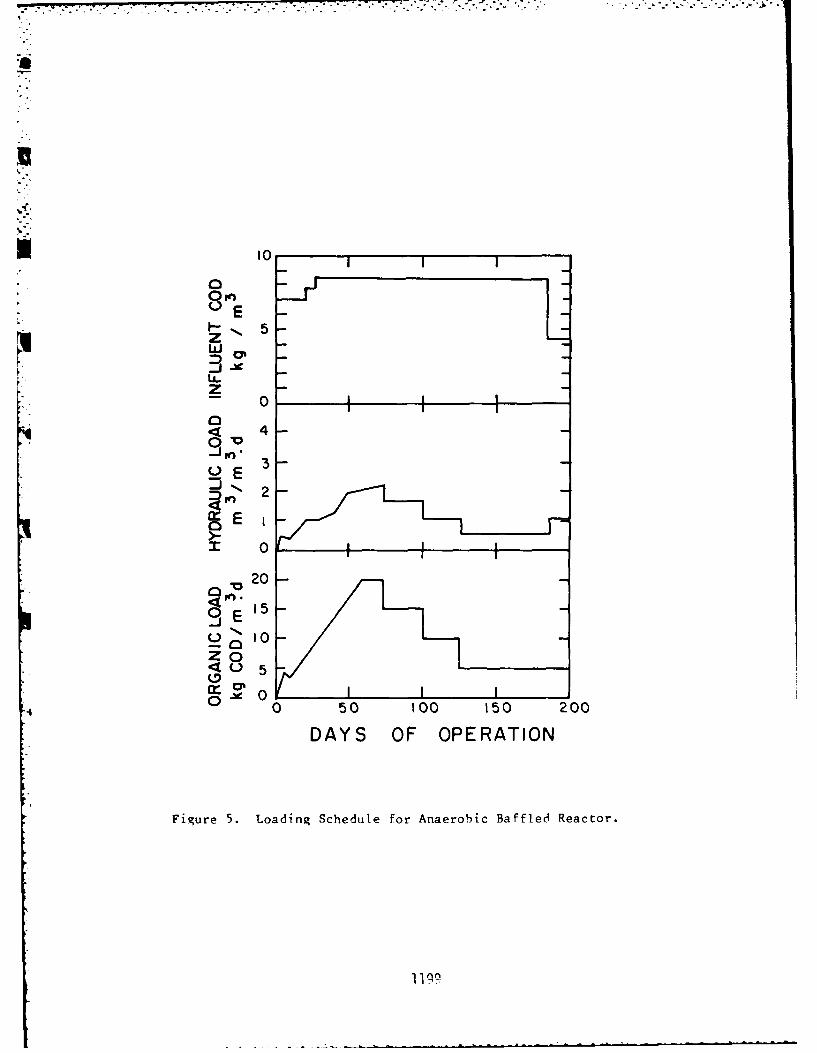
10
1...5
i ,o
3 -z
04
0 .i n3
YE
20
0j E
zo0
z o I
15
0 0 50 100 150 200
DAYS OF OPERATION
Figure 5. Loading Schedule for Anaerobic Baffled Reactor.
lI1O
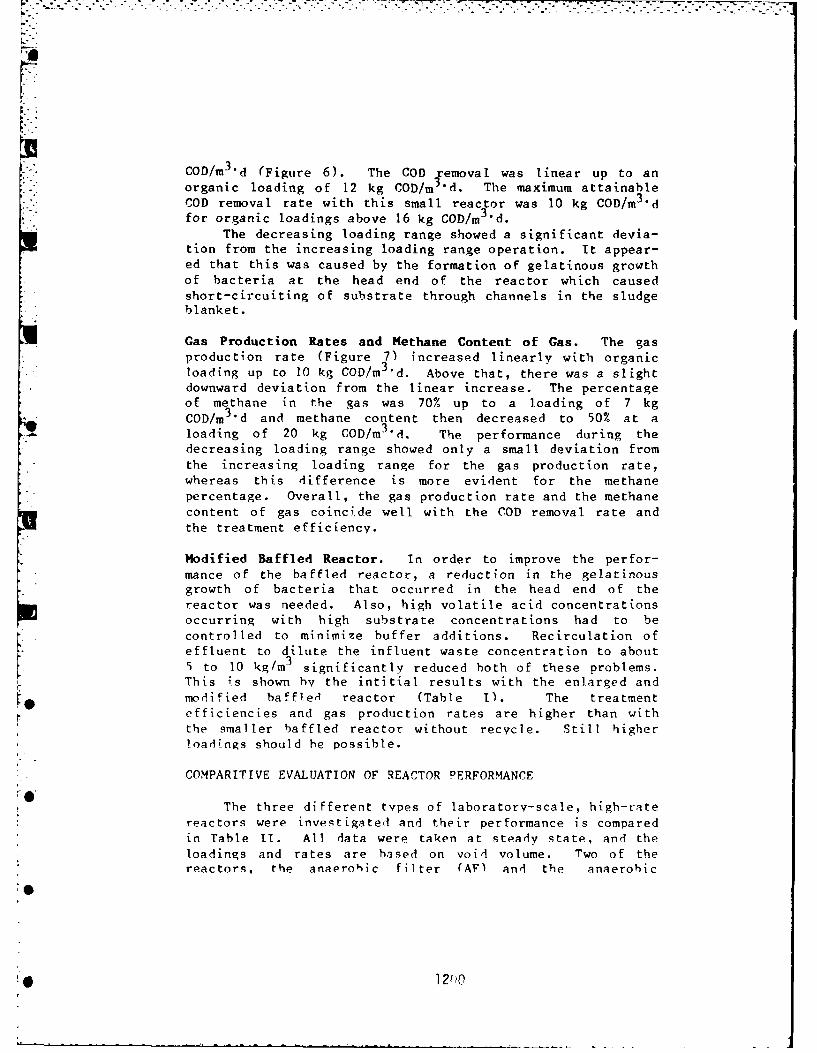
COD/m3"d (Figure 6). The COD {emoval was linear up to an* organic loading of 12 kg COD/m Id. The maximum attainable
COD removal rate with this small reactor was 10 kg COD/m 3 d* for organic loadings above 16 kg COD/m 3 .d.
The decreasing loading range showed a significant devia-tion from the increasing loading range operation. It appear-ed that this was caused by the formation of gelatinous growthof bacteria at the head end of the reactor which causedshort-circuiting of substrate through channels in the sludgeblanket.
Gas Production Rates and Methane Content of Gas. The gasproduction rate (Figure 7) increased linearly with organicloading up to 10 kg COD/m3 "d. Above that, there was a slightdownward deviation from the linear increase. The percentageof methane in the gas was 70% up to a loading of 7 kgCOD/m3 "d and methane content then decreased to 50% at a
- loading of 20 kg COD/m3 "d. The performance during thedecreasing loading range showed only a small deviation fromthe increasing loading range for the gas production rate,whereas this difference is more evident for the methanepercentage. Overall, the gas production rate and the methanecontent of gas coincide well with the COD removal rate andthe treatment efficiency.
Modified Baffled Reactor. In order to improve the perfor-mance of the baffled reactor, a reduction in the gelatinousgrowth of bacteria that occurred in the head end of thereactor was needed. Also, high volatile acid concentrationsoccurring with high substrate concentrations had to be
controlled to minimize buffer additions. Recirculation ofeffluent to dilute the influent waste concentration to about5 to 10 kg/m 3 significantly reduced both of these problems.This is shown by the intitial results with the enlarged andmodified baffled reactor (Table I). The treatment
efficiencies and gas production rates are higher than withthe smaller baffled reactor without recycle. Still higherload'ngs should he possible.
COMPARITIVE EVALUATION OF REACTOR PERFORMANCE
The three different types of laboratory-scale, high-ratereactors were investigated and their performance is comparedin Table I. All data were taken at steady state, and theloadings and rates are based on void volume. Two of thereactors, the anaerobic filter (AF) and the anaerobic
121K0
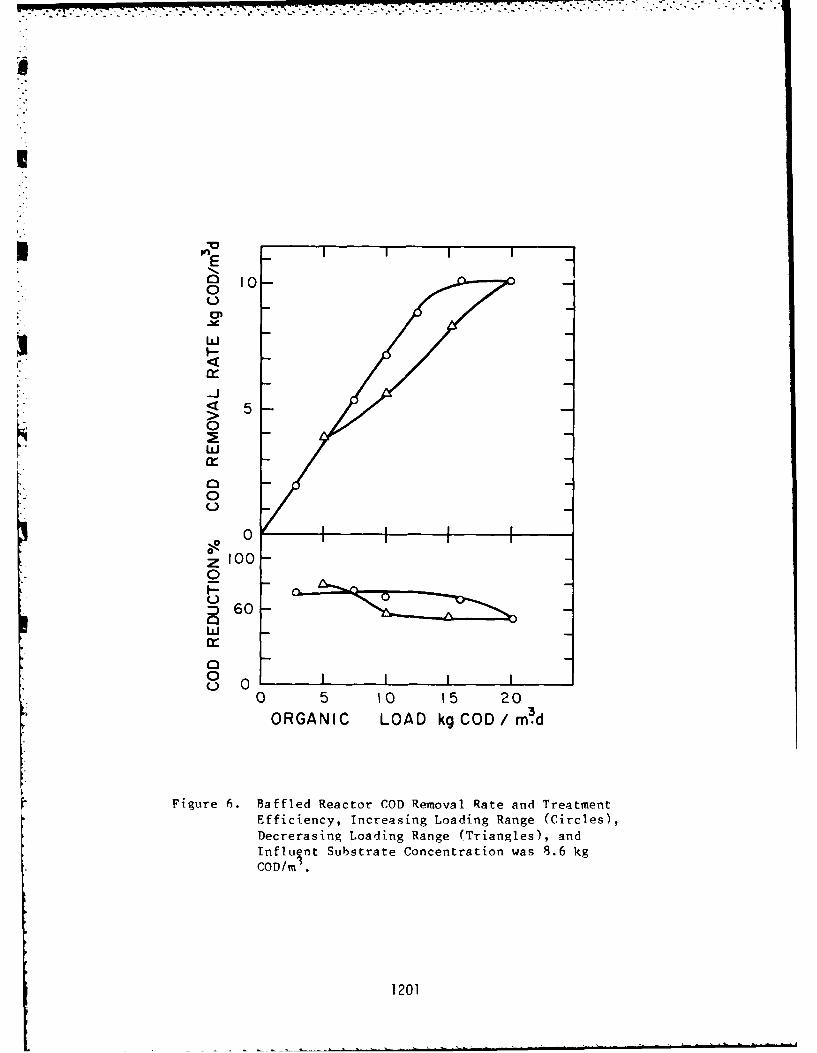
U
I -o _I I I I
o10-0U
i ---j
S5
0
0
z 1000
oI I I I0
0W
0 F0
0 5 10 15 20
ORGANIC LOAD kgCOD/ m.d
Figure 6. Baffled Reactor COD Removal Rate and TreatmentEfficiency, Increasing Loading Range (Circles),Decrerasing Loading Range (Triangles), andInfluInt Substrate Concentration was 8.6 kg
COD/m.
1201
I .
V
tv.
E 10-I,
E
z0
a050
0
(.1
0
50l
I-
0 5 I0 15 20
ORGANIC LOAD kg COD/m 3 .d
vigure 7. Baffled Reactor Gas Production Rate and MethanEPercentage of Gas. Increasing Loading Range(Circles), Decreasing Loading Range (Triangles),and Influent Substrate Concentration was 8.6 kgCOD/m 3.
10
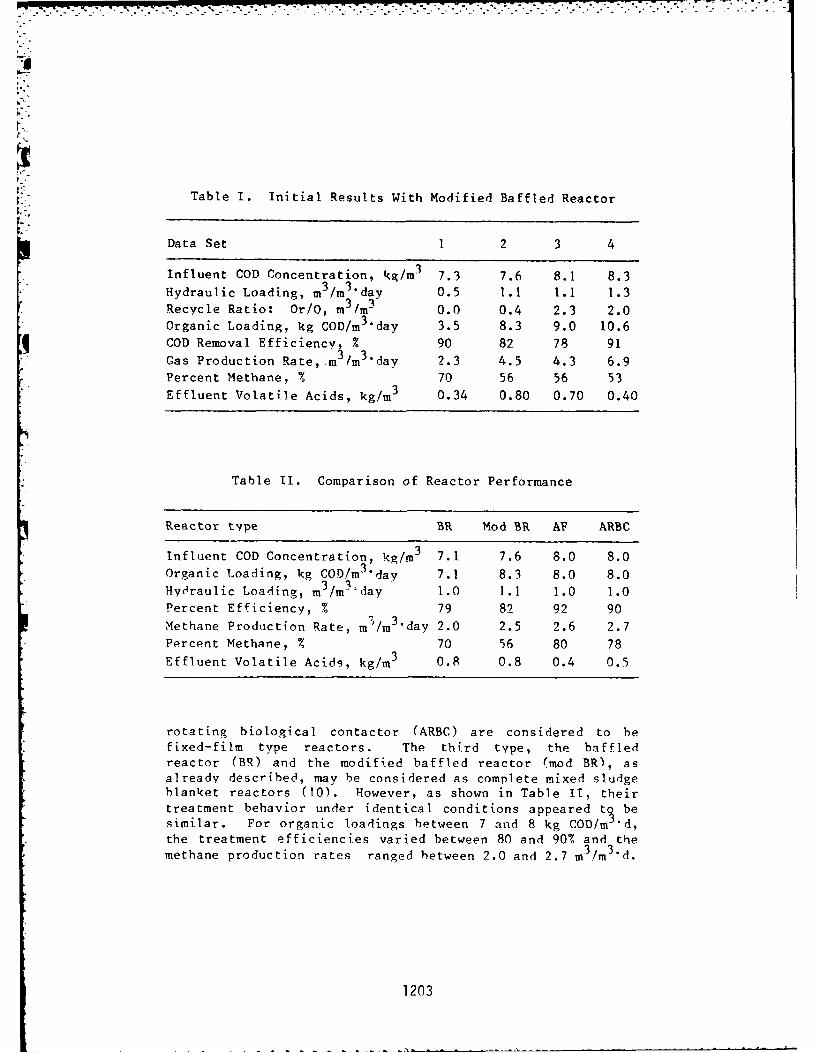
F.
Table I. Initial Results With Modified Baffled Reactor
Data Set 1 2 3 4
Influent COD Concentration, kg/m 7.3 7.6 8.1 8.3
Hydraulic Loading, m 3 /m3 "day 0.5 1.1 1.1 1.3Recycle Ratio: Or/O, m 3/m3 0.0 0.4 2.3 2.0Organic Loading, kg COD/m 3 "day 3.5 8.3 9.0 10.6
COD Removal Efficiency, % 90 82 78 91Gas Production Rate, m 3 /m3 "dav 2.3 4.5 4.3 6.9
Percent Methane, % 70 56 56 53Effluent Volatile Acids, kg/m 3 0.34 0.80 0.70 0.40
Table II. Comparison of Reactor Performance
Reactor type BR Mod BR AF ARBC
Influent COD Concentration, kg/m 3 7.1 7.6 8.0 8.0
Organic Loading, kg COD/m 3 "day 7.1 8.3 8.0 8.0Hydraulic Loading, m /m3 .iay 1.0 1.1 1.0 1.0Percent Efficiency, % 79 82 92 90
Methane Production Rate, m /m3 "day 2.0 2.5 2.6 2.7
Percent Methane, % 70 56 80 78
Effluent Volatile Acids, kg/m 3 0.8 0.8 0.4 0.5
rotating biological contactor (ARBC) are considered to befixed-film type reactors. The third type, the baffledreactor (BR) and the modified baffled reactor (mod BR), asalready described, may be considered as complete mixed sludgeblanket reactors (10). However, as shown in Table IT, theirtreatment behavior under identical conditions appeared to besimilar. For organic loadings between 7 and 8 kg COD/m 'd,the treatment efficiencies varied between 80 and 90% and themethane production rates ranged between 2.0 and 2.7 m 3 /m3 "d.
1203
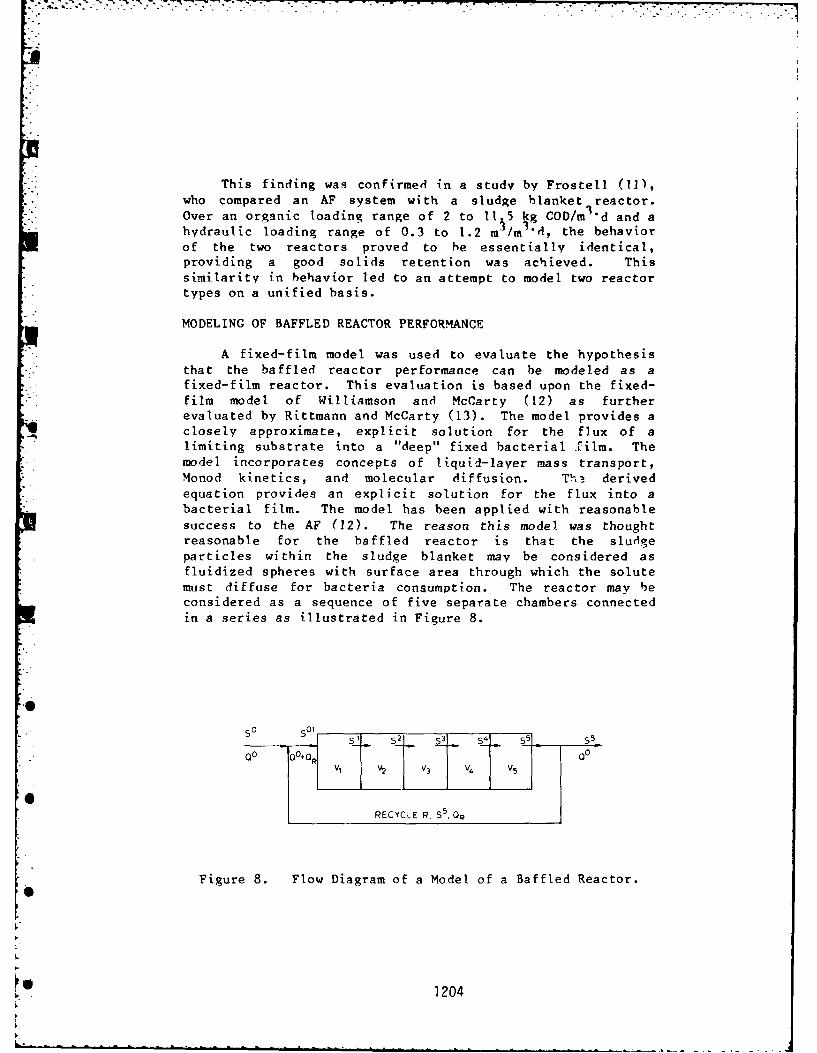
This finding was confirmed in a study by Frostell (1]),who compared an AF system with a sludge blanket reactor.
Over an organic loading range of 2 to I.5 kg COD/m" d and ahydraulic loading range of 0.3 to 1.2 ml/ml'd, the behaviorof the two reactors proved to he essentially identical,providing a good solids retention was achieved. Thissimilarity in behavior led to an attempt to model two reactor
types on a unified basis.
MODELING OF BAFFLED REACTOR PERFORMANCE
A fixed-film model was used to evaluate the hypothesisthat the baffled reactor performance can he modeled as afixed-film reactor. This evaluation is based upon the fixed-film model of Williamson and McCarty (12) as furtherevaluated by Rittmann and McCarty (13). The model provides aclosely approximate, explicit solution for the flux of alimiting substrate into a "deep" fixed bacterial film. Themodel incorporates concepts of liquid-laver mass transport,
Monod kinetics, and molecular diffusion. Tlt, derivedequation provides an explicit solution for the flux into abacterial film. The model has been applied with reasonable
success to the AF (12). The reason this model was thoughtreasonable for the baffled reactor is that the sludgeparticles within the sludge blanket may be considered asfluidized spheres with surface area through which the solute
must diffuse for bacteria consumption. The reactor may beconsidered as a sequence of five separate chambers connected
in a series as illustrated in Figure 8.
0 01S SI°° 5I 52 5oo 5s
V- v V2 V3 V5
RECYCLE R. 5. Oq
Figure 8. Flow Diagram of a Model of a Baffled Reactor.
1204
,-7
For a comolIete-mix reactor with specific flow ra tei'Q(T-1) and spec i Fic surface area a (surface area per unit
reactor volume, L ), a mass balance on substrate gives
_S _aCS q + oO_OS 0ldt
where S is the bulk-liquid substrate concentration (NL-'), S0
the influent concentration, C the variable-order reaction
coefficient and q the variable-order reaction order. For thesteady-state case, Eq. I can be solved algebraically for S:
q = So - (2)csq (?
The model was applied by estimating the specific surface area
a for each of the five chambers from profile-data of profile1 and applying these values of a to predict the reactorbehavior for other loadings (Profiles 2-4). This approach
assumes a constant specific surface area a for each reactor
chamber over the course of the study, which may not neces-sarilv have been true. Equation (2) must be solvediteratively for S for each compartment of the reactor and due
to the recycling, another iteration cycle needs to be doneover the overall reactor, assuming a certain recyclesubstrate concentration. A mass balance of influent andrecycle streams was used to determine the concentration in
the stream entering the first reactor.Figure 0 presents exper4mental results and model predic-
tions for the kinetic coefficients and model parameters ofTable T11. The kinetic coefficients are based on the valuesof Lawrence and McCarty (15), and the model parameters onvalues From Williamson (16) and Williamson and Chung (17).Overall, the predictions were good, although the model as
applied, resulted in a lower rate of removal for Profi.les 2,3 and 4 than actually found. This probably was partly due to
use of a constant diffusion laver depth (L) for all cases.This depth would, however, decrease with increased gas mixing
at higher loadings, leading to higher removal rates asnoted. Also, the increased mixing at )Figh loading rateswould probably increase the area exposed to the substrate.
Both of these corrections would lead to a better fit between
predicted and measured performance.A similar evaluation was performed assuming a series of
completelv-mixed dispersed growth reactors and using Monodkinetics. Values for active microorganism concentration were
1205
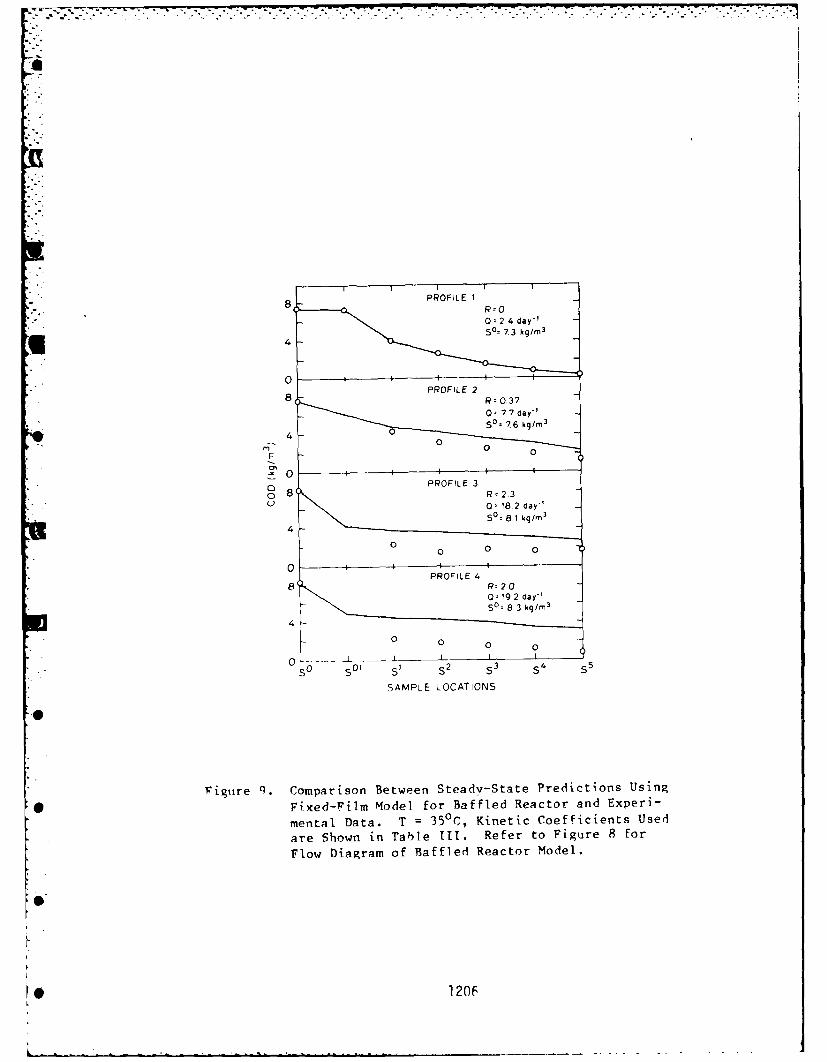
0 772 day"SO= 7.6 kg/rn
3
40
PROFILE 3
40
40 0 0
SAMPEROCAIONS3
00
0lo Diga of BafeectrMdl
1200
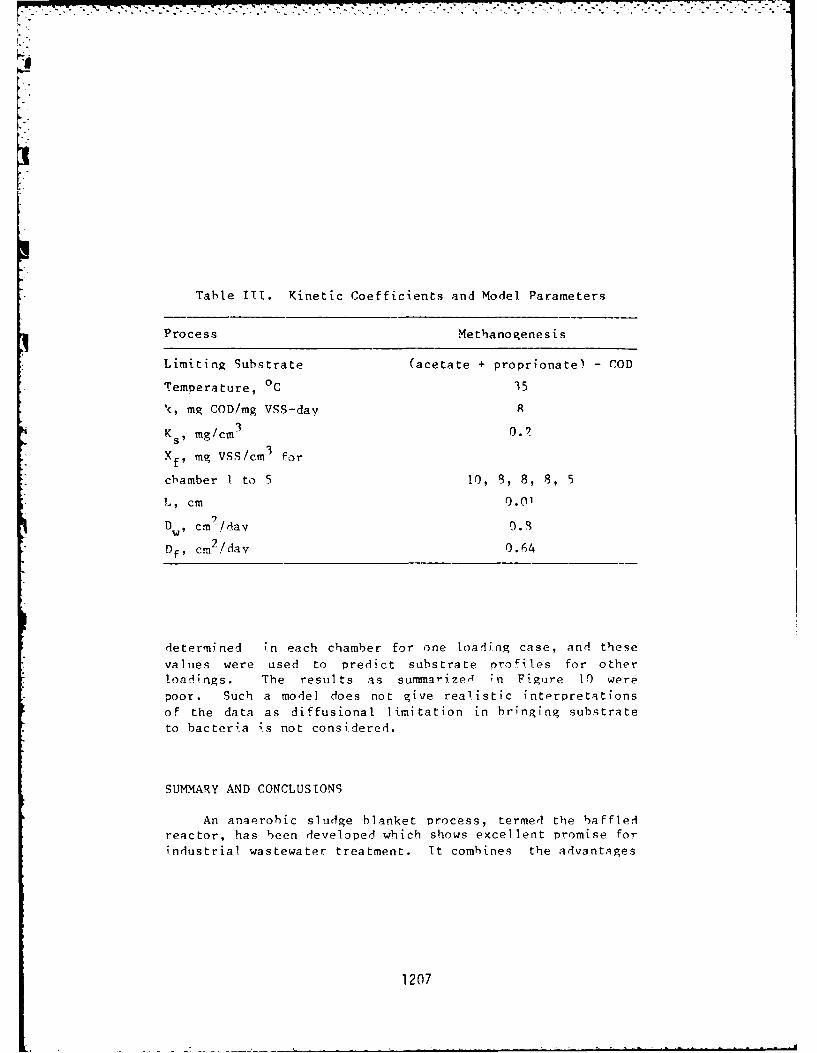
a1
Table ItI. Kinetic Coefficients and Model Parameters
Process Methanogenesis
Limiting Substrate (acetate + proprionate) - COD
Temperature, °C 35
k, mg COD/mg VSS-day 8
Ks, mg/cm3 0."
Xf, mg VSS/cm 3 For
chamber I to 5 10, 3, 8, 8, 5
L, cm 0.01
D , cm !day 0.,S
Df, cm 2 dav 0.64
determined in each chamber for one loading case, and these
values were used to predict substrate proFi les for otherloadings. The results as summarize,4 in Figure 10 were
poor. Such a model does not give realistic interpretationsof the data as diffusional limitation in brining substrateto bacteria is not considered.
SUMMARY AND CONCLUSIONS
An anaerobic sludge blanket process, termed the baffledreactor, has been developed which shows excellent promise for
industrial wastewater treatment. It combines the advantages
1207
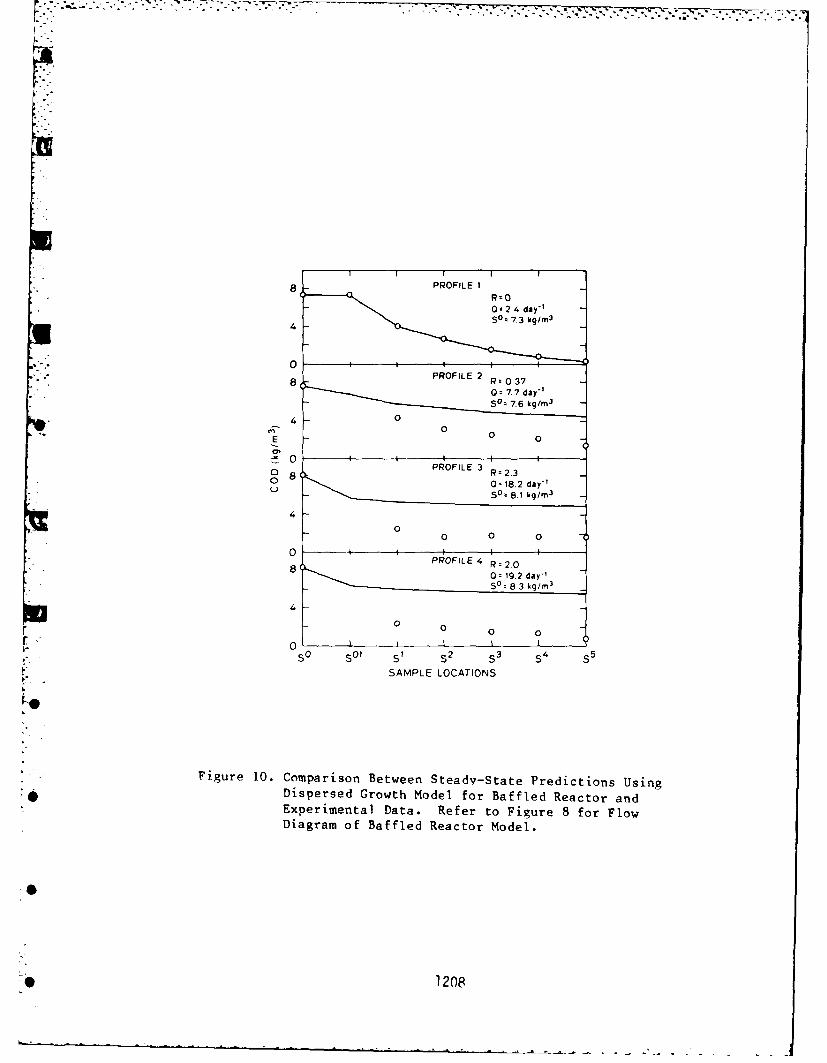
.2-1
8 PROFILE 1ROO= 2.4 day*?
4So= 73 k9 lm3
S 7.6 kg/m 30
4
E 0 0
PROFILE 3R= 2,30 O : 18.2 day
"1
U . ,SO
8.1 kg/rn3
0 0 0 0
PROFILE 4 R - 2.048L
0 0 0 0
0 1 1 1 1
sO So l 51 S2 S3 S4 S 5
SAMPLE LOCATIONS
Figure 10. Comparison Between Steady-State Predictions UsingDispersed Growth Model for Baffled Reactor andExperimental Data. Refer to Figure 8 for FlowDiagram of Baffled Reactor Model.
*O 1208
of the anaerobic filter (3), which has a high stability andreliability due to attachment of the biological solids ontoand between the filter media, and the upflow anaerobic sludgeprocess (5) in which the microbial mass itself functions asthe support medium for organism attachment, leading to a highvoid volume.
The baffled reactor's construction, however, avoidscertain significant limitations of these other reactors.Specifically, the risk of clogging and the risk of sludge bedexnansion with resulting high microbial losses have beenminimized. The baffled reactor maintains a high void volumewithout the need of expensive and operationally workintensive gas collection systems or sludge separationsystems. The over and under liquid flow reduces bacterialwashout considerably, and does not require unusual settlingDroperties for the microbial. culture./'
Although scale up factors are diffh-ciit to predict, theinfluence of gas stirring will he more important in largereactors due to the fact that gas is produced throughout thewhole column height in the reactor. This should lead togreater evolution of gas per unit horizontal cross-sectionalarea, leading to more complete mixing in the upper portion ofthe chamber. It should also result in greater turbulence andresulting increase in mass transfer rates. These aspectsshould lead to better efficiencies in large scale reactors.However, other scale factors may decrease these advantages.Thus, large scale experiments are now needed for betterevaluation of the baffled reactor patented.
The biofil.m model appears to be generally applicable tosludge blanket reactors. This suggest a unified approach canbe used in modeling several of the high rate anaerobicreactors. This aspect is of importance as the model is ableto predict the performance from fundamentals of bacterialkinetics and mass transport. Although this preliminary workseems promising, future research is needed to confirm theseobservations and to better include effects of turbulence onmass transfer rates to biofilms.
ACKNOWLEDOGEMENTS
This research was supported by Research Sub-Grant No.XR-9-8174-1 from the Solar Energy Research Institute, adivision of Midwest Research Institute.
1209
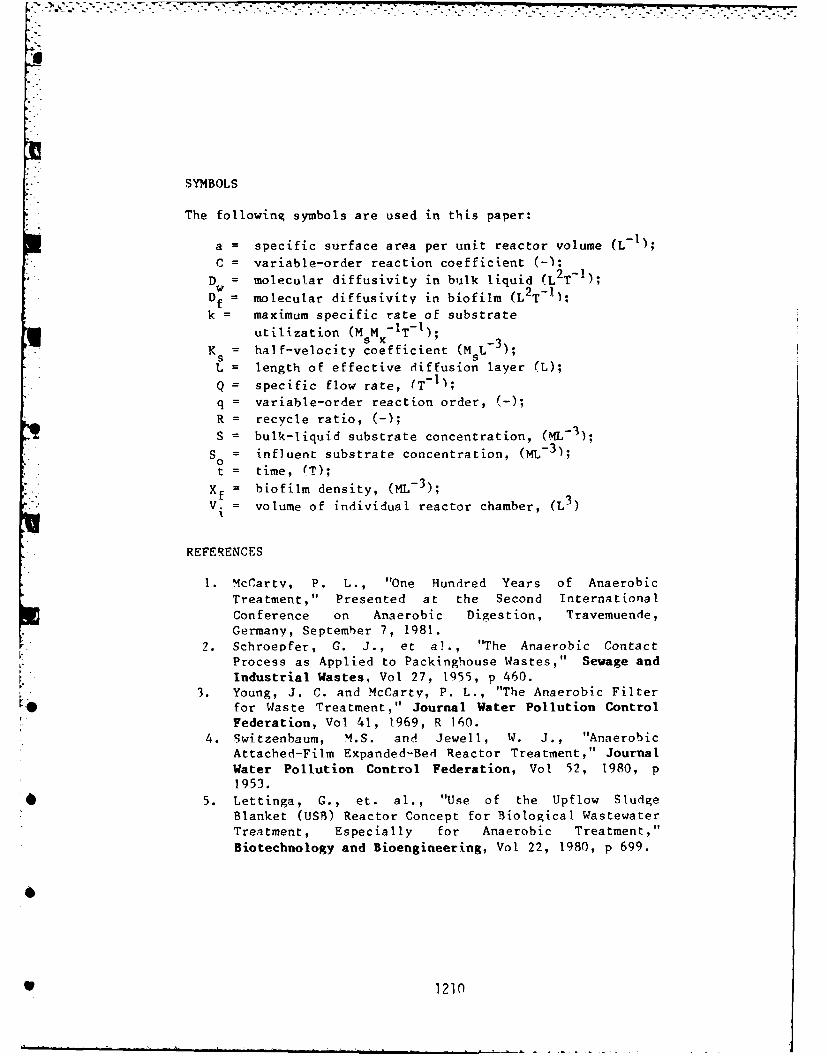
SYMBOLS
The following symbols are used in this paper:
a = specific surface area per unit reactor volume (L-l);C = variable-order reaction coefficient (-);
D = molecular diffusivity in bulk liquid (L2T-1 );Df = molecular diffusivity in biofilm (L2T-
k maximum specific rate of substrateutilization (M MX-IT-I);
K = half-velocity coefficient CM L')35 5L = length of effective diffusion layer (L);
Q = specific flow rate, (T-I);
q = variable-order reaction order, (-);R = recycle ratio, (-);
S bulk-liquid substrate concentration, (ML-3 );
so = influent substrate concentration, (ML-3);t = time, (T);
Xf = biofilm density, (ML-3 );V. = volume of individual reactor chamber, (L)
REFERENCES
1. McCarty, P. L., "One Hundred Years of AnaerobicTreatment," Presented at the Second InternationalConference on Anaerobic Digestion, Travemuende,
Germany, September 7, 1981.
2. Schroepfer, G. J., et al., "The Anaerobic ContactProcess as Applied to Packinghouse Wastes," Sewage andIndustrial Wastes, Vol 27, 1955, p 460.
3. Young, J. C. and McCarty, P. L., "The Anaerobic Filterfor Waste Treatment," Journal Water Pollution ControlFederation, Vol 41, 1969, R 160.
4. Switzenbaum, M.S. and Jewell, W. J., "AnaerobicAttached-Film Expanded-Bed Reactor Treatment," Journal
Water Pollution Control Federation, Vol 52, 1980, p1953.
* 5. Lettinga, G., et. al., "Use of the Upflow SludgeBlanket (USB) Reactor Concept for Biological WastewaterTreatment, Especially for Anaerobic Treatment,"
Biotechnology and Bioengineering, Vol 22, 1980, p 699.
* 1210
SI
6. Jennet, J. C., and Dennis, N. D., Jr., "AnaerobicFilter Treatment of Pharmaceutical Waste," JournalWater Pollution Control Federation, Vol 47, 1975, p104.
7. Baugh, K. D., et. al., "Characterization and MethaneFermentation of Soluble Products from StagedAutohydrolysi.s of Wood," Proceedings of the ThirdSymposium on Biotechnology in Energy Production andConservation, Tennessee, 1981.
8. Tait, S. J.. and Friedman, A. A., "Anaerobic RotatingBiological Contactor for Carbonaceous Wastewaters,"Journal Water Pollution Control Federation, Vol 52,1980, pp. 2251.
Q. Standard Methods for the Examination of Water andWastewater. 14th ed., American Public HealthAssociation, New York, NY 1975.
10. Heerties, P. M. and Van Der Meer, R. R., "Dynamics ofLiquid Flow in an Up-flow Reactor Used for AnaerobicTreatment of Wastewater," Biotechnology andBioengineering, Vol 20, 1978, pp 1577-1594.
11. Frostell, B., "Anaerobic treatment in a sludge bedsystem compared with a filter system," Journal WaterPollution Control Federation, Vol 53, 1981, p 216.
12. Williamson, K. and McCarty, P. L., "A Model ofSubstrate Utilization by Bacterial Films," JournalWater Pollution Control Federation, Vol 48, 1976, p 9.
13. Rittmann, B. E., and McCarty, P. L., "Variable-OrderModel of Bacterial-Film Kinetics," Journal of theEnvironmental Engineering Division, ASCE, Vol 104, No.EE5, Proc. Paper 14067, 1978, pp 889-900.
14. Rittmann, B. E. and McCarty, P. L., "Desig,-, of Fixed-Film Process with Steady-State-Biofilm Model," Progressin Water Technology, Vol 12, 1980, pp 271-281.
15. Lawrence, L. A. and McCarty, P. L., "Kinetics ofMethane Fermentation in Anaerobic Treatment," JournalWater Pollution Control Federation, Vol 41, 1969, R1.
16. Williamson, K. J., "The Kinetics of Substrate
Utilization by Bacterial Films," Ph.D. thesis presentedto Stanford University, Stanford, California, 1Q73.
17. Williamson, K. J., and Chung, T. M., "Dual Limitationof Substrate Utilization Kinetics Within BacterialFilms," presented at March 19, 1975, 49th NationalMeeting of the American Institute of ChemicalEngineers, Houston, Texas.
1211
PART XI: AEROBIC AND ANAEROBIC TREATMENT-SUBMERGED MEDIAREACTORS
TREATMENT OF HIGH-STRENGTH ORGANIC WASTES BY SUBMERGEDa>'.MEDIA AN4AEROBIC REACTORS* o STATE-OF-THE-ART REVIEW
0 Yeun C. Wu, Department of Civil Enqineering, Universityof Pittsburgh, Penna
C>W John C. Kennedy, Department of Civil Engineering, University
of Pittsburgh, PennaA. F. Gaudy, Jr., Department of Civil Engineering,
University of Delaware, Newark, DelawareMCC Ed. D. Smith, Environmental Division, U. S. Army
Construction Engineering Research Lab
INTRODUCTION
The anaerobic filter is basically an oxygen-free, media-filled bed reactor. Anaerobes grow not only in the voidspaces between the media but also on the entire surface ofthe media. The wastewater can bWe distributed from the top(stationary type reactor) or it can be fed across the bottomof the filter (suspended type reactor) . The latter type, theupf low reactor, is more popular than the downflow reactor.However, both reactors have completely submerged filter mediathat is arranged in either a packed bed or fluidized bed(Figure 1).
If anaerobic filters are classified on the basis offlow pattern, there are two main types: plug flow and com-plete mix. When the wastewater passes through an anaerobicplug-flow filter reactor, the pH decreases initially as aresult of acid fermentation, and then increases in thedirection of the process flow, due to the biological removalof the generated fatty acids, formation of ammonia andreduction of sulfates. Since the acidic pH in the bottom
* 1212
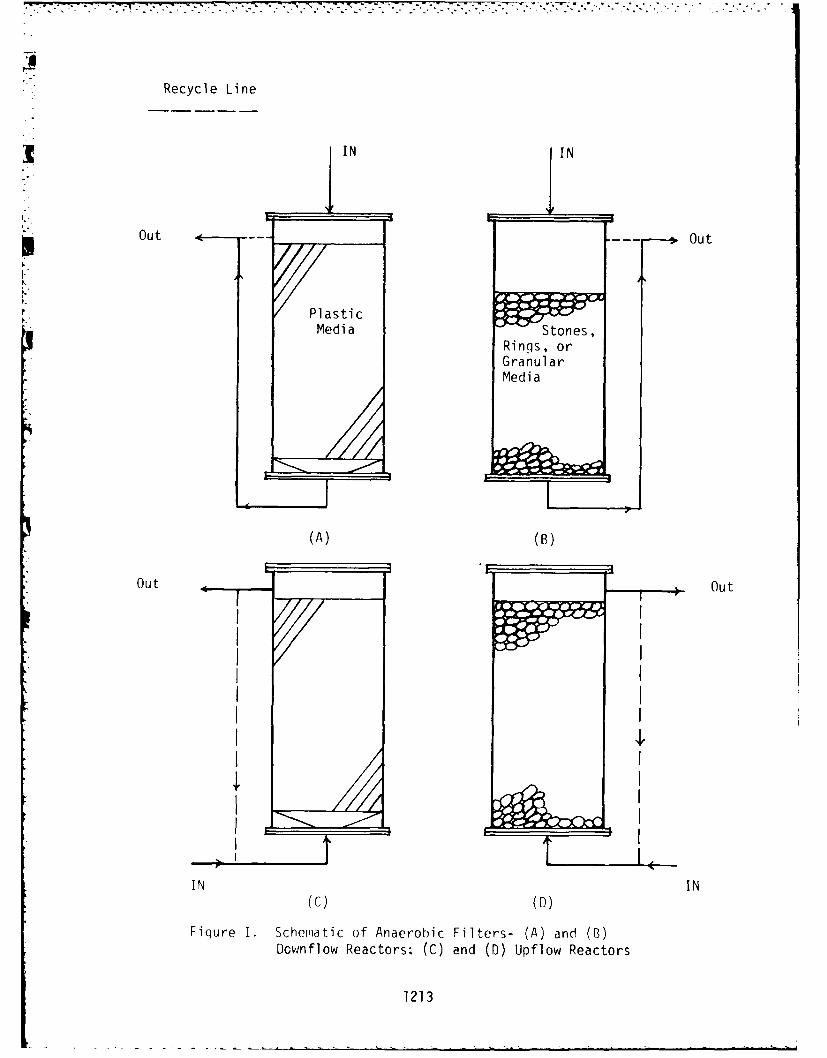
Recycle Line
IIN JIN
Out 0. Out
PlasticMedia Stones,
Rings, orGranularMedia
(A) (B)
Out Out
IN IN(C) (D)
Figure 1. Schem~atic of Anaerobic Filters- (A) and (B3)Downflow Reactors; (C) and (D) Upflow Reactors
1213
section of the filter can potentially inhibit the methane-
forming bacteria, substantial amounts of buffer solutionsare added to the influent waste stream to prevent such pHdecreases.
A completely mixed anaerobic filter would not experiencethe pH decrease observed in plug-flow units, since themixing maintains a fairly uniform pH throughout the depth ofthe filter. The mixing of the filter is achieved by recir-culating theeffluent into the filter at a large recycle: feedratio. This in turn would eliminate the need for addingcostly buffer solutions. If the effluent has a sufficientbicarbonate buffer capacity, it is even able to neutralizefeed solutions with an acidic pH.
The decomposition of waste water by the anaerobicfilter has traditionally been considered to involve twostages. In the first stage, complex materials such as fats,proteins, and carbohydrates (COD) are hydrolyzed, fermented,and converted to simple organic acids and alcohols byfacultative and anaerobic acid-forming bacteria. There is nowaste stabilization during the first step because there is nomethane production. Waste stabilization occurs in the secondstage when the volatile organic acids are converted to carbondioxide and methane by a special group of bacteria termed themethane farmers. The methanogens are the most important groupof bacteria because they carry out the final step in theoverall process. They have slow growth rates and theirmetabolism is usually considered rate-limiting in theanaerobic stabilization of waste. However, the success ofthe process is dependent on the presence of bath acid-producing and methane-producing bacteria, with the gas produc-tion stage responsible for stabilization of the organicmaterials.
Figure 2 represents the overall process of anaerobicdigestion according to the traditional concept. While thedistribution of carbon through the various types of inter-mediates may be correct, it is now recognized that the
* methane-forming bacteria do not utilize a variety of organicacids as substrate. Methane is farmed from acetic acid, formicacid, co 2 and H 2. Thus, the methane fermentation occurs only
* 1214
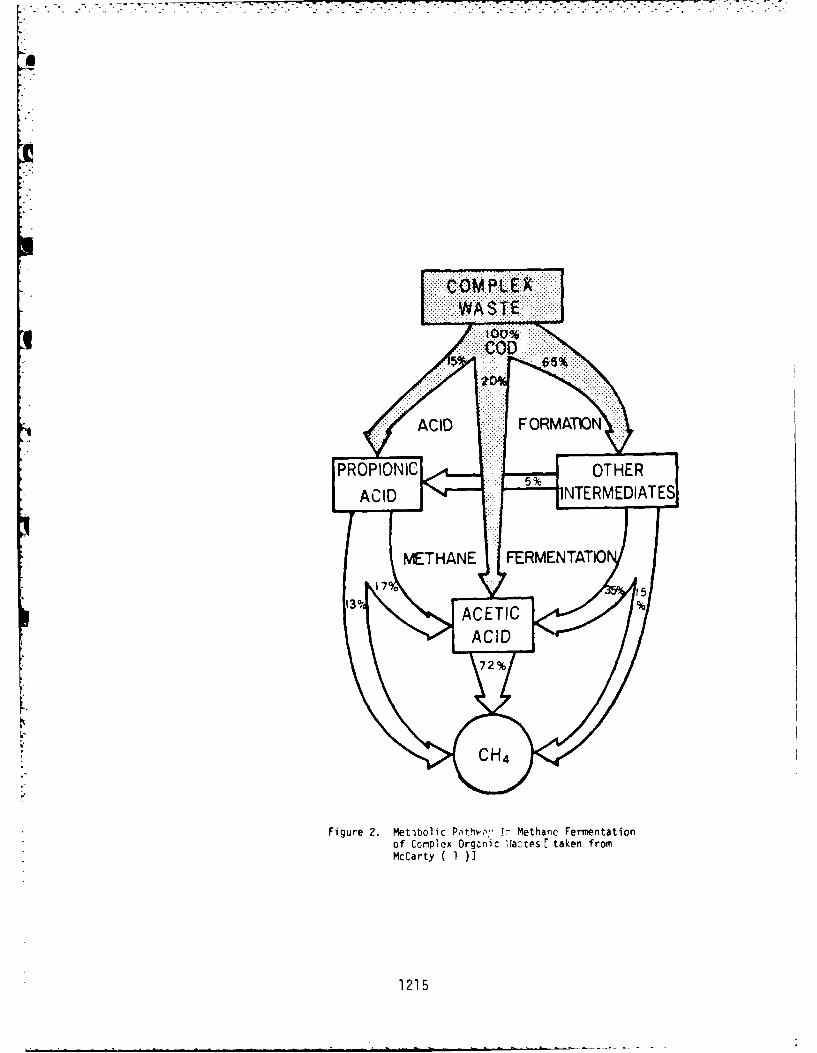
ACIDNTEWAIEIAT
ACI
Figure 2. Met.Tholic Pnth%.,o, !' Methane Fermentationof Conplax Orgenic laztps taken fromMcCarty I )l
1215
47.
in the lower part of the figure and other organisms areresponsible for the center portion, i.e., the conversion ofvarious low-molecular weight acids and alcohols to the sub-strates useable by the methane-formers.
A major advantage of the anaerobic filter is its abilityto produce methane gas. In general, the percentage of methanein the gas evolved from the filter is between 70 and 80%.
Theoretically this gas could be used to heat the incomingwastewater or the reactor, thus increasing the efficiency ofthe filter and decreasing power requirements. The abilityto use the methane gas in this way will depend on the quantity
* .~ of gas produced. The volume of methane gas produced is*approximately 4.3 to 8.0 ft 3 per lb COD stabilized.
The major factors influencing anaerobic filter performanceinclude organic loading, hydraulic detention time, temperature,pH, alkalinity, wastewater characteristics, flow pattern, andtype of filter media. These physical and chemical controllingfactors generally have the same effects on the anaerobicfilter as on the conventional suspended-growth anaerobicdigestion system, except that the fixed-film anaerobic filter
can be operated with higher organic loading, CO)D:N:P ratio,and metal concentrations.
Start-up of an anaerobic filter probably is the mostdifficult period of operation. Start-up times in exnerimental
full-scale units have ranged from 10 to 180 days, with theshorter times corresponding to the use of large amounts ofactive seed while the longer times were associated with theuse of light seeding.
Analysis of the action of the process during start-uphas indicated three factors of imnortance. First, the slow
* growth of anaerobic micro-organisms, especially at lowwaste concentrations and at temperatures below 301C, doesnot permit rapid build-up of biological solids. Consequently,a large seed mass is needed for rapid start-up. Secondly,decreases in the buffering capacity of the waste, so that thepH drons below about 6.5 at any point within the filter for
* even short periods of time, increases the starting timesignificantly. A third factor affecting start-up time isrelated to the physical characteristics of the biological
* 121 F
, ,: ... . - <:< - ,. - / .i_: ' ' -. ... i - . '. -. .- > .. .-.- " -<
suspended solids within the filter. During the early stagesof operation a significant fraction of the biological solidsremain finely dispersed throughout the liquid phase and asignificant proportion washes out with the filter effluent.At some time after initial seeding , flocculation of thebiological solids occurs in the filter and the solids washoutrate decreases, thereby increasing both the rate of activebiological solids accumulation and the rate of waste treatment.
The optimum method of seeding a filter is not known.Large seed volumes help to start the filter more rapidly byproviding a large viable microbial population, and the largeamounts of suspended solids help to promote the surfaceadhesion and flocculation which seem to be essential to goodoperation. However, using large seed volumes may also con-tribute significant amounts of volatile and non-volatilesolids which tend to plug the filter and reduce its effective-ness for treating wastes.
CASE HISTORIES
Upflow anaerobic filters have been built in Englandsince 1876 to purify sewage but the organic removal was mainlythought to be due to adsorption (2). Coulter, et al. (3) andWitherow, et al. (4) employed an anaerobic rock filterfollowing an anaerobic sludge contactor. The combined processesproduced a 65% reduction of BOD with most of it occurringin the first unit. Winneberger et al. (5) employed ananaerobic filter following a septic tank and noted a 65%BOD removal and a 70% suspended solids removal at a 5-daydetention time. Research on anaerobic filters was publishedin 1968 by Young and McCarty (6). Loadings ran ing from26.5 lb COD/day/1000 cubic feet (0.424 kg/day/m* to
212 lb COD/day/1000 cubic feet (3.392 kg/day/m3 ) were testedwith theoretical detention times from 5.4 to 72 hours. COD
removals ranged from 68% to 98%. Young and McCarty found that,at the same organic loading, the percentage of COD removalincreased when the concentration of the influent COD increased.
*Kg COD/day/m = 0.016 lb COD/day/100l ft3
1217
a7
Ham and Boyle (7) found that anaerobic treatment couldeffectively stabilize a raw leachate of approximately 10,000
mg/l COD with a detention time of 10 days and loading less
than 32 lb COD/day/1000 cubic feet (0.512 kg/day/m 3 ). Thissystem reduced COD by about 90%. A system with a 12.5-daydetention time and loading of 13.0 lb COD/day/1000 cubic feet(0.208 kg/day/m 3) increased the COD removal efficiency to93%. Foree and Reid (8) obtained a COD reduction of 96% forleachate with a COD of 12,900 mg/l. They obtained a higherdegree of treatment at a loading of 80.2 lb COD/day/1000 cubicfeet (1.283 kg/day/m3). Chian and DeWalle (9) concluded thata high strength wastewater with an acidic pH can be success-
fully treated using a completely mixed anaerobic filter. Table1 summarizes results of studies done with anaerobic filters.
Anaerobic treatment processes are very effective inremoving heavy metals from waste streams by adsorption andprecipitation. Digester studies have shown that heavv mete'sare present primarily in the solid phase as opposed to theaqueous phase. High metal removals result from the separationof the solids. A municipal digester study by Rudgal (32)found the influent copper concentration at 226 mg/l while theconcentration in the effluent supernatant was 11 mg/l. Theconcentration in the sludge was as high as 500 mg/l. Chianet ai. (33) investigated the anaerobic filter and obtained upto 95.5,, metal removal. When these removals were calculatedwith respect to soluble concentrations, the percentage increasedto 97.1%. This indicates that significant quantities of heavymetals are associated with the suspended solids leaving thefilter. They concluded that their completely mixed anaerobicfilter was effective in removing heavy metals. And as themetal concentrations increased in the effluent, the effective-hess of the filter increased. The metals are removed fromthe filter as a slurry in the bottom of the filter as they
* precipitate. They also indicated that with decreasing hydraulicdetention time the metal removal percentage decreased whilethe metal content in the bottom slurry increased.
SOLIDS PRODUCTION AND EFFLUENT CHARACTERISTICS
O A remarkable advantage of the anaerobic filter is itsability to retfin active bioloqical solids for long periori4sof time, There is a continual build-up of solids in the
1218L
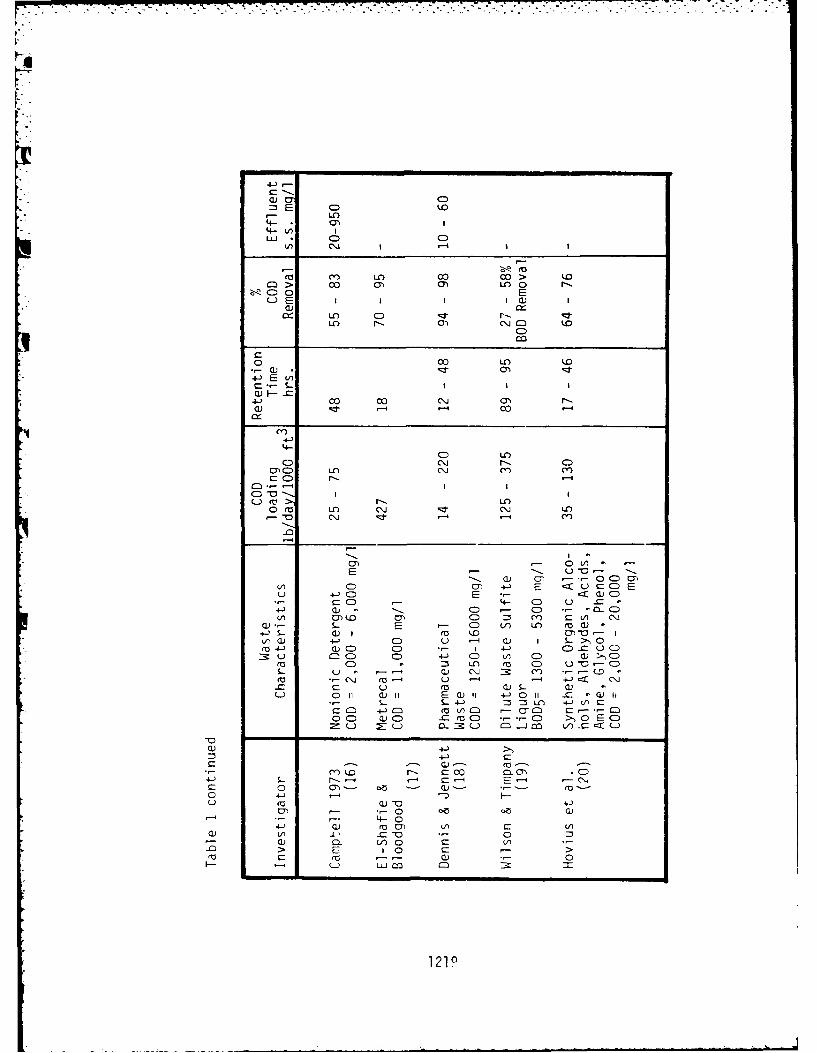
4--
E CD- Ln
(4-4-(uJ * CD CD
m LO 00 00 > to0C' > 00 o 0) LAO) r-.
SC) 0 E
LO CD ~ --LA r- al CNj CD .
0 00 LO .
a) F- -
4-
4-C) LO
CD AUj r- CD0) C) Ln AU)cCD) N-
E U
-. ~ ~ a)0 -- C) 0)() CD C0) 4-' E :ru CD)E
u 4~CD E cz ~ a) CD
CC) 4- C) u _sC
0- ) .. -. ) C) M-* C
a)S- E - C) Ln, LA ev a)+)a) ro .0 0 0')0- I
(/ CU 4-' CD u w~ a) I ->CO -' a) C) CD ' 4-' C)C uC)D
:gu C'CD CD 4-) CD '.n C) a)>,CD(0 C) :3 Ln ro CD U-0 ()&.- U * - -4 a) AUi :: C' *- CDm0 .- C\j (0-' U -4 -'l C\j
_sC: u (a a) S- aioi11 a1)II E a)ii 4-'0I C1 (3.)
S.- S-4-) Z3 Lr 4- 0Ccm' 4- C) (0a nC' -07CD C- -- CM
0 CD a) -C M5C) *,- -C) > 0E ()a- -: L) m) 0i V) -C CIc J c
a) 4-)
-'S.- r- C-4 w4 C'' -Ac0 G)- z (3 a)- .r-
C7)a)'4-0
4-' a VO L/, (Aa3) Ln -C C0 0D
-a) V) 0A C'> E 10 C >(0 ro -'- ) -0
F-J COC C'
1219
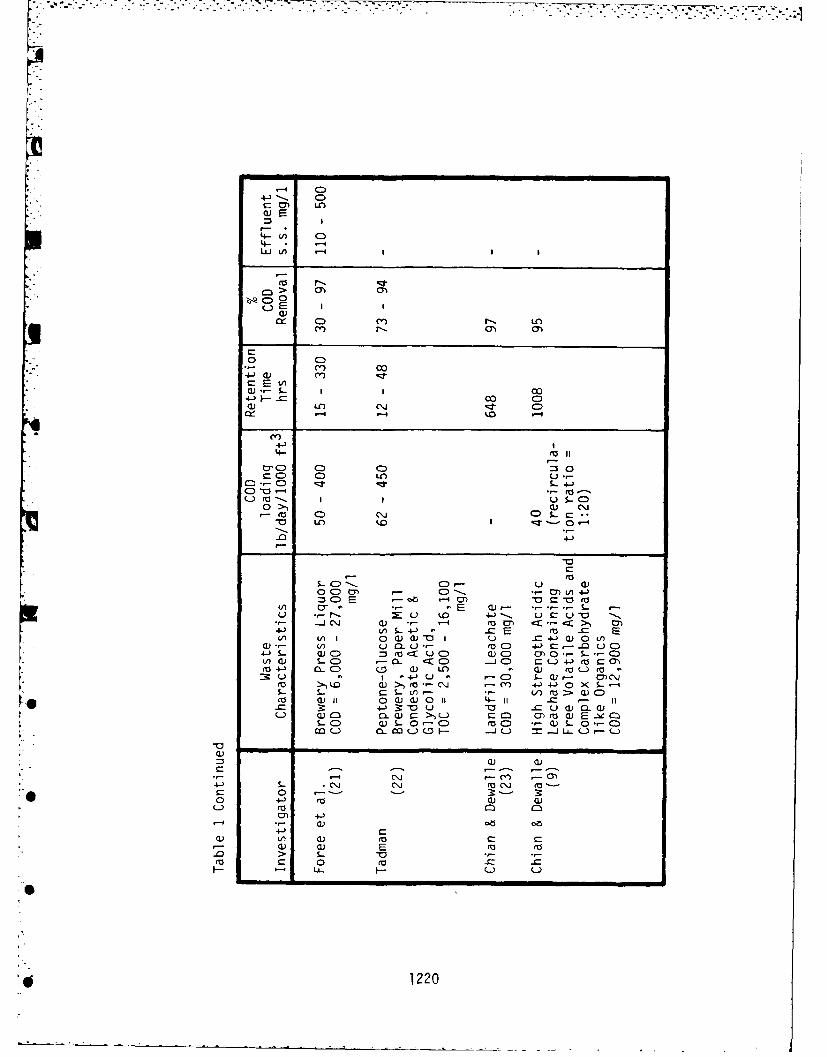
WE
4.-LA c04-. -4
4C3> al CN -. L
CEor C) Co
CY) LA O'sg
0. -4
4-- a (
oQ 0 0- 0
0- _I_ 0 C)ai LO '.0 KI C
CYC
0, ~ C- C- C C)00c -) C) LOL)
M A o *E C .- C.- -)-SU *.0N- S-0 C)*.. U UO
o .>) \ (3) *. .4 '~* j
4- O CAS.T- -C 0 -4
4-)5- W ~ C~U0 WO 0) 4-).~
S-J C: a) .
0 C-' 0) C) ) 4 -C) E CMc0 0(
X: Q+L 4)-- L Cu1*'- C j ()- o 0) . * I 0
4-)' Cn S 3 -- u -0C( dA -0 C -C 4))0(
C). (.) CLE o C #- - - )C4-) S- (L) *D,- uC ) n0. -C
S- L- C - LI Lr :: )C
eoS )0 1 -1 C - I
-C _-c -~10 u C u a La
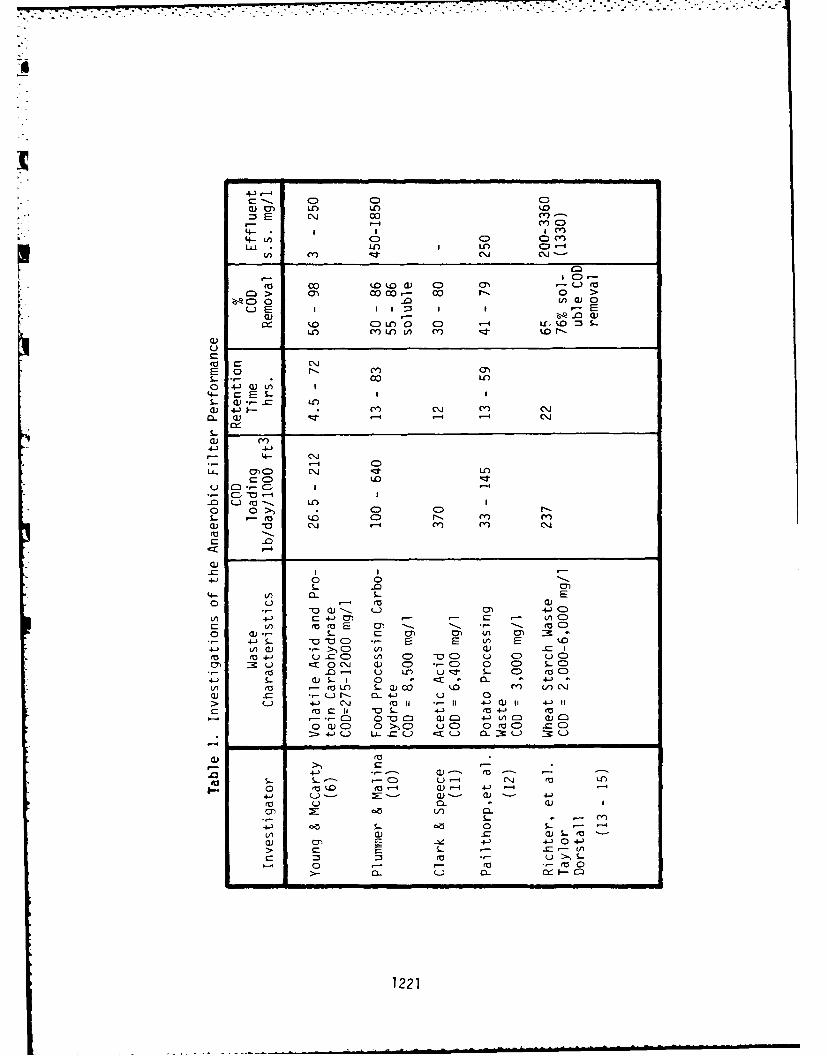
c.. C: C CW ~ LA LO kof
4--IL U- I O =I-
C)
m > moo CO0 o r. 0 >
a) o 0
a) Q
0:C~
2 o N.)S.- .- 00 LAo 4- QU
4- c: E I-S.- (V .- -= LA0) 4--- mC\j mC\J
a- (V ____
- 4-)4-
L- ). C A I~ zr
- U. m LO0) 0~ C'. C)
'00C- -0
-0 (I I 4- D4-' 0- 0J0L)C
V) OaF ) 1 aCD S- ca C0)0
L4-) ( )0 ) Aa -(o 4-) Li~ -CD (n C - C) u -C) C
uC ~ 'ara (31 C.. .-. C) 0 .C) 0Coo w-- S. u Lr - C) m CD C
S.- a) S- 0- 2 < ' 4- '
4. L-) -) >) LI) m 0. 1 4)Q) 1 -j I(0 S04- 4CO MI 4- (oUC) u
O0 cu CQ( 0) C0 u C) 0 0aC -CD40-) LA U'C u C- :9 C- : L.
4-' to. 0)5.- 0i -- 4-04-
0)~a .0 a(.)N 4-)' U
4..) ~ ~ L/ CL Ol 1 4')I -
4- S-I vL - (4' '
o) a)- '0S tcu E 44 -
>0 4- J- ) 0 -- - 0
'a~ ~~~ >, S-.0-' ') 0L0 (OL fu3 0)- -
'0 U 0- * 0
1221
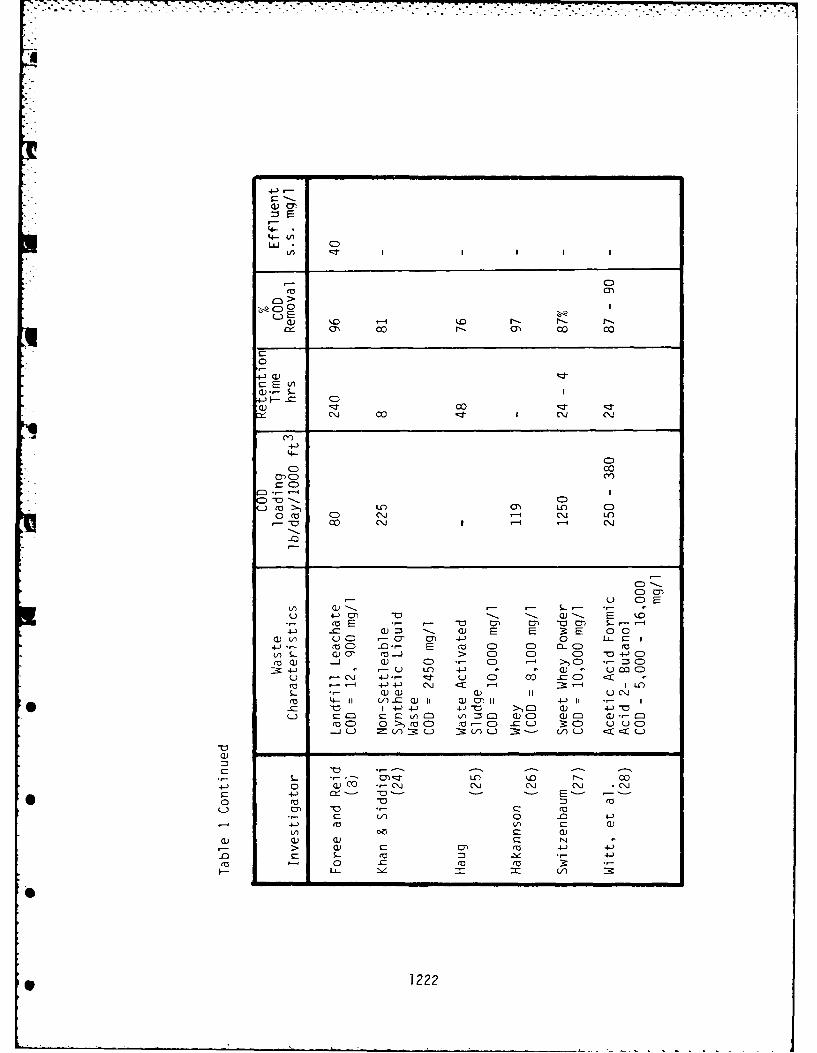
C3 E
4-.4- (ALI
ro 0)0>
0 )k
a)
0r0
C')4.)4-
0cC)o 00
0(D 0- C\J -1 (
CD _0- -- I C)'- *
(1E >) VO L)01 V) C)
Wl 0 ) 4-) 0~ ~ L C
4J ~ ~ ~ ~ ~ C CU 0*7 U CO
(ASE EC (UJ E 0 4.0uUi C) ~ 4--) 0 *r- C0 '- ,0
r-U > 4 ) C: Dw +j UCD
u -C\i 4-)-- cz U CD c 00 <(o 4-) -) C') <Z '-1 3:-4 1 U-S.. a a) a) 11 UC"J
4U~ -u V.) -C W WU1a)0)II -4-'l 11 -
C) CD M~l V)D =3 CM W-'-D ICD aj C(U0C 0 >,UoC) 1 (-0 .0'I-_.) :3 C L U C
W7D
S- *.-' Oa- r-_ coo. 0~ wC *-C. C') C') .C\J
*0 ro V (
c- V)i 0 -0 4.-34-) (D (A C i
> ci) c 0) (U 4-)' -0C S.- cc - e 4-)(U0 .0 3; (
1222
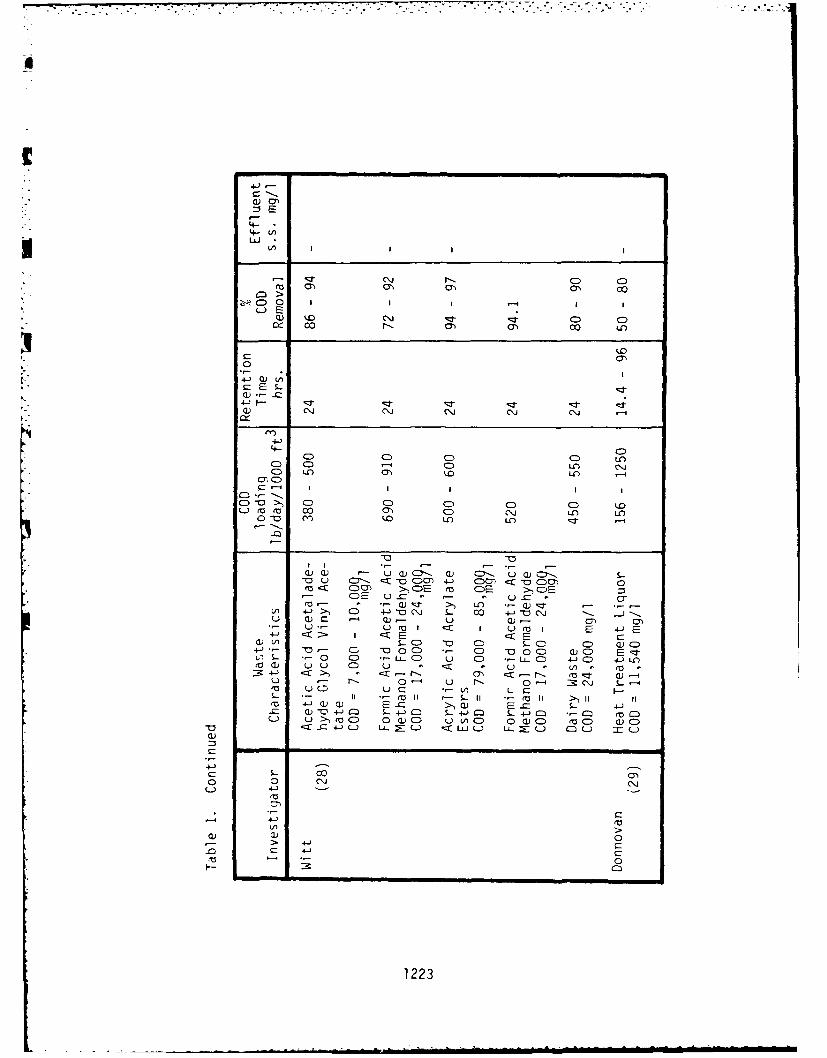
4-)-
4- unL*
Q)i r-.(J ~ C) C)
ak 00 c-m0o L
r4-) a) (A
4-) .,- Zz :0) ('U C\J (Nj ('U ('U
4-J4- C)C) C) CD C) LC:) C) '-4 C) (N Ci
~CD
CD- CD CD C C) C) .L-) (NJ m~ co0If)jLn
C) 0 cn) Lo0 U') IC)O
u a) CD- cu CI- )CIlS
-0 u C7-. cZ -0 CD)0 4-) CDC) -c -0 C)D, o(z:C C3O' >, CD) ro CDFE >, CD)C) E u c - - ..- C
(A 4- ) C) 4- 0 CU - 00 4 -0 CU -
U -' 0)- r 0) r- ,) 4-)<ur u 'o I I L) E
4-) cz: E Ia)LnS-C) -a CD) S LC- C) W)C)4-1~ -v- 7 - 0 (C:) r CD 0 oC) CUC) E z-
.1 5- 0 C:) -- L.L CD u C) -- -LCD 4-.)CD 4-) LOa) U'... CD U u U (A (4-3 <z <c M :Z: ~-r- CO- wu -T 0- U~ Q- ~Cj S.-4ro U( UC 'U . t C
ro 4-W - - -o) -0-C) S L4-jC) S- 4- C M -- C *,C) vCC.. U>,ro C) 0W) u (ACD 0 () roC) a) C
- .4-)L) LJ 2:C)<. -)L LJL-L) C) L-)
4-' -
o 0 C~J (Nj
-> 4- - (
F- > 3 4-'
1223
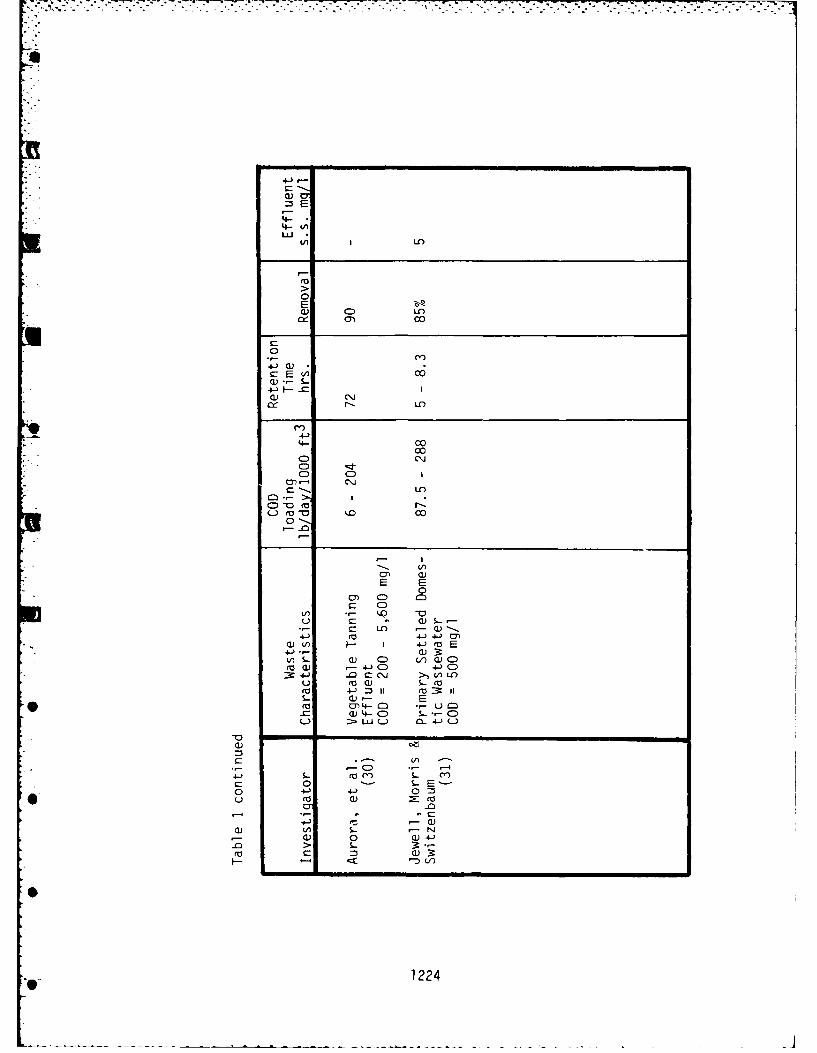
4- LnLiiO
E0) C LO
or 0 0
0
E C6,4.) 1
0) C\Jor. LO
4- coc"J
CD CiCDJ
CC--
- o 0 10
CD Im
C)
SSr_ LOQm0-)4-
0v
4-
n a)224V C
__ _ _ _ __ P_ C)4-)C
-.
filter due to biological synthesis and no appreciable lossoccurs until the filter becomes filled with highly concentratedbiological solids. The filter can be operated for long periodsof time before sludge wasting is needed because a low percentageof the COD removed is synthesized into biological solids. Amaterial balance done by Chian and DeWalle (9) indicated that93% of the COD removed could be accounted for by the methanegas formed.
Observation of the physical characteristics of the sludgewithin the filter indicates that the solids lie loosely inthe interstitial spaces rather than becoming attached to thesurface of the media. Plummier et al. (10) noted that solidsin their filter units were not attached strongly to themedia or to the sides of the unit.
It has been recognized that several factors determine theamount of solids leaving the anaerobic filter. Dennis andJennett (18) observed that the solids concentration was mainlydetermined by the hydraulic detention time. Young and McCarty(6) observed a gradual accumulation of solids in the anaerobicfilter, during which time the effluent suspended solids remainedlow. Only after the filter reached its maximum storage capacitywould the effluent solids show an increase. When the influentwaste contains solids, no net removal may be observed. Inaddition, it is noted that the porosity of the filter may havea large effect on the solids concentration which is to be expectedsince a lower void ratio will increase the collision frequencybetween the solids and the filter media.
The effluent characteristics cannot be categorized forall anaerobic filters. The properties of the effluent will bedependent on on-site conditions such as influcont concentrationsand loading rate. Most effluents contain a rather low concentra-tion of susponded solids, a portion of which is readily settle-able. All filters will have an effluent with a very lowdissolved oxygen content. This is a disadvantage of the filterbecause the effluent cannot be discharged to the environmentuntil the D.O. is raised to minimum requirements. The pH ofmost reactor effluents should range between 7.0 and 9.0.
1225
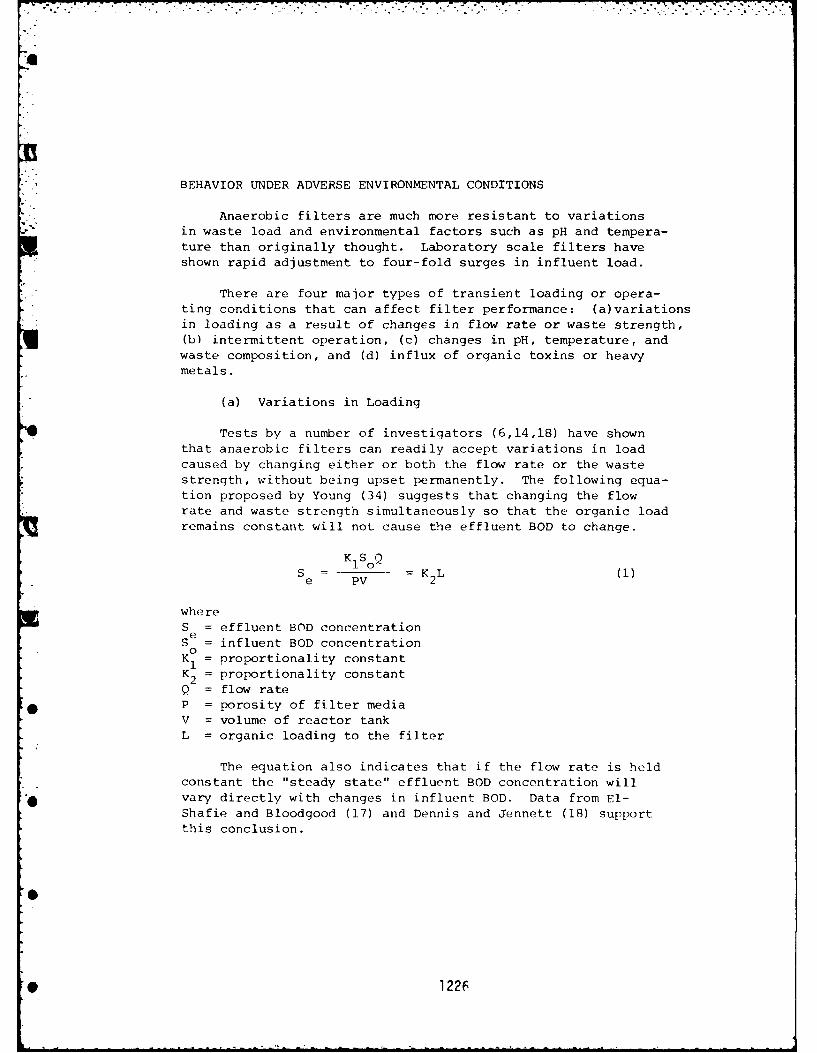
a
BEHAVIOR UNDER ADVERSE ENVIRONMENTAL CONDITIONS
Anaerobic filters are much more resistant to variationsin waste load and environmental factors such as pH and tempera-
ture than originally thought. Laboratory scale filters haveshown rapid adjustment to four-fold surges in influent load.
There are four major types of transient loading or opera-
ting conditions that can affect filter performance: (a)variations
in loading as a result of changes in flow rate or waste strength,
(b) intermittent operation, (c) changes in pH, temperature, andwaste composition, and (d) influx of organic toxins or heavy
metals.
(a) Variations in Loading
ITests by a number of investigators (6,14,18) have shownthat anaerobic filters can readily accept variations in load
caused by changing either or both the flow rate or the waste
strength, without being upset permanently. The following equa-
tion proposed by Young (34) suggests that changing the flowrate and waste strength simultaneously so that the organic load
remains constant will not cause the effluent BOD to change.
S K = KL (1)e PV 2
where
S = effluent BOD concentrationS = influent BOD concentration
pK1 = proportionality constantK21 = proportionality constant
Q = flow rate* P = porosity of filter media
V = volume of reactor tankL = organic loading to the filter
The equation also indicates that if the flow rate is heldconstant the "steady state" effluent BOD concentration willvary directly with changes in influent BOD. Data from El-Shafie and Bloodgood (17) and Dennis and Jennett (18) supportthis conclusion.
*0 1226
Short-term loading increases having a duration of one ortwo hydraulic detention times can be expected to produce onlyslight, short-term changes in effluent quality or gas pro-duction. Long-term changes, however, will cause the COD andvolatile acid profiles, and the population dynamics and solidsconcentrations, to shift until a new "steady state" level ofperformance is reached. Four-fold instantaneous increases inloading have caused no permanent adverse effects on filterperformance.
Chian and DeWalle (9) tested their complete mix anaero-bic filter for its ability to withstand shock loads. When thedetention time, based on feed stream flow alone, was reducedfrom 42 to 7 days for a 1-day period, only a small change inthe pH was observed. The pH decreased from 7.2 to 6.9 whenthe detention time was reduced to 4.25 days for a 1-day period.The gas production did not show a corresponding increase, ashigh concentrations of organics were present in the effluentof the unit, which reduced the organic removal efficiencyto 54%. Solids in the filter were resuspended at the higherflow rates which was indicated by the large differences inthe values for the filtered and unfiltered COD and the increasein suspended solids. When the detention time was restoredto 42 days, after the shock load, the effluent COD and suspendedsolids concentrations returned to values only slightly higherthan those observed before the shock load. Based on thesetests, it was concluded that the buffer capacity of the unitis sufficient to r~revent large pH depressions at relativelyshort detention tim~es. However, at detention times as shortas three days, a large portion of the organics leave the unitin the effluent stream and the suspended solids experience anincrease.
(b) Intermittent operation
The second major type of operating condition that canaffect filter performance is intermittent operation. Thepossibility has been tested by nvestigators (6,18) bystopping all flow and load to filters for several days, asmight be used in practice for weekend operation, and therewas essentially no loss in COD removal capacity or gasproduction efficiency upon restarting at full load. After
1227
fourteen days of down-time without feed, the COD removalefficiency decreased to a greater extent, but full CODremoval capacity and gas production were achieved afteronly three to four days of operation. Longer periods withoutfeed might be expected to produce a low quality effluentfor quite a long period of time after restoring waste load.
(c) Changes in pH, Temperature, and Waste Composition
Anaerobic filters, once "steady state" operation isachieved, become quite resistant to pH changes. Rapidrecovery has been observed in filters exposed for a twelvehour period to pH levels as low as 5.4. Exposure to pH- levelsof 9.3 for as long as four days has caused only temporaryloss of treatment efficiency. while gas production and CODremoval were impaired at these extreme pH values, the filtersrecovered completely within one to two days after restoringpH to normal levels.
In general, anaerobic filters are expected to performbest at temperatures Qreater than 250 C. Filters have been
used successfully to treat potato processing wastes attemperatures as low as 190 C, but too little information isavailable from which to draw significant conclusions aboutthe effect of lower temperatures on filter performances.
Variations in waste composition are expected to producelittle adverse response in anaerobic filters unless there isan associated influx of toxic materials. However, thecomposition of the waste significantly affects the solidsproduced in the system. Biological solids will accumulatemuch faster when treating a carbohydrate waste because synthe-sis of biological solids is greatest with carbohydrates, andat high loadings problems such as plugging or solids washout
6 might be encountered. However, in studies to date, no filterhas been reported to have become plugged beyond use.
(d) Orcqanic Toxins or Heavy Metals
It has been generally assumed that anaerobic processesare unable to cope with waste streams containing toxicants andtherefore are unsuitable for treatment of mnany wastewaters.
* 1228
Toxicants do alter the kinetic parameters of methanogens andthus increase their generation time and decrease pollutantremoval efficiency. However, these adverse effects can be off-set by proper attention to solids retention time. Properacclimation procedures can also increase the threshold concen-tration of toxicants which cause inhibition. The magnitude ofthe toxic effect generated by a substance can be reduced sig-nificantly if the concentration is increased slowly. Thisinvolves a process of acclimation which represents the adjust-ment of the biological population to the adverse effect of the
toxin. The acclimation process in a mixed microbial popula-tion may involve any or all of three mechanisms: (1) mutationof one or more species in the population; (2) selection of the
- least sensitive species in the population; (3) alteration ofthe metabolism of one or more species to overcome the metabolicblock produced by the toxic material. All these mechanismsmay interact. In any case, resistance to a toxic substanceoften involves an increase in the concentration of the substancewhich can be tolerated rather than acquisition of total
resistance to the substance at any level. When the concentra-tion of a toxic substance is increased slowly, the microbialpopulation can acquire increased resistance through all of themechanisms available to it. However, if a large concentrationof toxic material is introduced suddenly, the effects are quitedifferent than when the same concentration is reached afteran adequate series of acclimations because no time is allowedfor any of the available mechanisms to operate, and most of thepopulation will be -troyed. In evaluating data from toxicitystudies for design i. rposes, the engineer should consider thetest conditions used and whether toxic materials may be intro-duced into the waste stream to be treated as a slug dose of
hiqh concentration or as a constant component to which apopulation may become acclimated. Speece, et al. (35) showed
that methanogenic bacteria could acclimate to toxicpnt con-centrations that were 100 times greater than the concentra-tions which caused inhibition of unacclimated cultures. Theyfnund that -'ontinuous increments of nickel chloride -ould be
added to the feed of a filter with no adverse effect on gasproduction. An increase from 200 to 400 mg/ldecreased gas production but it resumed when nickel additionswere stopped. They were able to acclimate the filter to asulfide concentration oF 1000 mg/l. Long term acclimation of
1220
a filter to increasing levels of continuous sodium addition
showed no adverse effect up to additions of 7500 mq/i as NaFormaldehyde added to the feed of the anaerobic filter causedno inhibition of gas production up to 400 mg/l. Additionallythey were able to acclimate the filter to 600 mg/l of acrylicacid and to acrolein at a concentration of 100 mg/l.
Parkin, et al. (36) found that cyanide and ammoniatoxicity were fairly reversible while chloroform, formalde-hyde and sulfide exhibited some irreversible toxicity. Nickelshowed signs of irreversible toxicity depending on the concen-tration.
The early warning of possible metal toxicity is given bya gradual decrease in gas production and an increase of theeffluent COD. This can be anticipated if strict attention isgiven to the influent wastewater so that the operator willknow if inhibitory concentrations of metal ions are enteringthe filter.
KINETIC ASPECTS
Because of high cell mass concentration and immobilization
of cells within the attached film, the substrate utilizationrates per unit volume of the biological reactor are high;displacement of the culture composing the film by inactive cellsin the influent to the reactor is less likely than displacementof a culture in dispersed/suspended growth, and a fixed-filmreactor is less susceptible to upset by shock loadings of sub-strate and/or toxic metals.
As a result of these advantages inherent in the attached-growth wastewater treatment systems, many researchers haveateomTted to model growth and substrate removal by biofilms.Earlier studies described the removal kinetics in terms of sub-strate concentration existing in the bulk liquid phase. Recentinvstigations have generally described substrate removalkintics in terms of simulated substrate concentrations in eachla',zr of the hiofilm. The response of the entire film is pre-dicted by the sum of layers. The most complete biofilm models
Swere developed by Williamson and McCarty (37) and Dewalle andChian (38) on the basis of two competing mechanisms, diffusion
*I 1230
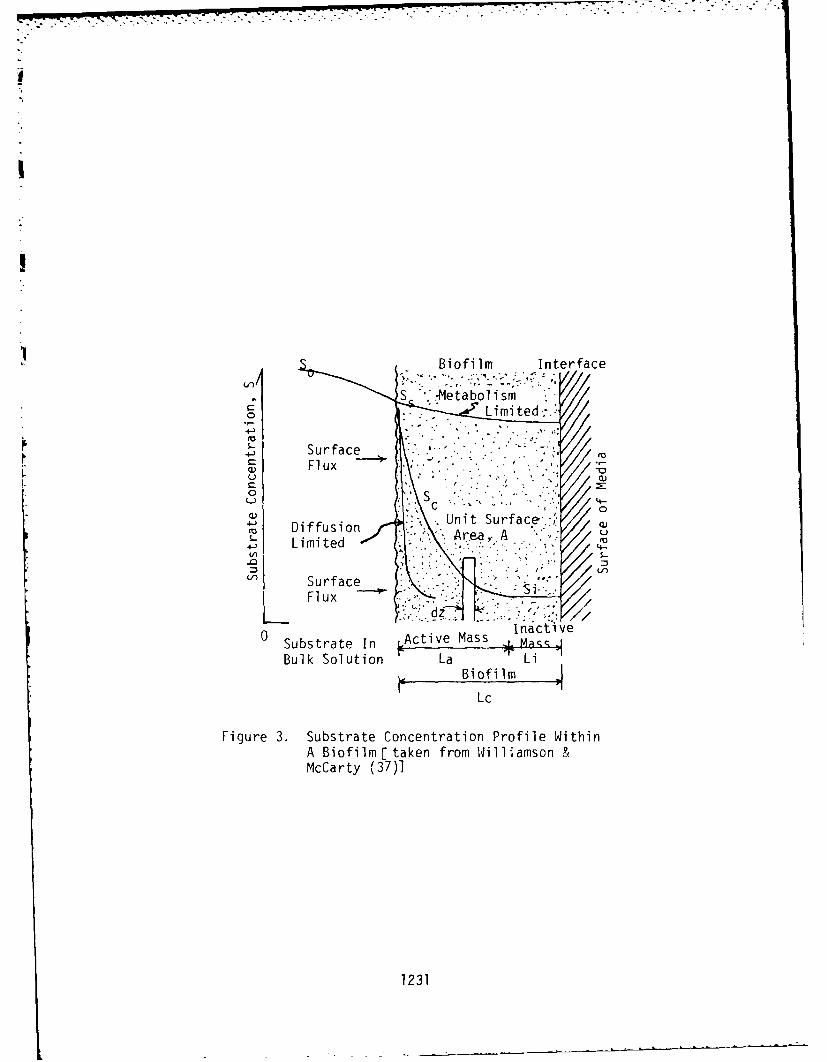
Biofilm Interface
C?)
S.-
M Diffusion4-) Limite
0Substrate In ____________
Bulk S oluti on La LiBio film
Lc
Figure 3. Substrate Concentration Profile WithinA Biofilm [taken from WilliamsonMcCarty (37)]
1231
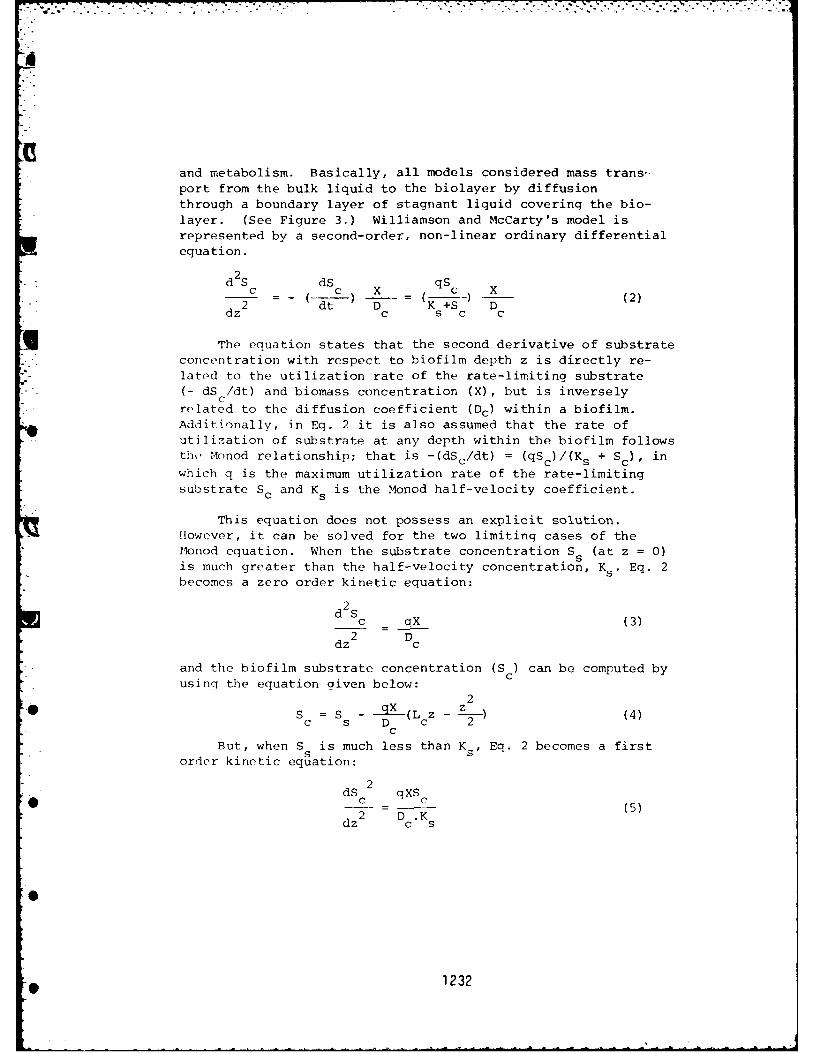
d -;
and metabolism. Basically, all models considered mass trans-port from the bulk liquid to the biolayer by diffusionthrough a boundary layer of stagnant liquid covering the bio-layer. (See Figure 3.) Williamson and McCarty's model isrepresented by a second-order, non-linear ordinary differential
equation.
2d2S dS qSc c X c X (2)dz 2 dt D - K--+S- D (
c s c c
The equation states that the second derivative of substrateconcentration with respect to biofilm depth z is directly re-lated to the utilization rate of the rate-limiting substrate(- dS /dt) and biomass concentration (X), but is inversely
related to the diffusion coefficient (Dc) within a biofilm.Additionally, in Eq. 2 it is also assumed that the rate ofutilization of substrate at any depth within the biofilm followsthte Monod relationship; that is -(dSc/dt) = (qSc)/(Ks + Sc), inwhich q is the maximum utilization rate of the rate-limitingsubstrate Sc and Ks is the Monod half-velocity coefficient.
This equation does not possess an explicit solution.However, it can be solved for the two limiting cases of theNonod equation. When the substrate concentration S5 (at z = 0)is much greater than the half-velocity concentration, Ks , Eq. 2becomes a zero order kinetic equation:
d2Sc aX (3)dz2 Dc
and the biofilm substrate concentration (S ) can be computed byusing the equation given below:
2S = S qX (LZ----) (4)
c s Dc
But, when S is much less than Ks , Eq. 2 becomes a firstorder kinetic equation:
dS 2 qXS* dc _ c
d2 D.K (5)dz c s
1232
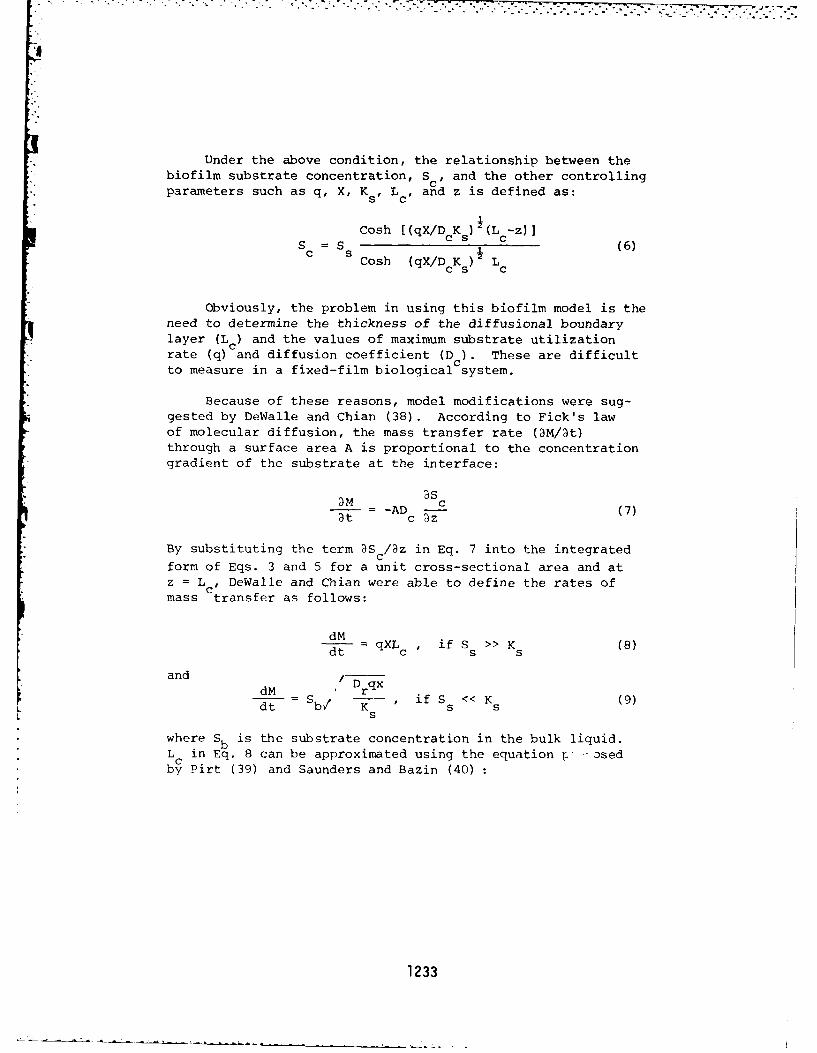
Under the above condition, the relationship between thebiofilm substrate concentration, Sc, and the other controllingparameters such as q, X, Ks, L c and z is defined as:
S S Cosh [(qX/Dc K s ) (L -z)JS = Ss c (6)c 5 Cosh (qX/DcKs) LcCs c
Obviously, the problem in using this biofilm model is theneed to determine the thickness of the diffusional boundarylayer (L ) and the values of maximum substrate utilizationrate (q) and diffusion coefficient (D ). These are difficult.... Cto measure in a fixed-film biological system.
Because of these reasons, model modifications were sug-gested by DeWalle and Chian (38). According to Fick's lawof molecular diffusion, the mass transfer rate (3M/3t)through a surface area A is proportional to the concentrationgradient of the substrate at the interface:
DM_3 c-AD (7)c 3z
By substituting the term DS / z in Eq. 7 into the integratedc
form of Eqs. 3 and 5 for a unit cross-sectional area and atz = L., DeWalle and Chian were able to define the rates ofmass transfer as follows:
dMdt , if S >> K (8)
and /D qx
dM =S r if S << K (9)dt = b/ K ' s ss
where Sb is the substrate concentration in the bulk liquid.L in Eq. 8 can be approximated using the equation 1 "osedby Pirt (39) and Saunders and Bazin (40)
1233
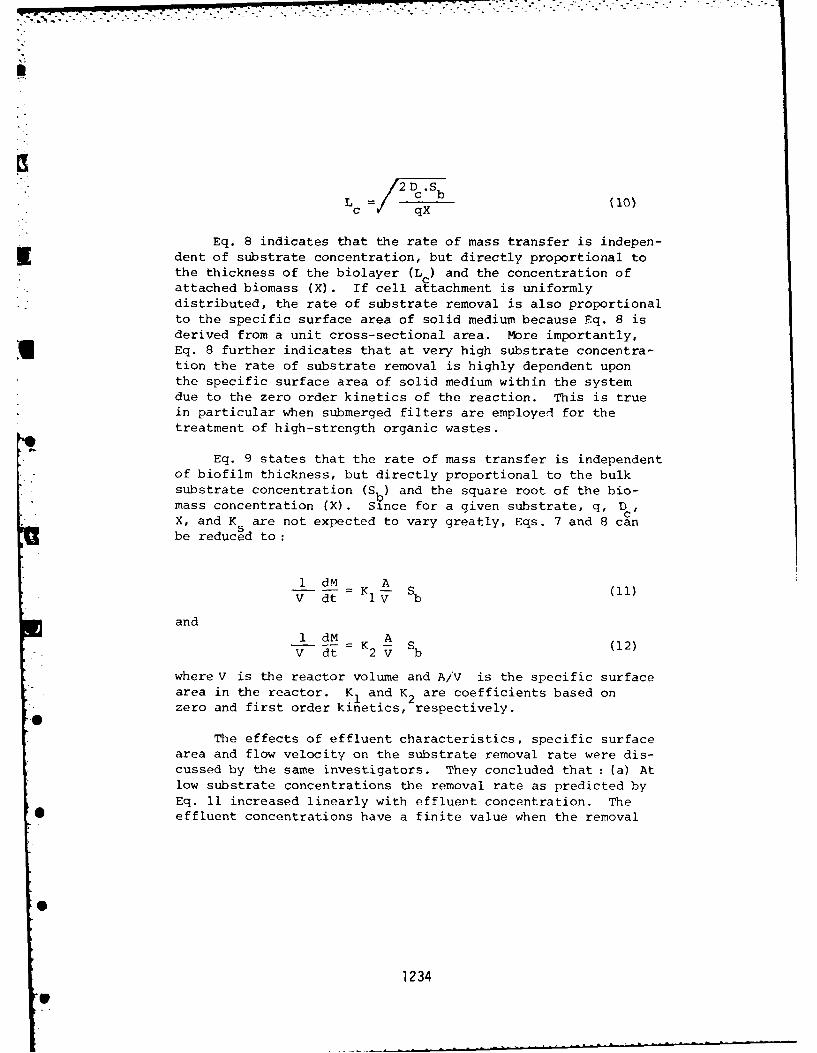
c b (10)qX
Eq. 8 indicates that the rate of mass transfer is indepen-Kdent of substrate concentration, but directly proportional to
the thickness of the biolayer (L ) and the concentration ofCattached biomass (X). If cell attachment is uniformly
distributed, the rate of substrate removal is also proportionalto the specific surface area of solid medium because Eq. 8 isderived from a unit cross-sectional area. More importantly,Eq. 8 further indicates that at very high substrate concentra-tion the rate of substrate removal is highly dependent uponthe specific surface area of solid medium within the systemdue to the zero order kinetics of the reaction. This is truein particular when submerged filters are employel for thetreatment of high-strength organic wastes.
Eq. 9 states that the rate of mass transfer is independentof biofilm thickness, but directly proportional to the bulksubstrate concentration CS1b,) and the square root of the bio-mass concentration MX. Since for a given substrate, q, D,X, and K Sare not expected to vary greatly, Eqs. 7 and 8 canbe reduced to:
1 dM KAV dt l v b (1
and1 dM A S(2
V dt 2 v (2
where V is the reactor volume and A/v is the specific surfacearea in the reactor. K1 and K2 are coefficients based onzero and first order kinetics, respectively.
The effects of effluent characteristics, specific surfacearea and flow velocity on the substrate removal rate were dis-cussed by the same investigators. They concluded that :(a) Atlow substrate concentrations the removal rate as predicted byEq. 11 increased linearly with effluent concentration. The
* effluent concentrations have a finite value when the removal
1234
-- 7 .- 7-
rate approaches zero. On the contrary, at high substrate con-centrations a satisfactory linear relationship was not obtainedfrom Eq. 11 when the reciprocal substrate removal was plottedversus that of the substrate concentration. (b) An increase inK2 was always observed as a result of increasing specific sur-face area although no definitive correlation between the rateof substrate removal and the value of the increasing specificsurface area could be established. (c) The calculated K2 (V/A)values appeared to have a straight relation with flow velocitywhen plotted on log-log paper. This means that the rate ofsubstrate removal can be improved by minimizing the diameterof the submerged filter column or maximizing the height of thecolumn in order to obtain high- r velocities. Practicallyspeaking, a tall column has one obvious disadvantage, i.e.,a relatively larger volume in the last portion of the columnis in contact with a low substrate concentration, which inturn tends to reduce the substrate removal rate.
Kinetic models are Presently not supoorted by sufficientanalytical data and it is necessary that more research beda)ne in this area.
SUMIMARY
The advantages inherent in the anaerobic filtration pro-cess suggest that it is worthy of consideration as a basis forfull scale waste treatment facilities. The fixed filmanaerobic process is well suited to handling large organicloads. High COD removals can be achieved, particularly withhigh strength wastes, without the high operating costs thatare associated with other treatment operations which use aera-tion or physical-chemical methods. Anaerobic digesters alsoproduct a useable methane gas which could be used to heat thereactors. The methane production is almost certain to be wellin excess of the necessary requirements for heating purposesand could Possibly be used for additional heating of the treat-ment facility. Research has shown that the filter can success-fully treat many types of waste efficiently. More quantitativedata from field installations and laboratory pilot plants arcneeded to establish design critiria for this treatment process.
1235
REFERENCES
i. McCarty, P.L., "Anaerobic Treatment of Soluble Wastes,"
Advances in Water Quality Improvement, The University ofTexas Press, Austin, Texas, p. 336, 1968.
2. Truesdale, G.A. et. al., "Journal Institute Public HealthEngrs.," Vol. 60, p. 273, 1961.
3. Coulter, J.B., Soneda, S., and Ettinger, M.B., "AnaerobicContact Process for Sewage Disposal," Sewage IndustrialWastes, Vol. 29, p. 468, 1957.
4. Witherow, J.L., Coulter, J.B., and Ettinger, M.D., "An-aerobic Contact Process for Treatment of Suburban Sew-age," Journal Sanitary Engineering Division ASCE, Vol. 84,1958.
5. Winneberger, J.H., Menar, A.B., and McGauhey, P.H.,"A Study of Methods of Preventing Failure of Septic TankPercolation Fields," Second Annual Report. SanitaryEngineering Research Laboratory, University of CaliforniaBerkeley, 1961.
6. Young, J.C., and McCarty, P.L., "The Anaerobic Filter for*Waste Treatment," Journal Water Pollution Control Federa-
tion, Vol. 41, R160, 1968.7. Ham, R.K., and Boyle, W.C., "The Treatability of Leachate
from Sanitary Landfills," Progress Report to the Environ-mental Protection Agency, Office of Solid Waste ManagementWashington, D.C., University of Wisconsin, 1971.
8. Foree, E.G., and Reid, V.M., "Anaerobic Biological Stabili-zation of Sanitary Landfill Leachate," University ofKentucky, Technical Report, UKY TR 65-73-CE 17, 1973.
9. Chian, E.S.K., and DeWalle, F.B., "Treatment of HighStrength Acidic Wastewater with a Completely Mixed Anaero-bic Filter," Water Research, Vol. 11, p. 295, 1977.
10. Plummer, A. H., Malina, J.F., and Eckenfelder, W.W., "Sta-
bilization of a Low Solids Carbohydrate Waste by an Anaer-* obic Filter," Proceedings 23rd Purdue Industrial Waste
Conf., Purdue Univ., P. 467, 1968.11. Clark, R.H., and Speece, R.E., "The pH Tolerance of Anaer-
obic Digestion," 5th International Water Pollution ResearchConference, 1970.
12. Paitthorp, R.E., Richter, G.A., and Filbert, J.W., "Anaer-*obic Secondary Treatment of Potato Process Wastewater,"
presented at 44th WPCF Convention, San Francisco, Oct., 197113. Richter, G.A., and Mackie, J.A., "Low Cost Treatment for
High Strength Waste," Cornell, Howland, Payes, Merryfield,and Hill, Consulting Engineers, Oct. 1971.
*re 1236
- . . ... . . . . " . ' -. . ., -i -' .
". .. *-- . .. . : : > . . : .
14. Taylor, D.W., "Full Scale Anaerobic Trickling FilterEvaluation," Proceedings 3rd National Symposium of FoodProcessing Wastes, EPA Report R 2-72-018, Nov. 1972.
15. Dorstall, K.A., "Centennial Mills Starch-Gluten Plant,Spokane Washington," unpublished report, EPA, PacificNorthwest Environmental Research Laboratory, Oct. 1974.
- 16. Campbell, G.R., Hydroscience, Inc., communication withJohn L. Mancini, 1973.
17. El Shafie, A.T., and Bloodgood, D.E., "AnaerobicTreatment in a Multiple Upflow System," Journal WaterPollution Control Federation, Vol 45, p. 2345, 1973.
18. Dennis, N.D., and Jennett, C.S., "Pharmaceutical WasteTreatment with an Anaerobic Filter," Proceedings 29thPurdue Industrial Waste Conf,, Purdue Univ., 1974.
19. Wilson, A.W., and Timpany, P.L., "Anaerobic ContactFilter for Treatment of Waste Sulphite Liquor,"presented at the 59th Annual Meeting of the CanadianPulp and Paper Association, Montreal, Quebec, Jan. 1973.
20. Hovius, J.C., Fisher, J.A., and Conway, K.A., "AnaerobicTreatment of Synthetic Organic Wastes," EPA Report, Pro-ject 12020 Dis., Jan. 1972.
21. Foree, E.G., and Horsley, E.E., "Advanced Studies ofthe Submerged Anaerobic Filter for Brewery Press Liquor
Stabilization," Technical Report UKY 48-72-CE-14,University of Kentucky, 1972.
22. Tadman, J.M., Dow Chemical, personal communication with
James Mueller, 1973.23. Chian, E.S.K., and DeWalle, F.B., "Evaluation of Leach-
ate Treatment; Vol. 1: Characterization of Leachate,"Environmental Protection Technology Series, EPA-600/2-77-186a, Sept. 1977.
24. Khan, A.N., and Siddiqi, R.H., "Wastewater Treatment byAnaerobic Contact Filter," Journal Environmental Engi-neering Division, ASCE, EE2, p. 10?, 1976.
25. Haug, R.T., "Anaerobic Filter Treats Waste," Water andSewage Works, Feb. 1977.
26. Hakannson, H. et. al., "Anaerobic Treatment of Whey and
Whey Permeate in Submerged Filters," Inst. Vatten-Luftuardsforsl, Pub. B, 406, 1977.
27. Switzenbaum, M.S., "Anaerobic Expanded Bed Treatment ofWastewater," Proceedings of the Seminar/Workshop on
Anaerobic 'ilters. Howey-In-The-Hills, Florida, Jan.1980.
28. Witt, E.R., et. al., "Full-Scale Anaerobic Filter TreatsHigh Strength Wastes," Proceedings, 34th Purdue Indust-
1237
rial Waste Conf., 1979.29. Donovan, E.J., "Treatment of High Strength Wastes by an
Anaerobic Filter," Proceedings of the Seminar/Workshopon Anaerobic Filters. Howey-In-Hills, Florida, 1980.
30. Arora, H.C., Chattopadhya, S.N., and Routh, T., "Treat-ment of Vegetable Tanning Effluent by the AnaerobicContact 'ilter Process," Journal Water Pollution ControlFederatien, p. 584, 1975. (G.B.)
31. Jewell, W.J., Switzenbaum, M.S., and Morris, J.W.,"Municipal Wastewater Treatment with the Anaerobic At-tached Microbial Film Expanded Bed Process," JournalWater Pollution Control Federation, Vol. 53, p. 482,1981.
32. Rudgal, H.T., "Effect of Copper Bearing Wastes on SludgeDigestion," Sewage Works Journal, Vol. 18, p. 1130,1946.
33. Chian, E.S.K., DeWalle, F.B., and Brush, J., "HeavyMetal Removal with Completely Mixed Anaerobic Filter,"Journal Water Pollution Control Federation, Vol. 51,p. 22, 1979.
34. Young, J.C., "Performance of Anaerobic Filters UnderTransient Loading and Operating Conditions," Proceedingsof the Seminar/Workshop on Anaerobic Filters. Howey-In-The-Hills, Florida, 1980.
35. Speece, R.E. et. al., "Metane Fermentation ToxicityResponse," Proceedings of the Seminar/Workshop on Anaer-obic Filters. Howey-In-The-Hills, Florida, 1980.
36. Parkin, G.F., Speece, R.E., and Yang, C.H., "A Comparisonof the Response of Methanogens to Toxicants: AnaerobicFilter vs Suspended Growth Systems," Proceedings of theSeminar/Workshop. Howey-In-The-Hills, Florida, 1980.
37. Williamson, K., and McCarty, P.L., "A Model of SubstrateUtilization by Bacterial Films," Journal of Water Pollu-tion Control Federation, Vol. 48, p. 9, 1976.
38. DeWalle, F.B., and Chian, E.S.K., "Kinetics of Substrate*0 Removal in a Completely Mixed Anaerobic Filter," Bio-
technology and Bioengineering, Vol. 18, p. 1275, 1976.39. Pirt, S.J., J. Appl. Chem. Biotechnol., Vol. 23, p. 389,
1973.40. Saunders, P.T., and Bazin, M.J., J. Appl. Chem. Bio-
technol., Vol. 23, p. 847, 1973.
1238S
* iif
41
-tA


