Embed Size (px)
Citation preview
Agricultural Water Management, 13 (1988) 113-125 113 Elsevier Science Publishers B.V., Amsterdam - - Printed in The Netherlands
Improving Irrigation Management by Modelling the Irrigation Schedule
P. Van AELST 1, R.A. RAGAB 2, J. FEYEN 1 and D. RAES'
'Laboratory of Soil and Water Engineering, Faculty of Agricultural Sciences, Katholieke Universiteit Leuven, Kardinaal Mercierlaan 92, Heverlee, 3030 Leuven (Belgium) 2Department of Soil and Water Sciences, Faculty of Agriculture, Alexandria University, El Chathy, Alexandria (Egypt)
ABSTRACT
Van Aelst, P., Ragab, R.A., Feyen, J. and Raes, D., 1988. Improving irrigation management by modelling the irrigation schedule. Agric. Water Manage., 13:113-125.
Three different treatments on corn, grown in Egyptian soil with shallow water table, on a cracked clay-loam soil subjected to swelling and shrinking, and in soil with a shallow water table have been evaluated using the simulation model SWATRE. With this field water balance model the in- and outgoing water fluxes, the soil moisture profile and the water-table depth of the three irrigation treatments monitored were simulated daily throughout the 1983 growing season. For validation the simulated water-table depths were compared to the observed water-table fluctuation. The validated field water balance model was then used to evaluate a number of hypothetical irrigation schedules in order to improve the actual irrigation practice.
The simulation runs indicated that the water-table contribution through capillary rise varies between 25 and 30% of the actual crop water consumption, and that this amount is barely affected by the screened irrigation schedules. In addition it was found that plant transpiration and yield respond accurately to modifications in the irrigation timing applied.
INTRODUCTION
Ancient irrigation practices, growing one crop per year, have been superseded by perennial irrigation. Due to the increasing availability of control structures, year-round cultivation is becoming more and more common in Egypt. How- ever, the use of more water on a relatively fixed area of land has generated new problems like rise of the water table, build-up of salts in the soil profile and, in some locations, water-logging. Those negative effects mainly emerge from the poor application efficiency attained by most farmers and from the low natural drainage capacity of most farmland in the Nile delta (EWUP, 1984 ).
Research partially funded by a grant from the CEC, Brussels, Belgium.
0378-3774/88/$03.50 © 1988 Elsevier Science Publishers B.V.
114
In this paper the results of three irrigation treatments on corn, run in Egyp- tian soil with shallow water table, were used to calibrate the field water-balance model SWATRE (Belmans et al., 1983 ). Consequentially, the validated model was used to screen the performance of a number of hypothetical irrigation schedules aiming to improve the water-use efficiency. A key point thereby was to find out if the lowering in water application by reducing irrigation frequency is compensated by an increase in capillary rise.
MATERIALS AND METHODS
Data from a field experiment run at the experimental farm of the Faculty of Agriculture, University of Alexandria (Egypt), were used for calibration and validation of the water balance model SWATRE. The farm is located south of Alexandria at a distance of about 10 km from the Mediterranean coast. The average level of the area is roughly 2 m below mean sea level. The Vertic ter- rifluvent soil is developed in the lacustrine deposits of Maryout lake. The upper 30 cm of the profile is clay loam, while the underlaying profile consists of clay mixed with shells.
The corn crop was sown on 7 June 1983 and harvested on 9 October 1983. The response of corn to three irrigation regimes, arranged in a split plot design experiment with four replications, was studied. The irrigation schedules ap- plied and given in Table 1 were based upon the sensitivity of the crop to water stress during different growth stages.
For the dynamic analysis of the soil water budget under the three irrigation regimes, a modified version of the SWATRE model is used. The SWATRE model is developed to simulate actual crop water-use and is based on the im- plicit finite-difference solution of the vertical one-dimensional, unsaturated- flow equation. The model is constructed such that it can deal with layered profiles and varying boundary conditions. One of the shortcomings of the SWATRE model, which limits its application for the given area, is that it is not able to describe in a mechanistic way the water flow in a bimodal soil, where part of the water percolates through the cracks and part participates in the water flow in the soil clods. In addition, in most cases the partitioning into both flow regimes is not constant but varies with the overall moisture content of the soil. If the soil moisture content rises, the volume of cracks reduces due to the swelling of the soil matrix; if soil moisture is depleted the soil might shrink, increasing the volume of cracks.
The soil on which the experiments were run is, due to the high content of montmorillonite clay, particular subjected to swelling and shrinking by alter- nate wetting and drying of the soil matrix. The mechanism of water flow through such profiles is not yet well understood and the only theoretical model describ- ing water flow through cracks has been reported by Hoogmoed and Bouma (1980). These authors use a combined model for vertical infiltration and hor-
115
T A B L E 1
R e s u m e of t h e t h r e e i r r i g a t i o n t r e a t m e n t s used for c a l i b r a t i o n a n d v a l i d a t i o n of t he f ield w a t e r
b a l a n c e mode l
D a t e W a t e r d e p t h ( m m ) a pp l i e d
pe r i r r i g a t i o n t r e a t m e n t
I I I I I I
15 /6 /1983 139 139 139
06 /7 91 91 91
19/7 - - - - 73
23/7 - - 89 - -
26/7 97 - - - -
31/7 - - - - 74
07 /8 - - 94 - -
11/8 - - - - 73
16/8 115 - - - -
21 /8 - - 86 - -
24 /8 - - - - 76
05 /9 101 74 74
T o t a l w a t e r
d e p t h a p p l i e d 543 573 600
izontal absorption to simulate the uptake of water into the soil surface and into the walls of the soil artifacts. For reasons of the small time-step required to describe the process of swelling accurately, and the difficulty in acquiring the soil parameters input in this study, preference has been given to a simplified empirical mechanism to approach the real water flow in the soil of the exper- imental area.
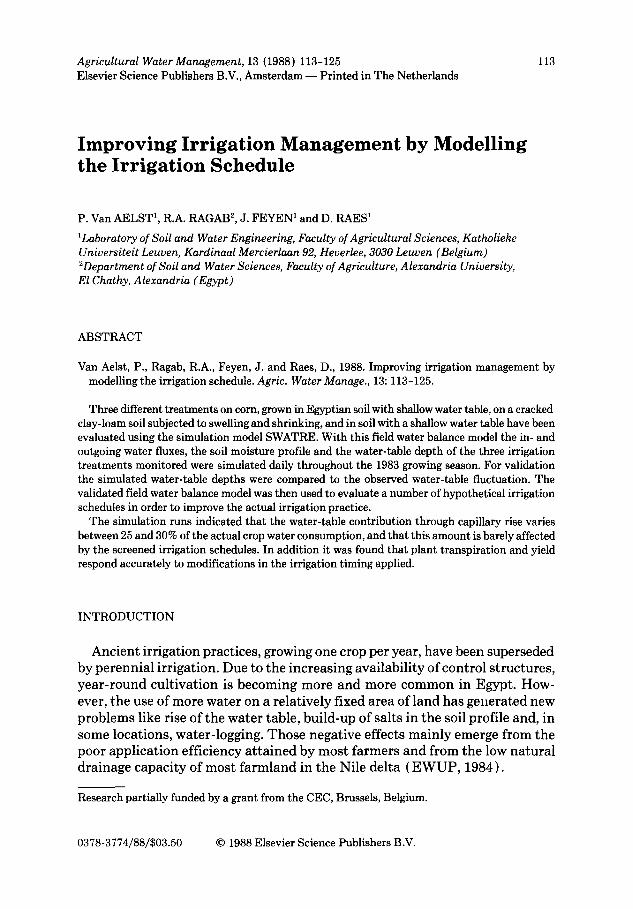
In this study it is assumed that a variable fraction of the water depth applied by basin irrigation will flow directly through the cracks and macropores and join the water table. This fraction, as shown in Fig. 1, is related to the water content 0 of the top layer of the profile. Mathematically this is expressed as:
Ic(O) =IF(O) (1)
where I¢(0) is the water depth (mm) adjoining the water table, I the gross application depth (mm), and F(0) is a dimensionless reduction factor, being a function of the water content of the top layer. The following empirical values were assumed for the reduction factor F(0) as a function of the overall mois- ture content of the upper 30 cm of the profile: 0.5 for 0<0.25; 0.3 for 0.25 < 0 < 0.40; and 0 for 0 > 0.40.
The soil data required to run the program are the soil water retention curve (h-O), and the hydraulic conductivity-soil water content relationship (K-0). The h-O curve was determined on undisturbed soil samples, whereas the K-O
116
0
30
120
I
I c (~-a- .. . . . . . . . . . . l
¢i//"~, I 0 __i 4:
w a t e r ±ctbte
Fig. 1. Schematic depiction of the dynamic flow partitioning between inter- and intra-aggregate water flow.
curve was derived from the water retention curve and the saturated hydraulic conductivity using Jackson's (1972) formula. The moisture distribution with depth was measured gravimetrically and the moisture profile at sowing was taken as the initial moisture profile before starting the simulation run. The profile was simplified by a two-layered profile with the upper horizon from 0 to 60 cm underlain by the shell-enriched substratum. The lower boundary of the profile was taken at a depth of 120 cm.
The flux to the drains is calculated using Ernst's (1962) equation:
q l = - ( O , - 0 2 ) T (2)
where ql is the flux (m day -1 ) to the subsurface drainage system, ~)1 drain base (m), ~2 ground-water level (m) half drain spacing, and T the flow resistance term (days). According to Ernst (1962) the drainage resistance can be calcu- lated as:
T = Lw + L 2/8kd ( 3 )
where L is the drain spacing (m), w the radial resistance (day m - 1 ) , k the saturated hydraulic conductivity for horizontal flow (m day- 1 ) , and d the av- erage thickness of the aquifer (m). For homogeneous soils and small variations in the water-table head, the radial resistance w can be found as (Ernst, 1962 ) :
w= (1/~k) ln(Do/Bw) (4)
where Do is the thickness of the aquifer below drain base, and Bw the wet pe- rimeter of the drain tube.
In the analysis, L was 35 m, Do, Bw, k and 01 were, respectively, equal to 3 m, 0.314 m, 0.29 m d a y -1 and -1.15 m.
117
The seepage flux into the soil profile is calculated using equation ( 5 ) :
q2 = - ( 0 3 - 0 4 ) / c (5)
where ¢3 is average level of the water table (m), ¢4 piezometric water level (m), and c is the vertical resistance for water flow (days); c was used as a calibration factor of the simulation model. By trial and error a value of 225 days was obtained.
The daily value of the potential evapotranspiration (ETp) was calculated using the computer package published by Raes et al. (1986), which is entirely based on the modified Penman formula as outlined extensively by Doorenbos and Pruitt (1977). The climatological data were taken from the experimental farm where the irrigation trials on corn were run. To split ETp into potential transpiration (Tp) and potential evaporation (Ep) a procedure as proposed by Tanner and Jury (1976) was used. Tp is calculated as the difference between ETp and Ep, whereby Ep is estimated using a Ritchie-type formula, as follows:
Ep--O~r WRn (6)
where a is a dimensionless coefficient, ~ the fraction of the total net radiation available at the soil surface, W a temperature-related weighing factor, and R, the net radiation (mm d a y - 1 ). The factor W is calculated as:
W=A/(,~+?) (7)
in which A is the slope of the saturated vapour pressure versus the temperature at air temperature (mbar °C-1) , and y the psychrometric constant ( mbar ° C - 1 ). The fraction of the total net radiation penetrat ing to the soil surface, 3, is described as ( Ritchie, 1972 ) :
7: : R n g / R n ,~, exp ( --fl LAI ) ( 8 )
where Rng is the net radiation (mm day-1) measured at the soil surface be- tween the canopy, and Rn the net radiation ( mm day- 1 ) above canopy; fl is an empirical coefficient, and LAI is the leaf area index (m 2 m - e ) .
The coefficient a is a correction factor proposed by Tanner and Jury (1976) to adjust Ritchie's formula. When the soil is not completely covered by the canopy, c~ can be approximated using:
a=Q- ( Q - 1) ( 1 - ~ ) / ( 1 - ~ c ) (9)
where Q is the ratio between ETp and WRn, and ~c a critical fraction of the total net radiation available at the soil surface. According to Tanner and Jury (1976), 0.35 is a good estimate for ~c. The fl coefficient was est imated to be 0.6, which is within the range of observed values (Raes et al., 1986). The daily value of LAI was calculated using Dale et al.'s (1980) model.
mbar-- millibar-- 100 Pa.
118
Pressure head (loglOl-h])
1 0.5 a (Sink term variable) (dimensionless)
1
5
i 0.I 0.2 0.3 0.4 0.5 0.6
Moisture content (cmS/cm ~)
Fig. 2. Soil moisture characteristic curve and the function of the sink term variable for the upper horizon of the soil profile.
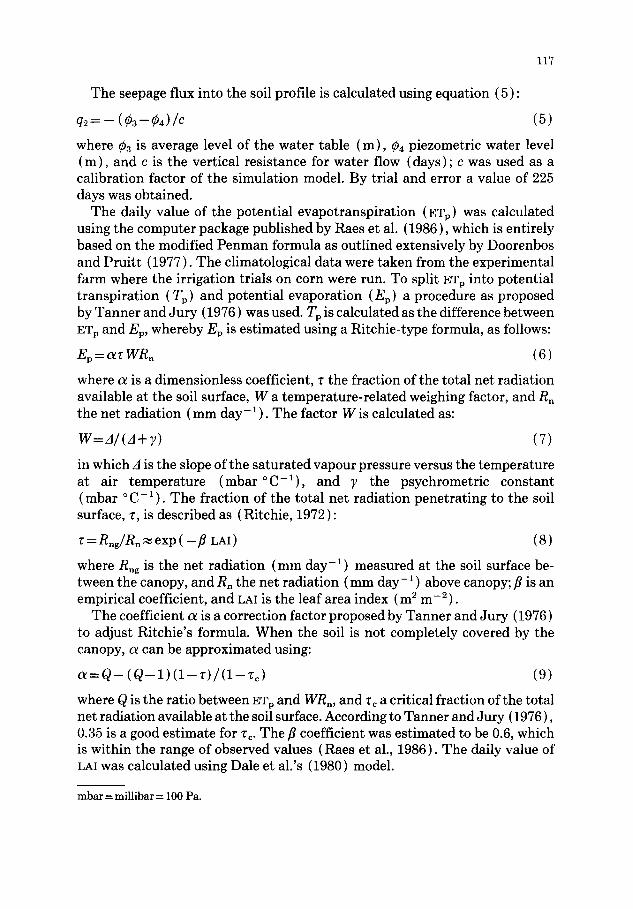
Root water uptake S (h, z) is calculated using Hoogland et al.'s (1981) sink term:
S(h, z) =o~(h) Smax(z) (10)
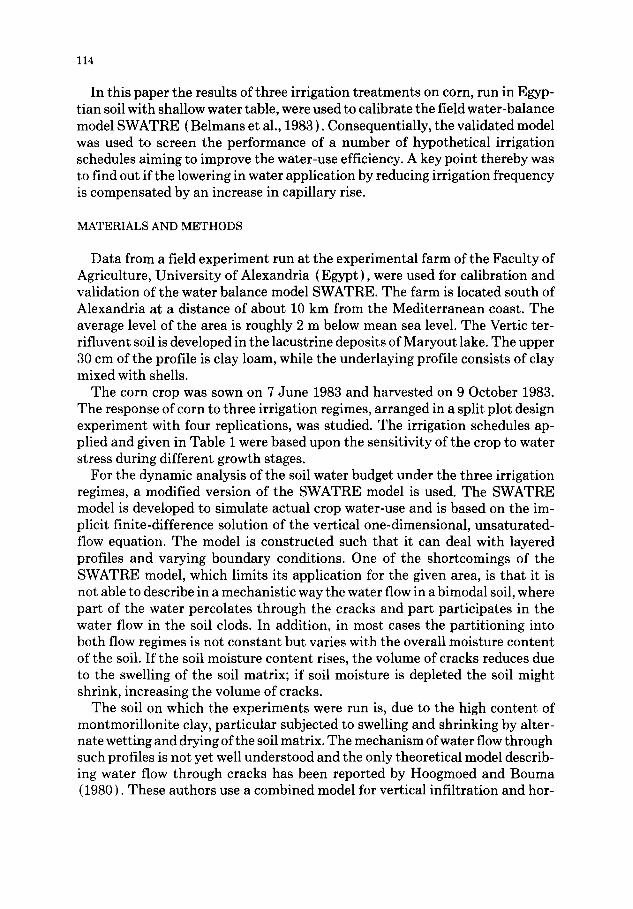
where ~ (h) is a dimensionless reduction factor related to pressure head h (m) , Smax (Z) is the maximum root water uptake (day - 1 ) at depth z, and S ( h, z) the actual water extraction ( d a y - 1 ) at depth z. The value of S~a~ was derived from climate and soil data. Its value varied from 0.03 day-1 at the top of the root zone to 0.02 d a y - 1 at the bot tom of the root zone. The value of c~ (h) is given in Fig. 2. The effective root zone was restricted to a depth of 35 cm due to the high water-table in early growing season.
RESULTS AND DISCUSSION
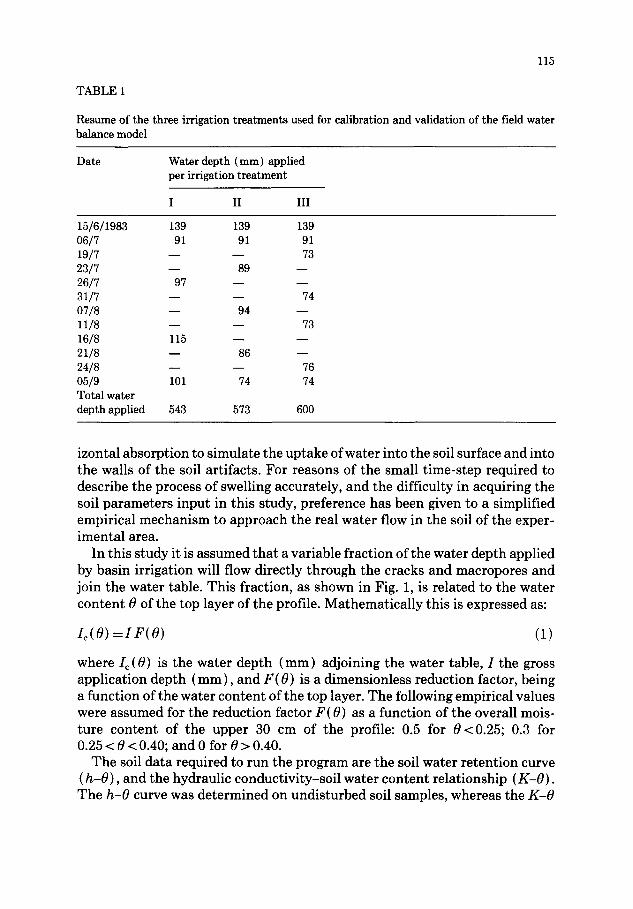
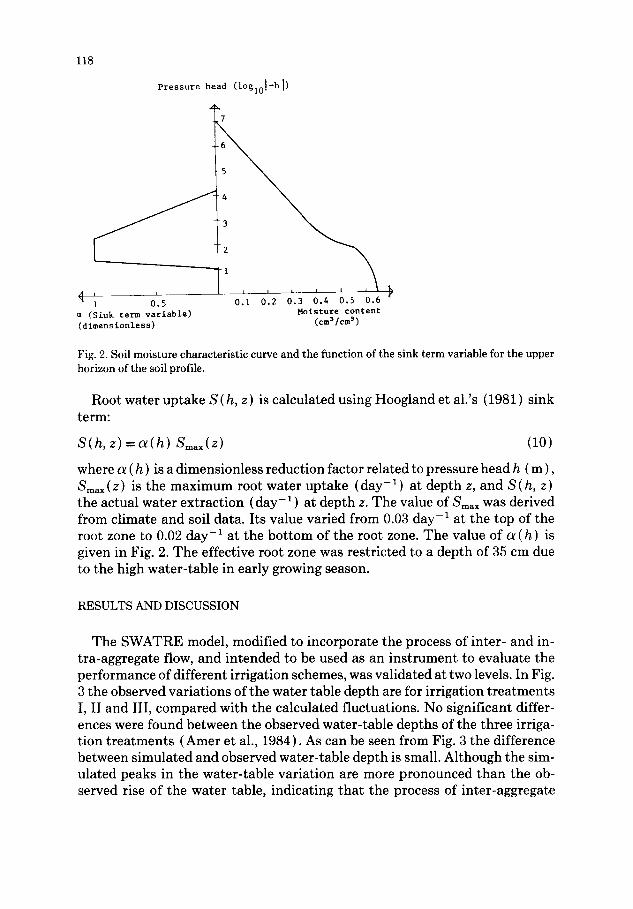
The SWATRE model, modified to incorporate the process of inter- and in- tra-aggregate flow, and intended to be used as an instrument to evaluate the performance of different irrigation schemes, was validated at two levels. In Fig. 3 the observed variations of the water table depth are for irrigation t reatments I, II and III, compared with the calculated fluctuations. No significant differ- ences were found between the observed water-table depths of the three irriga- tion t rea tments (Amer et al., 1984). As can be seen from Fig. 3 the difference between simulated and observed water-table depth is small. Although the sim- ulated peaks in the water-table variation are more pronounced than the ob- served rise of the water table, indicating that the process of inter-aggregate
119
-30
-40
-50
-60
-70
-80
150
Irrigation treatment I
i I L J i i
170 190 210 230 250 270 290
Julian date
v~
o*
-20
-30
-40
-50
-60
-70
-80
150
- 2 0
- 3 0
- 4 0
- 5 0
- 6 0
- 7 0
- 8 0
150
Irrigation treatment II
170 190 21 230 250 270 290
Julian date
Irrigation treatment III
'k ",, \ . ,
17o 19o 2io 230 250 270 290 J u l i a n d a t e
Fig. 3. Comparison of the variation of the observed ( . . . . . ) and the simulated ( - - ) water-table depth, under irrigation treatments I, II and III.
flow might have been slightly overestimated, it can be concluded that the sim- ulated water-table depths are completely within the range of the observed water- table depths.
The second level at which the model was validated was by comparing the
120
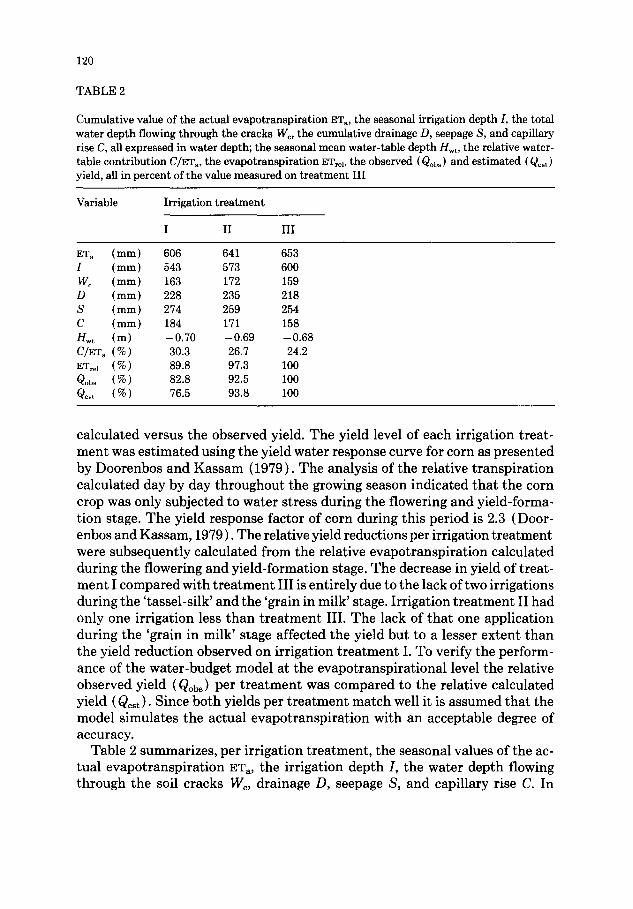
TABLE 2
Cumulative value of the actual evapotranspiration ETa, the seasonal irrigation depth I, the total water depth flowing through the cracks We, the cumulative drainage D, seepage S, and capillary rise C, all expressed in water depth; the seasonal mean water-table depth H~t, the relative water- table contribution C/ETa, the evapotranspiration EWrel, the observed (Qob~) and estimated (Qe~t) yield, all in percent of the value measured on treatment III
Variable Irrigation treatment
I II III
ET a (mm) 606 641 653 I (mm) 543 573 600 Wc (mm) 163 172 159 D (mm) 228 235 218 S (ram) 274 259 254 C (mm) 184 171 158 Hwt (m) -0 .70 -0 .69 -0 .68 C/ET a ( % ) 30.3 26.7 24.2
EWre I ( % ) 89.8 97.3 100 Qob~ ( % ) 82.8 92.5 100 Qest ( % ) 76.5 93.8 100
calculated versus the observed yield. The yield level of each irrigation treat- ment was estimated using the yield water response curve for corn as presented by Doorenbos and Kassam (1979). The analysis of the relative transpiration calculated day by day throughout the growing season indicated that the corn crop was only subjected to water stress during the flowering and yield-forma- tion stage. The yield response factor of corn during this period is 2.3 (Door- enbos and Kassam, 1979). The relative yield reductions per irrigation treatment were subsequently calculated from the relative evapotranspiration calculated during the flowering and yield-formation stage. The decrease in yield of treat- ment I compared with t reatment III is entirely due to the lack of two irrigations during the 'tassel-silk' and the 'grain in milk' stage. Irrigation t reatment II had only one irrigation less than t reatment III. The lack of that one application during the 'grain in milk' stage affected the yield but to a lesser extent than the yield reduction observed on irrigation t reatment I. To verify the perform- ance of the water-budget model at the evapotranspirational level the relative observed yield (Qobs) per t reatment was compared to the relative calculated yield (Qest). Since both yields per t reatment match well it is assumed that the model simulates the actual evapotranspiration with an acceptable degree of accuracy.
Table 2 summarizes, per irrigation treatment, the seasonal values of the ac- tual evapotranspiration ETa, the irrigation d e p t h / , the water depth flowing through the soil cracks We, drainage D, seepage S, and capillary rise C. In
121
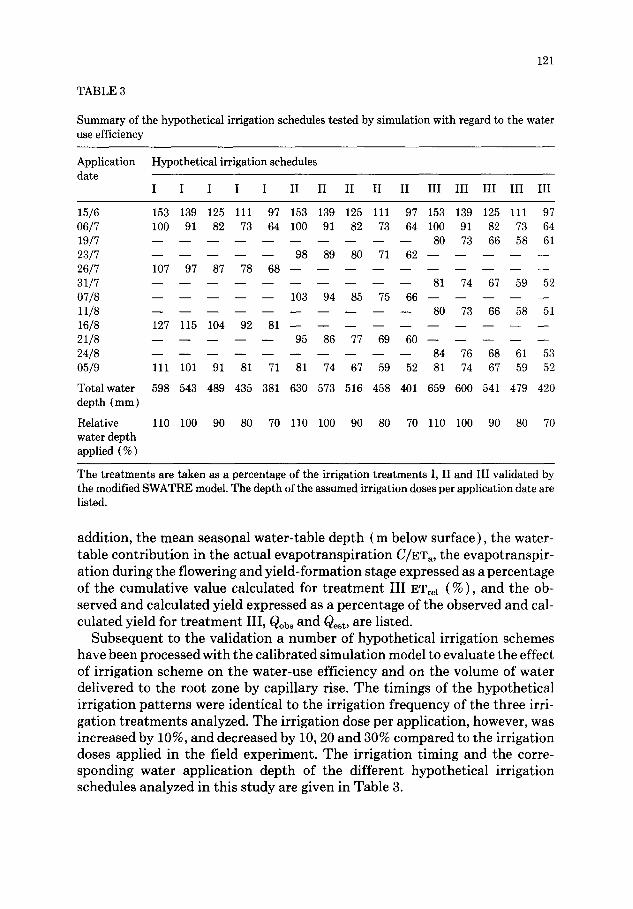
TABLE 3
Summary of the hypothetical irrigation schedules tested by simulation with regard to the water use efficiency
Application Hypothetical irrigation schedules date
I I I I I II II II II II III III III III III
15/6 153 139 125 111 97 153 139 125 111 97 153 139 125 111 97 06/7 100 91 82 73 64 100 91 82 73 64 100 91 82 73 64 19/7 80 73 66 58 61 23/7 98 89 80 71 62 26/7 107 97 87 78 68 31/7 81 74 67 59 52 07/8 103 94 85 75 66 11/8 80 73 66 58 51 16/8 127 115 104 92 81 21/8 95 86 77 69 60 24/8 84 76 68 61 53 05/9 111 101 91 81 71 81 74 67 59 52 81 74 67 59 52
Total water 598 543 489 435 381 630 573 516 458 401 659 600 541 479 420 depth (mm)
Relative 110 100 90 80 70 110 100 90 80 70 110 100 90 80 70 water depth applied ( % )
The treatments are taken as a percentage of the irrigation treatments I, II and III validated by the modified SWATRE model. The depth of the assumed irrigation doses per application date are listed.
addi t ion, the m e a n seasonal wa te r - t ab le dep th (m below sur face) , the water- table con t r i bu t ion in the actual evapo t r ansp i r a t i on C/ETa, the evapot ransp i r - a t ion dur ing the f lowering and y ie ld - fo rmat ion stage expressed as a pe rcen tage of the cumula t ive value ca lcula ted for t r e a t m e n t III EWrel ( % ) , and the ob- served and ca lcu la ted yield expressed as a pe rcen tage of the observed and cal- cu la ted yield for t r e a t m e n t III, Qobs and Qest, are listed.
Subsequen t to the va l ida t ion a n u m b e r of hypo the t i ca l i r r igat ion schemes have been processed wi th the ca l ib ra ted s imula t ion model to evaluate the effect of i r r igat ion scheme on the water -use eff ic iency and on the volume of wate r del ivered to the root zone by capi l lary rise. T h e t imings of the hypo the t i ca l i r r igat ion p a t t e r n s were ident ical to the i r r igat ion f r equency of the th ree irri- gat ion t r e a t m e n t s analyzed. T h e i r r igat ion dose per appl icat ion, however , was increased by 10%, and decreased by 10, 20 and 30% co m p ared to the i r r igat ion doses appl ied in the field expe r imen t . T h e i r r igat ion t iming and the corre- sponding wa te r app l ica t ion dep th of the d i f fe ren t hypo the t i ca l i r r igat ion schedules ana lyzed in th is s tudy are given in Table 3.
122
660
640
620
6OO E__t ~
580
560
350
..-''''~'~'°'°'~°° ~ 7 irrigations (III) ...... 6 irrigations (II) ........... 5 irrigations (I)
L I I I I 1
400 450 500 550 600 650 ~
Water supply (~m)
Fig. 4. Simulated seasonal actual evapotranspiration (ETa) as a function of the total water supply (mm) and the number of irrigations.
1 0 0 "
90 T 80
70
60
50
40
30
20
10
. ° - ~ " °
- ~ ° ~ ° 7 i r r i g a t i o n s ( I I I ) 6 i r r i g a t i o n s ( I I ) 5 i r r i g a t i o n s ( I )
! I , I I I i l ' k
350 400 450 500 550 600 650 ~
Water supply (ram)
Fig. 5 Relative calculated yield levels as a function of the total water supply (ram) and the number
o f i r r i g a t i o n s .
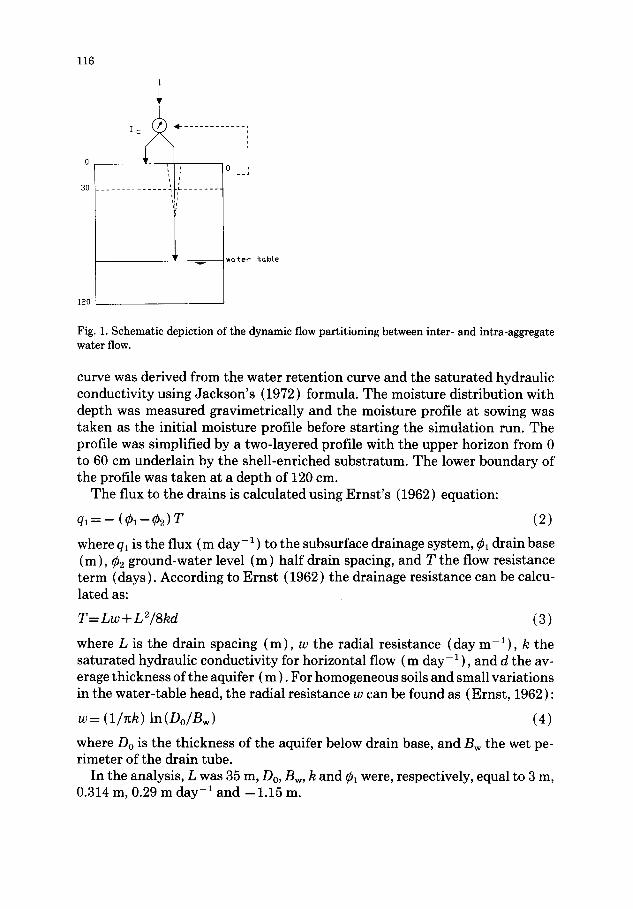
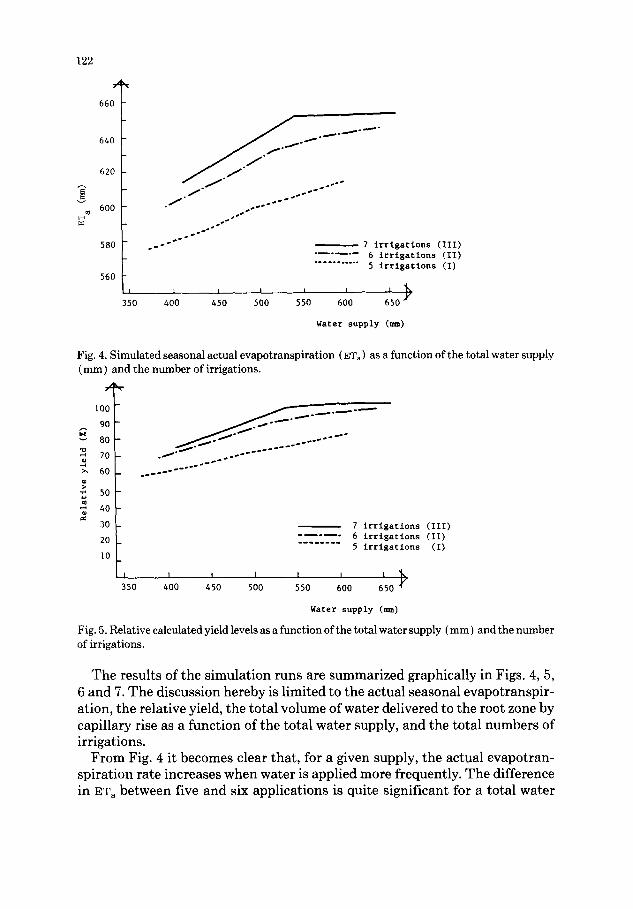
The results of the simulation runs are summarized graphically in Figs. 4, 5, 6 and 7. The discussion hereby is limited to the actual seasonal evapotranspir- ation, the relative yield, the total volume of water delivered to the root zone by capillary rise as a function of the total water supply, and the total numbers of irrigations.
From Fig. 4 it becomes clear that, for a given supply, the actual evapotran- spiration rate increases when water is applied more frequently. The difference in ET a between five and six applications is quite significant for a total water
123
] =.
-64
-65
-66
-67
-68
-69
-70
-71
-72
-73
-74
-75
I I I I I l I ~) A
350 400 450 500 550 600 650
Water supply (mm)
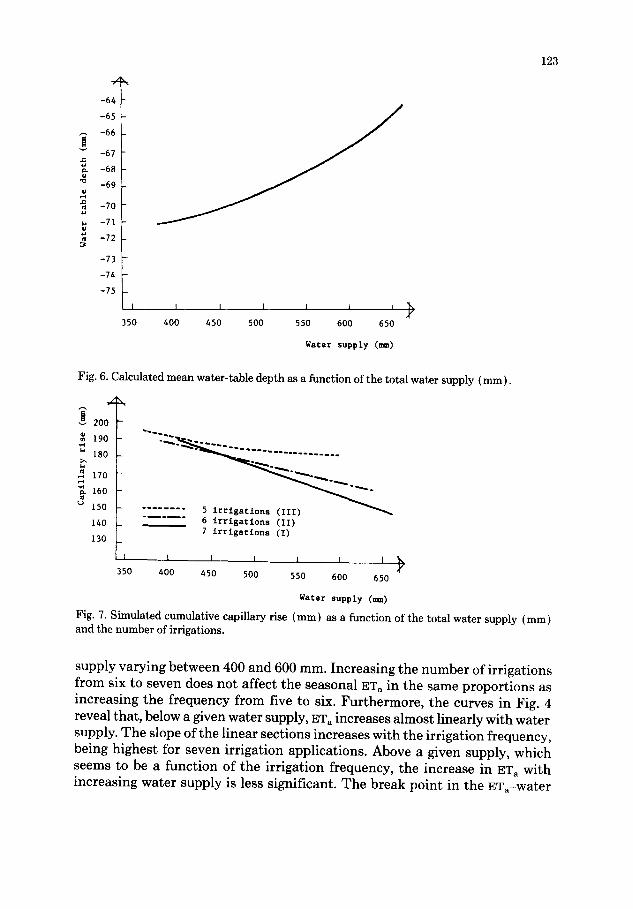
Fig. 6. Calculated mean water-table depth as a function of the total water supply (ram).
.Z
~,~ 200
19o
180
17o
16o
150
1 4 0
130
6 irrigations ( I I ) 7 irrigations ( I )
I L I t i I ~ 350 400 450 500 550 600 650
Water supply ( m )
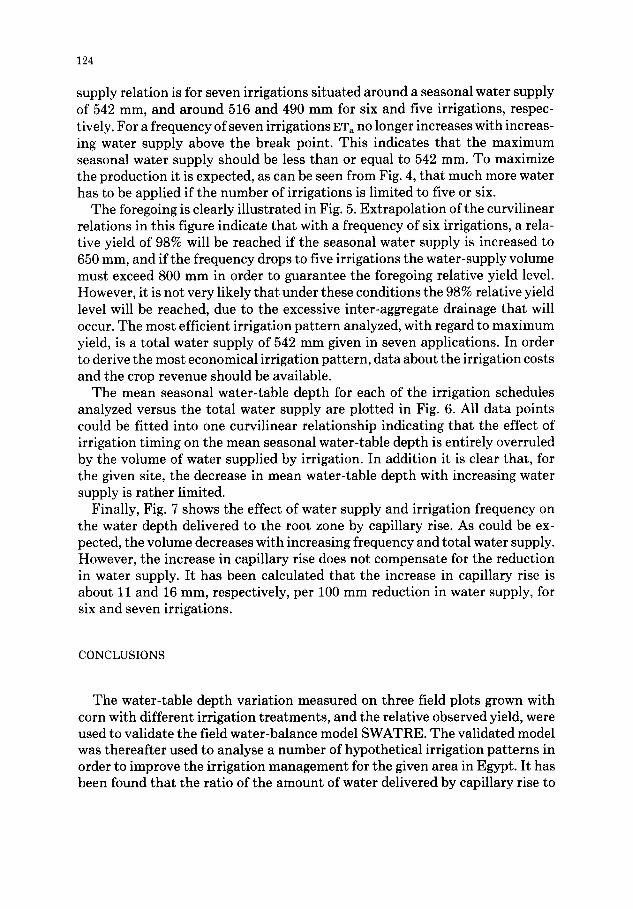
Fig. 7. Simulated cumulative capillary rise (mm) as a function of the total water supply (mm) and the number of irrigations.
supply varying between 400 and 600 mm. Increasing the number of irrigations from six to seven does not affect the seasonal ET a in the same proportions as increasing the frequency from five to six. Furthermore, the curves in Fig. 4 reveal that, below a given water supply, ET a increases almost linearly with water supply. The slope of the linear sections increases with the irrigation frequency, being highest for seven irrigation applications. Above a given supply, which seems to be a function of the irrigation frequency, the increase in ET a with increasing water supply is less significant. The break point in the ETa-water
124
supply relation is for seven irrigations situated around a seasonal water supply of 542 mm, and around 516 and 490 mm for six and five irrigations, respec- tively. For a frequency of seven irrigations ET a no longer increases with increas- ing water supply above the break point. This indicates that the maximum seasonal water supply should be less than or equal to 542 mm. To maximize the production it is expected, as can be seen from Fig. 4, that much more water has to be applied if the number of irrigations is limited to five or six.
The foregoing is clearly illustrated in Fig. 5. Extrapolation of the curvilinear relations in this figure indicate that with a frequency of six irrigations, a rela- tive yield of 98% will be reached if the seasonal water supply is increased to 650 mm, and if the frequency drops to five irrigations the water-supply volume must exceed 800 mm in order to guarantee the foregoing relative yield level. However, it is not very likely that under these conditions the 98% relative yield level will be reached, due to the excessive inter-aggregate drainage that will occur. The most efficient irrigation pattern analyzed, with regard to maximum yield, is a total water supply of 542 mm given in seven applications. In order to derive the most economical irrigation pattern, data about the irrigation costs and the crop revenue should be available.
The mean seasonal water-table depth for each of the irrigation schedules analyzed versus the total water supply are plotted in Fig. 6. All data points could be fitted into one curvilinear relationship indicating that the effect of irrigation timing on the mean seasonal water-table depth is entirely overruled by the volume of water supplied by irrigation. In addition it is clear that, for the given site, the decrease in mean water-table depth with increasing water supply is rather limited.
Finally, Fig. 7 shows the effect of water supply and irrigation frequency on the water depth delivered to the root zone by capillary rise. As could be ex- pected, the volume decreases with increasing frequency and total water supply. However, the increase in capillary rise does not compensate for the reduction in water supply. It has been calculated that the increase in capillary rise is about 11 and 16 mm, respectively, per 100 mm reduction in water supply, for six and seven irrigations.
CONCLUSIONS
The water-table depth variation measured on three field plots grown with corn with different irrigation treatments, and the relative observed yield, were used to validate the field water-balance model SWATRE. The validated model was thereafter used to analyse a number of hypothetical irrigation patterns in order to improve the irrigation management for the given area in Egypt. It has been found that the ratio of the amount of water delivered by capillary rise to
125
the water dep th lost by evapo t r ansp i r a t i on varies be tween 25 and 30%, and t h a t reducing the i r r igat ion f requency and the tota l water supply do no t induce capi l lary rise considerably. The mos t op t imal i r r igat ion pa t t e rn derived f rom the s imula t ion analysis cor responds to a seasonal water supply of 542 mm, f rac t iona ted in seven appl icat ions.
REFERENCES
Amer, F., Ragab, R.A., Nakhlawy, F., Ragab Depre, N. and Khalid, H.M., 1984. Optimizing fer- tility and water management for soils with shallow water table. Semi-Annual Rep. 2, Soil and Water Sciences Department, University of Alexandria, 77 pp.
Belmans, C., Wesseling, J.G. and Feddes, R.A., 1983. Simulation model of the water balance of a cropped soil: SWATRE. J. Hydrol., 63:271-286.
Dale, R.F., Coelho, D.T. and Gallo, K.P., 1980. Prediction of daily green leaf area index for corn. Agron. J., 72: 999-1005.
Doorenbos, J. and Kassam, A.H., 1979. Yield response to water. FAO Irrig. Drain. Pap. 33, 193 pp.
Doorenbos, J. and Pruitt, W.O., 1977. Crop water requirements. FAO Irrig. Drain. Pap. 24, 144 pp.
Ernst, L.F., 1962. Grondwaterstromingen in de verzadigde zone en hun berekening bij aanwezig- heid van horizontale open leidingen. Versl. Landbouwkd. Onderz. 67.15, Pudoc, Wageningen, 189 pp. (in Dutch with English summary).
EWUP, 1984. Improving Egypt's irrigation system in the old lands. Final Report, Egypt Water Use and Management Project, Cairo, Egypt, 68 pp.
Hoogland, J.C., Feddes, R.A. and Belmans, C., 1981. Root water uptake model depending on soil water pressure head and maximum extraction rate. Acta Hortic., 119: 123-136.
Hoogmoed, W.B. and Bouma, J., 1980. A simulation model for predicting infiltration into a cracked clay soil. J. Soil. Sci. Soc. Am., 44: 458-461.
Jackson, R.D., 1972. On the calculation of hydraulic conductivity. Soil Sci. Soc. Am. Proc., 36: 380-382.
Raes, D., Van Aelst, P. and Wyseure, G., 1986. ETREF, ETCROP, ETSPLIT and DEFICIT. A computer package for calculating crop water requirements. Reference Manual 1, Laboratory of Soil and Water Engineering, Katholieke Universiteit Leuven, Belgium, 104 pp.
Ritchie, J.T., 1972. Model for predicting evaporation from a row crop with incomplete cover. Water Resour. Res., 8: 1204-1213.
Tanner, C.B. and Jury, W.A., 1976. Estimating evaporation and transpiration from a row crop during incomplete cover. Agron. J., 68: 239-243.