Embed Size (px)
Citation preview

i
SCHEDULE OF ACTIVITIES
1. Inception Visit to Different Department of Tricot industries.……………...……….19/07/2014
2. Learn basic concept of knitting and its process…………………….20/07/2014 TO 25/08/2014
3. Work on improvement of power system of Industry...……………..26/07/2014 TO 02/08/2014
4. Work on alternative source (Solar System) and comparison with diesel generator…03/08/2014
To 10/08/2014
5. Preparation of Report……….………………………………………05/08/2014 TO 09/08/2014
6. Final Report……………………….………………………………...10/08/2014 TO 11/08/2014

ii
ACKNOWLEDGEMENT This Industrial Internship was a great opportunity for us and it is done by support of many others.
We are obliged and grateful to all individuals and the Institution who contributed their ideas and
support in the completion of our internship. At first, we would like to express our sincere
gratitude to the Department of Electrical and Electronics Engineering, Kathmandu University
and CEO of Tricot industries Private Limited, Mr. Sandeep Goenka.
We are very thankful to our intern coordinator, Asst. Prof. Prabal Sapkota and Asst. Prof.
Madhav Prasad Pandey, for their continuous support. It is because of their continuous support we
are able to achieve much in the internship. We would like to express our sincere gratitude to the
Intern Supervisors Mr. Sanjeev K. Jha and Mr.Raja Dongol. Also we would like to thanks to
Mr.Umesh Shah, Ravindra Thakur and Rajkumar Shah for their valuable suggestions and
guidance for electrical power system in Tricot. We are most thankful to our operator brothers &
sisters, who helped us to understand knitting process and gave opportunity to operate hand flat &
automatic knitting machine.
Finally, we would like to thank all our friends and individuals who helped and supported us
during internship.

iii
ABSTRACT Internship in Tricot Industries was completed as a requirement of course Industrial Internship
(PCEG 436). Understanding the technology used in this industry and understanding its work-
environment was the basic aim of this internship.
The internship was divided into two major sections. In the first part we were assigned with a task
of learning by reading the manuals and understanding about the Manufacturing process and
electrical power system. The second part was to study and calculate the size of capacitor bank
required to improve power factor and design of solar photovoltaic system for the key operating
areas of industries and comparison of it with the diesel generator.
This report describes the technical and managerial aspect of Tricot industry. It also contains
details of the internship work (log-sheets of work assigned), various pictures of the work
environment and the letter of certificated from the organization.

iv
SYMBOLS AND ABBREVIATIONS
A. Symbols
Symbol Description
Ω Ohm
KΩ Kilo ohm
v Voltage
KVAR Kilo Volt-Ampere Reactive
B. Abbreviations Abbreviation Full Form
LED Light Emitting Diode
Ah Ampere hour
Wh Watt-hour

v
TABLE OF CONTENTS ACKNOWLEDGEMENT ............................................................................................................................ ii
ABSTRACT ................................................................................................................................................. iii
SYMBOLS AND ABBREVIATIONS ........................................................................................................ iv
LIST OF FIGURES .................................................................................................................................... vii
LIST OF TABLES ..................................................................................................................................... viii
CHAPTER 1 ................................................................................................................................................. 1
OVERVIEW OF ORGANIZATION ............................................................................................................ 1
1.1 Introduction ................................................................................................................................... 1
1.1.1 The history of Tricot .................................................................................................................... 1
1.1.2 Mission statement ........................................................................................................................ 1
1.1.3 Objectives .................................................................................................................................... 1
1.1.4 Organizational Structure and Hierarchy....................................................................................... 2
1.1.5 About Location (Biratnagar) ........................................................................................................ 3
1.1.6 Environment ................................................................................................................................. 4
1.1.7 Manufacturing Process Flowchart................................................................................................ 5
1.1.8 Electrical & Electronics Machinery and Equipment available .................................................... 7
1.1.9 SWOT Analysis ......................................................................................................................... 16
CHAPTER 2 ............................................................................................................................................... 17
INTERNSHIP DETAILS ............................................................................................................................ 17
2.1 Capacitor Bank Installation Analysis ................................................................................................ 17
2.2 Solar Photovoltaic System Design for Key Areas of Factory ........................................................... 19
2.2.1 Introduction ................................................................................................................................ 19
2.2.2 Objectives .................................................................................................................................. 19
2.2.3 Scope of the project.................................................................................................................... 19
2.2.4 Limitations ................................................................................................................................. 20
2.3 Financial analysis and comparison with diesel generator ................................................................. 24
2.4 Solar System Design if Tube-light is Replaced by LED Light ......................................................... 26
2.5 Financial Analysis and Comparison with Diesel Generator ............................................................. 29
2.6 Comparison of Per Unit (kWh) Cost for Diesel Generator and Utility (NEA) Power Supply ......... 32
CHAPTER 3 ............................................................................................................................................... 33
CONCLUSION & RECOMMENDATIONS ............................................................................................. 33

vi
3.1 Conclusion ........................................................................................................................................ 33
3.2 Recommendations ............................................................................................................................. 33
REFERENCES ........................................................................................................................................... 34
APPENDIX ................................................................................................................................................. 35

vii
LIST OF FIGURES Figure 1: Map of Nepal ................................................................................................................................. 3
Figure 2: Map of Rani Mills Area of Biratnagar showing tricot industries .................................................. 4
Figure 3: Top view of Tricot industries ........................................................................................................ 4
Figure 4: Production process ........................................................................................................................ 5
Figure 5: Transformer ................................................................................................................................... 7
Figure 6: UPS ................................................................................................................................................ 7
Figure 7: Battery Backup for UPS ................................................................................................................ 8
Figure 8: Control Panel ................................................................................................................................. 8
Figure 9: 200kVA Diesel Generator ............................................................................................................. 9
Figure 10: 30kVA Diesel Generator ............................................................................................................. 9
Figure 11: Steam Boiler .............................................................................................................................. 10
Figure 12: Control Panel for Steam Boiler ................................................................................................. 10
Figure 13: Pump Used in Boiler ................................................................................................................. 11
Figure 14: Boiler ......................................................................................................................................... 11
Figure 15: Automatic Computerized Knitting Machine ............................................................................. 12
Figure 16: Yarns ......................................................................................................................................... 12
Figure 17: Hand-flat Knitting Department .................................................................................................. 13
Figure 18: Linking Machine ....................................................................................................................... 14
Figure 19: Drier........................................................................................................................................... 15
Figure 20: Washing Machine ...................................................................................................................... 15

viii
LIST OF TABLES Table 1: Total Load Specification for Solar System wih Tube-light .......................................................... 22
Table 2: Investment Cost Estimation for Solar System .............................................................................. 25
Table 3: Annual Expenditure for Solar System .......................................................................................... 25
Table 4: Comparison of Expenditure of Solar System and Diesel Generator ............................................. 26
Table 5: Load Calculation Details for Solar System with Tube-light Replaced by LED Light.................. 27
Table 6: Investment Cost Estimation for LED Light .................................................................................. 29
Table 7: Annual Expenditure ...................................................................................................................... 30
Table 8: Summary of total energy, cost and size decreased by installing the LED in place of tube light .. 31

1
CHAPTER 1
OVERVIEW OF ORGANIZATION
1.1 Introduction
Tricot is an international luxury cashmere manufacturer and market leader in the Nepalese
knitwear industry. Tricot is dedicated to providing excellent customer service and delivering a
high quality product, quickly and efficiently. Tricot's long standing supplier and customer
relationships make it superior and a world class knitwear manufacturer.
1.1.1 The history of Tricot
The Golyan Group and JV Partners set up Makalu Cashmere in 1999. Makalu Cashmere grew
from strength to strength and in 2006 the group took over complete control of the company
renaming it, Tricot Industries. The Golyan Group is Nepal’s leading private sector enterprise and
has been in the textile industry for over 60 years. The Golyan Group is a family company based
around core family values, most importantly honesty, integrity, reliability and transparency. At
Tricot Industries understand the customer needs and are constantly striving to maintain excellent
customer service and high quality products.
Today, Tricot Industries has the largest knitting unit in Nepal and an extensive international
client base. Over the last decade they have adapted to change and kept up to date with the latest
technology and market trends. Recently tricot unveiled new stock service system and cutting
edge Auto-sweat production control software, which helps towards a smoother buying
experience for customers. Whether customers are international fashion brands or small retail
outlets, they can expect the same quality of service and luxury product as one another.
1.1.2 Mission statement
The company's mission is to become the global leader in high quality cashmere and strive to
maintain the core company values: Honesty, integrity, reliability and transparency. Tricot
Industries is devoted to its customers and in delivering consistently high quality products fast and
efficiently with competitive prices for luxury products. Our mission is to become the leading
supply chain partner in flat knitwear across the globe whilst continuing to uphold our core
company values.
1.1.3 Objectives
Delivery on right time with ultimate customer satisfaction in quality.

2
1.1.4 Organizational Structure and Hierarchy
Sampling
YDR Master Panel check Mending
Cutting Linking Trims open Extra Fabric Hand Hamming Stitching
Washing Pressing Measure-
ment
Checking
Buttoning Labelling Folding Taging Packing
Manager Operation
Store Incharge Cixing M/c incharge Manager-Production Knitting Incharge
Yarn store Accessory Store
Designer
Technicians
Sr. operator
Clerck(Ydr3)
Operator
Helper
MUP
Incharge
Finishing
Incharge
Utility
Incharge
Home keeping
Incharge
Managing Director
CEO
Quality Manager
Vice President
Marketing & Merchandizing
Accounts Administration
Final Checking

3
1.1.5 About Location (Biratnagar)
Biratnagar is Nepal’s second biggest city which is located near the south-eastern border to India.
It is known by agriculture, commerce and industry. Country’s most manufacturing industries are
located in this region. Tourists discover Biratnagar on their way to the Himalayan states of India,
known as Sikkim and Darjeeling. Visitors also arrives Biratnagar by air to begin their trekking to
mountains such as Kanchanjunga. In recent days, a day or two is also spent at Biratnagar city by
tourists adventuring into Nepal’s tea growing regions like Illam and Dhankuta.
Nepal's first large scale industry was setup in Biratnagar, the Biratnagar Jute Mills in 1936.
Today, the city has some of the largest industrial undertakings in the country. It is Nepal's second
biggest city which is believed to be the capital of language, culture and politics of the country.
Biratnagar Jute Mills, was set up here in 1936. Koshi Tappu Wildlife Reserve (90-minute drive)
is a bird watching spot. The Koshi Barrage on the Koshi river (two-hour drive) is an impressive
sight. Biratnagar is the hub of air routes in eastern Nepal. (Temperature 8-39 degrees Celsius.)
Figure 1: Map of Nepal

4
Figure 2: Map of Rani Mills Area of Biratnagar showing tricot industries
Figure 3: Top view of Tricot industries
1.1.6 Environment
The company respects the environment and is putting its constant effort to save it by reducing
pollution and upgrading its equipment’s.

5
1.1.7 Manufacturing Process Flowchart
Figure 4: Production process
Yarn Store & Receive
Knitting(Production)
Panel Checking
Initial Mending (If Required)
Cutting
Linking
Sewing
Hand Hemming & Light Checking
Mending (If Required)
Washing & Drying
Final Pressing
Initial Pressing
Final Mending
Quality Checking
Finishing/Packing

6
First of all yarn is received from the yarn store, (yarn are sometime send by the buyer
itself or purchased from China).
After that the knitting is done in automatic computerized flatbed knitting machine or in
hand knitting machine and the particular panel is checked in panel checking to identify
any mistake done in knitting process. If any mending (correcting the defect pieces by
hand) is required it is done.
After an initial pressing is done to unfold the folded edges of panel and cutting is done if
the shoulder slope is not proper.
When all of these processes are completed then the panel are send to the linking
department, the panel and neck are linked with the help of linking machine and the pieces
are corrected by hand sewing.
When sewing process is completed the pieces are finally checked on light table by
inserting the piece on two sleeve . After that final mending is done if required. When all
of these process is finished then the product are washed and dried in washing department
after that final pressing is done, then the product is send for quality checking in finishing
department where final mending is done if required. Finally, the products are packed.

7
1.1.8 Electrical & Electronics Machinery and Equipment available
Electrical equipment available
Transformer
Figure 5: Transformer
Uninterruptable power supply
Figure 6: UPS
Rating
KVA:50kVA
Power factor:0.8
Battery input:348V D.C
Current :122Amp
Rating
Power: 500kVA
Type: Stepdown(11kV/440V)
Phase: Three phase

8
Battery Bank for UPS
Figure 7: Battery Backup for UPS
Control Panel
Figure 8: Control Panel

9
Diesel Generators
Figure 9: 200kVA Diesel Generator
Figure 10: 30kVA Diesel Generator
Steam Boiler
Steam boiler is used to produce the steam used in steam pressing. Here the cold water is
pumped from the water source by two pump, water is pumped at the interval of 5min then
heated and converted into steam .The water is heated by burning straw motors are used
for drawing straw and the gas to the chimney. Firing cut off for Boiler is 140°C.Total
load consumed is 30-50 Amp and system voltage is 350V.The rating of the boiler is
160A, 8kv.
Rating
KVA: 200kVA
Power factor: 0.75
Rating
KVA: 30kVA
Power factor: 0.80

10
Figure 11: Steam Boiler
Figure 12: Control Panel for Steam Boiler

11
Figure 13: Pump Used in Boiler
Figure 14: Boiler
Rating
Pump efficiency: 84%
R.P.M: 2840
Power: 2.7kW

12
CIXING Chinese Automatic Computerized Knitting Machine
Figure 15: Automatic Computerized Knitting Machine
Yarns Available in Computerized Knitting Department
Figure 16: Yarns

13
Hand-flat Knitting Hall
Figure 17: Hand-flat Knitting Department

14
Linking Machine
Figure 18: Linking Machine

15
Drier
Figure 19: Drier
Washing Machine
Figure 20: Washing Machine

16
1.1.9 SWOT Analysis
Strength
Tricot industry produces fewer amounts of harmful gases and polluted water which
doesn’t harm the environment greatly.
Reduction in electricity consumption by replacement of electric iron with steam iron
which is very important to the country like Nepal which produces less electricity.
Bio briquettes for smokeless chulaha can be produced from the incompletely burned
waste from the boiler.
Automatic computerized machine which need lesser employ.
Greatest garment industry of Nepal producing high quality garment products which is
popular worldwide.
Very good quality assurance system.
Weakness
Poor electrical power system.
Low system voltage.
Voltage fluctuation.
Running with low power factor.
Inefficient electrical power supply.
Old civil structure (buildings) dangerous in country like Nepal where Earthquake occurs
frequently.
Knitting labor problem as most of the machine are closed even they have orders.
Lack of proper manpower for the maintenance of machine.

17
CHAPTER 2
INTERNSHIP DETAILS
2.1 Capacitor Bank Installation Analysis
This analysis is intended top-lift the technological standard of industrial plants. The overall
power factor of modern industries is very poor because of inductive loads absorbing reactive
power. Especially, industrial plant with variable load conditions has large inductive loads and its
power factor is very poor. These industries benefit most from automatic capacitor banks. This
bank provides improved power factor, increased voltage level on the load and reduced electric
utility bills. Besides, automatic capacitor banks may be able to eliminate kVAR energized at
light-load periods and undesirable over-voltages. In most cases, the main reason why a customer
installs a capacitor bank is to avoid penalization in the electricity bill. This inappropriate
installation without enough study gives rise to a great variety of technical problems. Therefore,
the fact that capacitor banks are designed for long-term use should be considered.
The main benefits from PF correction are:
Avoid utility penalties
Reduce transformer, cabling, and motor losses
Reduce total plant KVA for the same KW working power
Lower utility electrical billing
Improved voltage regulation
Minimize electrical distribution system investment costs
Avoid utility penalties
As PF correction reduces the magnetizing current through the power circuit, the utility company
can deliver electrical energy to other customers more efficiently.
Reduce total plant KVA for the same KW working power
Improving PF frees up actual KVA for additional loads that in turn allows system transformers
operate more efficiently.
Less investment
In new installations, the reduction in size of distribution equipment (transformers, cables,
switchgears, etc) will imply less waste of money.
Increase KW working power for the same KVA demand
Improving PF will release system capacity permitting the addition of more loads without
overloading the source transformers. By using the next formula, it is possible to verify what was
stated above.
Improved voltage Regulation
As PF correction helps to reduce line voltage drops, motors, conveyors and other equipment will
have more efficient performance.

18
Calculation:
Yearly savings from demand charge:
Apparent power rate = Rs.230/kVA
Installed transformer capacity = 500 kVA
Voltage level of system = 440, 3-phase
Existing power factor = 0.82
Corrected power factor = 0.95
Apparent power demand = 250 kVA
Active power demand = 250×0.82 kVA
= 205 kW
Corrected apparent power demand = ⁄ kVA
= 215.79 kVA
Existing monthly utility charge = Rs.230/kVA×250kVA
= Rs.57,500
Corrected monthly utility charge = Rs.230/kVA×215.79kVA
= Rs.49, 632
Monthly savings = Existing monthly utility charge – Corrected monthly utility charge
= Rs.57, 500 – Rs.49,632
= Rs.7,868
Yearly savings = 12×(Monthly savings)
= 12×Rs.7,868
= Rs.94,416
Yearly saving after eliminating low voltage problem using capacitor bank:
Price of diesel = Rs.110 per litre
Number of hours that diesel generator run due to low voltage = 10 hrs.per month
Amount of diesel consumed by generator = 20 litres per hour
Monthly diesel cost for DG = 10 hrs×20 litres×Rs.110
= Rs.22,000
Yearly diesel cost for DG = Rs.22,000×12
= Rs.2,64,000
Total yearly savings = Yearly savings from demand charge + Yearly savings from DG
= Rs.94,416 + Rs.2,64,000
= Rs.3,58,416
Capacitor size selection and total cost associated with installation:
Capacitive reactive power required,
kVAR = Active power demand×tan(cos-1
existing pf.) – tan(cos-1
corrected pf.)
kVAR = 205kW×tan(cos-1
0.82) - tan(cos-1
0.95)
= 205×tan(34.92) – tan(18.19)
= 205×(0.698 – 0.33 )
= 205×0.369
= 75.73 kVAR, use 100kVAR
Hence, selected size of capacitor bank is 100kVAR.

19
Cost of 100 kVAR capacitor bank = Rs.2,08,000
Total installation charge = Rs.25,000
Total cost = Rs.2,08,000+Rs.25,000
= Rs.2,33,000
Equipment Payback Period:
The equipment payback Period, = Total cost of capacitor bank ÷ Total yearly savings
= Rs.2,33,000 ÷ Rs.3,58,416
= 0.65 yrs.
Hence, the payback period of the equipment is 0.65 years. This indicates that installation of
capacitor bank seems to be feasible.
2.2 Solar Photovoltaic System Design for Key Areas of Factory
2.2.1 Introduction
Electrification is the prompt need of today’s world. Solar photovoltaic is one of the most cost
effective means to provide small amounts of electricity in areas without a grid. It is considered as
the only form of electricity that can be generated anytime and anywhere provided sunshine is
available. Institution like schools, VDC buildings, health post, religious building, clubs etc. at
remote places are to be electrified. Solar photovoltaic systems can serve as source of power
supply. Alternative energy promotion center (AEPC), under the Ministry of Science and
Technology and Energy Sector Assistance Program ESAP are jointly working for the promotion
of alternative energy. The program supports both Solar Home System (SHS) for domestic
purpose and Institutional Solar PV System ISPS for institutional purpose.
2.2.2 Objectives
The basic objectives of the project were to:
Identify the need and demand
Define the load for the tricot industry
Propose the optimum design of the PV panel
Propose the optimum design of the battery
Propose the size of charge controller
Propose the size of wires
Propose the size of inverter
Propose the cost of all the components required for the system
Propose the total cost of installation
Perform the financial and socioeconomic analysis of the project
Financial comparison with respect to a diesel generator for the same
2.2.3 Scope of the project
The project is intended to provide the efficient and uninterrupted power to the key area of Tricot.
The project is intended to lighten the industry and to supply power for a fan, computers and
ventilation fan. Inverters were being used previously. But the inverter was not able to supply
power for long duration and useless for powering the appliance which draws high current.

20
Photovoltaic system would be the adequate source of supply. PV modules have no moving parts
and require little maintenance compared to other electricity-generating systems. Thus there is no
Need of highly qualified manpower. If the complex is expanded the PV systems can be expanded
too and thus the power demand can be satisfied. As the PV systems generate electricity without
polluting the environment and without creating noise, it would be the best choice for the
industries.
2.2.4 Limitations
The project has the following limitations:
Temperature effect is not considered in the design.
The shading effect on the solar array is not incorporated in the design.
The design for the safety disconnect is not detailed.
2.2.5 Methodology
The design of the solar photovoltaic was started with finding the details of the site. Then
The load for the individual block of complex was defined according to the requirement.
Then the sizing of the array was done using the formula;
Iarray = Total average daily load in Ah @ system voltage/(Peak sun x derating factor x columbic
efficiency)
Then the sizing of the battery was done using the formula
Capacity of the battery = (Daily load x days of autonomy)/ (DOD x efficiency)
Then the sizing of the charge regulator was done. The maximum load current capacity
Was calculated using the formula,
Imax = Σ power consumed by appliances/ system voltage
Also the maximum charge current capacity was found. This current should be greater
then or equal to short circuit current produced by the array.
Then wire sizing for the individual section was done using the formula
S = (0.3 x length x max. current)/ Maximum allowable voltage drop in percent.
Then the inverter sizing was done. The surge power for the ac load was calculated.
Then the sizing of the dc to dc converter was performed. The maximum output current
For the dc to dc converter was calculated.
Then the safety disconnect requirements were defined. Also the grounding was designed.
Finally the financial analysis of the project was carried.

21
Computer Department
Number of room=1
Number of tube light=16 of 60W,220Vac,12 hrs per day
Total number of computer =2 of 150W,220Vac,12hrs per day
Number of fans= 2 of 75W; 220 Vac ; 12hrs per day
VHF telecommunication equipment with the following details
~ Power consumption in talk/receive mode: 50
~ Power consumption in stand-by mode: 10W
~ System voltage: -48V dc
General Manager's office
Number of tube light=2 of 60W,220Vac,12 hrs per day
Total number of computer =1 of 150W,220Vac,12hrs per day
Number of fans= 2 of 75W; 220 Vac ; 12hrs per day
Yarn Store
Number of tube light=6 of 60W,220Vac,12 hrs per day
Number of printer= 1 of 70W,220 Vac ; 2hrs per day
Total number of computer =2 of 150W,220Vac,12hrs per day
Number of fans= 3 of 75W; 220 Vac ; 12hrs per day
Administration
Number of tube light=3 of 60W,220Vac,12 hrs per day
Number of computer =1 of 150W,220Vac,12hrs per day
Number of fans= 2 of 75W; 220 Vac ; 12hrs per day
Merchant's office
Number of tube light=5 of 60W,220Vac,12 hrs per day
Number of computer =2 of 150W,220Vac,12hrs per day
Number of fans= 2 of 75W; 220 Vac ; 12hrs per day
Canteen
Ventilation fan = 1 of 80W,220 Vac ; 2hrs per day
Number of tube light=3 of 60W,220Vac,8 hrs per day
Number of fans= 1 of 75W; 220 Vac ; 12hrs per day
Street
Number of tube light=5 of 60W,220Vac,8 hrs per day
22
Finishing Block
Number of tube light=15 of 60W,220Vac,12 hrs per day
Number of fans= 2 of 75W; 220 Vac ; 12hrs per day
Guard's office and Gate
Number of tube light=2 of 60W, 220Vac, 8 hrs. per day
Number of fans= 1 of 75W; 220 Vac, 12hrs. per day
Table 1: Total Load Specification for Solar System wih Tube-light
S.N Type of
load
Power(W) Numbers Total
power
Use
hours
Energy(Wh) Operating
voltage
1 Lamp 1 60 47 2820 12 33840/0.9
=37600
eqv.12
Vdc
2 Lamp 2 60 17 1020 8 8160/0.9
=9066.66
eqv.12
Vdc
3 Computers 150 9 1350 12 16200/0.9
=18000
eqv.12
Vdc
4 Fans 75 15 1125 12 13500/0.9
=15000
eqv.12
Vdc
5 Ventilator 80 1 80 8 640/0.9
=711.11
eqv.12
Vdc
6 Printer 70 1 70 2 140/0.9
=155.55
eqv.12
Vdc
7 Telephone 10 4 40 23 920 eqv.48Vdc
50 4 200 1 200
Total D.C load = 37600+9066.66+18000+15000+711.11+155.55
= 80533.32Wh for 12 vdc
And,
1120Wh for 48 vdc
Total energy required in Ampere hour =
+
= 6711.11 + 23.33
= 6734.44 Ah
Array Sizing:
Peak sun assumed: 5
Total array current required is
Iarray = 6734.44/(5 x 0.85 x 0.9)
= 1760.63 A

23
For this requirement 150W model of Astropower with Imp = 8.8 A is selected. The
Number of modules to be in parallel,
Np = 1760.63/8.8 = 200
Battery Sizing:
Autonomy day = 5 (assumed)-
The capacity of the battery bank (assumed DOD 80% and charging efficiency 0.8) is
C = (6734.44 x 5)/ (0.8 x 0.8) = 52613.593Ah, 12v
Thus, 200Ah, 12V deep cycle batteries are selected. To meet the required capacity 265 batteries
are to be connected in parallel
.
Charge regulator sizing:
Operating voltage: 12Vdc
The CR to be used must handle the full short circuit current from the array. For the
Selected model of array, the short circuit current is 9.8A. Thus the total maximum charge
Current is
Iarray = 200 x 9.8 = 1960A
Thus for CR with charge handling capacity greater or equal to 1960A is needed. A CR
With 2000A would meet the requirement.
The maximum possible load current is calculated as,
Imax = ( 2820+1020+1350+1125+80+70)/12
= 538.75 A
The load handling capacity of the CR must exceed538.75A; CR with 550 load current
Handling capacity would meet the requirement.
Wire Sizing:
We proposed load center is in the power house and array is to be mounted on the roof of the
Industry. For the purpose of wiring the following length of wires are required:
Array to load center (allowable voltage drop 3%) = 60m (cable S1)
Load center to battery bank (allowable voltage drop 1 %) = 10m (cable S2)
CR center to inverter (allowable voltage drop 3%) = 3m (cable S3)
CR to dc to dc converter (allowable voltage drop 3%) = 5m (cable S4)CR to loads
(allowable voltage drop 5%)
to Computer department = 50m (cable S5)
to Finishing block = 50m
to G.M's office=50m
to Merchant office = 50m
to Canteen = 30m (cable S5)
to Guard's room and Gate = 50m
S1 = (0.3 x 60m x Iarray)/3 = (0.3 x 60 x 1760.63)/3 = 10563.78 sq. mm.

24
S2 = (0.3 x 10m x 1760.63)/1 = 5280.9 sq. mm.
S3 = (0.3 x 3m x 1760.63)/3 = 528.09 sq mm.
S4 = (0.3 x 5m x 1760.3)/3 = 880.15 sq. mm.
S5 = (0.3m x 50m x 8.5)/5 = 42.5 sq. mm.
(Length 50m is considered for the largest distance from CR to computer department)
The same cable is to be considered for all the loads for convenience and for the cost.
If the wire of the calculated size is not found in the market, the wire size just exceeding
The calculated value is to be selected.
Inverter Sizing:
The capacity of the selected inverter is
P=(Total power x Surge power)/P.F
P = (6465 x 3)/ 0.9= 21550 VA
The input dc supply voltage of the inverter is 12V dc. Since the load is not very sensitive
To the wave shape of AC, high efficiency (0.9) square wave inverter is selected.
DC – to – DC Converter sizing:
Output voltage = 48V
Maximum output current should be greater than load current. Here
The load current = 50/48 = 1.04A
Thus, maximum output current = 2A
Efficiency, = 0.9
Grounding design:
All the ground wires from the equipment are to be connected to a ground electrode in the
earth. The entire negative is grounded.
Copper plate electrodes are to be used.
Dimensions 600mm x 600mm x 3mm
The copper plate is to be buried in a trench of minimum 2.5m depth.
The first meter of covering of the earthing plate is to be fine clay mixed with
Layers of charcoal and salt.
8SWG (4.06 mm diameter) copper wire is to be used for earth wire
2.3 Financial analysis and comparison with diesel generator
Project cost:
The project investment cost include the cost of different components, transportation,
Installation cost. The cost is as tabulated below:

25
Table 2: Investment Cost Estimation for Solar System
INVESTMENT COST ESTIMATION
S.N. Description Amount(NRs.)
1 Solar panel 2000000
2 Battery 6625000
3 Charge controller 150000
4 Inverter 5000
5 dc-to-dc converter 2,000
6 Cables 5,000
7 Safety fuses and grounding 10,000
9 Transportation 5,000
10 Installation 15,000
Total 8682000
Contingencies(5%) 434100
Grand total 9116100
The annual cost of operation is as tabulated below:
Table 3: Annual Expenditure for Solar System
Annual Expenditure
S.N. Description Amount(NRs.)
1 Annual salary 5,000
2 Repair and maintenance 1,000
Total 6,000
The estimated income from the project is as tabulated below:
Total cost of installation = Rs.9116100
Total annual expenditure = Rs.6000
Net present worth for the PV system is calculated as:
NPW(PVsystem)=-9116100-6625000(P/F,10%,5)-6625000(P/F,10%,10)-6625000(P/F,10%,15)-
6000(P/A,10%,20) [Since, batteries has to be replaced in every five years.]
=-9116100-4107500-2517500-1583375-57270
=NRs.-17381745

26
For Diesel Plant:
Size of plant required: 7kVA
From data observed, it was found that the generator at full load (6465W) requires 1.5ltr of diesel.
At 75% of load 1.5ltr is required.
At 50% of load 0.75ltr is required.
The diesel-generator is required to supply 75% load for 8 hrs, 50% load for 3 hours
Therefore, total diesel required = (1.5 x 8+0.75 x 3) = 14.25 ltrs daily.
Total annual cost of operation = Rs (14.25x110x365)
=Rs 572137.5
Initial Cost of diesel-generator = NRs 300000
NPW (Diesel-generator) = -300000-572137.5(P/A,10%,20)
= NRs.-300000-5461433.863
= NRs.-5761433.863
The NPW of diesel generator is less than that of PV system. Hence, the system is financially not
feasible.
Table 4: Comparison of Expenditure of Solar System and Diesel Generator
S.N Expenditures Solar System Diesel Generator
1 Installation/Initial Cost Rs 916100 Rs 300000
2 Annual Repair and Maintenance Cost Rs 1000 Rs 3000
3 Annual Operation Cost Rs 572137.5 Rs 0
4 Net Present Worth of 20 years Rs -17381745 Rs -5786973.86
2.4 Solar System Design if Tube-light is Replaced by LED Light
Since there are many latest technologies for lighting the room with low power consumption we
can replace the tube lights where it is not necessary with LED lights which can consume less
power and illumination is also good. So, replace the traditional. According to our survey out of
64 tube lights 50 tube lights can be replaced with LED lights.

27
Table 5: Load Calculation Details for Solar System with Tube-light Replaced by LED Light
S.N Type of
load
Power(W) Numbers Total
power
Use
hours
Energy(Wh) Operating
voltage
1 Lamp 1 10 33 330 12 3960/0.9
=4400
eqv.12
Vdc
2 Lamp 2 10 17 170 8 1360/0.9
=1511.11
eqv.12
Vdc
3 Lamp 3 60 14 840 12 10080/0.9
=11200
eqv.12
Vdc
4 Computers 150 9 1350 12 16200/0.9
=18000
eqv.12
Vdc
5 Fans 75 15 1125 12 13500/0.9
=15000
eqv.12
Vdc
6 Ventilator 80 1 80 8 640/0.9
=711.11
eqv.12
Vdc
7 Printer 70 1 70 2 140/0.9
=155.55
eqv.12
Vdc
8 Telephone 10 4 40 23 920 eqv.48Vdc
50 4 200 1 200
Total D.C load = 4400+1511.11+11200+18000+15000+711.11+155.55
= 50977.77Wh for 12 vdc
And,
1120Wh for 48 vdc
Total energy required in Ampere hour =
+
= 4248 + 23.33
= 4271.33 Ah
Array Sizing:
Peak sun assumed: 5
Total array current required is
Iarray = 4271.33/(5 x 0.85 x 0.9)
= 1116.68 A
For this requirement 150W model of Astropower with Imp = 8.8 A is selected. The
number of modules to be in parallel,
Np = 1116.68/8.8 = 126.8
=127
Battery Sizing:
Autonomy day = 5 (assumed)-
The capacity of the battery bank (assumed DOD 80% and charging efficiency 0.8) is
C = (4271.33 x 5)/ (0.8 x 0.8) = 33369.765Ah, 12v

28
Thus, 200Ah, 12V deep cycle batteries are selected. To meet the required capacity 167 batteries
are to be connected in parallel.
Wire Sizing:
We proposed load center is in the power house and array is to be mounted on the roof of the
Industry. For the purpose of wiring the following length of wires are required:
Array to load center (allowable voltage drop 3%) = 60m (cable S1)
Load center to battery bank (allowable voltage drop 1 %) = 10m (cable S2)
CR center to inverter (allowable voltage drop 3%) = 3m (cable S3)
CR to dc to dc converter (allowable voltage drop 3%) = 5m (cable S4)CR to loads
(allowable voltage drop 5%)
to Computer department = 50m (cable S5)
to Finishing block = 50m
to G.M's office=50m
to Merchant office = 50m
to Canteen = 30m (cable S5)
to Guard's room and Gate = 50m
S1 = (0.3 x 60m x Iarray)/3 = (0.3 x 60 x 1116.68)/3 = 6700.08 sq. mm.
S2 = (0.3 x 10m x 1116.68)/1 = 3350.04 sq. mm.
S3 = (0.3 x 3m x 1116.68)/3 = 335.005 sq mm.
S4 = (0.3 x 5m x 1116.68)/3 = 558.34 sq. mm.
S5 = (0.3m x 50m x 8.5)/5 = 42.5 sq. mm.
(Length 50m is considered for the largest distance from CR to computer department)
The same cable is to be considered for all the loads for convenience and for the cost.
If the wire of the calculated size is not found in the market, the wire size just exceeding
The calculated value is to be selected.
Inverter Sizing:
The capacity of the selected inverter is
P=(Total power x Surge power)/P.F
P = (3965 x 3)/ 0.9= 13216.66 VA
The input dc supply voltage of the inverter is 12V dc. Since the load is not very sensitive
to the wave shape of AC, high efficiency (0.9) square wave inverter is selected.
DC – to – DC Converter sizing:
Output voltage = 48V
Maximum output current should be greater than load current. Here
The load current = 50/48 = 1.04A
Thus, maximum output current = 2A
Efficiency, = 0.9

29
Charge regulator sizing:
Operating voltage: 12Vdc
The CR to be used must handle the full short circuit current from the array. For the
Selected model of array, the short circuit current is 9.8A. Thus the total maximum charge
Current is
Iarray = 127 x 9.8 = 1244.6A
Thus for CR with charge handling capacity greater or equal to 1244.6A is needed. A CR
with 1500A would meet the requirement.
The maximum possible load current is calculated as,
Imax = ( 3965)/12
= 330.41 A
The load handling capacity of the CR must exceed 330.A41 CR with 5350 load current
Handling capacity would meet the requirement.
2.5 Financial Analysis and Comparison with Diesel Generator
Project cost:
The project investment cost include the cost of different components, transportation,
Installation cost. The cost is as tabulated below:
Table 6: Investment Cost Estimation for LED Light
INVESTMENT COST ESTIMATION
S.N. Description Amount(NRs.)
1 Solar panel 1270000
2 Battery 4175000
3 Charge controller 130000
4 Inverter 5000
5 dc-to-dc converter 2,000
6 Cables 5,000
7 Safety fuses and grounding 10,000
9 Transportation 5,000
10 Installation 10,000
Total 5612000
Contingencies(5%) 280600
Grand total 5892600

30
The annual cost of operation is as tabulated below:
Table 7: Annual Expenditure
Annual Expenditure
S.N. Description Amount(NRs.)
1 Annual salary 5,000
2 Repair and maintenance 1,000
Total 6,000
The estimated income from the project is as tabulated below:
Total cost of installation = Rs.5892600
Total annual expenditure = Rs.6000
Net present worth for the PV system is calculated as:
NPW(PVsystem)=-5892600-4175000(P/F,10%,5)-4175000(P/F,10%,10)-4175000(P/F,10%,15)-
6000(P/A,10%,20) [Since, batteries has to be replaced in every five years.]
=-5892600-2588500-1586500-997825-57270
=NRs.-11122675
For Diesel Plant:
Size of plant required: 7kVA
From data observed, it was found that the generator at 75% of full load (3965W) requires 1.5ltr
of diesel.
At 75% of load 1ltr is required.
At 50% of load 0.5ltr is required.
The diesel-generator is required to supply 75% load for 8 hrs, 50% load for 3 hours
Therefore, total diesel required = (1 x 8+0.5 x 3) = 9.5 ltrs daily.
Total annual cost of operation = Rs (9.5x110x365)
=Rs 381425
Initial Cost of diesel-generator = NRs 250000
NPW (Diesel-generator) = -250000-381425(P/A,10%,20)
= NRs.-250000-3604466.25
= NRs.-3854466.25

31
The NPW of diesel generator is less than that of PV system. Hence, the system is financially
feasible.
Table 8: Summary of total energy, cost and size decreased by installing the LED in place of tube
light
Tube light LED
Energy in Wh 80533.32 50977.77
Energy in Ah 6734.44 4271.33
Total cost(NRS.) 17381745 11122675
Total number of panel used 200 127
Total number of batteries used 265 167
Rating of diesel generator 7KVA 5KVA
32
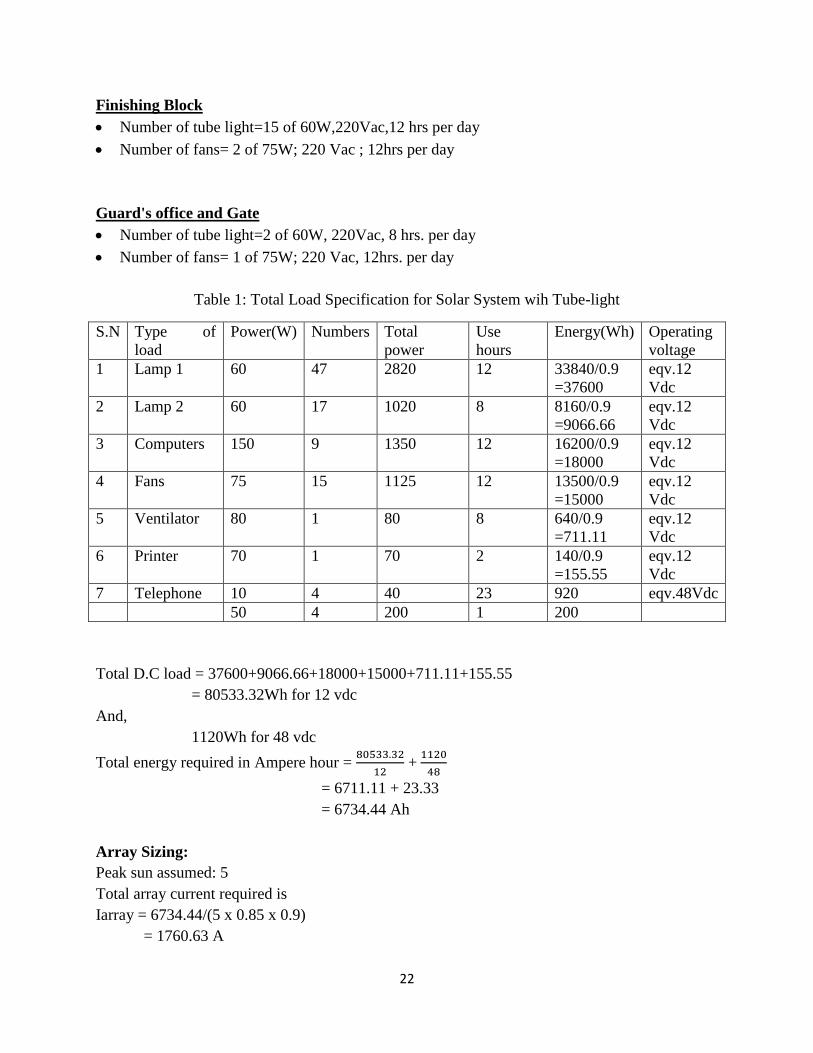
2.6 Comparison of Per Unit (kWh) Cost for Diesel Generator and Utility (NEA) Power
Supply
Per Unit (kWh) cost for Utility (NEA) Supply
Tariff 1 (6PM to 10PM) rate per unit of electricity = Rs.8.75
Tariff 2 (6AM to 6PM) rate per unit of electricity = Rs.7.10
Tariff 3 (10PM to 6AM) rate per unit of electricity = Rs.4.30
Per Unit (kWh) cost for Diesel Generator
Average load = 145A
Voltage level = 440V
Power factor = 0.74
kW = kVA × p.f.
= 440×145×0.74×√3
= 82 kW
Total number of Unit (kWh) produced in one hour is,
kWh = 82 kW×1h
= 82 Unit (kWh)
Amount of diesel consumed in 1 hour = 22 liters
Price of diesel = Rs.110 per liter
Total cost in 1 hour (82 Unit) = Rs.110×22liters
= Rs.2376
Rate per unit of electricity from Diesel Generator = Rs.2376/82
= Rs.28
Hence, we concluded that cost of electricity generated by diesel generator is four times
greater than that of Utility (NEA) cost.

33
CHAPTER 3
CONCLUSION & RECOMMENDATIONS
3.1 Conclusion
We studied about overview of Tricot Industries and gained knowledge about the Knitting
operation. We got chance to feel the professional life and introduced with staffs of the Tricot.
We gained knowledge about Capacitor Bank and solar system installation. We also gained
knowledge about the power system scenario of Industries.
Since the power bill is based on the usage of the active power – kilo-watt-hour (kWh) while the
power system equipment is built to handle the apparent power, the power company may charge a
higher rate for loads drawing below a certain power factor. By spending some money on power
factor correction equipment (Capacitor Bank) customer can save money on electricity bill due to
low power factor.
Solar system design is an ISPS for an industry place. The project would uplift the efficient power
supply. The project is technically feasible. But financially it is found to be not feasible. The use
of LED lights can save the huge amount of energy and also reduces the size of the solar system
also reduces the size of generator if generator is used instead of photovoltaic system in turns
results in consumption of diesel. The photovoltaic system reduces the harmful gas generated by
diesel generator which upgrades the concept of green industry. Another advantage of
photovoltaic system is that it does not produce sound like generator run by diesel. For this
reason the photovoltaic system can be considered.
3.2 Recommendations
Installation of Automatic Capacitor bank is needed because of the variation of load in industry.
The Solar Photovoltaic system design can be modified considering a 48V system, to reduce the
loss. Also solar tracker system can be used for maximum energy tapping from sun.

34
REFERENCES
1. S.K.Jha, “ The Design Of Solar Photovoltaic System For Muktinath Temple”
2. Alternative energy promotion center and Energy sector assistance programme,“Solar
photovoltaic system design manual for solar design Engineeers”,CRE,2003.
3. S.K.Jha, “Principle of Electrical Installations and Lighting System”, Supportive
document for PV design.
4. W.G.Sullivan, J.A.Bontadelli, E.M.Wicks, “Engineering Economy”, 11th
Edition,2000.

35
APPENDIX
36

37

38

39

40