Embed Size (px)
Citation preview

Pattern Recognition 41 (2008) 1867–1877www.elsevier.com/locate/pr
Identifying elephant photos by multi-curve matching
A. Ardovini, L. Cinque, E. Sangineto∗
Computer Science Department, University of Rome “La Sapienza”, via Salaria 113, 00198 Rome, Italy
Received 10 January 2007; received in revised form 15 October 2007; accepted 12 November 2007
Abstract
We present in this paper an elephant photo identification system based on the shape comparison of the nicks characterizing the elephants’ears. The method we propose can deal with very cluttered and noisy images as the ones commonly used by zoologists for wild elephant photoidentification. Difficult segmentation problems are solved using rough position information input by the user. Such information is used bythe system as a basis for a set of segmentation and normalization hypotheses aiming at comparing a query photo Q with different photos ofthe system’s database possibly representing the same individual as Q. The proposed shape comparison method, based on matching multiple,non-connected curves, can be applied to different retrieval by shape problems. Examples with real wild elephant photos are shown.� 2007 Elsevier Ltd. All rights reserved.
Keywords: Elephant photo identification; Image retrieval by shape; Symmetric invariant multiple curve matching
1. Introduction
This work has been motivated by the necessity to automateas much as possible the currently tedious and time-consuminghuman-made photo recognition of individuals in an elephantpopulation. In order to study demographic processes of theelephant populations, as well as to plan their conservation, itis essential to trace the elephant movements along time. Pho-tographic elephant identification is one of the cheapest, lessinvasive and most common marking system. It is currently ahuman-made operation based on the comparison of each newphoto with all the images of the zoologist’s database (usuallycomposed of hundreds of exemplars) looking to possible simi-larities with respect to some distinguishing biological features.One of these features is the shape of the nicks which character-ize the borders of the ears (e.g., see Fig. 1). Such nicks can beused to uniquely identify an exemplar almost like fingerprintsfor human beings.
For a computer vision point of view the problem is nottrivial because of the commonly highly cluttered and low-contrast images representing the interesting shapes. In fact, pho-tos of wild elephants can contain trees and shrubs either in the
∗ Corresponding author. Tel.: +39 06 49918358; fax: +39 06 8541842.E-mail address: [email protected] (E. Sangineto).
0031-3203/$30.00 � 2007 Elsevier Ltd. All rights reserved.doi:10.1016/j.patcog.2007.11.010
background or partially occluding the animal’s ear, while thethick veins of the elephant’s skin as well as the low contrastbetween the ear surface and the body skin make the segmenta-tion of the ear’s border from the surrounding lines a very hardprocess (e.g., see Fig. 3). We have dealt with this problem bybuilding a semi-automatic system in which the human operatorapproximately selects the nick position using the mouse andthe system produces a set of hypotheses on the nick composi-tion based on different candidate endpoints. These hypotheseshelp to refine the segmentation–detection process and are ver-ified by taking into account both their positions with respectto the whole ear and the nick shape by matching the selectedlines with the nick curves contained in the system’s database.The output of the system is the ranked list of the top 10 mostsimilar individuals to the input query.
The proposed system is currently used by some researchersof the Zoological Department of the University of Rome “LaSapienza”, who are studying the African elephant populationof Zakouma Ciad National Park [1]. The system has alsohelped the zoologists in discovering a few photos of the sameindividuals miss-classified as different exemplars during theprevious hand-made identification attempts. The experimen-tal results presented in Section 7, as well as all the exam-ple photos shown in this article have been taken from theirdatabases.
1868 A. Ardovini et al. / Pattern Recognition 41 (2008) 1867–1877
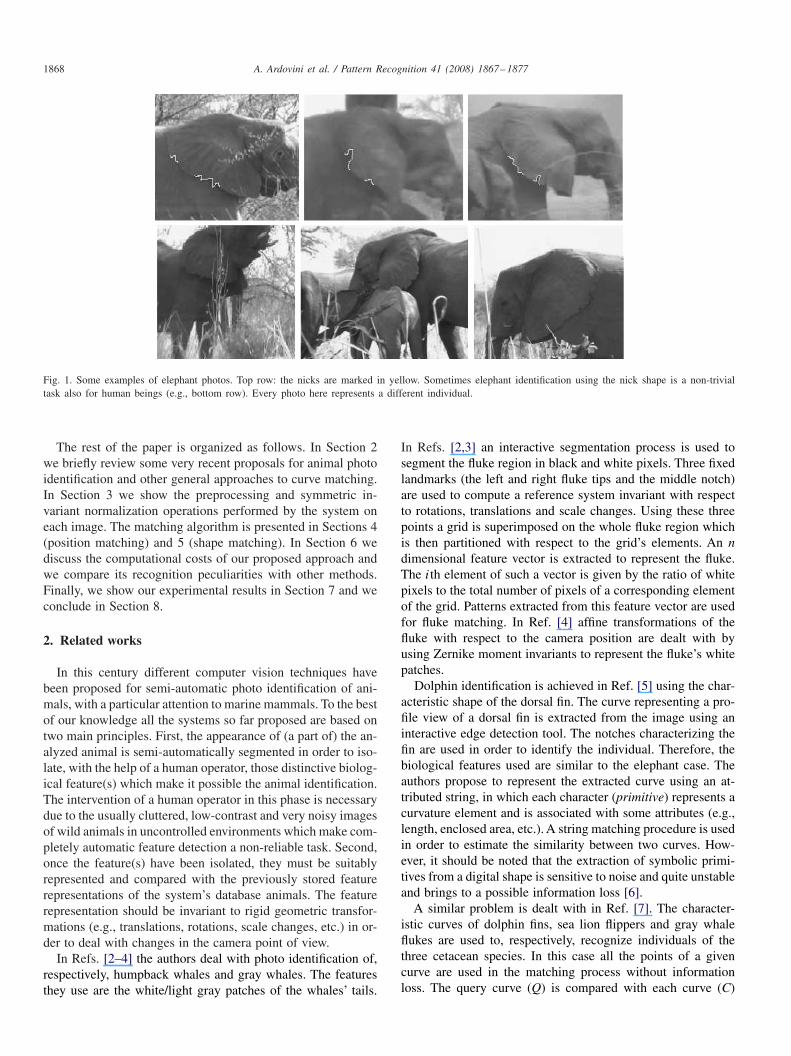
Fig. 1. Some examples of elephant photos. Top row: the nicks are marked in yellow. Sometimes elephant identification using the nick shape is a non-trivialtask also for human beings (e.g., bottom row). Every photo here represents a different individual.
The rest of the paper is organized as follows. In Section 2we briefly review some very recent proposals for animal photoidentification and other general approaches to curve matching.In Section 3 we show the preprocessing and symmetric in-variant normalization operations performed by the system oneach image. The matching algorithm is presented in Sections 4(position matching) and 5 (shape matching). In Section 6 wediscuss the computational costs of our proposed approach andwe compare its recognition peculiarities with other methods.Finally, we show our experimental results in Section 7 and weconclude in Section 8.
2. Related works
In this century different computer vision techniques havebeen proposed for semi-automatic photo identification of ani-mals, with a particular attention to marine mammals. To the bestof our knowledge all the systems so far proposed are based ontwo main principles. First, the appearance of (a part of) the an-alyzed animal is semi-automatically segmented in order to iso-late, with the help of a human operator, those distinctive biolog-ical feature(s) which make it possible the animal identification.The intervention of a human operator in this phase is necessarydue to the usually cluttered, low-contrast and very noisy imagesof wild animals in uncontrolled environments which make com-pletely automatic feature detection a non-reliable task. Second,once the feature(s) have been isolated, they must be suitablyrepresented and compared with the previously stored featurerepresentations of the system’s database animals. The featurerepresentation should be invariant to rigid geometric transfor-mations (e.g., translations, rotations, scale changes, etc.) in or-der to deal with changes in the camera point of view.
In Refs. [2–4] the authors deal with photo identification of,respectively, humpback whales and gray whales. The featuresthey use are the white/light gray patches of the whales’ tails.
In Refs. [2,3] an interactive segmentation process is used tosegment the fluke region in black and white pixels. Three fixedlandmarks (the left and right fluke tips and the middle notch)are used to compute a reference system invariant with respectto rotations, translations and scale changes. Using these threepoints a grid is superimposed on the whole fluke region whichis then partitioned with respect to the grid’s elements. An ndimensional feature vector is extracted to represent the fluke.The ith element of such a vector is given by the ratio of whitepixels to the total number of pixels of a corresponding elementof the grid. Patterns extracted from this feature vector are usedfor fluke matching. In Ref. [4] affine transformations of thefluke with respect to the camera position are dealt with byusing Zernike moment invariants to represent the fluke’s whitepatches.
Dolphin identification is achieved in Ref. [5] using the char-acteristic shape of the dorsal fin. The curve representing a pro-file view of a dorsal fin is extracted from the image using aninteractive edge detection tool. The notches characterizing thefin are used in order to identify the individual. Therefore, thebiological features used are similar to the elephant case. Theauthors propose to represent the extracted curve using an at-tributed string, in which each character (primitive) represents acurvature element and is associated with some attributes (e.g.,length, enclosed area, etc.). A string matching procedure is usedin order to estimate the similarity between two curves. How-ever, it should be noted that the extraction of symbolic primi-tives from a digital shape is sensitive to noise and quite unstableand brings to a possible information loss [6].
A similar problem is dealt with in Ref. [7]. The character-istic curves of dolphin fins, sea lion flippers and gray whaleflukes are used to, respectively, recognize individuals of thethree cetacean species. In this case all the points of a givencurve are used in the matching process without informationloss. The query curve (Q) is compared with each curve (C)

A. Ardovini et al. / Pattern Recognition 41 (2008) 1867–1877 1869
of the system’s database. Given a pair of curves Q and C, thepoints corresponding to the respective curvature maxima andminima are used as landmarks in order to compute the affinetransformation which best aligns Q upon C. The “mismatcharea” between the two aligned curves is then computed andused to estimate the curve dissimilarity. Unfortunately, thereare some assumptions on the number and on the nature of thecurvature maxima and minima (the landmarks used to com-pute the alignment) which makes the approach dependent onthe particular animal anatomy. Moreover, both Q and C needto be unoccluded and uninterrupted. For instance, if Q and Cwere piecewise connected lines composed of connected sub-curves Q1, Q2, . . . , QN and C1, C2, . . . , CM , it would not beclear how to match the single components and to compute theoverall mismatch area.
A similar problem is present in most of the approaches so farproposed for animal photo identification by shape matching. Forinstance, the extraction of a connected curve is also necessaryin Ref. [8] to classify Sperm Whale flukes. Once isolated fromthe background, the trailing edge of the animal’s tail is a curvedealt with as a mono-dimensional signal. The authors apply awavelet transform to such signals and compare the resultingcoefficients.
Unfortunately, the border of an elephant’s ear profile ex-tracted using a common edge detector is very hardly completelyconnected (this situation never happened in our experiments)and it is sometimes partially occluded by other elephants ortrees (e.g., Figs. 1–3). For this reason we need to deal withpartially defined curves. Moreover, it is not the shape of thewhole ear which is important for the recognition task, but theshape details of each single nick, as well as the nick posi-tion with respect to the rest of the ear. Generally speaking,the recognition process must be based on the comparison oftwo pairs of non-connected curve sets {Q1, Q2, . . . , QN } and{C1, C2, . . . , CM}.
In computer vision and pattern recognition literature curvematching problems are usually dealt with using the assump-tion of a closed or at least connected, single curve. Curvaturescale space [9–11] approaches are based on a scale-dependingrepresentation of a given curve C obtained by progressivelysmoothing C. C is assumed to be connected. Fourier descriptorsor wavelet coefficients are often used to describe the externalborder of a connected silhouette [12,8]. Shape signature-basedapproaches represent a curve using a string (called signature),in which each element (character or primitive) represents anatomic piece of the line (e.g., see Ref. [5]). Also shape signa-tures cannot deal with partially defined curves.
An active contour model (also called snake) [13,14] is a de-formable curve (S) which can be superimposed upon an imageedge map I and progressively deformed until either the pointsof S and I overlap on each other or the deformation of S exceedsa given value. Snakes and their statistical learning-based ver-sion point distribution models [15] can in principle deal withpartial occlusions and/or missing points in I. Nevertheless, Sneeds to be connected which introduces problems in its extrac-tion from a cluttered image. Moreover, all the points of S havethe same importance in the matching phase. Last but not the
least, a cluttered background in the proximity of the elephant’sear (e.g., see Fig. 3) can easily trap the deformation processinto a false local minimum.
Contrary to the above mentioned methods, the generalizedHough transform (GHT) [16] is a well-known technique witha proved ability in dealing with non-connected curves. A non-analytic curve C is represented by means of an “R-Table” Twhich contains the translation offsets of each point of C with re-spect to a given reference point p. At searching time, C is lookedfor in the image edge map I by computing the possible positionsof p with respect to all the points of I using T. No continuity as-sumption is used in this case, and in fact the GHT and its numer-ous, different versions (e.g., see Ref. [17]) are used in problemsin which occlusions and partial data prevent an exact segmen-tation of the image edge map. Nevertheless, there are two mainreasons for which the GHT cannot be used in our domain. First,we need to take into account not only x and y translations of thequery curves with respect to the database curves, but also rota-tional and scale parameters, due to possible viewpoint changes(e.g., see Fig. 1). It is well known that the GHT efficiency isquite critical in dealing with such additional parameters. More-over, the typical image background of an elephant in its naturalhabitat is composed of very thick twigs and shrubs (see Fig. 3)which make very confusing the voting phase. We have imple-mented the traditional version of the GHT with only translationparameters and applied it to a subset of fixed scale and orien-tation images of elephants. Our experimental trials have shownthat, as we expected, false positives are very frequently de-tected on the elephant’s skin vein or on the image backgroundregions.
The method proposed in this paper is based on two mainsteps. We assume to compare a set Q1, . . . , QN of curvesrepresenting the visible nicks of the query image and a setP1, . . . , PM of curves of a given individual of the database.First, we globally compare Q1, . . . , QN and P1, . . . , PM
searching for a matching of a subset of curves having con-sistent positions with respect to a few reference points on theanimal’s head selected by the user (Section 4). Second, eachvalid global match is subsequently locally verified by sepa-rately comparing pairs of matched curves (Section 5). In theglobal step the ear’s border between Qi and Qi+1, as well asthe border between Pj and Pj+1 do not need to be defined.This makes the comparison process depending only on thenicks. Conversely, in locally comparing the shape of two givennicks Qi and Pj , both Qi and Pj must be connected. The con-nectivity property of the curve shape of each single nick canbe easily guaranteed by a minor human intervention duringthe interactive segmentation process as described in the nextsection.
3. Extraction of the nick curvature
In this section we show the different phases of the semi-automatic segmentation process performed on each image whenit is either off-line stored in the system’s repository or used ason-line query.
1870 A. Ardovini et al. / Pattern Recognition 41 (2008) 1867–1877
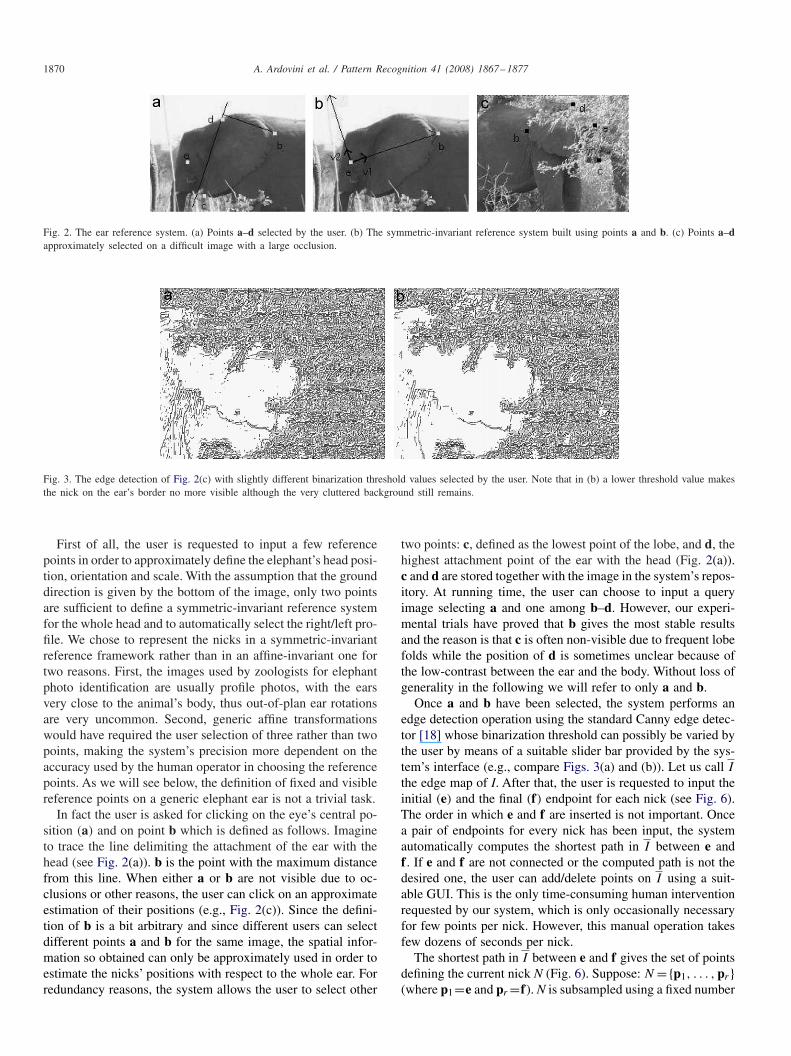
Fig. 2. The ear reference system. (a) Points a–d selected by the user. (b) The symmetric-invariant reference system built using points a and b. (c) Points a–dapproximately selected on a difficult image with a large occlusion.
Fig. 3. The edge detection of Fig. 2(c) with slightly different binarization threshold values selected by the user. Note that in (b) a lower threshold value makesthe nick on the ear’s border no more visible although the very cluttered background still remains.
First of all, the user is requested to input a few referencepoints in order to approximately define the elephant’s head posi-tion, orientation and scale. With the assumption that the grounddirection is given by the bottom of the image, only two pointsare sufficient to define a symmetric-invariant reference systemfor the whole head and to automatically select the right/left pro-file. We chose to represent the nicks in a symmetric-invariantreference framework rather than in an affine-invariant one fortwo reasons. First, the images used by zoologists for elephantphoto identification are usually profile photos, with the earsvery close to the animal’s body, thus out-of-plan ear rotationsare very uncommon. Second, generic affine transformationswould have required the user selection of three rather than twopoints, making the system’s precision more dependent on theaccuracy used by the human operator in choosing the referencepoints. As we will see below, the definition of fixed and visiblereference points on a generic elephant ear is not a trivial task.
In fact the user is asked for clicking on the eye’s central po-sition (a) and on point b which is defined as follows. Imagineto trace the line delimiting the attachment of the ear with thehead (see Fig. 2(a)). b is the point with the maximum distancefrom this line. When either a or b are not visible due to oc-clusions or other reasons, the user can click on an approximateestimation of their positions (e.g., Fig. 2(c)). Since the defini-tion of b is a bit arbitrary and since different users can selectdifferent points a and b for the same image, the spatial infor-mation so obtained can only be approximately used in order toestimate the nicks’ positions with respect to the whole ear. Forredundancy reasons, the system allows the user to select other
two points: c, defined as the lowest point of the lobe, and d, thehighest attachment point of the ear with the head (Fig. 2(a)).c and d are stored together with the image in the system’s repos-itory. At running time, the user can choose to input a queryimage selecting a and one among b–d. However, our experi-mental trials have proved that b gives the most stable resultsand the reason is that c is often non-visible due to frequent lobefolds while the position of d is sometimes unclear because ofthe low-contrast between the ear and the body. Without loss ofgenerality in the following we will refer to only a and b.
Once a and b have been selected, the system performs anedge detection operation using the standard Canny edge detec-tor [18] whose binarization threshold can possibly be varied bythe user by means of a suitable slider bar provided by the sys-tem’s interface (e.g., compare Figs. 3(a) and (b)). Let us call I
the edge map of I. After that, the user is requested to input theinitial (e) and the final (f) endpoint for each nick (see Fig. 6).The order in which e and f are inserted is not important. Oncea pair of endpoints for every nick has been input, the systemautomatically computes the shortest path in I between e andf . If e and f are not connected or the computed path is not thedesired one, the user can add/delete points on I using a suit-able GUI. This is the only time-consuming human interventionrequested by our system, which is only occasionally necessaryfor few points per nick. However, this manual operation takesfew dozens of seconds per nick.
The shortest path in I between e and f gives the set of pointsdefining the current nick N (Fig. 6). Suppose: N ={p1, . . . , pr}(where p1=e and pr =f). N is subsampled using a fixed number
A. Ardovini et al. / Pattern Recognition 41 (2008) 1867–1877 1871
of points n (currently, n = 25) using the following algorithm:
Subsampling Procedure ({p1, . . . , pr})1 step := r−1
n−1 , s := step + 1.2 P [1] := p1, P [n] := pr .3 For i ∈ [2, n − 1], do:4 k := �s�, d := s − k.5 P [i] := InterpolatedPoint(pk, pk+1, d).6 s := s + step.7 Return P.
In Step 4 “�s�” is the floor operation on s and, hence,0�d < 1 (i.e., k is the greatest integer smaller than or equal tos and d is the remaining decimal fraction). InterpolatedPoint()in Step 5 is defined as follows:
InterpolatedPoint(pk, pk+1, d) = pk + d(pk+1 − pk).Once all the nicks have been acquired by the system, the
current image can either be stored in the system’s database orused as a query in order to retrieve possible different photosof the same individual previously stored in the database. Inthe first case the original gray-level image I is stored in therepository together with the points aI and bI and the set ofnicks P1, . . . , PM computed as described above. Each Pi isin turn associated with the user-selected endpoints ei and fi ,which are normalized with respect to a symmetric-invariantreference system defined using the reference points aI and bI .The normalization is performed as follows. Assume x=bI −aI ,and d = ‖x‖2. Moreover, let v1 = 1
dx; and v2 be an unitary
vector centered in aI and orthogonal to v1 whose direction isfixed swapping a �/2 angle clockwise from x for the right earand counterclockwise for the left ear (see Fig. 2(b)). If e is anendpoint selected by the user, the normalized nick endpoint e′is then given by
e′ = 1
d
(vT1 (e − aI )
vT2 (e − aI )
)(1)
and the same is for f ′. From now on we will refer to e′, f ′ ande, f as, respectively, the normalized and the original endpointrepresentations.
The reference system defined by v1 and v2, centered in aI
and with unit of length d is invariant with respect to symmetrictransformations of the head appearance. In fact the same headcan be represented in different photos with different translationoffsets, scale factors and in-plane rotations (i.e., tilt movementsof the head with respect to the body, like in Fig. 1, bottom row,leftmost image). Note that three points on the ear (e.g., bI , cI
and dI ) would be enough to deal with out-of-plan rotations us-ing an affine-invariant reference system [19,7]. Nevertheless,for the reasons above mentioned we prefer to use only two ref-erence points and to deal with only symmetric transformationswhich are enough for the type of photos used in the elephant’sidentification domain.
The same class of rigid symmetric transformations is alsotaken into account when pairs of curves representing singlenicks are compared (Section 5). Also in this case, two referencepoints are enough for the type of analyzed images, and theycan be naturally chosen to be the nick’s endpoints. As we will
see in Section 5, each nick of I is separately compared with thenicks of Q. To this aim the points of each single nick Pi arenormalized with respect to the Pi’s endpoints. Assume that e isthe higher and f the lower endpoint of the nick P ={p1, . . . , pn},being p1=e and pn=f . Then we can define: �=‖f −e‖2, where‖x − y‖2 is the Euclidean distance between the points x and y;w1 = 1/�(f − e) and w2 be an unitary vector centered in e andorthogonal to w1 whose direction is fixed swapping a �/2 angleclockwise from w1 for the right ear and counterclockwise forthe left ear. The normalized nick P ′ = {p′
1, . . . , p′n} is obtained
by imposing, for each p′j (1�j �n) that:
p′j = 1
�
(wT1 (pj − e)
wT2 (pj − e)
). (2)
Finally, if the image is used as query (Q), we indicate withQ1, . . . , QN its nicks, being each Qi (1� i�N) associatedwith the normalized endpoints g′
i and h′i , obtained using Eq.
(1) and the corresponding reference points aQ and bQ. Wewill see in Section 5 how also the inner points of each nickQi are normalized using the same procedure described for Pi ,which will make it possible a direct point-to-point comparisonbetween nicks of different images.
4. Curve sequence matching
Given a database image I with M nicks (P1, . . . , PM) and aquery image Q with N nicks (Q1, . . . , QN), the problem is tofind a portion of I and a portion of Q which are similar, i.e.,contain the same nicks. Even if both I and Q represent the sameelephant’s ear E, we can have N �= M . In fact, a portion of Ecan be partially occluded either in I or in Q. Moreover the lobeand other parts of the ear are sometimes folded and non-visible.
We assume in the following that, if both Q and I repre-sent the same ear E of the same elephant, then there is onlyone portion V of E which is visible in both I and Q (e.g., seeFigs. 1 and 2(c)). V is defined by a subsequence of nicks
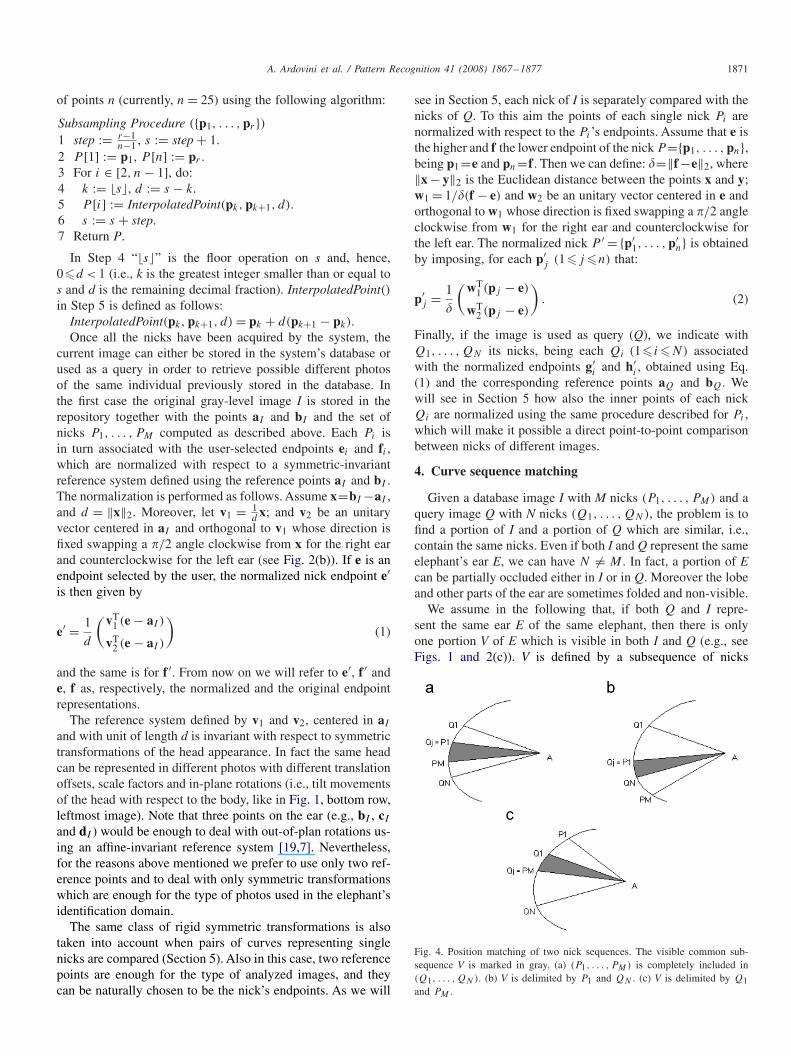
Fig. 4. Position matching of two nick sequences. The visible common sub-sequence V is marked in gray. (a) (P1, . . . , PM) is completely included in(Q1, . . . , QN ). (b) V is delimited by P1 and QN . (c) V is delimited by Q1and PM .
1872 A. Ardovini et al. / Pattern Recognition 41 (2008) 1867–1877
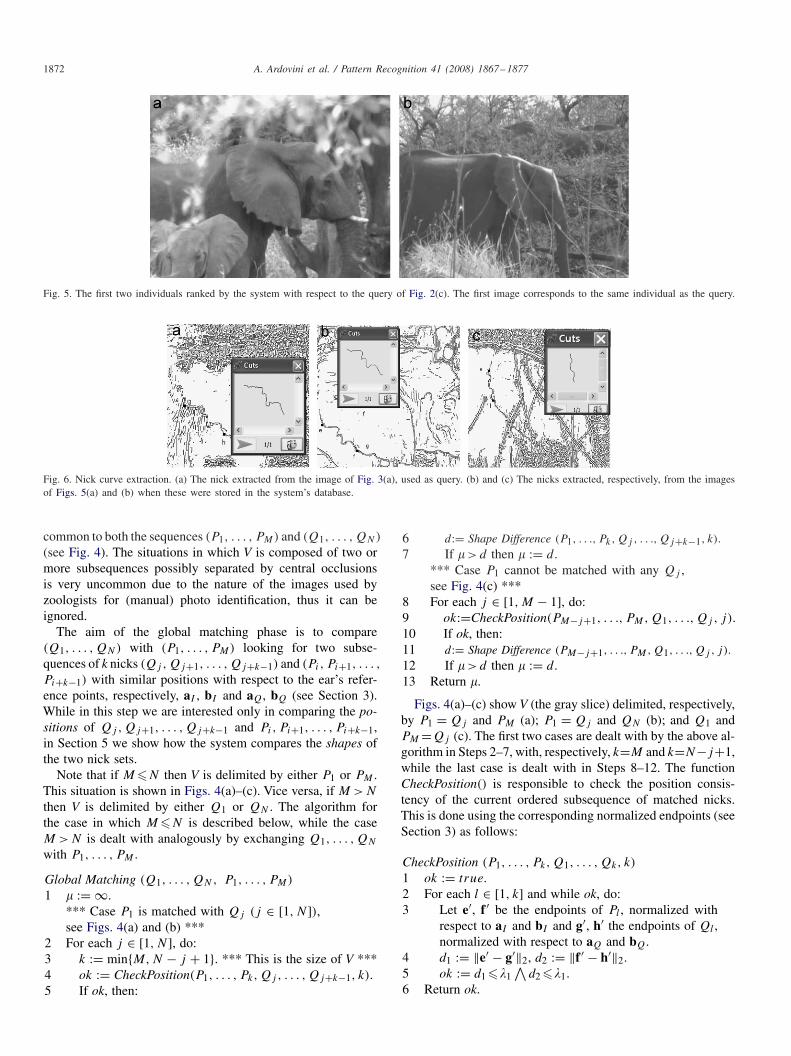
Fig. 5. The first two individuals ranked by the system with respect to the query of Fig. 2(c). The first image corresponds to the same individual as the query.
Fig. 6. Nick curve extraction. (a) The nick extracted from the image of Fig. 3(a), used as query. (b) and (c) The nicks extracted, respectively, from the imagesof Figs. 5(a) and (b) when these were stored in the system’s database.
common to both the sequences (P1, . . . , PM) and (Q1, . . . , QN)
(see Fig. 4). The situations in which V is composed of two ormore subsequences possibly separated by central occlusionsis very uncommon due to the nature of the images used byzoologists for (manual) photo identification, thus it can beignored.
The aim of the global matching phase is to compare(Q1, . . . , QN) with (P1, . . . , PM) looking for two subse-quences of k nicks (Qj , Qj+1, . . . , Qj+k−1) and (Pi, Pi+1, . . . ,
Pi+k−1) with similar positions with respect to the ear’s refer-ence points, respectively, aI , bI and aQ, bQ (see Section 3).While in this step we are interested only in comparing the po-sitions of Qj, Qj+1, . . . , Qj+k−1 and Pi, Pi+1, . . . , Pi+k−1,in Section 5 we show how the system compares the shapes ofthe two nick sets.
Note that if M �N then V is delimited by either P1 or PM .This situation is shown in Figs. 4(a)–(c). Vice versa, if M > N
then V is delimited by either Q1 or QN . The algorithm forthe case in which M �N is described below, while the caseM > N is dealt with analogously by exchanging Q1, . . . , QN
with P1, . . . , PM .
Global Matching (Q1, . . . , QN, P1, . . . , PM)
1 � := ∞.*** Case P1 is matched with Qj (j ∈ [1, N ]),see Figs. 4(a) and (b) ***
2 For each j ∈ [1, N ], do:3 k := min{M, N − j + 1}. *** This is the size of V ***4 ok := CheckPosition(P1, . . . , Pk, Qj , . . . , Qj+k−1, k).5 If ok, then:
6 d:= Shape Difference (P1, . . ., Pk, Qj , . . ., Qj+k−1, k).7 If � > d then � := d.
*** Case P1 cannot be matched with any Qj ,see Fig. 4(c) ***
8 For each j ∈ [1, M − 1], do:9 ok:=CheckPosition(PM−j+1, . . ., PM, Q1, . . ., Qj , j).10 If ok, then:11 d:= Shape Difference (PM−j+1, . . ., PM, Q1, . . ., Qj , j).12 If � > d then � := d.13 Return �.
Figs. 4(a)–(c) show V (the gray slice) delimited, respectively,by P1 = Qj and PM (a); P1 = Qj and QN (b); and Q1 andPM =Qj (c). The first two cases are dealt with by the above al-gorithm in Steps 2–7, with, respectively, k=M and k=N−j+1,while the last case is dealt with in Steps 8–12. The functionCheckPosition() is responsible to check the position consis-tency of the current ordered subsequence of matched nicks.This is done using the corresponding normalized endpoints (seeSection 3) as follows:
CheckPosition (P1, . . . , Pk, Q1, . . . , Qk, k)
1 ok := true.2 For each l ∈ [1, k] and while ok, do:3 Let e′, f ′ be the endpoints of Pl , normalized with
respect to aI and bI and g′, h′ the endpoints of Ql ,normalized with respect to aQ and bQ.
4 d1 := ‖e′ − g′‖2, d2 := ‖f ′ − h′‖2.5 ok := d1 ��1
∧d2 ��1.
6 Return ok.
A. Ardovini et al. / Pattern Recognition 41 (2008) 1867–1877 1873
In Step 5 above �1 is a threshold whose value must be chosenlarge enough in order to take into account that the endpointsof each nick are normalized using an approximate referencesystem. In fact, as mentioned in Section 3, the user selection ofpoints a and b in each photo is a somewhat arbitrary operation.Note that, if both Q and I represent the same ear E, then therepresentations of both e′, f ′ and g′, h′ are normalized withrespect to a same reference system and the values d1 and d2are invariant with respect to symmetric transformations.
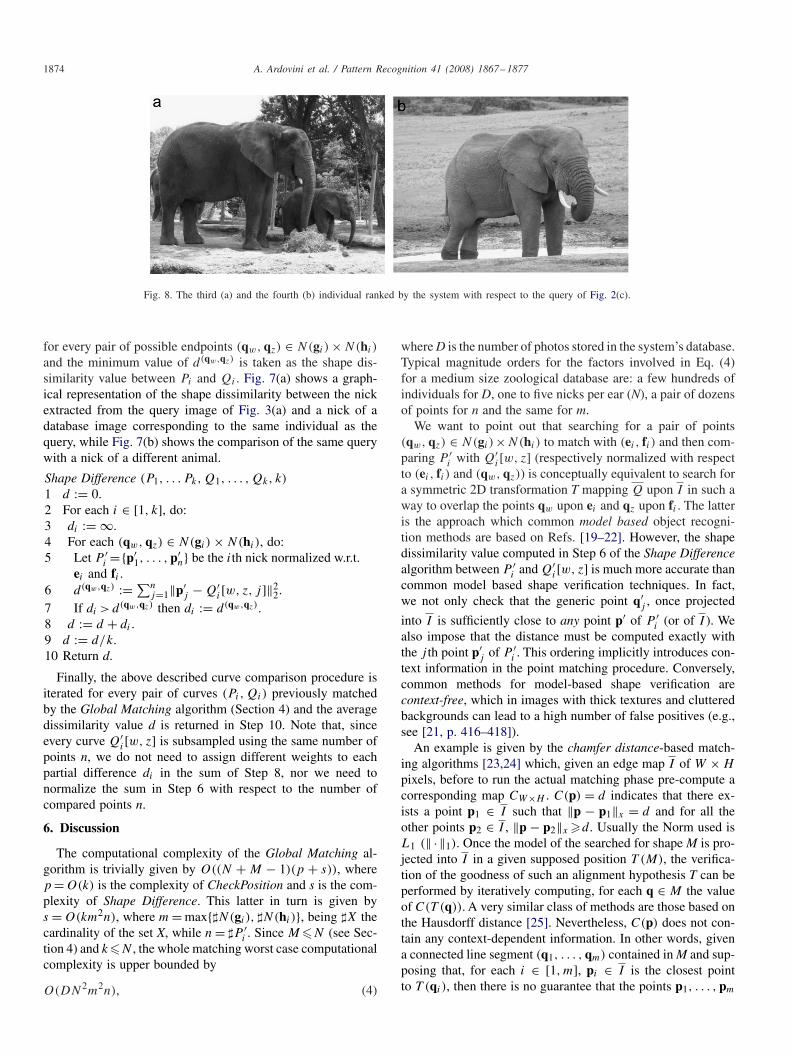
If CheckPosition() returns true, then the current candidatesequence V of common visible nicks in I and Q is furtheranalyzed in order to compute the shape dissimilarity amongpairs of matched curves (see the next section). Once all thepossible matches have been analyzed, the minimum computeddissimilarity value (�) is returned in Step 13 of the GlobalMatching algorithm. This is the value which will be used torank the current photo I with respect to the other database im-ages. The resulting decreasing ordered sequence of databasephotos is finally shown to the user. Figs. 5 and 8 show the firstfour individuals ranked by the system in correspondence of thequery shown in Fig. 2(c).
5. Shape comparison
For each subsequence (P1, . . . , Pk) and (Q1, . . . , Qk) ofnicks with a corresponding valid global position matched in theGlobal Matching algorithm, we need to verify the shape similar-ity of each pair of nicks (Qi, Pi). Given a query (Qi) and an im-age (Pi) nick, the shape difference of the corresponding curvescan be estimated by subsampling Qi and Pi using the samenumber of points (n) and then computing the squared Euclideandistance between pairs of corresponding points (qj , pj ), qj ∈Qi and pj ∈ Pi (1�j �n). However, before to compare Qi
and Pi , the two curves have to be aligned, i.e., they must berepresented in a symmetric-invariant reference system in or-der to take into account for possible viewpoint changes. Nev-ertheless, since the shape comparison of two curves must becarefully estimated, we cannot use the reference points aI , bI ,aQ and bQ for this purpose (see Sections 3 and 4). Rather, weuse the nick-specific endpoints ei , fi , gi and hi . Moreover, wehave to take into account that either different users or the sameuser in different working sessions can select slightly differentendpoints for the same nick in different photos of the same an-imal. For this reason we need to compare the nick defined bythe endpoints e and f with the nick defined by a pair of end-points chosen in the proximity of g and h. Of course, fixing gand h while varying e and f in a range around the user selectedpositions would produce the same or a very similar effect.
If gi and hi are the endpoints of Qi and Q is the edge mapof Q, then the neighborhoods N(gi ), N(hi ), respectively, of gi
and hi are defined using:
N(x) = {p ∈ Q : ‖x − p‖2 ��2,
and x and p are connected}, (3)
where �2 is a distance threshold. We omit the algorithm forthe effective construction of N(gi ) and N(hi ) since it is a
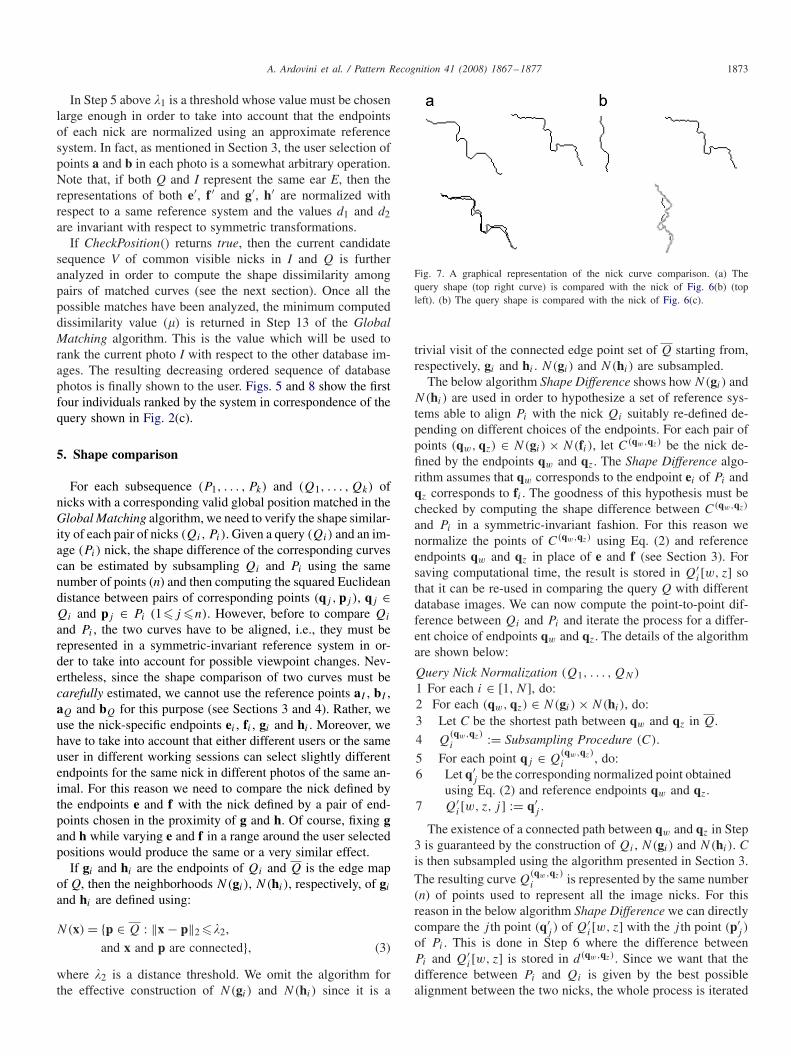
Fig. 7. A graphical representation of the nick curve comparison. (a) Thequery shape (top right curve) is compared with the nick of Fig. 6(b) (topleft). (b) The query shape is compared with the nick of Fig. 6(c).
trivial visit of the connected edge point set of Q starting from,respectively, gi and hi . N(gi ) and N(hi ) are subsampled.
The below algorithm Shape Difference shows how N(gi ) andN(hi ) are used in order to hypothesize a set of reference sys-tems able to align Pi with the nick Qi suitably re-defined de-pending on different choices of the endpoints. For each pair ofpoints (qw, qz) ∈ N(gi ) × N(fi ), let C(qw,qz) be the nick de-fined by the endpoints qw and qz. The Shape Difference algo-rithm assumes that qw corresponds to the endpoint ei of Pi andqz corresponds to fi . The goodness of this hypothesis must bechecked by computing the shape difference between C(qw,qz)
and Pi in a symmetric-invariant fashion. For this reason wenormalize the points of C(qw,qz) using Eq. (2) and referenceendpoints qw and qz in place of e and f (see Section 3). Forsaving computational time, the result is stored in Q′
i[w, z] sothat it can be re-used in comparing the query Q with differentdatabase images. We can now compute the point-to-point dif-ference between Qi and Pi and iterate the process for a differ-ent choice of endpoints qw and qz. The details of the algorithmare shown below:
Query Nick Normalization (Q1, . . . , QN)
1 For each i ∈ [1, N ], do:2 For each (qw, qz) ∈ N(gi ) × N(hi ), do:3 Let C be the shortest path between qw and qz in Q.
4 Q(qw,qz)
i := Subsampling Procedure (C).
5 For each point qj ∈ Q(qw,qz)
i , do:6 Let q′
j be the corresponding normalized point obtainedusing Eq. (2) and reference endpoints qw and qz.
7 Q′i[w, z, j ] := q′
j .
The existence of a connected path between qw and qz in Step3 is guaranteed by the construction of Qi , N(gi ) and N(hi ). Cis then subsampled using the algorithm presented in Section 3.The resulting curve Q
(qw,qz)
i is represented by the same number(n) of points used to represent all the image nicks. For thisreason in the below algorithm Shape Difference we can directlycompare the j th point (q′
j ) of Q′i[w, z] with the j th point (p′
j )
of Pi . This is done in Step 6 where the difference betweenPi and Q′
i[w, z] is stored in d(qw,qz). Since we want that thedifference between Pi and Qi is given by the best possiblealignment between the two nicks, the whole process is iterated
1874 A. Ardovini et al. / Pattern Recognition 41 (2008) 1867–1877
Fig. 8. The third (a) and the fourth (b) individual ranked by the system with respect to the query of Fig. 2(c).
for every pair of possible endpoints (qw, qz) ∈ N(gi ) × N(hi )
and the minimum value of d(qw,qz) is taken as the shape dis-similarity value between Pi and Qi . Fig. 7(a) shows a graph-ical representation of the shape dissimilarity between the nickextracted from the query image of Fig. 3(a) and a nick of adatabase image corresponding to the same individual as thequery, while Fig. 7(b) shows the comparison of the same querywith a nick of a different animal.
Shape Difference (P1, . . . Pk, Q1, . . . , Qk, k)
1 d := 0.2 For each i ∈ [1, k], do:3 di := ∞.4 For each (qw, qz) ∈ N(gi ) × N(hi ), do:5 Let P ′
i ={p′1, . . . , p′
n} be the ith nick normalized w.r.t.ei and fi .
6 d(qw,qz) := ∑nj=1‖p′
j − Q′i[w, z, j ]‖2
2.7 If di > d(qw,qz) then di := d(qw,qz).8 d := d + di .9 d := d/k.10 Return d.
Finally, the above described curve comparison procedure isiterated for every pair of curves (Pi, Qi) previously matchedby the Global Matching algorithm (Section 4) and the averagedissimilarity value d is returned in Step 10. Note that, sinceevery curve Q′
i[w, z] is subsampled using the same number ofpoints n, we do not need to assign different weights to eachpartial difference di in the sum of Step 8, nor we need tonormalize the sum in Step 6 with respect to the number ofcompared points n.
6. Discussion
The computational complexity of the Global Matching al-gorithm is trivially given by O((N + M − 1)(p + s)), wherep =O(k) is the complexity of CheckPosition and s is the com-plexity of Shape Difference. This latter in turn is given bys = O(km2n), where m = max{�N(gi ), �N(hi )}, being �X thecardinality of the set X, while n = �P ′
i . Since M �N (see Sec-tion 4) and k�N , the whole matching worst case computationalcomplexity is upper bounded by
O(DN2m2n), (4)
where D is the number of photos stored in the system’s database.Typical magnitude orders for the factors involved in Eq. (4)for a medium size zoological database are: a few hundreds ofindividuals for D, one to five nicks per ear (N), a pair of dozensof points for n and the same for m.
We want to point out that searching for a pair of points(qw, qz) ∈ N(gi )×N(hi ) to match with (ei , fi ) and then com-paring P ′
i with Q′i[w, z] (respectively normalized with respect
to (ei , fi ) and (qw, qz)) is conceptually equivalent to search fora symmetric 2D transformation T mapping Q upon I in such away to overlap the points qw upon ei and qz upon fi . The latteris the approach which common model based object recogni-tion methods are based on Refs. [19–22]. However, the shapedissimilarity value computed in Step 6 of the Shape Differencealgorithm between P ′
i and Q′i[w, z] is much more accurate than
common model based shape verification techniques. In fact,we not only check that the generic point q′
j , once projected
into I is sufficiently close to any point p′ of P ′i (or of I ). We
also impose that the distance must be computed exactly withthe j th point p′
j of P ′i . This ordering implicitly introduces con-
text information in the point matching procedure. Conversely,common methods for model-based shape verification arecontext-free, which in images with thick textures and clutteredbackgrounds can lead to a high number of false positives (e.g.,see [21, p. 416–418]).
An example is given by the chamfer distance-based match-ing algorithms [23,24] which, given an edge map I of W × H
pixels, before to run the actual matching phase pre-compute acorresponding map CW×H . C(p) = d indicates that there ex-ists a point p1 ∈ I such that ‖p − p1‖x = d and for all theother points p2 ∈ I , ‖p − p2‖x �d. Usually the Norm used isL1 (‖ · ‖1). Once the model of the searched for shape M is pro-jected into I in a given supposed position T (M), the verifica-tion of the goodness of such an alignment hypothesis T can beperformed by iteratively computing, for each q ∈ M the valueof C(T (q)). A very similar class of methods are those based onthe Hausdorff distance [25]. Nevertheless, C(p) does not con-tain any context-dependent information. In other words, givena connected line segment (q1, . . . , qm) contained in M and sup-posing that, for each i ∈ [1, m], pi ∈ I is the closest pointto T (qi ), then there is no guarantee that the points p1, . . . , pm
A. Ardovini et al. / Pattern Recognition 41 (2008) 1867–1877 1875
belong to the same object neither that they are connected in I ,even if
∑mi=1C(T (qi )) is a small value. For instance, in im-
ages with regions dense of edge pixels (e.g., Fig. 3) it is likelythat
∑mi C(T (qi )) is small due to sets of points {p1, . . . , pm}
randomly clustered.A similar problem due to the same reasons is present in
Hough-like approaches. In fact, it is well known that one of themost important problems with Hough-like techniques are thefalse positives in images with thick textured regions (e.g., see[21, p. 330]). Indeed, the Hough accumulator H represents allthe possible parameter discrete values of the searched for geo-metric transformation T of the shape model into the image ref-erence system. Nevertheless, uniformly distributed edge pixelsin I can randomly concentrate their votes in few H’s bucketsproducing high peaks not actually corresponding to any signifi-cant shape in the image [21,26]. As mentioned in Section 2, wehave implemented the traditional Ballard’s GHT and tested itin our elephant domain in which edge images are usually verycluttered. The experimental results confirmed the inadequacyof such a technique due to the high number of false positives.
Conversely, in our proposed matching method possible sur-rounding lines and/or isolated edge pixels of I close to P ′
i arenot taken into account by the shape comparison process and thej th point of the curve Qi is compared with only the j th pointof the curve P ′
i . This is possible thank to both a minor user in-tervention in selecting approximate landmark points (e.g., ei ,fi) in each image and a subsequent hypothesis-and-test processperformed in the algorithms Global Matching and Shape Dif-ference in order to refine such selections.
The method we propose does not depend on specific as-sumptions of the elephant domain and the curves representinginteresting nicks which are compared in the Shape Differencealgorithm have no restriction on the possible shape. For thesereasons the multi-curve matching approach presented in this ar-ticle can be used in domains different from animal photo identi-fication. Possible applications are those domains in which Con-tent Based Image Retrieval (CBIR) can be performed using theshape of one or more details of a given object. Such details donot need to be connected and an approximate user selection ofcandidate positions in each image to analyze allows the systemto perform a reliable detection also in very cluttered and noisyimages.
7. Experimental results
For testing purposes we have used an elephant photodatabase provided by the Zoological Department of the Uni-versity of Rome “La Sapienza”, which represents individualsof the elephant population of Zakouma Ciad National Park [1].Almost all the photos are actually frames extracted from a few(low-resolution) video sequences and previously used by theresearchers of the same department for manual elephant iden-tification. All the images represent elephants in a profile posebut with unknown positions with respect to the camera andpossible minor ear occlusions (see Fig. 1 for a few examples).The database used for testing is composed of 332 images of268 different individuals. Each individual is represented by
one to four photos, respectively, showing either the left or theright ear, and each ear of the image repository contains fromone to four nicks. Other 200 different photos of the same indi-viduals of the database have been randomly selected and usedas queries. The photos used as queries have not been includedinto the system’s database. The 200 query photos correspondto 200 out of the 268 individuals of the database.
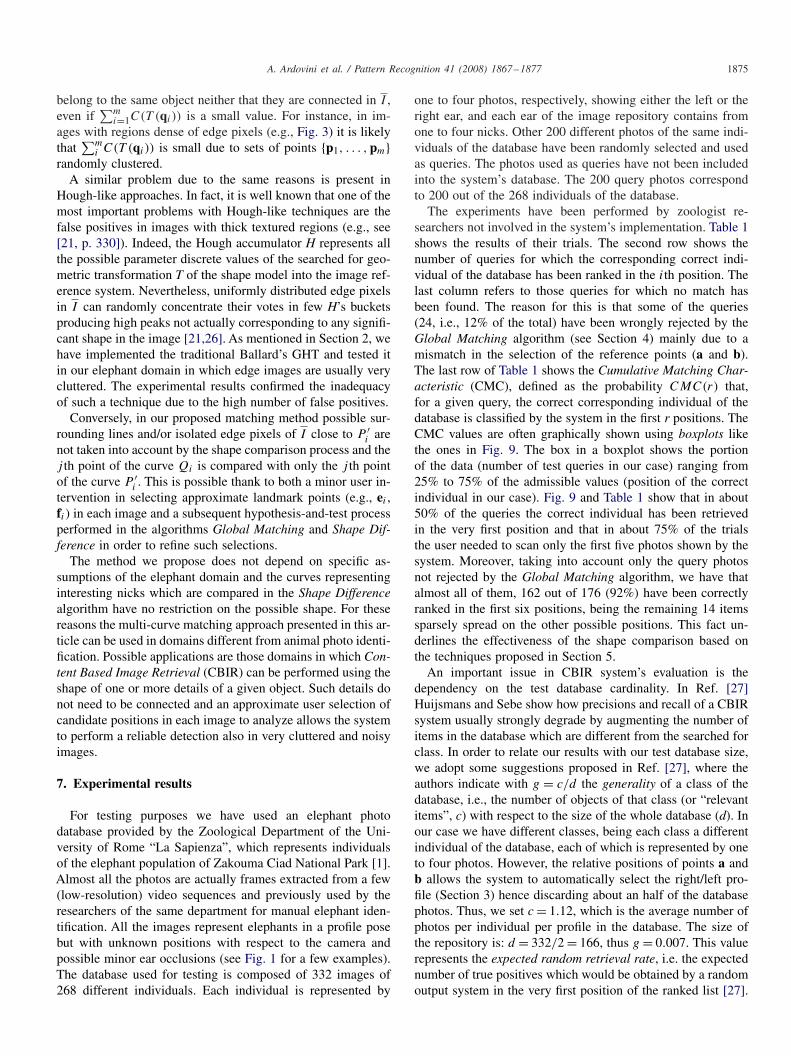
The experiments have been performed by zoologist re-searchers not involved in the system’s implementation. Table 1shows the results of their trials. The second row shows thenumber of queries for which the corresponding correct indi-vidual of the database has been ranked in the ith position. Thelast column refers to those queries for which no match hasbeen found. The reason for this is that some of the queries(24, i.e., 12% of the total) have been wrongly rejected by theGlobal Matching algorithm (see Section 4) mainly due to amismatch in the selection of the reference points (a and b).The last row of Table 1 shows the Cumulative Matching Char-acteristic (CMC), defined as the probability CMC(r) that,for a given query, the correct corresponding individual of thedatabase is classified by the system in the first r positions. TheCMC values are often graphically shown using boxplots likethe ones in Fig. 9. The box in a boxplot shows the portionof the data (number of test queries in our case) ranging from25% to 75% of the admissible values (position of the correctindividual in our case). Fig. 9 and Table 1 show that in about50% of the queries the correct individual has been retrievedin the very first position and that in about 75% of the trialsthe user needed to scan only the first five photos shown by thesystem. Moreover, taking into account only the query photosnot rejected by the Global Matching algorithm, we have thatalmost all of them, 162 out of 176 (92%) have been correctlyranked in the first six positions, being the remaining 14 itemssparsely spread on the other possible positions. This fact un-derlines the effectiveness of the shape comparison based onthe techniques proposed in Section 5.
An important issue in CBIR system’s evaluation is thedependency on the test database cardinality. In Ref. [27]Huijsmans and Sebe show how precisions and recall of a CBIRsystem usually strongly degrade by augmenting the number ofitems in the database which are different from the searched forclass. In order to relate our results with our test database size,we adopt some suggestions proposed in Ref. [27], where theauthors indicate with g = c/d the generality of a class of thedatabase, i.e., the number of objects of that class (or “relevantitems”, c) with respect to the size of the whole database (d). Inour case we have different classes, being each class a differentindividual of the database, each of which is represented by oneto four photos. However, the relative positions of points a andb allows the system to automatically select the right/left pro-file (Section 3) hence discarding about an half of the databasephotos. Thus, we set c = 1.12, which is the average number ofphotos per individual per profile in the database. The size ofthe repository is: d = 332/2 = 166, thus g = 0.007. This valuerepresents the expected random retrieval rate, i.e. the expectednumber of true positives which would be obtained by a randomoutput system in the very first position of the ranked list [27].
1876 A. Ardovini et al. / Pattern Recognition 41 (2008) 1867–1877
Table 1Number of queries for which the corresponding correct individual of the database has been ranked by the system in the first 10 positions
Position 1 2 3 4 5 6 7 8 9 10 N.C.Query � 92 32 5 13 4 16 0 1 4 3 24CMC 0.46 0.62 0.64 0.71 0.73 0.81 0.81 0.81 0.83 0.85 –
Fig. 9. The boxplots corresponding to Table 1. (a) CMC values with respectto the first 10 individuals ranked by the system. (b) CMC values with respectto all the individuals of the database. The vertical line ranging for all thedatabase individuals indicates that in a few cases (24), no match at all hasbeen found.
Comparing g with the probability (v) to obtain a relevant itemin the first position using our proposed system (i.e., CMC(1):see Table 1), we have v = 0.46 against g = 0.007.
Preliminary results, obtained with a subset (about 100 im-ages of 60 individuals) of the same database [1] produced sim-ilar success percentages (v = 0.5). However, database sizesconsiderably greater than the present could likely lower downthe precision of the system due to the frequency of individu-als with nicks with similar shapes and similar positions whichmake hard the recognition task also for a human being. Nev-ertheless, typical zoologist photo databases are not so huge,hence our system can be effective for medium size archives(a few hundreds of photos).
To the best of our knowledge, no other elephant photo identi-fication system has been proposed so far, hence a direct compar-ison is difficult, while single curve matching-based approacheswould not work in our domain for the reasons discussed in Sec-tion 2. However, the single curve matching approach proposedin Ref. [7] for marine mammals photo identification achievesworse results than our method. For instance, in the sea liondatabase (92 images of 37 individuals), in about 50% of thequeries the proposed system ranks the correct individual in thefirst 7 positions and in about 75% of the queries in the first 28positions. Similar values are obtained in the gray whale andin the dolphin databases, with, respectively, 95 images of 37
individuals and 75% of the queries in the first 23 positions and624 images of 164 individuals and 75% of the queries in thefirst 30 positions.
In Ref. [28] two different Sperm Whale photo identificationsystems are compared using a database of 592 photos of 296different individuals and 150 query photos. The two comparedsystems are: Europhlukes [8], based on a wavelet transform ofthe fluke contour’s representation and Highlight, in which theuser is requested to input the number of nicks, scallops andwaves present on the animal’s tail [29]. Both methods have ob-tained less than 78% of relevant items in the first 9 positions(against the 83% obtained by our system). Using a subset ofthe system composed of only high-quality photos highlight ob-tained 87.6% of correct matches in the first 9 positions andEurophlukes 86%, slightly outperforming our system (testedwith low-quality photos). However it should be noted that Eu-rophlukes is based on the possibility to extract the whole con-nected curve representing the tail’s characterizing shape (seeSections 1 and 2) and hence cannot be realistically used in ourdomain in which the elephant’s ear border usually has insuffi-cient contrast with respect to the body skin which makes theextraction of a connected curve particularly hard (see Section2). Conversely, Highlight needs a human intervention in thenick type classification, making the system less automatic andmore dependent on the human subjective judgment and exper-tise [28].
8. Conclusions
We have presented an elephant photo identification systembased on the comparison of the shape details of nick subse-quences characterizing the animals’ ears. The proposed methodis not dependent on specific assumptions on the elephant do-main and the photos used are generally low resolution andhighly cluttered images. Segmentation and recognition are per-formed using as basis rough position information input by theuser. Starting from the user suggested initial positions a set ofnormalization hypotheses is formulated by the system in orderto align the query image shape details with the curves storedin the system’s database. The achieved recognition accuracyoutperforms similar single curve matching-based animal recog-nition approaches when tested in low-medium quality imagesand allows the user to find the correct individual for a givenquery with a high probability in the very first positions rankedby the system.
The present version of our system is currently used by re-searchers of the Zoological Department of the University ofRome “La Sapienza” for elephant identification. We are in con-tact with zoologists of the Centre for African Conservation

A. Ardovini et al. / Pattern Recognition 41 (2008) 1867–1877 1877
Ecology (South Africa) for testing an improved version of thesystem with their databases.
Acknowledgments
This work has been done in collaboration with the Zoo-logical Department of the University of Rome “La Sapienza”.A particular thank to Francesca Della Rocca, who suggestedus the idea of an automatic system for elephant photo iden-tification and gave us the know how about elephant (manual)photo recognition as well as the database of images used in theexperiments. We also want to thank Luciana Massaro, DafnePetriccione and Sabrina Rossi for their passion, their patienceand their precious help in testing the system.
References
[1] D. Petriccione, A. Ardovini, L. Cinque, F. Della Rocca, L. Massaro, A.Ortolani, E. Sangineto, Computer-aided wild elephant identification, in:11th Congress of the International Society for Behavior Ecology, 2006,p. 264.
[2] E. Ranguelova, M. Huiskes, E.J. Pauwels, Towards computer-assistedphoto-identification of humpback whales, in: Proceedings of the IEEEInternational Conference on Image Processing, 2004, pp. 1727–1730.
[3] E. Ranguelova, E.J. Pauwels, Saliency detection and matching strategyfor photo-identification of humpback whales, in: ICGST InternationalJournal on Graphics, Vision and Image Processing, 2006 (Special Issueon Features and Analysis).
[4] C. Gope, N. Kehtarnavaz, G. Hillman, Zernike moment invariants basedphoto-identification using Fisher discriminant model, in: Proceedings ofthe 26th Annual International Conference of the IEEE Engineering inMedicine and Biology Society, 2004, pp. 1455–1458.
[5] B.N. Araabi, N. Kehtarnavaz, A string matching computer-assisted systemfor dolphin photoidentification, Biomed. Eng. 28 (2000) 1269–1279.
[6] B.B. Kimia, Shape representation for image retrieval, Image Databases:Search and Retrieval of Digital Imagery, 2002, pp. 345–372.
[7] C. Gope, N. Kehtarnavaz, G. Hillman, B. Wursig, An affine invariantcurve matching method for photo-identification of marine mammals,Pattern Recognition 38 (2005) 125–132.
[8] R. Huele, H.A. Udo de Haes, J.N. Ciano, J. Gordon, Finding similartrailing edges in large collections of photographs of Sperm Whales,J. Cetacean Res. Manage. 2 (3) (2000) 173–176.
[9] F. Mokhtarian, Silhouette-based isolated object recognition throughcurvature scale-space, IEEE Trans. PAMI 17 (5) (1995) 539–544.
[10] F. Mokhtarian, S. Abbasi, Shape similarity retrieval under affinetransforms, Pattern Recognition 35 (1) (2002) 31–41.
[11] H. Tek, B.B. Kimia, Boundary smoothing via symmetry transforms,J. Math. Imaging Vision 14 (3) (2001) 211–223.
[12] A. Folkers, H. Samet, Content-based image retrieval using Fourierdescriptors on a logo database, in: ICPR ’02, vol. 3, 2002, pp. 521–524.
[13] M. Kass, A. Witkin, D. Terzopoulos, Snakes: active contour models, Int.J. Comput. Vision 1 (1988) 321–331.
[14] Z. Xue, S.Z. Li, E.K. Teoh, AI-EigenSnake: an affine-invariantdeformable contour model for object matching, Image Vision Comput.20 (2) (2002) 77–84.
[15] T.F. Cootes, C.J. Taylor, D.H. Cooper, J. Graham, Training models ofshape from sets of examples, in: Proceedings of the British MachineVision Conference, 1992, pp. 9–18.
[16] D.H. Ballard, Generalizing the Hough transform to detect arbitraryshapes, Pattern Recognition 13 (2) (1981) 111–122.
[17] A.A. Kassim, T. Tan, K.H. Tan, A comparative study of efficientgeneralized Hough transform techniques, Image Vision Comput. 17 (10)(1999) 737–748.
[18] J. Canny, A computational approach to edge detection, IEEE Trans.PAMI 8 (6) (1986) 679–698.
[19] D.P. Huttenlocher, S. Ullman, Recognizing solid objects by alignmentwith an image, Int. J. Comput. Vision 5 (2) (1990) 195–212.
[20] N. Ayache, O.D. Faugeras, HYPER: A new approach for the recognitionand positioning of two-dimensional objects, IEEE Trans. PAMI 8 (1)(1986) 44–54.
[21] D.A. Forsyth, J. Ponce, Computer Vision: A Modern Approach, Prentice-Hall, Englewood Cliffs, NJ, 14 August 2003 ISBN: 0130851981.
[22] S. Ullman, High-level vision. Object recognition and visual cognition,in: A Bradford Book, The MIT Press, Cambridge, MA, 1996.
[23] C. Fouard, G. Malandain, 3-D chamfer distances and norms in anisotropicgrids, Image Vision Comput. 23 (2) (2005) 143–158.
[24] A. Thayananthan, B. Stenger, P.H.S. Torr, R. Cipolla, Shape context andChamfer matching in cluttered scenes, in: CVPR ’05, vol. 1, 2003.
[25] D.P. Huttenlocher, G.A. Klanderman, W.J. Rucklidge, Comparingimages using Hausdorff distance, IEEE Trans. PAMI 15 (9) (1993)850–863.
[26] M. Anelli, A. Micarelli, E. Sangineto, A new content basedimage retrieval method based on a sketch-driven interpretation ofline segments, in: Proceedings of IJCAI-2003, Acapulco, Mexico,2003.
[27] D.P. Huijsmans, N. Sebe, How to complete performance graphs incontent-based image retrieval: add generality and normalize scope, IEEETrans. PAMI 27 (2) (2005) 245–251.
[28] B.W.P.M. Beekmans, H. Whitehead, R. Huele, L. Steiner, A.G.Steenbeek, Comparison of two computer-assisted photo-identificationmethods applied to Sperm Whales (Physeter macrocephalus), Aquat.Mamm. 31 (2) (2005) 243–247.
[29] H. Whitehead, Computer-assisted individual identification of SpermWhales flukes, Reports of the International Whaling Commissionvol. 12, 1990, pp. 71–77 (special issue).
About the Author—ALESSANDRO ARDOVINI received the degree in Computer Science from the University of Rome “La Sapienza” in 2006. He is currentlyworking as software developer at Systemies s.r.l.
About the Author—LUIGI CINQUE received his degree in Physics from University of Napoli in 1983. After a few years spent at Artificial IntelligenceLaboratory (Selenia S.p.A), working on the development of expert systems and knowledge-based vision systems, in 1990 he joined the Department of ComputerScience of the University “La Sapienza” of Rome as Assistant Professor. Presently, he is Full Professor of Computer Science.His current interests include computer vision, parallel image analysis and architectures, shape and object recognition, image sequences analysis, and imagedatabase.He is a Senior Member of IEEE Computer Society, a member of the Association for Computing Machinery, and a member the Pattern Recognition Society.
About the Author—ENVER SANGINETO received his degree in Computer Science at the University of Pisa in 1995. In 2001 he received a Ph.D. inComputer Engineering at the University of Rome “La Sapienza”, discussing a thesis on: “Object Classification through Geometric Abstraction”. He has beenworking from 2001 to 2006 at the Artificial Intelligence Laboratory of the University of Rome “Roma Tre” and with the CRMPA (a research centre of theUniversity of Salerno, Italy). In 2006 he joined the Department of Computer Science of the University “La Sapienza” of Rome with a post-Doct. position. Hismain scientific interests concern computer vision, pattern recognition, e-learning, and robotics. He has published various papers on these topics in importantnational and international conferences and journals.