Embed Size (px)
Citation preview
HEALTHY study rationale, design and methods:moderating risk of type 2 diabetes in multi-ethnic middle school students
The HEALTHY Study Group
AbstractThe HEALTHY primary prevention trial was designed and implemented in response to the growingnumbers of children and adolescents being diagnosed with type 2 diabetes. The objective was tomoderate risk factors for type 2 diabetes. Modifiable risk factors measured were indicators ofadiposity and glycemic dysregulation: body mass index ≥85th percentile, fasting glucose ≥5.55 mmoll-1 (100 mg per 100 ml) and fasting insulin ≥180 pmol l-1 (30 μU ml-1). A series of pilot studiesestablished the feasibility of performing data collection procedures and tested the development of anintervention consisting of four integrated components: (1) changes in the quantity and nutritionalquality of food and beverage offerings throughout the total school food environment; (2) physicaleducation class lesson plans and accompanying equipment to increase both participation and numberof minutes spent in moderate-to-vigorous physical activity; (3) brief classroom activities and familyoutreach vehicles to increase knowledge, enhance decision-making skills and support and reinforceyouth in accomplishing goals; and (4) communications and social marketing strategies to enhanceand promote changes through messages, images, events and activities. Expert study staff providedtraining, assistance, materials and guidance for school faculty and staff to implement the interventioncomponents. A cohort of students were enrolled in sixth grade and followed to end of eighth grade.They attended a health screening data collection at baseline and end of study that involvedmeasurement of height, weight, blood pressure, waist circumference and a fasting blood draw. Heightand weight were also collected at the end of the seventh grade. The study was conducted in 42 middleschools, six at each of seven locations across the country, with 21 schools randomized to receive theintervention and 21 to act as controls (data collection activities only). Middle school was the unit ofsample size and power computation, randomization, intervention and primary analysis.
Keywordstype 2 diabetes; adolescents; primary prevention
IntroductionIn 2002, in response to dramatic increases in type 2 diabetes (T2D) in the pediatric population,the National Institute of Diabetes and Digestive and Kidney Diseases (NIDDK) of the NIH(National Institutes of Health) sponsored a collaborative agreement, Studies to Treat Or PreventPediatric Type 2 Diabetes (STOPP-T2D), to develop and conduct both a treatment and aprevention trial of T2D in children and adolescents. The prevention investigators and sitescollaborated to develop and conduct a series of pilot and feasibility studies ultimatelyculminating in the middle school-based HEALTHY primary prevention trial. HEALTHY was
© 2009 Macmillan Publishers Limited All rights reservedConflict of interestT Baranowski has received consulting fees from McDonald’s Global Advisory Committee. G Foster has received consulting fees fromGeneral Mills and ConAgra Foods. The remaining authors declare no conflict of interest.
NIH Public AccessAuthor ManuscriptInt J Obes (Lond). Author manuscript; available in PMC 2009 November 25.
Published in final edited form as:Int J Obes (Lond). 2009 August ; 33(Suppl 4): S4–20. doi:10.1038/ijo.2009.112.
NIH
-PA Author Manuscript
NIH
-PA Author Manuscript
NIH
-PA Author Manuscript

conducted in 42 schools over three school years from 2006 to 2009. Half of the schools wererandomly assigned to receive an intervention that was designed to reduce risk factors fordiabetes by implementing changes on multiple levels—environmental, social and individual.
Here, we report on the overall rationale, design and methods of the HEALTHY study. TheHEALTHY Study Group was composed of investigators from seven field centers (BaylorCollege of Medicine, Houston, TX, USA; Oregon Health & Science University, Portland, OR,USA; University of California at Irvine, Irvine, CA, USA; Temple University, Philadelphia,PA, USA; University of North Carolina at Chapel Hill, Chapel Hill, NC, USA; University ofPittsburgh, Pittsburgh, PA, USA; and University of Texas Health Science Center at SanAntonio, San Antonio, TX, USA), the NIDDK project office, the coordinating center (GeorgeWashington University, Rockville, MD, USA), the study chair and other experts. Throughoutits development, protocols and materials were approved by a Data and Safety MonitoringBoard, appointed by NIDDK, and by the Institutional Review Boards of each participatinginstitution.
Background and rationaleStatus of risk factors for type 2 diabetes in US adolescents
HEALTHY was originally conceived to test whether a multi-component school-basedintervention could reduce the development of T2D in middle school aged youth. However, the2003 pilot study designed to determine the prevalence of diabetes, pre-diabetes and diabetesrisk factors in eighth grade students in schools similar to HEALTHY schools showed a lowprevalence of actual T2D but a high prevalence of pre-diabetes and other diabetes risk factors.1 As a result, it was determined that the primary objective of the HEALTHY trial would be todetermine whether the intervention could moderate diabetes risk factors for T2D in middleschool students followed from sixth through eighth grades. These risk factors included bodymass index (BMI) ≥85th percentile, fasting glucose ≥5.55 mmol l-1 (100 mg per 100 ml,impaired fasting glucose or IFG) and fasting insulin ≥180 pmol l-1 (30 μU ml-1).
Obesity is a major risk factor for insulin resistance that precedes the development of impairedglucose tolerance (pre-diabetes) and T2D. In the last few decades, there has been a dramaticincrease in childhood overweight and obesity and this rise has matched the increase in T2D inyouth. The 85th percentile, which is approximately equivalent to a BMI of 25 kg m-2 in adults,has been reported as the level above which youth develop T2D.2 The proportion of youth aged12-17 years with a BMI ≥85th percentile has increased from 15.2% in the 1970s to 25% in the1990s3 to 31% in youth aged 12-19 during 1999-2002.4 Recently, it has been suggested thatthe prevalence has reached a plateau, although further tracking of data will be needed to confirmor refute this finding.5 The prevalence of obesity among African American, Mexican Americanand American Indian youth exceeds that of other ethnic groups. In 2004, the prevalence ofobesity was 20% in non-Hispanic Black children and 19% in Mexican American children,compared with 16% in non-Hispanic White children; the prevalence was highest in MexicanAmerican boys (22%) and African American girls (24%).6 In addition, youth with a positivefamily history of obesity and those exposed to diabetes in utero have a high risk of beingoverweight. The vast majority of youth who are overweight will progress to being obese asadults, and this will result in an increased risk for long-term morbidity and mortality.7-9
In our 2003 pilot study, 49% of the participating eighth grade students had a BMI ≥85thpercentile for gender and age, 19.8% were overweight (BMI ≥85th and <95th percentile) and29.2% were obese (BMI ≥95th percentile).1 Racial/ethnic differences showed that there was anearly 2.5-fold greater percentage of Hispanics and 3.5-fold greater percentage of AmericanIndian students compared with Whites in the obese category. In addition, BMI ≥85th percentile
Page 2
Int J Obes (Lond). Author manuscript; available in PMC 2009 November 25.
NIH
-PA Author Manuscript
NIH
-PA Author Manuscript
NIH
-PA Author Manuscript
was associated with a higher rate of IFG (fasting glucose ≥5.55 mmol l-1) and insulin resistance(fasting insulin ≥180 pmol l-1).
Impaired fasting glucose and impaired glucose tolerance (2-h glucose values ≥140 mg per 100ml after an oral glucose load) are indicative of pre-diabetes. IFG is an accepted indicator ofrisk for T2D, and impaired glucose tolerance confers risk for glucose-relatedcomplications10 and a high likelihood that normal insulin secretion is impaired.11 In adults,pre-diabetes progresses to diabetes at a rate of ∼10% per year.12 In youth, although there arelimited data to determine the rate of progression from pre-diabetes to diabetes, Weiss et al.13
have described a rate of progression in a limited number of obese youth with pre-diabetesbecause of impaired glucose tolerance of 24% over a mean of 20.4±10.3 months. The mainfeature of those who progressed was excessive weight gain during the observational period.
Minority and overweight youth had higher mean fasting glucose levels than the generalpopulation of American youth.14,15 In 2000, 7.6% of adolescents had fasting glucose values≥5.55 mmol l-1, although nearly double the percentage of Hispanic youth (13.5%) met thatcutoff.16 In our 2003 pilot study, we found a much higher rate of pre-diabetes because of IFGin our eighth grade sample, which was predominantly minority and heavily Hispanic. The meanfasting glucose value was 5.5 mmol l-1 (98.2 mg per 100 ml) and 40.5% of youth in our studyhad IFG. As progression to pre-diabetes and diabetes is associated with elevation of fastingglucose levels, population-wide reduction in glucose levels would suggest a reduction in therisk of developing diabetes.
Insulin resistance is generally an antecedent to the development of T2D, which, when coupledwith relative insulin deficiency, leads to outright disease. A fasting insulin level ≥180 pmoll-1 is suggestive of insulin resistance17 and is a measure that can easily be performed in a schoolsetting. Weiss et al.18 have reported mean fasting insulin values in obese and severely obesesubjects to be 188 and 232 pmol l-1 (31.3 and 38.6 μU ml-1), respectively. In our pilot study,the mean fasting insulin value was 180 pmol l-1 (30.1 μU ml-1) and 36.2% of eighth gradestudents had fasting insulin levels ≥180 pmol l-1. There was a 2-fold increase in mean fastinginsulin levels when comparing those with a BMI <85th percentile (135 pmol l-1 or 22.5 μUml-1) with those with a BMI ≥95th percentile (269 pmol l-1 or 44.8 μU ml-1). Similarly, thepercentage with fasting insulin values above 30 μU ml-1 increased by nearly 4.5-fold acrossthe three BMI categories. Hispanics and American Indians had the highest mean fasting insulinlevels and a 1.5-2-fold greater proportion with values ≥180 pmol l-1. As minority youth havethe highest rates of obesity, IFG and insulin resistance, and have been reported to be at highestrisk for T2D during childhood and adolescence, the HEALTHY trial targeted middle schoolswith predominantly minority populations.
Rationale for middle school-based interventionMiddle school was selected as representing a strategic time and place in which to studyinterventions to influence risk factors for T2D.
Children in the sixth to eighth grades (middle school) are generally 11-14 years old and in earlyadolescence. This is a time of both physical and metabolic as well as emotional and mentalgrowth and development. Middle school children are typically progressing through pubertywith increases in growth hormone secretory dynamics and sex steroid secretion that increasegrowth velocity and alter body composition, resulting in an increase in insulin resistance andother risk factors for T2D. Diet and physical activity behaviors are in flux during this period,and this transition represents an optimal opportunity to encourage healthier behaviors. Studentsat this age are developmentally capable of increasing and assuming personal responsibility forbehavior change and choices.
Page 3
Int J Obes (Lond). Author manuscript; available in PMC 2009 November 25.
NIH
-PA Author Manuscript
NIH
-PA Author Manuscript
NIH
-PA Author Manuscript
The school is the primary social environment of youth. No other institution has as much contactwith children.19 Policy recommendations and guidelines for increasing physical activity inyouth include the school as an important environmental influence on physical activity.20,21
Children who participate in the National School Breakfast (NSB) and National School LunchProgram (NSLP) receive up to two-thirds of their daily energy requirements from these meals,in addition to energy consumed from after-school snacks and in some cases twilight or eveningmeals. Schools also provide a broad platform for obesity prevention including classroom healthcurricula and physical education (PE) programs.
The school environment presents significant opportunities for obesity prevention22,23 and forinfluencing activity and eating habits.24-26 Richter et al.27 performed an extensive review ofthe environmental factors that relate to physical activity and nutrition in youth. They consideredthe key factors to be the number and type of exercise programs, exercise facilities, policies,types of health promotion activities, presence or absence of certain foods, ways in which foodis displayed, and the presence of positive or negative consequences of physical activity andeating. In addition, teacher influences and role modeling and the social network affect thepsychosocial culture and the social norms of the school. All of these factors are considered tobe part of the school climate, which can influence health behaviors of students, faculty andstaff.28-30
In addition, school-based learning activities provide a knowledge base and rationale for change.Both retrospective and prospective research31-35 show that well-designed and implementedprograms are effective in promoting a wide range of beneficial health behaviors amongadolescents, including reduction in drug use, improvement in nutrition practices and enhancingexercise self-efficacy.
Many adolescent behaviors are shaped more by peers and social influences than by parentalor other adult influences,32,33 and the school provides an environment conducive to fosteringpeer communications. Strong associations have been found between adolescents’ actions andtheir peers’ conduct through perceived normative behaviors and modeling.36 For example,perceived norms significantly predict the intention to drink regular soda.37 Furthermore,healthy and unhealthy behaviors often cluster among adolescents. The Youth Risk BehaviorSurveillance system found significant relationships between sedentary lifestyle and unhealthynutrition practices.38 For example, low physical activity among adolescents was associatedwith low fruit and vegetable consumption.
A comprehensive intervention that alters the nutrition and physical activity practices of middleschool children has the potential to prevent excessive weight gain and obesity. Preventing orlessening obesity should ameliorate insulin resistance and prevent glucose intolerance (pre-diabetes) and diabetes.
Study designCluster design primary prevention trial
HEALTHY was a primary prevention trial with a public health objective of preventing thedevelopment of risk factors for T2D in adolescents. The targeted population was clusteredtogether in middle schools, and hence HEALTHY was considered a cluster design trial.39,40
The cluster, or school, was the level of sample size and power computation, randomization,intervention, intent-to-treat and primary analysis. All members of the cluster—in our case,students—were exposed to the intervention. Data were collected at both the cluster (school)and the within-cluster (individual students and school staff) levels. Within-cluster data werecollected only from those individuals providing appropriate informed consent. Methods ofanalysis adjusted for the variability both between and within clusters.
Page 4
Int J Obes (Lond). Author manuscript; available in PMC 2009 November 25.
NIH
-PA Author Manuscript
NIH
-PA Author Manuscript
NIH
-PA Author Manuscript
HEALTHY applied two sampling schemes available to cluster designs. For the primaryanalysis, a cohort of sixth grade students enrolled at study start were followed through the 3years of middle school to end of study at the end of their eighth grade. In addition, a secondrecruitment and enrollment was undertaken in the eighth grade to enroll any eighth grader notin the cohort. Data were collected from this second cross-sectional sample documenting thelength of time in the current school, which was interpreted as exposure to the intervention. Asecondary dose-response type analysis was conducted by combining the cohort with the cross-sectional sample.
Treatment armsThe intervention consisted of four integrated components denoted nutrition, physicaleducation, behavior and communications. (1) The nutrition intervention component41 wasdesigned to implement changes in the quantity and nutritional quality of food and beverageofferings throughout the total school food environment, including cafeteria meals and after-school snacks provided through federal programs such as the NSLP and SBP, as well as a lacarte and vending machines. Nutrition intervention goals were enhanced with messaging,cafeteria-based educational events, taste tests to introduce new food items and food servicestaff training sessions. (2) The PE intervention component42 provided lesson plans andaccompanying equipment to increase both participation and number of minutes spent inmoderate-to-vigorous physical activity. The PE teachers attended training sessions thatincluded classroom management techniques. A PE teacher assistant was provided to helpdeliver the intervention. (3) The behavior intervention component43 provided brief classroomactivities designed to increase knowledge, enhance decision-making skills, promote peerinvolvement and interaction, and enhance social influence. A combination of individual andgroup behavior change initiatives promoted healthier behaviors through self-monitoring, goalsetting and problem solving. A HEALTHY assistant was provided to help deliver theintervention. Although the behavior intervention component was primarily school based, thestudy investigators recognized the important role played by parents and family members inenabling behavioral goals. Family outreach newsletters and take-home packages of materialswere distributed that provided information and strategies to support and reinforce youth inaccomplishing behavioral goals. (4) The communications integration component44 enhancedand promoted changes in nutrition, activity and behavior through messages, images, eventsand activities. Social marketing principles were applied to make HEALTHY a ‘brand’identified with good lifestyle practices. Taking advantage of the force of peer influence,volunteer student peer communicators were recruited and trained to help deliver theintervention components.
Each school year was divided in two, for a total of six semesters. The first semester of the firstyear (fall 2006) was devoted to recruitment of sixth graders and baseline measurements. Theintervention was delivered in the five remaining semesters. All the four interventioncomponents were integrated around a series of themes targeting specific behaviors and buildingon each other (see Table 1). The phased roll-out of messages and activities kept the programfresh and relevant. The themes highlighted the overarching emphasis of promotional andeducational campaigns and activities. Nutrition and activity were continuously targeted. Eachwas initially delivered as a separate theme and then integrated into the theme of energy balance.Finally, in the second half of the eighth grade school year (semester 6), a wrap-up campaignconsolidated the previous themes to address maintenance of a healthy lifestyle. The targetedbehaviors listed in Table 1 were emphasized consistently to reinforce messages addressinghealthy lifestyle behaviors and changes. In recognition of the mental and physical growth ofthe students, behaviors became sequentially more complex, starting with education andknowledge-based activities and extending to self-monitoring, goal setting and problem solving.
Page 5
Int J Obes (Lond). Author manuscript; available in PMC 2009 November 25.
NIH
-PA Author Manuscript
NIH
-PA Author Manuscript
NIH
-PA Author Manuscript
Perhaps what made HEALTHY unique among previous school-based programs was not justthe multiple nature of the intervention components, but their integration into a single, unifiedentity. The whole became more robust than just the sum of the parts as the HEALTHY programtook advantage of synergistic combinations of intervention elements to disseminateknowledge, develop behaviors and skills, enhance awareness of and attendance at events andactivities, and recognize accomplishments. Messages, lessons and skills developed and learnedin one component were reinforced and practiced in another. For example, specific facts andinformation provided as part of the classroom learning activities were also delivered inmessages posted on the cafeteria line, in ‘HEALTHY Habit’ reminders by the PE teacher duringend-of-class cool-down, and through schoolwide public address system announcements.Administration of the intervention components was coordinated by a ‘flighting plan’ thatspecified day-by-day and week-by-week timing, sequencing, placement and order for all studyactivities and materials. The plan was developed specifically for each intervention school,taking account of days off and other school scheduling. The plan ensured operational executionof the intervention as designed for optimal penetration of messages within a single conceptualand integrated framework.
Control school study activities emphasized recruitment and data collection. No ‘placebo’intervention was delivered. Activities and efforts to retain the involvement of control schoolsand students throughout the trial were implemented.45 At the end of the study, control schoolswere given a set of intervention materials (excluding equipment and training sessions).
Goals and objectivesPrimary and secondary objectives are stated in Table 2.
The primary objective was to moderate risk for T2D in middle school students. As noted above,the modifiable risk factors measured were indicators of adiposity and glycemic dysregulation:BMI ≥85th percentile, fasting glucose ≥5.55 mmol l-1 (100 mg per 100 ml) and fasting insulin≥180 pmol l-1 (30 μU ml-1).
The major secondary objectives included evaluating the ability of the intervention to influencelifestyle changes and choices both in and out of school, such as increased intake of healthyfoods and beverages and time spent in physical activity, with corresponding decreases innutrient-poor foods and beverages and time spent in sedentary behaviors. To understand thefeasibility of such intervention programs, we examined the cost-effectiveness of theintervention. To interpret our findings, we evaluated the degree to which the components ofthe intervention were delivered and administered as planned. We collected information onacademic performance, attendance and comportment in intervention versus control schoolsduring the study to detect either beneficial or deleterious trends associated with the intervention.In recognition of the increasing amount of publicity and public concern about health-relatedobesity in US adolescents, we monitored the influence of changes in the school environmentthat were not mandated by the study but were due to decisions and changes in policies,guidelines and recommendations at the school district, local, state and national levels. Finally,these data contributed to our understanding of the etiology of risk of T2D in this age group. Inaddition to a comparison of intervention versus control, the control schools provided naturalhistory data about secular trends in nutrient intake and physical activity, components of themetabolic syndrome (lipids, adiposity, blood pressure, fasting glucose) and pubertal status andtheir relationship to other factors.
Study participantsThe HEALTHY study first recruited and enrolled the six schools at each of the seven fieldcenters (42 schools total), and then recruited and enrolled students from within each school as
Page 6
Int J Obes (Lond). Author manuscript; available in PMC 2009 November 25.
NIH
-PA Author Manuscript
NIH
-PA Author Manuscript
NIH
-PA Author Manuscript
needed for data collection. Student recruitment efforts were identical in both intervention andcontrol schools.45
School eligibility criteria are given in Table 3. Schools had to be representative of theadolescent population at risk for T2D in terms of minority composition and/or lowersocioeconomic status, as determined by the percentage eligible for free or reduced cost lunch.Historical levels of annual out-migration must have been below 25% to ensure adequateretention of the initial cohort. In addition, for sample size and power purposes, we requiredthat at least 50 members of the initial cohort be retained at the end of the study in eighth grade.This was determined by assuming a 50% recruitment rate in the sixth grade student populationbased on pilot experience,1 and then applying the historical attrition levels provided by theschool to project to the end of the study. To deliver the PE intervention component, the schoolhad to meet certain minimum space and scheduling criteria. The school had to agree to let thestudy conduct minimal data collection of height, weight, gender, age and race/ethnicity of allsixth graders at baseline for the purpose of comparing students who consented with those whodid not. The school also had to assist the study with distributing materials to the students’homes, although all postage and materials were paid for by the study. Schools had to have orobtain FWA (Federal Wide Assurance) as mandated by the federal government to participatein federally funded research. Owing to the increased level of involvement, the schools and theiremployees were considered ‘agents’ of the field centers and, therefore, each school had tooperate under FWA. There was no formal document per se comparable to a school-levelinformed consent form or letter of intent. Study investigators experienced in conductingresearch in schools advised that this would be unenforceable and have little or no meaning overthe years as school administrators came and went. The study did seek consensus buy-in fromthroughout the school and district administrative structure to participate in the study and followthe protocol, including random assignment to either intervention or control.
Schools received annual compensation for participation that could be used at the discretion ofthe school administration for program enhancement. Schools assigned to intervention received$2000 in year 1, $3000 in year 2 and $4000 in year 3, and those assigned to control $2000 inyear 1, $4000 in year 2 and $6000 in year 3. The control school amounts became higher becausethe intervention schools received additional compensation in terms of PE equipment and foodservice costs. The amounts escalated each year as a retention strategy.
As the intervention was implemented schoolwide in schools randomized to intervention, allstudents were exposed. Student eligibility criteria were applied in both intervention and controlschools to participate in scheduled data collection and evaluation. To be enrolled in the cohortfollowed across the sixth, seventh and eighth grades, students had to be enrolled in sixth gradein fall 2006, be able to participate in the school’s standard PE program, not have been previouslydiagnosed with diabetes, and provide parent/guardian’s informed consent and minor childinformed assent to participate in data collection and evaluation procedures. Similar eligibilitycriteria were applied to the additional cross-sectional sample of students enrolled in eighthgrade to participate in end of study data collection. Students were compensated for participatingin the three data collections with $50 at baseline (sixth grade), $10 at interim (seventh grade)and $60 at end of study (eighth grade).
In addition to schools and students, the study also involved various members of the school staffas participants. In those schools assigned to the intervention, staff participation in theintervention was subsumed under the school’s FWA. Staff members did not need to provideconsent for engaging in intervention activity, but signed informed consent forms to participatein data collection and were compensated for their time and effort. Appropriate informed consentwas also obtained from parents who provided feedback on the program and from student peer
Page 7
Int J Obes (Lond). Author manuscript; available in PMC 2009 November 25.
NIH
-PA Author Manuscript
NIH
-PA Author Manuscript
NIH
-PA Author Manuscript

communicators who participated in intervention delivery activities, which involved trainingand time.
Outcome measures and evaluationsMeasurements and observations were made at the school, grade and student levels. There werethree major data collection periods: (1) baseline data were collected in the fall of 2006 whenthe student cohort was starting sixth grade, (2) interim data were collected in the spring of 2008when the student cohort was ending seventh grade and (3) end of study data were collected inthe spring of 2009 when the students were ending eighth grade. Table 4 lists data collectionmeasures and procedures and indicates when they were collected and recorded.
Demographic characteristics—Student demographic and descriptive characteristics werecollected at baseline and end of study. Students provided sex, date of birth and race/ethnicityby self-report. Ethnicity (Hispanic yes/no) and race were asked as two separate questions withlaminated cards showing and defining choices. Nevertheless, we found that the studentsthemselves did not make such distinctions and, having identified themselves as Hispanic, didnot respond to the follow-up question of race. The parent/guardian completed a self-reportform by mail with items for socioeconomic status (highest level of education attained by headof household), family history of diabetes in first-degree blood relatives, diagnosis of diabetesin the child and current medications used.
Health screening—At baseline and end of study, students participated in a comprehensivehealth screening; in addition, interim height and weight were collected in the seventh grade.Measurements were made by trained staff who used the standard equipment adhering tocalibration procedures provided by the study and the equipment manufacturers. Students wereinstructed to wear light, loose-fitting clothing. To ensure privacy, measurements were madebehind a screen. Height (Perspective Enterprises PE-AIM-101 stadiometer) and weight (SECAAlpha 882 and SECA Large Capacity 634 electronic scales) were measured without shoes.Blood pressure was measured using an automatic inflatable digital blood pressure monitor(Omron HEM-907 or HEM-907XL) three times, the first taken after the subject had been sittingquietly for at least 5 min and the second and third taken at 1 min intervals. Appropriate cuffsize was selected according to manufacturer’s specifications based on a single measurementof student’s upper arm circumference. Waist circumference was taken using a tape measureon bare skin measured just above the iliac crest. Fasting blood was drawn to determine insulin,glucose and lipids. On the evening before data collection, the study staff called the studentsscheduled for the next day’s blood draws to remind them not to eat any food or drink anythingexcept water after midnight and not to eat breakfast. At check-in, students were questionedabout the last time they had anything to eat or drink and were rescheduled if they had not fasted.Standard procedures were followed by licensed phlebotomists with experience in working withchildren. A study physician was available by phone in case of adverse events. A numbing creamwas applied with appropriate consent. On account of local restrictions, two sites were notpermitted to draw blood on school property and used mobile vans parked nearby.
Laboratory analysis—Blood was drawn, processed and shipped per protocol to the centralblood laboratory at the University of Washington Northwest Lipid Research Laboratories(Seattle, WA, USA) for all analyses.46 Analyses of glucose were performed on a Roche Pmodule autoanalyzer by the hexokinase method using a reagent from Roche Diagnostics.Insulin was measured by a two-site immunoenzymometric assay performed using a Tosoh 1800autoanalyzer. The inter-assay and intra-assay precision analysis consistently showed acoefficient of variation <10%. The assay sensitivity level was 12 pmol l-1 (2.0 μU ml-1). Theassay had a high specificity, as cross-reactivity with human C-peptide and proinsulin was 0and 2%, respectively. A reference interval for the assay for apparently healthy donors was
Page 8
Int J Obes (Lond). Author manuscript; available in PMC 2009 November 25.
NIH
-PA Author Manuscript
NIH
-PA Author Manuscript
NIH
-PA Author Manuscript

established at <102 pmol l-1 (17.0 μU ml-1). Measurements of total plasma cholesterol inplasma, cholesterol in the lipoprotein fractions and triglycerides were performed enzymaticallyon the Roche modular-P autoanalyzer using methods standardized to the Centers for DiseaseControl and Prevention Reference Methods.47 Determination of high-density lipoproteincholesterol was performed after precipitation of apolipoprotein B-containing particles bydextran sulfate Mg2+. Low-density lipoprotein cholesterol was calculated using the Friedewaldequation.48 This approach for calculating low-density lipoprotein is clinically reliable if themeasurements of total and high-density lipoprotein cholesterol are performed with a high levelof accuracy and the triglycerides are <4.5 mmol l-1 (400 mg per 100 ml).49 In the case ofelevated triglycerides, a complete lipoprotein separation by ultracentrifugation, which allowsquantitation of the individual lipoprotein classes, was performed using the Lipid ResearchClinics Beta Quantification procedure.50 The inter-assay coefficients of variation areconsistently <1.5% for total cholesterol and triglycerides and <2% for high-density lipoproteincholesterol. The measurement of relative proportion of hemoglobin subclasses and calculationof the HbA1c level was performed using an automated non-porous ion exchange high-performance liquid chromatography system (G-7 Tosoh Biosciences Inc.). The laboratory,using the Tosoh G7, has successfully completed National Glycohemoglobin StandardizationProgram Level 1 laboratory certification for traceability of values to the DCCT (DiabetesControl and Complications Trial) Reference Method. The intra-assay coefficient of variationis 0.047% and the inter-assay coefficient of variation 0.070%.
Self-report instruments—Students completed several standard self-report instruments.Sexual maturation or pubertal stage was determined using the gender-specific pubertaldevelopment scale from which the Tanner score was determined.51-53 The form was completedon hand-held devices (personal digital assistant, or PDA) at baseline and end of study. Alsocompleted in this time frame were instruments to determine the levels of dietary intake, physicalactivity and sedentary behavior. Students completed the 2-day version of the SAPAC (Self-Administered Physical Activity Checklist) to estimate the physical activity levels and sedentarybehaviors.54,55 Students’ self-reported dietary intake using a semi-quantified food frequencyquestionnaire that solicited information from the past week; the Block Kids FFQ asked aboutintake of 100 food items and solicited information concerning portion sizes using a servingsize visual.56-58 Standard software was applied to determine estimates of usual intake for avariety of nutrients, including calculations of daily frequency and amounts for individual fooditems as well as by food group. Two health-related quality of life instruments were completedby students at all three data collection periods: (1) the visual-analog feeling thermometer fromthe EuroQoL (EQ-5D) preference assessment instrument59 and (2) the Health Utilities Index,60,61 a preference-weighted health state classification system, the latter completed on PDA.
Fitness—Measurement of student fitness was based on the number of laps completed duringthe 20-meter shuttle test (20-MST).62-64 The test required the subjects to run back and forthbetween two lines set 20 m apart. The running pace was determined by audio signals emittedfrom a pre-recorded CD. The test was completed when the participant was not able to completethe distance at the stipulated pace on two laps. A score for the test was assigned on the basisof how many stages and laps were completed. The 20-MST was administered during PE classat baseline and at end of study.
Cost assessment—Cost data were collected at the school level only. The goal was to assessall resource use and costs, regardless of whether a monetary transaction took place. Total schoolfood environment and PE cost data were collected at both intervention and control schools.For the school food environment this included: food, labor and central kitchen costs; revenues(total a la carte cash sales by day, cash meal and program sales, United States Department ofAgriculture reimbursements); meal and program participation (total number of serving days,
Page 9
Int J Obes (Lond). Author manuscript; available in PMC 2009 November 25.
NIH
-PA Author Manuscript
NIH
-PA Author Manuscript
NIH
-PA Author Manuscript

count by day and by free/reduced/paid category). PE costs included time PE teachers spent inclass teaching students, equipment and supplies. Additional data were retrieved fromintervention schools only and included: intervention materials and supplies, salaries, trainingcosts and travel costs of study staff dedicated to delivering the intervention. Costs of schoolenvironment changes, in-kind donations and outside grants were also collected.
Total school food environment—To measure the total school food environment, salesand production records for foods and beverages from cafeteria meals and programs, a lacarte and vending machines were collected at all three data collection periods. Data werecollected consecutively for 20-day periods. Production records and meal participation rateswere extracted from source documents provided by the food service manager at each school.Sales data were provided by cash register records or by the food service manager at each school,or in the case of snack and beverage vending, by the party responsible for the vending machines(school specific). Foods were analyzed for nutrient content using the Nutrition Data Systemfor Research software (University of Minnesota Nutrition Coordinating Center, Minneapolis,MN, USA).
PE activity level—Activity level in PE classes was collected in both intervention and controlschools at all three data collection time points. Data were recorded on heart rate monitors wornby consented students during the PE class. The sample of specific classes and students wasselected by an unbiased scheme generated by the coordinating center. Heart rate monitor datawere summarized as minutes of moderate-to-vigorous physical activity (defined as heart rate≥130 beats per minute).
Academic performance—Although the potential health benefits of the proposedintervention were extremely important, scholastic achievement is the primary purpose ofschools. If the HEALTHY intervention was successful but associated with an adverse impacton scholastic performance, it would have little chance of being widely adopted. Therefore, datawere collected to document scholastic performance on the respective state accountability testsand the total number and passing rates of students taking the test. These tests were taken bysixth, seventh and eighth graders in intervention and control schools every year. Grade andschool level data were recorded—no individual student data were collected. In addition, datawere collected to determine the rates of grade level absences and referrals for disciplinaryaction. Policy and practice related to disciplinary referrals and any changes were recorded.These data detected relative change in the school from before the study to its end.
Environmental influences—Primary prevention trials such as HEALTHY are typicallyconducted in response to an identified public health need. This meant that although theHEALTHY researchers were trying to study the impact of an intervention that changed theenvironment, legislatures, action groups and the general public were also at work to changethe environment both individually and collectively.65 These changes could have occurred inand around the school environment, which affect the study school’s nutrition and physicalactivity programs during the intervention period. These influences could have occurred at eitheror both control and intervention schools and may have been because of federal, state or localmandates, policies or decisions. It was necessary to document external independentprogrammatic policy and environmental changes to assess their potential effects.66 Assessingthese potential confounding effects was critical in a multi-year intervention that focused on theimpact of a strong environmental intervention. It was particularly important for HEALTHYbecause of the increasing national awareness of the prevalence of obesity and low physicalactivity levels among children and adolescents.3 National recommendations, referenda andinitiatives were being proposed that could influence the trial’s primary outcome in bothintervention and control schools. Data were collected annually related to levels of physical
Page 10
Int J Obes (Lond). Author manuscript; available in PMC 2009 November 25.
NIH
-PA Author Manuscript
NIH
-PA Author Manuscript
NIH
-PA Author Manuscript
activity and nutrition that may occur in the school but that were not necessarily part of the studyintervention, including: (1) aspects of the environment in the school, in the schoolneighborhood, during school hours and after or before school, (2) relevant grants and researchprogram initiatives, (3) local, state or federal mandates and (4) promotions and advertising.Longitudinal changes from one year to the next or from the beginning of the study to the end,as well as group (control versus intervention) differences, helped to interpret study outcomes.
Process evaluation—In addition to the above, data were collected in intervention schoolsspecifically to conduct ongoing process evaluation to assess the extent to which the interventionwas delivered and received as intended.67 By monitoring the delivery of key interventioncomponents and providing timely feedback to the intervention staff, process evaluation datawere used to help ensure fidelity of intervention delivery. Monitoring and providing feedbackon the intervention ensured adequate implementation of the intervention components and wereused to help explain study outcomes.
Safety, risk management and follow-up proceduresOnly fasting blood draws were anticipated to result in the occurrence of reportable adverse andserious adverse events related to the study. The intervention was judged to involve no greaterrisk than what is normally found in the school environment and handled per established schoolpractices and procedures. Known side effects of drawing blood and applying a numbing creamwere recorded, including discolored skin (paleness or redness), swelling, itching or rash wherenumbing cream was applied, small bruise at point of venipuncture, feeling dizzy or lightheaded, fainting or loss of consciousness, and upset stomach or mild nausea. A serious adverseevent was defined as any event that occurred during the administration of or as a result of thehealth screening blood draw, caused bodily or psychological damage, and involved the on-sitepresence of emergency medical personnel (that is, not just the school nurse). To avoid andminimize these risks, only people trained and experienced in blood drawing techniques wereallowed to draw blood following standard sterile procedures. A physician was available on-site or by phone at all times during data collection involving blood draw. The students weregiven a healthy breakfast after the fasting blood draw.
As a follow-up to the health screening, parents were given written results of their child’sphysical assessments at baseline and end of study (BMI, blood pressure, fasting glucose andlipids) with normal ranges and interpretation. Where considered necessary for the child’shealth, study staff initiated follow-up contact and recommended action as needed. Parents werenotified of test results indicating diabetes (fasting glucose ≥7.0 mmol l-1 or 126 mg per 100ml) by phone within 48 h. A study team health professional called the parents and followed upwith a letter providing more information about interpretation and recommended action. In caseof clinically important elevated values (fasting glucose 5.55-6.9 mmol l-1 or 100-125 mg per100 ml, systolic blood pressure >150 mm Hg, diastolic blood pressure >95 mm Hg, totalcholesterol >7.8 mmol l-1 or 300 mg per 100 ml, low-density lipoprotein cholesterol or low-density lipoprotein-c >4.9 mmol l-1 or 190 mg per 100 ml, triglycerides >5.6 mmol l-1 or 500mg per 100 ml), a health professional on the study staff called the parents as soon as possible,usually within 5-10 days. The health care professional provided information aboutinterpretation and recommended that the family contact a physician for further testing anddiagnosis. The health care professional answered any questions and provided assistance withaccessing medical care if needed. In addition, the parent letter interpretation noted that fastingglucose 5.55-6.9 mmol l-1 (100-125 mg per 100 ml) was a high level and, although notindicative of diabetes, needed to be followed up with evaluation by a health care provider.
Page 11
Int J Obes (Lond). Author manuscript; available in PMC 2009 November 25.
NIH
-PA Author Manuscript
NIH
-PA Author Manuscript
NIH
-PA Author Manuscript
Management and structureSimilar to other collaborative groups, HEALTHY was governed by a Steering Committeecomposed of the field center and coordinating center principal investigators, NIDDK projectofficer and study chair. Members of the study group, including staff at the field centers,coordinating center and central cores and labs, were assigned to various committees thatreported to the Steering Committee. The study supported three central cores: the central bloodlaboratory (Northwest Research Lipid Laboratory, Seattle, WA, USA), the communicationsand social marketing core (Planit Agency, Baltimore, MD, USA) and the qualitative processevaluation data core (University of North Carolina, Chapel Hill, NC, USA).
The NIDDK appointed an External Advisory Board of experts to review and approve theHEALTHY protocol. The NIDDK appointed an independent group of external experts to serveas the DSMB (Data and Safety Monitoring Board), with responsibility for reviewing andapproving protocols and monitoring study progress and safety. The DSMB also reviewed majorinterim milestones: successful recruitment of schools and students, successful delivery of theintervention as designed, and evidence based on interim height and weight data collection thatthe control schools were not performing better than the intervention schools on the primaryoutcome.
Figure 1 shows the field center personnel structure. HEALTHY study staff operated in threegeneral categories: (1) administrative staff included investigators, project coordinator andschool coordinator; (2) intervention staff included health promotion coordinator, physicalactivity coordinator, research dietitian, student media coordinator, HEALTHY assistants andPE teacher assistants; (3) research staff included research assistants, data entry clerks, andtemporary data collection and recruitment personnel, such as phlebotomists, nurses andinterviewers. The project coordinator supervised, managed and coordinated the staff andoverall study implementation. The project coordinator was assisted by the school coordinatorwho coordinated the logistics of study events and activities at the schools. The study imposedseparation of intervention and research staff and functions to maintain objectivity.
Study staff involved in intervention conduct and delivery were specialists with relevanteducational backgrounds and experience. They provided training, monitoring, support andguidance to the local school staff. The health promotion coordinator had responsibility for thebehavior and parts of the communications components, including working with and trainingclassroom teachers and student peer communicators. The physical activity coordinator workedwith the PE teaching teams to assist in the implementation of the program by conductingtraining, developing strategic plans jointly with the PE teacher, and providing guidance. Theresearch dietitian worked with the school food service workers and management to monitorand assist with study changes to the nutrition/food service environment, develop strategic plansjointly with the food service manager, and conduct training sessions for the school food servicestaff. The student media coordinator assisted with the acquisition and processing of audiomessages and images produced by the students themselves as part of the social marketingcampaign in the later grades. Communication intervention events and activities were attendedby a broad cross-section of intervention staff members, consistent with the integrative natureof these activities. HEALTHY assistants worked with the health promotion coordinator tofacilitate implementation of the behavior and communications intervention activities. PEteacher assistants worked with physical activity coordinators to help the PE teacher deliver thePE intervention in class.
At each field center, a small number of research study staff were permanently hired to engagein data collection and management. For baseline, interim and end of study data collection,additional staff were hired on a temporary basis, including more research assistants as well asdata entry, phlebotomy and nursing specialists. One of the co-investigators was an
Page 12
Int J Obes (Lond). Author manuscript; available in PMC 2009 November 25.
NIH
-PA Author Manuscript
NIH
-PA Author Manuscript
NIH
-PA Author Manuscript
endocrinologist available as an on-call resource for consultation regarding adverse events andabnormal laboratory results.
Staff attended central training on an annual basis, delivered separately to intervention andresearch staff. Research staff had to pass criteria to become certified in equipment set-up andcalibration and measurement of height, weight, waist circumference and blood pressure. Allstaff members obtained security clearance and background checks as required to operate in theschools.
Statistical issuesSample size and power—Sample size was determined for the number of schools (clusters)needed in each treatment arm.39 The trial was powered to detect a 10% reduction in the percentof students with a BMI ≥85th percentile in the intervention versus control schools at the endof eighth grade. This translated into a decrease from 50% in the control schools, based on pilotstudy findings, to 45% in the intervention schools. Sample size calculations assumed a two-sided significant level α = 0.05 and 90% power. The average number of eighth graders perschool in the cohort at end of study was assumed to be 50. The intracluster correlationcoefficient, or ICC, which adjusts for the correlation within a single school (between students)compared with across schools, was set at 0.02, based on pilot data adjusting for gender, ethnicityand field center. The primary analysis adjusted for baseline outcome value, so sample size alsoadjusted for the correlation between baseline and end-of-study values, estimated at 0.9. Finally,we adjusted for student dropout and withdrawal. Student dropout and withdrawal wereprimarily for reasons unrelated to the intervention, such as family relocation. These studentswere removed from the cohort. However, a much smaller percentage of students remained inthe school but had missing outcome data (for example, refused measurement, absent on allmeasurement and make-up days). These students remained in the cohort and end-of-studyoutcome values were imputed. On the basis of the study group experience, this percentage wasassumed to be no more than 5%. For the purposes of sample size calculation, we assumed aconservative imputation scheme based on control school data, which decreased the detectabledifference.
On the basis of the above assumptions, 16 schools per arm were needed. The required samplesize of 16 schools per arm was adjusted upward so that there were an equal numbers of schoolsper field center (divisible by 7) and an even number of schools per field center (half randomizedto each arm). Therefore, 21 schools per arm were needed for a total of 42 schools.
Randomization and masking—The coordinating center developed a stratifiedrandomization scheme. The stratification factors were field center and sixth grade size to assigncomparable within cluster (school) sample sizes across treatment arms at each field center.Schools were notified of random assignments in the spring of 2006 to allow the schoolsassigned to the intervention time to place orders for appropriate changes in food and beverageitems.
Therefore, treatment assignment was known to both key school officials and to study staff. Tominimize staff bias, study staff who delivered the intervention appeared in the interventionschools only and were separate from study staff who administered data collection proceduresin both intervention and control schools.
The study took measures to keep students and their parents masked to the assignment.HEALTHY was presented identically at both control and intervention schools to students andtheir parents during recruitment and enrollment. In brochures and informed consent forms,HEALTHY was described as a study being conducted in 42 schools to ‘see if a program createdto help middle school children lower their risk of being overweight and having diabetes can
Page 13
Int J Obes (Lond). Author manuscript; available in PMC 2009 November 25.
NIH
-PA Author Manuscript
NIH
-PA Author Manuscript
NIH
-PA Author Manuscript

work.’ The program was not specified. Because the intervention was administered at the schoollevel, students and their parents could not provide consent about being exposed to theintervention, but only about participating in data collection procedures, which were thoroughlycovered in the informed consent process. In addition, local publicity about a school’sparticipation in a national study was discouraged. There was a minimal amount of cross activitybetween schools at the middle school level, but HEALTHY branded items were distributed atboth intervention and control schools as part of retention and incentives so that the study logowas a familiar sight. Perhaps the greatest potential for crossover occurred where a single foodservice corporation served both intervention and control schools and wanted to take advantagesof efficiencies by placing only one order. The study staff administering the nutritionintervention component actively monitored school orders and purchases, and formed alliancesat the district and corporate food service levels to restrict the intervention to only the threeassigned schools.
Dropout and withdrawal—HEALTHY followed the dictates of good research practice tomake every effort to retain the study subject for the duration of the trial despite any lack ofadherence to the protocol. In the cluster or group-randomized trial, the ‘subject’ that is the unitof primary outcome analysis and computation of sample size is the cluster, or the school in ourcase. During the study’s 3 years, a school could have closed, could have withdrawn from thestudy, or could have refused to adhere to the protocol in whole or in part. We were fully preparedto enter into negotiations or modifications as needed to collect as much data as possibleaccording to the original schedule, with the highest priority being given to collecting theprimary outcome at end of study and to applying an imputation scheme, if necessary.Fortunately, our school retention efforts were successful and we did not have to deal withschool dropout or withdrawal. We did experience acts of nature, such as wildfires in Californiaand hurricanes in Texas, that had temporary effects on school functioning above and beyondour control and certainly unrelated to the study.
Within the school, student turnover across the study period was anticipated and an upper limitof 25% per year was established as a school eligibility criterion. This trial design presupposesthat the major reasons for loss to follow-up are equally distributed in both intervention andcontrol and are due to factors unrelated to the study, most typically families’ geographicalrelocation.68 We attempted to track and document the students who left the cohort at interimdata collection in seventh grade, but found that the level of effort required to obtain currentcontact information for our student demographic was beyond the study’s resources. We alsofound that the school policies and practices regarding documentation and tracking of studentsvaried widely and frequently produced incorrect information. Therefore, we were not able tocollect specific information about student dropout and withdrawal related to transfer from theschool. Owing to the in-depth involvement of study staff in the school environment, we werecertain that we would learn if any student or family complained that the study made them leavethe school. This never happened.
Students who transferred out of the school over the course of the study were removed from thecohort. The other possibility for missing data came from students who remained in the schoolbut refused or were absent on data collection days. These students remained in the cohort andefforts were made on a one-on-one basis to accommodate data collection, with priority beinggiven to the primary outcome. Missing primary outcome data in the cohort were imputed. It isimportant to remember that the students at schools assigned to the intervention could not refuseto take part in the intervention, which was implemented at the entire school or grade level, butcould refuse or withdraw from data collection.
To evaluate the integrity and interpretation of the HEALTHY study outcomes, analysis isplanned to compare the end of study cohort with the two possible sources of missing primary
Page 14
Int J Obes (Lond). Author manuscript; available in PMC 2009 November 25.
NIH
-PA Author Manuscript
NIH
-PA Author Manuscript
NIH
-PA Author Manuscript

outcome data, that is, students who transfer out and students who remain in the school butwithdraw consent or refuse to participate in end of study data collection. The analysis mustalso compare intervention versus control to understand the nature of missing data. Thesecomparisons will apply the concepts of missing completely at random (MCAR) and missingat random (MAR). MCAR exists when missing values are distributed across all observationswith no difference across subgroups characterized by gender, race/ethnicity and so on. MARmeans that differences across subgroups regarding rates of missingness do exist, but not withinsubgroups; for example, Hispanic and White subgroups may differ from each other, but withineach subgroup there is no difference by gender.68 Each type of missing data has ramificationsfor study interpretation and inference.
Analysis plan and methods—Methods of analysis accounted for the structure of thecluster design trial, with measures of variance both between cluster (school) and within cluster(between students within the same school).39,40 General linear mixed models (GLMM) wereused to analyze differences between intervention and control schools.69,70 GLMM provides amethod for analyzing data when the responses are correlated and normally distributed randomeffects are assumed. The responses can be continuous, discrete or count data. The clusteringof observations within schools is taken into account by fitting a random effects parameter forschool. Correlation between all interschool observations is taken into account by the selectionof covariance structure. GLMM models allow for fixed (for example, gender, race) and time-varying covariates (for example, Tanner stage, waist) as well as for adjustment for individual-level and cluster-level covariates (for example, baseline values). Interaction terms may beincluded. These methods apply to analysis of point-in-time as well as longitudinal measuresfrom a cross-sectional or cohort sample, respectively.
The primary analysis was performed on the cohort enrolled in sixth grade and measured at endof study in eighth grade. Students in the cohort provided both consent and assent and data todetermine the primary outcome, BMI percentile, that is, valid measurements of height andweight, gender and age. Students diagnosed with diabetes at baseline were not eligible for thecohort. Intent-to-treat principles were applied as described above. Baseline value was includedin the model as a covariate. A secondary cross-sectional analysis of the outcome was performedon the entire eighth grade sample (cohort plus end of study recruits).
Preliminary studiesThe trial protocol represented the culmination of a series of pilot and feasibility studiesconducted by the prevention study group in preparation for the primary prevention trial. Thisseries of studies was conducted to guide all aspects of the HEALTHY study, includingrecruitment procedures, selection of primary and secondary outcome measures, scheduling andlogistics, development of the intervention components separately, and their integration.Feasibility, impact and acceptability were also determined by collecting formative researchdata and by consulting with local advisory boards. Each site assembled an advisory boardcomposed of key role players, such as state or district level superintendent or administratorsfrom the Department of Education, powerful or visible parents (such as current or past PTApresident), school principals, classroom and PE teachers, and food service directors at districtor state level. These groups reviewed the proposed research, provided feedback, and suggestedalternative strategies and approaches. Although constrained by the logistics and scheduling ofthe school year, the prevention study group developed and conducted eight pilot or feasibilityprotocols from winter 2003 through fall 2005.
The first pilot study was conducted in winter 2003 to determine the feasibility of recruitingstudents (that is, obtaining parent informed consent and student informed assent) to participatein a health screening that included the HEALTHY health screening procedures and also tricep
Page 15
Int J Obes (Lond). Author manuscript; available in PMC 2009 November 25.
NIH
-PA Author Manuscript
NIH
-PA Author Manuscript
NIH
-PA Author Manuscript

and subscapular skinfolds and an OGTT (oral glucose tolerance test). Results have beenreported.1,71,72 Although recruitment of a representative sample and performing all of the datacollection procedures were successful, we found almost no undetected diabetes (<1%) but highlevels of T2D risk factors. Of 1740 eighth graders, 49% had a BMI ≥85th percentile, 40.5%had fasting glucose values ≥5.55 mmol l-1 (100 mg per 100 ml), 36.2% had fasting insulinvalues ≥180 pmol l-1 (30 μU ml-1) and 14.8% had all three. On the basis of these results, theHEALTHY trial targeted prevention of modifiable risk indicators for T2D.
Subsequent pilot protocols were conducted specifically for the design and development of theintervention. The PE intervention component was piloted in fall 2003 to test the acceptabilityof the study lesson plans to teachers and students, and to gauge the intervention’s ability toattain satisfactory levels of moderate-to-vigorous physical activity. This was followed in winter2004 with a pilot to evaluate the feasibility of the nutrition intervention component’s abilityto achieve targeted changes in the school food environment.73,74 Formative research conductedin spring 2004 elicited information from sixth grade students, their parents and middle schoolstaff regarding attitudes about school activities, food and nutrition messages, physical activity,and student behaviors and preferences to inform the development of a school-based socialmarketing campaign. In fall 2004, the study group conducted a pilot study that implementedand integrated both the PE and nutrition intervention components with a schoolwidecommunications campaign of activities, education and promotion. Additional formativeresearch in spring 2005 took further steps to refine and specify student, parent, and facultyperceptions and reactions to a variety of proposed messages and approaches. Finally, two pilotswere conducted in fall 2005, one to evaluate the behavior intervention component for feasibilityand acceptability, and one to test refined aspects of the PE intervention component to train andguide the PE teachers as well as to assess lesson plans for seventh and eighth grades.
Results of sample comparisonsTable 5 compares intervention versus control schools on key baseline characteristics. Therandomization scheme resulted in equitable distribution in size of school (average 873 studentsper intervention school and 863 per control school), size of sixth grade (average 265 studentsfor intervention and 266 for control), percentage enrolled by providing signed informed consent(62.2% intervention, 62.5% control), percentage of students qualified for free/reduced meals(77% intervention, 74% control) and percentage either Hispanic or Black race/ethnicity (77%intervention, 70% control). By and large, the schools included only grades 6 through 8 (19intervention, 20 control).
At baseline in fall 2006 before the initiation of the intervention, two sets of data were collectedin students. One was the comprehensive health screening of HEALTHY student participantsalready described. The other was grade-wide data collection among all sixth graders of gender,date of birth, race/ethnicity, height and weight for the purpose of comparing participants versusnon-participants. Both data collections used identical procedures, but the grade-wide datacollection was conducted any time before lunch, whereas the health screening was conductedearly in the morning after at least an 8-h fast. In addition, the grade-wide data collection didnot include student names or other personal identifiers so that signed informed consent wasnot required by the school or Institutional Review Board. Study staff recorded whether thestudent was participating in HEALTHY (that is, signed informed consent/assent) or not. Table6 gives the comparison of participants versus non-participants. Table 7 gives the comparisonof baseline health screening results for students in intervention versus control schools. Thenumber of students participating in the health screening is greater than the number ofparticipants measured during the grade-wide data collection because there was no follow-upattempt to measure students who were absent or otherwise unable to be at grade-wide datacollection, and because students continued to provide HEALTHY consent after grade-wide
Page 16
Int J Obes (Lond). Author manuscript; available in PMC 2009 November 25.
NIH
-PA Author Manuscript
NIH
-PA Author Manuscript
NIH
-PA Author Manuscript
data were collected. Owing to the anonymity of grade-wide data collection, we were not ableto update the data, and we recognize that the distinction between participants and non-participants in Table 6 is not entirely accurate.
Table 6 shows significant differences in age, gender distribution, racial/ethnic breakdown andBMI between the sample of students who consented to be measured for the study and the samplewho did not. Table 7 shows no significant differences at baseline between the intervention andcontrol school participating students for any of the characteristics or measurements available.
DiscussionThe factors that motivated the NIDDK to fund the HEALTHY study group arose from scientificevidence combined with public awareness that deleterious lifestyle habits and behaviors wereendangering the health of US children and adolescents, specifically leading to burgeoning ratesof diagnosis of T2D. At this point in our understanding of diabetes treatments and glycemiccontrol, there is no stopping the ravages of T2D in the form of microvascular and macrovascularcomplications that can lead to such grim consequences as blindness, amputation, kidney failure,heart attack, stroke and death. That this disease is being identified in greater numbers at youngerages has ramifications not only for individuals and families but also for our health care system.
HEALTHY faced many challenges to implementation. Typical of public health trials by thetime they get underway, the problem addressed by the primary objective had already beenrecognized in terms of the contribution of junk foods and increasingly sedentary lifestylesleading to obesity. Strategies to address the problem had already reached the level of publicdiscourse in the popular media, affected public policy making at local, state and federal levels,and influenced decision making in corporate boardrooms. The environment was shifting, andHEALTHY study investigators asked themselves whether the planned intervention would besuperseded by new guidelines, regulations and products. To evaluate the extent of any temporalshifts, we took steps to collect data on secular changes that would affect the school healthenvironment.
However, there were reasons to suspect that the HEALTHY intervention would faceinsignificant competition from these secular trends. These reasons were related to institutional,social and economic factors. As institutions, the schools are primarily responsible for educationas measured most commonly by the standard verbal and mathematical test scores. As welearned, other activities were not allowed to interrupt the pursuit of this objective. The conflictbetween health promotion, learning and activities versus the preparation and administration ofstandardized tests was evident. Jobs and careers depended on test scores providing proof thatthe school was discharging its educational mission.
Public schools are also notoriously underfunded. School principals and administrators dependon revenue from snack bars, vending machine pouring contracts, and candy sales to pay forextras such as band uniforms, equipment, school trips or even art teachers. This puts them inconflict with the health community’s desire to shut down these sources of income, whichessentially promote foods and beverages that detract from the health of children. We providedstudy funds to offset lost revenue, but we had to continually work with the school faculty andstaff to identify alternative ways to raise money or reward performance that did not involveunhealthy products and practices. We were dealing with a system that was desperate to use thestudy money along with existing sources of revenue to fund more opportunities.
The HEALTHY study investigators recognized the critical role of parents in the health of theirchildren and considered various strategies to engage parents in school health promotioncampaigns and in supporting behavior change in their children. In the end, the studyincorporated methods that reached out to parents in their homes rather than depending on
Page 17
Int J Obes (Lond). Author manuscript; available in PMC 2009 November 25.
NIH
-PA Author Manuscript
NIH
-PA Author Manuscript
NIH
-PA Author Manuscript
parents to travel to or gather for events and activities. Parent outreach was accomplished intwo ways. First, a series of newsletters was distributed to the parents. The newsletters featuredfirst-person stories relating a family’s challenges to living healthier, family members’ personalhistories and struggles, and the approaches they used to adopt a healthier lifestyle. Thenewsletters also included tips and suggestions in question-and-answer and other formats.Second, packages of activities and challenges were developed and distributed just before thesummer and holiday breaks. The materials and supplies included in the package were intendedto involve family members of all ages and both genders, along with the student.
As the intervention deliberately unified and integrated the four components, we cannot separatethe contribution of any single intervention component. We believe that, despite the significantdifferences between study participants and non-participants shown in Table 6, the study resultsare broadly applicable. The percentage male in the study sample was less than that among thenon-participants. This may be related to lower maturity levels in sixth grade boys than girls,but the slight preponderance of females in the study sample is actually beneficial because itmirrors the ratio of adolescent females to males diagnosed with T2D (female: male ratio1.6-1.7:12,75,76). Likewise, the proportion with BMI ≥85th percentile was greater among thesample of participants (53.2 versus 48.6%), indicating that the study sample had a higherrepresentation of adolescents at risk. The racial/ethnic distribution was uneven betweenparticipants and non-participants, with the latter having a greater percentage of Hispanics andlesser percentages of Blacks and Whites. In general, the strength of the sample was thesubstantial representation (>70%) of minorities at greater risk for T2D and our ability toperform meaningful subgroup analyses.
Whether HEALTHY is successful or not, the argument that policies and practices need to bechanged will remain. If successful, then the wherewithal needs to be found to translate andimplement nationwide an intervention based on the HEALTHY model. If an intervention ofthis magnitude is not successful, then we need to address how to make even more fundamentalchanges to tackle the high levels of risk for serious diseases such as T2D.
AcknowledgmentsMembers of the writing group were Kathryn Hirst (Chair), Tom Baranowski, Lynn DeBar, Gary D Foster, FrancineKaufman, Phyllis Kennel, Barbara Linder, Margaret Schneider, Elizabeth M Venditti and Zenong Yin. We certify thatall applicable institutional and governmental regulations concerning the ethical use of human volunteers were followedduring this research.
References1. STOPP-T2D Prevention Study Group. Presence of diabetes risk factors in a large US eighth-grade
cohort. Diabetes Care 2006;29:212–217. [PubMed: 16443862]2. Fagot-Campagna A, Pettitt DJ, Engelgau MM, Burrows NR, Geiss LS, Valdez R, et al. Type 2 diabetes
among North American children and adolescents: an epidemiologic review and public healthperspective. J Pediatr 2000;136:664–672. [PubMed: 10802501]
3. Troiano RP, Flegal KM. Overweight children and adolescents: description, epidemiology, anddemographics. Pediatrics 1998;101:497–504. [PubMed: 12224656]
4. Hedley AA, Ogden CL, Johnson CL, Carroll MD, Curtin LR, Flegal KM. Prevalence of overweightand obesity among US children, adolescents, and adults, 1999-2002. JAMA 2004;291:2847–2850.[PubMed: 15199035]
5. Ogden CL, Carroll MD, Flegal KM. High body mass index for age among US children and adolescents,2003-2006. JAMA 2008;299:2401–2405. [PubMed: 18505949]
6. Harris KM, Gordon-Larsen P, Chantala K, Udry R. Longitudinal trends in race/ethnic disparities inleading health indicators from adolescence to young adulthood. Arch Pediatr Adolesc Med2006;160:74–81. [PubMed: 16389215]
Page 18
Int J Obes (Lond). Author manuscript; available in PMC 2009 November 25.
NIH
-PA Author Manuscript
NIH
-PA Author Manuscript
NIH
-PA Author Manuscript

7. Harlan WR. Epidemiology of childhood obesity: a national perspective. Ann N Y Acad Sci 1993;699:1–5. [PubMed: 8267299]
8. Mossberg H. 40-year follow-up of overweight children. Lancet 1989;2:491–493. [PubMed: 2570196]9. Must A, Jacques PF, Dallal GE, Bajema CJ, Dietz WH. Long-term morbidity and mortality of
overweight adolescents: a follow-up of the Harvard Growth Study of 1922-1935. N Engl J Med1992;327:1350–1355. [PubMed: 1406836]
10. Weigensberg MJ, Ball GD, Shaibi GQ, Cruz ML, Goran MI. Decreased B-cell function in overweightLatino children with impaired fasting glucose. Diabetes Care 2005;28:2519–2524. [PubMed:16186290]
11. Nathan DM, Davidson MB, DeFronzo RA, Heine RJ, Henry RR, Pratley R, et al. Impaired fastingglucose and impaired glucose tolerance. Diabetes Care 2007;30:253–259.
12. Diabetes Prevention Program Research Group. Reduction in the incidence of type 2 diabetes withlifestyle intervention or metformin. N Engl J Med 2002;346:393–403. [PubMed: 11832527]
13. Weiss R, Taksali SE, Tamborlane WV, Burgert TS, Savoye M, Caprio S. Predictors of changes inglucose tolerance status in obese youth. Diabetes Care 2005;28:902–909. [PubMed: 15793193]
14. Ford ES, Li C, Imperatore G, Cook S. Age, sex, and ethnic variations in serum insulin concentrationsamong US youth. Diabetes Care 2006;29:2605–2611. [PubMed: 17130192]
15. Goran MI, Gower BA. Longitudinal study on pubertal insulin resistance. Diabetes 2001;50:2444–2450. [PubMed: 11679420]
16. Duncan GE, Li SM, Zhou XH. Prevalence and trends of a metabolic syndrome phenotype among USadolescents, 1999-2000. Diabetes Care 2004;27:2438–2443. [PubMed: 15451913]
17. Viner RM, Segal TY, Lichtarowicz K, Hindmarsh P. Prevalence of insulin resistance syndrome inobesity. Arch Dis 2005;90:10–14.
18. Weiss MD, Dziura J, Burgert TS, Tamborlane WV, Taksali SE, Yeckel CW, et al. Obesity and themetabolic syndrome in children and adolescents. N Engl J Med 2004;350:2362–2374. [PubMed:15175438]
19. Story M. School-based approaches for preventing and treating obesity. Int J Obes 1999;23:S43–S51.20. American Academy of Pediatrics. Physical fitness and activity in schools. Pediatrics 2000;105:1156.
[PubMed: 10790480]21. National Center for Chronic Disease Prevention and Health Promotion. Guidelines for school and
community programs to promote lifelong physical activity among young people. J Sch Health1997;67:202–219. [PubMed: 9285866]
22. Katz DL, O’Connell M, Njike VY, Yeh M-C, Nawaz H. Strategies for the prevention and control ofobesity in the school setting: systematic review and meta-analysis. Int J Obes 2008;32:1780–1789.
23. Veugelers PJ, Fitzgerald AL. Effectiveness of school programs in preventing childhood obesity: amultilevel comparison. Amer J Public Health 2005;95:432–435. [PubMed: 15727972]
24. Stone EJ, McKenzie TL, Welk GJ, Booth ML. Effects of physical activity interventions in youth:review and synthesis. Am J Prev Med 1998;15:298–315. [PubMed: 9838974]
25. Sallis JF, McKenzie TL, Conway TL, Elder JP, Prochaska JJ, Brown M, et al. Environmentalinterventions for eating and physical activity: a randomized controlled trial in middle schools. Am JPrev Med 2003;24:209–217. [PubMed: 12657338]
26. Lytle LA, Murray DM, Perry CL, Story M, Birnbaum AS, Kubic MY, et al. School-based approachesto affect adolescents’ diets: results from the TEENS study. Health Educ Behav 2004;31:270–287.[PubMed: 15090126]
27. Richter KP, Harris KJ, Paine-Andrews A, Fawcett SB, Schmid TL, Lankenau BH, et al. Measuringthe health environment for physical activity and nutrition among youth: a review of the literature andapplications for community initiatives. Prev Med 2000;31:S98–S111.
28. Cullen KW, Baranowski T, Baranowski J, Hebert D, deMoor C, Hearn MD, et al. Influence of schoolorganizational characteristics on the outcomes of a school health promotion program. J Sch Health1999;69:376–380. [PubMed: 10633323]
29. Glanz K, Lankenau B, Foerster S, Temple S, Mullis R, Schmid T. Environmental and policyapproaches to cardiovascular disease prevention through nutrition: opportunities for state and localaction. Health Educ Q 1995;22:512–527. [PubMed: 8550374]
Page 19
Int J Obes (Lond). Author manuscript; available in PMC 2009 November 25.
NIH
-PA Author Manuscript
NIH
-PA Author Manuscript
NIH
-PA Author Manuscript

30. Paradis G, O’Loughlin J, Elliott M, Masson P, Renaud L, Sacks-Silver G, et al. Coeur en sante St-Henri, a heart health promotion programme in a low income, low education neighbourhood inMontreal, Canada: theoretical model and early field experience. J Epidemiol Community Health1995;49:503–512. [PubMed: 7499994]
31. Gottfredson DC, Wilson DB. Characteristics of effective school-based substance abuse prevention.Prev Sci 2003;4:27–38. [PubMed: 12611417]
32. Mellanby AR, Rees JB, Tripp JH. Peer-led and adult-led school health education: a critical reviewof available comparative research. Health Educ Res 2000;15:533–545. [PubMed: 11184213]
33. Story M, Lytle LA, Birnbaum AS, Perry CL. Peer-led, school-based nutrition education for youngadolescents: feasibility and process evaluation of the TEENS study. J Sch Health 2002;72:121–127.[PubMed: 11962228]
34. Goldberg L, MacKinnon D, Elliot DL, Moe EL, Clarke G, Cheong JW. The Adolescents Trainingand Learning to Avoid Steroids (ATLAS) program: preventing drug use and promoting healthbehaviors. Arch Pediatr Adolesc Med 2000;154:332–338. [PubMed: 10768668]
35. Elliot DL, Goldberg L, Moe EL, DeFrancesco CA, Durham MB, Hix-Small H. Preventing substanceuse and disordered eating: initial outcomes of the ATHENA (Athletes Targeting Healthy Exerciseand Nutrition Alternatives) Program. Arch Pediatr Adolesc Med 2004;158:1043–1051. [PubMed:15520341]
36. Backman DR, Haddad EH, Lee JW, Johnston PK, Hodgkin GE. Psychosocial predictors of healthfuldietary behavior in adoles-cents. J Nutr Educ Behav 2002;34:184–192. [PubMed: 12217261]
37. Kassem NO, Lee JW. Understanding soft drink consumption among male adolescents using the theoryof planned behavior. J Behav Med 2004;27:273–296. [PubMed: 15259456]
38. Grunbaum, JA.; Kann, L.; Kinchen, SA.; Williams, B.; Ross, JG.; Lowry, R., et al. Youth RiskBehavior Surveillance, United States, 2001. Jun 28. 2002 SurveillanceSummarieshttp://www.cdc.gov/mmwr/preview/mmwrhtml/ss5104a1.htm
39. Murray, DM. Design and Analysis of Group-Randomized Trials. Oxford University Press; New York:1998.
40. Donner, A.; Klar, N. Design and Analysis of Cluster Randomization Trials in Health Research. ArnoldPublishers; London: 2000.
41. Gillis B, Mobley C, Stadler DD, Hartstein J, Virus A, Volpe SL, et al. for the HEALTHY StudyGroup. Rationale, design and methods of the HEALTHY study nutrition intervention component.Int J Obes 2009;33(Suppl 4):S29–S36.
42. McMurray RG, Bassin S, Jago R, Bruecker S, Moe EL, Murray T, et al. for the HEALTHY StudyGroup. Rationale, design and methods of the HEALTHY study physical education interventioncomponent. Int J Obes 2009;33(Suppl 4):S37–S43.
43. Venditti EM, Elliot DL, Faith MS, Firrell LS, Giles CM, Goldberg L, et al. for the HEALTHY StudyGroup. Rationale, design and methods of the HEALTHY study behavior intervention component.Int J Obes 2009;33(Suppl 4):S44–S51.
44. DeBar LL, Schneider M, Ford EG, Hernandez AE, Showell B, Drews KL, et al. for the HEALTHYStudy Group. Social marketing-based communications to integrate and support the HEALTHY studyintervention. Int J Obes 2009;33(Suppl 4):S52–S59.
45. Drews KL, Harrell JS, Thompson D, Mazzuto SL, Ford EG, Carter M, et al. for the HEALTHY StudyGroup. Recruitment and retention strategies and methods in the HEALTHY study. Int J Obes 2009;33(Suppl 4):S21–S28.
46. Marcovina SM, Bowsher RR, Miller WG, Staten M, Myers G, Caudill SP, et al. on behalf of theInsulin Standardization Work Group. Standardization of insulin immunoassays: report of theAmerican Diabetes Association’s Workgroup. Clin Chem 2007;53:711–716. [PubMed: 17272483]
47. Warnick GR. Enzymatic methods for quantification of lipoprotein lipids. Methods Enzmol1986;129:101–123.
48. Friedewald WT, Levy RI, Fredrickson DS. Estimation of the concentration of low-density lipoproteincholesterol in plasma, without use of the preparative ultracentrifuge. Clin Chem 1972;18:499–502.[PubMed: 4337382]
Page 20
Int J Obes (Lond). Author manuscript; available in PMC 2009 November 25.
NIH
-PA Author Manuscript
NIH
-PA Author Manuscript
NIH
-PA Author Manuscript
49. Warnick GR, Knopp RH, Fitzpatrick V, Branson L. Estimating low-density lipoprotein cholesterolby the Friedewald equation is adequate for classifying patients on the basis of nationallyrecommended cutpoints. Clin Chem 1990;36:15–19. [PubMed: 2297909]
50. Hainline, A., Jr; Karon, J.; Lippel, K., editors. Manual of Laboratory Operations: Lipid ResearchClinics Program, Lipid and Lipoprotein Analysis. Vol. 2nd edn. US Department of Health and HumanServices, Public Health Service, National Institutes of Health; Bethesda, MD: 1983.
51. Petersen AC, Crockett L, Richards M, Boxer A. A self-report measure of pubertal status: reliability,validity, and initial norms. J Youth Adolesc 1988;17:117–133.
52. Petersen AC, Tobin-Richards M, Boxer A. Puberty: its measurement and its meaning. J Early Adolesc1983;3:7–62.
53. Robertson EB, Skinner ML, Love MM, Elder GH, Conger RD, Dubas JS, et al. The pubertaldevelopment scale: a rural and suburban comparison. J Early Adolesc 1992;12:174–186.
54. Sallis JF, Condon SA, Goggin KJ, Roby JJ, Kolody B, Alcaraz JE. The development of self-administered physical activity survey for 4th grade students. Res Quart Exerc Sport 1993;64:24–31.
55. Sallis JF, Strikmiller PK, Harsha DW, Feldman HA, Ehlinger S, Strone EJ, et al. Validation ofinterviewer- and self-administered physical activity checklist for fifth grade students. Med Sci SportsExerc 1996;28:840–851. [PubMed: 8832538]
56. Block G, Hartman AM, Dresser CM, Carroll MD, Gannon J, Gardner L. A data-based approach todiet questionnaire design and testing. Am J Epidemiol 1986;124:453–469. [PubMed: 3740045]
57. Block G, Thompson FE, Hartman AM, Larkin FA, Guire KE. Comparison of two dietaryquestionnaires validated against multiple dietary records collected during a 1-year period. J Am DietAssoc 1992;92:686–693. [PubMed: 1607564]
58. Block G, Coyle LM, Hartman AM, Scoppa SM. Revision of dietary analysis software for the healthhabits and history questionnaire. Am J Epidemiol 1994;139:1190–1196. [PubMed: 8209877]
59. Glick, HA.; Doshi, JA.; Sonnad, SF.; Polsky, D. Economic Evaluation in Clinical Trials. OxfordUniversity Press; Oxford: 2007. Assessing quality-adjusted life years; p. 59-87.
60. Torrance GW, Feeny DH, Furlong WJ, Barr RD, Zhang Y, Wang Q. Multi-attribute preferencefunctions for a comprehensive health status classification system: Health Utilities Index Mark 2. MedCare 1996;34:702–722. [PubMed: 8676608]
61. Feeny D, Furlong W, Torrance GW, Goldsmith CH, Zhu Z, Depauw S, et al. Multiattribute and single-attribute utility functions for the Health Utilities Index Mark 3 System. Med Care 2002;40:113–128.[PubMed: 11802084]
62. Guerra S, Rivero JC, Costa R, Duarte J, Mota J. Relationship between cardiorespiratory fitness, bodycomposition and blood pressure in school children. J Sports Med Phys Fitness 2002;42:207–213.[PubMed: 12032417]
63. Leger L, Lambert J. A maximal 20 meters shuttle run test to predict VO2max. Eur J Appl Physiol1982;49:1–12.
64. Leger L, Mercier D, Gadoury C, Lambert J. The multistage 20 meter shuttle run test for aerobic fitness.J Sports Sci 1988;6:93–101. [PubMed: 3184250]
65. Wechsler H, McKenna ML, Lee SM, Dietz WH. The role of schools in preventing childhood obesity.The State Education Standard 2004;5:4–12.
66. Centers for Disease Control and Prevention. School Health Index: A Self-Assessment and PlanningGuide, Middle School/High School Version. CDC; Atlanta, GA: 2005.
67. Schneider M, Hall WJ, Hernandez AE, Hindes K, Montez G, Pham T, et al. for the HEALTHY StudyGroup. Rationale, design, and methods for process evaluation in the HEALTHY study. Int J Obes2009;33(Suppl 4):S60–S67.
68. Gail MH, Mark SD, Carroll RJ, Green SB, Pee D. On design considerations and randomization-basedinference for community intervention trials. Stat Med 1996;15:1069–1092. [PubMed: 8804140]
69. Diggle, P.; Heagerty, P.; Liang, KY.; Zeger, SL. Analysis of Longitudinal Data. Oxford UniversityPress; Oxford: 2002.
70. Molenberghs, G.; Verbeke, G. Models For Discrete Longitudinal Data. Springer; New York: 2005.71. STOPP-T2D Prevention Study Group. Prevalence of the metabolic syndrome among a racially/
ethnically diverse group of US eighth-grade adolescents and associations with fasting insulin and
Page 21
Int J Obes (Lond). Author manuscript; available in PMC 2009 November 25.
NIH
-PA Author Manuscript
NIH
-PA Author Manuscript
NIH
-PA Author Manuscript
homeostasis model assessment of insulin resistance levels. Diabetes Care 2008;31:2020–2025.[PubMed: 18591405]
72. Jago R, Harrell JS, McMurray RG, Edelstein S, El ghormli L, Bassin S. Prevalence of abnormal lipidand blood pressure values among an ethnically diverse population of eighth-grade adolescents andscreening implications. Pediatrics 2006;117:2065–2073. [PubMed: 16740849]
73. Cullen KW, Hartstein J, Reynolds KD, Vu M, Resnicow K, Greene N, et al. Improving the schoolfood environment: results from a pilot study in middle schools. J Am Diet Assoc 2007;107:484–489.[PubMed: 17324667]
74. Hartstein J, Cullen KW, Reynolds KD, Harrell J, Resnicow K, Kennel P. The impact of portion sizecontrol for school a la carte items: changes in kilocalories and macronutrients purchased by middleschool students. J Am Diet Assoc 2008;108:140–144. [PubMed: 18156001]
75. Pinhas-Hamiel O, Dolan LM, Daniels SR, Standiford D, Khoury PR, Zeitler P. Increased incidenceof non-insulin-dependent diabetes mellitus among adolescents. J Pediatr 1996;128:608–615.[PubMed: 8627431]
76. Scott CR, Smith JM, Cradock MM, Pihoker C. Characteristics of youth-onset noninsulin-dependentdiabetes mellitus and insulin-dependent diabetes mellitus at diagnosis. Pediatrics 1997;100:84–91.[PubMed: 9200365]
Page 22
Int J Obes (Lond). Author manuscript; available in PMC 2009 November 25.
NIH
-PA Author Manuscript
NIH
-PA Author Manuscript
NIH
-PA Author Manuscript
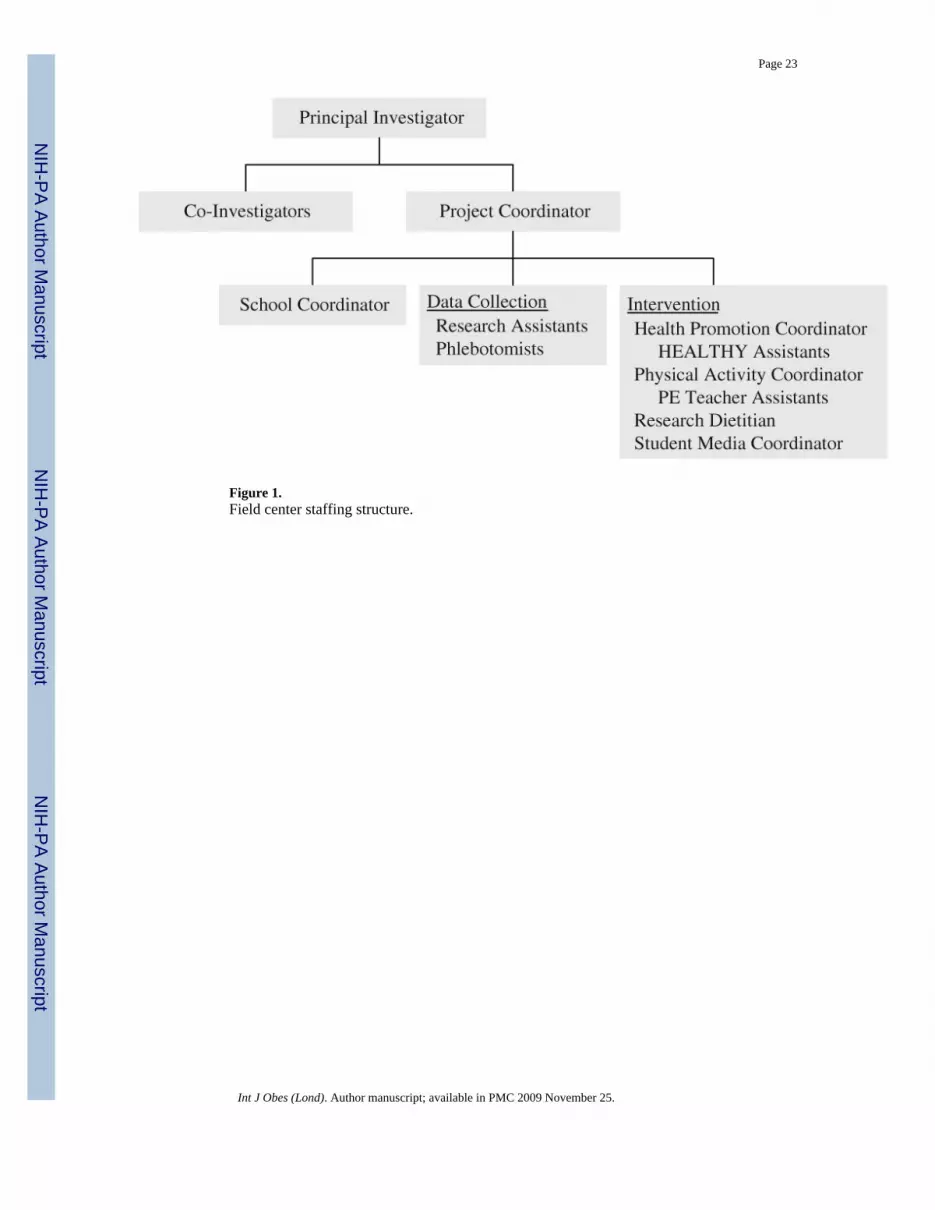
Figure 1.Field center staffing structure.
Page 23
Int J Obes (Lond). Author manuscript; available in PMC 2009 November 25.
NIH
-PA Author Manuscript
NIH
-PA Author Manuscript
NIH
-PA Author Manuscript
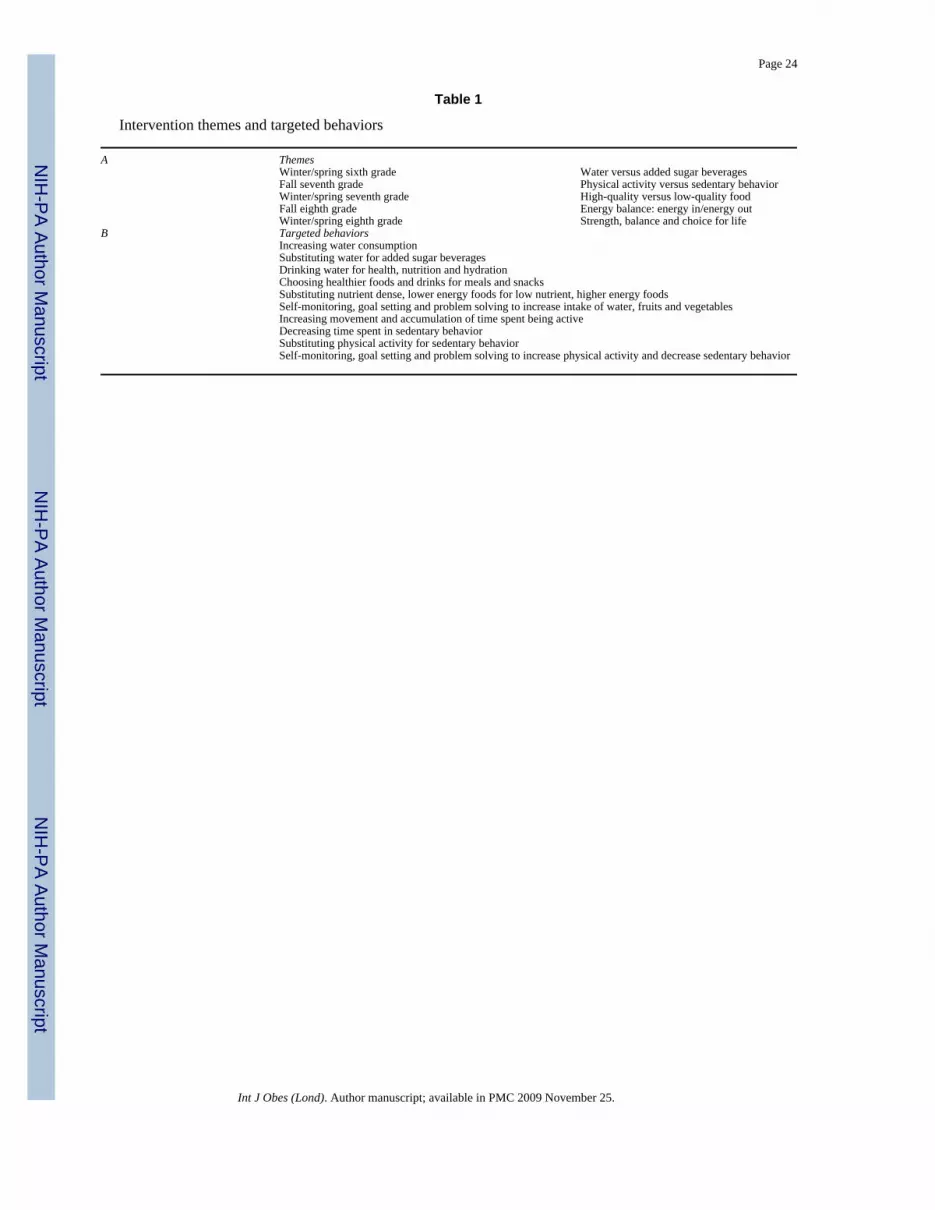
NIH
-PA Author Manuscript
NIH
-PA Author Manuscript
NIH
-PA Author Manuscript
Page 24
Table 1
Intervention themes and targeted behaviors
A ThemesWinter/spring sixth grade Water versus added sugar beveragesFall seventh grade Physical activity versus sedentary behaviorWinter/spring seventh grade High-quality versus low-quality foodFall eighth grade Energy balance: energy in/energy outWinter/spring eighth grade Strength, balance and choice for life
B Targeted behaviorsIncreasing water consumptionSubstituting water for added sugar beveragesDrinking water for health, nutrition and hydrationChoosing healthier foods and drinks for meals and snacksSubstituting nutrient dense, lower energy foods for low nutrient, higher energy foodsSelf-monitoring, goal setting and problem solving to increase intake of water, fruits and vegetablesIncreasing movement and accumulation of time spent being activeDecreasing time spent in sedentary behaviorSubstituting physical activity for sedentary behaviorSelf-monitoring, goal setting and problem solving to increase physical activity and decrease sedentary behavior
Int J Obes (Lond). Author manuscript; available in PMC 2009 November 25.
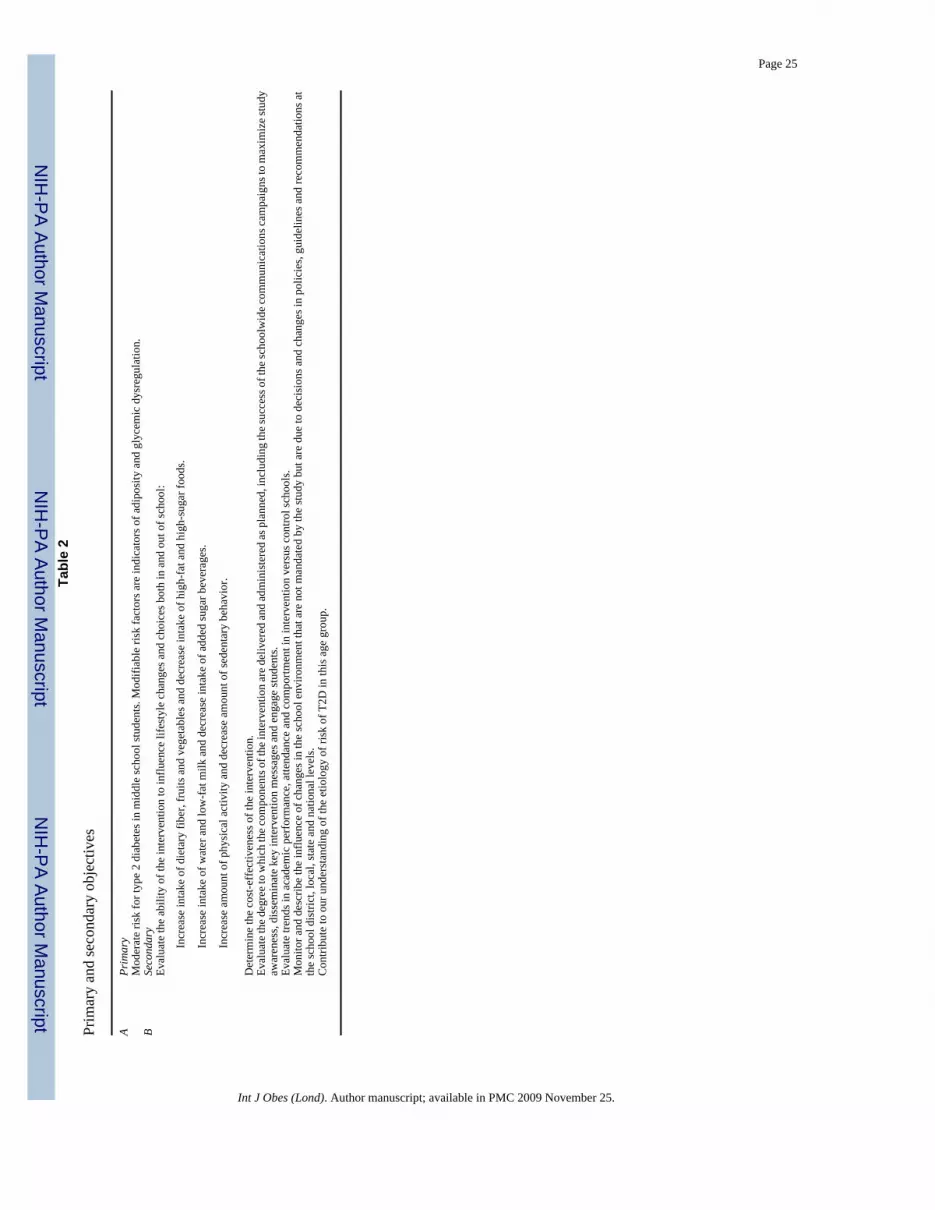
NIH
-PA Author Manuscript
NIH
-PA Author Manuscript
NIH
-PA Author Manuscript
Page 25Ta
ble
2
Prim
ary
and
seco
ndar
y ob
ject
ives
APr
imar
yM
oder
ate
risk
for t
ype
2 di
abet
es in
mid
dle
scho
ol st
uden
ts. M
odifi
able
risk
fact
ors a
re in
dica
tors
of a
dipo
sity
and
gly
cem
ic d
ysre
gula
tion.
BSe
cond
ary
Eval
uate
the
abili
ty o
f the
inte
rven
tion
to in
fluen
ce li
fest
yle
chan
ges a
nd c
hoic
es b
oth
in a
nd o
ut o
f sch
ool:
Incr
ease
inta
ke o
f die
tary
fibe
r, fr
uits
and
veg
etab
les a
nd d
ecre
ase
inta
ke o
f hig
h-fa
t and
hig
h-su
gar f
oods
.
Incr
ease
inta
ke o
f wat
er a
nd lo
w-f
at m
ilk a
nd d
ecre
ase
inta
ke o
f add
ed su
gar b
ever
ages
.
Incr
ease
am
ount
of p
hysi
cal a
ctiv
ity a
nd d
ecre
ase
amou
nt o
f sed
enta
ry b
ehav
ior.
Det
erm
ine
the
cost
-eff
ectiv
enes
s of t
he in
terv
entio
n.Ev
alua
te th
e deg
ree t
o w
hich
the c
ompo
nent
s of t
he in
terv
entio
n ar
e del
iver
ed an
d ad
min
iste
red
as p
lann
ed, i
nclu
ding
the s
ucce
ss o
f the
scho
olw
ide c
omm
unic
atio
ns ca
mpa
igns
to m
axim
ize s
tudy
awar
enes
s, di
ssem
inat
e ke
y in
terv
entio
n m
essa
ges a
nd e
ngag
e st
uden
ts.
Eval
uate
tren
ds in
aca
dem
ic p
erfo
rman
ce, a
ttend
ance
and
com
portm
ent i
n in
terv
entio
n ve
rsus
con
trol s
choo
ls.
Mon
itor a
nd d
escr
ibe
the
influ
ence
of c
hang
es in
the
scho
ol e
nviro
nmen
t tha
t are
not
man
date
d by
the
stud
y bu
t are
due
to d
ecis
ions
and
cha
nges
in p
olic
ies,
guid
elin
es a
nd re
com
men
datio
ns a
tth
e sc
hool
dis
trict
, loc
al, s
tate
and
nat
iona
l lev
els.
Con
tribu
te to
our
und
erst
andi
ng o
f the
etio
logy
of r
isk
of T
2D in
this
age
gro
up.
Int J Obes (Lond). Author manuscript; available in PMC 2009 November 25.
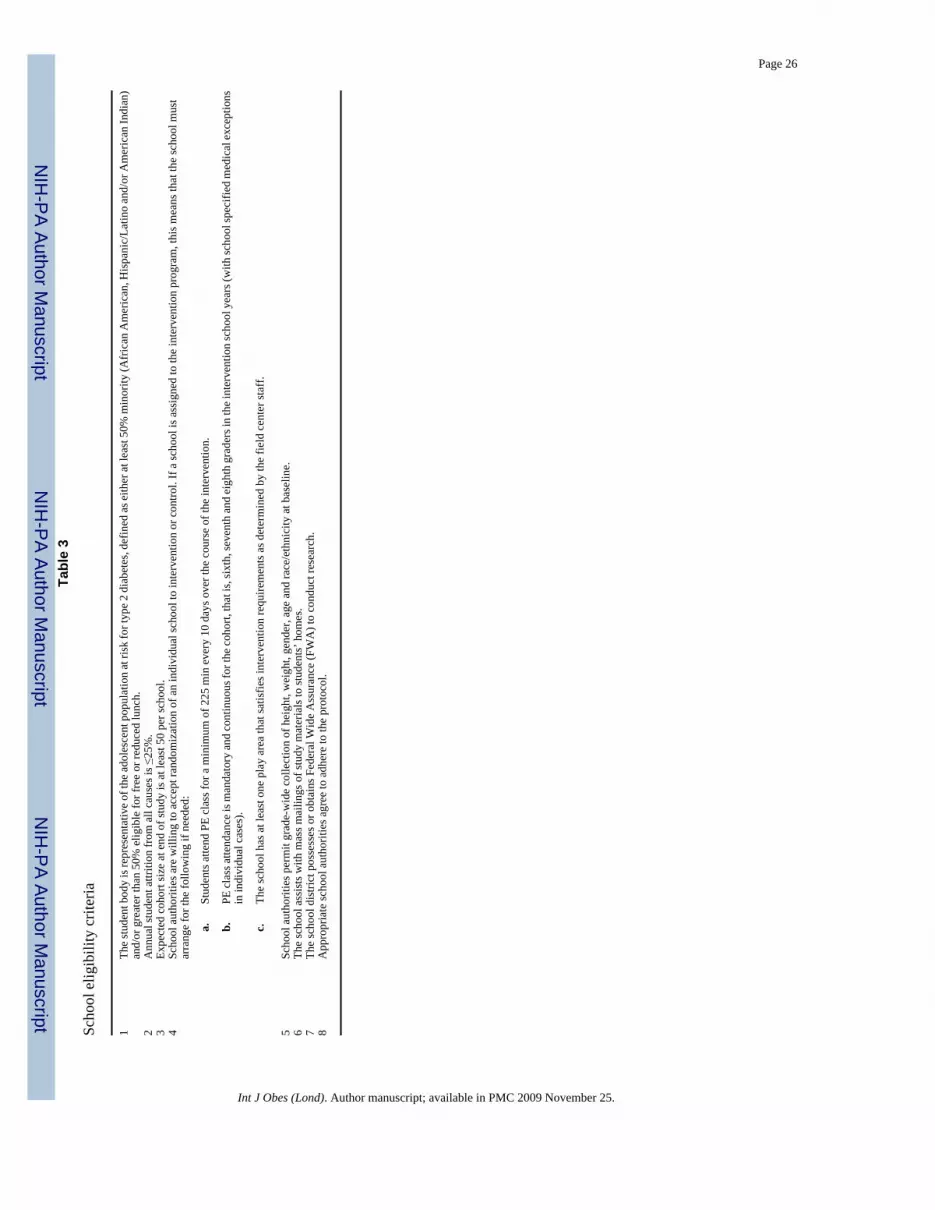
NIH
-PA Author Manuscript
NIH
-PA Author Manuscript
NIH
-PA Author Manuscript
Page 26Ta
ble
3
Scho
ol e
ligib
ility
crit
eria
1Th
e st
uden
t bod
y is
repr
esen
tativ
e of
the
adol
esce
nt p
opul
atio
n at
risk
for t
ype
2 di
abet
es, d
efin
ed a
s eith
er a
t lea
st 5
0% m
inor
ity (A
fric
an A
mer
ican
, His
pani
c/La
tino
and/
or A
mer
ican
Indi
an)
and/
or g
reat
er th
an 5
0% e
ligib
le fo
r fre
e or
redu
ced
lunc
h.2
Ann
ual s
tude
nt a
ttriti
on fr
om a
ll ca
uses
is ≤
25%
.3
Expe
cted
coh
ort s
ize
at e
nd o
f stu
dy is
at l
east
50
per s
choo
l.4
Scho
ol a
utho
ritie
s are
will
ing
to a
ccep
t ran
dom
izat
ion
of a
n in
divi
dual
scho
ol to
inte
rven
tion
or c
ontro
l. If
a sc
hool
is a
ssig
ned
to th
e in
terv
entio
n pr
ogra
m, t
his m
eans
that
the
scho
ol m
ust
arra
nge
for t
he fo
llow
ing
if ne
eded
:
a.St
uden
ts a
ttend
PE
clas
s for
a m
inim
um o
f 225
min
eve
ry 1
0 da
ys o
ver t
he c
ours
e of
the
inte
rven
tion.
b.PE
cla
ss a
ttend
ance
is m
anda
tory
and
con
tinuo
us fo
r the
coh
ort,
that
is, s
ixth
, sev
enth
and
eig
hth
grad
ers i
n th
e in
terv
entio
n sc
hool
yea
rs (w
ith sc
hool
spec
ified
med
ical
exc
eptio
nsin
indi
vidu
al c
ases
).
c.Th
e sc
hool
has
at l
east
one
pla
y ar
ea th
at sa
tisfie
s int
erve
ntio
n re
quire
men
ts a
s det
erm
ined
by
the
field
cen
ter s
taff
.
5Sc
hool
aut
horit
ies p
erm
it gr
ade-
wid
e co
llect
ion
of h
eigh
t, w
eigh
t, ge
nder
, age
and
race
/eth
nici
ty a
t bas
elin
e.6
The
scho
ol a
ssis
ts w
ith m
ass m
ailin
gs o
f stu
dy m
ater
ials
to st
uden
ts’ h
omes
.7
The
scho
ol d
istri
ct p
osse
sses
or o
btai
ns F
eder
al W
ide
Ass
uran
ce (F
WA
) to
cond
uct r
esea
rch.
8A
ppro
pria
te sc
hool
aut
horit
ies a
gree
to a
dher
e to
the
prot
ocol
.
Int J Obes (Lond). Author manuscript; available in PMC 2009 November 25.
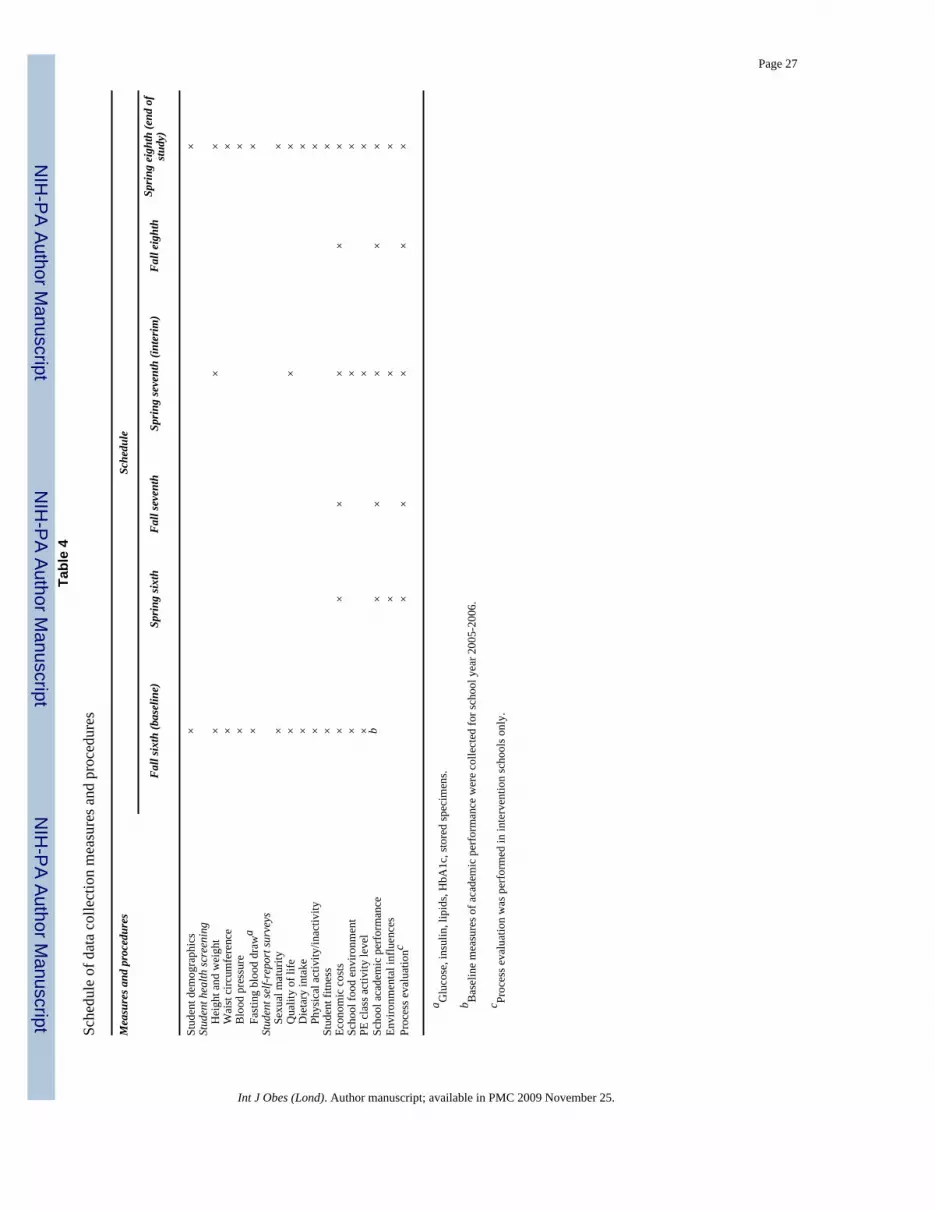
NIH
-PA Author Manuscript
NIH
-PA Author Manuscript
NIH
-PA Author Manuscript
Page 27Ta
ble
4
Sche
dule
of d
ata
colle
ctio
n m
easu
res a
nd p
roce
dure
s
Mea
sure
s and
pro
cedu
res
Sche
dule
Fall
sixth
(bas
elin
e)Sp
ring
sixth
Fall
seve
nth
Sprin
g se
vent
h (in
terim
)Fa
ll ei
ghth
Sprin
g ei
ghth
(end
of
study
)
Stud
ent d
emog
raph
ics
××
Stud
ent h
ealth
scre
enin
g
Hei
ght a
nd w
eigh
t×
××
W
aist
circ
umfe
renc
e×
×
Blo
od p
ress
ure
××
Fa
stin
g bl
ood
draw
a×
×St
uden
t sel
f-rep
ort s
urve
ys
Sexu
al m
atur
ity×
×
Qua
lity
of li
fe×
××
D
ieta
ry in
take
××
Ph
ysic
al a
ctiv
ity/in
activ
ity×
×St
uden
t fitn
ess
××
Econ
omic
cos
ts×
××
××
×Sc
hool
food
env
ironm
ent
××
×PE
cla
ss a
ctiv
ity le
vel
××
×Sc
hool
aca
dem
ic p
erfo
rman
ceb
××
××
×En
viro
nmen
tal i
nflu
ence
s×
××
Proc
ess e
valu
atio
nc×
××
××
a Glu
cose
, ins
ulin
, lip
ids,
HbA
1c, s
tore
d sp
ecim
ens.
b Bas
elin
e m
easu
res o
f aca
dem
ic p
erfo
rman
ce w
ere
colle
cted
for s
choo
l yea
r 200
5-20
06.
c Proc
ess e
valu
atio
n w
as p
erfo
rmed
in in
terv
entio
n sc
hool
s onl
y.
Int J Obes (Lond). Author manuscript; available in PMC 2009 November 25.
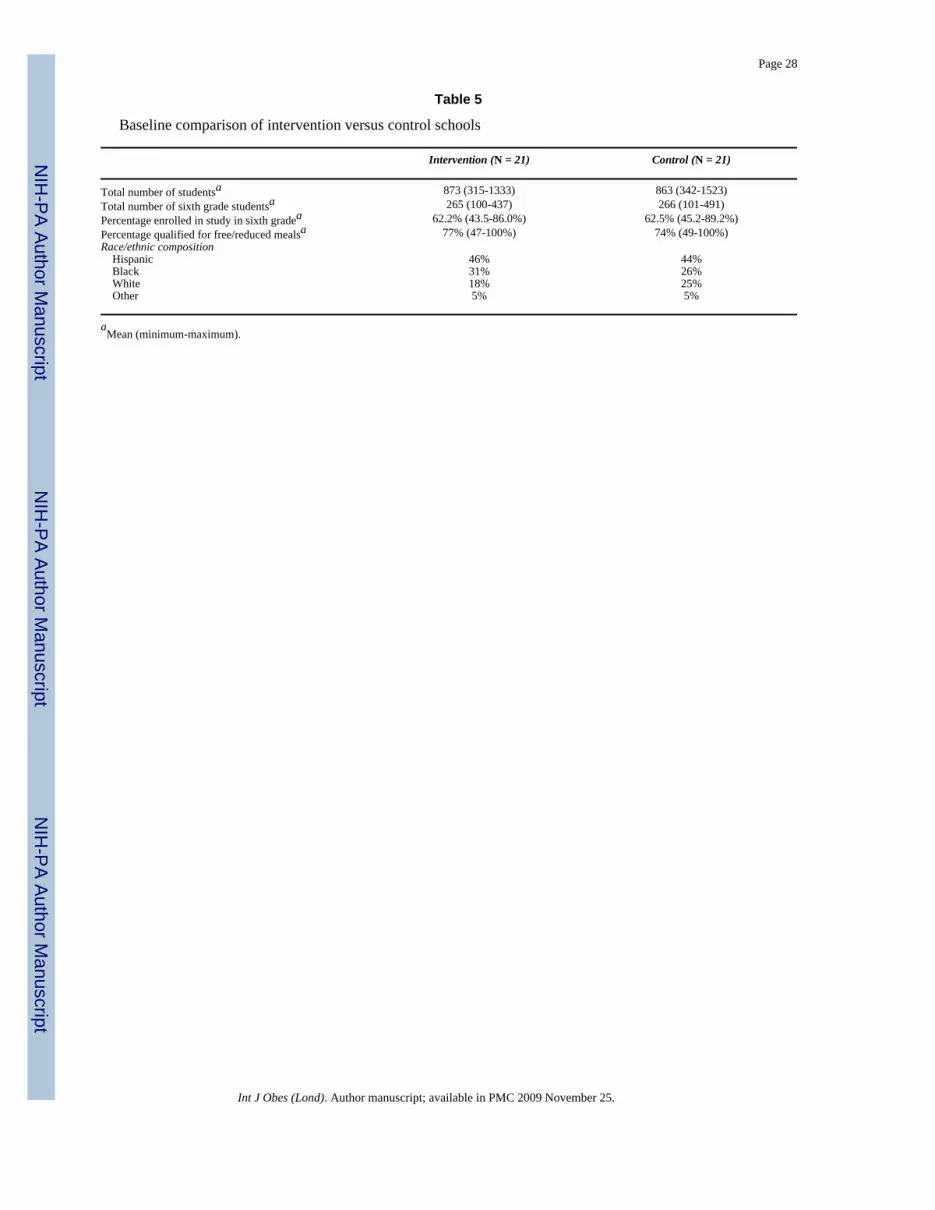
NIH
-PA Author Manuscript
NIH
-PA Author Manuscript
NIH
-PA Author Manuscript
Page 28
Table 5
Baseline comparison of intervention versus control schools
Intervention (N = 21) Control (N = 21)
Total number of studentsa 873 (315-1333) 863 (342-1523)Total number of sixth grade studentsa 265 (100-437) 266 (101-491)Percentage enrolled in study in sixth gradea 62.2% (43.5-86.0%) 62.5% (45.2-89.2%)Percentage qualified for free/reduced mealsa 77% (47-100%) 74% (49-100%)Race/ethnic composition Hispanic 46% 44% Black 31% 26% White 18% 25% Other 5% 5%
aMean (minimum-maximum).
Int J Obes (Lond). Author manuscript; available in PMC 2009 November 25.
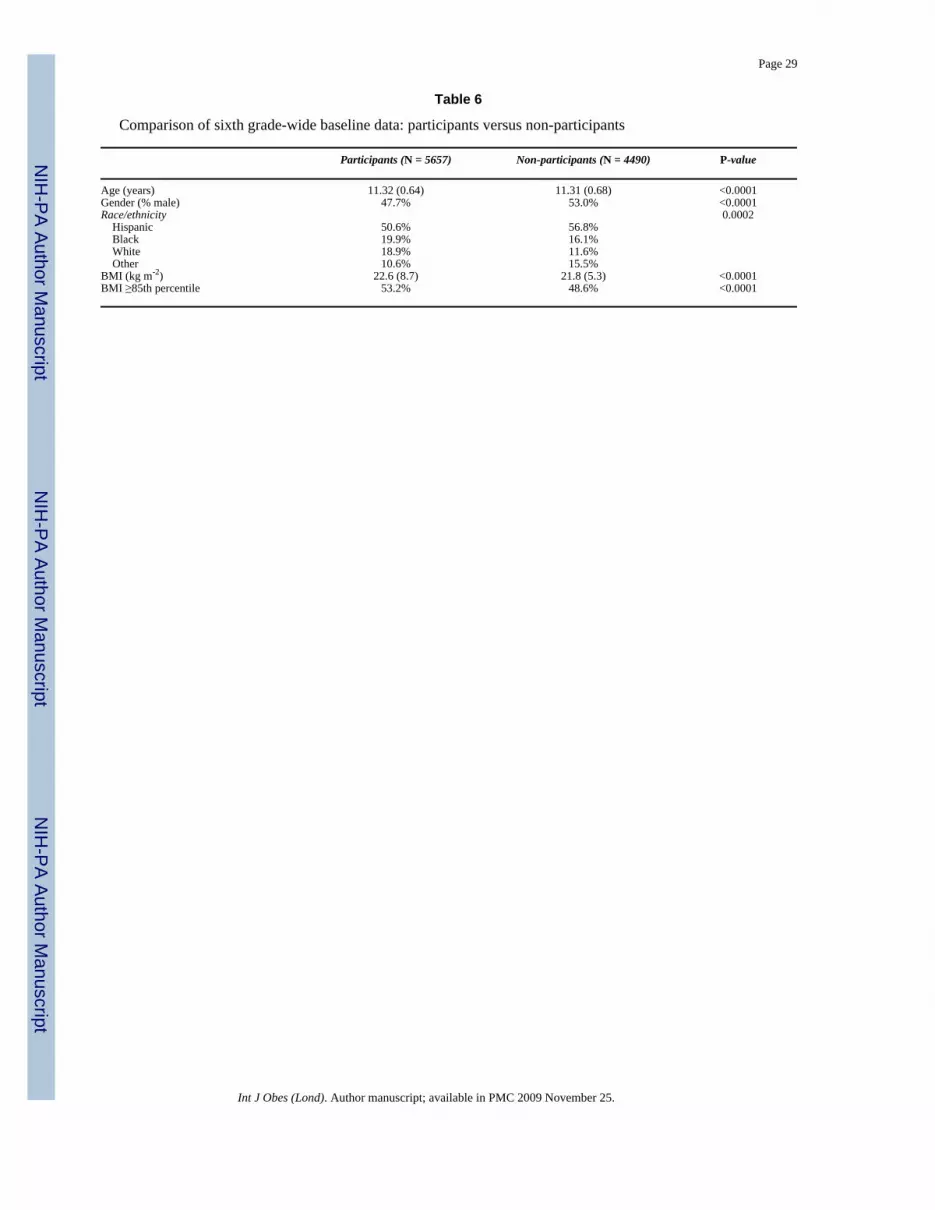
NIH
-PA Author Manuscript
NIH
-PA Author Manuscript
NIH
-PA Author Manuscript
Page 29
Table 6
Comparison of sixth grade-wide baseline data: participants versus non-participants
Participants (N = 5657) Non-participants (N = 4490) P-value
Age (years) 11.32 (0.64) 11.31 (0.68) <0.0001Gender (% male) 47.7% 53.0% <0.0001Race/ethnicity 0.0002 Hispanic 50.6% 56.8% Black 19.9% 16.1% White 18.9% 11.6% Other 10.6% 15.5%BMI (kg m-2) 22.6 (8.7) 21.8 (5.3) <0.0001BMI ≥85th percentile 53.2% 48.6% <0.0001
Int J Obes (Lond). Author manuscript; available in PMC 2009 November 25.
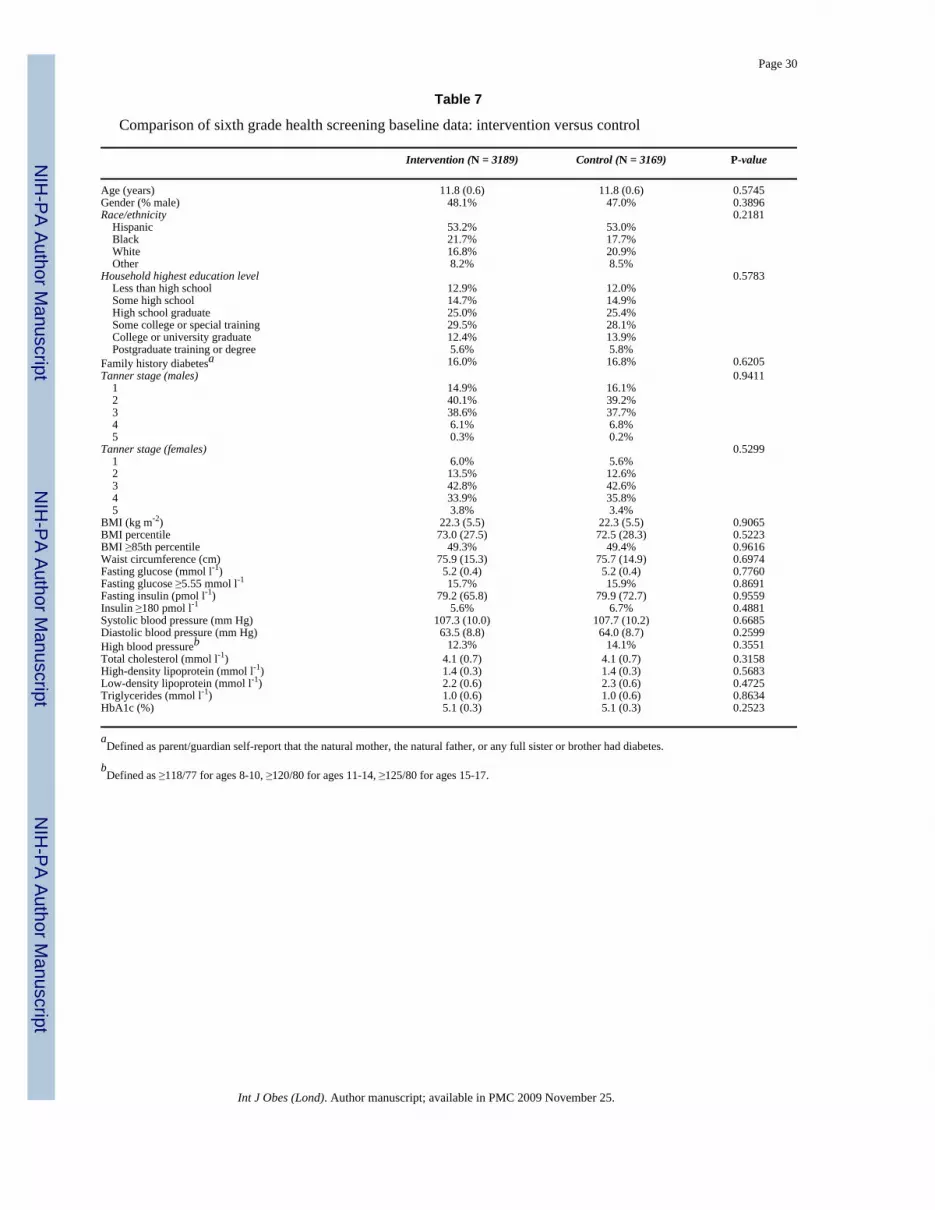
NIH
-PA Author Manuscript
NIH
-PA Author Manuscript
NIH
-PA Author Manuscript
Page 30
Table 7
Comparison of sixth grade health screening baseline data: intervention versus control
Intervention (N = 3189) Control (N = 3169) P-value
Age (years) 11.8 (0.6) 11.8 (0.6) 0.5745Gender (% male) 48.1% 47.0% 0.3896Race/ethnicity 0.2181 Hispanic 53.2% 53.0% Black 21.7% 17.7% White 16.8% 20.9% Other 8.2% 8.5%Household highest education level 0.5783 Less than high school 12.9% 12.0% Some high school 14.7% 14.9% High school graduate 25.0% 25.4% Some college or special training 29.5% 28.1% College or university graduate 12.4% 13.9% Postgraduate training or degree 5.6% 5.8%Family history diabetesa 16.0% 16.8% 0.6205Tanner stage (males) 0.9411 1 14.9% 16.1% 2 40.1% 39.2% 3 38.6% 37.7% 4 6.1% 6.8% 5 0.3% 0.2%Tanner stage (females) 0.5299 1 6.0% 5.6% 2 13.5% 12.6% 3 42.8% 42.6% 4 33.9% 35.8% 5 3.8% 3.4%BMI (kg m-2) 22.3 (5.5) 22.3 (5.5) 0.9065BMI percentile 73.0 (27.5) 72.5 (28.3) 0.5223BMI ≥85th percentile 49.3% 49.4% 0.9616Waist circumference (cm) 75.9 (15.3) 75.7 (14.9) 0.6974Fasting glucose (mmol l-1) 5.2 (0.4) 5.2 (0.4) 0.7760Fasting glucose ≥5.55 mmol l-1 15.7% 15.9% 0.8691Fasting insulin (pmol l-1) 79.2 (65.8) 79.9 (72.7) 0.9559Insulin ≥180 pmol l-1 5.6% 6.7% 0.4881Systolic blood pressure (mm Hg) 107.3 (10.0) 107.7 (10.2) 0.6685Diastolic blood pressure (mm Hg) 63.5 (8.8) 64.0 (8.7) 0.2599High blood pressureb 12.3% 14.1% 0.3551Total cholesterol (mmol l-1) 4.1 (0.7) 4.1 (0.7) 0.3158High-density lipoprotein (mmol l-1) 1.4 (0.3) 1.4 (0.3) 0.5683Low-density lipoprotein (mmol l-1) 2.2 (0.6) 2.3 (0.6) 0.4725Triglycerides (mmol l-1) 1.0 (0.6) 1.0 (0.6) 0.8634HbA1c (%) 5.1 (0.3) 5.1 (0.3) 0.2523
aDefined as parent/guardian self-report that the natural mother, the natural father, or any full sister or brother had diabetes.
bDefined as ≥118/77 for ages 8-10, ≥120/80 for ages 11-14, ≥125/80 for ages 15-17.
Int J Obes (Lond). Author manuscript; available in PMC 2009 November 25.


