Embed Size (px)
Citation preview
Hadriaca Patera: Insights into its volcanic history from Mars Express
High Resolution Stereo Camera
David A. Williams,1 Ronald Greeley,1 Wilhelm Zuschneid,2 Stephanie C. Werner,2,3
Gerhard Neukum,2 David A. Crown,4 Tracy K. P. Gregg,5 Klaus Gwinner,6
and Jouko Raitala7
Received 6 April 2007; revised 1 June 2007; accepted 30 July 2007; published 12 October 2007.
[1] High Resolution Stereo Camera (HRSC) images of Hadriaca Patera, Mars, incombination with Mars Orbiter Camera (MOC), Mars Orbiter Laser Altimeter (MOLA),and Thermal Infrared Imaging System (THEMIS) data sets, reveal morphologic detailsabout this volcano and enable determination of a chronology of the major geologicevents through new cratering age assessments. New topographic measurements of theHadriaca edifice were also made from a HRSC-based high-resolution (125 m) digitalterrain model (DTM) and compared to the MOLA DTM. We find evidence for a complexformation and erosional history at Hadriaca Patera, in which volcanic, fluvial, and aeolianprocesses were all involved. Crater counts and associated model ages suggest thatHadriaca Patera formed from early shield-building volcanic (likely explosive pyroclastic)eruptions at �3.7–3.9 Ga, with caldera formation no later than �3.5 Ga. A varietyof geologic activity occurred in the caldera and on the northern flank and plains at�3.3–3.5 Ga, likely including pyroclastic flows (that partially filled a large crater NW ofthe caldera, and plains to the NE) and differential erosion/deposition by aeolian and/orfluvial activity. There were some resurfacing event(s) in the caldera and on the easternflank at �2.4–2.6 Ga, in which the eastern flank’s morphology is indicative of fluvialerosion. The most recent dateable geologic activity on Hadriaca Patera includes calderaresurfacing by some process (most likely differential aeolian erosion/deposition) in theAmazonian Period, as recent as �1.5 Ga. This is coincident with the resurfacing of theheavily channeled south flank by fluvial erosion. Unlike the Tharsis shields, majorgeologic activity ended at Hadriaca Patera over a billion years ago.
Citation: Williams, D. A., R. Greeley, W. Zuschneid, S. C. Werner, G. Neukum, D. A. Crown, T. K. P. Gregg, K. Gwinner,
and J. Raitala (2007), Hadriaca Patera: Insights into its volcanic history from Mars Express High Resolution Stereo Camera,
J. Geophys. Res., 112, E10004, doi:10.1029/2007JE002924.
1. Introduction
[2] ‘‘Highland paterae’’ [Peterson, 1978; Schultz, 1984],surrounding the Hellas basin, are among the oldest centralvent volcanoes on Mars [Scott and Carr, 1978]. They haveshallow, central calderas on low-relief, deeply dissectedshields exhibiting radial channels and ridges [Plescia andSaunders, 1979; Greeley and Spudis, 1981], and are there-fore morphologically distinct from the Tharsis and Elysiumshields. The main edifices of Hadriaca and Tyrrhena Paterae
in particular display a lack of primary lava flow featureswhich, along with the nature of their eroded flanks, sug-gested that they are composed mostly of friable deposits,and that they are probably shields formed by gravity-drivenpyroclastic flows [Greeley and Spudis, 1981; Crown andGreeley, 1993]. This hypothesis is supported by results frommodeling of pyroclastic flow emplacement [Crown andGreeley, 1993; Greeley and Crown, 1990; Gregg andCrown, 2004; Gregg and Farley, 2006] and by geologicmapping [Gregg et al., 1998; Crown and Greeley, 2007].[3] New images of Hadriaca Patera from the High Res-
olution Stereo Camera (HRSC) on the European SpaceAgency’s Mars Express (MEx) orbiter [Neukum et al.,2004a] cover the whole volcano at relatively high resolu-tions (25–50 m/pixel). These images, when used in com-bination with narrow-angle images (�2–12 m/pixel) fromthe Mars Global Surveyor (MGS) Mars Orbiter Camera(MOC) and images (VIS: 18, 36 m/pixel; IR: �100 m/pixel)from the Mars Odyssey (MO) Thermal Infrared ImagingSystem (THEMIS) [Christensen et al., 2004], provide newdata sets to reassess previous Viking Orbiter–based geo-
JOURNAL OF GEOPHYSICAL RESEARCH, VOL. 112, E10004, doi:10.1029/2007JE002924, 2007
1School of Earth and Space Exploration, Arizona State University,Tempe, Arizona, USA.
2Institute of Geological Sciences, Freie Universitat, Berlin, Germany.3Now at Geological Survey of Norway (NGU), Trondheim, Norway.4Planetary Science Institute, Tucson, Arizona, USA.5Department of Geology, University at Buffalo, Buffalo, New York,
USA.6German Aerospace Center (DLR), Berlin, Germany.7Planetology Group, University of Oulu, Oulu, Finland.
Copyright 2007 by the American Geophysical Union.0148-0227/07/2007JE002924
E10004 1 of 18

logic mapping. Furthermore, the HRSC stereo imagesenable digital terrain models (DTMs) to be derived at aspatial resolution of up to 125 m/pixel, which can becompared with MGS Mars Orbiter Laser Altimeter (MOLA)data to assess regional slopes around the volcano. Inaddition, the HRSC images, which cover large areas atconsistent resolution, are ideal for age assessments usingimpact crater statistics [e.g., Hartmann and Neukum, 2001].In this paper we discuss insights into aspects of the volcanicand erosional history of Hadriaca Patera, including newinformation about the volcanic map units, new cratering
model ages for the map units, and the use of stereo image–based topographic data to constrain models of pyroclasticflow emplacement. This work is not intended to be anexhaustive treatment of all the processes that have shapedHadriaca Patera, but rather focuses on evaluation of previ-ous geologic mapping of Crown and Greeley [2007] andassignment of crater count model ages to map units usingthe new data sets.
2. HRSC Imaging
[4] The HRSC imaged Hadriaca Patera on MEx orbits528 (19 June 2004) and 550 (25 June 2004). Orbit 528coverage included nadir imaging at �44 m/pixel (reproc-essed to 25 m/px) (Figure 1a), with corresponding stereoimaging at �88 m/pixel and 4-color (red, green, blue,infrared) imaging at �176 m/pixel. Orbit 550 includednadir and stereo imaging at 50 m/pixel. Super ResolutionChannel (SRC) mosaics were also obtained on each orbit,imaging parts of the caldera rim region at �10 m/pixel. Forboth orbits, 200m spatial resolution DTMs and correspondingorthorectified images were generated as preliminary prod-ucts, which enable the production of color perspectiveviews. A 125 m, high spatial resolution DTM (with mean3D point accuracy of �24 m) was also generated using thenadir and stereo-2 channels from orbit 550 data to calculateregional slope values for comparison to MOLA data.
3. Comparison of New Data Sets to PreviousMapping
[5] We studied all the HRSC data covering HadriacaPatera, with a focus on the 25 m/pixel nadir image fromorbit 528 (Figure 1a), along with available MOC andTHEMIS visible and infrared images and HRSC andMOLA DTMs, and compared them to the Viking Orbiter(VO)–based geologic map of Crown and Greeley [2007].Whereas the initial characterization of the volcano intocaldera, smooth (upper) flank, and channeled (lower) flankmaterials is consistent with the new data, the combination ofHRSC and MOC images and HRSC and MOLA DTMsprovides more detailed information on the caldera andflanks than was previously available. THEMIS visibleimages of Hadriaca were generally of lower resolution(36 m/pixel) or had poorer image quality than the HRSCimages; however, a 100 m resolution daytime-IR mosaic ofHadriaca was generated (Figure 1b) and was useful to studyand compare to the HRSC images.
3.1. Caldera
[6] The caldera of Hadriaca Patera was characterized as asingle geologic unit in the Viking-era mapping [Crown andGreeley, 1993, 2007], due to the limited resolution of theVO images. A visual analysis of morphology and craterabundances in the HRSC images of the Hadriaca calderafloor suggests that there might be evidence for multipleresurfacing events. This observation is consistent with apreliminary crater count on the HRSC image from orbit528, in which the whole caldera floor was counted as asingle unit. The resulting cumulative crater size-frequencycurve contains multiple ‘‘kinks’’ (Figure 2) or deviationsfrom the standard size-frequency curve at small crater sizes,
Figure 1a. Mars Express HRSC nadir image of HadriacaPatera, obtained on orbit 528 (19 June 2004) with aresolution of 25 m/pixel. Illumination is from the northeast.The white box outlines the caldera region, shown in laterfigures.
E10004 WILLIAMS ET AL.: HADRIACA PATERA—VOLCANIC HISTORY
2 of 18
E10004
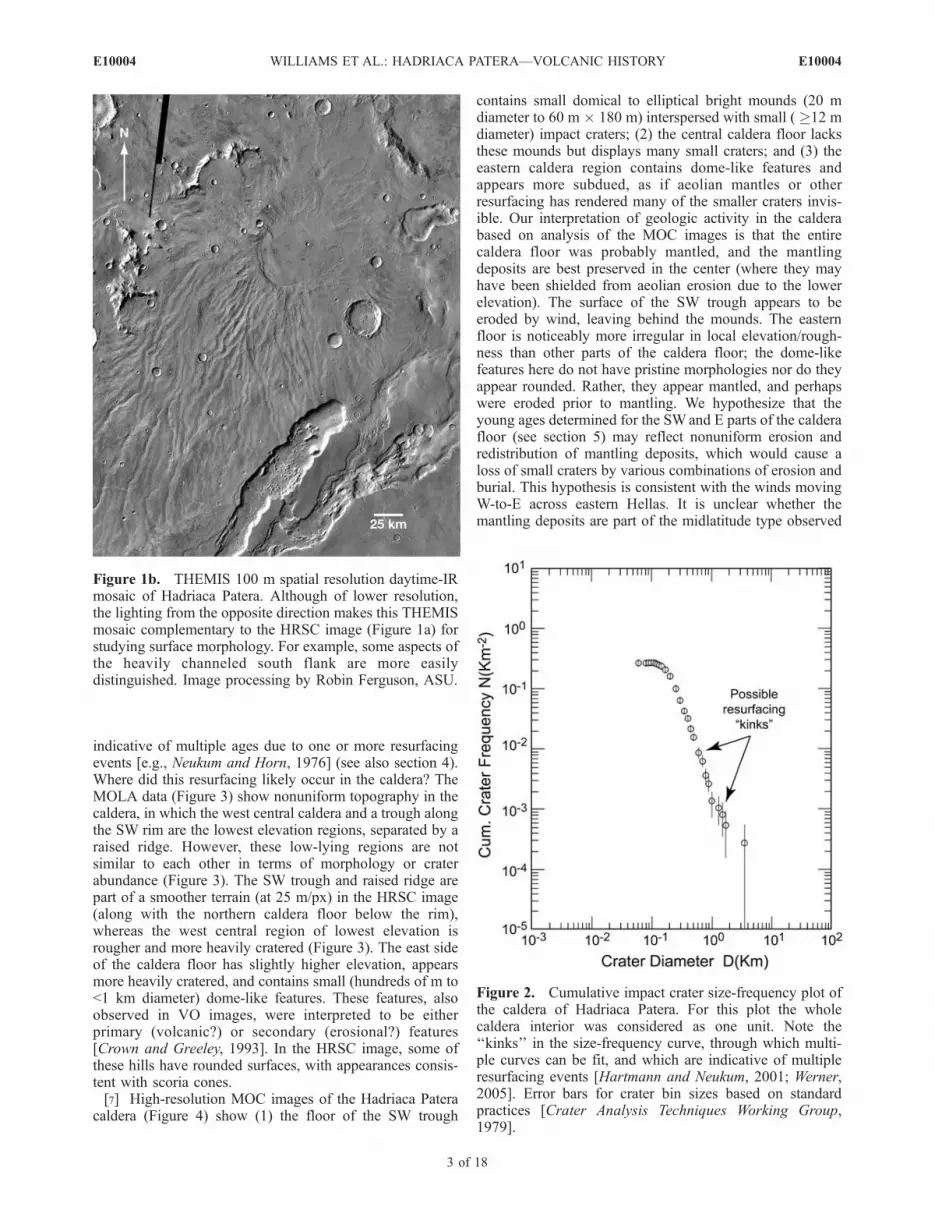
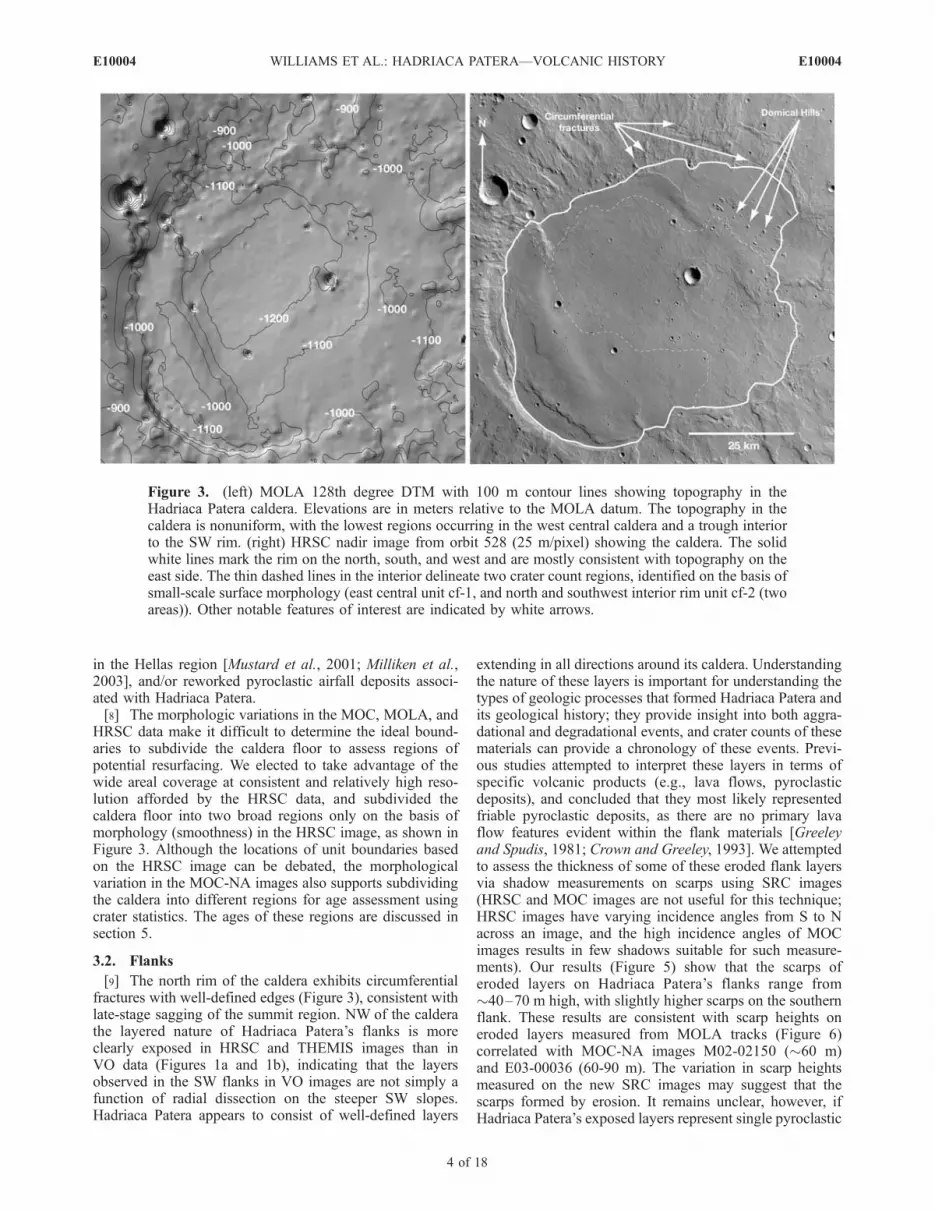
indicative of multiple ages due to one or more resurfacingevents [e.g., Neukum and Horn, 1976] (see also section 4).Where did this resurfacing likely occur in the caldera? TheMOLA data (Figure 3) show nonuniform topography in thecaldera, in which the west central caldera and a trough alongthe SW rim are the lowest elevation regions, separated by araised ridge. However, these low-lying regions are notsimilar to each other in terms of morphology or craterabundance (Figure 3). The SW trough and raised ridge arepart of a smoother terrain (at 25 m/px) in the HRSC image(along with the northern caldera floor below the rim),whereas the west central region of lowest elevation isrougher and more heavily cratered (Figure 3). The east sideof the caldera floor has slightly higher elevation, appearsmore heavily cratered, and contains small (hundreds of m to<1 km diameter) dome-like features. These features, alsoobserved in VO images, were interpreted to be eitherprimary (volcanic?) or secondary (erosional?) features[Crown and Greeley, 1993]. In the HRSC image, some ofthese hills have rounded surfaces, with appearances consis-tent with scoria cones.[7] High-resolution MOC images of the Hadriaca Patera
caldera (Figure 4) show (1) the floor of the SW trough
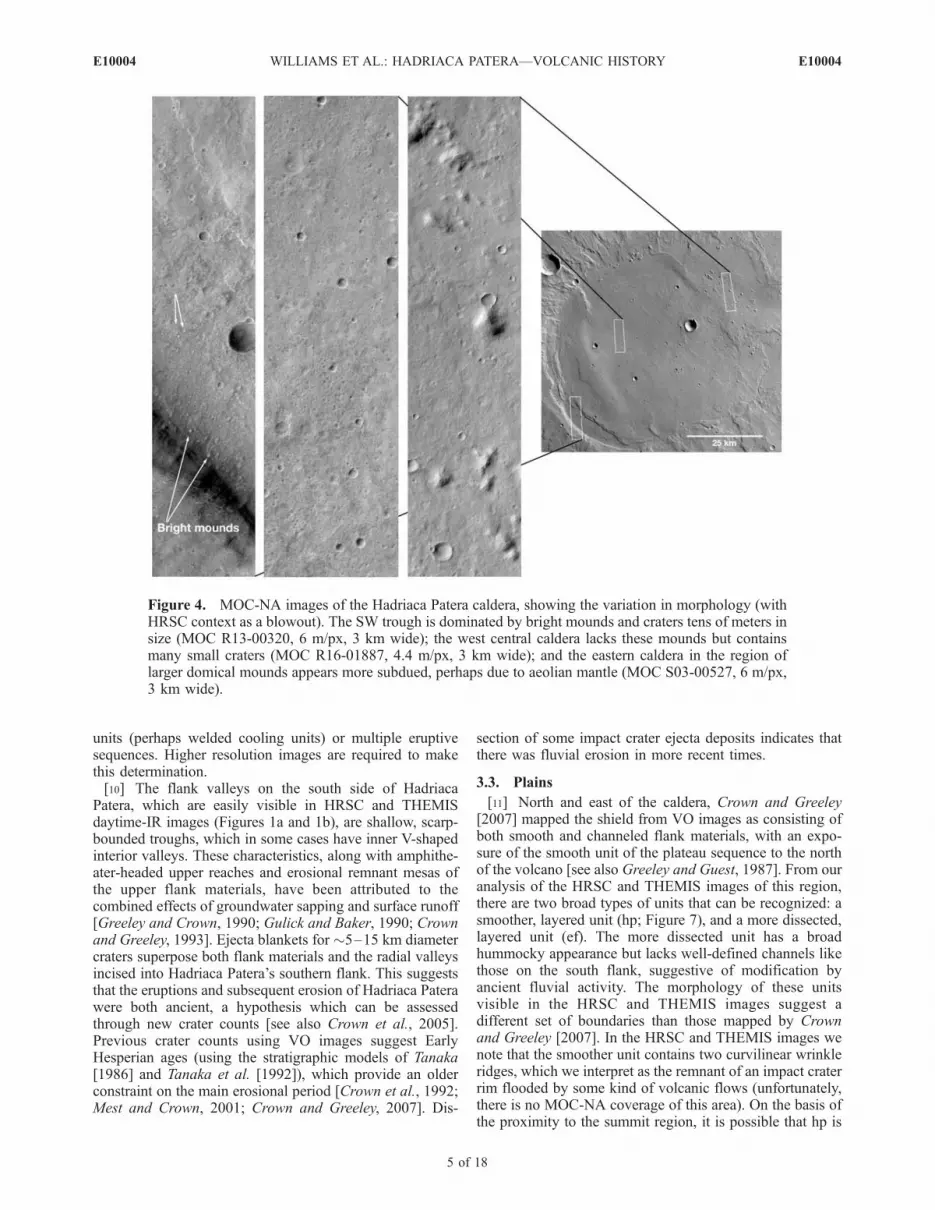
contains small domical to elliptical bright mounds (20 mdiameter to 60 m � 180 m) interspersed with small ( �12 mdiameter) impact craters; (2) the central caldera floor lacksthese mounds but displays many small craters; and (3) theeastern caldera region contains dome-like features andappears more subdued, as if aeolian mantles or otherresurfacing has rendered many of the smaller craters invis-ible. Our interpretation of geologic activity in the calderabased on analysis of the MOC images is that the entirecaldera floor was probably mantled, and the mantlingdeposits are best preserved in the center (where they mayhave been shielded from aeolian erosion due to the lowerelevation). The surface of the SW trough appears to beeroded by wind, leaving behind the mounds. The easternfloor is noticeably more irregular in local elevation/rough-ness than other parts of the caldera floor; the dome-likefeatures here do not have pristine morphologies nor do theyappear rounded. Rather, they appear mantled, and perhapswere eroded prior to mantling. We hypothesize that theyoung ages determined for the SWand E parts of the calderafloor (see section 5) may reflect nonuniform erosion andredistribution of mantling deposits, which would cause aloss of small craters by various combinations of erosion andburial. This hypothesis is consistent with the winds movingW-to-E across eastern Hellas. It is unclear whether themantling deposits are part of the midlatitude type observed
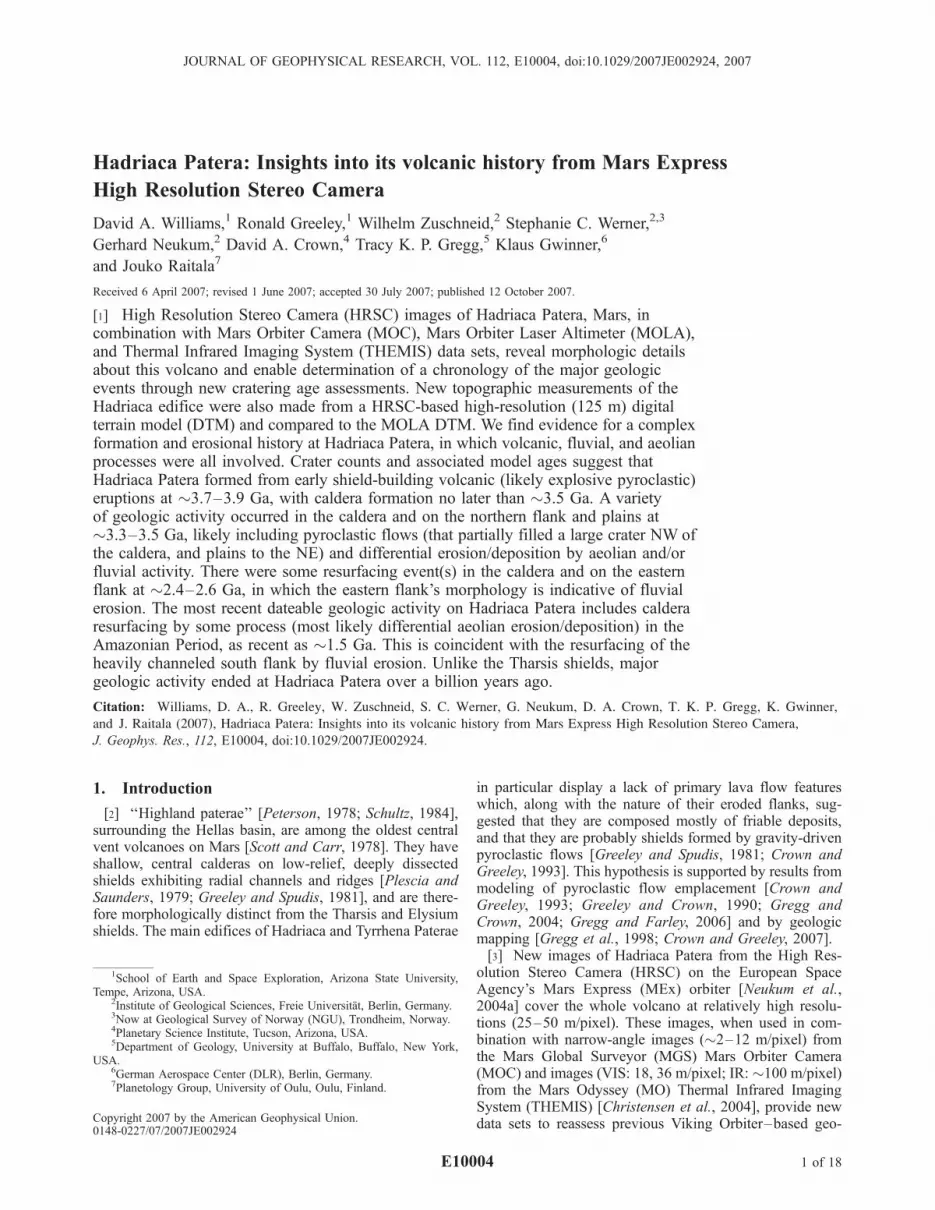
Figure 1b. THEMIS 100 m spatial resolution daytime-IRmosaic of Hadriaca Patera. Although of lower resolution,the lighting from the opposite direction makes this THEMISmosaic complementary to the HRSC image (Figure 1a) forstudying surface morphology. For example, some aspects ofthe heavily channeled south flank are more easilydistinguished. Image processing by Robin Ferguson, ASU.
Figure 2. Cumulative impact crater size-frequency plot ofthe caldera of Hadriaca Patera. For this plot the wholecaldera interior was considered as one unit. Note the‘‘kinks’’ in the size-frequency curve, through which multi-ple curves can be fit, and which are indicative of multipleresurfacing events [Hartmann and Neukum, 2001; Werner,2005]. Error bars for crater bin sizes based on standardpractices [Crater Analysis Techniques Working Group,1979].
E10004 WILLIAMS ET AL.: HADRIACA PATERA—VOLCANIC HISTORY
3 of 18
E10004
in the Hellas region [Mustard et al., 2001; Milliken et al.,2003], and/or reworked pyroclastic airfall deposits associ-ated with Hadriaca Patera.[8] The morphologic variations in the MOC, MOLA, and
HRSC data make it difficult to determine the ideal bound-aries to subdivide the caldera floor to assess regions ofpotential resurfacing. We elected to take advantage of thewide areal coverage at consistent and relatively high reso-lution afforded by the HRSC data, and subdivided thecaldera floor into two broad regions only on the basis ofmorphology (smoothness) in the HRSC image, as shown inFigure 3. Although the locations of unit boundaries basedon the HRSC image can be debated, the morphologicalvariation in the MOC-NA images also supports subdividingthe caldera into different regions for age assessment usingcrater statistics. The ages of these regions are discussed insection 5.
3.2. Flanks
[9] The north rim of the caldera exhibits circumferentialfractures with well-defined edges (Figure 3), consistent withlate-stage sagging of the summit region. NW of the calderathe layered nature of Hadriaca Patera’s flanks is moreclearly exposed in HRSC and THEMIS images than inVO data (Figures 1a and 1b), indicating that the layersobserved in the SW flanks in VO images are not simply afunction of radial dissection on the steeper SW slopes.Hadriaca Patera appears to consist of well-defined layers
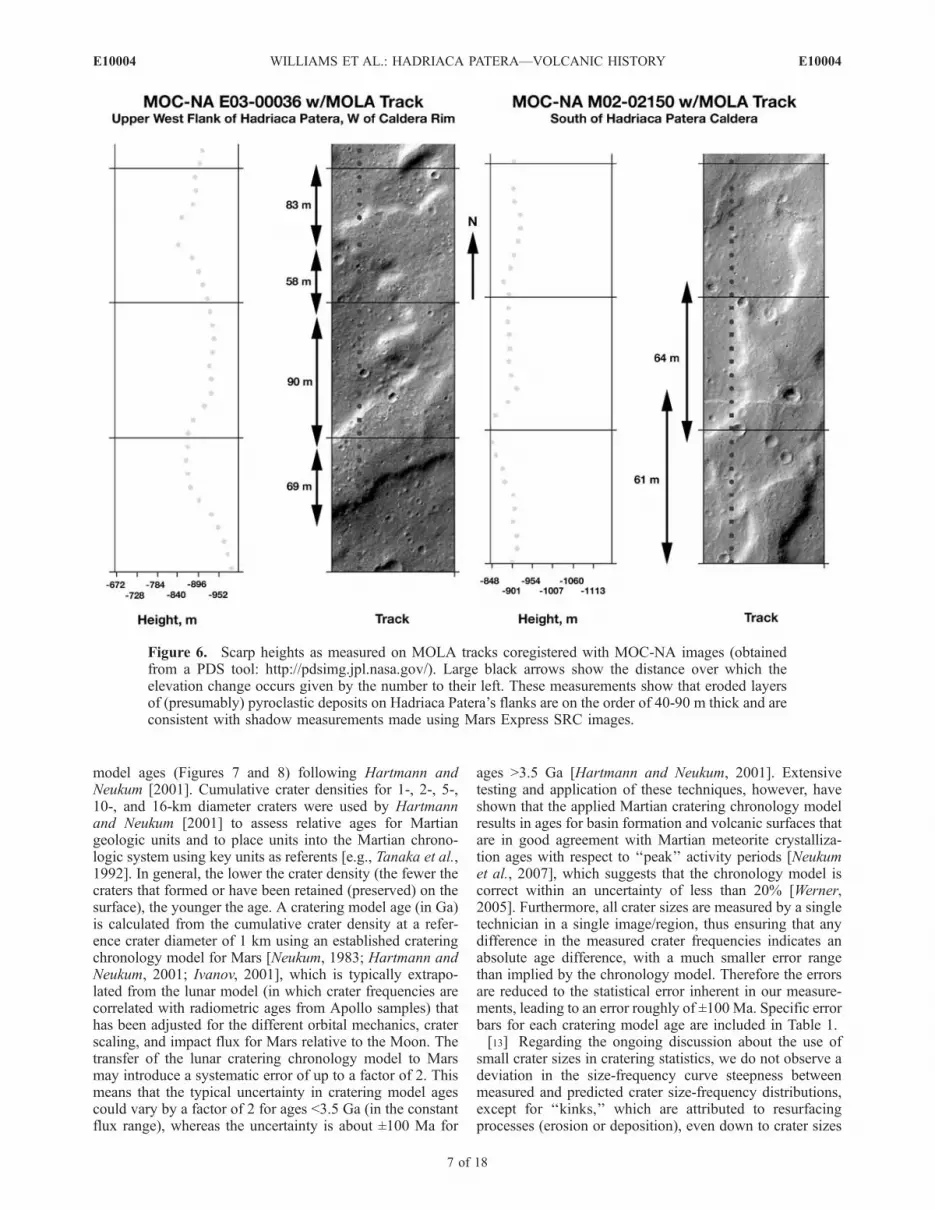
extending in all directions around its caldera. Understandingthe nature of these layers is important for understanding thetypes of geologic processes that formed Hadriaca Patera andits geological history; they provide insight into both aggra-dational and degradational events, and crater counts of thesematerials can provide a chronology of these events. Previ-ous studies attempted to interpret these layers in terms ofspecific volcanic products (e.g., lava flows, pyroclasticdeposits), and concluded that they most likely representedfriable pyroclastic deposits, as there are no primary lavaflow features evident within the flank materials [Greeleyand Spudis, 1981; Crown and Greeley, 1993]. We attemptedto assess the thickness of some of these eroded flank layersvia shadow measurements on scarps using SRC images(HRSC and MOC images are not useful for this technique;HRSC images have varying incidence angles from S to Nacross an image, and the high incidence angles of MOCimages results in few shadows suitable for such measure-ments). Our results (Figure 5) show that the scarps oferoded layers on Hadriaca Patera’s flanks range from�40–70 m high, with slightly higher scarps on the southernflank. These results are consistent with scarp heights oneroded layers measured from MOLA tracks (Figure 6)correlated with MOC-NA images M02-02150 (�60 m)and E03-00036 (60-90 m). The variation in scarp heightsmeasured on the new SRC images may suggest that thescarps formed by erosion. It remains unclear, however, ifHadriaca Patera’s exposed layers represent single pyroclastic
Figure 3. (left) MOLA 128th degree DTM with 100 m contour lines showing topography in theHadriaca Patera caldera. Elevations are in meters relative to the MOLA datum. The topography in thecaldera is nonuniform, with the lowest regions occurring in the west central caldera and a trough interiorto the SW rim. (right) HRSC nadir image from orbit 528 (25 m/pixel) showing the caldera. The solidwhite lines mark the rim on the north, south, and west and are mostly consistent with topography on theeast side. The thin dashed lines in the interior delineate two crater count regions, identified on the basis ofsmall-scale surface morphology (east central unit cf-1, and north and southwest interior rim unit cf-2 (twoareas)). Other notable features of interest are indicated by white arrows.
E10004 WILLIAMS ET AL.: HADRIACA PATERA—VOLCANIC HISTORY
4 of 18
E10004
units (perhaps welded cooling units) or multiple eruptivesequences. Higher resolution images are required to makethis determination.[10] The flank valleys on the south side of Hadriaca
Patera, which are easily visible in HRSC and THEMISdaytime-IR images (Figures 1a and 1b), are shallow, scarp-bounded troughs, which in some cases have inner V-shapedinterior valleys. These characteristics, along with amphithe-ater-headed upper reaches and erosional remnant mesas ofthe upper flank materials, have been attributed to thecombined effects of groundwater sapping and surface runoff[Greeley and Crown, 1990; Gulick and Baker, 1990; Crownand Greeley, 1993]. Ejecta blankets for �5–15 km diametercraters superpose both flank materials and the radial valleysincised into Hadriaca Patera’s southern flank. This suggeststhat the eruptions and subsequent erosion of Hadriaca Paterawere both ancient, a hypothesis which can be assessedthrough new crater counts [see also Crown et al., 2005].Previous crater counts using VO images suggest EarlyHesperian ages (using the stratigraphic models of Tanaka[1986] and Tanaka et al. [1992]), which provide an olderconstraint on the main erosional period [Crown et al., 1992;Mest and Crown, 2001; Crown and Greeley, 2007]. Dis-
section of some impact crater ejecta deposits indicates thatthere was fluvial erosion in more recent times.
3.3. Plains
[11] North and east of the caldera, Crown and Greeley[2007] mapped the shield from VO images as consisting ofboth smooth and channeled flank materials, with an expo-sure of the smooth unit of the plateau sequence to the northof the volcano [see also Greeley and Guest, 1987]. From ouranalysis of the HRSC and THEMIS images of this region,there are two broad types of units that can be recognized: asmoother, layered unit (hp; Figure 7), and a more dissected,layered unit (ef). The more dissected unit has a broadhummocky appearance but lacks well-defined channels likethose on the south flank, suggestive of modification byancient fluvial activity. The morphology of these unitsvisible in the HRSC and THEMIS images suggest adifferent set of boundaries than those mapped by Crownand Greeley [2007]. In the HRSC and THEMIS images wenote that the smoother unit contains two curvilinear wrinkleridges, which we interpret as the remnant of an impact craterrim flooded by some kind of volcanic flows (unfortunately,there is no MOC-NA coverage of this area). On the basis ofthe proximity to the summit region, it is possible that hp is
Figure 4. MOC-NA images of the Hadriaca Patera caldera, showing the variation in morphology (withHRSC context as a blowout). The SW trough is dominated by bright mounds and craters tens of meters insize (MOC R13-00320, 6 m/px, 3 km wide); the west central caldera lacks these mounds but containsmany small craters (MOC R16-01887, 4.4 m/px, 3 km wide); and the eastern caldera in the region oflarger domical mounds appears more subdued, perhaps due to aeolian mantle (MOC S03-00527, 6 m/px,3 km wide).
E10004 WILLIAMS ET AL.: HADRIACA PATERA—VOLCANIC HISTORY
5 of 18
E10004

composed of more recent volcanic flows from HadriacaPatera (perhaps from a flank vent), in contrast to ef whichappear to be an older, eroded part of the shield. We canassess these possibilities by comparing crater age dates ofthese plains units to those on the flank and caldera toconstrain whether they were emplaced synchronously, orif there has been differential erosion of these surfaces overtime.
4. Crater Counting Methodology
[12] We mapped regions on the highest-resolution HRSCimage (orbit 528 nadir channel, 25 m/px) for age assess-ment. We were guided by (but not constrained by) the
geologic map of Crown and Greeley [2007] in definingcount regions. A film transparency with our count regionsindicated was produced and examined by one of us (WZ)under a Zeiss PSK-2 stereo comparator. Crater measure-ments were recorded and partitioned into bins of increasingcrater diameter on the basis of standard practices, and thesebinned data were used to produce cumulative crater size-frequency distribution plots with corresponding statisticalerrors [see, e.g., Hartmann, 1966; Neukum and Wise, 1976;Crater Analysis Techniques Working Group, 1979; Neukumand Hiller, 1981; Neukum, 1983]. The cumulative size-frequency distributions were analyzed to determine craterdensities at specific reference diameters, and cratering
Figure 5. Two Mars Express Super Resolution Channel (SRC) mosaics (10 m/pixel resolution, withHRSC nadir 50 m/pixel context) showing flank regions of Hadriaca Patera, with marks indicatinglocations where shadow measurements were made of scarps of eroded layers.
E10004 WILLIAMS ET AL.: HADRIACA PATERA—VOLCANIC HISTORY
6 of 18
E10004
model ages (Figures 7 and 8) following Hartmann andNeukum [2001]. Cumulative crater densities for 1-, 2-, 5-,10-, and 16-km diameter craters were used by Hartmannand Neukum [2001] to assess relative ages for Martiangeologic units and to place units into the Martian chrono-logic system using key units as referents [e.g., Tanaka et al.,1992]. In general, the lower the crater density (the fewer thecraters that formed or have been retained (preserved) on thesurface), the younger the age. A cratering model age (in Ga)is calculated from the cumulative crater density at a refer-ence crater diameter of 1 km using an established crateringchronology model for Mars [Neukum, 1983; Hartmann andNeukum, 2001; Ivanov, 2001], which is typically extrapo-lated from the lunar model (in which crater frequencies arecorrelated with radiometric ages from Apollo samples) thathas been adjusted for the different orbital mechanics, craterscaling, and impact flux for Mars relative to the Moon. Thetransfer of the lunar cratering chronology model to Marsmay introduce a systematic error of up to a factor of 2. Thismeans that the typical uncertainty in cratering model agescould vary by a factor of 2 for ages <3.5 Ga (in the constantflux range), whereas the uncertainty is about ±100 Ma for
ages >3.5 Ga [Hartmann and Neukum, 2001]. Extensivetesting and application of these techniques, however, haveshown that the applied Martian cratering chronology modelresults in ages for basin formation and volcanic surfaces thatare in good agreement with Martian meteorite crystalliza-tion ages with respect to ‘‘peak’’ activity periods [Neukumet al., 2007], which suggests that the chronology model iscorrect within an uncertainty of less than 20% [Werner,2005]. Furthermore, all crater sizes are measured by a singletechnician in a single image/region, thus ensuring that anydifference in the measured crater frequencies indicates anabsolute age difference, with a much smaller error rangethan implied by the chronology model. Therefore the errorsare reduced to the statistical error inherent in our measure-ments, leading to an error roughly of ±100 Ma. Specific errorbars for each cratering model age are included in Table 1.[13] Regarding the ongoing discussion about the use of
small crater sizes in cratering statistics, we do not observe adeviation in the size-frequency curve steepness betweenmeasured and predicted crater size-frequency distributions,except for ‘‘kinks,’’ which are attributed to resurfacingprocesses (erosion or deposition), even down to crater sizes
Figure 6. Scarp heights as measured on MOLA tracks coregistered with MOC-NA images (obtainedfrom a PDS tool: http://pdsimg.jpl.nasa.gov/). Large black arrows show the distance over which theelevation change occurs given by the number to their left. These measurements show that eroded layersof (presumably) pyroclastic deposits on Hadriaca Patera’s flanks are on the order of 40-90 m thick and areconsistent with shadow measurements made using Mars Express SRC images.
E10004 WILLIAMS ET AL.: HADRIACA PATERA—VOLCANIC HISTORY
7 of 18
E10004
of about 100 m in diameter. We note this because of theongoing controversy regarding the minimum crater size thatis reasonable to include in crater counts of Mars [e.g.,McEwen et al., 2005; Hartmann, 2005], due to the possi-bility that many craters �300 m diameter are distantsecondary craters rather than primary craters. Recent workby Malin et al. [2006], who estimated the current Martiancratering rate on the basis of changes observed in MOCimages over a seven year period, found that the models that
scale lunar cratering rates to Mars are consistent with theobserved Martian cratering rate [Hartmann, 2007].[14] As we indicated above, the crater size-frequency data
for complex surfaces require multiple curve fits because ofone or more ‘‘kinks’’ in the plotted data [e.g., Neukum andHiller, 1981; Werner, 2005]. These kinks are interpreted torepresent resurfacing events, in which the crater distributionhas been affected by either the emplacement of new material(e.g., covering by new volcanic flows or aeolian deposition)or the degradation of existing material (e.g., by fluvial oraeolian erosion), such that the model age date marks the endof a period of significant erosion. A cratering model age isobtained from the crater production function [Hartmannand Neukum, 2001] using a nonlinear least squares fittingprocedure (following Marquardt [1963] and Levenberg[1944]). Any deviation from the crater production functionindicates a modification of the geological unit as explainedabove.[15] New piecewise fitting methods yield a refined cra-
tering model age to identify the end of the resurfacingprocesses. The procedure involves fitting the well-knowncrater production function to the crater size range smallerthan a certain diameter d* and predicting the expectednumber N(d*) of craters larger than that diameter. Becausethe production function is cumulative toward lower sizes,N(d*) influences the position of the curve in the smallerdiameter range. There are two approaches to finding theexpected N(d*): the first [Werner, 2005] is to calculate theexcess in the measured N(d*) by fitting the productionfunction to the larger diameter range. That fit can be used toobtain the excess over the smaller diameter fit at the cut-offdiameter d*. The other approach (used here) is to obtain itby an iterative extrapolation process from the smallerdiameter measurements alone [Michael and Neukum,2007]. The corrected cumulative crater size-frequency dis-tribution can finally be used to derive the resurfacing age. Incases where additional resurfacing processes took place, thecorrection has to be repeated at the next cut-off diameter[Werner, 2005]. On the basis of the morphology of a surfaceit might be possible to determine what kind of resurfacingoccurred (e.g., volcanic, fluvial, aeolian). Usually, however,it is impossible to determine whether the smaller craterpopulation was removed by deposition or erosion or acombination of both processes (e.g., exhumation).
5. Crater Count Results
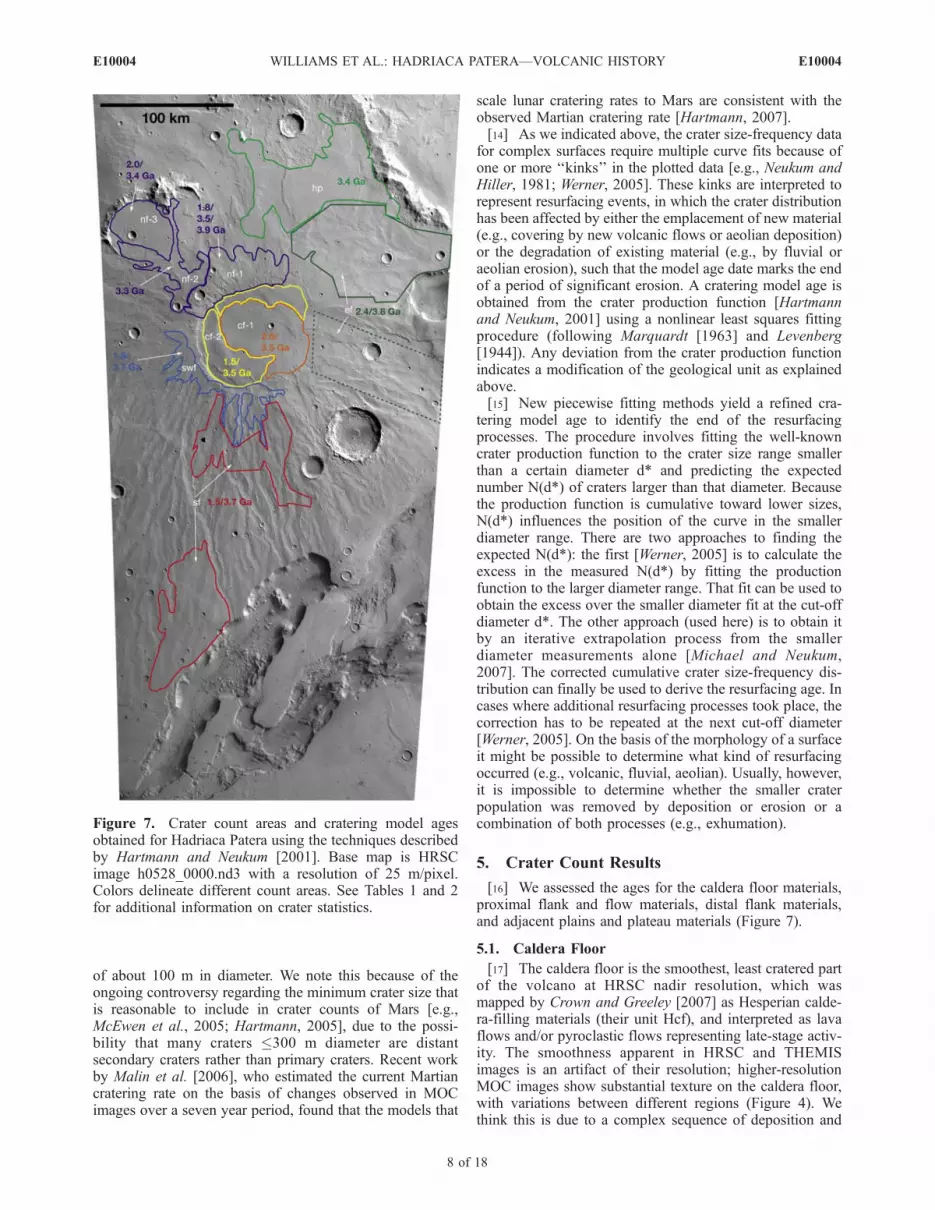
[16] We assessed the ages for the caldera floor materials,proximal flank and flow materials, distal flank materials,and adjacent plains and plateau materials (Figure 7).
5.1. Caldera Floor
[17] The caldera floor is the smoothest, least cratered partof the volcano at HRSC nadir resolution, which wasmapped by Crown and Greeley [2007] as Hesperian calde-ra-filling materials (their unit Hcf), and interpreted as lavaflows and/or pyroclastic flows representing late-stage activ-ity. The smoothness apparent in HRSC and THEMISimages is an artifact of their resolution; higher-resolutionMOC images show substantial texture on the caldera floor,with variations between different regions (Figure 4). Wethink this is due to a complex sequence of deposition and
Figure 7. Crater count areas and cratering model agesobtained for Hadriaca Patera using the techniques describedby Hartmann and Neukum [2001]. Base map is HRSCimage h0528_0000.nd3 with a resolution of 25 m/pixel.Colors delineate different count areas. See Tables 1 and 2for additional information on crater statistics.
E10004 WILLIAMS ET AL.: HADRIACA PATERA—VOLCANIC HISTORY
8 of 18
E10004

redistribution of aeolian materials on top of volcanic mate-rials. An initial crater size-frequency distribution for thewhole caldera floor (Figure 2) suggested that multiplecrater retention surfaces were present, probably represent-ing a formation age and one or more resurfacing ages dueto later activity. Thus we produced size-frequency plots fortwo subregions of the caldera floor counted separately
(Figures 3 and 7) that were subdivided on the basis ofmorphology: the center and east subregion (cf-1), and thesouthwest and north-northeast subregion (cf-2, including thelow-lying areas inside the caldera rim). The separate counts(Figures 7 and 8a) show that the center and east subregion(cf-1) has a cratering model age of �3.5 Ga with possibleresurfacing at �2.6 Ga, whereas the southwest and north-
Figure 8. Crater size-frequency plots for major Hadriaca Patera units (Figure 7). (a) Caldera unit cf-1;(b) caldera unit cf-2; (c) smooth flank unit nf-1; (d) smooth flank unit nf-3; (e) smooth flank unit nf-2;(f) smooth flank unit swf; (g) channeled flank unit sf; (h) east flank unit ef; (i) Hesperian plains unit hp.Black curves represent cratering model age fits for formation ages. Additional curves and symbolsrepresent cratering model fits for resurfacing ages as discussed by Michael and Neukum [2007]. Note:Some plots display additional isochrons for comparison.
Figure 8. (continued)
E10004 WILLIAMS ET AL.: HADRIACA PATERA—VOLCANIC HISTORY
9 of 18
E10004
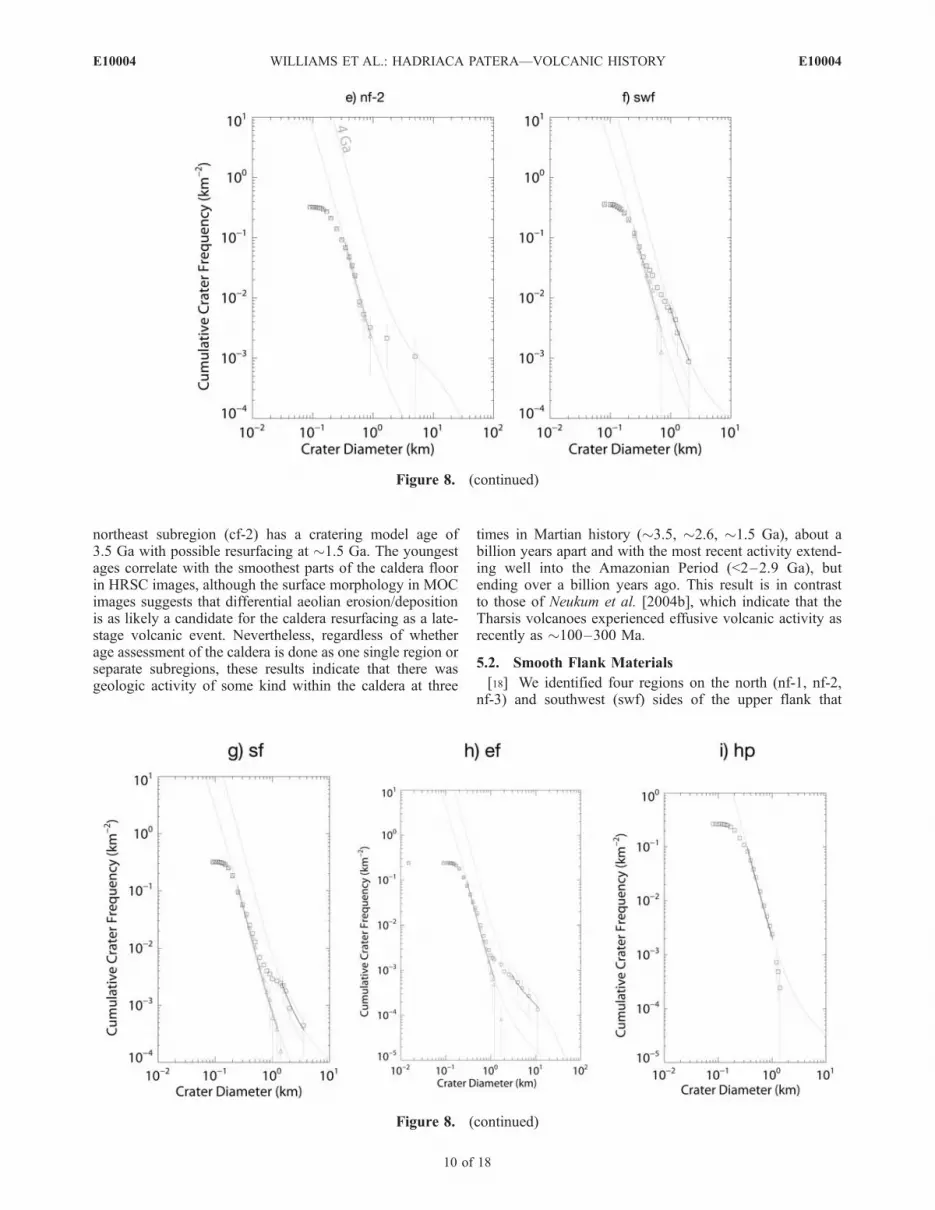
northeast subregion (cf-2) has a cratering model age of3.5 Ga with possible resurfacing at �1.5 Ga. The youngestages correlate with the smoothest parts of the caldera floorin HRSC images, although the surface morphology in MOCimages suggests that differential aeolian erosion/depositionis as likely a candidate for the caldera resurfacing as a late-stage volcanic event. Nevertheless, regardless of whetherage assessment of the caldera is done as one single region orseparate subregions, these results indicate that there wasgeologic activity of some kind within the caldera at three
times in Martian history (�3.5, �2.6, �1.5 Ga), about abillion years apart and with the most recent activity extend-ing well into the Amazonian Period (<2–2.9 Ga), butending over a billion years ago. This result is in contrastto those of Neukum et al. [2004b], which indicate that theTharsis volcanoes experienced effusive volcanic activity asrecently as �100–300 Ma.
5.2. Smooth Flank Materials
[18] We identified four regions on the north (nf-1, nf-2,nf-3) and southwest (swf) sides of the upper flank that
Figure 8. (continued)
Figure 8. (continued)
E10004 WILLIAMS ET AL.: HADRIACA PATERA—VOLCANIC HISTORY
10 of 18
E10004
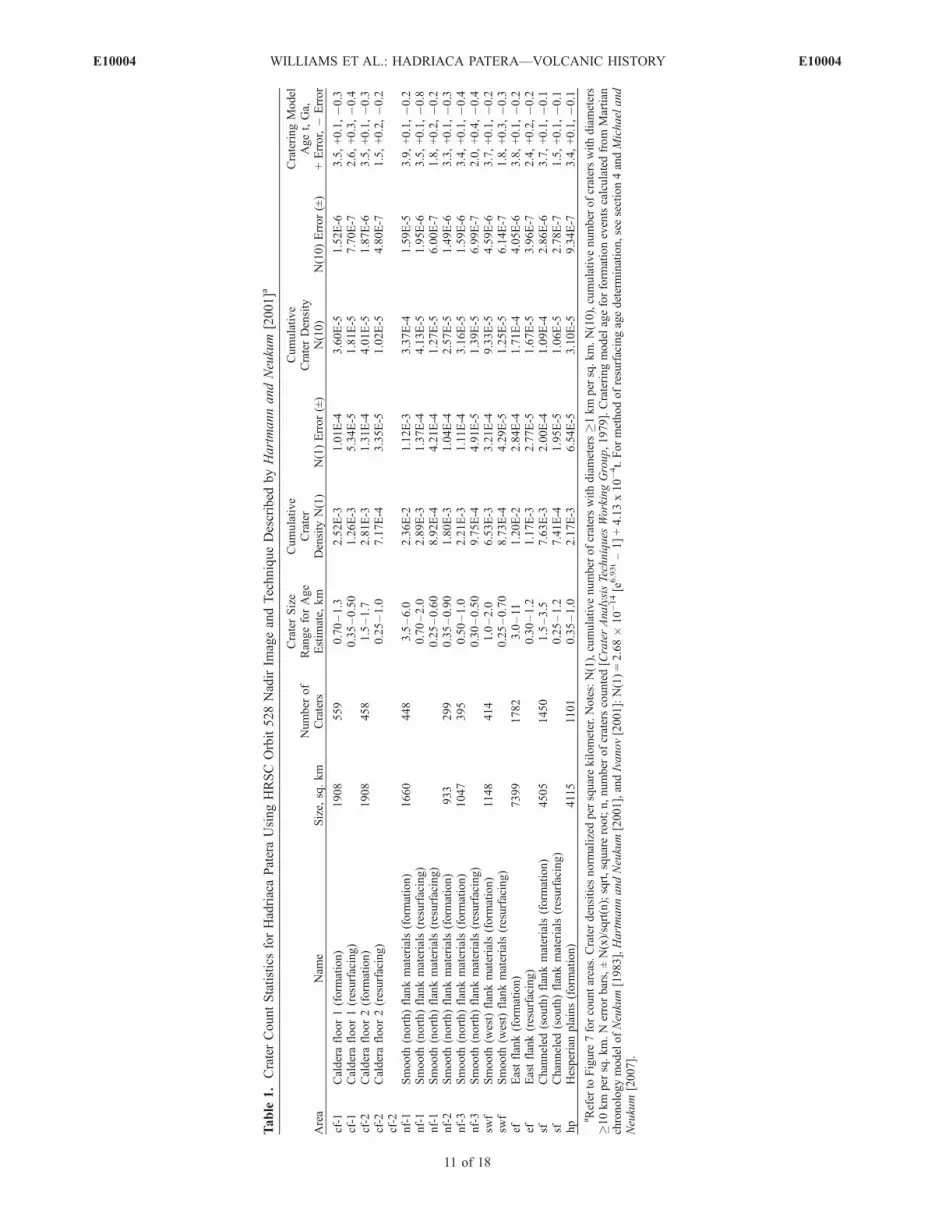
Table
1.CraterCountStatisticsforHadriacaPateraUsingHRSCOrbit528NadirIm
ageandTechniqueDescribed
byHartmannandNeukum
[2001]a
Area
Nam
eSize,
sq.km
Number
of
Craters
CraterSize
RangeforAge
Estim
ate,
km
Cumulative
Crater
Density
N(1)
N(1)Error(±)
Cumulative
CraterDensity
N(10)
N(10)Error(±)
CrateringModel
Aget,Ga,
+Error,�
Error
cf-1
Calderafloor1(form
ation)
1908
559
0.70–1.3
2.52E-3
1.01E-4
3.60E-5
1.52E-6
3.5,+0.1,�0.3
cf-1
Calderafloor1(resurfacing)
0.35–0.50
1.26E-3
5.34E-5
1.81E-5
7.70E-7
2.6,+0.3,�0.4
cf-2
Calderafloor2(form
ation)
1908
458
1.5–1.7
2.81E-3
1.31E-4
4.01E-5
1.87E-6
3.5,+0.1,�0.3
cf-2
Calderafloor2(resurfacing)
0.25–1.0
7.17E-4
3.35E-5
1.02E-5
4.80E-7
1.5,+0.2,�0.2
cf-2
nf-1
Smooth
(north)flankmaterials(form
ation)
1660
448
3.5–6.0
2.36E-2
1.12E-3
3.37E-4
1.59E-5
3.9,+0.1,�0.2
nf-1
Smooth
(north)flankmaterials(resurfacing)
0.70–2.0
2.89E-3
1.37E-4
4.13E-5
1.95E-6
3.5,+0.1,�0.8
nf-1
Smooth
(north)flankmaterials(resurfacing)
0.25–0.60
8.92E-4
4.21E-4
1.27E-5
6.00E-7
1.8,+0.2,�0.2
nf-2
Smooth
(north)flankmaterials(form
ation)
933
299
0.35–0.90
1.80E-3
1.04E-4
2.57E-5
1.49E-6
3.3,+0.1,�0.3
nf-3
Smooth
(north)flankmaterials(form
ation)
1047
395
0.50–1.0
2.21E-3
1.11E-4
3.16E-5
1.59E-6
3.4,+0.1,�0.4
nf-3
Smooth
(north)flankmaterials(resurfacing)
0.30–0.50
9.75E-4
4.91E-5
1.39E-5
6.99E-7
2.0,+0.4,�0.4
swf
Smooth
(west)flankmaterials(form
ation)
1148
414
1.0–2.0
6.53E-3
3.21E-4
9.33E-5
4.59E-6
3.7,+0.1,�0.2
swf
Smooth
(west)flankmaterials(resurfacing)
0.25–0.70
8.73E-4
4.29E-5
1.25E-5
6.14E-7
1.8,+0.3,�0.3
efEastflank(form
ation)
7399
1782
3.0–11
1.20E-2
2.84E-4
1.71E-4
4.05E-6
3.8,+0.1,�0.2
efEastflank(resurfacing)
0.30–1.2
1.17E-3
2.77E-5
1.67E-5
3.96E-7
2.4,+0.2,�0.2
sfChanneled
(south)flankmaterials(form
ation)
4505
1450
1.5–3.5
7.63E-3
2.00E-4
1.09E-4
2.86E-6
3.7,+0.1,�0.1
sfChanneled
(south)flankmaterials(resurfacing)
0.25–1.2
7.41E-4
1.95E-5
1.06E-5
2.78E-7
1.5,+0.1,�0.1
hp
Hesperianplains(form
ation)
4115
1101
0.35–1.0
2.17E-3
6.54E-5
3.10E-5
9.34E-7
3.4,+0.1,�0.1
aRefer
toFigure
7forcountareas.Craterdensities
norm
alized
per
squarekilometer.Notes:N(1),cumulativenumber
ofcraterswithdiameters�1km
per
sq.km.N(10),cumulativenumber
ofcraterswithdiameters
�10km
per
sq.km.Nerrorbars,±N(x)/sqrt(n);sqrt,squareroot;n,number
ofcraterscounted[CraterAnalysisTechniques
WorkingGroup,1979].Crateringmodelageforform
ationeventscalculatedfrom
Martian
chronologymodelofNeukum[1983],HartmannandNeukum[2001],andIvanov[2001]:N(1)=2.68�
10�14[e
6.93t–1]+4.13x10�4t.Formethodofresurfacingagedetermination,seesection4andMichaeland
Neukum
[2007].
E10004 WILLIAMS ET AL.: HADRIACA PATERA—VOLCANIC HISTORY
11 of 18
E10004
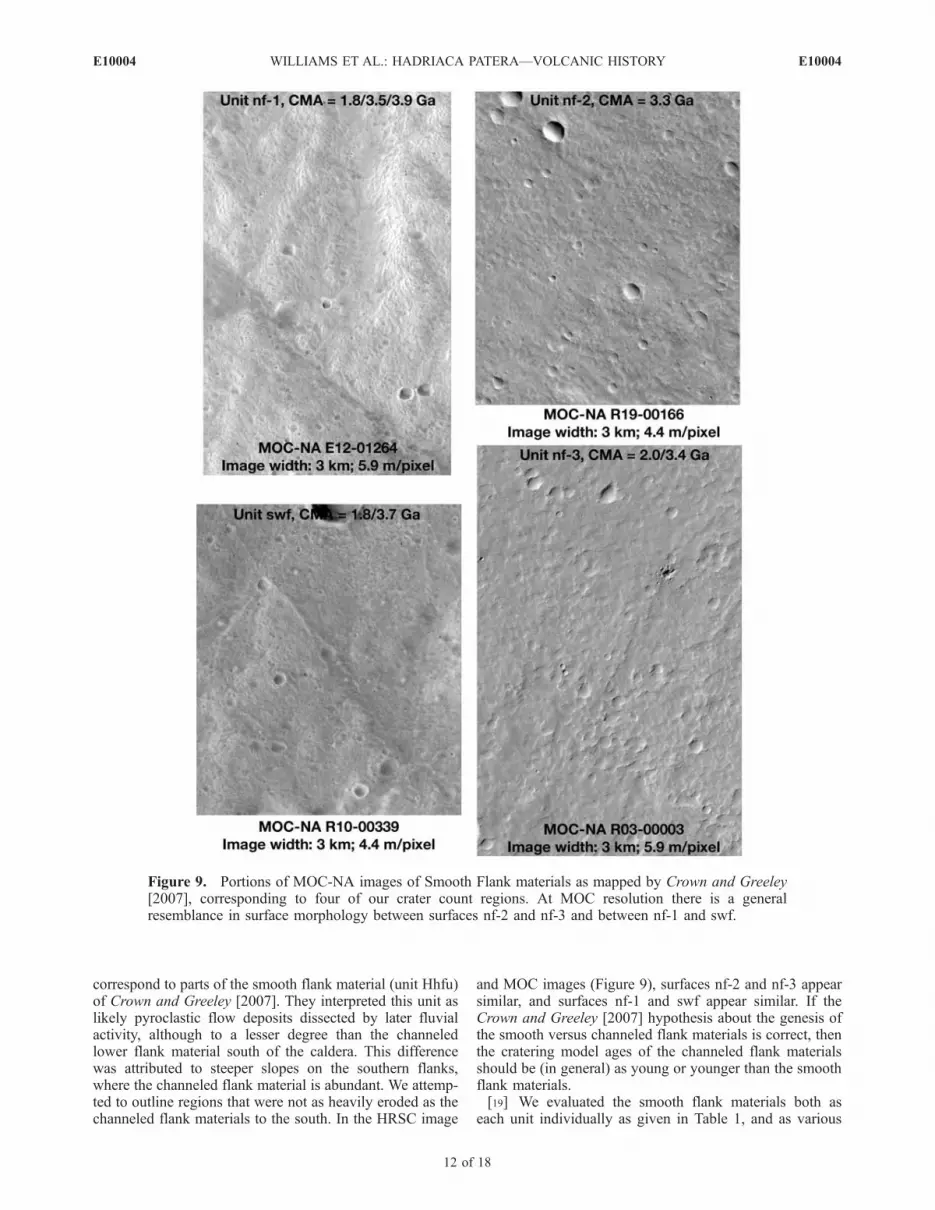
correspond to parts of the smooth flank material (unit Hhfu)of Crown and Greeley [2007]. They interpreted this unit aslikely pyroclastic flow deposits dissected by later fluvialactivity, although to a lesser degree than the channeledlower flank material south of the caldera. This differencewas attributed to steeper slopes on the southern flanks,where the channeled flank material is abundant. We attemp-ted to outline regions that were not as heavily eroded as thechanneled flank materials to the south. In the HRSC image
and MOC images (Figure 9), surfaces nf-2 and nf-3 appearsimilar, and surfaces nf-1 and swf appear similar. If theCrown and Greeley [2007] hypothesis about the genesis ofthe smooth versus channeled flank materials is correct, thenthe cratering model ages of the channeled flank materialsshould be (in general) as young or younger than the smoothflank materials.[19] We evaluated the smooth flank materials both as
each unit individually as given in Table 1, and as various
Figure 9. Portions of MOC-NA images of Smooth Flank materials as mapped by Crown and Greeley[2007], corresponding to four of our crater count regions. At MOC resolution there is a generalresemblance in surface morphology between surfaces nf-2 and nf-3 and between nf-1 and swf.
E10004 WILLIAMS ET AL.: HADRIACA PATERA—VOLCANIC HISTORY
12 of 18
E10004
combinations. Our crater counts give a model age for nf-1of 3.9 Ga, with possible resurfacing at 3.5 Ga (Figures 7 and8b) and at 1.8 Ga, a model age for unit nf-2 of 3.3 Ga, amodel age for unit nf-3 of 3.4 Ga with possible resurfacingat 2.0 Ga, and a model age for unit swf of 3.7 Ga, withpossible resurfacing at 1.8 Ga. We interpret these results toconfirm an ancient formation age of the Hadriaca edifice(3.7–3.9 Ga), dating back to the Noachian Period. The 3.3–3.5 Ga ages likely represent a volcanic resurfacing event(s)that partially fills a crater NW of the caldera rim (units nf-2and nf-3). This age is coincident with the 3.5 Ga oldest ageof activity in the caldera and the 3.5 Ga resurfacing event ofnf-1 (i.e., the terrain located between the caldera and nf-2).There is a series of small valleys on vf-1 that open towardthe caldera, perhaps related to a nf-1 resurfacing event.However, from a spatial perspective, it is difficult tointerpret older deposits (3.9 Ga) juxtaposed between youn-ger deposits (3.5 Ga in caldera, 3.3–3.4 Ga further down onN flank) on the volcano. Possible explanations include (1)younger flank volcanic activity at nf-2 and nf-3 emplacedfrom flank vent(s) (not apparent in any images) or (2)younger flank activity is erosional and crater statisticsreflect various mixtures of old primary volcanic surfacesand younger erosional surfaces. As in Hadriaca’s caldera,there may have been some differential erosion occurring onthe flanks. Nevertheless, all of these ages indicate that thetime around 3.3–3.5 Ga marks a period of widespreadresurfacing (some of which was likely caused by volcanicactivity) in the caldera and on the N-NW side of thevolcano.
5.3. Channeled Flank Materials
[20] We mapped one unit of Hesperian channeled flankmaterials (Crown and Greeley [2007] map unit Hhfl) on theheavily dissected southern flanks of the volcano (sf). Thechanneled flank materials are described by Crown andGreeley [2007] as layered, radially dissected material con-taining numerous scarps, channels, and ridges, and areinterpreted to be probable pyroclastic flow deposits dissect-ed by fluvial activity. We obtained a cratering model age of3.7 Ga (Figures 7 and 8c), with a resurfacing age of 1.5 Ga.The 1.5 Ga age is indeed younger than the smooth flankmaterials on the N flank, and places a constraint on the timeof some erosional (fluvial?) activity on the southern flank,which occurred at the same time as the youngest resurfacingactivity in the caldera.
5.4. Additional Flank Materials
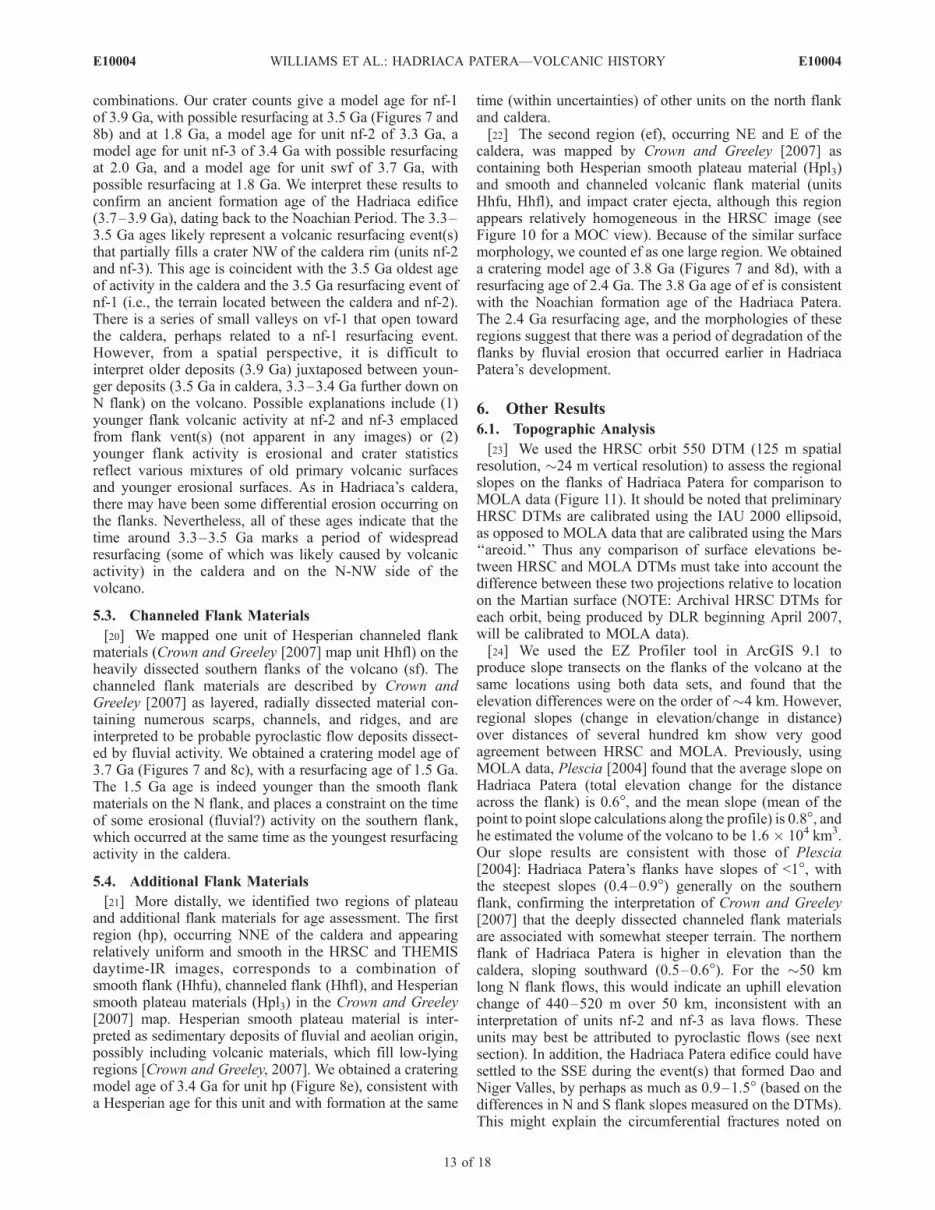
[21] More distally, we identified two regions of plateauand additional flank materials for age assessment. The firstregion (hp), occurring NNE of the caldera and appearingrelatively uniform and smooth in the HRSC and THEMISdaytime-IR images, corresponds to a combination ofsmooth flank (Hhfu), channeled flank (Hhfl), and Hesperiansmooth plateau materials (Hpl3) in the Crown and Greeley[2007] map. Hesperian smooth plateau material is inter-preted as sedimentary deposits of fluvial and aeolian origin,possibly including volcanic materials, which fill low-lyingregions [Crown and Greeley, 2007]. We obtained a crateringmodel age of 3.4 Ga for unit hp (Figure 8e), consistent witha Hesperian age for this unit and with formation at the same
time (within uncertainties) of other units on the north flankand caldera.[22] The second region (ef), occurring NE and E of the
caldera, was mapped by Crown and Greeley [2007] ascontaining both Hesperian smooth plateau material (Hpl3)and smooth and channeled volcanic flank material (unitsHhfu, Hhfl), and impact crater ejecta, although this regionappears relatively homogeneous in the HRSC image (seeFigure 10 for a MOC view). Because of the similar surfacemorphology, we counted ef as one large region. We obtaineda cratering model age of 3.8 Ga (Figures 7 and 8d), with aresurfacing age of 2.4 Ga. The 3.8 Ga age of ef is consistentwith the Noachian formation age of the Hadriaca Patera.The 2.4 Ga resurfacing age, and the morphologies of theseregions suggest that there was a period of degradation of theflanks by fluvial erosion that occurred earlier in HadriacaPatera’s development.
6. Other Results
6.1. Topographic Analysis
[23] We used the HRSC orbit 550 DTM (125 m spatialresolution, �24 m vertical resolution) to assess the regionalslopes on the flanks of Hadriaca Patera for comparison toMOLA data (Figure 11). It should be noted that preliminaryHRSC DTMs are calibrated using the IAU 2000 ellipsoid,as opposed to MOLA data that are calibrated using the Mars‘‘areoid.’’ Thus any comparison of surface elevations be-tween HRSC and MOLA DTMs must take into account thedifference between these two projections relative to locationon the Martian surface (NOTE: Archival HRSC DTMs foreach orbit, being produced by DLR beginning April 2007,will be calibrated to MOLA data).[24] We used the EZ Profiler tool in ArcGIS 9.1 to
produce slope transects on the flanks of the volcano at thesame locations using both data sets, and found that theelevation differences were on the order of �4 km. However,regional slopes (change in elevation/change in distance)over distances of several hundred km show very goodagreement between HRSC and MOLA. Previously, usingMOLA data, Plescia [2004] found that the average slope onHadriaca Patera (total elevation change for the distanceacross the flank) is 0.6�, and the mean slope (mean of thepoint to point slope calculations along the profile) is 0.8�, andhe estimated the volume of the volcano to be 1.6 � 104 km3.Our slope results are consistent with those of Plescia[2004]: Hadriaca Patera’s flanks have slopes of <1�, withthe steepest slopes (0.4–0.9�) generally on the southernflank, confirming the interpretation of Crown and Greeley[2007] that the deeply dissected channeled flank materialsare associated with somewhat steeper terrain. The northernflank of Hadriaca Patera is higher in elevation than thecaldera, sloping southward (0.5–0.6�). For the �50 kmlong N flank flows, this would indicate an uphill elevationchange of 440–520 m over 50 km, inconsistent with aninterpretation of units nf-2 and nf-3 as lava flows. Theseunits may best be attributed to pyroclastic flows (see nextsection). In addition, the Hadriaca Patera edifice could havesettled to the SSE during the event(s) that formed Dao andNiger Valles, by perhaps as much as 0.9–1.5� (based on thedifferences in N and S flank slopes measured on the DTMs).This might explain the circumferential fractures noted on
E10004 WILLIAMS ET AL.: HADRIACA PATERA—VOLCANIC HISTORY
13 of 18
E10004

the northern flanks seen in the HRSC image, and somewrinkle ridge-like structures on the southern flank thatpostdate the presumed fluvial dissection.
6.2. Modeling Pyroclastic Flow Emplacement
[25] We have used the concept of the ‘‘energy line’’[Sheridan, 1979; Crown and Greeley, 1993; Gregg andFarley, 2006] to investigate pyroclastic flow emplacement
at Hadriaca Patera, constrained by the new slope informa-tion obtained from HRSC data:
V ¼ gHð Þ0:5 ð1Þ
D ¼ V2= 2g Cd � tanQð Þð Þ ð2Þ
Figure 10. Portions of MOC-NA images of Channeled Flank and variously combined flank and plainsmaterials as mapped by Crown and Greeley [2007], corresponding to two of our crater count regions.
E10004 WILLIAMS ET AL.: HADRIACA PATERA—VOLCANIC HISTORY
14 of 18
E10004

in which V (m/s) is the minimum velocity required for apyroclastic flow to overtop a barrier of height H (m); g isgravitational acceleration (3.73 m/s2); D is flow distance(m), Cd is coefficient of friction, and Q is underlying slope.Values for Cd are unknown for Mars, and are empiricallydetermined on Earth to be in the range of 0.6 – 2.0 forpyroclastic flows [Sheridan, 1979]. Lower gravity on Marssuggests that particle-particle interactions should be weakerthere than on Earth, suggesting a range of Cd on Mars of0.05 – 0.5 [Crown and Greeley, 1993; Wilson and Head,1994].[26] Slopes on Hadriaca Patera range from 0.07� to 0.9�
(Figure 9). The visible runout distances of pyroclastic flowdeposits around Hadriaca Patera range from �120 km northof the summit (where the flow did not overtop an obstaclethat is almost 4 km high), to �170 km directly south of thesummit (where the deposits are cut by Dao Vallis), to�435 km to the southwest (their maximum measured extentin VO images [Crown and Greeley, 1993]). ApplyingHRSC-derived slopes and these distances to equation (1)requires pyroclastic flow velocities of �30 m/s to travel the�120 km north of the summit, velocities of �120 m/s totravel the �170 km south of the summit, and velocities of�600 m/s to travel the �435 km southwest of the summit totheir maximum mapped extent. For comparison, terrestrialpyroclastic flows have velocities �120 m/s [Sparks et al.,1997; Rosi, 2001]. However, there is considerable variationin the calculations of pyroclastic flow velocity, dependingon the value of Cd chosen and the assumption of slopevalue. For example, to reach 170 km from the summit,which is the distance Hadriaca Patera deposits are observedto crop out directly to the south, the pyroclastic flowvelocity could be as large as �200 to 400 m/s. Interestingly,
at these velocities, pyroclastic flows should have beencapable of overtopping the obstacles observed to the northof the summit. If the obstacles were overtopped, then thedistal deposits have been modified, removed, or buried andare no longer readily identified. Alternatively, the volcanomay not have generated radially symmetric pyroclastic flows.Perhaps, like the May 18, 1980 eruption of Mount St. Helens[Lipman and Mullineaux, 1981], there were some lateral ordirected eruptions at Hadriaca Patera. This is consistent withthe asymmetric distribution of the deposits as observed inavailable images. Alternatively, regional winds could haveaffected the distribution of the pyroclastic deposits, or theeruptions could have been fed from the caldera-boundingfaults. If the volcano worked like a ‘‘trapdoor’’ (common forterrestrial calderas), then one side of Hadriaca Patera(perhaps the south) could have had more activity.[27] Our modeling suggests that putative pyroclastic
eruptions at Hadriaca Patera were as energetic as thosepreviously modeled for Tyrrhena Patera based on earlierdata [Greeley and Crown, 1990; Gregg and Farley, 2006],and may have been emplaced as directed eruptions or lateralblasts. Cratering model ages show nearly contemporaneousvolcanic and fluvial erosional activity on Hadriaca Patera’sflanks and caldera, suggesting that the model results forTyrrhena and Hadriaca Paterae are more likely governed bythe degree of erosion of their deposits, and how continu-ously their deposits can be traced over various distances,than inherent differences in eruption behavior.
7. Discussion
[28] HRSC and other data sets provide new insight intothe volcanic history of Hadriaca Patera. The new images
Figure 11. Regional slopes on the flanks of Hadriaca Patera, as measured on transects made using boththe HRSC orbit 550 125 m DTM (lighter shade) and the MOLA DTM (darker shade). There is goodagreement in regional slopes over distances of hundreds of km, although elevations of specific pointsvary by several kilometers because of the different calibration of the HRSC DTM (IAU 2000 ellipsoid)versus the MOLA DTM (Mars areoid). Arrows point downslope. Note that the northern flanks ofHadriaca Patera are higher in elevation than the caldera.
E10004 WILLIAMS ET AL.: HADRIACA PATERA—VOLCANIC HISTORY
15 of 18
E10004

support theories regarding the genesis and the ancient age ofHadriaca Patera and generally support the geologic mappingof Crown and Greeley [2007]. Their unit definitions arebroadly consistent with the new data, although some unitboundaries on the NE flank could be altered. The HRSCimages provide new details in some areas, such as in thecaldera (e.g., indications of multiple stages of activity,possible scoria cones in the east) and on the north flank(e.g., well-defined layering as on the south flank, circum-ferential fractures indicative of late-stage settling of thesummit region).[29] A chronology of geologic activity on Hadriaca Patera
can be recognized from the crater statistics (Table 2 andFigure 12). The nonuniformity of ages (Figure 7) onHadriaca Patera indicates a complex geologic history. Onemight expect pyroclastic flows to either (1) become youngerinward, indicating dissipation of energy over the period oferuptive activity, (2) have similar ages across the shield,indicating a large, late-stage eruption essentially concludedthe period of eruptive activity (with exception of activity in
the caldera), or (3) have ages varying with direction,indicating a series of lateral blasts. This is not the case onthe northeast or southern flanks, where there is oldermaterial immediately adjacent to the caldera between youn-ger material further down the flanks and in the caldera.These data suggest that there has been widespread, nonuni-form erosion within the caldera and on the flanks ofHadriaca Patera. The cratering age dates clearly indicatethat Hadriaca Patera formed early in Martian history, withthe earliest shield-building events occurring �3.7–3.9 Ga,prior to the end of the Noachian period (3.5–3.7 Ga[Hartmann and Neukum, 2001]). The oldest preservedsurface in the caldera is dated at �3.5 Ga. These dates arecoincident (within uncertainties) with the �3.3–3.5 Ga ageson parts of the flanks and plains (unit nf-1 stands out, andmust have undergone some modification to preserve the3.9 Ga formation age where units vf-2 and vf-3 did not). Onthe southern flank, surface swf (3.7 Ga) has the same age assf. Some parts of the S flank are more heavily dissected bychannels than others, suggesting that fluvial erosion was
Figure 12. Graph of Hadriaca Patera age data for various crater count units. Cratering model ages (witherror bars) are plotted relative to the Martian geologic timescale of Hartmann and Neukum [2001]. Fromthis plot it is clear that most of Hadriaca Patera’s flanks formed in the Noachian Period, with caldera andsome northern flank units forming in the Hesperian. Resurfacing of various regions of Hadriaca Patera byfluvial and aeolian processes extended well into the Amazonian Period.
Table 2. Chronology of Activity on Hadriaca Patera, Mars, Based on Crater Statistics
Martian Period Location Cratering Model Age, Ga Type of Activity
Amazonian S flank 1.5 fluvial resurfacingAmazonian caldera 1.5 unknown resurfacingAmazonian NW-SW flank 1.8–2.0 unknown resurfacingAmazonian caldera, E flank 2.4–2.6 unknown resurfacing in caldera,
fluvial resurfacing on E flankHesperian N-NW flank 3.3–3.5 volcanic(?) formation of nf-2,
nf-3, hp; resurfacing of nf-1?Hesperian caldera 3.5 volcanic, earliest activity in calderaNoachian N, S flanks 3.7–3.9 volcanic, formation of shield
E10004 WILLIAMS ET AL.: HADRIACA PATERA—VOLCANIC HISTORY
16 of 18
E10004

more significant on some parts of the volcano. The youngestresurfacing ages of �1.5 Ga occur both on the S flank andalong the southwest and northern inside margins of thecaldera, in the smoothest material on the volcano (at tens ofm/pixel resolution). However, the MOC images suggestdifferential aeolian erosion/deposition rather than youngvolcanic or fluvial activity within the caldera. Finally,pyroclastic flow modeling constrained by slopes and dis-tances measured from the HRSC data suggest an equallyenergetic series of eruptions at Hadriaca Patera compared toTyrrhena Patera, but possibly also involving asymmetricblasts.[30] Recent work by Lillis et al. [2006] identified a
positive magnetic anomaly over Hadriaca Patera, the onlyMartian volcano that has such an anomaly over the mainedifice. Their work resulted in two hypotheses that haveimportant implications for the Martian dynamo: (1) forma-tion of a proto-Hadriaca edifice prior to the Hellas impact,that was magnetized by thermoremanent magnetization(TRM) in an early pre-Hellas dynamo magnetic field, andthat was partially demagnetized by post-Hellas volcanic andhydrothermal activity; and (2) formation of a post-Hellasedifice in which a high-density magma body cooled andacquired TRM in a post-Hellas global magnetic field, thatwas reduced by volcanic and hydrothermal activity aftercessation of the dynamo [Lillis et al., 2006]. Our resultsindicate that the Hadiaca edifice formed as early as 3.7–3.9 Ga, clearly after the Hellas impact (�4.0 Ga), and thatvolcanic and fluvial activity did occur later than 3.7 Ga,which could have acted to partially demagnetize the crust asLillis et al. [2006] suggested. Unfortunately, our results donot further constrain which of the Lillis et al. [2006]hypotheses is more likely.[31] All of our results hint at the complex volcanic and
erosional history of Hadriaca Patera, and there are manyaspects that have yet to be understood. Further study of thevolcano using new spacecraft data (e.g., very high resolutionimages from the HiRise camera on the Mars ReconnaissanceOrbiter), as well as spectrometers and magnetometers, willlikely be necessary to elucidate many of these outstandingquestions.
8. Conclusions
[32] New images from HRSC, combined with MOC,MOLA, and THEMIS data, enable a better understandingof the geology of Hadriaca Patera, and reveal a complexhistory of volcanic (likely pyroclastic) flow emplacement,differential aeolian erosion and deposition, and fluvialerosion. Hadriaca Patera formed early in Martian history,probably by pyroclastic emplacement from a central vent,forming the main edifice at �3.7–3.9 Ga. Regional flankslopes around Hadriaca Patera as measured by HRSC andMOLA DTMs are in good agreement, and are <1� butslightly steeper on the southern flank. A caldera existed byno later than �3.5 Ga. Resurfacing occurred in the calderaat 2.6 Ga and 1.5 Ga, although the exact mechanism cannotbe determined. No evidence of lava or pyroclastic flows orfluvial deposits are present in the caldera in MOC images;rather there is evidence of differential erosion/deposition byaeolian processes. The north and south flanks of HadriacaPatera are composed of well-defined layers, with scarps
40–70 m high as measured on SRC and MOLA/MOC data.Fractures on the north flank that are circumferential to thesummit suggest late-stage settling of the summit region.Smooth flank and plains materials on the north flank, mostlikely pyroclastic flows, are �3.3–3.5 Ga. Fluvial resurfac-ing likely occurred on the eastern flank at �2.4 Ga, and onpart of the NW and SW flanks at �1.8 Ga. The youngestcratering model ages on Hadriaca Patera occur on theinterior, SW and N caldera floor, and the heavily channeledsouth flank, which are �1.5 Ga (within in the AmazonianPeriod). This age marks the end of the time of extensivefluvial erosion that is thought to have formed the southernchanneled flank materials. In contrast to the Tharsis shields,major geologic activity ended at Hadriaca Patera over abillion years ago.
[33] Acknowledgments. The authors thank JGR–Planets AssociateEditor Jeff Plescia and reviewer Laszlo Keszthelyi for helpful reviews. Theauthors thank Frank Scholten and Marvin Simkin for assistance in HRSCdata processing. We thank Greg Michael for additional information onresurfacing age calculations. We thank Robin Ferguson and the THEMISteam for producing the Hadriaca THEMIS mosaic and for useful discus-sions on interpreting THEMIS data. The authors acknowledge the use ofMars Orbiter Camera images processed by Malin Space Science Systemsthat are available at http://www.msss.com/moc_gallery/. We thank theHRSC Experiment Teams at DLR Berlin and the Freie Universitat Berlinas well as the Mars Express Project Teams at ESTEC and ESOC for theirsuccessful planning and acquisition of data, as well as for making theprocessed data available to the HRSC Team. We acknowledge the effort ofthe HRSC Co-Investigator Team members and their associates who havecontributed to this investigation in the preparatory phase and in scientificdiscussions within the Team. This research was supported by NASAthrough the Jet Propulsion Laboratory for United States participation inthe ESA Mars Express mission, and through the NASA Planetary Geologyand Geophysics Program.
ReferencesChristensen, P. R., et al. (2004), The Thermal Emission Imaging System(THEMIS) for the Mars 2001 Odyssey Mission, Space Sci. Rev., 110,85–130.
Crater Analysis Techniques Working Group (1979), Standard techniquesfor presentation and analysis of crater size-frequency data, Icarus, 37,467–474.
Crown, D. A., and R. Greeley (1993), Volcanic geology of Hadriaca Pateraand the eastern Hellas region of Mars, J. Geophys. Res., 98, 3431–3451.
Crown, D. A., and R. Greeley (2007), Geologic map of MTM-30262 and -30267 quadrangles, Hadriaca Patera region of Mars, U. S. Geol. Surv. Sci.Invest. Ser., Map 2936, scale 1:1,004,000.
Crown, D. A., K. H. Price, and R. Greeley (1992), Geologic evolution ofthe east rim of the Hellas basin, Mars, Icarus, 100, 1–25.
Crown, D. A., D. C. Berman, L. F. Bleamaster, F. C. Chuang, and W. K.Hartmann (2005), Martian highland paterae: Studies of volcanic anddegradation histories from high-resolution images and impact crater popu-lations, Lunar Planet. Sci. [CD-ROM], XXXVI, Abstract 1476.
Greeley, R., and D. A. Crown (1990), Volcanic geology of Tyrrhena Patera,Mars, J. Geophys. Res., 95, 7133–7149.
Greeley, R., and J. E. Guest (1987), Geologic map of the eastern equatorialregion of Mars, U. S. Geol. Surv. Misc. Invest. Ser., Map I-1802B, scale1:15000,000.
Greeley, R., and P. D. Spudis (1981), Volcanism on Mars, Rev. Geophys.,19, 13–41.
Gregg, T. K. P., and D. A. Crown (2004), Basaltic pyroclastic flows atTyrrhena Patera and Hesperia Planum, Mars, abstract presented at IAV-CEI General Assembly, Int. Assoc. of Volcanol. and Chem. of the Earth’sInter., Pucon, Chile.
Gregg, T. K. P., and M. A. Farley (2006), Mafic pyroclastic flows at Tyr-rhena Patera, Mars: Constraints from observations and models, J. Volca-nol. Geotherm. Res., 155, 81–89.
Gregg, T. K. P., D. A. Crown, and R. Greeley (1998), Geologic map of partof the Tyrrhena Patera region of Mars (MTM-20252), U. S. Geol. Surv.Misc. Invest. Ser., Map I-2556, scale 1:500000.
Gulick, V. C., and V. R. Baker (1990), Origin and evolution of valleys onMartian volcanoes, J. Geophys. Res., 95, 14,325–14,344.
Hartmann, W. K. (1966), Martian cratering, Icarus, 5, 565–576.
E10004 WILLIAMS ET AL.: HADRIACA PATERA—VOLCANIC HISTORY
17 of 18
E10004

Hartmann, W. K. (2005), Martian cratering 8: Isochron refinement and thechronology of Mars, Icarus, 174, 294–320.
Hartmann, W. K. (2007), Mars: Toward resolution of the controversy aboutsmall craters, Lunar Planet. Sci. [CD-ROM], XXXVIII, Abstract 1060.
Hartmann, W. K., and G. Neukum (2001), Cratering chronology and theevolution of Mars, Space Sci. Rev., 96, 165–194.
Ivanov, B. A. (2001), Mars/Moon cratering rate ratio estimates, Space Sci.Rev., 96, 87–104.
Levenberg, K. (1944), A method for the solution of certain problems inleast squares, Q. Appl. Math., 2, 164–168.
Lillis, R. J., M. Manga, D. L. Mitchell, R. P. Lin, and M. H. Acuna (2006),Unusual magnetic signature of the Hadriaca Patera Volcano: Implications forearly Mars, Geophys. Res. Lett., 33, L03202, doi:10.1029/2005GL024905.
Lipman, P. W., and D. R. Mullineaux (1981), The 1980 eruptions of MountSt. Helens, Washington, U. S. Geol. Surv. Prof. Pap., 1250, 844 pp.
Malin, M. C., K. S. Edgett, L. V. Posiolova, S. M. McColley, and E. Z. NoeDobrea (2006), Present-day impact cratering rate and contemporary gullyactivity on Mars, Science, 314, 1573–1577.
Marquardt, D. (1963), An algorithm for least-squares estimation of non-linear parameters, SIAM J. Appl. Math., 11, 431–441.
McEwen, A. S., B. S. Preblich, E. P. Turtle, N. A. Artemieva, M. P.Golombek, M. Hurst, R. L. Kirk, D. M. Burr, and P. R. Christensen(2005), The rayed crater Zunil and interpretations of small impact craterson Mars, Icarus, 176, 351–381.
Mest, S. C., and D. A. Crown (2001), Geology of the Reull Vallis region,Mars, Icarus, 153, 89–110.
Michael, G., and G. Neukum (2007), Refinement of cratering model age forthe case of partial resurfacing, Lunar Planet. Sci. [CD-ROM], XXXVIII,Abstract 1825.
Milliken, R. E., J. F. Mustard, and D. L. Goldsby (2003), Viscous flowfeatures on the surface of Mars: Observations from high-resolution MarsOrbiter Camera (MOC) images, J. Geophys. Res., 108(E6), 5057,doi:10.1029/2002JE002005.
Mustard, J. F., C. D. Cooper, and M. K. Rifkin (2001), Evidence for recentclimate change on Mars from the identification of youthful near-surfaceground ice, Nature, 412, 411–414.
Neukum, G. (1983), Meteoritenbombardement und Datierung planetarerOberflachen, habilitation dissertation for faculty membership, 186 pp.,Ludwig-Maximilians Univ., Munich, Germany.
Neukum, G., and K. Hiller (1981), Martian Ages, J. Geophys. Res., 86,3097–3121.
Neukum, G., and P. Horn (1976), Effects of lava flows on lunar craterpopulations, Moon, 15, 205–222.
Neukum, G., and D. U. Wise (1976), Mars—A standard crater curve andpossible new time scale, Science, 194, 1381–1387.
Neukum, G., R. Jaumann, and the HRSC Co-Investigator and ExperimentTeam (2004a), HRSC: The High Resolution Stereo Camera of MarsExpress, in Mars Express: The Scientific Payload, edited by A. Wilson,Eur. Space Agency Spec. Publ., ESA-SP 1240, 17–36.
Neukum, G., et al. (2004b), Recent and episodic volcanic and glacialactivity on Mars revealed by the High Resolution Stereo Camera, Nature,432, 971–979.
Neukum, G., et al. (2007), The geologic evolution of Mars: Episodicity ofresurfacing events and ages from cratering analysis of image data andcorrelation with radiometric ages of Martian meteorites, Lunar Planet.Sci. [CD-ROM], XXXVIII, Abstract 2271.
Peterson, J. E. (1978), Volcanism in the Noachis-Hellas region of Mars, 2,Proc. Lunar Planet Sci. Conf., 9th, 3411–3432.
Plescia, J. B. (2004), Morphometric properties of Martian volcanoes,J. Geophys. Res., 109, E03003, doi:10.1029/2002JE002031.
Plescia, J. B., and R. S. Saunders (1979), The chronology of the Martianvolcanoes, Proc. Lunar Planet. Sci. Conf. 10th, 2841–2859.
Rosi, M. (2001), Plinian eruption columns: Particle transport and fallout, inFrom Magma to Tephra: Modeling Physical Processes of ExplosiveVolcanic Eruptions, edited by A. Freundt and Rosi, M., pp. 139–172,Elsevier, New York.
Schultz, P. H. (1984), Impact basin control of volcanic and tectonic pro-vinces on Mars, Lunar Planet. Sci., 728–729.
Scott, D. H., and M. H. Carr (1978), Geologic map of Mars, U. S. Geol.Surv. Misc. Invest. Ser., Map I-1083, scale 1:25M.
Sheridan, M. F. (1979), Emplacement of pyroclastic flows: A review, Spec.Pap. Geol. Soc. Am., 180, 125–136.
Sparks, R. S. J., M. I. Bursik, S. N. Carely, J. S. Gilbert, L. S. Glaze,H. Sigurdsson, and A. W. Woods (1997), Volcanic Plumes, 574 pp., JohnWiley, New York.
Tanaka, K. L. (1986), The stratigraphy of Mars, Proc. Lunar Planet. Sci.Conf., 17th, Part 1, J. Geophys. Res., 91, suppl., E139–E158.
Tanaka, K. L., D. H. Scott, and R. Greeley (1992), Global stratigraphy, inMars, edited by H. H. Kieffer et al., pp. 345–382, Univ. of Ariz. Press,Tucson.
Werner, S. (2005), The Martian crater size-frequency distribution andaspects of the evolutionary history ofMars (in German), Ph.D. dissertation,Free Univ., Berlin. (Available in English at http://www.diss.fu-berlin.de/2006/33/indexe.html)
Wilson, L., and J. W. Head (1994), Mars: Review and analysis of volcaniceruption theory and relationships to observed landforms, Rev. Geophys.,32(3), 221–263.
�����������������������D. A. Crown, Planetary Science Institute, 1700 East Ft. Lowell Road,
Suite 106, Tucson, AZ 85710, USA.R. Greeley and D. A. Williams, School of Earth and Space Exploration,
Arizona State University, Box 871404, Tempe, AZ 85287-1404, USA.([email protected])T. K. P. Gregg, Department of Geology, University at Buffalo, 876
Natural Sciences and Mathematics Complex, Buffalo, NY 14260, USA.K. Gwinner, German Aerospace Center (DLR), Rutherfordstr. 2, D-12489
Berlin, Germany.G. Neukum and W. Zuschneid, Institute of Geological Sciences, Freie
Universitat, D-12489 Berlin, Germany.J. Raitala, Planetology Group, University of Oulu, P.O. Box 3000, FIN-
90014 Oulu, Finland.S. C. Werner, Geological Survey of Norway (NGU), Leiv Eirikssons vei
39, N-7491 Trondheim, Norway.
E10004 WILLIAMS ET AL.: HADRIACA PATERA—VOLCANIC HISTORY
18 of 18
E10004