Embed Size (px)
Citation preview
Guided waves propagating in subducted
oceanic crust
S. Martin and A. Rietbrock1
Institut fur Geowissenschaften, Universitat Potsdam, Potsdam, Germany
C. Haberland and G. AschGeoForschungszentrum Potsdam, Potsdam, Germany
Received 14 February 2003; revised 1 August 2003; accepted 12 September 2003; published 20 November 2003.
[1] We use guided waves traveling updip along the surface of the Nazca slab to imagesubducted oceanic crust at the Chile-Peru subduction zone. Observed P onsets ofintermediate depth events near 21�S in northern Chile reveal waveguide behavior: withgrowing focal depth, low-frequency energy (<2 Hz) becomes more and more dominant,and higher frequencies arrive delayed, sometimes resembling two distinct phases. Toexplain the observations, we employ two-dimensional finite difference (FD) simulations ofcomplete P-SV wave propagation along an updip profile of the subduction zone. The FDcalculations shed some light on several basic issues regarding crustal waveguides. Thedevelopment of guided waves dependent on event focal depth is simulated. Further, weshow that the observed guided wave energy must decouple from the waveguide near100 km depth to reach the deployed stations and that the decoupling process is related tovariations in subduction angle. Simulations also yield constraints on source locationsrelative to the low-velocity structure. Finally, the frequency content of P onsets is usedto constrain the thickness of the waveguide. The results indicate that a structure of <4.5 kmaverage width and 7% low-velocity remains seismically slow compared to the surroundingmantle down to a depth of at least 160 km. The layer is interpreted as the unalteredlower part of the subducted oceanic crust, suggesting that complete eclogitetransformation in the Chile-Peru subduction zone is unlikely to take place until beyond thevolcanic front. INDEX TERMS: 3210 Mathematical Geophysics: Modeling; 7220 Seismology: Oceanic
crust; 7260 Seismology: Theory and modeling; 8150 Tectonophysics: Plate boundary—general (3040);
KEYWORDS: subducted oceanic crust, guided waves, FD modeling, low-velocity layer, Chile-Peru subduction
Citation: Martin, S., A. Rietbrock, C. Haberland, and G. Asch, Guided waves propagating in subducted oceanic crust, J. Geophys.
Res., 108(B11), 2536, doi:10.1029/2003JB002450, 2003.
1. Introduction
[2] The fate of subducted oceanic crust at intermediatedepths is of main contemporary interest for understandingthe subduction processes and, in particular, the origin ofintermediate depth earthquakes [Meade and Jeanloz, 1991;Abers, 2000; Yuan et al., 2000]. Seismic waves from intra-slab earthquakes that probe the seismic velocity structuresof slabs are a valuable source of information on themineralogical and thermal structure of subducted litho-sphere [e.g., Davies and McKenzie, 1969; Kirby et al.,1996]. Seismic wave anomalies are used to infer seismicvelocity structure of subducted lithosphere and ultimatelyinformation on slab mineralogy [Mitronovas et al., 1971].[3] Velocity contrasts are derived from observations of a
variety of seismic signals that are influenced by the
subducted plate. Travel times, for example, are easy tomeasure but only yield average velocities along ray paths[e.g., Fukao et al., 1978]. Detailed velocity structurewithin the slab that gives evidence for mineralogicalphase changes can thus not be imaged [Mitronovas etal., 1971].[4] Another widely used technique employs converted
waves caused by the slab surface or layering withinthe subducted lithosphere. Helffrich and Abers [1997], forexample, employed converted waves to investigate a low-velocity layer at the eastern Aleutian subduction zone.Studies at the Chile-Peru subduction zone in the westerncentral Andes inferred a similar layer up to depths of120–160 km from P-S-converted waves [Yuan et al., 2000;Bock et al., 2000]. The resulting velocity contrast is 15%with a thickness of 5–10 km. Likewise, investigations atthe northeast Japanese subduction zone found undulatingvelocity contrasts between the accretional wedge andsubducted crust at various depths which are interpretedas evidence of chemical phase changes of the gabbroicsubducted crust [Snoke et al., 1978; Helffrich, 1996].
JOURNAL OF GEOPHYSICAL RESEARCH, VOL. 108, NO. B11, 2536, doi:10.1029/2003JB002450, 2003
1Now at Department of Earth and Ocean Sciences, LiverpoolUniversity, Liverpool, UK.
Copyright 2003 by the American Geophysical Union.0148-0227/03/2003JB002450$09.00
ESE 8 - 1
[5] Last, subducted lithosphere not only causes convertedseismic body waves, but also can act as a seismic wave-guide for updip and along-strike signals of intraslab events.These signals provide the longest interaction times withinthe slab and thus yield potentially large slab related signals.The waveguide causes distortion in pulse shape and differ-ences in long- and short-period energy arrival times.[6] Among the mentioned methods, guided waves is one
that is directly linked to the existence of layered structuressuch as subducted crust. A more or less continuous layeringis a prerequisite for the occurrence of guided waves [Abersand Sarker, 1996; Abers, 2000]. Furthermore, studies onfault zones have shown so far that occurrence, pulse shapesand frequency content of guided waves are directly relatedto parameters such as layer thickness, length of the wave-guide structure and source location in relation to the layer[Li and Vidale, 1996; Igel et al., 1997; Ben-Zion, 1998;[M. Fohrmann et al., Guided waves from sources outsidefaults: An indication for shallow fault zone structure?, sub-mitted to Pure and Applied Geophysics, 2002, hereinafterreferred to as Fohrmann et al., submitted manuscript, 2002].[7] The first successful studies in subduction zones were
undertaken for high-velocity structures, often modeling thewhole slab as a high-velocity layer [e.g., Barazangi et al.,1972]. Observations at the Kermadec subduction zone gaveproof that thinner layering also results in frequency effects.High-frequency phases were observed prior to low-frequencyonsets at stations in New Zealand. This is explained byintroducing a thin (8–10 km) high-velocity layer (5% fasterthan surrounding mantle) on top of the Kermadec plate[Ansell and Gubbins, 1986; Van der Hilst and Snieder, 1996].[8] In accordance with investigations utilizing converted
waves, the Japanese subduction zone, which has so far beeninvestigated the most, features a low-velocity layer thatcauses guided wave effects. P onsets show low frequenciesarriving faster than high frequencies. Studies on the crustalwaveguide in the Philippine plate subducting beneathsouthwest Japan concluded that the wave guide was<10 km thick and that Vp equals 7 km/s for earthquakesources down to focal depth of 50–60 km [Fukao et al.,1983; Hori, 1990; Oda et al., 1990]. As these velocitieswere indistinguishable from those for oceanic crust beneathocean basins, the waveguide was identified as gabbroiccrust that survived untransformed to a depth of 50–60 km.In the Pacific plate subducting beneath northeast Japan, thelow-velocity crustal channel persists to depths of 75–150 km, and its thickness is estimated to be about 5 km[Matsuzawa et al., 1986; Hurukawa and Imoto, 1992; Iidakaand Obara, 1993]. Since change in temperature cannotcause the appropriate velocity contrasts [e.g., Helffrich,1996], it is likely, that a layering persists to greater depthsthan those reached beneath the volcanic arc. Recently, low-velocity layers were postulated for most of the subductedslabs in the north Pacific region down to depths of 100–250 km by evidence from guided waves [Abers, 2000].[9] This study is motivated by the mentioned results at
other subduction zones and promising observations fromintraslab events at stations of the ANCORP’96 seismicnetwork located between 21� and 24�S in northern Chile[Rietbrock et al., 1997].[10] Typically, the observation of guided waves is
restricted to the case of receivers situated within or close
to the waveguide rather than complex geometries includingreceivers at greater distances to the low-velocity layer [Ben-Zion et al., 2003]. Therefore we will address simple, butcrucial questions regarding the potential of guided waves toexamine layering of subducted lithosphere: (1) Under whichcircumstances does guided wave energy actually leave thewaveguide structure and is observable at surface stations?(2) Which restrictions on source locations are required tohave guided wave energy enter the low-velocity structure?(3) Do distorted P onsets allow estimates of structuralparameters of the low-velocity zone? Ultimately, we inferunder which circumstances guided wave energy from a low-velocity layer on top of the Nazca plate at the Chile-Perusubduction zone is observable in P onsets.[11] We calculate complete P-SV wave propagation for a
two-dimensional (2-D) cross section through the Chile-Perusubduction zone utilizing finite difference (FD) simulations.This allows us to compare directly pulse shapes andfrequency content (up to 8.5 Hz) of collected data withsynthetics for different slab geometries and internal struc-tures. The FD calculations allow a much more directapproach to the problem than analytical guided wavesolutions which are feasible for SH waves and plane layersonly. Furthermore, the FD approach allows to investigatethe decoupling process of guided waves from laterallyinhomogeneous waveguide structures.
2. Data and Observations: Distorted Arrivals atANCORP Station AER
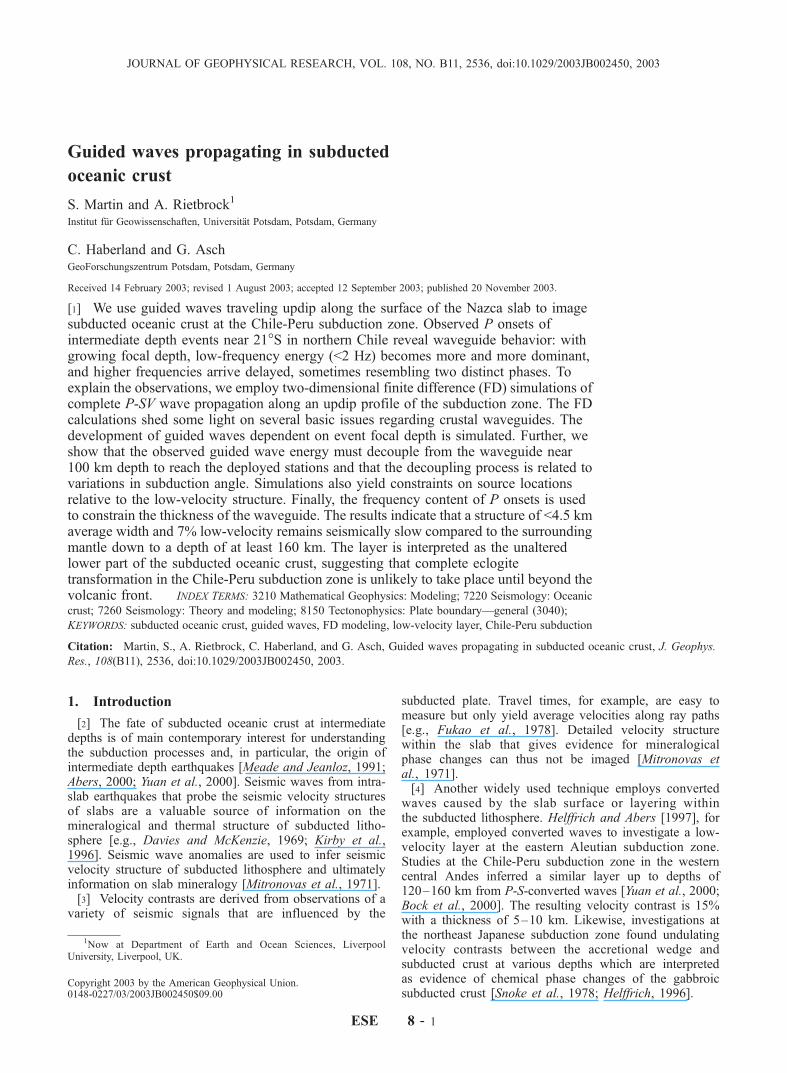
[12] Data used come from the ANCORP’96 campaignthat was undertaken during November 1996 to March 1997in northern Chile between 23�–20.5�S and 70�–66.5�W[Rietbrock et al., 1997]. The ANCORP temporary seismicnetwork consisted of 32 short-period stations equipped withMark L-4A-3D sensors.[13] A subset of stations (BOS, AER, VOL, CHG; see
Figure 1), all located close to 69� ± 0.2� longitude, showdistorted P wave first arrivals, sometimes resembling twodistinctive phases. This work focuses on the data recordedat station AER, where the effect is most pronounced and thenoise level is low. Events were selected from the latitude-longitude box 23.88�–21.95�S and 69.05�–66.29�W. Theycover a range of focal depths from 70 to 300 km and forman updip section centered around station AER (Figure 1).[14] P waveforms in seismograms recorded at AER can
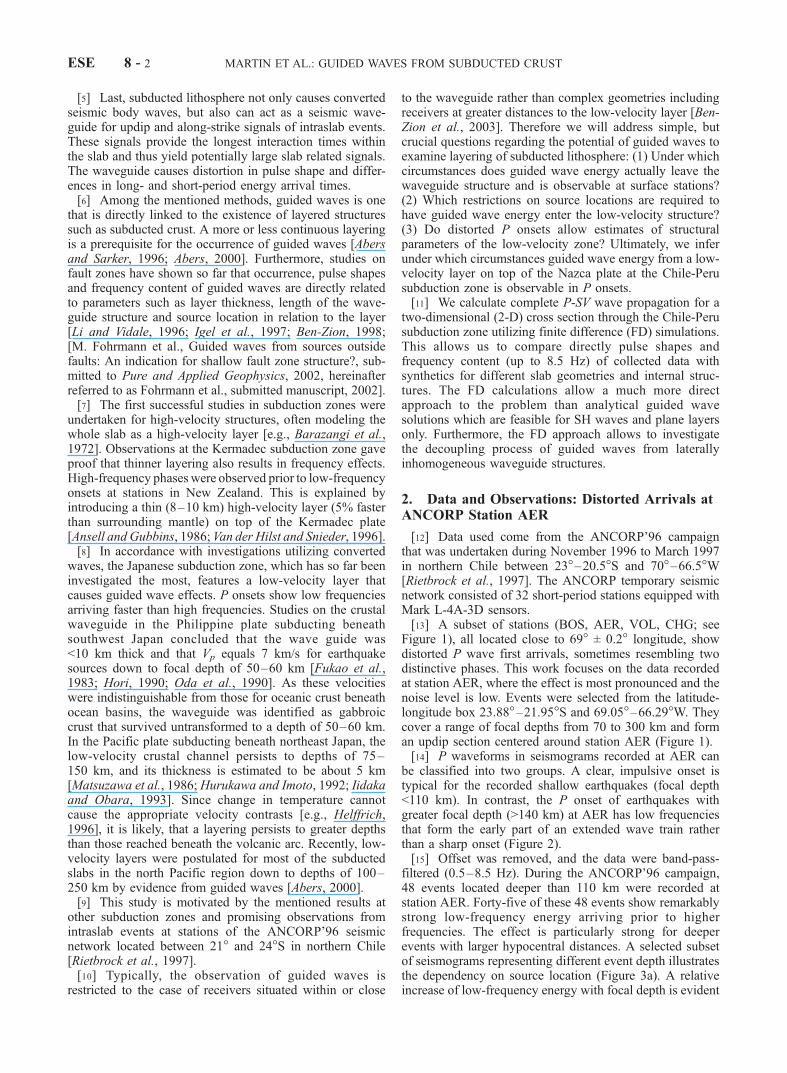
be classified into two groups. A clear, impulsive onset istypical for the recorded shallow earthquakes (focal depth<110 km). In contrast, the P onset of earthquakes withgreater focal depth (>140 km) at AER has low frequenciesthat form the early part of an extended wave train ratherthan a sharp onset (Figure 2).[15] Offset was removed, and the data were band-pass-
filtered (0.5–8.5 Hz). During the ANCORP’96 campaign,48 events located deeper than 110 km were recorded atstation AER. Forty-five of these 48 events show remarkablystrong low-frequency energy arriving prior to higherfrequencies. The effect is particularly strong for deeperevents with larger hypocentral distances. A selected subsetof seismograms representing different event depth illustratesthe dependency on source location (Figure 3a). A relativeincrease of low-frequency energy with focal depth is evident
ESE 8 - 2 MARTIN ET AL.: GUIDED WAVES FROM SUBDUCTED CRUST
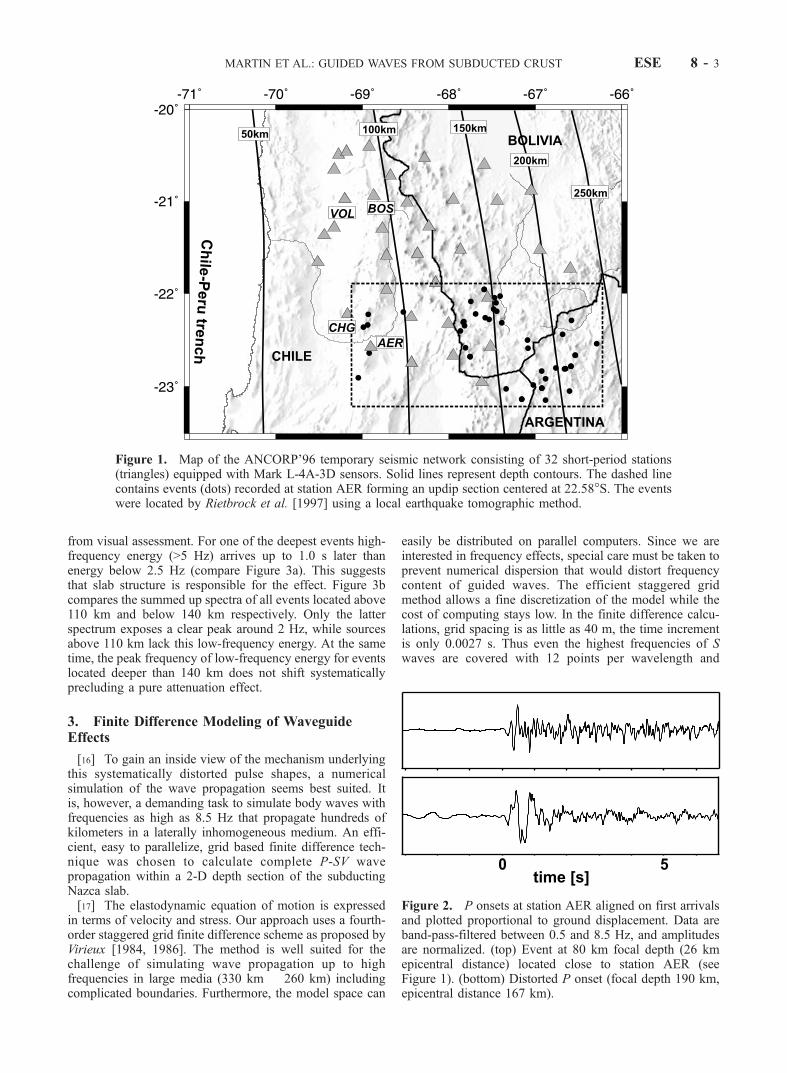
from visual assessment. For one of the deepest events high-frequency energy (>5 Hz) arrives up to 1.0 s later thanenergy below 2.5 Hz (compare Figure 3a). This suggeststhat slab structure is responsible for the effect. Figure 3bcompares the summed up spectra of all events located above110 km and below 140 km respectively. Only the latterspectrum exposes a clear peak around 2 Hz, while sourcesabove 110 km lack this low-frequency energy. At the sametime, the peak frequency of low-frequency energy for eventslocated deeper than 140 km does not shift systematicallyprecluding a pure attenuation effect.
3. Finite Difference Modeling of WaveguideEffects
[16] To gain an inside view of the mechanism underlyingthis systematically distorted pulse shapes, a numericalsimulation of the wave propagation seems best suited. Itis, however, a demanding task to simulate body waves withfrequencies as high as 8.5 Hz that propagate hundreds ofkilometers in a laterally inhomogeneous medium. An effi-cient, easy to parallelize, grid based finite difference tech-nique was chosen to calculate complete P-SV wavepropagation within a 2-D depth section of the subductingNazca slab.[17] The elastodynamic equation of motion is expressed
in terms of velocity and stress. Our approach uses a fourth-order staggered grid finite difference scheme as proposed byVirieux [1984, 1986]. The method is well suited for thechallenge of simulating wave propagation up to highfrequencies in large media (330 km � 260 km) includingcomplicated boundaries. Furthermore, the model space can
easily be distributed on parallel computers. Since we areinterested in frequency effects, special care must be taken toprevent numerical dispersion that would distort frequencycontent of guided waves. The efficient staggered gridmethod allows a fine discretization of the model while thecost of computing stays low. In the finite difference calcu-lations, grid spacing is as little as 40 m, the time incrementis only 0.0027 s. Thus even the highest frequencies of Swaves are covered with 12 points per wavelength and
Figure 1. Map of the ANCORP’96 temporary seismic network consisting of 32 short-period stations(triangles) equipped with Mark L-4A-3D sensors. Solid lines represent depth contours. The dashed linecontains events (dots) recorded at station AER forming an updip section centered at 22.58�S. The eventswere located by Rietbrock et al. [1997] using a local earthquake tomographic method.
Figure 2. P onsets at station AER aligned on first arrivalsand plotted proportional to ground displacement. Data areband-pass-filtered between 0.5 and 8.5 Hz, and amplitudesare normalized. (top) Event at 80 km focal depth (26 kmepicentral distance) located close to station AER (seeFigure 1). (bottom) Distorted P onset (focal depth 190 km,epicentral distance 167 km).
MARTIN ET AL.: GUIDED WAVES FROM SUBDUCTED CRUST ESE 8 - 3
numerical dispersion stays well below 0.5% [Levander,1988].[18] The scheme is rounded out using the planar free
surface condition given by, e.g., Levander [1988], thatemploys a zero stress formulation to produce accurate andnumerically stable surface reflections and P-SV conversions.In order to excite guided waves within a broad frequencyrange, we use a delta impulse as source wavelet in con-junction with subsequent low-pass filtering (8.5 Hz). Theartificial edges of the model are damped by simple expo-nential terms [Randal, 1989]. Because of hardware limita-tions, simulations of the given size, were, up to now,extremely cost intensive if not impossible to undertake.Today the scheme can be run on a LINUX cluster with16 knots (1 GHz Pentium III) within 16 hours real time.
4. Excitation of Guided Waves and Dependencieson Structural Parameters
4.1. Guided Waves: Effects and Prerequisites
[19] Understanding and using the available data require abasic knowledge of waveguide phenomena. Any continuouslayered structure that is slow compared to bounding mediacan act as a waveguide provided no large heterogeneities arepresent. Scales of layer thickness range frommeters to tens ofkilometers, dependent on the frequency range under obser-vation. This structure causes, for certain source-receiverconfigurations, internally reflected waves that produce prom-inent interference patterns called guided waves. The effectis most pronounced for shear energy but does also occurfor P waves. In this case, trapping of energy is less efficientand energy is leaking into the surrounding host rocks (P-SV-converted waves originating at the interfaces of the low-
velocity structure). The first studies to utilize the effect for Pand S waves in the context of tectonic faults are probablythose of Fukao et al. [1983] and Hori et al. [1985].[20] The dispersion properties of guided waves are such
that the lowest frequencies propagate along the structurewith velocities similar to P velocities of surrounding hostrocks, while higher-frequency energy arrives later, depen-dent on structural parameters [Li and Leary, 1990]. Thepulse shape and the frequency content of the resulting wavetrain is ultimately dependent on the material parameters andgeometry of the waveguide structure. The interferencepattern controlling the waveform character changes withthe number of times the waves are reflected internally in thewaveguide structure [Ben-Zion, 1998]. In particular, aminimum number of internal reflections is a prerequisiteto perceive the interference pattern as a continuous disper-sive wave train rather than separate phases. For givenvelocity contrasts, the number of reflections increases withpropagation distance along the structure, and it decreaseswith the thickness of the structure.[21] Thus occurrence of guided waves is restricted by a
lower limit of propagation distance and an upper limit ofwaveguide thickness. In addition, observed motion is astrong function of relative lateral position of the sourceand lateral receiver coordinates. Finally, low-quality factorsmodify the dominant period and overall duration of theguided waves considerably [Ben-Zion, 1998].[22] Within the context of the Chile-Peru subduction
zone, we are able to utilize mineralogical interpretationsto constrain velocity contrasts and studies of attenuationtomography give information on average quality factors.Thus geometry of the subducting slab along with receiverposition, propagation length of signals along the layer
Figure 3. (a) Aligned P onsets of selected events recorded at station AER plotted by focal depth (forfurther explanations see Figure 2). (b) Stacked displacement spectra of onsets (first 2 s) of all eventscontained in the updip section (see Figure 1) with focal depth <110 km and >140 km, respectively.
ESE 8 - 4 MARTIN ET AL.: GUIDED WAVES FROM SUBDUCTED CRUST
(i.e., focal depth), thickness of subducted crust and thesource position relative to the layer will be the parametersinvestigated.
4.2. Results
4.2.1. Slab Structure and Occurrence of Guided Waves[23] We aim to reproduce the observed effect in principle,
utilizing a velocity model that only contains the basicfeatures common along the extent of the subduction zonefrom surface to intermediate depth. The basis is a simplifiedsketch of the subducted slab, deduced from refractionseismic studies [Lessel, 1997; Patzwahl, 1998] and worksof Bock et al. [2000] and Yuan et al. [2000] using Psconverted waves. Seismic velocity contrasts between con-tinental mantle and slab surface in northern Chile could betraced down to depth of 160 km, while the oceanic Mohothat delineates the subducted crust is visible down to120 km. Continental crust is assumed to extend down to60 km with an average P velocity of 6.0 km/s. Mantle Pvelocities at depth greater than 60 km are averaged to be8.0 km/s, the subducted material of the relatively youngNazca plate appears only slightly faster (8.1 km/s). Ifsubducted crust persists as a partially eclogized layer on
top of the slab surface, P velocities of 7.5 km/s are expected[Helffrich et al., 1989; Hacker et al., 2003a, 2003b]. Theaverage subduction angle at latitude 21�S down to 300 kmdepth was inferred from the works of Graeber [1997] andRietbrock et al. [1997] to be 30�. In our simulations weinserted a simple, if unrealistic, explosive source. Thesimulation of complete P-SV wave propagation within alaterally inhomogeneous velocity model results in compli-cated seismogram sections. We therefore find it helpful toexclude influences of source functions and mechanismsfrom our investigations, allowing an unobstructed look atstructural parameters of the waveguide.[24] In advance of simulations that include a low-velocity
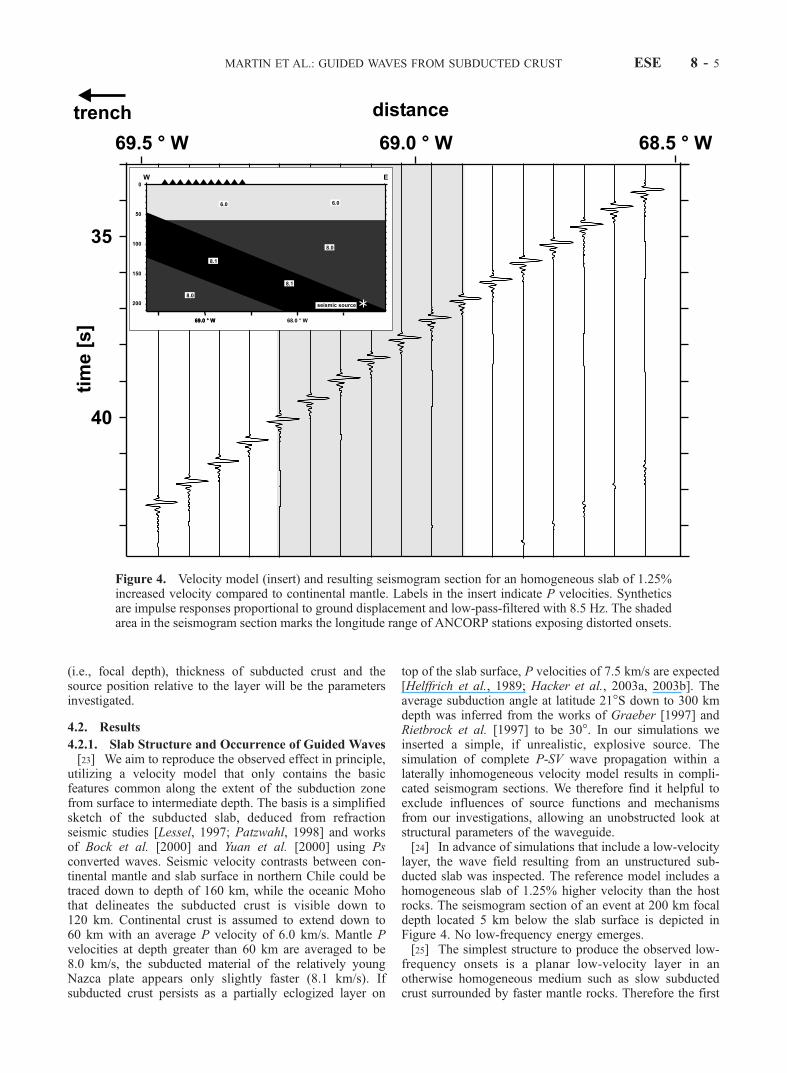
layer, the wave field resulting from an unstructured sub-ducted slab was inspected. The reference model includes ahomogeneous slab of 1.25% higher velocity than the hostrocks. The seismogram section of an event at 200 km focaldepth located 5 km below the slab surface is depicted inFigure 4. No low-frequency energy emerges.[25] The simplest structure to produce the observed low-
frequency onsets is a planar low-velocity layer in anotherwise homogeneous medium such as slow subductedcrust surrounded by faster mantle rocks. Therefore the first
Figure 4. Velocity model (insert) and resulting seismogram section for an homogeneous slab of 1.25%increased velocity compared to continental mantle. Labels in the insert indicate P velocities. Syntheticsare impulse responses proportional to ground displacement and low-pass-filtered with 8.5 Hz. The shadedarea in the seismogram section marks the longitude range of ANCORP stations exposing distorted onsets.
MARTIN ET AL.: GUIDED WAVES FROM SUBDUCTED CRUST ESE 8 - 5
approach uses a model that is reduced to these threecomponents. While guided waves begin to develop rightfrom the start of their journey through the slab, the point ofoccurrence of guided wave energy at the surface is assumedto be determined mainly by the velocity structure above100 km depth. Various studies on fault zone waves werealready dedicated to the issue. Under which circumstancesdo guided waves leave the wave guide and can be observedoutside of it? It has been shown that a maximum of guidedwave energy is observed within and directly above a verticallow-velocity layer. With increasing distance from the layer,amplitudes decay rapidly [Igel et al., 1997].[26] A zone of transition below the receiver line in the
continental mantle was assigned the same seismic velocitiesas the low velocity layer. The transition zone was placed at adepth of 80 km, where studies suggest the same velocitiesfor subducted lithosphere and mantle [ANCORP WorkingGroup, 1999] (model, see insert of Figure 5).[27] To restrict the range of layer thickness and source
location to those values that produce a maximum in guidedwave energy within the desired frequency range (<5 Hz),spot checks were undertaken for a range of layer thicknesses(1–10 km) and source locations relative to the low-velocity
layer (ranging from 10 km below the subducted crust tosources located in the center of the subducted crust). Focaldepth was 200 km, and the seismic velocity contrast towardcontinental mantle was kept at a constant of 7%. Thestrength of guided wave energy at a receiver located inthe center of the layer was used as a criterion to estimate anupper limit for the layer thickness and ideal values forsource location. In accordance with studies carried out forplanar, vertical low-velocity layers [Igel et al., 1997], thewaveguide effect was most pronounced for sources locatedwithin the layer. A closer look at the effects of sourcepositioning will be taken in section 4.2.4. The tests alsoindicated that for velocity contrasts <10% and the givenfocal depth, low-velocity layers thicker than 5 km do notcause sufficient internal reflections for the development of aguided wave train.[28] Using maximum amplitudes and frequency content
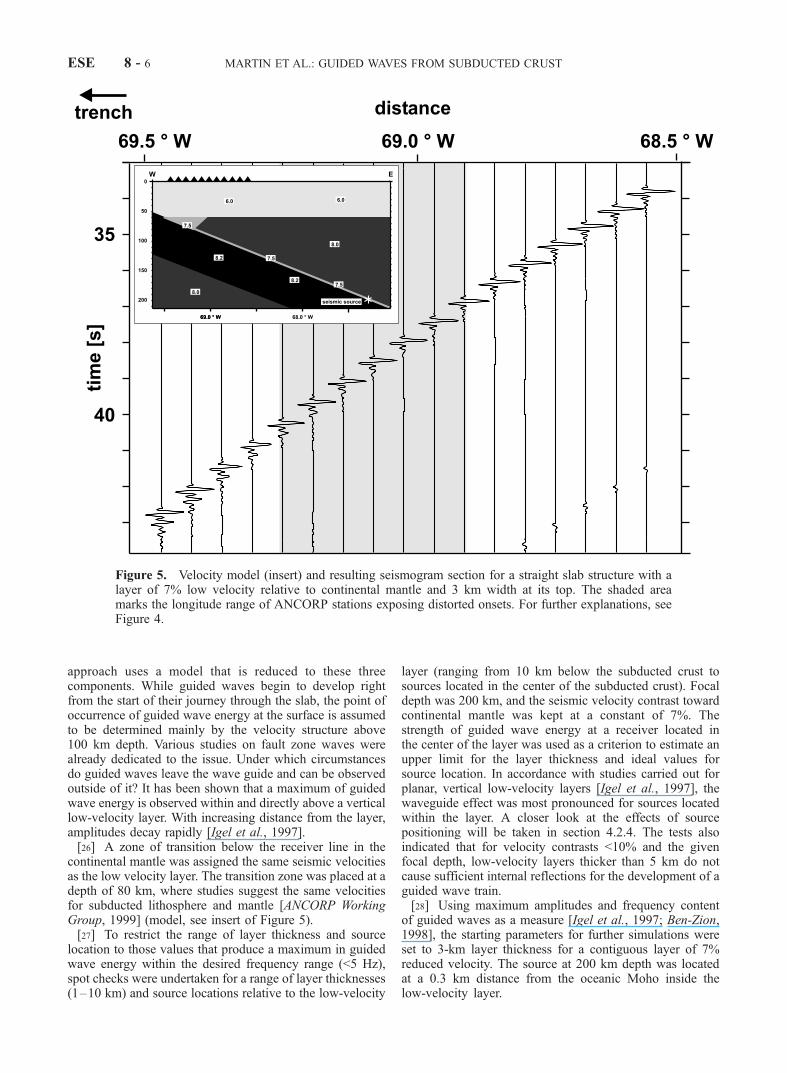
of guided waves as a measure [Igel et al., 1997; Ben-Zion,1998], the starting parameters for further simulations wereset to 3-km layer thickness for a contiguous layer of 7%reduced velocity. The source at 200 km depth was locatedat a 0.3 km distance from the oceanic Moho inside thelow-velocity layer.
Figure 5. Velocity model (insert) and resulting seismogram section for a straight slab structure with alayer of 7% low velocity relative to continental mantle and 3 km width at its top. The shaded areamarks the longitude range of ANCORP stations exposing distorted onsets. For further explanations, seeFigure 4.
ESE 8 - 6 MARTIN ET AL.: GUIDED WAVES FROM SUBDUCTED CRUST
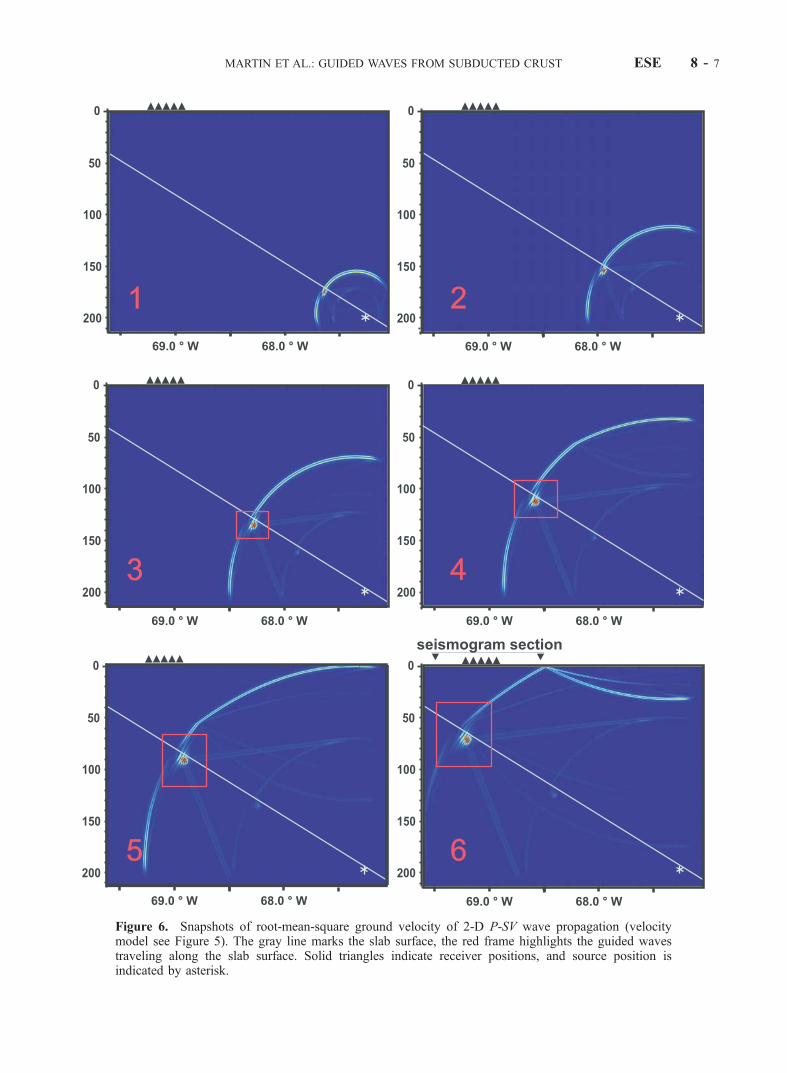
Figure 6. Snapshots of root-mean-square ground velocity of 2-D P-SV wave propagation (velocitymodel see Figure 5). The gray line marks the slab surface, the red frame highlights the guided wavestraveling along the slab surface. Solid triangles indicate receiver positions, and source position isindicated by asterisk.
MARTIN ET AL.: GUIDED WAVES FROM SUBDUCTED CRUST ESE 8 - 7
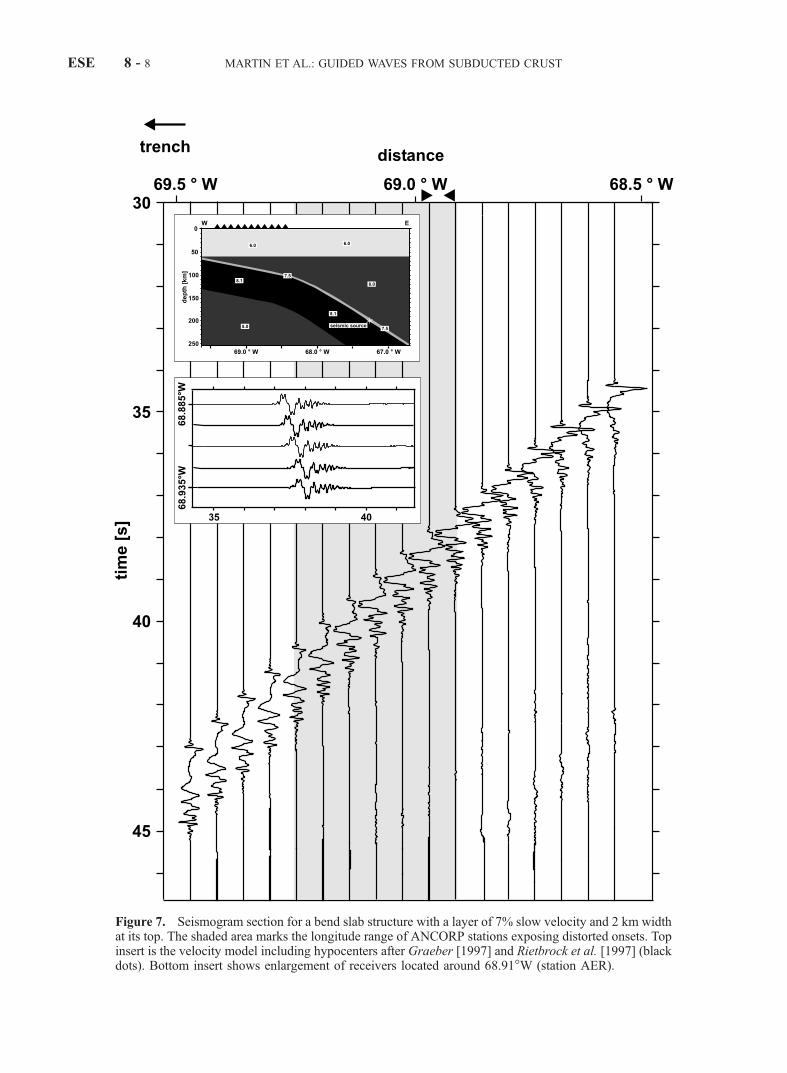
Figure 7. Seismogram section for a bend slab structure with a layer of 7% slow velocity and 2 km widthat its top. The shaded area marks the longitude range of ANCORP stations exposing distorted onsets. Topinsert is the velocity model including hypocenters after Graeber [1997] and Rietbrock et al. [1997] (blackdots). Bottom insert shows enlargement of receivers located around 68.91�W (station AER).
ESE 8 - 8 MARTIN ET AL.: GUIDED WAVES FROM SUBDUCTED CRUST
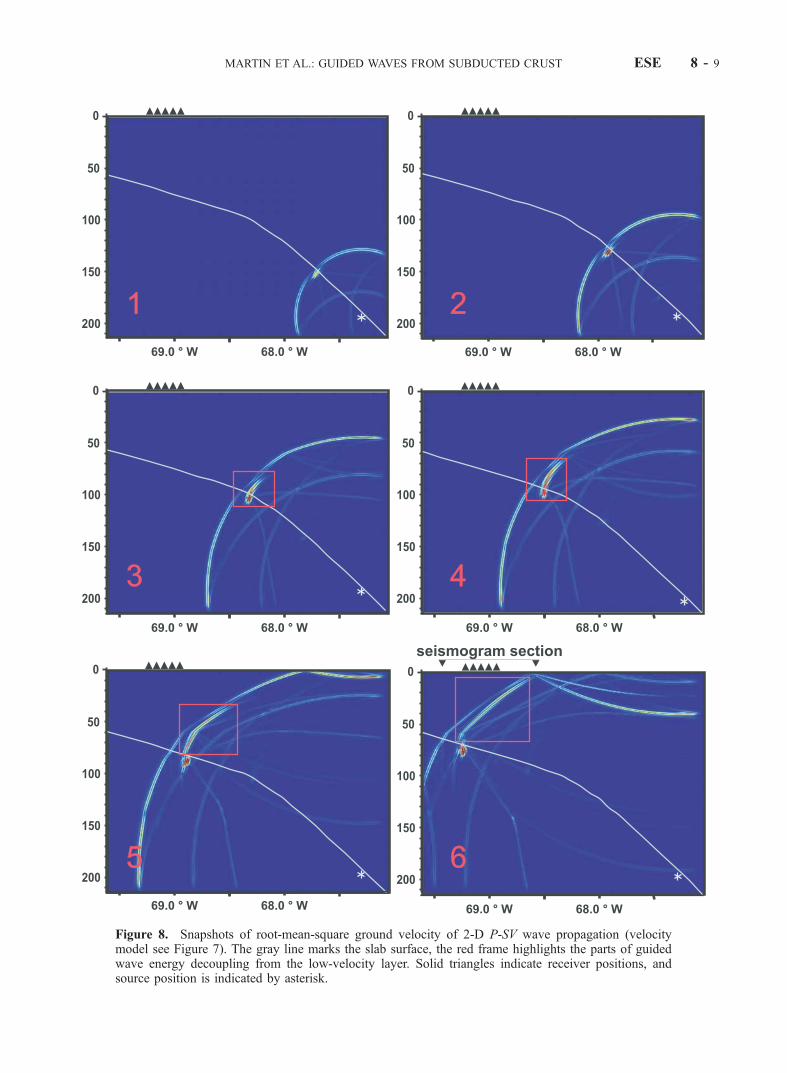
Figure 8. Snapshots of root-mean-square ground velocity of 2-D P-SV wave propagation (velocitymodel see Figure 7). The gray line marks the slab surface, the red frame highlights the parts of guidedwave energy decoupling from the low-velocity layer. Solid triangles indicate receiver positions, andsource position is indicated by asterisk.
MARTIN ET AL.: GUIDED WAVES FROM SUBDUCTED CRUST ESE 8 - 9
[29] The receiver line of Figure 5 shows displacementseismograms starting roughly 90 km inland from the coastline. Guided wave energy does not appear anywherenear the stations of the ANCORP network at the freesurface. However, snapshots of the wave field show thedevelopment of a guided wave train with strong amplitudespropagating upward along the slab surface (Figure 6).Considerable guided wave energy builds up, but the wavescontinue to travel trenchward with the same slownessoriginally formed by the direction of the layer. Despite theopening of the layer, guided waves in this context wouldonly be observable at stations offshore.[30] Since the initial slab structure appears oversimplified
and unsuited to explain the observations, the slab geometrywas adjusted. The modified slab is now smoothly bendingdownward in the depth range of 90–150 km (hypocentersderived by Graeber [1997] and Rietbrock et al. [1997]) (seeFigure 7). The subduction angle varies from 16� to 35�. Aseries of snapshots resulting from this enhanced modelreveals that the waves are not strictly ‘‘guided’’ by thelow-velocity layer but are, in fact, partially transmittedtoward the bounding rocks if the structure is not planar(Figure 8). At depth around 100 km, where bending is mostsevere, part of the energy leaves the low-velocity layer.After the decoupling process, this low-frequency energyproceeds with the same slowness as defined by the lowerportion of the slab and same direction through the conti-nental mantle and to the surface.[31] The slab geometry and alterations in subduction
angle, not the local velocity structure of the slab, thusdefine the point of appearance of guided wave energy atthe surface. Within a small stripe around 140 km inlandfrom the coastline (69.2�W–68.8�W) guided waves areobserved as P first arrivals (Figure 7). This is in accordancewith the locations of stations AER, BOS, and CHG of theANCORP network (compare Figure 1).[32] A receiver at 69.0�W, where guided wave energy is
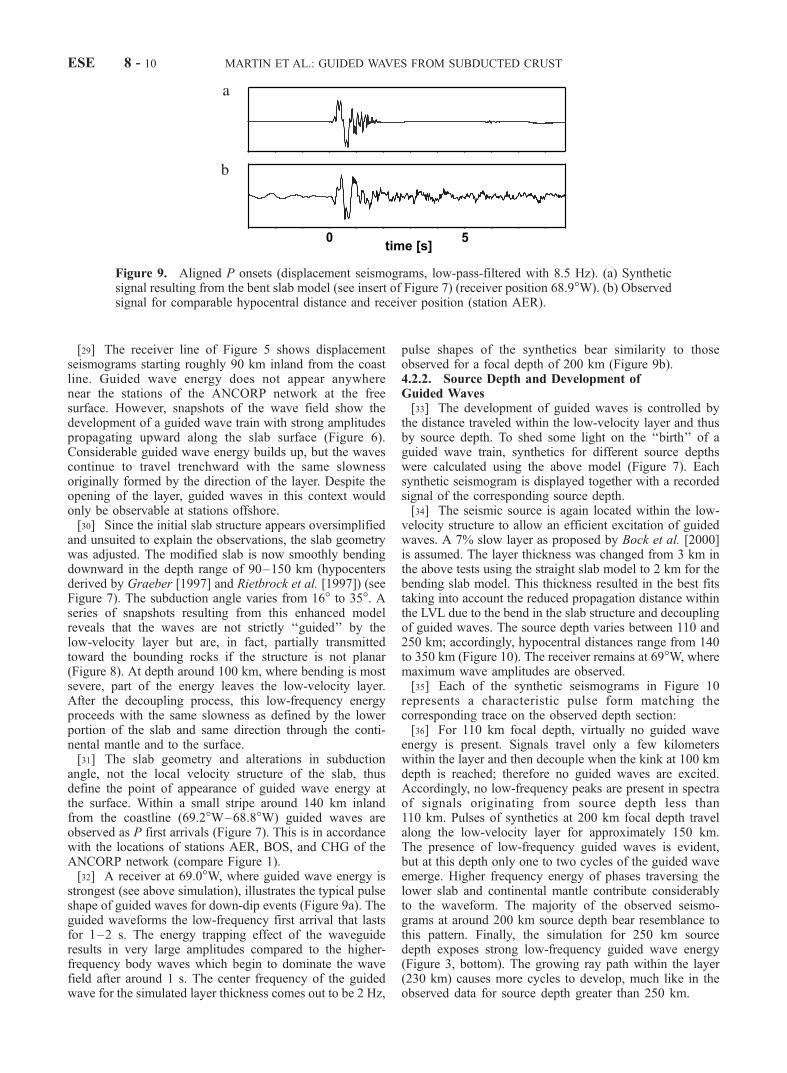
strongest (see above simulation), illustrates the typical pulseshape of guided waves for down-dip events (Figure 9a). Theguided waveforms the low-frequency first arrival that lastsfor 1–2 s. The energy trapping effect of the waveguideresults in very large amplitudes compared to the higher-frequency body waves which begin to dominate the wavefield after around 1 s. The center frequency of the guidedwave for the simulated layer thickness comes out to be 2 Hz,
pulse shapes of the synthetics bear similarity to thoseobserved for a focal depth of 200 km (Figure 9b).4.2.2. Source Depth and Development ofGuided Waves[33] The development of guided waves is controlled by
the distance traveled within the low-velocity layer and thusby source depth. To shed some light on the ‘‘birth’’ of aguided wave train, synthetics for different source depthswere calculated using the above model (Figure 7). Eachsynthetic seismogram is displayed together with a recordedsignal of the corresponding source depth.[34] The seismic source is again located within the low-
velocity structure to allow an efficient excitation of guidedwaves. A 7% slow layer as proposed by Bock et al. [2000]is assumed. The layer thickness was changed from 3 km inthe above tests using the straight slab model to 2 km for thebending slab model. This thickness resulted in the best fitstaking into account the reduced propagation distance withinthe LVL due to the bend in the slab structure and decouplingof guided waves. The source depth varies between 110 and250 km; accordingly, hypocentral distances range from 140to 350 km (Figure 10). The receiver remains at 69�W, wheremaximum wave amplitudes are observed.[35] Each of the synthetic seismograms in Figure 10
represents a characteristic pulse form matching thecorresponding trace on the observed depth section:[36] For 110 km focal depth, virtually no guided wave
energy is present. Signals travel only a few kilometerswithin the layer and then decouple when the kink at 100 kmdepth is reached; therefore no guided waves are excited.Accordingly, no low-frequency peaks are present in spectraof signals originating from source depth less than110 km. Pulses of synthetics at 200 km focal depth travelalong the low-velocity layer for approximately 150 km.The presence of low-frequency guided waves is evident,but at this depth only one to two cycles of the guided waveemerge. Higher frequency energy of phases traversing thelower slab and continental mantle contribute considerablyto the waveform. The majority of the observed seismo-grams at around 200 km source depth bear resemblance tothis pattern. Finally, the simulation for 250 km sourcedepth exposes strong low-frequency guided wave energy(Figure 3, bottom). The growing ray path within the layer(230 km) causes more cycles to develop, much like in theobserved data for source depth greater than 250 km.
Figure 9. Aligned P onsets (displacement seismograms, low-pass-filtered with 8.5 Hz). (a) Syntheticsignal resulting from the bent slab model (see insert of Figure 7) (receiver position 68.9�W). (b) Observedsignal for comparable hypocentral distance and receiver position (station AER).
ESE 8 - 10 MARTIN ET AL.: GUIDED WAVES FROM SUBDUCTED CRUST
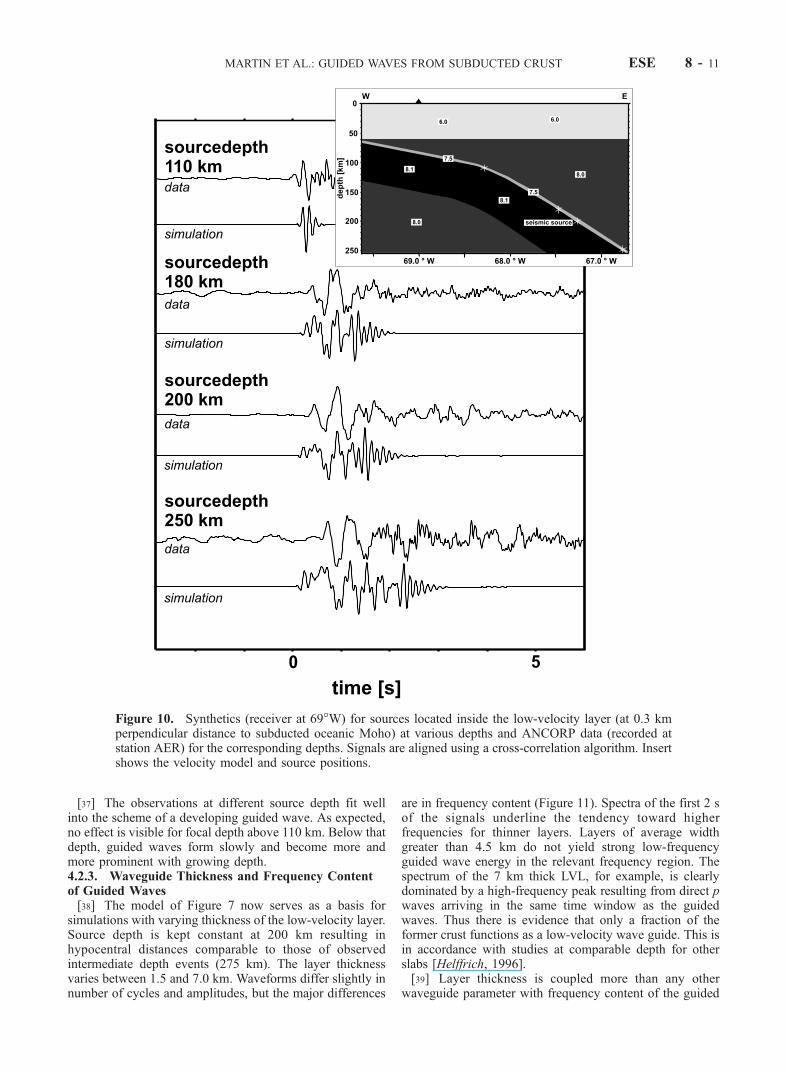
[37] The observations at different source depth fit wellinto the scheme of a developing guided wave. As expected,no effect is visible for focal depth above 110 km. Below thatdepth, guided waves form slowly and become more andmore prominent with growing depth.4.2.3. Waveguide Thickness and Frequency Contentof Guided Waves[38] The model of Figure 7 now serves as a basis for
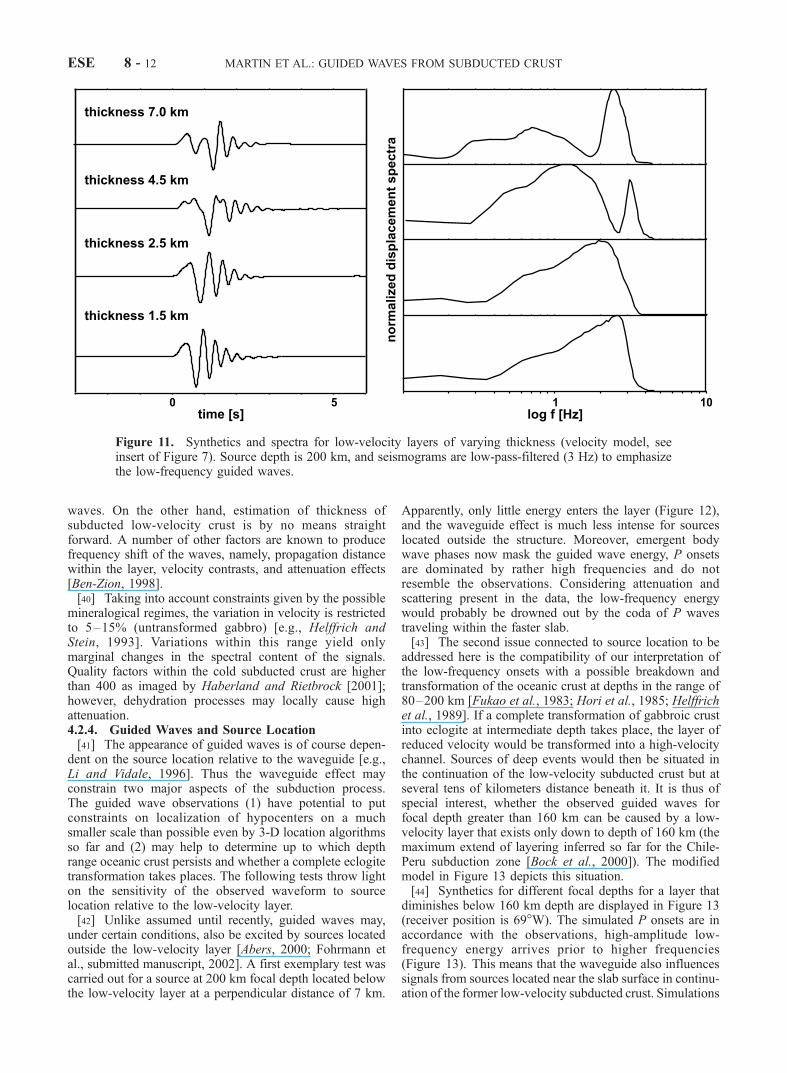
simulations with varying thickness of the low-velocity layer.Source depth is kept constant at 200 km resulting inhypocentral distances comparable to those of observedintermediate depth events (275 km). The layer thicknessvaries between 1.5 and 7.0 km. Waveforms differ slightly innumber of cycles and amplitudes, but the major differences
are in frequency content (Figure 11). Spectra of the first 2 sof the signals underline the tendency toward higherfrequencies for thinner layers. Layers of average widthgreater than 4.5 km do not yield strong low-frequencyguided wave energy in the relevant frequency region. Thespectrum of the 7 km thick LVL, for example, is clearlydominated by a high-frequency peak resulting from direct pwaves arriving in the same time window as the guidedwaves. Thus there is evidence that only a fraction of theformer crust functions as a low-velocity wave guide. This isin accordance with studies at comparable depth for otherslabs [Helffrich, 1996].[39] Layer thickness is coupled more than any other
waveguide parameter with frequency content of the guided
Figure 10. Synthetics (receiver at 69�W) for sources located inside the low-velocity layer (at 0.3 kmperpendicular distance to subducted oceanic Moho) at various depths and ANCORP data (recorded atstation AER) for the corresponding depths. Signals are aligned using a cross-correlation algorithm. Insertshows the velocity model and source positions.
MARTIN ET AL.: GUIDED WAVES FROM SUBDUCTED CRUST ESE 8 - 11
waves. On the other hand, estimation of thickness ofsubducted low-velocity crust is by no means straightforward. A number of other factors are known to producefrequency shift of the waves, namely, propagation distancewithin the layer, velocity contrasts, and attenuation effects[Ben-Zion, 1998].[40] Taking into account constraints given by the possible
mineralogical regimes, the variation in velocity is restrictedto 5–15% (untransformed gabbro) [e.g., Helffrich andStein, 1993]. Variations within this range yield onlymarginal changes in the spectral content of the signals.Quality factors within the cold subducted crust are higherthan 400 as imaged by Haberland and Rietbrock [2001];however, dehydration processes may locally cause highattenuation.4.2.4. Guided Waves and Source Location[41] The appearance of guided waves is of course depen-
dent on the source location relative to the waveguide [e.g.,Li and Vidale, 1996]. Thus the waveguide effect mayconstrain two major aspects of the subduction process.The guided wave observations (1) have potential to putconstraints on localization of hypocenters on a muchsmaller scale than possible even by 3-D location algorithmsso far and (2) may help to determine up to which depthrange oceanic crust persists and whether a complete eclogitetransformation takes places. The following tests throw lighton the sensitivity of the observed waveform to sourcelocation relative to the low-velocity layer.[42] Unlike assumed until recently, guided waves may,
under certain conditions, also be excited by sources locatedoutside the low-velocity layer [Abers, 2000; Fohrmann etal., submitted manuscript, 2002]. A first exemplary test wascarried out for a source at 200 km focal depth located belowthe low-velocity layer at a perpendicular distance of 7 km.
Apparently, only little energy enters the layer (Figure 12),and the waveguide effect is much less intense for sourceslocated outside the structure. Moreover, emergent bodywave phases now mask the guided wave energy, P onsetsare dominated by rather high frequencies and do notresemble the observations. Considering attenuation andscattering present in the data, the low-frequency energywould probably be drowned out by the coda of P wavestraveling within the faster slab.[43] The second issue connected to source location to be
addressed here is the compatibility of our interpretation ofthe low-frequency onsets with a possible breakdown andtransformation of the oceanic crust at depths in the range of80–200 km [Fukao et al., 1983; Hori et al., 1985; Helffrichet al., 1989]. If a complete transformation of gabbroic crustinto eclogite at intermediate depth takes place, the layer ofreduced velocity would be transformed into a high-velocitychannel. Sources of deep events would then be situated inthe continuation of the low-velocity subducted crust but atseveral tens of kilometers distance beneath it. It is thus ofspecial interest, whether the observed guided waves forfocal depth greater than 160 km can be caused by a low-velocity layer that exists only down to depth of 160 km (themaximum extend of layering inferred so far for the Chile-Peru subduction zone [Bock et al., 2000]). The modifiedmodel in Figure 13 depicts this situation.[44] Synthetics for different focal depths for a layer that
diminishes below 160 km depth are displayed in Figure 13(receiver position is 69�W). The simulated P onsets are inaccordance with the observations, high-amplitude low-frequency energy arrives prior to higher frequencies(Figure 13). This means that the waveguide also influencessignals from sources located near the slab surface in continu-ation of the former low-velocity subducted crust. Simulations
Figure 11. Synthetics and spectra for low-velocity layers of varying thickness (velocity model, seeinsert of Figure 7). Source depth is 200 km, and seismograms are low-pass-filtered (3 Hz) to emphasizethe low-frequency guided waves.
ESE 8 - 12 MARTIN ET AL.: GUIDED WAVES FROM SUBDUCTED CRUST
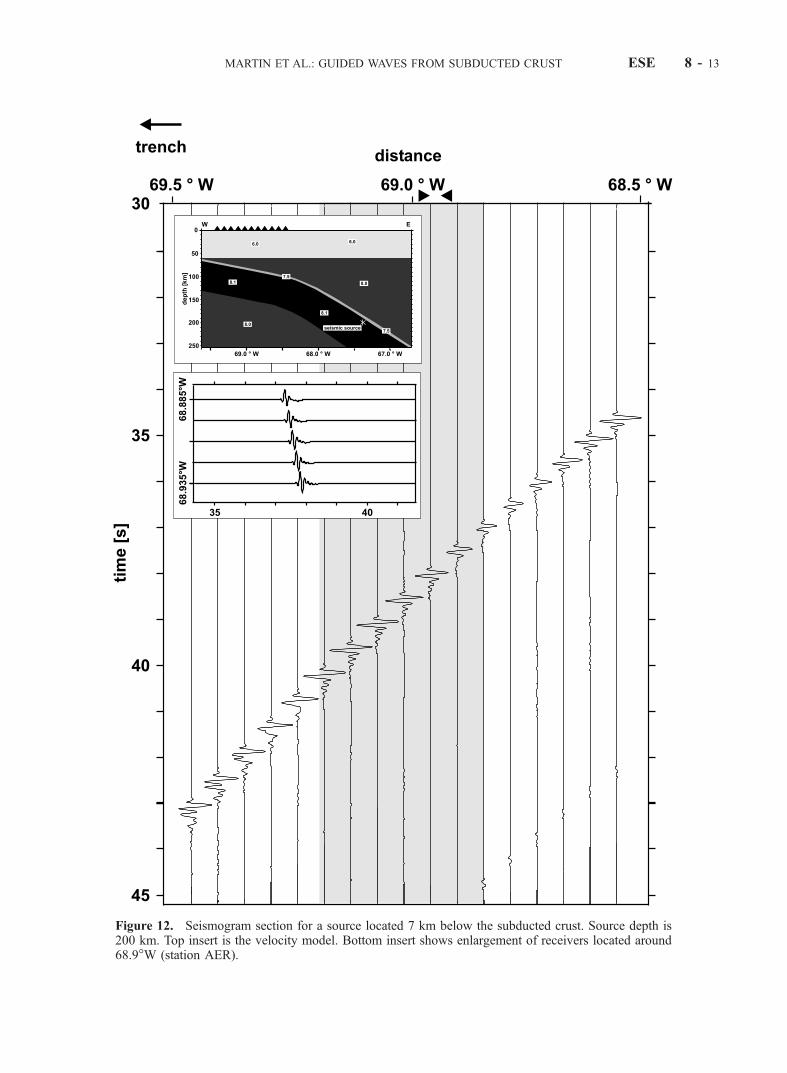
Figure 12. Seismogram section for a source located 7 km below the subducted crust. Source depth is200 km. Top insert is the velocity model. Bottom insert shows enlargement of receivers located around68.9�W (station AER).
MARTIN ET AL.: GUIDED WAVES FROM SUBDUCTED CRUST ESE 8 - 13
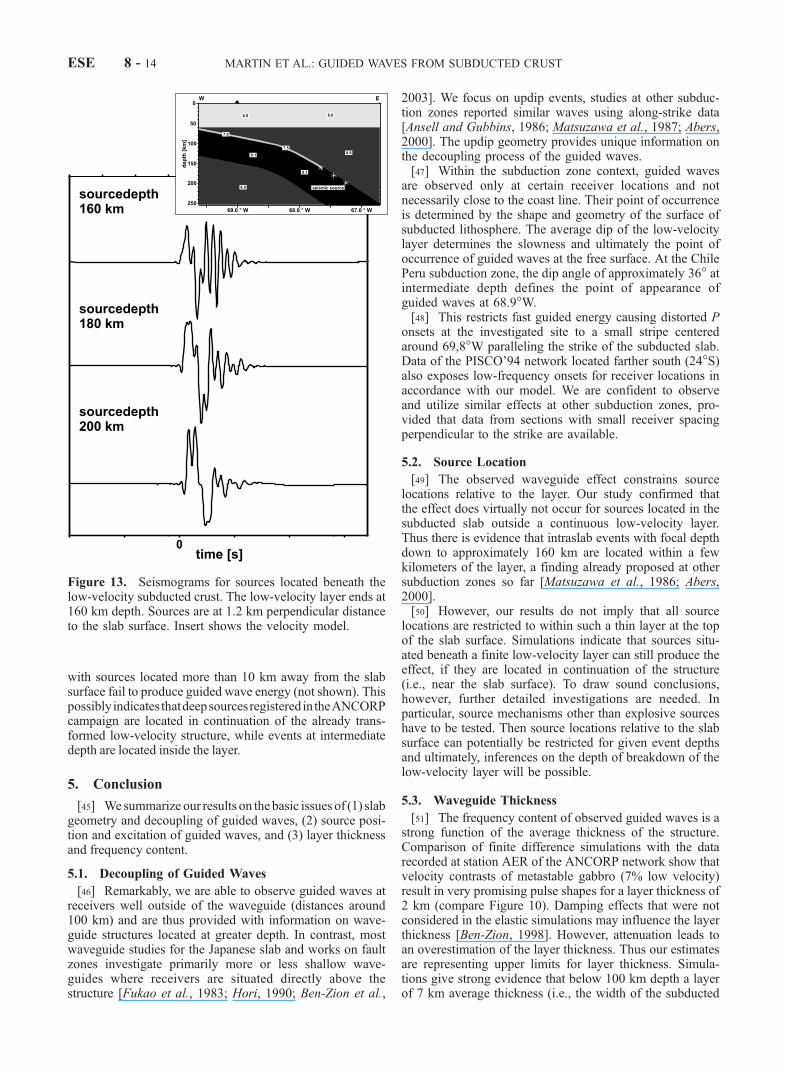
with sources located more than 10 km away from the slabsurface fail to produce guided wave energy (not shown). Thispossibly indicates thatdeepsourcesregisteredintheANCORPcampaign are located in continuation of the already trans-formed low-velocity structure, while events at intermediatedepth are located inside the layer.
5. Conclusion
[45] We summarize our results on the basic issues of (1) slabgeometry and decoupling of guided waves, (2) source posi-tion and excitation of guided waves, and (3) layer thicknessand frequency content.
5.1. Decoupling of Guided Waves
[46] Remarkably, we are able to observe guided waves atreceivers well outside of the waveguide (distances around100 km) and are thus provided with information on wave-guide structures located at greater depth. In contrast, mostwaveguide studies for the Japanese slab and works on faultzones investigate primarily more or less shallow wave-guides where receivers are situated directly above thestructure [Fukao et al., 1983; Hori, 1990; Ben-Zion et al.,
2003]. We focus on updip events, studies at other subduc-tion zones reported similar waves using along-strike data[Ansell and Gubbins, 1986; Matsuzawa et al., 1987; Abers,2000]. The updip geometry provides unique information onthe decoupling process of the guided waves.[47] Within the subduction zone context, guided waves
are observed only at certain receiver locations and notnecessarily close to the coast line. Their point of occurrenceis determined by the shape and geometry of the surface ofsubducted lithosphere. The average dip of the low-velocitylayer determines the slowness and ultimately the point ofoccurrence of guided waves at the free surface. At the ChilePeru subduction zone, the dip angle of approximately 36� atintermediate depth defines the point of appearance ofguided waves at 68.9�W.[48] This restricts fast guided energy causing distorted P
onsets at the investigated site to a small stripe centeredaround 69,8�W paralleling the strike of the subducted slab.Data of the PISCO’94 network located farther south (24�S)also exposes low-frequency onsets for receiver locations inaccordance with our model. We are confident to observeand utilize similar effects at other subduction zones, pro-vided that data from sections with small receiver spacingperpendicular to the strike are available.
5.2. Source Location
[49] The observed waveguide effect constrains sourcelocations relative to the layer. Our study confirmed thatthe effect does virtually not occur for sources located in thesubducted slab outside a continuous low-velocity layer.Thus there is evidence that intraslab events with focal depthdown to approximately 160 km are located within a fewkilometers of the layer, a finding already proposed at othersubduction zones so far [Matsuzawa et al., 1986; Abers,2000].[50] However, our results do not imply that all source
locations are restricted to within such a thin layer at the topof the slab surface. Simulations indicate that sources situ-ated beneath a finite low-velocity layer can still produce theeffect, if they are located in continuation of the structure(i.e., near the slab surface). To draw sound conclusions,however, further detailed investigations are needed. Inparticular, source mechanisms other than explosive sourceshave to be tested. Then source locations relative to the slabsurface can potentially be restricted for given event depthsand ultimately, inferences on the depth of breakdown of thelow-velocity layer will be possible.
5.3. Waveguide Thickness
[51] The frequency content of observed guided waves is astrong function of the average thickness of the structure.Comparison of finite difference simulations with the datarecorded at station AER of the ANCORP network show thatvelocity contrasts of metastable gabbro (7% low velocity)result in very promising pulse shapes for a layer thickness of2 km (compare Figure 10). Damping effects that were notconsidered in the elastic simulations may influence the layerthickness [Ben-Zion, 1998]. However, attenuation leads toan overestimation of the layer thickness. Thus our estimatesare representing upper limits for layer thickness. Simula-tions give strong evidence that below 100 km depth a layerof 7 km average thickness (i.e., the width of the subducted
Figure 13. Seismograms for sources located beneath thelow-velocity subducted crust. The low-velocity layer ends at160 km depth. Sources are at 1.2 km perpendicular distanceto the slab surface. Insert shows the velocity model.
ESE 8 - 14 MARTIN ET AL.: GUIDED WAVES FROM SUBDUCTED CRUST
oceanic crust) can not be reconciled with the data, even alayer of 5 km width can neither match the 2 Hz frequencypeak present in the data nor excite sufficient guided waves(see Figure 11).
5.4. Consequences for the Subducting Nazca Plate
[52] Our findings show that the observed frequency effectis caused by guided waves developing in a thin low-velocitylayer located in the continental mantle beneath northernChile at 21�S. The part of the low-velocity structureilluminated by guided waves is situated at depth greaterthan 100 km. It resembles a rather thin layer (<4.5 km) of7% low velocity at the slab surface reaching down to depthof 160 km, probably further. We therefore conclude that wedo not image an untransformed basaltic oceanic crust(which we expect to be thicker) but a low-velocity layerthat results from mineralogical phase changes taking placewithin or in the vicinity of the former subducted crust atthe interface between continental mantle and subductedlithosphere. For comparable depth, studies at other subduc-tion zones have so far found evidence for a similar low-velocity region [Matsuzawa et al., 1987; Abers and Sarker,1996; Helffrich and Abers, 1997; Abers, 2000]. Possiblecompositions for such a layer have been suggested, e.g., byHelffrich [1996], Peacock [1996], and Hacker et al. [2003a,2003b].[53] Our results regarding the Chile-Peru subduction zone
seem to agree with the latest mineralogical model proposedby Hacker et al. [2003a, 2003b]. In this scheme, subductedcrust in the depth range of interest is depicted as a coarsegrained, partially eclogized low-velocity layer (the lowercrust) topped by dehydrated upper crust. From the simulatedlayer width for the Chile-Peru slab, we deduce that theguided waves image the slow, lower part of subducted crustat intermediate depth. Whether or not this interpretation is tobe favored among the other possible mineral assemblagesrequires further research. In any case, the waveguide is apersistent feature of the subducted Nazca slab and the Chile-Peru subduction zone is one more example within thePacific subduction zones that features a low-velocity layerat the top of the slab surface extending to depthes of 100–160 km.
[54] Acknowledgments. Thanks are due to the members of theCluster Computing Group of the Institut fur Informatik (UniversitatPotsdam) for their support and resources on the LINUX cluster. ANCORPand PISCO experiments were financed by the German Science Foundation(DFG) through the SFB 267, the GeoForschungsZentrum Potsdam (GFZ),and the Free University of Berlin (FUB). GIPP (GFZ) and FUB providedthe instruments.
ReferencesAbers, G. A., Hydrated subducted crust at 100–250 km depth, Earth Pla-net. Sci. Lett., 176, 323–330, 2000.
Abers, G. A., and R. Sarker, Dispersion of regional body waves at 100–150 km depth beneath Alaska: in situ constraints on metamorphism ofsubducted crust, Geophys. Res. Lett., 23, 1171–1174, 1996.
ANCORP Working Group, Seismic reflection image revealing offset ofAndean subduction-zone earthquake locations into oceanic mantle,Nature, 397, 341–344, 1999.
Ansell, J. H., and D. Gubbins, Anomalous high-frequency wave propaga-tion from the Tonga-Kermadec seismic zone to New Zealand, Geophys.J. R. Astron. Soc., 85, 93–106, 1986.
Barazangi, M. B., B. Isacks, and J. Oliver, Propagation of seismic wavesthrough and beneath the lithosphere that descends under the Tonga islandarc, J. Geophys. Res., 77, 952–958, 1972.
Ben-Zion, Y., Properties of seismic fault zone waves and their utility forimaging low velocity structures, J. Geophys. Res., 103, 12,567–12,585,1998.
Ben-Zion, Y., Z. Peng, D. Okaya, L. Seeber, J. G. Armbruster, N. Ozer, A. J.Michael, S. Baris, and M. Aktar, A shallow fault zone structure illumi-nated by trapped waves in the Karadere-Duzca branch of the North Ana-tolian Fault, western Turkey, Geophys. J. Int., 152(3), 699–717, 2003.
Bock, G., B. Schurr, and G. Asch, High-resolution image of the oceanicMoho in the subducting Nazca plate from P-S converted waves, Geophys.Res. Lett., 27, 3929–3932, 2000.
Davies, D., and D. P. McKenzie, Seismic travel-time residuals and plates,Geophys. J. R. Astron. Soc., 18, 51–63, 1969.
Fukao, Y., K. Kanjo, and I. Nakamura, Deep seismic zone as an uppermantle reflector of body waves, Nature, 272, 606–608, 1978.
Fukao, Y., S. Hori, and M. Ukawa, A seismological constraint on the depthof basalt-eclogite transition in a subducting oceanic crust, Nature, 303,413–415, 1983.
Graeber, F. M., Seismische Geschwindigkeiten und Hypozentren in denSudlichen Zentralen Anden aus der simultanen Inversion von Laufzeit-daten des seismologischen Experiments PISCO ’94 in Nordchile, Ph.D.thesis, GeoForschungszentrum Potsdam, Germany, 1997.
Haberland, C., and A. Rietbrock, Attenuation tomography in the westerncentral Andes: A detailed insight into the structure of a magmatic arc,J. Geophys. Res., 106, 11,151–11,167, 2001.
Hacker, B. R., S. M. Peacock, G. A. Abers, and S. D. Holloway, Sub-duction factory, 1, Theoretical mineralogy, densities, seismic wavespeeds and H20 contents, J. Geophys. Res., 108(B1), 2029, doi:10.1029/2001JB001127, 2003a.
Hacker, B.R., S. M. Peacock, G. A. Abers, and S. D. Holloway, Subductionfactory, 2, Are intermediate-depth earthquakes in subducting slabs linkedto metamorphic dehydration reactions?, J. Geophys. Res., 108(B1), 2030,doi:10.1029/2001JB001129, 2003b.
Helffrich, G., Subducted lithospheric slab velocity structure: Observationsand mineralogical inferences, in Subduction Top to Bottom, Geophys.Monogr. Ser., vol. 96, edited by G. E. Bebout et al., pp. 215–222,AGU, Washington, D. C., 1996.
Helffrich, G., and G. A. Abers, Slab low-velocity layer in the easternAleutian subduction zone, Geophys. J. Int., 130, 640–648, 1997.
Helffrich, G. R., and S. Stein, Study of the structure of the slab mantleinterface using reflected and converted seismic waves, Geophys. J. Int.,115, 15–40, 1993.
Helffrich, G., S. Stein, and B. J. Wood, Subduction zone thermal structureand mineralogy and their relationship to seismic wave reflections andconversions at the slab/mantle interface, J. Geophys. Res., 94, 753–763, 1989.
Hori, S., Seismic waves guided by untransformed oceanic crust subductinginto the mantle: The case of the Kanto district, central Japan, Tectono-physics, 176, 355–376, 1990.
Hori, S., H. Inoue, Y. Fukao, and M. Ukawa, Seismic detection of theuntransformed basaltic oceanic crust subducting into the mantle, Geo-phys. J. R. Astron. Soc., 83, 169–197, 1985.
Hurukawa, N., and M. Imoto, Subducting oceanic crusts of the PhillipineSea and Pacific Plates, Geophys. J. Int., 109, 652–693, 1992.
Igel, H., Y. Ben-Zion, and P. C. Leary, Simulation of SH- and P-SV-wavepropagation in fault zones, Geophys. J. Int., 128, 533–546, 1997.
Iidaka, T., and K. Obara, The upper boundary of the subducting pacificplate estimated from ScSp waves beneath the Kanto region, Japan,J. Phys. Earth, 41, 103–108, 1993.
Kirby, S., E. R. Engdahl, and R. Denlinger, Intermediate-depth intraslabearthquakes and arc volcanism as physical expressions of crustal anduppermost mantle metamorphism in subducting slabs, in SubductionTop to Bottom, Geophys. Monogr. Ser., vol. 96, edited by G. E. Beboutet al., pp. 195–214, AGU, Washington, D. C., 1996.
Lessel, K., Die Krustenstruktur der zentralen Anden in Nordchile (21–24�S), abgeleitet aus 3D-Modellierungen refraktionsseismischer Daten,Ph.D. thesis, Freie Univ., Berlin, Germany, 1997.
Levander, A. R., Fourth order finite difference P-SV-seismograms, Geophy-sics, 53, 1425–1436, 1988.
Li, Y.-G., and P. C. Leary, Fault zone trapped waves, Bull. Seismol. Soc.Am., 80, 1245–1271, 1990.
Li, Y.-G., and J. E. Vidale, Low-velocity fault-zone guided waves: Numer-ical investigations of trapping efficiency, Bull. Seismol. Soc. Am., 86,371–378, 1996.
Matsuzawa, T., N. Umino, A. Hasegawa, and A. Takagi, Upper mantlevelocity structure estimated from PS-converted wave beneath the north-eastern Japan Arc, Geophys. J. R. Astron. Soc., 86, 767–787, 1986.
Matsuzawa, T., N. Umino, A. Hasegawa, and A. Takagi, Estimation ofthickness of a low-velocity layer at the surface of the descending oceanicplate beneath the norheastern Japan arc by using synthesized PS-wave,Thoku Geophys. J., 31, 19–28, 1987.
MARTIN ET AL.: GUIDED WAVES FROM SUBDUCTED CRUST ESE 8 - 15
Meade, C., and R. Jeanloz, Deep-focus earthquakes and recycling of waterinto the Earth’s mantle, Science, 252, 68–71, 1991.
Mitronovas, W., B. L. Isacks, C. Meade, and R. Jeanloz, Seismic velocityanomalies in the upper mantle beneath the Tonga-Kermadec island arc,J. Geophys. Res., 76, 7154–7180, 1971.
Oda, H., T. Tanaka, and K. Seya, Subducting oceanic crust on thePhilippine Sea Plate in southwest Japan, Tectonophysics, 172, 175–189, 1990.
Patzwahl, R., Plattengeometrie und Krustenstruktur am KontinentalrandNord-Chiles aus weitwinkelseismischen Messungen, Ph.D. thesis, FreieUniv., Berlin, Germany, 1998.
Peacock, S. M., Thermal and petrological structure of subduction zones,in Subduction Top to Bottom, Geophys. Monogr. Ser., vol. 96, edited byG. E. Bebout et al., pp. 119–133, AGU, Washington, D. C., 1996.
Randal, C. J., Absorbing boundary condition for the elastic wave equation:Velocity stress formulation, Geophysics, 54, 1141–1152, 1989.
Rietbrock, A., G. Asch, G. Chong, and P. Giese, ANCORP ’96—Seismicityalong the ANCORP traverse in northern Chile, Eos Trans, AGU, 78(46),Fall Meet. Suppl., F716, 1997.
Snoke, J. A., I. S. Sacks, and H. Okada, Determination of the subductinglithosphere boundary by use of converted phases, Bull. Seismol. Soc. Am.,67, 1051–1060, 1978.
Van der Hilst, R., and R. Snieder, High-frequency precursors to p wavearrivals in New Zealand: Implications for slab structure, J. Geophys. Res.,101, 8473–8488, 1996.
Virieux, J., SH-wave propagation in heterogeneous media: Velocity stressfinite difference method, Geophysics, 49, 1933–1957, 1984.
Virieux, J., P-SV-wave propagation in heterogeneous media: Velocity stressfinite difference method, Geophysics, 51, 889–901, 1986.
Yuan, X., S. V. Sobolev, R. Kind, O. Oncken, and A. S. Group, Subductionand collision processes in the central Andes constrained by convertedseismic phases, Nature, 408, 958–961, 2000.
�����������������������G. Asch and C. Haberland, GeoForschungszentrum Potsdam, Telegrafen-
berg E254, D-14473 Potsdam, Germany. ([email protected]; [email protected])S. Martin, Institut fur Geowissenschaften, Universitat Potsdam, Karl-
Liebknecht-Str. 24/H25, D-14476 Golm, Germany. ([email protected])A. Rietbrock, Department of Earth and Ocean Sciences, University of
Liverpool, Jane Herdman Laboratories, 4 Brownlow Street, Liverpool L693GP, UK. ([email protected])
ESE 8 - 16 MARTIN ET AL.: GUIDED WAVES FROM SUBDUCTED CRUST


