Embed Size (px)
Citation preview

lable at ScienceDirect
Animal Behaviour 82 (2011) 759e765
Contents lists avai
Animal Behaviour
journal homepage: www.elsevier .com/locate/anbehav
Propagating waves in starling, Sturnus vulgaris, flocks under predation
Andrea Procaccini a,d,h,*, Alberto Orlandi b, Andrea Cavagna b,c, Irene Giardina b,c, Francesca Zoratto e,Daniela Santucci e, Flavia Chiarotti e, Charlotte K. Hemelrijk f, Enrico Alleva e, Giorgio Parisi b,d,Claudio Carere b,g
a Politecnico di Torino, Dipartimento di FisicabCentre for Statistical Mechanics and Complexity (SMC), INFM-CNR, Italyc Istituto Sistemi Complessi (ISC), CNR, ItalydDipartimento di Fisica, Università ‘La Sapienza’, Italye Section of Behavioural Neuroscience, Department of Cell Biology and Neurosciences, Istituto Superiore di Sanità, Roma, ItalyfCentre for Ecological and Evolutionary Studies (CEES), University of Groningen, The NetherlandsgDepartment of Ecological and Biological Sciences, Università degli Studi della Tuscia, ItalyhHU.GE.F., Italy
a r t i c l e i n f o
Article history:Received 4 March 2011Initial acceptance 2 May 2011Final acceptance 17 June 2011Available online 16 August 2011MS. number: 11-00184
Keywords:birdscollective behaviourflockingpredationself-organizationstarlingSturnus vulgaris
* Correspondence: A. Procaccini, Politecnico di ToCorso Duca degli Abruzzi 24, 10129 Torino, Italy.
E-mail address: [email protected] (A.
0003-3472/$38.00 � 2011 The Association for the Studoi:10.1016/j.anbehav.2011.07.006
The formation of waves is a vivid example of collective behaviour occurring in insects, birds, fish andmammals, which has been interpreted as an antipredator response. In birds a quantitative character-ization of this phenomenon, involving thousands of individuals, is missing and its link with predationremains elusive. We studied waves in flocks of starlings, a highly gregarious species, by both directobservation and quantitative computer vision analysis of HD video recordings, under predation byperegrine falcons, Falco peregrinus. We found that waves originated from the position of the attackingpredator and always propagated away from it. We measured their frequency and velocities, the latteroften being larger than the velocity of the flock. A high positive correlation was found between theformation of waves and reduced predation success. We suggest that the tendency of a prey to escape,when initiated even by a few individuals in a cohesive group, elicits self-organized density waves. Suchevident fluctuations in the local structure of the flocks are efficient in confusing predators.� 2011 The Association for the Study of Animal Behaviour. Published by Elsevier Ltd. All rights reserved.
The formation of waves is a vivid example of self-organizedcollective behaviour occurring in insect swarms, bird flocks, fishschools and mammalian herds (Krause & Ruxton 2002; Couzin &Krause 2003; Gerlotto et al. 2006; Kastberger et al. 2008). Severalauthors have described such waves as (1) a collective responsepossibly facilitating cohesion in the presence of a predator, (2) rapidreorganization of a group upon predator attacks and (3) rapidinformation transfer within a large group (Radakov 1973; Webb1980; Treherne & Foster 1981; Gerlotto et al. 2006).
Where a predator approaches a group of prey, those nearest thepredator becomeaware of itfirst and react, for example byalarmcallor acceleration, thereby alerting other members of the groupotherwise unaware of the threat. If the rate of transmission of thisinformation is faster than the predator’s speed of approach, indi-viduals on the far side of the groupwill be alerted earlier than if they
rino, Dipartimento di Fisica,
Procaccini).
dy of Animal Behaviour. Published
were alone. In water insects and fish this phenomenon has beenlabelled the ‘Trafalgar effect’ because of the signals that were sentbetween ships to Admiral Nelson before the battle of Trafalgarinforming him that the French and Spanish combined fleet wasleaving Cadiz, even though it was below the horizon of his flagship,HMSVictory (Caro 2005). Treherne & Foster (1981), who coined thisterm, showed that marine isopods, Halobates robustus, increasedvelocity in response to a model predator and this change of motionspread across the group faster than the speed of approach of thepredator. The same hypothesis has been suggested for flocking birdsunder predation risk (Heppner 1997; Michaelsen & Byrkjedal 2002;Caro 2005). In particular, in flocking dunlins, Calidris alpina, anaccelerating wave has been described, reaching a speed three timeshigher than would be possible if birds were reacting only to thenearest neighbours, in an organization similar to a human chorusline in which individuals observe the approaching wave and timetheir own performance to coincide with its arrival (Potts 1984).
It could be that waves represent a peculiar form of ‘mobbing’,which occurs when individuals of certain speciesmob a predator by
by Elsevier Ltd. All rights reserved.

A. Procaccini et al. / Animal Behaviour 82 (2011) 759e765760
cooperatively harassing it, in order to scare it (Krause & Ruxton2002). If this were the case, waves would be expected to movetowards the predator. Another hypothesis is that wave activity, bymeans of a local breaking of the spatial order of the group, canconfuse the attacking predator, thereby reducing its chance ofsuccess (Treherne & Foster 1981; Buchanan et al. 1988; Kastbergeret al. 2008).
Few systematic observations, or quantitative and qualitativedescriptions, of waves in bird flocks have been made. It is thereforerelevant to carry out detailed characterization studies to understandtheirmechanism(s) of formation andultimate functions aswell as toprovide empirical data for individual-based models of collectivebehaviours. The European starling is an extremely gregarious birdspecies that forms flocks of thousands of individuals during autumnand winter (Feare 1984). In starlings, a commonly observed aerialcollective behaviour results from waves that can be detected froma great distance. Although this phenomenon has been describedanecdotally and is thought to occur in relation to aerial predation byfalcons (Tinbergen 1951; Feare 1984), its mechanism and functionremain largely unknown. In this study,wequantified the occurrenceof propagating waves and their relation to predation.
In the following, we refer to awave event (WE), whichwe defineas a train of several observable pulses of optical intensity thatpropagates along a given direction across the flock, not precededand not followed by any other train for at least 10 s. Our aim in thisstudy was to investigate (1) the circumstances under which a WEoccurs; (2) the correlation between waves and the success of thepredator; (3) the wave’s direction of propagation; (4) the correla-tion between predator position and origin of the wave; and (5) thefrequency and speed of propagation of the waves. We first focus onthe whole WE and on its links to predation, and then on thepropagation of single pulses.
METHODS
Field Video Recording
Data were collected from flying flocks of European starlings inproximity to two winter urban roosts in Rome, Italy(41�440Ne12�240E), situated 10 km from each other. Between 14January 2006 and 17 March 2006 we carried out 53 video-recordingsessions, and between 12 December 2006 and 2 March 2007 57video-recording sessions, in parallel with behavioural observations.One roost is located in the city centre (Termini), it comprises approx-imately 20 000 birds and has been used for at least 50 years; the otherroost is located in the southern part of the city (EUR), with about60 000 birds roosting daily, and it has been in use for about 20 years.
Flocks were videotaped from a fixed location (roof of a buildingfor roost Termini; open field for roost EUR; the distance from thebirds ranged from 200 m to 500e1000 m) with the operators beingin place about 90 min before sunset (when the first flocks arrive),until darkness. Opportunistic video recording was carried out witha High Definition video camera (JY-HD10, JVC, 30 fps) on miniDVdigital tapes. These video recordings were specifically aimed at theaerial displays of the flocks above the roost before and duringlanding when a predator was actively hunting, eliciting visiblecollective responses. Peregrine falcons, Falco peregrinus, frequentlyattack the incoming flocks in both roosts (Carere et al. 2009: Zorattoet al. 2010). During the first winter sessions they were observed in31 of 53 observation sessions at the roosts, whereas during thesecond winter sessions they were observed in 50 of 57. In bothwinters, attacks came from two individuals in Termini and up tofive individuals in EUR. We successfully videotaped more than 100wave events, from which we selected those that matched therequirements for frame processing (see belowand the video clips in
the Supplementary Material) and that were recorded on days withstable atmospheric conditions, especially wind speed [windintensity was limited to a range of 0e4 (Beaufort scale)], and withhigh visibility.
Field Observations
From 12 December 2006 to 2 March 2007 we performedbehavioural observations at the roosts for a total of 16 days inTermini and 41 days in EUR. Hunting falcons were observed during10 days in Termini and 40 days in EUR. On these days we recordedthe number of all hunting sequences (HSs) occurring at the roosts,where a singleHS is defined as thewhole set ofmanoeuvres adoptedby one or more attacking predators against the same flock. Asequence started when at least one falcon approached a flock andstopped when the falcon caught a starling (successful sequence) orwhen it withdrew from one flock, either disappearing or moving toanother flock (unsuccessful sequence). This definition is equivalentto the term ‘hunt’ used for the first time by Rudebeck (1951) andmore recently by Dekker (2003) and to the term ‘attack’ used byCresswell (1996). For each HS we also recorded its duration and thenumber of attacks.Within eachHSwe recorded the number ofWEs;eachobservedWE (occurring in the presence of the predator in closeproximity to the flock) was characterized by the direction of prop-agation of the wave front with respect to the position of the falcon.
We note that, as mentioned by other authors, any rigid rotationof a flock can result in a fast wave that is just an optical illusionbecause of a sort of interference resembling ‘moiré patterns’ (Davis1980; Heppner 1997). In such a scenario, the WEs that we filmedwould be just signals without any information transfer, that is,without biological meaning. Technically, identifying and quanti-fying such an effect is a very demanding task. Even so, in the WEsthat we analysedwe can reasonably exclude the presence of similarillusions by direct observations from the field: we firmly believethat such experience leaves no doubt to the density nature ofstarlings’ waves and their causal interaction with the predator.
Statistical Analyses of the Observations
For all the quantitative variables from the field observations weused both parametric and nonparametric tests. For variables withthree or more levels, we used analysis of variance (parametricANOVA) with a completely randomized design (one between-subjects factor) and a KruskaleWallis test. For variables with twolevels we used Student t tests for independent groups (both homo-geneous and nonhomogeneous variances) and a ManneWhitneytest. A Levene test for variance homogeneity was conducted in allcases prior to the analysis. For categorical (or categorized) variableswe used a chi-square test for variables with three ormore levels anda Fisher’s exact test for variables with two levels.
Video Processing and Measurements of Frequency and Velocity
Each movie, in mpeg2 format, was converted into frames, JPEGformat (1280 � 720), with the software HiMovie HD (packageHiLife, Apple). We computed the frequencies of 21WEs: these wereselected because of their particularly clear optical flow, whichallowed us to follow thewaves along their propagation. To measurefrequency, two of us (A.P. and C.C.) independently counted thewaves composing a WE, in a given temporal boundary, in bothnormal and slow motion. The measurements agreed perfectlybetween observers (Appendix Table A1).
To retrieve information on velocity, the images were processedwith an in-house-built program using LTI libraries (http://ltilib.sourceforge.net/doc/homepage/index.shtml), which transforms

A. Procaccini et al. / Animal Behaviour 82 (2011) 759e765 761
them into intensity channels. Our method is based on the corre-spondence between the density variation and the optical flowof thelight intensity. Any image was filtered by isolating the flock,removing the background and producing a ‘negative’ of the originalimage, where the intensity of the densest regionwas normalized toa value of 1 on a scale of [0:1]. With a threshold TF, set empirically atabout 0.5, the brightest part was selected, the result was smoothedfor noise reduction and then finally processed with a segmentationalgorithm (performed by the class lti::objectsFromMask of LTIlibraries), which identified the cluster representing the flock and itscentre of area (F ¼ centre of the flock). This operation transformedthe original frames into a sequence of channels, each one entirely setto black except for the part included within the border of the flock(Fig.1). A second threshold (TP) was then applied to themain clusterto select the densest region, which corresponds to the wave pulse,and identify the centre of its area (P ¼ centre of the wave pulse).
The estimation of the relative velocity proceeded as follows.(1) The two-dimensional difference vector D(TF,TP) ¼ P(TP) �
F(TF) represents the position of the wave pulse in the referenceframe of the flock. This vector can be considered as a function of TPonly since the uncertainty on it is dominated by the uncertainty onthe determination of P(TP). In the Appendix, the same argument is
Figure 1. Analysis of wave pulses: computer vision analysis of wave pulses propagating acrothe Supplementary Material). Below the original video frame, the digital segmentation ofCameras captured 30 frames/s; each frame is labelled with time (s) and frame number (foMaterial).
applied directly to Lp as defined below. Vector D(TP) was used tostudy the dynamics of the wave: each frame is associated with aninstance of D(TP).
(2) The discrete trajectory underwent a standard smoothingprocess: a Gaussian b-spline was computed from the vertices ofD(TP). Such interpolation represents the instant position of P (thecentre of the small blue cluster in Fig. 1), with respect to F (the largered cluster in Fig. 1). The length in pixels of the trajectory related toa particular value of TP was calculated as the length of the splinedtrajectory and called Lp(TP).
(3) To reduce the noise, the final length Lp was then obtained asan average on TP, over an interval of values (as described in theAppendix).
(4) To convert this length Lp into ametric distance, Lm,weused asa fixed reference the dimensions of the attacking peregrine falcon,according to commonly accepted morphometric measurements:36e48 cm for length; 95e110 cm for wing span (Cramp & Perrins1994).
(5) The conversion formula derived from elementary optics is
Lm ¼ Lp � Am=ap (1)
ss two different flocks (estimated velocities: 25.24 m/s and 13.73 m/s, video clip no. 7 inboth the flock (red contour) and the pulse within the flock (blue contour) is shown.r details see Methods; for more examples see the video clips in the Supplementary

Table 1Relative velocity of single wave pulses estimated in 15 wave events
Wave event Total frames Duration (s) Velocity (m/s) Error (m/s)
Series 1a 10 0.33 15.56 1.52Series 1b 27 0.90 6.89 0.49Series 4 12 0.40 25.24 4.21Series 8a 31 1.033 17.47 1.35Series 8b 11 0.37 25.10 2.06Series 8c 17 0.57 13.73 1.10Series 8d 37 1.23 7.79 0.62Series 9 22 0.73 18.26 3.04Series 10 57 1.90 7.63 0.54Series 12 15 0.50 9.44 0.67Series 13 26 0.87 3.66 0.61Series 15a 18 0.60 14.48 1.24Series 15b 14 0.47 11.76 0.84Series 18 10 0.33 8.21 0.70Series 19 16 0.53 10.44 1.74Mean 21.5 0.72 13.04 1.66
Table 2Predation success in relation to wave occurrence for all hunting sequences
Predation No wave Wave Total
Unsuccessful 97 68 165Successful 41 11 52Total 138 79 217
2
1.5
1
0.5
0
1
0.8
0.6
0.4
0.2
0
Above Below Lateral
Downwards Upwards Horizontally
(a)
(b)
No.
of
atta
cks/
seq
uen
ce
No.
of
wav
e ev
ents
/seq
uen
ce
Figure 2. (a) Direction of attack: number of attacks per sequence (mean þ SEM) fromthe three directions with respect to the flock (above, below and lateral). (b) Direction ofwave propagation: number of waves (mean þ SEM) propagating in the three directionswithin the flock (downwards, upwards and horizontally) in a hunting sequence.
A. Procaccini et al. / Animal Behaviour 82 (2011) 759e765762
where Am is the falcon’s metric size and ap the pixel size in theoriginal image.
(6) The average relative velocity (just velocity from now on)across the event was computed as
< V> ¼ Lm=Dt: (2)
Table 1 reports relative velocities for 15 wave pulses, again selectedfor their high optical quality. The uncertainties associatedwith suchmeasurements vary from 7% to 17%. The case inwhich the travellingwave changes its distance with respect to the observer is discussedin the Appendix. In such a scenario, errors on velocities can be evengreater, but velocity itself is always underestimated. Sowe can statethat lower limits to velocities are determined with a precisionvarying from 7% to 17%.
RESULTS AND DISCUSSION
Our observations suggest that WEs represent an antipredatorbehaviour. In agreement with similar studies in other species ofinsects and fish (Webb 1980; Treherne & Foster 1981; Gerlotto et al.2006, Kastberger et al. 2008), we found that WEs occurred almostexclusively under predator threat: observed exceptions, elicited byhelicopters or gulls, are still to be considered as antipredatorreactions. We studied 329 hunting sequences (HSs), 210 of whichtriggered WEs.
WEs showed up at least once on 77% of all observation days and in42%ofHSs (0.66 timesperHS).WEswerehomogeneouslydistributedacross the study period (DecembereMarch) divided into five blocksof 2 weeks (c2
4 ¼ 4.5, P ¼ 0.34). In one of the roosts there wasa nonsignificant trend for WEs to increase during the season(c2
4 ¼ 7.95,P¼ 0.09). Importantly,WEsweremore frequent andmorelikely to occur during unsuccessful hunting sequences (ManneWhitney test: z¼ 2.351,Nsuccessful ¼ 52,Nunsuccessful ¼ 165, one-tailedP¼ 0.019; Fisher’s exact test comparing HSs with or without WEs:two-tailed P ¼ 0.009), as the success rate of predation in the presenceof WEs was 0.14 and in the absence of WEs 0.30 (Table 2).
This result suggests an antipredator effect for WEs and showsthat waves form only under specific circumstances. Moreover, bydirect observation, we could exclude the possibility that environ-mental or weather conditions (such as wind or rain) can affectWEs.One possible hypothesis is that flock responses depend on thehunting strategies adopted by falcons (Rudebeck 1951; Zoratto et al.2010), to maximize the probability of escaping an attack, as sug-gested by the predatoreprey coevolution theory (Dawkins & Krebs1979). That wave formation and dynamics can depend on thepredator’s behaviour has been demonstrated in giant honeybees,
Apis dorsata, in response to hornets, Vespa sp. Their waves aremodulated in strength and rate by the predator’s speed and prox-imity (Kastberger et al. 2008).
Referring to the position of the falcon with respect to the flock,we grouped the attacking directions into ‘above’, ‘below’ and‘lateral’ in all HSs for which we had information on attack direction(N ¼ 175 sequences): on average falcons preferred to attack later-ally and there were more attacks from above than from below(F2, 348 ¼ 32.6, P < 0.0001; Fig. 2a). Furthermore, waves wereobserved propagating downwards more than upwards and

A. Procaccini et al. / Animal Behaviour 82 (2011) 759e765 763
upwards more than horizontally (F2, 348 ¼ 34.0, P < 0.0001; Fig. 2b,see also Appendix Table A2), hinting at some unknown mechanisminhibiting wave formation when the attack came from the preda-tor’s preferred direction. However, we noticed that flocks that failedto produce WEs tended to be sparser than those that producedthem, suggesting that there could be a sort of threshold, in densityor cohesion, for waves to originate and propagate. Unfortunately,we were technically unable to quantify density in our flocks, so thisremains an anecdotal observation to be further evaluated. A criticaldensity has recently been shown to trigger the formation of vastfish shoals of millions of individuals, independently from predators(Makris et al. 2009).
Systematically, waves formed in proximity to the falcon (Fig. 3)and propagated away from it (Appendix Table A2), thus excludingany mobbing function as hypothesized in the Introduction. On thecontrary, these results suggest that the predator is the perturbationphysically giving rise to the propagating wave. The fact that thewave initiation is near the source of an attack is known for birdflocks (although not explicitly called waves) and fish schools onlyunder simulated attack (Radakov 1973; Potts 1984). Here, we havecharacterized this phenomenon under true predation. Earlierliterature (Heppner 1997) suggested that waves, in birds, could beassociated with an antipredator context. Our study shows that WEsresult from a collective escape attempt.
WEs could last several seconds (in 21 WEs, selected from ourdata set, up to 19.2 s for 20 pulses) and the frequency of pulseemission had a distribution with a marked peak around its averagevalue, about 1.3 per s (Appendix Table A1). Conversely, the distri-bution of wave velocity was broader (ranging from 3.7 m/s to25.2 m/s, Table 1) with a large inter- and intraflock variability.Moreover, wave velocity was often greater than the absolutevelocity of the flock (Table 1; Ballerini et al. 2008a), a property thatseems general and applies to similar phenomena of collectivebehaviour in other species (Radakov 1973; Davis 1980; Potts 1984;Axelsen et al. 2001; Gerlotto et al. 2006). This result is consistentwith the ‘Trafalgar effect’whosemajor feature is that the velocity ofpropagation of the perturbation inside the group is greater than thevelocity of the individual (Treherne & Foster 1981; Gerlotto et al.2006). No correlation between the flockefalcon distance (DFF)and velocity was observed. As for elastic waves, the velocity of theperturbation did not seem to depend on the intensity of theperturbation itself (i.e. DFF). Since, in elastic waves, this velocity
0 100 200 300 400 Distance falcon-pulse DFP (pixels)
0
100
200
300
400
Dis
tan
ce f
alco
n-f
lock
DFF
(p
ixel
s)
Figure 3. Origin of waves: pixel distance between the falcon and the centre of theflock, DFF, versus the distance between the falcon and the centre of the pulse, DFP, at theinitial time of 15 independent WEs. These WEs involved only one, easily traceable,falcon. Typically DFP < DFF.
depends exclusively on the inner structure of the medium, webelieve that, analogously, in starling flocks, wave velocity dependson cohesion and density.
This study is an attempt at quantifying wave collectivebehaviour in flocks of thousands of individuals. That density isa key quantity in determining the dynamics appears from nearlyall the issues addressed here. Mechanically, the falcon acts asa perturbation of the resting state of those starlings that manageto discern it, typically those on a specific part of the surface of theflock. Each one reacts by trying to escape from the predator:sometimes a single flock under attack was observed to split intwo, even with waves propagating in both parts. If starlings arefree to move, they flee and no wave occurs. Still, at short mutualdistances, their flight is constrained by their neighbours: to avoidcollisions, the interindividual distance is reduced until a certainlimit is reached. Thus a deformation follows the perturbation,producing fluctuations in density on timescales related to theavoidance mechanism. For this reason, our guess is that wavevelocity may depend on the strength of the repulsive forcesbetween individuals at short distances. Our observations also donot exclude a similarity with a human chorus line as suggested fordunlin flocks (Potts 1984). Despite some recent insight intointerindividual interactions in bird flocks (Ballerini et al. 2008b),much remains to be understood and future research in individual-based modelling of collective animal behaviour could benefit fromour empirical data (Hildenbrandt et al. 2010; Hemelrijk &Hildenbrandt 2011).
WEs are a straightforward example of emerging complexity:a simple functional response (escaping from predators), whenaffecting even just a relatively small portion of a cohesive flock ofthousands of individuals, can produce very complex patterns.Probably, in birds, WEs occur only when the perturbation is sostrong that individuals almost come into contact, which is probablythe reason why they form only in the presence of a threat. WEspossess a measurable antipredator function: it is likely that rapidvariations, in local density and in both predatoreprey and preyeprey distances, perturb the visual perception of falcons. As sug-gested for similar phenomena (e.g. Trafalgar wave) in gianthoneybees (Kastberger et al. 2008; Schmelzer & Kastberger 2009),dunlins (Buchanan et al. 1988) and marine insects (Treherne &Foster 1981), we found that, also in starlings, waves can hamperpredation success.
Acknowledgments
This study is part of a project aimed at understanding patterns ofanimal group movements (STREP-project ‘StarFlag’ no. 12682) inthe NEST-programme of tackling complexity in science of the 6thEuropean framework. We thank Marcello De Cecco, Augusta Miceli,Alberto Russo, Wolfgang Goymann, Michael Raess and NadiaFrancia for helpful discussions. R. Paris and M. Petrecca grantedaccess to the roof of PalazzoMassimo, Museo Nazionale Romano forthe observations at the roost Termini. The association Ornis italica(www.ornisitalica.com), by successfully installing nestboxes in thecity of Rome, has contributed to increasing the population of urbanperegrine falcons, which allowed us to observe the high number ofpreyepredator interactions in this study. Finally, we acknowledgethe inspiring role of the late Nicola Cabibbo in promoting thepresent cooperation between theoretical physicists and behav-ioural biologists.
Supplementary Material
Supplementary material for this article is available, in the onlineversion, at doi:10.1016/j.anbehav.2011.07.006.

A. Procaccini et al. / Animal Behaviour 82 (2011) 759e765764
References
Axelsen, B. E., Anker-Nilson, T., Fosum, P., Kvamme, C. & Nottestad, L. 2001.Pretty pattern but a simple strategy: predatoreprey interaction betweenjuvenile herring and Atlantic puffins observed using multibeam sonar. CanadianJournal of Zoology, 79, 1586e1596.
Ballerini, M., Cabibbo, N., Candelier, R., Cavagna, A., Cisbani, E., Giardina, I.,Orlandi, A., Parisi, G., Procaccini, A. & Viale, M., et al. 2008a. Empiricalinvestigation of starling flocks: a benchmark study in collective animalbehaviour. Animal Behaviour, 76, 217e236.
Ballerini, M., Cabibbo, N., Candelier, R., Cavagna, A., Cisbani, E., Giardina, I.,Lecomte, A., Orlandi, A., Parisi, G. & Procaccini, A., et al. 2008b. Interactionruling animal collective behaviour depends on topological rather than metricdistance: evidence from a field study. Proceedings of the National Academy ofSciences, U.S.A., 105, 1232e1237.
Buchanan, J., Schick, C., Brennan, L. & Herman, S. 1988. Merlin predation onwintering dunlins: hunting success and dunlin escape tactics. Wilson Bulletin,100, 108e118.
Carere, C., Montanino, S., Moreschini, F., Zoratto, F., Chiarotti, F., Santucci, D. &Alleva, E. 2009. Aerial flocking patterns of wintering starlings under differentpredation risk. Animal Behaviour, 77, 101e107.
Caro, T. M. 2005. Antipredator Defenses in Birds and Mammals. Chicago: University ofChicago Press.
Couzin, I. D. & Krause, J. 2003. Self-organization and collective behaviour invertebrates. Advances in the Study of Behavior, 32, 1e75.
Cramp, S. & Perrins, C. M. 1994. The Birds of the Western Palearcti. Oxford: OxfordUniversity Press.
Cresswell, W. 1996. Surprise as a winter hunting strategy in sparrowhawksAccipiter nisus, peregrines Falco peregrinus and merlins Falco columbarius. Ibis,138, 684e692.
Davis, J. M. 1980. The coordinated aerobatics of dunlin flocks. Animal Behaviour, 28,668e673.
Dawkins, R. & Krebs, J. R. 1979. Arms races between and within species.Proceedings of the Royal Society B, 202, 489e511.
Dekker, D. 2003. Peregrine falcon predation on dunlins and ducks and kleptopar-asitic interference from bald eagles wintering at Boundary Bay, BritishColumbia. Journal of Raptor Research, 37, 91e97.
Feare, C. J. 1984. The Starling. Oxford: Oxford University Press.Gerlotto, F., Bertrand, S., Bez, N. & Gutierrez, M. 2006. Waves of agitation inside
anchovy schools observed with multibeam sonar: a way to transmit informa-tion in response to predation. ICES Journal of Marine Science, 63, 1405e1417.
Hemelrijk, C. K. & Hildenbrandt, H. 2011. Some causes of the variable shape offlocks of birds. PLoS ONE, e22479, doi:10.1371/journal.pone.0022479.
Heppner, F. H. 1997. Three-dimensional structure and dynamics of bird flocks.In: Animal Groups in Three Dimensions (Ed. by J. K. Parrish & W. M. Hamner),pp. 68e87. Cambridge: Cambridge University Press.
Hildenbrandt, H., Carere, C. & Hemelrijk, C. K. 2010. Self organized aerial displaysof thousands of starlings. Behavioral Ecology, 21, 1349e1359.
Kastberger, G., Schmelzer, E. & Kranner, I. 2008. Social waves in giant honeybeesrepel hornets. PLoS One, 3, e3141.
Krause, J. & Ruxton, G. D. 2002. Living in Groups. Oxford: Oxford University Press.Makris, C. M., Ratilal, P., Jagannathan, S., Gong, Z., Andrews, M., Bertsatos, I.,
God¢, O. R., Nero, R. W. & Jech, J. M. 2009. Critical population density triggersrapid formation of vast oceanic fish shoals. Science, 323, 1734e1737.
Michaelsen, T. C. & Byrkjedal, I. 2002. ‘Magic carpet’ flight in shorebirds attackedby raptors on a migrational stopover site. Ardea, 90, 167e171.
Potts, W. K. 1984. The chorus-line hypothesis of manoeuvre coordination in avianflocks. Nature, 309, 344e345.
Radakov, D. V. 1973. Schooling in the Ecology of Fish. New York: J. Wiley.Rudebeck, G.1951. The choice of prey and modes of hunting of predatory birds with
special reference to their selective effect [part 2]. Oikos, 3, 200e231.Schmelzer, E. & Kastberger, G. 2009. ‘Special agents’ trigger social waves in giant
honeybees (Apis dorsata). Naturwissenschaften, 96, 1431e1441.Tinbergen, N. 1951. The Study of Instinct. Oxford: Oxford University Press.Treherne, J. E. & Foster, W. A. 1981. Group transmission of predator avoidance in
a marine insect: the Trafalgar effect. Animal Behaviour, 29, 911e917.Webb, P. W. 1980. Does schooling reduce fast-start response latencies in teleosts?
Comparative Biochemistry and Physiology, 65, 231e234.Zoratto, F., Carere, C., Chiarotti, F., Santucci, D. & Alleva, E. 2010. Aerial hunting
behaviour and predation success by peregrine falcons (Falco peregrinus) onstarling (Sturnus vulgaris) flocks. Journal of Avian Biology, 41, 427e433.
APPENDIX
Sources of experimental error
Parallax errorEquation (1) in the main text (Lm ¼ Lp � Am/ap) is a good esti-
mator of the metric distance Lm assuming that the falcon and the
flock are approximately at the same distance (depth) from the videocamera, but since our approach is not stereoscopic (Ballerini et al.2008a) it is not possible to verify this. To quantify in our case howaccurate this approximation is, we proceed in the following way.
Let us suppose first that the trajectory of the wave front in thereal space, lm(t), lies on a plane p approximately perpendicular tothe optical axis of the camera (z direction), while the falcon is out ofthe plane, with a displacement dz along the axis direction.
For a conservative estimate of dz, one can imagine that dz isapproximately of the same magnitude as the distance betweenfalcon and flock on the image plane, which can be expressed as:
dzw��lmð0Þ � f ð0Þk;
where lm(0) and f(0) are the initial positions of the wave front andthe falcon.
According to optics, the error on Lm induced by the previousscenario amounts to:
dLm=Lm ¼ dz=zw klmð0Þ � f ð0Þk=z (A1)
For our videos, all taken from the same location, z is always morethan 200 m. To obtain an estimate of the numerator of the right-hand side of equation (A1), one can compute the distance in pixelsbetween the initial positions of the wave front and the falcon andthen convert it into a metric distance by use of equation (1), whichgives a first approximation value. From our data, for 15 WEs thisdistance varies from 5 to 19 m (average about 12 m). Taking allthese values into account, we finally get an average relative errordue to parallax effects of
dz=z< 5%;
which is negligible in most WEs (see below). Moreover, it is anoverestimate of the actual error, since the attacking predator'sorientation, which is clear from its billetail asymmetry, is most ofthe time nearly perpendicular to the optical axis.
Let us now consider the complementary situation, where falconand pulse are on a plane p perpendicular to the optical axis at theinitial time (t ¼ tin), but the pulse trajectory leaves the plane atsubsequent times. In this case, one would not track the trajectorylm(t) itself but rather its projection on p, lmp ðtÞ. One can imagine thatthe real trajectory runs in the z direction for as much as it runs on p,which is a rather conservative approximation. Namely
Ztfin
tin
kdlmp ðtÞdt
kdt
Then the length Lm of the trajectory is, by the Pythagorean theorem,
ffiffiffi2
p Ztfin
tin
kdlmp ðtÞdt
kdt;
which results in a correction of approximately 40% of the originalvalue.
We note that with the procedure that we followed, we arealways underestimating Lm, so that the computed velocities of thewave pulses are lower limits to the real velocity values. Theuncertainties that are associated with velocities in the Results anddiscussion section refer to such lower boundaries. As a conse-quence, real velocities of waves can be up to 40% bigger than theirassociated lower limit. Unfortunately, there is no means to judgethe 3D structure of our flocks and, as we report in the Results anddiscussion section, waves follow the morphology of the flock, itsshape and borders. So our results consist of window intervals
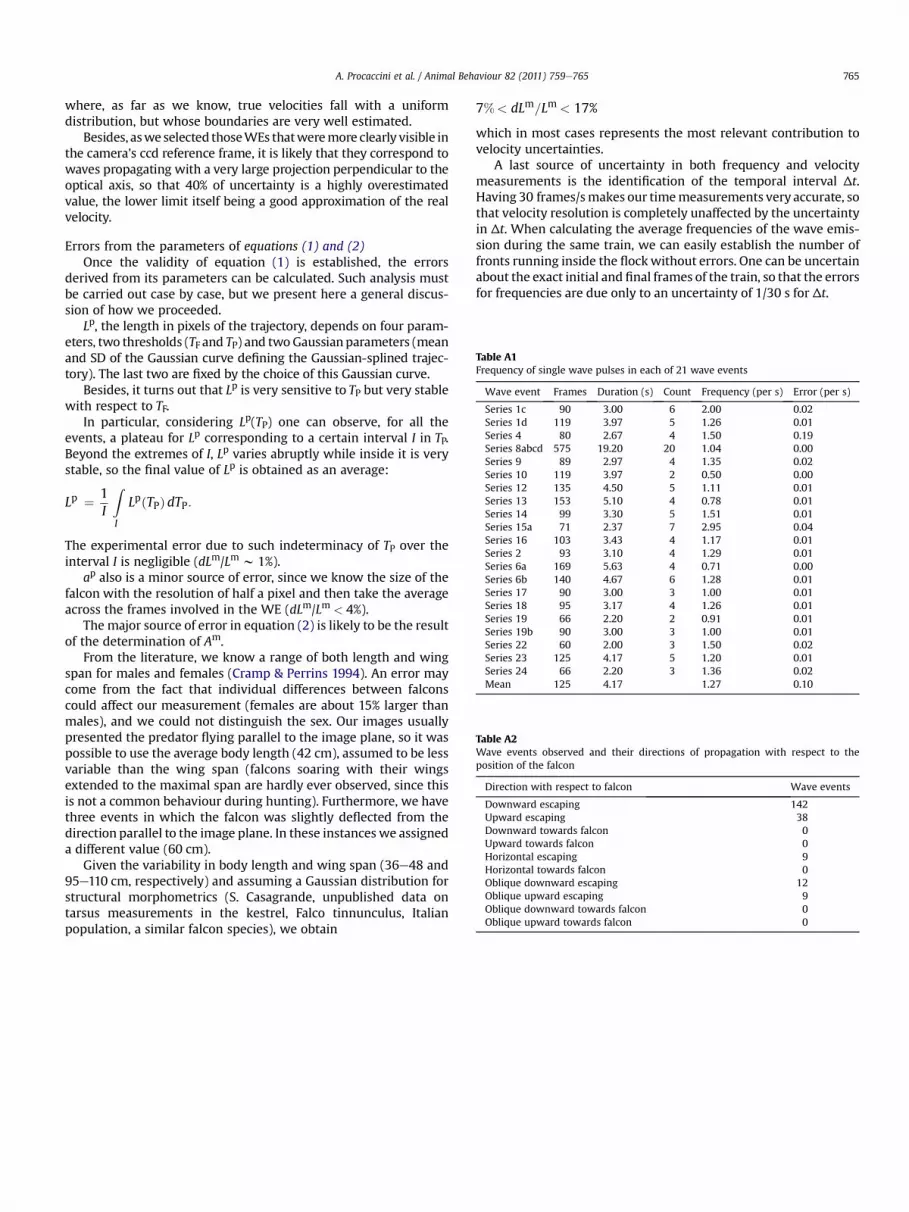
Table A2Wave events observed and their directions of propagation with respect to theposition of the falcon
Direction with respect to falcon Wave events
Downward escaping 142Upward escaping 38Downward towards falcon 0Upward towards falcon 0Horizontal escaping 9Horizontal towards falcon 0Oblique downward escaping 12Oblique upward escaping 9Oblique downward towards falcon 0Oblique upward towards falcon 0
Table A1Frequency of single wave pulses in each of 21 wave events
Wave event Frames Duration (s) Count Frequency (per s) Error (per s)
Series 1c 90 3.00 6 2.00 0.02Series 1d 119 3.97 5 1.26 0.01Series 4 80 2.67 4 1.50 0.19Series 8abcd 575 19.20 20 1.04 0.00Series 9 89 2.97 4 1.35 0.02Series 10 119 3.97 2 0.50 0.00Series 12 135 4.50 5 1.11 0.01Series 13 153 5.10 4 0.78 0.01Series 14 99 3.30 5 1.51 0.01Series 15a 71 2.37 7 2.95 0.04Series 16 103 3.43 4 1.17 0.01Series 2 93 3.10 4 1.29 0.01Series 6a 169 5.63 4 0.71 0.00Series 6b 140 4.67 6 1.28 0.01Series 17 90 3.00 3 1.00 0.01Series 18 95 3.17 4 1.26 0.01Series 19 66 2.20 2 0.91 0.01Series 19b 90 3.00 3 1.00 0.01Series 22 60 2.00 3 1.50 0.02Series 23 125 4.17 5 1.20 0.01Series 24 66 2.20 3 1.36 0.02Mean 125 4.17 1.27 0.10
A. Procaccini et al. / Animal Behaviour 82 (2011) 759e765 765
where, as far as we know, true velocities fall with a uniformdistribution, but whose boundaries are very well estimated.
Besides, aswe selected thoseWEs thatweremore clearly visible inthe camera's ccd reference frame, it is likely that they correspond towaves propagating with a very large projection perpendicular to theoptical axis, so that 40% of uncertainty is a highly overestimatedvalue, the lower limit itself being a good approximation of the realvelocity.
Errors from the parameters of equations (1) and (2)Once the validity of equation (1) is established, the errors
derived from its parameters can be calculated. Such analysis mustbe carried out case by case, but we present here a general discus-sion of how we proceeded.
Lp, the length in pixels of the trajectory, depends on four param-eters, two thresholds (TF and TP) and twoGaussianparameters (meanand SD of the Gaussian curve defining the Gaussian-splined trajec-tory). The last two are fixed by the choice of this Gaussian curve.
Besides, it turns out that Lp is very sensitive to TP but very stablewith respect to TF.
In particular, considering Lp(TP) one can observe, for all theevents, a plateau for Lp corresponding to a certain interval I in TP.Beyond the extremes of I, Lp varies abruptly while inside it is verystable, so the final value of Lp is obtained as an average:
Lp ¼ 1I
Z
I
LpðTPÞdTP:
The experimental error due to such indeterminacy of TP over theinterval I is negligible (dLm/Lm w 1%).
ap also is a minor source of error, since we know the size of thefalcon with the resolution of half a pixel and then take the averageacross the frames involved in the WE (dLm/Lm < 4%).
The major source of error in equation (2) is likely to be the resultof the determination of Am.
From the literature, we know a range of both length and wingspan for males and females (Cramp & Perrins 1994). An error maycome from the fact that individual differences between falconscould affect our measurement (females are about 15% larger thanmales), and we could not distinguish the sex. Our images usuallypresented the predator flying parallel to the image plane, so it waspossible to use the average body length (42 cm), assumed to be lessvariable than the wing span (falcons soaring with their wingsextended to the maximal span are hardly ever observed, since thisis not a common behaviour during hunting). Furthermore, we havethree events in which the falcon was slightly deflected from thedirection parallel to the image plane. In these instances we assigneda different value (60 cm).
Given the variability in body length and wing span (36e48 and95e110 cm, respectively) and assuming a Gaussian distribution forstructural morphometrics (S. Casagrande, unpublished data ontarsus measurements in the kestrel, Falco tinnunculus, Italianpopulation, a similar falcon species), we obtain
7%< dLm=Lm < 17%
which in most cases represents the most relevant contribution tovelocity uncertainties.
A last source of uncertainty in both frequency and velocitymeasurements is the identification of the temporal interval Δt.Having 30 frames/smakes our timemeasurements very accurate, sothat velocity resolution is completely unaffected by the uncertaintyin Δt. When calculating the average frequencies of the wave emis-sion during the same train, we can easily establish the number offronts running inside the flockwithout errors. One can be uncertainabout the exact initial and final frames of the train, so that the errorsfor frequencies are due only to an uncertainty of 1/30 s for Δt.


