Embed Size (px)
Citation preview
Molecular Ecology (1999)
8
, 1991–2001
© 1999 Blackwell Science Ltd
Blackwell Science, Ltd
Genetic structure of brown trout,
Salmo trutta
L., at the southern limit of the distribution range of the anadromous form
C . BOUZA, J . ARIAS, J . CASTRO, L . SÁNCHEZ and P. MARTÍNEZ
Departamento de Biología Fundamental, Área de Genética, Facultad de Veterinaria, Universidad de Santiago de Compostela, 27002 Lugo, Spain
Abstract
Genetic variation at 33 protein loci was investigated in 41 wild brown trout populationsfrom four river basins in Galicia (northwest Spain) to analyse the amount and distributionof genetic diversity in a marginal area, located in the distribution limit of the anadromousform of this species. The genetic diversity detected within populations (
H
between 0 and 6%)lies within the range quoted for this species in previous reports. The Miño, the most southernriver basin analysed, showed a significantly lower genetic diversity and the highest geneticdifferentiation among the river basins studied. The hierarchical gene diversity analysis showedhigh population differentiation in a restricted area (
G
ST
= 27%), mostly due to differences amongpopulations within basins (
G
SC
= 22%). The reduction of
G
ST
observed when the isolatedsamples were excluded from the analysis (
G
ST
= 17%) showed the importance of habitatfragmentation on the heterogeneity detected. Gene flow among populations was comparat-ively evaluated by three indirect methods, which in general revealed low figures of absolutenumber of migrants per generation, slightly higher than 1. The gene flow among basinsreflected a positive relationship with geographical distance. This trend was confirmed bythe significant correlation observed between geographical and genetic distances, includ-ing all population pairs, which suggests a component of isolation by distance in browntrout genetic structure. Nevertheless, the nonsignificant intrabasin correlation demon-strates the complexity of genetic relationships among populations in this species. Themodel of genetic structure in brown trout is discussed in the light of the results obtained.
Keywords
: allozymes, anadromous form, gene flow, genetic structure, isolation by distance,
Salmo trutta
Received 24 April 1999; revision received 20 July 1999; accepted 20 July 1999
Introduction
Brown trout (
Salmo trutta
) has been studied all along itsdistribution area, both for population structure and phylo-geographical analysis, as well as for conservation purposes.Substantial divergence has been reported between northand south European populations in this species, especiallybetween Mediterranean and Atlantic drainages (Krieg &Guyomard 1985; Ferguson 1989; Bernatchez
et al
. 1992;García-Marín & Pla 1996). The analysis of these datahas also evidenced important differences in the amount ofgenetic diversity between both areas (Presa
et al
. 1994),sometimes hidden by the different sets of loci employed.The influence of the anadromous form (sea trout), mainlypresent in the North Atlantic drainage, has hardly been
taken into account to understand the amount and distri-bution of genetic diversity in this species, despite its greatimportance in determining gene flow between basins.The southern limit of sea trout distribution has beenreported to be located around the 42
°
N parallel (Ferguson1989; Hamilton
et al
. 1989). This latitudinal reference doesnot mean a definitive barrier, especially in a geologicalscale, as in the past, during the last glaciation, the anadrom-ous trout was probably present more southwards, even inthe Mediterranean Sea (Hamilton
et al
. 1989).On the other hand, the studies on the microgeographical
structure of
S. trutta
have evidenced the remarkable com-ponent of the total genetic diversity distributed amongpopulations in this species, and the apparent lack of cor-relation between genetic and geographical distances (Ryman1983; Crozier & Ferguson 1986; Ferguson 1989). This
Correspondence: P. Martínez. Fax: 34-982254681.
MEC794.fm Page 1991 Saturday, December 18, 1999 12:47 PM
1992
C . B O U Z A
E T A L .
© 1999 Blackwell Science Ltd,
Molecular Ecology
, 8, 1991–2001
high differentiation among populations has been detectedquite frequently at a local level, including the total iso-lation of sympatric populations (Ryman
et al
. 1979; Ryman1983; Crozier & Ferguson 1986). Several factors have beenconsidered to explain the complex genetic structure observedin brown trout, although their relative contributions remainunclear. Among these, the hierarchical and physical charac-teristics of the hydrographic system, the influence of thelast glaciations (Ryman 1983; Hamilton
et al
. 1989), and alsothe important local differentiation without barriers to migra-tion due to homing behaviour (Crozier & Ferguson 1986;Ferguson 1989) have been commonly invoked. The existenceof isolated or semi-isolated populations, which are moresensitive to genetic drift, may have contributed in somestudies to hide a model of isolation by distance in this species.Also, stocking practices may obscure the patterns of geneflow, causing genetic similarities among distant unrelatedpopulations when stocks of common origin are employed.
In the present study, an electrophoretic survey wascarried out in 41 native populations of
S. trutta
from fourriver basins of Galicia (northwest Spain). This region hasbeen scarcely studied until now despite the presence ofsome differential characteristics within the distributionrange of this species, very interesting to address the ques-tions related above. Galicia is crossed by the 42
°
N parallel,which has been proposed as the limit to the natural distribu-tion of sea trout. Also this region shows a great populationstability with respect to other geographical areas, both ina short temporal scale (small water flow fluctuations alongthe year) and in a geological scale of time (minor effectsof the last glaciations), the hydrographic net essentiallybeing established during the Terciary period (Pérez-González
et al
. 1989; Valcárcel-Díaz 1998). Finally, the for-tunate failure of stocking practices developed for the lastthree decades in this area has hardly affected Galiciannative populations (Martínez
et al
. 1993; Arias
et al
. 1995).Therefore, brown trout from this region is representativeof populations which could have survived for at least100 000 years (Hamilton
et al
. 1989).The specific aim of the present work was to analyse the
amount and distribution of genetic diversity within andamong river basins in a stable area located at the south-ern limit of the sea trout distribution. Also, the geneticrelationships among populations were analysed in a largenumber of samples to establish the pattern of migration andthe influence of habitat fragmentation in the great popula-tion subdivision observed in this species. The results areanalysed to propose a model of genetic structure in
S. trutta
.
Materials and methods
Sampling
Forty-one samples of brown trout were collected by
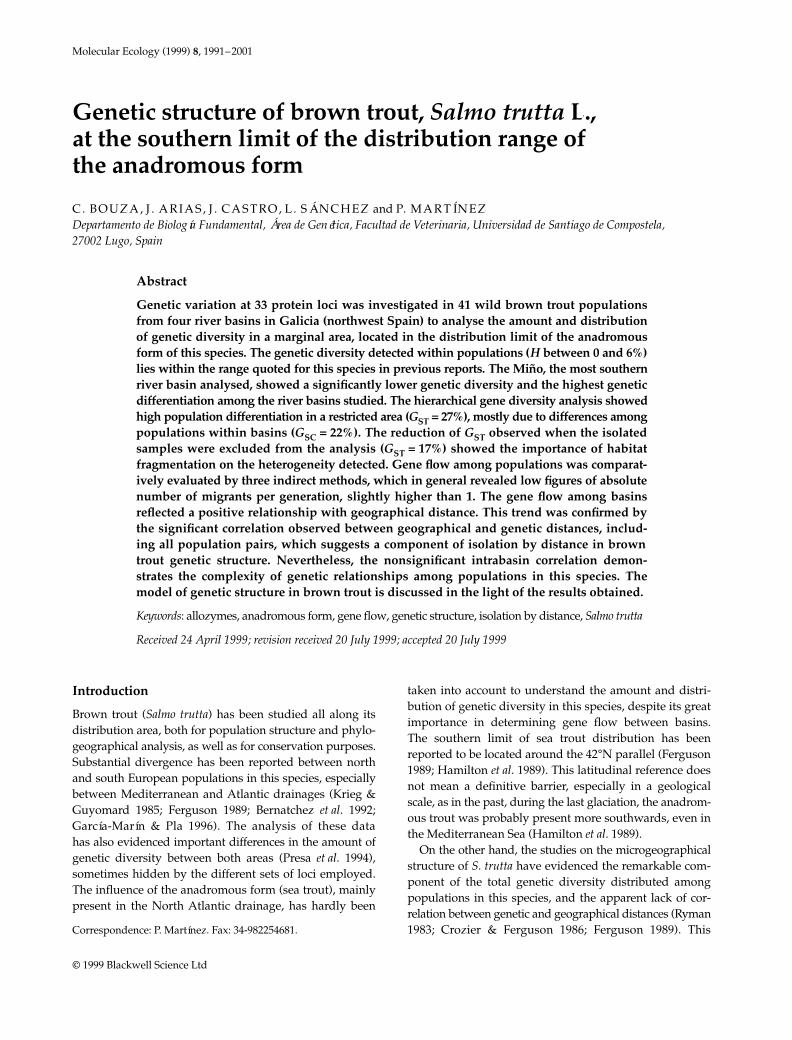
electrofishing between 1993 and 1995 in four river basinsfrom Galicia. The sampling scheme was designed toobtain a representative view of the area located aroundthe 42
°
N parallel in northwest Spain (Table 1, Fig. 1). Bothaccessible and isolated (by impassable natural barriers)populations from different drainages were analysed inorder to evaluate the relative component of genetic dif-ferentiation due to physical isolation. A large number ofsamples were taken within each river basin in accord-ance with its drainage area, in order to analyse the micro-geographical relationships among the populations, and toascertain the model of genetic structure in this species.
Galician rivers have been stocked during the last threedecades with hatchery stocks from German origin. Theimpact and outcome of the stocking was previously assessedusing the
LDH
-C* diagnostic marker and several otherpartial diagnostic loci (
s
MDH
-A2*,
G3PDH
-2*,
IDHP
-1*;Martínez
et al
. 1993; Arias
et al
. 1995; García-Marín & Pla1996). These studies evidenced that stocking programmeshave largely failed in this area and only a small numberof individuals of hatchery origin were detected. Only eightof the 47 populations analysed showed stocking indi-viduals (around 3–10% of the total sample). The extremeWahlund effect observed in most samples at the diagnosticlocus, with no hybrids between stocking and indigenousindividuals, has made it possible to obtain gene fre-quencies in 41 native populations analysed by excludingthe stocking specimens. The six nonintrogressed samplesfrom our previous study (Martínez
et al
. 1993) were alsoincluded in the analysis to obtain a more reliable pictureof
Salmo trutta
populations from this area (Table 1, Fig. 1).
Electrophoresis
Starch gel electrophoresis was used to analyse 14 enzym-atic systems corresponding to 33 loci. The proceduresapplied were previously reported by Martínez
et al
.(1993). The nomenclature employed follows Shaklee
et al
.(1990): aspartate aminotransferase (s
AAT
-1,2*, s
AAT
-4*),alcohol dehydrogenase (
ADH
*), adenylate kinase (
Ak
-1*,
Ak
-2*), creatine kinase (
CK
-A1*,
CK
-A2*,
CK
-C*), fructose-1,6-biphosphatase (
FBP
-1*,
FBP
-2*), glycerol-3-phosphatedehydrogenase (
G3PDH
-1*,
G3PDH
-2*,
G3PDH
-3*), isocitratedehydrogenase (
IDHP
-1*,
IDHP
-2*), lactate dehydrogenase(
LDH
-A1*,
LDH
-A2*,
LDH
-B1*,
LDH
-B2*,
LDH
-C*), malatedehydrogenase (s
MDH
-A1*, s
MDH
-A2*, s
MDH
-B1,2*),malic enzyme (NADP
+
) (
MEP
-1*,
MEP
-2*), mannose-6-phosphate isomerase (
MPI
-2*), phosphoglucose isomerase(
GPI
-A*,
GPI
-B1*,
GPI
-B2*), phosphoglucomutase (
PGM
-1*), superoxide dismutase (
SOD
*).
Statistical procedures
Allele frequencies were estimated from zymograms
MEC794.fm Page 1992 Saturday, December 18, 1999 12:47 PM
G E N E T I C S T RU C T U RE O F
S A L M O T R U T T A
1993
© 1999 Blackwell Science Ltd,
Molecular Ecology
, 8, 1991–2001
because of their codominant expression excluding s
MDH
-B1,2* and s
AAT
-1,2* isoloci. The variation observed at thes
AAT
-1,2* isoloci was attributed to a single locus, as nophenotypes with more than two doses of the less com-
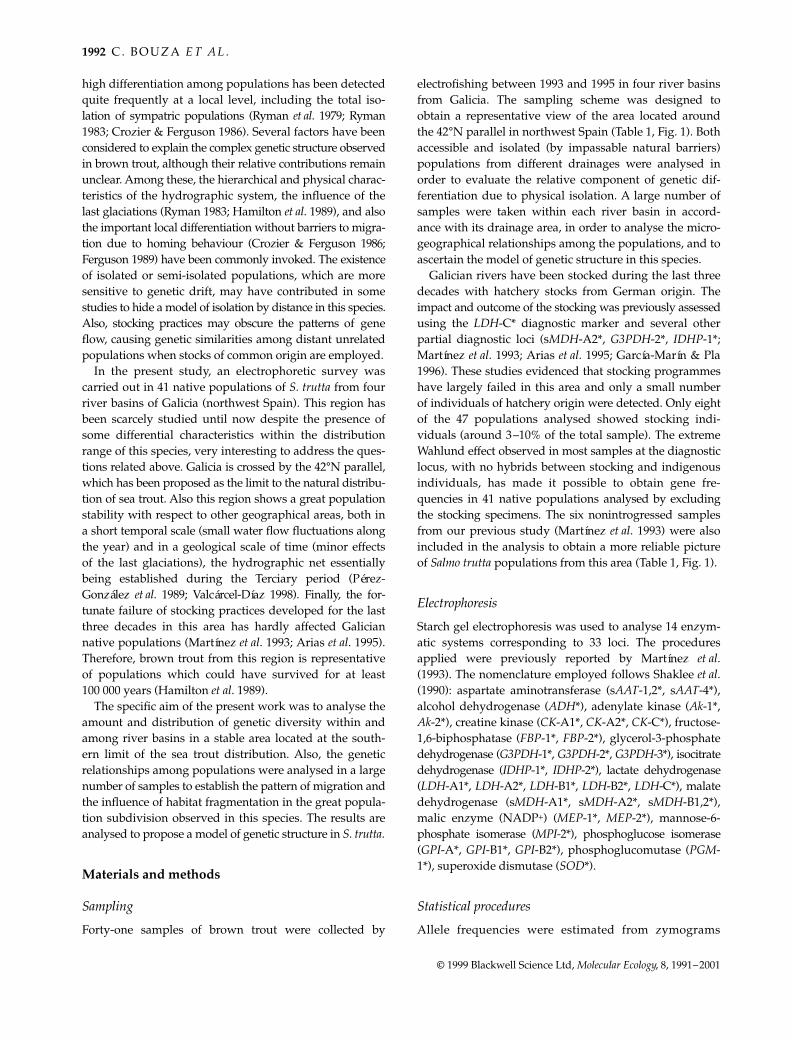
mon alleles were observed at zymograms in all samplesanalysed (Waples 1988). However, the phenotypic variationdetected at s
MDH
-B1,2*, especially in the Miño basin,necessarily involves variation at both loci (Fig. 2). In thiscase, a maximum likelihood procedure was applied toestimate gene frequencies at s
MDH
-B1,2* (Waples 1988;
isoloci
program) in all populations analysed. This is arecommended method for estimating allele frequencies atisoloci (Waples 1988; Ryman
et al
. 1993) and is more realisticthan other approaches which give equal frequencies toalleles at both loci, or which arbitrarily assign variants todifferent loci.
Pseudoprobability and classical chi-square (
χ
2
) tests wereperformed for conformance to Hardy–Weinberg at allcodominantly expressed loci (Hernández & Weir 1989). Theformer was only conducted at diallelic loci when extreme genefrequencies occurred (
chhw
program; Zaykin & Pudovkin1993). The sequential Bonferroni correction (Rice 1989)was employed over the multiple tests carried out.
Unbiased expected heterozygosity (
H
), its standarderror and the proportion of polymorphic loci (
P
99
and
P
95
)were obtained in each sample to estimate genetic variab-ility (Nei 1987). The averages per basin of each estimatorwere also calculated taking into account the six non-introgressed natural populations previously reported byMartínez
et al
. (1993). Hierarchical gene diversity analysis(Nei 1977; Chakraborty
et al
. 1982) was applied to ana-lyse the relative contribution of each structural level tothe total genetic variation detected (
H
T
). The analysis wasperformed both with and without the isolated samples toestimate the relative contribution of isolated populationsto the total divergence observed. The gene diversity com-ponent within populations (
H
S
/
H
T
) and the componentsof genetic differentiation with their sampling errors(
negst
program; Chakraborty
et al
. 1982) were obtainedin the two groups considered:
G
ST
(among populations);
G
SC
(among populations within basins);
G
CT
(amongbasins within the total). Contingency
χ
2
tests based ongene frequencies were performed using the
chirxc
pro-gram (Zaykin & Pudovkin 1993).
Two indirect methods were used to estimate geneflow (
N
e
m
: absolute number of migrants per generation)among populations, starting from allele frequencies atpolymorphic loci: the
F
ST
-based estimates following theexpression
F
ST
= 1/(1 + 4
N
e
m
) (Wright 1951) and the pri-vate allele method (Slatkin & Barton 1989). Isolatedsamples were excluded from calculations, because of theabsence of gene flow with respect to all remaining popu-lations. Two different estimators of
F
ST
were calculated:
G
ST
(Nei 1977) which does not take into account the dif-ferences in sample size or the number of locations, and
ϑ
(Weir & Cockerham 1984), an unbiased estimator of
F
ST
.Gene flow among basins was calculated from
G
ST
estim-ates based on mean gene frequencies per basin.
Table 1 Sampling characteristics of brown trout populationsanalysed in the present study. The origin of each sample isindicated with the following codes: M, Miño; U, Umia; T, Tambre;N, Navia river basins; #, isolated populations; *, samples fromthe previous study by Martínez et al. (1993). Within each basin,samples were sorted out in numerical order from the upper tothe lower section of the watercourse
Sample Drainage Code Sample size
Labrada Miño M1 31Abadín Miño M2 31Lea Miño M3 30Porto souto Miño M4 28Sarlonga Miño M5 24Rocamonde Miño M6 18Parga Miño M7 37Bahamonde Miño M8 27Chamoso Miño M9 22Neira Miño M10 27Freituxe Miño M11 29Teiguín Miño M12 29Sarria Miño M13 20Ferreira Miño M14 21Moreda Miño M15 34Fondós# Miño M16 26Mao Miño M17 24Cabe Miño M18 31Seoane Miño M19 26Lor Miño M20 27Soldón# Miño M21 32Requeixo# Miño M22 35Bibei Miño M23 25Navea Miño M24 23Nogueira Miño M25 31Pías Miño M26 32Tioira Miño M27 31Orille Miño M28 33Tuño Miño M29 29Deva# Miño M30 31Tea Miño M31 32Louro Miño M32 27Umia*# Umia U1 25Chaín*# Umia U2 20Bermaña Umia U3 33Cañón Umia U4 31Armenteira* Umia U5 30Sisán Umia U6 31Cabalar* Tambre T1 31Tambre* Tambre T2 31Sigüeiro Tambre T3 31Sionlla Tambre T4 31Barcala Tambre T5 31Navia* Navia N1 30Moia Navia N2 34Lamas Navia N3 31Navallo Navia N4 25
MEC794.fm Page 1993 Saturday, December 18, 1999 12:47 PM
1994
C . B O U Z A
E T A L .
© 1999 Blackwell Science Ltd,
Molecular Ecology
, 8, 1991–2001
Nei’s (1978) genetic distance was calculated between allpairs of samples analysed. Genetic relationships amongpopulations were estimated from genetic distances by gener-ating a neighbour-joining dendrogram (NJ) (Saitou & Nei1987;
dispan
program; 500 bootstrap replications), as wellas a multidimensional scaling (MDS) and a minimumspanning tree (MST) (
ntsys
statistical package; Rohlf 1992).The correlation between genetic and geographical dis-
tances (measured directly following the river contours)was examined to test for isolation by distance (Slatkin1993). Two different groups of distances, excluding theisolated samples, were considered in the correlation ana-lysis performed: (a) the distances between all pairs ofpopulations analysed; and (b) the distances within basins,excluding those among different basins. The statistical sig-nificance of the correlations was tested using Mantel ran-domization tests and 1000 permutations (
ntsys
program).
Results
Allelic variants and amount of genetic diversity
None of the 139 tests performed over the 10 polymorphicloci detected, revealed departure from Hardy–Weinbergexpectations after the application of the sequentialBonferroni correction. Ten of the 33 loci analysed werepolymorphic in at least one of the 41 populations studied.Some of them were polymorphic in most samplesanalysed (s
AAT
-4*,
CK
-A1*,
GPI
-B1*, s
MDH
-B1, 2*,
MPI
-2*), while others showed variation in a specific subset ofsamples (Table 2). At first sight, the populations analysedappeared largely heterogenic with divergence in genefrequencies and population-specific alleles at several loci
Fig. 1 Location of brown trout populations.Dark symbols represent the 41 samplesanalysed in the present study. The emptysymbols represent the six samples fromthe previous study reported by Martínezet al. (1993). Population codes from Table 1.
Fig. 2 Malate dehydrogenase (MDH) zymogram from brown troutmuscle samples, showing the five possible phenotypes observedat the dimeric sMDH-B1,2* isolocus pair, each segregating fortwo (*100, *78) of the five alleles detected in the present study. (B, I)100 (4); (K, M) 9:6:1 pattern, 100 (3): 78 (1); (A) 1:2:1 pattern, 100(2): 78 (2); (C–H, J) 1:6:9 pattern, 100 (1): 78 (3); (L) 78 (4). Thegene frequencies at both isoloci were estimated from the pheno-typic data following the approach of Waples (1988).
MEC794.fm Page 1994 Saturday, December 18, 1999 12:47 PM
GE
NE
TIC
ST
RU
CT
UR
E O
F
SA
LM
O T
RU
TT
A
1995
© 1999 B
lackwell Science L
td,
Molecular E
cology
, 8, 1991–2001
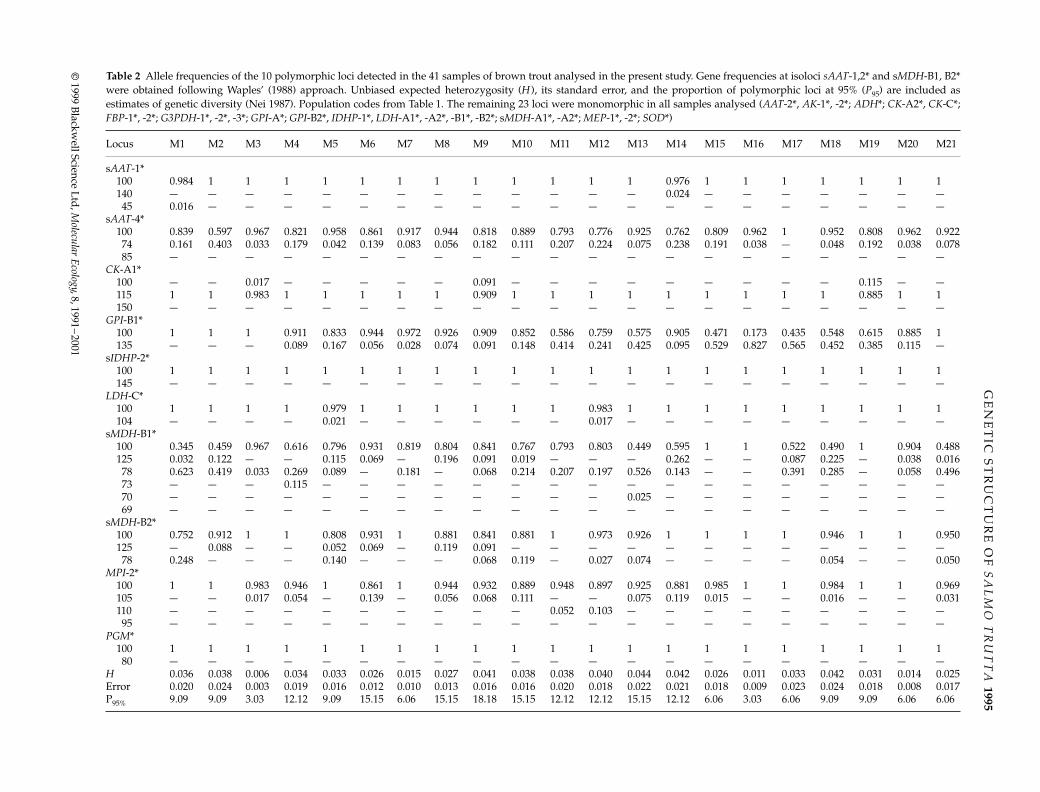
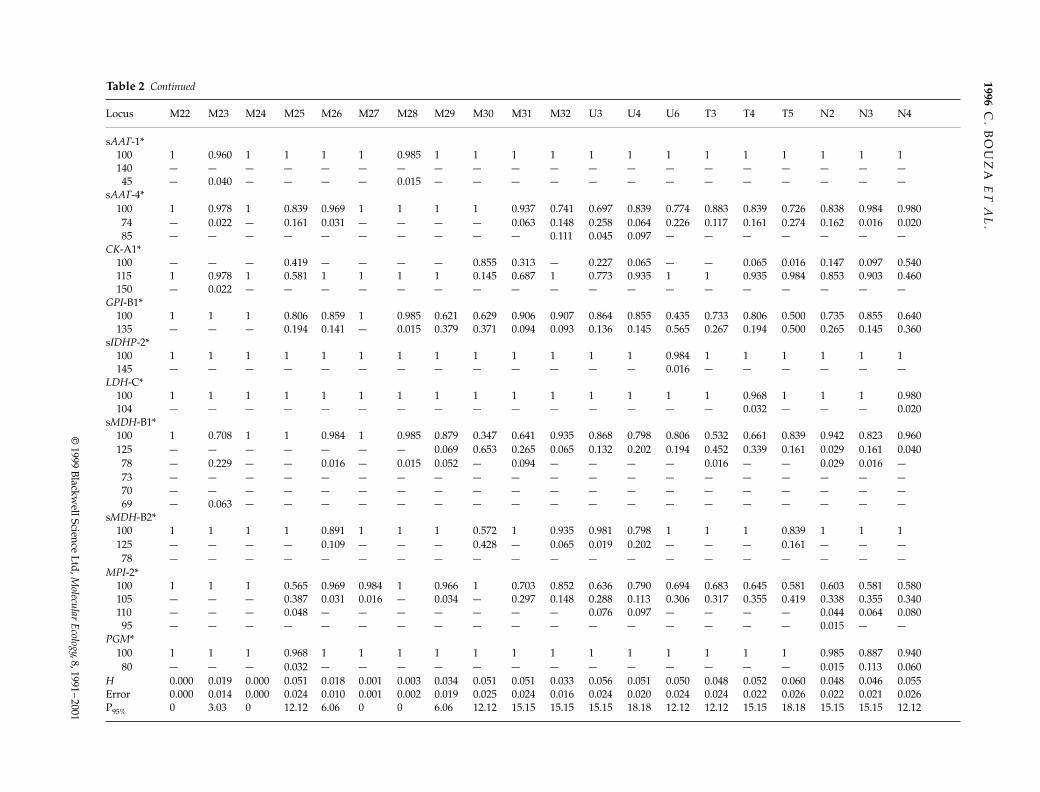
Table 2
Allele frequencies of the 10 polymorphic loci detected in the 41 samples of brown trout analysed in the present study. Gene frequencies at isoloci
sAAT
-1,2* and s
MDH
-B1, B2*were obtained following Waples’ (1988) approach. Unbiased expected heterozygosity (
H
), its standard error, and the proportion of polymorphic loci at 95% (
P
95
) are included asestimates of genetic diversity (Nei 1987). Population codes from Table 1. The remaining 23 loci were monomorphic in all samples analysed (
AAT
-2*,
AK
-1*, -2*;
ADH
*;
CK
-A2*,
CK
-C*;
FBP
-1*, -2*;
G3PDH
-1*, -2*, -3*;
GPI
-A*;
GPI
-B2*,
IDHP
-1*, LDH-A1*, -A2*, -B1*, -B2*; sMDH-A1*, -A2*; MEP-1*, -2*; SOD*)
Locus M1 M2 M3 M4 M5 M6 M7 M8 M9 M10 M11 M12 M13 M14 M15 M16 M17 M18 M19 M20 M21
sAAT-1*100 0.984 1 1 1 1 1 1 1 1 1 1 1 1 0.976 1 1 1 1 1 1 1140 — — — — — — — — — — — — — 0.024 — — — — — — —45 0.016 — — — — — — — — — — — — — — — — — — — —
sAAT-4*100 0.839 0.597 0.967 0.821 0.958 0.861 0.917 0.944 0.818 0.889 0.793 0.776 0.925 0.762 0.809 0.962 1 0.952 0.808 0.962 0.92274 0.161 0.403 0.033 0.179 0.042 0.139 0.083 0.056 0.182 0.111 0.207 0.224 0.075 0.238 0.191 0.038 — 0.048 0.192 0.038 0.07885 — — — — — — — — — — — — — — — — — — — — —
CK-A1*100 — — 0.017 — — — — — 0.091 — — — — — — — — — 0.115 — —115 1 1 0.983 1 1 1 1 1 0.909 1 1 1 1 1 1 1 1 1 0.885 1 1150 — — — — — — — — — — — — — — — — — — — — —
GPI-B1*100 1 1 1 0.911 0.833 0.944 0.972 0.926 0.909 0.852 0.586 0.759 0.575 0.905 0.471 0.173 0.435 0.548 0.615 0.885 1135 — — — 0.089 0.167 0.056 0.028 0.074 0.091 0.148 0.414 0.241 0.425 0.095 0.529 0.827 0.565 0.452 0.385 0.115 —
sIDHP-2*100 1 1 1 1 1 1 1 1 1 1 1 1 1 1 1 1 1 1 1 1 1145 — — — — — — — — — — — — — — — — — — — — —
LDH-C*100 1 1 1 1 0.979 1 1 1 1 1 1 0.983 1 1 1 1 1 1 1 1 1104 — — — — 0.021 — — — — — — 0.017 — — — — — — — — —
sMDH-B1*100 0.345 0.459 0.967 0.616 0.796 0.931 0.819 0.804 0.841 0.767 0.793 0.803 0.449 0.595 1 1 0.522 0.490 1 0.904 0.488125 0.032 0.122 — — 0.115 0.069 — 0.196 0.091 0.019 — — — 0.262 — — 0.087 0.225 — 0.038 0.01678 0.623 0.419 0.033 0.269 0.089 — 0.181 — 0.068 0.214 0.207 0.197 0.526 0.143 — — 0.391 0.285 — 0.058 0.49673 — — — 0.115 — — — — — — — — — — — — — — — — —70 — — — — — — — — — — — — 0.025 — — — — — — — —69 — — — — — — — — — — — — — — — — — — — — —
sMDH-B2*100 0.752 0.912 1 1 0.808 0.931 1 0.881 0.841 0.881 1 0.973 0.926 1 1 1 1 0.946 1 1 0.950125 — 0.088 — — 0.052 0.069 — 0.119 0.091 — — — — — — — — — — — —78 0.248 — — — 0.140 — — — 0.068 0.119 — 0.027 0.074 — — — — 0.054 — — 0.050
MPI-2*100 1 1 0.983 0.946 1 0.861 1 0.944 0.932 0.889 0.948 0.897 0.925 0.881 0.985 1 1 0.984 1 1 0.969105 — — 0.017 0.054 — 0.139 — 0.056 0.068 0.111 — — 0.075 0.119 0.015 — — 0.016 — — 0.031110 — — — — — — — — — — 0.052 0.103 — — — — — — — — —95 — — — — — — — — — — — — — — — — — — — — —
PGM*100 1 1 1 1 1 1 1 1 1 1 1 1 1 1 1 1 1 1 1 1 180 — — — — — — — — — — — — — — — — — — — — —
H 0.036 0.038 0.006 0.034 0.033 0.026 0.015 0.027 0.041 0.038 0.038 0.040 0.044 0.042 0.026 0.011 0.033 0.042 0.031 0.014 0.025Error 0.020 0.024 0.003 0.019 0.016 0.012 0.010 0.013 0.016 0.016 0.020 0.018 0.022 0.021 0.018 0.009 0.023 0.024 0.018 0.008 0.017P95% 9.09 9.09 3.03 12.12 9.09 15.15 6.06 15.15 18.18 15.15 12.12 12.12 15.15 12.12 6.06 3.03 6.06 9.09 9.09 6.06 6.06
ME
C794.fm
Page 1995 S
aturday, Decem
ber 18, 1999 12:47 PM
1996C
. BO
UZ
A E
T A
L.
© 1999 B
lackwell Science L
td, M
olecular Ecology, 8, 1991–2001
Locus M22 M23 M24 M25 M26 M27 M28 M29 M30 M31 M32 U3 U4 U6 T3 T4 T5 N2 N3 N4
sAAT-1*100 1 0.960 1 1 1 1 0.985 1 1 1 1 1 1 1 1 1 1 1 1 1140 — — — — — — — — — — — — — — — — — — — —45 — 0.040 — — — — 0.015 — — — — — — — — — — — — —
sAAT-4*100 1 0.978 1 0.839 0.969 1 1 1 1 0.937 0.741 0.697 0.839 0.774 0.883 0.839 0.726 0.838 0.984 0.98074 — 0.022 — 0.161 0.031 — — — — 0.063 0.148 0.258 0.064 0.226 0.117 0.161 0.274 0.162 0.016 0.02085 — — — — — — — — — — 0.111 0.045 0.097 — — — — — — —
CK-A1*100 — — — 0.419 — — — — 0.855 0.313 — 0.227 0.065 — — 0.065 0.016 0.147 0.097 0.540115 1 0.978 1 0.581 1 1 1 1 0.145 0.687 1 0.773 0.935 1 1 0.935 0.984 0.853 0.903 0.460150 — 0.022 — — — — — — — — — — — — — — — — — —
GPI-B1*100 1 1 1 0.806 0.859 1 0.985 0.621 0.629 0.906 0.907 0.864 0.855 0.435 0.733 0.806 0.500 0.735 0.855 0.640135 — — — 0.194 0.141 — 0.015 0.379 0.371 0.094 0.093 0.136 0.145 0.565 0.267 0.194 0.500 0.265 0.145 0.360
sIDHP-2*100 1 1 1 1 1 1 1 1 1 1 1 1 1 0.984 1 1 1 1 1 1145 — — — — — — — — — — — — — 0.016 — — — — — —
LDH-C*100 1 1 1 1 1 1 1 1 1 1 1 1 1 1 1 0.968 1 1 1 0.980104 — — — — — — — — — — — — — — — 0.032 — — — 0.020
sMDH-B1*100 1 0.708 1 1 0.984 1 0.985 0.879 0.347 0.641 0.935 0.868 0.798 0.806 0.532 0.661 0.839 0.942 0.823 0.960125 — — — — — — — 0.069 0.653 0.265 0.065 0.132 0.202 0.194 0.452 0.339 0.161 0.029 0.161 0.04078 — 0.229 — — 0.016 — 0.015 0.052 — 0.094 — — — — 0.016 — — 0.029 0.016 —73 — — — — — — — — — — — — — — — — — — — —70 — — — — — — — — — — — — — — — — — — — —69 — 0.063 — — — — — — — — — — — — — — — — — —
sMDH-B2*100 1 1 1 1 0.891 1 1 1 0.572 1 0.935 0.981 0.798 1 1 1 0.839 1 1 1125 — — — — 0.109 — — — 0.428 — 0.065 0.019 0.202 — — — 0.161 — — —78 — — — — — — — — — — — — — — — — — — — —
MPI-2*100 1 1 1 0.565 0.969 0.984 1 0.966 1 0.703 0.852 0.636 0.790 0.694 0.683 0.645 0.581 0.603 0.581 0.580105 — — — 0.387 0.031 0.016 — 0.034 — 0.297 0.148 0.288 0.113 0.306 0.317 0.355 0.419 0.338 0.355 0.340110 — — — 0.048 — — — — — — — 0.076 0.097 — — — — 0.044 0.064 0.08095 — — — — — — — — — — — — — — — — — 0.015 — —
PGM*100 1 1 1 0.968 1 1 1 1 1 1 1 1 1 1 1 1 1 0.985 0.887 0.94080 — — — 0.032 — — — — — — — — — — — — — 0.015 0.113 0.060
H 0.000 0.019 0.000 0.051 0.018 0.001 0.003 0.034 0.051 0.051 0.033 0.056 0.051 0.050 0.048 0.052 0.060 0.048 0.046 0.055Error 0.000 0.014 0.000 0.024 0.010 0.001 0.002 0.019 0.025 0.024 0.016 0.024 0.020 0.024 0.024 0.022 0.026 0.022 0.021 0.026P95% 0 3.03 0 12.12 6.06 0 0 6.06 12.12 15.15 15.15 15.15 18.18 12.12 12.12 15.15 18.18 15.15 15.15 12.12
Table 2 Continued
ME
C794.fm
Page 1996 S
aturday, Decem
ber 18, 1999 12:47 PM
G E N E T I C S T RU C T U RE O F S A L M O T R U T T A 1997
© 1999 Blackwell Science Ltd, Molecular Ecology, 8, 1991–2001
(some of them not reported to date: CK-A1*150, MPI-2*95,several slow variants of sMDH-B1,2*), and a wide rangeof polymorphism (P95: 0–27.3%; H: 0–10%). This hetero-geneity was in part due to the isolated samples (M17,M22, M23, M31, U1, U2) taken in the Miño and Umiabasins (see Fig. 1), that commonly showed higher diver-gence and very low genetic diversity.
Mean gene frequencies per basin also showed import-ant differences, especially at CK-A1*, MPI-2* and sMDH-B1,2* loci. The frequency of CK-A1*115, MPI-2*100 andsMDH-B1,2*78 alleles increased southwards, from Naviatowards Miño basin (from 0.675 to 0.938, from 0.570 to0.945, and from 0.020 to 0.140, respectively). Accordingly,the proportion of populations with presumed variationat both sMDH-B1,2* isoloci gradually decreased fromMiño (15 of 31 samples analysed) to Navia basin (no popu-lations with variation at both isoloci). The divergenceamong basins was also accounted for by genetic diversityestimates. The Miño basin revealed the lowest mean hetero-zygosity (H: 0.028 ± 0.003), with respect to all other basins(H: 0.040 ± 0.008; 0.051 ± 0.003; 0.050 ± 0.002; in Umia, Tambreand Navia, respectively). This could in part be due to theisolated samples taken in Miño, but the accessible samplesfrom this basin also evidenced significantly lower hetero-zygosity figures than the homologous populations fromall remaining drainages (averaged H: 0.029 vs. 0.052;Wilcoxon signed-test, P < 0.001; Sokal & Rohlf 1989).
Gene diversity and gene flow analysis
Genetic differentiation among all natural populations
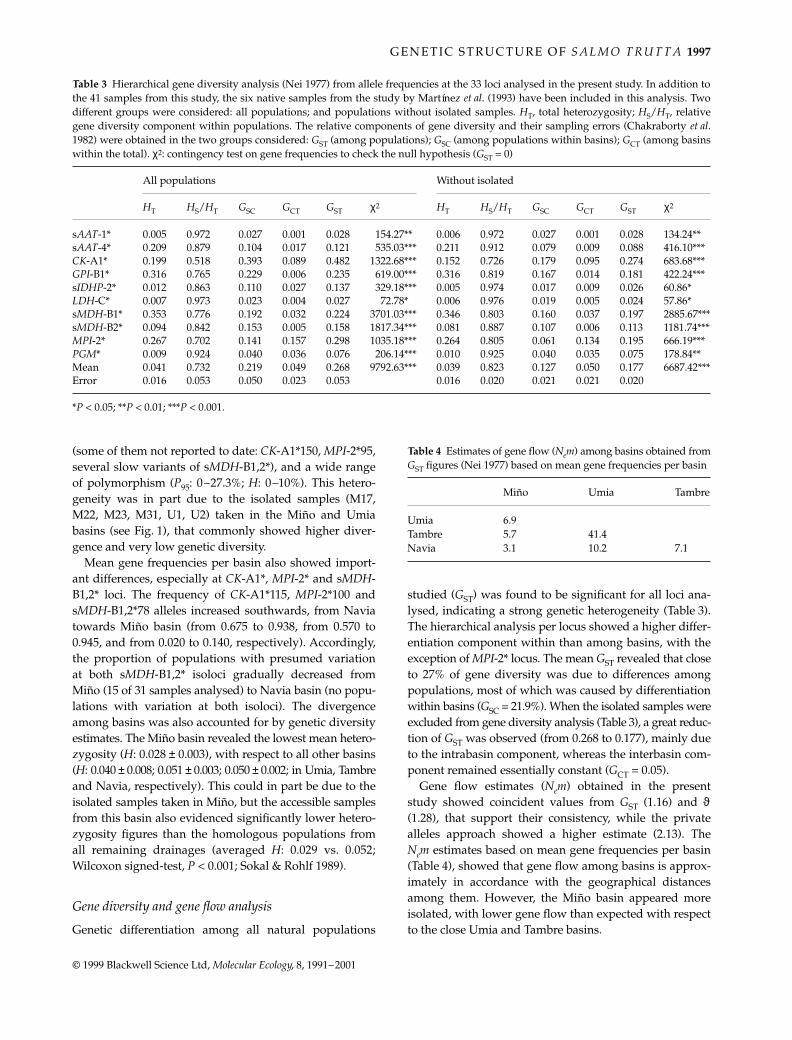
studied (GST) was found to be significant for all loci ana-lysed, indicating a strong genetic heterogeneity (Table 3).The hierarchical analysis per locus showed a higher differ-entiation component within than among basins, with theexception of MPI-2* locus. The mean GST revealed that closeto 27% of gene diversity was due to differences amongpopulations, most of which was caused by differentiationwithin basins (GSC = 21.9%). When the isolated samples wereexcluded from gene diversity analysis (Table 3), a great reduc-tion of GST was observed (from 0.268 to 0.177), mainly dueto the intrabasin component, whereas the interbasin com-ponent remained essentially constant (GCT = 0.05).
Gene flow estimates (Nem) obtained in the presentstudy showed coincident values from GST (1.16) and ϑ(1.28), that support their consistency, while the privatealleles approach showed a higher estimate (2.13). TheNem estimates based on mean gene frequencies per basin(Table 4), showed that gene flow among basins is approx-imately in accordance with the geographical distancesamong them. However, the Miño basin appeared moreisolated, with lower gene flow than expected with respectto the close Umia and Tambre basins.
Table 3 Hierarchical gene diversity analysis (Nei 1977) from allele frequencies at the 33 loci analysed in the present study. In addition tothe 41 samples from this study, the six native samples from the study by Martínez et al. (1993) have been included in this analysis. Twodifferent groups were considered: all populations; and populations without isolated samples. HT, total heterozygosity; HS/HT, relativegene diversity component within populations. The relative components of gene diversity and their sampling errors (Chakraborty et al.1982) were obtained in the two groups considered: GST (among populations); GSC (among populations within basins); GCT (among basinswithin the total). χ2: contingency test on gene frequencies to check the null hypothesis (GST = 0)
All populations Without isolated
HT HS/HT GSC GCT GST χ2 HT HS/HT GSC GCT GST χ2
sAAT-1* 0.005 0.972 0.027 0.001 0.028 154.27** 0.006 0.972 0.027 0.001 0.028 134.24**sAAT-4* 0.209 0.879 0.104 0.017 0.121 535.03*** 0.211 0.912 0.079 0.009 0.088 416.10***CK-A1* 0.199 0.518 0.393 0.089 0.482 1322.68*** 0.152 0.726 0.179 0.095 0.274 683.68***GPI-B1* 0.316 0.765 0.229 0.006 0.235 619.00*** 0.316 0.819 0.167 0.014 0.181 422.24***sIDHP-2* 0.012 0.863 0.110 0.027 0.137 329.18*** 0.005 0.974 0.017 0.009 0.026 60.86*LDH-C* 0.007 0.973 0.023 0.004 0.027 72.78* 0.006 0.976 0.019 0.005 0.024 57.86*sMDH-B1* 0.353 0.776 0.192 0.032 0.224 3701.03*** 0.346 0.803 0.160 0.037 0.197 2885.67***sMDH-B2* 0.094 0.842 0.153 0.005 0.158 1817.34*** 0.081 0.887 0.107 0.006 0.113 1181.74***MPI-2* 0.267 0.702 0.141 0.157 0.298 1035.18*** 0.264 0.805 0.061 0.134 0.195 666.19***PGM* 0.009 0.924 0.040 0.036 0.076 206.14*** 0.010 0.925 0.040 0.035 0.075 178.84**Mean 0.041 0.732 0.219 0.049 0.268 9792.63*** 0.039 0.823 0.127 0.050 0.177 6687.42***Error 0.016 0.053 0.050 0.023 0.053 0.016 0.020 0.021 0.021 0.020
*P < 0.05; **P < 0.01; ***P < 0.001.
Table 4 Estimates of gene flow (Nem) among basins obtained fromGST figures (Nei 1977) based on mean gene frequencies per basin
Miño Umia Tambre
Umia 6.9Tambre 5.7 41.4Navia 3.1 10.2 7.1
MEC794.fm Page 1997 Saturday, December 18, 1999 12:47 PM
1998 C . B O U Z A E T A L .
© 1999 Blackwell Science Ltd, Molecular Ecology, 8, 1991–2001
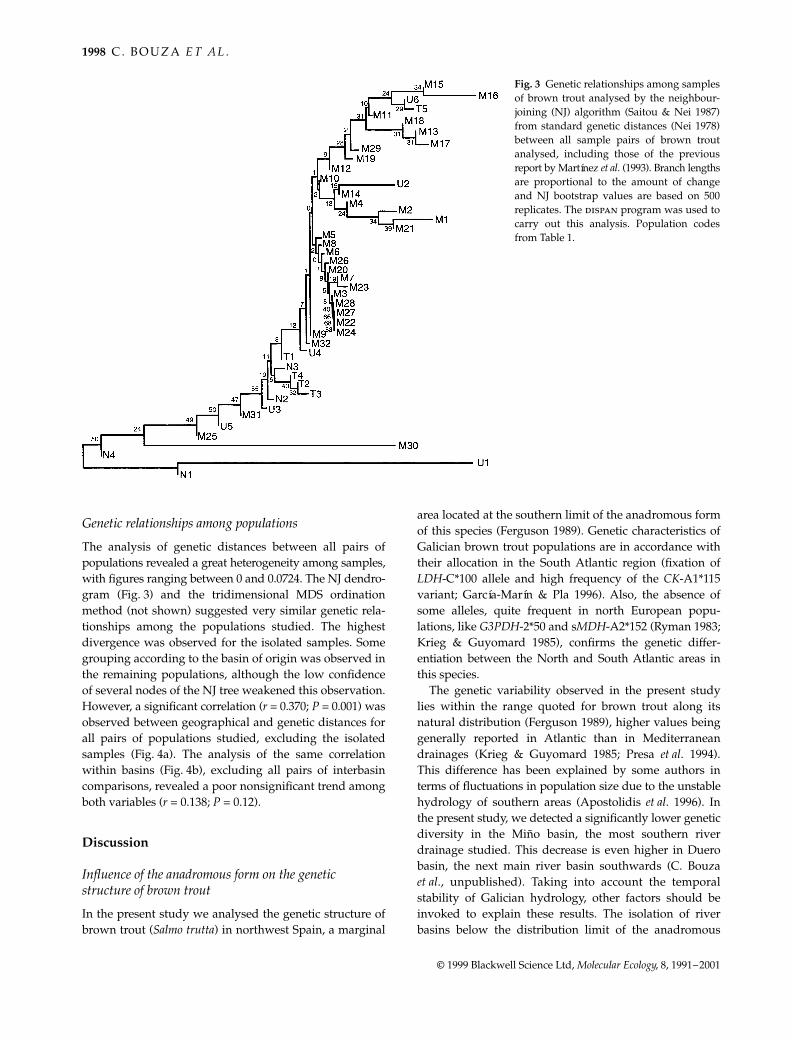
Genetic relationships among populations
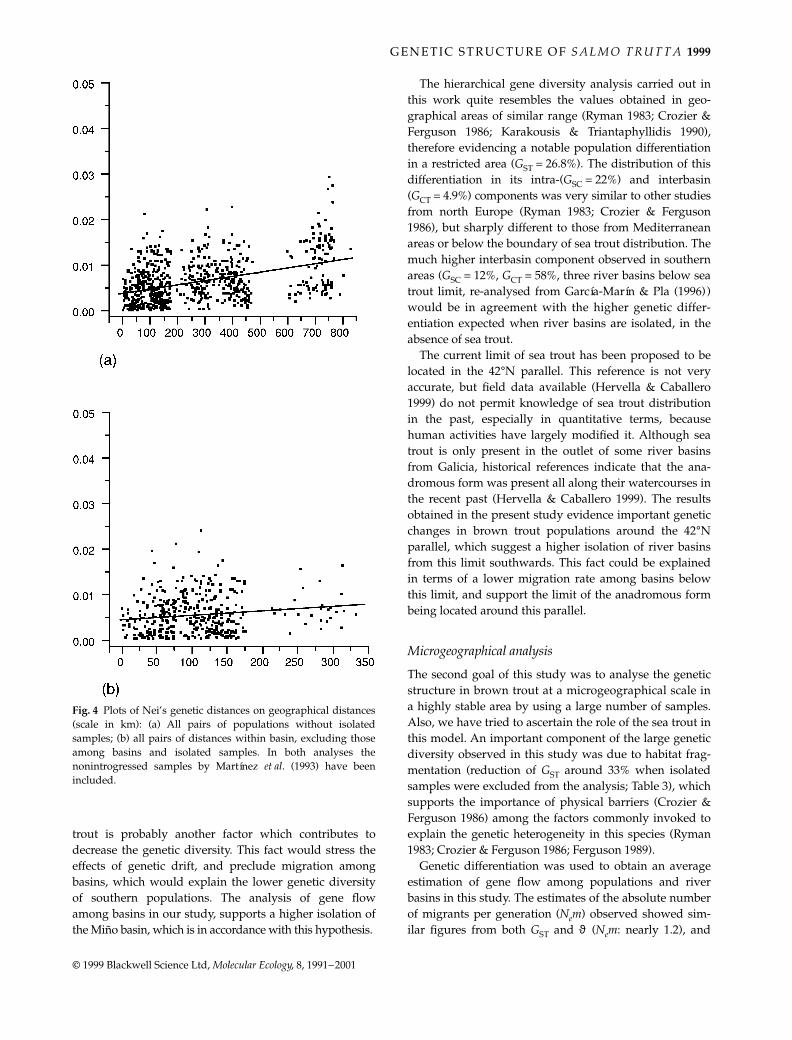
The analysis of genetic distances between all pairs ofpopulations revealed a great heterogeneity among samples,with figures ranging between 0 and 0.0724. The NJ dendro-gram (Fig. 3) and the tridimensional MDS ordinationmethod (not shown) suggested very similar genetic rela-tionships among the populations studied. The highestdivergence was observed for the isolated samples. Somegrouping according to the basin of origin was observed inthe remaining populations, although the low confidenceof several nodes of the NJ tree weakened this observation.However, a significant correlation (r = 0.370; P = 0.001) wasobserved between geographical and genetic distances forall pairs of populations studied, excluding the isolatedsamples (Fig. 4a). The analysis of the same correlationwithin basins (Fig. 4b), excluding all pairs of interbasincomparisons, revealed a poor nonsignificant trend amongboth variables (r = 0.138; P = 0.12).
Discussion
Influence of the anadromous form on the genetic structure of brown trout
In the present study we analysed the genetic structure ofbrown trout (Salmo trutta) in northwest Spain, a marginal
area located at the southern limit of the anadromous formof this species (Ferguson 1989). Genetic characteristics ofGalician brown trout populations are in accordance withtheir allocation in the South Atlantic region (fixation ofLDH-C*100 allele and high frequency of the CK-A1*115variant; García-Marín & Pla 1996). Also, the absence ofsome alleles, quite frequent in north European popu-lations, like G3PDH-2*50 and sMDH-A2*152 (Ryman 1983;Krieg & Guyomard 1985), confirms the genetic differ-entiation between the North and South Atlantic areas inthis species.
The genetic variability observed in the present studylies within the range quoted for brown trout along itsnatural distribution (Ferguson 1989), higher values beinggenerally reported in Atlantic than in Mediterraneandrainages (Krieg & Guyomard 1985; Presa et al. 1994).This difference has been explained by some authors interms of fluctuations in population size due to the unstablehydrology of southern areas (Apostolidis et al. 1996). Inthe present study, we detected a significantly lower geneticdiversity in the Miño basin, the most southern riverdrainage studied. This decrease is even higher in Duerobasin, the next main river basin southwards (C. Bouzaet al., unpublished). Taking into account the temporalstability of Galician hydrology, other factors should beinvoked to explain these results. The isolation of riverbasins below the distribution limit of the anadromous
Fig. 3 Genetic relationships among samplesof brown trout analysed by the neighbour-joining (NJ) algorithm (Saitou & Nei 1987)from standard genetic distances (Nei 1978)between all sample pairs of brown troutanalysed, including those of the previousreport by Martínez et al. (1993). Branch lengthsare proportional to the amount of changeand NJ bootstrap values are based on 500replicates. The dispan program was used tocarry out this analysis. Population codesfrom Table 1.
MEC794.fm Page 1998 Saturday, December 18, 1999 12:47 PM
G E N E T I C S T RU C T U RE O F S A L M O T R U T T A 1999
© 1999 Blackwell Science Ltd, Molecular Ecology, 8, 1991–2001
trout is probably another factor which contributes todecrease the genetic diversity. This fact would stress theeffects of genetic drift, and preclude migration amongbasins, which would explain the lower genetic diversityof southern populations. The analysis of gene flowamong basins in our study, supports a higher isolation ofthe Miño basin, which is in accordance with this hypothesis.
The hierarchical gene diversity analysis carried out inthis work quite resembles the values obtained in geo-graphical areas of similar range (Ryman 1983; Crozier &Ferguson 1986; Karakousis & Triantaphyllidis 1990),therefore evidencing a notable population differentiationin a restricted area (GST = 26.8%). The distribution of thisdifferentiation in its intra-(GSC = 22%) and interbasin(GCT = 4.9%) components was very similar to other studiesfrom north Europe (Ryman 1983; Crozier & Ferguson1986), but sharply different to those from Mediterraneanareas or below the boundary of sea trout distribution. Themuch higher interbasin component observed in southernareas (GSC = 12%, GCT = 58%, three river basins below seatrout limit, re-analysed from García-Marín & Pla (1996))would be in agreement with the higher genetic differ-entiation expected when river basins are isolated, in theabsence of sea trout.
The current limit of sea trout has been proposed to belocated in the 42°N parallel. This reference is not veryaccurate, but field data available (Hervella & Caballero1999) do not permit knowledge of sea trout distributionin the past, especially in quantitative terms, becausehuman activities have largely modified it. Although seatrout is only present in the outlet of some river basinsfrom Galicia, historical references indicate that the ana-dromous form was present all along their watercourses inthe recent past (Hervella & Caballero 1999). The resultsobtained in the present study evidence important geneticchanges in brown trout populations around the 42°Nparallel, which suggest a higher isolation of river basinsfrom this limit southwards. This fact could be explainedin terms of a lower migration rate among basins belowthis limit, and support the limit of the anadromous formbeing located around this parallel.
Microgeographical analysis
The second goal of this study was to analyse the geneticstructure in brown trout at a microgeographical scale ina highly stable area by using a large number of samples.Also, we have tried to ascertain the role of the sea trout inthis model. An important component of the large geneticdiversity observed in this study was due to habitat frag-mentation (reduction of GST around 33% when isolatedsamples were excluded from the analysis; Table 3), whichsupports the importance of physical barriers (Crozier &Ferguson 1986) among the factors commonly invoked toexplain the genetic heterogeneity in this species (Ryman1983; Crozier & Ferguson 1986; Ferguson 1989).
Genetic differentiation was used to obtain an averageestimation of gene flow among populations and riverbasins in this study. The estimates of the absolute numberof migrants per generation (Nem) observed showed sim-ilar figures from both GST and ϑ (Nem: nearly 1.2), and
Fig. 4 Plots of Nei’s genetic distances on geographical distances(scale in km): (a) All pairs of populations without isolatedsamples; (b) all pairs of distances within basin, excluding thoseamong basins and isolated samples. In both analyses thenonintrogressed samples by Martínez et al. (1993) have beenincluded.
MEC794.fm Page 1999 Saturday, December 18, 1999 12:47 PM
2000 C . B O U Z A E T A L .
© 1999 Blackwell Science Ltd, Molecular Ecology, 8, 1991–2001
twice as high from the private alleles method. Previousstudies in this species showed in general low figures ofNem from GST estimates, although higher than 1 (Hansenet al. 1993; Morán et al. 1995; Riffel et al. 1995). Our resultsare in accordance with the theoretical expectations. Infact, the estimators based on FST are expected to yield,under a wide variety of conditions and different modelsof genetic structure, more accurate estimates than theprivate alleles approach due to practical difficulties inestimating the frequency of rare alleles and its depend-ence on sample size (Slatkin & Barton 1989). This could bea real problem in our case taking into account the samplesize managed. On the other hand, the figures obtained inthis study probably represent an underestimation of theactual gene flow because they are based on a model ofislands (Wright 1951). As seen below, a component ofisolation by distance is present in brown trout geneticstructure, and this model requires higher figures of migra-tion to explain a specific value of genetic differentiation.
The lack of isolation by distance which has beenemphasized in brown trout is probably a reflection of thecomplex genetic relationships among populations in thisspecies without any apparent geographical trend (Ryman1983; Crozier & Ferguson 1986; Ferguson 1989; García-Marín & Pla 1996). This observation could be obscured bythe fragmentation of the habitat, which could determinestochastic relationships due to genetic drift, and by thegeological instability affecting the Quaternary period,which could result in populations being far from equi-librium. The area under study in this work showed highstability both in a short and in a long temporal scale, so, assome authors have pointed out, populations could havesurvived in this area from preglacial times (Hamiltonet al. 1989). In this study, a significant correlation betweengenetic and geographical distances was obtained whenall non-isolated populations were analysed, although theproportion of variation of genetic distances explainedby geographical distances was not very high (r2: 14%;P = 0.001). The same analysis, only taking into accountwithin-basin distances, reveals a poor nonsignificanttrend among both variables (r2: 2%; P = 0.12), which sug-gests an island model of structure within basins in browntrout (Wright 1951; Kimura & Weiss 1964). The combina-tion of the analysis of gene flow among basins, outlinedabove, and the correlations between genetic and geo-graphical distances, point towards sea trout as respons-ible for the significant isolation by distance componentdetected in brown trout. A similar result was obtained byMorán et al. (1995) and Hansen & Mensberg (1998), usingallozyme and mitochondrial DNA variation, respectively.This observation is also in agreement with tagging experi-ments, which showed that the probability of sea troutstraying to distant compared with adjacent basins israther low (Svärdson & Fagerström 1982).
The results obtained in this study suggest a combinedmodel of genetic structure in brown trout, depending onthe hierarchical level considered, with isolation by distanceamong basins, when sea trout is present, and an islandmodel within basins. It cannot be excluded, however,that higher variable genetic markers, like microsatellites,can detect some isolation by distance at a within-basinscale (Estoup et al. 1998).
Acknowledgements
We thank Dr M. M. Hansen for the interesting comments andcriticisms on the manuscript. The computer programs dispanand negst were kindly supplied by Dr M. Nei (PennsylvaniaState University, USA) and by Dr N. Ryman (Stockholm Uni-versity, Sweden), respectively. We also thank personnel of theEnvironment Service of the Xunta de Galicia for the facilities givenfor sampling. This study was supported by the Xunta de Galicia(XUGA 26106 A90).
References
Apostolidis A, Karakousis Y, Triantaphyllidis C (1996) Geneticdivergence and phylogenetic relationships among Salmo truttaL. (brown trout) populations from Greece and other Europeancountries. Heredity, 76, 551–560.
Arias J, Sánchez L, Martínez P (1995) Low stocking incidence inbrown trout populations from northwestern Spain monitoredby LDH-5* diagnostic marker. Journal of Fish Biology, 47(A),170–176.
Bernatchez L, Guyomard R, Bonhomme F (1992) DNA sequencevariation of the mitochondrial control region among geograph-ically and morphologically remote European brown troutSalmo trutta populations. Molecular Ecology, 1, 161–173.
Chakraborty R, Haag M, Ryman N, Stahl G (1982) Hierarchicalgene diversity analysis and its application to trout populationdata. Hereditas, 97, 17–21.
Crozier W, Ferguson A (1986) Electrophoretic examination of thepopulation structure of brown trout, Salmo trutta L., from theLough Neagh catchment, Northern Ireland. Journal of Fish Bio-logy, 28, 459–477.
Estoup A, Rousset F, Michalakis Y, Cornuet J-M, Adriamanga M,Guyomard R (1998) Comparative analysis of microsatelliteand allozyme markers: a case study investigating microgeo-graphic differentiation in brown trout (Salmo trutta). MolecularEcology, 7, 339–353.
Ferguson A (1989) Genetic differences among brown trout, Salmotrutta, stocks and their importance for the conservation andmanagement of the species. Freshwater Biology, 21, 35–46.
García-Marín JL, Pla C (1996) Origins and relationships of nativepopulations of Salmo trutta (brown trout) in Spain. Heredity, 77,313–323.
Hamilton KE, Ferguson A, Taggart JB et al. (1989) Post-glacialcolonization of brown trout, Salmo trutta L. LDH-5 as a phylo-geographic marker. Journal of Fish Biology, 35, 651–664.
Hansen MM, Loeschcke V, Rasmussen G, Simonssen V (1993)Genetic differentiation among Danish brown trout (Salmotrutta) populations. Hereditas, 118, 177–185.
Hansen MM, Mensberg K-L (1998) Genetic differentiation and
MEC794.fm Page 2000 Saturday, December 18, 1999 12:47 PM
G E N E T I C S T RU C T U RE O F S A L M O T R U T T A 2001
© 1999 Blackwell Science Ltd, Molecular Ecology, 8, 1991–2001
relationship between genetic and geographical distance inDanish sea trout (Salmo trutta L.) populations. Heredity, 81,493–504.
Hernández JL, Weir BS (1989) A disequilibrium coefficientapproach to Hardy–Weinberg testing. Biometrics, 45, 53–70.
Hervella F, Caballero P (1999) Inventariación piscícola de los ríosgallegos. Consellería de Medio Ambiente, Xunta de Galicia.
Karakousis Y, Triantaphyllidis C (1990) Genetic structure anddifferentiation among Greek brown trout (Salmo trutta L.)populations. Heredity, 64, 297–304.
Kimura M, Weiss GH (1964) The stepping stone model of popu-lation structure and the decrease of genetic correlation withdistance. Genetics, 49, 561–576.
Krieg F, Guyomard R (1985) Population genetics of Frenchbrown trout (Salmo trutta L.): large geographical differentiationof wild populations and high similarity of domesticated stocks.Génétique, Sélection, Evolution, 17, 225–242.
Martínez P, Arias J, Castro J, Sánchez L (1993) Differential stock-ing incidence in brown trout (Salmo trutta) populations fromNorthwestern Spain. Aquaculture, 114, 203–216.
Morán P, Pendás AM, García-Vázquez E, Izquierdo JI,Lobón-Cervia J (1995) Estimates of gene flow among neigh-bouring populations of brown trout. Journal of Fish Biology, 46,593–602.
Nei M (1977) F-statistics and analysis of gene diversity in sub-divided populations. Annals of Human Genetics, 41, 225–233.
Nei M (1978) Estimation of average heterozygosity and geneticdistance from a small number of individuals. Genetics, 89, 583–590.
Nei M (1987) Molecular Evolutionary Genetics. Columbia UniversityPress, New York.
Pérez-González A, Cabra P, Martín-Serrano A et al. (1989) Mapadel Cuaternario de España. Servicio de publicaciones. InstitutoTecnológico Geominero de España.
Presa P, Krieg F, Estoup A, Guyomard R (1994) Diversité etgestion génétique de la truite commune: apport de l’étude dupolymorphisme des locus protéiques et microsatellites. Génétique,Sélection, Evolution, 26, 183–202.
Rice WR (1989) Analyzing tables of statistical tests. Evolution, 43,223–225.
Riffel M, Storch V, Schreiber A (1995) Allozyme variability ofbrown trout (Salmo trutta L.) populations across the Rhenanian-Danubian watershed in southwest Germany. Heredity, 74, 241–249.
Rohlf FJ (1992) NTSYS-PC: Numerical Taxonomy and MultivariateAnalysis System. Department of Ecology and Evolution, StateUniversity of New York.
Ryman N (1983) Patterns of distribution of biochemical geneticvariation in Salmonids: differences between species. Aquaculture,33, 1–21.
Ryman N, Allendorf FW, Ståhl G (1979) Reproductive isolation
with little genetic divergence in sympatric populations ofbrown trout (Salmo trutta). Genetics, 92, 247–262.
Ryman N, Utter F, Allendorf FW, Bussac C, Shaklee J (1993)Genetic concerns about hatchery populations—a comment onthe conclusions of Nyman and Ring. Journal of Fish Biology, 42,471–480.
Saitou N, Nei M (1987) The neighbor-joining method: a newmethod for reconstructing phylogenetic trees. Molecular Biologyand Evolution, 4, 406–425.
Shaklee J, Allendorf FW, Morizot DC, Whitt GS (1990) Genenomenclature for protein-coding loci in fish. Transactions of theAmerican Fisheries Society, 119, 2–15.
Slatkin M (1993) Isolation by distance in equilibrium and non-equilibrium populations. Evolution, 47, 264–279.
Slatkin M, Barton NH (1989) A comparison of three indirectmethods for estimating average levels of gene flow. Evolution,43, 1349–1368.
Sokal RR, Rohlf FJ (1989) Biometry, 2nd edn. WH Freeman, SanFrancisco.
Svärdson G, Fagerström Å (1982) Adaptative differences in thelong-distance migration of some trout (Salmo trutta L.) stocks.Report. Institute of Freshwater Research (Drottningholm), 60, 51–80.
Valcárcel-Díaz M (1998) Evolución geomorfológica y dinámicade las vertientes en el Noroeste de Galicia: Importancia de losprocesos de origen frío en un sector de las montañas lucenses.PhD Thesis, University of Santiago de Compostela.
Waples RS (1988) Estimation of allele frequencies at isoloci.Genetics, 118, 371–384.
Weir BS, Cockerham CC (1984) Estimating F-statistics for theanalysis of population structure. Evolution, 38, 1358–1370.
Wright S (1951) The genetical structure of populations. Annals ofEugenics, 15, 323–354.
Zaykin DV, Pudovkin AI (1993) Two programs to estimate sig-nificance of χ2 values using pseudo-probability tests. Journal ofHeredity, 84, 152.
This paper represents part of the research programme aimed atdescribing the genetic structure and conservation of brown troutin Galicia (northwest Spain). This investigation was developedby the group co-headed by P. Martínez and L. Sánchez, AssociateProfessors of Genetics at the University of Santiago de Com-postela, where C. Bouza and J. Castro are Assistant Professors.The analyses carried out in the present study are based on dataobtained by J. Arias as part of his PhD project. Most researchof this group has been focused on fish genetics, analysing bothcytogenetics and population genetic aspects in different groups(Salmoniformes, Anguilliformes, Pleuronectiformes).
MEC794.fm Page 2001 Saturday, December 18, 1999 12:47 PM


