Embed Size (px)
Citation preview

Marine Genomics 9 (2013) 25–32
Contents lists available at SciVerse ScienceDirect
Marine Genomics
j ourna l homepage: www.e lsev ie r .com/ locate /margen
Genotyping of two populations of Southern Baltic Sea trout Salmo trutta m. truttausing an Atlantic salmon derived SNP-array
Agata Drywa a, Anita Poćwierz-Kotus b, Anna Wąs a, Stefan Dobosz c, Matthew P. Kent d, Sigbjørn Lien d,Rafał Bernaś e, Roman Wenne b,⁎a National Marine Fisheries Research Institute, Gdynia, ul. Kołłątaja 1, 81‐332, Gdynia, Polandb Polish Academy of Sciences, Institute of Oceanology PAS, Department of Genetics and Marine Biotechnology, Powstańców Warszawy 55, 81‐712 Sopot, Polandc Department of Salmonid Fish Breeding in Rutki, Inland Fisheries Institute, Olsztyn, Polandd Centre for Integrative Genetics, Department of Animal and Aquacultural Sciences, Norwegian University of Life Sciences, N‐1432 Ås, Norwaye Department of Migratory Fishes in Gdańsk, Inland Fisheries Institute, Olsztyn, Poland
⁎ Corresponding author. Tel.: +48 58 731 17 63; fax:E-mail address: [email protected] (R. Wenne).
1874-7787/$ – see front matter © 2012 Elsevier B.V. Allhttp://dx.doi.org/10.1016/j.margen.2012.08.001
a b s t r a c t
a r t i c l e i n f oArticle history:Received 29 April 2012Received in revised form 23 August 2012Accepted 30 August 2012
Keywords:Salmo truttaSNPMicroarrayPopulation genomics
The sea trout (Salmo trutta m. trutta) is an anadromous, teleost fish species characterized by homing behav-iour. The sea trout has considerable ecological and economic significance. It reproduces naturally in riversflowing into, and is common in, the Baltic Sea. In Poland spawning aggregations occur in the Vistula Riverand the rivers of Pomerania. Two populations from the Vistula River (TW) and a Pomeranian river, the Słupia(TP) weremixed in the past by stocking. Themain purpose of this studywas an assessment of the applicabilityof the Atlantic salmon custom design Illumina iSelect SNP (Single Nucleotide Polymorphisms) arraycontaining 15,225 markers for identification of genetic diversity between sea trout populations. A diagnosticpanel of 39 SNPs with a mean FST=0.1298 was selected from a pool of 15,225. At each locus, minor allele fre-quency was higher than 0.01 and mean expected heterozygosity for TW and TP populations were 0.343 and0.271 respectively. Individuals tested were clustered in one of two groups which corresponded to their originswhere the TW population was genetically more homogenous (membership coefficients ranked from 88.8% to98.6%) while the TP population was more diverse (membership coefficients ranked from 53.8% to 98.5%). Theresults demonstrated the applicability of the Salmon 15K SNP-chip for determining the differences betweenSouthern Baltic populations of the sea trout, a closely related salmonid species.
© 2012 Elsevier B.V. All rights reserved.
1. Introduction
Brown trout is a teleost fish species with considerable ecologicaland economic significance. The species is ecologically diverse withtwo forms: resident and migratory. An anadromous form, identifiedas a sea trout (Salmo trutta m. trutta), is characterized by migratorybehaviour, making spawning trips from sea to rivers and going backto the sea for feeding. They display homing behaviour—to spawnthey return to the rivers where they were born (Elliott, 1994;Heggberget et al., 1986; Klemetsen et al., 2003).
Sea trout is common in the Baltic Sea basin and is represented by arelatively large number of populations of which about 500 reproducenaturally in Baltic rivers (HELCOM, 2011). The spawning takes placein the upper sections of these rivers. Although, where barriers existpreventing free migration to spawning grounds, lower reaches of rivers
+48 58 551 21 30.
rights reserved.
are often used by migratory trout when these meet the requirementsnecessary for reproduction. The negative effect of barriers, even thoseequipped with fish passes, is well reported (Aarestrup and Jepsen,1998; Karppinen et al., 2002;Webb, 1990). The impossibility of freemi-gration forces sea trout to look for alternative often accidental spawninggrounds (Dunkley and Shearer, 1982; Gerlier and Roche, 1998).
In the Southern Baltic in Poland, there are two main spawning ag-gregations: fish belonging to the Vistula and to the Pomeranian rivers.The Włocławek dam cut off the main sea trout spawning grounds inthe Vistula River system in the Carpathian tributaries. Among thefew tributaries of the lower section of the Vistula, only the Drwęcahas accessible, though very limited, spawning areas. Most sea troutpopulations are found in rivers flowing directly to the sea (HELCOM,2011). In the Vistula River, the sea trout population consists of twostocks—winter and summer. In the past, the main part of the popula-tion was the winter stock (Żarnecki, 1963) but nowadays the summerpopulation prevails (Borzęcka, 2003). The summer sea trout popula-tion begins its spawning migration upstream in June and it lastsuntil early September. The fish have enlarged gonads and are in partialbreeding colours. Winter sea trout ascend the Vistula from Novemberto February, and these individuals have silver colouring and immature

26 A. Drywa et al. / Marine Genomics 9 (2013) 25–32
gonads. The summer sea trout spawn in the same year that they as-cend the river, while the winter sea trout spawn in the followingyear (Bartel et al., 2010). Sea trout from the Vistula River have the ben-efit of growing faster and reaching a larger size than other sea troutpopulations (Bartel, 1988; Woźnicki et al., 1999). The Pomeraniansea trout returns to the rivers, including Słupia in autumn or earlywinter and spawn in the same year (Chełkowski, 1969).
Generally, salmonids are very vulnerable to environmental pollu-tion. In particular, environmental degradation caused by unreasonablemelioration works, damming and regulation of rivers with the elimi-nation of natural wimples has lead to the loss of spawning grounds.The result has been a dramatic decrease in natural salmonid resourcesin some areas over the past century. The response to these collapseswas stock-enhancement programmes based on releases of hatchery-reared fish (Hansen and Loeschcke, 1994) and finally intensive artifi-cial spawning programmes. For populations from the Southern Balticthe stocking activity is currently assessed at a level of nearly 80%.Stocking in some cases compromised biodiversity and has lead tothe mixing of populations. However some studies show that evenheavily stocked salmonid populations may contain a surprisinglylow proportion of gene flow between stocked and wild fish (Hansen,2002).
In Poland in order to increase the size of sea trout populations, annualcompensatory stocking has been carried out since the early 20th century(Bartel, 1997) and artificially bred alevins and smolts have been releasedsince the 1950s. Unfortunately, the Vistula River was enhanced withPomeranian sea trout in the 1950s and 1960s (Bartel, 1993) resultingin mixing of the Vistula River population. Stocking programmes havenow been improved to accommodate biodiversity protection. Thespawn for hatchery purposes is obtained from spawners migrating totheir native river, smolts or fry originate from the specific river to bestocked and each hatchery breeds trout for stocking in only one river.However, there is still a possibility of mixing between populations dueto stocking intensity (Bartel and Dębowski, 1996; Dębowski and Bartel,1996) leading to the loss of historical and unique phenotypic propertiesof the Vistula sea trout population (Bartel, 1988; Woźnicki et al., 1999).
There are many papers dedicated to the issue of sea trout geneticbiodiversity (e.g. Carlsson and Nilsson, 2000; Hansen and Mensberg,1998; Hansen et al., 2002; Morán et al., 1995; Skaala and Naevdal,1989). The influence of stocking on natural populations of the specieshas also been studied frequently (Hansen, 2002; Hansen et al., 1999,2000, 2001; Ruzzante et al., 2001, 2004). In many cases polymorphicmicrosatellite DNA has been the marker of choice for the assessmentof genetic diversity between populations. However available geneticmarkers were not, in all instances, selective enough, as in the caseof the Southern Baltic populations (Wąs and Wenne, 2003). RecentlySNPs (single nucleotide polymorphism) have emerged as the mostpromising genetic markers (Helyar et al., 2011; Seeb et al., 2011a).Glover et al. (2010) published a highly informative set of 15 SNPloci discovered for Atlantic salmon, which were much more accuratein individual genetic self-assignment than any combination of 14 ap-plied microsatellite loci. SNPs are the most abundant type of variationin DNA sequences. They represent a huge potential for genome widescans of selectively neutral or adaptive variation (Wayne and Morin,2004) with simple mutation models and potential application tonon-invasive and historical DNA analysis (Morin and McCarthy,2007; Smith et al., 2011).
SNPs markers have been discovered and applied to populationstructure and kinship research in salmonids, such as sockeye salmon(Oncorhynchus nerka) and coho salmon (Oncorhynchus kisutch)(Campbell and Narum, 2011; Hauser et al., 2011), steelhead/rainbowtrout (Oncorhynchus mykiss) (Abadía-Cardoso et al., 2011; Hansen etal., 2011), Chinook salmon (Oncorhynchus tshawytscha) (Clementoet al., 2011; Hess et al., 2011; Templin et al., 2011), and chum (Pacificsalmon) (Oncorhynchus keta), (Seeb et al., 2011b). For Atlantic salm-on (Salmo salar) SNPs were screened to describe gene-affecting
quantitative traits (Hayes et al., 2007), in order to enable genetic dif-ferentiation of farmed and wild forms of this species (Karlsson et al.,2011) and 2 metapopulations of Western Atlantic salmon (Bay ofFundy) (Freamo et al., 2011). A set of SNPs to identify marble trout(Salmo marmoratus), softmouth trout (Salmo obtusirostris) and someevolutionary lineages of brown trout (S. trutta) in Europe have re-cently been described (Pustovrh et al., 2011).
DNA microarray technique has been developed for the identificationof commercial fish species: at various stages of the life cycle (Kochziuset al., 2008), and from geographically different populations in order toimprove compliance with and enforcement of fishing regulations(Martinsohn et al., 2009). Today's DNA microarray "SNP-chip" platformsallow genotyping of individual samples with a large number of SNPs. AnAtlantic salmon (Salmo salar) iSelect SNP-array has been developedcontaining 7000 markers (7K) of functional assays (it initially contained15,163 loci, 15K). This array has been used for pedigree identification inbreeding programmes (Dominik et al., 2010; Gidskehaug et al., 2011),and in a study defining genetic differences between farmed and wild At-lantic salmon in Norway (Karlsson et al., 2011). This has resulted in thedevelopment of a 60-SNP panel diagnostic for farmed and wild salmon,and in the construction of geneticmaps and the description of the geneticarchitecture of European (Lien et al., 2011) and North American salmonpopulations.
This paper reports the first use of SNP-array technology in researchon the Southern Baltic Sea trout populations. The phylogenetic prox-imity of S. salar to S. trutta m. trutta enabled the use of the Atlanticsalmon SNP-array to identify SNPs informative in the sea trout genomethat would be useful for population genetic research and analysis par-ticularly in identifying individual fish origins in mixed populations.We expect to apply this new panel of SNPs as a tool to improve seatrout stocking programmes in Polish rivers, focusing on the identifica-tion and selection of Vistula River descendants among returningspawners. This will contribute to the improvement of genetic biodi-versity restitution in sea trout populations migrating to rivers of theSouthern Baltic.
2. Materials and methods
2.1. Sampling
Two sea trout samples, each composed of 12 fishes (Pomeranian seatrout and Vistula sea trout), were collected in 2009. The Pomeranianriver Słupia (TP)was sampled usingwild spawners caught in Novemberby a Polish Anglers Association trap in Słupsk (54.460532, 17.039587)(Fig. 1). The Słupia River is 138 km in length with a catchment area of1623 km2. The river flows into the Baltic Sea in Ustka. The section ofthe river fully available for the migration of sea trout is only 36 km,from Ustka to Słupsk, at which point two weirs dam the water for hy-droelectric power plants. These weirs are equipped with fishways thatallow fish migration up the river for a further 57 km to the powerplant dam in Krzynia. Thewhole catchment area above this dam is inac-cessible for migrating sea trout.
A sample ofwinter Vistula sea trout (TW)was collected from smoltsin May 2009 from a broodstock created and maintained in the Depart-ment of Salmonid Fish Breeding at the Inland Fisheries Institute inRutki (Fig. 1). This breeding stock was established on the basis of eggsderived from the following sources: from fish showing characteristicsof winter run strain and held till spawning at the fishery centre inŚwibno in the mouth of the Vistula (twice between 1988 and 2000);eggs of sea trout from the River Dalälven in Sweden and imported in1998. The Dalälven broodfishes were the progeny of winter Vistulasea trout introduced there in the1960s. The Department of SalmonidFish Breeding currently has a breeding stock of winter Vistula seatrout, which is the second crossbreeding generation of fish from thesesources.

Fig 1. Map showing the sampling locations of the two sea trout populations: the Vistula River (Rutki hatchery), the Słupia River (Słupsk).
27A. Drywa et al. / Marine Genomics 9 (2013) 25–32
2.2. DNA extraction and SNP genotyping
Genomic DNA was extracted from fin clip samples preserved in96% ethanol, using Qiagen Dneasy Blood & Tissue Kit followingmanufacturer's recommendations. DNA qualitywas assessed by run-ning sample aliquots on 0.9% agarose gels. Samples were quantifiedby nanodrop and diluted to a final concentration of 50 ng/μl inwater. Genotyping was performed using the inifinum assay fromIllumina according to manufacturer's instructions. The iSelect SNP-array used in this studywasmanufactured by Illumina and containedSNPs (15,225) identified through re-sequencing of commercial Nor-wegian populations, bioinformatic analysis of public EST sequencesand mitochondrial resequencing. Arrays were scanned using aniScan platform with standard procedures as recommended by themanufacturer (Illumina, 2007).
2.3. Quality control and data analysis
Prior to this study, extensive genotyping was performed using a15K salmon SNP-array which allowed markers to be classified,according to salmon loci, as monomorphic (MONO), diploid polymor-phic (SNP), tetraploid polymorphic or multi-site variants (MSV),paralogous sequence variants (PSV), or failed assays (FAIL). To findpolymorphic SNPs for sea trout, all data from loci labelled as SNP andMONOwere taken from this 15K SNP-chip for preliminary analysis be-cause monomorphic loci for salmon can be polymorphic for trout. Forgenetic differentiation of populations, only polymorphic sea trout SNPmarkers were included in the analysis.
To monitor quality control for SNP genotyping the following pa-rameters were calculated for each locus separately: GenCall (GCscore), missing data rate, minor allele frequency (MAF), excess het-erozygosity and a test for Hardy–Weinberg equilibrium (HWE). GCscores correlate with the accuracy of the assay (Oliphant et al.,2002). Their values range from 0 to 1, and reflect the degree of
separation between homozygote and heterozygote clusters for eachSNP and the placement of the individual call within a cluster (Fan etal., 2003; Shen et al., 2005).
A no-call threshold of 0.05 (Illumina, 2010) was applied in thisstudy. To avoid ‘missing data’ problems, occurring through the inabilityto genotype a particular SNP, low DNA quality, or an unclear intensitysignal, an 80% threshold for missing data was adopted. The level lowerthan the recommended 95%was due to the small number of individuals.Loci with failure data from two or less individuals per sample/locuswere only accepted in further analyses.
Rare alleles can produce spurious associations between SNP markersand phenotypes. Therefore SNPs with a minor allele frequency (MAF)below a certain threshold should be discarded. In our study, MAF valuewas limited to 0.01. Observed (Ho) and expected (He) heterozygosity(Nei, 1978, 1987), as well as the Chi-square test to check for departurefrom the calculated normalized Hardy–Weinberg equilibrium (Guo andThompson, 1992), were assessed using Arlequin software 3.5.1.2(Excoffier and Lischer, 2010). A regime of 1,000,000 steps in Markovchain randomization and 1,000,000 dememorisation steps was appliedand its significance was assessed with Pb0.05. SNPs exhibiting signifi-cant departure from HWEwith heterozygosity excess omitted from fur-ther analysis.
2.4. Population genetics
Loci polymorphic for sea trout were selected from genotyping re-sults with the salmon SNP-array using locus-by-locus AMOVA (Analysisof Molecular Variance) after 10,000 permutations. Population differen-tiation was analyzed using global weighted average F-statistic over lociand pairwise FST (Weir and Cockerham, 1984; Weir, 1996) with 1000permutations and significance level Pb0.05. All tests were carried outby the Arlequin 3.5.1.2 (Excoffier and Lischer, 2010).
Identification of distinct genetic populations and assignment of indi-viduals to themwere performedwith a Bayesianmodel-based clustering

Fig. 2.Distribution ofMinor Allele Frequency (MAF) against SNPs for 24 sea trout specimens.Black represents the selected 39 population-specific SNPs and grey shows 69 neutral SNPs of108 polymorphic loci ranked according to allele frequency.
28 A. Drywa et al. / Marine Genomics 9 (2013) 25–32
analysis using the Structure 2.3.3 (Pritchard et al., 2000). Individualswere assigned to predefined K populations (from K=1 to K=3 with 5iterations for each K), where each K is characterized by a set of allele fre-quencies for each locus. An admixture model with no a priori informa-tion on the origin of the individuals with 10,000 repetitions as burn inand200,000 repetitions after burn inwas applied. Individualswere prob-abilistically assigned to one or more clusters if their genotypes indicateda mixing. To select the most optimal K value for studied populations theestimates of Pr(X|K) were compared. The model with K=2, with thehighest estimate value of Pr(X|K), was substantially better than othermodels with different K values. Determination of individuals as puretype, hybrid and introgressant was based on the classification ofAlbaladejo and Aparicio (2007).
Correspondence within and between populations was assessedusing a two-dimensional factorial correspondence analysis (FCA)implemented in GENETIX 4.05.2 (Belkhir et al., 2000; Benzécri, 1992)based on associations between two qualitative variables from SNP alle-lic frequency. The results are shown in the 2D graph, where each pointrepresents a separate individual.
The ability of the set of 39markers to assign individuals to themostlikely population was assessed using ONCOR software (Kalinowski etal., 2007). Assignment tests to estimate the origin of each individualand to evaluate the accuracy of identification of individuals topopulations by leave-one-out method were performed. Specimenswere divided into two groups—baseline and mixture. 6 fish individ-uals from each analyzed population have been placed in each group.Individuals from the mixture sample were assigned, with no a prioriinformation on the origin of the individuals, to the baseline pop-ulations that would have the highest probability of producing thegiven genotype in the mixture. The Rannala and Mountain (1997)method was used to estimate probability. During assessment of theaccuracy of fish identification in leave-one-out test each fish individu-al from each population was sequentially removed from the baselinegroup (one at a time) to estimate its origin using the rest data fromthe baseline.
3. Results
3.1. Characterization of SNPs and quality control
A 15K SNP-Chip designed for Atlantic salmon, which was later op-timized to 7K for salmon was evaluated as a genomic tool for seatrout. Twenty four sea trout specimens originating from the VistulaRiver and the Pomeranian river, Słupia, were genotyped, and datawere checked for population differentiation purposes. 732 of 15,225loci failed to amplify (no amplification at all). After omitting lociwith a lack of amplification, PSV and MSV (loci integrated into the du-plicated region of salmon and sea trout genomes) 9324 loci, consid-ered as representatives of a single copy of the genome (MONO andSNP), were analysed. GeneCall parameter (GCb0.15) and missingdata rate (missingb80%) qualified 8746 loci for further analysis. Im-plementation of AMOVA analysis resulted in the selection of 108polymorphic (Po) loci. Although for all of them MAF was greaterthan 0.01 (Fig. 2), for twenty six loci H–W disequilibrium was ob-served. Finally, applying all the steps of quality control as mentionedabove, 39 loci with FST for pairwise comparison greater than 0 wereselected and used in subsequent analyses (Table 1).
3.2. Genetic polymorphism
For 108 loci, the mean observed heterozygosity (Ho) for the popu-lation from the Vistula River (TW) was 0.536±0.00013 and valuesranged from 0 to 1. Themean expected heterozygosity (He) amountedto 0.377±0.00013 and ranged from 0.083 to 0.526. In the second, (theTP population from the Pomeranian river) the mean Ho and He wereslightly lower (0.42±0.00009 and 0.323±0.00009, respectively),
ranging from 0 to 1 and from 0.083 to 0.525, respectively. Atthirty-nine loci the mean Ho and He were similar to each other, withslightly lower values for the Pomeranian river sea trout. For the TWpopulation Ho and He were 0.389±0.00017 and 0.346±0.00017 re-spectively, and for TP 0.234±0.00012 and 0.271±0.00012. Rangesof homo- and heterozygosity were the same for the TW population,and slightly different for the TP population (from 0 to 0.6 and from0.083 to 0.518 for Ho and He, respectively).
The majority of the 108 selected loci were in HWE. Departure fromHWEwas observed at 26 loci (24%) and most of them (23) were com-mon in both populations. In the group of thirty nine loci departurefrom HWE was observed at 7 loci (4 for TW and 3 for TP).
3.3. Population differentiation
The average FST over all 108 polymorphic loci for the two studiedpopulations was 0.0407; in turn pairwise FST between the twopopulations was significant and reached 0.029. Genetic diversityappeared much higher at 39 selected loci. The average FST over allloci was 0.1298 and FST values at each of 39 loci, assessed usinglocus-by-locus AMOVA analysis, are shown in Fig. 3. In turn pairwiseFST between the two populations was significant and reached 0.1447.
3.4. Genetic structure
To identify distinct genetic populations, assign individuals to pop-ulations, and identify migrants and admixed individuals, STRUCTUREsoftware analysis was performed for 39 loci selected from theSNP-Chip. To infer themost likely number of populations a hypotheticalpopulation number from 1 to 3 was tested. K=2was the optimal num-ber of clusters in the studied populations, whichwas consistentwith theanticipated number.
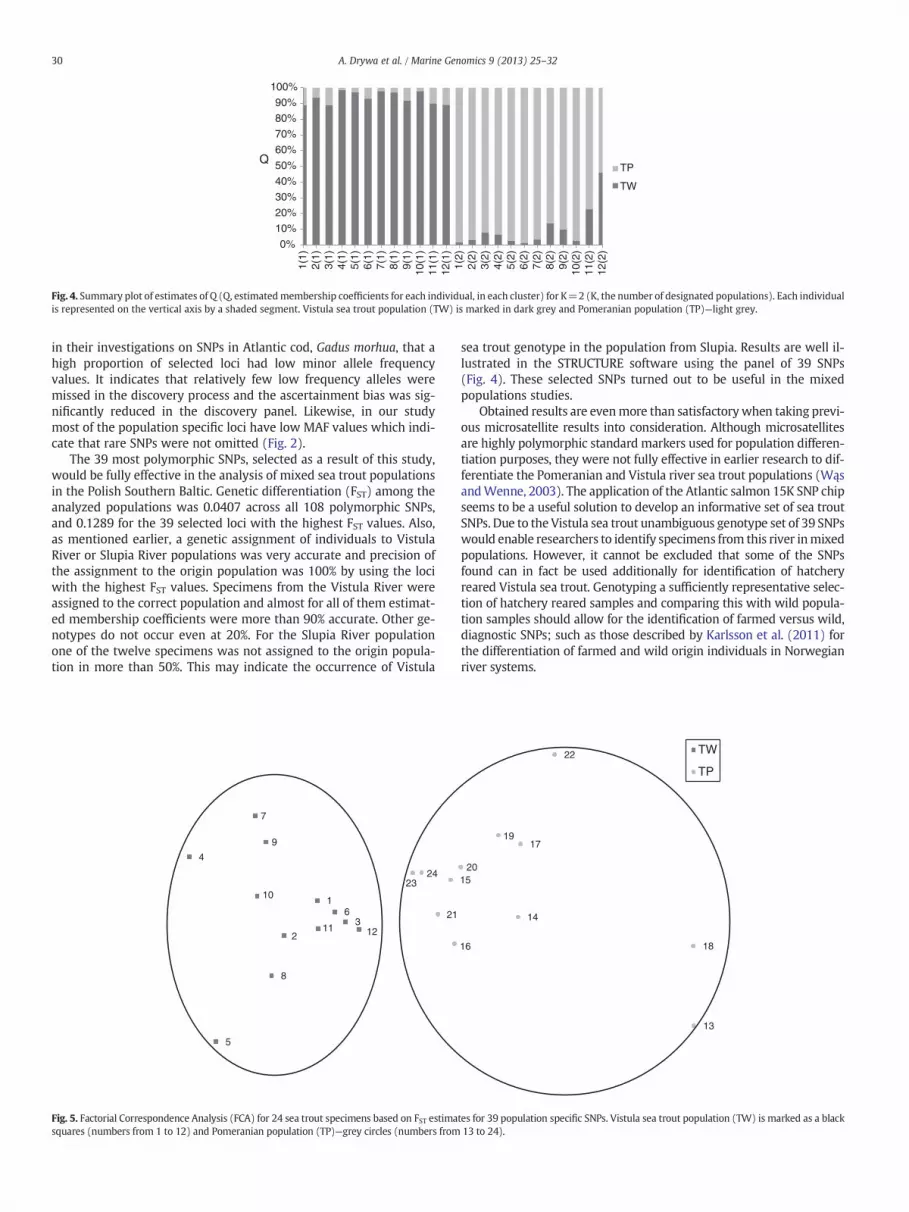
The twenty-four sea trout specimens were assigned to two clus-ters, each of them composed of fish from a given river. In the TW pop-ulation 9 individuals represented what was presumably the originalpopulation of the Vistula sea trout, with estimated membership coef-ficients ranging from 90.0% to 98.6%. However, 3 of 12 specimensshowed lower group association probability, ranging from 88.8% to89.2%. These were considered to represent the mixture of gene pooloriginating from the Vistula and Pomeranian populations. In the TPpopulation, 9 fish were assigned as sea trout originating from thePomeranian river with membership coefficients ranging from 90.0%to 98.5%. Another 3 individuals represented the presumed mixedgroup, with 53.8%, 77.2% and 86.1% of membership coefficient values.The proportions of membership of two sea trout populations in the
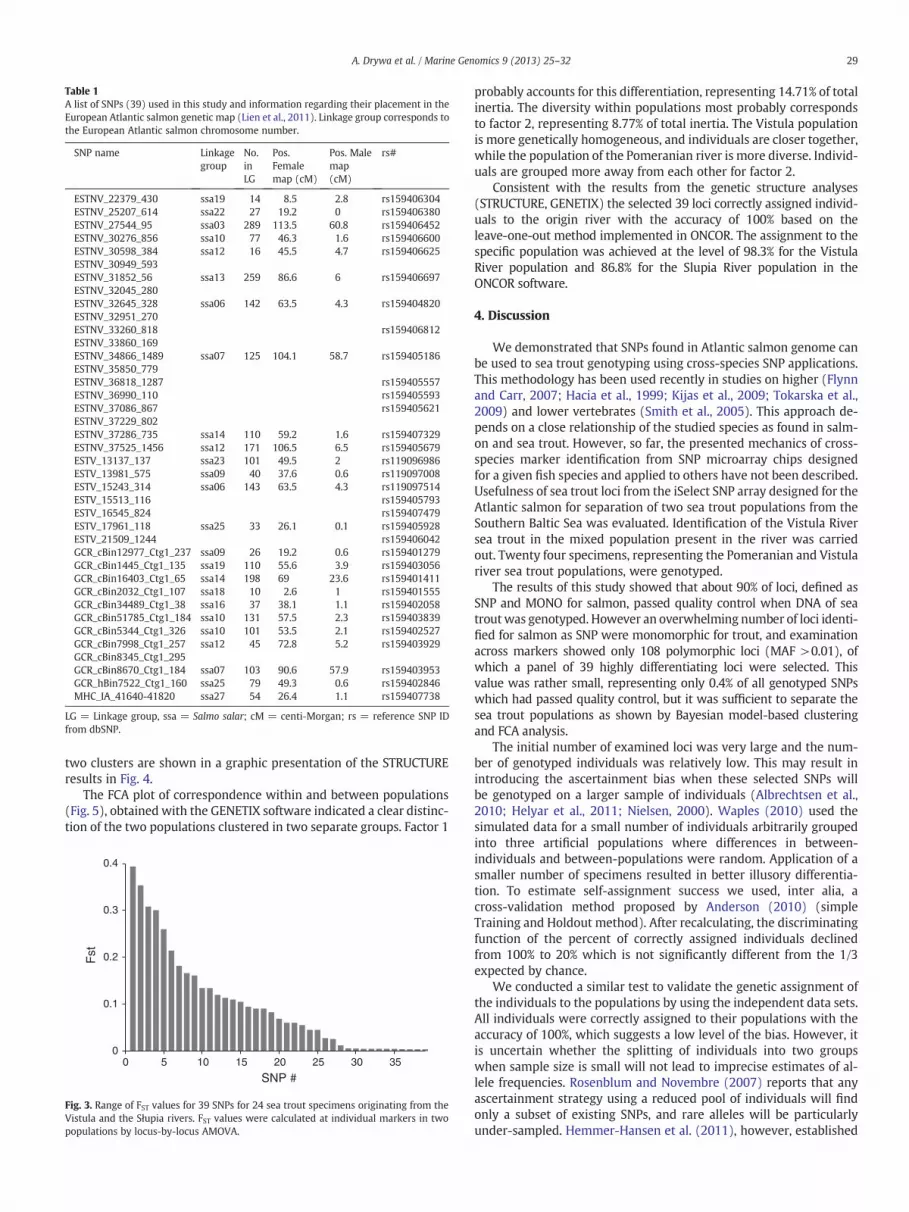
Table 1A list of SNPs (39) used in this study and information regarding their placement in theEuropean Atlantic salmon genetic map (Lien et al., 2011). Linkage group corresponds tothe European Atlantic salmon chromosome number.
SNP name Linkagegroup
No.inLG
Pos.Femalemap (cM)
Pos. Malemap(cM)
rs#
ESTNV_22379_430 ssa19 14 8.5 2.8 rs159406304ESTNV_25207_614 ssa22 27 19.2 0 rs159406380ESTNV_27544_95 ssa03 289 113.5 60.8 rs159406452ESTNV_30276_856 ssa10 77 46.3 1.6 rs159406600ESTNV_30598_384 ssa12 16 45.5 4.7 rs159406625ESTNV_30949_593ESTNV_31852_56 ssa13 259 86.6 6 rs159406697ESTNV_32045_280ESTNV_32645_328 ssa06 142 63.5 4.3 rs159404820ESTNV_32951_270ESTNV_33260_818 rs159406812ESTNV_33860_169ESTNV_34866_1489 ssa07 125 104.1 58.7 rs159405186ESTNV_35850_779ESTNV_36818_1287 rs159405557ESTNV_36990_110 rs159405593ESTNV_37086_867 rs159405621ESTNV_37229_802ESTNV_37286_735 ssa14 110 59.2 1.6 rs159407329ESTNV_37525_1456 ssa12 171 106.5 6.5 rs159405679ESTV_13137_137 ssa23 101 49.5 2 rs119096986ESTV_13981_575 ssa09 40 37.6 0.6 rs119097008ESTV_15243_314 ssa06 143 63.5 4.3 rs119097514ESTV_15513_116 rs159405793ESTV_16545_824 rs159407479ESTV_17961_118 ssa25 33 26.1 0.1 rs159405928ESTV_21509_1244 rs159406042GCR_cBin12977_Ctg1_237 ssa09 26 19.2 0.6 rs159401279GCR_cBin1445_Ctg1_135 ssa19 110 55.6 3.9 rs159403056GCR_cBin16403_Ctg1_65 ssa14 198 69 23.6 rs159401411GCR_cBin2032_Ctg1_107 ssa18 10 2.6 1 rs159401555GCR_cBin34489_Ctg1_38 ssa16 37 38.1 1.1 rs159402058GCR_cBin51785_Ctg1_184 ssa10 131 57.5 2.3 rs159403839GCR_cBin5344_Ctg1_326 ssa10 101 53.5 2.1 rs159402527GCR_cBin7998_Ctg1_257 ssa12 45 72.8 5.2 rs159403929GCR_cBin8345_Ctg1_295GCR_cBin8670_Ctg1_184 ssa07 103 90.6 57.9 rs159403953GCR_hBin7522_Ctg1_160 ssa25 79 49.3 0.6 rs159402846MHC_IA_41640-41820 ssa27 54 26.4 1.1 rs159407738
LG = Linkage group, ssa = Salmo salar; cM = centi‐Morgan; rs = reference SNP IDfrom dbSNP.
29A. Drywa et al. / Marine Genomics 9 (2013) 25–32
two clusters are shown in a graphic presentation of the STRUCTUREresults in Fig. 4.
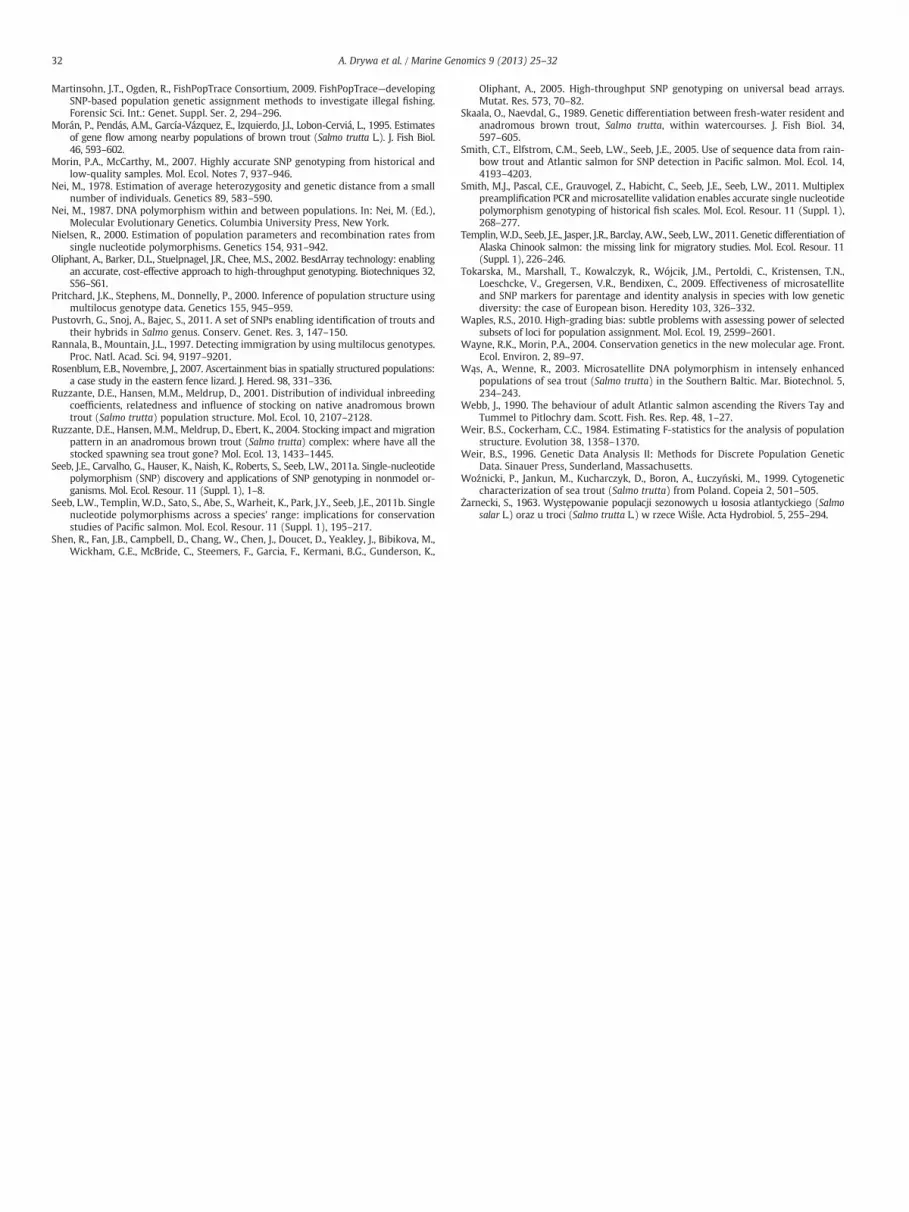
The FCA plot of correspondence within and between populations(Fig. 5), obtained with the GENETIX software indicated a clear distinc-tion of the two populations clustered in two separate groups. Factor 1
0
0.1
0.2
0.3
0.4
0 5 10 15 20 25 30 35
SNP #
Fst
Fig. 3. Range of FST values for 39 SNPs for 24 sea trout specimens originating from theVistula and the Słupia rivers. FST values were calculated at individual markers in twopopulations by locus-by-locus AMOVA.
probably accounts for this differentiation, representing 14.71% of totalinertia. The diversity within populations most probably correspondsto factor 2, representing 8.77% of total inertia. The Vistula populationis more genetically homogeneous, and individuals are closer together,while the population of the Pomeranian river is more diverse. Individ-uals are grouped more away from each other for factor 2.
Consistent with the results from the genetic structure analyses(STRUCTURE, GENETIX) the selected 39 loci correctly assigned individ-uals to the origin river with the accuracy of 100% based on theleave-one-out method implemented in ONCOR. The assignment to thespecific population was achieved at the level of 98.3% for the VistulaRiver population and 86.8% for the Slupia River population in theONCOR software.
4. Discussion
We demonstrated that SNPs found in Atlantic salmon genome canbe used to sea trout genotyping using cross-species SNP applications.This methodology has been used recently in studies on higher (Flynnand Carr, 2007; Hacia et al., 1999; Kijas et al., 2009; Tokarska et al.,2009) and lower vertebrates (Smith et al., 2005). This approach de-pends on a close relationship of the studied species as found in salm-on and sea trout. However, so far, the presented mechanics of cross-species marker identification from SNP microarray chips designedfor a given fish species and applied to others have not been described.Usefulness of sea trout loci from the iSelect SNP array designed for theAtlantic salmon for separation of two sea trout populations from theSouthern Baltic Sea was evaluated. Identification of the Vistula Riversea trout in the mixed population present in the river was carriedout. Twenty four specimens, representing the Pomeranian and Vistulariver sea trout populations, were genotyped.
The results of this study showed that about 90% of loci, defined asSNP and MONO for salmon, passed quality control when DNA of seatroutwas genotyped. However an overwhelming number of loci identi-fied for salmon as SNP were monomorphic for trout, and examinationacross markers showed only 108 polymorphic loci (MAF >0.01), ofwhich a panel of 39 highly differentiating loci were selected. Thisvalue was rather small, representing only 0.4% of all genotyped SNPswhich had passed quality control, but it was sufficient to separate thesea trout populations as shown by Bayesian model-based clusteringand FCA analysis.
The initial number of examined loci was very large and the num-ber of genotyped individuals was relatively low. This may result inintroducing the ascertainment bias when these selected SNPs willbe genotyped on a larger sample of individuals (Albrechtsen et al.,2010; Helyar et al., 2011; Nielsen, 2000). Waples (2010) used thesimulated data for a small number of individuals arbitrarily groupedinto three artificial populations where differences in between-individuals and between-populations were random. Application of asmaller number of specimens resulted in better illusory differentia-tion. To estimate self-assignment success we used, inter alia, across-validation method proposed by Anderson (2010) (simpleTraining and Holdout method). After recalculating, the discriminatingfunction of the percent of correctly assigned individuals declinedfrom 100% to 20% which is not significantly different from the 1/3expected by chance.
We conducted a similar test to validate the genetic assignment ofthe individuals to the populations by using the independent data sets.All individuals were correctly assigned to their populations with theaccuracy of 100%, which suggests a low level of the bias. However, itis uncertain whether the splitting of individuals into two groupswhen sample size is small will not lead to imprecise estimates of al-lele frequencies. Rosenblum and Novembre (2007) reports that anyascertainment strategy using a reduced pool of individuals will findonly a subset of existing SNPs, and rare alleles will be particularlyunder-sampled. Hemmer-Hansen et al. (2011), however, established
0%
10%
20%
30%
40%
50%
60%
70%
80%
90%
100%
1(1)
2(1)
3(1)
4(1)
5(1)
6(1)
7(1)
8(1)
9(1)
10(1
)11
(1)
12(1
)1(
2)2(
2)3(
2)4(
2)5(
2)6(
2)7(
2)8(
2)9(
2)10
(2)
11(2
)12
(2)
TP
TW
Q
Fig. 4. Summary plot of estimates of Q (Q, estimatedmembership coefficients for each individual, in each cluster) for K=2 (K, the number of designated populations). Each individualis represented on the vertical axis by a shaded segment. Vistula sea trout population (TW) is marked in dark grey and Pomeranian population (TP)—light grey.
30 A. Drywa et al. / Marine Genomics 9 (2013) 25–32
in their investigations on SNPs in Atlantic cod, Gadus morhua, that ahigh proportion of selected loci had low minor allele frequencyvalues. It indicates that relatively few low frequency alleles weremissed in the discovery process and the ascertainment bias was sig-nificantly reduced in the discovery panel. Likewise, in our studymost of the population specific loci have low MAF values which indi-cate that rare SNPs were not omitted (Fig. 2).
The 39 most polymorphic SNPs, selected as a result of this study,would be fully effective in the analysis of mixed sea trout populationsin the Polish Southern Baltic. Genetic differentiation (FST) among theanalyzed populations was 0.0407 across all 108 polymorphic SNPs,and 0.1289 for the 39 selected loci with the highest FST values. Also,as mentioned earlier, a genetic assignment of individuals to VistulaRiver or Slupia River populations was very accurate and precision ofthe assignment to the origin population was 100% by using the lociwith the highest FST values. Specimens from the Vistula River wereassigned to the correct population and almost for all of them estimat-ed membership coefficients were more than 90% accurate. Other ge-notypes do not occur even at 20%. For the Slupia River populationone of the twelve specimens was not assigned to the origin popula-tion in more than 50%. This may indicate the occurrence of Vistula
1
2
3
4
5
6
7
8
9
10
11 12
21
2324
Fig. 5. Factorial Correspondence Analysis (FCA) for 24 sea trout specimens based on FST estimasquares (numbers from 1 to 12) and Pomeranian population (TP)—grey circles (numbers from
sea trout genotype in the population from Slupia. Results are well il-lustrated in the STRUCTURE software using the panel of 39 SNPs(Fig. 4). These selected SNPs turned out to be useful in the mixedpopulations studies.
Obtained results are evenmore than satisfactorywhen taking previ-ous microsatellite results into consideration. Although microsatellitesare highly polymorphic standard markers used for population differen-tiation purposes, they were not fully effective in earlier research to dif-ferentiate the Pomeranian and Vistula river sea trout populations (WąsandWenne, 2003). The application of the Atlantic salmon 15K SNP chipseems to be a useful solution to develop an informative set of sea troutSNPs. Due to the Vistula sea trout unambiguous genotype set of 39 SNPswould enable researchers to identify specimens from this river inmixedpopulations. However, it cannot be excluded that some of the SNPsfound can in fact be used additionally for identification of hatcheryreared Vistula sea trout. Genotyping a sufficiently representative selec-tion of hatchery reared samples and comparing this with wild popula-tion samples should allow for the identification of farmed versus wild,diagnostic SNPs; such as those described by Karlsson et al. (2011) forthe differentiation of farmed and wild origin individuals in Norwegianriver systems.
13
14
15
16
17
18
19
20
22 TW
TP
tes for 39 population specific SNPs. Vistula sea trout population (TW) is marked as a black13 to 24).

31A. Drywa et al. / Marine Genomics 9 (2013) 25–32
Acknowledgements
This study was partially funded by project: No. 397/N-cGRASP/2009/0 of the Ministry of Science and Higher Education in Poland toRW and by the statutory topic IV.1 in the IO PAS.
References
Aarestrup, K., Jepsen, N., 1998. Spawning migration of sea trout (Salmo trutta L.) in aDanish river. Hydrobiologia 371 (372), 275–281.
Abadía-Cardoso, A., Clemento, A.J., Garza, C.G., 2011. Discovery and characterization ofsingle-nucleotide polymorphisms in steelhead/rainbow trout, Oncorhynchusmykiss. Mol. Ecol. Resour. 11 (Suppl. 1), 31–49.
Albaladejo, R.G., Aparicio, A., 2007. Population Genetic structure and hybridization patternsin the Mediterranean endemics Phlomis lychnitis and P. crinita (Lamiaceae). Ann. Bot.-London 100, 735–746.
Albrechtsen, A., Nielsen, F.C., Nielsen, R., 2010. Ascertainment biases in SNP chips affectmeasures of population divergence. Mol. Biol. Evol. 24, 1–20.
Anderson, E.C., 2010. Assessing the power of informative subsets of loci for population assignment:standard methods are upwardly biased. Mol. Ecol. Resour. 10, 701–710.
Bartel, R., 1988. Trouts in Poland. Pol. Arch. Hydrobiol. 35, 321–339.Bartel, R., 1993. Anadromous fishes in Poland Biul. Mor. Inst. Ryb. 128, 3–15.Bartel, R., Dębowski, P., 1996. Stocking of sea trout (Salmo truttam. trutta) smolts in Poland.
Part I. Preliminary analysis of tagging experiments. Arch. Ryb. Pol. 4, 5–18.Bartel, R., 1997. Wymagania jakościowe produkcji smoltów XXII Krajowa Konferencja
Hodowców Ryb Łososiowatych. Łeba 39–52.Bartel, R., Pachur, M., Bernaś, R., 2010. Distribution, migrations, and growth of tagged
sea trout released into the Vistula River. Arch. Pol. Fish. 18, 225–237.Belkhir, K., Borsa, P., Chikhi, L., Raufaste, N., Bonhomme, F., 2000. GENETIX 4.05, logiciel
sous Windows TM pour la génétique des populations. Laboratoire Génome,Populations, Interactions, CNRS UMR 5171. 1996–2004 Université de MontpellierII, Montpellier (France).
Benzécri, J.P., 1992. Correspondence analysis handbook. Statistics: A Series of Text-books and Monographs. Marcel Dekker Inc., New York.
Borzęcka, I., 2003. Characteristics of sea trout (Salmo trutta m. trutta) from the DrwęcaRiver based on scale samples collected between 1988–1992. Arch. Pol. Fish. 11,165–179.
Campbell, N.R., Narum, S.R., 2011. Development of 54 novel SNP assays for sockeye andcoho salmon and assessment of available SNPs to differentiate stocks within theColumbia River. Mol. Ecol. Resour. 11 (Suppl. 1), 20–30.
Carlsson, J., Nilsson, J., 2000. Population genetic structure of brown trout (Salmo truttaL.) within a northern boreal forest stream. Hereditas 132, 173–181.
Chełkowski, Z., 1969. The sea trout, Salmo trutta m. trutta L., of the Pomeranian coastalrivers. Przegląd Zool. 13, 72–91.
Clemento, A.J., Abadia-Cardoso, A., Starks, H.A., Garza, J.C., 2011. Discovery and charac-terization of single nucleotide polymorphisms in Chinook salmon, Oncorhynchustshawytscha. Mol. Ecol. Resour. 11 (Suppl. 1), 50–66.
Dębowski, P., Bartel, R., 1996. Stocking of sea trout (Salmo truttam. trutta) smolts in Poland.Part II. Factors influencing recaptures and verification of estimates. Arch. Ryb. Pol. 4,19–36.
Dominik, S., Henshall, J.M., Kube, P.D., King, H., Lien, S., Kent, M.P., Elliott, N.G., 2010.Evaluation of an Atlantic salmon SNP chip as a genomic tool for the applicationin a Tasmanian Atlantic salmon (Salmo salar) breeding population. Aquaculture308, S56–S61.
Dunkley, D., Shearer, W., 1982. An assessment of the performance of a resistivity fishcounter. J. Fish Biol. 20, 717–737.
Elliott, J.M., 1994. Quantitative Ecology and the Brown Trout. Oxford University Press,Oxford.
Excoffier, L., Lischer, H.E.L., 2010. Arlequin suite ver 3.5: a new series of programs toperform population genetics analyses under Linux and Windows. Mol. Ecol.Resour. 10, 564–567.
Fan, J.B., Oliphant, A., Shen, R., Kermani, B.G., Garcia, F., Gunderson, K.L., Hansen, M.M.,Steemers, F., Butler, S.L., Deloukas, P., Galver, L., Hunt, S., Mcbride, C., Bibikova, M.,Rubano, T., Chen, J., Wickham, E., Doucet, D., Chang, W., Campbell, D., Zhang, B.,Kruglyak, S., Bentley, D., Haas, J., Rigault, P., Zhou, L., Stuelpnagel, J., Chee, M.S., 2003.Highly Parallel SNP Genotyping Cold Spring Harbor Symposia on Quantitative Biology,68, pp. 69–78.
Flynn, S.M.C., Carr, S.M., 2007. Interspecies hybridization on DNA resequencingmicroarrays: efficiency of sequence recovery and accuracy of SNP detection inhuman, ape, and codfish mitochondrial DNA genomes sequenced on a human-specific MitoChip. BMC Genomics 8, 339 25.
Freamo, H., O'Reilly, P., Berg, P.R., Lien, S., Boulding, E.G., 2011. Outlier SNPs show moregenetic structure between two Bay of Fundy metapopulations of Atlantic salmonthan do neutral SNPs. Mol. Ecol. Resour. 11 (Suppl. 1), 254–267.
Gerlier, M., Roche, P., 1998. A radio telemetry study of the migration of Atlantic salmonSalmo salar L. and sea trout Salmo trutta L. in the upper Rhine. Hydrobiologia 371(372), 283–293.
Gidskehaug, L., Kent, M., Hayes, B.J., Lien, S., 2011. Genotype calling and mapping ofmultisite variants using an Atlantic salmon iSelect SNP array. Bioinformatics 27,303–310.
Glover, K.A., Hansen, M.M., Lien, S., Als, T.D., Høyheim, B., Skaala, O., 2010. A comparisonof SNP and STR loci for delineating population structure and performing individualgenetic assignment. BMC Genet. 11, 2.
Guo, S.W., Thompson, E.A., 1992. Performing the exact test of Hardy–Weinberg proportionfor multiple alleles. Biometrics 48, 361–372.
Hacia, J.G., Fan, J.B., Ryder, O., Jin, L., Edgemon, K., Ghandour, G., Mayer, R.A., Sun, B.,Hsie, L., Robbins, C.M., Brody, L.C., Wang, D., Lander, E.S., Lipshutz, R., Fodor, S.P.,Collins, F.C., 1999. Determination of ancestral alleles for human single-nucleotidepolymorphisms using high-density oligonucleotide arrays. Nat. Genet. 22,164–167.
Hansen, M.M., Loeschcke, V., 1994. Effects of releasing hatchery-reared brown trout towild trout populations. In: Loeschcke, V., Tomiuk, J., Jain, S.K. (Eds.), ConservationGenetics. Birkhäuser Verlag, Basel.
Hansen, M.M., Mensberg, K.-L.D., 1998. Genetic differentiation and relationship betweengenetic and geographical distance in Danish sea trout (Salmo trutta L.) populations.Heredity 81, 493–504.
Hansen, M.M., Mensberg, K.-L.D., Berg, S., 1999. Postglacial recolonization and geneticrelationships among whitefish (Coregonus sp.) populations in Denmark, inferredfrom mitochondrial DNA and microsatellite markers. Mol. Ecol. 8, 239–252.
Hansen, M.M., Nielsen, E.E., Ruzzante, D.E., Bouza, C., Mensberg, K.-L.D., 2000. Genetic mon-itoring of supportive breeding in brown trout (Salmo trutta L.), usingmicrosatellite DNAmarkers. Can. J. Fish. Aquat. Sci. 57, 2130–2139.
Hansen, M.M., Ruzzante, D., Nielsen, E.E., Mensberg, K.-L.D., 2001. Brown trout (Salmotrutta) stocking impact assessment using microsatellite DNA markers. Ecol. Appl.11, 148–160.
Hansen, M.M., 2002. Estimating the long-term effects of stocking domesticated troutinto wild brown trout (Salmo trutta) populations: an approach using microsatelliteDNA analysis of historical and contemporary samples. Mol. Ecol. 11, 1003–1015.
Hansen, M.M., Ruzzante, D.E., Nielsen, E.E., Bekkevold, D., Mensberg, K.-L.D., 2002.Long-term effective population sizes, temporal stability of genetic compositionand potential for local adaptation in anadromous brown trout (Salmo trutta)populations. Mol. Ecol. 11, 2523–2535.
Hansen, M.H., Young, S., Jørgensen, H.B., Pascal, C., Henryon, M., Seeb, J., 2011. Assem-bling a dual purpose TaqMan-based panel of single-nucleotide polymorphismmarkers in rainbow trout and steelhead (Oncorhynchus mykiss) for associationmapping and population genetics analysis. Mol. Ecol. Resour. 11 (Suppl. 1), 67–70.
Hauser, L., Baird, M., Hilborn, R., Seeb, L.W., Seeb, J.E., 2011. An empirical comparison ofSNPs and microsatellites for parentage and kinship assignment in a wild sockeyesalmon (Oncorhynchus nerka) population. Mol. Ecol. Resour. 11 (Suppl. 1), 150–161.
Hayes, B.J., Nilsen, K., Berg, P.R., Grindflek, E., Lien, S., 2007. SNP detection exploitingmultiple sources of redundancy in large EST collections improves validationrates. Bioinformatics 23, 1692–1693.
Heggberget, T.G., Lund, R.A., Ryman, N., Stahl, G., 1986. Growth and genetic variation ofAtlantic salmon (Salmo salar) from different sections of the River Alta, North Norway.Can. J. Fish. Aquat. Sci. 43, 1828–1835.
Hemmer-Hansen, J., Nielsen, E.E., Maldrup, D., Mittelholzer, C., 2011. Identification ofsingle nucleotide polymorphisms in candidate genes for growth and reproductionin a nonmodel organism; the Atlantic cod, Gadus morhua. Mol. Ecol. Resour. 11(Suppl. 1), 71–80.
HELCOM, 2011. Salmon and sea trout populations and rivers in the Baltic Sea—HELCOMassessment of salmon (Salmo salar) and sea trout (Salmo trutta) populations andhabitats in rivers flowing to the Baltic Sea. Baltic Sea Environmental ProceedingsNo. 126A.
Helyar, S.J., Hemmer-Hansen, J., Bekkevold, D., Taylor, M.I., Ogden, R., Limborg, M.T.,Cariani, A., Maes, G.E., Diopere, E., Carvalho, G.R., Nielsen, E.E., 2011. Applicationof SNPs for population genetics of nonmodel organisms: new opportunities andchallenges. Mol. Ecol. Resour. 11 (Suppl. 1), 123–136.
Hess, J.E., Matala, A.P., Narum, S.R., 2011. Comparison of SNPs and microsatellites for fine-scale application of genetic stock identification of Chinook salmon in the ColumbiaRiver Basin. Mol. Ecol. Resour. 11 (Suppl. 1), 137–149.
Illumina, 2007. Illumina Beadstudio Genotyping Module Userguide . Doc#1120766 RevC, February 2007.
Illumina, 2010. Infinium genotyping data analysis. Technical Note: Illumina DNA Analysis.Publication Number 970-2007-005, January 2010.
Kalinowski, S.T., Manlove, K.R., Taper, M.L., 2007. ONCOR: A Computer Program for GeneticStock Identification. Department of Ecology. Montana State University, Bozeman, MT .http://www. montana.edu/kalinowski/Software/ONCOR.htm.
Karlsson, S., Moen, T., Lien, S., Glover, K.A., Hindar, K., 2011. Generic genetic differencesbetween farmed and wild Atlantic salmon identified from a 7K SNP-chip. Mol. Ecol.11, 247–253.
Karppinen, P., Mäkinen, T., Erkinaro, J., Kostin, V., Sadkovskij, R., Lupandin, A.,Kaukoranta, M., 2002. Migratory and route seeking behaviour of ascending Atlanticsalmon in the regulated River Tuloma. Hydrobiologia 483, 23–30.
Kijas, J.W., Townley, D., Dalrymple, B.P., Heaton, M.P., Maddox, J.F., Wilson, P., Ingersoll,R.G., Mcculloch, R., Mcwilliam, S., Tang, D., Cockett, N., Oddy, V.H., Nicholas, F.W.,Raadsma, H., 2009. A genome wide survey of SNP variation reveals the geneticstructure of sheep breeds. PLoS One 4.
Klemetsen, A., Amundsen, P.A., Dempson, J.B., Jonsson, B., Jonsson, N., O'Connell, M.F.,Mortensen, E., 2003. Atlantic salmon Salmo salar L., brown trout Salmo trutta L.and Arctic charr Salvelinus alpinus (L.): a review of aspects of their life histories.Ecol. Freshw. Fish 12, 1–59.
Kochzius, M., Nölte, M., Weber, H., Silkenbeumer, N., Hjörleifsdottir, S., Hreggvidsson,G.O., Marteinsson, V., Kappel, K., Planes, S., Tinti, F., Magoulas, A., Garcia, VazquezE., Turan, C., Hervet, C., Campo Falgueras, D., Antoniou, A., Landi, M., Blohm, D.,2008. DNA microarrays for identifying fishes. Mar. Biotechnol. 10, 207–217.
Lien, S., Gidskehaug, L., Moen, T., Hayes, B.J., Berg, P.R., Davidson, W.S., Omholt, S.W.,Kent, M.P., 2011. A dense SNP-based linkage map for Atlantic salmon (Salmosalar) reveals extended chromosome homeologies and striking differences insex-specific recombination patterns. BMC Genomics 12, 615–625.
32 A. Drywa et al. / Marine Genomics 9 (2013) 25–32
Martinsohn, J.T., Ogden, R., FishPopTrace Consortium, 2009. FishPopTrace—developingSNP-based population genetic assignment methods to investigate illegal fishing.Forensic Sci. Int.: Genet. Suppl. Ser. 2, 294–296.
Morán, P., Pendás, A.M., García-Vázquez, E., Izquierdo, J.I., Lobon-Cerviá, L., 1995. Estimatesof gene flow among nearby populations of brown trout (Salmo trutta L.). J. Fish Biol.46, 593–602.
Morin, P.A., McCarthy, M., 2007. Highly accurate SNP genotyping from historical andlow-quality samples. Mol. Ecol. Notes 7, 937–946.
Nei, M., 1978. Estimation of average heterozygosity and genetic distance from a smallnumber of individuals. Genetics 89, 583–590.
Nei, M., 1987. DNA polymorphism within and between populations. In: Nei, M. (Ed.),Molecular Evolutionary Genetics. Columbia University Press, New York.
Nielsen, R., 2000. Estimation of population parameters and recombination rates fromsingle nucleotide polymorphisms. Genetics 154, 931–942.
Oliphant, A., Barker, D.L., Stuelpnagel, J.R., Chee, M.S., 2002. BesdArray technology: enablingan accurate, cost-effective approach to high-throughput genotyping. Biotechniques 32,S56–S61.
Pritchard, J.K., Stephens, M., Donnelly, P., 2000. Inference of population structure usingmultilocus genotype data. Genetics 155, 945–959.
Pustovrh, G., Snoj, A., Bajec, S., 2011. A set of SNPs enabling identification of trouts andtheir hybrids in Salmo genus. Conserv. Genet. Res. 3, 147–150.
Rannala, B., Mountain, J.L., 1997. Detecting immigration by using multilocus genotypes.Proc. Natl. Acad. Sci. 94, 9197–9201.
Rosenblum, E.B., Novembre, J., 2007. Ascertainment bias in spatially structured populations:a case study in the eastern fence lizard. J. Hered. 98, 331–336.
Ruzzante, D.E., Hansen, M.M., Meldrup, D., 2001. Distribution of individual inbreedingcoefficients, relatedness and influence of stocking on native anadromous browntrout (Salmo trutta) population structure. Mol. Ecol. 10, 2107–2128.
Ruzzante, D.E., Hansen, M.M., Meldrup, D., Ebert, K., 2004. Stocking impact and migrationpattern in an anadromous brown trout (Salmo trutta) complex: where have all thestocked spawning sea trout gone? Mol. Ecol. 13, 1433–1445.
Seeb, J.E., Carvalho, G., Hauser, K., Naish, K., Roberts, S., Seeb, L.W., 2011a. Single-nucleotidepolymorphism (SNP) discovery and applications of SNP genotyping in nonmodel or-ganisms. Mol. Ecol. Resour. 11 (Suppl. 1), 1–8.
Seeb, L.W., Templin, W.D., Sato, S., Abe, S., Warheit, K., Park, J.Y., Seeb, J.E., 2011b. Singlenucleotide polymorphisms across a species' range: implications for conservationstudies of Pacific salmon. Mol. Ecol. Resour. 11 (Suppl. 1), 195–217.
Shen, R., Fan, J.B., Campbell, D., Chang, W., Chen, J., Doucet, D., Yeakley, J., Bibikova, M.,Wickham, G.E., McBride, C., Steemers, F., Garcia, F., Kermani, B.G., Gunderson, K.,
Oliphant, A., 2005. High-throughput SNP genotyping on universal bead arrays.Mutat. Res. 573, 70–82.
Skaala, O., Naevdal, G., 1989. Genetic differentiation between fresh-water resident andanadromous brown trout, Salmo trutta, within watercourses. J. Fish Biol. 34,597–605.
Smith, C.T., Elfstrom, C.M., Seeb, L.W., Seeb, J.E., 2005. Use of sequence data from rain-bow trout and Atlantic salmon for SNP detection in Pacific salmon. Mol. Ecol. 14,4193–4203.
Smith, M.J., Pascal, C.E., Grauvogel, Z., Habicht, C., Seeb, J.E., Seeb, L.W., 2011. Multiplexpreamplification PCR andmicrosatellite validation enables accurate single nucleotidepolymorphism genotyping of historical fish scales. Mol. Ecol. Resour. 11 (Suppl. 1),268–277.
Templin,W.D., Seeb, J.E., Jasper, J.R., Barclay, A.W., Seeb, L.W., 2011. Genetic differentiation ofAlaska Chinook salmon: the missing link for migratory studies. Mol. Ecol. Resour. 11(Suppl. 1), 226–246.
Tokarska, M., Marshall, T., Kowalczyk, R., Wójcik, J.M., Pertoldi, C., Kristensen, T.N.,Loeschcke, V., Gregersen, V.R., Bendixen, C., 2009. Effectiveness of microsatelliteand SNP markers for parentage and identity analysis in species with low geneticdiversity: the case of European bison. Heredity 103, 326–332.
Waples, R.S., 2010. High-grading bias: subtle problems with assessing power of selectedsubsets of loci for population assignment. Mol. Ecol. 19, 2599–2601.
Wayne, R.K., Morin, P.A., 2004. Conservation genetics in the new molecular age. Front.Ecol. Environ. 2, 89–97.
Wąs, A., Wenne, R., 2003. Microsatellite DNA polymorphism in intensely enhancedpopulations of sea trout (Salmo trutta) in the Southern Baltic. Mar. Biotechnol. 5,234–243.
Webb, J., 1990. The behaviour of adult Atlantic salmon ascending the Rivers Tay andTummel to Pitlochry dam. Scott. Fish. Res. Rep. 48, 1–27.
Weir, B.S., Cockerham, C.C., 1984. Estimating F-statistics for the analysis of populationstructure. Evolution 38, 1358–1370.
Weir, B.S., 1996. Genetic Data Analysis II: Methods for Discrete Population GeneticData. Sinauer Press, Sunderland, Massachusetts.
Woźnicki, P., Jankun, M., Kucharczyk, D., Boron, A., Łuczyński, M., 1999. Cytogeneticcharacterization of sea trout (Salmo trutta) from Poland. Copeia 2, 501–505.
Żarnecki, S., 1963. Występowanie populacji sezonowych u łososia atlantyckiego (Salmosalar L.) oraz u troci (Salmo trutta L.) w rzece Wiśle. Acta Hydrobiol. 5, 255–294.


