Embed Size (px)
Citation preview

I M P R O V E D G R O W T H IN S T U N T E D B R O W N T R O U T
( S A L M O T R U T T A L . ) A F T E R R E L I M I N G O F L A K E H O V V A T N ,
S O U T H E R N N O R W A Y
B, T. BARLAUP, A. ATLAND, G. G. RADDUM,
Museum of Zoology, University of Bergen, N-5027 Bergen-Universitetet, Norway"
and
E. KLEIVEN
Directorate of Nature Management, Fylkeshuset, N-4800 ArendaL Norway
(Received April 24, 1989; revised August 21, 1989)
Abstract, The chronically acidic Lake Store Hovvatn and the adjoining pond Pollen in southernmost Norway were limed in March 1981. The two locations were stocked with brown trout (Salmo trutta L.) at low and high densities in Hovvatn and PoLlen, respectively. After 6 yr of reacidification, the locations were relimed in July 1987. Growth depression during the reacidification process in spite of low fish densities and superabundance of food was observed in Lake Store Hovvatn. Three months after reliming, a substantial growth response was found in trout from Lake Store Hovvatn; Mean annual length increment was 68% higher than that of the preceding year. In Pollen, reliming had no apparent effect on growth. In both populations reliming caused increased swimming activity measured as an increase in CPUE-values. These results show that the growth response to liming depends on population density and food availability. Moreover, the results indicate that the food conversion rate of the trout is negatively affected in acid waters.
1. Introduction
Acidification is the mos t serious environmental problem in Norwegian freshwaters
today. Until 1986 surface waters in an area of 36000 km 2 was affected, and fish
popula t ions had gone extinct within 18 000 km 2 of the area (Henriksen et at., 1988).
Acid S deposi t ion has leveled off in South-Norwegian lakes f rom 1974 to 1986
(Henriksen et al., 1987), but damages to fish popula t ions cont inue (Rosseland et
aL, 1986; Henriksen et aL, 1988). Growth-pa t te rns are often changed in fish popula t ions which experience acidi-
fication (Harvey, 1982). Increased growth in fish as a consequence of acidification
has been reported f rom several workers and includes a variety of species: b rown
t rout (Jensen and Snekvik, 1972; Andersson and Andersson, 1984), b rook t rout
(Frenette and Dodson , 1984), perch (Eriksson et at., 1983) and roach (Almer, 1974).
The increased growth has been explained by lower intra- a n d / o r inter-specific
compet i t ion and thereby improved food availability as the fish popula t ions decline.
In spite of food abundance , g rowth depression is frequently observed in acidified waters, e.g. b rown t rout (Rosseland et aI., 1980; Hul tberg and Andersson, 1982;
Sadler and Turnpenny, 1986) and white sucker (Beamish, 1974). Long- te rm exposure
Water, Air, and Soil Pollution 47: 139-15I, 1989. © 1989 Kluwer Academic Publishers. Printed in the Netherlands.

140 R,T. BARLAUP ET AL.
to acid water in laboratory experiments has shown reduced growth in brook trout and brown trout (Muniz and Leivestad, 1979; Sadler and Turnpenny, 1986). Growth depression in acid water has been ascribed to higher energetic costs for maintenance and therefore reduced surplus energy for growth (Rosseland, 1980, 1986).
In 1979 the Norwegian government initiated a 5-yr research pro jec t - the Norwegian Liming Project. Lake Store Hovvatn (here called Hovvatn), a chronically acidic lake in southern Norway, and the adjoining pond Pollen were chosen as one of the study areas. Hovvatn lost the original population of brown trout (Salmo trutta L.) in the late 1940s (Raddum et al., 1986).
Hovvatn and Pollen were limed in March 1981. After 6 yr of reacidification, Hovvatn and Pollen were limed for the second time, in July 1987. To study the effects offish density on growth and survival in relation to changes in water chemistry, the yearly stocking in the period 1981-1984 assured a much lower fish density in Hovvatn than in Pollen.
In the present study we report on growth, activity and nutrition of the trout populations in Hovvatn and Pollen during reacidification and after reliming. The correlation between growth and water quality is discussed in terms of energetic costs, food availability and food conversion rate.
2. Materials and Methods
~ T U D Y AREA
Hovvatn, a lake with a surface area of 1.1 km 2, is situated in southern Norway, 50 km from the coast 500 m above sea level (Figure 1). The terrestrial catchment- area is 5.8 km 2, and dominated by granitic and gneissic bedrock with a thin layer of soil. The sparse vegetation consists mainly of pine and heather. Lake morphology is complicated with numerous islets, inlets and rocks. Mean depth, Zm, is 5.6 m, and mean residence time 0.8 yr. The smaller pond Pollen, 0.05 km 2, has a mean depth of 3.3 m and with mean residence time 0.4 yr. Pollen is connected to the eastern part of Hovvatn by a shallow, 0.5 m wide rush-covered channel. Migration of fish between Hovvatn and Pollen is assumed to have negligible impact on the present study. This assumption is supported by recapture-data (Sve~ilv and Matzow, 1985). Lake Lille Hovvatn south of Hovvatn is chronically acid and was used as a reference for water chemistry. Hovvatn and Pollen were limed for the first time in March 1981 with 0.57 and 8.70 t ha -~ of powdered limestone, respectively. After liming, pH and Ca concentration rose, while A1 concentration decreased (Table I, Figure 2) (Wright, 1985). Reacidification was faster in Hovvatn than in Pollen (Table I, Figure 2).
In 1987 Hovvatn and Pollen were relimed. The doses were 0.06 t ha -~ in Hovvatn, and 1.04 t ha -1 in Pollen. Changes in water chemistry are shown in Table I and Figure 2.

IMPROVED GROWTH OF BROWN TROUT AFTER RELIM1NG OF LAKE HOVVATN 141
. - - . . . . . - . - s " . . . . . . . . . .
/ / " " /g--"" ~C./.r-~]{ Lille Howa~n ",
.-. f s w ~ :'
/ i
i i i
0 5 0 0 m
| I
Fig. 1. Lake Hovvam, Pollen and lake Lille Hovvatn. Bottom gillnet stations in Hovvatn (NE, NW and SW) and in Pollen (P). Pelagic gilInet station (PN).
METHODS
Brown trout from a lake spawning population in the moderately acid lake
Byglandsfjorden were reared in a hatchery, and stocked from 1981 to 1984. Fish were marked by fin clipping and stocked at stations NE and SW in Hovvatn and
in Pollen (Figure 1). If no other factor than mortality through testfishing is accounted
for, the stocking program conducted in the 1981-84 period would in 1987 give
56 and 379 fish ha 1 in Hovvatn and Pollen, respectively (Table II). Bottom gillnets
(each net 25 m long and 1.5 m deep) were used at three stations in Hovvatn (NE, NW and SW) and at one station (P) in Pollen (Figure 1). The bottom-gill-net serie consisted of 11 nets with the following meshsizes: 10, 12.5, 16, 19.5, 22.5, 26, 29, 35, 39, 45 and 52 ram. A chain of four pelagic gill nets (each net 42 m long and 6 m deep) were used at station PN in Hovvatn (Figure 1). Testfishing was carried out in May, August and October from 1981 to 1988. Exceptions are May and October in 1985 and 1987. In 1986 there was testfishing only in September. Testfishing included two nights at each of the three bottom-gill-net stations in Hovvatn, two nights at the pelagic station and one night in Pollen. There were no indications of natural recruitment in the material f rom Hovvatn or Pollen. Uncontrolled fishing
in Hovvatn and Pollen was negligible.

142 B . T . B A R L A U P E T A L .
t ' - 4
I
I s
/
c-- (3 ,- "E -v cv>>~
12. "r" ...I
L ........ "2- / -
" , j \
- - - S - ' " /
-':-" _U....
I v
r,,,. ¢,O
O~ p
\ cO O~
ID
3
. . -k
©
C?
©
Z:
.--2 ,-q
©
._=
o
t2
e.i
~r
IMPROVED G R O W T H OF BROWN T R O U T A F T E R RELIMING OF LAKE HOVVATN 143
TABLE I
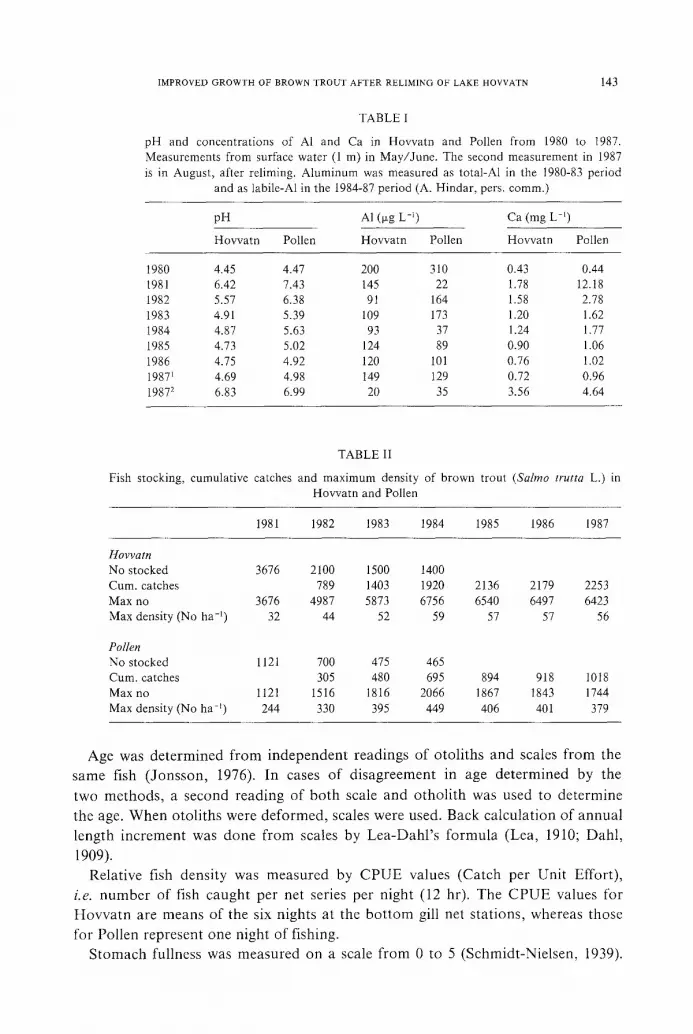
pH and concentrations of AI and Ca in Hovvatn and Pollen from 1980 to 1987. Measurements from surface water (1 m) in May/June. The second measurement in 1987 is in August, after reliming. Aluminum was measured as total-A1 in the 1980-83 period
and as labile-A1 in the 1984-87 period (A. Hindar, pers. comm.)
pH AI (Isg L -a) Ca (mg L ~)
Hovvatn Pollen Hovvatn Pollen Hovvam Pollen
1980 4.45 4.47 200 310 0.43 0.44 1981 6.42 7.43 145 22 1.78 12.18 1982 5.57 6.38 91 164 1.58 2.78 1983 4.91 5.39 109 173 1.20 1.62 1984 4.87 5.63 93 37 1.24 1.77 1985 4.73 5.02 124 89 0.90 1.06 1986 4.75 4.92 120 101 0.76 1.02 1987 ~ 4.69 4.98 149 129 0.72 0.96 19872 6.83 6.99 20 35 3.56 4.64
TABLE II
Fish stocking, cumulative catches and maximum density of brown trout (Salmo trutta L.) in Hovvatn and Pollen
1981 1982 1983 1984 1985 1986 1987
Hovvatn No stocked 3676 2100 1500 1400 Cum. catches 789 1403 1920 2136 2179 2253 Max no 3676 4987 5873 6756 6540 6497 6423 Max density (No ha -l ) 32 44 52 59 57 57 56
Pollen No stocked 1121 700 475 465 Cum. catches 305 480 695 894 918 1018 Max no 1121 1516 1816 2066 1867 1843 1744 Max density (No ha ~) 244 330 395 449 406 401 379
A g e was d e t e r m i n e d f r o m i n d e p e n d e n t r ead ings o f o to l i t h s a n d scales f r o m the
s a m e fish ( J o n s s o n , 1976). In cases o f d i s a g r e e m e n t in age d e t e r m i n e d by the
two m e t h o d s , a s e c o n d r e a d i n g o f b o t h scale a n d o t h o l i t h was used to d e t e r m i n e
the age. W h e n o to l i t h s were d e f o r m e d , scales were used. B a c k c a l c u l a t i o n o f a n n u a l
l eng th i n c r e m e n t was d o n e f r o m scales by L e a - D a h l ' s f o r m u l a (Lea , 1910; D a h t ,
1909).
Re la t ive fish dens i ty was m e a s u r e d by C P U E va lues ( C a t c h pe r U n i t Ef for t ) ,
i.e. n u m b e r o f fish c a u g h t pe r ne t series pe r n igh t (12 hr). T h e C P U E va lues for
H o v v a t n are m e a n s o f the six n igh t s at the b o t t o m gill net s t a t ions , whe rea s those
for Po l l en r ep re sen t one n igh t o f f ishing.
S t o m a c h ful lness was m e a s u r e d on a scale f r o m 0 to 5 ( S c h m i d t - N i e l s e n , 1939).

144 B.T. BARLAUP ET AL.
Fish condition was calculated as Fultons Condition Factor (K). Norwegian Institute for Water Research (NIVA) was responsible for the analysis of water chemistry.
3. Results
During the 1984-87 period the CPUE measurements indicate a substantial decrease in population numbers in both Hovvatn and Pollen (Table III). The CPUE values declined by 62% in Hovvatn and 34% in Pollen during these 3 yr (Table Ill). These figures indicate a higher mortality rate in Hovvatn than in Pollen. After
reliming, CPUE values increased both in Hovvatn and in Pollen, in spite of no recruitment in the populat ion (Table III).
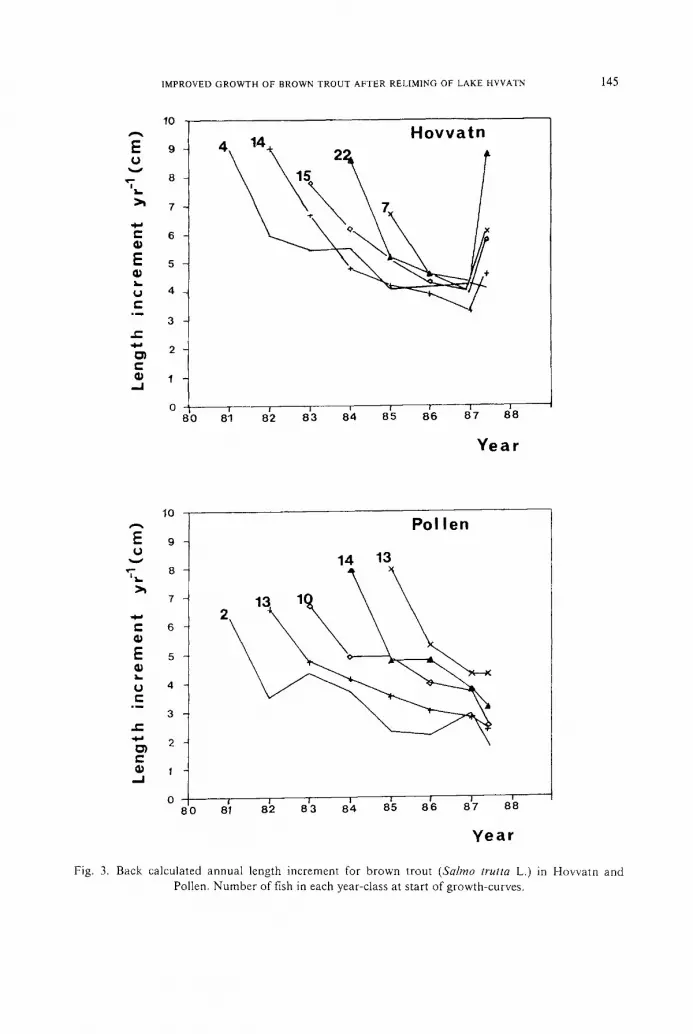
The yearly length increment of the year classes 1980-83 was significantly higher
in Hovvatn than in Pollen (p < 0.01 for the 1980 yearclass, p < 0.0005 for the 1981-83 year classes). The 1984 year class, however, showed a lower annual growth
in Hovvatn than in Pollen (Table IV). Except for the 1980 year class, all year classes caught in Hovvatn increased their
annual growth after the reliming (Figure 3, Table IV). The mean annual growth in the 1981-84 year classes was 68% higher in 1987 than in 1986. This calculation
was based on test-fishing in October 1987. The growth-response was underestimated because growth decline as an effect of ageing was not taken into consideration.
The same growth response was seen in fish caught by testfishing in May 1988. In Pollen growth seemed to be unaffected by the reliming (Figure 3, Table IV).
With one exception, all represented year classes had a decline in annual growth
in 1987 compared to 1986. The exception was the 1984-year class, which showed no change in growth pattern.
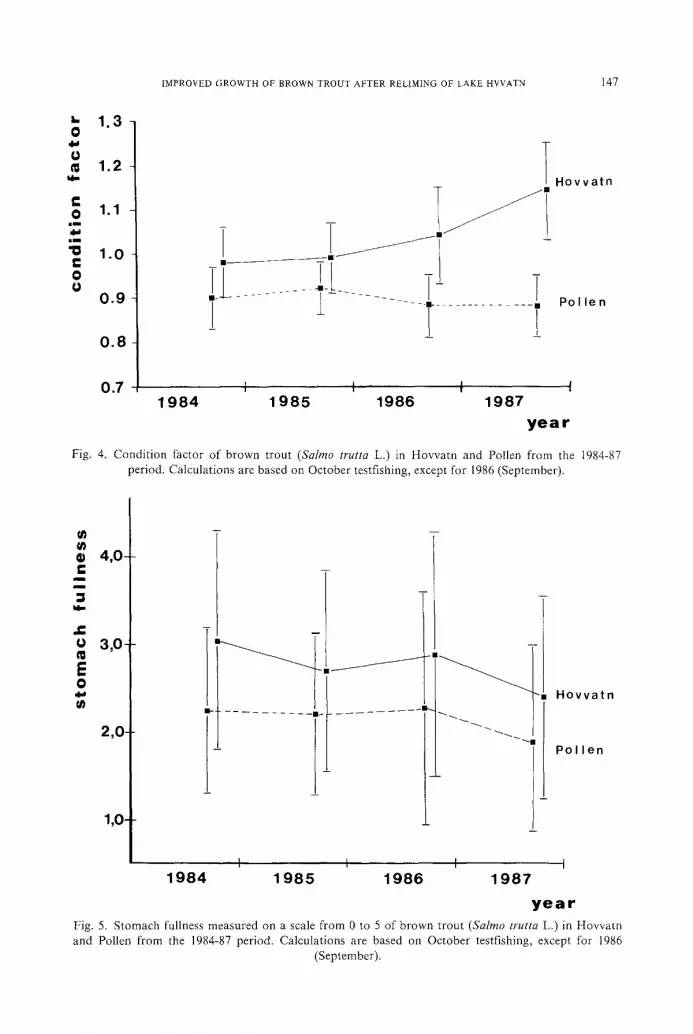
Condition factors (K) of fish were significantly higher for Hovvatn than for Pollen
during reacidification (p < 0.001, Figure 4). In Hovvatn, fish caught in October
1987 showed a significant increase in condition compared to the preceding 3 yr (p < 0.001, Figure 4). In Pollen there was no significant change in condition for
TABLE III
Catch per unit effort i.e. number of brown trout (Salmo trutta L.) caught per net series per night, absolute, and relative to 1984 catches. All catches are for October, except for 1986 catches
(September)
1984 1985 1986 1987
Pollen Abs. no. 79.0 92.0 24.0 52.0 Rel. no. 100% 117% 39% 66%
Hovvatn Abs. no. 27.8 21.5 7.2 10.5 Rel. no. 100 % 77 % 26 % 38 %
E (,,1
"7 t _
, . I , - I e-
E l l . .
u
c ° ~
,.z: . l l , - I
01 ¢-
, - I
E (J
10
9
8
7
6
5
4
3
2
1
0
H o v v a t n
8o 8~ 8'2 8'a 8'. 8'5 8'6 d7 d8
Y e a r
2 =
E
(.t t,-
t,-
, . I - I
¢,.
G) . . , I
l O
9
8
7
6
5
Pol len
14 13
IMPROVED G R O W T H OF BROWN T R O U T A F T E R RELIMING OF LAKE HVVATN 145
80 8~ 8~ 8'a 8~ 8; 8'6 8'7 8'8
Y e a r
Fig. 3. Back calculated annual length increment for brown trout (Salmo trutta L.) in Hovvatn and Pollen. Number of fish in each year-class at start of growth-curves.

146 B.T. BARLAUP ET AL.
TABLE IV
Back calculated length increments (in cm) and standard deviations for brown trout (Salmo trutta L.). Results from test-fishing in Hovvatn and Pollen October 1987
Year- Back calculated growth per year Mean- class length N
1 2 3 4 5 6 7 8
Pollen 1984 8.0 5.3 4,3 4.3 21.9 13 SD 1.4 1.4 1,2 0.8 1983 7.9 4.8 4.8 3.8 3.1 24.4 14 SD 2.0 0.8 1.8 1.1 1.2 1982 6.7 4.9 4.9 4.0 3.7 2.5 26.7 10 SD 0.8 0.5 0.5 0.7 0.7 0.5 1981 6.6 4.7 4.1 3.5 3.0 2.8 2.4 27.1 13 SD 1.2 0.8 0.8 0.6 0.4 0.6 0.7 1980 6.3 3.5 4.3 3.7 2.3 2.1 2.9 1.8 26.9 2 SD 0.6 0.5 0.9 0.0 0.4 0.8 0.3 0.5
Hovvatn 1984 6.7 4.6 4.3 6.1 21,7 7 SD 1.3 1.2 1.2 1.4 1983 8,6 5.2 4.6 4.0 8.8 31,2 22 SD 1,4 1.2 1.3 1.0 3.2 1982 7,8 6.2 5.1 4.3 3.9 5.8 33.1 15 SD 1.3 1.5 1.8 1.8 0.9 2.4 1981 9.0 6.7 4.8 4.2 3.9 3.3 4.6 36.5 14 SD 1.1 1.3 0.9 0.7 1.2 1.0 1.3 1980 9.0 6.0 5.4 5.5 4.1 4.1 4.2 4.1 42.4 4 SD 1.5 1.7 1.0 1.0 1.5 1.1 1.2 0.3
fish after re l iming when compared to 1984 and 1986 values bu t there was a significant
decrease relative to the 1985 values (p < 0.001, Figure 4).
S tomach fullness of fish was significantly higher for H ovva t n than for Pollen
in the 1984-87 per iod (p < 0.025, Figure 5), except for 1986 (p < 0.1). After rel iming,
s tomach fullness showed a significant decrease in H ovva t n when compared to 1986
and 1984 values (p < 0.05, Figure 5); the decrease relative to the 1985 values was
no t significant (p < 0.1). In Pol len the decrease in s tomach fullness after rel iming
was significant only when compared to the 1985 values (p < 0.001, Figure 5).
4. D i s c u s s i o n
All the energy ingested by the fish mus t emerge either as energy expended for
metabol i sm or growth, or as energy excreted (Brett and Groves, 1979). Growth
is based on surplus energy when the fish has met the energetic costs of basal
metabol ism. Growth therefore depends directly on the metabol ic requi rements of
the fish and on the a m o u n t and qual i ty of food ingested. In the following we
will discuss how these two factors and thereby growth were affected by the changes
IMPROVED G R O W T H OF BROWN T R O U T A F T E R RELIMING OF LAKE HVVATN 147
k ,
0
Ul,,
C o
= m
4,+ = m
"0 t: 0
1.3
1.2
1.1
1.0
0 .9
0 .8
0 . 7
T Hovvatn
!- .1_ . . . . . . . . ~ . . . . . . . . . . . . . ! P o l l e n
I I , , I I 1 9 8 4 1 9 8 5 1986 1987
y e a r
Fig. 4. Condit ion factor of brown trout (Salmo trutta L.) in Hovvatn and Pollen from the 1984-87 period. Calculations are based on October testfishing, except for 1986 (September).
0 C
i
m
3 14=
1,) m E 0 4~
4,0-
3,0-
2,0-
1,0-
Hovvatn
Pol len
I I I I 1984 1 9 8 5 1986 1987
y e a r
Fig. 5. Stomach fullness measured on a scale from 0 to 5 of brown trout (Salmo trutta L.) in Hovvam and Pollen from the 1984-87 period. Calculations are based on October testfishing, except for 1986
(September).
148 B.T. BARLAUP ET AL.
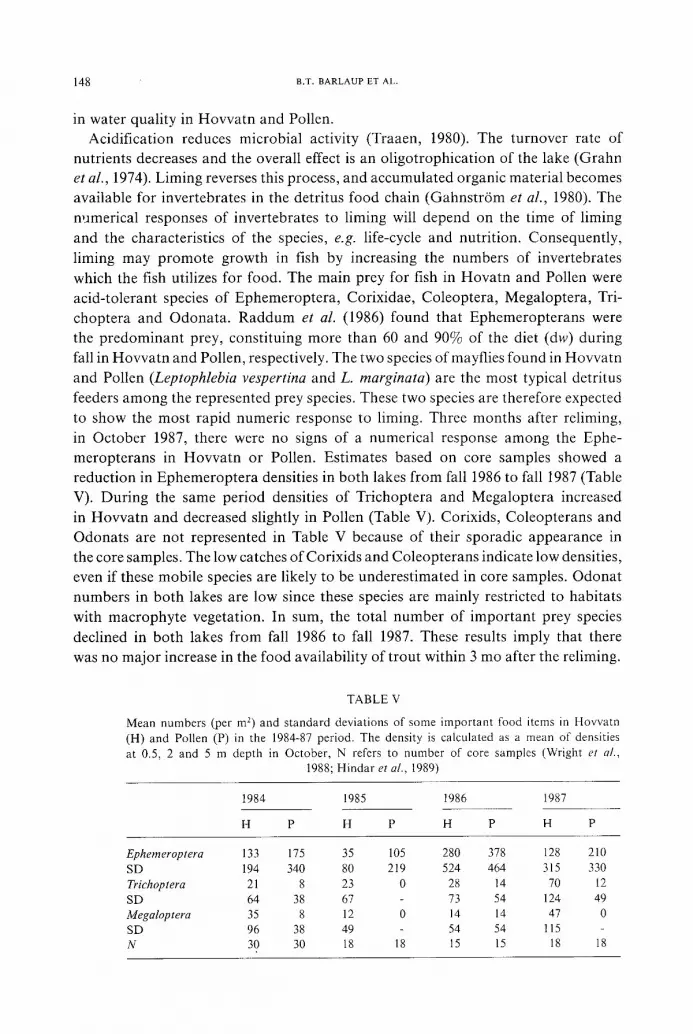
in water quality in Hovva tn and Pollen. Acidification reduces microbial activity (Traaen, 1980). The turnover rate of
nutrients decreases and the overall effect is an ol igotrophicat ion of the lake (Grahn et al., 1974). Liming reverses this process, and accumula ted organic material becomes
available for invertebrates in the detritus food chain (Gahns t r6m et al., 1980). The
numerical responses of invertebrates to liming will depend on the time of liming
and the characteristics of the species, e.g. life-cycle and nutrition. Consequent ly ,
liming may p romote growth in fish by increasing the numbers of invertebrates
which the fish utilizes for food. The main prey for fish in Hova tn and Pollen were
acid-tolerant species of Ephemeroptera , Corixidae, Coleoptera, Megaloptera , Tri-
choptera and Odonata . R a d d u m et al. (1986) found that Ephemeropterans were
the p redominan t prey, consti tuing more than 60 and 90% of the diet (dw) during
fall in Hovva tn and Pollen, respectively. The two species of mayflies found in Hovva tn
and Pollen (Leptophlebia vespertina and L. marginata) are the most typical detritus
feeders a m o n g the represented prey species. These two species are therefore expected
to show the most rapid numeric response to liming. Three months after reliming,
in October 1987, there were no signs of a numerical response among the Ephe- meropterans in Hovva tn or Pollen. Estimates based on core samples showed a
reduct ion in Ephemerop te ra densities in both lakes f rom fall 1986 to fall 1987 (Table
V). Dur ing the same period densities o f Trichoptera and Megaloptera increased
in Hovva tn and decreased slightly in Pollen (Table V). Corixids, Coleopterans and
Odonats are not represented in Table V because of their sporadic appearance in
the core samples. The low catches of Corixids and Coleopterans indicate low densities,
even if these mobile species are likely to be underest imated in core samples. Odona t
numbers in bo th lakes are low since these species are mainly restricted to habitats
with macrophy te vegetation. In sum, the total number of impor tan t prey species
declined in both lakes f rom fall 1986 to fall 1987. These results imply that there
was no major increase in the food availability of t rout within 3 mo after the reliming.
TABLE V
Mean numbers (per m 2) and standard deviations of some important food items in Hovvatn (H) and Pollen (P) in the 1984-87 period. The density is calculated as a mean of densities at 0.5, 2 and 5 m depth in October, N refers to number of core samples (Wright et al.,
1988; Hindar et al., 1989)
1984 1985 1986 1987
H P H P H P H P
Ephemeroptera 133 175 35 105 280 378 128 210 SD 194 340 80 219 524 464 315 330 Trichoptera 21 8 23 0 28 14 70 12 SD 64 38 67 73 54 124 49 Megaloptera 35 8 12 0 14 14 47 0 SD 96 38 49 54 54 115 N 30 30 18 18 15 15 18 18
IMPROVED GROWTH OF BROWN TROUT AFTER RELIMING OF LAKE HVVATN 149
The macroinvertebrates have life-cycles spanning over one or several years, and a numeric response in these species is therefore not likely to occur before the season
after liming. This 1-yr delay in numeric response was observed after the first liming of Hovvatn in 1981 (Raddum et al., 1986) and may also account for the low numbers of invertebrates found in Hovvatn and Pollen three months after the reliming.
Food availability in the littoral zone (0 to 5 m depth) seemed to be approximately the same in the two lakes (Table V). The amount of food available per fish, however, differed between Hovvatn and Pollen, due to the differences in fish density. If no other factor than mortality through test fishing is accounted for, the stocking program would give 6.8 times higher fish density in Pollen than in Hovvatn in 1987 (Table II). The density difference was enlarged by a higher mortality rate in Hovvatn than in Pollen as indicated by the CPUE values. Longer periods of unfavorable water quality in Hovvatn than in Pollen may explain the differences in mortality (Table I, Figure 2). The sparse trout population in Hovvatn most likely had superabundance of food, whereas the dense population in Pollen experienced food shortage. These differences are reflected in the growth rates and condition factors of fish in the two populations.
Trout suffer from physiological stress in acid water due to disturbance of the body salt regulation (Muniz and Leivestad, 1980). The degree of stress imposed on the fish is mainly determined by the pH-level and the A1 and Ca concentrations of the water (Baker and Schofield, 1980; Muniz and Leivestad, 1980; Brown, 1983; Staurnes et al., 1984). The fish increases its metabolic rate in acid water to maintain physiological homeostasis (Rosseland, 1980). If increased metabolic rate is not compensated for by increased food consumption, growth will be affected. Liming will change both the internal and external environment of the fish, and release it from physiological stress. The energetic costs for metabolism are reduced and the released energy can be allocated to growth.
The higher CPUE values in both Hovvatn and Pollen in 1987 than in 1986 indicate that the trout increased its activity after liming. This is strengthened by the fact that the population numbers were lower (due to mortality) in 1987 than in 1986. Increased activity has also been reported from other liming projects (Hultberg and Andersson, 1982). The increase in activity probably reflects an intensified search for food. Feeding rate is positively correlated with food conversion rate (Elliott, 1975) and this relationship can explain the observed increases in activity after liming. Increased activity will promote growth if the increment in amount of energy gained by increased food uptake exceeds the increment in the energy expended on search and competition for food. This was probably the situation in Hovvatn, with low fish density, little competition, high food availability and rapid growth, whereas the conditions and results in Pollen where just the opposite.
In Hovvatn, growth was depressed during acid conditions, in spite of high food availability. The extent to which the energy budget of trout is affected by an acid environment is not known, but higher energetic costs for metabolism most likely contributed to depress growth in Hovvatn. The fact that the growth rates in Pollen

150 B.T. BARLAUP ET AL,
were unaffected by liming implies that a positive growth response to liming depends also on food availability and not alone on reduced standard metabolism. The immediate growth response in Hovvatn suggests that the trout responded to liming by both decreasing its standard metabolism and increasing its ingestion rate. Considering that the trout in Hovvatn had superabundance of food both before and after liming, the shift in ingestion rate was most likely induced by the change in water quality. The stomach fullness in acid Hovvatn were higher than in the non-acid Hovvatn. Similar results were found in a survey including 71 trout populations in southern Norway; the highest stomach fullness was found in fish from the most acidified and sparsely populated lakes (Rosseland et al., 1980). These observations leads to our suggestion that the food conversion rate of trout is negatively affected in acid waters.
In conclusion, the growth response to liming was closely related to population density and food availability. The improved growth after reliming was probably caused both by lower energetic costs for maintenance, and by an increased food conversion rate. The growth response to liming depended on high food availability. This implies that increased food conversion rate was the most important factor enhancing growth after liming. Further understanding of how growth is affected by acid stress can be achieved by quantifying the energy budget of fish living in acid environments.
Acknowledgments
We thank B. O. Rosseland, A. Fjellheim, and H. Saegrov for valuable criticism of the manuscript, and A. Brettingen for improving the English. This work was financially supported by the Norwegian Ministry of the Environment.
References
Almer, B.: 1974, Ambio 3, 30. Andersson, B. and Andersson, R: 1984, The distribution of trout (Salmo trutta L.) in relation to pH
- an inventory of small streams in Delsbo, central Sweden. Inst. Freshw. Res. Drottningholm. Report No. 61: 28-33.
Baker, J. R and Schofield, C. L.: 1980, 'Aluminum Toxicity to Fish as Related to Acid Precipitation and Adirondack Surface Water quality', in Drablos, D. and Tollan, A., Ecological Impact of Acid Precipitation, p. 292-293. SNSF-project (Acid rain-effects on Forest and Fish). Available from: SNSF- project, RO. Box 61, 1432 As-NLH, Norway.
Beamish, R. J.: 1974, J. Fish. Res. Board Can. 31, 49. Brett, J. R. and Groves, D. D.: 1979, 'Physiological Energetics', in Hoar, W. S. and D. J. Randall
(eds.), Fish Physiology, Vol. VIII. Academic Press. New York. pp. 279-352. Brown, D. J. A.: 1983, .L Fish Biol. 18, 31. Dahl, K.: 1909, Int. Revue ges. Hydrobiol. Hydrogr. 2, 758. Elliott, J. M.: 1975, Freshwat. Biol. 5,287. Eriksson, F., H6rnstr6m, E., Mossberg, R, and Nyberg, P.: 1983, Hydrobiologia 101, 145. Frenette, J. J. and J. J. Dodson.: 1984, Can. J. Fish. Aquat. Sci. 41,865. Gahnstr6m, G., Anderson, G., and Fleischer: 1980, 'Decomposition and Exchange Processes in Acidified
Lake Sediment', in Drablos, D. and Tollan, A. Ecological Impact of Acid Precipitation, pp. 306-
IMPROVED GROWTH OF BROWN T R O U T AFTER RELIMING OF LAKE HVVATN 151
307. SNSF-project (Acid precipitation - effects on Forest and Fish). Available from: SNSF-project, P.O. Box 61, 1431 As-NLH, Norway.
Grahn, O. H., Hultberg, H., and Landner, L.: 1974, Ambio 3, 93. Harvey, H. H.: 1982, 'Population Responses of Fishes in Acidified Waters', in R. Johnson (ed.), Acid
Rain/Fisheries, pp. 227-242. Northeastern Division, American Fisheries Society, Bethesda, MD. 357 p. Henriksen, A.: 1987, State Pollution Control Authority (SFT), 1000-lake survey 1986. SFT report 283-
87. Available from: SFT, Pb. 8100 Dep., Oslo 1, Norway. Henriksen, A.: 1988, State Pollution Control Authority (SFT), 1000-1ake survey 1986. SFT report 314-
88. Available from: SFT, Pb. 8100 Dep., Oslo 1, Norway. Hindar, A., Barlaup, B., Atland, A., Raddum, G. G. and Kleiven, E.: 1989, Store Hovvatn, Aust-
Agder, in Kleiven, E. (ed.), Kalkingsvirksomheten i 1987. DN-report 5-1989. Available from: Directorate for Nature Management, Tungasletta 2, N-5007 Trondheim, Norway.
Hultberg, H. and Andersson, I. B.: 1982, Water, Air, and Soil Pollut. 18, 311. Jensen, K. W. and Snekvik, E.: 1972, Ambio 1,223. Jonsson, B.: 1976, Norw. J. Zool. 24,295. Lea, E.: 1910, Publs. Circonst. Cons. perm. int. Explor. Mer. 53, 7. Muniz, I. P. and Leivestad, H.: 1979, Langtidseksponering av risk til surt vann. Forsok med bekkeroye
Salvelinus fontinalis Mitchill. SNSF-prosjektet, IR 44/79; 32 pp. Available from: SNSF-project, P. O. Box 6t, 1432 As-NLH, Norway.
Muniz, I. P. and Leivestad, H.: 1980, 'Acidification - Effects on Freshwater Fish' in Drabl6s, D. and Tollan, A. Ecological Impact of Acid Precipitation, pp. 84-92. SNSF-project (Acid precipitation - effects on Forest and Fish). Available from: SNSF-project, P.O. Box 61, 1432 As-NLH, Norway.
Raddum, G. G., Brettum, P., Matzow, D., Nilssen, J. P., Skov, A., Sve~ilv, T. and Wright, R. F.: 1986, Water, Air, and Soil Pollut. 31,721.
Rosseland, B. O.: i980, 'Physiological Responses to Acid Water in Fish. 2. Effects of Acid Water on Metabolism and Gill Ventilation in Brown Trout, Salmo trutta L., and Brook Trout, Salvelinus fontinalis Mitchill', in Drabl6s, D. and Tollan, A. Ecological Impact of Acid Precipitation pp. 348- 349. SNSF-project (Acid precipitation - effects on Forest and Fish). Available from: SNSF-project, EO. Box 61, 1432 As-NLH, Norway.
Rosseland, B. O., Sevaldrud, I., Svalastog, D., and Muniz, I. R: 1980, 'Studies on Freshwater Fish Populations - Effects of Acidification on Reproduction, Population Structure, Growth and Food Selection, in Drabl6s, D. and Tollan, A. Ecological Impact of Acid Precipitation', p. 336-337. SNSF- project (Acid precipitation - effects on Forest and Fish). Available from: SNSF-project, E O. Box 61, 1432 ,~s-NLH, Norway.
Rosseland, B. O., Skogheim, O. K. and Sevaldrud, I. H.: 1986, Water, Air and Soil Pollut. 30: 65-74. Rosseland, B. O.: 1986, Water, Air and Soil Pollut. 41, 165-188. Sadler, K. and Turnpenny, A. W. H.: 1986, Water, Air and Soil Pollut. 30,593. Schmidt-Nielsen, K.: 1939, 'Comparative Studies of the Food Competition Between the Brown Trout
and the Char'. K. norske Vidsk. Selsk. Skr. 4, 1. Staurnes, M., Sigholt, T. and Reite, O. B.: 1984, Experentia 40,226. Sve~ilv, T. and Matzow, D. 1985. 'Studium av 6ring utplanterad i det partiellt kalkade store Hovvatn,
Aust-Agder', The Liming Project, Report 25/85. 81 pp. Available from: Directorate for Nature Management, Tungasletta 2, N-7004 Trondheim, Norway.
Traaen, T. S.: 1980, 'Effects of Acidity on the Decomposition of Organic Matter in Aquatic Environments', in Drabl6s, D. and Tollan, A. Ecological Impact of Acid Precipitation', pp. 350-351. SNSF-project (Acid precipitation - effects on Forest and Fish). Available from: SNSF-project, EO. Box 61, 1432 A.s-NLH, Norway.
Wright, R. F.: 1985, Can. J. Fish. Aquat. Sci. 42, 1103. Wright, R. F., Raddum, G. G., Fjellheim, A. and Hindar, A.: 1988, 'Store Hovvatn, Aust-Agder',
in: Hindar, A. (ed.), Kalkingsvirksomheten i perioden 1984-1986. DN-report 2-1987. Available from: Directorate for Nature Management, Tungasletta 2, N-7004 Trondheim, Norway.


