Embed Size (px)
Citation preview

Genetic and Metabolic Variationsamong Penicillium roqueforti isolates
El-meleigy Magda A.1, M.M. Mokhtar2 and Helmy Eman A.2
1-Botany and Microbiology Department, Faculty of Sciences (Girls), Al-AzharUniversity, Cairo, Egypt.
2-The Regional Center for Mycology and Biotechnology (RCMB), Al-AzharUniversity, Cairo, Egypt.
ABSTRACTEleven isolates belonging to Penicillium roqueforti were classified
from the analysis of their crude extracts by a polyphasic approach
with data processing, using the profiles of their fatty acid;
secondary and volatile metabolites as taxonomic markers for these
isolates, as well as random amplified polymorphic DNA-polymerase
chain reaction pattern (RAPD-PCR) technique for the phylogenetic
relationship analysis at the intraspecies level using six
universal primers. The study showed that with the harmony of all
the four investigated markers, about all of the investigated
isolates could be classified correctly at the intraspecific level
using only the analysis of metabolites produced on one growth
medium (YES), except in case of the volatile profile which
succeeded as cladogenetic profile but not as a strain marker. The
study revealed the ability of RAPD-PCR technique to evaluate the
genetic diversity among the investigated isolates at the sub-
species level, as well as a rapid and easy method than traditional
characterization techniques. Other relations between isolates
could be read from the dendrograms and the efficient
classification showed the potential of this polyphasic approach
identification system.
1
Keywords: Volatile metabolites; Fatty acids; Secondary metabolites; RAPD-PCR; Penicillium
roqueforti; Chemotaxonomy.
Introduction
Fungi play critical roles in human and animal health,
agriculture, food industry and biotechnology. However, until
recently, their importance in these areas had not been fully
appreciated. As a result of this, there is a pressing need to
improve the accuracy and speed of the diagnosis of fungal
infections, to identify the sources of individual cases and
outbreaks of these infections, and to understand the patterns of
genetic variation and evolutionary potentials in populations of
pathogenic fungi (Jianping, 2008).
Penicillium is one of the most economically important genera
among filamentous fungi. Much of their economic impact is
deleterious, with food spoilage, mycotoxins production and
biodeterioration heading the list, but in fact their potential for
economic utility is equally important. It was more difficult to
differentiate the species that belonged to the subgenus Penicillium
(Smedsgaard et al 2004).
The major industrial uses of P.roqueforti are for the production
of blue cheeses, flavoring agents, anti-bacterial, polysaccharides,
proteases and other enzymes. While, the chief industrial use of it
is in the production of Roquefort cheese, stilton and other blue
cheeses which has been eaten by human since about 500 years ago.
Unfortunately, there is evidence to indicate that most strains are
capable of producing harmful secondary metabolites (alkaloids and
other mycotoxins) under certain growth conditions. P.roqueforti is
2
considered a Class 1 Containment Agent under the IMI Guidelines for
Research Involving Recombinant DNA Molecules (IMI, 2007).
Cellular fatty acid (FA) composition is routinely determined
in bacterial systematics (Moss, 1981 and Veys, et al 1989). Both the
type of fatty acid present and its relative concentration are useful
characteristics for separating taxa. Until recently, these
techniques were only rarely used in fungal taxonomy. Although fewer
different fatty acids are produced by fungi than by bacteria
(Lechevalier and Lechevalier, 1988), these analyses are increasingly
used for differentiating fungi (Augustyn et al 1990; Brondz and
Olsen, 1990; Amano et al 1992; Blomquist et al 1992; Stahl and Klug,
1996).
Chemotaxonomic studies of large number of isolates in
Penicillium have shown that secondary metabolites (SMs) have a
potential for the characterization of its species and for
phylogenetic relationships. Thus, it complements morphological data
to give a fuller description of an important part of the phenotype
that may be perceived by other organisms. Chemical analysis of SMs
will provide more objective and comparable results than traditional
description of color and odor (Smedsgaard and Frisvad, 1997).
The scope of the use of fungal volatile metabolites (VMs) in
the detection and classification of fungi is likely to be in the
rapid detection of unwanted fungal growth and in the separation of
closely related species that are difficult to distinguish by other
methods (Zeringue et al.1993).
Similarly, it has been demonstrated by Frisvad et al (1998)
that a large number of related species in genus Penicillium could be
classified based solely on their profiles of VMs, a finding that
may be true for other genera.
3
Some studies have evaluated a large number of primers to
identify only a selected few isolates that can successfully
discriminate genetic strain types. Kac et al (1999) evaluated fifteen
RAPD primers identifying merely one that was highly discriminatory
for strains of Trichophyton mentagrophytes. So, RAPD technique was
evaluated as a reliable tool with good reproducibility of the
patterns for each investigated strain as affirmed by Stemmler et al
(2001). But problems of interpretation due to inconsistent
intensity of bands in different PCR runs may arise for less
experienced personnel. RAPD analysis can be performed within one
working day and needs less DNA compared with RFLP, so, costs will
be reduced.
Most of the known established techniques and designing
options of fungal taxonomy have been validated for only a few dozen
of fungal strains and the lack of efficient genetic engineering
strategic forms still an obstacle for a multitude of identifying
fungi producing commercially interesting metabolites. To fully
explore their biotechnological capacities, these constraints have
to be solved (Vera, 2008).
Materials and methodsFungal strains: all isolates were tested as an Egyptian local
isolates from soil that identified by the RCMB, except one single
type strain that was purchased from the International Mycological
Institute (IMI) culture collections. All isolates were coded here
as they were: (38) P.roqueforti (IMI 285518), (39) P.roqueforti
(RCMB0010093), (40) P.roqueforti (RCMB0010094), (41) P.roqueforti
(RCMB0010096), (42) P.roqueforti (RCMB0010097), (43) P.roqueforti
(RCMB0010099), (44) P.roqueforti (RCMB00100910), (45) P.roqueforti
4
(RCMB001009I), (46) P.roqueforti (RCMB001009II), (47) P.roqueforti
(RCMB001009III) and (48) P.roqueforti (RCMB001009IV).
Media: two types of media were used; Malt Extract Agar (MEA) medium
was used for maintenance of the isolates according to Smith and
Onions (1983). The other medium type was Yeast Extract Sucrose
(YES). This semi-synthetic medium was used in liquid form for the
production of intracellular fatty acids form the cultivated
isolates (Peter and Michael, 1996), intracellular secondary
metabolites (Frisvad, and Samson, 2004) and intracellular volatile
metabolites (Larsen and Frisvad, 1995; Kristian and Thomas, 2005),
as well as for the DNA study (Zhou and Linz, 1999). Media were
sterilized by autoclaving at 121οC for 20 min. Mycelia growth from 7
days old cultures on MEA slopes were scraped by using 2 ml of
sterile distilled water. Then, 2.0 ml of 4x10² cells/ml spore
suspension of each isolate were used to inoculate a 100 ml YES
medium in a universal 250 ml flask, and then incubated at 25°C for
7 days, except in case of the DNA analysis that all flasks were
incubated with a gentle shaking at 180 rpm. at 25οC for 2 days.
Fungal mycelia and pellets were harvested by filtration under
aseptic conditions using microcloth and washed thoroughly with
sterile distilled water then weighed, decanted in sterile
containers and stored at -4°C for further analysis. While for
complete DNA analysis, fungal pellets were lyophilized using a
freeze dryer system (Heto lyophilizer model Maxi Dry plus). The
lyophilized pellets were grounded in a sterile cold mortar using
sterile pestle and decanted in a sterile 1.5 ml microfuge tube.
It is worthy to mention that all of the experimental work
throughout this research was carried out at the Regional Center for
Mycology and Biotechnology (RCMB), at Al-Azhar University excepting
5
for the fatty acids analysis which was achieved at the Central Lab
of the Ain Shams University.
Volatile Metabolite Analysis: Intracellular volatile metabolites
were extracted from fungal mycelia according to Evans (2002) then
analyzed using Shimadzu QP 5050A GC /MS supported with a Class 5000
software and Whiley mass spectral data base searchable library.
Fatty Acid Analysis: Intracellular fatty acids were extracted
according to Peter and Michael (1996). Gas chromatographic analysis
was achieved using Dani GLC-FID 1000. For the complete
identification of the resulted compounds, a fatty acids standard
was used. This standard was manufactured by Supelcotm, containing
mixture of 37 fatty acids methyl ester (C4- C24) dissolved in
methylene chloride.
Secondary Metabolite Analysis: Extraction, analysis and
identification of intracellular secondary metabolites were carried
out using the TLC plate technique of the automatic scanner system
(HPTLC Scanner 3 -CAMAG, Switzerland) using griseofulvin as
reference standard. The identity of the metabolites was performed
by comparing shape, color and Rf values of the recorded spots with
those given at Paterson and Bridge (1994).
Fungal DNA Extraction: DNA extraction was conducted using DNeasy
kit (Qiagen, Germany).
(RAPD-PCR): Amplification reaction mixture solution was prepared in
a final volume of 50 µl containing: 3 µl (200 ng) of genomic DNA; 1
μl of 50 pmole of each desired primer; 25 µl of the Go Taq Green
Master Mixture (Promega Co.) and deionized RNase-DNase free water
in sufficient amount to give the total reaction mixture volume of
50 µl. The amplification was performed using Research Programmable
Thermal Cycler (gradient Robocycler 96 Stratagene, USA) where the
6
applied program was as follows: universal denaturation cycle (5
min. at 94°C), 45 cycles of annealing/extension reactions (30 sec.
at 94°C, 1 min. at an optimum annealing temperature 36°C for each
used universal primer and 2 min. at 72°C) and cycle of final
extension step (5 min. at 72°C) was followed by soaking at 4°C.The
sequence of six oligonucleotide universal primers used in the
current search were: primer 1: (5'-GGTGCGGGAA-3'), primer 2: (5'-
GTTTCGCTCC-3'), primer 3: (5'-GTAGACCCGT-3'), primer 4: (5'-
AAGAGCCCGT-3'), primer 5: (5'-AACGCGCAAC-3') and primer 6: (5'-
CCCGTCAGCA-3'). These applied primers were of HPSF grade and
obtained from the MGW Biotech. Ag. Co.
Horizontal Gel Electrophoresis: The amplified products were
separated by agarose gel electrophoresis using a horizontal
submarine gel system (Agagel Maxi, Biometra) as well as agarose
(Gibco BRL Life Technologies) at a concentration of 2% (w/v).
Electrophoresis was conducted in 0.5× TBE buffer (5.4 g of Tris
base, 2.75 g of Boric acid, and 2 ml of 0.5 M EDTA [pH 8.0] in
1 liter of distilled water) at 10 v/cm for various times, depending
on the size of the gel unit (Weising et al 1995). DNA bands were
stained with ethidium bromide (10 mg/ml) then visualized and
photographed under a UV Transilluminator system using a Gel Doc.
2000 (Bio-RAD).
Statistical Cluster Analysis of the Phylogenetic Relationships: The
role of the RAPD-PCR patterns as well as the fatty acid, volatile
metabolite and secondary metabolite profiles as useful criteria for
studying phylogenetic relationships among the investigated
penicillia strains was evaluated by using statistical cluster
analysis with joining (tree clustering) being the clustering
method. Genetic relationships and divergence between RAPD–PCR
7
patterns of the investigated isolates were calculated from the
decimal coefficient using the Quantity One (4.0.3) software and
were illustrated in dendrograms constructed using the unweighted
pair-group method with arithmetic averages (UPGMA). While, each of
fatty acid, volatile metabolite and secondary metabolite profiles
were amalgamated by a complete linkage using the Elucidation
distance as the distance metric as well as the dice coefficient as
the calculation method using the Statistica software for Windows
release (4.5 F, State Soft. Inc. 1993).
ResultsVolatile Metabolite Profile: The accessible outcomes from the
volatile metabolite (VM) profile of the tested P.roqueforti isolates,
discovered twenty two discrete forms of volatile compounds, which
can be demoralized efficiently to clarify special difficulties
fixed to the morphological alliance of the considered species,
(Table 1). Unfortunately, referring to their broadly dispenses in
the tested isolates, all of the detected volatiles from P.roqueforti
isolates couldn’t be used as chemotaxonomical markers for the
speciation of these penicillia. In a different way, the
demonstration of the VM profile appeared to be impenetrable.
Accordingly, the cluster analysis tree (Figure 1), revealed the
cladogenesis of the investigated isolates into two clades based on
their VMs content. The first one included P.roqueforti numbers 39, 41,
42, 45, 47 and 48, joining them together at a linkage distance
between zero and 1.0, which have this closeness among P.roqueforti
numbers 39, 41, 45 and 47, fusing all of them as one subspecies at
a linkage distance of zero. While, both of P.roqueforti numbers 42 and
48 appeared to be liable as the same strain due to the closeness of
their similarity matrix value, which was 1.0 to the rest isolates
8
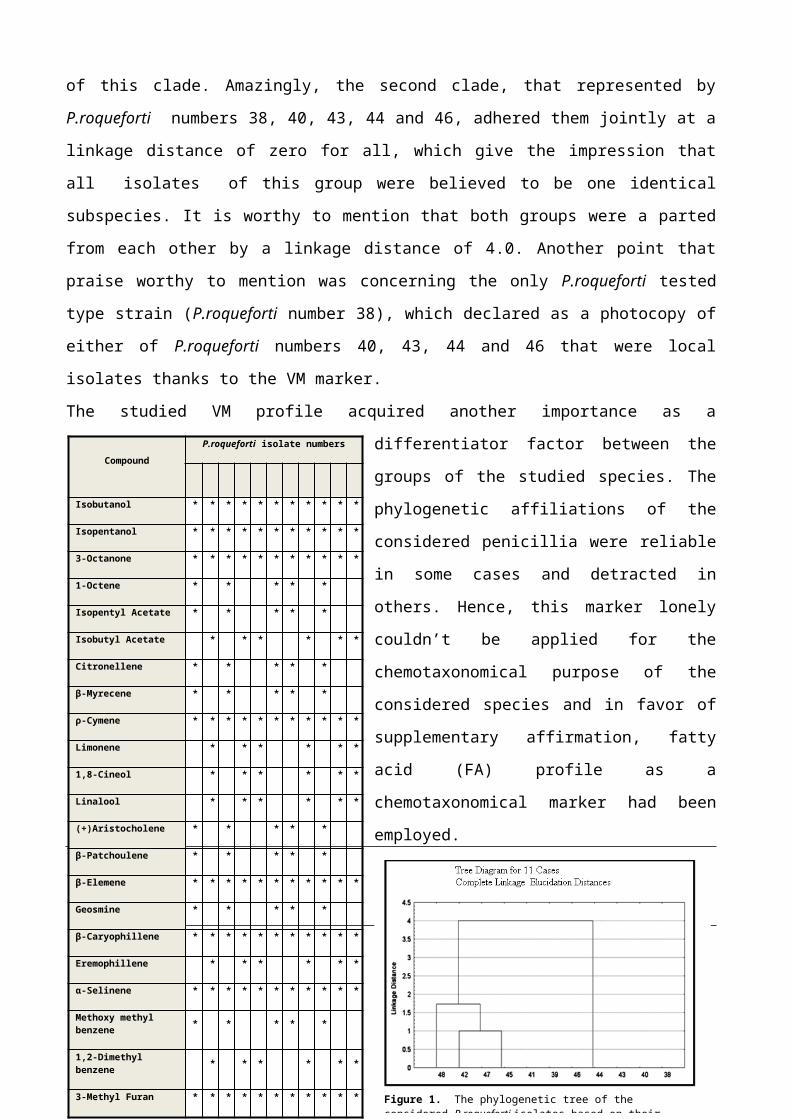
of this clade. Amazingly, the second clade, that represented by
P.roqueforti numbers 38, 40, 43, 44 and 46, adhered them jointly at a
linkage distance of zero for all, which give the impression that
all isolates of this group were believed to be one identical
subspecies. It is worthy to mention that both groups were a parted
from each other by a linkage distance of 4.0. Another point that
praise worthy to mention was concerning the only P.roqueforti tested
type strain (P.roqueforti number 38), which declared as a photocopy of
either of P.roqueforti numbers 40, 43, 44 and 46 that were local
isolates thanks to the VM marker.
The studied VM profile acquired another importance as a
differentiator factor between the
groups of the studied species. The
phylogenetic affiliations of the
considered penicillia were reliable
in some cases and detracted in
others. Hence, this marker lonely
couldn’t be applied for the
chemotaxonomical purpose of the
considered species and in favor of
supplementary affirmation, fatty
acid (FA) profile as a
chemotaxonomical marker had been
employed. Table 1. Volatile metabolite profile of the investigated P.roqueforti isolates.
9
CompoundP.roqueforti isolate numbers
Isobutanol * * * * * * * * * * *
Isopentanol * * * * * * * * * * *
3-Octanone * * * * * * * * * * *
1-Octene * * * * *
Isopentyl Acetate * * * * *
Isobutyl Acetate * * * * * *
Citronellene * * * * *
β-Myrecene * * * * *
ρ-Cymene * * * * * * * * * * *
Limonene * * * * * *
1,8-Cineol * * * * * *
Linalool * * * * * *
(+)Aristocholene * * * * *
β-Patchoulene * * * * *
β-Elemene * * * * * * * * * * *
Geosmine * * * * *
β-Caryophillene * * * * * * * * * * *
Eremophillene * * * * * *
α-Selinene * * * * * * * * * * *
Methoxy methyl benzene * * * * *
1,2-Dimethyl benzene * * * * * *
3-Methyl Furan * * * * * * * * * * * Figure 1. The phylogenetic tree of the considered P.roqueforti isolates based on their
Fatty Acid Profile: The presented results from the fatty acid (FA)
profile of an eleven P.roqueforti isolates, declared nineteen
different types of fatty acids, which studied to resolve certain
problems associated with the morphological classification of the
considered species, (Table 2). Fortunately, each of arachidic,
elaidic, capric, lauric, γ-linolenic and arachidonic acids were
seemed to be successful chemotaxonomic markers according to their
minor and restricted allocations among the tested isolates.
Additionally, the demonstration of the VM representation of the FA
profile looked confusing. So, the phylogenetic tree (Figure 2),
revealed the grouping of the investigated isolates into three
clades. The first clade embraced P.roqueforti numbers 38, 39, 40, 43,
44 and 45, joining them together at a linkage distance from 1.4 to
4.0. While, the closest two isolates through this group were
P.roqueforti numbers 38 and 43 that tied to each other as an identical
subspecies at a linkage distance of 1.4. The second clade included
P.roqueforti numbers 42 and 46 joining them together like a one and
the same strain at a linkage distance of 1.7. As the same time,
the third clade gathering either of P.roqueforti numbers 41 and 47 to
the same extent as a replicates at a linkage distance of 2.2. The
last point was the separation of P.roqueforti number 48 alone a part
10

from the rest clades at a linkage distance of 12.0, which
considered so far, indicating the speciation of this strain as a
separate subspecies making its own group.Table 2. Fatty acid profile of the investigated P.roqueforti isolates.
Convincingly, the results of the
fatty acid profile as a marker
confirmed the correlations between
the P.roqueforti numbers 38, 40, 43 and
44, as well as among P.roqueforti
numbers 41 and 47 owing to the VM
marker, while both markers argued
about the rest isolates; P.roqueforti
numbers 39, 42, 45, 46, and 48 being
located in different groups as
illustrated before. So, it seemed extra encouraging allowing for
the use of the FA profiling in penicillia speciation, but it
wouldn't be likely to corroborate such associations without
11
Fatty AcidP.roqueforti isolate numbers
Butyric * * * * * * * * * *
Caproic * * * * * * * *
Caprilic * * * * * * *
Capric * * * *
Lauric * * * *
Tridecanoic * * * * *
Myristic * * * * *
Pentadecanoic * * * * * * *
Palmitic * * * * * *
Palmitoleic * * * * * * * * * *
Margaric * * * * * * *
Heptadecenoic * * * * * * * *
Stearic * * * * * * * * * *
oleic * * * * * * * * * *
Elaidic * *
Linolelaidic * * * * * * *
γ-Linolenic * * * *
Arachidic *
Arachidonic * *
Figure 2. The phylogenetic tree of the considered P.roqueforti isolates based on their similarity matrix values of fatty acid profile.
supplementary consideration using other chemotaxonomical marker
such as the compliance of the secondary metabolite (SM) profile.
Secondary Metabolite Profile: The chemical diversity of the in
hands secondary metabolite (SM) profile findings of the
investigated P.roqueforti isolates, revealed twenty two different
chemical compounds, (Table 3 and Figure 3). So, neither of the
detected SMs could be considered as a useful taxonomic marker due
to their extensively scattering among the tested P.roqueforti
isolates, except for the two unidentified SMs with the Rf values of
21 and 40 that were regained from two different isolates, as well
as the three unknown SMs with Rf values of 5, 27 and 44 that were
found in three different isolates. The last five unknown compounds
were the most secondary metabolite compounds of interest thanks to
their constrained existence in the investigated P.roqueforti isolates.
Hence, they could be considered as excellent taxonomical markers
throughout the studied P.roqueforti isolates and they will be
characterized in further studies later on. Moreover, the previous
representation of the SM outline seemed to be confuses,
particularly for unspecialized scientists in taxonomy.
So, it was recommended to use the cluster analysis for this
purpose which represented as the phylogenetic relationships
(Figure 4) of the studied isolates according to their SM content
revealed the alliance of the investigated isolates into two
clades. The first one included P.roqueforti numbers 39, 41, 43, 45 and
47, joining them together at a linkage distance ranged from 1.0 to
2.0, in which each of P.roqueforti numbers 39, 47, 41 and 45 were
closely adhered to each other as the same subspecies at a linkage
distance of 1.0. While, P.roqueforti number 43 was likely to be the
same subspecies also due to its closeness to the remainder
12

isolates at a linkage distance of 2.0. Additionally, the second
clade which included P.roqueforti numbers 38, 40, 42, 44, 46 and 48,
combining them together at a linkage distance from zero to 2.2,
appearing to join closely the P.roqueforti numbers 38 with 42 and 48
like a single matching subspecies at a linkage distance of zero.
It is worthy to mention that both clades were connected not far
from each other at a linkage distance of 2.8.
It seemed clearly that both of the VM and SM markers were more
or less resembling each other referring to the grouping of the
tested P.roqueforti isolates into two clades that matched in most of
isolates (P.roqueforti numbers 38, 40, 44, 46 of the first clade and
P.roqueforti numbers 39, 41, 45, 47 of the second one), but conflicted
in the rest isolates (P.roqueforti numbers 42, 43, 48) that located in
different clades as illustrated before.
Similarly, both of the FA and SM markers agreed in grouping
each of P.roqueforti numbers (38, 40, 44), (42, 46) and (41, 47) in
three separate clades based on FA profile and in two clades
according to SM profile, which gathering all of P.roqueforti numbers
38 with 40, 44, 42 and 46 as several copies of one subspecies in
the same clade.
Apparently, the results obtained from the SM marker confirmed
what gained from both of the VM and FA markers concerning the
grouping of P.roqueforti number 38 as a type strain with P.roqueforti
numbers 40 and 44 as local isolates like one identical subspecies.
13
Figure 4. The phylogenetic tree of the considered P.roqueforti isolates based on their similarity matrix values of secondary metabolite profile.
Table 3. Secondary metabolite profile of the investigated P.roqueforti isolates.
Figure 3. TLC plate of P.roqueforti isolates secondary metabolites under long UV. Lane G; griseofulvin, lanes 38-48; P.roqueforti isolates.
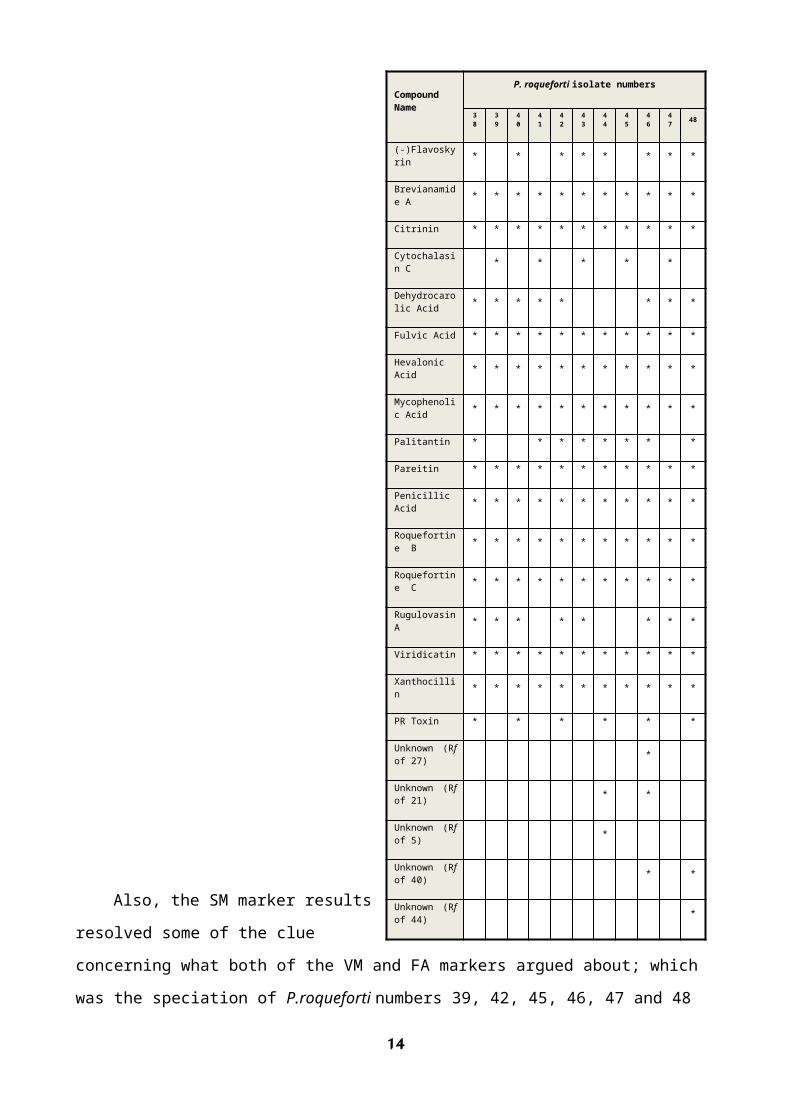
Also, the SM marker results
resolved some of the clue
concerning what both of the VM and FA markers argued about; which
was the speciation of P.roqueforti numbers 39, 42, 45, 46, 47 and 48
14
CompoundName
P. roqueforti isolate numbers
38
39
40
41
42
43
44
45
46
47 48
(-)Flavoskyrin * * * * * * * *
Brevianamide A * * * * * * * * * * *
Citrinin * * * * * * * * * * *
Cytochalasin C * * * * *
Dehydrocarolic Acid * * * * * * * *
Fulvic Acid * * * * * * * * * * *
HevalonicAcid * * * * * * * * * * *
Mycophenolic Acid * * * * * * * * * * *
Palitantin * * * * * * * *
Pareitin * * * * * * * * * * *
PenicillicAcid * * * * * * * * * * *
Roquefortine B * * * * * * * * * * *
Roquefortine C * * * * * * * * * * *
RugulovasinA * * * * * * * *
Viridicatin * * * * * * * * * * *
Xanthocillin * * * * * * * * * * *
PR Toxin * * * * * *
Unknown (Rfof 27) *
Unknown (Rfof 21) * *
Unknown (Rfof 5) *
Unknown (Rfof 40) * *
Unknown (Rfof 44) *
as said before. So, the SM marker gathered each of P.roqueforti
numbers 42, 46 and 48 to the group of P.roqueforti numbers 38, 40 and
44 as the same subspecies, but each of P.roqueforti numbers 39, 45 and
47 still remaindered as a problem that needed to solve.
Conclusively, it was more helpful allowing the use of the
secondary metabolite profiling in P.roqueforti speciation, which was
not an effortless mission. The succession of each of the FA and SM profiles in resolving
some morphological clues associated with P.roqueforti at the
intraspecific level was noticed. While, the VM profile was failed
at this level but considered as a good strain profile. The
succession of the chemotaxonomic marker depends on the use of a
lot of isolates (70%) of the same species.
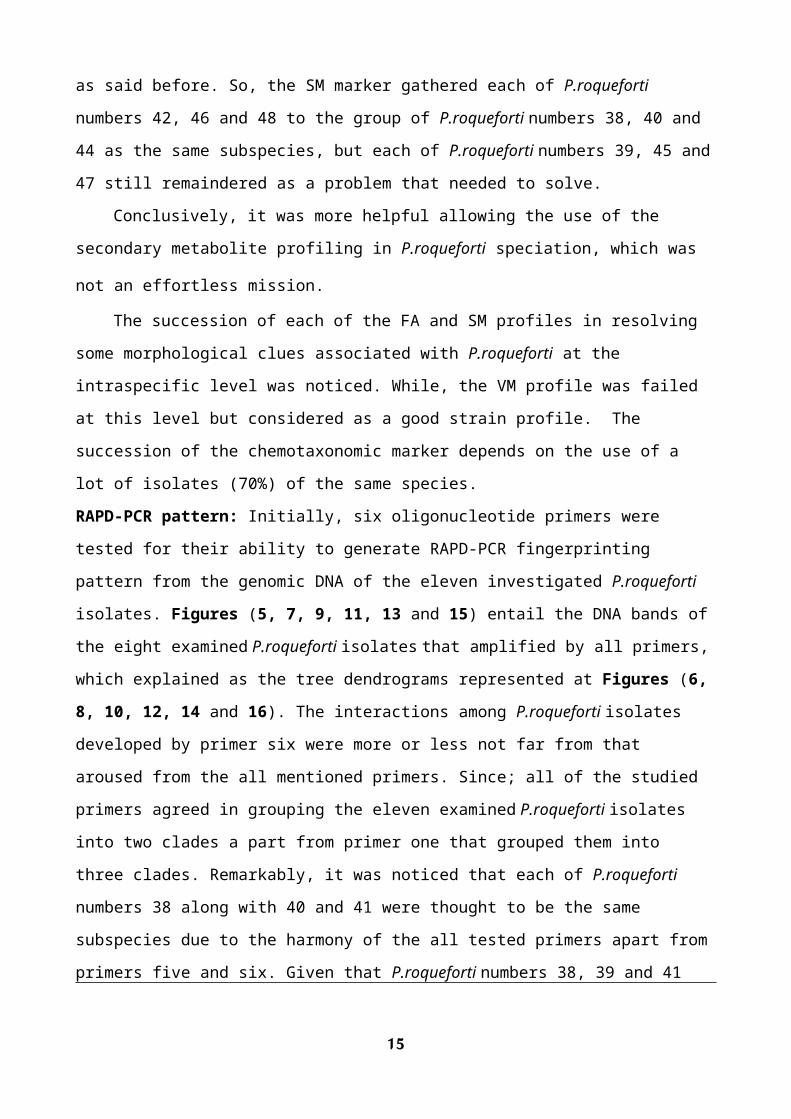
RAPD-PCR pattern: Initially, six oligonucleotide primers were
tested for their ability to generate RAPD-PCR fingerprinting
pattern from the genomic DNA of the eleven investigated P.roqueforti
isolates. Figures (5, 7, 9, 11, 13 and 15) entail the DNA bands of
the eight examined P.roqueforti isolates that amplified by all primers,
which explained as the tree dendrograms represented at Figures (6,
8, 10, 12, 14 and 16). The interactions among P.roqueforti isolates
developed by primer six were more or less not far from that
aroused from the all mentioned primers. Since; all of the studied
primers agreed in grouping the eleven examined P.roqueforti isolates
into two clades a part from primer one that grouped them into
three clades. Remarkably, it was noticed that each of P.roqueforti
numbers 38 along with 40 and 41 were thought to be the same
subspecies due to the harmony of the all tested primers apart from
primers five and six. Given that P.roqueforti numbers 38, 39 and 41
15
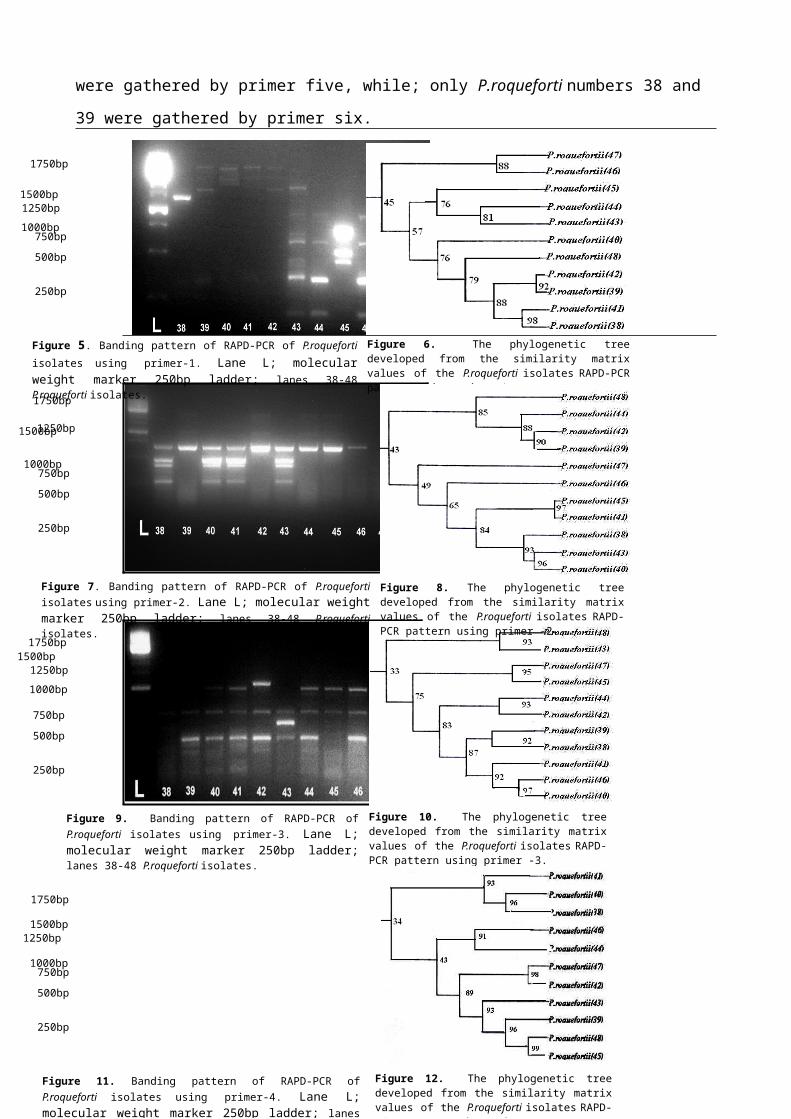
were gathered by primer five, while; only P.roqueforti numbers 38 and
39 were gathered by primer six.
16
250bp
500bp750bp
1000bp
1250bp
1500bp
1750bp
Figure 6. The phylogenetic tree developed from the similarity matrix values of the P.roqueforti isolates RAPD-PCR pattern using primer-1.
Figure 5. Banding pattern of RAPD-PCR of P.roqueforti isolates using primer-1. Lane L; molecular weight marker 250bp ladder; lanes 38-48 P.roqueforti isolates.
250bp
500bp750bp
1000bp 1250bp1500bp 1750bp
Figure 10. The phylogenetic tree developed from the similarity matrix values of the P.roqueforti isolates RAPD-PCR pattern using primer -3.
Figure 9. Banding pattern of RAPD-PCR of P.roqueforti isolates using primer-3. Lane L; molecular weight marker 250bp ladder; lanes 38-48 P.roqueforti isolates.
250bp
500bp750bp
1000bp
1250bp
1500bp
1750bp
Figure 8. The phylogenetic tree developed from the similarity matrix values of the P.roqueforti isolates RAPD-PCR pattern using primer -2.
Figure 7. Banding pattern of RAPD-PCR of P.roqueforti isolates using primer-2. Lane L; molecular weight marker 250bp ladder; lanes 38-48 P.roqueforti isolates.
250bp
500bp750bp
1000bp
1250bp 1500bp 1750bp
Figure 12. The phylogenetic tree developed from the similarity matrix values of the P.roqueforti isolates RAPD-PCR pattern using primer-4.
Figure 11. Banding pattern of RAPD-PCR of P.roqueforti isolates using primer-4. Lane L; molecular weight marker 250bp ladder; lanes 38-48 P.roqueforti isolates.
Correspondingly, without primers two and three, each of
P.roqueforti numbers 43, 44 and 45 might be considered as identical
duplicates of one subspecies. Additionally, both of P.roqueforti
numbers 46 and 47 were matched copies of the same subspecies owing
to the union of all the studied primers excluding merely primer
six. Hence, RAPD-PCR pattern as a chemotaxonomical marker
succeeded to a large degree in classifying and differentiating
among the investigated P.roqueforti isolates.
17250bp
500bp750bp
1000bp 1250bp 1500bp1750bp
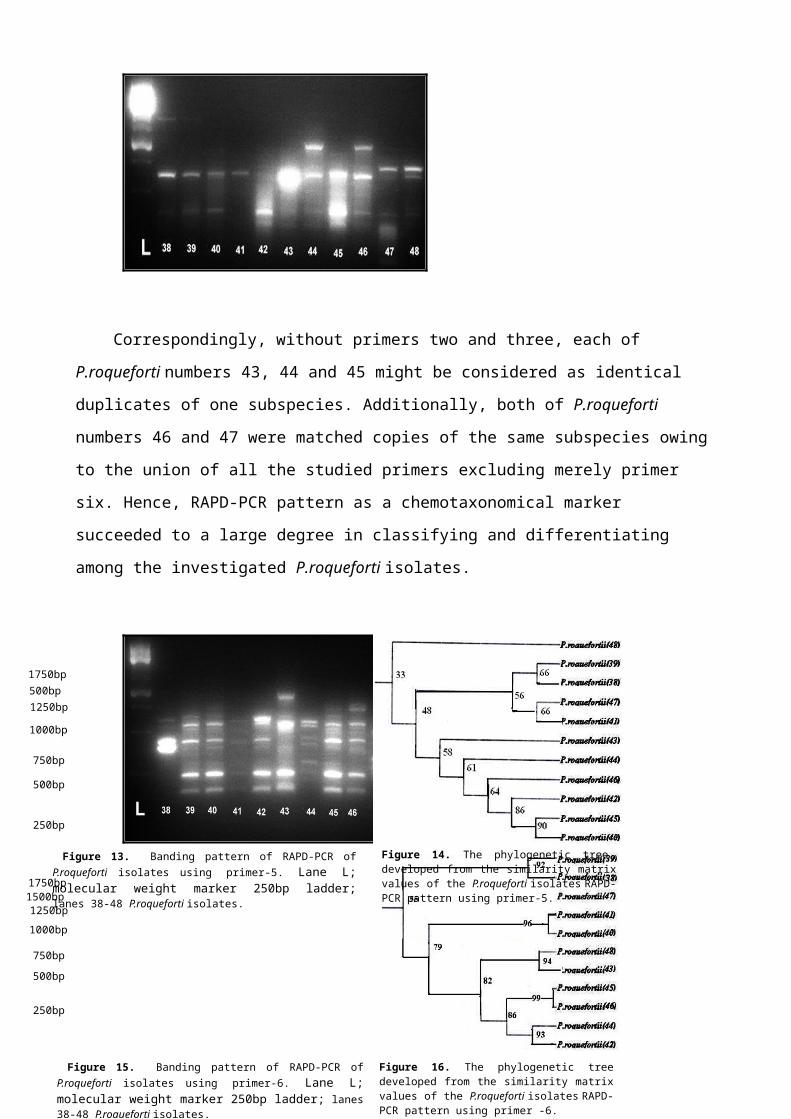
Figure 16. The phylogenetic tree developed from the similarity matrix values of the P.roqueforti isolates RAPD-PCR pattern using primer -6.
Figure 15. Banding pattern of RAPD-PCR of P.roqueforti isolates using primer-6. Lane L; molecular weight marker 250bp ladder; lanes 38-48 P.roqueforti isolates.
250bp
500bp
750bp
1000bp
1250bp 500bp 1750bp
Figure 14. The phylogenetic tree developed from the similarity matrix values of the P.roqueforti isolates RAPD-PCR pattern using primer-5.
Figure 13. Banding pattern of RAPD-PCR of P.roqueforti isolates using primer-5. Lane L; molecular weight marker 250bp ladder; lanes 38-48 P.roqueforti isolates.
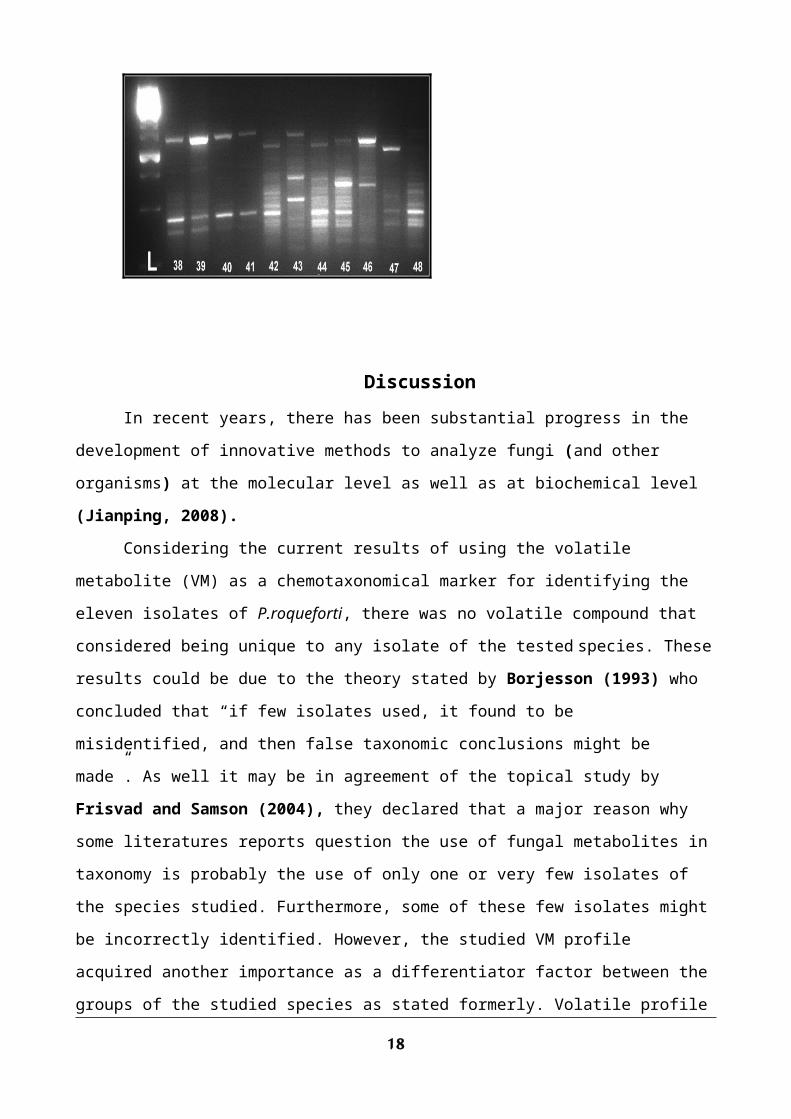
DiscussionIn recent years, there has been substantial progress in the
development of innovative methods to analyze fungi (and other
organisms) at the molecular level as well as at biochemical level
(Jianping, 2008).
Considering the current results of using the volatile
metabolite (VM) as a chemotaxonomical marker for identifying the
eleven isolates of P.roqueforti, there was no volatile compound that
considered being unique to any isolate of the tested species. These
results could be due to the theory stated by Borjesson (1993) who
concluded that “if few isolates used, it found to be
misidentified, and then false taxonomic conclusions might be
made”. As well it may be in agreement of the topical study by
Frisvad and Samson (2004), they declared that a major reason why
some literatures reports question the use of fungal metabolites in
taxonomy is probably the use of only one or very few isolates of
the species studied. Furthermore, some of these few isolates might
be incorrectly identified. However, the studied VM profile
acquired another importance as a differentiator factor between the
groups of the studied species as stated formerly. Volatile profile
18
from different species such as P.roqueforti and P.commune could easily
be distinguished by the studies of Lund and Frisvad (1994 and
1995). Likewise, a total of twenty four isolates of P.roqueforti and
P.paneum from the P.roqueforti group differentiated by VM profiling
primarily of sesquiterpenes produced on YES medium, some of
which they have in common and some of which are unique for the two
species Kristian and Thomas (2005). Regarding the only P.roqueforti
tested type strain (P.roqueforti number 38), which declared as a
photocopy of either of P.roqueforti numbers 40, 43, 44 and 46 that
were local isolates thanks to the VM marker. This fallout was in
concurrence with what recommended by Fischer et al (2000) in that
isolates of some species in their study were morphologically
compared to reference strains from the CBS culture collection
(Fungal Biodiversity Centre; Centraalbureau voor Schimmelcultures
Baaren-Nietherland) to confirm proper identification.
With reference to the succession of the fatty acid (FA)
profile as a chemotaxonomical marker for the speciation of the
inspected eleven P.roqueforti isolates, this was in agreement with the
conclusion made by Ricardo et al (2001) who investigated the chemical
composition of FAs in eighteen strains of two Cunninghamella
species, which had shown the presence of four groups. The average
percentage of fatty acids of the species C.elegans and C.bertholletiae,
showed variations in linolenic and stearic acids, suggesting the
possibility of differentiation between the two species using the
FA profile. Remarkable outcomes at the present work concerning
each of arachidic, elaidic, capric, lauric, γ-linolenic and
arachidonic acids as they all were seemed to be successful
chemotaxonomical markers thanks to their minor and restricted
allocations among the tested P.roqueforti isolates. Convincingly, the
19
results of the FA profile as a marker confirmed the correlations
between the P.roqueforti numbers 38, 40, 43 and 44 as four copies of
the same strain as illustrated by the VM marker results.
Since, the secondary metabolites (SM) profile of the studied
P.roqueforti isolates at the current work introduced very interested
results such as, the detection of unique compounds of very
restricted distribution (i.e. the five unknown SM compounds with
different Rf values) which consequently could be used as an
excellent chemotaxonomical markers at the strain level for the
examined species, these were in consistency with that concluded
by Lund and Frisvad (1994), they stated that “compounds of
restricted distribution might be considered as taxonomic markers
for the rapid identification of the species, however to ensure
their species specificity, a number of isolates belonging to the
same species needed to be analyzed”. Fungal extract mostly
contains compounds from the secondary metabolism, but also some
primary metabolites. Not all of these compounds can be used for
chemotaxonomic and classification purposes, even though they are
of great importance to the fungus. The profile is based on all the
secondary metabolites that have differentiation power. Other
compounds that are produced in response to the abiotic
environments, like cell wall constituents, accumulated different
polyols or lipids (Kock and Botha, 1998), can be included in
chemical profiling if they have differentiation power, even though
they are not secondary metabolites. It is not unusual that
different fungal species have one or more secondary metabolites in
common (Frisvad et al 2008). The in hands results of the SM
profiling can be used successfully to resolve certain
morphological systematic problems associated to these penicillia.
20
It seemed clearly that both of the VM and SM markers were more or
less resembling each other, similarly, both of the FA and SM
markers agreed in some cases and disagree in others as illustrated
before, therefore in that concern Frisvad and Samson (2004) stated
that “some of the similar and dissimilar features of the studied
species show why it is important to combine a suite of characters
in order to classify or identify these fungi correctly”. Based on
a smaller subset of these characters many species could be placed
in synonymy, but taken as a whole the species are indeed very
different. Apparently, the results obtained from the SM marker
confirmed by what gained from both of the VM and FA markers
concerning the grouping of P.roqueforti number 38 as a type strain
with P.roqueforti numbers 40 and 44 as local isolates like one
identical subspecies. Referring to all of the SMs that were
established at every single one of the investigated P.roqueforti
isolates, they couldn't be considered here to be useful
chemotaxonomical markers due to wide spreading among the testes
strains, such conclusion was coherently accepted with what
suggested by Ciegler et al (1973) that”production of similar
metabolic products does not provide an adequate basis for
recognition of a new taxon“, based on the advice of Frisvad and
Filtenborg (1990) whom was the first to suggest that "only unique
extrolites could be used directly in Penicillium taxonomy" and this
was followed up by a study on many of the species in subgenus
Penicillium by Frisvad et al (1998), where it was shown that only
restricted extrolites were of particularly high value in the
taxonomic sense.
RAPD pattern produced a profile of bands that allowed the
identification of intraspecific polymorphisms among the
21
investigated penicillia. Each primer yielded a strong distinctive
pattern for the studied isolates, while the number and the size of
the generated fragments were entirely differed from each other.
Results of the current study declared that the RAPD-PCR pattern as
a chemotaxonomical marker succeeded to a large extent in
classifying and differentiating among the investigated P.roqueforti
isolates. High polymorphism among ten Penicillium species was reported
by Pereira et al (2002), in which the species P.roqueforti, P.oxalicum,
P.griseofulvum, P.brevicompactum, P.camembertii and P.charlesii was demonstrated
by the amplifications using molecular characterization based on
the RAPD marker among them. Referring to the P.roqueforti results, the
tree dendrogram of the RAPD-PCR pattern decoded the tested
P.roqueforti isolates into three clades using primer one and into two
clades owing to the rest five primers. The associations among the
P.roqueforti isolates developed by the entire six studied primers
looked near to each other with the exception of primer one. Random
primed methods are particularly useful to determine relationships
below the level of species as demonstrated by Hadrys et al (1992),
but depending on the length of the primers and the recognized
taxonomic diversity of the group under study, the method may help
to discriminate species. The use of different primers for the
identification of the microorganisms increased the level of
confidence of the identification, but in practice, one primer is
usually sufficient (Pinto et al 2004; Foschino et al 2004). Like
wisely, Bergmann et al (2007) stated that primers with arbitrary
sequences give different banding patterns with the same DNA even
by applying on the same individual genotypes of species which may
be obtained due to the recombination generating species. These
results agreed with those of others (Cadez, et al 2002; Vasdinyei
22
and Deak, 2003; Fadda, et al 2004) which have shown that RAPD-PCR
methods performed with different oligonucleotide primers basically
generated consistent patterns, with several shared fragments
unique to each species. In another study that reported by Gomes et
al (2007), a remarkable polymorphism was detected among P.expansum
and P.griseoroseum by RAPD analysis that utilized by an adequate
number of primers. Finally, RAPD-PCR represented a powerful
technique that could be alone used in the discrimination at the
intraspecies level under the conditions of using a lot number of
universal primers as well as a lot number of isolates. The study
of Frisvad and Samson (2004) showed that about 70% of the Penicillium
species can be classified correctly into species level using only
the analysis of metabolites produced on one growth medium; such as
YES medium. This work demonstrated that with the harmony of all
the four investigated markers; the profiles of the fatty acid,
secondary and volatile metabolites, as well as RAPD-PCR pattern,
about all of the investigated isolates could be classified
correctly at the intraspecific level using only the analysis of
metabolites produced on one growth medium (YES), except in case of
the volatile profile which succeeded as cladogenetic profile but
not as a strain marker.
ReferencesAmano, N., Y. Shinmen; K. Akimoto; H. Kawashima and T. Amachi. (1992).Chemotaxonomic significance of fatty acid composition in the genusMortierella (Zygomycetes, Mortierellaceae). Mycotaxon, 44:257-265.Augustyn, O.P.H.; J.F.L. Kock and D. Ferreira (1990). Differentiationbetween yeasts species and strains within a species by cellular fattyacid analysis. Saccharomyces sensu lato, Arxiozyma and Pachytichospora. Syst. Appl.Microbiol., 13:44-55.
23

Bergmann, S.; J. Schumann; K. Scherlach; C. Lange; A. Brakhage and C.Hertweck (2007). Genomics-driven discovery of polyketide sesquiterpeneshybrid metabolites from Aspergillus nidulans. Nature Chemical Biology, 3:213–217. Blomquist, G.; B. Anderson; K. Anderson and I. Brondz (1992). Analysis offatty acids. A new method for characterization of moulds. J. Microbiol.Meth., 16:59.Borjesson, T. (1993). Volatile Fungal Metabolites as Indicator of Mould Growth in Stored Cereals. Ph.D. Thesis. Swedish University of Agricultural Sciences. Uppsala. ISBN. 91-576-4706-2.Brondz, I. and I. Olsen (1990). Multivariate analyses of cellularcarbohydrates and fatty acids of Candida albicans, Torulopsis glabrata, andSaccharomyces cerevisiae. J. Clin. Microbiol., 28:1854-1857.Cadez, N.; P. Raspor; A.W. de Cock; T. Boekhout and M.T. Smith (2002).Molecular identification and genetic diversity within species of generaHanseniaspora and Kloeckera. FEMS Yeast Res., 1(4):279-289.Ciegler, A., D.I. Fennell; G.A. Sansing; R.W. Detroy and G.A. Bennett(1973) Mycotoxin-producing strains of Penicillium viridicatum: Classificationinto subgroups. Applied Microbiology 26: 271-278.Evans, W.C. (2002). Pharmacopoeial and Related Drugs of Biological Origin. In: Treas, T. and S. Evans, Pharmacognosy. 15th Ed. pp. 253-288.(Saunders W.B. Ed.) Harcourt Publisher Ltd., London. Fadda, M.E.; V. Mossa; M.B. Pisano; M. Deplano and S. Cosentino (2004).Occurrence and characterization of yeasts isolated from artisanal FioreSardo cheese. Int. J. Food Microbiol., 95(1):51-59.Fischer, G.; T. Muller; R. Schwalbe; R. Ostrowski and W. Dott (2000).Species-specific profiles of mycotoxins produced in cultures andassociated with conidia of airborne fungi derived from biowaste. Int. J.Hyg. Environ. Health, 203: 105–116.Foschino, R.; S. Gallina; C. Andrighetto; L. Rossetti and A. Galli(2004). Comparison of cultural methods for the identification andmolecular investigation of yeasts from sourdoughs for Italian sweet bakedproducts. FEMS Yeast Res., 4(6):609-618.Frisvad, J.C. and O. Filtenborg (1990). Simple screening method formoulds producing intracellular mycotoxins in pure cultures. Applied andEnvironmental Microbiology 45: 581-585.Frisvad, J.C. and R.A. Samson (2004). Polyphasic taxonomy of Penicillium subgenus Penicillium. A guide to identification of food and air-borne terverticillate Penicillia and their mycotoxins. In: Samson, R.A. and J.C. Frisvad, Penicillium subgenus Penicillium: new taxonomic schemes, mycotoxins and other extrolites. (Samson, R.A. Ed.) Studies in Mycology,No. 49. pp.1-174. Centraalbureau voor Schimmelcultures. Netherlands. Frisvad, J.C.; O. Filtenborg and U. Thrane (1998). The role of the use ofsecondary metabolites in fungal taxonomy. In: (Frisvad J.C.; P.D. Bridgeand K.D. Arora, Eds). Chemical Fungal Taxonomy. pp. 289-320. MarcelDekker Inc. New York, USA.
24
Frisvad, J.C.; B. Andersen and U.Thrane (2008). The use of secondarymetabolite profiling in chemotaxonomy of filamentous fungi. MycologicalResearch, 112: 231–240. Gomes, P.C.; M.V. Queiroz; O.L. Pereira and E.F. Araújo (2007).Morphological and molecular differentiation of the pectinase producingfungi Penicillium expansum and Penicillium griseoroseum. Brazilian Journal ofMicrobiology, 38:71-77.Hadrys, H.; M. Balick, and B. Schierwater (1992). Applications of randomamplified polymorphic DNA (RAPD) in molecular ecology. Mol. Ecol., 1:55-63.IMI, (International Mycological Institute, Netherland). (2007). AnIntegration of Risk of P.roqueforti. in: The IMI Report of Penicilliumroqueforti Exemption of the Final Risk Assessment of P.roqueforti. April 30th,pp.1-45.Jianping, X.U. (2008). Fundamentals of Fungal Molecular PopulationGenetic Analyses. Curr. Issues Mol. Biol., 8: 75–90. Kac, G.; M.E. Bougnoux; D. Feuilhade; M. Chauvin; S. Sene and F. Derouin(1999). Genetic diversity among T.mentagrophytes isolates using randomamplified polymorphic DNA method. Br. J. Dermatol., 140:839–844.Kock, J.L.F and A. Botha (1998). Fatty acids in fungal taxonomy. In:(Frisvad J.C., P.D. Bridge and K.D. Arora, Eds). Chemical FungalTaxonomy. pp. 219-246. Marcel Dekker Inc. NewYork, USA. Kristian, K. and O.L. Thomas (2005). Differentiation of Species from thePenicillium roqueforti Group by Volatile Metabolite Profiling. J. Agric. FoodChem., 53 (3), 708 -715.Larsen, T.O. and J.C. Frisvad (1995). Aurantiamine, a diketopiperazinefrom two varieties of Penicillium aurantiogriseum. Phytochemistry 31: 1613-1615.Lechevalier, H. and M.P. Lechevalier (1988). Chemotaxonomic use of lipids- an overview. In: (Ratledge, C. and S.G. Wilkinson, Eds.). MicrobialLipids, vol. 1, pp.869-902. Academic Press, New York.Lund, F. and J.C. Frisvad (1994). Chemotaxonomy of Penicillium auratiogriseumand related species. Mycological Research 98: 481-492.Lund, F. and J.C. Frisvad (1995). Penicillium verrucosum in wheat and barleyindicates presence of ochratoxin A. Journal of Applied Microbiology, 95:1117-1123.Moss, C. W. (1981). Gas-liquid chromatography as an analytical tool inmicrobiology. J. Chromatogr., 203:337-347. Paterson, J.M. and C. Bridge (1994). Biochemical Techniques forFilamentous Fungi. pp. 96-121.CAB International Press, London. Pereira, J.F.; V.M. Queiroz; E.A. Gomes; J.I. Muro-Abad and E.F. Araújo(2002). Molecular characterization and evaluation of pectinase andcelulase production of Penicillium spp. Biotechnol. Lett., 24, 831-838. Peter, D.S. and J.K. Michael (1996). Characterization and differentiationof filamentous fungi based on fatty acid composition. Appl. Environ.Microbiol., 62: 4182-4191.
25
Pinto, P.M.; M.A. Resende; C.Y. Koga-Ito and M. Tendler (2004). Geneticvariability analysis among clinical Candida spp. isolates using randomamplified polymorphic DNA. Mem. Inst. Oswaldo Cruz. Mar.; 99(2):147-152. Ricardo, K.S.; O. Kaoru; B.G. Norma; N. Pragati; S.F. Peter; H.S. Niccio;F. Kazutaka; M. Makoto and M.C.T. Galba (2001). Biochemical markers intaxonomy of the genus Cunninghamella. Rev. Iberoam. Micol., 18: 123-127.Smedsgaard, J. and J.C. Frisvad (1997). Terverticillate penicilliastudied by direct electrospray mass spectrometric profiling of crudeextracts: I. Chemosystematics. Biochem. Sys. Ecol., 25: 51-64.Smedsgaard, J.; Nielsen K.F., Larsen T.O., Lund F., Thrane U. and FrisvadJ.C. (2004). Chemical identification of fungi - metabolite profiling andmetabolomics. In: (Arora, D.K., Ed.). Fungal Biotechnology inAgricultural, Food and Environmental Applications. pp. 19-35. MarcelDekker, New York, USA.Smith, D. and A.H.S. Onions (1983). The Preservation and Maintenance of Living Fungi. pp. 214-219. Kew., Commonwealth, Mycological Institute, Australia. Stahl, P.D. and M.J. Klug (1996). Characterization and differentiation offilamentous fungi based on fatty acid composition. Appl. Environ.Microbiol., 62:4136-4146.Stemmler, M.; H. Neubauer and H. Meyer (2001). Comparison of closelyrelated orthopoxvirus isolates by random amplified polymorphic DNA andrestriction fragment length polymorphism analysis. J. Vet. Med. B.Infect. Dis. Vet. Public Health, 48(9):647-654.Vasdinyei, R. and T. Deak (2003). Characterization of yeast isolatesoriginating from Hungarian dairy products using traditional and molecularidentification techniques. Int. J. Food Microbiol., 86(2):123-130.Vera, M. (2008). Genetic engineering of filamentous fungi: Progress,obstacles and future trends. Biotechnology Advances, 26 177–185. Veys, A.; W. Callewaert; E. Waelkens and K. van Den-Abeele, (1989).Application of gas-liquid chromatography to the routine identification ofnonfermenting gram-negative bacteria in clinical specimens. J. Clin.Microbiol., 27:1538-1542.Weising, K.; H. Nybom; K. Wolff and W. Meyer (1995). DNA Fingerprinting in Plants and Fungi. pp. 251-269. CRC Press, Inc. NewYork. Zeringue, H.J.; D. Bhatangar and E. Cleveland (1993). C15H24 volatilecompound unique to aflatoxigenic strains of Aspergillus flavus. Appl. Environ.Micribiol., 59: 2246-2270. Zhou, R. and J.F. Linz (1999). Enzymatic function of the Nor-1 protein inaflatoxin biosynthysis in Aspergillus parasiticus. Appl. Environ. Microbiol.,65(12): 5639-5641.
26
وع ن� ى ال�ت� ن� ي� ى و ال�ج� ض� ي�� ي$ن" الأ� لأت' ب�� Penicillium ع�ز�roqueforti
دة' د م�اج�� ف� ع�ب� ى ال�لطي� ج7 ار م�حمد 1ال�ملي� ت' ن" م�خ� �Cي مـان" 2م�حمد �Cي Hح�ـمـد ا 2ج�ـلـمـى ا�
سم1 اتP' - ق�' ب� ةP' ال�ت� ى-ك�لي� ول�وج� ن� 7Wب كرو ام�عة' ال�علوم وال�مب� ( - ج�� ات' ب� ه�ز )ب�� ر� ة'الأ� ي� �Wب . - م�د اه�زة' صر- ال�ق' ي��مى - ال�مرك�ز�2 لي� ق�' ات' الأ� �Wي طز ها و ل�لف� ات�' ق' ي� طي7 ام�عة' ي�' ه�ز - ج�� ر� ة'الأ� ي� �Wب . - م�د اه�زة' صر- ال�ق' ي��
م ا اه�ت' د� �PPPPPPPPPه yخث دراسPPPPPPPPPة' ال�ي� دى ي�� �PPPPPPPPPر اج yة' ع�شPPPPPPPPPل س م�ن" ع�ز� ن� ى Penicillium ج�� ن' �PPPPPPPPPي'مى وال ت� وع الى ب�� ��PPPPPPPPPن
P.roqueforti ى و ث' ال�ن' ف� لأل م�ن" ص�ي� ل ج�� جلب� واه�ا ت�' ات' م�ن" م�خن� ة' ال�مرك�ب� ي� ض� ي�� طاي��رة' الأ� ح�ماض�و ال�مت' ة' الأ� ي� ال�ده�ت�ل�ك�و د� �PPPوى ك �PPPى� ال�مخن �PPPض ي�� وى� الأ� �Cن ا� yPPPة' ال�ب اف� ��PPPالأض ل الى ي�� جلب� ات' ت�' '�PPPة' ال�علأق �PPPي yي$ن" ال�وراب� ة ب�� د� �PPPلأت' ه دام ال�عPPPز� ج� ت' �PPPاس ة' ي�� �PPPي ي� ق� ت�'
م خ� �PPض �ى ال�ت' وائ� yPPد ال�عش ة ع�دي�� وج� اع�ل ع�لى ال�معي'مد الأ� ق� لمPPرة' ت�' سلسل ال�ب� ك�((RAPD-PCR ال�مت' �PPل ق'ب�� وذ� ي� طPPب� ة' ب' ي' �PPواع س �CPPن ا�
ة' ي� ت$ اب�7 ات' م�ن" م�ب' اذي�� ة' ال�ب� ي� واب�� yع ع�ش �Cب ا ب' دام�هم ال�ت� ج� ج" لأس�ت' صمة' ك�ي�موذ� ع ي�� ص�ي� Hة' الأ ف�زف' ي$ن" ل�لي' لأت' ب�� و ، ال�دراسة' م�جل ال�عز�ك� �PPل ة' ذ� �PPدى ل�معزف �PPاذة' م ق� ي' �PPة م�ن" الأس د� �PPص ه صPPاي�� دلألأت' ال�خ� �PPة' ك ي� ف� ي� صPPت� ف� ي�' ��PPعزي ا ل�ي' د� �PPس ه ن� ة ع�لى ال�ج� ة و ال�عمPPوم وج� د� �PPه
ة ع�لى ال�سلألأت' صوض. وج� ال�خ�
د هرت' وق�' ة ال�دراسة' اظ�¾ اق' ان�� �Pق ات�' ع ي�� �Âب ر لأ� ة' ذلألأت' ا� ي� ف� ي� صPت� خثy م�جل ال�ت' د ال�ي� ف� ام�كن" ق�' ي� صPت� لأت' ك�ل ي�' ال�عPز�
اج ال�مدروسPPة' �PPج ي� وى ع�لى ب�� ك� و ال�سPPلألأت' م�سPPن' �PPل د ذ� ها ع�ب� ت' مت� ي� ة' ع�لى ب�' �PPي ت$ ة' ب�7 �PPي اب�� د� دة' ع�� �PPة' وهى م�وج �PPي ت$ لص ب�7 ج� رة' م�سPPت' مPPي� و ال�ح�
27

ما(YES) ال�سكرور� ي� وى ع�دا ق�� ة م�خن� لأت' ه�د� ات' م�ن" ال�عPPز� �Pة' ال�مرك�ب ي� �PPض ي�� طPPاي��رة' الأ� ى و ال�مت' ن' �Pخث' ال ج� ط ت�� ف' وى ع�لى ف�� م�سPن'
موع�ات' س ال�مح� وى ع�لى ول�ت� ل�ك� و ال�سلألأت' م�سن' زًا ذ� ط¾ لة' ي�� لأت' ع�دذ ل�ق' اجة' ال�عز� ا م�ن" ال�مب' وع.P ه�د� ال�ن�
ا د� �PPد ه ث' وق�' ف� yPPة ك�ش د� �PPة' هPPدرة' ع�ن" ال�دراس '�PPة' ق �PPي ي� ق� م ت�' خ� �PPض �ى ال�ت' وائ� yPPد ال�عش ة ع�دي�� وج� اع�ل ع�لى ال�معي'مد الأ� ق� لمPPرةP' ت�' ال�ب�سلسل م ع�لى (RAPD-PCR) ال�مت' ت� ي� 'PPق دى ت�' �PPوع م �PPن ى ال�ت� ن� �PPي ي$ن" ال�ج� ة ب�� د� �Pلأت' ه وى ع�لى ال�عPPز� ك� ال�سPPلألأت' م�سPPن' �PPل وذ�
لة' ب� �Pعة' ك�وس �Cت هلة' سPر �Pة' وس ��Pارن ال�طزق' م�ق' ��PPة' ي ��Pدن لب� ق' د ال�ي' زى. وق�' ��Pخ ل�ك� ام�كن" الأ� د� �Pك Pاط ب� ت� ب' �Pات' اس '�Pي$ن" ال�علأق ة ب�� د� �Pلأت' ه ال�عPPز�لأل م�ن" وم�ات' ج�� �PPPة' ال�زس �Âن ج�ز yPPPة' ال�ش �PPPطي طت� خ� ة' ال�ت' �PPPج ات�' ل ع�ن" ال�ب� جلب� وى ت�' �PPPدلألأت' م�خن �PPPة' ال ي� ف� ي� صPPPت� عPPPة' ال�ت' رت�� و ال�مدروسPPPة' الأ�
ى هرت' ال�ن' ظ�¾ ة' ا� عال�ي� ة ف�� ام ال�دلألأت' ه�د� ط¾ ى ك�ت� ف� ف� ي� صت� ى ي�' ف� �Cت عز ة ت�' . ل�هد� لأت' ال�عز�
م: جكت� ت�'.ذ/ م�حمد ح�مد ع�لى ا� ا�
لأل .ذ/ اج�� دال�لة ا� مى ع�ب� ي� ي� ع��
28