Embed Size (px)
Citation preview
This article was published in an Elsevier journal. The attached copyis furnished to the author for non-commercial research and
education use, including for instruction at the author’s institution,sharing with colleagues and providing to institution administration.
Other uses, including reproduction and distribution, or selling orlicensing copies, or posting to personal, institutional or third party
websites are prohibited.
In most cases authors are permitted to post their version of thearticle (e.g. in Word or Tex form) to their personal website orinstitutional repository. Authors requiring further information
regarding Elsevier’s archiving and manuscript policies areencouraged to visit:
http://www.elsevier.com/copyright
Author's personal copy
Ecophysiological characterization of Penicillium expansumpopulation in lleida (Spain)
Hector Morales a, Sonia Marín a, Laura Obea a, Belén Patiño b, Miriam Doménech b,Antonio J. Ramos a, Vicente Sanchis a,⁎
a Food Technology Dept., University of Lleida, CeRTA-UTPV, Rovira Roure 191, 25198, Lleida, Spainb Department of Microbiology III, Faculty of Biology, University Complutense of Madrid, José Antonio Novais, Madrid, Spain
Received 28 June 2007; received in revised form 3 December 2007; accepted 8 December 2007
Abstract
Penicillium expansum, a patulin producer fungus, is the most important fungus causing decay in cold stored both apples and pears. This canlead to patulin contaminated by-products. The aim of this assay was to evaluate the phenotypical and physiological variability in the population ofP. expansum that cause fruit spoilage in post-harvest stages in Lleida (Spain).
In total, 101 isolates of P. expansum from the 2004 and the 2005 seasons were obtained from decayed fruits. Significant differences were foundin the observations from both seasons. Variability of the isolates in each season seemed to be partially explained by differences in growth in media,patulin accumulation and resistance to fungicides. Patulin production was detected in almost 100% of the isolates.
Variability existing in P. expansum population could not be totally explained, but the above mentioned variables explained up to 74% of thediversity in some cases. The results obtained point to the existence of different populations of P. expansum in each season and may explain thedifferences in fungicide resistance observed between both seasons. The capacity to colonize apple flesh and some variables involved in fruitcolonization were not a source of variation neither in each season nor when both seasons were compared. As storage rooms are cleaned anddisinfected each season, this suggests that each season, the populations in storage rooms develop only from strains capable to colonize apple flesh.This may lead to rapid sporulation and spreading of spores.© 2007 Elsevier B.V. All rights reserved.
Keywords: Penicillium expansum; Ecophysiology; Characterization; Patulin; Resistance to fungicides; Multivariate analysis
1. Introduction
After the Republic of China, the EuropeanUnion is the 2ndmostimportant apple producer worldwide followed by the USA. A highpercentage of apples are processed into juice or other apple by-products. For example, 40% of apples produced in the United Statesare used for juice production andother by-products (USFDA, 2003).Most of the process-grade apples come from cold storage rooms,which furnish food-processing industry during the whole year.
Processed apple products often utilize lower quality fruit that isunsuitable for direct market retail. P. expansum is the most com-mon cause of apple decay in the apple industry (Rosenberger, 2003)
Other studies (Amiri and Bompeix, 2005) evaluated the presenceof Penicillium spp. in storage rooms in France and reported thatup to 62% of the isolates were P. expansum. Almost 100% ofP. expansum strains are patulin producers (Andersen et al., 2004).
Patulin, 4-hydroxy-4H-furo[3,2c]pirano-2(6H)-one, is one ofthe most characterized toxins of foodstuffs proceeding from theagriculture. Patulin can cause acute and chronic effects if ingested(McKinley et al., 1982). Other studies have demonstrated thatpatulin can induce oxidative damage in human cells, resulting inmutagenesis which can lead to cancer (Pfeiffer et al., 1998). TheEuropean Union (Official Journal of the European Communities,2006) has laid down maximum patulin levels of 50 μg kg−1 forapple juices, 25 μg kg−1 for solid apple products and 10 μg kg−1
for baby foods.A study carried out in Portugal (Martins et al., 2002) dem-
onstrated that 69% of cold stored apples that presented a small
Available online at www.sciencedirect.com
International Journal of Food Microbiology 122 (2008) 243–252www.elsevier.com/locate/ijfoodmicro
⁎ Corresponding author. Tel.: +34 973 702535.E-mail address: [email protected] (V. Sanchis).
0168-1605/$ - see front matter © 2007 Elsevier B.V. All rights reserved.doi:10.1016/j.ijfoodmicro.2007.12.014
Author's personal copy
lesion were patulin contaminated. Studies carried out in Lleida(Spain) (Viñas et al., 1993) reported that at least 50% of applesproceeding from packinghouses with evident symptoms ofblue rot were contaminated with patulin. Although cold storageseems to decelerate patulin accumulation, subsequent deck stor-age before processing (a common procedure in fruit processingindustries) may lead to strong patulin accumulation in infectedfruits (Morales et al., 2007b,c).
There is some information about P. expansum populations'genotypic and phenotypic diversity. However, it seems thatvariability is not very wide regarding e. g. patulin production,aggressiveness or other variables (Andersen and Frisvad, 2002;Pianzzola et al., 2004; Amiri and Bompeix, 2005). Nevertheless,the out-coming of fungicide resistant populations (Baraldi et al.,2003) may mean that differences in some isolates do exist.
The aim of this study was to characterize from the eco-physiological point of view the population of P. expansum fromtwo fruit processing industries during two seasons. The hetero-geneity of the population and some variables expected to beuseful to show this heterogeneity were evaluated. The incidenceof patulin producer isolates was also assessed.
2. Materials and methods
2.1. Isolates acquisition and identification
The isolates were obtained from both apples and pears withevident development of blue rot from two of the main fruitprocessing industries in the region of Lleida. The fruits werepicked up all along the 2004 and 2005 seasons. The fruits hadbeen harvested in different orchards in the region. Before coldstorage, the fruits were fungicide treated with the usual chem-icals and doses used in the region. After cold storage, the fruitsremained in deck (ambient) storage. At this moment the wholefruits were picked up. Both the date of sampling and the originof the sample (the zone into the region of Lleida) were recorded.The factors species (pear/apple) and variety from which theisolates were obtained were recorded as well.
With the aid of a loop, spores were collected and inoculated ina Petri dish with potato dextrose agar (PDA) and incubated at25 °C until mould development. Those isolates whose macro-scopic appearance was coincident to that of P. expansum werere-inoculated as many times as necessary, in order to obtaina pure culture. Then, a monosporic culture of the isolate wasobtained. Each isolate was verified to belong to P. expansumspecies, according to Pitt and Hocking (1997) identification key.In total, 101 isolates were obtained, 59 from the 2004 season and42 from the 2005 season. They were stored in plugs of PDAsubmerged in distilled water at 4 °C. When an isolate wasrequired for an assay, one plug was placed on PDA in a Petri dishand incubated at 25 °C until sporulation occurred.
2.2. Molecular identification of Penicillium expansum
In order to confirm the accuracy of morphological identifica-tion, those isolates classified as P. expansum were subjected tomolecular analysis with specific primers for this species.
Genomic DNA of the isolates was obtained using eitherthe genomic DNA Extraction Kit (Genomix, Talent, Trieste,Italy), according to the manufacturer's instructions, or follow-ing the methodology previously described by Querol et al.(1992).
Genomic DNA from the isolates was used for PCR ampli-fication using primers based on the polygalacturonase gene ofP. expansum (PEF and PER) (Marek et al., 2003). The genomicDNA from all the strains was tested for PCR amplification usingprimers ITS1 and using the same master mix used for specificPCR amplification except primers (Henry et al., 2000).
All amplification reactions were carried out in volumes of25 μL containing 3 μL (10 pg–10 ng) of template DNA, 1.50 μLof each primer (20 μM), 2.5 μL of 10×PCR buffer, 1 μL ofMgCl2 (50 mM), 0.25 μL of dNTPs (100 mM) and 0.2 μL ofTaq DNA polymerase (5 U/μL) supplied by the manufacturer(Ecogen, Barcelona, Spain). PCR products were detected in2% agarose ethidium bromide gels in TAE 1× buffer (Tris–acetate 40 mM and EDTA 1.0 mM). The DNA ladder “Realescala no 2” (Durviz, Valencia, Spain) was used as molecularsize marker.
2.3. Growth in different media and acidification capacity
To assess the growth rate in different media, spores of eachisolate were inoculated in Petri dishes with the aid of a loop inthree equidistant points. The media used were potato dextroseagar (PDA), malt extract agar (MEA), Czapek yeast extract agar(CYA), glycerol nitrate agar (G25N), creatine sucrose neutralagar (CSN) and semi-synthetic (SP) medium. The isolates wereincubated for 5 days at 25 °C. Then, two perpendicular diam-eters of each colony were measured and recorded.
The acidification capacity was visually assessed by observa-tion of the yellow area surrounding each colony that resultedfrom acidification of CSN medium. Depending on the size ofthe yellow area, a score from 0 (no acidification) to 3 (strongacidification) was assigned to each isolate and recorded.
The SPmediumwas obtained by adding 6 volumes of distilledwater to one volume of apple juice concentrate [sugar concentra-tion 71 g (100 g)−1]. Agar was added for a final concentration of15 g l−1. The pHwas adjusted to 4.2 with NaOH 0.1 mol l−1 withthe aid of a pHmeter. Sterilization was carried out at 121 °C for15 min.
2.4. Sensitivity to fungicides
Imazalil (an inhibitor of ergosterol synthesis) and thiaben-dazole (whose mechanism is based on its antimicrotubuleeffect) were used in this assay. PDA medium amended witheither imazalil or thiabendazol (1 mg kg−1 or 100 mg kg−1 ofactive ingredient respectively) was used for this assay. Theseamounts of fungicide were chosen according to the doses gen-erally used in the packinghouses in the region. Spores of eachisolate were inoculated in Petri dishes with PDA amended withfungicide with the aid of a loop in three equidistant points. Theisolates were incubated for 5 days at 25 °C and colony diametersrecorded and compared to control (PDA medium).
244 H. Morales et al. / International Journal of Food Microbiology 122 (2008) 243–252
Author's personal copy
2.5. Aggressiveness and patulin production in apple and in SPmedium
Aggressiveness and patulin accumulation were tested inGolden apples. A conidial suspension of each P. expansumisolate was prepared in Tween 80 (0.005% (v/v)) in sterile waterand adjusted to 106 conidia ml−1. Apples were surfacedisinfected in a 2% solution of sodium hypochlorite for 1 minand rinsed with distilled water. Then they were wounded with aneedle to make 2 wounds of 2×2 mm at the same side of theapple. One wound was made close to the calyx and the otherwas made close to the stem. Both wounds were inoculated with20 μl of the conidial suspension. Thus, each apple was in-oculated twice with same isolate. Apples were then stored at20 °C and 85–90% of relative humidity for 7 days. The rotscaused by the fungal development where then measured. Twoperpendicular diameters from each of the two lesions wererecorded. The necrosed tissue from the lesion closer to the stemwas removed for patulin analysis. For this purpose, a cylindricalcork borer was used with a diameter at least 1 cm bigger than theactual lesion diameter.
Distilled water was added to the decayed apple samples in a1:1 w/w relationship and pulped. The purée obtained wasenzymatically treated (at 40 °C for 1 h) with pectinase toremove the pectin and centrifuged at 6000 rpm for 5 min. Fivemilliliters of supernatant was taken to analyze patulin. TheAOAC method 995.10 (Brause et al., 1996) was used. Patulinwas extracted with ethyl acetate and then cleaned up byextraction with sodium carbonate solution. Extracts were driedwith anhydrous sodium sulphate. After evaporation of ethylacetate, patulin was resuspended in water adjusted to pH 4 withglacial acetic acid and determined by reversed-phase LC withUV detection. A solution of water and tetrahydrofuran (100+0.8) was used as the mobile phase. Patulin was detected underUV at 276 nm wavelength. Patulin was expressed in concen-tration of patulin in the supernatant (μg ml−1). The recoveryrates obtained by spiking apple pieces with 10, 40, and 100 ngpatulin g−1 in duplicate were 96.2, 88.5 and 69.1%, respec-tively. With regard to repeatability, the Sr of five determina-tions (25 ng g−1) was 0.005. Finally, the limit of detection of theanalysis was 5 ng g−1.
Patulin accumulation in SP medium was also assessed. TheSP medium above mentioned was used for this assay. Patulinaccumulated at a) 25 °C and b) 10 °C was assessed.
a) For patulin accumulation at 25 °C, each isolate was inoc-ulated in 3 equidistant points in a Petri dish with the SPmedium and incubated at 25 °C for 5 days. Colonies werethen measured and the data recorded.
b) For the patulin accumulation at 10 °C assay, the Petri disheswere incubated for 14 days, so that average colony diameterwas approximately the same as that reached at 25 °C.
After incubation, three plugs of agar with a diameter of0.5 cm were removed from each Petri dish. The three plugs wereremoved from the centre, middle and edge of one colonyrespectively. The weight of the three plugs of agar was recorded.
Then, they were put in a vial with 1 ml of ethyl acetate andvortexed. After 1 h at room temperature, the vials were vortexedagain and the ethyl acetate removed with the aid of a syringe.The syringe was then suited with a 0.45 μm nylon filter and theethyl acetate filtered and then evaporated. Subsequent steps arethe same as those for patulin accumulation in apple analysis. Inthis case, patulin was expressed in μg patulin (g agar)−1.
2.6. Statistical analysis
The influence of the factors season, date of sampling, ori-gin of sample, species and variety on the variables obtained(i.e. growth in different media, sensitivity to fungicides, acidi-fication capacity, aggressiveness and patulin production) wasassayed.
In order to asses the source of variability among the isolates,a multivariate statistical analysis was carried out. The abovementioned variables were assumed to be random values drawnfrom a normally distributed population in both seasons. Thevariances of the two groups were assumed to be equal as well. Apooled T-test was carried out (α=0.05) for each variable inorder to test the hypothesis that the population means didnot differ. The assumption of equality of variances was testedwith the folded form of the F statistic (F′). When this as-sumption resulted not to be reasonable for a given variable, theneither the Satterthwaite or the Cochran test was used. SASversion 8.2 (SAS Institute Inc., Cary, NC, USA) was used forthis analysis.
An overview of data was done by Principal ComponentsAnalysis (PCA). This method, allows for the variables that giveredundant information to be grouped in a Principal Component(latent variable). Each PC is a linear combination of the initialvariables and explains as much variability as possible. Then, ann-dimensional space (being n the number of initial variablesstudied) can be reduced to a 2- or 3-dimensional space. A pro-jection of the objects (in this case the isolates) can be done. Theplot of this projection is called scores plot. The initial variablescan also be projected in a 2 or 3 dimensional plot (loadings plot) soas both the weight of the variables in each PC and the grouping ofcorrelated variables can be observed. In order to know how manyPCs should be considered, a scree test was carried out. TheUnscramber version 7.6 (CAMOASA, Oslo, Norway) was usedfor this analysis.
A Cluster Analysis (CA) was performed so that clustersgrouping the isolates could be found. CA reaches the maximumhomogeneity into clusters and the maximum difference amongisolates from different clusters. The number of clusters waschosen according to pseudo-statistic F, pseudo-statistic T-squareand Cubic Clustering Criterion (CCC). The SAS software abovementioned was used for this analysis.
3. Results
Most of the isolates verified to belong to P. expansumspecies according to Pitt and Hocking (1997) identification keywere confirmed positively in the molecular analysis withspecific primers. Only these isolates were used for the assays.
245H. Morales et al. / International Journal of Food Microbiology 122 (2008) 243–252
Author's personal copy
When the variables growth in different media, resistance tofungicides, acidification, aggressiveness and patulin productionwere assayed, the T-tests showed that means significantly dif-fered when factor season was tested. On the other side, factorsdate of sampling, origin of samples, species and variety did notpresent significant differences. Thus from now on, the resultsobtained each season were assumed to belong to two samplesets from two different populations (each one belonging to oneseason) and hence, their data were processed and studied sepa-rately and compared.
3.1. Growth in different media
Average growth rate in MEA CYA and CSN media washigher in the 2004 season than in the 2005 season. Isolates from2004 season showed little tolerance to low aw in terms of growthin G25N medium compared to the 2005 season. Althoughaverage growth in PDA medium showed higher growth rate in
the 2005 season, the previously performed T-test showed thatpopulation means were equal.
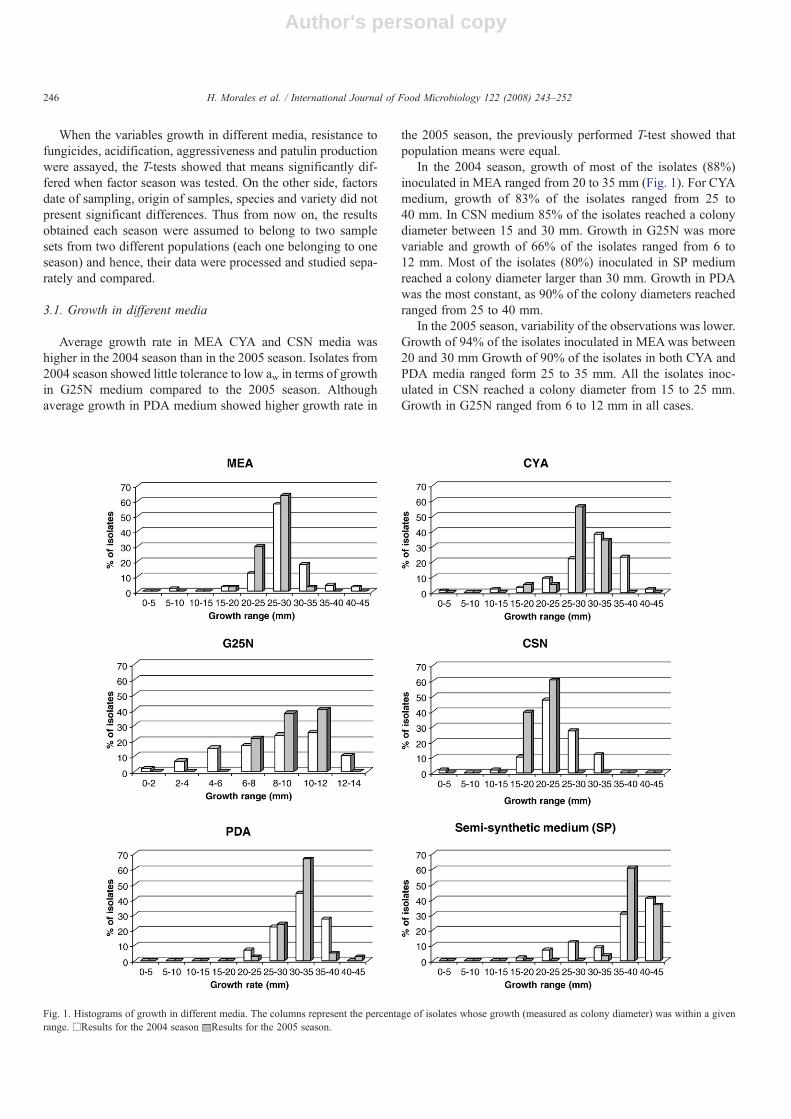
In the 2004 season, growth of most of the isolates (88%)inoculated in MEA ranged from 20 to 35 mm (Fig. 1). For CYAmedium, growth of 83% of the isolates ranged from 25 to40 mm. In CSN medium 85% of the isolates reached a colonydiameter between 15 and 30 mm. Growth in G25N was morevariable and growth of 66% of the isolates ranged from 6 to12 mm. Most of the isolates (80%) inoculated in SP mediumreached a colony diameter larger than 30 mm. Growth in PDAwas the most constant, as 90% of the colony diameters reachedranged from 25 to 40 mm.
In the 2005 season, variability of the observations was lower.Growth of 94% of the isolates inoculated in MEAwas between20 and 30 mm Growth of 90% of the isolates in both CYA andPDA media ranged form 25 to 35 mm. All the isolates inoc-ulated in CSN reached a colony diameter from 15 to 25 mm.Growth in G25N ranged from 6 to 12 mm in all cases.
Fig. 1. Histograms of growth in different media. The columns represent the percentage of isolates whose growth (measured as colony diameter) was within a givenrange. □Results for the 2004 season Results for the 2005 season.
246 H. Morales et al. / International Journal of Food Microbiology 122 (2008) 243–252
Author's personal copy
3.2. Resistance to fungicides
The T-test showed that growth in presence of fungicidesdiffered in both seasons as well. Generally, more resistance toboth fungicides was found in the isolates from the 2004 season.
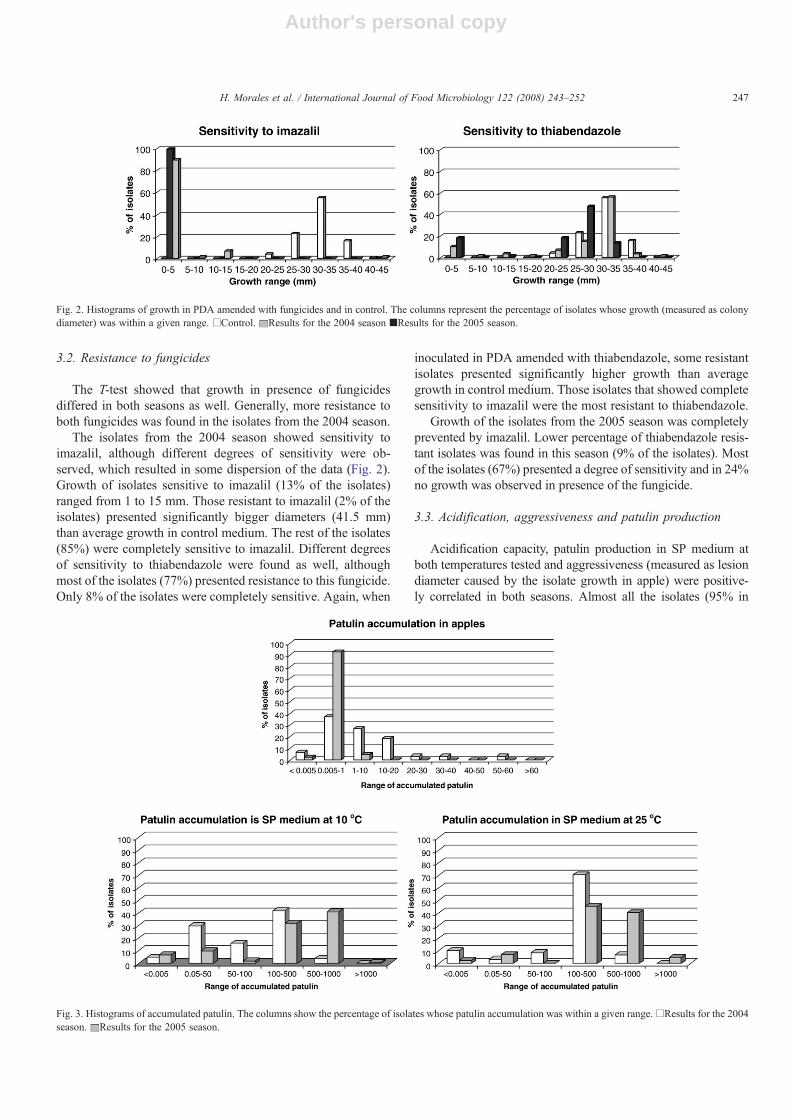
The isolates from the 2004 season showed sensitivity toimazalil, although different degrees of sensitivity were ob-served, which resulted in some dispersion of the data (Fig. 2).Growth of isolates sensitive to imazalil (13% of the isolates)ranged from 1 to 15 mm. Those resistant to imazalil (2% of theisolates) presented significantly bigger diameters (41.5 mm)than average growth in control medium. The rest of the isolates(85%) were completely sensitive to imazalil. Different degreesof sensitivity to thiabendazole were found as well, althoughmost of the isolates (77%) presented resistance to this fungicide.Only 8% of the isolates were completely sensitive. Again, when
inoculated in PDA amended with thiabendazole, some resistantisolates presented significantly higher growth than averagegrowth in control medium. Those isolates that showed completesensitivity to imazalil were the most resistant to thiabendazole.
Growth of the isolates from the 2005 season was completelyprevented by imazalil. Lower percentage of thiabendazole resis-tant isolates was found in this season (9% of the isolates). Mostof the isolates (67%) presented a degree of sensitivity and in 24%no growth was observed in presence of the fungicide.
3.3. Acidification, aggressiveness and patulin production
Acidification capacity, patulin production in SP medium atboth temperatures tested and aggressiveness (measured as lesiondiameter caused by the isolate growth in apple) were positive-ly correlated in both seasons. Almost all the isolates (95% in
Fig. 2. Histograms of growth in PDA amended with fungicides and in control. The columns represent the percentage of isolates whose growth (measured as colonydiameter) was within a given range. □Control. Results for the 2004 season ■Results for the 2005 season.
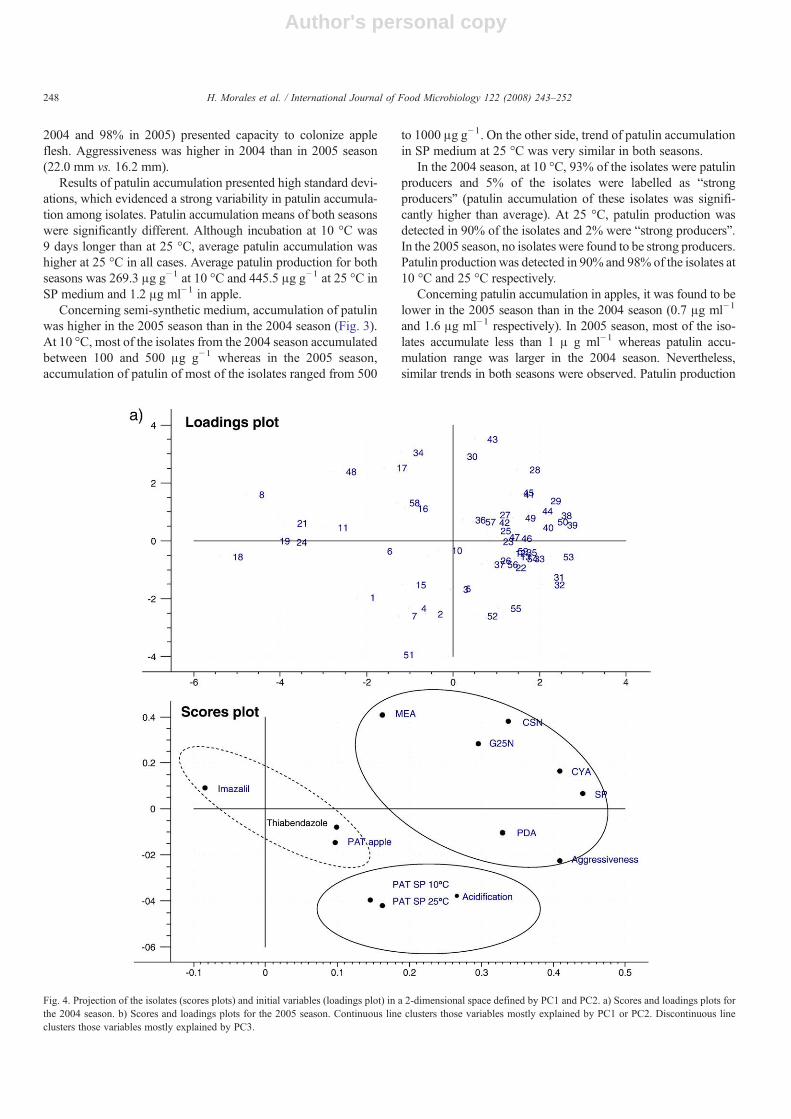
Fig. 3. Histograms of accumulated patulin. The columns show the percentage of isolates whose patulin accumulation was within a given range.□Results for the 2004season. Results for the 2005 season.
247H. Morales et al. / International Journal of Food Microbiology 122 (2008) 243–252
Author's personal copy
2004 and 98% in 2005) presented capacity to colonize appleflesh. Aggressiveness was higher in 2004 than in 2005 season(22.0 mm vs. 16.2 mm).
Results of patulin accumulation presented high standard devi-ations, which evidenced a strong variability in patulin accumula-tion among isolates. Patulin accumulation means of both seasonswere significantly different. Although incubation at 10 °C was9 days longer than at 25 °C, average patulin accumulation washigher at 25 °C in all cases. Average patulin production for bothseasons was 269.3 μg g−1 at 10 °C and 445.5 μg g−1 at 25 °C inSP medium and 1.2 μg ml−1 in apple.
Concerning semi-synthetic medium, accumulation of patulinwas higher in the 2005 season than in the 2004 season (Fig. 3).At 10 °C, most of the isolates from the 2004 season accumulatedbetween 100 and 500 μg g−1 whereas in the 2005 season,accumulation of patulin of most of the isolates ranged from 500
to 1000 μg g−1. On the other side, trend of patulin accumulationin SP medium at 25 °C was very similar in both seasons.
In the 2004 season, at 10 °C, 93% of the isolates were patulinproducers and 5% of the isolates were labelled as “strongproducers” (patulin accumulation of these isolates was signifi-cantly higher than average). At 25 °C, patulin production wasdetected in 90% of the isolates and 2% were “strong producers”.In the 2005 season, no isolates were found to be strong producers.Patulin production was detected in 90% and 98% of the isolates at10 °C and 25 °C respectively.
Concerning patulin accumulation in apples, it was found to belower in the 2005 season than in the 2004 season (0.7 μg ml−1
and 1.6 μg ml−1 respectively). In 2005 season, most of the iso-lates accumulate less than 1 μ g ml−1 whereas patulin accu-mulation range was larger in the 2004 season. Nevertheless,similar trends in both seasons were observed. Patulin production
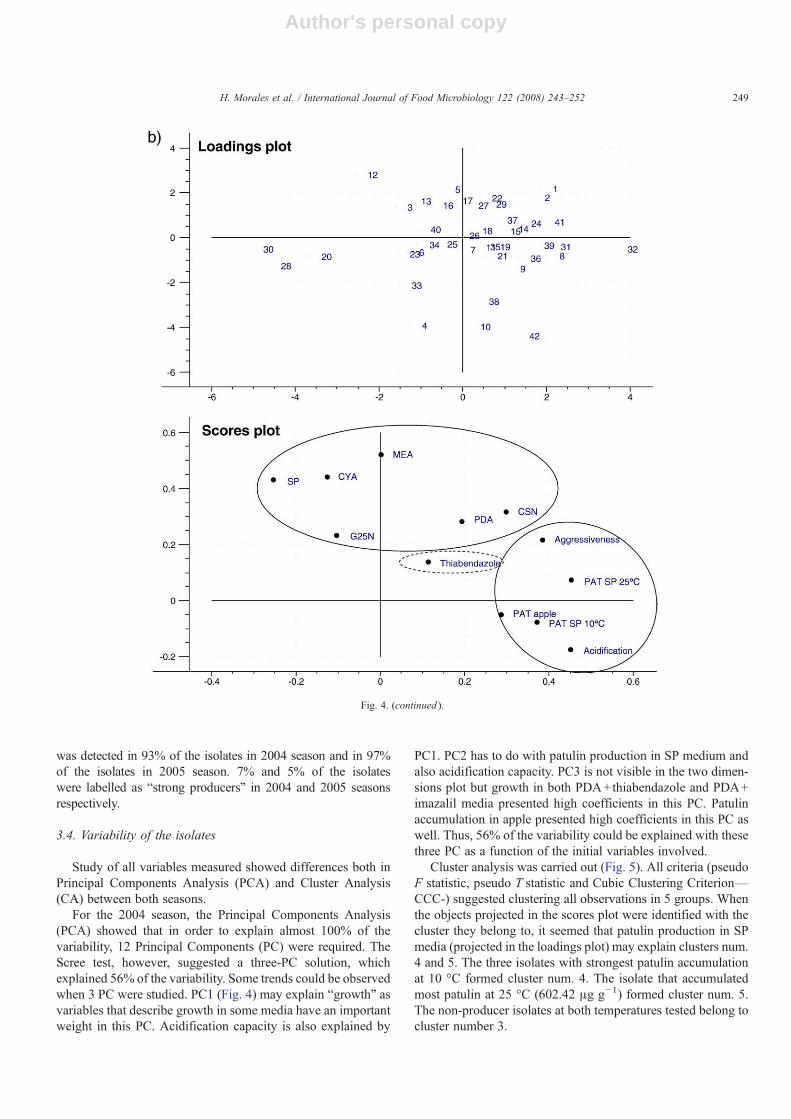
Fig. 4. Projection of the isolates (scores plots) and initial variables (loadings plot) in a 2-dimensional space defined by PC1 and PC2. a) Scores and loadings plots forthe 2004 season. b) Scores and loadings plots for the 2005 season. Continuous line clusters those variables mostly explained by PC1 or PC2. Discontinuous lineclusters those variables mostly explained by PC3.
248 H. Morales et al. / International Journal of Food Microbiology 122 (2008) 243–252
Author's personal copy
was detected in 93% of the isolates in 2004 season and in 97%of the isolates in 2005 season. 7% and 5% of the isolateswere labelled as “strong producers” in 2004 and 2005 seasonsrespectively.
3.4. Variability of the isolates
Study of all variables measured showed differences both inPrincipal Components Analysis (PCA) and Cluster Analysis(CA) between both seasons.
For the 2004 season, the Principal Components Analysis(PCA) showed that in order to explain almost 100% of thevariability, 12 Principal Components (PC) were required. TheScree test, however, suggested a three-PC solution, whichexplained 56% of the variability. Some trends could be observedwhen 3 PC were studied. PC1 (Fig. 4) may explain “growth” asvariables that describe growth in some media have an importantweight in this PC. Acidification capacity is also explained by
PC1. PC2 has to do with patulin production in SP medium andalso acidification capacity. PC3 is not visible in the two dimen-sions plot but growth in both PDA+thiabendazole and PDA+imazalil media presented high coefficients in this PC. Patulinaccumulation in apple presented high coefficients in this PC aswell. Thus, 56% of the variability could be explained with thesethree PC as a function of the initial variables involved.
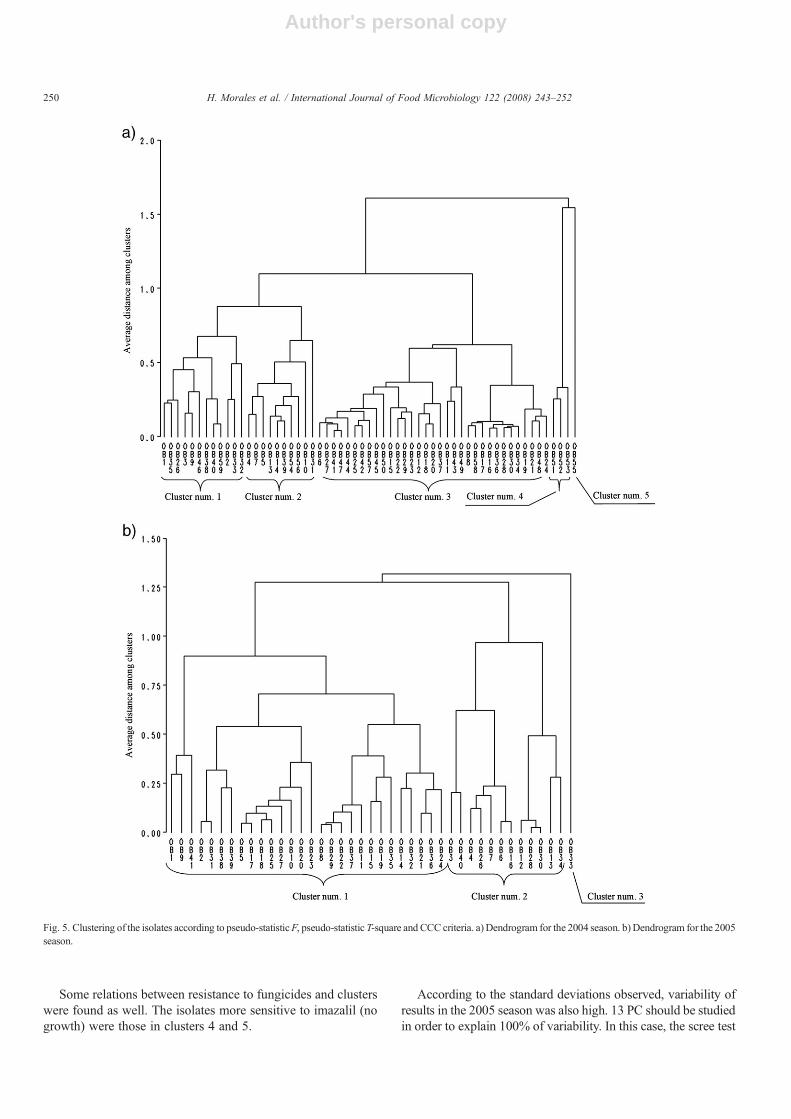
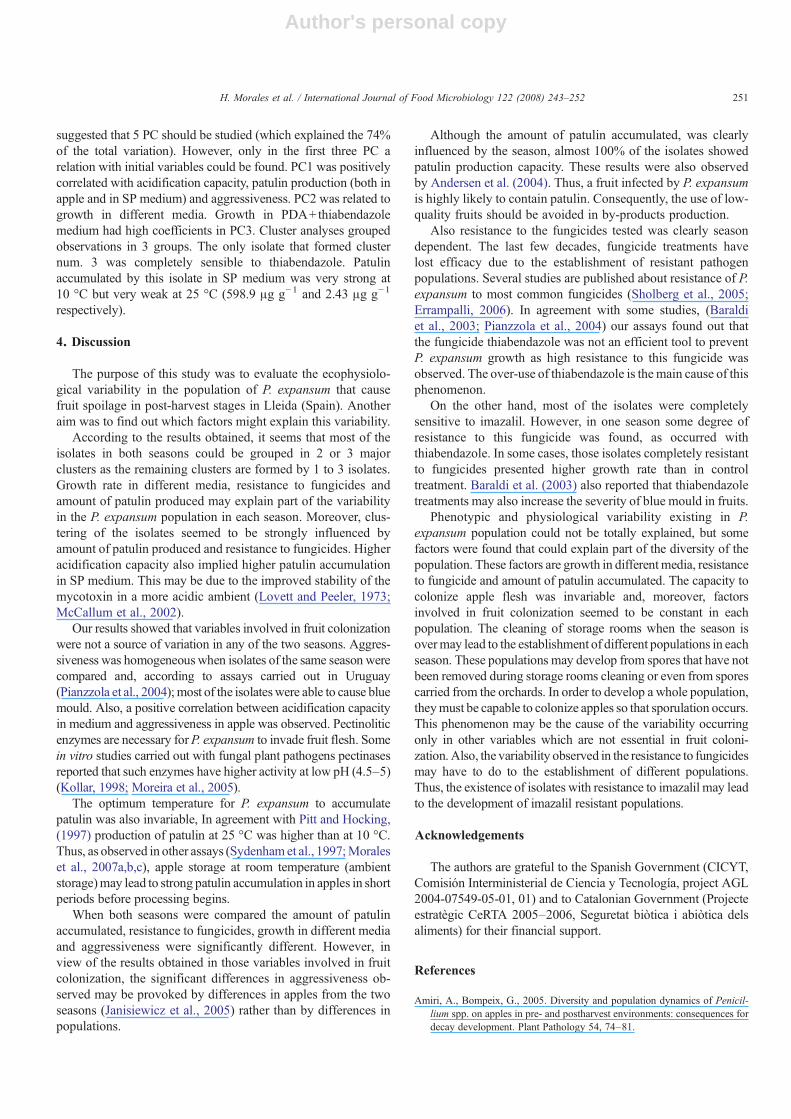
Cluster analysis was carried out (Fig. 5). All criteria (pseudoF statistic, pseudo T statistic and Cubic Clustering Criterion—CCC-) suggested clustering all observations in 5 groups. Whenthe objects projected in the scores plot were identified with thecluster they belong to, it seemed that patulin production in SPmedia (projected in the loadings plot) may explain clusters num.4 and 5. The three isolates with strongest patulin accumulationat 10 °C formed cluster num. 4. The isolate that accumulatedmost patulin at 25 °C (602.42 μg g−1) formed cluster num. 5.The non-producer isolates at both temperatures tested belong tocluster number 3.
Fig. 4. (continued ).
249H. Morales et al. / International Journal of Food Microbiology 122 (2008) 243–252
Author's personal copy
Some relations between resistance to fungicides and clusterswere found as well. The isolates more sensitive to imazalil (nogrowth) were those in clusters 4 and 5.
According to the standard deviations observed, variability ofresults in the 2005 season was also high. 13 PC should be studiedin order to explain 100% of variability. In this case, the scree test
Fig. 5. Clustering of the isolates according to pseudo-statisticF, pseudo-statistic T-square and CCC criteria. a) Dendrogram for the 2004 season. b) Dendrogram for the 2005season.
250 H. Morales et al. / International Journal of Food Microbiology 122 (2008) 243–252
Author's personal copy
suggested that 5 PC should be studied (which explained the 74%of the total variation). However, only in the first three PC arelation with initial variables could be found. PC1 was positivelycorrelated with acidification capacity, patulin production (both inapple and in SP medium) and aggressiveness. PC2 was related togrowth in different media. Growth in PDA+thiabendazolemedium had high coefficients in PC3. Cluster analyses groupedobservations in 3 groups. The only isolate that formed clusternum. 3 was completely sensible to thiabendazole. Patulinaccumulated by this isolate in SP medium was very strong at10 °C but very weak at 25 °C (598.9 μg g−1 and 2.43 μg g−1
respectively).
4. Discussion
The purpose of this study was to evaluate the ecophysiolo-gical variability in the population of P. expansum that causefruit spoilage in post-harvest stages in Lleida (Spain). Anotheraim was to find out which factors might explain this variability.
According to the results obtained, it seems that most of theisolates in both seasons could be grouped in 2 or 3 majorclusters as the remaining clusters are formed by 1 to 3 isolates.Growth rate in different media, resistance to fungicides andamount of patulin produced may explain part of the variabilityin the P. expansum population in each season. Moreover, clus-tering of the isolates seemed to be strongly influenced byamount of patulin produced and resistance to fungicides. Higheracidification capacity also implied higher patulin accumulationin SP medium. This may be due to the improved stability of themycotoxin in a more acidic ambient (Lovett and Peeler, 1973;McCallum et al., 2002).
Our results showed that variables involved in fruit colonizationwere not a source of variation in any of the two seasons. Aggres-siveness was homogeneouswhen isolates of the same season werecompared and, according to assays carried out in Uruguay(Pianzzola et al., 2004); most of the isolateswere able to cause bluemould. Also, a positive correlation between acidification capacityin medium and aggressiveness in apple was observed. Pectinoliticenzymes are necessary forP. expansum to invade fruit flesh. Somein vitro studies carried out with fungal plant pathogens pectinasesreported that such enzymes have higher activity at low pH (4.5–5)(Kollar, 1998; Moreira et al., 2005).
The optimum temperature for P. expansum to accumulatepatulin was also invariable, In agreement with Pitt and Hocking,(1997) production of patulin at 25 °C was higher than at 10 °C.Thus, as observed in other assays (Sydenham et al., 1997;Moraleset al., 2007a,b,c), apple storage at room temperature (ambientstorage)may lead to strong patulin accumulation in apples in shortperiods before processing begins.
When both seasons were compared the amount of patulinaccumulated, resistance to fungicides, growth in different mediaand aggressiveness were significantly different. However, inview of the results obtained in those variables involved in fruitcolonization, the significant differences in aggressiveness ob-served may be provoked by differences in apples from the twoseasons (Janisiewicz et al., 2005) rather than by differences inpopulations.
Although the amount of patulin accumulated, was clearlyinfluenced by the season, almost 100% of the isolates showedpatulin production capacity. These results were also observedby Andersen et al. (2004). Thus, a fruit infected by P. expansumis highly likely to contain patulin. Consequently, the use of low-quality fruits should be avoided in by-products production.
Also resistance to the fungicides tested was clearly seasondependent. The last few decades, fungicide treatments havelost efficacy due to the establishment of resistant pathogenpopulations. Several studies are published about resistance of P.expansum to most common fungicides (Sholberg et al., 2005;Errampalli, 2006). In agreement with some studies, (Baraldiet al., 2003; Pianzzola et al., 2004) our assays found out thatthe fungicide thiabendazole was not an efficient tool to preventP. expansum growth as high resistance to this fungicide wasobserved. The over-use of thiabendazole is the main cause of thisphenomenon.
On the other hand, most of the isolates were completelysensitive to imazalil. However, in one season some degree ofresistance to this fungicide was found, as occurred withthiabendazole. In some cases, those isolates completely resistantto fungicides presented higher growth rate than in controltreatment. Baraldi et al. (2003) also reported that thiabendazoletreatments may also increase the severity of blue mould in fruits.
Phenotypic and physiological variability existing in P.expansum population could not be totally explained, but somefactors were found that could explain part of the diversity of thepopulation. These factors are growth in differentmedia, resistanceto fungicide and amount of patulin accumulated. The capacity tocolonize apple flesh was invariable and, moreover, factorsinvolved in fruit colonization seemed to be constant in eachpopulation. The cleaning of storage rooms when the season isovermay lead to the establishment of different populations in eachseason. These populations may develop from spores that have notbeen removed during storage rooms cleaning or even from sporescarried from the orchards. In order to develop a whole population,theymust be capable to colonize apples so that sporulation occurs.This phenomenon may be the cause of the variability occurringonly in other variables which are not essential in fruit coloni-zation.Also, the variability observed in the resistance to fungicidesmay have to do to the establishment of different populations.Thus, the existence of isolates with resistance to imazalil may leadto the development of imazalil resistant populations.
Acknowledgements
The authors are grateful to the Spanish Government (CICYT,Comisión Interministerial de Ciencia y Tecnología, project AGL2004-07549-05-01, 01) and to Catalonian Government (Projecteestratègic CeRTA 2005–2006, Seguretat biòtica i abiòtica delsaliments) for their financial support.
References
Amiri, A., Bompeix, G., 2005. Diversity and population dynamics of Penicil-lium spp. on apples in pre- and postharvest environments: consequences fordecay development. Plant Pathology 54, 74–81.
251H. Morales et al. / International Journal of Food Microbiology 122 (2008) 243–252
Author's personal copy
Andersen, B., Frisvad, J.C., 2002. Characterization of Alternaria and Penicil-lium species from similar substrata based on growth at different temperature,pH and water activity. Systematic and Applied Microbiology 25, 162–172.
Andersen, B., Smedsgaard, J., Frisvad, J.C., 2004. Penicillium expansum: con-sistent production of patulin, chaetoglobosin, and other secondary me-tabolites in culture and their natural occurrence in fruit products. Journal ofAgricultural and Food Chemistry 52, 2421–2428.
Baraldi, E., Mari, M., Chierici, E., Pondrelli, M., Bertolini, P., Pratella, G.C.,2003. Studies on thiabendazole resistance of Penicillium expansum of pears:pathogenic fitness and genetic characterization. Plant Pathology 52,362–370.
Brause, A.R., Trucksess, M.W., Thomas, F.S., Page, S.W., 1996. Determinationof patulin in apple juice by liquid chromatography: collaborative study.Journal of the AOAC International 79, 451–455.
Errampalli, D., 2006. Postharvest control of blue mold of apples with reduced-risk fungicides together with anti-scald agent diphenylamine under cold andcontrolled atmosphere storage conditions. Journal of Food, Agriculture andEnvironment 4, 43–47.
Henry, T., Iwen, P.C., Hinrichs, S.H., 2000. Identification of Aspergillus spe-cies using internal transcribed spacer regions 1 and 2. Journal of ClinicalMicrobiology 38, 1510–1515.
Janisiewicz, W.J., Peterson, D.L., Yoder, K.S., Miller, S.S., 2005. Experimentalbin drenching system for testing biocontrol agents to control postharvestdecay of apples. Plant Disease 89, 487–490.
Kollar, A., 1998. Characterization of an endopolygalacturonase produced bythe apple scab fungus, Venturia inaequalis. Mycological Research 102,313–319.
Lovett, J., Peeler, J.T., 1973. Effect of pH on the thermal destruction kinetics ofpatulin in aqueous solution. Journal of Food Science 38, 1254–1255.
Marek, P., Annamalai, T., Venkitanarayanan, K., 2003. Detection of Penicilliumexpansum by polymerase chain reaction. International Journal of FoodMicrobiology 89, 139–144.
Martins, M.L., Gimeno, A., Martins, H.M., Bernardo, F., 2002. Co-occurrenceof patulin and citrinin in Portuguese apples with rotten spots. Food Additivesand Contaminants 19, 568–574.
McCallum, J.L., Tsao, R., Zhou, T., 2002. Factors affecting patulin productionby Penicillium expansum. Journal of Food Protection 65, 1937–1942.
McKinley, E.R., Carlton, W.W., Boon, G.D., 1982. Patulin mycotoxicosis in therat: toxicology, pathology and clinical pathology. Food and ChemicalToxicology 20, 289–300.
Morales, H., Marín, S., Centelles, X., Ramos, A.J., Sanchis, V., 2007a. Cold andambient deck storage prior to processing as a critical control point for patulinaccumulation. International Journal of Food Microbiology 116, 260–265.
Morales, H., Marín, S., Rovira, A., Ramos, A.J., Sanchis, V., 2007b. Patulinaccumulation in apples by Penicillium expansum during postharvest stages.Letters in Applied Microbiology 44, 30–35.
Morales, H., Sanchis, V., Rovira, A., Ramos, A.J., Marín, S., 2007c. Patulinaccumulation in apples during postharvest: effect of controlled atmospherestorage and fungicide treatments. Food Control 18, 1443–1448.
Moreira, F.G., Dos Reis, S., Ferreira Costa, M.A., Marques De Souza, C.G.,Peralta, R.M., 2005. Production of hydrolytic enzymes by the plantpathogenic fungusMyrothecium verrucaria in submerged cultures. BrazilianJournal of Microbiology 36, 7–11.
Official Journal of the European Communities, Commission Regulation (EC)No. 1881/2006 of (December 2006) setting maximum levels of certaincontaminants in foodstuffs. Brussels, Belgium (pp L364/7 and L364/16).
Pfeiffer, E., Gro β, K., Metzler, M., 1998. Aneuploidogenic and clastogenicpotential of themycotoxins citrinin and patulin. Carcinogenesis 19, 1313–1318.
Pianzzola, M.J., Moscatelli, M., Vero, S., 2004. Characterization of Penicilliumisolates associated with blue mold on apple in Uruguay. Plant Disease 88,23–28.
Pitt, J.I., Hocking, A.D., 1997. Fungi and Food Spoilage. Blackie Academic &Professional, London.
Querol, A., Barrio, E., Huerta, T., Ramon, D., 1992. Molecular monitoring ofwine fermentations conducted by active dry yeast strains. Applied andEnvironmental Microbiology 58, 2948–2953.
Rosenberger, D.A., 2003. Control of Penicillium expansum during apple harvestand storage. Patulin Technical Symposium. Florida (USA) February 2003.
Sholberg, P.L., Harlton, C., Haag, P., Levésque, C.A., O'Gorman, D., Seifert,K., 2005. Benzimidazole and diphenylamine sensitivity and identity ofPenicillium spp. that cause postharvest blue mold of apples using β-tubulingene sequences. Postharvest Biology and Technology 36, 41–49.
Sydenham, E.W., Vismer, H.F., Marasas, W.F.O., Brown, N.L., Schlechter, M.,Rheeder, J.P., 1997. The influence of deck storage and initial processingon patulin levels in apple juice. Food Additives and Contaminants 14,429–434.
United States Department of Agriculture (USFDA), 2003. Statistics of fruits,free nuts and horticultural specialties [online]. Natl. Agricultural StatisticsServices. Washington, D.C., USA. [Accessed on March 5th 2007]. Availableat: http://www.usda.gov/nass/pubs/agr02/02_ch5.pdf.
Viñas, I., Vela, E., Sanchis, V., 1993. Capacidad productora de patulina de cepasde Penicillium expansum procedentes de centrales hortofrutícolas de Lleida.Revista Iberoamerticana de Micología 10, 30–32.
252 H. Morales et al. / International Journal of Food Microbiology 122 (2008) 243–252