Embed Size (px)
Citation preview
1 23
European Journal of AppliedPhysiology ISSN 1439-6319Volume 112Number 10 Eur J Appl Physiol (2012) 112:3619-3627DOI 10.1007/s00421-012-2349-1
G tolerance vis-à-vis pressure-distensionand pressure-flow relationships of legarteries
Ola Eiken, Igor Mekjavic, PatrikSundblad & Roger Kölegård

1 23
Your article is protected by copyright and
all rights are held exclusively by Springer-
Verlag. This e-offprint is for personal use only
and shall not be self-archived in electronic
repositories. If you wish to self-archive your
work, please use the accepted author’s
version for posting to your own website or
your institution’s repository. You may further
deposit the accepted author’s version on a
funder’s repository at a funder’s request,
provided it is not made publicly available until
12 months after publication.
ORIGINAL ARTICLE
G tolerance vis-a-vis pressure-distension and pressure-flowrelationships of leg arteries
Ola Eiken • Igor Mekjavic • Patrik Sundblad •
Roger Kolegard
Received: 16 September 2011 / Accepted: 31 January 2012 / Published online: 16 February 2012
� Springer-Verlag 2012
Abstract During increased gravitoinertial (G) load in the
head-to-foot direction, pressures in dependent vascular
beds are commonly raised to levels capable of distending
precapillary vessels, which, in turn, may reduce arterial
pressure, and hence compromise the capacity to withstand
G load (G tolerance). We hypothesized that distensibility in
precapillary leg vessels would be lower in a group of
subjects possessing high G tolerance (H; n = 7; relaxed G
tolerance = 6.6 ± 0.8 G) than in a group with low G tol-
erance (L; n = 8; G tolerance = 3.9 ± 0.3 G). The groups
were matched with regard to gender, age, weight, height,
and resting arterial pressure. Arterial pressure-distension
and pressure-flow experiments were performed with the
subject supine in a pressure chamber with a lower leg
protruding to the outside. Increased intravascular pressure
in the blood vessels of the outside leg was accomplished
by stepwise increasing chamber pressure to 240 mmHg.
Diameter and flow in the posterior tibial artery were
measured by ultrasonographic/Doppler techniques. Pres-
sure-induced increments in arterial diameter and flow were
more pronounced (p \ 0.03) in the L (14.1 ± 4.2% and
32 ± 21 ml/min respectively) than in the H (1.7 ± 5.0%
and 1.6 ± 25 ml/min) group, and the pressure thresholds at
which these increments commenced were lower (by 52 and
48 mmHg, respectively) in the L than in the H group
(p \ 0.04). Negative correlations were observed between
G tolerance and the increments in diameter and flow
(p \ 0.02). Thus, the wall stiffness of precapillary leg
vessels is greater in individuals with high relaxed G
tolerance; whether a causal relationship exists remains to
be established.
Keywords Acceleration � Arterial stiffness �Distensibility � G-level tolerance � Precapillary vessels �Total peripheral resistance
Introduction
Pilots flying high-performance aircraft are exposed to high-
sustained acceleration with the gravitoinertial vector
directed head-to-foot (?Gz). An individuals’ capacity to
withstand increased ?Gz load is termed G-level tolerance
(in the following, G tolerance refers to G-level tolerance
unless otherwise stated) and is governed by his/her arterial
pressure response; the predominant challenge for the cir-
culatory system is to maintain adequate perfusion of the
brain in the face of the G-induced exaggerated pressure
drop along the arteries from the heart to the head (Wood
and Lambert 1952; Wood 1987; Burton and Whinnery
2008). G tolerance varies considerably in relaxed individ-
uals, especially when the G load is increased at a slow rate
(Burton and Whinnery 2008). Experience from our own
laboratory agrees well with that of others (for reviews see
Burton and Whinnery 2008) that relaxed G tolerance
amongst individuals of the same gender, and who are also
fairly well matched with regards to age and body mass,
may vary from 2.5 to 8.5 G. The mechanisms underlying
Communicated by Dag Linnarsson.
O. Eiken (&) � P. Sundblad � R. Kolegard
Department of Environmental Physiology, School of Technology
and Health, Royal Institute of Technology, Berzelius v 13,
Solna, 171 65 Stockholm, Sweden
e-mail: [email protected]
I. Mekjavic
Department of Automation Biocybernetics and Robotics,
Jozef Stefan Institute, Jamova 39, 1000 Ljubljana, Slovenia
123
Eur J Appl Physiol (2012) 112:3619–3627
DOI 10.1007/s00421-012-2349-1
Author's personal copy
the large interindividual variation in G tolerance are only
partly understood. Factors known to affect G tolerance
include resting arterial pressure and the vertical distance
between the heart and head (Klein et al. 1969). It is com-
monly assumed that also arterial baroreflex sensitivity
determines relaxed G tolerance even though evidence
to support this notion is indirect and inconclusive (cf
Newman et al. 1998; Convertino 1998).
We reasoned that the distensibility of precapillary blood
vessels in the lower body might influence relaxed G toler-
ance. Marked elevations of intravascular pressures distend
not only veins, but also peripheral arteries and presumably
arterioles (Eiken and Kolegard 2001). In the sitting position,
high ?Gz loads substantially increase pressures in depen-
dent vessels, since large hydrostatic pressure components
add to local intravascular pressures. Judging from previous
experiments, the wall stiffness of precapillary vessels in the
legs may not be sufficient to withstand such G-induced
increments in local intravascular pressure. Thus, once
intravascular pressure exceeds 250–270 mmHg in the lower
leg, local arteries distend and local arterial flows increase
promptly; the latter finding has been attributed to arteriolar
pressure distension (Eiken and Kolegard 2001, 2004; Eiken
et al. 2008). Pressure distension of precapillary vessels in
the lower body may result in a substantial drop in total
peripheral blood-flow resistance, which, in turn, may
compromise arterial pressure regulation and hence limit G
tolerance.
Accordingly, the purpose of the present study was to
compare the distensibility of precapillary leg vessels of
individuals with high versus low relaxed G-tolerance. We
hypothesized that precapillary wall stiffness would be
higher in individuals with high G tolerance than in those
with low G tolerance.
Methods
Subjects
The protocol and experimental procedures of the study
were approved by the Regional Human Ethics Committee
in Stockholm. After giving their informed consent, 15
healthy males took part in the study. They were recruited
amongst individuals who had previously participated in
G-tolerance experiments. Subjects were assigned to two
groups, high G tolerance (H; n = 7) and low G tolerance
(L; n = 8) individuals. The inclusion criteria were a
relaxed gradual onset-rate (see below) G tolerance of
C5.5 G for the H-group and of B4.2 G for the L-group,
these thresholds corresponding to the 80th and 20th per-
centile, respectively, of G-tolerance values obtained in our
laboratory.
Study protocol
Each subject reported to the laboratory on two different
days. On the first day, the subject underwent criterion tests
followed by G-tolerance tests in the human-use centrifuge.
On the second day, the pressure-distension and pressure–
flow relationships of an artery in his lower leg were
determined using a pressure-chamber model.
Criterion tests
Body height and mass were measured using standard
techniques. Resting systolic and diastolic arterial pressures
(SAP, DAP) were measured with the subject in a supine
position using a standard sphygmomanometric (Riva
Rocci) technique, with a 13 cm wide pressure cuff placed
around the right upper arm and with the heart as the
pressure reference level.
G-tolerance tests
G-level tolerance was determined employing gradual onset-
rate (GOR) G-time profiles. The G load was increased by
0.1 G/s, starting from ?1.4 Gz and terminating at the G
load resulting in impaired vision (see below). G tolerance
was defined as the average of three such GOR trials with an
inter-trial variation of B0.25 G, consecutive tests being
interspersed by about 5 min. If the EMG recordings (see
below) revealed that the subject did not sit relaxed during
a G-tolerance test, the test was terminated and restarted
after 5 min.
Centrifuge
The experiments were conducted in a 7.25 m radius human-
use centrifuge (ASEA, Sweden) at the Royal Institute of
Technology in Stockholm. During the trials the subject sat
in the centrifuge gondola in a seat with the back angle
reclining 28� from the vertical. During the tests, he wore a
short-sleeved T-shirt and long cotton trousers. Air temper-
ature in the gondola was maintained within the range
23–25�C. The centrifuge was controlled by an ‘‘open-loop’’
system employing a pre-set computer-derived G-time pro-
file. The subject, who was monitored via closed circuit
television, was not provided with any visual G-time feed-
back signal. Gz was measured by means of an analogue
accelerometer mounted in front of the subject at a vertical
level approximately corresponding to that of his heart.
Central and peripheral vision
A light bar comprising a central red light and two green
lights positioned at a 60� angle in relation to the subjects’
3620 Eur J Appl Physiol (2012) 112:3619–3627
123
Author's personal copy

eyes was used for assessment of impairments in central and
peripheral vision. Central and peripheral vision was rated
using a four-point scale (clear, dim, gray, light loss; Buick
et al. 1995). The subject was instructed to terminate the G
exposure by releasing a handgrip switch once both or one
of the peripheral lights were no longer visible (light loss)
and/or once the central light was gray/white.
Heart rate (HR) and mean arterial pressure (MAP)
Heart rate (HR) was derived from electrocardiographic
recordings using a cardiograph (Datex-Engstrom, Instru-
mentation Corp, Helsinki, Finland), electrodes being
positioned in a precordial 5-lead arrangement. mean arte-
rial pressure (MAP) was measured using a volume-clamp
technique (Portapres, TNO, Amsterdam, The Netherlands)
with the pressure cuff placed around the middle-phalanx of
the third or fourth finger of the right hand and the reference
pressure transducer taped to the skin of the temple, at the
level of the eyes. The right arm was supported by an
armrest adjusted so that the distal portions of the fingers
were at a vertical level corresponding to the jugulum sterni.
Prior to each experiment, arterial pressure values obtained
with the volume-clamp technique were compared, and
found to agree well, with those obtained from the right
brachial artery using a standard Riva Rocci method.
Electromyographic (EMG) activity was monitored
continuously in the right vastus lateralis and rectus abdo-
minis muscles using a Bagnoli-4 EMG system in combi-
nation with EMG-works computer software (DelSys Inc.
Boston, MA). The EMG signals were detected by bipolar
surface electrodes positioned over the mid-portion of the
muscles. Maximal voluntary isometric contractions (MVC;
attempted knee extension at 0� knee angle and hip flexion
at 90� hip angle) were performed prior to each experiment,
and the EMG recordings obtained during these maneuvers
were used as reference values for the EMG values obtained
during the experiments. To ensure that the subject kept
his glottis open, and hence refrained from performing
straining maneurers, he was instructed to sit as relaxed as
possible and to breathe quietly (to continuously chat with
the experimenters) during the G exposures. If the root-
mean-square EMG activity increased by [15% of MVC
from baseline either in the vastus lateralis or rectus abdo-
minis muscles, the experiment was disregarded and the
G-time profile was repeated in 5 min. EMG values were
used solely as data inclusion/exclusion criteria and were
not further analyzed.
All signals were transmitted via slip rings and continu-
ously monitored and/or recorded on magnetic tape (TEAC
DAT recorder RD-135T, TEAC Corp, Japan), video tape
(AG 7350, Panasonic, Japan) or on a computer (Optiplex
Gx1, Dell, USA).
Vascular pressure-distension relationships
Methods and instrumentation
To increase the transmural pressures in the blood vessels of
a subject’s lower leg, a method described in more detail
previously (Eiken and Kolegard 2001, 2004) was used,
Briefly, the experiments were carried out with the subject
positioned supine in a pressure chamber with the lower
portion of a leg (here termed the ‘‘test leg’’) extended
through a port in the chamber door. The test leg was sup-
ported at the level of the heart by means of a stand, and was
hermetically sealed to the door hole slightly proximally of
the knee, by use of a short self-sealing rubber sleeve.
A special harness was used to stabilize the trunk and to
prevent involuntary muscle activity and movements in the
leg as the pressure in the chamber was elevated. Ambient
temperature was maintained at 25�C (range: 23–27�C) at
the site of the test leg. As chamber pressure is raised,
pressure increases in all tissues enclosed in the chamber
and the pressure is also transmitted virtually without dis-
tortion to the blood vessels of the unexposed test leg, so
that transmural pressures in all vessels (arteries, capillaries
and veins) of the test leg are elevated by the same mag-
nitude as the applied chamber pressure (cf. Green et al.
2007; Kolegard 2010).
The diameter of the tibial posterior artery was measured
5–10 cm proximal to the medial malleolus using ultraso-
nography. Measurements were conducted in B-mode image
during end-diastole (determined from the ECG), as wall-to-
wall distance in the sagittal section, using a 6.0–11.0 MHz
linear array transducer (Aspen, Acuson, Mountain View,
CA, USA). Volume flow was estimated in the tibial artery
by simultaneous measurements of vessel diameter and
mean flow-velocity, employing an ultrasound/Doppler
technique (6.0–11.0 MHz transducer; Aspen, Acuson).
Assuming that the artery had a circular cross-section, flow
was subsequently calculated by multiplying vessel cross-
sectional area by the time integral of the mean flow-
velocity.
Heart rate (HR) and arterial pressures (SAP, DAP) were
measured using ECG and volume-clamp techniques,
respectively, as described above. The level of the heart was
used as the point of reference for the arterial pressure
measurements. Arterial distending pressure (DP) was cal-
culated, and arteriolar DP was approximated, by adding
chamber pressure to DAP (cf. Eiken and Kolegard 2001,
2004; Eiken et al. 2008). Since blood flow in the legs is
mainly controlled by local vascular resistance, it can be
argued that flow should be treated as a function of arteriolar
rather than arterial DP. However, since the average arte-
riolar DP is not readily determined, flow patterns in the
tibial artery were compared by treating them as functions
Eur J Appl Physiol (2012) 112:3619–3627 3621
123
Author's personal copy
of peak arteriolar DP (i.e. DP at the upstream end of the
arterioles, corresponding to arterial DP).
Each subject rated his perceived pain using a ratio scale
(Borg 1982), in which pain could be rated from 0 (no pain)
to 10 (very, very strong pain, almost intolerable).
Experimental protocol
Each experiment started with a 10-min baseline period with
normal atmospheric pressure in the chamber. Thereafter
chamber pressure was increased every 2.5 min in steps of
60 mmHg up to 180 mmHg above atmospheric, and there-
after in steps of 30 mmHg up to a maximum of 240 mmHg
above atmospheric. Chamber pressure was then rapidly
released and a 2.5-min recovery period at atmospheric
pressure ensued. Recordings of HR, SAP, DAP, tibial artery
diameter and flow as well as rating of perceived pain were
obtained during the last min at each pressure level.
Analyses
To determine whether differences in pressure-distension
relationships were due to changes in threshold or gain of the
distension, linear functions were fitted to the initial four and
final three data points, respectively, of every DP-D diameter
and DP-flow curve. The DP corresponding to the crossing
point of the two regression lines was defined as the threshold
DP and the slope of the regression line of the last three points
was defined as the gain of the pressure distension.
The statistical significance of intergroup differences was
tested using analysis of variance or a two-sample t test for
all variables except for perceived pain, which was evalu-
ated by a Mann–Whitney signed-rank test (Statistica Stat-
soft, Tulsa OK, USA). p \ 0.05 were regarded statistically
significant.
Results
Criterion variables
Subjects’ physical characteristics and resting arterial pres-
sures are given in Table 1. As evident from the table, the
groups were well matched with regard to age, mass, body
height and resting arterial pressures.
G-tolerance trials
Relaxed G tolerance was substantially higher (p \ 0.01) in
the H group (6.6 ± 0.8 G = mean ± SD) than in the L
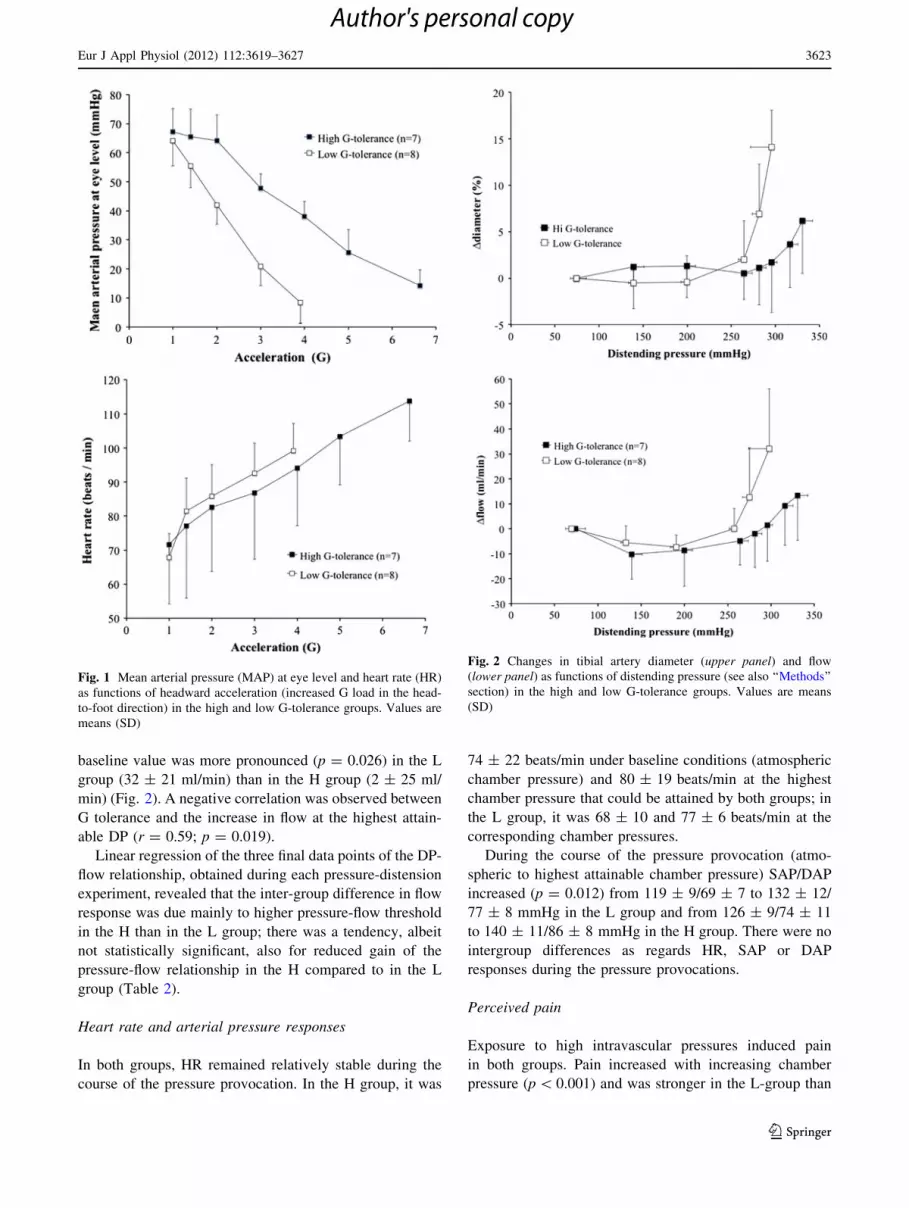
group (3.9 ± 0.3 G). Baseline values for HR and MAP,
obtained with the subject sitting in the centrifuge gondola
prior to the G-tolerance trials, were similar in the two
groups (Fig 1). During the trials, HR increased with
increasing G load in a similar fashion in the two groups,
whereas the MAP response was considerably stronger
(p \ 0.01) in the H group than in the L group with higher
values in the H group at any given G load (Fig 1).
Pressure-distension relationships
Arterial diameters
The baseline lumen diameter of the tibial artery, determined
at normal atmospheric chamber pressure prior to the pres-
sure provocation, was similar in the H group (2.4 ±
0.3 mm) and L group (2.2 ± 0.3 mm). In both groups,
lumen diameter remained unaltered at slight and moderate
elevations of DP, but increased (p \ 0.001) promptly at the
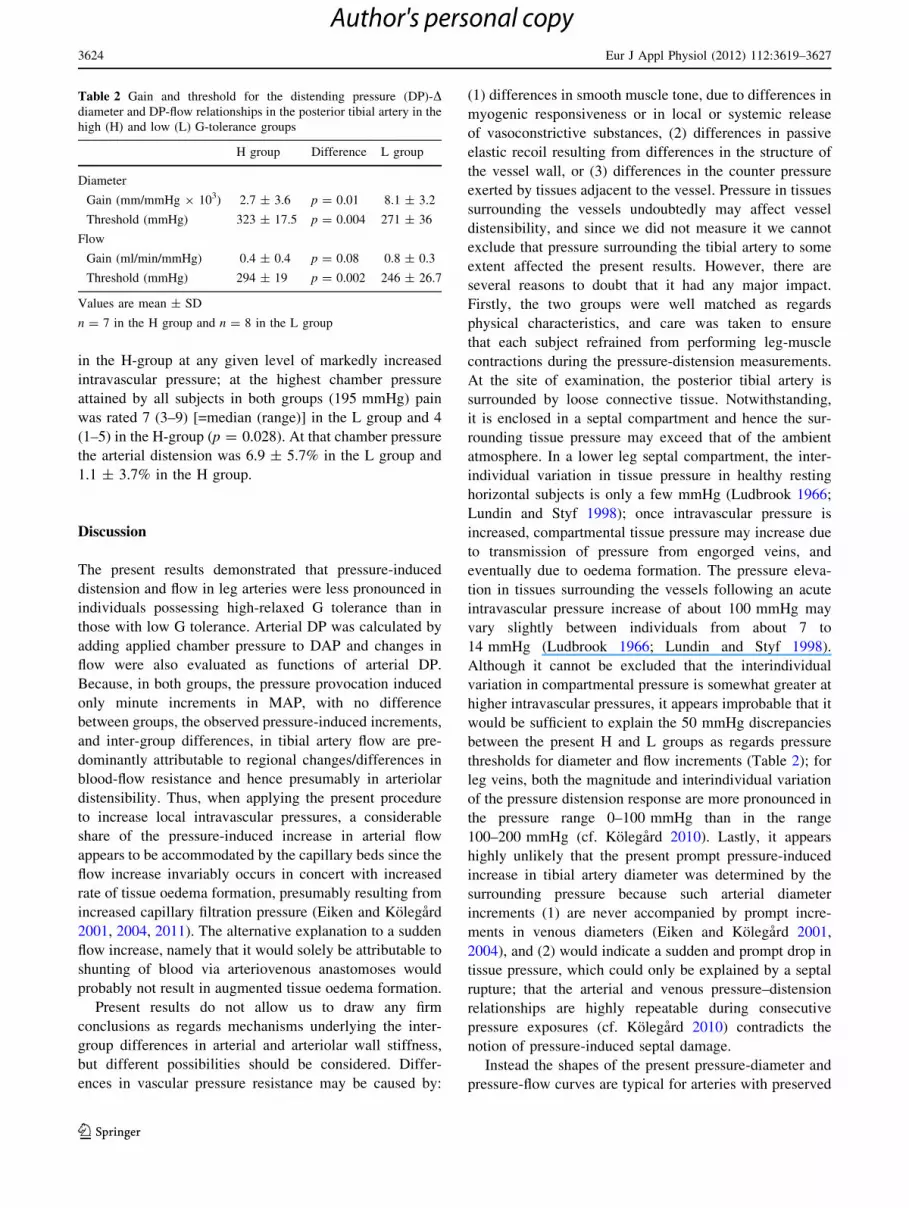
highest levels of DP (Fig. 2). Distension at the highest
DP that could be attained by all subjects in both groups
(about 290 mmHg) was more pronounced (p \ 0.001) in
the L-group (14.1 ± 4.2%) than in the H group (1.7 ± 5.0%)
(Fig. 2). A negative correlation was observed between G
tolerance and the relative increase in diameter at the highest
attainable DP (R = 0.79; p = 0.001).
Linear regression of the three final data points of the
DP-D diameter relationship, obtained during each pressure-
distension experiment, revealed that the inter-group differ-
ence in arterial distensibility was due both to a difference
in gain (slope) and threshold (intercept) of the pressure-
distension relationship, with lower gain and higher pressure
threshold in the H than in the L group. (Table 2).
Arterial flow
In both groups, tibial artery flow remained unaltered at
slight and moderate elevations of DP, whereas at the
highest levels of DP a prompt increase (p \ 0.001) in flow
occurred (Fig. 2). At the highest DP that could be attained
by all subjects in both groups, the increase in flow from the
Table 1 Subjects’ physical characteristics and resting systolic and
diastolic arterial pressures (SAP, DAP) in the high G-tolerance
(H) and low G-tolerance (L) groups
Variable Subject group
H Difference L
Age (year) 27 ± 4 n.s. 27 ± 3
Height (cm) 179 ± 10 n.s. 183 ± 5
Mass (kg) 84 ± 14 n.s. 75 ± 12
SAP (mmHg) 126 ± 9 n.s. 119 ± 9
DAP (mmHg) 74 ± 11 n.s. 69 ± 7
Values are mean ± SD
n = 7 in the H group and n = 8 in the L group
3622 Eur J Appl Physiol (2012) 112:3619–3627
123
Author's personal copy
baseline value was more pronounced (p = 0.026) in the L
group (32 ± 21 ml/min) than in the H group (2 ± 25 ml/
min) (Fig. 2). A negative correlation was observed between
G tolerance and the increase in flow at the highest attain-
able DP (r = 0.59; p = 0.019).
Linear regression of the three final data points of the DP-
flow relationship, obtained during each pressure-distension
experiment, revealed that the inter-group difference in flow
response was due mainly to higher pressure-flow threshold
in the H than in the L group; there was a tendency, albeit
not statistically significant, also for reduced gain of the
pressure-flow relationship in the H compared to in the L
group (Table 2).
Heart rate and arterial pressure responses
In both groups, HR remained relatively stable during the
course of the pressure provocation. In the H group, it was
74 ± 22 beats/min under baseline conditions (atmospheric
chamber pressure) and 80 ± 19 beats/min at the highest
chamber pressure that could be attained by both groups; in
the L group, it was 68 ± 10 and 77 ± 6 beats/min at the
corresponding chamber pressures.
During the course of the pressure provocation (atmo-
spheric to highest attainable chamber pressure) SAP/DAP
increased (p = 0.012) from 119 ± 9/69 ± 7 to 132 ± 12/
77 ± 8 mmHg in the L group and from 126 ± 9/74 ± 11
to 140 ± 11/86 ± 8 mmHg in the H group. There were no
intergroup differences as regards HR, SAP or DAP
responses during the pressure provocations.
Perceived pain
Exposure to high intravascular pressures induced pain
in both groups. Pain increased with increasing chamber
pressure (p \ 0.001) and was stronger in the L-group than
Fig. 1 Mean arterial pressure (MAP) at eye level and heart rate (HR)
as functions of headward acceleration (increased G load in the head-
to-foot direction) in the high and low G-tolerance groups. Values are
means (SD)
Fig. 2 Changes in tibial artery diameter (upper panel) and flow
(lower panel) as functions of distending pressure (see also ‘‘Methods’’
section) in the high and low G-tolerance groups. Values are means
(SD)
Eur J Appl Physiol (2012) 112:3619–3627 3623
123
Author's personal copy
in the H-group at any given level of markedly increased
intravascular pressure; at the highest chamber pressure
attained by all subjects in both groups (195 mmHg) pain
was rated 7 (3–9) [=median (range)] in the L group and 4
(1–5) in the H-group (p = 0.028). At that chamber pressure
the arterial distension was 6.9 ± 5.7% in the L group and
1.1 ± 3.7% in the H group.
Discussion
The present results demonstrated that pressure-induced
distension and flow in leg arteries were less pronounced in
individuals possessing high-relaxed G tolerance than in
those with low G tolerance. Arterial DP was calculated by
adding applied chamber pressure to DAP and changes in
flow were also evaluated as functions of arterial DP.
Because, in both groups, the pressure provocation induced
only minute increments in MAP, with no difference
between groups, the observed pressure-induced increments,
and inter-group differences, in tibial artery flow are pre-
dominantly attributable to regional changes/differences in
blood-flow resistance and hence presumably in arteriolar
distensibility. Thus, when applying the present procedure
to increase local intravascular pressures, a considerable
share of the pressure-induced increase in arterial flow
appears to be accommodated by the capillary beds since the
flow increase invariably occurs in concert with increased
rate of tissue oedema formation, presumably resulting from
increased capillary filtration pressure (Eiken and Kolegard
2001, 2004, 2011). The alternative explanation to a sudden
flow increase, namely that it would solely be attributable to
shunting of blood via arteriovenous anastomoses would
probably not result in augmented tissue oedema formation.
Present results do not allow us to draw any firm
conclusions as regards mechanisms underlying the inter-
group differences in arterial and arteriolar wall stiffness,
but different possibilities should be considered. Differ-
ences in vascular pressure resistance may be caused by:
(1) differences in smooth muscle tone, due to differences in
myogenic responsiveness or in local or systemic release
of vasoconstrictive substances, (2) differences in passive
elastic recoil resulting from differences in the structure of
the vessel wall, or (3) differences in the counter pressure
exerted by tissues adjacent to the vessel. Pressure in tissues
surrounding the vessels undoubtedly may affect vessel
distensibility, and since we did not measure it we cannot
exclude that pressure surrounding the tibial artery to some
extent affected the present results. However, there are
several reasons to doubt that it had any major impact.
Firstly, the two groups were well matched as regards
physical characteristics, and care was taken to ensure
that each subject refrained from performing leg-muscle
contractions during the pressure-distension measurements.
At the site of examination, the posterior tibial artery is
surrounded by loose connective tissue. Notwithstanding,
it is enclosed in a septal compartment and hence the sur-
rounding tissue pressure may exceed that of the ambient
atmosphere. In a lower leg septal compartment, the inter-
individual variation in tissue pressure in healthy resting
horizontal subjects is only a few mmHg (Ludbrook 1966;
Lundin and Styf 1998); once intravascular pressure is
increased, compartmental tissue pressure may increase due
to transmission of pressure from engorged veins, and
eventually due to oedema formation. The pressure eleva-
tion in tissues surrounding the vessels following an acute
intravascular pressure increase of about 100 mmHg may
vary slightly between individuals from about 7 to
14 mmHg (Ludbrook 1966; Lundin and Styf 1998).
Although it cannot be excluded that the interindividual
variation in compartmental pressure is somewhat greater at
higher intravascular pressures, it appears improbable that it
would be sufficient to explain the 50 mmHg discrepancies
between the present H and L groups as regards pressure
thresholds for diameter and flow increments (Table 2); for
leg veins, both the magnitude and interindividual variation
of the pressure distension response are more pronounced in
the pressure range 0–100 mmHg than in the range
100–200 mmHg (cf. Kolegard 2010). Lastly, it appears
highly unlikely that the present prompt pressure-induced
increase in tibial artery diameter was determined by the
surrounding pressure because such arterial diameter
increments (1) are never accompanied by prompt incre-
ments in venous diameters (Eiken and Kolegard 2001,
2004), and (2) would indicate a sudden and prompt drop in
tissue pressure, which could only be explained by a septal
rupture; that the arterial and venous pressure–distension
relationships are highly repeatable during consecutive
pressure exposures (cf. Kolegard 2010) contradicts the
notion of pressure-induced septal damage.
Instead the shapes of the present pressure-diameter and
pressure-flow curves are typical for arteries with preserved
Table 2 Gain and threshold for the distending pressure (DP)-Ddiameter and DP-flow relationships in the posterior tibial artery in the
high (H) and low (L) G-tolerance groups
H group Difference L group
Diameter
Gain (mm/mmHg 9 103) 2.7 ± 3.6 p = 0.01 8.1 ± 3.2
Threshold (mmHg) 323 ± 17.5 p = 0.004 271 ± 36
Flow
Gain (ml/min/mmHg) 0.4 ± 0.4 p = 0.08 0.8 ± 0.3
Threshold (mmHg) 294 ± 19 p = 0.002 246 ± 26.7
Values are mean ± SD
n = 7 in the H group and n = 8 in the L group
3624 Eur J Appl Physiol (2012) 112:3619–3627
123
Author's personal copy
myogenic tone (Folkow et al. 1970a, b). It is possible that
differences in vascular myogenic tone contributed to the
inter-group differences in arterial/arteriolar pressure resis-
tance. Changes in vascular myogenic responsiveness,
observed in rats have, in part, been attributed to changed
expression of endothelial and neuronal nitric oxide (NO)
and of inducible NO synthase (Jasperse et al. 1999; Vaziri
et al. 2000). It has been demonstrated that local NO-med-
iated dilatation of precapillary vessels is reduced in
hypertensive patients (Muiesan et al. 2009).
It is also possible that the inter-group differences in
arterial/arteriolar wall stiffness reflected differences in the
elastic recoil properties of the vessel wall resulting from
differences in wall thickness (Aalkjaer et al. 1987), wall
thickness-to-lumen ratio (Folkow et al. 1958; Folkow 1990)
and/or in the content and arrangement of collagen and
elastin (Intengan and Schiffrin 2000). Notably, the DP
threshold for increasing flow was substantially lower in the
L than in the H group, whereas the gain (slope) of the
DP-flow response only tended to be marginally higher in
the L than in the H group. Media hypertrophy in the arte-
rioles is expected to reduce the gain of the DP-flow curve,
whereas increased myogenic reactivity is likely to pre-
dominantly increase the pressure threshold at which flow
commences to increase (cf Folkow and Sivertsson 1968;
Folkow 1990; Eiken and Kolegard 2011). Even though
these findings support the notion that the inter-group dif-
ference in precapillary distensibility was predominantly
attributable to differences in local myogenic activity, it
should be emphasized that further investigations are needed
to establish to what degree the diminished arterial/arteriolar
distension in individuals possessing high G tolerance
reflects smooth muscle hypertrophy and increased myo-
genic activity, respectively.
Regardless of what mechanisms govern arterial/arterio-
lar distensibility, it appears that the magnitude of this
modality is not permanent. Instead, the wall stiffness of
arteries and precapillary resistance vessels adapts to meet
the long-term demands imposed by the hydrostatic pressure
acting locally on the vessel walls. Thus, removal of gravity-
dependent intravascular pressure components, by exposure
to prolonged horizontal bedrest, increases distensibility
of leg arteries/arterioles (Eiken et al. 2008). Inversely,
repeated exposures to moderately increased intravascular
pressures render peripheral arteries/arterioles more pressure
resistant (Eiken and Kolegard 1999, 2011). It cannot be
excluded that similar pressure habituation effects on arter-
ies/arterioles of the lower body may contribute to the
increase in G tolerance in response to repeated exposures to
high G loads (i.e. G training) (for review see Burton and
Smith 1996).
The finding that the distensibility of leg arteries and
arterioles was greater in the L group than in the H group,
and that negative correlations were found between G tol-
erance and both arterial and arteriolar distensibility raises
the question of whether a causal relationship exists
between relaxed G tolerance and the stiffness of precapil-
lary vessels of the lower body. As mentioned previously,
an individuals’ G-level tolerance is predominantly gov-
erned by his/her arterial pressure response. In the seated
position, increased ?Gz load creates exaggerated hydro-
static pressure gradients in blood vessels oriented longitu-
dinally in the body. To maintain adequate cerebral
perfusion, and hence consciousness, at high G loads, arte-
rial pressure at heart level must increase to the extent that it
overcomes the hydrostatic pressure drop in the arteries
from the heart to the head (Wood and Lambert 1952; Wood
1987; Eiken et al. 2007). Heart level arterial pressure, in
turn, is the product of cardiac output and total peripheral
blood-flow resistance. Assuming that the distension of
arteries/arterioles observed in our experiments reflected a
general response of dependent precapillary vessels, then it
is likely that during the G exposures, pressure distension in
dependent vessels diminished total peripheral resistance
and hence compromised the control of heart-level arterial
pressure. In the present study, initial signs of arterial/arte-
riolar distension were observed at DPs ranging from 250 to
300 mmHg. In the vasculature of the lower body, pressure
increases in direct proportion to the increased ?Gz load. It
can be estimated that, with the subject positioned as in the
present centrifuge experiments - which corresponds to the
position of a pilot flying the JAS 39 Gripen fighter air-
craft—a critical DP of 250–300 mmHg is attained in the
arteries/proximal arterioles of the legs at G loads ranging
from about 3–4 G in the ankles to 5–6 G in the thighs. This
is in the approximate range of the present G-tolerance
values. Thus, it seems likely that the observed difference
in arterial/arteriolar wall stiffness between the H- and
L-groups contributed to the intergroup difference in G
tolerance.
This does not exclude contribution by other mecha-
nisms, such as arterial baroreflex sensitivity, commonly
assumed to affect G tolerance (Newman et al. 1998;
Convertino 1998), to the inter-group difference in G tol-
erance. Thus, high arterial baroreflex sensitivity may reflect
high responsiveness in the effector organs, including high
myogenic responsiveness in arterioles. The observation
that, during the G-tolerance trials, the MAP response was
considerably stronger in the H group, even at slight and
moderate elevations of the G load, is compatible with the
notion of increased myogenic responsiveness in arterioles
of G tolerant individuals. Other factors that have been
shown to affect relaxed G-level tolerance in previous
studies include baseline arterial pressure and distance
between the heart and brain (Klein et al. 1969). Our find-
ings that both resting SAP/DAP and body height were
Eur J Appl Physiol (2012) 112:3619–3627 3625
123
Author's personal copy
similar in the H and L groups suggest that neither baseline
arterial pressure nor the heart-to-brain distance, constituted
distinguishing features between the two groups.
Present results showed that markedly increased pressure
in the hyperbaric chamber induced pain in the test leg,
which, at any given pressure, tended to be greater in the L
group than in the H group. Such pressure-induced pain
is most likely of vascular origin and akin to the pain
commonly experienced in the arms by pilots flying high-
performance fighter aircraft (Eiken and Kolegard 2001).
Thus, the magnified hydrostatic pressure gradients that
act along the vessels during exposure to high-sustained
acceleration may cause severe pain locally in the arms
(Green 1997; Watkins et al. 1998); in contrast to the leg
vessels, the arm vessels are typically not supported by the
external counter pressure of the anti-G suit during expo-
sures to high sustained G forces. Under certain circum-
stances, G-induced pain may develop also in the lower
legs/feet, for example in pilots/centrifuge subjects who are
not wearing anti-G suits or who are exposed to substantial
variations in G-suit pressure during the G-time profiles
(Paul 1996). There is ample evidence to support the notion
that G-induced arm pain is due mainly to local overdis-
tension of veins, presumably via activation of perivascular
mechanoreceptors that respond to stretch and to direct
mechanical stimulation (for review see Kolegard 2010). If,
or to what extent, pressure-induced distension of arteries
and arterioles contributes to the development of such pain
is less clear. There is some evidence to suggest that in
certain conditions distension of arteries may also induce
pain (Malliani and Lombardi 1982; Wooley et al. 1998).
Thus, our finding that the pressure-induced pain tended to
be attenuated in the H group compared to in the L group
may either suggest that distensibility of peripheral veins
differed between the groups in a similar manner as did
precapillary distensibility, or that the degree of pressure-
induced pain in fact reflected the degree of arterial/arte-
riolar distension.
The present pressure-distension and pressure-flow
examinations were limited to those of the posterior tibial
artery and the vascular circuits supplied by this artery. To
obtain a more comprehensive view of the relationship
between relaxed G tolerance and vascular distensibility,
future studies should include other, and larger, vascular
beds in dependent parts of the body. Another delimitation
of the present study was that only males were investigated.
In conclusion, present results showed that the in vivo
wall stiffness of precapillary leg vessels is higher in indi-
viduals with high-relaxed G tolerance. Whether a causal
relationship exists between wall stiffness in dependent
precapillary vessels and G tolerance remains to be estab-
lished, as do the mechanisms governing interindividual
differences in precapillary wall stiffness.
Acknowledgments This study was supported by grants from the
Swedish Armed Forces and the Gosta Fraenekel Foundation.
Conflict of interest The authors declare that they have no conflict
of interest.
References
Aalkjaer C, Heagerty AM, Petersen KK, Swales JD, Mulvany MJ
(1987) Evidence for increased media thickness, increased
neuronal amine uptake, and depressed exitation-contraction
coupling in isolated resistance vessels from essential hyperten-
sives. Circ Res 61:181–186
Borg GA (1982) Psychophysical bases of perceived exertion. Med Sci
Sports Exer 14:377–381
Buick F, Wood EH, Pecaric M, Maloan J (1995) Methods for
measuring physiological responses and protection in man
exposed to high ?Gz. In: AGARD-LS-202, Current Concepts
on G-protection research and development, North Atlantic
Treaty Organization, pp 8-1 to 8-15
Burton RR, Smith AH (1996) Adaptation to acceleration environ-
ments. In: Fregly and Blatteis (eds) Handbook of physiology
environmental physiology. sect. 4, vol II. Oxford University
Press, New York, pp 943–970
Burton RR, Whinnery JE (2008) Biodynamics: sustained acceleration.
In: DeHart RL (ed) Fundamentals of aerospace medicine, 3rd
edn. Williams & Wilkins, Baltimore, pp 201–260
Convertino VA (1998) High sustained ?Gz acceleration: physiolog-
ical adaptation to high-G tolerance. J Gravit Physiol 5(1):51–54
Eiken O, Kolegard R (1999) Pain in the arms induced by markedly
increased intravascular pressure decreases after repeated exposures
to moderately increased pressures. J Gravit Physiol 6(1):35–36
Eiken O, Kolegard R (2001) Relationship between arm pain and
distension of arteries and veins caused by elevation of transmural
pressure in local vascular segments. Aviat Space Environ Med
72:427–431
Eiken O, Kolegard R (2004) Comparison of vascular distensibility in
the upper and lower extremity. Acta Physiol Scand 181:281–287
Eiken O, Kolegard R (2011) Repeated exposures to moderately
increased intravascular pressure increases stiffness in human
arteries and arterioles. J Hypertens 29:1963–1971
Eiken O, Kolegard R, Bergsten E, Gronkvist M (2007) G protection:
interaction of straining maneuvers and positive pressure breath-
ing. Aviat Space Environ Med 78:392–398
Eiken O, Kolegard R, Mekjavic IB (2008) Pressure-distension
relationship in arteries and arterioles in response to 5 wk of
horizontal bedrest. Am J Physiol Heart Circ Physiol 295:H1296–
H1302
Folkow B (1990) ‘‘Structural factor’’ in primary and secondary
hypertension. Hypertension 16:89–101
Folkow B, Sivertsson R (1968) Adaptive changes in ‘‘reactivity’’ and
wall/lumen ratio in cat blood vessels exposed to prolonged
transmural pressure difference. Life Sciences 7:1283–1289
Folkow B, Grimby G, Thulesius O (1958) Adaptive structural
changes of the vascular walls in hypertension and their relation
to the control of the peripheral resistance. Acta Physiol Scand
44:255–272
Folkow B, Hallback M, Lundgren Y, Weiss L (1970a) Structurally
based increase of flow resistance in spontaneously hypertensive
rats. Acta Physiol Scand 79:373–378
Folkow B, Hallback M, Lundgren Y, Weiss L (1970b) Background of
increased flow resistance and vascular reactivity in spontane-
ously hypertensive rats. Acta Physiol Scand 80:93–106
3626 Eur J Appl Physiol (2012) 112:3619–3627
123
Author's personal copy

Green ND (1997) Arm arterial occlusion cuffs as a means of
alleviating high ?Gz-associated arm pain. Aviat Space Environ
Med 68:715–721
Green ND, Brown MD, Coote JH (2007) Pain and changes in
peripheral resistance at high vascular transmural pressure in the
human forearm. Eur J Appl Physiol 100:627–635
Intengan HD, Schiffrin EL (2000) Structure and mechanical proper-
ties of resistance arteries in hypertension: role of adhesion
molecules and extracellular matrix determinants. Hypertension
36:312–318
Jasperse JL, Woodman CR, Price EM, Hasser EM, Laughlin MH
(1999) Hindlimb unweighting decreases ecNOS gene expression
and endothelium-dependent dilation in rat soleus feed arteries.
J Appl Physiol 87:1476–1482
Klein KE, Bruner H, Jovy D, Vogt L, Wegmann HM (1969) Influence
of stature and physical fitness on tilt-table and acceleration
tolerance. Aerospace Med 40:293–297
Kolegard R (2010) Distensibility in arteries, arterioles and veins in
humans: adaptation to intermittent or prolonged change in
regional intravascular pressure. Dissertation, Royal Institute of
Technology. ISBN: 978-91-7415-788-9
Ludbrook J (1966) The musculovenous pumps of the human lower
limb. Am Heart J 71:635–641
Lundin O, Styf JR (1998) Intramuscular pressure in the leg and thigh
related to tensile strap force during knee brace wear: an
experimental study in man. Am J Sports Med 26:567–570
Malliani A, Lombardi F (1982) Consideration of the fundamental
mechanisms eliciting cardiac pain. Am Heart J 103:575–578
Muiesan ML, Salvetti M, Paini A, Agabiti-Rosei E (2009) Prognostic
significance of flow-mediated dilatation of the brachial artery in
hypertensive patients; possible role of central blood pressure.
J Hypertension 27:903–904
Newman DG, White SW, Callister R (1998) Evidence of baroreflex
adaptation to repetitive ?Gz in fighter pilots. Aviat Space
Environ Med 69:446–451
Paul M (1996) Extended-coverage-bladder G-suits can provide
improved G-tolerance and high Gz foot pain. Aviat Space
Environ Med 67:253–255
Vaziri ND, Ding Y, Sangha DS, Purdy RE (2000) Upregulation of
NOS by simulated microgravity, potential cause of orthostatic
intolerance. J Appl Physiol 89:338–344
Watkins SM, Welch L, Whitey P, Forster E (1998) The design of arm
pressure covers to alleviate pain in high G maneuvers. Aviat
Space Environ Med 69:461–467
Wood EH (1987) Development of Anti-G suits and their limitations.
Aviat Space Environ Med 58:699–706
Wood EH, Lambert EH (1952) Some factors which influence the
protection afforded by pneumatic anti-G suits. J Aviat Med
23:218–228
Wooley CF, Sparks EH, Boudoulas H (1998) Aortic pain. Prog
Cardiovasc Dis 40:563–589
Eur J Appl Physiol (2012) 112:3619–3627 3627
123
Author's personal copy


