Embed Size (px)
Citation preview
1Chapter 1. Socioeconomic Landscape
Full Report
Research and Writing by the Institute for Women’s Policy ResearchIn Partnership with the Women’s Foundation of Minnesota
Research Overview: IWPR No. R341Full Report: IWPR No. R342
ISBN # 978-1-933161-18-1Library of Congress Control # 2008927928
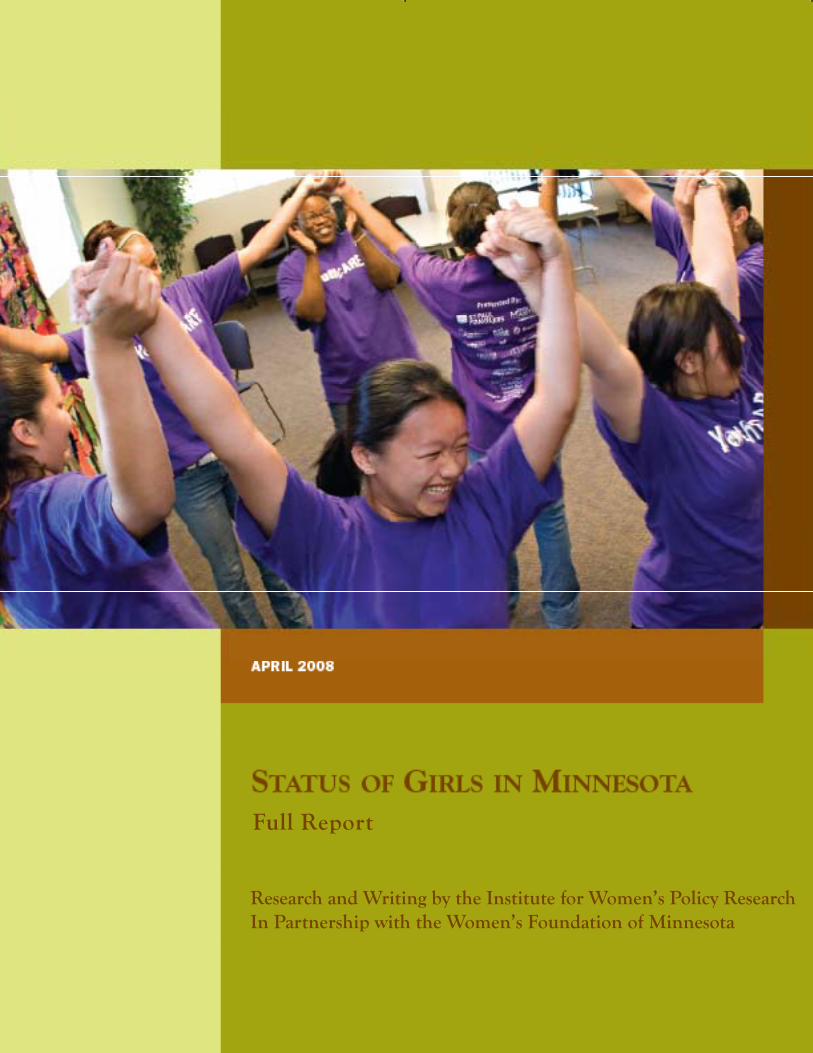
COVER PHOTO: YouthCare (Minneapolis). The nonprofit is a Women’s Foundation grantee.
makers, scholars, civic, labor and business leaders, and public interest groups to design, execute, and disseminate research and to build a network of individuals and organizations that conduct and use women-oriented policy research. IWPR, an independent, non-profit, scientific research organization also works in affiliation with the graduate programs in public policy and women’s studies at The George Washington University.
The Institute for Women’s Policy Research conducts rigorous research and disseminates its findings to address the needs of women, promote public dialogue, and strengthen families, communities, and societies. IWPR focuses on issues of poverty and welfare, employment and earnings, work and family issues, health and safety, and women’s civic and political participation. The Institute, founded in 1987 in Washington, DC, works with policy
About | Institute for Women’s Policy Research
The Women’s Foundation of Minnesota played a key role in the report’s vision and framing, providing invaluable ideas, feedback, and review, as well as qualitative pieces woven throughout the report. IWPR remains fully responsible for the research, writing, and content of the report and for errors of omission or commission.
The Status of Girls in Minnesota is part of a new offshoot of the Institute for Women’s Policy Research report card series Status of Women in the States. It draws upon a variety of data sources to examine the social, economic, and health status of girls and gives recommendations for program and policy change and development to improve the lives of girls for the betterment of all Minnesotans.
About | Status of Girls in Minnesota Report
Foundation has published in collaboration with the Institute for Women’s Policy Research, including Status of Women in Minnesota (2000), Status of Women in Minnesota Counties (2004) and Status of Women of Color in Minnesota (2005). Founded in 1983, the Women’s Foundation of Minnesota is the oldest statewide women’s foundation in the country. More information can be found at www.wfmn.org.
The Women’s Foundation of Minnesota is a statewide community foundation that grows equality for women and girls in Minnesota by funding innovative social change programs, building women’s philanthropy, conducting and reporting research, and educating the public about the successes and challenges of Minnesota’s women and girls. Status of Girls in Minnesota (2008) is the fourth research report the
About | Women’s Foundation of Minnesota
status oF gIRls In MInnesota
Research and Writing by the Institute for Women’s Policy Research
In Partnership with the Women’s Foundation of Minnesota


iiiChapter 1. Socioeconomic Landscape
TAble of conTenTs
Introduction..............................................................................................................................1
chapter 1. socioeconomic landscape.........................................................................................................3
chapter 2. security, safety, and Risky behaviors......................................................................................11
chapter 3. Reproductive Health.................................................................................................................21
chapter 4. Mental Health ..........................................................................................................................29
chapter 5. education.....................................................................................................................37
chapter 6. Leadership and Confidence .....................................................................................................45
conclusion: Moving Girls forward................................................................................................................48
Methodology Appendix.............................................................................................................49
Appendix figures, Maps, and Tables.......................................................................................52
iv Status of Girls in Minnesota
figures
Figure 1.1. Number of Girls and Boys Ages 5 to 17 in Minnesota, by Race and Ethnicity, American Community Survey, 2005..............................................................................................................................................................3
Figure 1.2. Families with Related Children Under 18 in Minnesota, by Family Type and Race and Ethnicity, American Community Survey, 2005....................................................................................................................3
Figure 1.3. Families with Own Children Under 18 by Family Type, Selected Counties, American Community Survey, 2005..............................................................................................................................................................4
Figure 1.4. Median Family Income in Minnesota, by Family Type and Race and Ethnicity, American Community Survey, 2005..............................................................................................................................................................5
Figure 1.5. Poverty Rates among Girls and Boys Under 18 in Minnesota, American Community Survey, 2005................................................................................................................................................................................6
Figure 1.6. Poverty among Women and Men 18 and Older in Minnesota, American Community Survey, 2005................................................................................................................................................................................6
Figure 1.7. Share of Minnesota Households Paying 30 Percent or More of Their Income on Housing, by Race and Ethnicity, American Community Survey, 2005......................................................................................................................7
Figure 1.8. Poverty among Women and Men in Selected Minnesota Counties, American Community Survey, 2005...........................7
Figure 1.9. Sources of Insurance Coverage for Children Living Between 0 to 200 Percent of the Poverty Line, Minnesota Health Access Survey, 2001.......................................................................................................................................................8
Figure 1.10. Sources of Insurance Coverage for Children Living Between 0 to 200 Percent of the Poverty Line, Minnesota Health Access Survey, 2004.......................................................................................................................................................8
Figure 1.11. Sources of Insurance Coverage for Children Living at 201 Percent of the Poverty Line and Above, Minnesota Health Access Survey, 2001......................................................................................................................................................8
Figure 1.12. Sources of Insurance Coverage for Children Living at 201 Percent of the Poverty Line and Above, Minnesota Health Access Survey, 2004......................................................................................................................................................8
Figure 2.1. I Feel Safe At School, Minnesota Student Survey, 2004...................................................................................................12
Figure 2.2. I Feel Safe Going To and From School, Minnesota Student Survey, 2004........................................................................12
Figure 2.3. Reasons for Use of Drugs or Alcohol, Minnesota Student Survey, 2004...............................................................................17
Figure 2.4. Selected Reasons for Drug and Alcohol Use among Girls and Boys, by Race and Ethnicity, Minnesota Student Survey, 2004................................................................................................................................................................18
Figure 3.1. Percent of Girls and Boys Who Report Having Had Sex, by Race and Ethnicity, Minnesota Student Survey, 2004................................................................................................................................................................22
Figure 3.2. Birth Rates for Teenage Girls, Ages 15 to 19, in Minnesota and the United States, Centers for Disease Control and Prevention, 2005...................................................................................................................................22
Figure 3.3. Birth Rates for Minnesota Girls Aged 15 to 19, by Race and Ethnicity, Minnesota Department of Health, 1997-2001 and 2001-2005.........................................................................................................................................................................23
Figure 3.4. Pregnancy Rates for Girls 15 to 19, by Race and Ethnicity, Minnesota Organization on Adolescent Pregnancy, Prevention and Parenting, 2002-2004..................................................................................................................................23
lIsT of fIGuRes, TAbles, And MAps
vChapter 1. Socioeconomic Landscape
Figure 3.5. Communication with Partner about STDs and Pregnancy Prevention among Sexually Active Girls and Boys, by Race and Ethnicity, Minnesota Student Survey, 2004.........................................................................................................25
Figure 3.6. Birth Control and Condom Use among Sexually Active Girls and Boys, by Race and Ethnicity, Minnesota Student Survey, 2004.................................................................................................................................................................25
Figure 3.7. Girls’ and Boys’ Selected Reasons for Waiting to Have Sex, Minnesota Student Survey, 2004...........................................26
Figure 4.1. Weight Perceptions among Girls and Boys, Minnesota Student Survey, 2004.....................................................................30
Figure 4.2. Self Esteem by Gender, Minnesota Student Survey, 2004.....................................................................................................32
Figure 4.3. Composite Self-Esteem Scores for Girls and Boys, by Race and Ethnicity and Grade Level, Minnesota Student Survey, 2004................................................................................................................................................................32
Figure 5.1. Percent Who Like School, by Gender and Race and Ethnicity, Minnesota Student Survey, 2004.................................38
Figure 5.2. Percent Reporting Truancy in Past 30 Days, by Gender and Race and Ethnicity, Minnesota Student Survey, 2004...............................................................................................................................................................38
Figure 5.3. Percent of Girls and Boys Spending 6 or More Hours Per Week on a Given Activity, Minnesota Student Survey, 2004...............................................................................................................................................................39
Figure 5.4. Percent of Girls and Boys Spending 6 or More Hours Per Week on Studying, by Race and Ethnicity, Minnesota Student Survey, 2004..............................................................................................................................................................39
Figure 5.5. Percent of Girls and Boys Spending 6 or More Hours Per Week Doing Chores/Babysitting, Minnesota Student Survey, 2004..............................................................................................................................................................39
Figure 5.6. Computer Usage among Girls and Boys, Minnesota Student Survey, 2004.....................................................................40
Figure 5.7. Composite ACT Scores for Students in Minnesota and the United States, by Race and Ethnicity, ACT, 2006..................40
Figure 5.8. Mean SAT Scores for Girls and Boys in Minnesota, College Board, 2006........................................................................41
Figure 5.9. Mean Advanced Placement Scores by Gender and Race and Ethnicity, College Board, 2006.......................................41
Figure 5.10. Public School Graduation and Dropout Rates, Minnesota Department of Education, 2006...........................................42
Figure 5.11. Educational Aspirations among Girls and Boys, Minnesota Student Survey, 2004........................................................43
Figure 5.12. Non-College Aspirations for Girls and Boys, by Race and Ethnicity, Minnesota Student Survey, 2004...............................................................................................................................................................43
Figure 5.13. College Plans and Beyond for Girls and Boys, by Race and Ethnicity, Minnesota Student Survey, 2004...............................................................................................................................................................43
Appendix figures
Appendix Figure 1.1. Poverty among Girls and Boys Under 18 in Minnesota by Selected Counties, American Community Survey, 2005...........................................................................................................................................................52
Appendix Figure 2.1. I Feel Drugs and Alcohol are a Problem a School, Minnesota Student Survey, 2004......................................55
Appendix Figure 2.2. I Feel Gangs are a Problem at School, Minnesota Student Survey, 2004.........................................................55
Tables
Table 1.1. Poverty by Age, Gender, and Race and Ethnicity, American Community Survey, 2005............................................................5
Table 1.2. Families with Related Children Under 18 in Poverty in Minnesota, by Family Type and Race and Ethnicity, American Community Survey, 2005..............................................................................................................................................................6
Table 1.3. Families with Related Children Under 18 in Poverty by Family Type in Selected Minnesota Counties, American Community Survey, 2005..............................................................................................................................................................7
vi Status of Girls in Minnesota
Table 1.4. Percent of Females and Males without Health Insurance in Minnesota by Age, Minnesota Health Access Survey, 2001 and 2004........................................................................................................................................7
Table 2.1. Perception of Racism in the School Environment, by Gender and Race and Ethnicity, Minnesota Student Survey, 2004.................................................................................................................................................................12
Table 2.2. Victimization at School, by Gender and Race and Ethnicity, Minnesota Student Survey, 2004............................................13
Table 2.3. Percent of Students Reporting Physical or Sexual Abuse, by Gender and Race and Ethnicity, Minnesota Student Survey, 2004.................................................................................................................................................................14
Table 2.4. Percent of Girls and Boys Experiencing Dating Violence or Date Rape, Minnesota Student Survey, 2004.......................14
Table 2.5. Percent Tobacco Use/Nonuse by Gender and Race and Ethnicity, Minnesota Student Survey, 2004...................................14
Table 2.6. Percent Alcohol Use/Nonuse by Gender and Race and Ethnicity, Minnesota Student Survey, 2004...............................15
Table 2.7. Percent of Students Who Have Used Drugs in the Past 12 Months, by Gender and Grade Level, Minnesota Student Survey, 2004.................................................................................................................................................................15
Table 2.8. Percent of Students Who Have Used Drugs in the Past 12 Months, by Gender and Race and Ethnicity, Minnesota Student Survey, 2004.................................................................................................................................................................17
Table 2.9. Apprehension of Youth and Youth Runaways in Minnesota..................................................................................................18
Table 2.10. Mean Responses for Anti Social Behavior, by Gender and Race and Ethnicity, Minnesota Student Survey, 2004.................................................................................................................................................................19
Table 3.1. Number of Sex Partners for Girls and Boys in the Past Year, by Race and Ethnicity, Minnesota Student Survey, 2004.................................................................................................................................................................22
Table 3.2. Induced Abortions in Minnesota, Minnesota Department of Health, 2006...........................................................................24
Table 4.1. Methods of Weight Control, by Gender and Race and Ethnicity, Minnesota Student Survey, 2004.........................................30
Table 4.2. Girls’ and Boys’ Weight Control Methods, by Weight Perceptions, Minnesota Student Survey, 2004....................................31
Table 4.3. Correlations Between Self-Esteem and Weight Perceptions for Girls and Boys, Minnesota Student Survey, 2004................................................................................................................................................................31
Table 4.4. Correlations Between Self-Esteem and Risky Behaviors for Girls and Boys, Minnesota Student Survey, 2004................................................................................................................................................................33
Table 4.5. Percent of Girls and Boys Reporting Suicidal Thoughts and Attempts, by Gender and Race and Ethnicity, Minnesota Student Survey, 2004................................................................................................................................................................33
Table 5.1. Grades Most Often Attained by Girls and Boys, by Race and Ethnicity and Grade Level, Minnesota Student Survey, 2004...............................................................................................................................................................40
Table 5.2. Percent of Minnesota Students Meeting ACT College Readiness Benchmarks (CRBs), by Gender and Race and Ethnicity, ACT, 2007...........................................................................................................................................41
Table 5.3. Mean SAT Scores, by Gender and Race and Ethnicity, College Board, 2006..........................................................................41
Table 5.4. Educational Attainment of the Minnesota Household Population, by Age and Gender, Minnesota Department of Administration, 2005......................................................................................................................................42
Appendix Tables
Appendix Table 1.1. Number of Youth in Minnesota and the United States, by Gender and Race and Ethnicity, American Community Survey, 2005............................................................................................................................................................52
Appendix Table 1.2. Number of Youth, by Gender and Age, in Selected Minnesota Counties, American Community Survey, 2005............................................................................................................................................................53
Appendix Table 1.3. Median Family Income by Family Type in Minnesota and the United States, by Race and Ethnicity, American Community Survey, 2005............................................................................................................................................................53
Appendix Table 1.4. Median Family Income for Families with Own Children by Family Type in Selected Minnesota Counties, American Community Survey, 2005............................................................................................................................................................53
viiChapter 1. Socioeconomic Landscape
Appendix Table 1.5. Proportion of Households in Minnesota and the United States that Pay 30 Percent or More of their Income on Housing, American Community Survey, 2005............................................................................................53
Appendix Table 1.6. Proportion of Households in Selected Minnesota Counties that Pay 30 Percent or More of their Income on Housing, American Community Survey, 2005............................................................................................53
Appendix Table 2.1. Daily Cigarette Use, by Gender and County, Minnesota Student Survey, 2004....................................................54
Appendix Table 2.2. Alcohol Use in the Past Month, by Gender and County, Minnesota Student Survey, 2004...................................56
Appendix Table 2.3. Drug Use in the Past Year, by Gender and County, Minnesota Student Survey, 2004.........................................57
Appendix Table 2.4. Student Reasons for Use/Non-Use of Alcohol or Drugs, by Gender and Race and Ethnicity, Minnesota Student Survey, 2004.................................................................................................................................................................59
Appendix Table 3.1. Mean Number of Pregnancies, by Gender and Race and Ethnicity, Minnesota Student Survey, 2004.................................................................................................................................................................60
Appendix Table 3.2. Reasons for Sexual Abstinence Selected by Girls and Boys, by Race and Ethnicity, Minnesota Student Survey, 2004.................................................................................................................................................................60
Appendix Table 4.1. Binge Eating and Nutrition, by Gender and Race and Ethnicity, Minnesota Student Survey, 2004.................................................................................................................................................................60
Appendix Table 4.2. Percent Reporting Suicidal Thoughts and Attempts, by Gender and County, Minnesota Student Survey, 2004.................................................................................................................................................................61
Appendix Table 5.1. Percent of Girls and Boys Spending Time on Various Activities, by Race and Ethnicity, Minnesota Student Survey, 2004.................................................................................................................................................................62
Appendix Table 5.2. Student Responses about Computer Activities, by Gender and Race and Ethnicity, Minnesota Student Survey, 2004.................................................................................................................................................................62
Maps
Map 1. Percent of Girls and Boys Reporting Daily Tobacco Use.....................................................................................................................16
Map 2. Percent of Girls and Boys Reporting Alcohol Use in the Past Month..............................................................................................16
Map 3. Composite Drug Use Score, by County...............................................................................................................................................16
Map 4. Percent of Girls and Boys Who Have Ever Had Suicidal Thoughts................................................................................................34
Map 5. Percent of Girls and Boys Who Have Ever Attempted Suicide......................................................................................................34
Appendix Maps
Appendix Map 2.1: Percent of Girls and Boys Reporting Marijuana Use within the Last Year...................................................................55
Appendix Map 2.2. Percent of Girls and Boys Reporting Use of ‘Others’ Prescription Drugs’ within the Last Year...................................55
Appendix Map 2.3. Percent of Girls and Boys Reporting Methamphetamine Use within the Last Year.................................................55
Appendix Map 2.4. Percent of Girls and Boys Reporting Amphetamine Use within the Last Year.......................................................55
Appendix Map 2.5. Percent of Girls and Boys Reporting LSD Use within the Last Year..........................................................................59
Appendix Map 2.6. Percent of Girls and Boys Reporting Ecstasy Use within the Last Year.....................................................................59
Appendix Map 2.7. Percent of Girls and Boys Reporting Barbiturate Use within the Last Year...............................................................59
Appendix Map 2.8. Percent of Girls and Boys Reporting Narcotic Use within the Last Year.................................................................59
Appendix Map 2.9. Percent of Girls and Boys Reporting Inhalant Use within the Last Year...................................................................60
Appendix Map 2.10. Percent of Girls and Boys Reporting Crack Use within the Last Year....................................................................60

1Chapter 1. Socioeconomic Landscape
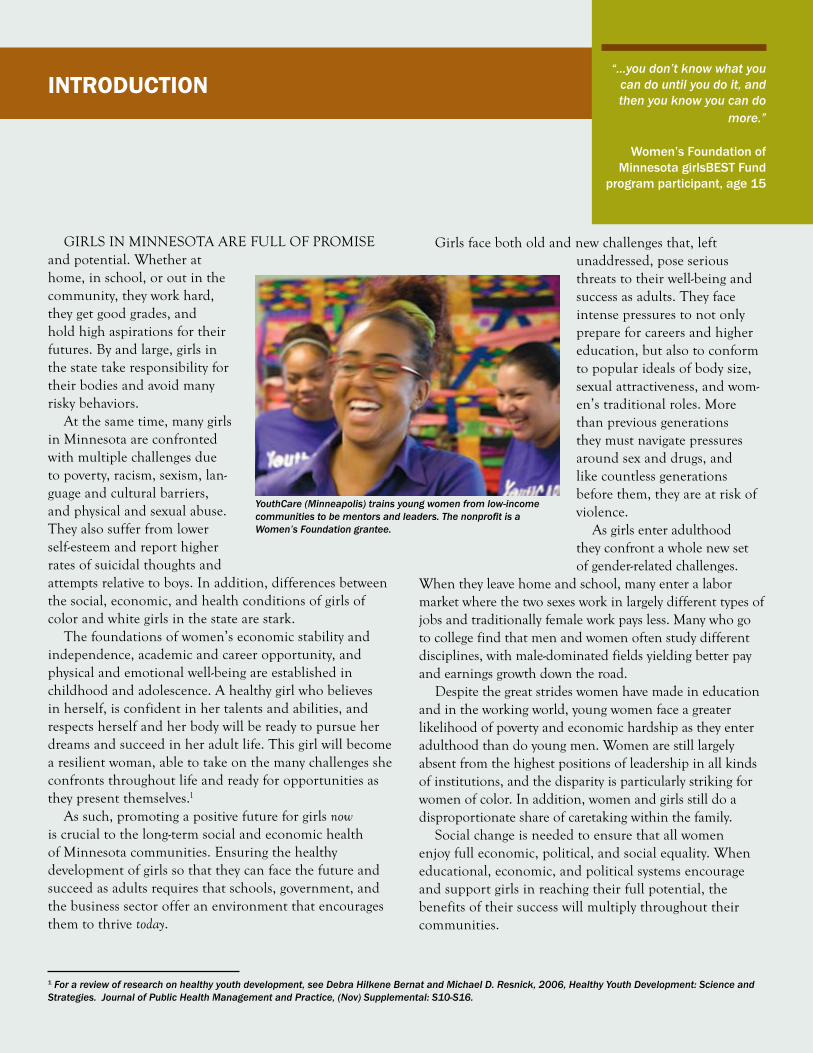
Girls in Minnesota are full of proMise and potential. Whether at home, in school, or out in the community, they work hard, they get good grades, and hold high aspira tions for their futures. By and large, girls in the state take responsibility for their bodies and avoid many risky behav iors.
at the same time, many girls in Minnesota are confronted with multiple challenges due to poverty, racism, sexism, language and cultural barriers, and physical and sexual abuse. they also suffer from lower selfesteem and report higher rates of suicidal thoughts and attempts relative to boys. in addition, differences between the social, economic, and health conditions of girls of color and white girls in the state are stark.
the foundations of women’s economic stability and independence, academic and career opportunity, and physical and emotional wellbeing are established in childhood and adolescence. a healthy girl who believes in herself, is confident in her talents and abilities, and respects herself and her body will be ready to pursue her dreams and succeed in her adult life. this girl will become a resilient woman, able to take on the many challenges she confronts throughout life and ready for opportunities as they present themselves.1
as such, promoting a positive future for girls now is crucial to the longterm social and economic health of Minnesota communities. ensuring the healthy development of girls so that they can face the future and succeed as adults requires that schools, government, and the business sector offer an environment that encourages them to thrive today.
InTRoducTIon“...you don’t know what you
can do until you do it, and then you know you can do
more.”
Women’s Foundation of Minnesota girlsBEST Fund
program participant, age 15
Girls face both old and new challenges that, left unad dressed, pose serious threats to their wellbeing and success as adults. they face intense pressures to not only prepare for careers and higher education, but also to conform to popular ideals of body size, sexual attractiveness, and women’s traditional roles. More than previous generations they must navigate pressures around sex and drugs, and like countless generations before them, they are at risk of violence.
as girls enter adulthood they confront a whole new set of genderrelated challenges.
When they leave home and school, many enter a labor market where the two sexes work in largely different types of jobs and traditionally female work pays less. Many who go to college find that men and women often study different disciplines, with maledominated fields yielding better pay and earnings growth down the road.
Despite the great strides women have made in education and in the working world, young women face a greater likelihood of poverty and economic hardship as they enter adulthood than do young men. Women are still largely absent from the highest positions of leadership in all kinds of institutions, and the disparity is particularly striking for women of color. in addition, women and girls still do a disproportionate share of care taking within the family.
social change is needed to ensure that all women enjoy full economic, political, and social equality. When educational, economic, and political systems encourage and support girls in reaching their full potential, the benefits of their success will multiply throughout their communities.
1 For a review of research on healthy youth development, see Debra Hilkene Bernat and Michael D. Resnick, 2006, Healthy Youth Development: Science and Strategies. Journal of Public Health Management and Practice, (Nov) Supplemental: S10-S16.
YouthCare (Minneapolis) trains young women from low-income communities to be mentors and leaders. The nonprofit is a Women’s Foundation grantee.
2 Status of Girls in Minnesota
the Status of Girls in Minnesota represents a collaborative effort by the Women’s foundation of Minnesota and the insti tute for Women’s policy research (iWpr) to provide detailed information on the status of girls in Minnesota. With the data and policy implications outlined in this report, the Women’s foundation of Minne sota will engage fifteen communities as part of its statewide road to equality tour in 2008. in each community, the Women’s foundation will hold a public meeting to introduce the research and focus groups with community, business, and political leaders. in formation gathered from the tour will inform the founda tion’s future public policy priori ties and focus.
Both the Women’s foundation and iWpr hope that this report will serve as a tool for advocates, researchers, and policy makers in developing a set of interventions that will en sure girls’ economic, social, and political equality.
the Status of Girls in Minnesota draws on data from the u.s. Cen sus Bureau, the Minnesota student survey interagency team, the Minnesota Department of Health, the Minnesota Department of ed ucation, and other sources to ex amine the economic, social, phys ical, and psychological wellbeing of girls in the state. each chapter intro duces key issues and data related to girls in Minnesota, as well as a set of recommendations for policy change, program improvement, and advocacy efforts to improve the status of Minnesota’s girls.
3Chapter 1. Socioeconomic Landscape
family Income and poverty2
Contrary to the popular conception of the american dream in which every individual has a chance to succeed, family income is sadly predictive of a girls’ later success, with poverty creating a hurdle that is very difficult for many to overcome. indeed, the economic security of families is incredibly important to the future outcomes of children and young adults. research on child development points to the detrimental and longlasting neurological effects of poverty on children’s brain architecture and development, shaping their future experiences and ultimately, undermining their access to equal opportunity (national scientific Council on
cHApTeR 1socioeconomic landscape
433,565455,951
347,743366,061
26,512 25,129 19,346 21,807 5,640 7,834 22,172 22,147
All White, non-Hispanic
African American Asian American American Indian Hispanic
Figure 1.1: Number of Boys and Girls Ages 5 to 17 in Minnesota, by Race/Ethnicity, 2005
Girls
Boys
figure 1.1. Number of Boys and Girls Ages 5 to 17 in Minnesota, by Race/Ethnicity, 2005
notes: see the Methodology Appendix for information on how race and ethnicity are categorized in the Census Bureau’s American Community survey.source: U.s. Department of Commerce, Bureau of the Census 2006.Calculated by the Institute for Women’s Policy Research.
demographics and family structure
Minnesota is home to nearly 900,000 girls and boys aged 5 to 17 (see Figure 1.1), with school-age girls making up 8.6 percent of the state’s total population (data not shown; see Appendix Table 1.1).
Among those girls, 19.8 percent are either non-white (African American, Asian American, American Indian, and other races or two or more races) or Hispanic (calculations not shown; figure 1.1).
While girls of color make up a small share of girls in the state, 11 counties in Minnesota have seen their populations of color grow by more than 58 percent (Anoka, Carver,
the Developing Child 2007; Korenman, Miller, and sjaastad 1994). Girls in impoverished and lowincome families that are struggling to get by are faced with all of the stresses and consequences of living in poor communities and under poor conditions, in addition to the genderspecific challenges that all girls experience regardless of income level. among girls of color these challenges are compounded further still by the racism and discrimination experienced by their communities.
Many girls face an adulthood in which they will be primary, if not sole, breadwinners for their families, and for those with low education levels, this will be no easy feat. Women play a large and growing role in the economic security of families and communities. in married couple
Chisago, Isanti, Pennington, Red Lake, Scott, Sherburne, Todd, Washington, and Wright; Toney 2007). The economic health and stability of these growing communities is becoming ever more crucial to the economic health and stability of the state.
As in other parts of the country, a substantial portion of families with children in the state are headed by single parents, which has serious implications for the youth that reside in those families. Among families with children under age 18 in Minnesota, 19.9 percent are headed solely by women, 7.6 are headed solely by men, and 72.5 are headed by married couples (see Figure 1.3). In contrast to the overall picture, among African American, and American Indian families with children under 18,
72.5%
19.9%
7.6%
75.9%
16.9%
7.2%
35.5%
54.7%
9.7%
78.2%
14.9%
6.9%
35.1%
42.7%
22.2%
59.8%
29.8%
10.4%
All White, Non-Hispanic
African American Asian American American Indian Hispanic
Figure 1.2: Families with Related Children Under 18 in Minnesota, by Family Type and Race and Ethnicity, 2005
Married Couple FamiliesFemale-Headed FamiliesMale-Headed Families
figure 1.2. Families with Related Children Under 18 in Minnesota, by Family Type and Race and Ethnicity, 2005
notes: see the Methodology Appendix for information on how race and ethnicity are categorized in the Census Bureau’s American Community survey.source: U.s. Bureau of the Census 2006.Calculated by the Institute for Women’s Policy Research.
2 Poverty data presented in this report are based on the official federal government poverty measure (the Federal Poverty Threshold), which was $19,806 for a family of four with two children in 2005 (U.S. Depart-ment of Commerce, Bureau of the Census 2006b). The Federal Poverty Threshold, the official poverty measure of the United States uses dollar amounts to determine poverty status based on family size, age of family members, and number of related children (U.S. Department of Commerce, Bureau of the Census 2007).
4 Status of Girls in Minnesota
families, wives’ median contribution to family income jumped from 26 percent in 1979 to 34 percent in the year 2000 (Mishel, Bernstein, and Boushey 2003). other research has shown that women’s earnings have become increasingly important to keeping families above poverty (Cancian, Danziger, and Gottschalk 1993; Cattan 1998; and spalterroth, Hartmann, and andrews 1990). obstacles like the wage gap, women’s prevalence in lowpaying, femaledominated occupations, and women’s lower relative hours of paid work all impede their ability to ensure their families’ financial security. this is particularly true for singlemothers. Women’s ability to provide for their families ensures stability for girls in a number of arenas, with housing and food security important among them.
Health insurance coverage is also of critical importance to women and their families, providing a safety net for families that cannot otherwise afford medical care for emergencies or chronic conditions. nationally, little more than one in three lowincome working mothers has employerprovided health insurance, despite the fact that such coverage not only improves health, but also has been shown to increase job retention among lowincome mothers (lee 2007). opening doors to good employment
Women’s foundation of Minnesota GRAnTee HIGHlIGHT
Women Venture: Change is on the Horizon
“Women have less access to higher-paying jobs in non-traditional fields – jobs that would not only provide a livable wage, but would also give them opportunities for advancement and long-term economic success. [Job segregation] is reinforced by job training programs and employers, who have implicitly discouraged women from pursuing these paths.”
- WomenVenture
WomenVenture worked with a woman auto technician who was frustrated that her workplace only had a men’s room in the employee area. As an employee, she had to walk to their public restroom at the front of the shop to use the bathroom. When her workplace finally added a women’s bathroom to the employee area, she knew they were starting to change attitudes and increase access for women auto technicians.
demographics and family structure (cont’d)
female-headed families are the most common family type. The share of all families with children under 18 that are
female-headed by county ranges from a low of 8.6 percent
in Sherburne County to a high of 26.6 percent in Ramsey County (Figure 1.4). Across the state’s counties, married couple families with children make up the largest share of family types, ranging from a low of 65.8 percent in Ramsey to a high of 87.9 percent in Carver.
74.6%
18.7%
6.7%
87.9%
8.7%
3.3%
71.0%
22.3%
6.7%
72.2%
20.2%
7.6%
73.9%
19.4%
6.7%
65.8%
26.6%
7.5%
69.6%
21.2%
9.2%
84.2%
10.1%5.7%
79.6%
8.6%11.8%
74.9%
18.8%
6.3%
76.8%
14.4%
8.7%
78.8%
16.4%
4.8%
Figure 1.3: Families with Own Children Under 18 by Family Type, Selected Minnesota Counties, American Community Survey, 2005
Married Couple FamiliesFemale Headed Families Male Headed Families
Anoka Dakota Olmsted St. Louis Sherburne Washington Carver Hennepin Ramsey Scott Stearns Wright
figure 1.3. Families with Own Children Under 18 by Family Type, Selected Counties, 2005
notes: see the Methodology Appendix for information on how race and ethnicity are categorized in the Census Bureau’s American Community survey.source: U.s. Department of Commerce, Bureau of the Census 2006.Calculated by the Institute for Women’s Policy Research.
5Chapter 1. Socioeconomic Landscape
Table 1.1. Poverty by Age, and by Gender and Race and Ethnicity, 2005
notes: see the Methodology Appendix for information on how race and ethnicity are categorized in the Census Bureau’s American Community survey. source: U.s. Department of Commerce, Bureau of the Census 2006. Calculated by the Institute for Women’s Policy Research.
Female Male Female Male Female Male Female Male12.0% 11.2% 9.7% 7.1% 18.8% 18.3% 13.5% 9.5%7.3% 6.8% 8.0% 5.6% 11.0% 10.7% 10.0% 7.0%
43.4% 41.4% 31.9% 23.8% 36.4% 35.6% 24.7% 16.3%22.0% 24.6% 14.3% 14.3% 12.1% 13.1% 11.6% 10.7%41.5% 28.8% 27.8% 17.3% 32.3% 32.4% 25.2% 19.6%27.0% 23.0% 23.5% 15.4% 29.3% 28.9% 22.5% 15.5%Hispanic
African AmericanAsian AmericanAmerican Indian
Minnesota United States
Table 1.1: Poverty by Age, Gender, and Race and Ethnicity, American Community Survey, 2005
Under 18 Over 18 Under 18 Over 18
AllWhite, Non-Hispanic
$63,998$72,029
$43,929$31,621
$66,575$73,144
$47,819$35,478
$27,609$50,840
$22,978$20,265
$57,490$64,414
$35,882$28,235
$37,215$52,056
$26,937$23,791
All
White, non-Hispanic
African American
Asian American
Hispanic
Figure 1.4: Median Family Income in Minnesota, by Family Type and Race and Ethnicity, American Community Survey, 2005
Female-Headed FamliesMale-Headed FamiliesMarried Couple FamiliesAll Families
figure 1.4. Median Family Income by Family Type and Race and Ethnicity in Minnesota, American Community Survey, 2005
notes: see the Methodology Appendix for information on how race and ethnicity are categorized in the Census Bureau’s American Community survey. In this figure, families include those with and without children.source: U.s. Department of Commerce, Bureau of the Census 2006.Calculated by the Institute for Women’s Policy Research.
opportunities that provide muchneeded benefits like health insurance coverage is crucial to the ability of single mothers to ensure their children’s physical wellbeing and to serve as reliable contributors to their families’ financial security.
this chapter examines poverty, family income, economic hardship, and health insurance coverage for girls and families in Minnesota, with a particular focus on wide disparities in wellbeing by race and ethnicity and family type.
Median Income and Poverty by Race and Family Type poverty is prevalent among women and girls in
Minnesota, with nearly 10 percent of women and 12 percent of girls living below poverty in the state, and with men and boys experiencing slightly less poverty (see table 1.1). these poverty rates, however, are lower than those observed among women and girls in the nation as a whole.
it should be noted that the federal poverty threshold is intended for use as a statistical yardstick, and according the
u.s. Census Bureau, is not a measure of what people and families need to live. it allows for consistent comparisons over time, but is largely inadequate in determining a family’s basic needs (u.s. Department of Commerce, Bureau of the Census 2007). the inadequacy of this measure would indicate that even more of Minnesota’s girls are living in families where income falls short of meeting basic needs.
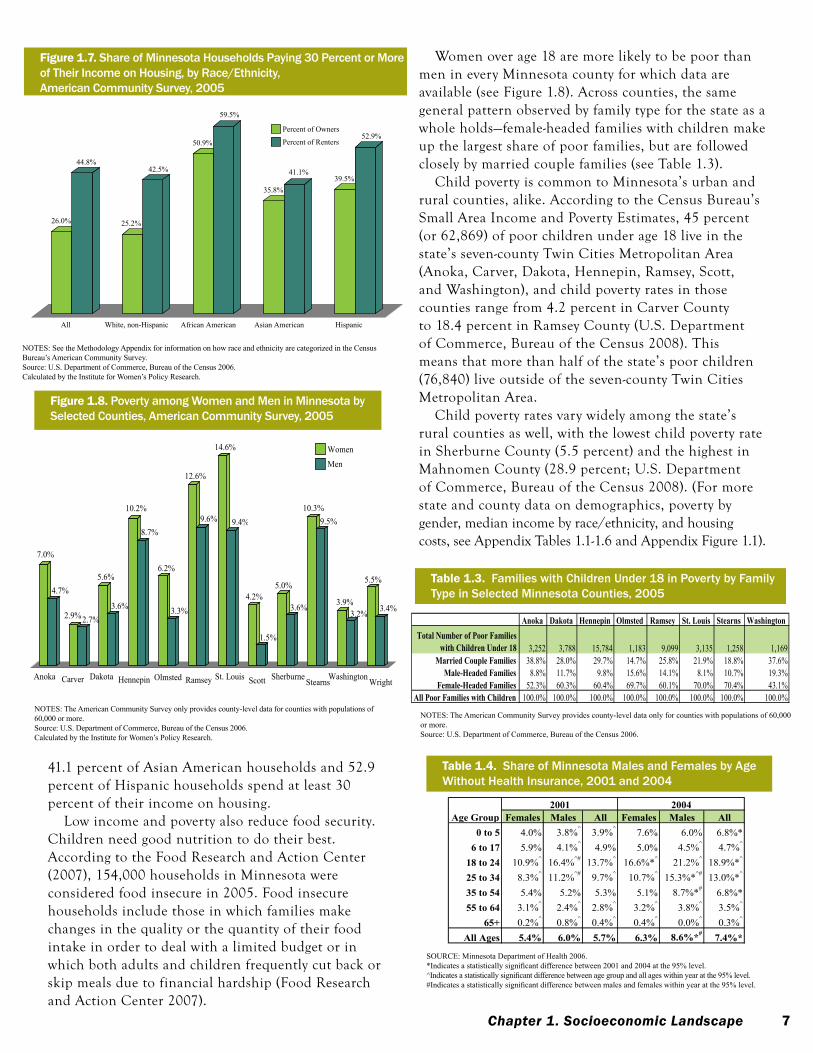
Despite a generally more positive economic picture for Minnesota relative to the nation as a whole, breakdowns by race and gender and race and family type reveal substantial disparities in the economic wellbeing of certain populations in the state. regardless of family type, white families have the highest median incomes and african american families have the lowest (figure 1.4).
the median income for white marriedcouple families is $73,144, compared with $50,840 for african american marriedcouple families.
the disparity is also great among femaleheaded families, with white families bringing in a median income of $35,478 and african american families bringing in $20,265.
likewise, wide variations in poverty are exposed when examining gender and race breakdowns. as shown in figures 1.5 and 1.6, african americans, asian americans, american indians, and Hispanics in Minnesota experience higher poverty rates than the state’s white population and with the exception of asian americans, girls and women of each racial and ethnic group are more likely to live in poverty than their male counterparts.
6 Status of Girls in Minnesota
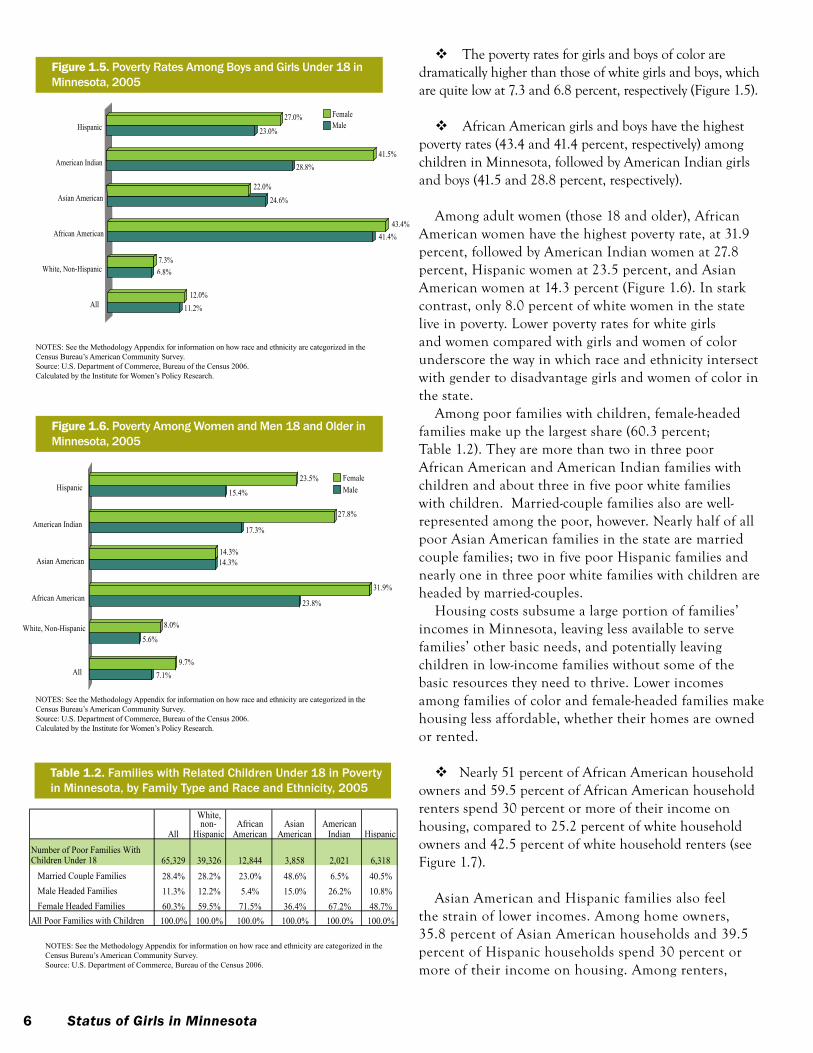
the poverty rates for girls and boys of color are dramatically higher than those of white girls and boys, which are quite low at 7.3 and 6.8 percent, respectively (figure 1.5).
african american girls and boys have the highest poverty rates (43.4 and 41.4 percent, respectively) among children in Minnesota, followed by american indian girls and boys (41.5 and 28.8 percent, respectively).
among adult women (those 18 and older), african american women have the highest poverty rate, at 31.9 percent, followed by american indian women at 27.8 percent, Hispanic women at 23.5 percent, and asian american women at 14.3 percent (figure 1.6). in stark contrast, only 8.0 percent of white women in the state live in poverty. lower poverty rates for white girls and women compared with girls and women of color underscore the way in which race and ethnicity intersect with gender to disadvantage girls and women of color in the state.
among poor families with children, femaleheaded families make up the largest share (60.3 percent; table 1.2). they are more than two in three poor african american and american indian families with children and about three in five poor white families with children. Marriedcouple families also are wellrepresented among the poor, however. nearly half of all poor asian american families in the state are married couple families; two in five poor Hispanic families and nearly one in three poor white families with children are headed by marriedcouples.
Housing costs subsume a large portion of families’ incomes in Minnesota, leaving less available to serve families’ other basic needs, and potentially leaving children in lowincome families without some of the basic resources they need to thrive. lower incomes among families of color and femaleheaded families make housing less affordable, whether their homes are owned or rented.
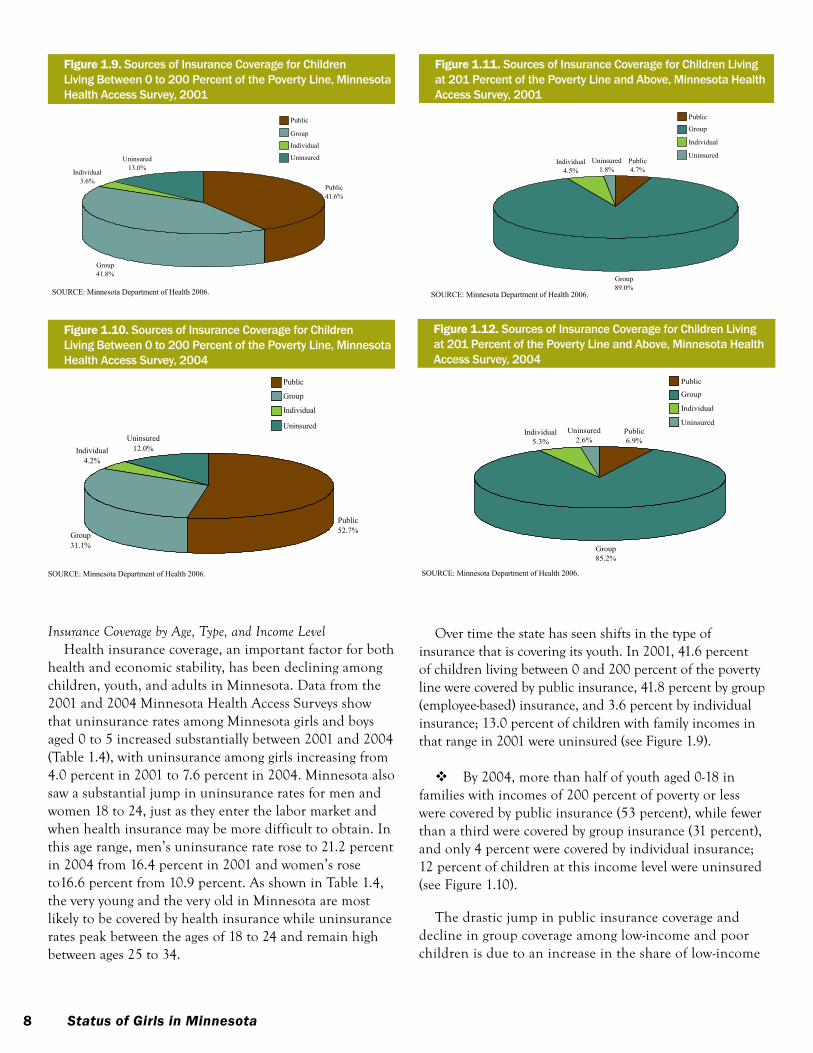
nearly 51 percent of african american household owners and 59.5 percent of african american household renters spend 30 percent or more of their income on housing, compared to 25.2 percent of white household owners and 42.5 percent of white household renters (see figure 1.7).
asian american and Hispanic families also feel the strain of lower incomes. among home owners, 35.8 percent of asian american households and 39.5 percent of Hispanic households spend 30 percent or more of their income on housing. among renters,
Table 1.2. Families with Related Children Under 18 in Poverty in Minnesota, by Family Type and Race and Ethnicity, 2005
notes: see the Methodology Appendix for information on how race and ethnicity are categorized in the Census Bureau’s American Community survey. source: U.s. Department of Commerce, Bureau of the Census 2006.
All
White, non-
Hispanic African
AmericanAsian
AmericanAmerican
Indian Hispanic
Number of Poor Families With Children Under 18 65,329 39,326 12,844 3,858 2,021 6,318 Married Couple Families 28.4% 28.2% 23.0% 48.6% 6.5% 40.5% Male Headed Families 11.3% 12.2% 5.4% 15.0% 26.2% 10.8% Female Headed Families 60.3% 59.5% 71.5% 36.4% 67.2% 48.7%All Poor Families with Children 100.0% 100.0% 100.0% 100.0% 100.0% 100.0%
Notes:
Table 1.2: Families with Related Children Under 18 in Poverty in Minnesota, by Family Type and Race and Ethnicity, 2005
Source: U.S. Department of Commerce, Bureau of the Census 2006.
See the Methodology Appendix for information on how race and ethnicity are categorized in the Census Bureau's American Community Survey.
11.2%12.0%
6.8%7.3%
41.4%43.4%
24.6%22.0%
28.8%41.5%
23.0%27.0%
All
White, Non-Hispanic
African American
Asian American
American Indian
Hispanic
Figure 1.5. Poverty Rates Among Boys and Girls Under 18 in Minnesota, 2005
FemaleMale
figure 1.5. Poverty Rates Among Boys and Girls Under 18 in Minnesota, 2005
notes: see the Methodology Appendix for information on how race and ethnicity are categorized in the Census Bureau’s American Community survey.source: U.s. Department of Commerce, Bureau of the Census 2006.Calculated by the Institute for Women’s Policy Research.
7.1%9.7%
5.6%
8.0%
23.8%
31.9%
14.3%14.3%
17.3%
27.8%
15.4%
23.5%
All
White, Non-Hispanic
African American
Asian American
American Indian
Hispanic
Figure 1.6: Poverty Among Women and Men 18 and Older in Minnesota, 2005
FemaleMale
figure 1.6. Poverty Among Women and Men 18 and Older in Minnesota, 2005
notes: see the Methodology Appendix for information on how race and ethnicity are categorized in the Census Bureau’s American Community survey.source: U.s. Department of Commerce, Bureau of the Census 2006.Calculated by the Institute for Women’s Policy Research.
7Chapter 1. Socioeconomic Landscape
41.1 percent of asian american households and 52.9 percent of Hispanic households spend at least 30 percent of their income on housing.
low income and poverty also reduce food security. Children need good nutrition to do their best. according to the food research and action Center (2007), 154,000 households in Minnesota were considered food insecure in 2005. food insecure households include those in which families make changes in the quality or the quantity of their food intake in order to deal with a limited budget or in which both adults and children frequently cut back or skip meals due to financial hardship (food research and action Center 2007).
Table 1.3. Families with Children Under 18 in Poverty by Family Type in Selected Minnesota Counties, 2005
notes: the American Community survey provides county-level data only for counties with populations of 60,000 or more. source: U.s. Department of Commerce, Bureau of the Census 2006.
Anoka Dakota Hennepin Olmsted Ramsey St. Louis Stearns Washington Total Number of Poor Families
with Children Under 18 3,252 3,788 15,784 1,183 9,099 3,135 1,258 1,169 Married Couple Families 38.8% 28.0% 29.7% 14.7% 25.8% 21.9% 18.8% 37.6%
Male-Headed Families 8.8% 11.7% 9.8% 15.6% 14.1% 8.1% 10.7% 19.3% Female-Headed Families 52.3% 60.3% 60.4% 69.7% 60.1% 70.0% 70.4% 43.1%
All Poor Families with Children 100.0% 100.0% 100.0% 100.0% 100.0% 100.0% 100.0% 100.0%
Notes:The American Community Survey provides county-level data only for counties with populations of 60,000 or more. Source: U.S. Department of Commerce, Bureau of the Census 2006.
Table 1.3: Families with Related Children Under 18 in Poverty by Family Type in Selected Minnesota Counties, American Community Survey, 2005
26.0%
44.8%
25.2%
42.5%
50.9%
59.5%
35.8%
41.1%39.5%
52.9%
All White, non-Hispanic African American Asian American Hispanic
Figure 1.7: Share of Minnesota Households Paying 30 Percent or More of Their Income on Housing, by Race and Ethnicity, American Community Survey, 2005
Percent of Owners
Percent of Renters
Source: U.S. Department of Commerce, Bureau of the Census 2006.
figure 1.7. Share of Minnesota Households Paying 30 Percent or More of Their Income on Housing, by Race/Ethnicity, American Community Survey, 2005
notes: see the Methodology Appendix for information on how race and ethnicity are categorized in the Census Bureau’s American Community survey.source: U.s. Department of Commerce, Bureau of the Census 2006.Calculated by the Institute for Women’s Policy Research.
7.0%
4.7%
2.9%2.7%
5.6%
3.6%
10.2%
8.7%
6.2%
3.3%
12.6%
9.6%
14.6%
9.4%
4.2%
1.5%
5.0%
3.6%
10.3%9.5%
3.9%3.2%
5.5%
3.4%
Anoka Dakota Olmsted St. Louis Sherburne Washington
Figure 1.8: Poverty among Women and Men in Selected Minnesota Counties, American Community Survey, 2005
WomenMen
Carver Hennepin Ramsey Scott Stearns Wright
figure 1.8. Poverty among Women and Men in Minnesota by Selected Counties, American Community Survey, 2005
notes: the American Community survey only provides county-level data for counties with populations of 60,000 or more. source: U.s. Department of Commerce, Bureau of the Census 2006.Calculated by the Institute for Women’s Policy Research.
Table 1.4. Share of Minnesota Males and Females by Age Without Health Insurance, 2001 and 2004
soURCe: Minnesota Department of Health 2006.*Indicates a statistically significant difference between 2001 and 2004 at the 95% level.^Indicates a statistically significant difference between age group and all ages within year at the 95% level.#Indicates a statistically significant difference between males and females within year at the 95% level.
Females Males All Females Males All0 to 5 4.0% 3.8%^ 3.9%^ 7.6% 6.0% 6.8%*
6 to 17 5.9% 4.1%^ 4.9% 5.0% 4.5%^ 4.7%^
18 to 24 10.9%^ 16.4%^# 13.7%^ 16.6%*^ 21.2%^ 18.9%*^
25 to 34 8.3%^ 11.2%^# 9.7%^ 10.7%^ 15.3%*^# 13.0%*^
35 to 54 5.4% 5.2% 5.3% 5.1% 8.7%*# 6.8%*55 to 64 3.1%^ 2.4%^ 2.8%^ 3.2%^ 3.8%^ 3.5%^
65+ 0.2%^ 0.8%^ 0.4%^ 0.4%^ 0.0%^ 0.3%^
All Ages 5.4% 6.0% 5.7% 6.3% 8.6%*# 7.4%*
Source: Minnesota Department of Health 2006.*Indicates a statistically significant difference between 2001 and 2004 at the 95% level.^Indicates a statistically significant difference between age group and all ages within year at the 95% level.#Indicates a statistically significant difference between males and females within year at the 95% level.
Table 1.4: Percent of Females and Males Without Health Insurance in Minnesota by Age, 2001 and 2004
Age Group2001 2004
Women over age 18 are more likely to be poor than men in every Minnesota county for which data are available (see figure 1.8). across counties, the same general pattern observed by family type for the state as a whole holds—femaleheaded families with children make up the largest share of poor families, but are followed closely by married couple families (see table 1.3).
Child poverty is common to Minnesota’s urban and rural counties, alike. according to the Census Bureau’s small area income and poverty estimates, 45 percent (or 62,869) of poor children under age 18 live in the state’s sevencounty twin Cities Metropolitan area (anoka, Carver, Dakota, Hennepin, ramsey, scott, and Washington), and child poverty rates in those counties range from 4.2 percent in Carver County to 18.4 percent in ramsey County (u.s. Department of Commerce, Bureau of the Census 2008). this means that more than half of the state’s poor children (76,840) live outside of the sevencounty twin Cities Metropolitan area.
Child poverty rates vary widely among the state’s rural counties as well, with the lowest child poverty rate in sherburne County (5.5 percent) and the highest in Mahnomen County (28.9 percent; u.s. Department of Commerce, Bureau of the Census 2008). (for more state and county data on demographics, poverty by gender, median income by race/ethnicity, and housing costs, see appendix tables 1.11.6 and appendix figure 1.1).
8 Status of Girls in Minnesota
over time the state has seen shifts in the type of insurance that is covering its youth. in 2001, 41.6 percent of children living between 0 and 200 percent of the poverty line were covered by public insurance, 41.8 percent by group (employeebased) insurance, and 3.6 percent by individual insurance; 13.0 percent of children with family incomes in that range in 2001 were uninsured (see figure 1.9).
By 2004, more than half of youth aged 018 in families with incomes of 200 percent of poverty or less were covered by public insurance (53 percent), while fewer than a third were covered by group insurance (31 percent), and only 4 percent were covered by individual insurance; 12 percent of children at this income level were uninsured (see figure 1.10).
the drastic jump in public insurance coverage and decline in group coverage among lowincome and poor children is due to an increase in the share of lowincome
Figure 1.9: Sources of Insurance Coverage for Children Living Between 0 to 200 Percent of the Poverty Line, Minnesota Health Access Survey, 2001
Public41.6%
Group 41.8%
Individual3.6%
Uninsured13.0%
Public
Group
Individual
Uninsured
figure 1.9. Sources of Insurance Coverage for Children Living Between 0 to 200 Percent of the Poverty Line, Minnesota Health Access Survey, 2001
soURCe: Minnesota Department of Health 2006.
Figure 1.10: Sources of Insurance Coverage for Children Living Between 0 to 200 Percent of the Poverty Line, Minnesota Health Access Survey, 2004
Public52.7%Group
31.1%
Individual4.2%
Uninsured12.0%
Public
Group
Individual
Uninsured
figure 1.10. Sources of Insurance Coverage for Children Living Between 0 to 200 Percent of the Poverty Line, Minnesota Health Access Survey, 2004
soURCe: Minnesota Department of Health 2006.
Insurance Coverage by Age, Type, and Income LevelHealth insurance coverage, an important factor for both
health and economic stability, has been declining among children, youth, and adults in Minnesota. Data from the 2001 and 2004 Minnesota Health access surveys show that uninsurance rates among Minnesota girls and boys aged 0 to 5 increased substantially between 2001 and 2004 (table 1.4), with uninsurance among girls increasing from 4.0 percent in 2001 to 7.6 percent in 2004. Minnesota also saw a substantial jump in uninsurance rates for men and women 18 to 24, just as they enter the labor market and when health insurance may be more difficult to obtain. in this age range, men’s uninsurance rate rose to 21.2 percent in 2004 from 16.4 percent in 2001 and women’s rose to16.6 percent from 10.9 percent. as shown in table 1.4, the very young and the very old in Minnesota are most likely to be covered by health insurance while uninsurance rates peak between the ages of 18 to 24 and remain high between ages 25 to 34.
Figure 1.11: Sources of Insurance Coverage for Children Living at 201 Percent of the Poverty Line and Above, Minnesota Health Access Survey, 2001
Public4.7%
Group 89.0%
Individual4.5%
Uninsured1.8%
Public
Group
Individual
Uninsured
Source: Minnesota Department of Health 2006.
figure 1.11. Sources of Insurance Coverage for Children Living at 201 Percent of the Poverty Line and Above, Minnesota Health Access Survey, 2001
soURCe: Minnesota Department of Health 2006.
Figure 1.12: Sources of Insurance Coverage for Children Living at 201 Percent of the Poverty Line and Above, Minnesota Health Access Survey, 2004
Public6.9%
Group 85.2%
Individual5.3%
Uninsured2.6%
Public
Group
Individual
Uninsured
figure 1.12. Sources of Insurance Coverage for Children Living at 201 Percent of the Poverty Line and Above, Minnesota Health Access Survey, 2004
soURCe: Minnesota Department of Health 2006.

9Chapter 1. Socioeconomic Landscape
Recommendations for Change
1. Local living wage ordinances based on good measures of what a family needs to maintain a basic standard of living would greatly improve the economic well-being of low-income families. In addition, local governments can adopt regional or county-level Family Budgets, such as those developed by the JOBS NOW Coalition in Minnesota (Ristau, LaFond, and Cederberg 2007). The JOBS NOW Coalition estimates that the income needed for a basic standard of living (including family expenses such as child care, housing, transportation, and more) for a dual-working parent family with two children is more than three times the 2006 poverty level for that family type and more than double the 2006 poverty level for a single parent family with two children (Ristau, LaFond, and Cenderberg 2007). A Family Budget or other such measure could replace the official poverty line as the basis for public program eligibility, opening up services to a larger number of families in need. 2. Expanding the Minnesota Family Investment Program to support higher education opportunities for single-headed households, low-income parents, and teen mothers will increase their earnings potential (Minnesota Department of Human Services 2005), as well as create a culture of learning within families and allow parents to serve as role models and supporters in their girls’ educations.
3. State investments in full-day early care and education interventions for low-income and poor children would help to offset some of the negative effects of poverty on children and would also provide single-mother and dual working parent families with safe, quality environments for their children while they work. Expanding child care resources for low-income families would also decrease the need for teen girls to spend precious time caring for siblings when they could be studying or participating in extracurricular activities.
and poor families in the state, resulting in an increase in the pool of those eligible for public coverage (Minnesota Department of Health 2005). this shift was particularly acute among Hispanics in Minnesota, with the share of Hispanics above 400 percent of poverty decreasing from 26.7 percent in 2001 to 13.0 percent in 2004 and the share with incomes above 300 percent of poverty falling from 11.5 percent in 2001 to 5.7 percent in 2004 (Minnesota Department of Health 2005). this was met with a concurrent increase in the share of Hispanic Minnesotans living below poverty, from 17.6 percent in 2001 to 37.8 percent in 2004 (Minnesota Department of Health 2005).
for children in families at 201 percent of the poverty line or higher, the large majority of children are covered by group insurance (89 percent in 2001 and 85 percent in 2004; see figures 1.11 and 1.12). the modest changes in coverage for children at this income level between 2001 and 2004 seem to point to greater cushioning from economic forces among nonHispanic white middle and upper income families.
In summary
in Minnesota, femaleheaded families and those from underrepresented racial and ethnic groups are at a particular risk of living below poverty, and while girls and boys in the state generally have similar poverty rates in childhood, girls are more likely to be poor in adulthood. poverty among femaleheaded families of color foretells an ominous future for girls of color in the state. Many are likely to experience a life of low earnings, high poverty, and sole child rearing responsibility. Creating economic justice for girls depends in large part upon their families’ ability to meet their basic economic needs. addressing genderbased wage discrimination, closing the gaps between white women and women of color, and opening doors to quality employment that offers health and other important benefits are key to ensuring the wellbeing of all children, and especially girls and young women of color. Devising antipoverty policies that target the needs of femaleheaded families and families of color also will promote healthier, more stable home and community environments for both girls and boys.


11Chapter 2. Security, Safety, and Risky Behaviors
cHApTeR 2security, safety, and Risky behaviors
DurinG a perioD in life WHen younG people should be able to take advantage of all of the opportunities available to them through school and extracurricular activities, many girls and boys face challenges beyond their years. some are confronted with threats to their basic safety and security, including family and dating violence, sexual abuse, victimization, and homelessness. each year, one in four adolescents reports verbal, physical, emotional, or sexual abuse (foshee et al. 1996; averyleaf et al. 1997).
unfortunately, dating violence among high school students is more common than most adolescents or adults realize. Based on data from the Centers for Disease Control and prevention, one in eleven adolescents is a victim of physical dating abuse each year (Centers for Disease Control and prevention 2006). in addition to sustaining physical injury, these victims are more likely to engage in binge drinking, suicide attempts, physical fights, and sexual activity (Centers for Disease Control and prevention 2006). some research indicates they may also struggle with issues surrounding selfesteem and body image as a result of their victimization (ackard and neumarksztainer 2002).
nationally, 11 percent of high school females and 4 percent of high school males report having been forced to have sex (eaton et al. 2006). Because rape is underreported these numbers underestimate the problem. sexual violence can lead to longterm health problems including chronic pain, headaches, stomach problems, eating disorders, sexually transmitted diseases, and depression, as well as anxiety and fearfulness (eaton et al. 2006). Whether the harassment, abuse, or violence some youth experience takes place at home, within schools, or in their broader community, that exposure can have damaging effects on the emotional, physical, and educational outcomes of girls and boys.
in addition, drug and alcohol use at an early age poses serious health risks to adolescents across the nation and is associated with a range of unintentional injuries, physical fights, academic and occupational problems, and illegal activities (Centers for Disease Control and prevention
About the Minnesota student survey
Much of the data in this report are derived from the 2004 Minnesota Student Survey. The 2004 survey data were the most recent available at the writing of this report. The 2004 Survey dataset was provided by the Minnesota Student Survey Interagency Team (which includes the Departments of Education, Health, Human Services, Public Safety, and Corrections) and contains data for 6th, 9th, and 12th grade girls and boys in public schools, charter schools, and tribal schools throughout the state. The dataset does not include girls and boys in alternative schools or juvenile centers. The Interagency Team administers the survey to every 6th, 9th, and 12th grade student in a participating district who has parental permission. The 2004 survey reached 77 percent of the state’s 6th graders, 73 percent of its 9th graders, and 49 percent of its 12th graders in participating public, charter, and tribal schools. The Interagency Team does not weight the data nor do they provide a weighting variable in the dataset, treating the survey as a census of 6th, 9th, and 12th graders rather than a sample. Unless otherwise noted, the data presented reflect average responses from girls and boys from the three grade levels combined. See the Methodology Appendix for further detail on the 2004 Minnesota Student Survey.
2007). for example, in 2005, 10 percent of high school students reported driving a vehicle in the past month after they had been drinking and 29 percent reported riding in a vehicle driven by someone who had been drinking (eaton et al. 2006).
this chapter presents data on the physical safety of girls in Minnesota, their use of tobacco, alcohol, and drugs and their vulnerability as demonstrated through their experience with homelessness and the juvenile detention system.
12 Status of Girls in Minnesota
92.9%
90.4%
94.4%
92.3%
84.7%83.8%
90.4%
85.8% 85.7%
82.3%
88.9%
85.1%
All White African American Asian American American Indian Hispanic
Figure 2.1: I Feel Safe At School, Minnesota Student Survey, 2004
Girls
Boys
Notes:Responses are for 6th, 9th, and 12th grade students combined.See the Methodology Appendix for information on how race and ethnicity are categorized in the Minnesota Student Survey.Source: Minnesota Student Survey Interagency Team 2005.
figure 2.1. I Feel Safe At School, Minnesota Student Survey, 2004
notes: Responses are for 6th, 9th, and 12th grade students combined.see the Methodology Appendix for information on how race and ethnicity are categorized in the Minnesota student survey.Source: Minnesota Student Survey Interagency Team 2005.Calculated by the Institute for Women’s Policy Research.
95.0%
93.5%
96.2%
95.0%
89.9%
88.3%
92.5%
90.0%89.6%
87.9%
91.0%
87.8%
All White African American Asian American American Indian Hispanic
Figure 2.2: I Feel Safe Going To and From School, Minnesota Student Survey, 2004
Girls
Boys
Notes:Responses are for 6th, 9th, and 12th grade students combined.See the Methodology Appendix for information on how race and ethnicity are categorized in the Minnesota Student Survey.Source: Minnesota Student Survey Interagency Team 2005.
figure 2.2. I Feel Safe Going To and From School, Minnesota Student Survey, 2004
notes: Responses are for 6th, 9th, and 12th grade students combined.see the Methodology Appendix for information on how race and ethnicity are categorized in the Minnesota student survey.Source: Minnesota Student Survey Interagency Team 2005.Calculated by the Institute for Women’s Policy Research.
safe schools and communities
Student Perception of Overall Safety at Schoolfeelings of safety in the community and in the school
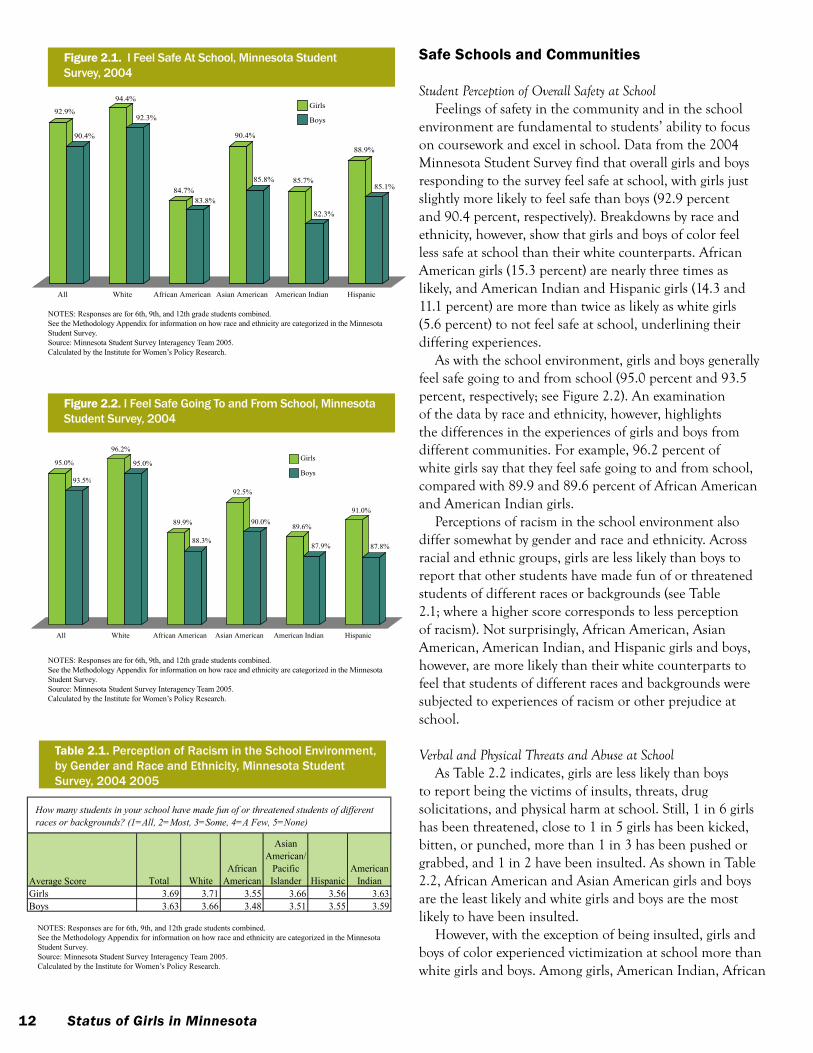
environment are fundamental to students’ ability to focus on coursework and excel in school. Data from the 2004 Minnesota student survey find that overall girls and boys responding to the survey feel safe at school, with girls just slightly more likely to feel safe than boys (92.9 percent and 90.4 percent, respectively). Breakdowns by race and ethnicity, however, show that girls and boys of color feel less safe at school than their white counterparts. african american girls (15.3 percent) are nearly three times as likely, and american indian and Hispanic girls (14.3 and 11.1 percent) are more than twice as likely as white girls (5.6 percent) to not feel safe at school, underlining their differing experiences.
as with the school environment, girls and boys generally feel safe going to and from school (95.0 percent and 93.5 percent, respectively; see figure 2.2). an examination of the data by race and ethnicity, however, highlights the differences in the experiences of girls and boys from different communities. for example, 96.2 percent of white girls say that they feel safe going to and from school, compared with 89.9 and 89.6 percent of african american and american indian girls.
perceptions of racism in the school environment also differ somewhat by gender and race and ethnicity. across racial and ethnic groups, girls are less likely than boys to report that other students have made fun of or threatened students of different races or backgrounds (see table 2.1; where a higher score corresponds to less perception of racism). not surprisingly, african american, asian american, american indian, and Hispanic girls and boys, however, are more likely than their white counterparts to feel that students of different races and backgrounds were subjected to experiences of racism or other prejudice at school.
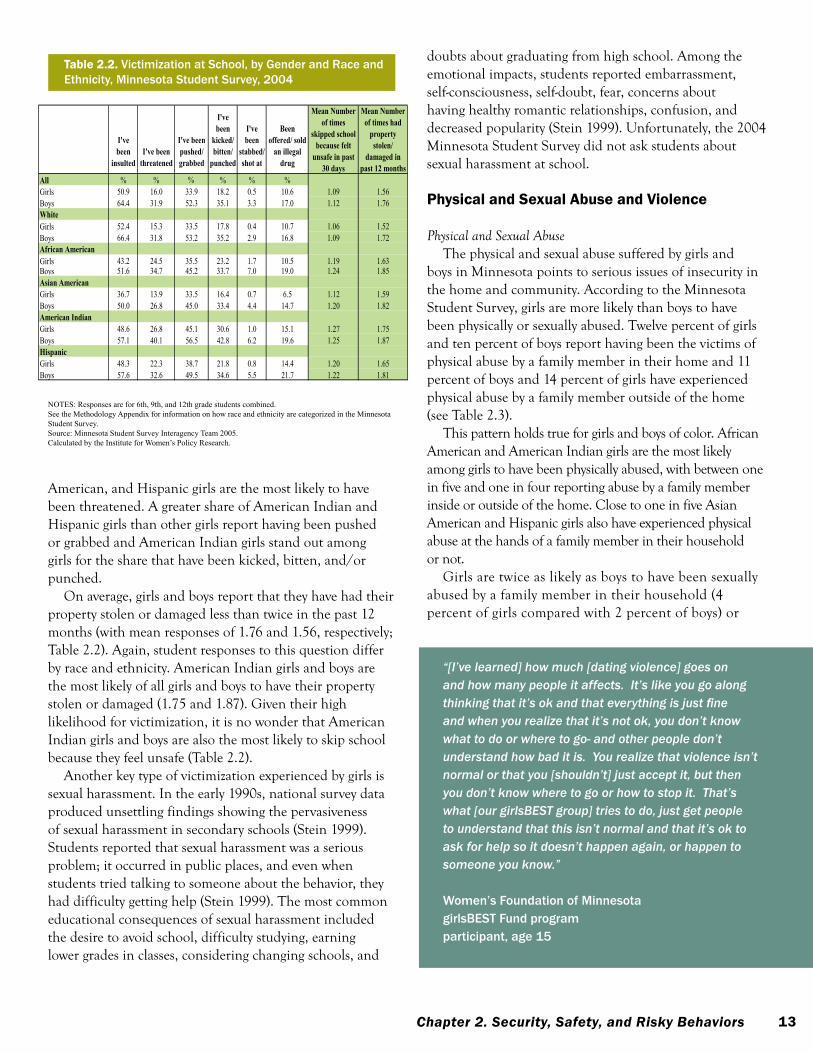
Verbal and Physical Threats and Abuse at Schoolas table 2.2 indicates, girls are less likely than boys
to report being the victims of insults, threats, drug solicitations, and physical harm at school. still, 1 in 6 girls has been threatened, close to 1 in 5 girls has been kicked, bitten, or punched, more than 1 in 3 has been pushed or grabbed, and 1 in 2 have been insulted. as shown in table 2.2, african american and asian american girls and boys are the least likely and white girls and boys are the most likely to have been insulted.
However, with the exception of being insulted, girls and boys of color experienced victimization at school more than white girls and boys. among girls, american indian, african
Table 2.1. Perception of Racism in the School Environment, by Gender and Race and Ethnicity, Minnesota Student Survey, 2004 2005
notes: Responses are for 6th, 9th, and 12th grade students combined. see the Methodology Appendix for information on how race and ethnicity are categorized in the Minnesota student survey. Source: Minnesota Student Survey Interagency Team 2005. Calculated by the Institute for Women’s Policy Research.
Average Score Total WhiteAfrican
American
Asian American/
Pacific Islander Hispanic
American Indian
Girls 3.69 3.71 3.55 3.66 3.56 3.63Boys 3.63 3.66 3.48 3.51 3.55 3.59
Notes:Responses are for 6th, 9th, and 12th grade students combined.
Source: Minnesota Student Survey Interagency Team 2005.Calculated by the Institute for Women's Policy Research.
How many students in your school have made fun of or threatened students of different races or backgrounds? (1=All, 2=Most, 3=Some, 4=A Few, 5=None)
Table 2.1: Perception of Racism in the School Environment, by Gender and Race and Ethnicity, Minnesota Student Survey, 2004
See the Methodology Appendix for information on how race and ethnicity are categorized in the Minnesota Student Survey.
13Chapter 2. Security, Safety, and Risky Behaviors
Table 2.2. Victimization at School, by Gender and Race and Ethnicity, Minnesota Student Survey, 2004
notes: Responses are for 6th, 9th, and 12th grade students combined. see the Methodology Appendix for information on how race and ethnicity are categorized in the Minnesota student survey. Source: Minnesota Student Survey Interagency Team 2005. Calculated by the Institute for Women’s Policy Research.
I've been
insulted I've been
threatened
I've been pushed/ grabbed
I've been
kicked/ bitten/
punched
I've been
stabbed/ shot at
Been offered/ sold
an illegal drug
Mean Number of times
skipped school because felt
unsafe in past 30 days
Mean Number of times had
property stolen/
damaged in past 12 months
All % % % % % %Girls 50.9 16.0 33.9 18.2 0.5 10.6 1.09 1.56Boys 64.4 31.9 52.3 35.1 3.3 17.0 1.12 1.76White Girls 52.4 15.3 33.5 17.8 0.4 10.7 1.06 1.52 Boys 66.4 31.8 53.2 35.2 2.9 16.8 1.09 1.72 African AmericanGirls 43.2 24.5 35.5 23.2 1.7 10.5 1.19 1.63Boys 51.6 34.7 45.2 33.7 7.0 19.0 1.24 1.85Asian AmericanGirls 36.7 13.9 33.5 16.4 0.7 6.5 1.12 1.59Boys 50.0 26.8 45.0 33.4 4.4 14.7 1.20 1.82American IndianGirls 48.6 26.8 45.1 30.6 1.0 15.1 1.27 1.75Boys 57.1 40.1 56.5 42.8 6.2 19.6 1.25 1.87Hispanic Girls 48.3 22.3 38.7 21.8 0.8 14.4 1.20 1.65Boys 57.6 32.6 49.5 34.6 5.5 21.7 1.22 1.81
Notes:Responses are for 6th, 9th, and 12th grade students combined.See the Methodology Appendix for information on how race and ethnicity are categorized in the Minnesota Student Survey.Source: Minnesota Student Survey Interagency Team 2005.Calculated by the Institute for Women's Policy Research.
Table 2.2: Victimization at School, by Gender and Race and Ethnicity, Minnesota Student Survey, 2004
american, and Hispanic girls are the most likely to have been threatened. a greater share of american indian and Hispanic girls than other girls report having been pushed or grabbed and american indian girls stand out among girls for the share that have been kicked, bitten, and/or punched.
on average, girls and boys report that they have had their property stolen or damaged less than twice in the past 12 months (with mean responses of 1.76 and 1.56, respectively; table 2.2). again, student responses to this question differ by race and ethnicity. american indian girls and boys are the most likely of all girls and boys to have their property stolen or damaged (1.75 and 1.87). Given their high likelihood for victimization, it is no wonder that american indian girls and boys are also the most likely to skip school because they feel unsafe (table 2.2).
another key type of victimization experienced by girls is sexual harassment. in the early 1990s, national survey data produced unsettling findings showing the pervasiveness of sexual harassment in secondary schools (stein 1999). students reported that sexual harassment was a serious problem; it occurred in public places, and even when students tried talking to someone about the behavior, they had difficulty getting help (stein 1999). the most common educational consequences of sexual harassment included the desire to avoid school, difficulty studying, earning lower grades in classes, considering changing schools, and
doubts about graduating from high school. among the emotional impacts, students reported embarrassment, selfconsciousness, selfdoubt, fear, concerns about having healthy romantic relationships, confusion, and decreased popularity (stein 1999). unfortunately, the 2004 Minnesota student survey did not ask students about sexual harassment at school.
physical and sexual Abuse and Violence
Physical and Sexual Abusethe physical and sexual abuse suffered by girls and
boys in Minnesota points to serious issues of insecurity in the home and community. according to the Minnesota student survey, girls are more likely than boys to have been physically or sexually abused. twelve percent of girls and ten percent of boys report having been the victims of physical abuse by a family member in their home and 11 percent of boys and 14 percent of girls have experienced physical abuse by a family member outside of the home (see table 2.3).
this pattern holds true for girls and boys of color. african american and american indian girls are the most likely among girls to have been physically abused, with between one in five and one in four reporting abuse by a family member inside or outside of the home. Close to one in five asian american and Hispanic girls also have experienced physical abuse at the hands of a family member in their household or not.
Girls are twice as likely as boys to have been sexually abused by a family member in their household (4 percent of girls compared with 2 percent of boys) or
“[I’ve learned] how much [dating violence] goes on and how many people it affects. It’s like you go along thinking that it’s ok and that everything is just fine and when you realize that it’s not ok, you don’t know what to do or where to go- and other people don’t understand how bad it is. You realize that violence isn’t normal or that you [shouldn’t] just accept it, but then you don’t know where to go or how to stop it. That’s what [our girlsBEST group] tries to do, just get people to understand that this isn’t normal and that it’s ok to ask for help so it doesn’t happen again, or happen to someone you know.”
Women’s Foundation of Minnesota girlsBEST Fund program participant, age 15
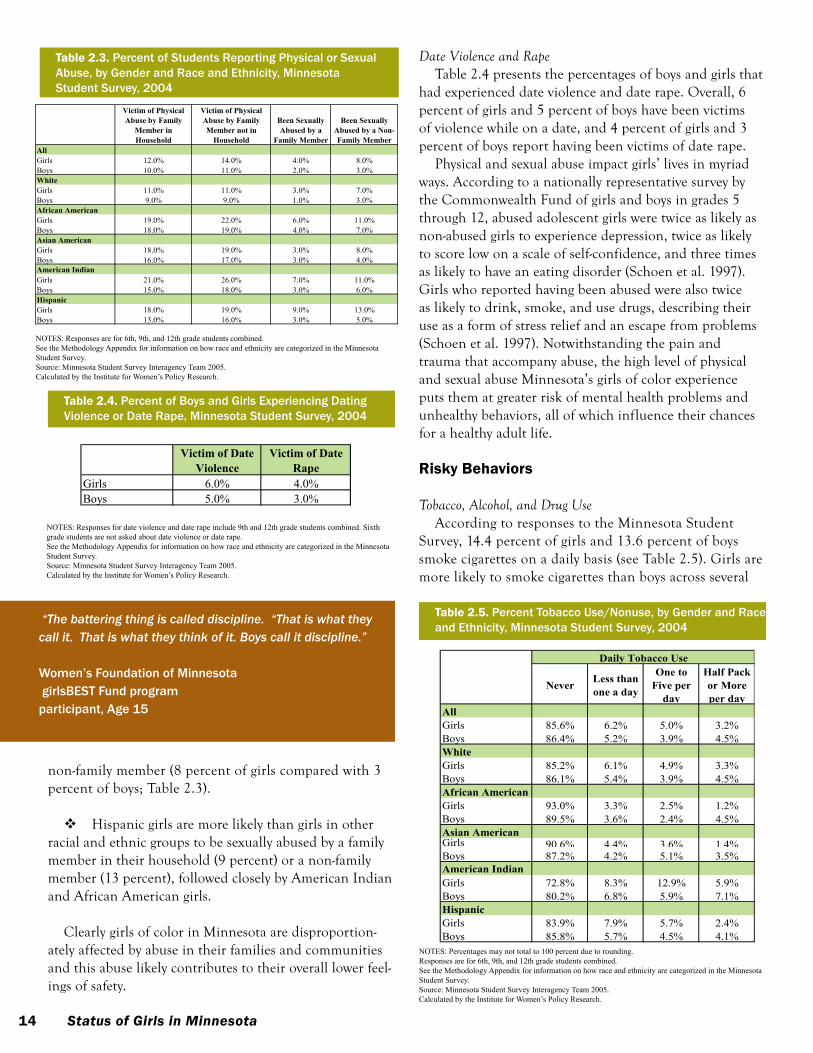
14 Status of Girls in Minnesota
Table 2.4. Percent of Boys and Girls Experiencing Dating Violence or Date Rape, Minnesota Student Survey, 2004
notes: Responses for date violence and date rape include 9th and 12th grade students combined. Sixth grade students are not asked about date violence or date rape. see the Methodology Appendix for information on how race and ethnicity are categorized in the Minnesota student survey. Source: Minnesota Student Survey Interagency Team 2005. Calculated by the Institute for Women’s Policy Research.
Victim of Date Violence
Victim of Date Rape
Girls 6.0% 4.0%Boys 5.0% 3.0%
Notes:
Source: Minnesota Student Survey Interagency Team 2005.Calculated by the Institute for Women's Policy Research.
Table 2.4: Percent of Boys and Girls Experiencing Dating Violence or Date Rape, Minnesota Student
Survey, 2004
Responses for date violence and date rape include 9th and 12th grade students combined. Sixth grade students are not asked about date violence or date rape.See the Methodology Appendix for information on how race and ethnicity are categorized in the Minnesota Student Survey.
nonfamily member (8 percent of girls compared with 3 percent of boys; table 2.3).
Hispanic girls are more likely than girls in other racial and ethnic groups to be sexually abused by a family member in their household (9 percent) or a nonfamily member (13 percent), followed closely by american indian and african american girls.
Clearly girls of color in Minnesota are disproportionately affected by abuse in their families and communities and this abuse likely contributes to their overall lower feelings of safety.
“The battering thing is called discipline. “That is what they call it. That is what they think of it. Boys call it discipline.”
Women’s Foundation of Minnesota girlsBEST Fund program participant, Age 15
Date Violence and Rape table 2.4 presents the percentages of boys and girls that
had experienced date violence and date rape. overall, 6 percent of girls and 5 percent of boys have been victims of violence while on a date, and 4 percent of girls and 3 percent of boys report having been victims of date rape.
physical and sexual abuse impact girls’ lives in myriad ways. according to a nationally representative survey by the Commonwealth fund of girls and boys in grades 5 through 12, abused adolescent girls were twice as likely as nonabused girls to experience depression, twice as likely to score low on a scale of selfconfidence, and three times as likely to have an eating disorder (schoen et al. 1997). Girls who reported having been abused were also twice as likely to drink, smoke, and use drugs, describing their use as a form of stress relief and an escape from problems (schoen et al. 1997). notwithstanding the pain and trauma that accompany abuse, the high level of physical and sexual abuse Minnesota’s girls of color experience puts them at greater risk of mental health problems and unhealthy behaviors, all of which influence their chances for a healthy adult life.
Risky behaviors
Tobacco, Alcohol, and Drug Useaccording to responses to the Minnesota student
survey, 14.4 percent of girls and 13.6 percent of boys smoke cigarettes on a daily basis (see table 2.5). Girls are more likely to smoke cigarettes than boys across several
Table 2.5. Percent Tobacco Use/Nonuse, by Gender and Race and Ethnicity, Minnesota Student Survey, 2004
notes: Percentages may not total to 100 percent due to rounding. Responses are for 6th, 9th, and 12th grade students combined. see the Methodology Appendix for information on how race and ethnicity are categorized in the Minnesota student survey. Source: Minnesota Student Survey Interagency Team 2005. Calculated by the Institute for Women’s Policy Research.
Never Less than one a day
One to Five per
day
Half Pack or More per day
AllGirls 85.6% 6.2% 5.0% 3.2%Boys 86.4% 5.2% 3.9% 4.5%WhiteGirls 85.2% 6.1% 4.9% 3.3%Boys 86.1% 5.4% 3.9% 4.5%African AmericanGirls 93.0% 3.3% 2.5% 1.2%Boys 89.5% 3.6% 2.4% 4.5%Asian AmericanGirls 90.6% 4.4% 3.6% 1.4%Boys 87.2% 4.2% 5.1% 3.5%American IndianGirls 72.8% 8.3% 12.9% 5.9%Boys 80.2% 6.8% 5.9% 7.1%Hispanic Girls 83.9% 7.9% 5.7% 2.4%Boys 85.8% 5.7% 4.5% 4.1%
Notes:Percentages may not total to 100 percent due to rounding.Responses are for 6th, 9th, and 12th grade students combined.
Calculated by the Institute for Women's Policy Research.
Daily Tobacco Use
Source: Minnesota Student Survey Interagency Team 2005.
Table 2.5: Percent Tobacco Use/Nonuse by Gender and Race/Ethnicity, Minnesota Student Survey, 2004
See the Methodology Appendix for information on how race and ethnicity are categorized in the Minnesota Student Survey.
Table 2.3. Percent of Students Reporting Physical or Sexual Abuse, by Gender and Race and Ethnicity, Minnesota Student Survey, 2004
notes: Responses are for 6th, 9th, and 12th grade students combined. see the Methodology Appendix for information on how race and ethnicity are categorized in the Minnesota student survey. Source: Minnesota Student Survey Interagency Team 2005. Calculated by the Institute for Women’s Policy Research.
Victim of Physical Abuse by Family
Member in Household
Victim of Physical Abuse by Family Member not in
Household
Been Sexually Abused by a
Family Member
Been Sexually Abused by a Non-Family Member
AllGirls 12.0% 14.0% 4.0% 8.0%Boys 10.0% 11.0% 2.0% 3.0%WhiteGirls 11.0% 11.0% 3.0% 7.0%Boys 9.0% 9.0% 1.0% 3.0%African AmericanGirls 19.0% 22.0% 6.0% 11.0%Boys 18.0% 19.0% 4.0% 7.0%Asian AmericanGirls 18.0% 19.0% 3.0% 8.0%Boys 16.0% 17.0% 3.0% 4.0%American IndianGirls 21.0% 26.0% 7.0% 11.0%Boys 15.0% 18.0% 3.0% 6.0%Hispanic Girls 18.0% 19.0% 9.0% 13.0%Boys 13.0% 16.0% 3.0% 5.0%
Notes:Responses are for 6th, 9th, and 12th grade students combined.See the Methodology Appendix for information on how race and ethnicity are categorized in the Minnesota Student Survey.Source: Minnesota Student Survey Interagency Team 2005.Calculated by the Institute for Women's Policy Research.
Table 2.3: Percent of Students Reporting Physical or Sexual Abuse, by Gender and Race and Ethnicity, Minnesota Student Survey, 2004
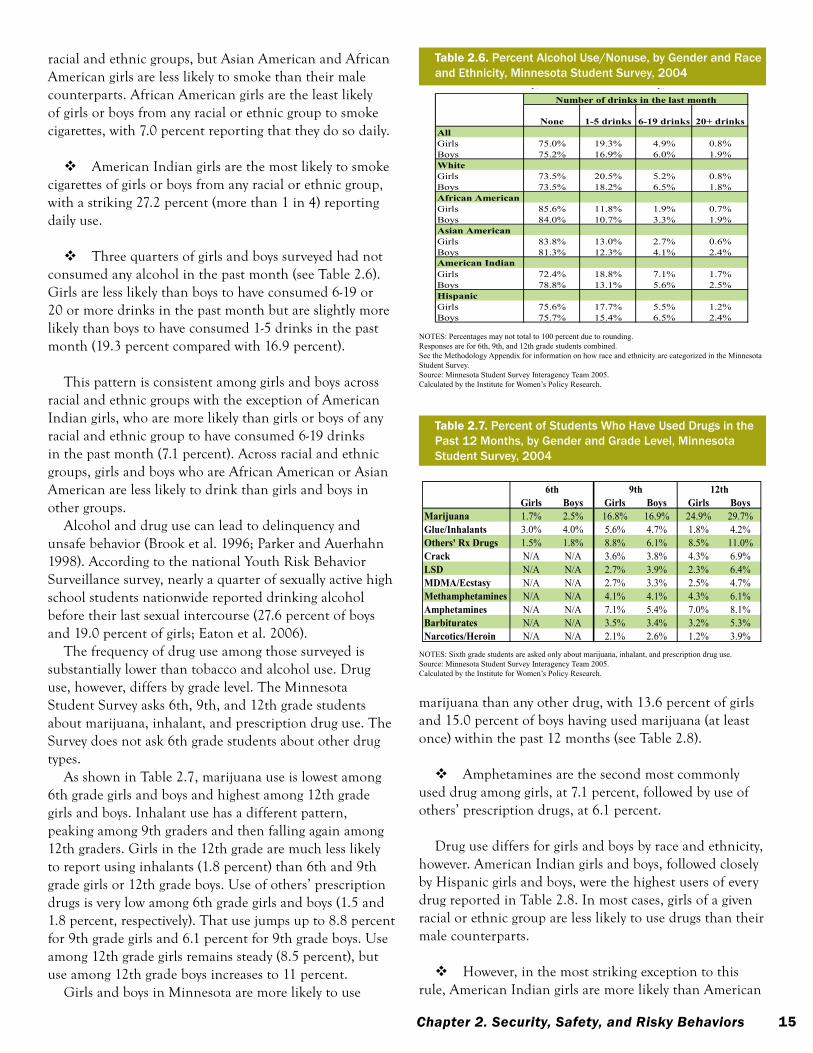
15Chapter 2. Security, Safety, and Risky Behaviors
Table 2.6. Percent Alcohol Use/Nonuse, by Gender and Race and Ethnicity, Minnesota Student Survey, 2004
notes: Percentages may not total to 100 percent due to rounding. Responses are for 6th, 9th, and 12th grade students combined. see the Methodology Appendix for information on how race and ethnicity are categorized in the Minnesota student survey. Source: Minnesota Student Survey Interagency Team 2005. Calculated by the Institute for Women’s Policy Research.
None 1-5 drinks 6-19 drinks 20+ drinksAllGirls 75.0% 19.3% 4.9% 0.8%Boys 75.2% 16.9% 6.0% 1.9%WhiteGirls 73.5% 20.5% 5.2% 0.8%Boys 73.5% 18.2% 6.5% 1.8%African AmericanGirls 85.6% 11.8% 1.9% 0.7%Boys 84.0% 10.7% 3.3% 1.9%Asian AmericanGirls 83.8% 13.0% 2.7% 0.6%Boys 81.3% 12.3% 4.1% 2.4%American IndianGirls 72.4% 18.8% 7.1% 1.7%Boys 78.8% 13.1% 5.6% 2.5%Hispanic Girls 75.6% 17.7% 5.5% 1.2%Boys 75.7% 15.4% 6.5% 2.4%Notes:Percentages may not total to 100 percent due to rounding.Responses are for 6th, 9th, and 12th grade students combined.
Source: Minnesota Student Survey Interagency Team 2005.Calculated by the Institute for Women's Policy Research.
Number of drinks in the last month
Table 2.6: Percent Alcohol Use/Nonuse, by Gender and Race and Ethnicity, Minnesota Student Survey, 2004
See the Methodology Appendix for information on how race and ethnicity are categorized in the Minnesota Student Survey.
Table 2.7. Percent of Students Who Have Used Drugs in the Past 12 Months, by Gender and Grade Level, Minnesota Student Survey, 2004
notes: sixth grade students are asked only about marijuana, inhalant, and prescription drug use. Source: Minnesota Student Survey Interagency Team 2005.Calculated by the Institute for Women’s Policy Research.
Girls Boys Girls Boys Girls BoysMarijuana 1.7% 2.5% 16.8% 16.9% 24.9% 29.7%Glue/Inhalants 3.0% 4.0% 5.6% 4.7% 1.8% 4.2%Others' Rx Drugs 1.5% 1.8% 8.8% 6.1% 8.5% 11.0%Crack N/A N/A 3.6% 3.8% 4.3% 6.9%LSD N/A N/A 2.7% 3.9% 2.3% 6.4%MDMA/Ecstasy N/A N/A 2.7% 3.3% 2.5% 4.7%Methamphetamines N/A N/A 4.1% 4.1% 4.3% 6.1%Amphetamines N/A N/A 7.1% 5.4% 7.0% 8.1%Barbiturates N/A N/A 3.5% 3.4% 3.2% 5.3%Narcotics/Heroin N/A N/A 2.1% 2.6% 1.2% 3.9%
Notes:
Source: Minnesota Student Survey Interagency Team 2005.Calculated by the Institute for Women's Policy Research.
Table 2.7: Percent of Students Who Have Used Drugs in the Past 12 Months, by Gender and Grade Level, Minnesota Student Survey, 2004
Sixth grade students are asked only about marijuana, inhalant, and prescription drug
6th 12th9th
racial and ethnic groups, but asian american and african american girls are less likely to smoke than their male counterparts. african american girls are the least likely of girls or boys from any racial or ethnic group to smoke cigarettes, with 7.0 percent reporting that they do so daily.
american indian girls are the most likely to smoke cigarettes of girls or boys from any racial or ethnic group, with a striking 27.2 percent (more than 1 in 4) reporting daily use.
three quarters of girls and boys surveyed had not consumed any alcohol in the past month (see table 2.6). Girls are less likely than boys to have consumed 619 or 20 or more drinks in the past month but are slightly more likely than boys to have consumed 15 drinks in the past month (19.3 percent compared with 16.9 percent).
this pattern is consistent among girls and boys across racial and ethnic groups with the exception of american indian girls, who are more likely than girls or boys of any racial and ethnic group to have consumed 619 drinks in the past month (7.1 percent). across racial and ethnic groups, girls and boys who are african american or asian american are less likely to drink than girls and boys in other groups.
alcohol and drug use can lead to delinquency and unsafe behavior (Brook et al. 1996; parker and auerhahn 1998). according to the national youth risk Behavior surveillance survey, nearly a quarter of sexually active high school students nationwide reported drinking alcohol before their last sexual intercourse (27.6 percent of boys and 19.0 percent of girls; eaton et al. 2006).
the frequency of drug use among those surveyed is substantially lower than tobacco and alcohol use. Drug use, however, differs by grade level. the Minnesota student survey asks 6th, 9th, and 12th grade students about marijuana, inhalant, and prescription drug use. the survey does not ask 6th grade students about other drug types.
as shown in table 2.7, marijuana use is lowest among 6th grade girls and boys and highest among 12th grade girls and boys. inhalant use has a different pattern, peaking among 9th graders and then falling again among 12th graders. Girls in the 12th grade are much less likely to report using inhalants (1.8 percent) than 6th and 9th grade girls or 12th grade boys. use of others’ prescription drugs is very low among 6th grade girls and boys (1.5 and 1.8 percent, respectively). that use jumps up to 8.8 percent for 9th grade girls and 6.1 percent for 9th grade boys. use among 12th grade girls remains steady (8.5 percent), but use among 12th grade boys increases to 11 percent.
Girls and boys in Minnesota are more likely to use
marijuana than any other drug, with 13.6 percent of girls and 15.0 percent of boys having used marijuana (at least once) within the past 12 months (see table 2.8).
amphetamines are the second most commonly used drug among girls, at 7.1 percent, followed by use of others’ prescription drugs, at 6.1 percent.
Drug use differs for girls and boys by race and ethnicity, however. american indian girls and boys, followed closely by Hispanic girls and boys, were the highest users of every drug reported in table 2.8. in most cases, girls of a given racial or ethnic group are less likely to use drugs than their male counterparts.
However, in the most striking exception to this rule, american indian girls are more likely than american
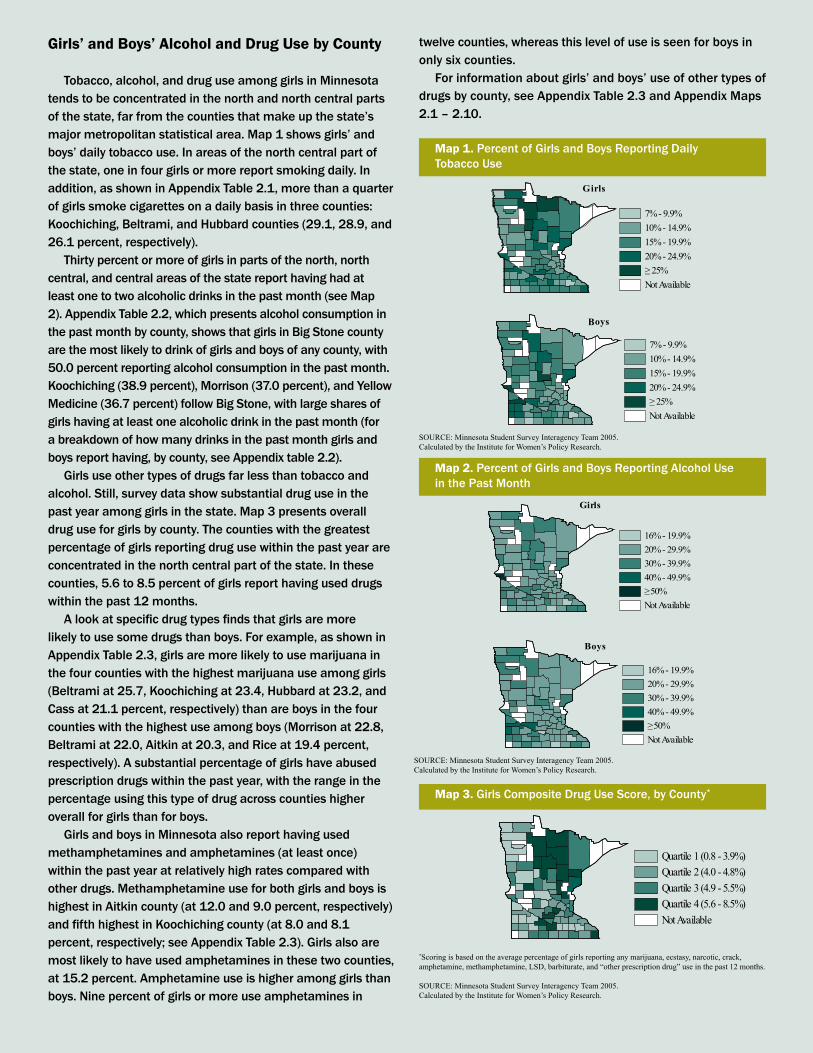
16 Status of Girls in Minnesota
twelve counties, whereas this level of use is seen for boys in only six counties.
For information about girls’ and boys’ use of other types of drugs by county, see Appendix Table 2.3 and Appendix Maps 2.1 – 2.10.
Girls’ and boys’ Alcohol and drug use by county
Tobacco, alcohol, and drug use among girls in Minnesota tends to be concentrated in the north and north central parts of the state, far from the counties that make up the state’s major metropolitan statistical area. Map 1 shows girls’ and boys’ daily tobacco use. In areas of the north central part of the state, one in four girls or more report smoking daily. In addition, as shown in Appendix Table 2.1, more than a quarter of girls smoke cigarettes on a daily basis in three counties: Koochiching, Beltrami, and Hubbard counties (29.1, 28.9, and 26.1 percent, respectively).
Thirty percent or more of girls in parts of the north, north central, and central areas of the state report having had at least one to two alcoholic drinks in the past month (see Map 2). Appendix Table 2.2, which presents alcohol consumption in the past month by county, shows that girls in Big Stone county are the most likely to drink of girls and boys of any county, with 50.0 percent reporting alcohol consumption in the past month. Koochiching (38.9 percent), Morrison (37.0 percent), and Yellow Medicine (36.7 percent) follow Big Stone, with large shares of girls having at least one alcoholic drink in the past month (for a breakdown of how many drinks in the past month girls and boys report having, by county, see Appendix table 2.2).
Girls use other types of drugs far less than tobacco and alcohol. Still, survey data show substantial drug use in the past year among girls in the state. Map 3 presents overall drug use for girls by county. The counties with the greatest percentage of girls reporting drug use within the past year are concentrated in the north central part of the state. In these counties, 5.6 to 8.5 percent of girls report having used drugs within the past 12 months.
A look at specific drug types finds that girls are more likely to use some drugs than boys. For example, as shown in Appendix Table 2.3, girls are more likely to use marijuana in the four counties with the highest marijuana use among girls (Beltrami at 25.7, Koochiching at 23.4, Hubbard at 23.2, and Cass at 21.1 percent, respectively) than are boys in the four counties with the highest use among boys (Morrison at 22.8, Beltrami at 22.0, Aitkin at 20.3, and Rice at 19.4 percent, respectively). A substantial percentage of girls have abused prescription drugs within the past year, with the range in the percentage using this type of drug across counties higher overall for girls than for boys.
Girls and boys in Minnesota also report having used methamphetamines and amphetamines (at least once) within the past year at relatively high rates compared with other drugs. Methamphetamine use for both girls and boys is highest in Aitkin county (at 12.0 and 9.0 percent, respectively) and fifth highest in Koochiching county (at 8.0 and 8.1 percent, respectively; see Appendix Table 2.3). Girls also are most likely to have used amphetamines in these two counties, at 15.2 percent. Amphetamine use is higher among girls than boys. Nine percent of girls or more use amphetamines in
Map 1. Percent of Girls and Boys Reporting Daily Tobacco Use
soURCe: Minnesota Student Survey Interagency Team 2005. Calculated by the Institute for Women’s Policy Research.
7% - 9.9%10% - 14.9%15% - 19.9%20% - 24.9%≥25%Not Available
7% - 9.9%10% - 14.9%15% - 19.9%20% - 24.9%≥25%Not Available
Boys
Girls
Map 1: Percentage of Girls and Boys ReportingDaily Tobacco Use
Map 2. Percent of Girls and Boys Reporting Alcohol Usein the Past Month
soURCe: Minnesota Student Survey Interagency Team 2005. Calculated by the Institute for Women’s Policy Research.
16% - 19.9%20% - 29.9%30% - 39.9%40% - 49.9%≥50%Not Available
16% - 19.9%20% - 29.9%30% - 39.9%40% - 49.9%≥50%Not Available
Girls
Boys
Map 2: Percentage of Girls and Boys ReportingAlcohol Use in the Past Month
Map 3. Girls Composite Drug Use Score, by County*
*scoring is based on the average percentage of girls reporting any marijuana, ecstasy, narcotic, crack, amphetamine, methamphetamine, LSD, barbiturate, and “other prescription drug” use in the past 12 months. soURCe: Minnesota Student Survey Interagency Team 2005. Calculated by the Institute for Women’s Policy Research.
Map 3: Girls Composite Drug Use Score, by County*
Quartile 1 (0.8 - 3.9%)Quartile 2 (4.0 - 4.8%)Quartile 3 (4.9 - 5.5%)Quartile 4 (5.6 - 8.5%)Not Available
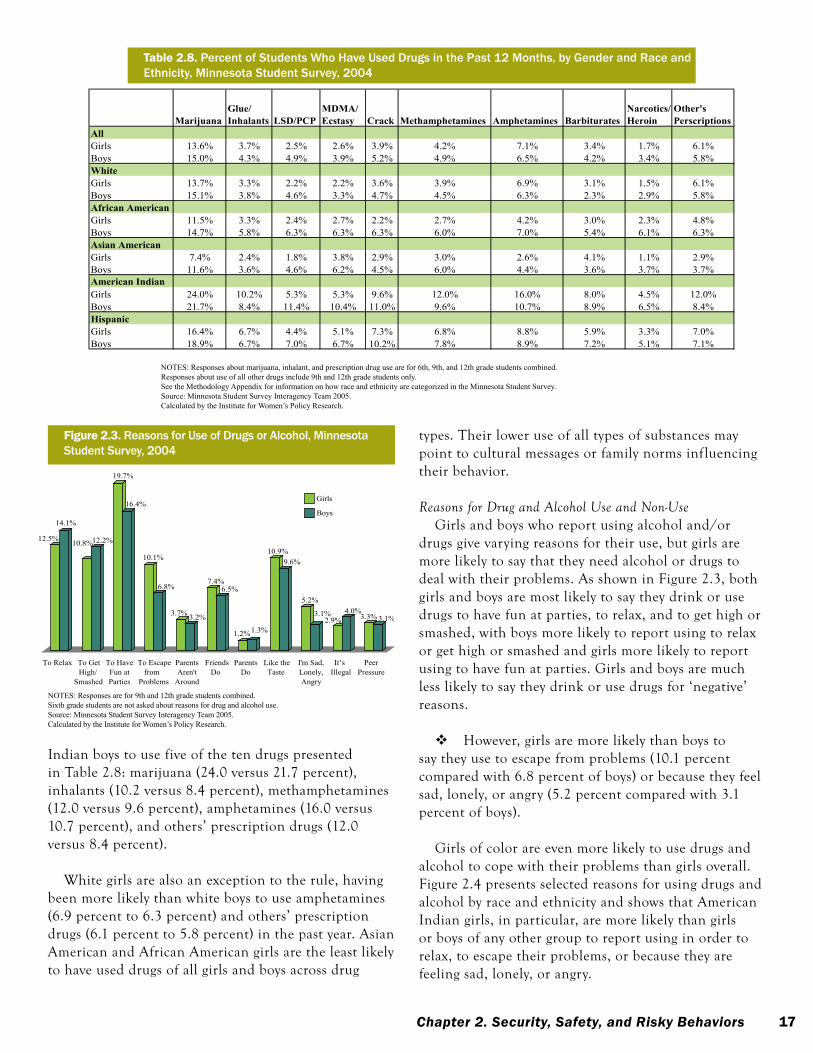
17Chapter 2. Security, Safety, and Risky Behaviors
types. their lower use of all types of substances may point to cultural messages or family norms influencing their behavior.
Reasons for Drug and Alcohol Use and Non-UseGirls and boys who report using alcohol and/or
drugs give varying reasons for their use, but girls are more likely to say that they need alcohol or drugs to deal with their problems. as shown in figure 2.3, both girls and boys are most likely to say they drink or use drugs to have fun at parties, to relax, and to get high or smashed, with boys more likely to report using to relax or get high or smashed and girls more likely to report using to have fun at parties. Girls and boys are much less likely to say they drink or use drugs for ‘negative’ reasons.
However, girls are more likely than boys to say they use to escape from problems (10.1 percent compared with 6.8 percent of boys) or because they feel sad, lonely, or angry (5.2 percent compared with 3.1 percent of boys).
Girls of color are even more likely to use drugs and alcohol to cope with their problems than girls overall. figure 2.4 presents selected reasons for using drugs and alcohol by race and ethnicity and shows that american indian girls, in particular, are more likely than girls or boys of any other group to report using in order to relax, to escape their problems, or because they are feeling sad, lonely, or angry.
12.5%
14.1%
10.8%12.2%
19.7%
16.4%
10.1%
6.8%
3.7% 3.2%
7.4%6.5%
1.2%1.3%
10.9%9.6%
5.2%
3.1%2.9%
4.0%3.3% 3.1%
To Relax To HaveFun atParties
ParentsAren't
Around
ParentsDo
I'm Sad,Lonely,Angry
PeerPressure
Figure 2.4: Reasons for Use of Drugs or Alcohol, Minnesota Student Survey, 2004
Girls
Boys
Notes:Responses are for 9th and 12th grade students combined. Sixth grade students are not asked about reasons for drug and alcohol use.Source: Minnesota Student Survey Interagency Team 2005.
To GetHigh/
Smashed
To Escapefrom
Problems
FriendsDo
Like the Taste
It’s Illegal
figure 2.3. Reasons for Use of Drugs or Alcohol, Minnesota Student Survey, 2004
notes: Responses are for 9th and 12th grade students combined. sixth grade students are not asked about reasons for drug and alcohol use.Source: Minnesota Student Survey Interagency Team 2005.Calculated by the Institute for Women’s Policy Research.
Table 2.8. Percent of Students Who Have Used Drugs in the Past 12 Months, by Gender and Race and Ethnicity, Minnesota Student Survey, 2004
notes: Responses about marijuana, inhalant, and prescription drug use are for 6th, 9th, and 12th grade students combined. Responses about use of all other drugs include 9th and 12th grade students only.see the Methodology Appendix for information on how race and ethnicity are categorized in the Minnesota student survey.Source: Minnesota Student Survey Interagency Team 2005.Calculated by the Institute for Women’s Policy Research.
Table 2.8: Percent of Students Who Have Used Drugs in the Past 12 Months, by Gender and Race and Ethnicity, Minnesota Student Survey, 2004
MarijuanaGlue/ Inhalants LSD/PCP
MDMA/ Ecstasy Crack Methamphetamines Amphetamines Barbiturates
Narcotics/Heroin
Other's Perscriptions
AllGirls 13.6% 3.7% 2.5% 2.6% 3.9% 4.2% 7.1% 3.4% 1.7% 6.1%Boys 15.0% 4.3% 4.9% 3.9% 5.2% 4.9% 6.5% 4.2% 3.4% 5.8%WhiteGirls 13.7% 3.3% 2.2% 2.2% 3.6% 3.9% 6.9% 3.1% 1.5% 6.1%Boys 15.1% 3.8% 4.6% 3.3% 4.7% 4.5% 6.3% 2.3% 2.9% 5.8%African AmericanGirls 11.5% 3.3% 2.4% 2.7% 2.2% 2.7% 4.2% 3.0% 2.3% 4.8%Boys 14.7% 5.8% 6.3% 6.3% 6.3% 6.0% 7.0% 5.4% 6.1% 6.3%Asian AmericanGirls 7.4% 2.4% 1.8% 3.8% 2.9% 3.0% 2.6% 4.1% 1.1% 2.9%Boys 11.6% 3.6% 4.6% 6.2% 4.5% 6.0% 4.4% 3.6% 3.7% 3.7%American IndianGirls 24.0% 10.2% 5.3% 5.3% 9.6% 12.0% 16.0% 8.0% 4.5% 12.0%Boys 21.7% 8.4% 11.4% 10.4% 11.0% 9.6% 10.7% 8.9% 6.5% 8.4%Hispanic Girls 16.4% 6.7% 4.4% 5.1% 7.3% 6.8% 8.8% 5.9% 3.3% 7.0%Boys 18.9% 6.7% 7.0% 6.7% 10.2% 7.8% 8.9% 7.2% 5.1% 7.1%
Notes:Responses about marijuana, inhalant, and prescription drug use are for 6th, 9th, and 12th grade students combined. Responses about use of all other drugs include 9th and 12th grade students only.See the Methodology Appendix for information on how race and ethnicity are categorized in the Minnesota Student Survey.Source: Minnesota Student Survey Interagency Team 2005.Calculated by the Institute for Women's Policy Research.
indian boys to use five of the ten drugs presented in table 2.8: marijuana (24.0 versus 21.7 percent), inhalants (10.2 versus 8.4 percent), methamphetamines (12.0 versus 9.6 percent), amphetamines (16.0 versus 10.7 percent), and others’ prescription drugs (12.0 versus 8.4 percent).
White girls are also an exception to the rule, having been more likely than white boys to use amphetamines (6.9 percent to 6.3 percent) and others’ prescription drugs (6.1 percent to 5.8 percent) in the past year. asian american and african american girls are the least likely to have used drugs of all girls and boys across drug
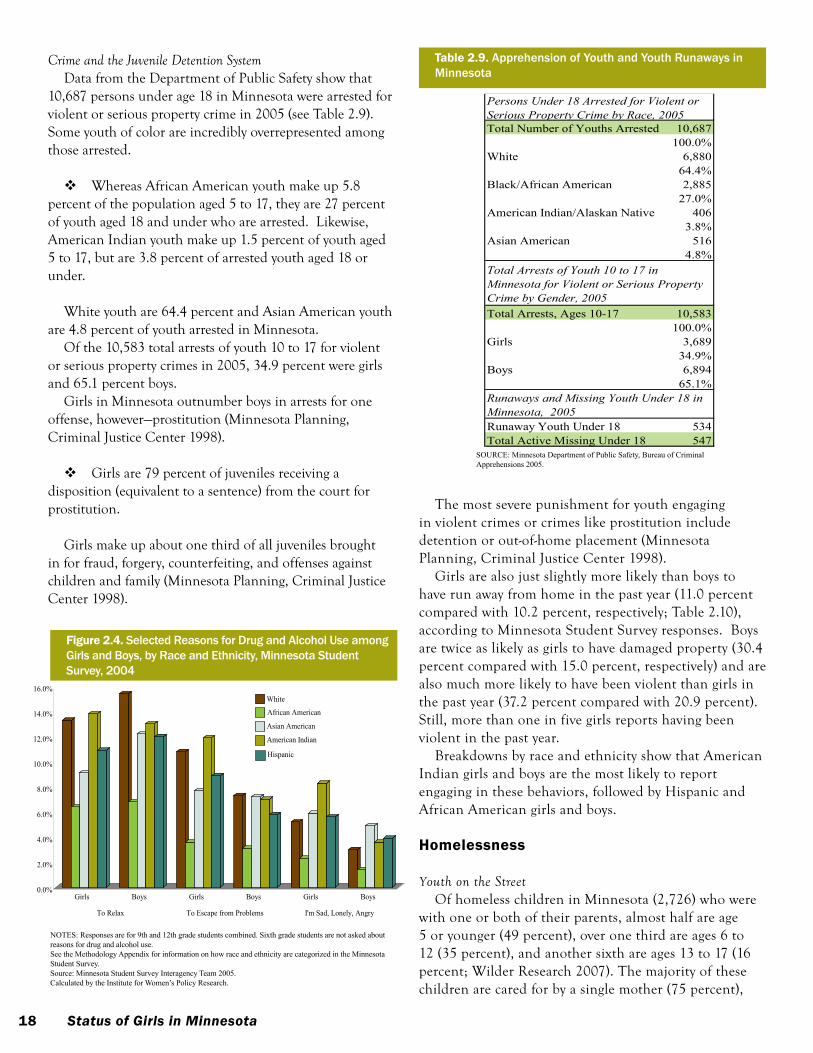
18 Status of Girls in Minnesota
Crime and the Juvenile Detention System Data from the Department of public safety show that
10,687 persons under age 18 in Minnesota were arrested for violent or serious property crime in 2005 (see table 2.9). some youth of color are incredibly overrepresented among those arrested.
Whereas african american youth make up 5.8 percent of the population aged 5 to 17, they are 27 percent of youth aged 18 and under who are arrested. likewise, american indian youth make up 1.5 percent of youth aged 5 to 17, but are 3.8 percent of arrested youth aged 18 or under.
White youth are 64.4 percent and asian american youth are 4.8 percent of youth arrested in Minnesota.
of the 10,583 total arrests of youth 10 to 17 for violent or serious property crimes in 2005, 34.9 percent were girls and 65.1 percent boys.
Girls in Minnesota outnumber boys in arrests for one offense, however—prostitution (Minnesota planning, Criminal Justice Center 1998).
Girls are 79 percent of juveniles receiving a disposition (equivalent to a sentence) from the court for prostitution.
Girls make up about one third of all juveniles brought in for fraud, forgery, counterfeiting, and offenses against children and family (Minnesota planning, Criminal Justice Center 1998).
soURCe: Minnesota Department of Public safety, Bureau of Criminal Apprehensions 2005.
0.0%
2.0%
4.0%
6.0%
8.0%
10.0%
12.0%
14.0%
16.0%
Girls Boys Girls Boys Girls Boys
To Relax To Escape from Problems I'm Sad, Lonely, Angry
Figure 2.5: Selected Reasons for Drug and Alcohol Use among Girls and Boys, by Race and Ethnicity, Minnesota Student Survey, 2004
White
African American
Asian American
American Indian
Hispanic
Notes:Responses are for 9th and 12th grade students combined. Sixth grade students are not asked about reasons for drug and alcohol use.See the Methodology Appendix for information on how race and ethnicity are categorized in the Minnesota
figure 2.4. Selected Reasons for Drug and Alcohol Use among Girls and Boys, by Race and Ethnicity, Minnesota Student Survey, 2004
notes: Responses are for 9th and 12th grade students combined. Sixth grade students are not asked about reasons for drug and alcohol use.see the Methodology Appendix for information on how race and ethnicity are categorized in the Minnesota student survey.Source: Minnesota Student Survey Interagency Team 2005.Calculated by the Institute for Women’s Policy Research.
Table 2.9. Apprehension of Youth and Youth Runaways in Minnesota
Total Number of Youths Arrested 10,687100.0%
White 6,88064.4%
Black/African American 2,88527.0%
American Indian/Alaskan Native 4063.8%
Asian American 5164.8%
Total Arrests, Ages 10-17 10,583100.0%
Girls 3,68934.9%
Boys 6,89465.1%
Runaway Youth Under 18 534Total Active Missing Under 18 547
Source: Minnesota Department of Public Safety, Bureau of Criminal Apprehensions 2005.
Table 2.9: Apprehension of Youth and Youth Runaways in Minnesota
Persons Under 18 Arrested for Violent or Serious Property Crime by Race, 2005
Total Arrests of Youth 10 to 17 in Minnesota for Violent or Serious Property Crime by Gender, 2005
Runaways and Missing Youth Under 18 in Minnesota, 2005
the most severe punishment for youth engaging in violent crimes or crimes like prostitution include detention or outofhome placement (Minnesota planning, Criminal Justice Center 1998).
Girls are also just slightly more likely than boys to have run away from home in the past year (11.0 percent compared with 10.2 percent, respectively; table 2.10), according to Minnesota student survey responses. Boys are twice as likely as girls to have damaged property (30.4 percent compared with 15.0 percent, respectively) and are also much more likely to have been violent than girls in the past year (37.2 percent compared with 20.9 percent). still, more than one in five girls reports having been violent in the past year.
Breakdowns by race and ethnicity show that american indian girls and boys are the most likely to report engaging in these behaviors, followed by Hispanic and african american girls and boys.
Homelessness
Youth on the Streetof homeless children in Minnesota (2,726) who were
with one or both of their parents, almost half are age 5 or younger (49 percent), over one third are ages 6 to 12 (35 percent), and another sixth are ages 13 to 17 (16 percent; Wilder research 2007). the majority of these children are cared for by a single mother (75 percent),
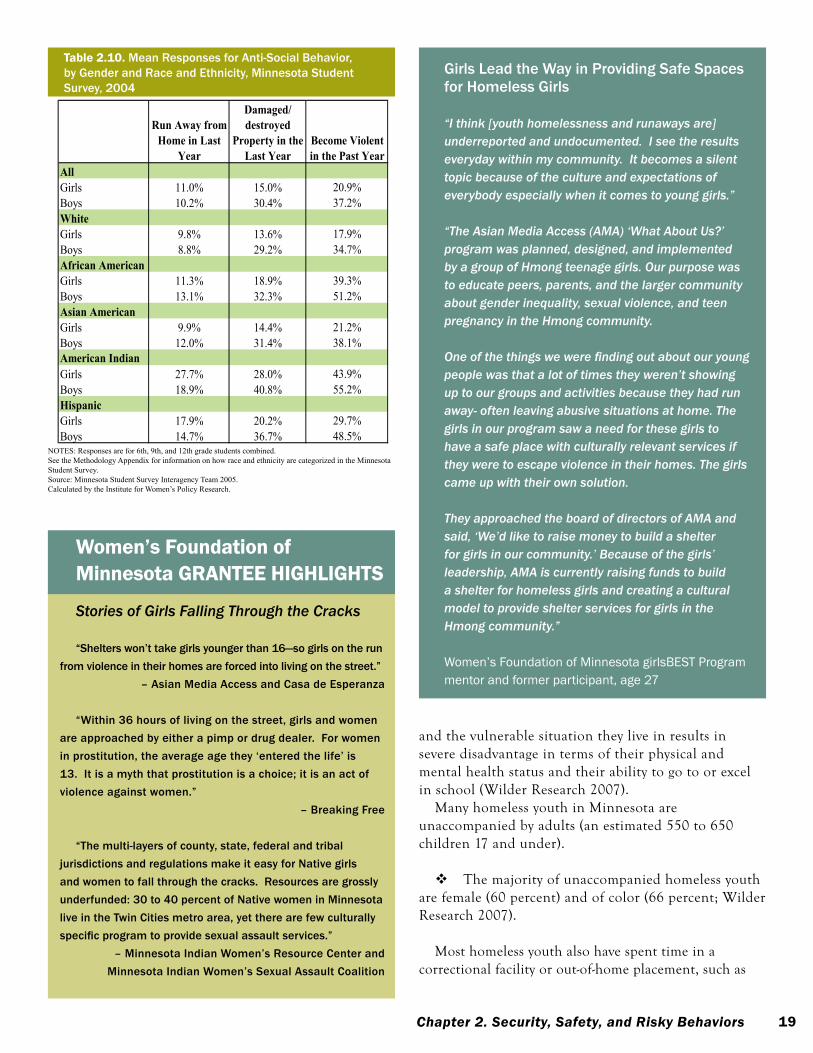
19Chapter 2. Security, Safety, and Risky Behaviors
Women’s foundation of Minnesota GRAnTee HIGHlIGHTs
Stories of Girls Falling Through the Cracks
“Shelters won’t take girls younger than 16—so girls on the run from violence in their homes are forced into living on the street.”
– Asian Media Access and Casa de Esperanza
“Within 36 hours of living on the street, girls and women are approached by either a pimp or drug dealer. For women in prostitution, the average age they ‘entered the life’ is 13. It is a myth that prostitution is a choice; it is an act of violence against women.”
– Breaking Free
“The multi-layers of county, state, federal and tribal jurisdictions and regulations make it easy for Native girls and women to fall through the cracks. Resources are grossly underfunded: 30 to 40 percent of Native women in Minnesota live in the Twin Cities metro area, yet there are few culturally specific program to provide sexual assault services.”
– Minnesota Indian Women’s Resource Center and Minnesota Indian Women’s Sexual Assault Coalition
and the vulnerable situation they live in results in severe disadvantage in terms of their physical and mental health status and their ability to go to or excel in school (Wilder research 2007).
Many homeless youth in Minnesota are unaccompanied by adults (an estimated 550 to 650 children 17 and under).
the majority of unaccompanied homeless youth are female (60 percent) and of color (66 percent; Wilder research 2007).
Most homeless youth also have spent time in a correctional facility or outofhome placement, such as
Girls Lead the Way in Providing Safe Spaces for Homeless Girls
“I think [youth homelessness and runaways are] underreported and undocumented. I see the results everyday within my community. It becomes a silent topic because of the culture and expectations of everybody especially when it comes to young girls.”
“The Asian Media Access (AMA) ‘What About Us?’ program was planned, designed, and implemented by a group of Hmong teenage girls. Our purpose was to educate peers, parents, and the larger community about gender inequality, sexual violence, and teen pregnancy in the Hmong community.
One of the things we were finding out about our young people was that a lot of times they weren’t showing up to our groups and activities because they had run away- often leaving abusive situations at home. The girls in our program saw a need for these girls to have a safe place with culturally relevant services if they were to escape violence in their homes. The girls came up with their own solution.
They approached the board of directors of AMA and said, ‘We’d like to raise money to build a shelter for girls in our community.’ Because of the girls’ leadership, AMA is currently raising funds to build a shelter for homeless girls and creating a cultural model to provide shelter services for girls in the Hmong community.”
Women’s Foundation of Minnesota girlsBEST Program mentor and former participant, age 27
Table 2.10. Mean Responses for Anti-Social Behavior, by Gender and Race and Ethnicity, Minnesota Student Survey, 2004
notes: Responses are for 6th, 9th, and 12th grade students combined. see the Methodology Appendix for information on how race and ethnicity are categorized in the Minnesota student survey. Source: Minnesota Student Survey Interagency Team 2005. Calculated by the Institute for Women’s Policy Research.
Run Away from Home in Last
Year
Damaged/ destroyed
Property in the Last Year
Become Violent in the Past Year
AllGirls 11.0% 15.0% 20.9%Boys 10.2% 30.4% 37.2%WhiteGirls 9.8% 13.6% 17.9%Boys 8.8% 29.2% 34.7%African AmericanGirls 11.3% 18.9% 39.3%Boys 13.1% 32.3% 51.2%Asian AmericanGirls 9.9% 14.4% 21.2%Boys 12.0% 31.4% 38.1%American IndianGirls 27.7% 28.0% 43.9%Boys 18.9% 40.8% 55.2%Hispanic Girls 17.9% 20.2% 29.7%Boys 14.7% 36.7% 48.5%
Notes:Responses are for 6th, 9th, and 12th grade students combined.
Source: Minnesota Student Survey Interagency Team 2005.Calculated by the Institute for Women's Policy Research.
Table 2.10: Mean Responses for Anti-Social Behavior, by Gender and Race and Ethnicity, Minnesota Student Survey, 2004
See the Methodology Appendix for information on how race and ethnicity are categorized in the Minnesota Student Survey.
20 Status of Girls in Minnesota
foster care or a group home (Wilder research 2007). Homeless youth are far more likely than other youth in Minnesota to have or have had an alcohol or drug problem, to have been in a violent relationship, to have experienced physical or sexual abuse, to have a serious mental health issue, or to have attempted suicide (Wilder research 2007). Many homeless youth link their situation to violence in the home, physical or sexual abuse by a family member, pregnancy, or lack of tolerance of their sexual orientation, among other reasons (Wilder research 2007). of homeless youth who identify as gay, lesbian, bisexual, or transgendered, 44 percent view their sexual orientation as part of the cause of their homelessness.
Homelessness among Minnesota’s youth leads to very gender specific vulnerabilities. Many homeless girls under the age of 17 end up trading sex for shelter, food, clothing, or other basic needs (16 percent compared with 5 percent of boys; Wilder research 2007).
for these girls, many of whom may have been victims of physical and sexual violence in their homes, survival comes with incredible risks.
In summary the high percentage african american, Hispanic,
and american indian girls reporting physical and sexual abuse is startling. While most of Minnesota’s girls see school as a safe place and are free from physical and sexual violence in the home, responses from girls of color about racism, victimization, and abuse point to a more varied picture of vulnerability. Girls who face abuse in the home and who feel vulnerable going to and from school and while at school are left without a safe space for healthy development. fully ensuring the safety and security of Minnesota’s girls in their homes, schools, and communities is fundamental to their ability to survive and succeed in life.
Recommendations for Change
1. Advocates for girls in Minnesota should convene a statewide task force on the well-being of girls of color in Minnesota. This task force should draw on experts in the areas of domestic abuse and sexual violence, homelessness, and mental health to address the wide ranging vulnerabilities experienced by girls of color in Minnesota.
2. The particular challenges and issues faced by girls of color in their respective communities should be studied to learn more about the different ways that girls deal with abuse and violence. For example, research might focus on American Indian girls’ greater engagement in risky behaviors, like cigarette, alcohol, and drug use, and whether it is a direct response to abuse and lack of safety. Research might also look at why African American girls use cigarettes, alcohol, and drugs at lower rates than other girls, given the safety issues they face in their communities.
3. Girls and boys also need school and community programs that educate them on the pervasiveness and harmfulness of physical and sexual violence against girls and women, in the home, in the school, in the community, and in the media. Girls should also have access to programs that teach them how to maximize their safety and provide them with support when they have experienced violence.
4. Schools should employ interventions to empower and give voice to gay, lesbian, bisexual, and transgendered youth, and build resources among educators, counselors, parents, administrators, and community leaders to address their needs and create an atmosphere of acceptance and safety.

21Chapter 3. Reproductive Health
aCCess to sex eDuCation anD ContraCeption is critical to girls’ ability to take care of themselves, their bodies, and their futures. an analysis of program evaluations of hundreds of sexual education programs finds that these programs have the potential to both delay early sexual activity and increase contraceptive use (Kirby, laris, rolleri 2006). research by the Guttmacher institute, however, shows that national reproductive health policy is not prioritizing education and access. Between 1995 and 2002, the proportion of 15 to 19yearolds receiving information about birth control dropped from 81 percent to 66 percent; with abstinenceonly education programs filling this void (Boonstra 2007).
although unintended pregnancy rates have remained constant over the past decade, unintended pregnancies have actually increased among poor women and decreased among higher income women (Guttmacher 2007). this trend reveals a widening gap in access to reproductive health information and services between low and highincome women in the united states. While the joint federalstate Medicaid program is the largest source of public funds for family planning services, title x is the only federal program specifically dedicated to family planning services for lowincome women and these funds decreased in real dollars between 1994 and 2001 (finder and Henshaw 2006; Guttmacher institute 2005).
at the same time, the number of women in need of publicly subsidized contraceptive services increased by more than one million from 2000 to 2004 (Gold 2006). furthermore, according to a recent study, many women choose to have an abortion out of a sense of responsibility and concern for their existing children. among women with children who reported having an abortion for this reason, twothirds lived below the poverty line and received little support from their partners (Jones, frohwirth, and Moore 2008).
ensuring that youth understand their own sexuality, how to have safe intimate relationships, and the risks associated with unsafe sex must be a priority. Girls’ autonomy over their bodies and their future education, career, and family plans should be encouraged through comprehensive sex education and access to contraception.
this chapter examines girls’ sexual activity, pregnancy and birth rates, incidence of stDs and HiV, and reasons for abstinence, focusing in on disparities by race and ethnicity.
sexual Activity and prevalence of pregnancy and Abortion
Sexual Activityfewer than one in three girls and boys in Minnesota have
had sex (30.3 percent of girls and 31.8 percent of boys; see figure 3.1). With the exception of asian americans, girls and boys of color are more likely to have had sex than their white counterparts. american indian girls and boys are the most sexually active. More than half of american indian girls say they have had sex at least once (51.0 percent). for Hispanic girls, 39.2 percent are sexually active. african american and asian american girls are much less likely to have had sex, however, with a little more than onethird of african american girls (36.6 percent) and less than onequarter of asian american girls (21.7 percent) reporting sexual activity. Gender differences are especially large among african americans and Hispanics: 13 percent more african
cHApTeR 3Reproductive Health
“Women feel like they need something else to complete themselves. Somehow we as young women are easily blinded; our own power is put to the side.”
Women’s Foundation of Minnesota’s girlsBEST Fund program participant, age 18
KFAI Radio’s “Youth News Initiative: Girls of Color Voicing Their Chioce” (Minneapolis) is creating the next generation of diverse female leadership in public broadcasting through training and mentoring. The nonprofit is a Women’s Foundation grantee.
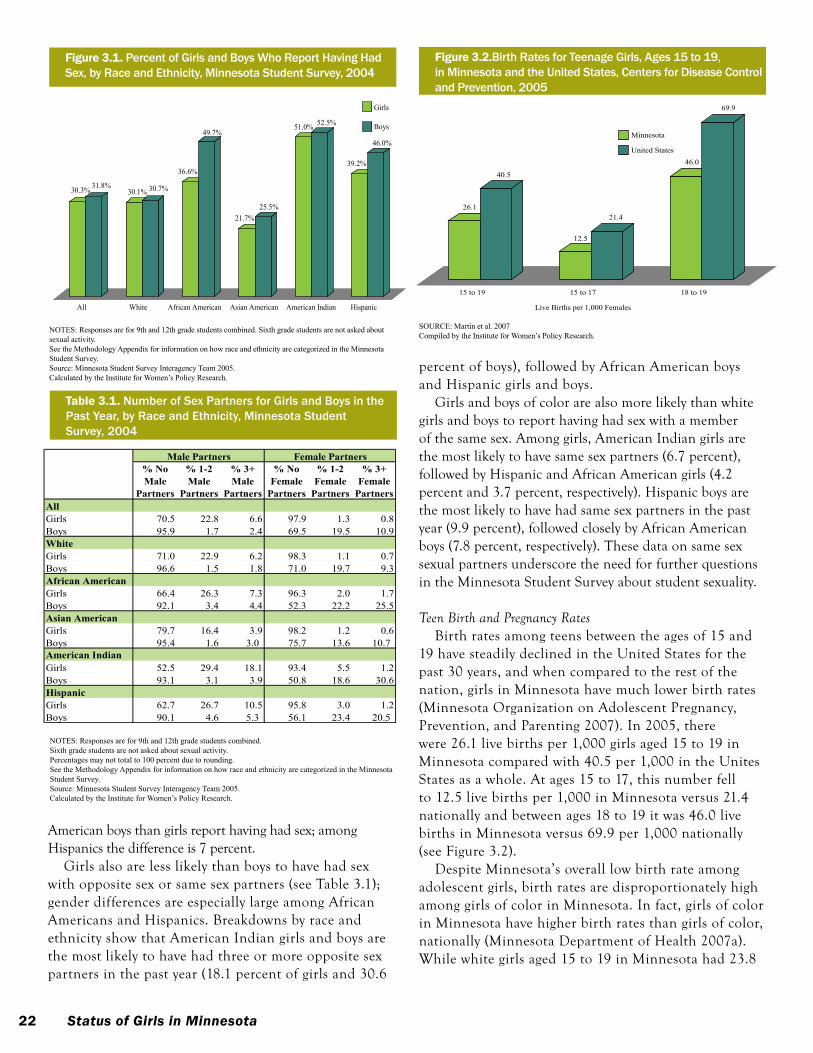
22 Status of Girls in Minnesota
american boys than girls report having had sex; among Hispanics the difference is 7 percent.
Girls also are less likely than boys to have had sex with opposite sex or same sex partners (see table 3.1); gender differences are especially large among african americans and Hispanics. Breakdowns by race and ethnicity show that american indian girls and boys are the most likely to have had three or more opposite sex partners in the past year (18.1 percent of girls and 30.6
percent of boys), followed by african american boys and Hispanic girls and boys.
Girls and boys of color are also more likely than white girls and boys to report having had sex with a member of the same sex. among girls, american indian girls are the most likely to have same sex partners (6.7 percent), followed by Hispanic and african american girls (4.2 percent and 3.7 percent, respectively). Hispanic boys are the most likely to have had same sex partners in the past year (9.9 percent), followed closely by african american boys (7.8 percent, respectively). these data on same sex sexual partners underscore the need for further questions in the Minnesota student survey about student sexuality.
Teen Birth and Pregnancy RatesBirth rates among teens between the ages of 15 and
19 have steadily declined in the united states for the past 30 years, and when compared to the rest of the nation, girls in Minnesota have much lower birth rates (Minnesota organization on adolescent pregnancy, prevention, and parenting 2007). in 2005, there were 26.1 live births per 1,000 girls aged 15 to 19 in Minnesota compared with 40.5 per 1,000 in the unites states as a whole. at ages 15 to 17, this number fell to 12.5 live births per 1,000 in Minnesota versus 21.4 nationally and between ages 18 to 19 it was 46.0 live births in Minnesota versus 69.9 per 1,000 nationally (see figure 3.2).
Despite Minnesota’s overall low birth rate among adolescent girls, birth rates are disproportionately high among girls of color in Minnesota. in fact, girls of color in Minnesota have higher birth rates than girls of color, nationally (Minnesota Department of Health 2007a). While white girls aged 15 to 19 in Minnesota had 23.8
Table 3.1. Number of Sex Partners for Girls and Boys in the Past Year, by Race and Ethnicity, Minnesota Student Survey, 2004
notes: Responses are for 9th and 12th grade students combined. sixth grade students are not asked about sexual activity. Percentages may not total to 100 percent due to rounding. see the Methodology Appendix for information on how race and ethnicity are categorized in the Minnesota student survey. Source: Minnesota Student Survey Interagency Team 2005. Calculated by the Institute for Women’s Policy Research.
% No Male
Partners
% 1-2 Male
Partners
% 3+ Male
Partners
% No Female
Partners
% 1-2 Female
Partners
% 3+ Female
PartnersAllGirls 70.5 22.8 6.6 97.9 1.3 0.8Boys 95.9 1.7 2.4 69.5 19.5 10.9WhiteGirls 71.0 22.9 6.2 98.3 1.1 0.7Boys 96.6 1.5 1.8 71.0 19.7 9.3African AmericanGirls 66.4 26.3 7.3 96.3 2.0 1.7Boys 92.1 3.4 4.4 52.3 22.2 25.5Asian American Girls 79.7 16.4 3.9 98.2 1.2 0.6Boys 95.4 1.6 3.0 75.7 13.6 10.7American IndianGirls 52.5 29.4 18.1 93.4 5.5 1.2Boys 93.1 3.1 3.9 50.8 18.6 30.6HispanicGirls 62.7 26.7 10.5 95.8 3.0 1.2Boys 90.1 4.6 5.3 56.1 23.4 20.5
Male Partners Female Partners
Table 3.1: Number of Sex Partners for Girls and Boys in the Past Year, by Race and Ethnicity, Minnesota Student Survey, 2004
26.1
40.5
12.5
21.4
46.0
69.9
15 to 19 15 to 17 18 to 19
Live Births per 1,000 Females
Figure 3.2: Birth Rates for Teenage Girls, Ages 15 to 19, in Minnesota and the United States, Centers for Disease Control and Prevention, 2005
Minnesota
United States
Source: Martin et al. 2007Compiled by the Institute for Women's Policy Research.
figure 3.2.Birth Rates for Teenage Girls, Ages 15 to 19, in Minnesota and the United States, Centers for Disease Control and Prevention, 2005
soURCe: Martin et al. 2007Compiled by the Institute for Women’s Policy Research.
30.3% 31.8%30.1% 30.7%
36.6%
49.7%
21.7%25.5%
51.0% 52.5%
39.2%
46.0%
All White African American Asian American American Indian Hispanic
Figure 3.1: Percent of Girls and Boys Who Report Having Had Sex, by Race and Ethnicity, Minnesota Student Survey, 2004
Girls
Boys
Notes:Responses are for 9th and 12th grade students combined. Sixth grade students are not asked about sexual activity. See the Methodology Appendix for information on how race and ethnicity are categorized in the Minnesota
figure 3.1. Percent of Girls and Boys Who Report Having Had Sex, by Race and Ethnicity, Minnesota Student Survey, 2004
notes: Responses are for 9th and 12th grade students combined. Sixth grade students are not asked about sexual activity. see the Methodology Appendix for information on how race and ethnicity are categorized in the Minnesota student survey.Source: Minnesota Student Survey Interagency Team 2005.Calculated by the Institute for Women’s Policy Research.
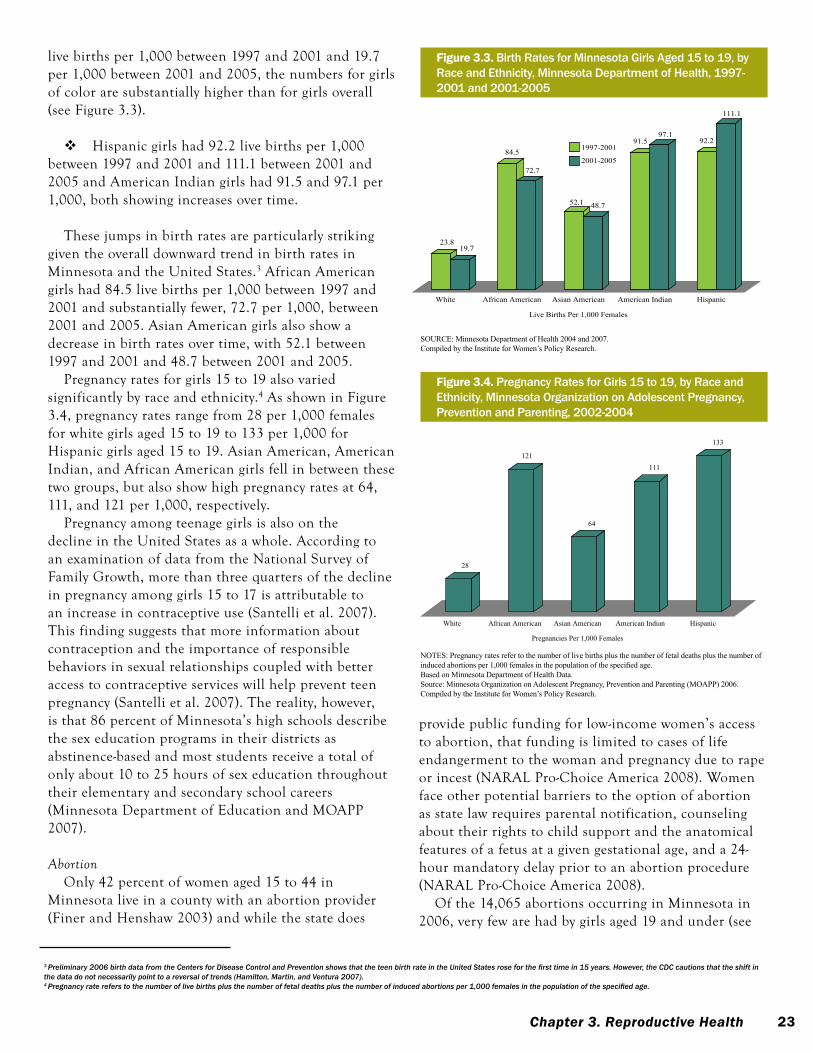
23Chapter 3. Reproductive Health
live births per 1,000 between 1997 and 2001 and 19.7 per 1,000 between 2001 and 2005, the numbers for girls of color are substantially higher than for girls overall (see figure 3.3).
Hispanic girls had 92.2 live births per 1,000 between 1997 and 2001 and 111.1 between 2001 and 2005 and american indian girls had 91.5 and 97.1 per 1,000, both showing increases over time.
these jumps in birth rates are particularly striking given the overall downward trend in birth rates in Minnesota and the united states.3 african american girls had 84.5 live births per 1,000 between 1997 and 2001 and substantially fewer, 72.7 per 1,000, between 2001 and 2005. asian american girls also show a decrease in birth rates over time, with 52.1 between 1997 and 2001 and 48.7 between 2001 and 2005.
pregnancy rates for girls 15 to 19 also varied significantly by race and ethnicity.4 as shown in figure 3.4, pregnancy rates range from 28 per 1,000 females for white girls aged 15 to 19 to 133 per 1,000 for Hispanic girls aged 15 to 19. asian american, american indian, and african american girls fell in between these two groups, but also show high pregnancy rates at 64, 111, and 121 per 1,000, respectively.
pregnancy among teenage girls is also on the decline in the united states as a whole. according to an examination of data from the national survey of family Growth, more than three quarters of the decline in pregnancy among girls 15 to 17 is attributable to an increase in contraceptive use (santelli et al. 2007). this finding suggests that more information about contraception and the importance of responsible behaviors in sexual relationships coupled with better access to contraceptive services will help prevent teen pregnancy (santelli et al. 2007). the reality, however, is that 86 percent of Minnesota’s high schools describe the sex education programs in their districts as abstinencebased and most students receive a total of only about 10 to 25 hours of sex education throughout their elementary and secondary school careers (Minnesota Department of education and Moapp 2007).
Abortiononly 42 percent of women aged 15 to 44 in
Minnesota live in a county with an abortion provider (finer and Henshaw 2003) and while the state does
provide public funding for lowincome women’s access to abortion, that funding is limited to cases of life endangerment to the woman and pregnancy due to rape or incest (naral proChoice america 2008). Women face other potential barriers to the option of abortion as state law requires parental notification, counseling about their rights to child support and the anatomical features of a fetus at a given gestational age, and a 24hour mandatory delay prior to an abortion procedure (naral proChoice america 2008).
of the 14,065 abortions occurring in Minnesota in 2006, very few are had by girls aged 19 and under (see
23.819.7
84.5
72.7
52.1 48.7
91.597.1
92.2
111.1
White African American Asian American American Indian Hispanic
Live Births Per 1,000 Females
Figure 3.3: Birth Rates for Minnesota Girls Aged 15 to 19, by Race and Ethnicity, 1997-2001 and 2001-2005
1997-2001
2001-2005
Source: Minnesota Department of Health, Center for Health Statistics 2004 and 2007.Compiled by the Institute for Women's Policy Research.
figure 3.3. Birth Rates for Minnesota Girls Aged 15 to 19, by Race and Ethnicity, Minnesota Department of Health, 1997-2001 and 2001-2005
soURCe: Minnesota Department of Health 2004 and 2007.Compiled by the Institute for Women’s Policy Research.
28
121
64
111
133
White African American Asian American American Indian Hispanic
Pregnancies Per 1,000 Females
Figure 3.4: Pregnancy Rates for Girls 15 to 19, by Race and Ethnicity, 2002-2004
Notes:Pregnancy rates refer to the number of live births plus the number of fetal deaths plus the number of induced abortions per 1,000 females in the population of the specified age.Source: Minnesota Organization on Adolescent Pregnancy, Prevention and Parenting (MOAPP) 2006.Compiled by the Institute for Women's Policy Research.
figure 3.4. Pregnancy Rates for Girls 15 to 19, by Race and Ethnicity, Minnesota Organization on Adolescent Pregnancy, Prevention and Parenting, 2002-2004
notes: Pregnancy rates refer to the number of live births plus the number of fetal deaths plus the number of induced abortions per 1,000 females in the population of the specified age.Based on Minnesota Department of Health Data.source: Minnesota organization on Adolescent Pregnancy, Prevention and Parenting (MoAPP) 2006.Compiled by the Institute for Women’s Policy Research.
3 Preliminary 2006 birth data from the Centers for Disease Control and Prevention shows that the teen birth rate in the United States rose for the first time in 15 years. However, the CDC cautions that the shift in the data do not necessarily point to a reversal of trends (Hamilton, Martin, and Ventura 2007).4 Pregnancy rate refers to the number of live births plus the number of fetal deaths plus the number of induced abortions per 1,000 females in the population of the specified age.
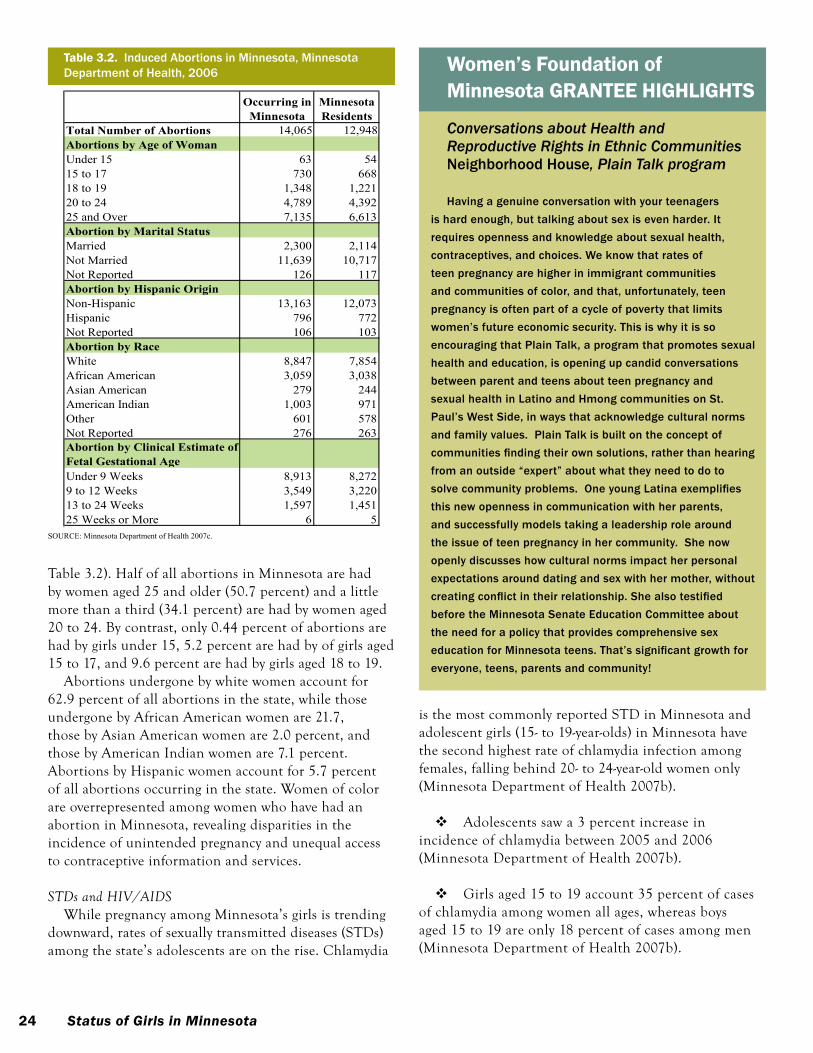
24 Status of Girls in Minnesota
table 3.2). Half of all abortions in Minnesota are had by women aged 25 and older (50.7 percent) and a little more than a third (34.1 percent) are had by women aged 20 to 24. By contrast, only 0.44 percent of abortions are had by girls under 15, 5.2 percent are had by of girls aged 15 to 17, and 9.6 percent are had by girls aged 18 to 19.
abortions undergone by white women account for 62.9 percent of all abortions in the state, while those undergone by african american women are 21.7, those by asian american women are 2.0 percent, and those by american indian women are 7.1 percent. abortions by Hispanic women account for 5.7 percent of all abortions occurring in the state. Women of color are overrepresented among women who have had an abortion in Minnesota, revealing disparities in the incidence of unintended pregnancy and unequal access to contraceptive information and services.
STDs and HIV/AIDSWhile pregnancy among Minnesota’s girls is trending
downward, rates of sexually transmitted diseases (stDs) among the state’s adolescents are on the rise. Chlamydia
is the most commonly reported stD in Minnesota and adolescent girls (15 to 19yearolds) in Minnesota have the second highest rate of chlamydia infection among females, falling behind 20 to 24yearold women only (Minnesota Department of Health 2007b).
adolescents saw a 3 percent increase in incidence of chlamydia between 2005 and 2006 (Minnesota Department of Health 2007b).
Girls aged 15 to 19 account 35 percent of cases of chlamydia among women all ages, whereas boys aged 15 to 19 are only 18 percent of cases among men (Minnesota Department of Health 2007b).
Table 3.2. Induced Abortions in Minnesota, Minnesota Department of Health, 2006
soURCe: Minnesota Department of Health 2007c.
Occurring in Minnesota
Minnesota Residents
Total Number of Abortions 14,065 12,948Abortions by Age of WomanUnder 15 63 5415 to 17 730 66818 to 19 1,348 1,22120 to 24 4,789 4,39225 and Over 7,135 6,613Abortion by Marital StatusMarried 2,300 2,114Not Married 11,639 10,717Not Reported 126 117Abortion by Hispanic OriginNon-Hispanic 13,163 12,073Hispanic 796 772Not Reported 106 103Abortion by RaceWhite 8,847 7,854African American 3,059 3,038Asian American 279 244American Indian 1,003 971Other 601 578Not Reported 276 263Abortion by Clinical Estimate of Fetal Gestational AgeUnder 9 Weeks 8,913 8,2729 to 12 Weeks 3,549 3,22013 to 24 Weeks 1,597 1,45125 Weeks or More 6 5
Table 3.2: Induced Abortions in Minnesota, Minnesota Department of Health, 2006
Source: Minnesota Department of Health 2007c.
Women’s foundation of Minnesota GRAnTee HIGHlIGHTs
Conversations about Health and Reproductive Rights in Ethnic Communities Neighborhood House, Plain Talk program
Having a genuine conversation with your teenagers is hard enough, but talking about sex is even harder. It requires openness and knowledge about sexual health, contraceptives, and choices. We know that rates of teen pregnancy are higher in immigrant communities and communities of color, and that, unfortunately, teen pregnancy is often part of a cycle of poverty that limits women’s future economic security. This is why it is so encouraging that Plain Talk, a program that promotes sexual health and education, is opening up candid conversations between parent and teens about teen pregnancy and sexual health in Latino and Hmong communities on St. Paul’s West Side, in ways that acknowledge cultural norms and family values. Plain Talk is built on the concept of communities finding their own solutions, rather than hearing from an outside “expert” about what they need to do to solve community problems. One young Latina exemplifies this new openness in communication with her parents, and successfully models taking a leadership role around the issue of teen pregnancy in her community. She now openly discusses how cultural norms impact her personal expectations around dating and sex with her mother, without creating conflict in their relationship. She also testified before the Minnesota Senate Education Committee about the need for a policy that provides comprehensive sex education for Minnesota teens. That’s significant growth for everyone, teens, parents and community!
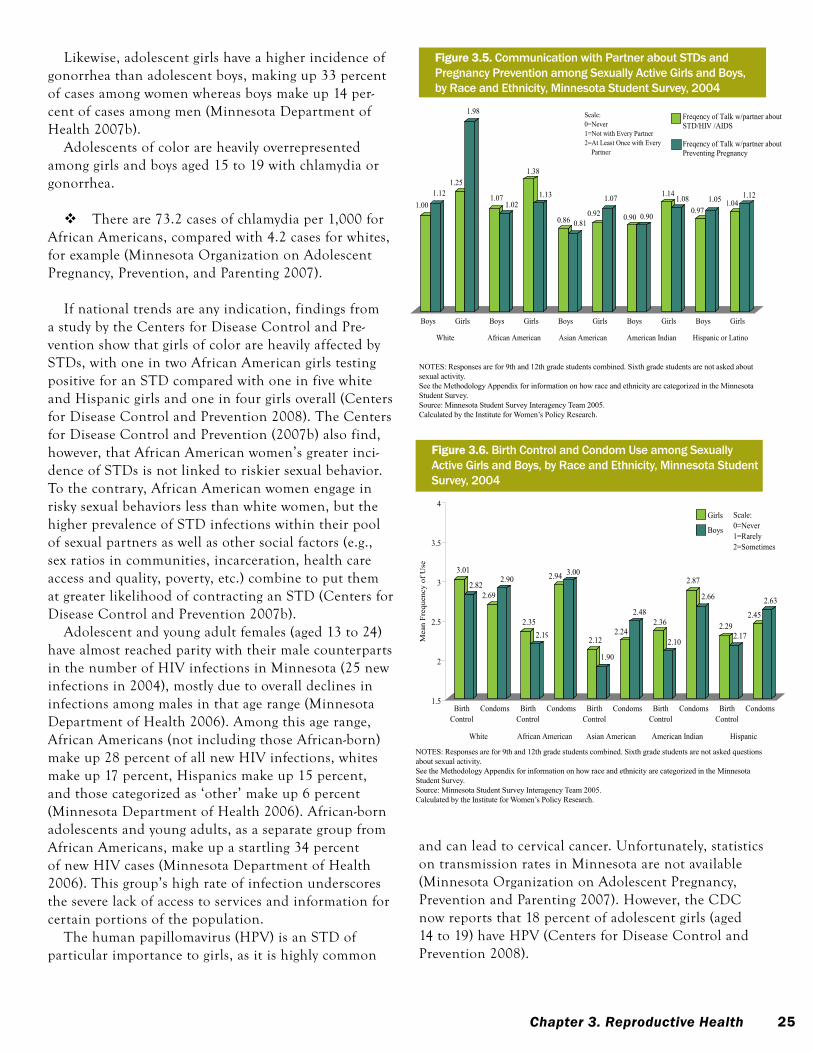
25Chapter 3. Reproductive Health
likewise, adolescent girls have a higher incidence of gonorrhea than adolescent boys, making up 33 percent of cases among women whereas boys make up 14 percent of cases among men (Minnesota Department of Health 2007b).
adolescents of color are heavily overrepresented among girls and boys aged 15 to 19 with chlamydia or gonorrhea.
there are 73.2 cases of chlamydia per 1,000 for african americans, compared with 4.2 cases for whites, for example (Minnesota organization on adolescent pregnancy, prevention, and parenting 2007).
if national trends are any indication, findings from a study by the Centers for Disease Control and prevention show that girls of color are heavily affected by stDs, with one in two african american girls testing positive for an stD compared with one in five white and Hispanic girls and one in four girls overall (Centers for Disease Control and prevention 2008). the Centers for Disease Control and prevention (2007b) also find, however, that african american women’s greater incidence of stDs is not linked to riskier sexual behavior. to the contrary, african american women engage in risky sexual behaviors less than white women, but the higher prevalence of stD infections within their pool of sexual partners as well as other social factors (e.g., sex ratios in communities, incarceration, health care access and quality, poverty, etc.) combine to put them at greater likelihood of contracting an stD (Centers for Disease Control and prevention 2007b).
adolescent and young adult females (aged 13 to 24) have almost reached parity with their male counterparts in the number of HiV infections in Minnesota (25 new infections in 2004), mostly due to overall declines in infections among males in that age range (Minnesota Department of Health 2006). among this age range, african americans (not including those africanborn) make up 28 percent of all new HiV infections, whites make up 17 percent, Hispanics make up 15 percent, and those categorized as ‘other’ make up 6 percent (Minnesota Department of Health 2006). africanborn adolescents and young adults, as a separate group from african americans, make up a startling 34 percent of new HiV cases (Minnesota Department of Health 2006). this group’s high rate of infection underscores the severe lack of access to services and information for certain portions of the population.
the human papillomavirus (HpV) is an stD of particular importance to girls, as it is highly common
1.001.12
1.25
1.98
1.071.02
1.38
1.13
0.86 0.810.92
1.07
0.90 0.90
1.141.08
0.971.05 1.04
1.12
Boys Girls Boys Girls Boys Girls Boys Girls Boys Girls
White African American Asian American American Indian Hispanic or Latino
Figure 3.5: Communication with Partner about STDs and Pregnancy Prevention among Sexually Active Students, Minnesota Student Survey, 2004
Freqency of Talk w/partner aboutSTD/HIV /AIDS
Freqency of Talk w/partner aboutPreventing Pregnancy
Source: Minnesota Student Survey Interagency Team 2005.
Scale:0=Never 1=Not with Every Partner2=At Least Once with Every
Partner
figure 3.5. Communication with Partner about STDs and Pregnancy Prevention among Sexually Active Girls and Boys, by Race and Ethnicity, Minnesota Student Survey, 2004
notes: Responses are for 9th and 12th grade students combined. Sixth grade students are not asked about sexual activity.see the Methodology Appendix for information on how race and ethnicity are categorized in the Minnesota student survey.Source: Minnesota Student Survey Interagency Team 2005.Calculated by the Institute for Women’s Policy Research.
3.01
2.822.69
2.90
2.352.19
2.94 3.00
2.12
1.90
2.24
2.482.36
2.10
2.87
2.66
2.292.17
2.45
2.63
1.5
2
2.5
3
3.5
4
Mea
n Fr
eque
ncy
of U
se
BirthControl
Condoms BirthControl
Condoms BirthControl
Condoms BirthControl
Condoms BirthControl
Condoms
White African American Asian American American Indian Hispanic
Figure 3.6: Birth Control and Condom Use among Sexually Active Girls and Boys, by Race and Ethnicity, Minnesota Student Survey, 2004
Girls
Boys
Notes:Responses are for 9th and 12th grade students combined. Sixth grade students are not asked questions about sexual activity.See the Methodology Appendix for information on how race and ethnicity are categorized in the Minnesota Student Survey.Source: Minnesota Student Survey Interagency Team 2005.Calculated by the Institute for Women's Policy Research.
Scale:0=Never 1=Rarely2=Sometimes
3=Usually
figure 3.6. Birth Control and Condom Use among Sexually Active Girls and Boys, by Race and Ethnicity, Minnesota Student Survey, 2004
notes: Responses are for 9th and 12th grade students combined. Sixth grade students are not asked questions about sexual activity.see the Methodology Appendix for information on how race and ethnicity are categorized in the Minnesota student survey.Source: Minnesota Student Survey Interagency Team 2005.Calculated by the Institute for Women’s Policy Research.
and can lead to cervical cancer. unfortunately, statistics on transmission rates in Minnesota are not available (Minnesota organization on adolescent pregnancy, prevention and parenting 2007). However, the CDC now reports that 18 percent of adolescent girls (aged 14 to 19) have HpV (Centers for Disease Control and prevention 2008).
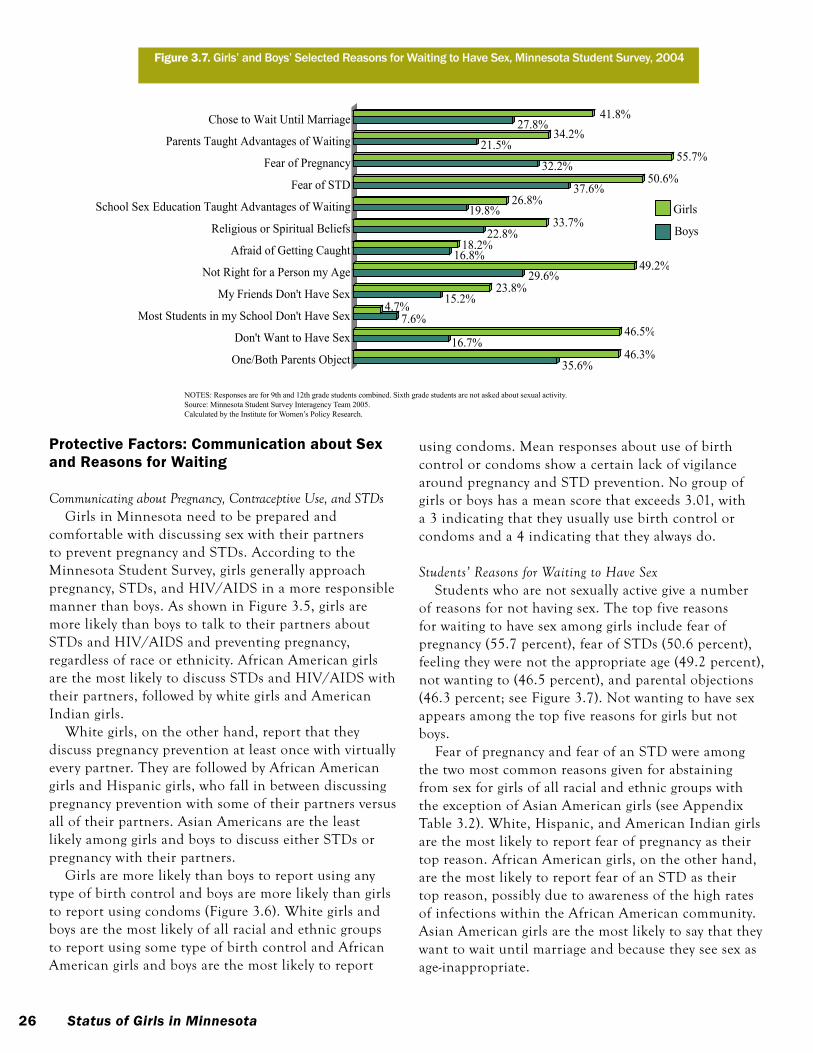
26 Status of Girls in Minnesota
protective factors: communication about sex and Reasons for Waiting
Communicating about Pregnancy, Contraceptive Use, and STDs Girls in Minnesota need to be prepared and
comfortable with discussing sex with their partners to prevent pregnancy and stDs. according to the Minnesota student survey, girls generally approach pregnancy, stDs, and HiV/aiDs in a more responsible manner than boys. as shown in figure 3.5, girls are more likely than boys to talk to their partners about stDs and HiV/aiDs and preventing pregnancy, regardless of race or ethnicity. african american girls are the most likely to discuss stDs and HiV/aiDs with their partners, followed by white girls and american indian girls.
White girls, on the other hand, report that they discuss pregnancy prevention at least once with virtually every partner. they are followed by african american girls and Hispanic girls, who fall in between discussing pregnancy prevention with some of their partners versus all of their partners. asian americans are the least likely among girls and boys to discuss either stDs or pregnancy with their partners.
Girls are more likely than boys to report using any type of birth control and boys are more likely than girls to report using condoms (figure 3.6). White girls and boys are the most likely of all racial and ethnic groups to report using some type of birth control and african american girls and boys are the most likely to report
35.6%46.3%
16.7%46.5%
7.6%4.7% 15.2%
23.8%29.6%
49.2%16.8%
18.2%22.8%
33.7%19.8%
26.8%37.6%
50.6%32.2%
55.7%21.5%
34.2%27.8%
41.8%
One/Both Parents Object
Don't Want to Have Sex
Most Students in my School Don't Have Sex
My Friends Don't Have Sex
Not Right for a Person my Age
Afraid of Getting Caught
Religious or Spiritual Beliefs
School Sex Education Taught Advantages of Waiting
Fear of STD
Fear of Pregnancy
Parents Taught Advantages of Waiting
Chose to Wait Until Marriage
Figure 3.7: Girls' and Boys' Selected Reasons for Waiting to Have Sex, Minnesota Student Survey, 2004
Girls
Boys
Notes:Responses are for 9th and 12th grade students combined. Sixth grade students are not asked about sexual activity.Source: Minnesota Student Survey Interagency Team 2005.Calculated by the Institute for Women's Policy Research.
figure 3.7. Girls’ and Boys’ Selected Reasons for Waiting to Have Sex, Minnesota Student Survey, 2004
notes: Responses are for 9th and 12th grade students combined. Sixth grade students are not asked about sexual activity.Source: Minnesota Student Survey Interagency Team 2005.Calculated by the Institute for Women’s Policy Research.
using condoms. Mean responses about use of birth control or condoms show a certain lack of vigilance around pregnancy and stD prevention. no group of girls or boys has a mean score that exceeds 3.01, with a 3 indicating that they usually use birth control or condoms and a 4 indicating that they always do.
Students’ Reasons for Waiting to Have Sexstudents who are not sexually active give a number
of reasons for not having sex. the top five reasons for waiting to have sex among girls include fear of pregnancy (55.7 percent), fear of stDs (50.6 percent), feeling they were not the appropriate age (49.2 percent), not wanting to (46.5 percent), and parental objections (46.3 percent; see figure 3.7). not wanting to have sex appears among the top five reasons for girls but not boys.
fear of pregnancy and fear of an stD were among the two most common reasons given for abstaining from sex for girls of all racial and ethnic groups with the exception of asian american girls (see appendix table 3.2). White, Hispanic, and american indian girls are the most likely to report fear of pregnancy as their top reason. african american girls, on the other hand, are the most likely to report fear of an stD as their top reason, possibly due to awareness of the high rates of infections within the african american community. asian american girls are the most likely to say that they want to wait until marriage and because they see sex as ageinappropriate.
27Chapter 3. Reproductive Health
In summary
While Minnesota girls generally approach pregnancy, stDs, and HiV/aiDs in a more responsible manner than boys, being more likely than boys to engage their partners in discussions about prevention, they still show a certain degree of ambivalence toward using contraception. the average response from sexually active girls of color as to whether they use birth control or condoms falls between ‘sometimes’ or ‘usually.’ likewise, while Minnesota’s overall teen birth rates are low compared with those for the nation as a whole, birth rates for Hispanic and american indian girls are higher than nationally and have actually increased. the growing birth rates for these girls amidst a decline among girls overall and increases in rates of stD infections among adolescents in the state are causes for deep concern. Guaranteeing Minnesota girls’ health and reproductive rights will mean engaging girls in sex education that underscores both the importance of talking with sex partners about pregnancy and stDs and of using contraception to safeguard their sexual health and future opportunities. sex education programs and other risk prevention programs will need to target girls of color and address their unique needs and realities.
Recommendations for Change
1. Minnesota should implement mandatory, comprehensive sex education programs in its public schools. These sex education programs should focus on how to avoid unintended pregnancy and STDs and provide information about sex that will empower girls to both delay and prepare for sexual activity.
2. Sex education programs should also address the economic and life altering impacts of having children at an early age. Girls of color disproportionately face socioeconomic inequities that make them more vulnerable to pregnancy at an early age. Numerous studies have linked poverty, lack of access to health insurance, limited educational expectations and opportunities, and lower career aspirations to increased likelihood of unintended adolescent pregnancy (Finer and Henshaw 2006; Beutel 2000; East 1998; and Geronimus 1997).
3. Improving access to and the quality of reproductive health care for girls of color will be of utmost importance in reducing racial and gender disparities in the incidence of STDs and HIV and the high levels of pregnancy among these teenage girls in the state.


29Chapter 4. Mental Health
DurinG aDolesCenCe, Girls are exposeD to a mix of messages, images, and environments that affect their selfesteem. for many girls, it is a time when gender roles related to dating and sexuality become entrenched, when body image and living up to society’s physical standards feel overwhelmingly important, and at the same time, when there is substantial pressure to excel in school.
Girls’ dissatisfaction with their bodies, in particular, is of great concern not only because it puts them at risk of developing eating disorders, but also because it increases their likelihood of experiencing depression. During adolescence, girls report higher levels of selfsurveillance, body shame, and depressive symptoms than their male counterparts, and selfsurveillance is a significant predictor of depression among girls (Grabe, Hyde, and linberg 2007). likewise, research by the american association of university Women (aauW) reveals that while both girls and boys experience a drop in selfesteem during adolescence, the drop is much more pronounced for girls (american association of university Women 1994).
adolescents who experience low selfesteem are also at risk of harming themselves. suicide is the third leading cause of death among 15 to 24yearolds in the united states and accounts for 12.9 percent of deaths annually for that age range (eaton et al. 2006). in 2005, 16.9 percent of u.s. high school students reported seriously considering suicide in the past year and over 8 percent actually attempted suicide during the preceding 12 months (eaton et al. 2006). the data show that females attempt suicide more frequently than males, but are far less likely to die from a suicide attempt (males account for 78.8 percent of all suicide deaths in the country; eaton et al. 2006). there are also significant disparities by race and sexuality. nationally, suicide is the second leading cause of death among american indians aged 15 to 34 and their suicide rates are 1.9 times higher than the national average for this age group. additionally, female Hispanic high school students in the united states report a higher percentage of suicide attempts than their nonHispanic white or nonHispanic Black counterparts (eaton et al. 2006).
Gay, lesbian, bisexual, and transgendered youth also face increased vulnerability to depression, low selfesteem, anxiety, and suicidal thoughts and attempts. these
patterns are especially pronounced among gay male youth (Brown and Mechiono 2006). analysis of the experiences of lesbian girls is less conclusive. although one populationbased study in Minnesota finds that lesbians are more likely than their heterosexual counterparts to report suicidal behavior, the difference was not statistically significant (remafedi et al. 1998).
the worry and stress of being smart, successful, the right size, and desirable to boys affects many girls (Girls, incorporated 2006) and can compound other issues they face in terms of selfesteem and mental health. for example, girls in early adolescence who internalize feminine body ideals and female body objectification have lower selfesteem and experience higher depressed moods (tolman et al. 2006). low selfesteem can also be predictive of unhealthy behaviors. among sexually active girls, lowself esteem is correlated with first sexual intercourse at an early age and risk of unprotected sex (ethier et al. 2006). several protective factors have been identified, however,
cHApTeR 4Mental Health
“We are the ones responsible for ourselves.
It’s important for young women dealing with these messages from the media
to have and reach out to an understanding source. It’s difficult to know who truly
has your best interest.”
Women’s Foundation of Minnesota girlsBEST Fund
program participant, age 18
Centro, Inc. (Minneapolis) apprentices Latina teens as dance instructors, developing their skills to claim and establish their own leadership and eco-nomic power. The nonprofit is a Women’s Foundation grantee.

30 Status of Girls in Minnesota
as sources of resistance to negative cultural messages for adolescent girls, including close connections to family, good interpersonal relationships, a strong ethnic identity, assertive female role models, athletics, exposure to nontraditional sex roles and occupations for women, and feminist ideas (american psychological association 1998; Johnson, roberts, and Worrell 1999; Carbonell 2002).
this section examines girls’ weight perceptions, methods of weight control, level of selfesteem, and suicide consideration and attempts, paying particular attention to the ways in which girls of different racial and ethnic groups differ in their selfevaluations and feelings of selfworth.
Weight perceptions and control
Weight PerceptionsMinnesota girls are less likely than boys across race and
ethnicity to be satisfied with their body weight. Hispanic and white girls are most likely to perceive themselves as overweight while african american and asian american girls are least likely (see figure 4.1). this is consistent with studies showing that african american adolescent girls report higher selfesteem and greater body satisfaction than their white and Hispanic counterparts (Crago, shisslak, and estes 1996). although further studies of both american indian and asian american girls in the united states are needed, research
based on the Bulimia test (Bulit) and the eating Disorder inventory (eDi) suggests that the rate of disturbed eating patterns among american indian and Hispanic adolescents is comparable to that of white adolescents (smith and Krejci 1991).
Girls’ perceptions of being overweight can differ drastically from their actual weight. Girls and boys who truly are overweight, as defined by having a bodymass index at or above the 95th percentile for children of the same age and sex, face a number of health challenges including conditions such as elevated blood pressure, sleep apnea, and type 2 diabetes (Dietz 2004). Because girls and boys of color are more likely to be overweight, they are disproportionately affected by these health risks (Dietz 2004). the Minnesota student survey, unfortunately, cannot easily assess whether girls and boys are actually overweight. Dealing with mass media’s unrealistic and unhealthy images of girls’ and women’s bodies, and providing girls with positive and varied body type images, could help reduce unhealthy weight control strategies on the part of girls.
Weight Controlin addition to a poorer body image, girls are more likely
than boys to report fasting or skipping meals, smoking, using diet pills or speed, or vomiting to control their weight (see table 4.1). they are equally as likely as boys to report exercising to control weight (91.8 percent) and half as likely to take laxatives to control their weight (1.5 versus 2.7 percent, respectively). across race and ethnicity, the majority of girls, like boys, report exercise as their most common form of weight control. fasting or skipping meals is the next most
2.16
2.04
2.21
2.04
2.14
1.98
2.192.12
2.16
2.06
2.25
2.13
1.5
2
2.5
3
Mea
n Pe
rcep
tion
Scor
e
All White African American American Indian Asian American Hispanic
Figure 4.1: Weight Perceptions among Girls and Boys, by Race and Ethnicity, Minnesota Student Survey, 2004
Girls
Boys
Notes:Responses are for 6th, 9th, and 12th grade students combined.See the Methodology Appendix for information on how race and ethnicity are categorized in the Minnesota Student Survey.
Scale:1=Underweight 2=About the right weight 3=Overweight
figure 4.1. Weight Perceptions among Girls and Boys, by Race and Ethnicity, Minnesota Student Survey, 2004
notes: Responses are for 6th, 9th, and 12th grade students combined.see the Methodology Appendix for information on how race and ethnicity are categorized in the Minnesota student survey.Source: Minnesota Student Survey Interagency Team 2005.Calculated by the Institute for Women’s Policy Research.
“I think people forget how hard it is [being young] because they think of it as the good ole days, but we’re going through a lot more than people think.”
Women’s Foundation of Minnesota girlsBEST Fund program participant, age 15
Table 4.1. Methods of Weight Control, by Gender and Race and Ethnicity, Minnesota Student Survey, 2004
notes: Responses are for 9th and 12th grade students combined. sixth grade students are not asked about methods of weight control. see the Methodology Appendix for information on how race and ethnicity are categorized in the Minnesota student survey. Source: Minnesota Student Survey Interagency Team 2005. Compiled by the Institute for Women’s Policy Research.
Exercise Fast or
skip meals Smoke
Use diet pills or speed Vomit
Take laxatives
AllGirls 91.8% 43.7% 10.9% 7.2% 7.5% 1.5%Boys 91.8% 22.1% 9.4% 3.8% 2.6% 2.7%WhiteGirls 92.6% 43.3% 10.9% 7.2% 7.5% 1.4%Boys 92.7% 22.3% 9.0% 3.4% 2.2% 2.1%African AmericanGirls 87.3% 38.0% 4.1% 4.5% 4.2% 2.0%Boys 89.4% 16.1% 6.6% 3.1% 3.7% 4.4%American IndianGirls 84.2% 47.2% 22.2% 8.9% 9.4% 1.4%Boys 86.1% 22.3% 14.9% 6.0% 4.1% 3.0%Asian AmericanGirls 91.3% 45.9% 7.6% 4.4% 4.0% 1.3%Boys 91.3% 23.0% 10.4% 3.4% 3.0% 3.1%Hispanic Girls 87.2% 44.7% 10.5% 8.7% 10.0% 3.4%Boys 89.9% 20.6% 9.2% 4.3% 2.6% 3.4%
During the Last 12 Months Have You Done Any of the Following to Lose or Control Weight?
Table 4.1: Methods of Weight Control, by Gender and Race and Ethnicity, Minnesota Student Survey, 2004
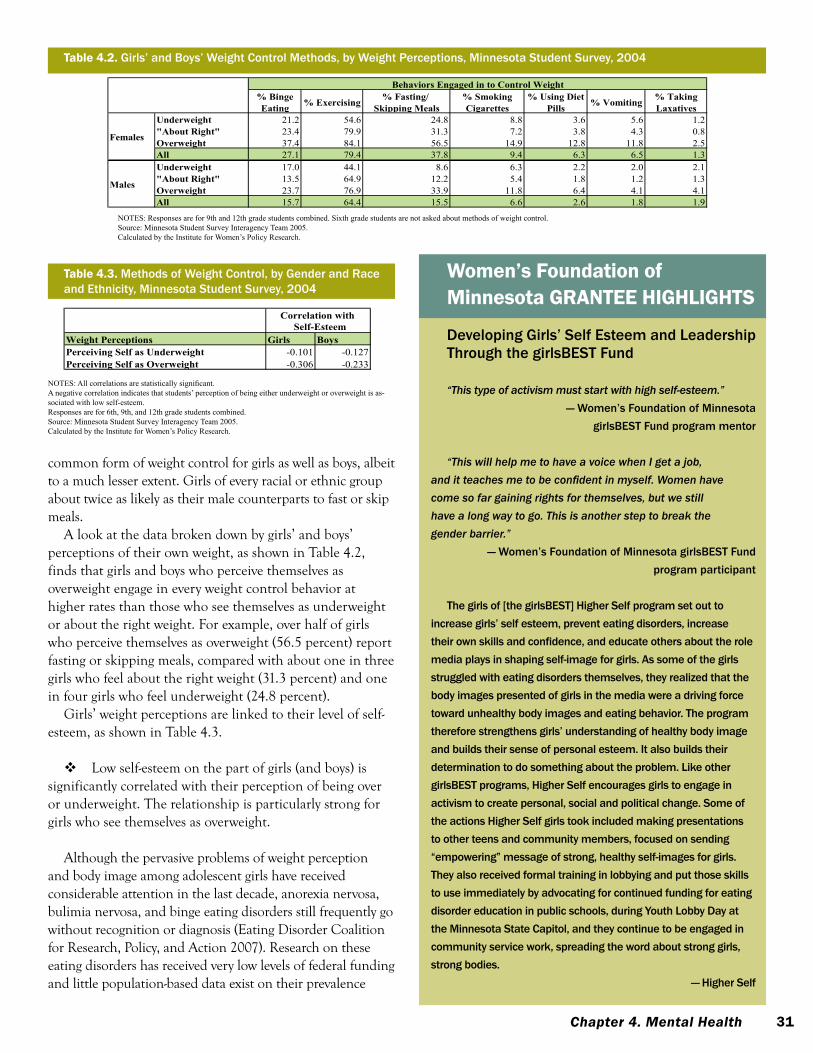
31Chapter 4. Mental Health
common form of weight control for girls as well as boys, albeit to a much lesser extent. Girls of every racial or ethnic group about twice as likely as their male counterparts to fast or skip meals.
a look at the data broken down by girls’ and boys’ perceptions of their own weight, as shown in table 4.2, finds that girls and boys who perceive themselves as overweight engage in every weight control behavior at higher rates than those who see themselves as underweight or about the right weight. for example, over half of girls who perceive themselves as overweight (56.5 percent) report fasting or skipping meals, compared with about one in three girls who feel about the right weight (31.3 percent) and one in four girls who feel underweight (24.8 percent).
Girls’ weight perceptions are linked to their level of selfesteem, as shown in table 4.3.
low selfesteem on the part of girls (and boys) is significantly correlated with their perception of being over or underweight. the relationship is particularly strong for girls who see themselves as overweight.
although the pervasive problems of weight perception and body image among adolescent girls have received considerable attention in the last decade, anorexia nervosa, bulimia nervosa, and binge eating disorders still frequently go without recognition or diagnosis (eating Disorder Coalition for research, policy, and action 2007). research on these eating disorders has received very low levels of federal funding and little populationbased data exist on their prevalence
Table 4.2. Girls’ and Boys’ Weight Control Methods, by Weight Perceptions, Minnesota Student Survey, 2004
notes: Responses are for 9th and 12th grade students combined. Sixth grade students are not asked about methods of weight control. Source: Minnesota Student Survey Interagency Team 2005. Calculated by the Institute for Women’s Policy Research.
Table 4.2: Girls' and Boys' Weight Control Methods, by Weight Perceptions, Minnesota Student Survey, 2004
% Binge Eating % Exercising % Fasting/
Skipping Meals% Smoking Cigarettes
% Using Diet Pills % Vomiting % Taking
LaxativesUnderweight 21.2 54.6 24.8 8.8 3.6 5.6 1.2"About Right" 23.4 79.9 31.3 7.2 3.8 4.3 0.8Overweight 37.4 84.1 56.5 14.9 12.8 11.8 2.5All 27.1 79.4 37.8 9.4 6.3 6.5 1.3Underweight 17.0 44.1 8.6 6.3 2.2 2.0 2.1"About Right" 13.5 64.9 12.2 5.4 1.8 1.2 1.3Overweight 23.7 76.9 33.9 11.8 6.4 4.1 4.1All 15.7 64.4 15.5 6.6 2.6 1.8 1.9
Males
Females
Behaviors Engaged in to Control Weight
Table 4.3. Methods of Weight Control, by Gender and Race and Ethnicity, Minnesota Student Survey, 2004
notes: All correlations are statistically significant. A negative correlation indicates that students’ perception of being either underweight or overweight is as-sociated with low self-esteem. Responses are for 6th, 9th, and 12th grade students combined. Source: Minnesota Student Survey Interagency Team 2005. Calculated by the Institute for Women’s Policy Research.
Weight Perceptions Girls BoysPerceiving Self as Underweight -0.101 -0.127Perceiving Self as Overweight -0.306 -0.233
Table 4.3: Correlations Between Self-Esteem and Weight Perception for Girls and Boys, Minnesota Student Survey, 2004
Correlation with Self-Esteem
Women’s foundation of Minnesota GRAnTee HIGHlIGHTs
Developing Girls’ Self Esteem and Leadership Through the girlsBEST Fund
“This type of activism must start with high self-esteem.” — Women’s Foundation of Minnesota
girlsBEST Fund program mentor
“This will help me to have a voice when I get a job, and it teaches me to be confident in myself. Women have come so far gaining rights for themselves, but we still have a long way to go. This is another step to break the gender barrier.”
— Women’s Foundation of Minnesota girlsBEST Fund program participant
The girls of [the girlsBEST] Higher Self program set out to increase girls’ self esteem, prevent eating disorders, increase their own skills and confidence, and educate others about the role media plays in shaping self-image for girls. As some of the girls struggled with eating disorders themselves, they realized that the body images presented of girls in the media were a driving force toward unhealthy body images and eating behavior. The program therefore strengthens girls’ understanding of healthy body image and builds their sense of personal esteem. It also builds their determination to do something about the problem. Like other girlsBEST programs, Higher Self encourages girls to engage in activism to create personal, social and political change. Some of the actions Higher Self girls took included making presentations to other teens and community members, focused on sending “empowering” message of strong, healthy self-images for girls. They also received formal training in lobbying and put those skills to use immediately by advocating for continued funding for eating disorder education in public schools, during Youth Lobby Day at the Minnesota State Capitol, and they continue to be engaged in community service work, spreading the word about strong girls, strong bodies.
— Higher Self
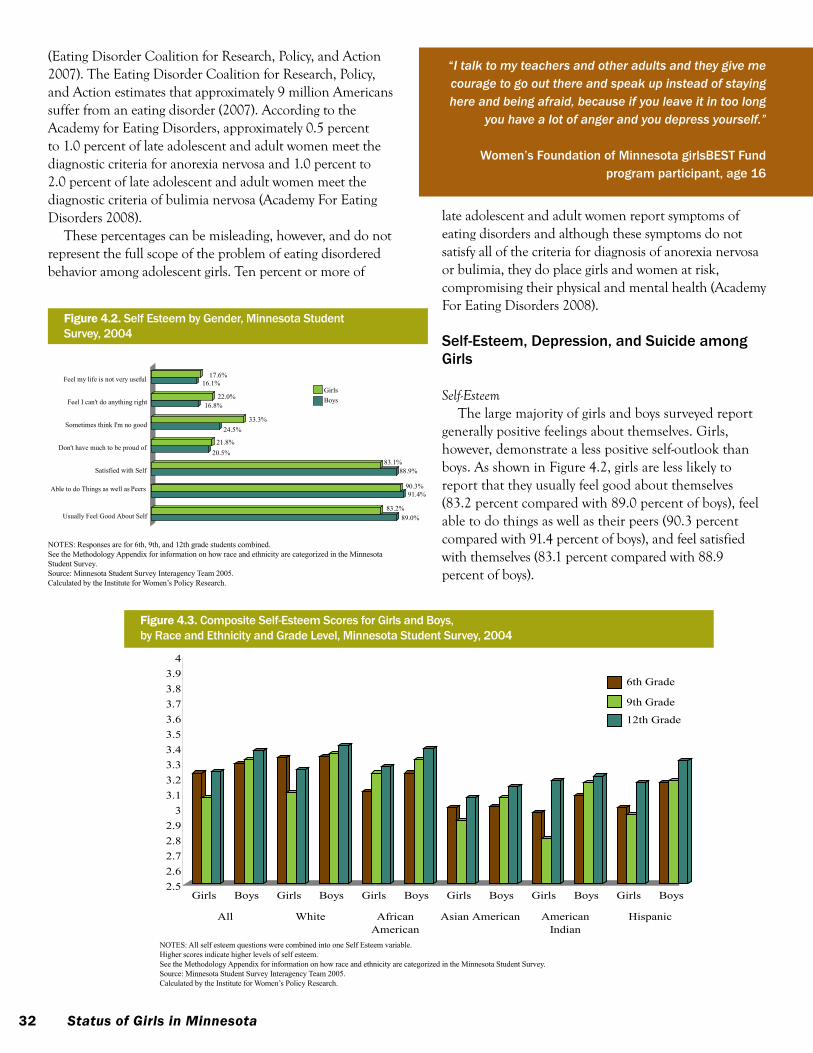
32 Status of Girls in Minnesota
(eating Disorder Coalition for research, policy, and action 2007). the eating Disorder Coalition for research, policy, and action estimates that approximately 9 million americans suffer from an eating disorder (2007). according to the academy for eating Disorders, approximately 0.5 percent to 1.0 percent of late adolescent and adult women meet the diagnostic criteria for anorexia nervosa and 1.0 percent to 2.0 percent of late adolescent and adult women meet the diagnostic criteria of bulimia nervosa (academy for eating Disorders 2008).
these percentages can be misleading, however, and do not represent the full scope of the problem of eating disordered behavior among adolescent girls. ten percent or more of
late adolescent and adult women report symptoms of eating disorders and although these symptoms do not satisfy all of the criteria for diagnosis of anorexia nervosa or bulimia, they do place girls and women at risk, compromising their physical and mental health (academy for eating Disorders 2008).
Self-Esteem, Depression, and Suicide among Girls
Self-Esteemthe large majority of girls and boys surveyed report
generally positive feelings about themselves. Girls, however, demonstrate a less positive selfoutlook than boys. as shown in figure 4.2, girls are less likely to report that they usually feel good about themselves (83.2 percent compared with 89.0 percent of boys), feel able to do things as well as their peers (90.3 percent compared with 91.4 percent of boys), and feel satisfied with themselves (83.1 percent compared with 88.9 percent of boys).
89.0%83.2%
91.4%90.3%
88.9%83.1%
20.5%21.8%
24.5%33.3%
16.8%22.0%
16.1%17.6%
Usually Feel Good About Self
Able to do Things as well as Peers
Satisfied with Self
Don't have much to be proud of
Sometimes think I'm no good
Feel I can't do anything right
Feel my life is not very useful
Figure 4.2: Self Esteem, Minnesota Student Survey, 2004
GirlsBoys
Notes:Responses are for 6th, 9th, and 12th grade students combined.Source: Minnesota Student Survey Interagency Team 2005.Calculated by the Institute for Women's Policy Research.
figure 4.2. Self Esteem by Gender, Minnesota Student Survey, 2004
notes: Responses are for 6th, 9th, and 12th grade students combined.see the Methodology Appendix for information on how race and ethnicity are categorized in the Minnesota student survey.Source: Minnesota Student Survey Interagency Team 2005.Calculated by the Institute for Women’s Policy Research.
2.52.62.72.82.9
33.13.23.33.43.53.63.73.83.9
4
Girls Boys Girls Boys Girls Boys Girls Boys Girls Boys Girls Boys
All White AfricanAmerican
Asian American AmericanIndian
Hispanic
Figure 4.3: Composite Self-Esteem Scores for Girls and Boys by Race/Ethnicity and Grade Level, Minnesota Student Survey, 2004
6th Grade
9th Grade
12th Grade
Notes: All self esteem questions were combined into one Self Esteem variable. Higher scores indicate higher levels of self esteem. See the Methodology Appendix for information on how race and ethnicity are categorized in the Minnesota Student Survey.Source: Minnesota Student Survey Interagency Team 2005.Calculated by the Institute for Women's Policy Research.
figure 4.3. Composite Self-Esteem Scores for Girls and Boys, by Race and Ethnicity and Grade Level, Minnesota Student Survey, 2004
notes: All self esteem questions were combined into one Self Esteem variable. Higher scores indicate higher levels of self esteem.see the Methodology Appendix for information on how race and ethnicity are categorized in the Minnesota student survey.Source: Minnesota Student Survey Interagency Team 2005.Calculated by the Institute for Women’s Policy Research.
“I talk to my teachers and other adults and they give me courage to go out there and speak up instead of staying here and being afraid, because if you leave it in too long
you have a lot of anger and you depress yourself.”
Women’s Foundation of Minnesota girlsBEST Fund program participant, age 16
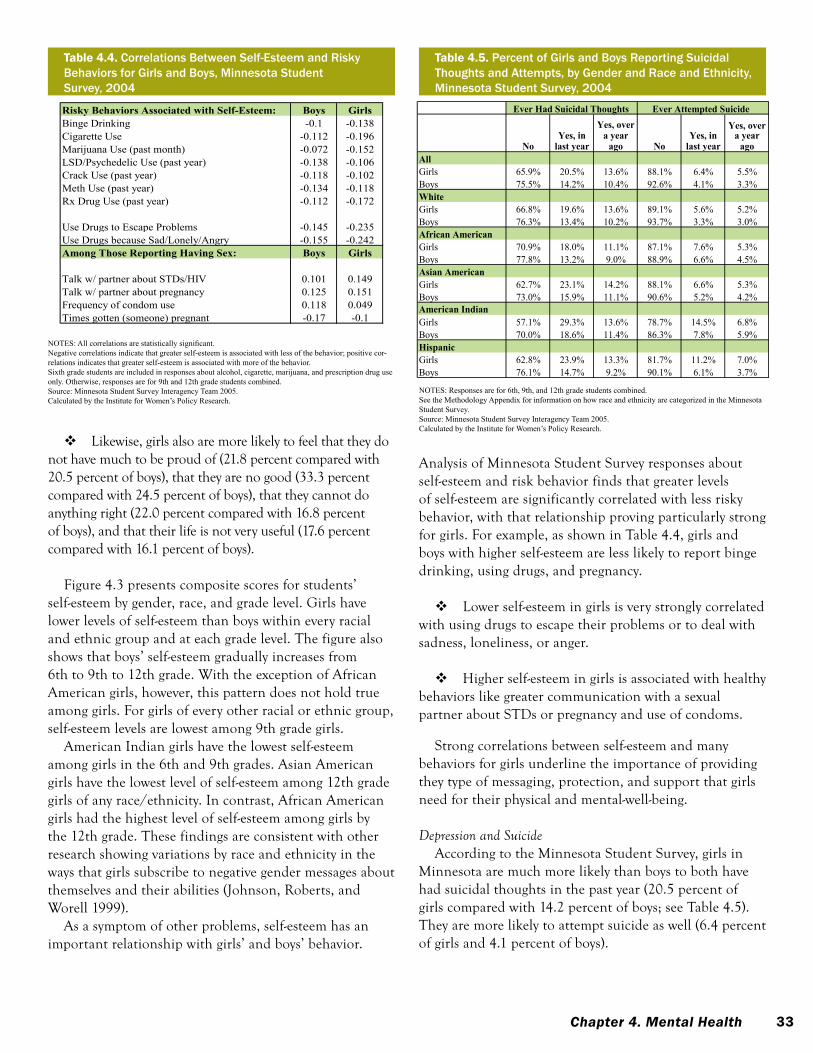
33Chapter 4. Mental Health
Table 4.4. Correlations Between Self-Esteem and Risky Behaviors for Girls and Boys, Minnesota Student Survey, 2004
notes: All correlations are statistically significant. negative correlations indicate that greater self-esteem is associated with less of the behavior; positive cor-relations indicates that greater self-esteem is associated with more of the behavior. sixth grade students are included in responses about alcohol, cigarette, marijuana, and prescription drug use only. Otherwise, responses are for 9th and 12th grade students combined. Source: Minnesota Student Survey Interagency Team 2005. Calculated by the Institute for Women’s Policy Research.
Risky Behaviors Associated with Self-Esteem: Boys GirlsBinge Drinking -0.1 -0.138Cigarette Use -0.112 -0.196Marijuana Use (past month) -0.072 -0.152LSD/Psychedelic Use (past year) -0.138 -0.106Crack Use (past year) -0.118 -0.102Meth Use (past year) -0.134 -0.118Rx Drug Use (past year) -0.112 -0.172
Use Drugs to Escape Problems -0.145 -0.235Use Drugs because Sad/Lonely/Angry -0.155 -0.242Among Those Reporting Having Sex: Boys Girls
Talk w/ partner about STDs/HIV 0.101 0.149Talk w/ partner about pregnancy 0.125 0.151Frequency of condom use 0.118 0.049Times gotten (someone) pregnant -0.17 -0.1
Table 4.4: Correlations Between Self-Esteem and Risky Behaviors, Minnesota Student Survey, 2004
Table 4.5. Percent of Girls and Boys Reporting Suicidal Thoughts and Attempts, by Gender and Race and Ethnicity, Minnesota Student Survey, 2004
notes: Responses are for 6th, 9th, and 12th grade students combined. see the Methodology Appendix for information on how race and ethnicity are categorized in the Minnesota student survey. Source: Minnesota Student Survey Interagency Team 2005. Calculated by the Institute for Women’s Policy Research.
Ever Had Suicidal Thoughts Ever Attempted Suicide
NoYes, in
last year
Yes, over a year
ago NoYes, in
last year
Yes, over a year
agoAllGirls 65.9% 20.5% 13.6% 88.1% 6.4% 5.5%Boys 75.5% 14.2% 10.4% 92.6% 4.1% 3.3%WhiteGirls 66.8% 19.6% 13.6% 89.1% 5.6% 5.2%Boys 76.3% 13.4% 10.2% 93.7% 3.3% 3.0%African AmericanGirls 70.9% 18.0% 11.1% 87.1% 7.6% 5.3%Boys 77.8% 13.2% 9.0% 88.9% 6.6% 4.5%Asian AmericanGirls 62.7% 23.1% 14.2% 88.1% 6.6% 5.3%Boys 73.0% 15.9% 11.1% 90.6% 5.2% 4.2%American IndianGirls 57.1% 29.3% 13.6% 78.7% 14.5% 6.8%Boys 70.0% 18.6% 11.4% 86.3% 7.8% 5.9%HispanicGirls 62.8% 23.9% 13.3% 81.7% 11.2% 7.0%Boys 76.1% 14.7% 9.2% 90.1% 6.1% 3.7%
Table 4.5: Percent of Girls and Boys Reporting Suicidal Thoughts and Attempts, by Gender and Race and Ethnicity, Minnesota Student Survey, 2004
likewise, girls also are more likely to feel that they do not have much to be proud of (21.8 percent compared with 20.5 percent of boys), that they are no good (33.3 percent compared with 24.5 percent of boys), that they cannot do anything right (22.0 percent compared with 16.8 percent of boys), and that their life is not very useful (17.6 percent compared with 16.1 percent of boys).
figure 4.3 presents composite scores for students’ selfesteem by gender, race, and grade level. Girls have lower levels of selfesteem than boys within every racial and ethnic group and at each grade level. the figure also shows that boys’ selfesteem gradually increases from 6th to 9th to 12th grade. With the exception of african american girls, however, this pattern does not hold true among girls. for girls of every other racial or ethnic group, selfesteem levels are lowest among 9th grade girls.
american indian girls have the lowest selfesteem among girls in the 6th and 9th grades. asian american girls have the lowest level of selfesteem among 12th grade girls of any race/ethnicity. in contrast, african american girls had the highest level of selfesteem among girls by the 12th grade. these findings are consistent with other research showing variations by race and ethnicity in the ways that girls subscribe to negative gender messages about themselves and their abilities (Johnson, roberts, and Worell 1999).
as a symptom of other problems, selfesteem has an important relationship with girls’ and boys’ behavior.
analysis of Minnesota student survey responses about selfesteem and risk behavior finds that greater levels of selfesteem are significantly correlated with less risky behavior, with that relationship proving particularly strong for girls. for example, as shown in table 4.4, girls and boys with higher selfesteem are less likely to report binge drinking, using drugs, and pregnancy.
lower selfesteem in girls is very strongly correlated with using drugs to escape their problems or to deal with sadness, loneliness, or anger.
Higher selfesteem in girls is associated with healthy behaviors like greater communication with a sexual partner about stDs or pregnancy and use of condoms.
strong correlations between selfesteem and many behaviors for girls underline the importance of providing they type of messaging, protection, and support that girls need for their physical and mentalwellbeing.
Depression and Suicideaccording to the Minnesota student survey, girls in
Minnesota are much more likely than boys to both have had suicidal thoughts in the past year (20.5 percent of girls compared with 14.2 percent of boys; see table 4.5). they are more likely to attempt suicide as well (6.4 percent of girls and 4.1 percent of boys).

34 Status of Girls in Minnesota
suicidal Thoughts and Attempts by Girls and boys by county
Girls’ greater tendency to think about or attempt to take their own lives becomes visually apparent when looking at Maps 4 and 5. These maps show the concentration of girls and boys reporting suicidal thoughts and acts in different parts of the state. Girls in the northern, north central, and southern areas of the state appear to be at greatest risk, with 15 percent of girls or more attempting suicide in 11 counties across the state. In contrast, no county in the state has that large a share of boys attempting suicide.
Girls in Hubbard, Waseca, Blue Earth, Faribault, and Pipestone are the most likely to think about committing
suicide (see Appendix Table 4.2). Between 39.6 to 44.6 percent of girls in these five counties have considered taking their own lives in the last year or over a year ago. In contrast, in the counties where boys are the most likely to consider suicide, the range is between 30.1 and 34.1 percent.
Beltrami, Hubbard, Watonwan, Fillmore, and Redwood counties have the largest shares of girls attempting suicide, with a range of 16.3 to 17.2 percent of girls trying to take their own lives within the past year or more than a year ago (Appendix Table 4.2). The range is lower for boys, with 10.0 percent to 12.6 percent of boys reporting suicide attempts in the five counties with the highest concentration of attempts.
Map 5. Percent of Girls and Boys Who Have Ever Attempted Suicide
soURCe: Minnesota Student Survey Interagency Team 2005. Calculated by the Institute for Women’s Policy Research.
Map 5: Percentage of Girls and Boys Who Have Ever Attempted Suicide
Girls
Boys
3.3% - 5.9%6% - 8.9%9% - 11.9%12% - 14.9%≥15%Not Available
3.3% - 5.9%6% - 8.9%9% - 11.9%12% - 14.9%≥15%Not Available
Map 4. Percent of Girls and Boys Who Have Ever Had Suicidal Thoughts
soURCe: Minnesota Student Survey Interagency Team 2005. Calculated by the Institute for Women’s Policy Research.
Map 4: Percentage of Girls and Boys Who Have Ever Had Suicidal Thoughts
17.4% - 24.9%25% - 29.9%30% - 34.9%35% - 39.9%≥40%Not Available
17.4% - 24.9%25% - 29.9%30% - 34.9%35% - 39.9%≥40%Not Available
Boys
Girls

35Chapter 4. Mental Health
Recommendations for Change
1. Girls in Minnesota employ a number of unhealthy methods of weight control associated with negative perceptions of their bodies and low levels of self-esteem. Because early intervention is key to successful treatment of eating disorders (Hamilton 2007; Lask and Bryant-Waugh 1994), school counselors, teachers, and parents need training in identification and treatment options. Reducing girls’ exposure to television and other forms of mass media could help modify their perceptions of normal female weight, and increase opportunities for healthy physical activity (American Psychological Association 2007).
2. Minnesota’s public school system should ensure that health curricula include information about eating disorders like anorexia, bulimia, and other levels of disordered eating behaviors.
3. A comprehensive approach to supporting girls and their healthy emotional development should be at the center of any policy or program designed to address the high levels of suicidal thoughts and attempts by Minnesota’s girls. Parents, schools, family doctors, and experts in the areas of adolescent depression and counseling should come together to develop a network of support that gives girls of different economic, linguistic, and cultural backgrounds plenty of support options.
4. More data collection on the mental health status of girls of color and lesbian, gay, bisexual, and transgendered is needed in order to build resources and networks of support for these youth.
among boys and girls by race and ethnicity. american indians consider and attempt suicide at higher rates than girls and boys of any other racial or ethnic group.
an alarming 29.3 percent of american indian girls have considered suicide in the last year and another 13.6 percent considered it over a year ago; 14.5 percent of american indian girls have attempted to take their own lives in the past year and 6.8 percent made an attempt more than a year ago.
african american girls and boys are least likely to have had suicidal thoughts in the last year or prior and white girls and boys are least likely to actually attempt suicide.
In summary
on the whole, Minnesota’s girls feel worse about themselves than boys do, and their poor self esteem is correlated with a number of other unhealthy attitudes and behaviors. Girls are more likely than boys to see themselves as overweight, to employ unhealthy methods of weight control, to feel that they are no good and cannot do anything right, and to think about and attempt suicide. in addition, lower selfesteem in girls, for example, is strongly correlated with greater engagement in risky behaviors such as binge drinking, smoking, prescription drug abuse, and using drugs or alcohol to escape problems or because of sadness, loneliness, or anger. large differences in the mental health of girls come to the fore when examining the data by race and ethnicity, with american indian girls more likely to think about and attempt suicide than girls or boys of any racial and ethnic group. Hispanic girls are also at a high risk of suicidal thoughts and attempts. promoting girls’ mental health will require that girls have positive, healthy messages about their bodies and access to support networks to combat depression and suicidal thoughts or as they confront physical and sexual abuse and victimization in their homes, schools, and communities.

37Chapter 5. Education
Girls’ aCaDeMiC aCHieVeMent anD aCCess to higher education influences their career opportunities, earnings, and professional advancement later in life. for girls in lowincome families, higher education can serve as a gateway to economic stability and a better life. access to higher education for girls of disadvantaged backgrounds proves difficult, however. even with aspirations of going to college, many may not know how to make that dream a reality. an iWpr study on the experiences of current and former welfare recipients in accessing higher education, for example, found that just figuring out how to enroll without losing public benefits was an intense challenge for many of the women surveyed (JonesDeWeever and Gault 2006). navigating the difficult terrain of applying for school and financial aid or securing affordable, reliable child care may also present themselves as barriers to young women’s dreams of higher education.
Despite the challenges for many, women in the united states have made steady progress in increasing their levels of education earning 57.5 percent of all bachelor’s degrees in 2003 (national Center for education statistics 2005). once in college, women also achieve higher grades than their male counterparts (Dey and Hill 2007). unfortunately, women’s earnings continue to lag behind men’s and segregation in the labor market that funnels women into lowerpaying occupations persists. part of the persistent gap in earnings is due to gender differences in fields of study, which affect career paths, pay, and possibilities for advancement. still, the aauW finds that men still outearn women working in the same field even just one year out of college (Dey and Hill 2007). this finding points to the impact that wage discrimination continues to have on women’s earnings
to begin to break down persistent gender divisions in career trajectories young girls need to be encouraged to pursue fields that fall outside of femaledominated areas of study and work. Jobs in the science, technology, and engineering fields, for example, are typically held by men and are among some of the highest paying. research also suggests that moving women into maledominated fields is good for all women, as occupational integration not only improves the earnings of women who have moved into betterpaying, male dominated fields, but also improves the earnings of women in traditionally female occupations (Cotter et al. 1997).
cHApTeR 5education
“Even though my mother was always saying we needed to
go to school and go to college. There was never initiative
in it because I was the first generation to go to college and
graduate and come out. So my mother did not teach me in essence what she did not
know. She desired for us to go to school and she knew it was
important for us to go. But she didn’t know how to get there
and how to support me to get there.”
Women’s Foundation of Minnesota girlsBEST Fund
program mentor and former participant, age 27
The YWCA Duluth’s Girl Power! program connects girl participants to activi-ties and experiences intended to inspire learning and nurture curiosity as a means to future economic success. The nonprofit is a Women’s Foundation grantee.
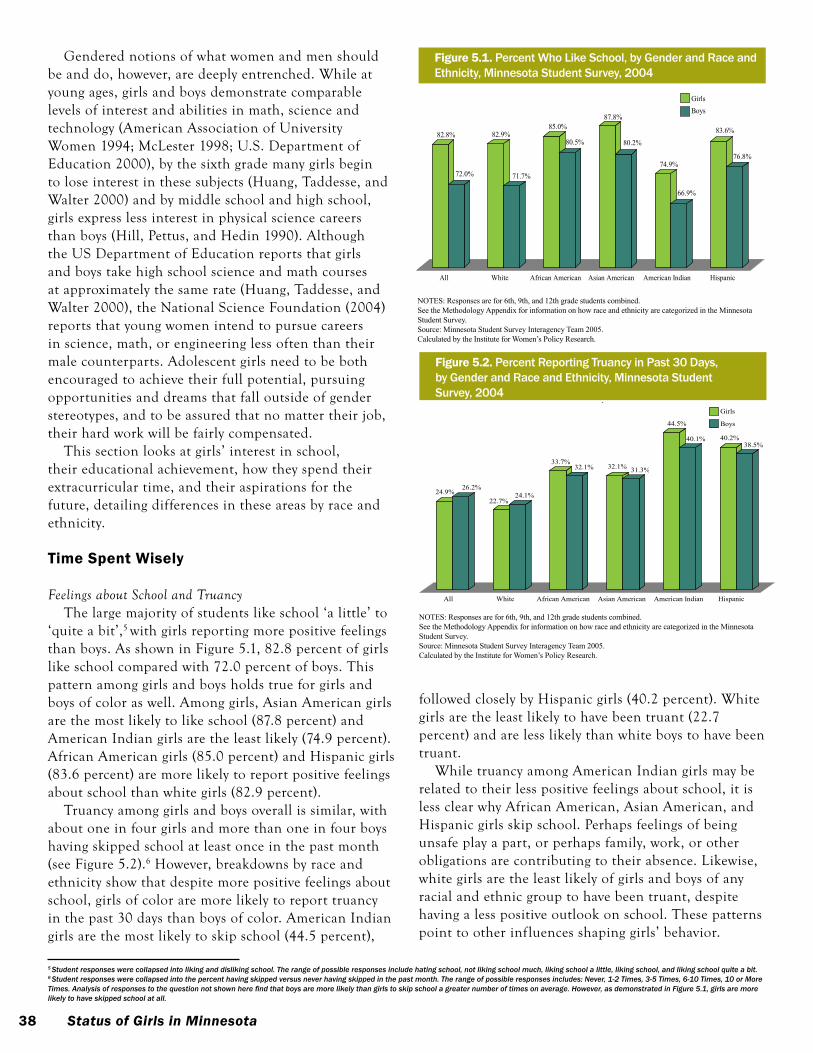
38 Status of Girls in Minnesota
Gendered notions of what women and men should be and do, however, are deeply entrenched. While at young ages, girls and boys demonstrate comparable levels of interest and abilities in math, science and technology (american association of university Women 1994; Mclester 1998; u.s. Department of education 2000), by the sixth grade many girls begin to lose interest in these subjects (Huang, taddesse, and Walter 2000) and by middle school and high school, girls express less interest in physical science careers than boys (Hill, pettus, and Hedin 1990). although the us Department of education reports that girls and boys take high school science and math courses at approximately the same rate (Huang, taddesse, and Walter 2000), the national science foundation (2004) reports that young women intend to pursue careers in science, math, or engineering less often than their male counterparts. adolescent girls need to be both encouraged to achieve their full potential, pursuing opportunities and dreams that fall outside of gender stereotypes, and to be assured that no matter their job, their hard work will be fairly compensated.
this section looks at girls’ interest in school, their educational achievement, how they spend their extracurricular time, and their aspirations for the future, detailing differences in these areas by race and ethnicity.
Time spent Wisely Feelings about School and Truancy
the large majority of students like school ‘a little’ to ‘quite a bit’,5 with girls reporting more positive feelings than boys. as shown in figure 5.1, 82.8 percent of girls like school compared with 72.0 percent of boys. this pattern among girls and boys holds true for girls and boys of color as well. among girls, asian american girls are the most likely to like school (87.8 percent) and american indian girls are the least likely (74.9 percent). african american girls (85.0 percent) and Hispanic girls (83.6 percent) are more likely to report positive feelings about school than white girls (82.9 percent).
truancy among girls and boys overall is similar, with about one in four girls and more than one in four boys having skipped school at least once in the past month (see figure 5.2).6 However, breakdowns by race and ethnicity show that despite more positive feelings about school, girls of color are more likely to report truancy in the past 30 days than boys of color. american indian girls are the most likely to skip school (44.5 percent),
82.8%
72.0%
82.9%
71.7%
85.0%
80.5%
87.8%
80.2%
74.9%
66.9%
83.6%
76.8%
All White African American Asian American American Indian Hispanic
Figure 5.1: Percent Who Like School, by Gender and Race and Ethnicity, Minnesota Student Survey, 2004
GirlsBoys
Notes:Responses are for 6th, 9th, and 12th grade students combined.See the Methodology Appendix for information on how race and ethnicity are categorized in the Minnesota Student Survey.Source: Minnesota Student Survey Interagency Team 2005.
figure 5.1. Percent Who Like School, by Gender and Race and Ethnicity, Minnesota Student Survey, 2004
notes: Responses are for 6th, 9th, and 12th grade students combined.see the Methodology Appendix for information on how race and ethnicity are categorized in the Minnesota student survey.Source: Minnesota Student Survey Interagency Team 2005.Calculated by the Institute for Women’s Policy Research.
24.9%26.2%
22.7%24.1%
33.7%32.1% 32.1% 31.3%
44.5%
40.1% 40.2%38.5%
All White African American Asian American American Indian Hispanic
Figure 5.2: Percent Reporting Truancy in Past 30 Days, by Gender and Race and Ethnicity, Minnesota Student Survey, 2004
Girls
Boys
figure 5.2. Percent Reporting Truancy in Past 30 Days, by Gender and Race and Ethnicity, Minnesota Student Survey, 2004
5 Student responses were collapsed into liking and disliking school. The range of possible responses include hating school, not liking school much, liking school a little, liking school, and liking school quite a bit.6 Student responses were collapsed into the percent having skipped versus never having skipped in the past month. The range of possible responses includes: Never, 1-2 Times, 3-5 Times, 6-10 Times, 10 or More Times. Analysis of responses to the question not shown here find that boys are more likely than girls to skip school a greater number of times on average. However, as demonstrated in Figure 5.1, girls are more likely to have skipped school at all.
notes: Responses are for 6th, 9th, and 12th grade students combined.see the Methodology Appendix for information on how race and ethnicity are categorized in the Minnesota student survey.Source: Minnesota Student Survey Interagency Team 2005.Calculated by the Institute for Women’s Policy Research.
followed closely by Hispanic girls (40.2 percent). White girls are the least likely to have been truant (22.7 percent) and are less likely than white boys to have been truant.
While truancy among american indian girls may be related to their less positive feelings about school, it is less clear why african american, asian american, and Hispanic girls skip school. perhaps feelings of being unsafe play a part, or perhaps family, work, or other obligations are contributing to their absence. likewise, white girls are the least likely of girls and boys of any racial and ethnic group to have been truant, despite having a less positive outlook on school. these patterns point to other influences shaping girls’ behavior.
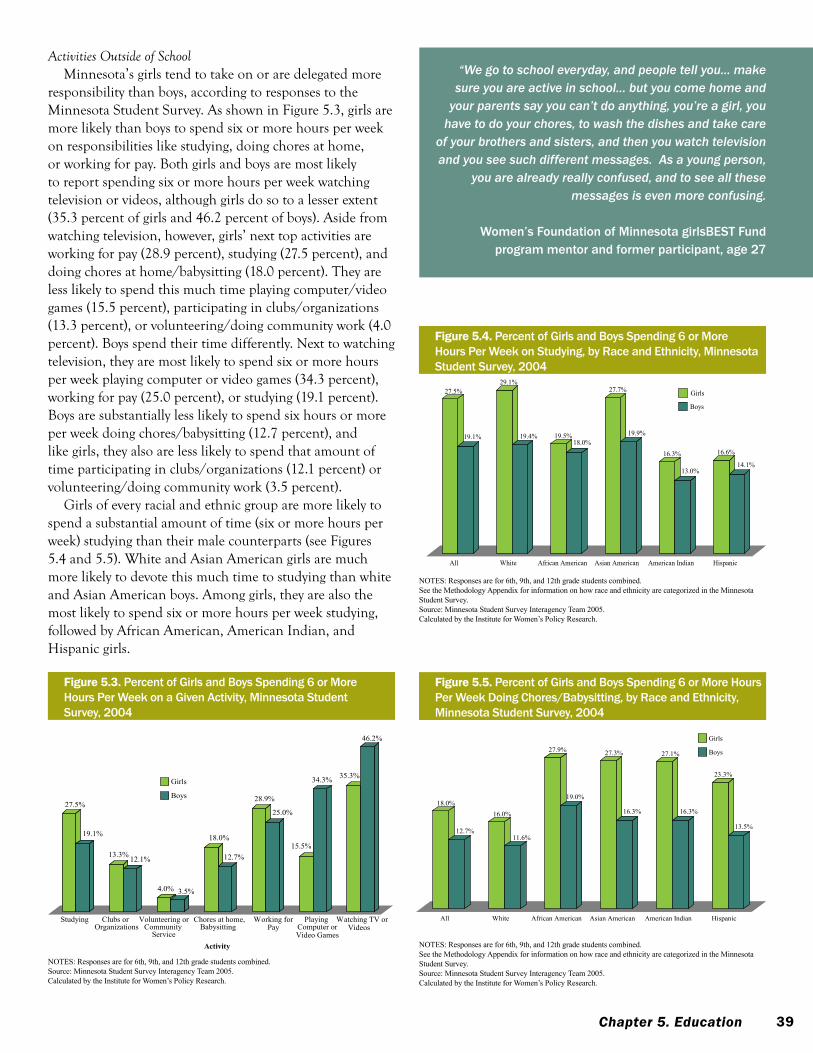
39Chapter 5. Education
Activities Outside of SchoolMinnesota’s girls tend to take on or are delegated more
responsibility than boys, according to responses to the Minnesota student survey. as shown in figure 5.3, girls are more likely than boys to spend six or more hours per week on responsibilities like studying, doing chores at home, or working for pay. Both girls and boys are most likely to report spending six or more hours per week watching television or videos, although girls do so to a lesser extent (35.3 percent of girls and 46.2 percent of boys). aside from watching television, however, girls’ next top activities are working for pay (28.9 percent), studying (27.5 percent), and doing chores at home/babysitting (18.0 percent). they are less likely to spend this much time playing computer/video games (15.5 percent), participating in clubs/organizations (13.3 percent), or volunteering/doing community work (4.0 percent). Boys spend their time differently. next to watching television, they are most likely to spend six or more hours per week playing computer or video games (34.3 percent), working for pay (25.0 percent), or studying (19.1 percent). Boys are substantially less likely to spend six hours or more per week doing chores/babysitting (12.7 percent), and like girls, they also are less likely to spend that amount of time participating in clubs/organizations (12.1 percent) or volunteering/doing community work (3.5 percent).
Girls of every racial and ethnic group are more likely to spend a substantial amount of time (six or more hours per week) studying than their male counterparts (see figures 5.4 and 5.5). White and asian american girls are much more likely to devote this much time to studying than white and asian american boys. among girls, they are also the most likely to spend six or more hours per week studying, followed by african american, american indian, and Hispanic girls.
“We go to school everyday, and people tell you… make sure you are active in school… but you come home and
your parents say you can’t do anything, you’re a girl, you have to do your chores, to wash the dishes and take care
of your brothers and sisters, and then you watch television and you see such different messages. As a young person,
you are already really confused, and to see all these messages is even more confusing.
Women’s Foundation of Minnesota girlsBEST Fund program mentor and former participant, age 27
27.5%
19.1%
29.1%
19.4% 19.5%18.0%
27.7%
19.9%
16.3%
13.0%
16.6%
14.1%
All White African American Asian American American Indian Hispanic
Figure 5.4: Percent of Boys and Girls Spending 6 or More Hours on Studying, by Race and Ethnicity, Minnesota Student Survey, 2004
Girls
Boys
Notes:Responses are for 6th, 9th, and 12th grade students combined.See the Methodology Appendix for information on how race and ethnicity are categorized in the Minnesota Student Survey.Source: Minnesota Student Survey Interagency Team 2005.
figure 5.4. Percent of Girls and Boys Spending 6 or More Hours Per Week on Studying, by Race and Ethnicity, Minnesota Student Survey, 2004
notes: Responses are for 6th, 9th, and 12th grade students combined.see the Methodology Appendix for information on how race and ethnicity are categorized in the Minnesota student survey.Source: Minnesota Student Survey Interagency Team 2005.Calculated by the Institute for Women’s Policy Research.
18.0%
12.7%
16.0%
11.6%
27.9%
19.0%
27.3%
16.3%
27.1%
16.3%
23.3%
13.5%
All White African American Asian American American Indian Hispanic
Figure 5.5: Percent of Boys and Girls Spending 6 or More Hours Doing Chores/Babysitting, Minnesota Student Survey, 2004
Girls
Boys
Notes:Responses are for 6th, 9th, and 12th grade students combined.See the Methodology Appendix for information on how race and ethnicity are categorized in the Minnesota Student Survey.
figure 5.5. Percent of Girls and Boys Spending 6 or More Hours Per Week Doing Chores/Babysitting, by Race and Ethnicity, Minnesota Student Survey, 2004
notes: Responses are for 6th, 9th, and 12th grade students combined.see the Methodology Appendix for information on how race and ethnicity are categorized in the Minnesota student survey.Source: Minnesota Student Survey Interagency Team 2005.Calculated by the Institute for Women’s Policy Research.
27.5%
19.1%
13.3% 12.1%
4.0% 3.5%
18.0%
12.7%
28.9%
25.0%
15.5%
34.3% 35.3%
46.2%
Studying Clubs orOrganizations
Volunteering orCommunity
Service
Chores at home,Babysitting
Working for PlayingComputer orVideo Games
Watching TV orVideos
Activity
Figure 5.3: Percent of Girls and Boys Spending 6 or More Hours Per Week on a Given Activity, Minnesota Student Survey, 2004
Girls
Boys
Pay
figure 5.3. Percent of Girls and Boys Spending 6 or More Hours Per Week on a Given Activity, Minnesota Student Survey, 2004
notes: Responses are for 6th, 9th, and 12th grade students combined.Source: Minnesota Student Survey Interagency Team 2005.Calculated by the Institute for Women’s Policy Research.
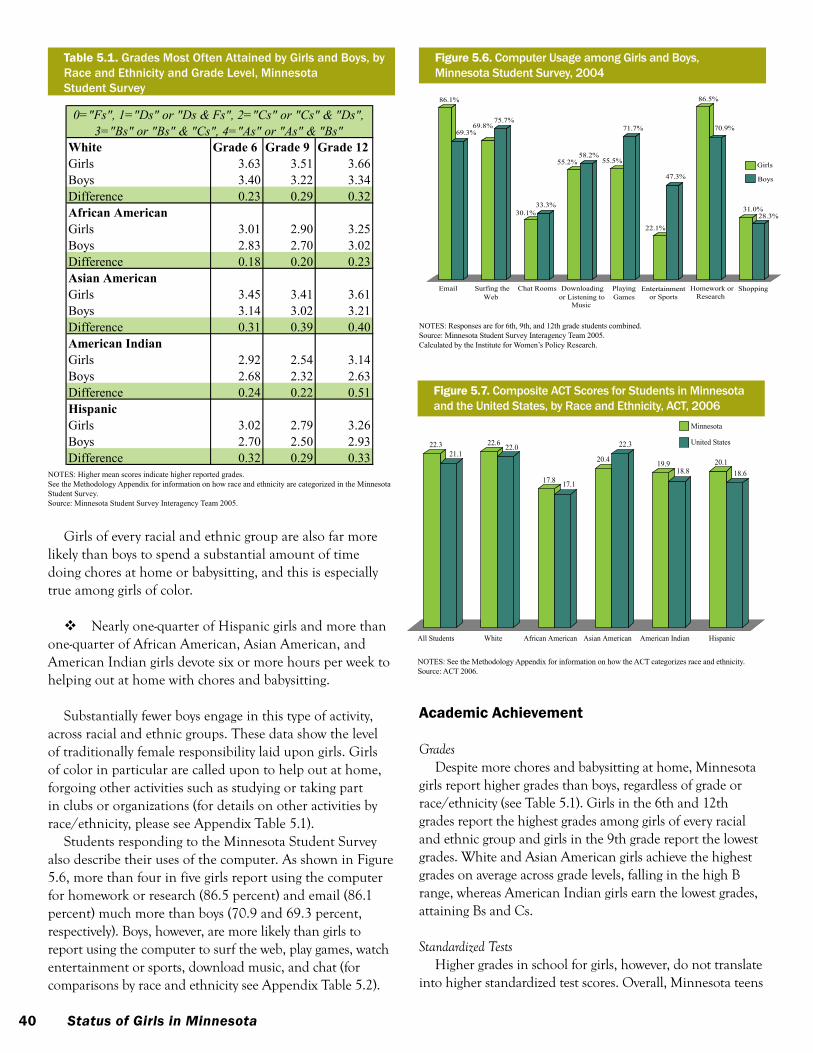
40 Status of Girls in Minnesota
Academic Achievement
GradesDespite more chores and babysitting at home, Minnesota
girls report higher grades than boys, regardless of grade or race/ethnicity (see table 5.1). Girls in the 6th and 12th grades report the highest grades among girls of every racial and ethnic group and girls in the 9th grade report the lowest grades. White and asian american girls achieve the highest grades on average across grade levels, falling in the high B range, whereas american indian girls earn the lowest grades, attaining Bs and Cs.
Standardized TestsHigher grades in school for girls, however, do not translate
into higher standardized test scores. overall, Minnesota teens
Table 5.1. Grades Most Often Attained by Girls and Boys, by Race and Ethnicity and Grade Level, Minnesota Student Survey
notes: Higher mean scores indicate higher reported grades. see the Methodology Appendix for information on how race and ethnicity are categorized in the Minnesota student survey. Source: Minnesota Student Survey Interagency Team 2005.
White Grade 6 Grade 9 Grade 12Girls 3.63 3.51 3.66Boys 3.40 3.22 3.34Difference 0.23 0.29 0.32African AmericanGirls 3.01 2.90 3.25Boys 2.83 2.70 3.02Difference 0.18 0.20 0.23Asian AmericanGirls 3.45 3.41 3.61Boys 3.14 3.02 3.21Difference 0.31 0.39 0.40American IndianGirls 2.92 2.54 3.14Boys 2.68 2.32 2.63Difference 0.24 0.22 0.51HispanicGirls 3.02 2.79 3.26Boys 2.70 2.50 2.93Difference 0.32 0.29 0.33
Table 5.1: Grades Most Often Attained by Girls and Boys, by Race and Ethnicity and Grade Level,
Minnesota Student Survey
0="Fs", 1="Ds" or "Ds & Fs", 2="Cs" or "Cs" & "Ds", 3="Bs" or "Bs" & "Cs", 4="As" or "As" & "Bs"
Girls of every racial and ethnic group are also far more likely than boys to spend a substantial amount of time doing chores at home or babysitting, and this is especially true among girls of color.
nearly onequarter of Hispanic girls and more than onequarter of african american, asian american, and american indian girls devote six or more hours per week to helping out at home with chores and babysitting.
substantially fewer boys engage in this type of activity, across racial and ethnic groups. these data show the level of traditionally female responsibility laid upon girls. Girls of color in particular are called upon to help out at home, forgoing other activities such as studying or taking part in clubs or organizations (for details on other activities by race/ethnicity, please see appendix table 5.1).
students responding to the Minnesota student survey also describe their uses of the computer. as shown in figure 5.6, more than four in five girls report using the computer for homework or research (86.5 percent) and email (86.1 percent) much more than boys (70.9 and 69.3 percent, respectively). Boys, however, are more likely than girls to report using the computer to surf the web, play games, watch entertainment or sports, download music, and chat (for comparisons by race and ethnicity see appendix table 5.2).
86.1%
69.3%69.8%
75.7%
30.1%33.3%
55.2%58.2%
55.5%
71.7%
22.1%
47.3%
86.5%
70.9%
31.0%28.3%
Email Chat Rooms PlayingGames
Homework orResearch
Figure 5.6: Computer Usage among Girls and Boys, Minnesota Student Survey, 2004
Girls
Boys
Notes:Responses are for 6th, 9th, and 12th grade students combined.Source: Minnesota Student Survey Interagency Team 2005.Calculated by the Institute for Women's Policy Research.
Surfing theWeb
Downloadingor Listening to
Music
Entertainmentor Sports
Shopping
figure 5.6. Computer Usage among Girls and Boys, Minnesota Student Survey, 2004
notes: Responses are for 6th, 9th, and 12th grade students combined.Source: Minnesota Student Survey Interagency Team 2005.Calculated by the Institute for Women’s Policy Research.
22.321.1
22.6 22.0
17.8 17.1
20.4
22.3
19.918.8
20.118.6
All Students White African American Asian American American Indian Hispanic
Figure 5.7: Composite ACT Scores for Students in Minnesota and the United States, by Race and Ethnicity, ACT, 2006
Minnesota
United States
Notes:See the Methodology Appendix for information on how the ACT categorizes race and ethnicity. Source: ACT 2006.
figure 5.7. Composite ACT Scores for Students in Minnesota and the United States, by Race and Ethnicity, ACT, 2006
notes: see the Methodology Appendix for information on how the ACt categorizes race and ethnicity. source: ACt 2006.
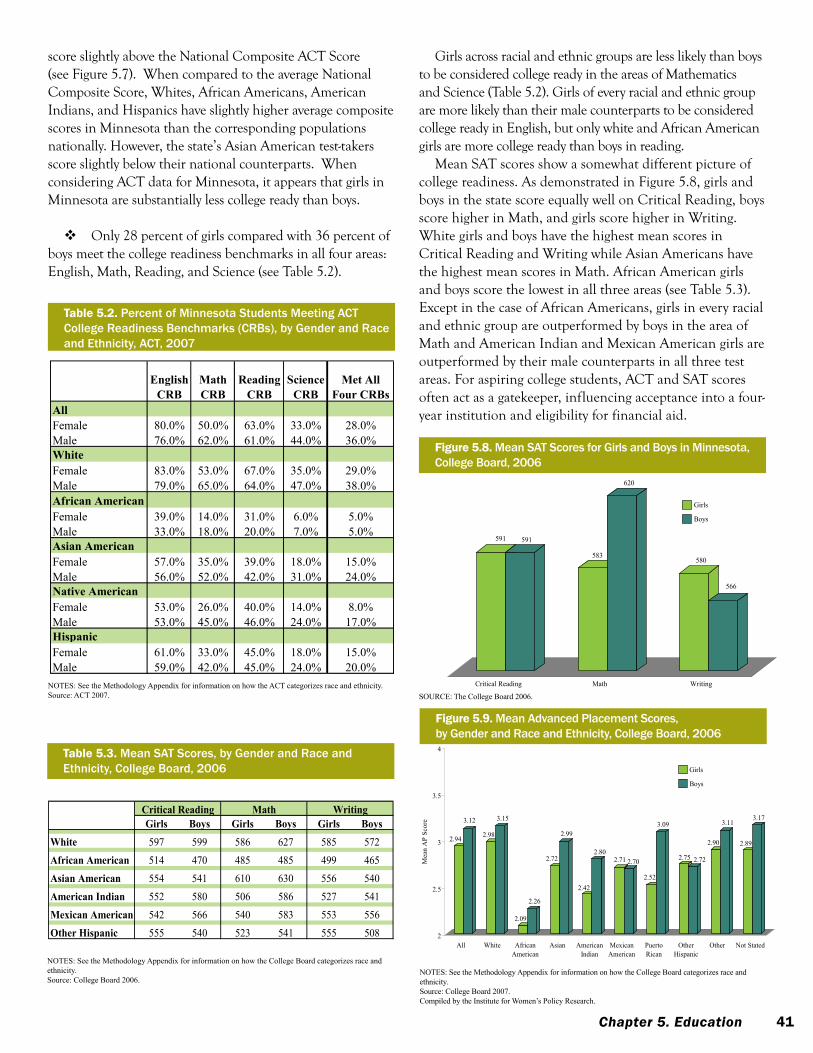
41Chapter 5. Education
591 591
583
620
580
566
Critical Reading Math Writing
Figure 5.8: Mean SAT Scores for Girls and Boys in Minnesota, College Board, 2006
Girls
Boys
Source: The College Board 2006.
figure 5.8. Mean SAT Scores for Girls and Boys in Minnesota, College Board, 2006
soURCe: the College Board 2006.
Table 5.3. Mean SAT Scores, by Gender and Race and Ethnicity, College Board, 2006
notes: see the Methodology Appendix for information on how the College Board categorizes race and ethnicity. source: College Board 2006.
Table 5.3: Mean SAT Scores, by Gender and Race and Ethnicity, College Board, 2006
Girls Boys Girls Boys Girls BoysWhite 597 599 586 627 585 572African American 514 470 485 485 499 465Asian American 554 541 610 630 556 540American Indian 552 580 506 586 527 541Mexican American 542 566 540 583 553 556Other Hispanic 555 540 523 541 555 508
Critical Reading Math Writing
2.94
3.12
2.98
3.15
2.09
2.26
2.72
2.99
2.42
2.802.71 2.70
2.52
3.09
2.75 2.72
2.90
3.11
2.89
3.17
2
2.5
3
3.5
4
Mea
n A
P Sc
ore
All White AfricanAmerican
Asian AmericanIndian
MexicanAmerican
PuertoRican
OtherHispanic
Other Not Stated
Figure 5.9: Mean Advanced Placement Scores, by Gender and Race and Ethnicity, College Board, 2006
Girls
Boys
Notes:See the Methodology Appendix for information on how the College Board categorizes race and ethnicity. Source: College Board 2007.Compiled by the Institute for Women's Policy Research.
figure 5.9. Mean Advanced Placement Scores, by Gender and Race and Ethnicity, College Board, 2006
notes: see the Methodology Appendix for information on how the College Board categorizes race and ethnicity. source: College Board 2007.Compiled by the Institute for Women’s Policy Research.
Girls across racial and ethnic groups are less likely than boys to be considered college ready in the areas of Mathematics and science (table 5.2). Girls of every racial and ethnic group are more likely than their male counterparts to be considered college ready in english, but only white and african american girls are more college ready than boys in reading.
Mean sat scores show a somewhat different picture of college readiness. as demonstrated in figure 5.8, girls and boys in the state score equally well on Critical reading, boys score higher in Math, and girls score higher in Writing. White girls and boys have the highest mean scores in Critical reading and Writing while asian americans have the highest mean scores in Math. african american girls and boys score the lowest in all three areas (see table 5.3). except in the case of african americans, girls in every racial and ethnic group are outperformed by boys in the area of Math and american indian and Mexican american girls are outperformed by their male counterparts in all three test areas. for aspiring college students, aCt and sat scores often act as a gatekeeper, influencing acceptance into a fouryear institution and eligibility for financial aid.
Table 5.2. Percent of Minnesota Students Meeting ACTCollege Readiness Benchmarks (CRBs), by Gender and Race and Ethnicity, ACT, 2007
notes: see the Methodology Appendix for information on how the ACt categorizes race and ethnicity. source: ACt 2007.
English CRB
Math CRB
Reading CRB
Science CRB
Met All Four CRBs
AllFemale 80.0% 50.0% 63.0% 33.0% 28.0%Male 76.0% 62.0% 61.0% 44.0% 36.0%WhiteFemale 83.0% 53.0% 67.0% 35.0% 29.0%Male 79.0% 65.0% 64.0% 47.0% 38.0%African AmericanFemale 39.0% 14.0% 31.0% 6.0% 5.0%Male 33.0% 18.0% 20.0% 7.0% 5.0%Asian AmericanFemale 57.0% 35.0% 39.0% 18.0% 15.0%Male 56.0% 52.0% 42.0% 31.0% 24.0%Native AmericanFemale 53.0% 26.0% 40.0% 14.0% 8.0%Male 53.0% 45.0% 46.0% 24.0% 17.0%HispanicFemale 61.0% 33.0% 45.0% 18.0% 15.0%Male 59.0% 42.0% 45.0% 24.0% 20.0%
Table 5.2: Percent of Minnesota Students Meeting 2007 ACT College Readiness Benchmarks (CRBs), by Gender and Race and
score slightly above the national Composite aCt score (see figure 5.7). When compared to the average national Composite score, Whites, african americans, american indians, and Hispanics have slightly higher average composite scores in Minnesota than the corresponding populations nationally. However, the state’s asian american testtakers score slightly below their national counterparts. When considering aCt data for Minnesota, it appears that girls in Minnesota are substantially less college ready than boys.
only 28 percent of girls compared with 36 percent of boys meet the college readiness benchmarks in all four areas: english, Math, reading, and science (see table 5.2).
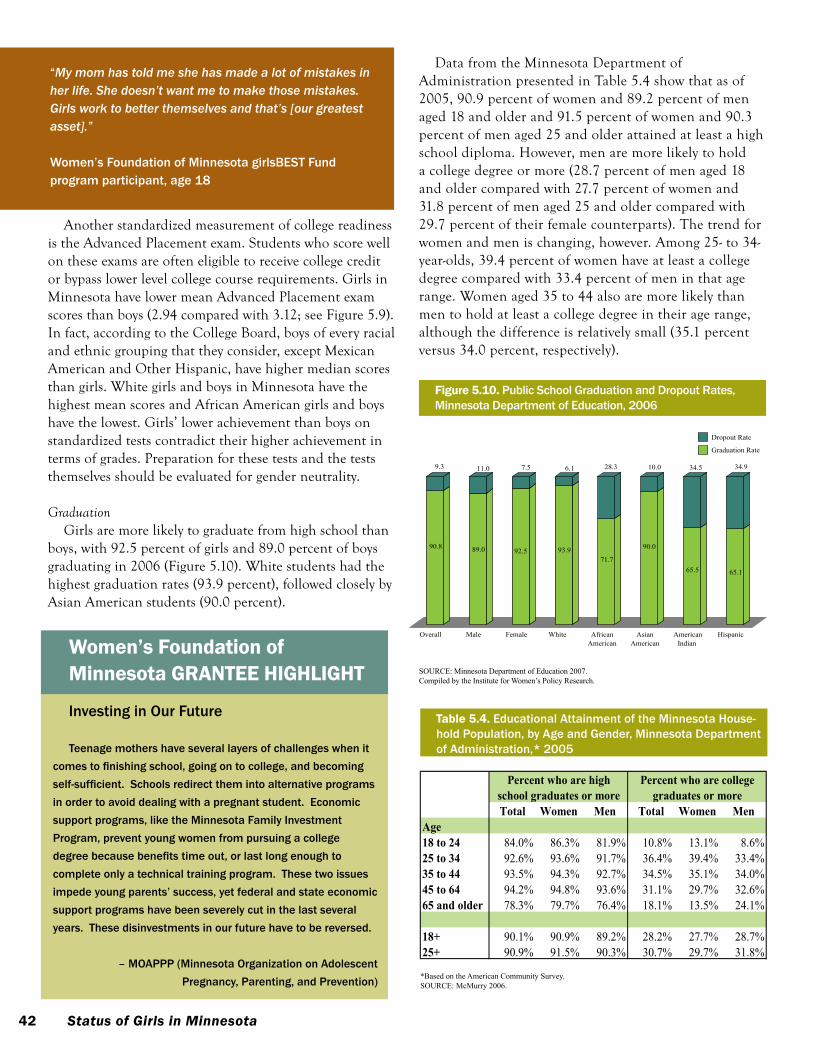
42 Status of Girls in Minnesota
another standardized measurement of college readiness is the advanced placement exam. students who score well on these exams are often eligible to receive college credit or bypass lower level college course requirements. Girls in Minnesota have lower mean advanced placement exam scores than boys (2.94 compared with 3.12; see figure 5.9). in fact, according to the College Board, boys of every racial and ethnic grouping that they consider, except Mexican american and other Hispanic, have higher median scores than girls. White girls and boys in Minnesota have the highest mean scores and african american girls and boys have the lowest. Girls’ lower achievement than boys on standardized tests contradict their higher achievement in terms of grades. preparation for these tests and the tests themselves should be evaluated for gender neutrality.
Graduation Girls are more likely to graduate from high school than
boys, with 92.5 percent of girls and 89.0 percent of boys graduating in 2006 (figure 5.10). White students had the highest graduation rates (93.9 percent), followed closely by asian american students (90.0 percent).
Women’s foundation of Minnesota GRAnTee HIGHlIGHT
Investing in Our Future
Teenage mothers have several layers of challenges when it comes to finishing school, going on to college, and becoming self-sufficient. Schools redirect them into alternative programs in order to avoid dealing with a pregnant student. Economic support programs, like the Minnesota Family Investment Program, prevent young women from pursuing a college degree because benefits time out, or last long enough to complete only a technical training program. These two issues impede young parents’ success, yet federal and state economic support programs have been severely cut in the last several years. These disinvestments in our future have to be reversed.
– MOAPPP (Minnesota Organization on Adolescent
Pregnancy, Parenting, and Prevention)
“My mom has told me she has made a lot of mistakes in her life. She doesn’t want me to make those mistakes. Girls work to better themselves and that’s [our greatest asset].”
Women’s Foundation of Minnesota girlsBEST Fund program participant, age 18
Data from the Minnesota Department of administration presented in table 5.4 show that as of 2005, 90.9 percent of women and 89.2 percent of men aged 18 and older and 91.5 percent of women and 90.3 percent of men aged 25 and older attained at least a high school diploma. However, men are more likely to hold a college degree or more (28.7 percent of men aged 18 and older compared with 27.7 percent of women and 31.8 percent of men aged 25 and older compared with 29.7 percent of their female counterparts). the trend for women and men is changing, however. among 25 to 34yearolds, 39.4 percent of women have at least a college degree compared with 33.4 percent of men in that age range. Women aged 35 to 44 also are more likely than men to hold at least a college degree in their age range, although the difference is relatively small (35.1 percent versus 34.0 percent, respectively).
90.8
9.3
89.0
11.0
92.5
7.5
93.9
6.1
71.7
28.3
90.0
10.0
65.5
34.5
65.1
34.9
Overall Male Female White AfricanAmerican
AsianAmerican
AmericanIndian
Hispanic
Figure 5.10: Public School Graduation and Dropout Rates, Minnesota Department of Education, 2006
Dropout Rate
Graduation Rate
Notes:Source: Minnesota Department of Education 2007.Compiled by the Institute for Women's Policy Research.
figure 5.10. Public School Graduation and Dropout Rates, Minnesota Department of Education, 2006
soURCe: Minnesota Department of education 2007.Compiled by the Institute for Women’s Policy Research.
Table 5.4. Educational Attainment of the Minnesota House-hold Population, by Age and Gender, Minnesota Department of Administration,* 2005
*Based on the American Community survey. soURCe: McMurry 2006.
Total Women Men Total Women MenAge18 to 24 84.0% 86.3% 81.9% 10.8% 13.1% 8.6%25 to 34 92.6% 93.6% 91.7% 36.4% 39.4% 33.4%35 to 44 93.5% 94.3% 92.7% 34.5% 35.1% 34.0%45 to 64 94.2% 94.8% 93.6% 31.1% 29.7% 32.6%65 and older 78.3% 79.7% 76.4% 18.1% 13.5% 24.1%
18+ 90.1% 90.9% 89.2% 28.2% 27.7% 28.7%25+ 90.9% 91.5% 90.3% 30.7% 29.7% 31.8%
Percent who are high school graduates or more
Percent who are college graduates or more
Table 5.4: Educational Attainment of the Minnesota Household Population, by Age and Gender, Minnesota Department of
Administration,* 2005
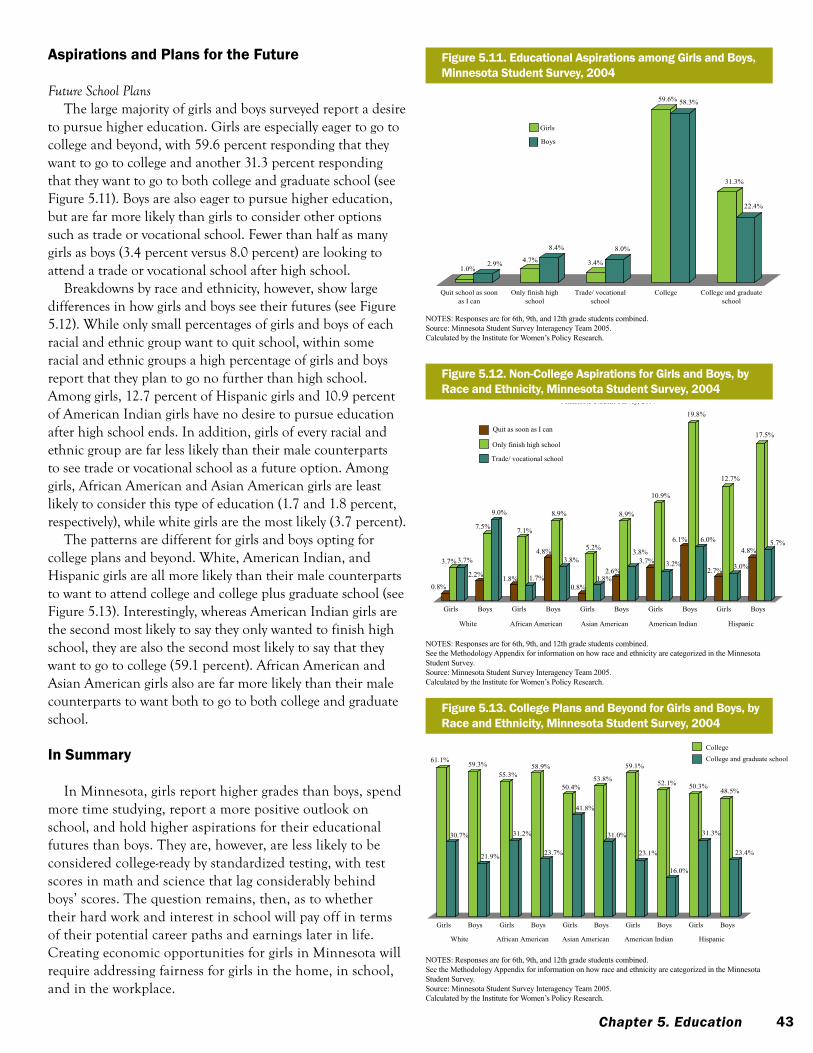
43Chapter 5. Education
1.0%2.9% 4.7%
8.4%
3.4%
8.0%
59.6% 58.3%
31.3%
22.4%
Quit school as soonas I can
Only finish highschool
Trade/ vocationalschool
College College and graduateschool
Figure 5.11: Educational Aspirations among Girls and Boys, Minnesota Student Survey, 2004
Girls
Boys
figure 5.11. educational Aspirations among Girls and boys, Minnesota student survey, 2004
notes: Responses are for 6th, 9th, and 12th grade students combined.Source: Minnesota Student Survey Interagency Team 2005.Calculated by the Institute for Women’s Policy Research.
0.8%
3.7% 3.7%
2.2%
7.5%
9.0%
1.8%
7.1%
1.7%
4.8%
8.9%
3.8%
0.8%
5.2%
1.8%2.6%
8.9%
3.8%3.7%
10.9%
3.2%
6.1%
19.8%
6.0%
2.7%
12.7%
3.0%
4.8%
17.5%
5.7%
Girls Boys Girls Boys Girls Boys Girls Boys Girls Boys
White African American Asian American American Indian Hispanic
Figure 5.12: Non-College Aspirations for Girls and Boys, by Race and Ethnicity, Minnesota Student Survey, 2004
Quit as soon as I can
Only finish high school
Trade/ vocational school
Notes:Responses are for 6th, 9th, and 12th grade students combined.See the Methodology Appendix for information on how race and ethnicity are categorized in the Minnesota Student Survey.Source: Minnesota Student Survey Interagency Team 2005.
figure 5.12. non-college Aspirations for Girls and boys, by Race and ethnicity, Minnesota student survey, 2004
notes: Responses are for 6th, 9th, and 12th grade students combined.see the Methodology Appendix for information on how race and ethnicity are categorized in the Minnesota student survey.Source: Minnesota Student Survey Interagency Team 2005.Calculated by the Institute for Women’s Policy Research.
61.1%
30.7%
59.3%
21.9%
55.3%
31.2%
58.9%
23.7%
50.4%
41.8%
53.8%
31.0%
59.1%
23.1%
52.1%
16.0%
50.3%
31.3%
48.5%
23.4%
Girls Boys Girls Boys Girls Boys Girls Boys Girls Boys
White African American Asian American American Indian Hispanic
Figure 5.13: College Plans and Beyond for Boys and Girls by Race/Ethnicity, Minnesota Studenty Survey, 2004
College
College and graduate school
Notes:Responses are for 6th, 9th, and 12th grade students combined.See the Methodology Appendix for information on how race and ethnicity are categorized in the Minnesota Student Survey.
figure 5.13. college plans and beyond for Girls and boys, by Race and ethnicity, Minnesota student survey, 2004
notes: Responses are for 6th, 9th, and 12th grade students combined.see the Methodology Appendix for information on how race and ethnicity are categorized in the Minnesota student survey.Source: Minnesota Student Survey Interagency Team 2005.Calculated by the Institute for Women’s Policy Research.
Aspirations and plans for the future
Future School Plansthe large majority of girls and boys surveyed report a desire
to pursue higher education. Girls are especially eager to go to college and beyond, with 59.6 percent responding that they want to go to college and another 31.3 percent responding that they want to go to both college and graduate school (see figure 5.11). Boys are also eager to pursue higher education, but are far more likely than girls to consider other options such as trade or vocational school. fewer than half as many girls as boys (3.4 percent versus 8.0 percent) are looking to attend a trade or vocational school after high school.
Breakdowns by race and ethnicity, however, show large differences in how girls and boys see their futures (see figure 5.12). While only small percentages of girls and boys of each racial and ethnic group want to quit school, within some racial and ethnic groups a high percentage of girls and boys report that they plan to go no further than high school. among girls, 12.7 percent of Hispanic girls and 10.9 percent of american indian girls have no desire to pursue education after high school ends. in addition, girls of every racial and ethnic group are far less likely than their male counterparts to see trade or vocational school as a future option. among girls, african american and asian american girls are least likely to consider this type of education (1.7 and 1.8 percent, respectively), while white girls are the most likely (3.7 percent).
the patterns are different for girls and boys opting for college plans and beyond. White, american indian, and Hispanic girls are all more likely than their male counterparts to want to attend college and college plus graduate school (see figure 5.13). interestingly, whereas american indian girls are the second most likely to say they only wanted to finish high school, they are also the second most likely to say that they want to go to college (59.1 percent). african american and asian american girls also are far more likely than their male counterparts to want both to go to both college and graduate school.
In summary
in Minnesota, girls report higher grades than boys, spend more time studying, report a more positive outlook on school, and hold higher aspirations for their educational futures than boys. they are, however, are less likely to be considered collegeready by standardized testing, with test scores in math and science that lag considerably behind boys’ scores. the question remains, then, as to whether their hard work and interest in school will pay off in terms of their potential career paths and earnings later in life. Creating economic opportunities for girls in Minnesota will require addressing fairness for girls in the home, in school, and in the workplace.
44 Status of Girls in Minnesota
“I have a big dream for myself. After college, I can see myself being a pediatrician. I love kids. I have siblings I have to take care of, even going to school and everything. I love helping people.”
Women’s Foundation of Minnesota girlsBEST Fund program participant, age 18
Recommendations for Change
1. Schools in Minnesota should address girls’ lower standardized test scores, particularly in math and science, by combating gender stereotypes about these subjects and finding ways to make the learning environment more hospitable to girls. A first step could be conducting an evaluation of student preparation for standardized testing and the factors that hold girls back.
2.School and community programs can be developed and expanded to encourage girls to pursue math and science, starting with the very young. Programs should focus on showing girls the types of careers available in nontraditional fields for women, which not only offer economic security, but also the opportunity for careers at the forefront of new research, technological, and medical developments. These programs might include mentoring and hands-on activities as well as access to on-line resources.
3. Financial aid for higher education should be targeted at girls of color, whose disproportionate representation among the poor limits their access to further schooling. Expanding access for girls of color can help move them into better paying work and can help to reverse the depressed economic conditions that communities of color often experience
4.Improving the quality and flexibility of low-income parents’ jobs will benefit girls by increasing both parents’ time and financial resources available to the family. Guaranteed access to paid time off, such as paid sick leave for a dependents’ illness, and paid vacation, would help parents spend time with their teens during key transitions or to attend to a child’s school difficulties.
5.The survey data show that girls in Minnesota do not see vocational school or education in the trades as a potential career path. School career counselors should be guiding girls down paths that will lead to economic security and potential career growth. They should provide information about training for well-paying jobs, resources for pursuing higher education, and the types of fields that yield good pay.
6. Directing Workforce Investment Act funds to education and training programs that target women and people of color can help to improve the economic security of some of Minnesota’s most disadvantaged populations. Workforce Development Boards in the state can also tailor job training to the needs of sectors that have better wage and professional growth and tailor services to the needs of specific communities (Wider Opportunities for Women 2006).
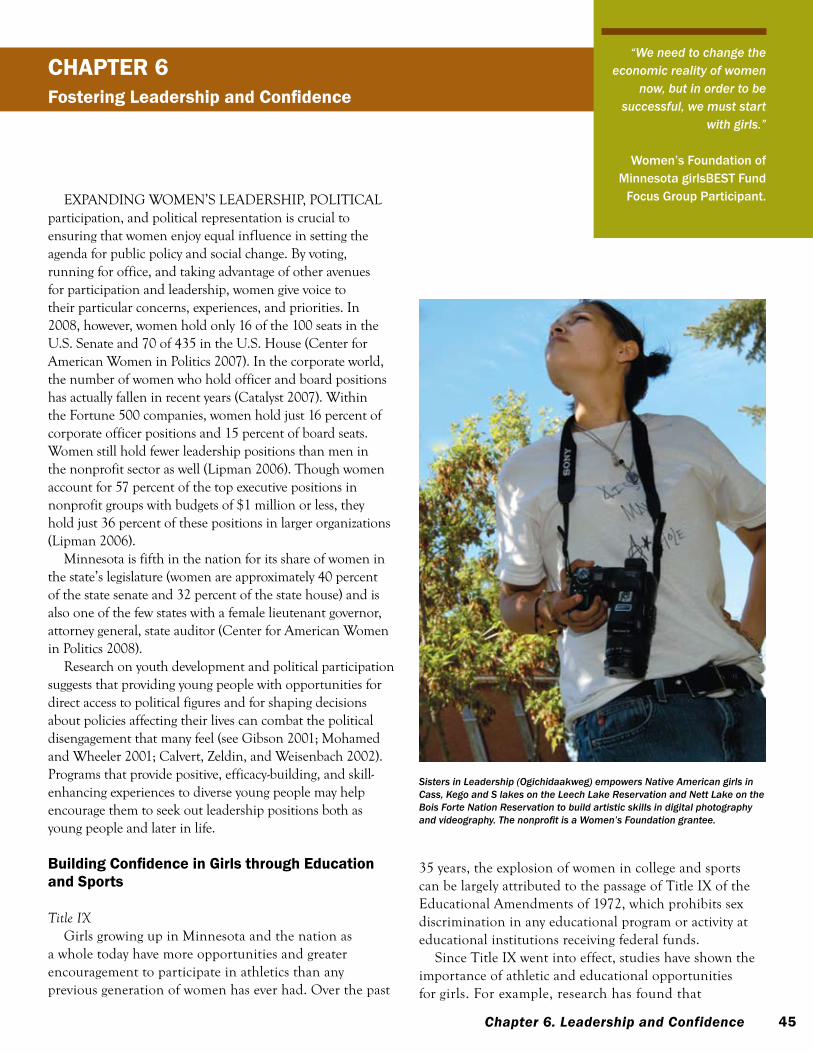
45Chapter 6. Leadership and Confidence
expanDinG WoMen’s leaDersHip, politiCal participation, and political representation is crucial to ensuring that women enjoy equal influence in setting the agenda for public policy and social change. By voting, running for office, and taking advantage of other avenues for participation and leadership, women give voice to their particular concerns, experiences, and priorities. in 2008, however, women hold only 16 of the 100 seats in the u.s. senate and 70 of 435 in the u.s. House (Center for american Women in politics 2007). in the corporate world, the number of women who hold officer and board positions has actually fallen in recent years (Catalyst 2007). Within the fortune 500 companies, women hold just 16 percent of corporate officer positions and 15 percent of board seats. Women still hold fewer leadership positions than men in the nonprofit sector as well (lipman 2006). though women account for 57 percent of the top executive positions in nonprofit groups with budgets of $1 million or less, they hold just 36 percent of these positions in larger organizations (lipman 2006).
Minnesota is fifth in the nation for its share of women in the state’s legislature (women are approximately 40 percent of the state senate and 32 percent of the state house) and is also one of the few states with a female lieutenant governor, attorney general, state auditor (Center for american Women in politics 2008).
research on youth development and political participation suggests that providing young people with opportunities for direct access to political figures and for shaping decisions about policies affecting their lives can combat the political disengagement that many feel (see Gibson 2001; Mohamed and Wheeler 2001; Calvert, Zeldin, and Weisenbach 2002). programs that provide positive, efficacybuilding, and skillenhancing experiences to diverse young people may help encourage them to seek out leadership positions both as young people and later in life.
Building Confidence in Girls through Education and sports
Title IXGirls growing up in Minnesota and the nation as
a whole today have more opportunities and greater encouragement to participate in athletics than any previous generation of women has ever had. over the past
35 years, the explosion of women in college and sports can be largely attributed to the passage of title ix of the educational amendments of 1972, which prohibits sex discrimination in any educational program or activity at educational institutions receiving federal funds.
since title ix went into effect, studies have shown the importance of athletic and educational opportunities for girls. for example, research has found that
cHApTeR 6Fostering Leadership and Confidence
“We need to change the economic reality of women
now, but in order to be successful, we must start
with girls.”
Women’s Foundation of Minnesota girlsBEST Fund
Focus Group Participant.
Sisters in Leadership (Ogichidaakweg) empowers Native American girls in Cass, Kego and S lakes on the Leech Lake Reservation and Nett Lake on the Bois Forte Nation Reservation to build artistic skills in digital photography and videography. The nonprofit is a Women’s Foundation grantee.
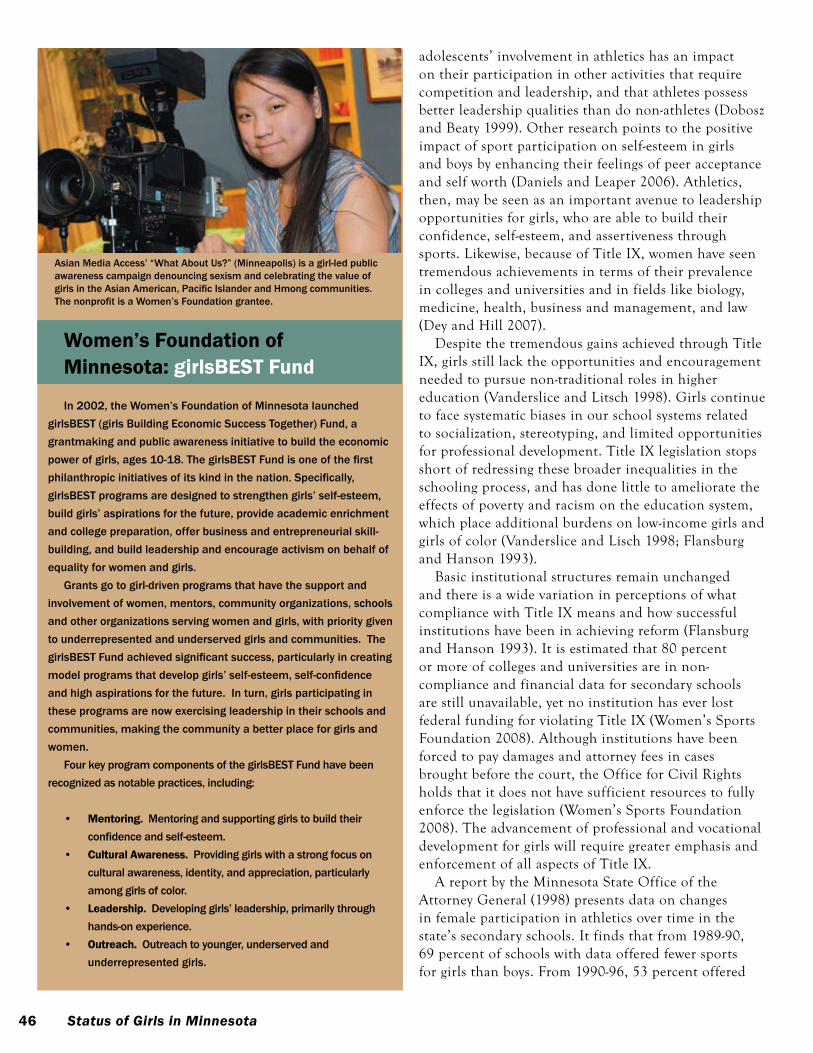
46 Status of Girls in Minnesota
adolescents’ involvement in athletics has an impact on their participation in other activities that require competition and leadership, and that athletes possess better leadership qualities than do nonathletes (Dobosz and Beaty 1999). other research points to the positive impact of sport participation on selfesteem in girls and boys by enhancing their feelings of peer acceptance and self worth (Daniels and leaper 2006). athletics, then, may be seen as an important avenue to leadership opportunities for girls, who are able to build their confidence, selfesteem, and assertiveness through sports. likewise, because of title ix, women have seen tremendous achievements in terms of their prevalence in colleges and universities and in fields like biology, medicine, health, business and management, and law (Dey and Hill 2007).
Despite the tremendous gains achieved through title ix, girls still lack the opportunities and encouragement needed to pursue nontraditional roles in higher education (Vanderslice and litsch 1998). Girls continue to face systematic biases in our school systems related to socialization, stereotyping, and limited opportunities for professional development. title ix legislation stops short of redressing these broader inequalities in the schooling process, and has done little to ameliorate the effects of poverty and racism on the education system, which place additional burdens on lowincome girls and girls of color (Vanderslice and lisch 1998; flansburg and Hanson 1993).
Basic institutional structures remain unchanged and there is a wide variation in perceptions of what compliance with title ix means and how successful institutions have been in achieving reform (flansburg and Hanson 1993). it is estimated that 80 percent or more of colleges and universities are in noncompliance and financial data for secondary schools are still unavailable, yet no institution has ever lost federal funding for violating title ix (Women’s sports foundation 2008). although institutions have been forced to pay damages and attorney fees in cases brought before the court, the office for Civil rights holds that it does not have sufficient resources to fully enforce the legislation (Women’s sports foundation 2008). the advancement of professional and vocational development for girls will require greater emphasis and enforcement of all aspects of title ix.
a report by the Minnesota state office of the attorney General (1998) presents data on changes in female participation in athletics over time in the state’s secondary schools. it finds that from 198990, 69 percent of schools with data offered fewer sports for girls than boys. from 199096, 53 percent offered
Women’s foundation of Minnesota: girlsbesT fund
In 2002, the Women’s Foundation of Minnesota launched girlsBEST (girls Building Economic Success Together) Fund, a grantmaking and public awareness initiative to build the economic power of girls, ages 10-18. The girlsBEST Fund is one of the first philanthropic initiatives of its kind in the nation. Specifically, girlsBEST programs are designed to strengthen girls’ self-esteem, build girls’ aspirations for the future, provide academic enrichment and college preparation, offer business and entrepreneurial skill-building, and build leadership and encourage activism on behalf of equality for women and girls.
Grants go to girl-driven programs that have the support and involvement of women, mentors, community organizations, schools and other organizations serving women and girls, with priority given to underrepresented and underserved girls and communities. The girlsBEST Fund achieved significant success, particularly in creating model programs that develop girls’ self-esteem, self-confidence and high aspirations for the future. In turn, girls participating in these programs are now exercising leadership in their schools and communities, making the community a better place for girls and women.
Four key program components of the girlsBEST Fund have been recognized as notable practices, including:
Mentoring. • Mentoring and supporting girls to build their confidence and self-esteem.cultural Awareness. • Providing girls with a strong focus on cultural awareness, identity, and appreciation, particularly among girls of color.leadership. • Developing girls’ leadership, primarily through hands-on experience.outreach. • Outreach to younger, underserved and underrepresented girls.
Asian Media Access’ “What About Us?” (Minneapolis) is a girl-led public awareness campaign denouncing sexism and celebrating the value of girls in the Asian American, Pacific Islander and Hmong communities. The nonprofit is a Women’s Foundation grantee.
47Chapter 6. Leadership and Confidence
fewer sports, 35 percent offered the same number, and 12 percent offered more sports for girls than boys. Despite the noted progress in girls’ access to sports programs, the report highlights some areas of concern, including incomplete, incorrect, and underutilized data from schools, infrequent surveying of students’ sports interests, and limited cooperation on the part of local school districts with the state Department of education (Minnesota state office of the attorney General 1998).
In summary
Minnesota’s girls deserve opportunities to build their sense of agency and confidence in their ability to lead and change their communities. Minnesota can expand leadership among girls and women in the state by fostering confidence and voice among its girls. youth development programs should provide mentorship and rolemodeling, and skillbuilding, to provide girls with the type of positive reinforcement and support that they need to overcome the challenges they face.
Recommendations for Change1. Minnesotans should invest in a leadership pipeline for girls by expanding programs like girlsBEST that offer girls and youth of color opportunities for skill-building, leadership training, and mentorship.
2. Investments in quality, comprehensive after-school programs, sports, and other positive activities for girls will help provide girls with safe, confidence-building environments.
3.State and local governments can create internship opportunities for girls, particularly those from underrepresented groups, to give them exposure to decision-making processes.
4.Other service-learning opportunities would provide girls with experiences that build their skills and confidence and sense of civic responsibility.
5.Schools and districts in Minnesota should be in full compliance with Title IX reporting policies and regulations.
6.In keeping with the spirit of Title IX, schools and districts should put forth efforts to bring diverse female role models into the education system, as coaches, heads of schools, math and science teachers, etc.

48 Status of Girls in Minnesota
MoVinG Minnesota’s Girls forWarD anD building their chances for future success is critical not only to their own lives, but to communities all across the state. Just as girls’ challenges are shared obstacles that impede Minnesota from reaching its full potential, girls’ triumphs are shared successes, as they bring their experiences to bear on their adulthood and the nurturing of their own families and communities. Creating an environment that nurtures girls to be confident, competent, and capable, and that is ripe with opportunities for economic independence, career growth, and leadership, benefits not only girls, but every Minnesotan. progressive policy, continued advocacy, and increased philan thropy, as well as mentorship and community support, will be key to ensuring that girls continue moving forward.
conclusIonMoving Girls forward
The Science Center at Maltby Nature Preserve (Randolph) engages girls (ages 10-18) in authentic science. Professional female scientists serve as mentors as girls develop social, leadership, and teamwork skills. The non-profit is a Women’s Foundation grantee.
49Methodology Appendix
2004 Minnesota student survey
the 2004 Minnesota student survey is a penandpaper questionnaire that asks 6th, 9th, and 12th grade students about their activities, opinions, and behaviors. participation in the survey is voluntary, confidential, and anonymous. the 2004 survey dataset was provided by the Minnesota student survey interagency team (which includes the Departments of education, Health, Human services, public safety, and Corrections) and contains data for 6th, 9th, and 12th grade girls and boys in public schools, charter schools, and tribal schools throughout the state. the dataset did not include girls and boys in alternative schools or juvenile centers. the interagency team administers the survey to every 6th, 9th, and 12th grade student in a participating district and who has parental permission. the 2004 survey reached 77 percent of the state’s 6th graders, 73 percent of its 9th graders, and 49 percent of its 12th graders in participating public, charter, and tribal schools. the overall participation rate for all three grade levels was 66 percent. the interagency team does not weight the data nor do they provide a weighting variable in the dataset, treating the survey as a census of 6th, 9th, and 12th graders rather than a sample.
students are asked to indicate their race/ethnicity by answering the question, “How do you describe yourself? (If more than one describes you, mark all that apply).” the response options provided are “american indian; Black, african, or african american; Mexican american or Chicano/Chicana; puerto rican or other latin american; asian american or pacific islander (including Cambodian, Hmong, Korean, laotian, Vietnamese); White; i don’t know.” in the Mss 2004 dataset the two ethnicity options “Mexican american or Chicano/Chicana” and “puerto rican or other latin american” were combined into one “Hispanic or latino” variable. all other race categories appear in the dataset as they do on the survey. in this report, iWpr uses the terms african american, asian american, american indian, and Hispanic when describing student survey data for the sake of simplicity. source: Minnesota student survey interagency team 2005.
Minnesota department of education
iWpr collected data on statewide public school dropout and graduation rates from the Minnesota Department of education (Mn Doe) for the year 2006. the Mn Doe uses the adequate yearly progress or ayp rate, which creates a cohort group by identifying students who graduate in 2006 plus students who dropped out as 9th graders in 2003, 10th graders in 2004, 11th graders in 2005, and 12th graders in 2006. the total number of graduating students in 2006 is divided by the cohort group (graduating students plus dropouts between 2003 and 2006). source: Minnesota Department of education 2007.
Minnesota department of Health
iWpr drew upon data from the Minnesota Department of Health for a number of indicators of girls’ health status.
Health Insurance Coverage and Type the Minnesota Department of Health provided
iWpr with data tables on uninsurance rates by age and types of health insurance coverage for children by family income level in 2001 and 2004. these data are derived from the 2001 and 2004 Minnesota Health access surveys. source: Minnesota Department of Health 2007a.
Abortion Dataabortion data are from the Minnesota Department
of Health and are based on data submitted by facilities and physicians who perform abortions in Minnesota. facilities and clinics may submit a “report of induced abortion” form on behalf of physicians who practice or physicians may submit reports independently. abortion percentages were calculated by iWpr based on abortion numbers reported in the Induced Abortions in Minnesota January—December 2005: Report to the Legislature.source: Minnesota Department of Health 2006.
MeTHodoloGy AppendIx
50 Status of Girls in Minnesota
Pregnancy and Birth RatesiWpr compiled figures on pregnancy rates by race
and ethnicity from the Minnesota organization on adolescent pregnancy, prevention, and parenting (2006), teen birth rates for Minnesota and the united states from the Centers for Disease Control and prevention (2007), and teen birth rates by race and ethnicity from the Minnesota Department of Health 2004 and 2007. sources: Minnesota organization on adolescent pregnancy, prevention, and parenting 2006; Martin et al. 2007; and Minnesota Department of Health 2004 and 2007.
college board
Mean advanced placement (ap) scores at the state level were aggregated by the College Board from individuallevel data for tests taken in May 2006. the means are available by grade level, race/ethnicity, and gender.
iWpr used mean sat scores reported by gender, race, and ethnicity from the 2006 College-Bound Seniors State Profile Report: Minnesota published by the College Board. this report presents data for high school graduates in 2006. regardless of how often they have tested, students are counted only once and their latest scores and most recent sat Questionnaire responses are included. since the collegebound population is relatively stable and the accuracy of selfreported information has been documented, the data are considered highly accurate.
When testtakers register for the sat, they complete an optional registration form called the sat Questionnaire. this questionnaire asks students to indicate their ethnic group membership. the groupings provided for this question are american indian or alaskan native; asian, asian american, or pacific islander; african american or Black; Mexican or Mexican american; puerto rican; latin american, south american, Central american, or other Hispanic or latino; White; and other. a small percentage of students indicate “other” or do not provide a response. source: College Board 2006 and 2007.
AcT
Data on the percent of students meeting aCt College readiness Benchmarks are for the year 2007 and were sent to iWpr electronically by aCt, inc. Data on composite aCt scores are derived from the ACT High School Profile Report for the Minnesota: The Graduating Class of 2006. aCt defines benchmark
scores in each subject tested as the minimum score needed to have a 75 percent chance of obtaining a C or higher in corresponding creditbearing college courses.
During registration for the aCt, students are asked to indicate a racial and/or ethnic category that best describes them. students can choose from the following categories: african american/Black; american indian/alaska native; Caucasian american/White; asian american/pacific islander; Mexican american/Chicano; puerto rican/other Hispanic; Multiracial; i prefer not to respond; or other. When the data are compiled by aCt into reports such as their High school profile reports, students indicating Mexican american/Chicano and puerto rican/other Hispanic are aggregated into the category “Hispanic.” students who indicate a race/ethnicity of multiracial, prefer not to respond, chose the “other” category, or do not respond at all are aggregated into a category called “other/Missing.” source: aCt, inc. 2006 and 2007.
American community survey data
iWpr used the 2005 american Community survey (aCs) data published by the Census Bureau, to provide demographic and economic information on children and families in Minnesota disaggregated by race and ethnicity and disaggregated by county.
Statewide Demographic Datastatewide demographic information on the number
and proportion of youths by age and families by family type in Minnesota includes data for nonHispanic whites, african americans, asian americans, american indians, and Hispanics. Hispanics, though reported separately, may be of any race except white (which we label white, nonHispanic).
Statewide Economic DataData on poverty rates by age and race/ethnicity
and poverty rates for families by family type and race/ethnicity include the racial and ethnic groups nonHispanic whites, african americans, asian americans, american indians, and Hispanics. Hispanics may be of any race except white.
statewide data on median family income by family type and race/ethnicity and households paying 30 percent or more of income on housing by race/ethnicity were derived from the american Community survey’s selected population profiles. Due to small sample sizes, the selected population profiles do not offer data on american indians for these indicators.
51Methodology Appendix
County Demographic and Economic Datathe aCs reports data for 13 counties in Minnesota,
including anoka, Carver, Dakota, Hennepin, olmsted, ramsey, st. louis, scott, sherburne, stearns, Washington, and Wright. County level data were not further disaggregated by race and ethnicity due to small sample sizes.
the aCs, as any other survey, is subject to statistical error. in some cases, differences between counties are large enough that they are likely to be statistically significant. that is, they are unlikely to have happened
by chance and probably represent a true difference between the counties. in other cases, these differences are too small to be statistically significant and are likely to have occurred by chance. iWpr did not calculate or report measures of statistical significance for this report. Generally, the larger a difference between two values (for any given sample size or distribution), the more likely it is that the difference will be statistically significant. source: u.s. Department of Commerce, Bureau of the Census 2006a.

52 Status of Girls in Minnesota
AppendIx fIGuRes, MAps, And TAbles
7.2%
9.1%
1.2%1.6%
8.8%
5.7%
16.5%
13.3%
9.4%7.8%
16.3%
20.5%
12.1%
16.6%
1.5% 1.8%
6.5% 6.1%
11.7%
6.6%
3.6% 4.3%5.1%
6.0%
Appendix Figure 1.1: Poverty Among Girls and Boys Under 18 in Minnesota by Selected Counties, American Community Survey, 2005
Female
Male
Notes:The American Community Survey provides county-level data only for counties with populations of 60,000 or more. Source: U.S. Department of Commerce, Bureau of the Census 2006.Calculated by the Institute for Women's Policy Research.
Anoka Dakota Olmsted St. Louis Sherburne Washington Carver Hennepin Ramsey Scott Stearns Wright
Appendix figure 1.1. Poverty Among Girls and Boys Under 18 in Minnesota by Selected Counties, American Community Survey, 2005
notes: the American Community survey provides county-level data only for counties with populations of 60,000 or more. source: U.s. Department of Commerce, Bureau of the Census 2006.Calculated by the Institute for Women’s Policy Research.
Appendix Table 1.1. Number of Youth in Minnesota and the United States, by Gender and Race and Ethnicity, American Community Survey, 2005
notes: Numbers for all children in each age range are not equal the sum of children by race and ethnicity because Hispanics may be of any race or two or more races. see the Methodology Appendix for information on how race and ethnicity are categorized in the Census Bureau’s American Community survey. source: U.s. Department of Commerce, Bureau of the Census 2006.
Age AllWhite, non-
Hispanic African
AmericanAmerican
Indian Asian
AmericanSome other
race
Two or more races Hispanic
Minnesota 156,780 120,923 10,819 2,125 7,725 4,726 5,683 10,425United States 9,567,062 5,477,003 1,398,525 89,788 387,749 774,197 375,128 1,943,016Minnesota 169,376 137,944 9,824 1,900 7,487 2,417 4,994 7,693United States 10,125,910 5,986,605 1,563,568 99,489 378,550 751,841 339,092 1,863,134Minnesota 107,409 88,876 5,869 1,615 4,134 1,761 3,127 4,054United States 6,136,448 3,773,293 936,814 62,739 225,965 429,563 178,968 1,011,190Minnesota 433,565 347,743 26,512 5,640 19,346 8,904 13,804 22,172United States 25,829,420 15,236,901 3,898,907 252,016 992,264 1,955,601 893,188 4,817,340Minnesota 166,352 129,223 10,609 2,961 8,103 4,765 6,216 9,873United States 9,945,226 5,749,031 1,414,065 93,060 393,134 803,951 400,924 2,011,121Minnesota 177,393 143,940 9,068 2,753 8,961 3,174 5,639 7,974United States 10,674,272 6,345,458 1,621,335 110,925 394,624 805,708 343,309 1,958,997Minnesota 112,206 92,898 5,452 2,120 4,743 1,603 2,663 4,300United States 6,415,594 3,969,133 948,927 59,554 242,891 452,887 178,053 1,062,331Minnesota 455,951 366,061 25,129 7,834 21,807 9,542 14,518 22,147United States 27,035,092 16,063,622 3,984,327 263,539 1,030,649 2,062,546 922,286 5,032,449Minnesota 4,989,848 4,301,409 205,160 53,573 177,645 87,512 73,458 181,959United States 288,378,137 192,615,561 16,202,981 2,357,544 12,471,815 17,298,601 5,557,184 41,870,703
10 to 14 years
15 to 17 years
5 to 17
Appendix Table 1.1: Number of Youth in Minnesota and the United States, by Gender and Race and Ethnicity, American Community Survey, 2005
Total Population (All Ages)
Boys
5 to 9 years
10 to 14 years
15 to 17 years
5 to 17
Girls
5 to 9 years
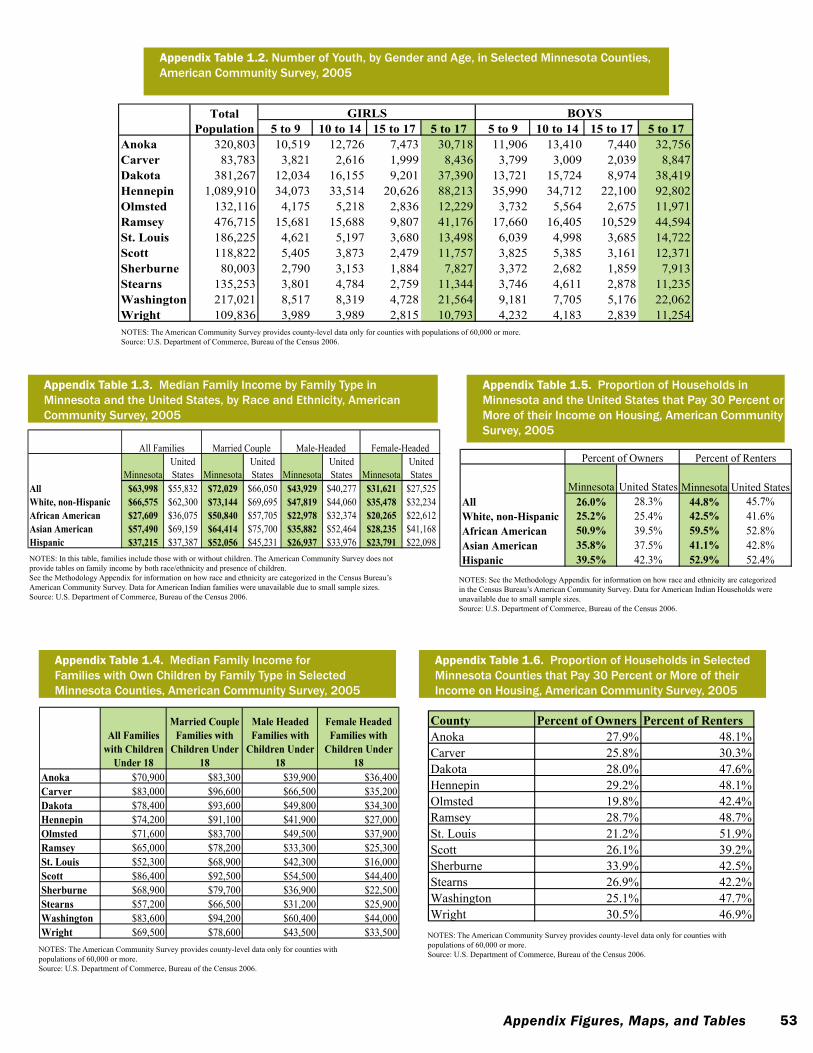
53Appendix Figures, Maps, and Tables
Appendix Table 1.4. Median Family Income for Families with Own Children by Family Type in Selected Minnesota Counties, American Community Survey, 2005
notes: the American Community survey provides county-level data only for counties with populations of 60,000 or more. source: U.s. Department of Commerce, Bureau of the Census 2006.
All Families with Children
Under 18
Married Couple Families with
Children Under 18
Male Headed Families with
Children Under 18
Female Headed Families with
Children Under 18
Anoka $70,900 $83,300 $39,900 $36,400Carver $83,000 $96,600 $66,500 $35,200Dakota $78,400 $93,600 $49,800 $34,300Hennepin $74,200 $91,100 $41,900 $27,000Olmsted $71,600 $83,700 $49,500 $37,900Ramsey $65,000 $78,200 $33,300 $25,300St. Louis $52,300 $68,900 $42,300 $16,000Scott $86,400 $92,500 $54,500 $44,400Sherburne $68,900 $79,700 $36,900 $22,500Stearns $57,200 $66,500 $31,200 $25,900Washington $83,600 $94,200 $60,400 $44,000Wright $69,500 $78,600 $43,500 $33,500
Appendix Table 1.4: Median Family Income for Families with Own Children by Family Type in Selected Minnesota Counties, American Community Survey, 2005
Appendix Table 1.5. Proportion of Households in Minnesota and the United States that Pay 30 Percent or More of their Income on Housing, American Community Survey, 2005
notes: see the Methodology Appendix for information on how race and ethnicity are categorized in the Census Bureau’s American Community survey. Data for American Indian Households were unavailable due to small sample sizes. source: U.s. Department of Commerce, Bureau of the Census 2006.
Minnesota United States Minnesota United StatesAll 26.0% 28.3% 44.8% 45.7%White, non-Hispanic 25.2% 25.4% 42.5% 41.6%African American 50.9% 39.5% 59.5% 52.8%Asian American 35.8% 37.5% 41.1% 42.8%Hispanic 39.5% 42.3% 52.9% 52.4%
Appendix Table 1.5: Proportion of Households in Minnesota and the United States that Pay 30 Percent or More of their Income on
Housing, American Community Survey, 2005
Percent of Owners Percent of Renters
Appendix Table 1.6. Proportion of Households in Selected Minnesota Counties that Pay 30 Percent or More of their Income on Housing, American Community Survey, 2005
notes: the American Community survey provides county-level data only for counties with populations of 60,000 or more. source: U.s. Department of Commerce, Bureau of the Census 2006.
County Percent of Owners Percent of RentersAnoka 27.9% 48.1%Carver 25.8% 30.3%Dakota 28.0% 47.6%Hennepin 29.2% 48.1%Olmsted 19.8% 42.4%Ramsey 28.7% 48.7%St. Louis 21.2% 51.9%Scott 26.1% 39.2%Sherburne 33.9% 42.5%Stearns 26.9% 42.2%Washington 25.1% 47.7%Wright 30.5% 46.9%
Appendix Table 1.6: Proportion of Households in Selected Minnesota Counties that Pay 30 Percent or More of their Income on Housing, American Community Survey, 2005
Appendix Table 1.2. Number of Youth, by Gender and Age, in Selected Minnesota Counties, American Community Survey, 2005
notes: the American Community survey provides county-level data only for counties with populations of 60,000 or more. source: U.s. Department of Commerce, Bureau of the Census 2006.
5 to 9 10 to 14 15 to 17 5 to 17 5 to 9 10 to 14 15 to 17 5 to 17Anoka 320,803 10,519 12,726 7,473 30,718 11,906 13,410 7,440 32,756Carver 83,783 3,821 2,616 1,999 8,436 3,799 3,009 2,039 8,847Dakota 381,267 12,034 16,155 9,201 37,390 13,721 15,724 8,974 38,419Hennepin 1,089,910 34,073 33,514 20,626 88,213 35,990 34,712 22,100 92,802Olmsted 132,116 4,175 5,218 2,836 12,229 3,732 5,564 2,675 11,971Ramsey 476,715 15,681 15,688 9,807 41,176 17,660 16,405 10,529 44,594St. Louis 186,225 4,621 5,197 3,680 13,498 6,039 4,998 3,685 14,722Scott 118,822 5,405 3,873 2,479 11,757 3,825 5,385 3,161 12,371Sherburne 80,003 2,790 3,153 1,884 7,827 3,372 2,682 1,859 7,913Stearns 135,253 3,801 4,784 2,759 11,344 3,746 4,611 2,878 11,235Washington 217,021 8,517 8,319 4,728 21,564 9,181 7,705 5,176 22,062Wright 109,836 3,989 3,989 2,815 10,793 4,232 4,183 2,839 11,254
GIRLS BOYSTotal Population
Appendix Table 1.2: Number of Youth, by Gender and Age, in Selected Minnesota Counties, American Community Survey, 2005
Appendix Table 1.3. Median Family Income by Family Type in Minnesota and the United States, by Race and Ethnicity, American Community Survey, 2005
notes: In this table, families include those with or without children. the American Community survey does not provide tables on family income by both race/ethnicity and presence of children. see the Methodology Appendix for information on how race and ethnicity are categorized in the Census Bureau’s American Community survey. Data for American Indian families were unavailable due to small sample sizes. source: U.s. Department of Commerce, Bureau of the Census 2006.
MinnesotaUnited States Minnesota
United States Minnesota
United States Minnesota
United States
All $63,998 $55,832 $72,029 $66,050 $43,929 $40,277 $31,621 $27,525White, non-Hispanic $66,575 $62,300 $73,144 $69,695 $47,819 $44,060 $35,478 $32,234African American $27,609 $36,075 $50,840 $57,705 $22,978 $32,374 $20,265 $22,612Asian American $57,490 $69,159 $64,414 $75,700 $35,882 $52,464 $28,235 $41,168Hispanic $37,215 $37,387 $52,056 $45,231 $26,937 $33,976 $23,791 $22,098
Appendix Table 1.3: Median Family Income by Family Type in Minnesota and the United States, by Race and Ethnicity, American Community Survey, 2005
All Families Married Couple Male-Headed Female-Headed

54 Status of Girls in Minnesota
County NeverLess than 1 a day 1-5 a Day
Half Pack a Day
Pack a Day
1 1/2 Packs a Day
2 Packs a Day County Never
Less than 1 a day 1-5 a Day
Half Pack a Day
Pack a Day
1 1/2 Packs a Day
2 Packs a Day
KOOCHICHING 70.9% 8.5% 12.1% 3.6% 3.0% 1.2% 0.6%
YELLOW MEDICINE 72.6% 10.4% 7.5% 5.0% 3.0% 1.0% 0.5%
BELTRAMI 71.1% 12.8% 10.7% 3.9% 1.0% 0.4% 0.2% BIG STONE 74.0% 3.8% 9.6% 6.7% 4.8% 0.0% 1.0%HUBBARD 73.9% 7.7% 10.8% 4.1% 3.2% 0.0% 0.5% MORRISON 74.1% 9.6% 5.0% 4.6% 3.8% 1.7% 1.3%MORRISON 75.5% 7.6% 12.0% 3.2% 1.6% 0.0% 0.0% MURRAY 75.4% 4.3% 13.8% 4.3% 1.4% 0.0% 0.7%PINE 76.6% 7.3% 9.0% 4.8% 1.7% 0.3% 0.3% LINCOLN 77.1% 10.2% 9.3% 1.7% 1.7% 0.0% 0.0%HOUSTON 76.7% 10.9% 9.1% 2.7% 0.6% 0.0% 0.0% RENVILLE 77.3% 7.3% 5.3% 6.0% 2.7% 0.7% 0.7%ROSEAU 77.0% 9.4% 9.4% 3.9% 0.3% 0.0% 0.0% BELTRAMI 77.8% 6.9% 6.7% 4.9% 1.5% 1.3% 0.9%SIBLEY 77.9% 9.1% 6.9% 3.5% 1.7% 0.9% 0.0% PIPESTONE 77.9% 3.4% 6.7% 6.7% 2.0% 2.0% 1.3%BROWN 78.0% 8.4% 8.7% 3.7% 1.0% 0.3% 0.0% CASS 79.5% 5.4% 8.0% 2.7% 2.7% 0.4% 1.3%YELLOW MEDICINE 78.0% 7.1% 7.1% 5.5% 0.5% 1.6% 0.0%
LYON 79.6% 7.7% 6.5% 3.8% 1.2% 0.7% 0.5%
BIG STONE 78.1% 5.2% 13.5% 2.1% 0.0% 0.0% 1.0% PINE 80.2% 6.4% 7.5% 3.4% 2.0% 0.6% 0.0%WASECA 78.3% 9.7% 7.9% 3.4% 0.7% 0.0% 0.0% POLK 80.5% 8.8% 4.3% 3.7% 1.6% 0.3% 0.8%CASS 78.4% 8.3% 11.5% 1.4% 0.4% 0.0% 0.0% WADENA 80.7% 9.3% 4.7% 2.3% 2.0% 0.0% 1.0%AITKIN 79.0% 6.0% 7.8% 4.2% 1.8% 0.6% 0.6% BECKER 80.8% 6.4% 4.4% 2.7% 2.7% 0.7% 2.2%TODD 80.4% 7.9% 6.9% 1.5% 2.5% 0.5% 0.2% STEVENS 81.0% 9.1% 5.0% 2.5% 2.5% 0.0% 0.0%CARLTON 80.8% 5.9% 7.9% 2.8% 1.8% 0.6% 0.2% WASECA 81.2% 8.6% 4.1% 4.1% 2.1% 0.0% 0.0%MILLE LACS 80.8% 5.7% 5.5% 5.3% 2.2% 0.5% 0.0% BROWN 81.6% 7.4% 6.5% 2.3% 2.0% 0.0% 0.3%ISANTI 81.0% 7.7% 6.9% 2.2% 1.4% 0.6% 0.2% WATONWAN 81.9% 5.9% 5.9% 0.5% 3.7% 1.6% 0.5%MARTIN 81.2% 9.7% 5.8% 2.2% 0.7% 0.0% 0.4% WABASHA 82.1% 6.0% 5.6% 2.9% 1.7% 0.2% 1.4%MEEKER 81.3% 7.7% 6.5% 3.1% 0.9% 0.4% 0.2% AITKIN 82.2% 8.1% 4.9% 1.1% 1.6% 0.5% 1.6%RENVILLE 81.3% 7.5% 6.4% 1.6% 2.7% 0.5% 0.0% LESUEUR 82.2% 5.9% 5.4% 2.0% 2.5% 0.8% 1.1%MCLEOD 81.5% 7.4% 7.3% 2.3% 1.1% 0.4% 0.0% HUBBARD 82.4% 4.7% 3.9% 3.1% 2.7% 2.4% 0.8%FARIBAULT 81.7% 8.3% 5.0% 1.3% 2.1% 1.7% 0.0% MILLE LACS 82.5% 3.4% 5.3% 4.6% 1.9% 0.5% 1.8%MURRAY 81.9% 3.4% 8.7% 4.7% 1.3% 0.0% 0.0% ROSEAU 82.7% 8.8% 4.8% 2.3% 0.3% 0.3% 0.9%WABASHA 82.1% 6.8% 6.5% 2.9% 1.5% 0.0% 0.2% WILKIN 82.8% 7.8% 4.7% 1.6% 1.6% 0.8% 0.8%LESUEUR 82.4% 5.2% 8.8% 1.7% 1.4% 0.2% 0.2% MARSHALL 83.0% 8.2% 4.1% 2.7% 1.4% 0.7% 0.0%ITASCA 82.6% 5.7% 5.3% 2.9% 2.6% 0.7% 0.2% SIBLEY 83.1% 3.7% 6.2% 5.0% 1.7% 0.4% 0.0%FILLMORE 83.2% 7.7% 5.8% 2.4% 0.5% 0.0% 0.5% MEEKER 83.3% 6.4% 4.0% 2.8% 2.6% 0.5% 0.5%WATONWAN 83.3% 5.9% 6.8% 2.3% 1.8% 0.0% 0.0% FARIBAULT 84.0% 3.9% 6.5% 2.2% 2.2% 0.4% 0.9%LAC QUI PARLE 83.4% 6.2% 5.2% 2.6% 2.1% 0.5% 0.0% ITASCA 84.3% 7.3% 3.2% 2.2% 1.9% 0.6% 0.4%PIPESTONE 83.4% 3.8% 6.4% 5.1% 1.3% 0.0% 0.0% BENTON 84.6% 4.8% 5.4% 3.9% 0.7% 0.0% 0.7%RICE 83.4% 7.6% 4.9% 2.3% 0.8% 0.7% 0.3% BLUE EARTH 84.6% 5.3% 4.4% 3.4% 1.2% 0.6% 0.5%ST. LOUIS 83.4% 7.4% 5.2% 1.9% 1.8% 0.3% 0.0% OTTER TAIL 84.6% 4.9% 4.4% 3.3% 1.3% 0.6% 0.9%MOWER 83.5% 6.8% 4.6% 3.0% 1.4% 0.2% 0.6% GRANT 84.7% 5.1% 4.1% 2.0% 4.1% 0.0% 0.0%SCOTT 83.6% 8.2% 4.5% 2.6% 0.9% 0.2% 0.1% LAC QUI PARLE 84.7% 3.4% 5.1% 3.4% 2.3% 0.6% 0.6%WRIGHT 84.0% 7.6% 4.7% 2.3% 1.0% 0.1% 0.1% STEARNS 84.7% 5.5% 4.5% 2.8% 2.0% 0.3% 0.3%MARSHALL 84.1% 6.3% 7.1% 0.8% 1.6% 0.0% 0.0% DODGE 84.8% 6.7% 4.0% 3.4% 0.7% 0.0% 0.3%RED LAKE 84.1% 7.2% 2.9% 4.3% 0.0% 0.0% 1.4% SCOTT 85.0% 5.0% 5.1% 2.7% 1.5% 0.2% 0.5%COTTONWOOD 84.2% 7.3% 6.6% 1.5% 0.4% 0.0% 0.0% COTTONWOOD 85.1% 5.0% 5.0% 2.9% 1.2% 0.4% 0.4%GOODHUE 84.2% 6.8% 5.4% 2.0% 1.2% 0.3% 0.2% HOUSTON 85.1% 5.9% 4.6% 2.3% 1.3% 0.3% 0.3%GRANT 84.2% 8.9% 5.0% 2.0% 0.0% 0.0% 0.0% KITTSON 85.2% 2.5% 9.9% 2.5% 0.0% 0.0% 0.0%BLUE EARTH 84.3% 7.7% 5.8% 1.5% 0.5% 0.1% 0.1% RICE 85.4% 6.2% 4.7% 1.2% 1.4% 0.4% 0.8%DOUGLAS 84.4% 4.3% 6.1% 3.2% 1.6% 0.2% 0.2% ST. LOUIS 85.5% 6.3% 4.0% 1.9% 1.1% 0.5% 0.7%BECKER 84.6% 5.2% 6.4% 3.3% 0.5% 0.0% 0.0% MOWER 85.6% 5.1% 3.6% 3.3% 1.3% 0.7% 0.4%FREEBORN 84.6% 5.3% 5.9% 2.9% 0.9% 0.2% 0.2% KOOCHICHING 85.8% 5.9% 2.4% 3.6% 0.0% 0.6% 1.8%STEARNS 84.7% 5.5% 5.4% 2.1% 1.5% 0.4% 0.4% WASHINGTON 85.8% 5.8% 4.1% 2.1% 1.1% 0.2% 0.9%CARVER 84.9% 7.1% 4.8% 1.9% 0.8% 0.3% 0.2% DAKOTA 86.2% 5.4% 4.2% 2.3% 1.0% 0.2% 0.6%KANDIYOHI 85.1% 8.6% 4.3% 1.1% 0.7% 0.2% 0.0% FREEBORN 86.4% 4.5% 4.2% 2.7% 1.7% 0.5% 0.0%CROW WING 85.3% 6.7% 5.1% 1.2% 1.2% 0.5% 0.0% ISANTI 86.4% 3.7% 3.9% 3.0% 2.2% 0.2% 0.6%JACKSON 85.5% 6.0% 3.6% 1.8% 3.0% 0.0% 0.0% NOBLES 86.5% 6.4% 3.1% 2.1% 0.3% 0.3% 1.2%REDWOOD 85.5% 9.2% 3.9% 1.0% 0.5% 0.0% 0.0% TODD 86.6% 4.6% 3.4% 2.8% 1.5% 1.0% 0.0%WADENA 85.5% 5.3% 3.9% 2.5% 2.1% 0.4% 0.4% CARVER 86.7% 5.1% 4.4% 2.4% 0.5% 0.3% 0.5%DAKOTA 85.7% 6.3% 5.1% 1.9% 0.6% 0.2% 0.2% DOUGLAS 86.7% 3.8% 4.9% 2.2% 1.5% 0.4% 0.4%LYON 85.8% 7.6% 5.3% 0.7% 0.2% 0.2% 0.2% NICOLLET 86.7% 6.9% 3.2% 0.5% 1.1% 0.0% 1.6%NICOLLET 85.9% 5.9% 4.5% 2.3% 1.4% 0.0% 0.0% WRIGHT 86.8% 4.8% 4.1% 2.6% 1.0% 0.4% 0.2%WINONA 85.9% 8.6% 3.0% 2.6% 0.0% 0.0% 0.0% GOODHUE 87.0% 5.7% 2.3% 3.0% 1.2% 0.5% 0.3%DODGE 86.2% 4.3% 3.1% 4.0% 2.5% 0.0% 0.0% FILLMORE 87.1% 5.5% 3.0% 2.5% 1.5% 0.0% 0.5%STEELE 86.2% 6.2% 4.8% 1.6% 1.1% 0.2% 0.0% KANDIYOHI 87.4% 5.9% 3.0% 2.0% 1.2% 0.4% 0.2%ANOKA 86.5% 5.3% 5.0% 2.1% 0.7% 0.2% 0.2% ANOKA 87.5% 4.1% 3.9% 2.3% 1.4% 0.3% 0.6%WILKIN 86.5% 3.9% 5.8% 3.9% 0.0% 0.0% 0.0% MARTIN 87.7% 5.7% 3.8% 1.9% 0.0% 0.5% 0.5%SHERBURNE 86.6% 5.1% 5.0% 2.0% 1.1% 0.2% 0.1% RED LAKE 87.7% 6.2% 6.2% 0.0% 0.0% 0.0% 0.0%CLAY 86.9% 4.3% 6.2% 2.0% 0.4% 0.0% 0.1% CLAY 87.8% 5.1% 3.7% 1.5% 1.4% 0.4% 0.2%WASHINGTON 86.9% 5.9% 4.8% 1.7% 0.5% 0.1% 0.1% NORMAN 88.2% 7.1% 2.4% 0.8% 1.6% 0.0% 0.0%BENTON 87.2% 4.9% 4.7% 2.7% 0.2% 0.2% 0.0% REDWOOD 88.2% 2.8% 4.7% 2.4% 1.9% 0.0% 0.0%LINCOLN 87.2% 11.5% 1.3% 0.0% 0.0% 0.0% 0.0% MCLEOD 88.6% 3.9% 2.9% 1.9% 2.3% 0.2% 0.2%OTTER TAIL 88.0% 6.1% 3.0% 2.2% 0.4% 0.1% 0.0% CARLTON 88.7% 3.9% 3.1% 2.2% 1.5% 0.0% 0.7%RAMSEY 88.1% 5.6% 4.0% 1.5% 0.3% 0.1% 0.3% RAMSEY 88.9% 4.7% 2.9% 1.6% 0.8% 0.3% 0.8%POLK 88.3% 4.6% 4.3% 2.2% 0.5% 0.0% 0.0% WINONA 89.0% 4.2% 3.4% 1.9% 0.8% 0.4% 0.4%NORMAN 88.4% 5.0% 3.3% 0.0% 3.3% 0.0% 0.0% HENNEPIN 89.1% 4.5% 2.9% 1.7% 0.9% 0.2% 0.7%STEVENS 88.8% 5.2% 3.4% 0.9% 0.0% 0.0% 1.7% SHERBURNE 89.1% 4.3% 3.6% 1.2% 0.8% 0.5% 0.5%HENNEPIN 89.3% 5.5% 3.5% 1.0% 0.4% 0.1% 0.1% CROW WING 89.3% 5.2% 3.2% 1.5% 0.5% 0.1% 0.3%OLMSTED 91.7% 3.7% 2.9% 1.0% 0.4% 0.1% 0.2% STEELE 89.5% 4.2% 2.6% 2.0% 0.4% 0.0% 1.2%NOBLES 92.3% 4.1% 2.1% 0.9% 0.3% 0.3% 0.0% JACKSON 90.4% 4.2% 1.8% 1.8% 0.0% 0.6% 1.2%KITTSON 92.8% 3.6% 3.6% 0.0% 0.0% 0.0% 0.0% OLMSTED 91.9% 2.6% 2.8% 0.8% 0.4% 0.2% 1.3%
MaleFemale
Cigarette Use Frequency
Appendix Table 2.1. Daily Cigarette Use, by Gender and County, Minnesota Student Survey, 2004
notes: Responses are for 6th, 9th, and 12th grade students combined. Source: Minnesota Student Survey Interagency Team 2005.
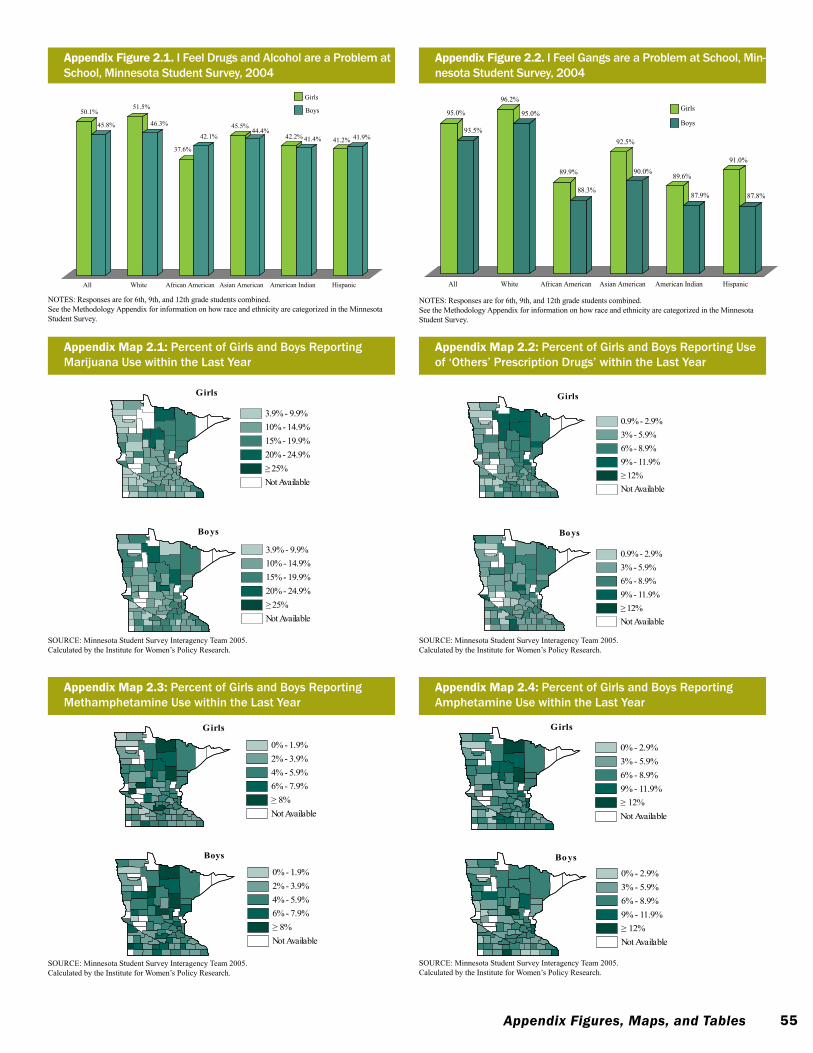
55Appendix Figures, Maps, and Tables
50.1%
45.8%
51.5%
46.3%
37.6%
42.1%45.5%
44.4%42.2% 41.4% 41.2% 41.9%
All White African American Asian American American Indian Hispanic
Appendix Figure 2.1: I Feel Drugs and Alcohol are a Problem at School, Minnesota Student Survey, 2004
Girls
Boys
Appendix figure 2.1. I Feel Drugs and Alcohol are a Problem at School, Minnesota Student Survey, 2004
notes: Responses are for 6th, 9th, and 12th grade students combined.see the Methodology Appendix for information on how race and ethnicity are categorized in the Minnesota student survey.
95.0%
93.5%
96.2%
95.0%
89.9%
88.3%
92.5%
90.0%89.6%
87.9%
91.0%
87.8%
All White African American Asian American American Indian Hispanic
Figure 2.2: I Feel Safe Going To and From School, Minnesota Student Survey, 2004
Girls
Boys
Notes:Responses are for 6th, 9th, and 12th grade students combined.See the Methodology Appendix for information on how race and ethnicity are categorized in the Minnesota Student Survey.Source: Minnesota Student Survey Interagency Team 2005.
Appendix figure 2.2. I Feel Gangs are a Problem at School, Min-nesota Student Survey, 2004
notes: Responses are for 6th, 9th, and 12th grade students combined.see the Methodology Appendix for information on how race and ethnicity are categorized in the Minnesota student survey.
soURCe: Minnesota Student Survey Interagency Team 2005. Calculated by the Institute for Women’s Policy Research.
Appendix Percent of Girls and Boys Reporting Map 2.1: Marijuana Use within the Last Year
3.9% - 9.9%10% - 14.9%15% - 19.9%20% - 24.9%≥25%Not Available
3.9% - 9.9%10% - 14.9%15% - 19.9%20% - 24.9%≥25%Not Available
Boys
Girls
soURCe: Minnesota Student Survey Interagency Team 2005. Calculated by the Institute for Women’s Policy Research.
Appendix Percent of Girls and Boys Reporting Map 2.2: Use of 'Others' Perscription Drugs' within the Last Year
0.9% - 2.9%3% - 5.9%6% - 8.9%9% - 11.9%≥12%Not Available
0.9% - 2.9%3% - 5.9%6% - 8.9%9% - 11.9%≥12%Not Available
Girls
Boys
Appendix Map 2.3: Percent of Girls and Boys Reporting Methamphetamine Use within the Last Year
Appendix Percent of Girls and Boys Reporting Map 2.7: Methamphetamine Use within the Last Yea
Girls
Boys
0% - 1.9%2% - 3.9%4% - 5.9%6% - 7.9%≥ 8%Not Available
0% - 1.9%2% - 3.9%4% - 5.9%6% - 7.9%≥ 8%Not Available
Appendix Map 2.4: Percent of Girls and Boys Reporting Amphetamine Use within the Last Year
Appendix Percent of Girls and Boys Reporting Map 2.8: Amphetamine Use within the Last Year
Girls
Boys
0% - 2.9%3% - 5.9%6% - 8.9%9% - 11.9%≥ 12%Not Available
0% - 2.9%3% - 5.9%6% - 8.9%9% - 11.9%≥ 12%Not Available
Appendix Map 2.1: Percent of Girls and Boys Reporting Marijuana Use within the Last Year
Appendix Map 2.2: Percent of Girls and Boys Reporting Use of ‘Others’ Prescription Drugs’ within the Last Year
soURCe: Minnesota Student Survey Interagency Team 2005. Calculated by the Institute for Women’s Policy Research.
soURCe: Minnesota Student Survey Interagency Team 2005. Calculated by the Institute for Women’s Policy Research.

56 Status of Girls in Minnesota
County 0 Drinks1 to 2 Drinks
3 to 5 Drinks
6 to 9 Drinks
10 to 19 Drinks
20 to 39 Drinks
40+ Drinks
YELLOW MEDICINE 58.3% 17.7% 7.3% 5.7% 4.7% 2.1% 4.2%LINCOLN 59.1% 15.5% 5.5% 4.5% 7.3% 6.4% 1.8%RENVILLE 59.7% 18.1% 9.7% 2.1% 6.3% 2.1% 2.1%MORRISON
61.0% 11.0% 8.3% 6.6% 6.6% 3.9% 2.6%PINE 61.4% 15.8% 9.6% 5.3% 5.3% 1.2% 1.5%BIG STONE 61.9% 11.3% 6.2% 8.2% 2.1% 5.2% 5.2%WABASHA 63.4% 16.0% 8.0% 5.5% 4.0% 1.0% 2.0%GRANT 63.8% 14.9% 5.3% 8.5% 5.3% 2.1% 0.0%BROWN 64.1% 16.8% 10.0% 3.5% 3.2% 1.5% 0.9%MURRAY 64.4% 13.6% 12.1% 3.8% 3.8% 1.5% 0.8%ROSEAU 64.5% 14.9% 9.0% 4.8% 2.7% 2.1% 2.1%JACKSON 65.4% 11.5% 7.7% 5.8% 7.7% 0.6% 1.3%LYON 65.8% 13.5% 7.9% 6.4% 4.1% 0.8% 1.5%FILLMORE 67.2% 13.5% 9.4% 5.2% 4.2% 0.0% 0.5%PIPESTONE 67.4% 13.2% 6.3% 5.6% 4.2% 1.4% 2.1%BELTRAMI 67.5% 11.3% 9.4% 5.3% 3.7% 0.9% 1.8%LAC QUI PARLE 68.4% 10.9% 10.9% 5.2% 2.3% 1.1% 1.1%MARSHALL 68.6% 15.3% 3.6% 4.4% 4.4% 0.7% 2.9%BECKER 68.9% 13.6% 8.7% 3.6% 2.8% 1.0% 1.3%WATONWAN 69.9% 13.6% 7.4% 2.8% 4.5% 0.6% 1.1%POLK 70.0% 9.6% 8.8% 6.6% 3.6% 0.3% 1.1%HOUSTON 70.1% 11.1% 10.4% 4.9% 2.1% 0.3% 1.0%ISANTI 70.3% 13.1% 7.7% 3.5% 2.3% 0.8% 2.3%STEVENS 70.3% 14.4% 5.4% 7.2% 1.8% 0.0% 0.9%RED LAKE 70.8% 13.9% 8.3% 4.2% 1.4% 0.0% 1.4%AITKIN 71.1% 10.4% 9.2% 4.6% 1.7% 1.2% 1.7%DOUGLAS 71.1% 13.4% 7.6% 3.7% 2.8% 0.9% 0.5%LESUEUR 71.1% 9.3% 7.6% 5.5% 4.4% 1.2% 0.9%WASECA 71.1% 8.8% 8.8% 7.0% 3.7% 0.4% 0.4%CLAY 71.2% 11.6% 7.9% 5.3% 2.7% 1.2% 0.1%STEARNS 71.2% 11.8% 6.4% 5.1% 3.2% 1.2% 1.2%WADENA 71.4% 10.8% 4.9% 3.1% 5.6% 1.7% 2.4%RICE 71.5% 10.2% 8.4% 5.8% 1.8% 0.6% 1.6%FARIBAULT 71.7% 12.8% 4.6% 5.0% 4.1% 0.9% 0.9%KITTSON 71.8% 10.3% 5.1% 5.1% 5.1% 0.0% 2.6%CASS 72.3% 12.6% 5.3% 2.9% 2.4% 2.4% 1.9%HUBBARD 72.3% 10.1% 7.6% 4.2% 3.8% 1.3% 0.8%NORMAN 72.8% 12.8% 3.2% 9.6% 0.8% 0.0% 0.8%OTTER TAIL 72.9% 10.7% 6.6% 4.1% 2.0% 1.4% 2.3%ST. LOUIS 72.9% 13.0% 5.6% 3.5% 2.7% 0.9% 1.4%GOODHUE 73.3% 10.5% 7.8% 3.7% 3.2% 0.5% 0.9%WILKIN 73.3% 10.8% 4.2% 8.3% 1.7% 0.8% 0.8%WINONA 73.4% 12.3% 8.6% 2.9% 2.0% 0.0% 0.8%TODD 73.5% 13.1% 6.4% 3.5% 1.6% 0.5% 1.3%DODGE 73.7% 12.3% 5.1% 3.8% 3.4% 0.3% 1.4%SIBLEY 74.1% 9.2% 6.1% 5.3% 3.5% 0.0% 1.8%SCOTT 74.2% 10.7% 5.5% 3.5% 3.2% 1.3% 1.6%MCLEOD 74.3% 10.8% 6.4% 3.8% 3.4% 0.8% 0.6%BENTON 74.4% 9.4% 8.9% 3.0% 2.1% 1.4% 0.9%WASHINGTON 74.6% 11.5% 6.1% 3.7% 2.2% 1.0% 0.9%DAKOTA 74.7% 11.7% 6.3% 4.0% 2.0% 0.6% 0.8%NOBLES 74.8% 10.6% 5.2% 3.2% 2.9% 1.0% 2.3%BLUE EARTH 75.3% 9.8% 5.9% 2.9% 4.4% 1.0% 0.7%MEEKER 75.3% 9.6% 6.1% 2.2% 3.0% 1.9% 1.9%COTTONWOOD 75.4% 10.8% 6.0% 3.4% 2.6% 0.9% 0.9%KOOCHICHING 75.6% 8.1% 5.6% 1.3% 3.8% 1.9% 3.8%MILLE LACS 75.6% 10.4% 5.2% 3.7% 1.9% 1.3% 1.9%MOWER 75.6% 11.0% 5.6% 4.2% 2.1% 0.7% 0.7%REDWOOD 75.6% 10.0% 5.0% 2.5% 2.0% 3.0% 2.0%WRIGHT 75.9% 10.7% 6.2% 3.3% 2.1% 0.6% 1.2%MARTIN 77.0% 7.8% 6.9% 2.9% 3.4% 1.0% 1.0%CARVER 77.1% 10.2% 4.7% 4.1% 1.6% 1.3% 1.0%ITASCA 77.2% 11.4% 2.7% 5.9% 1.4% 0.7% 0.7%RAMSEY 77.3% 10.9% 5.6% 2.7% 1.9% 0.6% 1.1%SHERBURNE 78.4% 11.4% 5.0% 2.6% 1.5% 0.4% 0.8%KANDIYOHI 78.6% 8.9% 5.4% 4.2% 2.3% 0.4% 0.2%HENNEPIN 78.8% 10.2% 5.1% 2.8% 1.7% 0.6% 0.8%ANOKA 79.0% 10.2% 4.6% 3.0% 1.6% 0.7% 1.0%CROW WING 79.4% 8.3% 5.9% 3.6% 2.4% 0.3% 0.3%STEELE 79.7% 10.6% 4.8% 2.2% 1.1% 0.2% 1.5%NICOLLET 80.3% 7.3% 3.9% 3.9% 3.4% 1.1% 0.0%CARLTON 81.0% 8.3% 3.9% 2.3% 3.4% 0.7% 0.5%OLMSTED 82.7% 8.3% 4.0% 2.0% 1.3% 0.3% 1.4%FREEBORN 83.6% 9.0% 3.6% 1.8% 1.0% 0.0% 1.0%
Boys
Appendix Table 2.2. Alcohol Use in the Past Month, by Gender and County, Minnesota Student Survey, 2004
notes: Responses are for 6th, 9th, and 12th grade students combined. Source: Minnesota Student Survey Interagency Team 2005.
County 0 Drinks1 to 2 Drinks
3 to 5 Drinks
6 to 9 Drinks
10 to 19 Drinks
20 to 39 Drinks
40+ Drinks
BIG STONE 50.0% 16.0% 11.7% 10.6% 6.4% 3.2% 2.1%
KOOCHICHING 61.1% 18.5% 5.1% 6.4% 5.1% 1.3% 2.5%MORRISON 63.0% 16.0% 8.8% 7.6% 3.8% 0.8% 0.0%YELLOW MEDICINE 63.3% 14.1% 11.9% 2.8% 5.6% 1.1% 1.1%HOUSTON 63.9% 16.4% 8.6% 5.2% 4.9% 0.6% 0.3%BELTRAMI 64.0% 15.4% 9.5% 5.7% 3.8% 1.0% 0.6%WABASHA 64.4% 20.3% 6.3% 4.5% 2.3% 1.3% 1.0%MURRAY 64.7% 18.0% 9.4% 5.8% 1.4% 0.0% 0.7%BROWN 64.8% 14.1% 10.8% 6.1% 3.3% 0.6% 0.3%LINCOLN 64.9% 14.9% 10.8% 4.1% 2.7% 2.7% 0.0%LESUEUR 66.6% 14.7% 10.6% 4.2% 2.9% 0.5% 0.5%ROSEAU 66.7% 15.7% 8.6% 4.3% 3.1% 0.9% 0.6%RENVILLE 66.9% 16.6% 8.8% 5.0% 2.8% 0.0% 0.0%FILLMORE 67.2% 15.6% 8.9% 6.8% 1.6% 0.0% 0.0%WILKIN 67.8% 17.4% 9.4% 3.4% 1.3% 0.7% 0.0%CASS 68.2% 17.8% 8.3% 3.4% 1.5% 0.0% 0.8%PINE 68.6% 15.5% 8.2% 3.8% 3.2% 0.6% 0.0%MCLEOD 69.4% 16.7% 7.8% 3.8% 1.4% 0.8% 0.2%WASECA 69.6% 12.6% 10.7% 3.6% 3.2% 0.4% 0.0%HUBBARD 70.0% 17.7% 5.0% 4.5% 2.3% 0.5% 0.0%WATONWAN 70.5% 16.2% 7.6% 1.9% 3.8% 0.0% 0.0%GOODHUE 70.7% 17.4% 6.6% 3.1% 1.9% 0.0% 0.3%TODD 70.9% 15.5% 7.9% 2.9% 2.1% 0.3% 0.5%JACKSON 71.4% 10.6% 9.9% 4.3% 2.5% 1.2% 0.0%ISANTI 71.7% 17.0% 6.4% 3.0% 1.1% 0.4% 0.4%SCOTT 71.7% 12.9% 8.1% 3.8% 2.2% 0.9% 0.3%LYON 71.9% 12.0% 8.9% 4.3% 1.9% 0.0% 1.0%BENTON 72.0% 15.7% 7.8% 2.8% 1.1% 0.2% 0.4%STEARNS 72.0% 13.6% 6.7% 5.0% 1.7% 0.8% 0.2%BLUE EARTH 72.1% 13.0% 6.8% 4.7% 2.5% 0.6% 0.3%ST. LOUIS 72.1% 15.2% 6.7% 3.1% 2.1% 0.7% 0.2%CLAY 72.3% 13.9% 8.1% 3.3% 1.8% 0.3% 0.3%FARIBAULT 72.8% 15.5% 6.0% 3.0% 1.3% 0.9% 0.4%MILLE LACS 73.2% 13.9% 5.9% 4.8% 1.3% 0.4% 0.5%NICOLLET 73.2% 14.1% 5.9% 2.4% 2.9% 0.5% 1.0%SIBLEY 73.2% 11.8% 9.1% 3.2% 2.3% 0.0% 0.5%GRANT 73.5% 12.7% 6.9% 4.9% 0.0% 2.0% 0.0%DOUGLAS 73.6% 9.6% 8.5% 3.7% 2.8% 1.4% 0.5%MARTIN 73.8% 8.6% 8.6% 5.2% 2.2% 1.1% 0.4%WADENA 73.9% 13.4% 6.3% 3.7% 2.6% 0.0% 0.0%ITASCA 74.0% 13.7% 6.8% 3.7% 0.7% 0.7% 0.5%NORMAN 74.3% 14.2% 6.2% 2.7% 0.9% 0.9% 0.9%MARSHALL 74.4% 10.7% 5.0% 6.6% 3.3% 0.0% 0.0%CARLTON 74.5% 14.3% 5.5% 2.9% 1.2% 1.0% 0.6%NOBLES 74.5% 14.5% 4.9% 4.3% 1.2% 0.0% 0.6%WINONA 74.5% 15.4% 7.7% 1.9% 0.4% 0.0% 0.0%STEVENS 74.6% 13.2% 6.1% 4.4% 1.8% 0.0% 0.0%CARVER 74.7% 12.6% 6.9% 3.0% 1.9% 0.7% 0.1%POLK 74.9% 15.0% 5.5% 2.3% 1.7% 0.6% 0.0%PIPESTONE 75.2% 13.4% 4.7% 3.4% 3.4% 0.0% 0.0%AITKIN 75.3% 9.3% 4.9% 6.2% 3.1% 0.6% 0.6%DAKOTA 75.3% 13.5% 5.8% 2.9% 1.8% 0.4% 0.3%KITTSON 75.3% 18.2% 3.9% 2.6% 0.0% 0.0% 0.0%BECKER 75.5% 10.5% 6.5% 2.5% 3.0% 1.0% 1.0%RED LAKE 75.7% 5.7% 11.4% 4.3% 1.4% 0.0% 1.4%CROW WING 75.8% 14.0% 6.0% 2.7% 0.6% 0.6% 0.3%LAC QUI PARLE 75.8% 8.6% 9.1% 2.7% 2.7% 0.5% 0.5%MEEKER 75.8% 13.0% 5.8% 3.9% 1.3% 0.0% 0.2%WASHINGTON 76.0% 12.6% 6.2% 2.9% 1.5% 0.3% 0.4%ANOKA 76.1% 13.1% 5.8% 2.9% 1.4% 0.3% 0.4%COTTONWOOD 76.1% 15.1% 5.6% 1.6% 1.6% 0.0% 0.0%RICE 76.3% 12.1% 5.9% 2.9% 1.4% 0.7% 0.7%KANDIYOHI 76.5% 12.8% 6.0% 3.0% 1.4% 0.2% 0.0%RAMSEY 77.0% 12.6% 5.4% 2.7% 1.3% 0.6% 0.3%WRIGHT 77.0% 11.4% 7.0% 2.2% 1.3% 0.6% 0.5%DODGE 77.1% 10.3% 6.0% 3.4% 2.8% 0.3% 0.0%SHERBURNE 77.4% 13.5% 5.5% 1.9% 1.5% 0.3% 0.1%HENNEPIN 78.3% 12.1% 5.1% 2.9% 1.1% 0.4% 0.1%OTTER TAIL 78.5% 9.7% 6.7% 2.2% 2.0% 0.5% 0.5%STEELE 79.1% 11.5% 4.3% 2.6% 2.1% 0.2% 0.2%MOWER 79.7% 10.0% 5.3% 2.5% 1.6% 0.4% 0.4%REDWOOD 80.1% 10.7% 4.6% 4.1% 0.0% 0.5% 0.0%OLMSTED 81.6% 9.6% 5.8% 1.8% 0.7% 0.2% 0.3%FREEBORN 82.4% 8.8% 3.7% 3.0% 1.6% 0.5% 0.0%
Girls
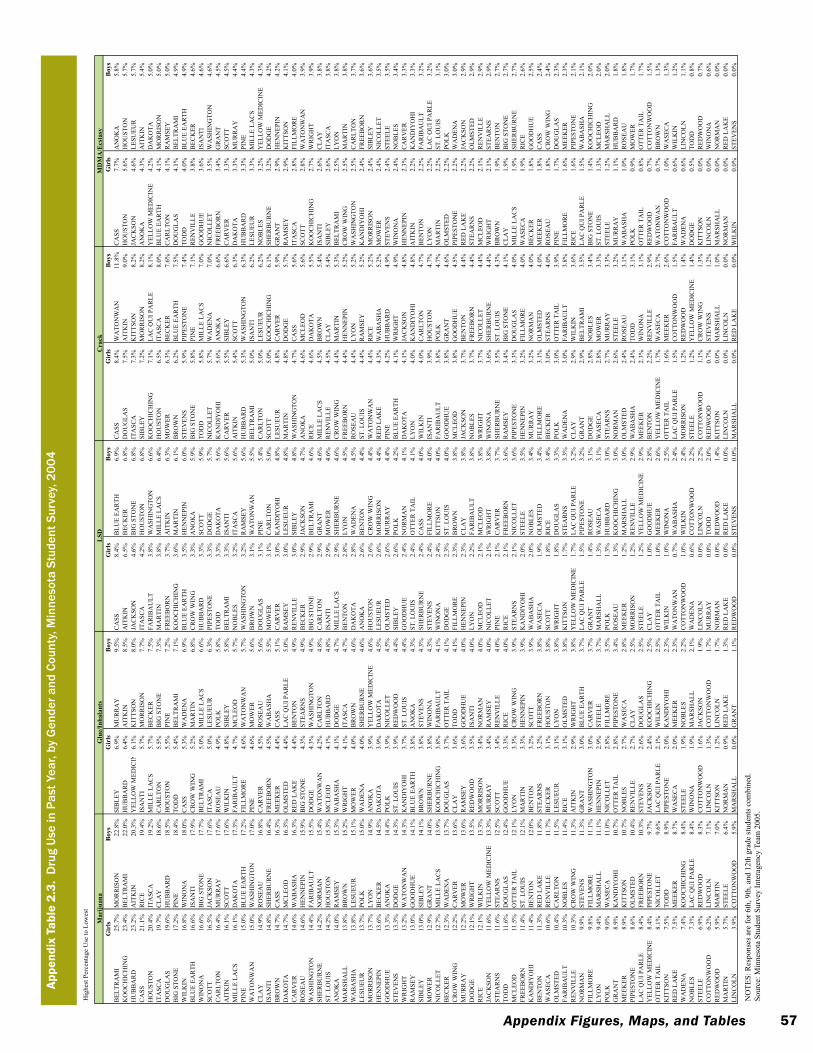
57Appendix Figures, Maps, and Tables
Hig
hest
Per
cent
age
Use
to L
owes
t
Gir
lsB
oys
Gir
lsB
oys
Gir
lsB
oys
Gir
lsB
oys
Gir
lsB
oys
BEL
TRA
MI
25.7
%M
OR
RIS
ON
22
.8%
SIB
LEY
6.
9%M
UR
RA
Y
9.5%
CA
SS
8.4%
BLU
E EA
RTH
6.
9%C
ASS
8.
4%W
ATO
NW
AN
11
.8%
CA
SS
7.7%
AN
OK
A
5.8%
KO
OC
HIC
HIN
G
23.4
%B
ELTR
AM
I 22
.0%
HU
BB
AR
D
6.4%
AIT
KIN
8.
5%A
ITK
IN
6.5%
BEC
KER
6.
8%D
OU
GLA
S 7.
5%A
ITK
IN
9.0%
HO
UST
ON
5.
6%H
OU
STO
N
5.7%
HU
BB
AR
D
23.2
%A
ITK
IN
20.3
%Y
ELLO
W M
EDIC
INE
6.1%
KIT
TSO
N
8.0%
JAC
KSO
N
4.6%
BIG
STO
NE
6.8%
ITA
SCA
7.
3%K
ITTS
ON
8.
2%JA
CK
SON
4.
6%LE
SUEU
R
5.7%
CA
SS
21.1
%R
ICE
19.4
%IS
AN
TI
5.7%
MO
RR
ISO
N
7.7%
ITA
SCA
4.
2%H
OU
STO
N
6.8%
SIB
LEY
7.
2%M
OR
RIS
ON
8.
2%A
NO
KA
4.
3%A
ITK
IN
5.4%
HO
UST
ON
20
.4%
ITA
SCA
19
.2%
MIL
LE L
AC
S 5.
7%B
ECK
ER
7.5%
FAR
IBA
ULT
3.
8%W
ASH
ING
TON
6.
6%K
OO
CH
ICH
ING
7.
1%LA
C Q
UI P
AR
LE
8.1%
YEL
LOW
MED
ICIN
E 4.
2%D
AK
OTA
5.
0%IT
ASC
A
19.7
%C
LAY
18
.6%
CA
RLT
ON
5.5%
BIG
STO
NE
7.3%
MA
RTI
N
3.8%
MIL
LE L
AC
S 6.
4%H
OU
STO
N
6.5%
ITA
SCA
8.
0%B
LUE
EAR
TH
4.1%
MO
RR
ISO
N
5.0%
DO
UG
LAS
19.6
%H
UB
BA
RD
18
.5%
HO
UST
ON
5.
5%PI
NE
7.2%
FREE
BO
RN
3.
7%A
ITK
IN
6.3%
MO
WER
6.
3%B
ECK
ER
7.6%
CA
RLT
ON
4.1%
RA
MSE
Y
5.0%
BIG
STO
NE
17.2
%PI
NE
18.4
%TO
DD
5.4%
BEL
TRA
MI
7.1%
KO
OC
HIC
HIN
G
3.6%
MA
RTI
N
6.1%
BR
OW
N
6.2%
BLU
E EA
RTH
7.
5%D
OU
GLA
S 4.
1%B
ELTR
AM
I 4.
9%W
ILK
IN
16.8
%W
INO
NA
18
.0%
CA
SS
5.3%
WA
DEN
A
6.9%
BLU
E EA
RTH
3.
5%H
ENN
EPIN
6.
0%ST
EVEN
S 5.
9%PI
PEST
ON
E 7.
4%TO
DD
4.0%
BLU
E EA
RTH
4.
9%B
LUE
EAR
TH
16.6
%IS
AN
TI
17.9
%C
RO
W W
ING
5.
2%M
AR
TIN
6.
8%C
RO
W W
ING
3.
3%A
NO
KA
5.
9%B
IG S
TON
E 5.
8%PI
NE
7.1%
REN
VIL
LE
3.8%
BEC
KER
4.
6%W
INO
NA
16
.6%
BIG
STO
NE
17.7
%B
ELTR
AM
I 5.
0%M
ILLE
LA
CS
6.6%
HU
BB
AR
D
3.3%
SCO
TT
5.9%
TOD
D5.
8%M
ILLE
LA
CS
7.0%
GO
OD
HU
E 3.
6%IS
AN
TI
4.6%
SCO
TT
16.5
%JA
CK
SON
17
.6%
ITA
SCA
5.
0%LE
SUEU
R
6.3%
PIPE
STO
NE
3.3%
DO
DG
E 5.
7%N
ICO
LLET
5.
7%W
AD
ENA
7.
0%N
ICO
LLET
3.
5%W
ASH
ING
TON
4.
6%C
AR
LTO
N16
.4%
MU
RR
AY
17
.6%
RO
SEA
U
4.9%
POLK
5.
8%TO
DD
3.3%
DA
KO
TA
5.6%
KA
ND
IYO
HI
5.6%
AN
OK
A
6.6%
FREE
BO
RN
3.
4%G
RA
NT
4.5%
AIT
KIN
16
.1%
SCO
TT
17.6
%W
ILK
IN
4.8%
SIB
LEY
5.
8%B
ELTR
AM
I 3.
3%IS
AN
TI
5.6%
CA
RV
ER
5.5%
SIB
LEY
6.
6%C
AR
VER
3.
3%SC
OTT
4.
5%M
ILLE
LA
CS
16.1
%D
AK
OTA
17
.3%
FAR
IBA
ULT
4.
7%M
CLE
OD
5.
7%N
OB
LES
3.2%
ITA
SCA
5.
6%A
ITK
IN
5.4%
SCO
TT
6.3%
DA
KO
TA
3.3%
MU
RR
AY
4.
4%PI
NE
15.0
%B
LUE
EAR
TH
17.2
%FI
LLM
OR
E 4.
6%W
ATO
NW
AN
5.
7%W
ASH
ING
TON
3.
2%R
AM
SEY
5.
6%H
UB
BA
RD
5.
3%W
ASH
ING
TON
6.
3%H
UB
BA
RD
3.
3%PI
NE
4.4%
WA
TON
WA
N
15.0
%W
ASH
ING
TON
17
.0%
PIN
E 4.
6%M
OW
ER
5.6%
BR
OW
N
3.1%
WA
TON
WA
N
5.5%
BEL
TRA
MI
5.0%
ISA
NTI
6.
2%LE
SUEU
R
3.3%
MIL
LE L
AC
S 4.
3%C
LAY
14
.9%
RO
SEA
U
16.8
%C
AR
VER
4.
5%R
OSE
AU
5.
6%D
OU
GLA
S 3.
1%PI
NE
5.4%
CA
RLT
ON
5.0%
LESU
EUR
6.
2%N
OB
LES
3.2%
YEL
LOW
MED
ICIN
E 4.
3%IS
AN
TI
14.8
%SH
ERB
UR
NE
16.4
%FR
EEB
OR
N
4.5%
WA
BA
SHA
5.
5%M
OW
ER
3.1%
CA
RLT
ON
5.0%
SCO
TT
5.0%
KO
OC
HIC
HIN
G
6.1%
SHER
BU
RN
E 3.
2%D
OD
GE
4.2%
BR
OW
N
14.7
%C
ASS
16
.3%
MEE
KER
4.
4%C
ASS
5.
1%C
AR
VER
3.
0%K
AN
DIY
OH
I 4.
8%LE
SUEU
R
4.8%
CA
RV
ER
5.9%
GR
AN
T 2.
9%H
ENN
EPIN
4.
2%D
AK
OTA
14
.7%
MC
LEO
D
16.3
%O
LMST
ED
4.4%
LAC
QU
I PA
RLE
5.
0%R
AM
SEY
3.
0%LE
SUEU
R
4.8%
MA
RTI
N
4.8%
DO
DG
E 5.
7%R
AM
SEY
2.
9%K
ITTS
ON
4.
1%C
AR
VER
14
.6%
WA
BA
SHA
16
.3%
RED
LA
KE
4.4%
BEN
TON
4.
9%R
ENV
ILLE
3.
0%SI
BLE
Y
4.8%
WA
SHIN
GTO
N
4.7%
CA
SS
5.6%
ITA
SCA
2.
8%FI
LLM
OR
E 4.
0%R
OSE
AU
14
.6%
HEN
NEP
IN
15.9
%B
IG S
TON
E 4.
3%ST
EAR
NS
4.9%
BEC
KER
2.
9%JA
CK
SON
4.
7%A
NO
KA
4.
6%M
CLE
OD
5.
6%SC
OTT
2.
8%W
ATO
NW
AN
3.
9%W
ASH
ING
TON
14
.4%
FAR
IBA
ULT
15
.5%
DO
DG
E 4.
3%W
ASH
ING
TON
4.
9%B
IG S
TON
E 2.
9%B
ELTR
AM
I 4.
6%R
ICE
4.6%
DA
KO
TA
5.5%
KO
OC
HIC
HIN
G
2.7%
WR
IGH
T 3.
9%SH
ERB
UR
NE
14.2
%N
OR
MA
N
15.4
%W
ATO
NW
AN
4.
2%C
AR
LTO
N4.
8%C
AR
LTO
N2.
9%G
RA
NT
4.6%
MIL
LE L
AC
S 4.
5%B
RO
WN
5.
4%IS
AN
TI
2.6%
CLA
Y
3.8%
ST. L
OU
IS
14.2
%H
OU
STO
N
15.3
%M
CLE
OD
4.
1%H
UB
BA
RD
4.
8%IS
AN
TI
2.9%
MO
WER
4.
6%R
ENV
ILLE
4.
5%C
LAY
5.
4%SI
BLE
Y
2.6%
ITA
SCA
3.
8%A
NO
KA
14
.0%
RA
MSE
Y
15.3
%W
AB
ASH
A
4.1%
DO
DG
E 4.
7%M
ILLE
LA
CS
2.9%
SHER
BU
RN
E 4.
6%C
RO
W W
ING
4.
4%M
AR
TIN
5.
3%B
ELTR
AM
I 2.
5%LY
ON
3.
8%M
AR
SHA
LL
13.8
%B
RO
WN
15
.2%
WR
IGH
T 4.
1%IT
ASC
A
4.7%
BEN
TON
2.
8%LY
ON
4.
5%FR
EEB
OR
N
4.4%
HEN
NEP
IN
5.2%
CR
OW
WIN
G
2.5%
MA
RTI
N
3.8%
WA
BA
SHA
13
.8%
LESU
EUR
15
.1%
MO
WER
4.
0%B
RO
WN
4.
6%D
AK
OTA
2.
8%W
AD
ENA
4.
5%R
OSE
AU
4.
4%LY
ON
5.
2%W
ASH
ING
TON
2.
5%C
AR
LTO
N3.
7%LE
SUEU
R
13.7
%PO
LK
15.0
%W
AD
ENA
4.
0%SH
ERB
UR
NE
4.6%
AN
OK
A
2.6%
BEN
TON
4.
4%ST
. LO
UIS
4.
4%R
AM
SEY
5.
2%K
AN
DIY
OH
I 2.
4%FR
EEB
OR
N
3.6%
MO
RR
ISO
N
13.7
%LY
ON
14
.9%
AN
OK
A
3.9%
YEL
LOW
MED
ICIN
E 4.
6%H
OU
STO
N
2.6%
CR
OW
WIN
G
4.4%
WA
TON
WA
N
4.4%
RIC
E 5.
2%M
OR
RIS
ON
2.
4%SI
BLE
Y
3.6%
HEN
NEP
IN
13.6
%B
ECK
ER
14.5
%D
AK
OTA
3.
9%D
AK
OTA
4.
5%LE
SUEU
R
2.6%
MO
RR
ISO
N
4.4%
RED
LA
KE
4.3%
WA
BA
SHA
5.
2%M
OW
ER
2.4%
NIC
OLL
ET
3.5%
GO
OD
HU
E 13
.3%
AN
OK
A
14.4
%PO
LK
3.9%
NIC
OLL
ET
4.5%
OLM
STED
2.
6%M
UR
RA
Y
4.4%
PIN
E 4.
2%H
UB
BA
RD
4.
9%ST
EVEN
S 2.
4%ST
EELE
3.
5%ST
EVEN
S 13
.3%
DO
DG
E 14
.3%
ST. L
OU
IS
3.9%
RED
WO
OD
4.
4%SI
BLE
Y
2.6%
POLK
4.
2%B
LUE
EAR
TH
4.1%
WR
IGH
T 4.
9%W
INO
NA
2.
4%N
OB
LES
3.4%
WR
IGH
T 13
.2%
WA
TON
WA
N
14.3
%K
AN
DIY
OH
I 3.
7%ST
. LO
UIS
4.
4%G
OO
DH
UE
2.4%
NO
RM
AN
4.
1%D
AK
OTA
4.
1%JA
CK
SON
4.
8%H
ENN
EPIN
2.
3%C
AR
VER
3.
3%R
AM
SEY
13
.0%
GO
OD
HU
E 14
.1%
BLU
E EA
RTH
3.
8%A
NO
KA
4.
3%ST
. LO
UIS
2.
4%O
TTER
TA
IL
4.1%
LYO
N
4.0%
KA
ND
IYO
HI
4.8%
AIT
KIN
2.
2%K
AN
DIY
OH
I 3.
3%SI
BLE
Y
13.0
%SI
BLE
Y
14.1
%B
RO
WN
3.
8%ST
EVEN
S 4.
3%SH
ERB
UR
NE
2.4%
CA
SS
4.0%
WIL
KIN
4.
0%C
AR
LTO
N4.
7%B
ENTO
N
2.2%
FAR
IBA
ULT
3.
2%M
OW
ER
12.9
%G
RA
NT
14.0
%SH
ERB
UR
NE
3.8%
WIN
ON
A
4.3%
STEV
ENS
2.4%
FILL
MO
RE
4.0%
ISA
NTI
3.
9%H
OU
STO
N
4.7%
LYO
N
2.2%
LAC
QU
I PA
RLE
3.
2%N
ICO
LLET
12
.7%
MIL
LE L
AC
S 13
.9%
KO
OC
HIC
HIN
G
3.8%
FAR
IBA
ULT
4.
1%W
INO
NA
2.
4%K
ITTS
ON
4.
0%FA
RIB
AU
LT
3.8%
POLK
4.
7%M
AR
TIN
2.
2%ST
. LO
UIS
3.
1%B
ECK
ER
12.3
%W
AD
ENA
13
.7%
DO
UG
LAS
3.7%
OTT
ER T
AIL
4.
1%D
OD
GE
2.3%
ST. L
OU
IS
4.0%
GO
OD
HU
E 3.
8%G
RA
NT
4.6%
OLM
STED
2.
2%PO
LK
3.0%
CR
OW
WIN
G
12.2
%C
AR
VER
13
.6%
CLA
Y
3.6%
TOD
D4.
1%FI
LLM
OR
E 2.
3%B
RO
WN
3.
8%M
CLE
OD
3.
8%G
OO
DH
UE
4.5%
PIPE
STO
NE
2.2%
WA
DEN
A
3.0%
MU
RR
AY
12
.2%
MO
WER
13
.6%
RA
MSE
Y
3.6%
GO
OD
HU
E 4.
0%H
ENN
EPIN
2.
3%C
LAY
3.
8%JA
CK
SON
3.
7%B
ENTO
N
4.4%
RED
LA
KE
2.2%
JAC
KSO
N
2.9%
DO
DG
E 12
.1%
WR
IGH
T 13
.5%
RED
WO
OD
3.
5%IS
AN
TI
4.0%
LYO
N
2.2%
FAR
IBA
ULT
3.
8%N
OB
LES
3.7%
FREE
BO
RN
4.
4%ST
EAR
NS
2.2%
OLM
STED
2.
9%R
ICE
12.1
%W
ILK
IN
13.3
%M
OR
RIS
ON
3.
4%N
OR
MA
N
4.0%
MC
LEO
D
2.1%
MC
LEO
D
3.8%
WR
IGH
T 3.
7%N
ICO
LLET
4.
4%M
CLE
OD
2.
1%R
ENV
ILLE
2.
9%JA
CK
SON
11
.6%
YEL
LOW
MED
ICIN
E 13
.3%
MU
RR
AY
3.
4%R
AM
SEY
4.
0%N
ICO
LLET
2.
1%W
RIG
HT
3.8%
WIN
ON
A
3.6%
SHER
BU
RN
E 4.
4%W
RIG
HT
2.1%
STEA
RN
S 2.
9%ST
EAR
NS
11.6
%ST
EAR
NS
12.5
%SC
OTT
3.
4%R
ENV
ILLE
4.
0%PI
NE
2.1%
CA
RV
ER
3.7%
SHER
BU
RN
E 3.
5%ST
. LO
UIS
4.
3%B
RO
WN
1.
9%B
ENTO
N
2.7%
TOD
D11
.6%
DO
UG
LAS
12.4
%G
OO
DH
UE
3.3%
RIC
E 4.
0%R
ICE
2.1%
FREE
BO
RN
3.
6%R
AM
SEY
3.
4%B
IG S
TON
E 4.
1%C
LAY
1.
9%B
IG S
TON
E 2.
7%M
CLE
OD
11
.5%
OTT
ER T
AIL
12
.1%
LYO
N
3.3%
CR
OW
WIN
G
3.9%
STEA
RN
S 2.
1%N
ICO
LLET
3.
6%PI
PEST
ON
E 3.
3%D
OU
GLA
S 4.
0%M
ILLE
LA
CS
1.9%
SHER
BU
RN
E 2.
7%FR
EEB
OR
N
11.4
%ST
. LO
UIS
12
.1%
MA
RTI
N
3.3%
HEN
NEP
IN
3.9%
KA
ND
IYO
HI
2.0%
STEE
LE
3.5%
HEN
NEP
IN
3.2%
FILL
MO
RE
4.0%
WA
SEC
A
1.9%
RIC
E 2.
6%K
AN
DIY
OH
I 11
.4%
BEN
TON
12
.0%
BEN
TON
3.
2%SC
OTT
3.
9%W
AB
ASH
A
2.0%
NO
BLE
S 3.
4%M
UR
RA
Y
3.2%
NO
RM
AN
4.
0%B
ECK
ER
1.8%
GO
OD
HU
E 2.
5%B
ENTO
N
11.3
%R
ED L
AK
E 11
.8%
STEA
RN
S 3.
2%FR
EEB
OR
N
3.8%
WA
SEC
A
1.9%
OLM
STED
3.
4%FI
LLM
OR
E 3.
1%O
LMST
ED
4.0%
MEE
KER
1.
8%C
ASS
2.
4%W
ASE
CA
10
.6%
REN
VIL
LE
11.7
%B
ECK
ER
3.1%
HO
UST
ON
3.
8%SC
OTT
1.
8%R
ICE
3.4%
BEC
KER
3.
0%ST
EAR
NS
4.0%
RO
SEA
U
1.8%
CR
OW
WIN
G
2.4%
OLM
STED
10
.4%
CA
RLT
ON
11.5
%LE
SUEU
R
3.1%
LYO
N
3.8%
WR
IGH
T 1.
8%D
OU
GLA
S 3.
3%PO
LK
3.0%
OTT
ER T
AIL
3.
9%PI
NE
1.7%
DO
UG
LAS
2.3%
FAR
IBA
ULT
10
.3%
NO
BLE
S 11
.4%
RIC
E 3.
1%O
LMST
ED
3.8%
KIT
TSO
N
1.7%
STEA
RN
S 3.
3%W
AD
ENA
3.
0%FA
RIB
AU
LT
3.8%
FILL
MO
RE
1.6%
MEE
KER
2.
3%R
ENV
ILLE
10
.3%
CR
OW
WIN
G
11.3
%A
ITK
IN
2.9%
WR
IGH
T 3.
8%Y
ELLO
W M
EDIC
INE
1.7%
LAC
QU
I PA
RLE
3.
2%C
LAY
2.
9%W
ILK
IN
3.6%
RIC
E 1.
6%PI
PEST
ON
E 2.
1%N
OR
MA
N
9.9%
STEV
ENS
11.3
%G
RA
NT
3.0%
BLU
E EA
RTH
3.
7%LA
C Q
UI P
AR
LE
1.5%
PIPE
STO
NE
3.2%
GR
AN
T 2.
9%B
ELTR
AM
I 3.
5%LA
C Q
UI P
AR
LE
1.5%
WA
BA
SHA
2.
1%FI
LLM
OR
E 9.
8%FI
LLM
OR
E 11
.1%
WA
SHIN
GTO
N
3.0%
CA
RV
ER
3.7%
GR
AN
T 1.
4%R
OSE
AU
3.
1%D
OD
GE
2.8%
NO
BLE
S 3.
4%B
IG S
TON
E 1.
4%K
OO
CH
ICH
ING
2.
0%LY
ON
9.
4%M
AR
SHA
LL
11.1
%H
ENN
EPIN
2.
9%ST
EELE
3.
7%M
AR
SHA
LL
1.3%
WA
SEC
A
3.1%
WA
SEC
A
2.8%
MO
WER
3.
3%ST
. LO
UIS
1.
3%M
CLE
OD
2.
0%PO
LK
9.0%
WA
SEC
A
11.0
%N
ICO
LLET
2.
8%FI
LLM
OR
E 3.
5%PO
LK
1.3%
HU
BB
AR
D
3.0%
STEA
RN
S 2.
7%M
UR
RA
Y
3.3%
STEE
LE
1.2%
MA
RSH
ALL
2.
0%G
RA
NT
8.9%
KA
ND
IYO
HI
10.7
%O
TTER
TA
IL
2.8%
PIPE
STO
NE
3.4%
RO
SEA
U
1.3%
KO
OC
HIC
HIN
G
3.0%
NO
RM
AN
2.
6%ST
EELE
3.
2%M
UR
RA
Y
1.1%
HU
BB
AR
D
1.8%
MEE
KER
8.
9%K
ITTS
ON
10
.7%
NO
BLE
S 2.
7%W
ASE
CA
2.
8%M
EEK
ER
1.2%
MA
RSH
ALL
3.
0%O
LMST
ED
2.4%
RO
SEA
U
3.1%
WA
BA
SHA
1.
0%R
OSE
AU
1.
8%PI
PEST
ON
E 8.
6%O
LMST
ED
10.4
%R
ENV
ILLE
2.
7%C
LAY
2.
5%M
OR
RIS
ON
1.
2%R
ENV
ILLE
2.
9%W
AB
ASH
A
2.4%
TOD
D3.
1%PO
LK
0.9%
MO
WER
1.
7%LA
C Q
UI P
AR
LE
8.4%
FREE
BO
RN
10
.3%
STEV
ENS
2.6%
DO
UG
LAS
2.5%
STEE
LE
1.2%
YEL
LOW
MED
ICIN
E 2.
9%M
EEK
ER
2.3%
WIN
ON
A
3.1%
OTT
ER T
AIL
0.
8%O
TTER
TA
IL
1.7%
YEL
LOW
MED
ICIN
E 8.
4%PI
PEST
ON
E 9.
7%JA
CK
SON
2.
4%K
OO
CH
ICH
ING
2.
5%C
LAY
1.
0%G
OO
DH
UE
2.8%
BEN
TON
2.
2%R
ENV
ILLE
2.
9%R
EDW
OO
D
0.7%
CO
TTO
NW
OO
D
1.5%
OTT
ER T
AIL
8.
1%N
ICO
LLET
9.
6%LA
C Q
UI P
AR
LE
2.1%
WIL
KIN
2.
5%O
TTER
TA
IL
1.0%
MEE
KER
2.
6%Y
ELLO
W M
EDIC
INE
1.7%
WA
SEC
A
2.7%
WA
TON
WA
N
0.7%
BR
OW
N
1.3%
KIT
TSO
N
7.5%
TOD
D8.
9%PI
PEST
ON
E 2.
0%K
AN
DIY
OH
I 2.
3%W
ILK
IN
1.0%
WIN
ON
A
2.5%
OTT
ER T
AIL
1.
6%M
EEK
ER
2.6%
CO
TTO
NW
OO
D
1.0%
WA
SEC
A
1.3%
RED
LA
KE
7.5%
MEE
KER
8.
7%W
ASE
CA
2.
0%M
EEK
ER
2.3%
WA
TON
WA
N
0.7%
WA
BA
SHA
2.
4%LA
C Q
UI P
AR
LE
1.5%
CO
TTO
NW
OO
D
1.5%
FAR
IBA
ULT
0.
6%W
ILK
IN
1.2%
WA
DEN
A
7.4%
KO
OC
HIC
HIN
G
8.4%
STEE
LE
1.9%
NO
BLE
S 2.
2%C
OTT
ON
WO
OD
1.
0%W
ILK
IN
2.4%
MO
RR
ISO
N
1.2%
RED
WO
OD
1.
4%W
AD
ENA
0.
6%LI
NC
OLN
1.
1%N
OB
LES
7.3%
LAC
QU
I PA
RLE
8.
4%W
INO
NA
1.
9%M
AR
SHA
LL
2.1%
WA
DEN
A
0.6%
CO
TTO
NW
OO
D
2.2%
STEE
LE
1.2%
YEL
LOW
MED
ICIN
E 1.
4%D
OD
GE
0.5%
TOD
D0.
8%ST
EELE
6.
9%R
EDW
OO
D
8.3%
CO
TTO
NW
OO
D
1.6%
JAC
KSO
N
1.9%
LIN
CO
LN
0.0%
LIN
CO
LN
2.2%
CO
TTO
NW
OO
D
1.1%
CR
OW
WIN
G
1.3%
KIT
TSO
N
0.0%
RED
WO
OD
0.
7%C
OTT
ON
WO
OD
6.
2%LI
NC
OLN
7.
1%LI
NC
OLN
1.
3%C
OTT
ON
WO
OD
1.
7%M
UR
RA
Y
0.0%
TOD
D2.
0%R
EDW
OO
D
0.7%
STEV
ENS
1.2%
LIN
CO
LN
0.0%
WIN
ON
A
0.6%
RED
WO
OD
5.
9%M
AR
TIN
7.
0%K
ITTS
ON
1.
2%LI
NC
OLN
1.
7%N
OR
MA
N
0.0%
RED
WO
OD
1.
4%K
ITTS
ON
0.
0%M
AR
SHA
LL
1.0%
MA
RSH
ALL
0.
0%N
OR
MA
N
0.0%
MA
RTI
N
5.7%
STEE
LE
6.4%
NO
RM
AN
0.
9%R
ED L
AK
E 1.
3%R
ED L
AK
E 0.
0%R
ED L
AK
E 0.
0%LI
NC
OLN
0.
0%LI
NC
OLN
0.
0%N
OR
MA
N
0.0%
RED
LA
KE
0.0%
LIN
CO
LN
3.9%
CO
TTO
NW
OO
D
5.9%
MA
RSH
ALL
0.
0%G
RA
NT
1.1%
RED
WO
OD
0.
0%ST
EVEN
S 0.
0%M
AR
SHA
LL
0.0%
RED
LA
KE
0.0%
WIL
KIN
0.
0%ST
EVEN
S 0.
0%
MD
MA
/Ecs
tasy
Mar
ijuan
aG
lue/
Inha
lant
sL
SDC
rack
Appe
ndix
Tab
le 2
.3.
Dru
g Us
e in
Pas
t Yea
r, by
Gen
der a
nd C
ount
y, M
inne
sota
Stu
dent
Sur
vey,
200
4
no
tes:
Res
pons
es a
re fo
r 6th
, 9th
, and
12t
h gr
ade
stud
ents
com
bine
d.
Sour
ce: M
inne
sota
Stu
dent
Sur
vey
Inte
rage
ncy
Team
200
5.
58 Status of Girls in Minnesota
Highest Percentage U
se to Lowest
Girls
BoysG
irlsBoys
Girls
BoysG
irlsBoys
Girls
BoysA
ITKIN
12.0%
AITK
IN
9.0%A
ITKIN
15.2%
MA
RTIN
12.9%K
OO
CHICH
ING
7.1%
AITK
IN
9.0%H
OU
STON
3.9%
MO
RRISON
7.5%
KO
OCH
ICHIN
G
11.9%M
ARTIN
10.6%
DO
UG
LAS
9.9%M
ORRISO
N
8.8%K
OO
CHICH
ING
15.2%
MO
RRISON
12.6%
ISAN
TI 5.6%
MU
RRAY
8.9%
ISAN
TI 3.6%
AITK
IN
7.2%H
UBBA
RD
10.5%BIG
STON
E 9.3%
SIBLEY
8.5%H
UBBA
RD
8.6%ITA
SCA
11.8%A
ITKIN
10.8%
HU
BBARD
5.3%
HU
BBARD
6.8%
CASS
3.5%D
OD
GE
5.8%ISA
NTI
10.5%W
ATO
NW
AN
9.1%
STEVEN
S 8.2%
PIPESTON
E 8.5%
BROW
N
10.1%BECK
ER 9.9%
MILLE LA
CS 5.3%
MA
RTIN
6.8%M
ILLE LACS
3.5%BIG
STON
E 5.6%
ITASCA
10.5%
MO
RRISON
9.0%
KO
OCH
ICHIN
G
8.0%K
OO
CHICH
ING
8.1%
DO
UG
LAS
9.9%W
ASH
ING
TON
9.7%
CARV
ER 5.2%
LESUEU
R 6.6%
DO
UG
LAS
3.4%N
ICOLLET
5.4%CA
RLTON
10.1%M
URRA
Y
8.8%CA
SS 7.7%
MU
RRAY
7.8%
HO
USTO
N
9.9%H
OU
STON
9.3%
HO
USTO
N
5.2%M
ORRISO
N
5.7%ITA
SCA
3.1%LESU
EUR
5.3%BEL TRA
MI
9.2%A
ITKIN
8.5%
KA
ND
IYO
HI
7.6%SIBLEY
7.8%
CASS
9.8%M
URRA
Y
8.9%CA
SS 4.9%
BIG STO
NE
5.5%REN
VILLE
3.0%M
ILLE LACS
4.9%M
ILLE LACS
8.8%LESU
EUR
8.3%ITA
SCA
7.3%BECK
ER 7.6%
ISAN
TI 9.8%
ITASCA
8.7%
WA
SHIN
GTO
N
4.9%PO
LK
5.5%BLU
E EARTH
2.8%
JACK
SON
4.8%
DO
UG
LAS
8.5%D
OD
GE
8.1%H
UBBA
RD
7.2%M
ARTIN
7.6%
BLUE EA
RTH
9.6%W
ATO
NW
AN
8.7%
JACK
SON
4.6%
WA
SHIN
GTO
N
5.4%K
AN
DIY
OH
I 2.8%
BLUE EA
RTH
4.7%H
OU
STON
8.5%
KITTSO
N
8.0%JA
CKSO
N
6.5%W
AD
ENA
7.5%
WA
TON
WA
N
9.5%D
AK
OTA
8.1%
ITASCA
4.5%
DO
DG
E 5.2%
MA
RTIN
2.7%BECK
ER 4.6%
CASS
8.3%W
INO
NA
8.0%
TOD
D6.2%
DO
DG
E 7.3%
HU
BBARD
9.2%
AN
OK
A
8.0%BECK
ER 4.4%
ISAN
TI 5.2%
HU
BBARD
2.6%
KA
ND
IYO
HI
4.4%A
ITKIN
8.1%
BELTRAM
I 7.8%
ISAN
TI 5.9%
ITASCA
7.3%
WA
SHIN
GTO
N
9.0%H
UBBA
RD
8.0%BLU
E EARTH
4.4%
AN
OK
A
5.1%SIBLEY
2.6%
RICE 4.4%
JACK
SON
8.0%
ST. LOU
IS 7.8%
MCLEO
D
5.9%W
ATO
NW
AN
7.1%
BECKER
8.9%LESU
EUR
8.0%W
ATO
NW
AN
4.4%
DA
KO
TA
5.0%D
AK
OTA
2.4%
HU
BBARD
4.3%
BROW
N
7.9%W
ASH
ING
TON
7.8%
MA
RTIN
5.9%A
NO
KA
7.0%
CARLTO
N8.8%
DO
DG
E 7.9%
RED LA
KE
4.3%M
ILLE LACS
4.9%FREEBO
RN
2.4%H
OU
STON
4.2%
ST. LOU
IS 7.8%
PINE
7.2%BIG
STON
E 5.8%
PINE
6.7%CA
RVER
8.8%PO
LK
7.6%ST. LO
UIS
4.2%BEN
TON
4.8%
BROW
N
2.3%K
ITTSON
4.1%
BECKER
7.6%D
AK
OTA
7.1%
FARIBA
ULT
5.7%BLU
E EARTH
6.5%
SHERBU
RNE
8.8%ST. LO
UIS
7.5%Y
ELLOW
MED
ICINE
4.2%FILLM
ORE
4.8%LA
C QU
I PARLE
2.2%RA
MSEY
4.1%
CARV
ER 7.4%
SCOTT
7.0%CA
RLTON
5.6%LA
C QU
I PARLE
6.5%TO
DD
8.7%PIPESTO
NE
7.4%D
OU
GLA
S 4.1%
JACK
SON
4.8%
LESUEU
R 2.2%
AN
OK
A
4.0%W
ILKIN
7.4%
BENTO
N
6.9%BELTRA
MI
5.5%M
ILLE LACS
6.4%M
URRA
Y
8.6%SCO
TT 7.4%
BROW
N
3.9%LA
C QU
I PARLE
4.8%LY
ON
2.2%
FILLMO
RE 4.0%
BENTO
N
7.2%ISA
NTI
6.7%PIN
E 5.5%
GRA
NT
6.2%BELTRA
MI
8.5%BLU
E EARTH
7.3%
FILLMO
RE 3.9%
WA
TON
WA
N
4.7%CA
RLTON
2.1%H
ENN
EPIN
4.0%W
ASH
ING
TON
7.1%
ITASCA
6.7%
MILLE LA
CS 5.3%
LESUEU
R 6.2%
PINE
8.5%ISA
NTI
7.2%BELTRA
MI
3.8%H
ENN
EPIN
4.6%N
ICOLLET
2.1%LA
C QU
I PARLE
4.0%W
RIGH
T 7.1%
YELLO
W M
EDICIN
E 6.6%
AN
OK
A
5.2%SCO
TT 5.9%
ST. LOU
IS 8.5%
SIBLEY
7.2%CA
RLTON
3.8%RA
MSEY
4.6%
PINE
2.1%SCO
TT 4.0%
BLUE EA
RTH
7.0%BECK
ER 6.5%
HO
USTO
N
4.8%CLA
Y
5.8%Y
ELLOW
MED
ICINE 8.4%
MILLE LA
CS 7.1%
FARIBA
ULT
3.8%SH
ERBURN
E 4.6%
RICE 2.1%
ISAN
TI 3.9%
AN
OK
A
6.2%SH
ERBURN
E 6.2%
DA
KO
TA
4.7%W
ASH
ING
TON
5.8%
DA
KO
TA
8.2%N
ICOLLET
7.1%PO
LK
3.8%ITA
SCA
4.5%BELTRA
MI
2.0%ITA
SCA
3.8%M
ORRISO
N
6.8%BRO
WN
6.1%
CARV
ER 4.6%
RAM
SEY
5.7%M
ILLE LACS
8.2%W
INO
NA
6.9%
RAM
SEY
3.8%N
ICOLLET
4.5%W
ASH
ING
TON
2.0%
DA
KO
TA
3.7%M
URRA
Y
6.8%H
UBBA
RD
6.1%SCO
TT 4.6%
CASS
5.6%M
ARTIN
8.1%
NO
RMA
N
6.8%W
RIGH
T 3.8%
ST. LOU
IS 4.5%
WILK
I N
2.0%W
ASH
ING
TON
3.7%
SHERBU
RNE
6.7%REN
VILLE
6.1%PIPESTO
NE
4.4%M
CLEOD
5.6%
CLAY
8.0%
WRIG
HT
6.7%N
OBLES
3.7%CA
RLTON
4.4%A
NO
KA
1.9%
FREEBORN
3.6%
YELLO
W M
EDICIN
E 6.7%
HEN
NEPIN
5.9%
WA
SHIN
GTO
N
4.4%CA
RLTON
5.4%K
AN
DIY
OH
I 7.9%
BELTRAM
I 6.6%
DA
KO
TA
3.6%W
RIGH
T 4.4%
OLM
STED
1.9%SH
ERBURN
E 3.6%
DA
KO
TA
6.6%RA
MSEY
5.9%
BLUE EA
RTH
4.3%STEA
RNS
5.2%M
CLEOD
7.9%
ROSEA
U
6.6%M
ORRISO
N
3.6%SCO
TT 4.3%
RAM
SEY
1.9%BELTRA
MI
3.5%PIN
E 6.6%
ROSEA
U
5.9%M
URRA
Y
4.3%O
TTER TAIL
5.1%W
ILKIN
7.9%
CASS
6.5%A
NO
KA
3.5%
BROW
N
4.2%M
CLEOD
1.8%
WRIG
HT
3.5%FREEBO
RN
6.5%CA
RVER
5.7%N
ICOLLET
4.3%ST. LO
UIS
5.1%FILLM
ORE
7.8%Y
ELLOW
MED
ICINE
6.5%M
OW
ER 3.5%
CARV
ER 4.2%
SHERBU
RNE
1.8%BRO
WN
3.4%
WA
TON
WA
N
6.5%M
ILLE LACS
5.7%ST. LO
UIS
4.3%D
OU
GLA
S 5.0%
PIPESTON
E 7.8%
BROW
N
6.3%N
ICOLLET
3.5%K
AN
DIY
OH
I 4.1%
MO
WER
1.7%M
URRA
Y
3.3%FA
RIBAU
LT 6.4%
NO
RMA
N
5.6%CLA
Y
4.2%D
AK
OTA
4.9%
CROW
WIN
G
7.7%K
AN
DIY
OH
I 6.3%
SHERBU
RNE
3.5%BELTRA
MI
4.0%ST. LO
UIS
1.7%CLA
Y
3.2%W
ABA
SHA
6.4%
AN
OK
A
5.5%CRO
W W
ING
4.2%
WRIG
HT
4.9%A
NO
KA
7.6%
HEN
NEPIN
6.2%
AITK
IN
3.3%N
ORM
AN
4.0%
WRIG
HT
1.7%W
ATO
NW
AN
3.1%
FILLMO
RE 6.2%
FILLMO
RE 5.5%
DO
DG
E 4.2%
KA
ND
IYO
HI
4.8%BIG
STON
E 7.2%
RAM
SEY
6.2%SIBLEY
3.3%
WA
DEN
A
4.0%Y
ELLOW
MED
ICINE
1.7%CA
RVER
3.0%N
ICOLLET
6.2%W
AD
ENA
5.5%
RAM
SEY
4.2%LY
ON
4.8%
NICO
LLET 7.1%
BENTO
N
6.1%W
ASECA
3.3%
GO
OD
HU
E 3.7%
CARV
ER 1.6%
MA
RTIN
3.0%CRO
W W
ING
6.0%
WRIG
HT
5.5%SH
ERBURN
E 4.2%
HO
USTO
N
4.7%BEN
TON
7.0%
KO
OCH
ICHIN
G
6.1%M
CLEOD
3.2%
RICE 3.7%
FILLMO
RE 1.6%
SIBLEY
3.0%CLA
Y
5.9%SIBLEY
5.4%
WRIG
HT
4.2%FREEBO
RN
4.4%SCO
TT 6.9%
CLAY
6.0%
MA
RTIN
3.2%PIN
E 3.6%
BECKER
1.5%REN
VILLE
2.9%M
ARTIN
5.9%
GO
OD
HU
E 5.2%
YELLO
W M
EDICIN
E 4.8%
BELTRAM
I 4.3%
NO
RMA
N
6.5%W
AD
ENA
6.0%
MU
RRAY
3.2%
SIBLEY
3.6%H
ENN
EPIN
1.4%STEA
RNS
2.8%RA
MSEY
5.9%
JACK
SON
5.2%
BECKER
4.1%TO
DD
4.3%SIBLEY
6.5%
PINE
5.8%W
ABA
SHA
3.1%
BLUE EA
RTH
3.5%N
OBLES
1.4%CA
RLTON
2.7%G
OO
DH
UE
5.6%CA
RLTON
5.1%LESU
EUR
4.0%G
OO
DH
UE
4.2%M
EEKER
6.4%CA
RLTON
5.7%FREEBO
RN
3.0%RO
SEAU
3.5%
SCOTT
1.4%N
OBLES
2.5%H
ENN
EPIN
5.6%CA
SS 5.1%
WILK
IN
4.0%H
ENN
EPIN
4.2%RA
MSEY
6.4%
FARIBA
ULT
5.7%H
ENN
EPIN
3.0%BECK
ER 3.4%
TOD
D1.4%
POLK
2.5%
KA
ND
IYO
HI
5.6%CRO
W W
ING
5.1%
BROW
N
3.9%ISA
NTI
4.2%RED
LAK
E 6.4%
JACK
SON
5.7%
PINE
3.0%CLA
Y
3.4%FA
RIBAU
LT 1.3%
WA
DEN
A
2.5%REN
VILLE
5.4%BLU
E EARTH
5.0%
RICE 3.9%
SHERBU
RNE
4.2%W
RIGH
T 6.4%
DO
UG
LAS
5.6%SCO
TT 3.0%
CROW
WIN
G
3.3%PO
LK
1.3%CA
SS 2.4%
MCLEO
D
5.3%RICE
5.0%BEN
TON
3.8%
BIG STO
NE
4.1%FA
RIBAU
LT 6.3%
FILLMO
RE 5.6%
WILK
IN
3.0%CA
SS 3.2%
ROSEA
U
1.3%LY
ON
2.4%
PIPESTON
E 5.3%
POLK
4.9%
GO
OD
HU
E 3.8%
KITTSO
N
4.1%M
OW
ER 6.3%
LAC Q
UI PA
RLE 5.6%
BIG STO
NE
2.9%FREEBO
RN
3.2%G
OO
DH
UE
1.2%O
TTER TAIL
2.4%PO
LK
5.3%FREEBO
RN
4.8%M
EEKER
3.8%REN
VILLE
3.9%G
OO
DH
UE
6.2%BIG
STON
E 5.5%
LAC Q
UI PA
RLE 2.9%
STEELE 3.2%
MEEK
ER 1.2%
DO
UG
LAS
2.3%W
INO
NA
5.3%
HO
USTO
N
4.8%M
OW
ER 3.8%
BROW
N
3.8%RO
SEAU
6.2%
SHERBU
RNE
5.5%LESU
EUR
2.9%H
OU
STON
3.1%
STEVEN
S 1.2%
ST. LOU
IS 2.3%
RICE 5.2%
STEARN
S 4.8%
RENV
ILLE 3.8%
CROW
WIN
G
3.8%D
OD
GE
6.1%O
TTER TAIL
5.4%CRO
W W
ING
2.7%
LYO
N
3.1%CLA
Y
1.1%PIN
E 2.2%
SCOTT
5.1%CLA
Y
4.7%N
OBLES
3.7%JA
CKSO
N
3.8%FREEBO
RN
6.1%STEA
RNS
5.4%G
OO
DH
UE
2.6%CO
TTON
WO
OD
3.0%
MU
RRAY
1.1%
PIPESTON
E 2.2%
SIBLEY
5.1%D
OU
GLA
S 4.7%
STEARN
S 3.6%
POLK
3.8%
GRA
NT
5.8%G
OO
DH
UE
5.3%N
ORM
AN
2.6%
NO
BLES 3.0%
PIPESTON
E 1.1%
BENTO
N
2.0%TO
DD
5.1%N
OBLES
4.7%W
ABA
SHA
3.4%
BENTO
N
3.7%H
ENN
EPIN
5.8%O
LMSTED
5.2%
OLM
STED
2.6%M
CLEOD
2.9%
BENTO
N
1.0%CRO
W W
ING
2.0%
MO
WER
5.0%FA
RIBAU
LT 4.5%
LYO
N
3.3%N
ICOLLET
3.5%RICE
5.8%W
ABA
SHA
5.1%
MA
RSHA
LL 2.5%
MEEK
ER 2.9%
OTTER TA
IL 1.0%
MEEK
ER 2.0%
GRA
NT
4.9%LA
C QU
I PARLE
4.5%FILLM
ORE
3.1%RO
SEAU
3.5%
JACK
SON
5.6%
REDW
OO
D
4.9%RICE
2.5%REN
VILLE
2.9%D
OD
GE
0.9%O
LMSTED
2.0%
ROSEA
U
4.9%M
OW
ER 4.5%
ROSEA
U
3.1%N
OBLES
3.4%LESU
EUR
5.5%REN
VILLE
4.9%TO
DD
2.5%W
ABA
SHA
2.7%
JACK
SON
0.9%
FARIBA
ULT
1.9%W
AD
ENA
4.7%
NICO
LLET 4.5%
FREEBORN
3.0%
RICE 3.4%
WIN
ON
A
5.4%STEV
ENS
4.8%K
AN
DIY
OH
I 2.4%
OLM
STED
2.6%STEA
RNS
0.9%W
INO
NA
1.9%
WA
SECA
4.7%G
RAN
T 4.3%
WIN
ON
A
3.0%FA
RIBAU
LT 3.2%
OLM
STED
5.2%TO
DD
4.7%STEV
ENS
2.4%STEA
RNS
2.5%W
ASECA
0.9%
MCLEO
D
1.8%O
LMSTED
4.5%
LYO
N
4.3%G
RAN
T 2.9%
FILLMO
RE 3.2%
POLK
5.1%
COTTO
NW
OO
D
4.5%W
AD
ENA
2.4%
OTTER TA
IL 2.4%
CROW
WIN
G
1.0%STEELE
1.8%D
OD
GE
4.4%M
CLEOD
4.3%
WA
TON
WA
N
2.9%W
INO
NA
3.1%
STEARN
S 5.1%
CROW
WIN
G
4.4%W
INO
NA
2.4%
DO
UG
LAS
2.3%W
ABA
SHA
0.7%
WA
SECA
1.8%M
EEKER
4.3%W
ABA
SHA
4.3%
WA
SECA
2.8%O
LMSTED
3.0%
MO
RRISON
4.8%
MCLEO
D
4.4%CLA
Y
2.3%LIN
COLN
2.2%
WA
TON
WA
N
0.7%G
OO
DH
UE
1.7%O
TTER TAIL
4.3%W
ASECA
4.3%
HEN
NEPIN
2.7%
CARV
ER 2.9%
WA
BASH
A
4.8%N
OBLES
4.4%M
EEKER
2.3%W
ASECA
2.2%
COTTO
NW
OO
D
1.0%G
RAN
T 1.5%
STEARN
S 4.3%
OTTER TA
IL 4.1%
NO
RMA
N
2.6%M
OW
ER 2.9%
WA
DEN
A
4.8%CA
RVER
4.3%PIPESTO
NE
2.2%Y
ELLOW
MED
ICINE
2.2%STEELE
0.6%Y
ELLOW
MED
ICINE
1.4%STEV
ENS
4.3%STEELE
3.9%O
LMSTED
2.6%
YELLO
W M
EDICIN
E 2.9%
OTTER TA
IL 4.7%
LYO
N
4.1%RO
SEAU
2.2%
KITTSO
N
2.0%W
AD
ENA
0.6%
ROSEA
U
1.3%LESU
EUR
3.6%TO
DD
3.8%O
TTER TAIL
2.6%STEELE
2.8%STEV
ENS
4.7%K
ITTSON
4.0%
STEARN
S 2.2%
KO
OCH
ICHIN
G
2.0%W
INO
NA
0.6%
LINCO
LN
1.1%N
OBLES
3.6%K
OO
CHICH
ING
3.7%
POLK
2.6%
NO
RMA
N
2.7%N
OBLES
4.6%M
ARSH
ALL
4.0%BEN
TON
1.9%
MA
RSHA
LL 2.0%
AITK
IN
0.0%K
OO
CHICH
ING
1.0%
NO
RMA
N
3.5%O
LMSTED
3.5%
MO
RRISON
2.4%
WA
BASH
A
2.7%REN
VILLE
4.5%RICE
3.9%K
ITTSON
1.7%
TOD
D2.0%
BIG STO
NE
0.0%M
ARSH
ALL
1.0%BIG
STON
E 3.2%
PIPESTON
E 3.5%
WA
DEN
A
2.4%W
ASECA
2.7%
WA
SECA
4.2%M
EEKER
3.7%STEELE
1.5%FA
RIBAU
LT 1.9%
GRA
NT
0.0%W
ABA
SHA
1.0%
LAC Q
UI PA
RLE 3.2%
KA
ND
IYO
HI
2.9%STEELE
2.2%M
EEKER
2.6%LA
C QU
I PARLE
3.7%STEELE
3.6%D
OD
GE
1.4%W
INO
NA
1.9%
KITTSO
N
0.0%M
OW
ER 0.8%
RED LA
KE
2.9%M
EEKER
2.9%RED
LAK
E 2.1%
COTTO
NW
OO
D
2.2%K
ITTSON
3.4%
WA
SECA
3.1%G
RAN
T 1.4%
REDW
OO
D
1.4%K
OO
CHICH
ING
0.0%
TOD
D0.8%
LYO
N
2.6%RED
LAK
E 2.6%
LAC Q
UI PA
RLE 1.5%
REDW
OO
D
2.1%LY
ON
3.3%
FREEBORN
2.8%
LYO
N
1.4%M
OW
ER 1.3%
LINCO
LN
0.0%CO
TTON
WO
OD
1.0%
STEELE 2.6%
REDW
OO
D
2.4%CO
TTON
WO
OD
1.1%
STEVEN
S 1.2%
STEELE 3.1%
MO
WER
2.5%O
TTER TAIL
1.3%W
ILKIN
1.2%
MA
RSHA
LL 0.0%
REDW
OO
D
0.7%K
ITTSON
2.5%
MA
RSHA
LL 2.1%
KITTSO
N
0.0%W
ILKIN
1.2%
MA
RSHA
LL 2.5%
WILK
IN
2.4%CO
TTON
WO
OD
1.0%
PIPESTON
E 1.1%
MO
RRISON
0.0%
NO
RMA
N
0.0%M
ARSH
ALL
2.5%CO
TTON
WO
OD
1.7%
LINCO
LN
0.0%M
ARSH
ALL
1.0%CO
TTON
WO
OD
1.7%
LINCO
LN
2.2%REN
VILLE
0.8%G
RAN
T 0.0%
NO
RMA
N
0.0%RED
LAK
E 0.0%
REDW
OO
D
2.5%LIN
COLN
1.7%
MA
RSHA
LL 0.0%
LINCO
LN
0.0%LIN
COLN
1.6%
GRA
NT
1.5%LIN
COLN
0.0%
RED LA
KE
0.0%RED
LAK
E 0.0%
STEVEN
S 0.0%
COTTO
NW
OO
D
2.0%W
ILKIN
1.7%
REDW
OO
D
0.0%RED
LAK
E 0.0%
REDW
OO
D
1.5%RED
LAK
E 0.0%
REDW
OO
D
0.0%STEV
ENS
0.0%RED
WO
OD
0.0%
WILK
IN
0.0%LIN
COLN
1.3%
STEVEN
S 0.9%
Use of O
thers' Rx
Metham
phetamines
Am
phetamines
BarbituratesN
arcotics/Heroin
Appendix Table 2.3. Drug Use in Past Year, by G
ender and County, Minnesota Student Survey, 2004 (cont’d)
no
tes: Responses are for 6th, 9th, and 12th grade students com
bined.
Source: M
innesota Student Survey Interagency Team 2005.

59Appendix Figures, Maps, and Tables
Appendix Table 2.4. Student Reasons for Use/Non-Use of Alcohol or Drugs, by Gender and Race and Ethnicity, Minnesota Student Survey, 2004
notes: Percents add up to more than 100 percent because respondents were allowed to select multiple answers to this question.Responses are for 6th grade students, only. Ninth and 12th grade students were not asked this question.Source: Minnesota Department of Education, Minnesota Student Survey Interagency Team 2004.
To RelaxTo Get High/
Smashed
To Have Fun at Parties
To Escape from
Problems
Parents Aren't
Around Friends Do Parents DoLike the
Taste
I'm Sad, Lonely, Angry It's Illegal
Peer Pressure
AllGirls 12.5% 10.8% 19.7% 10.1% 3.7% 7.4% 1.2% 10.9% 5.2% 2.9% 3.3%Boys 14.1% 12.2% 16.4% 6.8% 3.2% 6.5% 1.3% 9.6% 3.1% 4.0% 3.1%WhiteGirls 13.3% 11.7% 22.1% 10.8% 4.0% 8.5% 1.3% 12.2% 5.2% 3.2% 3.5%Boys 15.4% 13.5% 18.4% 7.3% 3.5% 7.3% 1.3% 10.8% 3.0% 4.3% 3.3%African AmericanGirls 6.4% 5.3% 6.4% 3.6% 1.5% 1.7% 0.6% 3.4% 2.3% 0.8% 1.5%Boys 6.8% 6.3% 6.5% 3.1% 1.4% 2.6% 1.0% 3.4% 1.4% 1.8% 1.9%Asian AmericanGirls 9.1% 5.5% 12.1% 7.7% 2.3% 3.2% 4.0% 5.2% 5.9% 1.2% 2.2%Boys 12.2% 8.7% 12.2% 7.2% 2.8% 4.8% 1.1% 5.5% 4.9% 2.6% 3.3%American IndianGirls 13.8% 15.2% 15.8% 11.9% 4.0% 5.4% 1.9% 9.0% 8.3% 2.0% 3.3%Boys 13.0% 10.7% 10.3% 7.0% 2.3% 4.1% 0.7% 7.1% 3.6% 3.6% 2.4%Hispanic or LatinoGirls 10.9% 7.5% 13.7% 8.9% 2.6% 4.3% 1.0% 7.7% 5.6% 2.0% 2.8%Boys 12.0% 9.6% 12.6% 5.8% 2.7% 4.6% 1.1% 7.4% 3.9% 2.9% 2.2%
Reasons Selected for Using Alcohol or Drugs
Appendix Map 2.5: Percent of Girls and Boys Reporting LSD Use within the Last Year
soURCe: Minnesota Student Survey Interagency Team 2005. Calculated by the Institute for Women’s Policy Research.
Appendix Percent of Girls and Boys Reporting Map 2.5: LSD Use within the Last Year
0% - 1.9%2% - 3.9%4% - 5.9%6% - 7.9%≥8%Not Available
0% - 1.9%2% - 3.9%4% - 5.9%6% - 7.9%≥8%Not Available
Boys
Girls
Appendix Map 2.6: Percent of Girls and Boys Reporting Ecstasy Use within the Last Year
soURCe: Minnesota Student Survey Interagency Team 2005. Calculated by the Institute for Women’s Policy Research.
Appendix Percent of Girls and Boys Reporting Map 2.4: Ecstasy Use within the Last Year
Girls
Boys
0% - 1.9%2% - 3.9%4% - 5.9%6% - 7.9%≥8%Not Available
0% - 1.9%2% - 3.9%4% - 5.9%6% - 7.9%≥8%Not Available
Appendix Map 2.7: Percent of Girls and Boys ReportingBarbiturate Use within the Last Year
soURCe: Minnesota Student Survey Interagency Team 2005. Calculated by the Institute for Women’s Policy Research.
Appendix Percentage of Girls and Boys Reporting Map 2.7: Barbituate Use within the Last Year
0% - 1.9%2% - 3.9%4% - 5.9%6% - 7.9%≥8%Not Available
0% - 1.9%2% - 3.9%4% - 5.9%6% - 7.9%≥8%Not Available
Boys
Girls
Appendix Map 2.8: Percent of Girls and Boys Reporting Nar-cotic Use within the Last Year
soURCe: Minnesota Student Survey Interagency Team 2005. Calculated by the Institute for Women’s Policy Research.
Appendix Percentage of Girls and Boys Reporting Map 2.8: Narcotic Use within the Last Year
Girls
Boys
0% - 0.9%1% - 1.9%2% - 2.9%3% - 3.9%≥ 4%Not Available
0% - 0.9%1% - 1.9%2% - 2.9%3% - 3.9%≥ 4%Not Available
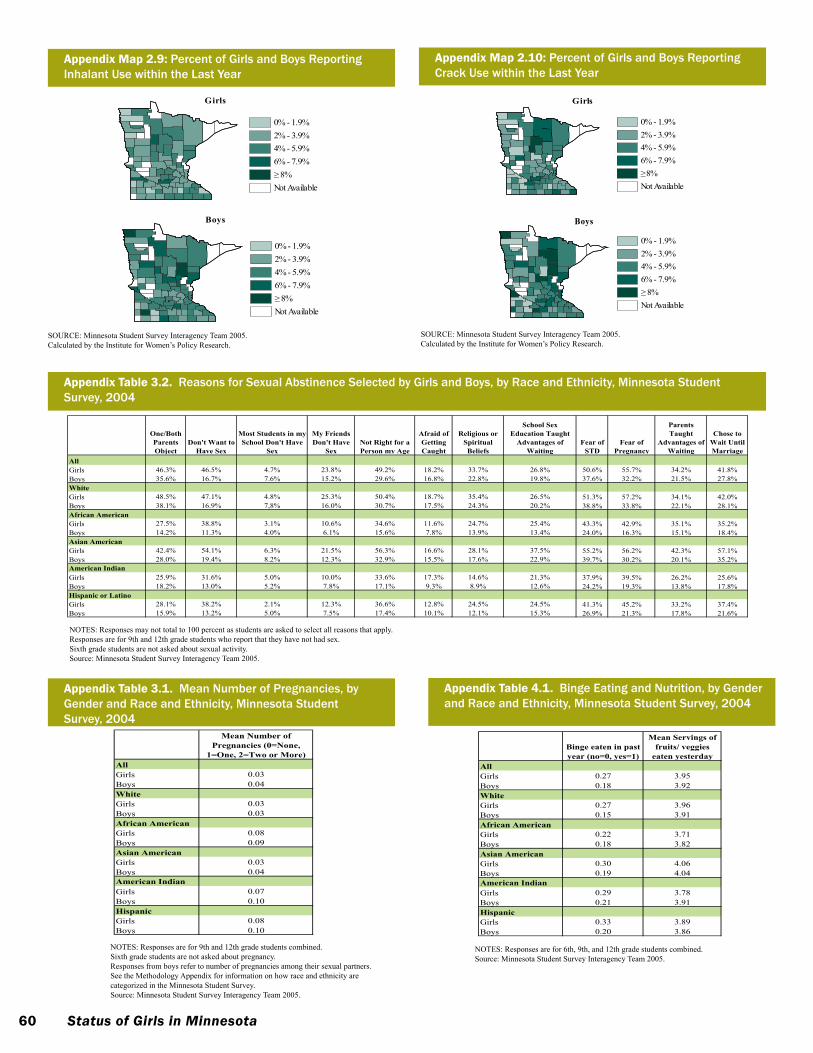
60 Status of Girls in Minnesota
Appendix Table 3.1. Mean Number of Pregnancies, by Gender and Race and Ethnicity, Minnesota Student Survey, 2004
notes: Responses are for 9th and 12th grade students combined. sixth grade students are not asked about pregnancy. Responses from boys refer to number of pregnancies among their sexual partners.see the Methodology Appendix for information on how race and ethnicity are categorized in the Minnesota student survey. Source: Minnesota Student Survey Interagency Team 2005.
Mean Number of Pregnancies (0=None,
1=One, 2=Two or More) AllGirls 0.03Boys 0.04WhiteGirls 0.03Boys 0.03African AmericanGirls 0.08Boys 0.09Asian AmericanGirls 0.03Boys 0.04American IndianGirls 0.07Boys 0.10Hispanic Girls 0.08Boys 0.10
Appendix Table 3.1: Mean Number of Pregnancies, by Gender and Race and
Ethnicity, Minnesota Student Survey, 2004
Appendix Table 3.2. Reasons for Sexual Abstinence Selected by Girls and Boys, by Race and Ethnicity, Minnesota Student Survey, 2004
notes: Responses may not total to 100 percent as students are asked to select all reasons that apply.Responses are for 9th and 12th grade students who report that they have not had sex. sixth grade students are not asked about sexual activity.Source: Minnesota Student Survey Interagency Team 2005.
Appendix Table 3.2: Reasons for Sexual Abstinence Selected by Girls and Boys, by Race and Ethnicity, Minnesota Student Survey, 2004
One/Both Parents Object
Don't Want to Have Sex
Most Students in my School Don't Have
Sex
My Friends Don't Have
SexNot Right for a Person my Age
Afraid of Getting Caught
Religious or Spiritual Beliefs
School Sex Education Taught
Advantages of Waiting
Fear of STD
Fear of Pregnancy
Parents Taught
Advantages of Waiting
Chose to Wait Until Marriage
AllGirls 46.3% 46.5% 4.7% 23.8% 49.2% 18.2% 33.7% 26.8% 50.6% 55.7% 34.2% 41.8%Boys 35.6% 16.7% 7.6% 15.2% 29.6% 16.8% 22.8% 19.8% 37.6% 32.2% 21.5% 27.8%WhiteGirls 48.5% 47.1% 4.8% 25.3% 50.4% 18.7% 35.4% 26.5% 51.3% 57.2% 34.1% 42.0%Boys 38.1% 16.9% 7,8% 16.0% 30.7% 17.5% 24.3% 20.2% 38.8% 33.8% 22.1% 28.1%African AmericanGirls 27.5% 38.8% 3.1% 10.6% 34.6% 11.6% 24.7% 25.4% 43.3% 42.9% 35.1% 35.2%Boys 14.2% 11.3% 4.0% 6.1% 15.6% 7.8% 13.9% 13.4% 24.0% 16.3% 15.1% 18.4%Asian AmericanGirls 42.4% 54.1% 6.3% 21.5% 56.3% 16.6% 28.1% 37.5% 55.2% 56.2% 42.3% 57.1%Boys 28.0% 19.4% 8.2% 12.3% 32.9% 15.5% 17.6% 22.9% 39.7% 30.2% 20.1% 35.2%American IndianGirls 25.9% 31.6% 5.0% 10.0% 33.6% 17.3% 14.6% 21.3% 37.9% 39.5% 26.2% 25.6%Boys 18.2% 13.0% 5.2% 7.8% 17.1% 9.3% 8.9% 12.6% 24.2% 19.3% 13.8% 17.8%Hispanic or LatinoGirls 28.1% 38.2% 2.1% 12.3% 36.6% 12.8% 24.5% 24.5% 41.3% 45.2% 33.2% 37.4%Boys 15.9% 13.2% 5.0% 7.5% 17.4% 10.1% 12.1% 15.3% 26.9% 21.3% 17.8% 21.6%
Appendix Table 4.1. Binge Eating and Nutrition, by Gender and Race and Ethnicity, Minnesota Student Survey, 2004
notes: Responses are for 6th, 9th, and 12th grade students combined. Source: Minnesota Student Survey Interagency Team 2005.
Binge eaten in past year (no=0, yes=1)
Mean Servings of fruits/ veggies
eaten yesterdayAllGirls 0.27 3.95Boys 0.18 3.92WhiteGirls 0.27 3.96Boys 0.15 3.91African AmericanGirls 0.22 3.71Boys 0.18 3.82Asian AmericanGirls 0.30 4.06Boys 0.19 4.04American IndianGirls 0.29 3.78Boys 0.21 3.91Hispanic Girls 0.33 3.89Boys 0.20 3.86
Appendix Table 4.1 Binge Eating and Nutrition, by Gender and Race and Ethnicity, Minnesota Student Survey, 2004
Appendix Map 2.9: Percent of Girls and Boys Reporting Inhalant Use within the Last Year
soURCe: Minnesota Student Survey Interagency Team 2005. Calculated by the Institute for Women’s Policy Research.
Appendix Percent of Girls and Boys Reporting Map 2.3: Inhalant Use within the Last Year
0% - 1.9%2% - 3.9%4% - 5.9%6% - 7.9%≥8%Not Available
0% - 1.9%2% - 3.9%4% - 5.9%6% - 7.9%≥8%Not Available
Boys
Girls
Appendix Map 2.10: Percent of Girls and Boys Reporting Crack Use within the Last Year
soURCe: Minnesota Student Survey Interagency Team 2005. Calculated by the Institute for Women’s Policy Research.
Appendix Percent of Girls and Boys Reporting Map 2.11: Crack Use within the Last Year
0% - 1.9%2% - 3.9%4% - 5.9%6% - 7.9%≥8%Not Available
0% - 1.9%2% - 3.9%4% - 5.9%6% - 7.9%≥8%Not Available
Boys
Girls
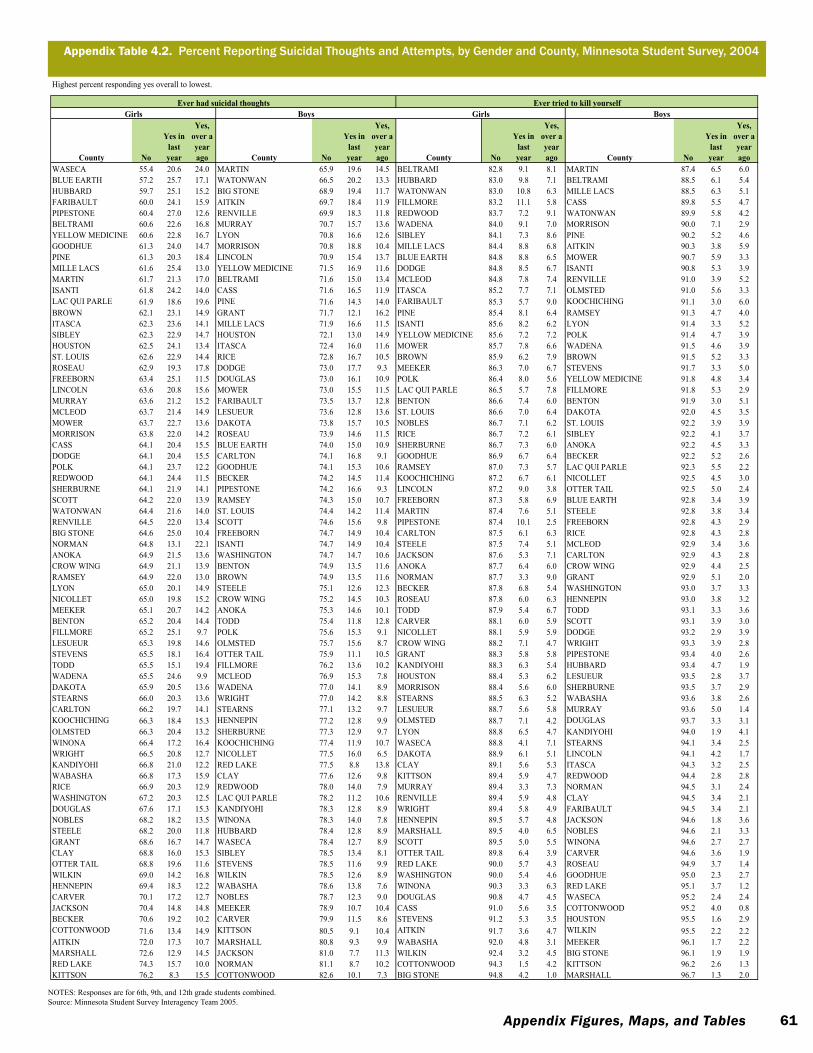
61Appendix Figures, Maps, and Tables
Highest percent responding yes overall to lowest.
County No
Yes in last year
Yes, over a year ago County No
Yes in last year
Yes, over a year ago County No
Yes in last year
Yes, over a year ago County No
Yes in last year
Yes, over a year ago
WASECA 55.4 20.6 24.0 MARTIN 65.9 19.6 14.5 BELTRAMI 82.8 9.1 8.1 MARTIN 87.4 6.5 6.0BLUE EARTH 57.2 25.7 17.1 WATONWAN 66.5 20.2 13.3 HUBBARD 83.0 9.8 7.1 BELTRAMI 88.5 6.1 5.4HUBBARD 59.7 25.1 15.2 BIG STONE 68.9 19.4 11.7 WATONWAN 83.0 10.8 6.3 MILLE LACS 88.5 6.3 5.1FARIBAULT 60.0 24.1 15.9 AITKIN 69.7 18.4 11.9 FILLMORE 83.2 11.1 5.8 CASS 89.8 5.5 4.7PIPESTONE 60.4 27.0 12.6 RENVILLE 69.9 18.3 11.8 REDWOOD 83.7 7.2 9.1 WATONWAN 89.9 5.8 4.2BELTRAMI 60.6 22.6 16.8 MURRAY 70.7 15.7 13.6 WADENA 84.0 9.1 7.0 MORRISON 90.0 7.1 2.9YELLOW MEDICINE 60.6 22.8 16.7 LYON 70.8 16.6 12.6 SIBLEY 84.1 7.3 8.6 PINE 90.2 5.2 4.6GOODHUE 61.3 24.0 14.7 MORRISON 70.8 18.8 10.4 MILLE LACS 84.4 8.8 6.8 AITKIN 90.3 3.8 5.9PINE 61.3 20.3 18.4 LINCOLN 70.9 15.4 13.7 BLUE EARTH 84.8 8.8 6.5 MOWER 90.7 5.9 3.3MILLE LACS 61.6 25.4 13.0 YELLOW MEDICINE 71.5 16.9 11.6 DODGE 84.8 8.5 6.7 ISANTI 90.8 5.3 3.9MARTIN 61.7 21.3 17.0 BELTRAMI 71.6 15.0 13.4 MCLEOD 84.8 7.8 7.4 RENVILLE 91.0 3.9 5.2ISANTI 61.8 24.2 14.0 CASS 71.6 16.5 11.9 ITASCA 85.2 7.7 7.1 OLMSTED 91.0 5.6 3.3LAC QUI PARLE 61.9 18.6 19.6 PINE 71.6 14.3 14.0 FARIBAULT 85.3 5.7 9.0 KOOCHICHING 91.1 3.0 6.0BROWN 62.1 23.1 14.9 GRANT 71.7 12.1 16.2 PINE 85.4 8.1 6.4 RAMSEY 91.3 4.7 4.0ITASCA 62.3 23.6 14.1 MILLE LACS 71.9 16.6 11.5 ISANTI 85.6 8.2 6.2 LYON 91.4 3.3 5.2SIBLEY 62.3 22.9 14.7 HOUSTON 72.1 13.0 14.9 YELLOW MEDICINE 85.6 7.2 7.2 POLK 91.4 4.7 3.9HOUSTON 62.5 24.1 13.4 ITASCA 72.4 16.0 11.6 MOWER 85.7 7.8 6.6 WADENA 91.5 4.6 3.9ST. LOUIS 62.6 22.9 14.4 RICE 72.8 16.7 10.5 BROWN 85.9 6.2 7.9 BROWN 91.5 5.2 3.3ROSEAU 62.9 19.3 17.8 DODGE 73.0 17.7 9.3 MEEKER 86.3 7.0 6.7 STEVENS 91.7 3.3 5.0FREEBORN 63.4 25.1 11.5 DOUGLAS 73.0 16.1 10.9 POLK 86.4 8.0 5.6 YELLOW MEDICINE 91.8 4.8 3.4LINCOLN 63.6 20.8 15.6 MOWER 73.0 15.5 11.5 LAC QUI PARLE 86.5 5.7 7.8 FILLMORE 91.8 5.3 2.9MURRAY 63.6 21.2 15.2 FARIBAULT 73.5 13.7 12.8 BENTON 86.6 7.4 6.0 BENTON 91.9 3.0 5.1MCLEOD 63.7 21.4 14.9 LESUEUR 73.6 12.8 13.6 ST. LOUIS 86.6 7.0 6.4 DAKOTA 92.0 4.5 3.5MOWER 63.7 22.7 13.6 DAKOTA 73.8 15.7 10.5 NOBLES 86.7 7.1 6.2 ST. LOUIS 92.2 3.9 3.9MORRISON 63.8 22.0 14.2 ROSEAU 73.9 14.6 11.5 RICE 86.7 7.2 6.1 SIBLEY 92.2 4.1 3.7CASS 64.1 20.4 15.5 BLUE EARTH 74.0 15.0 10.9 SHERBURNE 86.7 7.3 6.0 ANOKA 92.2 4.5 3.3DODGE 64.1 20.4 15.5 CARLTON 74.1 16.8 9.1 GOODHUE 86.9 6.7 6.4 BECKER 92.2 5.2 2.6POLK 64.1 23.7 12.2 GOODHUE 74.1 15.3 10.6 RAMSEY 87.0 7.3 5.7 LAC QUI PARLE 92.3 5.5 2.2REDWOOD 64.1 24.4 11.5 BECKER 74.2 14.5 11.4 KOOCHICHING 87.2 6.7 6.1 NICOLLET 92.5 4.5 3.0SHERBURNE 64.1 21.9 14.1 PIPESTONE 74.2 16.6 9.3 LINCOLN 87.2 9.0 3.8 OTTER TAIL 92.5 5.0 2.4SCOTT 64.2 22.0 13.9 RAMSEY 74.3 15.0 10.7 FREEBORN 87.3 5.8 6.9 BLUE EARTH 92.8 3.4 3.9WATONWAN 64.4 21.6 14.0 ST. LOUIS 74.4 14.2 11.4 MARTIN 87.4 7.6 5.1 STEELE 92.8 3.8 3.4RENVILLE 64.5 22.0 13.4 SCOTT 74.6 15.6 9.8 PIPESTONE 87.4 10.1 2.5 FREEBORN 92.8 4.3 2.9BIG STONE 64.6 25.0 10.4 FREEBORN 74.7 14.9 10.4 CARLTON 87.5 6.1 6.3 RICE 92.8 4.3 2.8NORMAN 64.8 13.1 22.1 ISANTI 74.7 14.9 10.4 STEELE 87.5 7.4 5.1 MCLEOD 92.9 3.4 3.6ANOKA 64.9 21.5 13.6 WASHINGTON 74.7 14.7 10.6 JACKSON 87.6 5.3 7.1 CARLTON 92.9 4.3 2.8CROW WING 64.9 21.1 13.9 BENTON 74.9 13.5 11.6 ANOKA 87.7 6.4 6.0 CROW WING 92.9 4.4 2.5RAMSEY 64.9 22.0 13.0 BROWN 74.9 13.5 11.6 NORMAN 87.7 3.3 9.0 GRANT 92.9 5.1 2.0LYON 65.0 20.1 14.9 STEELE 75.1 12.6 12.3 BECKER 87.8 6.8 5.4 WASHINGTON 93.0 3.7 3.3NICOLLET 65.0 19.8 15.2 CROW WING 75.2 14.5 10.3 ROSEAU 87.8 6.0 6.3 HENNEPIN 93.0 3.8 3.2MEEKER 65.1 20.7 14.2 ANOKA 75.3 14.6 10.1 TODD 87.9 5.4 6.7 TODD 93.1 3.3 3.6BENTON 65.2 20.4 14.4 TODD 75.4 11.8 12.8 CARVER 88.1 6.0 5.9 SCOTT 93.1 3.9 3.0FILLMORE 65.2 25.1 9.7 POLK 75.6 15.3 9.1 NICOLLET 88.1 5.9 5.9 DODGE 93.2 2.9 3.9LESUEUR 65.3 19.8 14.6 OLMSTED 75.7 15.6 8.7 CROW WING 88.2 7.1 4.7 WRIGHT 93.3 3.9 2.8STEVENS 65.5 18.1 16.4 OTTER TAIL 75.9 11.1 10.5 GRANT 88.3 5.8 5.8 PIPESTONE 93.4 4.0 2.6TODD 65.5 15.1 19.4 FILLMORE 76.2 13.6 10.2 KANDIYOHI 88.3 6.3 5.4 HUBBARD 93.4 4.7 1.9WADENA 65.5 24.6 9.9 MCLEOD 76.9 15.3 7.8 HOUSTON 88.4 5.3 6.2 LESUEUR 93.5 2.8 3.7DAKOTA 65.9 20.5 13.6 WADENA 77.0 14.1 8.9 MORRISON 88.4 5.6 6.0 SHERBURNE 93.5 3.7 2.9STEARNS 66.0 20.3 13.6 WRIGHT 77.0 14.2 8.8 STEARNS 88.5 6.3 5.2 WABASHA 93.6 3.8 2.6CARLTON 66.2 19.7 14.1 STEARNS 77.1 13.2 9.7 LESUEUR 88.7 5.6 5.8 MURRAY 93.6 5.0 1.4KOOCHICHING 66.3 18.4 15.3 HENNEPIN 77.2 12.8 9.9 OLMSTED 88.7 7.1 4.2 DOUGLAS 93.7 3.3 3.1OLMSTED 66.3 20.4 13.2 SHERBURNE 77.3 12.9 9.7 LYON 88.8 6.5 4.7 KANDIYOHI 94.0 1.9 4.1WINONA 66.4 17.2 16.4 KOOCHICHING 77.4 11.9 10.7 WASECA 88.8 4.1 7.1 STEARNS 94.1 3.4 2.5WRIGHT 66.5 20.8 12.7 NICOLLET 77.5 16.0 6.5 DAKOTA 88.9 6.1 5.1 LINCOLN 94.1 4.2 1.7KANDIYOHI 66.8 21.0 12.2 RED LAKE 77.5 8.8 13.8 CLAY 89.1 5.6 5.3 ITASCA 94.3 3.2 2.5WABASHA 66.8 17.3 15.9 CLAY 77.6 12.6 9.8 KITTSON 89.4 5.9 4.7 REDWOOD 94.4 2.8 2.8RICE 66.9 20.3 12.9 REDWOOD 78.0 14.0 7.9 MURRAY 89.4 3.3 7.3 NORMAN 94.5 3.1 2.4WASHINGTON 67.2 20.3 12.5 LAC QUI PARLE 78.2 11.2 10.6 RENVILLE 89.4 5.9 4.8 CLAY 94.5 3.4 2.1DOUGLAS 67.6 17.1 15.3 KANDIYOHI 78.3 12.8 8.9 WRIGHT 89.4 5.8 4.9 FARIBAULT 94.5 3.4 2.1NOBLES 68.2 18.2 13.5 WINONA 78.3 14.0 7.8 HENNEPIN 89.5 5.7 4.8 JACKSON 94.6 1.8 3.6STEELE 68.2 20.0 11.8 HUBBARD 78.4 12.8 8.9 MARSHALL 89.5 4.0 6.5 NOBLES 94.6 2.1 3.3GRANT 68.6 16.7 14.7 WASECA 78.4 12.7 8.9 SCOTT 89.5 5.0 5.5 WINONA 94.6 2.7 2.7CLAY 68.8 16.0 15.3 SIBLEY 78.5 13.4 8.1 OTTER TAIL 89.8 6.4 3.9 CARVER 94.6 3.6 1.9OTTER TAIL 68.8 19.6 11.6 STEVENS 78.5 11.6 9.9 RED LAKE 90.0 5.7 4.3 ROSEAU 94.9 3.7 1.4WILKIN 69.0 14.2 16.8 WILKIN 78.5 12.6 8.9 WASHINGTON 90.0 5.4 4.6 GOODHUE 95.0 2.3 2.7HENNEPIN 69.4 18.3 12.2 WABASHA 78.6 13.8 7.6 WINONA 90.3 3.3 6.3 RED LAKE 95.1 3.7 1.2CARVER 70.1 17.2 12.7 NOBLES 78.7 12.3 9.0 DOUGLAS 90.8 4.7 4.5 WASECA 95.2 2.4 2.4JACKSON 70.4 14.8 14.8 MEEKER 78.9 10.7 10.4 CASS 91.0 5.6 3.5 COTTONWOOD 95.2 4.0 0.8BECKER 70.6 19.2 10.2 CARVER 79.9 11.5 8.6 STEVENS 91.2 5.3 3.5 HOUSTON 95.5 1.6 2.9COTTONWOOD 71.6 13.4 14.9 KITTSON 80.5 9.1 10.4 AITKIN 91.7 3.6 4.7 WILKIN 95.5 2.2 2.2AITKIN 72.0 17.3 10.7 MARSHALL 80.8 9.3 9.9 WABASHA 92.0 4.8 3.1 MEEKER 96.1 1.7 2.2MARSHALL 72.6 12.9 14.5 JACKSON 81.0 7.7 11.3 WILKIN 92.4 3.2 4.5 BIG STONE 96.1 1.9 1.9RED LAKE 74.3 15.7 10.0 NORMAN 81.1 8.7 10.2 COTTONWOOD 94.3 1.5 4.2 KITTSON 96.2 2.6 1.3KITTSON 76.2 8.3 15.5 COTTONWOOD 82.6 10.1 7.3 BIG STONE 94.8 4.2 1.0 MARSHALL 96.7 1.3 2.0
BoysGirlsEver had suicidal thoughts Ever tried to kill yourself
BoysGirls
Appendix Table 4.2. Percent Reporting Suicidal Thoughts and Attempts, by Gender and County, Minnesota Student Survey, 2004
notes: Responses are for 6th, 9th, and 12th grade students combined.Source: Minnesota Student Survey Interagency Team 2005.
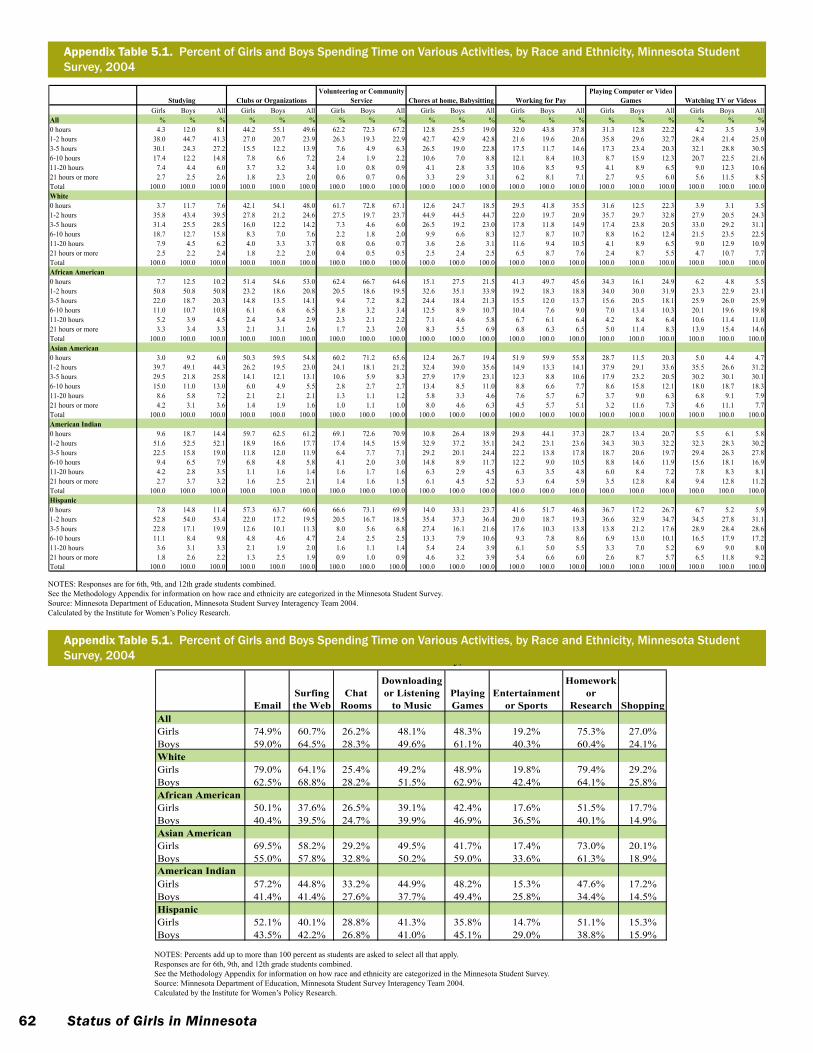
62 Status of Girls in Minnesota
Appendix Table 5.1. Percent of Girls and Boys Spending Time on Various Activities, by Race and Ethnicity, Minnesota Student Survey, 2004
Appendix Table 5.1: Percent of Girls and Boys Spending Time on Various Activities, by Race and Ethnicity, Minnesota Student Survey, 2004
Girls Boys All Girls Boys All Girls Boys All Girls Boys All Girls Boys All Girls Boys All Girls Boys AllAll % % % % % % % % % % % % % % % % % % % % %0 hours 4.3 12.0 8.1 44.2 55.1 49.6 62.2 72.3 67.2 12.8 25.5 19.0 32.0 43.8 37.8 31.3 12.8 22.2 4.2 3.5 3.91-2 hours 38.0 44.7 41.3 27.0 20.7 23.9 26.3 19.3 22.9 42.7 42.9 42.8 21.6 19.6 20.6 35.8 29.6 32.7 28.4 21.4 25.03-5 hours 30.1 24.3 27.2 15.5 12.2 13.9 7.6 4.9 6.3 26.5 19.0 22.8 17.5 11.7 14.6 17.3 23.4 20.3 32.1 28.8 30.56-10 hours 17.4 12.2 14.8 7.8 6.6 7.2 2.4 1.9 2.2 10.6 7.0 8.8 12.1 8.4 10.3 8.7 15.9 12.3 20.7 22.5 21.611-20 hours 7.4 4.4 6.0 3.7 3.2 3.4 1.0 0.8 0.9 4.1 2.8 3.5 10.6 8.5 9.5 4.1 8.9 6.5 9.0 12.3 10.621 hours or more 2.7 2.5 2.6 1.8 2.3 2.0 0.6 0.7 0.6 3.3 2.9 3.1 6.2 8.1 7.1 2.7 9.5 6.0 5.6 11.5 8.5Total 100.0 100.0 100.0 100.0 100.0 100.0 100.0 100.0 100.0 100.0 100.0 100.0 100.0 100.0 100.0 100.0 100.0 100.0 100.0 100.0 100.0White0 hours 3.7 11.7 7.6 42.1 54.1 48.0 61.7 72.8 67.1 12.6 24.7 18.5 29.5 41.8 35.5 31.6 12.5 22.3 3.9 3.1 3.51-2 hours 35.8 43.4 39.5 27.8 21.2 24.6 27.5 19.7 23.7 44.9 44.5 44.7 22.0 19.7 20.9 35.7 29.7 32.8 27.9 20.5 24.33-5 hours 31.4 25.5 28.5 16.0 12.2 14.2 7.3 4.6 6.0 26.5 19.2 23.0 17.8 11.8 14.9 17.4 23.8 20.5 33.0 29.2 31.16-10 hours 18.7 12.7 15.8 8.3 7.0 7.6 2.2 1.8 2.0 9.9 6.6 8.3 12.7 8.7 10.7 8.8 16.2 12.4 21.5 23.5 22.511-20 hours 7.9 4.5 6.2 4.0 3.3 3.7 0.8 0.6 0.7 3.6 2.6 3.1 11.6 9.4 10.5 4.1 8.9 6.5 9.0 12.9 10.921 hours or more 2.5 2.2 2.4 1.8 2.2 2.0 0.4 0.5 0.5 2.5 2.4 2.5 6.5 8.7 7.6 2.4 8.7 5.5 4.7 10.7 7.7Total 100.0 100.0 100.0 100.0 100.0 100.0 100.0 100.0 100.0 100.0 100.0 100.0 100.0 100.0 100.0 100.0 100.0 100.0 100.0 100.0 100.0African American0 hours 7.7 12.5 10.2 51.4 54.6 53.0 62.4 66.7 64.6 15.1 27.5 21.5 41.3 49.7 45.6 34.3 16.1 24.9 6.2 4.8 5.51-2 hours 50.8 50.8 50.8 23.2 18.6 20.8 20.5 18.6 19.5 32.6 35.1 33.9 19.2 18.3 18.8 34.0 30.0 31.9 23.3 22.9 23.13-5 hours 22.0 18.7 20.3 14.8 13.5 14.1 9.4 7.2 8.2 24.4 18.4 21.3 15.5 12.0 13.7 15.6 20.5 18.1 25.9 26.0 25.96-10 hours 11.0 10.7 10.8 6.1 6.8 6.5 3.8 3.2 3.4 12.5 8.9 10.7 10.4 7.6 9.0 7.0 13.4 10.3 20.1 19.6 19.811-20 hours 5.2 3.9 4.5 2.4 3.4 2.9 2.3 2.1 2.2 7.1 4.6 5.8 6.7 6.1 6.4 4.2 8.4 6.4 10.6 11.4 11.021 hours or more 3.3 3.4 3.3 2.1 3.1 2.6 1.7 2.3 2.0 8.3 5.5 6.9 6.8 6.3 6.5 5.0 11.4 8.3 13.9 15.4 14.6Total 100.0 100.0 100.0 100.0 100.0 100.0 100.0 100.0 100.0 100.0 100.0 100.0 100.0 100.0 100.0 100.0 100.0 100.0 100.0 100.0 100.0Asian American0 hours 3.0 9.2 6.0 50.3 59.5 54.8 60.2 71.2 65.6 12.4 26.7 19.4 51.9 59.9 55.8 28.7 11.5 20.3 5.0 4.4 4.71-2 hours 39.7 49.1 44.3 26.2 19.5 23.0 24.1 18.1 21.2 32.4 39.0 35.6 14.9 13.3 14.1 37.9 29.1 33.6 35.5 26.6 31.23-5 hours 29.5 21.8 25.8 14.1 12.1 13.1 10.6 5.9 8.3 27.9 17.9 23.1 12.3 8.8 10.6 17.9 23.2 20.5 30.2 30.1 30.16-10 hours 15.0 11.0 13.0 6.0 4.9 5.5 2.8 2.7 2.7 13.4 8.5 11.0 8.8 6.6 7.7 8.6 15.8 12.1 18.0 18.7 18.311-20 hours 8.6 5.8 7.2 2.1 2.1 2.1 1.3 1.1 1.2 5.8 3.3 4.6 7.6 5.7 6.7 3.7 9.0 6.3 6.8 9.1 7.921 hours or more 4.2 3.1 3.6 1.4 1.9 1.6 1.0 1.1 1.0 8.0 4.6 6.3 4.5 5.7 5.1 3.2 11.6 7.3 4.6 11.1 7.7Total 100.0 100.0 100.0 100.0 100.0 100.0 100.0 100.0 100.0 100.0 100.0 100.0 100.0 100.0 100.0 100.0 100.0 100.0 100.0 100.0 100.0American Indian0 hours 9.6 18.7 14.4 59.7 62.5 61.2 69.1 72.6 70.9 10.8 26.4 18.9 29.8 44.1 37.3 28.7 13.4 20.7 5.5 6.1 5.81-2 hours 51.6 52.5 52.1 18.9 16.6 17.7 17.4 14.5 15.9 32.9 37.2 35.1 24.2 23.1 23.6 34.3 30.3 32.2 32.3 28.3 30.23-5 hours 22.5 15.8 19.0 11.8 12.0 11.9 6.4 7.7 7.1 29.2 20.1 24.4 22.2 13.8 17.8 18.7 20.6 19.7 29.4 26.3 27.86-10 hours 9.4 6.5 7.9 6.8 4.8 5.8 4.1 2.0 3.0 14.8 8.9 11.7 12.2 9.0 10.5 8.8 14.6 11.9 15.6 18.1 16.911-20 hours 4.2 2.8 3.5 1.1 1.6 1.4 1.6 1.7 1.6 6.3 2.9 4.5 6.3 3.5 4.8 6.0 8.4 7.2 7.8 8.3 8.121 hours or more 2.7 3.7 3.2 1.6 2.5 2.1 1.4 1.6 1.5 6.1 4.5 5.2 5.3 6.4 5.9 3.5 12.8 8.4 9.4 12.8 11.2Total 100.0 100.0 100.0 100.0 100.0 100.0 100.0 100.0 100.0 100.0 100.0 100.0 100.0 100.0 100.0 100.0 100.0 100.0 100.0 100.0 100.0Hispanic 0 hours 7.8 14.8 11.4 57.3 63.7 60.6 66.6 73.1 69.9 14.0 33.1 23.7 41.6 51.7 46.8 36.7 17.2 26.7 6.7 5.2 5.91-2 hours 52.8 54.0 53.4 22.0 17.2 19.5 20.5 16.7 18.5 35.4 37.3 36.4 20.0 18.7 19.3 36.6 32.9 34.7 34.5 27.8 31.13-5 hours 22.8 17.1 19.9 12.6 10.1 11.3 8.0 5.6 6.8 27.4 16.1 21.6 17.6 10.3 13.8 13.8 21.2 17.6 28.9 28.4 28.66-10 hours 11.1 8.4 9.8 4.8 4.6 4.7 2.4 2.5 2.5 13.3 7.9 10.6 9.3 7.8 8.6 6.9 13.0 10.1 16.5 17.9 17.211-20 hours 3.6 3.1 3.3 2.1 1.9 2.0 1.6 1.1 1.4 5.4 2.4 3.9 6.1 5.0 5.5 3.3 7.0 5.2 6.9 9.0 8.021 hours or more 1.8 2.6 2.2 1.3 2.5 1.9 0.9 1.0 0.9 4.6 3.2 3.9 5.4 6.6 6.0 2.6 8.7 5.7 6.5 11.8 9.2Total 100.0 100.0 100.0 100.0 100.0 100.0 100.0 100.0 100.0 100.0 100.0 100.0 100.0 100.0 100.0 100.0 100.0 100.0 100.0 100.0 100.0
Working for PayPlaying Computer or Video
Games Watching TV or VideosStudying Clubs or OrganizationsVolunteering or Community
Service Chores at home, Babysitting
notes: Responses are for 6th, 9th, and 12th grade students combined.see the Methodology Appendix for information on how race and ethnicity are categorized in the Minnesota student survey.Source: Minnesota Department of Education, Minnesota Student Survey Interagency Team 2004.Calculated by the Institute for Women’s Policy Research.
Appendix Table 5.1. Percent of Girls and Boys Spending Time on Various Activities, by Race and Ethnicity, Minnesota Student Survey, 2004
EmailSurfing the Web
Chat Rooms
Downloading or Listening
to MusicPlaying Games
Entertainment or Sports
Homework or
Research ShoppingAllGirls 74.9% 60.7% 26.2% 48.1% 48.3% 19.2% 75.3% 27.0%Boys 59.0% 64.5% 28.3% 49.6% 61.1% 40.3% 60.4% 24.1%WhiteGirls 79.0% 64.1% 25.4% 49.2% 48.9% 19.8% 79.4% 29.2%Boys 62.5% 68.8% 28.2% 51.5% 62.9% 42.4% 64.1% 25.8%African AmericanGirls 50.1% 37.6% 26.5% 39.1% 42.4% 17.6% 51.5% 17.7%Boys 40.4% 39.5% 24.7% 39.9% 46.9% 36.5% 40.1% 14.9%Asian AmericanGirls 69.5% 58.2% 29.2% 49.5% 41.7% 17.4% 73.0% 20.1%Boys 55.0% 57.8% 32.8% 50.2% 59.0% 33.6% 61.3% 18.9%American IndianGirls 57.2% 44.8% 33.2% 44.9% 48.2% 15.3% 47.6% 17.2%Boys 41.4% 41.4% 27.6% 37.7% 49.4% 25.8% 34.4% 14.5%Hispanic Girls 52.1% 40.1% 28.8% 41.3% 35.8% 14.7% 51.1% 15.3%Boys 43.5% 42.2% 26.8% 41.0% 45.1% 29.0% 38.8% 15.9%
Appendix Table 5.2: Student Responses about Computer Activities, by Gender and Race and Ethnicity, Minnesota Student Survey, 2004
notes: Percents add up to more than 100 percent as students are asked to select all that apply.Responses are for 6th, 9th, and 12th grade students combined.see the Methodology Appendix for information on how race and ethnicity are categorized in the Minnesota student survey.Source: Minnesota Department of Education, Minnesota Student Survey Interagency Team 2004.Calculated by the Institute for Women’s Policy Research.
RefeRences
63References
academy for eating Disorders. 2008. “prevalence of eating Disorders.” <http://www.aedweb.org/eating_disorders/prevalence.cfm> (January 16, 2008).
ackard, Dianne M. and Dianne neumarksztainer. 2002. “Date Violence and Date rape among adolescents: associations with Disordered eating Behaviors and psychological Health.” Child Abuse & Neglect: The International Journal 26(5) (May): 45573.
aCt, inc. 2007. students Meeting aCt Collegereadiness Benchmarks in 2007. Data sent electronically by aCt, inc.
aCt, inc. 2006. ACT High School Profile Report, Minnesota High School Graduating Class of 2006. <http://www.act.org/news/data/06/pdf/states/Minnesota.pdf>.
american association of university Women. 1994. Shortchanging Girls, Shortchanging America. Washington, DC: aauW.
american psychological association, task force on the sexualization of Girls. 2007. Report of the APA Task Force on the Sexualization of Girls. Washington, DC: american psychological association. <www.apa.org/pi/wpo/sexualization.html>.
american psychological association. 1998. “a new look at adolescent Girls strengths and stresses: research agenda.” <http://www.apa.org/pi/cyf/adolesgirls.html> (november 7, 2007).
averyleaf sarah, Michele Cascardi, KD o’leary, and a. Cano. 1997. “efficacy of a dating violence prevention program on attitudes justifying aggression.” Journal of Adolescent Health 21: 117.
Bernat, Debra Hilkene and Michael D. resnick. 2006. “Healthy youth Development: science and strategies.” Journal of Public Health Management and Practice, (nov) supplemental: s10s16.
Beutel, ann M. 2000. “the relationship between adolescent nonmarital Childbearing and educational expections: a Cohort and period Comparison.” The Sociological Quarterly 41(2): 297314.
Boonstra, Heather D. 2007. “the Case for a new approach to sex education Mounts; Will policymakers Heed the Message?” Guttmacher Policy Review 10 (2). Brook, Judith s., Martin Whiteman, stephen J. finch, and patricia Cohen. 1996. “young adult Drug use and Delinquency: Childhood antecedents and adolescent Mediators.” American Academy of Child and Adolescent Psychiatry 35 (12):1584–1592.
Brown, Joanna D. and Maurice W. Mechiono. 2006. “Heath Concerns of sexual Minority adolescent Girls.” Current Opinion in Pediatrics 18: 359364.
Calvert, Matthew, shepherd Zeldin, and amy Weisenbach. 2002. Youth Involvement for Community, Organizational, and Youth Development: Directions for Research, Evaluation, and Practice. Madison, Wi, and Chevy Chase, MD: university of WisconsinMadison and innovation Center for Community and youth Development.
Cancian, Maria, sheldon Danzinger, and peter Gottschalk. 1993. “Working Wives and family income inequality among Married Couples.” in Uneven Tides: Rising Inequality in America, sheldon Danziger and peter Gottschalk (eds). new york: russell sage foundation.
Carbonell, Dina M., Helen Z. reinherz, rose M. Giaconia, Cecilia K. stashwick, angela D. paradis, and William r. Beardslee. 2002. “adolescent protective factors promoting resilience in young adults at risk for Depression.” Child and Adolescent Social Work Journal 19 (oct): 393412.
Catalyst. 2007. 2006 Census of Women in Fortune 500 Corporate Officer and Board Positions. < http://www.catalystwomen.org/> (november 1, 2007).
RefeRences
64 Status of Girls in Minnesota
Cattan, peter. 1998. “the effect of Working Wives on the incidence of poverty.” Monthly Labor Review 22 (Mar).
Center for american Women and politics. 2008a. “fact sheet: Women in state legislatures 2008.” new Brunswick, nJ: Center for american Women and politics.
Center for american Women and politics. 2008b. “fact sheet: statewide elective executive Women 2008.” new Brunswick, nJ: Center for american Women and politics.
Center for american Women in politics. 2007. “facts and findings: Women serving in the 110th Congress 200709.” <http://www.cawp.rutgers.edu/facts/officeholders/congcurrent.html> (november 1, 2007).
Centers for Disease Control and prevention. 2008. “nationally representative CDC study finds 1 in 4 teenage Girls Has a sexually transmitted Disease.” <http://www.cdc.gov/stDConference/2008/media/release11march2008.htm>.
Centers for Disease Control and prevention. 2007b. Consultation to address stD Disparities in african american Communities: Meeting report. <http://www.cdc.gov/std/general/stDHealthDisparitiesConsultationJune2007.pdf>.
Centers for Disease Control and prevention. 2007a. “Health topics: alcohol and Drug use.” national Center for Chronic Disease prevention and Health promotion. <http://www.cdc.gov/Healthyyouth/alcoholdrug/index.htm>.
Centers for Disease Control and prevention. 2006. “Dating abuse fact sheet.” <http://www.cdc.gov/ncipc/dvp/DatingViolence.htm>.
College Board. 2007. 2006 Minnesota State Summary Report <http://professionals.collegeboard.com/datareportsresearch/ap/archived/2006>.
College Board. 2006. 2006 College-Bound Seniors State Profile Report: Minnesota. <http://www.collegeboard.com/prod_downloads/about/news_info/cbsenior/yr2006/minnesota2006.pdf>.
Cotter, David a., Joann Defiore, Joan M. Hermsen, Brenda Marsteller Kowaleski, and reeve Vanneman. 1997. “all Women Benefit: the Macrolevel effect of occupational integration on Gender earnings equality.” The American Sociological Review, 62 (october): 714734.
Crago, Marjorie, Catherine M. shisslak, and linda s. estes. 1996. “eating Disturbances among american Minority Groups: a review.” International Journal of Eating Disorders 19: 239248.
Daniels, elizabeth and Campbell leaper. 2006. “a longitudinal investigation of sport participation, peer acceptance, and selfesteem among adolescent Girls and Boys.” Sex Roles 55 (Dec): 875880.
Dey, Judy Goldberg and Catherine Hill. 2007. Behind the Pay Gap. Washington, DC: american association of university Women educational foundation.
Dietz, William H. 2004. “overweight in Childhood and adolescence.” New England Journal of Medicine 350 (9): 855857.
Dobosz, robert p. and lee a. Beaty. 1999. “the relationship Between athletic participation and High school students’ leadership ability.” Adolescence 34(133).
eating Disorders Coalition for research, policy, and action. 2007. “eating Disorder statistics: 9 Million americans, Hundreds Dying each year.” http://www.eatingdisorderscoalition.org (January 8, 2008)
east, patricia. 1988. “racial and ethnic Differences in Girls’ sexual, Marital, and Birth expectations.” Journal of Marriage and the Family 60 (1): 150162.
eaton, Danice K., laura Kann, steve Kinchen, James ross, Joseph Hawkins, William a. Harris, richard lowry, tim McManus, David Chyen, shari shanklin, Connie lim, Jo anne Grunbaum, and Howell Wechsler. 2006. “youth risk behavior surveillance—united states, 2005.” MMWR 55(no. ss5):1108.
ethier, Kathleen a., trace s. Kershaw, Jessica B. lewis, stephanie Milan, linda M. niccolai, and Jeannette r. ickovics. 2006. “selfesteem, emotional distress and sexual behavior among adolescent females: interrelationships and temporal effects.” Journal of Adolescent Health 38: 268274.
finer, lawrence B. and stanley K. Henshaw. 2006. “Disparities in rates of unintended pregnancy in the united states, 1994 and 2001.” Perspectives on Sexual and Reproductive Health. 38 (2): 9096. <http://www.guttmacher.org/pubs/journals/3809006.html>

65References
finer, lawrence and stanley Henshaw. 2003. “abortion incidence and services in the united states in 2000.” Perspectives on Sexual and Reproductive Health. 35 (1): 615.
flansburg, sandra and Katherine Hanson. 1993. Legislation for Change: A Case Study of Title IX and the Women’s Equality Act Program (eD 392 705). Center for equity and Cultural Diversity Working paper 3. newton, Ma: education Development Center.
food research and action Center. 2007. “state of the states 2007: Minnesota.” <http://www.frac.org/state_of_states/2007/states/Mn.pdf> (January 2008).
foshee, Vangie a., Karl e. Bauman, susan t. ennett, Chirayath suchindran, thad Benefield, and G. fletcher linder. 2005. “assessing the effects of the dating violence prevention program “safe Dates” using random coefficient regression modeling.” Prevention Science 6(3): 24558.
Geronimus, arline t. 1997. “teenage Childbearing and personal responsibility: an alternative View.” Political Science Quarterly 112 (3).
Gibson, Cynthia. 2001. From Inspiration to Participation: A Review of Perspectives on Youth Engagement. new york: Grantmaker forum on Community and national service.
Girls incorporated. 2006. The Supergirl Dilemma: Girls Grapple with the Mounting Pressures of Expectations. <http://www.girlsinc.org> (March 11, 2008).
Gold Benson, rachel. 2006. “rekindling efforts to prevent unplanned pregnancy: a Matter of ‘equity and Common sense.’ Guttmacher Policy Review 9 (3).
Grabe, shelly, Janet shibley Hyde, and sara M. lindberg. 2007. “Body objectification and Depression in adolescents: the role of Gender, shame, and rumination. Psychology of Women Quarterly (31) 2 (June) 2007: 164175.
Guttmacher institute. 2005. “Contraceptive services facts in Brief.” <http://www.guttmacher.org/pubs/fb_contr_serv.html>
Guttmacher institute. 2008. “an overview of abortion in the united states.” <http://www.guttmacher.org/media/presskits/2005/06/28/abortionoverview.html>.
Hamilton, Jan D. 2007. “eating Disorders in preadolescent Children.” Nurse Practitioner (March) 32(3): 4448.
Hamilton, Brady e., Joyce a. Martin, and stephanie J. Ventura. 2007. “Births: preliminary Data for 2006.” National Vital Statistics Reports (DHHs publication no. (pHs) 20081120). Washington, DC: u.s. Government printing office.
Hill, o., W. pettus, and B. Hedin. 1990. “three studies of factors affecting the attitudes of blacks and females toward the pursuit of science and sciencerelated careers.” Journal of Research in Science Teaching, 27(4): 289314.
Huang, Gary, nebiyu taddese, and elizabeth Walter. 2000. Entry and Persistence of Women and Minorities in College Science and Engineering Education. nCes 2000ñ601. Washington, DC: u.s. Department of education, national Center for education statistics.
Johnson, norine G., Michael C. roberts, and Judith Worell. 1999. Beyond Appearance: A New Look at Adolescent Girls. Washington, DC: the american psychological association.
Jones, rachel K., lori f. frohwirth, and ann M. Moore. 2008. “‘i Would Want to Give My Child, like, everything in the World’: How issues of Motherhood influence Women Who Have abortions.” Journal of Family Issues 29 (1): 7999.
JonesDeWeever, avis and Barbara Gault. 2006. Resilient and Reaching for More: Challenges and Benefits of Higher Education for Welfare Participants and Their Children. Washington, DC: institute for Women’s policy research.
Kirby, Douglas, B.a laris, and lori rolleri. 2006. The Impact of Sex and HIV Education Programs in Schools and Communities on Sexual Behaviors among Young Adults. research triangle park, nC: family Health international.
Knapp, l.G., J.e. Kellyreid, r.W. Whitmore, s. Wu, l. Gallego, J. Cong, M. Berzofsky, s. Huh, B. levine, and s.G. Broyles. 2005. Postsecondary Institutions in the United States: Fall 2003 and Degrees and Other Awards Conferred: 2002ñ03 (nCes 2005ñ154). <http://nces.ed.gov/pubs2005/2005154.pdf>.
Korenman, sanders, Jane e. Miller, and John e. sjaastad. 1994. Long-term poverty and child development in the United States: Results from the NLSY (Discussion paper no. 104494). university of Wisonsin: institute for research on poverty.
66 Status of Girls in Minnesota
lask, B. and r. BryantWaugh. 1999. “prepubertal eating Disorders.” in Preventing Eating Disorders. n. piran, M. levine, & C. steineradair (eds.). philadelphia, pa: taylor & francis.
lee, sunhwa. 2007. Keeping Moms on the Job: The Impacts of Health Insurance and Child Care on Job Retention and Mobility among Low-Income Mothers. Washington, DC: institute for Women’s policy research.
lipman, Harvy. 2006. “pay Gap narrows for Male and female nonprofit executives, study finds.” The Chronicle of Philanthropy. <http://www.philanthropy.com/free/articles/v19/i01/01002801.htm>
Martin, Joyce a., Brady e. Hamilton, paul D. sutton, stephanie J. Ventura, fay Menacker, sharon Kirmeyer, and Martha l. Munson. 2007. “Births: final Data for 2005.” National Vital Statistics Reports 56 (Dec).
Mclester, s. 1998. “Girls and technology: What’s the story.” Technology and Learning, 18: 1826.
McMurry, Martha. 2006. Minnesota Education Trends, 2000-2005. <http://www.demography.state.mn.us/documents/Minnesotaeducationtrends20002005.pdf>.
Minnesota Department of education. 2007. Minnesota Statewide Graduation Indicators Report 2006. <http://education.state.mn.us/reportCard2005/schoolDistrictinfo.do; jsessionid=HzbQZgMKrn18tn1s7QJ5vQrJ8nvnkc0Jp0g1lKjC6xdq7KKmhgln!92858710?sCHool_nuM=000&DistriCt_nuM=9999&DistriCt_type=99>.
Minnesota Department of education and Minnesota organization on adolescent pregnancy, prevention and parenting. 2007. HIV Prevention & Sex Education in Minnesota: What’s Being Taught in the Classroom. <http://www.moappp.org/Documents/publicpolicy/sexedsurvey2007.pdf>.
Minnesota Department of Health. 2007a. Data tables from the 2001 and 2004 Minnesota Health access surveys, provided to iWpr electronically by the Minnesota Department of Health.
Minnesota Department of Health. 2007b. Populations of Color in Minnesota: Health Status Report. <http://www.health.state.mn.us/divs/chs/poC/poCupdate2007.pdf>.
Minnesota Department of Health. 2007c. Induced Abortions in Minnesota January – December 2006: Report the Legislature. <http://www.health.state.mn.us/divs/chs/abrpt/2006abrpt.pdf>.
Minnesota Department of Health. 2007d. 2006 Minnesota Sexually Transmitted Disease Statistics. <http://www.health.state.mn.us/divs/idepc/dtopics/stds/stats/stdreport2006.pdf>.
Minnesota Department of Health. 2006. 2005 Report on Minnesota Adolescents: STD, HIV, and Pregnancy. <http://education.state.mn.us/mdeprod/idcplg?idcservice=Get_file&dDocname=010029&revisionselectionMethod=latestreleased&rendition=primary>.
Minnesota Department of Health. 2005. “fact sheet: Health insurance Coverage in Minnesota, 2001 vs. 2004.” < http://www.statecoverage.net/statereports/mn70.pdf>.
Minnesota Department of Health. 2004. Populations of Color in Minnesota: Health Status Report. < http://www.health.state.mn.us/divs/chs/poC/pocfall2004.pdf>.
Minnesota Department of Human services. 2005. Minnesota Family Investment Program Longitudinal Study: Four Years After Baseline. <http://edocs.dhs.state.mn.us/lfserver/legacy/DHs4450JenG>.
Minnesota Department of public safety. 2006. Minnesota Crime Information 2005. <http://www.dps.state.mn.us/BCa/cjis/Documents/Crime2005/MCi2005.pdf>.
Minnesota organization on adolescent pregnancy, prevention, and parenting (Moapp). 2007. 2007 Minnesota State Adolescent Sexual Health Report <http://www.moappp.org/Documents/2007adoHealthreport.pdf>.
Minnesota organization on adolescent pregnancy, prevention, and parenting (Moapp). 2006. 2006 Minnesota State Adolescent Sexual Health Report <http://www.moappp.org/Documents/2006adoHealthreport.pdf>.
Minnesota planning, Criminal Justice Center. 1998. Judging by the Data: Offenders in Minnesota’s Juvenile Courts. st. paul, Mn: Criminal Justice Center. <http://www.gda.state.mn.us/pdf/jjac.pdf>.
67References
Minnesota state office of the attorney General. 1998. “review of Gender equity in interscholastic athletic opportunities in Minnesota’s secondary schools” (eD 442 787). <http://www.eric.ed.gov/eriCDocs/data/ericdocs2sql/content_storage_01/0000019b/80/16/48/73.pdf>.
Minnesota student survey interagency team. 2005. 2004 Minnesota student survey Dataset, provided by the interagency team via CDroM.
Misehl, lawrence, Jared Bernstein, and Heather Boushey. 2003. The State of Working America 2002/2003. ithaca, ny: Cornell university press.
Mohamed, inca a., and Wendy Wheeler. 2001. Broadening the Bounds of Youth Development: Youth As Engaged Citizens. new york and Chevy Chase, MD: the ford foundation and the innovation Center for Community and youth Development.
Morehouse, Diane l. 2007. girlsBEST Initiative 2002-2007: Final Evaluation Report. Minneapolis, Mn: Women’s foundation of Minnesota. <http://www.wfmn.org/pDfs/girlsBestinitiative200207_finalevalreport.pdf>.
naral proChoice america. 2008. “state profiles: Minnesota.” <http://www.prochoiceamerica.org/choiceactioncenter/in_your_state/whodecides/state profiles/minnesota.html>.
national science foundation. 2004. Women, Minorities, and Persons with Disabilities in Science and Engineering: 2004. <http://www.nsf.gov/statistics/wmpd/pdf/tabh6.pdf> (May 15, 2006).
national scientific Council on the Developing Child. 2007. The Timing and Quality of Early Experiences Combine to Shape Brain Architecture. Cambridge, Ma: Center on the Developing Child at Harvard university.
national Women’s law Center. 2006. “Making the Grade for Care: ranking state Child and Dependent Care tax provisions.” <http://www.nwlc.org/pdf/MakingtheGradeforCare2006.pdf >.
parker, robert nash and Kathleen auerhahn. 1998. “alcohol, Drugs, and Violence.” Annual Review of Sociology 24: 291311.
remafedi, Gary and simone french, Mary story, Michael D. resnick, and robert Blum. 1998. “the relationship Between suicide risk and sexual orientation: results of a populationBased study.” American Journal of Public Health 88: 5760.
ristau, Kevin, Colette lafond, and Dr. Herbert Cederberg. 2007. “the Cost of living in Minnesota.” <http://www.jobsnowcoalition.org/vertical/sites/%7B9f1D3C88376f40619B43f420D6164008%7D/uploads/ColM_2003.pdf>.
santelli, John s., laura Duberstein lindberg, lawrence finer, and susheela singh. 2007. “explaining recent Declines in adolescent pregnancy in the united states: the Contribution of abstinence and improved Contraceptive use.” American Journal of Public Health 97 (1): 150156.
schoen, Cathy, Karen Davis, Karen scott Collins, linda Greenberg, Catherine Des roches, and Melinda abrams. 1997. The Commonwealth Fund Survey of the Health of Adolescent Girls. <http://www.commonwealthfund.org/usr_doc/schoen_adolescentgirls.pdf?section=4039>.
smith, Jane e. and Jonathan Krejci. 1991. “Minorities Join the Majority: eating Disturbances among Hispanic and native american youth.” International Journal of Eating Disorders (10): 239248.
spalterroth, roberta, Heidi Hartmann, and linda M. andrews. 1990. Mothers, Children, and Low-Wage Work: The Ability to Earn a Family Wage. Washington, DC: institute for Women’s policy research.
stein, nan. 1999. Classrooms and Courtrooms: Facing Sexual Harassment in K-12 Schools. new york: teacher’s College press.
strandberg, nina. 2001. Conceptualising Empowerment as a Transformative Strategy for Poverty Eradication and the Implications for Measuring Progress. <http://www.un.org/womenwatch/daw/csw/empower/documents/strandbergep6.pdf>.
tolman, Deborah l., emily a. impett, allison J. tracy, and alice Michael. 2006. “looking Good, sounding Good: femininity ideology and adolescent Girls’ Mental Health.” psychology of Women Quarterly, 30 (Mar): 8595.
toney, Jermaine. 2007. Minnesota Legislative Report Card on Racial Equality. <http://www.oaproject.org/files/oap_racialJustice_077.pdf>.
68 Status of Girls in Minnesota
u.s. Department of Commerce, Bureau of the Census. 2008. “estimates for Minnesota Counties, 2005.” Small Area Income and Poverty Estimates. <http://www.census.gov/cgibin/saipe/saipe.cgi>.
u.s. Department of Commerce, Bureau of the Census. 2007. “How the Census Bureau Measures poverty.” <http://www.census.gov/hhes/www/poverty/povdef.html#2>.
u.s. Department of Commerce, Bureau of the Census. 2006a. 2005 American Community Survey. <http://factfinder.census.gov>.
u.s. Department of Commerce, Bureau of the Census. 2006b. “poverty thresholds 2005.” <http://www.census.gov/hhes/www/poverty/threshld/thresh05.html>.
Vanderslice, ronna and Kelli litsch. 1988. Women in Development: Advancing Women in Higher Education. <http://www.eric.ed.gov/eriCDocs/data/ericdocs2sql/content_storage_01/0000019b/80/16/68/0b.pdf>.
Wider opportunities for Women. 2006. Reality Check: Promoting Self-Sufficiency in the Public Workforce System. <http://76.12.84.24/ourprograms/promising/summary/documents/realityCheck1.pdf>.
Wilder research. 2007. Overview of Homelessness in Minnesota 2006: Key Facts from the Statewide Survey. <http://www.wilder.org/fileadmin/user_upload/research/Homelessoverview2006_307.pdf>.
Women’s sports foundation. 2008. “issues and action: title ix Compliance.” <http://www.womenssportsfoundation.org/cgibin/iowa/issues/expert_results.html>.
The Women’s Foundation of Minnesota acknowledges the overall project management and key contributions of the following staff in the production and publication of this report: Lee Roper-Batker, president and CEO; Carol McGee Johnson, vice president of community philanthropy and programs; Sida Ly-Xiong, associate director of evaluation
Chamberlain Fellow Claudia Williams provided data analy-sis assistance. The project team would also like to thank IWPR president Dr. Heidi Hartmann for her thoughtful review and feedback on the report and special assistant to the president, Ashley English, for her help with copyediting. Finally, IWPR thanks former Fellow Tori Finkle and former GWU Work Study student Layla Moughari for their research assistance.
IWPR Study Director Erica Williams, IWPR/GWU Research Fellow Casey Clevenger, and Research Associate Lynette Osborne did much of the writing and data collection for the report. IWPR Vice President and Director of Research, Dr. Barbara Gault, provided indispensable vision and guid-ance for shaping the project and report content. Mariam K. Chamberlain Fellow Angela Carlberg is responsible for the mapping of county data presented here and Mariam K.
Acknowledgements | Institute for Women’s Policy Research
and research; and Mary Beth Hanson, communications director. The Women’s Foundation of Minnesota thanks the Blandin Foundation, W.K. Kellogg Foundation, and The Minneapolis Foundation for providing the key funding for this research report:
Amy Brenengen, Director, Research & Policy Analyst, Office on the Economic Status of Women
Karen Diver, Tribal Chair, Fond du Lac Band of Lake Superior Chippewa
Nancy Gruver, Founder and CEO, New Moon
Kao Ly Ilean Her, Executive Director, Council on Asian-Pacific Minnesotans
Sally Kenney, Professor, and Director, Center on Women and Public Policy, Humphrey Institute of Public Affairs, University of Minnesota
Andrea Lindgren, Research & Policy Analyst, Office on the Economic Status of Women
Heather Johnston Nicholson, Ph.D., Director of Research, Girls Incorporated
Melanie Peterson-Hickey, Research Scientist 3, Minnesota State Department of Health
Dr. Verna Cornelia Price, President/Principal Consultant, J. Cameron & Associates
Michael D. Resnick, Ph.D., Professor, and Gisela and E. Paul Konopka Chair in Adolescent Health and Development Director, Healthy Youth Development Prevention Research Center, Division of Adolescent Health and Medicine, Department of Pediatrics, University of Minnesota
Brigid Riley, Executive Director, Minnesota Organization on Adolescent Pregnancy, Prevention and Parenting
April Shaw, U.S. House of Representatives, Congresswoman Betty McCollum’s Office
Jo-Anne E. Stately, Vice President of Development, Indian Land Tenure Foundation
Sarah Stinson, Executive Director, Higher Self
Acknowledgements | Women’s Foundation of Minnesota