Embed Size (px)
Citation preview

OREGON PUBLIC EMPLOYEES RETIREMENT SYSTEM
BOARD MEETING AGENDA
Sadhana Shenoy, Chair Lawrence Furnstahl, Vice Chair Stephen Buckley Steve Demarest Jardon Jaramillo Kevin Olineck, Director SL1
Public testimony will be taken on action items at the Chair’s discretion. Please submit written testimony to [email protected] (three days in advance of the meeting is preferred.)
http://www.oregon.gov/PERS/
2020 Meetings: January 31, March 30*, May 29, July 31*, October 2, December 4* *Audit Committee planned for post-Board meeting
Friday
December 6, 2019 9:00 A.M.
PERS 11410 SW 68th Parkway
Tigard, OR
ITEM PRESENTER A. Administration
1. 2. 3. 4. 5.
October 4, 2019 Board Meeting Minutes Board Governance Assignments Director’s Report
a. Forward-Looking Calendar b. OPERF Investment Report c. Budget Execution Report d. Board Scorecard Report on Agency Performance Measures
Agency Strategic Plan Update CEM Benchmarking Results
SHENOY OLINECK RICKARD OLINECK REID
B. Administrative Rulemaking
1. 2. 3. 4. 5.
Notice of Alternate Death Benefit Rule First Reading of Work After Retirement Rules Adoption of Rules to Implement 2019 Legislation Adoption of Retirement Installments Fund and Retirement Allocation Fund Rules Adoption of SB 1049 Employer Programs Rules
VAUGHN
C. Action and Discussion Items
1. 2. 3. 4. 5. 6.
Secretary of State Actuarial Review Milliman Actuarial Contract Renewal SB 1049 Implementation Update Employer Incentive Fund Participation 2018 Valuation Update and Financial Modeling Results Adoption of Actuarial Equivalency Factor Tables
OLINECK MARBLE ELLEDGE-RHODES SOSNE MILLIMAN MILLIMAN

OREGON PUBLIC EMPLOYEES RETIREMENT SYSTEM
BOARD MEETING MINUTES
SL1 PERS Board Meeting December 6, 2019
Item A.1.a.
October 4, 2019
Board members present: Chair Sadhana Shenoy, Vice Chair Lawrence Furnstahl, Stephen Buckley and Jardon Jaramillo were present. Steve Demarest attended by phone.
Staff present: Amanda Marble, Anne Marie Vu, Dean Carson, Elizabeth Rossman, Jason Stanley, Jordan Masanga, Katie Brogan, Kevin Olineck, Laurel Galego, Marjorie Taylor, MaryMichelle Sosne, Melissa Piezonka, Richard Horsford, Sam Paris, Shane Perry, Shawn Range, Stephanie Vaughn, Yong Yang, Yvette Elledge-Rhodes
Others present: Aruna Masih, Carol Samuels, David Barenberg, David Moore, Deborah Tremblay, GayLynn Bath, Jaime Rodycer, Jeff Gudman, Jenn Baker, John Borden, Josh Eggleston, Kali Leinenbach, Kevin Grainey, Matt Larrabee, Nancy Brewer, Nate Carter, Nathan Klinkhammer, Patrick Heath, Roger Daws, Scott Preppernau, Shauna Tobiasson, Tahnin Fagerberg, Tim Collier A.1.a. Exhibit 1 is the meeting sign in sheet. Chair Sadhana Shenoy called the meeting to order at 10:00 a.m.
ADMINISTRATION
A.1.A. MEETING MINUTES OF JULY 26, 2019 At the request of Chair Shenoy, the minutes on item C.2. “valuation methods and assumptions including the assumed rate of return” will be updated to acknowledge that each Board member provided their rationale of what assumed rate of return they believed the board should adopt. This process allowed for a more fulsome discussion on this particular actuarial assumption, given its impact on the overall actuarial valuation. At the request of board member Buckley the meeting notes will be updated to reflect how each member voted on item C.2. Chair Shenoy, Vice Chair Furnstahl and board member Demarest voted for the motion. Board members Buckley and deAsis voted against the motion. Vice Chair Furnstahl moved to approve the minutes with the suggested amendments from the July 26, 2019 PERS Board meeting. Board member Buckley seconded the approval of the minutes. The motion passed unanimously. A.1.B. MEETING MINUTES OF AUGUST 16, 2019 Vice Chair Furnstahl moved to approve the minutes from the August 16, 2019 PERS Board meeting. Board member Buckley seconded the approval of the minutes. The motion passed unanimously. A.2. DIRECTOR’S REPORT Director Kevin Olineck presented the Director’s Report.

Board Meeting Minutes October 4, 2019 Page 2 of 5
SL1 PERS Board Meeting December 6, 2019
Olineck welcomed new PERS Board member Jardon Jaramillo. Olineck highlighted agency accomplishments, including the implementation of Fonolo, a callback feature for our members, and the completion of a major upgrade to the IBM FileNet electronic content management system. The agency received the National Association of Government Defined Contribution Administrators Inc. (NAGDCA) award, in recognition of PERS/OSGP Expo 2018. The 2019 PERS Expo will take place October 9 in Salem. PERS is expecting the release of both the Secretary of State (SOS) actuarial review and PERS’ response by next Wednesday. The review looked at the reasonableness and consistency of the methods, assumptions, data used in the December 31, 2017 actuarial valuation. This will be added as an agenda item at the December 6, 2019 Board meeting. The Board Orientation manual has received some minor updates. The 2020 Board meeting dates have been finalized. Going forward, the meeting times will be moved from 10:00 a.m. to 9:00 a.m. This will allow for longer meetings that do not stretch into lunch. The OPERF investment returns for the period ending August 31, 2019 show earnings of 8.87% year to date. Volatility continues in the market. The Pensions & Investments magazine recently posted its top 300 retirement funds in the world and Oregon PERS was ranked as the 45th largest in the world, based on assets under management, and the 16th largest public sector plan in the United States. For Item C.6., Milliman will be presenting, for adoption, their final Actuarial Methods and Assumptions recommendations, which include PERS specific data and experience. This is part two of the adoption process, as the board adopted the Actuarial Methods and Assumptions, on a preliminary basis, at the July meeting. SB1049 implemented a new reporting requirement whereby the board has to provide a report to the Legislature at least 30 days prior to formally adopting the Methods and Assumptions, including the Assumed Rate at this meeting. This report was provided to the Legislature, and accepted by the Interim Ways and Means Committee, in September Legislative Days. Chair Shenoy welcomed Jardon Jaramillo to the PERS Board. Jaramillo serves as Controller and Assistant Treasurer at Portland General Electric. He previously worked as Director of Compensation and Benefits. A.3. AGENCY STRATEGIC PLAN UPDATE Director Kevin Olineck presented the Agency Strategic Plan Update. The purpose is provide an update on progress on the Strategic Plan Goals and Objectives. Management will be providing an updated Strategic Plan at the December meeting that will guide the agency’s 2021-23 budget submissions. Approximately 1/3 of what had been planned is being constrained by SB1049. Many of the strategic pillars recognize risks. Olineck explained that the

Board Meeting Minutes October 4, 2019 Page 3 of 5
SL1 PERS Board Meeting December 6, 2019
agency wants to build out the enterprise risk management program, which shows the risk profile for the entire organization.
ADMINISTRATIVE RULEMAKING Stephanie Vaughn, Policy Analysis and Compliance Section Manager, presented. The board adopted the assumed rate rule at the July board meeting, however rules are not official until they are filed with the Secretary of State. SB 1049 established a new requirement that the PERS Board must provide notice to the Legislature at least 30 days prior to adopting the actuarial methods and assumptions. The report was sent to the Legislature on August 13, 2019 and 30 days passed on September 13, 2019 and the rules were filed with the Secretary of State, making them official as of September 26, 2019. The SB1049 rules will come to the December board meeting for adoption.
B.1. NOTICE OF RULES TO IMPLEMENT 2019 LEGISLATION
Vaughn presented Notice of Rulemaking for Rules to Implement 2019 Legislation: OAR 459-005-0525, Ceiling on Compensation for Purposes of Contributions and Benefits, OAR 459-009-0070, Actuarial Pooling of Employer Liability, OAR 459-017-0060, Reemployment of Retired Members, OAR 459-075-0300, Reemployment of a Retired Member of the OPSRP Pension Program, OAR 459-050-0001, OSGP Definitions, OAR 459-076-0045, Cessation of Disability Benefits Upon Reaching Normal Retirement Age. A rulemaking hearing will be held October 29, 2019, at 2:00 p.m. at PERS headquarters in Tigard. The public comment period ends November 5, 2019, at 5:00 p.m. The rule is scheduled to be brought before the PERS Board for adoption at the December 6, 2019 Board meeting. No Board action was required.
B.2. NOTICE OF RETIREMENT INSTALLMENT FUND AND RETIREMENT ALLOCATION
Vaughn presented notice of Rulemaking for Retirement Allocation Fund and Retirement Installments Fund Rules: OAR 459-007-0001, Definitions, OAR 459-007-0005, Annual Earnings Crediting, OAR 459-007-0330, Crediting Earnings for IAP Account Installment Payments, OAR 459-007-0335, Crediting Earnings for IAP Account Pre-Retirement Death Benefit Payments, OAR 459-080-0015, Investment of IAP Account Balance. A rulemaking hearing will be held October 29, 2019, at 2:00 p.m. at PERS headquarters in Tigard. The public comment period ends November 5, 2019, at 5:00 p.m. The rules are scheduled to be brought before the PERS Board for adoption at the December 6, 2019 Board meeting. No board action was required.
ACTION AND DISCUSSION ITEMS
C.1. MILLIMAN CONTRACT RENEWAL
Amanda Marble, Financial Reporting Manager presented. PERS’ actuarial services contract with Milliman will terminate December 31, 2019, unless the PERS Board takes specific action to extend the contract. This contract took effect on January 1, 2015, and has been in effect for the initial four-year term. The contract allows for an extension of additional one- or two-year periods, for a total term not-to-exceed 10 years. Staff recommends extending the contract.

Board Meeting Minutes October 4, 2019 Page 4 of 5
SL1 PERS Board Meeting December 6, 2019
Board member Buckley commented positively of Milliman, however the board has not seen the SOS actuarial review report that has been prepared and is being released next week. He suggested deferring action on the renewal of the Milliman contract to the December meeting so the board members can have the opportunity to review the peer review report before voting.
Vice Chair Furnstahl commented that he is willing to defer or take action today. It seems likely they will renew the contract, but it would be good form to review the report prior to voting.
The PERS Board decided to defer the vote to the December 6, 2019 Board meeting.
C.2. SB1049 IMPLEMENTATION UPDATE
Yvette Elledge-Rhodes, Deputy Director, presented.
Elledge-Rhodes gave an update on the five individual projects that make up the SB 1049 implementation program. Updates include the establishment of program and project governance, project planning activities, resource acquisition, OSCIO Stage Gate process requirements, budget structure, reporting, and communications.
The biweekly program dashboard and status reports were shared in the board packet. The dashboard has since been updated to better reflect dates and a more realistic assessment of the health of the projects. Staff are meeting monthly with external stakeholders who are helping the processes move quickly. Two of the projects are in effect January 1, 2020, so much of the work is determining and defining what will be delivered.
The member redirect project has been the most challenging. The identification of what we will be delivering on July 1, 2020 is still in process. Progress is being made. With further development of schedules, we will be able to determine what may be missing or not delivered on time.
No board action was required.
C.3. EMPLOYER INCENTIVE FUND PARTICIPATION
MaryMichelle Sosne, Actuarial Business Specialist presented.
Sosne gave an update on the Employer Incentive Fund (EIF). As of September 13, 2019, PERS has approved 31 EIF applications from 29 total employers. PERS has received applications from 11 special districts, nine school districts, three charter schools, three cities, two counties, and one education service district. PERS will open the Employer Incentive Fund to all employers on December 2, 2019.
No board action was required.
C.4. MEMBER & EMPLOYER SURVEY RESULTS Dean Carson, Member Engagement and Communications Director, and Elizabeth Rossman, Communications Officer, presented the 2019 Member & Employer Satisfaction Survey results.

Board Meeting Minutes October 4, 2019 Page 5 of 5
SL1 PERS Board Meeting December 6, 2019
PERS’ 2019 results show a decline in satisfaction from members and employers since 2018, but show fairly similar overall member results with 2017—another year with major legislative discussions around PERS. However, non-retiree satisfaction increased compared with 2017. Carson reviewed the results and highlighted key issues and suggestions to resolve these issues. PERS recognizes the need for more actionable feedback from non-retired members. Analysis shows that moving the surveys to online-only and conducting them in May was a success. Survey data will be used to further develop and enhance the best communication strategies to serve member and employer stakeholder needs. No board action was required. C.5. FINAL ADOPTION OF VALUATION METHODS & ASSUMPTIONS Stephanie Vaughn, Policy Analysis and Compliance Section Manager, stated that in July the board passed a preliminary adoption subject to filing the report to the legislature. Board member Buckley motioned to adopt the recommended changes to the actuarial methods and assumptions as presented by Milliman in the 2018 Experience Study. Vice Chair Furnstahl seconded the motion. The motion passed unanimously. C.6. DECEMBER 31, 2018 SYSTEM-WIDE VALUATION RESULTS This agenda item was taken out of order before item C.5. Scott Preppernau and Matt Larrabee of Milliman presented. The presentation reviewed valuation results that form the basis for advisory rates for 2021-23. Formal, detailed results will be issued in the December 31, 2018 System-Wide Actuarial Valuation Report. Milliman will return to the December 6, 2019 Board meeting with detailed advisory employer contribution rates and funded status projections. No board action was required. Chair Shenoy noted that written public testimony (A.1.a. Exhibit 2) from Douglas Berg of Eugene was received by the board. She adjourned the board meeting at 11:46 a.m. Respectfully submitted,
Kevin Olineck, Director

A.1.a. Exhibit 1

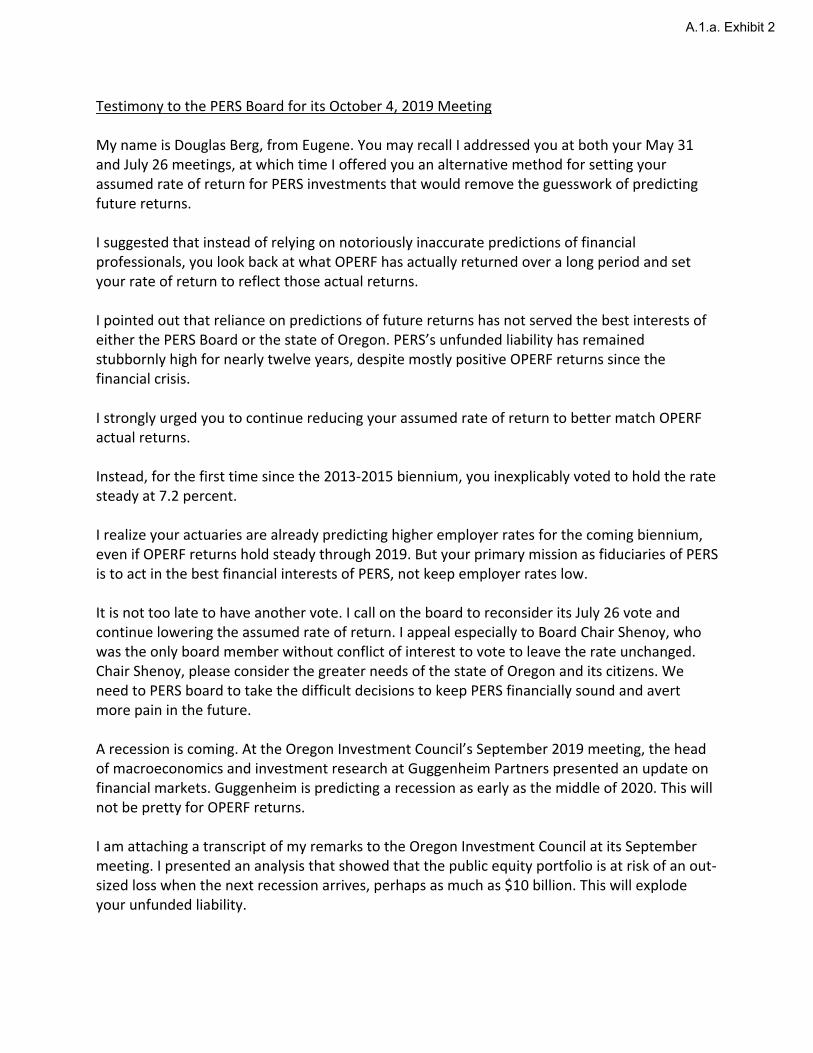
Testimony to the PERS Board for its October 4, 2019 Meeting
My name is Douglas Berg, from Eugene. You may recall I addressed you at both your May 31 and July 26 meetings, at which time I offered you an alternative method for setting your assumed rate of return for PERS investments that would remove the guesswork of predicting future returns.
I suggested that instead of relying on notoriously inaccurate predictions of financial professionals, you look back at what OPERF has actually returned over a long period and set your rate of return to reflect those actual returns.
I pointed out that reliance on predictions of future returns has not served the best interests of either the PERS Board or the state of Oregon. PERS’s unfunded liability has remained stubbornly high for nearly twelve years, despite mostly positive OPERF returns since the financial crisis.
I strongly urged you to continue reducing your assumed rate of return to better match OPERF actual returns.
Instead, for the first time since the 2013-2015 biennium, you inexplicably voted to hold the rate steady at 7.2 percent.
I realize your actuaries are already predicting higher employer rates for the coming biennium, even if OPERF returns hold steady through 2019. But your primary mission as fiduciaries of PERS is to act in the best financial interests of PERS, not keep employer rates low.
It is not too late to have another vote. I call on the board to reconsider its July 26 vote and continue lowering the assumed rate of return. I appeal especially to Board Chair Shenoy, who was the only board member without conflict of interest to vote to leave the rate unchanged. Chair Shenoy, please consider the greater needs of the state of Oregon and its citizens. We need to PERS board to take the difficult decisions to keep PERS financially sound and avert more pain in the future.
A recession is coming. At the Oregon Investment Council’s September 2019 meeting, the head of macroeconomics and investment research at Guggenheim Partners presented an update on financial markets. Guggenheim is predicting a recession as early as the middle of 2020. This will not be pretty for OPERF returns.
I am attaching a transcript of my remarks to the Oregon Investment Council at its September meeting. I presented an analysis that showed that the public equity portfolio is at risk of an out-sized loss when the next recession arrives, perhaps as much as $10 billion. This will explode your unfunded liability.
A.1.a. Exhibit 2

Now is not the time to hold your assumed rate steady. You must lower it further before you face the much larger problem that is on the horizon. Thank you. Douglas Berg 206 353-2350 [email protected] Transcript of my remarks to the Oregon Investment Council, September 18, 2019 My name is Douglas Berg from Eugene. You may recall I addressed you in August 2018, to express my concerns about the poor OPERF returns over the last decade and their negative impact on the PERS unfunded liability. I return today to reiterate those concerns and to sound an urgent warning about OPERF’s substantial downside risk as the economy weakens. After your Public Equity Annual Review in October 2018, I studied the makeup of the public equity portfolio in some detail. Considering public equity is OPERF’s core portfolio, it was very concerning to see that you manage the entire portfolio under a single all-world benchmark. This means you allocate about half your public equity to foreign stocks. This allocation is as inexplicable as it is dangerous and likely is the biggest single reason your public equities have done so poorly since 2008. Starting with the last recession (2008), the annualized rate of return on your public equity portfolio through 2018 is under 4 percent, while the S&P 500 and Russell 3000 annualized returns for the same period are about 7.5 percent. Note that I am referring to the 11 plus year period starting in 2008, not to the current 10-year returns reported on your website, which reflect only the long bull market in stocks. Any analysis of OPERF’s long-term return potential must include a full economic cycle, but the information on your website is decidedly unhelpful as you recently scrubbed it of return details prior to 2009. After my review of the public equities portfolio, I wrote you a letter expressing my concerns, in which I said “You have perfectly positioned this portfolio to get clobbered when the next recession hits, since few foreign economies have fully recovered from the 2008 financial crisis, including most of the largest economies in Europe.” As it turned out, 2018 provided a glimpse as to how vulnerable your public equities are in falling markets. In 2018, the public equity portfolio lost over 10 percent, while the S&P 500 lost about 4.5 percent. So on a percentage basis, your public equities lost almost 2 ½ times the S&P, a truly

horrifying performance. And this while we are still in a bull market. Yes, you beat your benchmark, but that only underscores how completely inappropriate this benchmark is. We all know a recession is coming. If we extrapolate your 2018 public equity losses to losses that are typical in broad markets during a recession, such as a 20 percent loss in the S&P 500, your public equities will indeed get clobbered. Thirty or 40 percent is not out of the question, based on 2018’s performance, perhaps erasing as much as $10 billion from OPERF, exploding PERS’s unfunded liability, and creating a crisis for the state of Oregon. You must not ignore the warning in 2018. You must act now to correct your bizarre asset allocation in public equities. I understand the need for diversity in investing. But allocating half of your public equities to foreign investments is way outside normal diversification. If you had been using a more sensible allocation of 25 percent foreign stocks since 2008, you could have realized about $10 billion more in returns, close to half of the current PERS unfunded liability. I call on you to change your policy so that the public equity portfolio is managed using two benchmarks, one for U.S. equities and one for foreign equities, and to set the U.S. equity allocation to a much safer and more normal 75 percent of equities. Continuing on your current path should not be an option. Thank you.

SL1 PERS Board Meeting December 6, 2019
Item A.2.
PERS Board Governance Assignments
Proposed for 2020
Stephen Buckley Audit Committee
Steve Demarest Legislative Advisory Committee
Retiree Health Insurance Advisory Committee
Lawrence Furnstahl Board Vice-Chair
Legislative Advisory Committee
Jardon Jaramillo Audit Committee (Chair)
Sadhana Shenoy Board Chair
Audit Committee

PERS makes use of the ADKAR (Awareness, Desire, Knowledge,
Ability, and Reinforcement) change management methodology and
is rigorously applying it to our SB 1049 implementation efforts. We
surveyed all staff to understand their change readiness and were
pleased that close to half of staff responded. Results show that most
staff members feel pretty good about the changes occurring due to
SB 1049. The survey identified the Knowledge category as a barrier
point, which suggests that change management work should make
training plans the most important area of focus at this time. Staff and
managers indicated that they have the ability to successfully execute
the SB 1049 Implementation Program, which is a very positive place
to build upon.
More detailed SB 1049 implementation reports will be provided in
the board packet.
AGENCY HIGHLIGHTSAND ACCOMPLISHMENTS
EMPLOYEE SURVEY
Recently, staff had the opportunity to participate in an employee
engagement survey. Spearheaded by Human Resources, this is the
first comprehensive engagement survey the agency has done in
some years. The survey measured two components – Employee
Satisfaction and Employee Engagement. Employee Satisfaction was
based on one question, “How satisfied are you as an employee at
PERS?” Employee Satisfaction is a measure of how content employees
are with the overall agency as a place to work. It is important to note,
however, that being a satisfied employee does not equate with being
engaged, though the two are highly related.
Employee Engagement was based on twelve questions from
Gallup’s pioneering research and global meta-analysis on employee
engagement, as those that best predict employee and work-group
performance. Gallup defines engaged employees as those who are
“involved in, enthusiastic about, and committed to their work and
contribute to their organization in a positive manner.”
The survey response rate was 63% (225 out of 355 employees
responded to the survey). In the world of surveys, a good response
rate is +60%, so we were confident the survey gives us reliable data.
Employee Satisfaction Results
The TopBox score, which combines the highest two responses to
create a single score for employee satisfaction is 46%.
The positive news is that the majority of respondents:
• believe in the PERS mission
• know what’s expected of them at work
• are committed to doing what they do best every day to produce
quality work
Where we have opportunities for improvement are in:
• recognizing employees for doing good work
• giving timely performance and progress feedback
• valuing others’ opinions
• encouraging employees’ developmentI want to continue to highlight where PERS staff members have not only
made great progress with standard operational initiatives, but also made
significant progress on strategic initiatives. The following are initiatives
that deserve to be mentioned, with staff publicly acknowledged for their
efforts.
DECEMBER 2019
SENATE BILL 1049 (SB 1049) CHANGE MANAGEMENT METHODOLOGY
The grand mean on the Employee Survey shows largely positive results for PERS and its culture, and also enables us to see opportunities for improvement.
Item A.3.
SL1 PERS Board Meeting December 6, 2019
OREGON PUBLIC EMPLOYEES RETIREMENT SYSTEM DIRECTOR'S REPORT
KEVIN OLINECK, DIRECTOR
This Director’s Report tries to encapsulate, at a high level,
noteworthy changes that have taken place since the last board
meeting, while highlighting staff accomplishments.
DE
CE
MB
ER
20
181
DE
CE
MB
ER
20
19

SL1 PERS Board Meeting December 6, 2019
DE
CE
MB
ER
20
18
OREGON PUBLIC EMPLOYEES RETIREMENT SYSTEM DIRECTOR'S REPORT2
DE
CE
MB
ER
20
19
CDM NOW OPERATIONAL
Accomplishments since this initiative began are as follows:
• completion of the installation of the Data Warehouse into Production
• development of the CDM Team
• development of the workflow for new report requests
• continued development, testing, and migration of current production reports to the CDM
Executive leadership and management are committed to focus our change initiatives
and engagement strategy on items impacting overall engagement and on items with
low scores that are strongly linked to engagement.
PERS EXPO
PERS hosted its fourth Retirement Expo in conjunction with National Retirement
Security Week. This year’s theme was "Your Path to Financial Wellness” and
was attended by over 3,000 members. I am particularly proud of how the Expo is
moving towards a more holistic view of the benefits that PERS offers to members,
be they our PERS Benefits, Oregon Savings Growth Plan (OSGP), or the PERS
Health Insurance Plan (PHIP). As we continue to brand ourselves as a Retirement
Education Resource, I believe it is incumbent upon the agency to build out integrated
communications, so that members can understand and appreciate our full offerings.
Given our ongoing success with the Expo, we received some great media attention.
Dean Carson and Roger Smith participated in a podcast hosted by Cammack
Retirement Group. Additionally, an article about PERS Expo, written by Dean,
was published by My Oregon News. The website, which is administered by the
Governor’s Office, is dedicated to delivering interesting and engaging articles about
how government impacts the lives of Oregonians. Additionally, Dean and Roger
were also interviewed by Benefits Magazine, with the article being tentatively
published in the January issue.
CENTRAL DATA MANAGEMENT
One of our Strategic Goals centered on the
development of a Data Warehouse to serve
the reporting needs of the agency. This
is supported by a customer service team
specializing in managing data requests,
gathering requirements, partnering with
report developers, and monitoring the testing
of reporting functionality and accuracy. This
agency-wide service makes access to data
easier to achieve, consistent in quality and
accuracy and serves as the custodian of the
single source of truth for the agency.
Recently, this initiative shifted from project to
operational, though further progress has been
slowed with the passing of SB 1049; despite
this, work still continues. Over the longer term,
the Central Data Management (CDM) team
will build out integrated reports to support our
POBMS program, as well as enable the agency
to make strategic, tactical, and operational
decisions based on facts and data.
This year's PERS Expo boasted a large turnout from both PERS employee volunteers and PERS members. Staff were on hand to welcome, assist, and counsel members, and state and local government employees turned out in droves to take advantage of the educational opportunities and workshops.

CONTINUITY MANAGEMENT PROGRAM
As noted in the July 2019 Director’s Report, the agency has made
significant progress with respect to our Continuity Management
Program. Through a properly designed, implemented, and
maintained Continuity Management Program (CMP), PERS will
be better prepared to respond and recover its critical operations,
in the event of a business disruption or crisis event. This includes
a governance structure intended to provide oversight to ensure
the execution of the CMP-related activities, including business
continuity (BC), disaster recovery (DR), and continuity of operations
(COOP).
Part of governance support includes ready access to relevant
information. Recently, the Continuity Management Team published
its first comprehensive Continuity Management Binder. Easy access
to all relevant information allows staff to be more prepared to
activate and execute CMP-related plans when needed.
SUPPORTING OUR COMMUNITY
Charitable Fund Drive
PERS staff are ardent supporters of the Charitable Fund Drive (CFD),
a cross-governmental annual fundraising initiative. Staff are engaged
in supporting the CFD through direct monetary pledges and other
fundraising activities. By raising over $16,000, we are one of the top
governmental fundraising entities for similar-sized organizations.
Children’s Transitional School Halloween Visit
For over 25 years, PERS has hosted an annual Halloween event for
the children from the Community Transitional School (CTS). We had
over 70 students come to our headquarters location to participate
in judging our Halloween Costume Parade, have lunch with staff,
and trick-or-treat. Staff member participation includes providing
CTS with much needed classroom supplies which allows them to
continue their great work.
Hosting a loaded baked potato sale was just one of the many ways that PERS staff creatively raised money in support of the Charitable Fund Drive.
In addition to donating supplies, staff knitted hats and provided copious treats for the visiting students, arrayed all along the official trick-or-treat path that wound through the sections. The culmination of the visit was when the kids voted for the best decorated cubicle and best costume, over lunch donated from Olive Garden.
SL1 PERS Board Meeting December 6, 2019
DE
CE
MB
ER
20
183
DE
CE
MB
ER
20
19
OREGON PUBLIC EMPLOYEES RETIREMENT SYSTEM DIRECTOR'S REPORT

SL1 PERS Board Meeting October 4, 2019
Item A.3.a.
PERS Board Meeting Forward-Looking Calendar
Friday, January 31, 2020 Annual Report of Director’s Financial Transactions Legislative Preview/Update Preliminary Earnings Crediting and Reserving IAP TDF Update Monday, March 30, 2020* Legislative Session Review Final Earnings Crediting and Reserving Oregon Investment Council Performance Review Agency Budget Preview for Next Biennium Friday, May 29, 2020 Board Scorecard Report on Agency Performance Measures Retiree Health Insurance Plan Renewals and Rates Agency Budget Development for Next Biennium Friday, July 24, 2020* Propose 2021 Board Meeting Dates Approve 2021-2023 Agency Request Budget Presentation of December 31, 2019 System Valuation Friday, October 2, 2020 Legislative Update and Agency-Requested Legislative Concepts Member and Employer Survey Results Actuarial Valuation and Adoption of 2021-2023 Employer Contribution Rates Friday, December 4, 2020* Board Governance Assignments Board Scorecard Report on Agency Performance Measures Approval to File Agency-Requested Legislative Concepts Financial Modeling Presentation *Audit Committee planned for post-Board meeting

Returns for periods ending SEP-2019 Oregon Public Employees Retirement Fund
Year- 1 2 3 4 5 7 10OPERF Policy1 Target1 $ Thousands2
Actual To-Date3YEAR YEARS YEARS YEARS YEARS YEARS YEARS
Public Equity 27.5-37.5% 32.5% 26,442,226$ 34.3% 15.41 (0.07) 4.69 9.57 10.21 7.01 9.44 9.00Private Equity 13.5-21.5% 17.5% 17,188,196$ 22.3% 9.04 13.83 16.27 16.02 12.45 11.61 13.42 14.18Total Equity 45.0-55.0% 50.0% 43,630,422$ 56.5%Opportunity Portfolio 0-3% 0% 1,678,094$ 2.2% 2.66 1.28 5.03 6.31 6.40 5.75 7.82 9.18
Total Fixed 15-25% 20.0% 15,827,308$ 20.5% 8.50 9.40 4.50 3.32 3.71 3.27 3.13 5.00Risk Parity 0.0-2.5% 2.5% -$ 0.0%Real Estate 9.5-15.5% 12.5% 8,405,853$ 10.9% 5.67 6.34 8.02 8.13 8.62 9.18 10.34 9.68Alternative Investments 7.5-17.5% 15.0% 7,598,481$ 9.8% (0.67) (2.98) (0.54) 2.70 2.81 1.01 2.60
Cash w/Overlay 0-3% 0% 16,937$ 0.0% 2.70 3.28 2.49 2.08 1.82 1.56 1.30 1.18
TOTAL OPERF Regular Account 100.0% 77,157,095$ 100.0% 9.75 5.42 7.01 8.80 8.57 7.05 8.57 9.06OPERF Policy Benchmark 0 9.63 5.95 7.25 9.12 9.01 7.44 9.03 9.30Value Added 0.11 (0.54) (0.25) (0.32) (0.44) (0.39) (0.46) (0.24)
Target Date Funds 2,417,185
TOTAL OPERF Variable Account 469,736$ 16.12 0.84 5.34 9.77 10.47 7.02 9.21 8.81
Asset Class Benchmarks:Russell 3000 20.09 2.92 10.00 12.83 13.36 10.44 13.00 13.08OREGON MSCI ACWI EX US IMI NET 11.38 (1.84) (0.04) 6.10 7.02 3.05 5.16 4.66MSCI ACWI IMI NET 15.87 0.48 4.95 9.36 10.07 6.61 8.83 8.45RUSSELL 3000+300 BPS QTR LAG 4.02 12.23 15.17 17.41 14.23 13.47 17.17 18.05OREGON CUSTOM FI BENCHMARK 8.14 9.28 4.34 3.02 3.33 2.98 2.69 3.85OREGON CUSTOM REAL ESTATE BENCHMARK 3.53 5.46 6.46 6.61 7.50 8.57 9.25 9.12CPI +4% 5.24 5.77 6.07 6.15 5.99 5.58 5.55 5.7891 Day Treasury Bill 1.81 2.39 1.99 1.54 1.22 0.98 0.72 0.54
Total OPERF NAV(includes Variable Fund assets)
One year ending SEP-2019($ in Millions)
1OIC Policy revised April 2019.2Includes impact of cash overlay management.3For mandates beginning after January 1 (or with lagged performance), YTD numbers are "N/A". Performance is reflected in Total OPERF. YTD is not annualized.
Regular Account Historical Performance (Annual Percentage)
76,287 76,55275,094
77,267 77,660 77,87878,728
77,413
79,494 79,559 79,401 80,044
50,000
55,000
60,000
65,000
70,000
75,000
80,000
85,000
OCT-2018 NOV-2018 DEC-2018 JAN-2019 FEB-2019 MAR-2019 APR-2019 MAY-2019 JUN-2019 JUL-2019 AUG-2019 SEP-2019 Item A.3.b.

Returns for periods ending OCT-2019 Oregon Public Employees Retirement Fund
Year- 1 2 3 4 5 7 10OPERF Policy1 Target1 $ Thousands2
Actual To-Date3YEAR YEARS YEARS YEARS YEARS YEARS YEARS
Public Equity 27.5-37.5% 32.5% 26,413,425$ 34.1% 18.26 10.91 4.81 11.13 8.99 7.34 9.93 9.49Private Equity 13.5-21.5% 17.5% 17,184,545$ 22.2% 9.56 14.11 15.47 16.20 12.58 11.72 13.49 14.24Total Equity 45.0-55.0% 50.0% 43,597,970$ 56.2%Opportunity Portfolio 0-3% 0% 1,680,950$ 2.2% 3.55 2.06 5.41 6.76 6.70 6.03 7.82 9.00
Total Fixed 15-25% 20.0% 15,904,473$ 20.5% 8.72 10.36 4.56 3.57 3.66 3.20 3.08 4.91Risk Parity 0.0-2.5% 2.5% -$ 0.0%Real Estate 9.5-15.5% 12.5% 8,682,941$ 11.2% 5.59 6.08 7.82 8.62 8.16 8.82 10.31 9.71Alternative Investments 7.5-17.5% 15.0% 7,650,694$ 9.9% (1.20) (1.87) (0.76) 2.58 2.13 1.17 2.56
Cash w/Overlay 0-3% 0% 21,720$ 0.0% 2.96 3.38 2.57 2.14 1.87 1.60 1.33 1.19
TOTAL OPERF Regular Account 100.0% 77,538,749$ 100.0% 10.75 9.63 6.79 9.50 7.97 7.11 8.72 9.21OPERF Policy Benchmark 0 11.03 10.15 7.27 9.91 8.47 7.62 9.25 9.50Value Added (0.29) (0.52) (0.47) (0.41) (0.50) (0.50) (0.53) (0.28)
Target Date Funds 2,448,164
TOTAL OPERF Variable Account 476,023$ 19.33 12.35 5.71 11.48 9.23 7.43 9.73 9.30
Asset Class Benchmarks:Russell 3000 22.68 13.49 9.99 14.47 11.82 10.31 13.63 13.62OREGON MSCI ACWI EX US IMI NET 15.35 10.92 0.78 7.93 6.09 4.01 5.64 5.16MSCI ACWI IMI NET 19.06 12.01 5.33 11.07 8.82 7.02 9.36 8.94RUSSELL 3000+300 BPS QTR LAG 4.67 10.12 14.54 17.65 14.41 13.62 17.28 18.12OREGON CUSTOM FI BENCHMARK 8.26 10.08 4.36 3.28 3.33 2.88 2.65 3.81OREGON CUSTOM REAL ESTATE BENCHMARK 3.90 5.19 6.36 6.73 7.60 8.65 9.31 9.16CPI +4% 5.83 5.83 6.22 6.19 6.06 5.68 5.59 5.7991 Day Treasury Bill 2.01 2.40 2.04 1.60 1.27 1.02 0.75 0.56
Total OPERF NAV(includes Variable Fund assets)
One year ending OCT-2019($ in Millions)
1OIC Policy revised April 2019.2Includes impact of cash overlay management.3For mandates beginning after January 1 (or with lagged performance), YTD numbers are "N/A". Performance is reflected in Total OPERF. YTD is not annualized.
Regular Account Historical Performance (Annual Percentage)
76,55275,094
77,267 77,660 77,87878,728
77,413
79,494 79,559 79,401 80,044 80,463
50,000
55,000
60,000
65,000
70,000
75,000
80,000
85,000
NOV-2018 DEC-2018 JAN-2019 FEB-2019 MAR-2019 APR-2019 MAY-2019 JUN-2019 JUL-2019 AUG-2019 SEP-2019 OCT-2019 Item A.3.b.

SL1 PERS Board Meeting December 6, 2019
Item A.3.c.
Public Employees Retirement System Headquarters:
11410 S.W. 68th Parkway, Tigard, OR Mailing Address:
P.O. Box 23700 Tigard, OR 97281-3700
888-320-7377 TTY (503) 603-7766
www.o re go n .go v/p er s
Oregon Kate Brown, Governor
December 6, 2019 TO: Members of the PERS Board FROM: Greg Gabriel, Senior Financial Analyst SUBJECT: December 2019 Board Report 2019-21 OPERATING BUDGET Operating expenditures for September 2019 and preliminary expenditures for October 2019 were $3,729,477 and $8,445,994 respectively. Final expenditures for October closed in the Statewide Financial Management System (SFMS) on November 15, 2019, and will be included in the January 2020 report to the PERS Board.
• To date, the agency has expended a total of $18,785,019 or 16.7% of PERS’ legislatively adopted operations budget of $112,657,461.
• At this time, the agency’s projected positive variance is $3,796,869. • SB 1049 expenditures for September 2019 and preliminary October expenditures were $71,803
and $407,775 respectively. To date the agency has expended $479,578 of the legislatively adopted budget of $39,059,714.
2017-19 OPERATING BUDGET Operating expenditures for the 2017 – 2019 biennium paid September and October 2019 were $184,995 and $164,485 respectively. The current projected positive variance is $5,725,025, or approximately 5.6% of the operations budget. To date, the agency has expended a total of $95,643,846 or 94.1% of PERS’ legislatively approved operations budget of $101,647,871. PERS will continue to pay invoices for goods received and for services rendered as of June 30, 2019 in the following months, up until December 31, 2019. 2019-21 NON-LIMITED BUDGET
The adopted budget includes $12,504,627,192 in total estimated non-limited budget expenditures. Non-limited budget expenditures include benefit payments, health insurance premiums, and third-party administration payments for both the PERS Health Insurance Program and the Individual Account Program (IAP).
• Preliminary Non-Limited expenditures through October 2019 are $1,534,821,543. A.3.c. Attachment – 2017-19, 2019-21, SB1049 Agency-wide Budget Execution Summary Analysis

PERS Monthly Budget Report2017-19 Agency-wide Budget Execution
Summary For the Month of October 2019
Limited - Operating Budget
2017-19 Biennial Summary
Summary of activity after AY 17/19 close
2017-19 Biennial Summary
Non-Limited Budget
Projected ExpendituresActual Expenditures
Actual Expenditures
Pension0%
IAP0%
Health Insurance
0%
Projected Expenditures

PERS Monthly Budget Report2019-21 Agency-wide Budget Execution
Preliminary For the Month of October 2019
Limited - Operating Budget
2019-21 Biennial Summary
Monthly Summary
2019-21 Biennial Summary
Non-Limited Budget
Actual Expenditures
Actual Expenditures Projected Expenditures
Projected Expenditures

Biennial Summary
SB 1049 Budget ReportSummary Budget Analysis
Preliminary For The Month of October 2019
G E N E R A L O V E R H E A D
S A L A R Y L I M I T S P R O J E C T
W O R K A F T E R R E T I R E M E N T
P R O J E C T
M E M B E R R E D I R E C T P R O J E C T
E M P L O Y E R P R O G R A M S
P R O J E C T
M E M B E R C H O I C E
P R O J E C T
EXPENDITURES BY PROJECT
8 0 2 - P R O J E C T M A N A G E M E N T &
A D M I N
8 0 3 - Q U A L I T Y A S S U R A N C E A N D
T E S T I N G
8 0 4 - I N F O T E C H N O L O G Y
A P P L I C A T I O N S
8 0 5 - O P E R A T I O N A L I M P L E M E N T A T I O N
8 0 6 - C O N T I N G E N C Y R E S E R V E
EXPENDITURES BY PACKAGE

SL1 PERS Board Meeting December 6, 2019
Item A.3.d.
Public Employees Retirement System Headquarters:
11410 S.W. 68th Parkway, Tigard, OR Mailing Address:
P.O. Box 23700 Tigard, OR 97281-3700
888-320-7377 TTY (503) 603-7766
www.o re go n .go v/p er s
Oregon Kate Brown., Governor
December 6, 2019 TO: Members of the PERS Board FROM: POBMS Council SUBJECT: Board Scorecard Report on Agency Performance Measures
A key part of PERS’ Outcome-Based Management System (POBMS) is a Quarterly Target Review of scorecards that evaluate our effectiveness in a number of Outcome and Process Measures. These measures foster accountability and transparency in key operating areas. The scorecard results help direct strategic planning, resource allocation, and risk assessment.
The attached Board Scorecard Report for third quarter 2019 focuses on several measures we currently track, based on essential business operations. A targeted performance range is created for each measure:
“Green” – performance is at, or above, acceptable levels “Yellow” – performance is marginally below acceptable levels “Red” – performance is significantly below; corrective action such as assigning a problem
solving team should be directed
Highlights include:
Four consecutive quarters in the Green range for Eligibility Reviews Completed Three out of four quarters in the Green for Accuracy of Calculations A positive trend with five of the eight measures Four of the eight highlighted measures in the Green range
The next report will be presented at the May 29, 2020 meeting, showing the scorecard results for the first quarter. If you would like us to report on any different measures, please let us know.
A.3.d. Attachment 1 – Board Scorecard Report for Third Quarter 2019

PUBLIC EMPLOYEES RETIREMENT SYSTEMOutcome-Based Performance Review
K:\Board Documents\2019\12 06 2019 Board Meeting\A.3.d Att 1 PERS Board Scorecard Report Q3 2019 1 of 2
PERS Board Scorecard Report - QTR: 2019 Q3 - Quarter ended September 30, 2019
Operating Processes - Highlighted Measures
Red Yellow Green
OP3c Estimate KPM% of estimate requests completed within 30 days of receipt
<75% 75-85 >85% 95% Quarterly 90.0% 78.0% 64.0% 38.0% -Estimate tracking tool broke, using manual process to track estimates, process improvement initiated during 3rd quarter, multiple system outages.
OP4aEligibility review completed
% of applications completed by the eligibility team within 30 days of the effective retirement
<50% 50-70 >70% 80% Monthly 82.0% 86.0% 90.0% 85.0% -
OP5bAccuracy of calculations
% of sample calculations that are accurate within plus or minus $5
<95% 95-99 >99% 100% Monthly 100.0% 96.7% 99.4% 100.0% +
OP5cTimely benefit calculation
% of calculations completed within 15 calendar days from completed application date
<93% 93-96 >96% 100% Monthly 95.4% 98.3% 96.1% 96.7% +July retirement spike and system down time impacted performance. Measure ranges updated to reflect challenging, but realizable goals.
Q4 2018 Q3 2019 Corrective Action & CommentsTrendQ1 2019 Q2 2019Desired Perform
Trend
Data Collection Frequency
Measure Name Measure Calculation
RANGE
Target
14
16
35
Outcome & Process Measure Performance
0%
10%
20%
30%
40%
50%
60%
70%
2018 Q4 2019 Q1 2019 Q2 2019 Q3
70%
57% 58%54%
% P
Ms i
n G
reen
Sta
tus
Quarterly Green Performance
A.3.d. Attachment 1

PUBLIC EMPLOYEES RETIREMENT SYSTEMOutcome-Based Performance Review
K:\Board Documents\2019\12 06 2019 Board Meeting\A.3.d Att 1 PERS Board Scorecard Report Q3 2019 2 of 2
Supporting Processes - Highlighted Measures
Red Yellow Green
OP1f Call Wait TimeAverage length of wait before caller reaches live person
>6minutes
6-4minutes
<4 minutes
2 minutes
Monthly 5.2 10.4 18.1 6.1 +
With addition of callback solution program, Fonolo, was able to reduce call wait times by 2/3; wait times in Sept ended with an average of 4.07 mins; daily call volumes decreased slightly by an average of 40/day.
SP2cAppeal reversal rate
% of staff determinations that are reversed on appeal
>15% 15-10 <10% 5% Quarterly 2.0% 4.8% 6.3% 14.0% - 3.5 reversals is not much, but only 25 decisions in the quarter.
SP3h System uptime% of time systems are available during the service window
<97% 97-98 >98% 100% Monthly 97.31% 93.41% 97.36% 97.42% +Long month-end batches and the infrastructure (Virtual Connect) issue accounted for 95% of the downtime.
SP5cRecruiting / Onboarding
% of employees completing trial service
<85% 85-94 >94% 100% Quarterly 100% 91% 86% 100% +
Q4 2018 Q3 2019 Trend Corrective Action & CommentsQ1 2019 Q2 2019Desired Perform
Trend
Data Collection Frequency
Measure Name Measure Calculation
RANGE
Target

SL1 PERS Board Meeting December 6, 2019
Item A.4.
Public Employees Retirement System Headquarters:
11410 S.W. 68th Parkway, Tigard, OR Mailing Address:
P.O. Box 23700 Tigard, OR 97281-3700
888-320-7377 TTY (503) 603-7766
www.o re go n .go v/p er s
Oregon Kate Brown, Governor
December 6, 2019 TO: Members of the PERS Board FROM: Kevin Olineck, Director SUBJECT: 2018-2023 Strategic Plan Update BACKGROUND The PERS Strategic Plan covers the 2018-2023 time period. At the October board meeting, the PERS Board was provided with a report on progress made to date, as well as a review as to whether the strategic goals and/or objectives remain relevant. Based on the discussion at the October meeting, the Strategic Plan was updated. Some areas of the plan did not need revision, as the initiatives were still in development; others were already completed, so they were deleted; still other areas needed to reflect revised strategies as areas that needed attention emerged. As noted in October, a new strategic plan pillar, “Enterprise Risk Management,” was added, given the heightened sensitivity and awareness levels around risk management generally, as well as information security and continuity management, specifically. We would ask that the PERS Board review the Strategic Plan update with a view to ensuring that the strategic pillars, goals, and objectives continue to be both comprehensive and relevant. NEXT STEPS The Strategic Plan forms the foundation for the agency’s resource allocation priorities. Those initiatives in the plan that will move to the front of the agency’s priorities in the next biennium, and those that require additional resources to be accomplished, will form the basis for policy option packages that staff will present to the PERS Board as part of the agency’s 2021-23 Agency Request Budget. At the March 2020 meeting, we will present information on the business cases we have developed to support these budget requests. The actual draft requests will be submitted to the board for review at the May 29, 2020 meeting, with final board approval sought at the July 24, 2020 meeting. A.4. Attachment 1 – Strategic Plan 2018-23(updated)

A.4.Attachment 1

MISSION STATEMENT
We serve the people of Oregon by administering public
employee benefit trusts to pay the right person the right benefit at the right time.

SHARED VISION
Honoring your public service through secure retirement benefits.
Service-Focus
We work together to meet the needs of others with dependability, professionalism, and respect.
Accountability
We take ownership for our decisions, actions, and outcomes.
Integrity
We inspire trust through transparency and ethical, sound judgment.
Professional
We are responsive, respectful, and sensitive to the needs of our members, employers, and staff.
Accurate
We ensure data integrity and provide consistent, dependable information and benefits.
Judicious
We use sound judgment and prudent, principled decision-making in upholding our fiduciary responsibility.
Information Security
We are constantly vigilant to safeguard confidential information.
CORE VALUES
OPERATING PRINCIPLES

TABLE OF CONTENTS
INTRODUCTION ................................................................................................................... 1
ORGANIZATIONAL MANAGEMENT AND DEVELOPMENT ............................................... 2
Workforce Development ......................................................................................................................... 3
Organizational Communication ............................................................................................................. 4
PERS Outcome-Based Management System (POBMS) ............................................................... 5
MEMBER SERVICES AND COMMUNICATIONS .................................................................. 6
Member Relations ....................................................................................................................................... 7
Quality Delivery Methods ........................................................................................................................ 8
DATA RELIABILITY .............................................................................................................. 9
Member Accountability ............................................................................................................................ 11
Data Constancy .......................................................................................................................................... 12
Agency Data Warehouse ....................................................................................................................... 13
INFORMATION GOVERNANCE AND TECHNOLOGY ............................................................ 14
Information Governance Practices ...................................................................................................... 15
ORION Business Modernization ........................................................................................................... 16
IT Digital Transformation ......................................................................................................................... 17
FINANCIAL MANAGEMENT .............................................................................................. 18
Technology Upgrades and System Integration ............................................................................. 19
Financial Management Resource Development. ........................................................................... 21
ENTERPRISE RISK MANAGEMENT ................................................................................... 22
Enterprise Risk Management ................................................................................................................ 23

Oregon PERS 2018-2023 Strategic Plan Page 1
INTRODUCTION This strategic plan looks to a five-year horizon and answers the questions: If we are to become better at delivering on our mission, where will we, as an agency, be able to improve over this time? The strategic focus areas that we identified derive from a comprehensive review of organizational challenges and strengths, thoughtful consideration of stakeholder needs and perspectives, and the provocative and insightful conversations that we engage in regularly as we strive to foster a climate of consistent improvement and build upon our strengths in achieving our vision. This version updates the status a year into the 2018-2023 timeframe.
The plan articulates ambitious goals to achieve through 2023 within these focus areas, with specific, achievable goals and objectives related to each. The plan also links our objectives to the core outcome and process measures documented in PERS’ Fundamentals Map, a key artifact in our PERS Outcome Based Management System. Our strategies to achieve these goals and objectives leverage the resources any organization has to affect change – people, process, and technology – but unifies and prioritizes the allocation of these resources to assure that they are directed consistently and productively on the highest purposes we can achieve.
Achieving the goals outlined in this strategic plan depends upon successful execution of the strategies identified, as well as regular monitoring our progress, and strategic decisions during plan implementation on how to further our progress. As such, this strategic plan is a living document, and we anticipate that changes may be necessary to achieve the goals we set forth. In the 2019 legislative session, Senate Bill (SB)1049 was passed which introduced substantial changes to many aspects of the System and the Plan. Consequently, the Agency’s focus had to shift to implementing SB1049. This placed significant resource constraints with respect to our ability to make substantive progress on many of this Plan’s Goals and Objectives. The Agency is hopeful that work on those constrained Goals and Objectives can begin anew in the 2021-23 biennium.
PERS will use its existing strategic and operational planning function to prioritize and allocate resources for each of the strategies identified. Strategies will be executed with a variety of approaches, including problem solving, project management, breakthrough initiatives, and integration into core business practices. Specific performance metrics will be identified for tracking our progress as part of strategy initiation.
Some strategies depend on additional funding. We plan to develop and submit corresponding policy option packages with the agency’s budget requests, for the 2021-23 budget cycle.
One new pillar, added in 2019, is Enterprise Risk Management (ERM). Implementing an ERM practice would enable the Agency to truly understand, at an enterprise as well as divisional level, our overall risk levels and use this information to prioritize and plan how best to mitigate those risks that have the most potential to derail the agency from achieving its Mission.

Oregon PERS 2018-2023 Strategic Plan Page 2
ORGANIZATIONAL MANAGEMENT AND DEVELOPMENT
Introduction This strategic priority includes goals related to three organizational management and development focus areas: workforce development, organizational communications, and PERS’ Outcome-Based Management System (POBMS).
PERS’ success in delivering upon our mission depends on having a highly-skilled workforce supported by leadership that sets clear policies, procedures, and performance expectations. The plan’s workforce development goals and strategies recognize that this can only be achieved by continued investment in the development, implementation, and performance management of workforce and leadership best practices.
Enhancing organizational communications is also priority for PERS. Access to timely, accurate, and relevant internal information helps ensure that we, as an agency, communicate effectively with our members, employers, and stakeholders. This priority was identified by staff in PERS’ employee engagement survey. Survey results indicate many staff would like greater transparency and different content regarding information relevant to their jobs; staff also noted the desire for more information on decisions and policies that could affect them.
The third focus area relates to the work of fully integrating POBMS. The agency initiated POBMS in 2012 to improve operations and processes by engaging employees through an outcome-based approach, allowing those closest to the work to drive the improvement. Completing the integration and normalization of POBMS is important to continuing to improve performance outcomes. Employees support and benefit from POBMS because it provides a clear line of sight and a transparent approach to connect to the agency’s goals and objectives and staff’s role in meeting them.

Oregon PERS 2018-2023 Strategic Plan Page 3
ORGANIZATIONAL MANAGEMENT AND DEVELOPMENT
Focus Area: Workforce Development
GOAL Develop and support a culture of workforce excellence and effective leadership practices.
Objective 1 Define and communicate PERS’ measures of workforce excellence and desired leadership practices, consistent with organizational needs and strategic priorities.
Related measure SP 5: Managing and Developing the Workforce
Objective 2 Develop and implement hiring, training, and performance management practices that support a culture of workforce and leadership excellence.
Related measures OM2: Employee Engagement OM3: Operating Effectiveness SP1: Communicating Internally and Externally SP5: Managing and Developing the Workforce SP6: Strategic and Operational Planning
Strategies 1. Use defined competencies for workforce excellence and leadership from Objective
#1 to assess current hiring, training, and performance management practices.
2. Create standards of practice for effective hiring, training, and performance management.
3. Reinforce the use of these management practices throughout the agency through consistent review,
Strategies 1. Identify the desired workforce competencies and the obstacles to achieving
workforce excellence.
2. Develop a change management plan to ensure communication of the defined workforce competencies and associated measures.
3. Create an action plan to drive measurable adoption of these competencies.

Oregon PERS 2018-2023 Strategic Plan Page 4
ORGANIZATIONAL MANAGEMENT AND DEVELOPMENT
Focus Area: Organizational Communication
GOAL Foster and enhance transparency, relevancy, and employee satisfaction with internal communications.
Objective 1 Develop and implement an inclusive internal communication strategy to build a knowledgeable, engaged workforce.
Related measure OM1: Clear, Concise Communication OM2: Employee Engagement SP1: Communicating Internally and Externally SP5: Managing and Developing the Workforce
Strategies 1. Determine which tools and processes will lead to effective internal communications.
Use staff meetings, surveys, and employee focus groups to achieve this.
2. Maximize the intranet as a communication channel.

Oregon PERS 2018-2023 Strategic Plan Page 5
ORGANIZATIONAL MANAGEMENT AND DEVELOPMENT
Focus Area: PERS Outcome-Based Management System (POBMS)
GOAL Complete POBMS integration throughout the agency.
Objective 1 Fully develop team scorecards to measure performance and drive strategic, tactical and operational decisions.
Related measure SP6: Strategic and Operational Planning
Objective 2 Normalize POBMS-related methods throughout the agency.
Related measures SP6: Strategic and Operational Planning
Strategies 1. Build a structure to support all POBMS components such as the fundamentals
map; agency, division, and team scorecards; and problem-solving and breakthrough methodology.
2. Build a structure to support using the problem-solving methodology from initiation through implementation.
3. Ensure a structure is in place to support initiation and implementation of breakthroughs and alignment with the strategic plan and priorities.
Strategies 1. Communicate the consistent expectation and value of POBMS and scorecard
development for all staff.
2. Train the remaining staff in measures development and POBMS.
3. Complete scorecard development for divisions that do not have them at the team level.

Oregon PERS 2018-2023 Strategic Plan Page 6
MEMBER SERVICES AND COMMUNICATIONS
Introduction PERS administers public employee benefit trusts to provide retirement benefits and services to our members. In fact, all of PERS’ strategic priorities ultimately support our ability to provide the services needed by members and to ensure we “pay the right person, the right benefit, at the right time.” As a strategic priority, enhancing member services and communications addresses two focus areas: member relations, and quality delivery methods.
For the last decade, PERS’ member education and outreach has focused primarily on those who are within two years of their effective retirement date. This just-in-time focus does not provide members with a full under- standing of the need to financially prepare for retirement over their entire career. PERS recognizes that providing members with useful tools, resources, and education earlier, and throughout their careers, will better support our goal of having engaged and educated stakeholders. A key component of this education will be the need for members to augment their PERS retirement with other means, such as deferred compensation and personal savings. Additionally, efforts will be taken to better integrate communications alignment, such that members understand their PERS benefits (Tier One, Tier Two, OPSRP and IAP) as well as benefits offered under the Oregon Savings Growth Plan (OSGP) and the PERS Health Insurance Plan (PHIP).
Engaging and supporting our members in making informed retirement decisions engenders a broader role for PERS as a retirement education and planning resource. To be that resource, we must support members by pro- viding the information and easy-to-use tools to track their retirement benefits. Our current tool set needs to be more accessible and include a broader array of relevant content: not only account and benefit information, but transaction status tracking. This is what our goals under quality delivery methods aim to accomplish.

Oregon PERS 2018-2023 Strategic Plan Page 7
MEMBER SERVICES AND COMMUNICATIONS
Focus Area: Member Relations
GOAL Engage members throughout their careers so they are better prepared for retirement.
Objective 1 Develop tools and profiles relevant to members at different life and career stages.
Related measure OM1: Clear/Concise Communication OM7: Member Service Satisfaction OM10: Informed Retirement Decisions SP1: Communicating Internally and Externally
Objective 2 Brand PERS as a retirement education and planning resource.
Related measures OM1: Clear/Concise Communication OM7: Member Service Satisfaction OM10: Informed Retirement Decisions SP1: Communicating Internally and Externally
Strategies 1. Create an identity that will personalize PERS, instill a sense of ownership (“My”
PERS) among our members, and promote the agency as an accessible, comprehensive, and easy-to-use resource.
2. Develop and execute a plan to connect members to PERS through collaboration with employers and other stakeholders and the use of multiple communication channels.
Strategies 1. Develop tools and profiles relevant to members at different life and career stages.
Identify profiles, life events, and career stages and create tailored information, resources, and tools for each profile, event, or stage.
2. Engage with, and provide relevant information to, members at known events or career stages.
3. Leverage member annual statements to vet and verify account data.

Oregon PERS 2018-2023 Strategic Plan Page 8
MEMBER SERVICES AND COMMUNICATIONS Focus Area: Quality Delivery Methods
GOAL Improve members’ online experience and access to secure content.
Objective 1 Enhance and modernize Online Member Services (OMS) with more electronic transactions and views into workflow progress.
Related measure OM1: Clear, Concise Communication OM7: Member Service Satisfaction OM10: Informed Retirement Decisions SP1: Communicating Internally and Externally
Objective 2 Launch new education tools and resources valuable to the member journey from hire to retire.
Related measures OM1: Clear/Concise Communication OM7: Member Service Satisfaction OM10: Informed Retirement Decisions SP1: Communicating Internally and Externally
Strategies 1. Integrate member and stakeholder feedback on what additional educational tools
and resources are needed.
2. Establish a member education webinar program and continuously improve other education channels such as the PERS website and videos.
Strategies 1. Collaborate with ISD to understand issues, budgets, technical debt, and timeframes
necessary to improve OMS.
2. Use member and stakeholder feedback to design and implement enhancements to OMS.

Oregon PERS 2018-2023 Strategic Plan Page 9
DATA RELIABILITY
Introduction Data reliability is the cornerstone of PERS’ mission to “pay the right person the right benefit at the right time.” Good, reliable data is compromised by many factors: changes in determinations of service credit, contributions, and other key retirement data elements over a member’s career; changes in employer reporting and recordkeeping systems as well as retroactive changes to member data by employers; and changes in technology. Further, PERS is a complex plan, with data terms that confound comprehension by members and employers alike. All of these factors result in data that may be incomplete, inconsistent, and even missing, which in turns erodes confidence and trust in PERS by our members, employers, and the public.
To improve data reliability PERS will take a three-pronged approach. First, we will engage members as the primary quality checkpoint for their data. They are in the best position to know whether their data is valid, accurate, and complete. We will support members in fulfilling this responsibility by providing the tools and information they need. We will target specific data elements for remediation and work with members and employers to correct the data of record.
PERS has made improvements in our online services to support members’ ability to review their data in the hopes that data corrections would result. Before 2011, members’ only access to their data was through annual statements, written estimates, and verbal conversations with PERS staff. PERS introduced Online Member Services (OMS) in 2011 to allow members to view their data: employment history, salary details, and service credit. However, we have found that members need education about the relevancy of this data and their role in ensuring the data is ready for PERS to process. We will prioritize and target data for remediation and develop an expanded set of tools for members to access information and review their data, including more online applications and access via mobile devices.
Second, to achieve data constancy, PERS will institute new procedures to lock member data on an annual basis. This is important as data inconsistencies that are not resolved until after the member has received a benefit can disrupt their plans and come at a time after the member has made a life-altering decision to retire. Retroactive data corrections can also present a significant financial burden to employers. Any problems with a member’s data should be resolved before the transaction is final.
Our third focus area for improving data reliability relates to PERS’ internal data management procedures. Having access to good, reliable data is important for PERS staff, too, and our current data management structure presents many challenges that result in data that is difficult to access or inconsistent. Data management practices that contribute to internal data inconsistencies include: different methodologies used to access data; data sources are not mapped; lacking common data definitions and business context descriptions; and the need for an integrated structure to leverage existing data expertise in the agency. PERS’ central data management goals derive from the 2013 central data management breakthrough and implementation of the breakthrough plan. PERS has completed a comprehensive data

Oregon PERS 2018-2023 Strategic Plan Page 10
DATA RELIABILITY information gathering and cataloging effort. We are currently in the development phase of data tool and data warehouse redesign projects and a restructuring of functions and staff with the formation of a Central Data Team. The objectives identified in this plan will support completion of the central data management structure and tools.

Oregon PERS 2018-2023 Strategic Plan Page 11
DATA RELIABILITY
Focus Area: Member Accountability
GOAL Establish members as the primary quality check-point on their data of record.
Objective 1 Target specific data for remediation to allow members to more meaningfully review the content.
Related measure OP1: Managing Client Data and Services OM10: Informed Retirement Decisions
Objective 2 Educate members on the use and limitations of OMS legacy data.
Related measures OM1: Clear/Concise Communication
Strategies 1. Leverage our existing and to-be-developed communication tools to connect
members to these data issues.
2. Execute a campaign to recruit members to review and confirm data issues as they engage in activities related to their accounts.
Strategies 1. Identify those data elements that are or may be in a member’s record that are
inaccurate or most likely to be misunderstood, and develop an education plan to address those elements.
2. Prioritize remediation of the most critical data elements to resolve potential misunderstandings.

Oregon PERS 2018-2023 Strategic Plan Page 12
DATA RELIABILITY
Focus Area: Data Constancy
GOAL Ensure data remains static after it is used in a transaction or payment.
Objective 1 Lock submitted data for each calendar year.
Related measure OP1: Managing Client Data and Services
Objective 2 Lock legacy data after allowing employers to review and correct prior records.
Related measures OP1: Managing Client Data and Services
Strategies 1. Create a staging plan to close access for employers to change currently submitted
data of record over time, based on priority demographic groups and managing the volume of work required.
Strategies 1. Establish the requirement to lock member data at the close of each calendar year.
2. Resolve system reporting issues that may prevent employers from completing their calendar year reports.

Oregon PERS 2018-2023 Strategic Plan Page 13
DATA RELIABILITY
Focus Area: Agency Data Warehouse
GOAL Provide staff access to consistent, prompt, and reliable data reports.
Objective 1 Define all data terms and map data as it relates to technical and business needs and usage.
Related measure OP1: Managing Client Data and Services
Objective 2 Provide staff a data reporting structure that allows the user to derive and customize data reports.
Related measures SP1: Communicating Internally and Externally
Strategies 1. Create a user-friendly data tool for end users to request and create customizable
reports.
2. Create a glossary of business terms to define various contextual uses of data terms.
3. Form the Central Data Team to establish a central structure for data delivery.
Strategies 1. Create a data dictionary to lay the foundation for the technical framework of the
data.
2. Map data on end users’ screens to where it is stored and derived.
3. Redesign the data warehouse to make query process more efficient and less complex.

Oregon PERS 2018-2023 Strategic Plan Page 14
INFORMATION GOVERNANCE AND TECHNOLOGY
Introduction PERS’ information technology (IT) system provides the foundational data and information management necessary to “pay the right person the right benefit at the right time.” Our primary IT system is the Oregon Retirement Information Online Network (ORION). ORION needs to be continuously maintained and enhanced to provide necessary business functionality due to changes initiated both internally and by outside stakeholders. PERS must continuously work to optimize controls over the change management process, because it impacts efficiency and responsiveness in meeting evolving business needs.

Oregon PERS 2018-2023 Strategic Plan Page 15
INFORMATION GOVERNANCE AND TECHNOLOGY
Focus Area: Information Governance Practices
GOAL Improve management of agency information by standardizing processes and procedures.
Objective 1 Stand up an Enterprise Information Governance Program that support industry standards.
Related measure SP3: Leveraging Technology OM1: Clear, Concise Communication
Objective 2 Establish and implement information repository standards for the management of the information governance program across the enterprise.
Related measures SP3: Leveraging Technology OP1: Managing Client Data and Services OM1: Clear, Concise Communication
Strategies 1. Develop policies and processes that implement standard classifications and
naming conventions for enterprise storage locations that reflect the functional activity of the information retained.
2. Develop repositories that support enterprise content with appropriate access and versioning for all agency policies, practices, and knowledge-based programs.
Strategies 1. Adopt industry and regulatory standards and best practices as the guides for
building an enterprise framework for Information Governance.
2. Implement an Enterprise Information Governance Training Program that focuses on the capture, maintenance, and retrieval of all stored information.

Oregon PERS 2018-2023 Strategic Plan Page 16
INFORMATION GOVERNANCE AND TECHNOLOGY
Focus Area: ORION Business Modernization
GOAL Improve IT efficiency and responsiveness to business operational changes.
Objective 1 Re-architect Core Applications in ORION as independent, discrete business services.
Related measure SP3a: # of business days in a month ORION systems are not available within the standard service window SP3d: # of batch incidents/abends in a month SP3h: % of time ORION systems are available during the service window
Objective 2 Architect, plan, and design the PERS Production Data Center migration.
Related measures SP3: Leveraging Technology OP1: Managing Client Data and Services
Strategies 1. Migrate existing services from PERS Data Center to the State Data Center (SDC), as
appropriate, with minimal disruption to ORION.
2. Research and explore opportunities between the SDC and private cloud providers as architected by the ORION Modernization.
Strategies 1. Resolve key issues that are affecting ORION’s administration, performance,
maintainability, and sustainability to prepare for modernization.
2. Refactor batch processes to improve maintainability and efficiency, and reduce the batch processing window.
3. Redesign logging, monitoring, and error handling systems of the batch process and core applications.
4. Explore opportunities to externalize business rules from core applications.
5. Create an application-programming interface (API) ecosystem to allow ORION to loosely integrate between applications, commercial-off-the-shelf (COTS) solutions, and external services.

Oregon PERS 2018-2023 Strategic Plan Page 17
INFORMATION GOVERNANCE AND TECHNOLOGY
Focus Area: IT Digital Transformation
GOAL Improve workforce environment and prepare for and attract the next generation of technical talent.
Objective 1 Transform Information Services Division (ISD) working environment to encourage collaboration and innovation.
Related measure SP3: Leveraging Technology SP5: Managing & Developing the Workforce
Objective 2 Attract and retain IT talent at PERS.
Related measures SP3: Leveraging Technology SP5: Managing & Developing the Workforce
Strategies 1. Build relationships and community outreach to state and community colleges to
provide a clear path for IT careers at PERS and the State.
2. Initiate a formal Internship Program to graduating students as an entry into IT positions with PERS and the State.
3. Cultivate a career path to retain IT staff by encouraging innovation and investment in training.
Strategies 1. Deploy innovative and collaborative tools for effective real-time communication
to support teleworking and telecommuting between staff, outside contractors, and other partners.
2. Create an open-space working environment and reorganize staff to encourage collaboration, enable flexible co-location of teams by project, and reduce topical and functional silos within ISD.

Oregon PERS 2018-2023 Strategic Plan Page 18
FINANCIAL MANAGEMENT
Introduction As the financial world continues to evolve with a focus on greater transparency and ease of use for consumers, so too must PERS develop strategies to keep pace with these changes and meet member expectations. This level of responsiveness and transparency requires investing in an enhancement to our financial management tools, resources, and knowledge. Over the past decade, PERS has been required to provide multiple pension plan options and enhancements, and the increasing demands appear likely to continue. To meet these and future needs, we need to create a financial management strategy that allows greater flexibility to pivot when legislation or members demand it. To succeed, we need to enhance and integrate our financial management systems as well as invest in professional and organizational development.
Our current financial management systems require intense manual oversight, which exposes us to quality control and duplicative work. As a result, we spend an inordinate amount of time not only verifying staff work but also verifying the data we receive. Enhancing our systems promotes efficiency, limits manual oversight, and streamlines workflows.
Additionally, we need to invest in our financial management division’s professional development. As we invest in technology upgrades, we must ensure our workforce is able to meet the demands of new programs and be educated on the most up-to-date processes. This group will influence and inform the implementation of our financial strategy and we need to insure we invest the same amount of attention in their development as we have in the technology meant to assist them.

Oregon PERS 2018-2023 Strategic Plan Page 19
FINANCIAL MANAGEMENT
Focus Area: Technology Upgrades and System Integration
GOAL Enhance and improve productivity, reduce manual processes, and accurately and quickly respond to legislative and stakeholder needs.
Objective 1 Increase efficiency, improve communication, and reduce manual work.
Related measure OP6a: Manual Checks
Objective 2 Standardize financial data organization and reduce manual reconciliation between systems to improve accuracy and responsiveness to legislative and stakeholder needs.
Related measure OP6e: Tax Reporting
Strategies 1. Enhance ORION and its interactions with the General Ledger to minimize manual
processes.
2. Create FASD documentation standards, including file structure and organizational management.
3. Enhance ORION to improve data accuracy and reconciliations.
Strategies 1. Enhance our current technology systems and tools to provide integration and
sustainability within our existing infrastructure.
2. Secure communication with third-party administrators and vendors.
3. Ease and enhance the development of financial reporting.
4. Automate wholly manual processes and integrate them into existing infrastructure.

Oregon PERS 2018-2023 Strategic Plan Page 20
FINANCIAL MANAGEMENT Objective 3 Evaluate and implement electronic filing and paperless processes to effectively and promptly respond to inquiries and efficiently process transactions.
Related measure OP6b: Direct Deposit SP4d: Timely Payment Processing
Strategies 1. Convert physical records and existing paper intake to electronic filing, including
introducing e- signature capability.
2. Enhance our ability to send EFT and promote its use for members, vendors, and employees.

Oregon PERS 2018-2023 Strategic Plan Page 21
FINANCIAL MANAGEMENT
Focus Area: Financial Management Resource Development
GOAL Ensure PERS has the appropriate level of professional staff to perform the financial accounting, reporting, budgeting, analysis, and forecasting required to be compliant and deliver exceptional service to our stakeholders.
Objective 1 Ensure financial operations has the appropriate staffing to provide timely and accurate service to all stakeholders.
Objective 2 Increase professional certification and training within financial operations to engage staff and prepare them for potential shifts in expectations as our processes evolve, ensuring adherence to compliance and implementation of best practices.
Strategies 1. Develop standardized competencies as well as a fully funded training program to
ensure adoption of these new standards.
2. Determine a benchmark for the percent of certifications along with a funding plan to ensure that the benchmark is attainable.
Strategies 1. Evaluate and develop a plan for the structure and staff level requirements needed,
including acquiring the resources to execute such a plan.
2. Determine the staffing resources needed to support continuous process improvement, query development, systems research and testing, and tool development.

Oregon PERS 2018-2023 Strategic Plan Page 22
ENTERPRISE RISK MANAGEMENT
Introduction Risk is defined as the “effect of uncertainty on objectives”. The consequences associated with a risk can enhance the achievement of objectives (i.e., positive consequences) or can limit or diminish the achievement of objectives (i.e., negative consequences). Management of risk therefore, is an essential business activity required to help the agency achieve its core mission.
Enterprise Risk Management (ERM) is a process applied across the enterprise designed to identify potential events (risks) that may affect the agency and to manage risk to be within the agency’s risk appetite (tolerance), in order to provide reasonable assurance regarding the achievement of the agencies objectives.
Information Security and Risk section (SRS) is tasked with developing and implementing an Enterprise Risk Management program, designed to provide oversight, guidance, and monitoring activities for evaluating agency risk for business and technological activities necessary to achieve agency objectives. The agency’s Enterprise Risk Management program will focus on the following types of risk:
• Reputational Risk
• Operational Risk
• Financial Risk
• Strategic Risk
• Hazard Risk
• Compliance Risk
To this end, it is essential for agency staff to have a common understanding of risks associated with the decisions we make while performing our mission. Establishing an Enterprise Risk Management function will serve to guide management and staff during their decisions making process to ensure reducing agency risk is paramount when choosing one path over another.

Oregon PERS 2018-2023 Strategic Plan Page 23
ENTERPRISE RISK MANAGEMENT
Focus Area: Enterprise Risk Management
GOAL To establish an Enterprise Risk Management program within the Security & Risk Section.
Objective 1 Secure Leglislative support and funding to stand up an Enterprise Risk Management Program which meets industry standards.
Related measure SP2: Conducting enterprise risk management efforts SP6: Nurturing the agency’s mission, values, and core operating principles OM1: Clear, Concise Communication
Objective 2 Establish and implement an Enterprise Risk Management program throughout the agency.
Related measures SP2: Conducting enterprise risk management efforts SP6: Nurturing the agency’s mission, values, and core operating principles OM1: Clear, Concise Communication
Strategies 1. Utilizing the ISO 31000-2018 Risk Management Guidelines, develop a program
charter, policies, standards, and processes to establish and govern the Enterprise Risk Management program.
2. Develop and implement an Enterprise Risk Management Governance Training Program which focuses on ensuring enterprise risk is engrained into staff’s decision making process
Strategies 1. Adopt industry and regulatory standards, such as ISO 31000-2018, and best
practices as the guidelines for building and operating an enterprise framework for Enterprise Risk Management.
2. Develop a compelling business case for submission to the Legislative Fiscal Office for consideration.

Oregon Public Employees Retirement System
Pension Administration Benchmarking Report FY 2018
Mike ReidDecember 6, 2019

Key Takeaways:
1
Cost
•
• Primary reasons why your cost per member was higher:- more front office FTE per 10,000 members- higher support and IT costs
•
Service
• Your total service score was 60. This was below the peer average of 82.
• Your service score decreased from 64 to 60 mainly due to high turnover of staff, particularly in the call center.
Your total pension administration cost of $130 per active member and annuitant was $25 above the peer average of $105.
Oregon PERS has one of the highest plan design complexity scores among CEM's global universe. High complexity negatively impacts service, front office productivity, and back office costs.

CEM’s universe of participants
2
Participants
United States Canada The Netherlands*Arizona SRS PSRS PEERS of Missouri APS ABN Amro PensioenfondsCalPERS South Carolina RS Alberta Teachers’ RF ABPCalSTRS South Dakota RS BC Pension Corporation bpfBOUWColorado PERA STRS Ohio Canadian Forces Pension Plans Pensioenfonds Metaal en TechniekDelaware PERS Texas County and District RS FPSPP Pensioenfonds VervoerFlorida RS TRS Illinois LAPP Philips PensioenfondsIdaho PERS TRS Louisiana OMERS PFZWIllinois MRF TRS of Texas Ontario Pension Board Rabobank PensioenfondsIndiana PRS Utah RS Ontario Teachers Shell PensioenfondsIowa PERS Virginia RS OPTrust St. Pensioenfonds Openbaar VervoerKPERS Washington State DRS RCMP SpoorwegpensioenfondsLACERA Wisconsin DETF Retraite QuebecMichigan ORS SHEPPNevada PERS United Kingdom*North Carolina RS Armed Forces Pension SchemesNYC ERS BSA NHS PensionsNYC TRS Pension Protection FundNYSLRS Principal Civil Service Pension SchemeOhio PERS Scottish Public Pension AgencyOregon PERS Teachers' Pensions SchemePennsylvania PSERS Universities Superannuation Scheme
* Systems in the UK and most systems in the Netherlands complete different benchmarking surveys and hence your analysis does not include their results.

Oregon PERS was compared to the following 15 peers:
3
Ohio PERS 348 211 559Virginia RS 343 206 549Washington State DRS 321 186 507Wisconsin DETF 257 203 461Indiana PRS 255 157 411STRS Ohio 211 160 371Colorado PERA 242 118 359Arizona SRS 207 150 357Oregon PERS 173 148 321Illinois MRF 176 127 302Iowa PERS 170 121 291TRS Illinois 161 122 283PSRS PEERS of Missouri 127 92 219TRS Louisiana 91 79 170LACERA 98 66 165Peer Median 207 148 357Peer Average 212 143 355
Custom Peer Group for Oregon PERS
Peers (sorted by size) Active
Members Annuitants Total
Membership (in 000's)

Back office costs, service and productivity are impacted by system complexity. Your total complexity score of 54 was above the peer median of 40.
4
Oregon PERS' high complexity:• Negatively impacts service• Reduces front-office productivity• Increases costs, especially in the back-office
0
10
20
30
40
50
60
70
80
90
100Total Complexity Score
You Peer AllPeer Median All Median
1. CEM's total complexity score changed in 2018, from a relative measure to absolute and individual scores by cause are no longer scaled.
Cause You Peer AvgPension Payment Options 46 39 Customization Choices 26 15 Multiple Plan Types and Overlays 65 32 Multiple Benefit Formula 70 52 External Reciprocity 0 31 COLA Rules 57 31 Contribution Rates 64 38 Variable Compensation 100 81 Service Credit Rules 48 46 Divorce Rules 100 60 Purchase Rules 67 59 Refund Rules 24 43 Disability Rules 83 66 Total Complexity Score¹ 54 40
Complexity Score by Cause(0 least - 100 most)

-30
-20
-10
0
10
20
30
-$200 -$100 $0 $100 $200 $300
Rela
tive
Com
plex
ity =
Com
plex
ity Sc
ore
-All
Aver
age
Scor
e
Relative Admin. Cost =Admin. Cost - All Average Admin. Cost
Relative Complexity versus Relative Cost
All Peers You
The relationship between complexity and pension administration cost in the CEM universe:
5
High complexity Low cost
High complexity High cost
Low complexity Low cost
Low complexity High cost

Your total pension administration cost of $130 per active member and annuitant was $25 above the peer average of $105.
6
Category You You Peer AvgFront officeMember Transactions 5,410 17 17Member Communication 6,083 19 19Collections and Data Maintenance 5,546 17 7Back officeGovernance and Financial Control 2,437 8 9Major Projects 2,929 9 7Information Technology 11,051 34 25Building 1,448 5 6Legal 2,067 6 5HR, Actuarial, Audit, Other 4,669 15 11Total Pension Administration 41,640 130 105
$ per Active Member and Annuitant
$000s
Your total pension administration cost was $41.6 million. This excludes the fully-attributed cost of administering healthcare, and optional and third party administered benefits of $14.9 million.
$0
$50
$100
$150
$200
$250
$300
$350
$400
$450
Pension Administration Cost Per Active Member and Annuitant
You PeerPeer Avg Peer Median

Cost trends:
Between 2015 and 2018:
• Your total pension administration cost per active member and annuitant increased by 0.6% per annum.
• Your higher costs per member in FYE 2016 & 2017 were due to State Government Service Charges.
• During this same period, the average cost of your peers with 4 years of consecutive data increased by 1.1% per annum.
7
Trend analysis is based on systems that have provided 4 consecutive years of data (14 of your 15 peers).
$0
$20
$40
$60
$80
$100
$120
$140
$160
2015 2016 2017 2018You $128 $145 $144 $130Peer Avg $103 $107 $106 $107
Trend in Total Pension Administration Costs

Size matters: you have an economies of scale disadvantage relative to the peer average. After adjusting the cost of each peer for its scale advantage/disadvantage, your cost was $28 above the adjusted peer average of $102.
• Your system had 10% fewer members than the peer average. Your smaller size means that you have a scale disadvantage of $2 relative to the peer average.
• The scale adjustment is based on regression analysis using cost and membership data from 370 global pension plans. Approximately 70% of differences in cost per member can be explained by differences in size.
8
• Each peer's cost was adjusted for its scale advantage/disadvantage relative to your system.
0.00
50.00
100.00
150.00
200.00
250.00
300.00
350.00
Pension Administration Cost Per Active Member and Annuitant
You Peer Peer Avg Peer Median
0
500
1000
1500
2000
2 3 4 5 6 7
Cost
per
mem
ber
# of members
Economies of scale
100 1k 10k 100k 1M 10M

CEM uses the following cost model to explain differences in costs.
9
1 Higher/ lower headcount per member
2
3 Higher/ lower third party costs and other miscellaneous costs in front office activities(Front office activities are Member Transactions, Member Communication and Collections and Data Maintenance.)
4 Higher/ lower back office activity costs(Back office activities are Governance and Financial Control, Major Projects and Support Services.)
Reasons for differences in total costs
Paying more/ less per FTE for: salaries and benefits, building and utilities, HR and IT desktop
Cost per Member

Reasons why your total cost was $25 above the peer average:
10
Impact
Reason You Peer Avg$ per active member
and annuitant
1 More front office FTE per 10,000 members 6.3 3.9 $24.02
2 Lower third party costs per member in the $4 $8 -$3.92 front-office
3 Lower costs per FTE $105,485 $135,185 -$17.71
4 Higher support costs per member $64 $42 $22.92
Total $25.31

Your total service score was 60.
• This was below the peer average of 82.
• CEM defines service from the member’s perspective:– More channels– Faster turnaround times– More availability– More choice– Better content– Higher quality
11
0
10
20
30
40
50
60
70
80
90
100Total Service Score
You Peer AllPeer Median All Median Peer Avg

The total service score is the weighted average of the activity level service scores.
12
Activity Weight YouPeer Avg
Input Relative to peers
1. Member Transactionsa. Pension Payments 10.0% 100 100 0.0b. Pension Inceptions 7.4% 8 86 -6.1c. Refunds, Withdrawals, and Transfers-o 1.3% 5 82 -1.2d. Purchases and Transfers-in 3.1% 63 75 -0.7e. Disability 3.8% 55 86 -1.2
2. Member Communicationa. Call Center 21.0% 33 74 -8.8c. 1-on-1 Counseling 7.4% 70 85 -1.3d. Member Presentations 6.5% 100 97 0.0e. Written Pension Estimates 4.7% 38 86 -2.6f. Mass Communication
• Website 21.3% 76 80 -2.1• News and targeted communication 2.8% 57 82 -0.7• Member statements 4.7% 81 84 -0.3
3. OtherSatisfaction Surveying 5.0% 49 58 -0.8Disaster Recovery 1.0% 86 92 -0.1
Weighted Total Service Score 100.0% 60 82 -22.0
Service Scores by Activity

Examples of key service measures included in your Service Score:
13
Select Key Service Metrics You Peer Avg
Member Contacts• % of calls resulting in undesired outcomes (busy signals, messages, hang- 26% 12%• Average total wait time including time negotiating auto attendants, etc. 1,308 secs 209 secs
Website• Can members access their own data in a secure environment? Yes 93% Yes• Do you have an online calculator linked to member data? Yes 93% Yes• # of other website tools offered such as changing address information,
registering for counseling sessions and/or workshops, viewing or printing tax receipts, etc.
10 14
1-on-1 Counseling and Member Presentations• % of your active membership that attended a 1-on-1 counseling session 2.0% 5.4%• % of your active membership that attended a presentation 7.3% 6.2%
Pension Inceptions• What % of annuity pension inceptions are paid without an interruption of
cash flow greater than 1 month between the final pay check and the first pension check?
5.6% 91.6%
Member Statements• 5.0 mos 2.5 mos
• Do statements provide an estimate of the future pension entitlement? Yes 80% Yes
How current is an active member's data in the statements that the member receives?

Your service score decreased from 64 to 60 between 2015 and 2018.
14
Trend analysis is based on systems that have provided 4 consecutive years of data (14 of your 15 peers).
0
10
20
30
40
50
60
70
80
90
2015 2016 2017 2018You 64 63 60 60Peer Avg 80 81 81 82
Trends in Total Service Scores
•
•
• Menu layers: You added 2 additional layers in 2016.
•
•
You had historic call center staffing shortages in 2018 which had a significant impact on your service score trend.
Undesired call outcomes, such as abandoned calls in menu, in queue or on hold: increased from 9% to 26%.Call wait time: increased from 140 seconds to 1,308 seconds.
The following activities had a positive impact on your service score:
Website: Since 2016 you offer educational videos on your website.
Member statements: You now show an estimate of future pension entitlements on some statements.

The relationship between service and pension administration cost in the CEM universe:
15
-30
-20
-10
0
10
20
-$200 -$100 $0 $100 $200 $300
Rela
tive S
ervi
ce =
Serv
ice Sc
ore
-All A
vera
ge Sc
ore
Relative Admin. Cost =Admin. Cost - All Average Admin. Cost
Relative Service versus Relative Cost
All Peers You

16

SL1 PERS Board Meeting December 6, 2019
Item B.1.
Public Employees Retirement System Headquarters:
11410 S.W. 68th Parkway, Tigard, OR Mailing Address:
P.O. Box 23700 Tigard, OR 97281-3700
888-320 -7377 TTY (503) 603-7766
www.o re go n .go v/p er s
Oregon Kate Brown, Governor
December 6, 2019 TO: Members of the PERS Board FROM: Stephanie Vaughn, Manager, Policy Analysis & Compliance Section SUBJECT: Notice of Rulemaking for Alternate Death Benefit Rule:
OAR 459-014-0040, Valid Request for Distribution of Pre-Retirement Death Benefits
OVERVIEW
• Action: None. This is notice that staff has begun rulemaking.
• Reason: To allow a surviving spouse sufficient time to request and review estimated benefit options before deciding whether to elect the new alternate pre-retirement death benefit provided in HB 2417 (2019).
• Policy Issue: Should PERS accept a written request for an estimate from a surviving spouse beneficiary of a Tier 1 or Tier 2 member as a preliminary election for the new alternate pre-retirement death benefit under HB 2417 (2019), and allow them to formally elect the new alternate pre-retirement death benefit after the estimate is issued?
BACKGROUND Oregon Revised Statutes (ORS) 238.395 provides an employer match of a Tier 1 or Tier 2 member’s member account as an additional pre-retirement death benefit to be paid to designated beneficiaries when the member died while employed by a PERS-participating employer or within 120 days after termination from service with a public employer. But in cases where the member has a small member account balance, as is often the case with Tier 2 members, the pre-retirement death benefit provided by the member account and the employer match provided for in ORS 238.395 can be de minimis. HB 2417 (2019) allows for an alternate death benefit in lieu of the above described benefit for a surviving spouse beneficiary of a PERS member who dies before retirement, if that member was in the service of a participating employer at the time of their death or within 120 days after termination from service with a participating employer and the member’s spouse is the member’s named beneficiary under ORS 238.390. The alternate death benefit provided for in this legislation is the actuarial equivalent of 50 percent of the service retirement allowance that the deceased member would otherwise have been paid. This new provision requires a spouse-beneficiary to make the election for this benefit “no later than 60 days after the date of death of the member.” Often, PERS is not notified of a member's death within 60 days of their passing. Even in cases when PERS is notified in a timely manner, it will take time for PERS staff to generate an estimate and provide it to the surviving spouse. This

Notice of Rulemaking - Tier 1/Tier 2 Alternate Death Benefit Rule 12/6/19 Page 2 of 3
SL1 PERS Board Meeting December 6, 2019
time will then be running against the surviving spouse’s time limit to make the election, which may cause unintended stress and uncertainty during a period of grieving.
POLICY ISSUE Should PERS accept a written request for an estimate from a surviving spouse beneficiary of a Tier 1 or Tier 2 member as a preliminary election for the new alternate pre-retirement death benefit under HB 2417 (2019), and allow them to formally elect the new alternate pre-retirement death benefit after the estimate is issued? The language of HB 2417 was modeled after the OPSRP pre-retirement death benefit; however, the OPSRP program provides only one pre-retirement death benefit, thus no election or estimate is needed. For the new alternate pre-retirement death benefit provided under HB 2417, however, the member’s surviving spouse has two benefit options from which to choose and without an estimate, would not know the effect of each option. Staff anticipates that generating the estimate and providing it, along with the requisite forms to the surviving spouse, could take a number of weeks. The amendments to the rule incorporate language deeming the request for their available pre-retirement death benefit options a preliminary election to receive the new alternate pre-retirement death benefit when a surviving spouse requests the estimate within 60 days after the date of the member’s death. It then provides the surviving spouse 60 days from the date on the estimate to formally make the election, should they choose. These amendments will ensure that the time required for processing requests will not cause a surviving spouse beneficiary to lose the opportunity to make the election. Unless the board directs otherwise, staff will continue with the amendments as presented.
PUBLIC COMMENT AND HEARING TESTIMONY A rulemaking hearing will be held December 31, 2019, at 2:00 p.m. at PERS headquarters in Tigard. The public comment period ends January 7, 2020, at 5:00 p.m. LEGAL REVIEW The attached draft rule was submitted to the Department of Justice for legal review and any comments or changes will be incorporated before the rule is presented for adoption. IMPACT Mandatory: No. Benefit: Allows surviving spouses a period of review for them to evaluate their options. Cost: There are no discrete costs attributable to the rule.
RULEMAKING TIMELINE November 25, 2019 Staff began the rulemaking process by filing a Notice of
Rulemaking with the Secretary of State.
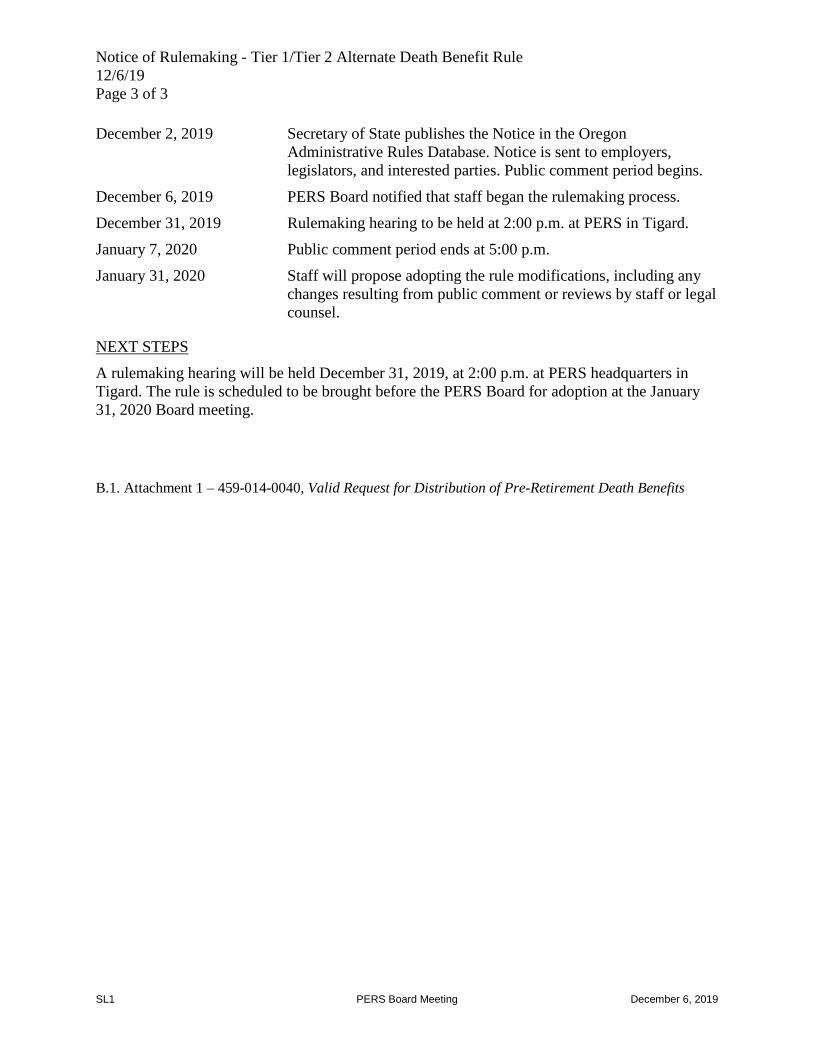
Notice of Rulemaking - Tier 1/Tier 2 Alternate Death Benefit Rule 12/6/19 Page 3 of 3
SL1 PERS Board Meeting December 6, 2019
December 2, 2019 Secretary of State publishes the Notice in the Oregon Administrative Rules Database. Notice is sent to employers, legislators, and interested parties. Public comment period begins.
December 6, 2019 PERS Board notified that staff began the rulemaking process. December 31, 2019 Rulemaking hearing to be held at 2:00 p.m. at PERS in Tigard. January 7, 2020 Public comment period ends at 5:00 p.m. January 31, 2020 Staff will propose adopting the rule modifications, including any changes resulting from public comment or reviews by staff or legal counsel.
NEXT STEPS A rulemaking hearing will be held December 31, 2019, at 2:00 p.m. at PERS headquarters in Tigard. The rule is scheduled to be brought before the PERS Board for adoption at the January 31, 2020 Board meeting. B.1. Attachment 1 – 459-014-0040, Valid Request for Distribution of Pre-Retirement Death Benefits

B.1. Attachment 1 OREGON ADMINISTRATIVE RULE
PUBLIC EMPLOYEES RETIREMENT BOARD CHAPTER 459
DIVISION 014 – DEATH AND SURVIVOR BENEFITS
014-0040-2 Page 1 Draft
459-014-0040 1
Valid Request for Distribution of Pre-Retirement Death Benefits 2
(1) For the purposes of this rule, “valid request for distribution” is when PERS 3
receives the last required document PERS has determined necessary to distribute a death 4
benefit to a beneficiary. 5
(2) Effective January 1, 2020, a written request for an estimate by a surviving 6
spouse of a Tier One or Tier Two member received no later than 60 days after the 7
member’s date of death will be deemed a preliminary election under ORS 238.395(2). 8
The surviving spouse then has 60 days after the date of the estimate to notify the 9
Board in a final written election if they elect to receive the benefit provided under this 10
section. 11
[(2)](3) PERS must receive a copy of the death certificate of the deceased member or 12
alternate payee. PERS will provide instructions to a beneficiary identifying additional 13
documents that must be received to make a valid request for distribution. Required 14
documents may include but are not limited to: 15
(a) Death Benefit Election; 16
(b) Letters of Testamentary/Administration; 17
(c) Small Estate Affidavit or out of state equivalent; 18
(d) Affidavit of Next of Kin; 19
(e) Affidavit of Beneficiary; 20
(f) Declaration of Beneficiary; 21
(g) Proof of marriage; 22

DRAFT DRAFT DRAFT DRAFT DRAFT DRAFT
014-0040-2 Page 2 Draft
(h) Proof of registered domestic partnership; 1
(i) Proof of birth of the beneficiary; 2
(j) Trust document or certification of trust; 3
(k) Proof of Conservatorship; and 4
(l) Proof of Guardianship. 5
[(3)](4) Earnings crediting for the distribution amount for an IAP account beneficiary 6
will be determined under OAR 459-007-0320. 7
Stat. Auth.: ORS 238.650 & 238A.450 8
Stats. Implemented: ORS 238.390, 238.395, 238A.230 & 238A.410 9

SL1 PERS Board Meeting December 6, 2019
Item B.2.
Public Employees Retirement System Headquarters:
11410 S.W. 68th Parkway, Tigard, OR Mailing Address:
P.O. Box 23700 Tigard, OR 97281-3700
888-320-7377 TTY (503) 603-7766
www.o re go n .go v/p er s
Oregon Kate Brown, Governor
December 6, 2019 TO: Members of the PERS Board FROM: Stephanie Vaughn, Manager, Policy Analysis & Compliance Section SUBJECT: First Reading of Work After Retirement Rules to Implement 2019 Legislation: OAR 459-009-0070, Actuarial Pooling of Employer Liability OAR 459-017-0060, Reemployment of Retired Members OAR 459-075-0300, Reemployment of a Retired Member of the OPSRP Pension
Program OVERVIEW
• Action: None. This is first reading of the Work After Retirement rules.
• Reason: Implement work after retirement provisions of 2019 legislation impacting PERS and provide clarification regarding work after retirement restrictions for early retirees.
• Policy Issue: No policy issues have been identified at this time.
BACKGROUND The 2019 Oregon Legislature enacted several bills relating to work after retirement which require rulemaking: Senate Bill 1049 (Chapter 355, Oregon Laws 2019), Senate Bill 576 (Chapter 152, Oregon Laws 2019), and House Bill 2972 (Chapter 496, Oregon Laws 2019). Changes relating to members: Current PERS statutes allow retired members to return to work for a PERS-participating employer so long as they work less than a certain number of hours during a calendar year (less than 1,040 hours for Tier One and Tier Two retirees, or 600 hours for OPSRP retirees). As retired members, such persons continue to receive PERS retirement benefits, but do not accrue any new retirement benefits for post-retirement employment. However, if the retiree meets or exceeds the maximum hours of retiree employment in a calendar year, PERS will cancel the member’s retirement and return the retiree to active member status. Over time, special statutory exceptions to these hour limits have been adopted that allow qualifying Tier One/Tier Two retirees, who work for certain employers or in certain positions, to exceed those limits and work unlimited hours. Generally, to comply with federal rules for qualified governmental plans, such exceptions are only available to members who retired at normal retirement age, or early age retirees hired into certain positions, if they have a bona fide retirement and their date of hire with any participating public employer is at least six months after their retirement date. However, currently, no statutory exceptions exist for OPSRP retirees, requiring different treatment of members depending on their membership. Senate Bill 1049 (2019) simplifies the current “work after retirement” framework by allowing retirees in all programs to work unlimited hours for PERS-participating employers during calendar years 2020-2024, while continuing to receive their retirement benefits. The bill

First Reading –Work After Retirement Rules to Implement 2019 Legislation 12/6/19 Page 2 of 4
SL1 PERS Board Meeting December 6, 2019
effectively lifts the 1,040-hour limit for Tier One/Tier Two retirees, and the 600-hour limit for OPSRP retirees during the five-year period. Note that SB 1049’s unlimited hours provision does not apply to early retirees unless they are hired by any PERS-participating employer more than six months after their effective retirement date, and they otherwise have a bona fide retirement. An early retiree is a member who retires before they reach normal retirement age, usually on a reduced service retirement allowance. If an early retiree does not meet the bona fide retirement requirement, then they are not allowed to work unlimited hours for a PERS-participating employer and remain subject to the current hourly limits and exceptions. PERS is a governmental retirement plan and trust, qualified and maintained under sections 401(a), 414(d) and 414(k) of the federal Internal Revenue Code. Oregon Revised Statutes (ORS) 238.630 requires the board to adopt rules and take all actions to maintain its status as a qualified governmental retirement plan and trust. Federal regulations provide that a pension plan is a plan established and maintained by an employer, primarily to provide systematically for the payment of definitely determinable benefits after a bona fide retirement, or attainment of normal retirement age. To have a bona fide retirement, a member cannot retire from service with their employer, but also have a prearranged agreement to be rehired by the same employer post-retirement. To comply with federal requirements, PERS statutes provide that early retirees may not return to work unless their date of hire is more than six months from their date of retirement. In updating the work after retirement administrative rules to reflect legislative changes made by SB 1049, PERS has become aware that some early retirees are returning to work with a participating PERS employer immediately or shortly after their retirement date. To avoid factual circumstances that could create plan qualification concerns, PERS is defining “bona fide separation” to establish that an early retiree must have a six-month break in service with all participating PERS employers before the member may return to service with a participating PERS employer and work unlimited hours. This separation requirement is similar to the federal requirement for withdrawals as set forth in ORS 238.265 and 238A.375, and therefore, the rule language is modeled on those statutory provisions. Work After Retirement (for employers): Currently, employers do not pay any PERS contributions on the amounts paid to reemployed retirees. As a financing modification under SB 1049, in addition to the employer contributions currently paid under ORS 238.225, based on active members’ salary, public employers will be required to make an additional payment of employer contributions on the wages of any retired PERS member that they employ.1 The additional payment of employer contributions will be based on the same net employer contribution rate that employers pay for their active members. These additional contribution payments made on the retiree’s wages will benefit the public employer who is making those contributions, by helping to reduce the employer’s projected future UAL. Net employer contribution rates are established for single employers, or for groups of employers who have been pooled for contribution rate purposes. This means additional 1 This means that employer contributions will be required for wages of any retired member employed by the participating public employer, including if the retired member is employed in a non-qualifying position (including temporary and part-time positions), or is working limited or unlimited hours after retirement (whether under Senate Bill 1049 or under other statutory provisions).

First Reading –Work After Retirement Rules to Implement 2019 Legislation 12/6/19 Page 3 of 4
SL1 PERS Board Meeting December 6, 2019
contribution payments made by an individual employer will be applied to the employer’s individual UAL, while additional contribution payments made by a pooled employer will be applied to the employer’s rate pool’s UAL. Senate Bill 576 was effective May 24, 2019. SB 576 created a new work after retirement exemption that allows a Tier One or Tier Two retired member to work unlimited hours as a special campus security officer commissioned by a public university, or a security officer for a community college, without impacting their retired member status. For calendar years 2020 to 2024, the use of this new statutory exception will not be necessary, because a retiree who qualifies for this narrow exception would also qualify for SB 1049’s broader allowance. However, as a permanent statutory amendment, this exception will apply to calendar years in which SB 1049 does not apply. House Bill 2972 was effective upon passage on June 25, 2019. HB 2972 created a new work after retirement exemption that allows a Tier One or Tier Two retired member who is employed by the Harney County Health District as a person licensed, registered, or certified to provide health services to work unlimited hours without impacting their status as a retired member. For calendar years 2020 to 2024, the use of this new statutory exception will not be necessary, because a retiree who qualifies for this narrow exception would also qualify for SB 1049’s broader allowance. However, as a permanent statutory amendment, this exception will apply to calendar years in which SB 1049 does not apply.
PUBLIC COMMENT AND HEARING TESTIMONY A rulemaking hearing was held October 29, 2019, at 2:00 p.m. at PERS headquarters in Tigard. No members of the public attended. The first public comment period ended November 5, 2019, at 5:00 p.m. No public comment was received. Due to the additional rule modifications, the public comment period has been extended until January 7, 2020, at 5:00 p.m.
LEGAL REVIEW The attached draft rules were submitted to the Department of Justice for legal review and any comments or changes will be incorporated before the rules are presented for adoption.
IMPACT Mandatory: Yes, changes are necessary to bring the rules in line with changes or additions to statute made by the 2019 legislature and to ensure compliance with federal requirements. Benefit: Updates the rules to reflect recent legislative changes, provides clarification on the agency’s administration of work after retirement, and ensures compliance with federal requirements. Cost: There are no discrete costs attributable to the rules.
RULEMAKING TIMELINE October 3, 2019 Staff began the rulemaking process by filing a Notice of
Rulemaking with the Secretary of State.

First Reading –Work After Retirement Rules to Implement 2019 Legislation 12/6/19 Page 4 of 4
SL1 PERS Board Meeting December 6, 2019
October 4, 2019 Secretary of State published the Notice in the Oregon Administrative Rules Database. Notice was sent to employers, legislators, and interested parties. Public comment period began.
October 4, 2019 PERS Board notified that staff began the rulemaking process. October 29, 2019 Rulemaking hearing held at 2:00 p.m. at PERS in Tigard. November 5, 2019 First public comment period ended at 5:00 p.m. November 25, 2019 Staff extended the public comment period by filing a Notice of
Rulemaking with the Secretary of State. December 2, 2019 Secretary of State publishes the second Notice in the Oregon
Administrative Rules Database. Notice is sent to employers, legislators, and interested parties. Public comment period resumes.
December 6, 2019 First reading of the rules. January 7, 2020 Public comment period ends at 5:00 p.m. January 31, 2020 Staff will propose adopting the rule modifications, including any changes resulting from public comment or reviews by staff or legal counsel.
NEXT STEPS The second public comment period will end on January 7, 2020. The rules are scheduled to be brought before the PERS Board for adoption at the January 31, 2020 board meeting. B.2. Attachment 1 - 459-009-0070, Actuarial Pooling of Employer Liability B.2. Attachment 2 - 459-017-0060, Reemployment of Retired Members B.2. Attachment 3 - 459-075-0300, Reemployment of a Retired Member of the OPSRP Pension
Program

B.2. Attachment 1 OREGON ADMINISTRATIVE RULE
PUBLIC EMPLOYEES RETIREMENT BOARD CHAPTER 459
DIVISION 009 – PUBLIC EMPLOYER
009-0070-2 Page 1 Draft
459-009-0070 1
Actuarial Pooling of Employer Liability 2
(1) Definitions. Definitions as used in this rule: 3
(a) “Actuarial Surplus” means the excess of the fair market actuarial value of assets 4
over the actuarial liabilities. 5
(b) “Consolidation” means the uniting or joining of two or more political 6
subdivisions into a single new successor political subdivision. 7
(c) “Liability” or “Liabilities” means any costs assigned by the Board to a specific 8
employer or to a pool of employers to provide PERS benefits. 9
(d) “Local government” shall have the same meaning as in subsection (f) of this 10
section. 11
(e) “Merger” means the extinguishment, termination and cessation of the existence 12
of one or more political subdivisions by uniting with and being absorbed into another 13
political subdivision. 14
(f) “Political subdivision” means any city, county, municipal or public corporation, 15
any other political subdivision as provided in Oregon Law, or any instrumentality thereof, 16
or an agency created by one or more political subdivisions to provide themselves 17
governmental service. Political subdivision does not mean a school district or a 18
community college. 19
(g) “Pooled” or “pooling” means the combining or grouping of public employers 20
participating in PERS for the purposes of determining employer liability for retirement or 21
other benefits under ORS Chapter 238. 22

DRAFT DRAFT DRAFT DRAFT DRAFT DRAFT
009-0070-2 Page 2 Draft
(h) “School district” means a common school district, a union high school district, or 1
an education service district, including chartered schools authorized under Oregon law. 2
(i) “Transition Unfunded Actuarial Liabilities or Surplus” means the unfunded 3
actuarial liability or actuarial surplus, attributed to an individual employer for the period 4
of time the employer was not participating in a pool, prior to entry into the Local 5
Government Rate Pool or the State and Local Government Rate Pool. 6
(j) “Unfunded Actuarial Liabilities” or “UAL” means the excess of the actuarial 7
liabilities over the fair market actuarial value of assets. 8
(2) Two employer pools. In accordance with ORS 238.225 and only for the purposes 9
of determining the amounts that are actuarially necessary to adequately fund the benefits 10
provided by the contributions of PERS participating employers, employers will be pooled 11
as a single employer as follows: 12
(a) The State and Local Government Rate Pool, which consists of the following 13
employers: 14
(A) The State of Oregon, excluding the state judiciary under ORS 238.500; 15
(B) All community colleges; and 16
(C) All political subdivisions which elect to join the pool; or 17
(b) The School District Pool, which consists of all school districts of the state. 18
(3) The Local Government Rate Pool established as of January 1, 2000, and certified 19
by the Board on June 12, 2001, for political subdivisions was dissolved as of December 20
31, 2001. 21
(4) Political subdivision participation. Political subdivisions may elect to participate 22
in the State and Local Government Rate Pool by the adoption of a resolution or ordinance 23

DRAFT DRAFT DRAFT DRAFT DRAFT DRAFT
009-0070-2 Page 3 Draft
by the governing body of the political subdivision and submitting a copy of the resolution 1
or ordinance to the Board. The effective date of the election is established as follows: 2
(a) If the election is received, in accordance with OAR 459-005-0220, by December 3
31, 2001, the political subdivision will join the pool effective January 1, 2002. Its liability 4
as a member of the pool, from the effective date of entering the pool, will be based on the 5
actuarial valuation period beginning on January 1, 2002; or 6
(b) If the election is received, in accordance with OAR 459-005-0220, on or after 7
January 1, 2002, the political subdivision will join the pool effective the first day of the 8
next actuarial valuation period following the date of receipt of the election. 9
(c) Prior to entering the pool, any unfunded actuarial liabilities or surplus of such 10
employers will be actuarially accounted for as provided in section [(9)](10) of this rule. 11
(d) Participation in the pool, as provided in this section [(4) of this rule], is 12
irrevocable by the employer. 13
(e) Political subdivisions that do not elect to participate in the State and Local 14
Government Rate Pool, as provided in this section [(4) of this rule], shall be regarded as 15
individual employers for actuarial purposes. 16
(5) Employer rates. The basis for any actuarial computation required under ORS 17
238.225 or this rule will be the actuarial report on PERS prepared in accordance with 18
ORS 238.605. 19
(6) In determining the amounts to be paid to PERS by a public employer pooled as 20
provided in section (2) of this rule, the PERS consulting actuary will express those 21
amounts as a rate or percentage of PERS covered payroll. 22

DRAFT DRAFT DRAFT DRAFT DRAFT DRAFT
009-0070-2 Page 4 Draft
(7) In determining the amounts to be paid to PERS by employer participants in the 1
Local Government Rate Pool, the State and Local Government Rate Pool, and the School 2
District Pool, the PERS Board will issue rate(s) representing the amount necessary to 3
provide benefits as provided in ORS 238.225, for all members of that pooled group. The 4
rates, at a minimum, shall include: 5
(a) Rates representing the amount necessary to provide benefits as provided in ORS 6
238.225, for all Tier One and Tier Two police officer and firefighter members of that 7
pooled group. 8
(b) Rates representing the amount necessary to provide benefits as provided in ORS 9
238.225, for all Tier One and Tier Two general service members of that pooled group. 10
(c) In addition to the rate(s) in this section, the State of Oregon will be charged the 11
additional amount necessary to fund the Retiree Health Insurance Premium Account as 12
provided in ORS 238.415(5). 13
(8) A public employer employing a retired member shall apply the employer’s 14
net contribution rate for its active members to the wages paid to the retired 15
member, and shall make a payment to the Public Employees Retirement Fund. This 16
payment is in addition to the employer’s contribution required under ORS 238.225 17
or 238A.220. 18
(a) Retired member wages will not be included in covered payroll for purposes 19
of determining the employer’s contribution rate. 20
(b) The additional payment shall be applied to the rate pool’s unfunded 21
actuarial liability. 22

DRAFT DRAFT DRAFT DRAFT DRAFT DRAFT
009-0070-2 Page 5 Draft
(c) If the employer has a side account established under ORS 238.229, any side 1
account rate offset that applies to the employer’s contribution rate for its active 2
members will be applied to the employer’s contribution rate for its retired 3
members. 4
[(8)](9) For each participant in the State and Local Government Rate Pool: 5
(a) Each employer’s police officer and firefighter payroll as reported for the actuarial 6
valuation will be multiplied times the rate described in subsection (7)(a) of this rule; 7
(b) Each employer’s general service payroll as reported for the actuarial valuation 8
will be multiplied times the rate described in subsection (7)(b) of this rule. 9
(c) By dividing the sum of the amounts in subsections (a) and (b) of this section by 10
the employer’s total payroll as reported for the actuarial valuation, a composite employer 11
contribution rate is derived, which will be the basis for the employer contributions. 12
[(9)](10) Unfunded actuarial liabilities or surplus. 13
(a) If a political subdivision elected to join the Local Government Rate Pool 14
described in section (3) of this rule, any transition unfunded actuarial liabilities or surplus 15
as of December 31, 1999, will remain part of the actuarial calculation of employer costs 16
for the individual political subdivision, until fully amortized, and will not be pooled with 17
other public employers. However, the political subdivision will continue to be pooled for 18
the purpose of funding the resulting unfunded actuarial liabilities associated with the 19
Local Government Rate Pool from January 1, 2000 to December 31, 2001. 20
(b) If a political subdivision elects to join the State and Local Government Rate Pool 21
as provided in section (4) of this rule, any transition unfunded actuarial liabilities or 22
surplus as of the day immediately preceding the effective date of entering the pool will 23

DRAFT DRAFT DRAFT DRAFT DRAFT DRAFT
009-0070-2 Page 6 Draft
remain part of the actuarial calculation of employer costs for each individual political 1
subdivision, until fully amortized, and will not be pooled with other public employers in 2
the State and Local Government Rate Pool. 3
(c) The pooled unfunded actuarial liability or surplus for the community colleges and 4
the State of Oregon as of December 31, 2001, will remain part of the actuarial calculation 5
of employer costs for community colleges and the State of Oregon combined until fully 6
amortized, and will not be pooled with any political subdivision. 7
(d) Any unfunded actuarial liability or surplus for the State and Local Government 8
Rate Pool that accrues during a valuation period occurring after December 31, 2001, will 9
become part of the actuarial calculation of employer costs for only those employers who 10
participated in the pool during that valuation period. 11
(e) Any unfunded actuarial liabilities or surplus of individual employers being 12
amortized as provided for in subsection [(9)](a), [(9)](b), or [(9)](c) of this [rule] 13
section, will be amortized based on the Board’s adopted assumed earnings rate and 14
amortization period. If at the end of the amortization period a surplus remains, the surplus 15
will continue to be amortized as determined by the Board. 16
(f) If the PERS Board should change the assumed earnings rate, as it applies to ORS 17
238.255, in effect at the time of the amortization provided for in subsection [(9)](a), 18
[(9)](b), or [(9)](c) of this [rule] section, the actuary will recalculate the remaining 19
liability or surplus being amortized using the new assumed earnings rate. The 20
amortization period provided in subsection [(9)](e) of this section will not change due to 21
this recalculation. 22

DRAFT DRAFT DRAFT DRAFT DRAFT DRAFT
009-0070-2 Page 7 Draft
[(10)](11) Employer UAL lump-sum payment. If an employer elects to make a UAL 1
lump-sum payment to offset the unfunded actuarial liabilities under subsection 2
[(9)](10)(a), [(9)](b), [(9)](c), or [(9)](d) of this rule, or as provided under ORS 3
238.225(8), the payment shall be made in accordance with ORS 238.225 and OAR 459-4
009-0084. 5
[(11)](12) New employers and integrations. Political subdivisions entering PERS, as 6
provided in ORS 238.015(3), 238.035, or 238.680, will be pooled upon election to join 7
the State and Local Government Rate Pool as follows: 8
(a) To join the pool upon entering PERS, the election as well as the methods and 9
effective date of entry, must be included in the coverage agreement or contract of 10
integration. If the election is made after the effective date of joining PERS, the political 11
subdivision will join the pool effective the first day of the next actuarial valuation period 12
following the date of receipt of the election. 13
(b) An election completed by an integrating employer or a partially integrated 14
employer will apply to all current and future groups of employees who are integrated into 15
PERS by the employer. Upon entering the respective pool, any unfunded actuarial 16
liabilities or surplus of such employers will be actuarially accounted for as provided in 17
section [(9)](10) of this rule. 18
[(12)](13) Dissolution of an employer or non-participating employer. In the event a 19
public employer is dissolved, no longer has PERS eligible employees, or is no longer 20
eligible to participate in PERS, the employer or its successor will be required to make the 21
contributions necessary to fund any remaining unfunded actuarial liability, as provided 22
for in subsection [(9)](10)(a), [(9)](b), or [(9)](c) of this rule, for PERS benefits. The 23

DRAFT DRAFT DRAFT DRAFT DRAFT DRAFT
009-0070-2 Page 8 Draft
Board will determine the method and amount of funding this unfunded actuarial liability 1
or the return of any surplus, as well as the determination of the employer’s successor. 2
[(13)](14) Consolidation of political subdivisions. In the event a political 3
subdivision consolidates with another political subdivision, the succeeding employer will 4
determine the status in the pool by election into the pool. 5
(a) If the succeeding employer has not elected to join the pool as of the effective date 6
of the consolidation, the following will occur: 7
(A) The pooled and non-pooled assets, liabilities, and employees of the former 8
employers will continue as they were prior to the consolidation; 9
(B) Any unfunded actuarial liability or surplus of the former employers as of the 10
effective date of the consolidation will be combined and assumed by the succeeding 11
employer; 12
(C) New hires will not be pooled; and 13
(D) If the succeeding employer consists of pooled and non-pooled employees, 14
separate payrolls must be maintained for each and reported to PERS. 15
(E) At any time after the consolidation, the succeeding employer may elect to join 16
the pool and the effective date will be the first day of the next actuarial valuation period 17
following the date of receipt of an election. 18
(b) If the succeeding employer elects to join the pool as of the effective date of the 19
consolidation, the following will occur: 20
(A) Any non-pooled assets, liabilities, and employees of the former employers will 21
be added to the pool; 22

DRAFT DRAFT DRAFT DRAFT DRAFT DRAFT
009-0070-2 Page 9 Draft
(B) Any unfunded actuarial liability or surplus of the former employers as of the 1
effective date of the consolidation will be combined and assumed by the succeeding 2
employer and provided for as in subsection [(9)](10)(a) or [(9)](b) of this rule; and 3
(C) New hires will be pooled. 4
(c) The succeeding employer must join the pool as of the effective date of the 5
consolidation if it consists of only pooled employers. Any unfunded actuarial liability or 6
surplus of the former employers as of the effective date of the consolidation will be 7
combined and assumed by the succeeding employer. 8
[(14)](15) Merger of political subdivisions. In the event a political subdivision 9
merges with another political subdivision, the status of the surviving employer in the pool 10
depends on its status prior to the merger. 11
(a) If the surviving employer was not in the pool and has not elected to join the pool 12
as of the effective date of the merger, the following will occur: 13
(A) The pooled and non-pooled assets, liabilities, and employees of the former 14
employers will continue as they were prior to the merger; 15
(B) Any unfunded actuarial liability or surplus of the former employers as of the date 16
of the merger will be transferred to the surviving employer; 17
(C) New hires will not be pooled; and 18
(D) If the surviving employer consists of pooled and non-pooled employees, separate 19
payrolls must be maintained for each and reported to PERS. 20
(E) At any time after the merger, the surviving employer may elect to join the pool 21
and the effective date will be the first day of the next actuarial valuation period following 22
the date of receipt of an election. 23
DRAFT DRAFT DRAFT DRAFT DRAFT DRAFT
009-0070-2 Page 10 Draft
(b) If the surviving employer was in the pool as of the effective date of the merger, 1
the following will occur: 2
(A) Any non-pooled assets, liabilities, and employees of the former employers will 3
be added to the pool as of the effective date of the merger; 4
(B) Any unfunded actuarial liability or surplus of the former employers as of the 5
effective date of the merger will be transferred to the surviving employer and provided 6
for in subsection [(9)](10)(a) or [(9)](b) of this rule; and 7
(C) New hires will be pooled. 8
[(15)](16) In the event of any legal mandates or changes adopted by the Board: 9
(a) If the change provides for an increased or decreased benefit to police officer and 10
firefighter members, but is not applicable to general service members, the PERS Board 11
will direct the actuary to attribute the cost or savings of the change to the rate indicated in 12
subsection (7)(a) of this rule. 13
(b) If the change provides for an increased or decreased benefit to general service 14
members, but is not applicable to police officer or firefighter members, the PERS Board 15
will direct the actuary to attribute the cost or savings of the change to the rate indicated in 16
subsection (7)(b) of this rule. 17
(17) Section (8) of this rule is repealed effective January 2, 2025. 18
Stat. Auth.: ORS 238.650 19
Stats. Implemented: 2005 OL, Ch. 808, Sec. (12), (13), (14), ORS 238.225 & 20
238.605, 2019 OL, Ch. 355, Sec. 35 & 37 21

B.2. Attachment 2 OREGON ADMINISTRATIVE RULE
PUBLIC EMPLOYEES RETIREMENT BOARD CHAPTER 459
DIVISION 017 – REEMPLOYED RETIRED MEMBERS
017-0060-5 Page 1 Draft
459-017-0060 1
Reemployment of Retired Members 2
(1) For purposes of this rule[,]: 3
(a) “Bona fide retirement” means that the retired member has been absent 4
from service with all participating employers and all employers in a controlled 5
group with a participating employer for at least six full calendar months between 6
the effective date of retirement and the date of hire. 7
(b) “[r]Retired member” means a member of the PERS Chapter 238 Program who is 8
retired for service. 9
(2) A retired member may be employed under ORS 238.082 by a participating 10
employer without loss of retirement benefits provided: 11
(a) The period or periods of employment with one or more participating employers 12
total less than 1,040 hours in a calendar year; or 13
(b) If the retired member is receiving retirement, survivors, or disability benefits 14
under the federal Social Security Act, the period or periods of employment total less than 15
either 1,040 hours in a calendar year, or the total number of hours in a calendar year that, 16
at the retired member’s specified hourly rate of pay, would cause the annual 17
compensation of the retired member to exceed the following Social Security annual 18
compensation limits, whichever is greater. 19
(A) For retired members who have not reached full retirement age under the Social 20
Security Act, the annual compensation limit is $17,640; or 21

DRAFT DRAFT DRAFT DRAFT DRAFT DRAFT
017-0060-5 Page 2 Draft
(B) For the calendar year in which the retired member reaches full retirement age 1
under the Social Security Act and only for compensation for the months before reaching 2
full retirement age, the annual compensation limit is $46,920. 3
(3) The limitations on employment in section (2) of this rule do not apply if the 4
retired member has reached full retirement age under the Social Security Act. 5
(4) The limitations on employment in section (2) of this rule do not apply if: 6
(a) The retired member meets the requirements of ORS 238.082(4), (5), (6), (7), or 7
(8), and did not retire at a reduced benefit under the provisions of ORS 238.280(1), (2), or 8
(3); 9
(b) The retired member retired at a reduced benefit under ORS 238.280(1), (2), or 10
(3), is employed in a position that meets the requirements of ORS 238.082(4), the date of 11
[employment] hire is more than six months after the member’s effective retirement date, 12
and the member’s retirement otherwise meets the standard of a bona fide retirement; 13
(c) The retired member is employed by a school district or education service district 14
as a speech-language pathologist or speech-language pathologist assistant and: 15
(A) The retired member did not retire at a reduced benefit under the provisions of 16
ORS 238.280(1) or (3); or 17
(B) [If t]The retired member retired at a reduced benefit under the provisions of 18
ORS 238.280(1) or (3), [the retired member] but is not [so] employed by any 19
participating employer until more than six months after the member’s effective 20
retirement date, and the member’s retirement otherwise meets the standard of a bona fide 21
retirement; 22
(d) The retired member meets the requirements of section 2, chapter 499, Oregon 23
Laws 2007, as amended by section 1, chapter 108, Oregon Laws 2015; 24

DRAFT DRAFT DRAFT DRAFT DRAFT DRAFT
017-0060-5 Page 3 Draft
(e) The retired member meets the requirements of section 2, chapter 475, Oregon 1
Laws 2015; 2
(f) The retired member is employed for service during a legislative session under 3
ORS 238.092(2); 4
(g) The retired member meets the requirements of ORS 238.088(2), and did not 5
retire at a reduced benefit under the provisions of ORS 238.280(1), (2), or (3); or 6
(h) The retired member is on active state duty in the organized militia and meets the 7
requirements under ORS 399.075(8). 8
(i) The retired member is employed as a special campus security officer 9
commissioned by a public university and meets the requirements under section 5, 10
chapter 152, Oregon Laws 2019. 11
(j) The retired member is employed as a security officer for a community 12
college and meets the requirements under section 5, chapter 152, Oregon Laws 13
2019. 14
(k) The retired member is employed by Harney County Health District as a 15
person licensed, registered or certified to provide health services and meets the 16
requirements under section 2, chapter 496, Oregon Laws 2019. 17
(5) For purposes of population determinations referenced by statutes listed in this 18
rule, the latest federal decennial census shall first be operative on the first day of the 19
second calendar year following the census year. 20
(6) For purposes of ORS 238.082(6), a retired member replaces an employee if the 21
retired member: 22
(a) Is assigned to the position of the employee; and 23

DRAFT DRAFT DRAFT DRAFT DRAFT DRAFT
017-0060-5 Page 4 Draft
(b) Performs the duties of the employee or duties that might be assigned to an 1
employee in that position. 2
(7) If a retired member is reemployed subject to the limitations of ORS 238.082 and 3
section (2) of this rule, the period or periods of employment subsequently exceed those 4
limitations, and employment continues into the month following the date the limitations 5
are exceeded: 6
(a) If the member has been retired for six or more calendar months: 7
(A) PERS will cancel the member’s retirement. 8
(i) If the member is receiving a monthly service retirement allowance, the last 9
payment to which the member is entitled is for the month in which the limitations were 10
exceeded. 11
(ii) If the member is receiving installment payments under ORS 238.305(4), the last 12
installment payment to which the member is entitled is the last payment due on or before 13
the last day of the month in which the limitations were exceeded. 14
(iii) If the member received a single lump sum payment under ORS 238.305(4) or 15
238.315, the member is entitled to the payment provided the payment was dated on or 16
before the last day of the month in which the limitations were exceeded. 17
(iv) A member who receives benefits to which he or she is not entitled must repay 18
those benefits to PERS. 19
(B) The member will reestablish active membership the first of the calendar month 20
following the month in which the limitations were exceeded. 21
(C) The member’s account must be rebuilt in accordance with the provisions of 22
section (9) of this rule. 23
(b) If the member has been retired for less than six calendar months: 24

DRAFT DRAFT DRAFT DRAFT DRAFT DRAFT
017-0060-5 Page 5 Draft
(A) PERS will cancel the member’s retirement effective the date the member was 1
reemployed. 2
(B) All retirement benefits received by the member must be repaid to PERS in a 3
single payment. 4
(C) The member will reestablish active membership effective the date the member 5
was reemployed. 6
(D) The member account will be rebuilt as of the date that PERS receives the single 7
payment. The amount in the member account must be the same as the amount in the 8
member account at the time of the member’s retirement. 9
(8) For purposes of determining period(s) of employment in section (2) of this rule: 10
(a) Hours of employment are hours on and after the retired member’s effective 11
retirement date for which the member receives wages, salary, paid leave, or other 12
compensation. 13
(b) Hours of employment that are performed under the provisions of section (4) of 14
this rule on or after the later of January 1, 2004, or the operative date of the applicable 15
statutory provision, are not counted. 16
(9) If a member has been retired for service for more than six calendar months and is 17
reemployed in a qualifying position by a participating employer under the provisions of 18
238.078(1): 19
(a) PERS will cancel the member’s retirement effective the date the member is 20
reemployed. 21
(b) The member will reestablish active membership on the date the member is 22
reemployed. 23

DRAFT DRAFT DRAFT DRAFT DRAFT DRAFT
017-0060-5 Page 6 Draft
(c) If the member elected a benefit payment option other than a lump sum option 1
under ORS 238.305(2) or (3), the last monthly service retirement allowance payment to 2
which the member is entitled is for the month before the calendar month in which the 3
member is reemployed. Upon subsequent retirement, the member may choose a different 4
benefit payment option. 5
(A) The member’s account will be rebuilt as required by ORS 238.078 effective the 6
date active membership is reestablished. 7
(B) Amounts from the Benefits-In-Force Reserve (BIF) credited to the member’s 8
account under the provisions of paragraph (A) of this subsection will be credited with 9
earnings at the BIF rate or the assumed rate, whichever is less, from the date of retirement 10
to the date of active membership. 11
(d) If the member elected a partial lump sum option under ORS 238.305(2), the last 12
monthly service retirement allowance payment to which the member is entitled is for the 13
month before the calendar month in which the member is reemployed. The last lump sum 14
or installment payment to which the member is entitled is the last payment due before the 15
date the member is reemployed. Upon subsequent retirement, the member may not 16
choose a different benefit payment option unless the member has repaid to PERS in a 17
single payment an amount equal to the lump sum and installment benefits received and 18
the earnings that would have accumulated on that amount. 19
(A) The member’s account will be rebuilt as required by ORS 238.078 effective the 20
date active membership is reestablished. 21
(B) Amounts from the BIF credited to the member’s account under the provisions of 22
paragraph (A) of this subsection, excluding any amounts attributable to repayment by the 23

DRAFT DRAFT DRAFT DRAFT DRAFT DRAFT
017-0060-5 Page 7 Draft
member, will be credited with earnings at the BIF rate or the assumed rate, whichever is 1
less, from the date of retirement to the date of active membership. 2
(e) If the member elected the total lump sum option under ORS 238.305(3), the last 3
lump sum or installment payment to which the member is entitled is the last payment due 4
before the date the member is reemployed. Upon subsequent retirement, the member may 5
not choose a different benefit payment option unless the member has repaid to PERS in a 6
single payment an amount equal to the benefits received and the earnings that would have 7
accumulated on that amount. 8
(A) If the member repays PERS as described in this subsection the member’s 9
account will be rebuilt as required by ORS 238.078 effective the date that PERS receives 10
the single payment. 11
(B) If any amounts from the BIF are credited to the member’s account under the 12
provisions of paragraph (A) of this subsection, the amounts may not be credited with 13
earnings for the period from the date of retirement to the date of active membership. 14
(f) If the member received a lump sum payment under ORS 238.315: 15
(A) If the payment was dated before the date the member is reemployed, the member 16
is not required or permitted to repay the benefit amount. Upon subsequent retirement: 17
(i) The member may choose a different benefit payment option. 18
(ii) The member’s retirement benefit will be calculated based on the member’s 19
periods of active membership after the member’s initial effective retirement date. 20
(B) If the payment was dated on or after the date the member is reemployed, the 21
member must repay the benefit amount. Upon subsequent retirement: 22
(i) The member may choose a different benefit payment option. 23

DRAFT DRAFT DRAFT DRAFT DRAFT DRAFT
017-0060-5 Page 8 Draft
(ii) The member’s retirement benefit will be calculated based on the member’s 1
periods of active membership before and after the member’s initial effective retirement 2
date. 3
(iii) The member’s account will be rebuilt as described in ORS 238.078(2). 4
(g) A member who receives benefits to which he or she is not entitled must repay 5
those benefits to PERS. 6
(10) If a member has been retired for less than six calendar months and is 7
reemployed in a qualifying position by a participating employer under the provisions of 8
238.078(2): 9
(a) PERS will cancel the member’s retirement effective the date the member is 10
reemployed. 11
(b) All retirement benefits received by the member must be repaid to PERS in a 12
single payment. 13
(c) The member will reestablish active membership effective the date the member is 14
reemployed. 15
(d) The member account will be rebuilt as of the date that PERS receives the single 16
payment. The amount in the member account must be the same as the amount in the 17
member account at the time of the member’s retirement. 18
(e) Upon subsequent retirement, the member may choose a different benefit payment 19
option. 20
(11) Upon the subsequent retirement of any member who reestablished active 21
membership under ORS 238.078 and this rule, the retirement benefit of the member must 22
be calculated using the actuarial equivalency factors in effect on the effective date of the 23
subsequent retirement. 24
DRAFT DRAFT DRAFT DRAFT DRAFT DRAFT
017-0060-5 Page 9 Draft
(12) The provisions of paragraphs (9)(c)(B), (9)(d)(B), and (9)(e)(B) of this rule are 1
applicable to retired members who reestablish active membership under ORS 238.078 2
and this rule and whose initial effective retirement date is on or after March 1, 2006. 3
(13) A participating employer that employs a retired member must notify PERS in a 4
format acceptable to PERS under which statute the retired member is employed. 5
(a) Upon request by PERS, a participating employer must certify to PERS that a 6
retired member has not exceeded the number of hours allowed under ORS 238.082 and 7
section (2) of this rule. 8
(b) Upon request by PERS a participating employer must provide PERS with 9
business and employment records to substantiate the actual number of hours a retired 10
member was employed. 11
(c) Participating employers must provide information requested under this section 12
within 30 days of the date of the request. 13
(14) Accumulated unused sick leave reported by an employer to PERS upon a 14
member’s retirement, as provided in ORS 238.350, may not be made available to a 15
retired member returning to employment under sections (2) or (9) of this rule. 16
(15) Subsections (4)(c) and (4)(d) of this rule are repealed effective January 2, 2026. 17
(16) Subsection (4)(e) of this rule is repealed effective June 30, 2023. 18
(17) A member who is retired for service maintains their status as a retired 19
member of the system, and does not accrue additional benefits during the period of 20
employment. A retired member may not participate in the pension program or the 21
Individual Account Program as an active member, except as provided by ORS 22
238.092(1) or 237.650. 23

DRAFT DRAFT DRAFT DRAFT DRAFT DRAFT
017-0060-5 Page 10 Draft
(18) For calendar years 2020 through 2024, a public employer employing a 1
retired member shall apply the employer’s net contribution rate for its active 2
members to the wages paid to the retired member, and shall make a payment to the 3
Public Employees Retirement Fund. This payment is in addition to the employer’s 4
contribution required under ORS 238.225. The additional payment will be applied 5
to the employer’s liabilities, including pension benefit costs and retiree medical 6
benefit costs. If the employer is a member of a pool established under ORS 238.227, 7
the additional payment will be applied to the employer’s rate pool’s liabilities. 8
(19) For calendar years 2020 through 2024, the limitations on employment in 9
section (2) of this rule do not apply to a retired member unless the retired member 10
retired under the provisions of ORS 238.280(1), (2), or (3), and the member’s date of 11
hire with any participating employer is less than six months from the member’s 12
effective retirement date as provided under section 35, chapter 355, Oregon Laws 13
2019, and the member’s retirement otherwise meets the standard of a bona fide 14
retirement. 15
(20) For calendar years 2020 through 2024, if the member retired under the 16
provisions of ORS 238.280(1), (2), or (3), and the member’s date of hire with any 17
participating employer is less than six months after the member’s effective 18
retirement date, or the member’s retirement does not otherwise meet the standards 19
of a bona fide retirement, the member is subject to the limitations on employment in 20
section (2) of this rule. 21
(21) Sections (18), (19), and (20) of this rule are repealed effective January 2, 22
2025. 23
Stat. Authority: ORS 238.630 & ORS 238.650 24

DRAFT DRAFT DRAFT DRAFT DRAFT DRAFT
017-0060-5 Page 11 Draft
Stats. Implemented: ORS 238.078, ORS 238.082, ORS 238.088, ORS 238.092, ORS 1
399.075, 2007 OL Ch. 499 & 774, 2015 OL Ch. 108 & 475, [&] 2018 OL Ch. 48, & 2
2019 OL Ch. 355 3

B.2. Attachment 3 OREGON ADMINISTRATIVE RULE
PUBLIC EMPLOYEES RETIREMENT BOARD CHAPTER 459
DIVISION 075 – OPSRP PENSION PROGRAM
075-0300-5 Page 1 Draft
459-075-0300 1
Reemployment of a Retired Member of the OPSRP Pension Program 2
(1) For purposes of this rule, “bona fide retirement” means that the retired 3
member has been absent from service with all participating employers and all 4
employers in a controlled group with a participating employer for at least six full 5
calendar months between the effective date of retirement and the date of hire. 6
[(1)](2) If a retired member of the OPSRP Pension Program who is receiving 7
monthly pension payments is employed by a participating public employer in a qualifying 8
position: 9
(a) The member’s retirement is canceled effective the first of the month in which the 10
member was hired. 11
(b) The last pension payment the member is entitled to receive is for the month 12
before the calendar month in which the member was hired. A member who receives 13
benefits to which he or she is not entitled must repay those benefits to PERS. 14
(c) The member reestablishes active membership effective the date the member was 15
hired. 16
[(2)](3) If a retired member of the OPSRP Pension Program who received a lump 17
sum benefit in lieu of a small pension under ORS 238A.195 is employed by a 18
participating public employer in a qualifying position, the member reestablishes active 19
membership effective the date of hire. 20
(a) If the member was hired after the date of the payment, the member is not required 21
or permitted to repay the benefit amount. 22

DRAFT DRAFT DRAFT DRAFT DRAFT DRAFT
075-0300-5 Page 2 Draft
(b) If the member was hired on or before the date of the payment, the member must 1
repay the gross benefit amount. 2
[(3)](4) A retired member of the OPSRP Pension Program who is hired by a 3
participating public employer in a non-qualifying position may receive pension payments 4
or a lump sum payment under ORS 238A.195 without affecting the member’s status as a 5
retired member, provided the period or periods of employment worked as a retired 6
member total less than 600 hours in a calendar year. 7
(a) If, by reason of hours of service performed by the retired member, the non-8
qualifying position becomes qualifying in a calendar year, the position is qualifying 9
effective the later of the first day of the calendar year or the date of hire. 10
(b) If a position becomes qualifying under subsection (a) of this section, the retired 11
member is subject to the provisions of sections (1) and (2) of this rule. 12
[(4)](5) A retired member who reestablishes active membership may, at subsequent 13
retirement, elect any option provided in ORS 238A.180 and 238A.190, subject to the 14
provisions of ORS 238A.195. 15
(a) The member’s subsequent retirement benefit will be calculated based on the 16
member’s periods of active membership before and after the member’s initial effective 17
retirement date if at the initial retirement: 18
(A) The member received a monthly pension; or 19
(B) The member received a lump sum payment under ORS 238A.195 and repaid the 20
benefit amount under subsection (2)(b) of this rule. 21

DRAFT DRAFT DRAFT DRAFT DRAFT DRAFT
075-0300-5 Page 3 Draft
(b) The member’s subsequent retirement benefit will be calculated based on the 1
member’s periods of active membership after the member’s initial effective retirement 2
date if: 3
(A) At initial retirement, the member received a lump sum payment under ORS 4
238A.195 and was not required to repay the benefit amount under subsection (2)(b) of 5
this rule; or 6
(B) The member is required to repay the benefit amount under subsection (2)(b) of 7
this rule and, as of the effective retirement date of the member’s subsequent retirement, 8
the member has not repaid the benefit amount. 9
(c) The member’s subsequent retirement benefit will be calculated using the actuarial 10
equivalency factors in effect on the effective retirement date of the subsequent retirement. 11
(6) A member who is retired for service maintains the member’s status as a 12
retired member of the system and does not accrue additional benefits during the 13
period of employment. A retired member may not participate in the pension 14
program or the Individual Account Program as an active member, except as 15
provided by ORS 238A.250 or 237.650. 16
(7) For calendar years 2020 through 2024, a public employer employing a 17
retired member shall apply the employer’s net contribution rate for its active 18
members to the wages paid to the retired member. The public employer shall make 19
a payment to the Public Employees Retirement Fund in that amount that is in 20
addition to the employer’s contribution required under ORS 238A.220. The 21
additional payment will be applied to the employer’s liabilities, including pension 22
benefit costs and retiree medical benefit costs. 23

DRAFT DRAFT DRAFT DRAFT DRAFT DRAFT
075-0300-5 Page 4 Draft
(8) For calendar years 2020 through 2024, the limitations on employment in 1
section (4) of this rule do not apply to a retired member unless the member retired 2
under the provisions of ORS 238A.185, and the member’s date of hire with any 3
participating public employer is less than six months from the member’s effective 4
retirement date, as provided under section 37, chapter 355, Oregon Laws 2019, and 5
the member’s retirement otherwise meets the standard of a bona fide retirement. 6
(9) For calendar years 2020 through 2024, if a member retired under the 7
provisions of ORS 238A.185, and the member’s date of hire is less than six months 8
after the member’s effective retirement date or the member’s retirement does not 9
otherwise meet the standards of a bona fide retirement, the member is subject to the 10
limitations on employment in section (4) of this rule. 11
(10) Sections 6, 7, and 8 of this rule are repealed effective January 2, 2025. 12
Stat. Auth.: ORS 238.630 & 238A.450 13
Stats. Implemented: ORS 238A.245, 2019 OL, Ch. 355, Sec. 37 14
SL1 PERS Board Meeting December 6, 2019
Item B.3.
Public Employees Retirement System Headquarters:
11410 S.W. 68th Parkway, Tigard, OR Mailing Address:
P.O. Box 23700 Tigard, OR 97281-3700
888-320-7377 TTY (503) 603-7766
www.o re go n .go v/p er s
Oregon Kate Brown, Governor
December 6, 2019 TO: Members of the PERS Board FROM: Stephanie Vaughn, Manager, Policy Analysis & Compliance Section SUBJECT: Adoption of Rules to Implement 2019 Legislation: OAR 459-005-0525, Ceiling on Compensation for Purposes of Contributions and
Benefits OAR 459-050-0001, OSGP Definitions OAR 459-076-0045, Cessation of Disability Benefits Upon Reaching Normal
Retirement Age OVERVIEW
• Action: Adopt modifications to the rules to implement 2019 legislation.
• Reason: Implement 2019 legislation impacting PERS.
• Policy Issue: None identified.
BACKGROUND The 2019 Oregon Legislature enacted several PERS-related bills which require rulemaking: Senate Bill 1049 (Chapter 355, Oregon Laws 2019), became effective June 11, 2019. Rules to implement different sections of the bill will be presented for notice over the course of several board meetings, based on the effective dates of the bill sections. At this time we are presenting for adoption rule amendments for the definition of salary. SB 1049 changed the definition of “salary” for PERS purposes, creating a new limitation on subject salary used for PERS benefit calculations and contributions. Currently, salary limits exist for all programs according to federal law. Tier Two and OPSRP salary is limited for all plan purposes (i.e. contributions and benefits); Tier One is limited only for contributions. SB 1049 establishes a salary limit for all programs that is lower than the federal limits. For calendar years beginning on or after January 1, 2020, the annual subject salary taken into account for purposes of determining contributions and calculating final average salary (FAS) for all PERS members may not exceed $195,000 in a calendar year. The proposed rule modifications incorporate the salary limitation for calendar year 2020, and are necessary to ensure compliance with the statutory limits on the amount of annual salary allowed for determining contributions and for calculating final average salary. House Bill 2118 (Chapter 57, Oregon Laws 2019), is effective January 1, 2020. HB 2118 updated Consumer Price Index (CPI) references to align with the current applicable CPI, the West Region CPI for All Items. One reference to the discontinued CPI is updated in OAR 459-076-0045.

Adoption – Rules to Implement 2019 Legislation 12/6/19 Page 2 of 3
SL1 PERS Board Meeting December 6, 2019
House Bill 3146 (Chapter 213, Oregon Laws 2019), is effective January 1, 2020. HB 3146 replaced the term “inmate” with “adult in custody” throughout Oregon laws. One use of the term is updated in OAR 459-050-0001.
SUMMARY OF MODIFICATIONS TO RULES SINCE NOTICE In OAR 459-005-0525(3), the phrase “beginning in 2020” in the last sentence was moved from the end of the sentence to the beginning of the sentence for readability.
PUBLIC COMMENT AND HEARING TESTIMONY A rulemaking hearing was held October 29, 2019, at 2:00 p.m. at PERS headquarters in Tigard. No members of the public attended. The public comment period ended November 5, 2019, at 5:00 p.m. Two public comment letters were received. Aruna Masih, with Bennett Hartman, submitted public comment on November 1, 2019. A copy of her letter is included as Attachment 4. David Elott, a PERS member, submitted public comment on November 4, 2019. A copy of his comments is included as Attachment 5. Regarding the concerns of preserving the record of the provisions of the rule and PERS practices prior to implementation, staff has specifically amended the rule sparingly for precisely this reason. OAR 459-005-0525(3), which relates specifically to Tier 1 members, for whom the SB 1049 change to salary definition is most significant, has been retained, and language added, to indicate the pre-2020 and post-2020 standards. For Tier 2 and OPSRP members, who were already subject to a salary limit in the rule, we have followed the same practice we follow every year when the limit is adjusted. Although the history of the dollar limits are not in the rule, the rule specifies the year to which the limit applies, and PERS retains, in its system, a history table of the annual limits. Regarding the concern about calculating final average salary, staff notes that the Milliman information to which Ms. Masih refers was generated prior to review of the actual language of SB 1049. Discussions prior to release of the actual language of the bill had referenced the concept as a limit on final average salary, hence Milliman’s analysis. However, the actual language of the bill is structured as a limit on annual salary and does not make any changes to the final average salary statutes.
LEGAL REVIEW The attached draft rules were submitted to the Department of Justice for legal review and any comments or changes are incorporated in the rules as presented for adoption.
IMPACT Mandatory: Yes, changes are necessary to bring the rules in line with changes or additions to statute made by the 2019 legislature. Benefit: Updates the rules to reflect recent legislative changes and provides clarification on the agency’s administration of work after retirement. Cost: There are no discrete costs attributable to the rules.

Adoption – Rules to Implement 2019 Legislation 12/6/19 Page 3 of 3
SL1 PERS Board Meeting December 6, 2019
RULEMAKING TIMELINE October 3, 2019 Staff began the rulemaking process by filing a Notice of
Rulemaking with the Secretary of State. October 4, 2019 Secretary of State published the Notice in the Oregon
Administrative Rules Database. Notice was sent to employers, legislators, and interested parties. Public comment period began.
October 4, 2019 PERS Board notified that staff began the rulemaking process. October 29, 2019 Rulemaking hearing held at 2:00 p.m. at PERS in Tigard. November 5, 2019 Public comment period ended at 5:00 p.m. December 6, 2019 Board may adopt the permanent rule modifications.
BOARD OPTIONS The board may: 1. Pass a motion to “adopt modifications to the rules to implement 2019 legislation, as
presented.” 2. Direct staff to make other changes to the rules or explore other options.
STAFF RECOMMENDATION Staff recommends the board choose Option #1. • Reason: Implement 2019 legislation impacting PERS. If the PERS Board does not adopt: Staff would return with rule modifications that more closely fit the board’s policy direction if the board determines that a change is warranted. B.3. Attachment 1 - 459-005-0525, Ceiling on Compensation for Purposes of Contributions and Benefits B.3. Attachment 2 - 459-050-0001, OSGP Definitions B.3. Attachment 3 - 459-076-0045, Cessation of Disability Benefits Upon Reaching Normal Retirement Age B.3. Attachment 4 - Public Comment Letter dated 11-1-19 from Aruna Masih B.3. Attachment 5 - Public Comment Letter dated 11-4-19 from David Elott

B.3. Attachment 1 OREGON ADMINISTRATIVE RULE
PUBLIC EMPLOYEES RETIREMENT BOARD CHAPTER 459
DIVISION 005 – ADMINISTRATION
005-0525-3 Page 1 Draft
459-005-0525 1
Ceiling on Compensation for Purposes of Contributions and Benefits 2
(1) This administrative rule shall be construed consistently with the requirements of 3
the Internal Revenue Code (IRC) Section 401(a)(17) relating to the limitation on annual 4
compensation allowable for determining contribution and benefits under ORS Chapters 5
238 and 238A. 6
(2) For purposes of this rule: 7
(a) “Annual compensation” means “salary,” as defined in ORS 238.005 and 238.205 8
with respect to Chapter 238 and in 238A.005 with respect to Chapter 238A paid to the 9
member during a calendar year or other 12-month period, as specified in this rule. 10
(b) “Eligible participant” means a person who first becomes a member of PERS 11
before January 1, 1996. 12
(c) “Employer” means a “public employer” as defined in ORS 238.005, for the 13
purposes of this rule as it applies to Chapter 238. For the purposes of this rule as it 14
applies to Chapter 238A, an “employer” means a “participating public employer” as 15
defined in 238A.005. 16
(d) “Noneligible participant” means a person who first becomes a member of PERS 17
after December 31, 1995. 18
(e) “Participant” means an active or inactive member of PERS. 19
(3) For eligible participants, the limit set forth in IRC Section 401(a)(17) shall not 20
apply for purposes of determining the amount of employee or employer contributions that 21
may be paid into PERS, and for purposes of determining benefits due under ORS 22

DRAFT DRAFT DRAFT DRAFT DRAFT DRAFT
005-0525-3 Page 2 Draft
Chapters 238 and 238A. The limit on annual compensation for eligible participants shall 1
be no less than the amount which was allowed to be taken into account for purposes of 2
determining contributions or benefits under former ORS 237.001 to 237.315 as in effect 3
on July 1, 1993, for calendar years before 2020. Beginning in 2020, the limit on 4
annual compensation taken into account for purposes of determining contributions 5
or benefits under ORS Chapter 238 or 238A for eligible participants shall be 6
measured on a calendar year basis, and shall not exceed $195,000 per calendar year. 7
(4) For noneligible participants, the annual compensation taken into account for 8
purposes of determining contributions or benefits under ORS Chapters 238 and 238A 9
shall be measured on a calendar year basis, and shall not exceed [$280,000] $195,000 per 10
calendar year beginning in [2019] 2020. 11
[(a) The limitation on annual compensation will be indexed by cost-of-living 12
adjustments in subsequent years as provided in IRC Section 401(a)(17)(B).] 13
[(b)](5) A [noneligible] participant employed by two or more agencies or 14
instrumentalities of a PERS participating employer in a calendar year, whether 15
concurrently or consecutively, shall have all compensation paid by the employer 16
combined for determining the allowable annual compensation under this rule. 17
[(c)](6) PERS participating employers shall monitor annual compensation and 18
contributions to assure that reports and remitting are within the limits established by this 19
rule and IRC Section 401(a)(17). 20
[(5)](7) For a [noneligible] participant, Final Average Salary under ORS 238.005 21
with respect to Chapter 238 and under 238A.130 with respect to Chapter 238A shall be 22
calculated based on the amount of compensation that is allowed to be taken into account 23
under this rule. 24

DRAFT DRAFT DRAFT DRAFT DRAFT DRAFT
005-0525-3 Page 3 Draft
[(6) Notwithstanding sections (4) and (5) of this rule, if the Final Average Salary as 1
defined in ORS 238.005 with respect to Chapter 238 and as defined in 238A.130 with 2
respect to Chapter 238A is used in computing a noneligible participant’s retirement 3
benefits, the annual compensation shall be based on compensation paid in a 12-month 4
period beginning with the earliest calendar month used in determining the 36 months of 5
salary paid. For each 12-month period, annual compensation shall not exceed the 6
amount of compensation that is allowable under this rule for the calendar year in which 7
the 12-month period begins.] 8
[(7)](8) With respect to ORS Chapter 238, creditable service, as defined in 238.005, 9
shall be given for each month that an active member is paid salary or wages and 10
allowable contributions have been remitted to PERS, or would be remitted but for the 11
annual compensation limit in [IRC Section 401(a)(17)] this rule. With respect to Chapter 12
238A, retirement credit as determined in 238A.140, shall be given for each month that an 13
active member is paid salary or wages and allowable contributions have been remitted to 14
PERS, or would be remitted but for the annual compensation limit in [IRC Section 15
401(a)(17)] this rule. 16
(9) Beginning in 2020, the limitation on annual compensation under sections (3) 17
and (4) of this rule will be indexed by cost-of-living adjustments in subsequent years 18
as provided in the Consumer Price Index for All Urban Consumers, West Region 19
(All Items), as published by the Bureau of Labor Statistics of the United States 20
Department of Labor. 21
[(8) The provisions of this rule are effective on January 1, 2004.] 22
Stat. Auth.: ORS 238.630, 238.650, 238A.370 & 238A.450 23
Stats. Implemented: ORS chapters 238 & 238A 24

B.3. Attachment 2 OREGON ADMINISTRATIVE RULE
PUBLIC EMPLOYEES RETIREMENT BOARD CHAPTER 459
DIVISION 050 – DEFERRED COMPENSATION
050-0001-1 Page 1 Draft
459-050-0001 1
Definitions 2
The words and phrases used in this Division have the same meaning given them in 3
ORS 243.401 — 243.507 and ORS 293.701 — 293.820. Specific and additional terms are 4
defined as follows unless the context requires otherwise. 5
(1) “Advisory Committee” means the committee established pursuant to ORS 6
243.505 and appointed by the Board. 7
(2) “Alternate Payee” shall have the same meaning as provided in ORS 8
243.507(9)(a). 9
(3) “Alternate Payee Account” means a separate account created under ORS 243.507 10
in the name of an alternate payee pursuant to a court order. 11
(4) “Alternate Payee’s Award” is the portion of a participant’s Deferred 12
Compensation Account, Designated Roth Account, or a combination of both, awarded to 13
an alternate payee by a court order, and includes the creation of separate account(s) in the 14
fund in the name of the alternate payee. 15
(5) “Alternate Payee Release” means a written statement signed by the alternate 16
payee and received by the Deferred Compensation Program. An alternate payee release 17
may pertain to any of the matters set forth in subsections (5)(a) through (5)(c) of this rule, 18
may authorize the release of information, and direct the Deferred Compensation Program 19
to send information to a named person at a specified address. 20
(a) Pertaining to the alternate payee’s interest in the participant’s Deferred 21
Compensation Account and the Designated Roth Account; 22
DRAFT DRAFT DRAFT DRAFT DRAFT DRAFT
050-0001-1 Page 2 Draft
(b) Pertaining to the alternate payee’s account(s) and distribution(s) if separate 1
account(s) have been created in the name of the alternate payee; or 2
(c) Pertaining to award information contained in any draft or final court order in 3
regard to the alternate payee on record with the Deferred Compensation Program. 4
(6) “Board” shall have the same meaning as provided in ORS 243.401(1). 5
(7) “Committee” shall have the same meaning as provided in section (1) of this rule. 6
(8) “Court Order” means a court decree or judgment of dissolution of marriage, 7
separation, or annulment, or the terms of any court order or court approved marital 8
property settlement agreement, incident to any court decree or judgment of dissolution of 9
marriage, separation, or annulment. 10
(9) “Deferred Compensation Account” means the participant’s individual account in 11
the Deferred Compensation Plan as defined in ORS 243.401(5) that is made up of pre-tax 12
employee contributions and earnings. 13
(10) “Deferred Compensation Advisory Committee” shall have the same meaning as 14
provided in section (1) of this rule. 15
(11) “Deferred Compensation Contract” shall have the same meaning as provided in 16
ORS 243.401(3). 17
(12) “Deferred Compensation Investment Program” shall have the same meaning as 18
provided in ORS 243.401(4). 19
(13) “Deferred Compensation Manager” means the person appointed by the Director 20
to serve as the Manager of the Deferred Compensation Program of the Public Employees 21
Retirement System. 22

DRAFT DRAFT DRAFT DRAFT DRAFT DRAFT
050-0001-1 Page 3 Draft
(14) “Deferred Compensation Plan” shall have the same meaning as provided in 1
ORS 243.401(5). 2
(15) “Deferred Compensation Program” means a program established by the State of 3
Oregon and administered under policies established by the Public Employees Retirement 4
Board that has as its purposes the deferral of compensation to eligible employees. 5
(16) “Designated Roth Account” means a participant’s individual account in the 6
Deferred Compensation Program that is made up of Designated Roth Contributions, 7
eligible rollovers and earnings. 8
(17) “Designated Roth Contribution” means any elective deferral which would 9
otherwise be excludable from gross income of an employee under section 457(b) of the 10
Internal Revenue Code and the employee designates as not being so excludable under 11
section 402A of the Internal Revenue Code. 12
(18) “Disclosure Statement” means the statement, required by ORS 243.450, that 13
describes the probable income and probable safety of money deferred. 14
(19) “Domestic Relations Order” means a judgment, decree or court order made 15
pursuant to a state’s domestic relations law that creates or recognizes the existence of an 16
alternate payee’s right, or assigns to an alternate payee the right, to receive all or a 17
portion of a participant’s Deferred Compensation Account, Designated Roth Account, or 18
a combination of both, or benefit payments. 19
(20) “Draft Court Order” means an Order as described in section (8) of this rule 20
which contains proposed language for the division of a Deferred Compensation Account, 21
Designated Roth Account, or a combination of both, and has been prepared but not 22
approved or signed by the court or has not been filed with the court clerk. 23

DRAFT DRAFT DRAFT DRAFT DRAFT DRAFT
050-0001-1 Page 4 Draft
(21) “Eligible Employee” shall have the same meaning as ORS 243.401(6) for an 1
employee of the state, or as provided in the plan description of a local government 2
deferred compensation plan, and shall exclude persons who are [inmates] adults in 3
custody of any prison or detention facility operated by the state or local government, and 4
persons who are employed by contract with a private sector business. 5
(22) “Enrollment Form” means a contract between the eligible employee and the 6
plan sponsor which defines the circumstance, responsibilities and liabilities of both 7
parties relating to the participation of the employee in the Deferred Compensation 8
Program. 9
(23) “Estimate” means a projection of distributions prepared by staff. An estimate is 10
not a guarantee or promise of actual distributions that eventually may become due and 11
payable. 12
(24) “Final Court Order” means a court order or judgment that has been signed by a 13
judge and shows the stamp of the court clerk or trial court administrator, indicating the 14
order is a certified copy of the original record on file with the court. 15
(25) “Fund” shall have the same meaning as provided in ORS 243.401(7). 16
(26) “Local Government” shall have the same meaning as provided in ORS 17
243.401(8). 18
(27) “Local Government Deferred Compensation Contract” means a written contract 19
between a local government and an eligible employee of that local government that 20
provides for deferral of income for service currently rendered, as defined in the 21
established policy of the local government. 22

DRAFT DRAFT DRAFT DRAFT DRAFT DRAFT
050-0001-1 Page 5 Draft
(28) “Local Government Deferred Compensation Plan” shall have the same meaning 1
as provided in ORS 243.401(9). 2
(29) “Manager” shall have the same meaning as provided in section (13) of this rule. 3
(30) “OIC” means the Oregon Investment Council created by ORS 293.706. 4
(31) “Participant” means a person defined in either ORS 243.401(10) or 243.401(13) 5
participating in one or more deferred compensation plans under ORS 243.401 to 243.507, 6
either through current or past deferrals or compensation. 7
(32) “Participant’s Release” means a written statement signed by a deferred 8
compensation plan participant and received by the Deferred Compensation Program. A 9
participant’s release may pertain to any of the matters set forth in subsections (a) through 10
(c) of this section, may authorize the release of information, and direct the Deferred 11
Compensation Program to send information to a named person at a specified address. 12
(a) Pertaining to the participant’s Deferred Compensation Account and Designated 13
Roth Account; 14
(b) Pertaining to the participant’s distribution(s); or 15
(c) Pertaining to award information contained in any draft or final court order in 16
regard to the participant on record with the Deferred Compensation Program. 17
(33) “Participating Local Government” shall have the same meaning as provided in 18
ORS 243.401(11). 19
(34) “Payroll Disbursing Officer” means: 20
(a) The person authorized by the state to disburse moneys in payment of salaries and 21
wages of employees of a state agency; or 22

DRAFT DRAFT DRAFT DRAFT DRAFT DRAFT
050-0001-1 Page 6 Draft
(b) The person authorized by a local government to disburse money in payment of 1
salaries and wages of employees of that local government. 2
(35) “PERS” shall have the same meaning as provided in ORS 243.401(14). 3
(36) “Plan Sponsor” means a public employer that establishes an eligible deferred 4
compensation plan as defined in Section 457 of the Internal Revenue Code and which 5
enters into an agreement with PERS to participate in the Deferred Compensation 6
Program. 7
(37) “Program” shall have the same meaning as provided in section (15) of this rule. 8
(38) “Public Employees Retirement Board” shall have the same meaning as provided 9
in ORS 243.401(1). 10
(39) “Public Employer” means the state or a local government as defined in ORS 11
243.401(8). 12
(40) “Qualified Domestic Relations Order” or “QDRO” means a domestic relations 13
order that has been reviewed and determined to be qualified by the Deferred 14
Compensation Program Manager. 15
(41) “Solicitation of Offers from Vendors” means a notice to potential vendors of 16
investment services prepared by the OIC informing the potential vendor of the needs of 17
the Deferred Compensation Investment Program and notice that the OIC will accept 18
offers from qualified vendors to sign a contract with the State of Oregon providing for the 19
vendors’ acceptance of deposits under the terms and conditions of the contract. 20
(42) “Staff” means any employee of the Public Employees Retirement System, who 21
has been appointed in accordance with ORS 238.645. 22

DRAFT DRAFT DRAFT DRAFT DRAFT DRAFT
050-0001-1 Page 7 Draft
(43) “State Agency” means every state officer, board, commission, department or 1
other activity of state government. 2
(44) “State Deferred Compensation Plan” shall have the same meaning as provided 3
in ORS 243.401(12). 4
(45) “Vendor” means an entity offering investment or other service related to 5
investment of deferred compensation pursuant to a contract with the State of Oregon. 6
[Publications: Publications referenced are available from the agency.] 7
Stat. Auth: ORS 243.470 8
Stats. Implemented: ORS 243.401 - ORS 243.507 9

B.3. Attachment 3 OREGON ADMINISTRATIVE RULE
PUBLIC EMPLOYEES RETIREMENT BOARD CHAPTER 459
DIVISION 076 – OPSRP DISABILITY BENEFIT
076-0045-1 Page 1 Draft
459-076-0045 1
Cessation of Disability Benefits Upon Reaching Normal Retirement Age 2
(1) If a member who is receiving an OPSRP disability benefit reaches normal 3
retirement age, as defined in ORS 238A.160, disability benefits will cease as of the first 4
of the following month. 5
(2) The disability benefit will not automatically convert to a retirement benefit upon 6
the member reaching normal retirement age. The member must apply for service 7
retirement benefits before receiving them. In order to receive a service retirement benefit 8
beginning in the month in which a disability benefit ceases under section (1) above, the 9
member must: 10
(a) Complete the applicable Service Retirement application(s); and 11
(b) Submit the application(s) to PERS at least 92 days before the first of the month in 12
which the disability benefit ceases under section (1). In no case will a service retirement 13
benefit become payable during a month in which a member receives a disability benefit 14
or earlier than the first of the month in which an application was submitted. 15
(3) The OPSRP retirement pension benefit will be based on: 16
(a) The adjusted salary as set forth in section (4) of this rule; and 17
(b) The total retirement credit accrued, set forth in section (5) of this rule. 18
(4) The salary the member was receiving immediately prior to leaving active 19
employment as a result of disability will be adjusted for the cost-of-living for each year 20
after the member left employment and before the member’s effective date of service 21
retirement. 22

DRAFT DRAFT DRAFT DRAFT DRAFT DRAFT
076-0045-1 Page 2 Draft
(a) Cost-of-living adjustments will be based on the [Portland-Salem, OR-WA CPI] 1
Consumer Price Index for All Urban Consumers, West Region (All Items), as 2
published by the Bureau of Labor Statistics of the United States Department of 3
Labor and may not exceed a two percent increase or decrease for any year. 4
(b) Cost-of-living adjustments will be made only for calendar years in which the 5
member received an OPSRP disability benefit for at least six months during a calendar 6
year. 7
(5) Retirement credit. A member receiving OPSRP disability benefits will accrue 8
retirement credit, as well as hours of service credit toward vesting, for the entire period of 9
disability until: 10
(a) The member is no longer disabled; or 11
(b) The member reaches normal retirement age. 12
(6) The retirement credit will accrue under the same employment classification in 13
which the member was immediately employed prior to becoming disabled. 14
(7) A member who is receiving disability benefits who reaches normal retirement 15
age and has not applied for a service retirement will become an inactive member on the 16
first of the month following the month in which they reach normal retirement age. 17
Statutory/Other Authority: ORS 238A.450 18
Statutes/Other Implemented: ORS 238A.155 & 238A.235 19

Robert A. Bennett (1931-2018)
Nora J. Broker
Thomas K. Doyle WA
Talia Y. Guerriero WA
Nelson R. Hall
Gregory A. Hartman
Henry J. Kaplan NY
Linda J. Larkin *
Aruna A. Masih WA
Michael J. Morris
Richard B. Myers WA
Margaret S. Olney WA WA also a member of the Washington bar
NY also a member of the New York bar
* of counsel
210 SW Morrison Street, Suite 500, Portland, Oregon 97204
office: 503.227.4600 | fax: 503.248.6800
November 1, 2019
Via Email [email protected]
& Regular Mail
Attn. Daniel Rivas
PERS Rules Coordinator
11410 SW 68th Parkway
Tigard, OR 97223
Re: Comments – Proposed Rules to Implement SB 1049
Our File No. 5415-237
Dear Mr. Rivas:
This firm represents the PERS Coalition of Unions and individual union members who have
challenged some of the changes enacted by SB 1049 (2019) in the case of Jennifer James et al. v.
State of Oregon et al., Supreme Court Case No. S066933. Without waiving any legal arguments
raised in the pending case, we submit the following brief comments regarding PERS’ proposed
administrative rules to implement the 2019 legislation.
Since the Oregon Supreme Court’s decision in Moro v. State of Oregon, 357 Or 167 (2015), at a
minimum, it is clear that, benefits attributable to service already provided must be protected. In
that case, the court explained that,
“by the time the legislature enacted SB 822 and SB 861, modifying the pre-
amendment COLA provisions, PERS members already had a contractual right to
their accrued retirement benefits that would be subject to the pre-amendment
COLA. Hughes, therefore, establishes a contractual obligation applicable here:
Members are entitled to have the pre-amendment COLA applied to accrued PERS
benefits earned before the COLA amendments went into effect.”
Id. at 220. The court then concluded that a blended COLA must be applied “that reflects the
different COLA provisions applicable to benefits earned at different time periods” and cited the
segmenting of service approach used in ORS 238.364(5) as an example of a potential approach
PERS could take. Id. at 232 n36. To the extent PERS’ proposed regulations implementing SB 1049
fail to apply the pre-amendment law to benefits attributable to service performed under that pre-
amendment law, the proposed regulations violate the Moro decision.
Aruna Masih
direct: 503.546.9636
B.3. Attachment 4

Comments – Proposed Rules to Implement SB 1049
November 1, 2019
Page 2 of 2
For example, proposed OAR 459-005-0525 related to the Ceiling on Compensation for Purposes
of Contributions and Benefits does not protect benefits attributable to service already provided. It
does not clarify adequately that for purposes of calculating benefits attributable to that segment of
service provided before January of 2020 (the effective date of the change under SB 1049), the
Board will use the pre-amendment definition of salary, including salary increases through the date
of retirement. Instead, the rule imposes the SB 1049 limits on salary even to the calculation of
benefits attributable to that segment of service provided before January of 2020.
Again, at a minimum, PERS should be using the segmented service approach to implement the
salary provisions of SB 1049. The approach would be similar to that taken by the PERS Actuary
in their analysis of SB 1049 presented to the legislature.1 Under that approach, for example, the
PERS Actuary explained that, “if an OPSRP general service member retires with a FAS of
$220,000 prior to application of the SB 1049 indexed salary limit, has 15 years of service prior to
January 1, 2020, and 10 years of service after that date, the initial benefit calculation (prior to any
adjustment for early commencement or form of payment) would be: [1.5% x 15 x $220,000] +
[1.5% x 10 x (Lesser of $220,000 or Indexed Limit)].”
Also, we recommend that PERS not delete existing regulations so that it is clear for purposes of
protecting benefits attributable to prior service that there is a record of how benefits were to be
calculated before the effective date of the change. We also do not see any provision in the rules
for how the PERS Board intends to address mid-year retirements.
We appreciate PERS’ attention to these issues as it finalizes the regulations.
Best regards,
BENNETT HARTMAN, LLP
Aruna A. Masih
1 See https://olis.leg.state.or.us/liz/2019R1/Downloads/CommitteeMeetingDocument/198603

B.3. Attachment 5
November 4, 2019 Comments on Proposed OAR 459-005-0525 submitted by David Elott: Although it is not entirely clear from the language how PERS will interpret and apply the rule, under Moro v. State of Oregon (657 Or 167)1, PERS cannot apply proposed OAR 459-005-0525 to retrospectively limit the final average salary (FAS) calculation for Tier 1/Tier 2 members for years of service performed before January 1, 2020 (the effective date of the salary cap provisions of SB 1049). Rather, for a Tier 1/Tier2 member, the final FAS calculation must be a pro-rata combination of the FAS for years of service prior to 2020 (uncapped by SB 1049) and the capped FAS for years of service beginning with 2020. In fact, the actuarial materials PERS, itself, submitted to the Joint Subcommittee on Capital Construction as part of its testimony on SB 1049 on May 10, 2019, stated as much. Specifically, those materials state (Letter from Milliman to Kevin Olineck dated May 9, 2019, submitted to the Joint Subcommittee on Capital Construction on May 10, 2019, as part of PERS’ testimony on SB 1049 (emphasis added)): “FINAL AVERAGE SALARY LIMIT We understand the proposed $195,000 limit on FAS would apply prospectively (i.e., only for benefits associated with service performed after 2019), would be indexed over time, and would affect both Tier 1/Tier 2 members and OPSRP pension members. Specifically, we understand the Final Average Salary used in the benefit calculations for service performed before January 1, 2020 would be unaffected by the limit, and would also reflect post 2019 salary growth, if applicable. For example, if an OPSRP general service member retires with a FAS of $220,000 prior to application of this concept’s indexed limit, has 15 years of service prior to January 1, 2020, and 10 years of service after that date, we understand the initial benefit calculation (prior to any adjustment for early commencement or form of payment) would be: [1.5% x 15 x $220,000] + [1.5% x 10 x (Lesser of $220,000 or Indexed Limit)] Tier 2 and OPSRP pension participants are already subject to a limit on the amount of annual salary in any year that may be reflected in the FAS calculation. This limit is consistent with the level prescribed in Internal Revenue Code Section 401(a)(17), which is $280,000 in 2019 and indexed with inflation in future years. Tier 1 members currently do not have any limit on the annual salary reflected in the FAS calculation. We understand the proposed indexed limit would be applied to the calculated FAS, not to the annual salary amounts used in the FAS calculation. The effect of prospectively introducing a lower limit will be to reduce projected future benefits (and associated liabilities) for the small minority of Tier 1, Tier 2, and OPSRP members with future salary 1 In Moro, the Oregon Supreme Court invalidated the legislature’s retroactive application of a COLA reduction stating: “We therefore hold that respondents constitutionally may cease the income tax offset payments to nonresidents as set out in SB 822 and that respondents also constitutionally may apply the COLA amendments as set out in SB 822 and SB 861 prospectively to benefits earned on or after the effective dates of those laws, but not retrospectively to benefits earned before those effective dates. Subject to applicable vesting requirements, PERS members who have worked for participating employers both before and after the relevant effective dates are entitled to a COLA rate that is blended to reflect the different COLA provisions applicable to benefits earned at different times.” Moro, 174 (emphasis added).

B.3. Attachment 5
over the selected indexed limit. This limitation would not affect the benefits or liabilities for members whose benefit is determined by the Money Match calculation. Our analysis assumed that employer contribution rates would continue to apply to all subject salary, including salary in excess of the indexed limit. The relatively small magnitude of the changes to liabilities and contributions rates from the FAS limitation concept reflects the fact that a small percentage of members actually have salary levels in excess of the indexed limit, and that applying such a limit prospectively affects only a portion of those members’ projected benefits. That portion is smaller for older, longer-service members, who tend to make up a disproportionate share of the members with pay over any level of FAS limit.” Accordingly, I urge PERS to discard the current proposed language of OAR 459-005-0525 and replace it with language similar to that of OAR 459-005-0510, which would reflect the proration described above and mandated by Moro. OAR 459-005-510 (quoted below, emphasis added) correctly applies the proration required by Moro to the legislature’s changes to the COLA in 2013.
459-005-0510 Cost-of-Living Adjustment
(1) A cost-of-living adjustment (COLA) under ORS 238.360 and 238A.210 is calculated on an annual basis and may use up to three COLA methods that are blended into a COLA percentage rate, as follows:
(a) Creditable service or retirement credit earned before May 1, 2013, will receive an annual COLA based on ORS 238.360 (2011) or 238A.210 (2011).
(b) Creditable service or retirement credit earned on or after May 1, 2013, and before October 1, 2013, will receive an annual COLA based on Chapter 53, Oregon Laws 2013.
(c) Creditable service or retirement credit earned on or after October 1, 2013, will receive an annual COLA based on ORS 238.360 (2013) or 238A.210 (2013).
(2) The member’s prorated periods in section (1) of this rule will be multiplied by the appropriate annual COLA percentage for the same periods to determine the blended annual COLA percentage rate that is applied to a yearly allowance, pension, or benefit. The resulting annual COLA amount is divided by 12 to determine the adjustment to the monthly allowance, pension, or benefit.
(3) A beneficiary’s annual COLA percentage rate will be based on the associated member’s creditable service time.
(4) COLA increases end when the recipient is no longer eligible to receive a monthly allowance, pension, or benefit.
I also urge PERS to correct the Tier 1/Tier 2 Salary Cap examples on its website to reflect the proration required by Moro and described above. A number of the current examples do not reflect the required proration and are misleading to members.

SL1 PERS Board Meeting December 6, 2019
Item B.4.
Public Employees Retirement System Headquarters:
11410 S.W. 68th Parkway, Tigard, OR Mailing Address:
P.O. Box 23700 Tigard, OR 97281-3700
888-320-7377 TTY (503) 603-7766
www.o re go n .go v/p er s
Oregon Kate Brown, Governor
December 6, 2019 TO: Members of the PERS Board FROM: Stephanie Vaughn, Manager, Policy Analysis & Compliance Section SUBJECT: Adoption of Retirement Allocation Fund and Retirement Installments Fund Rules: OAR 459-007-0001, Definitions
OAR 459-007-0005, Annual Earnings Crediting OAR 459-007-0330, Crediting Earnings for IAP Account Installment Payments OAR 459-007-0335, Crediting Earnings for IAP Account Pre-Retirement Death
Benefit Payments OAR 459-080-0015, Investment of IAP Account Balance
OVERVIEW
• Action: Adopt modifications to the Retirement Allocation Fund and Retirement Installments Fund Rules.
• Reason: Address complications in the administration of earnings crediting for the Retirement Allocation Fund in the IAP.
• Policy Issue: None identified.
BACKGROUND A Target Date Fund (TDF) investment structure for IAP member accounts was adopted by the Oregon Investment Council (OIC) on September 20, 2017. During the April 1, 2019 PERS Board meeting, the OIC reported a discrepancy of 1.15% between the actual investment performance rate and the preliminary crediting rate for the Retirement Allocation Fund (RAF). In addition to being the default investment option for IAP members who have reached age 65, the RAF is currently also the target date fund from which IAP installment payments are being made when a member chooses an installment payment option at retirement. Installment payments are credited with earnings on a monthly basis whereas the target date funds receive annual earnings crediting. This mismatch in operational requirements and needs created the earnings crediting discrepancy reported by the OIC at the April Board meeting. Specifically, installment payments require liquid short term cash disbursement, but the RAF still has a large equity component that is not designed for efficient and accurate short term earnings crediting. PERS staff has worked closely with the OIC and is now proposing, as an administrative solution, a new Retirement Installments Fund (RIF) that is separate and apart from the TDFs. The RIF will be used specifically for making IAP installment payments and any residual, pre-retirement death benefits. The RIF will receive monthly earnings crediting and will not be a designated target date fund. This means that accounts in the RIF will not be able to elect to move their accounts to one of the target date funds. Separating the accounts receiving monthly earnings crediting from the accounts receiving annual earnings crediting will simplify the administration of accounts

Adoption – Retirement Allocation Fund/Retirement Installments Fund Rules 12/6/19 Page 2 of 3
SL1 PERS Board Meeting December 6, 2019
receiving monthly earnings crediting and should prevent the discrepancy we experienced with the 2018 annual earnings crediting for the RAF.
SUMMARY OF MODIFICATIONS TO RULES SINCE NOTICE In section (4) of OAR 459-080-0015, “month” was replaced with “calendar year” in two places. This edit was made to ensure the least amount of programming and process changes.
PUBLIC COMMENT AND HEARING TESTIMONY A rulemaking hearing was held October 29, 2019, at 2:00 p.m. at PERS headquarters in Tigard. No members of the public attended. The public comment period ended November 5, 2019, at 5:00 p.m. No public comment was received.
LEGAL REVIEW The attached draft rules were submitted to the Department of Justice for legal review and any comments or changes are incorporated in the rules as presented for adoption.
IMPACT Mandatory: No, the board need not adopt the rule modifications. Benefit: Simplify the administration of the RAF and accounts receiving monthly earnings crediting. Cost: There are no discrete costs attributable to the rules.
RULEMAKING TIMELINE October 3, 2019 Staff began the rulemaking process by filing a Notice of
Rulemaking with the Secretary of State. October 4, 2019 Secretary of State published the Notice in the Oregon
Administrative Rules Database. Notice was sent to employers, legislators, and interested parties. Public comment period began.
October 4, 2019 PERS Board notified that staff began the rulemaking process. October 29, 2019 Rulemaking hearing held at 2:00 p.m. at PERS in Tigard. November 5, 2019 Public comment period ended at 5:00 p.m. December 6, 2019 Board may adopt the rule modifications.
BOARD OPTIONS The PERS Board may: 1. Pass a motion to “adopt modifications to the Retirement Allocation Fund and Retirement
Installments Fund rules, as presented.” 2. Direct staff to make other changes to the rules or explore other options.

Adoption – Retirement Allocation Fund/Retirement Installments Fund Rules 12/6/19 Page 3 of 3
SL1 PERS Board Meeting December 6, 2019
STAFF RECOMMENDATION Staff recommends the PERS Board choose Option #1. • Reason: Address complications in the administration of earnings crediting for the Retirement
Allocation Fund in the IAP. If the Board does not adopt: Staff would return with rule modifications that more closely fit the board’s policy direction if the PERS Board determines that a change is warranted. B.4. Attachment 1 - 459-007-0001, Definitions B.4. Attachment 2 - 459-007-0005, Annual Earnings Crediting B.4. Attachment 3 - 459-007-0330, Crediting Earnings for IAP Account Installment Payments B.4. Attachment 4 - 459-007-0335, Crediting Earnings for IAP Account Pre-Retirement Death Benefit
Payments B.4. Attachment 5 - 459-080-0015, Investment of IAP Account Balance

B.4. Attachment 1 OREGON ADMINISTRATIVE RULE
PUBLIC EMPLOYEES RETIREMENT BOARD CHAPTER 459
DIVISION 007 – EARNINGS AND INTEREST DISTRIBUTION
007-0001-1 Page 1 Draft
459-007-0001 1
Definitions 2
The words and phrases used in this division have the same meaning given them in 3
ORS Chapter 238, 238A and OAR 459-005-0001. Specific and additional terms for 4
purposes of this division are defined as follows unless context requires otherwise: 5
(1) “Annual rate” means the rates determined by the Board for crediting earnings to 6
Tier One regular accounts, Tier Two regular accounts, IAP accounts, judge member 7
regular accounts and member variable accounts, effective as of December 31 of each 8
year. 9
(2) “Assumed rate” means the actuarial assumed rate of return on investments as 10
adopted by the Board for the most recent actuarial valuation. 11
(3) “Average annualized rate” means the monthly rate provided by the Oregon State 12
Treasury representing the rate credited to cash accounts. 13
(4) “Benefits-in-Force Reserve” or “BIF Reserve” means the reserve established 14
under ORS 238.670(2). 15
(5) “Capital Preservation Reserve” means the reserve established under ORS 16
238.670(3). 17
(6) “Contingency Reserve” means the reserve established under ORS 238.670(1). 18
(7) “Date of distribution” is the date inscribed on the check, warrant, or electronic 19
transfer issued to or on behalf of the member, the member’s beneficiary, or an alternate 20
payee. 21
(8) “Date of payment” means the date a payment is received by PERS. 22

DRAFT DRAFT DRAFT DRAFT DRAFT DRAFT
007-0001-1 Page 1 Draft
(9) “Earnings” means all income or losses to the Fund from investments and other 1
sources, but does not include member or employer contributions. 2
(10) “Retirement allocation fund” means the particular target date fund so designated 3
by the Oregon State Treasury when it determines the investment allocation for all the 4
target date funds. 5
(11) “Retirement installments fund” means the fund so designated by the 6
Oregon State Treasury and is separate and apart from target date funds. 7
[(11)](12) “Target date fund” means a fund with an investment allocation that is 8
aligned with the member’s birth year. 9
[(12)](13) “Tier One Member Rate Guarantee Reserve” and “Rate Guarantee 10
Reserve” mean the reserve referenced in ORS 238.255(1) that enables the Board to credit 11
earnings at or above the assumed rate under the conditions specified in 238.255. 12
[(13)](14) “Year-to-date calculation” means the rates used to credit a pro-rata 13
distribution of year-to-date earnings, allowing for reserves and expenses, to Tier One 14
regular accounts, Tier Two regular accounts, IAP accounts, judge member regular 15
accounts or member variable accounts. These rates are calculated by staff on a monthly 16
basis using the market value of investments in the Fund as supplied by the Oregon State 17
Treasury. Year-to-date calculations for Tier One member regular accounts will be 18
determined in accordance with OAR 459-007-0003. 19
Stat. Auth.: ORS 238.650 20
Stats. Implemented: ORS 238 21

B.4. Attachment 2 OREGON ADMINISTRATIVE RULE
PUBLIC EMPLOYEES RETIREMENT BOARD CHAPTER 459
DIVISION 007 – EARNINGS AND INTEREST DISTRIBUTION
007-0005-1 Page 1 Draft
459-007-0005 1
Annual Earnings Crediting 2
(1) For purposes of this rule, “remaining earnings” means earnings available for 3
distribution to a particular account or reserve after deduction of amounts required or 4
authorized by law for other purposes. 5
(2) Except as otherwise specified in this division, earnings on all accounts and 6
reserves in the Fund shall be credited as of December 31 of each calendar year in the 7
manner specified in this rule. 8
(3) Health insurance accounts. All earnings attributable to the Standard Retiree 9
Health Insurance Account (SRHIA), Retiree Health Insurance Premium Account 10
(RHIPA) or Retirement Health Insurance Account (RHIA) shall be credited to the 11
account from which they were derived, less administrative expenses incurred by each 12
account, as provided in ORS 238.410, 238.415 and 238.420, respectively. 13
(4) Employer lump sum payments. All earnings or losses attributable to the 14
employer lump sum payment accounts established under ORS 238.229 shall be credited 15
to the accounts from which they were derived. 16
(5) Member variable accounts. Earnings on the Variable Annuity Account shall first 17
be used to pay a pro rata share of administrative expenses in accordance with ORS 18
238.260(6). If the annual earnings from the Variable Annuity Account are insufficient to 19
pay for the pro rata share of administrative expenses, those administrative expenses shall 20
be paid from earnings on other accounts within the Public Employees Retirement Fund 21
(PERF), if available. If earnings from those accounts within the PERF are insufficient to 22

DRAFT DRAFT DRAFT DRAFT DRAFT DRAFT
007-0005-1 Page 2 Draft
pay for the administrative expenses, those expenses shall be paid from employer accounts 1
as required by ORS 238.610. All remaining earnings or losses attributable to the Variable 2
Annuity Account shall be credited to the participants of that account, as provided under 3
238.260(6) and (7)(b). 4
(6) Individual Account Program accounts. Earnings on the Individual Account 5
Program accounts shall first be used to pay a pro rata share of administrative expenses in 6
accordance with ORS 238A.350(1). Losses on Individual Account Program target date 7
funds shall be increased by a pro rata share of administrative expenses. After 8
administrative expenses, each Individual Account Program account shall be credited with 9
the earnings or losses of the specific target date fund to which the account is allocated, 10
except for account balances allocated to the retirement installments fund, which 11
shall be credited with earnings or losses on a monthly basis. 12
(7) Administrative expenses. Earnings attributable to Tier One regular accounts, the 13
Tier One Rate Guarantee Reserve, Tier Two member regular accounts, judge member 14
regular accounts, the OPSRP Pension Program reserve, employer contribution accounts, 15
the Contingency Reserve, the Benefits-in-Force Reserve and the Capital Preservation 16
Reserve shall first be used to pay the system’s remaining administrative expenses under 17
ORS 238.610. 18
(8) Contingency Reserve. 19
(a) In any year in which total earnings on the Fund equal or exceed the assumed rate, 20
an amount not exceeding seven and one-half percent of remaining earnings attributable to 21
Tier One regular accounts, the Tier One Rate Guarantee Reserve, Tier Two regular 22
accounts, Judge member regular accounts, the OPSRP Pension Program reserve, the 23
Benefits-in-Force Reserve, employer contribution accounts, the Capital Preservation 24

DRAFT DRAFT DRAFT DRAFT DRAFT DRAFT
007-0005-1 Page 3 Draft
Reserve and the Contingency Reserve shall be credited to the Contingency Reserve to the 1
level at which the Board determines it is adequately funded for the purposes specified in 2
ORS 238.670(1). 3
(b) The portion of the Contingency Reserve allowed under ORS 238.670(1)(a) for 4
use in preventing a deficit in the fund due to employer insolvency may only be credited 5
using earnings attributable to employer contribution accounts. 6
(9) Tier One Member Rate Guarantee Reserve. All remaining earnings attributable to 7
Tier One regular accounts, the Tier One Member Rate Guarantee Reserve, Judge member 8
regular accounts, the Benefits-in-Force Reserve, and the Contingency Reserve may be 9
credited to the Tier One Member Rate Guarantee Reserve established under ORS 10
238.255(1). 11
(10) Capital Preservation Reserve. Remaining earnings attributable to the Tier Two 12
member regular accounts, Judge member regular accounts, OPSRP Pension Program 13
reserve, employer contribution accounts, the Benefits-in-Force Reserve, the Contingency 14
Reserve and the Capital Preservation Reserve may be credited from those sources to one 15
or more reserve accounts that may be established under ORS 238.670(3) to offset gains 16
and losses of invested capital. 17
(11) Tier One regular accounts. All remaining earnings attributable to Tier One 18
regular accounts and the Tier One Rate Guarantee Reserve shall be credited to Tier One 19
member regular accounts at the assumed rate in any year in which the conditions set out 20
in ORS 238.255 have not been met. Crediting under this subsection shall be funded first 21
by all remaining earnings attributable to Tier One regular accounts and the Tier One Rate 22
Guarantee Reserve, then moneys in the Tier One Rate Guarantee Reserve. 23

DRAFT DRAFT DRAFT DRAFT DRAFT DRAFT
007-0005-1 Page 4 Draft
(12) Judge member regular accounts. All remaining earnings attributable to Judge 1
member regular accounts shall be credited to all active and inactive Judge member 2
regular accounts at the Judge member rate. Crediting under this subsection shall be 3
funded first by all remaining earnings attributable to the Judge member regular accounts 4
and the Tier One Rate Guarantee Reserve, then moneys in the Tier One Rate Guarantee 5
Reserve. 6
(13) Tier Two member regular accounts. All remaining earnings or losses 7
attributable to Tier Two member regular accounts shall be credited to all active and 8
inactive Tier Two member regular accounts under ORS 238.250. 9
(14) OPSRP Pension Program Reserve. Remaining earnings attributable to the 10
OPSRP Pension Program Reserve, the Contingency Reserve, and the Capital Preservation 11
Reserve may be used to credit the OPSRP Pension Program reserve. 12
(15) Benefits-in-Force Reserve. Remaining earnings attributable to the Benefits-in-13
Force Reserve, the Contingency Reserve, the Capital Preservation Reserve and employer 14
contribution accounts, in that order, shall be used, to the extent available, to credit the 15
Benefits-in-Force Reserve with earnings up to the assumed rate for that calendar year in 16
accordance with ORS 238.670(2). 17
(16) Employer contribution accounts. All remaining earnings attributable to 18
employer contribution accounts shall be credited to employer contribution accounts. 19
(17) Remaining earnings. Any remaining earnings shall be credited to accounts and 20
reserves in the Fund at the Board’s discretion. 21
Stat. Auth.: ORS 238.650, 238A.450 22
Stats. Implemented: ORS 238, 238A.350 23

B.4. Attachment 3 OREGON ADMINISTRATIVE RULE
PUBLIC EMPLOYEES RETIREMENT BOARD CHAPTER 459
DIVISION 007 – EARNINGS AND INTEREST DISTRIBUTION
007-0330-1 Page 1 Draft
459-007-0330 1
Crediting Earnings for IAP Account Installment Payments 2
(1) For the purposes of this rule, “monthly change rate” means the monthly earnings 3
rate for IAP account(s) invested in the retirement [allocation] installments fund when a 4
retiree elects installment payments. 5
(2) When an IAP member retires and elects to receive installment payments under 6
ORS 238A.400(2), earnings will be credited in the manner specified in this rule: 7
(a) For the initial installment payment: 8
(A) If earnings for the calendar year before the date of distribution have not been 9
credited, earnings for that year shall be credited based on the member’s target date fund’s 10
latest IAP year-to-date calculation available for that year. 11
(B) Earnings credited for the calendar year of distribution will be credited based on 12
the member’s target date fund’s latest IAP year-to-date calculation as of the first day of 13
the calendar month of the initial date of distribution. 14
(b) After the initial installment payment is made, the member’s IAP account 15
balance(s) will be transferred to the retirement [allocation] installments fund. Earnings 16
will be credited monthly using the latest monthly change rate beginning with the first of 17
the month after the initial date of distribution. 18
Stat. Auth.: ORS 238A.450 19
Stats. Implemented: ORS 238A.350 & 238A.400 20

B.4. Attachment 4 OREGON ADMINISTRATIVE RULE
PUBLIC EMPLOYEES RETIREMENT BOARD CHAPTER 459
DIVISION 007 – EARNINGS AND INTEREST DISTRIBUTION
007-0335-1 Page 1 Draft
459-007-0335 1
Crediting Earnings for IAP Account Pre-Retirement Death Benefit Payments 2
(1) For the purposes of this rule, “monthly change rate” means the monthly earnings 3
rate for IAP account(s) invested in the retirement [allocation] installments fund. 4
(2) When a beneficiary or beneficiaries receive(s) pre-retirement death benefit 5
payments under ORS 238A.410, earnings will be credited in the manner specified in this 6
rule. 7
(a) For payments made in the first month of distribution: 8
(A) If earnings for the calendar year before the date of distribution(s) have not been 9
credited, earnings for that year shall be credited based on the member’s target date fund’s 10
latest IAP year-to-date calculation available for that year. 11
(B) Earnings credited for the calendar year of distribution will be credited based on 12
the member’s target date fund’s latest IAP year-to-date calculation as of the first day of 13
the calendar month of the initial date of distribution. 14
(b) After the first month of distribution, any remaining account balance from a 15
deceased non-retired member’s IAP account will be moved to the retirement [allocation] 16
installments fund. Earnings for the remaining account balance will be credited monthly 17
using the latest monthly change rate beginning with the first of the month after the first 18
month of distribution. 19
Stat. Auth.: ORS 238A.450 20
Stats. Implemented: ORS 238A.350 & 238A.410 21

B.4. Attachment 5 OREGON ADMINISTRATIVE RULE
PUBLIC EMPLOYEES RETIREMENT BOARD CHAPTER 459
DIVISION 080 – OPSRP INDIVIDUAL ACCOUNT PROGRAM
080-0015-2 Page 1 Draft
459-080-0015 1
Investment of IAP Account Balance 2
(1) Definitions. For the purposes of this rule: 3
(a) “Retirement allocation fund” has the same meaning as defined in OAR 459-007-4
0001(10). 5
(b) “Retirement installments fund” has the same meaning as defined in OAR 6
459-007-0001(11). 7
[(b)](c) “Target date fund” has the same meaning as defined in OAR 459-007-8
0001[(11)](12). 9
(2) Each member’s IAP account balance will be invested in one of the target date 10
funds based upon the member’s birth year, except as provided in sections (4) and (5) of 11
this rule. 12
(3) Once PERS accepts as administrable a divorce decree that awards a portion of a 13
non-retired member’s IAP account to an alternate payee, PERS will administer the decree 14
accordingly and the alternate payee IAP account will be allocated to a target date fund 15
based on the alternate payee’s birth year. PERS will allocate the alternate payee’s IAP 16
account to the appropriate target date fund effective December 31 of the last closed year 17
for earnings crediting, as of the date PERS administers the decree. 18
(4) During the calendar year [W]when a retired member who elected IAP 19
installment payments reestablishes active membership, the member’s remaining IAP 20
account balance and any new IAP contributions will be allocated in the retirement 21
[allocation] installments fund. Beginning on the first day of the following calendar 22

DRAFT DRAFT DRAFT DRAFT DRAFT DRAFT
080-0015-2 Page 1 Draft
year, the member’s remaining IAP account balance and any new IAP contributions 1
will be allocated to a target date fund based on the member’s birth year unless the 2
member made a timely choice for a different target date fund. 3
(5) Except as otherwise provided in this paragraph, a deceased non-retired member’s 4
IAP account will be distributed from the member’s target date fund. Once the account has 5
been processed for distribution, any balance that remains at the end of the month in which 6
the first distribution is made will be allocated to the retirement [allocation] installments 7
fund as of the first of the following month. All remaining distributions will be made from 8
the retirement [allocation] installments fund. 9
Stat. Auth.: ORS 238A.450 10
Stats. Implemented: ORS 238A.050 & OL 2018, Ch. 118 11

SL1 Special PERS Board Meeting December 6, 2019
Item B.5.
Public Employees Retirement System Headquarters:
11410 S.W. 68th Parkway, Tigard, OR Mailing Address:
P.O. Box 23700 Tigard, OR 97281-3700
888-320-7377 TTY (503) 603-7766
www.o re go n .go v/p er s
Oregon Kate Brown, Governor
December 6, 2019 TO: Members of the PERS Board FROM: Stephanie Vaughn, Manager, Policy Analysis & Compliance Section SUBJECT: Adoption of Employer Programs Rules: OAR 459-007-0530, Crediting Earnings to Employer Lump Sum Payments OAR 459-009-0084, Employer Unfunded Actuarial Liability Lump-Sum
Payments With an Actuarial Calculation OAR 459-009-0086, Employer Unfunded Actuarial Liability Lump-Sum Payments, Generally
OAR 459-009-0091, Unfunded Actuarial Liability Resolution Program OAR 459-009-0092, Employer Incentive Fund Program
OVERVIEW
• Action: Adopt modifications to the Employer Programs rules.
• Reason: Adopt and amend the administrative rules necessary to fully implement the Employer Incentive Fund (EIF), Unfunded Actuarial Liability Resolution Program (UALRP), and the provisions of SB 1049 related to employer lump-sum payments of $10 million or more.
• Policy Issue: None identified.
BACKGROUND SB 1049 (2019) amends provisions of the Employer Incentive Fund (EIF) Program and UAL Resolution Program (UALRP) that were originally established in SB 1566 (2018). These new provisions were effective on passage of SB 1049 – June 11, 2019. The rules include new rules and amendments to existing rules that establish the EIF and UALRP and implement new provisions for employers making lump sum payments of $10 million or more. The following is a brief description of each area. Employer Incentive Fund (EIF) Program The EIF was established to encourage employers, especially smaller employers with high UALs, to make lump sum payments into side accounts that are used to offset their employer contribution rates. The program provides matching funds of up to 25% of an employer’s eligible lump sum contribution of at least $25,000 that is not sourced from borrowed funds. Statute specifies that for the first 90 days after the board begins accepting applications, only employers whose UAL is 200% or more of payroll may apply for matching funds. The new rule OAR 459-009-0092 provides the structure of this new program, including defining the application period, the information required in the application, the match percentage, and the establishment of a waiting list. This rule is written at a high level, providing the framework

Adoption – Employer Programs Rules 12/06/19 Page 2 of 3
SL1 PERS Board Meeting December 6, 2019
necessary for the board to open and administer the first application cycle. Staff acknowledges that there are elements that have not been addressed and expects that the provisions will be expanded, and some elements will be refined over time, as we continue to work with employers on developing the program further. We also acknowledge that the timeline may need to be adjusted to accommodate the timing of future streams of revenue. UAL Resolution Program (UALRP) The UALRP requires PERS to provide employers with technical expertise to assist them in developing funding plans to improve their PERS funded status. PERS does provide a tool to employers that allows them to see the effects of different variables associated with their employer rate. Staff continues to investigate other options, in addition to the existing tool, to assist employers in developing funding plans such that we will have a more robust program available for employers. Participation in the UALRP is a requirement to receive matching funds from the EIF. Staff has incorporated participation in the UALRP into the actual application for EIF matching funds. It will require employers to use the employer rate tool, review their most recent valuation, and consider other factors to complete the application. Employer Lump-Sum Payments of $10 Million or More Currently, employers who make a lump sum payment of $10 million or more into a new side account have the option of electing a 6, 10, or 16 year amortization period instead of the standard 20 year amortization period. SB 1049 additionally allows employers making a $10 million or more lump sum payment into a new side account to elect a deferred rate offset year. Typically, an employer will receive a rate offset from a lump sum payment at the next rate-setting date at the latest. The new provision of SB 1049 will allow employers to delay the rate offset for years; however, the date the employer chooses must still allow for all the funds in the side account to be used within 20 years. The amendments to OAR 459-009-0084 and 459-009-0086 incorporate this new provision and require an employer electing a deferred rate offset to request an actuarial calculation for the delay rate offset to ensure that the delay, the shorter amortization period, or the combination of the two options, does not put the employer in a negative employer rate situation.
PUBLIC COMMENT AND HEARING TESTIMONY A rulemaking hearing was held October 29, 2019, at 2:00 p.m. at PERS headquarters in Tigard. No members of the public attended. The public comment period ended November 5, 2019, at 5:00 p.m. No public comment was received.
LEGAL REVIEW The attached draft rules were submitted to the Department of Justice for legal review and any comments or changes are incorporated in the rules as presented for permanent adoption.
IMPACT Mandatory: Yes, the rule establishes the EIF program and provides guidance regarding the UAL Resolution Program.

Adoption – Employer Programs Rules 12/06/19 Page 3 of 3
SL1 PERS Board Meeting December 6, 2019
Benefit: Provides direction to staff and employers regarding the administration of the EIF and UALRP Programs. Cost: There are no discrete costs attributable to the rules.
RULEMAKING TIMELINE August 16, 2019 PERS Board adopted the proposed temporary rules, effective for
180 days; PERS staff proceeded with permanent rulemaking. Staff began the permanent rulemaking process by filing Notice of
Rulemaking with the Secretary of State. Secretary of State published the Notice in the Oregon Administrative Rules Database. Notice was sent to employers, legislators, and interested parties. Public comment period began. October 29, 2019 Rulemaking hearing held at 2:00 p.m. at PERS in Tigard. November 5, 2019 Public comment period ended at 5:00 p.m. December 6, 2019 Board may adopt the rule modifications.
BOARD OPTIONS The PERS Board may: 1. Pass a motion to “adopt new rules regarding the administration of the Employer Incentive
Fund Program and the UAL Resolution Program as well as modifications to the Employer Side Account Rules, as presented.”
2. Direct staff to make other changes to the rules or explore other options.
STAFF RECOMMENDATION Staff recommends the board choose Option #1. • Reason: Adopt and amend the administrative rules necessary to fully implement the
Employer Incentive Fund (EIF), Unfunded Actuarial Liability Resolution Program (UALRP), and the provisions of SB 1049 related to employer lump-sum payments of $10 million or more.
If the board does not adopt: Staff would return with rule modifications that more closely fit the board’s policy direction if the PERS Board determines that a change is warranted.
B.5. Attachment 1 – 459-007-0530, Crediting Earnings to Employer Lump Sum Payments B.5. Attachment 2 – 459-009-0084, Employer Unfunded Actuarial Liability Lump-Sum Payments With an Actuarial Calculation B.5. Attachment 3 – 459-009-0086, Employer Unfunded Actuarial Liability Lump-Sum Payments, Generally B.5. Attachment 4 – 459-009-0091, Unfunded Actuarial Liability Resolution Program B.5. Attachment 5 – 459-009-0092, Employer Incentive Fund Program

B.5. Attachment 1 OREGON ADMINISTRATIVE RULE
PUBLIC EMPLOYEES RETIREMENT BOARD CHAPTER 459
DIVISION 007 – EARNINGS AND INTEREST DISTRIBUTION
007-0530-1 Page 1 Draft
459-007-0530 1
Crediting Earnings to Employer Lump Sum Payments 2
(1) Definitions. For the purposes of this rule: 3
(a) “Allocated Earnings” means the actual investment earnings or losses of the Public 4
Employees Retirement Fund (PERF), apportioned based upon the proportionate size of the 5
side account in relation to the PERF and adjusted for administrative costs as described in ORS 6
238.229(3). These earnings are exempt from funding requirements of the Contingency or 7
Capital Preservation Reserves. 8
(b) “Amortized Amount” means the amount of a Side Account used to offset 9
contributions due from the employer. 10
(c) “Employer lump-sum payment” means: 11
(A)[a]Any employer payment that is: 12
[(A)](i) Not regularly scheduled; 13
[(B)](ii) Not paid as a percentage of salary; [and] 14
[(C)](iii) Paid at the employer’s election instead of at the PERS Board’s direction; and 15
(B) Any payment deposited into a side account for the benefit of an employer. 16
(d) “UAL factor” means the monthly or annual rate based upon allocated side account 17
earnings. 18
(2) Subject to ORS 238.229(4), the employer lump-sum payment shall first be applied to 19
liabilities attributable to creditable service by employees of the employer before the employer 20
was grouped with other public employers. Earnings on these amounts shall be credited based 21
on the following: 22

DRAFT DRAFT DRAFT DRAFT DRAFT DRAFT
007-0530-1 Page 2 Draft
(a) For the month in which the employer lump-sum payment is received, earnings shall 1
be credited based on the average annualized rate, prorated for the number of days from date of 2
receipt to the end of the month. 3
(b) For the remainder of the year, the employer lump-sum payment shall receive earnings 4
based on the difference between the final Tier Two annual earnings rate and the Tier Two 5
earnings rate in effect as of the first of the month after receipt of the payment. 6
(c) In subsequent calendar years, earnings or losses shall be credited to the employer 7
lump-sum payment in accordance with OAR 459-007-0005(14). 8
(3) Earnings on an employer lump-sum payment held in a separate Side Account shall be 9
credited to the Side Account based on the following: 10
(a) For the month in which the employer lump-sum payment is received, earnings shall 11
be credited based on the average annualized rate, prorated for the number of days from date of 12
receipt to the end of the month. 13
(b) For the remainder of the year, the employer lump-sum payment shall receive earnings 14
based on the difference between the annual UAL factor and the UAL factor in effect as of the 15
first of the month after receipt of the payment. 16
(4)(a) Amortized amounts to be applied to the Employer Contribution Account shall 17
receive earnings or losses based on the UAL factor, effective as of the first of the calendar 18
month following the date of the application of the amortized amount. 19
(b) In subsequent calendar years, earnings shall be credited to the remaining balance of 20
the employer’s side account created when the lump-sum payment was received on an annual 21
basis in accordance with OAR 459-007-0005(4). 22
(5) The provisions of this rule are effective on January 1, 2008. 23

DRAFT DRAFT DRAFT DRAFT DRAFT DRAFT
007-0530-1 Page 3 Draft
Statutory/Other Authority: ORS 238.650 1
Statutes/Other Implemented: ORS 238.225 - 238.229 2

B.5. Attachment 2 OREGON ADMINISTRATIVE RULE
PUBLIC EMPLOYEES RETIREMENT BOARD CHAPTER 459
DIVISION 009 – PUBLIC EMPLOYER
009-0084-1 Page 1 Draft
459-009-0084 1
Employer Unfunded Actuarial Liability Lump-Sum Payments With an Actuarial 2
Calculation 3
The words and phrases used in this rule have the same meaning given them in OAR 4
459-009-0086. 5
(1) An actuarial calculation is required before an employer may make a UAL lump-6
sum payment if the employer: 7
(a) Has a transition liability; 8
(b) Intends to establish a new side account with a new employer contribution rate as 9
of a date specified by the employer; 10
(c) Has requested an actuarial calculation where a calculation is not otherwise 11
required; or 12
(d) Intends to make a UAL lump-sum payment as specified in OAR 459-009-13
0086(9). 14
(2) At least 45 calendar days before the date the employer intends to make a UAL 15
lump-sum payment with an actuarial calculation, the employer must notify PERS 16
Actuarial Services in writing that it intends to make such a UAL lump-sum payment. The 17
notification must specify: 18
(a) The amount of the intended lump-sum payment; 19
(b) Whether it is a lump-sum payment pursuant to OAR 459-009-0086(9), and if so: 20
(i) The amortization period elected, and 21
(ii) The year the employer rate offset is to begin; 22

DRAFT DRAFT DRAFT DRAFT DRAFT DRAFT
009-0084-1 Page 2 Draft
(c) At least one potential date for the payment; and 1
(d) If the employer so elects, a specific effective date for the contribution rate change 2
resulting from the UAL lump-sum payment, [. S]such date must be the first of any month 3
following the employer’s intended payment date but may not be more than 12 months 4
after the employer’s intended payment date, except for UAL lump-sum payments made 5
pursuant to OAR 459-009-0086(9). 6
(3) PERS staff must notify the employer within five business days of receipt of a 7
notification in section (2) of this rule if the notification is incomplete or the process 8
cannot be completed by the earliest intended date of the UAL lump-sum payment. 9
(4) The PERS consulting actuary must provide an invoice charging the employer for 10
the cost of the UAL calculation requested by the employer. At least 30 calendar days 11
before the date the employer intends to make a UAL lump-sum payment, the employer 12
must remit payment for the cost of the UAL calculation directly to the PERS consulting 13
actuary according to the instructions on the invoice. Failure to remit payment according 14
to the terms of this section may result in the PERS consulting actuary not completing the 15
employer’s UAL calculation by the proposed UAL lump-sum payment date. 16
(5) Upon receipt of notification that an employer has made payment in full for the 17
requested UAL calculation, PERS staff shall request that the PERS consulting actuary 18
calculate: 19
(a) For an employer participating in an employer actuarial pool, 100 percent of the 20
employer’s share of the UAL for the employer actuarial pool. This calculation will be: 21
(A) Based on the fair value UAL of the employer actuarial pool, from the most 22
recent actuarial valuation; 23

DRAFT DRAFT DRAFT DRAFT DRAFT DRAFT
009-0084-1 Page 3 Draft
(B) Based on the employer’s covered salary, as a proportion of the pool, as reported 1
in the most recent actuarial valuation; and 2
(C) Adjusted to reflect the effect of time from the most recent actuarial valuation to 3
the intended date(s) of payment, using generally recognized and accepted actuarial 4
principles and practices. 5
(b) For an employer not participating in an employer actuarial pool, 100 percent of 6
the individual employer’s UAL. This calculation will be: 7
(A) Based on the fair value UAL of the individual employer, from the most recent 8
actuarial valuation; and 9
(B) Adjusted to reflect the effect of time from the most recent actuarial valuation to 10
the intended date(s) of payment, using generally recognized and accepted actuarial 11
principles and practices. 12
(c) For a UAL lump-sum payment to establish a new side account, the effect of the 13
following UAL lump-sum payment amounts on the individual employer’s contribution 14
rates using the information specified by the employer in its notification in section (2) of 15
this rule: 16
(A) 100 percent of the individual employer’s UAL calculated in subsection (5)(a) or 17
(b) of this rule; 18
(B) The UAL lump-sum payment amount(s) specified by the employer in its 19
notification, if provided; and 20
(C) The minimum amount of the UAL lump-sum payment, if any. 21
(d) For a UAL lump-sum payment as specified in OAR 459-009-0086(9), the 22
maximum lump-sum payment amount that will not result in a contribution rate of less 23

DRAFT DRAFT DRAFT DRAFT DRAFT DRAFT
009-0084-1 Page 4 Draft
than 0.00%, if the amount of the intended lump-sum payment specified by the employer 1
in subsection (2)(a) of this rule would in effect result in a surplus lump-sum payment as 2
defined under OAR 459-009-0090(1)(g). 3
(e) For a UAL lump-sum payment into an existing side account, the estimated effect 4
of the additional deposit on the individual employer’s contribution rates effective July 1 5
of the year following publication of the actuarial valuation for the year in which the 6
additional deposit is made. 7
(6) PERS staff must notify the employer in writing of the results of the individual 8
employer’s calculation in section (5) of this rule otherwise designated by the employer 9
under subsection (2)(c) of this rule. In addition, PERS must send the employer a 10
notification describing risks and uncertainties associated with the calculation of the 11
individual employer’s UAL if such notification has not already been provided. 12
(7) The employer must notify PERS Actuarial Services in writing at least three 13
business days before making a UAL lump-sum payment. This notification shall be in 14
addition to the notification in section (2) of this rule and must specify: 15
(a) The amount of the payment; 16
(b) The date the employer intends to make the payment; 17
(c) Whether the payment is to establish a new side account or to be deposited into an 18
existing side account; and 19
(d) If the payment is to be deposited into an existing side account and the employer 20
has more than one side account, which side account is to receive the deposit. 21
(8) For a UAL lump-sum payment to establish a new side account, PERS must 22
receive the correct funds no later than five business days after the intended date of the 23

DRAFT DRAFT DRAFT DRAFT DRAFT DRAFT
009-0084-1 Page 5 Draft
UAL lump-sum payment specified by the employer in the notification described in 1
section (7) of this rule in order to adjust the employer contribution rate to that reported by 2
PERS in section (6) of this rule. 3
(a) If the UAL lump-sum payment is received by PERS on or before the intended 4
payment date specified in the notification described in section (7) of this rule or within 5
the five business days following the intended payment date, the new employer 6
contribution rate shall be effective for payrolls dated on or after: 7
(A) The first of the month following receipt of the UAL lump-sum payment by 8
PERS; or 9
(B) The date specified by the employer in subsection (2)(c) of this rule, whichever is 10
later. 11
(b) If the UAL lump-sum payment is received by PERS more than five business days 12
after the intended payment date, the employer’s contribution rate shall be adjusted based 13
on the next actuarial valuation after the date of receipt of the UAL lump-sum payment 14
and effective July 1 of the year following publication of that valuation. 15
(c) If the UAL lump-sum payment received is other than any amount specified in the 16
notification under section (7) of this rule, the employer’s contribution rate shall be 17
adjusted to the rate the payment amount fully funds using the actuarial calculation in 18
subsection (5)(c) of this rule. 19
(d) If the UAL lump-sum payment received is less than the minimum amount 20
described in OAR 459-009-0086, the payment will be returned to the employer and no 21
adjustment will be made to the employer contribution rate. 22

DRAFT DRAFT DRAFT DRAFT DRAFT DRAFT
009-0084-1 Page 6 Draft
(9) When an employer makes a UAL lump-sum payment into an existing side 1
account: 2
(a) The final rate adjustment from the additional UAL lump-sum payment(s) will be 3
calculated in the actuarial valuation for the year in which the payment is made, and will 4
be effective on July 1 of the year following publication of that valuation. 5
(b) The calculation in subsection (a) of this section will supersede any estimate 6
provided in an actuarial calculation under subsection (5)(d) of this rule. 7
(10) Nothing in this rule shall be construed to prevent the Board from: 8
(a) Adjusting employer contribution rates based upon the date of receipt of funds or 9
errors in the notification described in section (7) of this rule; or 10
(b) Taking action pursuant to ORS 238.225. 11
Stat. Auth.: ORS 238.650 12
Stats. Implemented: ORS 238.225 - 238.229 13

B.5. Attachment 3 OREGON ADMINISTRATIVE RULE
PUBLIC EMPLOYEES RETIREMENT BOARD CHAPTER 459
DIVISION 009 – PUBLIC EMPLOYER
009-0086-1 Page 1 Draft
459-009-0086 1
Employer Unfunded Actuarial Liability Lump-Sum Payments, Generally 2
(1) Definitions. For the purposes of this rule: 3
(a) “Amortized amount” means the amount of a side account used to offset pension 4
contributions due from the employer. 5
(b) “Employer actuarial pool” means a grouping of employers for actuarial purposes 6
such as the School District Pool and the State and Local Government Rate Pool. 7
(c) “Fair value UAL” means the unfunded actuarial liability calculated using the fair 8
market value of assets. 9
(d) “Side account” means an account in the Public Employees Retirement Fund into 10
which a UAL lump-sum payment that is not used to satisfy a transition liability is 11
deposited. 12
(e) “Transition liability” means the unfunded actuarial liability attributed to an 13
individual employer for the period before entry into the State and Local Government Rate 14
Pool. 15
(f) “Transition surplus” means the actuarial surplus attributed to an individual 16
employer for the period before entry into the State and Local Government Rate Pool. 17
(g) “Unfunded actuarial liability” or “UAL” means the excess of the actuarial 18
liability over the actuarial value of assets for the specified pension program. 19
(h) “UAL lump-sum payment” means any employer payment that is: 20
(A) Not regularly scheduled; 21
(B) Not paid as a percentage of salary; 22

DRAFT DRAFT DRAFT DRAFT DRAFT DRAFT
009-0086-1 Page 2 Draft
(C) Made for the express purpose of reducing the pension contributions that would 1
otherwise be required from the employer, or reducing or paying off the employer’s 2
transition liability; and 3
(D) Paid at the employer’s election instead of at the PERS Board’s direction. 4
(2) A UAL lump-sum payment must be made by either wire transfer or check 5
payable to the Public Employees Retirement System. 6
(3) An employer may make a UAL lump-sum payment to pay 100 percent of its 7
transition liability. 8
(4) A UAL lump-sum payment shall first be applied to the employer’s transition 9
liability, if any. The remainder of the payment, if any, shall be held in a side account. 10
(5) An actuarial calculation must be performed prior to an employer making a UAL 11
lump-sum payment if the employer: 12
(a) Has a transition liability; 13
(b) Intends to establish a new side account with rate relief beginning on a date 14
specified by the employer; [or] 15
(c) Requests an actuarial calculation where a calculation is not otherwise required; 16
or 17
(d) Intends to make a lump sum payment pursuant to section (9) of this rule. 18
(6) The amount of a UAL lump-sum payment that is held in a side account will be 19
used to reduce the pension contributions that would otherwise be required from the 20
employer making the UAL lump-sum payment. The amortized amount for each payroll 21
reporting period shall be transferred from the side account to the appropriate employer 22
reserve account. 23

DRAFT DRAFT DRAFT DRAFT DRAFT DRAFT
009-0086-1 Page 3 Draft
(7) The minimum UAL lump-sum payment required to establish a new side account 1
is the lesser of: 2
(a) 25 percent of the individual employer’s UAL calculated under OAR 459-009-3
0084 or 459-009-0085; or 4
(b) $250,000. 5
(8) An employer with one or more existing side accounts may make additional UAL 6
lump-sum payments into such side account(s). 7
(a) An employer may not make more than two additional UAL lump-sum payments 8
per side account in a calendar year. 9
(b) Additional UAL lump-sum payments into an existing side account will not affect 10
the amortization period of the existing side account. 11
(c) Adjustment to the employer’s contribution rates from a UAL lump-sum payment 12
into an existing side account will be effective on July 1 of the calendar year following 13
completion of the actuarial valuation for the year in which the additional deposit is made. 14
(9) An employer making a UAL lump-sum payment equal to or greater than $10 15
million, not sourced from a pension obligation bond, [and electing] must establish a 16
new side account for the lump-sum payment if it: 17
(a) Elects an amortization period of 6 years, 10 years, or 16 years; or 18
(b) Chooses the year in which to begin the employer rate offset. [must establish a 19
new side account for the lump-sum payment.] 20
(10) Each employer side account shall be charged an administration fee of $1,500 for 21
the year in which the side account is established, and $500 per year thereafter. 22

DRAFT DRAFT DRAFT DRAFT DRAFT DRAFT
009-0086-1 Page 4 Draft
(11) Side accounts shall be credited with earnings and losses in accordance with 1
OAR 459-007-0530. 2
(12) Nothing in this rule shall be construed to prevent the PERS Board from taking 3
action pursuant to ORS 238.225. 4
(13) Nothing in this rule shall be construed to convey to an employer making a UAL 5
lump-sum payment any proprietary interest in the Public Employees Retirement Fund or 6
in the UAL lump-sum payment made to the fund by the employer. 7
(14) Employers making lump-sum payments into employer side accounts under this 8
rule on or after June 2, 2018, will be eligible to apply to have those payments matched by 9
the Employer Incentive Fund provided under sections 1 and 2, chapter 105, Oregon Laws 10
2018 according to the conditions established by the Board under that program. 11
Stat. Auth.: ORS 238.650 12
Stats. Implemented: ORS 238.225 - 238.229 13

B.5. Attachment 4 OREGON ADMINISTRATIVE RULE
PUBLIC EMPLOYEES RETIREMENT BOARD CHAPTER 459
DIVISION 009 – PUBLIC EMPLOYER
009-0091-1 Page 1 Draft
459-009-0091 1
Unfunded Actuarial Liability Resolution Program 2
(1) The Unfunded Actuarial Liability Resolution Program offers employers a 3
PERS resource checklist and the use of the Employer Rate Projection Tool to assess 4
the potential impact on employer contribution rates with varying employer lump 5
sum payments and amortization periods. 6
(2) An employer will meet the requirement for participation in the Unfunded 7
Actuarial Liability Resolution Program when it submits an attestation confirming 8
its use of the Employer Rate Projection Tool along with the resource checklist 9
provided by PERS to form its own funding plan. 10
Stat. Auth.: ORS 238.650 & 238A.450 11
Stats. Implemented: ORS 238.225 - 238.229 12

B.5. Attachment 5 OREGON ADMINISTRATIVE RULE
PUBLIC EMPLOYEES RETIREMENT BOARD CHAPTER 459
DIVISION 009 – PUBLIC EMPLOYER
009-0092-3 Page 1 Draft
459-009-0092 1
Employer Incentive Fund Program 2
The words and phrases used in this rule have the same meaning given them in 3
OAR 459-009-0086. 4
(1) When the PERS Board determines that a sufficient amount of money has 5
been allocated to the Employer Incentive Fund, it shall open an application period by 6
declaring: 7
(a) The date upon which the application period shall open; and 8
(b) The total amount of funds available for matching employer UAL lump-sum 9
payments during the application period. 10
(2) The application period shall end at the earlier of: 11
(a) 12 months after the application period start date; or 12
(b) Once all funds available for matching employer UAL lump-sum payments 13
declared in subsection (1)(b) of this rule have been paid out. 14
(3) Unless otherwise specified in this rule, all the requirements and timelines 15
established in OAR 459-009-0084, 459-009-0085, and 459-009-0086 apply to UAL 16
lump-sum payments made in association with the Employer Incentive Fund Program. 17
(4) During the first 90 days of an application period, applications for the 18
Employer Incentive Fund Program will only be open to employers with an unfunded 19
actuarial liability greater than 200 percent of the employer’s PERS payroll. After the 20
first 90 days have expired, applications will be open to all PERS participating 21
employers. 22

DRAFT DRAFT DRAFT DRAFT DRAFT DRAFT
009-0092-3 Page 2 Draft
(5) A PERS employer seeking participation in the Employer Incentive Fund 1
Program must submit an application to PERS and provide: 2
(a) The amount of the UAL lump-sum payment. The amount eligible for 3
matching funds excludes: 4
(A) Side account deposits of less than $25,000; and 5
(B) Any amount that will be applied to any outstanding transition liability; 6
(b) The date the employer made, or intends to make, the UAL lump-sum 7
payment. Such date must be: 8
(A) No earlier than June 2, 2018; and 9
(B) No later than 12 months after the date the application period opens; 10
(c) A statement that the UAL lump-sum payment is not sourced from any type of 11
borrowed funds; 12
(d) The information required under OAR 459-009-0084(2)(c), if the employer is 13
making a UAL lump-sum payment under OAR 459-009-0084(2); and 14
(e) Proof of participation in the Unfunded Actuarial Liability Resolution 15
Program as provided under OAR 459-009-0091. 16
(6) PERS shall allocate a match amount equal to 25 percent of the eligible 17
employer UAL lump-sum payment amount indicated in subsection (5)(a) of this rule 18
upon approval of the employer’s application; however, such allocated match amount 19
may not exceed the greater of: 20
(a) Five percent of the unfunded liability attributable to the employer applying to 21
participate in the Employer Incentive Fund Program; or 22
(b) $300,000. 23

DRAFT DRAFT DRAFT DRAFT DRAFT DRAFT
009-0092-3 Page 3 Draft
(7) For the purposes of sections (4) and (6) of this rule, the unfunded actuarial 1
liability calculated by the PERS consulting actuary for the most recent actuarial 2
report prepared under ORS 238.605 as of the application period start date will be 3
used. 4
(8) Notwithstanding section (6) of this rule, in the event that moneys in the 5
Employer Incentive Fund are not sufficient to match the entire 25% of an employer’s 6
UAL lump-sum payment commitment, only available moneys will be used in the 7
match. 8
(9) PERS shall process the applications and allocate matching funds based upon 9
the order in which the applications are received. 10
(10) Except as otherwise provided in this rule, an employer will fail to qualify to 11
participate in the Employer Incentive Fund Program, thereby forfeiting any allocated 12
matching funds, if PERS does not receive the UAL lump-sum payment the employer 13
has committed under subsection (5)(a) of this rule on the due date specified in the 14
application. An employer may change: 15
(a) The amount of the UAL lump-sum payment indicated in its application. 16
(A) If the UAL lump-sum payment amount is increased, only the original amount 17
will be eligible for matching funds; and 18
(B) If the UAL lump-sum payment amount is decreased: 19
(i) The new amount must be at least $25,000; and 20
(ii) Any allocated matching funds will be decreased proportionately. 21
(b) The date of the UAL lump-sum payment indicated in its application. 22
(A) The employer must notify PERS at least five business days before the date 23
the employer indicated it would make the payment; and 24

DRAFT DRAFT DRAFT DRAFT DRAFT DRAFT
009-0092-3 Page 4 Draft
(B) The new payment date must be within 12 months after the date the 1
application period opened. 2
(c) The rate offset date or UAL lump-sum payment amount for employers 3
making UAL lump-sum payments under OAR 459-009-0084. 4
(A) The employer will need to request and pay for a new actuarial calculation; 5
and 6
(B) The UAL lump-sum payment must be made within 12 months after the date 7
the application period opens to remain eligible to receive matching funds. 8
(11) Once all the funds identified in subsection (1)(b) of this rule have been 9
allocated, employers applying for matching funds will be placed on a waiting list. 10
(a) If moneys become available again during the same application period, the 11
employers on the waiting list will receive matching allocations based upon the order 12
in which their applications were received. 13
(b) If additional moneys become available on the last day of the application 14
period, employers on the waiting list that are notified they will receive a matching 15
allocation will have an additional five days to submit their UAL lump-sum payment. 16
(12) OAR 459-009-0084(8), 459-009-0085(4) and (5), and 459-009-0086(7) do not 17
apply to UAL lump-sum payments receiving matching funds under this rule. 18
Stat. Auth.: ORS 238.650 & 238A.450 19
Stats. Implemented: ORS 238.225 - 238.229 20

SL1 PERS Board Meeting December 6, 2019
Item C.1.
Public Employees Retirement System Headquarters:
11410 S.W. 68th Parkway, Tigard, OR Mailing Address:
P.O. Box 23700 Tigard, OR 97281-3700
888-320-7377 TTY (503) 603-7766
www.o re go n .go v/p er s
Oregon Kate Brown, Governor
December 6, 2019 TO: Members of the PERS Board FROM: Kevin Olineck, Director SUBJECT: Secretary of State Actuarial Review BACKGROUND Oregon House Bill 4163 (2018), section 11, requires the Secretary of State to contract with a firm to perform an independent actuarial review of the report on PERS, prepared under Oregon Revised Statutes (ORS) 238.605. The Secretary of State contracted with Gabriel, Roeder, Smith & Company (GRS), an actuarial firm based in Colorado, to perform this review. This is the first actuarial review conducted under this new legislative requirement. Subsequent reviews are to take place no more than four years from the release of the first report. As part of the review, PERS, and our consulting actuary, Milliman, were provided opportunity to review and respond to drafts of the report. Certain edits put forth were incorporated into the final version while some were not. Based on the final report (Attachment 1), PERS worked with Milliman to provide responses to the recommendations contained within the report (Attachment 2), and provided those responses to the Secretary of State. The full report, and our response, were posted on the Secretary of State’s website during the week of October 7. Subsequent to the posting, PERS was invited to present to the Joint Legislative Audit Committee (JLAC) on November 13, to discuss the report and its findings (Attachment 3). Additionally, Milliman is of the opinion that some of the findings deserved a more formal response from them to the PERS Board (Attachment 4). As noted in our response to the report, as well as the presentation to JLAC, both PERS and Milliman used this actuarial review as an opportunity to fine tune PERS’ actuarial practices and will incorporate certain of the recommendations in future actuarial work and reports. PERS has recommended that the next review take place the year prior to PERS’ engaging in its Experience Study and review of actuarial methods and assumptions cycle, given this report was released after the board had gone through its 2018 Experience Study and had adopted revised actuarial methods and assumptions. This ensures future recommendations are incorporated into the PERS Board’s review cycle. NEXT STEPS PERS will ensure the recommendations are addressed timely and incorporate recommended changes to reporting and review cycles, as appropriate. C.1. Attachment 1 - Oregon Secretary of State: A Review of the Oregon Public Employees Retirement System (PERS) C.1. Attachment 2 - PERS Response C.1. Attachment 3 - PERS Presentation to the Joint Legislative Audit Committee C.1. Attachment 4 - Milliman Response to the Actuarial Review

[Type text]
Oregon Secretary of State A Review of the Oregon Public Employees
Retirement System (PERS)
C.1. Attachment 1

0
TRANSMITTAL LETTER

September 18, 2019 Secretary of State Audits Division Secretary of State 255 Capitol Street, NE Suite 180 Salem, Oregon 97310
This report contains the results of the study of the Oregon Public Employees Retirement System (Oregon PERS). This study was conducted pursuant to the 2018 Oregon House Bill 4163, Section 11.
This report is intended to be fully responsive to the required services as described in Exhibit A “Statement of Work”, PO # 1650-00000216. This study looks at the reasonableness and consistency of the methods, assumptions, data used in the December 31, 2017 actuarial valuation. The review includes an attribution analysis to isolate the source in the growth of the unfunded accrued liability; looks at the calculation of the employer rates as well as the rate collaring policy. A review was made of the experience study and the projection models.
The work presented herein is based on data furnished by Oregon PERS and Milliman. We gratefully acknowledge the cooperation of Milliman and Oregon PERS, without whose assistance this project could not have been completed.
The work presented in this study relies on the actuarial work conducted by Oregon PERS actuaries, and is based on the actuarial assumptions approved by the Oregon PERS Board of Trustees. As with any actuarial study which engages in the prediction of future outcomes, to the extent future experience differs from the assumptions, then the actuarial outcomes will similarly differ. This report was prepared at the request of the Secretary of State and is intended for use by the Secretary
of State and those designated or approved by the Secretary of State. This report may be provided to
parties other than the Secretary of State only in its entirety and only with the permission of the Secretary
of State. GRS is not responsible for unauthorized use of this report.

The actuaries submitting this statement are members of the American Academy of Actuaries and meet all of the Qualification standards of the American Academy of Actuaries to render the actuarial opinion contained herein. In addition, the undersigned are experienced in performing actuarial valuations for other large public retirement systems.
Respectfully submitted,
Gabriel, Roeder, Smith & Company
Leslie Thompson, FSA, FCA, EA, MAAA Paul Wood, ASA, MAAA, FCA Senior Consultant Consultant

0
TABLE OF CONTENTS

Oregon Secretary of State
A Review of the Oregon Public Employees Retirement System (PERS)
Table of Contents
Page
Section I Executive Summary ....................................................................................................... 2
Section II Scope of Review and Methodology .............................................................................. 5
Section III Attribution Analysis ....................................................................................................... 8
Section IV Experience Study, Assumptions, Modeling, Data and Assets ..................................... 25
Section V Funding Policy and Rate Collaring ............................................................................... 38
Section VI Valuation Review ........................................................................................................ 42
Section VII Actuarial Contract Review........................................................................................... 47
Appendices
Appendix A Tier 1/Tier 2 Data Schedules
Appendix B OPSRP Data Schedules
Appendix C Retiree Medical (RHIA and RHIPA) Data Schedules

0
SECTION I
EXECUTIVE SUMMARY

Oregon Secretary of State
A Review of the Oregon Public Employees Retirement System (PERS)
2
Executive Summary
This in-depth look at the Oregon PERS system shows that the System is balancing its many objectives and is working toward meeting its goal of full funding over the next twenty years.
The last decade has found Oregon PERS moving from being fully funded to having a $17 billion unfunded accrued liability. The velocity of change in the expectation for future returns is unprecedented in history and the impact to employers with these fast rate increases has been mitigated (not eliminated) through the use of rate collaring.
This study has found that the rate collaring has the impact of adding to the unfunded liability, but that when looking at the long term projections through the financial (asset/liability) modeling that the plan is expected to meet its funding objectives.
We found the actuarial work to be consistent with generally accepted actuarial standards and practices. Different actuaries will differ in their approach and this report highlights areas of consideration where we feel we would differ from Milliman.
The ultimate security of the funding promise will depend on employers’ ability to meet their contribution requirements, given the volatility of the capital markets and the question around what investment returns can truly be delivered to Oregon PERS.
In summary, the following are the highlights of our review:
• The attribution analysis shows that the emergence of the UAL of the System to $17 billion over the last decade is primarily due to the capital markets performing less than expected, lowering of anticipated future investment returns; longer life expectancy and the under-contributing toward the unfunded accrued liability.
• The success of the funding policy rests on the validity of the actuarial assumptions working in concert with the rate collaring. Employer contribution rates are expected to continue to increase. Concern exists over certain actuarial assumptions; if the investment return (earnings into the trust) and payroll growth (the engine which delivers contributions to the trust) are set too high then the unfunded will continue to grow.
• We recommend Oregon PERS discuss with their actuary how and whether their funding policy should recognize that, in such a maturing plan, the contributions related to the unfunded liability should be determined solely as a dollar amount. This is due to the liability being mostly fixed (retirees) and no longer related to payroll (and its related volatility).
• We recommend Oregon PERS discuss with their actuary whether interest should be added to the determination of the new rates each biennium to cover the lag period between the valuation and the implementation of the new rates.
• The experience study recommended changes in assumptions with which the underlying trends generally concur. We understand the ultimate decision for the assumed rate of return was heavily weighted by an outside investment consultant, however, concerns still remain with the investment return assumption (7.2%, compared to Milliman’s estimate of 6.7%) and the assumption for growth in total payroll of 3.5%. Both of these assumptions may be too high; and both work in the same direction (compounding underfunding should the assumptions not materialize as expected). We also recommend considering adding an assumption for data changes and for new entrants (OPSRP).

Oregon Secretary of State
A Review of the Oregon Public Employees Retirement System (PERS)
3
• Financial (asset/liability) modeling shows the System to be on target to meet its funding
objectives. The meeting of the target is contingent upon employers continuing to meet increasing rate requirements. Ultimately the successful funding of the plan will depend on the employers’ ability to meet the contribution requirements.
• Rate collaring does limit the growth in employer contributions and it is contributing to the unfunded accrued liability.
• Audit of the valuation indicated that Milliman and GRS match to within acceptable degrees of certainty on the total liabilities of the sample members. Some enhancements could be made to the report to improve communication of the methods, assumptions, and plan provision being used to calculate liabilities.
• Review of the actuarial contract indicated the work reviewed generally complies with the Statement of Work.
• Recommendations include the creation of a written funding policy incorporating the rate collar; a review of the economic assumptions for discount rate and payroll growth.
• The retiree health care plans have moved into a better funded position over the last decade.

0
SECTION II
SCOPE OF REVIEW AND METHODOLOGY

4
Oregon Secretary of State
A Review of the Oregon Public Employees Retirement System (PERS)
5
Scope of Review and Methodology
Section III
How did we get here? Attribution Analysis
A decade ago there was no unfunded accrued liability-the system, including side funds, had funded ratios (the ratio of assets to the accrued liability) in excess of 100%. Over the last decade, a $17 billion unfunded liability has appeared, prompting the question of what caused the emergence of this unfunded accrued liability. The attribution analysis examines the last decade in order to identify the key sources in the emergence of this unfunded accrued liability. Using each valuation report, variances from the expected accrued liability were isolated. Three main categories contributing to the unfunded accrued liability development were seen:
• Investment return-lower than expected during the decade and the expectations for future returns have decreased;
• Underperforming demographic assumptions; • Contribution rate less than gross actuarially determined (i.e. uncollared rate).
Section IV
Are assumptions reasonable going forward? Experience study review The experience study, which looks at the plan’s experience by assumption, was reviewed. The key assumptions were compared to the trend for each assumption that had been detailed in each valuation report. This was done to determine whether the recommended assumptions changes were in alignment with the underlying trend in the valuations.
Section IV (continued)
Will Oregon PERS meet its objectives for full funding? Financial (asset/liability) modeling Stress testing, deterministic modeling with set assumptions; stochastic modeling with changing assumptions, were all reviewed. These asset/liability models were conducted by the retained actuary to demonstrate the risks to the plan as well as the potential for meeting the objectives of Oregon PERS for full funding of its accrued liability. Impacts due to rate collaring are also studied, and compared to the gross actuarially determined contribution rates.
Section V
Is the funding policy working? Funding policy and rate collar review The rate setting structure, including the rate collar, were reviewed. The financial (asset/liability) models show the impact of the rate collar. The effect of the rate collar on contributions is to primarily push the difference between the uncollared rates and the collared rates out into the future. The financial (asset/liability) models do not yet indicate an overall negative impact to the funded status of the plan; but rather show extended “higher” contribution rates for employers who defer a portion of their uncollared contribution rate increases. Recommendations for some consideration on the method have been included in Section V of this report.

Oregon Secretary of State
A Review of the Oregon Public Employees Retirement System (PERS)
6
Section VI
Is the valuation appropriately valuing benefits and determining costs and liabilities? Valuation Audit Using a full replication of the selected sample lives, we have determined that the valuation is producing adequate liabilities of the Oregon PERS. Specific, non-material issues for consideration were found and are detailed in the audit section of this report. The issues are primarily associated with communication of the methods, assumptions, and plan provisions in the report.
Section VII
Is the actuarial contract being fulfilled? Actuarial Contract Review The contract was reviewed and compared to the valuation, experience study and projection models. We found the work to be consistent with the detailed statement of work for the retained actuary. We have made a couple of recommended additions to the statement of work for the retained actuary. First, we recommend that any actuarial audit receive a written response from the retained actuary and secondly, that a section be added for the transfer of work should the retained actuary’s contract terminate.

4
SECTION III
ATTRIBUTION ANALYSIS

7
Oregon Secretary of State
A Review of the Oregon Public Employees Retirement System (PERS)
8
Attribution Analysis
Total System Overview
Attribution analysis – Creation of the Unfunded Accrued Liability (UAL) and Funded Ratio impact
This analysis examines a history of the actuarial condition of Oregon PERS and, based on the valuations, provides an explanation for the overall change in funded status over a recent period. For Tier 1/Tier 2, the analysis looks at a 10 year period- starting when the plan had no unfunded liability to the most recently available valuation (December 31, 2017) when the System has a $17 billion dollar unfunded accrued liability. (Page 9 of the December 31, 2017 Actuarial Valuation)
Brief history of the funded condition-from fully funded to 80% funded in a decade
In 2007 the Oregon PERS pension systems were fully funded. Fully funded means there was no unfunded accrued liability. When a plan is fully funded, its assets meet or exceed its accrued liabilities. Funded ratios are shown below:
December 31, SLGRP School
Independent
Employers OPSRP Total
2006 111.00% 110.60% 109.70% 131.60% 110.50%
2007 112.80% 112.90% 107.70% 135.50% 112.20%
2008 80.90% 80.30% 78.30% 80.30% 80.20%
2009 86.40% 86.10% 84.20% 83.20% 85.80%
>
2017 79.20% 84.00% 76.80% 73.10% 80.10%
Source: Executive summaries of the valuation reports for the indicated year.
Funded Ratios (including the side funds)
Oregon PERS Pension Systems
The impact of the Great Recession in 2008 on the funded status cannot be overlooked in this analysis. That was a key driver in lowering the funded ratio to 80% in 2008. But since then, the funded ratio has further deteriorated. Funded Status-Pension System Totals
It is not merely a matter of the decline in the funded ratios; the dollar amount which must be funded has increased. In 2007 there was no unfunded accrued liability and hence no payments to be made toward an unfunded accrued liability. By 2017 the unfunded accrued liability for the total system has grown to nearly $17 billion. The accrued liability has grown to $84.056 billion; the assets combined with the side fund have grown to $67.326 billion. The difference between these two items is the unfunded accrued liability of $16.730 billion.
Accrued liabilities grow reliably over time-unless plan amendments are enacted which slow the growth rate in these liabilities. Accrued liabilities increase each year by the normal cost and interest, and decrease each year by the benefit payments. The accrued liability represents the value of all the benefits earned to date; typically legal and policy constraints make the amendment of these liabilities more difficult. This means, these liabilities are here to stay.

Oregon Secretary of State
A Review of the Oregon Public Employees Retirement System (PERS)
9
Assets, unlike the accrued liabilities, grow and change with variability over time. Although there are techniques to smooth out some of the “noise” in the assets, the assets will generally not directly follow the pattern in the growth of liabilities. Payments on the unfunded accrued liability can similarly change each year with the change in the assets. Changes in the unfunded accrued liability create changes in the payments on an unfunded accrued liability. Volatile assets can create volatile contribution rates. For Oregon PERS, there has been an additional element contributing to the departure between the assets and the liabilities. The recommended contributions include a rate collar. This rate collar slows down (but does not eliminate) the contribution rate increase each biennium. This rate collaring creates an annual shortfall in the funding of the plan. This shortfall debt accrues interest at 7.2% per year.
Tier 1/Tier 2 (SLGRP; School and Independent Employers)
The primary drivers of the increase in the unfunded accrued liability
The unfunded accrued liability is the difference between the accrued liability and the assets. The payment on the unfunded accrued liability is driving up the employer rates. (Employer gross actuarially determined contribution rates are the sum of the normal cost and the payment on the unfunded accrued liability. The normal cost rate is fairly stable). Each year the unfunded accrued liability is expected to increase by the normal cost plus administrative expenses and interest, and to decrease by the contributions. In the case of Oregon PERS, when looking over a ten year period, the contributions have not been sufficient to pay off the normal cost plus administrative expenses and all of the interest on the unfunded accrued liability. This means the principal balance on the unfunded accrued liability is continuing to grow. A ten-year trace of this effect is shown below (numbers exclude side funds):
Unfunded Accrued Liability
January 1, 20081,273.6$
Normal Cost plus Admin 6,151.1
Interest 10,650.7
Contributions (11,189.3)
Liability (gain) or loss 1,060.6
Asset (gain) or loss 5,035.4
Assumption/Plan changes 7,797.6
Employers joining SLGRP (6.7)
Unfunded Accrued Liability
December 31, 201720,773.0$
Ten Year
Cumulative TotalItem

Oregon Secretary of State
A Review of the Oregon Public Employees Retirement System (PERS)
10
Over the decade contributions were outrun by interest and asset losses
The expected increase (normal cost plus administrative expenses and interest) was $16.8 billion while the actual contributions made were $11.2 billion. In addition, the liability losses (discussed in detail later) totaled $1 billion. The actual asset losses over the study period were $5 billion and the losses due to the change in future expectations (assumption and plan changes) totaled $7.8 billion.
Contributions cover normal cost and only a part of the interest on the debt
Over the last decade, the interest on the unfunded accrued liability was $10.7 billion and the normal cost and expenses were $6.1 billion. The contributions were $11.2 billion. This implies that, of the $11.2 billion in contributions, $6.1 went for current year expenses (normal cost plus administrative expenses) and the rest went to the UAL ($5.1 billion). That leaves $5.6 billion in UAL interest that flowed back into the UAL. The table below shows the year by year comparison of total contributions to normal cost plus administrative expenses and the interest on the UAL.
Valuation Date
Total
Contributions
Total Normal Cost
Plus Admin Interest on UAL
Contributions
Toward Normal
Cost Plus Admin
Contributions
Toward Interest on
UAL
Contributions
Towards Paying
Down the UAL*
December 31 (1) (2) (3) (4) (5) (6)
2008 $1,134.4 $403.5 $87.8 $403.5 $87.8 $643.1
2009 1,035.9 513.1 1,263.4 513.1 522.8 -740.6
2010 873.8 547.8 1,086.5 547.8 326.0 -760.5
2011 957.6 537.5 1,061.1 537.5 420.1 -641.0
2012 1,133.7 531.6 1,284.8 531.6 602.1 -682.7
2013 1,139.9 748.4 829.1 748.4 391.5 -437.6
2014 1,186.3 698.9 592.6 698.9 487.4 -105.2
2015 1,194.4 758.8 1,251.3 758.8 435.6 -815.7
2016 1,218.1 716.4 1,516.8 716.4 501.7 -1,015.1
2017 1,315.2 695.1 1,677.3 695.1 620.1 -1,057.2
Total $11,189.3 $6,151.1 $10,650.7 $6,151.1 $4,395.1 -$5,612.5
*Negative values imply that contributions were not sufficient to cover at least normal cost with admin and interest on the UAL. As shown, only one year in the last ten was the contributions to the plan sufficient to cover normal cost plus administrative expenses and the interest on the UAL.

Oregon Secretary of State
A Review of the Oregon Public Employees Retirement System (PERS)
11
The unfunded accrued liability is growing by the missed interest payments
$0
$5,000
$10,000
$15,000
$20,000
$25,000
2007 2008 2009 2010 2011 2012 2013 2014 2015 2016 2017
Oregon PERS Tier 1/Tier 2UAL (in 000s) - Ten year History
UAL (in 000s)
As shown in the chart above, the unfunded accrued liability has increased over the decade. The growth in the unfunded accrued liability over the last decade is due to the underperformance of the assets (relative to the actuarial assumed rate); to the change in future expectations for the assets (and some other assumptions) and to the contribution not paying off the principal balance on the UAL. If this continues the UAL could grow without bound. Looking at the historical impact in a slightly different way, the chart below also illustrates that past and future asset performance accounts for 77% of the growth in the UAL; the rate collaring for 17% of the growth in the UAL and the balance is due to the demographic assumptions.

Oregon Secretary of State
A Review of the Oregon Public Employees Retirement System (PERS)
12
30%
47%
6%
17%
Oregon PERSPrimary Contributors to the UAL
Tier 1/Tier 2
Investment Performance over 10 years
Changing Future expectations(assumptions)
Demographic Performance over 10years
Rate Collaring (includes legislative ratechanges)
Ten year history in the growth of the unfunded accrued liability
Biggest driver in the development of the UAL- Asset performance less than assumed
The last decade saw nearly unprecedented velocity of changes in the expectations for long term asset performance. Nearly three-quarters of the unfunded has developed due to the underperformance of the assets (actual returns lower than assumed returns) and the decline in future expectations for the performance of the assets (assumption changes). The largest contributor over the decade to Tier 1/ Tier 2 pension unfunded accrued liability is the change in future expectations for both the investments and the population. $7.8 billion is the value over the period for the change in actuarial assumptions and methods. This is primarily driven by the change in expectations for the amount of investment earnings that will be made in order to pay for benefits. The velocity of change in the investment earnings would need to be met with a similar velocity of increase in the contributions if the actuarial condition of the plan were to be stabilized. However, the change in the investment returns coincided with a deceleration in the increase of the employer contributions (rate collaring)-creating a funding gap (the unfunded accrued liability.) Within the last decade, Oregon PERS, like so many other plans, has experienced a quick and not insignificant decline in the expected returns for their investments. Every time the expectations for future earnings decrease, there is an offsetting increase in the required contributions.

Oregon Secretary of State
A Review of the Oregon Public Employees Retirement System (PERS)
16
Year(s) Changed Assumed Earnings Rate Years in Effect
2017 7.20% >1
2015 7.50% 2
2013 7.75% 2
1989 8.00% 23
Source: Public Employees Retirement System
Legislative Review of System Financing
Oregon PERS
Assumed Earnings and Discount Rate
Joint Committee on Ways and Means
Capital Construction Subcommittee
March 29, 2019
Valuation Year Rate Change Impact
2016 7.50% to 7.20% $2.3 billion
2014 7.75% to 7.5% $1.7 billion
2013 8.00% to 7.75% $2.5 billion
Total increase to the UAL $6.5 billion
Source: Public Employees Retirement System
Legislative Review of System Financing
Oregon PERS
Impact of Assumed Rate changes to the UAL*
Joint Committee on Ways and Means
Capital Construction Subcommittee
March 29, 2019
*These values may include other assumptions changes in addition to the assumed rate of return.
Rate collaring adds to the unfunded accrued liability
The actuarially determined contribution typically includes the normal cost, annual expenses, interest on the unfunded accrued liability and a portion of a principal payment on the unfunded accrued liability. The actuarially determined contribution may also include an “output smoothing” component. Oregon PERS uses rate collaring as an output smoothing component and thus the actuarially determined contribution, or the “collared rate” includes rate collaring. Since 2005, when the rate collaring has been in effect, the payment has been less than the sum of the component parts referenced above. This most typically means the unfunded accrued liability is paid off at slower rate than would be with the uncollared rate (or not at all in a given year), and may even result in the growth of the unfunded accrued liability in the short term. Rate collaring may limit the amount of a rate increase in any rate-setting year. Dampening the contribution requirements has also contributed to the growth in the unfunded accrued liability. What is now a more concerning outcome is that, as of the December 31, 2017 actuarial valuation, the total interest payment required on the unfunded accrued liability is larger than the total expected contributions. The unfunded has grown so large that the actuarially determined contributions (collared rates) cannot pay off the interest on the unfunded, let alone touch the principal. How will this funding

Oregon Secretary of State
A Review of the Oregon Public Employees Retirement System (PERS)
16
deficit be resolved? Can Oregon PERS earn its way out of this? Will using time actually help, or is time now the enemy (with the continuing accrual of interest). These are the issues we recommend Oregon PERS continue to pursue with their retained actuary. Milliman, in their December 31, 2017 valuation report (page 2) states “Of concern, even with the rate increase noted above the system-average uncollared employer contribution rate remains almost 4% of payroll above the collared rate for 2019-2021. Because of this, if actual experience is near assumption and assumptions remain unchanged in the next rate-setting valuation, we anticipate a system-average collared rate increase for the 2021-2023 biennium similar to the increase for the 2019-2021 biennium calculated in this valuation.” (Emphasis added) Milliman is signaling that actuarially determined contributions (collared rates) are insufficient to meet the payments of normal cost, expenses, interest and principal on the unfunded accrued liability (the uncollared rates). They are also signaling additional large rate increases are to come, and that is based on assumptions being met. The rate collaring policy as described in the valuation is not truly rate relief; the funds “not contributed” will return to the contribution requirement in later years (with interest). Essentially, employers who use rate collaring are “borrowing” at 7.2% per year. These contribution requirements will be higher, since the contribution deficit created by rate collaring will become part of the unfunded accrued liability and will grow at 7.2% per year. Rate collaring for SLGRP and School districts has added to the unfunded accrued liability about $2.7 billion ($2.0 billion for SLGRP and $0.7 billion for the School Districts). In the chart below, the Collar Adjustment is the amount that the required contribution is reduced due to the rate collaring policy. It should also be noted that in this period the legislative actions of decreasing and later reversing benefit decreases has also impacted the funding of Oregon PERS.
2009 2010 2011 2012 2013 2014 2015 2016 2017
Nine year
total
SLGRP Payroll (millions) $4,850.1 $4,973.4 $4,935.7 $5,018.0 $5,121.9 $5,390.8 $5,594.3 $5,714.0 $5,897.8
Collar Adjustment 3.95% 0.57% 2.20% 3.30% 1.14% 6.26% 8.35% 5.58% 4.68%
Dollar amount of Collar
Adjustment (millions) $191.58 $28.35 $108.59 $165.59 $58.39 $337.46 $467.12 $318.84 $276.02 $1,951.94
2009 2010 2011 2012 2013 2014 2015 2016 2017
Nine year
total
School District Payroll
(millions) $2,873.7 $2,950.7 $2,786.0 $2,731.5 $2,723.5 $2,872.7 $3,060.7 $3,240.7 $3,314.2
Collar Adjustment 4.24% 0.00% 2.23% 0.00% 0.00% 5.83% 7.48% 3.95% 1.93%
Dollar amount of Collar
Adjustment (millions) $121.84 $0.00 $62.13 $0.00 $0.00 $167.48 $228.94 $128.01 $63.96 $772.36
Source: each year's actuarial valuation report
Grand Total contribution deferment $2,724.31
(excluding independent employers)
SLGRP Estimated Impact of Rate Collar
Valuation Date December 31,
School District Estimated Impact of Rate Collar
Valuation Date December 31,
Rate collaring creates a deficit which in turn becomes a part of the unfunded accrued liability and the current period deficit is spread over a longer period of time. Rate collaring takes current expenses and pays them off over 10 or more years. This creates a structural deficit to the plan and this will resolve when the actuarially required contributions exceed the uncollared actuarially determined contributions.

Oregon Secretary of State
A Review of the Oregon Public Employees Retirement System (PERS)
16
Plan changes had virtually no impact, as the decrease in liabilities in 2012 was nearly matched by an increase in liabilities due to plan changes in 2014. The impact due to these changes was in the decrease in funding that later had to be recovered through subsequent rate increases.
Demographic losses (primarily members living longer than expected, retiring more than expected, and data corrections)
The impact of the demographic assumptions not meeting their assumed rates over the ten year period was only 6% of the total impact to the emergence of the unfunded accrued liability. The largest contributor in the demographic assumptions to the increase in the unfunded accrued liability was the retirement assumption. The next largest contributor was the mortality (life expectancy) assumption. The third largest contribution was the data corrections, for which there is no assumption.
Over the last five years the losses from the retirement assumption have improved. It appears, from looking at the annual gain/loss by source, the retirement assumption is sometimes greater, and sometimes less than expected. Over the ten year period the loss on this assumption was $0.6 billion. Over the last five year period, that loss on the retirement assumption was $0.2 billion.
The next largest assumption that contributed to the growth in the unfunded accrued liability was the mortality assumption. The experience deviation on this assumption contributed $0.5 billion over the ten year period. In fact, there has been a loss due to this assumption for every year out of the last ten years, except for one year.
The third largest deviation from assumption was “data corrections”. We understand that every year there are members who “show up” and must be added to the membership file. However, there was a significantly large data correction in 2017. The liability with this data correction was ten times greater than the “standard” amount in this category. We understand from the retained actuary that this data correction is due to certain members of State Agencies whose employers participate in the unused sick leave program but the valuations did not apply the assumed load for unused sick leave.

7
Oregon Secretary of State
A Review of the Oregon Public Employees Retirement System (PERS)
17
-$600
-$400
-$200
$0
$200
$400
$600
$800
Ten Year TotalDemographic Assumption Analysis
(Amount the assumption contributed to the ten year total of $1 billion)
Conclusions
The bulk of the reason for the actuarial condition of the plan can be found in three main sources; expectations for investments were not and will not be met; employers are deferring current period required contributions through the use of the rate collaring policy; and members are living longer and retiring with higher liabilities than expected.
OPSRP
The OPSRP plan was over 135% funded in 2008 and by 2017 the OPSRP was 73.1% funded. As of December 31, 2017 the plan had an unfunded accrued liability of $1.518 billion. (Page 48 of the December 31, 2017 Actuarial Valuation) Similar issues are faced by the OPSRP plan, albeit on a different scale, than for the Tier 1/Tier 2 plans.
The primary drivers of the increase in the unfunded accrued liability
As a relatively newer plan than the Tier 1/Tier 2 plan, OPSRP is subject to different pressures. The actual asset performance over the last ten years has exceeded the actuarially assumed return. For OPSRP, there has been no utilization of a rate collar.

7
Oregon Secretary of State
A Review of the Oregon Public Employees Retirement System (PERS)
18
In a number of years the contributions did not even reach the normal cost. We consider this a serious funding issue since it means the current expenses were not being met by the contributions. This is also a violation of a funding policy that requires payment of interest and principal on any unfunded accrued liability. We suggest this could be a result of the two year delay in rate implementation. One of our recommendations is to have Oregon PERS work with their retained actuary to see whether there should be interest placed on the required contributions to make up for the timing delay, or whether other circumstances exist which created this funded deficit. We understand a change in funding method contributed to this overall result of contributions not being sufficient to pay for the normal cost.
The changes in future expectations, as evidenced by the changes in the actuarial assumptions, accounts for $1 billion of the unfunded accrued liability. Another $0.5 billion is shown in the actuarial reports as coming from new entrants. These are members of OPSRP who enter the system and immediately have an unfunded accrued liability. Milliman shows these members incurring an unfunded accrued liability at around 10% of the accrued liability each year. This is a significant amount of liability being added to the plan each year. These members have had contributions made on their behalf. In our analysis of the experience study we will be recommending a review of whether an explicit assumption should be made to cover any difference between liabilities and contributions for new hires- any net liability with such a regular and significant occurrence may need to be actuarially funded and recognized.
-$453
$1,023
$569
$385
-$71Investment
Performance (Gain!)
over 10 years
Changing Futureexpectations
(assumptions)
DemographicPerformance over 10
years
Contributions less thanthe expected increase
Plan Changes (Gain!)
-$600
-$400
-$200
$0
$200
$400
$600
$800
$1,000
$1,200
OPSRP Change in UAL Components

7
Oregon Secretary of State
A Review of the Oregon Public Employees Retirement System (PERS)
20
Dollar amounts in (000's)
Primary Category Contribution to the 10-year UALInvestment Performance
(Gain!) over 10 years -$453.10
Changing Future
expectations (assumptions) $1,022.50
Demographic Performance
over 10 years $568.80
Contributions less than the
expected increase $384.70
Plan Changes (Gain!) -$70.90
OPSRP
Demographic Assumptions play a larger role in OPSRP
The largest source of the increase in unfunded accrued liability due to variance from expected was in the new entrant category. When members enter the plan they are coming in with some service (by the time the valuation is performed). Over the ten year period, these losses due to new entrants average about $52 million per year. Contributions have also been made on behalf of these new entrants. We recommend that Oregon PERS work with their retained actuary to wee whether an assumption should be made for the new entrants.
The second largest source of loss is due to the salary increase assumption. Over the ten year period the expected pay increases have been underestimated (in seven years out of ten) for an increase in the unfunded of $177.5 million. In 2017 the salary “loss” (meaning the actual salary increase was “higher” and thereby added to the unfunded accrued liability) was 2% of the total beginning accrued liability. We consider this a significant deviation and warrants further explanation.

7
Oregon Secretary of State
A Review of the Oregon Public Employees Retirement System (PERS)
21
-$100
$0
$100
$200
$300
$400
$500
$600
Retirementsfrom Active
Status
Disabilityretirements
Activemortality and
withdrawal
Payincreases
Inactivemortality
DataCorrections
NewEntrants
Other
OPSRP Demographic Assumptions Contribution to the Increase in UAL
Assets, over the ten year period, returned more than expected on a dollar basis. Over the ten year period the assets were $326 million more than expected. This is a good illustration of how timing matters. In the years near the Great Recession the trust was much lower in value (and lost fewer dollars), but gains in contributions occurred during times of higher returns, bringing an overall positive value to the trust for the ten year period.
The rate collaring policy has not impacted OPSRP. Thus, the growth in the unfunded accrued liability over the last decade is primarily due to the changing expectations on future investment earnings and the additional unexpected liability associated with new entrants. Here is what Milliman (the retained actuary) had to say about the new entrant liability:
“One important point to bear in mind is that new hires do not become members until after they pass a six-month “waiting period”. In OPSRP, they automatically get service credit for that waiting period time. As a result, when a new member is reported to us for the valuation, they already have between 0.5 and 1.5 years of service credit, which increases their Accrued Liability in the first valuation relative to if they did not receive credit for this waiting time period.” Since the demographic assumptions play a larger role in managing the UAL in OPSRP, we recommend that the new entrant assumption be established. New entrants are a continuing source of loss and, based on the comments from the retained actuary, are a source of loss that is expected to continue.

7
Oregon Secretary of State
A Review of the Oregon Public Employees Retirement System (PERS)
22
Retiree Medical Benefits - RHIA/RHIPA
Retiree Medical plans move to a surplus position over the decade
The retiree medical plan makes up a much smaller component of the total Oregon liabilities. The unfunded accrued liability at December 31, 2007 was $264.3 million. As of December 31, 2017 the combined RHIA and RHIPA had a surplus of $76.2 million. (Page 59 of the 12/31/2017 Actuarial Valuation; RHIA has a surplus of $115.7 while RHIPA has an unfunded accrued liability of $39.5) Over the decade contributions covered more than the current interest and expenses; there were plan changes that decreased the liabilities; assumption changes which increased liabilities and actual positive experience (which decreased the liabilities). Overall, the largest contributor to the positive result was the contributions.
-$223
-$183
$20
$45
-$250
-$200
-$150
-$100
-$50
$0
$50
$100
Contributions in (excess) ofnormal cost, expenses and
interest
Liability (gain) or loss Asset (gain) or loss Assumption/Plan changes
RHIA and RHIPAChange in UAL Components

7
Oregon Secretary of State
A Review of the Oregon Public Employees Retirement System (PERS)
23
RHIA and RHIPA
Item
Ten Year
Cumulative
Total
Unfunded Accrued Liability
January 1, 2008 $264.3
Contributions in (excess) of
normal cost, expenses and
interest -$222.7
Liability (gain) or loss -$183.0
Asset (gain) or loss $20.3
Assumption/Plan changes $45.1
Unfunded Accrued Liability
December 31, 2017 -$76.2
The contributions in excess of normal cost, expenses and interest are the portion of the contributions used to pay off the unfunded accrued liability. The amount of -$222.7 indicates the unfunded accrued liability was decreased by that amount. The assumption changes over the decade increased the unfunded accrued liability by $45.1 million, and the actual experience of all the demographic assumptions decreased the plan liabilities by $183.0 million.
Over the decade, actual asset losses (assets performing below the actuarially assumed rate) added $20.3 million to the unfunded accrued liability.
Contributions and conservative assumptions biggest driver in moving to surplus
The retiree medical plan is facing pressures similar to the pension plans; members are living longer, investment returns are not meeting expectations (so the expectations are decreasing). There is no collaring of the rates in the retiree medical plan. The unfunded liability of the retiree medical plan went on a different trajectory than the pension plan. The retiree medical plans started with an unfunded accrued liability and, a decade later, now have assets exceeding the accrued liability. Based on the data presented in the actuarial valuations, it appears this occurred primarily because the 2008 demographic assumption have turned out to be overly conservative. Actual gains on the demographic assumptions have occurred in eight of the last ten years. The reports do not break out the assumptions so it cannot be ascertained which assumptions are creating the largest gains in the plan. The experience study review will look more closely at the retiree medical plan to see whether those assumptions are detailed more fully.

0
SECTION IV
EXPERIENCE STUDY, ASSUMPTIONS, MODELING, DATA AND
ASSETS

20
Oregon Secretary of State
A Review of the Oregon Public Employees Retirement System (PERS)
25
Experience Study, Assumptions, Modeling, Data and Assets
This is a review of the 2016 experience study, released July 26, 2017 by Milliman. This review is intended to fulfill the scope of services described under Exhibit A, Statement of Work, B. REQUIRED SERVICES, DELIVERABLES AND DELIVERY SCHEDULE, Subsection (A) Actuarial methods used; (B) Demographic and economic assumptions used; and (G) Assumed rate of return and discount rate used, which should be compared with both historical plan returns and the range of projected future scenarios from an asset/liability study. This report will look at the experience study report which reviews and recommends the actuarial methods, demographic and economic assumptions and the assumed rate of return and discount rate. Actuarial Methods (Scope of Work Section A)
The primary actuarial methods employed include the actuarial cost method, the amortization of the unfunded accrued liability method and the rate collar.
We believe these primary actuarial methods produce valuation results that are not unreasonable. However, in the application of certain assumptions with these methods that may introduce funding risk to the plan.
We concur with the use of the entry age normal cost allocation method.
Concern exists over assuming higher future amortization payments and an unfunded lag period
In the method for amortizing the unfunded accrued liability (UAL) and developing those UAL payments we have a couple of concerns. These concerns are (1) the assumed growth rate in future amortization payments is too high (which lowers current required payments) and (2) there is a lag between the new rates and their implementation.
The payroll growth assumption serves as a proxy for growth in future amortization payments. Assuming higher payments in the future lowers the current year payment. While the method of developing the unfunded accrued liability amortization payments over an increasing payroll is a fairly standard actuarial practice, we are concerned that the payroll growth assumption of 3.5% is too high. Assuming that payroll growth is too high is the same as assuming higher future payments on the unfunded accrued liability, thereby artificially lowering the amortization payments required today.
We are also concerned that there is a timing lag between the development of the rate to fund the UAL (the “rate setting valuation”) and the actual implementation of the rate. There does not appear to be any recognition of lost interest on that lag period for the lagged UAL payment.
Review of Demographic Assumptions (Scope of Work Section B)
History of demographic assumption performance
With each valuation an analysis of the gain (or loss) on the liabilities is performed on each significant actuarial assumption. In looking at the history of that assumption’s performance we can get an idea of the changes that we would expect to see in the upcoming experience study.
The experience study covered the four year period 1/1/2013 through 12/31/2016. An excerpt of the assumption analysis performance for the period is shown below:

Oregon Secretary of State
A Review of the Oregon Public Employees Retirement System (PERS)
26
Cumulative for study
period 2016 2015 2014 2013
Deviations from Expected Experience
Retirements from Active Status $95.60 -$59.60 $70.50 -$12.70 $97.40
Disability retirements -$21.50 -$7.30 -$5.00 -$5.60 -$3.60
Active mortality and withdrawal $166.10 $65.70 $25.30 $40.90 $34.20
Pay increases $23.00 -$36.60 $48.30 $37.30 -$26.00
Interest crediting experience $58.30 $5.40 -$53.50 -$18.60 $125.00
Inactive mortality $356.30 $8.30 $114.60 $147.50 $85.90
Data corrections $105.60 $25.60 $23.40 $37.40 $19.20
Other -$54.00 -$33.40 $19.00 -$2.70 -$36.90
Total demographic (gains) and losses $729.40 -$31.90 $242.60 $223.50 $295.20
New Entrants $1.20 $0.50 $0.70
Tier 1/ Tier 2 PensionAnalysis of Changes in the Actuarial Accrued Liability (Gain)/Loss
We are looking for assumptions which are trending in one direction (they are said to have a bias) and which have an impact on the accrued liability. The yellow highlighted categories are those which present with a persistent bias. Based on the above chart we would expect to see a change on the inactive mortality/withdrawal assumption, the active mortality and withdrawal assumption, and data corrections.
In looking at the experience study we see the following recommended changes to the demographic assumptions:
• Mortality assumption (adjust for longer life expectancy) • Retirement rate adjustments (to match experience) • Withdrawal assumption (pre-retirement termination, lowering the rates of withdrawal generally) • Lower disability rates
We would expect these recommendations. For example, the inactive mortality cumulative effect was a loss in every year and a total loss for the four year period of $356.30. A loss on mortality means members are living longer than expected. Thus we would expect to see the mortality assumption change to assuming members are living longer (which is does). For withdrawal (termination prior to retirement) we see losses every year. A loss on withdrawal means people are staying longer and not leaving employment as much as assumed. Thus we would expect the assumption to change such that the rates of termination decrease. This does match what Milliman’s experience study recommends. We did not see a recommendation on data corrections as an assumption. This merits further explanation to determine whether data corrections can be expected each year and the extent to which the liability changes as a result of these corrections. Based on the analysis in the valuation reports there are data corrections every year that do create an additional liability to be funded.
The new assumptions are still a little off (but only shown for one year)
The yellow highlighted categories on the chart below show the 2017 contribution to the unfunded accrued liability for experience not meeting assumptions. Since it is just one year it could be an anomalous event. However, the data correction is a large and a contributor to the unfunded accrued liability. We recommend a discussion on planning and funding for these data corrections as they appear every year.

20
Oregon Secretary of State
A Review of the Oregon Public Employees Retirement System (PERS)
27
2017 2016 2015 2014 2013
Deviations from Expected Experience
Retirements from Active Status $146.80 -$59.60 $70.50 -$12.70 $97.40
Disability retirements -$1.80 -$7.30 -$5.00 -$5.60 -$3.60
Active mortality and withdrawal $12.50 $65.70 $25.30 $40.90 $34.20
Pay increases $70.70 -$36.60 $48.30 $37.30 -$26.00
Interest crediting experience $95.70 $5.40 -$53.50 -$18.60 $125.00
Inactive mortality $18.60 $8.30 $114.60 $147.50 $85.90
Data corrections $273.00 $25.60 $23.40 $37.40 $19.20
Other $24.10 -$33.40 $19.00 -$2.70 -$36.90
Total demographic (gains) and losses $639.60 -$31.90 $242.60 $223.50 $295.20
New Entrants $1.20 $0.50 $0.70
Tier 1/ Tier 2 PensionAnalysis of Changes in the Actuarial Accrued Liability (Gain)/Loss
2017 analysis under the new assumptions
New Public Mortality Tables
Since the 2016 experience study was published, the Society of Actuaries has recently published a new set of mortality tables for U.S. public pension plans. These tables generally show longer life expectancy than the RP-2014 tables. It’s our understanding that these tables were recommended by Milliman in the most recent 2018 experience study.
Healthcare cost trend
We recommend Milliman provide additional detail and clarification on the development of the healthcare cost trend rates be communicated in the experience study. They should disclose the underlying assumptions used, such as the model and inflation, as well as any modifications being made. They should also justify these assumptions and provide additional details on how the excise tax is being modeled in the trend rates.
Review of the Rate of Return Assumption
The investment return assumption is one of the principle assumptions used in any actuarial valuation of a retirement plan. It is used to discount future expected benefit payments to the valuation date in order to determine the liabilities of the plans. Even a small change to this assumption can produce significant changes to the liabilities and contribution rates. Currently, it is assumed that future investment returns will average 7.20% per year, net of investment expenses. The current assumption assumes inflation of 2.50% per annum and an annual real rate of return of 4.70%, net of expenses.

20
Oregon Secretary of State
A Review of the Oregon Public Employees Retirement System (PERS)
28
Comparison to Peers
The Plan exists within a peer group who all undertake this same exercise of setting their long-term investment return assumption. The following chart shows the distribution of the investment return assumptions in the Public Plans Data as of 2018.
Source: 2018 Public Plans Database (n=156), with known adjustments after 2018. Median investment return assumption: 7.25% nominal return.
We have included the same information from the 2015 survey to show the national trends in this
assumption. The median rate of return is 7.50% and the average is 7.58%.
Asset Allocation
The most appropriate approach to selecting an investment return assumption is to identify expected returns given the funds’ asset allocation mapped to forward-looking capital market assumptions. Below is a summary of the asset allocation that was used in the analysis for Oregon PERS based on the State of Investment Objectives and Policy Framework.
Asset Class Target Allocation
Public Equity 37.50%
Private Equity 17.50%
Fixed Income 20.00%
Real Estate 12.50%
Alternatives 12.50%
Total 100.00%
GRS maintains survey information on a number of investment consultants. For this analysis, the following firms were used: Aon Hewitt, Blackrock, BNY Mellon, Callan, Cambridge, JPMorgan, Marquette Associates, Meketa, Mercer, NEPC, RVK, Verus, Voya and Wilshire. We believe the benefit of performing this analysis
Current Assumption
For Oregon PERS

20
Oregon Secretary of State
A Review of the Oregon Public Employees Retirement System (PERS)
29
using multiple investment advising firms is to recognize the uncertain nature of the items affecting the selection of the investment return assumption.
While there may be differences in asset classes, investment horizons, inflation assumptions, treatment of investment expenses, excess manager performance (i.e., alpha), etc., we have attempted to align the various assumption sets from the different investment advisors to be as consistent as possible.
Arithmetic Return (Mean Return)
(1) (2) (3) (4) (5) (6) (9)
1 5.22% 2.20% 3.02% 2.50% 5.52% 10.71%
2 6.95% 2.50% 4.45% 2.50% 6.95% 12.70%
3 6.52% 2.20% 4.32% 2.50% 6.82% 9.90%
4 7.31% 2.50% 4.81% 2.50% 7.31% 12.58%
5 6.78% 2.00% 4.78% 2.50% 7.28% 10.87%
6 7.64% 2.26% 5.38% 2.50% 7.88% 14.10%
7 7.50% 2.25% 5.25% 2.50% 7.75% 12.69%
8 7.56% 2.21% 5.35% 2.50% 7.85% 12.93%
9 7.66% 2.31% 5.36% 2.50% 7.86% 11.61%
10 7.53% 2.00% 5.53% 2.50% 8.03% 12.16%
11 8.43% 2.30% 6.13% 2.50% 8.63% 12.25%
12 8.34% 2.15% 6.19% 2.50% 8.69% 12.81%
13 8.05% 2.00% 6.05% 2.50% 8.55% 9.67%
14 8.11% 1.70% 6.41% 2.50% 8.91% 13.12%
Average 7.40% 2.18% 5.22% 2.50% 7.72% 12.01%
Standard
Deviation
of Expected
Return
(1-Year)
Investment
Consultant
Investment
Consultant
Expected
Nominal
Return
Investment
Consultant
Inflation
Assumption
Expected
Real Return
(2)–(3)
Actuary
Inflation
Assumption
Expected
Nominal
Return
(4)+(5)
Based on averages from these surveyed institutions, the expected return for one year would be 7.72%. This expected return is based on an inflation assumption of 2.50% and an expected real return of 5.22%.
However, the above model does not yet account for the expected higher portfolio volatility. Higher volatility reduces returns, so the next analysis will look at the expectations, given the assumed levels of volatility, for Oregon PERS asset allocation.
Geometric Return (Median Return) Given the plan’s current asset allocation and the investment consultant’s capital market assumptions, the development of the average compound nominal return, net of investment and administrative expenses, is provided in the following table. The table provides the 40th, 50th, and 60th percentiles of the 20-year geometric average of the expected nominal return, net of expenses, as well as the probability of exceeding the current 7.2% assumption, as well as 7.00% and 6.75% assumptions.

20
Oregon Secretary of State
A Review of the Oregon Public Employees Retirement System (PERS)
30
Expected Annual Geometric Returns and Return Probabilities (Based on 20-Year Capital Market Assumptions)
Probability of
exceeding
Probability of
exceeding
Probability of
exceeding
40th 50th 60th 7.20% 7.00% 6.75%
(1) (2) (3) (4) (5) (6) (7)
1 4.38% 4.98% 5.59% 17.82% 20.06% 23.08%
2 5.49% 6.20% 6.92% 36.17% 38.85% 42.28%
3 5.81% 6.37% 6.93% 35.32% 38.73% 43.12%
4 5.88% 6.58% 7.29% 41.28% 44.08% 47.63%
5 6.12% 6.73% 7.34% 42.27% 45.53% 49.65%
6 6.19% 6.97% 7.76% 47.08% 49.63% 52.84%
7 6.30% 7.01% 7.73% 47.36% 50.20% 53.75%
8 6.36% 7.08% 7.81% 48.36% 51.15% 54.63%
9 6.59% 7.24% 7.89% 50.59% 53.69% 57.54%
10 6.67% 7.35% 8.03% 52.19% 55.15% 58.81%
11 7.26% 7.94% 8.63% 60.85% 63.67% 67.10%
12 7.23% 7.95% 8.67% 60.42% 63.13% 66.44%
13 7.58% 8.13% 8.67% 66.75% 70.09% 74.04%
14 7.40% 8.13% 8.87% 62.61% 65.22% 68.38%
Average 6.38% 7.05% 7.72% 47.79% 50.66% 54.23%
Investment
Consultant
Distribution of 20-Year Average
Geometric Net Nominal Return
The capital market assumptions provided by the investment consultants and used in the analysis above are based on 7 to 10 year investment horizon. Investment consultants develop their forecast assumptions with this time horizon in part because most pension investment management teams use this time period for developing and monitoring their investment strategies.
The investment return assumption used in the actuarial valuation has a much longer investment horizon. Therefore, it may be necessary to identify and reflect differences in the economy and financial markets over the short-term and long-term time horizon.
Rate of Return Summary We would recommend a rate that is between the mean return of 7.72% and the median return of 7.05%. The closer the assumption is to the median return, the higher the likelihood of achieving the rate. For example, the likelihood of achieving a return of 7.20% is 47.8% while the likelihood of achieving a return of 6.75%, which is closer to the median return, is 54.2%.
Based on this entire analysis, the current return of 7.20% is considered reasonable. However, based on Milliman’s analysis, a lower rate may be more appropriate. But, it is our understanding that Oregon PERS relies more heavily on the recommendations of the Oregon Investment Council and that recommendation more than supported the current discount rate.

20
Oregon Secretary of State
A Review of the Oregon Public Employees Retirement System (PERS)
31
Review of the Payroll Growth Assumption
Lower than assumed growth in total payroll means fewer contributions Every other year, contribution rates are developed that are assessed as a percent of payroll. These rates are intended to cover the annual cost accrual (normal cost) and the payment on the unfunded accrued liability. When payroll is lower than expected fewer contributions come into the plan than expected. Plan costs come in two main pieces-the unfunded liability payment and the normal cost payment. If payroll is lower, normal cost is not so much affected since the normal cost in a final pay plan is a function of payroll. However, this is not true for the amortization payment. The bulk of the unfunded accrued liability (and related amortization payment) is based on benefits already in pay status. These benefits will not fluctuate with changing payroll. This portion of the plan’s total cost is a fixed dollar amount, and a decline in payroll will short the plan by that amount. The assumed growth in payroll appears high The payroll growth assumption is high relative to its own history. We believe it is also high relative to peers and our experience with other clients. The following chart shows the historical payroll growth rates by rate pool.
-8.00%
-6.00%
-4.00%
-2.00%
0.00%
2.00%
4.00%
6.00%
8.00%
2010 2011 2012 2013 2014 2015 2016 2017
Oregon PERS Tier 1/ Tier 2History of Payroll Growth Rate
SLGRP Payroll (millions) School District Payroll (millions) Independents (millions)
Combined Payroll (mill ions) Assumed Payroll growth
Average Payroll Growth for nine year period
SLGRP Payroll (millions) 2.47%
School District Payroll (millions) 1.80%
Independents (millions) 1.48%
Combined Payroll (millions) 2.16% Payroll growth is not meeting the 3.5% assumed rate of growth. In fact, only three times in the last nine years has total payroll growth met or exceeded the assumption. If this pattern continues, the plan will not receive the actuarially determined contributions and this will contribute to the growth in the unfunded accrued liability.

20
Oregon Secretary of State
A Review of the Oregon Public Employees Retirement System (PERS)
32
Recommendations regarding assumptions-rate of return; payroll growth
We recommend a continued discussion on the assumed rate of return. Milliman’s work shows a long term expectation of 6.7%. Future consideration should be given to lowering the investment rate of return assumption to remove some risk from the Plan. We recommend discussing the payroll growth assumption and considering lowering the rate in future valuations. Asset liability modeling
The scope of work references asset liability modeling in a number of different places. This report will examine the asset liability (financial modeling) performed by Milliman and relate those results to the statement of work requested in Section A.
We found the asset/liability modeling performed does meet the requirements in the Statement of Work. The modeling incorporates the three main financial drivers, looks at a wide range of future conditions and portrays the contribution requirements for the employers and the health of the plan.
The model does not indicate that any assumptions are unreasonable, but it also cannot comment on any acceptable level of risk tolerance. This is because the risk of underperforming resides with the employers as the underperformance will be assessed through their contribution rate. The model shows a variety of scenarios and the potential changes to the contribution rate, but it cannot show what the level of tolerance is for an employer’s contribution rate for the future. To fully understand the risk tolerance, the tolerance of an employer base contribution rate amount would need to be assessed.
Milliman has performed number asset liability studies. Milliman refers to these as “Financial Modeling” and this report will adopt that same language in order to maintain consistency in the naming of the work products.
Financial Modeling – General Comments
The purpose of the financial modeling is to integrate the multiple moving parts in a pension system (assets, liabilities, contribution, benefit payments, expenses etc.) and test potential outcomes under many different scenarios. For Oregon, the financial modeling will determine whether the system is headed to full funding and whether the contributions and earnings are enough to support the objectives of Oregon PERS.
The financial modeling is the process used to manage the financial objectives of Oregon PERS through an assessment of assets and liabilities in an integrated manner.
The financial model for Oregon PERS also quantifies the possible financial impacts on the employers due to transition liabilities, side fund amortization and the rate collaring policies.
The financial modeling shows potential outcomes for different rates of return. These different rates of return may be a product of different investment strategies or various market outcomes.
Ideally, the financial modeling will permit Oregon PERS to coordinate investments with plan liabilities in order to meet the financial objectives. This strategy generally involves reducing risk while maximizing investment return. Volatility management also plays a key role in Oregon PERS since variance in the funded ratios can change the size of the contribution rate collar.

20
Oregon Secretary of State
A Review of the Oregon Public Employees Retirement System (PERS)
33
Financial models typically help to assess three key areas: Return, duration and risk. For Oregon PERS these three areas have been described in the objectives as:
Return (Performance target)
Actuarial Soundness- a policy that will fully fund the system if assumptions are met
Duration Plan should achieve full funding under the models in twenty years (the amortization period for the unfunded accrued liability)
Risk Predictable and stable employer contribution rates and protection of the plan’s funded status to enhance members’ benefit security
Financial Modeling studies
In December of 2017 and December of 2018 Milliman conducted financial modeling under a variety of assumptions.
The financial model looked at both a “constant” future year rate of return (no variability) and a variable rate of return for each year. The model uses a Monte Carlo simulation and 10,000 trials to illustrate a confidence interval around the future employer contribution rates, funded ratios and the unfunded accrued liability. The Monte Carlo simulation was also used to estimate the probability of certain “stress” events occurring within the next 20 years. The model uses the new assumptions from the 2016 experience study, including the 7.20% rate of return/discount rate. The model also employs the rate collar. Investment Policy, Funding Policy and Benefit Policy
The model incorporates all three primary drivers simultaneously in order to provide a long term perspective on the actuarial health of the plan. In doing so, the current benefit policy is held constant and the funding policy, with its anticipated changes in contribution rates pursuant to the rate collar, is fully implemented. The investment policy, to the extent it is reflected in the long term rates of return, is modeled under a number of different scenarios. The financial model did perform a modest variance on the funding policy. Using the “constant” return model, the future health of the plan was modeled assuming there would be no rate increases after the 2017-2019 biennium increase. If the base contribution rates for 2017-2019 are head steady, and the fund earns 7.2% per year thereafter, the funded ratio at the end of 20 years would decline to 63%. If base contribution rates for 2019-2021 are held steady, and the rate of return is 7.2% per year, the funded ratio increases to 83% over the 20 year period. However, if the fund only earns 6.7% then the 2017-2019 rate freeze leads to a 20 year funded ratio of 56% and the 2019-2021 rate freeze leads to a 71% funded ratio.

20
Oregon Secretary of State
A Review of the Oregon Public Employees Retirement System (PERS)
34
Conclusions of the financial model
If the assumed 7.2% rate of return is met, then over the next 20 years the employer rates can be expected to increase from 20.8% in 2017-2019, to 25.2% in 2019-2021 and then up to 31.2% in 2021-2023. The average rate would remain in the low 30%’s until 2035-2037, at which point the rates start to decline as the unfunded accrued liability is paid off. This contribution pattern and the rate of return of 7.2% would lead to a funded ratio at the end of the 20 years of over 100%. Continued concern on the assumed rate of return
However, one concern with the model is that Milliman, in the “Valuations Method & Assumptions” report presented on July 28, 2017, indicated their findings that the 20-year annualized geometric median is 6.7%. In that case, the employer rates progress very similarly to those under the above 7.2% example, expect the rates remain about 1-2% higher in all years after 2023-2025. The funded ratio would not be 100% after 20 years (but close-at about 98%). Can the employers keep absorbing rate increases?
Risk tolerance is best demonstrated through the employer contribution rates, since the risk for paying the unfunded accrued liability resides with the employers. The model cannot predict what level of contribution rate an employer can manage; but it can predict the increases and length of time for which the contributions will remain at their level. The model also predicts a “stress” or shock that could occur in the contribution rates. The Monte Carlo simulation asked “What is the likelihood that the employer base rate (excluding retiree healthcare) would exceed 30% of pay?” The answer is 86%. Employers should expect that sometime over the next 20 years their base rate including the collar (excluding retiree healthcare) will exceed 30% of pay. The probability that the rate will pop up to over 40% of pay in the next 20 years is 51%. On the other hand, the probability that the rate will fall below 10% sometime in the next 20 years is 41%. (This would occur after the unfunded accrued liability is paid off, and the contribution requirement is normal cost only). Are these models enough for assessing risk?
These financial models show, on an aggregate basis, the future funding condition of the plan. But can an individual employer look at the model and determine whether the plan is affordable in the long term? With the concern over assumptions being on the optimistic side, the impact of rate collaring and the unfunded lag period, the growth in the interest on the unfunded accrued liability; it appears that employer rate increases may be in store for a very long time. When viewing the actuarial condition in the aggregate combined with projections based on optimistic assumptions, it is entirely possible that the financial reality an employer faces is obscured.
Census Data
ASOP 23 provides the actuary guidance on the use of census data. Milliman has indicated the data was supplied by PERS and Milliman is relying upon their data.
ASOP 23 Section 3.5 Reliance on Data Supplied by Others—in most situations, the data are provided to the actuary by others. The accuracy and completeness of data supplied by others are the responsibility of those who supply the data. The actuary may rely on data supplied by others, subject to the guidance in sections 3.3 and 3.4, unless it is or becomes apparent to the actuary in the course of the assignment that the data are unsuitable for use in the actuary’s analysis. However, if an actuary is required by a regulator

Oregon Secretary of State
A Review of the Oregon Public Employees Retirement System (PERS)
35
or other governmental authority to use data that the actuary considers unsuitable for use in the actuary’s analysis, the actuary may use the data subject to the disclosure requirements of section 4. The actuary should disclose reliance on data supplied by others in an appropriate actuarial communication, as described in section 4.
Milliman discloses in their cover letter that they relied,” without audit on information (some oral and some in writing) supplied by the System’s staff. This information includes, but is not limited to, System benefit provisions as defined by statute, member census data, and financial information. We found this information to be reasonably consistent and comparable with information used for other purposes. The valuation results depend on the integrity of this information. If any of this information is inaccurate or incomplete our results may be different and our calculations may need to be revised”.
This level of review of the census data is in compliance with actuarial standards. Further, Milliman supplies a number of exhibits on the participant data (see the valuation section Data Exhibits) which details census data by membership category and tier. Milliman also provides a prior year to current year illustration of the data counts-which allows for an additional review of the reasonableness of the census data. We verified that the exhibits are consistent, reasonable, and complete.
Additionally, for each tier Milliman provides an age-service distribution with covered payroll for active members, which can provide another level of reasonableness check on the data. These age service distributions are divided into Tier 1, Tier 2, ; Tier 1 Police and Fire, Tier 2 Police and Fire, the SLGRP membership as well as the independent employers membership and OPSRP General and Police/Fire. The active age service distributions allow the reader to look at the data at the granular level of age combined with years of service, and adds another opportunity for a review of the reasonableness of the data. One suggestion we would make with regards to these distributions is that Milliman not disclose the covered payroll for any categories where there are fewer than 5 members included. This helps protect the personal information of these members.
Milliman also provides additional detail on the census data for the inactive members, for both terminated vested members and the retirees and beneficiaries. Counts and average monthly benefits are shown by age for tier 1/tier 2, OPSRP, and in total. This helps assist the reader in understanding the distribution of benefits and adds another review for reasonableness.
Milliman has made no disclosures (as required under the actuarial standards of practice) regarding significant concerns with the data; alterations or corrections made to the data. We recommend that if Milliman does have any concerns with the data or makes any assumptions and adjustments for the valuation that they disclose this information.
If there is interest in reviewing the reasonableness of data further, Milliman could look at the feasibility of providing a status reconciliation matrix. This type of exhibit starts with members, by status code, at the beginning of the year, and traces each member’s movement to the end of the year, ending with the membership listed by status code at year end. A status reconciliation such as this can provide the reader with useful information, such as how many members retired or died over the time-period between valuations. It could also help isolate any members that are unexpectedly showing up or any large data corrections, such as those shown in the gain/loss analysis. We cannot comment on the feasibility of creating the matrix for Oregon, since we do not have the full details of the underlying data. We are not recommending this as a requirement, only suggesting it as an additional layer of data review should that be desired.
In conclusion, based on our reading of the December 31, 2017 actuarial valuation, we believe that appropriate reasonableness checks have been applied to the census data.

20
Oregon Secretary of State
A Review of the Oregon Public Employees Retirement System (PERS)
36
Valuation Assets
The valuation uses the market value of assets. This is an acceptable method for use in pension valuations.
We reviewed the assets used in the valuation to be sure the assets reconcile to the market value of assets.
We found that Milliman provides ample exhibits which tie the market value of assets to the asset value used in the valuation report.
First, Milliman illustrates the System-Wide Assets (which, according to the actuarial standards of practice, they are permitted to accept without audit). The total market value of assets reported by PERS is $69,316.4 million. This total amount of assets is shared between the Tier 1/Tier 2; OPSRP, Side Accounts, Contingency Reserve, Capital Preservation Reserve, Rate Guarantee Reserve, RHIA, and RHIPA. Next, Milliman takes this market value and adjusts it by a transition liability receivable and the Net Pre-SLGRP liabilities for the end of year Actuarial Value of Assets.
Next, we noted the reconciliation from beginning of year to end of year for each of these categories totals to the market value system total of $69,316.4 million.
Side accounts are also part of the assets. Milliman also provides a reconciliation of the side accounts from the beginning of the year to the end of the year. We did verify that the system total for the side accounts matches side account shown in total for the System-Wide assets.
Thus we conclude that the assets used by Milliman reconcile to the market value of assets provided by PERS.

0
SECTION V
FUNDING POLICY AND RATE COLLARING

31
Oregon Secretary of State
A Review of the Oregon Public Employees Retirement System (PERS)
38
Funding Policy and Rate Collaring
When looking at the attribution analysis earlier in this report it has become apparent that contributions are insufficient to pay off the unfunded accrued liability. Absent future rate increases, to pay off the unfunded accrued liability the uncollared rates would need to be contributed. This observation leads to the question of whether there is a structural deficiency in the funding policy which creates these insufficient contributions. The written portions of the funding policy have the goal to fully fund the plan. However, the data shows that the combined impact of the funding policy (with rate collaring) and underperforming assumptions is to create the growth of the unfunded accrued liability. Setting rates
Rate setting policy supports Oregon PERS broader policy objectives for the funding of the system. These policies include paying off the unfunded accrued liability in a fixed time period (intergenerational equity). For rates to be adequate they need to appropriately measure the future benefit payments using the most reasonable assumptions and methods.
Current rate setting process
Oregon PERS operates under a two year rate setting cycle. Rates are adjusted every “odd” year, and those rates are in-force for two years. Thus there is an 18 month lag between the valuation date and the beginning of the new rate cycle, and a 42 month lag between the valuation date and the end of the new rate cycle. It is 30 months between the valuation date and the midpoint of the new rate cycle.
Normal Cost charged on its own payroll
The normal cost is charged only to its applicable payroll (i.e. OPSRP general service normal cost rate is only paid on OPSRP general service payroll).
Unfunded Accrued Liability payments charged over entire pool payroll
The unfunded accrued liability is charged over its entire pool (i.e. Tier 1/Tier 2 UAL rate for School District rate pool is charged on the entire school district payroll.
Rate collar calculated on base rate; but applied to the UAL rate
Rate increases (before side account rate relief or any transition liability) cannot exceed the greater of 20% of the current rate or 3% of payroll. This has the two-fold effect of dampening the rate increase on employers and pushing those delayed increases into the next biennium. Based on the financial modelling this is not projected to alter the payment schedule for the UAL, it is only spreading employer costs over a longer period (when compared to uncollared employer contribution rates.) As can be seen earlier in this report, the rate collar does create an increase to the unfunded accrued liability. This is due to the fact that the unfunded accrued liability increases by the amount of “missed” gross actuarially determined contributions (uncollared rates). The amount of the collar is determined as the greater of 20% of the base rate or 3% of payroll. (There is a gradation based on funded ratios less than 70%). However, the collar is applied only to the UAL rate.

Oregon Secretary of State
A Review of the Oregon Public Employees Retirement System (PERS)
39
Unfunded Accrued Liability (UAL) Amortization Policy
To pay off the unfunded accrued liability, Oregon PERS uses a 20 year period for the Tier 1/Tier 2 UAL’s and a 16 year period for the OPSRP UALs. These periods, when combined with the assumed earnings rate of 7.20% and growth in payroll of 3.5% are expected to pay off a portion of the principal balance each year. The policy for the UAL amortization meets the overarching principle of intergenerational equity. However, the rate collaring and offsets will have an effect on the actual amount of unfunded accrued liability paid off each year; the balances of unfunded accrued liability need to be monitored individually to determine the extent of adherence to the “pay off principal each year “ implied policy. Based on the overall review of the System, this policy of paying off principal on the unfunded accrued liability is not being achieved. In summary, the written policy for the collared base rates will lead to the policy objectives for funding the plan; but along the way the individual employer effects of collaring and offsets may cause some variances away from a policy of paying off the unfunded accrued liability. Ultimately, meeting the funding objective will depend on the employers’ ability to absorb all rate increases over time. As with all rate-based funding, the amount of contributions coming into the plan is a function of payroll. There can be a mis-match between the unfunded accrued liability (which is more of a fixed-dollar liability) and the normal cost contribution rate. This is because a large portion of the UAL is for members already in pay status-their UAL no longer is a function of payroll, but has become a fixed dollar amount. In times when payroll does not grow as expected there will be greater pressure on contribution rates since a same dollar amount needs to be funded over a smaller payroll. In conclusion, the rates and funding of the Oregon PERS can become very sensitive to the changes in total payroll. Payroll growth is a critical assumption in the management of contribution rate volatility.
Summary
We recommend a single written funding policy document that incorporates the entire rate setting policy, including the rate collaring. We also recommend ongoing annual monitoring of the UAL bases to see that the funding policy in practice is paying off a piece of the principal balance each year. Oregon PERS may wish to discuss with their retained actuary whether a funding policy of a fixed dollar amount for paying off the unfunded accrued liability would be more appropriate. We recommend re-examination of the assumed growth in payroll. This is a risky assumption because when payroll doesn’t grow as expected, then contributions do not come into the trust as expected, and there is continued growth in the unfunded accrued liability.
Concerns on interaction of methods with the payroll growth assumption
Concerns rest not on the policy or rate collaring by themselves, but on the underlying assumptions used for the application of these policies and the interaction of the assumptions with the policies and practices. In particular we are concerned about the assumption for the rate of growth in payroll (which is a proxy for the assumed rate of growth in the unfunded accrued liability payment). As expressed in the experience study review, concern exists over the 3.5% payroll growth assumption.

31
Oregon Secretary of State
A Review of the Oregon Public Employees Retirement System (PERS)
40
This concern translates to an overall concern that the unfunded accrued liability rate may be too low and not enough payroll will exist in the future to support bringing in the required contributions.

0
SECTION VI
VALUATION REVIEW
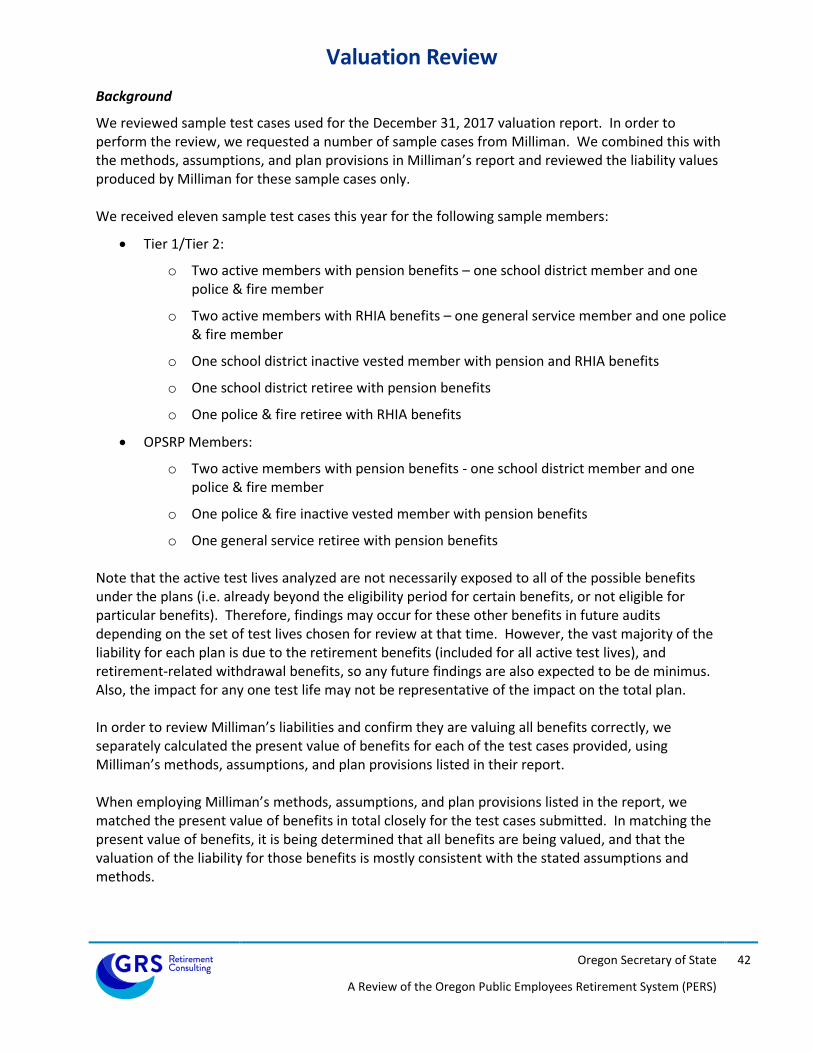
0
Oregon Secretary of State
A Review of the Oregon Public Employees Retirement System (PERS)
42
Valuation Review
Background
We reviewed sample test cases used for the December 31, 2017 valuation report. In order to perform the review, we requested a number of sample cases from Milliman. We combined this with the methods, assumptions, and plan provisions in Milliman’s report and reviewed the liability values produced by Milliman for these sample cases only. We received eleven sample test cases this year for the following sample members:
Tier 1/Tier 2:
o Two active members with pension benefits – one school district member and one police & fire member
o Two active members with RHIA benefits – one general service member and one police & fire member
o One school district inactive vested member with pension and RHIA benefits
o One school district retiree with pension benefits
o One police & fire retiree with RHIA benefits
OPSRP Members:
o Two active members with pension benefits - one school district member and one police & fire member
o One police & fire inactive vested member with pension benefits
o One general service retiree with pension benefits Note that the active test lives analyzed are not necessarily exposed to all of the possible benefits under the plans (i.e. already beyond the eligibility period for certain benefits, or not eligible for particular benefits). Therefore, findings may occur for these other benefits in future audits depending on the set of test lives chosen for review at that time. However, the vast majority of the liability for each plan is due to the retirement benefits (included for all active test lives), and retirement-related withdrawal benefits, so any future findings are also expected to be de minimus. Also, the impact for any one test life may not be representative of the impact on the total plan. In order to review Milliman’s liabilities and confirm they are valuing all benefits correctly, we separately calculated the present value of benefits for each of the test cases provided, using Milliman’s methods, assumptions, and plan provisions listed in their report. When employing Milliman’s methods, assumptions, and plan provisions listed in the report, we matched the present value of benefits in total closely for the test cases submitted. In matching the present value of benefits, it is being determined that all benefits are being valued, and that the valuation of the liability for those benefits is mostly consistent with the stated assumptions and methods.

0
Oregon Secretary of State
A Review of the Oregon Public Employees Retirement System (PERS)
43
Quantitative Results
First we calculated our own independent liabilities for each sample life provided using only the methods, assumptions, and plan provisions Milliman listed in their December 31, 2017 actuarial valuation report. We would expect to closely match Milliman’s liabilities, but differences between actuarial firms will always occur due to system differences and other nuances in the calculations. As shown in the chart below, we were able to match the total present value of future benefits for all test cases to within a reasonable range.
Milliman GRS % Diff
Active School Distirct OPSRP Pension 50,975 50,554 -0.8%
Active General Service Tier 1 Pension 2,029,108 2,079,878 2.5%
Active General Service Tier 1 RHIA 500 513 2.6%
Active Police & Fire OPSRP Pension 257,633 260,436 1.1%
Active Police & Fire Tier 2 Pension 303,023 307,962 1.6%
Active Police & Fire Tier 1 RHIA 945 945 0.0%
Milliman GRS % Diff
Vested Term School District Tier 2 Pension 10,917 10,913 0.0%
Vested Term School District Tier 2 RHIA 1,094 1,079 -1.4%
Vested Term Police & Fire OPSRP Pension 9,896 9,916 0.2%
Retired School District Tier 1 Pension 203,507 203,507 0.0%
Retired Police & Fire Tier 1 RHIA 7,212 7,269 0.8%
Retired General Service OPSRP Pension 73,892 73,893 0.0%
Actuarial Review - December 31, 2017
Comparison of Present Value of Benefits
Active
Inactive
Findings
After completing our independent calculations shown in the chart above, we examined the detailed calculations Milliman provided with the sample lives and asked a few follow-up questions. We discovered some items that were not listed in the report and believe they explain a lot of the differences between our calculated liabilities and Milliman’s. Had these items been listed in the methods, assumptions, and plan provisions sections of the report, we would have been able to more closely match the liabilities. In order to improve the ability of the report to communicate the methods, assumptions, and plan provisions, we recommend Milliman incorporate the enhancements listed below in the appropriate sections of any actuarial valuation reports for Oregon PERS going forward. We also discovered a few inconsistencies in Milliman’s calculations and have included them in the list below. Here is a summary of our findings:
o Decrements and pay increase timing appear to be assumed to occur at the beginning of each year. Decrements also appear to be independent probabilities. We recommend Milliman include these assumptions in their report. Furthermore, we recommend considering a change to assume that decrements occur in the middle of the year. Assuming decrements will occur at the beginning of the year tends to understate the actual benefit members will receive, since it assumes the member will have the least possible service, the youngest attained age (or highest early reduction factor), and have the smallest accumulated contribution balance that they will have during the valuation year.

0
Oregon Secretary of State
A Review of the Oregon Public Employees Retirement System (PERS)
44
o It appears no 401(a)(17) salary or 415 benefit maximums are being applied. We recommend Milliman include this information in their report.
o It appears that 100% of members are assumed to be married and for unknown spouse ages, males are assumed to be 3 years older than females. We recommend Milliman include these assumptions in their report.
o It appears Milliman is assuming that members who elected a 100% joint & survivor option with pop-up are assumed to have had a 0.9 optional form reduction. We recommend Milliman include this assumption, along with any other optional form reductions assumed for other pop-up elections, in their report.
o For tier 1/tier 2 members, Milliman appears to stop applying disability rates starting at normal retirement age, but for OPSRP members, Milliman appears to stop applying disability rates at the age when the member is assumed to be 100% retired (age 65 for police & fire members and age 70 for all other members). We recommend Milliman either apply the disability rates consistently, or provide an explanation for why the disability rates are being applied differently and include that assumption in their report.
o We were not able to consistently match the different age and service amounts being used for salary increases, termination rates, and retirement eligibility dates. We recommend Milliman include an assumption for the age and service calculations being used for eligibility testing in their report.
o We were not able to match the actuarially equivalent early retirement factors (ERFs) Milliman is using in their calculations. We recommend Milliman include the assumptions they are using to calculate these ERFs for each group in their report.
o Milliman appears to be assuming the cost of living accumulation on the post retirement disability benefit for OPSRP members is 1.25%. We recommend Milliman include this assumption in their report.
o Milliman is calculating the liability for retirees using an average benefit that assumes cost of living adjustments will occur on August 1st, but it appears this method is not being used for active members or inactive vested members. We recommend Milliman use consistent COLA timing for all members in the valuation.
o For members who are assumed to take a partial lump sum, Milliman is subtracting a service purchase component from the employee and employer balances assumed to be paid, but this service purchase component and the assumptions used to calculate it are not listed in the report. We recommend Milliman include this information in their report.

0
Oregon Secretary of State
A Review of the Oregon Public Employees Retirement System (PERS)
45
o For police & fire members, it appears Milliman is assuming they have purchased a full eight units of additional police & fire benefits for $4,000. We recommend Milliman include this assumption in their report.
o It appears Milliman is assuming that the retiree healthcare participation rates also assume a surviving spouse is eligible for RHIA and RHIPA benefits. We recommend Milliman include this assumption in their report.
o We recommend Milliman disclose that the normal form for the tier 1/tier 2 full formula benefit is a refund annuity.
o The retirement rates developed by Milliman do not include an assumption for tier 1/tier 2 police & fire members who retire before age 50 with 25 or more years of service. Any tier 1/tier 2 police & fire members who are eligible for retirement before age 50 with 25 or more years of service are not having retirement rates or termination rates applied to them (one of the sample lives provided by Milliman fell into this category). We recommend Milliman develop and assume a retirement rate for tier 1/tier 2 police & fire members who retire before age 50 with 25 or more years of service.
o Milliman assumes that for purposes of determining eligibility for SB 656/HB 3349 benefit adjustments, 85% of retirees are assumed to remain Oregon residents after retirement. This 85% assumption is also being applied to lump sums, but we believe the assumption for lump sums should probably be 100%. We would expect all members are still living in Oregon at the time of retirement when they receive lump sums. We recommend Milliman examine this assumption for members who receive lump sums to determine its reasonableness.
Note
Ancillary or non-retirement benefits such as death and disability tend to be low probability events (and hence low liability) and they also tend to have many “bells and whistles” which can be valued in different ways by different actuaries.

0
SECTION VII
ACTUARIAL CONTRACT REVIEW

0
Oregon Secretary of State
A Review of the Oregon Public Employees Retirement System (PERS)
47
Actuarial Contract Review
We have reviewed the contract “Exhibit A-Statement of Work”. We reviewed the valuation, experience study and selected projection studies. We found the work in these reports complies with the Statement of Work. We have two recommendations for consideration regarding the Statement of Work. First, for section 1.4 on actuarial audits, OPERS may wish to add a statement that the retained actuary will respond in writing to any actuarial audit findings. This could help “close the work” on the actuarial audits. Second, we recommend OPERS consider adding a clause that sets out the orderly transition of records and services should the actuarial contract be terminated.

0
APPENDIX A
TIER 1/TIER 2 DATA SCHEDULES

Tier 1/ Tier 2 Data Schedules
Analysis of changes in the actuarial accrued liability
2008 2009 2010 2011 2012 2013 2014 2015 2016 2017 Ten year total
AAL prior period $52,668.10 $53,922.70 $56,275.00 $58,561.90 $60,212.00 $58,609.60 $60,350.30 $70,394.80 $72,454.10 $76,253.20
Expected Change $1,701.40 $1,885.80 $1,875.60 $1,719.60 $1,864.00 $1,445.50 $1,325.20 $1,816.70 $1,734.10 $1,527.30
Assumption and Method changes $284.80 $235.10 $1,785.60 $3,468.00 $2,096.40 $0.00 $7,869.90
Plan changes $0.90 -$5,100.30 $5,027.00 $0.00 -$72.40
Deviations from Expected Experience
Retirements from Active Status $108.60 $149.60 $122.60 $68.90 -$45.40 $97.40 -$12.70 $70.50 -$59.60 $146.80 $646.70
Disability retirements -$2.70 -$1.20 -$3.60 -$5.60 -$5.00 -$7.30 -$1.80 -$27.20
Active mortality and withdrawal -$16.40 $38.00 $46.00 $19.40 $32.40 $34.20 $40.90 $25.30 $65.70 $12.50 $298.00
Pay increases $80.00 $48.00 -$139.60 -$115.20 -$140.80 -$26.00 $37.30 $48.30 -$36.60 $70.70 -$173.90
Interest crediting experience -$701.20 $191.30 $70.00 -$171.90 $81.30 $125.00 -$18.60 -$53.50 $5.40 $95.70 -$376.50
Inactive mortality $69.70 $2.50 $15.50 $73.70 -$101.90 $121.10 $148.40 $114.40 $6.50 $34.60 $484.50
From Dormant Status -$137.70 -$16.70 $14.10 -$27.70 -$35.20 -$0.90 $0.20 $1.80 -$15.90 -$218.00
Cola Experience -$54.00 -$54.00
Data corrections $12.60 -$27.70 $53.40 $19.20 $37.40 $23.40 $25.60 $273.00 $416.90
Other -$134.60 $40.30 $47.50 $140.10 -$1.80 -$36.90 -$2.70 $19.00 -$33.40 $24.10 $61.60
Total demographic (gains) and losses -$731.60 $465.60 $176.10 -$69.40 -$151.70 $295.20 $223.50 $242.60 -$31.90 $639.70 $1,058.10
New Entrants $0.70 $0.50 $1.10 $2.30
AAL December 31, $53,922.70 $56,275.00 $58,561.90 $60,212.00 $58,609.60 $60,350.30 $70,394.80 $72,454.10 $76,253.20 $78,421.30
Tier 1/ Tier 2 PensionAnalysis of Changes in the Actuarial Accrued Liability
Actuarial Accrued Liability as of December 31,
Analysis of changes in the assets
2008 2009 2010 2011 2012 2013 2014 2015 2016 2017 Ten year total
Assets prior period $51,394.60 $38,115.60 $42,793.40 $45,345.40 $44,102.60 $48,075.90 $52,459.90 $53,493.60 $51,976.70 $52,648.80
Actual contributions for year $1,134.40 $1,035.90 $873.80 $957.60 $1,133.70 $1,139.90 $1,186.30 $1,194.40 $1,218.10 $1,315.20 $1,315.20
Benefit payments and expenses for year -$2,833.60 -$2,866.50 -$3,093.30 -$3,408.60 -$3,390.40 -$3,756.50 -$3,925.80 -$4,096.70 -$4,282.60 -$4,520.40 -$4,520.40
Assumed Investment Return $4,043.60 $2,975.80 $3,334.70 $3,529.60 $3,437.90 $3,624.50 $3,959.50 $3,903.20 $3,783.30 $3,675.30 $3,675.30
Expected Actuarial Value of Assets before
changes $53,739.00 $39,260.80 $43,908.60 $46,424.00 $45,283.90 $49,083.80 $53,679.90 $54,494.50 $52,695.50 $53,118.90
Change in actuarial value of assets due to
assumption changes $0.00
Expected actuarial value of assets at end
of year $53,739.00 $39,260.80 $43,908.60 $46,424.00 $45,283.90 $49,083.80 $53,679.90 $54,494.50 $52,695.50 $53,118.90
Actuarial Valuation of Assets at end of
year $38,115.60 $42,809.50 $45,345.40 $44,103.30 $48,075.90 $52,461.80 $53,493.60 $51,984.30 $52,648.80 $57,615.60
Asset gain/(loss) -$15,623.40 $3,548.70 $1,436.80 -$2,320.70 $2,792.00 $3,378.00 -$186.30 -$2,510.20 -$46.70 $4,496.70 $4,496.70
Assets as of December 31,
Tier 1/ Tier 2 PensionAnalysis of Changes in the Assets

Year by Year progression of the UAL
2008 2009 2010 2011 2012 2013 2014 2015 2016 2017
Unfunded Accrued Liability -
January 1,1,273.6$ 15,807.1$ 13,481.6$ 13,216.5$ 16,109.4$ 10,533.7$ 7,890.4$ 16,901.2$ 20,477.4$ 23,604.4$
Normal Cost plus Admin 403.5 513.1 547.8 537.5 531.6 748.4 698.9 758.8 716.4 695.1
Interest 87.8 1,263.4 1,086.5 1,061.1 1,284.8 829.1 592.6 1,251.3 1,516.8 1,677.3
Contributions (1,134.4) (1,035.9) (873.8) (957.6) (1,133.7) (1,139.9) (1,186.3) (1,194.4) (1,218.1) (1,315.2)
Liability (gain) or loss (731.6) 465.6 176.0 (69.4) (151.7) 295.2 224.3 242.6 (31.3) 640.9
Asset (gain) or loss 15,623.4 (3,548.7) (1,436.8) 2,320.7 (2,792.0) (3,378.0) 186.3 2,510.3 46.8 (4,496.6)
Assumption/Plan changes 284.8 0.9 235.2 - (3,314.7) - 8,495.0 - 2,096.4 -
Employers joining SLGRP - 16.1 - 0.6 - 1.9 - 7.6 - (32.9)
Unfunded Accrued Liability -
December 31,15,807.1$ 13,481.6$ 13,216.5$ 16,109.4$ 10,533.7$ 7,890.4$ 16,901.2$ 20,477.4$ 23,604.4$ 20,773.0$
Tier 1/ Tier 2 Pension (SLGRP, School Districts and Independent Employers)
Year by Year Progression of the Unfunded Accrued Liability
0
APPENDIX B
OPSRP DATA SCHEDULES

OPSRP Data Schedules
Analysis of changes in the actuarial accrued liability
2008 2009 2010 2011 2012 2013 2014 2015 2016 2017 Ten year total
AAL prior period $203.00 $336.80 $535.50 $767.60 $986.40 $1,795.60 $2,243.30 $3,064.10 $3,742.50 $4,717.00
Expected Change $102.10 $145.70 $199.20 $244.00 $274.50 $388.90 $448.40 $583.90 $684.50 $808.30 $3,879.50
Assumption and Method changes $1.30 -$17.90 $678.00 $188.70 $173.70 $0.00 $1,023.80
Plan changes $1.60 -$143.20 $70.70 $0.00 -$70.90
Deviations from Expected Experience
Retirements from Active Status $1.10 $1.40 $1.50 $2.50 -$0.80 -$1.60 -$0.60 -$3.40 $3.90 $0.70 $4.70
Disability retirements -$1.80 -$1.80
Active mortality and withdrawal -$3.20 -$4.40 -$8.70 -$38.70 -$18.30 $5.40 $11.80 $19.70 $22.70 -$10.20 -$23.90
Pay increases $13.20 $20.60 $18.20 -$15.40 -$16.30 $6.30 $32.90 $20.70 -$0.40 $97.70 $177.50
Interest crediting experience $0.00
Inactive mortality -$2.00 -$2.00
Data corrections -$27.90 -$27.90
Other -$11.70 -$4.70 -$3.60 $4.60 $3.80 -$4.90 -$5.60 -$25.00 $10.30 -$14.20 -$51.00
Total demographic (gains) and losses -$0.60 $12.90 $7.40 -$47.00 -$31.60 $5.20 $38.50 $12.00 $36.50 $42.30 $75.60
New Entrants $31.00 $38.50 $43.40 $21.80 $31.50 $53.60 $74.50 $82.50 $79.70 $67.10 $523.60
AAL December 31, $336.80 $535.50 $767.60 $986.40 $1,795.60 $2,243.30 $3,064.10 $3,742.50 $4,716.90 $5,634.70
OPSRPAnalysis of Changes in the Actuarial Accrued Liability
Actuarial Accrued Liability as of December 31,
Analysis of changes in the assets
2008 2009 2010 2011 2012 2013 2014 2015 2016 2017 Ten Year Total
Assets prior period $275.10 $270.50 $445.40 $659.00 $840.50 $1,190.00 $1,630.20 $2,024.60 $2,389.10 $3,021.40
Actual contributions for year $103.50 $110.80 $146.70 $171.70 $209.90 $229.30 $271.00 $335.70 $450.90 $571.10 $2,600.60
Benefit payments and expenses for year -$7.20 -$7.50 -$7.70 -$10.60 -$10.80 -$12.10 -$15.40 -$19.70 -$23.30 -$30.50 -$144.80
Assumed Investment Return $25.60 $25.50 $40.90 $59.20 $75.20 $100.60 $136.20 $163.70 $195.20 $237.00 $1,059.10
Expected Actuarial Value of Assets before
changes $397.00 $399.30 $625.30 $879.30 $1,114.80 $1,507.80 $2,022.00 $2,504.30 $3,011.90 $3,799.00
Change in actuarial value of assets due to
assumption changes
Expected actuarial value of assets at end
of year $397.00 $399.40 $625.40 $879.30 $1,114.80 $1,507.90 $2,022.00 $2,504.30 $3,011.90 $3,799.00
Actuarial Valuation of Assets at end of
year $270.50 $445.40 $659.00 $840.50 $1,190.00 $1,630.20 $2,024.60 $2,389.10 $3,021.40 $4,116.50
Asset gain/(loss) -$126.50 $46.10 $33.60 -$38.80 $75.20 $122.30 2.6 -$115.20 $9.50 $317.50 $326.30
OPSRPAnalysis of Changes in the Assets
Assets as of December 31,

Year by Year progression of the UAL
2017 2016 2015 2014 2013 2012 2011 2010 2009 2008 Ten year total
UAL, December 31 $1,695.60 $1,353.60 $1,039.50 $613.20 $605.60 $145.90 $108.60 $90.10 $66.30
Normal Cost and Expenses 482.9 412.5 361.1 279.7 252.6 191.7 179.5 152.4 $117.40 $2,429.80
Contributions -571.1 -450.9 -335.7 -271 -229.3 -209.9 -171.7 -146.7 -$110.80 -$2,497.10
Liability (Gain) or Loss 109.4 116.2 94.5 113 58.8 -0.1 -25.2 50.8 $51.40 $568.80
Asset (Gain) or Loss -317.6 -9.5 115.3 -2.6 -122.3 -75.2 38.5 -33.6 -$46.10 -$453.10
Assumption Changes 0 173.7 0 188.7 0 678 0 -17.9 $0.00 $1,022.50
Plan Changes 0 0 0 70.7 0 -143.2 0 0 $1.60 -$70.90
Interest 118.9 100.1 78.9 47.9 47.8 18.4 16.2 13.5 $10.30 $452.00
UAL, December 31 $1,518.10 $1,695.70 $1,353.60 $1,039.60 $613.20 $605.60 $145.90 $108.60 $90.10
OPSRPAnalysis of Changes in the Unfunded Actuarial Accrued Liability
Actuarial Accrued Liability as of December 31,

0
APPENDIX C
RETIREE MEDICAL (RHIA AND RHIPA) DATA SCHEDULES

Retiree Medical (RHIA and RHIPA) Data Schedules
Analysis of changes in the actuarial accrued liability
2008 2009 2010 2011 2012 2013 2014 2015 2016 2017 Ten year total
AAL prior period $522.90 $515.30 $535.70 $581.10 $495.50 $532.20 $534.70 $538.90 $533.40 $531.60
Expected Change $18.90 $16.30 $16.70 $19.80 $11.40 $10.60 $9.30 $7.40 $6.90 $4.50
Assumption and Method
changes $0.00 $26.20 $33.00 $6.10 $2.20 $0.00 $67.50
Plan changes -$22.40 $0.00 -$22.40
Total demographic
(gains) and losses -$4.00 $4.10 $2.50 -$105.40 -$7.70 -$8.10 -$11.20 -$12.90 -$10.90 -$29.20 -$182.80
AAL December 31, $515.30 $535.70 $581.10 $495.50 $532.20 $534.70 $538.90 $533.40 $531.60 $506.90
RHIA and RHIPA
Analysis of Changes in the Actuarial Accrued Liability
Actuarial Accrued Liability as of December 31,
Analysis of changes in the assets
2008 2009 2010 2011 2012 2013 2014 2015 2016 2017 Ten year total
Assets prior period $258.60 $189.50 $220.50 $238.00 $244.10 $296.00 $358.80 $403.10 $430.50 $484.10
Actual contributions for
year $29.90 $27.60 $23.60 $35.00 $51.60 $52.40 $55.80 $57.60 $60.00 $61.80
Benefit payments and
expenses for year -$30.90 -$31.60 -$32.80 -$34.50 -$35.30 -$36.70 -$37.60 -$38.40 -$38.20 -$38.60
Assumed Investment Return$20.60 $15.00 $17.30 $19.10 $20.20 $23.60 $28.50 $31.00 $33.00 $35.80
Expected Actuarial Value
of Assets before changes $278.20 $200.50 $228.60 $257.60 $280.60 $335.30 $405.50 $453.30 $485.30 $543.10
Actuarial Valuation of
Assets at end of year $189.50 $220.50 $238.00 $244.10 $296.00 $358.80 $403.10 $430.50 $484.10 $583.10
Asset gain/(loss) -$88.70 $20.00 $9.40 -$13.50 $15.40 $23.50 -$2.40 -$22.80 -$1.20 $40.00 -$20.30
Assets as of December 31,
RHIA and RHIPAAnalysis of Changes in the Assets

Year by Year progression of the UAL
2008 2009 2010 2011 2012 2013 2014 2015 2016 2017 Ten year total
UAL Beginning of year $264.30 $325.80 $315.30 $343.00 $251.40 $236.10 $175.90 $135.80 $102.90 $47.50
Normal Cost and Expenses $8.60 $7.50 $7.40 $8.60 $7.80 $7.00 $6.70 $6.50 $6.30 $6.10 $72.50
Contributions -$29.90 -$27.70 -$23.70 -$34.90 -$51.60 -$52.40 -$55.90 -$57.50 -$59.90 -$61.80 -$455.30
Liability (gain) or loss -$4.10 $4.10 $2.40 -$105.40 -$7.70 -$8.00 -$11.20 -$13.00 -$10.90 -$29.20 -$183.00
Asset (gain) or loss $88.70 -$20.00 -$9.50 $13.40 -$15.40 -$23.40 $2.40 $22.90 $1.20 -$40.00 $20.30
Assumption changes -$22.40 $26.20 $0.00 $33.00 $0.00 $6.10 $0.00 $2.20 $0.00 $45.10
Interest $20.50 $25.50 $24.90 $26.70 $18.60 $16.80 $11.70 $8.30 $5.70 $1.40 $160.10
UAL End of Year $325.80 $315.30 $343.00 $251.40 $236.10 $175.90 $135.80 $102.90 $47.50 -$76.20
RHIA and RHIPAAnalysis of Changes in the Unfunded Actuarial Accrued Liability

Public Employees Retirement System Headquarters:
11410 S.W. 68th Parkway, Tigard, OR Mailing Address:
P.O. Box 23700 Tigard, OR 97281-3700
888-320-7377TTY (503) 603-7766
www.o re go n .go v/p er s
Oregon Kate Brown, Governor
October 8, 2019
Kip Memmott, Director Secretary of State, Audits Division 255 Capitol St. NE, Suite 500 Salem, OR 97310
Dear Mr. Memmott,
This letter provides a written response to the Audits Division’s final audit report titled A Review of the Oregon Public Employees Retirement System.
Thank you for sharing this audit report that looked at the reasonableness and consistency of the methods, assumptions and data used in the December 31, 2017 actuarial valuation. The Public Employees Retirement System (PERS) Executive Management appreciates the collaborative approach taken by the Audits Division and their subcontractor conducting the audit, GRS Retirement Consulting.
Given this was the first audit conducted pursuant to House Bill 4163, Section 11 (2018), PERS looked upon the report process as a learning experience and an opportunity to continue to mature, in concert with our consulting actuary, our actuarial practices.
PERS agrees with many of these findings. However, there are certain aspects where PERS and its consulting actuary, Milliman, have a different perspective than those set out within the report’s recommendations. Some of those differences will be highlighted in our responses to the recommendations attached (Attachment A).
We also note that some of the wording and phrasing within the report could lead a non-expert reader to misinterpret the results of the report. We did raise these concerns when reviewing drafts of the report, however, our concerns were not incorporated into the final report.
That said, we are pleased the report found that: • “…when looking at the long term projections through the financial (asset/liability) modeling
that the plan is expected to meet its funding objectives”; and• “We found the actuarial work to be consistent with generally accepted actuarial standards
and practices.”
The PERS Mission is to pay the right person the right benefit at the right time. Having a well defined funding policy that is reviewed in public session by the PERS Board, stress tested by our retained actuaries regularly, and includes the appropriate use of associated actuarial methods, assumptions and data is paramount to ensuring PERS can achieve its mission.
C.1. Attachment 2

PERS Response Secretary of State Audit – October 2018 2
As is noted above, the report was based upon the methods, assumptions and data used in the December 31, 2017 actuarial valuation. Subsequent to that valuation, PERS conducted a 2018 experience study and, as a result of the study, approved changes to the actuarial methods, assumptions and data that were used in the December 31, 2018 actuarial valuation.
The 2018 actuarial valuation also took into account legislative changes resulting from the passing of SB1049 in the 2019 session, including mandating that the Tier One and Tier Two Unfunded Actuarial Liability be re-amortized over a twenty-two year period. A secondary change arising from SB1049 was for the PERS Board to report to the Legislature at least 30 days prior to formally adopting the Methods and Assumptions. This report (Attachment B) was provided to the Legislature and accepted by the Interim Ways and Means Committee in September Legislative Days.
Attached is our response to each recommendation in the audit as well as other supporting documentation.
We look forward to having subsequent actuarial audits as per House Bill 4163, Section 11 (2018), demonstrate that PERS has implemented those recommendations PERS agrees with, while ensuring other highlighted issues such as rate collaring, payroll growth assumptions and the assumed rate of return continue to be regularly reviewed for appropriateness and soundness by the PERS Board in public session as one of their principal fiduciary duties to PERS members.
Please contact Kevin Olineck, Director at (503) 603-7695 with any questions.
Sincerely,
Kevin Olineck, Director
Attachment A – PERS Responses to GRS Recommendations Attachment B – Report to Oregon Legislative Assembly – Preliminary Adoption of Actuarial Methods and Assumptions

#
Stat
emen
t/Rec
omm
enda
tion
Page
in
GR
S R
epor
t R
espo
nse
Expe
cted
C
ompl
etio
n D
ate
Not
es
Exec
utiv
e Su
mm
ary
1 Th
e at
tribu
tion
anal
ysis
sho
ws
that
the
emer
genc
e of
the
UAL
of t
he S
yste
m to
$17
billi
on o
ver t
he la
st
deca
de is
prim
arily
due
to th
e ca
pita
l mar
kets
pe
rform
ing
less
than
exp
ecte
d, lo
wer
ing
of
antic
ipat
ed fu
ture
inve
stm
ent r
etur
ns; l
onge
r life
ex
pect
ancy
and
the
unde
r-co
ntrib
utin
g to
war
d th
e un
fund
ed a
ccru
ed li
abilit
y.
2 PE
RS
agre
es, i
n pa
rt, w
ith th
e th
ree
prim
ary
driv
ers
that
dro
ve th
e em
erge
nce
of th
e U
AL.
How
ever
, the
re s
houl
d al
so b
e di
stin
ct re
cogn
ition
of
the
impa
ct a
nd ti
min
g of
legi
slat
ive
chan
ges
and
cour
t dec
isio
ns o
ver t
he p
erio
d of
tim
e th
is
repo
rt en
com
pass
es. W
ithin
the
repo
rt, o
f the
17
% o
f the
UAL
incr
ease
attr
ibut
ed to
rate
co
llarin
g, P
ERS
has
estim
ated
that
7%
is
attri
buta
ble
to le
gisl
ativ
e ch
ange
s an
d ju
dici
al
deci
sion
s w
ith th
e ot
her 1
0% a
ttrib
utab
le to
rate
co
llarin
g.
Com
plet
e Th
e in
form
atio
n on
pag
e 16
(1
3)is
inco
rrect
in th
e ch
art
entit
led:
Impa
ct o
f Ass
umed
Rat
e ch
ange
s to
the
UA
L.T h
e co
rrect
num
bers
are
:Va
luat
ion
Year
Impa
ct
2016
$2.3
B
2014
$1.7
B
2013
$1.1
B
2 Th
e su
cces
s of
the
fund
ing
polic
y re
sts
on th
e va
lidity
of t
he a
ctua
rial a
ssum
ptio
ns w
orki
ng in
co
ncer
t with
the
rate
col
larin
g. E
mpl
oyer
co
ntrib
utio
n ra
tes
are
expe
cted
to c
ontin
ue to
in
crea
se. C
once
rn e
xist
s ov
er c
erta
in a
ctua
rial
assu
mpt
ions
; if t
he in
vest
men
t ret
urn
(ear
ning
s in
to
the
trust
) and
pay
roll
grow
th (t
he e
ngin
e w
hich
de
liver
s co
ntrib
utio
ns to
the
trust
) are
set
too
high
th
en th
e un
fund
ed w
ill co
ntin
ue to
gro
w.
2 Th
e PE
RS
Boar
d, a
s pa
rt of
its
2018
exp
erie
nce
stud
y, re
view
ed th
e ra
te o
f ret
urn
assu
mpt
ion
and
conf
irmed
that
7.2
% is
app
ropr
iate
bas
ed o
n al
l av
aila
ble
info
rmat
ion,
incl
udin
g th
e O
rego
n In
vest
men
t Cou
ncil’s
con
sulta
nt e
stim
atin
g a
7.3%
rate
of r
etur
n in
Apr
il 20
19. A
dditi
onal
ly, t
he
PER
S Bo
ard
revi
ewed
the
payr
oll g
row
th
assu
mpt
ion
and
conf
irmed
that
3.5
% is
ap
prop
riate
bas
ed o
n al
l ava
ilabl
e in
form
atio
n.
This
is p
artic
ular
ly tr
ue o
ver a
long
er ti
mef
ram
e th
an w
hat w
as re
view
ed a
s pa
rt of
this
repo
rt.
Com
plet
e It
shou
ld b
e no
ted
that
the
audi
t rep
ort r
ecom
men
ds a
n as
sum
ptio
n be
twee
n 7.
05%
an
d 7.
72%
. As
is e
vide
nced
by
the
NAS
RA
Issu
e Br
ief:
Publ
ic
Pens
ion
Plan
Inve
stm
ent
Ret
urn
Assu
mpt
ions
(F
ebru
ary
2019
), PE
RS
has
adop
ted
very
reas
onab
le
inve
stm
ent r
etur
n as
sum
ptio
ns th
at a
re
com
plet
ely
in li
ne w
ith p
ublic
se
ctor
pee
rs.
In th
e tim
e fra
me
2010
to 2
019,
PER
S ha
s m
oved
from
8.0
% to
7.
2%, w
hile
our
pee
rs h
ave,
ov
er th
e sa
me
time
perio
d,
mov
ed fr
om 7
.91%
to
7.28
%, o
n av
erag
e.
3 W
e re
com
men
d O
rego
n PE
RS
disc
uss
with
thei
r ac
tuar
y ho
w a
nd w
heth
er th
eir f
undi
ng p
olic
y sh
ould
reco
gniz
e th
at, i
n su
ch a
mat
urin
g pl
an, t
he
cont
ribut
ions
rela
ted
to th
e un
fund
ed li
abilit
y sh
ould
be
det
erm
ined
sol
ely
as a
dol
lar a
mou
nt. T
his
is
due
to th
e lia
bilit
y be
ing
mos
tly fi
xed
(retir
ees)
and
no
long
er re
late
d to
pay
roll
(and
its
rela
ted
vola
tility
).
2 W
e do
not
agr
ee w
ith th
e st
atem
ent t
hat t
his
chan
ge “s
houl
d” b
e m
ade
for a
mat
urin
g pl
an.
Con
tribu
tions
to a
mor
tize
the
unfu
nded
liab
ility
are
spre
ad a
cros
s co
mbi
ned
Tier
1/T
ier 2
and
O
PSR
P pa
yrol
l, w
hich
redu
ces
the
vola
tility
of t
he
payr
oll b
ase,
refle
cts
the
long
-term
nat
ure
of th
e pr
ogra
m, a
nd is
con
sist
ent w
ith th
e va
st m
ajor
ity
of p
eer s
yste
ms.
July
202
1 as
pa
rt of
the
2020
Ex
perie
nce
Stud
y

#
Stat
emen
t/Rec
omm
enda
tion
Page
in
GR
S R
epor
t R
espo
nse
Expe
cted
C
ompl
etio
n D
ate
Not
es
This
can
be
expl
ored
as
part
of th
e 20
20
Expe
rienc
e St
udy,
but
a fi
xed
dolla
r am
ortiz
atio
n ap
proa
ch m
ay b
e im
prac
tical
giv
en th
e lo
gist
ics
of
the
hund
reds
of e
mpl
oyer
s in
the
syst
em a
nd a
co
ntrib
utio
n in
frast
ruct
ure
pred
icat
ed o
n co
ntrib
utio
n ra
tes
defin
ed a
s a
perc
enta
ge o
f pa
yrol
l.
4 W
e re
com
men
d O
rego
n PE
RS
disc
uss
with
thei
r ac
tuar
y w
heth
er in
tere
st s
houl
d be
add
ed to
the
dete
rmin
atio
n of
the
new
rate
s ea
ch b
ienn
ium
to
cove
r the
lag
perio
d be
twee
n th
e va
luat
ion
and
the
impl
emen
tatio
n of
the
new
rate
s.
2 Th
is c
an b
e ex
plor
ed a
s pa
rt of
the
2020
Ex
perie
nce
Stud
y. S
impl
y ad
ding
inte
rest
to th
e co
ntrib
utio
n ra
tes
may
not
be
appr
opria
te g
iven
th
at c
ontri
butio
ns (a
t diff
eren
t rat
es) a
re a
lread
y be
ing
rece
ived
dur
ing
the
18 m
onth
lag
perio
d. I
n th
e ris
ing
cont
ribut
ion
rate
env
ironm
ent o
f the
pa
st fe
w b
ienn
ia, r
ates
dur
ing
the
lag
perio
d ha
ve
typi
cally
bee
n lo
wer
than
the
rate
s th
at c
ome
into
ef
fect
afte
r 18
mon
ths,
but
this
rela
tions
hip
wou
ld
not b
e ex
pect
ed to
per
sist
in a
sta
ble
or
decr
easi
ng c
ontri
butio
n ra
te e
nviro
nmen
t.
July
202
1 as
pa
rt of
the
2020
Ex
perie
nce
Stud
y
5 Th
e ex
perie
nce
stud
y re
com
men
ded
chan
ges
in
assu
mpt
ions
with
whi
ch th
e un
derly
ing
trend
s ge
nera
lly c
oncu
r. W
e un
ders
tand
the
ultim
ate
deci
sion
for t
he a
ssum
ed ra
te o
f ret
urn
was
hea
vily
w
eigh
ted
by a
n ou
tsid
e in
vest
men
t con
sulta
nt,
how
ever
, con
cern
s st
ill re
mai
n w
ith th
e in
vest
men
t re
turn
ass
umpt
ion
(7.2
%, c
ompa
red
to M
illim
an’s
es
timat
e of
6.7
%) a
nd th
e as
sum
ptio
n fo
r gro
wth
in
tota
l pay
roll
of 3
.5%
. Bot
h of
thes
e as
sum
ptio
ns
may
be
too
high
; and
bot
h w
ork
in th
e sa
me
dire
ctio
n (c
ompo
undi
ng u
nder
fund
ing
shou
ld th
e as
sum
ptio
ns n
ot m
ater
ializ
e as
exp
ecte
d). W
e al
so
reco
mm
end
cons
ider
ing
addi
ng a
n as
sum
ptio
n fo
r da
ta c
hang
es a
nd fo
r new
ent
rant
s (O
PSR
P).
2 Se
e R
espo
nse
to R
ecom
men
datio
n #2
abo
ve a
nd
#12
belo
w.
Com
plet
e

#
Stat
emen
t/Rec
omm
enda
tion
Page
in
GR
S R
epor
t R
espo
nse
Expe
cted
C
ompl
etio
n D
ate
Not
es
6 Fi
nanc
ial (
asse
t/lia
bilit
y) m
odel
ing
show
s th
e Sy
stem
to b
e on
targ
et to
mee
t its
fund
ing
obje
ctiv
es. T
he m
eetin
g of
the
targ
et is
con
tinge
nt
upon
em
ploy
ers
cont
inui
ng to
mee
t inc
reas
ing
rate
requ
irem
ents
. Ulti
mat
ely
the
succ
essf
ul
fund
ing
of th
e pl
an w
ill de
pend
on
the
empl
oyer
s’
abilit
y to
mee
t the
con
tribu
tion
requ
irem
ents
.
3 PE
RS
agre
es th
at o
ur m
odel
ing
show
s th
at th
e sy
stem
is o
n ta
rget
to m
eet i
ts fu
ndin
g ob
ject
ives
. C
ompl
ete
7 R
ate
colla
ring
does
lim
it th
e gr
owth
in e
mpl
oyer
co
ntrib
utio
ns a
nd it
is c
ontri
butin
g to
the
unfu
nded
ac
crue
d lia
bilit
y.
3 As
par
t of s
ettin
g el
emen
ts o
f the
fund
ing
polic
y in
20
04, t
he P
ERS
Boar
d re
view
ed o
ptio
ns to
ass
ist
in s
moo
thin
g vo
latil
e co
ntrib
utio
n ra
tes
in o
rder
to
mee
t the
ir fu
ndin
g ob
ject
ive
of h
avin
g pr
edic
tabl
e an
d st
able
rate
s.
Ther
e ar
e tw
o m
etho
ds p
lans
can
ado
pt to
ac
hiev
e th
at o
bjec
tive.
The
firs
t is
thro
ugh
the
smoo
thin
g of
inpu
ts s
uch
as a
sset
sm
ooth
ing,
w
hich
the
maj
ority
of p
ublic
sec
tor p
lans
use
and
is
refe
renc
ed in
the
audi
t rep
ort.
Anot
her c
omm
on
inpu
t sm
ooth
ing
tech
niqu
e is
to p
hase
-in c
hang
es
in th
e in
vest
men
t ass
umpt
ion,
with
the
boar
d ad
optin
g an
ass
umpt
ion
that
is h
ighe
r tha
n th
e be
st e
stim
ate
of th
e sy
stem
’s c
onsu
ltant
s.
The
othe
r opt
ion
is o
n th
e ou
tput
sid
e, w
hich
is
the
rate
col
larin
g ap
proa
ch.
Anal
ysis
at t
he ti
me
of a
dopt
ing
rate
col
larin
g co
mpa
red
both
met
hods
an
d fo
und,
ove
r the
long
-term
, ver
y si
mila
r res
ults
w
ith re
gard
to th
e fu
ndin
g im
pact
. Th
e Bo
ard
belie
ves
the
rate
col
larin
g ap
proa
ch,
whi
ch u
ses
the
fair
mar
ket a
sset
val
ue a
nd a
bes
t es
timat
e as
sum
ptio
n fo
r inv
estm
ent r
etur
n, is
a
mor
e tra
nspa
rent
mea
ns o
f dea
ling
with
co
ntrib
utio
n ra
te s
moo
thin
g an
d co
nfirm
ed th
is
appr
oach
as
part
of it
s 20
18 e
xper
ienc
e st
udy.
Com
plet
e
8 Au
dit o
f the
val
uatio
n in
dica
ted
that
Milli
man
and
G
RS
mat
ch to
with
in a
ccep
tabl
e de
gree
s of
ce
rtain
ty o
n th
e to
tal l
iabi
litie
s of
the
sam
ple
mem
bers
. Som
e en
hanc
emen
ts c
ould
be
mad
e to
th
e re
port
to im
prov
e co
mm
unic
atio
n of
the
met
hods
, ass
umpt
ions
, and
pla
n pr
ovis
ion
bein
g us
ed to
cal
cula
te li
abilit
ies.
3 PE
RS
is p
leas
ed th
at G
RS
mat
ches
with
M
illim
an’s
cal
cula
tions
of l
iabi
litie
s an
d ha
s as
ked
that
Milli
man
pro
vide
gre
ater
dis
clos
ure,
in c
erta
in
circ
umst
ance
s.
Com
plet
e

#
Stat
emen
t/Rec
omm
enda
tion
Page
in
GR
S R
epor
t R
espo
nse
Expe
cted
C
ompl
etio
n D
ate
Not
es
9 R
evie
w o
f the
act
uaria
l con
tract
indi
cate
d th
e w
ork
revi
ewed
gen
eral
ly c
ompl
ies
with
the
Stat
emen
t of
Wor
k.
3 PE
RS
is p
leas
ed th
at th
e w
ork
done
is in
ac
cord
ance
with
the
Stat
emen
t of W
ork.
C
ompl
ete
10
Rec
omm
enda
tions
incl
ude
the
crea
tion
of a
writ
ten
fund
ing
polic
y in
corp
orat
ing
the
rate
col
lar;
a re
view
of t
he e
cono
mic
ass
umpt
ions
for d
isco
unt
rate
and
pay
roll
grow
th.
3 PE
RS
will
take
ele
men
ts o
f the
fund
ing
polic
y th
at
have
bee
n ad
opte
d ov
er th
e ye
ars
and
enca
psul
ate
in a
sin
gle
writ
ten
fund
ing
polic
y.
Jul
y 20
20
Cer
tain
ele
men
ts o
f a
com
plet
e fu
ndin
g po
licy,
pa
rticu
larly
the
asse
t m
anag
emen
t com
pone
nts,
ar
e un
der t
he p
urvi
ew o
f the
O
rego
n In
vest
men
t Cou
ncil.
11
Th
e re
tiree
hea
lth c
are
plan
s ha
ve m
oved
into
a
bette
r fun
ded
posi
tion
over
the
last
dec
ade.
3
PER
S is
ple
ased
that
the
chan
ges
mad
e to
the
fund
ing
and
assu
mpt
ions
has
led
to a
bet
ter
fund
ed p
ositi
on o
ver t
he la
st d
ecad
e.
Com
plet
e
Sect
ion
III A
ttrib
utio
n An
alys
is
12
Sinc
e th
e de
mog
raph
ic a
ssum
ptio
ns p
lay
a la
rger
ro
le in
man
agin
g th
e U
AL in
OPS
RP,
we
reco
mm
end
that
the
new
ent
rant
ass
umpt
ion
be
esta
blis
hed.
New
ent
rant
s ar
e a
cont
inui
ng s
ourc
e of
loss
and
, bas
ed o
n th
e co
mm
ents
from
the
reta
ined
act
uary
, are
a s
ourc
e of
loss
that
is
expe
cted
to c
ontin
ue.
21
The
amou
nt s
how
n on
pag
e 21
of t
he a
udit
repo
rt as
an
incr
ease
in U
AL d
ue to
new
ent
rant
s ov
er a
te
n-ye
ar p
erio
d is
inco
rrect
; tha
t am
ount
is
actu
ally
the
incr
ease
in A
ccru
ed L
iabi
lity.
To
asse
ss th
e ef
fect
on
the
UAL
from
new
ent
rant
s,
the
Accr
ued
Liab
ility
incr
ease
wou
ld n
eed
to b
e co
mpa
red
to th
e co
ntrib
utio
ns th
at w
ere
mad
e fo
r ne
w e
ntra
nts
in th
e ye
ar th
ey e
nter
ed th
e pl
an.
This
poi
nt w
as c
larif
ied
for G
RS
afte
r the
ir in
itial
dr
aft,
and
they
revi
sed
page
20
to re
flect
this
, ad
ding
the
stat
emen
t “co
ntrib
utio
ns h
ave
also
be
en m
ade
on b
ehal
f of t
hese
new
ent
rant
s.”
How
ever
, the
y di
d no
t see
m to
inco
rpor
ate
this
in
form
atio
n in
to p
age
21, w
here
they
con
tinue
d to
re
pres
ent t
he fu
ll Ac
crue
d Li
abilit
y in
crea
se
amou
nt a
s a
UAL
loss
. G
ranu
lar d
ata
isn’
t ava
ilabl
e to
isol
ate
the
porti
on
of O
PSR
P as
sets
due
to c
ontri
butio
ns o
n ne
w
entra
nts
to m
ake
a pr
ecis
e co
mpa
rison
, but
M
illim
an c
ould
est
imat
e th
is a
mou
nt fo
r the
cu
rrent
and
upc
omin
g va
luat
ions
to s
ee if
ther
e is
an
y ju
stifi
catio
n to
intro
duci
ng a
new
ent
rant
as
sum
ptio
n. I
f so,
suc
h an
ass
umpt
ion
coul
d be
ad
opte
d w
ith th
e 20
20 E
xper
ienc
e St
udy.
July
202
1 as
pa
rt of
the
2020
Ex
perie
nce
Stud
y
Sect
ion
IV E
xper
ienc
e St
udy,
Ass
umpt
ions
, M
odel
ing,
Dat
a an
d As
sets

#
Stat
emen
t/Rec
omm
enda
tion
Page
in
GR
S R
epor
t R
espo
nse
Expe
cted
C
ompl
etio
n D
ate
Not
es
13
We
reco
mm
end
a di
scus
sion
on
plan
ning
and
fu
ndin
g fo
r the
se d
ata
corre
ctio
ns a
s th
ey a
ppea
r ev
ery
year
.
26
PER
S w
ill en
sure
that
dis
cuss
ion
on d
ata
corre
ctio
ns b
e in
corp
orat
ed in
to a
ll fu
ture
ex
perie
nce
stud
ies
and
actu
aria
l val
uatio
n re
conc
iliatio
n an
alys
is.
July
202
1 as
pa
rt of
the
2020
Ex
perie
nce
Stud
y 14
W
e re
com
men
d M
illim
an p
rovi
de a
dditi
onal
det
ail
and
clar
ifica
tion
on th
e de
velo
pmen
t of t
he
heal
thca
re c
ost t
rend
rate
s be
com
mun
icat
ed in
the
expe
rienc
e st
udy.
27
Milli
man
will
expa
nd it
s di
scus
sion
of t
his
assu
mpt
ion
begi
nnin
g w
ith th
e 20
20 E
xper
ienc
e St
udy.
July
202
1 as
pa
rt of
the
2020
Ex
perie
nce
Stud
y 15
W
e re
com
men
d a
cont
inue
d di
scus
sion
on
the
assu
med
rate
of r
etur
n. M
illim
an’s
wor
k sh
ows
a lo
ng te
rm e
xpec
tatio
n of
6.7
%. F
utur
e co
nsid
erat
ion
shou
ld b
e gi
ven
to lo
wer
ing
the
inve
stm
ent r
ate
of re
turn
ass
umpt
ion
to re
mov
e so
me
risk
from
the
Plan
.
32
The
PER
S Bo
ard,
as
part
of it
s 20
18 e
xper
ienc
e st
udy
revi
ewed
the
rate
of r
etur
n as
sum
ptio
n an
d co
nfirm
ed th
at 7
.2%
is a
ppro
pria
te b
ased
on
all
avai
labl
e in
form
atio
n, in
clud
ing
the
Ore
gon
Inve
stm
ent C
ounc
il’s o
utsi
de c
onsu
ltant
pro
ject
ing
a 7.
3% a
vera
ge fu
ture
long
-term
ann
ual r
etur
n in
Ap
ril 2
019.
The
Boa
rd w
ill co
ntin
ue to
eva
luat
e th
e as
sum
ed ra
te o
f ret
urn
ever
y tw
o ye
ars
as
part
of th
e ne
xt ra
te s
ettin
g cy
cle.
Com
plet
e
16
We
reco
mm
end
disc
ussi
ng th
e pa
yrol
l gro
wth
as
sum
ptio
n an
d co
nsid
erin
g lo
wer
ing
the
rate
in
futu
re v
alua
tions
.
32
The
PER
S Bo
ard,
as
part
of it
s 20
18 e
xper
ienc
e st
udy,
revi
ewed
the
payr
oll g
row
th a
ssum
ptio
n an
d co
nfirm
ed th
at 3
.5%
is a
ppro
pria
te b
ased
on
all a
vaila
ble
info
rmat
ion.
Thi
s is
par
ticul
arly
true
ov
er a
long
er ti
mef
ram
e th
an w
hat w
as re
view
ed
as p
art o
f thi
s re
port.
Com
plet
e
17
Milli
man
has
mad
e no
dis
clos
ures
(as
requ
ired
unde
r the
act
uaria
l sta
ndar
ds o
f pra
ctic
e) re
gard
ing
sign
ifica
nt c
once
rns
with
the
data
; alte
ratio
ns o
r co
rrect
ions
mad
e to
the
data
. We
reco
mm
end
that
if
Milli
man
doe
s ha
ve a
ny c
once
rns
with
the
data
or
mak
es a
ny a
ssum
ptio
ns a
nd a
djus
tmen
ts fo
r the
va
luat
ion
that
they
dis
clos
e th
is in
form
atio
n.
35
Ther
e is
no
requ
irem
ent u
nder
Act
uaria
l St
anda
rds
of P
ract
ice
to n
ote
the
abse
nce
of
sign
ifica
nt c
once
rns
or c
orre
ctio
ns.
Milli
man
did
no
t mak
e an
y di
sclo
sure
s of
sig
nific
ant d
ata
conc
erns
in re
cent
repo
rts b
ecau
se th
ere
wer
e no
kn
own
sign
ifica
nt c
once
rns.
(As
dis
clos
ed in
the
repo
rts, M
illim
an d
id n
ot a
udit
the
data
, but
did
fin
d it
to b
e co
nsis
tent
with
info
rmat
ion
prov
ided
fo
r oth
er p
urpo
ses.
) In
yea
rs w
here
sig
nific
ant
data
alte
ratio
ns o
r cor
rect
ions
did
app
ly, t
hey
wer
e no
ted
in th
e re
port.
For
exa
mpl
e, d
ata
exhi
bits
in th
e D
ecem
ber 3
1, 2
014
actu
aria
l va
luat
ion
repo
rt no
ted
that
est
imat
ed a
djus
tmen
ts
wer
e m
ade
to m
onth
ly b
enef
its fo
r ret
irees
and
Dec
embe
r 20
19

#
Stat
emen
t/Rec
omm
enda
tion
Page
in
GR
S R
epor
t R
espo
nse
Expe
cted
C
ompl
etio
n D
ate
Not
es
bene
ficia
ries
who
se b
enef
its h
ad n
ot y
et b
een
upda
ted
to re
flect
the
Mor
o de
cisi
on.
Star
ting
with
the
Dec
embe
r 31,
201
8 ac
tuar
ial
valu
atio
n re
port,
Milli
man
will
add
a sp
ecifi
c pa
ragr
aph
rela
ted
to th
e ex
iste
nce
or a
bsen
ce o
f an
y si
gnifi
cant
dat
a co
ncer
ns o
r adj
ustm
ents
in
the
appe
ndix
sum
mar
izin
g ac
tuar
ial m
etho
ds.
Sect
ion
V Fu
ndin
g Po
licy
and
Rat
e C
olla
ring
18
We
reco
mm
end
a si
ngle
writ
ten
fund
ing
polic
y do
cum
ent t
hat i
ncor
pora
tes
the
entir
e ra
te s
ettin
g po
licy,
incl
udin
g th
e ra
te c
olla
ring.
39
PER
S w
ill ta
ke e
lem
ents
of t
he fu
ndin
g po
licy
that
ha
ve b
een
adop
ted
over
the
year
s an
d en
caps
ulat
e in
a s
ingl
e w
ritte
n fu
ndin
g po
licy.
July
202
1 as
pa
rt of
the
2020
Ex
perie
nce
Stud
y
Cer
tain
ele
men
ts o
f a
com
plet
e fu
ndin
g po
licy,
pa
rticu
larly
the
asse
t m
anag
emen
t com
pone
nts,
ar
e un
der t
he p
urvi
ew o
f the
O
rego
n In
vest
men
t Cou
ncil.
19
We
also
reco
mm
end
ongo
ing
annu
al m
onito
ring
of
the
UAL
bas
es to
see
that
the
fund
ing
polic
y in
pr
actic
e is
pay
ing
off a
pie
ce o
f the
prin
cipa
l ba
lanc
e ea
ch y
ear.
39
We
agre
e th
at o
ngoi
ng m
onito
ring
of u
nfun
ded
liabi
litie
s is
impo
rtant
. Cha
nges
in th
e U
AL fr
om
one
year
to th
e ne
xt a
re re
conc
iled
in th
e an
nual
ac
tuar
ial v
alua
tion
repo
rt, a
nd p
roje
ctio
ns o
f ex
pect
ed fu
ture
cha
nges
to th
e U
AL a
re in
clud
ed
as p
art o
f the
ann
ual f
inan
cial
mod
ellin
g w
ork
perfo
rmed
by
Milli
man
that
stre
ss te
sts
the
fund
ing
polic
y un
der a
wid
e va
riety
of p
oten
tial
scen
ario
s fo
r act
ual f
utur
e in
vest
men
t ret
urn.
Ong
oing
20
Ore
gon
PER
S m
ay w
ish
to d
iscu
ss w
ith th
eir
reta
ined
act
uary
whe
ther
a fu
ndin
g po
licy
of a
fixe
d do
llar a
mou
nt fo
r pay
ing
off t
he u
nfun
ded
accr
ued
liabi
lity
wou
ld b
e m
ore
appr
opria
te.
39
This
can
be
expl
ored
as
part
of th
e 20
20
Expe
rienc
e St
udy,
but
a fi
xed
dolla
r am
ortiz
atio
n ap
proa
ch m
ay b
e im
prac
tical
giv
en th
e lo
gist
ics
of
the
hund
reds
of e
mpl
oyer
s in
the
syst
em a
nd a
co
ntrib
utio
n in
frast
ruct
ure
pred
icat
ed o
n co
ntrib
utio
n ra
tes
defin
ed a
s a
perc
enta
ge o
f pa
yrol
l. Su
ch a
n ap
proa
ch w
ould
als
o be
at
varia
nce
with
the
maj
ority
of o
ur p
eer s
yste
ms.
July
202
1 as
pa
rt of
the
2020
Ex
perie
nce
Stud
y
21
We
reco
mm
end
re-e
xam
inat
ion
of th
e as
sum
ed
grow
th in
pay
roll.
Thi
s is
a ri
sky
assu
mpt
ion
beca
use
whe
n pa
yrol
l doe
sn’t
grow
as
expe
cted
, th
en c
ontri
butio
ns d
o no
t com
e in
to th
e tru
st a
s ex
pect
ed, a
nd th
ere
is c
ontin
ued
grow
th in
the
unfu
nded
acc
rued
liab
ility.
39
The
payr
oll g
row
th a
ssum
ptio
n is
reex
amin
ed
ever
y tw
o ye
ars
as p
art o
f the
exp
erie
nce
stud
y.
It is
set
on
a fo
rwar
d-lo
okin
g ba
sis
base
d on
ex
pect
atio
ns a
bout
mac
roec
onom
ic v
aria
bles
(in
flatio
n an
d ge
nera
l pro
duct
ivity
/wag
e gr
owth
).
It is
als
o re
view
ed c
ompa
red
to a
ctua
l his
toric
al
PER
S pa
y gr
owth
for a
n ad
ded
pers
pect
ive
on
July
202
1 as
pa
rt of
the
2020
Ex
perie
nce
Stud
y

#
Stat
emen
t/Rec
omm
enda
tion
Page
in
GR
S R
epor
t R
espo
nse
Expe
cted
C
ompl
etio
n D
ate
Not
es
the
assu
mpt
ion’
s co
nsis
tenc
y an
d ap
prop
riate
ness
. An
y hi
stor
ical
com
paris
on s
uch
as th
is d
epen
ds g
reat
ly o
n th
e en
dpoi
nts
of th
e an
alys
is, a
nd s
o th
e av
erag
e ov
er a
ny o
ne
sele
cted
per
iod
shou
ld n
ot b
e co
nsid
ered
de
term
inat
ive
of th
e ap
prop
riate
ness
of t
he
assu
mpt
ion.
The
GR
S au
dit r
epor
t cite
s a
spec
ific
nine
-yea
r per
iod
with
an
aver
age
com
bine
d pa
yrol
l gro
wth
of 2
.16%
in e
xpre
ssin
g th
eir c
once
rn th
at th
e cu
rrent
Boa
rd-s
elec
ted
assu
mpt
ion
of 3
.50%
may
be
too
high
. H
owev
er,
the
nine
-yea
r per
iod
chos
en h
appe
ns to
repr
esen
t am
ong
the
low
est a
vera
ging
per
iods
that
cou
ld
have
bee
n se
lect
ed.
The
trailin
g te
n-ye
ar
aver
age
at th
e tim
e th
e 20
16 E
xper
ienc
e St
udy
was
con
duct
ed w
as 3
.46%
. Fo
r the
201
8 Ex
perie
nce
Stud
y, th
e tra
iling
ten-
year
ave
rage
w
as 2
.72%
and
the
trailin
g fiv
e-ye
ar a
vera
ge w
as
3.29
%.
Mor
e re
cent
ly, t
he d
ata
prov
ided
for t
he
Dec
embe
r 31,
201
8 va
luat
ion
show
ed a
one
-yea
r in
crea
se o
f abo
ut 7
.4%
. Th
e pa
yrol
l gro
wth
ass
umpt
ion
is im
porta
nt, a
nd
will
cont
inue
to b
e m
onito
red
clos
ely
goin
g fo
rwar
d, b
ut th
e Bo
ard-
adop
ted
assu
mpt
ion
shou
ld n
ot b
e vi
ewed
as
“risk
y” o
r “op
timis
tic”
base
d on
the
resu
lts o
f one
spe
cific
sel
ecte
d hi
stor
ical
per
iod.
Se
ctio
n VI
Val
uatio
n R
evie
w
22
In o
rder
to im
prov
e th
e ab
ility
of th
e re
port
to
com
mun
icat
e th
e m
etho
ds, a
ssum
ptio
ns, a
nd p
lan
prov
isio
ns, w
e re
com
men
d M
illim
an in
corp
orat
e th
e en
hanc
emen
ts li
sted
bel
ow (#
23-3
8) in
the
appr
opria
te s
ectio
ns o
f any
act
uaria
l val
uatio
n re
ports
for O
rego
n PE
RS
goin
g fo
rwar
d.
43
Milli
man
resp
onds
to e
ach
spec
ific
reco
mm
enda
tion
belo
w.
Actu
aria
l sta
ndar
ds
requ
ire th
at a
n ac
tuar
ial r
epor
t sho
uld
“iden
tify
the
met
hods
, pro
cedu
res,
ass
umpt
ions
, and
dat
a us
ed b
y th
e ac
tuar
y w
ith s
uffic
ient
cla
rity
that
an
othe
r act
uary
qua
lifie
d in
the
sam
e pr
actic
e ar
ea c
ould
mak
e an
obj
ectiv
e ap
prai
sal o
f the
re
ason
able
ness
of t
he a
ctua
ry’s
wor
k as
pr
esen
ted
in th
e ac
tuar
ial r
epor
t.” S
ome
of th
e re
com
men
datio
ns in
the
audi
t rep
ort g
o fa
r be
yond
the
requ
ired
stan
dard
to a
dd a
leve
l of
deta
il th
at w
ould
onl
y be
rele
vant
whe
n an
Com
plet
e

#
Stat
emen
t/Rec
omm
enda
tion
Page
in
GR
S R
epor
t R
espo
nse
Expe
cted
C
ompl
etio
n D
ate
Not
es
audi
ting
actu
ary
is tr
ying
to re
plic
ate
resu
lts, a
nd
wou
ld n
ot b
e ex
pect
ed to
pro
vide
any
ben
efit
to
inte
nded
repo
rt us
ers.
Milli
man
is h
appy
to
prov
ide
exte
nsiv
e de
tail
for a
uditi
ng a
ctua
ries,
as
was
don
e fo
r GR
S, b
ut m
ay n
ot v
iew
it a
s pr
actic
al to
incl
ude
som
e of
the
reco
mm
ende
d de
tail
in th
e an
nual
val
uatio
n re
port.
23
D
ecre
men
ts a
nd p
ay in
crea
se ti
min
g ap
pear
to b
e as
sum
ed to
occ
ur a
t the
beg
inni
ng o
f eac
h ye
ar.
Dec
rem
ents
als
o ap
pear
to b
e in
depe
nden
t pr
obab
ilitie
s. W
e re
com
men
d M
illim
an in
clud
e th
ese
assu
mpt
ions
in th
eir r
epor
t.
43
This
leve
l of t
echn
ical
det
ail i
s be
yond
wha
t is
requ
ired
by a
ctua
rial s
tand
ards
and
is o
f qu
estio
nabl
e va
lue
to in
tend
ed u
sers
. It
is n
ot
rout
inel
y in
clud
ed in
act
uaria
l val
uatio
n re
ports
an
d is
not
exp
ecte
d to
be
adde
d at
this
tim
e.
Com
plet
e
24
Furth
erm
ore,
we
reco
mm
end
cons
ider
ing
a ch
ange
to
ass
ume
that
dec
rem
ents
occ
ur in
the
mid
dle
of
the
year
. Ass
umin
g de
crem
ents
will
occu
r at t
he
begi
nnin
g of
the
year
tend
s to
und
erst
ate
the
actu
al b
enef
it m
embe
rs w
ill re
ceiv
e, s
ince
it
assu
mes
the
mem
ber w
ill ha
ve th
e le
ast p
ossi
ble
serv
ice,
the
youn
gest
atta
ined
age
(or h
ighe
st e
arly
re
duct
ion
fact
or),
and
have
the
smal
lest
ac
cum
ulat
ed c
ontri
butio
n ba
lanc
e th
at th
ey w
ill ha
ve d
urin
g th
e va
luat
ion
year
.
44
Appl
ying
dec
rem
ents
at e
ither
the
begi
nnin
g of
ye
ar o
r mid
dle
of y
ear i
s w
ell-e
stab
lishe
d,
acce
ptab
le a
ctua
rial p
ract
ice.
The
re a
re
adva
ntag
es a
nd d
isad
vant
ages
to e
ither
ap
proa
ch.
In th
is c
ase,
Milli
man
app
lies
decr
emen
ts a
t beg
inni
ng o
f yea
r and
doe
s no
t cu
rrent
ly in
tend
to c
hang
e th
e pr
actic
e.
The
audi
t rep
ort s
tate
s th
at b
egin
ning
of y
ear
decr
emen
ts te
nd to
pro
duce
a lo
wer
pro
ject
ed
bene
fits
for m
embe
rs a
t dec
rem
ent,
whi
ch is
true
, bu
t thi
s do
es n
ot n
eces
saril
y tra
nsla
te in
to a
low
er
actu
aria
l lia
bilit
y be
caus
e th
ere
are
man
y ot
her
fact
ors
invo
lved
in th
e ca
lcul
atio
ns, p
artic
ular
ly
unde
r the
Ent
ry A
ge N
orm
al c
ost a
lloca
tion
met
hod
used
for t
his
valu
atio
n. F
or e
xam
ple,
be
ginn
ing
of y
ear d
ecre
men
ts te
nd to
pro
duce
hi
gher
liab
ilitie
s fo
r act
ive
mem
bers
who
are
el
igib
le fo
r im
med
iate
unr
educ
ed re
tirem
ent
bene
fits,
as
is th
e ca
se fo
r man
y lo
ng-s
ervi
ce T
ier
1/Ti
er 2
mem
bers
(inc
ludi
ng th
ose
with
ben
efits
de
term
ined
und
er th
e M
oney
Mat
ch fo
rmul
a).
Com
plet
e
25
It ap
pear
s no
401
(a)(1
7) s
alar
y or
415
ben
efit
max
imum
s ar
e be
ing
appl
ied.
We
reco
mm
end
Milli
man
incl
ude
this
info
rmat
ion
in th
eir r
epor
t.
44
His
toric
ally
, PER
S ha
s ap
plie
d th
e 40
1(a)
(17)
lim
its to
sal
ary
field
s in
the
data
for a
ffect
ed
mem
bers
(Tie
r 2 a
nd O
PSR
P) b
efor
e pr
ovid
ing
Milli
man
the
cens
us fi
les.
Milli
man
als
o re
flect
s 40
1(a)
(17)
lim
its w
hen
calc
ulat
ing
Fina
l Ave
rage
Sa
lary
for a
ffect
ed m
embe
rs (n
ote
that
Tie
r 1
mem
bers
are
not
sub
ject
to 4
01(a
)(17)
lim
its).
Com
plet
e

#
Stat
emen
t/Rec
omm
enda
tion
Page
in
GR
S R
epor
t R
espo
nse
Expe
cted
C
ompl
etio
n D
ate
Not
es
415
limits
are
not
exp
licitl
y ap
plie
d in
the
valu
atio
n. M
illim
an w
ill ad
d a
desc
riptio
n of
this
ha
ndlin
g to
the
repo
rt be
ginn
ing
with
the
Dec
embe
r 31,
201
8 ac
tuar
ial v
alua
tion.
Not
e th
at
the
401(
a)(1
7) li
mit
will
not i
mpa
ct s
alar
y st
artin
g in
202
0, b
ecau
se th
e $1
95,0
00 (i
ndex
ed) l
imit
intro
duce
d by
SB
1049
will
supe
rsed
e it.
26
It
appe
ars
that
100
% o
f mem
bers
are
ass
umed
to
be m
arrie
d an
d fo
r unk
now
n sp
ouse
age
s, m
ales
ar
e as
sum
ed to
be
3 ye
ars
olde
r tha
n fe
mal
es. W
e re
com
men
d M
illim
an in
clud
e th
ese
assu
mpt
ions
in
thei
r rep
ort.
44
Milli
man
will
add
a de
scrip
tion
to th
e re
port
begi
nnin
g w
ith th
e D
ecem
ber 3
1, 2
018
actu
aria
l va
luat
ion.
Dec
embe
r 20
19
27
It ap
pear
s M
illim
an is
ass
umin
g th
at m
embe
rs w
ho
elec
ted
a 10
0% jo
int &
sur
vivo
r opt
ion
with
pop
-up
are
assu
med
to h
ave
had
a 0.
9 op
tiona
l for
m
redu
ctio
n. W
e re
com
men
d M
illim
an in
clud
e th
is
assu
mpt
ion,
alo
ng w
ith a
ny o
ther
opt
iona
l for
m
redu
ctio
ns a
ssum
ed fo
r oth
er p
op-u
p el
ectio
ns, i
n th
eir r
epor
t.
44
Milli
man
will
add
a de
scrip
tion
to th
e re
port
begi
nnin
g w
ith th
e D
ecem
ber 3
1, 2
018
actu
aria
l va
luat
ion.
Dec
embe
r 20
19
28
For t
ier 1
/tier
2 m
embe
rs, M
illim
an a
ppea
rs to
sto
p ap
plyi
ng d
isab
ility
rate
s st
artin
g at
nor
mal
re
tirem
ent a
ge, b
ut fo
r OPS
RP
mem
bers
, Milli
man
ap
pear
s to
sto
p ap
plyi
ng d
isab
ility
rate
s at
the
age
whe
n th
e m
embe
r is
assu
med
to b
e 10
0%
retir
ed (a
ge 6
5 fo
r pol
ice
& fir
e m
embe
rs a
nd a
ge
70 fo
r all
othe
r mem
bers
). W
e re
com
men
d M
illim
an
eith
er a
pply
the
disa
bilit
y ra
tes
cons
iste
ntly
, or
prov
ide
an e
xpla
natio
n fo
r why
the
disa
bilit
y ra
tes
are
bein
g ap
plie
d di
ffere
ntly
and
incl
ude
that
as
sum
ptio
n in
thei
r rep
ort.
44
Milli
man
’s tr
eatm
ent i
s ac
tual
ly th
e op
posi
te o
f w
hat i
s st
ated
in G
RS’
s re
port:
ass
umed
dis
abilit
y ra
tes
are
appl
ied
until
100
% re
tirem
ent a
ge fo
r Ti
er 1
/Tie
r 2 m
embe
rs, b
ut a
re s
topp
ed a
t nor
mal
re
tirem
ent a
ge fo
r OPS
RP
mem
bers
. Th
is is
be
caus
e O
PSR
P di
sabi
lity
bene
fits
are
repl
aced
w
ith re
tirem
ent b
enef
its o
nce
a di
sabl
ed m
embe
r re
ache
s no
rmal
retir
emen
t age
, so
ther
e is
no
clea
r dis
tinct
ion
betw
een
OPS
RP
mem
bers
who
le
ave
activ
e PE
RS
empl
oym
ent d
ue to
retir
emen
t or
due
to d
isab
ility
afte
r nor
mal
retir
emen
t age
. M
illim
an w
ill ad
d a
desc
riptio
n to
the
repo
rt be
ginn
ing
with
the
Dec
embe
r 31,
201
8 ac
tuar
ial
valu
atio
n.
Dec
embe
r 20
19
29
We
wer
e no
t abl
e to
con
sist
ently
mat
ch th
e di
ffere
nt a
ge a
nd s
ervi
ce a
mou
nts
bein
g us
ed fo
r sa
lary
incr
ease
s, te
rmin
atio
n ra
tes,
and
retir
emen
t el
igib
ility
date
s. W
e re
com
men
d M
illim
an
incl
ude
an a
ssum
ptio
n fo
r the
age
and
ser
vice
ca
lcul
atio
ns b
eing
use
d fo
r elig
ibilit
y te
stin
g in
thei
r re
port.
44
This
leve
l of t
echn
ical
det
ail i
s be
yond
wha
t is
requ
ired
by a
ctua
rial s
tand
ards
and
is o
f qu
estio
nabl
e va
lue
to in
tend
ed u
sers
. It
is n
ot
rout
inel
y in
clud
ed in
act
uaria
l val
uatio
n re
ports
an
d is
not
exp
ecte
d to
be
adde
d at
this
tim
e.
Com
plet
e

#
Stat
emen
t/Rec
omm
enda
tion
Page
in
GR
S R
epor
t R
espo
nse
Expe
cted
C
ompl
etio
n D
ate
Not
es
30
We
wer
e no
t abl
e to
mat
ch th
e ac
tuar
ially
eq
uiva
lent
ear
ly re
tirem
ent f
acto
rs (E
RFs
) Milli
man
is
usi
ng in
thei
r cal
cula
tions
. We
reco
mm
end
Milli
man
incl
ude
the
assu
mpt
ions
they
are
usi
ng to
ca
lcul
ate
thes
e ER
Fs fo
r eac
h gr
oup
in th
eir r
epor
t.
44
The
ERFs
use
d in
the
valu
atio
n re
flect
the
publ
ishe
d ac
tuar
ial e
quiv
alen
cy fa
ctor
s ad
opte
d by
the
Boar
d. M
illim
an w
ill ad
d a
desc
riptio
n to
th
e re
port
begi
nnin
g w
ith th
e D
ecem
ber 3
1, 2
018
actu
aria
l val
uatio
n.
Dec
embe
r 20
19
31
Milli
man
app
ears
to b
e as
sum
ing
the
cost
of l
ivin
g ac
cum
ulat
ion
on th
e po
st re
tirem
ent d
isab
ility
bene
fit fo
r OPS
RP
mem
bers
is 1
.25%
. We
reco
mm
end
Milli
man
incl
ude
this
ass
umpt
ion
in
thei
r rep
ort.
44
This
des
crip
tion
is in
corre
ct.
Milli
man
use
s th
e Bo
ard-
adop
ted
2.50
% in
flatio
n as
sum
ptio
n to
re
flect
the
assu
med
cos
t of l
ivin
g ad
just
men
t ap
plie
d w
hen
calc
ulat
ing
a di
sabl
ed m
embe
r’s
norm
al re
tirem
ent b
enef
it. M
illim
an w
ill ad
d a
desc
riptio
n to
the
repo
rt be
ginn
ing
with
the
Dec
embe
r 31,
201
8 ac
tuar
ial v
alua
tion.
Dec
embe
r 20
19
32
Milli
man
is c
alcu
latin
g th
e lia
bilit
y fo
r ret
irees
usi
ng
an a
vera
ge b
enef
it th
at a
ssum
es c
ost o
f liv
ing
adju
stm
ents
will
occu
r on
Augu
st 1
st, b
ut it
ap
pear
s th
is m
etho
d is
not
bei
ng u
sed
for a
ctiv
e m
embe
rs o
r ina
ctiv
e ve
sted
mem
bers
. We
reco
mm
end
Milli
man
use
con
sist
ent C
OLA
tim
ing
for a
ll m
embe
rs in
the
valu
atio
n.
44
Milli
man
refle
cts
the
know
n Au
gust
1 e
ffect
ive
date
of a
nnua
l cos
t of l
ivin
g in
crea
ses
for
mem
bers
who
are
in p
ay s
tatu
s as
of t
he
valu
atio
n da
te.
The
mos
t app
ropr
iate
CO
LA
timin
g as
sum
ptio
n fo
r mem
bers
who
are
not
yet
in
pay
stat
us a
s of
the
Dec
embe
r 31
valu
atio
n da
te
is le
ss o
bvio
us, s
ince
the
mem
ber’s
firs
t CO
LA
will
occu
r on
Augu
st 1
rega
rdle
ss o
f the
dat
e on
w
hich
the
mem
ber c
omm
ence
s be
nefit
s. M
illim
an
will
revi
ew th
e C
OLA
tim
ing
assu
mpt
ion
for
mem
bers
not
yet
in p
ay s
tatu
s w
ith th
e 20
20
Expe
rienc
e St
udy
and
will
dete
rmin
e if
a ch
ange
to
the
curre
nt tr
eatm
ent i
s re
com
men
ded
at th
at
time.
July
202
1 as
pa
rt of
the
2020
Ex
perie
nce
Stud
y
33
For m
embe
rs w
ho a
re a
ssum
ed to
take
a p
artia
l lu
mp
sum
, Milli
man
is s
ubtra
ctin
g a
serv
ice
purc
hase
com
pone
nt fr
om th
e em
ploy
ee a
nd
empl
oyer
bal
ance
s as
sum
ed to
be
paid
, but
this
se
rvic
e pu
rcha
se c
ompo
nent
and
the
assu
mpt
ions
us
ed to
cal
cula
te it
are
not
list
ed in
the
repo
rt. W
e re
com
men
d M
illim
an in
clud
e th
is in
form
atio
n in
th
eir r
epor
t.
44
The
repo
rt cu
rrent
ly in
clud
es a
des
crip
tion
of th
e pe
rcen
tage
of T
ier 1
/Tie
r 2 m
embe
rs a
ssum
ed to
pu
rcha
se th
e si
x-m
onth
wai
ting
perio
d. T
he
addi
tiona
l lev
el o
f spe
cific
det
ail r
ecom
men
ded
is
beyo
nd w
hat i
s re
quire
d by
act
uaria
l sta
ndar
ds,
give
n th
e sm
all s
hare
of l
iabi
lity
asso
ciat
ed w
ith
serv
ice
purc
hase
s on
par
tial l
ump
sum
s, b
ut
Milli
man
will
revi
ew th
e ex
istin
g de
scrip
tion
and
expe
cts
to a
dd s
ome
addi
tiona
l cla
rific
atio
n to
the
repo
rt be
ginn
ing
with
the
Dec
embe
r 31,
201
8 ac
tuar
ial v
alua
tion.
Dec
embe
r 20
19

#
Stat
emen
t/Rec
omm
enda
tion
Page
in
GR
S R
epor
t R
espo
nse
Expe
cted
C
ompl
etio
n D
ate
Not
es
34
For p
olic
e &
fire
mem
bers
, it a
ppea
rs M
illim
an is
as
sum
ing
they
hav
e pu
rcha
sed
a fu
ll ei
ght u
nits
of
addi
tiona
l pol
ice
& fir
e be
nefit
s fo
r $4,
000.
We
reco
mm
end
Milli
man
incl
ude
this
ass
umpt
ion
in
thei
r rep
ort.
45
Milli
man
refle
cts
a $4
,000
ass
umed
cos
t to
the
empl
oyer
for m
atch
ing
an a
ctiv
e m
embe
r’s fu
ture
po
lice
& fir
e un
it pu
rcha
se u
nder
cer
tain
ci
rcum
stan
ces.
Milli
man
will
add
a de
scrip
tion
to
the
repo
rt be
ginn
ing
with
the
Dec
embe
r 31,
201
8 ac
tuar
ial v
alua
tion.
Dec
embe
r 20
19
35
It ap
pear
s M
illim
an is
ass
umin
g th
at th
e re
tiree
he
alth
care
par
ticip
atio
n ra
tes
also
ass
ume
a su
rviv
ing
spou
se is
elig
ible
for R
HIA
and
RH
IPA
bene
fits.
We
reco
mm
end
Milli
man
incl
ude
this
as
sum
ptio
n in
thei
r rep
ort.
45
Milli
man
will
add
a de
scrip
tion
to th
e re
port
begi
nnin
g w
ith th
e D
ecem
ber 3
1, 2
018
actu
aria
l va
luat
ion.
Dec
embe
r 20
19
36
We
reco
mm
end
Milli
man
dis
clos
e th
at th
e no
rmal
fo
rm fo
r the
tier
1/ti
er 2
full
form
ula
bene
fit is
a
refu
nd a
nnui
ty.
45
Milli
man
’s a
ctua
rial v
alua
tion
repo
rts a
lread
y sp
ecify
this
in th
e Su
mm
ary
of P
lan
Prov
isio
ns
appe
ndix
.
Com
plet
e
37
The
retir
emen
t rat
es d
evel
oped
by
Milli
man
do
not
incl
ude
an a
ssum
ptio
n fo
r tie
r 1/ti
er 2
pol
ice
& fir
e m
embe
rs w
ho re
tire
befo
re a
ge 5
0 w
ith 2
5 or
mor
e ye
ars
of s
ervi
ce. A
ny ti
er 1
/tier
2 p
olic
e &
fire
mem
bers
who
are
elig
ible
for r
etire
men
t bef
ore
age
50 w
ith 2
5 or
mor
e ye
ars
of s
ervi
ce a
re n
ot h
avin
g re
tirem
ent r
ates
or t
erm
inat
ion
rate
s ap
plie
d to
th
em (o
ne o
f the
sam
ple
lives
pro
vide
d by
Milli
man
fe
ll in
to th
is c
ateg
ory)
. We
reco
mm
end
Milli
man
de
velo
p an
d as
sum
e a
retir
emen
t rat
e fo
r tie
r 1/ti
er
2 po
lice
& fir
e m
embe
rs w
ho re
tire
befo
re a
ge 5
0 w
ith 2
5 or
mor
e ye
ars
of s
ervi
ce.
45
Tier
1/T
ier 2
Pol
ice
and
Fire
mem
bers
can
not
retir
e pr
ior t
o ag
e 50
with
less
than
30
year
s of
se
rvic
e [s
ee O
RS
238.
280(
4)].
As
a re
sult,
it
wou
ld n
ot b
e ap
prop
riate
to d
evel
op a
n as
sum
ptio
n fo
r tha
t situ
atio
n.
The
prov
isio
n re
late
d to
age
50
and
25 y
ears
of
serv
ice
that
app
ears
to b
e th
e so
urce
of c
onfu
sion
in
the
audi
t rep
ort i
s th
at a
Tie
r 1/T
ier 2
Pol
ice
and
Fire
mem
ber i
s el
igib
le fo
r unr
educ
ed re
tirem
ent
once
ach
ievi
ng b
oth
age
50 a
nd 2
5+ y
ears
of
serv
ice
[OR
S 23
8.28
0(4)
(a)].
Thi
s st
atut
ory
prov
isio
n is
alre
ady
refle
cted
in th
e st
ruct
ure
and
appl
icat
ion
of a
ssum
ed re
tirem
ent r
ates
.
Com
plet
e
38
Milli
man
ass
umes
that
for p
urpo
ses
of d
eter
min
ing
elig
ibilit
y fo
r SB
656/
HB
3349
ben
efit
adju
stm
ents
, 85
% o
f ret
irees
are
ass
umed
to re
mai
n O
rego
n re
side
nts
afte
r ret
irem
ent.
This
85%
ass
umpt
ion
is
also
bei
ng a
pplie
d to
lum
p su
ms,
but
we
belie
ve
the
assu
mpt
ion
for l
ump
sum
s sh
ould
pro
babl
y be
10
0%. W
e w
ould
exp
ect a
ll m
embe
rs a
re s
till l
ivin
g in
Ore
gon
at th
e tim
e of
retir
emen
t whe
n th
ey
rece
ive
lum
p su
ms.
We
reco
mm
end
Milli
man
ex
amin
e th
is a
ssum
ptio
n fo
r mem
bers
who
rece
ive
lum
p su
ms
to d
eter
min
e its
reas
onab
lene
ss.
45
Milli
man
can
con
side
r thi
s re
com
men
datio
n in
the
2020
Exp
erie
nce
Stud
y. H
owev
er, t
he
perc
enta
ge o
f ben
efits
pai
d ou
t as
lum
p su
ms
is
quite
low
(the
tota
l lum
p su
m a
ssum
ptio
n fo
r re
tirem
ents
occ
urrin
g in
201
9 is
1%
, dec
linin
g to
0%
for r
etire
men
ts fr
om 2
021
onw
ards
, and
the
parti
al lu
mp
sum
ass
umpt
ion
is n
ow 3
.0%
).
Betw
een
that
and
the
fact
that
a n
on-tr
ivia
l fra
ctio
n of
mem
bers
may
resi
de o
utsi
de o
f O
rego
n ev
en w
hen
activ
e, it
is u
nlik
ely
any
revi
sion
to th
is a
ssum
ptio
n w
ould
mat
eria
lly
impa
ct c
alcu
late
d lia
bilit
ies.
July
202
1 as
pa
rt of
the
2020
Ex
perie
nce
Stud
y

#
Stat
emen
t/Rec
omm
enda
tion
Page
in
GR
S R
epor
t R
espo
nse
Expe
cted
C
ompl
etio
n D
ate
Not
es
Sect
ion
VII A
ctua
rial C
ontr
act R
evie
w
39
For s
ectio
n 1.
4 on
act
uaria
l aud
its, O
PER
S m
ay
wis
h to
add
a s
tate
men
t tha
t the
reta
ined
act
uary
w
ill re
spon
d in
writ
ing
to a
ny a
ctua
rial a
udit
findi
ngs.
Thi
s co
uld
help
“clo
se th
e w
ork”
on
the
actu
aria
l aud
its.
47
The
PER
S Bo
ard
will
cons
ider
ext
endi
ng th
e ac
tuar
ial c
ontra
ct to
the
cons
ultin
g ac
tuar
y fo
r a
furth
er tw
o ye
ars
at it
s D
ecem
ber 2
019
boar
d m
eetin
g an
d th
e ne
w c
ontra
ct w
ill ad
d in
this
st
atem
ent.
Dec
embe
r 20
20
40
We
reco
mm
end
OPE
RS
cons
ider
add
ing
a cl
ause
th
at s
ets
out t
he o
rder
ly tr
ansi
tion
of re
cord
s an
d se
rvic
es s
houl
d th
e ac
tuar
ial c
ontra
ct b
e te
rmin
ated
.
47
The
PER
S Bo
ard
will
cons
ider
ext
endi
ng th
e ac
tuar
ial c
ontra
ct to
the
cons
ultin
g ac
tuar
y fo
r a
furth
er tw
o ye
ars
at it
s D
ecem
ber 2
019
boar
d m
eetin
g an
d th
e ne
w c
ontra
ct w
ill ad
d in
this
cl
ause
.
Dec
embe
r 20
20

Public Employees Retirement System Headquarters:
11410 S.W. 68th Parkway, Tigard, OR Mailing Address:
P.O. Box 23700 Tigard, OR 97281-3700
888-320-7377TTY (503) 603-7766 www.o rego n .go v/p er s
Oregon Kate Brown, Governor
August 13, 2019
The Honorable Senator Betsy Johnson, Co-Chair The Honorable Senator Elizabeth Steiner-Hayward, Co-Chair The Honorable Representative Dan Rayfield, Co-Chair Joint Interim Committee on Ways and Means 900 Court Street NE H-178 State CapitolSalem, OR 97301-4048
Dear Co-Chairpersons:
Nature of the Request
The Public Employees Retirement System (PERS) requests acknowledgement of receipt of this report on the PERS Board’s preliminary approval of changes to actuarial methods and assumptions. This report is provided in accordance with Section 57 of Senate Bill 1049(2019) (Chapter 355, 2019 Oregon Laws), which requires PERS to submit this report to the Joint Interim Committee on Ways and Means at least 30 days prior to the final adoption of actuarial methods and assumptions. Final adoption is scheduled for the October 4, 2019 PERS Board meeting.
Agency Action
On July 26, 2019, the PERS Board preliminarily approved actuarial methods and assumptions that will be used for the December 31, 2018 and December 31, 2019 actuarial valuations of the system.
In this preliminary action, the Board retained or changed the following actuarial methods and assumptions:
ACTUARIAL METHODS
• Retain the Funding Policy based on the following objectives, while they might havecompeting interests: transparent; predictable and stable rates; protect funded status;equitable across generations; actuarially sound; and GASB compliant.
• Confirm continued use of the Entry Age Normal methodology.• Continue use of the rate collaring policy which limits the change in base contribution rates to
the larger of 20% of current rate or 3.00% of payroll. The collar widens incrementally whenfunded status is below 70%.
• As directed in Senate Bill 1049, on a one-time basis, set the amortization period for Tier Oneand Tier Two members to 22 years and reamortize the full liability of those two tiers. Theamortization period for OPSRP liability remains at 16 years.

Joint Interim Committee on Ways and Means 8/13/19 Page 2 of 3
NON-ECONOMIC ASSUMPTIONS
• Retain the inflation rate of 2.5%, which affects all other assumptions including systempayroll growth, investment return and health care inflation.
• Retain the real wage growth rate of 1.0%, which represents the increase in wages inexcess of inflation for the whole population.
• Retain the system payroll growth of 3.5%, which is assumed to equal the sum ofinflation and real wage growth.
ECONOMIC ASSUMPTIONS and ASSUMED RATE of RETURN
• Update the explicit assumptions regarding administrative expenses for Tier One/Tier Two andOPSRP.
• Update the assumed health cost trend (i.e., health cost inflation) rates for the RHIPAretiree healthcare program
• The Board recommended maintaining the assumed rate of return at 7.20%. They gaveconsideration to lowering the investment return assumption to 7.10% or 7.00%, based onan analysis of PERS’s current target asset allocation using different sets of capital marketoutlook assumptions. The averages of the 50th percentiles for those outlooks across 10-year (one outlook) and 20-year (two outlooks) time horizons fell in the range between6.64% and 7.32%. The median assumption for large public sector plans currently sits at7.25%.
DEMOGRAPHIC ASSUMPTIONS
• Adjust mortality assumptions to use Pub-2010 base tables and mortality improvement scalebased on 60-year unisex average Social Security experience and updated to reflect mostrecent information available (January 2019).
• Adjust retirement rates for certain member categories and service bands to more closely alignwith recent and expected future experience; reduce percentage of future retirees assumed toelect a partial lump sum; increase percentage of members assumed to purchase creditedservice at retirement.
• Increase the merit component of the salary increase assumption for two member categoriesbased on observations of the last eight years of experience.
• Update pre-retirement termination of employment assumptions for two member categories.• Lower assumed rates of ordinary disability and general service duty disability to more closely
match recent experience.• Increase the Tier One unused vacation cash out assumption for most member categories• Adjust the Tier One/Tier Two unused sick leave assumption for five member categories to
reflect observed experience.• Decrease the healthy participation assumption for the RHIA retiree healthcare program and
decrease the RHIPA participation assumption for most service bands.

Joint Interim Committee on Ways and Means 8/13/19 Page 3 of 3
ALLOCATION PROCEDURES
• When allocating accrued liability for Tier One/Tier Two active members who have earnedservice with multiple PERS employers, base 90% of the allocation on service with eachemployer (100% for police & fire members) and base the rest on the member account balanceassociated with each employer. The assumption for general service has increased 5% sincethe prior experience study. This movement illustrates the continued migration of projectedfuture Tier One/Tier Two retirement benefits away from the Money Match calculation, whichis based on account balances, toward the ongoing Full Formula approach, which is based onfinal average salary.
Action Requested
PERS requests the Committee acknowledge receipt of the report.
Legislation Affected
No legislation is affected by this request.
Sincerely,
Kevin Olineck, Director
Attachments July 31, 2019 Memo on Adoption of Actuarial Assumptions 2018 Experience Study

SL1 July 31, 2019
Public Employees Retirement System Headquarters:
11410 S.W. 68 th Parkway, Tigard, OR
Mailing Address:
P.O. Box 23700
Tigard, OR 97281-3700
(503) 598-7377
TTY (503) 603-7766 www.o rego n .go v/p er s
Oregon Kate Brown, Governor
July 31, 2019
TO: Members of the Joint Committee on Ways and Means
FROM: Kevin Olineck, Director
SUBJECT: PERS Board Adoption of Actuarial Assumptions including Assumed Earnings
Rate (Senate Bill 1049 Report)
BACKGROUND
The PERS Board is directed, via ORS 238.605, to review actuarial methods and assumptions,
including the assumed rate of return, every two years. This review reflects expectations for both
investment earnings and benefit levels for some members, and the assumptions help establish an
appropriate path for employer contribution rates.
Section 57 of SB 1049 (2019) states:
“At least 30 days before the Public Employees Retirement Board adopts changes to actuarial
methods and assumptions used for purposes of the Public Employees Retirement System, the
board shall submit a report to the Joint Committee on Ways and Means or the Joint Interim
Committee on Ways and Means detailing the proposed changes and the associated, actuarially
determined impact to the total liability of the system, the accrued liability of the system and
employer contribution rates.”
At their July 26 meeting, the PERS Board reviewed and preliminarily approved a new set of
actuarial methods and assumptions. This was part of a three-meeting process that the board
undertook to review all the relevant methods and assumptions. The Board will formally approve
the actuarial methods and assumptions on October 4, 2019.
These methods and assumptions will be used for:
The December 31, 2018 actuarial valuation that will provide the 2021-23 advisory employer
contribution rates at the October 4, 2019 Board meeting; and
The December 31, 2019 actuarial valuation whose results establish the 2021-23 actual employer
contribution rates to be adopted by the Board in Fall, 2020.
To comply with SB 1049, the following is a report of the methods and assumptions preliminarily
approved by the PERS Board for the above-noted actuarial valuations and the actuarial valuation
results. I have also attached a copy of the 2018 Experience Study that provides more detailed
explanations of the following elements.

SB 1049 – Report on Actuarial Methods and Assumptions
7/31/19
Page 2 of 7
SL1 SB 1049 – Report on Actuarial Methods and Assumptions July 31, 2019
ACTUARIAL METHODS
Board Funding Policy
The Board agreed that the Funding Policy encapsulated in the following policy objectives
continue to be relevant while acknowledging the competing interests within these objectives:
Transparent
Predictable and Stable Rates
Protect Funded Status
Equitable Across Generations
Actuarially Sound
GASB Compliant
Cost Allocation Method
The Board confirmed continued use of the Entry Age Normal Methodology.
Rate Collaring
The Board agreed to continue to use the rate collaring policy that was originally implemented
with the December 31, 2004 actuarial valuation. This limits the change in base contribution rate
to larger of 20% of current rate or 3.00% of payroll. The Collar widens incrementally when
funded status is below 70%.
Amortization Period
In 2013, on a go-forward basis, the PERS Board set the amortization period to determine the
liabilities of Tier One and Tier Two members, at 20 years with the amortization period for
OPSRP members set at 16 years. The respective liabilities were re-amortized at that time and
then, in subsequent valuations, new liabilities that arose were amortized on a rolling 20- or 16-
year basis, respectively (known as the level percent of pay, layered fixed period methodology).
Section 27 of SB1049 directed the PERS Board, to set, on a one-time basis, the amortization
period for Tier One and Tier Two members to 22 years and reamortize the full liability of those
two tiers.
In subsequent valuations, the PERS Board is expected to revert to the 20- and 16-year
amortization periods.
NON-INVESTMENT ECONOMIC ASSUMPTIONS
There are four primary non-investment economic assumptions the Board reviews and approves.
Inflation – this assumption affects others assumptions, including system payroll growth,
investment return and health care inflation.
Real Wage Growth – represents the increase in wages in excess of inflation for the entire group
due to improvements in productivity and competitive market pressures.
System Payroll Growth – is assumed to equal the sum of inflation and real wage growth. This
assumption determines the shape of payments to amortize the unfunded liability.

SB 1049 – Report on Actuarial Methods and Assumptions
7/31/19
Page 3 of 7
SL1 SB 1049 – Report on Actuarial Methods and Assumptions July 31, 2019
Administrative Expenses – reflect the costs incurred by PERS in administering the Tier One, Tier
Two and OPSRP programs. Note: no assumption is made for investment-related expenses as
they are accounted for in the long-term investment return assumption.
The following chart shows the December 31, 2017 assumptions previously adopted by the Board
and the updated December 31, 2018 assumptions adopted by the Board at the July 26, 2019
meeting.
DEMOGRAPHIC ASSUMPTIONS
Milliman has analyzed member census data provided by PERS. Four years of data were analyzed
for most demographic assumptions and eight years of data for salary increase assumptions.
Recommendations were developed based on the statistical analysis. The attached 2018
Experience Study provides further detail.
Mortality Assumption – ORS 238.608 requires that actuarial equivalency factors use the best
actuarial information on mortality available at the time. The mortality assumption consists of two
parts: 1) a base table that lists probability of death at a given age; and 2) a projection scale that
modifies the base table entries to reflect mortality improvement over time. Milliman
recommends updating tables to reflect the January 2019 study from the Society of Actuaries
(Pub-2010 base tables). The combined effect of changes is a decrease in liability of less than
$150 million.
Rate of Retirement Assumption – This is the likelihood that an eligible member will retire in a
given year. Data are grouped by School District; Other General Service; and Police & Fire. Data
are divided into three service bands and then Tier One/Tier Two vs. OPSRP. Milliman
recommends lowing assumptions at some earlier retirement ages.
Individual Member Salary Increase Assumption – This reflects the combined effects of
merit/longevity, general wage growth, and inflation assumptions. Eight years of data were
analyzed for School Districts, Other General Service, and Police & Fire. It was noted that
assumptions and experience for Police & Fire matched well. School District and Other General
Service had higher increases therefore it was recommended that assumptions be updated to
reflect a blend of current assumptions and recent experience.

SB 1049 – Report on Actuarial Methods and Assumptions
7/31/19
Page 4 of 7
SL1 SB 1049 – Report on Actuarial Methods and Assumptions July 31, 2019
Pre-Retirement Employment Termination Assumption – This is the likelihood that a member
will leave employment prior to retirement eligibility for reasons other than death or disability.
Milliman reviewed experience data and recommended adjustments to two of five groups for
minor differences between current assumptions and actual experience.
Final Average Salary Adjustments – Milliman applies assumptions regarding the increase in
final average salary for Tier One and Tier Two members reflecting unused sick leave and lump
sum vacation payouts. It was recommended that adjustments be made to more closely track
recent experience.
RHIA and RHIPA Assumptions – Milliman recommended changes to assumptions based on
lower participation in RHIA and lower RHIPA rates.
ASSUMED RATE
The assumed rate is used as a “discount rate” for establishing: the actuarial accrued liability,
which is a net present value of the Oregon Public Employees Retirement Fund (OPERF); and the
associated unfunded actuarial liability (UAL), or actuarial shortfall of the fund. The rate is also
the guaranteed annual crediting level for Tier One active member regular accounts, and is used as
the annuitization rate to convert Tier One and Tier Two member account balances to lifetime
monthly retirement benefits.
The history of recent assumed rate changes is shown below:
Effective Dates Assumed Earnings Rate
1989 – 2013 8.0%
2013 – 2015 7.75%
2015 – 2017 7.50%
2017 – 2019 7.20%
Data to support changes to the Assumed Earnings Rate
When considering changes to the assumed rate, the Board considers analysis presented to the
Oregon Investment Council (OIC), charged with investing the OPERF, and from Milliman,
PERS’ actuary.
The Oregon Investment Council consultants, Callan, and Milliman reported the following
information at the June 5, 2019 joint OIC, PERS Board meeting with regard to projected returns:

SB 1049 – Report on Actuarial Methods and Assumptions
7/31/19
Page 5 of 7
SL1 SB 1049 – Report on Actuarial Methods and Assumptions July 31, 2019
Milliman also reported a downward trend in return assumptions among public retirement plans,
and over half of the 126 state-wide systems tracked by the National Association of State
Retirement Administrators (NASRA) have reduced their return assumptions over the last several
years. The current median assumption for large public systems is 7.25%.
The following Milliman chart shows distribution of pension plan return assumptions (Source
NASRA April 2019).
Given the information noted above, the PERS Board retained and re-adopted an assumed rate
of return for the above-noted valuation periods of 7.20%.

SB 1049 – Report on Actuarial Methods and Assumptions
7/31/19
Page 6 of 7
SL1 SB 1049 – Report on Actuarial Methods and Assumptions July 31, 2019
ACTUARIALLY DETERMINED IMPACT TO THE ACCRUED LIABILITY OF THE
SYSTEM
On a preliminary basis, the estimated effect on combined Tier One, Tier Two and OPSRP
liabilities based on Milliman’s valuation work for the period ending December 31, 2018 would
be to not have a net impact to the Accrued Liability of $86.6 billion. The different impacts to the
Accrued Liability with the new assumptions are shown below.

SB 1049 – Report on Actuarial Methods and Assumptions
7/31/19
Page 7 of 7
SL1 SB 1049 – Report on Actuarial Methods and Assumptions July 31, 2019
ACTUARIALLY DETERMINED IMPACT TO EMPLOYER CONTRIBUTION RATES
On a preliminary basis, the estimated effect on uncollared system-average advisory pension rates
for 2021 based on Milliman’s valuation work would be to add 0.3% to the Normal Cost and no
impact to the Unfunded Actuarial Liability for a combined total of 0.3%. The different impacts to
the Contribution Rate with the new assumptions are shown below.
Changes shown above are stated as a percent of payroll and exclude changes for the RHIA and
RHIPA retiree healthcare programs.

C o p y r i g h t © P E R S 2 0 1 8
Joint Committee on Legislative Audits
November 18, 2019
Kevin OlineckDirector

C o p y r i g h t © P E R S 2 0 1 8 2
Response to Actuarial Review entitled: “A Review of
the Oregon Public Employees Retirement System”
1. Actuarial Review Requirement
2. PERS’ Statutory Actuarial Requirements
3. Role of Methods & Assumptions
4. Review of Findings and PERS’ Response
5. Actuarial & Fiscal Impacts
6. Response Plan & Timeline
7. Questions
Agenda

C o p y r i g h t © P E R S 2 0 1 8 3
Actuarial Review Requirement
Section 11 of HB 4163 (2018) requires the Secretary of State to have a qualified firm perform an independent actuarial review of PERS based on the last actuarial valuation that was used to determine employer contribution rates.
The independent firm shall use all appropriate actuarial standards of practice. The review shall examine the reasonableness and consistency of the actuarial methods, assumptions and data used in the last actuarial valuation.
The basis of this review was the Actuarial Valuation for the year ending December 31, 2017.
Such reviews shall be conducted at least every four years.

C o p y r i g h t © P E R S 2 0 1 8 4
Statutory Actuarial Requirements
The PERS Board is directed, via ORS 238.605, to review actuarial methods and assumptions, including the assumed rate of return, every two years.
The PERS Board is directed, via ORS 238.607, to once every two calendar years, adopt actuarial equivalency factor tables for the purpose of computing the payments to be made to members and their beneficiaries, alternate payees and judge members and their spouses and beneficiaries.
The PERS Board is also directed, via Section 57 of SB 1049 (2019), to submit a report to the Joint Interim Committee on Ways and Means regarding the preliminary approval of changes to the actuarial methods and assumptions at least 30 days prior to final adoption.

C o p y r i g h t © P E R S 2 0 1 8 5
Statutory Actuarial Requirements
• The PERS Board is assisted in fulfilling its duties byretaining consulting actuaries to provide actuarialadvice and guidance to the Board.
• Milliman became the Board’s consulting actuaryJanuary 2012, taking over from Mercer.
• Current contract was awarded in 2015 through RFPprocess.
• Current four-year term expires in December andBoard will consider a further two-year extension atthe December 6, 2019 meeting.

C o p y r i g h t © P E R S 2 0 1 8 6
Role of Methods & Assumptions
• Actuarial methods and assumptions are used aspart of the actuarial valuation exercise to:
• Determine actuarial accrued liabilities;
• Determine normal costs;
• Allocate costs to individual employers; and
• Amortize unfunded liabilities.

C o p y r i g h t © P E R S 2 0 1 8 7
Review of FindingsSetting the Context:
• Actuarial Review based on 2017 Actuarial Valuation.
• In 2019 the PERS Board, as per 238.605, engaged,over three board meetings, in a review of theactuarial methods and assumptions. The primarybasis was an actuarial experience study for the yearending December 31, 2018.
• PERS submitted a report, as per SB 1049 (2019), withregard to the preliminary adoption of revisedactuarial methods and, subsequently, adopted allmethods and assumptions for use in futurevaluations beginning with December 31, 2018.
• 2018 Actuarial Valuation completed based onupdated methods and assumptions as well as impactof SB 1049 (2019).

C o p y r i g h t © P E R S 2 0 1 8 8
Review of Findings
Overall Findings from Review:
Requirement: The independent firm shall use all appropriate actuarial standards of practice. The review shall examine the reasonableness and consistency of the actuarial methods, assumptions and data used in the last actuarial valuation.
“when looking at the long term projections through the financial (asset/liability) modeling that the plan is expected to meet its funding objectives.”
“We found the actuarial work to be consistent with generally accepted actuarial standards and practices.”

C o p y r i g h t © P E R S 2 0 1 8 9
Review of Findings
Overall Findings from Review:
There were three primary actuarial elements noted for further consideration, by the PERS Board, going forward:
• Use of the rate collaring approach;
• Payroll growth assumptions; and
• Assumed rate of return.

C o p y r i g h t © P E R S 2 0 1 8 10
Review of Findings
Rate Collaring: Limits biennium to biennium changes in employer contribution rates to be within a specified “collar” range. The collar currently restricts the change in base Tier 1/Tier 2 rates to the greater of 20% of the current rate or 3% of payroll.
The use of collared rates balance competing Rate Setting Guiding Principles set by the Board in 2004
• Transparent• Predictable and stable rates• Protect funded status• Equitable across generations• Actuarially sound• GASB compliant

C o p y r i g h t © P E R S 2 0 1 8 11
Review of FindingsRate Collaring
• Originally established by the PERS Board after the 2003reforms.
• Is an actuarially acceptable practice used to smoothcontribution rate fluctuations and spreads large UALrate increases over time.
• Analysis, at the time of initial adoption, showed ratecollaring has a very similar actuarial impact as the othermore frequently used method - asset smoothing.
• Collaring is more transparent than asset smoothing inthat it uses best currently available market data in theuncollared rate calculation.
• Allows for employers to more easily budget for changesto contribution rates. Particularly important whensetting individual employer rates as PERS does.

C o p y r i g h t © P E R S 2 0 1 8 12
System-Wide Weighted Total Pension-Only Rates
Assumed
Return:
8.00% 8.00% 7.20%7.50%7.75%8.00%
Collared Net Rate
Collared Base Rate
Uncollared Rate
This work product was prepared for discussion purposes only and may not be appropriate to use for other purposes.Milliman does not intend to benefit and assumes no duty or liability to other parties who receive this work. Anyrecipient of this work product who desires professional guidance should engage qualified professionals for adviceappropriate to its own specific needs.
7.20%
2011-2013 rates first to reflect -27%return in 2008
2013-2015 shown before (dotted line) and after (solid line) legislated changes
2015-2017 set pre-Mororeflecting 2012 (+14.3%) & 2013 (+15.6%) returns, first decrease inassumed return
2017-2019 set post-Moro, reflecting 2015 return (+2.1%) and second decrease inassumed return
2019-2021 reflects +15.4% return in 2017 and third decrease in assumed return
2009-2011 rates set prior to economic downturn
2021-2023 are advisory estimates, based on published 2018 return of +0.48% and provisions of SB 1049. Final rates will depend on actual 2019 returns

C o p y r i g h t © P E R S 2 0 1 8 13
Review of Findings
Payroll Growth Assumption
• The actuarial review stated that the 3.50% payroll growth may be too high and consideration should be given to lower the growth rate. The timeframe used in analysis included years where public sector salary freezes were in place, consequently, analysis was skewed.
• PERS actuarial analysis over a trailing 10-year period shows that payroll growth averaged 3.46%.
• 2018 data shows a one year payroll growth of close to 7.40%.

C o p y r i g h t © P E R S 2 0 1 8 14
Review of FindingsAssumed Rate of Return
• The actuarial review recommends an assumption between7.05% and 7.72%.
• Significant weighting given by Board with respect toassumed rate of return adopted by OIC on therecommendation of their advisors – currently 7.30%.
• PERS actuary stated: “In our opinion, the current 7.20%long-term future investment assumption is reasonablebased on current data from the capital markets outlookmodels, the guiding principles, and Actuarial Standards ofPractice.”
• PERS Board confirmed 7.20% for future valuations. This ratewas first adopted in 2017.
• Peer median rate of return assumption in 2019 is 7.28%.• PERS’ actual rate of return over ten years is 9.46% and
twenty years is 7.08% (as of December 31, 2018).

C o p y r i g h t © P E R S 2 0 1 8 15
Actuarial & Fiscal Impacts
• This initial review provides PERS with theopportunity to further refine our actuarialpractices and we have approached the review inthis manner.
• Given the Board just completed their bi-annualactuarial assumption and methodology reviewcycle and adopted revised assumptions,consequently there will not be any immediate orlong-term actuarial or fiscal impact as a result ofthe review.
• To better align with the Board’s actuarial reviewcycle, recommend these reviews be conducted inthe year prior to the Board conducting theirexperience study and methodology andassumption setting process (i.e. 2022 for review).

C o p y r i g h t © P E R S 2 0 1 8 16
Response Plan & Timeline
• Our response letter as well as action plan andtimelines were provided to the Secretary of Stateon October 8, 2019.
• Many of the recommendations are considered“complete” given the Board just completed athorough review of assumptions andmethodologies and had updated these elementswhere appropriate.
• The Board will adopt a more formal writtenfunding policy in 2020 that encapsulates theboard’s rate setting guiding principles.
• Other recommendations will be incorporated intofuture actuarial work with the latest completiondate of July 2021 based on the next experiencestudy for the year ending December 31, 2020.

C o p y r i g h t © P E R S 2 0 1 8 17
Questions?

C o p y r i g h t © P E R S 2 0 1 8 18
Thank You
Insert Image

2019 Milliman Comments on the Actuarial Review of System Report.docx
Offices in Principal Cities Worldwide
1455 SW Broadway Suite 1600 Portland, OR 97201
Tel +1 503 227 0634
milliman.com
November 19, 2019
Public Employees Retirement Board Oregon Public Employees Retirement System
Re: Milliman Comments to the Board on the Actuarial Review of System Report
Dear Board Members:
This letter provides our comments on the September 18, 2019 report A Review of the Oregon Public Employees Retirement System that was issued by Gabriel, Roeder, Smith & Company (GRS) at the request of the Oregon Secretary of State’s office. We are available to discuss this comment letter if it would be helpful to the Board.
Scope of the report and organization of our comments
At a high level, the report sought to accomplish four tasks, the first three of which are standard components of a normal-course audit of actuarial work. The fourth, which the report refers to as an “attribution analysis”, is novel.
Replicate Milliman’s technical actuarial work and indicate if the current contributionrate-setting policy is actuarially sound
Comment on the reasonableness and appropriateness of actuarial assumptions Comment on the reasonableness and appropriateness of actuarial methods Analyze source-by-source changes in the unfunded actuarial liability (UAL) over a
ten-year period starting just prior to the 2008 economic downturn
Our comments on the report’s narrative on each of these tasks are provided in the order noted above. After that, we discuss an important omission from the report that relates to the attribution analysis.
Correctness of technical work and actuarial soundness of contribution rate policy
The most important parts of Milliman’s actuarial work are that we accurately project future system benefit payments and that our advice to the Board leads to an actuarially sound contribution rate policy that follows best practices for assumptions and methods. The report indicated a successful replication of our technical work and confirmed the soundness of the contribution rate-setting policy, stating “we found the actuarial work to be consistent with generally accepted actuarial standards and practices.” The report also noted “the plan is expected to meet its funding objectives” and “modeling shows the System to be on target to meet its funding objectives”.
Reasonableness and appropriateness of actuarial assumptions
The report’s commentary regarding actuarial assumptions primarily focused on two key assumptions – assumed future average annual investment return and assumed average annual future growth in system payroll.
C.1. Attachment 4

Public Employees Retirement Board November 19, 2019 Page 2
The report indicated the 7.20% investment return assumption selected in 2017 is “considered reasonable” and that GRS “would recommend a rate…between the mean return of 7.72% and the median return of 7.05%”. However, the report also stated that “a lower rate may be more appropriate” and that “consideration should be given to lowering the investment rate of return assumption”. While we agree that the investment return assumption should be monitored and reviewed regularly, we found the statements in the GRS report to be internally inconsistent with regard to the appropriateness of the assumption as selected in the 2016 Experience Study.
In our opinion the PERS Board’s assumed rate decisions have consistently aligned with the outlook of the Oregon Investment Council’s investment consultant rather than showing unwarranted optimism, and that is well-reflected in the public record. The Board’s approach of using an unbiased return assumption is consistent with its use of a fair market asset value and the rate collaring methodology. Each is designed to be transparent and prudent. On system payroll growth, the report indicated the 3.50% assumption “is too high” and that “payroll growth is not meeting the 3.5% assumed rate”. To support those statements, the report cites observed increases over a specific nine-year historical period. The report’s authors were asked to opine on assumptions which were set as part of the 2016 Experience Study. At the time that study was conducted, the most recently completed actuarial valuation was the December 31, 2015 report. Information from that valuation report and the valuation report ten years prior indicates the actual ten-year average annual system payroll growth was +3.46%, compared to the adopted 3.50% assumption.
12/31/2005 Combined Valuation Payroll $6.79 billion
12/31/2015 Combined Valuation Payroll $9.54 billion
Annualized System Payroll Growth +3.46%
The ten years in question included a period with pay freezes and a period of economic growth. This ten-year historical data was communicated to the Board as part of the public process which set the 3.50% assumption in 2017. We do not believe relevant historical data bear out the report’s conclusion or articulated concern. Further, the report lacked comment on a key aspect of setting the assumption. While it is appropriate to review historical data, the assumption is forward-looking. The most important data inputs for setting a forward-looking economic assumption are reasonable forward-looking assumptions for inflation and real wage growth contemplative of projected future economic conditions. Those forward-looking inputs are the cornerstones of our advice to the Board in this area. The report fails to mention those data points or this general approach in its commentary.
Reasonableness and appropriateness of actuarial methods The majority of the discussion of actuarial methods in the GRS report – both in review of methods themselves and in the “attribution analysis” of UAL changes over a ten-year period – focused on the rate collar methodology used to set employer contribution rates. However, the report does not display a full understanding of the rationale for and application of PERS’ rate

Public Employees Retirement Board November 19, 2019 Page 3
collar approach for calculating employer contribution rates, which was adopted by the Board in 2005 after extensive actuarial analysis. The PERS rate collar calculations use transparent, best-practice inputs:
A fair-market asset value, A Board-adopted, prudent assumption for investment return and payroll growth, and A period length for UAL amortization that follows best practices.
Those best-practice inputs determine an uncollared rate. The uncollared rate provides all interested parties with a clear-eyed view of what the contribution rate would ideally be immediately using assumptions and methods that adhere to best practices, including fully taking into account already-known actual investment returns. When large contribution rate increases are advisable under best practices due to events such as adverse experience or unfavorable assumption changes, the rate collar methodology systematically spreads those increases across several biennia. The rate actually paid in a given biennium is referred to as the collared rate. The collared rate is the actuarially determined contribution rate for the biennium, and it has been paid in full by PERS employers each biennium since the rate collar methodology was adopted. The uncollared rate serves as a target rate that the collared contribution rate will systematically approach if actual future experience is similar to the valuation assumptions. The Board adopted the policy of using the rate collar along with current market value of assets as a more transparent approach to rate-setting than the common practice of smoothing the inputs to the rate calculation process (e.g. using a smoothed asset value that only fully reflects actual investment experience five years after it occurs). The input smoothing approach would produce an actuarially determined contribution rate analogous to the collared rate described above, but typically nothing analogous to the uncollared rate would be published to quantify the future direction and magnitude of rate changes if the input smoothing approach used an optimistic investment return assumption or an amortization period for UAL that is lengthier than best practice. An understanding of the above information on the development, rationale and application of the PERS rate collar approach can be gained from publicly available materials, but at times this background did not appear to be considered in the report. Examples of this include:
References to a “contribution rate less than gross actuarially determined (i.e. uncollared rate)” and “missed” contributions when collared contribution rates have been fully paid but the collared rate is less than the uncollared rate. Statements such as these seem to fail to recognize that the collared rate is the actuarially determined contribution rate for PERS employers.
The report’s statement that “rate collaring policy…is not truly rate relief” seems to be trying to refute a contention that no one associated with the policy has ever made. The collar policy was put into place in 2005 and 2006, at a time when PERS was in a better funded position than present. At that time, the 2003 reforms had gone into effect, the investment return assumption was 8.00%, and the 2008 economic downturn had yet to occur. The collar methodology was developed to have a

Public Employees Retirement Board November 19, 2019 Page 4
systematic, actuarially sound response to unknown potential future volatility that balances competing Board objectives for assumptions and methods. It was not developed in a time of significant financial stress as “rate relief”. It has never been presented to the Board as such, either at the time of implementation or subsequent to that.
The report’s statement that “employers who use rate collaring are ‘borrowing’ at 7.2% per year” betrays a lack of understanding. First, the statement implies that application of the rate collar for “rate relief” is an elective decision that each employer can “use” (or not use) at its discretion. It is not. Second, the “pay less now or more later” financial dynamic to contributions is well-understood by employers, legislators and other interested parties, and is frequently acknowledged in publicly available materials. The report’s statement implies a broad lack of understanding in an area where we believe the financial dynamic is fairly widely understood.
For context, it is worth considering the more traditional “input smoothing” contribution rate approach used by most systems, which stands in clear contrast to PERS’ rate collar approach in several ways. One difference with the traditional approach is the use of smoothed assets, which don’t fully reflect actual investment experience. However, in the traditional approach frequently other inputs are managed in ways that do not follow best practices in order to manage the contribution rate outputs. This can occur with selection of amortization periods far longer than best practice or selection of optimistic investment return assumptions materially above the investment consultant’s best estimate of future experience. Examples of this are in abundant supply around the country. Further, the traditional approach is prone to forcing boards into making ad hoc policy decisions in response to large-effect events, be they poor investment results, unwelcome assumption change recommendations, or adverse court decisions. The ad hoc policy response will often be to further extend an amortization or asset smoothing period and/or refusal to make a recommended investment return assumption decrease.
Looking back to the 2019-21 rate calculations in the December 31, 2017 valuation that was reviewed by the study, at a system-average level the best practices uncollared rate was approximately 29.2% of payroll. The 2019-21 collared base rate, which is paid by a combination of employer contributions and side account transfers, was approximately 25.2% of payroll. In other words, the system-average actuarially determined contribution rate in effect for 2019-21 is 25.2%, and that rate is projected to increase to near 29.2% in 2021-23 if actual experience during 2018 and 2019 is near assumption and assumptions are not changed. The report’s response to similar situations in the period studied was to identify a “gross actuarially determined” 2019-21 contribution rate of 29.2% and express concern over “missed” contributions.
We think this treatment of the rate collaring methodology in the GRS report is insufficient and biased in favor of the traditional approach. To understand why, it helps to visualize an alternative methodology version of the December 31, 2017 valuation that set 2019-21 contribution rates using the traditional approach. In that alternative valuation methodology, the amortization period input is managed (with the assistance of an alternative version of the Board) to achieve a calculated 2019-21 contribution rate of 25.2% of payroll. Based on fair

Public Employees Retirement Board November 19, 2019 Page 5
market asset levels and liabilities as of the valuation date, a managed input of a 25-year re-amortization period for all UAL would have yielded an actuarially determined 2019-21 contribution rate of approximately 25.2% of payroll. Further, under that alternative methodology the projected contribution rate in the subsequent biennium (2021-23) would have also been near 25.2% of payroll. We believe a consistent GRS evaluation of this alternative methodology using the traditional approach would have declared 25.2% to be the actuarially determined contribution rate for 2019-21. It would not have declared a higher, unpublished contribution rate using prudent assumptions and best practices amortization periods as the “gross actuarially determined” rate and would not have any discussion of “missed” contributions.
Given the above, in our view the report’s statements on rate collaring display a concerning lack of understanding. Certain report statements are, quite simply, factually incorrect. Attribution analysis and omission of the effect of legislative and judicial actions The draft report cites three and only three main categories that contributed to UAL changes:
Actual investment returns and the investment return assumption Demographic experience versus assumption Rate collaring methodology.
Of these, it was noted that the lowering of the investment return assumption and the actual investment performance were the two primary drivers of the increase in UAL during that period. Amounts that the report ascribed to the rate collaring methodology were listed as the next most significant, with actual demographic experience as the smallest contributor to UAL. We agree with the assessment that actual investment experience and reduced assumptions for future investment returns had the biggest influence on the UAL change during this period. However, the calculation of the UAL effect they attribute to the rate collaring methodology has meaningful shortcomings. Most obvious is that the entire sequence of events related to 2013 legislative changes and the subsequent 2015 reversal of much of those changes after the Moro decision is not separately identified, and so is being portrayed as part of the effect of “rate collaring”. A historical analysis that attempts to assess sources of change in the PERS UAL over the past decade but fails to quantify effects and timing of legislative and judicial actions is incomplete. Legislative actions in 2013 lowered liabilities between $5 billion and $6 billion via changes in projected benefits. The 2013 legislation also directed the Board to decrease its (adopted) collared contribution rates for the 2013-15 biennium by over 4% of payroll on average to reflect the effect of the legislative action. Board materials presented at that time and more recently illustrate that after that 2013 legislative action a) system-average collared rates did not significantly increase from either 2011-13 to 2013-15 or from 2013-15 to 2015-17 and b) uncollared and collared rates for 2015-17 were identical for the school district pool. In other words, the 2013 legislative changes combined with the PERS Board’s rate setting approach meant the 2015-17 rates were projected to be sufficient to systematically eliminate UAL over the best-practice amortization period without future rate increases if post-2013 experience matched the December 31, 2013 actuarial valuation’s assumptions and the assumptions did not change.

Public Employees Retirement Board November 19, 2019 Page 6
Of course, the 2015 Moro decision overturned about $5 billion in legislated benefit changes. To accommodate the judicial decision, long-term contribution rates needed to be higher than previously forecast. Assumed rate of return decreases also had an impact on forecast rates. Given budgetary and rate-setting timing, the initial response to the judicial action was an increase in the rates for the 2017-19 biennium adopted by the Board in 2016.
An additional increase was adopted in 2018 for the 2019-21 biennium, with the size of that increase dictated by the rate collar methodology. The effects and timing of the legislative and judicial actions over the past decade played a major role in both of those increases. In regards to the UAL attribution analysis, in four years of the ten-year period studied, legislative direction caused the employer contribution rates to be set lower than what the Board-adopted rates would have been absent that legislative intervention. The report is silent on the timing and magnitude of those actions, and the UAL effect of this sequence is lumped into a “rate collar” category with only a passing mention of legislative changes.
As noted at the start of this letter, we would be happy to discuss our comments if it would be helpful to the Board.
Sincerely,
Matt Larrabee, FSA, EA, MAAA Scott Preppernau, FSA, EA, MAAA Principal and Consulting Actuary Principal and Consulting Actuary
MRL:SDP
cc: Kevin Olineck

SL1 PERS Board Meeting December 6, 2019
Item C.2.
Public Employees Retirement System Headquarters:
11410 S.W. 68th Parkway, Tigard, OR Mailing Address:
P.O. Box 23700 Tigard, OR 97281-3700
888-320-7377 TTY (503) 603-7766
www.o re go n .go v/p er s
Oregon Kate Brown, Governor
December 6, 2019 TO: Members of the PERS Board FROM: Amanda Marble, Financial Reporting Manager Kevin Olineck, Director SUBJECT: Milliman Actuarial Contract Renewal OVERVIEW PERS’ actuarial services contract with Milliman will terminate December 31, 2019, unless the PERS Board takes specific action to extend the contract. This contract took effect on January 1, 2015, and has been in effect for the initial four-year term. The contract allows for an extension of additional one- or two-year periods, for a total term not-to-exceed 10 years. BACKGROUND Milliman became the PERS Actuary, replacing Mercer, in January 2012, as a result of Mercer assigning their contractual obligation to Milliman. Mercer had decided that they would no longer provide services to public sector entities. Subsequently, Milliman was awarded the current contract, through an RFP process, with an initial four-year term. Oregon House Bill 4163 requires the Secretary of State to have an independent actuarial firm conduct a review of Milliman’s work. The independent firm examined the reasonableness and consistency of the full assumption set used with the December 31, 2017 actuarial report. This review was to determine if the assumptions proposed were the best possible assumptions based on an asset/liability study and an attribution analysis. PERS has received a final version of the report, the findings of the draft report show that the body of work completed by Milliman, for the PERS Board, is consistent with generally accepted actuarial standards and practices and the work reviewed generally complies with the Contractual Statement of Work. A copy of the final report was provided to the Board as agenda item C.1, along with comments and analysis from both the agency, as well as Milliman. RECOMMENDATION Staff recommends that the board extend the Milliman contract for an additional two-year period. Staff makes this recommendation based on the following: 1. Milliman has performed more than adequately under the current contract. 2. Changing actuaries at this time would result in a significant disruption in PERS’ ability to
deliver critical and timely information to the PERS Board, Legislature, and other stakeholders. The learning curve required for a new actuary may not allow for the same level of timeliness or

Milliman Contract Renewal 12/6/2019 Page 2 of 2
SL1 PERS Board Meeting December 6, 2019
accuracy that can be provided by Milliman. This is particularly important, given that SB 1049 implementation has significant agency impacts on the actuarial front. There has also been turnover in the already-small Actuarial Services area of PERS, where a longstanding Actuarial Analysis Coordinator has retired; consequently, we will need to rely on Milliman more than usual to assist.
3. There is a scarcity of actuarial firms that: a) have the level of expertise required to properly support PERS, the system, as well as the agency, b) have a local presence, and; c) have the corporate capacity to take on substantial Indemnification and Liability contractual obligations. Consequently, should the board decide to move forward with an RFP for actuarial services, that decision would need to be made a minimum of 12 to 15 months prior to the end of the term of the contract to allow for a comprehensive transition of information and data, should a new firm be chosen.
BOARD OPTIONS The board may:
1. Pass a motion to extend the current actuarial services contract with Milliman to December 31, 2021; or
2. Direct staff to make changes to these terms or explore other options. STAFF RECOMMENDATION Staff recommends the PERS Board approve the contract renewal as presented in Option #1.

SL1 PERS Board Meeting December 6, 2019
Item C.3
Public Employees Retirement System Headquarters:
11410 S.W. 68th Parkway, Tigard, OR Mailing Address:
P.O. Box 23700 Tigard, OR 97281-3700
888-320-7377 TTY (503) 603-7766
www.o re go n .go v/p er s
Oregon Kate Brown, Governor
December 6, 2019 TO: Members of the PERS Board FROM: Yvette Elledge-Rhodes, Deputy Director SUBJECT: SB 1049 Implementation Update Senate Bill 1049 was signed into law by the Governor on June 11, 2019. PERS staff continue to focus on building an implementation plan that will allow us to complete work in an efficient and effective manner. Due to the short time frames, minimum viable products (MVP) are being identified to meet the legislative mandates, even if this means that initially manual solutions will be implemented. Long-term sustainable solutions will be delivered afterwards. PROGRAM/PROJECT PLANNING The SB 1049 Implementation Program is being managed as one comprehensive program, with the following five individual projects. All projects are going through the OSCIO stage gate process. Project Effective Date Status
SB 1049 Program Program team is focusing efforts on schedule development and project planning documentation required for Stage Gate 2 and 3 endorsements. Program status is “yellow” due to lack of schedule and product owner resource constraints.
Employer Programs Project
Effective 7/1/2019 Employer Incentive Fund (EIF) has approved 49 applications as of mid-November. EIF matching funds for those applications is $15,366,630. The UAL Resolution Program is under development.
Salary Limit Project Effective 1/1/2020 Short-term manual solution identified. Members who may reach limit will be contacted directly.
Work After Retirement Project
Effective 1/1/2020 Elaboration has been completed and the implementation option has been decided. The team is focusing on the business case, the schedule and MVP.
Member Redirect Project
Effective 7/1/2020 Stage Gate approval is the current priority, which includes the project charter, business case and schedule.
Member Choice Project
Effective 1/1/2021 This project kicked off on October 23. Elaboration has begun, to identify possible solutions. Project team has begun work to define project scope.

SB 1049 Implementation Update 12/6/2019
SL1 PERS Board Meeting December 6, 2019
Highlighted activities completed or in progress:
• Program and project activities o Continuing to enhance program/project reporting o Standardizing meeting routines
Lean project core teams focused on MVP, facilitating decisions quickly o Fully integrating Enterprise Information Systems (EIS) oversight within program o Incorporating change management within all projects
• Resources o External architects, developers, and project managers onsite o Staff recruitments; 41 total positions
Eight critical to project • Three Product Owners – positions being filled with internal staff • Three Communications staff – one ready for offer; two at interview stage • Two Business Rules positions – recruitment posted
33 operational positions • Drafting/planning recruitment posting – 13 • Active Recruitments – 20
o Executed lease and moved project team into the Barbur Building on November 5 o Independent quality assurance vendor
Estimated contract execution week of November 18 • EIS Stage Gate process requirements
o Program level stage gate two documents targeted for completion in November • Budget structure and reporting
o Regular meetings with Chief Financial Office and Legislative Fiscal Office • Communications
o Weekly external stakeholder meeting o Change management and internal communications plans o Defining communication deliverables for each project
PROGRAM/PROJECT BUDGET The budget information is contained within Page 3 of the attachment to agenda item A.3.c. PERS staff will continue to update the board as project implementation continues throughout the next year.

Public Employees Retirement System
Headquarters: 11410 S.W. 68th Parkway, Tigard, OR
Mailing Address: P.O. Box 23700
Tigard, OR 97281-3700 888-320-7377
TTY (503) 603-7766 www.o re go n .go v/p er s
Oregon Kate Brown, Governor
December 6, 2019 TO: Members of the PERS Board
FROM: MaryMichelle Sosne, Actuarial Business Specialist
SUBJECT: Senate Bill 1049: Employer Programs
OVERVIEW
Senate Bill 1049 was signed into law by the Governor on June 11, 2019; effective immediately were several employer programs that both require, and incentivize, employers to proactively manage their employer rates. EMPLOYER INCENTIVE FUND (EIF) Employers who have made a lump sum payment from non-borrowed funds of at least $25,000 since June 2, 2018, to establish a new side account, or as a payment into an existing side account, are eligible for a 25% match from the Employer Incentive Fund (subject to the limitations stated in statute). The EIF opened to employers with an unfunded actuarial liability (UAL) exceeding 200% of their UAL on September 2 and the second window opens to all employers on December 2, 2019. The December 2 application cycle will end when all matching funds are allocated and money from employers is received for side accounts. As of November 12, 2019, PERS has approved 49 EIF applications from 46 employers (two employers applied for matching funds for two eligible payments). PERS matched $15,366,630.89 from the EIF and employers have made, or will make, new lump-sum payments of $57,317,079.541, with an additional, $37,332,999.00 in transition liability payments. Also as of November 12, 2019, six employers qualifying for the December 2 application window have paid for an actuarial calculation to establish their side accounts; their lump sum payments total $31,034,870, with an additional $382,692 in transition liability. Assuming those six employers apply and qualify for EIF, we expect to match $4,496,217.50 to these payments. Additionally, 17 existing side accounts currently qualify for EIF matches. These employers received a reminder email in November, from the Actuarial Services team, about their potential eligibility and next steps. If these employers are eligible, apply, and are approved, we expect to match $27,323,546.35 in EIF funds.
1 Does not include $2,949,445 in previously Side Account funds.
Item C.4.

Assuming all immediately eligible employers apply when the window opens on December 2, PERS anticipates receiving a grand total of $78,113,149.80 in new lump sum payments from employers, along with $37,236,395 in transition liability payments, and giving $43,589,356.05 in matches from EIF by the end of December 2019. In total, as of November 12, 2019, PERS anticipates receiving $124,326,949.54 in lump sum payments from employers; matching $55,771,144.74 of that with EIF funds; and eliminating $37,715,691 in transition liability debt. Additional employer lump sum payments and EIF matching will occur after the December 2 application window opens. UNFUNDED ACTUARIAL LIABILITY RESOLUTION PROGRAM (UALRP) PERS has reviewed programs, from other retirement systems, that are similar to the UALRP and is incorporating ideas from these programs into the iterative rollout of the UALRP. To satisfy the UALRP requirement for the current Employer Incentive Fund application process, the last two questions of the application require the employer to use the PERS Employer Rate Projection Tool to understand how a side account may affect their rates over the next 20 years, and to utilize their annual valuation report to identify their current funded status, combined valuation payroll, and UAL as a percentage of payroll. Employer rate education content is being developed to add to the UALRP website. Additionally, the employer programs team has begun work on a request for procurement for an improved employer projection tool, to assist employers with creating funding plans. The new tool is expected to allow employers to adjust for actual experience, adjust the projection start date, estimate rates without transition liability, transition surplus and pre-SLGRP liabilities, and provide greater flexibility when quoting with side accounts. DEFERRED RATE OFFSET The PERS Board adopted modifications to OAR 459-009-0084 and 459-009-0086 on August 16, 2019, to allow employers to defer their rate offset beyond the standard 12 months for current side accounts, for employers making a lump sum payment exceeding $10 million or more. PERS has a service request for a work order with Milliman to determine the appropriate way to calculate rate offsets for these types of side accounts; due to complexity and statutory requirements, the standard side account calculation will not suffice. This work order will also determine how state agency side accounts will be calculated, should an employer currently combined under state agencies decide to establish their own side account. An update on the employer programs project will be provided at the next board meeting.

Presented by:
Matt Larrabee, FSA, EAScott Preppernau, FSA, EA
FINANCIAL MODELINGOREGON PUBLIC EMPLOYEES RETIREMENT SYSTEM
December 6, 2019
This work product was prepared for discussion purposes only and may not be appropriate to use for other purposes. Milliman does not intend tobenefit and assumes no duty or liability to other parties who receive this work. Any recipient of this work product who desires professional guidanceshould engage qualified professionals for advice appropriate to its own specific needs.

1
Introduction
July: Board adopted updated valuation methods and assumptions, including 7.20% rate of return Calculated as of December 31, 2017 for the Tier 1/Tier 2 & OPSRP programs
October: Milliman presented system-average results from the advisoryDecember 31, 2018 valuation December 31, 2019 actuarial valuation will develop rates for July 2021 – June
2023 Today: Long-term financial modeling projections reflecting
published investment results through September 30 System average contribution rates System funded status System unfunded actuarial liability (UAL)
This work product was prepared for discussion purposes only and may not be appropriate to use for other purposes.Milliman does not intend to benefit and assumes no duty or liability to other parties who receive this work. Anyrecipient of this work product who desires professional guidance should engage qualified professionals for adviceappropriate to its own specific needs.

2
Models and Inputs
System financials are projected using two different models Steady return model – consistent year-to-year future investment returns Variable return model – future investment returns vary from year to year
Modeling starts with liabilities and actuarial assumptions from the 12/31/2018 system-wide actuarial valuation report This includes the current Board-adopted 7.20% return assumption for valuing
liabilities Modeling uses 12/31/2018 assets adjusted for published regular
account returns of +9.75% through September 2019 Returns for October through December 2019 vary in our models based on
scenario
This work product was prepared for discussion purposes only and may not be appropriate to use for other purposes.Milliman does not intend to benefit and assumes no duty or liability to other parties who receive this work. Anyrecipient of this work product who desires professional guidance should engage qualified professionals for adviceappropriate to its own specific needs.

3
Financial Modeling & Senate Bill 1049
SB 1049 provisions relevant to valuation and funding: Redirects portion of member contribution to fund DB benefits starting in July 2020
Employer contributions paid for rehired retirees effective January 2020
One-time re-amortization of Tier 1/Tier 2 UAL over 22 years
Salary for benefits limited to $195,000 (indexed) starting in 2020 Only change affecting DB benefits; projected effect is small at system level
Of these, Tier 1/Tier 2 UAL re-amortization has biggest impact on advisory 2021-23 contribution rates
This work product was prepared for discussion purposes only and may not be appropriate to use for other purposes.Milliman does not intend to benefit and assumes no duty or liability to other parties who receive this work. Anyrecipient of this work product who desires professional guidance should engage qualified professionals for adviceappropriate to its own specific needs.

4
Financial Modeling & Senate Bill 1049
Financial modeling results reflect most SB 1049 provisions No estimate of employer contributions paid for rehired retirees is reflected, given
limited duration of the provision and uncertainty regarding contribution amounts that will result
Rates shown in this presentation are “employer” rates Reflects our understanding that member contribution redirection serves as an
offset to employer rates effective with 2021-2023 rate setting
Redirection of 2.5% of payroll for Tier 1 and Tier 2 and 0.75% for OPSRP, only on salary exceeding $30,000 (indexed)
This work product was prepared for discussion purposes only and may not be appropriate to use for other purposes.Milliman does not intend to benefit and assumes no duty or liability to other parties who receive this work. Anyrecipient of this work product who desires professional guidance should engage qualified professionals for adviceappropriate to its own specific needs.

5
Financial ModelingComments on System Average Rates
Projections depict system average funded status and contribution rates Comparable to system average rates shown in October 2019 presentation
No single employer pays the system average rate Contribution rates vary both by employer and by type of payroll
Under many scenarios, average employer rates for the 2021-2023 biennium are projected to be similar to those in the 2019-2021 biennium Actual outcome will vary by rate pool and employer
Previous modeling projected increases in 2021-2023; change is due to: Tier 1/Tier 2 re-amortization under SB 1049 Member redirect Investment performance through September 2019
Rates shown do not include: Contribution rates for the Individual Account Plan (IAP) Employer contribution rates for the RHIA & RHIPA retiree healthcare programs Debt service payments on employer-specific pension obligation bonds
This work product was prepared for discussion purposes only and may not be appropriate to use for other purposes.Milliman does not intend to benefit and assumes no duty or liability to other parties who receive this work. Anyrecipient of this work product who desires professional guidance should engage qualified professionals for adviceappropriate to its own specific needs.

Steady Return Model
This work product was prepared for discussion purposes only and may not be appropriate to use for other purposes. Milliman does not intend tobenefit and assumes no duty or liability to other parties who receive this work. Any recipient of this work product who desires professional guidanceshould engage qualified professionals for advice appropriate to its own specific needs.

7
Steady Return Model
The next four slides show financial projections under the current rate setting structure Employer rates adjust each biennium, with changes limited by the rate collar
Four scenarios for steady annual actual future investment return are shown +5.0%; +6.7%; +7.2%; +9.0%
While actual future returns won’t be steady year-to-year, the steady return model clearly illustrates the financial dynamics More realistic “noisy” future returns will be shown in the variable return model
later in this presentation The effects of near-term and/or long-term future returns worse than +5.0% are
captured in the variable return model Model incorporates published returns through September 2019
This work product was prepared for discussion purposes only and may not be appropriate to use for other purposes.Milliman does not intend to benefit and assumes no duty or liability to other parties who receive this work. Anyrecipient of this work product who desires professional guidance should engage qualified professionals for adviceappropriate to its own specific needs.

8
Employer Collared Base Pension Rates (System Average)
This work product was prepared for discussion purposes only and may not be appropriate to use for other purposes.Milliman does not intend to benefit and assumes no duty or liability to other parties who receive this work. Anyrecipient of this work product who desires professional guidance should engage qualified professionals for adviceappropriate to its own specific needs.
If investment results are near assumption, system average employer collared base pension rates in 2021-23 are projected to be similar to 2019-21 rates
Blue line: rates decrease as new OPSRP members replace exiting Tier 1 / Tier 2s 2021-23 rates are based on asset returns through December 31, 2019
0%
5%
10%
15%
20%
25%
30%
35%
40%
2017-2019 2019-2021 2021-2023 2023-2025 2025-2027 2027-2029 2029-2031 2031-2033 2033-2035 2035-2037 2037-2039
+5.0% Steady Return +6.7% Steady Return +7.2% Steady Return +9.0% Steady Return

9
Biennial Change in Collared Base Rate (System Average)
This work product was prepared for discussion purposes only and may not be appropriate to use for other purposes.Milliman does not intend to benefit and assumes no duty or liability to other parties who receive this work. Anyrecipient of this work product who desires professional guidance should engage qualified professionals for adviceappropriate to its own specific needs.

10
System Funded Status (Excluding Side Accounts)
This work product was prepared for discussion purposes only and may not be appropriate to use for other purposes.Milliman does not intend to benefit and assumes no duty or liability to other parties who receive this work. Anyrecipient of this work product who desires professional guidance should engage qualified professionals for adviceappropriate to its own specific needs.
50%
60%
70%
80%
90%
100%
110%
120%
130%
2018 2019 2020 2021 2022 2023 2024 2025 2026 2027 2028 2029 2030 2031 2032 2033 2034 2035 2036 2037
+5.0% Steady Return +6.7% Steady Return +7.2% Steady Return +9.0% Steady Return
2019 funded status increases due to estimated year-end 2019 investment returns In steady +7.2% return scenario, funded status projected to reach 93% in 2037

11
System Funded Status (Including Side Accounts)
This work product was prepared for discussion purposes only and may not be appropriate to use for other purposes.Milliman does not intend to benefit and assumes no duty or liability to other parties who receive this work. Anyrecipient of this work product who desires professional guidance should engage qualified professionals for adviceappropriate to its own specific needs.
2019 funded status increases due to estimated year-end 2019 investment returns Funded status projected to reach 93% in 2037 with steady +7.2% returns
50%
60%
70%
80%
90%
100%
110%
120%
130%
2018 2019 2020 2021 2022 2023 2024 2025 2026 2027 2028 2029 2030 2031 2032 2033 2034 2035 2036 2037
+5.0% Steady Return +6.7% Steady Return +7.2% Steady Return +9.0% Steady Return

12
UAL (Unfunded Actuarial Liability) Excluding Side Accounts
This work product was prepared for discussion purposes only and may not be appropriate to use for other purposes.Milliman does not intend to benefit and assumes no duty or liability to other parties who receive this work. Anyrecipient of this work product who desires professional guidance should engage qualified professionals for adviceappropriate to its own specific needs.
-$30
-$20
-$10
$0
$10
$20
$30
$40
2018 2019 2020 2021 2022 2023 2024 2025 2026 2027 2028 2029 2030 2031 2032 2033 2034 2035 2036 2037
$ bi
llions
+5.0% Steady Return +6.7% Steady Return +7.2% Steady Return +9.0% Steady Return
2019 UAL decreases due to estimated year-end 2019 investment returns At steady +7.2% returns, UAL remains relatively level for several years before
declining to below $8 billion at year-end 2037

Variable Return Model
This work product was prepared for discussion purposes only and may not be appropriate to use for other purposes. Milliman does not intend tobenefit and assumes no duty or liability to other parties who receive this work. Any recipient of this work product who desires professional guidanceshould engage qualified professionals for advice appropriate to its own specific needs.

14
Variable Return Model
Model results are likelihood ranges instead of a single amount The range’s distribution is based on a stochastic simulation using 10,000 trials Scenarios were developed by our national capital market specialists, and use
the current OPERF target asset allocation policy; for these scenarios, the median annualized average geometric 20-year return is 6.84%When the PERS Board last reviewed the return assumption in July 2019, the median annualized future return was 6.87% using Milliman’s capital market outlook assumptions
In that review, the median 10-year annualized future return using outlook assumptions from Callan (the outside advisors to Oregon Investment Council) was 7.32%
Model incorporates published returns through September 2019 In our results charts, the dots represent median (50th percentile) outcomes We display model results from the 5th to 95th percentiles
Ten percent of model outcomes fall outside of the depicted range The chart format is demonstrated on the next slide
This work product was prepared for discussion purposes only and may not be appropriate to use for other purposes.Milliman does not intend to benefit and assumes no duty or liability to other parties who receive this work. Anyrecipient of this work product who desires professional guidance should engage qualified professionals for adviceappropriate to its own specific needs.

15
PERS Fund Rate of ReturnProjected 2020 Investment Returns
Demonstrates the format of the charts using single year projected returns in 2020.
-15%
-10%
-5%
0%
5%
10%
15%
20%
25%
30%
35%
2020
95th
25th
–75
th
5th
Median(50th)
10th – 90th
This work product was prepared for discussion purposes only and may not be appropriate to use for other purposes.Milliman does not intend to benefit and assumes no duty or liability to other parties who receive this work. Anyrecipient of this work product who desires professional guidance should engage qualified professionals for adviceappropriate to its own specific needs.

16
PERS Fund Rate of ReturnSingle Calendar Year Investment Returns
Our capital market outlook model projects lower median returns in the first few years following 2019 due to current low yields on fixed income. Higher median returns are projected in the latter portion of the modeling period.
0.0%
5.0%
10.0%
15.0%
20.0%
25.0%
30.0%
35.0%
40.0%
45.0%
50.0%
-15%
-10%
-5%
0%
5%
10%
15%
20%
25%
30%
35%
2019 2020 2021 2022 2023 2024 2025 2026 2027 2028 2029 2030 2031 2032 2033 2034 2035 2036 2037 2038
An
nu
al R
OR
95th ─ 21.4% 24.5% 26.1% 27.2% 27.5% 28.3% 28.6% 28.5% 28.8% 30.0% 29.6% 29.7% 29.7% 29.7% 29.9% 29.7% 29.2% 29.6% 29.3% 29.5%90th 19.1% 19.7% 21.1% 21.9% 22.5% 22.9% 22.7% 23.1% 23.4% 24.1% 23.9% 24.2% 23.9% 24.0% 23.9% 24.1% 23.9% 23.8% 23.6% 24.1%75th 15.1% 12.7% 13.3% 14.2% 14.3% 14.5% 14.3% 14.8% 14.9% 15.1% 15.1% 15.3% 15.1% 15.3% 15.2% 15.4% 15.3% 15.1% 15.4% 15.4%50th ● 11.3% 5.7% 6.0% 6.0% 6.3% 6.4% 6.4% 6.4% 6.7% 6.5% 6.5% 6.7% 6.5% 6.7% 6.6% 6.7% 6.6% 6.8% 6.8% 6.7%25th 7.6% -0.7% -1.0% -0.9% -0.9% -0.9% -0.9% -1.1% -1.0% -1.0% -0.9% -1.0% -0.8% -1.2% -1.0% -0.9% -1.0% -0.9% -1.0% -1.0%10th 4.5% -5.7% -6.3% -6.6% -6.7% -6.8% -6.8% -6.7% -6.9% -7.1% -7.1% -7.2% -6.9% -7.1% -7.1% -7.1% -7.2% -7.1% -7.0% -7.1%5th ─ 2.7% -8.6% -9.1% -9.6% -9.9% -10.2% -10.1% -9.8% -10.3% -10.6% -10.5% -10.4% -10.4% -10.6% -10.3% -10.7% -10.5% -10.5% -10.4% -10.8%
This work product was prepared for discussion purposes only and may not be appropriate to use for other purposes.Milliman does not intend to benefit and assumes no duty or liability to other parties who receive this work. Anyrecipient of this work product who desires professional guidance should engage qualified professionals for adviceappropriate to its own specific needs.

0.0%
5.0%
10.0%
15.0%
20.0%
25.0%
30.0%
35.0%
40.0%
45.0%
50.0%
-15%
-10%
-5%
0%
5%
10%
15%
20%
25%
30%
35%
2020 2021 2022 2023 2024 2025 2026 2027 2028 2029 2030 2031 2032 2033 2034 2035 2036 2037 2038
Cu
mu
lati
ve A
vera
ge R
OR
17
Average Annualized Rate of Investment ReturnPost-2019 Modeled Returns (Geometric Average)
95th ─ 24.5% 19.4% 17.3% 16.0% 15.0% 14.4% 13.9% 13.4% 13.1% 12.9% 12.7% 12.5% 12.2% 12.1% 11.9% 11.7% 11.6% 11.5% 11.4%90th 19.7% 16.0% 14.6% 13.7% 13.1% 12.5% 12.1% 11.9% 11.7% 11.5% 11.3% 11.2% 10.9% 10.8% 10.7% 10.6% 10.5% 10.4% 10.4%75th 12.7% 11.1% 10.4% 10.0% 9.7% 9.5% 9.4% 9.3% 9.2% 9.1% 9.0% 9.0% 8.9% 8.9% 8.8% 8.7% 8.7% 8.7% 8.6%50th ● 5.7% 5.9% 6.0% 6.2% 6.3% 6.4% 6.5% 6.5% 6.6% 6.6% 6.7% 6.7% 6.7% 6.7% 6.7% 6.8% 6.8% 6.8% 6.8%25th -0.7% 1.2% 2.1% 2.7% 3.1% 3.5% 3.7% 3.9% 4.1% 4.3% 4.4% 4.5% 4.6% 4.7% 4.8% 4.8% 4.9% 5.0% 5.0%10th -5.7% -2.6% -1.1% -0.3% 0.4% 0.9% 1.3% 1.6% 1.9% 2.1% 2.3% 2.5% 2.7% 2.9% 3.0% 3.2% 3.3% 3.4% 3.5%5th ─ -8.6% -4.8% -3.1% -2.0% -1.1% -0.6% -0.1% 0.2% 0.6% 0.9% 1.2% 1.4% 1.6% 1.8% 2.0% 2.2% 2.3% 2.5% 2.6%
Modeled asset returns after September 2019 assume median 20 year return of 6.84% with 12.2% annual standard deviation. The 7.20% assumed return is between the 55th and 60th percentile of returns over this period.
This work product was prepared for discussion purposes only and may not be appropriate to use for other purposes.Milliman does not intend to benefit and assumes no duty or liability to other parties who receive this work. Anyrecipient of this work product who desires professional guidance should engage qualified professionals for adviceappropriate to its own specific needs.

0.0%
5.0%
10.0%
15.0%
20.0%
25.0%
30.0%
35.0%
40.0%
45.0%
50.0%
-15%
-10%
-5%
0%
5%
10%
15%
20%
25%
30%
35%
2019 2020 2021 2022 2023 2024 2025 2026 2027 2028 2029 2030 2031 2032 2033 2034 2035 2036 2037 2038
Cu
mu
lati
ve A
vera
ge R
OR
18
Average Annualized Rate of Investment ReturnPost-2018 Modeled Returns (Geometric Average)
95th ─ 21.4% 18.9% 17.2% 16.0% 15.2% 14.6% 14.0% 13.6% 13.3% 13.1% 12.8% 12.7% 12.4% 12.2% 12.1% 11.9% 11.8% 11.6% 11.5% 11.4%90th 19.1% 16.5% 14.9% 14.1% 13.4% 12.9% 12.5% 12.0% 11.8% 11.6% 11.5% 11.4% 11.2% 11.0% 10.9% 10.8% 10.7% 10.6% 10.5% 10.4%75th 15.1% 12.5% 11.3% 10.8% 10.3% 10.1% 9.8% 9.7% 9.5% 9.4% 9.3% 9.2% 9.2% 9.1% 9.1% 9.0% 8.9% 8.9% 8.8% 8.8%50th ● 11.3% 8.5% 7.7% 7.3% 7.2% 7.1% 7.1% 7.1% 7.1% 7.1% 7.1% 7.0% 7.0% 7.1% 7.0% 7.0% 7.0% 7.0% 7.0% 7.0%25th 7.6% 4.7% 4.3% 4.2% 4.3% 4.4% 4.5% 4.6% 4.7% 4.8% 4.8% 4.9% 5.0% 5.0% 5.1% 5.2% 5.2% 5.2% 5.3% 5.3%10th 4.5% 1.7% 1.5% 1.7% 1.8% 2.1% 2.3% 2.4% 2.6% 2.7% 2.8% 3.0% 3.2% 3.3% 3.4% 3.5% 3.6% 3.7% 3.8% 3.9%5th ─ 2.7% -0.2% -0.2% 0.2% 0.3% 0.7% 1.1% 1.2% 1.4% 1.6% 1.8% 2.0% 2.1% 2.3% 2.4% 2.5% 2.6% 2.8% 2.9% 3.0%
Published regular account returns of 9.75% through September 2019 are combined with projected future returns for each of the 10,000 scenarios. The resulting distribution of cumulative average returns has a median of 7.0% over the projection period.
This work product was prepared for discussion purposes only and may not be appropriate to use for other purposes.Milliman does not intend to benefit and assumes no duty or liability to other parties who receive this work. Anyrecipient of this work product who desires professional guidance should engage qualified professionals for adviceappropriate to its own specific needs.

0%
5%
10%
15%
20%
25%
30%
35%
40%
45%
50%
2017-2019 2019-2021 2021-2023 2023-2025 2025-2027 2027-2029 2029-2031 2031-2033 2033-2035 2035-2037 2037-2039
Co
ntr
ibu
tio
n (
% o
f p
ayro
ll)
19
Employer Collared Base Pension Rates (System Average)“Base” rates are system average Tier 1/Tier 2/OPSRP contribution rates excluding IAP contributions, the effect of side accounts & pension bond debt service, and contributions to the retiree healthcare programs.
Rates for 2021-2023 are based on the modeled returns for the period ending 12/31/2019.
5th ─ 20.8% 25.2% 28.3% 34.3% 38.1% 40.6% 42.7% 44.5% 45.1% 46.4% 47.2%10th 20.8% 25.2% 27.7% 32.5% 35.9% 38.0% 39.8% 41.0% 41.6% 42.2% 43.2%25th 20.8% 25.2% 26.7% 29.6% 31.7% 32.7% 33.8% 34.3% 34.5% 34.8% 35.0%50th ● 20.8% 25.2% 25.4% 26.0% 26.2% 26.1% 25.7% 25.3% 24.6% 23.8% 23.1%75th 20.8% 25.2% 24.2% 21.9% 20.3% 18.3% 16.4% 14.1% 11.5% 9.0% 6.2%90th 20.8% 25.2% 22.9% 18.6% 15.0% 11.5% 8.2% 4.0% 0.0% 0.0% 0.0%95th ─ 20.8% 25.2% 22.1% 17.4% 12.7% 8.5% 4.4% 0.0% 0.0% 0.0% 0.0%
This work product was prepared for discussion purposes only and may not be appropriate to use for other purposes.Milliman does not intend to benefit and assumes no duty or liability to other parties who receive this work. Anyrecipient of this work product who desires professional guidance should engage qualified professionals for adviceappropriate to its own specific needs.

0.0%
5.0%
10.0%
15.0%
20.0%
25.0%
30.0%
35.0%
40.0%
-20%
-15%
-10%
-5%
0%
5%
10%
15%
20%
Eff. Jul 19 Eff. Jul 21 Eff. Jul 23 Eff. Jul 25 Eff. Jul 27 Eff. Jul 29 Eff. Jul 31 Eff. Jul 33 Eff. Jul 35 Eff. July 37
Bas
e R
ate
Ch
ange
20
Biennial Change in Collared Base Pension RateSystem Average Rates
Less than 10% of modeled scenarios show base contribution rate increases above 3% of payroll effective July 2021.
5th ─ 4.4% 3.1% 8.4% 8.4% 7.8% 7.9% 7.5% 6.9% 6.9% 6.6%10th 4.4% 2.5% 6.8% 6.8% 6.2% 6.1% 5.8% 5.3% 5.3% 4.9%25th 4.4% 1.4% 4.0% 3.9% 3.4% 3.3% 3.2% 2.7% 2.8% 2.2%50th ● 4.4% 0.2% 0.6% 0.2% -0.4% -0.4% -0.5% -0.3% 0.0% 0.0%75th 4.4% -1.1% -3.3% -4.1% -4.6% -4.5% -4.7% -4.5% -3.6% -3.1%90th 4.4% -2.4% -6.6% -6.8% -7.4% -7.6% -8.0% -7.9% -7.3% -6.8%95th ─ 4.4% -3.1% -7.2% -7.7% -8.7% -8.9% -9.4% -9.6% -9.7% -8.7%
Due to the reamortization of Tier 1/ Tier 2 UAL, unlike prior modeling there is no longer a significant rate decrease at the median in later years of the projection
This work product was prepared for discussion purposes only and may not be appropriate to use for other purposes.Milliman does not intend to benefit and assumes no duty or liability to other parties who receive this work. Anyrecipient of this work product who desires professional guidance should engage qualified professionals for adviceappropriate to its own specific needs.

0%
5%
10%
15%
20%
25%
30%
35%
40%
45%
50%
2017-2019 2019-2021 2021-2023 2023-2025 2025-2027 2027-2029 2029-2031 2031-2033 2033-2035 2035-2037 2037-2039
Co
ntr
ibu
tio
n (
% o
f p
ayro
ll)
21
Employer Collared Net Pension Rates (System Average)
“Net” rates are collared base rates adjusted to reflect the projected effect of side account rate offsets and pre-SLGRP rate offsets.
5th ─ 14.2% 18.3% 21.9% 29.0% 34.0% 38.0% 42.7% 44.5% 45.1% 46.4% 47.2%10th 14.2% 18.3% 21.1% 27.0% 31.2% 34.8% 39.8% 41.0% 41.6% 42.2% 43.2%25th 14.2% 18.3% 19.9% 23.5% 26.2% 28.2% 33.8% 34.3% 34.5% 34.8% 35.0%50th ● 14.2% 18.3% 18.5% 19.2% 19.7% 19.7% 25.7% 25.3% 24.6% 23.8% 23.1%75th 14.2% 18.3% 17.0% 14.3% 12.2% 9.7% 16.4% 14.1% 11.5% 9.0% 6.2%90th 14.2% 18.3% 15.4% 10.1% 5.4% 0.0% 8.2% 4.0% 0.0% 0.0% 0.0%95th ─ 14.2% 18.3% 14.5% 8.4% 2.0% 0.0% 4.4% 0.0% 0.0% 0.0% 0.0%
Net rate increases in 2029-2031 reflect projected exhaustion of current side accounts and their associated side account rate offsets.
This work product was prepared for discussion purposes only and may not be appropriate to use for other purposes.Milliman does not intend to benefit and assumes no duty or liability to other parties who receive this work. Anyrecipient of this work product who desires professional guidance should engage qualified professionals for adviceappropriate to its own specific needs.

22
Biennial Change in Collared Net Pension RateSystem Average Rates
-20%
-15%
-10%
-5%
0%
5%
10%
15%
20%
Eff. Jul 19 Eff. Jul 21 Eff. Jul 23 Eff. Jul 25 Eff. Jul 27 Eff. Jul 29 Eff. Jul 31 Eff. Jul 33 Eff. Jul 35 Eff. Jul 37
Bas
e R
ate
Ch
ange
5th ─ 4.1% 3.5% 9.9% 10.1% 10.1% 15.5% 7.5% 6.9% 6.9% 6.6%10th 4.1% 2.8% 8.1% 8.3% 8.1% 13.4% 5.8% 5.3% 5.3% 4.9%25th 4.1% 1.6% 4.8% 4.8% 4.6% 9.6% 3.2% 2.7% 2.8% 2.2%50th ● 4.1% 0.1% 0.8% 0.4% 0.0% 5.5% -0.5% -0.3% 0.0% 0.0%75th 4.1% -1.4% -3.9% -4.7% -4.4% 1.7% -4.7% -4.5% -3.6% -3.1%90th 4.1% -2.9% -8.0% -8.5% -8.8% -1.2% -8.0% -7.9% -7.3% -6.8%95th ─ 4.1% -3.8% -9.0% -9.8% -10.6% -3.0% -9.4% -9.6% -9.7% -8.7%
The July 2029 increase is related to the projected exhaustion of side accounts and pre-SLGRP rate offsets prior to the expiration of the UAL rate amortization charges related to prior investment losses.
This work product was prepared for discussion purposes only and may not be appropriate to use for other purposes.Milliman does not intend to benefit and assumes no duty or liability to other parties who receive this work. Anyrecipient of this work product who desires professional guidance should engage qualified professionals for adviceappropriate to its own specific needs.

0%
20%
40%
60%
80%
100%
120%
140%
160%
180%
200%
2018 2019 2020 2021 2022 2023 2024 2025 2026 2027 2028 2029 2030 2031 2032 2033 2034 2035 2036 2037
Syst
em-W
ide
Fun
ded
Sta
tus
23
Funded Status (Excluding Side Accounts)
95th ─ 68.8% 77.7% 85.1% 91.5% 97.7% 103.8% 109.5% 114.8% 120.9% 126.3% 133.1% 138.8% 146.7% 152.2% 158.7% 164.3% 169.8% 174.8% 180.8% 186.6%90th 68.8% 76.3% 81.7% 86.3% 91.2% 95.6% 99.7% 103.9% 107.3% 111.9% 116.7% 122.2% 126.4% 130.7% 133.5% 138.9% 143.4% 147.3% 151.8% 156.0%75th 68.8% 73.8% 76.4% 78.5% 81.0% 83.1% 85.2% 87.3% 90.1% 92.1% 94.4% 96.9% 99.7% 102.3% 105.0% 106.8% 110.1% 112.4% 115.5% 118.5%50th ● 68.8% 71.5% 71.1% 71.0% 71.1% 71.7% 72.1% 73.0% 73.9% 75.2% 75.8% 77.1% 78.1% 79.2% 81.0% 82.5% 83.7% 85.8% 87.7% 89.5%25th 68.8% 69.1% 66.3% 64.6% 63.2% 62.1% 61.7% 61.3% 61.1% 60.9% 61.2% 61.6% 61.9% 63.0% 63.6% 64.6% 65.8% 67.1% 68.6% 69.9%10th 68.8% 67.2% 62.5% 59.3% 56.8% 54.8% 53.5% 52.3% 51.4% 50.9% 50.5% 50.3% 50.7% 50.9% 51.4% 52.6% 53.3% 54.4% 55.3% 56.8%5th ─ 68.8% 66.1% 60.2% 56.4% 53.3% 50.8% 49.0% 47.8% 46.7% 45.7% 45.2% 45.2% 45.2% 45.2% 45.9% 46.3% 47.2% 48.4% 49.5% 50.4%
At the 50th percentile, funded status is 71.5% at year-end 2019, and decreases by 0.5% over the next two years before starting to improve, reaching 89.5% by the end of 2037. Median funded status fails to reach 100% by the end of the modeled period because the Tier 1/Tier 2 amortization period now extends beyond the projection period and the 50th
percentile return in our model lags the current assumed return of 7.20%.
This work product was prepared for discussion purposes only and may not be appropriate to use for other purposes.Milliman does not intend to benefit and assumes no duty or liability to other parties who receive this work. Anyrecipient of this work product who desires professional guidance should engage qualified professionals for adviceappropriate to its own specific needs.

0%
20%
40%
60%
80%
100%
120%
140%
160%
180%
200%
2018 2019 2020 2021 2022 2023 2024 2025 2026 2027 2028 2029 2030 2031 2032 2033 2034 2035 2036 2037
Syst
em-W
ide
Fun
ded
Sta
tus
24
Funded Status (Including Side Accounts)
95th ─ 74.9% 84.0% 91.3% 97.4% 103.3% 108.8% 113.8% 118.1% 123.1% 127.4% 133.1% 138.8% 146.7% 152.2% 158.7% 164.3% 169.8% 174.8% 180.8% 186.6%90th 74.9% 82.4% 87.6% 91.9% 96.3% 100.2% 103.5% 106.8% 109.1% 112.5% 116.7% 122.2% 126.4% 130.7% 133.5% 138.9% 143.4% 147.3% 151.8% 156.0%75th 74.9% 79.8% 81.9% 83.5% 85.4% 86.8% 88.1% 89.4% 91.4% 92.4% 94.4% 96.9% 99.7% 102.3% 105.0% 106.8% 110.1% 112.4% 115.5% 118.5%50th ● 74.9% 77.2% 76.2% 75.5% 74.9% 74.8% 74.4% 74.5% 74.7% 75.3% 75.8% 77.1% 78.1% 79.2% 81.0% 82.5% 83.7% 85.8% 87.7% 89.5%25th 74.9% 74.7% 71.0% 68.6% 66.3% 64.6% 63.5% 62.4% 61.5% 60.9% 61.2% 61.6% 61.9% 63.0% 63.6% 64.6% 65.8% 67.1% 68.6% 69.9%10th 74.9% 72.6% 66.9% 62.9% 59.6% 56.9% 54.8% 53.1% 51.6% 50.9% 50.5% 50.3% 50.7% 50.9% 51.4% 52.6% 53.3% 54.4% 55.3% 56.8%5th ─ 74.9% 71.3% 64.4% 59.7% 55.9% 52.6% 50.1% 48.4% 46.8% 45.7% 45.2% 45.2% 45.2% 45.2% 45.9% 46.3% 47.2% 48.4% 49.5% 50.4%
At the 50th percentile, funded status including side accounts is 77.2% at year-end 2019, and decreases by 2.8% over the next five years before starting to improve, reaching 89.5% by the end of 2037. Most side accounts will be fully amortized by the end of 2027.
This work product was prepared for discussion purposes only and may not be appropriate to use for other purposes.Milliman does not intend to benefit and assumes no duty or liability to other parties who receive this work. Anyrecipient of this work product who desires professional guidance should engage qualified professionals for adviceappropriate to its own specific needs.

25
UAL (Excluding Side Accounts)
-$40
-$30
-$20
-$10
$0
$10
$20
$30
$40
$50
$60
2018 2019 2020 2021 2022 2023 2024 2025 2026 2027 2028 2029 2030 2031 2032 2033 2034 2035 2036 2037
UA
L ($
bill
ion
s)
At the 50th percentile, the UAL excluding side accounts is $25.3 billion at year-end 2019, grows to $27.4 billion at the end of 2024, then declines to $12.2 billion by the end of 2037. Median UAL fails to reach $0 by the end of the modeled period because the Tier 1/Tier 2 amortization period now extends beyond the projection period and the 50th percentile return in our model lags the current assumed return of 7.20%.
5th ─ 27.0 30.0 36.0 40.3 44.0 47.4 50.0 52.0 54.0 55.8 57.2 57.9 58.6 59.3 59.3 59.5 59.2 58.6 57.9 57.310th 27.0 29.0 33.9 37.7 40.8 43.5 45.6 47.5 49.1 50.4 51.7 52.7 52.9 53.3 53.3 52.7 52.2 51.8 51.2 49.925th 27.0 27.3 30.5 32.7 34.8 36.5 37.6 38.6 39.5 40.2 40.6 40.5 40.8 40.2 39.9 39.4 38.4 37.4 35.9 34.750th ● 27.0 25.3 26.2 26.8 27.3 27.2 27.4 27.0 26.5 25.6 25.3 24.4 23.5 22.5 21.0 19.5 18.3 16.1 14.1 12.275th 27.0 23.2 21.4 19.9 18.0 16.4 14.6 12.7 10.0 8.2 5.8 3.3 0.3 -2.5 -5.5 -7.6 -11.3 -14.1 -17.9 -21.490th 27.0 21.0 16.6 12.7 8.3 4.2 0.3 -3.9 -7.4 -12.3 -17.6 -23.5 -28.5 -33.5 -36.9 -43.1 -49.2 -53.8 -59.6 -64.895th ─ 27.0 19.8 13.6 7.9 2.2 -3.6 -9.3 -14.8 -21.2 -27.1 -34.8 -41.1 -50.3 -56.8 -64.8 -71.5 -79.0 -84.9 -93.7 -100.4
This work product was prepared for discussion purposes only and may not be appropriate to use for other purposes.Milliman does not intend to benefit and assumes no duty or liability to other parties who receive this work. Anyrecipient of this work product who desires professional guidance should engage qualified professionals for adviceappropriate to its own specific needs.

26
UAL (Including Side Accounts)
-$40
-$30
-$20
-$10
$0
$10
$20
$30
$40
$50
$60
2018 2019 2020 2021 2022 2023 2024 2025 2026 2027 2028 2029 2030 2031 2032 2033 2034 2035 2036 2037
UA
L ($
bill
ion
s)
5th ─ 21.8 25.4 32.2 37.2 41.6 45.6 48.9 51.4 53.9 55.8 57.2 57.9 58.6 59.3 59.3 59.5 59.2 58.6 57.9 57.310th 21.8 24.3 30.0 34.4 38.2 41.6 44.3 46.8 49.0 50.4 51.7 52.7 52.9 53.3 53.3 52.7 52.2 51.8 51.2 49.925th 21.8 22.5 26.3 29.1 31.8 34.1 35.9 37.5 39.1 40.2 40.6 40.5 40.8 40.2 39.9 39.4 38.4 37.4 35.9 34.750th ● 21.8 20.2 21.5 22.7 23.8 24.3 25.1 25.5 25.7 25.6 25.3 24.4 23.5 22.5 21.0 19.5 18.3 16.1 14.1 12.275th 21.8 17.9 16.4 15.3 13.8 12.7 11.6 10.7 8.8 7.9 5.8 3.3 0.3 -2.5 -5.5 -7.6 -11.3 -14.1 -17.9 -21.490th 21.8 15.6 11.2 7.5 3.5 -0.1 -3.5 -6.8 -9.3 -12.9 -17.6 -23.5 -28.5 -33.5 -36.9 -43.1 -49.2 -53.8 -59.6 -64.895th ─ 21.8 14.2 7.9 2.4 -3.1 -8.5 -13.5 -18.2 -23.5 -28.2 -34.8 -41.1 -50.3 -56.8 -64.8 -71.5 -79.0 -84.9 -93.7 -100.4
At the 50th percentile, the UAL including side accounts is $20.2 billion at year-end 2019, grows to $25.7 billion at the end of 2026, then declines to $12.2 billion by the end of 2037. Most side accounts will be fully amortized by the end of 2027.
This work product was prepared for discussion purposes only and may not be appropriate to use for other purposes.Milliman does not intend to benefit and assumes no duty or liability to other parties who receive this work. Anyrecipient of this work product who desires professional guidance should engage qualified professionals for adviceappropriate to its own specific needs.

27
Variable Return Model Stress Test
As in recent years, we also used the variable return model to do a “stress test” of the likelihood of certain events in the 10,000 scenarios modeled
The likelihood of specified events occurring at some point during the 20-year projection period is shown below
Likelihood of Event Occurring at Some Point in Next 20 YearsFunded Status (Excluding Side Accounts) > 100% 57%Funded Status (Excluding Side Accounts) < 60% 55%Funded Status (Excluding Side Accounts) < 40% 7%
This work product was prepared for discussion purposes only and may not be appropriate to use for other purposes.Milliman does not intend to benefit and assumes no duty or liability to other parties who receive this work. Anyrecipient of this work product who desires professional guidance should engage qualified professionals for adviceappropriate to its own specific needs.

28
Variable Return Model Stress Test
The likelihood of specified events occurring at some point during the 20 year projection period is shown below
The system-average base rate for the 2019-2021 biennium is between 25% and 26%, per the December 31, 2017 valuation
Likelihood of Event Occurring at Some Point in Next 20 YearsBase Rate (Excluding Retiree Healthcare) < 10% of Pay 35%Base Rate (Excluding Retiree Healthcare) > 30% of Pay 62%Base Rate (Excluding Retiree Healthcare) > 40% of Pay 24%
This work product was prepared for discussion purposes only and may not be appropriate to use for other purposes.Milliman does not intend to benefit and assumes no duty or liability to other parties who receive this work. Anyrecipient of this work product who desires professional guidance should engage qualified professionals for adviceappropriate to its own specific needs.

29
Variable Return Model Stress Test
As shown earlier, less than 10% of modeled scenarios show an increase in the collared rate above 3% of payroll at July 2021
Table shows likelihood in the model of a collared rate increase exceeding a selected threshold at the July 2021 rate change
Likelihood of the July 2021 Collared Rate Increase Exceeding ThresholdThreshold Increase Base Rate Net Rate3% of Pay 5% 8%4% of Pay 1% 3%5% of Pay <1% <1%6% of Pay <1% <1%
This work product was prepared for discussion purposes only and may not be appropriate to use for other purposes.Milliman does not intend to benefit and assumes no duty or liability to other parties who receive this work. Anyrecipient of this work product who desires professional guidance should engage qualified professionals for adviceappropriate to its own specific needs.

30
Variable Return Model Stress Test
Likelihood in the model of cumulative July 2021 and July 2023 collared rate increases exceeding a selected threshold For example, a scenario with increases of 4% of pay at July 2021 and 2% of pay
in July 2023 would reach the 6% of pay cumulative threshold
Likelihood of Cumulative July 2021 and July 2023 CollaredRate Increases Exceeding Threshold
Threshold Increase Base Rate Net Rate6% of Pay 16% 21%8% of Pay 8% 12%10% of Pay 3% 6%12% of Pay 1% 3%
This work product was prepared for discussion purposes only and may not be appropriate to use for other purposes.Milliman does not intend to benefit and assumes no duty or liability to other parties who receive this work. Anyrecipient of this work product who desires professional guidance should engage qualified professionals for adviceappropriate to its own specific needs.

31
Wrap Up / Next Steps
At the January 31, 2020 meeting, preliminary year-end 2019 investment results will be available We can then comment as warranted on estimated impact on the 12/31/2019
actuarial valuation results, which will develop 2021 – 2023 contribution rates
This work product was prepared for discussion purposes only and may not be appropriate to use for other purposes.Milliman does not intend to benefit and assumes no duty or liability to other parties who receive this work. Anyrecipient of this work product who desires professional guidance should engage qualified professionals for adviceappropriate to its own specific needs.

Appendix
This work product was prepared for discussion purposes only and may not be appropriate to use for other purposes. Milliman does not intend tobenefit and assumes no duty or liability to other parties who receive this work. Any recipient of this work product who desires professional guidanceshould engage qualified professionals for advice appropriate to its own specific needs.

33
Certification
This presentation summarizes deterministic and stochastic modeling for the Oregon Public Employees Retirement System (“PERS” or “the System”) over a 20 year period beginning December 31, 2018 under a wide range of potential economic scenarios. The results are based upon the same assumptions, methods, and plan provisions as described in the December 31, 2018 System-Wide Actuarial Valuation Report, except where noted otherwise.
In preparing this report, we relied, without audit, on information (some oral and some in writing) supplied by the System’s staff. This information includes, but is not limited to, statutory provisions, employee data, and financial information. We found thisinformation to be reasonably consistent and comparable with information used for other purposes. The valuation results depend on the integrity of this information. If any of this information is inaccurate or incomplete our results may be different and our calculations may need to be revised.
All costs, liabilities, rates of interest, and other factors for the System have been determined on the basis of actuarial assumptions and methods which are individually reasonable (taking into account the experience of the System and reasonable expectations); and which, in combination, offer our best estimate of anticipated experience affecting the System.
Future actuarial measurements may differ significantly from the current measurements presented in this report due to such factors as the following: plan experience differing from that anticipated by the economic or demographic assumptions; changesin economic or demographic assumptions; increases or decreases expected as part of the natural operation of the methodology used for these measurements (such as the end of an amortization period or additional cost or contribution requirements based on the plan's funded status); and changes in plan provisions or applicable law. Due to the limited scope of our assignment, we did not perform an analysis of the potential range of future measurements. The PERS Board has the final decision regarding the appropriateness of the assumptions.
Actuarial computations presented in this report are for purposes of determining the recommended funding amounts for the System. The computations prepared for other purposes may differ as disclosed in our report. The calculations in the enclosedreport have been made on a basis consistent with our understanding of the System’s funding requirements and goals.
This work product was prepared for discussion purposes only and may not be appropriate to use for other purposes.Milliman does not intend to benefit and assumes no duty or liability to other parties who receive this work. Anyrecipient of this work product who desires professional guidance should engage qualified professionals for adviceappropriate to its own specific needs.

34
Certification
The calculations in this report have been made on a basis consistent with our understanding of the plan provisions described in the appendix of this report. Determinations for purposes other than meeting these requirements may be significantly different from the results contained in this report. Accordingly, additional determinations may be needed for other purposes.
Milliman’s work is prepared solely for the internal business use of the Oregon Public Employees Retirement System. Milliman does not intend to benefit or create a legal duty to any third party recipient of its work product.
No third party recipient of Milliman's work product should rely upon Milliman's work product. Such recipients should engage qualified professionals for advice appropriate to their own specific needs.
The consultants who worked on this assignment are pension actuaries. Milliman’s advice is not intended to be a substitute for qualified legal or accounting counsel.
The signing actuaries are independent of the System. We are not aware of any relationship that would impair the objectivity of our work.
On the basis of the foregoing, we hereby certify that, to the best of our knowledge and belief, this report is complete and accurate and has been prepared in accordance with generally recognized and accepted actuarial principles and practices. We are members of the American Academy of Actuaries and meet the Qualification Standards to render the actuarial opinion contained herein.
This work product was prepared for discussion purposes only and may not be appropriate to use for other purposes.Milliman does not intend to benefit and assumes no duty or liability to other parties who receive this work. Anyrecipient of this work product who desires professional guidance should engage qualified professionals for adviceappropriate to its own specific needs.

35
AppendixActuarial BasisDataWe have based our calculation of the liabilities on the data supplied by the Oregon Public Employees Retirement System and summarized in the Valuation Report.
Assets as of December 31, 2018, were based on values provided by Oregon PERS reflecting the Board’s earnings crediting decisions for 2018, as shown in the Valuation Report. Financial model projections reflect September 30, 2019 investment results for regular and variable accounts as published by Oregon State Treasury.
Methods / PoliciesActuarial Cost Method: Entry Age Normal, adopted effective December 31, 2012.
UAL Amortization: The UAL for OPSRP and Retiree Health Care as of December 31, 2007 are amortized as a level percentage of combined valuation payroll over a closed 16 year period for OPSRP and a closed 10 year period for Retiree Health Care. For the Tier 1/Tier 2 UAL, the amortization period was reset at 20 years as of December 31, 2013, and will be reset at 22 years as of December 31, 2019, as required by Senate Bill 1049. Gains and losses between subsequent odd-year valuations are amortized as a level percentage of combined valuation payroll over the amortization period (20 years for Tier/Tier 1, 16 years for OPSRP, 10 years for Retiree Health Care) from the odd-year valuation in which they are first recognized.
Contribution rate stabilization method: Contribution rates for a rate pool (e.g. Tier 1/Tier 2 SLGRP, Tier 1/Tier 2 School Districts, OPSRP) are confined to a collar based on the prior contribution rate (prior to application of side accounts, pre-SLGRP liabilities, and 6 percent Independent Employer minimum). The new contribution rate will generally not increase or decrease from the prior contribution rate by more than the greater of 3 percentage points or 20 percent of the prior contribution rate. If the funded percentage excluding side accounts drops below 60% or increases above 140%, the size of the collar doubles. If the funded percentage excluding side accounts is between 60% and 70% or between 130% and 140%, the size of the rate collar is increased on a graded scale.
This work product was prepared for discussion purposes only and may not be appropriate to use for other purposes.Milliman does not intend to benefit and assumes no duty or liability to other parties who receive this work. Anyrecipient of this work product who desires professional guidance should engage qualified professionals for adviceappropriate to its own specific needs.

36
Appendix
Methods / Policies (cont’d)
Expenses: Annual administration expenses are assumed to be $32.5M for Tier 1/Tier 2 and $8.0M for OPSRP, as described in the 2018 Experience Study Report, and are added to the corresponding normal cost for the year in which they are incurred. Administration expenses for each year after 2020 are assumed to increase with inflation, which varies by scenario based on capital market assumptions.
Actuarial Value of Assets: Equal to Market Value of Assets excluding Contingency and Tier 1 Rate Guarantee Reserves. The Tier 1 Rate Guarantee Reserve is not excluded from assets if it is negative (i.e. in deficit status).
AssumptionsAssumptions for valuation calculations are as described in the 2018 Experience Study Report.
ProvisionsProvisions valued are as detailed in the December 31, 2018 System-Wide Actuarial Valuation Report.
Actuarial Basis
This work product was prepared for discussion purposes only and may not be appropriate to use for other purposes.Milliman does not intend to benefit and assumes no duty or liability to other parties who receive this work. Anyrecipient of this work product who desires professional guidance should engage qualified professionals for adviceappropriate to its own specific needs.

37
Appendix Rate Projection BasisAssumptionsIn general, all assumptions are as described in the 2018 Experience Study Report.
The major actuarial valuation assumptions used in our projections are shown below. They are aggregate average assumptions that apply to the whole population and were held constant throughout the projection period. The economic experience adjustments were allowed to vary in future years given the conditions defined in each economic scenario.
Valuation interest rate – 7.20%
Tier 1 Regular account growth – 7.20%
Actual fund investment return – Varies by scenario according to capital market assumptions
Variable account growth – Equal to investment return on public equity portion of the fund
Inflation assumption – 2.50%
Inflation experience – Varies by scenario according to capital market assumptions
Wage growth assumption – 3.50%
Wage growth experience – 1.00% greater than inflation experience
Demographic experience – as described in 2018 Experience Study Report
New entrant experience – New members are assumed to be hired at the rate necessary to keep the total number of members in each job class (General Service, School District, Police & Fire, and Judges) constant over the duration of the projection. All new entrants other than judges are assumed to join as OPSRP members. New entrant pay is assumed to grow at the rate necessary for overall system payroll to increase with wage growth experience, as described above.
This work product was prepared for discussion purposes only and may not be appropriate to use for other purposes.Milliman does not intend to benefit and assumes no duty or liability to other parties who receive this work. Anyrecipient of this work product who desires professional guidance should engage qualified professionals for adviceappropriate to its own specific needs.

38
Appendix Rate Projection BasisReserve ProjectionContingency Reserve as of 12/31/2018 was $50.0M. No future increases or decreases to this reserve were assumed.
The Tier 1 Rate Guarantee Reserve (“RGR”) was $257.6M as of 12/31/2018. The RGR was assumed to grow with excess returns above the 7.20% target growth on Tier 1 Member Accounts. When modeled aggregate returns were below 7.20%, applicable amounts from the RGR were assumed to transfer to Tier 1 Member Accounts to maintain the 7.20% target growth rate. The RGR is allowed to be negative, but the reserve is not excluded from valuation assets when it is negative. We did not include in rates any potential additional employer levy that could be required to eliminate a persistent negative RGR.
Offset for Member Redirect ContributionsUnder Senate Bill 1049, a portion of the 6% of pay member contribution previously made to the IAP will be redirected to fund Tier 1/Tier 2 and OPSRP defined benefits beginning July 1, 2020. For Tier 1/Tier 2 members, the redirected amount will be 2.50% of pay, and for OPSRP it will be 0.75% of pay. Members with less than $2,500 in monthly pay (indexed in future years) will be exempt from the redirection.
For the rate projection, member redirect contributions are assumed to offset the contribution rates paid by employers beginning with the July 2021 – June 2023 biennium. The offset is assumed to be 2.45% of total payroll for Tier 1/Tier 2 and 0.70% of total payroll for OPSRP.
This work product was prepared for discussion purposes only and may not be appropriate to use for other purposes.Milliman does not intend to benefit and assumes no duty or liability to other parties who receive this work. Anyrecipient of this work product who desires professional guidance should engage qualified professionals for adviceappropriate to its own specific needs.

39
Appendix Rate Projection Basis
Capital Market ModelFor each 20-year projection, we ran 10,000 stochastic scenarios for inflation and asset class rates of return. The scenarios were calibrated to represent Milliman’s capital market assumptions in terms of expected average real returns, the expected year-to-year volatility of the returns, and the expected correlation between the returns of different asset classes. Annual rates of return for each of the asset classes and inflation are generated from a multivariate lognormal probability distribution. Rates of return are independent from year to year.
For this purpose, we considered the Oregon PERS Fund to be allocated among the model’s asset classes as shown on the following slide. This allocation is based on the OIC’s Statement of Investment Objectives and Policy Framework for the Oregon PERS Fund, as revised in April 2019.
This work product was prepared for discussion purposes only and may not be appropriate to use for other purposes.Milliman does not intend to benefit and assumes no duty or liability to other parties who receive this work. Anyrecipient of this work product who desires professional guidance should engage qualified professionals for adviceappropriate to its own specific needs.

40
Appendix Rate Projection BasisCapital Market ModelReflects Milliman’s capital market assumptions as of July 1, 2019.
This work product was prepared for discussion purposes only and may not be appropriate to use for other purposes.Milliman does not intend to benefit and assumes no duty or liability to other parties who receive this work. Anyrecipient of this work product who desires professional guidance should engage qualified professionals for adviceappropriate to its own specific needs.
* The model’s 20-year annualized geometric median is 6.84%.
Annual Arithmetic Mean
20-Year Annualized Geometric
MeanAnnual Standard
DeviationPolicy
AllocationUS Large/Mid-Cap Equity 7.07% 5.99% 15.70% 16.17%US Small Cap Equity 8.23% 6.49% 20.15% 1.35%US Micro-Cap Equity 8.84% 6.69% 22.50% 1.35%Non-US Developed Equity 8.54% 7.14% 18.05% 13.48%Emerging Markets Equity 10.69% 8.04% 25.30% 4.24%Non-US Small Cap Equity 9.13% 7.54% 19.30% 1.93%Private Equity 11.92% 8.29% 30.00% 17.50%US Core Fixed Income 3.95% 3.88% 3.90% 9.60%US Short-Term Bonds 3.44% 3.42% 2.10% 9.60%US Bank/Leveraged Loans 5.32% 5.10% 6.90% 3.60%High Yield Bonds 6.22% 5.83% 9.40% 1.20%Real Estate 6.43% 5.79% 12.00% 10.00%Global REITs 8.09% 6.49% 19.25% 2.50%Timber 6.64% 5.89% 13.00% 1.13%Farmland 7.13% 6.39% 13.00% 1.13%Infrastructure 7.38% 6.54% 13.85% 2.25%Commodities 5.44% 3.89% 18.70% 1.13%Hedge Fund of Funds - Diversified 4.51% 4.29% 6.95% 1.50%Hedge Fund Event-Driven 6.09% 5.79% 8.15% 0.38%US Inflation (CPI-U) 2.50% 2.50% 1.65% N/A
Fund Total (reflecting asset class correlations) 7.53% 6.88%* 12.22% 100.00%

Employer NameEmployer Number
Tier 1/ Tier 2 Payroll
OPSRP General Service
Payroll
OPSRP Police and Fire Payroll
Net Employer Contribution Rate 7/1/19 - 6/30/21
Tier 1/ Tier 2 Payroll
(reflects 2.45% member
redirect offset)
OPSRP General
Service Payroll
OPSRP Police and Fire Payroll
Advisory Net Employer Contribution Rate7/1/21 - 6/30/23
Rates shown reflect the effect of side account rate offsets and retiree healthcare contributions,and exclude contributions to the IAP and debt service for pension obligation bonds.
Summary of PERS Employer Contribution Rates
(reflects 0.70% member redirect offset)
Independent Employers
City
City of Athena2167 13.89% 12.38% 17.01% 14.74% 15.00% 19.37%
City of Beaverton2106 21.45% 12.45% 17.08% 24.89% 17.96% 22.33%
City of Bend2107 24.88% 16.20% 20.83% 23.65% 16.85% 21.22%
City of Canyonville2149 20.88% 14.84% 19.47% 22.99% 19.50% 23.87%
City of Chiloquin2186 15.51% 7.28% 11.91% 14.24% 7.42% 11.79%
City of Clatskanie2162 23.41% 15.96% 20.59% 28.71% 21.74% 26.11%
City of Coos Bay2152 24.50% 13.41% 18.04% 27.87% 18.10% 22.47%
City of Cornelius2165 19.16% 12.95% 17.58% 20.54% 16.18% 20.55%
City of Cottage Grove2127 25.27% 13.87% 18.50% 27.87% 19.24% 23.61%
City of Culver2257 28.12% 23.67% 28.30% 36.61% 33.86% 38.23%
City of Dufur2262 23.61% 15.03% 19.66% 28.53% 21.96% 26.33%
City of Eagle Point2282 22.91% 13.10% 17.73% 28.46% 20.48% 24.85%
City of Eugene2111 25.07% 16.23% 20.86% 27.63% 20.83% 25.20%
City Of Forest Grove2112 18.69% 10.27% 14.90% 15.99% 10.21% 14.58%
City of Fossil2248 15.92% 0.00% 1.74% 16.77% 10.20% 14.57%
City of Gearhart2309 19.22% 9.43% 14.06% 20.61% 11.76% 16.13%
City of Gervais2264 17.88% 13.79% 18.42% 18.94% 16.01% 20.38%
City of Gold Beach2250 18.93% 11.62% 16.25% 18.02% 12.57% 16.94%
City of Gresham2114 18.66% 8.29% 12.92% 23.78% 15.63% 20.00%
City of Helix2210 15.86% 7.28% 11.91% 16.71% 10.14% 14.51%
City of Hillsboro2115 22.95% 14.99% 19.62% 24.40% 18.38% 22.75%
City of Jacksonville2222 21.86% 12.34% 16.97% 23.78% 18.17% 22.54%
City of Joseph2232 24.91% 16.33% 20.96% 27.44% 20.87% 25.24%
City of Keizer2279 20.65% 9.49% 14.12% 23.48% 14.11% 18.48%
City of Maupin2283 15.97% 6.76% 11.39% 18.02% 10.66% 15.03%
City of Merrill2246 12.98% 0.00% 4.33% 13.83% 0.00% 4.31%
City of Metolius2195 7.45% 0.00% 0.00% 5.31% 0.00% 1.72%
City of Molalla2290 17.33% 10.94% 15.57% 17.77% 13.54% 17.91%
City of Mt Angel2174 17.05% 10.33% 14.96% 18.01% 13.95% 18.32%
City of Ontario2118 35.17% 24.95% 29.58% 43.79% 35.19% 39.56%
City of Powers2215 N/A N/A N/A 5.31% 0.00% 0.00%
City of Prairie City2218 16.23% 14.81% 19.44% 19.18% 19.20% 23.57%
City of Prineville2146 14.62% 6.97% 11.60% 18.52% 12.70% 17.07%
City of Rainier2297 19.22% 8.75% 13.38% 20.96% 10.44% 14.81%
City of Salem2101 25.49% 16.41% 21.04% 26.26% 19.44% 23.81%
City of Sheridan2219 17.90% 13.52% 18.15% 19.03% 16.11% 20.48%
City of Stanfield2213 10.01% 0.00% 0.00% 10.86% 0.00% 2.75%
Issued December 2019 Page 1 of 18

Employer NameEmployer Number
Tier 1/ Tier 2 Payroll
OPSRP General Service
Payroll
OPSRP Police and Fire Payroll
Net Employer Contribution Rate 7/1/19 - 6/30/21
Tier 1/ Tier 2 Payroll
(reflects 2.45% member
redirect offset)
OPSRP General
Service Payroll
OPSRP Police and Fire Payroll
Advisory Net Employer Contribution Rate7/1/21 - 6/30/23
Rates shown reflect the effect of side account rate offsets and retiree healthcare contributions,and exclude contributions to the IAP and debt service for pension obligation bonds.
Summary of PERS Employer Contribution Rates
(reflects 0.70% member redirect offset)
Independent Employers
City
City of Sweet Home2129 12.98% 3.36% 7.99% 13.83% 6.05% 10.42%
City of Waldport2261 15.20% 7.83% 12.46% 16.05% 10.64% 15.01%
City of Willamina2189 7.45% 0.00% 3.24% 5.31% 1.30% 5.67%
Town of Butte Falls2253 15.92% 8.58% 13.21% 16.77% 12.09% 16.46%
County
Clackamas County2001 27.07% 19.22% 23.85% 28.87% 23.09% 27.46%
Curry County2002 26.06% 15.46% 20.09% 29.80% 21.87% 26.24%
Douglas County2003 38.00% 27.86% 32.49% 45.34% 37.54% 41.91%
Jefferson County2006 21.97% 12.20% 16.83% 23.18% 16.34% 20.71%
Lane County2008 21.87% 14.22% 18.85% 23.79% 18.28% 22.65%
Linn County2014 27.17% 18.55% 23.18% 31.18% 24.62% 28.99%
Malheur County2039 20.90% 12.90% 17.53% 22.63% 16.44% 20.81%
Polk County2037 24.54% 16.76% 21.39% 27.50% 21.74% 26.11%
Wallowa County2050 14.03% 0.00% 0.75% 14.88% 2.51% 6.88%
Yamhill County2015 19.22% 10.98% 15.61% 20.61% 14.35% 18.72%
Special Districts
Applegate Valley Rural Fire Protection District #92664 20.70% 10.76% 15.39% 26.23% 14.90% 19.27%
Banks Fire District #132702 27.02% 13.83% 18.46% 25.18% 14.17% 18.54%
Bend Parks & Recreation2596 18.82% 13.75% 18.38% 19.20% 16.15% 20.52%
Black Butte Ranch Rural Fire Protection District2648 19.22% 5.62% 10.25% 20.61% 8.74% 13.11%
Boardman Rural Fire Protection District2833 23.91% 11.09% 15.72% 21.83% 10.94% 15.31%
Brownsville Rural Fire Protection District2779 19.11% 7.33% 11.96% 20.48% 9.70% 14.07%
Central Oregon Regional Housing Authority2678 15.49% 12.70% 17.33% 16.34% 15.63% 20.00%
Chiloquin Agency Lake Rural Fire Protection District2645 22.40% 13.82% 18.45% 22.86% 14.86% 19.23%
City-County Insurance Services2693 15.94% 11.43% 16.06% 14.47% 11.68% 16.05%
Clackamas County Housing Authority2518 25.27% 17.75% 22.38% 27.31% 22.64% 27.01%
Clackamas River Water Providers2870 12.50% 12.13% 16.76% 11.03% 12.48% 16.85%
Columbia River Public Utility District2679 20.78% 16.53% 21.16% 24.79% 22.31% 26.68%
Deschutes Public Library District2828 19.39% 14.29% 18.92% 18.87% 15.29% 19.66%
Deschutes Valley Water District2527 19.47% 14.17% 18.80% 25.87% 22.38% 26.75%
Douglas County Fire District #22729 44.82% 32.41% 37.04% 59.99% 50.24% 54.61%
Douglas Soil & Water Conservation District2743 8.45% 0.00% 0.75% 10.20% 0.00% 1.98%
East Fork Irrigation District2529 16.80% 2.81% 7.44% 17.71% 3.94% 8.31%
Estacada Cemetery District2618 7.45% 0.00% 0.00% 5.31% 0.00% 0.00%
Evans Valley Fire District #62623 11.44% 0.00% 3.13% 12.29% 5.72% 10.09%
Fern Ridge Community Library2785 13.69% 2.01% 6.64% 14.54% 7.97% 12.34%
Gaston Rural Fire Protection District2608 16.73% 8.15% 12.78% 17.62% 11.05% 15.42%
Issued December 2019 Page 2 of 18

Employer NameEmployer Number
Tier 1/ Tier 2 Payroll
OPSRP General Service
Payroll
OPSRP Police and Fire Payroll
Net Employer Contribution Rate 7/1/19 - 6/30/21
Tier 1/ Tier 2 Payroll
(reflects 2.45% member
redirect offset)
OPSRP General
Service Payroll
OPSRP Police and Fire Payroll
Advisory Net Employer Contribution Rate7/1/21 - 6/30/23
Rates shown reflect the effect of side account rate offsets and retiree healthcare contributions,and exclude contributions to the IAP and debt service for pension obligation bonds.
Summary of PERS Employer Contribution Rates
(reflects 0.70% member redirect offset)
Independent Employers
Special Districts
Halsey Shedd Rural Fire Protection District2698 16.49% 10.12% 14.75% 20.34% 15.53% 19.90%
Harbor Water PUD2771 16.55% 5.50% 10.13% 17.41% 12.13% 16.50%
Ice Fountain Water District2717 19.22% 12.83% 17.46% 18.45% 13.87% 18.24%
Jackson County Fire District #52556 32.25% 19.23% 23.86% 41.39% 30.75% 35.12%
Jefferson County Rural Fire Protection District #12575 20.78% 13.34% 17.97% 22.48% 16.87% 21.24%
Jefferson County Soil & Water Conservation District2841 14.01% 11.52% 16.15% 13.97% 13.50% 17.87%
Klamath County Fire District #12515 34.78% 23.01% 27.64% 45.69% 36.47% 40.84%
Lake Chinook Fire and Rescue District2881 18.58% 10.00% 14.63% 16.47% 9.90% 14.27%
Lake Health District2892 N/A N/A N/A 16.47% 9.90% 14.27%
Lakeside Water District2644 16.41% 12.90% 17.53% 14.33% 12.82% 17.19%
League of Oregon Cities2521 25.16% 22.19% 26.82% 31.40% 30.14% 34.51%
Mapleton Water District2597 18.12% 9.41% 14.04% 15.01% 7.83% 12.20%
Mid-Columbia Fire And Rescue V1-8012877 19.98% 10.20% 14.83% 16.57% 10.00% 14.37%
Mid-valley Behavioral Care Network2889 N/A N/A N/A 13.91% 9.93% 14.30%
Millington Rural Fire Protection District2782 12.98% 0.00% 2.29% 16.83% 10.26% 14.63%
Mt Angel Fire District2861 19.68% 8.51% 13.14% 19.82% 10.92% 15.29%
Nehalem Bay Wastewater Agency2724 15.92% 7.67% 12.30% 16.77% 9.63% 14.00%
Neskowin Regional Sanitary Authority2740 11.97% 6.05% 10.68% 12.00% 7.55% 11.92%
North Clackamas County Water Commission2835 20.14% 13.26% 17.89% 24.75% 19.74% 24.11%
Northeast Oregon Housing Authority2637 17.08% 7.21% 11.84% 18.35% 10.07% 14.44%
Nyssa Road Assessment District #22550 29.33% 18.42% 23.05% 28.28% 25.02% 29.39%
Oregon Community College Association2685 12.67% 8.61% 13.24% 13.52% 7.24% 11.61%
Oregon Municipal Electric Utilities Association2876 14.72% 6.14% 10.77% 15.57% 9.00% 13.37%
Owyhee Irrigation District2533 31.91% 23.94% 28.57% 29.47% 23.44% 27.81%
Polk County Fire District #12688 26.42% 15.24% 19.87% 27.40% 18.25% 22.62%
Polk Soil & Water Conservation District2613 20.77% 13.14% 17.77% 15.85% 13.62% 17.99%
Port of Astoria2507 15.70% 12.83% 17.46% 15.20% 13.83% 18.20%
Port of Cascade Locks2633 13.26% 7.44% 12.07% 14.11% 10.85% 15.22%
Port of Hood River2788 19.13% 14.02% 18.65% 19.22% 16.00% 20.37%
Port of St Helens2570 11.34% 8.38% 13.01% 12.02% 10.35% 14.72%
Port of Umatilla2581 25.93% 9.10% 13.73% 28.66% 18.56% 22.93%
Redmond Area Park & Recreation District2689 16.33% 11.27% 15.90% 15.54% 12.17% 16.54%
Rockwood Water PUD2672 22.65% 16.76% 21.39% 26.14% 22.12% 26.49%
Salem Housing Authority2747 23.83% 19.02% 23.65% 27.92% 25.20% 29.57%
Salmon Harbor-Douglas County2675 15.92% 12.87% 17.50% 16.77% 15.60% 19.97%
Siletz Rural Fire Protection District2885 18.58% 10.00% 14.63% 16.47% 9.90% 14.27%
Sisters-Camp Sherman Rural Fire Protection District2701 40.06% 27.19% 31.82% 41.09% 30.04% 34.41%
Issued December 2019 Page 3 of 18

Employer NameEmployer Number
Tier 1/ Tier 2 Payroll
OPSRP General Service
Payroll
OPSRP Police and Fire Payroll
Net Employer Contribution Rate 7/1/19 - 6/30/21
Tier 1/ Tier 2 Payroll
(reflects 2.45% member
redirect offset)
OPSRP General
Service Payroll
OPSRP Police and Fire Payroll
Advisory Net Employer Contribution Rate7/1/21 - 6/30/23
Rates shown reflect the effect of side account rate offsets and retiree healthcare contributions,and exclude contributions to the IAP and debt service for pension obligation bonds.
Summary of PERS Employer Contribution Rates
(reflects 0.70% member redirect offset)
Independent Employers
Special Districts
South Lane County Fire and Rescue2859 35.45% 23.46% 28.09% 33.02% 23.67% 28.04%
Sunrise Water Authority2845 20.34% 17.91% 22.54% 16.71% 16.05% 20.42%
Sweet Home Cemetery2643 20.65% 11.88% 16.51% 19.01% 12.00% 16.37%
Tillamook 9-1-12722 12.98% 7.42% 12.05% 13.83% 11.38% 15.75%
Tillamook County Soil And Water Conservation District2821 19.85% 14.49% 19.12% 20.00% 16.17% 20.54%
Tillamook Fire District2783 20.52% 7.62% 12.25% 22.17% 13.41% 17.78%
Tri-County Cooperative Weed Management Area2865 18.98% 10.40% 15.03% 17.46% 10.89% 15.26%
Turner Fire District2610 22.47% 5.84% 10.47% 24.51% 2.57% 6.94%
Umatilla County Fire District #12887 30.73% 19.88% 24.51% 27.02% 18.14% 22.51%
Umatilla-Morrow Radio and Data District2874 13.70% 10.92% 15.55% 12.58% 11.45% 15.82%
Valley View Cemetery2536 7.45% 0.00% 0.00% 5.31% 0.00% 0.00%
Vernonia Fire2797 12.02% 8.98% 13.61% 6.82% 5.32% 9.69%
West Side Rural Fire Protection District2796 10.27% 1.69% 6.32% 11.12% 4.55% 8.92%
West Valley Fire District2725 21.86% 10.04% 14.67% 21.34% 14.28% 18.65%
Winchester Bay Sanitary District2714 20.93% 13.27% 17.90% 24.50% 19.75% 24.12%
Yamhill Fire Protection District2878 15.00% 11.11% 15.74% 11.85% 10.04% 14.41%
Issued December 2019 Page 4 of 18

Employer NameEmployer Number
Tier 1/ Tier 2 Payroll
OPSRP General Service
Payroll
OPSRP Police and Fire Payroll
Net Employer Contribution Rate 7/1/19 - 6/30/21
Tier 1/ Tier 2 Payroll
(reflects 2.45% member
redirect offset)
OPSRP General
Service Payroll
OPSRP Police and Fire Payroll
Advisory Net Employer Contribution Rate7/1/21 - 6/30/23
Rates shown reflect the effect of side account rate offsets and retiree healthcare contributions,and exclude contributions to the IAP and debt service for pension obligation bonds.
Summary of PERS Employer Contribution Rates
(reflects 0.70% member redirect offset)
Judiciary - member redirect offset does not apply
State Judiciary2099 20.92% N/A N/A 24.94% N/A N/A
Issued December 2019 Page 5 of 18

Employer NameEmployer Number
Tier 1/ Tier 2 Payroll
OPSRP General Service
Payroll
OPSRP Police and Fire Payroll
Net Employer Contribution Rate 7/1/19 - 6/30/21
Tier 1/ Tier 2 Payroll
(reflects 2.45% member
redirect offset)
OPSRP General
Service Payroll
OPSRP Police and Fire Payroll
Advisory Net Employer Contribution Rate7/1/21 - 6/30/23
Rates shown reflect the effect of side account rate offsets and retiree healthcare contributions,and exclude contributions to the IAP and debt service for pension obligation bonds.
Summary of PERS Employer Contribution Rates
(reflects 0.70% member redirect offset)
School Districts
School
Amity School District4306 8.29% 2.84% 7.47% 8.16% 4.93% 9.30%
Baker School District #5J3003 20.04% 14.59% 19.22% 19.01% 15.78% 20.15%
Banks School District4035 26.91% 21.46% 26.09% 25.39% 22.16% 26.53%
Beaverton School District4062 22.86% 17.41% 22.04% 21.93% 18.70% 23.07%
Bend-La Pine Public Schools3291 22.76% 17.31% 21.94% 21.64% 18.41% 22.78%
Brookings-Harbor School District #17C3283 14.83% 9.38% 14.01% 14.23% 11.00% 15.37%
Canby School District4333 11.46% 6.01% 10.64% 11.65% 8.42% 12.79%
Cascade School District #54334 14.33% 8.88% 13.51% 14.49% 11.26% 15.63%
Central School District #13J3859 17.27% 11.82% 16.45% 16.46% 13.23% 17.60%
Clackamas Education Service District4259 18.99% 13.54% 18.17% 18.20% 14.97% 19.34%
Clatsop County School District #1C3179 6.11% 0.66% 5.29% 5.55% 2.32% 6.69%
Coos Bay School District #93242 24.86% 19.41% 24.04% 23.50% 20.27% 24.64%
Corvallis School District #509J3039 18.77% 13.32% 17.95% 18.25% 15.02% 19.39%
Creswell School District #403502 26.82% 21.37% 26.00% 25.35% 22.12% 26.49%
Crook County School District3274 9.57% 4.12% 8.75% 10.06% 6.83% 11.20%
David Douglas School District3843 28.45% 23.00% 27.63% 26.79% 23.56% 27.93%
Dayton Public Schools4291 12.93% 7.48% 12.11% 12.09% 8.86% 13.23%
Douglas Education Service District4237 27.16% 21.71% 26.34% 25.68% 22.45% 26.82%
Echo School District3927 21.42% 15.97% 20.60% 20.79% 17.56% 21.93%
Estacada School District #1084323 18.48% 13.03% 17.66% 17.15% 13.92% 18.29%
Eugene School District 4J3473 26.16% 20.71% 25.34% 24.72% 21.49% 25.86%
Falls City School District3887 9.48% 4.03% 8.66% 13.02% 9.79% 14.16%
Fern Ridge School District3494 18.14% 12.69% 17.32% 17.31% 14.08% 18.45%
Forest Grove School District4313 24.20% 18.75% 23.38% 22.94% 19.71% 24.08%
Gaston Public Schools4034 15.48% 10.03% 14.66% 13.54% 10.31% 14.68%
Gervais School District #14329 7.87% 2.42% 7.05% 7.07% 3.84% 8.21%
Gladstone School District #1153160 7.82% 2.37% 7.00% 6.71% 3.48% 7.85%
Glide School District #123316 20.46% 15.01% 19.64% 20.69% 17.46% 21.83%
Greater Albany School District #8J4260 23.14% 17.69% 22.32% 22.07% 18.84% 23.21%
Gresham-Barlow School District #104332 17.89% 12.44% 17.07% 17.02% 13.79% 18.16%
Harney County School District #34326 0.06% 0.00% 0.00% 0.05% 0.00% 0.00%
Hermiston School District #8R4258 22.06% 16.61% 21.24% 21.26% 18.03% 22.40%
High Desert Education Service District4252 22.04% 16.59% 21.22% 21.14% 17.91% 22.28%
Hillsboro School District #1J4341 21.73% 16.28% 20.91% 20.62% 17.39% 21.76%
Hood River County School District3409 20.03% 14.58% 19.21% 18.92% 15.69% 20.06%
InterMountain Education Service District4223 19.06% 13.61% 18.24% 18.54% 15.31% 19.68%
Jefferson School District #14Cj3729 14.27% 8.82% 13.45% 11.69% 8.46% 12.83%
Issued December 2019 Page 6 of 18

Employer NameEmployer Number
Tier 1/ Tier 2 Payroll
OPSRP General Service
Payroll
OPSRP Police and Fire Payroll
Net Employer Contribution Rate 7/1/19 - 6/30/21
Tier 1/ Tier 2 Payroll
(reflects 2.45% member
redirect offset)
OPSRP General
Service Payroll
OPSRP Police and Fire Payroll
Advisory Net Employer Contribution Rate7/1/21 - 6/30/23
Rates shown reflect the effect of side account rate offsets and retiree healthcare contributions,and exclude contributions to the IAP and debt service for pension obligation bonds.
Summary of PERS Employer Contribution Rates
(reflects 0.70% member redirect offset)
School Districts
School
John Day School District4315 14.74% 9.29% 13.92% 14.09% 10.86% 15.23%
Junction City School District #693520 21.24% 15.79% 20.42% 19.00% 15.77% 20.14%
La Grande Public Schools3965 19.90% 14.45% 19.08% 18.91% 15.68% 20.05%
Lake Oswego School District4268 18.28% 12.83% 17.46% 18.04% 14.81% 19.18%
Lane County Education Service District4276 23.54% 18.09% 22.72% 22.15% 18.92% 23.29%
Lincoln County School District3579 0.06% 0.00% 0.00% 0.05% 0.00% 0.00%
Madras School District3447 23.40% 17.95% 22.58% 21.63% 18.40% 22.77%
McMinnville Schools4142 23.07% 17.62% 22.25% 21.75% 18.52% 22.89%
Medford School District #549C4288 26.96% 21.51% 26.14% 25.33% 22.10% 26.47%
Milton-Freewater Unified School District #74335 9.80% 4.35% 8.98% 10.38% 7.15% 11.52%
Molalla River School District4331 3.21% 0.00% 2.39% 2.73% 0.00% 3.87%
Monroe School District #1J4340 21.95% 16.50% 21.13% 20.37% 17.14% 21.51%
Monument School District #83372 16.62% 11.17% 15.80% 15.40% 12.17% 16.54%
Morrow County Schools3809 23.63% 18.18% 22.81% 22.21% 18.98% 23.35%
Multnomah Education Service District4238 14.56% 9.11% 13.74% 15.50% 12.27% 16.64%
Nestucca Valley School District #1014336 22.76% 17.31% 21.94% 21.06% 17.83% 22.20%
Newberg School District #29Jt4135 15.88% 10.43% 15.06% 12.99% 9.76% 14.13%
North Bend Public Schools3245 22.32% 16.87% 21.50% 21.02% 17.79% 22.16%
North Clackamas School District #124321 16.75% 11.30% 15.93% 15.92% 12.69% 17.06%
North Marion School District #153730 17.72% 12.27% 16.90% 16.64% 13.41% 17.78%
North Santiam School District #29J4342 13.57% 8.12% 12.75% 12.76% 9.53% 13.90%
North Wasco County School District #214381 18.17% 12.72% 17.35% 17.82% 14.59% 18.96%
Ontario School District #8C3684 21.88% 16.43% 21.06% 20.75% 17.52% 21.89%
Oregon City School District #623122 21.05% 15.60% 20.23% 19.47% 16.24% 20.61%
Parkrose School District3820 23.92% 18.47% 23.10% 21.93% 18.70% 23.07%
Pendleton School District #16R3931 8.71% 3.26% 7.89% 8.04% 4.81% 9.18%
Philomath School District #17J3043 21.25% 15.80% 20.43% 21.10% 17.87% 22.24%
Phoenix-Talent School District3414 18.97% 13.52% 18.15% 17.03% 13.80% 18.17%
Pilot Rock School District #2R3958 16.97% 11.52% 16.15% 16.17% 12.94% 17.31%
Portland Public Schools3818 8.81% 3.36% 7.99% 10.22% 6.99% 11.36%
Prairie City School District #43370 25.06% 19.61% 24.24% 23.33% 20.10% 24.47%
Rainier School District #134320 15.50% 10.05% 14.68% 16.73% 13.50% 17.87%
Redmond School District #2J4311 23.28% 17.83% 22.46% 22.29% 19.06% 23.43%
Reedsport School District4312 18.09% 12.64% 17.27% 18.84% 15.61% 19.98%
Reynolds School District3824 15.44% 9.99% 14.62% 13.69% 10.46% 14.83%
Riverdale School3847 21.18% 15.73% 20.36% 18.76% 15.53% 19.90%
Roseburg Public Schools3310 15.32% 9.87% 14.50% 14.15% 10.92% 15.29%
Issued December 2019 Page 7 of 18

Employer NameEmployer Number
Tier 1/ Tier 2 Payroll
OPSRP General Service
Payroll
OPSRP Police and Fire Payroll
Net Employer Contribution Rate 7/1/19 - 6/30/21
Tier 1/ Tier 2 Payroll
(reflects 2.45% member
redirect offset)
OPSRP General
Service Payroll
OPSRP Police and Fire Payroll
Advisory Net Employer Contribution Rate7/1/21 - 6/30/23
Rates shown reflect the effect of side account rate offsets and retiree healthcare contributions,and exclude contributions to the IAP and debt service for pension obligation bonds.
Summary of PERS Employer Contribution Rates
(reflects 0.70% member redirect offset)
School Districts
School
Salem-Keizer Public Schools3735 20.96% 15.51% 20.14% 19.82% 16.59% 20.96%
Santiam Canyon School District3665 13.33% 7.88% 12.51% 15.23% 12.00% 16.37%
School Districts3000 32.03% 26.58% 31.21% 30.04% 26.81% 31.18%
Seaside Schools3187 21.09% 15.64% 20.27% 20.02% 16.79% 21.16%
Sherwood School District #88J4317 27.20% 21.75% 26.38% 25.64% 22.41% 26.78%
Silver Falls School District4270 21.21% 15.76% 20.39% 20.10% 16.87% 21.24%
Sisters School District3296 12.89% 7.44% 12.07% 9.60% 6.37% 10.74%
Siuslaw School District #97J3537 17.12% 11.67% 16.30% 15.99% 12.76% 17.13%
South Lane School District3506 12.41% 6.96% 11.59% 13.05% 9.82% 14.19%
South Umpqua School District3319 0.06% 0.00% 0.00% 0.05% 0.00% 0.00%
Springfield School District #193487 20.71% 15.26% 19.89% 19.92% 16.69% 21.06%
St Helens School District #5024279 9.07% 3.62% 8.25% 8.00% 4.77% 9.14%
Stanfield School District3942 14.08% 8.63% 13.26% 13.86% 10.63% 15.00%
Sutherlin School District #1303353 11.17% 5.72% 10.35% 9.85% 6.62% 10.99%
Sweet Home School District #553618 8.33% 2.88% 7.51% 10.38% 7.15% 11.52%
Three Rivers U J School District4338 20.80% 15.35% 19.98% 19.84% 16.61% 20.98%
Tigard-Tualatin School District #23J4316 27.59% 22.14% 26.77% 26.01% 22.78% 27.15%
Tillamook Public Schools3902 8.49% 3.04% 7.67% 9.42% 6.19% 10.56%
Umatilla School District #6R3928 24.08% 18.63% 23.26% 23.42% 20.19% 24.56%
Union County School District3966 17.16% 11.71% 16.34% 18.05% 14.82% 19.19%
Warrenton-Hammond School District3195 24.49% 19.04% 23.67% 23.46% 20.23% 24.60%
West Linn School District3075 24.25% 18.80% 23.43% 23.63% 20.40% 24.77%
Willamette Education Service District4254 10.86% 5.41% 10.04% 12.16% 8.93% 13.30%
Willamina School District #30J4314 27.35% 21.90% 26.53% 26.06% 22.83% 27.20%
Winston-Dillard Schools3349 0.06% 0.00% 0.00% 0.05% 0.00% 0.00%
Yamhill-Carlton School District #14166 0.11% 0.00% 0.00% 0.05% 0.00% 0.00%
Issued December 2019 Page 8 of 18

Employer NameEmployer Number
Tier 1/ Tier 2 Payroll
OPSRP General Service
Payroll
OPSRP Police and Fire Payroll
Net Employer Contribution Rate 7/1/19 - 6/30/21
Tier 1/ Tier 2 Payroll
(reflects 2.45% member
redirect offset)
OPSRP General
Service Payroll
OPSRP Police and Fire Payroll
Advisory Net Employer Contribution Rate7/1/21 - 6/30/23
Rates shown reflect the effect of side account rate offsets and retiree healthcare contributions,and exclude contributions to the IAP and debt service for pension obligation bonds.
Summary of PERS Employer Contribution Rates
(reflects 0.70% member redirect offset)
SLGRP (Default Tier 1/Tier 2 Rates)
CC
Blue Mountain Community College2901 18.16% 12.07% 16.70% 20.00% 16.00% 20.37%
Central Oregon Community College2999 22.54% 16.45% 21.08% 24.67% 20.67% 25.04%
Chemeketa Community College2919 15.75% 9.66% 14.29% 18.74% 14.74% 19.11%
Clackamas Community College2908 18.15% 12.06% 16.69% 20.99% 16.99% 21.36%
Clatsop Community College2900 15.17% 9.08% 13.71% 18.94% 14.94% 19.31%
Columbia Gorge Community College2996 19.42% 13.33% 17.96% 21.65% 17.65% 22.02%
Klamath Community College2906 27.46% 21.37% 26.00% 29.41% 25.41% 29.78%
Lane Community College2904 12.72% 6.63% 11.26% 14.83% 10.83% 15.20%
Linn-Benton Community College2910 17.23% 11.14% 15.77% 19.90% 15.90% 20.27%
Mt Hood Community College2905 11.81% 5.72% 10.35% 15.44% 11.44% 15.81%
Oregon Coast Community College2995 18.44% 12.35% 16.98% 21.57% 17.57% 21.94%
Portland Community College2918 8.46% 2.37% 7.00% 11.11% 7.11% 11.48%
Rogue Community College2922 17.97% 11.88% 16.51% 20.29% 16.29% 20.66%
Southwestern Community College2998 15.73% 9.64% 14.27% 18.01% 14.01% 18.38%
Tillamook Bay Community College2997 20.73% 14.64% 19.27% 23.53% 19.53% 23.90%
Treasure Valley Community College2902 11.87% 5.78% 10.41% 13.85% 9.85% 14.22%
Umpqua Community College2903 17.15% 11.06% 15.69% 19.70% 15.70% 20.07%
City
City of Adair Village2258 26.57% 19.08% 23.71% 28.56% 23.18% 27.55%
City of Albany2103 26.51% 17.27% 21.90% 28.73% 21.54% 25.91%
City of Amity2235 14.97% 7.48% 12.11% 16.73% 10.12% 14.49%
City of Ashland2104 27.51% 19.02% 23.65% 29.60% 23.15% 27.52%
City of Astoria2105 28.91% 20.55% 25.18% 30.66% 24.65% 29.02%
City of Aumsville2234 21.77% 14.38% 19.01% 24.02% 18.67% 23.04%
City of Aurora2272 10.35% 2.86% 7.49% 17.73% 12.35% 16.72%
City of Baker City2159 27.21% 18.11% 22.74% 29.05% 22.26% 26.63%
City of Bandon2150 24.76% 18.23% 22.86% 27.24% 22.41% 26.78%
City of Banks2231 14.08% 9.78% 14.41% 20.86% 15.48% 19.85%
City of Bay City2241 19.33% 15.03% 19.66% 22.47% 20.03% 24.40%
City of Boardman2178 26.05% 17.94% 22.57% 27.81% 22.17% 26.54%
City of Brookings2216 26.19% 17.57% 22.20% 27.74% 21.45% 25.82%
City of Burns2204 22.00% 14.27% 18.90% 24.28% 18.60% 22.97%
City of Canby2109 22.37% 13.60% 18.23% 24.84% 18.32% 22.69%
City of Cannon Beach2223 23.15% 16.38% 21.01% 25.63% 20.71% 25.08%
City of Carlton2198 15.24% 10.94% 15.57% 17.87% 15.43% 19.80%
City of Cascade Locks2182 35.28% 26.44% 31.07% 37.07% 30.46% 34.83%
City of Cave Junction2194 23.59% 17.25% 21.88% 25.77% 21.50% 25.87%
Issued December 2019 Page 9 of 18

Employer NameEmployer Number
Tier 1/ Tier 2 Payroll
OPSRP General Service
Payroll
OPSRP Police and Fire Payroll
Net Employer Contribution Rate 7/1/19 - 6/30/21
Tier 1/ Tier 2 Payroll
(reflects 2.45% member
redirect offset)
OPSRP General
Service Payroll
OPSRP Police and Fire Payroll
Advisory Net Employer Contribution Rate7/1/21 - 6/30/23
Rates shown reflect the effect of side account rate offsets and retiree healthcare contributions,and exclude contributions to the IAP and debt service for pension obligation bonds.
Summary of PERS Employer Contribution Rates
(reflects 0.70% member redirect offset)
SLGRP (Default Tier 1/Tier 2 Rates)
City
City of Central Point2181 24.86% 17.54% 22.17% 27.20% 21.79% 26.16%
City of Coburg2201 16.49% 9.16% 13.79% 21.06% 15.61% 19.98%
City of Columbia City2271 27.81% 18.47% 23.10% 34.44% 22.64% 27.01%
City of Condon2177 36.56% 32.26% 36.89% 40.12% 37.47% 41.84%
City of Coquille2110 27.95% 19.77% 24.40% 30.13% 23.86% 28.23%
City of Corvallis2155 19.52% 10.72% 15.35% 22.11% 15.64% 20.01%
City of Creswell2236 23.50% 18.48% 23.11% 25.71% 22.63% 27.00%
City of Dallas2202 26.60% 18.24% 22.87% 28.34% 22.45% 26.82%
City of Dayton2252 18.16% 11.33% 15.96% 20.74% 16.71% 21.08%
City of Depoe Bay2294 24.32% 18.43% 23.06% 27.40% 22.62% 26.99%
City of Drain2131 27.36% 18.53% 23.16% 29.31% 22.70% 27.07%
City of Dundee2245 24.73% 17.18% 21.81% 26.62% 21.35% 25.72%
City of Dunes City2299 37.65% 30.16% 34.79% 34.90% 29.52% 33.89%
City of Durham2269 24.49% 17.00% 21.63% 26.41% 21.03% 25.40%
City of Echo2225 32.84% 24.50% 29.13% 36.17% 29.99% 34.36%
City of Elgin2205 0.06% 0.00% 0.00% 0.05% 0.00% 0.31%
City of Elkton2305 22.91% 18.61% 23.24% 25.22% 22.78% 27.15%
City of Enterprise2180 26.44% 20.15% 24.78% 27.75% 24.20% 28.57%
City of Estacada2179 25.98% 19.17% 23.80% 28.45% 23.24% 27.61%
City of Fairview2208 23.20% 15.74% 20.37% 21.42% 17.28% 21.65%
City of Falls City2224 21.88% 15.01% 19.64% 26.62% 20.01% 24.38%
City of Florence2291 18.85% 10.14% 14.77% 19.51% 14.36% 18.73%
City of Garibaldi2220 27.90% 21.49% 26.12% 29.65% 25.33% 29.70%
City of Gaston2242 0.06% 0.00% 0.00% 0.05% 0.00% 0.00%
City of Gladstone2304 25.38% 15.92% 20.55% 26.17% 19.98% 24.35%
City of Gold Hill2274 0.06% 0.00% 0.00% 0.05% 0.00% 0.00%
City of Grants Pass2113 28.25% 18.95% 23.58% 30.25% 23.06% 27.43%
City of Halsey2284 17.37% 13.07% 17.70% 20.26% 17.82% 22.19%
City of Happy Valley2296 24.29% 18.53% 23.16% 26.41% 22.70% 27.07%
City of Harrisburg2268 23.02% 17.66% 22.29% 25.27% 21.86% 26.23%
City of Heppner2193 4.67% 0.00% 1.81% 6.94% 1.56% 5.93%
City of Hermiston2160 26.81% 18.84% 23.47% 29.06% 23.04% 27.41%
City of Hines2226 24.98% 17.49% 22.12% 27.07% 21.69% 26.06%
City of Hood River2138 27.86% 17.56% 22.19% 30.44% 21.78% 26.15%
City of Hubbard2196 28.71% 19.97% 24.60% 30.79% 24.07% 28.44%
City of Huntington2191 63.86% 56.37% 61.00% 65.44% 60.06% 64.43%
City of Imbler2306 26.21% 18.72% 23.35% 28.20% 22.82% 27.19%
Issued December 2019 Page 10 of 18

Employer NameEmployer Number
Tier 1/ Tier 2 Payroll
OPSRP General Service
Payroll
OPSRP Police and Fire Payroll
Net Employer Contribution Rate 7/1/19 - 6/30/21
Tier 1/ Tier 2 Payroll
(reflects 2.45% member
redirect offset)
OPSRP General
Service Payroll
OPSRP Police and Fire Payroll
Advisory Net Employer Contribution Rate7/1/21 - 6/30/23
Rates shown reflect the effect of side account rate offsets and retiree healthcare contributions,and exclude contributions to the IAP and debt service for pension obligation bonds.
Summary of PERS Employer Contribution Rates
(reflects 0.70% member redirect offset)
SLGRP (Default Tier 1/Tier 2 Rates)
City
City of Independence2267 24.83% 16.15% 20.78% 27.49% 20.54% 24.91%
City of Irrigon2266 22.76% 17.12% 21.75% 24.96% 21.29% 25.66%
City of Jefferson2211 0.06% 0.00% 0.00% 0.05% 0.00% 0.00%
City of John Day2229 17.02% 9.09% 13.72% 13.70% 11.26% 15.63%
City of Jordan Valley2256 0.06% 0.00% 0.00% 0.05% 0.00% 0.00%
City of Junction City2199 25.08% 17.81% 22.44% 26.83% 21.97% 26.34%
City of King City2287 28.42% 16.03% 20.66% 30.22% 20.00% 24.37%
City of Klamath Falls2148 20.54% 11.41% 16.04% 22.28% 15.13% 19.50%
City of La Grande2263 25.50% 13.01% 17.64% 28.03% 17.63% 22.00%
City of Lafayette2233 20.73% 14.64% 19.27% 24.12% 20.10% 24.47%
City of Lake Oswego2120 28.66% 19.12% 23.75% 30.60% 23.18% 27.55%
City of Lakeside2244 8.85% 4.55% 9.18% 7.86% 5.42% 9.79%
City of Lebanon2140 23.31% 14.42% 19.05% 25.20% 18.36% 22.73%
City of Lincoln City2298 21.66% 13.43% 18.06% 24.52% 18.22% 22.59%
City of Lowell2293 24.73% 17.24% 21.87% 25.90% 20.52% 24.89%
City of Lyons2270 26.24% 17.41% 22.04% 28.09% 21.48% 25.85%
City of Madras2170 27.39% 16.93% 21.56% 29.50% 21.08% 25.45%
City of Malin2247 21.38% 14.91% 19.54% 19.68% 16.79% 21.16%
City of Manzanita2281 29.09% 17.38% 22.01% 31.22% 21.62% 25.99%
City of McMinnville2117 28.39% 18.53% 23.16% 30.19% 22.70% 27.07%
City of Medford2102 22.52% 12.80% 17.43% 25.28% 17.53% 21.90%
City of Mill City2207 23.04% 18.74% 23.37% 25.32% 22.88% 27.25%
City of Millersburg2286 23.09% 18.79% 23.42% 25.69% 23.25% 27.62%
City of Milton-Freewater2158 28.23% 20.30% 24.93% 30.07% 24.20% 28.57%
City of Milwaukie2163 23.45% 13.99% 18.62% 25.87% 18.59% 22.96%
City of Monmouth2157 22.54% 14.77% 19.40% 24.54% 19.23% 23.60%
City of Monroe2209 13.89% 6.40% 11.03% 14.00% 8.62% 12.99%
City of Moro2301 15.11% 7.62% 12.25% 18.52% 13.14% 17.51%
City of Mt. Vernon2302 20.10% 11.27% 15.90% 24.00% 17.39% 21.76%
City of Myrtle Creek2197 20.16% 13.96% 18.59% 21.92% 17.87% 22.24%
City of Myrtle Point2183 18.60% 9.91% 14.54% 22.10% 15.76% 20.13%
City of Newberg2777 21.99% 12.10% 16.73% 25.04% 17.36% 21.73%
City of Newport2276 25.49% 13.16% 17.79% 27.82% 17.60% 21.97%
City of North Bend2292 25.74% 15.95% 20.58% 27.72% 20.25% 24.62%
City of North Plains2192 20.49% 16.19% 20.82% 23.24% 20.80% 25.17%
City of North Powder2308 21.67% 17.37% 22.00% 23.18% 20.74% 25.11%
City of Nyssa2166 27.15% 17.74% 22.37% 29.33% 22.00% 26.37%
Issued December 2019 Page 11 of 18

Employer NameEmployer Number
Tier 1/ Tier 2 Payroll
OPSRP General Service
Payroll
OPSRP Police and Fire Payroll
Net Employer Contribution Rate 7/1/19 - 6/30/21
Tier 1/ Tier 2 Payroll
(reflects 2.45% member
redirect offset)
OPSRP General
Service Payroll
OPSRP Police and Fire Payroll
Advisory Net Employer Contribution Rate7/1/21 - 6/30/23
Rates shown reflect the effect of side account rate offsets and retiree healthcare contributions,and exclude contributions to the IAP and debt service for pension obligation bonds.
Summary of PERS Employer Contribution Rates
(reflects 0.70% member redirect offset)
SLGRP (Default Tier 1/Tier 2 Rates)
City
City of Oakland2143 33.17% 28.87% 33.50% 35.98% 33.54% 37.91%
City of Oakridge2168 34.57% 23.55% 28.18% 35.63% 27.65% 32.02%
City of Oregon City2119 22.76% 15.11% 19.74% 25.24% 19.52% 23.89%
City of Pendleton2154 24.07% 14.25% 18.88% 26.62% 18.72% 23.09%
City of Philomath2187 24.49% 15.85% 20.48% 26.47% 19.87% 24.24%
City of Phoenix2249 15.57% 8.80% 13.43% 18.68% 13.23% 17.60%
City of Pilot Rock2161 30.69% 23.81% 28.44% 32.39% 27.46% 31.83%
City of Port Orford2184 26.10% 17.71% 22.34% 28.54% 21.93% 26.30%
City of Portland2121 21.86% 15.53% 20.16% 24.25% 19.98% 24.35%
City of Redmond2122 23.49% 15.42% 20.05% 25.99% 19.89% 24.26%
City of Reedsport2139 14.44% 6.74% 11.37% 17.25% 11.25% 15.62%
City of Riddle2260 24.25% 16.67% 21.30% 24.69% 20.00% 24.37%
City of Rockaway Beach2203 23.41% 16.92% 21.55% 25.66% 21.00% 25.37%
City of Rogue River2251 31.18% 22.36% 26.99% 32.36% 26.52% 30.89%
City of Roseburg2100 28.11% 18.53% 23.16% 30.28% 22.70% 27.07%
City of Sandy2172 26.40% 17.87% 22.50% 28.42% 22.07% 26.44%
City of Scappoose2176 26.28% 18.87% 23.50% 28.21% 23.01% 27.38%
City of Shady Cove2254 10.00% 2.51% 7.14% 14.30% 8.92% 13.29%
City of Sherwood2142 26.61% 18.28% 22.91% 28.66% 22.45% 26.82%
City of Silverton2273 24.84% 16.02% 20.65% 26.48% 20.07% 24.44%
City of Sisters2221 18.80% 14.50% 19.13% 20.88% 18.44% 22.81%
City of Springfield2278 21.65% 12.67% 17.30% 23.96% 16.93% 21.30%
City of St Helens2123 29.62% 22.22% 26.85% 31.18% 26.26% 30.63%
City of Stayton2757 29.33% 17.62% 22.25% 31.17% 21.57% 25.94%
City of Sutherlin2217 18.29% 10.88% 15.51% 21.79% 16.13% 20.50%
City of Talent2188 23.60% 14.35% 18.98% 24.46% 17.41% 21.78%
City of Tigard2295 25.25% 12.99% 17.62% 26.92% 17.02% 21.39%
City of Tillamook2128 25.06% 16.46% 21.09% 27.15% 20.35% 24.72%
City of Toledo2275 15.46% 6.44% 11.07% 18.53% 11.90% 16.27%
City of Troutdale2237 14.69% 8.63% 13.26% 15.69% 12.24% 16.61%
City of Tualatin2288 28.84% 19.98% 24.61% 30.99% 24.20% 28.57%
City of Turner2228 25.93% 19.67% 24.30% 28.10% 23.76% 28.13%
City of Umatilla2175 19.07% 11.02% 15.65% 21.38% 14.99% 19.36%
City of Vale2145 31.75% 25.64% 30.27% 34.07% 29.70% 34.07%
City of Veneta2285 23.29% 16.02% 20.65% 25.87% 20.38% 24.75%
City of Vernonia2125 21.70% 12.87% 17.50% 24.03% 17.42% 21.79%
City of Wallowa2200 18.29% 12.97% 17.60% 17.17% 13.94% 18.31%
Issued December 2019 Page 12 of 18

Employer NameEmployer Number
Tier 1/ Tier 2 Payroll
OPSRP General Service
Payroll
OPSRP Police and Fire Payroll
Net Employer Contribution Rate 7/1/19 - 6/30/21
Tier 1/ Tier 2 Payroll
(reflects 2.45% member
redirect offset)
OPSRP General
Service Payroll
OPSRP Police and Fire Payroll
Advisory Net Employer Contribution Rate7/1/21 - 6/30/23
Rates shown reflect the effect of side account rate offsets and retiree healthcare contributions,and exclude contributions to the IAP and debt service for pension obligation bonds.
Summary of PERS Employer Contribution Rates
(reflects 0.70% member redirect offset)
SLGRP (Default Tier 1/Tier 2 Rates)
City
City of Warrenton2238 26.80% 17.62% 22.25% 29.01% 22.16% 26.53%
City of West Linn2126 23.39% 15.80% 20.43% 25.01% 19.71% 24.08%
City of Westfir2265 18.72% 11.23% 15.86% 23.70% 18.32% 22.69%
City of Weston2206 14.96% 10.66% 15.29% 16.20% 13.76% 18.13%
City of Wheeler2147 27.70% 20.21% 24.84% 29.64% 24.26% 28.63%
City of Wilsonville2240 24.37% 17.94% 22.57% 26.61% 22.15% 26.52%
City of Winston2280 17.80% 8.03% 12.66% 20.29% 12.56% 16.93%
City of Wood Village2185 20.02% 15.72% 20.35% 25.52% 20.25% 24.62%
City of Woodburn2303 24.19% 16.23% 20.86% 26.47% 20.46% 24.83%
City of Yachats2300 20.94% 12.11% 16.74% 24.75% 18.14% 22.51%
City of Yamhill2214 22.90% 14.88% 19.51% 24.81% 18.97% 23.34%
City of Yoncalla2307 22.45% 18.15% 22.78% 24.62% 22.18% 26.55%
Town of Canyon City2255 28.19% 20.70% 25.33% 30.24% 24.86% 29.23%
Town of Lakeview2212 15.17% 6.50% 11.13% 17.97% 10.22% 14.59%
County
Baker County2021 23.23% 15.49% 20.12% 25.48% 19.72% 24.09%
Benton County2040 20.92% 13.56% 18.19% 23.77% 18.43% 22.80%
Clatsop County2036 20.68% 12.10% 16.73% 23.44% 16.94% 21.31%
Columbia County2017 20.74% 12.75% 17.38% 23.77% 17.77% 22.14%
Coos County2018 29.34% 21.10% 25.73% 31.15% 25.10% 29.47%
Crook County2044 25.74% 13.14% 17.77% 27.04% 16.78% 21.15%
Deschutes County2027 22.27% 14.26% 18.89% 24.89% 18.95% 23.32%
Gilliam County2022 24.78% 17.66% 22.29% 27.36% 21.85% 26.22%
Grant County2012 8.47% 0.72% 5.35% 11.22% 5.17% 9.54%
Harney County2004 23.86% 16.31% 20.94% 26.01% 20.77% 25.14%
Hood River County2035 14.90% 7.71% 12.34% 17.30% 12.06% 16.43%
Jackson County2005 25.40% 17.29% 21.92% 27.66% 21.59% 25.96%
Josephine County2042 28.58% 20.85% 25.48% 30.32% 24.66% 29.03%
Klamath County2007 15.92% 3.53% 8.16% 18.57% 8.41% 12.78%
Lake County2000 24.06% 15.75% 20.38% 26.76% 19.93% 24.30%
Lincoln County2043 21.39% 8.76% 13.39% 23.85% 13.31% 17.68%
Marion County2009 21.18% 13.01% 17.64% 23.30% 17.21% 21.58%
Multnomah County2038 21.79% 13.77% 18.40% 24.23% 18.29% 22.66%
Sherman County2016 27.16% 20.24% 24.87% 29.20% 24.31% 28.68%
Umatilla County2013 19.84% 11.46% 16.09% 22.81% 16.52% 20.89%
Wasco County2020 24.10% 16.27% 20.90% 26.05% 20.53% 24.90%
Washington County2011 26.73% 18.56% 23.19% 28.74% 22.73% 27.10%
Issued December 2019 Page 13 of 18

Employer NameEmployer Number
Tier 1/ Tier 2 Payroll
OPSRP General Service
Payroll
OPSRP Police and Fire Payroll
Net Employer Contribution Rate 7/1/19 - 6/30/21
Tier 1/ Tier 2 Payroll
(reflects 2.45% member
redirect offset)
OPSRP General
Service Payroll
OPSRP Police and Fire Payroll
Advisory Net Employer Contribution Rate7/1/21 - 6/30/23
Rates shown reflect the effect of side account rate offsets and retiree healthcare contributions,and exclude contributions to the IAP and debt service for pension obligation bonds.
Summary of PERS Employer Contribution Rates
(reflects 0.70% member redirect offset)
SLGRP (Default Tier 1/Tier 2 Rates)
Special Districts
Amity Fire District2742 25.74% 12.23% 16.86% 28.15% 16.66% 21.03%
Arch Cape Water-Sanitary District2631 18.14% 13.84% 18.47% 20.37% 17.93% 22.30%
Aumsville Rural Fire Protection District2602 14.72% 10.42% 15.05% 20.50% 18.06% 22.43%
Aurora Rural Fire Protection District2804 14.48% 2.77% 7.40% 24.39% 14.79% 19.16%
Baker County Library District2728 26.00% 18.28% 22.91% 27.70% 22.39% 26.76%
Baker Valley Irrigation District2601 0.06% 0.00% 0.00% 0.05% 0.00% 0.00%
Black Butte Ranch Police2749 22.67% 10.96% 15.59% 24.19% 14.59% 18.96%
Canby Fire District2595 29.54% 17.76% 22.39% 29.81% 21.47% 25.84%
Canby Utility Board2731 25.60% 18.70% 23.33% 27.33% 22.86% 27.23%
Cannon Beach Rural Fire Protection District2840 31.86% 18.48% 23.11% 34.03% 22.66% 27.03%
Central Oregon Coast Fire & Rescue District2820 0.06% 0.00% 0.00% 16.09% 10.71% 15.08%
Central Oregon Intergovernmental Council2569 11.92% 6.38% 11.01% 14.28% 10.77% 15.14%
Central Oregon Irrigation District2563 27.21% 21.14% 25.77% 30.03% 25.52% 29.89%
Charleston Rural Fire Protection District2567 13.21% 0.00% 3.92% 26.31% 14.51% 18.88%
Chetco Library Board2699 26.88% 18.05% 22.68% 28.79% 22.18% 26.55%
Clackamas County Fire District2745 28.53% 16.37% 21.00% 30.55% 20.79% 25.16%
Clackamas River Water2761 26.71% 21.38% 26.01% 28.73% 25.43% 29.80%
Clackamas Vector Control2538 29.19% 21.70% 26.33% 31.16% 25.78% 30.15%
Clatskanie Library2707 26.43% 18.95% 23.58% 29.83% 23.22% 27.59%
Clatskanie PUD2526 24.70% 18.16% 22.79% 26.29% 22.70% 27.07%
Clatskanie Rural Fire Protection District2588 29.08% 16.01% 20.64% 31.79% 20.93% 25.30%
Clean Water Services2617 20.40% 13.67% 18.30% 22.80% 18.29% 22.66%
Cloverdale Rural Fire Protection District2681 35.46% 21.54% 26.17% 37.46% 25.66% 30.03%
Coburg Rural Fire Protection District2801 26.20% 14.53% 19.16% 30.22% 20.40% 24.77%
Colton Fire Department2649 19.97% 6.05% 10.68% 16.04% 9.43% 13.80%
Columbia 911 Communications District2671 22.64% 17.51% 22.14% 25.12% 21.78% 26.15%
Columbia Drainage Vector Control District2687 35.70% 31.40% 36.03% 33.70% 31.26% 35.63%
Columbia River Fire & Rescue2528 24.33% 12.24% 16.87% 26.56% 16.36% 20.73%
Community Services Consortium2612 22.55% 16.76% 21.39% 24.91% 21.05% 25.42%
Coos County Airport District2860 18.91% 14.61% 19.24% 20.15% 17.71% 22.08%
Corbett Water District2603 22.83% 18.53% 23.16% 25.14% 22.70% 27.07%
Council of Governments2545 24.61% 18.52% 23.15% 27.12% 22.69% 27.06%
Crescent Rural Fire Protection District2834 24.86% 17.37% 22.00% 28.41% 23.03% 27.40%
Crook County Rural Fire Protection District #12844 28.59% 18.34% 22.97% 30.60% 22.53% 26.90%
Crooked River Ranch Rural Fire Protection District2647 24.94% 17.45% 22.08% 27.02% 21.64% 26.01%
Crystal Springs Water District2571 23.31% 19.01% 23.64% 25.76% 23.32% 27.69%
Curry Library2718 7.80% 3.50% 8.13% 7.64% 2.26% 6.63%
Issued December 2019 Page 14 of 18

Employer NameEmployer Number
Tier 1/ Tier 2 Payroll
OPSRP General Service
Payroll
OPSRP Police and Fire Payroll
Net Employer Contribution Rate 7/1/19 - 6/30/21
Tier 1/ Tier 2 Payroll
(reflects 2.45% member
redirect offset)
OPSRP General
Service Payroll
OPSRP Police and Fire Payroll
Advisory Net Employer Contribution Rate7/1/21 - 6/30/23
Rates shown reflect the effect of side account rate offsets and retiree healthcare contributions,and exclude contributions to the IAP and debt service for pension obligation bonds.
Summary of PERS Employer Contribution Rates
(reflects 0.70% member redirect offset)
SLGRP (Default Tier 1/Tier 2 Rates)
Special Districts
Depoe Bay Rural Fire Protection District2576 32.10% 18.18% 22.81% 34.19% 22.39% 26.76%
Dexter Rural Fire Protection District2642 21.12% 13.63% 18.26% 25.76% 20.38% 24.75%
East Umatilla County Rural Fire Protection District2851 24.61% 12.28% 16.91% 5.23% 0.00% 0.00%
Eisenschmidt Pool2784 20.57% 16.27% 20.90% 23.20% 20.76% 25.13%
Estacada Fire Department2557 21.41% 7.49% 12.12% 21.99% 10.19% 14.56%
Eugene Water & Electric Board2132 24.23% 18.67% 23.30% 26.37% 22.84% 27.21%
Fairview Water District2798 23.01% 15.52% 20.15% 26.33% 20.95% 25.32%
Farmers Irrigation District2789 14.48% 7.03% 11.66% 16.86% 11.53% 15.90%
Glide Fire Department2824 31.41% 17.49% 22.12% 31.48% 21.89% 26.26%
Goshen Fire District2573 42.08% 34.59% 39.22% 41.63% 36.25% 40.62%
Grants Pass Irrigation District2511 28.31% 19.48% 24.11% 29.32% 23.94% 28.31%
Green Sanitary2765 23.47% 16.97% 21.60% 25.53% 21.22% 25.59%
Harney Hospital2855 21.79% 16.73% 21.36% 24.02% 20.98% 25.35%
Harrisburg Fire-Rescue2819 29.48% 17.77% 22.40% 31.38% 21.78% 26.15%
High Desert Parks & Recreation District2838 26.40% 18.91% 23.54% 28.46% 23.08% 27.45%
Home Forward2519 20.69% 14.96% 19.59% 22.96% 19.30% 23.67%
Hoodland Fire District #742607 29.22% 17.18% 21.81% 31.18% 21.36% 25.73%
Horsefly Irrigation District2510 35.56% 28.07% 32.70% 31.18% 25.80% 30.17%
Housing Authority of Jackson County2773 25.10% 20.17% 24.80% 26.99% 24.16% 28.53%
Hubbard Rural Fire Protection District2829 N/A N/A N/A 14.95% 9.57% 13.94%
Idanha-Detroit Rural Fire Protection District2886 27.70% 20.21% 24.84% 29.64% 24.26% 28.63%
Illinois Valley Fire District2564 22.54% 10.83% 15.46% 27.13% 17.53% 21.90%
Imbler Rural Fire Protection District2651 33.06% 19.14% 23.77% 35.03% 23.23% 27.60%
Jackson County Fire District #32715 24.93% 12.62% 17.25% 26.71% 16.78% 21.15%
Jackson County Fire District #42620 34.13% 20.21% 24.84% 36.06% 24.26% 28.63%
Jackson County Vector Control District2541 23.64% 16.15% 20.78% 26.32% 20.94% 25.31%
Jefferson County EMS2712 23.09% 18.79% 23.42% 25.34% 22.90% 27.27%
Jefferson County Library District2846 24.38% 19.60% 24.23% 25.90% 23.46% 27.83%
Jefferson Rural Fire Protection District2561 19.39% 8.80% 13.43% 22.23% 15.05% 19.42%
Junction City Fire Department2763 26.42% 17.46% 22.09% 22.41% 19.97% 24.34%
Keizer Fire Department2559 27.63% 15.96% 20.59% 30.39% 20.12% 24.49%
Klamath County Emergency Communications District2710 26.41% 20.54% 25.17% 28.22% 24.31% 28.68%
Klamath Housing Authority2721 19.65% 15.35% 19.98% 22.96% 20.52% 24.89%
Klamath Vector Control2624 30.50% 23.01% 27.64% 31.48% 26.10% 30.47%
La Pine Rural Fire Protection District2579 27.36% 15.50% 20.13% 29.53% 19.78% 24.15%
Lake County Library District2768 27.11% 19.34% 23.97% 28.42% 23.42% 27.79%
Lane Council of Governments2522 25.48% 18.77% 23.40% 27.72% 22.96% 27.33%
Issued December 2019 Page 15 of 18
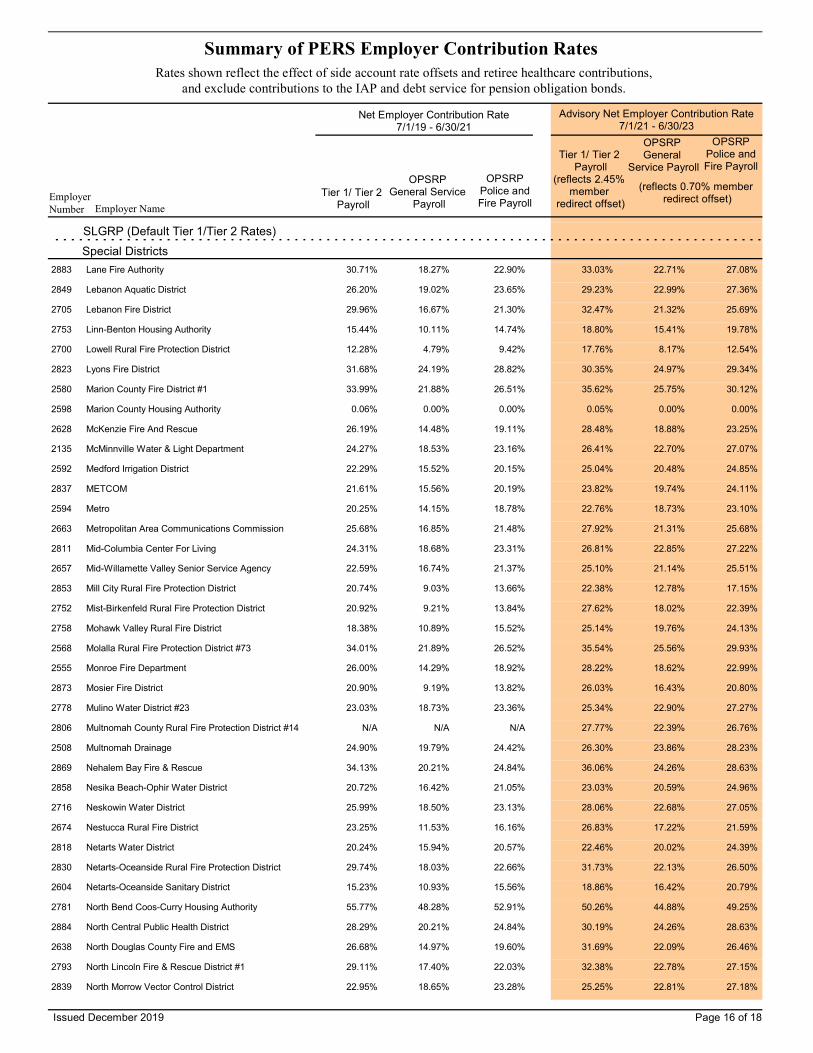
Employer NameEmployer Number
Tier 1/ Tier 2 Payroll
OPSRP General Service
Payroll
OPSRP Police and Fire Payroll
Net Employer Contribution Rate 7/1/19 - 6/30/21
Tier 1/ Tier 2 Payroll
(reflects 2.45% member
redirect offset)
OPSRP General
Service Payroll
OPSRP Police and Fire Payroll
Advisory Net Employer Contribution Rate7/1/21 - 6/30/23
Rates shown reflect the effect of side account rate offsets and retiree healthcare contributions,and exclude contributions to the IAP and debt service for pension obligation bonds.
Summary of PERS Employer Contribution Rates
(reflects 0.70% member redirect offset)
SLGRP (Default Tier 1/Tier 2 Rates)
Special Districts
Lane Fire Authority2883 30.71% 18.27% 22.90% 33.03% 22.71% 27.08%
Lebanon Aquatic District2849 26.20% 19.02% 23.65% 29.23% 22.99% 27.36%
Lebanon Fire District2705 29.96% 16.67% 21.30% 32.47% 21.32% 25.69%
Linn-Benton Housing Authority2753 15.44% 10.11% 14.74% 18.80% 15.41% 19.78%
Lowell Rural Fire Protection District2700 12.28% 4.79% 9.42% 17.76% 8.17% 12.54%
Lyons Fire District2823 31.68% 24.19% 28.82% 30.35% 24.97% 29.34%
Marion County Fire District #12580 33.99% 21.88% 26.51% 35.62% 25.75% 30.12%
Marion County Housing Authority2598 0.06% 0.00% 0.00% 0.05% 0.00% 0.00%
McKenzie Fire And Rescue2628 26.19% 14.48% 19.11% 28.48% 18.88% 23.25%
McMinnville Water & Light Department2135 24.27% 18.53% 23.16% 26.41% 22.70% 27.07%
Medford Irrigation District2592 22.29% 15.52% 20.15% 25.04% 20.48% 24.85%
METCOM2837 21.61% 15.56% 20.19% 23.82% 19.74% 24.11%
Metro2594 20.25% 14.15% 18.78% 22.76% 18.73% 23.10%
Metropolitan Area Communications Commission2663 25.68% 16.85% 21.48% 27.92% 21.31% 25.68%
Mid-Columbia Center For Living2811 24.31% 18.68% 23.31% 26.81% 22.85% 27.22%
Mid-Willamette Valley Senior Service Agency2657 22.59% 16.74% 21.37% 25.10% 21.14% 25.51%
Mill City Rural Fire Protection District2853 20.74% 9.03% 13.66% 22.38% 12.78% 17.15%
Mist-Birkenfeld Rural Fire Protection District2752 20.92% 9.21% 13.84% 27.62% 18.02% 22.39%
Mohawk Valley Rural Fire District2758 18.38% 10.89% 15.52% 25.14% 19.76% 24.13%
Molalla Rural Fire Protection District #732568 34.01% 21.89% 26.52% 35.54% 25.56% 29.93%
Monroe Fire Department2555 26.00% 14.29% 18.92% 28.22% 18.62% 22.99%
Mosier Fire District2873 20.90% 9.19% 13.82% 26.03% 16.43% 20.80%
Mulino Water District #232778 23.03% 18.73% 23.36% 25.34% 22.90% 27.27%
Multnomah County Rural Fire Protection District #142806 N/A N/A N/A 27.77% 22.39% 26.76%
Multnomah Drainage2508 24.90% 19.79% 24.42% 26.30% 23.86% 28.23%
Nehalem Bay Fire & Rescue2869 34.13% 20.21% 24.84% 36.06% 24.26% 28.63%
Nesika Beach-Ophir Water District2858 20.72% 16.42% 21.05% 23.03% 20.59% 24.96%
Neskowin Water District2716 25.99% 18.50% 23.13% 28.06% 22.68% 27.05%
Nestucca Rural Fire District2674 23.25% 11.53% 16.16% 26.83% 17.22% 21.59%
Netarts Water District2818 20.24% 15.94% 20.57% 22.46% 20.02% 24.39%
Netarts-Oceanside Rural Fire Protection District2830 29.74% 18.03% 22.66% 31.73% 22.13% 26.50%
Netarts-Oceanside Sanitary District2604 15.23% 10.93% 15.56% 18.86% 16.42% 20.79%
North Bend Coos-Curry Housing Authority2781 55.77% 48.28% 52.91% 50.26% 44.88% 49.25%
North Central Public Health District2884 28.29% 20.21% 24.84% 30.19% 24.26% 28.63%
North Douglas County Fire and EMS2638 26.68% 14.97% 19.60% 31.69% 22.09% 26.46%
North Lincoln Fire & Rescue District #12793 29.11% 17.40% 22.03% 32.38% 22.78% 27.15%
North Morrow Vector Control District2839 22.95% 18.65% 23.28% 25.25% 22.81% 27.18%
Issued December 2019 Page 16 of 18

Employer NameEmployer Number
Tier 1/ Tier 2 Payroll
OPSRP General Service
Payroll
OPSRP Police and Fire Payroll
Net Employer Contribution Rate 7/1/19 - 6/30/21
Tier 1/ Tier 2 Payroll
(reflects 2.45% member
redirect offset)
OPSRP General
Service Payroll
OPSRP Police and Fire Payroll
Advisory Net Employer Contribution Rate7/1/21 - 6/30/23
Rates shown reflect the effect of side account rate offsets and retiree healthcare contributions,and exclude contributions to the IAP and debt service for pension obligation bonds.
Summary of PERS Employer Contribution Rates
(reflects 0.70% member redirect offset)
SLGRP (Default Tier 1/Tier 2 Rates)
Special Districts
North Wasco County Parks And Recreation District2792 27.36% 18.53% 23.16% 29.31% 22.70% 27.07%
Northern Oregon Corrections2825 17.65% 9.77% 14.40% 20.40% 14.81% 19.18%
Oak Lodge Water Services District2888 23.22% 17.65% 22.28% 25.75% 21.90% 26.27%
Ochoco Irrigation District2852 17.41% 13.11% 17.74% 20.53% 17.62% 21.99%
Odell Sanitary District2816 23.75% 19.45% 24.08% 25.95% 23.51% 27.88%
Oregon Health & Science University2880 19.65% 12.98% 17.61% 21.62% 17.10% 21.47%
Oregon School Boards Association2531 28.02% 20.31% 24.94% 29.36% 24.34% 28.71%
Oregon Trail Library District2774 22.17% 17.88% 22.51% 24.68% 22.23% 26.60%
Parkdale Fire District2684 32.40% 20.69% 25.32% 34.32% 24.72% 29.09%
Philomath Fire Department2694 29.08% 17.37% 22.00% 31.61% 22.01% 26.38%
Pleasant Hill Fire Department2650 23.77% 16.28% 20.91% 26.30% 20.92% 25.29%
Port of Coos Bay2513 25.96% 19.09% 23.72% 27.97% 23.21% 27.58%
Port of Garibaldi2741 23.19% 16.79% 21.42% 24.52% 20.02% 24.39%
Port of Newport2625 13.99% 6.14% 10.77% 20.74% 15.10% 19.47%
Port of Portland2512 20.10% 12.87% 17.50% 22.63% 17.47% 21.84%
Port of The Dalles2501 12.55% 7.17% 11.80% 11.32% 8.88% 13.25%
Port of Tillamook Bay2713 20.69% 16.39% 21.02% 23.10% 20.66% 25.03%
Port Orford Library2673 15.62% 11.32% 15.95% 21.96% 19.52% 23.89%
Rainbow Water District2542 29.29% 20.46% 25.09% 31.03% 24.42% 28.79%
Rainier Cemetery District2776 6.79% 0.00% 3.93% 7.93% 2.55% 6.92%
Redmond Fire & Rescue2590 27.47% 15.21% 19.84% 29.36% 19.54% 23.91%
Rogue River Fire District2549 24.68% 13.17% 17.80% 27.52% 18.07% 22.44%
Rogue River Valley Irrigation District2585 32.12% 27.82% 32.45% 33.97% 31.53% 35.90%
Roseburg Urban Sanitary Authority2669 20.80% 14.56% 19.19% 22.99% 18.44% 22.81%
Rural Road Assessment District #32802 23.02% 18.72% 23.35% 28.32% 22.94% 27.31%
Sandy Fire Department2551 25.08% 12.95% 17.58% 28.23% 18.14% 22.51%
Scappoose Public Library2709 13.85% 6.36% 10.99% 20.86% 15.48% 19.85%
Scappoose Rural Fire Protection District2739 30.21% 18.08% 22.71% 32.20% 22.29% 26.66%
Scio Fire District2605 0.06% 0.00% 0.00% 16.42% 8.35% 12.72%
Seal Rock Rural Fire Protection District2786 15.42% 7.93% 12.56% 24.71% 19.33% 23.70%
Seal Rock Water District2734 21.62% 15.39% 20.02% 23.80% 19.56% 23.93%
Sheridan Fire District2630 23.81% 14.86% 19.49% 29.67% 18.06% 22.43%
Silver Falls Library District2790 24.49% 17.64% 22.27% 26.95% 22.36% 26.73%
Silverton Fire District2659 27.43% 15.73% 20.36% 28.79% 19.09% 23.46%
Siuslaw Public Library2692 21.44% 16.35% 20.98% 23.70% 20.31% 24.68%
Siuslaw Rural Fire Protection District #12794 33.83% 19.97% 24.60% 29.39% 24.01% 28.38%
South Suburban Sanitary District2599 25.64% 18.12% 22.75% 27.88% 22.46% 26.83%
Issued December 2019 Page 17 of 18

Employer NameEmployer Number
Tier 1/ Tier 2 Payroll
OPSRP General Service
Payroll
OPSRP Police and Fire Payroll
Net Employer Contribution Rate 7/1/19 - 6/30/21
Tier 1/ Tier 2 Payroll
(reflects 2.45% member
redirect offset)
OPSRP General
Service Payroll
OPSRP Police and Fire Payroll
Advisory Net Employer Contribution Rate7/1/21 - 6/30/23
Rates shown reflect the effect of side account rate offsets and retiree healthcare contributions,and exclude contributions to the IAP and debt service for pension obligation bonds.
Summary of PERS Employer Contribution Rates
(reflects 0.70% member redirect offset)
SLGRP (Default Tier 1/Tier 2 Rates)
Special Districts
Southwest Lincoln County Water District2766 22.65% 17.13% 21.76% 24.87% 21.30% 25.67%
Stayton Fire District2696 29.28% 18.47% 23.10% 31.53% 22.68% 27.05%
Sublimity Fire District2799 13.43% 9.13% 13.76% 17.99% 15.55% 19.92%
Suburban East Salem Water District2641 24.86% 17.09% 21.72% 27.50% 21.92% 26.29%
Sunriver Service District2857 22.81% 11.10% 15.73% 25.09% 15.49% 19.86%
Sutherlin Water Control District2810 24.73% 17.24% 21.87% 27.09% 21.71% 26.08%
Sweet Home Fire and Ambulance District2847 30.53% 17.78% 22.41% 32.69% 21.98% 26.35%
Talent Irrigation District2582 27.56% 19.59% 24.22% 29.59% 23.78% 28.15%
Tangent Rural Fire Protection District2553 47.03% 33.03% 37.66% 47.88% 36.09% 40.46%
Tillamook Peoples Utility District2626 24.99% 18.28% 22.91% 26.95% 22.48% 26.85%
Tri-City Water and Sanitary Authority2864 20.87% 16.57% 21.20% 23.04% 20.60% 24.97%
Tualatin Valley Fire & Rescue2660 27.75% 15.68% 20.31% 29.91% 19.98% 24.35%
Tualatin Valley Irrigation District2587 19.78% 15.48% 20.11% 21.87% 19.43% 23.80%
Tualatin Valley Water District2842 21.78% 15.65% 20.28% 24.02% 20.05% 24.42%
Umatilla County Soil & Water District2772 18.10% 10.61% 15.24% 25.69% 20.31% 24.68%
Umatilla County Special Library District2732 9.42% 0.59% 5.22% 20.59% 13.98% 18.35%
Umatilla Fire Department2653 20.52% 13.03% 17.66% 32.51% 20.71% 25.08%
Wasco County Soil-Water Conservation District2826 17.40% 13.10% 17.73% 20.27% 17.83% 22.20%
Washington County Consolidated Communications Agency2695 25.28% 19.29% 23.92% 27.31% 23.41% 27.78%
West Extension Irrigation District2540 16.74% 12.44% 17.07% 19.04% 16.60% 20.97%
West Multnomah Soil And Water Conservation District2867 24.51% 20.21% 24.84% 26.70% 24.26% 28.63%
West Slope Water District2589 33.41% 24.58% 29.21% 34.85% 28.24% 32.61%
West Valley Housing Authority2606 19.87% 14.80% 19.43% 22.83% 19.19% 23.56%
Western Lane Ambulance District2754 23.96% 18.33% 22.96% 25.73% 22.52% 26.89%
Weston Cemetery2686 14.25% 6.76% 11.39% 15.09% 9.71% 14.08%
Wickiup Water District2817 25.88% 18.39% 23.02% 27.95% 22.57% 26.94%
Winston-Dillard Fire District2552 43.61% 31.32% 35.95% 47.02% 36.97% 41.34%
Winston-Dillard Water District2600 23.44% 17.41% 22.04% 23.34% 20.90% 25.27%
Woodburn Fire District2676 37.06% 24.82% 29.45% 39.14% 29.00% 33.37%
Wy’East Fire District2562 34.24% 22.53% 27.16% 34.97% 25.37% 29.74%
Yachats Rural Fire Protection District2843 30.81% 19.10% 23.73% 32.69% 23.09% 27.46%
Yamhill Communications Agency2726 24.06% 18.40% 23.03% 26.64% 22.56% 26.93%
State
State Agencies1000 22.24% 14.75% 19.38% 24.80% 19.43% 23.80%
Issued December 2019 Page 18 of 18

SL1 PERS Board Meeting December 6, 2019
Item C.6.
Public Employees Retirement System Headquarters:
11410 S.W. 68th Parkway, Tigard, OR Mailing Address:
P.O. Box 23700 Tigard, OR 97281-3700
888-320-7377 TTY (503) 603-7766
www.o re go n .go v/p er s
Oregon Kate Brown, Governor
December 6, 2019 TO: Members of the PERS Board FROM: Kevin Olineck, Director SUBJECT: Adoption of Actuarial Equivalency Factor Tables BOARD OPTIONS The Board may:
1. Pass a motion to “Adopt the Actuarial Equivalency Factor Tables, as prepared by Milliman, based on the board adopted changes to the actuarial methods and assumptions as presented by Milliman in the 2018 Experience Study, including setting the assumed rate at 7.2%.
2. Direct Milliman to review one or more of their recommended changes and return with recommendations that more closely align with the Board’s direction.
STAFF RECOMMENDATION Staff recommends that the PERS Board choose Option #1 above.

Offices in Principal Cities Worldwide This work product was prepared solely for Oregon PERS for the purposes described herein and may not be appropriate to use for other purposes. Milliman does not intend to benefit and assumes no duty or liability to other parties who receive this work. Milliman recommends that third parties be aided by their own actuary or other qualified professional when reviewing the Milliman work product. \\porteb-wr\wr\oregonpers\ac\corr\letters\191101_aeq_factors.docx
1455 SW Broadway Suite 1600 Portland, OR 97201 USA
Tel +1 503 227 0634 Fax +1 503 227 7956
milliman.com
November 25, 2019
VIA E-MAIL
MaryMichelle Sosne Actuarial Business Specialist Oregon PERS Re: Actuarial Equivalency Factors Proposed Effective January 1, 2020
Dear MaryMichelle:
On October 4, 2019, the Board adopted actuarial assumptions and methods to be used in the December 31, 2018 and December 31, 2019 actuarial valuations. The adopted assumptions include an update to the valuation mortality tables. This letter provides new actuarial equivalency factors for ORS Chapter 238 and ORS Chapter 238A proposed to be effective January 1, 2020, reflecting the updates to the mortality assumptions, along with the assumed earnings rate of 7.20% adopted by the Board.
As directed by PERS, we have used a COLA of 2.00% where noted in developing these factors.
The mortality tables for healthy members and beneficiaries are "generational", meaning there are different rates for members who have different years of birth, with lower mortality for members who have later years of birth. This means that, even if the mortality assumption for the actuarial valuation does not change in the future, it will be necessary to update these tables periodically since the factor tables used by PERS in administering the program are based on ages rather than years of birth.
We understand it is the Board's intention to review and update the factors every two years, to coincide with the experience study. Therefore, these factors are proposed to be effective for determination dates during 2020 and 2021.
WEIGHTING FACTORS TO DEVELOP UNISEX MORTALITY BASIS
In the December 31, 2018 valuation, there are six separate mortality tables that apply to healthy retirees based on sex and membership classification, two tables that apply to disabled retirees, and two tables that apply to beneficiaries. Federal law requires the use of unisex factors for actuarial equivalence factors used to determine benefit amounts. For determining actuarial equivalency factors, a single blended mortality basis is used for Tier 1, Tier 2, and OPSRP. For most factors that use a mortality basis, separate blended tables are developed for healthy members, beneficiaries, and disabled members.
The blended mortality tables are developed by weighting each separate mortality table by the percentage of liabilities attributed to each sex/classification group for all active and dormant members in the most recently published valuation. Unless indicated otherwise, the mortality tables and weightings shown below are used in the development of all actuarial equivalency factors:

MaryMichelle Sosne November 25, 2019 Page 2
This work product was prepared solely for Oregon PERS for the purposes described herein and may not be appropriate to use for other purposes. Milliman does not intend to benefit and assumes no duty or liability to other parties who receive this work. Milliman recommends that third parties be aided by their own actuary or other qualified professional when reviewing the Milliman work product. \\Porteb-wr\wr\OregonPERS\AC\Corr\Letters\191101_AEQ_Factors.docx
HEALTHY RETIREE MORTALITY WEIGHTING FACTORS
Sex/Classification Group
Mortality Table Weighting Factor
General Service Males Pub-2010 Male Healthy Retiree, General Employees, Generational with Unisex Social Security Data Scale, set back 12 months
25.0%
Police & Fire Males Pub-2010 Male Healthy Retiree, Public Safety, Generational with Unisex Social Security Data Scale, no set back
12.5%
School District Males Pub-2010 Male Healthy Retiree, Teachers, Generational with Unisex Social Security Data Scale, no set back
10.0%
General Service Females
Pub-2010 Female Healthy Retiree, General Employees, Generational with Unisex Social Security Data Scale, no set back
27.5%
Police & Fire Females Pub-2010 Female Healthy Retiree, Public Safety, Generational with Unisex Social Security Data Scale, set back 12 months
2.5%
School District Females Pub-2010 Female Healthy Retiree, Teachers, Generational with Unisex Social Security Data Scale, no set back
22.5%
DISABLED RETIREE MORTALITY WEIGHTING FACTORS
Sex Mortality Table Weighting Factor
General Service Males Pub-2010 Male Non-Safety Disabled Retiree Generational with Unisex Social Security Data Scale, set forward 24 months
35.0%
Police & Fire Males Pub-2010 Male Blended 50% Public Safety, 50% Non-Safety Disabled Retiree Generational with Unisex Social Security Data Scale, no set back
12.5%
General Service Females
Pub-2010 Female Non-Safety Disabled Retiree Generational with Unisex Social Security Data Scale, set forward 12 months
50.0%
Police & Fire Females Pub-2010 Male Blended 50% Public Safety, 50% Non-Safety Disabled Retiree Generational with Unisex Social Security Data Scale, no set back
2.5%

MaryMichelle Sosne November 25, 2019 Page 3
This work product was prepared solely for Oregon PERS for the purposes described herein and may not be appropriate to use for other purposes. Milliman does not intend to benefit and assumes no duty or liability to other parties who receive this work. Milliman recommends that third parties be aided by their own actuary or other qualified professional when reviewing the Milliman work product. \\Porteb-wr\wr\OregonPERS\AC\Corr\Letters\191101_AEQ_Factors.docx
BENEFICIARY MORTALITY WEIGHTING FACTORS
Sex Mortality Table Weighting Factor
Males Pub-2010 Male Healthy Retiree, General Employees, Generational with Unisex Social Security Data Scale, set back 12 months
52.5%
Females Pub-2010 Female Healthy Retiree, General Employees, Generational with Unisex Social Security Data Scale, no set back
47.5%
ACTUARIAL EQUIVALENCY FACTOR TABLES
There are many actuarial equivalency factor tables provided as part of this letter. The following chart summarizes the tables provided, and indicates which tables apply to healthy and disabled members, as well as to Tier 1/Tier 2 and OPSRP. Descriptions of the tables and the assumptions used are detailed in the remainder of this letter. Note that these tables should not be combined or altered to produce other factors. Each table contains a description of how the table should be used in calculations. If you are unsure of how to use the tables or require additional tables for other purposes, such as converting from a single life annuity to a 15-year certain and life annuity, please let us know and we will provide the appropriate factors. Tier 1/Tier 2 OPSRP
Actuarial Equivalency Factor Table Healthy Disabled Healthy Disabled
Early Retirement Reduction Factors Table 1 N/A Table 1 N/A
Refund Annuity Conversion Factors (Option 0)
Table 2a Table 2b N/A N/A
Non-Refund Life Annuity Conversion Factors (Option 1)
Table 3a Table 3b N/A N/A
15-Year Certain and Life Annuity Conversion Factors (Option 4)
Table 4a Table 4b N/A N/A
Option 4 death benefit (conversion of remaining benefit to a lump sum)
Table 5 Table 5 N/A N/A
Joint & Survivor Conversion Factors Tables 6a, 7a, 8a, 9a
Tables 6b, 7b, 8b, 9b
Tables 6a, 7a, 8a, 9a
Tables 6b, 7b, 8b, 9b,
Police & Fire Unit purchases Tables 10-12 Tables 10-12 N/A N/A

MaryMichelle Sosne November 25, 2019 Page 4
This work product was prepared solely for Oregon PERS for the purposes described herein and may not be appropriate to use for other purposes. Milliman does not intend to benefit and assumes no duty or liability to other parties who receive this work. Milliman recommends that third parties be aided by their own actuary or other qualified professional when reviewing the Milliman work product. \\Porteb-wr\wr\OregonPERS\AC\Corr\Letters\191101_AEQ_Factors.docx
Tier 1/Tier 2 OPSRP
Actuarial Equivalency Factor Table Healthy Disabled Healthy Disabled
Full Cost factors for purchasing service Tables 13a, 14-15, 16a
Tables 13b, 14-15, 16b
N/A N/A
Lump Sum Cash Out Factors N/A N/A Tables 17-19 Not provided
Lump Sum Cash Out Factors - Beneficiaries
Table 20 Not provided Table 20 Not provided
Spouse Death Benefit Conversion Factors
Tables 21-22 Tables 21-22 Tables 21-22 Tables 21-22
OPSRP QDRO Factors N/A N/A Tables 23-24 Tables 23-24
Single Life Annuity with COLA Table 25a Table 25b Table 25a Table 25b
TABLE 1: EARLY RETIREMENT REDUCTION FACTORS
Members may elect to receive a reduced retirement benefit prior to their Normal Retirement Dates if they qualify for early retirement. The reduction for early retirement does not apply to Money Match benefits as the reduction is included in the factors used to convert the account balance to an annuity. Normal and Early Retirement Dates vary by Tier and member classification as follows:
Classification Normal Retirement Date
Early Retirement Date
Tier 1 General Service Earlier of age 58 or 30 years of service Age 55
Tier 2 General Service Earlier of age 60 or 30 years of service Age 55
OPSRP General Service Earlier of age 65 or age 58 and 30 years of service Age 55
Tier 1/Tier 2 Police & Fire Earlier of age 55 or age 50 and 25 years of service or 30 years of service
Age 50
OPSRP Police & Fire Earlier of age 60 or age 53 and 25 years of service Age 50
The current and recommended new early retirement factors are shown below. While the recommended new early retirement factors where developed separately based on the updated mortality assumption, the result was an unchanged set of factors when rounded to the nearest 0.1%.

MaryMichelle Sosne November 25, 2019 Page 5
This work product was prepared solely for Oregon PERS for the purposes described herein and may not be appropriate to use for other purposes. Milliman does not intend to benefit and assumes no duty or liability to other parties who receive this work. Milliman recommends that third parties be aided by their own actuary or other qualified professional when reviewing the Milliman work product. \\Porteb-wr\wr\OregonPERS\AC\Corr\Letters\191101_AEQ_Factors.docx
Years prior to Normal Retirement Date
Current Early Retirement Factors
Recommended Early Retirement Factors as of 1/1/2020
1st year Reduced 8.4% Reduced 8.4%
2nd year Reduced 7.6% Reduced 7.6%
3rd year Reduced 6.9% Reduced 6.9%
4th year Reduced 6.3% Reduced 6.3%
5th year Reduced 5.7% Reduced 5.7%
6th year Reduced 5.3% Reduced 5.3%
7th year Reduced 4.8% Reduced 4.8%
8th year Reduced 4.3% Reduced 4.3%
9th year Reduced 3.9% Reduced 3.9%
10th year Reduced 3.6% Reduced 3.6%
The Early Retirement Factors (ERFs) shown above that are effective January 1, 2020 reflect the new mortality assumptions, but reflect the same graded structure that was introduced with the ERFs effective January 1, 2016. Prior to that time, a simplified structure was used.
Under this graded structure, the ERF for a member is based on a combination of factors from the table, depending on the period by which the member’s retirement precedes the Normal Retirement Date. For example, the ERF for an OPSRP member with a Normal Retirement Age of 65 who retires at age 62 is 77.1 percent (100 percent minus 8.4 percent minus 7.6 percent minus 6.9 percent).
These factors should be periodically reviewed to ensure that the reductions continue to provide benefits that are approximately actuarially equivalent as mortality rates improve.
TABLES 2-4: ANNUITY CONVERSION FACTORS FOR TIER 1/TIER 2
Actuarial equivalency factors are used to convert member account balances to one of three annuity amounts: refund annuity, non-refund (single life) annuity, or a 15-year certain & life annuity. These factors do not include the value of the COLA, and therefore should not be used for any purpose other than converting member accounts to these benefit forms.
TABLE 5: TIER 1/TIER 2 OPTION 4 DEATH BENEFIT
For a retired member with an Option 4 benefit who dies before 180 payments have been made, these factors are used to convert the remainder of the 180 payments to a lump sum payable to the beneficiary. These factors are based on interest only, with no mortality, and do not include the value of the COLA, consistent with historical plan administrative practice.

MaryMichelle Sosne November 25, 2019 Page 6
This work product was prepared solely for Oregon PERS for the purposes described herein and may not be appropriate to use for other purposes. Milliman does not intend to benefit and assumes no duty or liability to other parties who receive this work. Milliman recommends that third parties be aided by their own actuary or other qualified professional when reviewing the Milliman work product. \\Porteb-wr\wr\OregonPERS\AC\Corr\Letters\191101_AEQ_Factors.docx
TABLES 6-9: CONVERSION TO JOINT & SURVIVOR FORMS
Members have the option of electing an optional form of benefit that provides a survivor benefit equal to 50 percent or 100 percent of the member's benefit. The actuarial equivalency factors are used to ensure that the optional form of benefit has the same value as the single life annuity (Option 1). These factors do include the value of the COLA. Tables 6a, 7a, 8a, and 9a are to be used for healthy retired members. Factors are provided for retirees between the ages of 45 and 100 with beneficiaries between the ages of 0 and 110. If a member/beneficiary age combination falls outside of this range, please contact us so that we can provide the correct conversion factor.
Tables 6b, 7b, 8b, and 9b are to be used for disabled retired members. Factors are provided for retirees between the ages of 20 and 75 with beneficiaries between the ages of 0 and 110. If a member/beneficiary age combination falls outside of this range, please contact us so that we can provide the correct conversion factor.
These tables are structured by age difference between retiree and beneficiary. If you would like the tables in a different format, please let us know.
Please note that if a member selects a non-spouse beneficiary who is more than 10 years younger than the member, the 100 percent survivor benefit requires adjustment to comply with required minimum distribution rules under IRS regulation 1.401(a)(9)-6. Please let us know if you would like to discuss.
TABLES 10-12: TIER 1/TIER 2 POLICE & FIRE ADDITIONAL UNITS
Tier 1/Tier 2 Police & Fire members have the option of purchasing "units" which provide an additional benefit at retirement. The police and fire additional unit factors are based on interest, with no mortality.
TABLES 13-16: TIER 1/TIER 2 FULL COST FACTORS FOR PURCHASING SERVICE
Tier 1/Tier 2 members have the option of purchasing certain periods of service by contributing the "full cost" of the increased benefit. The current methodology for full cost purchases was determined in the late 1990s. As part of this year’s update, we reviewed that methodology and confirmed its continued appropriateness and reasonability, while relying on our understanding of PERS' historical plan administrative practices for the methodology used in these calculations. We updated the tables to reflect the updated mortality assumptions.
TABLES 17-20: TIER 1/TIER 2 AND OPSRP LUMP SUM DISTRIBUTIONS
Members or beneficiaries may receive a lump sum distribution from OPSRP in certain situations. Separate lump sum factors are to be used for members who have not yet met the Early Retirement criteria and members who are at or beyond their Earliest Retirement Date. To calculate the lump sum for a member who has not yet met the Early Retirement criteria, the normal retirement benefit is multiplied by the appropriate factor from Table 17 or 18. Different

MaryMichelle Sosne November 25, 2019 Page 7
This work product was prepared solely for Oregon PERS for the purposes described herein and may not be appropriate to use for other purposes. Milliman does not intend to benefit and assumes no duty or liability to other parties who receive this work. Milliman recommends that third parties be aided by their own actuary or other qualified professional when reviewing the Milliman work product. \\Porteb-wr\wr\OregonPERS\AC\Corr\Letters\191101_AEQ_Factors.docx
tables are required for General Service and Police & Fire due to differing Normal Retirement Ages for General Service and Police & Fire members.
To calculate the lump sum for members who are at or beyond their Earliest Retirement Date, the early retirement benefit (equal to the normal retirement benefit times the early retirement reduction factor from Table 1) is multiplied by the appropriate factor from Table 19.
To calculate the death benefit lump sum for a beneficiary of a Tier 1/Tier 2 or OPSRP member, the death benefit must first be calculated and then multiplied by the factor from Table 20.
As discussed with PERS in the past, we have not provided lump sum factor tables for disabled members who could potentially be eligible for a lump sum distribution at retirement age. We believe it is very unlikely that a disability retirement benefit will meet the requirements for a lump sum distribution. In the event that a disability retirement benefit is less than $200 per month, please contact us and we will provide the appropriate factor.
In our reading, statute indicates that the cash out for a vested terminated member does not include the value of the COLA. However, in our reading statute does not specify if the lump sum cash out factors for small benefits at retirement eligibility should include the value of the COLA. In keeping with our understanding of prior plan administrative practice by PERS, the lump sum factors provided do not include the value of the COLA. Please let us know if these factors should include the value of the COLA.
TABLES 21-22: TIER 1/TIER 2 AND OPSRP DEATH BENEFIT
Upon the death of a vested non-retired OPSRP member, a benefit is payable to the member's spouse. The benefit is a life annuity for the spouse that is actuarially equivalent to 50 percent of the benefit the member would have received if the member had retired on the date of the member's death, or if not eligible for retirement, had terminated employment on the date of death and retired as of the earliest retirement date. Effective January 1, 2020, under HB 2417 spouses of Tier 1/Tier 2 members may elect to receive this benefit in lieu of death benefits provided under ORS 238.390.
Table 21 is used to convert the monthly benefit that would have been payable to the member to a monthly benefit payable to the spouse as of the date at which the member would have commenced receipt of the benefit. Table 22 is used to convert the spouse benefit so determined to a different commencement age. This is necessary since the spouse is not required to commence benefits at the date utilized in Table 21.
Since the statutes are not clear, in the past we asked for guidance from PERS as to whether separate tables should be provided for calculating the death benefit for a member who was receiving the temporary disability benefit prior to normal retirement age. We understand that the same tables for reducing the benefit for early retirement and converting the member's benefit to a spouse's benefit should apply to both healthy and disabled members. If PERS' administrative interpretation differs from that understanding, please contact us and we will provide a separate table for disabled members.

MaryMichelle Sosne November 25, 2019 Page 8
This work product was prepared solely for Oregon PERS for the purposes described herein and may not be appropriate to use for other purposes. Milliman does not intend to benefit and assumes no duty or liability to other parties who receive this work. Milliman recommends that third parties be aided by their own actuary or other qualified professional when reviewing the Milliman work product. \\Porteb-wr\wr\OregonPERS\AC\Corr\Letters\191101_AEQ_Factors.docx
TABLES 23-24: OPSRP QDROS – IMMEDIATE
These tables are used to separate OPSRP benefits into Member and Alternate Payee components in an actuarially equivalent manner. Tables 23 and 24 are based on member mortality or beneficiary mortality, respectively, and have thus been updated to reflect the change in mortality rates.
TABLE 25: SINGLE LIFE ANNUITY WITH COLA
As requested, these tables were added this year. They may be used to determine an actuarially equivalent present value for a benefit which includes a COLA. Table 25a is to be used for healthy retired members, while Table 25b is for disabled retired members. Our understanding is that these tables will be used to estimate the present value of overpayments arising when the data verification process leads to a benefit being paid in excess of the statutory benefit formulas. The factors in these tables should be multiplied by the total dollar amount of the monthly overpayment. These factors do include the value of the COLA, and therefore should not be used for converting member accounts to the Option 1 benefit form.
DATA, METHODS, PLAN PROVISIONS AND ASSUMPTIONS
The assumptions used in developing the actuarial equivalency factors are the same as those in the December 31, 2018 Experience Study, published July 24, 2019, including an interest assumption of 7.20 percent per year. All factors, unless otherwise noted, include the value of an assumed 2.00 percent annual COLA.
The weighting of separate mortality tables to produce a blended mortality table was based on liabilities attributed to each sex/classification group for all active and dormant members in the December 31, 2017 actuarial valuation, dated September 28, 2018. Other than the exceptions and additions discussed in this letter, the data, methods, assumptions, and plan provisions used in the December 31, 2017 system-wide actuarial valuation report were also used for this analysis. That information, including a discussion of the inherent limitations of use of actuarial valuation results, is herein incorporated to this letter by reference.
We updated the existing actuarial equivalency factor tables as described in this letter, relying on our understanding of prior PERS administrative practices to indicate the appropriate statutory interpretations and procedures for certain calculations.
Our analysis and conclusions are based on our understanding of the request and the data, methods and assumptions described above. Differences in the data, methods, assumptions and interpretations of the plan provisions may produce different results.
Milliman’s work is prepared solely for the use of Oregon PERS. To the extent that Milliman's work is not subject to disclosure under applicable public records laws, Milliman’s work may not be provided to third parties without Milliman's prior written consent. Milliman does not intend to benefit or create a legal duty to any third party recipient of its work product.

MaryMichelle Sosne November 25, 2019 Page 9
This work product was prepared solely for Oregon PERS for the purposes described herein and may not be appropriate to use for other purposes. Milliman does not intend to benefit and assumes no duty or liability to other parties who receive this work. Milliman recommends that third parties be aided by their own actuary or other qualified professional when reviewing the Milliman work product. \\Porteb-wr\wr\OregonPERS\AC\Corr\Letters\191101_AEQ_Factors.docx
No third party recipient of Milliman's work product should rely upon Milliman's work product. Such recipients should engage qualified professionals for advice appropriate to their own specific needs.
The consultants who worked on this assignment are pension actuaries. Milliman’s advice is not intended to be a substitute for qualified legal or accounting counsel.
The signing actuaries are independent of the plan sponsor. We are not aware of any relationship that would impair the objectivity of our work.
If you have any questions about our response or need any additional information, please let us know.
Sincerely,
Matt Larrabee, FSA, EA, MAAA Scott Preppernau, FSA, EA, MAAA Principal and Consulting Actuary Principal and Consulting Actuary
MRL:lre encl.


