Embed Size (px)
Citation preview
Food Security and Nutrition Assessment
of the conflict-affected population in Darfur, SUDAN 2007
Final Report
June 2008
ii
TTaabbllee ooff CCoonntteennttss
SUMMARY .......................................................................................................................................1
1 – CONTEXT AND BACKGROUND OF THE ASSESSMENT......................................................1
1.1 Context and developments in 2006/07.................................................................................1
1.2 Food security and nutrition background to the assessment.................................................2 1.2.1 Geography and Agro-ecology .......................................................................................2 1.2.2 Food security and nutrition background situation .........................................................2
2 – ASSESSMENT OBJECTIVES AND METHODS.......................................................................5
2.1 Objectives of the DFSNA......................................................................................................5
2.2 Partnership ...........................................................................................................................5
2.3 Sampling...............................................................................................................................5 2.3.1 Definitions......................................................................................................................7 2.3.2 Consent .........................................................................................................................8
2.4 Sources of information and data collection tools..................................................................8
2.5 Enumerator teams and training ......................................................................................... 11
2.6 Data entry and analysis ..................................................................................................... 11
2.7 Limitations.......................................................................................................................... 11 (b) 2.7.1 Sampling frame and coverage ...................................................................... 11 (c) 2.7.2 Security and access .......................................................................................... 12 (d) 2.7.3 Conflict-related and political contextual information...................................... 12 (e) 2.7.4 Timing............................................................................................................ 12 (f) 2.7.5 Training and data collection............................................................................... 12 (g) 2.7.6 Bias ............................................................................................................... 13
3 – DEMOGRAPHIC PROFILE OF THE SAMPLED POPULATION........................................... 14
3.1 Distribution of the various population groups in the three Darfur States........................... 14
3.2 Head of households gender, age, literacy and disability status ........................................ 15
3.3 Household size .................................................................................................................. 16
3.4 Timing of displacement...................................................................................................... 16
3.5 Housing conditions ............................................................................................................ 17
3.6 Access to drivable roads ................................................................................................... 17
iii
CHAPTER 4. MORTALITY RATES.............................................................................................. 18
4.1 Crude and Under-5 Mortality rates .................................................................................... 18
4.2 Causes of death................................................................................................................. 18
CHAPTER 5. NUTRITIONAL STATUS OF CHILDREN AND MOTHERS.................................. 20
5.1 Rates of malnutrition of children under 5 years of age...................................................... 20
5.2 Maternal Nutrition .............................................................................................................. 23 5.2.1 Micronutrient supplementation of pregnant women ................................................... 23 5.2.2 Maternal morbidity...................................................................................................... 24 5.2.3 Mosquito net usage by pregnant women ................................................................... 24
CHAPTER 6 – MAIN FACTORS OF MALNUTRITION: HEALTH, WATER AND SANITATION, AND HOUSEHOLD FOOD SECURITY ........................................................................................ 26
6.1 Health status of children under five ................................................................................... 26 6.1.2 Use of mosquito nets.................................................................................................. 27 6.1.3 Children’s immunization and vitamin A distribution coverage.................................... 27 6.1.4 Coverage of vitamin A supplementation .................................................................... 28 6.1.5 Access to health facilities ........................................................................................... 29 6.1.6 Coverage of supplementary and therapeutic feeding programmes ........................... 31
6.2 Care practices.................................................................................................................... 33 6.2.1 Child Caregivers......................................................................................................... 33 6.2.2 Breastfeeding Practices ............................................................................................. 33
6.3 Water and Sanitation ......................................................................................................... 34 6.3.1 Access to safe water .................................................................................................. 34 6.3.2 Source of water .......................................................................................................... 35 6.3.3 Factors linked to access to safe water ....................................................................... 35 6.3.4 Treatment of drinking water at household level ......................................................... 35 6.3.5 Sanitation ................................................................................................................... 36
6.4 Main causes of child malnutrition ..................................................................................... 38 6.4.1 Relationship between nutritional status and illness ................................................... 38
Section 1.02............................................................................................................................. 39 6.4.2 Relationship between nutritional status of children and their mothers....................... 39 6.4.3 Relationship between nutritional status and source of water..................................... 39 6.4.4 Relationship between nutritional status and type of latrine........................................ 40 6.4.5 Relationship between nutritional status and household food security ....................... 40 6.4.6 Food availability, proxied by cultivation and animal raising ....................................... 41 6.4.7 Relationship between malnutrition and household demographic and social characteristics............................................................................................................................................. 41
6.5 Regression analysis .......................................................................................................... 41
7 – FOOD AVAILABILITY: AGRICULTURAL PRODUCTION (CROPS, LIVESTOCK) AND MARKET SUPPLIES..................................................................................................................... 44
7.1 Crop cultivation.................................................................................................................. 44
iv
7.1.1 Forecasted 2007/08 Cereal Balance in crisis-affected Darfur ................................... 44 7.1.2 Land Ownership and Household crop cultivation....................................................... 47 7.1.3 Crops cultivated.......................................................................................................... 49 7.1.4 Main constraints to cultivation .................................................................................... 49 7.1.5 Farmers’ Yield Expectations this year........................................................................ 50 7.1.6 Crop production and use of the production last year ................................................. 51 7.1.7 Characteristics of the head of household, size of the household and cultivation ...... 51
7.2 Cereal markets and trade .................................................................................................. 52 7.2.1 Physical access to cereal markets ............................................................................. 52 7.2.2 Changes in the numbers of cereal markets and traders, and in the volumes of cereals traded, compared to 2006 ................................................................................................... 53 7.2.3 Changes in commodity prices compared to 2006 ...................................................... 54 7.2.4 Perceptions of traders ................................................................................................ 54 7.2.5 Market integration....................................................................................................... 55
7.3 Livestock............................................................................................................................ 58 7.3.1 Livestock ownership ................................................................................................... 58 7.3.2 Main constraints to livestock raising........................................................................... 59 7.3.3 Characteristics of the head of household, size of household and ownership of livestock............................................................................................................................................. 61 7.3.5 Livestock markets and trade ...................................................................................... 62
8 – HOUSEHOLD FOOD SECURITY SITUATION ...................................................................... 64
8.1 Household food consumption ............................................................................................ 64 8.1.1 Food consumption patterns........................................................................................ 64 8.1.2 Access to cooking fuel (firewood) .............................................................................. 69
8.2 Household food access ..................................................................................................... 70 8.2.1 Income sources .......................................................................................................... 70 8.2.2 Migration and remittances .......................................................................................... 74 8.2.3 Access to credit .......................................................................................................... 75 8.2.4 Main sources of food consumed ................................................................................ 75 8.2.5 Household expenditures ............................................................................................ 76 8.2.6 Market prices, daily wages and Terms of Trade ........................................................ 77 8.2.7 Ownership of assets................................................................................................... 82 8.2.8 Food self-sufficiency capacity .................................................................................... 84
8.3 Household food security status ......................................................................................... 85 8.3.1 Household food security groups................................................................................. 85 8.3.2 Food insecurity and characteristics of the head of household and household size... 89 8.3.3 Food insecurity, food sources, income sources, remittances, expenditures and assets89 8.3.4 Crop cultivation, livestock and food insecurity ........................................................... 92
8.4 Coping mechanisms .......................................................................................................... 92 8.4.1 Main strategies in case of food shortages ................................................................. 92 8.4.2 Relationship between coping strategies and food security status ............................. 93
8.5 Estimation of risks to lives and livelihoods ........................................................................ 94 8.5.1 Combination of household food security status and coping strategies...................... 94 8.5.2 Groups at risk to lives and livelihoods........................................................................ 96
8.6 Chronic and transitory food insecurity ............................................................................... 97
v
9 – FOOD ASSISTANCE .............................................................................................................. 99
9.1 Food aid beneficiaries January-August 2007 .................................................................... 99
9.2 Food aid commodities distributed.................................................................................... 101
9.3 Households’ receipt and reliance on food aid for consumption....................................... 101
9.4 Food aid sales ................................................................................................................. 101 9.4.1 Household food aid sale patterns............................................................................. 101 9.4.2 Transfer Income Value of food aid ........................................................................... 104 9.4.3 Food aid sales on the market................................................................................... 105
9.5 Implementation of food aid distributions.......................................................................... 112
9.6 Food aid targeting............................................................................................................ 113 9.6.1 Gender issues .......................................................................................................... 113 9.6.2 Estimation of inclusion and exclusion errors ............................................................ 113
10.1 Receipt of agricultural assistance.................................................................................. 115 10.1.1 Seeds and tools...................................................................................................... 115 10.1.2 Veterinary assistance ............................................................................................. 116
10.3 Receipt of non-food items (NFIs)................................................................................... 116
11 – FORECASTS AND SCENARIOS ....................................................................................... 118
11.1 Food availability prospects ............................................................................................ 118
11.2 Forecasted shocks and opportunities............................................................................ 118 11.2.1 Shocks.................................................................................................................... 118 11.2.2 Opportunities .......................................................................................................... 118
11.3 Most likely scenario: status quo..................................................................................... 119
11.4 Worst case scenario (preparedness and contingency planning) .................................. 122
12 – NUMBERS AT RISKS TO LIVES AND LIVELIHOODS AND NEEDING ASSISTANCE.. 124
12.1 Number of individuals at risks to lives (malnutrition) ..................................................... 124
12.2 Number of households at risk to lives and livelihoods................................................... 124 12.2.1 Current numbers of households at risk to lives and livelihoods ............................. 124 12.2.2 Projection of the number of households at risk to lives and livelihoods in the most likely scenario ............................................................................................................................. 124 12.2.3 Projection of the number of households at risk to lives and livelihoods in the worst case scenario ............................................................................................................................. 126 12.2.4 Main population groups at risk to lives and livelihoods and targeting criteria ........ 126
13 – RESPONSE OPTIONS ....................................................................................................... 128
13.1 Community and household own priorities ..................................................................... 128 13.1.1 Immediate priorities ................................................................................................ 128 13.1.2 Longer term priorities ............................................................................................. 129
vi
13.2 Options to address individuals’ risks to lives linked to malnutrition............................... 130
13.3 Options to address households’ risks to lives and livelihoods ...................................... 131 13.3.1 Overview of the situation and main assistance requirements................................ 131 13.3.2 Food aid or cash/voucher transfers?...................................................................... 133 13.3.3 Food transfers ........................................................................................................ 135 13.3.4 Cash/voucher Transfers ......................................................................................... 138 13.3.5 School feeding response option............................................................................. 140 13.3.7 Improving Household Food Production through Agriculture and Livestock Production144 13.3.8 Improving management, protection and restoration of natural resources for food security........................................................................................................................................... 147 13.3.7 Complementary non-food assistance options ........................................................ 151
14 - RECOMMENDATIONS........................................................................................................ 152
14.1 Recommendations for interventions to address individual risks to lives ....................... 152
14.2 Recommendations for interventions to address household risks to lives and livelihoods153 14.2.1 Recommendations for General food distributions.................................................. 153 14.2.2 Recommendations for Food- or Cash- for-Work.................................................... 156 14.2.3 Recommendations for Food-for-Training ............................................................... 156 14.2.4 School Feeding ...................................................................................................... 157 14.2.5 Recommendations for cash/voucher interventions ................................................ 157 14.2.6 Recommendations for improving Household Nutrition Practices........................... 158 14.2.6 Agricultural and environmental interventions ............. Error! Bookmark not defined. 14.3.8 Improving management and protection of natural resources for food security...... 159
14.3 Recommendations for monitoring and assessments .................................................... 161
ANNEXES ................................................................................................................................... 162
vii
Acknowledgement
Those involved in this assessment are deeply grateful to the individuals, households and communities of Greater Darfur for their time and hospitality. This assessment report is the culmination of months’ worth of effort of many individuals and organizations. The assessment was truly an inter-agency effort and many organizations were involved in its design, the collection of data and the production of this report. The main agencies involved in the assessment were the Ministries of Health (MOH) and Agriculture (MOA) and the Humanitarian Aid Commission (HAC) of the Government of Sudan in partnership with the Food and Agriclture Organization of the United Nations (FAO), United Nations Chidren’s Fund (UNICEF), the World Food Programme (WFP) and the United States Center for Disease Control and Prevention (CDC). We gratefully acknowledge the many organizations (too many to list here) that contributed staff, vehicles and other logistical support to ensure that everything went smoothly. We are deeply appreciative for the helpful comments of various organizations on the design of the survey, its implementation and on the preliminary findings and recommendations during the presentations in Khartoum and in the three Darfur States.
viii
Team Members Please see Annex 3 for the full list of enumerators, supervisors and team leaders who ensured the data collection in the field. The core team members of the assessment included: Federal Ministry of Health: Dr. Mohammed Ali Yehia El Abassi, General Director, Primary Health Care Dr. Saad El-Din Hussein Hassan, Director, Emergency and Humanitarian Action Dr. Amani Mustafa, Director, National Nutrition Department Wafaa Mustafa, Deputy, National Nutrition Department Suad Osman Mohammed Khair, Head of Emergency Unit, National Nutrition Department Hassan Ali Suleman, Fedeal Ministry of Health Humanitarian Aid Commission: Dr. Bakhiet Abdalla Yagoub, Deputy Commissioner Badreldin Abdelrahman, Emergency Coordination Unit Ministry of Agriculture: Mr. Babiker Haj Hassan, Head of Food Security Department Elamien Hassan Elamien, Food Security Department Fatima El Hassan, Special Programme for Foor Security (SPFS) Mahasin Mohamed Ahmed, SPFS FAO: Marc Abdala, Coordination Unit, Khartoum Mahmoud Nouman, Coordination Unit, Khartoum Corinna Bothe, Emergency Coordination Unit, Khartoum Luca Russo, Economic and Food Security Service, Rome Erdgin Mane, Economic and Food Security Service, Rome UNICEF: Diane Holland, Nutrition Programme, Khartoum Josephine Ippe, Nutrition Programme, Khartoum Zivai Murira, Khartoum Themba Nduna, Khartoum Andrea Berardo, Khartoum WFP: Agnès Dhur, ODAN, Rome (main author of this report) Daniel Molla, Vulnerability Analysis and Mapping (VAM) Unit, Khartoum Rukia Yacoub, Nutrition Programme, Khartoum Le Kim Nguyen, VAM, Rome Mariko Kawabata, VAM, Darfur Henk-Jan Brinkman, Economic Analysis Unit, Rome Simon Dradri, ODJ, Lusaka Simon Renk, Economic Analysis Unit, Rome Subran Ludovic, Economic Analysis Unit, Rome Hanan Elabas, Programme Services (Gender), Khartoum Edith Heines, Gender Unit, Rome CDC: Leisel Talley, Epidemiologist, Atlanta

Acronyms ACF Action Contre la Faim AHA African Humanitarian Agency ARI Acute Respiratory Infection AU African Union CDC Center for Disease Control (Atlanta) CO Country Office CMR Crude Mortality Rate CRS Catholic Relief Services CSB Corn-Soya Blend DPA Darfur Peace Agreement DFSNA Darfur Food Security and Nutrition Assessment EFSNA Emergency Food Security and Nutrition Assessment FAO Food and Agriculture Organisation GAA German Agro Action GoS Government of Sudan HEB High Energy Biscuits HH Household ICRC International Committee of the Red Cross IDP Internally displaced person IGA Income Generating Activity IMC International Medical Corps IPM Integrated Pest Management MoH Ministry of Health NFI Non Food Item NGO Non-Governmental Organization NSS Nutritional Surveillance System PDM Post Distribution Monitoring PPS Probability Proportional to Size SC-US Save the Children USA SUDO Sudanese Office U5MR Under-5 Mortality Rate UNICEF United Nations Children’s Fund UNOCHA United Nations Office for the Coordination of Humanitarian Affairs WFP World Food Programme
1
SUMMARY 1 – CONTEXT AND BACKGROUND OF THE ASSESSMENT 1.1 Context and developments in 2006/07 In February 2003, a conflict began in the Greater Darfur region of Sudan with an insurgency campaign launched by the rebel Sudan Liberation Movement/Army (SLM/A) and counter-insurgency action by the Government of Sudan. The Darfur Peace Agreement (DPA), signed in May 2006, failed to end the conflict that had plagued the three Darfur States since 2003. Instead, it contributed to the splintering of armed factions, warlordism and renewed violence. Between 2004 and 2007, the three original rebel movements fragmented into 12 armed groups, civilian displacement continued, banditry increased and humanitarian access reduced1. Over 2006/07, the conflict has seen a dramatic evolution with much of the violence originating from clashes between and amongst tribal militia and rebel factions. Many forces are not coherently aligned and many are isolated without real leadership. According to the United Nations Office for the Coordination of Humanitarian Affairs (OCHA)2, the conflict-affected population in Darfur has reached 4.14 million persons, including an estimated 2.15 million IDPs, of which 250,000 were newly displaced or re-displaced since the beginning of 2007. In 2007, new arrivals were reported in IDP camps such as Abu Shouk and Al Salaam in North Darfur, Ed Daien and Kalma camps in South Darfur (including refugees from the Central African Republic), and Forabaranga, Um Dukhum and Beida in West Darfur (including refugees from Chad and the Central African Republic). As insecurity within Darfur and tensions across the borders persist, population movements are expected to continue. The newly displaced often arrive in an appalling state into the already overcrowded IDP settlements, after weeks of traveling through the bush. Since 2004, localised nutrition surveys have reported levels of GAM ranging from 6.4% to 39%, however, these rates decreased considerably in 2005-2006. GAM rates show a seasonal trend, for example, they report a higher GAM rate in April to September than when conducted during October to March (see Section 1.2). Insecurity and random targeted attacks on aid workers and their assets seriously hamper the delivery and quality of humanitarian assistance. Since the beginning of 2007, 98 humanitarian vehicles have been highjacked, a marked increase compared to the year before, and 61 humanitarian convoys ambushed3. One hundred humanitarian staff were kidnapped, 66 were physically/sexually assaulted, and 5 were killed. In June 2007, a joint African Union (AU)-UN mediation team led a new initiative to resume peace negotiations for the Darfur conflict. The AU mission was to be replaced by a 26,000 strong UNAMID, a hybrid AU-UN peacekeeping mission, by October/November 2007 to assist with establishing and monitoring a ceasefire and bring much needed security to the population4. As shown by the experience of the DPA, the challenges are many, including the importance of ensuring an inclusive process by which all key parties attend the negotiations and of a long term recovery and stabilization process with sustained external support, and the difficulty of resolving power-sharing and security arrangement issues. The composition of UNAMID is also an issue given the request from the Government of Sudan that it maintains an African character. Although there have been many pledges for troops, issues regarding equipment and training remain unresolved. As a result, the UNAMID deployment continues to face delays. 1 “Darfur: Another chance for peace?” ODI Humanitarian Policy Group and Christian Aid event, London, 5 September 2007 (http://www.odi.org.uk/events/darfur_peace/) 2 Sudan, Darfur Humanitarian Profile, September 2007 - OCHA 3 Sudan, Darfur Humanitarian Profile, September 2007 - OCHA 4 United Nations Council Resolution 1769 of 31 July 2007
2
Peace talks between the various parties took place at the end of October. The lack of unity and fragmentation between different movements is a major issue, however. The situation remains fragile and precarious. There are also concerns that the Comprehensive Peace Agreement (CPA) signed in 2005 by the Government of Sudan and the Sudan People’s Liberation Movement/Army, formally ending 21 years of civil war in South Sudan, is not getting sufficient international attention for implementation. A collapse of the CPA would affect a much larger number of Sudanese people and endanger any lasting peace process for Darfur. Conversely, the conflict in Darfur could spread across the rest of the country, including to neighboring Chad. After 4 years of conflict, the livelihoods of all civilian population groups in the three Darfur states have been affected either directly, through asset stripping, or indirectly, through loss of access to natural and economic resources. A war economy has developed, including a construction boom which is leading to the overexploitation of natural resources such as timber. Local governance institutions are virtually absent to address and solve competition over natural resources. This has contributed to conflict. The economic dimensions of the conflict have increased, stressing the need to link immediate recovery needs with longer term development, provided progress in security and in the political process is achieved. Institutional and local actor capacity building is also recognized as a priority. Regional dimensions to the conflict must be tackled. The situation in Chad, the Central African Republic and the influence of regional stakeholders such as Egypt, Libya, Eritrea and the Arab League must be addressed. 1.2 Food security and nutrition background to the assessment
1.2.1 Geography and Agro-ecology The Greater Darfur region consists of three States (North, South, West) covering an area of 511, 410 km2. The total population in 2007 was estimated at 6.97 million, of which approximately 80% reside in rural areas. The Darfur region is a mixture of semi desert in the north and savannah in the south, with annual rainfall ranging from 150 to 300 mm per annum. It is crossed by small seasonal water courses (wadis), with alluvial beds that allow for the growing of trees and seasonal fodder grasses.
1.2.2 Food security and nutrition background situation Prior to the conflict, the Darfur economy was mostly based on trade in cereals, cash crops, horticulture and livestock export. Darfur was a net earner of foreign exchange through livestock export, which generated 20% of national export earnings prior to the discovery of oil. Since the conflict, livestock trade from Darfur has declined drastically and sales are mostly for local consumption. Markets in local cereals (millet and sorghum) have similarly declined and current agricultural markets are sustained only by the trade in food aid5. The previously well-established regional trade market was based on the complementary livelihoods of farmers and pastoralists. With increasing drought, livestock migration patterns have changed and some pastoralist groups have diversified their activities to include cultivation. Farming has expanded across the traditional rangelands in the central belt of Darfur that
5 M. Buchanan-Smith, S. Jaspars: “Conflict, camps and coercion: the continuing livelihoods crisis in Darfur”. WFP, June 2006
3
previously provided pasture. Environmental pressures and land tenure issues have led to increased tension and conflict between these competing livelihood systems6. The main food security and economic repercussions of the conflict in Darfur include7: • the marked decline of local rural markets (cereals and livestock); • the collapse of wider cereal markets, now upheld by the trade in food aid grain; • increased market prices of basic goods because of insecurity restricting transport; • the closure of the main trade routes to Libya, Egypt, central Sudan (Omdurman), thereby
restricting livestock exports and imports of food and non-food commodities; • the cessation of remittance flows and labour migration as a result of insecurity; • the blocking of livestock migration routes with subsequent livestock concentrations triggering
increased morbidity and over-grazing of pasture; • the organized targeting, looting and recycling of humanitarian assets such as communicaton
equipment and vehicles; • a construction boom (brick-making) with adverse impact on natural resources (wood); • increasing competition over natural assets such as firewood and fodder, including the use of
gender-based violence (to control the collection of firewood, in particular). Besides internal displacement, a new influx of refugees from bordering countries occurred in West Darfur in 2007. Their settlement on agricultural areas may have negatively affected cultivation by residents. Main results of the 2006 Darfur Food Security and Nutrition Assessment (DFSNA) The DFSNA carried out in September 2006 showed that the proportion of food insecure households (70%) and of acutely malnourished under-5 children (12.9%) were comparable to 2005, and improved in comparison to 2004. While these results showed a measure of stabilization, food insecurity and malnutrition rates remained high and indicated the continued risk to lives and livelihoods for a large part of the population. The situation was worse for IDPs in camps than for IDPs in communities and resident populations. On the other hand, both IDPs in communities and residents had less access to water and sanitation facilities than IDPs in camps. Malnutrition in children under five was associated with health (morbidity), water access and feeding practices more than with household food security, perhaps owing to the food aid access by households interviewed and/or preference for food given to children within the households. Household food insecurity was characterized by inadequate food consumption, greater reliance on food aid, dependence on unreliable and low-earning income activities such as firewood and grass collection, lack of assets including animals and limited land cultivation. These factors, in turn, were greatly influenced by insecurity, which constrained movement and jeopardized assets. Food aid was a crucial source of food and income, particularly for IDPs in camps. As expected, however, food aid was insufficient by itself to address household food insecurity. Beneficiaries of food aid, especially IDPs, lacked the means to access complementary foods (such as dry and fresh vegetables) and to cover expenses for milling, firewood, healthcare, transportation and education. As a result, they were compelled to sell part of their food ration and became indebted to local traders. In addition to being cost inefficient, selling of part of the food ration eventually affects dietary intake and the nutritional status of household members. Together with disease, poor water quality and unsatisfactory child feeding practices, food aid sales may contribute to the persistent (although stable) rates of child malnutrition observed.
6 H. Young, A. Osman, R. Dale: “Strategies for Economic Recovery and Peace in Darfur; Why a wider livelihoods approach is imperative and inclusion of the Abbala (camel herding) Arabs is a priority”. Feinstein International Center, Tufts University, July 2007. 7 Ibid.
4
Localised nutrition surveys8 In early 2007, with the exception of Ed Daien, reported GAM rates were below the 15% emergency threshold. From May onwards, however, higher GAM rates were reported ranging from 15.9% to 30.4 % (see footnote9 for details in the three Darfur States). Key areas of concern were the camps, which faced constraints of crowding and public health problems, especially during the rainy season. In these areas, GAM declined in 2005 and 2006 in comparison to 2004. GAM rates in 2007 are higher than those in 2006, however, and approach levels reported at the height of the crisis in 2004, indicating the precarious physical condition of individuals resulting from limited access to diversified diets (either through their own production or market mechanisms). Additional factors contributing to this rise included new displacements and decreased services due to insecurity, as well as inadequate water and sanitation. Consistently, young children (6-29 months) were most at risk (compared to 30-59 months). Optimal infant and young child feeding is a major problem but limited progress was made in this area. Access to water remained at good levels in IDP camps but seasonal deterioration in sanitation was reported in all surveys in the larger camps. Health indicators, such as prevalence of disease steadily increased from March 2007 (Malaria, RTI and diarrhoea). A number of surveys showed strong linkages between diarrhoea and malnutrition and, to a lesser extent, with fever/malaria. These trends are for the most part supported by the feeding centre data, though coverage and access to centres must be taken into account. Therapeutic Feeding Center (TFC) and Supplementary Feeding Center (SFC) admissions follow seasonal trends. From January to July 2007, SFC admissions rose and levelled off, remaining below 2006 levels. From January to July 2007, TFC admissions increased steadily, above 2006 levels. The absolute number of SFC admissions decreased compared to 2006, with the exception of centres in West Darfur. This may be linked to the closure or suspension of some SFCs rather than to improvements in the nutritional situation. In West Darfur, the influx of refugees, increased diarrhea prevelence and social mobilization efforts are believed to have contributed to the higher number of TFC admissions. 2007 results from Sentinel Site Surveillance System10 Depending on access, nutritional and food security data are collected from 10 to 14 nutriton surveillance sentienl sites (IDP and resident areas) in each Darfur State. Routine nutrition surveillance has detected a steady increase in GAM. Results from May/ June 2007, however, did not reveal significant changes in food consumption and access patterns of IDPs and residents compared to the global results of the 2006 DFSNA. Food aid continues to provide a key source of food for both IDPs and residents. In West Darfur, there were reports of an increased sale of assets by residents in June 2007, suggesting that residents are increasingly vulnerable during the hunger gap.
8 UNICEF Darfur Nutrition Update May - June 2007 9 In North Darfur, the nutritional situation is of particular concern in Abu Shouk and Al Salaam camps, and in Kebkabiya town. Nutritional surveys done in June 2007 by the NGO Action Contre la Faim (ACF) found very high child acute malnutrition rates in the two camps (30.4%) as well as in the town (27%). Insecurity hampers the smooth operation of nutrition interventions in these areas. In South Darfur, ACF nutritional surveys in Al Salaam IDP camp in June 2007 revealed global acute malnutrition rates among under-5 children of 23.3% and 17.8% in Kass town (including both IDPs and residents). Mortality rates in the town were above emergency levels but the exact causes of death (infectious diseases) were not clearly identified. In West Darfur, the NGO Concern found global acute malnutrition rates of 17.4% in Geneina town and surrounding camps in June, higher than in June 2006, possibly linked to deteriorations in the water and sanitation environment. 10 UNICEF Darfur Nutrition Update May - June 2007
5
2 – ASSESSMENT OBJECTIVES AND METHODS 2.1 Objectives of the DFSNA The main objectives of the 2007 Emergency Food Security and Nutrition Assessment (DFSNA) were to:
1. Provide updated information on the food security and nutritional situation of the IDP and resident populations affected by 4 years of conflict in Darfur;
2. Compare the food security and nutrition situation among the conflict-affected populations to that of 2004, 2005 and 2006;
3. Re-assess coverage of nutrition, public health, food security and agricultural services and other assistance programmes among the conflict-affected population in Darfur;
4. Recommend immediate and medium term interventions to save lives and support livelihoods and inform strategic longer term interventions; and,
5. Develop key recommendations from current and previous DFSNAs to inform more appropriate longer term nutrition and food security monitoring systems in Darfur.
2.2 Partnership The DFSNA was conducted jointly by the Ministries of Health, Ministries of Agriculture and the Humanitarian Aid Commission of the Government of Sudan, with the support of the Food and Agricultural Organization (FAO), the United Nations Children’s Fund (UNICEF) and the World Food Programme (WFP) and, the Center for Disease Control and Prevention (CDC-Atlanta), and several international and national non-governmental organizations including German Agro Action, Action Against Hunger, Relief International, Sudanese Red Crescent, SUDO, GOAL, Tearfund, Kuwaiti Patient Helping Fund, WID, International Medical Corps, World Vision International, Save the Children US, Catholic Relief Services, Concern as well as UNHCR. A ‘lessons learned’ workshop was conducted in Khartoum from 27 to 28 June 2007, wherein 39 Government representatives, UN and NGO staff shared experiences from previous EFSNAs in order to:
• Identify good practices for DFSNA and define areas for improvement; • Form the basis for a subsequent detailed review of survey tools; and, • Agree on the timeline for the 2007 DFSNA and implementation arrangements.
2.3 Sampling The DFSNA covered crisis-affected areas of North, South and West Darfur States, as defined by the humanitarian community. A list of all villages and camps was compiled from several sources, including (1) OCHA population figures dated August 2007 (2) ICRC figures dated August 2007 (3) WFP beneficiary population figures from June 2007 not included in the August list. The sample frame included 3.55 million people (2.07 million IDPs and 1.36 million residents) and 484 communities (248 in North Darfur, 136 in South Darfur and 100 in West Darfur). As such, the survey does not represent the whole of Darfur but only the population that is accessible to humanitarian assistance. The primary objectives of the household survey were to measure the nutritional status of young children, to examine coverage of essential nutrition and health programmes and to measure the level of household food consumption. Additionally, as recommended by the Federal Ministry of Health (MoH) National Nutrition Survey Guidelines, the survey also included an objective to estimate the crude mortality rate with as much precision as logistically feasible. In brief, estimates of the sample size were made to ensure that key nutritional and mortality indicators would be statistically representative at the individual Darfur State and/or overall conflict affected population level with 0.05 statistical significance (95% confidence interval). Sample size
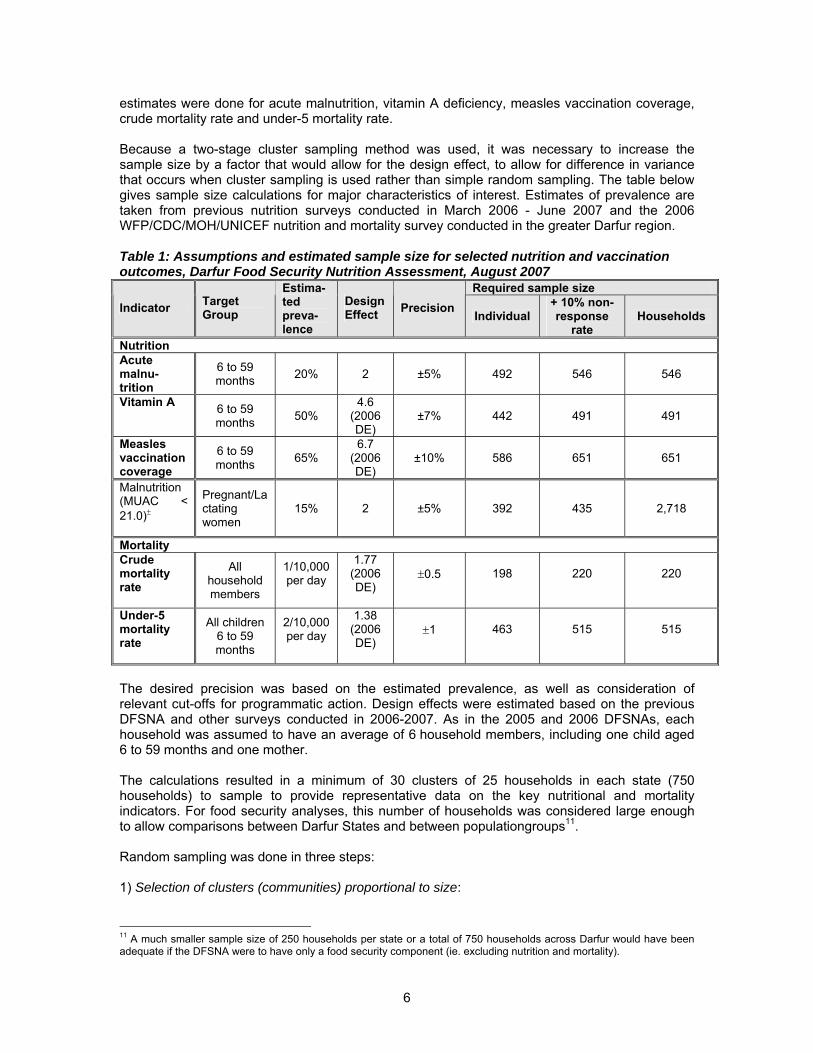
6
estimates were done for acute malnutrition, vitamin A deficiency, measles vaccination coverage, crude mortality rate and under-5 mortality rate. Because a two-stage cluster sampling method was used, it was necessary to increase the sample size by a factor that would allow for the design effect, to allow for difference in variance that occurs when cluster sampling is used rather than simple random sampling. The table below gives sample size calculations for major characteristics of interest. Estimates of prevalence are taken from previous nutrition surveys conducted in March 2006 - June 2007 and the 2006 WFP/CDC/MOH/UNICEF nutrition and mortality survey conducted in the greater Darfur region. Table 1: Assumptions and estimated sample size for selected nutrition and vaccination outcomes, Darfur Food Security Nutrition Assessment, August 2007
Required sample size Indicator Target
Group
Estima-ted preva-lence
Design Effect Precision Individual
+ 10% non-response
rate Households
Nutrition Acute malnu-trition
6 to 59 months 20% 2 ±5% 492 546 546
Vitamin A 6 to 59 months 50%
4.6 (2006 DE)
±7% 442 491 491
Measles vaccination coverage
6 to 59 months 65%
6.7 (2006 DE)
±10% 586 651 651
Malnutrition (MUAC < 21.0)±
Pregnant/Lactating women
15% 2 ±5% 392 435 2,718
Mortality Crude mortality rate
All household members
1/10,000 per day
1.77 (2006 DE)
±0.5
198
220
220
Under-5 mortality rate
All children 6 to 59 months
2/10,000 per day
1.38 (2006 DE)
±1
463
515
515
The desired precision was based on the estimated prevalence, as well as consideration of relevant cut-offs for programmatic action. Design effects were estimated based on the previous DFSNA and other surveys conducted in 2006-2007. As in the 2005 and 2006 DFSNAs, each household was assumed to have an average of 6 household members, including one child aged 6 to 59 months and one mother. The calculations resulted in a minimum of 30 clusters of 25 households in each state (750 households) to sample to provide representative data on the key nutritional and mortality indicators. For food security analyses, this number of households was considered large enough to allow comparisons between Darfur States and between populationgroups11. Random sampling was done in three steps: 1) Selection of clusters (communities) proportional to size:
11 A much smaller sample size of 250 households per state or a total of 750 households across Darfur would have been adequate if the DFSNA were to have only a food security component (ie. excluding nutrition and mortality).
7
To account for the expected intra-State variability, 30 clusters per state were selected randomly by calculating the sample interval (using the cumulative total population), choosing a random number between one and the sampling interval for the assignment of the first cluster, and using the sampling interval for assignment of all other clusters (90 total). For each state, 7 additional clusters above the desired 30 were drawn in order to allow for the possibility of replacement of some clusters that may be inaccessible owing to the poor security conditions on the ground and flooding/road damage. 2) Second stage: selection of sampling (cluster location within chosen community) Once survey teams arrived in each state, they met with NGOs and local officials to try to obtain additional information about the populations included in the sample. To determine the actual location of clusters within the selected locations, a sampling proportional to size (PPS) method was used. The goal was to reach a population size of 100 to 200 households from which to choose the final 25 households12. In towns and large camps, several stages were sometimes required. Two main methods were used to achieve PPS sampling, depending on the situation: • geographical segmentation, using a map of the area divided into segments of roughly equal
size; and, • population density, using a map showing the relative density of the population and selecting
sections proportional to size. If the selected area was small, less than 100 households, it was combined with an adjacent area to ensure an adequate sample. 3). Selection of households within the cluster: To reach the required sample size, 25 households had to be interviewed in each cluster, chosen by systematic random sampling. The DFSNA survey Team Leader walked the boundary of the cluster with a community leader, counted the total number of households, determined the sampling interval, randomly selected the first household within the interval, and then proceeded sampling every ninth household until 25 households were marked for follow up by the enumerators. All households were selected, whether or not they contained a child 6-59 months of age. Households were visited at least three times if household members were absent, unless security or logistics constraints restricted the time to be spent in the cluster. If members had departed permanently or were not expected to return before the departure of the survey team, the household was skipped and not replaced.
2.3.1 Definitions
• Household: A group of people who routinely ate out of the same pot13. • Head of Household: the person who makes major decisions within the household. • Internally Displaced Persons (IDPs): those persons not residing in their usual place of
residence, and consider themselves as displaced in a camp setting or residing within a larger community. Refugees from Chad were also included within this category.
• Residents: persons who reported that they were living in their usual place of residence. Returnees were also classified as residents.
12 This translates into a sampling interval of 4-8 households, ensuring that the distance covered by enumerators when traveling from one household to thenext is manageable. 13 Some household members may have lived in different physical structures within the same compound. If they were not eating together, they were recorded as separate households. Members of a household were also not necessarily relatives by blood or marriage.
8
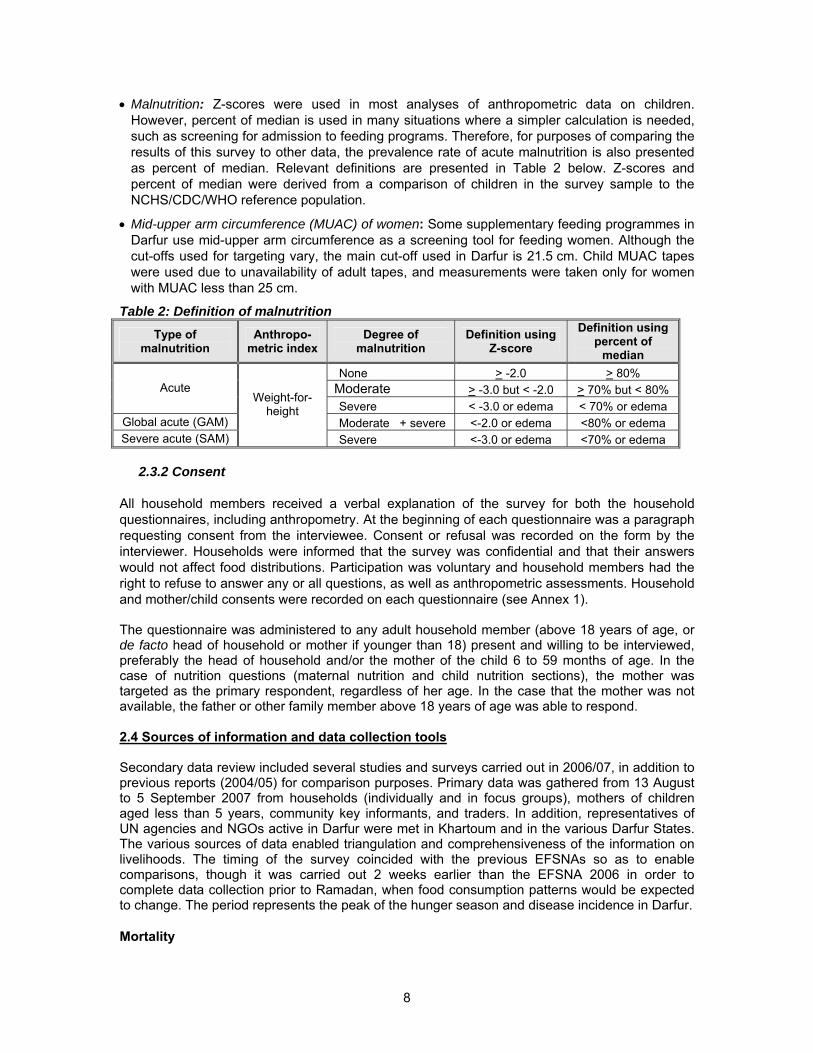
• Malnutrition: Z-scores were used in most analyses of anthropometric data on children. However, percent of median is used in many situations where a simpler calculation is needed, such as screening for admission to feeding programs. Therefore, for purposes of comparing the results of this survey to other data, the prevalence rate of acute malnutrition is also presented as percent of median. Relevant definitions are presented in Table 2 below. Z-scores and percent of median were derived from a comparison of children in the survey sample to the NCHS/CDC/WHO reference population.
• Mid-upper arm circumference (MUAC) of women: Some supplementary feeding programmes in Darfur use mid-upper arm circumference as a screening tool for feeding women. Although the cut-offs used for targeting vary, the main cut-off used in Darfur is 21.5 cm. Child MUAC tapes were used due to unavailability of adult tapes, and measurements were taken only for women with MUAC less than 25 cm.
Table 2: Definition of malnutrition Type of
malnutrition Anthropo-
metric index Degree of
malnutrition Definition using
Z-score Definition using
percent of median
None > -2.0 > 80% Moderate > -3.0 but < -2.0 > 70% but < 80% Acute Severe < -3.0 or edema < 70% or edema
Global acute (GAM) Moderate + severe <-2.0 or edema <80% or edema Severe acute (SAM)
Weight-for-height
Severe <-3.0 or edema <70% or edema
2.3.2 Consent All household members received a verbal explanation of the survey for both the household questionnaires, including anthropometry. At the beginning of each questionnaire was a paragraph requesting consent from the interviewee. Consent or refusal was recorded on the form by the interviewer. Households were informed that the survey was confidential and that their answers would not affect food distributions. Participation was voluntary and household members had the right to refuse to answer any or all questions, as well as anthropometric assessments. Household and mother/child consents were recorded on each questionnaire (see Annex 1). The questionnaire was administered to any adult household member (above 18 years of age, or de facto head of household or mother if younger than 18) present and willing to be interviewed, preferably the head of household and/or the mother of the child 6 to 59 months of age. In the case of nutrition questions (maternal nutrition and child nutrition sections), the mother was targeted as the primary respondent, regardless of her age. In the case that the mother was not available, the father or other family member above 18 years of age was able to respond. 2.4 Sources of information and data collection tools Secondary data review included several studies and surveys carried out in 2006/07, in addition to previous reports (2004/05) for comparison purposes. Primary data was gathered from 13 August to 5 September 2007 from households (individually and in focus groups), mothers of children aged less than 5 years, community key informants, and traders. In addition, representatives of UN agencies and NGOs active in Darfur were met in Khartoum and in the various Darfur States. The various sources of data enabled triangulation and comprehensiveness of the information on livelihoods. The timing of the survey coincided with the previous EFSNAs so as to enable comparisons, though it was carried out 2 weeks earlier than the EFSNA 2006 in order to complete data collection prior to Ramadan, when food consumption patterns would be expected to change. The period represents the peak of the hunger season and disease incidence in Darfur. Mortality
9
Mortality was assessed using the retrospective household census method. Respondents were asked to list all members living in the household at the time of the previous Eid Al Adha. This religious event occurred around December 31, 2006 in the Gregorian calendar. This event was chosen as it was well known to the population, even in isolated rural areas. First, all household members living in the household at that time were listed by age and sex, with the head of the household listed first. The respondent was then asked where each person was at the time of interview. Possible choices were: alive and living in the household, alive and living elsewhere, missing, and dead. Births and deaths occurring in each household between Eid Al Adha and the date of the survey were recorded along with month of occurrence. Individual state-based local calendar of events were developed and used to determine ages of household members and dates of death more accurately (see Annex 1). Cause of death was collected from the respondent. Child feeding practices Survey workers asked questions of each mother with a child 6 to 59 months of age in the household regarding breastfeeding practices, pregnancy, mother’s enrollment in supplementary feeding, night-blindness, and diarrheal disease in the two weeks prior to the survey. For mothers with children 0 to 24 months of age, questions were asked regarding breastfeeding initiation and duration and infant and young child feeding practices. Information was also gathered on each child 6 to 59 months of age from an adult household member (preferably the mother). Questions were asked regarding enrollment in selective feeding programs (therapeutic and supplementary), vitamin A supplementation, measles vaccination, use of mosquito nets, and recent illness. Vaccination records were reviewed where available, however, mothers’ reports were also taken as evidence of vaccination against measles and receipt of vitamin A supplementation. To assist mothers and avoid confusion with polio vaccination, vitamin A capsules were shown.
Anthropometric measurement
Survey workers measured children’s weight, height/length, and assessed the presence of oedema. Children were weighed to the nearest 100 grams with a UNICEF Uniscale. For children younger than 2 years of age or less than 85 centimeters (cm), length was measured to the nearest millimeter in the recumbent position using a standard height board. Children 85 to 110 cm were measured in a standing position. Oedema was assessed by applying thumb pressure to the feet for approximately 3 seconds and then examining for the presence of a shallow print or pit. MUAC was measured on all mothers in the survey using a MUAC measuring tape. Where facilities existed, malnourished children and women were referred to therapeutic feeding centers for treatment of severe malnutrition (<70% weight-for-height percent of median or bilateral oedema) or to supplementary feeding programs for treatment of moderate malnutrition (>70% to <80% weight-for-height percent of median). A seasonal calendar was developed for each Darfur state in order to estimate child age as accurately as possible.)
Household Interviews At individual household level, data was collected on: • mortality and main reported cause of death; • household residence status (IDP, resident, refugee, returnee, nomad), size and household
head characteristics; • housing material, access to water and sanitation; • enrolment of children in primary school and constraints; • ownership of assets and animals;
10
• land cultivation and constraints; main use of agricultural production; • sources of income and constraints; receipt of remittances; • food, health and education expenditures; • food consumption and food sources; • coping strategies; • receipt of food and non-food assistance; and • immediate and long-term priorities. A total of 2,167 households were interviewed. Each mother of children under 5 years of age was interviewed on: • child feeding practices; • child health; • child enrolment in therapeutic or supplementary feeding programme; • use of mosquito net; • measles vaccination; • maternal antenatal care and health status; and • main child caretaker. Anthropometric measurements were taken on 1,375 pregnant women as well as mothers of children under 5 years(mid-upper arm circumference) and 2,247 children under 5 (weight, height and oedema) to assess their nutritional status. Focus Group Discussions Using a semi-structured checklist, a total of 23 focus group discussions were held separately with men/women and IDPs/residents, in approximately one third of the communities visited in each Darfur State, on the following topics: • main wealth groups in the community; • intra-community cultivation arrangements and changes; • main cash income sources and intra-household decision-making on cash use; • credit access and indebtedness (sources of loans, reasons and reimbursement capacity); • reliance on markets for food consumption and for sales of cereals and livestock; • coverage/exclusion from food and non-food assistance, and preferences; • main problems with water and with firewood; • attitude towards schooling; and • Infant and young child feeding practices Community Interviews A total of 83 interviews with key informants (community representatives) were held using structured questionnaires covering the following issues: • land cultivation, crop growth status and environmental problems; • livestock raising, animal health services and constraints; • access to health facilities, primary school, and roadworthy roads; • water treatment; • access to cereal and to livestock markets, and variations of volume of market activity, number
of traders, price of key food commodities, livestock, fodder, firewood and charcoal, and daily wages for unskilled labour;
• food aid distribution mechanisms; and, • immediate and short-term priorities. Trader Interviews
11
For the rapid market assessment component of the survey, a total of 72 traders in the three main Darfur states and some communities and IDP camps were interviewed on: • type of trade and commodities, selling and buying prices; • main sources and volume of cereals traded; • catchment area; • main trade routes for the market; • transportation costs, storage conditions and losses, taxes; • access to credit; • main constraints to trade; market-related shocks, their effects on trade and coping mechanisms; • perceptions about food aid. 2.5 Enumerator teams and training Each State was surveyed by 3 to 4 teams of enumerators. Each team included a supervisor, a team leader, a community interviewer, 5-6 household interviewers, and 2-3 persons for anthropometric measurements. The WFP Gender Focal Point for Sudan joined the teams for the focus group discussions on gender. Training of Team Leaders was held in El Fasher, North Darfur for 15 Team Leaders. This training was used to finetune the various data collection tools. Subsequnt enumerator training sessions were held in each Darfur State for the 120 enumerators. Field testing occurred over 1 to 2 days, followed by extensive debriefing. 2.6 Data entry and analysis Twelve Data Entry Clerks and Supervisors participated in the enumerators’ training to familiarize themselves with the questionnaires. Data entry took place simultaneously in the three Darfur States and was completed a few days after the field work. A first stage of data cleaning was done at State level, followed by a second stage cleaning of the merged datasets at Khartoum level. Analysis of anthropometric indices were conducted in EpiNut, and of maternal and child variables using SAS version 9.1 and SPSS version 14. Household and community variables were analysed using SPSS. Tests of statistical signifance were done using Chi-square. A sample weight was associated with each record to account for the probability of selection and post-stratification adjustment based on the population size of each camp/community. 2.7 Limitations
(a) 2.7.1 Sampling frame and coverage The sample is based on the ‘crisis-affected’ population in Darfur, as defined by the humanitarian community. This excludes de facto areas which are not accessible due to insecurity, and areas that are considered ‘non-affected’. The results therefore do not reflect the situation of population groups that may be affected by the conflict but could not be reached, as well as some population groups who reside, or migrate14, in ‘non-affected’/non-accessible areas. This includes in particular the nomads. In addition, the accuracy of the population lists of the humanitarian community is uncertain, and the survey may have missed some vulnerable groups not included in the lists. Indeed, the sampling distribution of IDPs and residents in the DFSNA does not match with the IDPs/residents distribution in the original sampling frame (see below table). This may be due partly to the fact that some areas were not accessible at the time of the survey due to poor security conditions. 14 The survey took place in the rainy season, when many households migrate temporarily to tend their fields or take their animals in search of good pasture.
12
Table 3: Comparison of DFSNA and OCHA Samples North Darfur South Darfur West Darfur % households % IDPs % residents % IDPs % residents % IDPs % residents
DFSNA sample 34% 64% 70% 27% 78% 17% OCHA population data 30% 70% 58% 42% 64% 36% The distribution of the sampling frame also differs with WFP/ICRC lists of IDP/resident beneficiaries of humanitarian assistance. Table 4: Distribution of sampling frame (OCHA versus WFP/ICRC population lists)
Difference OCHA/WFP-ICRC Darfur State
OCHA population data as of
July 2007
WFP/ICRC population list August 2007
(sampling frame) Absolute Percent
North Darfur 1 372 591 1 379 059 -6 468 -0.5% South Darfur 1 562 188 1 102 750 459 438 29.4% West Darfur 1 205 470 1 067 485 137 985 11.4% Total 4 140 249 3 549 294 590 955 14.3%
(b) 2.7.2 Security and access Some areas within each State could not be accessed for security and logistical reasons. Where possible, these clusters were replaced by the designated replacement clusters drawn before the start of the survey. As a result, 3 clusters could not be visited in North Darfur (2 were repaced), 3 in South Darfur (all 3 were replaced) while all clusters were visited in West Darfur. Some locations, particularly in West Darfur, could only be reached by helicopter, which limited the mobility of teams and time for data collection. Curfew rules also limited the time spent on the ground.
(c) 2.7.3 Conflict-related and political contextual information The data collection process and instruments did not enable a sufficient analysis of the broader conflict and political situation affecting households’ livelihoods, and how it influences their displacement and their current strategies to secure food and income. While community interviews and Focus Group Discussions did collect information on food and income sources, and constraints affecting livelihood activities, they did not go in-depth into the role of various stakeholders in the current conflict context, or how current livelihood activities may contribute to perpetuate the tension15.
(d) 2.7.4 Timing This survey took place at the peak of the hunger season, before the main staple crop harvest. While this allowed comparison with the previous DFSNAs and allowed the completion of data collection prior to the commencement of Ramdan (wherein food consumption patterns change in comparision to usual consumption patterns), the early timing complicated the forecast of the evolution of the food security and nutritional situation once the harvest would be available.
(e) 2.7.5 Training and data collection
15 Workshops to discuss livelihoods, their relationships with the conflict, and strategic interventions were organized in the three Darfur States by Tufts University in July 2007. Results of these discussions were used in the interpretation of the EFSNA data and recommendations. See”Sharpening the Strategic Focus of Livelihoods Programming in the Darfur Region. A Report of Four Livelihood Workshops in the Darfur Region (June 30 to July 11, 2007” – Feinstein International Center, Tufts University, September 2007.
13
Some enumerators encountered difficulties with the use of proportional piling techniques, such as for the estimation of the main income sources and expenditures. Some sensitivity was also reported in the collection of mortality-related data. The staff involved in focus group discussions (FGD) participated in the enumerator and team leader trainings but also benefited from limited training on group interview techniques. Language differences were a constraint in some FGDs. Time for proper discussions was also short in many cases. In community Key Informant Interviews, the mix of individuals may have constrained their freedom to speak openly about some sensitive issues.
(f) 2.7.6 Bias Enumerators’ bias was minimized through intensive training and field tests. Respondents’ recall bias may have occurred for the retrospective survey of mortality, given the rather lengthy recall period (Eid Al Adha, a religious holiday approximately 8 months prior to the survey was the most easily recognizable date for the recall). Specific local calendars were developed for each of the three States and used both for the mortality and for the anthropometric data. Cause of death was collected through self-reporting, and was not medically confirmed. This may therefore have been influenced by local perceptions of disease or of the health worker. Even though community key informants and households were informed that their participation to the survey did not entail changes in the assistance they were currently receiving (if any), the visibility of WFP and other agencies’ staff and vehicles and associations with food and other aid, may have influenced respondents’ answers, particularly with regard to cultivation practices and ownership of animals and possibly reporting of mortalities within the household (systematic under-estimation).
14
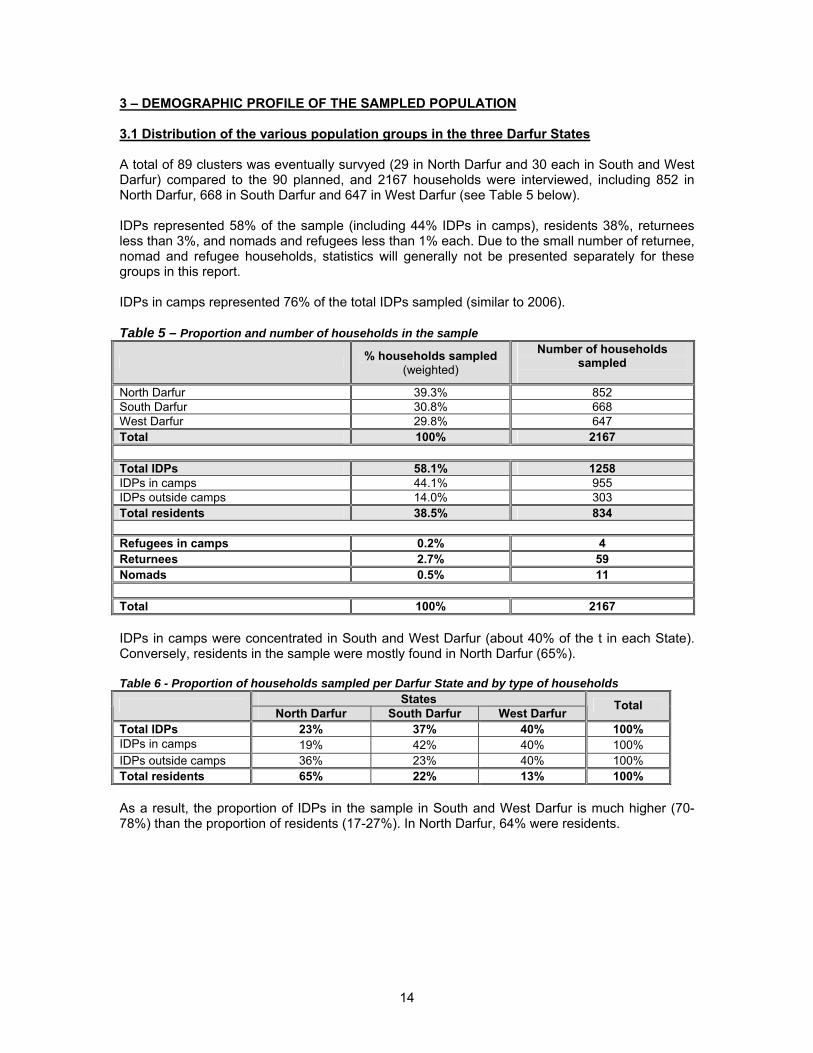
3 – DEMOGRAPHIC PROFILE OF THE SAMPLED POPULATION 3.1 Distribution of the various population groups in the three Darfur States A total of 89 clusters was eventually survyed (29 in North Darfur and 30 each in South and West Darfur) compared to the 90 planned, and 2167 households were interviewed, including 852 in North Darfur, 668 in South Darfur and 647 in West Darfur (see Table 5 below). IDPs represented 58% of the sample (including 44% IDPs in camps), residents 38%, returnees less than 3%, and nomads and refugees less than 1% each. Due to the small number of returnee, nomad and refugee households, statistics will generally not be presented separately for these groups in this report. IDPs in camps represented 76% of the total IDPs sampled (similar to 2006). Table 5 – Proportion and number of households in the sample
% households sampled (weighted)
Number of households sampled
North Darfur 39.3% 852 South Darfur 30.8% 668 West Darfur 29.8% 647 Total 100% 2167
Total IDPs 58.1% 1258 IDPs in camps 44.1% 955 IDPs outside camps 14.0% 303 Total residents 38.5% 834
Refugees in camps 0.2% 4 Returnees 2.7% 59 Nomads 0.5% 11
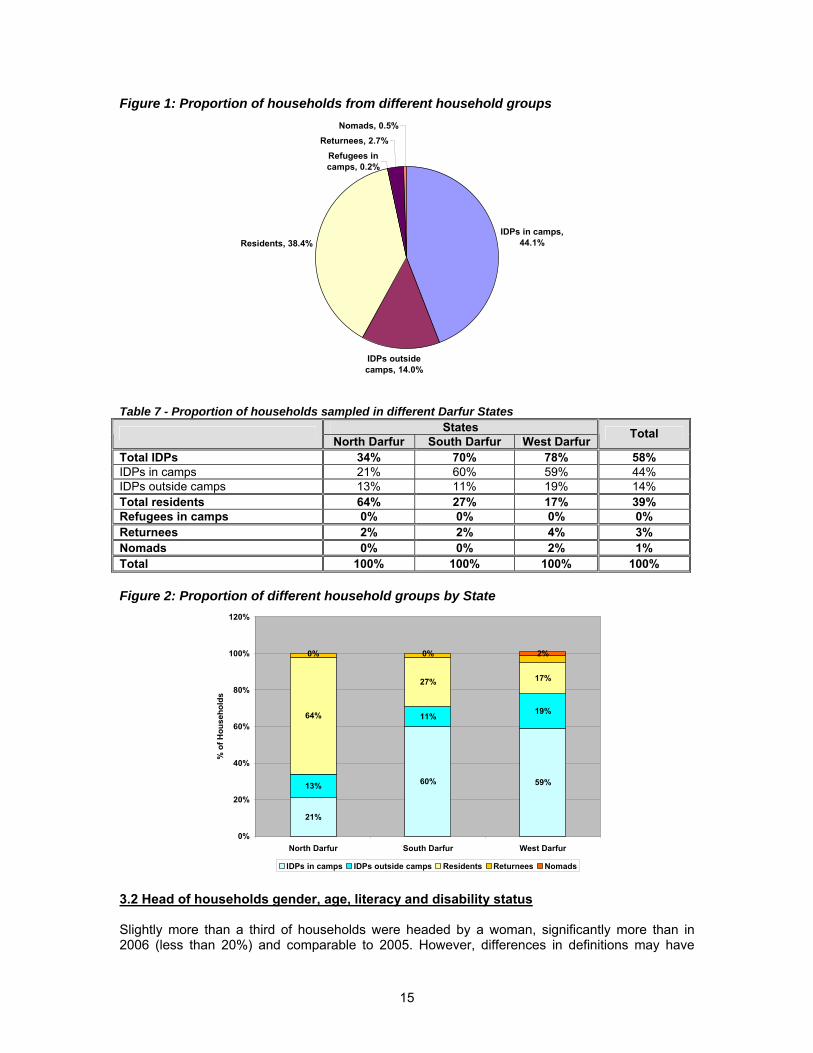
Total 100% 2167 IDPs in camps were concentrated in South and West Darfur (about 40% of the t in each State). Conversely, residents in the sample were mostly found in North Darfur (65%). Table 6 - Proportion of households sampled per Darfur State and by type of households
States North Darfur South Darfur West Darfur Total
Total IDPs 23% 37% 40% 100% IDPs in camps 19% 42% 40% 100% IDPs outside camps 36% 23% 40% 100% Total residents 65% 22% 13% 100% As a result, the proportion of IDPs in the sample in South and West Darfur is much higher (70-78%) than the proportion of residents (17-27%). In North Darfur, 64% were residents.
15
Figure 1: Proportion of households from different household groups
IDPs in camps, 44.1%
IDPs outside camps, 14.0%
Residents, 38.4%
Refugees in camps, 0.2%
Returnees, 2.7%Nomads, 0.5%
Table 7 - Proportion of households sampled in different Darfur States
States North Darfur South Darfur West Darfur Total
Total IDPs 34% 70% 78% 58% IDPs in camps 21% 60% 59% 44% IDPs outside camps 13% 11% 19% 14% Total residents 64% 27% 17% 39% Refugees in camps 0% 0% 0% 0% Returnees 2% 2% 4% 3% Nomads 0% 0% 2% 1% Total 100% 100% 100% 100% Figure 2: Proportion of different household groups by State
21%
60% 59%13%
11% 19%64%
27% 17%
0% 0% 2%
0%
20%
40%
60%
80%
100%
120%
North Darfur South Darfur West Darfur
% o
f Hou
seho
lds
IDPs in camps IDPs outside camps Residents Returnees Nomads
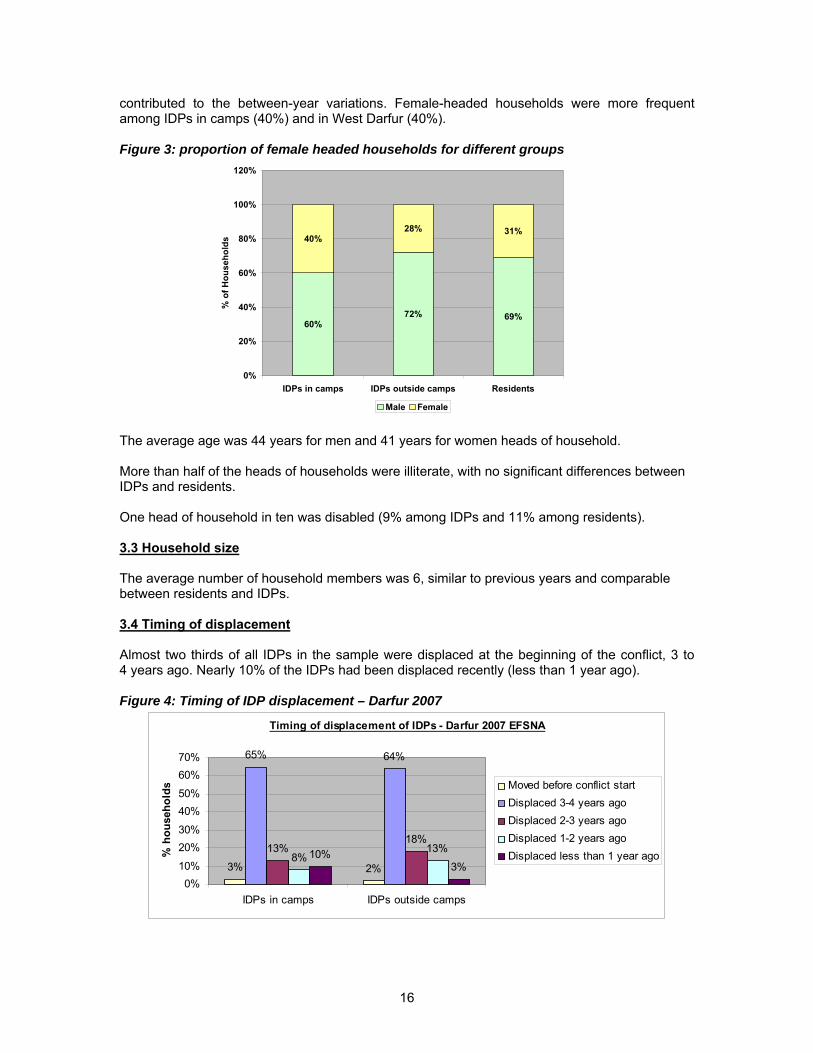
3.2 Head of households gender, age, literacy and disability status Slightly more than a third of households were headed by a woman, significantly more than in 2006 (less than 20%) and comparable to 2005. However, differences in definitions may have
16
contributed to the between-year variations. Female-headed households were more frequent among IDPs in camps (40%) and in West Darfur (40%). Figure 3: proportion of female headed households for different groups
60%72% 69%
40%28% 31%
0%
20%
40%
60%
80%
100%
120%
IDPs in camps IDPs outside camps Residents
% o
f Hou
seho
lds
Male Female The average age was 44 years for men and 41 years for women heads of household. More than half of the heads of households were illiterate, with no significant differences between IDPs and residents. One head of household in ten was disabled (9% among IDPs and 11% among residents). 3.3 Household size The average number of household members was 6, similar to previous years and comparable between residents and IDPs. 3.4 Timing of displacement Almost two thirds of all IDPs in the sample were displaced at the beginning of the conflict, 3 to 4 years ago. Nearly 10% of the IDPs had been displaced recently (less than 1 year ago). Figure 4: Timing of IDP displacement – Darfur 2007
Timing of displacement of IDPs - Darfur 2007 EFSNA
3% 2%
65% 64%
13%18%
8%13%10%
3%0%
10%
20%30%
40%50%
60%70%
IDPs in camps IDPs outside camps
% h
ouse
hold
s Moved before conflict startDisplaced 3-4 years agoDisplaced 2-3 years agoDisplaced 1-2 years agoDisplaced less than 1 year ago
17
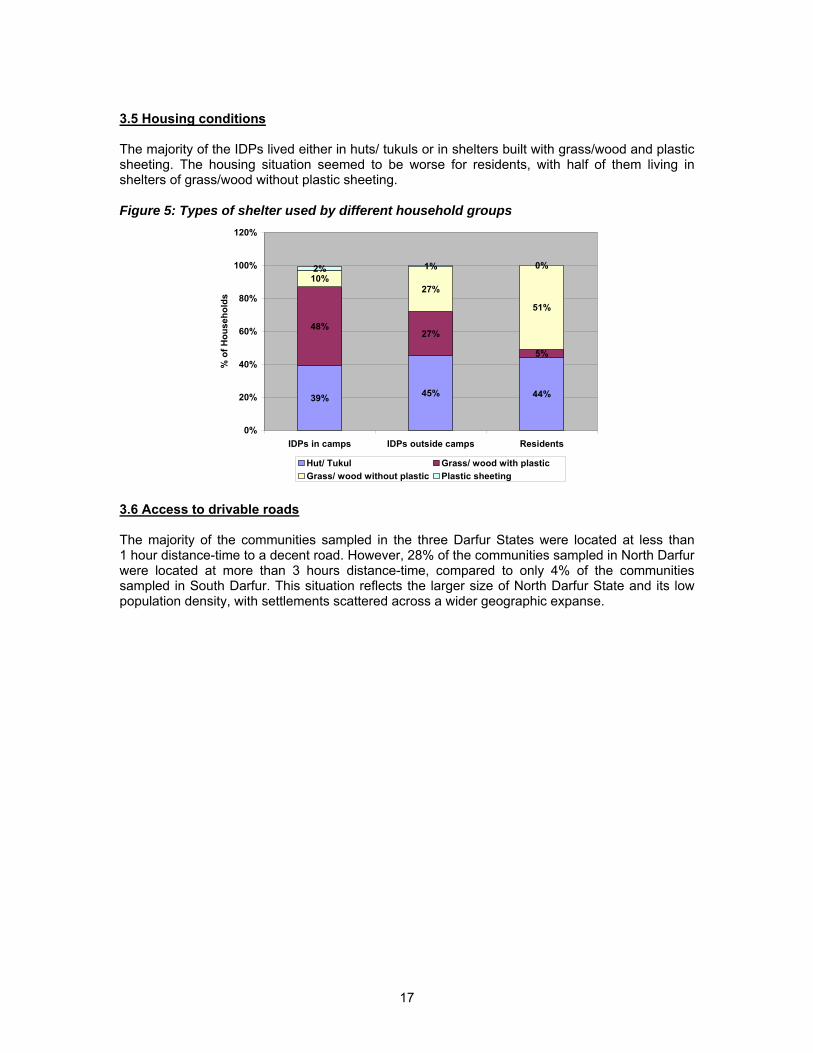
3.5 Housing conditions The majority of the IDPs lived either in huts/ tukuls or in shelters built with grass/wood and plastic sheeting. The housing situation seemed to be worse for residents, with half of them living in shelters of grass/wood without plastic sheeting. Figure 5: Types of shelter used by different household groups
39% 45% 44%
48%27%
5%
10%27%
51%
2% 1% 0%
0%
20%
40%
60%
80%
100%
120%
IDPs in camps IDPs outside camps Residents
% o
f Hou
seho
lds
Hut/ Tukul Grass/ wood with plasticGrass/ wood without plastic Plastic sheeting
3.6 Access to drivable roads The majority of the communities sampled in the three Darfur States were located at less than 1 hour distance-time to a decent road. However, 28% of the communities sampled in North Darfur were located at more than 3 hours distance-time, compared to only 4% of the communities sampled in South Darfur. This situation reflects the larger size of North Darfur State and its low population density, with settlements scattered across a wider geographic expanse.
18
Chapter 4. MORTALITY RATES 4.1 Crude and Under-5 Mortality rates The analysis of mortality rates was based on 14,044 individuals included in the survey for whom all information was recorded. This included 2,592 children aged 0-59 months, 321 of whom were newborns. In addition, 816 individuals had moved during the recall period, i.e. were coded as alive, living elsewhere. The recall period was 8 months, from the previous Eid-al-Adha (December 31, 2006- September 5, 2007). A total of 96 deaths were recorded during this time, including 38 children under five and 57 people over five years of age. It should be noted that the survey results are applicable only to the conflict affected populations that were accessible during the survey. The point prevalence estimate for the crude mortality rate (CMR) across crisis-affected Darfur as a whole was 0.29 deaths per 10,000 per day [95% CI: 0.21-0.36]. The under-5 mortality rate (U5MR) was 0.66 deaths per 10,000 per day [95% CI: 0.42-0.9]. Both of these are below the emergency thresholds of 1 and 2 respectively, and show a progressive decline over the past three years. See tables 8, 9 and 10 below. Table 8: Comparison of mortality rates (deaths per 10,000 per day) Darfur, 2004 - 2007 2004 2005 2006 2007
CMR 0.72
[95%CI: 0.45 – 0.99] 0.46
[95%CI:0.36 – 0.55] 0.35
[95%CI: 0.27 – 0.44] 0.29
[95%CI: 0.21-0.36]
U5MR 1.03 [95%CI: 0.38 – 1.68
0.79 [95%CI: 0.5 – 1.1]
0.77 [95%CI: 0.5 – 1.05]
0.66 [95%CI: 0.42-0.9]
Table 9: Crude and under-5 mortality rates (deaths per 10 000 per day) by population group for Darfur, August 2007 Whole population IDP Resident
CMR 0.29 [95%CI: 0.21-0.36]
0.38 [95%CI:0.27-0.49]
0.17 [95%CI: 0.1-0.24]
U5MR 0.66 [95%CI: 0.42-0.9]
0.84 [95%CI: 0.47-1.2]
0.44 [95%CI: 0.15-0.74]
Table 10: Crude and under-5 mortality rates (deaths per 10 000 per day) by state, August 2007 North Darfur South Darfur West Darfur
CMR 0.22 [95%CI: 0.13-0.31]
0.30 [95%CI: 0.15-0.45]
0.38 [95%CI: 0.21-0.54]
U5MR 0.61 [95%CI: 0.24-0.98]
0.73 [95%CI: 0.29-1.18]
0.95 [95%CI: 0.66-1.12]
CMR and U5MR were found to be lower for residents than for IDPs. West Darfur was the state with the highest mortality rates relative to South and North Darfur. 4.2 Causes of death The leading causes of death for the whole population were fever (26%), “other” (20%), and watery diarrhoea (11%). While the proportion of mortality attributed to watery diarrhea decreased in comparison to 2006 figures, mortality attributed to bloody diarrhea, fever, difficulty breathing and measles increased. “Violence” and “accident” together accounted for approximately 16% of
19
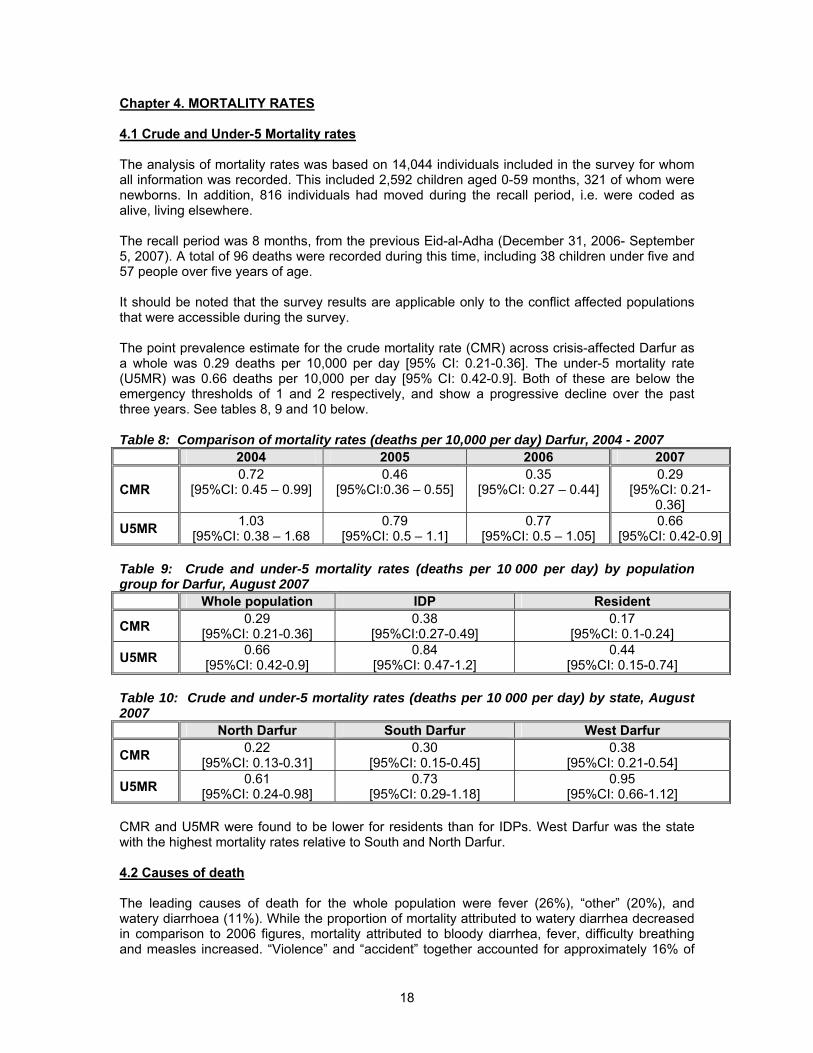
the total deaths – all the ‘violence’-related deaths were in people over 5 years of age, similar to the 2006 figures. Figure 6: Causes of death amongst the over-5s, Darfur, August 2007
Watery diarrhea11%
Bloody diarrhea8%
Fever26%
Measles5%
Difficulty Breathing10%
Violent/conflict related
8%
Accident8%
Other20%
Missing4%
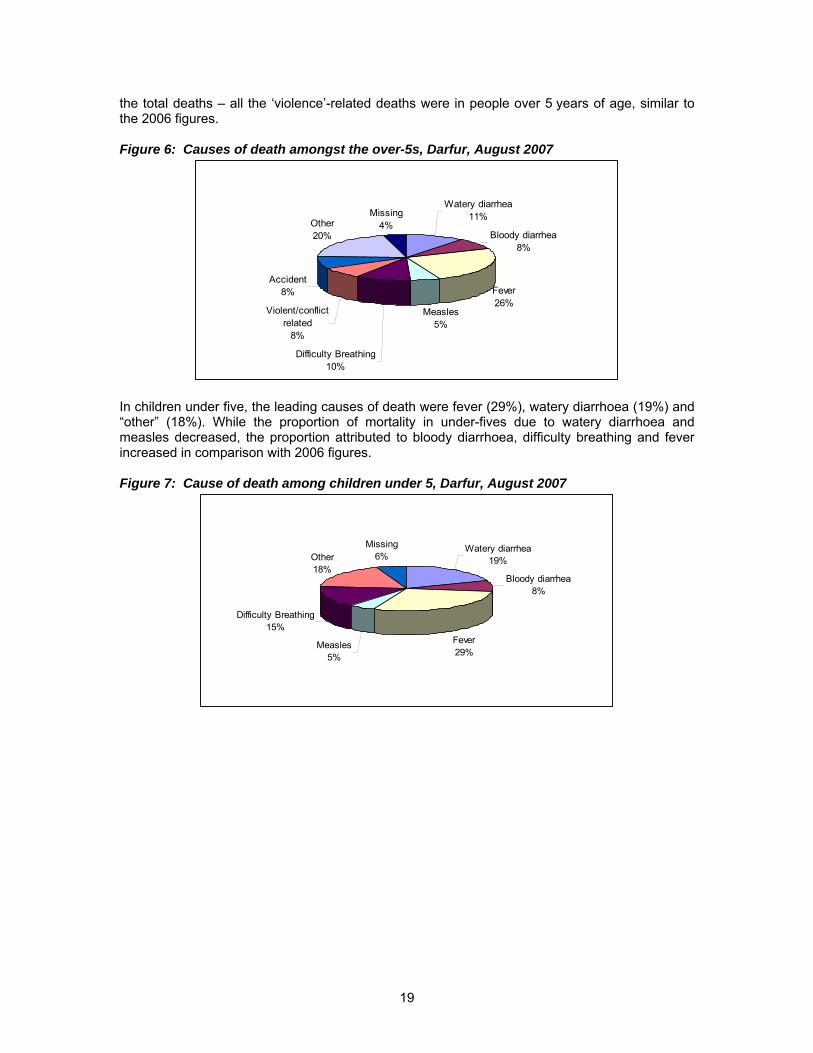
In children under five, the leading causes of death were fever (29%), watery diarrhoea (19%) and “other” (18%). While the proportion of mortality in under-fives due to watery diarrhoea and measles decreased, the proportion attributed to bloody diarrhoea, difficulty breathing and fever increased in comparison with 2006 figures. Figure 7: Cause of death among children under 5, Darfur, August 2007
Watery diarrhea19%
Bloody diarrhea8%
Fever29%
Measles5%
Difficulty Breathing15%
Other18%
Missing6%
20
Chapter 5. NUTRITIONAL STATUS OF CHILDREN AND MOTHERS 5.1 Rates of malnutrition of children under 5 years of age Anthropometric measurements were taken from a total of 2,271 children, broken down as follows: Table 11: Anthropometric Measurements
State Boys Girls Boy:Girl ratio
6-11 months
12-23 months
24-35 months
36-47 months
48-59 months
Total
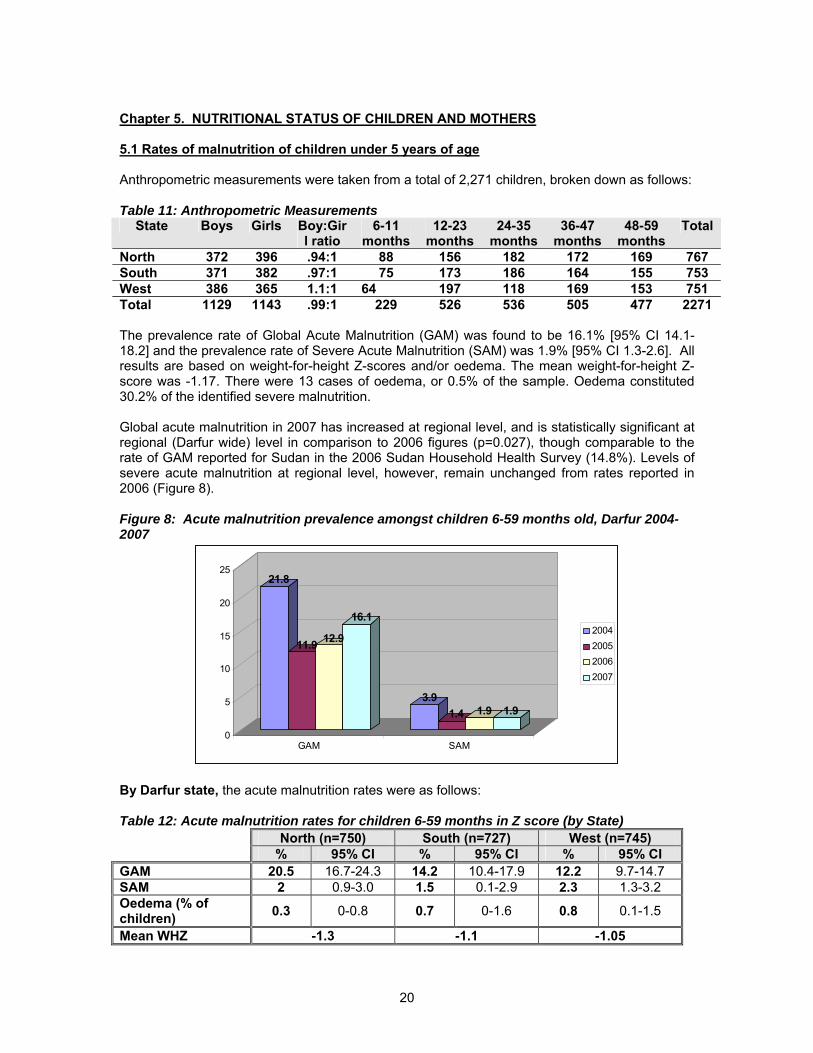
North 372 396 .94:1 88 156 182 172 169 767 South 371 382 .97:1 75 173 186 164 155 753 West 386 365 1.1:1 64 197 118 169 153 751 Total 1129 1143 .99:1 229 526 536 505 477 2271 The prevalence rate of Global Acute Malnutrition (GAM) was found to be 16.1% [95% CI 14.1-18.2] and the prevalence rate of Severe Acute Malnutrition (SAM) was 1.9% [95% CI 1.3-2.6]. All results are based on weight-for-height Z-scores and/or oedema. The mean weight-for-height Z-score was -1.17. There were 13 cases of oedema, or 0.5% of the sample. Oedema constituted 30.2% of the identified severe malnutrition. Global acute malnutrition in 2007 has increased at regional level, and is statistically significant at regional (Darfur wide) level in comparison to 2006 figures (p=0.027), though comparable to the rate of GAM reported for Sudan in the 2006 Sudan Household Health Survey (14.8%). Levels of severe acute malnutrition at regional level, however, remain unchanged from rates reported in 2006 (Figure 8). Figure 8: Acute malnutrition prevalence amongst children 6-59 months old, Darfur 2004-2007
21.8
11.9 12.9
16.1
3.91.4 1.9 1.9
0
5
10
15
20
25
GAM SAM
2004200520062007
By Darfur state, the acute malnutrition rates were as follows: Table 12: Acute malnutrition rates for children 6-59 months in Z score (by State) North (n=750) South (n=727) West (n=745) % 95% CI % 95% CI % 95% CI GAM 20.5 16.7-24.3 14.2 10.4-17.9 12.2 9.7-14.7 SAM 2 0.9-3.0 1.5 0.1-2.9 2.3 1.3-3.2 Oedema (% of children) 0.3 0-0.8 0.7 0-1.6 0.8 0.1-1.5
Mean WHZ -1.3 -1.1 -1.05
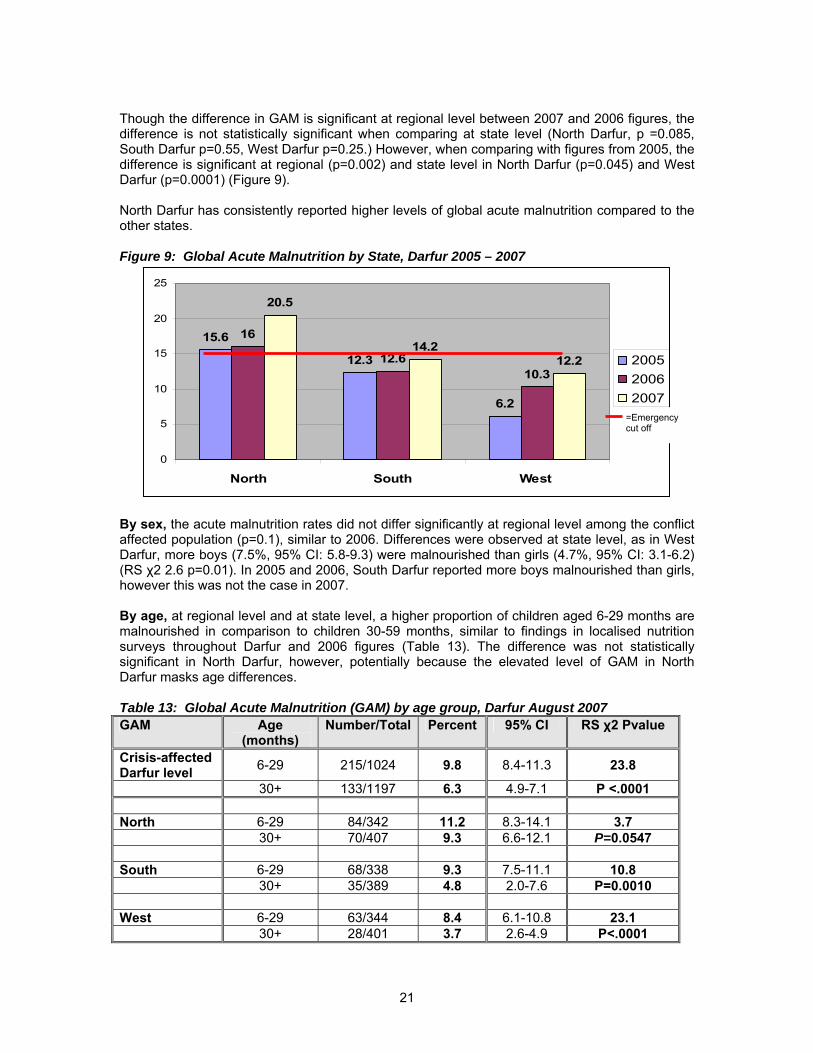
21
Though the difference in GAM is significant at regional level between 2007 and 2006 figures, the difference is not statistically significant when comparing at state level (North Darfur, p =0.085, South Darfur p=0.55, West Darfur p=0.25.) However, when comparing with figures from 2005, the difference is significant at regional (p=0.002) and state level in North Darfur (p=0.045) and West Darfur (p=0.0001) (Figure 9). North Darfur has consistently reported higher levels of global acute malnutrition compared to the other states. Figure 9: Global Acute Malnutrition by State, Darfur 2005 – 2007
15.6
12.3
6.2
16
12.610.3
20.5
14.212.2
0
5
10
15
20
25
North South West
200520062007
By sex, the acute malnutrition rates did not differ significantly at regional level among the conflict affected population (p=0.1), similar to 2006. Differences were observed at state level, as in West Darfur, more boys (7.5%, 95% CI: 5.8-9.3) were malnourished than girls (4.7%, 95% CI: 3.1-6.2) (RS χ2 2.6 p=0.01). In 2005 and 2006, South Darfur reported more boys malnourished than girls, however this was not the case in 2007. By age, at regional level and at state level, a higher proportion of children aged 6-29 months are malnourished in comparison to children 30-59 months, similar to findings in localised nutrition surveys throughout Darfur and 2006 figures (Table 13). The difference was not statistically significant in North Darfur, however, potentially because the elevated level of GAM in North Darfur masks age differences. Table 13: Global Acute Malnutrition (GAM) by age group, Darfur August 2007 GAM Age
(months) Number/Total Percent 95% CI RS χ2 Pvalue
Crisis-affected Darfur level 6-29 215/1024 9.8 8.4-11.3 23.8
30+ 133/1197 6.3 4.9-7.1 P <.0001 North 6-29 84/342 11.2 8.3-14.1 3.7 30+ 70/407 9.3 6.6-12.1 P=0.0547 South 6-29 68/338 9.3 7.5-11.1 10.8 30+ 35/389 4.8 2.0-7.6 P=0.0010 West 6-29 63/344 8.4 6.1-10.8 23.1 30+ 28/401 3.7 2.6-4.9 P<.0001
=Emergency cut off
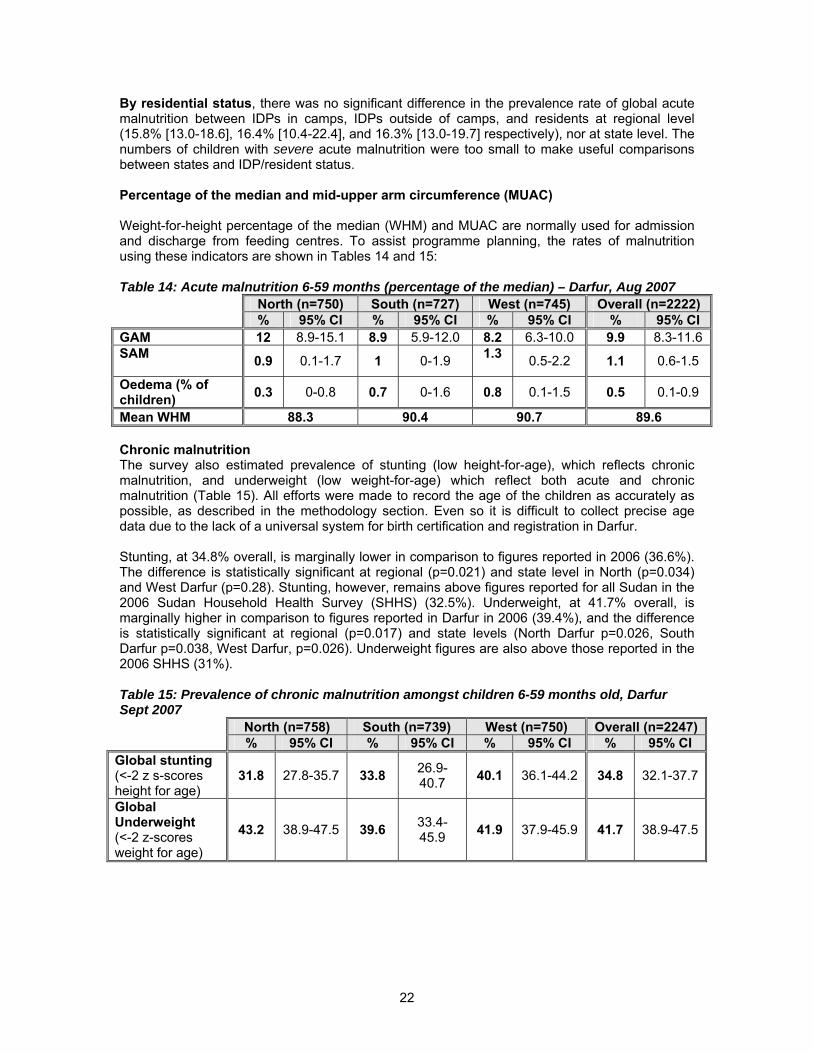
22
By residential status, there was no significant difference in the prevalence rate of global acute malnutrition between IDPs in camps, IDPs outside of camps, and residents at regional level (15.8% [13.0-18.6], 16.4% [10.4-22.4], and 16.3% [13.0-19.7] respectively), nor at state level. The numbers of children with severe acute malnutrition were too small to make useful comparisons between states and IDP/resident status. Percentage of the median and mid-upper arm circumference (MUAC) Weight-for-height percentage of the median (WHM) and MUAC are normally used for admission and discharge from feeding centres. To assist programme planning, the rates of malnutrition using these indicators are shown in Tables 14 and 15: Table 14: Acute malnutrition 6-59 months (percentage of the median) – Darfur, Aug 2007 North (n=750) South (n=727) West (n=745) Overall (n=2222) % 95% CI % 95% CI % 95% CI % 95% CI GAM 12 8.9-15.1 8.9 5.9-12.0 8.2 6.3-10.0 9.9 8.3-11.6 SAM 0.9 0.1-1.7 1 0-1.9 1.3
0.5-2.2 1.1 0.6-1.5
Oedema (% of children) 0.3 0-0.8 0.7 0-1.6 0.8 0.1-1.5 0.5 0.1-0.9
Mean WHM 88.3 90.4 90.7 89.6 Chronic malnutrition The survey also estimated prevalence of stunting (low height-for-age), which reflects chronic malnutrition, and underweight (low weight-for-age) which reflect both acute and chronic malnutrition (Table 15). All efforts were made to record the age of the children as accurately as possible, as described in the methodology section. Even so it is difficult to collect precise age data due to the lack of a universal system for birth certification and registration in Darfur. Stunting, at 34.8% overall, is marginally lower in comparison to figures reported in 2006 (36.6%). The difference is statistically significant at regional (p=0.021) and state level in North (p=0.034) and West Darfur (p=0.28). Stunting, however, remains above figures reported for all Sudan in the 2006 Sudan Household Health Survey (SHHS) (32.5%). Underweight, at 41.7% overall, is marginally higher in comparison to figures reported in Darfur in 2006 (39.4%), and the difference is statistically significant at regional (p=0.017) and state levels (North Darfur p=0.026, South Darfur p=0.038, West Darfur, p=0.026). Underweight figures are also above those reported in the 2006 SHHS (31%). Table 15: Prevalence of chronic malnutrition amongst children 6-59 months old, Darfur Sept 2007
North (n=758) South (n=739) West (n=750) Overall (n=2247) % 95% CI % 95% CI % 95% CI % 95% CI Global stunting (<-2 z s-scores height for age)
31.8 27.8-35.7 33.8 26.9-40.7 40.1 36.1-44.2 34.8 32.1-37.7
Global Underweight (<-2 z-scores weight for age)
43.2 38.9-47.5 39.6 33.4-45.9 41.9 37.9-45.9 41.7 38.9-47.5
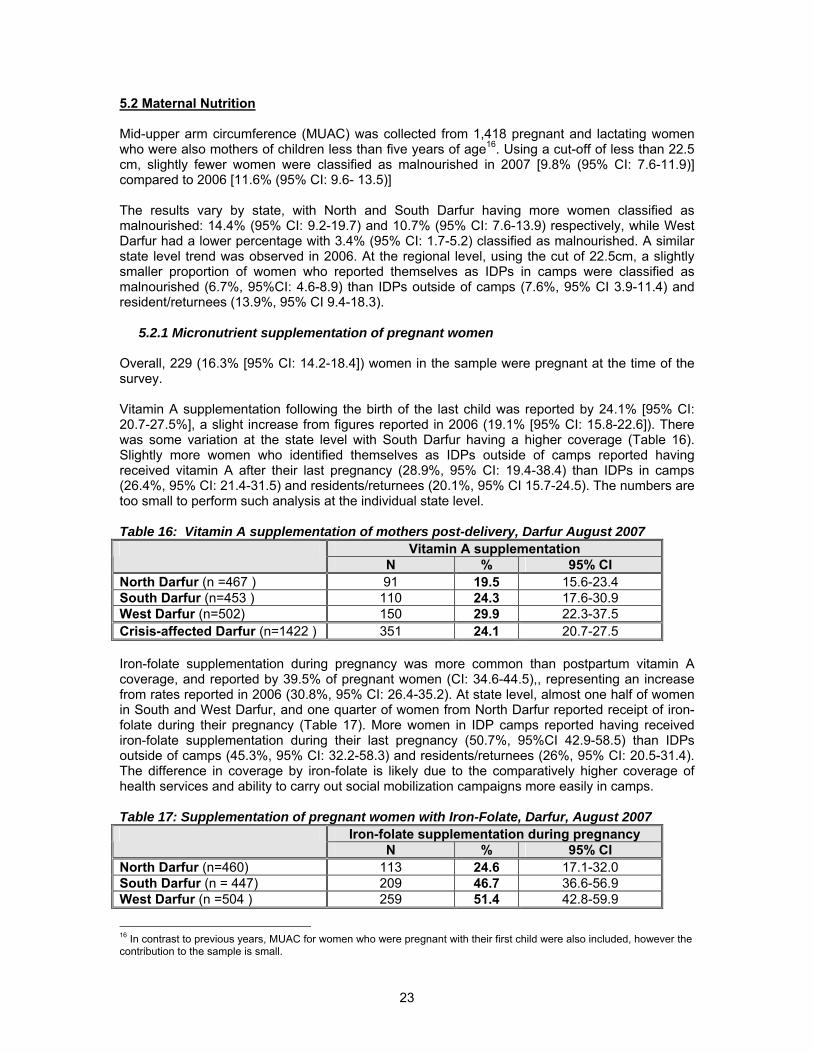
23
5.2 Maternal Nutrition Mid-upper arm circumference (MUAC) was collected from 1,418 pregnant and lactating women who were also mothers of children less than five years of age16. Using a cut-off of less than 22.5 cm, slightly fewer women were classified as malnourished in 2007 [9.8% (95% CI: 7.6-11.9)] compared to 2006 [11.6% (95% CI: 9.6- 13.5)] The results vary by state, with North and South Darfur having more women classified as malnourished: 14.4% (95% CI: 9.2-19.7) and 10.7% (95% CI: 7.6-13.9) respectively, while West Darfur had a lower percentage with 3.4% (95% CI: 1.7-5.2) classified as malnourished. A similar state level trend was observed in 2006. At the regional level, using the cut of 22.5cm, a slightly smaller proportion of women who reported themselves as IDPs in camps were classified as malnourished (6.7%, 95%CI: 4.6-8.9) than IDPs outside of camps (7.6%, 95% CI 3.9-11.4) and resident/returnees (13.9%, 95% CI 9.4-18.3).
5.2.1 Micronutrient supplementation of pregnant women Overall, 229 (16.3% [95% CI: 14.2-18.4]) women in the sample were pregnant at the time of the survey. Vitamin A supplementation following the birth of the last child was reported by 24.1% [95% CI: 20.7-27.5%], a slight increase from figures reported in 2006 (19.1% [95% CI: 15.8-22.6]). There was some variation at the state level with South Darfur having a higher coverage (Table 16). Slightly more women who identified themselves as IDPs outside of camps reported having received vitamin A after their last pregnancy (28.9%, 95% CI: 19.4-38.4) than IDPs in camps (26.4%, 95% CI: 21.4-31.5) and residents/returnees (20.1%, 95% CI 15.7-24.5). The numbers are too small to perform such analysis at the individual state level. Table 16: Vitamin A supplementation of mothers post-delivery, Darfur August 2007
Vitamin A supplementation N % 95% CI
North Darfur (n =467 ) 91 19.5 15.6-23.4 South Darfur (n=453 ) 110 24.3 17.6-30.9 West Darfur (n=502) 150 29.9 22.3-37.5 Crisis-affected Darfur (n=1422 ) 351 24.1 20.7-27.5 Iron-folate supplementation during pregnancy was more common than postpartum vitamin A coverage, and reported by 39.5% of pregnant women (CI: 34.6-44.5),, representing an increase from rates reported in 2006 (30.8%, 95% CI: 26.4-35.2). At state level, almost one half of women in South and West Darfur, and one quarter of women from North Darfur reported receipt of iron-folate during their pregnancy (Table 17). More women in IDP camps reported having received iron-folate supplementation during their last pregnancy (50.7%, 95%CI 42.9-58.5) than IDPs outside of camps (45.3%, 95% CI: 32.2-58.3) and residents/returnees (26%, 95% CI: 20.5-31.4). The difference in coverage by iron-folate is likely due to the comparatively higher coverage of health services and ability to carry out social mobilization campaigns more easily in camps. Table 17: Supplementation of pregnant women with Iron-Folate, Darfur, August 2007
Iron-folate supplementation during pregnancy N % 95% CI
North Darfur (n=460) 113 24.6 17.1-32.0 South Darfur (n = 447) 209 46.7 36.6-56.9 West Darfur (n =504 ) 259 51.4 42.8-59.9
16 In contrast to previous years, MUAC for women who were pregnant with their first child were also included, however the contribution to the sample is small.
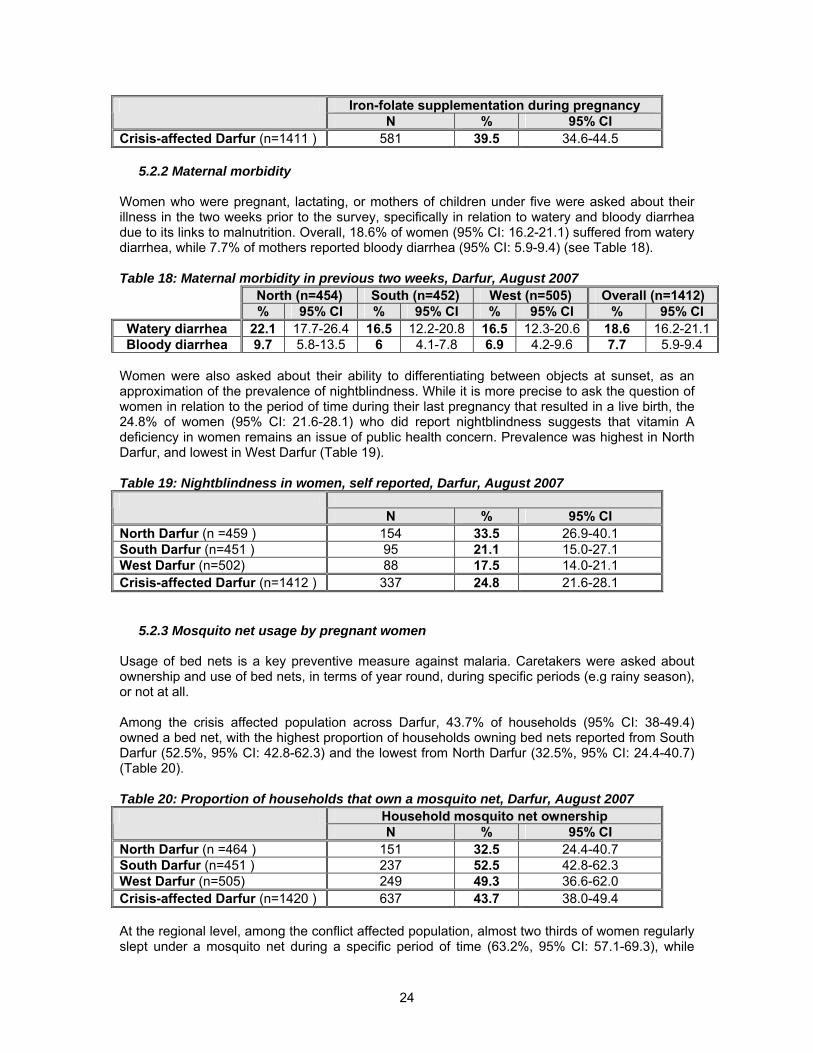
24
Iron-folate supplementation during pregnancy N % 95% CI
Crisis-affected Darfur (n=1411 ) 581 39.5 34.6-44.5
5.2.2 Maternal morbidity Women who were pregnant, lactating, or mothers of children under five were asked about their illness in the two weeks prior to the survey, specifically in relation to watery and bloody diarrhea due to its links to malnutrition. Overall, 18.6% of women (95% CI: 16.2-21.1) suffered from watery diarrhea, while 7.7% of mothers reported bloody diarrhea (95% CI: 5.9-9.4) (see Table 18).
Table 18: Maternal morbidity in previous two weeks, Darfur, August 2007 North (n=454) South (n=452) West (n=505) Overall (n=1412) % 95% CI % 95% CI % 95% CI % 95% CI Watery diarrhea 22.1 17.7-26.4 16.5 12.2-20.8 16.5 12.3-20.6 18.6 16.2-21.1Bloody diarrhea 9.7 5.8-13.5 6 4.1-7.8 6.9 4.2-9.6 7.7 5.9-9.4
Women were also asked about their ability to differentiating between objects at sunset, as an approximation of the prevalence of nightblindness. While it is more precise to ask the question of women in relation to the period of time during their last pregnancy that resulted in a live birth, the 24.8% of women (95% CI: 21.6-28.1) who did report nightblindness suggests that vitamin A deficiency in women remains an issue of public health concern. Prevalence was highest in North Darfur, and lowest in West Darfur (Table 19). Table 19: Nightblindness in women, self reported, Darfur, August 2007
N % 95% CI
North Darfur (n =459 ) 154 33.5 26.9-40.1 South Darfur (n=451 ) 95 21.1 15.0-27.1 West Darfur (n=502) 88 17.5 14.0-21.1 Crisis-affected Darfur (n=1412 ) 337 24.8 21.6-28.1
5.2.3 Mosquito net usage by pregnant women
Usage of bed nets is a key preventive measure against malaria. Caretakers were asked about ownership and use of bed nets, in terms of year round, during specific periods (e.g rainy season), or not at all. Among the crisis affected population across Darfur, 43.7% of households (95% CI: 38-49.4) owned a bed net, with the highest proportion of households owning bed nets reported from South Darfur (52.5%, 95% CI: 42.8-62.3) and the lowest from North Darfur (32.5%, 95% CI: 24.4-40.7) (Table 20). Table 20: Proportion of households that own a mosquito net, Darfur, August 2007
Household mosquito net ownership N % 95% CI
North Darfur (n =464 ) 151 32.5 24.4-40.7 South Darfur (n=451 ) 237 52.5 42.8-62.3 West Darfur (n=505) 249 49.3 36.6-62.0 Crisis-affected Darfur (n=1420 ) 637 43.7 38.0-49.4 At the regional level, among the conflict affected population, almost two thirds of women regularly slept under a mosquito net during a specific period of time (63.2%, 95% CI: 57.1-69.3), while
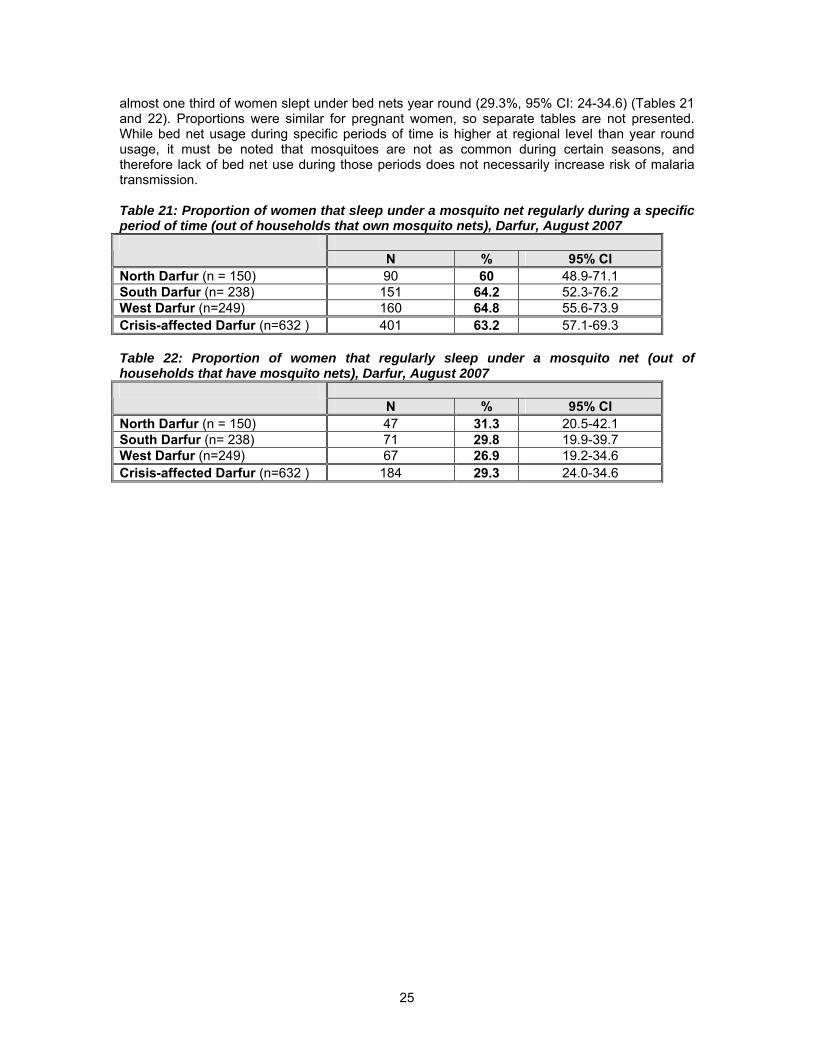
25
almost one third of women slept under bed nets year round (29.3%, 95% CI: 24-34.6) (Tables 21 and 22). Proportions were similar for pregnant women, so separate tables are not presented. While bed net usage during specific periods of time is higher at regional level than year round usage, it must be noted that mosquitoes are not as common during certain seasons, and therefore lack of bed net use during those periods does not necessarily increase risk of malaria transmission. Table 21: Proportion of women that sleep under a mosquito net regularly during a specific period of time (out of households that own mosquito nets), Darfur, August 2007
N % 95% CI
North Darfur (n = 150) 90 60 48.9-71.1 South Darfur (n= 238) 151 64.2 52.3-76.2 West Darfur (n=249) 160 64.8 55.6-73.9 Crisis-affected Darfur (n=632 ) 401 63.2 57.1-69.3 Table 22: Proportion of women that regularly sleep under a mosquito net (out of households that have mosquito nets), Darfur, August 2007
N % 95% CI
North Darfur (n = 150) 47 31.3 20.5-42.1 South Darfur (n= 238) 71 29.8 19.9-39.7 West Darfur (n=249) 67 26.9 19.2-34.6 Crisis-affected Darfur (n=632 ) 184 29.3 24.0-34.6
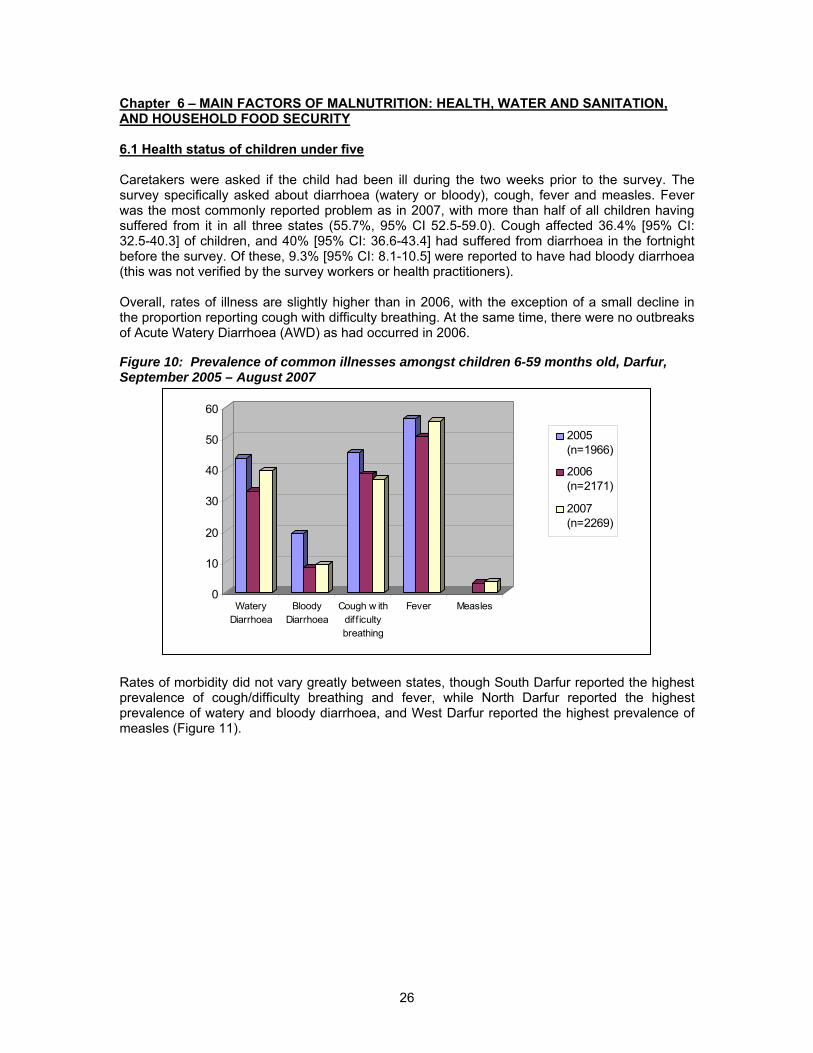
26
Chapter 6 – MAIN FACTORS OF MALNUTRITION: HEALTH, WATER AND SANITATION, AND HOUSEHOLD FOOD SECURITY 6.1 Health status of children under five Caretakers were asked if the child had been ill during the two weeks prior to the survey. The survey specifically asked about diarrhoea (watery or bloody), cough, fever and measles. Fever was the most commonly reported problem as in 2007, with more than half of all children having suffered from it in all three states (55.7%, 95% CI 52.5-59.0). Cough affected 36.4% [95% CI: 32.5-40.3] of children, and 40% [95% CI: 36.6-43.4] had suffered from diarrhoea in the fortnight before the survey. Of these, 9.3% [95% CI: 8.1-10.5] were reported to have had bloody diarrhoea (this was not verified by the survey workers or health practitioners). Overall, rates of illness are slightly higher than in 2006, with the exception of a small decline in the proportion reporting cough with difficulty breathing. At the same time, there were no outbreaks of Acute Watery Diarrhoea (AWD) as had occurred in 2006. Figure 10: Prevalence of common illnesses amongst children 6-59 months old, Darfur, September 2005 – August 2007
0
10
20
30
40
50
60
WateryDiarrhoea
BloodyDiarrhoea
Cough w ithdiff icultybreathing
Fever Measles
2005(n=1966)
2006(n=2171)
2007(n=2269)
Rates of morbidity did not vary greatly between states, though South Darfur reported the highest prevalence of cough/difficulty breathing and fever, while North Darfur reported the highest prevalence of watery and bloody diarrhoea, and West Darfur reported the highest prevalence of measles (Figure 11).
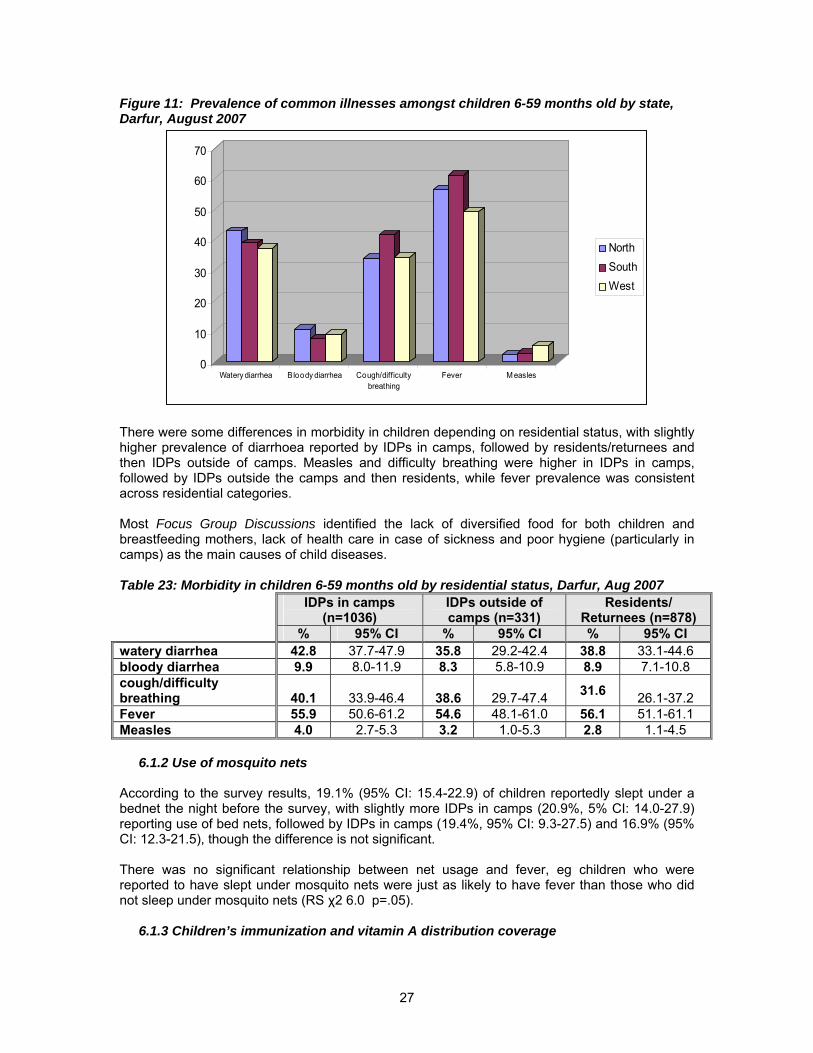
27
Figure 11: Prevalence of common illnesses amongst children 6-59 months old by state, Darfur, August 2007
0
10
20
30
40
50
60
70
Watery diarrhea Bloody diarrhea Cough/difficultybreathing
Fever M easles
NorthSouth West
There were some differences in morbidity in children depending on residential status, with slightly higher prevalence of diarrhoea reported by IDPs in camps, followed by residents/returnees and then IDPs outside of camps. Measles and difficulty breathing were higher in IDPs in camps, followed by IDPs outside the camps and then residents, while fever prevalence was consistent across residential categories. Most Focus Group Discussions identified the lack of diversified food for both children and breastfeeding mothers, lack of health care in case of sickness and poor hygiene (particularly in camps) as the main causes of child diseases. Table 23: Morbidity in children 6-59 months old by residential status, Darfur, Aug 2007 IDPs in camps
(n=1036) IDPs outside of camps (n=331)
Residents/ Returnees (n=878)
% 95% CI % 95% CI % 95% CI watery diarrhea 42.8 37.7-47.9 35.8 29.2-42.4 38.8 33.1-44.6 bloody diarrhea 9.9 8.0-11.9 8.3 5.8-10.9 8.9 7.1-10.8 cough/difficulty breathing 40.1 33.9-46.4 38.6 29.7-47.4 31.6 26.1-37.2 Fever 55.9 50.6-61.2 54.6 48.1-61.0 56.1 51.1-61.1 Measles 4.0 2.7-5.3 3.2 1.0-5.3 2.8 1.1-4.5
6.1.2 Use of mosquito nets According to the survey results, 19.1% (95% CI: 15.4-22.9) of children reportedly slept under a bednet the night before the survey, with slightly more IDPs in camps (20.9%, 5% CI: 14.0-27.9) reporting use of bed nets, followed by IDPs in camps (19.4%, 95% CI: 9.3-27.5) and 16.9% (95% CI: 12.3-21.5), though the difference is not significant. There was no significant relationship between net usage and fever, eg children who were reported to have slept under mosquito nets were just as likely to have fever than those who did not sleep under mosquito nets (RS χ2 6.0 p=.05).
6.1.3 Children’s immunization and vitamin A distribution coverage
28
Overall, 73.7% [95% CI: 68.7-78.7] of children aged 9-59 months had received a measles vaccination, including those with a marked health card and verbal history reported by the caregiver, which is an increase from 2006 when 67.3% [95% CI: 62.1 – 72.5] of children aged 9-59 months were reported to be vaccinated against measles. In 2005, the rate of measles vaccination uptake was found to be 69.8% [95% CI: 64.5 – 75.0]. A small percentage (2%) of caretakers did not know whether the child had been immunized (Table 24). There were some differences in measles vaccination rates in relation to resident status; however the differences are not significant. Table 24: Measles immunisation coverage among children, Darfur, August 2007 Number % 95% CI
Measles immunisation (9-59 months) Yes – all 1570/2122 73.7 68.7-78.7 Yes – card 687/2122 31.6 27.6-35.4 Yes – caretaker 882/2122 42.1 37.6-46.5 No 510/2122 24.3 19.3-29.4 Unknown 42 2 1.0-3.0 While there is an overall improvement in coverage in relation to previous years, the coverage remains too low to ensure community-level protection.
6.1.4 Coverage of vitamin A supplementation
Overall, vitamin A supplementation had been received by 54.4% of children aged 6-59 months, verified either by a health card or the caretaker’s recall, which is an improvement from 2006 when coverage was reported as 38%. Coverage levels were highest in North Darfur, followed by South and then West Darfur (Table 25). Table 25: Coverage of children 6-59 with vitamin A supplementation, Darfur, Aug 2007 North (n=767) South (n=745) West (n=713) Overall (n=2225) % 95% CI % 95% CI % 95% CI % 95% CI Yes, card
15.1 9.8-20.4 16.5 11.9-21.1 23.7 16.8-30.6 17.9 14.8-21.1
Yes, recall 45.1 35.3-54.9 38.6 30.9-46.4 21.4 17.1-25.8 36.5 31.6-
41.4 No
38.8 28.6-49.1 42.1 34.3-50 52.9 46.0-59.8 43.8 38.6-49.0
Don’t know 0.9 2.7 2.0 1.7 (1.0-2.5) These figures are well below the 90-95% supplementation rates reported from campaigns (vitamin A is distributed at the same time as polio vaccine) however the reliability of campaign coverage figures may be doubtful. The survey looked at supplementation in the previous 6 months, and the most recent supplementation campaign was conducted in April and May 2007. No significant difference was detected for either measles vaccination or vitamin A supplementation in relation to resident status. Caretakers were asked about the ability of their children to differentiate between objects at dusk, in order to estimate the prevalence of night blindness. Of those children 24-59 months surveyed, 10.2% (95% CI: 8.2-12.3) reported nightblindness, indicating that vitamin A deficiency is at a level of public health concern (see Table 26). There was no significant difference in nightblindness in relation to resident status.
29
Table 26: Nightblindness in children 24-59 months, Darfur August 2007 North (n= 522) South (n=500) West (n=489) Overall (n= 1511) % 95% CI % 95% CI % 95% CI % 95% CI 24-59 9 5.7-12.3 7.4 4.1-10.7 15.1 10.8-19.4 10.2 8.2-12.3 Don’t know 4.8 2.8-6.7 7.8 3.7-11.9 2.6 0.9- 4.4 5.1 3.4-6.6
6.1.5 Access to health facilities
Traditional healers and NGO clinics were reported as the most commonly available health facilities in communities, followed by village health care workers, pharmacies and primary health units. Mobile health clinics were only reported from South Darfur. Two thirds of communities reported that the available health facilities were within the community, accessible in less than one hour. Physical access was highest in West Darfur and lowest in North Darfur. Lack of drugs or equipment and lack of trained health workers were the most common problems reported for health facilities. NGO clinics were the most commonly used health facilities, as in 2006. Table 27: Availability and physical access to health facilities, Darfur, August 2007
States Health facilities available North
Darfur South Darfur
West Darfur
Crisis-affected Darfur
Hospital 14% 15% 30% 19% Rural Hospital 7% 19% 26% 17% Health centre 28% 19% 11% 19% NGO clinic 34% 59% 63% 52% Mobile/ outreach clinic 0% 7% 0% 2% Village health care worker 28% 67% 19% 37% Private clinic 10% 19% 7% 12% Traditional healer 48% 81% 63% 64% Pharmacy 14% 59% 63% 34% Primary Health Unit 28% 48% 15% 30% No services 7% 4% 4% 5% Total sampled communities 29 27 27 83
States Problems with health facilities North
Darfur South Darfur
West Darfur
Crisis-affected Darfur
Too far away 37% 54% 27% 39% Expensive 44% 50% 58% 51% Lack drugs, equipment 74% 85% 77% 78% Lack trained health workers 56% 88% 50% 65% Total sampled communities with health facilities 27 26 26 79
States Most used health facilities (in communities where they exist) North
Darfur South Darfur
West Darfur
Crisis-affected Darfur
Hospital 12% 12% 12% 12% Rural Hospital 8% 4% 8% 6% Health centre 15% . 8% 8% NGO clinic 46% 60% 65% 57% Mobile/ outreach clinic . . . . Village health care worker 4% . . 1% Private clinic . . . . Traditional healer 8% 3% Pharmacy . . . . Primary Health Unit 15% 16% 8% 13% Total 100% (26
comm) 100% (25
comm) 100% (26
comm) 100% (77 comm)
Physical access to health facilities States Crisis-
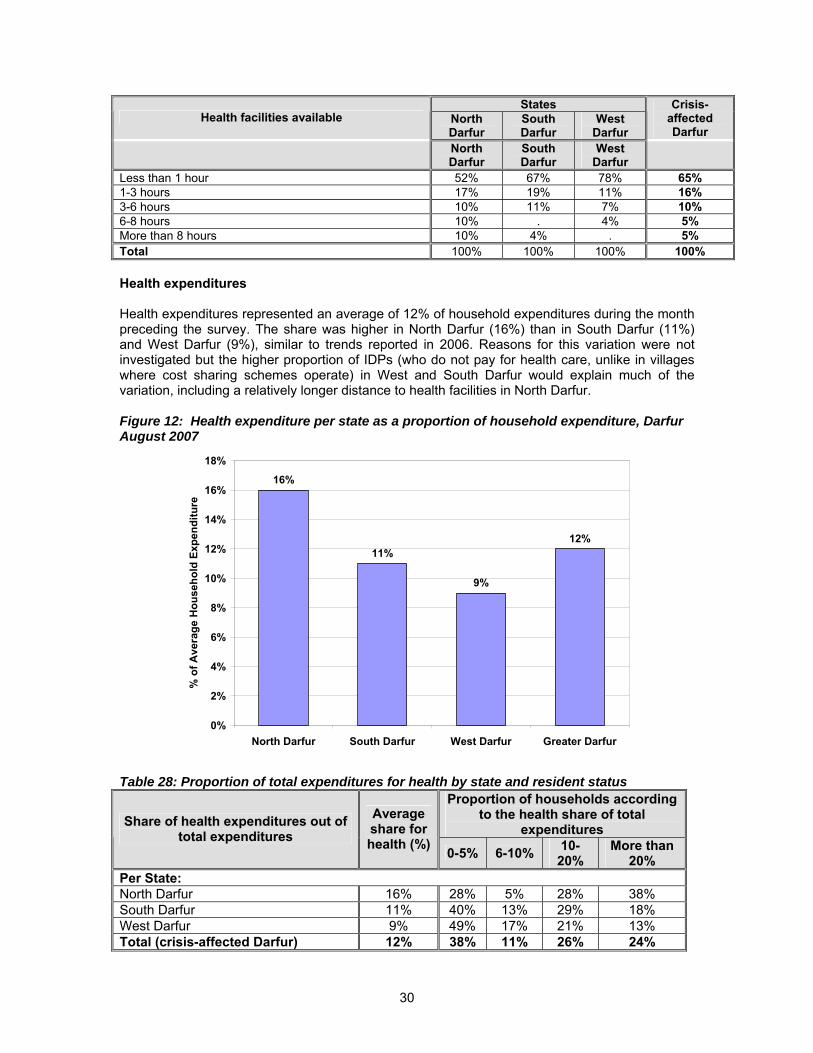
30
States Health facilities available North
Darfur South Darfur
West Darfur
Crisis-affected Darfur
North Darfur
South Darfur
West Darfur
Less than 1 hour 52% 67% 78% 65% 1-3 hours 17% 19% 11% 16% 3-6 hours 10% 11% 7% 10% 6-8 hours 10% . 4% 5% More than 8 hours 10% 4% . 5% Total 100% 100% 100% 100% Health expenditures Health expenditures represented an average of 12% of household expenditures during the month preceding the survey. The share was higher in North Darfur (16%) than in South Darfur (11%) and West Darfur (9%), similar to trends reported in 2006. Reasons for this variation were not investigated but the higher proportion of IDPs (who do not pay for health care, unlike in villages where cost sharing schemes operate) in West and South Darfur would explain much of the variation, including a relatively longer distance to health facilities in North Darfur. Figure 12: Health expenditure per state as a proportion of household expenditure, Darfur August 2007
16%
11%
9%
12%
0%
2%
4%
6%
8%
10%
12%
14%
16%
18%
North Darfur South Darfur West Darfur Greater Darfur
% o
f Ave
rage
Hou
seho
ld E
xpen
ditu
re
Table 28: Proportion of total expenditures for health by state and resident status
Proportion of households according to the health share of total
expenditures Share of health expenditures out of total expenditures
Average share for health (%) 0-5% 6-10% 10-
20% More than
20% Per State: North Darfur 16% 28% 5% 28% 38% South Darfur 11% 40% 13% 29% 18% West Darfur 9% 49% 17% 21% 13% Total (crisis-affected Darfur) 12% 38% 11% 26% 24%
31
Proportion of households according to the health share of total
expenditures Share of health expenditures out of total expenditures
Average share for health (%) 0-5% 6-10% 10-
20% More than
20%
IDPs in camps 10% 46% 10% 24% 20% IDPs outside camps 13% 33% 13% 31% 23% Residents 14% 32% 11% 28% 30% IDPs allocated on average, a slightly lower proportion of their monthly expenditures (11%) for health than residents (14%). There are fewer differences in terms of proportion of total expenditures are dedicated to health between IDP and resident households than in 2006, with slightly more IDP than resident households reporting health expenditures comprising a small share (0-5%) of household expenditures, and slightly more residents than IDPs reporting that they spend more than 20% of total expenditures on health. The lower proportion of household expenditures for health by IDPs is most likely a reflection of the free NGO clinical services provided to IDPs. There was little variation between average monthly share of household expenditure in relation to the number of sources of income, though households with one source of income reported 12% share on health, households with two income sources reported 13% share on health, and households with three income sources reported 14% share on health. There is also very little variation between the share of health expenditures and the type of health service most used by the community. Average share of expenditure varied from 11-13%, with the exception of communities that used village health workers most commonly where average share of monthly expenditure was 21%. Village health workers are however the third most commonly available health service (37% of communities), starting with traditional healers (64% of communities), NGO clinics (52% of communities. This may be explained by differences in the fees charged by the various health services. Households receiving remittances regularly reported a higher average share for health (16%) than those not receiving remittances (12%). Households that reported sale of livestock and animal products as their primary source of income reported higher share (17%) on health expenditure than other primary income sources (ranging from 11-15%). A higher proportion of households without livestock reported monthly expenditure on health of 0-5%, likely because those within IDP camps are less likely to have livestock assets and at the same time are more able to access NGO supported health care that is provided free of charge, while those with livestock and outside of camps have to pay for services.
6.1.6 Coverage of supplementary and therapeutic feeding programmes Coverage of selective feeding programmes is a proxy indicator for accessibility of programmes. Coverage was calculated through the indirect method, eg. the proportion of the number of eligible children (based on WHM% cut-offs) who are currently enrolled in a feeding programme divided by the number of eligible children in the sample. Coverage of selective feeding programmes across conflict affected Darfur was low (13%, 95% CI: 7.4-18.6), and below SPHERE17 standards of 50% coverage in rural areas. Coverage was highest in South Darfur (16.2%, 95% CI 5.2-27.3) and West Darfur (15.6%, 95% CI: 7.6-23.6), and lowest in North Darfur (9.7%, 95% CI 0.6-18.7) Coverage did not markedly improve from levels reported in 2006 at either state or regional level (see Table 29). 17 SPHERE standards refer to minimum standards in humanitarian response to be attained in five key sectors (water supply and sanitation, nutrition, food aid, shelter and health services), that were developed through inputs from practitioners.
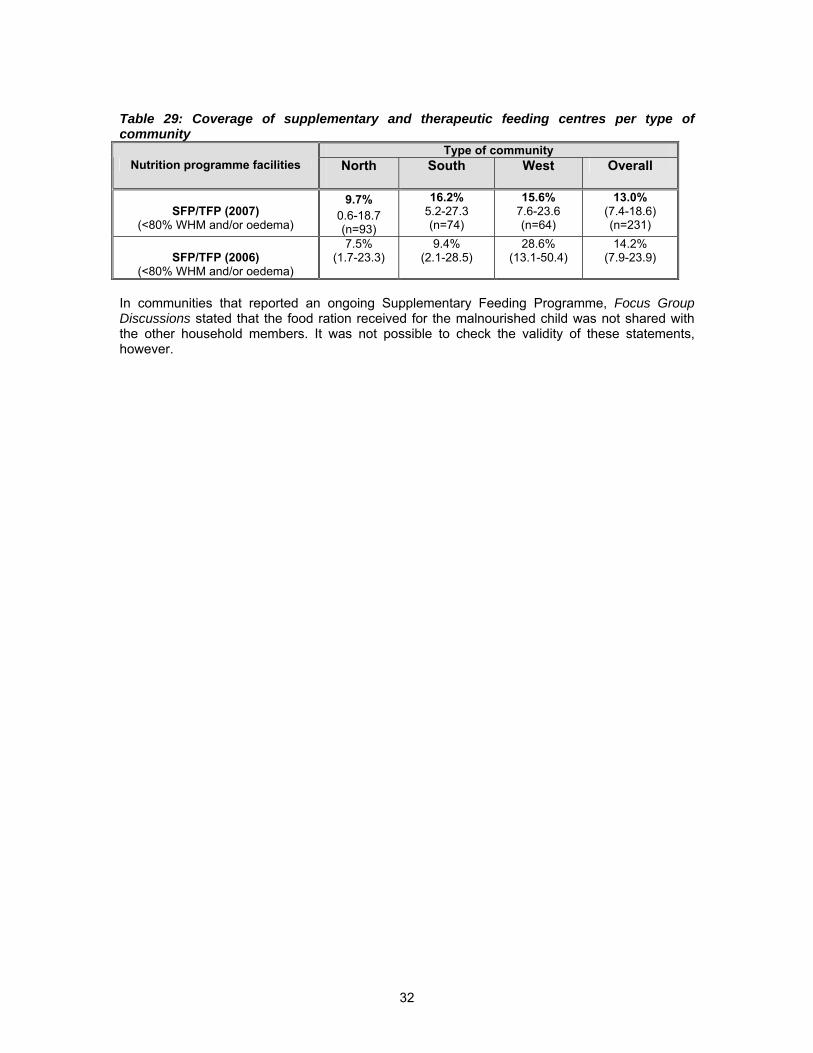
32
Table 29: Coverage of supplementary and therapeutic feeding centres per type of community
Type of community Nutrition programme facilities North
South
West
Overall
SFP/TFP (2007)
(<80% WHM and/or oedema)
9.7% 0.6-18.7 (n=93)
16.2% 5.2-27.3 (n=74)
15.6% 7.6-23.6 (n=64)
13.0% (7.4-18.6) (n=231)
SFP/TFP (2006)
(<80% WHM and/or oedema)
7.5% (1.7-23.3)
9.4% (2.1-28.5)
28.6% (13.1-50.4)
14.2% (7.9-23.9)
In communities that reported an ongoing Supplementary Feeding Programme, Focus Group Discussions stated that the food ration received for the malnourished child was not shared with the other household members. It was not possible to check the validity of these statements, however.
33
6.2 Care practices 6.2.1 Child Caregivers
This survey was not specifically designed to investigate the care and feeding practices of infants and young children. In order to assist the interpretation of the nutritional findings, however, questions regarding care practices of children under the age of two years were included. Overall, the primary caregiver for 87.6% (95% CI: 85.3-89.9) of children under two years old was the mother. This was similar in North and South (91% and 94.6% respectively) though lower in West Darfur (77.5%). Very few caretakers reported that the children were being left alone to look after themselves. At regional level, 2.8% of under-twos were reported to care for themselves at regional level, and 1%, 3.5%, and 4.1% in North, South and West Darfur, respectively. Four percent of under-twos in North Darfur, 10% of children in West Darfur, and 1% of children in South Darfur were looked after by a sibling. The remaining children were cared for by either another family member or another person. Leaving a child under the age of two years alone during the day increases the risk for negative health outcomes such as malnutrition and illness. Even when infants and young children are cared for by siblings, the inherent risks are similar as the sibling responsible for the child (often an older sister) is only 6 or 7 years old and therefore does not properly understand what the child’s needs or their own needs are. Grandmothers serve an important role, and are most frequently those who were classified as “other family members” caring for the child. There may be traditional practices which are potentially detrimental to the health and development of the child and education campaigns may benefit this particular group.
6.2.2 Breastfeeding Practices Breastfeeding status was based upon maternal recall and a series of questions related to feeding practices and age (see questionnaire in Annex 1). While breastfeeding is commonly practiced by the vast majority of mothers, exclusive breastfeeding is not commonly practiced. Breastfeeding among children younger than 6 months of age was very high in all three states, at 97.2% overall [95% CI: 95.3-99.2], however exclusive breastfeeding was not common. More than one third of breastfeeding women (41.8%, 95% CI: 35.4-48.3) reported having administered solids and liquids to their children under 6 months, meaning that they are not in the process of exclusively breastfeeding. At the regional level, approximately one third of mothers (36.4%, 95% CI 32.2-40.4), report successful exclusive breastfeeding to six months, which is consistent across states (Table 30). While a number of Focus Group Discussions demonstrated awareness of the benefits of exclusive breastfeeding, it was not practiced due to traditional beliefs. Insufficient breastmilk linked to mothers’ tiredness and inadequate dietary intake, was also mentioned. Water was generally given in the first week after birth. Table 30: Breastfeeding rates, Darfur, August 2007 North South West Overall % 95% CI % 95% CI % 95% CI % 95% CI Breastfeeding a child < 6 months of age 96.1 (91.7-
100.0) 97.9 95.1-100 97.9 94.8-100 97.2 (95.3-99.2)
Proportion of children under 6 months old who have received solids or liquids in addition to breastmilk
32.9 (21.3-44.4) 47.3 34.0-60.6 45.8 35.6-56.0 41.8 35.4-48.3
Children 6-24 months 35.8 (29.2-42.4) 35.5 26.3-44.7 37.8 31.8-43.7 36.4 32.3-40.4
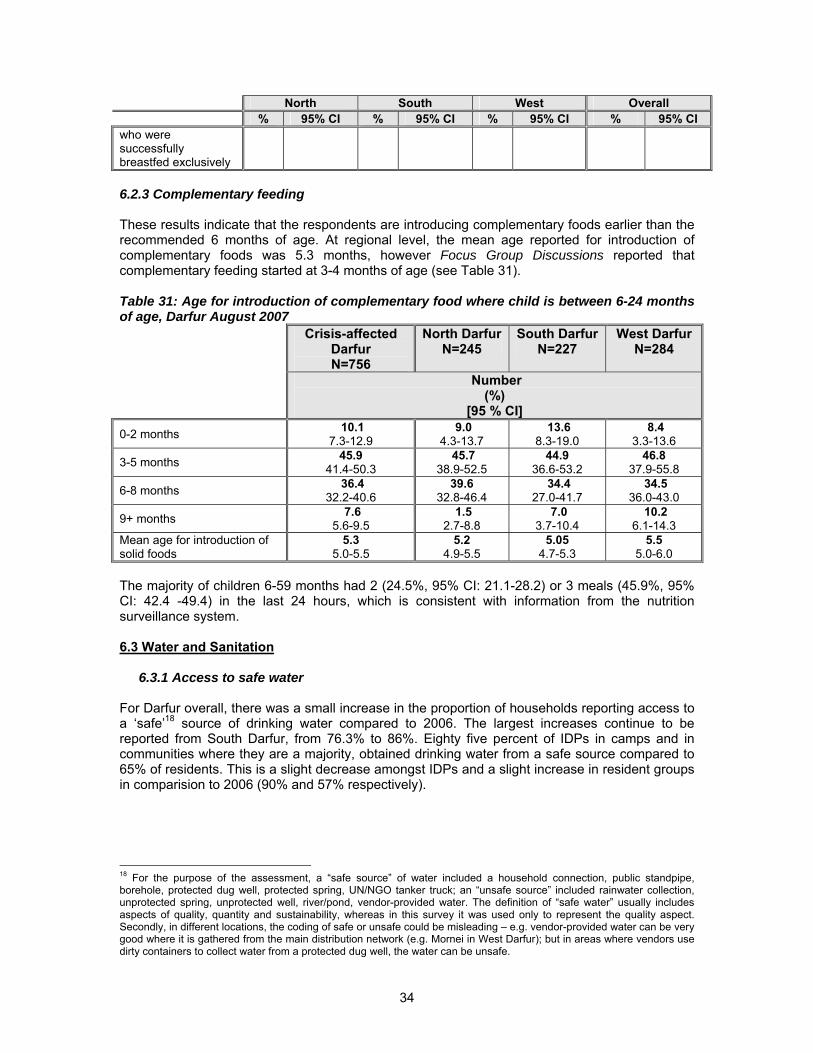
34
North South West Overall % 95% CI % 95% CI % 95% CI % 95% CI who were successfully breastfed exclusively 6.2.3 Complementary feeding These results indicate that the respondents are introducing complementary foods earlier than the recommended 6 months of age. At regional level, the mean age reported for introduction of complementary foods was 5.3 months, however Focus Group Discussions reported that complementary feeding started at 3-4 months of age (see Table 31). Table 31: Age for introduction of complementary food where child is between 6-24 months of age, Darfur August 2007
Crisis-affected Darfur N=756
North DarfurN=245
South Darfur N=227
West Darfur N=284
Number (%)
[95 % CI] 0-2 months 10.1
7.3-12.9 9.0
4.3-13.7 13.6
8.3-19.0 8.4
3.3-13.6
3-5 months 45.9 41.4-50.3
45.7 38.9-52.5
44.9 36.6-53.2
46.8 37.9-55.8
6-8 months 36.4 32.2-40.6
39.6 32.8-46.4
34.4 27.0-41.7
34.5 36.0-43.0
9+ months 7.6 5.6-9.5
1.5 2.7-8.8
7.0 3.7-10.4
10.2 6.1-14.3
Mean age for introduction of solid foods
5.3 5.0-5.5
5.2 4.9-5.5
5.05 4.7-5.3
5.5 5.0-6.0
The majority of children 6-59 months had 2 (24.5%, 95% CI: 21.1-28.2) or 3 meals (45.9%, 95% CI: 42.4 -49.4) in the last 24 hours, which is consistent with information from the nutrition surveillance system. 6.3 Water and Sanitation
6.3.1 Access to safe water For Darfur overall, there was a small increase in the proportion of households reporting access to a ‘safe’18 source of drinking water compared to 2006. The largest increases continue to be reported from South Darfur, from 76.3% to 86%. Eighty five percent of IDPs in camps and in communities where they are a majority, obtained drinking water from a safe source compared to 65% of residents. This is a slight decrease amongst IDPs and a slight increase in resident groups in comparision to 2006 (90% and 57% respectively).
18 For the purpose of the assessment, a “safe source” of water included a household connection, public standpipe, borehole, protected dug well, protected spring, UN/NGO tanker truck; an “unsafe source” included rainwater collection, unprotected spring, unprotected well, river/pond, vendor-provided water. The definition of “safe water” usually includes aspects of quality, quantity and sustainability, whereas in this survey it was used only to represent the quality aspect. Secondly, in different locations, the coding of safe or unsafe could be misleading – e.g. vendor-provided water can be very good where it is gathered from the main distribution network (e.g. Mornei in West Darfur); but in areas where vendors use dirty containers to collect water from a protected dug well, the water can be unsafe.
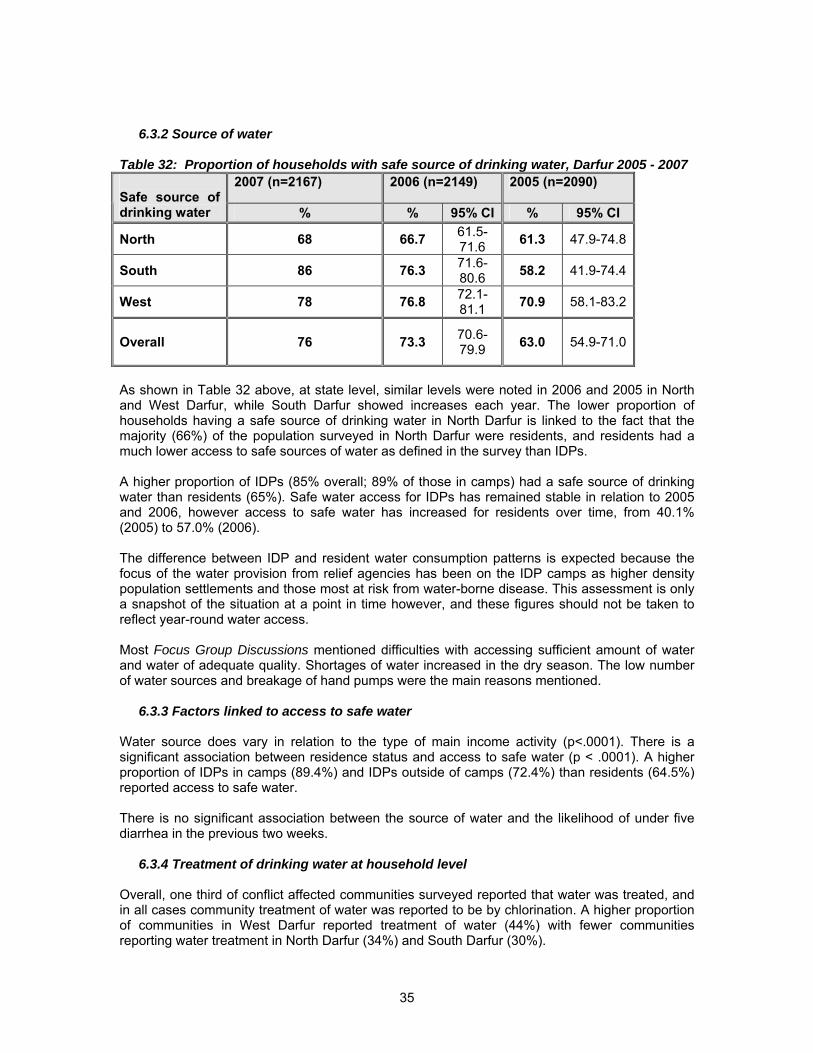
35
6.3.2 Source of water
Table 32: Proportion of households with safe source of drinking water, Darfur 2005 - 2007
2007 (n=2167) 2006 (n=2149) 2005 (n=2090) Safe source of drinking water % % 95% CI % 95% CI
North 68 66.7 61.5-71.6 61.3 47.9-74.8
South 86 76.3 71.6-80.6 58.2 41.9-74.4
West 78 76.8 72.1-81.1 70.9 58.1-83.2
Overall 76 73.3 70.6-79.9 63.0
54.9-71.0
As shown in Table 32 above, at state level, similar levels were noted in 2006 and 2005 in North and West Darfur, while South Darfur showed increases each year. The lower proportion of households having a safe source of drinking water in North Darfur is linked to the fact that the majority (66%) of the population surveyed in North Darfur were residents, and residents had a much lower access to safe sources of water as defined in the survey than IDPs. A higher proportion of IDPs (85% overall; 89% of those in camps) had a safe source of drinking water than residents (65%). Safe water access for IDPs has remained stable in relation to 2005 and 2006, however access to safe water has increased for residents over time, from 40.1% (2005) to 57.0% (2006). The difference between IDP and resident water consumption patterns is expected because the focus of the water provision from relief agencies has been on the IDP camps as higher density population settlements and those most at risk from water-borne disease. This assessment is only a snapshot of the situation at a point in time however, and these figures should not be taken to reflect year-round water access. Most Focus Group Discussions mentioned difficulties with accessing sufficient amount of water and water of adequate quality. Shortages of water increased in the dry season. The low number of water sources and breakage of hand pumps were the main reasons mentioned.
6.3.3 Factors linked to access to safe water Water source does vary in relation to the type of main income activity (p<.0001). There is a significant association between residence status and access to safe water (p < .0001). A higher proportion of IDPs in camps (89.4%) and IDPs outside of camps (72.4%) than residents (64.5%) reported access to safe water. There is no significant association between the source of water and the likelihood of under five diarrhea in the previous two weeks.
6.3.4 Treatment of drinking water at household level Overall, one third of conflict affected communities surveyed reported that water was treated, and in all cases community treatment of water was reported to be by chlorination. A higher proportion of communities in West Darfur reported treatment of water (44%) with fewer communities reporting water treatment in North Darfur (34%) and South Darfur (30%).
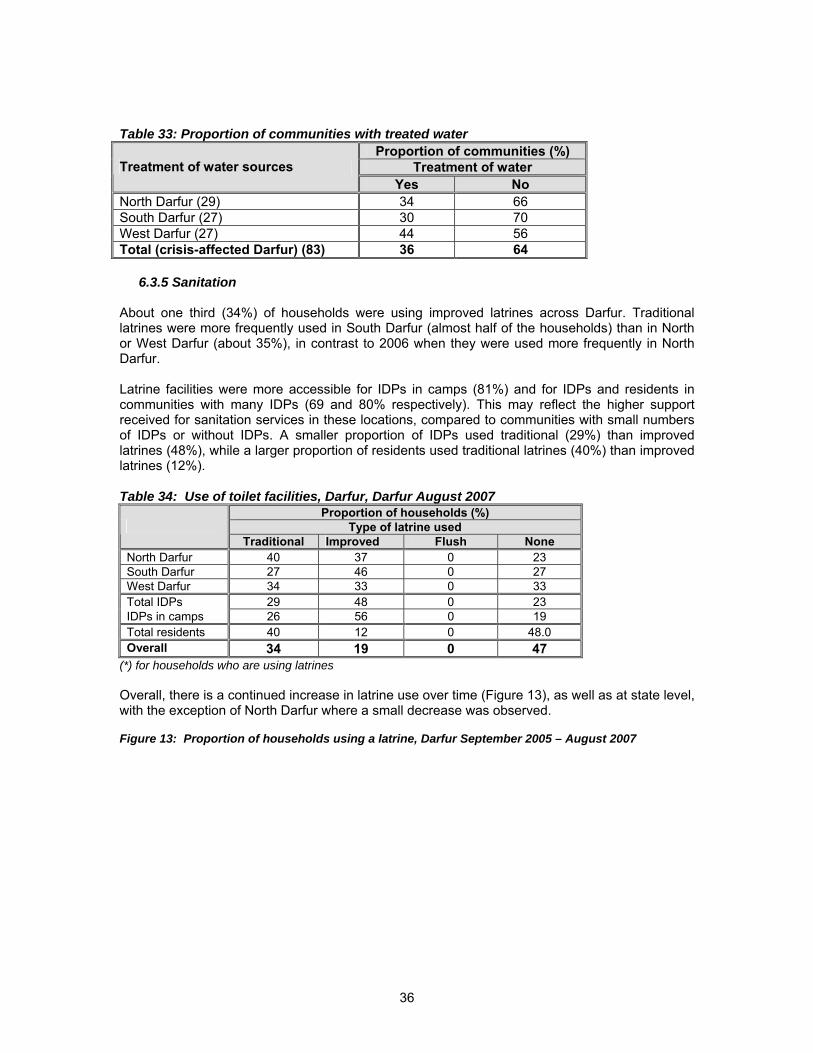
36
Table 33: Proportion of communities with treated water
Proportion of communities (%) Treatment of water Treatment of water sources
Yes No North Darfur (29) 34 66 South Darfur (27) 30 70 West Darfur (27) 44 56 Total (crisis-affected Darfur) (83) 36 64
6.3.5 Sanitation About one third (34%) of households were using improved latrines across Darfur. Traditional latrines were more frequently used in South Darfur (almost half of the households) than in North or West Darfur (about 35%), in contrast to 2006 when they were used more frequently in North Darfur. Latrine facilities were more accessible for IDPs in camps (81%) and for IDPs and residents in communities with many IDPs (69 and 80% respectively). This may reflect the higher support received for sanitation services in these locations, compared to communities with small numbers of IDPs or without IDPs. A smaller proportion of IDPs used traditional (29%) than improved latrines (48%), while a larger proportion of residents used traditional latrines (40%) than improved latrines (12%). Table 34: Use of toilet facilities, Darfur, Darfur August 2007
Proportion of households (%) Type of latrine used
Traditional Improved Flush None North Darfur 40 37 0 23 South Darfur 27 46 0 27 West Darfur 34 33 0 33 Total IDPs 29 48 0 23 IDPs in camps 26 56 0 19 Total residents 40 12 0 48.0 Overall 34 19 0 47
(*) for households who are using latrines Overall, there is a continued increase in latrine use over time (Figure 13), as well as at state level, with the exception of North Darfur where a small decrease was observed. Figure 13: Proportion of households using a latrine, Darfur September 2005 – August 2007
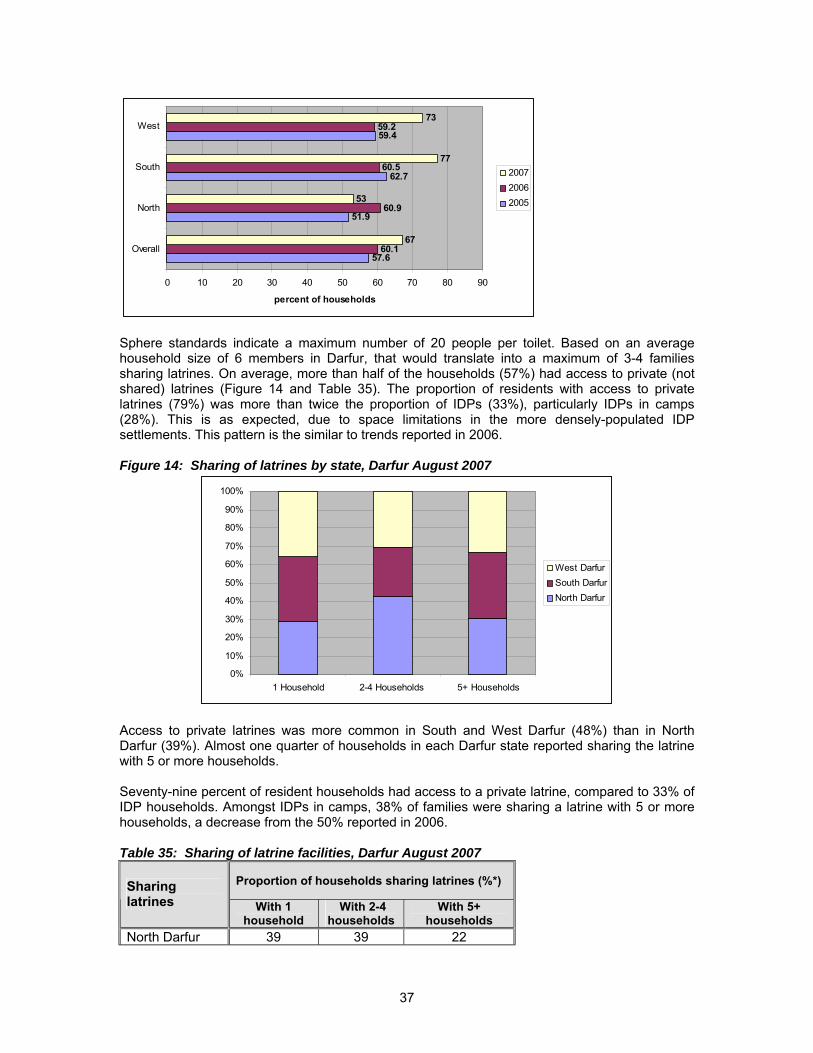
37
57.6
51.9
62.7
59.4
60.1
60.9
60.5
59.2
67
53
77
73
0 10 20 30 40 50 60 70 80 90
Overall
North
South
West
percent of households
200720062005
Sphere standards indicate a maximum number of 20 people per toilet. Based on an average household size of 6 members in Darfur, that would translate into a maximum of 3-4 families sharing latrines. On average, more than half of the households (57%) had access to private (not shared) latrines (Figure 14 and Table 35). The proportion of residents with access to private latrines (79%) was more than twice the proportion of IDPs (33%), particularly IDPs in camps (28%). This is as expected, due to space limitations in the more densely-populated IDP settlements. This pattern is the similar to trends reported in 2006. Figure 14: Sharing of latrines by state, Darfur August 2007
0%
10%
20%
30%
40%
50%
60%
70%
80%
90%
100%
1 Household 2-4 Households 5+ Households
West DarfurSouth DarfurNorth Darfur
Access to private latrines was more common in South and West Darfur (48%) than in North Darfur (39%). Almost one quarter of households in each Darfur state reported sharing the latrine with 5 or more households. Seventy-nine percent of resident households had access to a private latrine, compared to 33% of IDP households. Amongst IDPs in camps, 38% of families were sharing a latrine with 5 or more households, a decrease from the 50% reported in 2006. Table 35: Sharing of latrine facilities, Darfur August 2007
Proportion of households sharing latrines (%*) Sharing latrines With 1
household With 2-4
households With 5+
households North Darfur 39 39 22
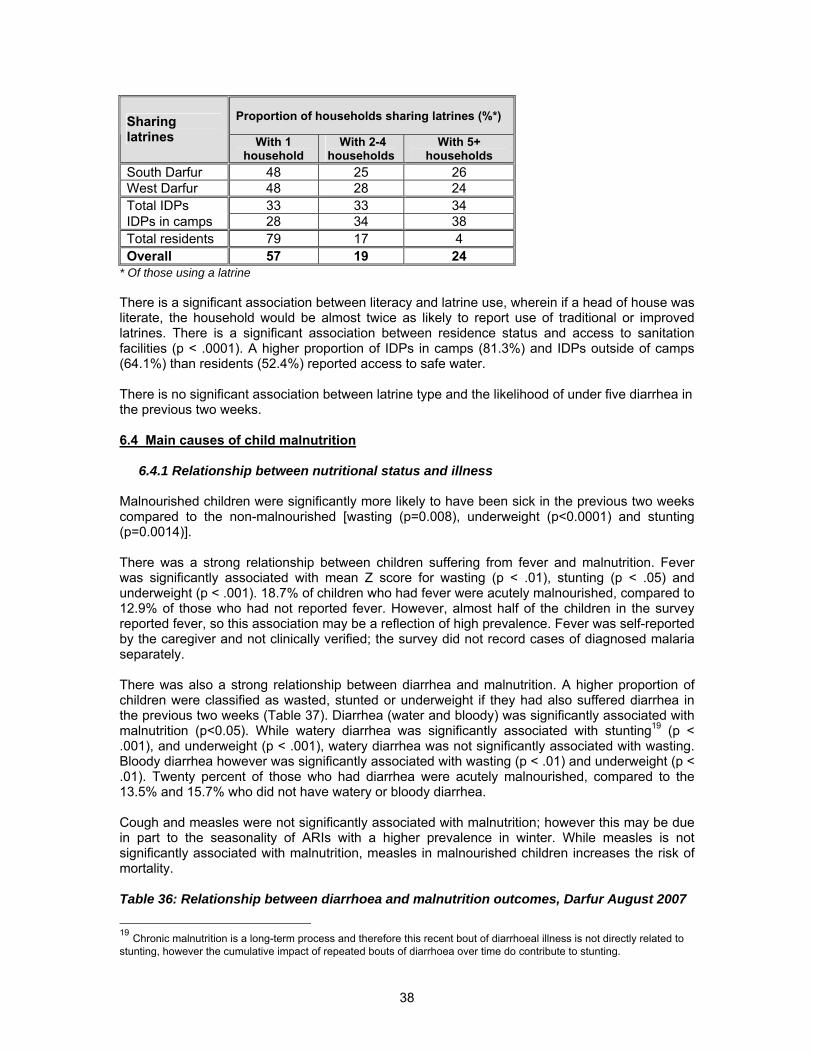
38
Proportion of households sharing latrines (%*) Sharing latrines With 1
household With 2-4
households With 5+
households South Darfur 48 25 26 West Darfur 48 28 24 Total IDPs 33 33 34 IDPs in camps 28 34 38 Total residents 79 17 4 Overall 57 19 24
* Of those using a latrine There is a significant association between literacy and latrine use, wherein if a head of house was literate, the household would be almost twice as likely to report use of traditional or improved latrines. There is a significant association between residence status and access to sanitation facilities (p < .0001). A higher proportion of IDPs in camps (81.3%) and IDPs outside of camps (64.1%) than residents (52.4%) reported access to safe water. There is no significant association between latrine type and the likelihood of under five diarrhea in the previous two weeks. 6.4 Main causes of child malnutrition
6.4.1 Relationship between nutritional status and illness Malnourished children were significantly more likely to have been sick in the previous two weeks compared to the non-malnourished [wasting (p=0.008), underweight (p<0.0001) and stunting (p=0.0014)]. There was a strong relationship between children suffering from fever and malnutrition. Fever was significantly associated with mean Z score for wasting (p < .01), stunting (p < .05) and underweight (p < .001). 18.7% of children who had fever were acutely malnourished, compared to 12.9% of those who had not reported fever. However, almost half of the children in the survey reported fever, so this association may be a reflection of high prevalence. Fever was self-reported by the caregiver and not clinically verified; the survey did not record cases of diagnosed malaria separately. There was also a strong relationship between diarrhea and malnutrition. A higher proportion of children were classified as wasted, stunted or underweight if they had also suffered diarrhea in the previous two weeks (Table 37). Diarrhea (water and bloody) was significantly associated with malnutrition (p<0.05). While watery diarrhea was significantly associated with stunting19 (p < .001), and underweight (p < .001), watery diarrhea was not significantly associated with wasting. Bloody diarrhea however was significantly associated with wasting (p < .01) and underweight (p < .01). Twenty percent of those who had diarrhea were acutely malnourished, compared to the 13.5% and 15.7% who did not have watery or bloody diarrhea. Cough and measles were not significantly associated with malnutrition; however this may be due in part to the seasonality of ARIs with a higher prevalence in winter. While measles is not significantly associated with malnutrition, measles in malnourished children increases the risk of mortality. Table 36: Relationship between diarrhoea and malnutrition outcomes, Darfur August 2007
19 Chronic malnutrition is a long-term process and therefore this recent bout of diarrhoeal illness is not directly related to stunting, however the cumulative impact of repeated bouts of diarrhoea over time do contribute to stunting.
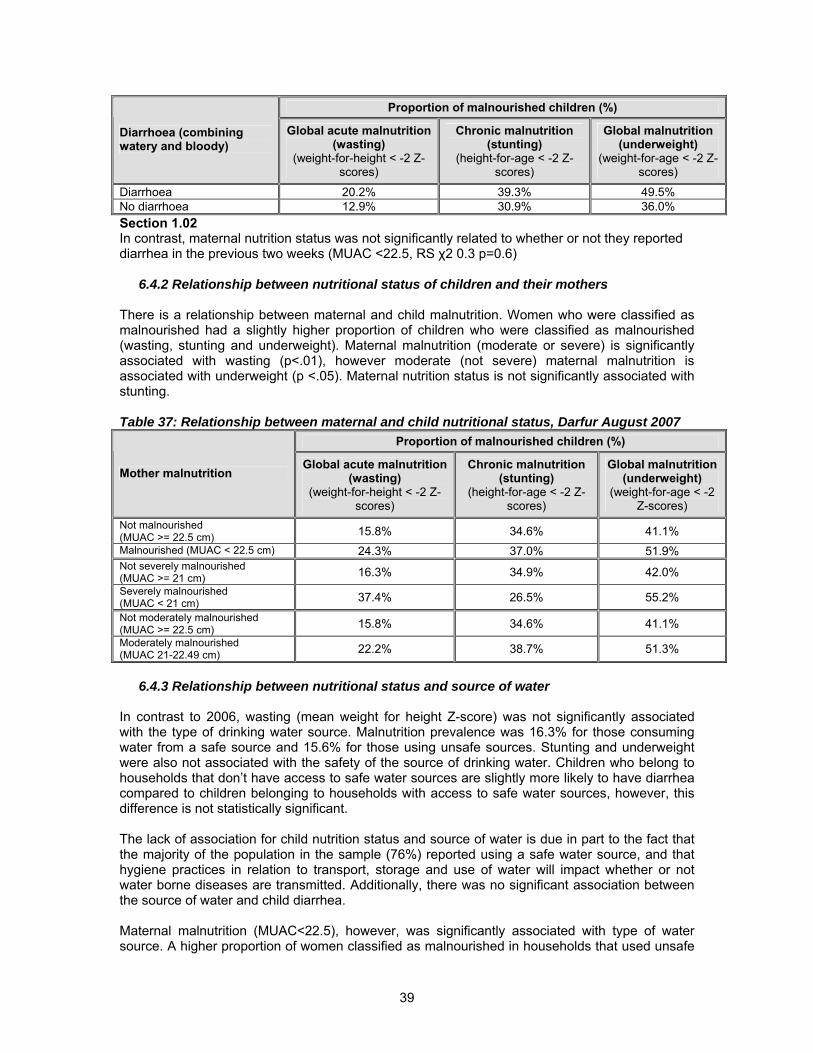
39
Proportion of malnourished children (%)
Diarrhoea (combining watery and bloody)
Global acute malnutrition (wasting)
(weight-for-height < -2 Z-scores)
Chronic malnutrition (stunting)
(height-for-age < -2 Z-scores)
Global malnutrition (underweight)
(weight-for-age < -2 Z-scores)
Diarrhoea 20.2% 39.3% 49.5% No diarrhoea 12.9% 30.9% 36.0% Section 1.02 In contrast, maternal nutrition status was not significantly related to whether or not they reported diarrhea in the previous two weeks (MUAC <22.5, RS χ2 0.3 p=0.6)
6.4.2 Relationship between nutritional status of children and their mothers There is a relationship between maternal and child malnutrition. Women who were classified as malnourished had a slightly higher proportion of children who were classified as malnourished (wasting, stunting and underweight). Maternal malnutrition (moderate or severe) is significantly associated with wasting (p<.01), however moderate (not severe) maternal malnutrition is associated with underweight (p <.05). Maternal nutrition status is not significantly associated with stunting. Table 37: Relationship between maternal and child nutritional status, Darfur August 2007
Proportion of malnourished children (%)
Mother malnutrition Global acute malnutrition
(wasting) (weight-for-height < -2 Z-
scores)
Chronic malnutrition (stunting)
(height-for-age < -2 Z-scores)
Global malnutrition (underweight)
(weight-for-age < -2 Z-scores)
Not malnourished (MUAC >= 22.5 cm) 15.8% 34.6% 41.1% Malnourished (MUAC < 22.5 cm) 24.3% 37.0% 51.9% Not severely malnourished (MUAC >= 21 cm) 16.3% 34.9% 42.0% Severely malnourished (MUAC < 21 cm) 37.4% 26.5% 55.2% Not moderately malnourished (MUAC >= 22.5 cm) 15.8% 34.6% 41.1% Moderately malnourished (MUAC 21-22.49 cm) 22.2% 38.7% 51.3%
6.4.3 Relationship between nutritional status and source of water
In contrast to 2006, wasting (mean weight for height Z-score) was not significantly associated with the type of drinking water source. Malnutrition prevalence was 16.3% for those consuming water from a safe source and 15.6% for those using unsafe sources. Stunting and underweight were also not associated with the safety of the source of drinking water. Children who belong to households that don’t have access to safe water sources are slightly more likely to have diarrhea compared to children belonging to households with access to safe water sources, however, this difference is not statistically significant. The lack of association for child nutrition status and source of water is due in part to the fact that the majority of the population in the sample (76%) reported using a safe water source, and that hygiene practices in relation to transport, storage and use of water will impact whether or not water borne diseases are transmitted. Additionally, there was no significant association between the source of water and child diarrhea. Maternal malnutrition (MUAC<22.5), however, was significantly associated with type of water source. A higher proportion of women classified as malnourished in households that used unsafe
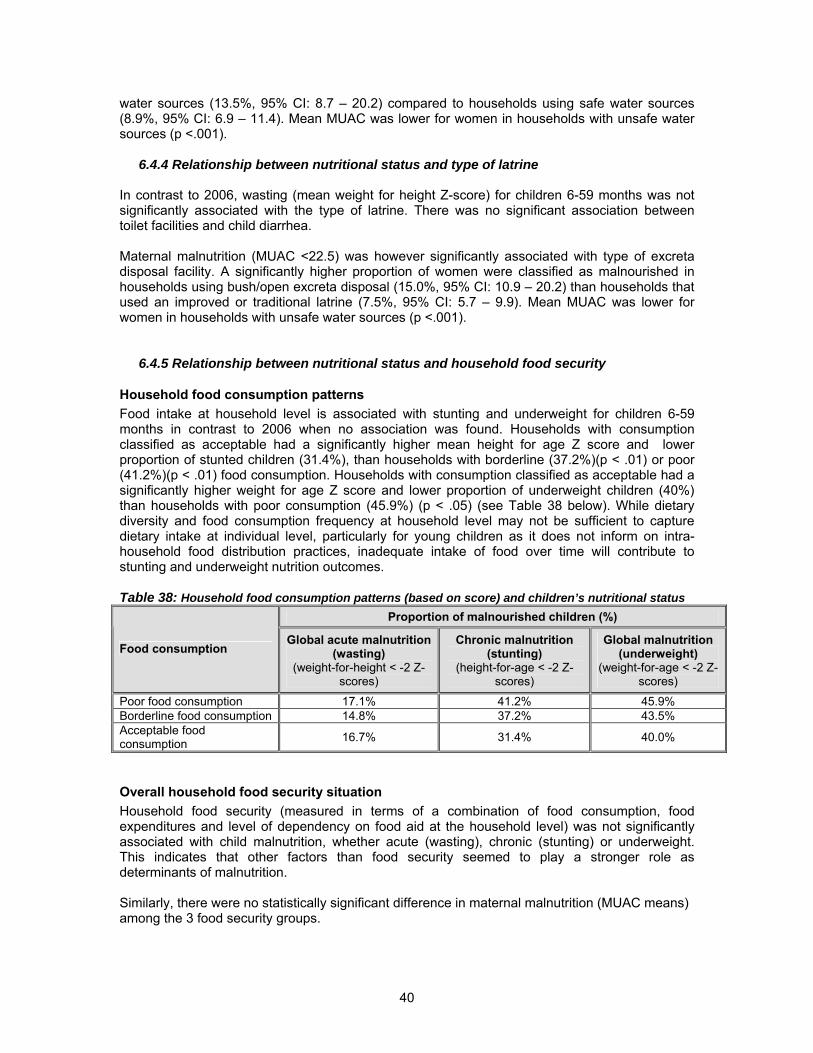
40
water sources (13.5%, 95% CI: 8.7 – 20.2) compared to households using safe water sources (8.9%, 95% CI: 6.9 – 11.4). Mean MUAC was lower for women in households with unsafe water sources (p <.001).
6.4.4 Relationship between nutritional status and type of latrine In contrast to 2006, wasting (mean weight for height Z-score) for children 6-59 months was not significantly associated with the type of latrine. There was no significant association between toilet facilities and child diarrhea. Maternal malnutrition (MUAC <22.5) was however significantly associated with type of excreta disposal facility. A significantly higher proportion of women were classified as malnourished in households using bush/open excreta disposal (15.0%, 95% CI: 10.9 – 20.2) than households that used an improved or traditional latrine (7.5%, 95% CI: 5.7 – 9.9). Mean MUAC was lower for women in households with unsafe water sources (p <.001).
6.4.5 Relationship between nutritional status and household food security
Household food consumption patterns Food intake at household level is associated with stunting and underweight for children 6-59 months in contrast to 2006 when no association was found. Households with consumption classified as acceptable had a significantly higher mean height for age Z score and lower proportion of stunted children (31.4%), than households with borderline (37.2%)(p < .01) or poor (41.2%)(p < .01) food consumption. Households with consumption classified as acceptable had a significantly higher weight for age Z score and lower proportion of underweight children (40%) than households with poor consumption (45.9%) (p < .05) (see Table 38 below). While dietary diversity and food consumption frequency at household level may not be sufficient to capture dietary intake at individual level, particularly for young children as it does not inform on intra-household food distribution practices, inadequate intake of food over time will contribute to stunting and underweight nutrition outcomes. Table 38: Household food consumption patterns (based on score) and children’s nutritional status
Proportion of malnourished children (%)
Food consumption Global acute malnutrition
(wasting) (weight-for-height < -2 Z-
scores)
Chronic malnutrition (stunting)
(height-for-age < -2 Z-scores)
Global malnutrition (underweight)
(weight-for-age < -2 Z-scores)
Poor food consumption 17.1% 41.2% 45.9% Borderline food consumption 14.8% 37.2% 43.5% Acceptable food consumption 16.7% 31.4% 40.0%
Overall household food security situation Household food security (measured in terms of a combination of food consumption, food expenditures and level of dependency on food aid at the household level) was not significantly associated with child malnutrition, whether acute (wasting), chronic (stunting) or underweight. This indicates that other factors than food security seemed to play a stronger role as determinants of malnutrition. Similarly, there were no statistically significant difference in maternal malnutrition (MUAC means) among the 3 food security groups.
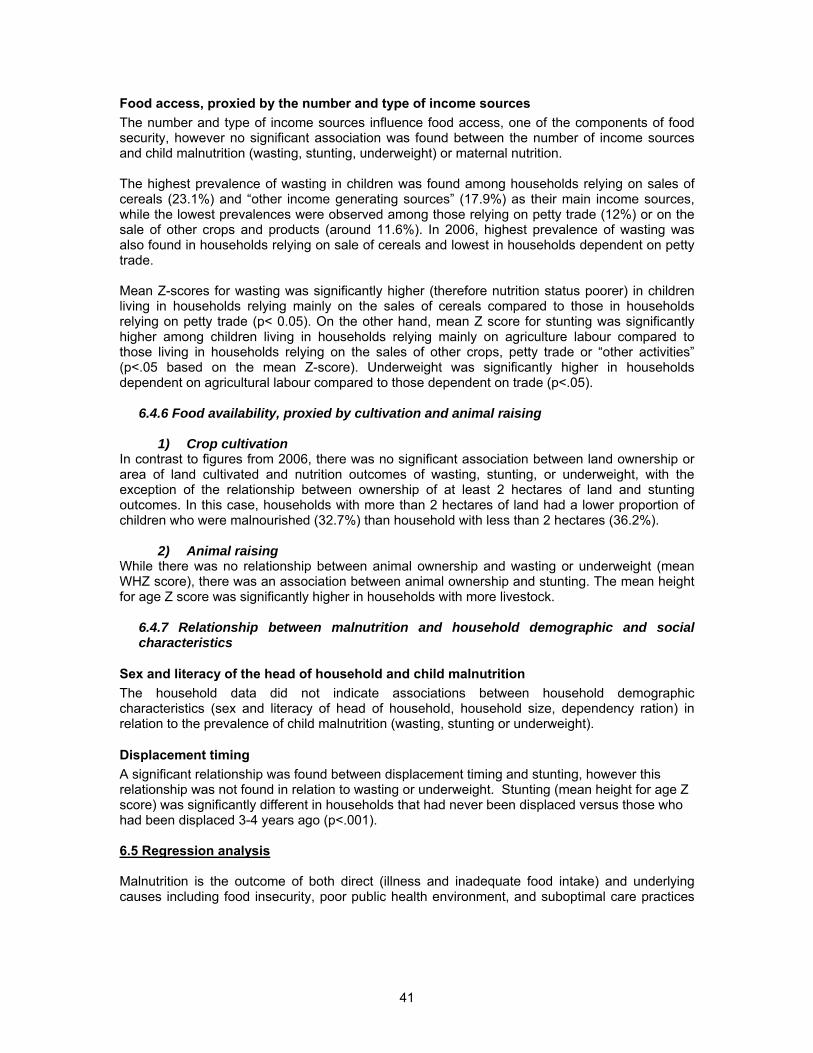
41
Food access, proxied by the number and type of income sources The number and type of income sources influence food access, one of the components of food security, however no significant association was found between the number of income sources and child malnutrition (wasting, stunting, underweight) or maternal nutrition. The highest prevalence of wasting in children was found among households relying on sales of cereals (23.1%) and “other income generating sources” (17.9%) as their main income sources, while the lowest prevalences were observed among those relying on petty trade (12%) or on the sale of other crops and products (around 11.6%). In 2006, highest prevalence of wasting was also found in households relying on sale of cereals and lowest in households dependent on petty trade. Mean Z-scores for wasting was significantly higher (therefore nutrition status poorer) in children living in households relying mainly on the sales of cereals compared to those in households relying on petty trade (p< 0.05). On the other hand, mean Z score for stunting was significantly higher among children living in households relying mainly on agriculture labour compared to those living in households relying on the sales of other crops, petty trade or “other activities” (p<.05 based on the mean Z-score). Underweight was significantly higher in households dependent on agricultural labour compared to those dependent on trade (p<.05).
6.4.6 Food availability, proxied by cultivation and animal raising
1) Crop cultivation In contrast to figures from 2006, there was no significant association between land ownership or area of land cultivated and nutrition outcomes of wasting, stunting, or underweight, with the exception of the relationship between ownership of at least 2 hectares of land and stunting outcomes. In this case, households with more than 2 hectares of land had a lower proportion of children who were malnourished (32.7%) than household with less than 2 hectares (36.2%).
2) Animal raising While there was no relationship between animal ownership and wasting or underweight (mean WHZ score), there was an association between animal ownership and stunting. The mean height for age Z score was significantly higher in households with more livestock.
6.4.7 Relationship between malnutrition and household demographic and social characteristics
Sex and literacy of the head of household and child malnutrition The household data did not indicate associations between household demographic characteristics (sex and literacy of head of household, household size, dependency ration) in relation to the prevalence of child malnutrition (wasting, stunting or underweight).
Displacement timing A significant relationship was found between displacement timing and stunting, however this relationship was not found in relation to wasting or underweight. Stunting (mean height for age Z score) was significantly different in households that had never been displaced versus those who had been displaced 3-4 years ago (p<.001). 6.5 Regression analysis Malnutrition is the outcome of both direct (illness and inadequate food intake) and underlying causes including food insecurity, poor public health environment, and suboptimal care practices
42
in particular in relation to infant and young child feeding. In order to further explore the immediate and underlying causes of malnutrition in children under 5, linear regression analysis20 was used. The variables included in the regressions took into account some of the standard variables suggested in the UNICEF framework, i.e. variables related to:
• child demographics (sex, age, age-squared) • child health (diarrhoea, fever) • number of meals received by the child in the last 24 hours, as proxy for child food intake • mother health (severely malnourished, measured through MUAC) • household demographics (household size, size-squared) • household food consumption level – measured through the food consumption score • household access to safe water sources and improved toilet • community health environment (access to health services)
The statistical relationship between the mentioned variables and weight-for-height has already been explored above through bivariate analyses (cross tabulations and mean comparison). Few statistical significant relationships were found in that previous analysis. However, some interesting points could be stressed through the multivariate models. Multiple regression analysis was run taking weight for height z-score (WHZ) as dependent variable. Table below is a summary of the analysis. Overall, a weak regression (r2 ranges from 0.018 to 0.037) was observed for all the models presented in the table. As all the regressions presented here were weak, we are still missing major contributing factors to child acute malnutrition. Access to health services, measured at community level, was not found to be statistically significant; however, the inclusion of the different types of heath facilities slightly improved the quality of the model. Looking at wasting z-score, when controlling for the other factors in the model, it is found that boys have a significantly lower mean z-score than girls, that wasting z-score decreases with age and with fever, and that it decreases in case of malnourished mother. Findings about child health are of particular interest. The Comprehensive Food Security and Vulnerability Analysis (CFSVA)21 indicates that in Darfur, there is a peak in wasting during the beginning (May/June) and end of the rainy season (October) which also coincides with the “hunger” or lean season and the high malaria season. DFSNA data also indicates that malaria could be playing a role, as data were collected about the same time. This is important because children that are malnourished who get malaria have been shown in other studies to be at greater risk of mortality. Malaria prevention should, therefore, be a part of integrated nutrition programmes in Darfur. Interestingly, numbers of meals received by the child, food consumption level of the household and household size do not appear to significantly influence child wasting z-score. Similarly, wasting z-score is not significantly related to water access and sanitation. Even if safe water source is significant only when community health facilities are considered in the model, it is interesting to note that water quality indicator presents an opposite sign for its coefficient. In other words, it seems that access to safe water might imply a decrease of the wasting z-score. This finding should be carefully interpreted, not only because it goes against conventional wisdom. Water quality is just one of the possible causes of wasting. The very wide coverage of safe water
20 Weights were used but clusters were not accounted for in the regression analysis. See Annex 2 21 CFSVA was done by WFP primarily on the basis of data collected under the 2006 Sudan Houehold Health Survey.
43
access among the surveyed population (76% in total crisis-affected Darfur, a sort of camp-effect, where people get good quality water), might suggest that even though the overall water access situation is pretty good, that might not be sufficient to guarantee a positive nutritional outcome among children under 5, and that other key factors must be taken into account to improve their nutritional status. It is to be noted that there is widespread use of drinking water for brick making among IDPs in and around urban areas, possibly affecting actual drinking water access by households. Running regression analysis on underweight and stunting does not reveal any additional strong relationships between the immediate causes and the underlying causes. Using similar indicators as in the underweight and stunting regression analyses, adjusted R2s of less than 0.02 were achieved. This may be in part due to the high standard deviations caused by age heaping, and rounding off of height and weight measurements. This study does not find strong relationships with the usual causes of malnutrition, i.e. the ones directly related to food intake, health and diseases. Beside basic causes, this challenging situation may merit further exploration of the underlying causes, which might influence child nutritional outcomes to a greater degree.
44
7 – FOOD AVAILABILITY: AGRICULTURAL PRODUCTION (CROPS, LIVESTOCK) AND MARKET SUPPLIES 7.1 Crop cultivation
7.1.1 Forecasted 2007/08 Cereal Balance in crisis-affected Darfur The early collection of field data for the 2007 DFSNA in the months of August and September allowed only for a very preliminary estimate of cereal yields in the 2007/2008 season. Later in the year (November/December 2007), the Darfur State Ministries of Agriculture conducted their regular Post Harvest Assessments which provided a more detailed estimate for cereal harvests in the three Darfur States. The early and heavy onset of the 2007 rainy season with cumulative rainfalls between 50 to 100% over average encouraged many farmers to cultivate areas larger than the previous year. During the DFSNA household interviews early in the season farmers stated very positive expectations for the 2007/2008 harvest. However, early cessation of rains affected cereal crops in the grain filling stage, leading to a decrease of yields. Parts of Northern Darfur were also affected by local locusts and significant crop areas in Southern Darfur were attacked by Quelea-Quelea birds. While the security situation was relatively calm and comparable with 2006 at the planting and weeding stage, it started to deteriorate dramatically in some areas of South and West Darfur around harvest time, which may locally have led to abandonment of grown crops on the fields. The indicative cereal balance sheets presented in this report are based on data of two different sources: on one hand the 2007/2008 Darfur state level post harvest assessments, on the other hand population data and standardized assumptions for cereal consumption and losses similar to those of the 2006 EFSNA. The estimate cereal production amounts per state are taken from the reports of the 2007/2008 post harvest assessment figures, which have been endorsed by the Darfur State Ministries of Agriculture. Estimates for post harvest losses, needs for seeds and consumption by livestock are calculated, on standard rates of deduction form the overall available produce which are: -10% of the production for post harvest losses, -2% for seeds retained for the next planting season and -5% for consumption by livestock. Similar as in the previous 2006 DFSNA, human consumption was calculated based on a standard rate of 146 kg of cereals per capita and year. Population figures for the individual states were based on population data from the Central Bureau of Statistics and UNFPA and extrapolated to mid 2008 using state-specific annual growth rates22. Table 39: Projection of the Population in Darfur based in UNFPA and Central Bureau of Statistics Data
State Annual growth rate (%) 2004 2007 Mid year 2008
North Darfur 3.16 1 655 000 1 761 000 1 845 532 South Darfur 3.41 3 171 000 3 391 000 3 566 612 West Darfur 2.37 1 734 000 1 817 000 1 894 869 Greater Darfur 2.98 6 560 000 6 969 000 7 307 013
22 To reach the projected population figure for Darfur in mid 2008, projections per state for 2007 were taken from the 2006 EFSNA (Emergency Food Security and Nutrition Assessments in Darfur, Sudan 2006, p. 45) and extrapolated using the average yearly population growth rate for each state.
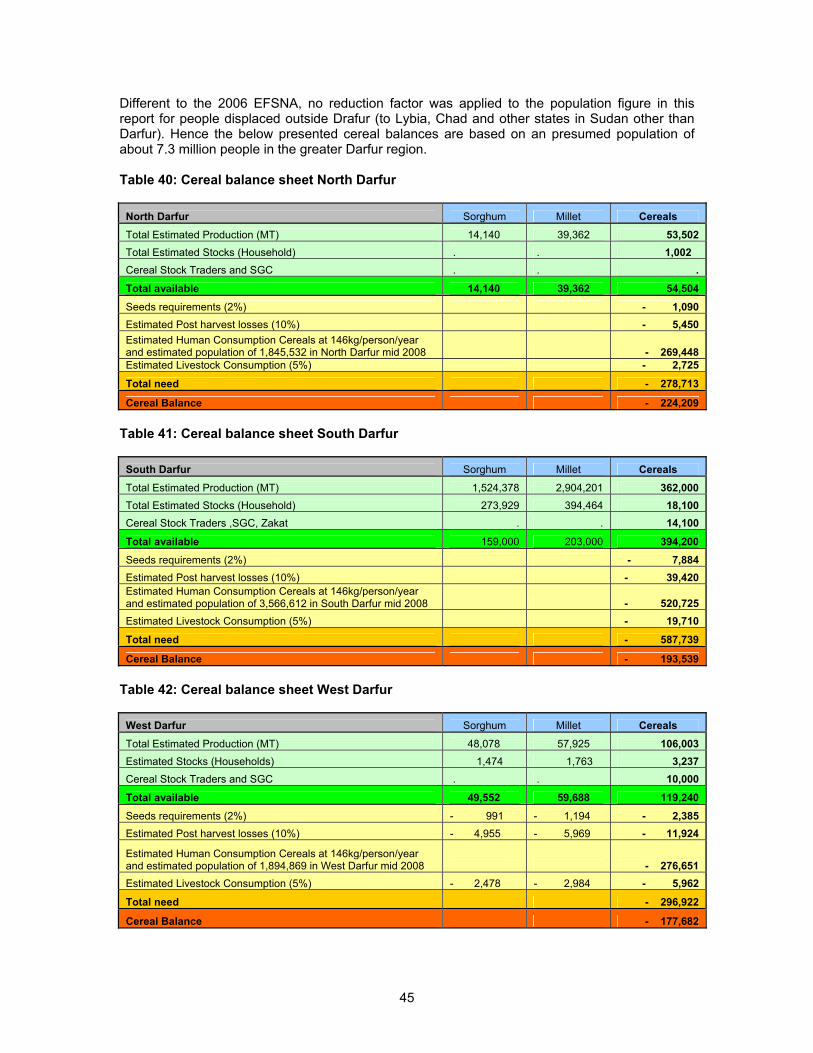
45
Different to the 2006 EFSNA, no reduction factor was applied to the population figure in this report for people displaced outside Drafur (to Lybia, Chad and other states in Sudan other than Darfur). Hence the below presented cereal balances are based on an presumed population of about 7.3 million people in the greater Darfur region. Table 40: Cereal balance sheet North Darfur
North Darfur Sorghum Millet Cereals Total Estimated Production (MT) 14,140 39,362 53,502 Total Estimated Stocks (Household) . . 1,002 Cereal Stock Traders and SGC . . .
Total available 14,140 39,362 54,504 Seeds requirements (2%) - 1,090 Estimated Post harvest losses (10%) - 5,450 Estimated Human Consumption Cereals at 146kg/person/year and estimated population of 1,845,532 in North Darfur mid 2008 - 269,448 Estimated Livestock Consumption (5%) - 2,725
Total need - 278,713
Cereal Balance - 224,209 Table 41: Cereal balance sheet South Darfur
South Darfur Sorghum Millet Cereals Total Estimated Production (MT) 1,524,378 2,904,201 362,000 Total Estimated Stocks (Household) 273,929 394,464 18,100 Cereal Stock Traders ,SGC, Zakat . . 14,100
Total available 159,000 203,000 394,200 Seeds requirements (2%) - 7,884 Estimated Post harvest losses (10%) - 39,420 Estimated Human Consumption Cereals at 146kg/person/year and estimated population of 3,566,612 in South Darfur mid 2008 - 520,725 Estimated Livestock Consumption (5%) - 19,710
Total need - 587,739
Cereal Balance - 193,539 Table 42: Cereal balance sheet West Darfur
West Darfur Sorghum Millet Cereals Total Estimated Production (MT) 48,078 57,925 106,003 Estimated Stocks (Households) 1,474 1,763 3,237 Cereal Stock Traders and SGC . . 10,000
Total available 49,552 59,688 119,240 Seeds requirements (2%) - 991 - 1,194 - 2,385 Estimated Post harvest losses (10%) - 4,955 - 5,969 - 11,924
Estimated Human Consumption Cereals at 146kg/person/year and estimated population of 1,894,869 in West Darfur mid 2008 - 276,651 Estimated Livestock Consumption (5%) - 2,478 - 2,984 - 5,962
Total need - 296,922
Cereal Balance - 177,682
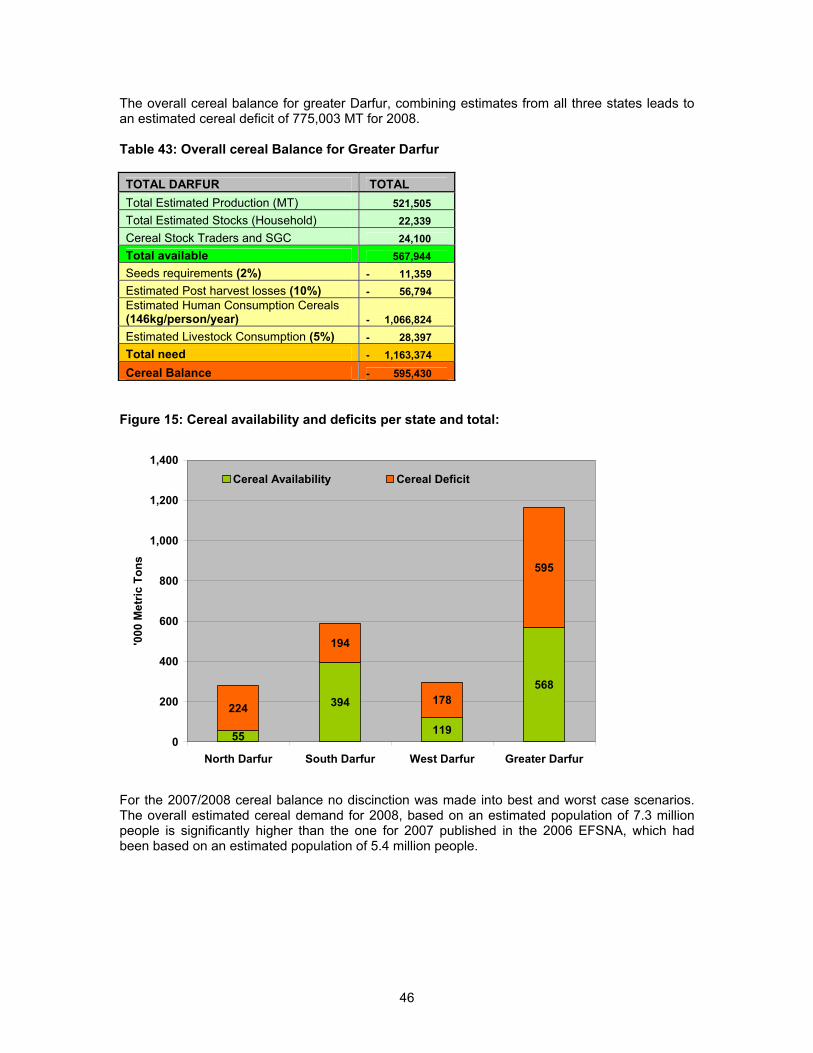
46
The overall cereal balance for greater Darfur, combining estimates from all three states leads to an estimated cereal deficit of 775,003 MT for 2008. Table 43: Overall cereal Balance for Greater Darfur TOTAL DARFUR TOTAL Total Estimated Production (MT) 521,505 Total Estimated Stocks (Household) 22,339 Cereal Stock Traders and SGC 24,100 Total available 567,944 Seeds requirements (2%) - 11,359 Estimated Post harvest losses (10%) - 56,794 Estimated Human Consumption Cereals (146kg/person/year) - 1,066,824 Estimated Livestock Consumption (5%) - 28,397 Total need - 1,163,374 Cereal Balance - 595,430
Figure 15: Cereal availability and deficits per state and total:
55
394
119
568
224
194
178
595
0
200
400
600
800
1,000
1,200
1,400
North Darfur South Darfur West Darfur Greater Darfur
'000
Met
ric T
ons
Cereal Availability Cereal Deficit
For the 2007/2008 cereal balance no discinction was made into best and worst case scenarios. The overall estimated cereal demand for 2008, based on an estimated population of 7.3 million people is significantly higher than the one for 2007 published in the 2006 EFSNA, which had been based on an estimated population of 5.4 million people.
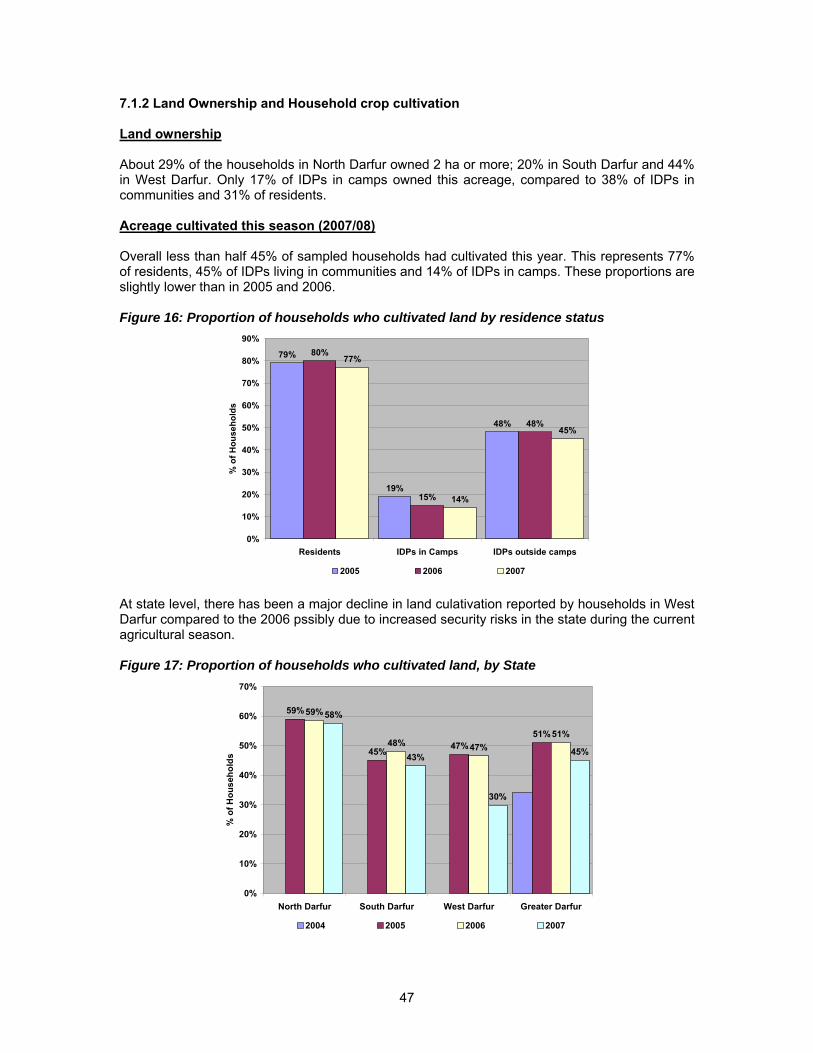
47
7.1.2 Land Ownership and Household crop cultivation Land ownership About 29% of the households in North Darfur owned 2 ha or more; 20% in South Darfur and 44% in West Darfur. Only 17% of IDPs in camps owned this acreage, compared to 38% of IDPs in communities and 31% of residents. Acreage cultivated this season (2007/08) Overall less than half 45% of sampled households had cultivated this year. This represents 77% of residents, 45% of IDPs living in communities and 14% of IDPs in camps. These proportions are slightly lower than in 2005 and 2006. Figure 16: Proportion of households who cultivated land by residence status
79%
19%
48%
80%
15%
48%
77%
14%
45%
0%
10%
20%
30%
40%
50%
60%
70%
80%
90%
Residents IDPs in Camps IDPs outside camps
% o
f Hou
seho
lds
2005 2006 2007 At state level, there has been a major decline in land culativation reported by households in West Darfur compared to the 2006 pssibly due to increased security risks in the state during the current agricultural season. Figure 17: Proportion of households who cultivated land, by State
59%
45% 47%51%
59%
48% 47%51%
58%
43%
30%
45%
0%
10%
20%
30%
40%
50%
60%
70%
North Darfur South Darfur West Darfur Greater Darfur
% o
f Hou
seho
lds
2004 2005 2006 2007
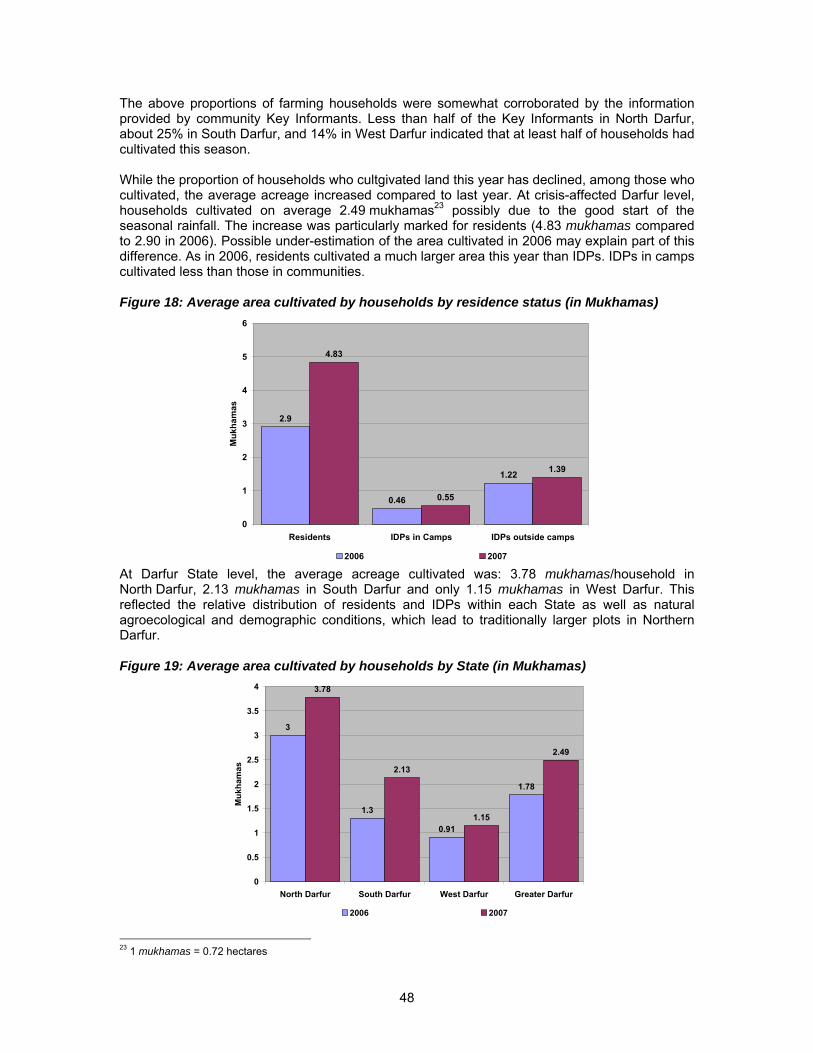
48
The above proportions of farming households were somewhat corroborated by the information provided by community Key Informants. Less than half of the Key Informants in North Darfur, about 25% in South Darfur, and 14% in West Darfur indicated that at least half of households had cultivated this season. While the proportion of households who cultgivated land this year has declined, among those who cultivated, the average acreage increased compared to last year. At crisis-affected Darfur level, households cultivated on average 2.49 mukhamas23 possibly due to the good start of the seasonal rainfall. The increase was particularly marked for residents (4.83 mukhamas compared to 2.90 in 2006). Possible under-estimation of the area cultivated in 2006 may explain part of this difference. As in 2006, residents cultivated a much larger area this year than IDPs. IDPs in camps cultivated less than those in communities. Figure 18: Average area cultivated by households by residence status (in Mukhamas)
2.9
0.46
1.22
4.83
0.55
1.39
0
1
2
3
4
5
6
Residents IDPs in Camps IDPs outside camps
Muk
ham
as
2006 2007 At Darfur State level, the average acreage cultivated was: 3.78 mukhamas/household in North Darfur, 2.13 mukhamas in South Darfur and only 1.15 mukhamas in West Darfur. This reflected the relative distribution of residents and IDPs within each State as well as natural agroecological and demographic conditions, which lead to traditionally larger plots in Northern Darfur. Figure 19: Average area cultivated by households by State (in Mukhamas)
3
1.3
0.91
1.78
3.78
2.13
1.15
2.49
0
0.5
1
1.5
2
2.5
3
3.5
4
North Darfur South Darfur West Darfur Greater Darfur
Muk
ham
as
2006 2007 23 1 mukhamas = 0.72 hectares
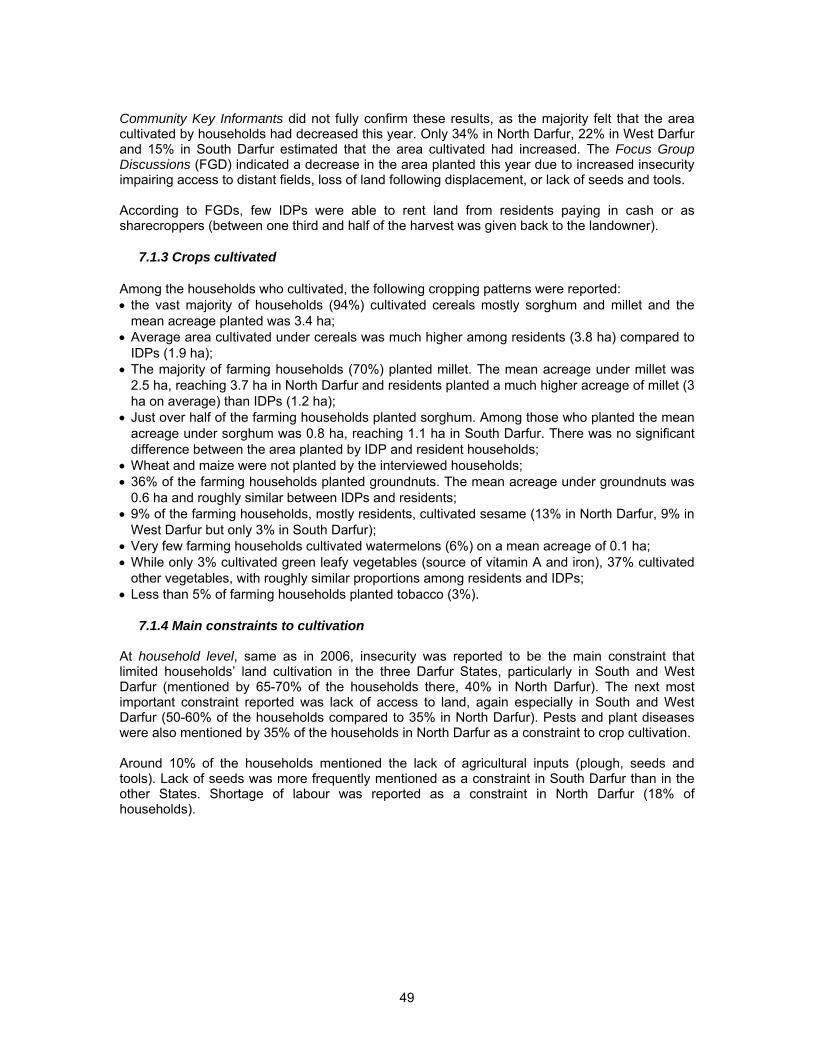
49
Community Key Informants did not fully confirm these results, as the majority felt that the area cultivated by households had decreased this year. Only 34% in North Darfur, 22% in West Darfur and 15% in South Darfur estimated that the area cultivated had increased. The Focus Group Discussions (FGD) indicated a decrease in the area planted this year due to increased insecurity impairing access to distant fields, loss of land following displacement, or lack of seeds and tools. According to FGDs, few IDPs were able to rent land from residents paying in cash or as sharecroppers (between one third and half of the harvest was given back to the landowner).
7.1.3 Crops cultivated Among the households who cultivated, the following cropping patterns were reported: • the vast majority of households (94%) cultivated cereals mostly sorghum and millet and the
mean acreage planted was 3.4 ha; • Average area cultivated under cereals was much higher among residents (3.8 ha) compared to
IDPs (1.9 ha); • The majority of farming households (70%) planted millet. The mean acreage under millet was
2.5 ha, reaching 3.7 ha in North Darfur and residents planted a much higher acreage of millet (3 ha on average) than IDPs (1.2 ha);
• Just over half of the farming households planted sorghum. Among those who planted the mean acreage under sorghum was 0.8 ha, reaching 1.1 ha in South Darfur. There was no significant difference between the area planted by IDP and resident households;
• Wheat and maize were not planted by the interviewed households; • 36% of the farming households planted groundnuts. The mean acreage under groundnuts was
0.6 ha and roughly similar between IDPs and residents; • 9% of the farming households, mostly residents, cultivated sesame (13% in North Darfur, 9% in
West Darfur but only 3% in South Darfur); • Very few farming households cultivated watermelons (6%) on a mean acreage of 0.1 ha; • While only 3% cultivated green leafy vegetables (source of vitamin A and iron), 37% cultivated
other vegetables, with roughly similar proportions among residents and IDPs; • Less than 5% of farming households planted tobacco (3%).
7.1.4 Main constraints to cultivation At household level, same as in 2006, insecurity was reported to be the main constraint that limited households’ land cultivation in the three Darfur States, particularly in South and West Darfur (mentioned by 65-70% of the households there, 40% in North Darfur). The next most important constraint reported was lack of access to land, again especially in South and West Darfur (50-60% of the households compared to 35% in North Darfur). Pests and plant diseases were also mentioned by 35% of the households in North Darfur as a constraint to crop cultivation. Around 10% of the households mentioned the lack of agricultural inputs (plough, seeds and tools). Lack of seeds was more frequently mentioned as a constraint in South Darfur than in the other States. Shortage of labour was reported as a constraint in North Darfur (18% of households).
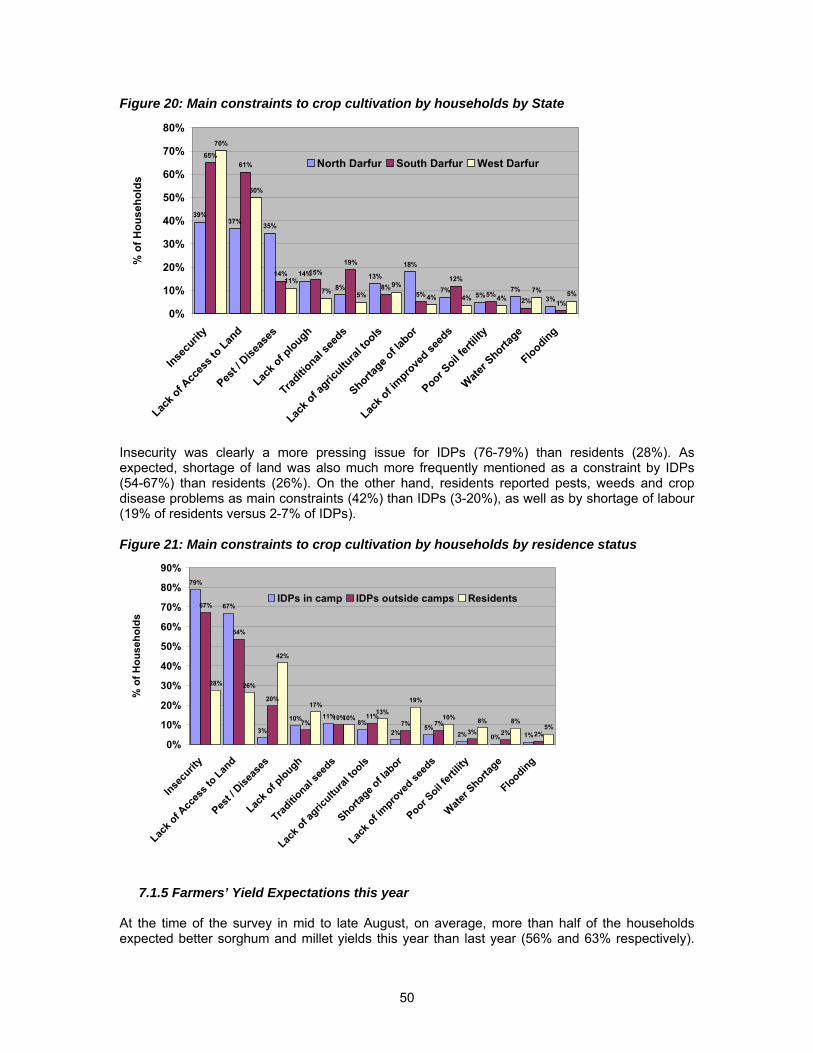
50
Figure 20: Main constraints to crop cultivation by households by State
39%37% 35%
14%
8%13%
18%
7%5%
7%3%
65%61%
14% 15%19%
8%5%
12%
5%2% 1%
70%
50%
11%7% 5%
9%
4% 4% 4%7% 5%
0%
10%
20%
30%
40%
50%
60%
70%
80%
Insecu
rity
Lack o
f Acc
ess t
o Land
Pest /
Diseas
es
Lack o
f plough
Traditio
nal se
eds
Lack o
f agric
ultural
tools
Shortage o
f labor
Lack o
f impro
ved se
eds
Poor Soil f
ertilit
y
Water S
hortage
Flooding
% o
f Hou
seho
lds
North Darfur South Darfur West Darfur
Insecurity was clearly a more pressing issue for IDPs (76-79%) than residents (28%). As expected, shortage of land was also much more frequently mentioned as a constraint by IDPs (54-67%) than residents (26%). On the other hand, residents reported pests, weeds and crop disease problems as main constraints (42%) than IDPs (3-20%), as well as by shortage of labour (19% of residents versus 2-7% of IDPs). Figure 21: Main constraints to crop cultivation by households by residence status
79%
67%
3%
10% 11%8%
2%5%
2% 0% 1%
67%
54%
20%
7%10% 11%
7% 7%3% 2% 2%
28% 26%
42%
17%
10%13%
19%
10% 8% 8%5%
0%
10%
20%
30%
40%
50%
60%
70%
80%
90%
Insecu
rity
Lack o
f Acc
ess t
o Land
Pest /
Diseas
es
Lack o
f plough
Traditio
nal se
eds
Lack o
f agric
ultural
tools
Shortage o
f labor
Lack o
f impro
ved se
eds
Poor Soil f
ertilit
y
Water S
hortage
Flooding
% o
f Hou
seho
lds
IDPs in camp IDPs outside camps Residents
7.1.5 Farmers’ Yield Expectations this year At the time of the survey in mid to late August, on average, more than half of the households expected better sorghum and millet yields this year than last year (56% and 63% respectively).
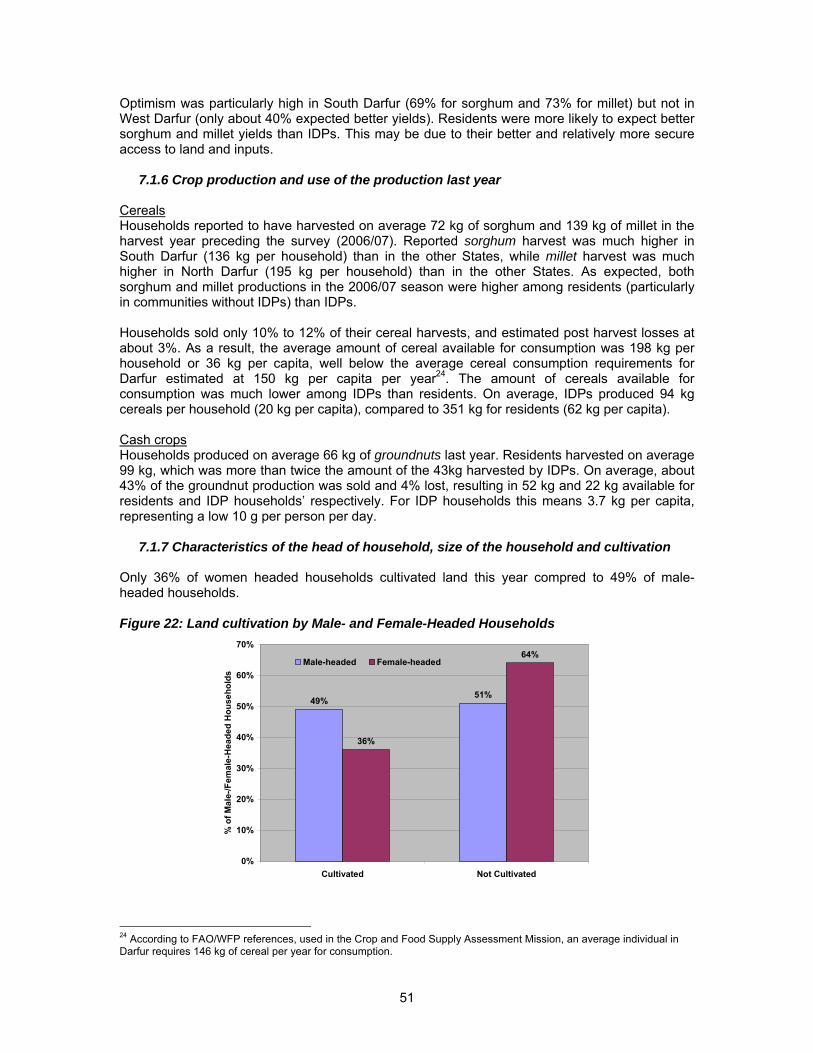
51
Optimism was particularly high in South Darfur (69% for sorghum and 73% for millet) but not in West Darfur (only about 40% expected better yields). Residents were more likely to expect better sorghum and millet yields than IDPs. This may be due to their better and relatively more secure access to land and inputs.
7.1.6 Crop production and use of the production last year Cereals Households reported to have harvested on average 72 kg of sorghum and 139 kg of millet in the harvest year preceding the survey (2006/07). Reported sorghum harvest was much higher in South Darfur (136 kg per household) than in the other States, while millet harvest was much higher in North Darfur (195 kg per household) than in the other States. As expected, both sorghum and millet productions in the 2006/07 season were higher among residents (particularly in communities without IDPs) than IDPs. Households sold only 10% to 12% of their cereal harvests, and estimated post harvest losses at about 3%. As a result, the average amount of cereal available for consumption was 198 kg per household or 36 kg per capita, well below the average cereal consumption requirements for Darfur estimated at 150 kg per capita per year24. The amount of cereals available for consumption was much lower among IDPs than residents. On average, IDPs produced 94 kg cereals per household (20 kg per capita), compared to 351 kg for residents (62 kg per capita). Cash crops Households produced on average 66 kg of groundnuts last year. Residents harvested on average 99 kg, which was more than twice the amount of the 43kg harvested by IDPs. On average, about 43% of the groundnut production was sold and 4% lost, resulting in 52 kg and 22 kg available for residents and IDP households’ respectively. For IDP households this means 3.7 kg per capita, representing a low 10 g per person per day.
7.1.7 Characteristics of the head of household, size of the household and cultivation Only 36% of women headed households cultivated land this year compred to 49% of male-headed households. Figure 22: Land cultivation by Male- and Female-Headed Households
49%51%
36%
64%
0%
10%
20%
30%
40%
50%
60%
70%
Cultivated Not Cultivated
% o
f Mal
e-/F
emal
e-H
eade
d H
ouse
hold
s
Male-headed Female-headed
24 According to FAO/WFP references, used in the Crop and Food Supply Assessment Mission, an average individual in Darfur requires 146 kg of cereal per year for consumption.
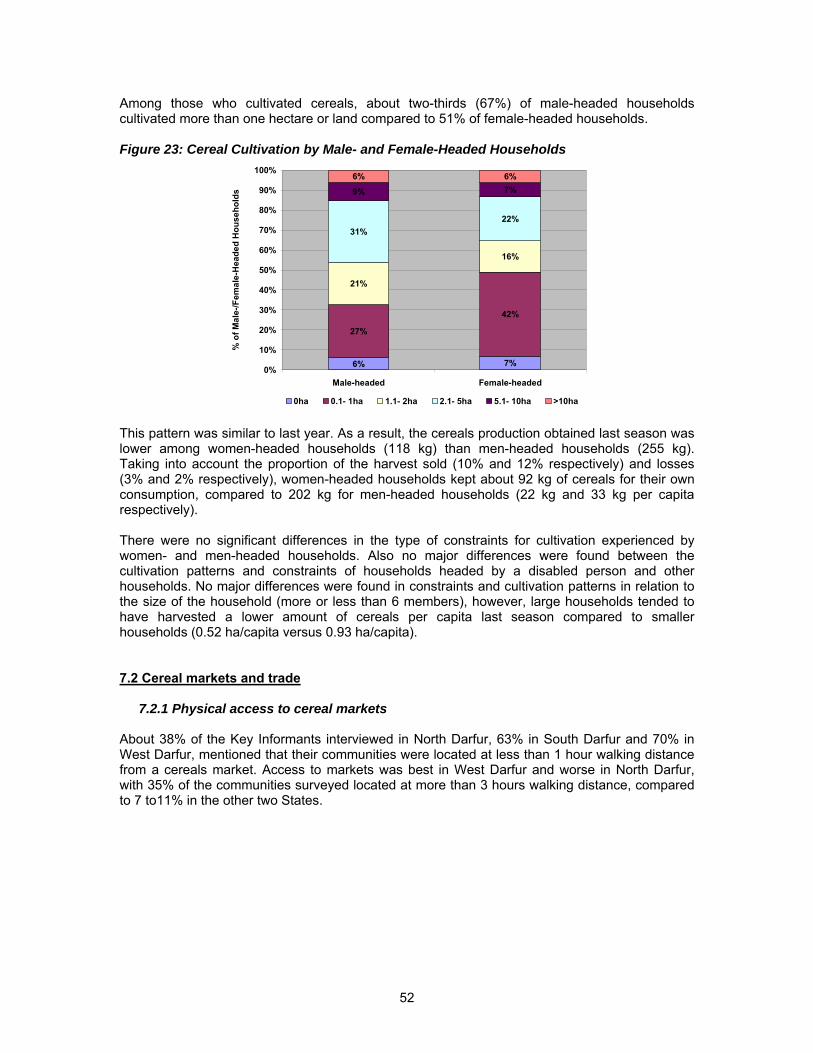
52
Among those who cultivated cereals, about two-thirds (67%) of male-headed households cultivated more than one hectare or land compared to 51% of female-headed households. Figure 23: Cereal Cultivation by Male- and Female-Headed Households
6% 7%
27%
42%
21%
16%
31%22%
9% 7%6% 6%
0%
10%
20%
30%
40%
50%
60%
70%
80%
90%
100%
Male-headed Female-headed
% o
f Mal
e-/F
emal
e-H
eade
d H
ouse
hold
s
0ha 0.1- 1ha 1.1- 2ha 2.1- 5ha 5.1- 10ha >10ha This pattern was similar to last year. As a result, the cereals production obtained last season was lower among women-headed households (118 kg) than men-headed households (255 kg). Taking into account the proportion of the harvest sold (10% and 12% respectively) and losses (3% and 2% respectively), women-headed households kept about 92 kg of cereals for their own consumption, compared to 202 kg for men-headed households (22 kg and 33 kg per capita respectively). There were no significant differences in the type of constraints for cultivation experienced by women- and men-headed households. Also no major differences were found between the cultivation patterns and constraints of households headed by a disabled person and other households. No major differences were found in constraints and cultivation patterns in relation to the size of the household (more or less than 6 members), however, large households tended to have harvested a lower amount of cereals per capita last season compared to smaller households (0.52 ha/capita versus 0.93 ha/capita). 7.2 Cereal markets and trade
7.2.1 Physical access to cereal markets About 38% of the Key Informants interviewed in North Darfur, 63% in South Darfur and 70% in West Darfur, mentioned that their communities were located at less than 1 hour walking distance from a cereals market. Access to markets was best in West Darfur and worse in North Darfur, with 35% of the communities surveyed located at more than 3 hours walking distance, compared to 7 to11% in the other two States.
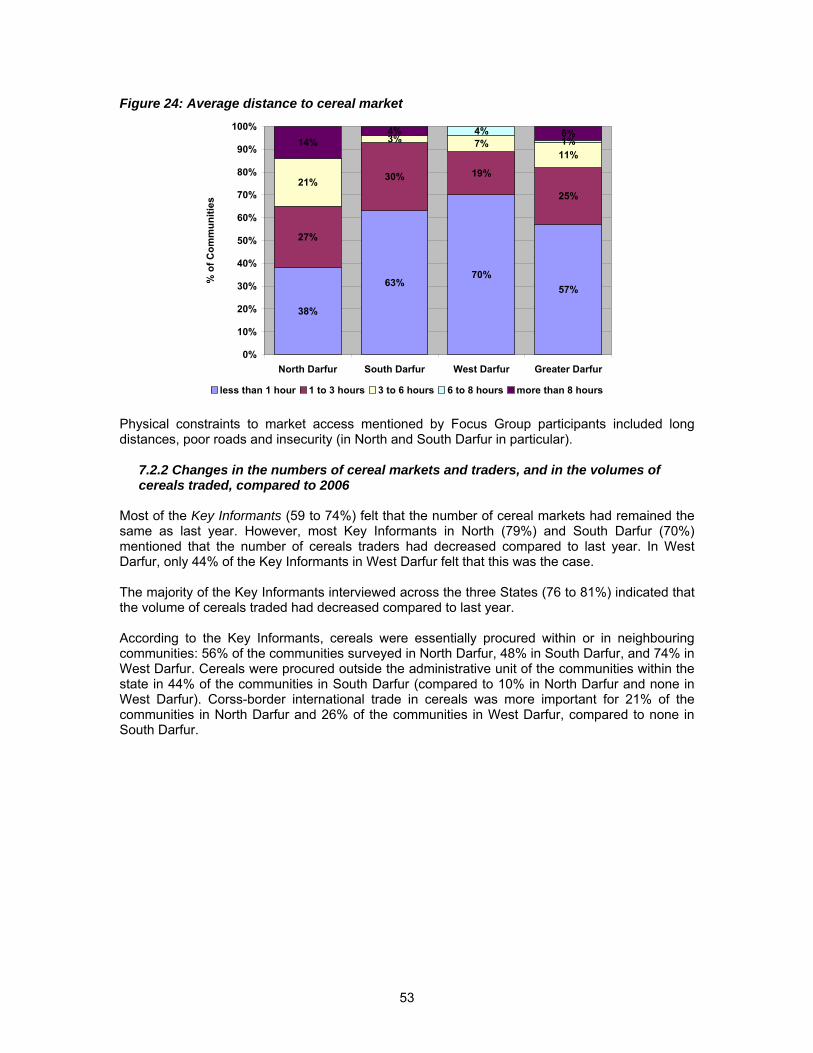
53
Figure 24: Average distance to cereal market
38%
63%70%
57%
27%
30% 19%
25%21%
3% 7%11%
4%1%14%
4% 6%
0%
10%
20%
30%
40%
50%
60%
70%
80%
90%
100%
North Darfur South Darfur West Darfur Greater Darfur
% o
f Com
mun
ities
less than 1 hour 1 to 3 hours 3 to 6 hours 6 to 8 hours more than 8 hours Physical constraints to market access mentioned by Focus Group participants included long distances, poor roads and insecurity (in North and South Darfur in particular).
7.2.2 Changes in the numbers of cereal markets and traders, and in the volumes of cereals traded, compared to 2006
Most of the Key Informants (59 to 74%) felt that the number of cereal markets had remained the same as last year. However, most Key Informants in North (79%) and South Darfur (70%) mentioned that the number of cereals traders had decreased compared to last year. In West Darfur, only 44% of the Key Informants in West Darfur felt that this was the case. The majority of the Key Informants interviewed across the three States (76 to 81%) indicated that the volume of cereals traded had decreased compared to last year. According to the Key Informants, cereals were essentially procured within or in neighbouring communities: 56% of the communities surveyed in North Darfur, 48% in South Darfur, and 74% in West Darfur. Cereals were procured outside the administrative unit of the communities within the state in 44% of the communities in South Darfur (compared to 10% in North Darfur and none in West Darfur). Corss-border international trade in cereals was more important for 21% of the communities in North Darfur and 26% of the communities in West Darfur, compared to none in South Darfur.
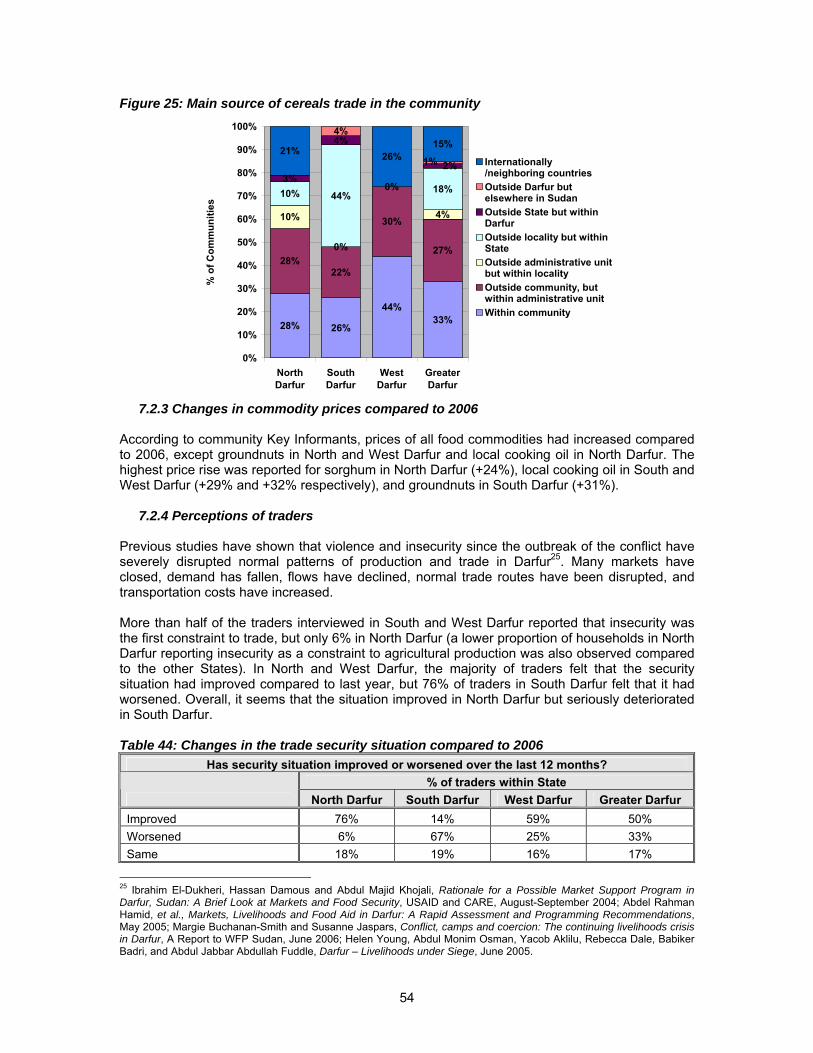
54
Figure 25: Main source of cereals trade in the community
28% 26%
44%33%
28%22%
30%
27%
10%
0%
0%
4%
10% 44% 18%3%
4%4%
21% 26%15%
2%1%
0%
10%
20%
30%
40%
50%
60%
70%
80%
90%
100%
NorthDarfur
SouthDarfur
WestDarfur
GreaterDarfur
% o
f Com
mun
ities
Internationally/neighboring countriesOutside Darfur butelsewhere in SudanOutside State but withinDarfurOutside locality but withinStateOutside administrative unitbut within localityOutside community, butwithin administrative unitWithin community
7.2.3 Changes in commodity prices compared to 2006
According to community Key Informants, prices of all food commodities had increased compared to 2006, except groundnuts in North and West Darfur and local cooking oil in North Darfur. The highest price rise was reported for sorghum in North Darfur (+24%), local cooking oil in South and West Darfur (+29% and +32% respectively), and groundnuts in South Darfur (+31%).
7.2.4 Perceptions of traders Previous studies have shown that violence and insecurity since the outbreak of the conflict have severely disrupted normal patterns of production and trade in Darfur25. Many markets have closed, demand has fallen, flows have declined, normal trade routes have been disrupted, and transportation costs have increased. More than half of the traders interviewed in South and West Darfur reported that insecurity was the first constraint to trade, but only 6% in North Darfur (a lower proportion of households in North Darfur reporting insecurity as a constraint to agricultural production was also observed compared to the other States). In North and West Darfur, the majority of traders felt that the security situation had improved compared to last year, but 76% of traders in South Darfur felt that it had worsened. Overall, it seems that the situation improved in North Darfur but seriously deteriorated in South Darfur. Table 44: Changes in the trade security situation compared to 2006
Has security situation improved or worsened over the last 12 months? % of traders within State
North Darfur South Darfur West Darfur Greater Darfur Improved 76% 14% 59% 50% Worsened 6% 67% 25% 33% Same 18% 19% 16% 17%
25 Ibrahim El-Dukheri, Hassan Damous and Abdul Majid Khojali, Rationale for a Possible Market Support Program in Darfur, Sudan: A Brief Look at Markets and Food Security, USAID and CARE, August-September 2004; Abdel Rahman Hamid, et al., Markets, Livelihoods and Food Aid in Darfur: A Rapid Assessment and Programming Recommendations, May 2005; Margie Buchanan-Smith and Susanne Jaspars, Conflict, camps and coercion: The continuing livelihoods crisis in Darfur, A Report to WFP Sudan, June 2006; Helen Young, Abdul Monim Osman, Yacob Aklilu, Rebecca Dale, Babiker Badri, and Abdul Jabbar Abdullah Fuddle, Darfur – Livelihoods under Siege, June 2005.
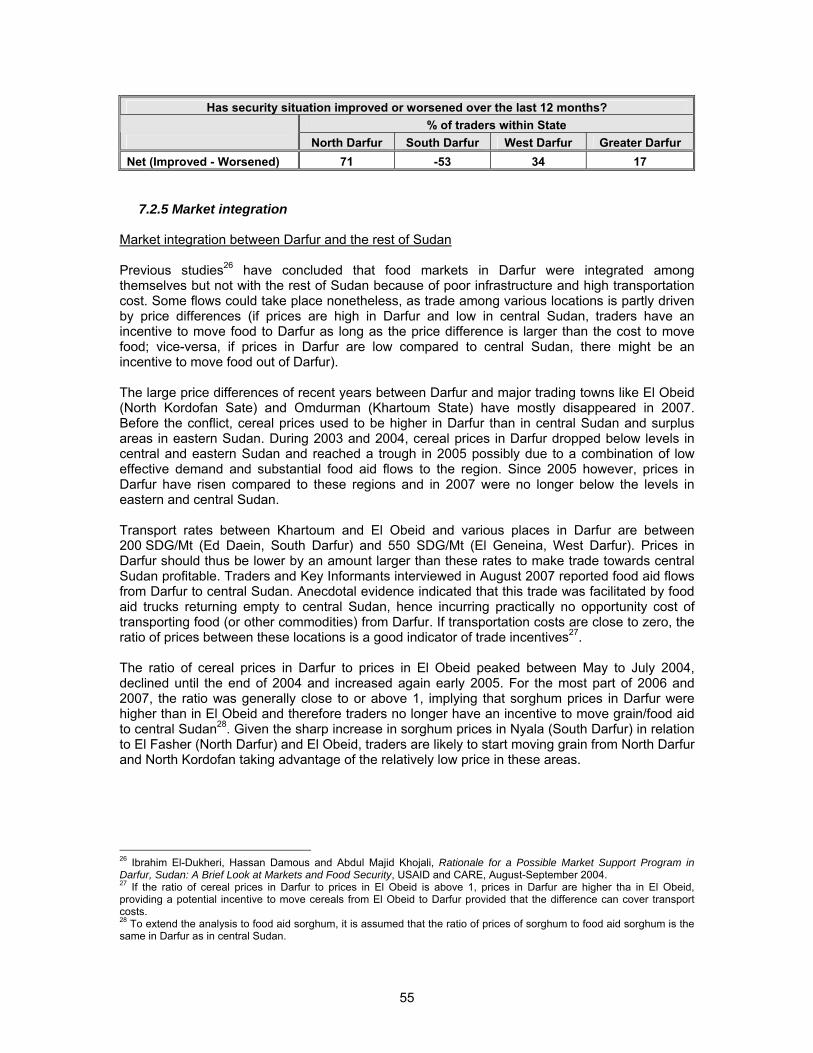
55
Has security situation improved or worsened over the last 12 months? % of traders within State
North Darfur South Darfur West Darfur Greater Darfur Net (Improved - Worsened) 71 -53 34 17
7.2.5 Market integration Market integration between Darfur and the rest of Sudan Previous studies26 have concluded that food markets in Darfur were integrated among themselves but not with the rest of Sudan because of poor infrastructure and high transportation cost. Some flows could take place nonetheless, as trade among various locations is partly driven by price differences (if prices are high in Darfur and low in central Sudan, traders have an incentive to move food to Darfur as long as the price difference is larger than the cost to move food; vice-versa, if prices in Darfur are low compared to central Sudan, there might be an incentive to move food out of Darfur). The large price differences of recent years between Darfur and major trading towns like El Obeid (North Kordofan Sate) and Omdurman (Khartoum State) have mostly disappeared in 2007. Before the conflict, cereal prices used to be higher in Darfur than in central Sudan and surplus areas in eastern Sudan. During 2003 and 2004, cereal prices in Darfur dropped below levels in central and eastern Sudan and reached a trough in 2005 possibly due to a combination of low effective demand and substantial food aid flows to the region. Since 2005 however, prices in Darfur have risen compared to these regions and in 2007 were no longer below the levels in eastern and central Sudan. Transport rates between Khartoum and El Obeid and various places in Darfur are between 200 SDG/Mt (Ed Daein, South Darfur) and 550 SDG/Mt (El Geneina, West Darfur). Prices in Darfur should thus be lower by an amount larger than these rates to make trade towards central Sudan profitable. Traders and Key Informants interviewed in August 2007 reported food aid flows from Darfur to central Sudan. Anecdotal evidence indicated that this trade was facilitated by food aid trucks returning empty to central Sudan, hence incurring practically no opportunity cost of transporting food (or other commodities) from Darfur. If transportation costs are close to zero, the ratio of prices between these locations is a good indicator of trade incentives27. The ratio of cereal prices in Darfur to prices in El Obeid peaked between May to July 2004, declined until the end of 2004 and increased again early 2005. For the most part of 2006 and 2007, the ratio was generally close to or above 1, implying that sorghum prices in Darfur were higher than in El Obeid and therefore traders no longer have an incentive to move grain/food aid to central Sudan28. Given the sharp increase in sorghum prices in Nyala (South Darfur) in relation to El Fasher (North Darfur) and El Obeid, traders are likely to start moving grain from North Darfur and North Kordofan taking advantage of the relatively low price in these areas.
26 Ibrahim El-Dukheri, Hassan Damous and Abdul Majid Khojali, Rationale for a Possible Market Support Program in Darfur, Sudan: A Brief Look at Markets and Food Security, USAID and CARE, August-September 2004. 27 If the ratio of cereal prices in Darfur to prices in El Obeid is above 1, prices in Darfur are higher tha in El Obeid, providing a potential incentive to move cereals from El Obeid to Darfur provided that the difference can cover transport costs. 28 To extend the analysis to food aid sorghum, it is assumed that the ratio of prices of sorghum to food aid sorghum is the same in Darfur as in central Sudan.
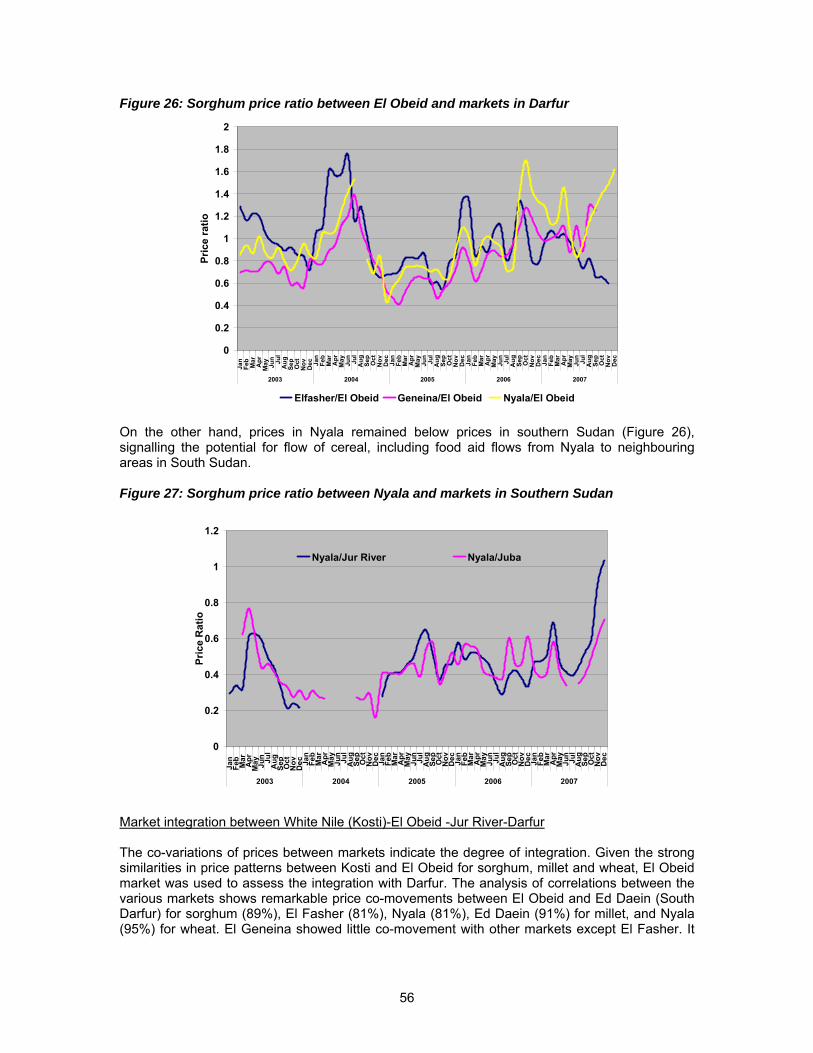
56
Figure 26: Sorghum price ratio between El Obeid and markets in Darfur
0
0.2
0.4
0.6
0.8
1
1.2
1.4
1.6
1.8
2
Jan
Fe
b
Mar
A
pr
May
Ju
n Jul
Aug
Se
p
Oct
N
ov
Dec
Ja
nFe
bM
arA
prM
ay Jun
Jul
Aug Se
pO
ctN
ov Dec Jan
Feb
Mar
Apr
May Jun
Jul
Aug Se
pO
ctN
ov Dec Jan
Feb
Mar
Apr
May Jun
Jul
Aug Se
pO
ctN
ov Dec Jan
Feb
Mar
Apr
May Jun
Jul
Aug Se
pO
ctN
ov Dec
2003 2004 2005 2006 2007
Pric
e ra
tio
Elfasher/El Obeid Geneina/El Obeid Nyala/El Obeid
On the other hand, prices in Nyala remained below prices in southern Sudan (Figure 26), signalling the potential for flow of cereal, including food aid flows from Nyala to neighbouring areas in South Sudan.
Figure 27: Sorghum price ratio between Nyala and markets in Southern Sudan
0
0.2
0.4
0.6
0.8
1
1.2
Jan
Fe
b
Mar
A
pr
May
Ju
n Jul
Aug
Se
p
Oct
N
ov
Dec
Ja
nFe
bM
arA
prM
ay Jun
Jul
Aug Se
pO
ctN
ov Dec Jan
Feb
Mar
Apr
May Jun
Jul
Aug Se
pO
ctN
ov Dec Jan
Feb
Mar
Apr
May Jun
Jul
Aug Se
pO
ctN
ov Dec Jan
Feb
Mar
Apr
May Jun
Jul
Aug Se
pO
ctN
ov Dec
2003 2004 2005 2006 2007
Pric
e R
atio
Nyala/Jur River Nyala/Juba
Market integration between White Nile (Kosti)-El Obeid -Jur River-Darfur The co-variations of prices between markets indicate the degree of integration. Given the strong similarities in price patterns between Kosti and El Obeid for sorghum, millet and wheat, El Obeid market was used to assess the integration with Darfur. The analysis of correlations between the various markets shows remarkable price co-movements between El Obeid and Ed Daein (South Darfur) for sorghum (89%), El Fasher (81%), Nyala (81%), Ed Daein (91%) for millet, and Nyala (95%) for wheat. El Geneina showed little co-movement with other markets except El Fasher. It
57
seems that West Darfur was more segmented market than North and South Darfur. South Darfur, especially Ed Daein, showed strong linkages with El Obeid market. In Jur River, market prices seemed uncorrelated with Darfur, Kosti or El Obeid markets. However, traders interviewed in Nyala underlined the importance of sorghum (local and food aid) transported from Nyala to Wau in Suthern Sudan. Poor transport infrastrudcture and cross-border trade in Southern Sudan with neighboring Kenya and Uganda could explain the relative segmentation with the rest of Sudan. Market integration between the three Darfur States Correlation coefficients indicate strong co-movements of prices for local cereals among the markets in the three Darfur States. Wheat prices, however, show little co-movement, except between Nyala and Ed Daein, both in South Darfur. Food aid sorghum prices are poorly correlated except beween El Fasher, El Geneina and Ed Daein (above 70%). Millet prices in North Darfur are lower than in West Darfur, which are, in turn, below South Darfur. Local sorghum prices are lower in West Darfur than in South Darfur, which are lower than in North Darfur. Food aid sorghum prices are lowest in West Darfur and highest in North Darfur. While these differences may indicate possible flows of cereals, transportation costs in Darfur remain very high in comparison and would limit these movements. Table 45: Possible trade flows between Darfur States Routes within Darfur Likelihood of movement
North West Unlikely for millet North South High likelihood for millet – Unlikely for food aid sorghum West South Medium likelihood for millet and food aid sorghum – Unlikely for local sorghum West North Low likelihood for local sorghum – Unlikely for food aid sorghum South North Unlikely for local sorghum Nyala and Ed Daein markets seem to be integrated for all cereals (70%-90% correlations), not surprising given the proximity between the two. Given the lower prices in Ed Daein for local grain (minus SDG 70/Mt) and estimated transportation costs of 150 SDG/Mt, there would be limited incentives for cereal flows from Ed Daein to Nyala. Sorghum food aid prices are only 10 SDG/Mt higher in Ed Daein, insufficient to motivate food aid flows from Nyala to Ed Daein. In the absence of a comprehensive market price collection system, traders’ information provided a sense of market integration within each Darfur State. For example, local grain was usually coming from (limited) production areas, and food aid was mainly flowing from IDP camps to nearby cities, generally indicating strong localized market integration. Table 46: Examples of trade flows within the Darfur States North Darfur South Darfur West Darfur
Local sorghum Jebel Marra (South Darfur) El Fasher and Kebkabiya
Zalingei (West Darfur) Kass Nyala
Jebel Marra (Southt Darfur) El Geneina
Food aid sorghum
IDP camps in Kutum, El Fasher, Mellit and Dar es Salam El Fasher North Khordofan
IDP camps Nyala Wau in South
Sudan
Millet Jebel Marra Kebkabiya and El Fasher
Southern areas Nyala Ed Daein
Saleah (Kulbus) in North Darfur El Geneina Chad For Baranga (West Darfur)
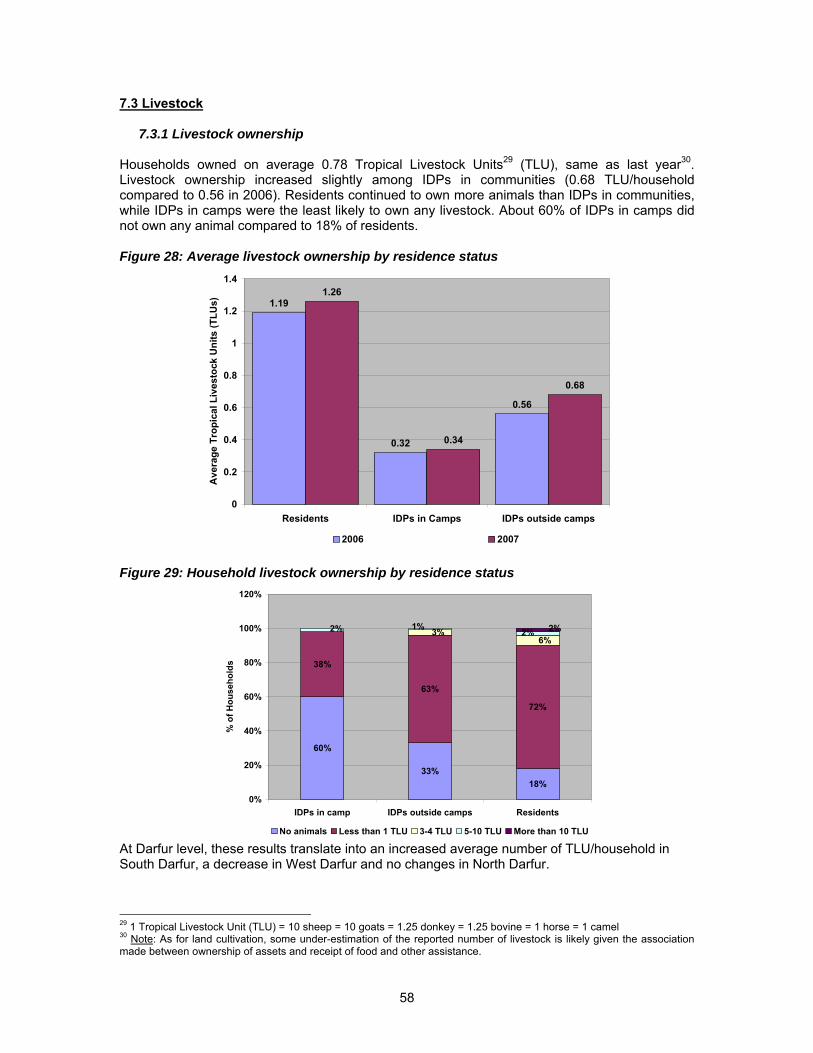
58
7.3 Livestock
7.3.1 Livestock ownership Households owned on average 0.78 Tropical Livestock Units29 (TLU), same as last year30. Livestock ownership increased slightly among IDPs in communities (0.68 TLU/household compared to 0.56 in 2006). Residents continued to own more animals than IDPs in communities, while IDPs in camps were the least likely to own any livestock. About 60% of IDPs in camps did not own any animal compared to 18% of residents. Figure 28: Average livestock ownership by residence status
1.19
0.32
0.56
1.26
0.34
0.68
0
0.2
0.4
0.6
0.8
1
1.2
1.4
Residents IDPs in Camps IDPs outside camps
Ave
rage
Tro
pica
l Liv
esto
ck U
nits
(TLU
s)
2006 2007 Figure 29: Household livestock ownership by residence status
60%
33%18%
38%
63%
72%
6%3% 2%1%2% 2%
0%
20%
40%
60%
80%
100%
120%
IDPs in camp IDPs outside camps Residents
% o
f Hou
seho
lds
No animals Less than 1 TLU 3-4 TLU 5-10 TLU More than 10 TLU At Darfur level, these results translate into an increased average number of TLU/household in South Darfur, a decrease in West Darfur and no changes in North Darfur.
29 1 Tropical Livestock Unit (TLU) = 10 sheep = 10 goats = 1.25 donkey = 1.25 bovine = 1 horse = 1 camel 30 Note: As for land cultivation, some under-estimation of the reported number of livestock is likely given the association made between ownership of assets and receipt of food and other assistance.
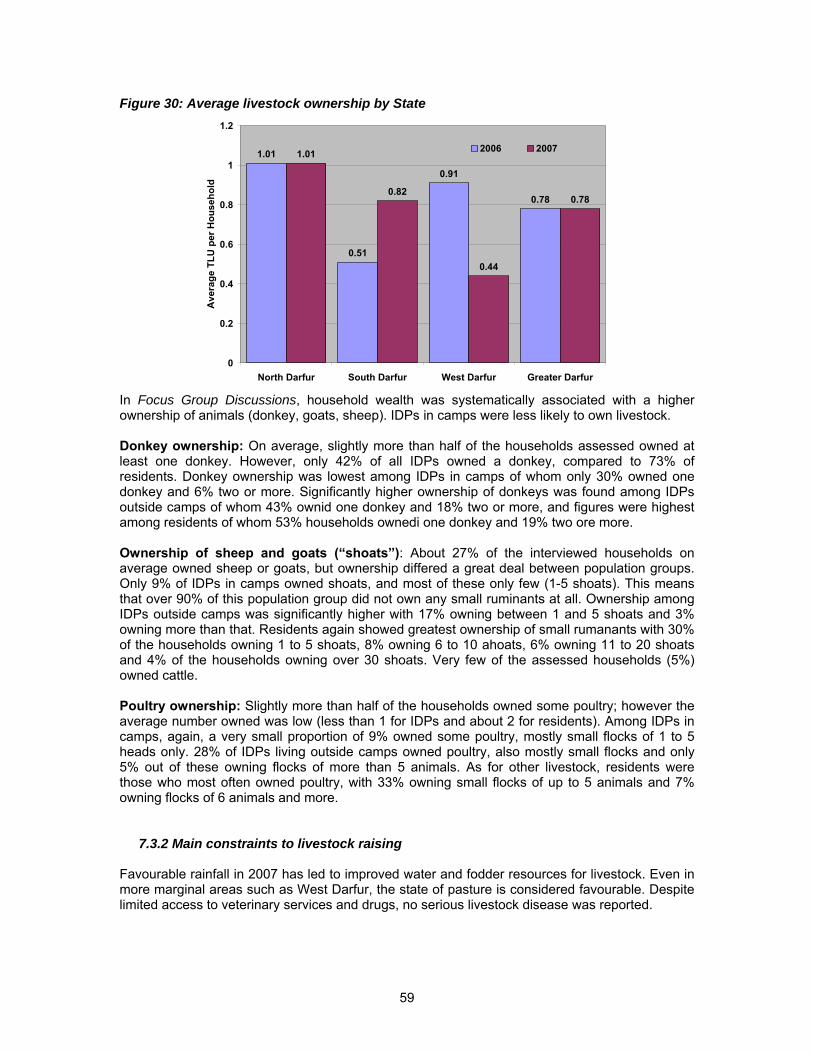
59
Figure 30: Average livestock ownership by State
1.01
0.51
0.91
0.78
1.01
0.82
0.44
0.78
0
0.2
0.4
0.6
0.8
1
1.2
North Darfur South Darfur West Darfur Greater Darfur
Ave
rage
TLU
per
Hou
seho
ld
2006 2007
In Focus Group Discussions, household wealth was systematically associated with a higher ownership of animals (donkey, goats, sheep). IDPs in camps were less likely to own livestock. Donkey ownership: On average, slightly more than half of the households assessed owned at least one donkey. However, only 42% of all IDPs owned a donkey, compared to 73% of residents. Donkey ownership was lowest among IDPs in camps of whom only 30% owned one donkey and 6% two or more. Significantly higher ownership of donkeys was found among IDPs outside camps of whom 43% ownid one donkey and 18% two or more, and figures were highest among residents of whom 53% households ownedi one donkey and 19% two ore more. Ownership of sheep and goats (“shoats”): About 27% of the interviewed households on average owned sheep or goats, but ownership differed a great deal between population groups. Only 9% of IDPs in camps owned shoats, and most of these only few (1-5 shoats). This means that over 90% of this population group did not own any small ruminants at all. Ownership among IDPs outside camps was significantly higher with 17% owning between 1 and 5 shoats and 3% owning more than that. Residents again showed greatest ownership of small rumanants with 30% of the households owning 1 to 5 shoats, 8% owning 6 to 10 ahoats, 6% owning 11 to 20 shoats and 4% of the households owning over 30 shoats. Very few of the assessed households (5%) owned cattle. Poultry ownership: Slightly more than half of the households owned some poultry; however the average number owned was low (less than 1 for IDPs and about 2 for residents). Among IDPs in camps, again, a very small proportion of 9% owned some poultry, mostly small flocks of 1 to 5 heads only. 28% of IDPs living outside camps owned poultry, also mostly small flocks and only 5% out of these owning flocks of more than 5 animals. As for other livestock, residents were those who most often owned poultry, with 33% owning small flocks of up to 5 animals and 7% owning flocks of 6 animals and more.
7.3.2 Main constraints to livestock raising Favourable rainfall in 2007 has led to improved water and fodder resources for livestock. Even in more marginal areas such as West Darfur, the state of pasture is considered favourable. Despite limited access to veterinary services and drugs, no serious livestock disease was reported.
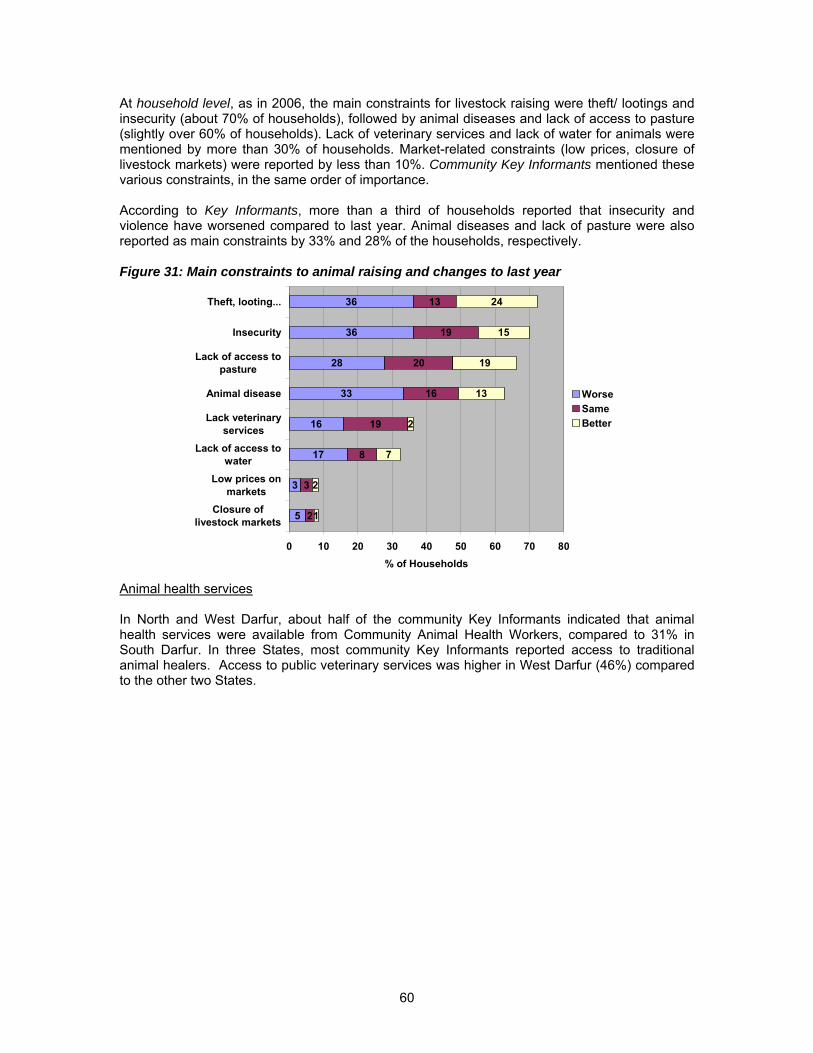
60
At household level, as in 2006, the main constraints for livestock raising were theft/ lootings and insecurity (about 70% of households), followed by animal diseases and lack of access to pasture (slightly over 60% of households). Lack of veterinary services and lack of water for animals were mentioned by more than 30% of households. Market-related constraints (low prices, closure of livestock markets) were reported by less than 10%. Community Key Informants mentioned these various constraints, in the same order of importance. According to Key Informants, more than a third of households reported that insecurity and violence have worsened compared to last year. Animal diseases and lack of pasture were also reported as main constraints by 33% and 28% of the households, respectively. Figure 31: Main constraints to animal raising and changes to last year
5
3
17
16
33
28
36
36
2
3
8
19
16
20
19
13
1
2
7
2
13
19
15
24
0 10 20 30 40 50 60 70 80
Closure oflivestock markets
Low prices onmarkets
Lack of access towater
Lack veterinaryservices
Animal disease
Lack of access topasture
Insecurity
Theft, looting...
% of Households
WorseSameBetter
Animal health services In North and West Darfur, about half of the community Key Informants indicated that animal health services were available from Community Animal Health Workers, compared to 31% in South Darfur. In three States, most community Key Informants reported access to traditional animal healers. Access to public veterinary services was higher in West Darfur (46%) compared to the other two States.
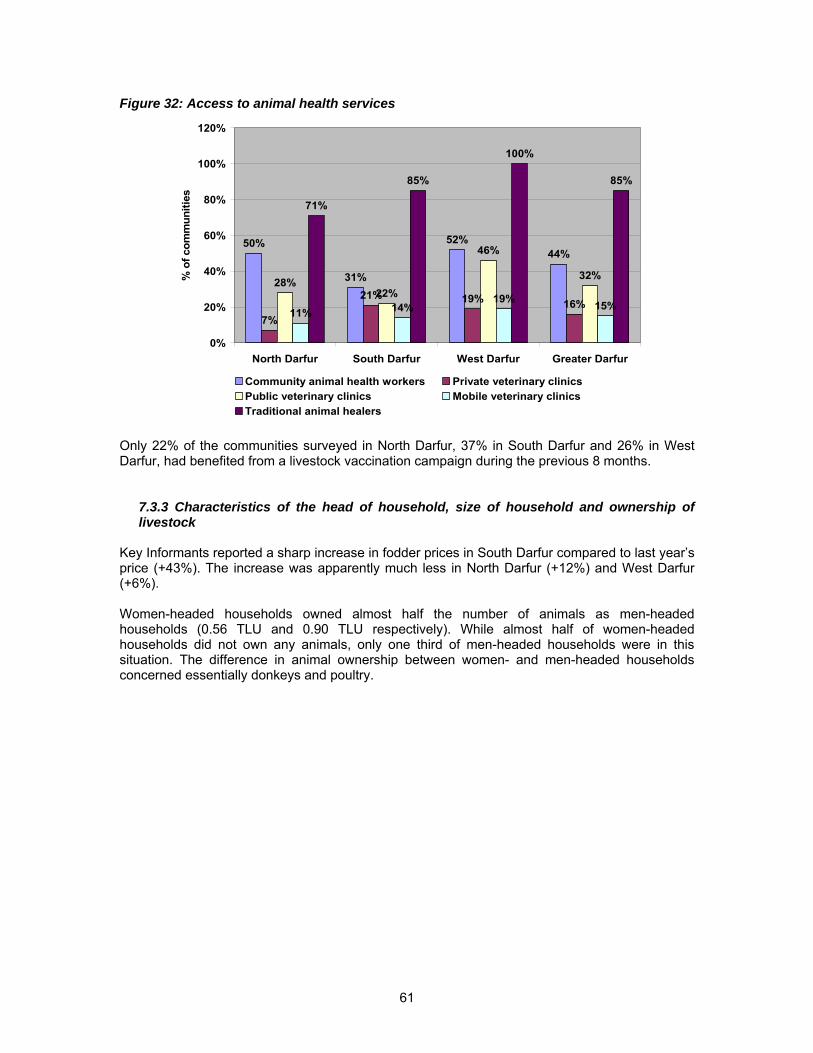
61
Figure 32: Access to animal health services
50%
31%
52%44%
7%
21% 19% 16%
28%22%
46%
32%
11% 14%19% 15%
71%
85%
100%
85%
0%
20%
40%
60%
80%
100%
120%
North Darfur South Darfur West Darfur Greater Darfur
% o
f com
mun
ities
Community animal health workers Private veterinary clinicsPublic veterinary clinics Mobile veterinary clinicsTraditional animal healers
Only 22% of the communities surveyed in North Darfur, 37% in South Darfur and 26% in West Darfur, had benefited from a livestock vaccination campaign during the previous 8 months.
7.3.3 Characteristics of the head of household, size of household and ownership of livestock
Key Informants reported a sharp increase in fodder prices in South Darfur compared to last year’s price (+43%). The increase was apparently much less in North Darfur (+12%) and West Darfur (+6%). Women-headed households owned almost half the number of animals as men-headed households (0.56 TLU and 0.90 TLU respectively). While almost half of women-headed households did not own any animals, only one third of men-headed households were in this situation. The difference in animal ownership between women- and men-headed households concerned essentially donkeys and poultry.
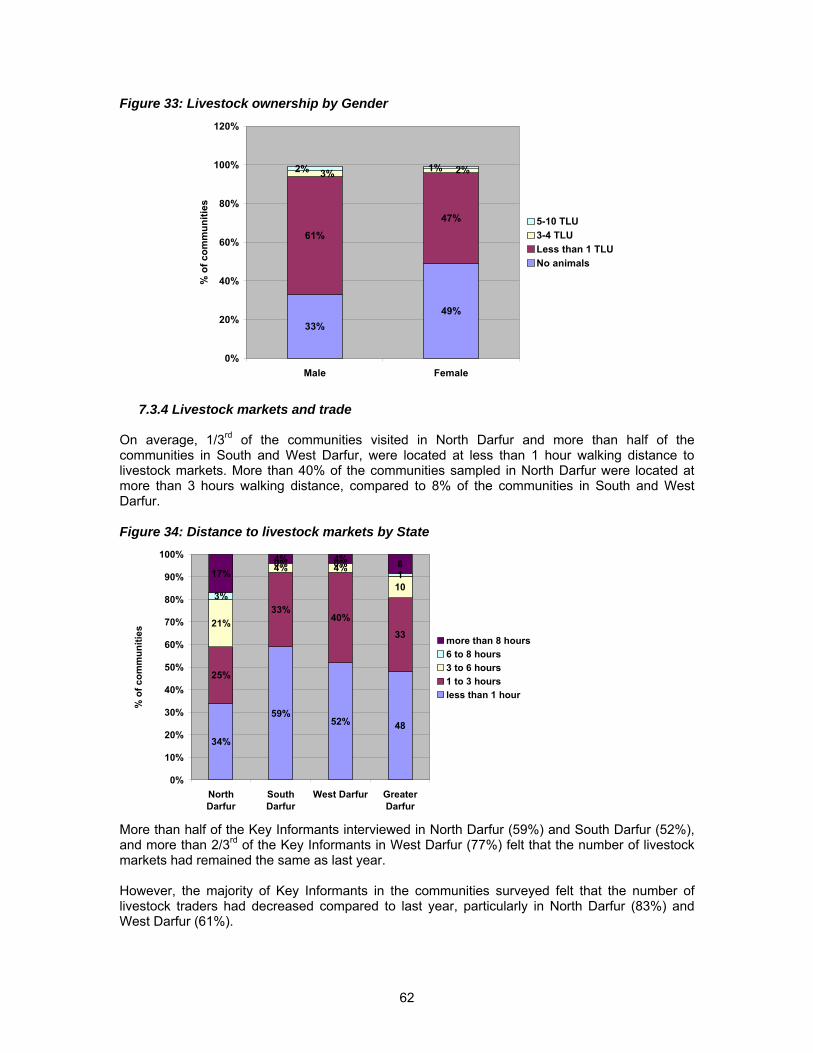
62
Figure 33: Livestock ownership by Gender
33%49%
61%
47%
3% 2%1%2%
0%
20%
40%
60%
80%
100%
120%
Male Female
% o
f com
mun
ities
5-10 TLU3-4 TLULess than 1 TLUNo animals
7.3.4 Livestock markets and trade
On average, 1/3rd of the communities visited in North Darfur and more than half of the communities in South and West Darfur, were located at less than 1 hour walking distance to livestock markets. More than 40% of the communities sampled in North Darfur were located at more than 3 hours walking distance, compared to 8% of the communities in South and West Darfur. Figure 34: Distance to livestock markets by State
34%
59%52% 48
25%
33%40%
3321%
4% 4%
103%
0% 0%117%
4% 4% 8
0%
10%
20%
30%
40%
50%
60%
70%
80%
90%
100%
NorthDarfur
SouthDarfur
West Darfur GreaterDarfur
% o
f com
mun
ities
more than 8 hours6 to 8 hours3 to 6 hours1 to 3 hoursless than 1 hour
More than half of the Key Informants interviewed in North Darfur (59%) and South Darfur (52%), and more than 2/3rd of the Key Informants in West Darfur (77%) felt that the number of livestock markets had remained the same as last year. However, the majority of Key Informants in the communities surveyed felt that the number of livestock traders had decreased compared to last year, particularly in North Darfur (83%) and West Darfur (61%).
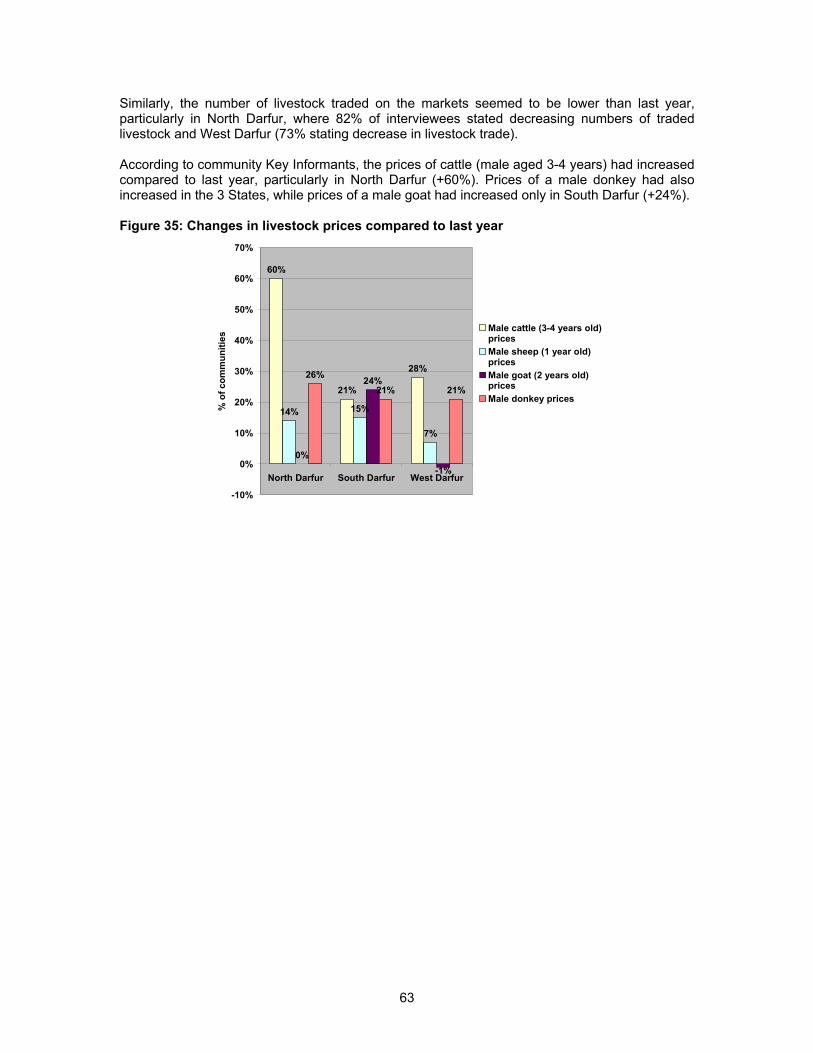
63
Similarly, the number of livestock traded on the markets seemed to be lower than last year, particularly in North Darfur, where 82% of interviewees stated decreasing numbers of traded livestock and West Darfur (73% stating decrease in livestock trade). According to community Key Informants, the prices of cattle (male aged 3-4 years) had increased compared to last year, particularly in North Darfur (+60%). Prices of a male donkey had also increased in the 3 States, while prices of a male goat had increased only in South Darfur (+24%). Figure 35: Changes in livestock prices compared to last year
60%
21%
28%
14% 15%
7%
0%
24%26%21% 21%
-1%
-10%
0%
10%
20%
30%
40%
50%
60%
70%
North Darfur South Darfur West Darfur
% o
f com
mun
ities
Male cattle (3-4 years old)pricesMale sheep (1 year old)pricesMale goat (2 years old)pricesMale donkey prices
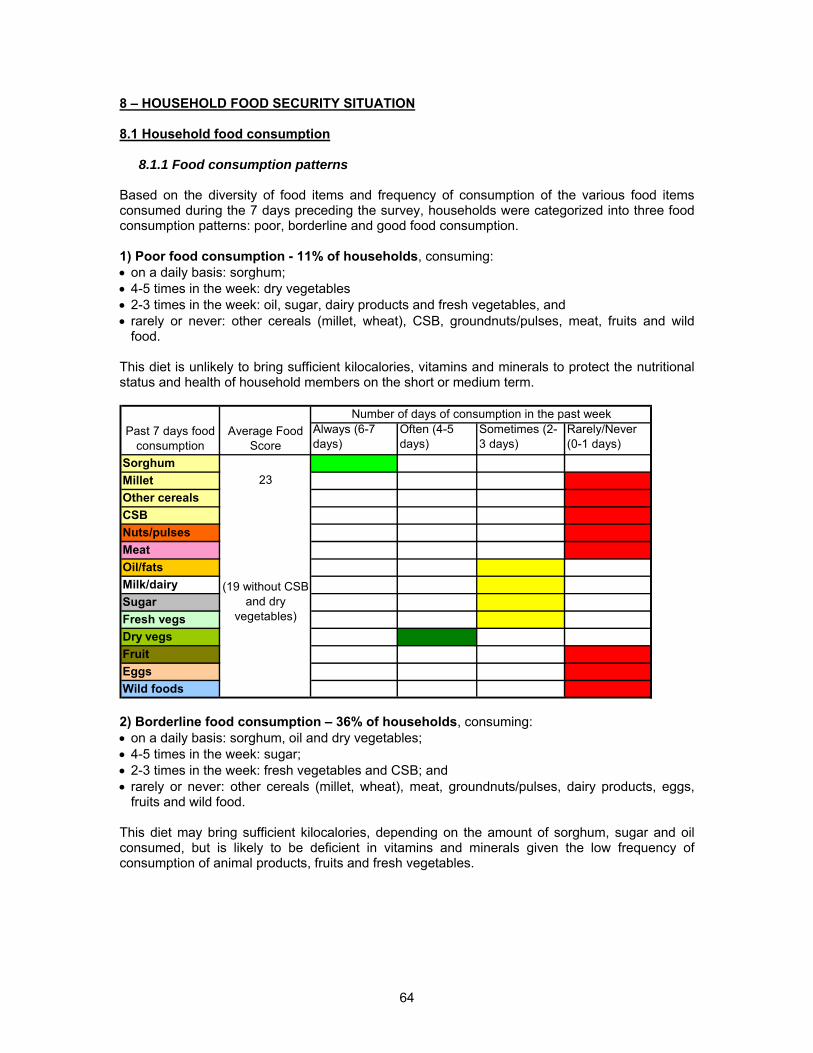
64
8 – HOUSEHOLD FOOD SECURITY SITUATION 8.1 Household food consumption
8.1.1 Food consumption patterns Based on the diversity of food items and frequency of consumption of the various food items consumed during the 7 days preceding the survey, households were categorized into three food consumption patterns: poor, borderline and good food consumption. 1) Poor food consumption - 11% of households, consuming: • on a daily basis: sorghum; • 4-5 times in the week: dry vegetables • 2-3 times in the week: oil, sugar, dairy products and fresh vegetables, and • rarely or never: other cereals (millet, wheat), CSB, groundnuts/pulses, meat, fruits and wild
food. This diet is unlikely to bring sufficient kilocalories, vitamins and minerals to protect the nutritional status and health of household members on the short or medium term.
Always (6-7 days)
Often (4-5 days)
Sometimes (2-3 days)
Rarely/Never (0-1 days)
SorghumMilletOther cerealsCSBNuts/pulsesMeatOil/fatsMilk/dairySugarFresh vegsDry vegsFruitEggsWild foods
Number of days of consumption in the past week
23
(19 without CSB and dry
vegetables)
Past 7 days food consumption
Average Food Score
2) Borderline food consumption – 36% of households, consuming: • on a daily basis: sorghum, oil and dry vegetables; • 4-5 times in the week: sugar; • 2-3 times in the week: fresh vegetables and CSB; and • rarely or never: other cereals (millet, wheat), meat, groundnuts/pulses, dairy products, eggs,
fruits and wild food. This diet may bring sufficient kilocalories, depending on the amount of sorghum, sugar and oil consumed, but is likely to be deficient in vitamins and minerals given the low frequency of consumption of animal products, fruits and fresh vegetables.
65
Always (6-7 days)
Often (4-5 days)
Sometimes (2-3 days)
Rarely/Never (0-1 days)
SorghumMilletOther cerealsCSBNuts/pulsesMeatOil/fatsMilk/dairySugarFresh vegsDry vegsFruitEggsWild foods
(24 without CSB and dry
vegetables)
Past 7 days food consumption
Average Food Score
Number of days of consumption in the past week
31
3) Acceptable food consumption – 53% of househoods, consuming: • on a daily basis: sorghum, oil, sugar and dry vegetables; • 4-5 times in the week: dairy products • 2-3 times in the week: other cereals (millet, wheat), CSB, groundnuts/pulses, meat and fresh
vegetables; and • rarely or never: eggs, fruits and wild foods. This diet is expected to bring sufficient kilocalories, however may not be sufficien to protect against micronutrient deficiency diseases, depending on the actual amount of food consumed, particularly meat and fresh vegetables.
Always (6-7 days)
Often (4-5 days)
Sometimes (2-3 days)
Rarely/Never (0-1 days)
SorghumMilletOther cerealsCSBNuts/pulsesMeatOil/fatsMilk/dairySugarFresh vegsDry vegsFruitEggsWild foods
46
(38 without CSB and dry
vegetables)
Past 7 days food consumption
Average Food Score
Number of days of consumption in the past week
Trends in the food consumption patterns of households between 2004 and 2007 show no improvement since 2005, with 11% of households having a poor diet, 36% borderline and 53% acceptable. Ten percent of households continue to have a diet grossly insufficient in terms of
66
energy, vitamins and minerals, and slightly more than a third of households consume a diet which may bring enough calories but is likely deficient in vitamins and minerals. Figure 36: Household Food Consumption Trends – Greater Darfur
16%
53%
31%
5%
39%
55%
10%
36%
54%
11%
36%
53%
0%
10%
20%
30%
40%
50%
60%
Poor Borderline Acceptable
% o
f hou
seho
lds
2004 2005 2006 2007 The food consumption patterns of IDPs in camps have not changed compared to last year and to 2005.
Figure 37: Household Food Consumption Trends – IDPs in camps
23%
64%
14%
5%
44%
51%
12%
41%
47%
12%
41%
47%
0%
10%
20%
30%
40%
50%
60%
70%
Poor Borderline Acceptable
% o
f hou
seho
lds
2004 2005 2006 2007 The food consumption patterns of IDPs in communities have deteriorated since 2005 with an increase in the proportions of those having a poor diet.
67
Figure 38: Household Food Consumption Trends - IDPs in Communities
19%
50%
31%
6%
39%
55%
9%
43%
48%
16%
39%
45%
0%
10%
20%
30%
40%
50%
60%
Poor Borderline Acceptable
% o
f hou
seho
lds
2004 2005 2006 2007 Similarly as in previous years, IDPs have poorer food consumption patterns than residents generally. The trend towards a deterioration of the food patterns of residents has continued, with an increase of those with poor food consumption.
Figure 39: Household Food Consumption Trends - Residents
9%
44%47%
4%
31%
65%
8%
29%
63%
9%
29%
62%
0%
10%
20%
30%
40%
50%
60%
70%
Poor Borderline Acceptable
% o
f hou
seho
lds
2004 2005 2006 2007 At Darfur State level, these results translate into an increase in the proportion of households having poor food consumption patterns in North and West Darfur compared to 2006, while food consumption patterns have improved in South Darfur.
68
Figure 40: Household Food Consumption Trends - North Darfur
6%
30%
64%
9%
36%
56%
0%
10%
20%
30%
40%
50%
60%
70%
Poor Borderline Acceptable
% o
f hou
seho
lds
2006 2007
Figure 41: Household Food Consumption Trends - South Darfur
10%
38%
52%
7%
30%
63%
0%
10%
20%
30%
40%
50%
60%
70%
Poor Borderline Acceptable
% o
f hou
seho
lds
2006 2007 Figure 42: Household Food Consumption Trends - West Darfur
13%
40%
47%
19%
42%40%
0%
5%
10%
15%
20%
25%
30%
35%
40%
45%
50%
Poor Borderline Acceptable
% o
f hou
seho
lds
2006 2007
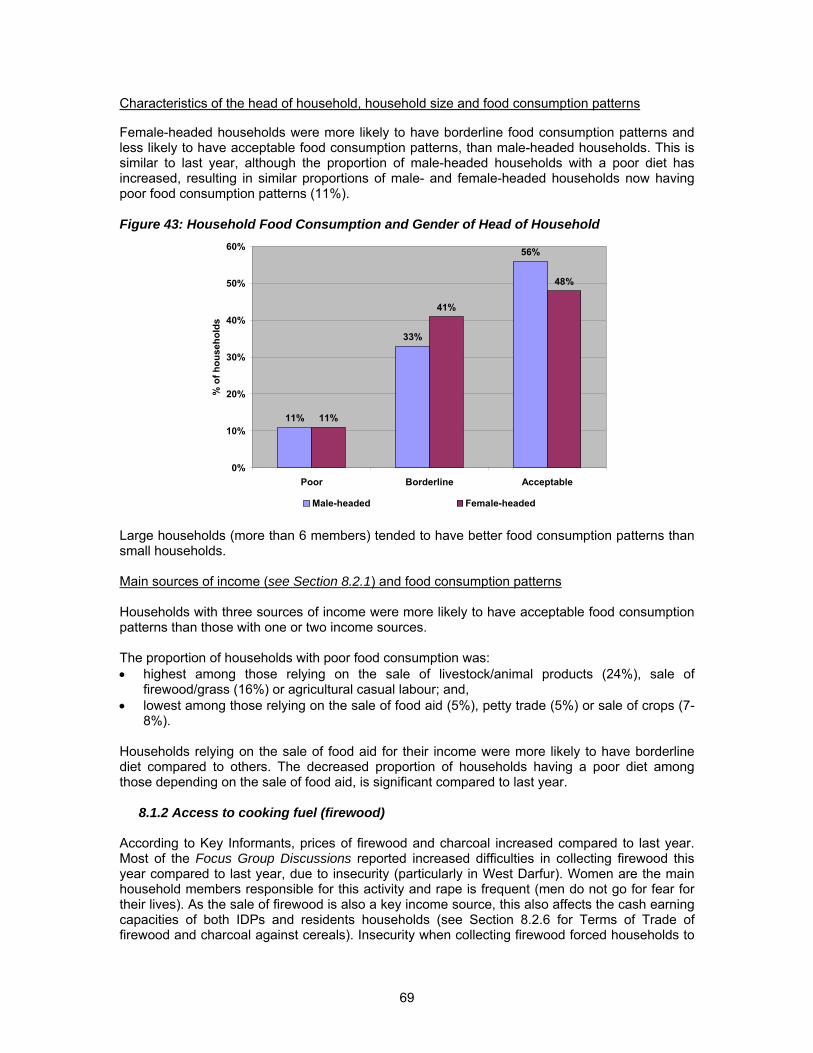
69
Characteristics of the head of household, household size and food consumption patterns Female-headed households were more likely to have borderline food consumption patterns and less likely to have acceptable food consumption patterns, than male-headed households. This is similar to last year, although the proportion of male-headed households with a poor diet has increased, resulting in similar proportions of male- and female-headed households now having poor food consumption patterns (11%). Figure 43: Household Food Consumption and Gender of Head of Household
11%
33%
56%
11%
41%
48%
0%
10%
20%
30%
40%
50%
60%
Poor Borderline Acceptable
% o
f hou
seho
lds
Male-headed Female-headed
Large households (more than 6 members) tended to have better food consumption patterns than small households. Main sources of income (see Section 8.2.1) and food consumption patterns Households with three sources of income were more likely to have acceptable food consumption patterns than those with one or two income sources. The proportion of households with poor food consumption was: • highest among those relying on the sale of livestock/animal products (24%), sale of
firewood/grass (16%) or agricultural casual labour; and, • lowest among those relying on the sale of food aid (5%), petty trade (5%) or sale of crops (7-
8%). Households relying on the sale of food aid for their income were more likely to have borderline diet compared to others. The decreased proportion of households having a poor diet among those depending on the sale of food aid, is significant compared to last year.
8.1.2 Access to cooking fuel (firewood) According to Key Informants, prices of firewood and charcoal increased compared to last year. Most of the Focus Group Discussions reported increased difficulties in collecting firewood this year compared to last year, due to insecurity (particularly in West Darfur). Women are the main household members responsible for this activity and rape is frequent (men do not go for fear for their lives). As the sale of firewood is also a key income source, this also affects the cash earning capacities of both IDPs and residents households (see Section 8.2.6 for Terms of Trade of firewood and charcoal against cereals). Insecurity when collecting firewood forced households to
70
rely more on purchase and increase of firewood prices compared to last year compounded their difficulties. The negative effects of intense firewood collection on the environment were mentioned by a few FGDs in West Darfur. 8.2 Household food access
8.2.1 Income sources Number and type of income sources About 44% had only one source of income, 39% two sources and 17% three sources. Residents were more likely to have three sources of income.
Figure 44: Number of Income Sources by Residence Status
46%
39%
16%
46%
38%
16%
42%
37%
21%
0%
5%
10%
15%
20%
25%
30%
35%
40%
45%
50%
One source ofincome
2 sources ofincome
3 sources ofincome
% o
f Hou
seho
lds
IDPs in campsIDPs outside campsResidents
Non-agricultural wage labour (including construction work for brick-making, poles, fences etc., domestic help such as laundry and cleaning, watchman/guard, porter, water sale and cart driving) was the main source of income for 33% of the households, followed by the sale of firewood/grass (17%), agricultural wage labour (15%), petty trade (9%), sale of cereals (6%) and sale of food aid (5%). Remaining income earning activities31 (sale of livestock/animal products, sale of handicraft, remittances and gifts) were less frequently mentioned. About 7% of the IDPs and 2% of residents relied on food aid as their main source of income. Residents were less likely to depend on non-agricultural wage labour and on the sale of firewood/grass than IDPs, and more likely to rely on the sale of crop and animal production. Compared to 2006, all groups seemed to rely much more on wage labour as their main source of income. In camps, this is compensated by a decreased reliance on the sale of food aid, while in communities it is compensated by a decreased reliance on the sale of crops:
31 A number of sources of income were used by a very small proportion of households in the sample, including sales of handicraft (3%), gifts from family/relatives (3%), remittances (less than 2%), begging (less than 1%) and gifts from family/relatives (3%). As the 2006 EFSNA had showed that the livelihoods profile of these households was quite similar, for the rest of the analyses they were merged into a unique group ‘Other low-income earning activities’ (8% of households).
71
• IDPs in camps have increased their reliance on wage labour (53% in 2007, 45% in 2006) and much decreased their reliance on the sale of food aid (9% in 2007, 21% in 2006) as a source of income;
• IDPs in communities also rely more on wage labour (55% in 2007, 46% in 2006); • Residents rely more on wage labour than last year (39% in 2007, 29% in 2006) and less on the
sale of other crops (8% in 2007, 14% in 2006). These trends were confirmed by the Focus Group Discussions32 (FGD). Participants mentioned that IDPs and residents relied on the sale of food aid for their income but the relative share of this source of income was not enquired. The main sources of income reflect the share of income obtained from the various activities and confirm the importance of wage labour and sale of firewood/grass for providing cash to both IDPs and residents: • IDPs in camps obtained 35% of their income from non-agricultural wage labour, 20% from the
sale of firewood/grass, 16% from agricultural wage labour, and only 8% from the sale of food aid;
• About half of the income of IDPs in communities came from wage labour. In communities with many IDPs, the IDPs obtained a higher share of income from the sale of firewood/grass (26%) than IDPs in other communities (11%);
• Residents obtained 38% of their income from wage labour, 14% from the sale of firewood/grass, 11% from the sale of cereals and 10% from petty trade.
Compared to previous years: • IDPs: the importance of wage labour for income has kept increasing, the share of
firewood/grass sales is pretty stable, but there is a marked decrease in the income brought by the sale of food aid for IDPs in camps, especially compared to last year;
• Residents: the share of income obtained from the sale of agricultural productions has decreased compared to previous years while the reliance on wage labour and gifts has increased.
Over the past 4 years, casual labour has become the main livelihood activity of the population (both IDPs and residents), followed by the sale of firewood/grass. Residents are better able to complement their income with the sale of their agricultural produce than IDPs.
32 FGD participants mentioned the following main cash sources for households: • IDPs: sale of food aid, casual labour including agricultural (weeding, sharecropping) and non-agricultural (brick-making,
construction of grass fences, domestic chores for residents), and sale of firewood and grass. In locations where residents could cultivate, opportunities for agricultural wage labour increased for the IDPs; however new influx of IDPs augmented competition for jobs and encouraged low remunerations.
• Residents: mostly sale of their crop production and livestock, as well as sale of food aid. The richest engage in petty trade as well.
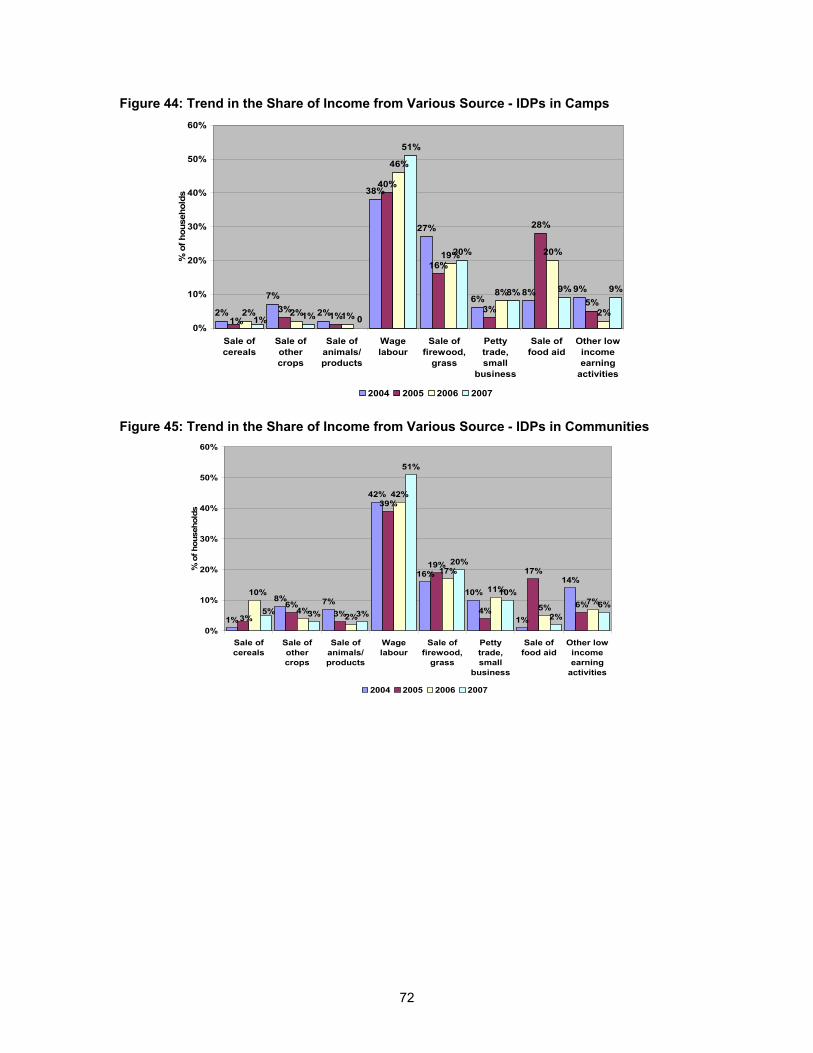
72
Figure 44: Trend in the Share of Income from Various Source - IDPs in Camps
2%
7%
2%
38%
27%
6%8% 9%
3%1%
40%
16%
3%
28%
5%2% 1%
46%
19%
8%
20%
2%1% 0
51%
20%
8% 9% 9%
1%2%
1%0%
10%
20%
30%
40%
50%
60%
Sale ofcereals
Sale ofothercrops
Sale ofanimals/products
Wagelabour
Sale offirewood,
grass
Pettytrade,small
business
Sale offood aid
Other lowincomeearning
activities
% o
f hou
seho
lds
2004 2005 2006 2007
Figure 45: Trend in the Share of Income from Various Source - IDPs in Communities
1%
8% 7%
42%
16%
10%
1%
14%
6%3%
39%
19%
4%
17%
6%4%
2%
42%
17%
11%
5%7%
3% 3%
51%
20%
10%
2%6%
3%
10%
5%
0%
10%
20%
30%
40%
50%
60%
Sale ofcereals
Sale ofothercrops
Sale ofanimals/products
Wagelabour
Sale offirewood,
grass
Pettytrade,small
business
Sale offood aid
Other lowincomeearning
activities
% o
f hou
seho
lds
2004 2005 2006 2007
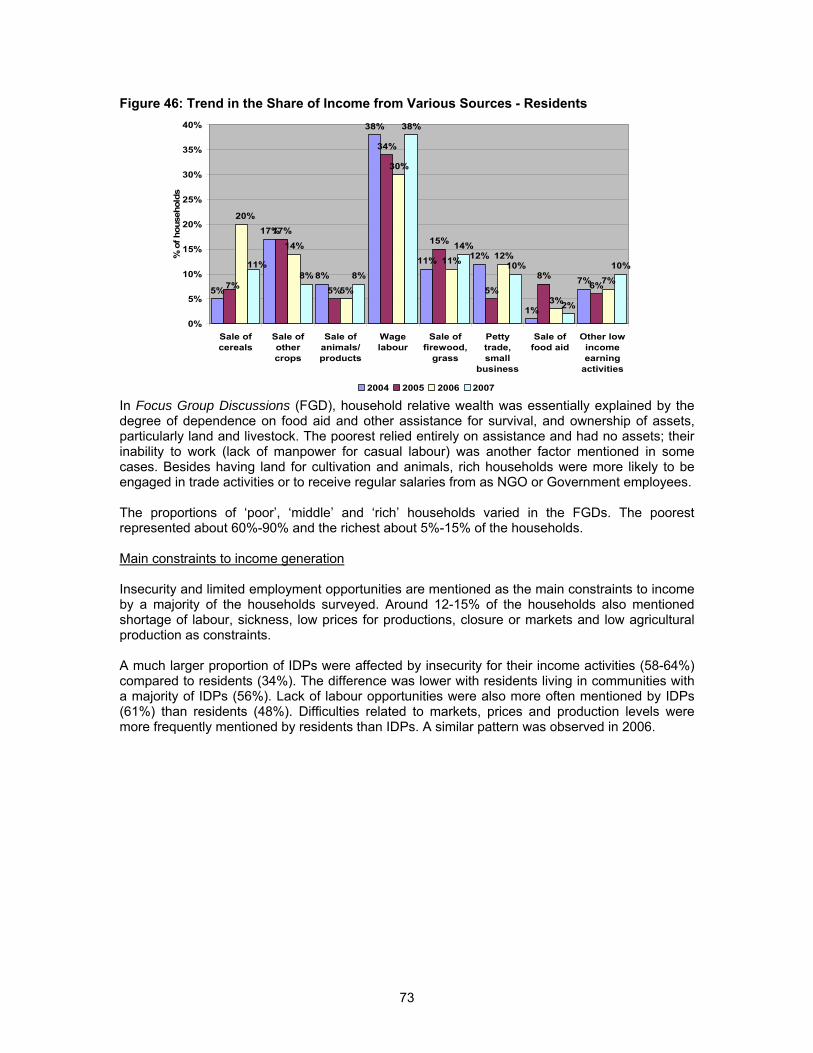
73
Figure 46: Trend in the Share of Income from Various Sources - Residents
5%
17%
8%
38%
11% 12%
1%
7%
17%
5%
34%
15%
5%
8%6%
14%
5%
30%
11% 12%
3%
7%8% 8%
38%
14%
10%
2%
10%
7%
20%
11%
0%
5%
10%
15%
20%
25%
30%
35%
40%
Sale ofcereals
Sale ofothercrops
Sale ofanimals/products
Wagelabour
Sale offirewood,
grass
Pettytrade,small
business
Sale offood aid
Other lowincomeearning
activities
% o
f hou
seho
lds
2004 2005 2006 2007 In Focus Group Discussions (FGD), household relative wealth was essentially explained by the degree of dependence on food aid and other assistance for survival, and ownership of assets, particularly land and livestock. The poorest relied entirely on assistance and had no assets; their inability to work (lack of manpower for casual labour) was another factor mentioned in some cases. Besides having land for cultivation and animals, rich households were more likely to be engaged in trade activities or to receive regular salaries from as NGO or Government employees. The proportions of ‘poor’, ‘middle’ and ‘rich’ households varied in the FGDs. The poorest represented about 60%-90% and the richest about 5%-15% of the households. Main constraints to income generation Insecurity and limited employment opportunities are mentioned as the main constraints to income by a majority of the households surveyed. Around 12-15% of the households also mentioned shortage of labour, sickness, low prices for productions, closure or markets and low agricultural production as constraints. A much larger proportion of IDPs were affected by insecurity for their income activities (58-64%) compared to residents (34%). The difference was lower with residents living in communities with a majority of IDPs (56%). Lack of labour opportunities were also more often mentioned by IDPs (61%) than residents (48%). Difficulties related to markets, prices and production levels were more frequently mentioned by residents than IDPs. A similar pattern was observed in 2006.
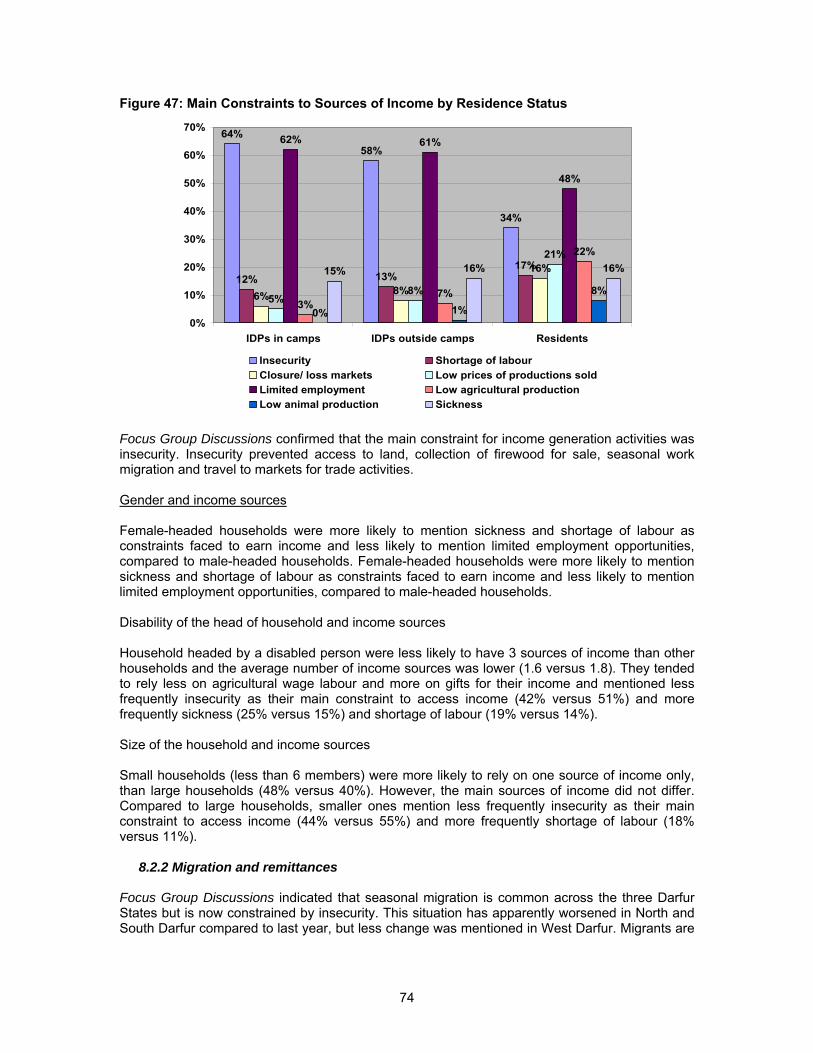
74
Figure 47: Main Constraints to Sources of Income by Residence Status
64%58%
34%
12% 13%17%
6% 8%
16%
5%8%
21%
62% 61%
48%
3%7%
22%
0% 1%
8%
15% 16% 16%
0%
10%
20%
30%
40%
50%
60%
70%
IDPs in camps IDPs outside camps Residents
Insecurity Shortage of labourClosure/ loss markets Low prices of productions soldLimited employment Low agricultural productionLow animal production Sickness
Focus Group Discussions confirmed that the main constraint for income generation activities was insecurity. Insecurity prevented access to land, collection of firewood for sale, seasonal work migration and travel to markets for trade activities. Gender and income sources Female-headed households were more likely to mention sickness and shortage of labour as constraints faced to earn income and less likely to mention limited employment opportunities, compared to male-headed households. Female-headed households were more likely to mention sickness and shortage of labour as constraints faced to earn income and less likely to mention limited employment opportunities, compared to male-headed households. Disability of the head of household and income sources Household headed by a disabled person were less likely to have 3 sources of income than other households and the average number of income sources was lower (1.6 versus 1.8). They tended to rely less on agricultural wage labour and more on gifts for their income and mentioned less frequently insecurity as their main constraint to access income (42% versus 51%) and more frequently sickness (25% versus 15%) and shortage of labour (19% versus 14%). Size of the household and income sources Small households (less than 6 members) were more likely to rely on one source of income only, than large households (48% versus 40%). However, the main sources of income did not differ. Compared to large households, smaller ones mention less frequently insecurity as their main constraint to access income (44% versus 55%) and more frequently shortage of labour (18% versus 11%).
8.2.2 Migration and remittances Focus Group Discussions indicated that seasonal migration is common across the three Darfur States but is now constrained by insecurity. This situation has apparently worsened in North and South Darfur compared to last year, but less change was mentioned in West Darfur. Migrants are
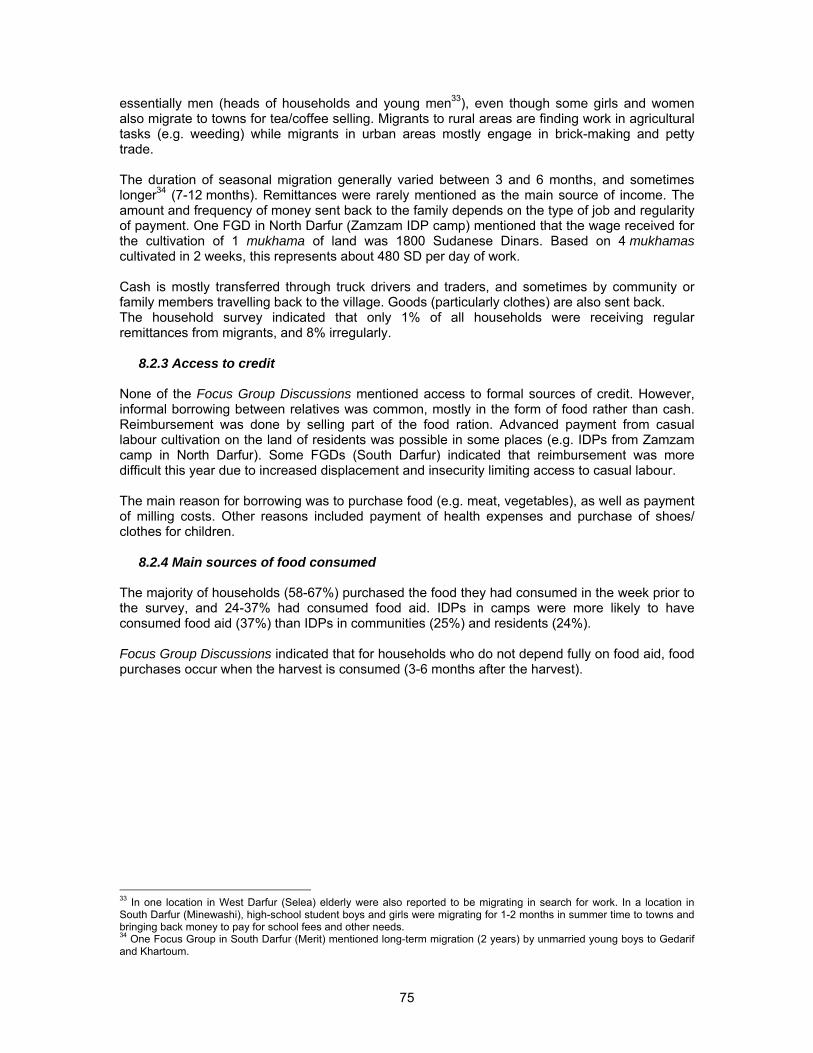
75
essentially men (heads of households and young men33), even though some girls and women also migrate to towns for tea/coffee selling. Migrants to rural areas are finding work in agricultural tasks (e.g. weeding) while migrants in urban areas mostly engage in brick-making and petty trade. The duration of seasonal migration generally varied between 3 and 6 months, and sometimes longer34 (7-12 months). Remittances were rarely mentioned as the main source of income. The amount and frequency of money sent back to the family depends on the type of job and regularity of payment. One FGD in North Darfur (Zamzam IDP camp) mentioned that the wage received for the cultivation of 1 mukhama of land was 1800 Sudanese Dinars. Based on 4 mukhamas cultivated in 2 weeks, this represents about 480 SD per day of work. Cash is mostly transferred through truck drivers and traders, and sometimes by community or family members travelling back to the village. Goods (particularly clothes) are also sent back. The household survey indicated that only 1% of all households were receiving regular remittances from migrants, and 8% irregularly.
8.2.3 Access to credit None of the Focus Group Discussions mentioned access to formal sources of credit. However, informal borrowing between relatives was common, mostly in the form of food rather than cash. Reimbursement was done by selling part of the food ration. Advanced payment from casual labour cultivation on the land of residents was possible in some places (e.g. IDPs from Zamzam camp in North Darfur). Some FGDs (South Darfur) indicated that reimbursement was more difficult this year due to increased displacement and insecurity limiting access to casual labour. The main reason for borrowing was to purchase food (e.g. meat, vegetables), as well as payment of milling costs. Other reasons included payment of health expenses and purchase of shoes/ clothes for children.
8.2.4 Main sources of food consumed The majority of households (58-67%) purchased the food they had consumed in the week prior to the survey, and 24-37% had consumed food aid. IDPs in camps were more likely to have consumed food aid (37%) than IDPs in communities (25%) and residents (24%). Focus Group Discussions indicated that for households who do not depend fully on food aid, food purchases occur when the harvest is consumed (3-6 months after the harvest).
33 In one location in West Darfur (Selea) elderly were also reported to be migrating in search for work. In a location in South Darfur (Minewashi), high-school student boys and girls were migrating for 1-2 months in summer time to towns and bringing back money to pay for school fees and other needs. 34 One Focus Group in South Darfur (Merit) mentioned long-term migration (2 years) by unmarried young boys to Gedarif and Khartoum.
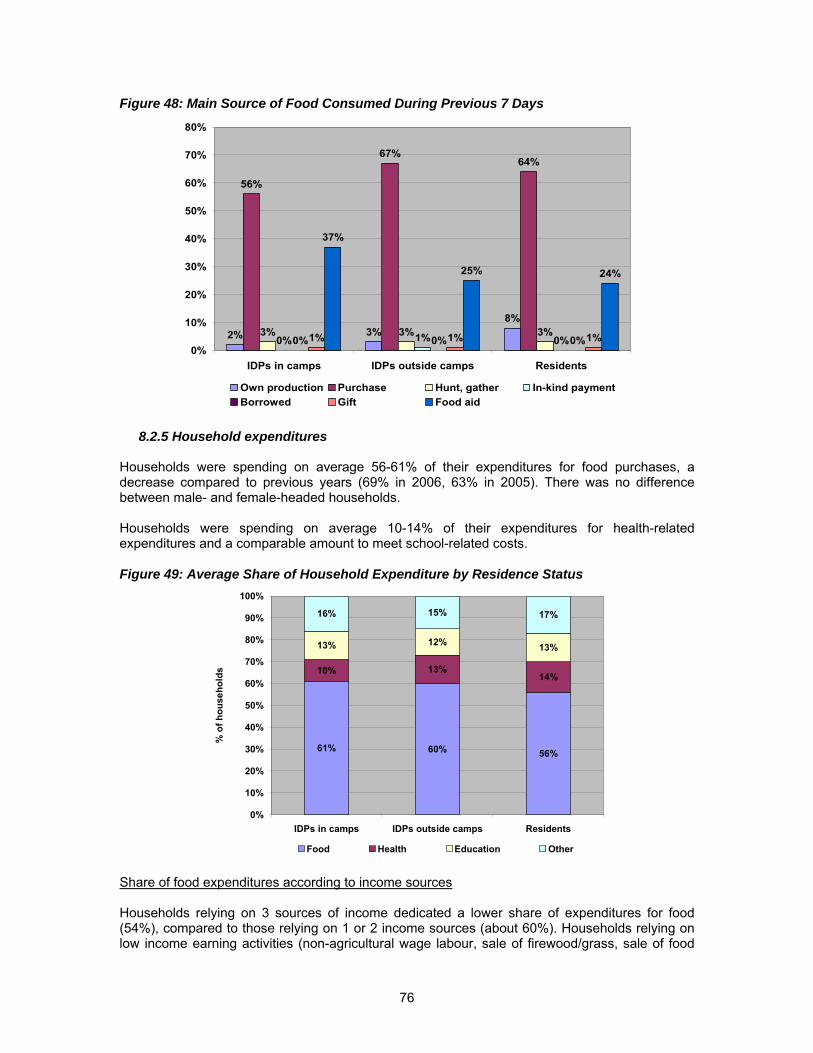
76
Figure 48: Main Source of Food Consumed During Previous 7 Days
2% 3%8%
56%
67%64%
3% 3% 3%0% 1% 0%0% 0% 0%1% 1% 1%
37%
25% 24%
0%
10%
20%
30%
40%
50%
60%
70%
80%
IDPs in camps IDPs outside camps Residents
Own production Purchase Hunt, gather In-kind paymentBorrowed Gift Food aid
8.2.5 Household expenditures
Households were spending on average 56-61% of their expenditures for food purchases, a decrease compared to previous years (69% in 2006, 63% in 2005). There was no difference between male- and female-headed households. Households were spending on average 10-14% of their expenditures for health-related expenditures and a comparable amount to meet school-related costs. Figure 49: Average Share of Household Expenditure by Residence Status
61% 60% 56%
10% 13%14%
13% 12% 13%
16% 15% 17%
0%
10%
20%
30%
40%
50%
60%
70%
80%
90%
100%
IDPs in camps IDPs outside camps Residents
% o
f hou
seho
lds
Food Health Education Other Share of food expenditures according to income sources Households relying on 3 sources of income dedicated a lower share of expenditures for food (54%), compared to those relying on 1 or 2 income sources (about 60%). Households relying on low income earning activities (non-agricultural wage labour, sale of firewood/grass, sale of food
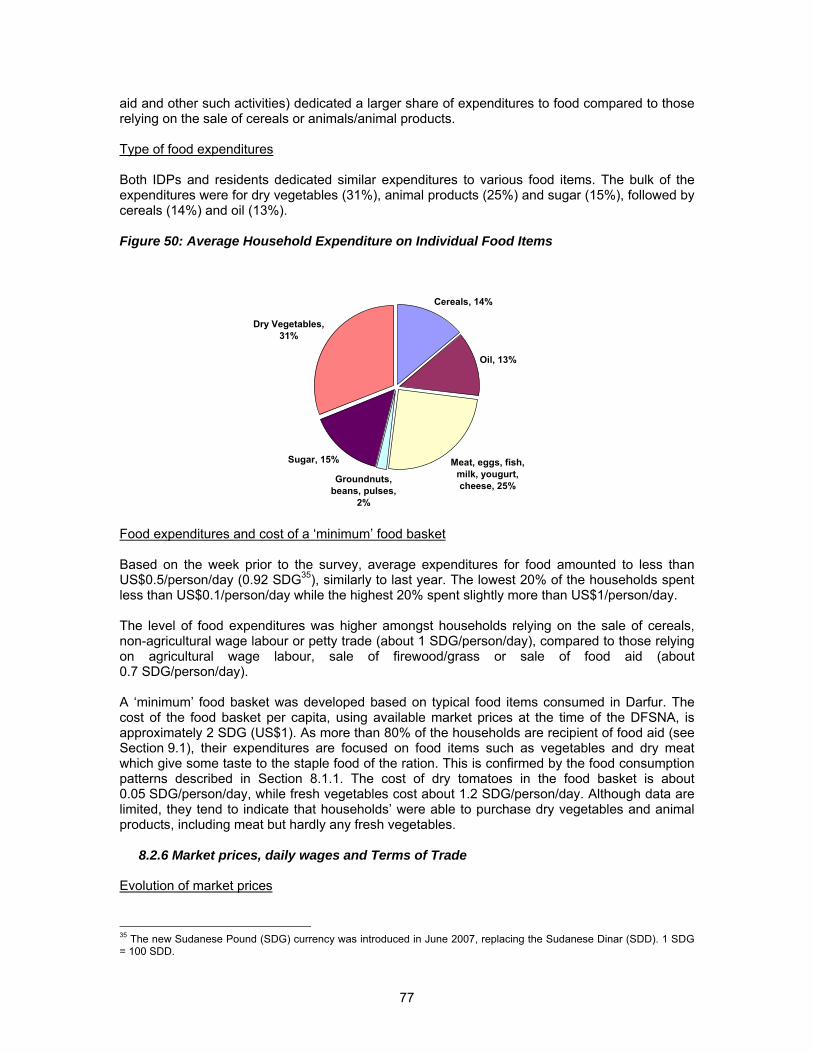
77
aid and other such activities) dedicated a larger share of expenditures to food compared to those relying on the sale of cereals or animals/animal products. Type of food expenditures Both IDPs and residents dedicated similar expenditures to various food items. The bulk of the expenditures were for dry vegetables (31%), animal products (25%) and sugar (15%), followed by cereals (14%) and oil (13%). Figure 50: Average Household Expenditure on Individual Food Items
Cereals, 14%
Oil, 13%
Meat, eggs, fish, milk, yougurt, cheese, 25%
Groundnuts, beans, pulses,
2%
Sugar, 15%
Dry Vegetables, 31%
Food expenditures and cost of a ‘minimum’ food basket Based on the week prior to the survey, average expenditures for food amounted to less than US$0.5/person/day (0.92 SDG35), similarly to last year. The lowest 20% of the households spent less than US$0.1/person/day while the highest 20% spent slightly more than US$1/person/day. The level of food expenditures was higher amongst households relying on the sale of cereals, non-agricultural wage labour or petty trade (about 1 SDG/person/day), compared to those relying on agricultural wage labour, sale of firewood/grass or sale of food aid (about 0.7 SDG/person/day). A ‘minimum’ food basket was developed based on typical food items consumed in Darfur. The cost of the food basket per capita, using available market prices at the time of the DFSNA, is approximately 2 SDG (US$1). As more than 80% of the households are recipient of food aid (see Section 9.1), their expenditures are focused on food items such as vegetables and dry meat which give some taste to the staple food of the ration. This is confirmed by the food consumption patterns described in Section 8.1.1. The cost of dry tomatoes in the food basket is about 0.05 SDG/person/day, while fresh vegetables cost about 1.2 SDG/person/day. Although data are limited, they tend to indicate that households’ were able to purchase dry vegetables and animal products, including meat but hardly any fresh vegetables.
8.2.6 Market prices, daily wages and Terms of Trade Evolution of market prices
35 The new Sudanese Pound (SDG) currency was introduced in June 2007, replacing the Sudanese Dinar (SDD). 1 SDG = 100 SDD.
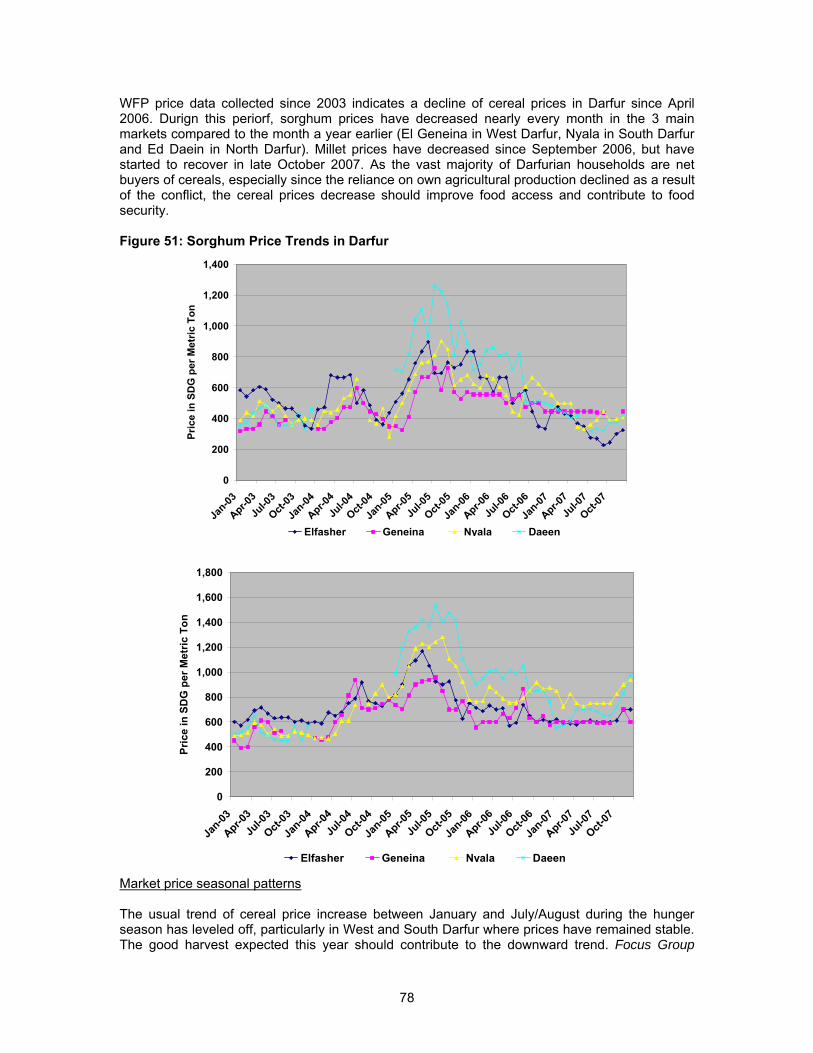
78
WFP price data collected since 2003 indicates a decline of cereal prices in Darfur since April 2006. Durign this periorf, sorghum prices have decreased nearly every month in the 3 main markets compared to the month a year earlier (El Geneina in West Darfur, Nyala in South Darfur and Ed Daein in North Darfur). Millet prices have decreased since September 2006, but have started to recover in late October 2007. As the vast majority of Darfurian households are net buyers of cereals, especially since the reliance on own agricultural production declined as a result of the conflict, the cereal prices decrease should improve food access and contribute to food security. Figure 51: Sorghum Price Trends in Darfur
0
200
400
600
800
1,000
1,200
1,400
Jan-03
Apr-03Ju
l-03
Oct-03
Jan-04
Apr-04Ju
l-04
Oct-04
Jan-05
Apr-05Ju
l-05
Oct-05
Jan-06
Apr-06Ju
l-06
Oct-06
Jan-07
Apr-07Ju
l-07
Oct-07
Pric
e in
SD
G p
er M
etric
Ton
Elfasher Geneina Nyala Daeen
0
200
400
600
800
1,000
1,200
1,400
1,600
1,800
Jan-03
Apr-03Ju
l-03
Oct-03
Jan-04
Apr-04Ju
l-04
Oct-04
Jan-05
Apr-05Ju
l-05
Oct-05
Jan-06
Apr-06Ju
l-06
Oct-06
Jan-07
Apr-07Ju
l-07
Oct-07
Pric
e in
SD
G p
er M
etric
Ton
Elfasher Geneina Nyala Daeen
Market price seasonal patterns The usual trend of cereal price increase between January and July/August during the hunger season has leveled off, particularly in West and South Darfur where prices have remained stable. The good harvest expected this year should contribute to the downward trend. Focus Group
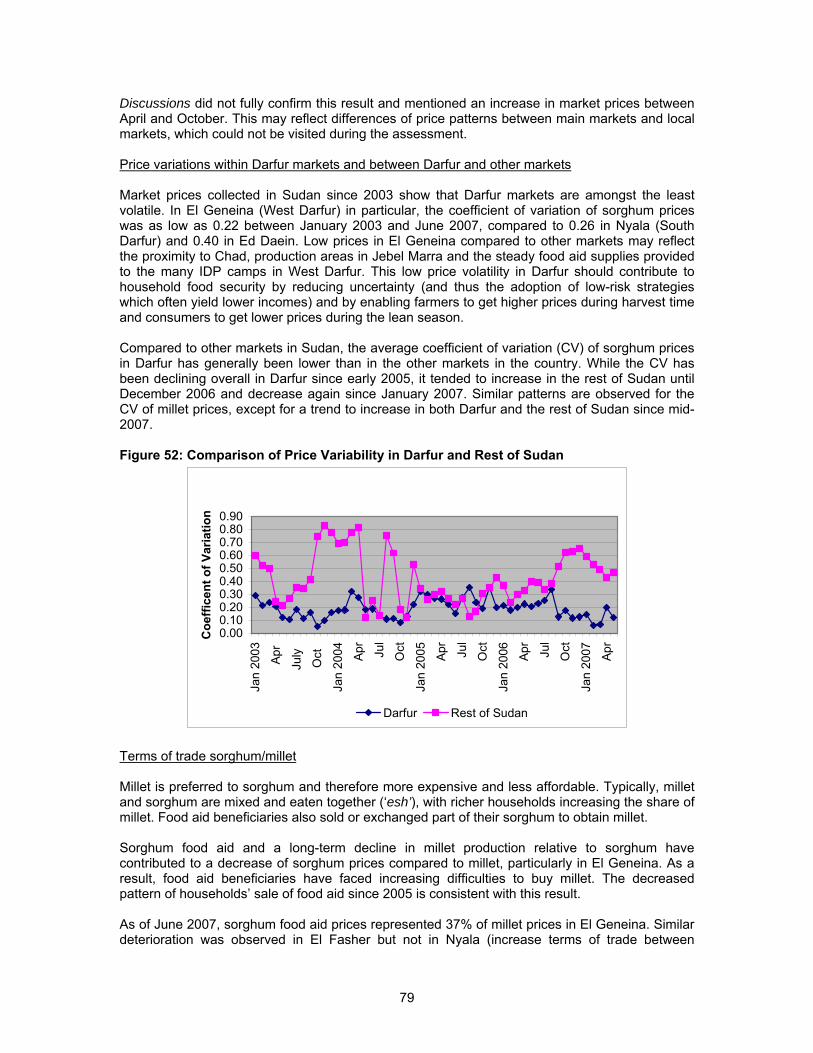
79
Discussions did not fully confirm this result and mentioned an increase in market prices between April and October. This may reflect differences of price patterns between main markets and local markets, which could not be visited during the assessment. Price variations within Darfur markets and between Darfur and other markets Market prices collected in Sudan since 2003 show that Darfur markets are amongst the least volatile. In El Geneina (West Darfur) in particular, the coefficient of variation of sorghum prices was as low as 0.22 between January 2003 and June 2007, compared to 0.26 in Nyala (South Darfur) and 0.40 in Ed Daein. Low prices in El Geneina compared to other markets may reflect the proximity to Chad, production areas in Jebel Marra and the steady food aid supplies provided to the many IDP camps in West Darfur. This low price volatility in Darfur should contribute to household food security by reducing uncertainty (and thus the adoption of low-risk strategies which often yield lower incomes) and by enabling farmers to get higher prices during harvest time and consumers to get lower prices during the lean season. Compared to other markets in Sudan, the average coefficient of variation (CV) of sorghum prices in Darfur has generally been lower than in the other markets in the country. While the CV has been declining overall in Darfur since early 2005, it tended to increase in the rest of Sudan until December 2006 and decrease again since January 2007. Similar patterns are observed for the CV of millet prices, except for a trend to increase in both Darfur and the rest of Sudan since mid-2007.
Figure 52: Comparison of Price Variability in Darfur and Rest of Sudan
0.000.100.200.300.400.500.600.700.800.90
Jan
2003
Apr
July
Oct
Jan
2004 Ap
r
Jul
Oct
Jan
2005 Ap
r
Jul
Oct
Jan
2006 Ap
r
Jul
Oct
Jan
2007 Ap
rCoe
ffice
nt o
f Var
iatio
n
Darfur Rest of Sudan
Terms of trade sorghum/millet Millet is preferred to sorghum and therefore more expensive and less affordable. Typically, millet and sorghum are mixed and eaten together (‘esh’), with richer households increasing the share of millet. Food aid beneficiaries also sold or exchanged part of their sorghum to obtain millet. Sorghum food aid and a long-term decline in millet production relative to sorghum have contributed to a decrease of sorghum prices compared to millet, particularly in El Geneina. As a result, food aid beneficiaries have faced increasing difficulties to buy millet. The decreased pattern of households’ sale of food aid since 2005 is consistent with this result. As of June 2007, sorghum food aid prices represented 37% of millet prices in El Geneina. Similar deterioration was observed in El Fasher but not in Nyala (increase terms of trade between
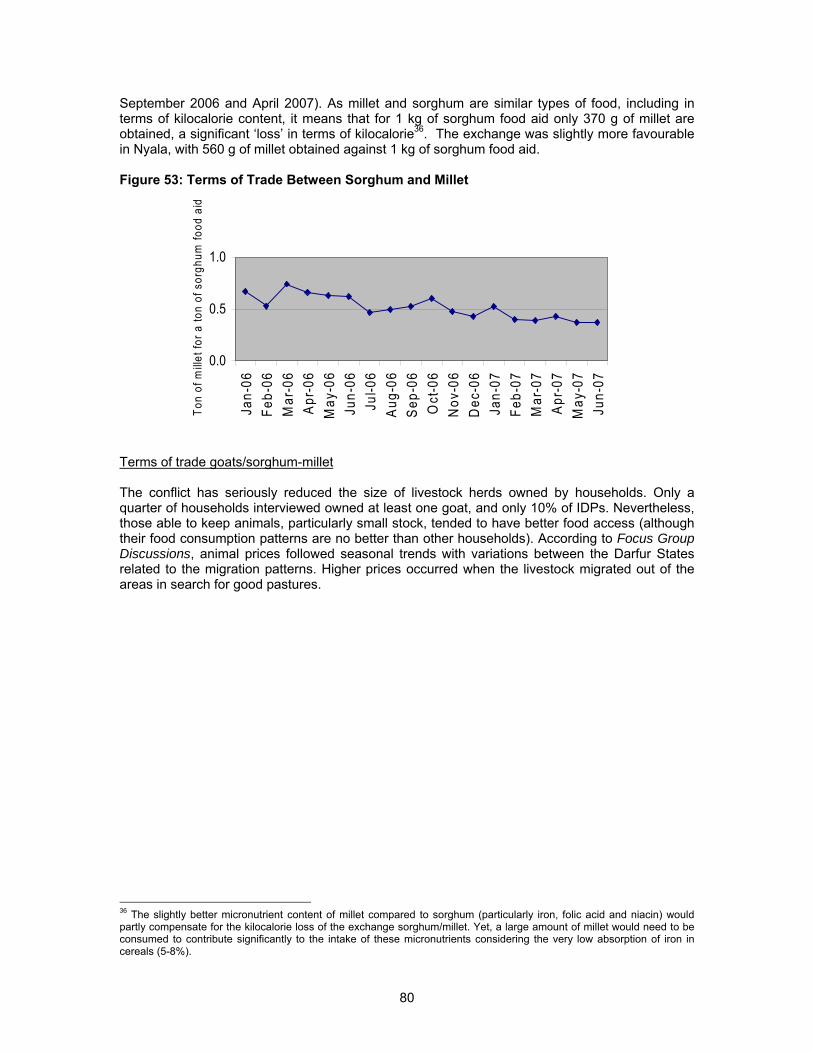
80
September 2006 and April 2007). As millet and sorghum are similar types of food, including in terms of kilocalorie content, it means that for 1 kg of sorghum food aid only 370 g of millet are obtained, a significant ‘loss’ in terms of kilocalorie36. The exchange was slightly more favourable in Nyala, with 560 g of millet obtained against 1 kg of sorghum food aid. Figure 53: Terms of Trade Between Sorghum and Millet
0.0
0.5
1.0Ja
n-06
Feb-
06M
ar-0
6A
pr-0
6M
ay-0
6Ju
n-06
Jul-0
6A
ug-0
6S
ep-0
6O
ct-0
6N
ov-0
6D
ec-0
6Ja
n-07
Feb-
07M
ar-0
7A
pr-0
7M
ay-0
7Ju
n-07
Ton
of m
illet f
or a
ton
of s
orgh
um fo
od a
id
Terms of trade goats/sorghum-millet The conflict has seriously reduced the size of livestock herds owned by households. Only a quarter of households interviewed owned at least one goat, and only 10% of IDPs. Nevertheless, those able to keep animals, particularly small stock, tended to have better food access (although their food consumption patterns are no better than other households). According to Focus Group Discussions, animal prices followed seasonal trends with variations between the Darfur States related to the migration patterns. Higher prices occurred when the livestock migrated out of the areas in search for good pastures.
36 The slightly better micronutrient content of millet compared to sorghum (particularly iron, folic acid and niacin) would partly compensate for the kilocalorie loss of the exchange sorghum/millet. Yet, a large amount of millet would need to be consumed to contribute significantly to the intake of these micronutrients considering the very low absorption of iron in cereals (5-8%).
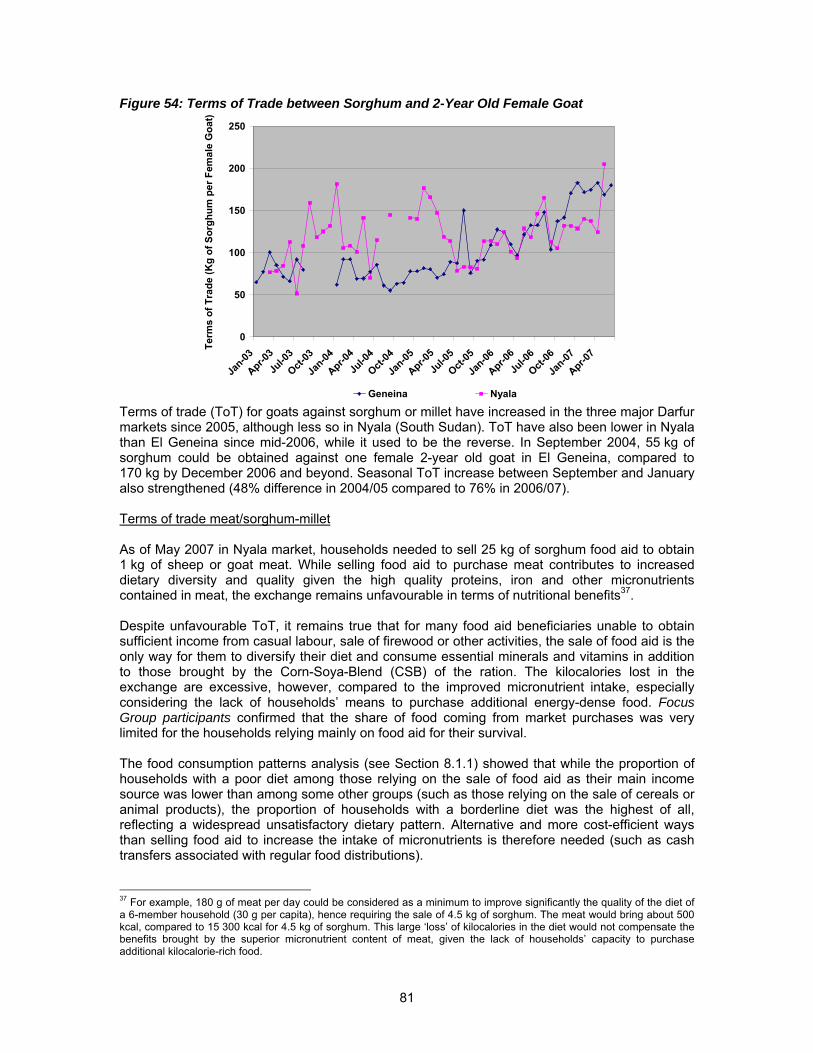
81
Figure 54: Terms of Trade between Sorghum and 2-Year Old Female Goat
0
50
100
150
200
250
Jan-03
Apr-03Ju
l-03
Oct-03
Jan-04
Apr-04Ju
l-04
Oct-04
Jan-05
Apr-05Ju
l-05
Oct-05
Jan-06
Apr-06Ju
l-06
Oct-06
Jan-07
Apr-07
Term
s of
Tra
de (K
g of
Sor
ghum
per
Fem
ale
Goa
t)
Geneina Nyala Terms of trade (ToT) for goats against sorghum or millet have increased in the three major Darfur markets since 2005, although less so in Nyala (South Sudan). ToT have also been lower in Nyala than El Geneina since mid-2006, while it used to be the reverse. In September 2004, 55 kg of sorghum could be obtained against one female 2-year old goat in El Geneina, compared to 170 kg by December 2006 and beyond. Seasonal ToT increase between September and January also strengthened (48% difference in 2004/05 compared to 76% in 2006/07). Terms of trade meat/sorghum-millet As of May 2007 in Nyala market, households needed to sell 25 kg of sorghum food aid to obtain 1 kg of sheep or goat meat. While selling food aid to purchase meat contributes to increased dietary diversity and quality given the high quality proteins, iron and other micronutrients contained in meat, the exchange remains unfavourable in terms of nutritional benefits37. Despite unfavourable ToT, it remains true that for many food aid beneficiaries unable to obtain sufficient income from casual labour, sale of firewood or other activities, the sale of food aid is the only way for them to diversify their diet and consume essential minerals and vitamins in addition to those brought by the Corn-Soya-Blend (CSB) of the ration. The kilocalories lost in the exchange are excessive, however, compared to the improved micronutrient intake, especially considering the lack of households’ means to purchase additional energy-dense food. Focus Group participants confirmed that the share of food coming from market purchases was very limited for the households relying mainly on food aid for their survival. The food consumption patterns analysis (see Section 8.1.1) showed that while the proportion of households with a poor diet among those relying on the sale of food aid as their main income source was lower than among some other groups (such as those relying on the sale of cereals or animal products), the proportion of households with a borderline diet was the highest of all, reflecting a widespread unsatisfactory dietary pattern. Alternative and more cost-efficient ways than selling food aid to increase the intake of micronutrients is therefore needed (such as cash transfers associated with regular food distributions). 37 For example, 180 g of meat per day could be considered as a minimum to improve significantly the quality of the diet of a 6-member household (30 g per capita), hence requiring the sale of 4.5 kg of sorghum. The meat would bring about 500 kcal, compared to 15 300 kcal for 4.5 kg of sorghum. This large ‘loss’ of kilocalories in the diet would not compensate the benefits brought by the superior micronutrient content of meat, given the lack of households’ capacity to purchase additional kilocalorie-rich food.
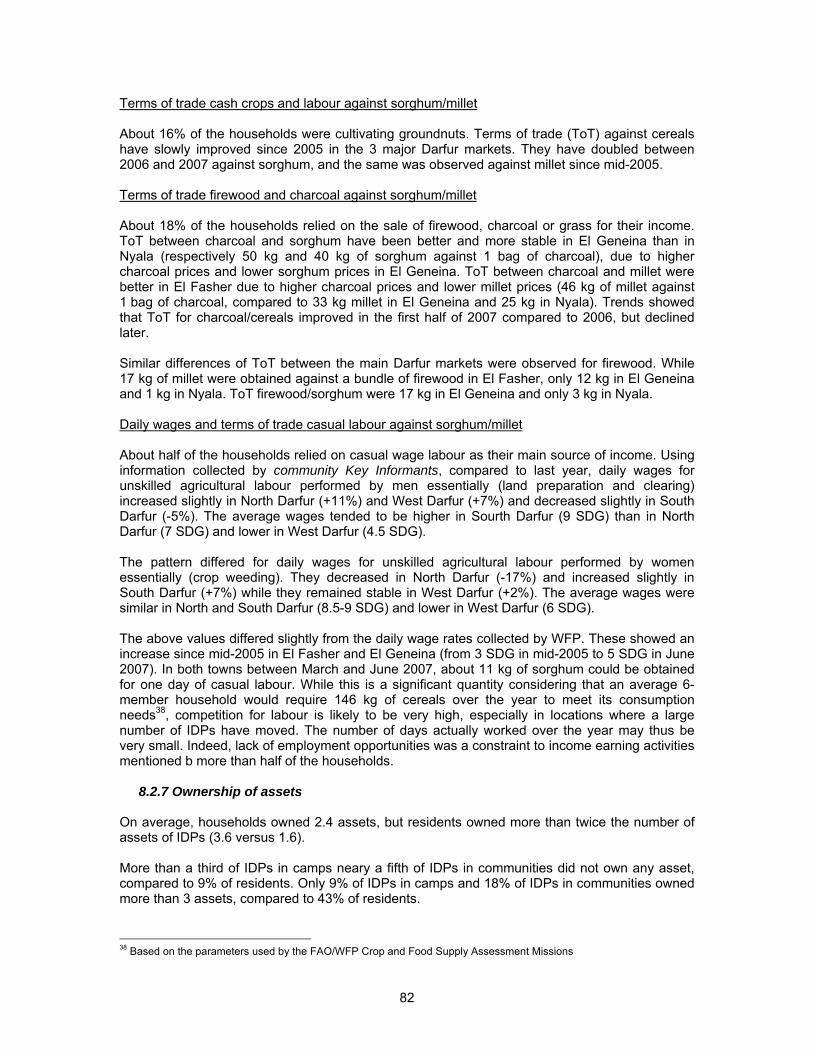
82
Terms of trade cash crops and labour against sorghum/millet About 16% of the households were cultivating groundnuts. Terms of trade (ToT) against cereals have slowly improved since 2005 in the 3 major Darfur markets. They have doubled between 2006 and 2007 against sorghum, and the same was observed against millet since mid-2005. Terms of trade firewood and charcoal against sorghum/millet About 18% of the households relied on the sale of firewood, charcoal or grass for their income. ToT between charcoal and sorghum have been better and more stable in El Geneina than in Nyala (respectively 50 kg and 40 kg of sorghum against 1 bag of charcoal), due to higher charcoal prices and lower sorghum prices in El Geneina. ToT between charcoal and millet were better in El Fasher due to higher charcoal prices and lower millet prices (46 kg of millet against 1 bag of charcoal, compared to 33 kg millet in El Geneina and 25 kg in Nyala). Trends showed that ToT for charcoal/cereals improved in the first half of 2007 compared to 2006, but declined later. Similar differences of ToT between the main Darfur markets were observed for firewood. While 17 kg of millet were obtained against a bundle of firewood in El Fasher, only 12 kg in El Geneina and 1 kg in Nyala. ToT firewood/sorghum were 17 kg in El Geneina and only 3 kg in Nyala. Daily wages and terms of trade casual labour against sorghum/millet About half of the households relied on casual wage labour as their main source of income. Using information collected by community Key Informants, compared to last year, daily wages for unskilled agricultural labour performed by men essentially (land preparation and clearing) increased slightly in North Darfur (+11%) and West Darfur (+7%) and decreased slightly in South Darfur (-5%). The average wages tended to be higher in Sourth Darfur (9 SDG) than in North Darfur (7 SDG) and lower in West Darfur (4.5 SDG). The pattern differed for daily wages for unskilled agricultural labour performed by women essentially (crop weeding). They decreased in North Darfur (-17%) and increased slightly in South Darfur (+7%) while they remained stable in West Darfur (+2%). The average wages were similar in North and South Darfur (8.5-9 SDG) and lower in West Darfur (6 SDG). The above values differed slightly from the daily wage rates collected by WFP. These showed an increase since mid-2005 in El Fasher and El Geneina (from 3 SDG in mid-2005 to 5 SDG in June 2007). In both towns between March and June 2007, about 11 kg of sorghum could be obtained for one day of casual labour. While this is a significant quantity considering that an average 6-member household would require 146 kg of cereals over the year to meet its consumption needs38, competition for labour is likely to be very high, especially in locations where a large number of IDPs have moved. The number of days actually worked over the year may thus be very small. Indeed, lack of employment opportunities was a constraint to income earning activities mentioned b more than half of the households.
8.2.7 Ownership of assets On average, households owned 2.4 assets, but residents owned more than twice the number of assets of IDPs (3.6 versus 1.6). More than a third of IDPs in camps neary a fifth of IDPs in communities did not own any asset, compared to 9% of residents. Only 9% of IDPs in camps and 18% of IDPs in communities owned more than 3 assets, compared to 43% of residents.
38 Based on the parameters used by the FAO/WFP Crop and Food Supply Assessment Missions
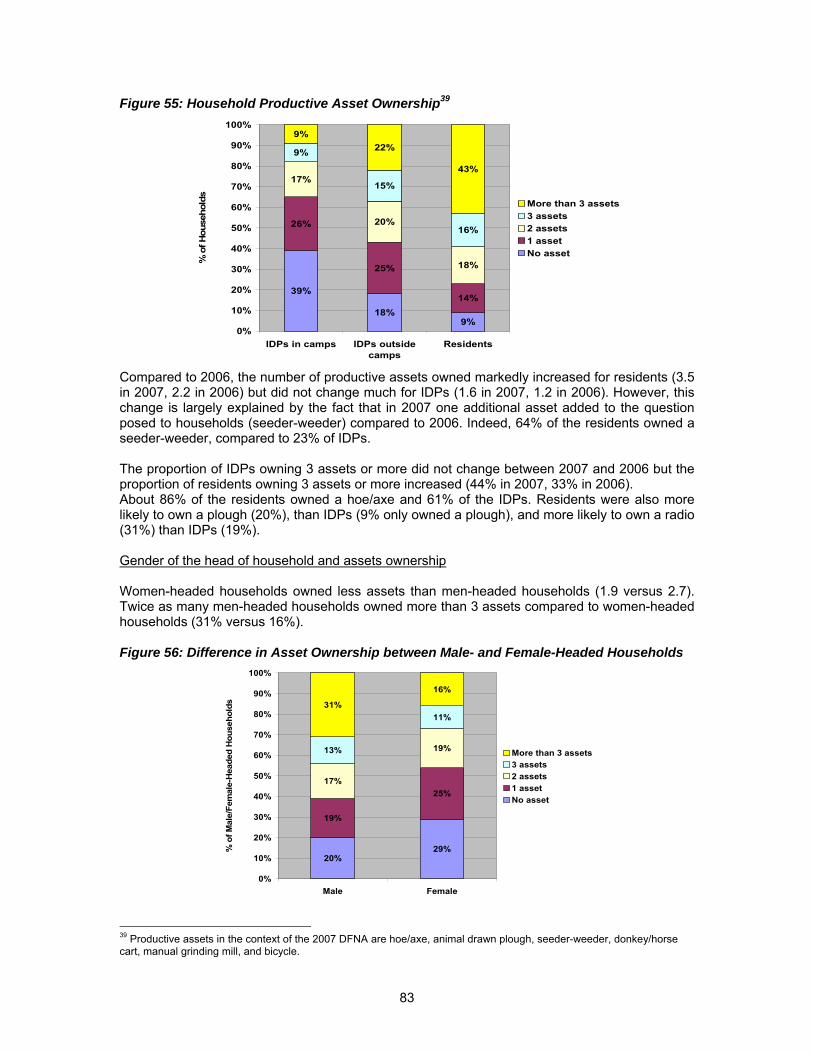
83
Figure 55: Household Productive Asset Ownership39
39%
18%9%
26%
25%
14%
17%
20%
18%
9%
15%
16%
9%22%
43%
0%
10%
20%
30%
40%
50%
60%
70%
80%
90%
100%
IDPs in camps IDPs outsidecamps
Residents
% o
f Hou
seho
lds
More than 3 assets3 assets2 assets1 assetNo asset
Compared to 2006, the number of productive assets owned markedly increased for residents (3.5 in 2007, 2.2 in 2006) but did not change much for IDPs (1.6 in 2007, 1.2 in 2006). However, this change is largely explained by the fact that in 2007 one additional asset added to the question posed to households (seeder-weeder) compared to 2006. Indeed, 64% of the residents owned a seeder-weeder, compared to 23% of IDPs. The proportion of IDPs owning 3 assets or more did not change between 2007 and 2006 but the proportion of residents owning 3 assets or more increased (44% in 2007, 33% in 2006). About 86% of the residents owned a hoe/axe and 61% of the IDPs. Residents were also more likely to own a plough (20%), than IDPs (9% only owned a plough), and more likely to own a radio (31%) than IDPs (19%). Gender of the head of household and assets ownership Women-headed households owned less assets than men-headed households (1.9 versus 2.7). Twice as many men-headed households owned more than 3 assets compared to women-headed households (31% versus 16%).
Figure 56: Difference in Asset Ownership between Male- and Female-Headed Households
20%29%
19%
25%17%
19%13%
11%31%
16%
0%
10%
20%
30%
40%
50%
60%
70%
80%
90%
100%
Male Female
% o
f Mal
e/Fe
mal
e-H
eade
d H
ouse
hold
s
More than 3 assets3 assets2 assets1 assetNo asset
39 Productive assets in the context of the 2007 DFNA are hoe/axe, animal drawn plough, seeder-weeder, donkey/horse cart, manual grinding mill, and bicycle.
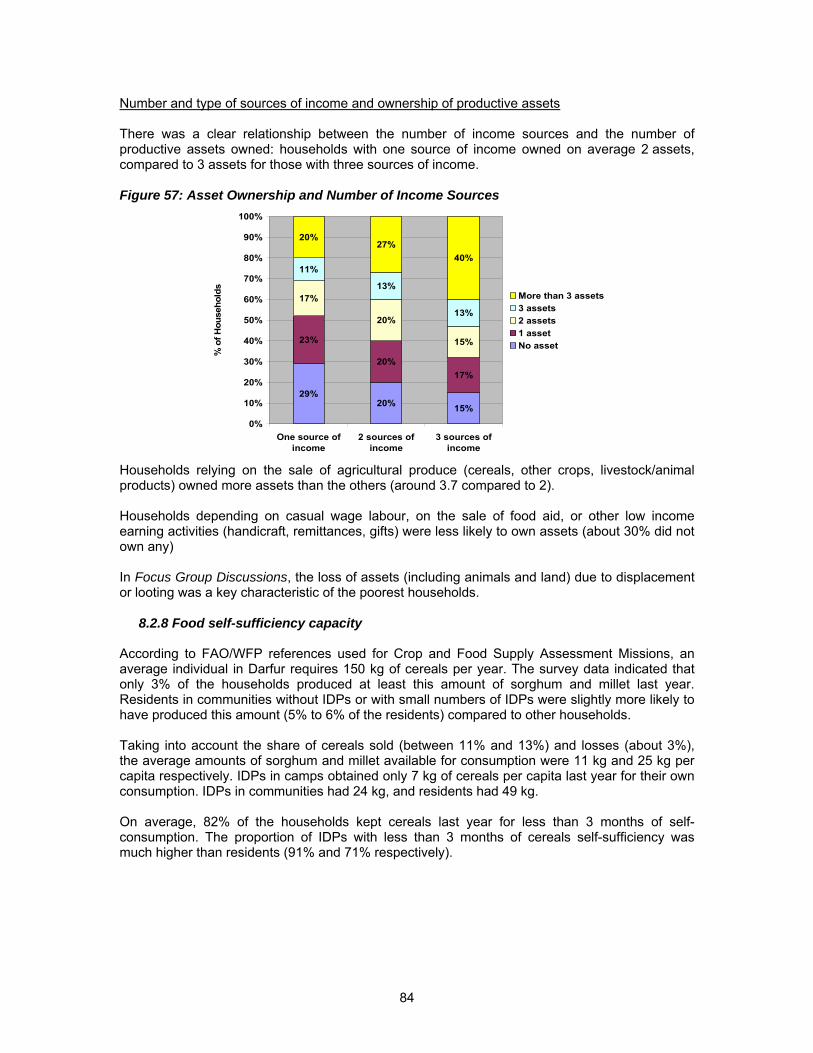
84
Number and type of sources of income and ownership of productive assets There was a clear relationship between the number of income sources and the number of productive assets owned: households with one source of income owned on average 2 assets, compared to 3 assets for those with three sources of income.
Figure 57: Asset Ownership and Number of Income Sources
29%20% 15%
23%
20%17%
17%
20%
15%
11%
13%
13%
20%27%
40%
0%
10%
20%
30%
40%
50%
60%
70%
80%
90%
100%
One source ofincome
2 sources ofincome
3 sources ofincome
% o
f Hou
seho
lds
More than 3 assets3 assets2 assets1 assetNo asset
Households relying on the sale of agricultural produce (cereals, other crops, livestock/animal products) owned more assets than the others (around 3.7 compared to 2). Households depending on casual wage labour, on the sale of food aid, or other low income earning activities (handicraft, remittances, gifts) were less likely to own assets (about 30% did not own any) In Focus Group Discussions, the loss of assets (including animals and land) due to displacement or looting was a key characteristic of the poorest households.
8.2.8 Food self-sufficiency capacity According to FAO/WFP references used for Crop and Food Supply Assessment Missions, an average individual in Darfur requires 150 kg of cereals per year. The survey data indicated that only 3% of the households produced at least this amount of sorghum and millet last year. Residents in communities without IDPs or with small numbers of IDPs were slightly more likely to have produced this amount (5% to 6% of the residents) compared to other households. Taking into account the share of cereals sold (between 11% and 13%) and losses (about 3%), the average amounts of sorghum and millet available for consumption were 11 kg and 25 kg per capita respectively. IDPs in camps obtained only 7 kg of cereals per capita last year for their own consumption. IDPs in communities had 24 kg, and residents had 49 kg. On average, 82% of the households kept cereals last year for less than 3 months of self-consumption. The proportion of IDPs with less than 3 months of cereals self-sufficiency was much higher than residents (91% and 71% respectively).
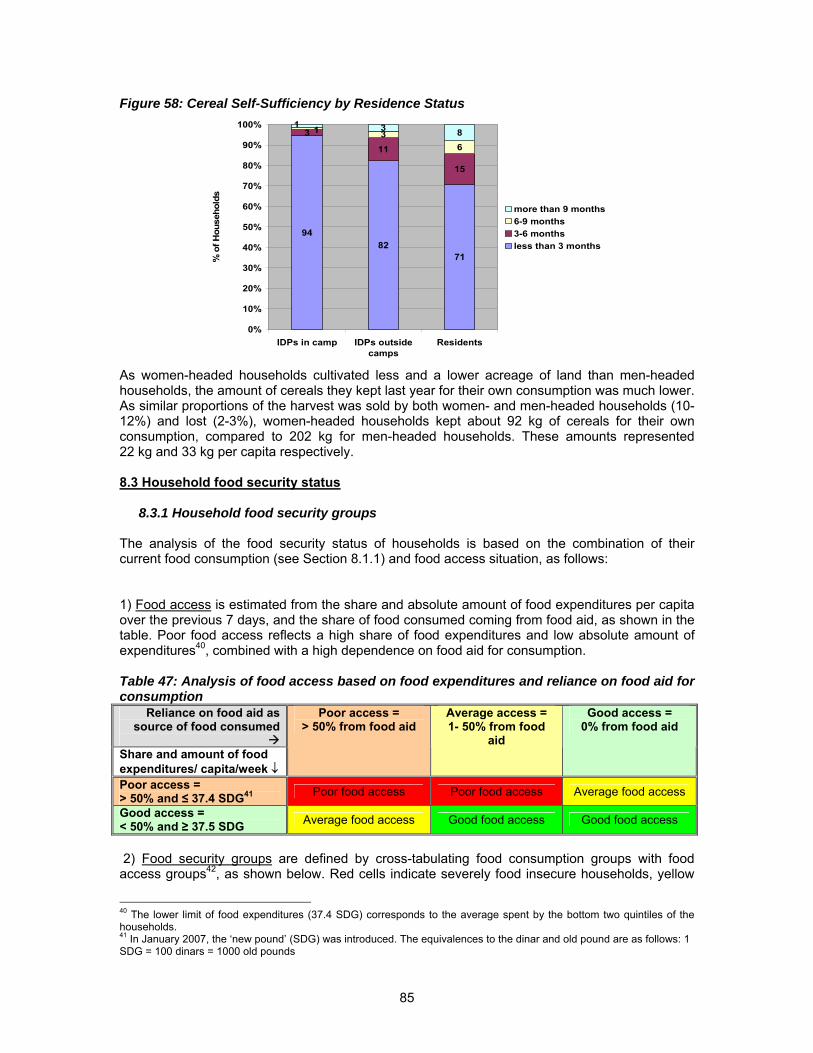
85
Figure 58: Cereal Self-Sufficiency by Residence Status
9482
71
3
11
15
36
3 811
0%
10%
20%
30%
40%
50%
60%
70%
80%
90%
100%
IDPs in camp IDPs outsidecamps
Residents
% o
f Hou
seho
lds
more than 9 months6-9 months3-6 monthsless than 3 months
As women-headed households cultivated less and a lower acreage of land than men-headed households, the amount of cereals they kept last year for their own consumption was much lower. As similar proportions of the harvest was sold by both women- and men-headed households (10-12%) and lost (2-3%), women-headed households kept about 92 kg of cereals for their own consumption, compared to 202 kg for men-headed households. These amounts represented 22 kg and 33 kg per capita respectively. 8.3 Household food security status
8.3.1 Household food security groups The analysis of the food security status of households is based on the combination of their current food consumption (see Section 8.1.1) and food access situation, as follows: 1) Food access is estimated from the share and absolute amount of food expenditures per capita over the previous 7 days, and the share of food consumed coming from food aid, as shown in the table. Poor food access reflects a high share of food expenditures and low absolute amount of expenditures40, combined with a high dependence on food aid for consumption. Table 47: Analysis of food access based on food expenditures and reliance on food aid for consumption
Reliance on food aid as source of food consumed
Share and amount of food expenditures/ capita/week ↓
Poor access = > 50% from food aid
Average access = 1- 50% from food
aid
Good access = 0% from food aid
Poor access = > 50% and ≤ 37.4 SDG41 Poor food access Poor food access Average food access
Good access = < 50% and ≥ 37.5 SDG Average food access Good food access Good food access
2) Food security groups are defined by cross-tabulating food consumption groups with food access groups42, as shown below. Red cells indicate severely food insecure households, yellow
40 The lower limit of food expenditures (37.4 SDG) corresponds to the average spent by the bottom two quintiles of the households. 41 In January 2007, the ‘new pound’ (SDG) was introduced. The equivalences to the dinar and old pound are as follows: 1 SDG = 100 dinars = 1000 old pounds
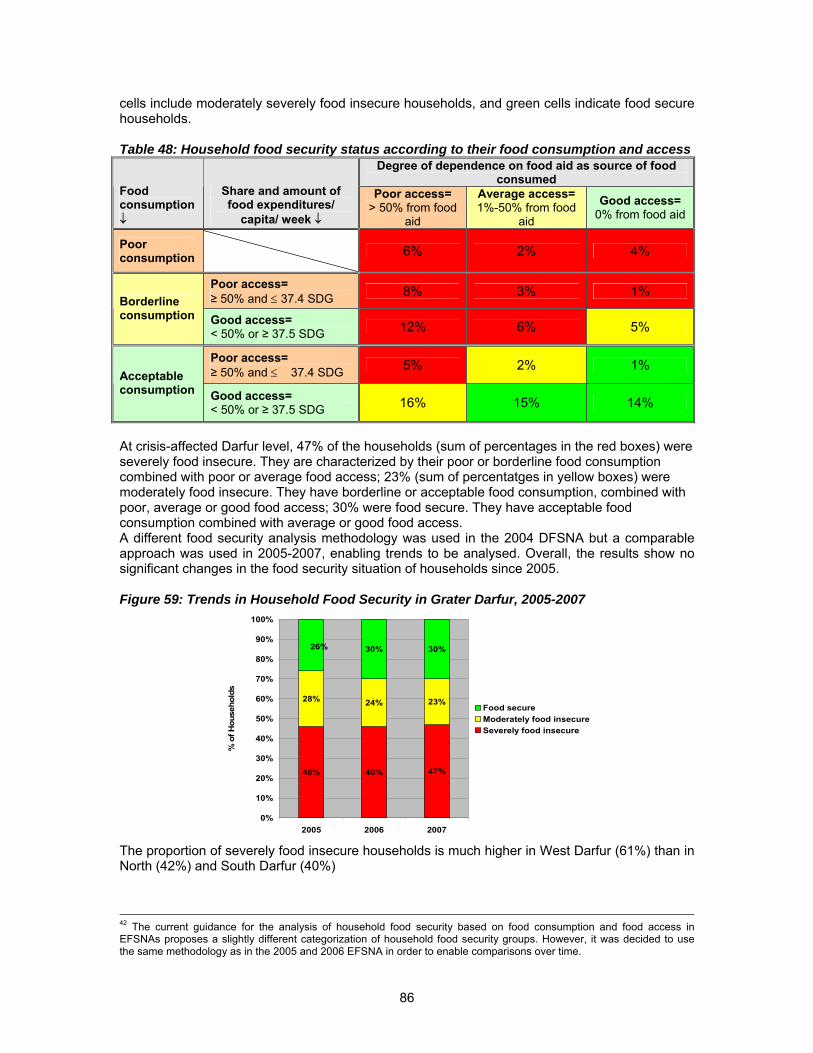
86
cells include moderately severely food insecure households, and green cells indicate food secure households. Table 48: Household food security status according to their food consumption and access
Degree of dependence on food aid as source of food consumed
Food consumption ↓
Share and amount of food expenditures/
capita/ week ↓
Poor access= > 50% from food
aid
Average access= 1%-50% from food
aid
Good access= 0% from food aid
Poor consumption
6% 2% 4%
Poor access= ≥ 50% and ≤ 37.4 SDG 8% 3% 1%
Borderline consumption Good access=
< 50% or ≥ 37.5 SDG 12% 6% 5%
Poor access= ≥ 50% and ≤ 37.4 SDG 5% 2% 1%
Acceptable consumption Good access=
< 50% or ≥ 37.5 SDG 16% 15% 14%
At crisis-affected Darfur level, 47% of the households (sum of percentages in the red boxes) were severely food insecure. They are characterized by their poor or borderline food consumption combined with poor or average food access; 23% (sum of percentatges in yellow boxes) were moderately food insecure. They have borderline or acceptable food consumption, combined with poor, average or good food access; 30% were food secure. They have acceptable food consumption combined with average or good food access. A different food security analysis methodology was used in the 2004 DFSNA but a comparable approach was used in 2005-2007, enabling trends to be analysed. Overall, the results show no significant changes in the food security situation of households since 2005. Figure 59: Trends in Household Food Security in Grater Darfur, 2005-2007
46% 46% 47%
28% 24% 23%
30% 30%26%
0%
10%
20%
30%
40%
50%
60%
70%
80%
90%
100%
2005 2006 2007
% o
f Hou
seho
lds
Food secureModerately food insecureSeverely food insecure
The proportion of severely food insecure households is much higher in West Darfur (61%) than in North (42%) and South Darfur (40%)
42 The current guidance for the analysis of household food security based on food consumption and food access in EFSNAs proposes a slightly different categorization of household food security groups. However, it was decided to use the same methodology as in the 2005 and 2006 EFSNA in order to enable comparisons over time.
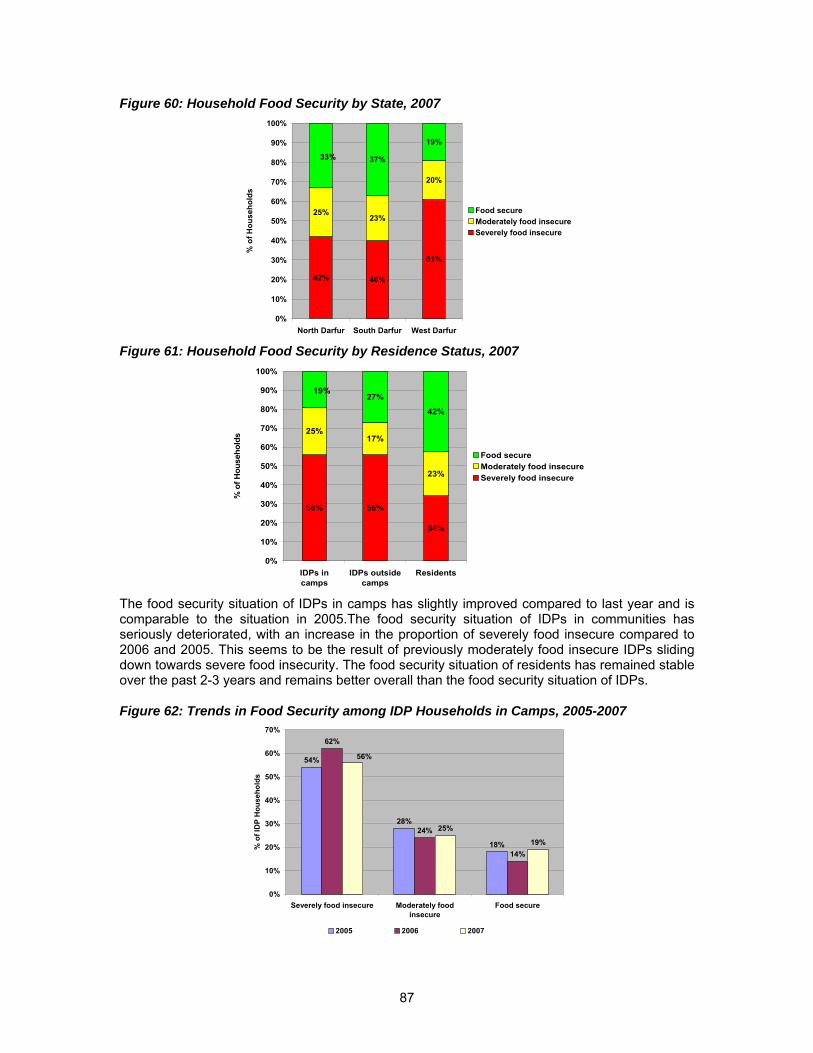
87
Figure 60: Household Food Security by State, 2007
42% 40%
61%
25%23%
20%
37%
19%
33%
0%
10%
20%
30%
40%
50%
60%
70%
80%
90%
100%
North Darfur South Darfur West Darfur
% o
f Hou
seho
lds
Food secureModerately food insecureSeverely food insecure
Figure 61: Household Food Security by Residence Status, 2007
56% 56%
34%
25%17%
23%
27%
42%
19%
0%
10%
20%
30%
40%
50%
60%
70%
80%
90%
100%
IDPs incamps
IDPs outsidecamps
Residents
% o
f Hou
seho
lds
Food secureModerately food insecureSeverely food insecure
The food security situation of IDPs in camps has slightly improved compared to last year and is comparable to the situation in 2005.The food security situation of IDPs in communities has seriously deteriorated, with an increase in the proportion of severely food insecure compared to 2006 and 2005. This seems to be the result of previously moderately food insecure IDPs sliding down towards severe food insecurity. The food security situation of residents has remained stable over the past 2-3 years and remains better overall than the food security situation of IDPs. Figure 62: Trends in Food Security among IDP Households in Camps, 2005-2007
54%
28%
18%
62%
24%
14%
25%
19%
56%
0%
10%
20%
30%
40%
50%
60%
70%
Severely food insecure Moderately foodinsecure
Food secure
% o
f ID
P H
ouse
hold
s
2005 2006 2007
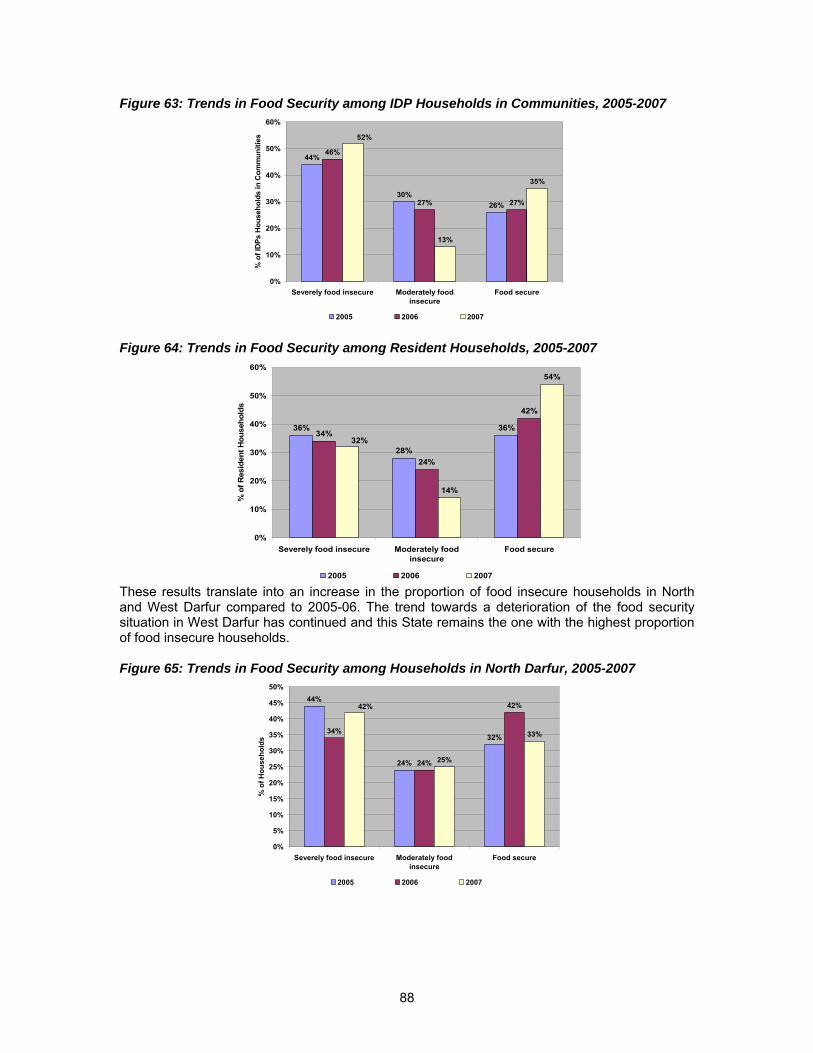
88
Figure 63: Trends in Food Security among IDP Households in Communities, 2005-2007
44%
30%26%
46%
27% 27%
13%
35%
52%
0%
10%
20%
30%
40%
50%
60%
Severely food insecure Moderately foodinsecure
Food secure
% o
f ID
Ps H
ouse
hold
s in
Com
mun
ities
2005 2006 2007 Figure 64: Trends in Food Security among Resident Households, 2005-2007
36%
28%
36%34%
24%
42%
14%
54%
32%
0%
10%
20%
30%
40%
50%
60%
Severely food insecure Moderately foodinsecure
Food secure
% o
f Res
iden
t Hou
seho
lds
2005 2006 2007 These results translate into an increase in the proportion of food insecure households in North and West Darfur compared to 2005-06. The trend towards a deterioration of the food security situation in West Darfur has continued and this State remains the one with the highest proportion of food insecure households. Figure 65: Trends in Food Security among Households in North Darfur, 2005-2007
44%
24%
32%34%
24%
42%
25%
33%
42%
0%
5%
10%
15%
20%
25%
30%
35%
40%
45%
50%
Severely food insecure Moderately foodinsecure
Food secure
% o
f Hou
seho
lds
2005 2006 2007
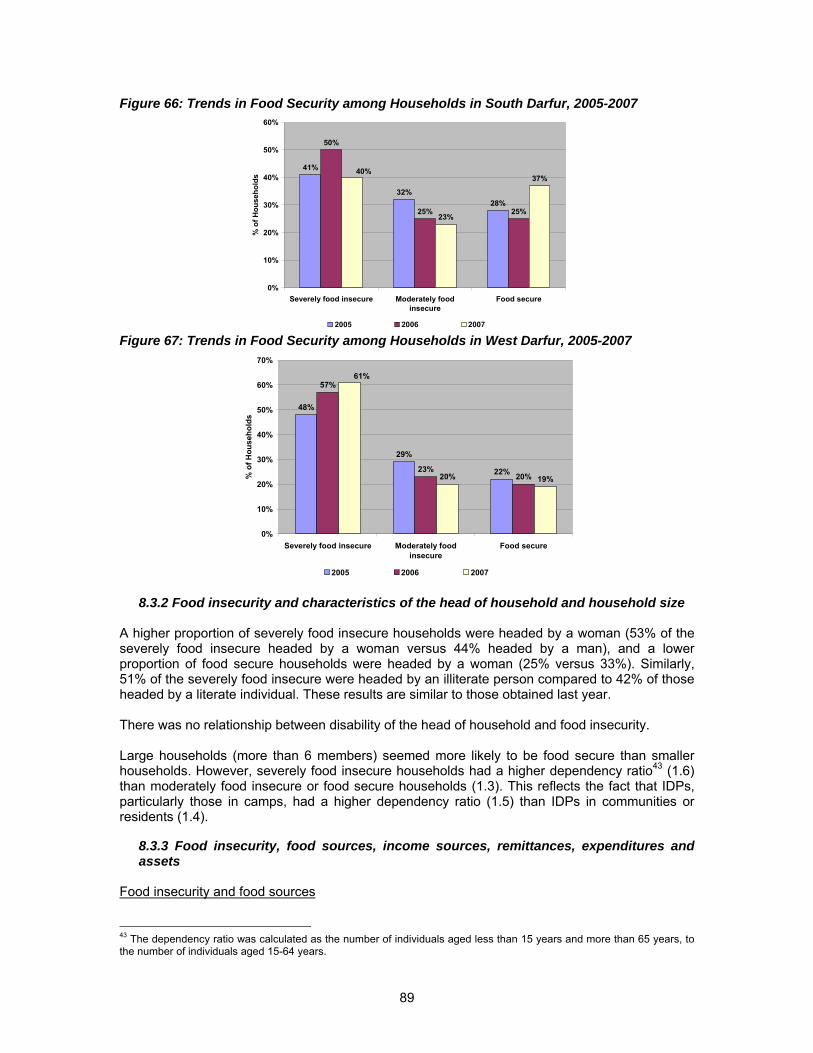
89
Figure 66: Trends in Food Security among Households in South Darfur, 2005-2007
41%
32%28%
50%
25% 25%23%
37%40%
0%
10%
20%
30%
40%
50%
60%
Severely food insecure Moderately foodinsecure
Food secure
% o
f Hou
seho
lds
2005 2006 2007 Figure 67: Trends in Food Security among Households in West Darfur, 2005-2007
48%
29%
22%
57%
23%20%20% 19%
61%
0%
10%
20%
30%
40%
50%
60%
70%
Severely food insecure Moderately foodinsecure
Food secure
% o
f Hou
seho
lds
2005 2006 2007
8.3.2 Food insecurity and characteristics of the head of household and household size A higher proportion of severely food insecure households were headed by a woman (53% of the severely food insecure headed by a woman versus 44% headed by a man), and a lower proportion of food secure households were headed by a woman (25% versus 33%). Similarly, 51% of the severely food insecure were headed by an illiterate person compared to 42% of those headed by a literate individual. These results are similar to those obtained last year. There was no relationship between disability of the head of household and food insecurity. Large households (more than 6 members) seemed more likely to be food secure than smaller households. However, severely food insecure households had a higher dependency ratio43 (1.6) than moderately food insecure or food secure households (1.3). This reflects the fact that IDPs, particularly those in camps, had a higher dependency ratio (1.5) than IDPs in communities or residents (1.4).
8.3.3 Food insecurity, food sources, income sources, remittances, expenditures and assets
Food insecurity and food sources 43 The dependency ratio was calculated as the number of individuals aged less than 15 years and more than 65 years, to the number of individuals aged 15-64 years.
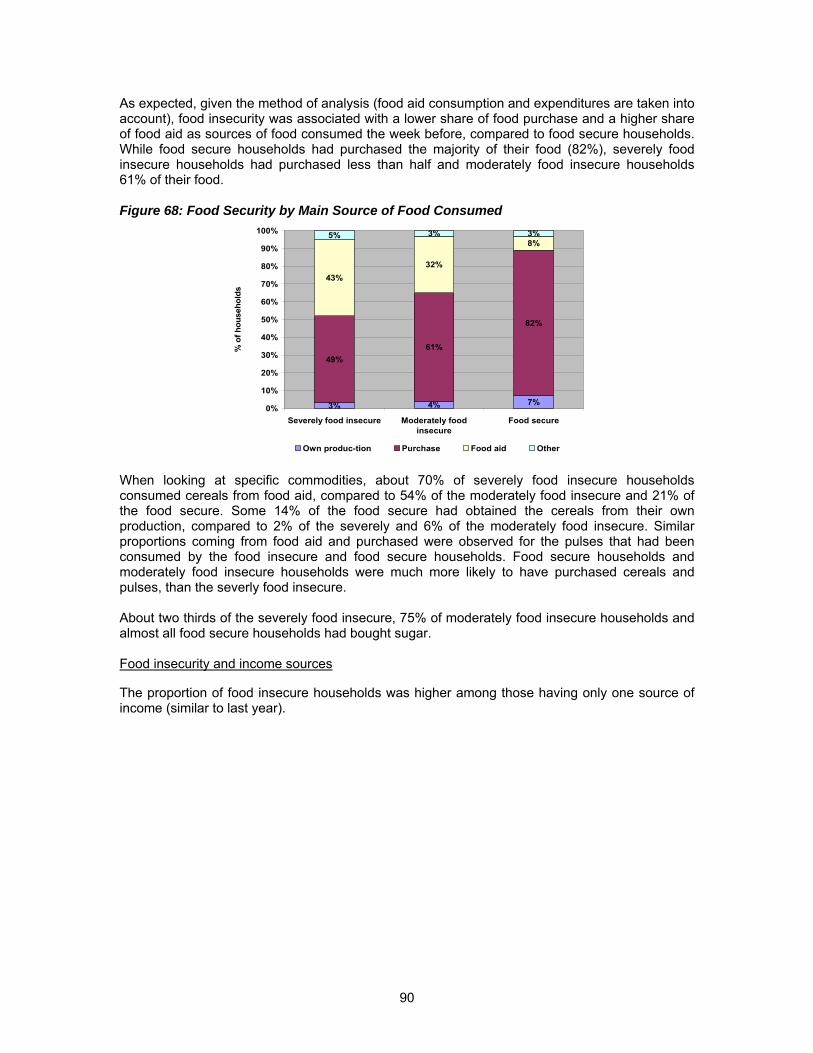
90
As expected, given the method of analysis (food aid consumption and expenditures are taken into account), food insecurity was associated with a lower share of food purchase and a higher share of food aid as sources of food consumed the week before, compared to food secure households. While food secure households had purchased the majority of their food (82%), severely food insecure households had purchased less than half and moderately food insecure households 61% of their food.
Figure 68: Food Security by Main Source of Food Consumed
3% 4% 7%
49%61%
82%
43%32%
8%5% 3% 3%
0%
10%
20%
30%
40%
50%
60%
70%
80%
90%
100%
Severely food insecure Moderately foodinsecure
Food secure
% o
f hou
seho
lds
Own produc-tion Purchase Food aid Other When looking at specific commodities, about 70% of severely food insecure households consumed cereals from food aid, compared to 54% of the moderately food insecure and 21% of the food secure. Some 14% of the food secure had obtained the cereals from their own production, compared to 2% of the severely and 6% of the moderately food insecure. Similar proportions coming from food aid and purchased were observed for the pulses that had been consumed by the food insecure and food secure households. Food secure households and moderately food insecure households were much more likely to have purchased cereals and pulses, than the severly food insecure. About two thirds of the severely food insecure, 75% of moderately food insecure households and almost all food secure households had bought sugar. Food insecurity and income sources The proportion of food insecure households was higher among those having only one source of income (similar to last year).
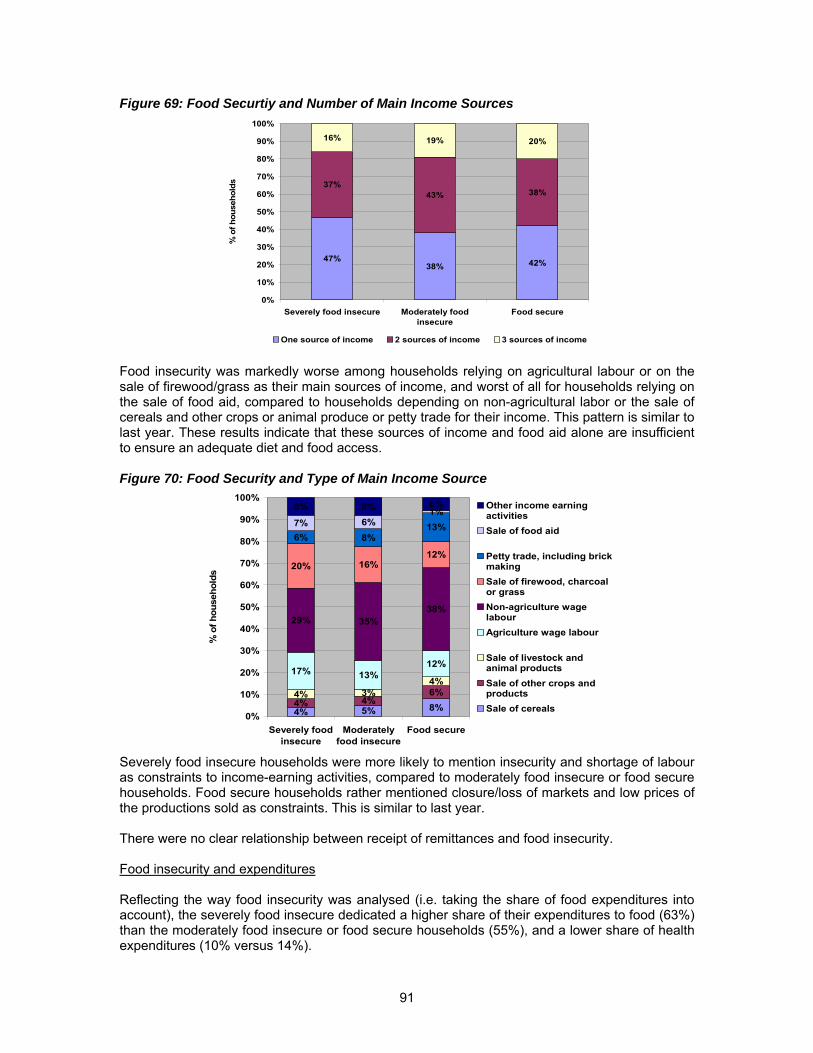
91
Figure 69: Food Securtiy and Number of Main Income Sources
47%38% 42%
37%43% 38%
16% 19% 20%
0%
10%
20%
30%
40%
50%
60%
70%
80%
90%
100%
Severely food insecure Moderately foodinsecure
Food secure
% o
f hou
seho
lds
One source of income 2 sources of income 3 sources of income Food insecurity was markedly worse among households relying on agricultural labour or on the sale of firewood/grass as their main sources of income, and worst of all for households relying on the sale of food aid, compared to households depending on non-agricultural labor or the sale of cereals and other crops or animal produce or petty trade for their income. This pattern is similar to last year. These results indicate that these sources of income and food aid alone are insufficient to ensure an adequate diet and food access. Figure 70: Food Security and Type of Main Income Source
4% 5% 8%4% 4%6%4% 3%4%
17% 13%12%
29% 35%38%
20% 16%12%
6% 8%13%7% 6%1%8% 8% 6%
0%
10%
20%
30%
40%
50%
60%
70%
80%
90%
100%
Severely foodinsecure
Moderatelyfood insecure
Food secure
% o
f hou
seho
lds
Other income earningactivitiesSale of food aid
Petty trade, including brickmakingSale of firewood, charcoalor grassNon-agriculture wagelabourAgriculture wage labour
Sale of livestock andanimal productsSale of other crops andproductsSale of cereals
Severely food insecure households were more likely to mention insecurity and shortage of labour as constraints to income-earning activities, compared to moderately food insecure or food secure households. Food secure households rather mentioned closure/loss of markets and low prices of the productions sold as constraints. This is similar to last year. There were no clear relationship between receipt of remittances and food insecurity. Food insecurity and expenditures Reflecting the way food insecurity was analysed (i.e. taking the share of food expenditures into account), the severely food insecure dedicated a higher share of their expenditures to food (63%) than the moderately food insecure or food secure households (55%), and a lower share of health expenditures (10% versus 14%).
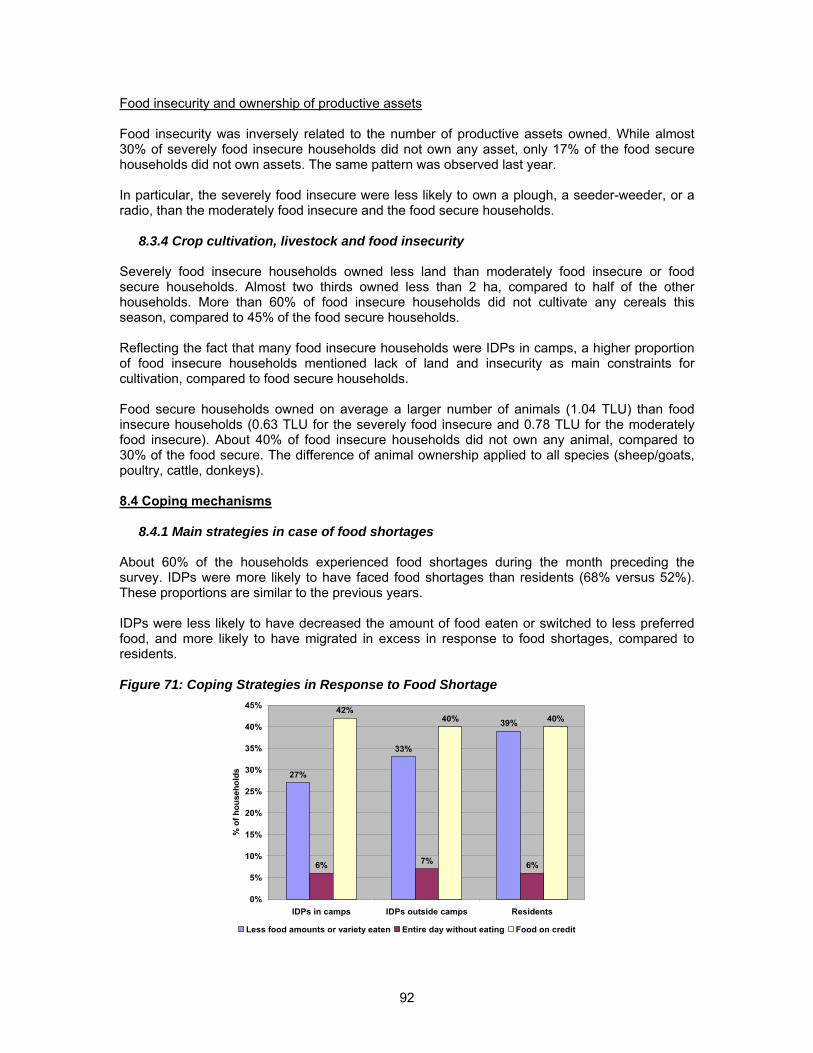
92
Food insecurity and ownership of productive assets Food insecurity was inversely related to the number of productive assets owned. While almost 30% of severely food insecure households did not own any asset, only 17% of the food secure households did not own assets. The same pattern was observed last year. In particular, the severely food insecure were less likely to own a plough, a seeder-weeder, or a radio, than the moderately food insecure and the food secure households.
8.3.4 Crop cultivation, livestock and food insecurity
Severely food insecure households owned less land than moderately food insecure or food secure households. Almost two thirds owned less than 2 ha, compared to half of the other households. More than 60% of food insecure households did not cultivate any cereals this season, compared to 45% of the food secure households. Reflecting the fact that many food insecure households were IDPs in camps, a higher proportion of food insecure households mentioned lack of land and insecurity as main constraints for cultivation, compared to food secure households. Food secure households owned on average a larger number of animals (1.04 TLU) than food insecure households (0.63 TLU for the severely food insecure and 0.78 TLU for the moderately food insecure). About 40% of food insecure households did not own any animal, compared to 30% of the food secure. The difference of animal ownership applied to all species (sheep/goats, poultry, cattle, donkeys). 8.4 Coping mechanisms
8.4.1 Main strategies in case of food shortages About 60% of the households experienced food shortages during the month preceding the survey. IDPs were more likely to have faced food shortages than residents (68% versus 52%). These proportions are similar to the previous years.
IDPs were less likely to have decreased the amount of food eaten or switched to less preferred food, and more likely to have migrated in excess in response to food shortages, compared to residents.
Figure 71: Coping Strategies in Response to Food Shortage
27%
33%
39%
6% 7% 6%
42%40% 40%
0%
5%
10%
15%
20%
25%
30%
35%
40%
45%
IDPs in camps IDPs outside camps Residents
% o
f hou
seho
lds
Less food amounts or variety eaten Entire day without eating Food on credit
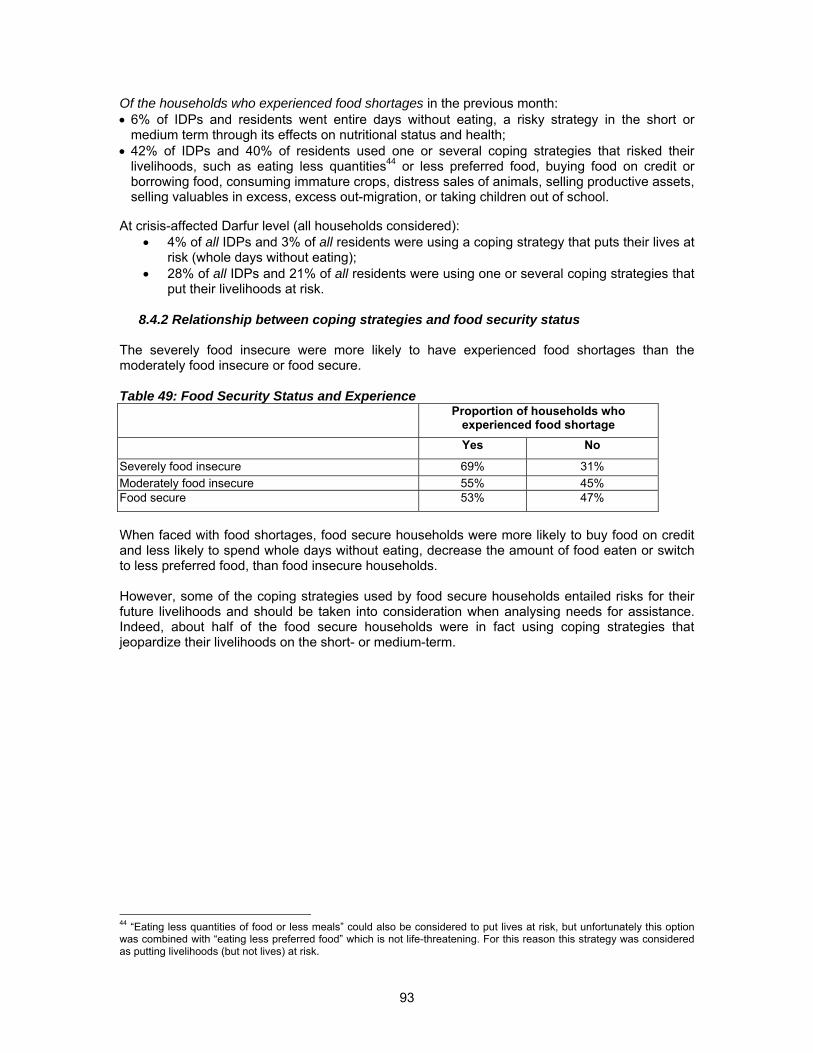
93
Of the households who experienced food shortages in the previous month: • 6% of IDPs and residents went entire days without eating, a risky strategy in the short or
medium term through its effects on nutritional status and health; • 42% of IDPs and 40% of residents used one or several coping strategies that risked their
livelihoods, such as eating less quantities44 or less preferred food, buying food on credit or borrowing food, consuming immature crops, distress sales of animals, selling productive assets, selling valuables in excess, excess out-migration, or taking children out of school.
At crisis-affected Darfur level (all households considered):
• 4% of all IDPs and 3% of all residents were using a coping strategy that puts their lives at risk (whole days without eating);
• 28% of all IDPs and 21% of all residents were using one or several coping strategies that put their livelihoods at risk.
8.4.2 Relationship between coping strategies and food security status
The severely food insecure were more likely to have experienced food shortages than the moderately food insecure or food secure.
Table 49: Food Security Status and Experience Proportion of households who
experienced food shortage Yes No
Severely food insecure 69% 31% Moderately food insecure 55% 45% Food secure 53% 47%
When faced with food shortages, food secure households were more likely to buy food on credit and less likely to spend whole days without eating, decrease the amount of food eaten or switch to less preferred food, than food insecure households. However, some of the coping strategies used by food secure households entailed risks for their future livelihoods and should be taken into consideration when analysing needs for assistance. Indeed, about half of the food secure households were in fact using coping strategies that jeopardize their livelihoods on the short- or medium-term.
44 “Eating less quantities of food or less meals” could also be considered to put lives at risk, but unfortunately this option was combined with “eating less preferred food” which is not life-threatening. For this reason this strategy was considered as putting livelihoods (but not lives) at risk.
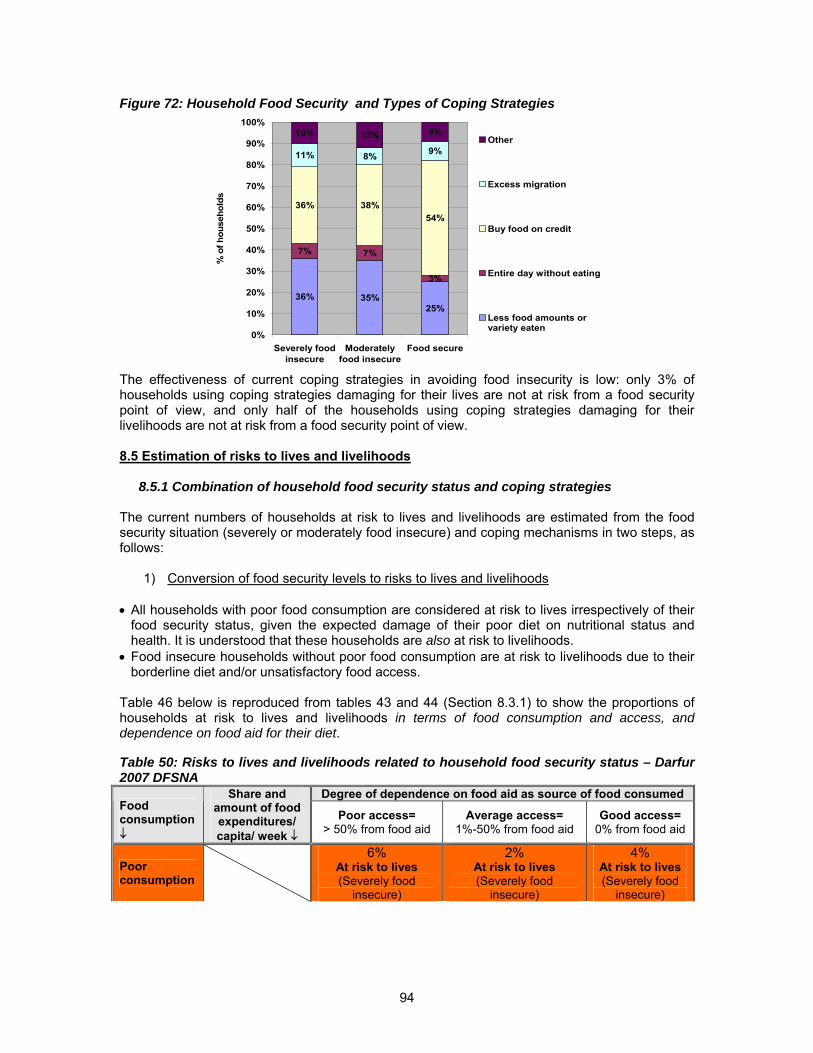
94
Figure 72: Household Food Security and Types of Coping Strategies
36% 35%25%
7% 7%
3%
36% 38%54%
11% 8% 9%
10% 12% 9%
0%
10%
20%
30%
40%
50%
60%
70%
80%
90%
100%
Severely foodinsecure
Moderatelyfood insecure
Food secure
% o
f hou
seho
lds
Other
Excess migration
Buy food on credit
Entire day without eating
Less food amounts orvariety eaten
The effectiveness of current coping strategies in avoiding food insecurity is low: only 3% of households using coping strategies damaging for their lives are not at risk from a food security point of view, and only half of the households using coping strategies damaging for their livelihoods are not at risk from a food security point of view. 8.5 Estimation of risks to lives and livelihoods
8.5.1 Combination of household food security status and coping strategies The current numbers of households at risk to lives and livelihoods are estimated from the food security situation (severely or moderately food insecure) and coping mechanisms in two steps, as follows:
1) Conversion of food security levels to risks to lives and livelihoods • All households with poor food consumption are considered at risk to lives irrespectively of their
food security status, given the expected damage of their poor diet on nutritional status and health. It is understood that these households are also at risk to livelihoods.
• Food insecure households without poor food consumption are at risk to livelihoods due to their borderline diet and/or unsatisfactory food access.
Table 46 below is reproduced from tables 43 and 44 (Section 8.3.1) to show the proportions of households at risk to lives and livelihoods in terms of food consumption and access, and dependence on food aid for their diet.
Table 50: Risks to lives and livelihoods related to household food security status – Darfur 2007 DFSNA
Degree of dependence on food aid as source of food consumed Food consumption ↓
Share and amount of food expenditures/ capita/ week ↓
Poor access= > 50% from food aid
Average access= 1%-50% from food aid
Good access= 0% from food aid
Poor consumption
6% At risk to lives (Severely food
insecure)
2% At risk to lives (Severely food
insecure)
4% At risk to lives (Severely food
insecure)
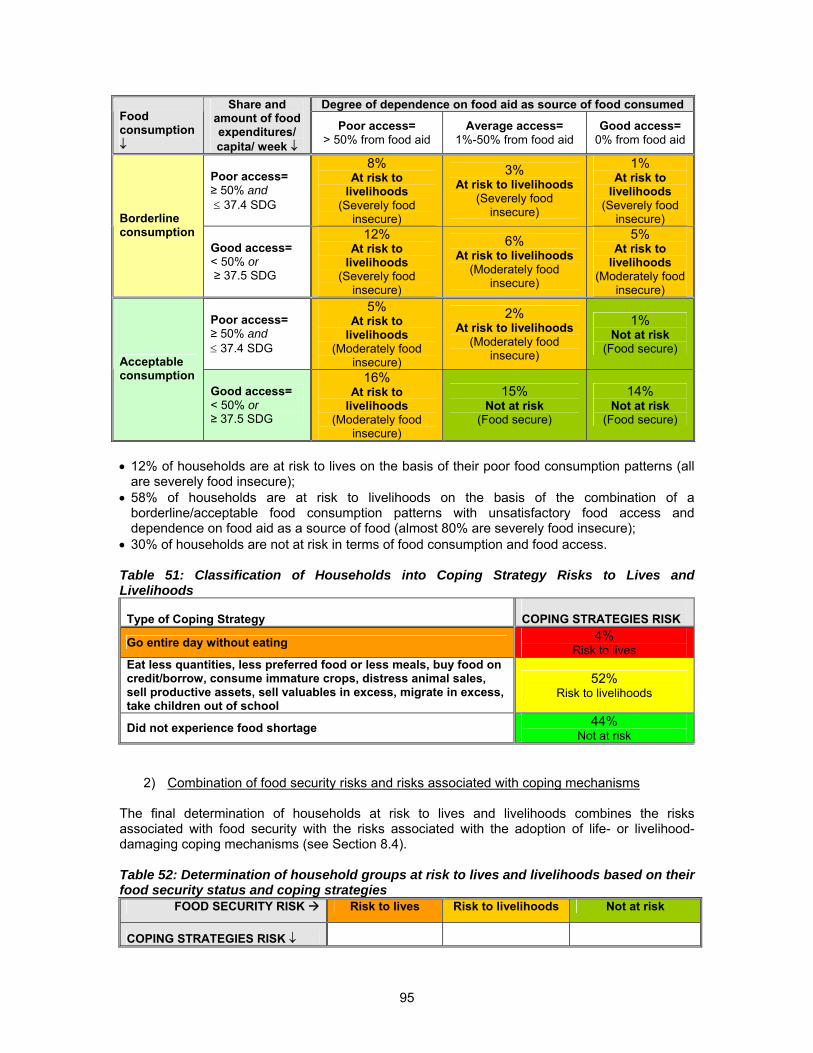
95
Degree of dependence on food aid as source of food consumed Food consumption ↓
Share and amount of food expenditures/ capita/ week ↓
Poor access= > 50% from food aid
Average access= 1%-50% from food aid
Good access= 0% from food aid
Poor access= ≥ 50% and ≤ 37.4 SDG
8% At risk to
livelihoods (Severely food
insecure)
3% At risk to livelihoods
(Severely food insecure)
1% At risk to
livelihoods (Severely food
insecure) Borderline consumption
Good access= < 50% or ≥ 37.5 SDG
12% At risk to
livelihoods (Severely food
insecure)
6% At risk to livelihoods
(Moderately food insecure)
5% At risk to
livelihoods (Moderately food
insecure)
Poor access= ≥ 50% and ≤ 37.4 SDG
5% At risk to
livelihoods (Moderately food
insecure)
2% At risk to livelihoods
(Moderately food insecure)
1% Not at risk
(Food secure) Acceptable consumption
Good access= < 50% or ≥ 37.5 SDG
16% At risk to
livelihoods (Moderately food
insecure)
15% Not at risk
(Food secure)
14% Not at risk
(Food secure)
• 12% of households are at risk to lives on the basis of their poor food consumption patterns (all
are severely food insecure); • 58% of households are at risk to livelihoods on the basis of the combination of a
borderline/acceptable food consumption patterns with unsatisfactory food access and dependence on food aid as a source of food (almost 80% are severely food insecure);
• 30% of households are not at risk in terms of food consumption and food access. Table 51: Classification of Households into Coping Strategy Risks to Lives and Livelihoods
Type of Coping Strategy COPING STRATEGIES RISK
Go entire day without eating 4% Risk to lives
Eat less quantities, less preferred food or less meals, buy food on credit/borrow, consume immature crops, distress animal sales, sell productive assets, sell valuables in excess, migrate in excess, take children out of school
52% Risk to livelihoods
Did not experience food shortage 44% Not at risk
2) Combination of food security risks and risks associated with coping mechanisms The final determination of households at risk to lives and livelihoods combines the risks associated with food security with the risks associated with the adoption of life- or livelihood-damaging coping mechanisms (see Section 8.4). Table 52: Determination of household groups at risk to lives and livelihoods based on their food security status and coping strategies
FOOD SECURITY RISK Risk to lives Risk to livelihoods Not at risk
COPING STRATEGIES RISK ↓
96
FOOD SECURITY RISK Risk to lives Risk to livelihoods Not at risk
COPING STRATEGIES RISK ↓
Risk to lives 1% Risk to lives
2% Risk to lives
1% Risk to lives
Risk to livelihoods 7% Risk to lives
30% Risk to livelihoods
15% Risk to livelihoods
Not at risk 3% Risk to lives
25% Risk to livelihoods
16% Not at risk
At the time of the survey (August 2007):
• 14% households were at risk to lives (sum of figures in all red boxes), and 70% at risk to livelihoods (sum of figures in all yellow boxes) on the basis of their food consumption patterns, food access and coping strategies employed. Only 16% were currently not at risk considering their food security status and coping strategies (figure in green box at the bottom right corner of the above table).
• Of the households at risk to lives, about 80% are severely food insecure, and almost 30% use a highly damaging coping strategy;
• Of the households at risk to livelihoods, more than 1/3rd are severely food insecure, almost half are moderately food insecure, and 2/3rd use coping strategies damaging their livelihoods.
About half of the households not at risk on the basis of their food security situation are in fact using coping mechanisms that put their livelihoods at risk.
8.5.2 Groups at risk to lives and livelihoods IDPs and residents IDPs in communities were the most likely to be at risk to lives (20%) compared to IDPs in camps (14%) or residents (12%). This is partly linked to the higher proportion of IDPs in communities having a poor diet which threatens their health and nutritional status (16%), compared to IDPs in camps (12%) and residents (9%). However, IDPs in camps were the most likely to be at risk to livelihoods (78%) compared to IDPs in communities (63%) or residents (65%), mostly because of their poor food access (high reliance on food aid and low food expenditures). About a quarter of residents were not at risk (24%), compared to only 8% of IDPs in camps and 17% of IDPs in communities. Characteristics of the head of household A higher proportion of women-headed households were at risk to lives and livelihoods (88%) than male-headed households (82%). Type of income sources Households relying on only one source of income, and households depending mainly on agricultural wage labour or on the sale of firewood/grass for their income were more likely to be at risk to lives than other households.
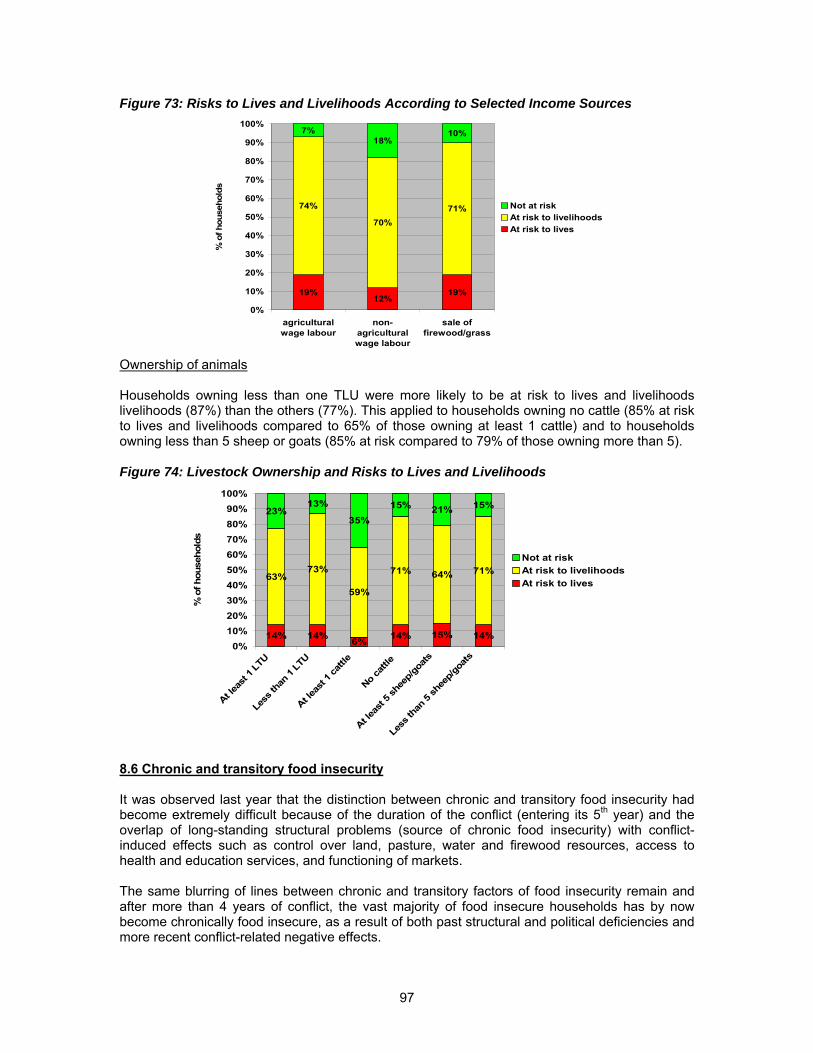
97
Figure 73: Risks to Lives and Livelihoods According to Selected Income Sources
19%12%
19%
74%
70%71%
7%18%
10%
0%
10%
20%
30%
40%
50%
60%
70%
80%
90%
100%
agriculturalwage labour
non-agriculturalwage labour
sale offirewood/grass
% o
f hou
seho
lds
Not at riskAt risk to livelihoodsAt risk to lives
Ownership of animals Households owning less than one TLU were more likely to be at risk to lives and livelihoods livelihoods (87%) than the others (77%). This applied to households owning no cattle (85% at risk to lives and livelihoods compared to 65% of those owning at least 1 cattle) and to households owning less than 5 sheep or goats (85% at risk compared to 79% of those owning more than 5).
Figure 74: Livestock Ownership and Risks to Lives and Livelihoods
14% 14% 6% 14% 15% 14%
63%73%
59%
71% 64% 71%
23%13%
35%15% 21% 15%
0%10%20%30%40%50%60%70%80%90%
100%
At leas
t 1 LT
U
Less
than
1 LT
U
At leas
t 1 ca
ttle
No catt
le
At leas
t 5 sh
eep/g
oats
Less
than
5 sh
eep/g
oats
% o
f hou
seho
lds
Not at riskAt risk to livelihoodsAt risk to lives
8.6 Chronic and transitory food insecurity It was observed last year that the distinction between chronic and transitory food insecurity had become extremely difficult because of the duration of the conflict (entering its 5th year) and the overlap of long-standing structural problems (source of chronic food insecurity) with conflict-induced effects such as control over land, pasture, water and firewood resources, access to health and education services, and functioning of markets. The same blurring of lines between chronic and transitory factors of food insecurity remain and after more than 4 years of conflict, the vast majority of food insecure households has by now become chronically food insecure, as a result of both past structural and political deficiencies and more recent conflict-related negative effects.

98
Assuming that safe access to fields to harvest will be granted and the good rains early in the season this year continue, this may avoid a worsening of the food security situation of chronically food insecure households who were able to plant. However, sporadic fightings, looting and violence in localized areas will continue to deepen the severity of chronic food insecurity for the rest of the households.
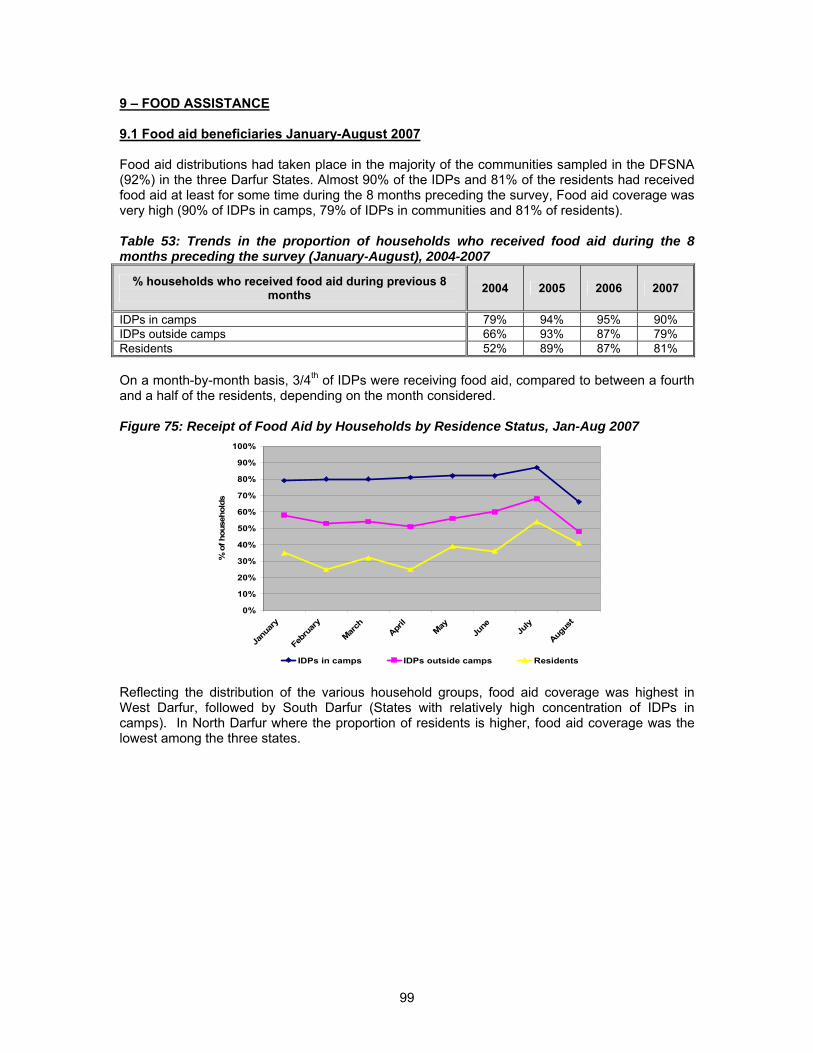
99
9 – FOOD ASSISTANCE 9.1 Food aid beneficiaries January-August 2007 Food aid distributions had taken place in the majority of the communities sampled in the DFSNA (92%) in the three Darfur States. Almost 90% of the IDPs and 81% of the residents had received food aid at least for some time during the 8 months preceding the survey, Food aid coverage was very high (90% of IDPs in camps, 79% of IDPs in communities and 81% of residents). Table 53: Trends in the proportion of households who received food aid during the 8 months preceding the survey (January-August), 2004-2007
% households who received food aid during previous 8 months 2004 2005 2006 2007
IDPs in camps 79% 94% 95% 90% IDPs outside camps 66% 93% 87% 79% Residents 52% 89% 87% 81% On a month-by-month basis, 3/4th of IDPs were receiving food aid, compared to between a fourth and a half of the residents, depending on the month considered.
Figure 75: Receipt of Food Aid by Households by Residence Status, Jan-Aug 2007
0%
10%
20%
30%
40%
50%
60%
70%
80%
90%
100%
Janu
ary
Febr
uary
March
April
MayJu
ne July
Augus
t
% o
f hou
seho
lds
IDPs in camps IDPs outside camps Residents Reflecting the distribution of the various household groups, food aid coverage was highest in West Darfur, followed by South Darfur (States with relatively high concentration of IDPs in camps). In North Darfur where the proportion of residents is higher, food aid coverage was the lowest among the three states.
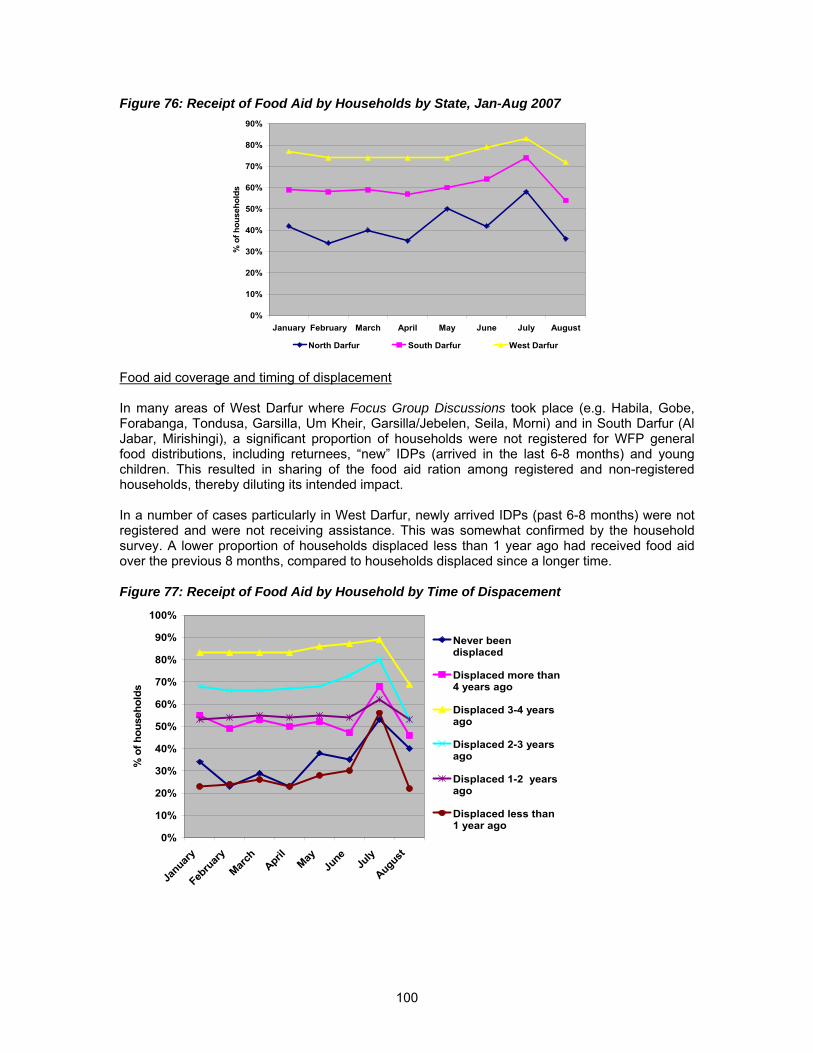
100
Figure 76: Receipt of Food Aid by Households by State, Jan-Aug 2007
0%
10%
20%
30%
40%
50%
60%
70%
80%
90%
January February March April May June July August
% o
f hou
seho
lds
North Darfur South Darfur West Darfur Food aid coverage and timing of displacement In many areas of West Darfur where Focus Group Discussions took place (e.g. Habila, Gobe, Forabanga, Tondusa, Garsilla, Um Kheir, Garsilla/Jebelen, Seila, Morni) and in South Darfur (Al Jabar, Mirishingi), a significant proportion of households were not registered for WFP general food distributions, including returnees, “new” IDPs (arrived in the last 6-8 months) and young children. This resulted in sharing of the food aid ration among registered and non-registered households, thereby diluting its intended impact. In a number of cases particularly in West Darfur, newly arrived IDPs (past 6-8 months) were not registered and were not receiving assistance. This was somewhat confirmed by the household survey. A lower proportion of households displaced less than 1 year ago had received food aid over the previous 8 months, compared to households displaced since a longer time. Figure 77: Receipt of Food Aid by Household by Time of Dispacement
0%
10%
20%
30%
40%
50%
60%
70%
80%
90%
100%
January
Febru
ary
March
AprilMay
June
July
August
% o
f hou
seho
lds
Never beendisplaced
Displaced more than4 years ago
Displaced 3-4 yearsago
Displaced 2-3 yearsago
Displaced 1-2 yearsago
Displaced less than1 year ago
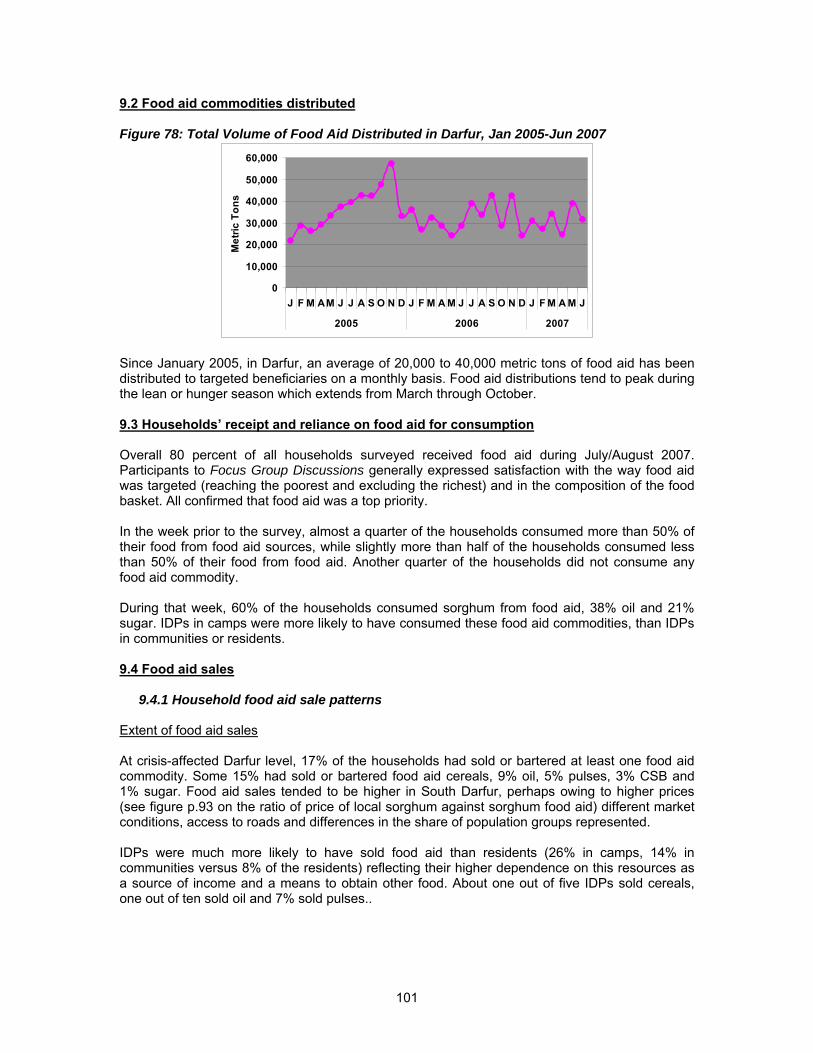
101
9.2 Food aid commodities distributed Figure 78: Total Volume of Food Aid Distributed in Darfur, Jan 2005-Jun 2007
0
10,000
20,000
30,000
40,000
50,000
60,000
J F M AM J J A S O N D J F M A M J J A S O N D J F M A M J
2005 2006 2007
Met
ric T
ons
Since January 2005, in Darfur, an average of 20,000 to 40,000 metric tons of food aid has been distributed to targeted beneficiaries on a monthly basis. Food aid distributions tend to peak during the lean or hunger season which extends from March through October. 9.3 Households’ receipt and reliance on food aid for consumption Overall 80 percent of all households surveyed received food aid during July/August 2007. Participants to Focus Group Discussions generally expressed satisfaction with the way food aid was targeted (reaching the poorest and excluding the richest) and in the composition of the food basket. All confirmed that food aid was a top priority. In the week prior to the survey, almost a quarter of the households consumed more than 50% of their food from food aid sources, while slightly more than half of the households consumed less than 50% of their food from food aid. Another quarter of the households did not consume any food aid commodity. During that week, 60% of the households consumed sorghum from food aid, 38% oil and 21% sugar. IDPs in camps were more likely to have consumed these food aid commodities, than IDPs in communities or residents. 9.4 Food aid sales
9.4.1 Household food aid sale patterns Extent of food aid sales At crisis-affected Darfur level, 17% of the households had sold or bartered at least one food aid commodity. Some 15% had sold or bartered food aid cereals, 9% oil, 5% pulses, 3% CSB and 1% sugar. Food aid sales tended to be higher in South Darfur, perhaps owing to higher prices (see figure p.93 on the ratio of price of local sorghum against sorghum food aid) different market conditions, access to roads and differences in the share of population groups represented. IDPs were much more likely to have sold food aid than residents (26% in camps, 14% in communities versus 8% of the residents) reflecting their higher dependence on this resources as a source of income and a means to obtain other food. About one out of five IDPs sold cereals, one out of ten sold oil and 7% sold pulses..
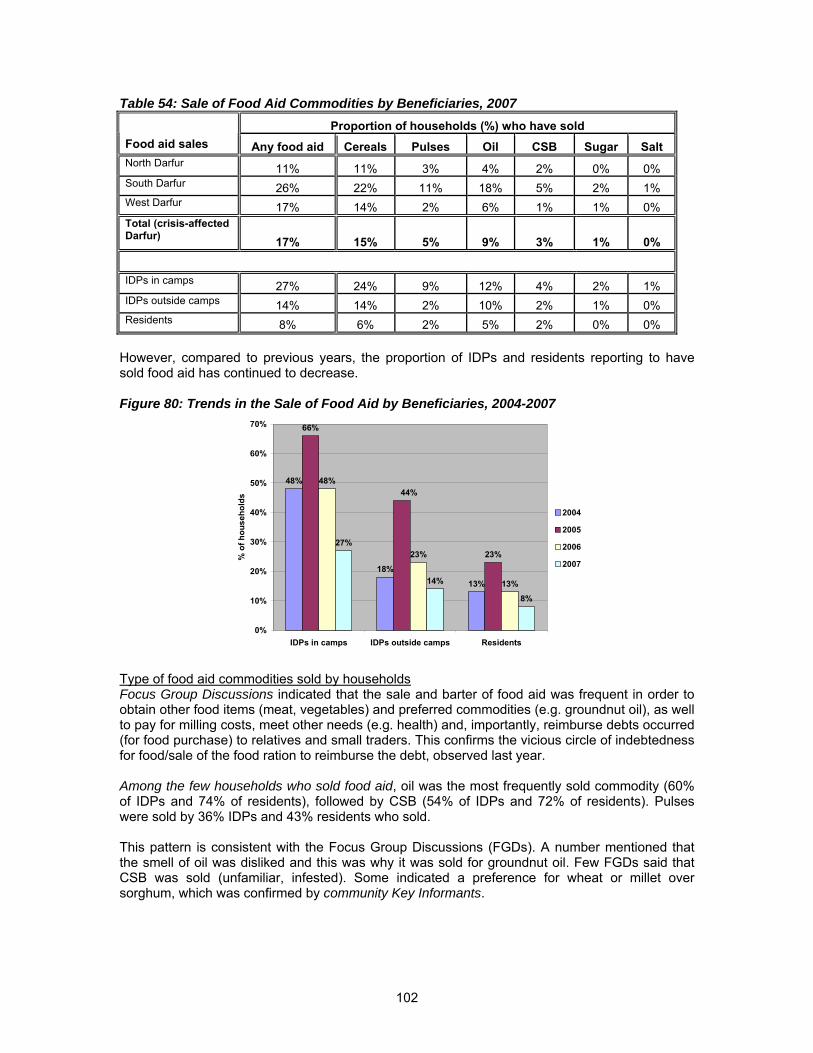
102
Table 54: Sale of Food Aid Commodities by Beneficiaries, 2007 Proportion of households (%) who have sold
Food aid sales Any food aid Cereals Pulses Oil CSB Sugar Salt North Darfur 11% 11% 3% 4% 2% 0% 0% South Darfur 26% 22% 11% 18% 5% 2% 1% West Darfur 17% 14% 2% 6% 1% 1% 0% Total (crisis-affected Darfur) 17% 15% 5% 9% 3% 1% 0%
IDPs in camps 27% 24% 9% 12% 4% 2% 1% IDPs outside camps 14% 14% 2% 10% 2% 1% 0% Residents 8% 6% 2% 5% 2% 0% 0%
However, compared to previous years, the proportion of IDPs and residents reporting to have sold food aid has continued to decrease.
Figure 80: Trends in the Sale of Food Aid by Beneficiaries, 2004-2007
48%
18%
13%
66%
23%
48%
23%
13%
27%
14%
8%
44%
0%
10%
20%
30%
40%
50%
60%
70%
IDPs in camps IDPs outside camps Residents
% o
f hou
seho
lds
2004
2005
2006
2007
Type of food aid commodities sold by households Focus Group Discussions indicated that the sale and barter of food aid was frequent in order to obtain other food items (meat, vegetables) and preferred commodities (e.g. groundnut oil), as well to pay for milling costs, meet other needs (e.g. health) and, importantly, reimburse debts occurred (for food purchase) to relatives and small traders. This confirms the vicious circle of indebtedness for food/sale of the food ration to reimburse the debt, observed last year. Among the few households who sold food aid, oil was the most frequently sold commodity (60% of IDPs and 74% of residents), followed by CSB (54% of IDPs and 72% of residents). Pulses were sold by 36% IDPs and 43% residents who sold. This pattern is consistent with the Focus Group Discussions (FGDs). A number mentioned that the smell of oil was disliked and this was why it was sold for groundnut oil. Few FGDs said that CSB was sold (unfamiliar, infested). Some indicated a preference for wheat or millet over sorghum, which was confirmed by community Key Informants.
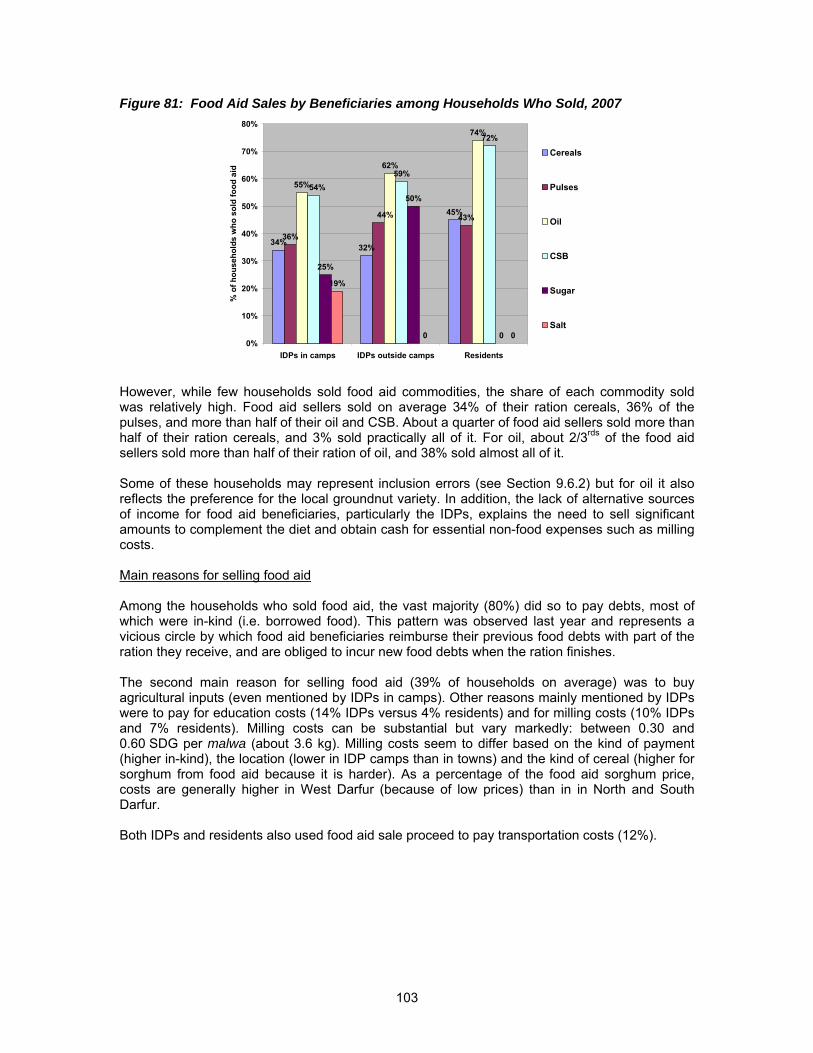
103
Figure 81: Food Aid Sales by Beneficiaries among Households Who Sold, 2007
34% 32%
45%
36%
43%
55%
62%
74%
59%
72%
25%
50%
0
19%
0 0
44%
54%
0%
10%
20%
30%
40%
50%
60%
70%
80%
IDPs in camps IDPs outside camps Residents
% o
f hou
seho
lds
who
sol
d fo
od a
id
Cereals
Pulses
Oil
CSB
Sugar
Salt
However, while few households sold food aid commodities, the share of each commodity sold was relatively high. Food aid sellers sold on average 34% of their ration cereals, 36% of the pulses, and more than half of their oil and CSB. About a quarter of food aid sellers sold more than half of their ration cereals, and 3% sold practically all of it. For oil, about 2/3rds of the food aid sellers sold more than half of their ration of oil, and 38% sold almost all of it. Some of these households may represent inclusion errors (see Section 9.6.2) but for oil it also reflects the preference for the local groundnut variety. In addition, the lack of alternative sources of income for food aid beneficiaries, particularly the IDPs, explains the need to sell significant amounts to complement the diet and obtain cash for essential non-food expenses such as milling costs. Main reasons for selling food aid Among the households who sold food aid, the vast majority (80%) did so to pay debts, most of which were in-kind (i.e. borrowed food). This pattern was observed last year and represents a vicious circle by which food aid beneficiaries reimburse their previous food debts with part of the ration they receive, and are obliged to incur new food debts when the ration finishes. The second main reason for selling food aid (39% of households on average) was to buy agricultural inputs (even mentioned by IDPs in camps). Other reasons mainly mentioned by IDPs were to pay for education costs (14% IDPs versus 4% residents) and for milling costs (10% IDPs and 7% residents). Milling costs can be substantial but vary markedly: between 0.30 and 0.60 SDG per malwa (about 3.6 kg). Milling costs seem to differ based on the kind of payment (higher in-kind), the location (lower in IDP camps than in towns) and the kind of cereal (higher for sorghum from food aid because it is harder). As a percentage of the food aid sorghum price, costs are generally higher in West Darfur (because of low prices) than in in North and South Darfur. Both IDPs and residents also used food aid sale proceed to pay transportation costs (12%).
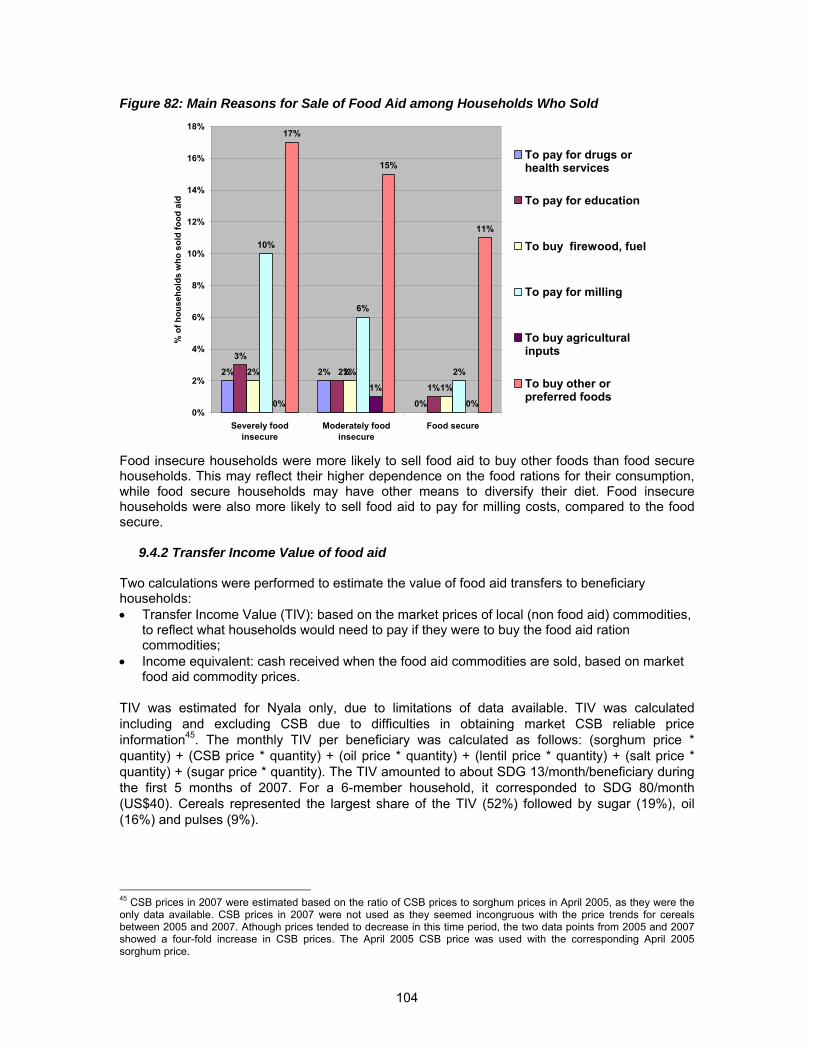
104
Figure 82: Main Reasons for Sale of Food Aid among Households Who Sold
2% 2%
0%
3%
1%
2% 2%
1%
10%
6%
2%
0%
1%
0%
17%
15%
11%
2%
0%
2%
4%
6%
8%
10%
12%
14%
16%
18%
Severely foodinsecure
Moderately foodinsecure
Food secure
% o
f hou
seho
lds
who
sol
d fo
od a
id
To pay for drugs orhealth services
To pay for education
To buy firewood, fuel
To pay for milling
To buy agriculturalinputs
To buy other orpreferred foods
Food insecure households were more likely to sell food aid to buy other foods than food secure households. This may reflect their higher dependence on the food rations for their consumption, while food secure households may have other means to diversify their diet. Food insecure households were also more likely to sell food aid to pay for milling costs, compared to the food secure.
9.4.2 Transfer Income Value of food aid Two calculations were performed to estimate the value of food aid transfers to beneficiary households: • Transfer Income Value (TIV): based on the market prices of local (non food aid) commodities,
to reflect what households would need to pay if they were to buy the food aid ration commodities;
• Income equivalent: cash received when the food aid commodities are sold, based on market food aid commodity prices.
TIV was estimated for Nyala only, due to limitations of data available. TIV was calculated including and excluding CSB due to difficulties in obtaining market CSB reliable price information45. The monthly TIV per beneficiary was calculated as follows: (sorghum price * quantity) + (CSB price * quantity) + (oil price * quantity) + (lentil price * quantity) + (salt price * quantity) + (sugar price * quantity). The TIV amounted to about SDG 13/month/beneficiary during the first 5 months of 2007. For a 6-member household, it corresponded to SDG 80/month (US$40). Cereals represented the largest share of the TIV (52%) followed by sugar (19%), oil (16%) and pulses (9%).
45 CSB prices in 2007 were estimated based on the ratio of CSB prices to sorghum prices in April 2005, as they were the only data available. CSB prices in 2007 were not used as they seemed incongruous with the price trends for cereals between 2005 and 2007. Athough prices tended to decrease in this time period, the two data points from 2005 and 2007 showed a four-fold increase in CSB prices. The April 2005 CSB price was used with the corresponding April 2005 sorghum price.
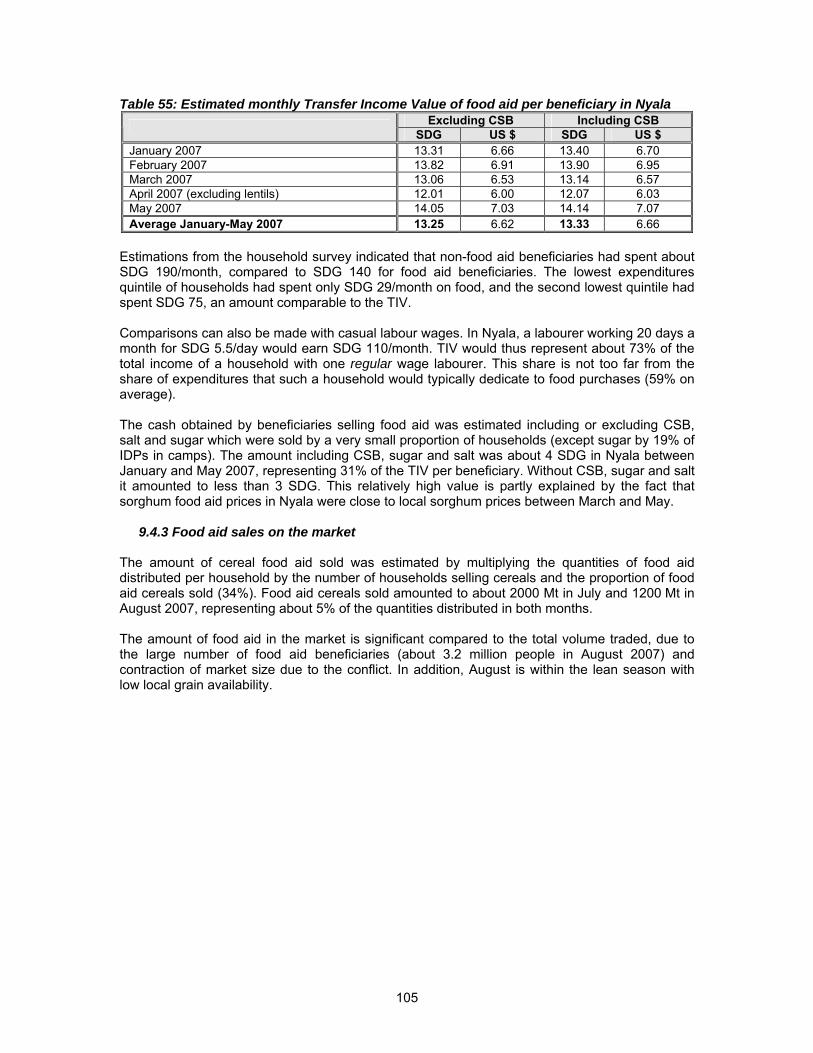
105
Table 55: Estimated monthly Transfer Income Value of food aid per beneficiary in Nyala Excluding CSB Including CSB SDG US $ SDG US $
January 2007 13.31 6.66 13.40 6.70 February 2007 13.82 6.91 13.90 6.95 March 2007 13.06 6.53 13.14 6.57 April 2007 (excluding lentils) 12.01 6.00 12.07 6.03 May 2007 14.05 7.03 14.14 7.07 Average January-May 2007 13.25 6.62 13.33 6.66
Estimations from the household survey indicated that non-food aid beneficiaries had spent about SDG 190/month, compared to SDG 140 for food aid beneficiaries. The lowest expenditures quintile of households had spent only SDG 29/month on food, and the second lowest quintile had spent SDG 75, an amount comparable to the TIV. Comparisons can also be made with casual labour wages. In Nyala, a labourer working 20 days a month for SDG 5.5/day would earn SDG 110/month. TIV would thus represent about 73% of the total income of a household with one regular wage labourer. This share is not too far from the share of expenditures that such a household would typically dedicate to food purchases (59% on average). The cash obtained by beneficiaries selling food aid was estimated including or excluding CSB, salt and sugar which were sold by a very small proportion of households (except sugar by 19% of IDPs in camps). The amount including CSB, sugar and salt was about 4 SDG in Nyala between January and May 2007, representing 31% of the TIV per beneficiary. Without CSB, sugar and salt it amounted to less than 3 SDG. This relatively high value is partly explained by the fact that sorghum food aid prices in Nyala were close to local sorghum prices between March and May.
9.4.3 Food aid sales on the market The amount of cereal food aid sold was estimated by multiplying the quantities of food aid distributed per household by the number of households selling cereals and the proportion of food aid cereals sold (34%). Food aid cereals sold amounted to about 2000 Mt in July and 1200 Mt in August 2007, representing about 5% of the quantities distributed in both months. The amount of food aid in the market is significant compared to the total volume traded, due to the large number of food aid beneficiaries (about 3.2 million people in August 2007) and contraction of market size due to the conflict. In addition, August is within the lean season with low local grain availability.
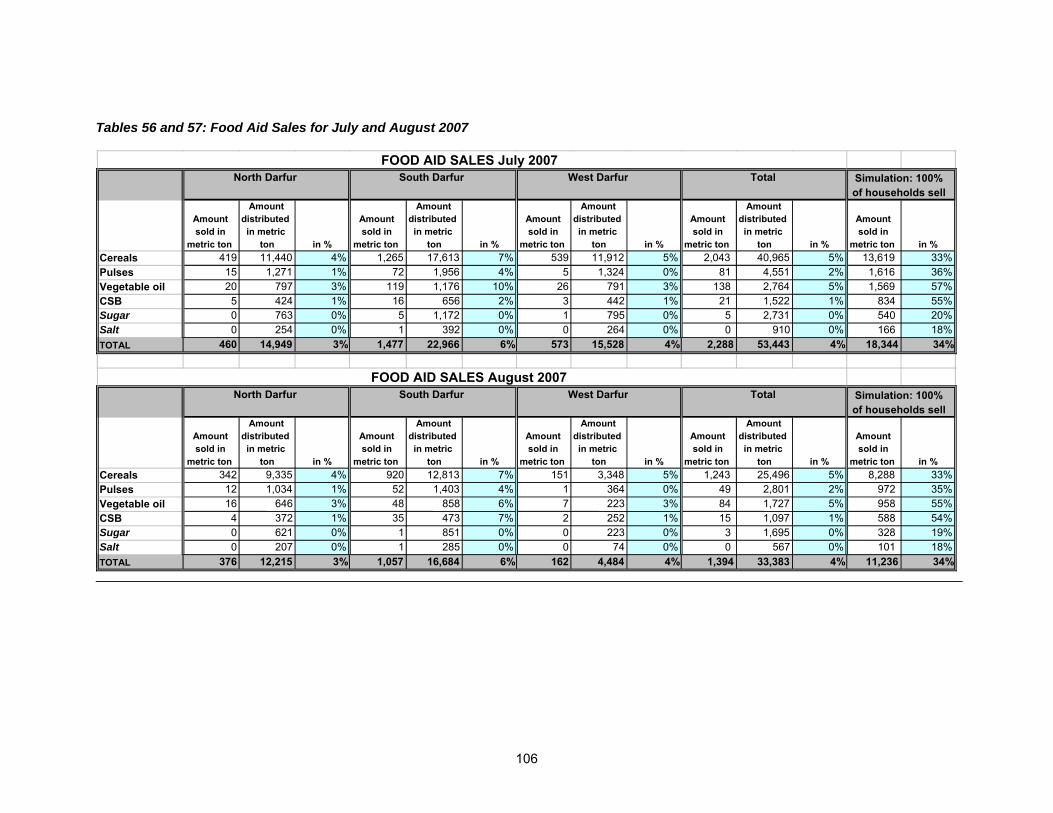
106
Tables 56 and 57: Food Aid Sales for July and August 2007
Amount sold in
metric ton
Amount distributed in metric
ton in %
Amount sold in
metric ton
Amount distributed in metric
ton in %
Amount sold in
metric ton
Amount distributed in metric
ton in %
Amount sold in
metric ton
Amount distributed in metric
ton in %
Amount sold in
metric ton in %Cereals 419 11,440 4% 1,265 17,613 7% 539 11,912 5% 2,043 40,965 5% 13,619 33%Pulses 15 1,271 1% 72 1,956 4% 5 1,324 0% 81 4,551 2% 1,616 36%Vegetable oil 20 797 3% 119 1,176 10% 26 791 3% 138 2,764 5% 1,569 57%CSB 5 424 1% 16 656 2% 3 442 1% 21 1,522 1% 834 55%Sugar 0 763 0% 5 1,172 0% 1 795 0% 5 2,731 0% 540 20%Salt 0 254 0% 1 392 0% 0 264 0% 0 910 0% 166 18%TOTAL 460 14,949 3% 1,477 22,966 6% 573 15,528 4% 2,288 53,443 4% 18,344 34%
Amount sold in
metric ton
Amount distributed in metric
ton in %
Amount sold in
metric ton
Amount distributed in metric
ton in %
Amount sold in
metric ton
Amount distributed in metric
ton in %
Amount sold in
metric ton
Amount distributed in metric
ton in %
Amount sold in
metric ton in %Cereals 342 9,335 4% 920 12,813 7% 151 3,348 5% 1,243 25,496 5% 8,288 33%Pulses 12 1,034 1% 52 1,403 4% 1 364 0% 49 2,801 2% 972 35%Vegetable oil 16 646 3% 48 858 6% 7 223 3% 84 1,727 5% 958 55%CSB 4 372 1% 35 473 7% 2 252 1% 15 1,097 1% 588 54%Sugar 0 621 0% 1 851 0% 0 223 0% 3 1,695 0% 328 19%Salt 0 207 0% 1 285 0% 0 74 0% 0 567 0% 101 18%TOTAL 376 12,215 3% 1,057 16,684 6% 162 4,484 4% 1,394 33,383 4% 11,236 34%
Simulation: 100% of households sell
Simulation: 100% of households sell
FOOD AID SALES July 2007
FOOD AID SALES August 2007
South Darfur West Darfur TotalNorth Darfur
North Darfur South Darfur West Darfur Total
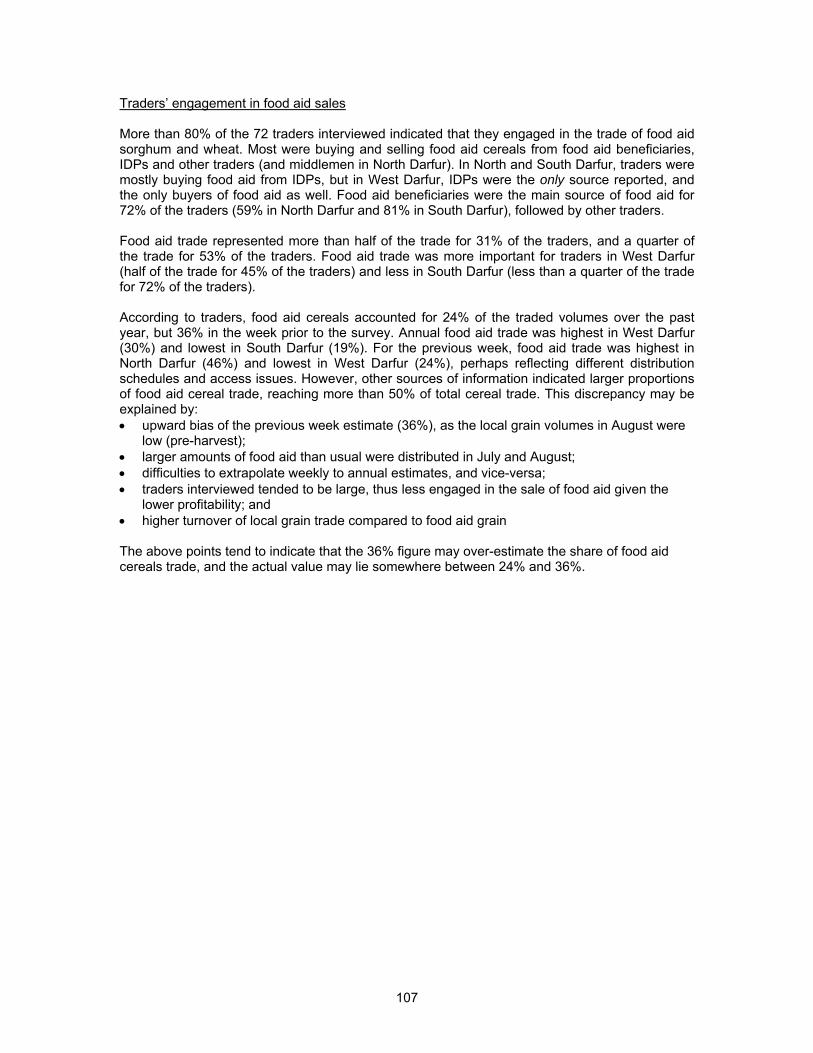
107
Traders’ engagement in food aid sales More than 80% of the 72 traders interviewed indicated that they engaged in the trade of food aid sorghum and wheat. Most were buying and selling food aid cereals from food aid beneficiaries, IDPs and other traders (and middlemen in North Darfur). In North and South Darfur, traders were mostly buying food aid from IDPs, but in West Darfur, IDPs were the only source reported, and the only buyers of food aid as well. Food aid beneficiaries were the main source of food aid for 72% of the traders (59% in North Darfur and 81% in South Darfur), followed by other traders. Food aid trade represented more than half of the trade for 31% of the traders, and a quarter of the trade for 53% of the traders. Food aid trade was more important for traders in West Darfur (half of the trade for 45% of the traders) and less in South Darfur (less than a quarter of the trade for 72% of the traders). According to traders, food aid cereals accounted for 24% of the traded volumes over the past year, but 36% in the week prior to the survey. Annual food aid trade was highest in West Darfur (30%) and lowest in South Darfur (19%). For the previous week, food aid trade was highest in North Darfur (46%) and lowest in West Darfur (24%), perhaps reflecting different distribution schedules and access issues. However, other sources of information indicated larger proportions of food aid cereal trade, reaching more than 50% of total cereal trade. This discrepancy may be explained by: • upward bias of the previous week estimate (36%), as the local grain volumes in August were
low (pre-harvest); • larger amounts of food aid than usual were distributed in July and August; • difficulties to extrapolate weekly to annual estimates, and vice-versa; • traders interviewed tended to be large, thus less engaged in the sale of food aid given the
lower profitability; and • higher turnover of local grain trade compared to food aid grain The above points tend to indicate that the 36% figure may over-estimate the share of food aid cereals trade, and the actual value may lie somewhere between 24% and 36%.
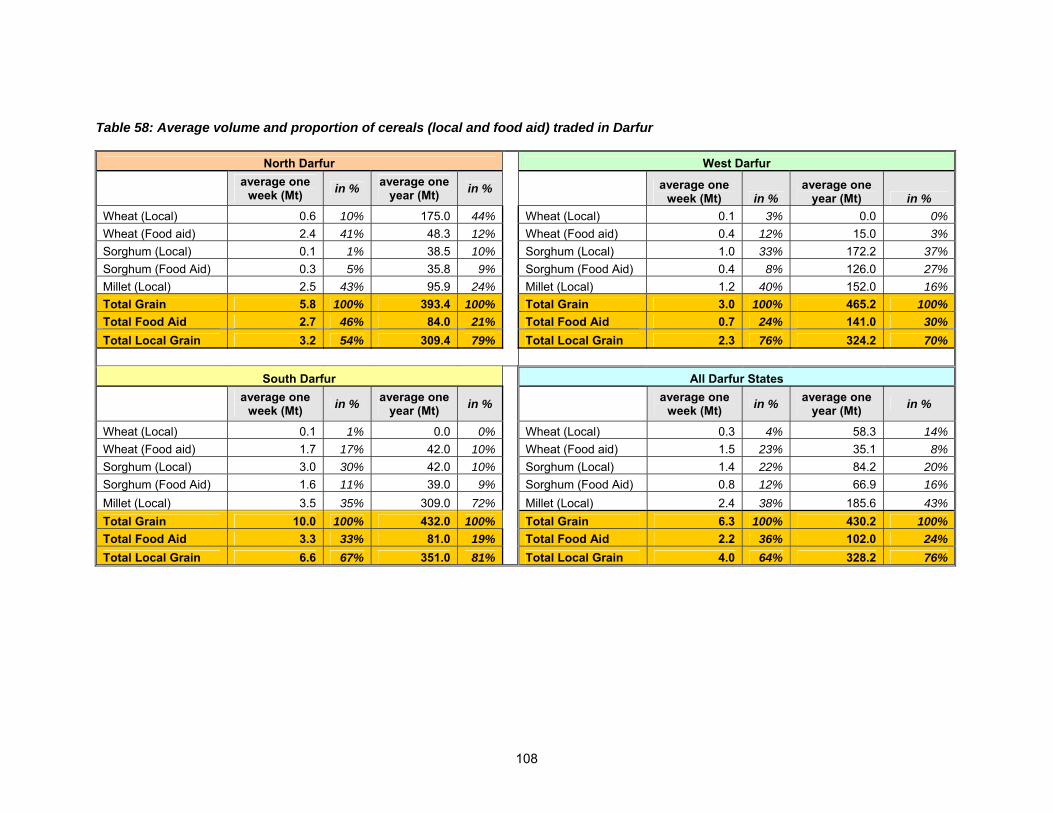
108
Table 58: Average volume and proportion of cereals (local and food aid) traded in Darfur
North Darfur West Darfur
average one
week (Mt) in % average one year (Mt) in %
average one
week (Mt) in % average one
year (Mt) in % Wheat (Local) 0.6 10% 175.0 44% Wheat (Local) 0.1 3% 0.0 0%Wheat (Food aid) 2.4 41% 48.3 12% Wheat (Food aid) 0.4 12% 15.0 3%Sorghum (Local) 0.1 1% 38.5 10% Sorghum (Local) 1.0 33% 172.2 37%Sorghum (Food Aid) 0.3 5% 35.8 9% Sorghum (Food Aid) 0.4 8% 126.0 27%Millet (Local) 2.5 43% 95.9 24% Millet (Local) 1.2 40% 152.0 16%Total Grain 5.8 100% 393.4 100% Total Grain 3.0 100% 465.2 100%Total Food Aid 2.7 46% 84.0 21% Total Food Aid 0.7 24% 141.0 30%Total Local Grain 3.2 54% 309.4 79% Total Local Grain 2.3 76% 324.2 70%
South Darfur All Darfur States
average one
week (Mt) in % average one year (Mt) in %
average one
week (Mt) in % average one year (Mt) in %
Wheat (Local) 0.1 1% 0.0 0% Wheat (Local) 0.3 4% 58.3 14%Wheat (Food aid) 1.7 17% 42.0 10% Wheat (Food aid) 1.5 23% 35.1 8%Sorghum (Local) 3.0 30% 42.0 10% Sorghum (Local) 1.4 22% 84.2 20%Sorghum (Food Aid) 1.6 11% 39.0 9% Sorghum (Food Aid) 0.8 12% 66.9 16%Millet (Local) 3.5 35% 309.0 72% Millet (Local) 2.4 38% 185.6 43%Total Grain 10.0 100% 432.0 100% Total Grain 6.3 100% 430.2 100%Total Food Aid 3.3 33% 81.0 19% Total Food Aid 2.2 36% 102.0 24%Total Local Grain 6.6 67% 351.0 81% Total Local Grain 4.0 64% 328.2 76%
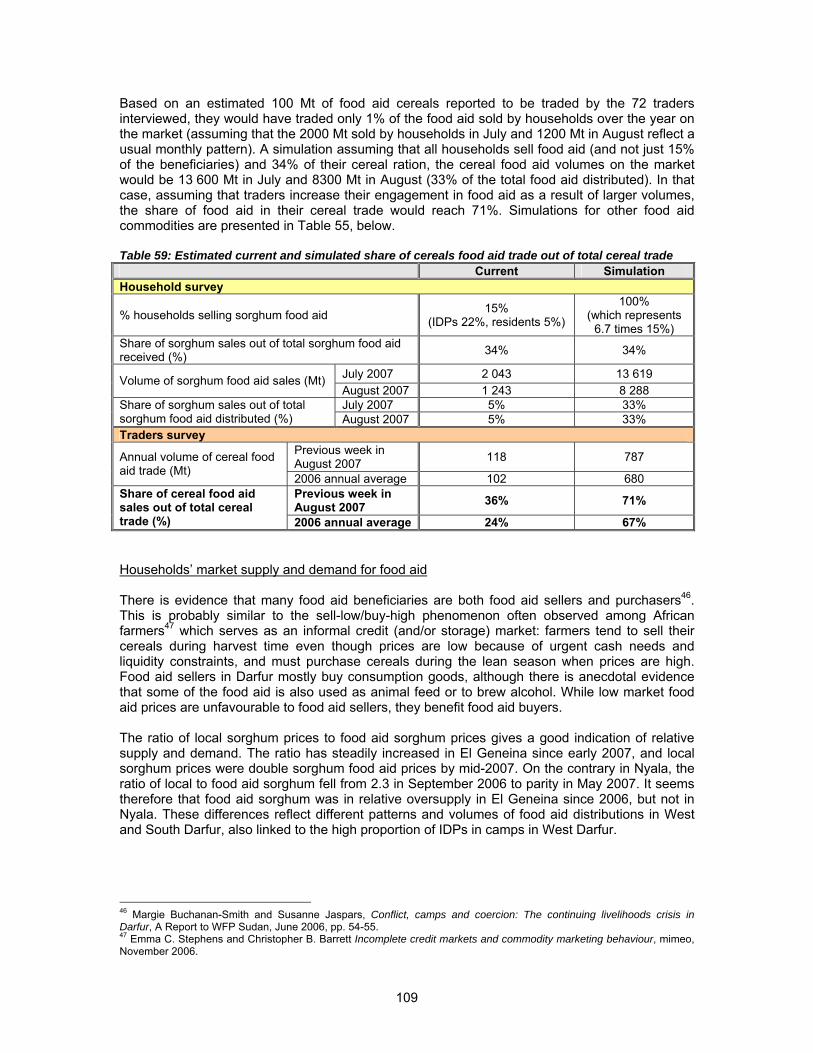
109
Based on an estimated 100 Mt of food aid cereals reported to be traded by the 72 traders interviewed, they would have traded only 1% of the food aid sold by households over the year on the market (assuming that the 2000 Mt sold by households in July and 1200 Mt in August reflect a usual monthly pattern). A simulation assuming that all households sell food aid (and not just 15% of the beneficiaries) and 34% of their cereal ration, the cereal food aid volumes on the market would be 13 600 Mt in July and 8300 Mt in August (33% of the total food aid distributed). In that case, assuming that traders increase their engagement in food aid as a result of larger volumes, the share of food aid in their cereal trade would reach 71%. Simulations for other food aid commodities are presented in Table 55, below. Table 59: Estimated current and simulated share of cereals food aid trade out of total cereal trade Current Simulation Household survey
% households selling sorghum food aid 15% (IDPs 22%, residents 5%)
100% (which represents
6.7 times 15%) Share of sorghum sales out of total sorghum food aid received (%) 34% 34%
July 2007 2 043 13 619 Volume of sorghum food aid sales (Mt) August 2007 1 243 8 288 July 2007 5% 33% Share of sorghum sales out of total
sorghum food aid distributed (%) August 2007 5% 33% Traders survey
Previous week in August 2007 118 787 Annual volume of cereal food
aid trade (Mt) 2006 annual average 102 680 Previous week in August 2007 36% 71% Share of cereal food aid
sales out of total cereal trade (%) 2006 annual average 24% 67% Households’ market supply and demand for food aid There is evidence that many food aid beneficiaries are both food aid sellers and purchasers46. This is probably similar to the sell-low/buy-high phenomenon often observed among African farmers47 which serves as an informal credit (and/or storage) market: farmers tend to sell their cereals during harvest time even though prices are low because of urgent cash needs and liquidity constraints, and must purchase cereals during the lean season when prices are high. Food aid sellers in Darfur mostly buy consumption goods, although there is anecdotal evidence that some of the food aid is also used as animal feed or to brew alcohol. While low market food aid prices are unfavourable to food aid sellers, they benefit food aid buyers. The ratio of local sorghum prices to food aid sorghum prices gives a good indication of relative supply and demand. The ratio has steadily increased in El Geneina since early 2007, and local sorghum prices were double sorghum food aid prices by mid-2007. On the contrary in Nyala, the ratio of local to food aid sorghum fell from 2.3 in September 2006 to parity in May 2007. It seems therefore that food aid sorghum was in relative oversupply in El Geneina since 2006, but not in Nyala. These differences reflect different patterns and volumes of food aid distributions in West and South Darfur, also linked to the high proportion of IDPs in camps in West Darfur.
46 Margie Buchanan-Smith and Susanne Jaspars, Conflict, camps and coercion: The continuing livelihoods crisis in Darfur, A Report to WFP Sudan, June 2006, pp. 54-55. 47 Emma C. Stephens and Christopher B. Barrett Incomplete credit markets and commodity marketing behaviour, mimeo, November 2006.
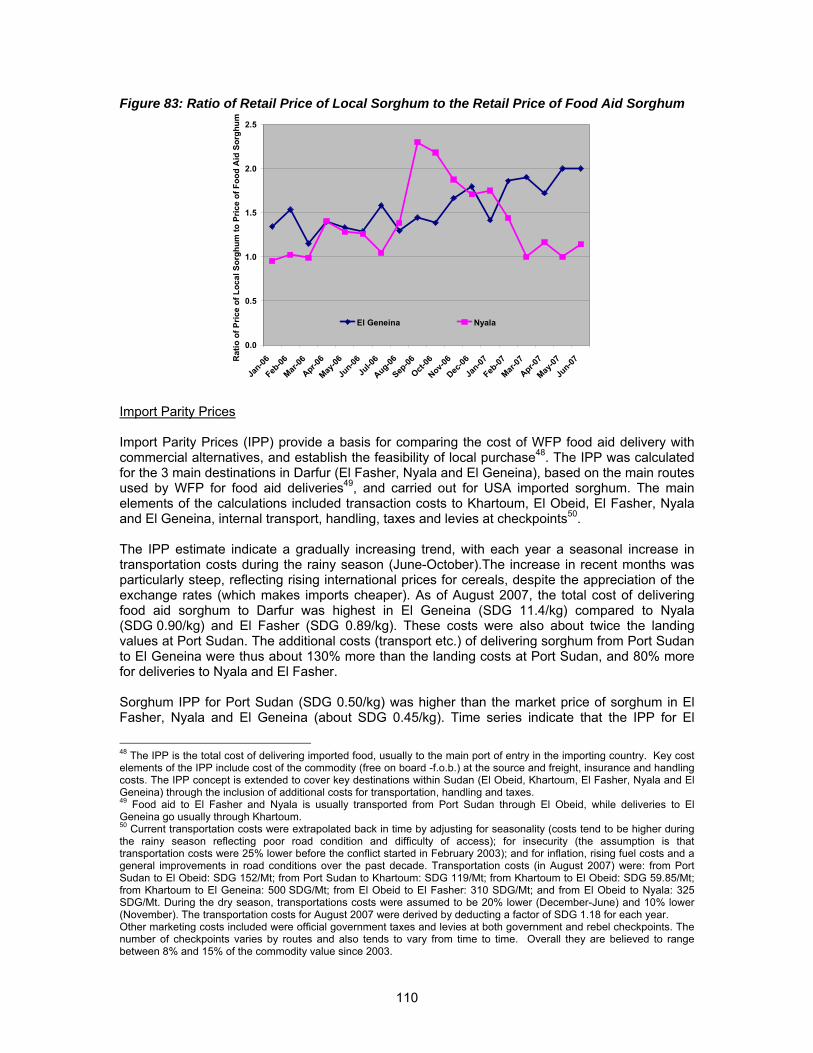
110
Figure 83: Ratio of Retail Price of Local Sorghum to the Retail Price of Food Aid Sorghum
0.0
0.5
1.0
1.5
2.0
2.5
Jan-06
Feb-06
Mar-06
Apr-06
May-06
Jun-06
Jul-0
6
Aug-06
Sep-06
Oct-06
Nov-06
Dec-06
Jan-07
Feb-07
Mar-07
Apr-07
May-07
Jun-07
Rat
io o
f Pric
e of
Loc
al S
orgh
um to
Pric
e of
Foo
d A
id S
orgh
um
El Geneina Nyala
Import Parity Prices Import Parity Prices (IPP) provide a basis for comparing the cost of WFP food aid delivery with commercial alternatives, and establish the feasibility of local purchase48. The IPP was calculated for the 3 main destinations in Darfur (El Fasher, Nyala and El Geneina), based on the main routes used by WFP for food aid deliveries49, and carried out for USA imported sorghum. The main elements of the calculations included transaction costs to Khartoum, El Obeid, El Fasher, Nyala and El Geneina, internal transport, handling, taxes and levies at checkpoints50. The IPP estimate indicate a gradually increasing trend, with each year a seasonal increase in transportation costs during the rainy season (June-October).The increase in recent months was particularly steep, reflecting rising international prices for cereals, despite the appreciation of the exchange rates (which makes imports cheaper). As of August 2007, the total cost of delivering food aid sorghum to Darfur was highest in El Geneina (SDG 11.4/kg) compared to Nyala (SDG 0.90/kg) and El Fasher (SDG 0.89/kg). These costs were also about twice the landing values at Port Sudan. The additional costs (transport etc.) of delivering sorghum from Port Sudan to El Geneina were thus about 130% more than the landing costs at Port Sudan, and 80% more for deliveries to Nyala and El Fasher. Sorghum IPP for Port Sudan (SDG 0.50/kg) was higher than the market price of sorghum in El Fasher, Nyala and El Geneina (about SDG 0.45/kg). Time series indicate that the IPP for El
48 The IPP is the total cost of delivering imported food, usually to the main port of entry in the importing country. Key cost elements of the IPP include cost of the commodity (free on board -f.o.b.) at the source and freight, insurance and handling costs. The IPP concept is extended to cover key destinations within Sudan (El Obeid, Khartoum, El Fasher, Nyala and El Geneina) through the inclusion of additional costs for transportation, handling and taxes. 49 Food aid to El Fasher and Nyala is usually transported from Port Sudan through El Obeid, while deliveries to El Geneina go usually through Khartoum. 50 Current transportation costs were extrapolated back in time by adjusting for seasonality (costs tend to be higher during the rainy season reflecting poor road condition and difficulty of access); for insecurity (the assumption is that transportation costs were 25% lower before the conflict started in February 2003); and for inflation, rising fuel costs and a general improvements in road conditions over the past decade. Transportation costs (in August 2007) were: from Port Sudan to El Obeid: SDG 152/Mt; from Port Sudan to Khartoum: SDG 119/Mt; from Khartoum to El Obeid: SDG 59.85/Mt; from Khartoum to El Geneina: 500 SDG/Mt; from El Obeid to El Fasher: 310 SDG/Mt; and from El Obeid to Nyala: 325 SDG/Mt. During the dry season, transportations costs were assumed to be 20% lower (December-June) and 10% lower (November). The transportation costs for August 2007 were derived by deducting a factor of SDG 1.18 for each year. Other marketing costs included were official government taxes and levies at both government and rebel checkpoints. The number of checkpoints varies by routes and also tends to vary from time to time. Overall they are believed to range between 8% and 15% of the commodity value since 2003.
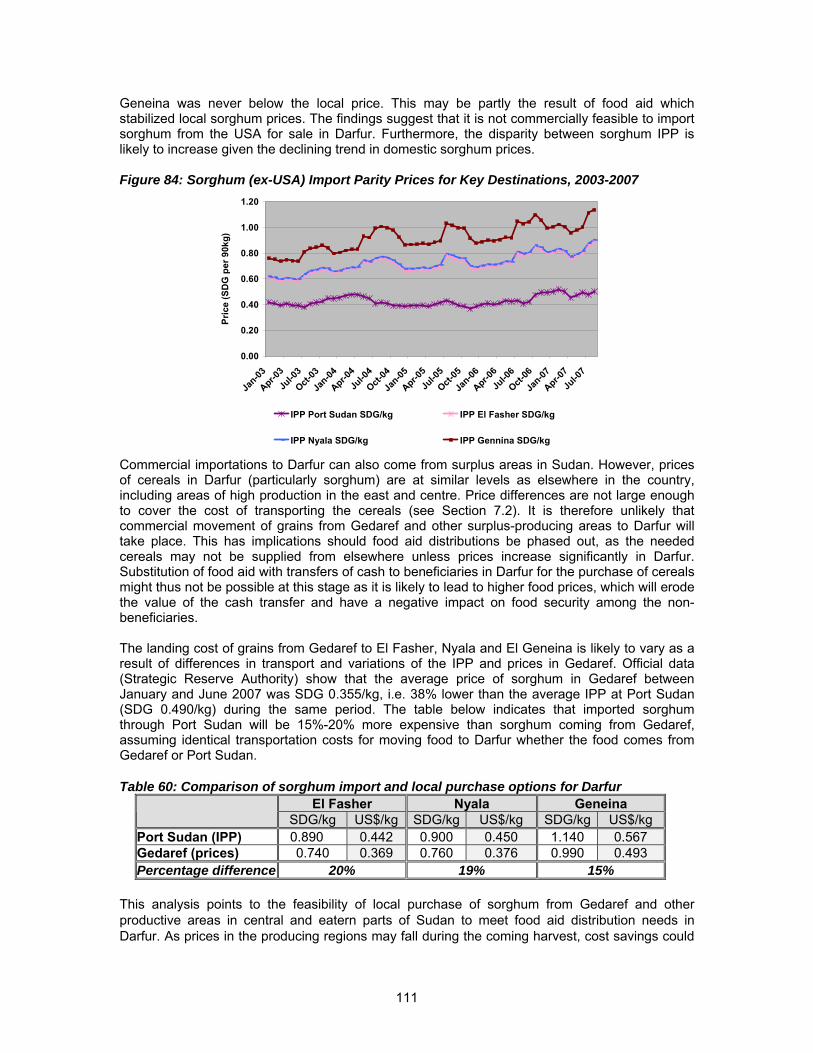
111
Geneina was never below the local price. This may be partly the result of food aid which stabilized local sorghum prices. The findings suggest that it is not commercially feasible to import sorghum from the USA for sale in Darfur. Furthermore, the disparity between sorghum IPP is likely to increase given the declining trend in domestic sorghum prices. Figure 84: Sorghum (ex-USA) Import Parity Prices for Key Destinations, 2003-2007
0.00
0.20
0.40
0.60
0.80
1.00
1.20
Jan-03
Apr-03Ju
l-03
Oct-03
Jan-04
Apr-04Ju
l-04
Oct-04
Jan-05
Apr-05Ju
l-05
Oct-05
Jan-06
Apr-06Ju
l-06
Oct-06
Jan-07
Apr-07Ju
l-07
Pric
e (S
DG
per
90k
g)
IPP Port Sudan SDG/kg IPP El Fasher SDG/kg
IPP Nyala SDG/kg IPP Gennina SDG/kg
Commercial importations to Darfur can also come from surplus areas in Sudan. However, prices of cereals in Darfur (particularly sorghum) are at similar levels as elsewhere in the country, including areas of high production in the east and centre. Price differences are not large enough to cover the cost of transporting the cereals (see Section 7.2). It is therefore unlikely that commercial movement of grains from Gedaref and other surplus-producing areas to Darfur will take place. This has implications should food aid distributions be phased out, as the needed cereals may not be supplied from elsewhere unless prices increase significantly in Darfur. Substitution of food aid with transfers of cash to beneficiaries in Darfur for the purchase of cereals might thus not be possible at this stage as it is likely to lead to higher food prices, which will erode the value of the cash transfer and have a negative impact on food security among the non-beneficiaries. The landing cost of grains from Gedaref to El Fasher, Nyala and El Geneina is likely to vary as a result of differences in transport and variations of the IPP and prices in Gedaref. Official data (Strategic Reserve Authority) show that the average price of sorghum in Gedaref between January and June 2007 was SDG 0.355/kg, i.e. 38% lower than the average IPP at Port Sudan (SDG 0.490/kg) during the same period. The table below indicates that imported sorghum through Port Sudan will be 15%-20% more expensive than sorghum coming from Gedaref, assuming identical transportation costs for moving food to Darfur whether the food comes from Gedaref or Port Sudan. Table 60: Comparison of sorghum import and local purchase options for Darfur
El Fasher Nyala Geneina SDG/kg US$/kg SDG/kg US$/kg SDG/kg US$/kg
Port Sudan (IPP) 0.890 0.442 0.900 0.450 1.140 0.567 Gedaref (prices) 0.740 0.369 0.760 0.376 0.990 0.493 Percentage difference 20% 19% 15%
This analysis points to the feasibility of local purchase of sorghum from Gedaref and other productive areas in central and eatern parts of Sudan to meet food aid distribution needs in Darfur. As prices in the producing regions may fall during the coming harvest, cost savings could
112
even be higher than estimated. Discussions with the Government’s Strategic Reserve Authority and a representative of large commercial traders suggested marketable surpluses of around 500 000 Mt in the coming season. Local purchase of sorghum will depend on the availability of donors’ funding and logistic capacities51. 9.5 Implementation of food aid distributions Food Aid Committees (FACs) were in all communities visited in North and West Darfur, and 88% of the communities in South Darfur. Women participated in a FAC in about 90% of the cases, but they represented on average only 35% of the members. The proportion of communities in which women were FAC members was higher when there was a majority of IDPs in the community (41% versus 33-34% in other communities). In between 76% (North and South Darfur) and 92% (West Darfur) of the communities, women participated in the design of food aid distributions. Women’s participation was lower in communities without IDPs or with a minority of IDPs (77-80%) compared with communities with large numbers of IDPs (100% communities). Focus Group Discussions confirmed that women were part of FACs but they were: • rarely involved in decision-making due to traditional/cultural factors limiting their capacity to
speak up and challenge men; and • tasked only with the distribution of oil, CSB and salt because oil is viewed as dirty and CSB/salt
are lighter. All FGD participants (men and women) were aware of their entitlements to food rations and knew where to go for complaints. Except one case, there were no reports of abuse or violence in connection to food distributions. In North Darfur, some FGD said that sheiks controlled the information flow and requested payment against ration cards. Community Key Informants confirmed that announcements of food aid distributions were made (99% of the communities. Arrangements for closer distribution points, fast implementation to enable return by day-lights, men accompanying women or women going in groups were found appropriate except in some cases in North Darfur. FGD participants recommended better gender-balanced committees to improve safety at food distributions. The majority of community Key informants confirmed that access to food aid distribution sites was safe for women (81% in North Darfur, 100% in South Darfur and 88% in West Darfur). Safe access was more frequently reported in communities where IDPs represent large numbers of the population, compared to other communities. They also indicated that most distributions were scheduled in the early morning to enable return by day-light (all communities in North and South Darfur, 72% in West Darfur).
Shelters and water points at food aid distribution sites were available in very few communities in North Darfur (16%) but existed in 68% and 80% of the communities in South and West Darfur respectively. These facilities were also less likely to be found in communities with a minority of IDPs (55% of communities) and very rarely in communities with no IDPs (8%).
51 WFP Local Procurement Office in Khartoum has already a system in place for local food aid procurement, which could be expanded.
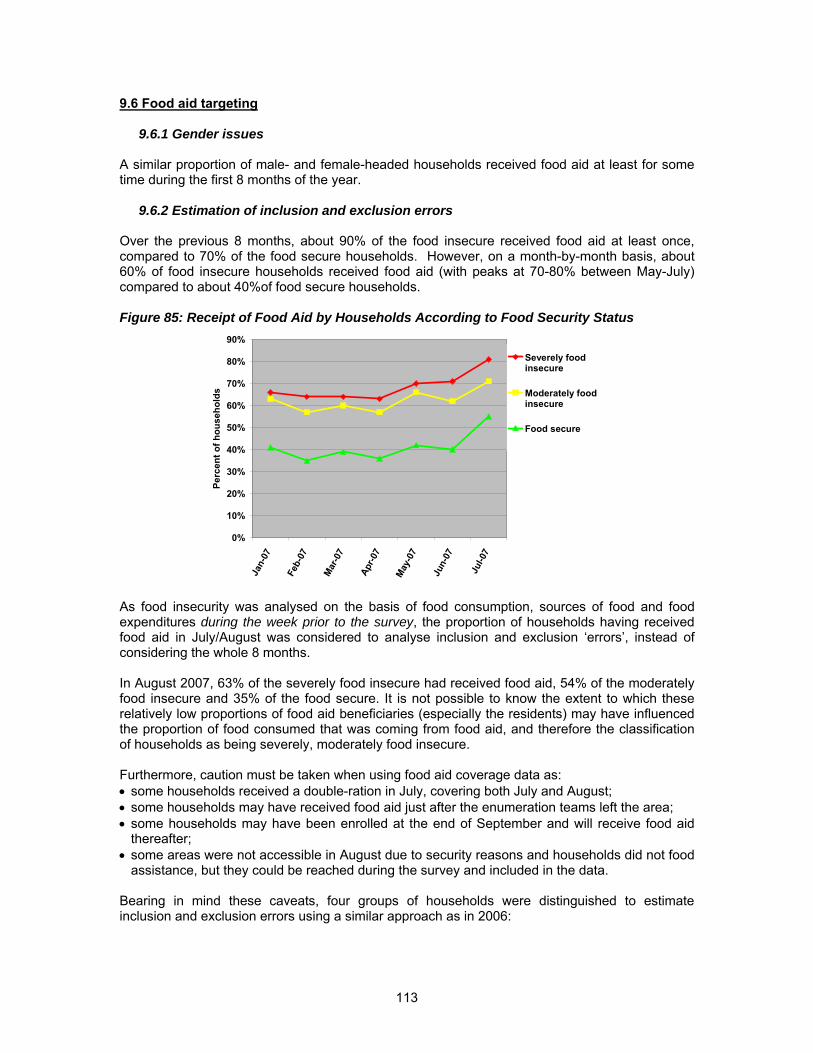
113
9.6 Food aid targeting
9.6.1 Gender issues A similar proportion of male- and female-headed households received food aid at least for some time during the first 8 months of the year.
9.6.2 Estimation of inclusion and exclusion errors Over the previous 8 months, about 90% of the food insecure received food aid at least once, compared to 70% of the food secure households. However, on a month-by-month basis, about 60% of food insecure households received food aid (with peaks at 70-80% between May-July) compared to about 40%of food secure households.
Figure 85: Receipt of Food Aid by Households According to Food Security Status
0%
10%
20%
30%
40%
50%
60%
70%
80%
90%
Jan-
07
Feb-
07
Mar
-07
Apr-0
7
May
-07
Jun-
07
Jul-0
7
Perc
ent o
f hou
seho
lds
Severely foodinsecure
Moderately foodinsecure
Food secure
As food insecurity was analysed on the basis of food consumption, sources of food and food expenditures during the week prior to the survey, the proportion of households having received food aid in July/August was considered to analyse inclusion and exclusion ‘errors’, instead of considering the whole 8 months. In August 2007, 63% of the severely food insecure had received food aid, 54% of the moderately food insecure and 35% of the food secure. It is not possible to know the extent to which these relatively low proportions of food aid beneficiaries (especially the residents) may have influenced the proportion of food consumed that was coming from food aid, and therefore the classification of households as being severely, moderately food insecure. Furthermore, caution must be taken when using food aid coverage data as: • some households received a double-ration in July, covering both July and August; • some households may have received food aid just after the enumeration teams left the area; • some households may have been enrolled at the end of September and will receive food aid
thereafter; • some areas were not accessible in August due to security reasons and households did not food
assistance, but they could be reached during the survey and included in the data. Bearing in mind these caveats, four groups of households were distinguished to estimate inclusion and exclusion errors using a similar approach as in 2006:
114
1) Food insecure households, and food secure households using damaging coping strategies, who did not receive food aid in July/August (average): “exclusion errors” • On average 33% of the severely food insecure and 22% of the moderately food insecure
households did not receive food aid in July/August. If truly missed, these would represent exclusion errors amounting to 21% of all households in the sample.
• In addition, 55% of the food secure who did not receive food aid had used coping strategies
that put either their lives (1%) or their livelihoods (average 50% in July/August) at risk. These households would have benefited from food aid (or other assistance) to protect their livelihoods. They represent 7% of all the sampled households.
In total, 28% of the households in the sample would be exclusion errors. In 2006, 29% of food insecure households had apparently been ‘excluded’. Difficulties in targeting the most food insecure continue to pose a challenge in the Darfur context. 2) Food aid beneficiaries in July/August who were still food insecure at the time of the survey: appropriate targeting 63% of the severely food insecure and 54% of the moderately food insecure households had received food aid in July/August. These households were adequately targeted. However, their persistent food insecurity confirms that food aid by itself is not sufficient to improve their food consumption and/or that they lack alternative means to procure additional food. 3) Food aid beneficiaries in July/August who were food secure at the time of the survey: “inclusion errors” An average of 22% of the food secure households received food aid in July/August. These households received food aid while they could apparently consume an appropriate diet and/or use their own economic resources to purchase their food without depending heavily on food aid. The proportion was similar last year (23% of food aid beneficiaries were food secure), confirming again the persisting challenges to target food aid according to food security needs in Darfur. However, it should not be concluded too hastily that all these food secure households represent inclusion errors: • Only half of the food secure households had not consumed any food aid in the week prior to
the survey. Even if food aid represented a small share of the food consumed, it may have played an important role to enable a better diet by saving resources to purchase complementary food items.
• Almost half of the food secure households who received food aid in July or August had used coping strategies that either put their lives (2%) or their livelihoods at risk (average 48%) during the month preceding the survey (August). Thus only 52% of the food secure receiving food aid had not used any damaging coping strategy. The inclusion errors would thus be limited to these beneficiaries, representing 11% of total food aid beneficiaries (7% of all households in the sample).
4) Food secure households who did not receive food aid in August and were not using damaging coping strategies: ‘truly food secure’ Of the 55% of the food secure households who did not receive food aid in July/August (close to the 49% identified in 2006), about half (52%) did not use any coping strategies that put either their lives or their livelihoods at risk during the month prior to the survey (August). Therefore only 29% of the food secure households excluded from food aid were truly able to secure an adequate diet and food access using appropriate coping strategies. These households appropriately excluded from food aid represent 19% of all households in the sample.
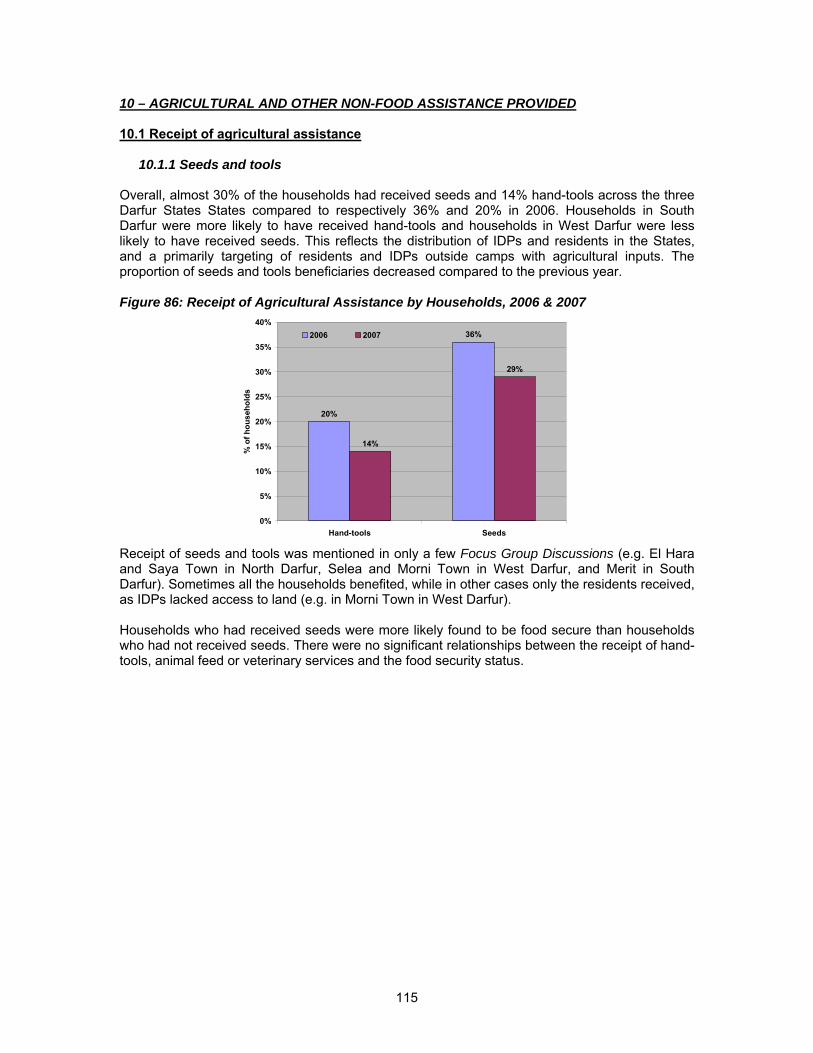
115
10 – AGRICULTURAL AND OTHER NON-FOOD ASSISTANCE PROVIDED 10.1 Receipt of agricultural assistance
10.1.1 Seeds and tools Overall, almost 30% of the households had received seeds and 14% hand-tools across the three Darfur States States compared to respectively 36% and 20% in 2006. Households in South Darfur were more likely to have received hand-tools and households in West Darfur were less likely to have received seeds. This reflects the distribution of IDPs and residents in the States, and a primarily targeting of residents and IDPs outside camps with agricultural inputs. The proportion of seeds and tools beneficiaries decreased compared to the previous year.
Figure 86: Receipt of Agricultural Assistance by Households, 2006 & 2007
20%
36%
14%
29%
0%
5%
10%
15%
20%
25%
30%
35%
40%
Hand-tools Seeds
% o
f hou
seho
lds
2006 2007
Receipt of seeds and tools was mentioned in only a few Focus Group Discussions (e.g. El Hara and Saya Town in North Darfur, Selea and Morni Town in West Darfur, and Merit in South Darfur). Sometimes all the households benefited, while in other cases only the residents received, as IDPs lacked access to land (e.g. in Morni Town in West Darfur). Households who had received seeds were more likely found to be food secure than households who had not received seeds. There were no significant relationships between the receipt of hand-tools, animal feed or veterinary services and the food security status.
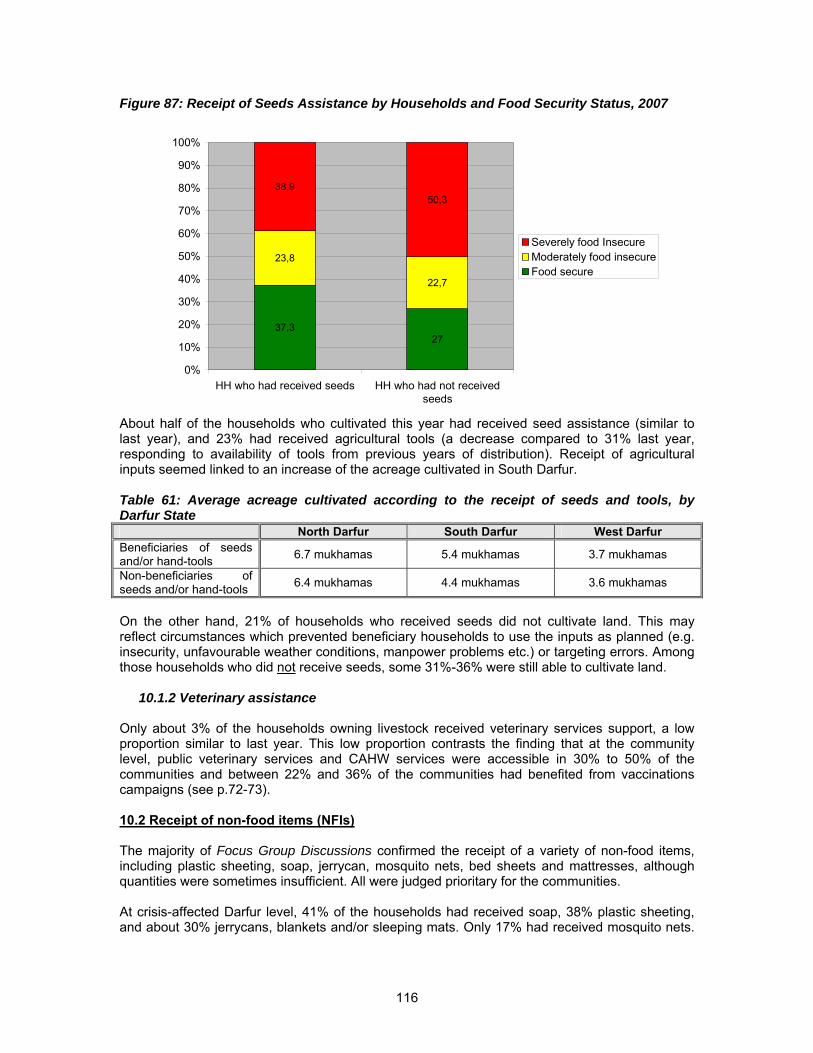
116
Figure 87: Receipt of Seeds Assistance by Households and Food Security Status, 2007
23,8
22,7
37,327
38,950,3
0%
10%
20%
30%
40%
50%
60%
70%
80%
90%
100%
HH who had received seeds HH who had not receivedseeds
Severely food InsecureModerately food insecureFood secure
About half of the households who cultivated this year had received seed assistance (similar to last year), and 23% had received agricultural tools (a decrease compared to 31% last year, responding to availability of tools from previous years of distribution). Receipt of agricultural inputs seemed linked to an increase of the acreage cultivated in South Darfur. Table 61: Average acreage cultivated according to the receipt of seeds and tools, by Darfur State
North Darfur South Darfur West Darfur Beneficiaries of seeds and/or hand-tools 6.7 mukhamas 5.4 mukhamas 3.7 mukhamas
Non-beneficiaries of seeds and/or hand-tools 6.4 mukhamas 4.4 mukhamas 3.6 mukhamas
On the other hand, 21% of households who received seeds did not cultivate land. This may reflect circumstances which prevented beneficiary households to use the inputs as planned (e.g. insecurity, unfavourable weather conditions, manpower problems etc.) or targeting errors. Among those households who did not receive seeds, some 31%-36% were still able to cultivate land.
10.1.2 Veterinary assistance Only about 3% of the households owning livestock received veterinary services support, a low proportion similar to last year. This low proportion contrasts the finding that at the community level, public veterinary services and CAHW services were accessible in 30% to 50% of the communities and between 22% and 36% of the communities had benefited from vaccinations campaigns (see p.72-73). 10.2 Receipt of non-food items (NFIs) The majority of Focus Group Discussions confirmed the receipt of a variety of non-food items, including plastic sheeting, soap, jerrycan, mosquito nets, bed sheets and mattresses, although quantities were sometimes insufficient. All were judged prioritary for the communities. At crisis-affected Darfur level, 41% of the households had received soap, 38% plastic sheeting, and about 30% jerrycans, blankets and/or sleeping mats. Only 17% had received mosquito nets.
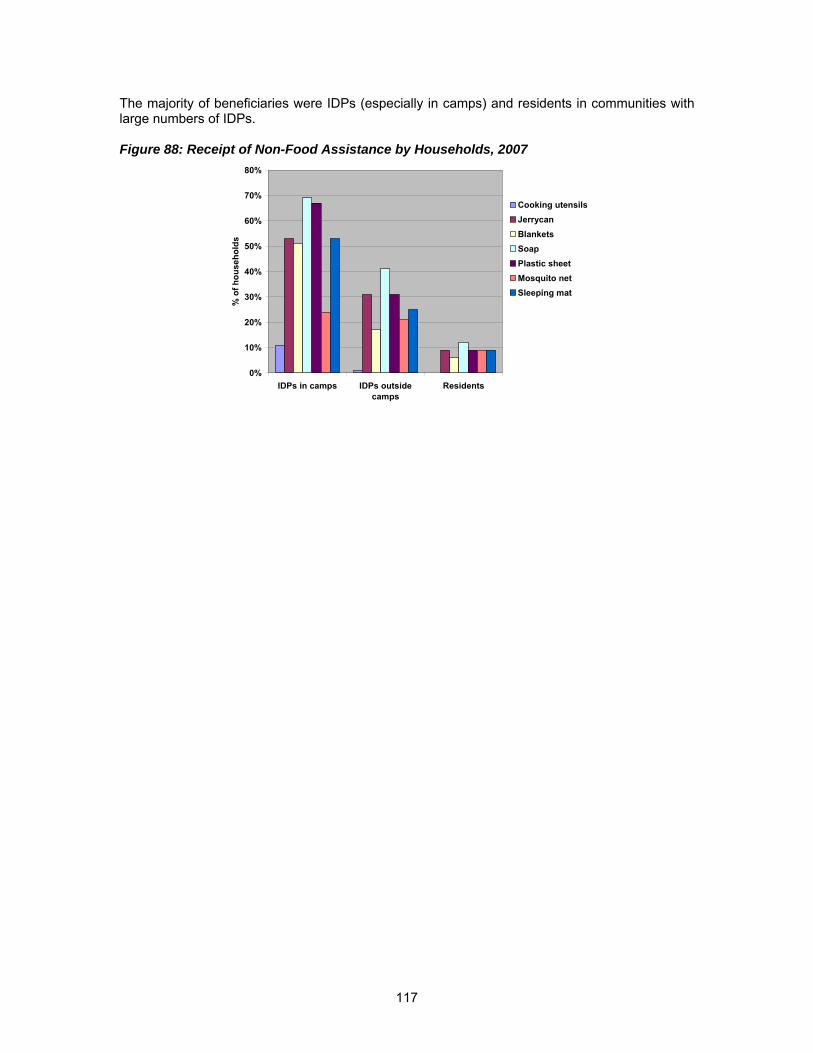
117
The majority of beneficiaries were IDPs (especially in camps) and residents in communities with large numbers of IDPs.
Figure 88: Receipt of Non-Food Assistance by Households, 2007
0%
10%
20%
30%
40%
50%
60%
70%
80%
IDPs in camps IDPs outsidecamps
Residents
% o
f hou
seho
lds
Cooking utensilsJerrycanBlanketsSoapPlastic sheetMosquito netSleeping mat
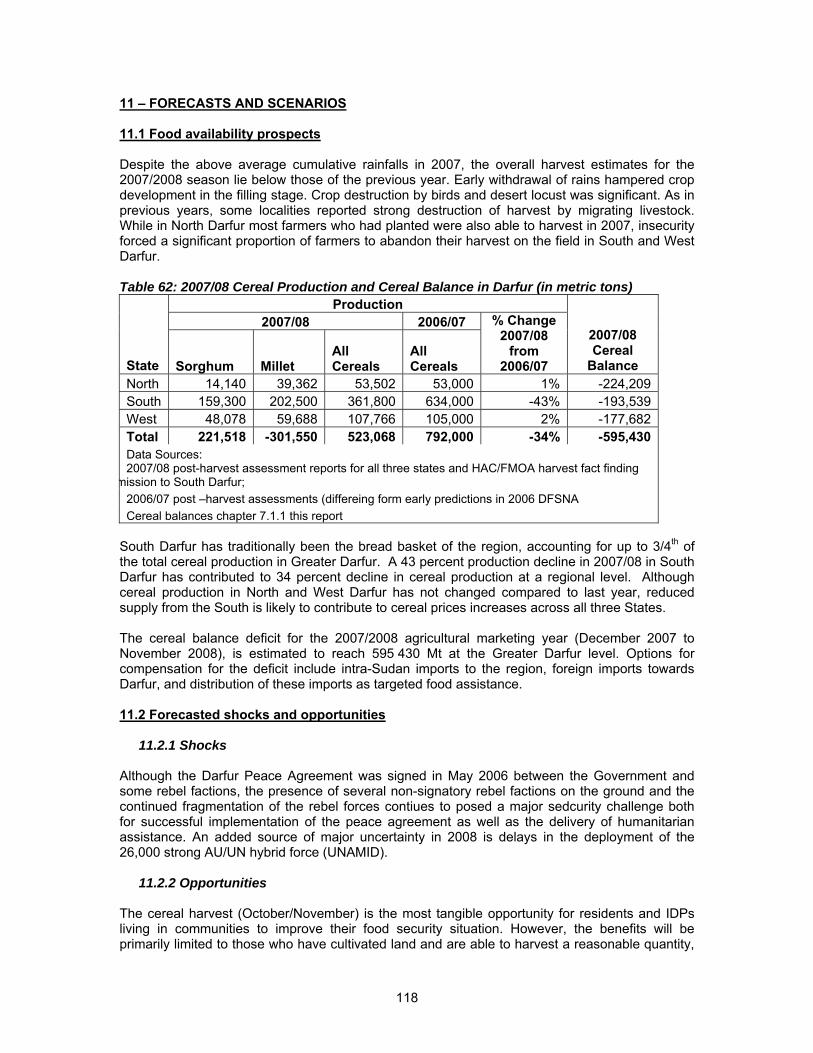
118
11 – FORECASTS AND SCENARIOS 11.1 Food availability prospects Despite the above average cumulative rainfalls in 2007, the overall harvest estimates for the 2007/2008 season lie below those of the previous year. Early withdrawal of rains hampered crop development in the filling stage. Crop destruction by birds and desert locust was significant. As in previous years, some localities reported strong destruction of harvest by migrating livestock. While in North Darfur most farmers who had planted were also able to harvest in 2007, insecurity forced a significant proportion of farmers to abandon their harvest on the field in South and West Darfur. Table 62: 2007/08 Cereal Production and Cereal Balance in Darfur (in metric tons)
Production 2007/08 2006/07
State Sorghum Millet
All Cereals
All Cereals
% Change 2007/08
from 2006/07
2007/08 Cereal
Balance North 14,140 39,362 53,502 53,000 1% -224,209 South 159,300 202,500 361,800 634,000 -43% -193,539 West 48,078 59,688 107,766 105,000 2% -177,682 Total 221,518 -301,550 523,068 792,000 -34% -595,430 Data Sources: 2007/08 post-harvest assessment reports for all three states and HAC/FMOA harvest fact finding
mission to South Darfur; 2006/07 post –harvest assessments (differeing form early predictions in 2006 DFSNA Cereal balances chapter 7.1.1 this report
South Darfur has traditionally been the bread basket of the region, accounting for up to 3/4th of the total cereal production in Greater Darfur. A 43 percent production decline in 2007/08 in South Darfur has contributed to 34 percent decline in cereal production at a regional level. Although cereal production in North and West Darfur has not changed compared to last year, reduced supply from the South is likely to contribute to cereal prices increases across all three States. The cereal balance deficit for the 2007/2008 agricultural marketing year (December 2007 to November 2008), is estimated to reach 595 430 Mt at the Greater Darfur level. Options for compensation for the deficit include intra-Sudan imports to the region, foreign imports towards Darfur, and distribution of these imports as targeted food assistance. 11.2 Forecasted shocks and opportunities
11.2.1 Shocks Although the Darfur Peace Agreement was signed in May 2006 between the Government and some rebel factions, the presence of several non-signatory rebel factions on the ground and the continued fragmentation of the rebel forces contiues to posed a major sedcurity challenge both for successful implementation of the peace agreement as well as the delivery of humanitarian assistance. An added source of major uncertainty in 2008 is delays in the deployment of the 26,000 strong AU/UN hybrid force (UNAMID).
11.2.2 Opportunities The cereal harvest (October/November) is the most tangible opportunity for residents and IDPs living in communities to improve their food security situation. However, the benefits will be primarily limited to those who have cultivated land and are able to harvest a reasonable quantity,
119
such as at least 0.5 ha under cereals for 3-month self-sufficiency, assuming average yields (see Section 11.2.3). The resumption of Peace Talks and successful deployment of UNAMID could provide further opportunities to enhance the food security and livelihoods of IDPs and residents in Darfur. UNAMID is planning to deploy an “early effects” package and carry out quick impact projects in order to demonstrate immediate impact. The international community is also planning to establish a Darfur Community Peace and Stability Fund (CPSF) to promote an environment conducive to peace at local level, provided certain agreed-upon principles and criteria are respected and met52. Activities financed by this fund are intended to ensure appropriate tangible support to security and peace on the ground at community level, not formally linked to the Peace Talks or the Darfur Joint Assessment Mission (DJAM) process (see below). Programme interventions that may be considered for the fund include: livelihoods, governance/rule of law, peace support at local level, and expansion of basic social service delivery53. The DJAM launched subsequently to the Darfur Peace Agreement of May 2006, was suspended in November 2006, due to the continued violence and insecurity in Darfur. With new initiatives now underway, discussions have resumed on how the DJAM could be completed. The DJAM’s expected outputs are (i) a Darfur Early Recovery Programme with detailed costing of priority programmes; and (ii) a longer-term Recovery and Development strategic framework54. It is understood however, that various forms of humanitarian support will need to continue in parallel for some time, until livelihoods and minimal social services have been restored. The intentions of the IDPs and their willingness – and feasibility - to return to their place of origins are unknown at present and this will condition the type of support to give. Provided peace in Darfur is on its way to being restored and a sustained ceasefire is in place, the DJAM should assist with gathering the views of IDPs and residents and in adjusting the programme priorities and strategies identified in 2006. 11.3 Most likely scenario: status quo Security is the driving force to humanitarian needs, recovery and development in Darfur. Although the joint AU/UN initiative with UNAMID and plans for funding and quick impact projects are being made, most stakeholders concur that the situation remains precarious. Delays in the deployment of peacekeeping troops are likely, and the full participation of the multiple fractions that contribute to the conflict is not ensured. Most of the food insecurity in Darfur is chronic in character due to the protracted nature of the conflict overlapping with past structural and political inefficiencies. Any improvement in the security, agricultural and livelihoods situation will therefore take time before it translates into visible improvement for households. The forecasted changes are anticipated to be slow even under the hypothesis of successful peace talks and favourable agricultural conditions next year. At best, a temporary improvement of the food security situation of residents and IDPs who cultivated and will be able to harvest a sufficient acreage (at least 0.5 ha under cereals for 3-
52 Darfur Community Peace and Stability Fund: Draft Proposal for Comments and Discussion, 24 September 2007 53 Projects and activities eligible for funding through the Darfur Community Peace and Stability Fund will be assessed by an Oversight Committee based on agreed upon principles and criteria (security, inclusiveness, willingness to return, impartiality/neutrality, local consultation and accountability, and rapid starting date). 54 The Darfur Joint Assessment Mission (DJAM) process includes two parallel tracks: one focused on identifying urgent needs for returning populations covering a period of 24 months; and a concurrent second track focused on identifying longer-term recovery and development needs to reach the Millenium Development Goals (DJAM Concept Note, September 2006). The DJAM is supported by a Core Coordinating Group comprising representatives of the Government, SLM/M, United Nations, World Bank, AfDB, African Union, and selected donors.
120
month self-sufficiency and at least 1 ha for 6-month self-sufficiency55) can be expected. This will apply mostly to households living in communities, given the low proportion of IDPs in camps who planted more than 0.5 ha (9%) and the practical difficulties of targeting these households within camp settings. Assuming no further deterioration in the security situation, the number of people at risk to lives and livelihoods among those who were able to cultivate may decrease slightly at the beginning of 2008, due to the harvest. To account for possible failures to harvest due to localized outbreaks of insecurity or climatic/pest conditions, it may be hypothetised that the harvest will benefit only 2/3rds of the households who could cultivate a reasonable acreage under cereals. The temporary improvement might thus be as follows: • during the first month of 2008 (January): improvement for 2/3rds of the residents and IDPs in
communities who cultivated at least 0.5 ha as they would have 3 months self-sufficiency after the November 2007 harvest;
• during the next 3 months of 2008 (February-April): improvement for 2/3rd of the residents and IDPs in communities who cultivated at least 1 ha as they would have 6 months self-sufficiency after the November 2007 harvest.
At crisis-affected Darfur-level, 9% of the households cultivated at least 0.5 ha under cereals and might have between 3 and 6 months of cereals self-sufficiency and 29% cultivated at least 1 ha and might have more than 6 months of cereals self-sufficiency. However, the situation varies greatly according to the population groups: • about 12% of IDPs in communities might be self-sufficient in cereals for 3 to 6 months and 22%
for more than 6 months; • 13% of residents might be self-sufficient for 3 to 6 months and 55% for more than 6 months. In November/December 2008, assuming an average cereal harvest, the number of people at risk will again decrease thanks to the 2008 harvest, in a proportion similar to that estimated for the post-harvest period of January 2008. Given the current uncertainties, it cannot be guaranteed that beyond the harvest, the deployment of UNAMID troops will improve security and hence facilitate mobility of the population (with positive effects on crop cultivation, livestock raising, access to food, and income). The food security and lives and livelihoods risk situation of households who cannot harvest sufficiently for their own consumption and IDPs in camps, will at best, remain the same throughout 2008. The forecasted total numbers of people at risk to lives and livelihoods in 2008 are indicated in the table below. Table 63: Estimated proportions of households at risk to lives and livelihoods in the most likely scenario in 2008
Most likely scenario in 2008 At risk to lives At risk to livelihoods Not at risk:
Current situation (September 2007): IDPs in camps 14% 78% 8% IDPs in communities 20% 63% 17%
Residents 12% 65% 24%
55 According to FAO/WFP references, an average individual in Darfur requires 150 kg of cereal per year for consumption. The 2005 EFSA indicated average yield of cereal of 450 kg/ha. Therefore, in order to produce enough food, a household must cultivate at least 0.33 ha of cereals per household member. Based on a 6-member households, the minimum acreage for 12 months self-sufficiency, assuming adequate soil fertility and climatic conditions to obtain the average yield, is about 2 ha; for 6 months self-sufficiency, it is about 1 ha/household, and for 3 months 0.5 ha/household.
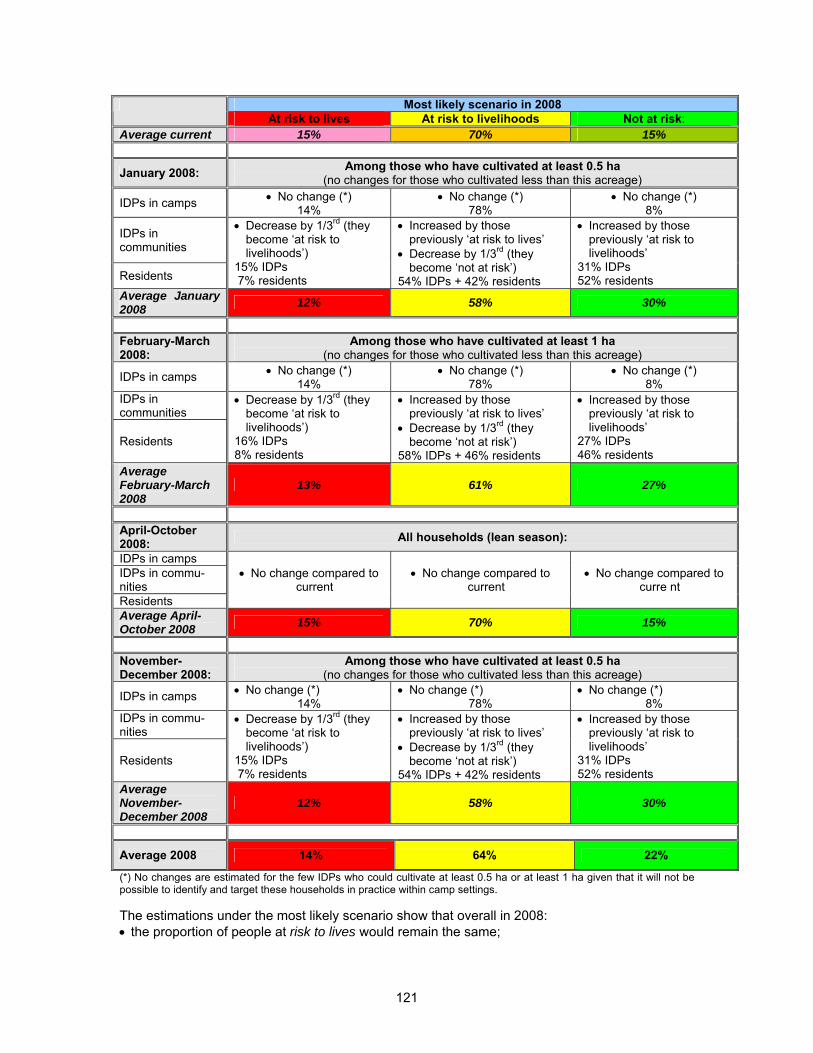
121
Most likely scenario in 2008 At risk to lives At risk to livelihoods Not at risk:
Average current 15% 70% 15%
January 2008: Among those who have cultivated at least 0.5 ha (no changes for those who cultivated less than this acreage)
IDPs in camps • No change (*) 14%
• No change (*) 78%
• No change (*) 8%
IDPs in communities
Residents
• Decrease by 1/3rd (they become ‘at risk to livelihoods’)
15% IDPs 7% residents
• Increased by those previously ‘at risk to lives’
• Decrease by 1/3rd (they become ‘not at risk’)
54% IDPs + 42% residents
• Increased by those previously ‘at risk to livelihoods’
31% IDPs 52% residents
Average January 2008 12% 58% 30%
February-March 2008:
Among those who have cultivated at least 1 ha (no changes for those who cultivated less than this acreage)
IDPs in camps • No change (*) 14%
• No change (*) 78%
• No change (*) 8%
IDPs in communities
Residents
• Decrease by 1/3rd (they become ‘at risk to livelihoods’)
16% IDPs 8% residents
• Increased by those previously ‘at risk to lives’
• Decrease by 1/3rd (they become ‘not at risk’)
58% IDPs + 46% residents
• Increased by those previously ‘at risk to livelihoods’
27% IDPs 46% residents
Average February-March 2008
13% 61% 27%
April-October 2008: All households (lean season):
IDPs in camps IDPs in commu-nities Residents
• No change compared to current
• No change compared to current
• No change compared to curre nt
Average April-October 2008 15% 70% 15%
November-December 2008:
Among those who have cultivated at least 0.5 ha (no changes for those who cultivated less than this acreage)
IDPs in camps • No change (*) 14%
• No change (*) 78%
• No change (*) 8%
IDPs in commu-nities
Residents
• Decrease by 1/3rd (they become ‘at risk to livelihoods’)
15% IDPs 7% residents
• Increased by those previously ‘at risk to lives’
• Decrease by 1/3rd (they become ‘not at risk’)
54% IDPs + 42% residents
• Increased by those previously ‘at risk to livelihoods’
31% IDPs 52% residents
Average November-December 2008
12% 58% 30%
Average 2008 14% 64% 22%
(*) No changes are estimated for the few IDPs who could cultivate at least 0.5 ha or at least 1 ha given that it will not be possible to identify and target these households in practice within camp settings. The estimations under the most likely scenario show that overall in 2008: • the proportion of people at risk to lives would remain the same;
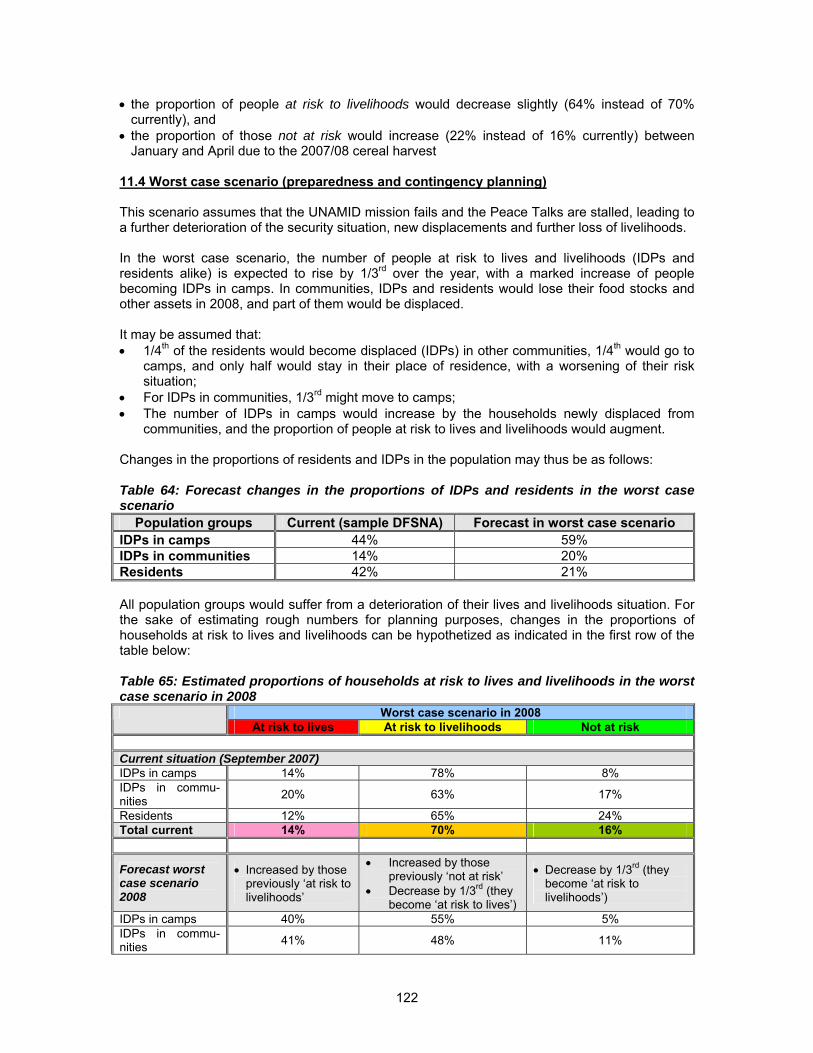
122
• the proportion of people at risk to livelihoods would decrease slightly (64% instead of 70% currently), and
• the proportion of those not at risk would increase (22% instead of 16% currently) between January and April due to the 2007/08 cereal harvest
11.4 Worst case scenario (preparedness and contingency planning) This scenario assumes that the UNAMID mission fails and the Peace Talks are stalled, leading to a further deterioration of the security situation, new displacements and further loss of livelihoods. In the worst case scenario, the number of people at risk to lives and livelihoods (IDPs and residents alike) is expected to rise by 1/3rd over the year, with a marked increase of people becoming IDPs in camps. In communities, IDPs and residents would lose their food stocks and other assets in 2008, and part of them would be displaced. It may be assumed that: • 1/4th of the residents would become displaced (IDPs) in other communities, 1/4th would go to
camps, and only half would stay in their place of residence, with a worsening of their risk situation;
• For IDPs in communities, 1/3rd might move to camps; • The number of IDPs in camps would increase by the households newly displaced from
communities, and the proportion of people at risk to lives and livelihoods would augment. Changes in the proportions of residents and IDPs in the population may thus be as follows: Table 64: Forecast changes in the proportions of IDPs and residents in the worst case scenario
Population groups Current (sample DFSNA) Forecast in worst case scenario IDPs in camps 44% 59% IDPs in communities 14% 20% Residents 42% 21% All population groups would suffer from a deterioration of their lives and livelihoods situation. For the sake of estimating rough numbers for planning purposes, changes in the proportions of households at risk to lives and livelihoods can be hypothetized as indicated in the first row of the table below: Table 65: Estimated proportions of households at risk to lives and livelihoods in the worst case scenario in 2008
Worst case scenario in 2008 At risk to lives At risk to livelihoods Not at risk
Current situation (September 2007) IDPs in camps 14% 78% 8% IDPs in commu-nities 20% 63% 17%
Residents 12% 65% 24% Total current 14% 70% 16%
Forecast worst case scenario 2008
• Increased by those previously ‘at risk to livelihoods’
• Increased by those previously ‘not at risk’
• Decrease by 1/3rd (they become ‘at risk to lives’)
• Decrease by 1/3rd (they become ‘at risk to livelihoods’)
IDPs in camps 40% 55% 5% IDPs in commu-nities 41% 48% 11%
123
Worst case scenario in 2008 At risk to lives At risk to livelihoods Not at risk
Residents 34% 51% 16% Total 2008 38% 53% 11% In this scenario, the proportion of households at risk to lives would almost triple in 2008. This deterioration would be mostly reflected in camps and amongst the residents who would still be living in their communities. The proportion of IDPs at risk to lives in communities would double.
124
12 – NUMBERS AT RISKS TO LIVES AND LIVELIHOODS AND NEEDING ASSISTANCE 12.1 Number of individuals at risks to lives (malnutrition) The overall increase in GAM is the outcome of a broad spectrum of factors, including both direct causes of malnutrition such as poor food intake and illness, as well as underlying causes of malnutrition such a food insecurity, poor public health environment, and poor caring practices. While the specific contribution of each factor varies from state to state, these include:
• Consistently poor infant and young child feeding practices with limited practice of exclusive breastfeeding to 6 months, lack of timely introduction of complementary foods, etc.;
• Morbidity, in particular fever and bloody/watery diarrhoea which are significantly associated with acute malnutrition;
• Limited ownership and use of mosquito nets as part of malaria prevention activities, contributing to morbidity;
• Low coverage of therapeutic and supplementary feeding programmes to identify early and treat cases of malnutrition;
• Low coverage of public health services at community level, contributing to inability to detect and treat morbidities in a timely manner;
• Variable access to adequate sanitation; • Deterioration in the overall food security situation in Darfur; • The high reliance on food aid combined with limited income earning activities which
contribute to low dietary diversity; and, • Limited progress in ensuring adequate programming to prevent malnutrition through
sustained behaviour change efforts. At the time of the assessment, 16.1% of the conflict affected population under five was either moderately or severely malnourished. Based on the rate of GAM, approximately 101,500 children under five in the conflict affected population would be at risk of malnutrition in 2008, out of which, approximately 12,000 children under five would be at risk of severe acute malnutrition. 12.2 Number of households at risk to lives and livelihoods
12.2.1 Current numbers of households at risk to lives and livelihoods Based on the proportions of IDPs in camps, IDPs in communities and residents estimated to be at risk to lives and livelihoods (see Section 8.5), the number of people at risk to lives and livelihoods can be estimated. At the time of the assessment, there were an estimated 3.48 million people at risk to lives and livelihoods, including some 0.63 million at risk to lives and 2.85 million at risk to livelihoods56. These numbers comprise 2.90 million food insecure people, including 1.95 million severely and 0.95 million moderately food insecure. They are higher than last year (2.65 million food insecure), reflecting the continuous insecurity resulting in further displacement and lack of improvement of households’ food consumption and access at crisis-affected Darfur level.
12.2.2 Projection of the number of households at risk to lives and livelihoods in the most likely scenario
56 Note: As mentioned in Section 2.7.1, the population figures in the WFP/ICRC lists of population receiving humanitarian assistance are lower than OCHA estimated figures of crisis-affected people. If WFP/ICRC figures are used, the estimated number of people at risk to lives and livelihoods would be 2.98 million people, including about 0.54 million at risk to lives and 2.44 million at risk to livelihoods. These numbers comprise 2.48 million food insecure people, of which 1.67 million were severely and 0.82 million moderately food insecure.
125
The numbers of people at risk to lives and livelihoods can be estimated (Section 11.3), based on the projected timeline of changes in the proportions of people at risk to lives and livelihoods in the most likely scenario, taking into account the positive effects of the 2007 harvest. These people at risk will require assistance in 2008. In the most likely scenario, taking into account the positive effects of the harvests of 2007 and 2008, an average of 3.22 million people will be at risk to lives and livelihoods throughout 2008, including 0.57 million at risk to lives and 2.65 million at risk to livelihoods57. The above numbers would break down as follows, taking into account the positive effect of the harvest for the IDPs and residents in communities who will be able to harvest: • January 2008: 2.90 million people at risk to lives and livelihoods, including 0.50 million at risk to
lives and 2.40 million at risk to livelihoods; • Average February to April 2008: 3.04 million people at risk to lives and livelihoods, including
0.53 million at risk to lives and 2.51 million at risk to livelihoods; • Average May to October 2008: 3.48 million people at risk to lives and livelihoods, including 0.63
million at risk to lives and 2.85 million at risk to livelihoods; • Average November to December 2008: 2.90 million people at risk to lives and livelihoods,
including 0.50 million at risk to lives and 2.40 million at risk to livelihoods. Table 66: Forecast number of people at risk to lives and livelihoods requiring assistance in 2008 in the most likely scenario
Forecast 2008 Most likely scenario At risk to lives At risk to livelihoods Not at risk
January 2008 496 800 2 405 800 661 200 Average February-April 529 400 2 509 600 1 251 500 Average May-October 632 100 2 847 000 1 107 500 Average November-December 496 800 2 405 800 661 200 Average 2008 572 600 2 652 300 920 400
Figure 89: Number of People at Risk to Lives and Livelihood Under the Most Likely Scenario
0
500,000
1,000,000
1,500,000
2,000,000
2,500,000
3,000,000
3,500,000
4,000,000
Current (S
eptem
ber 20
07)
January
2008
Febru
ary-A
pril 20
08
May-O
ctober
2008
November-
Decem
ber 20
08
Averag
e 200
8
Num
ber o
f Peo
ple
At risk to livesAt risk to livelihoodsTotal at riskNot at risk
57 Note: Using WFP/ICRC population figures (lower than OCHA), in the most likely scenario an average of 2.85 million people will be at risk to lives and livelihoods in 2008, including 0.51 million at risk to lives and 2.34 million at risk to livelihoods.
126
12.2.3 Projection of the number of households at risk to lives and livelihoods in the worst case scenario
Projected numbers of people at risk to lives and livelihoods can be estimated as follows: Table 67: Forecast number of people at risk to lives and livelihoods requiring assistance in the worst case scenario
Forecast 2008 Worst case scenario At risk to lives At risk to livelihoods Not at risk
Average 2008 1 557 620 2 173 725 441 075 In the worst case scenario, a total of 3.73 million people would be at risk to lives and livelihoods (about 90% of the population) and would require assistance, including 1.56 million at risk to lives and 2.17 million at risk to livelihoods58.
12.2.4 Main population groups at risk to lives and livelihoods and targeting criteria Based on the food security analysis (food consumption, sources of income, assets, sources of food, and coping strategies), IDPs, female-headed households, households who do not cultivate or cultivate very small acreage (e.g. less than 0.5 ha), households owning no animals or less than 5 sheep/goats, and households relying on casual labour, sale of firewood/grass, sale of food aid or other low income earning activities (handicraft, remittances, gifts) as their main source of income were the most at risk to lives and livelihoods. There are overlaps between these groups, resulting in a ‘gradation’ of the degree of risk as the number of factors increase. For instance, female-headed IDPs in camps, relying mostly on the sale of food aid for their income, owning no animals and not cultivating, would be the worst off. Other households at risk are those headed by a disabled person (unsatisfactory food consumption, decreased mobility) and households relying on one source of income only. The main factors of risk of each type of households are summarized in table 66. Table 68: Population groups most at risk to lives and livelihoods
Population groups Characteristics and factors of risk IDPs 58% of the population • 20% IDPs in
communities, 14% IDPs in camps at risk to lives
• 63% IDPs in communities, 78% IDPs in camps at risk to livelihoods
• Higher proportion of female-headed households (IDPs in camps) • Less access to land and animals • Less likely to own productive assets • More likely to be at risk to lives and livelihoods than residents. • More likely to use coping strategies that put their livelihoods at risk (37%)
compared to residents (27%) • More likely to migrate in excess in the event of food shortage • More likely to sell food aid (especially in camps)
Female-headed households 34% of the population • 15% at risk to lives • 73% at risk to livelihoods
• More likely to be IDPs in camps (40% female-headed) • Cultivated less and owned less animals • More likely to have borderline food consumption patterns and less likely to have
acceptable food consumption, than male-headed households. • More likely to be at risk to lives and livelihoods than male-headed households. • Higher proportion than male-headed households face health-related difficulties
and shortage of members able to work, to access income. • Twice as many female-headed households depend on remittances for their
58 Note: Using WFP/ICRC population figures (lower than OCHA), in the worst case scenario a total of 3.20 million people would be at risk to lives and livelihoods, including 1.34 million at risk to lives and 1.86 million at risk to livelihoods.
127
Population groups Characteristics and factors of risk income compared to male-headed households (13% versus 6%).
• Tend to own less assets than male-headed households. • Higher proportion severely food insecure compared to male-headed households
(53% versus 44%) • More likely to adopt a coping strategy that put their lives at risk, when faced with
food shortage (9% versus 5% male-headed) Households relying on agricultural casual wage labour or sale of firewood/grass or sale of food aid for income 78% of the population • 19% of agricultural wage
labourers or relying on sale firewood/grass at risk to lives
• 74% of agricultural wage labourers and 71% of those relying on sale of firewood/grass at risk to livelihoods
• Dedicated a higher share of expenditures to food, but a lower absolute amount. • Higher proportion of food insecure households, and households at risk to lives and
livelihoods, than others; highest proportion of food insecure among those relying on the sale of food aid
• Less likely to own assets including animals and productive assets • Less likely to sell animals, assets and valuables when faced with food shortages,
and more likely to adopt a strategy that put their lives at risk
Households headed by a disabled person 10% of the population • 14% at risk to lives • 69% at risk to livelihoods
• More likely to have borderline food consumption patterns and less likely to have acceptable food consumption, than others
• More likely to depend on remittances as main source of income
Households depending on one income source only 44% of the population • 17% at risk to lives • 65% at risk to livelihoods
• Owned less productive assets • Cultivated less and owned less animals • More vulnerable to total loss of income • More likely to be at risk to lives, than those relying on 2 or more income sources
Identification of practical targeting criteria on the basis of the characteristics of people at risk to lives and livelihoods is not straightforward. While some characteristics might be observable or measurable (e.g. access to land, ownership of animals, sex of the head of household), others are more complicated (e.g. sources of income, type of coping strategies, duration of displacement). The most feasible criteria to identify households at risk to lives and livelihoods would be ‘excluding’ those that have the following profiles (those that are not at riks): • Cultivation of more than 2 hectares (1.4 mukhamas); • Ownership of more than 1 cattle or more than 5 sheep/goats; • Ownership of ‘luxury’ asset such as a car or large shop. These criteria could be discussed at community level and should be considered regardless of whether the households in question are displaced or residents.
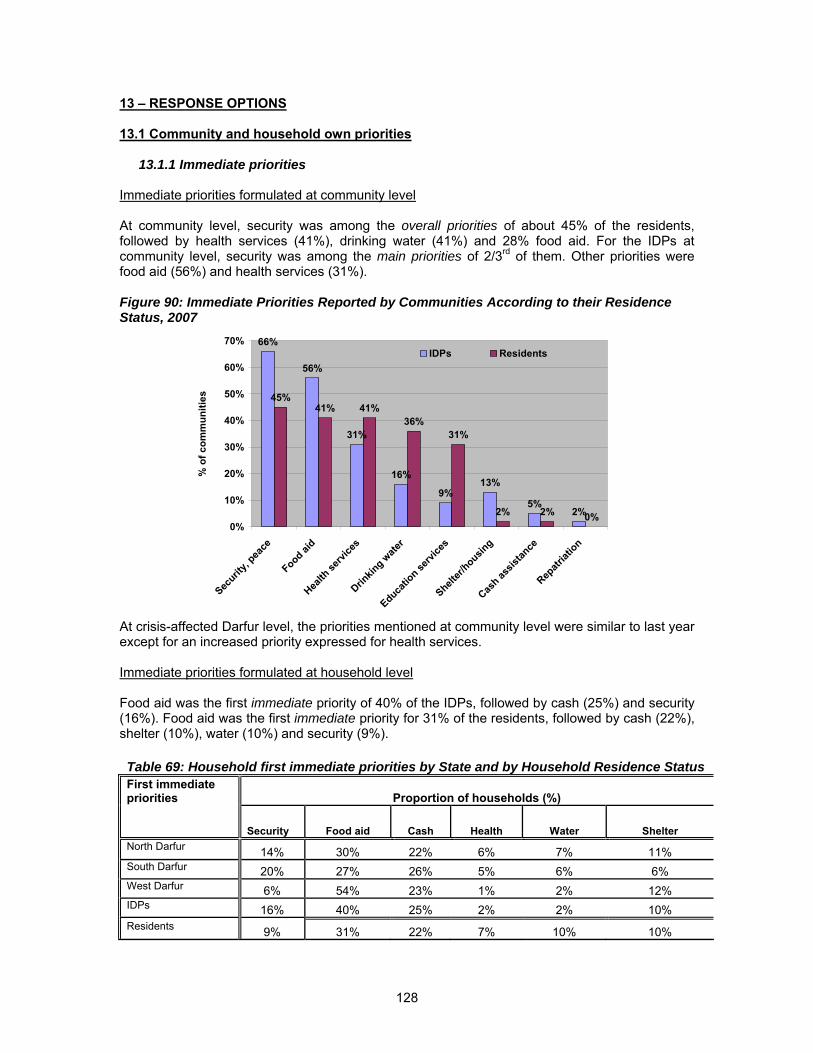
128
13 – RESPONSE OPTIONS 13.1 Community and household own priorities
13.1.1 Immediate priorities Immediate priorities formulated at community level At community level, security was among the overall priorities of about 45% of the residents, followed by health services (41%), drinking water (41%) and 28% food aid. For the IDPs at community level, security was among the main priorities of 2/3rd of them. Other priorities were food aid (56%) and health services (31%). Figure 90: Immediate Priorities Reported by Communities According to their Residence Status, 2007
66%
56%
31%
16%
9%13%
5%2%
45%41% 41%
36%31%
2% 2% 0%0%
10%
20%
30%
40%
50%
60%
70%
Securit
y, pea
ce
Food aid
Health
servi
ces
Drinkin
g wate
r
Educatio
n servi
ces
Shelter/
housing
Cash as
sistan
ce
Repatr
iation
% o
f com
mun
ities
IDPs Residents
At crisis-affected Darfur level, the priorities mentioned at community level were similar to last year except for an increased priority expressed for health services. Immediate priorities formulated at household level Food aid was the first immediate priority of 40% of the IDPs, followed by cash (25%) and security (16%). Food aid was the first immediate priority for 31% of the residents, followed by cash (22%), shelter (10%), water (10%) and security (9%). Table 69: Household first immediate priorities by State and by Household Residence Status First immediate priorities Proportion of households (%)
Security Food aid Cash Health Water Shelter North Darfur 14% 30% 22% 6% 7% 11% South Darfur 20% 27% 26% 5% 6% 6% West Darfur 6% 54% 23% 1% 2% 12% IDPs 16% 40% 25% 2% 2% 10% Residents 9% 31% 22% 7% 10% 10%
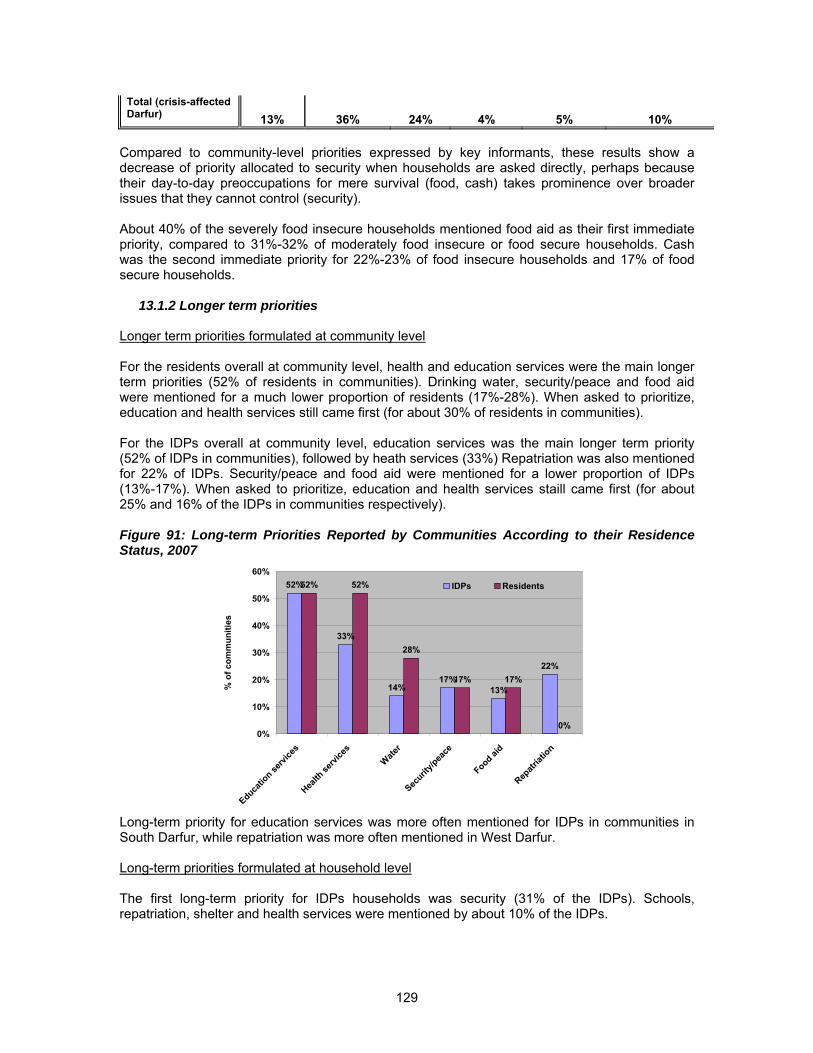
129
Total (crisis-affected Darfur) 13% 36% 24% 4% 5% 10%
Compared to community-level priorities expressed by key informants, these results show a decrease of priority allocated to security when households are asked directly, perhaps because their day-to-day preoccupations for mere survival (food, cash) takes prominence over broader issues that they cannot control (security). About 40% of the severely food insecure households mentioned food aid as their first immediate priority, compared to 31%-32% of moderately food insecure or food secure households. Cash was the second immediate priority for 22%-23% of food insecure households and 17% of food secure households.
13.1.2 Longer term priorities Longer term priorities formulated at community level For the residents overall at community level, health and education services were the main longer term priorities (52% of residents in communities). Drinking water, security/peace and food aid were mentioned for a much lower proportion of residents (17%-28%). When asked to prioritize, education and health services still came first (for about 30% of residents in communities). For the IDPs overall at community level, education services was the main longer term priority (52% of IDPs in communities), followed by heath services (33%) Repatriation was also mentioned for 22% of IDPs. Security/peace and food aid were mentioned for a lower proportion of IDPs (13%-17%). When asked to prioritize, education and health services staill came first (for about 25% and 16% of the IDPs in communities respectively). Figure 91: Long-term Priorities Reported by Communities According to their Residence Status, 2007
52%
33%
14%17%
13%
22%
52% 52%
28%
17% 17%
0%0%
10%
20%
30%
40%
50%
60%
Educatio
n servi
ces
Health
servi
ces
Water
Securit
y/pea
ce
Food aid
Repatr
iation
% o
f com
mun
ities
IDPs Residents
Long-term priority for education services was more often mentioned for IDPs in communities in South Darfur, while repatriation was more often mentioned in West Darfur. Long-term priorities formulated at household level The first long-term priority for IDPs households was security (31% of the IDPs). Schools, repatriation, shelter and health services were mentioned by about 10% of the IDPs.
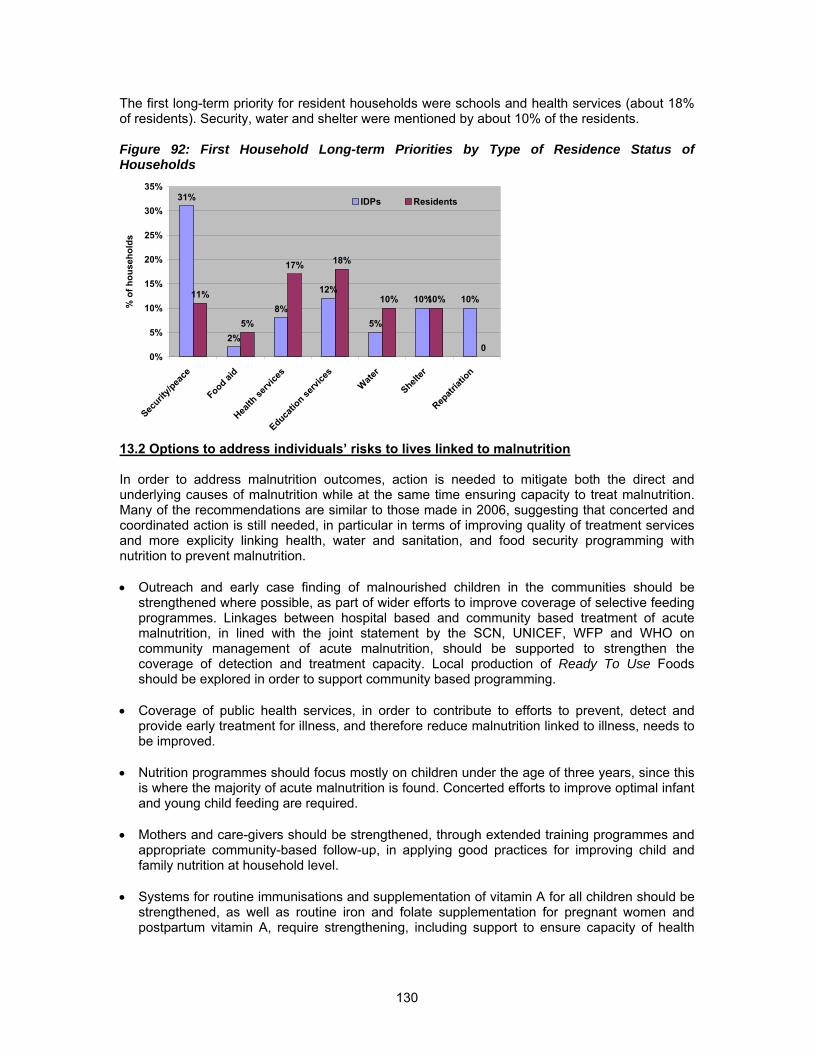
130
The first long-term priority for resident households were schools and health services (about 18% of residents). Security, water and shelter were mentioned by about 10% of the residents. Figure 92: First Household Long-term Priorities by Type of Residence Status of Households
31%
2%
8%
12%
5%
10% 10%11%
5%
17% 18%
10% 10%
00%
5%
10%
15%
20%
25%
30%
35%
Securit
y/pea
ce
Food aid
Health
servi
ces
Educatio
n servi
ces
Water
Shelter
Repatr
iation
% o
f hou
seho
lds
IDPs Residents
13.2 Options to address individuals’ risks to lives linked to malnutrition In order to address malnutrition outcomes, action is needed to mitigate both the direct and underlying causes of malnutrition while at the same time ensuring capacity to treat malnutrition. Many of the recommendations are similar to those made in 2006, suggesting that concerted and coordinated action is still needed, in particular in terms of improving quality of treatment services and more explicity linking health, water and sanitation, and food security programming with nutrition to prevent malnutrition. • Outreach and early case finding of malnourished children in the communities should be
strengthened where possible, as part of wider efforts to improve coverage of selective feeding programmes. Linkages between hospital based and community based treatment of acute malnutrition, in lined with the joint statement by the SCN, UNICEF, WFP and WHO on community management of acute malnutrition, should be supported to strengthen the coverage of detection and treatment capacity. Local production of Ready To Use Foods should be explored in order to support community based programming.
• Coverage of public health services, in order to contribute to efforts to prevent, detect and
provide early treatment for illness, and therefore reduce malnutrition linked to illness, needs to be improved.
• Nutrition programmes should focus mostly on children under the age of three years, since this
is where the majority of acute malnutrition is found. Concerted efforts to improve optimal infant and young child feeding are required.
• Mothers and care-givers should be strengthened, through extended training programmes and
appropriate community-based follow-up, in applying good practices for improving child and family nutrition at household level.
• Systems for routine immunisations and supplementation of vitamin A for all children should be
strengthened, as well as routine iron and folate supplementation for pregnant women and postpartum vitamin A, require strengthening, including support to ensure capacity of health
131
clinics to provide these vital services. Campaigns to maintain high levels of measles and polio immunisation are also a necessary strategy in situations of conflict such as Darfur.
• Community sensitization to promote health seeking behaviour for treatment of both moderate
and severe malnutrition should be undertaken in order to increase participation and compliance in selective feeding programme. Additionally, supplementary feeding programmes should focus more on education for caretakers, and be used as an opportunity to raise awareness of appropriate health, hygiene and caring practices, rather than simply a distribution of food. Outreach should also be expanded to ensure early detection and treatment of moderately malnourished children and women.
• Sustained effort is required to maintain and improve coverage of vitamin A and iron/folate for
pregnant and postpartum women, as well as maintain and improve vitamin A and measles coverage of children, in particular to ensure coverage in both resident and displaced groups.
• Livelihood assets which have become depleted by households in their attempt to alleviate
acute food insecurity should be restored and home production of highly nutritious foods intensively promoted.
• Any programme aiming to reduce and/or prevent malnutrition must focus on increasing access
to safe water and sanitation through both hardware as well as behaviour change programmes, in order to contribute to reductions in disease incidence, particularly diarrhoeal disease, respiratory infections and fever. Action could include activities to improve access to safe water sources: digging wells, building hand-pumps and providing training and spare parts to ensure maintenance and supporting the organization of community-based water management committees. They should be tailored to localised needs.
• Health and hygiene promotion should be strengthened to include all populations, resident and
non-resident, and supported by provision of appropriate non-food items such as water containers, blankets, mosquito nets, where needed.
• Food assistance plays a vital role in ensuring good health and nutrition status, and should be
continued for those who are unable to provide adequately for themselves. Food aid should be complemented by efforts to increase nutrient adequacy in the diet among the conflict affected population in terms of quantity and quality (micronutrients) through dietary diversification and access to micronutrients through support to Univeral Salt Iodization and flour fortification.
• There is a need to further strengthen and institutionalise capacity for routine nutrition
surveillance activities into government structures to allow early detection of changes in nutrition and health status, and to reduce the need for large scale surveys such as the DFSNA which are costly and do not allow for monitoring trends in the short term. Support is required in the areas of collection, compilation, analysis and use of routine nutrition data (eg.routinefeedingcentredata, localised nutritiondata, and sentinelsitedata) as well as establishment of furtherlinkageswithfoodsecurityandhealthmonitoringsystems, and incorporation of relevantinformation from programmatic evaluationsand rapid assessments.
• Greater emphasis is required in the planning, coordination, implementation and monitoring of
integrated programmes, such as the Accelerated Child Survival Initiative, and between sectors, is required.
13.3 Options to address households’ risks to lives and livelihoods
13.3.1 Overview of the situation and main assistance requirements
132
• While the food security situation of both residents and IDPs overall has remained stable compared to previous years, there are more severely food insecure IDPs in communities than in 2006. There is also a high proportion of residents in communities with a majority of IDPs with such a poor diet that it puts their lives at risk.
• The stability of the food security situation must be considered in the light of a persistent high
dependency on food aid. At the same time, the sale of food aid continued to decrease and it contributes to a lower share of beneficiaries’ income than in previous years.
• Both IDPs and residents have increased their reliance on casual labour for their income, and
decreased their reliance on the sale of food aid (particularly IDPs) and sale of agricultural and animal produce (particularly residents). This confirms that households in Darfur are not passively dependent on humanitarian assistance but struggle to improve their livelihoods by looking for work (agricultural and non agricultural) and actively engaging in activities such as the collection and sale of firewood/grass and petty trade. These activities provide a low and irregular income, however, and were found to be associated with the use of coping strategies that put households’ lives at risk (whole days without eating) when faced with food shortages.
Income-earning activities are constrained by: • Insecurity: Limiting the movement of people to search for work, including seasonal migration, to
cultivate and harvest fields, and to access markets for trading of crop and animal productions; • Insufficient opportunities for casual labour, related to the influx of IDPs competing with residents
and decreased migration: Limiting the number of days of employment and the remuneration that people can obtain, and increasing dependency on food aid;
• Negative environmental impact of the excessive collection of firewood: Increasing the distance and time required to collect firewood and the associated security risks for women in particular; and jeopardizing future livelihoods.
Constraints to income-earning activities result in: • low food self-sufficiency and insufficient income to meet essential food and non-food
requirements (health, education, grain milling, transportation and firewood), and • dependency on unreliable or unsustainable resources including food aid and firewood to get
food and income. Population groups most affected are IDPs, female-headed households, and households dependent on the above-mentioned income-earning activities. Residents, particularly those living in communities with large number of IDPs, are also increasingly food insecure. Response options to address risks to lives and livelihoods should support the own efforts and capacities of the conflict-affected population and address the above constraints. Broadly speaking, they include: • Address insecurity:
► Support/advocate for the expeditious deployment of UNAMID peace-keeping troops; ► Set up an integrated nutrition and food security monitoring system which also captures
political and conflict-related factors that influence the impact of humanitarian assistance programmes and the relationship between assistance and the various conflict actors;
► Make efforts to design food and non-food assistance programmes in such a way that it encourage dialogues between the various stakeholders of the conflict at local level.
• Address the dependency on food aid and low income:
► Increase cash income through limited and selected food- and/or cash/voucher transfers, including provisions to cover milling costs, health care and school fees;
► Increase employment opportunities through food- or cash-for-work programmes;
133
► Assist seasonal migration and receipt of remittances by facilitating linkages between migrants and the rest of the family, identifying and supporting networks in migrant recipient areas;
► Increase own food (crops and animals) production and income by continuing to provide agricultural inputs and increase assistance with veterinary services;consider animal re-stocking; and the establishment, or strengthening of community mechanisms to manage water resources for both human and animal usage;
► Set up mechanisms to build and manage food reserves at community-level; ► Facilitate physical access to markets by rehabilitating roads, possibly through food- or
cash-for-work programmes; ► Continue the distribution of non-food items for newly displaced people; ► Provide training on basic literacy, vocational skills and business management, possibly
through food- or cash-for-training programmes; ► Support the enrolment of children at school and the provision of education to enhance
human capital, possibly through exemption of school fees, food- or cash-for-work for volunteer teachers, distribution of educational material, and school feeding.
Note: Food aid distributions will continue to be needed while the above interventions are set up.
• To address negative environmental impact of excessive firewood collection: ► Launch reforestation activities, possibly through food- or cash-for-work programmes; ► Facilitate or strengthen community mechanisms to manage the collection of firewood.
Combinations of the above options are probably best. However, some options are more appropriate and feasible than others. The advantages and disadvantages of the various options are examined below.
13.3.2 Food aid or cash/voucher transfers? The impact of food aid on markets and production, and the performance of markets are key elements in the analysis of the comparative advantages of food and cash/voucher transfers. Impact of food aid on markets In the current conflict context, the discentives effects of food aid on agricultural production are somewhat irrelevant given the security-related constraints to cultivation59. Should the security situation improve, any possible disincentive effects on crop production caused by food aid will need to be carefully monitored. Food aid has clearly had beneficial effects by increasing food availability and lowering food prices in Darfur, thus improving households’ food security of both beneficiaries and non beneficiaries60 by providing an important and stable safety net. Traders interviewed had mixed views on the impact of food aid on markets. About 25%-30% cited price stability as the first or second impact of food aid sales in the three Darfur States, but food aid sales were also considered a cause of lower prices (particularly in South and North Darfur) and of low demand. On the other hand, they cited increased availability of food and higher demand for non-food items, especially in West Darfur. It is clear that without food aid many traders would not be active. Food aid is considered to have stimulated the local economy61, and traders interviewed generally seem satisfied despite lower profits with food aid than local grain sales. When possible, traders seem to switch out of
59 Margie Buchanan-Smith and Susanne Jaspars, Conflict, camps and coercion: The continuing livelihoods crisis in Darfur, A Report to WFP Sudan, June 2006, pp. 120-121 - Abdel Rahman Hamid, et al., Markets, Livelihoods and Food Aid in Darfur: A Rapid Assessment and Programming Recommendations, May 2005, pp. 34-35. 60 2005 Darfur EFSNA Final Report, April 2007 - Margie Buchanan-Smith and Susanne Jaspars, Conflict, camps and coercion: The continuing livelihoods crisis in Darfur, A Report to WFP Sudan, June 2006. 61 Abdel Rahman Hamid, et al., Markets, Livelihoods and Food Aid in Darfur: A Rapid Assessment and Programming Recommendations, May 2005.
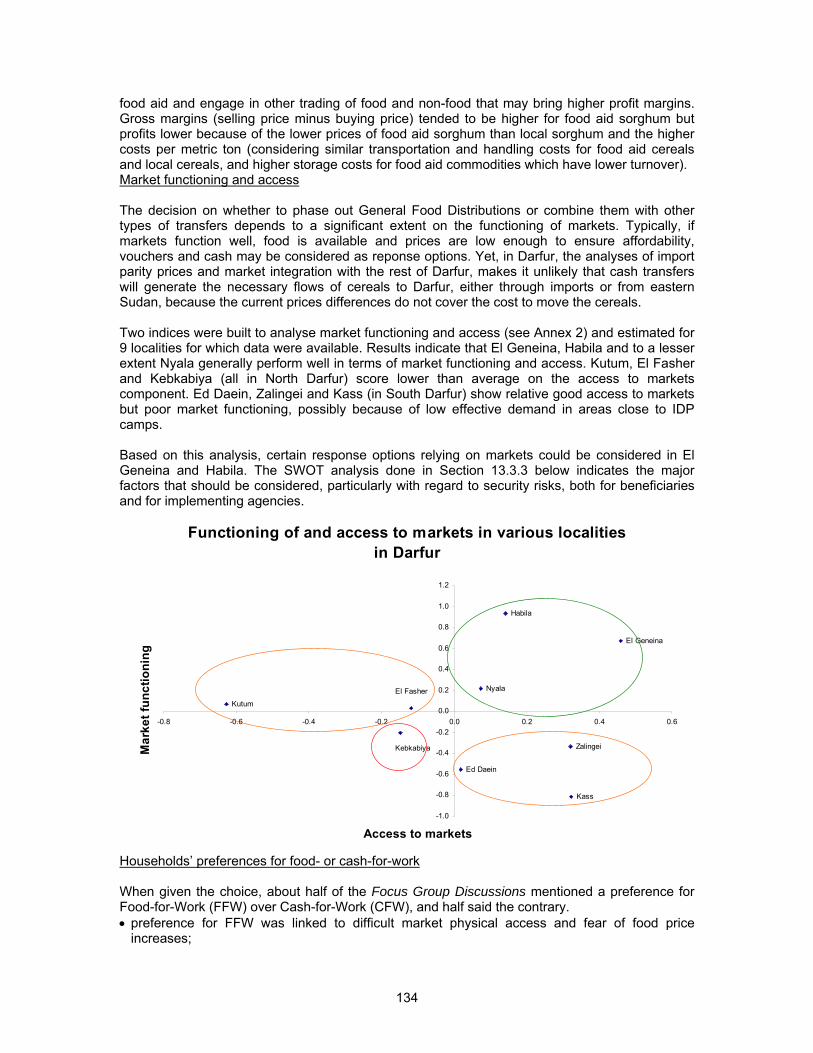
134
food aid and engage in other trading of food and non-food that may bring higher profit margins. Gross margins (selling price minus buying price) tended to be higher for food aid sorghum but profits lower because of the lower prices of food aid sorghum than local sorghum and the higher costs per metric ton (considering similar transportation and handling costs for food aid cereals and local cereals, and higher storage costs for food aid commodities which have lower turnover). Market functioning and access The decision on whether to phase out General Food Distributions or combine them with other types of transfers depends to a significant extent on the functioning of markets. Typically, if markets function well, food is available and prices are low enough to ensure affordability, vouchers and cash may be considered as reponse options. Yet, in Darfur, the analyses of import parity prices and market integration with the rest of Darfur, makes it unlikely that cash transfers will generate the necessary flows of cereals to Darfur, either through imports or from eastern Sudan, because the current prices differences do not cover the cost to move the cereals. Two indices were built to analyse market functioning and access (see Annex 2) and estimated for 9 localities for which data were available. Results indicate that El Geneina, Habila and to a lesser extent Nyala generally perform well in terms of market functioning and access. Kutum, El Fasher and Kebkabiya (all in North Darfur) score lower than average on the access to markets component. Ed Daein, Zalingei and Kass (in South Darfur) show relative good access to markets but poor market functioning, possibly because of low effective demand in areas close to IDP camps. Based on this analysis, certain response options relying on markets could be considered in El Geneina and Habila. The SWOT analysis done in Section 13.3.3 below indicates the major factors that should be considered, particularly with regard to security risks, both for beneficiaries and for implementing agencies.
Functioning of and access to markets in various localities in Darfur
Zalingei
Habila
El Geneina
Ed Daein
Kass
Nyala
Kebkabiya
El Fasher
Kutum
-1.0
-0.8
-0.6
-0.4
-0.2
0.0
0.2
0.4
0.6
0.8
1.0
1.2
-0.8 -0.6 -0.4 -0.2 0.0 0.2 0.4 0.6
Access to markets
Mar
ket f
unct
ioni
ng
Households’ preferences for food- or cash-for-work When given the choice, about half of the Focus Group Discussions mentioned a preference for Food-for-Work (FFW) over Cash-for-Work (CFW), and half said the contrary. • preference for FFW was linked to difficult market physical access and fear of food price
increases;
135
• preference for CFW was explained by the need for cash to purchase items not included in the assistance, such as other food, and cover other basic needs;
• some groups expressed a preference for FFW should free food distributions be suspended, but CFW if food distributions continue.
In many cases, participants did not restrict FFW or CFW programmes to a specific period of the year, reflecting the paucity of alternative employment opportunities throughout the year, and the inability to cultivate.
13.3.3 Food transfers Strengths, Weaknesses, Opportunities and Threats (SWOT) of food transfers Objectives of food transfers in Darfur: • to provide food for direct consumption (nutrition) • to provide an economic transfer to compensate for the loss of own food production (sales) and
income (economic transfer); • to build/restore physical assets, if transfers are FFW. Food transfers can be done through General Food Distributions (GFD), Food-for-Work (FFW), Food-for-Training (FFT), Supplementary Feeding Programmes (SFP) and Food-for-Education programmes (FFE school feeding). While GFD have proved essential to protect household food security in Darfur, the possibility for food aid to have a disincentive effect on crop production must be carefully monitored if the security situation improves, including through monitoring of prices. A SWOT analysis of GFD and FFW interventions (see table below) shows that the benefits of GFD are limited by the absence of complementary economic assistance including cash/vouchers to buy other essential food items and pay for milling costs and health expenses. Household earnings from casual labour are clearly insufficient, resulting in the sale of part of the ration and food/cash borrowing which is reimbursed with the next ration. The net result is inadequate food consumption at household level and cost-inefficient use of food resources. The same limitations will apply to FFW if they are substituting GFD. However, if FFW participants receive an extra ration, while GFD is still provided at household level, the additional transfer will enable them to cover other essential needs while limiting the negative effects on the diet. The need for material inputs, experimented implementing partners, and ability to monitor implementation of works, are significant constraints with FFW. FFW would seem appropriate at a small scale to start with, in locations where the provision of material inputs, technical assistance and monitoring is not/less jeopardized by insecurity. However, the practical constraints of providing the necessary non-food inputs and regular technical assistance and monitoring, must not be under-estimated. Until the security situation improves and the heavy control procedures imposed on implementing agencies (controls at checkpoints, daily permits etc.) lighten, the upscaling of FFW (or CFW) interventions will not be possible. The full benefits of GFD and FFW require the implementation of complementary interventions that increase the capacity of beneficiaries to earn income or decrease their need to pay for unavoidable costs (milling, health, school fees, land rental). This assistance can take the form of (see Section 13.3.4): • vouchers for milling;
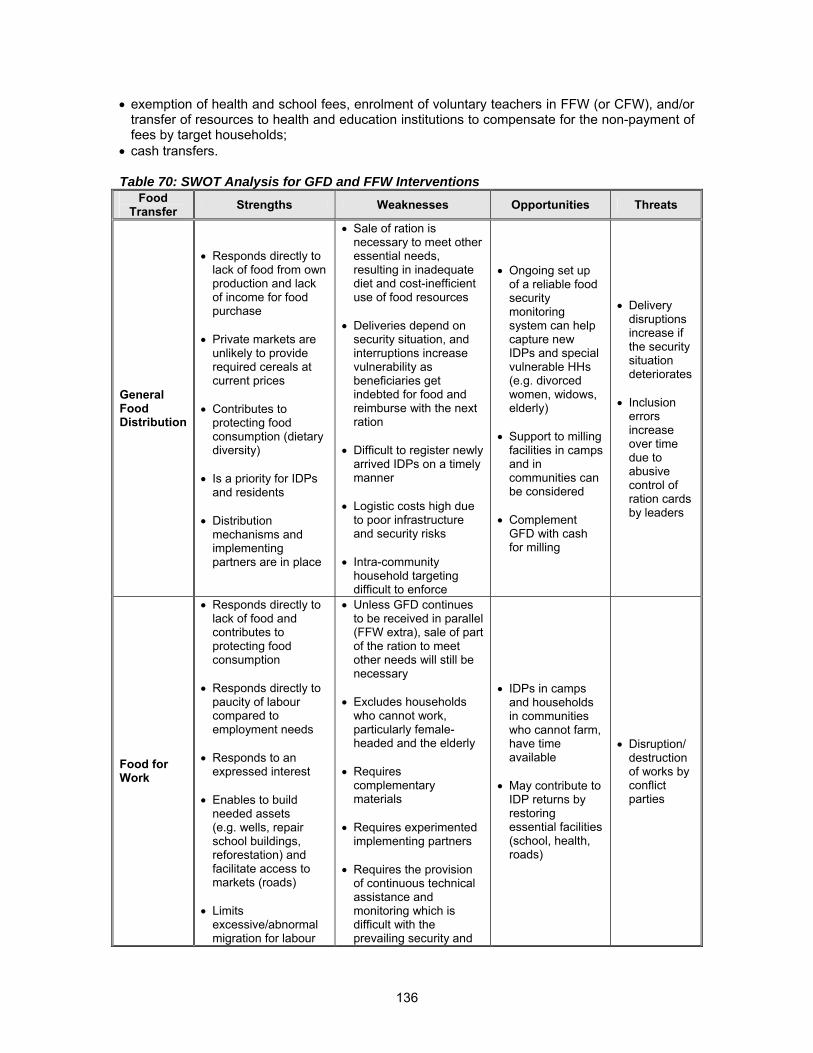
136
• exemption of health and school fees, enrolment of voluntary teachers in FFW (or CFW), and/or transfer of resources to health and education institutions to compensate for the non-payment of fees by target households;
• cash transfers. Table 70: SWOT Analysis for GFD and FFW Interventions
Food Transfer Strengths Weaknesses Opportunities Threats
General Food Distribution
• Responds directly to lack of food from own production and lack of income for food purchase
• Private markets are
unlikely to provide required cereals at current prices
• Contributes to
protecting food consumption (dietary diversity)
• Is a priority for IDPs
and residents • Distribution
mechanisms and implementing partners are in place
• Sale of ration is necessary to meet other essential needs, resulting in inadequate diet and cost-inefficient use of food resources
• Deliveries depend on
security situation, and interruptions increase vulnerability as beneficiaries get indebted for food and reimburse with the next ration
• Difficult to register newly
arrived IDPs on a timely manner
• Logistic costs high due
to poor infrastructure and security risks
• Intra-community
household targeting difficult to enforce
• Ongoing set up of a reliable food security monitoring system can help capture new IDPs and special vulnerable HHs (e.g. divorced women, widows, elderly)
• Support to milling
facilities in camps and in communities can be considered
• Complement
GFD with cash for milling
• Delivery disruptions increase if the security situation deteriorates
• Inclusion
errors increase over time due to abusive control of ration cards by leaders
Food for Work
• Responds directly to lack of food and contributes to protecting food consumption
• Responds directly to
paucity of labour compared to employment needs
• Responds to an
expressed interest • Enables to build
needed assets (e.g. wells, repair school buildings, reforestation) and facilitate access to markets (roads)
• Limits
excessive/abnormal migration for labour
• Unless GFD continues to be received in parallel (FFW extra), sale of part of the ration to meet other needs will still be necessary
• Excludes households
who cannot work, particularly female-headed and the elderly
• Requires
complementary materials
• Requires experimented
implementing partners • Requires the provision
of continuous technical assistance and monitoring which is difficult with the prevailing security and
• IDPs in camps and households in communities who cannot farm, have time available
• May contribute to
IDP returns by restoring essential facilities (school, health, roads)
• Disruption/ destruction of works by conflict parties
137
Food Transfer Strengths Weaknesses Opportunities Threats
• Self-targeting
control conditions
Modalities of General Food Distributions (GFD) Even though it has improved compared to last year, particularly in IDP camps, women’s participation (balance) and role in decision-making within Food Aid Committees need to be strengthened. Options include: • awareness sessions to both men and women; • special outreach sessions for local leaders; • training for leadership and jobs for women; • youth education. The current system is also weak in identifying and providing food aid to newly arrived IDPs. Current beneficiaries share part of their ration with them, further contributing to inadequate diets overall. Allocating food stocks as buffer for newly displaced, to be mobilized on a monthly basis and based on notification of new displacements, may be an option. Targeting of GFD can be based on geographic and/or household criteria: • geographic criteria: security situation affecting access to fields, possibility of seasonal migration
and receipt of remittances, and possibilities of trading goods at the market; rains affecting the size of the harvest;
• household criteria (see Section 12.2.4 ‘exclusion’ crlteria): ownership/rental of land, capacities to cover food consumption needs from own agricultural production and cash income from labour (casual, seasonal migration), and ownership of assets (livestock, shop, car); women-headed households deserve special attention given that they are likely to own less assets, cultivate less, have lower mobility and higher health-related constraints to earn income.
Household targeting requires discussions/agreements with community leaders and spot-checks household surveys to monitor compliance with the agreed-upon criteria. As the conflict endures and GFD have become ‘routine’ in many communities, the formerly sensitive community household targeting may now be feasible in communities. Food for Training (FFT) Objectives of FFT in Darfur: • to increase beneficiaries’ capacities to access better remunerated jobs; and, • to enhance human assets in the longer term and facilitate the resumption of livelihoods (both
residents and livelihoods) upon return of IDPs in their place of origin. Many Focus Group Discussions expressed interest in FFT programmes: • Men: training on agricultural machinery, water pumps, adult education, carpentry, mechanics
and constructions; • Women: adult education, training for sewing, handicraft, soap making, biscuit making,
construction of fuel-efficient stoves, management of revolving funds, first aid and Traditional Birth Attendants.
Such training could take place within IDP camps and in communities (including both residents and IDPs to minimize tensions). Options include: • stand-alone training activities parallel to general food distributions (extra ration to account for
the opportunity cost of time spent in training versus engaged in income-earning activities);
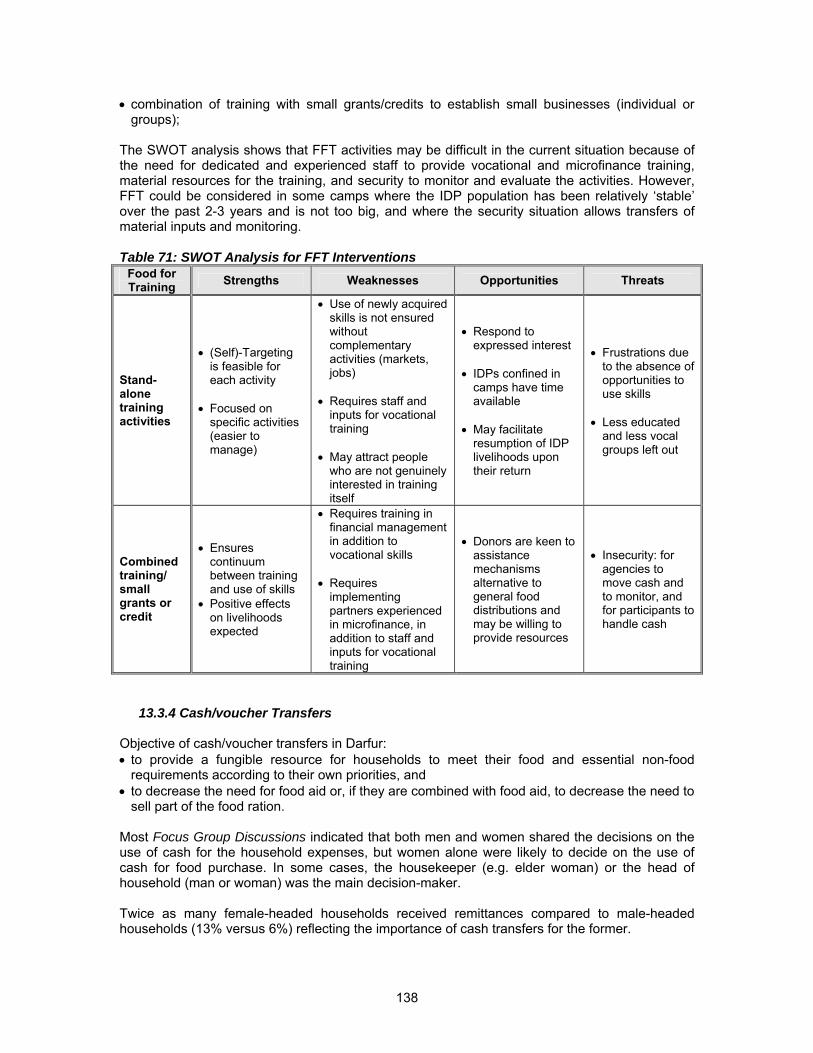
138
• combination of training with small grants/credits to establish small businesses (individual or groups);
The SWOT analysis shows that FFT activities may be difficult in the current situation because of the need for dedicated and experienced staff to provide vocational and microfinance training, material resources for the training, and security to monitor and evaluate the activities. However, FFT could be considered in some camps where the IDP population has been relatively ‘stable’ over the past 2-3 years and is not too big, and where the security situation allows transfers of material inputs and monitoring. Table 71: SWOT Analysis for FFT Interventions
Food for Training Strengths Weaknesses Opportunities Threats
Stand-alone training activities
• (Self)-Targeting is feasible for each activity
• Focused on
specific activities (easier to manage)
• Use of newly acquired skills is not ensured without complementary activities (markets, jobs)
• Requires staff and
inputs for vocational training
• May attract people
who are not genuinely interested in training itself
• Respond to expressed interest
• IDPs confined in
camps have time available
• May facilitate
resumption of IDP livelihoods upon their return
• Frustrations due to the absence of opportunities to use skills
• Less educated
and less vocal groups left out
Combined training/ small grants or credit
• Ensures continuum between training and use of skills
• Positive effects on livelihoods expected
• Requires training in financial management in addition to vocational skills
• Requires
implementing partners experienced in microfinance, in addition to staff and inputs for vocational training
• Donors are keen to assistance mechanisms alternative to general food distributions and may be willing to provide resources
• Insecurity: for agencies to move cash and to monitor, and for participants to handle cash
13.3.4 Cash/voucher Transfers Objective of cash/voucher transfers in Darfur: • to provide a fungible resource for households to meet their food and essential non-food
requirements according to their own priorities, and • to decrease the need for food aid or, if they are combined with food aid, to decrease the need to
sell part of the food ration. Most Focus Group Discussions indicated that both men and women shared the decisions on the use of cash for the household expenses, but women alone were likely to decide on the use of cash for food purchase. In some cases, the housekeeper (e.g. elder woman) or the head of household (man or woman) was the main decision-maker. Twice as many female-headed households received remittances compared to male-headed households (13% versus 6%) reflecting the importance of cash transfers for the former.
139
Insecurity is the biggest constraint to the implementation of cash or voucher interventions, in relation to (i) the risks associated with the transfer of cash, and (ii) the lack of access for the management of the activities. However: • Community mechanisms already exist to transfer cash, including through truck drivers, traders
and arrangements with members travelling back to the communities. It may be possible to use these mechanisms to transfer larger amounts of cash as part of assistance programmes.
• The lack of access to some areas could be addressed by arranging with traders for example, to meet at Darfur State central towns for the redemption of vouchers and payment.
Implementation capacities are the second constraint, as agency staff and resources are currently mostly dedicated to food aid distributions and management of feeding programmes. Some NGOs have already started to implement voucher interventions, however, for example ACTED (a WFP GFD partner) has implemented a small CFW pilot for road building in Hasahisa camp (Zalengei), and ACF is currently doing a 3 months pilot in Al Sareif camp (Nyala). Their experiences could be built upon and expanded where appropriate. It would thus seem that both cash and voucher transfers could be tried out to complement GFD, initially small-scale to secure implementation capacity and proper monitoring and evaluation. The set up of these interventions requires a specific feasibility/ programming study to determine target locations, size of transfers/content of vouchers, frequency of transfers and transfer modalities. As shown by the market analysis (see Section 13.3.2), cash/voucher interventions could be attempted in areas with good market access and functioning, such as Geneina and Habila. While CFW may be feasible for small IDP camps (larg camps would make implementation difficult), cash/voucher unconditional transfers may not be appropriate in IDP camps as they may attract people even more than food assistance and as community-based mechanisms to transfer cash cannot be applied. Table 72: SWOT Analysis for Cash For Work Interventions Cash or voucher transfer
Strengths Weaknesses Opportunities Threats
Cash Transfer
• Enables beneficiaries to decide on the allocation of resources for food and non-food essential needs
• Reduce need for
excessive/ abnormal migration to earn cash income
• Stimulates local
economy including small-scale millers, traders
• Market price rise reduce the value of cash transfers (as early as 2-3 months post-harvest)
• Poorly functioning of
and poor access to markets in several locations
• May be even more
appealing than food and attract people to locations where cash is distributed
• Requires heavy
financial and administrative arrangements to transfer cash and monitor payments
• Donors are keen to assistance mechanisms alternative to general food distributions and may be willing to provide cash resources
• Community
mechanisms exist already for informal cash transfers
• Insecurity for agencies to move cash and to monitor
• Insecurity for
beneficiaries who receive cash
Voucher Transfer
• Reduce risks for beneficiaries compared to cash
• Stimulates local economy including small-scale millers,
• Donors are keen to assistance mechanisms
• Insecurity for agencies to move cash
140
Cash or voucher transfer
Strengths Weaknesses Opportunities Threats
• If set as amounts for
certain goods, rather than value protects against price rise
• Reduce need for
excessive/ abnormal migration to earn cash income
• Stimulates local
economy including small-scale millers, traders
traders • Requires heavy
financial and administrative arrangements to recover vouchers and pay the providers
• Requires experimented
implementing partners, and strong monitoring system
alternative to general food distributions and may be willing to provide cash resources
• Arrangements
may be possible with traders to meet at safe locations (e.g. central towns) for vouchers’ redemption
• Some agencies
have already started to experiment with voucher transfers
and to monitor
Cash for Work
• Responds directly to paucity of labour compared to employment needs
• Enables beneficiaries
to decide on the allocation of resources for food and non-food essential needs
• Responds to an
expressed interest • Enables to build
needed assets such as wells, repair school buildings, roads or reforestation
• Limits excessive/
abnormal migration for cash income
• Stimulates local
economy including small-scale millers, traders through injection of cash
• Self-targeting
• Excludes households who cannot work, particularly female-headed and the elderly
• Requires
complementary materials
• Requires experimented
implementing partners • Requires the provision
of continuous technical and financial assistance and mo itoring which is difficult with the prevailing security and control conditions
• IDPs in camps and households in communities who cannot farm, have time available
• May contribute to
IDP returns by restoring essential facilities (school, health, roads)
• Insecurity for agencies to move cash and to monitor
• Insecurity for
beneficiaries who receive cash
• Disruption/
destruction of works by conflict parties
13.3.5 School feeding response option
Physical access to primary schools
141
While the majority of communities sampled in West Darfur were located at less than 1 hour distance-time to a primary school, only 59% of the communities sampled in South Darfur and 66% of those in North Darfur were that close to a primary school. Physical access was difficult for about 30% of communities sampled in South and North Darfur, and 19% in West Darfur located at 1-3 hours distance-time to a primary school. Table 73: Distance to the Nearest Primary School
North Darfur South Darfur West Darfur Greater Darfur Less than 1 hour
66% 59% 81% 69% 1 to 3 hours
28% 33% 19% 27% 3 to 6 hours
3% 4% 0% 2% 6 to 8 hours
0% 0% 0% 0% More than 8 hours
3% 4% 0% 2% Education expenditures On average, both IDPs and residents dedicated 13% of their expenditures to education. However, about 40% of the households dedicated less than 5% of the expenditures to schooling. Between 25% (IDPs) and 30% (residents) dedicated more than 20% of their expenditures to schools. Severely food insecure households were more likely to mention education cost as a constraint to child enrolment in primary schools, compared to moderately food insecure or food secure households. Status of child enrolment in primary schools On average, 64% of boys were enrolled in primary schools and 59% of girls. Enrolment rates were slightly higher amongst IDPs (67% boys and 62% girls) than residents (60% boys and 50% girls).
142
Figure 93: Primary School Enrolment by Residence Status of Households
65%
73%
60%61%64%
55%
0%
10%
20%
30%
40%
50%
60%
70%
80%
IDPs in camps IDPs outside camps Residents
Perc
ent o
f Prim
ary
Scho
ol A
ge B
oys/
Girl
s Boys Girls
Note: The rate of enrolment of boys and girls in primary schools was estimated, and the reasons for non-enrolment were enquired. However, the results may be inaccurate due to the fact that: (i) the Arabic translation used the term ‘registered’; and (ii) ‘enrolment’ at primary school takes place only in the first year, while school fees and other costs in subsequent years occur without re-enrolment. The main reason for non-enrolment was cost (40%). A few households mentioned the need for the children to assist the household (9%) and 7% mentioned the lack of accessible primary school. IDPs living in communities where they represent large number of the population were more likely to mention cost difficulties than other IDPs or residents. Very few households mentioned taking children out of school when faced with food shortages during the month prior to the assessment, confirming the importance given to education by the population. Current WFP school feeding programmes Currently WFP is working with the Ministry of Education to expand assistance in line with the increase in school enrolment and access. WFP is reaching around 150,000 children through school feeding interventions and has a target of around 250,000 next year (2008). SWOT analysis of school feeding response options Objectives of school feeding interventions in Darfur: • to encourage the attendance of children at school by providing an economic transfer to
households, and • to contribute to enhanced learning by decreasing short-term hunger. School feeding can take the form of on-site meals or take-home rations. At present WFP is doing on-site feeding in almost all the schools and small-scale take-home rations in South Darfur. The SWOT analysis of these options indicates that take-home rations are probably easiest in the Darfur context, taking into account the conditions of schools (cooking facilities and staff). However, complementary inputs are required to achieve the educational objectives, including adequate remuneration of teachers, upgrade of teachers’ training, provision of textbooks and repair of school buildings (see Section 13.3.5). Table 74: SWOT Analysis of School Feeding Programmes School feeding Strengths Weaknesses Opportunities Threats
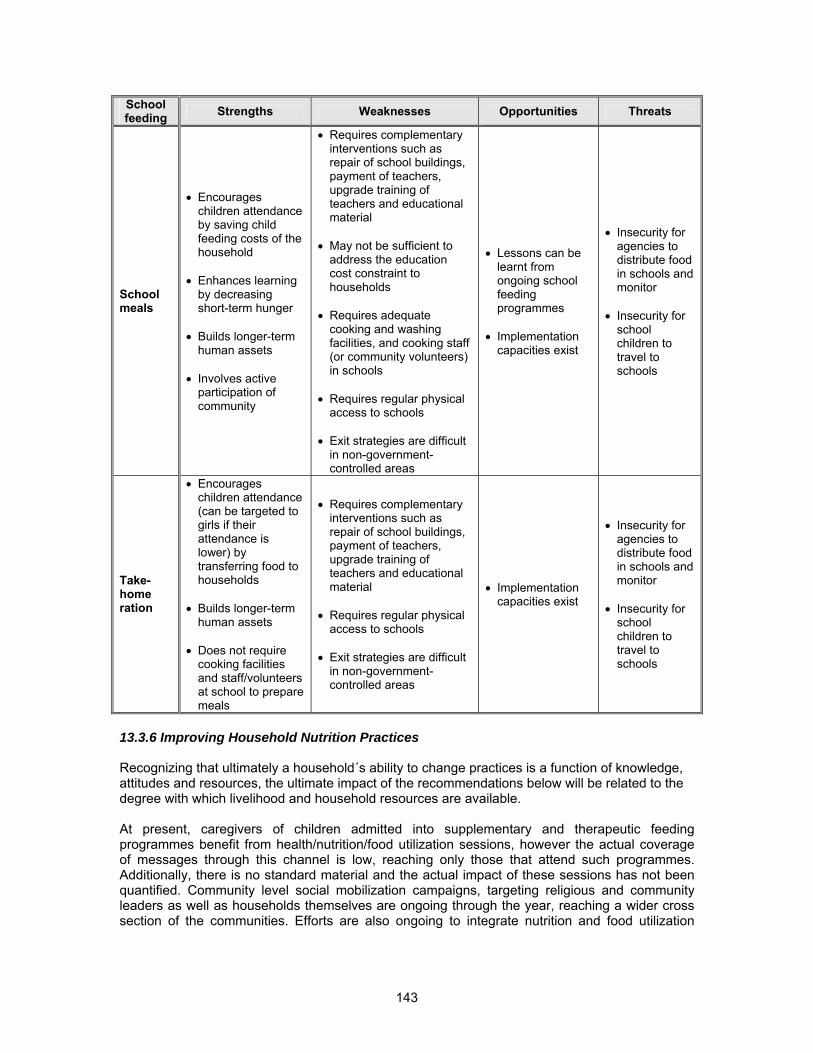
143
School feeding Strengths Weaknesses Opportunities Threats
School meals
• Encourages children attendance by saving child feeding costs of the household
• Enhances learning
by decreasing short-term hunger
• Builds longer-term
human assets • Involves active
participation of community
• Requires complementary interventions such as repair of school buildings, payment of teachers, upgrade training of teachers and educational material
• May not be sufficient to
address the education cost constraint to households
• Requires adequate
cooking and washing facilities, and cooking staff (or community volunteers) in schools
• Requires regular physical
access to schools • Exit strategies are difficult
in non-government-controlled areas
• Lessons can be learnt from ongoing school feeding programmes
• Implementation
capacities exist
• Insecurity for agencies to distribute food in schools and monitor
• Insecurity for
school children to travel to schools
Take-home ration
• Encourages children attendance (can be targeted to girls if their attendance is lower) by transferring food to households
• Builds longer-term
human assets • Does not require
cooking facilities and staff/volunteers at school to prepare meals
• Requires complementary interventions such as repair of school buildings, payment of teachers, upgrade training of teachers and educational material
• Requires regular physical
access to schools • Exit strategies are difficult
in non-government-controlled areas
• Implementation capacities exist
• Insecurity for agencies to distribute food in schools and monitor
• Insecurity for
school children to travel to schools
13.3.6 Improving Household Nutrition Practices Recognizing that ultimately a household´s ability to change practices is a function of knowledge, attitudes and resources, the ultimate impact of the recommendations below will be related to the degree with which livelihood and household resources are available. At present, caregivers of children admitted into supplementary and therapeutic feeding programmes benefit from health/nutrition/food utilization sessions, however the actual coverage of messages through this channel is low, reaching only those that attend such programmes. Additionally, there is no standard material and the actual impact of these sessions has not been quantified. Community level social mobilization campaigns, targeting religious and community leaders as well as households themselves are ongoing through the year, reaching a wider cross section of the communities. Efforts are also ongoing to integrate nutrition and food utilization
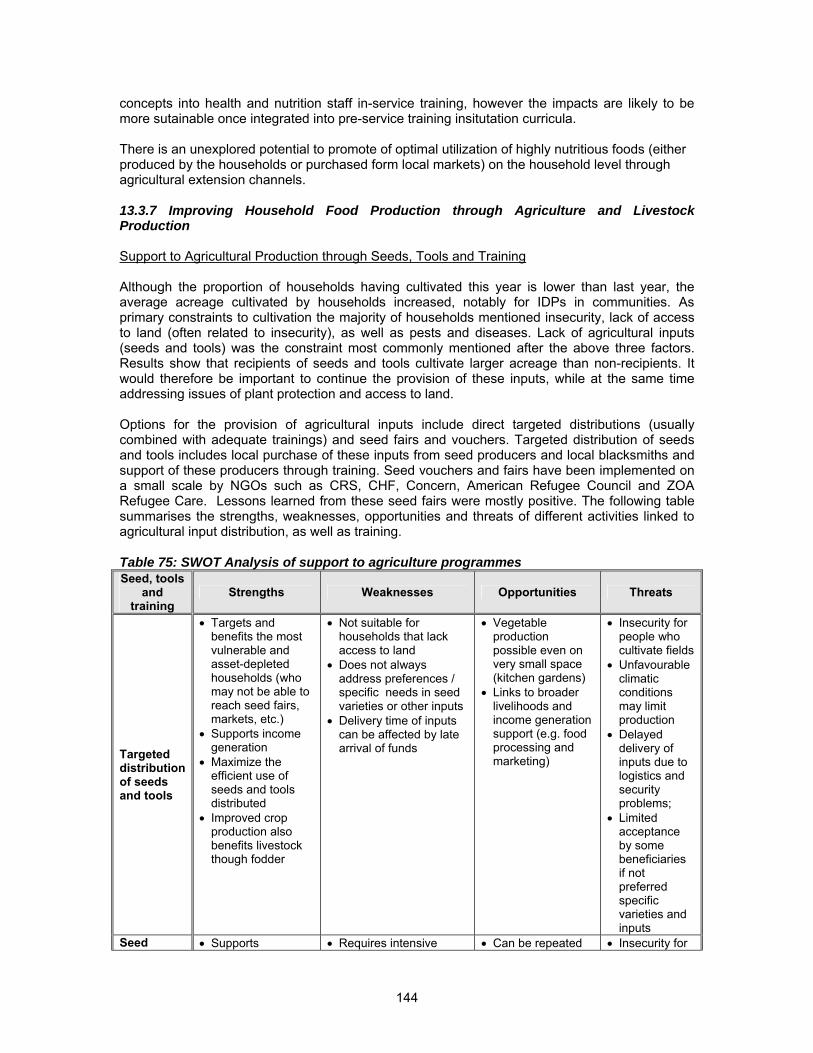
144
concepts into health and nutrition staff in-service training, however the impacts are likely to be more sutainable once integrated into pre-service training insitutation curricula. There is an unexplored potential to promote of optimal utilization of highly nutritious foods (either produced by the households or purchased form local markets) on the household level through agricultural extension channels. 13.3.7 Improving Household Food Production through Agriculture and Livestock Production Support to Agricultural Production through Seeds, Tools and Training Although the proportion of households having cultivated this year is lower than last year, the average acreage cultivated by households increased, notably for IDPs in communities. As primary constraints to cultivation the majority of households mentioned insecurity, lack of access to land (often related to insecurity), as well as pests and diseases. Lack of agricultural inputs (seeds and tools) was the constraint most commonly mentioned after the above three factors. Results show that recipients of seeds and tools cultivate larger acreage than non-recipients. It would therefore be important to continue the provision of these inputs, while at the same time addressing issues of plant protection and access to land. Options for the provision of agricultural inputs include direct targeted distributions (usually combined with adequate trainings) and seed fairs and vouchers. Targeted distribution of seeds and tools includes local purchase of these inputs from seed producers and local blacksmiths and support of these producers through training. Seed vouchers and fairs have been implemented on a small scale by NGOs such as CRS, CHF, Concern, American Refugee Council and ZOA Refugee Care. Lessons learned from these seed fairs were mostly positive. The following table summarises the strengths, weaknesses, opportunities and threats of different activities linked to agricultural input distribution, as well as training. Table 75: SWOT Analysis of support to agriculture programmes Seed, tools
and training
Strengths Weaknesses Opportunities Threats
Targeted distribution of seeds and tools
• Targets and benefits the most vulnerable and asset-depleted households (who may not be able to reach seed fairs, markets, etc.)
• Supports income generation
• Maximize the efficient use of seeds and tools distributed
• Improved crop production also benefits livestock though fodder
• Not suitable for households that lack access to land
• Does not always address preferences / specific needs in seed varieties or other inputs
• Delivery time of inputs can be affected by late arrival of funds
• Vegetable production possible even on very small space (kitchen gardens)
• Links to broader livelihoods and income generation support (e.g. food processing and marketing)
• Insecurity for people who cultivate fields
• Unfavourable climatic conditions may limit production
• Delayed delivery of inputs due to logistics and security problems;
• Limited acceptance by some beneficiaries if not preferred specific varieties and inputs
Seed • Supports • Requires intensive • Can be repeated • Insecurity for
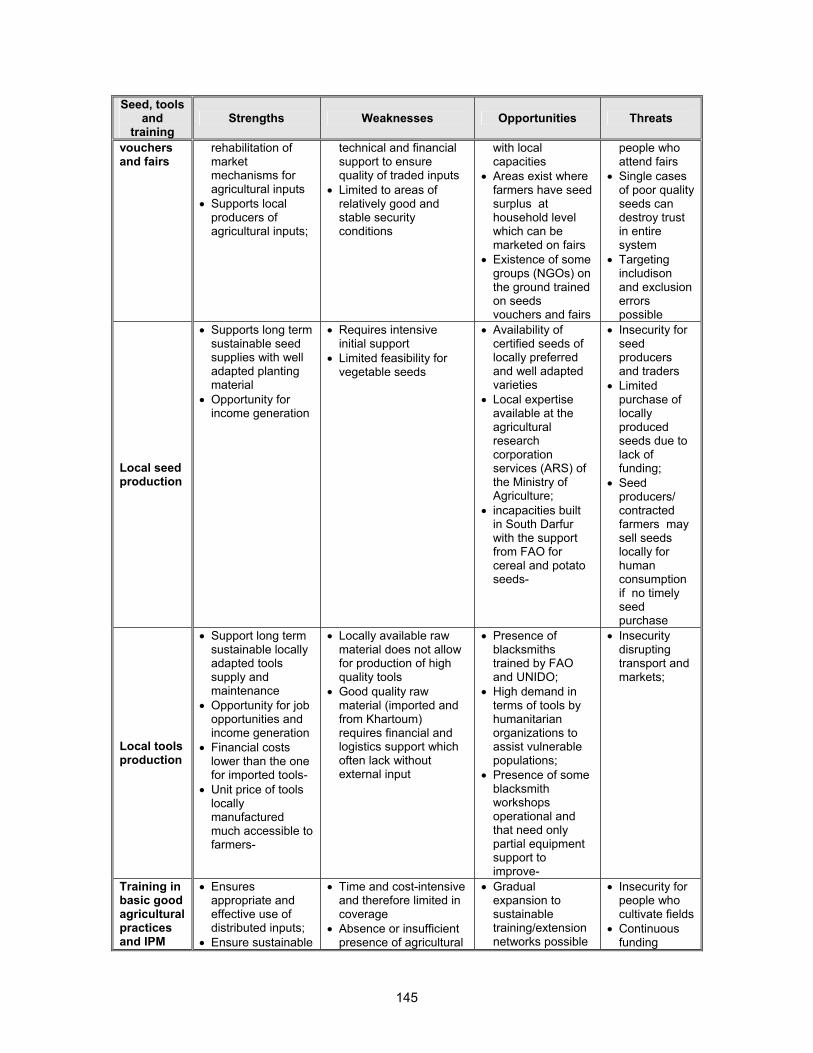
145
Seed, tools and
training Strengths Weaknesses Opportunities Threats
vouchers and fairs
rehabilitation of market mechanisms for agricultural inputs
• Supports local producers of agricultural inputs;
technical and financial support to ensure quality of traded inputs
• Limited to areas of relatively good and stable security conditions
with local capacities
• Areas exist where farmers have seed surplus at household level which can be marketed on fairs
• Existence of some groups (NGOs) on the ground trained on seeds vouchers and fairs
people who attend fairs
• Single cases of poor quality seeds can destroy trust in entire system
• Targeting includison and exclusion errors possible
Local seed production
• Supports long term sustainable seed supplies with well adapted planting material
• Opportunity for income generation
• Requires intensive initial support
• Limited feasibility for vegetable seeds
• Availability of certified seeds of locally preferred and well adapted varieties
• Local expertise available at the agricultural research corporation services (ARS) of the Ministry of Agriculture;
• incapacities built in South Darfur with the support from FAO for cereal and potato seeds-
• Insecurity for seed producers and traders
• Limited purchase of locally produced seeds due to lack of funding;
• Seed producers/ contracted farmers may sell seeds locally for human consumption if no timely seed purchase
Local tools production
• Support long term sustainable locally adapted tools supply and maintenance
• Opportunity for job opportunities and income generation
• Financial costs lower than the one for imported tools-
• Unit price of tools locally manufactured much accessible to farmers-
• Locally available raw material does not allow for production of high quality tools
• Good quality raw material (imported and from Khartoum) requires financial and logistics support which often lack without external input
• Presence of blacksmiths trained by FAO and UNIDO;
• High demand in terms of tools by humanitarian organizations to assist vulnerable populations;
• Presence of some blacksmith workshops operational and that need only partial equipment support to improve-
• Insecurity disrupting transport and markets;
Training in basic good agricultural practices and IPM
• Ensures appropriate and effective use of distributed inputs;
• Ensure sustainable
• Time and cost-intensive and therefore limited in coverage
• Absence or insufficient presence of agricultural
• Gradual expansion to sustainable training/extension networks possible
• Insecurity for people who cultivate fields
• Continuous funding
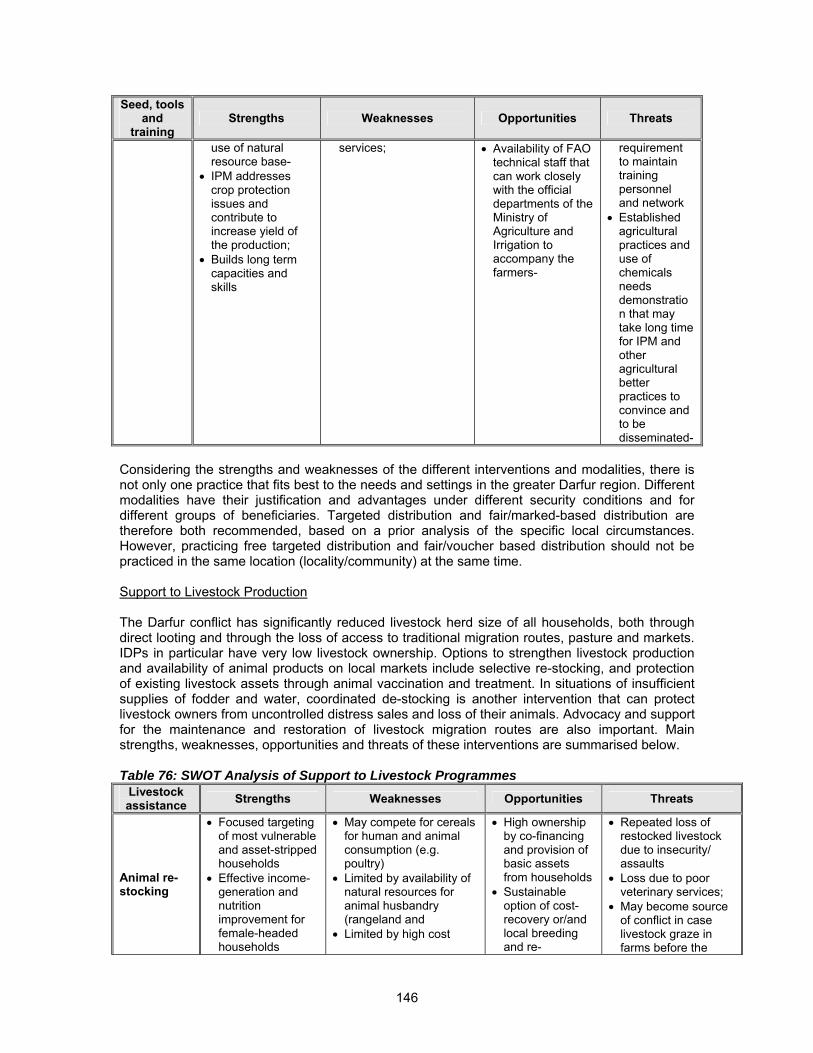
146
Seed, tools and
training Strengths Weaknesses Opportunities Threats
use of natural resource base-
• IPM addresses crop protection issues and contribute to increase yield of the production;
• Builds long term capacities and skills
services;
• Availability of FAO technical staff that can work closely with the official departments of the Ministry of Agriculture and Irrigation to accompany the farmers-
requirement to maintain training personnel and network
• Established agricultural practices and use of chemicals needs demonstration that may take long time for IPM and other agricultural better practices to convince and to be disseminated-
Considering the strengths and weaknesses of the different interventions and modalities, there is not only one practice that fits best to the needs and settings in the greater Darfur region. Different modalities have their justification and advantages under different security conditions and for different groups of beneficiaries. Targeted distribution and fair/marked-based distribution are therefore both recommended, based on a prior analysis of the specific local circumstances. However, practicing free targeted distribution and fair/voucher based distribution should not be practiced in the same location (locality/community) at the same time. Support to Livestock Production The Darfur conflict has significantly reduced livestock herd size of all households, both through direct looting and through the loss of access to traditional migration routes, pasture and markets. IDPs in particular have very low livestock ownership. Options to strengthen livestock production and availability of animal products on local markets include selective re-stocking, and protection of existing livestock assets through animal vaccination and treatment. In situations of insufficient supplies of fodder and water, coordinated de-stocking is another intervention that can protect livestock owners from uncontrolled distress sales and loss of their animals. Advocacy and support for the maintenance and restoration of livestock migration routes are also important. Main strengths, weaknesses, opportunities and threats of these interventions are summarised below. Table 76: SWOT Analysis of Support to Livestock Programmes
Livestock assistance Strengths Weaknesses Opportunities Threats
Animal re-stocking
• Focused targeting of most vulnerable and asset-stripped households
• Effective income-generation and nutrition improvement for female-headed households
• May compete for cereals for human and animal consumption (e.g. poultry)
• Limited by availability of natural resources for animal husbandry (rangeland and
• Limited by high cost
• High ownership by co-financing and provision of basic assets from households
• Sustainable option of cost-recovery or/and local breeding and re-
• Repeated loss of restocked livestock due to insecurity/ assaults
• Loss due to poor veterinary services;
• May become source of conflict in case livestock graze in farms before the
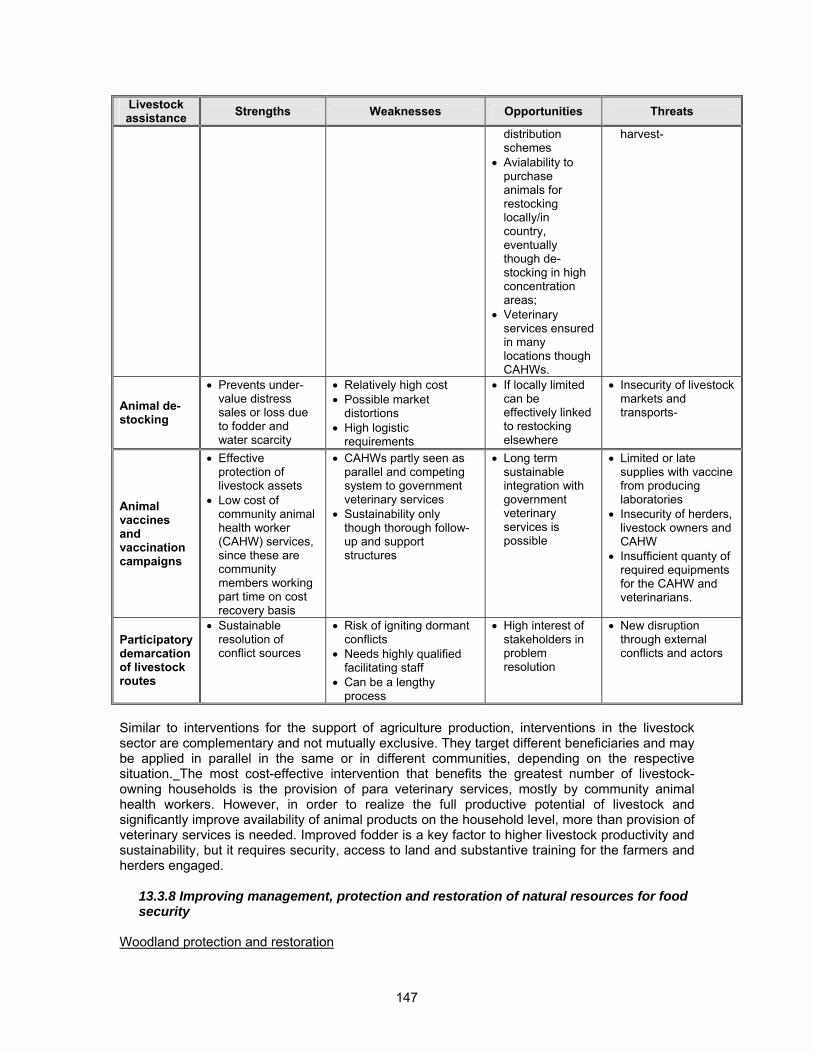
147
Livestock assistance Strengths Weaknesses Opportunities Threats
distribution schemes
• Avialability to purchase animals for restocking locally/in country, eventually though de-stocking in high concentration areas;
• Veterinary services ensured in many locations though CAHWs.
harvest-
Animal de-stocking
• Prevents under-value distress sales or loss due to fodder and water scarcity
• Relatively high cost • Possible market
distortions • High logistic
requirements
• If locally limited can be effectively linked to restocking elsewhere
• Insecurity of livestock markets and transports-
Animal vaccines and vaccination campaigns
• Effective protection of livestock assets
• Low cost of community animal health worker (CAHW) services, since these are community members working part time on cost recovery basis
• CAHWs partly seen as parallel and competing system to government veterinary services
• Sustainability only though thorough follow-up and support structures
• Long term sustainable integration with government veterinary services is possible
• Limited or late supplies with vaccine from producing laboratories
• Insecurity of herders, livestock owners and CAHW
• Insufficient quanty of required equipments for the CAHW and veterinarians.
Participatory demarcation of livestock routes
• Sustainable resolution of conflict sources
• Risk of igniting dormant conflicts
• Needs highly qualified facilitating staff
• Can be a lengthy process
• High interest of stakeholders in problem resolution
• New disruption through external conflicts and actors
Similar to interventions for the support of agriculture production, interventions in the livestock sector are complementary and not mutually exclusive. They target different beneficiaries and may be applied in parallel in the same or in different communities, depending on the respective situation. The most cost-effective intervention that benefits the greatest number of livestock-owning households is the provision of para veterinary services, mostly by community animal health workers. However, in order to realize the full productive potential of livestock and significantly improve availability of animal products on the household level, more than provision of veterinary services is needed. Improved fodder is a key factor to higher livestock productivity and sustainability, but it requires security, access to land and substantive training for the farmers and herders engaged.
13.3.8 Improving management, protection and restoration of natural resources for food security
Woodland protection and restoration
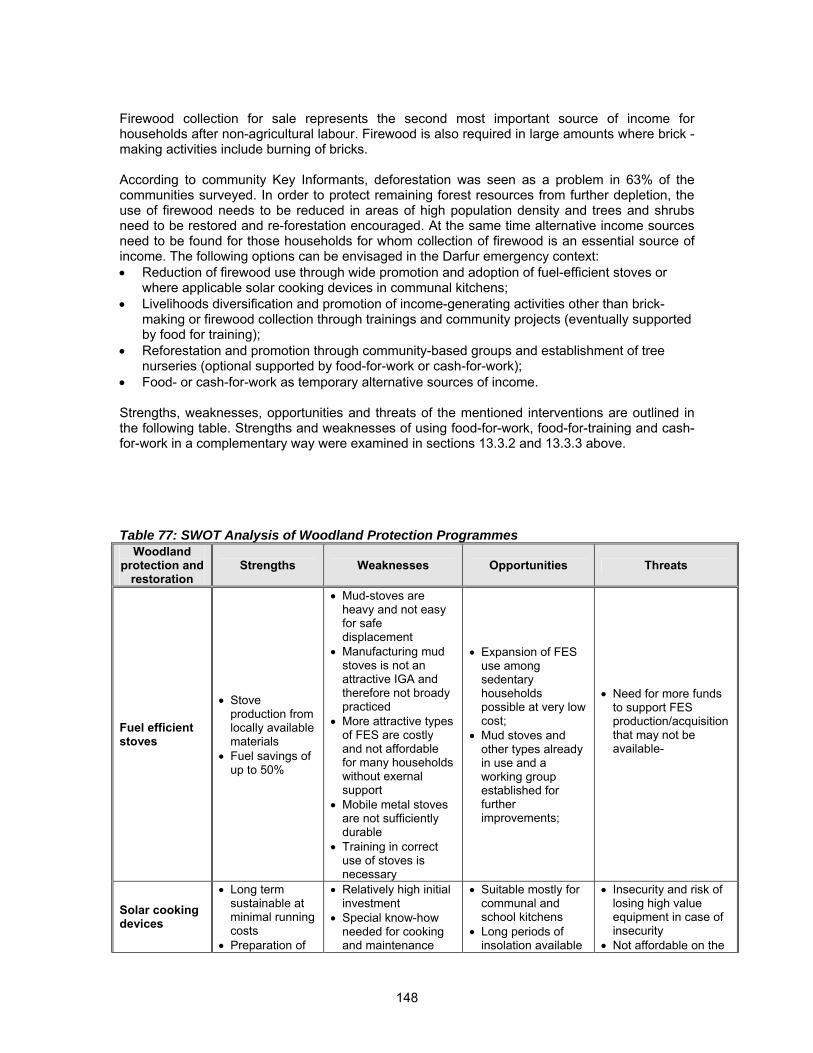
148
Firewood collection for sale represents the second most important source of income for households after non-agricultural labour. Firewood is also required in large amounts where brick -making activities include burning of bricks. According to community Key Informants, deforestation was seen as a problem in 63% of the communities surveyed. In order to protect remaining forest resources from further depletion, the use of firewood needs to be reduced in areas of high population density and trees and shrubs need to be restored and re-forestation encouraged. At the same time alternative income sources need to be found for those households for whom collection of firewood is an essential source of income. The following options can be envisaged in the Darfur emergency context: • Reduction of firewood use through wide promotion and adoption of fuel-efficient stoves or
where applicable solar cooking devices in communal kitchens; • Livelihoods diversification and promotion of income-generating activities other than brick-
making or firewood collection through trainings and community projects (eventually supported by food for training);
• Reforestation and promotion through community-based groups and establishment of tree nurseries (optional supported by food-for-work or cash-for-work);
• Food- or cash-for-work as temporary alternative sources of income. Strengths, weaknesses, opportunities and threats of the mentioned interventions are outlined in the following table. Strengths and weaknesses of using food-for-work, food-for-training and cash-for-work in a complementary way were examined in sections 13.3.2 and 13.3.3 above. Table 77: SWOT Analysis of Woodland Protection Programmes
Woodland protection and
restoration Strengths Weaknesses Opportunities Threats
Fuel efficient stoves
• Stove production from locally available materials
• Fuel savings of up to 50%
• Mud-stoves are heavy and not easy for safe displacement
• Manufacturing mud stoves is not an attractive IGA and therefore not broady practiced
• More attractive types of FES are costly and not affordable for many households without exernal support
• Mobile metal stoves are not sufficiently durable
• Training in correct use of stoves is necessary
• Expansion of FES use among sedentary households possible at very low cost;
• Mud stoves and other types already in use and a working group established for further improvements;
• Need for more funds to support FES production/acquisition that may not be available-
Solar cooking devices
• Long term sustainable at minimal running costs
• Preparation of
• Relatively high initial investment
• Special know-how needed for cooking and maintenance
• Suitable mostly for communal and school kitchens
• Long periods of insolation available
• Insecurity and risk of losing high value equipment in case of insecurity
• Not affordable on the
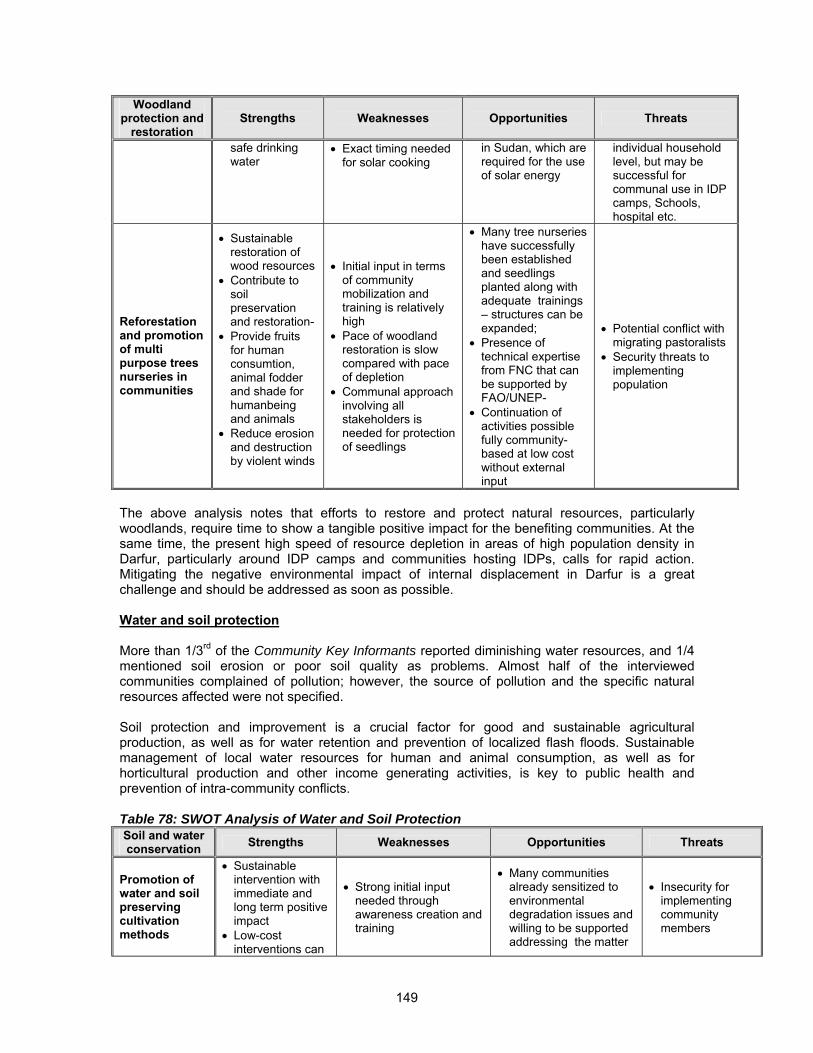
149
Woodland protection and
restoration Strengths Weaknesses Opportunities Threats
safe drinking water
• Exact timing needed for solar cooking
in Sudan, which are required for the use of solar energy
individual household level, but may be successful for communal use in IDP camps, Schools, hospital etc.
Reforestation and promotion of multi purpose trees nurseries in communities
• Sustainable restoration of wood resources
• Contribute to soil preservation and restoration-
• Provide fruits for human consumtion, animal fodder and shade for humanbeing and animals
• Reduce erosion and destruction by violent winds
• Initial input in terms of community mobilization and training is relatively high
• Pace of woodland restoration is slow compared with pace of depletion
• Communal approach involving all stakeholders is needed for protection of seedlings
• Many tree nurseries have successfully been established and seedlings planted along with adequate trainings – structures can be expanded;
• Presence of technical expertise from FNC that can be supported by FAO/UNEP-
• Continuation of activities possible fully community-based at low cost without external input
• Potential conflict with migrating pastoralists
• Security threats to implementing population
The above analysis notes that efforts to restore and protect natural resources, particularly woodlands, require time to show a tangible positive impact for the benefiting communities. At the same time, the present high speed of resource depletion in areas of high population density in Darfur, particularly around IDP camps and communities hosting IDPs, calls for rapid action. Mitigating the negative environmental impact of internal displacement in Darfur is a great challenge and should be addressed as soon as possible. Water and soil protection More than 1/3rd of the Community Key Informants reported diminishing water resources, and 1/4 mentioned soil erosion or poor soil quality as problems. Almost half of the interviewed communities complained of pollution; however, the source of pollution and the specific natural resources affected were not specified. Soil protection and improvement is a crucial factor for good and sustainable agricultural production, as well as for water retention and prevention of localized flash floods. Sustainable management of local water resources for human and animal consumption, as well as for horticultural production and other income generating activities, is key to public health and prevention of intra-community conflicts. Table 78: SWOT Analysis of Water and Soil Protection Soil and water conservation Strengths Weaknesses Opportunities Threats
Promotion of water and soil preserving cultivation methods
• Sustainable intervention with immediate and long term positive impact
• Low-cost interventions can
• Strong initial input needed through awareness creation and training
• Many communities already sensitized to environmental degradation issues and willing to be supported addressing the matter
• Insecurity for implementing community members
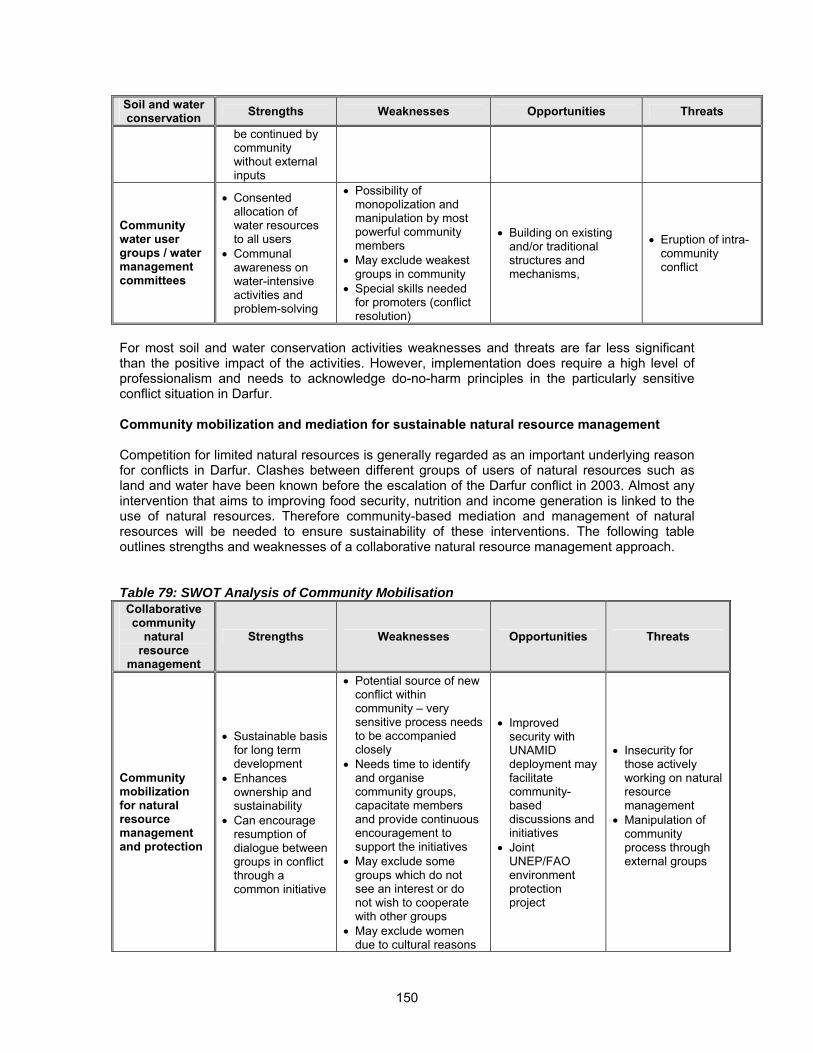
150
Soil and water conservation Strengths Weaknesses Opportunities Threats
be continued by community without external inputs
Community water user groups / water management committees
• Consented allocation of water resources to all users
• Communal awareness on water-intensive activities and problem-solving
• Possibility of monopolization and manipulation by most powerful community members
• May exclude weakest groups in community
• Special skills needed for promoters (conflict resolution)
• Building on existing and/or traditional structures and mechanisms,
• Eruption of intra-community conflict
For most soil and water conservation activities weaknesses and threats are far less significant than the positive impact of the activities. However, implementation does require a high level of professionalism and needs to acknowledge do-no-harm principles in the particularly sensitive conflict situation in Darfur. Community mobilization and mediation for sustainable natural resource management Competition for limited natural resources is generally regarded as an important underlying reason for conflicts in Darfur. Clashes between different groups of users of natural resources such as land and water have been known before the escalation of the Darfur conflict in 2003. Almost any intervention that aims to improving food security, nutrition and income generation is linked to the use of natural resources. Therefore community-based mediation and management of natural resources will be needed to ensure sustainability of these interventions. The following table outlines strengths and weaknesses of a collaborative natural resource management approach. Table 79: SWOT Analysis of Community Mobilisation Collaborative community
natural resource
management
Strengths Weaknesses Opportunities Threats
Community mobilization for natural resource management and protection
• Sustainable basis for long term development
• Enhances ownership and sustainability
• Can encourage resumption of dialogue between groups in conflict through a common initiative
• Potential source of new conflict within community – very sensitive process needs to be accompanied closely
• Needs time to identify and organise community groups, capacitate members and provide continuous encouragement to support the initiatives
• May exclude some groups which do not see an interest or do not wish to cooperate with other groups
• May exclude women due to cultural reasons
• Improved security with UNAMID deployment may facilitate community-based discussions and initiatives
• Joint UNEP/FAO environment protection project
• Insecurity for those actively working on natural resource management
• Manipulation of community process through external groups
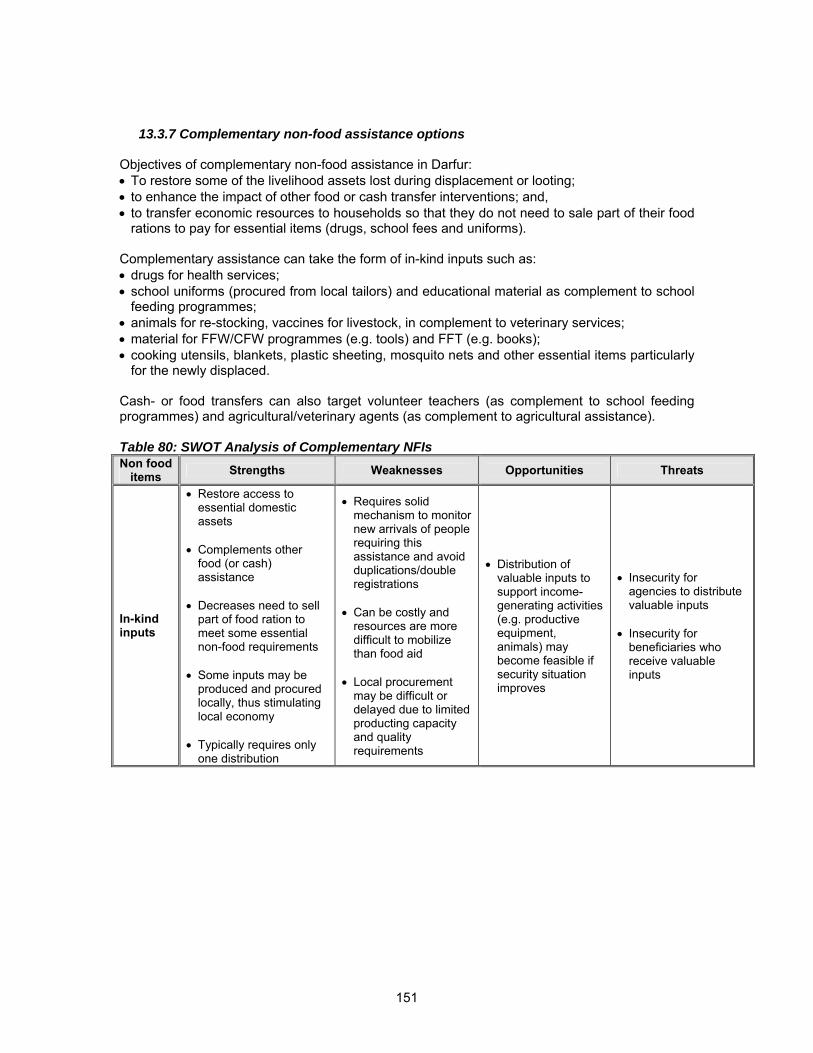
151
13.3.7 Complementary non-food assistance options Objectives of complementary non-food assistance in Darfur: • To restore some of the livelihood assets lost during displacement or looting; • to enhance the impact of other food or cash transfer interventions; and, • to transfer economic resources to households so that they do not need to sale part of their food
rations to pay for essential items (drugs, school fees and uniforms). Complementary assistance can take the form of in-kind inputs such as: • drugs for health services; • school uniforms (procured from local tailors) and educational material as complement to school
feeding programmes; • animals for re-stocking, vaccines for livestock, in complement to veterinary services; • material for FFW/CFW programmes (e.g. tools) and FFT (e.g. books); • cooking utensils, blankets, plastic sheeting, mosquito nets and other essential items particularly
for the newly displaced. Cash- or food transfers can also target volunteer teachers (as complement to school feeding programmes) and agricultural/veterinary agents (as complement to agricultural assistance). Table 80: SWOT Analysis of Complementary NFIs Non food
items Strengths Weaknesses Opportunities Threats
In-kind inputs
• Restore access to essential domestic assets
• Complements other
food (or cash) assistance
• Decreases need to sell
part of food ration to meet some essential non-food requirements
• Some inputs may be
produced and procured locally, thus stimulating local economy
• Typically requires only
one distribution
• Requires solid mechanism to monitor new arrivals of people requiring this assistance and avoid duplications/double registrations
• Can be costly and
resources are more difficult to mobilize than food aid
• Local procurement
may be difficult or delayed due to limited producting capacity and quality requirements
• Distribution of valuable inputs to support income-generating activities (e.g. productive equipment, animals) may become feasible if security situation improves
• Insecurity for agencies to distribute valuable inputs
• Insecurity for
beneficiaries who receive valuable inputs
152
14 - RECOMMENDATIONS The international community should support the peace process that resumed in July 2007, and the timely deployment of the UNAMID hybrid UN/AU mission. A humanitarian ceasefire is indispensable to allow the negotiations to take place in an amenable context. In addition to addressing protection and human rights issues, the causes and evolution of the conflict that are linked to livelihoods must also be tackled: • the current fragmentation of the conflict, with more groups forming and increased inter-tribal
fighting, has an impact on livelihoods through asset stripping (direct and indirect); • the war economy is leading to an overexploitation of natural resources such as timber; and, • the lack of local governance institutions prevents the resolution of competition over natural
resources that has led to the conflict. The above requires a deeper understanding of local dynamics, stronger participation from all groups, and priority to capacity building of local and international stakeholders to support livelihoods62. 14.1 Recommendations for interventions to address individual risks to lives – In order to address malnutrition outcomes, action is needed to mitigate both the direct and underlying causes of malnutrition while at the same time ensuring capacity to treat malnutrition. Many of the recommendations are similar to those made in 2006, suggesting that concerted and coordinated action is still needed, in particular in terms of improving quality of treatment services and more explicity linking health, water and sanitation, and food security programming with nutrition to prevent malnutrition. • Outreach and early case finding of malnourished children in the communities should be
strengthened where possible, as part of wider efforts to improve coverage of selective feeding programmes. Linkages between hospital based and community based treatment of acute malnutrition, in lined with the joint statement by the SCN, UNICEF, WFP and WHO on community management of acute malnutrition should be supported to strengthen the coverage of detection and treatment capacity. Local production of ‘Ready To Use’ foods should be explored in order to support community based programming.
• Coverage of public health services, in order to contribute to efforts to prevent, detect and
provide early treatment for illness, and therefore reduce malnutrition linked to illness, needs to be improved.
• Nutrition programmes should focus mostly on children under three years, since this is where
the majority of acute malnutrition is found. Concerted efforts to improve optimal infant and young child feeding are required.
• Mothers and care-givers should be strengthened, through extended training programmes and
appropriate community-based follow-up, in applying good practices for improving child and family nutrition at household level.
• Systems for routine immunisation and supplementation of vitamin A for all children should be
strengthened, as well as routine iron and folate supplementation for pregnant women and postpartum vitamin A, including support to ensure capacity of health clinics to provide these vital services. Campaigns to maintain high levels of measles and polio immunisation are also a necessary strategy in situations of conflict such as Darfur.
62 “Darfur: Another chance for peace?” ODI Humanitarian Policy Group and Christian Aid event, London, 5 September 2007 (http://www.odi.org.uk/events/darfur_peace/)
153
• Community sensitization to promote health seeking behaviour for treatment of both moderate and severe malnutrition should be undertaken in order to increase participation and compliance in selective feeding programmes. Additionally, supplementary feeding programmes should focus more on education for caretakers, and be used as an opportunity to raise awareness of appropriate health, hygiene and caring practices, rather than simply a distribution of food. Outreach should also be expanded to ensure early detection and treatment of moderately malnourished children and women.
• A sustained effort is required to maintain and improve coverage of vitamin A and iron/folate for
pregnant and postpartum women, as well as maintain and improve vitamin A and measles coverage of children, in particular to ensure coverage of both resident and diplaced groups.
• Livelihood assets which have become depleted by households in their attempt to alleviate
acute food insecurity should be restored and home production of highly nutritious foods intensively promoted.
• Any programme aiming to reduce and/or prevent malnutrition must focus on increasing access
to safe water and sanitation through both hardware as well as behaviour change programmes, in order to contribute to reductions in disease incidence, particularly diarrhoeal disease, respiratory infections and fever. Action could include initiating activities to improve access to safe water sources: digging wells, building hand-pumps and providing training and spare parts to ensure maintenance, supporting the organization of community-based water management committees, and should be tailored to local need.
• Health and hygiene promotion should be strengthened to include all populations, resident and
non-resident, and supported by provision of appropriate non-food items such as water containers, blankets and mosquito nets, where needed.
• Food assistance plays a vital role in ensuring good health and nutrition status, and should be
continued for those who are unable to provide adequately for themselves. Food aid should be complemented by efforts to increase nutrient adequacy in the diet among the conflict affected population in terms of quantity and quality (micronutrients) through dietary diversification and access to micronutrients through support to Univeral Salt Iodization and flour fortification.
• There is a need to further strengthen and institutionalise capacity for routine nutrition
surveillance activities into government structures to allow early detection of changes in nutrition and health status, and to reduce the need for large scale surveys such as the DFSNA which are costly and do not allow for monitoring trends in the short term. Support is required in the areas of collection, compilation, analysis and use of routine nutrition data (eg.routinefeedingcentredata, localised nutritiondata, and sentinelsitedata) as well as establishment of furtherlinkageswithfoodsecurityandhealthmonitoringsystems, and incorporation of relevantinformation from programmatic evaluationsand rapid assessments.
• Greater emphasis is required in the planning, coordination, implementation and monitoring of
integrated programmes, such as the Accelerated Child Survival Initiative, and between sectors.
14.2 Recommendations for interventions to address household risks to lives and livelihoods
14.2.1 Recommendations for General food distributions In the most likely scenario, an average of 3.22 million people will be at risk to lives and livelihoods in 2008, including 0.57million people at risk to lives and 2.55 million at risk to livelihoods in 2008, and will require humanitarian assistance.
154
• Peace is paramount to address risks to lives and livelihoods in the short and longer term. • Food aid (general food distributions) will remain necessary until:
► pilot projects using other transfer mechanisms (e.g. cash, vouchers, agricultural inputs, non-food items etc.) can be launched and scaled up so that they provide sufficient income to meet all essential food and non-food requirements;
► communities have access to markets and markets are functioning well; and/or, ► access to land and capacity to raise animals are restored.
• Small-scale Food-for-work interventions may be attempted, but upscaling these will not be an
option until insecurity and access limitations improve significantly. • Pilot cash/voucher transfers should be launched as soon as possible at small scale in locations
where security and access allow, to complement food transfers and support other livelihood interventions (e.g. agriculture, vocational training).
• Agricultural production and income generating activities should be promoted intensively to help
households exit from aid dependency and improve self reliance in locations/ communities where security conditions allow.
• Environmental asset protection needs to be mainstreamed in all livelihood support activities in
order to avoid further depletion of natural resources in areas of high population density and in order to protect the basis for eventual recovery of livelihoods.
• Community-based natural resource management needs to be recognized as key to prevent
localized conflict and should be pursued. • Contingency plans for a worst case scenario assuming a deterioration of the security situation
should consider a case load of 3.73 million people at risk to lives and livelihoods in 2008. • An integrated nutrition and food security monitoring system including linkages with sources of
conflict-related information is indispensable to adjust programmes according to needs and avoid fuelling the conflict unintendly by targeting certain groups or areas, or by providing resources which may be diverted by conflict stakeholders.
• Continue GFDs in camps and in communities for about 3.22 million people, given the lack of
alternative food production, and trade and cash earning opportunities in IDP camps and in many communities due to security constraints, difficulties to implement large-scale cash/voucher transfers (see Section 14.2.2) and the role of food aid in protecting food consumption patterns.
• Consider increasing local procurement of sorghum food aid and oil. • Mobilize extra resources and partners to complement the ration with non-food transfers so as to
reduce the need for beneficiaries to sell part of their ration and to improve their diet (see Section 14.2.2).
• As pilot projects using non-food transfer mechanisms are launched and hopefully expanded
(e.g. cash/voucher, material inputs), consider a switch/decrease in the level of food ration received by households participating in these projects.
155
• Analyse GFD phasing out, food flows within Sudan, possibilities for local procurement and their effect on prices and each other (perhaps through applying the “Zambia model” to Sudan)63.
• Put in place a mechanism to ensure registration and distribution of ration cards to newly arrived
IDPs, within a maximum of 2 months. Follow up with verification of the true nature of the displacement to avoid double registration. Organize the pre-allocation of food stocks to enable distributions to additional caseloads, possibly involving community mechanisms.
• Provide a full ration to IDPs in camps given that sources of cash to purchase complementary
food items (meat, vegetables), pay for milling costs and meet other essential needs (health, clothing) are very scarce, and their food consumption patterns have not improved.
• For the same reasons, provide a full ration to IDPs and residents in communities who:
► cannot cultivate sufficiently (no land, fields inaccessible); ► cannot diversify their sources of income either because of shortage of manpower, health
problems, or insecurity; and, ► do not own valuable assets such as a shop or a car.
Female-headed households are likely to meet most of these conditions and should be paid particular attention. • For IDPs and residents in communities with some possibilities to cultivate or to migrate for
seasonal labour, switch between full/half ration throughout the year according to harvest time and seasonal labour opportunities. Ensure systematic and frequent monitoring of the situation.
• Targeting mechanisms can be a combination of geographic (security conditions preventing
cultivation and movement) and community/household-based (above criteria should be discussed with community sheiks and spot-checks of households done to monitor compliance).
• Improve women’s decision-making role in community Food Aid Committees by implementing
awareness sessions to men, women, and local leaders, women leadership training, and youth education. Table 81: Recommendations for General Food Distributions
General Food Distributions Target groups Duration Ration
Camps IDPs and refugees, including newly arrived 12 months Full ration IDPs and refugees (including newly arrived) and Residents who: • cannot cultivate • cannot send members to migrate for work • own less than 8 sheep/goats or less than
2 cattle • do not own a shop or other valuable asset
(e.g. car) Women-headed households are likely to meet most of the above criteria
12 months Full ration
Communities
IDPs, refugees and Residents who: • can cultivate/harvest at least 0.5 -1 ha • can send members to migrate for work • own more than 4 sheep/goat or more than
1 cattle
12 months
• Half ration during about 3 -6 months post-harvest or at times of seasonal labour opportunities
• Full ration for about 6-9 months pre-harvest or times of low seasonal
63 See Paul A. Dorosh, Simon Dradri and Steven Haggblade, “Trade Policy and Food Security in Zambia”, mimeo, January 2007
156
General Food Distributions Target groups Duration Ration
labour
14.2.2 Recommendations for Food- or Cash- for-Work • Implement FFW/CFW programmes in communities with majority of IDPs, to increase labour
opportunities, build community assets (e.g. access roads, schools), and encourage re-forestation and protection of natural resources.
• Consider FFW/CFW for IDPs in camps or communities where the population is small, to
facilitate the implementation of the activities. If cash is provided, select locations where market access and functioning are satisfactory (e.g. Geneina, Habila).
• The programmes can be carried out sequentially with GFD to take advantages of periods of
lower labour opportunities (e.g. slack agricultural season). • If cash is given, the wage rate must be calculated to encourage self-targeting and avoid
community labour displacement while providing a sufficient transfer to substitute for GFD. • Communities must be consulted for their own priorities in terms of asset building (e.g roads,
schools, health centres, market structures etc.). Table 82: Recommendations for Food For Work Food- or Cash-
for-Work Target groups Duration (*) Ration/Wage
Camps IDPs and refugees in small camps 6 months Food: full ration Cash: wage level to determine
Communities IDPs, refugees and Residents in communities with majority of IDPs/refugees
6 months Food: full ration Cash: wage level to determine
(*) The proposed duration takes into consideration start-up time to design the programme and secure resources
14.2.3 Recommendations for Food-for-Training Consider small-scale FFT in some camps where the IDP population has been relatively ‘stable’ over the past 2-3 years and is not too big, as a means to increase men and women’s income-earning opportunities. • Given expected difficulties to find suitable implementing partners, start FFT programmes in only
a few locations and expand gradually to other camps and to communities with large number of IDPs building on the experience gained, provided the security/access situation allows.
• Provide a full ration to FFT participants to compensate for the opportunity cost of time spent in
training. • Ensure complementary material inputs and mobilize experienced implementing partners. • Consider complementary grants/credit when security conditions and implementation capacity
allow. • Targeting through community groups (e.g. Food Aid Committee) where both men and women
participate, checking that IDPs/refugees are also included. Target criteria are similar to General
157
Food Distributions, with priority to households having the lowest access to land, animals and seasonal labour migration, and women-headed households. Check the profiles of enrolled participants for compliance with proposed criteria.
Table 83: Recommendations for Food For Training
Food for Training Target groups Duration (*) Ration
Camps IDPs and refugees arrived over the past 2-4 years 6 months Full ration for participants
Communities
IDPs and refugees arrived over the past 2-4 year and Residents who: • cannot cultivate • own less than 5 sheep/goats or less than
2-3 cattle • do not own a shop or other valuable
asset (e.g. car) Priority to women-headed households
6 months Full ration for participants
(*) The proposed duration takes into consideration start-up time to design the programme and secure resources
14.2.4 School Feeding • Expand the number of primary schools benefiting from school-feeding, considering also the
advantages of take-home ration programmes coipared to on-site meals. • Ensure that complementary inputs are provided to increase the impact on enrolment and
learning, including food or cash transfers to volunteer teachers, repair of school facilities, teachers’ training and educational material.
• A specific programming study is required to identify additional eligible schools and requirements
(e.g. repairs, teacher staff, educational material). • The number of schools benefiting from a school feeding programme in Darfur is currently
reaching 150,000 children. Tentatively, it could be increased to 250,000 children during the next 12 months.
Table 84: Recommendations for School Feeding Programmes School feeding Target groups Duration (*) Ration
Camps Primary school-age IDP and refugee children 10 months Take home full ration
per child
Communities Primary school age IDP, refugees and resident children 10 months Take home full ration
per child
(*) The proposed duration takes into the normal school year
14.2.5 Recommendations for cash/voucher interventions See Section 14.2.2 for recommendations for CFW. Below recommendations refer to cash/voucher unconditional transfers. • Complete a feasibility/programming study to identify locations, functioning and access to
markets, community preferences, implementing partners, financial and administrative arrangements, size and modalities of transfers for pilot cash/voucher project(s).
158
Consider providing these transfers together with GFD in a first instance64. WFP has already undertaken several steps to identify suitable locations and discuss with potential implementing partners. A comprehensive feasibility/programming study should be completed as quickly as possible, as it will take time to mobilize implementing partners and resources and make the necessary financial and administrative arrangements. Given the adequate market access and functioning characteristics of Geneina and Habila, pilot cash/voucher transfers may be appropriate there. Table 85: Recommendations for Cash Voucher interventions Cash/voucher
transfers Target groups Duration (*) Rate
Communities IDP, refugees and residents in selected communities 6 months To be determined
(*) The proposed duration takes into consideration start-up time to design the programme and secure resources.
14.2.6 Recommendations for improving Household Nutrition Practices • Strengthen and expand training in good health and nutrition practices for mothers and
caregivers admitted into supplementary and therapeutic feeding programmes, e.g. through cooking demonstrations and promotion of nutrient rich foods from local products.
• Build and improve capacities of health facility and community level health and nutrition staff,
hygiene promoters, village health committees and agriculture outreach workers/facilitators to deliver core nutrition messages to promote optimal care practices at the household level;
• Support integration of food and nutrition education into primary school curricula, supported by
experience-based learning, e.g. using school gardens. • Promote integration of nutrition and food utilization concepts into pre-service and in-service
training for public staff, including government institutions and the private sector; Table 86: Recommendations for Improving Household Nutrition Practices
Improve HH Nutrition practices
Target groups Intervention
Camps and communities
Caregivers, heads of households, religious leaders, a.o. Social mobilization and training
Public sector services
Primary school teachers Outreach workers Health and nutrition staff- facility and community level
Pre-service and in- service training
14.2.7 Recommendations for Household Food Production through Agriculture and Livestock Production
• Continue free targeted distribution of seeds, to beneficiaries whose movement and access to markets and fairs is restricted by insecurity.
• Promote voucher-based seed fairs in locations where security allows, including seed
quality assessment. 64 It may be possible, later on, to envisage substitution or sequential cash (or voucher)/food assistance at different periods of the year to minimize possible negative effects on market prices.
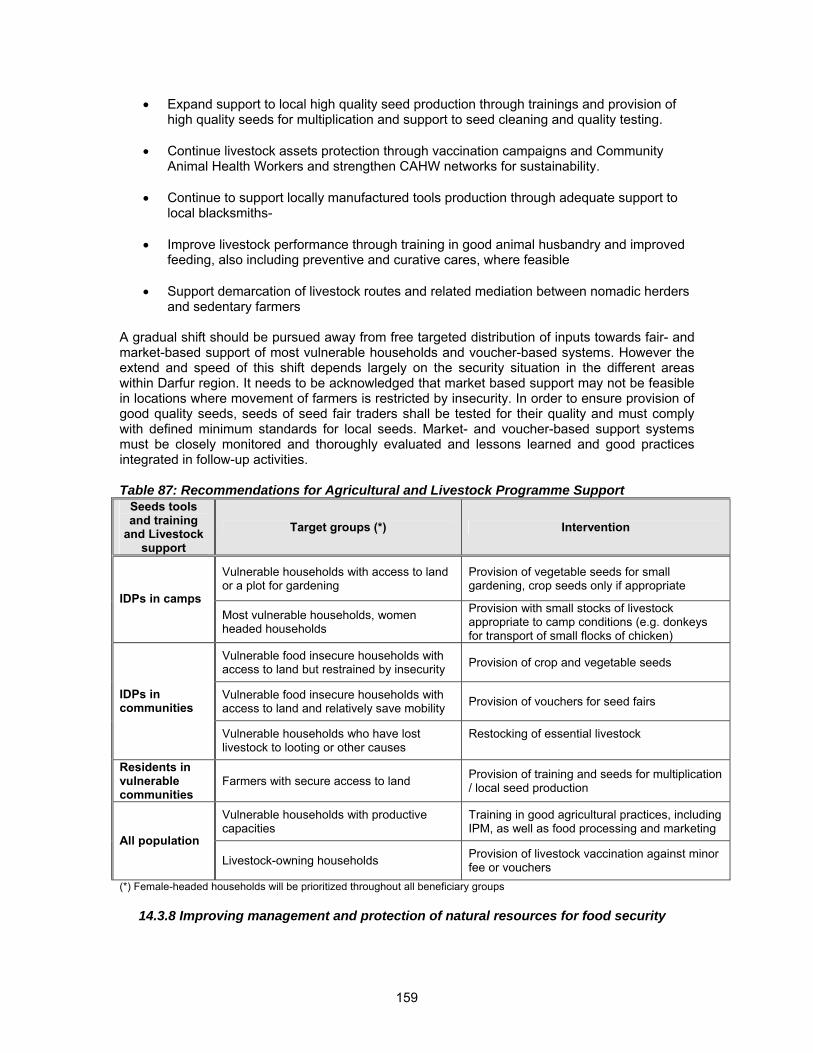
159
• Expand support to local high quality seed production through trainings and provision of high quality seeds for multiplication and support to seed cleaning and quality testing.
• Continue livestock assets protection through vaccination campaigns and Community
Animal Health Workers and strengthen CAHW networks for sustainability.
• Continue to support locally manufactured tools production through adequate support to local blacksmiths-
• Improve livestock performance through training in good animal husbandry and improved
feeding, also including preventive and curative cares, where feasible
• Support demarcation of livestock routes and related mediation between nomadic herders and sedentary farmers
A gradual shift should be pursued away from free targeted distribution of inputs towards fair- and market-based support of most vulnerable households and voucher-based systems. However the extend and speed of this shift depends largely on the security situation in the different areas within Darfur region. It needs to be acknowledged that market based support may not be feasible in locations where movement of farmers is restricted by insecurity. In order to ensure provision of good quality seeds, seeds of seed fair traders shall be tested for their quality and must comply with defined minimum standards for local seeds. Market- and voucher-based support systems must be closely monitored and thoroughly evaluated and lessons learned and good practices integrated in follow-up activities. Table 87: Recommendations for Agricultural and Livestock Programme Support
Seeds tools and training
and Livestock support
Target groups (*) Intervention
Vulnerable households with access to land or a plot for gardening
Provision of vegetable seeds for small gardening, crop seeds only if appropriate
IDPs in camps Most vulnerable households, women headed households
Provision with small stocks of livestock appropriate to camp conditions (e.g. donkeys for transport of small flocks of chicken)
Vulnerable food insecure households with access to land but restrained by insecurity Provision of crop and vegetable seeds
Vulnerable food insecure households with access to land and relatively save mobility Provision of vouchers for seed fairs IDPs in
communities
Vulnerable households who have lost livestock to looting or other causes
Restocking of essential livestock
Residents in vulnerable communities
Farmers with secure access to land Provision of training and seeds for multiplication / local seed production
Vulnerable households with productive capacities
Training in good agricultural practices, including IPM, as well as food processing and marketing
All population Livestock-owning households Provision of livestock vaccination against minor
fee or vouchers (*) Female-headed households will be prioritized throughout all beneficiary groups
14.3.8 Improving management and protection of natural resources for food security
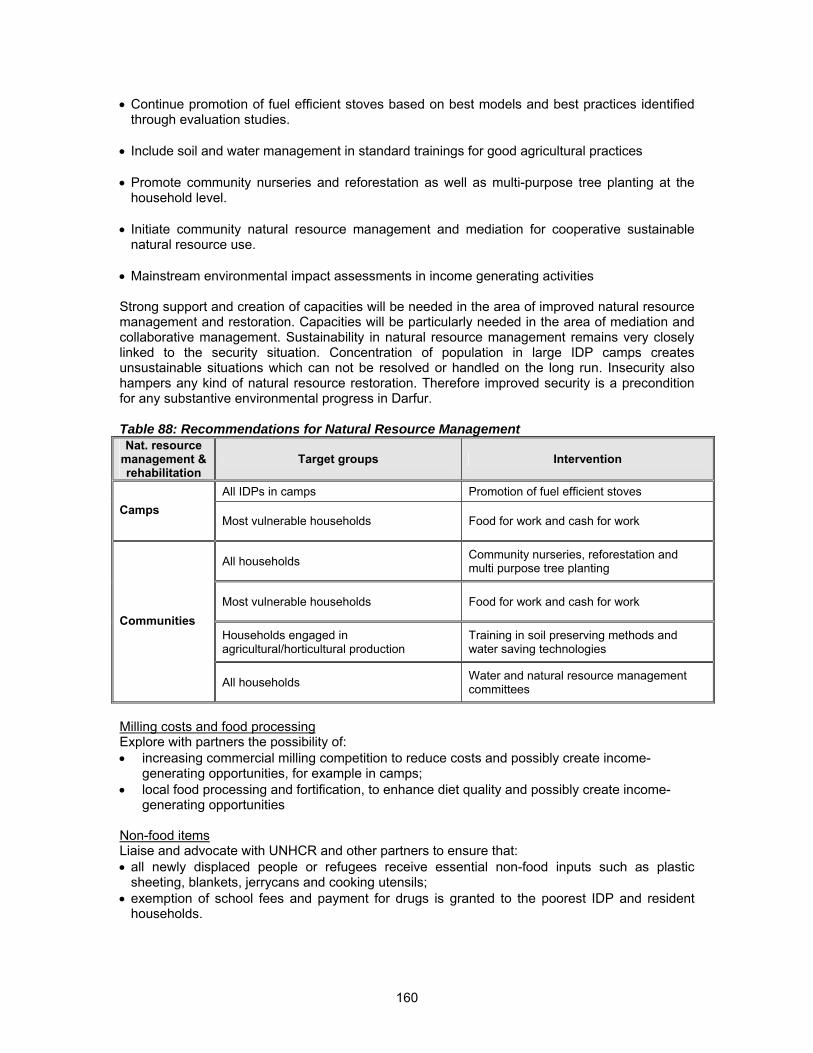
160
• Continue promotion of fuel efficient stoves based on best models and best practices identified through evaluation studies.
• Include soil and water management in standard trainings for good agricultural practices • Promote community nurseries and reforestation as well as multi-purpose tree planting at the
household level. • Initiate community natural resource management and mediation for cooperative sustainable
natural resource use. • Mainstream environmental impact assessments in income generating activities Strong support and creation of capacities will be needed in the area of improved natural resource management and restoration. Capacities will be particularly needed in the area of mediation and collaborative management. Sustainability in natural resource management remains very closely linked to the security situation. Concentration of population in large IDP camps creates unsustainable situations which can not be resolved or handled on the long run. Insecurity also hampers any kind of natural resource restoration. Therefore improved security is a precondition for any substantive environmental progress in Darfur. Table 88: Recommendations for Natural Resource Management Nat. resource
management & rehabilitation
Target groups Intervention
All IDPs in camps Promotion of fuel efficient stoves Camps
Most vulnerable households Food for work and cash for work
All households Community nurseries, reforestation and multi purpose tree planting
Most vulnerable households Food for work and cash for work
Households engaged in agricultural/horticultural production
Training in soil preserving methods and water saving technologies
Communities
All households Water and natural resource management committees
Milling costs and food processing Explore with partners the possibility of: • increasing commercial milling competition to reduce costs and possibly create income-
generating opportunities, for example in camps; • local food processing and fortification, to enhance diet quality and possibly create income-
generating opportunities Non-food items Liaise and advocate with UNHCR and other partners to ensure that: • all newly displaced people or refugees receive essential non-food inputs such as plastic
sheeting, blankets, jerrycans and cooking utensils; • exemption of school fees and payment for drugs is granted to the poorest IDP and resident
households.
161
Non food items Target groups Duration Level Camps Communities
Newly arrived IDPs and refugees One-off Standard package
While the current targeting of non-food item beneficiaries is appropriate in terms of food insecurity status (including female-headed households), the newly displaced are missed. Better monitoring mechanisms to track new displacements and respond promptly with assistance are required. Migration and remittances Carry out a study of social and family networks in migration recipient areas to identify ways to support seasonal and other work migration patterns, and facilitate receipt of remittances. Seasonal migration is traditional in Darfur but hampered by insecurity and disruption of family networks due to displacement. There may be ways to restore or strengthen linkages with family or community members who already migrated in some areas and have identified places to stay and work opportunities, in order to facilitate the resumption of work migration patterns. It may also be possible to strengthen mechanisms of remittance transfers. 14.3 Recommendations for monitoring and assessments As recommended in previous years, an integrated nutrition and food security surveillance system must be strengthened in Darfur to avoid the need for large-scale, expensive and burdensome annual DFSNAs and facilitate the adjustment of interventions. The current FMOH Nutrition Surveillance System (NSS) supported by UNICEF, comprised of feeding centre data, localized nutrition surveys and sentinel site data, offers a basis for such a system. The NSS was originally conceived as an inter-agency and multisectoral collaboration, however in practice, the links between the nutrition surveillance system and other existing surveillance systems supported by WFP, WHO and FAO are limited, for a number of reasons, including lack of formalization of the relationships between these systems in terms of tools and institutional responsibilities. Further work to strengthen the links with livelihoods and food security is needed. Since 2007, FAO is supporting capacity building of the Government of Sudan in Food Security Information Systems, through the Sudan Food Security Information for Action Project (SIFSIA). The FAO SIFSIA project is fully funded by the European Commission over a peirld of four years. The objective of the FAO SIFSA project is not to create a new food security information system, but to integrate existing surveillance and information systems and improve accessibility and use of information. Present systems already do collect a wealth of information on production-related factors, such as Rainfall patterns (risks of drought as well as floods), acreage planted under the main food and cash crops and acreage harvested, yields, threats of locust infestation and other pests on crops, outbreaks of animal diseases, market prices and terms of trade of different agricultural products. An interagency review of existing surveillance systems in order to formalize these links and develop concrete strategies to improve data collection, analysis and use at field level, in addition to defining a strategy for further institutionalization within government structures, would be a necessary first step in strengthening routine and integrated nutrition and food security information systems. Conflict analysis needs to be strengthened and ways to integrate (from existing sources and data collection systems) conflict-related information should be identified so that this information is also integrated into the nutrition and food security monitoring system.
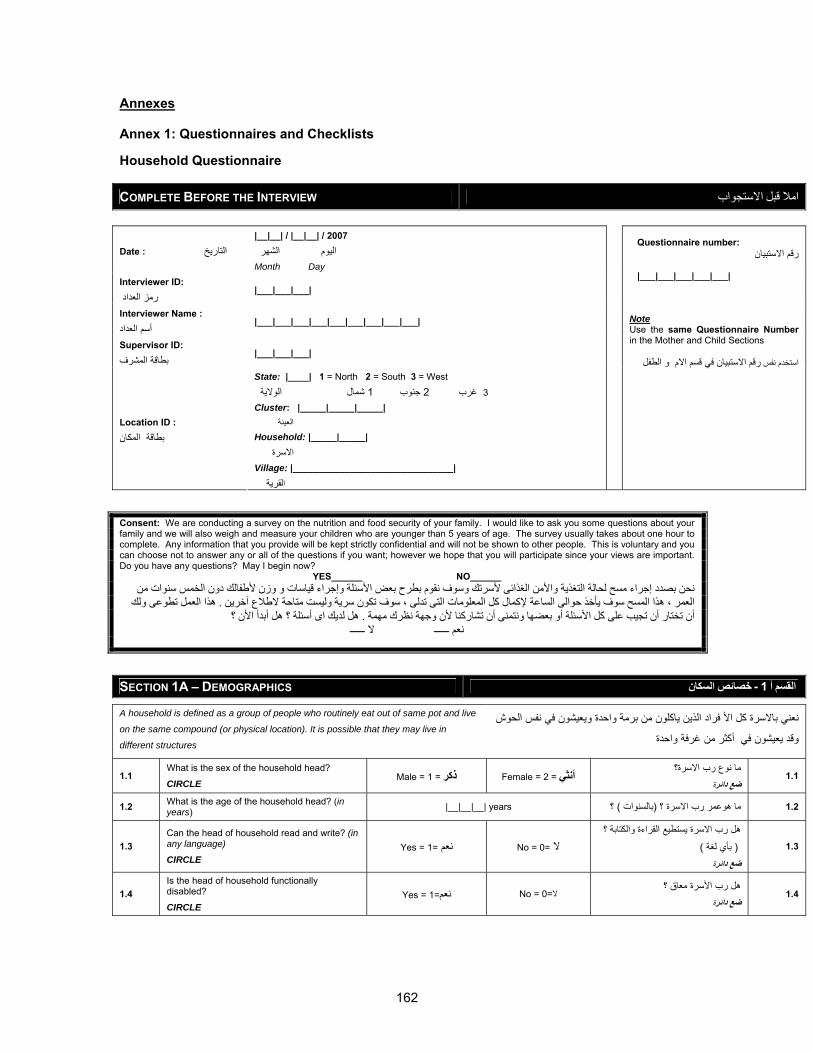
162
Annexes Annex 1: Questionnaires and Checklists
Household Questionnaire COMPLETE BEFORE THE INTERVIEW االستجواب قبل امال
Date : التاريخ
|__|__| / |__|__| / 2007 اليوم الشهر
Month Day
Interviewer ID: |___|___|___| رمز العداد
Interviewer Name : |___|___|___|___|___|___|___|___|___| أسم العداد
Supervisor ID: |___|___|___| بطاقة المشرف
Location ID : المكانبطاقة
State: |____| 1 = North 2 = South 3 = West شمال الوالية 1 جنوب2 غرب 3
Cluster: |_____|_____|_____| العينة
Household: |_____|_____| السرة ا
Village: |_______________________________| لقرية ا
Questionnaire number:
رقم االستبيان
|___|___|___|___|___| Note Use the same Questionnaire Number in the Mother and Child Sections
رقم االستبيان في قسم االم و الطفلاستخدم نفس
Consent: We are conducting a survey on the nutrition and food security of your family. I would like to ask you some questions about your family and we will also weigh and measure your children who are younger than 5 years of age. The survey usually takes about one hour to complete. Any information that you provide will be kept strictly confidential and will not be shown to other people. This is voluntary and you can choose not to answer any or all of the questions if you want; however we hope that you will participate since your views are important. Do you have any questions? May I begin now?
YES______ NO______ نحن بصدد إجراء مسح لحالة التغذية واألمن الغذائى ألسرتك وسوف نقوم بطرح بعض األسئلة وإجراء قياسات و وزن ألطفالك دون الخمس سنوات من
هذا العمل تطوعى ولك . ف تكون سرية وليست متاحة الطالع آخرين العمر ، هذا المسح سوف يأخذ حوالى الساعة إلآمال آل المعلومات التى تدلى ، سوهل لديك اى أسئلة ؟ هل أبدأ األن ؟. أن تختار أن تجيب على آل األسئلة أو بعضها ونتمنى أن تشارآنا ألن وجهة نظرك مهمة
نعم ــــــ ال ــــــ
SECTION 1A – DEMOGRAPHICS السكان خصائص - 1 أ القسم
A household is defined as a group of people who routinely eat out of same pot and live
on the same compound (or physical location). It is possible that they may live in
different structures
ويعيشون في نفس الحوش من برمة واحدةنعني باالسرة آل األ فراد الذين ياآلون
وقد يعيشون في أآثر من غرفة واحدة
1.1 What is the sex of the household head?
CIRCLE Male = 1 = ذآر Female = 2 = أنثي
ما نوع رب االسرة؟ةضع دائر
1.1
1.2 What is the age of the household head? (in years) |__|__|__| years 1.2 ؟) بالسنوات ( ما هوعمر رب االسرة ؟
1.3 Can the head of household read and write? (in any language)
CIRCLE Yes = 1= نعم No = 0= ال
هل رب االسرة يستطيع القراءة والكتابة ؟)بأي لغة (
ةضع دائر 1.3
1.4 Is the head of household functionally disabled?
CIRCLE Yes = 1=نعم No = 0=هل رب األسرة معاق ؟ ال
ةضع دائر1.4
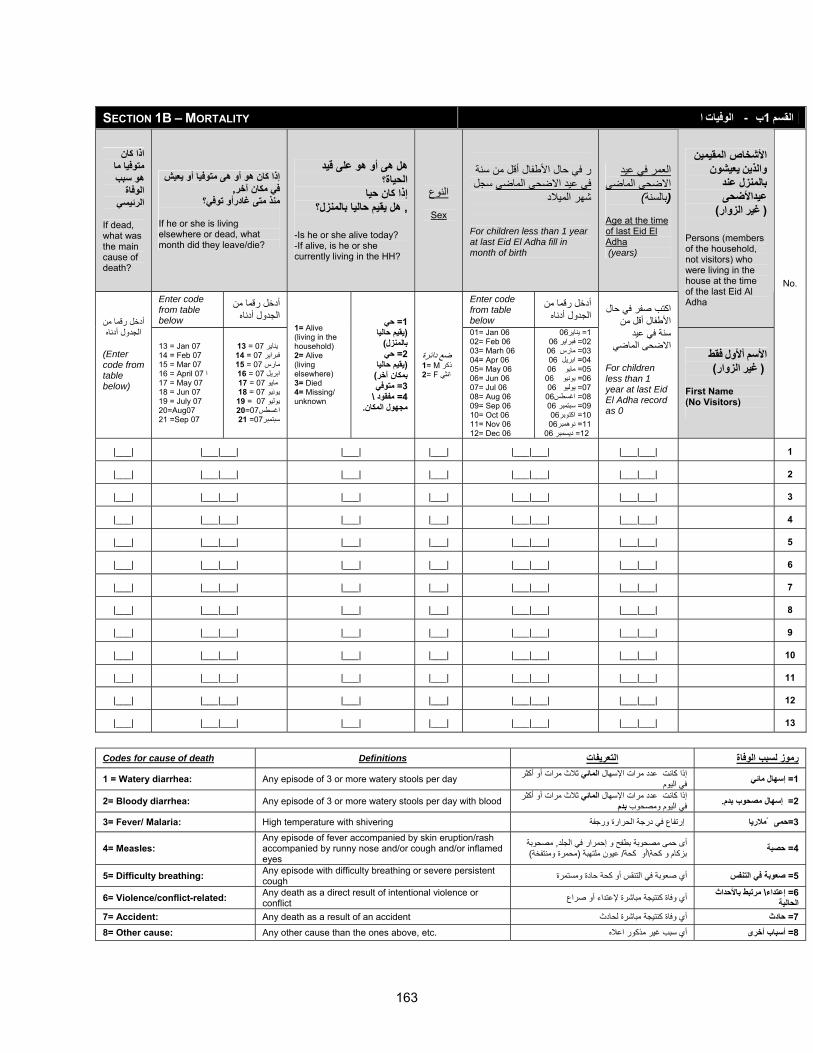
163
SECTION 1B – MORTALITY ا الوفيات - ب1 القسم
اذا آان متوفيا ما هو سبب
الوفاة الرئيسي
If dead, what was the main cause of death?
إذا آان هو أو هى متوفيا أو يعيش ,في مكان آخر
منذ متى غادرأو توفي؟ If he or she is living elsewhere or dead, what month did they leave/die?
هل هى أو هو على قيد ؟الحياة
إذا آان حياهل يقيم حاليا بالمنزل؟,
-Is he or she alive today? -If alive, is he or she currently living in the HH?
النوع
Sex
ر في حال األطفال أقل من سنة في عيد االضحى الماضي سجل
شهر الميالد
For children less than 1 year at last Eid El Adha fill in month of birth
العمر في عيد االضحى الماضي
(بالسنة)
Age at the time of last Eid El Adha (years)
Enter code from table below
أدخل رقما من الجدول أدناه
Enter code from table below
دخل رقما منأ الجدول أدناه
المقيميناألشخاص يعيشون والذين
عند لمنزلبا عيداألضحى
)الزوار غير (
Persons (members of the household, not visitors) who were living in the house at the time of the last Eid Al Adha
أدخل رقما من الجدول أدناه
(Enter code from table below)
13 = Jan 07 14 = Feb 07 15 = Mar 07 16 = April 07 ا 17 = May 07 18 = Jun 07 19 = July 07 20=Aug07 21 =Sep 07
يناير 07 = 13 فبراير 07 = 14مارس 07 = 15ابريل 07 = 16 مايو 07 = 17 يونيو 07 = 18 يوليو 07 = 19 اغسطس07=20 سبتمبر07= 21
1= Alive (living in the household) 2= Alive (living elsewhere) 3= Died 4= Missing/ unknown
حي = 1 يقيم حاليا(
)بالمنزل حي= 2 يقيم حاليا(
)بمكان آخر متوفي= 3 \مفقود = 4
.مجهول المكان
ضع دائرة1= M ذآر 2= F انثي
01= Jan 06 02= Feb 06 03= Marh 06 04= Apr 06 05= May 06 06= Jun 06 07= Jul 06 08= Aug 06 09= Sep 06 10= Oct 06 11= Nov 06 12= Dec 06
06يناير= 1 06فبراير = 02 06مارس = 03 06ابريل = 04 06مايو = 05 06يونيو = 06 06يوليو = 07 06اغسطس= 0806سبتمبر = 09 06اآتوبر= 10 06نوهمبر= 11 06ديسمبر = 12
اآتب صفر في حال األطفال أقل من
سنة في عيد االضحى الماضي
For children less than 1 year at last Eid El Adha record as 0
فقط أألول األسم)الزوار غير (
First Name (No Visitors)
No.
|___| |___|___| |___| |___| |___|___| |___|___| 1
|___| |___|___| |___| |___| |___|___| |___|___| 2
|___| |___|___| |___| |___| |___|___| |___|___| 3
|___| |___|___| |___| |___| |___|___| |___|___| 4
|___| |___|___| |___| |___| |___|___| |___|___| 5
|___| |___|___| |___| |___| |___|___| |___|___| 6
|___| |___|___| |___| |___| |___|___| |___|___| 7
|___| |___|___| |___| |___| |___|___| |___|___| 8
|___| |___|___| |___| |___| |___|___| |___|___| 9
|___| |___|___| |___| |___| |___|___| |___|___| 10
|___| |___|___| |___| |___| |___|___| |___|___| 11
|___| |___|___| |___| |___| |___|___| |___|___| 12
|___| |___|___| |___| |___| |___|___| |___|___| 13
Codes for cause of death Definitions رموز لسبب الوفاة التعريفات
1 = Watery diarrhea: Any episode of 3 or more watery stools per day ثالث مرات أو أآثر المائياإلسهال إذا آانت عدد مراتإسهال مائي= 1 في اليوم
2= Bloody diarrhea: Any episode of 3 or more watery stools per day with blood ثالث مرات أو أآثر المائياإلسهال إذا آانت عدد مرات.إسهال مصحوب بدم= 2 بدممصحوبم وفي اليو
3= Fever/ Malaria: High temperature with shivering حمى ْ مالريا=3 إرتفاع في درجة الحرارة ورجفة
4= Measles: Any episode of fever accompanied by skin eruption/rash accompanied by runny nose and/or cough and/or inflamed eyes
مصحوبة , أى حمى مصحوبة بطفح و إحمرار في الجلد) محمرة ومنتفخة(عيون ملتهبة / أو آحة\بزآام و آحة حصبة= 4
5= Difficulty breathing: Any episode with difficulty breathing or severe persistent cough فسصعوبة في التن= 5 أي صعوبة في التنقس أو آحة حادة ومستمرة
6= Violence/conflict-related: Any death as a direct result of intentional violence or conflict مرتبط باألحداث \إعتداء= 6 أي وفاة آنتيجة مباشرة إلعتداء أو صراع
الحالية7= Accident: Any death as a result of an accident ادثح= 7 أي وفاة آنتيجة مباشرة لحادث
8= Other cause: Any other cause than the ones above, etc. أسباب أخرى= 8 أي سبب غير مذآور اعاله
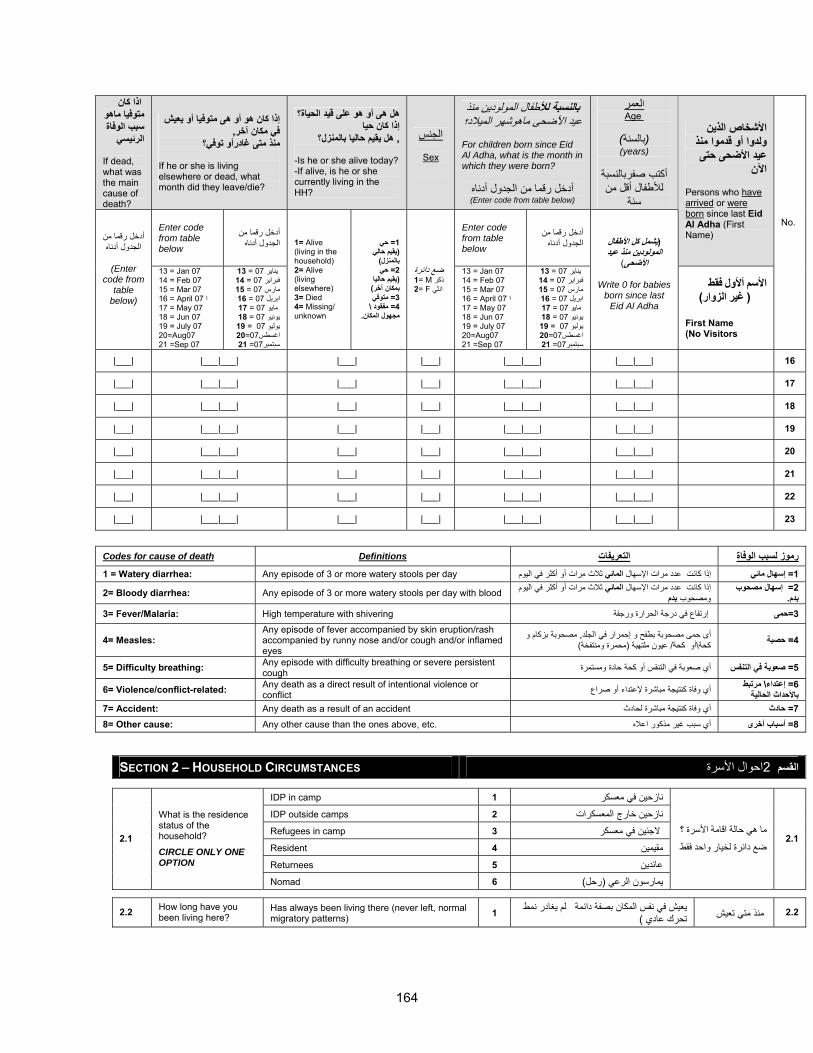
164
اذا آان متوفيا ماهو سبب الوفاة الرئيسي
If dead, what was the main cause of death?
إذا آان هو أو هى متوفيا أو يعيش ,في مكان آخر
منذ متى غادرأو توفي؟ If he or she is living elsewhere or dead, what month did they leave/die?
هل هى أو هو على قيد الحياة؟إذا آان حيا
هل يقيم حاليا بالمنزل؟, -Is he or she alive today? -If alive, is he or she currently living in the HH?
الجنس
Sex
ذ طفال المولودين منبالنسبة لأل؟عيد األضحى ماهوشهر الميالد
For children born since Eid Al Adha, what is the month in which they were born? أدخل رقما من الجدول أدناه(Enter code from table below)
العمرAge
(بالسنة)(years)
أآتب صفربالنسبةلألطفال أقل من
سنة
Enter code from table below
أدخل رقما من الجدول أدناه
Enter code from table below
أدخل رقما من الجدول أدناه
األشخاص الذين قدموا منذ ولدوا أو
عيد األضحى حتى اآلن
Persons who have arrived or were born since last Eid Al Adha (First Name) أدخل رقما من
الجدول أدناه
(Enter code from
table below)
13 = Jan 07 14 = Feb 07 15 = Mar 07 16 = April 07 ا 17 = May 07 18 = Jun 07 19 = July 07 20=Aug07 21 =Sep 07
يناير 07 = 13 فبراير 07 = 14مارس 07 = 15ابريل 07 = 16 17 = 07 مايو يونيو 07 = 18 يوليو 07 = 19 اغسطس07=20 سبتمبر07= 21
1= Alive (living in the household) 2= Alive (living elsewhere) 3= Died 4= Missing/ unknown
حي = 1 يقيم حالي(
)بالمنزل حي= 2 يقيم حاليا(
)بمكان آخر متوفي= 3 \مفقود = 4
.مجهول المكان
ضع دائرة1= M ذآر 2= F انثي
13 = Jan 07 14 = Feb 07 15 = Mar 07 16 = April 07 ا 17 = May 07 18 = Jun 07 19 = July 07 20=Aug07 21 =Sep 07
يناير 07 = 13 فبراير 07 = 14مارس 07 = 15ابريل 07 = 16 مايو 07 = 17 يونيو 07 = 18 يوليو 07 = 19 اغسطس07=20 سبتمبر07= 21
يشمل آل األطفال (
ودين منذ عيد المول)األضحى
Write 0 for babies
born since last Eid Al Adha
فقط أألول األسم)الزوار غير (
First Name (No Visitors
No.
|___| |___|___| |___| |___| |___|___| |___|___| 16
|___| |___|___| |___| |___| |___|___| |___|___| 17
|___| |___|___| |___| |___| |___|___| |___|___| 18
|___| |___|___| |___| |___| |___|___| |___|___| 19
|___| |___|___| |___| |___| |___|___| |___|___| 20
|___| |___|___| |___| |___| |___|___| |___|___| 21
|___| |___|___| |___| |___| |___|___| |___|___| 22
|___| |___|___| |___| |___| |___|___| |___|___| 23
Codes for cause of death Definitions رموز لسبب الوفاة التعريفات1 = Watery diarrhea: Any episode of 3 or more watery stools per day ثالث مرات أو أآثر في اليوم المائياإلسهال إذا آانت عدد مرات إسهال مائي= 1
2= Bloody diarrhea: Any episode of 3 or more watery stools per day with blood ثالث مرات أو أآثر في اليوم المائياإلسهال آانت عدد مراتإذا بدممصحوبو
إسهال مصحوب = 2.بدم
3= Fever/Malaria: High temperature with shivering حمى=3 إرتفاع في درجة الحرارة ورجفة
4= Measles: Any episode of fever accompanied by skin eruption/rash accompanied by runny nose and/or cough and/or inflamed eyes
مصحوبة بزآام و , أى حمى مصحوبة بطفح و إحمرار في الجلد) محمرة ومنتفخة(عيون ملتهبة / أو آحة\آحة حصبة= 4
5= Difficulty breathing: Any episode with difficulty breathing or severe persistent cough التنقس أو آحة حادة ومستمرةأي صعوبة في صعوبة في التنفس= 5
6= Violence/conflict-related: Any death as a direct result of intentional violence or conflict مرتبط \إعتداء= 6 أي وفاة آنتيجة مباشرة إلعتداء أو صراع
باألحداث الحالية7= Accident: Any death as a result of an accident حادث= 7 أي وفاة آنتيجة مباشرة لحادث
8= Other cause: Any other cause than the ones above, etc. أسباب أخرى= 8 أي سبب غير مذآور اعاله
SECTION 2 – HOUSEHOLD CIRCUMSTANCES احوال األسرة 2 القسم
IDP in camp 1 نازحين في معسكرIDP outside camps 2 نازحين خارج المعسكراتRefugees in camp 3 الجئين في معسكر Resident 4 مقيمينReturnees 5 ينعائد
2.1
What is the residence status of the household? CIRCLE ONLY ONE OPTION
Nomad 6 رحل(يمارسون الرعي (
ما هي حالة اقامة األسرة ؟ ضع دائرة لخيار واحد فقط
2.1
2.2 How long have you been living here?
Has always been living there (never left, normal migratory patterns) 1 يعيش في نفس المكان بصفة دائمة لم يغادر نمط
)تحرك عادي 2.2 منذ متي تعيش
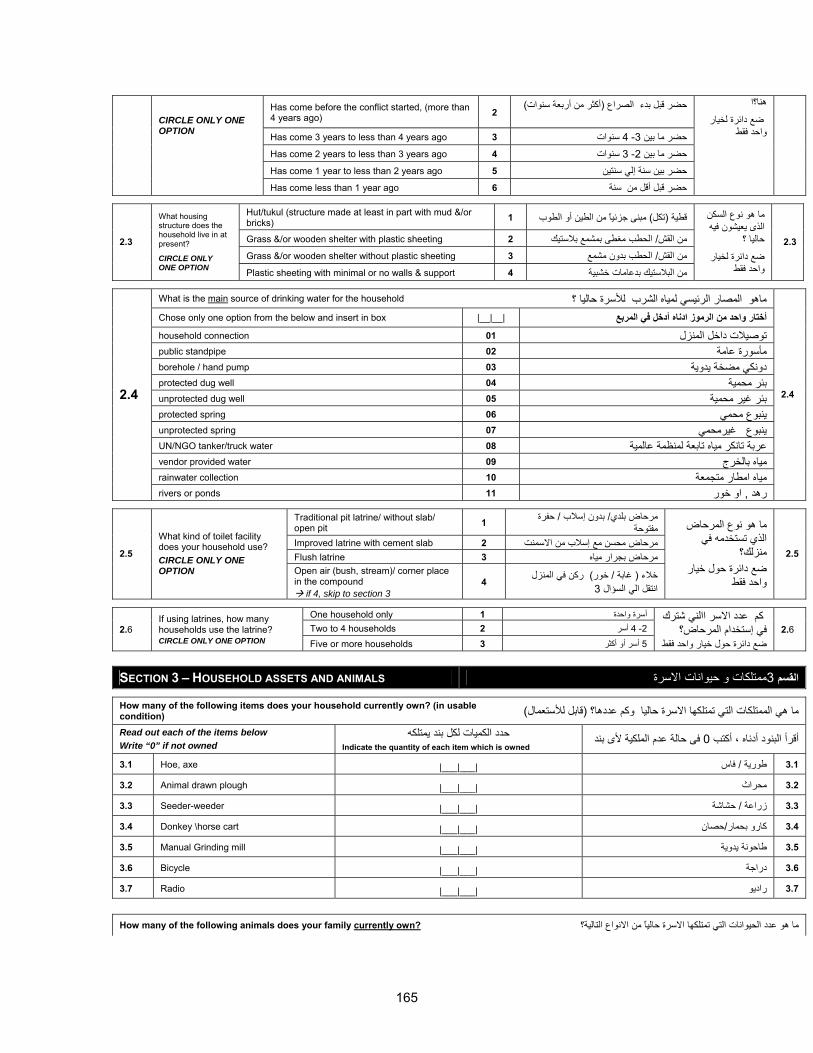
165
Has come before the conflict started, (more than 4 years ago) 2
) أآثر من أربعة سنوات(حضر قبل بدء الصراع
Has come 3 years to less than 4 years ago 3 سنوات4 -3حضر ما بين Has come 2 years to less than 3 years ago 4 سنوات3 -2حضر ما بين Has come 1 year to less than 2 years ago 5 حضر بين سنة إلي سنتين
CIRCLE ONLY ONE OPTION
Has come less than 1 year ago 6 حضر قبل أقل من سنة
هنا؟ا ضع دائرة لخيار واحد فقط
Hut/tukul (structure made at least in part with mud &/or bricks) 1 مبنى جزئيًا من الطين أو الطوب) تكل(قطية
Grass &/or wooden shelter with plastic sheeting 2 شمع بالستيكالحطب مغطى بم/ من القش Grass &/or wooden shelter without plastic sheeting 3 الحطب بدون مشمع/ من القش
2.3
What housing structure does the household live in at present?
CIRCLE ONLY ONE OPTION Plastic sheeting with minimal or no walls & support 4 من البالستيك بدعامات خشبية
ما هو نوع السكنالذى يعيشون فيه
حاليا ؟ضع دائرة لخيار
واحد فقط
2.3
What is the main source of drinking water for the household الشرب لألسرة حاليا ؟ المصار الرئيسي لمياهماهو Chose only one option from the below and insert in box |__|__| أدخل في المربعن الرموز ادناهم واحدأختار household connection 01 توصيالت داخل المنزل public standpipe 02 مأسورة عامة borehole / hand pump 03 دونكي مضخة يدوية protected dug well 04 بئر محمية unprotected dug well 05 بئر غير محمية protected spring 06 ينبوع محمي unprotected spring 07 ينبوع غيرمحمي UN/NGO tanker/truck water 08 عربة تانكر مياه تابعة لمنظمة عالمية vendor provided water 09 مياه بالخرج rainwater collection 10 مياه امطار متجمعة
2.4
rivers or ponds 11 او خور, رهد
2.4
Traditional pit latrine/ without slab/ open pit 1 حفرة / بدون إسالب / بلديمرحاض
مفتوحة Improved latrine with cement slab 2 مرحاض محسن مع إسالب من االسمنتFlush latrine 3 2.5مرحاض بجرار مياه
What kind of toilet facility does your household use? CIRCLE ONLY ONE OPTION Open air (bush, stream)/ corner place
in the compound if 4, skip to section 3
رآن في المنزل ) خور/ غابة ( خالء 4 3انتقل الي السؤال
ما هو نوع المرحاض الذي تستخدمه في
منزلك؟ ضع دائرة حول خيار
واحد فقط
2.5
One household only 1 أسرة واحدة Two to 4 households 2 2- 4 2.6 أسر
If using latrines, how many households use the latrine? CIRCLE ONLY ONE OPTION Five or more households 3 5أسر أو أآثر
عدد االسر االني شترك آم ستخدام المرحاض؟ في إ
ضع دائرة حول خيار واحد فقط2.6
SECTION 3 – HOUSEHOLD ASSETS AND ANIMALS االسرةحيواناتممتلكات و 3 القسم
How many of the following items does your household currently own? (in usable condition) قابل لألستعمال(ما هي الممتلكات التي تمتلكها االسرة حاليا وآم عددها؟ ( Read out each of the items below Write “0” if not owned
حدد الكميات لكل بند يمتلكهIndicate the quantity of each item which is owned
فى حالة عدم الملكية ألى بند0قرأ البنود أدناه ، أآتب أ
3.1 Hoe, axe |___|___| فاس / طورية 3.1
3.2 Animal drawn plough |___|___| 3.2 محراث
3.3 Seeder-weeder |___|___| حشاشة/ زراعة 3.3
3.4 Donkey \horse cart |___|___| حصان/آارو بحمار 3.4
3.5 Manual Grinding mill |___|___| طاحونة يدوية 3.5
3.6 Bicycle |___|___| دراجة 3.6
3.7 Radio |___|___| راديو 3.7
How many of the following animals does your family currently own? نواع التالية؟ عدد الحيوانات التي تمتلكها االسرة حاليًا من االما هو
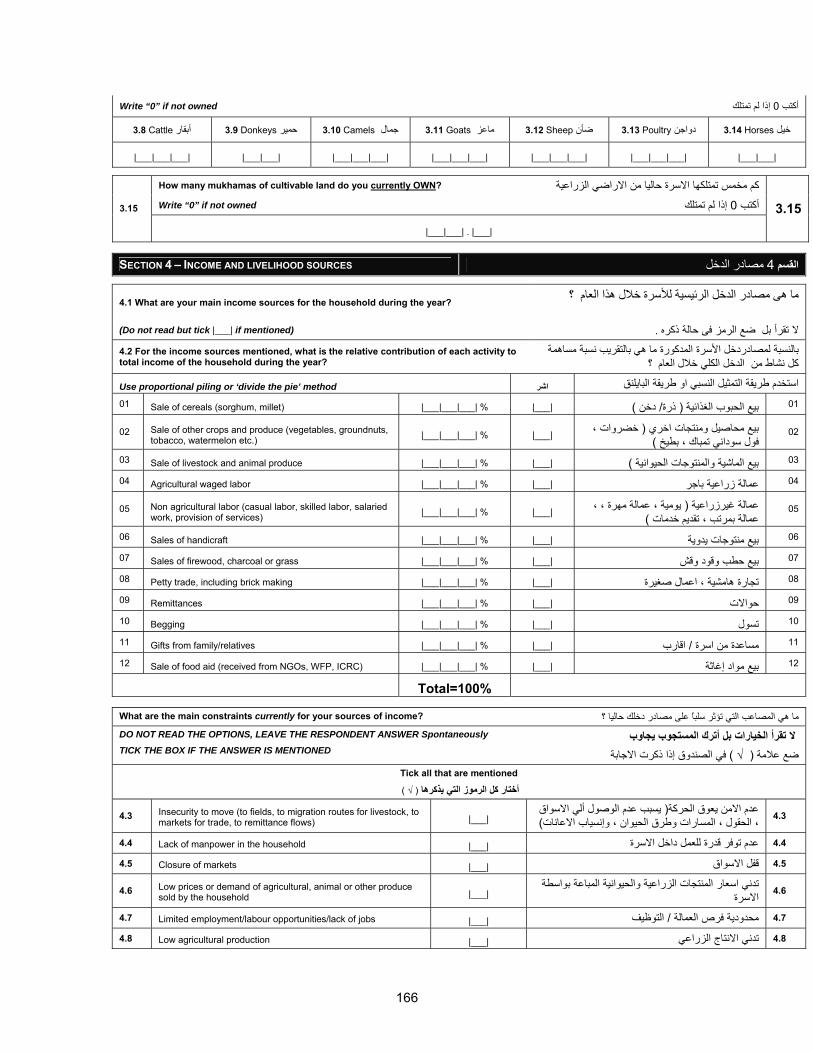
166
Write “0” if not owned إذا لم تمتلك0أآتب
3.8 Cattle 3.9 أبقار Donkeys 3.10 حمير Camels 3.11 جمال Goats 3.12 ماعز Sheep 3.13 ضأن Poultry 3.14 دواجن Horses خيل
|___|___|___| |___|___| |___|___|___| |___|___|___| |___|___|___| |___|___|___| |___|___|
How many mukhamas of cultivable land do you currently OWN? تمتلكها االسرة حاليا من االراضي الزراعيةمخمسآم Write “0” if not owned 3.15 إذا لم تمتلك 0أآتب
|___|___| . |___|
3.15
SECTION 4 – INCOME AND LIVELIHOOD SOURCES مصادر الدخل 4 لقسما
4.1 What are your main income sources for the household during the year? ما هى مصادر الدخل الرئيسية لألسرة خالل هذا العام ؟
(Do not read but tick |___| if mentioned) مز فى حالة ذآرهال تقرأ بل ضع الر.
4.2 For the income sources mentioned, what is the relative contribution of each activity to total income of the household during the year?
مساهمة ما هي بالتقريب نسبة بالنسبة لمصادردخل األسرة المدآورة ؟خالل العام آل نشاط من الدخل الكلي
Use proportional piling or ‘divide the pie’ method استخدم طريقة التمثيل النسبي او طريقة البايلنق اشر 01 Sale of cereals (sorghum, millet) |___|___|___| % |___| دخن / ذرة( بيع الحبوب الغذائية( 01
02 Sale of other crops and produce (vegetables, groundnuts, tobacco, watermelon etc.) |___|___|___| % |___| خضروات ، ( بيع محاصيل ومنتجات اخري
)فول سوداني تمباك ، بطيخ 02
03 Sale of livestock and animal produce |___|___|___| % |___| بيع الماشية والمنتوجات الحيوانية( 03
04 Agricultural waged labor |___|___|___| % |___| 04 عمالة زراعية باجر
05 Non agricultural labor (casual labor, skilled labor, salaried work, provision of services) |___|___|___| % |___| يومية ، عمالة مهرة ، ، ( عمالة غيرزراعية
)عمالة بمرتب ، تقديم خدمات 05
06 Sales of handicraft |___|___|___| % |___| 06 بيع منتوجات يدوية
07 Sales of firewood, charcoal or grass |___|___|___| % |___| 07 بيع حطب وقود وقش
08 Petty trade, including brick making |___|___|___| % |___| 08 تجارة هامشية ، اعمال صغيرة
09 Remittances |___|___|___| % |___| 09 حواالت
10 Begging |___|___|___| % |___| 10 تسول
11 Gifts from family/relatives |___|___|___| % |___| اقارب/ مساعدة من اسرة 11
12 Sale of food aid (received from NGOs, WFP, ICRC) |___|___|___| % |___| 12 بيع مواد إغاثة
Total=100% What are the main constraints currently for your sources of income? ما هي المصاعب التي تؤثر سلبًا على مصادر دخلك حاليا ؟ DO NOT READ THE OPTIONS, LEAVE THE RESPONDENT ANSWER Spontaneously TICK THE BOX IF THE ANSWER IS MENTIONED
لمستجوب يجاوب ال تقرأ الخيارات بل أترك ا في الصندوق إذا ذآرت االجابة ) √ (ضع عالمة
Tick all that are mentioned
)√( التي يذآرها ز ورمآل الأختار
4.3 Insecurity to move (to fields, to migration routes for livestock, to markets for trade, to remittance flows) |___|
يسبب عدم الوصول ألي االسواق ( عوق الحرآةعدم االمن ي) ، الحقول ، المسارات وطرق الحيوان ، وإنسياب االعانات 4.3
4.4 Lack of manpower in the household |___| 4.4 عدم توفر قدرة للعمل داخل االسرة
4.5 Closure of markets |___| 4.5 قفل االسواق
4.6 Low prices or demand of agricultural, animal or other produce sold by the household |___|
تدني اسعار المنتجات الزراعية والحيوانية المباعة بواسطة 4.6 االسرة
4.7 Limited employment/labour opportunities/lack of jobs |___| التوظيف/ محدودية فرص العمالة 4.7
4.8 Low agricultural production |___| 4.8 تدني االنتاج الزراعي
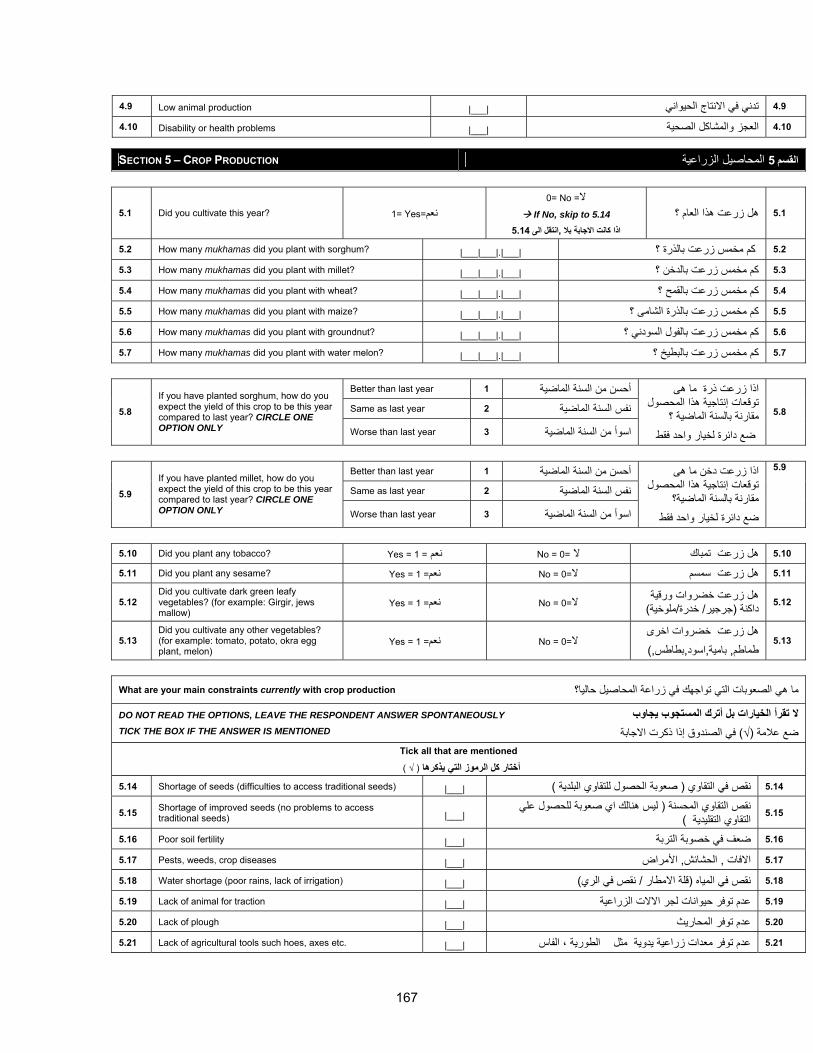
167
4.9 Low animal production |___| 4.9 تدني في االنتاج الحيواني
4.10 Disability or health problems |___| 4.10 العجز والمشاآل الصحية
SECTION 5 – CROP PRODUCTION الزراعية المحاصيل5 القسم
5.1 Did you cultivate this year? 1= Yes=نعم 0= No =ال
If No, skip to 5.14 5.14انتقل الى ,اذا آانت االجابة بال
5.1 هل زرعت هذا العام ؟
5.2 How many mukhamas did you plant with sorghum? |___|___|.|___| آم مخمس زرعت بالذرة ؟ 5.2
5.3 How many mukhamas did you plant with millet? |___|___|.|___| 5.3 آم مخمس زرعت بالدخن ؟
5.4 How many mukhamas did you plant with wheat? |___|___|.|___| 5.4 آم مخمس زرعت بالقمح ؟
5.5 How many mukhamas did you plant with maize? |___|___|.|___| 5.5 آم مخمس زرعت بالذرة الشامى ؟
5.6 How many mukhamas did you plant with groundnut? |___|___|.|___| 5.6 آم مخمس زرعت بالفول السودني ؟
5.7 How many mukhamas did you plant with water melon? |___|___|.|___| 5.7 آم مخمس زرعت بالبطيخ ؟
Better than last year 1 أحسن من السنة الماضية Same as last year 2 5.8 نفس السنة الماضية
If you have planted sorghum, how do you expect the yield of this crop to be this year compared to last year? CIRCLE ONE OPTION ONLY Worse than last year 3 اسوأ من السنة الماضية
اذا زرعت ذرة ما هى توقعات إنتاجية هذا المحصول
مقارنة بالسنة الماضية ؟ ضع دائرة لخيار واحد فقط
5.8
Better than last year 1 أحسن من السنة الماضية Same as last year 2 5.9 نفس السنة الماضية
If you have planted millet, how do you expect the yield of this crop to be this year compared to last year? CIRCLE ONE OPTION ONLY Worse than last year 3 اسوأ من السنة الماضية
اذا زرعت دخن ما هى وقعات إنتاجية هذا المحصول ت
مقارنة بالسنة الماضية؟ ضع دائرة لخيار واحد فقط
5.9
5.10 Did you plant any tobacco? Yes = 1 = نعم No = 0= 5.10 هل زرعت تمباك ال
5.11 Did you plant any sesame? Yes = 1 =نعم No = 0=5.11 هل زرعت سمسم ال
5.12 Did you cultivate dark green leafy vegetables? (for example: Girgir, jews mallow)
Yes = 1 =نعم No = 0=ال هل زرعت خضروات ورقية
)ملوخية/خدرة/ جرجير(داآنة 5.12
5.13 Did you cultivate any other vegetables? (for example: tomato, potato, okra egg plant, melon)
Yes = 1 =نعم No = 0=ال هل زرعت خضروات اخرى
),بطاطس,اسود,بامية, طماطم5.13
What are your main constraints currently with crop production عة المحاصيل حاليا؟ما هي الصعوبات التي تواجهك في زرا
DO NOT READ THE OPTIONS, LEAVE THE RESPONDENT ANSWER SPONTANEOUSLY TICK THE BOX IF THE ANSWER IS MENTIONED
ال تقرأ الخيارات بل أترك المستجوب يجاوب في الصندوق إذا ذآرت االجابة ) √(ضع عالمة
Tick all that are mentioned
)√( التي يذآرها ز ورم الآلأختار
5.14 Shortage of seeds (difficulties to access traditional seeds) |___| صعوبة الحصول للتقاوي البلدية ( نقص في التقاوي( 5.14
5.15 Shortage of improved seeds (no problems to access traditional seeds) |___|
ليس هنالك اي صعوبة للحصول علي (نقص التقاوي المحسنة )التقاوي التقليدية 5.15
5.16 Poor soil fertility |___| 5.16 ضعف في خصوبة التربة
5.17 Pests, weeds, crop diseases |___| األمراض , الحشائش, االفات 5.17
5.18 Water shortage (poor rains, lack of irrigation) |___| نقص في الري/ قلة االمطار (نقص في المياه( 5.18
5.19 Lack of animal for traction |___| 5.19 عدم توفر حيوانات لجر االالت الزراعية
5.20 Lack of plough |___| 5.20 عدم توفر المحاريث
5.21 Lack of agricultural tools such hoes, axes etc. |___| 5.21 الطورية ، الفاس دات زراعية يدوية مثلعدم توفر مع
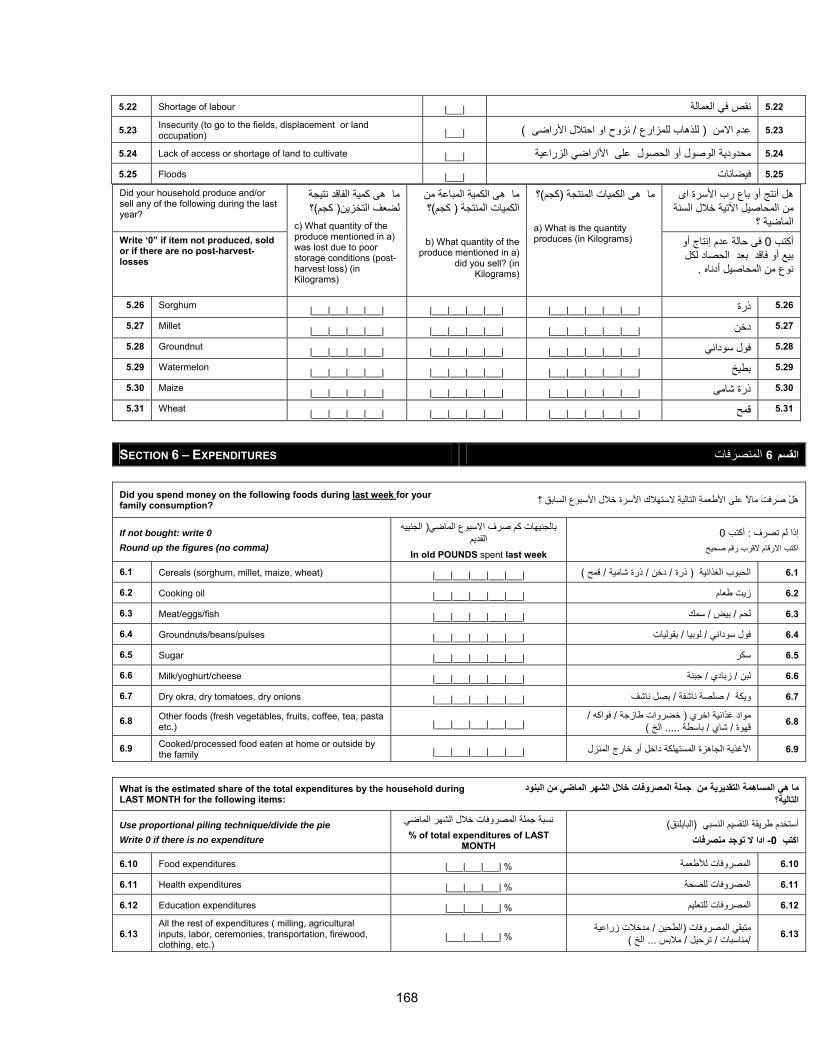
168
5.22 Shortage of labour |___| 5.22 نقص في العمالة
5.23 Insecurity (to go to the fields, displacement or land occupation) |___| نزوح او احتالل األراضى / للذهاب للمزارع ( عدم االمن ( 5.23
5.24 Lack of access or shortage of land to cultivate |___| 5.24 محدودية الوصول أو الحصول على األاراضي الزراعية
5.25 Floods |___| 5.25 فيضانات
Did your household produce and/or sell any of the following during the last year?
هل أنتج أو باع رب األسرة اى من المحاصيل اآلتية خالل السنة
الماضية ؟Write ‘0” if item not produced, sold or if there are no post-harvest-losses
ما هى آمية الفاقد نتيجة؟)آجم( لضعف التخزين
c) What quantity of the produce mentioned in a) was lost due to poor storage conditions (post-harvest loss) (in Kilograms)
ما هى الكمية المباعة من ؟)آجم( الكميات المنتجة
b) What quantity of the produce mentioned in a)
did you sell? (in Kilograms)
؟)آجم(ما هى الكميات المنتجة
a) What is the quantity produces (in Kilograms)
و فى حالة عدم إنتاج أ0أآتب بيع أو فاقد بعد الحصاد لكل
.نوع من المحاصيل أدناه
5.26 Sorghum |___|___|___|___| |___|___|___|___| |___|___|___|___|___| 5.26 ذرة
5.27 Millet |___|___|___|___| |___|___|___|___| |___|___|___|___|___| 5.27 دخن
5.28 Groundnut |___|___|___|___| |___|___|___|___| |___|___|___|___|___| 5.28 فول سوداني
5.29 Watermelon |___|___|___|___| |___|___|___|___| |___|___|___|___|___| 5.29 بطيخ
5.30 Maize |___|___|___|___| |___|___|___|___| |___|___|___|___|___| 5.30 ذرة شامى
5.31 Wheat |___|___|___|___| |___|___|___|___| |___|___|___|___|___| 5.31 قمح
SECTION 6 – EXPENDITURES المنصرفات6 القسم Did you spend money on the following foods during last week for your family consumption? ِ؟السابق سبوعاأل الستهالك األسرة خالل التاليِة األطعمِة على ماًال َصرفَت َهْل
If not bought: write 0 Round up the figures (no comma)
الجنييه ( بالجنيهات آم صرف االسبوع الماضي القديم
In old POUNDS spent last week
0أآتب : إذا لم تصرف اآتب االرقام القرب رقم صحيح
6.1 Cereals (sorghum, millet, maize, wheat) |___|___|___|___|___| قمح / ذرة شامية / دخن / ذرة ( الحبوب الغذائية ( 6.1
6.2 Cooking oil |___|___|___|___|___| زيت طعام 6.2
6.3 Meat/eggs/fish |___|___|___|___|___| سمك / بيض / لحم 6.3
6.4 Groundnuts/beans/pulses |___|___|___|___|___| بقوليات / لوبيا / ني فول سودا 6.4
6.5 Sugar |___|___|___|___|___| سكر 6.5
6.6 Milk/yoghurt/cheese |___|___|___|___|___| جبنة/ زبادي / لبن 6.6
6.7 Dry okra, dry tomatoes, dry onions |___|___|___|___|___| بصل ناشف / صلصة ناشفة / ويكة 6.7
6.8 Other foods (fresh vegetables, fruits, coffee, tea, pasta etc.) |___|___|___|___|___|
/ فواآه / خضروات طازجة ( مواد غذائية اخري )الخ ..... باسطة / شاي / قهوة 6.8
6.9 Cooked/processed food eaten at home or outside by the family |___|___|___|___|___| الجاهزة المستهلكة داخل أو خارج المنزلاألغذية 6.9
What is the estimated share of the total expenditures by the household during LAST MONTH for the following items:
ما هي المساهمة التقديرية من جملة المصروفات خالل الشهر الماضي من البنود التالية؟
Use proportional piling technique/divide the pie Write 0 if there is no expenditure
نسبة جملة المصروفات خالل الشهر الماضي% of total expenditures of LAST
MONTH
)البايلنق(أستخدم طريقة التقسيم النسبي ادا ال توجد منصرفات-0اآتب
6.10 Food expenditures |___|___|___| % المصروفات لألطعمة 6.10
6.11 Health expenditures |___|___|___| % المصروفات للصحة 6.11
6.12 Education expenditures |___|___|___| % 6.12 المصروفات للتعليم
6.13 All the rest of expenditures ( milling, agricultural inputs, labor, ceremonies, transportation, firewood, clothing, etc.)
|___|___|___| % مدخالت زراعية / الطحين (متبقي المصروفات
)الخ ... مالبس / ترحيل / مناسبات / 6.13
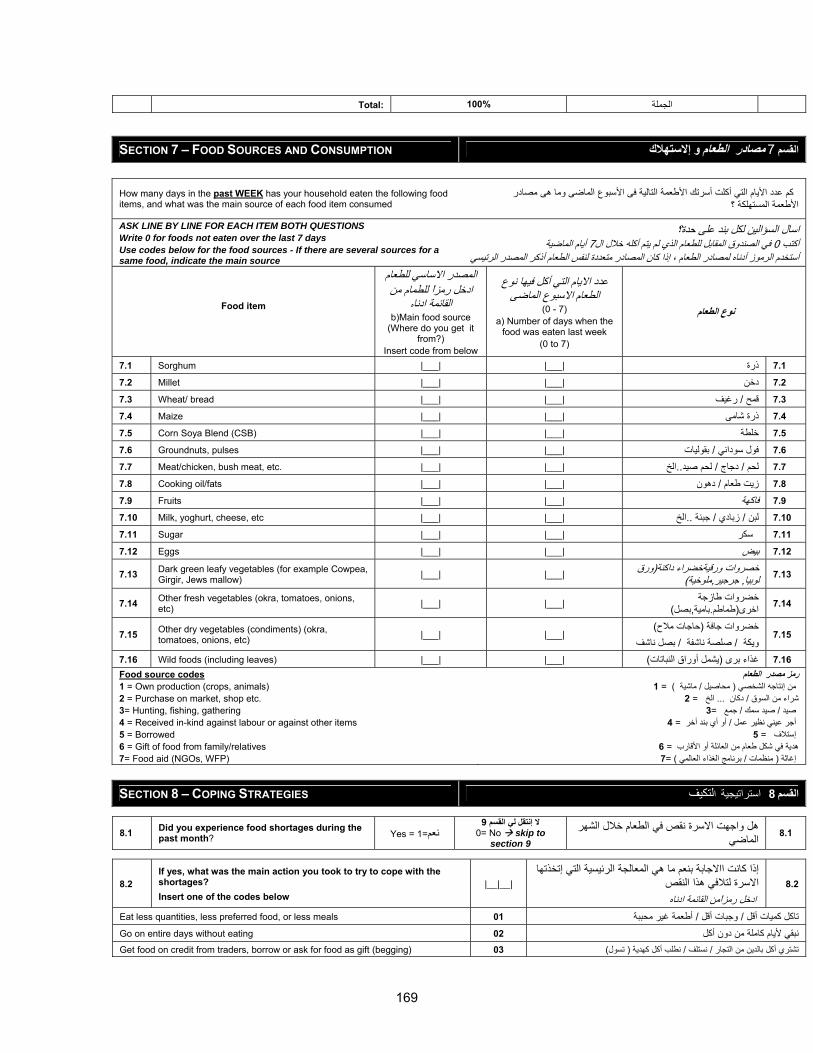
169
Total: 100% الجملة
SECTION 7 – FOOD SOURCES AND CONSUMPTION إالستهالك و مصادر الطعام القسم 7
How many days in the past WEEK has your household eaten the following food items, and what was the main source of each food item consumed
أآلت أسرتك األطعمة التالية فى األسبوع الماضى وما هى مصادر التيآم عدد األيام األطعمة المستهلكة ؟
ASK LINE BY LINE FOR EACH ITEM BOTH QUESTIONS Write 0 for foods not eaten over the last 7 days Use codes below for the food sources - If there are several sources for a same food, indicate the main source
اسال السؤالين لكل بند على حدة؟ماضية أيام ال7 في الصندوق المقابل للطعام الذي لم يتم أآله خالل ال0أآتب
أستخدم الرموز أدناه لمصادر الطعام ، إذا آان المصادر متعددة لنفس الطعام أذآر المصدر الرتيسي
Food item
المصدر االساسي للطعامادخل رمزًا للطمام من
هالقائمة ادنا b)Main food source
(Where do you get it from?)
Insert code from below
أآل فيها نوع عدد االيام التي االسبوع الماضى الطعام
(0 - 7) a) Number of days when the
food was eaten last week (0 to 7)
نوع الطعام
7.1 Sorghum |___| |___| ذرة 7.1
7.2 Millet |___| |___| دخن 7.2
7.3 Wheat/ bread |___| |___| رغيف/ قمح 7.3
7.4 Maize |___| |___| 7.4 ذرة شامى
7.5 Corn Soya Blend (CSB) |___| |___| خلطة 7.5
7.6 Groundnuts, pulses |___| |___| بقوليات/ فول سوداني 7.6
7.7 Meat/chicken, bush meat, etc. |___| |___| الخ..لحم صيد/ دجاج / لحم 7.7
7.8 Cooking oil/fats |___| |___| دهون/ زيت طعام 7.8
7.9 Fruits |___| |___| فاآهة 7.9
7.10 Milk, yoghurt, cheese, etc |___| |___| الخ..جبنة / زبادي / لبن 7.10
7.11 Sugar |___| |___| 7.11 سكر
7.12 Eggs |___| |___| بيض 7.12
7.13 Dark green leafy vegetables (for example Cowpea, Girgir, Jews mallow) |___| |___| ورق (خصروات ورقيةخضراء داآنة
)ملوخية,جرجير, لوبيا 7.13
7.14 Other fresh vegetables (okra, tomatoes, onions, etc) |___| |___| خضروات طازجة
)بصل,بامية.طماطم(اخرى 7.14
7.15 Other dry vegetables (condiments) (okra, tomatoes, onions, etc) |___| |___|
)حاجات مالح(خضروات جافة بصل ناشف/ صلصة ناشفة / ويكة
7.15
7.16 Wild foods (including leaves) |___| |___| يشمل أوراق النباتات(غذاء برى( 7.16 Food source codes 1 = Own production (crops, animals) 2 = Purchase on market, shop etc. 3= Hunting, fishing, gathering 4 = Received in-kind against labour or against other items 5 = Borrowed 6 = Gift of food from family/relatives 7= Food aid (NGOs, WFP)
رمز مصدر الطعام ) ماشية / محاصيل ( من إنتاجه الشخصي = 1
الخ ... دآان / شراء من السوق = 2جمع / صيد سمك / صيد =3
أو أي بند أخر / أجر عيني نظير عمل = 4 إستالف = 5
هدية في شكل طعام من العائلة أو األقارب = 6)برنامج الغذاء العالمي / منظمات ( إغاثة =7
SECTION 8 – COPING STRATEGIES 8 لتكيفا استراتيجية القسم
8.1 Did you experience food shortages during the past month? Yes = 1=نعم
9ال إنتقل لي القسم 0= No skip to
section 9
هل واجهت االسرة نقص في الطعام خالل الشهرالماضي 8.1
8.2 If yes, what was the main action you took to try to cope with the shortages? Insert one of the codes below
|__|__| إذا آانت ااالجابة بنعم ما هي المعالجة الرئيسية التي إتخذتها
االسرة لتالفي هذا النقص ادخل رمزًامن القائمة ادناه
8.2
Eat less quantities, less preferred food, or less meals 01 أطعمة غير محببة/ وجبات أقل / تاآل آميات أقلGo on entire days without eating 02 نبقي أليام آاملة من دون أآلGet food on credit from traders, borrow or ask for food as gift (begging) 03 تسول( نطلب أآل آهدية / نستلف / تشتري أآل بالدين من التجار(
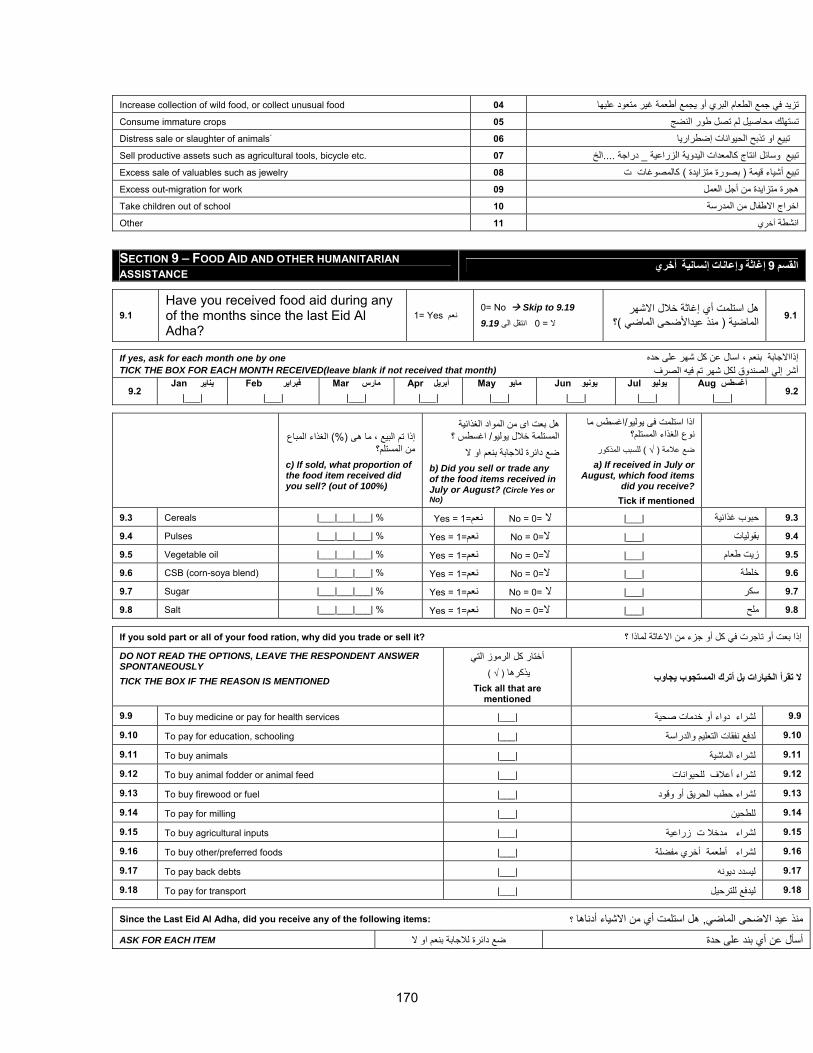
170
Increase collection of wild food, or collect unusual food 04 تزيد في جمع الطعام البري أو يجمع أطعمة غير متعود عليهاConsume immature crops 05 تستهلك محاصيل لم تصل طور النضجDistress sale or slaughter of animals ً 06 تبيع او تذبح الحيوانات إضطراريا Sell productive assets such as agricultural tools, bicycle etc. 07 الخ....دراجة _ تبيع وسائل انتاج آالمعدات اليدوية الزراعيةExcess sale of valuables such as jewelry 08 آالمصوغات ت) بصورة متزايدة ( تبيع أشياء قيمةExcess out-migration for work 09 هجرة متزايدة من أجل العملTake children out of school 10 اخراج االطفال من المدرسةOther 11 أخري انشطة
SECTION 9 – FOOD AID AND OTHER HUMANITARIAN ASSISTANCE
أخري إنسانية وإعانات إغاثة 9 القسم
9.1 Have you received food aid during any of the months since the last Eid Al Adha?
1= Yes نعم 0= No Skip to 9.19
0= ال انتقل الى 9.19 هل استلمت أي إغاثة خالل االشهر
؟)منذ عيداألضحى الماضي ( الماضية 9.1
If yes, ask for each month one by one TICK THE BOX FOR EACH MONTH RECEIVED(leave blank if not received that month)
، اسال عن آل شهر على حدهإذااالجابة بنعمأشر إلي الصندوق لكل شهر تم فيه الصرف
9.2 Jan يناير
|___| Feb فبراير
|___| Mar مارس
|___| Apr أبريل
|___| May مايو
|___| Jun يونيو
|___| Jul يوليو
|___| Aug أغسطس
|___| 9.2
الغذاء المباع (%) ى إذا تم البيع ، ما ه من المستلم؟
c) If sold, what proportion of the food item received did you sell? (out of 100%)
هل بعت اى من المواد الغذائية اغسطس ؟/ المستلمة خالل يوليو
ضع دائرة لالجابة بنعم او الb) Did you sell or trade any of the food items received in July or August? (Circle Yes or No)
اغسطس ما /اذا استلمت فى يوليونوع الغذاء المستلم؟
للسبب المذآور ) √( ضع عالمة a) If received in July or
August, which food items did you receive?
Tick if mentioned
9.3 Cereals |___|___|___| % Yes = 1=نعم No = 0= حبوب غذائية |___| ال 9.3
9.4 Pulses |___|___|___| % Yes = 1=نعم No = 0=بقوليات |___| ال 9.4
9.5 Vegetable oil |___|___|___| % Yes = 1=نعم No = 0=زيت طعام |___| ال 9.5
9.6 CSB (corn-soya blend) |___|___|___| % Yes = 1=نعم No = 0=خلطة |___| ال 9.6
9.7 Sugar |___|___|___| % Yes = 1=نعم No = 0= سكر |___| ال 9.7
9.8 Salt |___|___|___| % Yes = 1=نعم No = 0=ملح |___| ال 9.8
If you sold part or all of your food ration, why did you trade or sell it? إذا بعت أو تاجرت في آل أو جزء من االغاثة لماذا ؟
DO NOT READ THE OPTIONS, LEAVE THE RESPONDENT ANSWER SPONTANEOUSLY TICK THE BOX IF THE REASON IS MENTIONED
التيز ورمآل الأختار )√( يذآرها
Tick all that are mentioned
ال تقرأ الخيارات بل أترك المستجوب يجاوب
9.9 To buy medicine or pay for health services |___| لشراء دواء أو خدمات صحية 9.9
9.10 To pay for education, schooling |___| لدفع نفقات التعليم والدراسة 9.10
9.11 To buy animals |___| لشراء الماشية 9.11
9.12 To buy animal fodder or animal feed |___| عالف للحيوانات لشراء أ 9.12
9.13 To buy firewood or fuel |___| لشراء حطب الحريق أو وقود 9.13
9.14 To pay for milling |___| للطحين 9.14
9.15 To buy agricultural inputs |___| لشراء مدخال ت زراعية 9.15
9.16 To buy other/preferred foods |___| راء أطعمة أخري مفضلة لش 9.16
9.17 To pay back debts |___| ليسدد ديونه 9.17
9.18 To pay for transport |___| 9.18 ليدفع للترحيل
Since the Last Eid Al Adha, did you receive any of the following items: ؟ اأدناههل استلمت أي من االشياء , منذ عيد االضحى الماضي
ASK FOR EACH ITEM أسأل عن أي بند على حدة ضع دائرة لالجابة بنعم او ال
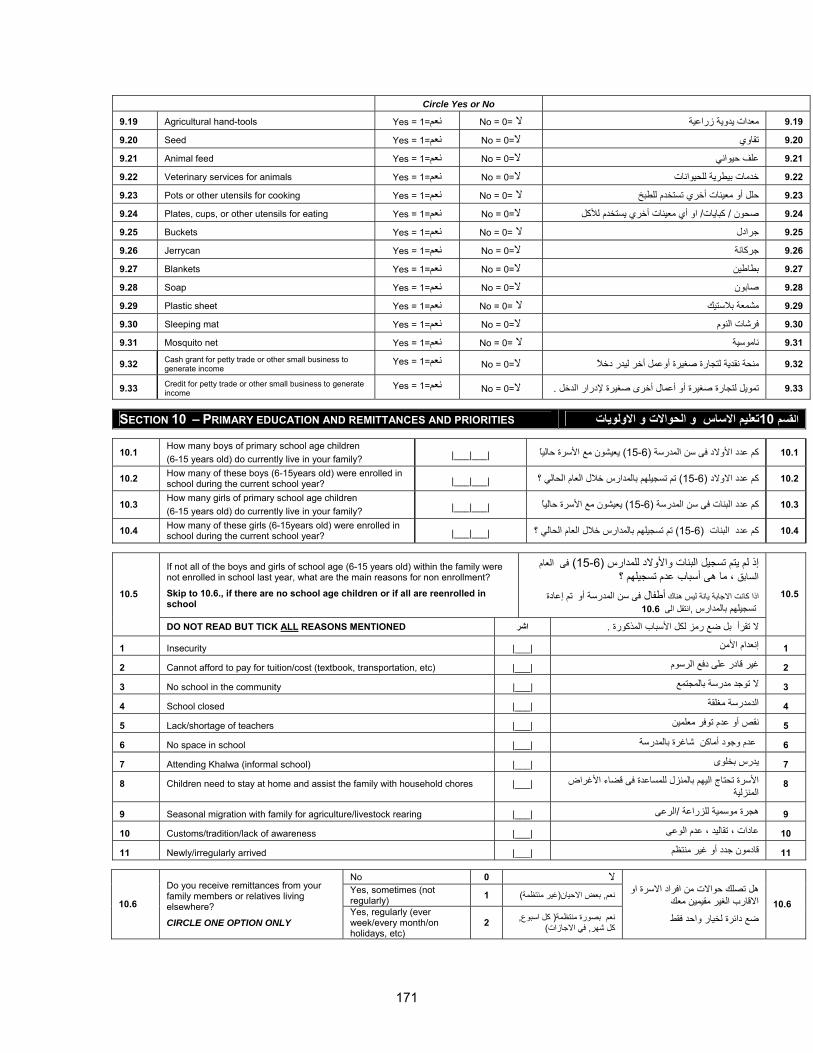
171
Circle Yes or No
9.19 Agricultural hand-tools Yes = 1=نعم No = 0= معدات يدوية زراعية ال 9.19
9.20 Seed Yes = 1=نعم No = 0=تقاوي ال 9.20
9.21 Animal feed Yes = 1=نعم No = 0=علف حيواني ال 9.21
9.22 Veterinary services for animals Yes = 1=نعم No = 0=خدمات بيطرية للحيوانات ال 9.22
9.23 Pots or other utensils for cooking Yes = 1=نعم No = 0= حلل أو معينات أخري تستخدم للطبخ ال 9.23
9.24 Plates, cups, or other utensils for eating Yes = 1=نعم No = 0=او أي معينات أخري يستخدم لألآل/ آبايات/ صحون ال 9.24
9.25 Buckets Yes = 1=نعم No = 0= جرادل ال 9.25
9.26 Jerrycan Yes = 1=نعم No = 0=جرآانة ال 9.26
9.27 Blankets Yes = 1=نعم No = 0=بطاطين ال 9.27
9.28 Soap Yes = 1=نعم No = 0=صابون ال 9.28
9.29 Plastic sheet Yes = 1=نعم No = 0= مشمعة بالستيك ال 9.29
9.30 Sleeping mat Yes = 1=نعم No = 0=فرشات النوم ال 9.30
9.31 Mosquito net Yes = 1=نعم No = 0= ناموسية ال 9.31
9.32 Cash grant for petty trade or other small business to generate income
Yes = 1=نعم No = 0=منحة نقدية لتجارة صغيرة أوعمل أخر ليدر دخًال ال 9.32
9.33 Credit for petty trade or other small business to generate income
Yes = 1=نعم No = 0=الدخل تمويل لتجارة صغيرة أو أعمال أخرى صغيرة إلدرار ال . 9.33
SECTION 10 – PRIMARY EDUCATION AND REMITTANCES AND PRIORITIES تعليم االساس و الحواالت و االولويات10 القسم
10.1 How many boys of primary school age children (6-15 years old) do currently live in your family? |___|___| يعيشون مع األسرة حاليًا) 15-6(ى سن المدرسة آم عدد األوالد ف 10.1
10.2 How many of these boys (6-15years old) were enrolled in school during the current school year? |___|___| تم تسجيلهم بالمدارس خالل العام الحالي ؟) 15-6(آم عدد االوالد 10.2
10.3 How many girls of primary school age children (6-15 years old) do currently live in your family? |___|___| يعيشون مع األسرة حاليًا) 15-6(آم عدد البنات فى سن المدرسة 10.3
10.4 How many of these girls (6-15years old) were enrolled in school during the current school year? |___|___| تم تسجيلهم بالمدارس خالل العام الحالي ؟) 15-6(آم عدد البنات 10.4
If not all of the boys and girls of school age (6-15 years old) within the family were not enrolled in school last year, what are the main reasons for non enrollment?
Skip to 10.6., if there are no school age children or if all are reenrolled in school
فى العام ) 15-6(إذ لم يتم تسجيل البنات واألوالد للمدارس ، ما هى أسباب عدم تسجيلهم ؟السابق
تم إعادة فى سن المدرسة أوأطفال اذا آانت االجابة يانة ليس هناك 10.6 انتقل الى ,ارستسجيلهم بالمد
10.5
DO NOT READ BUT TICK ALL REASONS MENTIONED ال تقرأ بل ضع رمز لكل األسباب المذآورة اشر.
10.5
1 Insecurity |___| 1 إنعدام األمن
2 Cannot afford to pay for tuition/cost (textbook, transportation, etc) |___| 2 غير قادر على دفع الرسوم
3 No school in the community |___| ال توجد مدرسة بالمجتمع 3
4 School closed |___| الدمدرسة مغلقة 4
5 Lack/shortage of teachers |___| 5 نقص أو عدم توفر معلمين
6 No space in school |___| 6 عدم وجود أماآن شاغرة بالمدرسة
7 Attending Khalwa (informal school) |___| 7 يدرس بخلوى
8 Children need to stay at home and assist the family with household chores |___| األسرة تحتاج اليهم بالمنزل للمساعدة فى قضاء األغراضالمنزلية
8
9 Seasonal migration with family for agriculture/livestock rearing |___| الرعى/هجرة موسمية للزراعة 9
10 Customs/tradition/lack of awareness |___| 10 عادات ، تقاليد ، عدم الوعى
11 Newly/irregularly arrived |___| 11 قادمون جدد أو غير منتظم
No 0 ال Yes, sometimes (not regularly) 1 غير منتظمة(بعض االحيان, نعم(
10.6
Do you receive remittances from your family members or relatives living elsewhere?
CIRCLE ONE OPTION ONLY Yes, regularly (ever week/every month/on holidays, etc)
, آل اسبوع( نعم بصورة منتظمة 2)في االجازات, آل شهر
هل تصلك حواالت من افراد االسرة او االقارب الغير مقيمين معكضع دائرة لخيار واحد فقط
10.6
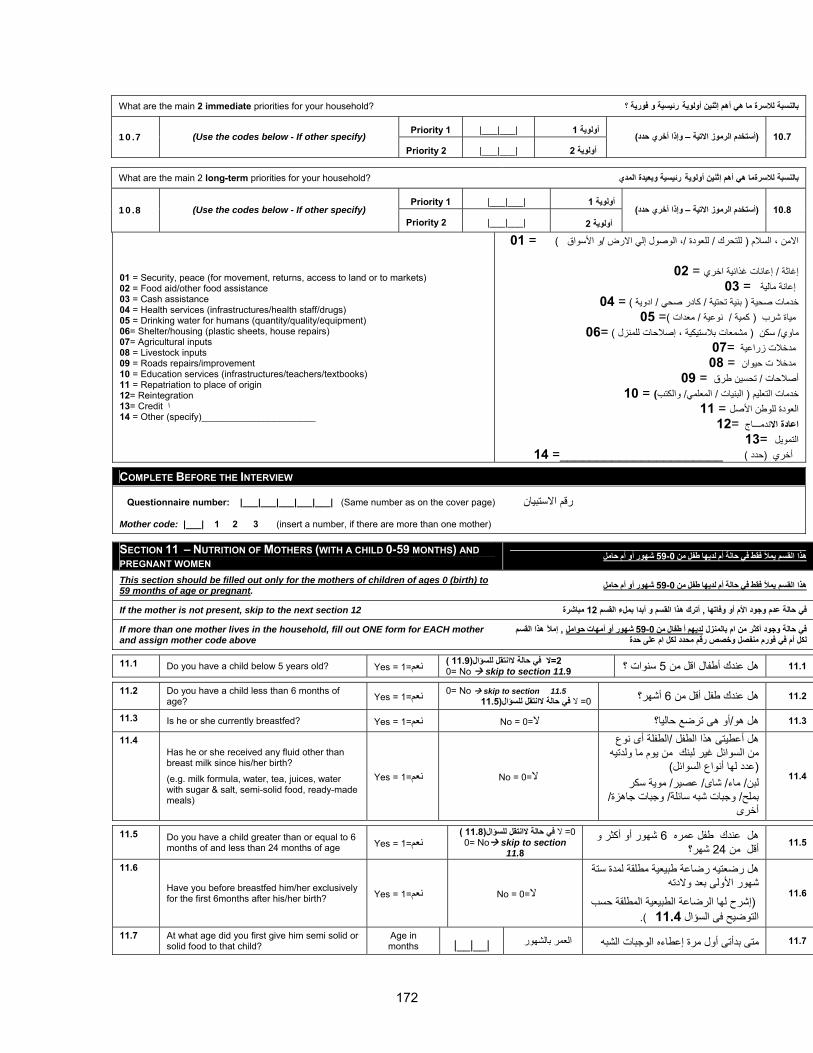
172
What are the main 2 immediate priorities for your household? رئيسية و فورية ؟ بالنسبة لالسرة ما هي أهم إثنين أولوية
Priority 1 |___|___| 1 أولوية 10.7 (Use the codes below - If other specify)
Priority 2 |___|___| 2 أولوية ) وإذا أخري حدد–ستخدم الرموز االتية أ( 10.7
What are the main 2 long-term priorities for your household? رئيسية وبعيدة المدي بالنسبة لالسرةما هي أهم إثنين أولوية
Priority 1 |___|___| 1 أولوية 10.8 (Use the codes below - If other specify)
Priority 2 |___|___| 2 أولوية ) وإذا أخري حدد–أستخدم الرموز االتية ( 10.8
01 = Security, peace (for movement, returns, access to land or to markets) 02 = Food aid/other food assistance 03 = Cash assistance 04 = Health services (infrastructures/health staff/drugs) 05 = Drinking water for humans (quantity/quality/equipment) 06= Shelter/housing (plastic sheets, house repairs) 07= Agricultural inputs 08 = Livestock inputs 09 = Roads repairs/improvement 10 = Education services (infrastructures/teachers/textbooks) 11 = Repatriation to place of origin 12= Reintegration 13= Credit ا 14 = Other (specify)______________________
) و األسواق /، الوصول إلي االرض /للعودة / للتحرك ( االمن ، السالم = 01
إعانات غذائية اخري/ إغاثة = 02 إعانة مالية = 03
04 = ) ادوية / آادر صحي / بنية تحتية ( خدمات صحية 05 = )معدات / ة نوعي/ آمية ( مياة شرب
06= ) مشمعات بالستيكية ، إصالحات للمنزل ( سكن / ماوي مدخالت زراعية =07 مدخال ت حيوان = 08
تحسين طرق / أصالحات = 09)والكتب/ المعلمي/ البنيات ( خدمات التعليم = 10
العودة للوطن األصل = 1112= ندمـــاج اعادة اال
التمويل =1314 =______________________ ) حدد ( أخري
COMPLETE BEFORE THE INTERVIEW
Questionnaire number: |___|___|___|___|___| (Same number as on the cover page) رقم االستبيان Mother code: |___| 1 2 3 (insert a number, if there are more than one mother)
SECTION 11 – NUTRITION OF MOTHERS (WITH A CHILD 0-59 MONTHS) AND PREGNANT WOMEN هذا القسم يمأل فقط في حالة أم لديها طفل من 0-59 شهور أو أم حامل
This section should be filled out only for the mothers of children of ages 0 (birth) to 59 months of age or pregnant. هذا القسم يمأل فقط في حالة أم لديها طفل من 0-59 شهور أو أم حامل
If the mother is not present, skip to the next section 12 مباشرة 12أترك هذا القسم و أبدا بملء القسم , في حالة عدم وجود األم أو وفاتها
If more than one mother lives in the household, fill out ONE form for EACH mother and assign mother code above
في حالة وجود أآثر من ام بالمنزل لديهم أ طفال من 0-59 شهور أو أمهات حوامل , إمآل هذا القسم لكل أم في فورم منفصل وخصص رقم محدد لكل ام على حدة
11.1 Do you have a child below 5 years old? Yes = 1=11.9(ال في حالة الانتقل للسؤال=2 نعم( 0= No skip to section 11.9 11.1 سنوات ؟5هل عندك أطفال اقل من
11.2 Do you have a child less than 6 months of age? Yes = 1=0 نعم= No skip to section 11.5
11.2 أشهر؟ 6هل عندك طفل أقل من 11.5(الفي حالة الانتقل للسؤ ال= 0
11.3 Is he or she currently breastfed? Yes = 1=نعم No = 0=11.3 أو هى ترضع حاليا؟/هل هو ال
11.4 Has he or she received any fluid other than breast milk since his/her birth?
(e.g. milk formula, water, tea, juices, water with sugar & salt, semi-solid food, ready-made meals)
Yes = 1=نعم No = 0=ال
الطفلة أى نوع /هل أعطيتى هذا الطفل من السوائل غير لبنك من يوم ما ولدتيه
)عدد لها أنواع السوائل( موية سكر / عصير/ شاى/ ماء/ لبن/ وجبات جاهزة/ وجبات شبه سائلة/ بملح
أخرى
11.4
11.5 Do you have a child greater than or equal to 6 months of and less than 24 months of age Yes = 1=نعم
) 11.8(في حالة الانتقل للسؤالال = 00= No skip to section
11.8
شهور أو أآثر و 6هل عندك طفل عمره 11.5 شهر؟24أقل من
11.6
Have you before breastfed him/her exclusively for the first 6months after his/her birth? Yes = 1=نعم No = 0=ال
هل رضعتيه رضاعة طبيعية مطلقة لمدة ستة شهور األولى بعد والدته
إشرح لها الرضاعة الطبيعية المطلقة حسب ( ). 11.4التوضيح فى السؤال
11.6
11.7 At what age did you first give him semi solid or solid food to that child?
Age in months |__|__| متى بدأتى أول مرة إعطاءه الوجبات الشبه العمر بالشهور 11.7
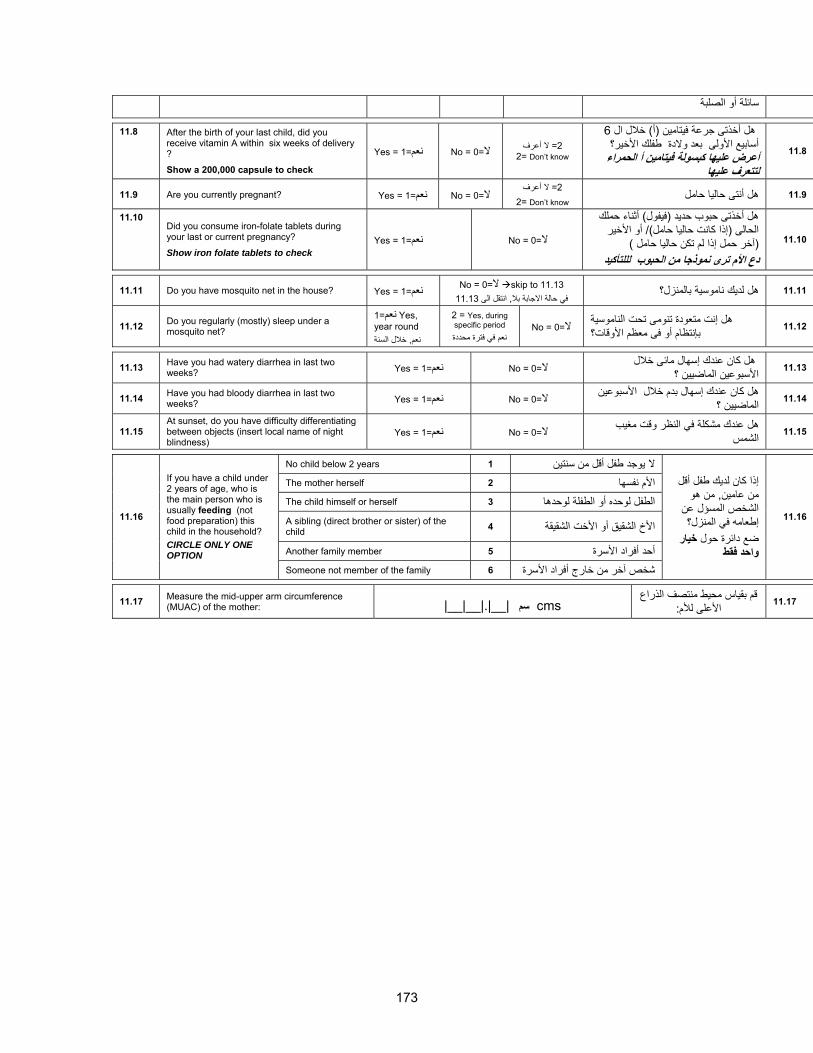
173
سائلة أو الصلبة
11.8 After the birth of your last child, did you receive vitamin A within six weeks of delivery ?
Show a 200,000 capsule to check
Yes = 1=نعم No = 0=ال ال أعرف= 2
2= Don’t know
6 خالل ال) أ( هل أخذتى جرعة فيتامين أسابيع األولى بعد والدة طفلك األخير؟
أعرض عليها آبسولة فيتامين أ الحمراء لتتعرف عليها
11.8
11.9 Are you currently pregnant? Yes = 1= منع No = 0=ال ال أعرف= 2
2= Don’t know 11.9 هل أنتى حاليا حامل
11.10 Did you consume iron-folate tablets during your last or current pregnancy?
Show iron folate tablets to check Yes = 1=نعم No = 0=ال
أثناء حملك ) فيفول(هل أخذتى حبوب حديد أو األخير )/ حاليا حاملإذا آانت (الحالى
)آخر حمل إذا لم تكن حاليا حامل (دع األم ترى نموذجا من الحبوب لللتأآيد
11.10
11.11 Do you have mosquito net in the house? Yes = 1=نعم No = 0=ال skip to 11.13 11.13انتقل الى , في حالة االجابة بال
11.11 هل لديك ناموسية بالمنزل؟
11.12 Do you regularly (mostly) sleep under a mosquito net?
,Yes نعم=1year round
خالل السنة, نعم
2 = Yes, during specific period نعم في فترة محددة
No = 0=ال هل إنت متعودة تنومى تحت الناموسية بإنتظام أو فى معظم األوقات؟
11.12
11.13 Have you had watery diarrhea in last two weeks? Yes = 1=نعم No = 0=ال
هل آان عندك إسهال مائى خالل 11.13 األسبوعين الماضيين ؟
11.14 Have you had bloody diarrhea in last two weeks? Yes = 1=نعم No = 0=ال
هل آان عندك إسهال بدم خالل األسبوعين 11.14 الماضيين ؟
11.15 At sunset, do you have difficulty differentiating between objects (insert local name of night blindness)
Yes = 1=نعم No = 0=ال هل عندك مشكلة في النظر وقت مغيب
الشمس11.15
No child below 2 years 1 ال يوجد طفل أقل من سنتين The mother herself 2 األم نفسها
The child himself or herself 3 الطفل لوحده أو الطفلة لوحدها
A sibling (direct brother or sister) of the child 4 األخ الشقيق أو األخت الشقيقة
Another family member 5 أحد أفراد األسرة
11.16
If you have a child under 2 years of age, who is the main person who is usually feeding (not food preparation) this child in the household? CIRCLE ONLY ONE OPTION
Someone not member of the family 6 شخص آخر من خارج أفراد األسرة
إذا آان لديك طفل أقل من هو , من عامين
الشخص المسؤل عن إطعامه في المنزل؟ خيار ضع دائرة حول
واحد فقط
11.16
11.17 Measure the mid-upper arm circumference (MUAC) of the mother: |__|__|.|__| سم cms
قم بقياس محيط منتصف الذراع :األعلى لألم 11.17
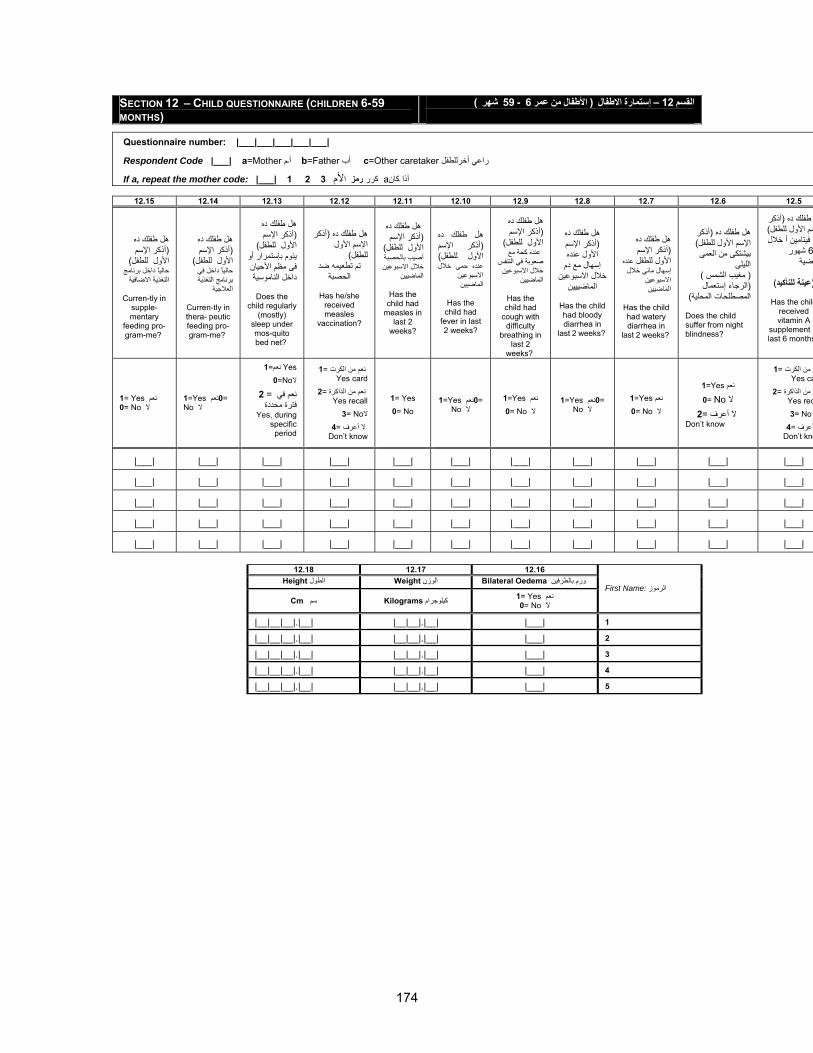
174
SECTION 12 – CHILD QUESTIONNAIRE (CHILDREN 6-59 MONTHS)
) شهر 59 - 6 عمر من األطفال ( االطفال إستمارة – 12 القسم
Questionnaire number: |___|___|___|___|___|
Respondent Code |___| a=Mother أـم b=Father أب c=Other caretaker راعي أخرللطفل
If a, repeat the mother code: |___| 1 2 3 ألما أذا آانa آرر رمز
12.15 12.14 12.13 12.12 12.11 12.10 12.9 12.8 12.7 12.6 12.5
هل طفلك ده أذآر اإلسم (
) األول للطفلحاليًا داخل برنامج التغذية االضافية
Curren-tly in
supple-mentary
feeding pro-gram-me?
فلك ده هل طأذآر اإلسم (
) األول للطفلحاليًا داخل في برنامج التغذية
العالجية
Curren-tly in thera- peutic feeding pro-gram-me?
هل طفلك ده أذآر اإلسم (
) األول للطفلينوم بإستمرار أو فى مظم األحيان داخل الناموسية
Does the
child regularly (mostly)
sleep under mos-quito bed net?
أذآر (هل طفلك ده اإلسم األول
) للطفلتم تطعيمه ضد
الحصبة
Has he/she received measles
vaccination?
هل طفلك ده أذآر اإلسم (
) األول للطفل أصيب بالحصبة
خالل االسبوعين الماضيين
Has the child had
measles in last 2
weeks?
ده هل طفلك أذآر اإلسم (
) األول للطفلعنده حمى خالل
االسبوعين الماضيين
Has the child had
fever in last 2 weeks?
هل طفلك ده أذآر اإلسم (
) األول للطفلعنده آحة مع
صعوبة في التنفس خالل االسبوعين
الماضيين
Has the child had
cough with difficulty
breathing in last 2
weeks?
هل طفلك ده أذآر اإلسم (
األول عنده إسهال مع دم
خالل االسبوعين الماضييين
Has the child had bloody diarrhea in
last 2 weeks?
هل طفلك ده أذآر اإلسم (
عنده األول للطفل إسهال مائي خالل
االسبوعين الماضيين
Has the child had watery diarrhea in
last 2 weeks?
أذآر (هل طفلك ده ) اإلسم األول للطفلبيشتكى من العمى
الليلى ) مغيب الشمس(الرجاء إستعمال (
)المصطلحات المحلية
Does the child suffer from night blindness?
أذآر ( طفلك ده) سم األول للطفلذ فيتامين أ خالل
شهور 6 اضية
)عينة للنأآيد(
Has the child
received vitamin A
supplement ilast 6 months
1= Yes نعم 0= No ال
1=Yes 0نعم= No ال
Yes نعم=10=Noال
نعم في = 2 فترة محددة
Yes, during specific period
كرتمن ال نعم =1 Yes card
نعم من الذاآرة =2Yes recall
3= Noال ال أعرف =4
Don’t know
1= Yes 0= No
1=Yes 0نعم= No ال
1=Yes نعم 0= No ال
1=Yes 0نعم= No ال
1=Yes نعم 0= No ال
1=Yes نعم
0= No ال ال أعرف =2
Don’t know
كرتمن الم =1Yes ca
م من الذاآرة =2Yes rec3= No
أعرف =4Don’t kno
|___| |___| |___| |___| |___| |___| |___| |___| |___| |___| |___| |___| |___| |___| |___| |___| |___| |___| |___| |___| |___| |___| |___| |___| |___| |___| |___| |___| |___| |___| |___| |___| |___| |___| |___| |___| |___| |___| |___| |___| |___| |___| |___| |___| |___| |___| |___| |___| |___| |___| |___| |___| |___| |___| |___|
12.18 12.17 12.16 Height الطول Weight الوزن Bilateral Oedema بالطرفين ورم
Cm سم Kilograms 1 آيلوجرام= Yes نعم 0= No ال
First Name: الرموز
|__|__|__|.|__| |__|__|.|__| |___| 1
|__|__|__|.|__| |__|__|.|__| |___| 2
|__|__|__|.|__| |__|__|.|__| |___| 3
|__|__|__|.|__| |__|__|.|__| |___| 4
|__|__|__|.|__| |__|__|.|__| |___| 5
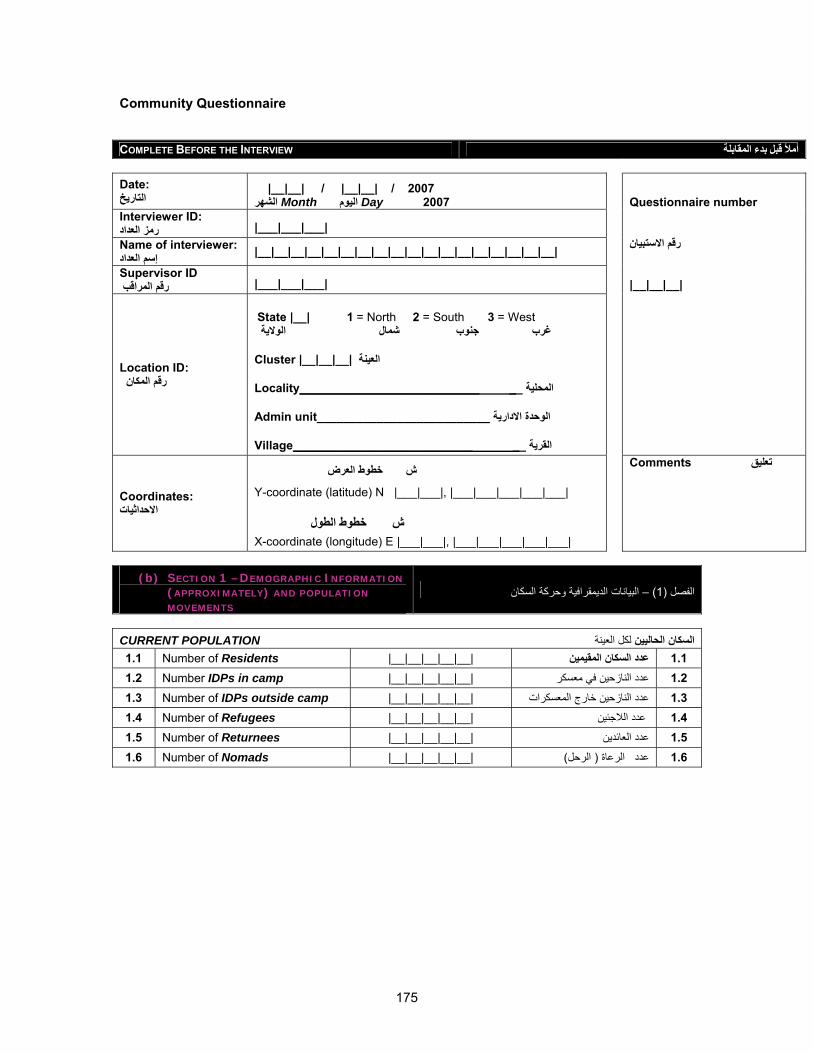
175
Community Questionnaire COMPLETE BEFORE THE INTERVIEW المقابلة بدء قبل أمأل Date: التاريخ
|__|__| / |__|__| / 2007 Day 2007 اليوم Month الشهر
Interviewer ID: |___|___|___| رمز العداد
Name of interviewer: |__|__|__|__|__|__|__|__|__|__|__|__|__|__|__|__|__|__| إسم العداد
Supervisor ID |___|___|___| رقم المراقب
Location ID: نرقم المكا
State |__| 1 = North 2 = South 3 = West غرب جنوب شمال الوالية
Cluster |__|__|__| العينة
Locality___________________________ __ المحلية
Admin unit__________________________ الوحدة االدارية
Village___________________________ __ القرية
Questionnaire number رقم االستبيان |__|__|__|
Coordinates: االحداثيات
ش خطوط العرض
Y-coordinate (latitude) N |___|___|, |___|___|___|___|___|
X-coordinate (longitude) E |___|___|, |___|___|___|___|___|
Comments تعليق
(b) SECTION 1 –DEMOGRAPHIC INFORMATION
(APPROXIMATELY) AND POPULATION
MOVEMENTS البيانات الديمقرافية وحرآة السكان–) 1(الفصل
CURRENT POPULATION لكل العينةالسكان الحاليين 1.1 Number of Residents |__|__|__|__|__| 1.1 عدد السكان المقيمين 1.2 Number IDPs in camp |__|__|__|__|__| 1.2 عدد النازحين في معسكر 1.3 Number of IDPs outside camp |__|__|__|__|__| 1.3 عدد النازحين خارج المعسكرات 1.4 Number of Refugees |__|__|__|__|__| 1.4 عدد الالجئين 1.5 Number of Returnees |__|__|__|__|__| 1.5 عدد العائدين 1.6 Number of Nomads |__|__|__|__|__| الرحل( الرعاة( 1.6 عدد
خطوط الطولش
176
SECTION 2 –AGRICULTURE (CROP PRODUCTION) المحاصيل الزراعية -2القسم What proportions of households in this community have cultivated land this season? CIRCLE ONLY ONE OPTION
ما هي نسبة االسر التي زرعت في هذا المجتمع هذا الموسم؟ ضع دائرة حول خيار واحد فقط
Almost all 1 تقريبًا الكل Half of the households 2 نصف االسر Less than half of the households 3 رأقل من نصف االس
2.1
Very few or none 4 احد لم يزرعقليل جدًا أو
2.1
Compared with last year, how much land has been planted in your community? CIRCLE ONLY ONE OPTION
مقارنة مع العام الماضي ما هي المساحة التي تمت زراعتها بواسطة المجتمع؟ ضع دائرة حول خيار واحد فقط
Cultivated area has increased 1 زادت المساحة المزروعة
Cultivated area remained the same 2 المساحة المزروعة آالعام السابق
Cultivated area has decreased 3 نقصت المساحة المزروعة 2.2
Did not plant this year ( skip to Section 2.8) 4 2.8اذا لم تزرع انتقل الى لعاملم تزرع هذا ا
2.2
Currently, what is the status of crops cultivated in your community (tick under the relevant column):
ما هي مرحلة نمو المحاصيل التي تمت زراعتها في هذا المجتمع؟, حاليًا )أشر تحت العمود المناسب (
If the crops are not grown in the community, write “0” in the columns-
فى العمود المقابل0اآتب , اذا لم تزرع هذه المحاصيل
زراعة Planting
النموالخضريVegetative
اإلزهارFlowering
النضجMaturing
2.3 Millet |___| |___| |___| |___| 2.3 الدخن
2.4 Sorghum 2.4 الذرة |___| |___| |___| |___|
2.5 Wheat |___| |___| |___| |___| 2.5 القمح
2.6 Groundnuts |___| |___| |___| |___| 2.6 فول سوداني
2.7 Water Melon |___| |___| |___| |___| 2.7 البطيخ What are the major environmental problems in the Community? ما هى المشاآل البيئية الغالبة فى المجتمع ؟ DO NOT LIST THE OPTIONS, LEAVE THE RESPONDENTS ANSWER SPONTANEOUSLY Tick all what is mentioned
ال تقرأ الخيارات أترك المستجوب يجاوب تلقائيًا اشر على الخيارات المذآورة ادناه
2.8 Deforestation (excessive tree cutting and charcoal making) |___| القطع المكثف لألشجار وانتاج الفحم(تدهور الغطاء النباتى( 2.8
2.9 Desertification (encroachment of cultivated/grazing land by sand dunes) |___| تغطية المساحة الزراعية والرعوية بالرمال (التصحر( 2.9
2.10 Diminishing or shrinking water resources |___| نقص أو إنحسار مصادر المياه. 2.10 2.11 Soil erosion and poor soils |___| 2.11 ضعف وتعرية التربة 2.12 Pollution |___| 2.12 التلوث
177
(c) SECTION 3 –LIVESTOCK AND PASTURE (d) والمراعي الماشية - )3( القسم
a) Currently, what are the main problems for raising livestock?
حاليًا ، ما هي المشاآل التي تواجه سعاية الحيوانات؟
b) If problem is mentioned, is it different from last year this time of the year?
هل المشكلةالمذآورة في هذا العام تختلف عن العام الماضي؟
1 = Worse problem than last year 1=أسوأ من العام السابق 2 = Same problem as last year 2=آالعام السابق 3 = Better than last year ضيأحسن من العام الما =3
DO NOT LIST THE OPTIONS, LEAVE THE RESPONDENTS ANSWER SPONTANEOUSLY
ال تقرأ الخيارات ، أترك المستجوب يجاوب تلقائيًا
CHOSE FROM THE CODES ABOVE AND INSERT INTO BOX
أختر من الرموز أعاله وضع في المربع المشاآل المذآورةشر على آلا
Tick all Problems that are mentioned
3.1 Shortage / lack of access to pasture and other feeding |___| |___|
المراعي أو عدم الوصول الي / نقص اعالف اخرى
3.1
3.2 Shortage / lack of access to water |___| |___| عدم الوصول الي المياه/ نقص 3.2
3.3 Animal diseases |___| |___| 3.3 أمراض الحيوان
3.4 lack of veterinary services, drugs |___| |___| 3.4 نقص في الخدمات البيطرية واألدوية
3.5 Closure of livestock markets |___| |___| 3.5 قفل أسواق الماشية
3.6 Low prices of animals on markets |___| |___| 3.6 إنخفاض أسعار الماشية في االسواق
3.7 Insecurity |___| |___| 3.7 عدم األمن
3.8 Thefts, looting |___| |___| 3.8 السرقة والنهب Currently, what are the types of animal health services available to the community?
حاليًا ما هي أنواع خدمات صحة الحيوان المتوفرة في هذا المجتمع؟
ASK FOR EACH OF THE OPTIONS أسأل عن آل خيار علي حدة
3.9 Community Animal Health Workers Yes = 1= نعم No = 0 = 3.9 معاون صحي بيطري أل
3.10 Private veterinary clinics Yes = 1= نعم No = 0 = 3.10 عيادة بيطرية خاصة أل 3.11 Public veterinary clinics Yes = 1= نعم No = 0 = 3.11 عيادة بيطرية عامة أل 3.12 Mobile veterinary clinics (public) Yes = 1= نعم No = 0 = 3.12 عيادة بيطرية متنقلة أل 3.13 Traditional animal healers Yes = 1= نعم No = 0 = 3.13 المعالجون التقليديون للحيوان أل What are the main problems with the existing animal health services?
يوان الموجودة لديكم حاليًا ؟ما هي المشاآل الرئيسية لخدمات صحة الح
DO NOT LIST THE OPTIONS, LEAVE THE RESPONDENTS ANSWER SPONTANEOUSLY
المشاآل المذآورةشر على آلاTick all Problems that are
mentioned ال تقرأ الخيارات ، أترك المستجوب يجاوب تلقائيًا
3.14 Lack of animal vaccines and drugs |___| 3.14 نقص في اللقاحات واألدوية البيطرية
3.15 Not affordable (price too high) |___| األسعار عالية ( ال يمكن الحصول عليها( 3.15
3.16 Too far away to reach the services |___| 3.16 بعد المسافة للوصول للخدمات
3.17 Lack of trained animal health staff |___| 3.17 نقص في الكوادر البيطرية المدربة
3.18 Has there been livestock vaccination since the last Eid Al Adha?
Yes = 1= نعم No = 0 = هل آان هناك تطعيم للحيوانات منذ عيد األضحى أل 3.18 المبارك ؟
178
(e) SECTION 4 – HEALTH (f) الصحة - 4 القسم
What types of facilities exist in the community? (tick all that are mentioned) ما هي الخدمات الصحية المتواجدة في هذا المجتمع
Tick all that are mentioned التي يذآرها ز ورم آل ال شرا
01= Hospital |___| 01= مستشفي
02= Rural Hospital |___| 02 =مستشفى ريفي
03= Health Center |___| 03 =مرآز صحي
04= NGO clinic |___| 04 = عيادة منظمات غير حكومية
05= Mobile/outreach clinic |___| 05 = عيادة متجولة
06= Village health care worker |___| 06 = معاون صحي بالقرية
07= Private clinic |___| 07 = عيادة خاصة
08= Traditional healer |___| 08 = المعالج التقليدي
09= Pharmacy |___| 09 = صيدلية
10= Primary Health unit (Dressing station Dispensary) |___| نقطة غيار/ شفخانة(وحدة رعاية صحية( = 10
4.1
11= No Services at all – skip to Question 4.7 |___| 4.7اذا لم توجد خدمات انتقل الى = 11
4.1
What are the main problems with the existing health services? ما هى المشاآل الرئيسية بالخدمات الصحية الموجودة حاليًا بمنطقتكم؟
DO NOT LIST THE OPTIONS, LEAVE THE RESPONDENTS ANSWER SPONTANEOUSLY
المشاآل المذآورةشر على آلTick all problems that are
mentioned ون تلقائيا يجاوبيبينال تقرأ الخيارات ، أترك المستج
4.2 Health services are too far away |___| 4.2 الخدمات الصحية بعيدة جدا
4.3 Health services are not affordable |___| 4.3 رخيصَةتيسالخدمات الصحية َل
4.4 Lack of drugs and materials (in health services and pharmacies) |___|
الخدمات مراآزفي ( الطبية والمواِد ألدويةقلة)الصحية والصيدليات 4.4
4.5 Lack of trained health workers |___| 4.5 لقلة الكوادر الصحية المدربة
4.6 What is the health facility most used by the community? Choose from the codes in 4.1
|__|__| ما هي أآثر الوحدات الصحيةالتي يستخدمها المجتمع
4.1اعاله في أختار رمز واحد من الرموز 4.6
How long does it take to walk to the nearest Health unit (one way on foot) CIRCLE ONLY ONE OPTION
آم من الزمن تستغرقه مشيًا علي االقدام للوصول ألقرب وحدة صحية)الوقت ألتجاه واحد دون الرجوع (
ضع دائرة حول خيار واحد فقط
less than one hour 0 اقل من ساعة one to three hours 1 من ساعة واحدة لثالث ساعات three to six hours 2 ن ثالث الى ستة ساعاتم six to eight hours 3 من ستة الى ثمانية ساعات
4.7
more than eight hours 4 اآثر من ثمانية ساعات
4.7
4.8 Does the community treat its drinking water? Yes = 1= نعم
No = 2= ال if no skip to Question 5.1 ى اذا لم توجد خدمات انتقل ال 5.1
4.8 هل يعالج المجتمع مياه الشرب ؟
179
By chlorination 1 4.9 إضافة الكلور How do you treat the drinking water ? By boiling 2 بالغلي
4.9 آيف تعالجون مياه الشرب؟
(g) SECTION 5 – ACCESS TO SOCIAL SERVICES AND ECONOMIC
INFRASTRUCTURE (h) القسم 5 - الوصول للخدمات االجتماعية والبنى
االقتصادية التحتية How long does it take to walk to the nearest primary school? (one way on foot) CIRCLE ONLY ONE OPTION
اتجاه ( آم من الزمن تستغرقه مشيًا علي االقدام للوصول ألقرب مدرسة أساس؟ )وع الوقت ألتجاه واحد دون الرج(
ضع دائرة حول خيار واحد فقطless than one hour 0 اقل من ساعة
one to three hours 1 من ساعة واحدة لثالث ساعات
three to six hours 2 من ثالث الى ستة ساعات
six to eight hours 3 من ستة الى ثمانية ساعات 5.1
more than eight hours 4 من ثمانية ساعاتاآثر
5.1
How long does it take to walk to the nearest drivable (motorized) road? (one way on foot) CIRCLE ONLY ONE OPTION
آم من الزمن تستغرقه مشيًا على األقدام ألقرب طريق للعربات؟)الوقت ألتجاه واحد دون الرجوع (
ضع دائرة حول خيار واحد فقطless than one hour 0 اقل من ساعة
one to three hours 1 من ساعة واحدة لثالث ساعات
three to six hours 2 من ثالث الى ستة ساعات
six to eight hours 3 من ستة الى ثمانية ساعات 5.2
more than eight hours 4 اآثر من ثمانية ساعات
5.2
SECTION 6 – MARKETS AND PRICE INFORMATION معلومات األسواق واألسعار- 6القسم
How long does it take to walk to the nearest cereal market? (time one way on foot) CIRCLE ONLY ONE OPTION
آم من الزمن تستغرقه مشيًا علي االقدام للوصول ألقرب سوق الغاللل الزراعية ؟)ه واحد دون الرجوع الوقت ألتجا(
ضع دائرة حول خيار واحد فقطless than one hour 0 اقل من ساعة
one to three hours 1 من ساعة واحدة لثالث ساعات
three to six hours 2 من ثالث الى ستة ساعات
six to eight hours 3 من ستة الى ثمانية ساعات 6.1
more than eight hours 4 اآثر من ثمانية ساعات
6.1
1= Within community 1= داخل المجتمع 2= Outside community, but within administrative unit
خارج المجتمع وداخل الوحدة = 2 االدارية
3= Outside administrative unit but within locality
2= خارج الوحدة اإلدارية و داخل = 3 المحلية
4= Outside locality but within state 4 =خارج المحلية و داخل الوالية 5= Outside state but within Darfur والية وداخل دارفور خارج ال =5 6= Outside Darfur but elsewhere in Sudan
خارج دارفور وفى موقع آخر = 6 بالسودان
6.2
Where is the main source of cereal traded in your community?
7= International/neighboring countries
|___|
دول مجاورة/ عالميًا = 7
ما هى مصادر الغالل المعروضة
للتجارة فى المجتمع ؟
6.2
180
Same 1 شبيه Less 2 6.3 أقل
Has the number of cereal markets changed compared to last year? CIRCLE ONLY ONE OPTION More 3 أآثر
هل تغير عدد اسواق الغالل مقارنة بالعام السابق ؟
ضع دائرة حول خيار واحد فقط6.3
Same 1 شبيه Less 2 6.4 أقل
Is the amount of cereals on the markets different from last year at this time of the year? CIRCLE ONLY ONE OPTION More 3 أآثر
هل تختلف آمية الغالل الموجودة حالياً باالسواق عن مثيالتها في نفس الوقت من
العام السابق ؟ ضع دائرة حول خيار واحد فقط
6.4
Same 1 شبيه Less 2 6.5 أقل
Has the number of cereal traders changed compared to last year? CIRCLE ONLY ONE OPTION More 3 أآثر
هل تغير عدد تجار الغالل مقارنة مع ؟ السنة الماضية
ضع دائرة حول خيار واحد فقط6.5
How long does it take to walk to the nearest livestock market? (time one way on foot) CIRCLE ONLY ONE OPTION
آم من الزمن تستغرقه مشيًا علي االقدام للوصول ألقرب سوق للماشية ؟ )الوقت ألتجاه واحد دون الرجوع (
ضع دائرة حول خيار واحد فقط
less than one hour 0 اقل من ساعة
one to three hours 1 من ساعة واحدة لثالث ساعات
three to six hours 2 ن ثالث الى ستة ساعاتم
six to eight hours 3 من ستة الى ثمانية ساعات 6.6
more than eight hours 4 اآثر من ثمانية ساعات
6.6
Same 1 شبيه Less 2 6.7 أقل
Has the number of livestock markets changed compared to last year? CIRCLE ONLY ONE OPTION More 3 أآثر
مقارنة هل تغير عدد أسواق الماشية بالعام السابق ؟
ضع دائرة حول خيار واحد فقط6.7
Same 1 شبيه Less 2 6.8 أقل
Is the number of livestock on the markets different from last year at this time of the year? CIRCLE ONLY ONE OPTION More 3 أآثر
نية هل تختلف آمية الثروة الحيواالموجودة حاليًا باألسواق عن مثييالتها
فى نفس الوقت من العام السابق ؟ ضع دائرة حول خيار واحد فقط
6.8
Same 1 شبيه Less 2 6.9 أقل
Has the number of livestock traders changed compared to last year? CIRCLE ONLY ONE OPTION More 3 أآثر
ير عدد تجار الماشية مقارنة مع هل تغ السنة الماضية ؟
ضع دائرة حول خيار واحد فقط6.9
What is the retail price of the following foods
سعر الوحدة قبل عام جنية
c- Price/unit 12 months ago (old pound)
السعر الحالي للوحدة جنيه
b- Current price/unit (old pound)
وحدة التجزئة آجم
a-Retail Unit
(kilograms)
؟ما هو سعر التجزئة لألطعمة اآلتية
6.10 Millet |___|___|___|___|___|___| |___|___|___|___|___|___| |_______| 6.10 الدخن
6.11 Sorghum (traditional) |___|___|___|___|___|___| |___|___|___|___|___|___| |_______| المنتج محليًا( الذرة( 6.11
6.12 Sorghum (food aid) |___|___|___|___|___|___| |___|___|___|___|___|___| |_______| 6.12 )إغاثة(الذرة
6.13 Wheat traditional |___|___|___|___|___|___| |___|___|___|___|___|___| |_______| المنتج محليًا ( القمح( 6.13
6.14 Wheat (Food Aid) |___|___|___|___|___|___| |___|___|___|___|___|___| |_______| 6.14 )إغاثة( قمح
181
6.15 Maize 6.15 لذرة الشامية |_______| |___|___|___|___|___|___| |___|___|___|___|___|___|
6.16 Groundnuts |___|___|___|___|___|___| |___|___|___|___|___|___| |_______| 6.16 الفول السوداني
6.17 Cooking oil (non food aid) |___|___|___|___|___|___| |___|___|___|___|___|___| |_______|
غير (زيت الطعام )االغاثة
6.17
6.18 Cooking oil (food aid) |___|___|___|___|___|___| |___|___|___|___|___|___| |_______| االغاثة ( زيت الطعام ( 6.18
6.19 Sugar |___|___|___|___|___|___| |___|___|___|___|___|___| |_______| 6.19 السكر
6.20 Water (one jerrycan) |___|___|___|___|___|___| |___|___|___|___|___|___| |----------| 6.20 جرآانة الماء الواحدة
What is the price of the following animals?
جنية السعر قبل عامPrice 12 months ago
(old pound)
جنية السعر الحالي Current price (old pound)
ما هو سعرذآور الحيوانات االتية ؟
6.21 Male cattle 3 to 4 years |___|___|___|___|___|___| |___|___|___|___|___|___| 6.21 سنة 4 -3أبقار من عمر
6.22 Male Sheep 1 year old |___|___|___|___|___|___| |___|___|___|___|___|___| 6.22 ضأن عمر سنة واحدة
6.23 Male Goats 2 year |___|___|___|___|___|___| |___|___|___|___|___|___| 6.23 عمر سنتين الماعز
6.24 Male donkey local |___|___|___|___|___|___| |___|___|___|___|___|___| 6.24 حمار محلي
What is the retail price of the following commodities?
جنيةالسعر قبل عام بال Price 12 months ago
(old pound)
جنيةبال السعر الحالي Current price (old pound)
للسلع أدناه ما هو سعرالتجزئة ؟
6.25 Fodder (bundle/heap) |___|___|___|___|___|___| |___|___|___|___|___|___| آوم / ربطة (علف ( 6.25
6.26 Firewood (small bundle) |___|___|___|___|___|___| |___|___|___|___|___|___| يرةربطة صغ( حطب الحريق( 6.26
6.27 Firewood (large bundle) |___|___|___|___|___|___| |___|___|___|___|___|___| ربطة آبيرة ( حطب الحريق( 6.27
6.28 Charcoal (1 bag) |___|___|___|___|___|___| |___|___|___|___|___|___| جوال ( فحم ( 6.28
Waged labor rates جنيةالالسعر قبل عام ب
Price 12 months ago (old pound)
جنيةبال السعر الحالي Current price (old pound)
معدل اجرة العمالة
6.29 What is the daily wage rate for agricultural labour for land preparation and clearing?
|___|___|___|___|___|___| pound/day
يوم/ جنيه
|___|___|___|___|___|___| pound/day
يوم/ جنيه
ما هو األجر اليومي لعامل 6.29 زراعة لتجهيز ونظافة األرض ؟
6.30 What is the daily wage rate for agricultural labour for weeding of crops?
|___|___|___|___|___|___| pound/day
يوم/ جنيه
|___|___|___|___|___|___| pound/day
يوم/ جنيه
ما هو األجر اليومي لعامل زراعة إلزالة أعشاب
؟) الحشاشة ( المحاصيل 6.30
6.31 What is the daily wage rate for non-agricultural labors?
|___|___|___|___|___|___| pound/day
يوم/ جنيه
|___|___|___|___|___|___| pound/day
يوم/ جنيه
جر اليومي لعمال غير ما هو األ 6.31 زراعيين ؟
(i) SECTION 7 – FOOD AID DISTRIBUTIONS IN THE COMMUNITY القسم 7 - توزيع اإلغاثة في المجتمع
7.1 Are there food aid distributions Yes = 1= نعم No = 2= هل تم توزيع مساعدات إنسانية ال ) 7.1
182
in the community? skip to Section 8 8انتقل الى القسم
في هذا المجتمع) إغاثة
7.2 Is there a Food Aid Committee in the community? Yes = 1= نعم
No = 2= ال skip to 7.5 7.5انتقل الى القسم
( ات إنسانية هل توجد لجنة مساعدفي وسط هذا المجتمع) إغاثة 7.2
7.3 If yes, do women participate in this Committee? Yes = 1= نعم
No = 2= ال skip to 7.5 7.5انتقل الى القسم
إذا آانت االجابة بنعم ، هل النساء 7.3 يشارآن في هذه اللجنة
7.4 If yes, what is the proportion of women in the Committee? |___||___| % إذاآانت االجابة بنعم ، ما هي نسبة
7.4 النساء في هذه اللجنة
7.5 Did women participate in the design of the food aid distribution system (such as the selection of food aid distribution points)?
Yes = 1= نعم No = 2= ال ل النساء شارآن في تصميم نظام توزيع ه
مثل إختيار مرآز توزيع ( المساعدات الغذائية ) المساعدات الغذائية
7.5
7.6 Is it safe for women to walk to the food aid distribution points? Yes = 1= نعم No = 2= هل الذهاب الى مراآز توزيع المساعدات الغذائية ال
ء؟ أمن للنسا 7.6
Have the following interventions been made to help women and men during food aid distributions?
غذائيِة؟ال اتمساعدال توزيع أثناء والرجاِل الِنساِء لُمَساَعَدة صممت التالية التدّخالت َهْل
ASK FOR EACH OF THE OPTIONS BELOW أدناهخياراتال ِمْن ُآّل عن إسأْل
7.7 Construction of shelters and water points Yes = 1= نعم No = 2= 7.7 بناء روآيب ونقاط مياه ال
7.8 Announcement of food aid distributions a day before Yes = 1= نعم No = 2= األعالن عن توزيع المساعدات الغذائية قبل يوم ال
7.8 من بداية التوزيع
7.9 Distributions of food aid early in the morning Yes = 1= نعم No = 2= يتم توزيع المساعدات الغذائية في الصباح ال
7.9 الباآر
(j) SECTION 8 – COMMUNITY PRIORITIES (k) مع 8القسم
الرحلf. Nomads
الالجئينd. Refugees
العائدينc. Returnees
النازحين b. IDPs
مقيمينa. Residents
أولوية 11st priority |___|___|
أولوية 11st priority |___|___|
أولوية 11st priority |___|___|
أولوية 11st priority |___|___|
أولوية 11st priority |___|___|
8.1
For the various groups of people of the community, what are the main 2 immediate priorities? (Use the codes below - If other specify) Insert 99 if a group is not represented in the community
أولوية 22nd priority |___|___|
أولوية 22nd priority |___|___|
أولوية 22nd priority |___|___|
أولوية 22nd priority |___|___|
أولوية 22nd priority |___|___|
بالنسبة عات في للمجمو
المجتمع ما هي إثنين أولويةأهم
رئيسية فورية ؟
أستخدم الرموز ( وإذا –االتية
)أخري حدد اذا 99ادخل الرقم
لم يتواجد ممثل الي من
مجموعات المجتمع
8.1
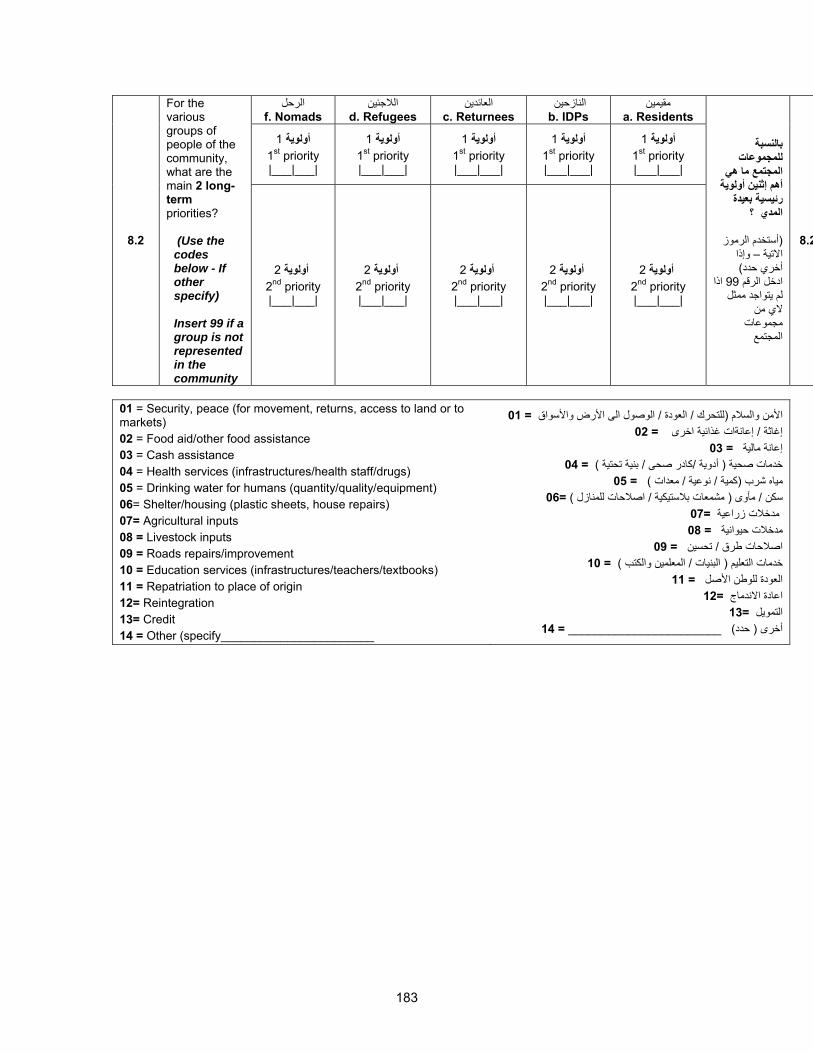
183
الرحلf. Nomads
الالجئينd. Refugees
العائدينc. Returnees
النازحين b. IDPs
مقيمينa. Residents
أولوية 11st priority |___|___|
أولوية 11st priority |___|___|
أولوية 11st priority |___|___|
أولوية 11st priority |___|___|
أولوية 11st priority |___|___|
8.2
For the various groups of people of the community, what are the main 2 long-term priorities?
(Use the codes below - If other specify) Insert 99 if a group is not represented in the community
أولوية 22nd priority |___|___|
أولوية 22nd priority |___|___|
أولوية 22nd priority |___|___|
أولوية 22nd priority |___|___|
أولوية 22nd priority |___|___|
بالنسبة للمجموعات
المجتمع ما هي أهم إثنين أولوية
رئيسية بعيدة المدي ؟
أستخدم الرموز (
وإذا –االتية )أخري حدد
اذا 99ادخل الرقم لم يتواجد ممثل
الي من مجموعات المجتمع
8.2
01 = Security, peace (for movement, returns, access to land or to markets) 02 = Food aid/other food assistance 03 = Cash assistance 04 = Health services (infrastructures/health staff/drugs) 05 = Drinking water for humans (quantity/quality/equipment) 06= Shelter/housing (plastic sheets, house repairs) 07= Agricultural inputs 08 = Livestock inputs 09 = Roads repairs/improvement 10 = Education services (infrastructures/teachers/textbooks) 11 = Repatriation to place of origin 12= Reintegration 13= Credit 14 = Other (specify_______________________
الوصول الى األرض واألسواق / العودة / للتحرك (األمن والسالم = 01 إعانةات غذائية اخرى / إغاثة = 02
إعانة مالية = 03)ية بنية تحت/ آادر صحى /أدوية ( خدمات صحية = 04
)معدات / نوعية / آمية (مياه شرب = 05 )اصالحات للمنازل / مشمعات بالستيكية ( مأوى / سكن =06
مدخالت زراعية =07 مدخالت حيوانية = 08
تحسين/ اصالحات طرق = 09 ) المعلمين والكتب / البنيات ( خدمات التعليم = 10
العودة للوطن األصل = 11الندماجاعادة ا =12
التمويل =1314 = _______________________ ) حدد( أخرى
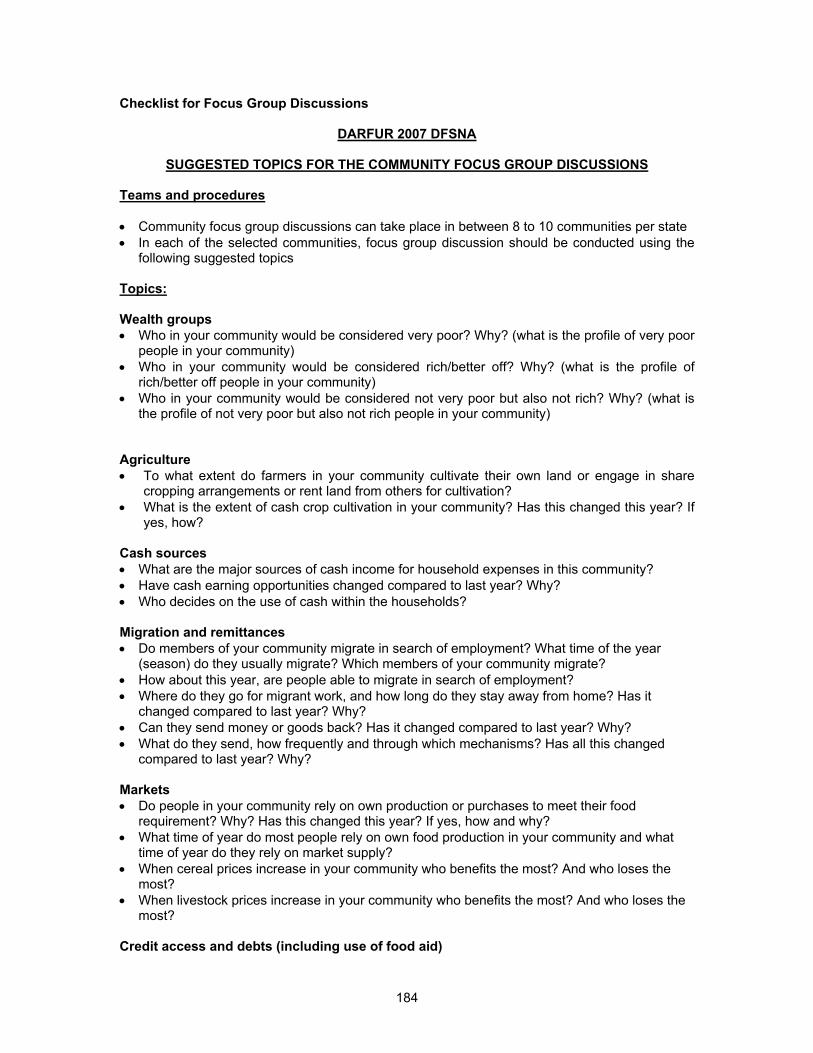
184
Checklist for Focus Group Discussions
DARFUR 2007 DFSNA
SUGGESTED TOPICS FOR THE COMMUNITY FOCUS GROUP DISCUSSIONS Teams and procedures • Community focus group discussions can take place in between 8 to 10 communities per state • In each of the selected communities, focus group discussion should be conducted using the
following suggested topics Topics: Wealth groups • Who in your community would be considered very poor? Why? (what is the profile of very poor
people in your community) • Who in your community would be considered rich/better off? Why? (what is the profile of
rich/better off people in your community) • Who in your community would be considered not very poor but also not rich? Why? (what is
the profile of not very poor but also not rich people in your community) Agriculture • To what extent do farmers in your community cultivate their own land or engage in share
cropping arrangements or rent land from others for cultivation? • What is the extent of cash crop cultivation in your community? Has this changed this year? If
yes, how? Cash sources • What are the major sources of cash income for household expenses in this community? • Have cash earning opportunities changed compared to last year? Why? • Who decides on the use of cash within the households? Migration and remittances • Do members of your community migrate in search of employment? What time of the year
(season) do they usually migrate? Which members of your community migrate? • How about this year, are people able to migrate in search of employment? • Where do they go for migrant work, and how long do they stay away from home? Has it
changed compared to last year? Why? • Can they send money or goods back? Has it changed compared to last year? Why? • What do they send, how frequently and through which mechanisms? Has all this changed
compared to last year? Why? Markets • Do people in your community rely on own production or purchases to meet their food
requirement? Why? Has this changed this year? If yes, how and why? • What time of year do most people rely on own food production in your community and what
time of year do they rely on market supply? • When cereal prices increase in your community who benefits the most? And who loses the
most? • When livestock prices increase in your community who benefits the most? And who loses the
most? Credit access and debts (including use of food aid)
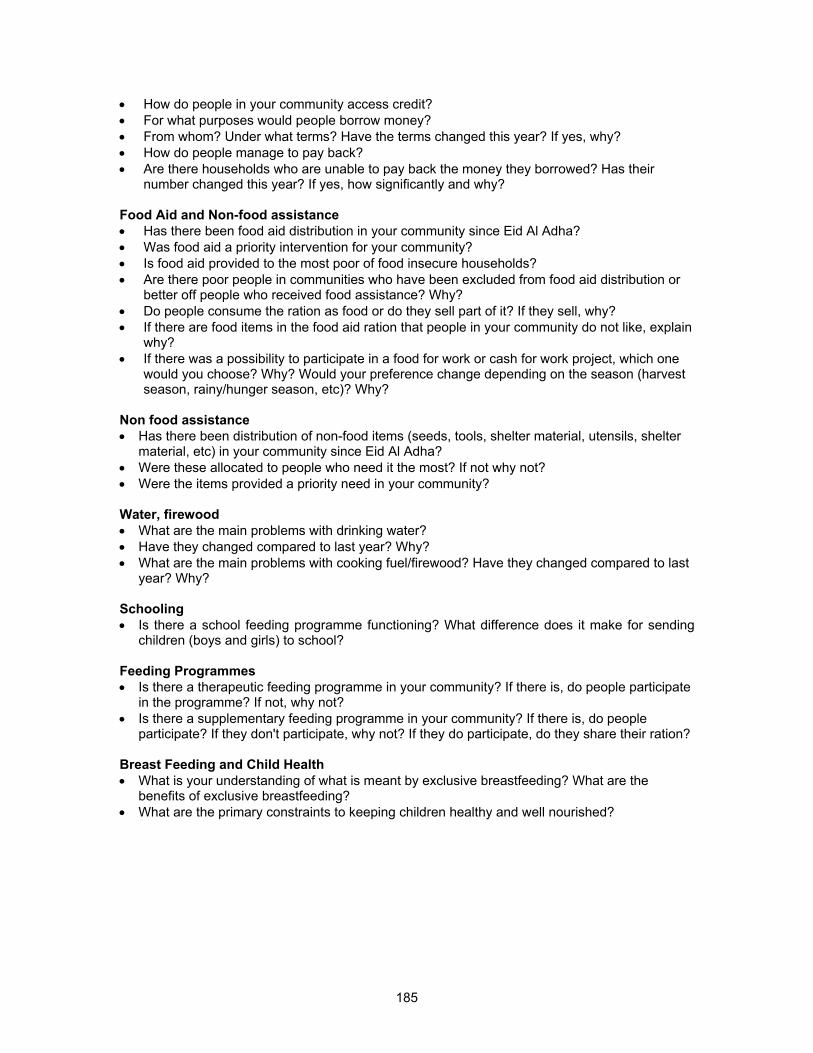
185
• How do people in your community access credit? • For what purposes would people borrow money? • From whom? Under what terms? Have the terms changed this year? If yes, why? • How do people manage to pay back? • Are there households who are unable to pay back the money they borrowed? Has their
number changed this year? If yes, how significantly and why? Food Aid and Non-food assistance • Has there been food aid distribution in your community since Eid Al Adha? • Was food aid a priority intervention for your community? • Is food aid provided to the most poor of food insecure households? • Are there poor people in communities who have been excluded from food aid distribution or
better off people who received food assistance? Why? • Do people consume the ration as food or do they sell part of it? If they sell, why? • If there are food items in the food aid ration that people in your community do not like, explain
why? • If there was a possibility to participate in a food for work or cash for work project, which one
would you choose? Why? Would your preference change depending on the season (harvest season, rainy/hunger season, etc)? Why?
Non food assistance • Has there been distribution of non-food items (seeds, tools, shelter material, utensils, shelter
material, etc) in your community since Eid Al Adha? • Were these allocated to people who need it the most? If not why not? • Were the items provided a priority need in your community? Water, firewood • What are the main problems with drinking water? • Have they changed compared to last year? Why? • What are the main problems with cooking fuel/firewood? Have they changed compared to last
year? Why? Schooling • Is there a school feeding programme functioning? What difference does it make for sending
children (boys and girls) to school? Feeding Programmes • Is there a therapeutic feeding programme in your community? If there is, do people participate
in the programme? If not, why not? • Is there a supplementary feeding programme in your community? If there is, do people
participate? If they don't participate, why not? If they do participate, do they share their ration? Breast Feeding and Child Health • What is your understanding of what is meant by exclusive breastfeeding? What are the
benefits of exclusive breastfeeding? • What are the primary constraints to keeping children healthy and well nourished?
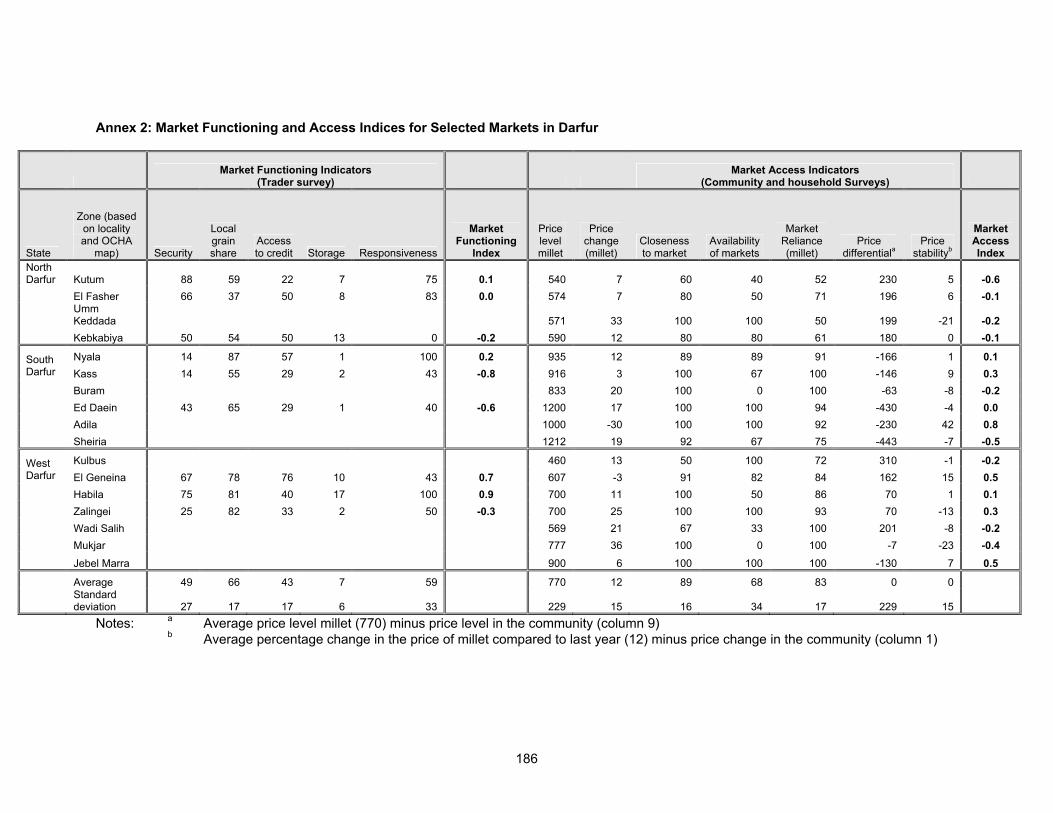
186
Annex 2: Market Functioning and Access Indices for Selected Markets in Darfur
Market Functioning Indicators
(Trader survey) Market Access Indicators
(Community and household Surveys)
State
Zone (based on locality and OCHA
map) Security
Local grain share
Access to credit Storage Responsiveness
Market Functioning
Index
Price level millet
Price change (millet)
Closeness to market
Availability of markets
Market Reliance (millet)
Price differentiala
Price stabilityb
Market Access Index
North Darfur Kutum 88 59 22 7 75 0.1 540 7 60 40 52 230 5 -0.6 El Fasher 66 37 50 8 83 0.0 574 7 80 50 71 196 6 -0.1
Umm Keddada 571 33 100 100 50 199 -21 -0.2
Kebkabiya 50 54 50 13 0 -0.2 590 12 80 80 61 180 0 -0.1
Nyala 14 87 57 1 100 0.2 935 12 89 89 91 -166 1 0.1 South Darfur Kass 14 55 29 2 43 -0.8 916 3 100 67 100 -146 9 0.3 Buram 833 20 100 0 100 -63 -8 -0.2 Ed Daein 43 65 29 1 40 -0.6 1200 17 100 100 94 -430 -4 0.0 Adila 1000 -30 100 100 92 -230 42 0.8 Sheiria 1212 19 92 67 75 -443 -7 -0.5
Kulbus 460 13 50 100 72 310 -1 -0.2 West Darfur El Geneina 67 78 76 10 43 0.7 607 -3 91 82 84 162 15 0.5 Habila 75 81 40 17 100 0.9 700 11 100 50 86 70 1 0.1 Zalingei 25 82 33 2 50 -0.3 700 25 100 100 93 70 -13 0.3 Wadi Salih 569 21 67 33 100 201 -8 -0.2 Mukjar 777 36 100 0 100 -7 -23 -0.4 Jebel Marra 900 6 100 100 100 -130 7 0.5
Average 49 66 43 7 59 770 12 89 68 83 0 0
Standard deviation 27 17 17 6 33 229 15 16 34 17 229 15
Notes: a Average price level millet (770) minus price level in the community (column 9) b Average percentage change in the price of millet compared to last year (12) minus price change in the community (column 1)
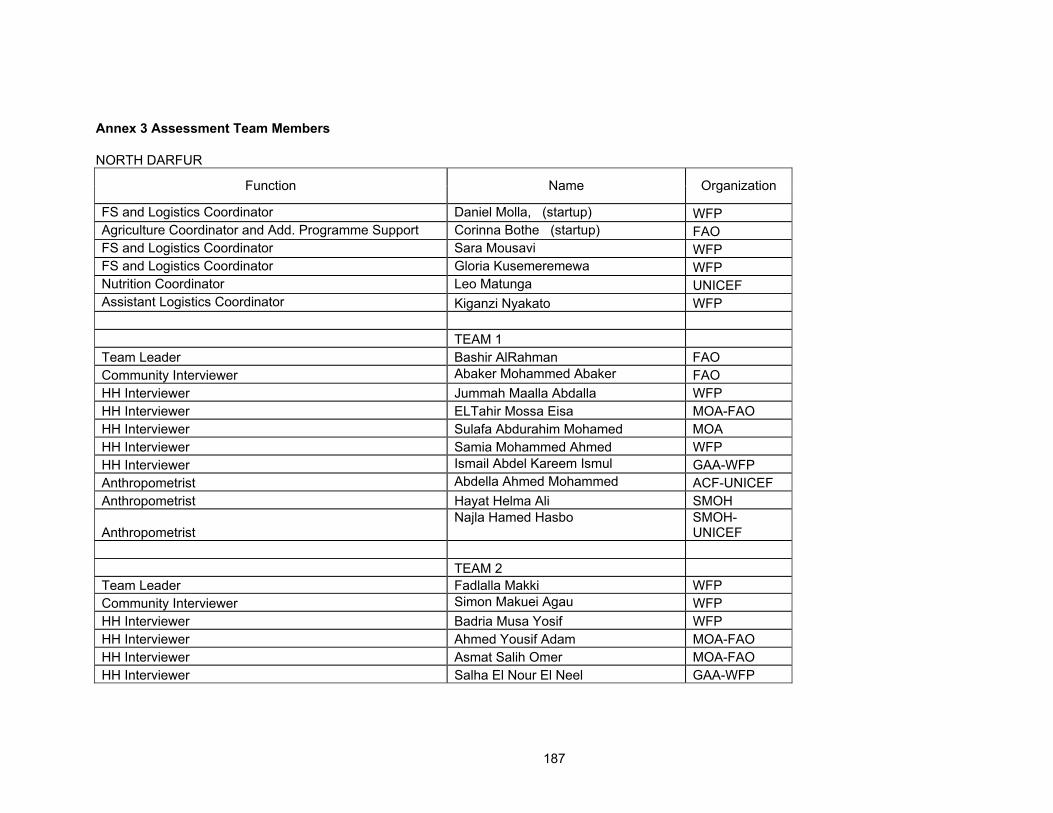
187
Annex 3 Assessment Team Members NORTH DARFUR
Function Name Organization
FS and Logistics Coordinator Daniel Molla, (startup) WFP Agriculture Coordinator and Add. Programme Support Corinna Bothe (startup) FAO FS and Logistics Coordinator Sara Mousavi WFP FS and Logistics Coordinator Gloria Kusemeremewa WFP Nutrition Coordinator Leo Matunga UNICEF Assistant Logistics Coordinator Kiganzi Nyakato WFP TEAM 1 Team Leader Bashir AlRahman FAO Community Interviewer Abaker Mohammed Abaker FAO HH Interviewer Jummah Maalla Abdalla WFP HH Interviewer ELTahir Mossa Eisa MOA-FAO HH Interviewer Sulafa Abdurahim Mohamed MOA HH Interviewer Samia Mohammed Ahmed WFP HH Interviewer Ismail Abdel Kareem Ismul GAA-WFP Anthropometrist Abdella Ahmed Mohammed ACF-UNICEF Anthropometrist Hayat Helma Ali SMOH
Anthropometrist Najla Hamed Hasbo SMOH-
UNICEF TEAM 2 Team Leader Fadlalla Makki WFP Community Interviewer Simon Makuei Agau WFP HH Interviewer Badria Musa Yosif WFP HH Interviewer Ahmed Yousif Adam MOA-FAO HH Interviewer Asmat Salih Omer MOA-FAO HH Interviewer Salha El Nour El Neel GAA-WFP
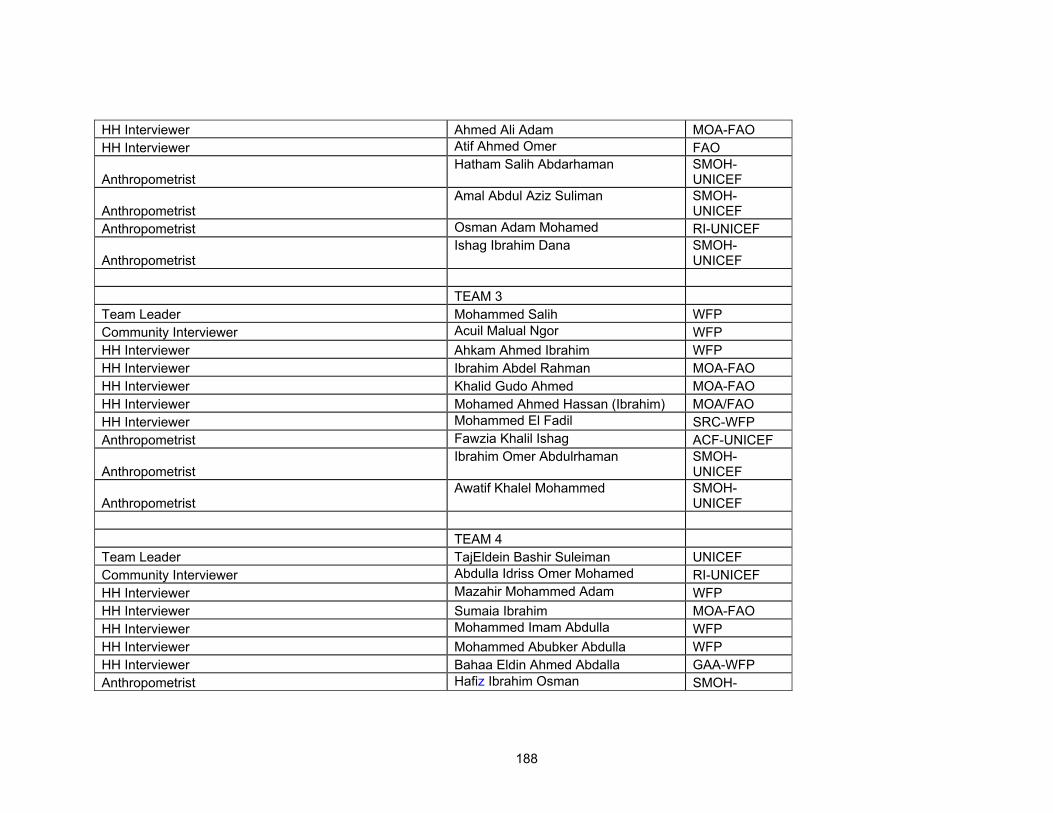
188
HH Interviewer Ahmed Ali Adam MOA-FAO HH Interviewer Atif Ahmed Omer FAO
Anthropometrist Hatham Salih Abdarhaman SMOH-
UNICEF
Anthropometrist Amal Abdul Aziz Suliman SMOH-
UNICEF Anthropometrist Osman Adam Mohamed RI-UNICEF
Anthropometrist Ishag Ibrahim Dana SMOH-
UNICEF TEAM 3 Team Leader Mohammed Salih WFP Community Interviewer Acuil Malual Ngor WFP HH Interviewer Ahkam Ahmed Ibrahim WFP HH Interviewer Ibrahim Abdel Rahman MOA-FAO HH Interviewer Khalid Gudo Ahmed MOA-FAO HH Interviewer Mohamed Ahmed Hassan (Ibrahim) MOA/FAO HH Interviewer Mohammed El Fadil SRC-WFP Anthropometrist Fawzia Khalil Ishag ACF-UNICEF
Anthropometrist Ibrahim Omer Abdulrhaman SMOH-
UNICEF
Anthropometrist Awatif Khalel Mohammed SMOH-
UNICEF TEAM 4 Team Leader TajEldein Bashir Suleiman UNICEF Community Interviewer Abdulla Idriss Omer Mohamed RI-UNICEF HH Interviewer Mazahir Mohammed Adam WFP HH Interviewer Sumaia Ibrahim MOA-FAO HH Interviewer Mohammed Imam Abdulla WFP HH Interviewer Mohammed Abubker Abdulla WFP HH Interviewer Bahaa Eldin Ahmed Abdalla GAA-WFP Anthropometrist Hafiz Ibrahim Osman SMOH-
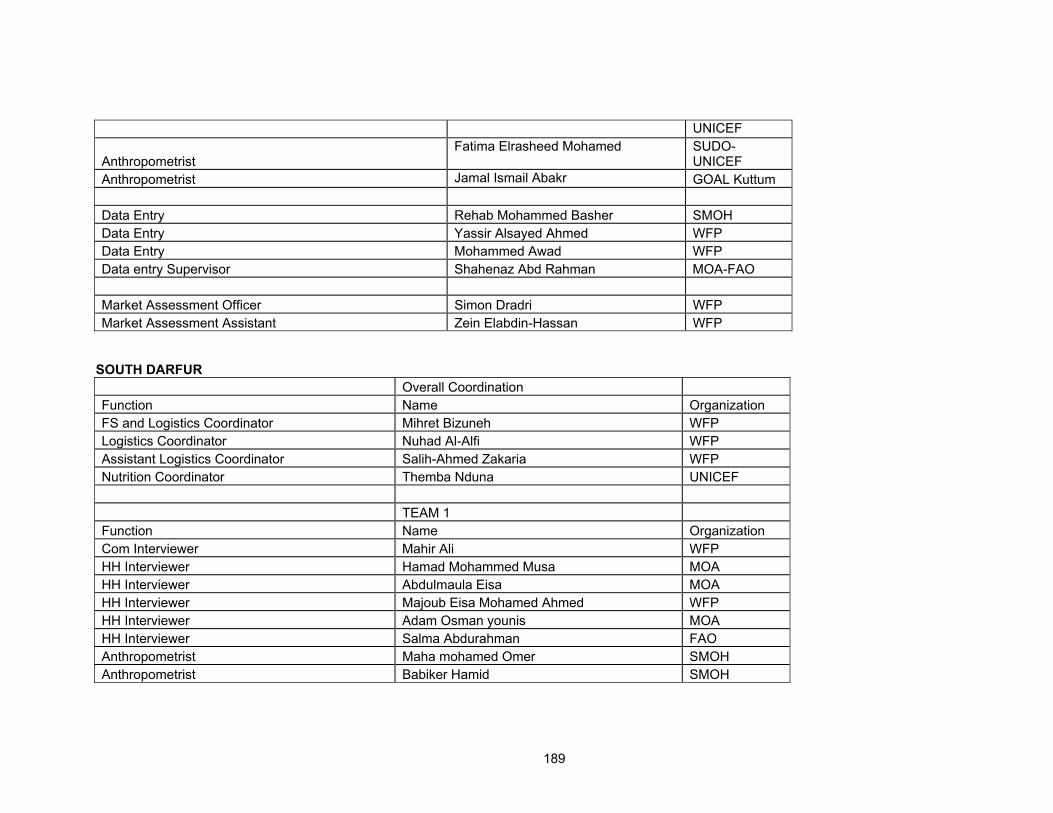
189
UNICEF
Anthropometrist Fatima Elrasheed Mohamed SUDO-
UNICEF Anthropometrist Jamal Ismail Abakr GOAL Kuttum Data Entry Rehab Mohammed Basher SMOH Data Entry Yassir Alsayed Ahmed WFP Data Entry Mohammed Awad WFP Data entry Supervisor Shahenaz Abd Rahman MOA-FAO Market Assessment Officer Simon Dradri WFP Market Assessment Assistant Zein Elabdin-Hassan WFP
SOUTH DARFUR Overall Coordination Function Name Organization FS and Logistics Coordinator Mihret Bizuneh WFP Logistics Coordinator Nuhad Al-Alfi WFP Assistant Logistics Coordinator Salih-Ahmed Zakaria WFP Nutrition Coordinator Themba Nduna UNICEF TEAM 1 Function Name Organization Com Interviewer Mahir Ali WFP HH Interviewer Hamad Mohammed Musa MOA HH Interviewer Abdulmaula Eisa MOA HH Interviewer Majoub Eisa Mohamed Ahmed WFP HH Interviewer Adam Osman younis MOA HH Interviewer Salma Abdurahman FAO Anthropometrist Maha mohamed Omer SMOH Anthropometrist Babiker Hamid SMOH
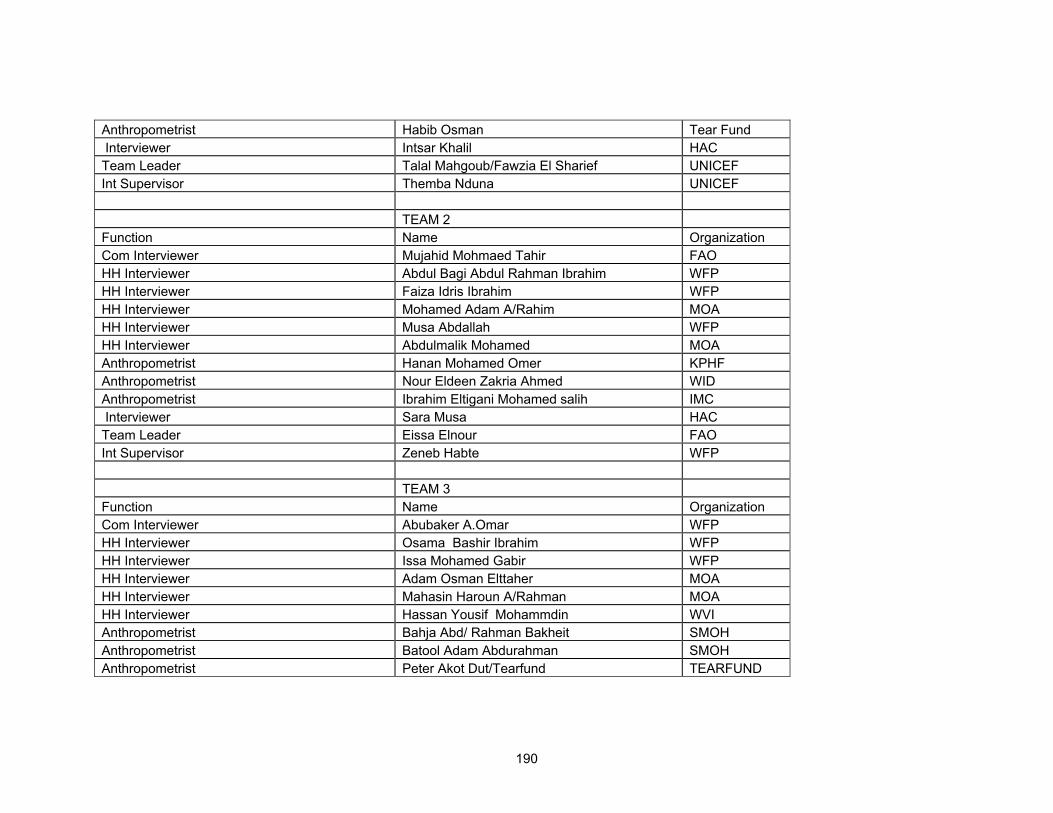
190
Anthropometrist Habib Osman Tear Fund Interviewer Intsar Khalil HAC Team Leader Talal Mahgoub/Fawzia El Sharief UNICEF Int Supervisor Themba Nduna UNICEF TEAM 2 Function Name Organization Com Interviewer Mujahid Mohmaed Tahir FAO HH Interviewer Abdul Bagi Abdul Rahman Ibrahim WFP HH Interviewer Faiza Idris Ibrahim WFP HH Interviewer Mohamed Adam A/Rahim MOA HH Interviewer Musa Abdallah WFP HH Interviewer Abdulmalik Mohamed MOA Anthropometrist Hanan Mohamed Omer KPHF Anthropometrist Nour Eldeen Zakria Ahmed WID Anthropometrist Ibrahim Eltigani Mohamed salih IMC Interviewer Sara Musa HAC Team Leader Eissa Elnour FAO Int Supervisor Zeneb Habte WFP TEAM 3 Function Name Organization Com Interviewer Abubaker A.Omar WFP HH Interviewer Osama Bashir Ibrahim WFP HH Interviewer Issa Mohamed Gabir WFP HH Interviewer Adam Osman Elttaher MOA HH Interviewer Mahasin Haroun A/Rahman MOA HH Interviewer Hassan Yousif Mohammdin WVI Anthropometrist Bahja Abd/ Rahman Bakheit SMOH Anthropometrist Batool Adam Abdurahman SMOH Anthropometrist Peter Akot Dut/Tearfund TEARFUND
191
Interviewer Hafith Taha HAC Team Leader Malony Tong WFP TEAM 4 Function Name Organization Com Interviewer El Nor Mohamed El Tom WFP HH Interviewer Hashim Ibrahim Karmalla Ibrahim WFP HH Interviewer Moheid Eldin Jaber Teya WFP HH Interviewer Asha Salih Adam MOA HH Interviewer Alsaida Adam Abdelmagid MOA HH Interviewer Mohamed Abdulkareem WFP Anthropometrist Aldaif Abderlehaman Abbas SUDO Anthropometrist Abdulkarim Ibrahim Mohamed WVI Anthropometrist Habeeba essadig SMOH Interviewer Faisal said Meeden HAC Team Leader Team Leader Bakri Osman WFP Market Assessment Officer Simon Renk WFP Market Assessment Assistant Abdalla El-Sheikh WFP Data Entry Supervisor Hassan Ali Suleiman FMOH Data Entry Supervisor Suad Osman MOH Data Entry Clerk Murtada Ahmed Abdel-Gadir WFP Data Entry Clerk Hassan Ibrahim Mohammed kheir Elsaed WFP
WEST DARFUR
Function Name Organization Agriculture Coordinator Mohammad Hafiz FAO Nutrition Coordinator Diane Holland UNICEF Nutrition Coordinator Joyce Ayume UNICEF FS and Logistics Coordinator Mariko Kawabata WFP
192
Assistant Logistics Coordinator Andrea Ujang WFP Logistics Coordinator El Sadig Sharnof HAC (WFP) TEAM 1
Function Name Organization International Supervisor Eduard Shirinyan WFP Team Leader Mohamed Osman Meezan WFP Community Interviewer Abdulatiif Adam Abdulrahim MoA Household Interviewer Ilham Hamam FAO Household Interviewer Kamal Abdulkarim MoA Household Interviewer Mohamed Ahmed Markhous SC-US Household Interviewer Abdelaziz Mohammed Adam CRS Household Interviewer Omer Abdalla Adam MoA Household Interviewer Adam El Sadig WFP Anthropometrist Alfiya Mohamed Ibrahim MoH Anthropometrist Abdalla Abdul Rasoul SC-US Anthropometrist Abulgasim Is-hag adam MoH TEAM 2
Function Name Organization Supervisor Themba Nduna UNICEF Team Leader Abdulrahman Mohamed Nour FAO Community Interviewer Bahr Eldin Hassan Lissan UNICEF Household Interviewer Mubarak Musa FAO Household Interviewer Safaa Abdallah Yusif MoA Household Interviewer Hanni Abdalla WFP Household Interviewer Mona Yusuf Eltoum SC-US Household Interviewer Alemseged Yeneneh WFP Anthropometrist Mustafa Abdullah Adergi MoH Anthropometrist Asadiq Ibrahim Tearfund Anthropometrist Amira Saleh Widaa MoH Security Salah Sabeel WFP
193
Security Emmanuel Ankrah WFP Household Interviewer Batricia Primato UNHCR Supervisor Diane Holland UNICEF TEAM 3
Function Name Organization Supervisor Abdalla Ismail FAO Team Leader Abdulrahim Norein WFP Community Interviewer Adam A/Rahman MoAResource Household Interviewer Yasir Babiker Ahamed MoA Household Interviewer Abdalla Ali Abdallah WFP Household Interviewer Kamal Sabrin Sawa SC-US Household Interviewer Asma Tibin Abdalla CRS Household Interviewer Mohamad Yusif Ismail MoA Anthropometrist Abdalla Mohammad Adam SC-US Anthropometrist Marwa Mubarak Ahmed Concern Anthropometrist Aymana Ismael Sulaiman MoH Security Abdelhakeem Elnour WFP Household Interviewer Adam Issa WFP Coordinator Mariko Kawabata WFP
Function Name Organization Gender FGD Interviewer Tunna William Amoi WFP Gender FGD Interviewer Hanan el Abbas WFP
Function Name Organization Market Assessment Officer Ludovic Subran WFP Market Assessment Assistant Sidahmed Bietek WFP
Function Name Organization Supervisor Lekim Nguyen WFP Data Entry Supervisor Mohamed Zakaria Mohamed MoH
194
Data Entry Mohamed Alhafiz Yousif MoH Data Entry Emam Elsir Emam MoH Data Entry Abubakar ArRasheed Omar (WFP) Data Entry Mohammad Abdulwahab Ahmed (WFP)