Embed Size (px)
Citation preview

Food Habits and Prey Abundance of Leopard (Pantherapardus fusca) in Gir National Park and Wildlife Sanctuary
M. Sc. Dissertation
Department of Wildlife SciencesAligarh Muslim University
Aligarh 202 0022006

Food Habits and Prey Abundance of Leopard (Pantherapardus fusca) in Gir National Park and Wildlife Sanctuary
M. Sc. Dissertation
Department of Wildlife SciencesAligarh Muslim University
Aligarh 202 0022006
ByAishwarya Maheshwari
Supervised ByDr. Jamal A. Khan

Dedicated to Radio collared Leopards

CONTENTS
List of Tables iv List of Figures v List of Appendices iii Acknowledgement vi
CHAPTER 1
1.1 Introduction 1
1.2 Objectives 2
1.3 Duration of study 3
1.4 Literature review 4
CHAPTER 2 – Study Area
2.1 Location 6
2.2 Geology and geomorphology 6
2.3 Climate 7
2.4 Flora 8
2.5 Fauna 9
CHAPTER 3 – Estimation of Prey Base
3.1 Introduction 10
3.2 Methodology 11
3.3 Data Analysis 12

3.4 Results
3.4.1 Density of wild prey species 13
3.4.2 Group size and encounter rate 13
3.5 Discussion 14
CHAPTER 4 – Scat Analysis
4.1 Introduction 20
4.2 Methodology
4.2.1 Collection of scats 21
4.2.2 Analysis of scats 21
4.3 Data analysis 22
4.4 Results
4.4.1 Food habits of leopard 22
4.4.2 Diet of leopards 23
4.5 Discussion 23
CHAPTER 5 – Kill Monitering
5.1 Methodology 28
5.2 Kill Searching 28
5.3 Guidelines developed for kill searching 30
5.4 Collection of data 32
5.5 Results
5.5.1 Analysis of kill data 33
5.5.2 Estimation of age of kills 33
5.5.3 Estimation of kills 34
5.5.4 Dragging of the kills 34

5.5.5 Kills taken over by lion 34
5.6 Discussion 35
CHAPTER 6 – References 40
List of Appendices
A.1. List of mammals at Gir PA 46
A.2. List of Birds identified at Gir PA 47
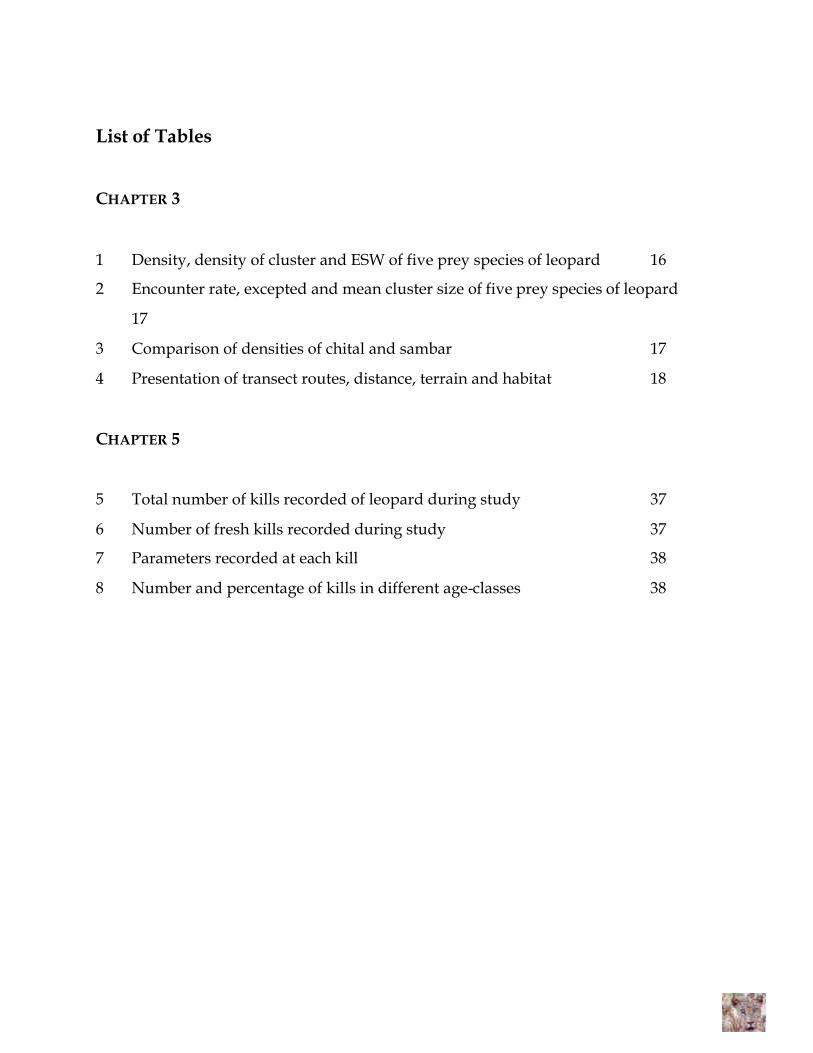
List of Tables
CHAPTER 3
1 Density, density of cluster and ESW of five prey species of leopard 16
2 Encounter rate, excepted and mean cluster size of five prey species of leopard
17
3 Comparison of densities of chital and sambar 17
4 Presentation of transect routes, distance, terrain and habitat 18
CHAPTER 5
5 Total number of kills recorded of leopard during study 37
6 Number of fresh kills recorded during study 37
7 Parameters recorded at each kill 38
8 Number and percentage of kills in different age-classes 38

List of Figures
CHAPTER 3
1 Map showing transects for prey abundance 19
CHAPTER 4
1 Percentage occurrence of prey species of leopard (pie chart) 25
2 Percentage occurrence of prey species of leopard in 3D view 25
3 Percentage occurrence of prey species of leopard (graph) 26
4 Mean values with CL of prey species of leopard 27
5 Occurrence of different prey species in leopard scat 28
CHAPTER 5
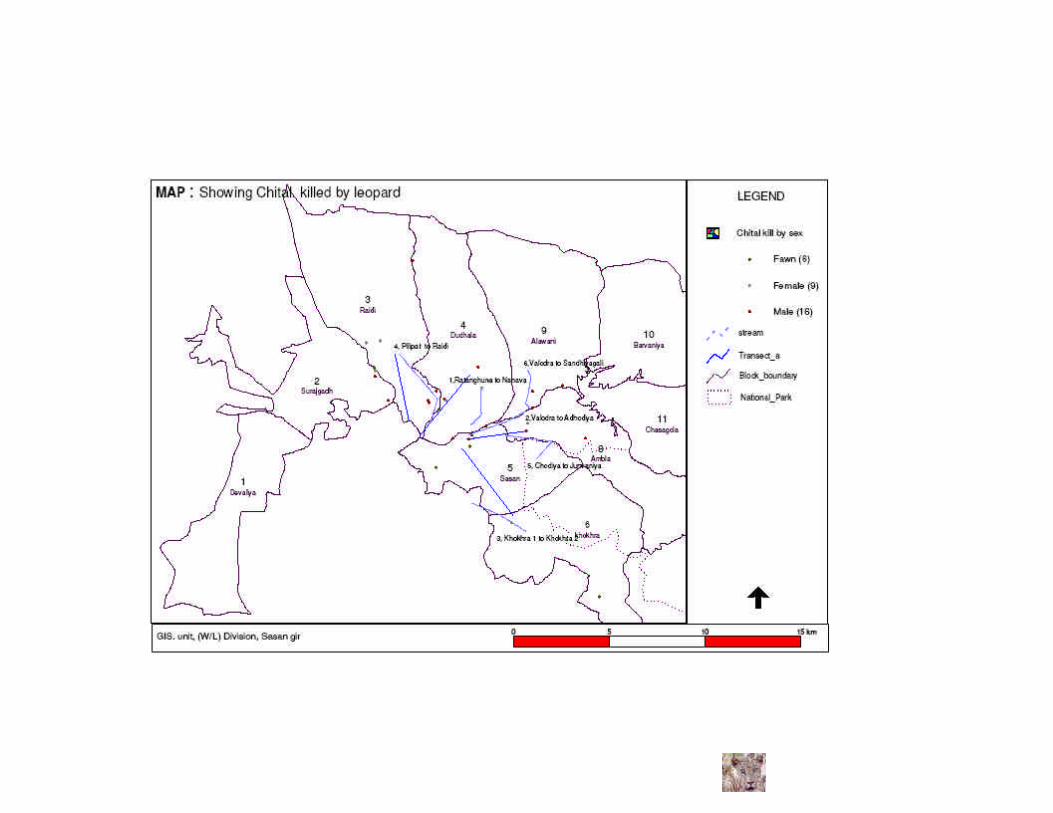
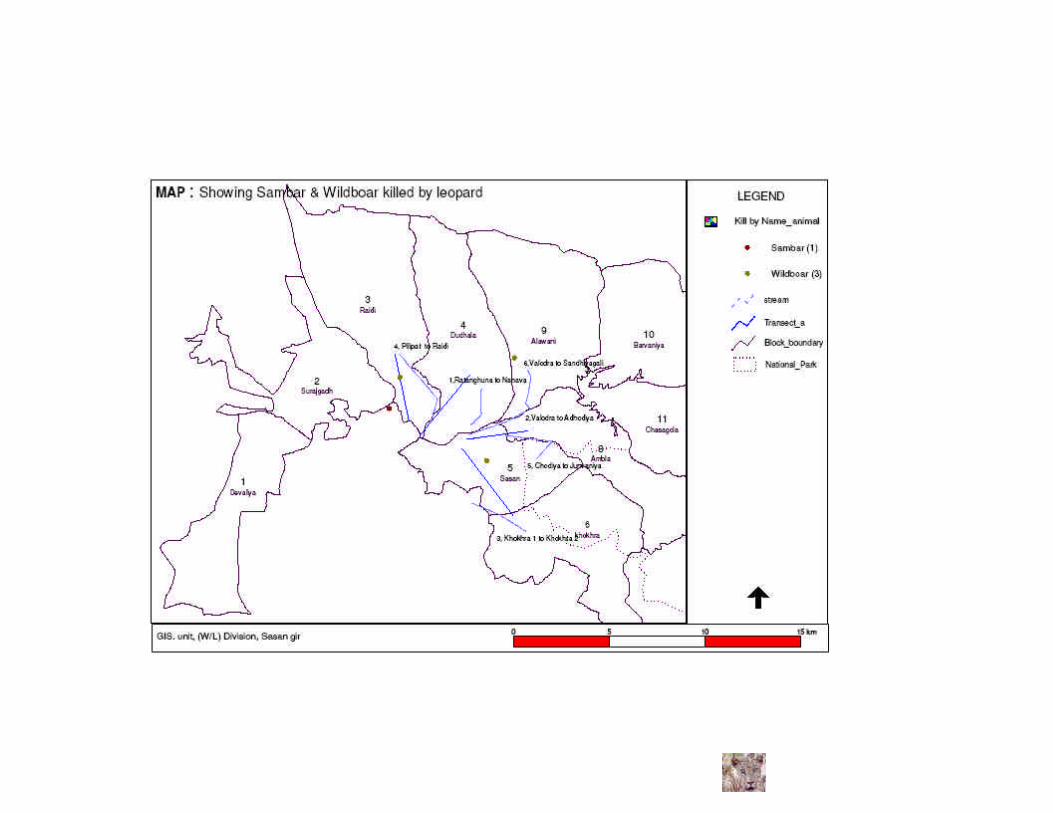
1 Map showing routes for kill monitering 39
APPENDIX
1 Map showing the location of Gir NP and WLS on the map of India

AAACCCKKKNNNOOOWWWLLLEEEDDDGGGEEEMMMEEENNNTTT
I am indebted to Dr. Jamal A. Khan my teacher and supervisor for
providing the opportunity to work in Gir Lion Sanctuary. I am sincerely
thankful to him supervising my M.Sc. dissertation and providing me all
the necessary support, required throughout my field work and writing
phase. I especially thank him for keen advices, lots of good ideas, his
availability as well as support during the whole work.
I am equally thankful to my teachers Dr. Afifullah Khan, Dr. Satish
Kumar, Prof. H. S. A. Yahaya, Prof. Wazahat Husain, Dr. Akram Javed and
Dr. Ekwal Imam for their valuable guidance and explain things clearly and
simply in the classes.
I would like to thank Dr. Y. V. Jhala for his discussion and good ideas that
help me a lot in field work.
I would like to thank Bilal Habib, Dr. Orus Ilya for his valuable guidance
during my field work and in data analysis. Equally I am thankful to
Sharad Kumar, Usham Singh (especially for some photographs), Meena V.
and Kausik Banerjee for their suggestions and support.
I am also thankful to my classmates and friends for their encouragement
during study.
I would like to thank to Anees, Library in-charge who extended his full
cooperation and provided the relevant material.
I sincerely wish to thank the Forest Department of Gujarat, Wildlife
Division Sasan, Gir. The Division staff, Forest guards who really help and
encourage me during field work.
In particular I would like to thank Mr. B. J. Pathak (Conservator of Forest,
Wildlife Division), Mr. P. P. Raval (Deputy Conservator of Forest,
Wildlife Division), Mr. V. J. Rana (Assistant Conservator of Forest,
Wildlife Division) and Dr. Heerpara (Veterinary Doctor) for their valuable
suggestions and support during the whole study.
I remember the support of my field assistant and thankful to Dost
Mohammad and Suresh Darbar during field work.
Aishwarya Maheshwari

Chapter 1
1.1 Introduction
Leopard (Panthera pardus) is the most widely distributed of all the wild cats in the world
(Nowell and Jackson 1996). Fossil evidence, some as old as 1.5 to 2.0 million years
(Hemmer 1976, Brain 1981) suggests leopards were once more widely distributed than
today. The geographical distribution of leopard extends throughout Africa, central Asia,
south-east Asia and north Amur valley in Russia. Leopard is found through the Indian
sub-continent with the exception of deserts, the sundarbans mangroves, and densely
settled areas (Khan 1986, Jhonsingh et al. 1991). It is the most common of the big cats,
Myres (1976) recommended that it remain in Appendix 1 of CITES because of its
extensive hunting had depressed populations in several parts of Africa. In India it
figures in the Schedule I of the Indian Wildlife Protection Act, 1972 (Anonymous).
Leopard is placed under Least Concern category of 2002 IUCN Red List of threatened
animals.
It has an elongate body and limbs of moderate length. The paws are broad, rounded
and the ears are short, The tail is longer than comparison with body or that of Tiger
(Panthera tigris), assisting its movements. It has a coat of pale yellow to deep gold,
pattern with black rosettes. The throat, chest, belly and insides of the limbs are white.

The backs of the ears are black with a white central spot but there are various aberrant
coat patterns. One of the most striking is melanism, the leopard being totally black. It is
caused by a recessive gene. The skull is relatively elongate but flat on the upper surface.
Average adult weights for male 50-70 kg and female ranges 29-54 kg (Nowell and
Jackson 1996). Over most of their range, leopards have no particular breeding season.
Females are sexually receptive at 3 – 7 week intervals and the period of receptivity lasts
for a few days. Sexual maturity is probably achieved at about 2.5 years. Leopard in
Africa and India mate at any time of the year, the gestation period is an average of 96
days (90-112) with 2-3 cubs being borned. The young weights 400-700 gm at the time of
birth and open their eyes after 7-9 days (Ewer 1973, Hemmer 1976).
1.2 Objectives
The present study was undertaken to investigate the following three objectives:
• Prey Abundance.
• Food and Feeding Habits.
• Kill Monitering.
• Prey Abundance
The Line Transect method (Emberhardt 1968, Burnham et al. 1980, Buckland et al. 1993)
was used to estimate the density of wild prey species of leopard (Panthera pardus fusca).
This method has been effectively used to determine the ungulate densities in the same
dry deciduous forest of Gir (khan 1987).

• Food and Feeding Habits
Scat analysis reveal information on the feeding habits of wild cats which may not be
possible when using other techniques such as locating and identifying the kills (Grobler
and Wilson 1972, Smith 1978, Meche et al.1990). Scat analysis provides useful
information on the feeding ecology of mammals (Riney 1957, Putman 1984).
• Kill Monitering
In case of carnivores kills provide useful information pertaining to the hunting
strategies, mode of feeding and also competition with other carnivores. Kill also speaks
about the prey selection e.g. selectivity for prey species, selectivity for prey size,
selectivity for age, sex classes and selectivity towards physically substandard
individuals (Karanth and Sunquist 1995).
1.3 Duration of the Study
The present was carried out over a period of four months, from 1st February to 31st May
2006 as an exercise to fulfill the requirements for completion of M.Sc. Curriculum.
1.4 Literature Review
The leopard, up to the 1970’s remained unstudied in the wild. Then observations of
leopard, often associated with other studies, were reported by Schaller (1972), Eisenberg
and Lockhart (1972) and Muckenhirn and Eisenberg (1973). First intensive study was
carried out by Hamilton (1976) on movements using radiotelemetry equipment.
Leopard is less studied than any other big cat like lion and tiger in India. The main
focus is on conflict with human at Sanjay Ghandhi National Park, Baria Forest Divison
Gujarat and Garhwal Himalayas. Of course the species is more involved in conflict with
human than any other large cat but the ecology and of biology should be known and
important for long term conservation.
The work on feeding ecology through scat analysis and standardization has been done
by Mukherjee et al. (1994), Sankar et al.(2002) in India and Bothma et al.(1994) on
Kalahari leopards. Biomass consumption and scat produced in captive leopards and
lion was studied by Mukherjee et al.(2004). Reproductive biology has been studied by
Desai (1973) on captive leopards, Atkinson et al. (2002) on side-striped jackals (Canis
adustus), Reynolds et al. (1991) on fox (Vulpes vulpes).
Behavioral studies have been conducted on leopard by Chambers and Santipillai (1982)
in Sri lanka, work on density estimation from camera trapping and scat counts has been
carried out by Khorozyan (2003) in Armenia. Genetic work was conducted for
phylogeographic subspecies recognition of 27 subspecies of leopard by Miththapala et
al. (1995) and same work carried out by Spong et al. (2000) on Tanzanian leopard.
Prey abundance for carnivores through transect monitering has been done by Biswas et
al. (2002), Goyal et al. on Tiger, Karanth et al.(1995) on leopard, dhol (Cuon alpinus) and
tiger, Pole et al. (2004) on African wild dog (Lycaon pictus), Herfindal et al.(2005) on

Eurasian lynx (Lynx lynx), Density estimation of ungulates was carried out in the same
forest of Gir by Khan et al.(1996).
The work on prey selection and kill mointering have been carried out by Karanth et al.
(2000) on leopard, tiger and dhole, Stander et al. (1997) on Namibian leopard, Smith et
al. (2004) on wolf (Canis lupus).

Chapter 2
Study Area
Gir falls in Afro tropical (palaeotropical) realm. As per the Champion and Seth
classification, the biome is Dry Deciduous Thorn Forest and Scrublands.
2.1 Location
The Gir Wildlife Sanctuary and National Park spreading in an area of 1412.12 sq.km. in
which Gir National Park extending over an area of 258.71 sq.km. is surrounded by the
Wildlife Sanctuary extending to an area of 1153.41 sq.km. all around. Major part of Gir
is reserve forest. Gir Lion sanctuary lies at 21°20' to 20° 57' N Latitude and 70° 27' to 71°
13' longitude in the Kathiawar peninsula of Gujarat.
2.2 Geology and geomorphology
The Gir forest area is rugged and hilly. The elevation varies from 150.3 to 530.7 m above
mean sea level. Hills are of volcanic origin. In this area limestone is in abundance as can
be seen form the quarries around the tract. Other rocks are found in the patches like
gneiss, quartzite, quartz and feldspar. The area is divided into a number of watersheds,
from water streams originate and feed the principle rivers of the tract e.g. Hiran,
Datadri, Shinghoda, Machhundri, Ghodavadi, Raval and Shetrunji. Soil varies from
place to place. It is generally black with varying proportion of loam. Such soil is found

mainly in valleys and on gentle slopes. The best teak growth is seen on well drained
sandy loam soil. The other soils found in the tract are red soils, yellowish-white clay
soils, clay and sandy soils.
2.3 Climate
Gir has a wide temperature variation i.e. the maximum temperature goes up to 44°C in
the month of May and it falls down to as low as 10°C in the month of December and
January. During summer the temperature in the eastern Gir remains slightly higher
than in western Gir.
There are three different seasons viz. mansoon, winter and summer. Mansoon extends
from June-July to September-October, winter from November to January-February and
summer from February-March to May-June. Rain fall in Gir is very irregularly
disturbed with maximum 1866 mm in 1994 and minimum as 199 mm in 1987. Rain
begins with the onset of the south west mansoon in the month of June and last up to
September and a few showers are also received in October and winter rains are
unusual.
2.4 Flora
Champion and Seth gave a general description of Gir forest in their revised
classification in 1966. These areas fall under the type 5A/Cla i.e. very dry teak forests.
From the forestry point of view, it can be classified in to the following sub types:

A. Dry Deciduous Teak Forest
The main species associated with teak (Tectona grandis) are khair (Acacia catechu), sadad
(Terminalia crenulata), timbru (Diospyros melanoxylon), babul (Acacia nilotica), amla
(Phyllanthus emblica), ber (Zizyphus mauritina), gorad (Acacia senegal), hermo (Acacia
leucophloea), khakhar (Butea monosperma), garmalo (Cassia fistula), lapdu (Aristida
adscensionis), ratad (Andropogon cymbaria) etc.
B. Non Teak Forest
The remaining half of Gir is occupied by this type of forest. The composition of
vegetation is more or less same but in eastern Gir dhavdo (Anogeissus latifolia) is
dominant in the place of teak.
C. Riverine Forest
Riverine forest has a distinct type of vegetation along the rivers and streams. The main
species are jambudo (Syzygium rubicundum), ravano (Syzygium cummini), karanj
(Pongomia pinnata), vad (Ficus benghalensis), kalam (Mitragyna parvifolia), amli
(Tamarindus indica), karamdi (Carissa conjesta) etc.
D. Coastal Border Forest
These are the plantations of gandobaval (Prosopis juliflora) and saru (Casuarina
equisetifolia) raised all along the coastal border.

2.5 Fauna
Gir lion sanctuary supports 32 species of mammals, 26 species of reptiles, 300 species of
birds and more than 2000 species of insects. Gir is the last home of Asiatic Lion. The
important carnivores of the sanctuary include lion (Panthera leo persica), leopard
(Panthera pardus fusca), hyaena (Hyaena hyaena), jackal (Canis aureus), jungle cat (Felis
chaus)etc. The important herbivores are chital (Cervus axis), sambar (Cervus unicolor),
nilgai (Boselaphus tragocamelus), chousingha (Tetracerus quadricornis), hanuman langur
(Presbytis entellus) etc. Some of the important reptilian fauna are fresh water crocodile
(Crocodylus palustris), pink ringed tent turtle (Kachuga tentoria), starred tortoise
(Geochelone elegans), Indian monitor (Varanus bengalensis), yellow monitor (Varanus
flavescens), common vine snake (Ahaetulla nasuta), common cobra (Naja naja), russels
viper (Vipera russelli), python (Python morulus). The avian fauna of Gir forest is also very
rich that supports the resident and very few migratory birds. Some of them are peafowl
(Pavo cristatus), cormorant (Phalacrocorax niger), painted stork (Mycteria leucocephala), red
headed vulture (Sarcogyps calvus), common quail (Coturinx coturinx), Indian river tern
(Sterna aurantia), brown fish owl (Bubo zylonensis) etc.

Chapter 3
Estimation of Prey Base
3.1 Introduction
It is very necessary and important to collect the data on distribution, density, age and
sex composition of prey bases of any predator. Population distribution and behaviour
of prey influence the quality of a predator’s habitat and the health of predator
populations. Therefore, some knowledge about the prey species of any predator is
essential before one can understand the ecology of the predator. As far the distribution
of prey species is concerned i.e. influenced by the resource gradients, their combination
and rate of exploitation. Normally the leopard is an opportunistic feeder and attempts
to kill any prey which comes across (Eltringham 1979). The factors which influence the
food habits or prey selection are the absolute abundance, relative abundance and
relative value of potential prey (Estabrook et al. 1976). These three factors are
interrelated and the theory of optimal diet predicts that higher abundance of prey
species results in greater specialization by increased foraging for the most profitable
food item (Pyke et al. 1977).
The relative abundance of many smaller mammals such as rodents were difficult to
determine because of their habitat preferences and behaviour. Some species like
porcupine and black naped hare were seen only at night. This study focus on the food

habits of leopard in relation to the relative density of its prey species including chital,
sambar, wild boar, nilgai, chousinga, chinkara, langur and peafowl.
3.2 Methodology
Line transect method (Burnham et al. 1980, Anderson 1979) was used to estimate the
overall density, relative density, encounter rate and group size. Line transect method is
practical, efficient and inexpensive. Four transects were systematic randomly laid
varying in length between 3.2km to 4.4km. The total length of all transects was 15.3 km
and 14 monitoring were made on each transect at morning (07.00 to 10.00). Two
observers carefully scanned the either sides for prey species. Four assumptions were
always taken into consideration on transect monitoring:
• Points directly on the line were seen with probability one.
• Points were fixed at the initial sighting position (they do not move before being
sighted) and none was counted twice.
• There were no measurement errors.
• All sightings were independent events.
On each sighting on the transect the following parameters were recorded:
• Species and Group Size: The species sighted with the total number of individuals,
sex and their status (adult, sub adult and young one) and the distance was pursued for
recording one or more animals of the same species with 30m of each other showing
signs of coordinated movements were considered as a group.

• Perpendicular distance: The perpendicular distance to the centre of the group or the
single animal from the transect line was measured using a range finder (Bushnell 20 –
1000).
The sex was identified on the basis of some characteristic features such as the males of
sambar and chital posses antlers but females do not have, similarly male peafowl has
colorful feathers. But it was very difficult to categorize the sex of chital and sambar,
especially during the fawning period when sub adult males and females appear almost
same. Thus such animals were not categorized sex wise to minimize bias in determining
the sex ratio.
Distances between starting points of two transects were maintained 0.5km. to 2.5km. to
minimize the bias of over counting the prey species on more than one transect.
3.3 Data Analysis
Each transect in summer 2006 had 14 monitoring thus a total of 214.2km walked along
transects. The analysis was carried out separately for each species on each transect. The
transect data was analysed using the programme DISTANCE (version 5.0 BETA 5,
Thomas et al. 1993) to estimate species density, mean group size and encounter rate. The
minimum Akaike Information Criterion was used to select the model after checking the
heaping effect.

Nilgai, hare and chousinga had only 12, 10 and 01 sightings on the transect thus they
were not included in the analysis because there should be minimum 40 sightings are
necessary for accuracy.
3.4 Results
3.4.1 Density of Wild Prey Species
The estimated overall densities and individuals of all five prey species are in Table. The
value of overall density estimated 134.78 animals/km². Chital had the highest density,
61.45 animals/km² where as wild boar had the lowest value of density, 1.62
animals/km². The overall and individual encounter rate, expected and mean group size
are also summarized in the table 1.
3.4.2 Group Size and Encounter Rate
The expected value of group size at 95% confidence intervals was estimated 3.7
animals/group. The estimate of mean group size was 3.9 animals/group that varied
within 95% confidence intervals from 2.3 to 2.9 animals/group. The encounter rate
estimated for overall prey species 2.6 individuals that were varied within 95%
confidence intervals form 2.3 to 2.9 individuals. In summer the highest encounter rate
was 1.23 individuals of chital population and wild boar had the lowest 0.07 individuals
(Table 2).

3.5 Discussion
The prey species play a vital role which limits the population of predator. Thus it is
important to collect the data on the status and distribution of prey species and their
fluctuations during time intervals. Population size is a wildlife management tool by
which the success of a management programme is ultimately judged. Ecologists have
emphasized the important role that wild prey species play in ecosystems through their
influences on the composition, productivity, nutrient cycle and succession (Crawely
1983) and ultimately on the population of the predator.
Karanth et al. (1995) reported from tropical forests of Nagarhole National Park Chital
had the highest density (49.1/km²) and supports the highest frequency of occurrence
(43.7%) in leopard diet in scats and 83% composed the total kills made by leopard.
Bailey (1973) reported that impala was the most frequent ungulate species and prey in
Kruger National Park. Similarly, here chital was the most abundant ungulate and prey
species in kill monitoring. Khan et al. (1996) reported the densities of chital in 1970 was
3.57/km² and it was surprisingly increased up to 50.8/km² in 1970. Same with sambar
density increased 0.24/km² in 1970 to 2.0/km² in1989.
There is a pronounced effect of terrain and habitat structure upon the population,
distribution and group size of wild herbivore prey species. Ungulates preferred the
habitat types which fulfill their requirements e.g. highest densities of chital were
recorded in flat or plain topography harbors Tectona, Acacia and Zizyphus like
woodlands and in the ecotone areas with riverine habitats (khan et al. 1996). Similarly
Transect4 (T4) was on the hilly terrain and harbors lest density of ungulates especially

of chital, wild boar and nilgai. These habitats types and terrain provide ungulates food,
cover and shelter. Ultimately these places are also preferred by predators as far their
availability of food, cover and habitat structure are necessary for survival. The
differences in densities of chital and sambar in last 35 years are summarized in table 3
with three years data of 1970, 1989 (Khan et al. 1996) and 2006 (present study). The
transects (n = 4) routes on the map of Gir Protected Area (Map 1) their distances,
terrain, habitat types and main plant species are represented and summerised in table 4.
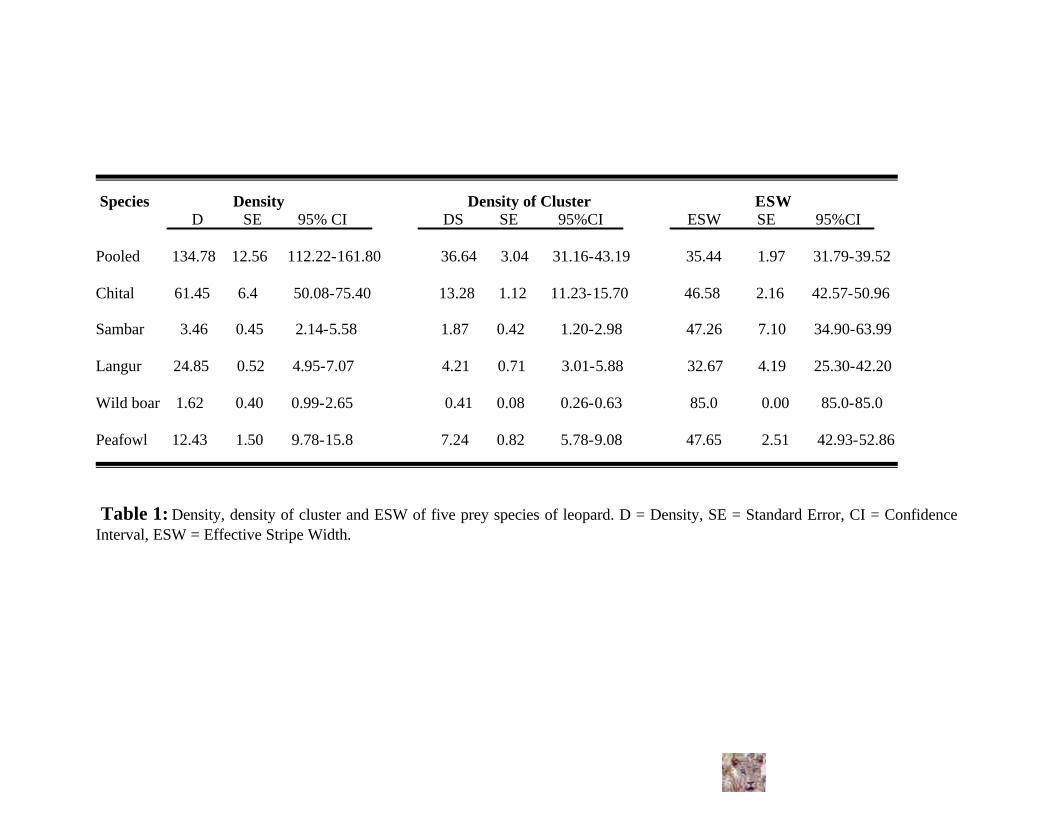
Species Density Density of Cluster ESW D SE 95% CI DS SE 95%CI ESW SE 95%CI Pooled 134.78 12.56 112.22-161.80 36.64 3.04 31.16-43.19 35.44 1.97 31.79-39.52 Chital 61.45 6.4 50.08-75.40 13.28 1.12 11.23-15.70 46.58 2.16 42.57-50.96 Sambar 3.46 0.45 2.14-5.58 1.87 0.42 1.20-2.98 47.26 7.10 34.90-63.99 Langur 24.85 0.52 4.95-7.07 4.21 0.71 3.01-5.88 32.67 4.19 25.30-42.20 Wild boar 1.62 0.40 0.99-2.65 0.41 0.08 0.26-0.63 85.0 0.00 85.0-85.0 Peafowl 12.43 1.50 9.78-15.8 7.24 0.82 5.78-9.08 47.65 2.51 42.93-52.86 Table 1: Density, density of cluster and ESW of five prey species of leopard. D = Density, SE = Standard Error, CI = Confidence Interval, ESW = Effective Stripe Width.

Species Encounter Rate Expected Cluster Size Mean Cluster Size n/L SE 95% CI E (S) SE 95% CI M (S) SE 95%CI Pooled 2.6 0.16 2.3-2.94 3.67 0.16 3.38-3.1 3.9 0.16 2.3-2.94 Chital 1.23 0.08 1.07-1.43 4.63 0.28 4.11-5.21 5.36 0.28 4.83-5.93 Sambar 0.18 0.03 0.12-0.24 1.85 0.17 1.52-2.30 1.84 0.16 1.54-2.20 Langur 0.27 0.03 0.22-0.34 5.90 0.52 4.95-7.03 5.35 0.52 4.68-6.12 Wild boar 0.07 0.01 0.04-0.10 3.93 0.50 2.99-5.16 3.93 0.50 2.99-5.16 Peafowl 0.69 0.06 0.56-0.84 1.71 0.07 1.57-1.86 1.61 0.08 1.44-1.80 Table 2: Encounter rate, Expected and Mean cluster size of five prey species of leopard. n/L = Encounter Rate, SE = Standard Error, CI = Confidence Interval, E (S) = Expected Cluster size, M (S) = Mean Cluster Size. Species 1970* 1989* 2006 Chital 3.57 50.8 61.45 Sambar 0.24 2.09 3.46 Table 3: Comparison of densities (animals/km²) of chital and sambar in Gir in 1970, 1989 and summer 2006. *Data source: Khan et al (1996).

Table 4: Presentation of transect routes, distance, terrain and habitat. CP=Check-Post s.t.=Starting Points Habitat: TAZ: Teak, Acacia and Zizyphus R: Riverine M: Mixed. Main Plant Species: Tectona grandis, Zizyphus species, Acacia species, Syzygium species, Ficus species, Carissa conjesta, Butea monosperma, Abrus precatorius, Bombax ceiba, Cassia fistula, Manilkara hexandra, Aegle marmelose, Boswellia serrata, Wrightia tinctoria, Phyllanthus emblica, Diospyros melanoxylon etc.
S.N. Transect Route
Length (Km)
Distance between s.t.
of two transects
(Km)
Terrain Habitat
T1 Bambaphod
to Raidi
3.6 Plain and Hilly
TAZ 0.9, between T1 and T2
T2 Akadia to Pillipat
4.1 Plain and stream
TAZ+R 2.5, between T2 and T3
T3 Kanki CP to Bawalwala
Chauk
3.2
Plain TAZ+M
T4 Umrawala shinda to Kapuriya
4.4
0.5 between T3 and T4
Hilly AZ+M

Chapter 4
Scat Analysis
4.1 Introduction
Estimating the consumption of any particular prey type by carnivores depends
upon the reliable analysis of diet. The analysis of either stomach contents
(Bothma 1965, Fritts et al. 1978, Smuts 1979) or scats (Reynolds et al. 1991,
Mukherjee et al. 1994, Biswas et al. 2002, Jethva et al. 2003) has become
fundamental tool in carnivore research. Of the two, scat analysis has the great
advantage that material is easy to collect and does not involve destruction of
animals from the study population. Scats provide much more material for
studies than any other predator signs, e.g. kill monitoring has not much sound
for food and feeding ecology of a predator like leopard because all the kills can
not be detected until unless a radio collared is attached with, scavenging is also
reported i.e. the preference among the kills can not be thoroughly analysed.
Contrast in case of scat analysis the prey species eaten by predator and
preference among them can also be studied. Leopard is a solitary, elusive and
shy animal and difficult to study its feeding habits in wild. The ability of leopard
to feed on a broad spectrum of prey items makes it the most successful predator
among big cats.
4.2 Methodology
4.2.1 Collection of Scats
“Scat” is defined as the cluster of individual feces deposited in a single act of
defecation (Khorozyan 2003). During summer 2005 under leopard ecology
project all the scats were collected. The leopard scats were identified on a basis of
field experience and the general criteria described in literature characteristic
“segmented” shape with mean diameter 2.7 cm (range 2.0 – 3.0 cm), pointed ends
many lobes (Karanth et al. 1995, Edgaonkar et al. 1998) and the scats create
confusion with that of lion sub-adult were not included in the analysis.
4.2.2 Analysis of Scats
The scats were crushed and observed carefully for the presence of indigestible
macro elements like claws, feathers etc.12 hairs were collected randomly per scat.
This size of hair collection per scat was standardized by analyzing 50 scats and a
total of 50 hairs per scat were examined and calculate the mean value. The
asymptote was attained at 24 hairs per scat at 100% Confidence Interval (CI)
and12 hairs for 95 % CI. The hairs were kept in xylol (xylene and ethyl alcohol)
for 24 hours. Slides were prepared with four hairs per slide i.e. three slides for
each scat, by mounting hairs in dpx. All the slides were examined under
microscope (Olympus) under 40X * 10X magnification. These hairs were
compared with known reference slides which were prepared the hairs collected
from different kills of wild ungulates and domestic livestock also. Reference
hairs were taken from different parts of the body such as belly, hind and neck
portion to minimize the bias of any unknown hair extracted from the scat as
there is a considerable difference of different hairs within the body,
microscopically.
The hairs were identified on the basis of structural differences like medullary
portion, cuticle, cortex and pigmentation in the cells (Koppikar et al. 1975). The
long hairs such those of buffalo, wild boar etc were cut in to three pieces of
proximal, middle and distal and then examined under microscope.
4.3 Data Analysis
A total of 71 scats were analysed of summer 2005 for studying the food habits of
leopard. Each prey item was recorded when it was examined under microscope,
in case of peafowl the feathers were examined visually at the time of hair
extraction and again examined under microscope. The total number of prey
species which were examined (i.e. total number of all prey species whenever they
were recorded) were cross checked through taking the frequency in percentage
at interval of 10 scats.
4.4 Results
4.4.1 Food Habits of Leopard: Analysis of 71 scats shows the diet of
leopard in summer-mansoon 2005. There is not a considerable difference in

single prey (35 scats) and two prey (30 scats) and 6 scats shows three prey items
(fig).
4.4.2 Diet of Leopard: There is a great diversity found in leopard scat, a total
of 12 prey items were recorded in the scats and there percentage occurrence is
summarized in the fig.
4.5 Discussion
The diet of a carnivore reflects both the availability of its potential prey items, as
well as a suite of morphological, behavioural and physiological adaptations that
allow the individual to locate, capture, ingest and digest a variety of prey taxa
(Kok et al. 2004)
The present study focus on the diet of leopard and it represents the aver all diet
spectrum in summer 2005. Sambar has the highest frequency (28.32%) in leopard
diet. It is not supported from the available literature by Mukherjee et al. i.e.
reported chital has the highest frequency (64.7%) in leopard diet followed by
sambar (20.2%) langur (15.33%) and other prey species. Here, chital is second
highest occurred prey species (23%). The highest frequency of sambar tends to
over – represent the larger prey, as they induce the production of a great number
of scats (Reynolds et al. 1991, Mukherjee et al. 2004) and leopard was also
reported scavenging on sambar kills made by lion. Chital is of course the one of
the best available, abundant and easy to prey. Langur is followed by chital i.e.

13.27% occurrence then civet has 11.5% in leopard scat. Hare is also one of the
preferred prey item has 7.96% of frequency of occurrence. Four horned antelope
is confined that’s why has the lowest frequency as like food dependency is equal
on dog and peafowl. Livestock has 4.42% frequency of occurrence include goat
(2.65%) and buffalo (1.77%) Mukherjee et al. reported 18% occurrence of livestock
includes buffalo and cow i.e. absent here in place of goat. Livestock depredation
in form of cubs of cow and buffalo and goat, scavenging was also recorded two
times on the kills of cow made by lion. Rodents (7.08%) got place after civet in
leopard diet and proof the adaptability to survive on such a small prey and feed
whatever is available and fluctuate the prey size from largest sambar to smallest
rodent in leopard diet.

1.7711.5
2.65
7.08
0.88
13.27
28.32
26
0.88
1.77
7.96
0.88
Fig.1: Percentage Occurrence of Prey species of leopard.
2628.32
7.96
0.88
1.7713.27
0.88
1.77
11.52.65
0.88
7.08
Fig. 2: Percentage occurrence of prey species of Leopard (3D view).
Chital Sambar BNH 4HA Wild boar Langur
Peafowl Buff Civet Goat Dog Rodent

26
28.32
7.96
0.881.77
13.27
0.881.77
11.5
2.65
0.88
7.08
0
5
10
15
20
25
30
Prey Species
Per
cen
tag
e O
ccu
ren
ce
Chital Sambr BNH 4HAWlldboar Langur Peafowl Buff.Civet Goat Dog Rodent
Fig. 3: Percentage occurrence of prey species of leopard.

0
5
10
15
20
25
30
35
40
Chital
Sam
bar
Hare
Chausinga
Wild boar
Langur
Peafow
l
Buff.
Civet
Goat
Dog
Rodent
Prey species
Mea
n ±
95%
C
L
Mean
Highervaluae
Lowervalue
Fig. 4: Mean Values with Confidence limits (CL) of Prey species of leopard.

Photograph 2: Leopard on the Chital Kill

Chapter 5
Kill Monitoring
5.1 Methodology
Very less is known about the hunting strategies or hunting behaviour of leopard
because there are very rare encounters to sight a hunting leopard due to its
nocturnal habits.
This study is an investigation of the kills made by leopard. The wild species in
the prey items of leopard include chital, chousinga, chinkara, sambar, wild boar,
civet, rodents, black napped hare, langur and peafowl. The work of kill
monitoring of leopard is actually done in the three months February, March and
April 2006.
5.2 Kill Searching
Six streams or riverine tracts (Map 2) were selected for kill searching and about
5km track was walked by foot everyday. The main aim is to select these areas for
searching is to give preference by ungulates for rich water and food resources
and leopard also prefer these areas as far the same food or natural resources are
concerned. The tendency to hide or store the kills by leopard under the bushes

and keep them on the branches of the trees, thus the bushes along the streams
and tree branches were thoroughly searched.
The kills were located using such cues as decomposition odour, prey alarm calls,
predator signs and activities of scavenging animals. When a kill was found then
it is classified in the following categories:
A. Fresh Kill: The kill is not consumed completely and chances that leopard
would return at the kill. Whenever a fresh kill was encountered, it was
monitored in morning and evening hours until the kill was completely
consumed.
B. Old kill: The kill is completely consumed and nothing remained in the kill
to feed for leopard. The time limitation 5-10 days and this time is recorded on the
basis of the condition of the kill, specially if some flesh is attached with some
bones then the activity of decomposers, condition of the carcass and the skin
attached on the limbs. These cues categorize the kill in the old kills.
C. Very Old Kill: The kill is completely consumed and older than the old kill
i.e. more than 10 days. The condition itself defines like no flesh is attached with
the kill, the bones are much white and shining to categorize it in the very old kill.
Kills which were confused with lion kill (n = 8) are recorded in the field but not
included in the analysis.
5.2 Guidelines Developed for Kill Identification
Two large cats exist in Gir sanctuary (leopard and lion) and for the correct
identification of the leopard kills I developed some guidelines which were
followed to identify the kill and distinguish the kill with lion. These guidelines
were developed on the basis of leopard old and fresh kills and lion fresh kills (n
= 14) and also the experience in the field on the old kills of the both cats.
A. Sighting of Leopard: It is the simplest way to decide whether the kill is of
leopard or not that if leopard is sighted at the kill (n = 2) on the condition that the
kill was made by leopard i.e. hunting was seen if not then sure evidences no
other predator had made the kill. Such cues as predator signs like pugmark or
claws marks if the kill is tried to climbed on the trees were also helpful.
B. Canine Marks: I have recorded the marks of the lower and upper canines
on the neck of the prey in some of the fresh kills (n = 4). Throat bite or neck bite is
usually done for hunting the prey, thus theses canines marks provide useful
information to identify the kill. I have measured these marks.
Space between lower and upper canine = 7.3 – 10.0 cm
Space between two upper canines = 3.4 – 3.8 cm
Space between two lower canines = 2.5 – 2.8 cm
C. Mode of Feeding: On the basis of the fresh kills of leopard and lion I
found there is a separate mode of feeding. Leopard opens the kill from the
ventral or lateral portion of the abdomen and take off the stomach and intestinal

or inedible portion and starts feeding from the abdominal portion, finish it and
reaches to the upper abdomen and chest and at last it feeds on the hind portion.
In contrast lion starts feeding from the hind portion first then reaches to the
abdomen and chest and neck at last.
D. Condition of the Kill: Condition of the kill also speaks about its predator.
In case of fresh kills the signs of dragging and lasts up to a bush where the cover
is almost about 100%, the tendency to hide the kill from lion, hyaena, jackal and
scavenging birds.
If the kill is climbed on a tree then claws marks on the tree trunk and branches
and it applicable for both old and fresh kill. I found in one of the fresh kill that
the leopard tried to take the kill on the tree but not succeed and in one of the old
kill, the claws marks were visible on the tree and the kill was just lying under the
tree.
E. Personal Communication: Information about the kill of leopard and lion
is taken from the forest staff and nesses. The aim to take the information about
lion kill is minimize the chances of confusing with that of leopard kill in future.
The kill is also confirmed with the help of these peoples like in any case of doubt
whether the kill is of leopard or lion. A total of six kills were informed from
which one kill was fresh and rests were old.
5.3 Collection of Data
At each kill the following parameters were recorded
a) Species, Sex, Reference Place, Time of finding the kill, Date and the probable
date when the kill was actually made.
b) GPS Location: Magellan 350. In case of fresh kill the gps is recorded of
fighting place, dragging at each point and of course where the kill was found.
c) Bone Marrow: For assessing the health status of the prey animal, the limb is
broken and bone marrow is examined visually.
d) Injury and Throat Bite: Any kinds of injury at any place, specially the softer
parts or openings of the body were examined. The canine marks on the neck
were measured.
e) Habitat, Cover and Vegetation: The type of habitat, the percentage of cover
(visually) and the major tree and bush species were also recorded.
f) Distance from Water Point: The distance of the nearest water point or water
accumulated areas from the kill is recorded.
g) Nearest Ness: Ness is the Maldhari settlement. Thus I assume ness as the
human habitation areas and the distance is recorded from the kill.
h) Jaws Collection: The lower jaw was collected from most of the kills. The age
estimation of the killed species is being done on the basis of the lower jaw
(Cohen et al.1977).
i) Dragging of the kills: Dragging of the fresh kills were measured and recorded
at each time whenever they were dragged from place to place to have an idea of
dragging done at different kills.
5.4 Results
5.4.1 Analysis of Kill Data
The total numbers of 45 kills were recorded during the study. Among them, 16
kills were fresh and 29 kills were old and very old. The analysis was carried out
on the basis of the parameters were recorded and separately for fresh and old
kills to estimate the species preyed, percentage killing rate of each species,
preference among the species, sex of the species and age group class of the
species.
5.4.2 Estimation of Age of Kills: On the basis of total kills (n = 45) they are
classified on the basis of different age classes.
i. Birth to 1.5 Years: Fawn or Young one
ii. 1.5 to 3 Years: Sub adult
iii. 3 to 5 Years: Adult
iv. More than 5 Years: Old
It is actually done on the basis of the relative structural differences in the tooth
structure at different age classes (Cohen et al. 1977) The lower third premolar
(P3), first molar (M1), second molar (M2) and third molar (M3) are taken in to

consideration, e.g. the P3 of chital and sambar fawns (birth to 1.5 years) is tri-
cusped looks like having three distinct sections, it is replaced by two cusped in
older than 1.5 years. In general, as the animal grows the upper surfaces of the
teeth become worn away and the chewing ridges become smooth and concave.
5.4.3 Estimation of Kills: The overall kills were found, percentage killing
rate of each species, preference among the species, sex of the species and age
group class of the species, preferred cover, distance from water points and nesses
of the fresh and old kills separately have been summarized in Tabel-5 and 6.
5.4.4 Dragging of the kills: Leopard face a great competition with lion,
hyaena, jackal and scavenging avian fauna like crow, kite, eagle and vulture that
either they overcome the kill like lion or feed on the leopard kill. Thus it is
important to store the kill at suitable places like under the dense bushes of
Carissa conjesta, Syzygium cumini etc.
In fresh kills the maximum and minimum dragging was recorded 150m and 5m
respectively and the average dragging was recorded 41.66m. Maximum dragging
was recorded in chital fawn, because it was light in weight i.e. easy to drag. The
minimum dragging was recorded in chital adult and sambar fawn. No dragging
was seen in one of the fresh kill of adult wild boar.
5.4.5 Kills taken over by Lion: There is a competition between leopard
and lion for utilization of natural resources and food is one of the very important
and necessary natural resource. As Eaton (1970) described lion is dominant over

leopard and this is also supported by snatching the kills from leopard. The total
of 16 fresh kills 6 were overcome by lion and among 29 old kills 3 were taken
over by lion i.e. a total of 9 kills taken over by lion.
5.5 Discussion
Chital was found the preferred species in the kills and males are more frequently
killed as comparison with females and followed by chital fawns. Not a single
adult sambar was being recorded but only a young one was killed in a fruit
orchard. Chital population is very large (data from prey abundance on the
transects recorded by the student), is the easily available species. Wild boar (n =
3) was also recorded and one of them was injured and old at the time of hunting
by leopard. Peafowl is one of the frequent species come across in the kill
monitoring. Langur is also one of the prey species in Gir forest and supported by
scat analysis but no kill was found in the kill monitoring.
The age-group class also one of the parameter which effect the prey selection.
Most of the kills of chital around 3 -5 years old or the adult ones followed by
young ones of chital and one sambar, followed by sub adult of chital and 5 kills
are of the age more than five years.
Average distance maintained from the nesses is about 1.87 km and the maximum
distance is about 4 km i.e. the human habitation areas were avoided at the time
of predation support that leopard is a shy cat and avoid disturbances, but the

minimum distance recorded was only 0.2 km on a chital fawn was preyed that
may be some of the individuals come near to the settlements areas or it may
supports the population of leopard which survives is at the fringes and show the
adaptability of this cat.
The availability of water at the time of predation has a very fluctuating role to
assume a relationship between point of killing and water point. The average
distance calculated about 0.39 km from the water point and the maximum and
minimum values are 2 km and 0.003 km respectively.
The tendency to store the kills under the bushes plays an important role i.e. the
selection of the maximum cover as 100% found in 12 kills but the cover was nil
(0%) was also found in 6 kills and the average cover was recorded 59.56%.
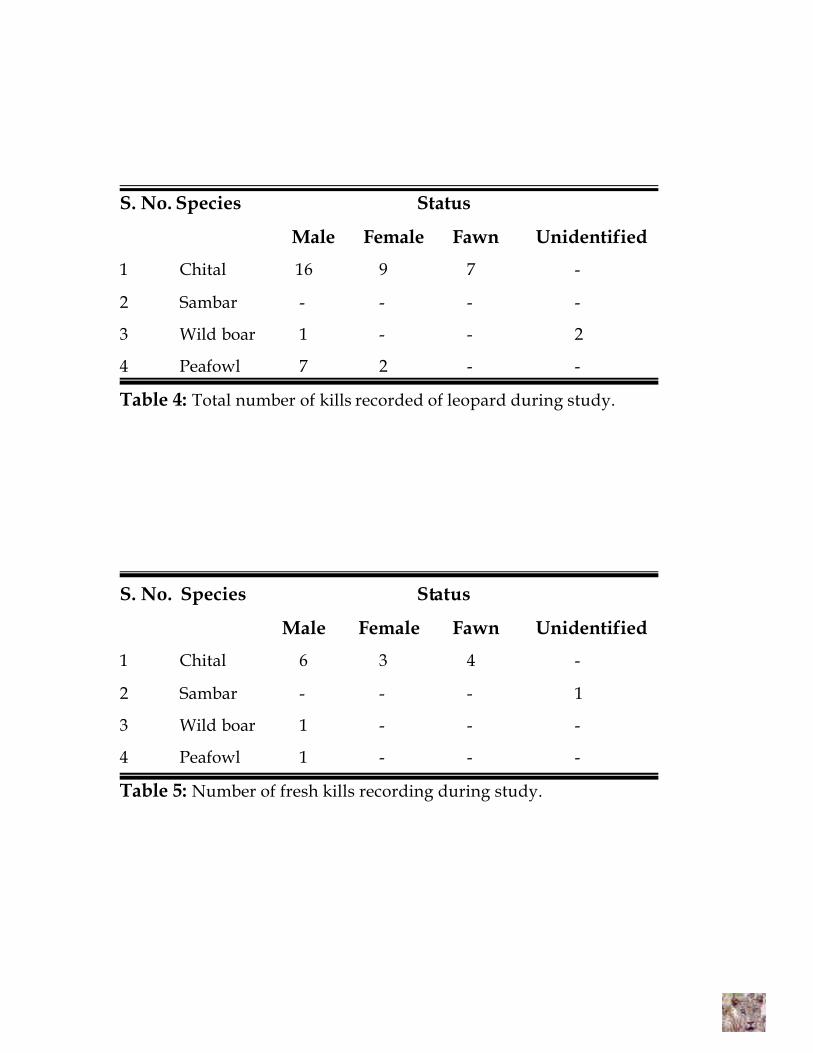
S. No. Species Status
Male Female Fawn Unidentified
1 Chital 16 9 7 -
2 Sambar - - - -
3 Wild boar 1 - - 2
4 Peafowl 7 2 - -
Table 4: Total number of kills recorded of leopard during study.
S. No. Species Status
Male Female Fawn Unidentified
1 Chital 6 3 4 -
2 Sambar - - - 1
3 Wild boar 1 - - -
4 Peafowl 1 - - -
Table 5: Number of fresh kills recording during study.
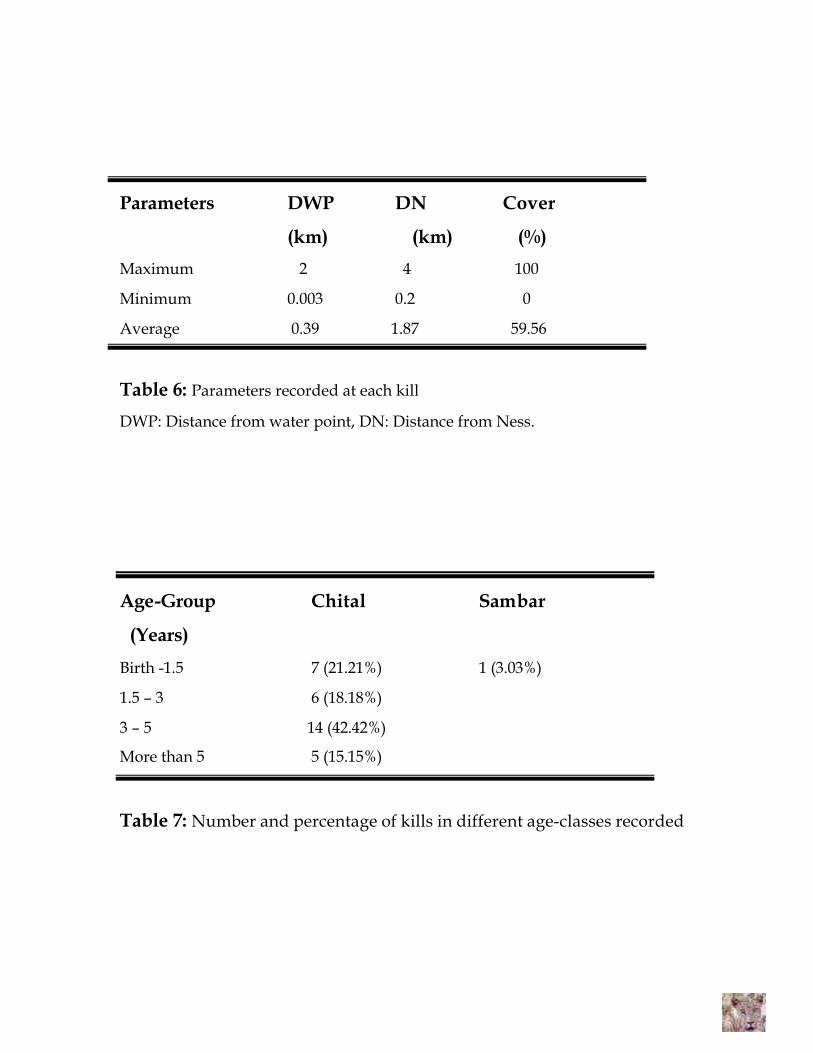
Parameters DWP DN Cover
(km) (km) (%)
Maximum 2 4 100
Minimum 0.003 0.2 0
Average 0.39 1.87 59.56
Table 6: Parameters recorded at each kill
DWP: Distance from water point, DN: Distance from Ness.
Age-Group Chital Sambar
(Years)
Birth -1.5 7 (21.21%) 1 (3.03%)
1.5 – 3 6 (18.18%)
3 – 5 14 (42.42%)
More than 5 5 (15.15%)
Table 7: Number and percentage of kills in different age-classes recorded

Photograph 1 (A and B): Fresh kill of female chital made by leopard.
A
B
Chapter 6
References
Khan J. A. 1996. Analysis of woody vegetation of Gir Lion Sanctuary and
National Park, Gujarat, India. Tropical Ecology, 37, 247 – 255.
Khan J. A., Chellam R., Rodgers W. A., Johnsingh A. J. T. 1996. Ungulate
densities and biomass in the tropical dry deciduous forests of Gir, Gujarat, India.
Journal of Tropical Ecology, 12, 149 – 162.
Karanth U. K., Sunquist M. E. 1995. Prey Selection by tiger, leopard and dhole in
tropical forests. Journal of Animal Ecology, 64, 439 – 450.
Karanth U. K., Sunquist M. E. 2000. Behavioural correlates of predation by tigers,
leopard and dhole in Nagarhole, India. J. Zool. Lond. 250, 255 – 265.
Karanth K. U., Sunquist M. E. 1992. Population structure, density and biomass of
large herbivores in the tropical forests of Nagarhole, India. Journal of Tropical
Ecology, 8, 21 – 35.
Karanth K. U., Nichols J. D., Kumar N. S., Link W. A., Hines J. E. 2004. Tigers and
their prey: predicting carnivore densities from prey abundance. PNAS, 101, 4854
– 4858.

Kohen J. A. 1977. Species identification and age classification of the jaws of some
common Indian ungulates near Mudumali Wildlife Snactuary. J. Bambay Nat.
Hist. Soc. 74, 246 – 248.
Smith D. W., Drummer T. D., Murphy K. M., Guernsey D. S., Evans S. B. 2004.
Winter prey selection and estimation of wolf kill rates in Yellowstone National
Park. J. Wildl. Manage. 68, 153 – 166.
Spong G., Johansson M., Bjorklund M. 2000. High genetic variation in leopards
indicates large and long-term stable effective population size. Molecular Ecology,
9, 1773 – 1782.
Miththapala S., Seidensticker J., O’Brien S. 1995. Phylogeographic subspecies
recognition in leopards (Panthera pardus): molecular genetic variation.
Conservation Biology, 10, 1115 – 1131.
Desai J. H. 1973. Observation on the reproductive biology and early postnatal
development of the panther, in captivity. J. Bombay Nat. Hist. Soc. 72, 293 – 304.
Chambers M. R., Santipiapillai C. 1983. Tourist activity and behaviour of the
leopard in the Ruhuna National Park, Sri Lanka. J. Bombay Nat. Hist. Soc. 81, 42
– 48.
Oli M. K. Taylor I. R. Rogers M. E. 1994. Snow leopard (Panthera uncia) predation
on livestock: an assessment of local predations in the Annpurna conservation
area, Nepal. Biological Conservation, 68, 63 – 68.
Baskaya S., Bilgili E. 2004. Does the leopard still exists in the eastern Karadeniz
mountain of Turkey? Oryx, 38, 228 – 232.
Bothma J. du P., Riche E. A. N. le. 1994. The relationship between minimum air
temperature and dsaily distances moved by Kalahari leopards. S. Afri. Tydskr.
Natuurnav, 24, 18 – 20.
Bothma J. du P., Riche E. A. N. le. 1994. Scat analysis and aspects of defecation in
northern Cape leopards. S. Afri. Tydskr. Natuurnav, 24, 21 – 25.
Bothma J. du P., Riche E. A. N. le. 1982. Prey preference and hunting efficiency of
the Kalahari desert leopard. 389 – 413. In Miller D. S., Everett D. D. Cats of the
world: biology, conservation and management.
Koppikar B. R., Sabins J. H. 1975. Identification of hairs of some Indian
mammals. J. Bombay Nat. Hist. Soc. 73, 5 – 20.
Mukherjee S. Goyal S. P. 2004. Determining the relationship between biomass
consumed and scat produced in captive Asiatic lions and leopards. J. Bombay
Nat. Hist. Soc. 101, 221 – 223.
Mukherjee S. Goyal S. P., Chellem R. 1994. Standardisation of scat analysis
techniques for leopard in Gir National, western India. Mammalia, 58, 139 – 143.
Mukherjee S. Goyal S. P., Johnsingh A. J. T., Pitman M. R. P. L. 2004. The
importance of rodents in the diet of jungle cat (Felis chaus), caracal (Caracal
caracal) and golden jackal (Canis aureus) in Sariska Tiger Reserve, Rajasthan,
India. J. Zool. Lond. 262, 405 – 411.

Reynolds J. C., Aebischer J. N. 1991. Comparison and quantification of carnivore
diet by faecal analysis: a critique, with recommendations, based on a study of the
fox (Vulpes vulpes). Mmmal Rev. 21, 97 – 122.
Jethva B.D., Jhala Y. V. 2003. Sample size considerations for food habits studies of
wolves from scats. Mammalia, 68, 589 – 591.
Atkinson R. P. D., Macdonald D. W., Kamizola R. 2002. Dietary opportunism in
side-stripped jackals (Canis adustus). J. Zool. Lond. 257, 129 – 139.
Khorozyan I. 2003. Camera photo trapping of the endangered leopards in
Armenia: a key element of species status assessment. Report submitted to
People’s Trust for Endangered species, UK.
Khorozyan I., Malkhasayan A., Asmaryan S. 2005. The Persian leopard prowls its
way to survival. Endangered Species Update, 22, 51 – 60.
Sankar K. S., Johnsingh A. J. T. 2002. Food habits of tiger and leopard in Sariska
Tiger Reserve, Rajasthan, India, as shown by scat analysis. Mammalia, 66, 285 –
289.
Bagchi S., Goyal S. P., Sankar K. 2003. prey abundance and prey selection by
tigers in a semi-arid, dry deciduous forest in western India. J. Zool. Lond. 260,
285 – 290.
Anderson D. R., Lakke J. L., Crain B. R., Burnham K. P. 1979. Guidelines for line
transect sampling of biological population. J. Wildl. Manage. 43, 70 – 78.

Oli M. K. 1994. Snow leopard and blue sheep in Nepal: densities and predator:
prey ratio. Journal of Mammalogy, 75, 998 – 1004.
Eberhardt L. L. 1978. Transects methods for population studies. J. Wildl. Manage.
42, 1 – 31.
Focardi S., Isotti R., Tinelli A. 2002. Line transect estimates of ungulate
populations in a Mediterranean forest. J. Wildl. Manage. 66, 48 – 58.
Herfindal I., Linell J. D. C., Odden J., Nilsen E. B., Anderson R. 2005. Prey
density, enviornmental productivity and home-range size in the Eurasian lynx
(Lynx lynx). J. Zool. Lond. 265. 63 – 71.
Biswas S., Sankar K. 2002. Prey abundance and food habit of tigers in Pench
National Park, Madhya Pradesh, India. J. Zool. Lond. 256, 411 – 420.
Stander P. E., Haden P. J., Kaquce, Ghau. 1997. The ecology of asociality in
Namibian leopards. J. Zool. Lond. 243, 343 – 364.
Pole A., Gordon I. J., Gorman M. L., Askill M. M. 2004. Prey selection by African
wild dogs (Lycon pictus) in southern Zimbabwe. J. Zool. Lond. 262, 207 – 215.
Rodgers W. A. 1991. Techniques for wildlife census in India, a field manual.
Technical Manual, Wildlife Institute of India.
Mondolfi E., Hoogesteijn R. 1982. Notes on the biology and status of the jaguar in
Venezuela. 85 – 123. In Miller D. S., Everett D. D. Cats of the world: biology,
conservation and management.

Orsdol K. V. G. 1982. Feeding behaviour and food intake of lions in Rwenzori
National Park, Uganda. 377 – 388. In Miller D. S., Everett D. D. Cats of the world:
biology, conservation and management.
Hornocker M., Theodore B. Natural regulation in three species of felids. 211 –
220. In Miller D. S., Everett D. D. Cats of the world: biology, conservation and
management.
Bailey T. N., 1993. The African leopard ecology and behaviour of a solitary felid.
Columbia University Press, New York.
Kok O.B., Nel J. A. J. 2004. Convergence and divergence in prey of sympatric
canids and felids: opportunism or phylogenetic constraint? Biological journal of
the Linnean Society, 83, 527 – 538.
Athreya V. R., Thakur S. S., Chaudhuri S., Belsare A. 2004. a study of the man –
leopard conflict in the Junnar Forest Division, Pune District, Maharashtra.
Submitted to the office of the Chief Wildlife warden, Nagpur. Maharashtra
Forest Department.
Goyal S. P. 2001. Man–eating leopards – status and ecology of leopard in Pauri
Garhwal, India. Carnivore Damage Prevention News, 3, 9 – 10.

Chapter 7
Appendices Appendix 1: List of Mammals at Gir Protected Area. (* Sighted in the field)
S.No. English Name Scientific Name 1 Leopard* Panthera pardus fusca 2 Lion* Panthera leo persica 3 Stripped Hyaena* Hyaena hyaena 4 Common Langur* Presbytis entellus 5 Desert cat Felis libyca 6 Rusty spotted cat Felis rubiginosa 7 Jungle cat Felis chaus 8 Jackal* Canis aureus 9 Indian fox Vulpes bengalensis 10 Indian ratel Mellivora capensis 11 Sambar* Cervus unicolor 12 Spotted deer* Cervus axis 13 Four horned antelope* Tetraceros quadricornis 14 Chinkara* Gazelle gazelle 15 Blue bull* Boselaphus tragocamelus 16 Wild boar* Sus scorfa 17 Small Indian civet* Viverricula indica 18 Common palm civet Paradoxurus hermaphroditus 19 Common mangoose* Herpestes edwardsi 20 Ruddy mangoose* Herpestes smithi 21 Small Indian mangoose Herpestes auropunctatus 22 Pangolin Manis carissacaudata 23 Pale hedgehog Paraechinus misfopus 24 Long eared hedgehog Hemiechinus auritus 25 Musk shrew Suncus murinus 26 Indian hare* Lepus nigricollis 27 Indian porcupine* Hystrix indica 28 Five stripped squirrel* Funambulus pennanti 29 Three stripped squirrel* Funambulus palmarum 30 Indian flying fox* Pteropus giganteus 31 Fulvous fruit bat Rousettus leschenaultia 32 Indian gerbille Tetera indica 33 Indian field mouse Mus boodgya

Appendix 2: List of Birds identified at Gir Protected Area
Appendix 2 : List of Birds Identified in Gir Protected AreaS.No. Common Name Scientific Name
1 Little cormorant Phalacrocorax niger 2 Grey heron Ardea cinerea 3 Pond heron Ardeola grayii 4 Cattle egret Bubulcus ibis 5 Large egret Ardea alba 6 Little egret Egretta grazetta 7 Painted stork Mycteria leucoecephala 8 Whitenecked stork Ciconia episcopus 9 White ibis Threskiornis aethiopicus 10 Black ibis Pseudibis paplliosa 11 Black shouldered kite Elanus caeruleus 12 Black kite Milvus migrans 13 Changeable hawk eagle Spizaetus cirrhatus 14 Bonelli’s eagle Hieraetus fascitus 15 Tawny eagle Aquilla rapax 16 Crested serpent eagle Spilornis cheela 17 Red headed vulture Sarcogyps calvus 18 White backed vulture Gyps bengalensis 19 Long-billed vulture Gyps indicus 20 Egyptian vulture Neophron percnopterus 21 Indian peafowl Pavo cristatus 22 White breasted water hen Amaurornis phoenicurus 23 Red wattled lapwing Vanellus indicus 24 Yellow wattled lapwing Vanellus malabaricus 25 Common sandpiper Tringa tetanus 26 Indian river tern Sterna aurantia 27 Chestnut bellied sandgrouse Pterocles exustus 28 Painted sandgrouse Pterocles indicus 29 Green pigeon Treron phoenicoptera 30 Blue rock pigeon Columba livia 31 Eurasian collared dove Streptopelia decaocta 32 Spotted dove Streptopelia chinensis 33 Laughing dove Streptopelia seneglansis 34 Roseringed parakeet Psittacula krameri

35 Blossomheaded parakeet Psittacula cyanocephala 36 Koel Eudynamys scolopaces 37 Crow pheasant Centropus sinensis 38 Brown fish owl Bubo zeylonsis 39 Spotted owlet Athene barma 40 House swift Apus affinis 41 Common kingfisher Alcedo athis 42 Whitebreasted kingfisher Halcyon smyrensis 43 Green bee eater Merops orientalis 44 Indian roller Coracias benghalensis 45 Hoopoe Upapa epops 46 Crimson breasted barbet Magalaima haemacephala 47 Goldenbacked woodpecker Dinopium benghalensis 48 Pygmy woodpecker Picioedes canicapillus 49 Black drongo Dicrurus adsimilis 50 Brahminy myna Sturnus pagodarum 51 Common myna Acridotheres tristis 52 Bank myna Acridotheres ginginianus 53 Jungla myna Acridotheres fuscus 54 Indian treepie Dendroditta vagabunda 55 House crow Corvus splendes 56 Jungla crow Corvus macrorhynchos 57 Small minivet Pericrocotus cinnamoneus 58 Common iora Pericrocotus tiphia 59 Redvented bulbul Pycnonotus cafer 60 Common babbler Turdoides caudatus 61 Large grey babbler Turdoides malcolmi 62 Jungla babbler Turoides straitus 63 Rufoustailed flycatcher Muscicapa ruficauda 64 Tickell’s blue flycatcher Muscicapa tickellioe 65 Papadise flycatcher Tersiphone paradisi 66 Tailor bird Orthotomus sutorius 67 Magpie robin Copsychus saularis 68 Common redstart Phoenicurus phoenicurus
69 Indian robin Saxicoloides fulicata 70 Yellow wagtail Motacilla flava 70 Purple sunbird Nectarina asiatica 72 Oriental white eye Zosterops palpebrosus 73 House sparrow Passer domesticus 74 Indian baya Ploceus philippinus 75 Grey shrike Lanius excubitor