Embed Size (px)
Citation preview
Molecular Ecology (2009) doi: 10.1111/j.1365-294X.2009.04134.x
© 2009 Blackwell Publishing Ltd
Blackwell Publishing LtdPhylogeography of lions (Panthera leo ssp.) reveals three distinct taxa and a late Pleistocene reduction in genetic diversity
ROSS BARNETT,* BETH SHAPIRO,† IAN BARNES,‡ S IMON Y. W. HO,§ JOACHIM BURGER,¶ NOBUYUKI YAMAGUCHI,** THOMAS F. G . HIGHAM,†† H. TODD WHEELER,‡‡ WILFRIED ROSENDAHL,§§ ANDREI V. SHER,¶¶,‡‡‡‡ MARINA SOTNIKOVA,*** TATIANA KUZNETSOVA,††† GENNADY F. BARYSHNIKOV,‡‡‡ LARRY D. MARTIN,§§§ C. RICHARD HARINGTON,¶¶¶ JAMES A. BURNS**** and ALAN COOPER††††*Department of Zoology, University of Oxford, Oxford OX1 3PS, UK, †Department of Biology, Pennsylvania State University, University Park, PA 16801, USA, ‡Department of Biology, University College London, London WC1E 6BT, UK, §Centre for Macroevolution and Macroecology, School of Botany and Zoology, Australian National University, Canberra, ACT 0200, Australia, ¶Institute of Anthropology, Mainz University, 55099 Mainz, Germany, **Department of Biological and Environmental Sciences, University of Qatar, PO Box 2713, Doha, Qatar, ††Research Laboratory for Archaeology, University of Oxford, Oxford OX1 3QJ, UK, ‡‡George C. Page Museum of La Brea Discoveries, Los Angeles, CA 90036, USA, §§Reiss-Engelhorn-Museen, D-68159 Mannheim, Germany, ¶¶Severtsov Institute of Ecology and Evolution, Russian Academy of Sciences, 119071 Moscow, Russia, ***Geological Institute, Russian Academy of Sciences, 119017 Moscow, Russia, †††Palaeontological Department, Geological Faculty, Moscow State University, 119899 Moscow, Russia, ‡‡‡Zoological Institute, Russian Academy of Sciences, 199034 St Petersburg, Russia, §§§Department of Ecology and Evolutionary Biology, University of Kansas, Lawrence, KS 66045, USA, ¶¶¶Canadian Museum of Nature (Palaeobiology), Ottawa, ON, Canada K1P 6P4, ****Quaternary Palaeontology, Royal Alberta Museum, Edmonton, AB, Canada T5N 0M6, ††††School of Earth and Environmental Sciences, University of Adelaide, Adelaide, SA 5005, Australia
Abstract
Lions were the most widespread carnivores in the late Pleistocene, ranging from southernAfrica to the southern USA, but little is known about the evolutionary relationships amongthese Pleistocene populations or the dynamics that led to their extinction. Using ancient DNAtechniques, we obtained mitochondrial sequences from 52 individuals sampled across thepresent and former range of lions. Phylogenetic analysis revealed three distinct clusters: (i)modern lions, Panthera leo; (ii) extinct Pleistocene cave lions, which formed a homogeneouspopulation extending from Europe across Beringia (Siberia, Alaska and western Canada); and(iii) extinct American lions, which formed a separate population south of the Pleistocene icesheets. The American lion appears to have become genetically isolated around 340 000 yearsago, despite the apparent lack of significant barriers to gene flow with Beringian populationsthrough much of the late Pleistocene. We found potential evidence of a severe populationbottleneck in the cave lion during the previous interstadial, sometime after 48 000 years,adding to evidence from bison, mammoths, horses and brown bears that megafaunal popu-lations underwent major genetic alterations throughout the last interstadial, potentiallypresaging the processes involved in the subsequent end-Pleistocene mass extinctions.
Keywords: American lion, ancient DNA, Beringia, cave lion, extinction, megafauna
Received 3 October 2008; revision received 6 January 2009; accepted 15 January 2009
Introduction
Lions currently survive only in parts of Africa and India,yet as recently as the late Pleistocene (LP), large andmorphologically diverse forms of lion were distributedacross the Northern Hemisphere. Lions survived in Europe,
Correspondence: Ross Barnett, E-mail: [email protected];Alan Cooper, Australian Centre for Ancient DNA, School of Earthand Environmental Sciences, University of Adelaide, Adelaide,SA 5005, Australia. E-mail: [email protected]‡‡‡‡Deceased.
2 R . B A R N E T T E T A L .
© 2009 Blackwell Publishing Ltd
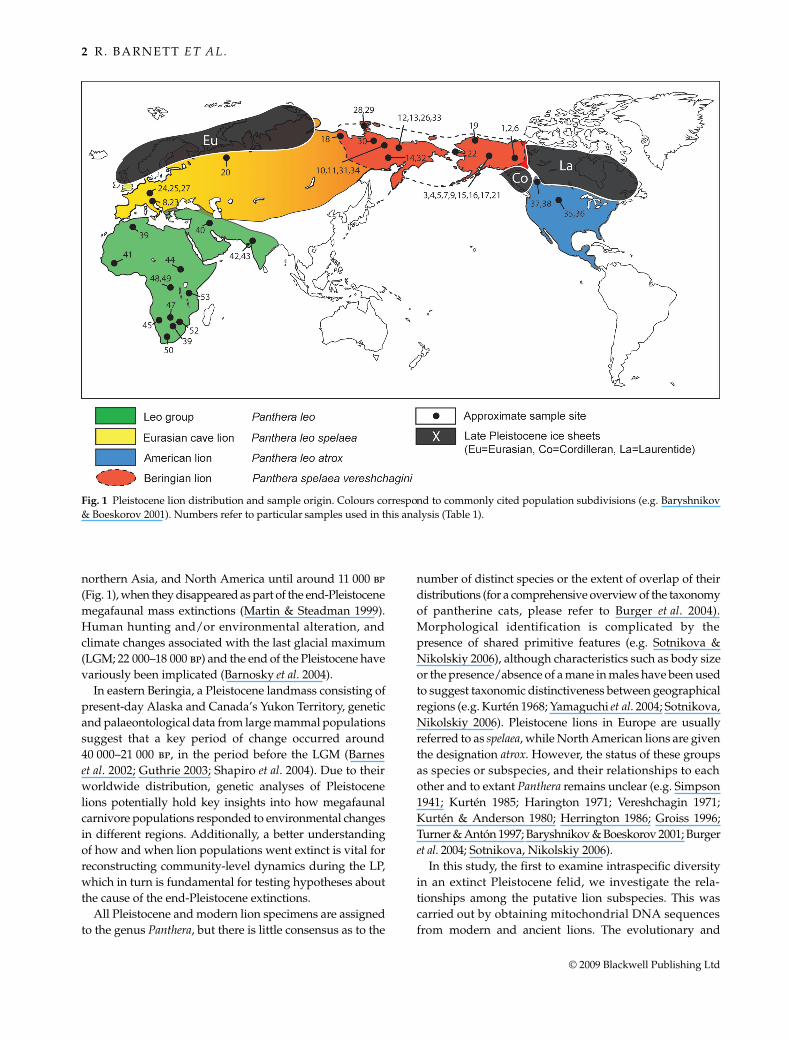
northern Asia, and North America until around 11 000 bp(Fig. 1), when they disappeared as part of the end-Pleistocenemegafaunal mass extinctions (Martin & Steadman 1999).Human hunting and/or environmental alteration, andclimate changes associated with the last glacial maximum(LGM; 22 000–18 000 bp) and the end of the Pleistocene havevariously been implicated (Barnosky et al. 2004).
In eastern Beringia, a Pleistocene landmass consisting ofpresent-day Alaska and Canada’s Yukon Territory, geneticand palaeontological data from large mammal populationssuggest that a key period of change occurred around40 000–21 000 bp, in the period before the LGM (Barneset al. 2002; Guthrie 2003; Shapiro et al. 2004). Due to theirworldwide distribution, genetic analyses of Pleistocenelions potentially hold key insights into how megafaunalcarnivore populations responded to environmental changesin different regions. Additionally, a better understandingof how and when lion populations went extinct is vital forreconstructing community-level dynamics during the LP,which in turn is fundamental for testing hypotheses aboutthe cause of the end-Pleistocene extinctions.
All Pleistocene and modern lion specimens are assignedto the genus Panthera, but there is little consensus as to the
number of distinct species or the extent of overlap of theirdistributions (for a comprehensive overview of the taxonomyof pantherine cats, please refer to Burger et al. 2004).Morphological identification is complicated by thepresence of shared primitive features (e.g. Sotnikova &Nikolskiy 2006), although characteristics such as body sizeor the presence/absence of a mane in males have been usedto suggest taxonomic distinctiveness between geographicalregions (e.g. Kurtén 1968; Yamaguchi et al. 2004; Sotnikova,Nikolskiy 2006). Pleistocene lions in Europe are usuallyreferred to as spelaea, while North American lions are giventhe designation atrox. However, the status of these groupsas species or subspecies, and their relationships to eachother and to extant Panthera remains unclear (e.g. Simpson1941; Kurtén 1985; Harington 1971; Vereshchagin 1971;Kurtén & Anderson 1980; Herrington 1986; Groiss 1996;Turner & Antón 1997; Baryshnikov & Boeskorov 2001; Burgeret al. 2004; Sotnikova, Nikolskiy 2006).
In this study, the first to examine intraspecific diversityin an extinct Pleistocene felid, we investigate the rela-tionships among the putative lion subspecies. This wascarried out by obtaining mitochondrial DNA sequencesfrom modern and ancient lions. The evolutionary and
Fig. 1 Pleistocene lion distribution and sample origin. Colours correspond to commonly cited population subdivisions (e.g. Baryshnikov& Boeskorov 2001). Numbers refer to particular samples used in this analysis (Table 1).
P H Y L O G E O G R A P H Y O F P L E I S TO C E N E L I O N S 3
© 2009 Blackwell Publishing Ltd
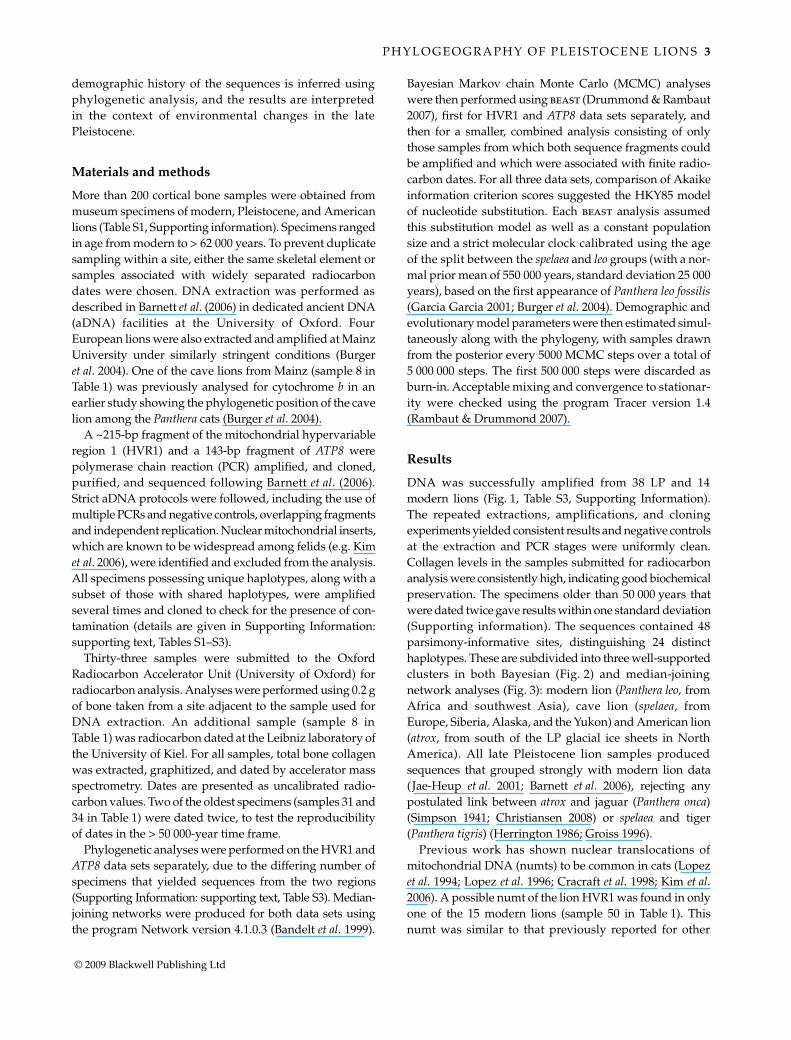
demographic history of the sequences is inferred usingphylogenetic analysis, and the results are interpretedin the context of environmental changes in the latePleistocene.
Materials and methods
More than 200 cortical bone samples were obtained frommuseum specimens of modern, Pleistocene, and Americanlions (Table S1, Supporting information). Specimens rangedin age from modern to > 62 000 years. To prevent duplicatesampling within a site, either the same skeletal element orsamples associated with widely separated radiocarbondates were chosen. DNA extraction was performed asdescribed in Barnett et al. (2006) in dedicated ancient DNA(aDNA) facilities at the University of Oxford. FourEuropean lions were also extracted and amplified at MainzUniversity under similarly stringent conditions (Burgeret al. 2004). One of the cave lions from Mainz (sample 8 inTable 1) was previously analysed for cytochrome b in anearlier study showing the phylogenetic position of the cavelion among the Panthera cats (Burger et al. 2004).
A ~215-bp fragment of the mitochondrial hypervariableregion 1 (HVR1) and a 143-bp fragment of ATP8 werepolymerase chain reaction (PCR) amplified, and cloned,purified, and sequenced following Barnett et al. (2006).Strict aDNA protocols were followed, including the use ofmultiple PCRs and negative controls, overlapping fragmentsand independent replication. Nuclear mitochondrial inserts,which are known to be widespread among felids (e.g. Kimet al. 2006), were identified and excluded from the analysis.All specimens possessing unique haplotypes, along with asubset of those with shared haplotypes, were amplifiedseveral times and cloned to check for the presence of con-tamination (details are given in Supporting Information:supporting text, Tables S1–S3).
Thirty-three samples were submitted to the OxfordRadiocarbon Accelerator Unit (University of Oxford) forradiocarbon analysis. Analyses were performed using 0.2 gof bone taken from a site adjacent to the sample used forDNA extraction. An additional sample (sample 8 inTable 1) was radiocarbon dated at the Leibniz laboratory ofthe University of Kiel. For all samples, total bone collagenwas extracted, graphitized, and dated by accelerator massspectrometry. Dates are presented as uncalibrated radio-carbon values. Two of the oldest specimens (samples 31 and34 in Table 1) were dated twice, to test the reproducibilityof dates in the > 50 000-year time frame.
Phylogenetic analyses were performed on the HVR1 andATP8 data sets separately, due to the differing number ofspecimens that yielded sequences from the two regions(Supporting Information: supporting text, Table S3). Median-joining networks were produced for both data sets usingthe program Network version 4.1.0.3 (Bandelt et al. 1999).
Bayesian Markov chain Monte Carlo (MCMC) analyseswere then performed using beast (Drummond & Rambaut2007), first for HVR1 and ATP8 data sets separately, andthen for a smaller, combined analysis consisting of onlythose samples from which both sequence fragments couldbe amplified and which were associated with finite radio-carbon dates. For all three data sets, comparison of Akaikeinformation criterion scores suggested the HKY85 modelof nucleotide substitution. Each beast analysis assumedthis substitution model as well as a constant populationsize and a strict molecular clock calibrated using the ageof the split between the spelaea and leo groups (with a nor-mal prior mean of 550 000 years, standard deviation 25 000years), based on the first appearance of Panthera leo fossilis(Garcia Garcia 2001; Burger et al. 2004). Demographic andevolutionary model parameters were then estimated simul-taneously along with the phylogeny, with samples drawnfrom the posterior every 5000 MCMC steps over a total of5 000 000 steps. The first 500 000 steps were discarded asburn-in. Acceptable mixing and convergence to stationar-ity were checked using the program Tracer version 1.4(Rambaut & Drummond 2007).
Results
DNA was successfully amplified from 38 LP and 14modern lions (Fig. 1, Table S3, Supporting Information).The repeated extractions, amplifications, and cloningexperiments yielded consistent results and negative controlsat the extraction and PCR stages were uniformly clean.Collagen levels in the samples submitted for radiocarbonanalysis were consistently high, indicating good biochemicalpreservation. The specimens older than 50 000 years thatwere dated twice gave results within one standard deviation(Supporting information). The sequences contained 48parsimony-informative sites, distinguishing 24 distincthaplotypes. These are subdivided into three well-supportedclusters in both Bayesian (Fig. 2) and median-joiningnetwork analyses (Fig. 3): modern lion (Panthera leo, fromAfrica and southwest Asia), cave lion (spelaea, fromEurope, Siberia, Alaska, and the Yukon) and American lion(atrox, from south of the LP glacial ice sheets in NorthAmerica). All late Pleistocene lion samples producedsequences that grouped strongly with modern lion data(Jae-Heup et al. 2001; Barnett et al. 2006), rejecting anypostulated link between atrox and jaguar (Panthera onca)(Simpson 1941; Christiansen 2008) or spelaea and tiger(Panthera tigris) (Herrington 1986; Groiss 1996).
Previous work has shown nuclear translocations ofmitochondrial DNA (numts) to be common in cats (Lopezet al. 1994; Lopez et al. 1996; Cracraft et al. 1998; Kim et al.2006). A possible numt of the lion HVR1 was found in onlyone of the 15 modern lions (sample 50 in Table 1). Thisnumt was similar to that previously reported for other
4R
. BA
RN
ET
T E
TA
L.
© 2009 Blackw
ell Publishing Ltd
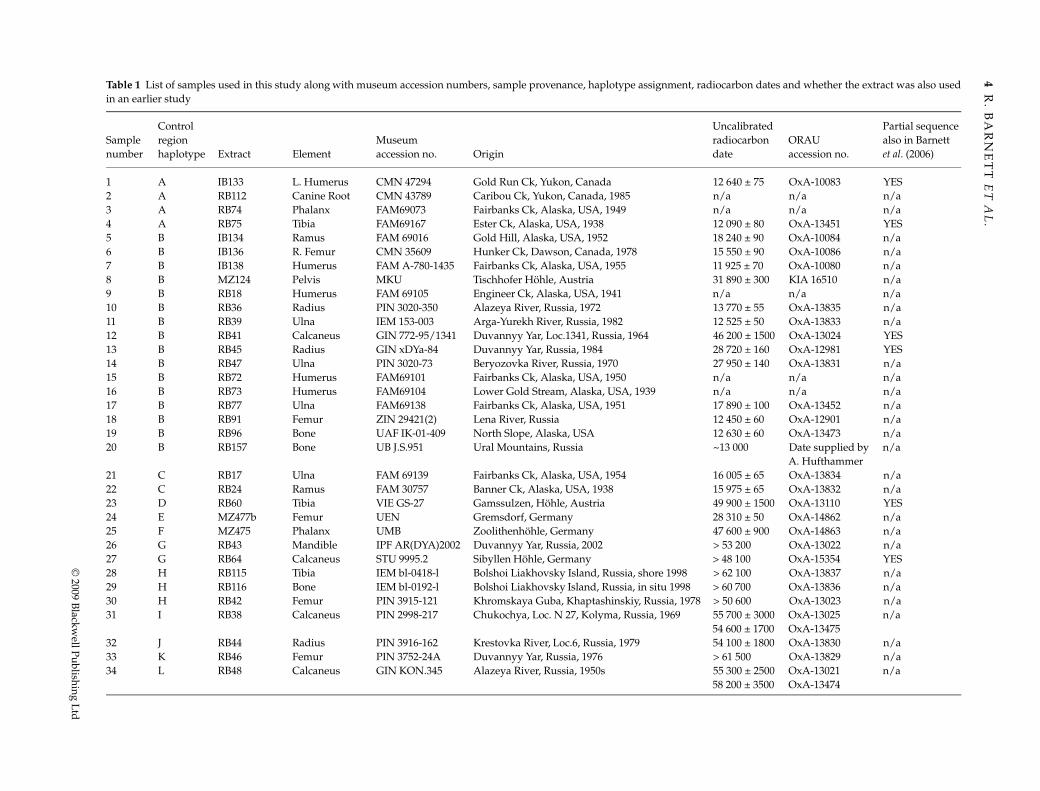
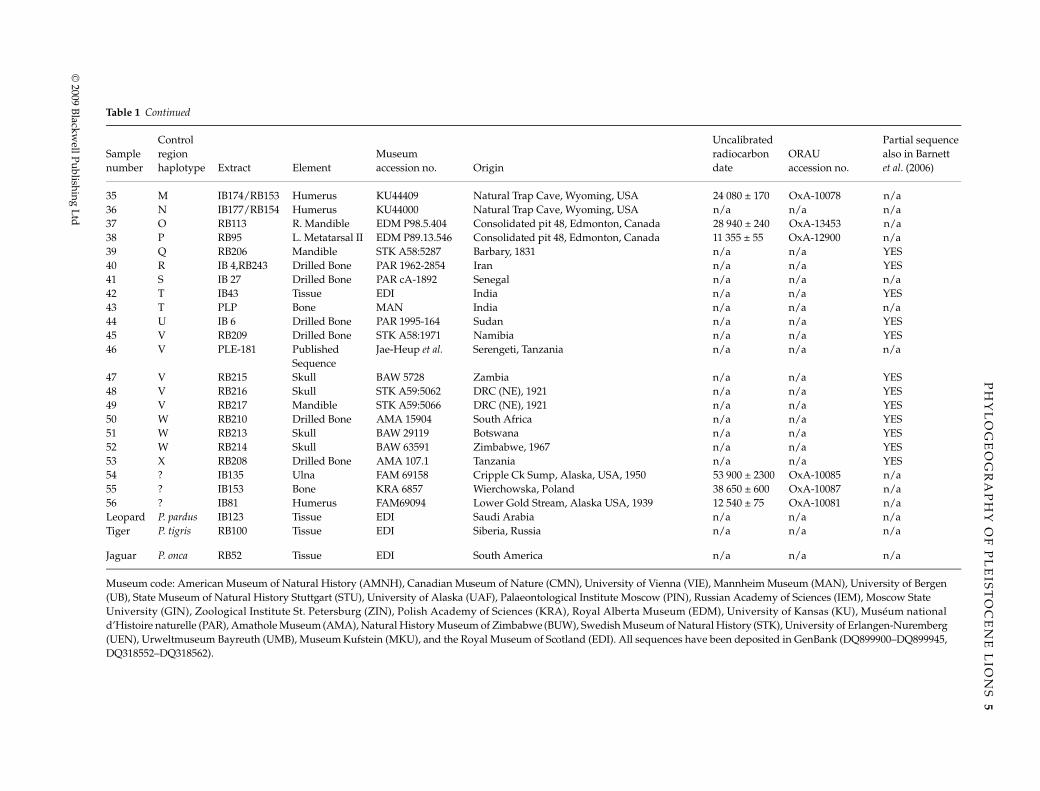
Table 1 List of samples used in this study along with museum accession numbers, sample provenance, haplotype assignment, radiocarbon dates and whether the extract was also usedin an earlier study
Sample number
Control region haplotype Extract Element
Museum accession no. Origin
Uncalibrated radiocarbon date
ORAU accession no.
Partial sequence also in Barnett et al. (2006)
1 A IB133 L. Humerus CMN 47294 Gold Run Ck, Yukon, Canada 12 640 ± 75 OxA-10083 YES2 A RB112 Canine Root CMN 43789 Caribou Ck, Yukon, Canada, 1985 n/a n/a n/a3 A RB74 Phalanx FAM69073 Fairbanks Ck, Alaska, USA, 1949 n/a n/a n/a4 A RB75 Tibia FAM69167 Ester Ck, Alaska, USA, 1938 12 090 ± 80 OxA-13451 YES5 B IB134 Ramus FAM 69016 Gold Hill, Alaska, USA, 1952 18 240 ± 90 OxA-10084 n/a6 B IB136 R. Femur CMN 35609 Hunker Ck, Dawson, Canada, 1978 15 550 ± 90 OxA-10086 n/a7 B IB138 Humerus FAM A-780-1435 Fairbanks Ck, Alaska, USA, 1955 11 925 ± 70 OxA-10080 n/a8 B MZ124 Pelvis MKU Tischhofer Höhle, Austria 31 890 ± 300 KIA 16510 n/a9 B RB18 Humerus FAM 69105 Engineer Ck, Alaska, USA, 1941 n/a n/a n/a10 B RB36 Radius PIN 3020-350 Alazeya River, Russia, 1972 13 770 ± 55 OxA-13835 n/a11 B RB39 Ulna IEM 153-003 Arga-Yurekh River, Russia, 1982 12 525 ± 50 OxA-13833 n/a12 B RB41 Calcaneus GIN 772-95/1341 Duvannyy Yar, Loc.1341, Russia, 1964 46 200 ± 1500 OxA-13024 YES13 B RB45 Radius GIN xDYa-84 Duvannyy Yar, Russia, 1984 28 720 ± 160 OxA-12981 YES14 B RB47 Ulna PIN 3020-73 Beryozovka River, Russia, 1970 27 950 ± 140 OxA-13831 n/a15 B RB72 Humerus FAM69101 Fairbanks Ck, Alaska, USA, 1950 n/a n/a n/a16 B RB73 Humerus FAM69104 Lower Gold Stream, Alaska, USA, 1939 n/a n/a n/a17 B RB77 Ulna FAM69138 Fairbanks Ck, Alaska, USA, 1951 17 890 ± 100 OxA-13452 n/a18 B RB91 Femur ZIN 29421(2) Lena River, Russia 12 450 ± 60 OxA-12901 n/a19 B RB96 Bone UAF IK-01-409 North Slope, Alaska, USA 12 630 ± 60 OxA-13473 n/a20 B RB157 Bone UB J.S.951 Ural Mountains, Russia ~13 000 Date supplied by
A. Hufthammern/a
21 C RB17 Ulna FAM 69139 Fairbanks Ck, Alaska, USA, 1954 16 005 ± 65 OxA-13834 n/a22 C RB24 Ramus FAM 30757 Banner Ck, Alaska, USA, 1938 15 975 ± 65 OxA-13832 n/a23 D RB60 Tibia VIE GS-27 Gamssulzen, Höhle, Austria 49 900 ± 1500 OxA-13110 YES24 E MZ477b Femur UEN Gremsdorf, Germany 28 310 ± 50 OxA-14862 n/a25 F MZ475 Phalanx UMB Zoolithenhöhle, Germany 47 600 ± 900 OxA-14863 n/a26 G RB43 Mandible IPF AR(DYA)2002 Duvannyy Yar, Russia, 2002 > 53 200 OxA-13022 n/a27 G RB64 Calcaneus STU 9995.2 Sibyllen Höhle, Germany > 48 100 OxA-15354 YES28 H RB115 Tibia IEM bl-0418-l Bolshoi Liakhovsky Island, Russia, shore 1998 > 62 100 OxA-13837 n/a29 H RB116 Bone IEM bl-0192-l Bolshoi Liakhovsky Island, Russia, in situ 1998 > 60 700 OxA-13836 n/a30 H RB42 Femur PIN 3915-121 Khromskaya Guba, Khaptashinskiy, Russia, 1978 > 50 600 OxA-13023 n/a31 I RB38 Calcaneus PIN 2998-217 Chukochya, Loc. N 27, Kolyma, Russia, 1969 55 700 ± 3000
54 600 ± 1700OxA-13025 OxA-13475
n/a
32 J RB44 Radius PIN 3916-162 Krestovka River, Loc.6, Russia, 1979 54 100 ± 1800 OxA-13830 n/a33 K RB46 Femur PIN 3752-24A Duvannyy Yar, Russia, 1976 > 61 500 OxA-13829 n/a34 L RB48 Calcaneus GIN KON.345 Alazeya River, Russia, 1950s 55 300 ± 2500
58 200 ± 3500OxA-13021 OxA-13474
n/a
PH
YL
OG
EO
GR
AP
HY
OF
PL
EIS
TO
CE
NE
LIO
NS
5
© 2009 Blackw
ell Publishing Ltd
35 M IB174/RB153 Humerus KU44409 Natural Trap Cave, Wyoming, USA 24 080 ± 170 OxA-10078 n/a36 N IB177/RB154 Humerus KU44000 Natural Trap Cave, Wyoming, USA n/a n/a n/a37 O RB113 R. Mandible EDM P98.5.404 Consolidated pit 48, Edmonton, Canada 28 940 ± 240 OxA-13453 n/a38 P RB95 L. Metatarsal II EDM P89.13.546 Consolidated pit 48, Edmonton, Canada 11 355 ± 55 OxA-12900 n/a39 Q RB206 Mandible STK A58:5287 Barbary, 1831 n/a n/a YES40 R IB 4,RB243 Drilled Bone PAR 1962-2854 Iran n/a n/a YES41 S IB 27 Drilled Bone PAR cA-1892 Senegal n/a n/a n/a42 T IB43 Tissue EDI India n/a n/a YES43 T PLP Bone MAN India n/a n/a n/a44 U IB 6 Drilled Bone PAR 1995-164 Sudan n/a n/a YES45 V RB209 Drilled Bone STK A58:1971 Namibia n/a n/a YES46 V PLE-181 Published
SequenceJae-Heup et al. Serengeti, Tanzania n/a n/a n/a
47 V RB215 Skull BAW 5728 Zambia n/a n/a YES48 V RB216 Skull STK A59:5062 DRC (NE), 1921 n/a n/a YES49 V RB217 Mandible STK A59:5066 DRC (NE), 1921 n/a n/a YES50 W RB210 Drilled Bone AMA 15904 South Africa n/a n/a YES51 W RB213 Skull BAW 29119 Botswana n/a n/a YES52 W RB214 Skull BAW 63591 Zimbabwe, 1967 n/a n/a YES53 X RB208 Drilled Bone AMA 107.1 Tanzania n/a n/a YES54 ? IB135 Ulna FAM 69158 Cripple Ck Sump, Alaska, USA, 1950 53 900 ± 2300 OxA-10085 n/a55 ? IB153 Bone KRA 6857 Wierchowska, Poland 38 650 ± 600 OxA-10087 n/a56 ? IB81 Humerus FAM69094 Lower Gold Stream, Alaska USA, 1939 12 540 ± 75 OxA-10081 n/aLeopard P. pardus IB123 Tissue EDI Saudi Arabia n/a n/a n/aTiger P. tigris RB100 Tissue EDI Siberia, Russia n/a n/a n/a
Jaguar P. onca RB52 Tissue EDI South America n/a n/a n/a
Museum code: American Museum of Natural History (AMNH), Canadian Museum of Nature (CMN), University of Vienna (VIE), Mannheim Museum (MAN), University of Bergen (UB), State Museum of Natural History Stuttgart (STU), University of Alaska (UAF), Palaeontological Institute Moscow (PIN), Russian Academy of Sciences (IEM), Moscow State University (GIN), Zoological Institute St. Petersburg (ZIN), Polish Academy of Sciences (KRA), Royal Alberta Museum (EDM), University of Kansas (KU), Muséum national d’Histoire naturelle (PAR), Amathole Museum (AMA), Natural History Museum of Zimbabwe (BUW), Swedish Museum of Natural History (STK), University of Erlangen-Nuremberg (UEN), Urweltmuseum Bayreuth (UMB), Museum Kufstein (MKU), and the Royal Museum of Scotland (EDI). All sequences have been deposited in GenBank (DQ899900–DQ899945, DQ318552–DQ318562).
Sample number
Control region haplotype Extract Element
Museum accession no. Origin
Uncalibrated radiocarbon date
ORAU accession no.
Partial sequence also in Barnett et al. (2006)
Table 1 Continued
6 R . B A R N E T T E T A L .
© 2009 Blackwell Publishing Ltd
pantherines (Cracraft et al. 1998; Kim et al. 2006) and washighly divergent from the target mitochondrial locus.A nuclear copy of the ATP8 gene was also detected inseveral lion specimens, as well as in leopard and tiger. TheATP8 numt sequences clustered in a basal position in thephylogeny, and were also distinguished by an adenineinsertion in the tiger sequence and a stop codon in theleopard sequence.
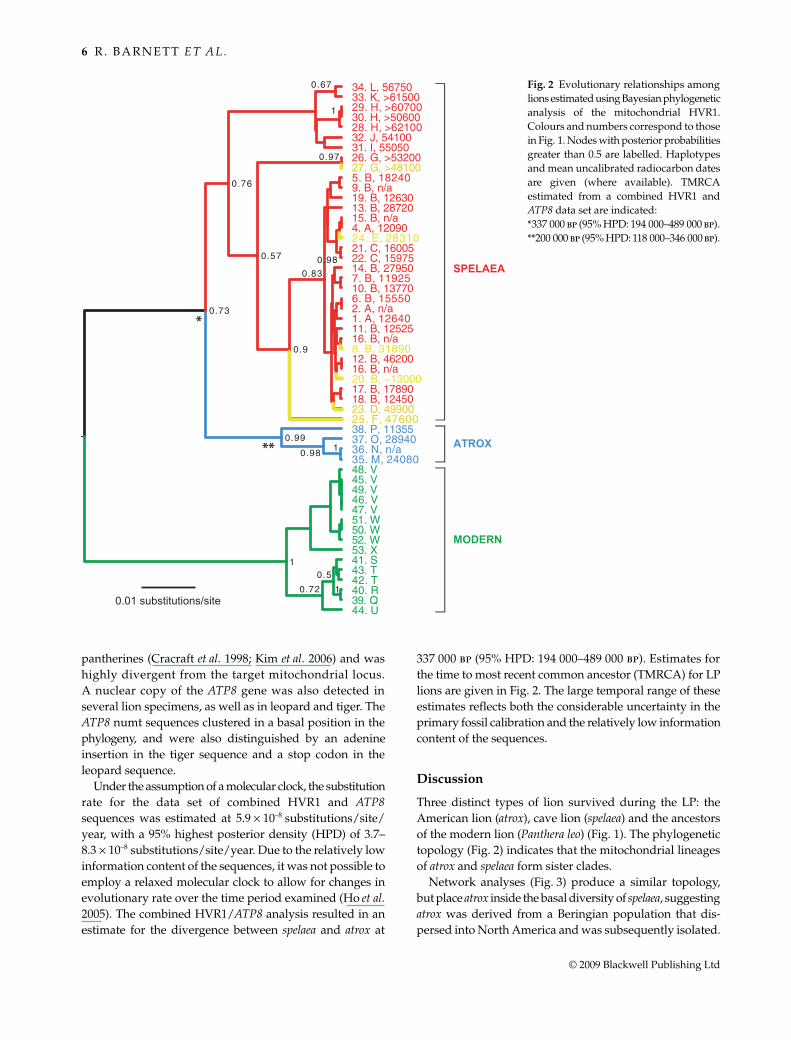
Under the assumption of a molecular clock, the substitutionrate for the data set of combined HVR1 and ATP8sequences was estimated at 5.9 ! 10–8 substitutions/site/year, with a 95% highest posterior density (HPD) of 3.7–8.3 ! 10–8 substitutions/site/year. Due to the relatively lowinformation content of the sequences, it was not possible toemploy a relaxed molecular clock to allow for changes inevolutionary rate over the time period examined (Ho et al.2005). The combined HVR1/ATP8 analysis resulted in anestimate for the divergence between spelaea and atrox at
337 000 bp (95% HPD: 194 000–489 000 bp). Estimates forthe time to most recent common ancestor (TMRCA) for LPlions are given in Fig. 2. The large temporal range of theseestimates reflects both the considerable uncertainty in theprimary fossil calibration and the relatively low informationcontent of the sequences.
Discussion
Three distinct types of lion survived during the LP: theAmerican lion (atrox), cave lion (spelaea) and the ancestorsof the modern lion (Panthera leo) (Fig. 1). The phylogenetictopology (Fig. 2) indicates that the mitochondrial lineagesof atrox and spelaea form sister clades.
Network analyses (Fig. 3) produce a similar topology,but place atrox inside the basal diversity of spelaea, suggestingatrox was derived from a Beringian population that dis-persed into North America and was subsequently isolated.
Fig. 2 Evolutionary relationships amonglions estimated using Bayesian phylogeneticanalysis of the mitochondrial HVR1.Colours and numbers correspond to thosein Fig. 1. Nodes with posterior probabilitiesgreater than 0.5 are labelled. Haplotypesand mean uncalibrated radiocarbon datesare given (where available). TMRCAestimated from a combined HVR1 andATP8 data set are indicated:*337 000 bp (95% HPD: 194 000–489 000 bp).**200 000 bp (95% HPD: 118 000–346 000 bp).
P H Y L O G E O G R A P H Y O F P L E I S TO C E N E L I O N S 7
© 2009 Blackwell Publishing Ltd
Molecular date estimates place this initial divergence at337 000 bp (95% HPD: 194 000–489 000 bp) with a most recentcommon ancestor of the atrox lineage c. 200 000 bp (95%HPD: 118 000–346 000 bp; Fig. 2). This is consistent withpalaeontological evidence of lions in eastern Beringiaduring the Illinoian glacial (c. 300 000–130 000 bp, Harington1969), and in central North America from the Sangamoninterglacial (c. 130 000–120 000 bp). Lions persisted inNorth America, both north and south of the ice, untilthe end of the Pleistocene (Harington 1969; Kurtén &Anderson 1980).
The most recent directly radiocarbon dated atrox is thatfrom Edmonton, at 11 355 ± 55 bp. (Table 1) This is youngerthan the lion metatarsal from Jaguar Cave, Idaho, whichpreviously yielded a date of 11 900 ± 130 bp (Kurtén &
Anderson 1980; Stuart 1991). The date of 10 370 ± 150 bp,which has been used previously as the terminal date forPanthera leo atrox (Kurtén & Anderson 1980; Stuart 1991) isbased indirectly on hearth charcoal from Jaguar Cave. Theradiocarbon-dated cave lions from western Beringiareveal a reasonably continuous chronological distributionwith a terminal date from the Lena River of 12 450 ± 60 bp(Table 1). The terminal date for eastern Beringia (11 925 ±70 bp, Fairbanks Creek) is 1500 years older than the widelyreported Lost Chicken Creek date of 10 370 ± 160 bp(Kurtén & Anderson 1980; Stuart 1991; Harington 1980),which comes not directly from a lion, but a bison found atthe same site. In Eurasia, the youngest dated lion is thatreported from Zigeuenerfels, Sigmaringen, Germany at12 375 ± 50 bp (Stuart & Lister 2007). The widely reported
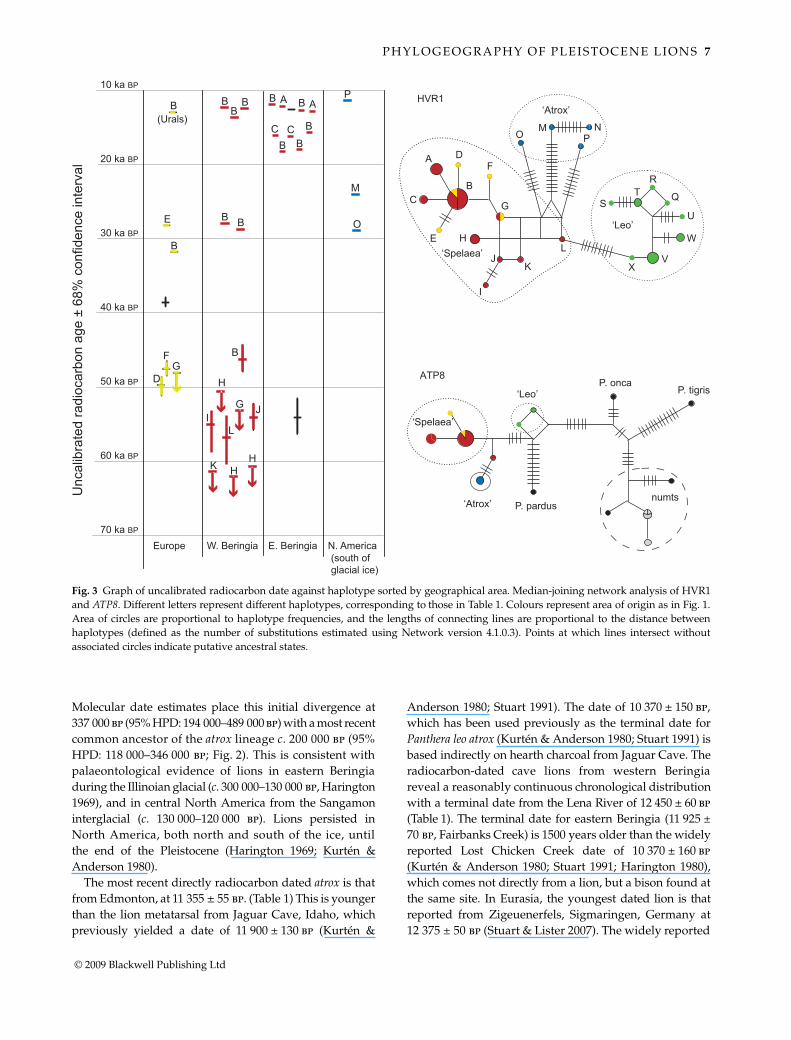
Fig. 3 Graph of uncalibrated radiocarbon date against haplotype sorted by geographical area. Median-joining network analysis of HVR1and ATP8. Different letters represent different haplotypes, corresponding to those in Table 1. Colours represent area of origin as in Fig. 1.Area of circles are proportional to haplotype frequencies, and the lengths of connecting lines are proportional to the distance betweenhaplotypes (defined as the number of substitutions estimated using Network version 4.1.0.3). Points at which lines intersect withoutassociated circles indicate putative ancestral states.
8 R . B A R N E T T E T A L .
© 2009 Blackwell Publishing Ltd
date from Lathum in the Netherlands (10 670 ± 160 bp)(Stuart 1991) has recently been shown to be much older,and therefore invalid (Stuart & Lister 2007).
Modern and LP European cave lions have been shownpreviously (Burger et al. 2004) to be distinct, but this is thefirst genetic evidence for a grouping of European spelaeawith lions from Beringia as a single population. Similarly,the genetic separation between LP lions in Beringia andthose south of the North American ice sheets is reported forthe first time. The reasons for the lack of gene flow withinNorth America remain unclear, as there is no evidence of abarrier between Beringia and central North America duringinterstadial periods for other taxa such as horse and bison(Burns 1996; Shapiro et al. 2004; Weinstock et al. 2005). Atroxis also present in Edmonton, Alberta, within the regionpostulated to be an ice-free corridor at various times in thelate Pleistocene (Burns 1996; Wilson 1996) both before andafter the LGM (Fig. 1, samples 37 and 38 in Table 1). Whilethis indicates that the region was habitable by lions duringinterstadial periods, it is possible that currently unidentifiedecological barriers prevented movement between theYukon and southern Canada, such as the intermittentpresence of forested regions (Wilson 1996) suggested tohave been a barrier to the dispersal of bison following theLGM (Shapiro et al. 2004). Alternatively, some form ofinterspecific competition may have existed between atroxand spelaea, preventing interchange between the areas, as itseems unlikely that environmental or ecological barriersoperated over the entire 200 000-year period of separation.Interestingly, there is also no evidence for genetic inter-change between cave lions and modern lions, despite along-term contact zone in the Near East (Fig. 1; Kurtén 1968;Burger et al. 2004). These observations are consistent withthe suggestion that the three forms may represent separatespecies, rather than subspecies (Sotnikova, Nikolskiy 2006).However, pronounced mitochondrial phylogeographicalstructure has also been observed in Pleistocene easternBeringian brown bear populations, albeit for much shortertime periods (Barnes et al. 2002). To fully resolve the speciesstatus of the three lion forms, it will be necessary to includeboth nuclear and morphological data.
The clear genetic distinction between the atrox and spelaeagroups in North America is in sharp contrast to the paucityof genetic divisions within spelaea across Europe, Asia, andAlaska/Yukon, suggesting genetic interchange across animmense geographical range. This is particularly apparentafter c. 46 000–48 000 bp when, despite the small sample size,we observe a dramatic and widespread decline in geneticdiversity within spelaea across western Beringia and Europe(Figs 2 and 3). Before 46 000 bp, nine diverse mitochondrialhaplotypes (B, D, F–L; Figs 2 and 3) are observed from 12specimens. In contrast, all 18 spelaea specimens sampledacross the entire range of spelaea after this point form partof a closely related star-shaped radiation, consistent with a
rapid population expansion, of four derived haplotypes(A, B, C, and E; Figs 2 and 3) centred around B, the onlyhaplotype shared with the earlier time period. This markeddecline in diversity may simply reflect genetic drift, com-bined with the relatively sparse temporal–geographicalsampling. However, this seems somewhat unlikely giventhe pattern of loss, where all seven known haplotypes fromoutside the star cluster disappear, including apparentlycommon and widespread haplotypes such as H and G. Analternative is that a geographically widespread geneticbottleneck occurred in spelaea populations sometime after48 000 bp (the last occurrence of a haplotype external to the starradiation) which removed the earlier lineages. A subsequentre-invasion and/or range expansion of haplotype B isconsistent with it being the most widespread and numerousmitochondrial sequence across the spelaea range (12 out of17 specimens) after 48 000 bp. Members of the star radiation(haplotypes B and D) are first detected at 46 000 and 50 000bp, suggesting that this group had started diversifyingbefore the putative genetic bottleneck. The other derivedhaplotypes (A, C and E) may have also existed at this point,or evolved subsequently as populations containing haplo-type B expanded in range and numbers. Such a pattern couldbe produced by the localized extinction of populations(e.g. across Eurasia), followed by the replacement withindividuals from other parts of the range (e.g. easternBeringia), as has previously been detected in Pleistocenebison and mammoth populations (Shapiro et al. 2004;Debruyne et al. 2008).
It is difficult to identify a cause for the putative bottle-neck in spelaea populations without a precise date estimatefor the event. However, it is notable that a major geneticalteration is also detectable in west Beringian bison popu-lations between 48 000 and 50 000 bp (Cooper and Shapiro,unpublished data). This is especially significant becausebison are thought to be a primary prey item for Beringianspelaea (Guthrie 1990; Matheus et al. 2003), suggesting thata population bottleneck might reflect major changes inprey availability or ecology. Alternatively, it is possible thata larger environmental change is occurring across the entireBeringian community around 48 000–50 000 bp, as thisperiod has been identified as Heinrich event 5a (Hemming2004), a pronounced cold stadial between Dansgaard-Oeschger (DO) interstadials 14 and 15 (GRIP 1993). Heinrichevents occur during the coldest DO stadials, and areassociated with catastrophic iceberg outbursts and raft-ing in the North Atlantic (Heinrich 1988). Heinrich eventsare associated with major environmental changes acrossthe Holarctic, including neighbouring terrestrial andmarine areas such as the Northwest Pacific (Gorbarenkoet al. 2007).
With the current data, it is impossible to identify theprecise nature of the genetic changes taking place in spelaeapopulations during the late Pleistocene. However, our data
P H Y L O G E O G R A P H Y O F P L E I S TO C E N E L I O N S 9
© 2009 Blackwell Publishing Ltd
add to the growing body of evidence that large-scale shiftsin climate during MIS 3 were associated with major altera-tions in genetic structure in megafaunal populations(Barnes et al. 2002, 2007; Guthrie 2003; Shapiro et al. 2004;Hofreiter et al. 2007; Debruyne et al. 2008) well before theend-Pleistocene megafaunal extinctions in the northernhemisphere. As more data become available, integratedwith detailed records of vegetative change, it shouldbecome possible to reconstruct the environment in Beringiathroughout the LP to investigate the relationship betweenclimate change and the response of megafaunal populations,providing key background information to understandtheir subsequent extinctions.
Acknowledgements
Financial support was provided by Linacre College, NERC,ORADS, BBSRC, the Royal Society, and the Leverhulme Trust.Analyses in Mainz were funded in part by Geocycles. We aregrateful to R. Wayne, J. Leonard, and P. Matheus, H. Hemmer, G.T.Jefferson, and the George C. Page Museum for assistance andcomments. We especially thank the many individuals andmuseums that provided access to samples, listed in the SupportingInformation.
References
Bandelt HJ, Forster P, Rohl A (1999) Median-joining networks forinferring intraspecific phylogenies. Molecular Biology and Evolu-tion, 16, 37–48.
Barnes I, Matheus P, Shapiro B, Jensen D, Cooper A (2002) Dynamicsof Pleistocene population extinctions in Beringian brown bears.Science, 295, 2267–2270.
Barnes I, Shapiro B, Lister AM et al. (2007) Genetic structure andextinction of the woolly mammoth, Mammuthus primigenius.Current Biology, 17, 1–4.
Barnett R, Yamaguchi N, Barnes I, Cooper A (2006) The origin,current diversity, and future conservation of the modern lion(Panthera leo). Proceedings of the Royal Society B: Biological Sciences,273, 2159–2168.
Barnosky AD, Koch PL, Feranec RS, Wing SL, Shabel AB (2004)Assessing the causes of Late Pleistocene extinctions on thecontinents. Science, 306, 70–75.
Baryshnikov G, Boeskorov G (2001) The Pleistocene cave lionPanthera spelaea (Carnivora, Felidae) from Yakutia, Russia.Cranium, 18, 7–24.
Burger J, Rosendahl W, Loreille O et al. (2004) Molecular phylogenyof the extinct cave lion Panthera leo spelaea. Molecular Phylogeneticsand Evolution, 30, 841–849.
Burns JA (1996) Vertebrate Palaeontology of the alleged ice-freecorridor: the meat of the matter. Quaternary International, 32,107–112.
Christiansen P (2008) Phylogeny of the great cats (Felidae: Panth-erinae), and the influence of fossil taxa and missing characters.Cladistics, 24, 1–16.
Cracraft J, Feinstein J, Vaughn J, Helm-Bychowski K (1998) Sortingout tiger (Panthera tigris): mitochondrial sequences, nuclear inserts,systematics, and conservation genetics. Animal Conservation, 1,139–150.
Debruyne R, Chu G, King CE et al. (2008) Out of America: ancientDNA evidence for a new world origin of late quaternary woollymammoths. Current Biology, 18, 1320–1326.
Drummond AJ, Rambaut A (2007) beast: Bayesian evolutionaryanalysis by sampling trees. BMC Evolutionary Biology, 7, 214.
Garcia Garcia N (2001) Los Carnivoros de los Yacimientos Pleistocenosde la Sierra de Atapuerca. PhD Thesis, Universidad Complutensede Madrid, Madrid, Spain.
Gorbarenko SA, Goldberg EL, Kashgarian M et al. (2007) Mille-nium scale environmental changes of the Okhotsk Sea duringlast 80 kyr and their phase relationship with global climatechanges. Journal of Oceanography, 63, 609–623.
GRIP (1993) Climate instability during the last interglacial periodrecorded in the GRIP ice core. Nature, 364, 203–207.
Groiss JT (1996) Der Höhlentiger Panthera tigris spelaea (Goldfuss).Neues Jahrbuch für Geologie und Paläontologie, Mh. 1996/7, 399–414.
Guthrie RD (1990) Frozen Fauna of the Mammoth Steppe: the Story ofBlue Babe. The University of Chicago Press, London.
Guthrie RD (2003) Rapid body size decline in Alaskan Pleistocenehorses before extinction. Nature, 426, 169–171.
Harington CR (1969) Pleistocene remains of the lion-like cat(Panthera atrox) from the Yukon Territory and northern Alaska.Canadian Journal of Earth Sciences, 6, 1277–1288.
Harington CR (1971) A Pleistocene lion-like cat (Panthera atrox)from Alberta. Canadian Journal of Earth Sciences, 8, 170–174.
Harington CR (1980) Pleistocene mammals from Lost ChickenCreek, Alaska. Canadian Journal of Earth Sciences, 17, 168–198.
Heinrich H (1988) Origin and consequences of cyclic ice rafting inthe Northeast Atlantic Ocean during the past 130 000 years.Quaternary Research, 29, 142–152.
Hemming SR (2004) Heinrich events: massive late Pleistocenedetritus layers of the North Atlantic and their global climateimpact. Review of Geophysics, 42, RG1005.
Herrington SJ (1986) Phylogenetic relationships of the wild cats of theworld PhD, University of Kansas.
Ho SYW, Phillip MJ, Cooper A, Drummond AJ (2005) Timedependency of molecular rate estimates and systematicoverestimation of recent divergence times. Molecular Biology andEvolution, 22, 1561–1568.
Hofreiter M, Munzel S, Conard NJ et al. (2007) Sudden replace-ment of cave bear mitochondrial DNA in the late Pleistocene.Current Biology, 17, R122–R123.
Jae-Heup K, Eizirik E, O’Brien SJ, Johnson WE (2001) Structureand patterns of sequence variation in the mitochondrial DNAcontrol region of the great cats. Mitochondrion, 1, 279–292.
Kim J-H, Antunes A, Luo S-J et al. (2006) Evolutionary analysis ofa large mtDNA translocation (numt) into the nuclear genome ofthe Panthera genus species. Gene, 366, 292–302.
Kurtén B (1968) Pleistocene Mammals of Europe. Weidenfeld andNicolson, London.
Kurtén B (1985) The Pleistocene lion of Beringia. Annales ZoologiciFennici, 22, 177–121.
Kurtén B, Anderson E (1980) Pleistocene Mammals of North America.Columbia University Press, New York.
Lopez JV, Yuhki N, Masuda R, Modi W, O’Brien SJ (1994) Numt,a recent transfer and tandem amplification of mitochondrial-DNA to the nuclear genome of the domestic cat. Journal ofMolecular Evolution, 39, 174–190.
Lopez JV, Cevario S, O’Brien SJ (1996) Complete nucleotidesequences of the domestic cat (Felis catus) mitochondrial genomeand a transposed mtDNA tandem repeat (Numt) in the nucleargenome. Genomics, 33, 229–246.
10 R . B A R N E T T E T A L .
© 2009 Blackwell Publishing Ltd
Martin PS, Steadman DW (1999) 2. Prehistoric extinctions onislands and continents. In: Extinctions in Near Time: Causes,Contexts, and Consequences (ed. MacPhee RDE), pp. 17–50.Kluwer Academic/Plenum Publishing, New York.
Matheus P, Guthrie RD, Kunz ML (2003) Predator-Prey links inPleistocene East Beringia: evidence from stable isotopes. In:3rd International Mammoth Conference, Dawson City, YukonTerritory.
Rambaut A, Drummond AJ (2007) Tracer v1.4. Institute of Evolu-tionary Biology, University of Edinburgh, Edinburgh, Scotland.
Shapiro B, Drummond AJ, Rambaut A et al. (2004) Rise and fall ofthe Beringian steppe bison. Science, 306, 1561–1565.
Simpson GG (1941) Large Pleistocene Felines of North America.American Museum Novitates, 1136, 1–27.
Sotnikova M, Nikolskiy P (2006) Systematic position of the cavelion Panthera spelaea (Goldfuss) based on cranial and dentalcharacters. Quaternary International, 142–143, 218–228.
Stuart AJ (1991) Mammalian extinctions in the Late Pleistocene ofNorthern Eurasia and North-America. Biological Reviews of theCambridge Philosophical Society, 66, 453–562.
Stuart AJ, Lister AM (2007) Patterns of Late Quaternary megafaunalextinctions in Europe and northern Asia. Cour Forschung-InstituteSenckenberg, 259, 287–297.
Turner A, Antón M (1997) The Big Cats and Their Fossil Relatives.Columbia University Press, New York.
Vereshchagin NK (1971) Cave lions of Holarctics [in Russian].Trudy Zoologicheskogo Instituta, 49, 123–199.
Weinstock J, Willerslev E, Sher A et al. (2005) Evolution, systematics,and phylogeography of pleistocene horses in the new world: amolecular perspective. PLoS Biology, 3, e241.
Wilson MC (1996) Late quaternary vertebrates and the opening ofthe ice-free corridor, with special reference to the genus bison.Quaternary International, 32, 97–105.
Yamaguchi N, Cooper A, Werdelin L, MacDonald DW (2004)Evolution of the mane and group-living in the lion (Panthera leo):a review. Journal of Zoology, 263, 329–342.
Ross Barnett: ancient DNA, phylogeography of felids andPleistocene extinctions. Beth Shapiro: ancient DNA, virus evolutionand phylogenetic methods. Ian Barnes: genetic changes ofmegafauna during the late Pleistocene. Simon Y. W. Ho: Bayesianphylogenetic methods and molecular dating. Joachim Burger:ancient DNA. Nobuyuki Yamaguchi: taxonomy and ecology offelids. Thomas F. G. Higham: radiocarbon dating and AMSmethods. H. Todd Wheeler: experimental palaeontology andAmerican Pleistocene felids. Wilfried Rosendahl: EuropeanPleistocene cave fauna and quaternary studies. Marina Sotnikova:Pleistocene felids. Tatiana Kuznetsova: Mammoth fauna of Eurasia.Gennady F. Baryshnikov: taxonomy and evolution of carnivoraand northern Eurasian Pleistocene mammals. Larry D. Martin:sabretoothed carnivores, Pleistocene felids and palaeopathology.C. Richard Harington: quaternary zoology and palaeontology.James A. Burns: Pleistocene mammalian palaeobiology andzoogeography of Alberta and North America. Alan Cooper:ancient DNA, island extinction and Pleistocene megafauna.
Supporting information
Additional supporting information may be found in the onlineversion of this article:
Table S1 List of all samples extracted during this study along withmuseum accession numbers and sample provenance. Calibratedradiocarbon dates were calculated using CalPal (Danzeglockeet al. 2008).
Table S2 Primer sequences, primer combinations, annealingtemperatures (Ta), and number of thermal cycles used.
Table S3 Number of amplifications, cloning, and replication forlion samples.
Please note: Wiley-Blackwell are not responsible for the content orfunctionality of any supporting information supplied by theauthors. Any queries (other than missing material) should bedirected to the corresponding author for the article.


