Embed Size (px)
Citation preview

2

3
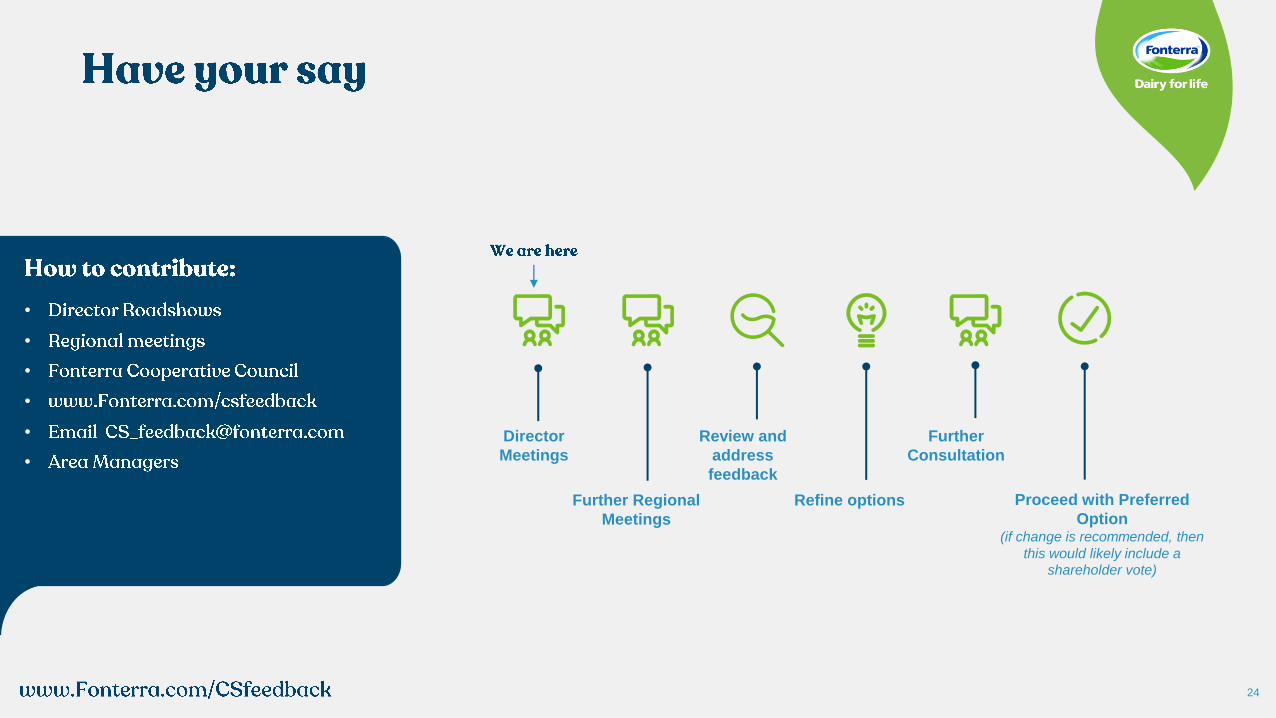
•
•
•
•
•
•
Proceed with Preferred
Option(if change is recommended, then
this would likely include a
shareholder vote)
Further Regional
Meetings
Review and
address
feedback
Refine options
Further
Consultation
Director
Meetings
4
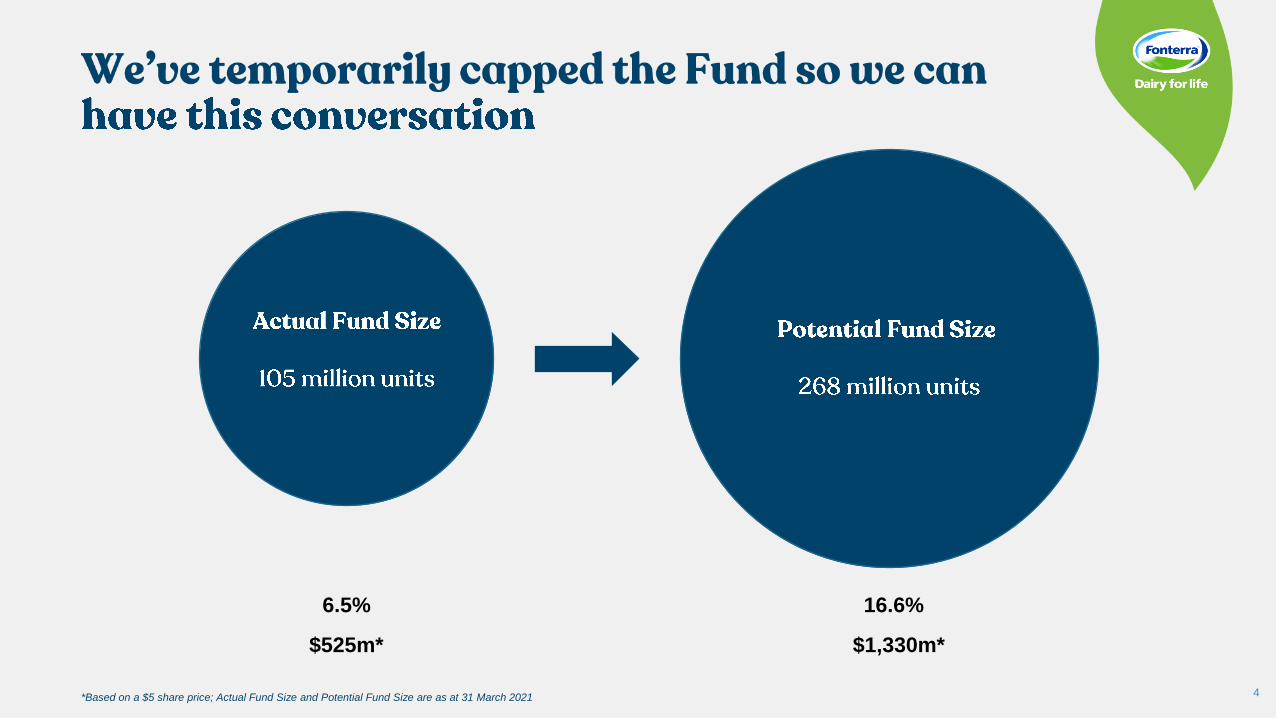
6.5% 16.6%
$525m* $1,330m*
*Based on a $5 share price; Actual Fund Size and Potential Fund Size are as at 31 March 2021
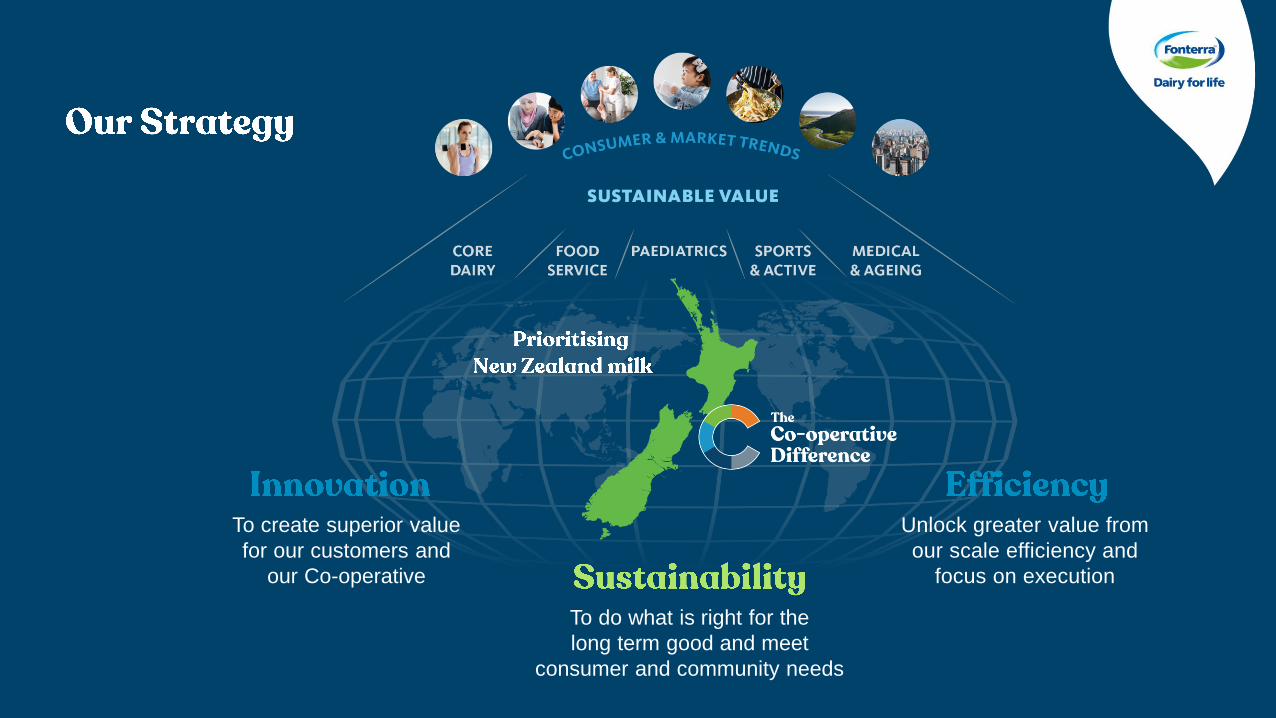
To create superior value
for our customers and
our Co-operative
To do what is right for the
long term good and meet
consumer and community needs
Unlock greater value from
our scale efficiency and
focus on execution
8
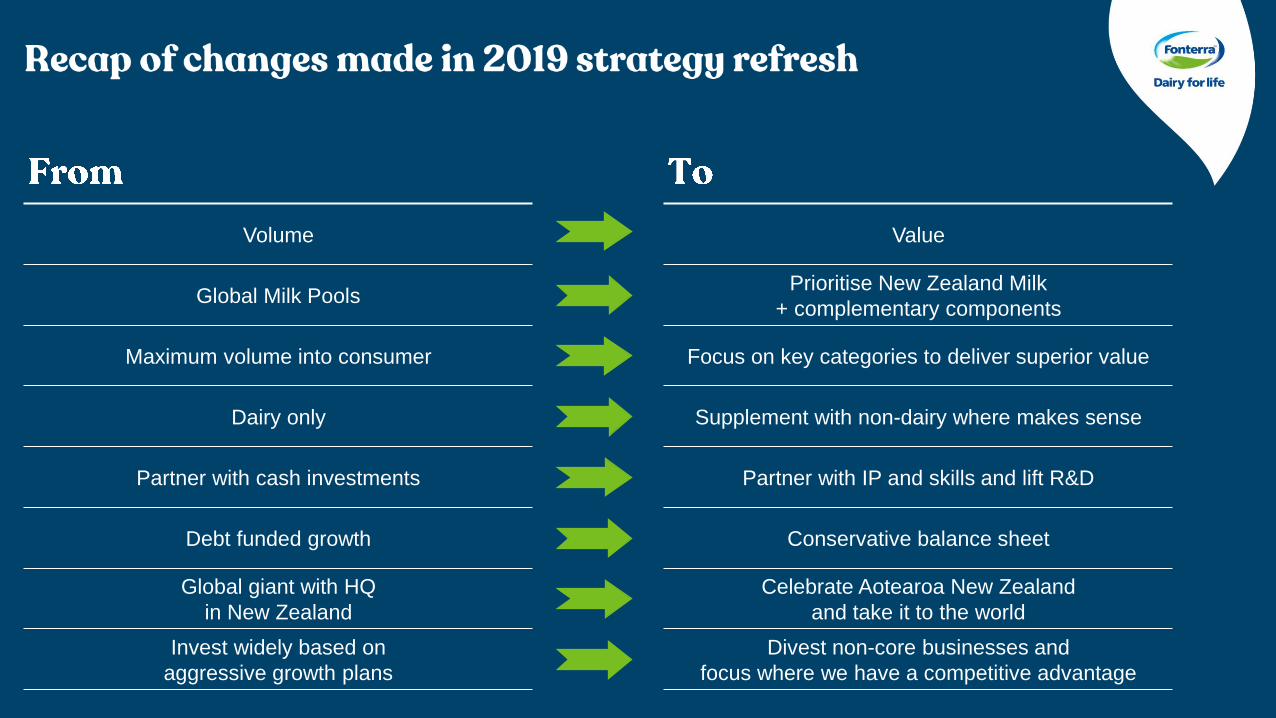
Volume Value
Global Milk PoolsPrioritise New Zealand Milk
+ complementary components
Maximum volume into consumer Focus on key categories to deliver superior value
Dairy only Supplement with non-dairy where makes sense
Partner with cash investments Partner with IP and skills and lift R&D
Debt funded growth Conservative balance sheet
Global giant with HQ
in New Zealand
Celebrate Aotearoa New Zealand
and take it to the world
Invest widely based on
aggressive growth plans
Divest non-core businesses and
focus where we have a competitive advantage
9
0
200
400
600
800
1,000
1,200
1,400
1,600
1,800
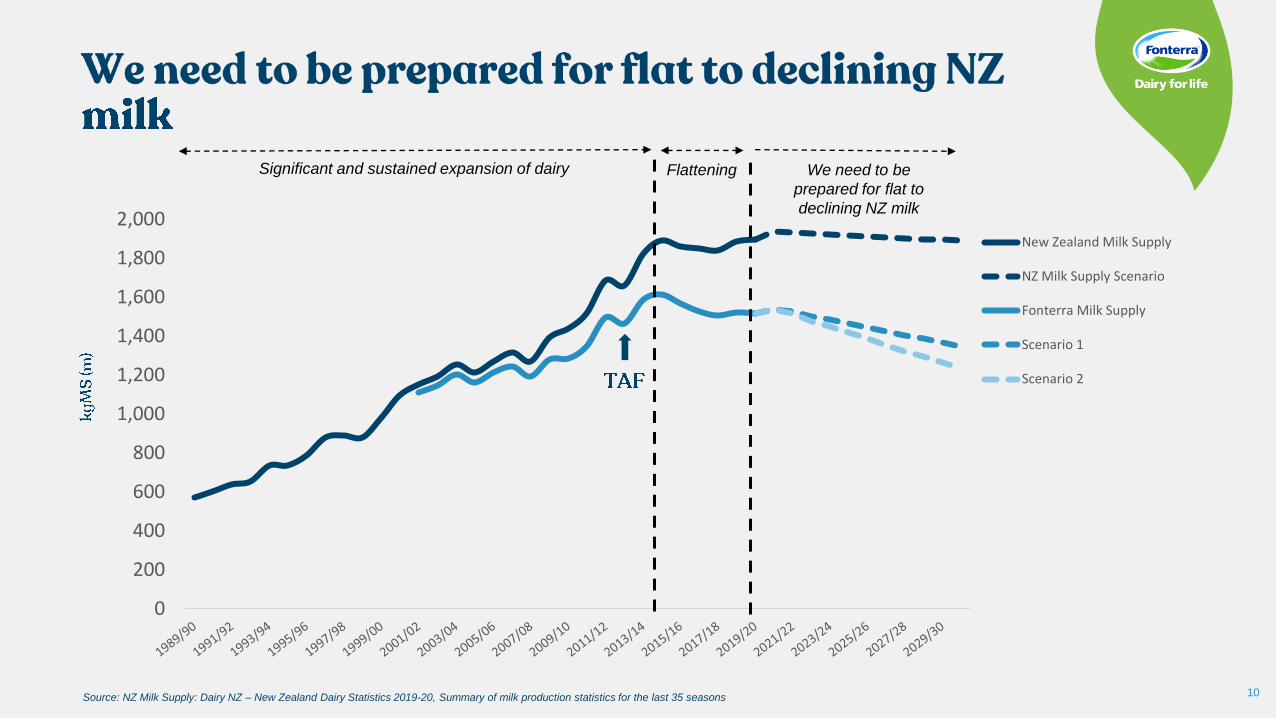
2,000New Zealand Milk Supply
NZ Milk Supply Scenario
Fonterra Milk Supply
Scenario 1
Scenario 2
10Source: NZ Milk Supply: Dairy NZ – New Zealand Dairy Statistics 2019-20, Summary of milk production statistics for the last 35 seasons
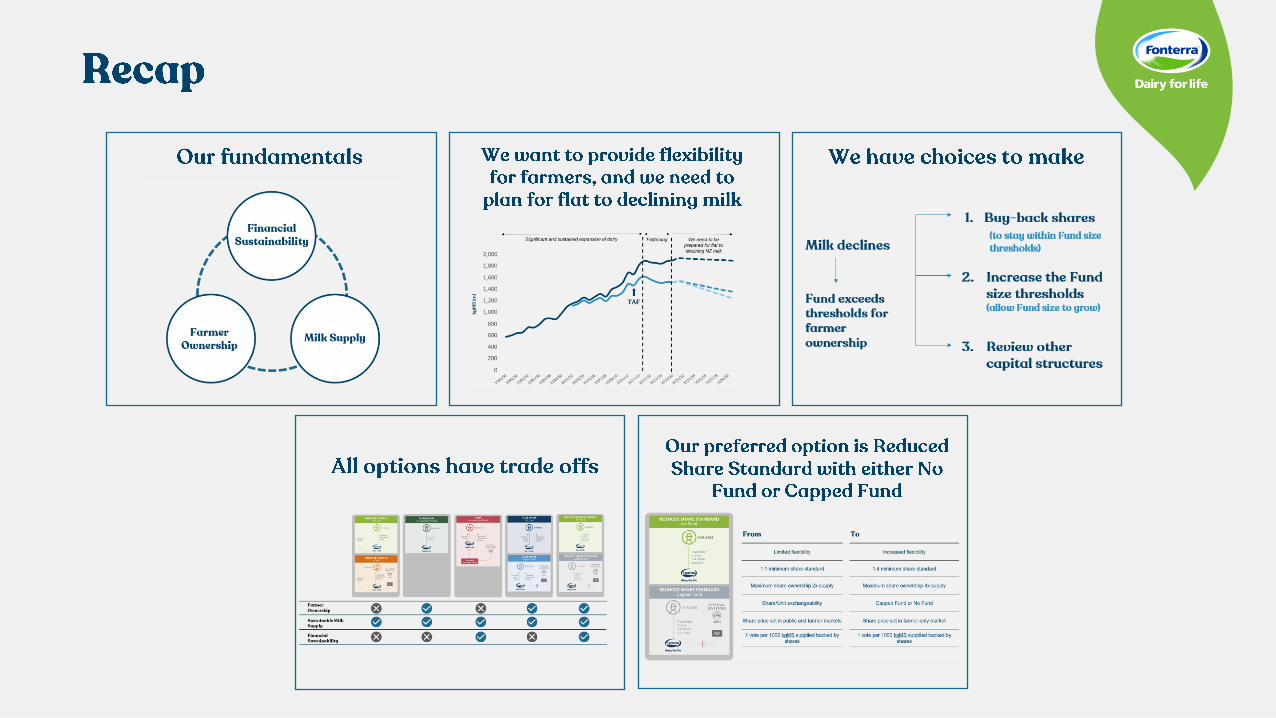
Significant and sustained expansion of dairy We need to be
prepared for flat to
declining NZ milk
Flattening
11
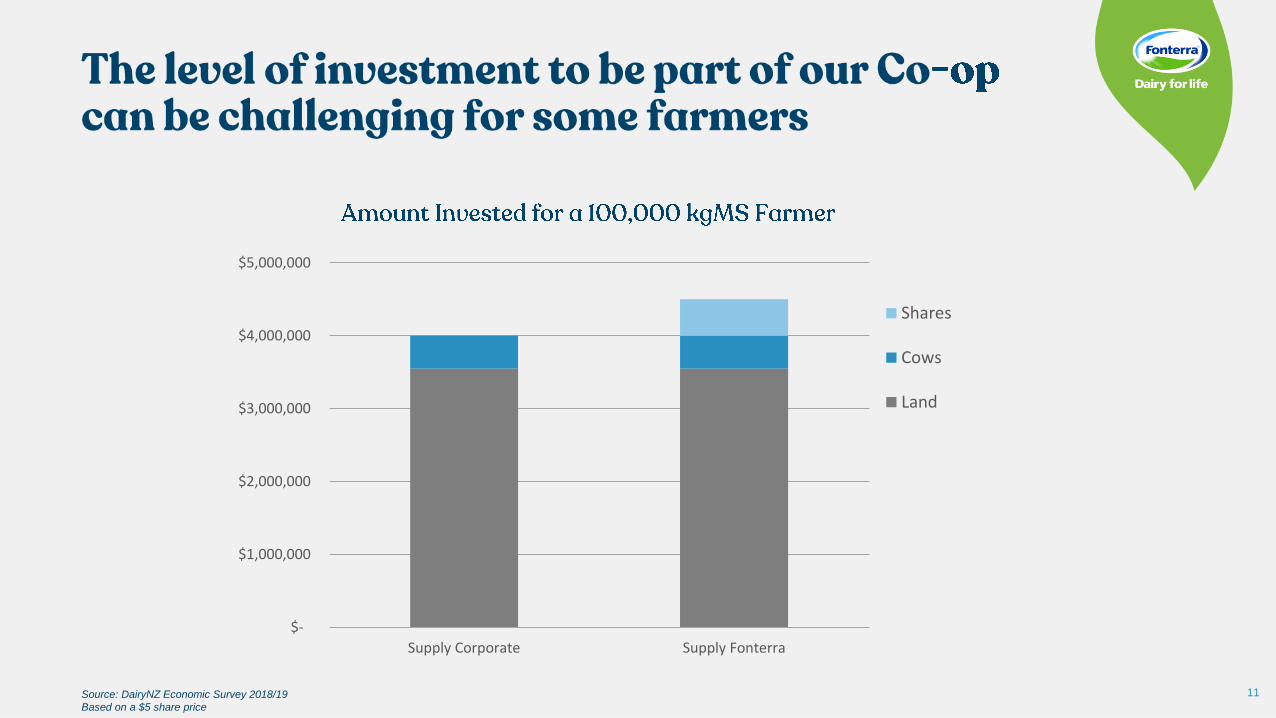
$-
$1,000,000
$2,000,000
$3,000,000
$4,000,000
$5,000,000
Supply Corporate Supply Fonterra
Shares
Cows
Land
Source: DairyNZ Economic Survey 2018/19
Based on a $5 share price
12
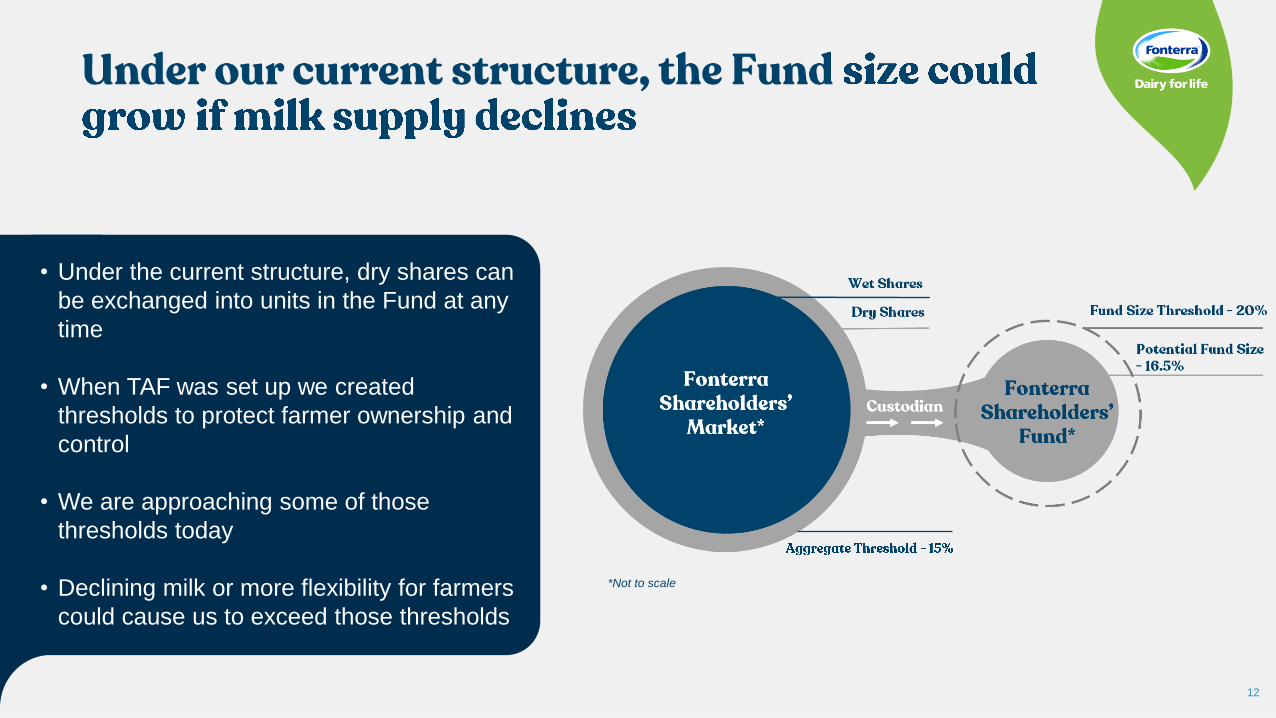
• Under the current structure, dry shares can
be exchanged into units in the Fund at any
time
• When TAF was set up we created
thresholds to protect farmer ownership and
control
• We are approaching some of those
thresholds today
• Declining milk or more flexibility for farmers
could cause us to exceed those thresholds
*Not to scale
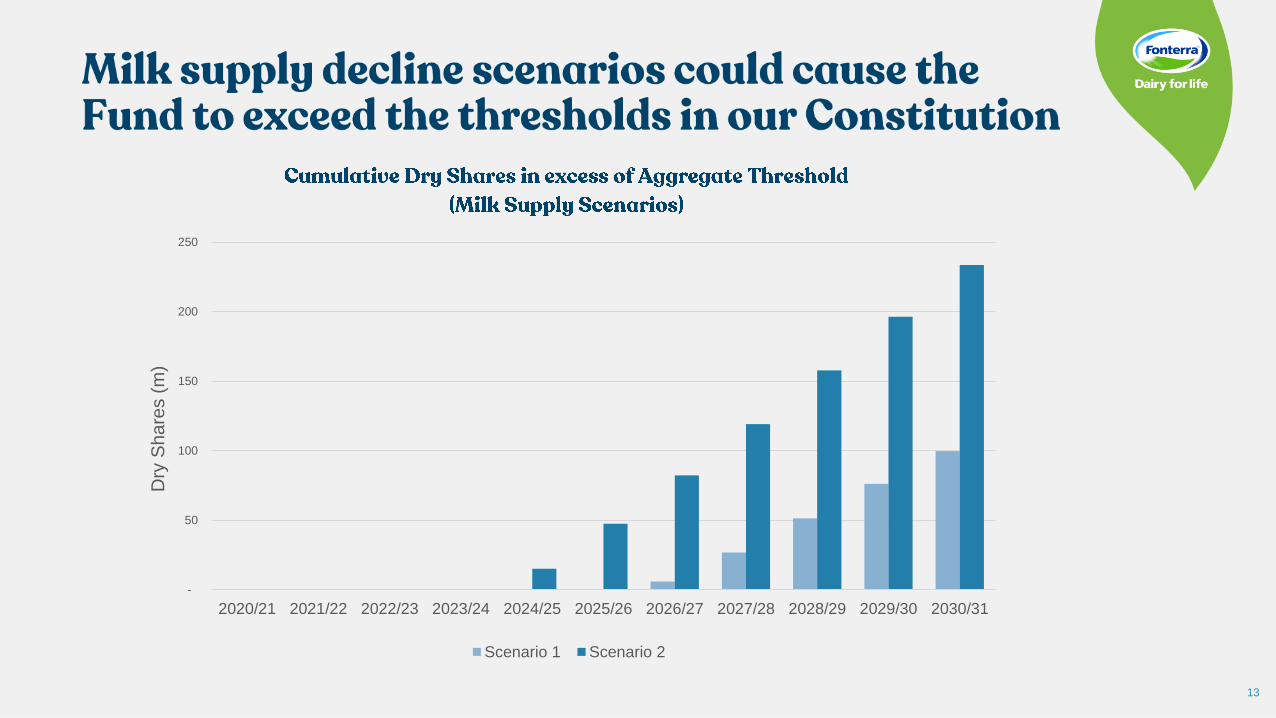
13
-
50
100
150
200
250
2020/21 2021/22 2022/23 2023/24 2024/25 2025/26 2026/27 2027/28 2028/29 2029/30 2030/31
Dry
Sh
are
s (
m)
Scenario 1 Scenario 2


•
•
•
•
•
17
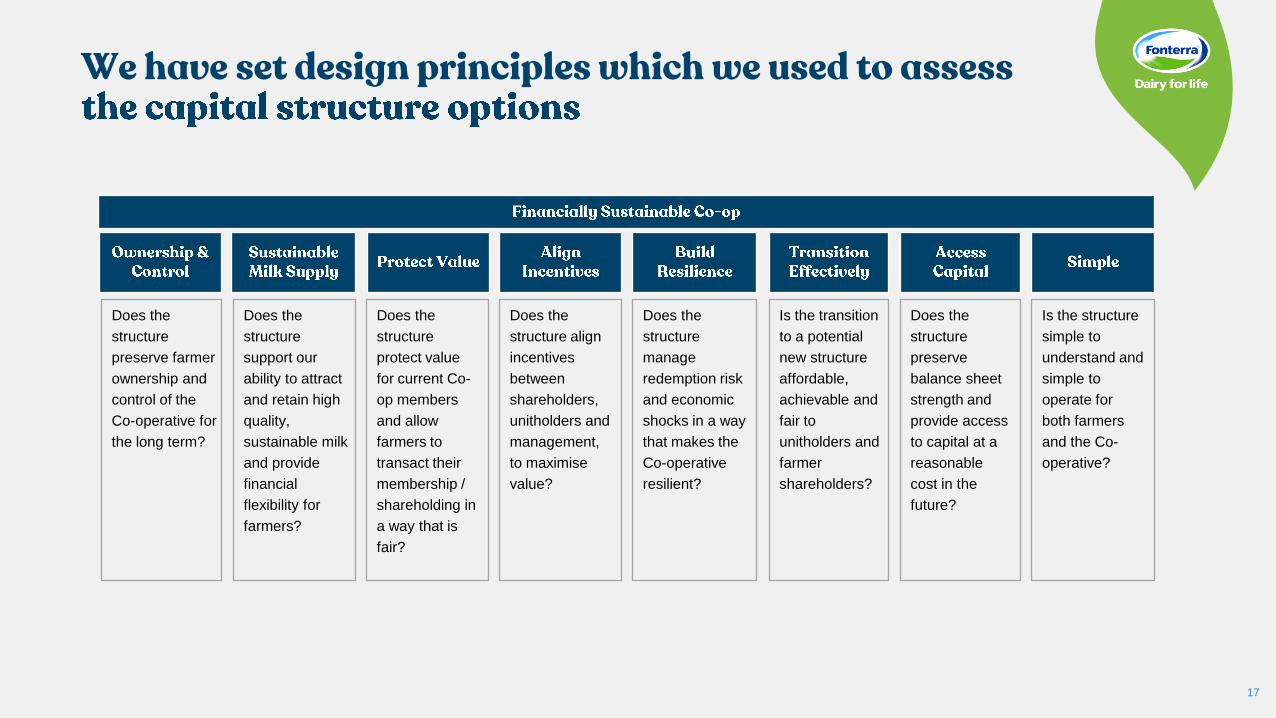
Does the
structure
support our
ability to attract
and retain high
quality,
sustainable milk
and provide
financial
flexibility for
farmers?
Does the
structure align
incentives
between
shareholders,
unitholders and
management,
to maximise
value?
Is the transition
to a potential
new structure
affordable,
achievable and
fair to
unitholders and
farmer
shareholders?
Is the structure
simple to
understand and
simple to
operate for
both farmers
and the Co-
operative?
Does the
structure
manage
redemption risk
and economic
shocks in a way
that makes the
Co-operative
resilient?
Does the
structure
preserve
balance sheet
strength and
provide access
to capital at a
reasonable
cost in the
future?
Does the
structure
protect value
for current Co-
op members
and allow
farmers to
transact their
membership /
shareholding in
a way that is
fair?
Does the
structure
preserve farmer
ownership and
control of the
Co-operative for
the long term?
18
19
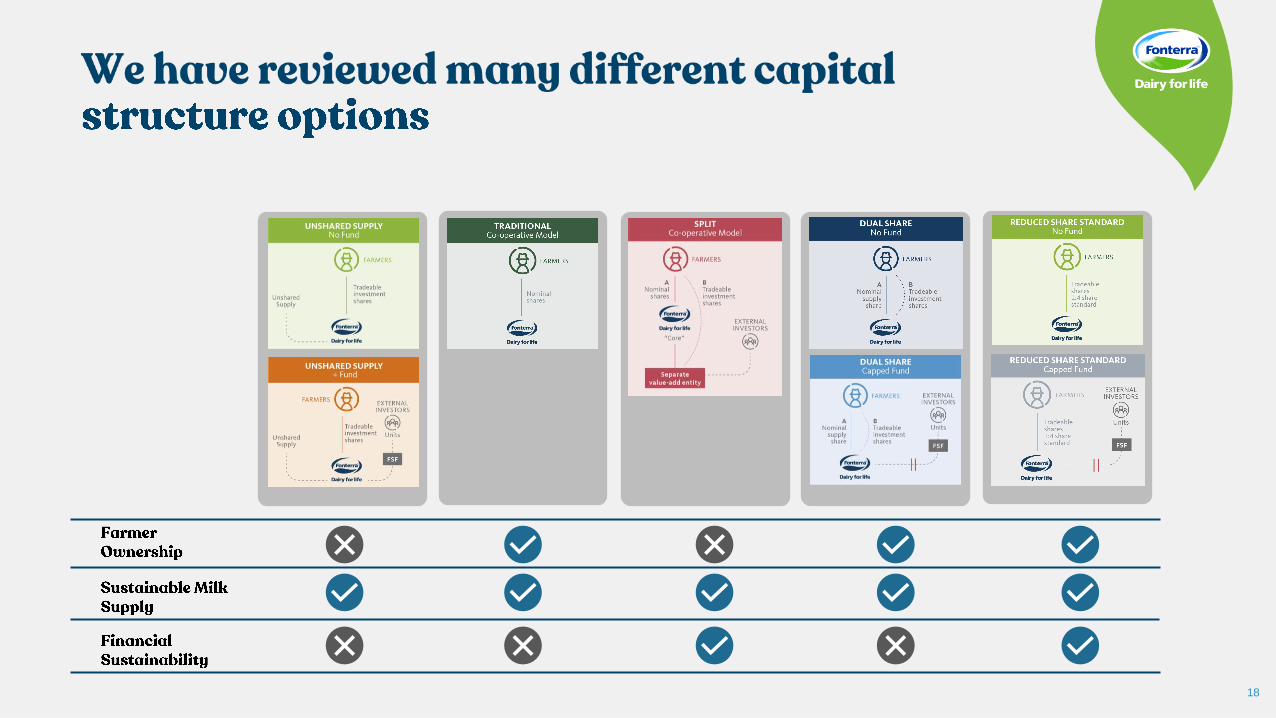
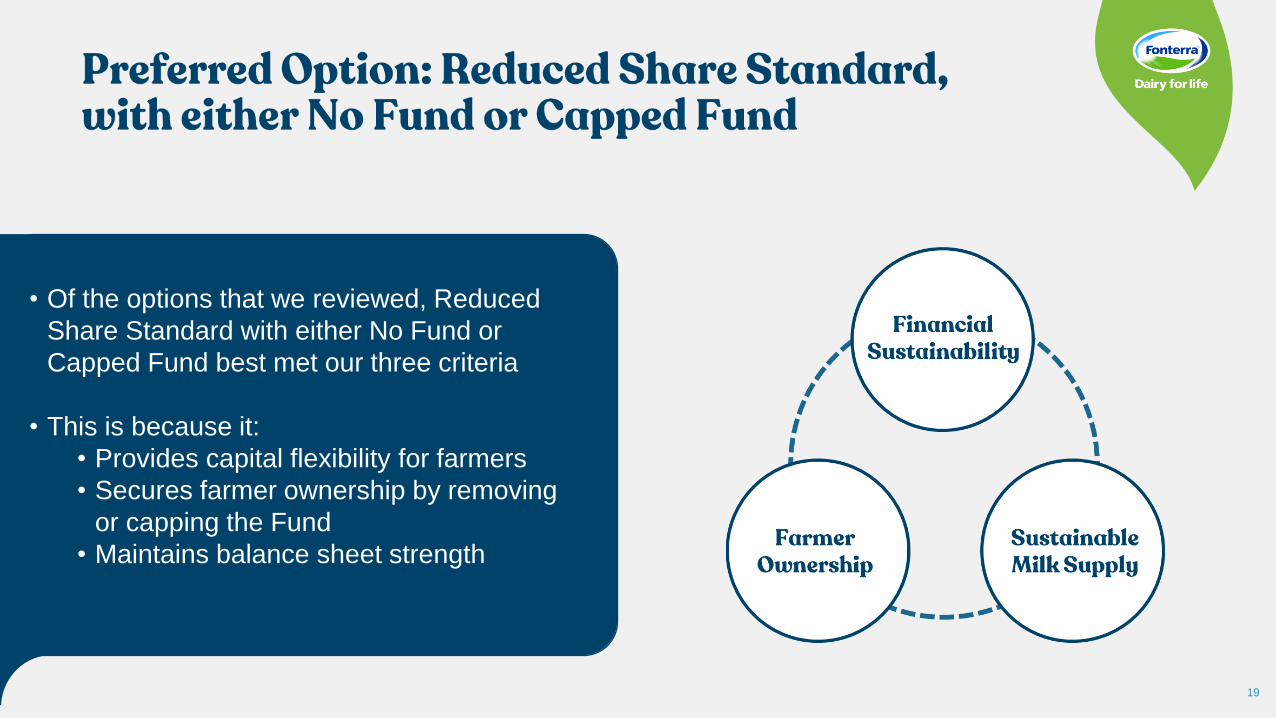
• Of the options that we reviewed, Reduced
Share Standard with either No Fund or
Capped Fund best met our three criteria
• This is because it:
• Provides capital flexibility for farmers
• Secures farmer ownership by removing
or capping the Fund
• Maintains balance sheet strength
20
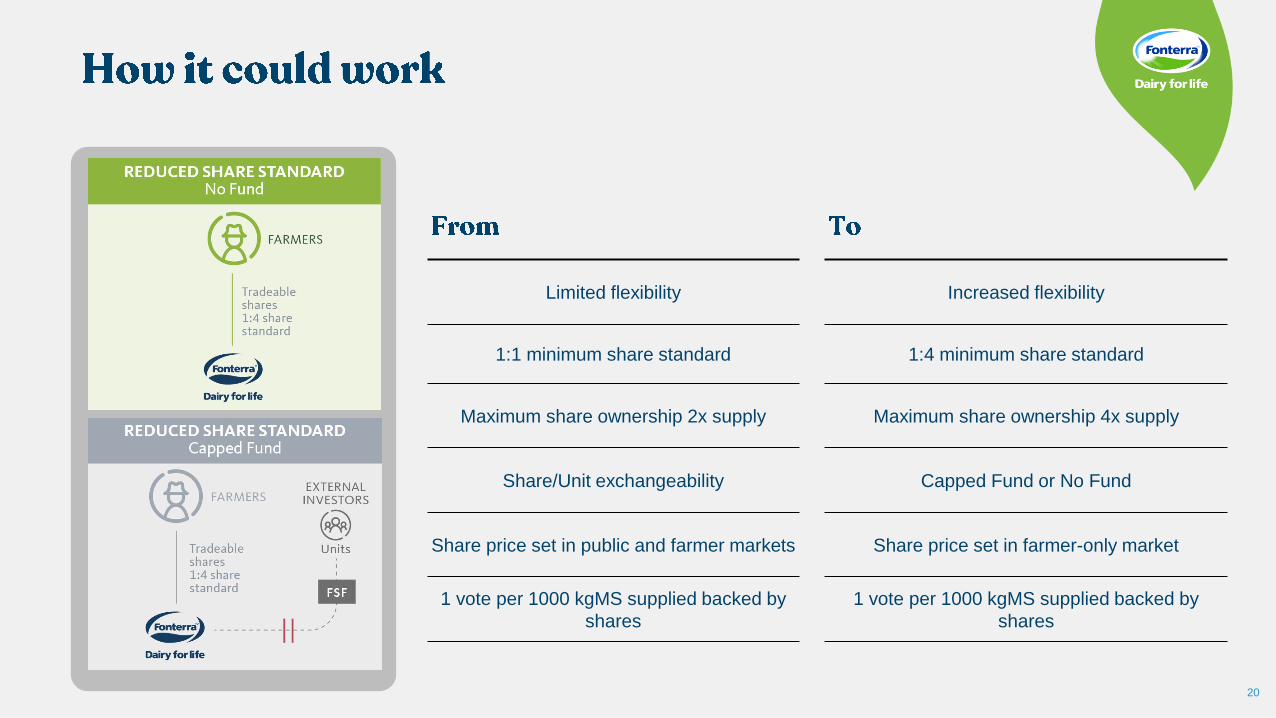
Limited flexibility Increased flexibility
1:1 minimum share standard 1:4 minimum share standard
Maximum share ownership 2x supply Maximum share ownership 4x supply
Share/Unit exchangeability Capped Fund or No Fund
Share price set in public and farmer markets Share price set in farmer-only market
1 vote per 1000 kgMS supplied backed by
shares
1 vote per 1000 kgMS supplied backed by
shares
21
•
•
•
•
•
•
•
22
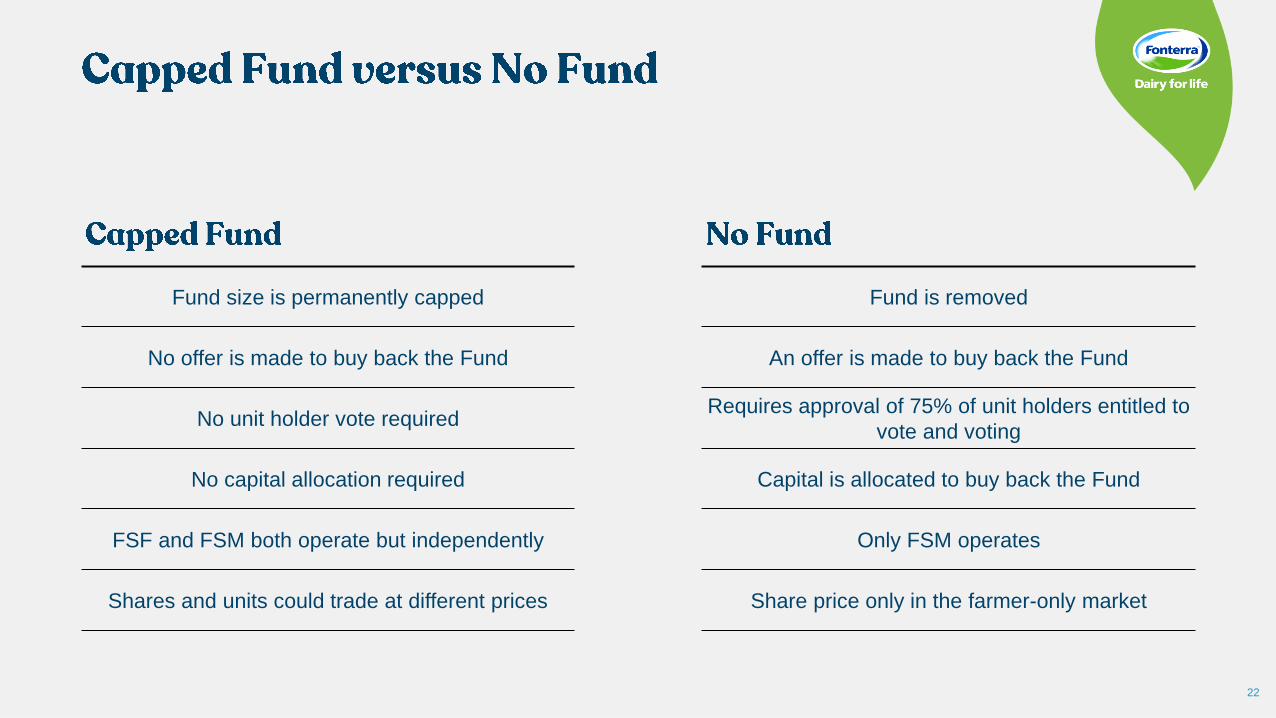
Fund size is permanently capped Fund is removed
No offer is made to buy back the Fund An offer is made to buy back the Fund
No unit holder vote requiredRequires approval of 75% of unit holders entitled to
vote and voting
No capital allocation required Capital is allocated to buy back the Fund
FSF and FSM both operate but independently Only FSM operates
Shares and units could trade at different prices Share price only in the farmer-only market
24
•
•
•
•
•
•
Proceed with Preferred
Option(if change is recommended, then
this would likely include a
shareholder vote)
Further Regional
Meetings
Review and
address
feedback
Refine options
Further
Consultation
Director
Meetings

26
Link 5Link 4Link 3Link 2Link 1Fonterra Capital Structure Review Slide #
28
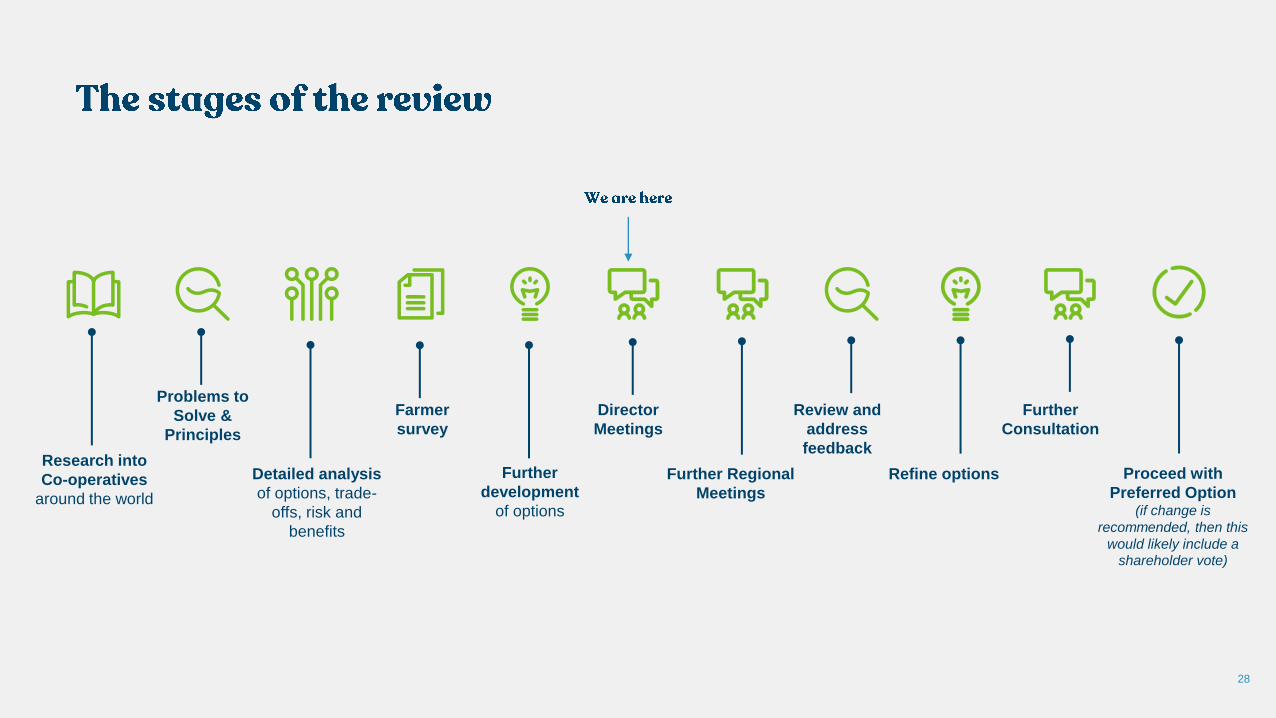
Further
development
of options
Farmer
survey
Problems to
Solve &
Principles
Detailed analysis
of options, trade-
offs, risk and
benefits
Research into
Co-operatives
around the world
Proceed with
Preferred Option(if change is
recommended, then this
would likely include a
shareholder vote)
Further Regional
Meetings
Review and
address
feedback
Refine options
Further
Consultation
Director
Meetings
29
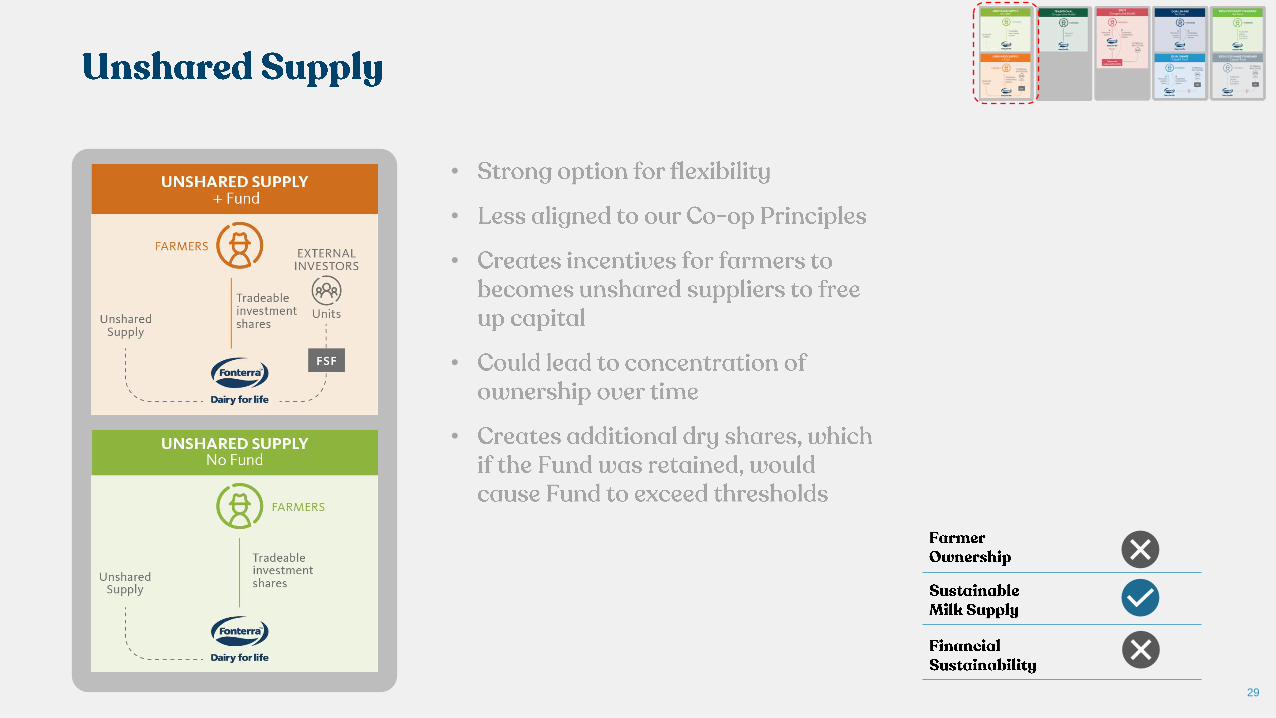
•
•
•
•
•
30
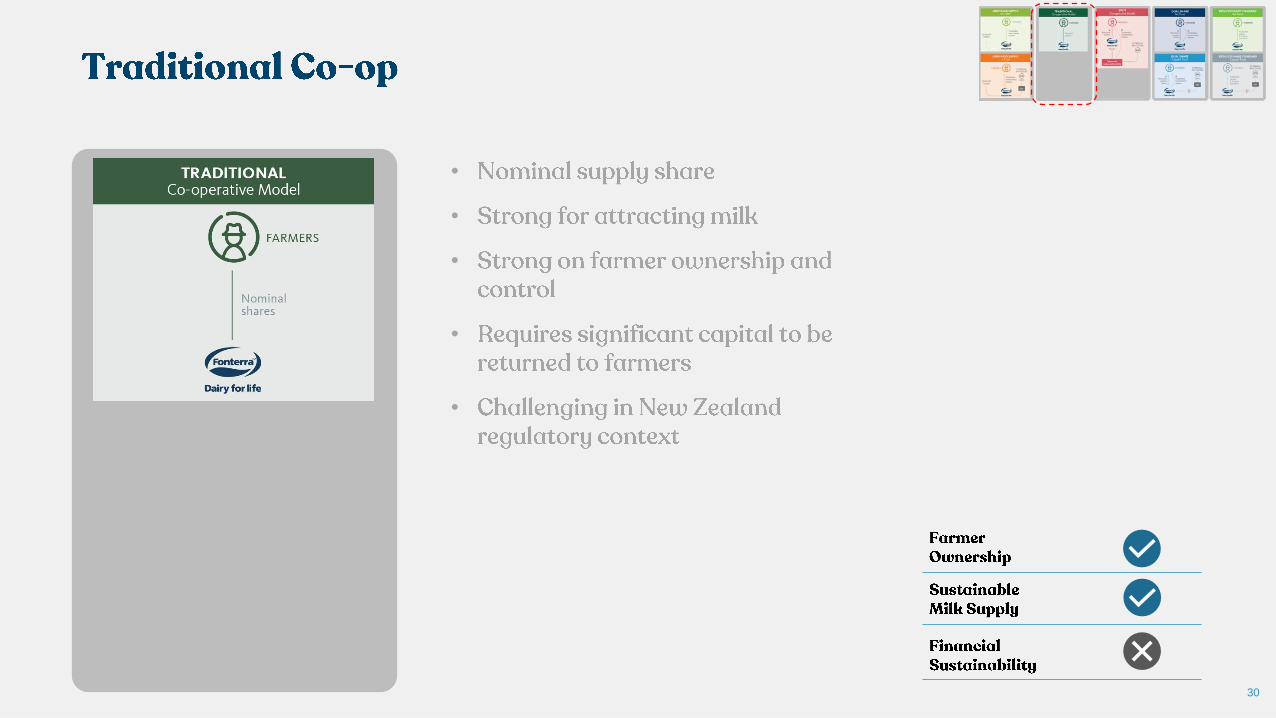
•
•
•
•
•

31
•
•
•
32
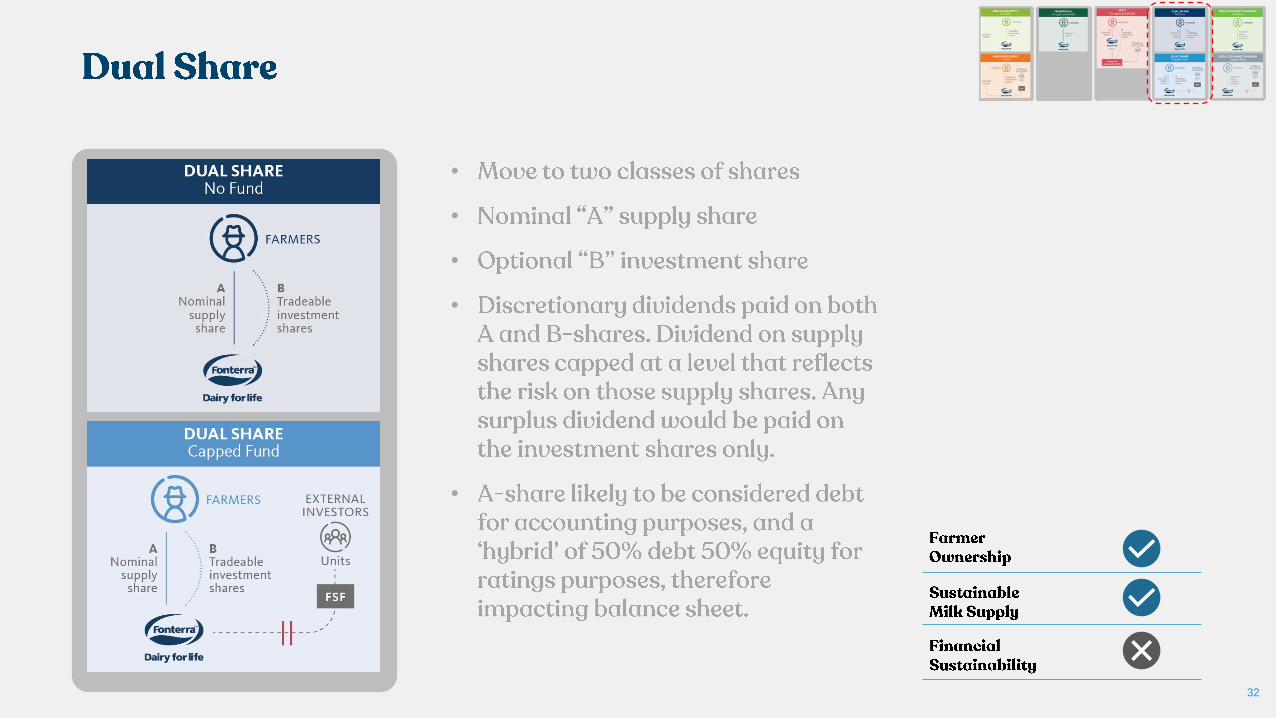
•
•
•
•
•
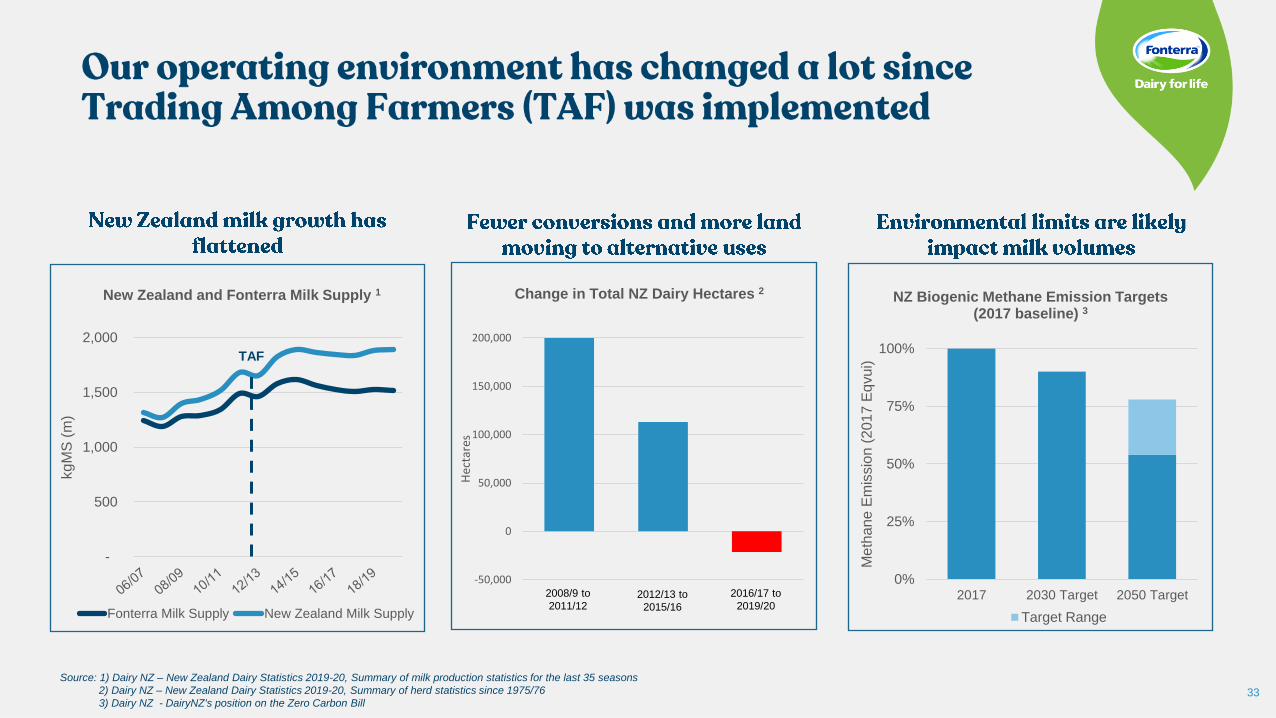
33
0%
25%
50%
75%
100%
2017 2030 Target 2050 Target
Me
tha
ne E
mis
sio
n (
201
7 E
qvu
i)
NZ Biogenic Methane Emission Targets (2017 baseline) 3
Target Range
-
500
1,000
1,500
2,000
kg
MS
(m)
New Zealand and Fonterra Milk Supply 1
Fonterra Milk Supply New Zealand Milk Supply
TAF
Source: 1) Dairy NZ – New Zealand Dairy Statistics 2019-20, Summary of milk production statistics for the last 35 seasons
2) Dairy NZ – New Zealand Dairy Statistics 2019-20, Summary of herd statistics since 1975/76
3) Dairy NZ - DairyNZ's position on the Zero Carbon Bill
-50,000
0
50,000
100,000
150,000
200,000
Hec
tare
s
Change in Total NZ Dairy Hectares 2
2008/9 to
2011/122012/13 to
2015/16
2016/17 to
2019/20

34
FONTERRA FARMERS FUND INVESTORS
Shares
Custodian
Units