Embed Size (px)
Citation preview

FACULTEIT ECONOMIE EN BEDRIJFSKUNDE
HOVENIERSBERG 24 B-9000 GENT
Tel. : 32 - (0)9 – 264.34.61 Fax. : 32 - (0)9 – 264.35.92
WORKING PAPER
Follow-on financing of venture capital backed companies:
The choice between debt, equity, existing and new investors
Katleen Baeyens 1
Sophie Manigart 2
January 2006
2006/362
1 Ghent University, Kuiperskaai 55E, B – 9000 Gent Belgium 2 Corresponding author, Ghent University and Vlerick Leuven Gent Management School, Reep 1, B-9000 Gent, tel. (32)9/210 97 11, fax (32)9/210 97 00, e-mail [email protected] We acknowledge financial support from Ghent University (Bijzonder Onderzoeksfonds) and the Faculty of Business and Economics (Impulsfonds I). The paper benefited from discussions at the 2005 EISB Conference and workshops in Katholieke Universiteit Leuven and Erasmus University Rotterdam. We especially thank Marc Deloof, Koen Schoors, Hubert Ooghe and Mike Wright for helpful comments on earlier drafts.
D/2006/7012/07

2
FOLLOW-ON FINANCING OF VENTURE CAPITAL BACKED COMPANIES: THE CHOICE BETWEEN DEBT, EQUITY, EXISTING AND NEW INVESTORS
ABSTRACT We study the financing strategies of 191 start-ups after they have received venture capital
(VC) and thereby contribute to the staging literature. The VC backed start-ups have raised
financing on 345 occasions over a five-year period after the initial VC investment.
Surprisingly, bank debt is the most important source of funding for these young and growth-
oriented companies, supporting the view that VC investors have a certifying role in their
portfolio companies. Bank debt is available to firms with a lower demand for money, lower
levels of risk and of information asymmetries, implying that staging of equity funding is less
important for these firms. A firm only raises equity when it’s debt capacity is exhausted,
hinting that equity investors are investors of last resort. New equity is provided by the existing
shareholders in 70% of the equity issues, supporting earlier findings that staged financing is
important in venture capital financing. New shareholders invest when large amounts of
funding are required and when risk and information asymmetries are high. We interpret these
findings as support for the extended pecking order theory. In line with syndication arguments,
new investors thus provide risk sharing opportunities and skills to screen and monitor and
thereby reduce information asymmetries. New equity investors face adverse selection
problems, however, in that only the most risky investments are syndicated.
Keywords: financing strategy, venture capital, bank debt, external shareholders
JEL classification: G32
3
FOLLOW-ON FINANCING OF VENTURE CAPITAL BACKED COMPANIES: THE CHOICE BETWEEN DEBT, EQUITY, EXISTING AND NEW INVESTORS
1. Executive Summary Entrepreneurial companies need to access sufficient and adequate funding from external
sources to pursue their value creating investment opportunities, as their internally generated
cash flow is generally limited or negative. A critical question that they therefore face is
whether to raise new funding under the form of debt or equity and, in the latter case, whether
to raise equity from existing shareholders only or to involve new shareholders. This question
is important, as entrepreneurial ventures are typically characterised by high risk and large
information asymmetries and information opacities between the entrepreneur and capital
providers (Berger and Udell, 1998). This makes that they are especially sensitive to problems
of adverse selection and moral hazard (Gompers, 1995). Moreover, entrepreneurial firms
exhibit high probability of failure. The purpose of this study is to investigate empirically the
financing choices of young, growth-oriented firms after they received a first round of venture
capital (VC). This setting allows us to focus on entrepreneurial companies that have been
certified by VC investors as promising and high growth-oriented ventures.
The 191 ventures in our sample raise substantial amounts of equity or debt on 345 occasions
over the five-year window after the initial VC investment. Each venture thus raises new
financing on 1.8 occasions on average in this five-year time period. Surprisingly, bank debt is
the most important source of funding for these young, growth oriented companies, especially
for firms with lower demand for money, with lower levels of risk and lower levels of
information asymmetries. Equity is only important for firms that have exhausted their debt
capacity, hinting that equity investors are investors of last resort. Following Lemmon and
Zender (2004), we interpret the findings as strong support for the extended pecking order
theory.
We further distinguish equity that is provided by existing shareholder only from equity that is
provided by at least one new investor. External equity is provided by the existing shareholders
in 70% of the equity issues, supporting earlier findings that staged financing is important in
VC financing. New investors, being either VC firms or other equity investors, invest when
larger amounts of funding are required and when risk and information asymmetries are
highest. In line with syndication arguments, new equity investors thus provide risk sharing
opportunities and reduce information asymmetries between entrepreneurs and existing VC
investors. New equity investors face adverse selection problems, however, in that only the

4
most risky investments are syndicated. Existing investors are sole investors for intermediate
levels of risk and information asymmetries.
By focusing on the new issues of young, unquoted VC backed ventures, this study addresses a
number of limitations of previous empirical research on entrepreneurial firm financing. First,
most studies on unquoted companies deal with ‘average’ start-ups or SMEs. In contrast, all
firms in our sample have successfully appealed to VC investors at start-up. Therefore, our
study addresses the financing choices of high growth-oriented companies. Further, the
‘average’ entrepreneur is often reluctant to issue equity to outside shareholders, because this
may entail significant loss of independence and control. Hence, they truncate their financing
options to internally generated cash flows and debt financing (Howorth, 2001). As the firms
in our sample have all obtained VC early on, their shareholders are open to external equity
financing and do not fear the loss of independence and control associated with it. Finally, the
initial VC participation suggests that the entrepreneurs in our sample are relatively
sophisticated in financing their venture (Van Auken, 2001), as applying for venture capital is
more difficult than applying for bank debt. This, again, broadens the financing options
available to finance the venture. The drawback of using a VC backed sample is that our
findings may not be applicable to all entrepreneurial companies, as the VC participation early
on may influence the search for and the availability of funding from different sources.
A second contribution of the present study is that we study the financing strategy from the
point of view of the entrepreneurial venture, rather than from the supply side. The few studies
looking at the demand side, i.e. at how growth-oriented ventures are financed, often restrict
themselves to follow-on equity financing (e.g. Gompers, 1995). Here, we not only include
equity issues, but also bank debt as a financing source.
2. Introduction
Young, growth-oriented companies often develop products and ideas that require substantial
capital, exceeding the internally generated cash flows or entrepreneur’s own funds (Berger
and Udell, 1998). Entrepreneurial companies need to access sufficient and adequate funding
from external sources to pursue their opportunities. A critical question that they face is
whether to raise new funding under the form of debt or equity and, in the latter case, whether
to raise equity from the existing shareholders or to involve new shareholders. This question is
important, as entrepreneurial ventures are typically characterised by high risk and large
5
information asymmetries and information opacities between the entrepreneur and capital
providers (Berger and Udell, 1998). This makes that they are especially sensitive to problems
of adverse selection and moral hazard (Gompers, 1995). Moreover, due to liabilities of
newness and smallness, entrepreneurial firms exhibit high probability of failure. Investors
may, therefore, ration capital and positive net present value projects may be denied financing,
or companies may only be able to obtain certain types of funding (Carpenter and Petersen,
2002a). As a result, entrepreneurial ventures often face financing constraints that may lead to
underinvestment problems (Hubbard, 1998) and thereby constrain growth (Carpenter and
Petersen, 2002b).
So far, our understanding of how early-stage ventures select among alternative financing
sources at a given point in time and in a given context is limited. Studies on the financing
choices of high potential ventures are scarce, mainly due to a lack of reliable data. The
purpose of this study is to investigate empirically the financing choices of young, growth-
oriented firms after they received a first round of venture capital (VC). This setting allows us
to focus on entrepreneurial companies that have been certified by VC investors as promising
and high growth-oriented ventures. Drawing upon an extended version of the pecking order
theory (Lemmon and Zender, 2004), we use information asymmetry and risk arguments to
develop hypotheses that explain how entrepreneurial companies select among bank debt or
equity, from either existing shareholders or from new shareholders. New shareholders may be
VC firms or other equity investors, such as corporations. We test the hypotheses on a unique
hand-collected sample of 191 VC backed start-ups and we examine how these firms are
financed during the first five years following the initial VC investment.
The 191 ventures in our sample raise substantial amounts of equity or debt on 345 occasions
over the five-year window after the initial VC investment. Each venture thus raises new
financing on 1.8 occasions on average in this five-year time period. Bank debt is the most
important source of funding, especially for firms with lower demand for money, with lower
levels of risk and lower levels of information asymmetries. Equity is only important for firms
that have exhausted their debt capacity, hinting that equity investors are investors of last
resort. Following Lemmon and Zender (2004), we interpret the findings as strong support for
the extended pecking order theory.
We further distinguish equity provided by existing shareholder only from equity provided by
at least one new investor. Equity is provided by the existing shareholders in 70% of the equity
issues, supporting earlier findings that staged financing is important in VC financing. New
investors, being either VC firms or other equity investors, invest when larger amounts of

6
funding are required and when risk and information asymmetries are highest. In line with
syndication arguments, new equity investors thus provide risk sharing opportunities and
reduce information asymmetries between entrepreneurs and existing VC investors. New
equity investors face adverse selection problems, however, in that only the most risky
investments are syndicated. Existing investors are sole investors for intermediate levels of risk
and information asymmetries.
By focusing on the new issues of young, unquoted VC backed ventures, this study addresses a
number of limitations of previous empirical research on entrepreneurial firm financing. This
study differs from most previous studies in the type of firms and the type of data that are
examined. First, most studies on unquoted companies deal with ‘average’ start-ups or SMEs.
In contrast, all firms in our sample have successfully appealed to VC investors at start-up.
Therefore, our study addresses the financing choices of high growth-oriented companies, as it
is well established that VC firms try to select the most promising ventures through extensive
pre-investment screening and due diligence (Amit et al., 1998; Manigart and Sapienza, 1999).
Further, the ‘average’ entrepreneur is often reluctant to issue equity to VCs, because this
entails significant loss of independence and control. Through their seats in the board of
directors, venture capitalists take part in strategic decision making (Fried et al., 1998; Kaplan
and Stromberg, 2004). Therefore, entrepreneurs are often reluctant to raise equity and hence,
truncate their financing options to the use of internally generated cash flows and debt
financing (Howorth, 2001). Our sample of VC backed firms thus allows to examine financing
decisions of entrepreneurs that do not constrain the growth of their firms to the availability of
internal funds or to debt financing. Finally, the initial VC participation suggests that the
entrepreneurs in our sample are relatively sophisticated in financing their venture (Van
Auken, 2001), as applying for equity is more difficult than applying for bank debt. This,
again, broadens the financing options available to finance the start-up.
The drawback of using a VC backed sample is that our findings may not be applicable to all
entrepreneurial companies, as the VC participation early on may influence the search for and
the availability of funding from different sources. For example, VCs may have a certifying
role. The presence of VC may provide credibility and legitimacy to the entrepreneurial firm,
making them more attractive to other investors. Moreover, VC is available to only a limited
number of companies; numerous high growth companies were never financed with VC. Our
findings therefore do not extend to non-VC backed high growth companies.
A second contribution of the present study is that we study the financing strategy from the
point of view of the entrepreneurial venture. A limitation of the existing literature is that most
7
studies on VC financing study the supply side, i.e. how VC firms select and manage their
portfolio companies. The few studies looking at the demand side, i.e. at how growth-oriented
ventures are financed, often restrict themselves to follow-on equity financing (e.g. Gompers,
1995). Here, we not only include equity issues, but also bank debt as a financing source. Our
data thus allow to address issues related to the full spectrum of follow-on financing, including
issues related to staging and syndication of VC funding, as the ventures develop. We thereby
address the call of Gompers (1995) for more studies on how appropriate sources of capital
change as new firms evolve.
A third contribution of this study is that all firms in the sample are between one and seven
years old and unquoted, while most studies focus on post-IPO financing (for example
Hovakimian et al., 2001). This introduces a bias in the latter towards more mature, more
successful and larger firms, which typically face less financing constraints compared to young
ventures. This also implies that our study does not suffer from survivor bias. Unlike most
studies, surviving, acquired and failing firms are included in our analyses. This allows us to
eliminate a positive survivor bias that may be important for this type of firms (Manigart et al.,
2002a) and increases the validity of the results. Finally, we focus on Continental European
firms rather than on US firms which constitute the sample frame of the majority of empirical
studies on firms’ financing decisions. This allows us to examine financing decisions in a bank
oriented financial and institutional setting, in contrast to most studies.
Finally, our study further differs from most studies on firm financing in the method that is
used. First, we focus on the impact of firm characteristics on entrepreneurs’ financing choices
at a particular point in time, and not on the firm’s debt ratio, which is a static picture of a
firm’s complete history of financing choices (de Haan and Hinloopen, 2003). This approach
has major advantages. Because young, high potential firms may change considerably over
relatively short time frames, this may affect the availability and suitability of different
financing sources (Berger and Udell, 1998). It is therefore important to take into account firm
characteristics at the moment new funding is obtained. By studying new financing issues,
information on the timing of these issues is taken into account (de Haan and Hinloopen,
2003). Finally, although important differences exist between internally generated funds and
external equity in terms of asymmetric information, this distinction is typically not made
when studying debt ratios (de Haan and Hinloopen, 2003). Second, we follow the call of
Schwartz and Teach (2000) in that we examine firms’ financing choices in a dynamic,
longitudinal way, contrary to cross sectional studies. Firms are followed from the year after
8
VC participation up to five years after participation or until the firm ceases to exist as an
independent venture due to take-over, liquidation or bankruptcy.
The rest of the paper is structured as follows. Hypotheses with respect to the choice between
bank debt and equity are developed in section 2. We make a distinction between existing and
new equity investors. Section 3 presents the sample and describes the data collection. Section
4 presents a dynamic picture of how the start-ups in our sample are financed after the initial
VC investment. Section 5 describes the method of analysis and defines the variables used in
further analyses. Section 6 reports the bivariate and multivariate results. Finally, section 7
discusses the results and concludes.
3. The choice between bank debt, equity from existing shareholders and equity from new
shareholders
In this section, we develop hypotheses as to why some entrepreneurial ventures are financed
with bank debt, whereas others raise equity. We present theoretical arguments that explain
why certain ventures issue equity to new shareholders, rather than to existing ones. We first
focus on the role of information asymmetries. Thereafter, we focus on bankruptcy risk and
limited debt capacity to explain financing choices. We address the financing question from
the supply side (debt or equity investors) and from the demand side, including the
entrepreneurs and the VCs that initially invested in the venture.3
3.1. Information asymmetries and agency problems
The difficulties of young ventures in securing sufficient and adequate external financing are
often attributed to information asymmetries between entrepreneurs and financiers (Berger and
Udell, 1998), which may lead to agency problems such as adverse selection and moral hazard
(Eisenhardt, 1989). Following the pecking order theory, concerns with respect to asymmetric
information and potential agency problems are expected to affect the financing choices of VC
backed start-ups in the financing rounds following the initial VC investment. Investors differ
in how they deal with agency problems, making certain types of investors more appropriate
3 We largely draw upon the venture capital literature and to a smaller extent on the business angel literature to explain the choice for equity. We point to the fact, however, that although most equity investors in these ventures are VC firms or business angels, other equity investors also play a role in the financing of entrepreneurial ventures. These may, for example, be corporate investors.

9
depending on the firm’s characteristics (Carpenter and Petersen, 2002a). Entrepreneurial
ventures, on the other hand, will consider the signalling effect and the ability of investors to
generate information on the venture when seeking outside funding.
3.1.1. Bank debt versus equity
Pecking order theory asserts that information asymmetries and potential agency problems
affect the supply of financing for any company. Equity investors have, in comparison to
banks, more incentives and are often better equipped to mitigate substantial information
problems associated with entrepreneurial ventures (Ueda, 2004), thereby creating an
informational advantage and reducing potential adverse selection and moral hazard problems.
First, the equity nature of their claims incites them to reduce information asymmetries
(Wright and Robbie, 1998). In contrast to bank debt, which involves a fixed claim restricted
to interest and principal payments, equity entails a claim on the firm’s residual income.
Hence, equity investors have a more powerful incentive to deal with the asymmetric
information problems of entrepreneurial ventures than banks providing debt as the formers’
return potential depends on a firm’s value creation,.
Second, although theoretical and empirical work in the banking literature stresses the role of
bank screening, contracting and monitoring in reducing asymmetric information problems, the
processes and instruments typically used by banks do not always work in the context of early
stage, high potential ventures. The screening process of banks focuses mainly on historical
financial information, making bank financing especially appropriate for firms with a positive
financial history (Rosman and O'Neill, 1993). However, historical financial information is not
always available, let alone positive, for young, high potential ventures (Berger and Udell,
1998). Relationship lending is another mechanism typically used by banks to reduce problems
stemming from information asymmetries between entrepreneurs and banks (Boot, 2000).
Again, because their credit history may be limited or even inexistent, young, entrepreneurial
ventures may not be able to benefit from relationship lending.
Furthermore, banks typically use collateral, guarantees and debt covenants to deal with
information problems (Berger and Udell, 1998). Collateralization allows banks to deal with
problems of adverse selection and moral hazard, as it protects the interests of the bank and
limits the decisions of the entrepreneur. However, young, high potential ventures often lack
assets that may serve as collateral for bank debt (Carpenter and Petersen, 2002a; Cassar,

10
2004). Their investments are often intangible and relate to growth opportunities (Baeyens et
al., 2003). The lack of a positive financial history and of a lending relationship with banks,
combined with low levels of collateralizable assets and investments in growth opportunities
rather than in tangible assets, make that information asymmetries in these type of firms are
high (Carpenter and Petersen, 2002a). Entrepreneurs are often better informed than financial
intermediaries about the riskiness of their projects, thus creating problems of adverse
selection. Indeed, banks may choose to ration credit instead of exerting more efforts to
decrease information asymmetries or increasing interest rates (Stiglitz and Weiss, 1981)4.
One of the primary reasons for the existence of informed equity investors such as VC firms or
business angels is their information processing capacities (Amit et al., 1998). These investors
are able to exert more costly efforts, given that they share in the potential upside of their
portfolio companies. The information processing of VC firms and business angels focuses
more on strategic information rather than on past financial information. They engage in
extensive due diligence activities, including the collection of information about the business,
the market in which the venture operates, and the entrepreneur or start-up team (Manigart et
al., 1997). As a result, they are better equipped to screen early stage ventures (Rosman and
O'Neill, 1993). Extensive screening is also done by corporate investors, wishing to invest for
strategic reasons or to have a window on technology. Intensive screening before the funds are
provided allows equity investors to reduce information asymmetries and addresses the
problems of adverse selection. Moral hazard problems are addressed by closely monitoring
the firm as soon as funds are provided (Lerner, 1995).
An additional method used by equity investors – especially VC firms - to hedge against moral
hazard is to write tailor-made contracts (Sahlman, 1990) and to stage the funding. A tailor-
made contract reduces goal incongruence between entrepreneurs and investors (Kaplan and
Stromberg, 2004; Sahlman, 1990) for example by using convertible instruments (Gompers,
1998). Staging implies that equity investors commit themselves to further invest if pre-
defined milestones are met. Conversely, this gives the equity investors an option to abandon
the venture if it does not perform as expected (Gompers, 1995). Staging is considered to be
one of the strongest control mechanisms used by VC investors and business angels as it
provides a powerful incentive for the entrepreneur to perform well (Sahlman, 1990). Gompers
(1995) shows that the number of financing rounds of VC backed ventures increases and the
duration between financing rounds decreases as asymmetric information problems and
4 In contrast to the model of Stiglitz and Weiss (1981), which leads to underinvestment, the model of asymmetric information of de Meza and Webb (1987) leads to overlending. However, consistent with the ideas of Carpenter and Petersen (2002a), we believe that overlending is unlikely to occur in entrepreneurial ventures.
11
potential agency costs increase. Hence, he shows that staging becomes more important when
the value of monitoring increases. Based on staging arguments, a first round of VC funding is
more likely to be followed by another equity round rather than by debt in firms with more
important information asymmetries and potential agency costs.
Foregoing supply side arguments suggest that the relation between information asymmetries
and the supply of bank debt and equity is motivated by the nature of the investors’ claims and
their screening, contracting and monitoring techniques. Based on these arguments, we expect
that firms with higher information asymmetries are more likely to be financed by equity,
rather than by bank debt (Cassar, 2004).
Demand side arguments lead to the same expectation, as entrepreneurs trade off the relative
costs of funding against its benefits. On the one hand, equity funding is an expensive
financing source. For example, required rates of return of European VC investors vary
between 15% and 55% depending on the stage of development of the investee company
(Manigart et al., 2002b). Everything else equal, firms are likely to prefer funding from
cheaper sources, such as bank financing. However, equity funding, especially from VCs, is
associated with important advantages in terms of information production, signalling,
certification and post-investment value adding. When information asymmetries increase and
hence, the relative benefits of informed equity become more important, the relative cost of
informed equity decreases and firms may opt for equity instead of bank debt (Fulghieri and
Lukin, 2001) 5.
The demand for bank debt may finally be driven by the VC as shareholder of the venture. A
VC firm’s return potential increases if the total funding requirement of the venture can be
split between equity (provided by the VC) and bank debt. VC firms will therefore push firms
to obtain bank debt when it is available, thus when information asymmetries are low.
Based on supply and demand related arguments, we hypothesize:
5 All the firms in this study get VC early on. This may have reduced to some extent the asymmetric information problems that they face and their need to signal firm quality to outsiders. Indeed, the initial VC investment may convey positive information (certification) and should lead to more financing from other, cheaper sources (Manigart and Sapienza, 1999). Hence, the first VC funding round may have improved their ability to get bank funding for certain firms. However, concerns with respect to information asymmetries, and the agency costs associated with it, may nevertheless continue to play an important role in their financing choices (Janney and Folta, 2003).

12
Hypothesis 1: VC backed companies with lower levels of information asymmetries are more
likely to be financed with bank debt instead of equity.
3.1.2. Existing versus new equity investors
Information asymmetries and potential agency problems may not only affect the choice
between bank debt and equity, but also the choice between different providers of equity.
Previous studies have suggested that information asymmetries and the resulting need for
effective selection and monitoring by outside investors lead established firms to choose
private equity over public equity (for example Janney and Folta, 2003). Similarly, the
existence of information asymmetries may play an important role in the choice of young
ventures between external equity from new or from existing shareholders.
Information asymmetries between entrepreneurs and investors induce growth-oriented
ventures to incur important information production costs in order to secure sufficient and
adequate financing from outside investors. In the financial growth cycle paradigm, firms’
financing sources change as firms develop: young firms with important information
asymmetries mainly rely on inside financing sources, while outside financing becomes more
important as problems of asymmetric information are smaller (Berger and Udell, 1998). First
round VC investors are insiders and are thus typically better informed than new investors on
the firm’s investment opportunities (Admati and Pfleiderer, 1994). Thus, by selling new
shares to existing shareholders rather than to new shareholders, firms are able to reduce the
costs of information production. By focusing on existing investors, firms further avoid the
search costs of looking for new investors.
Next to the argument that producing information may be costly, the degree of sensitivity of
the private information may also impact the choice of investor. Yosha (1995) argues that the
financing choices of entrepreneurial firms are likely to be influenced by their attempt to avoid
the disclosure of sensitive, private information. Firms with important growth options, and
hence large information asymmetries, may choose to limit the number of informed investors
in order to reduce the risk that proprietary information leaks to competitors. Therefore, firms
with a lot of sensitive private information are expected to sell their new equity to existing
shareholders rather than to new investors. Based on the above arguments, we propose that:
Hypothesis 2a: VC backed companies with higher levels of information asymmetries are more
likely to be financed with equity from existing investors rather than from new investors.
13
However, the opposite relation may be true. Inviting new shareholders to invest in a venture
relates to a decision to syndicate a deal. Following the VC syndication literature, there are
supply side arguments to explain the syndication decision. Information production is higher
when new investors are invited as shareholder, which is especially valuable when information
asymmetries are high. First, existing VC investors may invite colleagues to co-invest in order
to help them to better assess the investment decision (Lerner, 1994) or to better manage the
portfolio companies after the investment (Brander et al., 2002; Wright and Lockett, 2003).
Screening by new investors allows existing shareholders to make better reinvestment
decisions (Birmingham et al., 2003). Existing shareholders have to decide whether or not to
reinvest in the firm in each financing round. Although investors from prior rounds are
expected to be better informed compared to outsiders (Admati and Pfleiderer, 1994), they
may still experience some asymmetric information problems related to the further
development of the portfolio company (Wright and Robbie, 1998). New investors bring along
new skills to evaluate and screen firms and hence further reduce information asymmetries
(Lerner, 1995). They may bring up new information and provide a fresh, unbiased perspective
on the prospects of the venture that is not influenced by an escalation of commitment
(Birmingham et al., 2003). Therefore, the willingness of new investors to finance the venture
signals to existing investors that it is economically rational to reinvest. Bringing in skilled
outsiders is an especially valuable strategy when information asymmetries are more important
(Meuleman et al., 2005), enabling existing VC investors to make better reinvestment
decisions.
Next to improving investment decisions, new investors may play a positive role in enhancing
the existing investors’ monitoring and value adding capabilities. Previous studies have
stressed the role of monitoring as a mechanism to alleviate problems with external equity
financing under asymmetric information (Wright and Robbie, 1998; Manigart and Sapienza,
1999). Early stage companies have different monitoring and value adding needs compared to
later stage companies. Given the development of the firm, the skills of early stage investors
may not be adequate any more and they may benefit from specialised capabilities of new VC
investors (Kaplan and Strömberg, 2004).
Improved selection, monitoring and value-adding activities are particularly important in firms
with important information asymmetries and agency problems (Gompers, 1995). Hence, it
will be beneficial for the initial VC investors to invite new investors to co-invest when
information asymmetries are more important.
14
Foregoing arguments to understand the syndication decision are developed from the point of
view of the initial VC investor. There are also arguments that relate to the entrepreneur,
however: inviting new investors may be especially beneficial for the entrepreneurial firm or
the entrepreneur when information asymmetries are important. When existing investors are
the only ones providing follow-on financing, their negotiation power is high and may lead
them to bankroll the entrepreneur. When the entrepreneur is wealth constrained and therefore
unable to co-invest along with the VC, the latter’s negotiation power may lead the
entrepreneur having to accept a low valuation and therefore to face high dilution. Bringing in
new investors gives an unbiased estimate of the value of the venture, thereby protecting the
entrepreneur from reverse agency problems induced by initial VC investors (Admati and
Pfleiderer, 1994). Again, agency problems are more likely to arise when information
asymmetries are high. Bringing in new investors alongside existing investors may thus be
stimulated by the entrepreneurs, wishing to reduce agency problems with the initial VC
investors.
Adding new investors may not only solve the agency problem entrepreneurs may face vis-à-
vis their initial VC investors, but it may also enhance the value of the entrepreneurial firm.
New information on the firms’ prospects is generated when new investors are added. Hence,
firms with important information asymmetries may choose to obtain financing from new
shareholders in order to stimulate information production (Fulghieri and Lukin, 2001).
thereby not only reducing information asymmetries, but also enhancing value and reducing
the dilution that entrepreneurs face. New investors may further bring in new resources and
thereby enhance the value adding capabilities and legitimacy of the entrepreneurial firm. For
example, international shareholders may have a better view on market prospects in the
investors’ home markets, or may be beneficial in providing legitimacy and networks in their
home markets. This may be important for entrepreneurial ventures wishing to
internationalize. Foregoing supply and demand side arguments lead to the opposite
hypothesis:
Hypothesis 2b: VC backed companies with higher levels of information asymmetries are
more likely to be financed with equity from new investors, instead of existing investors.
3.2. Bankruptcy risk and limited debt capacity

15
Next to information asymmetries and associated agency risks, the financing of VC backed
start-ups may be explained by other risk considerations. Supply and demand of debt is
expected to be influenced by concerns about both costs and probability of financial distress.
This is particularly important for young, high potential ventures. First, the costs of financial
distress are expected to be high for growth-oriented firms, as they often possess a lot of
specific assets with low liquidation value (Opler and Titman, 1994). Second, young, growth-
oriented ventures typically face important challenges, threatening their survival. Due to
liabilities of newness and smallness, young firms are more prone to financial distress. VC
backed ventures have been found to exhibit even higher failure rates, compared to other early-
stage ventures (Manigart et al., 2002a). Even if financial distress does not lead to liquidation,
entrepreneurial ventures may still incur indirect financial distress costs. These costs include,
for example, suboptimal investment decisions, lost sales, high employee turnover or less
generous supplier credit (Altman, 1984). We argue that risk considerations may affect both
the choice between bank debt and equity and the choice between existing and new equity
investors. We further consider the role of limited debt capacity in the choice between bank
debt and equity.
3.2.1. Bank debt versus equity
The use of debt involves fixed payments; failure to make these payments leads to default and
may potentially result in bankruptcy. Banks do not share the firm’s upside potential and are
therefore particularly concerned about downside risk. Banks ration credit to firms with high
default and bankruptcy risk, thereby limiting firms’ capacity to get additional debt (Carpenter
and Petersen, 2002a). Maximum debt capacity is described as a situation in which the costs of
additional debt become so high that there are important limitations on additional debt issues
(Chirinko and Singha, 2000). The role of debt capacity in understanding how firms choose
between debt and equity has recently been stressed recently (Lemmon and Zender, 2004;
Chirinko and Singha, 2000). Once a firm’s debt capacity is exhausted, it has to turn to equity
to finance their investment projects. As such, equity investors can be considered as investors
of last resort (Chirinko and Singha, 2000). Lemmon and Zender (2004) hereby reconcile the
traditional pecking order theory with the observation that certain types of firms, such as
young and high tech firms, rely heavily on equity financing. They argue that empirical
evidence is in line with the pecking order theory, once limitations on debt capacity are taken
into account. Thus, firms with higher bankruptcy risk and a debt level that is close to its
16
maximum debt capacity will be denied bank debt and will hence be forced to turn to equity
investors, even if their current debt position is low. This interpretation is labeled the
“extended pecking order theory”.
In contrast to banks, equity investors may be willing to provide financing to firms with
relatively high risk of bankruptcy, as they share in the firms’ upside potential. Equity
investors are not so much in the business of dealing with risk, but in that of enhancing value
through increasing returns in high growth environments (Manigart and Sapienza, 1999). This
is not to say that equity investors do not hedge against investment risk. Staged financing may
help in dealing with financial risk (Kaplan and Strömberg, (2004). Rather than investing the
total amount at once, staging allows investors to limit the initial amount of funding at risk and
allows to more quickly abandon projects that head towards failure. This is important since
entrepreneurs have no incentives to stop investing in a failing project as long as others put up
the money for continuation (Admati and Pfleiderer, 1994). Hence, based on staging
arguments, it is expected that a first round of VC funding is more likely to be followed by
another equity round, rather than by a debt round, when bankruptcy risk is important.
A negative relation between bankruptcy risk and the use of debt is also consistent with
demand considerations. Firm survival is an important concern for entrepreneurs, therefore
entrepreneurs of firms that face a high probability and/or costs of financial distress are less
likely to use debt. Based on the above arguments, we hypothesize that:
Hypothesis 3a: VC backed companies with higher bankruptcy risk are more likely to be
financed with equity, instead of bank debt;
Hypothesis 3b: VC backed companies with lower debt capacity are more likely to be financed
with equity, instead of bank debt.
3.2.2. Existing versus new equity investors
Arguments related to risk sharing may explain why some VC backed start-ups get equity from
new shareholders in further equity rounds, whereas existing investors provide additional
equity in other firms. Risk sharing implies that new investors are sought to (co-)finance
investments with high default and bankruptcy risk, allowing the initial VC investors to better
diversify their portfolio (Manigart et al., 2005). The decision of existing investors to invest,
either by co-investing with new investors or alone, depends on how the investment
contributes to the investors’ overall portfolio risk. Assuming that the contribution of an

17
investment to the investors’ portfolio risk is positively associated with the risk of the portfolio
firm (Brander et al., 2002), risk sharing arguments imply that high-risk firms are (co-
)financed by new investors. For example, Brander et al (2002) find that the variability of
returns is higher for syndicated investments, in comparison with stand-alone investments,
suggesting that high-risk investments are syndicated more often. The risk sharing motive has
been found to be more important to explain syndication than improved selection and value
adding motives in Europe (Manigart et al., 2005; Wright and Lockett, 2003). Based on these
arguments, we hypothesize that:
Hypothesis 4: VC backed companies with higher bankruptcy risk are more likely to be
financed with equity from new investors, instead of existing investors.
4. Sample description and data collection
Foregoing hypotheses are tested on a sample of unquoted, young Belgian VC backed
companies. In contrast with the U.S. where most studies on firms’ financing decisions have
been done, Belgium has a Continental European financial system. While U.S. firms obtain an
important share of their external financing from capital markets, this financing source is
considerably less important for European firms. As in most countries, only a minority of
Belgian firms are quoted on a stock exchange. In contrast, European firms rely to a large
extent on bank loans (Hartmann et al., 2003). The VC industry, however, is quite well
developed in Belgium. Belgian venture capital investors are quite active in early stage and in
high tech investments compared to their European colleagues (EVCA, 1987-2003). Still, the
role of the VC industry in financing firms remains limited: in the period 1996 – 2000, for
example, investments made by Belgian VC companies accounted for only 3.3% of the net
issuance of unlisted equities by Belgian firms (ECB, 2002).
Our sample of VC backed start-up companies is a unique, hand-collected sample, gathered
from secondary sources. Yearly accounts of VC firms, press clippings, press releases and
websites are used to identify start-ups that received VC between 1987 and 1997. A start-up
company is defined as a company that is at most 2 years old at the time of its first VC
funding. This sampling procedure yields a sample of 191 high potential start-up companies,
covering 40% of all Belgian VC backed start-ups that received VC during that period (EVCA)

18
(see Table 1 – Panel A). Table 1 – Panel B shows the industry distribution of the sample firms
using 1-digit NACE code6. One quarter of the firms in our sample are active in NACE
industry 8 (“Business services”), 20% in NACE industry 3 (“Metal manufacture; mechanical
and instrument engineering”) and 17% in NACE industry 6 (“Distributive trades, hotels,
catering, repairs”).
[Insert Table 1 about here]
Data on the sample firms are collected from several sources. First, we use the yearly financial
accounts of the companies, from the year after the investment up to at most 5 years after the
initial investment or until the company is liquidated, bankrupt or acquired. All Belgian
companies are required to file annual financial statements with the National Bank of Belgium.
More than 50 variables from the financial accounts (balance sheet, profit and loss statement)
are recorded. For each company year, information is available on the use of bank debt and
external equity financing. Next to the financial statements, information on the investors in
follow-on equity rounds is collected manually through press clippings, press releases and
websites. Moreover, statutory required publications with respect to capital increases,
published in ‘Het Belgisch Staatsblad/Le Moniteur Belge’7 are screened for investor
information. We further use the Belfirst CD-ROM, containing information on shareholder
structure.
5. Financing choices of the entrepreneurial start-ups in our sample
Given that little is known on the follow-on financing of young, entrepreneurial companies, we
start with describing extensively to what extent the companies in our sample raise external
financing after the initial VC funding and which types of financing are issued: bank debt,
equity from new shareholders or equity from existing shareholders (Table 2). Following
Hovakimian, Opler and Titman (2001) and de Haan and Hinlopen (2003), an issue is defined
as a net external equity or bank debt increase that amounts to at least 5% of pre-issue total
assets8. We do not make a distinction between long-term and short-term bank debt. Both the
number of issues and the amounts of funding, recorded per year after initial VC investment, 6 Firms active in the financial sector and holding companies are excluded from the sample. 7 ‘The Belgian Law Gazette’
19
are shown in Table 2 (Panels A and B). Equity issues are split according to whether new
shareholders, existing shareholders or both invest in the firm (Table 2 – Panel C). Further, we
provide a description of the number of issues per firm within the first five years after initial
VC participation (Table 2 – Panel D). Finally, firms are classified based on whether they issue
only equity, only debt or a combination of both during the observation period (Table 2 –
Panel E).
[Insert Table 2 – Panels A, B, C, D and E about here]
The 191 ventures in our sample have together raised equity or debt on 345 occasions in the
five years following the initial VC investment. A sample firm thus raises on average 1.8 times
new money for an average amount of € 3 502 693. Table 2 - Panel A reports issues by year
after the initial VC participation. This panel illustrates the continued need for external funding
by the start-ups in our sample. 29% of the firms obtain new funding during the first year after
VC investment, while as much as half of the sample firms raise equity or debt in the second
year after VC investment. More than one third of the firms raise external financing in year 3
or year 4, whereas one quarter of the firms raises new equity or debt in the fifth year after VC.
This hints that raising money is particularly important shortly after having received VC, but
the initial VC investment allows many companies to bridge the first year. After a couple of
years, internally generated cash flows seem to be sufficient to finance the further growth of a
majority of the ventures. Table 2 – Panel A shows moreover that the sample firms more often
raise bank debt than equity: 67% of the new issues (230 out of 345 issues) are bank debt
issues, compared to 33% equity rounds (115 out of 345 issues). Debt financing is thus
important, even for early stage ventures.
Of the 191 ventures, only 143 (75%) have raised equity, debt or both at least once in the five
years following the initial VC investment. Conversely, 48 VC backed start-up companies
(25%) do not raise funding in the observation period. The additional financing of these firms
thus solely consists of internally generated cash flows. The non-issuing firms invest less in
fixed assets compared to firms that raise external financing. This may either be due to a lack
of supply of external funding, which may restrict their investments to the availability of
internally generated funds, or a lower demand for external funding, due to a lack of value
creating investment projects or high cash flow generation. The lack of external funding does
8 The 5% threshold percentage is used in order to focus on substantial security issues.

20
not lead to higher failure rates, however. Of the 48 non-issuing firms, 12 firms (25%) fail
within the first 5 years after the initial VC participation, compared to 24 firms that do issue
follow-on financing (17% of the issuing sample). None of the non-issuing firms is involved in
a merger, while 4 issuing firms are involved in a merger9.
Since the focus of this study is on the determinants of follow-on financing and the choice
between bank debt and equity from existing or new investors, the initial sample is reduced to
firms that do get new bank debt or equity. Table 2 – Panel B presents the median and total
amounts that are raised in equity and bank debt issues. The 143 ventures have raised a total of
€ 1.2 billion over the five-year period or on average € 8 450 552 per firm. More than € 400
million is raised as equity, while banks have provided almost € 800 million or almost twice
the amount of equity. This again stresses the importance of bank debt for VC backed
companies. However, the median equity investment (€ 495 787) is larger than the median debt
investment (€ 373 353). It is remarkable that the largest median and total amounts of bank
debt are raised in the very first year after having received the initial VC investment. This may
hint that the initial VC funding round has improved the ability of firms to get bank funding.
Indeed, the mere presence of a venture capitalist in the start-up of a firm may have sent a
positive signal to other investors, thereby certifying the venture and improving its availability
to raise cheaper funding (Manigart and Sapienza, 1999). This also supports the argument that
VC firms invest as little as possible in order to enhance their return prospects. After the first
year, the importance of bank debt declines steadily. This is not the case for the equity issues,
however. The median amount of equity raised remains rather constant, but the total amount of
equity raised by the sample firms declines over time. This is, of course, partly due to the fact
that more than a quarter of the firms have disappeared after 5 years due to acquisitions,
liquidations or bankruptcies.
Table 2 – Panel C reports the distribution of the equity issues split by existing or new
investors. 77 firms in our sample are involved in 115 equity rounds. 11 of them raise only
equity, while the remainder raise combinations of equity and bank debt. We have data on the
identity of the equity investors for more than 75% (90) of the equity issues. In particular, we
know whether the issues where financed by existing shareholders only, by new shareholders
only or whether both existing and new shareholders invested. 69% (62) of the equity issues
for which we have investor data are financed by existing shareholders only. 13 out of 90
issues are financed by new shareholders, whereas 15 issues are financed both by existing and
by new shareholders. This implies that about 31% of the equity issues involve at least one 9 In order not to introduce a bias caused by the merger, these firms are excluded from the analyses from the year

21
new investor. It should be noted that the new shareholders are not necessarily other VC firms.
On the contrary, new VC firms are involved in only 9 out of the 28 issues with at least one
new investor.
Table 2 – Panel D presents the number of equity and bank debt issues per firm within the first
5 years after initial VC participation. The results show that more than 70% of the issuing
firms raise new financing on more than one occasion. About one third of the firms get new
funding twice, and 30% of the issuers receive three or four times new funding within the first
5 years. Finally, 10% of the issuing firms obtain additional financing on five or more
occasions. This indicates that the initial VC participation does not fully cover the further
external financing needs of the young, high potential ventures in our sample. This is
consistent with theories on staging VC.
Table 2 – Panel E shows that 46% of the issuing firms do not get further equity funding
within the first 5 years after the initial VC participation, but issue only bank debt. These firms
account for 31% (108 of 345) of all financing events. Only 8% of the issuing firms in our
sample get equity only. Most firms that issue equity within the first 5 years also raise bank
debt at least once: 66 firms or 46% of the issuing firms obtain both bank debt and equity,
representing 65% of all issues (224 of 345 issues). The first issue after initial VC participation
of 35 firms is a simultaneous debt and equity issue. 16 firms issue bank debt first, while the
remaining 15 firms issue equity first. These results show that about half of the young, high
potential ventures in our sample rely on debt only, while most of the other firms use a
combination of bank debt and equity to finance further growth. Almost none rely solely on
equity.
In this section, we have shown that the initial VC participation does not fully cover the further
external financing needs of the young high potential ventures in our sample. A majority of the
firms in our sample gets additional external funding, often on more than one occasion. About
half of the issuing firms rely solely on debt, while most of the other firms use a combination
of bank debt and equity to finance further growth. Firms in our sample raise more often bank
debt, rather than equity. Moreover, the total amount of debt raised is almost twice the total
amount of equity raised. However, this does not imply that follow-on equity funding and
staging does not play an important role in the financing of the equity issuing entrepreneurial
firms: equity issues are substantially larger than bank debt issues. Firms that obtain additional
equity funding are often financed by existing investors. New shareholders are sought in only
of the merger onwards.

22
one third of the equity issues. Bringing in new investors is thus not a common event for the
VC backed ventures in our sample.
6. Variables and method of analysis
6.1. Method of analysis
So far, we have presented a dynamic picture of how VC backed start-ups are financed in the
first five years after the initial VC investment. We now analyse the determinants of the
financing choices. The units of analysis are the external financing issues, expanding the
sample for the analyses to 345 issues. Most independent variables are measured in the year of
the financing issue. If the financing issue has an impact on the variable, it is measured in the
year before the financing issue, namely the debt ratio, the bankruptcy ratio and firm size.
The data are first analysed using bivariate analyses. Since our data are not normally
distributed, the Wilcoxon test is used to compare the characteristics of the ventures in our
sample across different financing types. Second, financing choices are studied using
multinomial logit analyses with three possible outcomes: debt, equity from existing
shareholders only or equity from at least one new shareholder. Equity issues in which there
are only new shareholders and equity issues where existing shareholders co-invest with new
shareholders are combined in one group ‘at least one new shareholder’10. This group contains
28 observations, compared to 62 issues where existing shareholders only provide funding (see
also Table 1 – Panel D).
Some of the firms in our sample simultaneously raise bank debt and equity. This is the case
for 108 of the 345 issues. In order to include as much information as possible, we treat
simultaneous equity and bank debt issues as two separate issues in the bivariate analyses. This
is not possible for the multivariate analyses, which require mutually exclusive dependent
variables. Different procedures can be adopted to take into account a combination of equity
and bank debt in a single year. Following Helwege and Liang (1996), we code multiple issues
10 We acknowledge the fact that equity issues that involve a combination of new and existing shareholders on the one hand, and equity issues that involve only new investors may be different in nature. The small sample size prevents us to distinguish between both situations, however.
23
in one year as one particular type of financing. Firms that get equity financing are coded as
issuing equity, irrespective of whether or not they also issue bank debt in the same year11.
6.2. Independent variables
Three variables are included to proxy information asymmetries and associated agency
problems: tangible assets, intangible assets and the number of years since the initial VC
participation. The banking literature stresses the role of collateral as a way for banks to reduce
problems caused by asymmetric information with entrepreneurs (Berger and Udell, 1998).
Tangible assets can serve as collateral. More tangible assets are thus associated with less
information asymmetry problems. Intangible assets, on the other hand, consist mainly of
R&D expenses, patents and licenses. It is difficult or not rewarding for traditional debt
providers to ascertain the value of intangible assets, and their value may drop considerably in
case of default. Therefore, bankers usually do not accept intangible assets as collateral. More
intangible assets are therefore associated with more information asymmetry problems.
tangible assets and intangible assets are measured respectively as the ratio of tangible assets
and intangible assets to total assets. Bank debt is expected to be more used by firms with a
higher proportion of tangibles and a lower proportion of intangibles. Finally, young firms do
not have an established reputation or track record (Berger and Udell, 1998). We include #
years since initial VC participation as a negative proxy for information asymmetries. This
variable measures the time that has elapsed since the initial VC participation, which is
expected to reduce information asymmetries.
We include the variable bankruptcy risk as a proxy for financial risk. This variable is
measured as a short-term bankruptcy indicator developed for Belgian companies, the Ooghe –
Joos – De Vos score. It is a multivariate logit score for short-term failure prediction developed
in a Belgian context and therefore an appropriate alternative risk indicator for Altman’s Z
score (Ooghe et al., 1995)12. The risk indicator varies between zero (financially healthy firm)
and one (firm in financial distress). We also include three indicators of a firm’s debt capacity:
11 Results are robust, irrespective of how simultaneous equity and bank debt issues are treated. Excluding simultaneous debt and equity issues from the analyses or treating them as debt issues leads to similar results. 12 The Ooghe-Joos-De Vos score is computed using 8 of the firm’s financial variables: (1) direction of financial leverage, (2) accumulated profits and reserves to total liabilities, (3) cash to total assets, (4) overdue short-term priority debt, (5) operational net working capital to total assets, (6) net operating result to working assets, (7) short-term financial debt to short-term liabilities and (8) amounts payable guaranteed by public authorities and real securities to total amounts payable
24
the internally generated cash flow, the lagged debt ratio and the so-called notional debt
ratio13. cash flow, measured as the ratio of the internally generated cash flow to total assets,
is a negative proxy for the risk that firms default on their debt obligations (de Haan and
Hinloopen, 2003) and hence, it is expected to be especially important in the decision between
debt and equity. Cash rich, profitable firms have a higher debt capacity and are less likely to
default compared to firms with low cash flows. The debt ratio gives an indication of how the
firm has been financed in the past. It is a snapshot of a firm’s complete history of financing
choices (de Haan and Hinloopen, 2003). A higher debt ratio presents lower protection of
present or future debt providers, because of the smaller buffer of equity that debt providers
can depend upon in case of liquidation. It is an indication that the firm has extensively used
debt in the past, thereby reducing its additional debt capacity. To capture this effect, we
include lagged debt ratio in our empirical model. This variable is measured as total debt,
relative to total assets and lagged one year, to account for the fact that the financing decision
alters the debt ratio. Following Mayer and Sussman (2005), we further compute a
hypothetical debt ratio, the notional debt ratio. This measure indicates what the firm’s
leverage would have been in case the firm would not have issued equity, but debt instead. The
notional debt ratio is measured as follows: if debt is issued, then the notional debt ratio equals
the debt ratio; if equity is issued, then the equity issue is added to the debt to compute the
hypothetical debt ratio. So, the notional debt ratio allows to examine whether equity is issued
when debt financing would force firms to excessively high debt levels.
6.3. Control variables
Control variables are included to deal with effects that may impact the dependent variables,
but that are not taken into account yet. Issue size may affect a firm’s choice between different
types of funding. Firms with few investment opportunities that require only a limited amount
of external funding are expected to issue debt financing, in order to avoid the relatively high
due diligence and contracting costs associated with equity issues. Issue size may also affect
the choice between equity from existing and new shareholders. For example, existing
shareholders may not be willing to concentrate too much of their financial resources in one
firm, but instead diversify their investments, thereby reducing the overall risk of their
portfolio (Manigart et al., 2005). Moreover, financial resources of existing shareholders may
13 Unreported results show that our results do not change significantly when using alternative measures for debt capacity, such as interest coverage and cash flow coverage of debt.
25
be insufficient to finance the entrepreneurial firm’s growth aspirations. Therefore, attracting
new investors may well be the only way to cover large financing needs. Two measures of
issue size are included in the analyses. relative issue size is computed as the ratio of issue size
to pre-issue total assets. absolute issue size is measured as the log of issue size (in €).
Market conditions may affect a firm’s choice between debt and equity. Previous studies have
used firm level measures such as price earnings ratio (Panno, 2003) or stock price run-up (de
Haan and Hinloopen, 2003) and aggregate equity market level measures (Bayless and Diltz,
1994) to control for public equity market conditions. As the firms in our sample are unquoted,
firm level market data are not available. Since it is expected that private equity markets follow
the evolution of public equity markets, we include yearly price/earnings for the Belgian
market in our analyses (Source: Thompson Financial Datastream) to control for general
conditions in the equity markets. Following Bayless and Diltz (1994), we also include a
measure for the level of interest. ltinterest, measured per year, is the 10-year benchmark
Belgian government bond yield (Source: OECD). It is expected that increasing price/earnings
and interest rates lead firms to prefer equity rather than debt financing. Higher price earnings
ratios make equity cheaper and thus more attractive to entrepreneurs.
Firms within a certain industry often have similar capital structures. To control for industry
effects, industry dummies, based on 1-digit Nace codes, are included in our analyses (but not
reported in the Tables). Finally, in order to capture potential effects of the initial VC investor,
firms are split in 3 groups according to their initial VC backer: firms financed by independent,
by captive or by government related VC companies. For example, ventures which are initially
financed by bank-related VC firms may find it easier to get additional debt from that bank
afterwards (Hellmann et al., 2004). Two dummy variables, independent and captive, are
included in the analyses. Of the 191 firms, a majority (151 firms) is backed by a government
related VC company, the remainder by independent (13 firms) or captive VC companies (27
firms).
[Insert Table 3 about here]
Table 3 presents the Pearson correlation coefficients of the continuous independent variables.
As shown in Table 3, correlations between independent variables may cause collinearity
problems in multivariate analyses. The notional debt ratio is highly correlated with cash flow
(-0.65), bankruptcy risk (0.51) and the lagged debt ratio (0.64). Therefore, we specify two

26
multivariate regression models. In the first model, we include three proxies for risk: the
bankruptcy risk indicator, cash flow - as a negative proxy for the default risk - and lagged
debt ratio. We specify a second model in which only the notional debt ratio is included as
indicator of limited debt capacity. Table 3 further shows that lagged firm size and absolute
issue size are highly correlated (0.86), indicating that larger firms typically raise larger
amounts of external funding. Absolute issue size, rather than firm size, is included in the
reported multivariate logit models14. The effect of market conditions of equity and debt
markets are hard to disentangle, since the price/earnings variable is highly negatively
correlated with the long-term interest rate variable (-0.65), indicating that periods with a high
price earnings ratio, in which more equity issues are expected, are also periods which are
characterised by low long-term interest rates, in which more debt issues are expected.
Price/earnings are included in the reported multivariate logit models13.
7. Results
7.1. Bivariate analyses
Table 4 shows the characteristics of firms issuing debt (D firms), of firms issuing equity to
existing VC shareholders only (E-E firms) and of firms issuing equity to at least one new
investor (E-N firms). The results indicate that the characteristics of D, E-E and E-N firms
exhibit a certain order, but the differences are not always statistically significant15.
[Insert Table 4 about here]
The median ratio of tangible assets to total assets is 25% for D firms, 21% for E-E firms and
16% for E-N firms (not significantly different). D firms have significantly lower levels of
intangible assets than E-E firms and E-N firms, which have the highest levels of intangible
assets. D firms have a median intangible assets ratio of zero, compared to 2% for firms that
issue equity. This finding is consistent with hypotheses 1 and 2b. The results also indicate that
firms typically get equity from new shareholders sooner after the initial VC participation,
14 Results are robust, irrespective of which variable is included in the analyses. 15 The statistical insignificance of some of the results may be due to the small sample size, especially of E-N firms.
27
compared to equity from existing shareholders (significant at 5% level) and get equity from
existing shareholders sooner relative to D (marginally significant at 10% level).
Consistent with hypotheses 3a and 4, our results show that D firms have the lowest level of
bankruptcy risk, while E-N firms have the highest levels of bankruptcy risk. E-E firms have
intermediate levels of bankruptcy risk. This difference is statistically significant.
Overall, the results for cash flow, debt ratio and notional debt ratio suggest that firms tend to
issue equity when their additional debt capacity is low, confirming hypothesis 3b. The
internally generated cash flows of the young, growth-oriented firms in our sample are low.
About 37% of the firms that get new financing have negative cash flows. About half of the
firms that issue equity have negative cash flows, compared to only 30% of the firms that issue
debt. Cash flows of D firms are significantly larger (significant at 1% level), compared to
firms that issue equity. The median ratio of cash flows to total assets for E-N firms is even
negative.
The median debt ratio equals about 71% for D firms and E-E firms, with 80% debt for E-N
firms. The difference between D firms and E-N firms is marginally significant at the 10%
level. Notional debt ratios are significantly different between the three groups. The median
notional debt ratio for firms that issue VC is 88%. For E-N firms, the notional debt ratio is
even higher: if the latter would have obtained bank debt instead of equity, their median debt
ratio would have gone up to 97%.
Finally, the control variables indicate that both relative and absolute issue sizes are
significantly larger for firms that issue equity. A median debt issue equals 20% of firm assets
or € 373 353. E-E firms issue 25% of their assets or € 495 787, while E-N firms issue 26% of
their assets or € 793 258 (median values). The firm size also shows the same order: pre-issue
total assets are smallest for D firms (€ 1 829 380), followed by E-E firms (€ 2 045 122), and
finally E-N firms (€ 2 805 000). However, the difference is not statistically significant. No
significant differences exist with respect to price/earnings and long-term interest rate.
7.2. Multivariate logit analyses
Table 5 presents the results of multinomial logit analyses on the choice between the three
financing sources: bank debt, equity from existing shareholders only and equity from at least
one new investor. Multinomial logit analyses are used rather than a two-step logit model,
28
where the first step would model the choice between debt and equity and the second step
would model the choice between new investors and existing investors for equity issuing
companies. For our analyses, multinomial logit analyses are preferred since unreported results
indicate that the Irrelevance of Independent Alternatives (IAA) condition, a key assumption
of multinomial logit, is satisfied. This suggests that the choice between debt, equity from
existing shareholders only and equity from at least one new investor is a one-step choice
rather than a two-step choice. Three models are presented: the base model including only the
control variables (model 0) and the two models previously discussed.16 Models (1) and (2)
are statistically significant at the 1% level. The results of the bivariate statistics are confirmed
by the multivariate logit analyses17. We first present the coefficients of the control variables
and thereafter we discuss the coefficients related to the hypotheses.
[Insert Table 5 about here]
The results of the base model (model 0) show that firms tend to use equity instead of debt
when the relative issue size is large, especially when equity is raised from new investors
(significant at the 1% level). Moreover, firms with large financing needs relative to their size
are more likely to get equity from new investors rather than from existing investors
(marginally significant at the 10% level). Absolute issue size does not affect the choice
between equity from existing and equity from new shareholders, however. The coefficient of
price/earnings in models 1 and 2 indicates that firms tend to finance with debt, followed by
equity from existing shareholders and finally by equity from new shareholders when
price/earnings are high. Because price/earnings are negatively correlated to long-term interest
rates, this result suggests that low interest rates lead firms to opt for debt, rather than equity.
Firms initially backed by captive VC firms get more debt or equity from new shareholders,
compared to firms initially funded by government backed VC firms. This is consistent with
earlier findings that bank related VC backed companies more easily raise money from banks
(Hellmann et al., 2004), but bank related VC firms tend to be less involved in follow-on
equity financing rounds.
The variables that capture the effect of information asymmetries and the way in which
different financiers deal with asymmetric information and associated agency problems are 16 The multinomial logit specification takes into account that some observations are not independent, as one company may experience multiple financing events.
29
significantly related to a venture’s choice between the three types of funding sources.
Hypothesis 1 states that firms with high levels of information asymmetries will issue equity
rather than debt. The results provide strong support for hypothesis 1. Firms with a lower
proportion of tangible assets and a higher proportion of intangible assets raise equity rather
than debt. Firms with a lot of tangible assets especially use debt rather than equity from
existing shareholders (models 1 and 2, significant at 5% level) and to a lesser extent use debt
rather than equity from new shareholders (model 1, marginally significant at 10%). This is
strong evidence for the role of collateral in the provision of debt financing. The opposite
relation is true for firms with a lot of intangible assets, as the results suggest that these firms
have a low probability of raising debt. Having more intangible assets increases the probability
of raising equity from existing shareholders (model 1,marginally significant at 10% level and
model 2, significant at 5% level) or from new shareholders (models 1 and 2, significant at 1%
level). Further, firms that get equity, both from existing and from new shareholders, do so
sooner after the initial equity participation, compared to debt financing 18 (significant at the
10% for existing shareholders and at the 1% and 5% level for new shareholders). Consistent
with hypothesis 2b and in contrast with hypothesis 2a, firms with the highest levels of
information asymmetries are likely to involve new shareholders, rather than restrict
themselves to existing shareholders only. The results for tangible assets point in the
hypothesized direction, but are not significant. This may indicate that tangible assets and
hence collateral value are especially important in the choice between debt and equity, but less
so in the choice between equity from existing and new shareholders. New shareholders rather
than existing shareholders are sought by firms with important intangible assets (model 1,
significant at 10% level and model 2, significant at 5% level). Finally, new shareholders are
especially important in financing young firms in a short time period after the initial VC
investment (model 1, significant at 10% level and model 2, significant at 5% level).
Bankruptcy risk also affects ventures’ financing choices. Consistent with hypothesis 3a, firms
with higher bankruptcy risk typically issue equity from new shareholders rather than debt
(model 1, significant at 5% level). Consistent with hypothesis 4, firms with high bankruptcy
risk tend to involve new shareholders, instead of existing shareholders only. The choice
between debt and VC is further affected by considerations of limited additional debt capacity.
Model 1 shows that there is a significant positive relation (1% significance level) between 17 Although the coefficients are not always statistically significant, which may be due to the small sample size, they always have the expected sign. 18 This result also suggests that firms are younger when applying for equity, compared to debt. However, one should keep in mind that even the oldest firms in this study are still relatively young compared to the firms that
30
internally generated cash flows and the use of debt. This indicates that firms with relatively
high cash flows are able to raise debt, whereas firms with low cash flows are financed by
equity. The lagged debt ratio is positively related to the use of equity, but this coefficient is
never statistically significant. The coefficient of the notional debt ratio, however, (model 2) is
highly significant (1% level) in the choice of firms between debt and equity. This indicates
that considerations of limited debt capacity are important in the follow-on financing decision
of VC backed start-ups between debt and equity, consistent with hypothesis 3b.
8. Discussion and conclusion
The new financing issues of a sample of 191 venture capital backed start-ups are studied and
the determinants of the choice between bank debt and equity from existing or new investors
are sought. Consistent with staging arguments (Gompers, 1995), we show that the initial VC
investment does not fully cover the further external financing needs of the VC backed start-
ups in our sample. 75% of the firms get additional external funding over a five year period
after the first VC investment, often on more than one occasion. 40% percent of the firms in
our sample get additional equity funding. Staging of capital allows VC firms to cut their
losses, if portfolio companies do not perform as expected. Moreover, it allows ventures to
reconsider which type of financing they want to use when they develop and conditions
change.
Surprisingly and in contrast with the entrepreneurial finance literature that almost exclusively
stresses the role of equity in funding young, high growth-oriented companies, the financing
strategy of the VC backed start-ups in our sample includes more debt than equity. About half
of the ventures in our sample rely on debt only, while most of the other firms use a
combination of bank debt and equity to finance further growth. The total amount raised from
banks is considerably larger than the external equity raised, showing that banks are important
and cannot be ignored in financing young, growth-oriented companies. The evidence strongly
suggests that the initial VC investment is sufficient to become bankworthy for some of the
VC backed start-ups in our sample. The presence of a VC firm may have facilitated the firms’
access to debt financing, suggesting a certification role of VC firms. The fact that the initial
VC investment increased the equity of their portfolio companies of course also make them
more bankworthy. Equity issues are, however, substantially larger than debt issues, indicating
are typically examined in studies on mature firms. Therefore, even the ‘older’ firms in our sample may still be confronted with important information asymmetries.

31
that equity is important if the venture requires large amounts of money. Firms that obtain
additional equity funding are often financed by the VC firms that invested at the start, as we
show that new shareholders (co-)invest in only one third of the equity issues.
We examine the determinants of the choice of young, VC backed ventures between bank debt
and equity from new or existing shareholders. Low collateral value, high risk and large
projects all drive the entrepreneurs to finance their firm with equity, rather than with bank
debt and vice versa. Further, ventures rely more on equity investors when information
asymmetries are high. Firms use equity to finance intangible assets and activities with little
collateral, while firms with more tangible assets are typically financed with bank debt. These
results confirm the findings of Gompers (1995) that equity staging is more important as the
expected agency costs increase. The findings also highlight how investors deal with
asymmetric information and the agency problems associated with it and the merits that
specialised financial intermediaries, such as VC investors, have in dealing with large
information asymmetries. While financial intermediaries such as banks are able to assess the
value of tangible assets, VC investors, as highly specialised and well-informed investors
(Ueda, 2004), are better suited for assessing the value of intangible assets and growth
opportunities. Our results are consistent with the extended pecking order theory, and more
specifically with the idea developed by Lemmon and Zender (2004). It is not because a large
proportion of growth-oriented entrepreneurial companies do not rely on debt, that this
invalidates the pecking order theory. We showed that companies that have excess debt
capacity do issue bank debt, but equity is raised by companies that could not access bank debt
given their information asymmetries, high risk, high growth options and low collateral. This
goes against the traditional interpretation of the pecking order theory (e.g. Shyam-Sunder and
Myers (1999)).
We further show that information asymmetries are important in understanding the choice
between new and existing shareholders. Firms get equity from new instead of existing
shareholders when information asymmetries are larger. This suggests that the choice between
existing and new shareholders is not driven by attempts of entrepreneurs to minimize costs of
information production or to avoid the disclosure of sensitive information. Instead, new
investors are sought when specialised skills, necessary to screen and monitor growth options,
are important. This is in line with previous research on the motives for VC syndication
(Brander et al., 2002). This may also point to the fact that entrepreneurs may wish to decrease
the negotiation power of the initial VC investors by inviting new investors (Admati and

32
Pfleiderer, 1994). We showed that this is especially important when the value of the venture is
highly uncertain due to high information asymmetries.
Our results further highlight another important role of VC in financing young, growth-
oriented ventures. Consistent with the findings of Mayer and Sussman (2005), early stage
firms with important growth aspirations rely on equity financing when the use of debt would
push them to excessively high debt levels. Equity investors act as financiers of last resort in
that firms only issue equity in case debt capacity is exhausted. Our results with respect to risk
also provide insights in why certain firms are financed by existing shareholders while others
look for new investors. We show that new investors are especially prevalent in high-risk
firms. Existing VC shareholders may wish to diversify their risks and invite other players to
the syndicate, so as to share the risk. The results also hint that there may exist adverse
selection problems between new and existing shareholders in that existing shareholders invite
new investors especially in low quality and high-risk firms (Meuleman et al., 2005; Brander et
al., 2002).
The sample used for this study has a number of important advantages. First, contrary to most
studies on young ventures that use a random sample of SMEs, our sample allows us to test a
set of financing choices that is not truncated to the use of internal funds and debt financing
only (Howorth, 2001). As the firms in our sample have received VC, they have proven that
they are willing to open their shareholder base and share control over the venture. We
emphasize that our sample is not a random sample of young ventures as all companies in the
present study were successful in attracting VC at a very young age. The empirical evidence on
the financing needs, the availability, role and importance of equity and debt funding for young
ventures may therefore not be generalizable to firms with lower growth potential or lower
growth orientation. Moreover, receiving venture capital at start-up may have affected the
availability of further financing from other parties. Entrepreneurs that previously have
acquired external financing have been found more likely to do so again (de Haan and
Hinloopen, 2003; Helwege and Liang, 1996). This may be attributed to learning effects: the
experience of getting external financing may enhance the ability of entrepreneurs to negotiate
with investors (Van Auken, 2001; Wright et al., 1997). Further, next to financial resources,
VC firms certify their portfolio companies and provide them with credibility and legitimacy.
Moreover, because VC firms reduce information asymmetries through screening and
monitoring, VC backed start-ups may be more attractive to other investors. Other parties may
therefore free-ride on the efforts that the VC has exerted. Finally, the availability of different
financing sources may also be affected by other factors than those considered in this study.

33
For example, we have no information on the technological or business progress of the firms
since the last cash injection, which may nonetheless be an important determinant for the
availability of subsequent equity funding by the same or a new investor.
The results of this study are important for entrepreneurs. Our findings suggest that about 60%
of the firms do not get further equity funding, in contrast to the emphasis in the literature on
the importance and widespread use of staged equity financing by the VC firm. Hence, further
dilution and loss of control should not be a major concern for the average VC backed
entrepreneurial company. After having received VC, bank debt is by far the most important
financing source. However, further equity rounds are important for firms with large
information asymmetries, high risk of default and bankruptcy, and with large financing needs.
Those firms should expect follow-on equity investments and hence, take into account further
dilution.
The results of this study are important for VC investors. Our study suggests that VC investors
may act as financiers of last resort in that firms especially rely on equity when other, cheaper
sources of funding are unavailable. This has important implications for VC investors.
Effective selection by VC investors should result in the funding of the most promising
projects. However, our results suggest that VC investors face an important adverse selection
problem. Indeed, as argued by Amit, Muller and Glosten (1990), our results suggest that
equity investors who join in follow-on equity financing rounds may only be invited into
projects with high levels of financial and agency risks. Their role is then to decrease
information asymmetries and to mitigate the risk of the initial VC investors. These findings
confirm the important role that equity investors have as producers of information. Bringing in
new investors may also strengthen the negotiation position of the entrepreneurs by decreasing
the negotiation power of the initial VC investors and thereby reducing the reverse agency and
hold-up problem. This is again especially important in ventures with high information
asymmetries. This outcome may, however, be less attractive from the point of view of the
new syndicate partners, as they know that they may face adverse selection problems.
On the other hand, it may well be that the higher risk profile of the ventures may significantly
reduce the value of the venture at investment and thereby yield high upside potential.
Comparing the type of investors with the value at investment may yield a fruitful avenue for
future research. Distinguishing between equity rounds involving solely new investors on the
one hand and those involving both existing and new investors may also increase our
understanding of the financing process in these types of ventures.

34
The results of this study are important for policy makers. Getting sufficient and adequate
funding is often considered to be especially difficult for young, entrepreneurial ventures and
may put significant constraints on the growth of these firms (Carpenter and Petersen, 2002b).
Therefore, governments all over the world have set up programs to enhance the availability of
financing for this type of companies. This study has shown that equity – especially from
specialized VC investors - plays a crucial role in the growth of young, high potential firms.
Equity is used especially by firms faced with large information asymmetries, which may have
difficulties in accessing more traditional sources of funding. Moreover, equity issues are
especially important when debt issues would push firms beyond their debt capacity. Hence,
VC alleviates constraints on firm growth and allows firms to grow beyond what would have
been possible using only internal funding or debt. This is an important reason for
governments to further stimulate the availability of VC financing for entrepreneurial ventures.
It might be worthwhile to understand whether business angels, who also provide equity
funding to young, entrepreneurial companies, play similar roles, as European governments
also tend to subsidize business angel networks.
However, although VC and, more generally, equity may be crucial for the growth of some
entrepreneurial ventures, we have shown that bank debt is even more important for these
growth-oriented ventures. There are major concerns about how the availability of credit to
small ventures is affected by waves of consolidation in the banking industry. Moreover, so far
little is known on, for example, the effect of the Basel II regulation on the availability of bank
financing for young, high potential ventures. Careful monitoring by the public authorities of
the availability of bank debt to SMEs is therefore important.
References
Admati, A. R., Pfleiderer, P., 1994. Robust financial contracting and the role of venture
capitalists. Journal of Finance 49, 371-402.
Altman, E. I., 1984. A further empirical investigation of the bankruptcy cost question. Journal
of Finance 39, 1067-1089.
Amit, R., Brander, J., Zott, C., 1998. Why do venture capital firms exist? Theory and
Canadian evidence. Journal of Business Venturing 13, 441-466.
Amit, R., Glosten, L., Muller, E., 1990. Entrepreneurial ability, venture investments, and risk
sharing. Management Science 36, 1232-1245.

35
Baeyens,K., Manigart,S., Verschueren,I., 2003. Financing and investment interdependencies
in unquoted Belgian companies: the role of venture capital. In: Butzen,P., Fuss,C. (eds.),
Firms' investment and finance decisions - Theory and empirical methodology, 105-125.
Cheltenham,UK - Northampton, MA, USA: Edward Elgar.
Bayless, M. E., Diltz, D. J., 1994. Securities offerings and capital structure theory. Journal of
Business, Finance and Accounting 21, 77-91.
Berger, A. N., Udell, G. F., 1998. The economics of small business finance: the roles of
private equity and debt markets in the financial growth cycle. Journal of Banking and Finance
22, 613-673.
Birmingham, C., Busenitz, L. W., Arthurs, J., 2003. The escalation of commitment by venture
capitalists in reinvestment decisions. Venture Capital 5, 218-230.
Boot, A. W. A., 2000. Relationship banking: What do we know? Journal of Financial
Intermediation 9[1], 7.
Brander, J. A., Amit, R., Antweiler, W., 2002. Venture capital syndication: improved venture
selection vs. the value-added hypothesis. Journal of Economics & Management Strategy 11,
423-452.
Carpenter, R. E. and Petersen, B. C., 2002a. Capital market imperfections, high-tech
investment, and new equity financing. Economic Journal 112, F54-F72.
Carpenter, R. E. and Petersen, B. C., 2002b. Is the growth of small firms constrained by
internal finance? The Review of Economics and Statistics 84[2], 298-309.
Cassar, G., 2004. The financing of business start-ups. Journal of Business Venturing 19, 261-
283.
Chirinko, R. S., Singha, A. R., 2000. Testing static trade off against pecking order models of
capital structure: a critical comment. Journal of Financial Economics 58, 417-425.
de Haan, L., Hinloopen, J., 2003. Preference hierarchies for internal finance, bank loans, bond
and share issues: evidence for Dutch firms. Journal of Empirical Finance 10, 681.
De Meza, D., Webb, D. C., 1987. Too much investment: a problem of asymmetric
information. Quarterly Journal of Economics 101, 282-292.
ECB, 2002. Report on financial structure. European Central Bank, Frankfurt.
Eisenhardt, K. M., 1989. Agency theory: an assessment and review. Academy of Management
Review 14, 57-74.
36
EVCA, 1987-2003. EVCA Yearbook.
Fried, V. H., Bruton, G. D., Hisrich, R. D., 1998. Strategy and the board of directors in
venture capital-backed firms. Journal of Business Venturing 13, 493-503.
Fulghieri, P., Lukin, D., 2001. Information production, dilution costs, and optimal security
design. Journal of Financial Economics 61, 3-42.
Gompers, P., 1995. Optimal investment, monitoring, and the staging of venture capital.
Journal of Finance 50, 1461-1489.
Gompers, P. A., 1998. An examination of convertible securities in venture capital
investments. Working Paper Harvard Business School.
Hartmann, P., Maddaloni, A., Manganelli, S., 2003. The Euro area financial system: structure,
integration and policy initiatives. European Central Bank Working Paper No.230.
Hellmann, T., Lindsey, L., Manju, P., 2004. Building relationships early: banks in venture
capital. NBER Working Paper 10535.
Helwege, J., Liang, N., 1996. Is there a pecking order? Evidence from a panel of IPO firms.
Journal of Financial Economics 40, 429-458.
Hovakimian, A., Opler, T., Titman, S., 2001. The debt-equity choice. Journal of Financial and
Quantitative Analysis 36, 1-24.
Howorth, C. A., 2001. Small firms' demand for finance: A research note. International Small
Business Journal 19, 78-86.
Hubbard, G. R., 1998. Capital-market imperfections and investment. Journal of Economic
Literature 36, 193-225.
Janney, J. J., Folta, T. B., 2003. Signalling through private equity placements and its impact
on the valuation of biotechnology firms. Journal of Business Venturing 18, 361-380.
Kaplan, S. N., Stromberg, P., 2004. Characteristics, contracts and actions: evidence from
venture capitalist analyses. Journal of Finance 59, 2177-2210.
Lemmon, M. L., Zender, J. F., 2004. Debt capacity and tests of capital structure theories.
University of Utah and University of Colorado Working Paper.
Lerner, J., 1994. The syndication of venture capital investments. Financial Management 23,
16-27.
Lerner, J., 1995. Venture capitalists and the oversight of private firms. Journal of Finance 50,
301-318.
37
Manigart, S., Baeyens, K., Van Hyfte, W., 2002a. The survival of venture capital backed
companies. Venture Capital 4, 103-124.
Manigart, S., De Waele, K., Wright, M., Robbie, K., Desbrières, P., Sapienza, H. J.,
Beekman, A., 2002b. Determinants of required returns in venture capital investments: A five
country study. Journal of Business Venturing 17, 291-312.
Manigart, S., De Waele, K., Wright, M., Robbie, K., Desbrières, P., Sapienza, H. J.,
Beekman, A., 2000. Venture capitalists, investment appraisal and accouting information: a
comparative study of the USA, UK, France; Belgium and Holland. European Financial
Management 6, 389-403.
Manigart, S., Lockett, A., Meuleman, M., Wright, M., Landström, H., Bruining, H.,
Desbrières, P., Hommel, U., 2005. The syndication decision of venture capital companies.
Entrepreneurship: Theory & Practice, Forthcoming.
Manigart,S., Sapienza,H., 1999. Venture capital and growth. In: Sexton,D.L., Landström,H.
(eds.), The Blackwell handbood of entrepreneurship, 240-285. Oxford (UK): Blackwell
Publishers.
Manigart, S., Wright, M., Robbie, K., Desbrières, P., and De Waele, K., 1997. Venture
capitalists' appraisal of investment projects: An empirical European study. Entrepreneurship:
Theory & Practice 21[4], 29.
Mayer, C., Sussman, O., 2005. A new test of capital structure. American Finance Association
(AFA) 2005 Philadelphia Meetings 1.
Meuleman, M., Manigart, S., Lockett, A., Wright, M., 2005. The syndication of private equity
investments: an agency perspective. Working Paper, Ghent University.
Ooghe, H., Joos, P., De Bourdeaudhuij, C., 1995. Financial distress models in Belgium: The
results of a decade of empirical research. the International Journal of Accounting 30, 245-274.
Opler, T. C., Titman, S., 1994. Financial distress and corporate performance. Journal of
Finance 49, 1015-1040.
Panno, A., 2003. An empirical investigation on the determinants of capital structure: the UK
and Italian experience. Applied Financial Economics 13, 97-112.
Rosman, A. J., O'Neill, H. M., 1993. Comparing the information acquisition strategies of
venture capital and commercial lenders: A computer-based experiment. Journal of Business
Venturing 8, 443-460.

38
Sahlman, W. A., 1990. The structure and governance of venture-capital organizations. Journal
of Financial Economics 27, 473-521.
Schwartz, R. G., Teach, R. D., 2000. Research note: entrepreneurship research: an empirical
perspective. Entrepreneurship Theory and Practice 77-81.
Shyam-Sunder, L., Myers, S. C., 1999. Testing static tradeoff against pecking order models of
capital structure. Journal of Financial Economics 51, 219-244.
Stiglitz, J. E., Weiss, A., 1981. Credit rationing in markets with imperfect information. The
American Economic Review 71, 393-410.
Ueda, M., 2004. Banks versus venture capital: project evaluation, screening and
expropriation. Journal of Finance 59, 601-621.
Van Auken, H. E., 2001. Financing small technology-based companies: The relationship
between familiarity with capital and ability to price and negotiate investment. Journal of
Small Business Management 39, 240.
Wright, M., Lockett, A., 2003. The structure and management of alliances: syndication in the
venture capital industry. Journal of Management Studies 40, 2073-2102.
Wright, M., Robbie, K., 1998. Venture capital and private equity: a review and synthesis.
Journal of Business Finance and Accounting 25, 521-570.
Wright, M., Robbie, K., Ennew, C., 1997. Venture capitalists and serial entrepreneurs. Journal
of Business Venturing 12, 227-249.
Yosha, O., 1995. Information disclosure costs and the choice of financing source. Journal of
Financial Intermediation 4, 3-20.
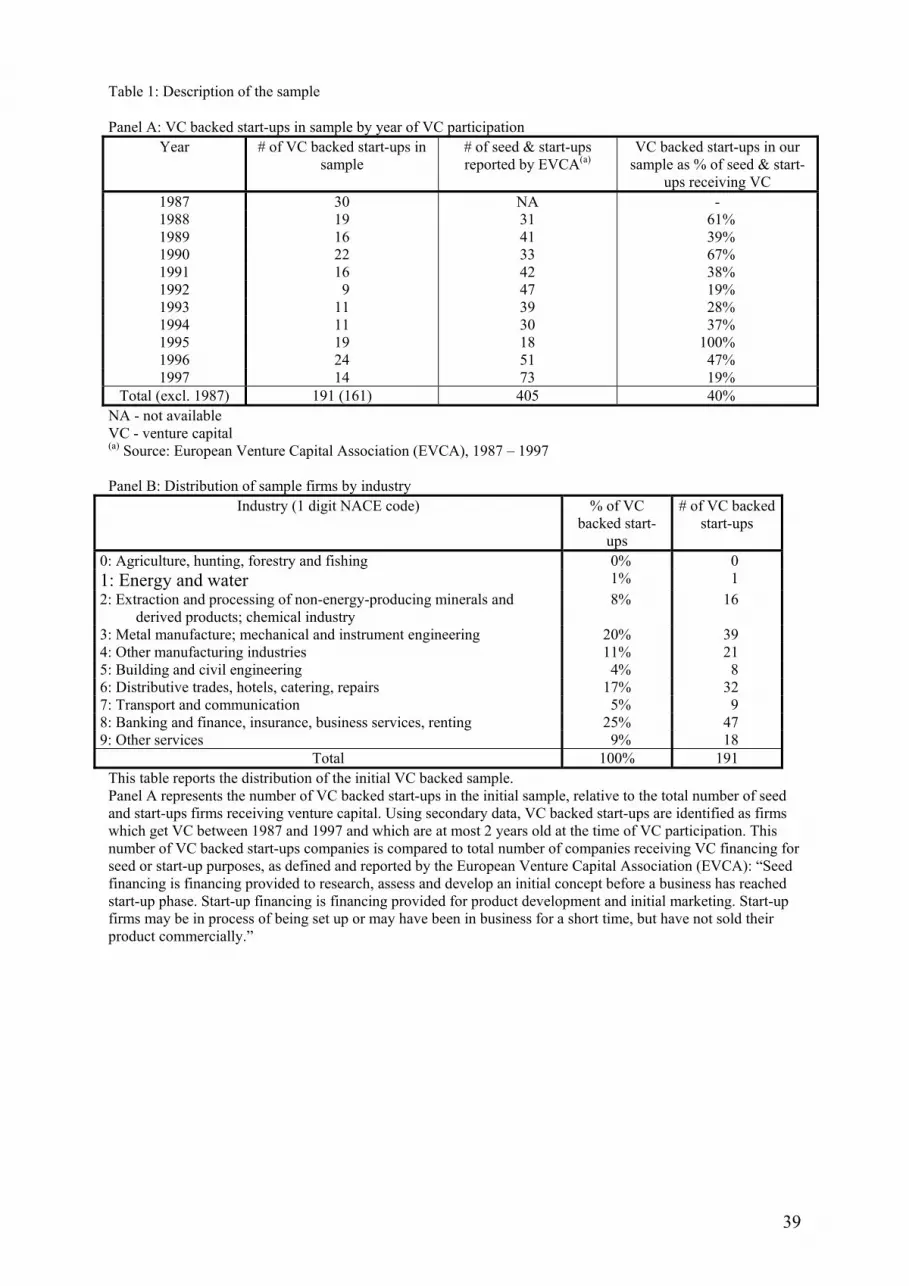
39
Table 1: Description of the sample
Panel A: VC backed start-ups in sample by year of VC participation Year # of VC backed start-ups in
sample # of seed & start-ups reported by EVCA(a)
VC backed start-ups in our sample as % of seed & start-
ups receiving VC 1987 30 NA - 1988 19 31 61% 1989 16 41 39% 1990 22 33 67% 1991 16 42 38% 1992 9 47 19% 1993 11 39 28% 1994 11 30 37% 1995 19 18 100% 1996 24 51 47% 1997 14 73 19%
Total (excl. 1987) 191 (161) 405 40% NA - not available VC - venture capital (a) Source: European Venture Capital Association (EVCA), 1987 – 1997 Panel B: Distribution of sample firms by industry
Industry (1 digit NACE code) % of VC backed start-
ups
# of VC backed start-ups
0: Agriculture, hunting, forestry and fishing 0% 0 1: Energy and water 1% 1 2: Extraction and processing of non-energy-producing minerals and
derived products; chemical industry 8% 16
3: Metal manufacture; mechanical and instrument engineering 20% 39 4: Other manufacturing industries 11% 21 5: Building and civil engineering 4% 8 6: Distributive trades, hotels, catering, repairs 17% 32 7: Transport and communication 5% 9 8: Banking and finance, insurance, business services, renting 25% 47 9: Other services 9% 18
Total 100% 191 This table reports the distribution of the initial VC backed sample. Panel A represents the number of VC backed start-ups in the initial sample, relative to the total number of seed and start-ups firms receiving venture capital. Using secondary data, VC backed start-ups are identified as firms which get VC between 1987 and 1997 and which are at most 2 years old at the time of VC participation. This number of VC backed start-ups companies is compared to total number of companies receiving VC financing for seed or start-up purposes, as defined and reported by the European Venture Capital Association (EVCA): “Seed financing is financing provided to research, assess and develop an initial concept before a business has reached start-up phase. Start-up financing is financing provided for product development and initial marketing. Start-up firms may be in process of being set up or may have been in business for a short time, but have not sold their product commercially.”
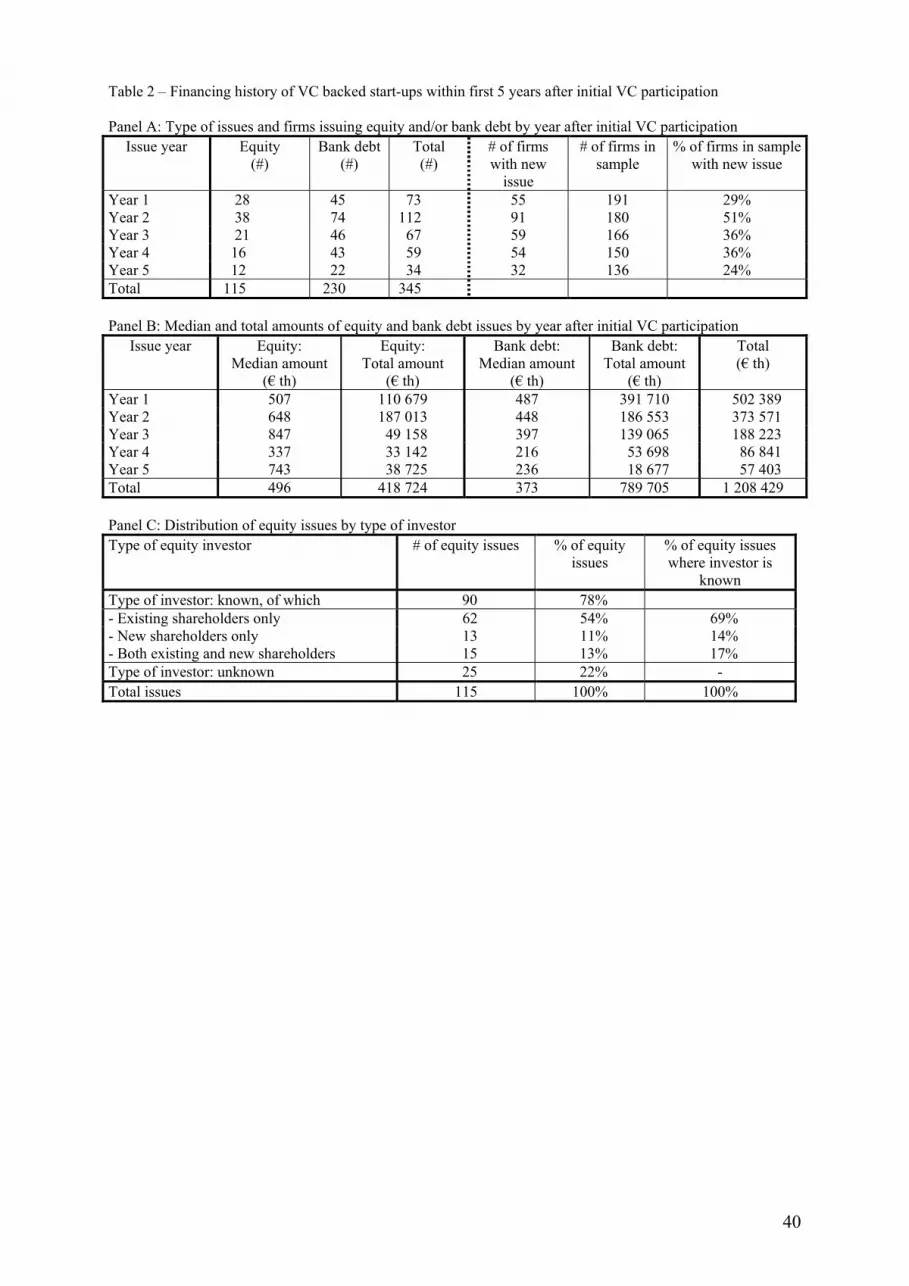
40
Table 2 – Financing history of VC backed start-ups within first 5 years after initial VC participation Panel A: Type of issues and firms issuing equity and/or bank debt by year after initial VC participation
Issue year Equity (#)
Bank debt (#)
Total (#)
# of firms with new
issue
# of firms in sample
% of firms in sample with new issue
Year 1 28 45 73 55 191 29% Year 2 38 74 112 91 180 51% Year 3 21 46 67 59 166 36% Year 4 16 43 59 54 150 36% Year 5 12 22 34 32 136 24% Total 115 230 345 Panel B: Median and total amounts of equity and bank debt issues by year after initial VC participation
Issue year Equity: Median amount
(€ th)
Equity: Total amount
(€ th)
Bank debt: Median amount
(€ th)
Bank debt: Total amount
(€ th)
Total (€ th)
Year 1 507 110 679 487 391 710 502 389 Year 2 648 187 013 448 186 553 373 571 Year 3 847 49 158 397 139 065 188 223 Year 4 337 33 142 216 53 698 86 841 Year 5 743 38 725 236 18 677 57 403 Total 496 418 724 373 789 705 1 208 429 Panel C: Distribution of equity issues by type of investor Type of equity investor # of equity issues % of equity
issues % of equity issues where investor is
known Type of investor: known, of which 90 78% - Existing shareholders only 62 54% 69% - New shareholders only 13 11% 14% - Both existing and new shareholders 15 13% 17% Type of investor: unknown 25 22% - Total issues 115 100% 100%
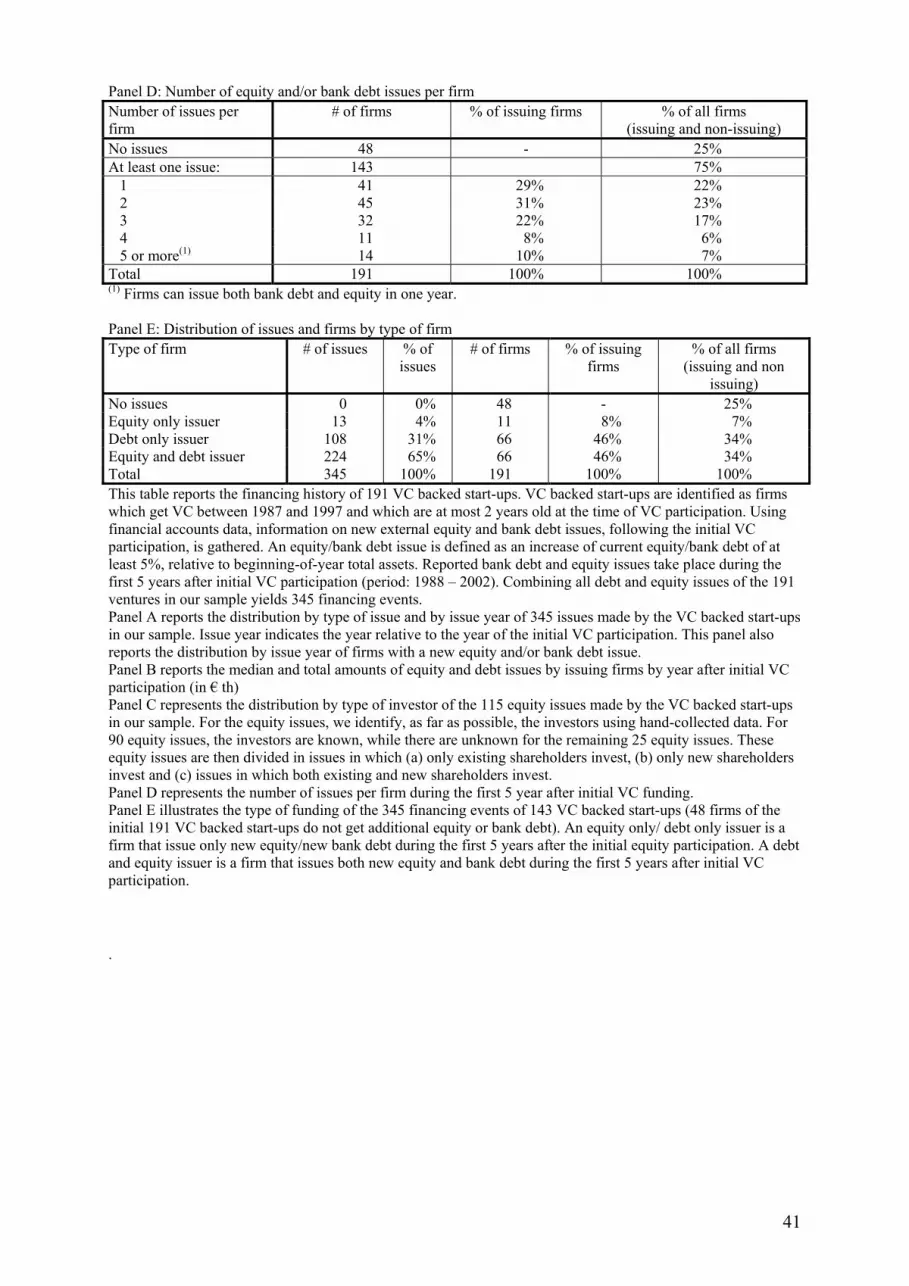
41
Panel D: Number of equity and/or bank debt issues per firm Number of issues per firm
# of firms % of issuing firms % of all firms (issuing and non-issuing)
No issues 48 - 25% At least one issue: 143 75% 1 41 29% 22% 2 45 31% 23% 3 32 22% 17% 4 11 8% 6% 5 or more(1) 14 10% 7% Total 191 100% 100% (1) Firms can issue both bank debt and equity in one year. Panel E: Distribution of issues and firms by type of firm Type of firm # of issues % of
issues # of firms % of issuing
firms % of all firms
(issuing and non issuing)
No issues 0 0% 48 - 25% Equity only issuer 13 4% 11 8% 7% Debt only issuer 108 31% 66 46% 34% Equity and debt issuer 224 65% 66 46% 34% Total 345 100% 191 100% 100% This table reports the financing history of 191 VC backed start-ups. VC backed start-ups are identified as firms which get VC between 1987 and 1997 and which are at most 2 years old at the time of VC participation. Using financial accounts data, information on new external equity and bank debt issues, following the initial VC participation, is gathered. An equity/bank debt issue is defined as an increase of current equity/bank debt of at least 5%, relative to beginning-of-year total assets. Reported bank debt and equity issues take place during the first 5 years after initial VC participation (period: 1988 – 2002). Combining all debt and equity issues of the 191 ventures in our sample yields 345 financing events. Panel A reports the distribution by type of issue and by issue year of 345 issues made by the VC backed start-ups in our sample. Issue year indicates the year relative to the year of the initial VC participation. This panel also reports the distribution by issue year of firms with a new equity and/or bank debt issue. Panel B reports the median and total amounts of equity and debt issues by issuing firms by year after initial VC participation (in € th) Panel C represents the distribution by type of investor of the 115 equity issues made by the VC backed start-ups in our sample. For the equity issues, we identify, as far as possible, the investors using hand-collected data. For 90 equity issues, the investors are known, while there are unknown for the remaining 25 equity issues. These equity issues are then divided in issues in which (a) only existing shareholders invest, (b) only new shareholders invest and (c) issues in which both existing and new shareholders invest. Panel D represents the number of issues per firm during the first 5 year after initial VC funding. Panel E illustrates the type of funding of the 345 financing events of 143 VC backed start-ups (48 firms of the initial 191 VC backed start-ups do not get additional equity or bank debt). An equity only/ debt only issuer is a firm that issue only new equity/new bank debt during the first 5 years after the initial equity participation. A debt and equity issuer is a firm that issues both new equity and bank debt during the first 5 years after initial VC participation. .
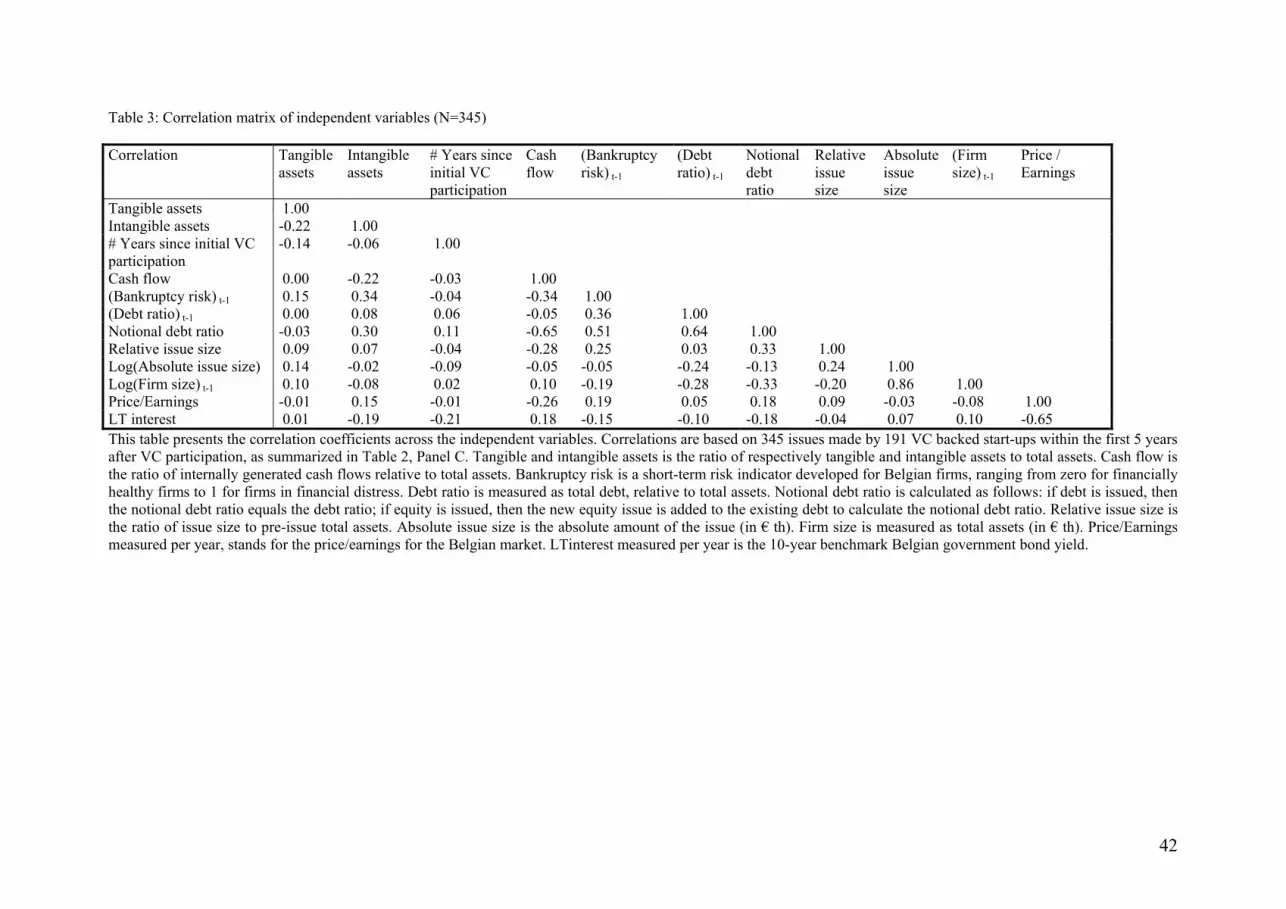
42
Table 3: Correlation matrix of independent variables (N=345) Correlation Tangible
assets Intangible assets
# Years since initial VC participation
Cash flow
(Bankruptcy risk) t-1
(Debt ratio) t-1
Notional debt ratio
Relative issue size
Absolute issue size
(Firm size) t-1
Price / Earnings
Tangible assets 1.00 Intangible assets -0.22 1.00 # Years since initial VC participation
-0.14 -0.06 1.00
Cash flow 0.00 -0.22 -0.03 1.00 (Bankruptcy risk) t-1 0.15 0.34 -0.04 -0.34 1.00 (Debt ratio) t-1 0.00 0.08 0.06 -0.05 0.36 1.00 Notional debt ratio -0.03 0.30 0.11 -0.65 0.51 0.64 1.00 Relative issue size 0.09 0.07 -0.04 -0.28 0.25 0.03 0.33 1.00 Log(Absolute issue size) 0.14 -0.02 -0.09 -0.05 -0.05 -0.24 -0.13 0.24 1.00 Log(Firm size) t-1 0.10 -0.08 0.02 0.10 -0.19 -0.28 -0.33 -0.20 0.86 1.00 Price/Earnings -0.01 0.15 -0.01 -0.26 0.19 0.05 0.18 0.09 -0.03 -0.08 1.00 LT interest 0.01 -0.19 -0.21 0.18 -0.15 -0.10 -0.18 -0.04 0.07 0.10 -0.65 This table presents the correlation coefficients across the independent variables. Correlations are based on 345 issues made by 191 VC backed start-ups within the first 5 years after VC participation, as summarized in Table 2, Panel C. Tangible and intangible assets is the ratio of respectively tangible and intangible assets to total assets. Cash flow is the ratio of internally generated cash flows relative to total assets. Bankruptcy risk is a short-term risk indicator developed for Belgian firms, ranging from zero for financially healthy firms to 1 for firms in financial distress. Debt ratio is measured as total debt, relative to total assets. Notional debt ratio is calculated as follows: if debt is issued, then the notional debt ratio equals the debt ratio; if equity is issued, then the new equity issue is added to the existing debt to calculate the notional debt ratio. Relative issue size is the ratio of issue size to pre-issue total assets. Absolute issue size is the absolute amount of the issue (in € th). Firm size is measured as total assets (in € th). Price/Earnings measured per year, stands for the price/earnings for the Belgian market. LTinterest measured per year is the 10-year benchmark Belgian government bond yield.

43
Table 4: Firm characteristics by issue type VARIABLE Debt Equity Equity from
existing shareholders
Equity from at least one new shareholder
Debt – Equity
Debt – Equity from existing shareholders
Debt – Equity from at least
one new shareholder
Equity from existing shareholders –
Equity from at least one new shareholder
Median St.Dev. Median St.Dev. Median St.Dev. Median St.Dev. Sign.(1) Sign.(1) Sign.(1) Sign.(1) Information asymmetries Tangible assets 0.25 0.25 0.19 0.27 0.21 0.28 0.16 0.26 Intangible assets 0.00 0.13 0.02 0.17 0.01 0.16 0.02 0.21 *** ** *** * # Years since initial VC participation
2.00 1.25 2.00 1.28 2.00 1.33 2.00 1.14 **(2) *(3)
Bankruptcy Risk (Bankruptcy risk) t-1 0.54 0.32 0.73 0.33 0.64 0.36 0.87 0.28 *** * *** ** Debt capacity Cash flow 0.05 0.21 0.00 0.29 0.01 0.30 -0.01 0.28 *** *** *** (Debt ratio) t-1 0.71 0.26 0.72 0.30 0.71 0.31 0.80 0.27 * Notional debt ratio 0.79 0.32 0.88 0.37 0.86 0.39 0.97 0.37 *** ** *** * Control variables Relative issue size 0.20 0.54 0.25 0.66 0.25 0.60 0.26 0.80 *** ** ** Log(Absolute issue size) 12.79 1.85 13.11 1.89 13.11 1.87 13.59 1.78 ** * ** Log(Firm size) t-1 14.42 1.70 14.61 1.84 14.53 1.73 14.85 1.99 Price/Earnings 13.95 4.00 13.40 4.00 13.40 3.57 13.40 3.35 LT interest 7.40 1.83 7.20 1.84 7.70 7.25 8.00 1.91 Number of issues 230 115 62 28
This table reports the issue and firm characteristics of 345 issues made by 143 VC backed start-ups. VC backed start-ups are identified as firms which get VC between 1987 and 1997 and which are at most 2 years old at the time of VC participation. Using yearly financial accounts data, information on new equity and bank debt issues, following the initial VC participation, is gathered. An equity/bank debt issue is defined as an increase of current equity/bank debt of at least 5%, relative to beginning-of-year total assets. Reported bank debt and equity issues take place during the first 5 years after initial VC participation (period: 1988 – 2002). The initial sample of firms consists of 191 VC backed start-ups, of which 48 do not issue new equity or debt within the first 5 years after initial VC participation (see also Table 2 – Panel A). For the 115 equity issues, we identify, as far as possible, the investors using hand-collected data. For 90 equity issues, the investors are known. These equity issues are divided in (a) 62 issues in which only existing shareholders invest and (b) 28 issues in which at least one new shareholder invests. Category (b) is a combination of 13 issues in which only new shareholders invest and 15 issues in which both existing and new shareholders invest (see also Table 2 – Panel D). For the remaining 25 equity issues, the investor(s) are unknown. Within 1 year firms can issue both equity and bank debt. In this case, the firm characteristics of both issues are the same, whereas the issue characteristics differ. Within each issue category, we report median values and standard deviations for several characteristics that are expected to affect the issue choice. Also reported are the results from a Wilcoxon – Mann - Whitney test across between different categories. Tangible and intangible assets are the ratio of respectively tangible and intangible assets to total assets. Cash flow is the ratio of internally generated cash flows relative to total assets. Bankruptcy risk is a short-term risk indicator developed for Belgian firms, ranging from zero for financially healthy firms to 1 for firms in financial distress. Debt ratio is measured as total debt, relative to total assets. Notional debt ratio is calculated as follows: if debt is issued, then the notional debt ratio equals the debt ratio; if equity is issued, then the new equity issue is added to the existing debt to calculate the notional debt ratio. Relative issue size is the ratio of issue size to pre-issue total assets. Absolute issue size is the absolute amount of the issue (in € th). Firm size is measured as total assets (in € th).

44
Price/Earnings measured per year, stands for the price/earnings for the Belgian market. LT interest measured per year is the 10-year benchmark Belgian government bond yield. (1) Sign.: Results of Wilcoxon – Mann - Whitney test: Significance level (1-sided): * 0.05 ≤ p < 0.10; ** 0.01 ≤ p < 0.05;*** p <0.01; (2) Debt > At least one new shareholder (3) Existing shareholders > At least one new shareholder
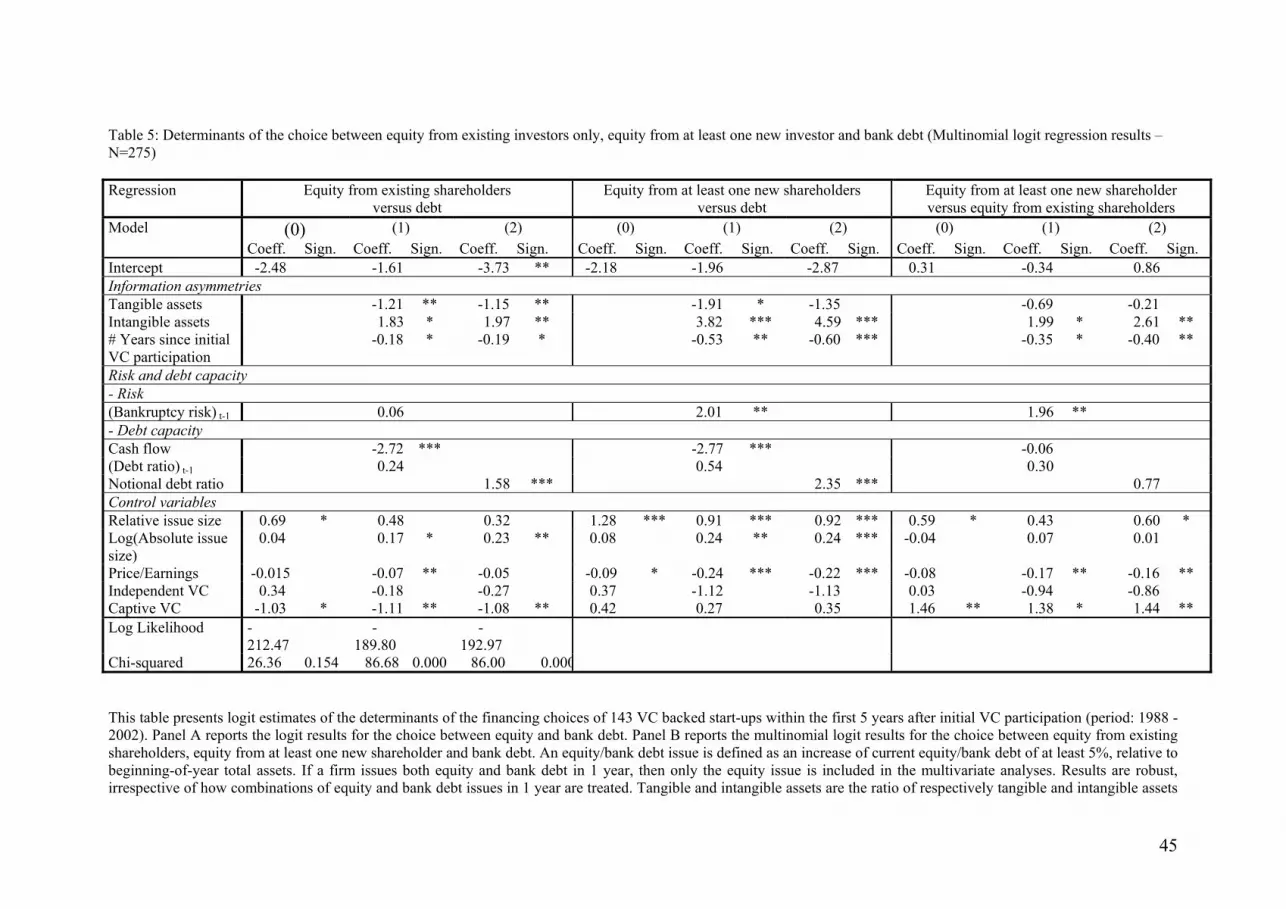
45
Table 5: Determinants of the choice between equity from existing investors only, equity from at least one new investor and bank debt (Multinomial logit regression results – N=275) Regression Equity from existing shareholders
versus debt Equity from at least one new shareholders
versus debt Equity from at least one new shareholder versus equity from existing shareholders
Model (0) (1) (2) (0) (1) (2) (0) (1) (2) Coeff. Sign. Coeff. Sign. Coeff. Sign. Coeff. Sign. Coeff. Sign. Coeff. Sign. Coeff. Sign. Coeff. Sign. Coeff. Sign. Intercept -2.48 -1.61 -3.73 ** -2.18 -1.96 -2.87 0.31 -0.34 0.86 Information asymmetries Tangible assets -1.21 ** -1.15 ** -1.91 * -1.35 -0.69 -0.21 Intangible assets 1.83 * 1.97 ** 3.82 *** 4.59 *** 1.99 * 2.61 ** # Years since initial VC participation
-0.18 * -0.19 * -0.53 ** -0.60 *** -0.35 * -0.40 **
Risk and debt capacity - Risk (Bankruptcy risk) t-1 0.06 2.01 ** 1.96 ** - Debt capacity Cash flow -2.72 *** -2.77 *** -0.06 (Debt ratio) t-1 0.24 0.54 0.30 Notional debt ratio 1.58 *** 2.35 *** 0.77 Control variables Relative issue size 0.69 * 0.48 0.32 1.28 *** 0.91 *** 0.92 *** 0.59 * 0.43 0.60 * Log(Absolute issue size)
0.04 0.17 * 0.23 ** 0.08 0.24 ** 0.24 *** -0.04 0.07 0.01
Price/Earnings -0.015 -0.07 ** -0.05 -0.09 * -0.24 *** -0.22 *** -0.08 -0.17 ** -0.16 ** Independent VC 0.34 -0.18 -0.27 0.37 -1.12 -1.13 0.03 -0.94 -0.86 Captive VC -1.03 * -1.11 ** -1.08 ** 0.42 0.27 0.35 1.46 ** 1.38 * 1.44 ** Log Likelihood -
212.47 -
189.80 -
192.97
Chi-squared 26.36 0.154 86.68 0.000 86.00 0.000 This table presents logit estimates of the determinants of the financing choices of 143 VC backed start-ups within the first 5 years after initial VC participation (period: 1988 - 2002). Panel A reports the logit results for the choice between equity and bank debt. Panel B reports the multinomial logit results for the choice between equity from existing shareholders, equity from at least one new shareholder and bank debt. An equity/bank debt issue is defined as an increase of current equity/bank debt of at least 5%, relative to beginning-of-year total assets. If a firm issues both equity and bank debt in 1 year, then only the equity issue is included in the multivariate analyses. Results are robust, irrespective of how combinations of equity and bank debt issues in 1 year are treated. Tangible and intangible assets are the ratio of respectively tangible and intangible assets

46
to total assets. Cash flow is the ratio of internally generated cash flows relative to total assets. Bankruptcy risk is a short-term risk indicator developed for Belgian firms, ranging from zero for financially healthy firms to 1 for firms in financial distress. Debt ratio is measured as total debt, relative to total assets. Notional debt ratio is calculated as follows: if debt is issued, then the notional debt ratio equals the debt ratio; if equity is issued, then the new equity issue is added to the existing debt to calculate the notional debt ratio. Relative issue size is the ratio of issue size to pre-issue total assets. Absolute issue size is the absolute amount of the issue (in € th). Firm size is measured as total assets (in € th). Price/Earnings measured per year, is the price/earnings for the Belgian market. LTinterest measured per year is the 10-year benchmark Belgian government bond yield. Firms are split in 3 groups according to the type of initial venture capitalist: independent, captive or government related venture capitalist. Independent VC equals 1 if the firm is initially financed by an independent venture capitalist and 0 otherwise. Captive VC equals 1 if the firm is initially financed by a captive venture capitalist and 0 otherwise. Industry dummies, based on the 1-digit NACE code are included (not reported). (1) Sign.: Significance level (1-sided): * 0.05 ≤ p < 0.10; ** 0.01 ≤ p < 0.05;*** p <0