Embed Size (px)
Citation preview
First StateGlobal Umbrella Fund plc
2014 Annual Report
First State Investments (Hong Kong) Limited
Level 6Three Exchange Square8 Connaught PlaceCentral, Hong Kong
Telephone: (852) 2846 7555Intermediary Hotline: (852) 2846 7575Investor Services Hotline: (852) 2846 7566Fax: (852) 2868 4742Email: info@fi rststate.com.hkwww.fi rststateinvestments.com
FIRST STATE GLOBAL UMBRELLA FUND PLC
TABLE OF CONTENTS
DIRECTORS’ REPORT 1
INVESTMENT MANAGERS’ REPORT AND SCHEDULES OF INVESTMENT:
First State Asian Growth Fund 4 First State China Growth Fund 12 First State Worldwide Leaders Fund (Formerly First State Global
20
Opportunities Fund) First State Hong Kong Growth Fund 29 First State Indian Subcontinent Fund 38 First State Global Bond Fund 46 First State High Quality Bond Fund 56 First State Long Term Bond Fund 66 First State Greater China Growth Fund 71 First State Singapore and Malaysia Growth Fund 78 First State Asia Innovation Fund 83 First State Asian Equity Plus Fund 89 First State Asian Bond Fund 99 First State Asian Quality Bond Fund 109 First State Hong Kong Dollar Bond Fund 119 First State Global Emerging Markets Leaders Fund 126 First State Global Resources Fund
134 First State Global Property Securities Fund 144 First State Asian Property Securities Fund 152 First State China Focus Fund 160 First State Global Listed Infrastructure Fund 165 First State Global Emerging Markets Select Fund 172 First State Asia Pacific Select Fund 179 First State Global Agribusiness Fund 185 First State Australian Growth Fund 195 First State Worldwide Equity Fund 201 First State Emerging Markets Bond Fund 208 First State Global Credit Income Fund 223 First State Asia Pacific All Cap Fund 253 STATEMENT OF FINANCIAL POSITION 261
STATEMENT OF COMPREHENSIVE INCOME 271
STATEMENT OF CHANGES IN NET ASSETS ATTRIBUTABLE TO REDEEMABLE
PARTICIPATING SHAREHOLDERS 281
STATEMENT OF CASH FLOWS 289
DISTRIBUTION STATEMENT 298
NOTES FORMING PART OF THE FINANCIAL STATEMENTS 313
CUSTODIAN’S REPORT TO THE SHAREHOLDERS 407
INDEPENDENT AUDITORS’ REPORT 408
DIRECTORY 411
This annual report shall not constitute an offer to sell or a solicitation of an offer to buy shares in
any of the sub-funds of First State Global Umbrella Fund Plc (the “Company”). Subscriptions
are to be made only on the basis of the information contained in the Company’s prospectus, and
the relevant key investor information document as supplemented by the latest semi-annual and
annual reports.
FIRST STATE GLOBAL UMBRELLA FUND PLC
DIRECTORS’ REPORT
1
The Directors submit their Annual Report for the year ended 31 December 2014.
Activities, Business Review and Future Prospects
The Directors have directed the affairs of the Company in accordance with the Companies Acts 1963 to
2014. A detailed business review and future prospects are outlined in the Investment Managers’ Reports.
Risk Management Objectives and Policies
Investment in the Company involves a number of risks. Details of the general and specific risks are
contained in the Prospectus. Details of the risks associated with financial instruments are included in
Note 8.
Results and Dividend
The results for the year are shown in the Statement of Comprehensive Income on pages 271-280.
Details of the dividends declared during the year in respect of certain Funds, by the Directors are shown
in the Distribution Statement on pages 298-312. The Directors did not declare or pay dividends on any of the Funds not mentioned in the Distribution Statement.
Directors
With effect from 12 August 2014, Mr. Hans Vogel resigned as a Director and the Chairman of the Company and was replaced by Mr. Peter Blessing as Chairman. Ms. Bronwyn Wright and Mr. Kevin
Molony were also appointed as new Directors with effect from 12 August 2014. The Directors of the
Company are detailed on page 411.
Statement of Directors' Responsibilities
The Directors are responsible for preparing the Annual Report and the financial statements in
accordance with applicable Irish law and International Financial Reporting Standards (“IFRS”) as
adopted by the European Union.
Irish company law requires the Directors to prepare financial statements for each financial year that
give a true and fair view of the state of affairs of the Company and of the Statement of Comprehensive Income of the Company for that year. In preparing the Financial Statements, the Directors are required
to:
select suitable accounting policies and then apply them consistently;
make judgements and estimates that are reasonable and prudent; and
prepare the financial statements on the going concern basis unless it is inappropriate to presume
that the Company will continue in business.
The Directors confirm that they have complied with the above requirements in preparing the financial statements.
FIRST STATE GLOBAL UMBRELLA FUND PLC
DIRECTORS’ REPORT (CONTINUED)
2
Statement of Directors' Responsibilities (continued)
The Directors are responsible for keeping proper books of account which disclose with reasonable
accuracy at any time the financial position of the Company and to enable them to ensure that the
Financial Statements are prepared in accordance with accounting standards generally accepted in
Ireland and comply with the Irish Companies Acts, 1963 to 2013 and the European Communities
(Undertakings for Collective Investment in Transferable Securities) Regulations, 2011 (as amended)
(the “UCITS Regulations”) and the Hong Kong Securities and Futures Commission (“SFC”) Code on
Unit Trust and Mutual Funds (the “Code”). They are also responsible for safeguarding the assets of the
Company and hence for taking reasonable steps for the prevention and detection of fraud and other
irregularities.
Under the UCITS Regulations, the Directors are required to entrust the assets of the Company to the
Custodian for safe-keeping. In carrying out this duty, the Directors have delegated custody of the Company’s assets to HSBC Institutional Trust Services (Ireland) Limited, 1 Grand Canal Square,
Grand Canal Harbour, Dublin 2.
Books of Account
The measures taken by the Directors to secure compliance with the Company’s obligation to keep
proper books of account are the use of appropriate systems and procedures and employment of competent service providers. The books of account are kept at 1 Grand Canal Square, Grand Canal
Harbour, Dublin 2.
The Directors are responsible for the maintenance and integrity of the corporate and financial
information included on the Company’s website. Legislation in Ireland governing the preparation and dissemination of financial statements may differ from legislation in other jurisdictions.
Corporate Governance Code
The Board of Directors has assessed the measures included in the voluntary Corporate Governance Code for Collective Investment Schemes and Management Companies as published by the Irish Fund
Industry Association in December 2011 (the “IFIA Code”). The Board adopted the IFIA Code with
effect from 20 November 2012 and it follows the corporate governance practices and procedures in the code. However, during the year ended 31 December 2014, in one instance, one Director was unable to
attend the meeting and Mr. Stapleton, who resides in Singapore, participated in the meetings by conference call.
Directors and Secretary’s Interests in the Share Capital of the Company
The Secretary did not hold any interest, beneficial or otherwise, in the share capital of the Company
during or at the end of the year.
At the year end, Mr. Michael Stapleton held 4,580 (2013: 4,580) Class I shares in the First State Asia
Innovation Fund, 3,418 (2013: 3,418) Class I shares in the First State Global Emerging Market Leaders Fund and 5,922 (2013: 5,783) Class I Distributing shares in the First State Global Listed Infrastructure
Fund. No other Directors had any interests in the shares of the Company at that date or at any time
during the financial year.
In accordance with the requirements of UCITS Notices and SFC Code, all transactions carried out with
the Company by the promoter, manager, trustee, investment adviser and associates/group companies (“connected parties”) must be carried out as if negotiated at arm’s length and be in the best interests of
shareholders. The Directors are satisfied that there are arrangements in place to ensure that the
obligations set out in the UCITS Notices and SFC Code are applied to all transactions with connected parties and transactions with connected parties entered into during the period complied with the
obligations set out in the UCITS Notices and SFC Code.
FIRST STATE GLOBAL UMBRELLA FUND PLC
DIRECTORS’ REPORT (CONTINUED)
3
Subsequent Events
Details of subsequent events are disclosed in Note 17 to these financial statements.
Independent Auditors
The Independent Auditors, PricewaterhouseCoopers will be re-appointed in accordance with section 160(2) of the Companies Act, 1963.
By order of the Board
Director Director
Date: 14 April 2015
FIRST STATE ASIAN GROWTH FUND
INVESTMENT MANAGER’S REPORT
4
PERFORMANCE
01/01/13 01/01/14 To To 31/12/13 31/12/14
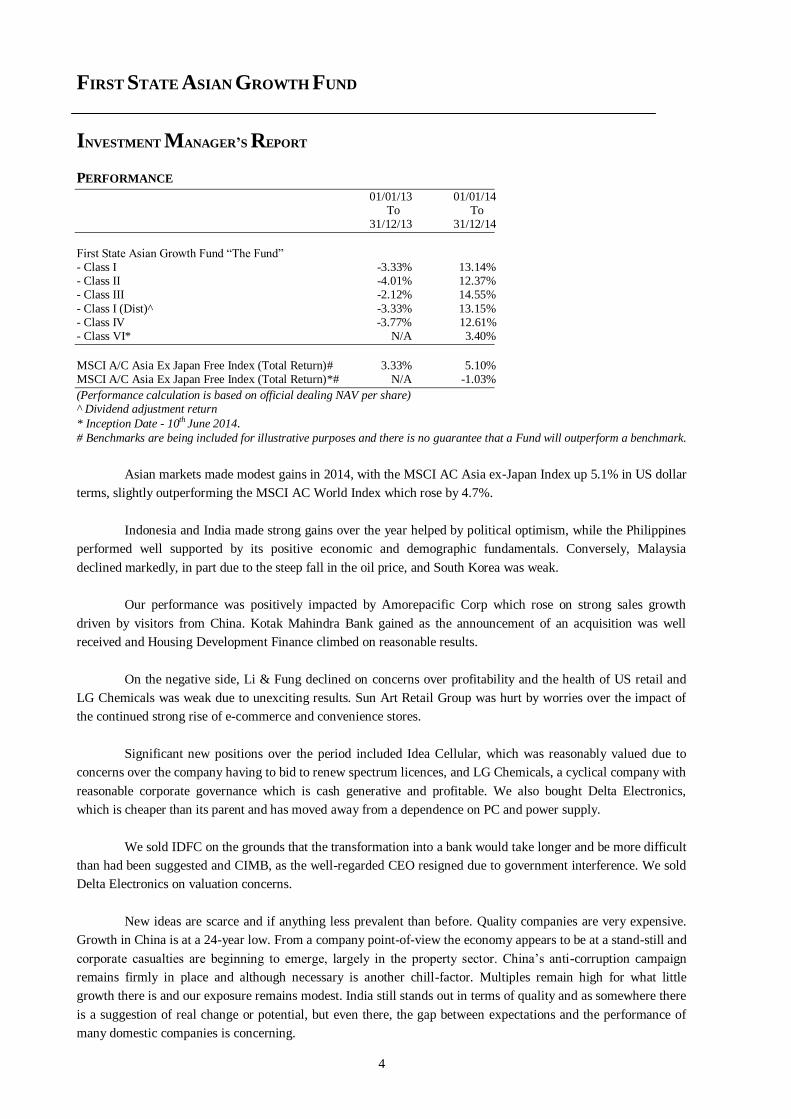
First State Asian Growth Fund “The Fund” - Class I -3.33% 13.14%
- Class II -4.01% 12.37% - Class III -2.12% 14.55%
- Class I (Dist)^ -3.33% 13.15% - Class IV -3.77% 12.61% - Class VI* N/A 3.40%
MSCI A/C Asia Ex Japan Free Index (Total Return)# 3.33% 5.10% MSCI A/C Asia Ex Japan Free Index (Total Return)*# N/A -1.03%
(Performance calculation is based on official dealing NAV per share) ^ Dividend adjustment return
* Inception Date - 10th June 2014. # Benchmarks are being included for illustrative purposes and there is no guarantee that a Fund will outperform a benchmark.
Asian markets made modest gains in 2014, with the MSCI AC Asia ex-Japan Index up 5.1% in US dollar
terms, slightly outperforming the MSCI AC World Index which rose by 4.7%.
Indonesia and India made strong gains over the year helped by political optimism, while the Philippines
performed well supported by its positive economic and demographic fundamentals. Conversely, Malaysia
declined markedly, in part due to the steep fall in the oil price, and South Korea was weak.
Our performance was positively impacted by Amorepacific Corp which rose on strong sales growth
driven by visitors from China. Kotak Mahindra Bank gained as the announcement of an acquisition was well
received and Housing Development Finance climbed on reasonable results.
On the negative side, Li & Fung declined on concerns over profitability and the health of US retail and
LG Chemicals was weak due to unexciting results. Sun Art Retail Group was hurt by worries over the impact of
the continued strong rise of e-commerce and convenience stores.
Significant new positions over the period included Idea Cellular, which was reasonably valued due to
concerns over the company having to bid to renew spectrum licences, and LG Chemicals, a cyclical company with
reasonable corporate governance which is cash generative and profitable. We also bought Delta Electronics,
which is cheaper than its parent and has moved away from a dependence on PC and power supply.
We sold IDFC on the grounds that the transformation into a bank would take longer and be more difficult
than had been suggested and CIMB, as the well-regarded CEO resigned due to government interference. We sold
Delta Electronics on valuation concerns.
New ideas are scarce and if anything less prevalent than before. Quality companies are very expensive.
Growth in China is at a 24-year low. From a company point-of-view the economy appears to be at a stand-still and
corporate casualties are beginning to emerge, largely in the property sector. China’s anti-corruption campaign
remains firmly in place and although necessary is another chill-factor. Multiples remain high for what little
growth there is and our exposure remains modest. India still stands out in terms of quality and as somewhere there
is a suggestion of real change or potential, but even there, the gap between expectations and the performance of
many domestic companies is concerning.
FIRST STATE ASIAN GROWTH FUND
PERFORMANCE TABLE
AS OF 31 DECEMBER 2014
5
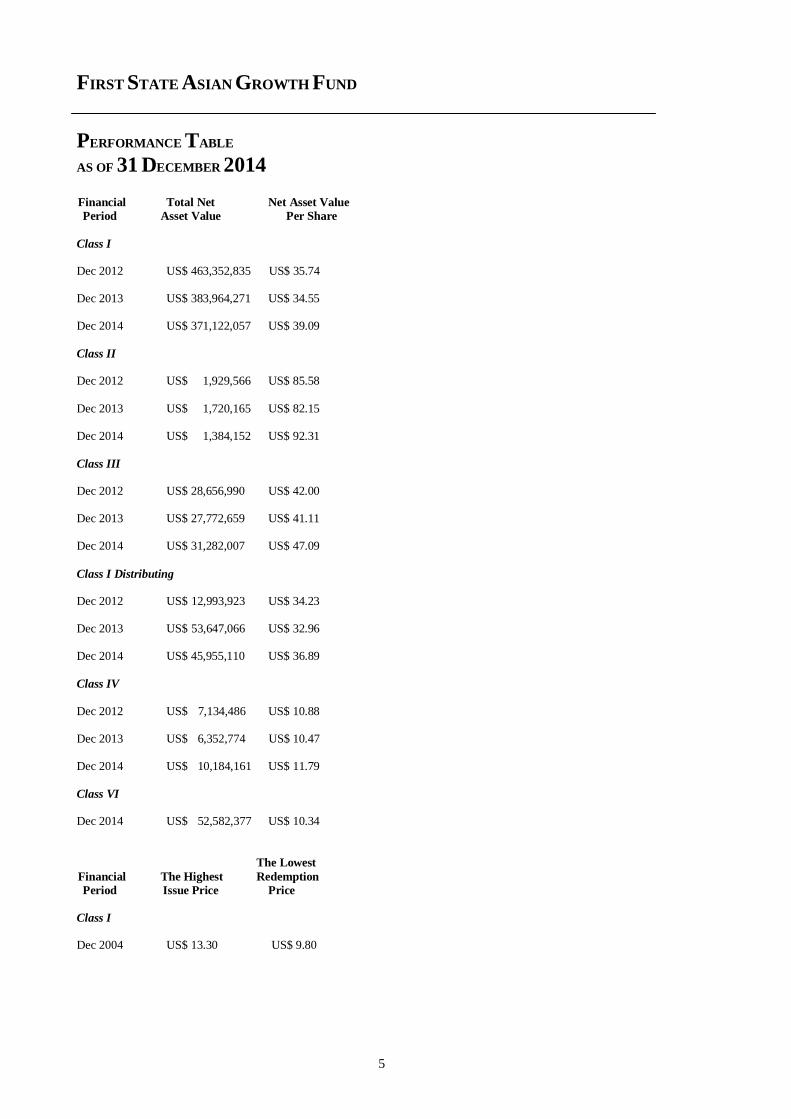
Financial Total Net Net Asset Value
Period Asset Value Per Share
Class I Dec 2012 US$ 463,352,835 US$ 35.74 Dec 2013 US$ 383,964,271 US$ 34.55 Dec 2014 US$ 371,122,057 US$ 39.09
Class II Dec 2012 US$ 1,929,566 US$ 85.58
Dec 2013 US$ 1,720,165 US$ 82.15 Dec 2014 US$ 1,384,152 US$ 92.31
Class III Dec 2012 US$ 28,656,990 US$ 42.00 Dec 2013 US$ 27,772,659 US$ 41.11 Dec 2014 US$ 31,282,007 US$ 47.09
Class I Distributing Dec 2012 US$ 12,993,923 US$ 34.23 Dec 2013 US$ 53,647,066 US$ 32.96 Dec 2014 US$ 45,955,110 US$ 36.89
Class IV
Dec 2012 US$ 7,134,486 US$ 10.88 Dec 2013 US$ 6,352,774 US$ 10.47 Dec 2014 US$ 10,184,161 US$ 11.79
Class VI Dec 2014 US$ 52,582,377 US$ 10.34
The Lowest
Financial The Highest Redemption
Period Issue Price Price
Class I Dec 2004 US$ 13.30 US$ 9.80
FIRST STATE ASIAN GROWTH FUND
PERFORMANCE TABLE (CONTINUED)
AS OF 31 DECEMBER 2014
6
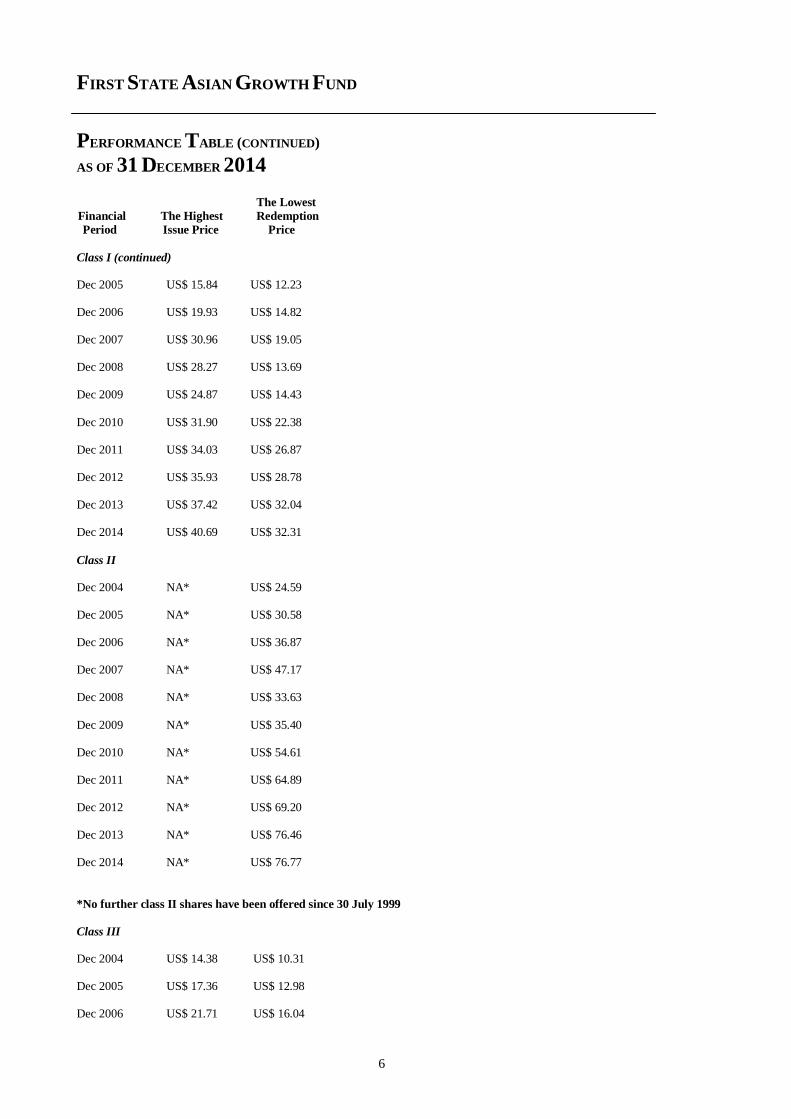
The Lowest
Financial The Highest Redemption
Period Issue Price Price
Class I (continued) Dec 2005 US$ 15.84 US$ 12.23 Dec 2006 US$ 19.93 US$ 14.82 Dec 2007 US$ 30.96 US$ 19.05 Dec 2008 US$ 28.27 US$ 13.69 Dec 2009 US$ 24.87 US$ 14.43
Dec 2010 US$ 31.90 US$ 22.38 Dec 2011 US$ 34.03 US$ 26.87 Dec 2012 US$ 35.93 US$ 28.78 Dec 2013 US$ 37.42 US$ 32.04 Dec 2014 US$ 40.69 US$ 32.31
Class II Dec 2004 NA* US$ 24.59 Dec 2005 NA* US$ 30.58 Dec 2006 NA* US$ 36.87 Dec 2007 NA* US$ 47.17 Dec 2008 NA* US$ 33.63
Dec 2009 NA* US$ 35.40 Dec 2010 NA* US$ 54.61 Dec 2011 NA* US$ 64.89 Dec 2012 NA* US$ 69.20 Dec 2013 NA* US$ 76.46 Dec 2014 NA* US$ 76.77
*No further class II shares have been offered since 30 July 1999
Class III
Dec 2004 US$ 14.38 US$ 10.31 Dec 2005 US$ 17.36 US$ 12.98 Dec 2006 US$ 21.71 US$ 16.04
FIRST STATE ASIAN GROWTH FUND
PERFORMANCE TABLE (CONTINUED)
AS OF 31 DECEMBER 2014
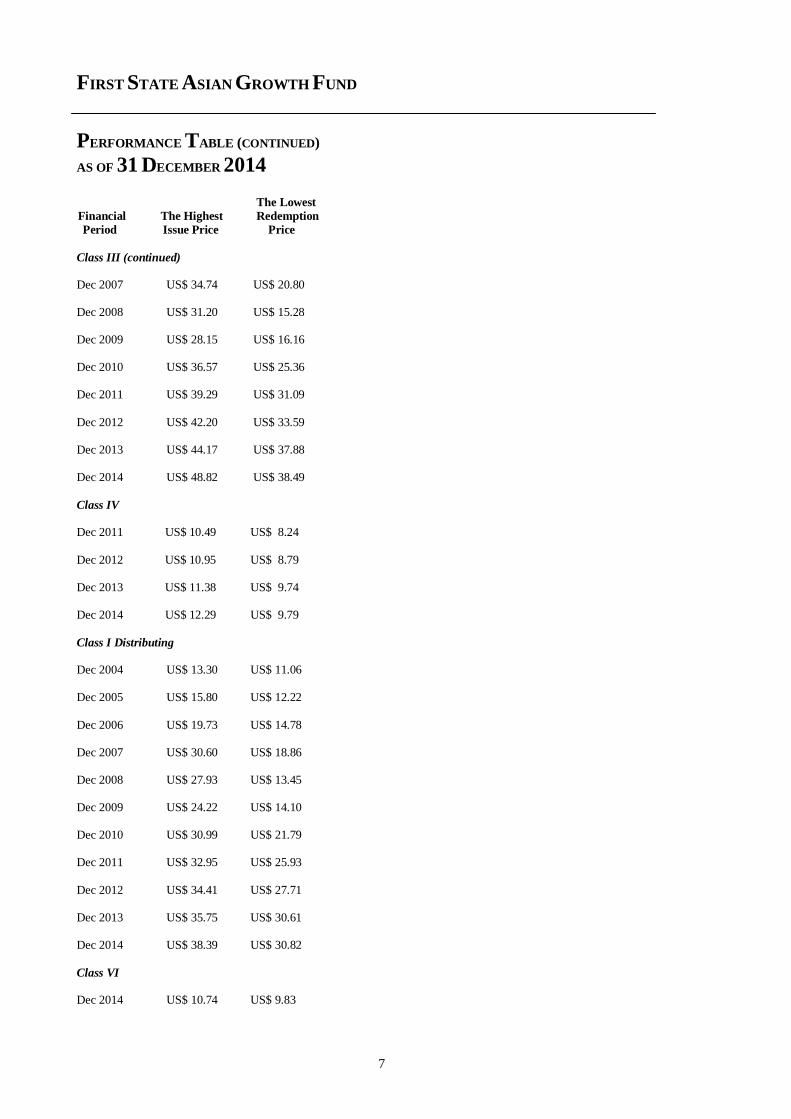
7
The Lowest
Financial The Highest Redemption
Period Issue Price Price
Class III (continued) Dec 2007 US$ 34.74 US$ 20.80 Dec 2008 US$ 31.20 US$ 15.28 Dec 2009 US$ 28.15 US$ 16.16 Dec 2010 US$ 36.57 US$ 25.36 Dec 2011 US$ 39.29 US$ 31.09
Dec 2012 US$ 42.20 US$ 33.59 Dec 2013 US$ 44.17 US$ 37.88 Dec 2014 US$ 48.82 US$ 38.49
Class IV
Dec 2011 US$ 10.49 US$ 8.24
Dec 2012 US$ 10.95 US$ 8.79 Dec 2013 US$ 11.38 US$ 9.74 Dec 2014 US$ 12.29 US$ 9.79
Class I Distributing Dec 2004 US$ 13.30 US$ 11.06 Dec 2005 US$ 15.80 US$ 12.22 Dec 2006 US$ 19.73 US$ 14.78 Dec 2007 US$ 30.60 US$ 18.86 Dec 2008 US$ 27.93 US$ 13.45 Dec 2009 US$ 24.22 US$ 14.10 Dec 2010 US$ 30.99 US$ 21.79 Dec 2011 US$ 32.95 US$ 25.93
Dec 2012 US$ 34.41 US$ 27.71 Dec 2013 US$ 35.75 US$ 30.61 Dec 2014 US$ 38.39 US$ 30.82
Class VI Dec 2014 US$ 10.74 US$ 9.83
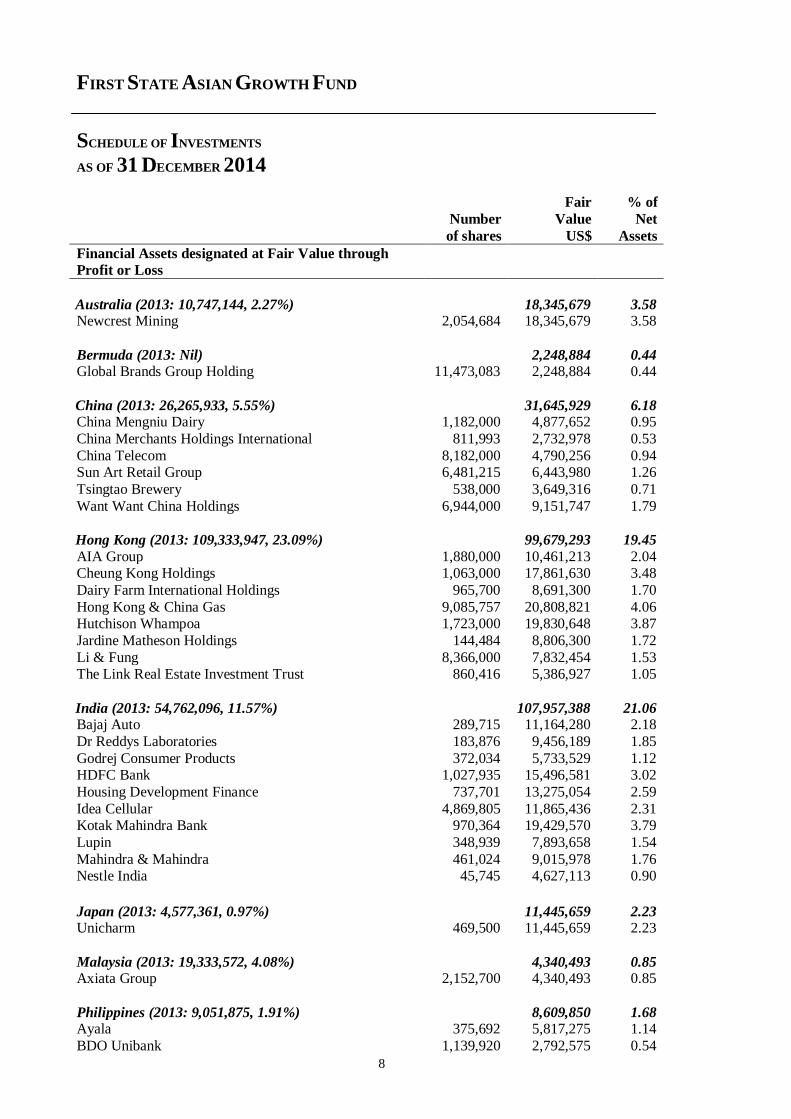
FIRST STATE ASIAN GROWTH FUND
SCHEDULE OF INVESTMENTS
AS OF 31 DECEMBER 2014
8
Fair % of
Number Value Net
of shares US$ Assets
Financial Assets designated at Fair Value through
Profit or Loss
Australia (2013: 10,747,144, 2.27%) 18,345,679 3.58 Newcrest Mining 2,054,684 18,345,679 3.58
Bermuda (2013: Nil) 2,248,884 0.44 Global Brands Group Holding 11,473,083 2,248,884 0.44
China (2013: 26,265,933, 5.55%) 31,645,929 6.18 China Mengniu Dairy 1,182,000 4,877,652 0.95
China Merchants Holdings International 811,993 2,732,978 0.53
China Telecom 8,182,000 4,790,256 0.94 Sun Art Retail Group 6,481,215 6,443,980 1.26
Tsingtao Brewery 538,000 3,649,316 0.71
Want Want China Holdings 6,944,000 9,151,747 1.79
Hong Kong (2013: 109,333,947, 23.09%) 99,679,293 19.45
AIA Group 1,880,000 10,461,213 2.04 Cheung Kong Holdings 1,063,000 17,861,630 3.48
Dairy Farm International Holdings 965,700 8,691,300 1.70
Hong Kong & China Gas 9,085,757 20,808,821 4.06 Hutchison Whampoa 1,723,000 19,830,648 3.87
Jardine Matheson Holdings 144,484 8,806,300 1.72
Li & Fung 8,366,000 7,832,454 1.53 The Link Real Estate Investment Trust 860,416 5,386,927 1.05
India (2013: 54,762,096, 11.57%) 107,957,388 21.06 Bajaj Auto 289,715 11,164,280 2.18
Dr Reddys Laboratories 183,876 9,456,189 1.85
Godrej Consumer Products 372,034 5,733,529 1.12 HDFC Bank 1,027,935 15,496,581 3.02
Housing Development Finance 737,701 13,275,054 2.59
Idea Cellular 4,869,805 11,865,436 2.31 Kotak Mahindra Bank 970,364 19,429,570 3.79
Lupin 348,939 7,893,658 1.54
Mahindra & Mahindra 461,024 9,015,978 1.76 Nestle India 45,745 4,627,113 0.90
Japan (2013: 4,577,361, 0.97%) 11,445,659 2.23 Unicharm 469,500 11,445,659 2.23
Malaysia (2013: 19,333,572, 4.08%) 4,340,493 0.85 Axiata Group 2,152,700 4,340,493 0.85
Philippines (2013: 9,051,875, 1.91%) 8,609,850 1.68 Ayala 375,692 5,817,275 1.14
BDO Unibank 1,139,920 2,792,575 0.54
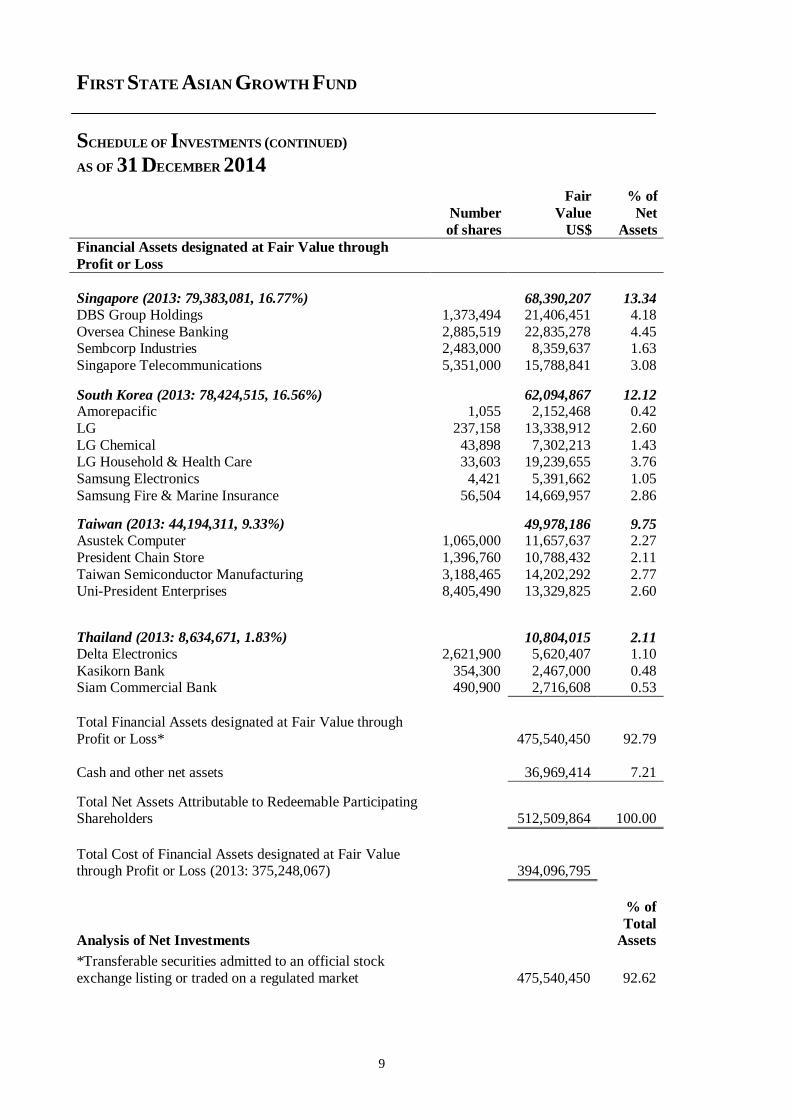
FIRST STATE ASIAN GROWTH FUND
SCHEDULE OF INVESTMENTS (CONTINUED)
AS OF 31 DECEMBER 2014
9
Fair % of
Number Value Net
of shares US$ Assets
Financial Assets designated at Fair Value through
Profit or Loss
Singapore (2013: 79,383,081, 16.77%) 68,390,207 13.34 DBS Group Holdings 1,373,494 21,406,451 4.18
Oversea Chinese Banking 2,885,519 22,835,278 4.45 Sembcorp Industries 2,483,000 8,359,637 1.63
Singapore Telecommunications 5,351,000 15,788,841 3.08
South Korea (2013: 78,424,515, 16.56%) 62,094,867 12.12 Amorepacific 1,055 2,152,468 0.42
LG 237,158 13,338,912 2.60
LG Chemical 43,898 7,302,213 1.43 LG Household & Health Care 33,603 19,239,655 3.76
Samsung Electronics 4,421 5,391,662 1.05
Samsung Fire & Marine Insurance 56,504 14,669,957 2.86 Taiwan (2013: 44,194,311, 9.33%) 49,978,186 9.75 Asustek Computer 1,065,000 11,657,637 2.27
President Chain Store 1,396,760 10,788,432 2.11
Taiwan Semiconductor Manufacturing 3,188,465 14,202,292 2.77 Uni-President Enterprises 8,405,490 13,329,825 2.60
Thailand (2013: 8,634,671, 1.83%) 10,804,015 2.11 Delta Electronics 2,621,900 5,620,407 1.10
Kasikorn Bank 354,300 2,467,000 0.48 Siam Commercial Bank 490,900 2,716,608 0.53
Total Financial Assets designated at Fair Value through
Profit or Loss*
475,540,450 92.79
Cash and other net assets 36,969,414 7.21
Total Net Assets Attributable to Redeemable Participating Shareholders 512,509,864 100.00
Total Cost of Financial Assets designated at Fair Value through Profit or Loss (2013: 375,248,067) 394,096,795
Analysis of Net Investments
% of
Total
Assets
*Transferable securities admitted to an official stock
exchange listing or traded on a regulated market 475,540,450 92.62
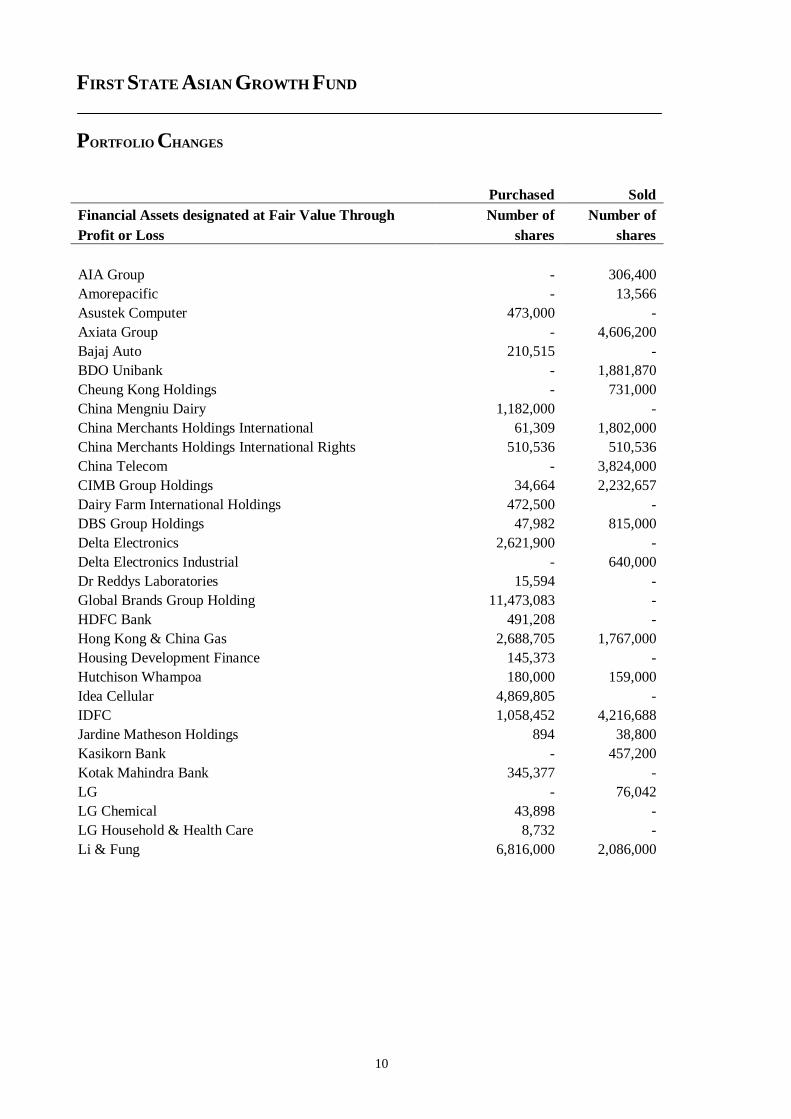
FIRST STATE ASIAN GROWTH FUND
PORTFOLIO CHANGES
10
Purchased Sold
Financial Assets designated at Fair Value Through Number of Number of
Profit or Loss shares shares
AIA Group - 306,400
Amorepacific - 13,566
Asustek Computer 473,000 -
Axiata Group - 4,606,200
Bajaj Auto 210,515 -
BDO Unibank - 1,881,870
Cheung Kong Holdings - 731,000
China Mengniu Dairy 1,182,000 -
China Merchants Holdings International 61,309 1,802,000
China Merchants Holdings International Rights 510,536 510,536
China Telecom - 3,824,000
CIMB Group Holdings 34,664 2,232,657
Dairy Farm International Holdings 472,500 -
DBS Group Holdings 47,982 815,000
Delta Electronics 2,621,900 -
Delta Electronics Industrial - 640,000
Dr Reddys Laboratories 15,594 -
Global Brands Group Holding 11,473,083 -
HDFC Bank 491,208 -
Hong Kong & China Gas 2,688,705 1,767,000
Housing Development Finance 145,373 -
Hutchison Whampoa 180,000 159,000
Idea Cellular 4,869,805 -
IDFC 1,058,452 4,216,688
Jardine Matheson Holdings 894 38,800
Kasikorn Bank - 457,200
Kotak Mahindra Bank 345,377 -
LG - 76,042
LG Chemical 43,898 -
LG Household & Health Care 8,732 -
Li & Fung 6,816,000 2,086,000
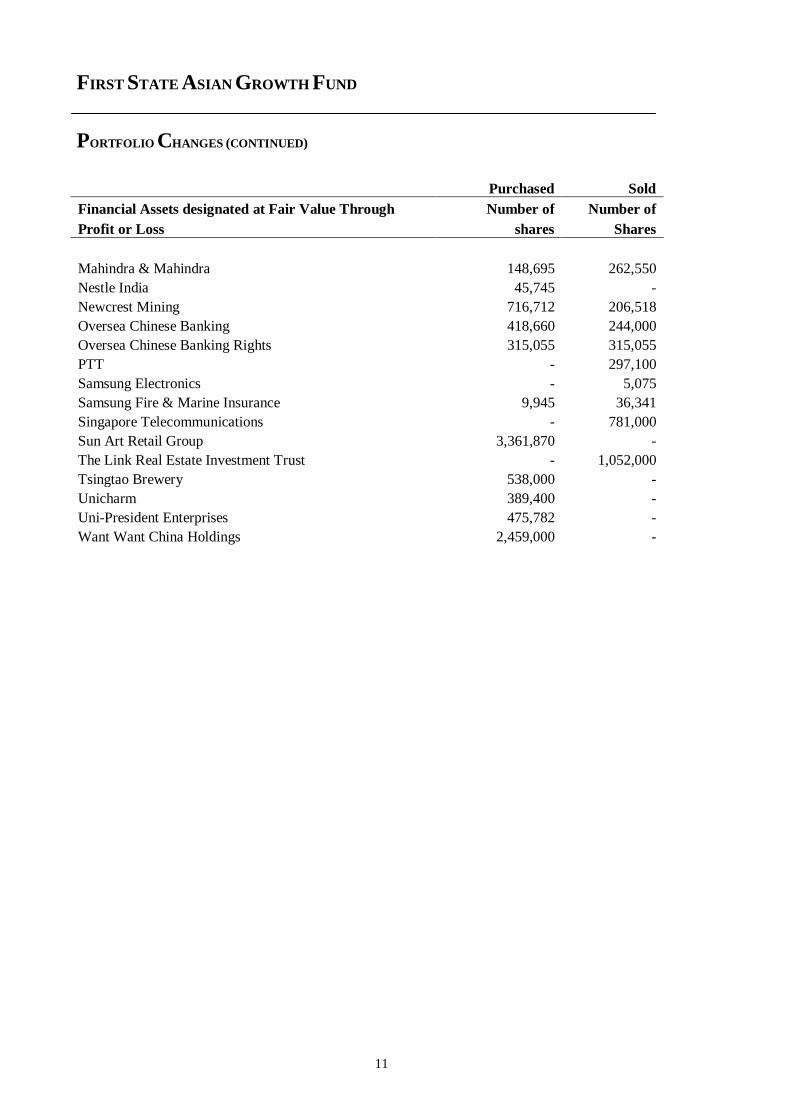
FIRST STATE ASIAN GROWTH FUND
PORTFOLIO CHANGES (CONTINUED)
11
Purchased Sold
Financial Assets designated at Fair Value Through Number of Number of
Profit or Loss shares Shares
Mahindra & Mahindra 148,695 262,550
Nestle India 45,745 -
Newcrest Mining 716,712 206,518
Oversea Chinese Banking 418,660 244,000
Oversea Chinese Banking Rights 315,055 315,055
PTT - 297,100
Samsung Electronics - 5,075
Samsung Fire & Marine Insurance 9,945 36,341
Singapore Telecommunications - 781,000
Sun Art Retail Group 3,361,870 -
The Link Real Estate Investment Trust - 1,052,000
Tsingtao Brewery 538,000 -
Unicharm 389,400 -
Uni-President Enterprises 475,782 -
Want Want China Holdings 2,459,000 -
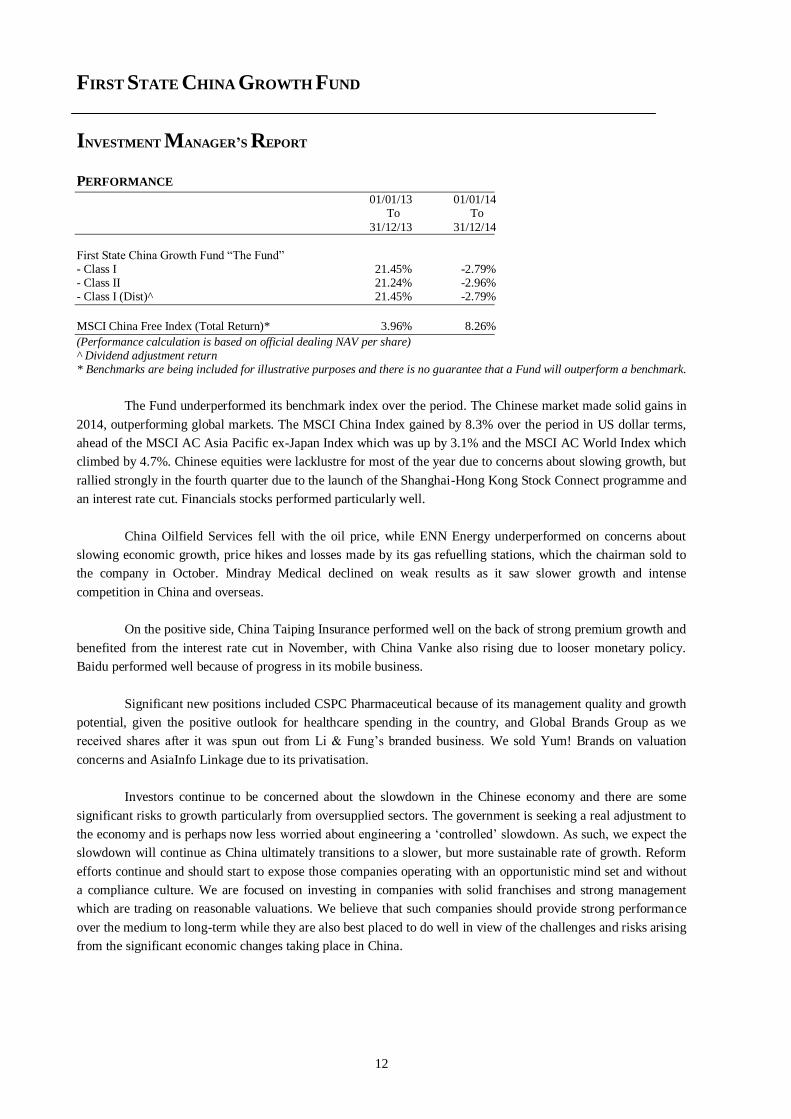
FIRST STATE CHINA GROWTH FUND
INVESTMENT MANAGER’S REPORT
12
PERFORMANCE
01/01/13 01/01/14 To To
31/12/13 31/12/14
First State China Growth Fund “The Fund” - Class I 21.45% -2.79%
- Class II 21.24% -2.96% - Class I (Dist)^ 21.45% -2.79%
MSCI China Free Index (Total Return)* 3.96% 8.26%
(Performance calculation is based on official dealing NAV per share) ^ Dividend adjustment return * Benchmarks are being included for illustrative purposes and there is no guarantee that a Fund will outperform a benchmark.
The Fund underperformed its benchmark index over the period. The Chinese market made solid gains in
2014, outperforming global markets. The MSCI China Index gained by 8.3% over the period in US dollar terms,
ahead of the MSCI AC Asia Pacific ex-Japan Index which was up by 3.1% and the MSCI AC World Index which
climbed by 4.7%. Chinese equities were lacklustre for most of the year due to concerns about slowing growth, but
rallied strongly in the fourth quarter due to the launch of the Shanghai-Hong Kong Stock Connect programme and
an interest rate cut. Financials stocks performed particularly well.
China Oilfield Services fell with the oil price, while ENN Energy underperformed on concerns about
slowing economic growth, price hikes and losses made by its gas refuelling stations, which the chairman sold to
the company in October. Mindray Medical declined on weak results as it saw slower growth and intense
competition in China and overseas.
On the positive side, China Taiping Insurance performed well on the back of strong premium growth and
benefited from the interest rate cut in November, with China Vanke also rising due to looser monetary policy.
Baidu performed well because of progress in its mobile business.
Significant new positions included CSPC Pharmaceutical because of its management quality and growth
potential, given the positive outlook for healthcare spending in the country, and Global Brands Group as we
received shares after it was spun out from Li & Fung’s branded business. We sold Yum! Brands on valuation
concerns and AsiaInfo Linkage due to its privatisation.
Investors continue to be concerned about the slowdown in the Chinese economy and there are some
significant risks to growth particularly from oversupplied sectors. The government is seeking a real adjustment to
the economy and is perhaps now less worried about engineering a ‘controlled’ slowdown. As such, we expect the
slowdown will continue as China ultimately transitions to a slower, but more sustainable rate of growth. Reform
efforts continue and should start to expose those companies operating with an opportunistic mind set and without
a compliance culture. We are focused on investing in companies with solid franchises and strong management
which are trading on reasonable valuations. We believe that such companies should provide strong performance
over the medium to long-term while they are also best placed to do well in view of the challenges and risks arising
from the significant economic changes taking place in China.
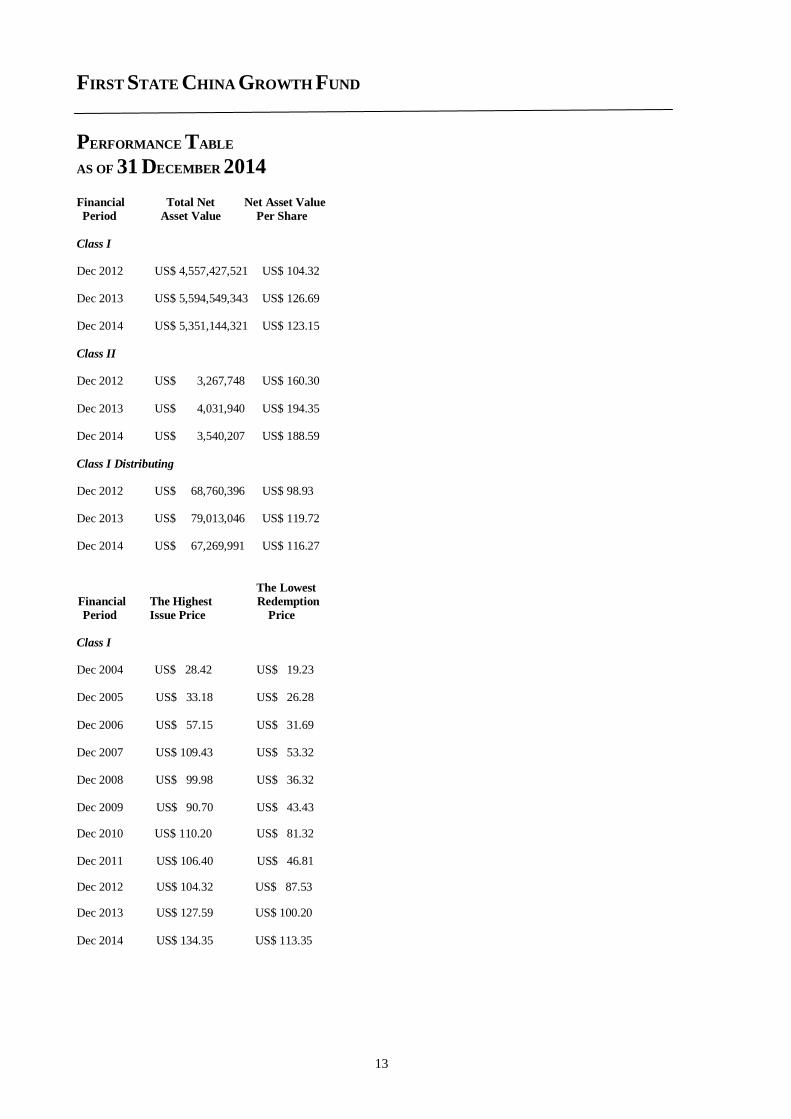
FIRST STATE CHINA GROWTH FUND
PERFORMANCE TABLE
AS OF 31 DECEMBER 2014
13
Financial Total Net Net Asset Value
Period Asset Value Per Share
Class I Dec 2012 US$ 4,557,427,521 US$ 104.32 Dec 2013 US$ 5,594,549,343 US$ 126.69 Dec 2014 US$ 5,351,144,321 US$ 123.15
Class II Dec 2012 US$ 3,267,748 US$ 160.30
Dec 2013 US$ 4,031,940 US$ 194.35 Dec 2014 US$ 3,540,207 US$ 188.59
Class I Distributing Dec 2012 US$ 68,760,396 US$ 98.93 Dec 2013 US$ 79,013,046 US$ 119.72 Dec 2014 US$ 67,269,991 US$ 116.27
The Lowest
Financial The Highest Redemption
Period Issue Price Price
Class I Dec 2004 US$ 28.42 US$ 19.23 Dec 2005 US$ 33.18 US$ 26.28
Dec 2006 US$ 57.15 US$ 31.69 Dec 2007 US$ 109.43 US$ 53.32 Dec 2008 US$ 99.98 US$ 36.32
Dec 2009 US$ 90.70 US$ 43.43
Dec 2010 US$ 110.20 US$ 81.32 Dec 2011 US$ 106.40 US$ 46.81
Dec 2012 US$ 104.32 US$ 87.53
Dec 2013 US$ 127.59 US$ 100.20
Dec 2014 US$ 134.35 US$ 113.35
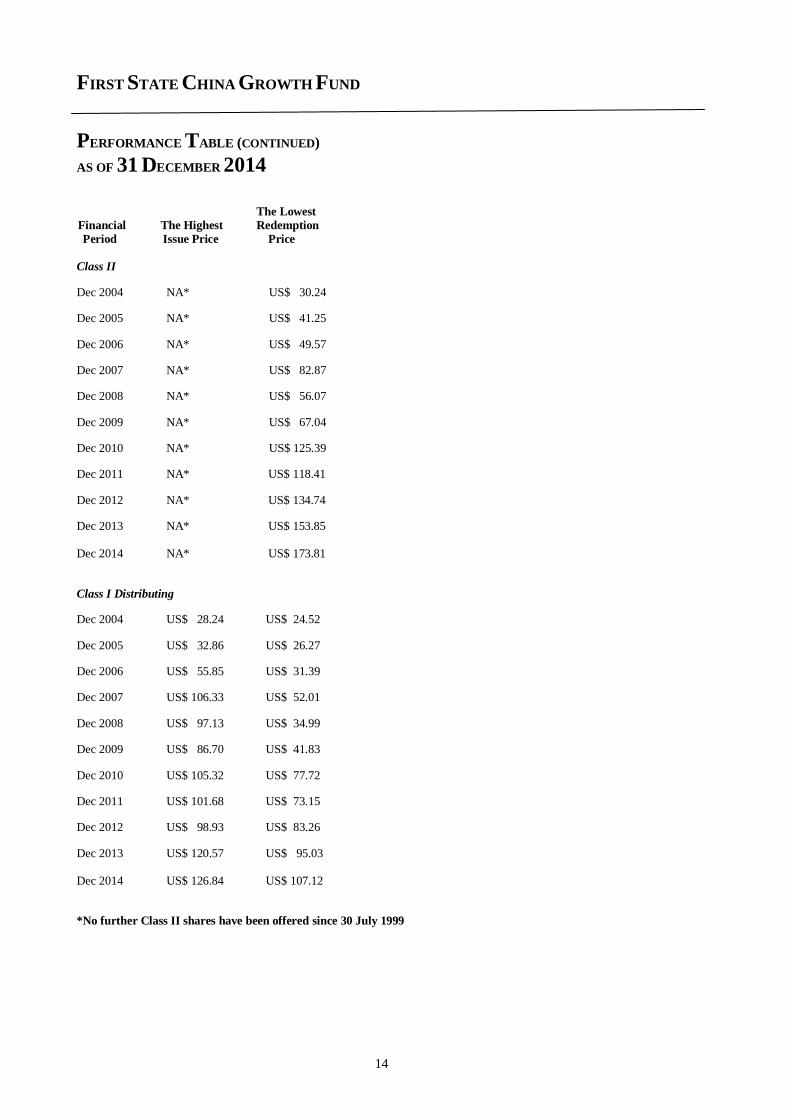
FIRST STATE CHINA GROWTH FUND
PERFORMANCE TABLE (CONTINUED)
AS OF 31 DECEMBER 2014
14
The Lowest
Financial The Highest Redemption
Period Issue Price Price
Class II
Dec 2004 NA* US$ 30.24 Dec 2005 NA* US$ 41.25 Dec 2006 NA* US$ 49.57
Dec 2007 NA* US$ 82.87
Dec 2008 NA* US$ 56.07
Dec 2009 NA* US$ 67.04
Dec 2010 NA* US$ 125.39
Dec 2011 NA* US$ 118.41
Dec 2012 NA* US$ 134.74
Dec 2013 NA* US$ 153.85 Dec 2014 NA* US$ 173.81
Class I Distributing
Dec 2004 US$ 28.24 US$ 24.52
Dec 2005 US$ 32.86 US$ 26.27
Dec 2006 US$ 55.85 US$ 31.39
Dec 2007 US$ 106.33 US$ 52.01
Dec 2008 US$ 97.13 US$ 34.99
Dec 2009 US$ 86.70 US$ 41.83
Dec 2010 US$ 105.32 US$ 77.72
Dec 2011 US$ 101.68 US$ 73.15
Dec 2012 US$ 98.93 US$ 83.26
Dec 2013 US$ 120.57 US$ 95.03 Dec 2014 US$ 126.84 US$ 107.12
*No further Class II shares have been offered since 30 July 1999
FIRST STATE CHINA GROWTH FUND
SCHEDULE OF INVESTMENTS
AS OF 31 DECEMBER 2014
15
Fair % of
Number Value Net
of shares US$ Assets
Financial Assets designated at Fair Value Through
Profit or Loss
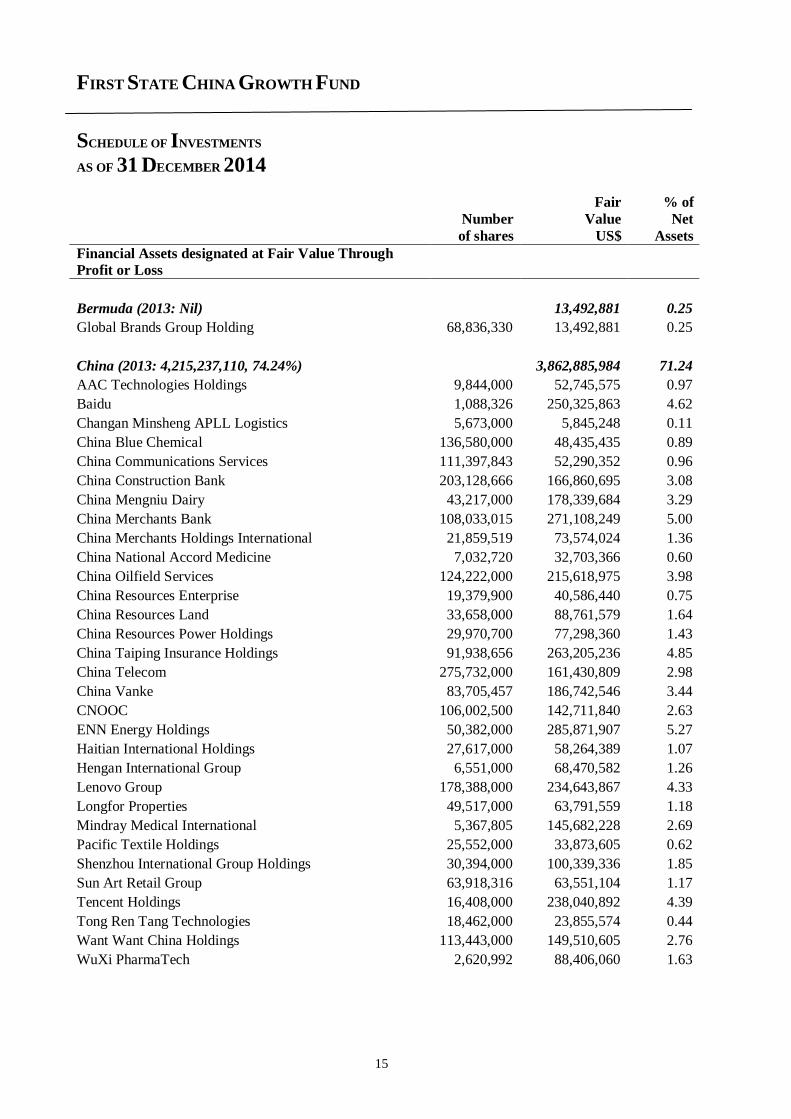
Bermuda (2013: Nil) 13,492,881 0.25
Global Brands Group Holding 68,836,330 13,492,881 0.25
China (2013: 4,215,237,110, 74.24%) 3,862,885,984 71.24
AAC Technologies Holdings 9,844,000 52,745,575 0.97
Baidu 1,088,326 250,325,863 4.62
Changan Minsheng APLL Logistics 5,673,000 5,845,248 0.11
China Blue Chemical 136,580,000 48,435,435 0.89
China Communications Services 111,397,843 52,290,352 0.96
China Construction Bank 203,128,666 166,860,695 3.08
China Mengniu Dairy 43,217,000 178,339,684 3.29
China Merchants Bank 108,033,015 271,108,249 5.00
China Merchants Holdings International 21,859,519 73,574,024 1.36
China National Accord Medicine 7,032,720 32,703,366 0.60
China Oilfield Services 124,222,000 215,618,975 3.98
China Resources Enterprise 19,379,900 40,586,440 0.75
China Resources Land 33,658,000 88,761,579 1.64
China Resources Power Holdings 29,970,700 77,298,360 1.43
China Taiping Insurance Holdings 91,938,656 263,205,236 4.85
China Telecom 275,732,000 161,430,809 2.98
China Vanke 83,705,457 186,742,546 3.44
CNOOC 106,002,500 142,711,840 2.63
ENN Energy Holdings 50,382,000 285,871,907 5.27
Haitian International Holdings 27,617,000 58,264,389 1.07
Hengan International Group 6,551,000 68,470,582 1.26
Lenovo Group 178,388,000 234,643,867 4.33
Longfor Properties 49,517,000 63,791,559 1.18
Mindray Medical International 5,367,805 145,682,228 2.69
Pacific Textile Holdings 25,552,000 33,873,605 0.62
Shenzhou International Group Holdings 30,394,000 100,339,336 1.85
Sun Art Retail Group 63,918,316 63,551,104 1.17
Tencent Holdings 16,408,000 238,040,892 4.39
Tong Ren Tang Technologies 18,462,000 23,855,574 0.44
Want Want China Holdings 113,443,000 149,510,605 2.76
WuXi PharmaTech 2,620,992 88,406,060 1.63
FIRST STATE CHINA GROWTH FUND
SCHEDULE OF INVESTMENTS (CONTINUED)
AS OF 31 DECEMBER 2014
16
Fair % of Number Value Net of shares US$ Assets
Financial Assets designated at Fair Value Through
Profit or Loss
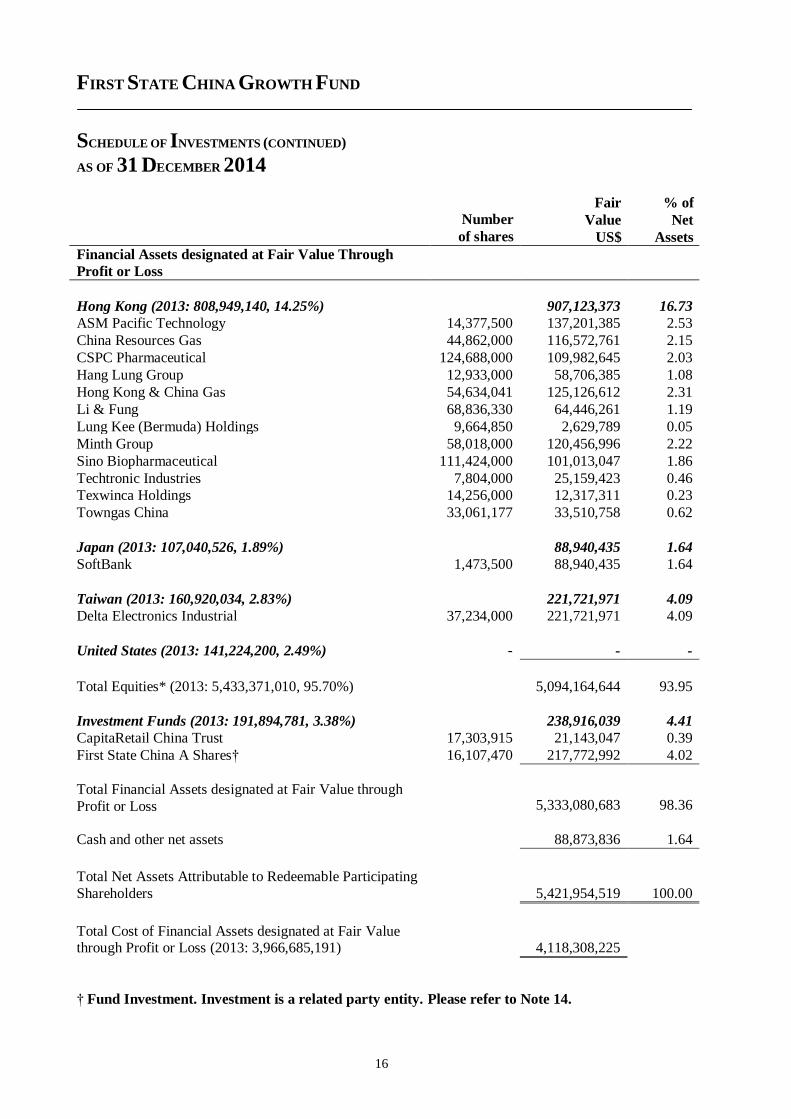
Hong Kong (2013: 808,949,140, 14.25%) 907,123,373 16.73
ASM Pacific Technology 14,377,500 137,201,385 2.53
China Resources Gas 44,862,000 116,572,761 2.15
CSPC Pharmaceutical 124,688,000 109,982,645 2.03
Hang Lung Group 12,933,000 58,706,385 1.08
Hong Kong & China Gas 54,634,041 125,126,612 2.31
Li & Fung 68,836,330 64,446,261 1.19
Lung Kee (Bermuda) Holdings 9,664,850 2,629,789 0.05
Minth Group 58,018,000 120,456,996 2.22
Sino Biopharmaceutical 111,424,000 101,013,047 1.86
Techtronic Industries 7,804,000 25,159,423 0.46
Texwinca Holdings 14,256,000 12,317,311 0.23
Towngas China 33,061,177 33,510,758 0.62
Japan (2013: 107,040,526, 1.89%) 88,940,435 1.64
SoftBank 1,473,500 88,940,435 1.64
Taiwan (2013: 160,920,034, 2.83%) 221,721,971 4.09
Delta Electronics Industrial 37,234,000 221,721,971 4.09
United States (2013: 141,224,200, 2.49%) - - -
Total Equities* (2013: 5,433,371,010, 95.70%) 5,094,164,644 93.95
Investment Funds (2013: 191,894,781, 3.38%) 238,916,039 4.41
CapitaRetail China Trust 17,303,915 21,143,047 0.39
First State China A Shares† 16,107,470 217,772,992 4.02
Total Financial Assets designated at Fair Value through
Profit or Loss 5,333,080,683 98.36
Cash and other net assets 88,873,836 1.64
Total Net Assets Attributable to Redeemable Participating
Shareholders 5,421,954,519 100.00
Total Cost of Financial Assets designated at Fair Value through Profit or Loss (2013: 3,966,685,191) 4,118,308,225
† Fund Investment. Investment is a related party entity. Please refer to Note 14.
FIRST STATE CHINA GROWTH FUND
SCHEDULE OF INVESTMENTS (CONTINUED)
AS OF 31 DECEMBER 2014
17
Fair % of
Number Value Net
of shares US$ Assets
Financial Assets designated at Fair Value Through
Profit or Loss
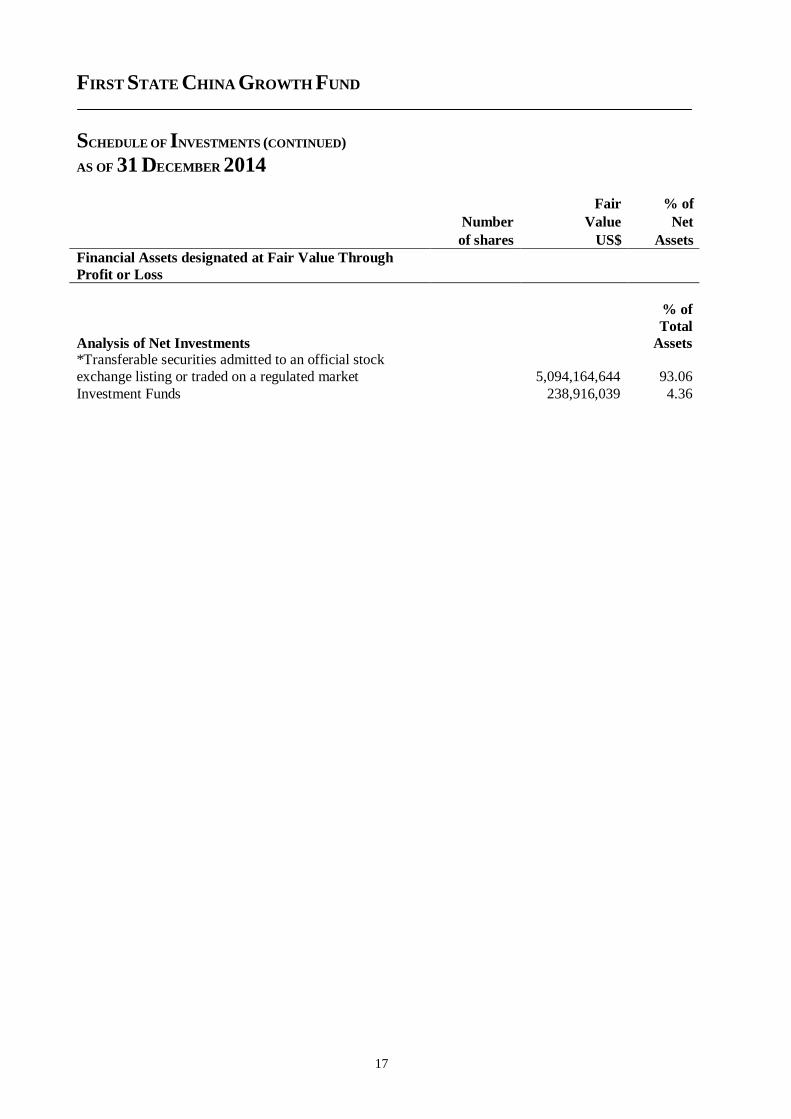
Analysis of Net Investments
% of
Total
Assets *Transferable securities admitted to an official stock
exchange listing or traded on a regulated market
5,094,164,644 93.06
Investment Funds 238,916,039 4.36
FIRST STATE CHINA GROWTH FUND
PORTFOLIO CHANGES
18
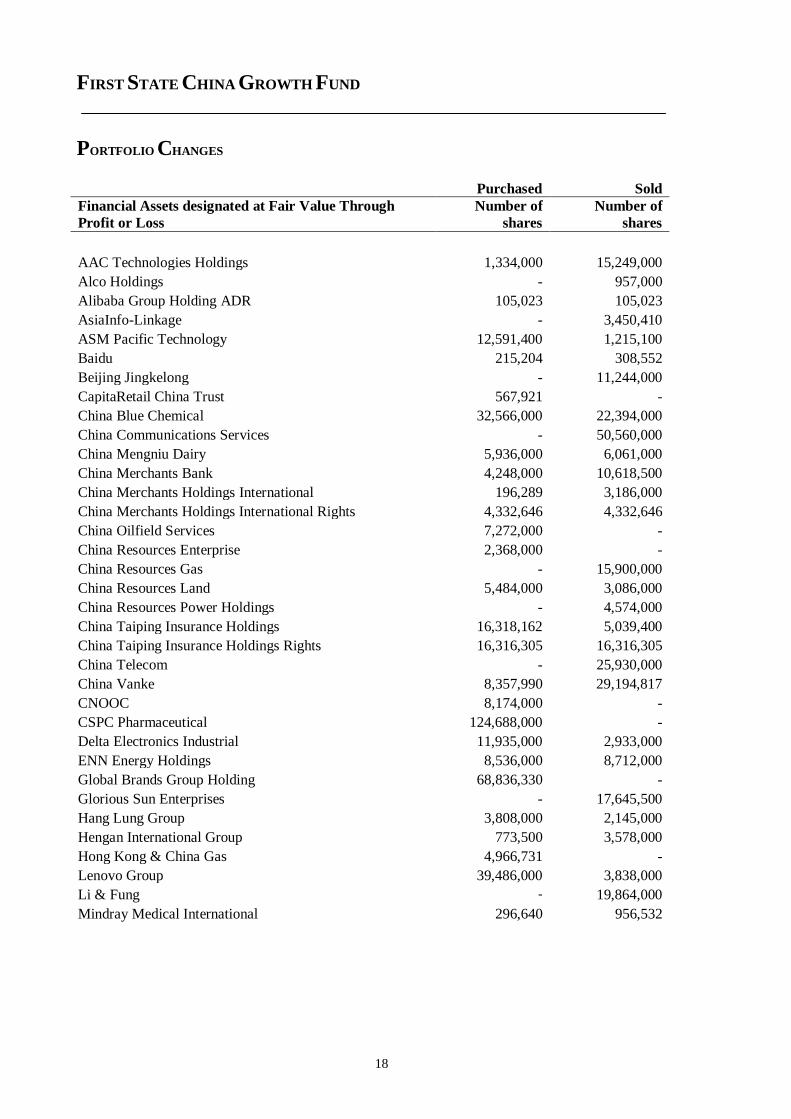
Purchased Sold
Financial Assets designated at Fair Value Through
Profit or Loss
Number of
shares
Number of
shares
AAC Technologies Holdings 1,334,000 15,249,000
Alco Holdings - 957,000
Alibaba Group Holding ADR 105,023 105,023
AsiaInfo-Linkage - 3,450,410
ASM Pacific Technology 12,591,400 1,215,100
Baidu 215,204 308,552
Beijing Jingkelong - 11,244,000
CapitaRetail China Trust 567,921 -
China Blue Chemical 32,566,000 22,394,000
China Communications Services - 50,560,000
China Mengniu Dairy 5,936,000 6,061,000
China Merchants Bank 4,248,000 10,618,500
China Merchants Holdings International 196,289 3,186,000
China Merchants Holdings International Rights 4,332,646 4,332,646
China Oilfield Services 7,272,000 -
China Resources Enterprise 2,368,000 -
China Resources Gas - 15,900,000
China Resources Land 5,484,000 3,086,000
China Resources Power Holdings - 4,574,000
China Taiping Insurance Holdings 16,318,162 5,039,400
China Taiping Insurance Holdings Rights 16,316,305 16,316,305
China Telecom - 25,930,000
China Vanke 8,357,990 29,194,817
CNOOC 8,174,000 -
CSPC Pharmaceutical 124,688,000 -
Delta Electronics Industrial 11,935,000 2,933,000
ENN Energy Holdings 8,536,000 8,712,000
Global Brands Group Holding 68,836,330 -
Glorious Sun Enterprises - 17,645,500
Hang Lung Group 3,808,000 2,145,000
Hengan International Group 773,500 3,578,000
Hong Kong & China Gas 4,966,731 -
Lenovo Group 39,486,000 3,838,000
Li & Fung - 19,864,000
Mindray Medical International 296,640 956,532
FIRST STATE CHINA GROWTH FUND
PORTFOLIO CHANGES (CONTINUED)
19
Purchased Sold
Financial Assets designated at Fair Value Through
Profit or Loss
Number of
shares
Number of
shares
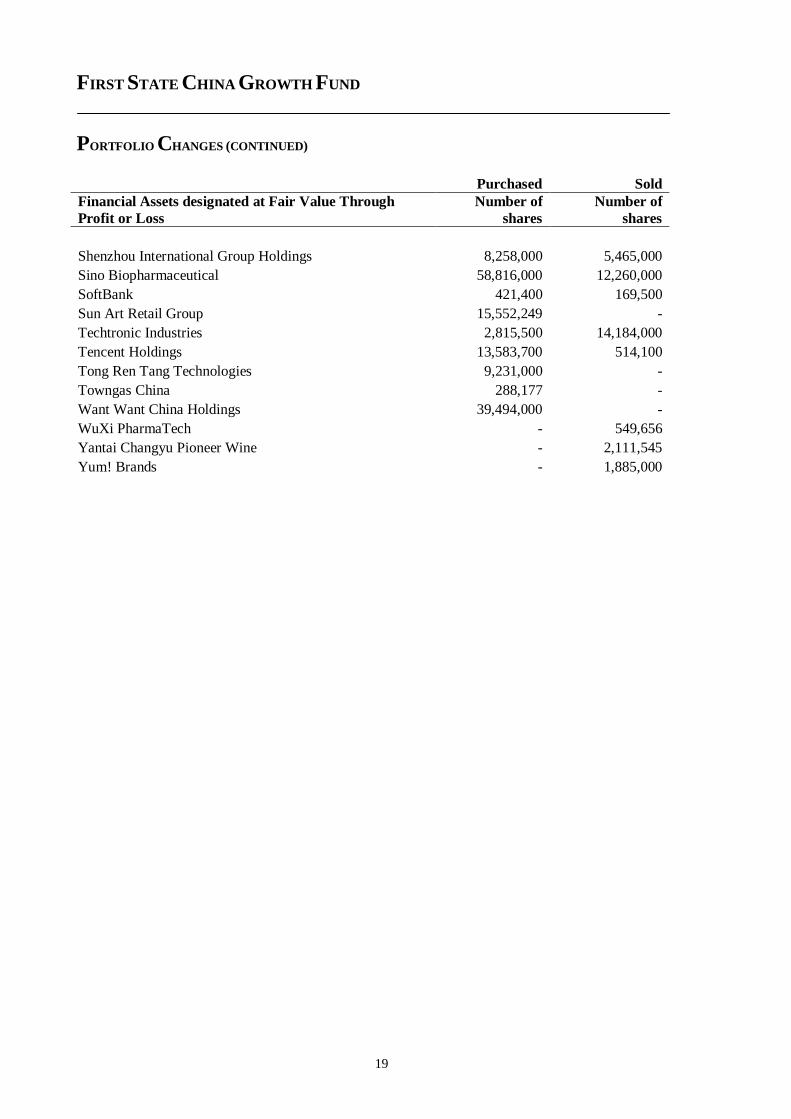
Shenzhou International Group Holdings 8,258,000 5,465,000
Sino Biopharmaceutical 58,816,000 12,260,000
SoftBank 421,400 169,500
Sun Art Retail Group 15,552,249 -
Techtronic Industries 2,815,500 14,184,000
Tencent Holdings 13,583,700 514,100
Tong Ren Tang Technologies 9,231,000 -
Towngas China 288,177 -
Want Want China Holdings 39,494,000 -
WuXi PharmaTech - 549,656
Yantai Changyu Pioneer Wine - 2,111,545
Yum! Brands - 1,885,000
FIRST STATE WORLDWIDE LEADERS FUND (FORMERLY KNOWN AS
GLOBAL OPPORTUNITIES FUND)
INVESTMENT MANAGER’S REPORT
20
PERFORMANCE
01/01/13 01/01/14 To To 31/12/13 31/12/14
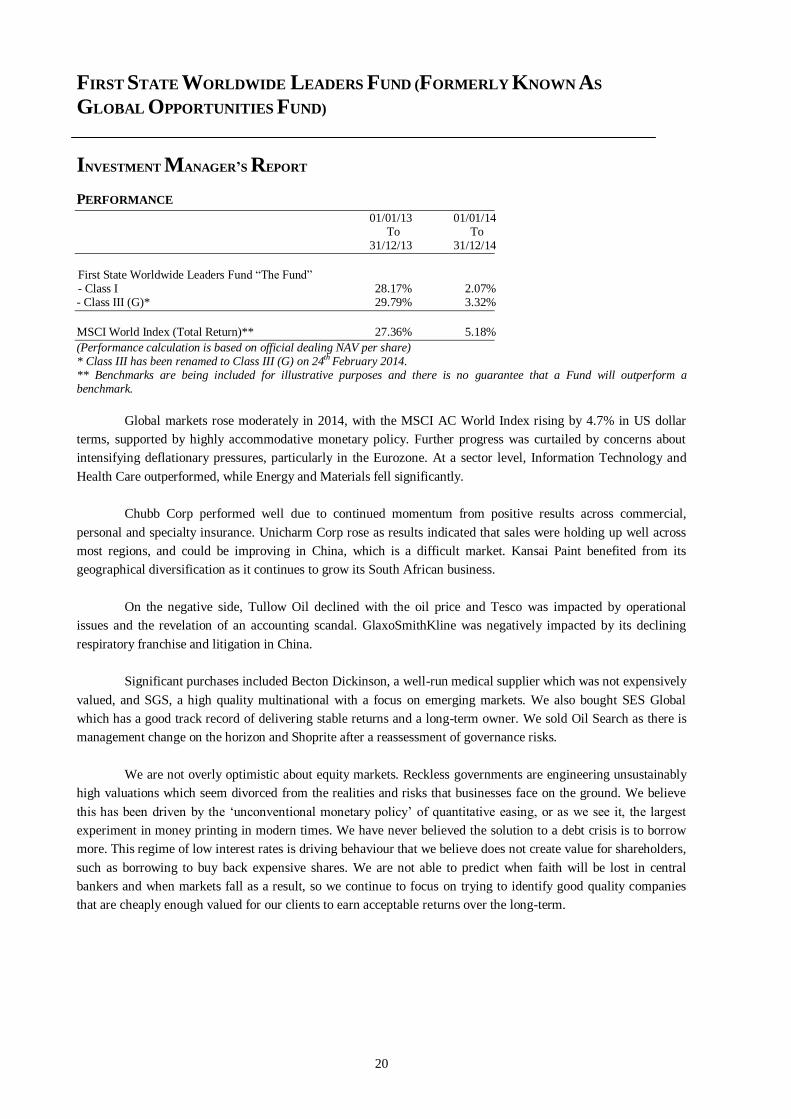
First State Worldwide Leaders Fund “The Fund” - Class I 28.17% 2.07% - Class III (G)* 29.79% 3.32%
MSCI World Index (Total Return)** 27.36% 5.18%
(Performance calculation is based on official dealing NAV per share) * Class III has been renamed to Class III (G) on 24th February 2014. ** Benchmarks are being included for illustrative purposes and there is no guarantee that a Fund will outperform a benchmark.
Global markets rose moderately in 2014, with the MSCI AC World Index rising by 4.7% in US dollar
terms, supported by highly accommodative monetary policy. Further progress was curtailed by concerns about
intensifying deflationary pressures, particularly in the Eurozone. At a sector level, Information Technology and
Health Care outperformed, while Energy and Materials fell significantly.
Chubb Corp performed well due to continued momentum from positive results across commercial,
personal and specialty insurance. Unicharm Corp rose as results indicated that sales were holding up well across
most regions, and could be improving in China, which is a difficult market. Kansai Paint benefited from its
geographical diversification as it continues to grow its South African business.
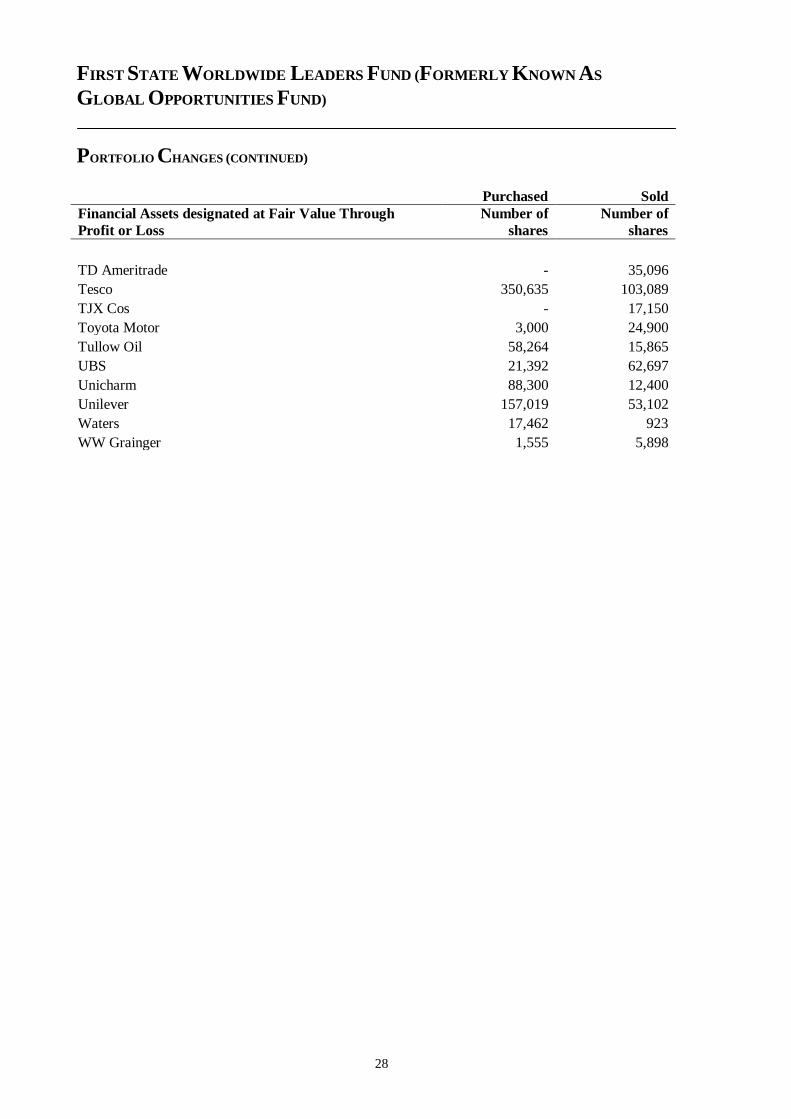
On the negative side, Tullow Oil declined with the oil price and Tesco was impacted by operational
issues and the revelation of an accounting scandal. GlaxoSmithKline was negatively impacted by its declining
respiratory franchise and litigation in China.
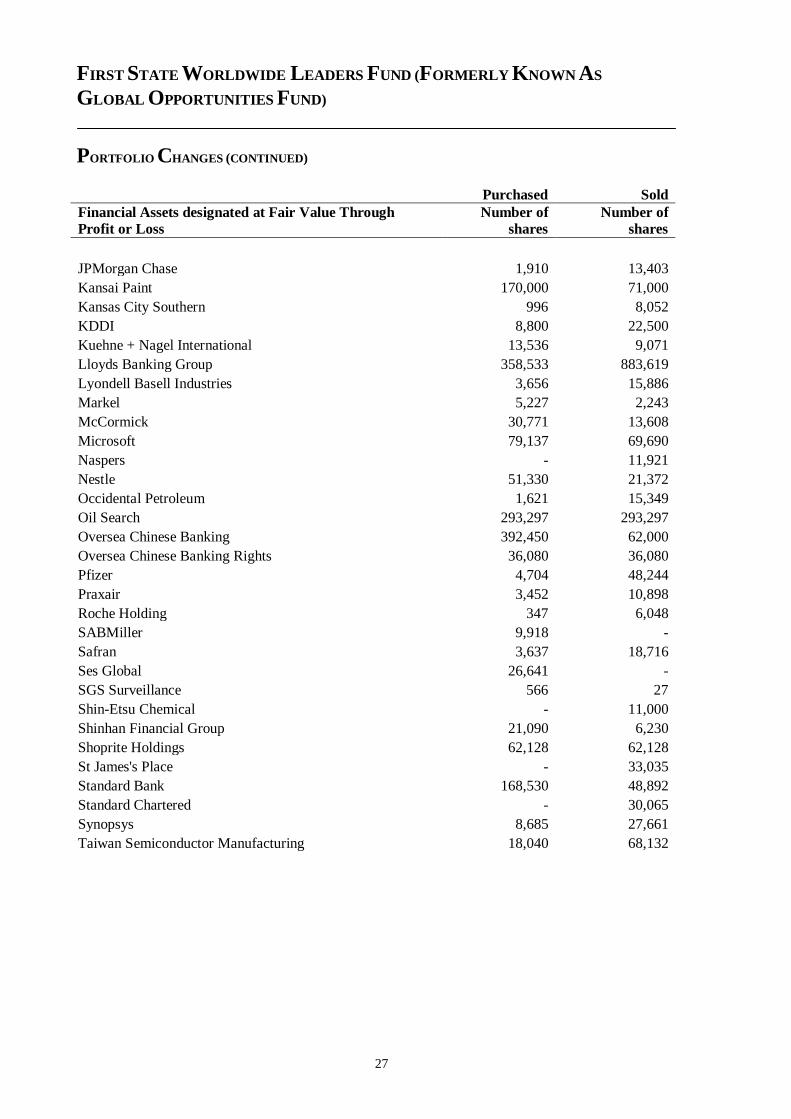
Significant purchases included Becton Dickinson, a well-run medical supplier which was not expensively
valued, and SGS, a high quality multinational with a focus on emerging markets. We also bought SES Global
which has a good track record of delivering stable returns and a long-term owner. We sold Oil Search as there is
management change on the horizon and Shoprite after a reassessment of governance risks.
We are not overly optimistic about equity markets. Reckless governments are engineering unsustainably
high valuations which seem divorced from the realities and risks that businesses face on the ground. We believe
this has been driven by the ‘unconventional monetary policy’ of quantitative easing, or as we see it, the largest
experiment in money printing in modern times. We have never believed the solution to a debt crisis is to borrow
more. This regime of low interest rates is driving behaviour that we believe does not create value for shareholders,
such as borrowing to buy back expensive shares. We are not able to predict when faith will be lost in central
bankers and when markets fall as a result, so we continue to focus on trying to identify good quality companies
that are cheaply enough valued for our clients to earn acceptable returns over the long-term.
FIRST STATE WORLDWIDE LEADERS FUND (FORMERLY KNOWN AS
GLOBAL OPPORTUNITIES FUND)
PERFORMANCE TABLE
AS OF 31 DECEMBER 2014
21
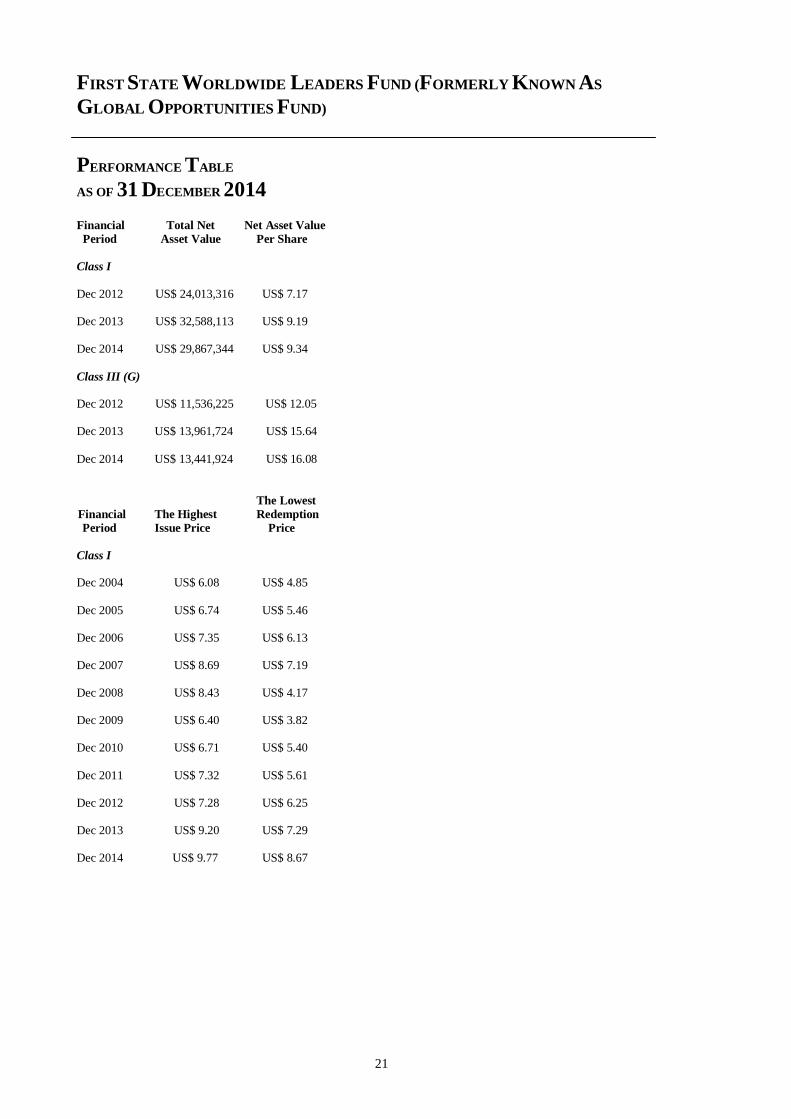
Financial Total Net Net Asset Value
Period Asset Value Per Share
Class I
Dec 2012 US$ 24,013,316 US$ 7.17 Dec 2013 US$ 32,588,113 US$ 9.19 Dec 2014 US$ 29,867,344 US$ 9.34
Class III (G) Dec 2012 US$ 11,536,225 US$ 12.05 Dec 2013 US$ 13,961,724 US$ 15.64
Dec 2014 US$ 13,441,924 US$ 16.08
The Lowest
Financial The Highest Redemption
Period Issue Price Price
Class I Dec 2004 US$ 6.08 US$ 4.85
Dec 2005 US$ 6.74 US$ 5.46 Dec 2006 US$ 7.35 US$ 6.13 Dec 2007 US$ 8.69 US$ 7.19 Dec 2008 US$ 8.43 US$ 4.17 Dec 2009 US$ 6.40 US$ 3.82 Dec 2010 US$ 6.71 US$ 5.40
Dec 2011 US$ 7.32 US$ 5.61 Dec 2012 US$ 7.28 US$ 6.25 Dec 2013 US$ 9.20 US$ 7.29 Dec 2014 US$ 9.77 US$ 8.67
FIRST STATE WORLDWIDE LEADERS FUND (FORMERLY KNOWN AS
GLOBAL OPPORTUNITIES FUND)
PERFORMANCE TABLE (CONTINUED)
AS OF 31 DECEMBER 2014
22
The Lowest
Financial The Highest Redemption
Period Issue Price Price
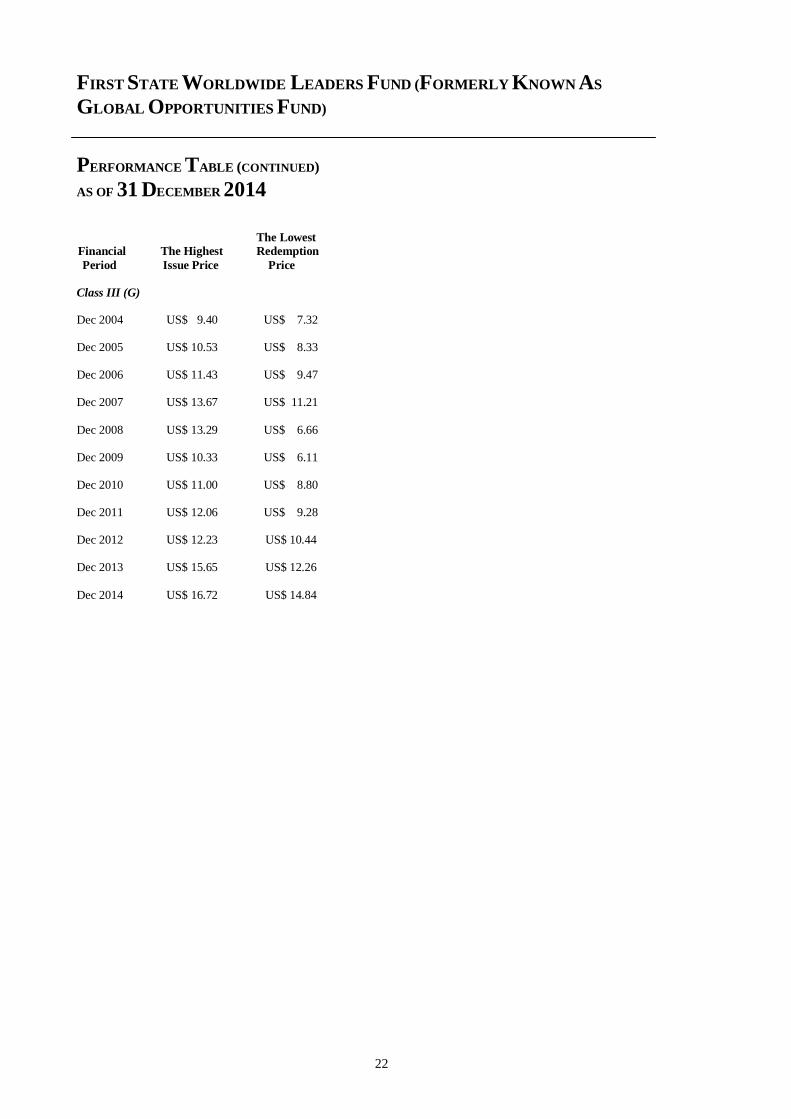
Class III (G) Dec 2004 US$ 9.40 US$ 7.32 Dec 2005 US$ 10.53 US$ 8.33 Dec 2006 US$ 11.43 US$ 9.47 Dec 2007 US$ 13.67 US$ 11.21
Dec 2008 US$ 13.29 US$ 6.66 Dec 2009 US$ 10.33 US$ 6.11 Dec 2010 US$ 11.00 US$ 8.80 Dec 2011 US$ 12.06 US$ 9.28 Dec 2012 US$ 12.23 US$ 10.44 Dec 2013 US$ 15.65 US$ 12.26
Dec 2014 US$ 16.72 US$ 14.84
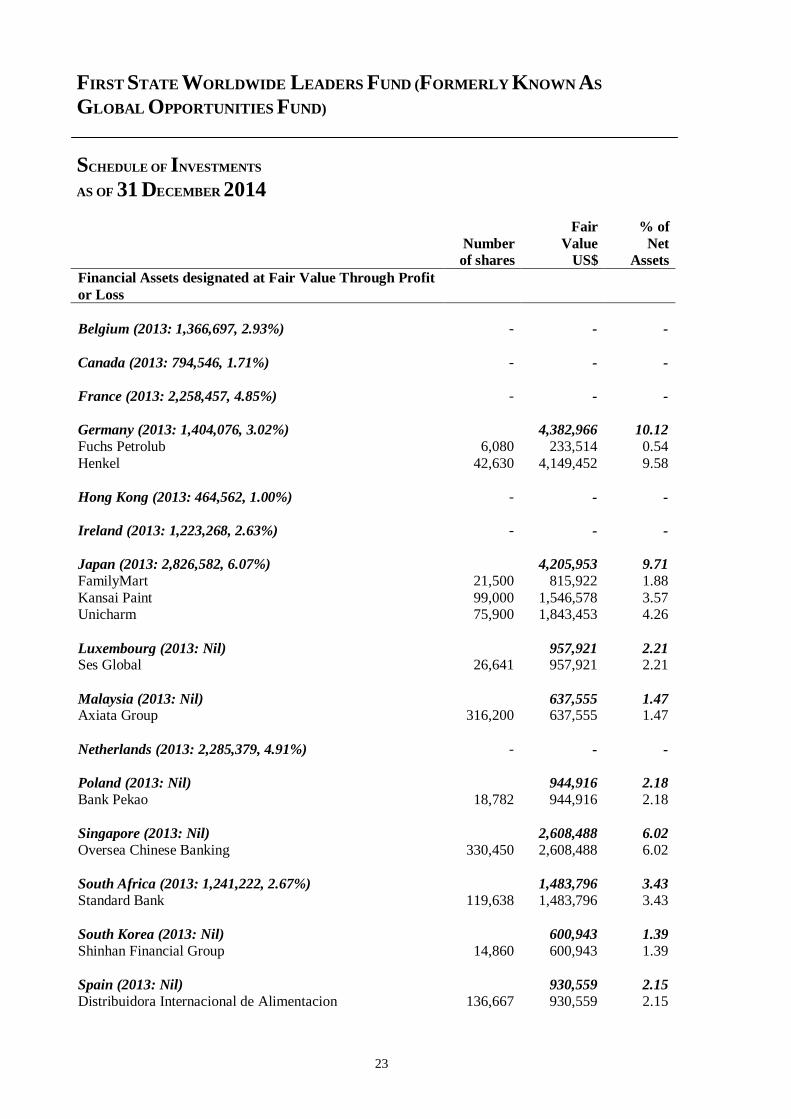
FIRST STATE WORLDWIDE LEADERS FUND (FORMERLY KNOWN AS
GLOBAL OPPORTUNITIES FUND)
SCHEDULE OF INVESTMENTS
AS OF 31 DECEMBER 2014
23
Fair % of
Number Value Net of shares US$ Assets
Financial Assets designated at Fair Value Through Profit
or Loss
Belgium (2013: 1,366,697, 2.93%) - - -
Canada (2013: 794,546, 1.71%) - - -
France (2013: 2,258,457, 4.85%) - - -
Germany (2013: 1,404,076, 3.02%) 4,382,966 10.12
Fuchs Petrolub 6,080 233,514 0.54
Henkel 42,630 4,149,452 9.58
Hong Kong (2013: 464,562, 1.00%) - - -
Ireland (2013: 1,223,268, 2.63%) - - -
Japan (2013: 2,826,582, 6.07%) 4,205,953 9.71
FamilyMart 21,500 815,922 1.88
Kansai Paint 99,000 1,546,578 3.57 Unicharm 75,900 1,843,453 4.26
Luxembourg (2013: Nil) 957,921 2.21 Ses Global 26,641 957,921 2.21
Malaysia (2013: Nil) 637,555 1.47 Axiata Group 316,200 637,555 1.47
Netherlands (2013: 2,285,379, 4.91%) - - -
Poland (2013: Nil) 944,916 2.18
Bank Pekao 18,782 944,916 2.18
Singapore (2013: Nil) 2,608,488 6.02
Oversea Chinese Banking 330,450 2,608,488 6.02
South Africa (2013: 1,241,222, 2.67%) 1,483,796 3.43
Standard Bank 119,638 1,483,796 3.43
South Korea (2013: Nil) 600,943 1.39
Shinhan Financial Group 14,860 600,943 1.39
Spain (2013: Nil) 930,559 2.15
Distribuidora Internacional de Alimentacion 136,667 930,559 2.15
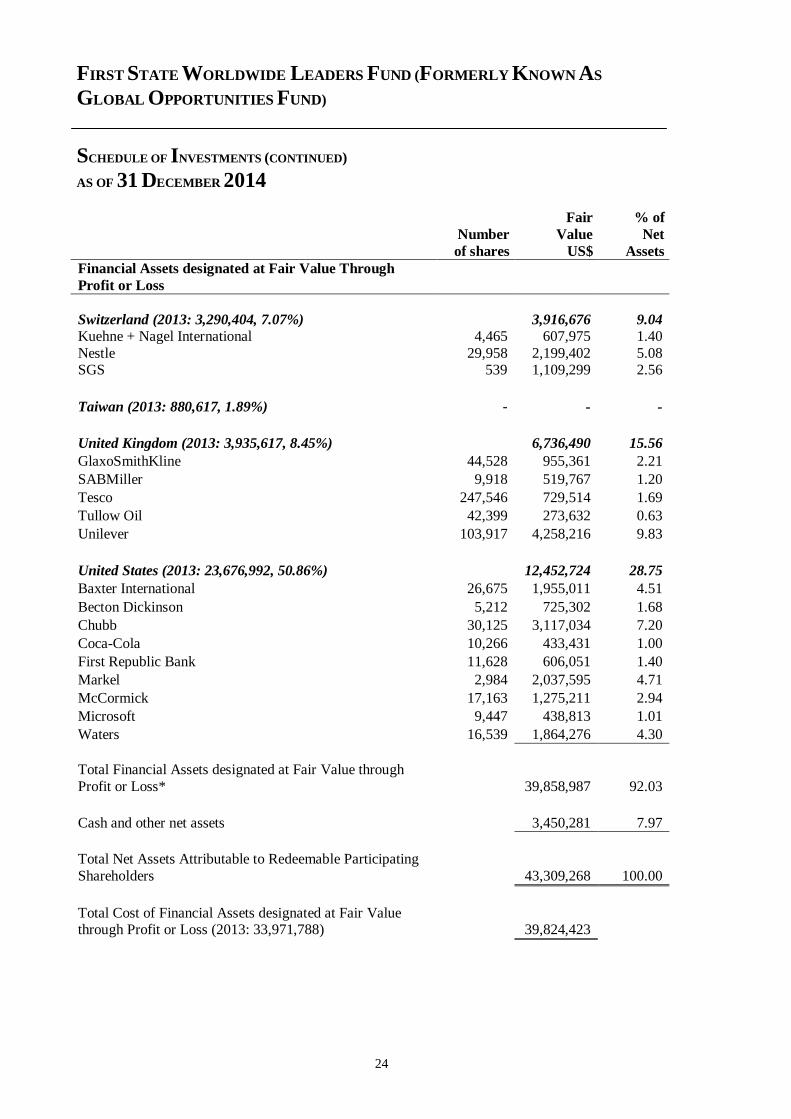
FIRST STATE WORLDWIDE LEADERS FUND (FORMERLY KNOWN AS
GLOBAL OPPORTUNITIES FUND)
SCHEDULE OF INVESTMENTS (CONTINUED)
AS OF 31 DECEMBER 2014
24
Fair % of
Number Value Net
of shares US$ Assets
Financial Assets designated at Fair Value Through
Profit or Loss
Switzerland (2013: 3,290,404, 7.07%) 3,916,676 9.04
Kuehne + Nagel International 4,465 607,975 1.40
Nestle 29,958 2,199,402 5.08 SGS 539 1,109,299 2.56
Taiwan (2013: 880,617, 1.89%) - - -
United Kingdom (2013: 3,935,617, 8.45%) 6,736,490 15.56
GlaxoSmithKline 44,528 955,361 2.21
SABMiller 9,918 519,767 1.20
Tesco 247,546 729,514 1.69
Tullow Oil 42,399 273,632 0.63
Unilever 103,917 4,258,216 9.83
United States (2013: 23,676,992, 50.86%) 12,452,724 28.75
Baxter International 26,675 1,955,011 4.51
Becton Dickinson 5,212 725,302 1.68
Chubb 30,125 3,117,034 7.20
Coca-Cola 10,266 433,431 1.00
First Republic Bank 11,628 606,051 1.40
Markel 2,984 2,037,595 4.71
McCormick 17,163 1,275,211 2.94
Microsoft 9,447 438,813 1.01
Waters 16,539 1,864,276 4.30
Total Financial Assets designated at Fair Value through
Profit or Loss* 39,858,987 92.03
Cash and other net assets 3,450,281 7.97
Total Net Assets Attributable to Redeemable Participating
Shareholders 43,309,268 100.00
Total Cost of Financial Assets designated at Fair Value through Profit or Loss (2013: 33,971,788) 39,824,423
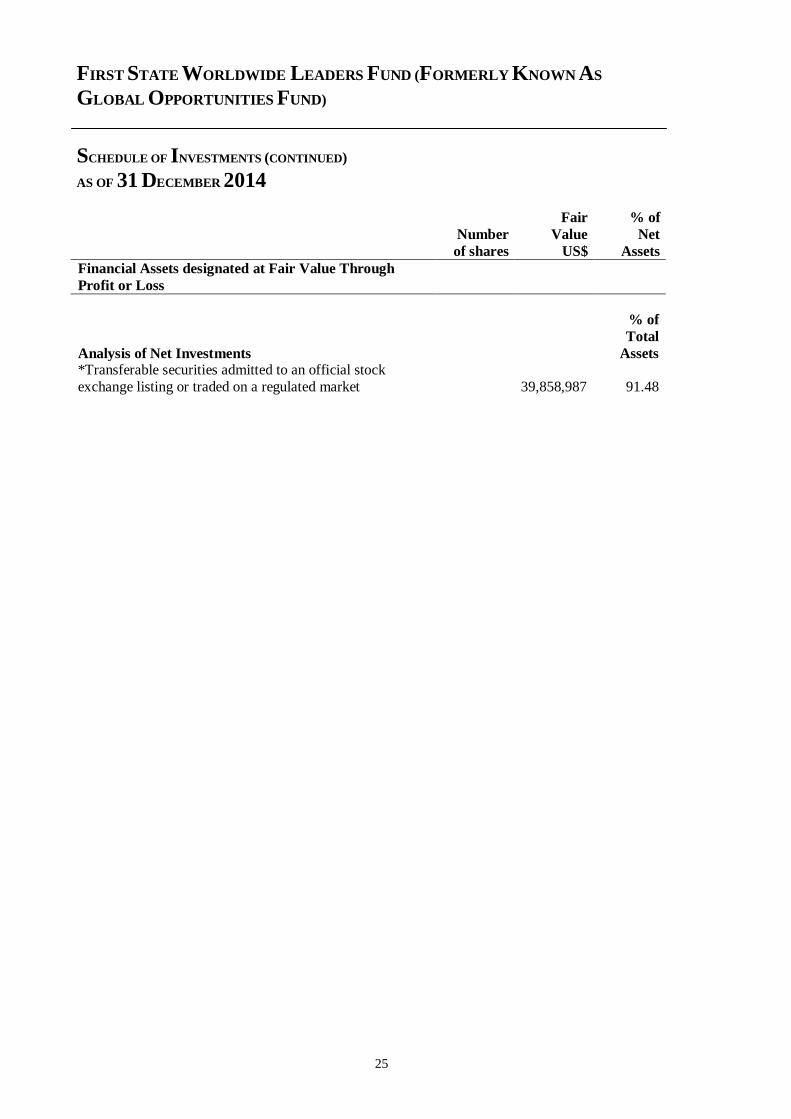
FIRST STATE WORLDWIDE LEADERS FUND (FORMERLY KNOWN AS
GLOBAL OPPORTUNITIES FUND)
SCHEDULE OF INVESTMENTS (CONTINUED)
AS OF 31 DECEMBER 2014
25
Fair % of
Number Value Net
of shares US$ Assets
Financial Assets designated at Fair Value Through
Profit or Loss
Analysis of Net Investments
% of
Total
Assets *Transferable securities admitted to an official stock
exchange listing or traded on a regulated market 39,858,987 91.48
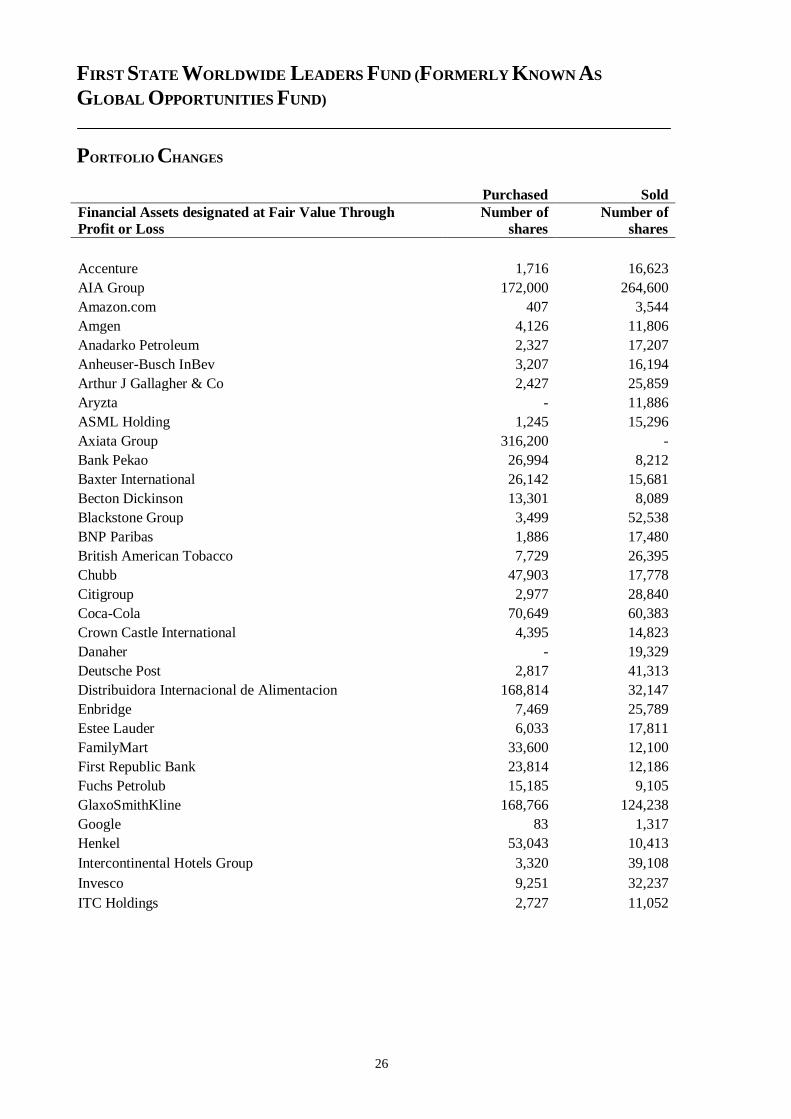
FIRST STATE WORLDWIDE LEADERS FUND (FORMERLY KNOWN AS
GLOBAL OPPORTUNITIES FUND)
PORTFOLIO CHANGES
26
Purchased Sold
Financial Assets designated at Fair Value Through
Profit or Loss
Number of
shares
Number of
shares
Accenture 1,716 16,623
AIA Group 172,000 264,600
Amazon.com 407 3,544
Amgen 4,126 11,806
Anadarko Petroleum 2,327 17,207
Anheuser-Busch InBev 3,207 16,194
Arthur J Gallagher & Co 2,427 25,859
Aryzta - 11,886
ASML Holding 1,245 15,296
Axiata Group 316,200 -
Bank Pekao 26,994 8,212
Baxter International 26,142 15,681
Becton Dickinson 13,301 8,089
Blackstone Group 3,499 52,538
BNP Paribas 1,886 17,480
British American Tobacco 7,729 26,395
Chubb 47,903 17,778
Citigroup 2,977 28,840
Coca-Cola 70,649 60,383
Crown Castle International 4,395 14,823
Danaher - 19,329
Deutsche Post 2,817 41,313
Distribuidora Internacional de Alimentacion 168,814 32,147
Enbridge 7,469 25,789
Estee Lauder 6,033 17,811
FamilyMart 33,600 12,100
First Republic Bank 23,814 12,186
Fuchs Petrolub 15,185 9,105
GlaxoSmithKline 168,766 124,238
Google 83 1,317
Henkel 53,043 10,413
Intercontinental Hotels Group 3,320 39,108
Invesco 9,251 32,237
ITC Holdings 2,727 11,052
FIRST STATE WORLDWIDE LEADERS FUND (FORMERLY KNOWN AS
GLOBAL OPPORTUNITIES FUND)
PORTFOLIO CHANGES (CONTINUED)
27
Purchased Sold
Financial Assets designated at Fair Value Through
Profit or Loss
Number of
shares
Number of
shares
JPMorgan Chase 1,910 13,403
Kansai Paint 170,000 71,000
Kansas City Southern 996 8,052
KDDI 8,800 22,500
Kuehne + Nagel International 13,536 9,071
Lloyds Banking Group 358,533 883,619
Lyondell Basell Industries 3,656 15,886
Markel 5,227 2,243
McCormick 30,771 13,608
Microsoft 79,137 69,690
Naspers - 11,921
Nestle 51,330 21,372
Occidental Petroleum 1,621 15,349
Oil Search 293,297 293,297
Oversea Chinese Banking 392,450 62,000
Oversea Chinese Banking Rights 36,080 36,080
Pfizer 4,704 48,244
Praxair 3,452 10,898
Roche Holding 347 6,048
SABMiller 9,918 -
Safran 3,637 18,716
Ses Global 26,641 -
SGS Surveillance 566 27
Shin-Etsu Chemical - 11,000
Shinhan Financial Group 21,090 6,230
Shoprite Holdings 62,128 62,128
St James's Place - 33,035
Standard Bank 168,530 48,892
Standard Chartered - 30,065
Synopsys 8,685 27,661
Taiwan Semiconductor Manufacturing 18,040 68,132
FIRST STATE WORLDWIDE LEADERS FUND (FORMERLY KNOWN AS
GLOBAL OPPORTUNITIES FUND)
PORTFOLIO CHANGES (CONTINUED)
28
Purchased Sold
Financial Assets designated at Fair Value Through
Profit or Loss
Number of
shares
Number of
shares
TD Ameritrade - 35,096
Tesco 350,635 103,089
TJX Cos - 17,150
Toyota Motor 3,000 24,900
Tullow Oil 58,264 15,865
UBS 21,392 62,697
Unicharm 88,300 12,400
Unilever 157,019 53,102
Waters 17,462 923
WW Grainger 1,555 5,898
FIRST STATE HONG KONG GROWTH FUND
INVESTMENT MANAGER’S REPORT
29
PERFORMANCE
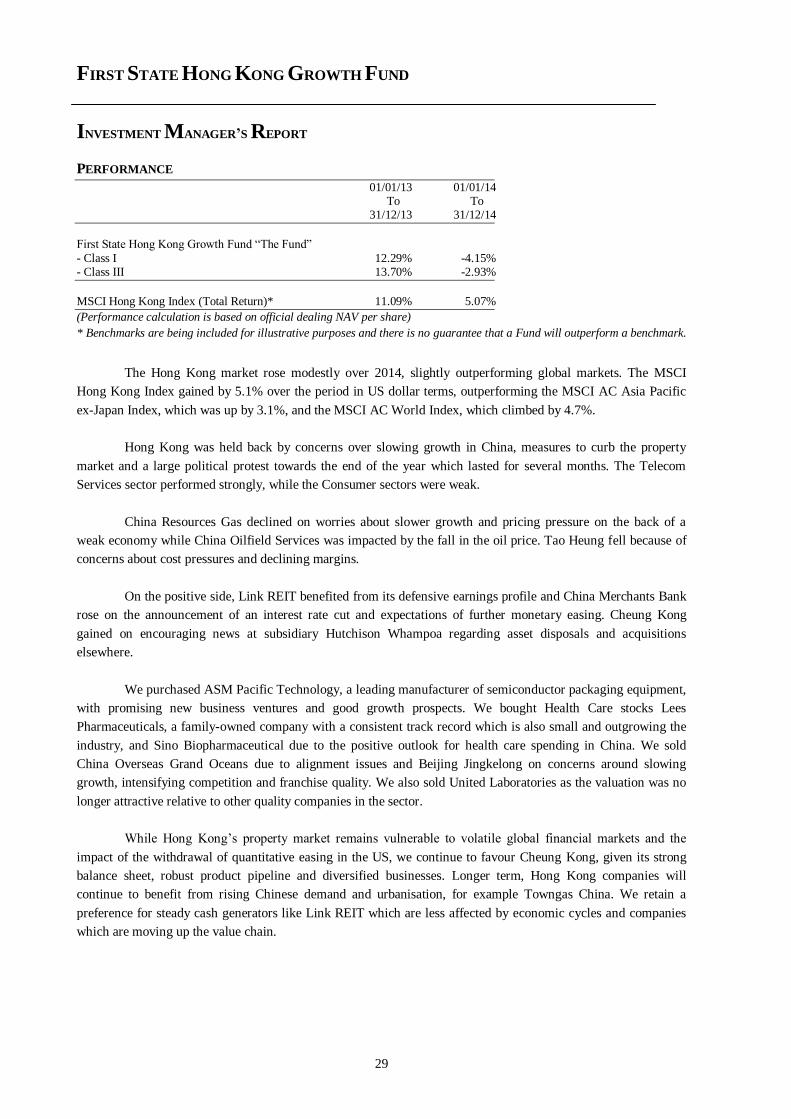
01/01/13 01/01/14 To To 31/12/13 31/12/14
First State Hong Kong Growth Fund “The Fund”
- Class I 12.29% -4.15% - Class III 13.70% -2.93%
MSCI Hong Kong Index (Total Return)* 11.09% 5.07%
(Performance calculation is based on official dealing NAV per share)
* Benchmarks are being included for illustrative purposes and there is no guarantee that a Fund will outperform a benchmark.
The Hong Kong market rose modestly over 2014, slightly outperforming global markets. The MSCI
Hong Kong Index gained by 5.1% over the period in US dollar terms, outperforming the MSCI AC Asia Pacific
ex-Japan Index, which was up by 3.1%, and the MSCI AC World Index, which climbed by 4.7%.
Hong Kong was held back by concerns over slowing growth in China, measures to curb the property
market and a large political protest towards the end of the year which lasted for several months. The Telecom
Services sector performed strongly, while the Consumer sectors were weak.
China Resources Gas declined on worries about slower growth and pricing pressure on the back of a
weak economy while China Oilfield Services was impacted by the fall in the oil price. Tao Heung fell because of
concerns about cost pressures and declining margins.
On the positive side, Link REIT benefited from its defensive earnings profile and China Merchants Bank
rose on the announcement of an interest rate cut and expectations of further monetary easing. Cheung Kong
gained on encouraging news at subsidiary Hutchison Whampoa regarding asset disposals and acquisitions
elsewhere.
We purchased ASM Pacific Technology, a leading manufacturer of semiconductor packaging equipment,
with promising new business ventures and good growth prospects. We bought Health Care stocks Lees
Pharmaceuticals, a family-owned company with a consistent track record which is also small and outgrowing the
industry, and Sino Biopharmaceutical due to the positive outlook for health care spending in China. We sold
China Overseas Grand Oceans due to alignment issues and Beijing Jingkelong on concerns around slowing
growth, intensifying competition and franchise quality. We also sold United Laboratories as the valuation was no
longer attractive relative to other quality companies in the sector.
While Hong Kong’s property market remains vulnerable to volatile global financial markets and the
impact of the withdrawal of quantitative easing in the US, we continue to favour Cheung Kong, given its strong
balance sheet, robust product pipeline and diversified businesses. Longer term, Hong Kong companies will
continue to benefit from rising Chinese demand and urbanisation, for example Towngas China. We retain a
preference for steady cash generators like Link REIT which are less affected by economic cycles and companies
which are moving up the value chain.
FIRST STATE HONG KONG GROWTH FUND
PERFORMANCE TABLE
AS OF 31 DECEMBER 2014
30
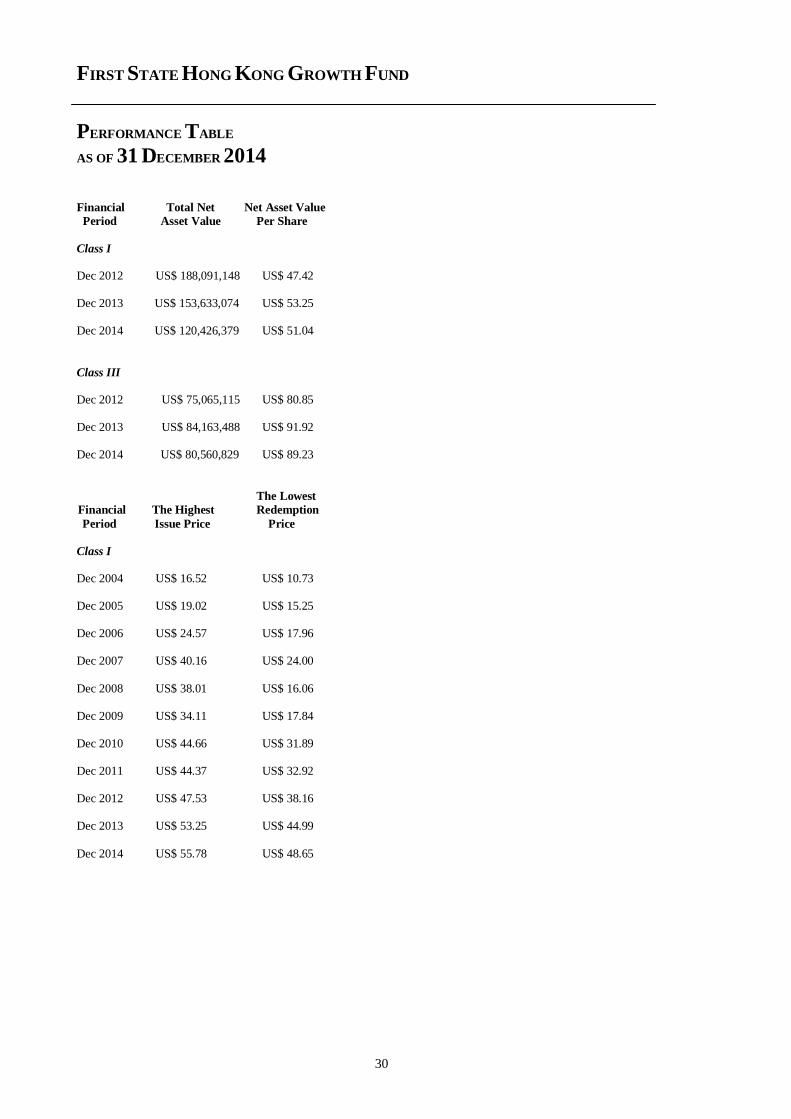
Financial Total Net Net Asset Value
Period Asset Value Per Share
Class I Dec 2012 US$ 188,091,148 US$ 47.42
Dec 2013 US$ 153,633,074 US$ 53.25
Dec 2014 US$ 120,426,379 US$ 51.04
Class III Dec 2012 US$ 75,065,115 US$ 80.85 Dec 2013 US$ 84,163,488 US$ 91.92 Dec 2014 US$ 80,560,829 US$ 89.23
The Lowest
Financial The Highest Redemption
Period Issue Price Price
Class I Dec 2004 US$ 16.52 US$ 10.73 Dec 2005 US$ 19.02 US$ 15.25 Dec 2006 US$ 24.57 US$ 17.96 Dec 2007 US$ 40.16 US$ 24.00
Dec 2008 US$ 38.01 US$ 16.06
Dec 2009 US$ 34.11 US$ 17.84 Dec 2010 US$ 44.66 US$ 31.89 Dec 2011 US$ 44.37 US$ 32.92 Dec 2012 US$ 47.53 US$ 38.16 Dec 2013 US$ 53.25 US$ 44.99
Dec 2014 US$ 55.78 US$ 48.65
FIRST STATE HONG KONG GROWTH FUND
PERFORMANCE TABLE (CONTINUED)
AS OF 31 DECEMBER 2014
31
The Lowest
Financial The Highest Redemption
Period Issue Price Price
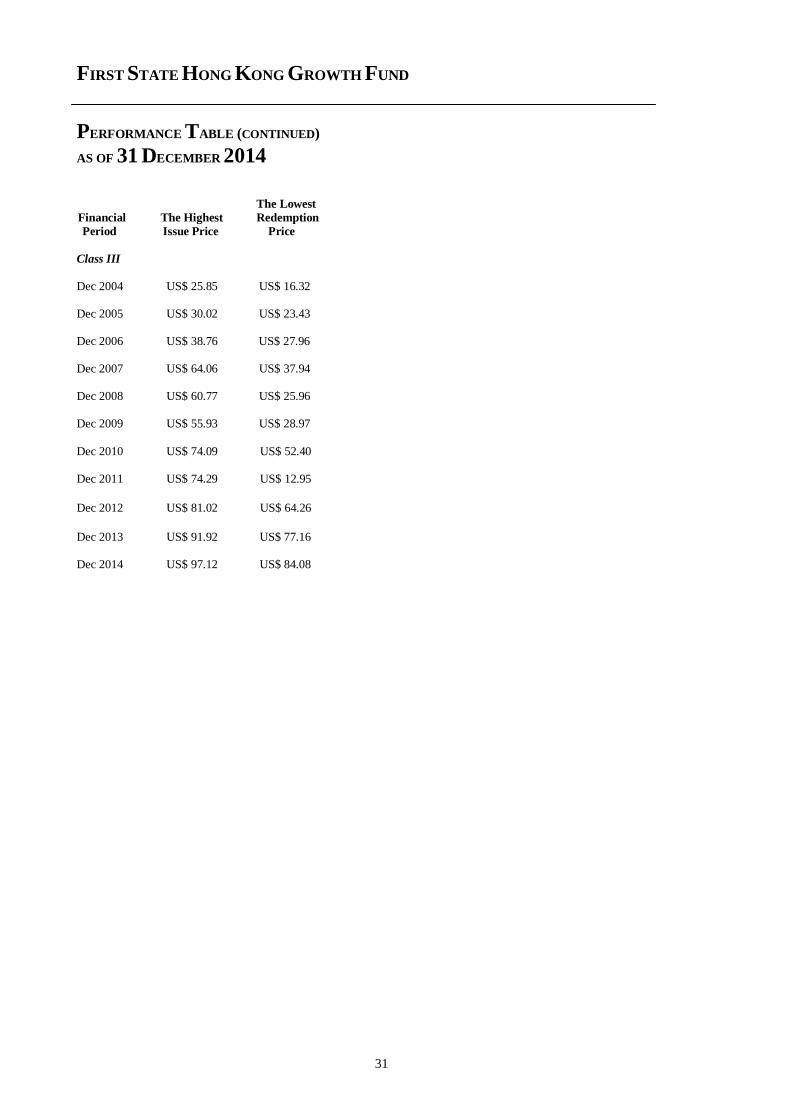
Class III
Dec 2004 US$ 25.85 US$ 16.32 Dec 2005 US$ 30.02 US$ 23.43 Dec 2006 US$ 38.76 US$ 27.96 Dec 2007 US$ 64.06 US$ 37.94 Dec 2008 US$ 60.77 US$ 25.96 Dec 2009 US$ 55.93 US$ 28.97
Dec 2010 US$ 74.09 US$ 52.40 Dec 2011 US$ 74.29 US$ 12.95
Dec 2012 US$ 81.02 US$ 64.26
Dec 2013 US$ 91.92 US$ 77.16 Dec 2014 US$ 97.12 US$ 84.08
FIRST STATE HONG KONG GROWTH FUND
SCHEDULE OF INVESTMENTS
AS OF 31 DECEMBER 2014
32
Fair % of Number Value Net of shares US$ Assets
Financial Assets designated at Fair Value Through
Profit or Loss
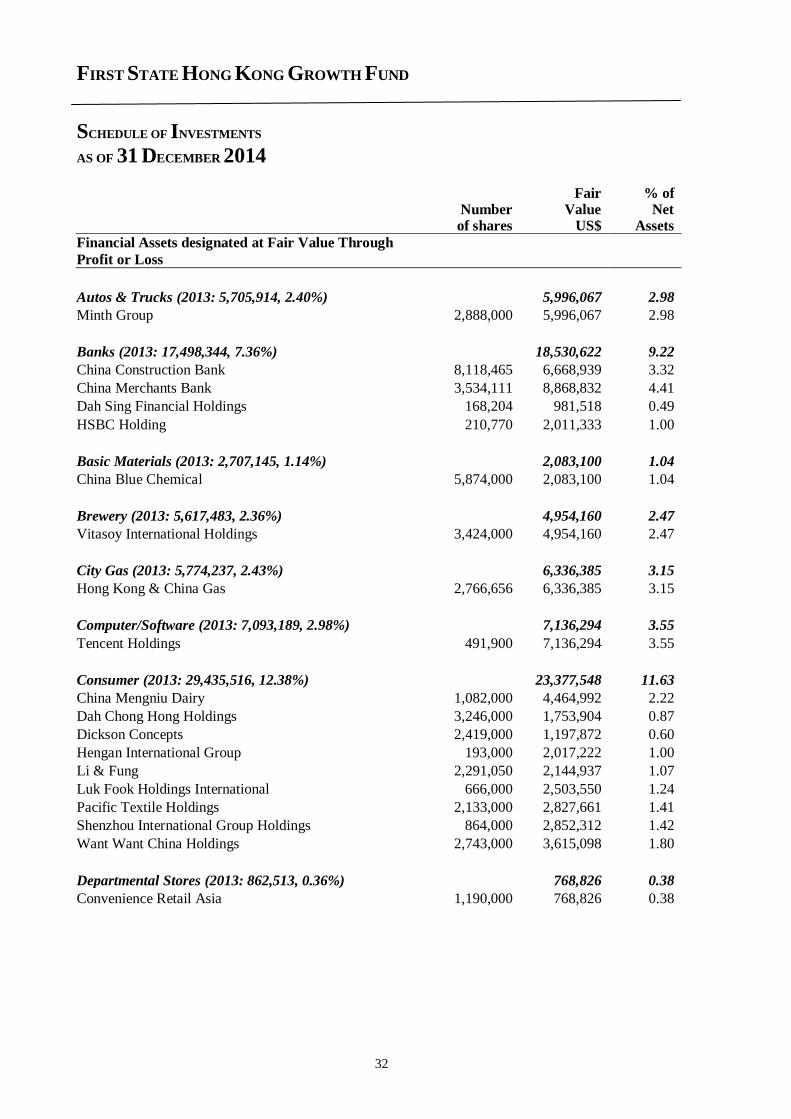
Autos & Trucks (2013: 5,705,914, 2.40%) 5,996,067 2.98
Minth Group 2,888,000 5,996,067 2.98
Banks (2013: 17,498,344, 7.36%) 18,530,622 9.22
China Construction Bank 8,118,465 6,668,939 3.32
China Merchants Bank 3,534,111 8,868,832 4.41
Dah Sing Financial Holdings 168,204 981,518 0.49
HSBC Holding 210,770 2,011,333 1.00
Basic Materials (2013: 2,707,145, 1.14%) 2,083,100 1.04
China Blue Chemical 5,874,000 2,083,100 1.04
Brewery (2013: 5,617,483, 2.36%) 4,954,160 2.47
Vitasoy International Holdings 3,424,000 4,954,160 2.47
City Gas (2013: 5,774,237, 2.43%) 6,336,385 3.15
Hong Kong & China Gas 2,766,656 6,336,385 3.15
Computer/Software (2013: 7,093,189, 2.98%) 7,136,294 3.55
Tencent Holdings 491,900 7,136,294 3.55
Consumer (2013: 29,435,516, 12.38%) 23,377,548 11.63
China Mengniu Dairy 1,082,000 4,464,992 2.22
Dah Chong Hong Holdings 3,246,000 1,753,904 0.87
Dickson Concepts 2,419,000 1,197,872 0.60
Hengan International Group 193,000 2,017,222 1.00
Li & Fung 2,291,050 2,144,937 1.07
Luk Fook Holdings International 666,000 2,503,550 1.24
Pacific Textile Holdings 2,133,000 2,827,661 1.41
Shenzhou International Group Holdings 864,000 2,852,312 1.42
Want Want China Holdings 2,743,000 3,615,098 1.80
Departmental Stores (2013: 862,513, 0.36%) 768,826 0.38
Convenience Retail Asia 1,190,000 768,826 0.38
FIRST STATE HONG KONG GROWTH FUND
SCHEDULE OF INVESTMENTS (CONTINUED)
AS OF 31 DECEMBER 2014
33
Fair % of Number Value Net
of shares US$ Assets
Financial Assets designated at Fair Value Through
Profit or Loss
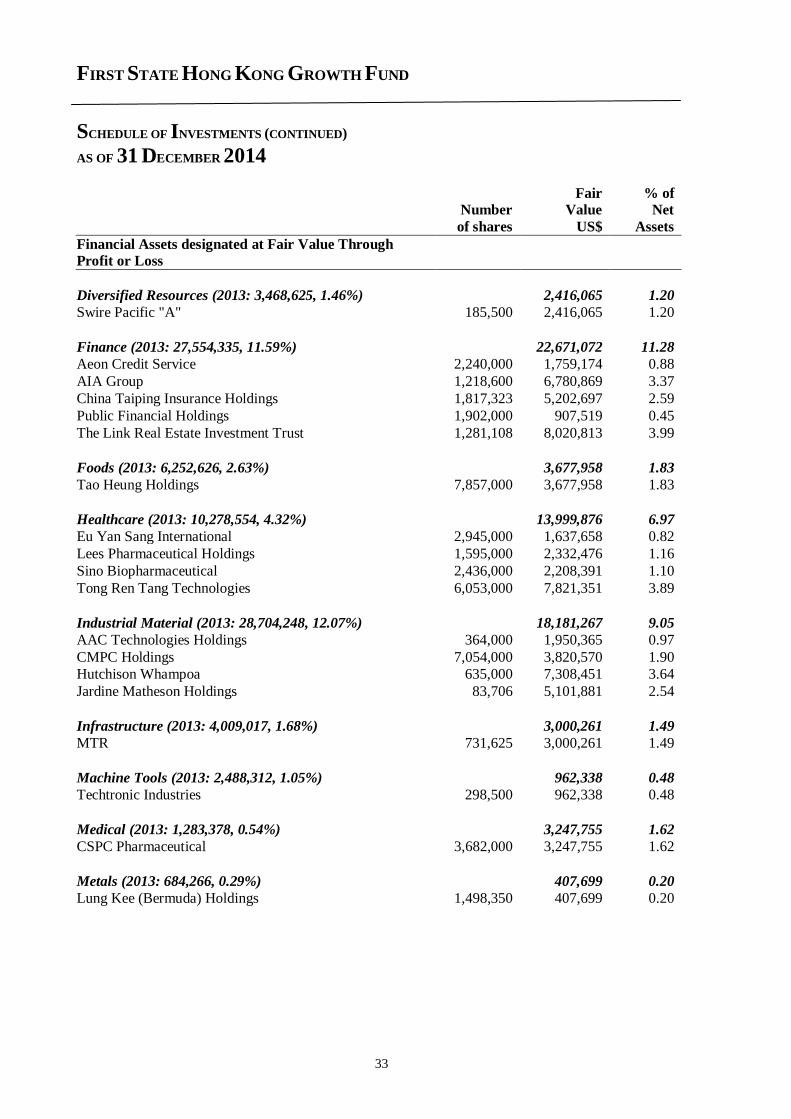
Diversified Resources (2013: 3,468,625, 1.46%) 2,416,065 1.20
Swire Pacific "A" 185,500 2,416,065 1.20
Finance (2013: 27,554,335, 11.59%) 22,671,072 11.28
Aeon Credit Service 2,240,000 1,759,174 0.88
AIA Group 1,218,600 6,780,869 3.37
China Taiping Insurance Holdings 1,817,323 5,202,697 2.59
Public Financial Holdings 1,902,000 907,519 0.45
The Link Real Estate Investment Trust 1,281,108 8,020,813 3.99
Foods (2013: 6,252,626, 2.63%) 3,677,958 1.83
Tao Heung Holdings 7,857,000 3,677,958 1.83
Healthcare (2013: 10,278,554, 4.32%) 13,999,876 6.97
Eu Yan Sang International 2,945,000 1,637,658 0.82
Lees Pharmaceutical Holdings 1,595,000 2,332,476 1.16
Sino Biopharmaceutical 2,436,000 2,208,391 1.10
Tong Ren Tang Technologies 6,053,000 7,821,351 3.89
Industrial Material (2013: 28,704,248, 12.07%) 18,181,267 9.05
AAC Technologies Holdings 364,000 1,950,365 0.97
CMPC Holdings 7,054,000 3,820,570 1.90
Hutchison Whampoa 635,000 7,308,451 3.64
Jardine Matheson Holdings 83,706 5,101,881 2.54
Infrastructure (2013: 4,009,017, 1.68%) 3,000,261 1.49
MTR 731,625 3,000,261 1.49
Machine Tools (2013: 2,488,312, 1.05%) 962,338 0.48
Techtronic Industries 298,500 962,338 0.48
Medical (2013: 1,283,378, 0.54%) 3,247,755 1.62
CSPC Pharmaceutical 3,682,000 3,247,755 1.62
Metals (2013: 684,266, 0.29%) 407,699 0.20
Lung Kee (Bermuda) Holdings 1,498,350 407,699 0.20
FIRST STATE HONG KONG GROWTH FUND
SCHEDULE OF INVESTMENTS (CONTINUED)
AS OF 31 DECEMBER 2014
34
Fair % of Number Value Net
of shares US$ Assets
Financial Assets designated at Fair Value Through
Profit or Loss
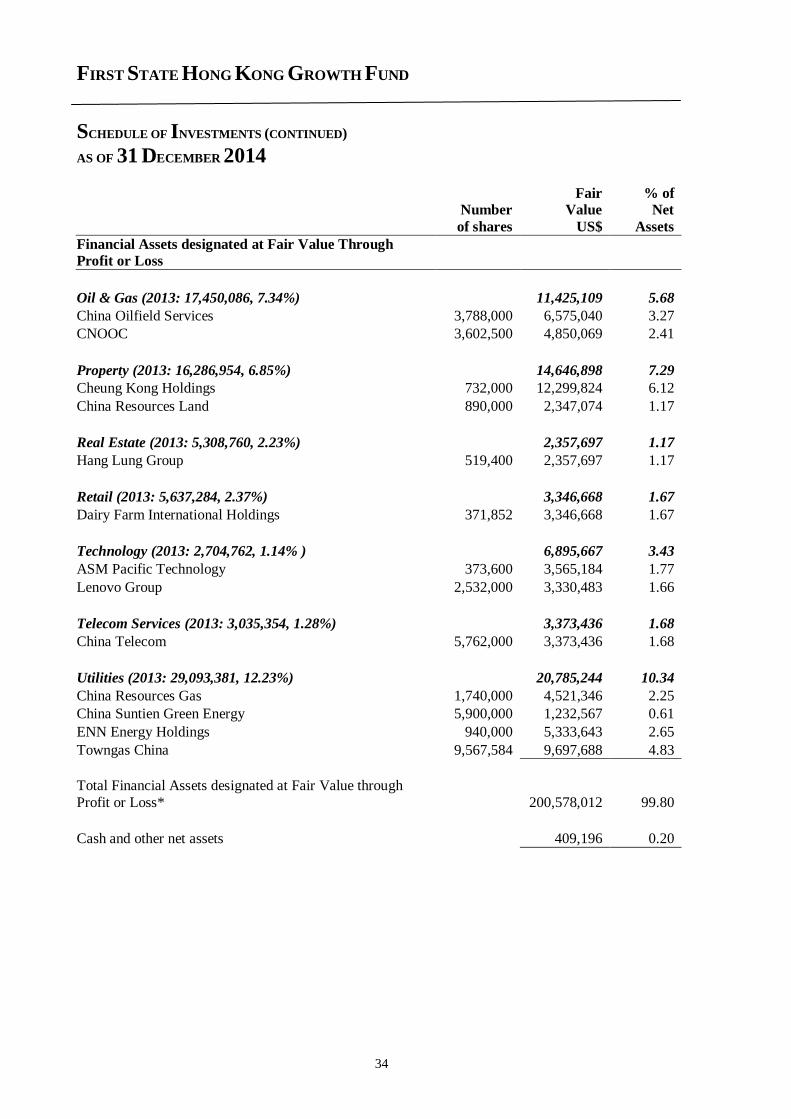
Oil & Gas (2013: 17,450,086, 7.34%) 11,425,109 5.68
China Oilfield Services 3,788,000 6,575,040 3.27
CNOOC 3,602,500 4,850,069 2.41
Property (2013: 16,286,954, 6.85%) 14,646,898 7.29
Cheung Kong Holdings 732,000 12,299,824 6.12
China Resources Land 890,000 2,347,074 1.17
Real Estate (2013: 5,308,760, 2.23%) 2,357,697 1.17
Hang Lung Group 519,400 2,357,697 1.17
Retail (2013: 5,637,284, 2.37%) 3,346,668 1.67
Dairy Farm International Holdings 371,852 3,346,668 1.67
Technology (2013: 2,704,762, 1.14% ) 6,895,667 3.43
ASM Pacific Technology 373,600 3,565,184 1.77
Lenovo Group 2,532,000 3,330,483 1.66
Telecom Services (2013: 3,035,354, 1.28%) 3,373,436 1.68
China Telecom 5,762,000 3,373,436 1.68
Utilities (2013: 29,093,381, 12.23%) 20,785,244 10.34
China Resources Gas 1,740,000 4,521,346 2.25
China Suntien Green Energy 5,900,000 1,232,567 0.61
ENN Energy Holdings 940,000 5,333,643 2.65
Towngas China 9,567,584 9,697,688 4.83
Total Financial Assets designated at Fair Value through
Profit or Loss*
200,578,012 99.80
Cash and other net assets 409,196 0.20
FIRST STATE HONG KONG GROWTH FUND
SCHEDULE OF INVESTMENTS (CONTINUED)
AS OF 31 DECEMBER 2014
35
Fair % of Number Value Net
of shares US$ Assets
Financial Assets designated at Fair Value Through
Profit or Loss
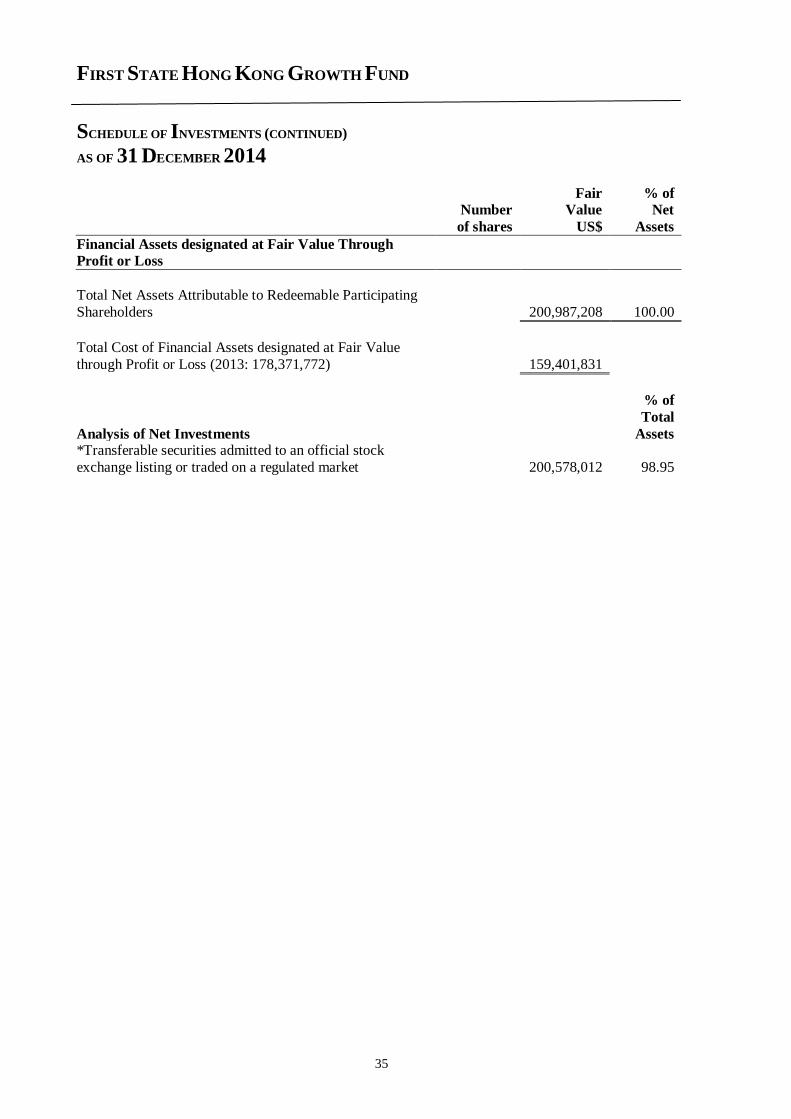
Total Net Assets Attributable to Redeemable Participating
Shareholders 200,987,208 100.00
Total Cost of Financial Assets designated at Fair Value
through Profit or Loss (2013: 178,371,772) 159,401,831
Analysis of Net Investments
% of
Total
Assets *Transferable securities admitted to an official stock
exchange listing or traded on a regulated market 200,578,012 98.95
FIRST STATE HONG KONG GROWTH FUND
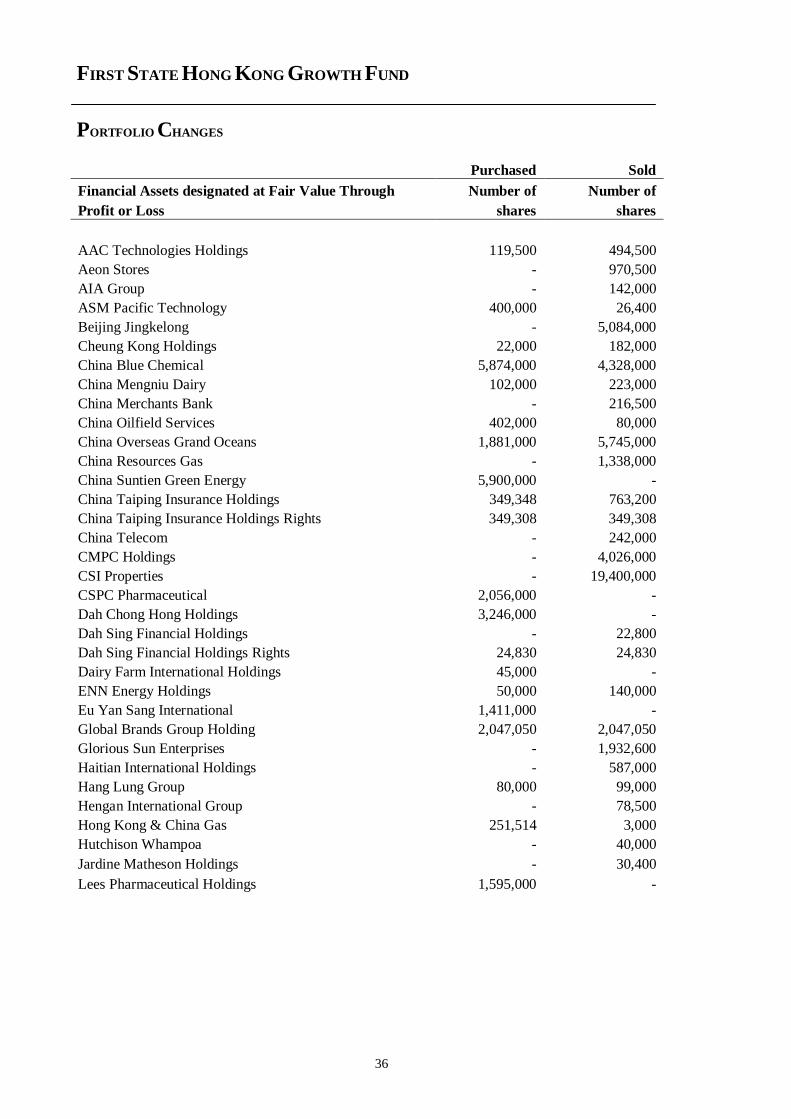
PORTFOLIO CHANGES
36
Purchased Sold
Financial Assets designated at Fair Value Through Number of Number of
Profit or Loss shares shares
AAC Technologies Holdings 119,500 494,500
Aeon Stores - 970,500
AIA Group - 142,000
ASM Pacific Technology 400,000 26,400
Beijing Jingkelong - 5,084,000
Cheung Kong Holdings 22,000 182,000
China Blue Chemical 5,874,000 4,328,000
China Mengniu Dairy 102,000 223,000
China Merchants Bank - 216,500
China Oilfield Services 402,000 80,000
China Overseas Grand Oceans 1,881,000 5,745,000
China Resources Gas - 1,338,000
China Suntien Green Energy 5,900,000 -
China Taiping Insurance Holdings 349,348 763,200
China Taiping Insurance Holdings Rights 349,308 349,308
China Telecom - 242,000
CMPC Holdings - 4,026,000
CSI Properties - 19,400,000
CSPC Pharmaceutical 2,056,000 -
Dah Chong Hong Holdings 3,246,000 -
Dah Sing Financial Holdings - 22,800
Dah Sing Financial Holdings Rights 24,830 24,830
Dairy Farm International Holdings 45,000 -
ENN Energy Holdings 50,000 140,000
Eu Yan Sang International 1,411,000 -
Global Brands Group Holding 2,047,050 2,047,050
Glorious Sun Enterprises - 1,932,600
Haitian International Holdings - 587,000
Hang Lung Group 80,000 99,000
Hengan International Group - 78,500
Hong Kong & China Gas 251,514 3,000
Hutchison Whampoa - 40,000
Jardine Matheson Holdings - 30,400
Lees Pharmaceutical Holdings 1,595,000 -
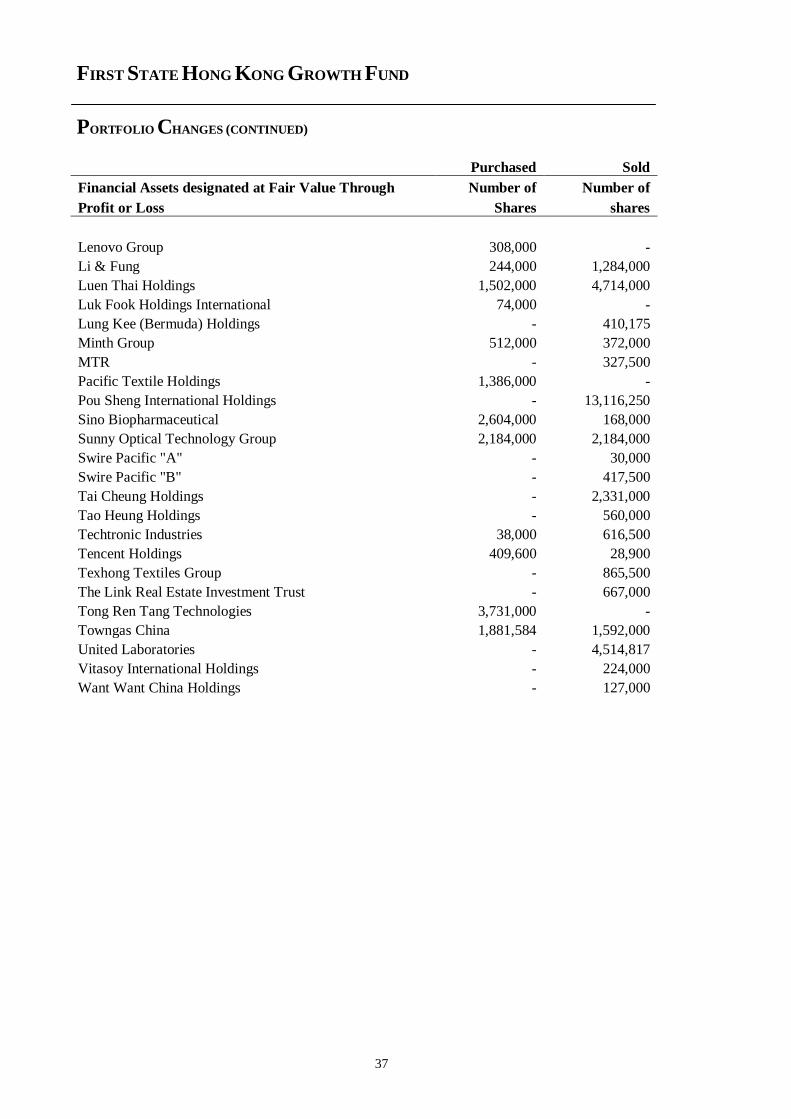
FIRST STATE HONG KONG GROWTH FUND
PORTFOLIO CHANGES (CONTINUED)
37
Purchased Sold
Financial Assets designated at Fair Value Through Number of Number of
Profit or Loss Shares shares
Lenovo Group 308,000 -
Li & Fung 244,000 1,284,000
Luen Thai Holdings 1,502,000 4,714,000
Luk Fook Holdings International 74,000 -
Lung Kee (Bermuda) Holdings - 410,175
Minth Group 512,000 372,000
MTR - 327,500
Pacific Textile Holdings 1,386,000 -
Pou Sheng International Holdings - 13,116,250
Sino Biopharmaceutical 2,604,000 168,000
Sunny Optical Technology Group 2,184,000 2,184,000
Swire Pacific "A" - 30,000
Swire Pacific "B" - 417,500
Tai Cheung Holdings - 2,331,000
Tao Heung Holdings - 560,000
Techtronic Industries 38,000 616,500
Tencent Holdings 409,600 28,900
Texhong Textiles Group - 865,500
The Link Real Estate Investment Trust - 667,000
Tong Ren Tang Technologies 3,731,000 -
Towngas China 1,881,584 1,592,000
United Laboratories - 4,514,817
Vitasoy International Holdings - 224,000
Want Want China Holdings - 127,000
FIRST STATE INDIAN SUBCONTINENT FUND
INVESTMENT MANAGER’S REPORT
38
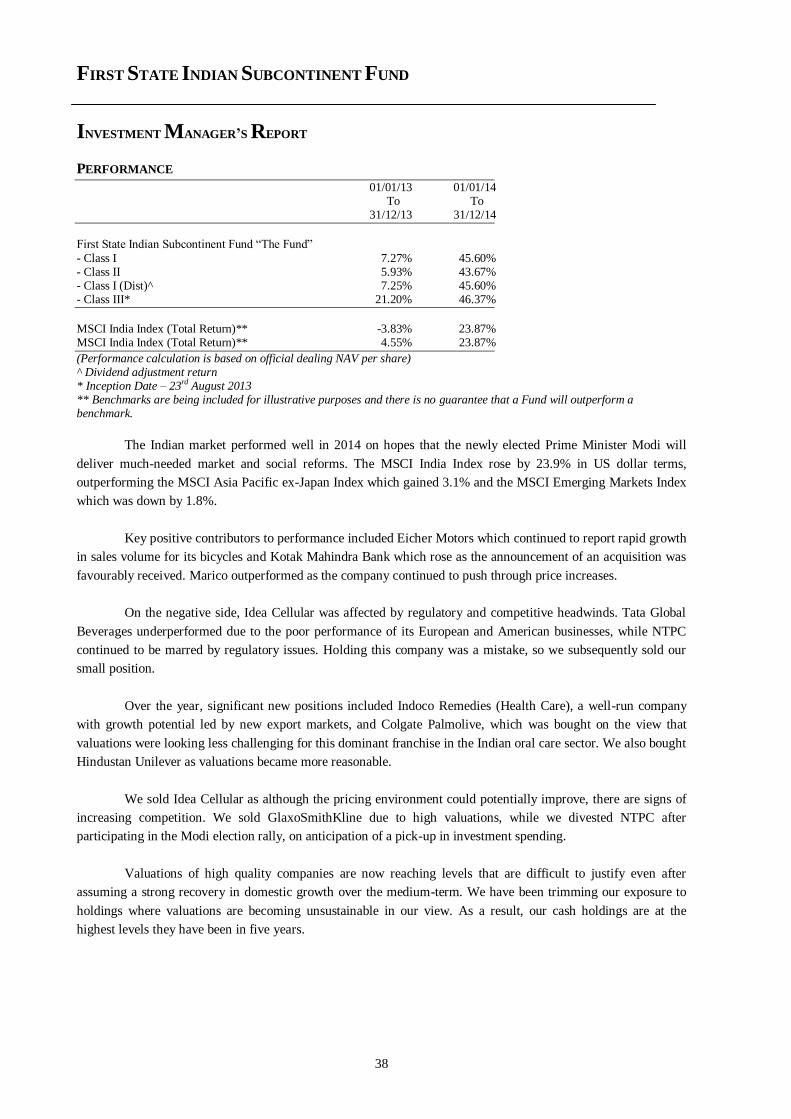
PERFORMANCE
01/01/13 01/01/14 To To 31/12/13 31/12/14
First State Indian Subcontinent Fund “The Fund”
- Class I 7.27% 45.60% - Class II 5.93% 43.67% - Class I (Dist)^ 7.25% 45.60% - Class III* 21.20% 46.37%
MSCI India Index (Total Return)** -3.83% 23.87% MSCI India Index (Total Return)** 4.55% 23.87%
(Performance calculation is based on official dealing NAV per share) ^ Dividend adjustment return * Inception Date – 23rd August 2013 ** Benchmarks are being included for illustrative purposes and there is no guarantee that a Fund will outperform a benchmark.
The Indian market performed well in 2014 on hopes that the newly elected Prime Minister Modi will
deliver much-needed market and social reforms. The MSCI India Index rose by 23.9% in US dollar terms,
outperforming the MSCI Asia Pacific ex-Japan Index which gained 3.1% and the MSCI Emerging Markets Index
which was down by 1.8%.
Key positive contributors to performance included Eicher Motors which continued to report rapid growth
in sales volume for its bicycles and Kotak Mahindra Bank which rose as the announcement of an acquisition was
favourably received. Marico outperformed as the company continued to push through price increases.
On the negative side, Idea Cellular was affected by regulatory and competitive headwinds. Tata Global
Beverages underperformed due to the poor performance of its European and American businesses, while NTPC
continued to be marred by regulatory issues. Holding this company was a mistake, so we subsequently sold our
small position.
Over the year, significant new positions included Indoco Remedies (Health Care), a well-run company
with growth potential led by new export markets, and Colgate Palmolive, which was bought on the view that
valuations were looking less challenging for this dominant franchise in the Indian oral care sector. We also bought
Hindustan Unilever as valuations became more reasonable.
We sold Idea Cellular as although the pricing environment could potentially improve, there are signs of
increasing competition. We sold GlaxoSmithKline due to high valuations, while we divested NTPC after
participating in the Modi election rally, on anticipation of a pick-up in investment spending.
Valuations of high quality companies are now reaching levels that are difficult to justify even after
assuming a strong recovery in domestic growth over the medium-term. We have been trimming our exposure to
holdings where valuations are becoming unsustainable in our view. As a result, our cash holdings are at the
highest levels they have been in five years.
FIRST STATE INDIAN SUBCONTINENT FUND
PERFORMANCE TABLE
AS OF 31 DECEMBER 2014
39
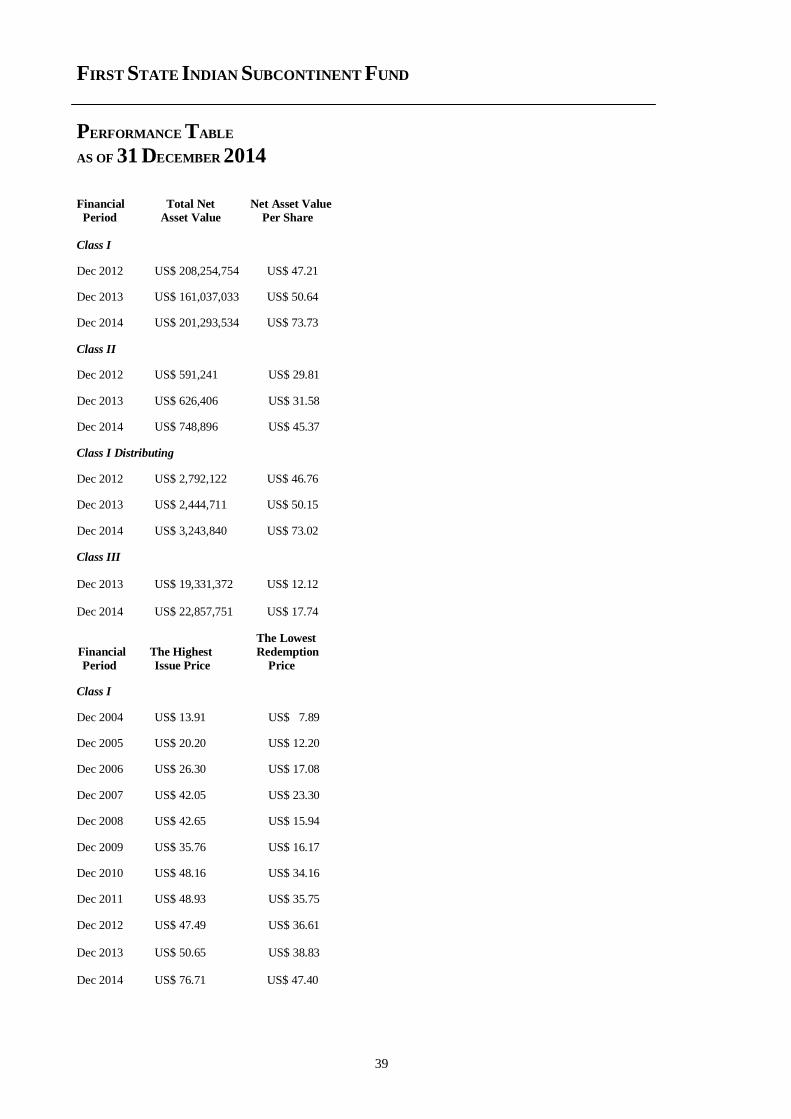
Financial Total Net Net Asset Value
Period Asset Value Per Share
Class I
Dec 2012 US$ 208,254,754 US$ 47.21
Dec 2013 US$ 161,037,033 US$ 50.64
Dec 2014 US$ 201,293,534 US$ 73.73
Class II
Dec 2012 US$ 591,241 US$ 29.81
Dec 2013 US$ 626,406 US$ 31.58
Dec 2014 US$ 748,896 US$ 45.37
Class I Distributing
Dec 2012 US$ 2,792,122 US$ 46.76
Dec 2013 US$ 2,444,711 US$ 50.15
Dec 2014 US$ 3,243,840 US$ 73.02
Class III
Dec 2013 US$ 19,331,372 US$ 12.12 Dec 2014 US$ 22,857,751 US$ 17.74
The Lowest
Financial The Highest Redemption
Period Issue Price Price
Class I
Dec 2004 US$ 13.91 US$ 7.89
Dec 2005 US$ 20.20 US$ 12.20
Dec 2006 US$ 26.30 US$ 17.08
Dec 2007 US$ 42.05 US$ 23.30
Dec 2008 US$ 42.65 US$ 15.94
Dec 2009 US$ 35.76 US$ 16.17
Dec 2010 US$ 48.16 US$ 34.16
Dec 2011 US$ 48.93 US$ 35.75
Dec 2012 US$ 47.49 US$ 36.61 Dec 2013 US$ 50.65 US$ 38.83 Dec 2014 US$ 76.71 US$ 47.40
FIRST STATE INDIAN SUBCONTINENT FUND
PERFORMANCE TABLE (CONTINUED)
AS OF 31 DECEMBER 2014
40
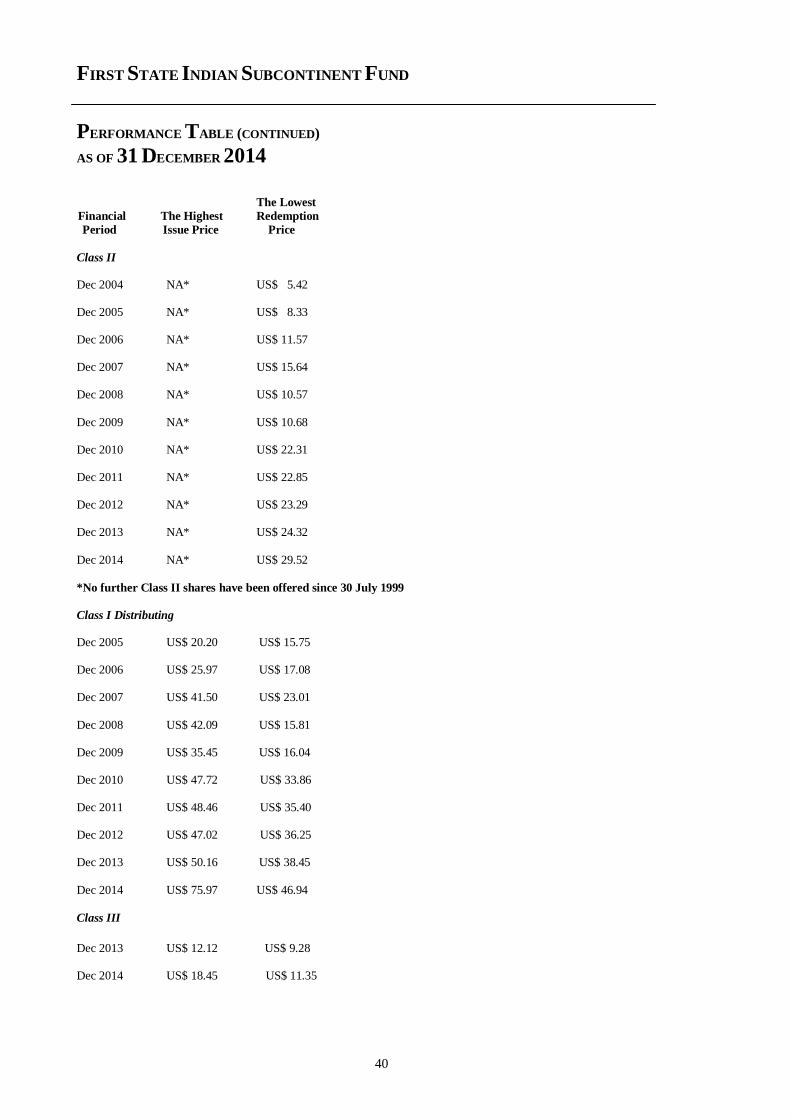
The Lowest
Financial The Highest Redemption
Period Issue Price Price
Class II Dec 2004 NA* US$ 5.42 Dec 2005 NA* US$ 8.33 Dec 2006 NA* US$ 11.57 Dec 2007 NA* US$ 15.64 Dec 2008 NA* US$ 10.57
Dec 2009 NA* US$ 10.68 Dec 2010 NA* US$ 22.31 Dec 2011 NA* US$ 22.85 Dec 2012 NA* US$ 23.29 Dec 2013 NA* US$ 24.32
Dec 2014 NA* US$ 29.52
*No further Class II shares have been offered since 30 July 1999
Class I Distributing Dec 2005 US$ 20.20 US$ 15.75 Dec 2006 US$ 25.97 US$ 17.08 Dec 2007 US$ 41.50 US$ 23.01
Dec 2008 US$ 42.09 US$ 15.81 Dec 2009 US$ 35.45 US$ 16.04 Dec 2010 US$ 47.72 US$ 33.86 Dec 2011 US$ 48.46 US$ 35.40 Dec 2012 US$ 47.02 US$ 36.25 Dec 2013 US$ 50.16 US$ 38.45
Dec 2014 US$ 75.97 US$ 46.94
Class III Dec 2013 US$ 12.12 US$ 9.28 Dec 2014 US$ 18.45 US$ 11.35
FIRST STATE INDIAN SUBCONTINENT FUND
SCHEDULE OF INVESTMENTS
AS OF 31 DECEMBER 2014
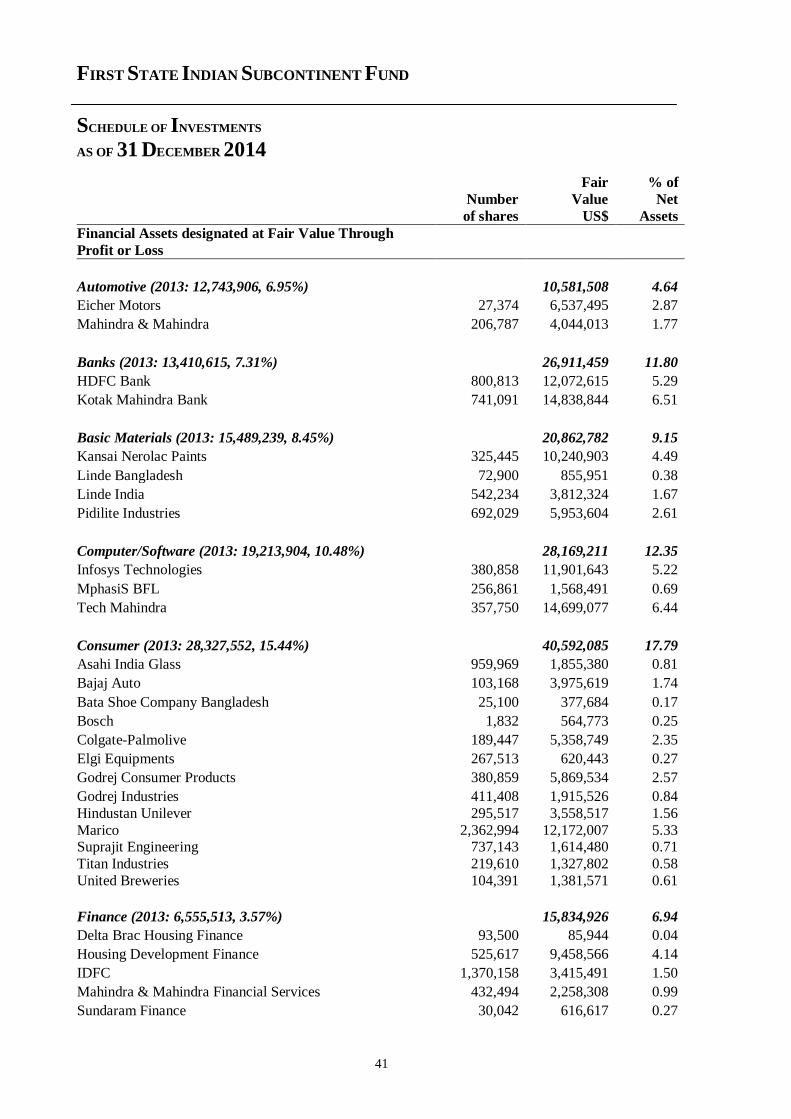
41
Fair % of
Number Value Net
of shares US$ Assets
Financial Assets designated at Fair Value Through
Profit or Loss
Automotive (2013: 12,743,906, 6.95%) 10,581,508 4.64
Eicher Motors 27,374 6,537,495 2.87
Mahindra & Mahindra 206,787 4,044,013 1.77
Banks (2013: 13,410,615, 7.31%) 26,911,459 11.80
HDFC Bank 800,813 12,072,615 5.29
Kotak Mahindra Bank 741,091 14,838,844 6.51
Basic Materials (2013: 15,489,239, 8.45%) 20,862,782 9.15
Kansai Nerolac Paints 325,445 10,240,903 4.49
Linde Bangladesh 72,900 855,951 0.38
Linde India 542,234 3,812,324 1.67
Pidilite Industries 692,029 5,953,604 2.61
Computer/Software (2013: 19,213,904, 10.48%) 28,169,211 12.35
Infosys Technologies 380,858 11,901,643 5.22
MphasiS BFL 256,861 1,568,491 0.69
Tech Mahindra 357,750 14,699,077 6.44
Consumer (2013: 28,327,552, 15.44%) 40,592,085 17.79
Asahi India Glass 959,969 1,855,380 0.81
Bajaj Auto 103,168 3,975,619 1.74
Bata Shoe Company Bangladesh 25,100 377,684 0.17
Bosch 1,832 564,773 0.25
Colgate-Palmolive 189,447 5,358,749 2.35
Elgi Equipments 267,513 620,443 0.27
Godrej Consumer Products 380,859 5,869,534 2.57
Godrej Industries 411,408 1,915,526 0.84
Hindustan Unilever 295,517 3,558,517 1.56
Marico 2,362,994 12,172,007 5.33 Suprajit Engineering 737,143 1,614,480 0.71
Titan Industries 219,610 1,327,802 0.58
United Breweries 104,391 1,381,571 0.61
Finance (2013: 6,555,513, 3.57%) 15,834,926 6.94
Delta Brac Housing Finance 93,500 85,944 0.04
Housing Development Finance 525,617 9,458,566 4.14
IDFC 1,370,158 3,415,491 1.50
Mahindra & Mahindra Financial Services 432,494 2,258,308 0.99
Sundaram Finance 30,042 616,617 0.27
FIRST STATE INDIAN SUBCONTINENT FUND
SCHEDULE OF INVESTMENTS (CONTINUED)
AS OF 31 DECEMBER 2014
42
Fair % of
Number Value Net
of shares US$ Assets
Financial Assets designated at Fair Value Through
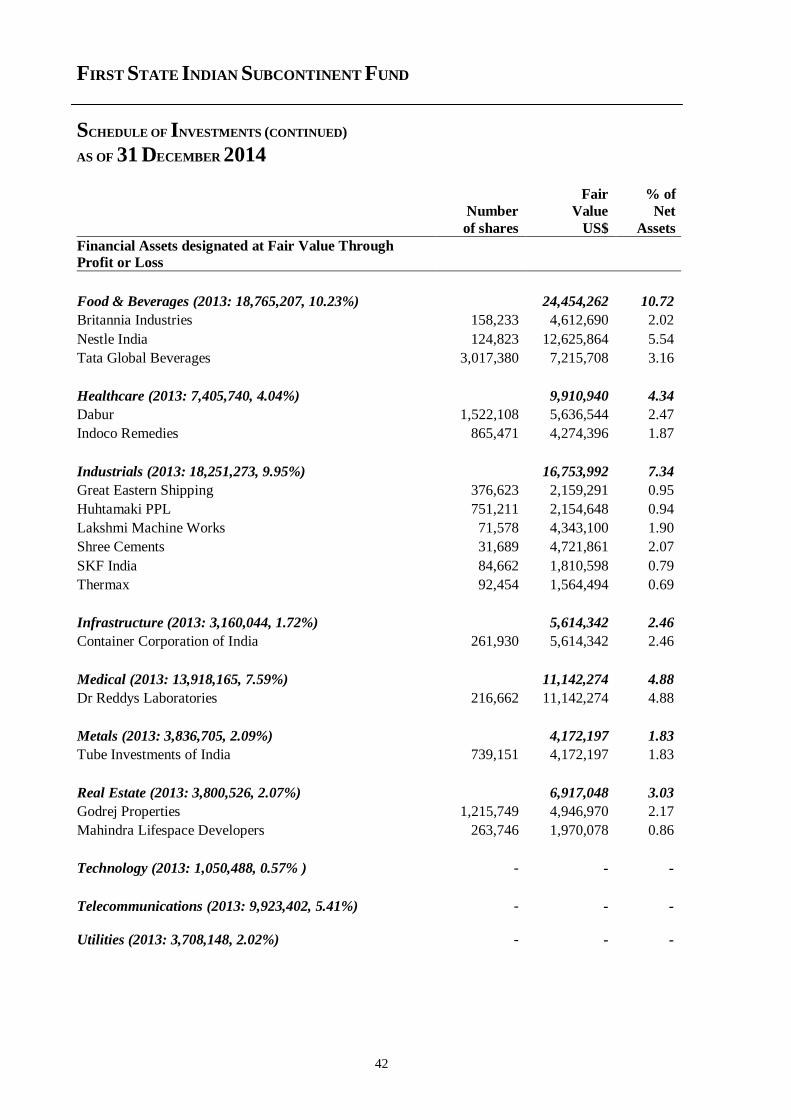
Profit or Loss
Food & Beverages (2013: 18,765,207, 10.23%) 24,454,262 10.72
Britannia Industries 158,233 4,612,690 2.02
Nestle India 124,823 12,625,864 5.54
Tata Global Beverages 3,017,380 7,215,708 3.16
Healthcare (2013: 7,405,740, 4.04%) 9,910,940 4.34
Dabur 1,522,108 5,636,544 2.47
Indoco Remedies 865,471 4,274,396 1.87
Industrials (2013: 18,251,273, 9.95%) 16,753,992 7.34
Great Eastern Shipping 376,623 2,159,291 0.95
Huhtamaki PPL 751,211 2,154,648 0.94
Lakshmi Machine Works 71,578 4,343,100 1.90
Shree Cements 31,689 4,721,861 2.07
SKF India 84,662 1,810,598 0.79
Thermax 92,454 1,564,494 0.69
Infrastructure (2013: 3,160,044, 1.72%) 5,614,342 2.46
Container Corporation of India 261,930 5,614,342 2.46
Medical (2013: 13,918,165, 7.59%) 11,142,274 4.88
Dr Reddys Laboratories 216,662 11,142,274 4.88
Metals (2013: 3,836,705, 2.09%) 4,172,197 1.83
Tube Investments of India 739,151 4,172,197 1.83
Real Estate (2013: 3,800,526, 2.07%) 6,917,048 3.03
Godrej Properties 1,215,749 4,946,970 2.17
Mahindra Lifespace Developers 263,746 1,970,078 0.86
Technology (2013: 1,050,488, 0.57% ) - - -
Telecommunications (2013: 9,923,402, 5.41%) - - -
Utilities (2013: 3,708,148, 2.02%) - - -
FIRST STATE INDIAN SUBCONTINENT FUND
SCHEDULE OF INVESTMENTS (CONTINUED)
AS OF 31 DECEMBER 2014
43
Fair % of
Value Net
US$ Assets
Financial Assets designated at Fair Value Through
Profit or Loss
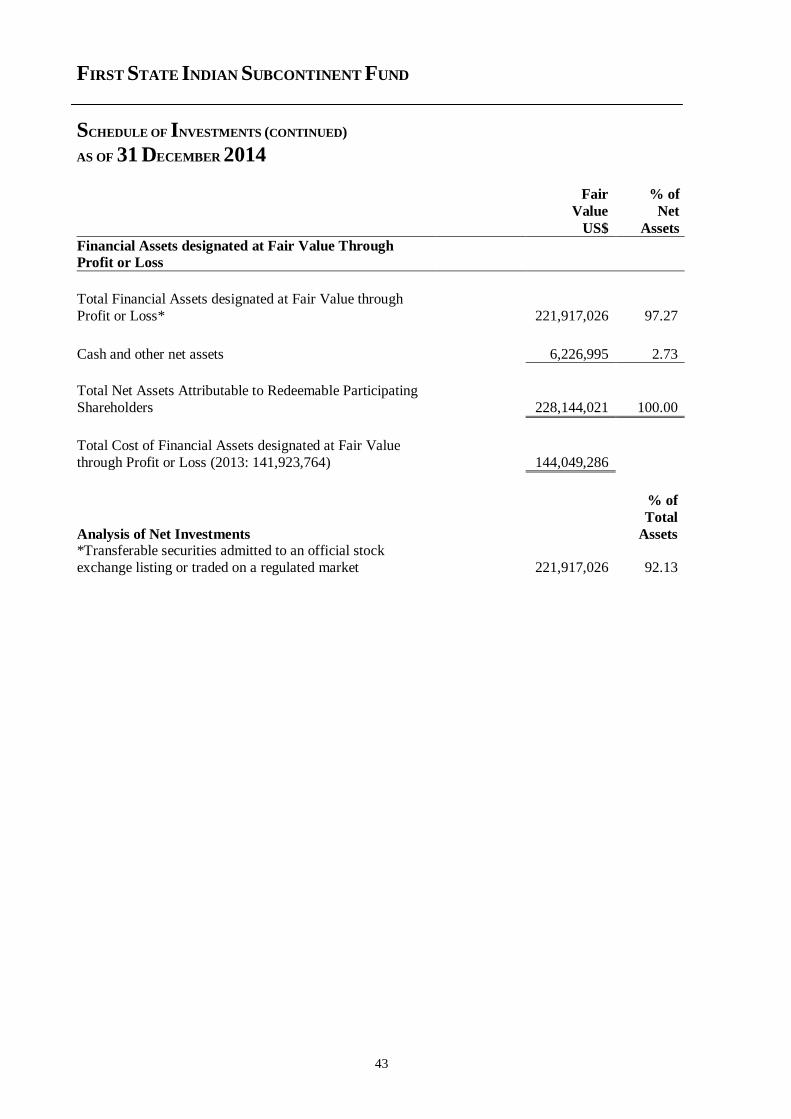
Total Financial Assets designated at Fair Value through
Profit or Loss* 221,917,026 97.27
Cash and other net assets 6,226,995 2.73
Total Net Assets Attributable to Redeemable Participating
Shareholders 228,144,021 100.00
Total Cost of Financial Assets designated at Fair Value
through Profit or Loss (2013: 141,923,764) 144,049,286
Analysis of Net Investments
% of
Total
Assets *Transferable securities admitted to an official stock
exchange listing or traded on a regulated market 221,917,026 92.13
FIRST STATE INDIAN SUBCONTINENT FUND
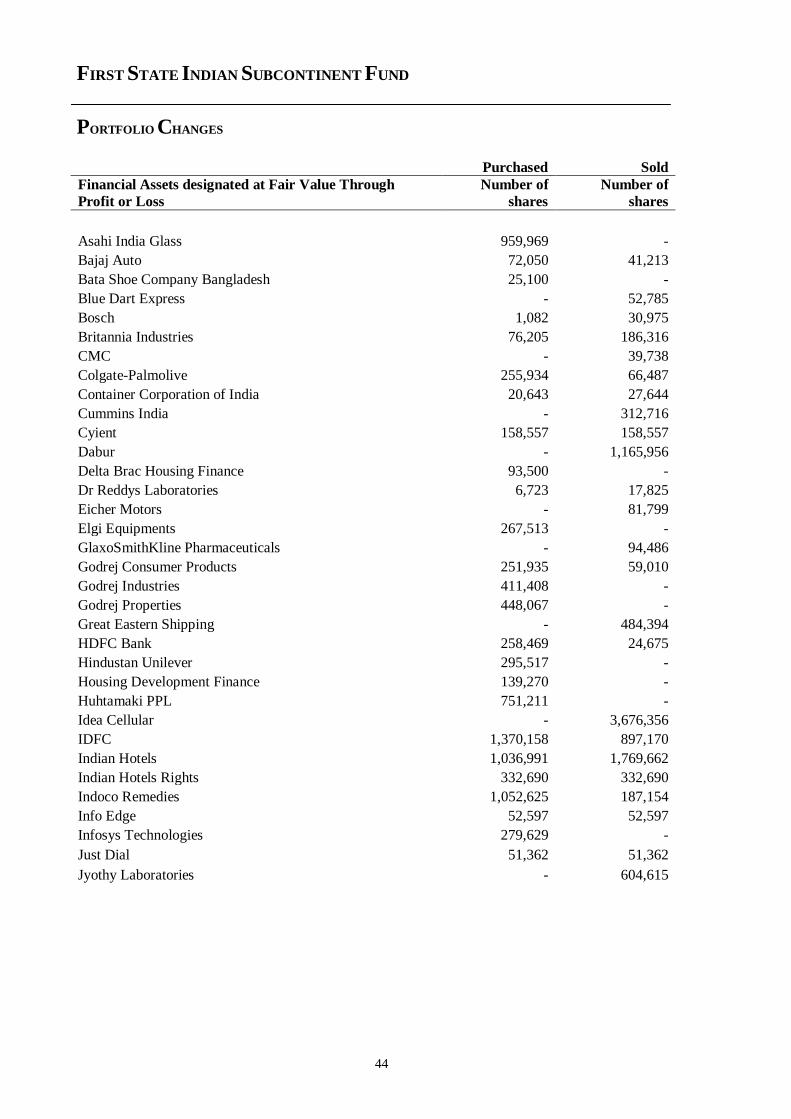
PORTFOLIO CHANGES
44
Purchased Sold
Financial Assets designated at Fair Value Through
Profit or Loss
Number of
shares
Number of
shares
Asahi India Glass 959,969 -
Bajaj Auto 72,050 41,213
Bata Shoe Company Bangladesh 25,100 -
Blue Dart Express - 52,785
Bosch 1,082 30,975
Britannia Industries 76,205 186,316
CMC - 39,738
Colgate-Palmolive 255,934 66,487
Container Corporation of India 20,643 27,644
Cummins India - 312,716
Cyient 158,557 158,557
Dabur - 1,165,956
Delta Brac Housing Finance 93,500 -
Dr Reddys Laboratories 6,723 17,825
Eicher Motors - 81,799
Elgi Equipments 267,513 -
GlaxoSmithKline Pharmaceuticals - 94,486
Godrej Consumer Products 251,935 59,010
Godrej Industries 411,408 -
Godrej Properties 448,067 -
Great Eastern Shipping - 484,394
HDFC Bank 258,469 24,675
Hindustan Unilever 295,517 -
Housing Development Finance 139,270 -
Huhtamaki PPL 751,211 -
Idea Cellular - 3,676,356
IDFC 1,370,158 897,170
Indian Hotels 1,036,991 1,769,662
Indian Hotels Rights 332,690 332,690
Indoco Remedies 1,052,625 187,154
Info Edge 52,597 52,597
Infosys Technologies 279,629 -
Just Dial 51,362 51,362
Jyothy Laboratories - 604,615
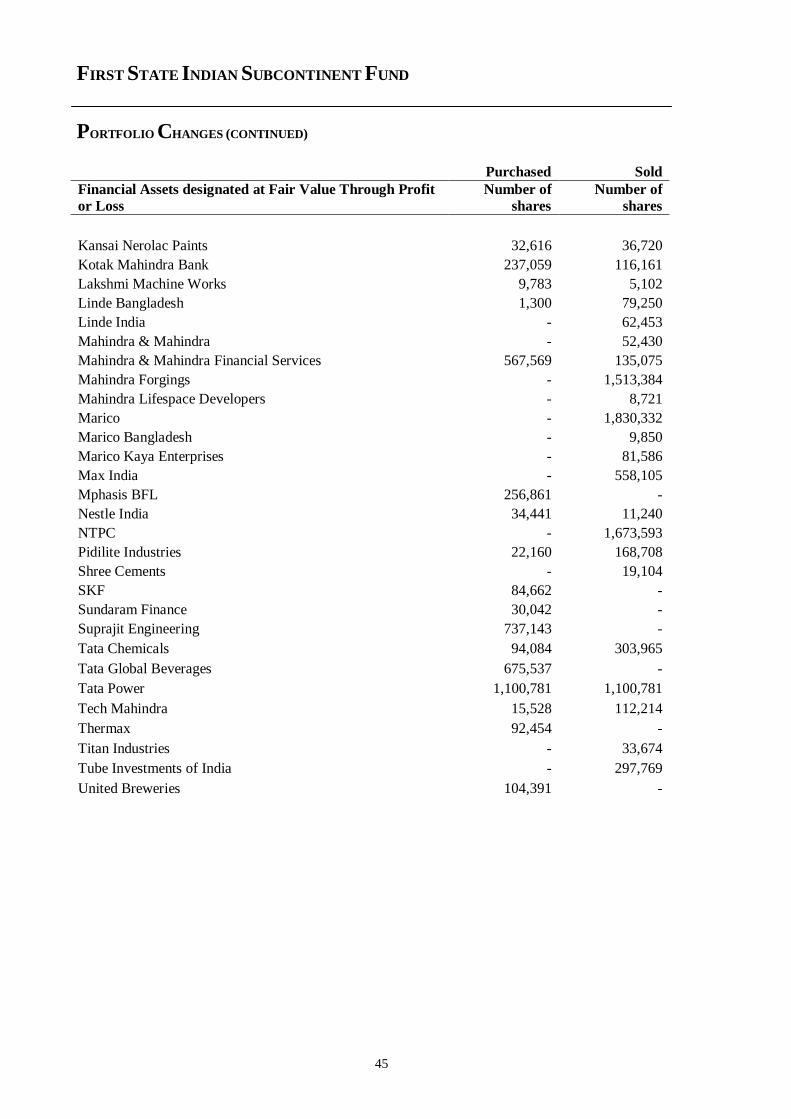
FIRST STATE INDIAN SUBCONTINENT FUND
PORTFOLIO CHANGES (CONTINUED)
45
Purchased Sold
Financial Assets designated at Fair Value Through Profit
or Loss
Number of
shares
Number of
shares
Kansai Nerolac Paints 32,616 36,720
Kotak Mahindra Bank 237,059 116,161
Lakshmi Machine Works 9,783 5,102
Linde Bangladesh 1,300 79,250
Linde India - 62,453
Mahindra & Mahindra - 52,430
Mahindra & Mahindra Financial Services 567,569 135,075
Mahindra Forgings - 1,513,384
Mahindra Lifespace Developers - 8,721
Marico - 1,830,332
Marico Bangladesh - 9,850
Marico Kaya Enterprises - 81,586
Max India - 558,105
Mphasis BFL 256,861 -
Nestle India 34,441 11,240
NTPC - 1,673,593
Pidilite Industries 22,160 168,708
Shree Cements - 19,104
SKF 84,662 -
Sundaram Finance 30,042 -
Suprajit Engineering 737,143 -
Tata Chemicals 94,084 303,965
Tata Global Beverages 675,537 -
Tata Power 1,100,781 1,100,781
Tech Mahindra 15,528 112,214
Thermax 92,454 -
Titan Industries - 33,674
Tube Investments of India - 297,769
United Breweries 104,391 -
FIRST STATE GLOBAL BOND FUND
INVESTMENT MANAGER’S REPORT
46
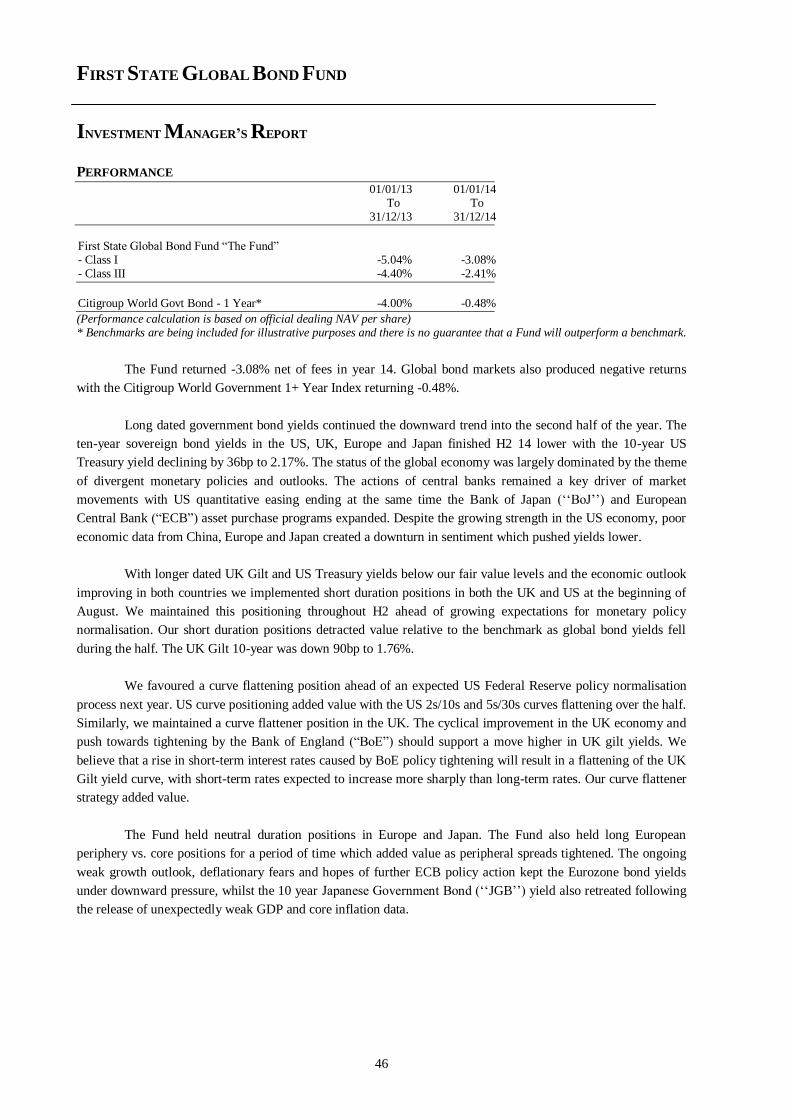
PERFORMANCE
01/01/13 01/01/14 To To 31/12/13 31/12/14
First State Global Bond Fund “The Fund” - Class I -5.04% -3.08% - Class III -4.40% -2.41%
Citigroup World Govt Bond - 1 Year* -4.00% -0.48%
(Performance calculation is based on official dealing NAV per share) * Benchmarks are being included for illustrative purposes and there is no guarantee that a Fund will outperform a benchmark.
The Fund returned -3.08% net of fees in year 14. Global bond markets also produced negative returns
with the Citigroup World Government 1+ Year Index returning -0.48%.
Long dated government bond yields continued the downward trend into the second half of the year. The
ten-year sovereign bond yields in the US, UK, Europe and Japan finished H2 14 lower with the 10-year US
Treasury yield declining by 36bp to 2.17%. The status of the global economy was largely dominated by the theme
of divergent monetary policies and outlooks. The actions of central banks remained a key driver of market
movements with US quantitative easing ending at the same time the Bank of Japan (‘‘BoJ’’) and European
Central Bank (“ECB”) asset purchase programs expanded. Despite the growing strength in the US economy, poor
economic data from China, Europe and Japan created a downturn in sentiment which pushed yields lower.
With longer dated UK Gilt and US Treasury yields below our fair value levels and the economic outlook
improving in both countries we implemented short duration positions in both the UK and US at the beginning of
August. We maintained this positioning throughout H2 ahead of growing expectations for monetary policy
normalisation. Our short duration positions detracted value relative to the benchmark as global bond yields fell
during the half. The UK Gilt 10-year was down 90bp to 1.76%.
We favoured a curve flattening position ahead of an expected US Federal Reserve policy normalisation
process next year. US curve positioning added value with the US 2s/10s and 5s/30s curves flattening over the half.
Similarly, we maintained a curve flattener position in the UK. The cyclical improvement in the UK economy and
push towards tightening by the Bank of England (“BoE”) should support a move higher in UK gilt yields. We
believe that a rise in short-term interest rates caused by BoE policy tightening will result in a flattening of the UK
Gilt yield curve, with short-term rates expected to increase more sharply than long-term rates. Our curve flattener
strategy added value.
The Fund held neutral duration positions in Europe and Japan. The Fund also held long European
periphery vs. core positions for a period of time which added value as peripheral spreads tightened. The ongoing
weak growth outlook, deflationary fears and hopes of further ECB policy action kept the Eurozone bond yields
under downward pressure, whilst the 10 year Japanese Government Bond (‘‘JGB’’) yield also retreated following
the release of unexpectedly weak GDP and core inflation data.
FIRST STATE GLOBAL BOND FUND
PERFORMANCE TABLE
AS OF 31 DECEMBER 2014
47
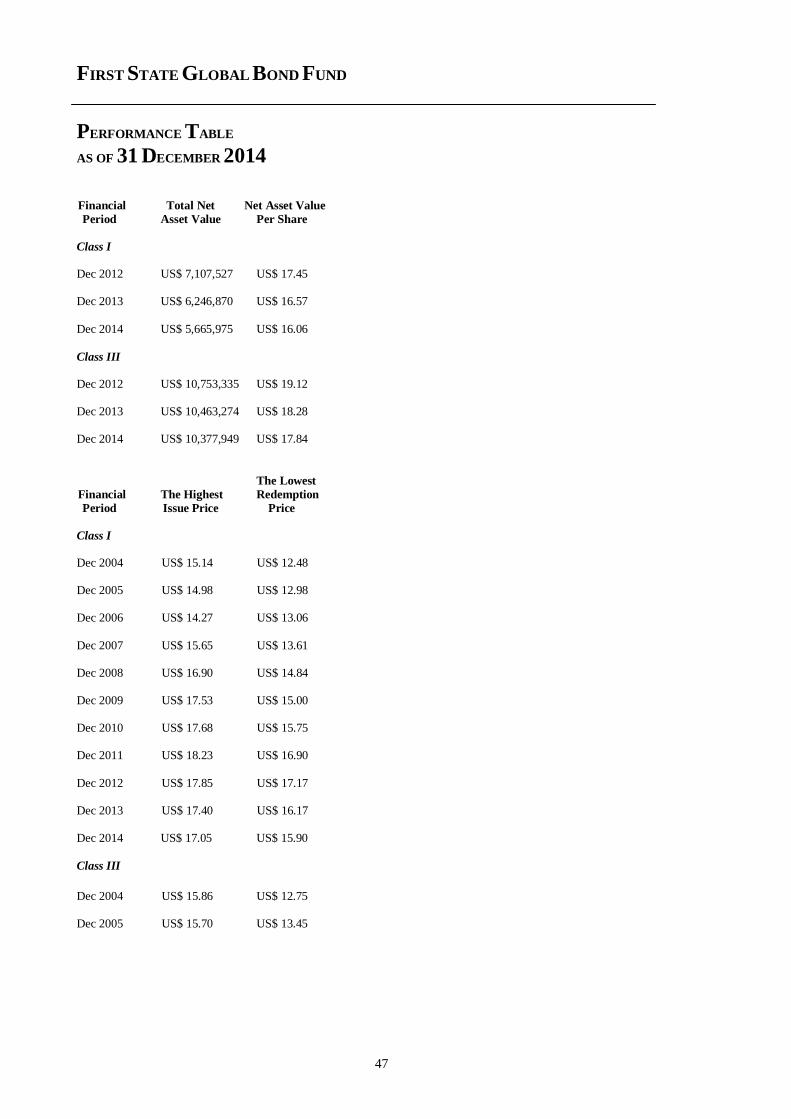
Financial Total Net Net Asset Value
Period Asset Value Per Share
Class I Dec 2012 US$ 7,107,527 US$ 17.45 Dec 2013 US$ 6,246,870 US$ 16.57
Dec 2014 US$ 5,665,975 US$ 16.06
Class III Dec 2012 US$ 10,753,335 US$ 19.12 Dec 2013 US$ 10,463,274 US$ 18.28 Dec 2014 US$ 10,377,949 US$ 17.84
The Lowest
Financial The Highest Redemption
Period Issue Price Price
Class I Dec 2004 US$ 15.14 US$ 12.48 Dec 2005 US$ 14.98 US$ 12.98 Dec 2006 US$ 14.27 US$ 13.06
Dec 2007 US$ 15.65 US$ 13.61 Dec 2008 US$ 16.90 US$ 14.84 Dec 2009 US$ 17.53 US$ 15.00
Dec 2010 US$ 17.68 US$ 15.75 Dec 2011 US$ 18.23 US$ 16.90
Dec 2012 US$ 17.85 US$ 17.17 Dec 2013 US$ 17.40 US$ 16.17 Dec 2014 US$ 17.05 US$ 15.90
Class III
Dec 2004 US$ 15.86 US$ 12.75 Dec 2005 US$ 15.70 US$ 13.45
FIRST STATE GLOBAL BOND FUND
PERFORMANCE TABLE (CONTINUED)
AS OF 31 DECEMBER 2014
48
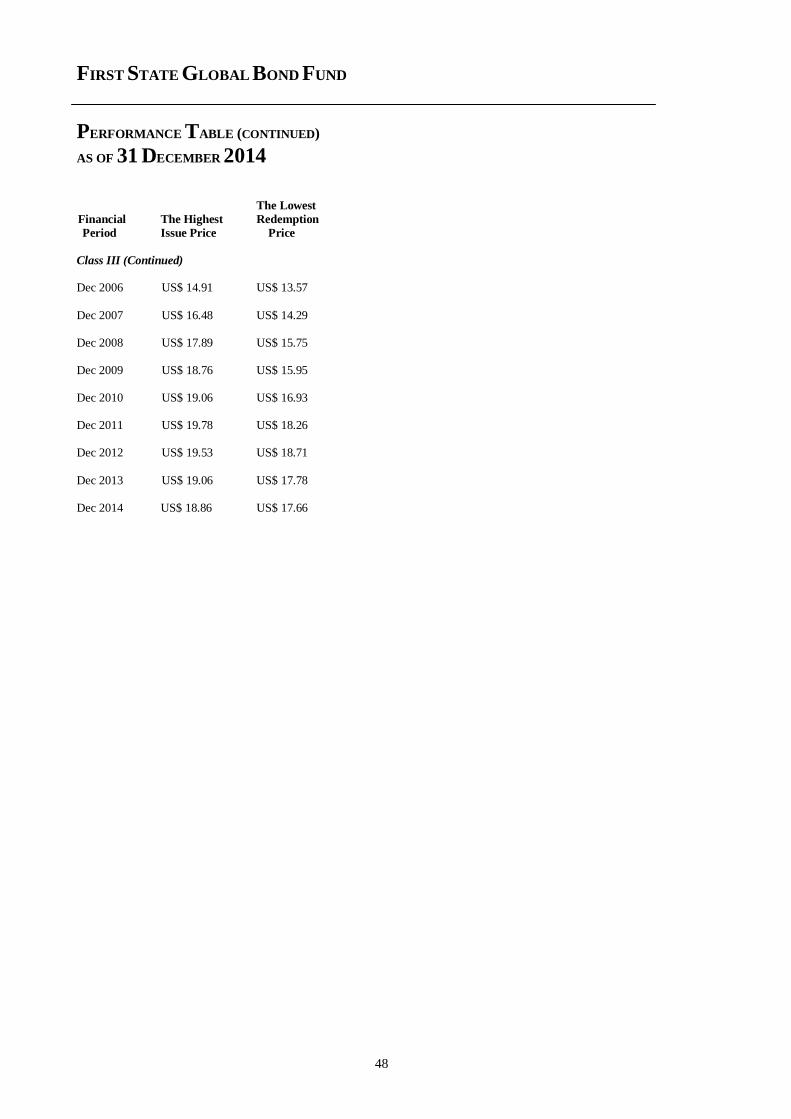
The Lowest Financial The Highest Redemption
Period Issue Price Price
Class III (Continued) Dec 2006 US$ 14.91 US$ 13.57
Dec 2007 US$ 16.48 US$ 14.29 Dec 2008 US$ 17.89 US$ 15.75 Dec 2009 US$ 18.76 US$ 15.95 Dec 2010 US$ 19.06 US$ 16.93 Dec 2011 US$ 19.78 US$ 18.26 Dec 2012 US$ 19.53 US$ 18.71
Dec 2013 US$ 19.06 US$ 17.78 Dec 2014 US$ 18.86 US$ 17.66
FIRST STATE GLOBAL BOND FUND
SCHEDULE OF INVESTMENTS
AS OF 31 DECEMBER 2014
49
Fair % of
Number Value Net
of shares US$ Assets
Financial Assets designated at Fair Value Through
Profit or Loss
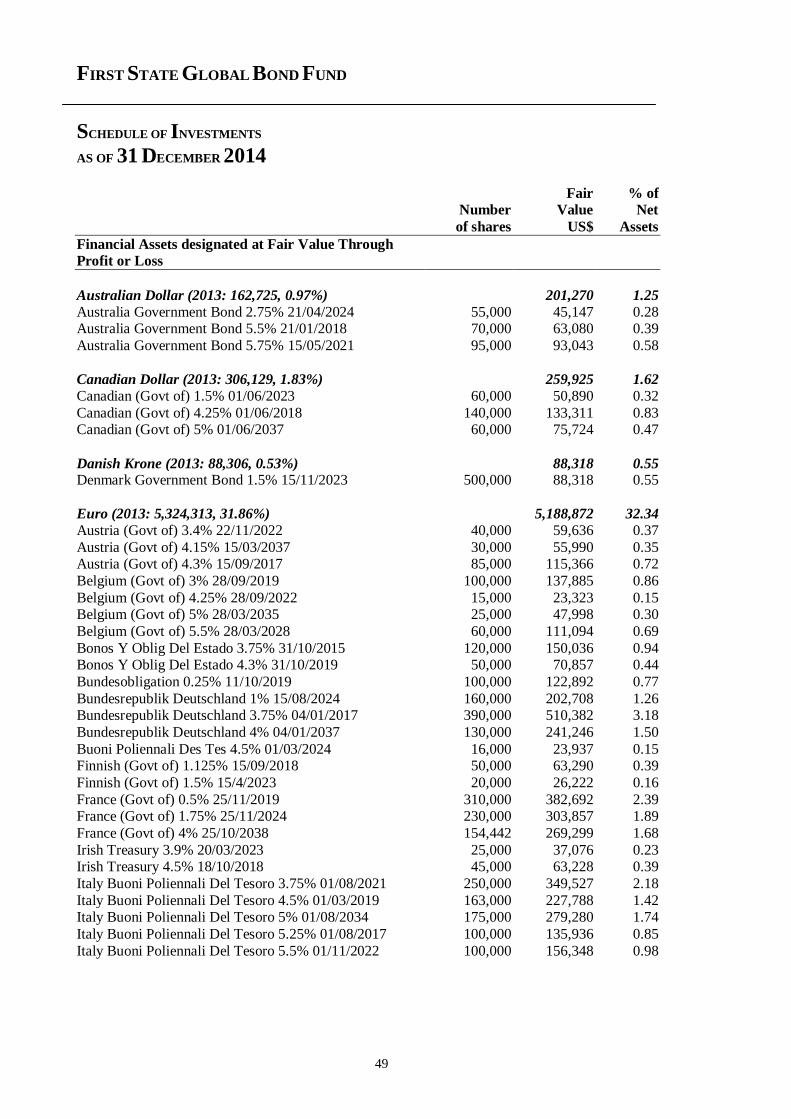
Australian Dollar (2013: 162,725, 0.97%) 201,270 1.25
Australia Government Bond 2.75% 21/04/2024 55,000 45,147 0.28 Australia Government Bond 5.5% 21/01/2018 70,000 63,080 0.39
Australia Government Bond 5.75% 15/05/2021 95,000 93,043 0.58
Canadian Dollar (2013: 306,129, 1.83%) 259,925 1.62
Canadian (Govt of) 1.5% 01/06/2023 60,000 50,890 0.32
Canadian (Govt of) 4.25% 01/06/2018 140,000 133,311 0.83 Canadian (Govt of) 5% 01/06/2037 60,000 75,724 0.47
Danish Krone (2013: 88,306, 0.53%) 88,318 0.55 Denmark Government Bond 1.5% 15/11/2023 500,000 88,318 0.55
Euro (2013: 5,324,313, 31.86%) 5,188,872 32.34
Austria (Govt of) 3.4% 22/11/2022 40,000 59,636 0.37
Austria (Govt of) 4.15% 15/03/2037 30,000 55,990 0.35 Austria (Govt of) 4.3% 15/09/2017 85,000 115,366 0.72
Belgium (Govt of) 3% 28/09/2019 100,000 137,885 0.86
Belgium (Govt of) 4.25% 28/09/2022 15,000 23,323 0.15 Belgium (Govt of) 5% 28/03/2035 25,000 47,998 0.30
Belgium (Govt of) 5.5% 28/03/2028 60,000 111,094 0.69
Bonos Y Oblig Del Estado 3.75% 31/10/2015 120,000 150,036 0.94 Bonos Y Oblig Del Estado 4.3% 31/10/2019 50,000 70,857 0.44
Bundesobligation 0.25% 11/10/2019 100,000 122,892 0.77
Bundesrepublik Deutschland 1% 15/08/2024 160,000 202,708 1.26 Bundesrepublik Deutschland 3.75% 04/01/2017 390,000 510,382 3.18
Bundesrepublik Deutschland 4% 04/01/2037 130,000 241,246 1.50
Buoni Poliennali Des Tes 4.5% 01/03/2024 16,000 23,937 0.15 Finnish (Govt of) 1.125% 15/09/2018 50,000 63,290 0.39
Finnish (Govt of) 1.5% 15/4/2023 20,000 26,222 0.16
France (Govt of) 0.5% 25/11/2019 310,000 382,692 2.39 France (Govt of) 1.75% 25/11/2024 230,000 303,857 1.89
France (Govt of) 4% 25/10/2038 154,442 269,299 1.68
Irish Treasury 3.9% 20/03/2023 25,000 37,076 0.23 Irish Treasury 4.5% 18/10/2018 45,000 63,228 0.39
Italy Buoni Poliennali Del Tesoro 3.75% 01/08/2021 250,000 349,527 2.18
Italy Buoni Poliennali Del Tesoro 4.5% 01/03/2019 163,000 227,788 1.42 Italy Buoni Poliennali Del Tesoro 5% 01/08/2034 175,000 279,280 1.74
Italy Buoni Poliennali Del Tesoro 5.25% 01/08/2017 100,000 135,936 0.85
Italy Buoni Poliennali Del Tesoro 5.5% 01/11/2022 100,000 156,348 0.98
FIRST STATE GLOBAL BOND FUND
SCHEDULE OF INVESTMENTS (CONTINUED)
AS OF 31 DECEMBER 2014
50
Fair % of
Number Value Net
of shares US$ Assets
Financial Assets designated at Fair Value Through
Profit or Loss
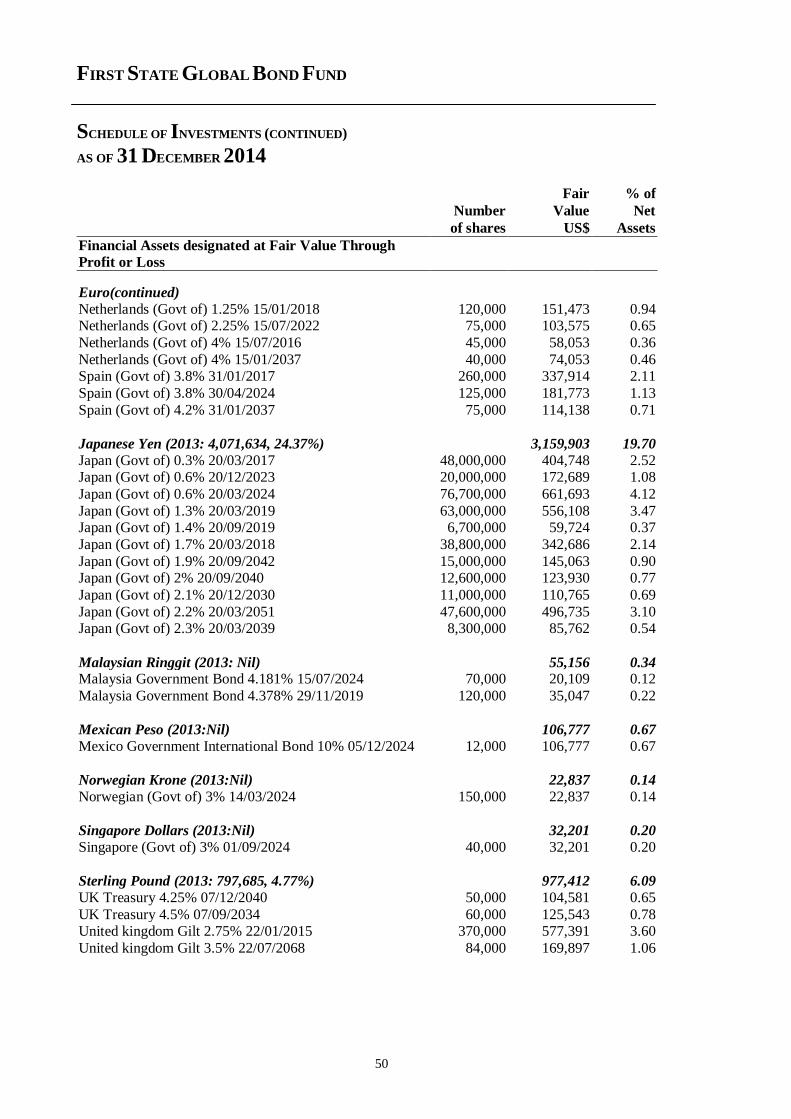
Euro(continued)
Netherlands (Govt of) 1.25% 15/01/2018 120,000 151,473 0.94 Netherlands (Govt of) 2.25% 15/07/2022 75,000 103,575 0.65
Netherlands (Govt of) 4% 15/07/2016 45,000 58,053 0.36
Netherlands (Govt of) 4% 15/01/2037 40,000 74,053 0.46 Spain (Govt of) 3.8% 31/01/2017 260,000 337,914 2.11
Spain (Govt of) 3.8% 30/04/2024 125,000 181,773 1.13
Spain (Govt of) 4.2% 31/01/2037 75,000 114,138 0.71
Japanese Yen (2013: 4,071,634, 24.37%) 3,159,903 19.70
Japan (Govt of) 0.3% 20/03/2017 48,000,000 404,748 2.52 Japan (Govt of) 0.6% 20/12/2023 20,000,000 172,689 1.08
Japan (Govt of) 0.6% 20/03/2024 76,700,000 661,693 4.12
Japan (Govt of) 1.3% 20/03/2019 63,000,000 556,108 3.47 Japan (Govt of) 1.4% 20/09/2019 6,700,000 59,724 0.37
Japan (Govt of) 1.7% 20/03/2018 38,800,000 342,686 2.14
Japan (Govt of) 1.9% 20/09/2042 15,000,000 145,063 0.90 Japan (Govt of) 2% 20/09/2040 12,600,000 123,930 0.77
Japan (Govt of) 2.1% 20/12/2030 11,000,000 110,765 0.69
Japan (Govt of) 2.2% 20/03/2051 47,600,000 496,735 3.10 Japan (Govt of) 2.3% 20/03/2039 8,300,000 85,762 0.54
Malaysian Ringgit (2013: Nil) 55,156 0.34 Malaysia Government Bond 4.181% 15/07/2024 70,000 20,109 0.12
Malaysia Government Bond 4.378% 29/11/2019 120,000 35,047 0.22
Mexican Peso (2013:Nil) 106,777 0.67
Mexico Government International Bond 10% 05/12/2024 12,000 106,777 0.67
Norwegian Krone (2013:Nil) 22,837 0.14
Norwegian (Govt of) 3% 14/03/2024 150,000 22,837 0.14
Singapore Dollars (2013:Nil) 32,201 0.20
Singapore (Govt of) 3% 01/09/2024 40,000 32,201 0.20
Sterling Pound (2013: 797,685, 4.77%) 977,412 6.09
UK Treasury 4.25% 07/12/2040 50,000 104,581 0.65
UK Treasury 4.5% 07/09/2034 60,000 125,543 0.78 United kingdom Gilt 2.75% 22/01/2015 370,000 577,391 3.60
United kingdom Gilt 3.5% 22/07/2068 84,000 169,897 1.06
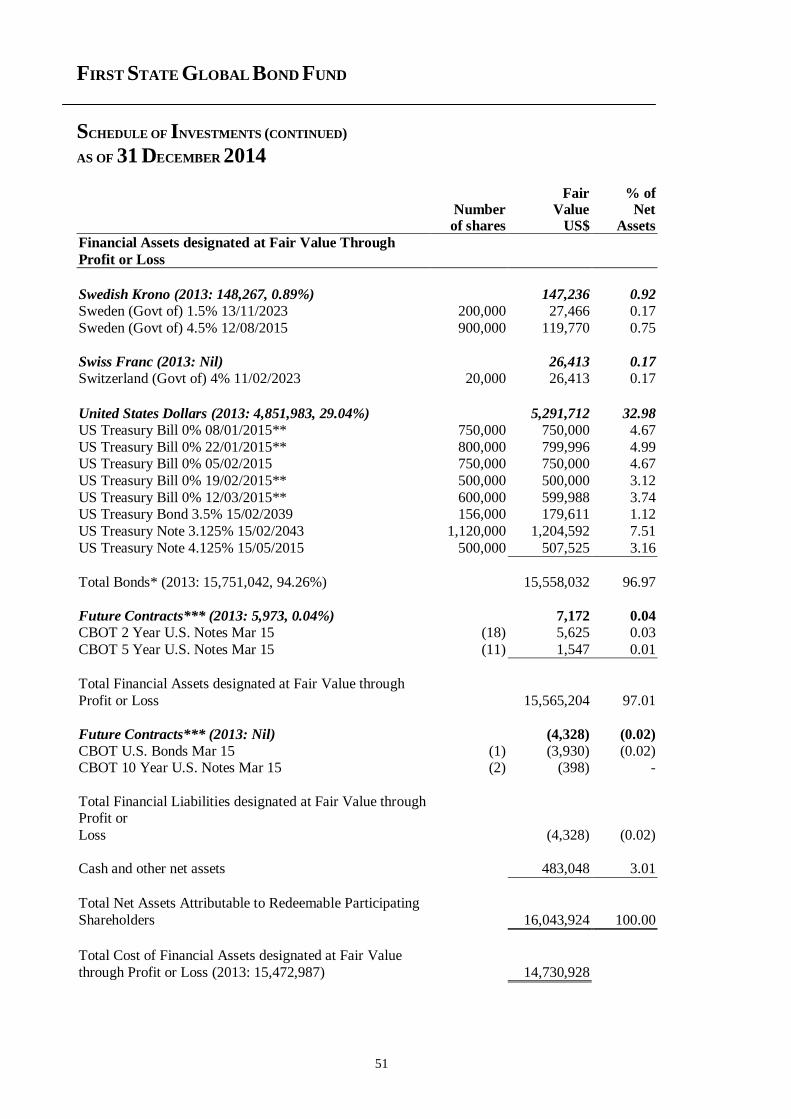
FIRST STATE GLOBAL BOND FUND
SCHEDULE OF INVESTMENTS (CONTINUED)
AS OF 31 DECEMBER 2014
51
Fair % of Number Value Net
of shares US$ Assets
Financial Assets designated at Fair Value Through
Profit or Loss
Swedish Krono (2013: 148,267, 0.89%) 147,236 0.92
Sweden (Govt of) 1.5% 13/11/2023 200,000 27,466 0.17
Sweden (Govt of) 4.5% 12/08/2015 900,000 119,770 0.75
Swiss Franc (2013: Nil) 26,413 0.17
Switzerland (Govt of) 4% 11/02/2023 20,000 26,413 0.17
United States Dollars (2013: 4,851,983, 29.04%) 5,291,712 32.98
US Treasury Bill 0% 08/01/2015** 750,000 750,000 4.67
US Treasury Bill 0% 22/01/2015** 800,000 799,996 4.99 US Treasury Bill 0% 05/02/2015 750,000 750,000 4.67
US Treasury Bill 0% 19/02/2015** 500,000 500,000 3.12
US Treasury Bill 0% 12/03/2015** 600,000 599,988 3.74 US Treasury Bond 3.5% 15/02/2039 156,000 179,611 1.12
US Treasury Note 3.125% 15/02/2043 1,120,000 1,204,592 7.51
US Treasury Note 4.125% 15/05/2015 500,000 507,525 3.16
Total Bonds* (2013: 15,751,042, 94.26%) 15,558,032 96.97
Future Contracts*** (2013: 5,973, 0.04%) 7,172 0.04
CBOT 2 Year U.S. Notes Mar 15 (18) 5,625 0.03
CBOT 5 Year U.S. Notes Mar 15 (11) 1,547 0.01
Total Financial Assets designated at Fair Value through
Profit or Loss 15,565,204 97.01
Future Contracts*** (2013: Nil) (4,328) (0.02)
CBOT U.S. Bonds Mar 15 (1) (3,930) (0.02) CBOT 10 Year U.S. Notes Mar 15 (2) (398) -
Total Financial Liabilities designated at Fair Value through Profit or
Loss (4,328) (0.02)
Cash and other net assets 483,048 3.01
Total Net Assets Attributable to Redeemable Participating
Shareholders 16,043,924 100.00
Total Cost of Financial Assets designated at Fair Value
through Profit or Loss (2013: 15,472,987) 14,730,928
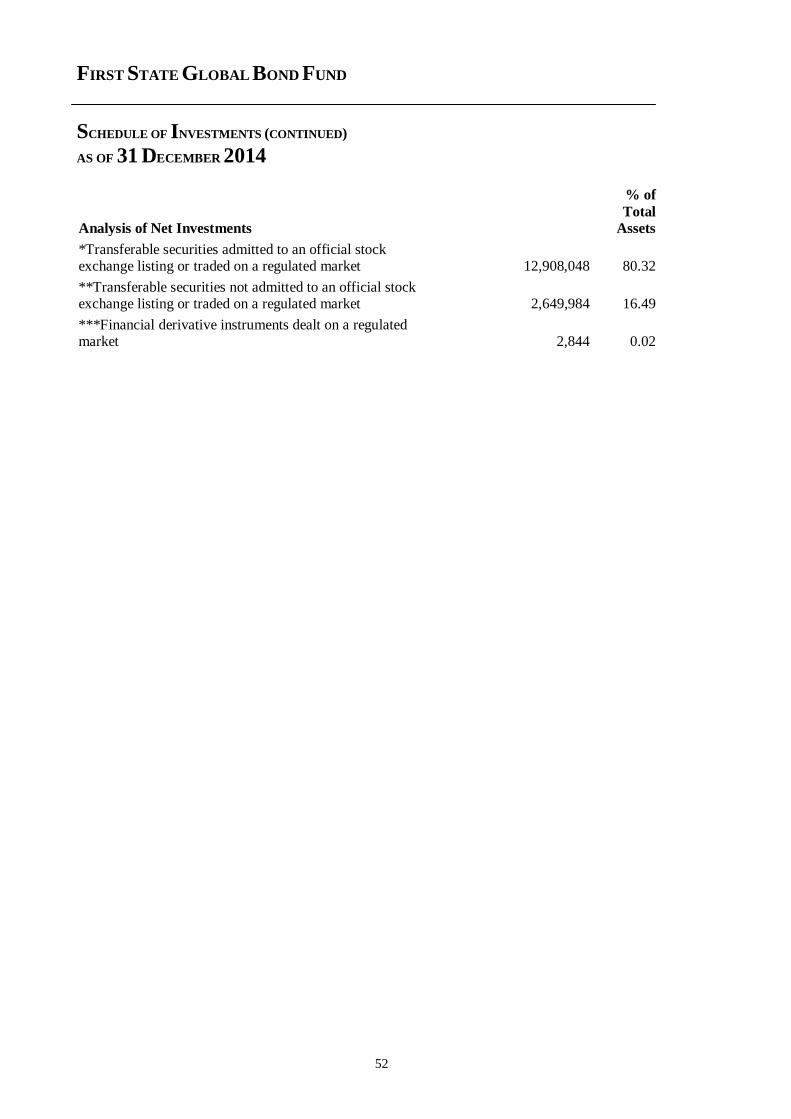
FIRST STATE GLOBAL BOND FUND
SCHEDULE OF INVESTMENTS (CONTINUED)
AS OF 31 DECEMBER 2014
52
Analysis of Net Investments
% of
Total
Assets
*Transferable securities admitted to an official stock exchange listing or traded on a regulated market 12,908,048 80.32
**Transferable securities not admitted to an official stock exchange listing or traded on a regulated market 2,649,984 16.49
***Financial derivative instruments dealt on a regulated market 2,844 0.02
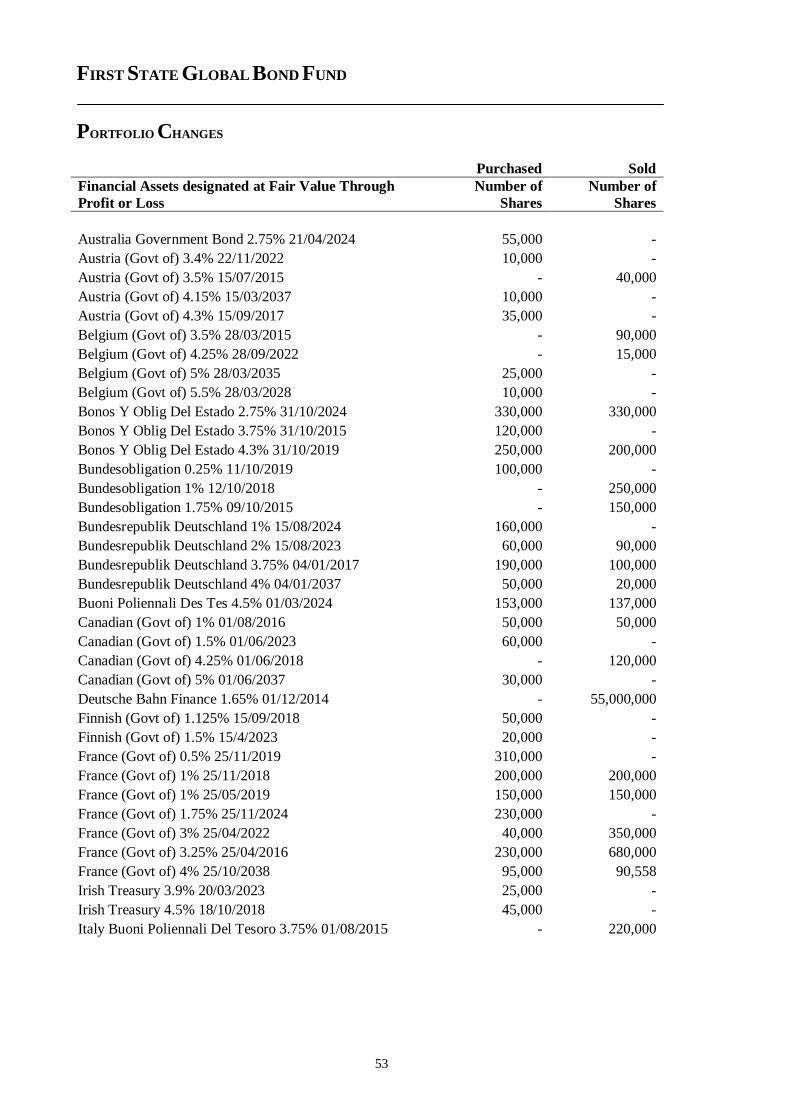
FIRST STATE GLOBAL BOND FUND
PORTFOLIO CHANGES
53
Purchased Sold
Financial Assets designated at Fair Value Through
Profit or Loss
Number of
Shares
Number of
Shares
Australia Government Bond 2.75% 21/04/2024 55,000 -
Austria (Govt of) 3.4% 22/11/2022 10,000 -
Austria (Govt of) 3.5% 15/07/2015 - 40,000
Austria (Govt of) 4.15% 15/03/2037 10,000 -
Austria (Govt of) 4.3% 15/09/2017 35,000 -
Belgium (Govt of) 3.5% 28/03/2015 - 90,000
Belgium (Govt of) 4.25% 28/09/2022 - 15,000
Belgium (Govt of) 5% 28/03/2035 25,000 -
Belgium (Govt of) 5.5% 28/03/2028 10,000 -
Bonos Y Oblig Del Estado 2.75% 31/10/2024 330,000 330,000
Bonos Y Oblig Del Estado 3.75% 31/10/2015 120,000 -
Bonos Y Oblig Del Estado 4.3% 31/10/2019 250,000 200,000
Bundesobligation 0.25% 11/10/2019 100,000 -
Bundesobligation 1% 12/10/2018 - 250,000
Bundesobligation 1.75% 09/10/2015 - 150,000
Bundesrepublik Deutschland 1% 15/08/2024 160,000 -
Bundesrepublik Deutschland 2% 15/08/2023 60,000 90,000
Bundesrepublik Deutschland 3.75% 04/01/2017 190,000 100,000
Bundesrepublik Deutschland 4% 04/01/2037 50,000 20,000
Buoni Poliennali Des Tes 4.5% 01/03/2024 153,000 137,000
Canadian (Govt of) 1% 01/08/2016 50,000 50,000
Canadian (Govt of) 1.5% 01/06/2023 60,000 -
Canadian (Govt of) 4.25% 01/06/2018 - 120,000
Canadian (Govt of) 5% 01/06/2037 30,000 -
Deutsche Bahn Finance 1.65% 01/12/2014 - 55,000,000
Finnish (Govt of) 1.125% 15/09/2018 50,000 -
Finnish (Govt of) 1.5% 15/4/2023 20,000 -
France (Govt of) 0.5% 25/11/2019 310,000 -
France (Govt of) 1% 25/11/2018 200,000 200,000
France (Govt of) 1% 25/05/2019 150,000 150,000
France (Govt of) 1.75% 25/11/2024 230,000 -
France (Govt of) 3% 25/04/2022 40,000 350,000
France (Govt of) 3.25% 25/04/2016 230,000 680,000
France (Govt of) 4% 25/10/2038 95,000 90,558
Irish Treasury 3.9% 20/03/2023 25,000 -
Irish Treasury 4.5% 18/10/2018 45,000 -
Italy Buoni Poliennali Del Tesoro 3.75% 01/08/2015 - 220,000
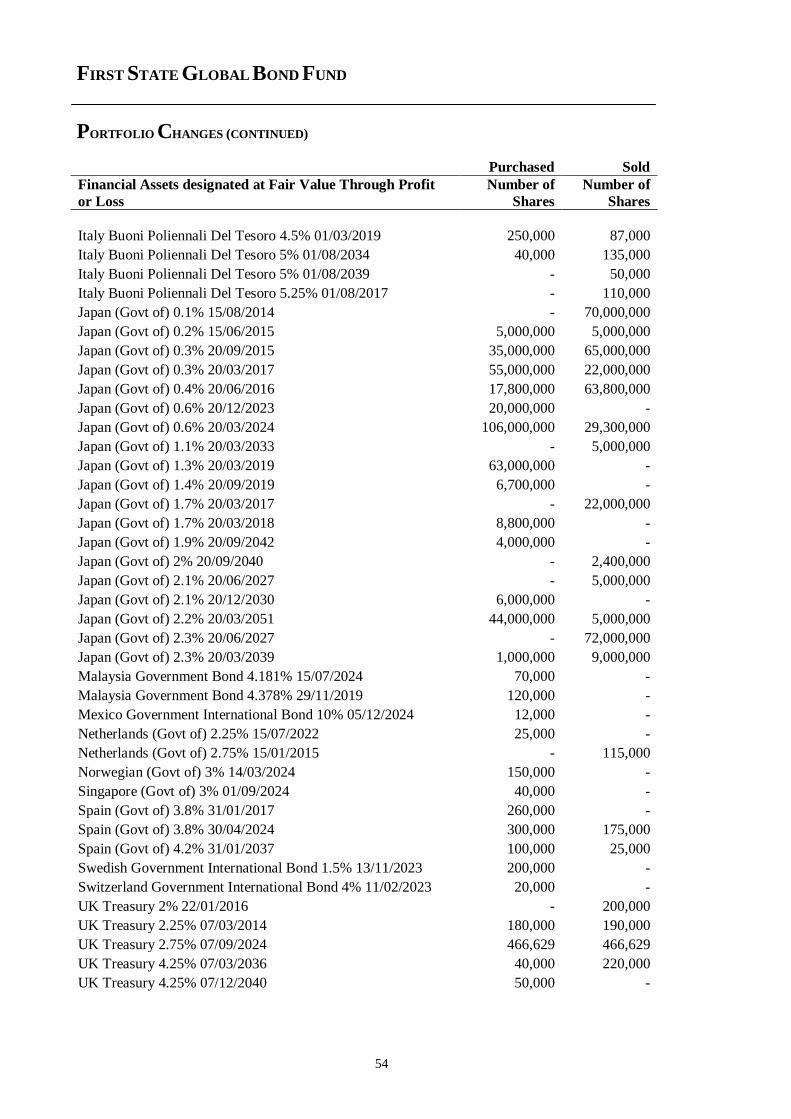
FIRST STATE GLOBAL BOND FUND
PORTFOLIO CHANGES (CONTINUED)
54
Purchased Sold
Financial Assets designated at Fair Value Through Profit
or Loss
Number of
Shares
Number of
Shares
Italy Buoni Poliennali Del Tesoro 4.5% 01/03/2019 250,000 87,000
Italy Buoni Poliennali Del Tesoro 5% 01/08/2034 40,000 135,000
Italy Buoni Poliennali Del Tesoro 5% 01/08/2039 - 50,000
Italy Buoni Poliennali Del Tesoro 5.25% 01/08/2017 - 110,000
Japan (Govt of) 0.1% 15/08/2014 - 70,000,000
Japan (Govt of) 0.2% 15/06/2015 5,000,000 5,000,000
Japan (Govt of) 0.3% 20/09/2015 35,000,000 65,000,000
Japan (Govt of) 0.3% 20/03/2017 55,000,000 22,000,000
Japan (Govt of) 0.4% 20/06/2016 17,800,000 63,800,000
Japan (Govt of) 0.6% 20/12/2023 20,000,000 -
Japan (Govt of) 0.6% 20/03/2024 106,000,000 29,300,000
Japan (Govt of) 1.1% 20/03/2033 - 5,000,000
Japan (Govt of) 1.3% 20/03/2019 63,000,000 -
Japan (Govt of) 1.4% 20/09/2019 6,700,000 -
Japan (Govt of) 1.7% 20/03/2017 - 22,000,000
Japan (Govt of) 1.7% 20/03/2018 8,800,000 -
Japan (Govt of) 1.9% 20/09/2042 4,000,000 -
Japan (Govt of) 2% 20/09/2040 - 2,400,000
Japan (Govt of) 2.1% 20/06/2027 - 5,000,000
Japan (Govt of) 2.1% 20/12/2030 6,000,000 -
Japan (Govt of) 2.2% 20/03/2051 44,000,000 5,000,000
Japan (Govt of) 2.3% 20/06/2027 - 72,000,000
Japan (Govt of) 2.3% 20/03/2039 1,000,000 9,000,000
Malaysia Government Bond 4.181% 15/07/2024 70,000 -
Malaysia Government Bond 4.378% 29/11/2019 120,000 -
Mexico Government International Bond 10% 05/12/2024 12,000 -
Netherlands (Govt of) 2.25% 15/07/2022 25,000 -
Netherlands (Govt of) 2.75% 15/01/2015 - 115,000
Norwegian (Govt of) 3% 14/03/2024 150,000 -
Singapore (Govt of) 3% 01/09/2024 40,000 -
Spain (Govt of) 3.8% 31/01/2017 260,000 -
Spain (Govt of) 3.8% 30/04/2024 300,000 175,000
Spain (Govt of) 4.2% 31/01/2037 100,000 25,000
Swedish Government International Bond 1.5% 13/11/2023 200,000 -
Switzerland Government International Bond 4% 11/02/2023 20,000 -
UK Treasury 2% 22/01/2016 - 200,000
UK Treasury 2.25% 07/03/2014 180,000 190,000
UK Treasury 2.75% 07/09/2024 466,629 466,629
UK Treasury 4.25% 07/03/2036 40,000 220,000
UK Treasury 4.25% 07/12/2040 50,000 -
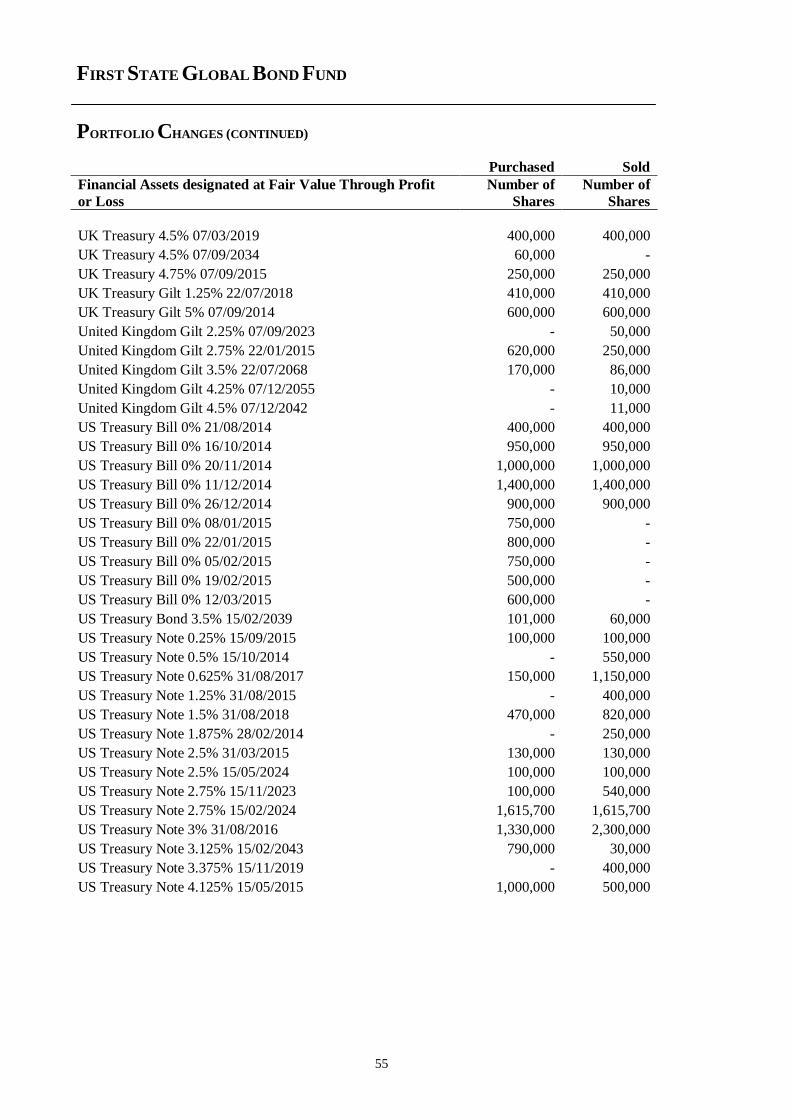
FIRST STATE GLOBAL BOND FUND
PORTFOLIO CHANGES (CONTINUED)
55
Purchased Sold
Financial Assets designated at Fair Value Through Profit
or Loss
Number of
Shares
Number of
Shares
UK Treasury 4.5% 07/03/2019 400,000 400,000
UK Treasury 4.5% 07/09/2034 60,000 -
UK Treasury 4.75% 07/09/2015 250,000 250,000
UK Treasury Gilt 1.25% 22/07/2018 410,000 410,000
UK Treasury Gilt 5% 07/09/2014 600,000 600,000
United Kingdom Gilt 2.25% 07/09/2023 - 50,000
United Kingdom Gilt 2.75% 22/01/2015 620,000 250,000
United Kingdom Gilt 3.5% 22/07/2068 170,000 86,000
United Kingdom Gilt 4.25% 07/12/2055 - 10,000
United Kingdom Gilt 4.5% 07/12/2042 - 11,000
US Treasury Bill 0% 21/08/2014 400,000 400,000
US Treasury Bill 0% 16/10/2014 950,000 950,000
US Treasury Bill 0% 20/11/2014 1,000,000 1,000,000
US Treasury Bill 0% 11/12/2014 1,400,000 1,400,000
US Treasury Bill 0% 26/12/2014 900,000 900,000
US Treasury Bill 0% 08/01/2015 750,000 -
US Treasury Bill 0% 22/01/2015 800,000 -
US Treasury Bill 0% 05/02/2015 750,000 -
US Treasury Bill 0% 19/02/2015 500,000 -
US Treasury Bill 0% 12/03/2015 600,000 -
US Treasury Bond 3.5% 15/02/2039 101,000 60,000
US Treasury Note 0.25% 15/09/2015 100,000 100,000
US Treasury Note 0.5% 15/10/2014 - 550,000
US Treasury Note 0.625% 31/08/2017 150,000 1,150,000
US Treasury Note 1.25% 31/08/2015 - 400,000
US Treasury Note 1.5% 31/08/2018 470,000 820,000
US Treasury Note 1.875% 28/02/2014 - 250,000
US Treasury Note 2.5% 31/03/2015 130,000 130,000
US Treasury Note 2.5% 15/05/2024 100,000 100,000
US Treasury Note 2.75% 15/11/2023 100,000 540,000
US Treasury Note 2.75% 15/02/2024 1,615,700 1,615,700
US Treasury Note 3% 31/08/2016 1,330,000 2,300,000
US Treasury Note 3.125% 15/02/2043 790,000 30,000
US Treasury Note 3.375% 15/11/2019 - 400,000
US Treasury Note 4.125% 15/05/2015 1,000,000 500,000
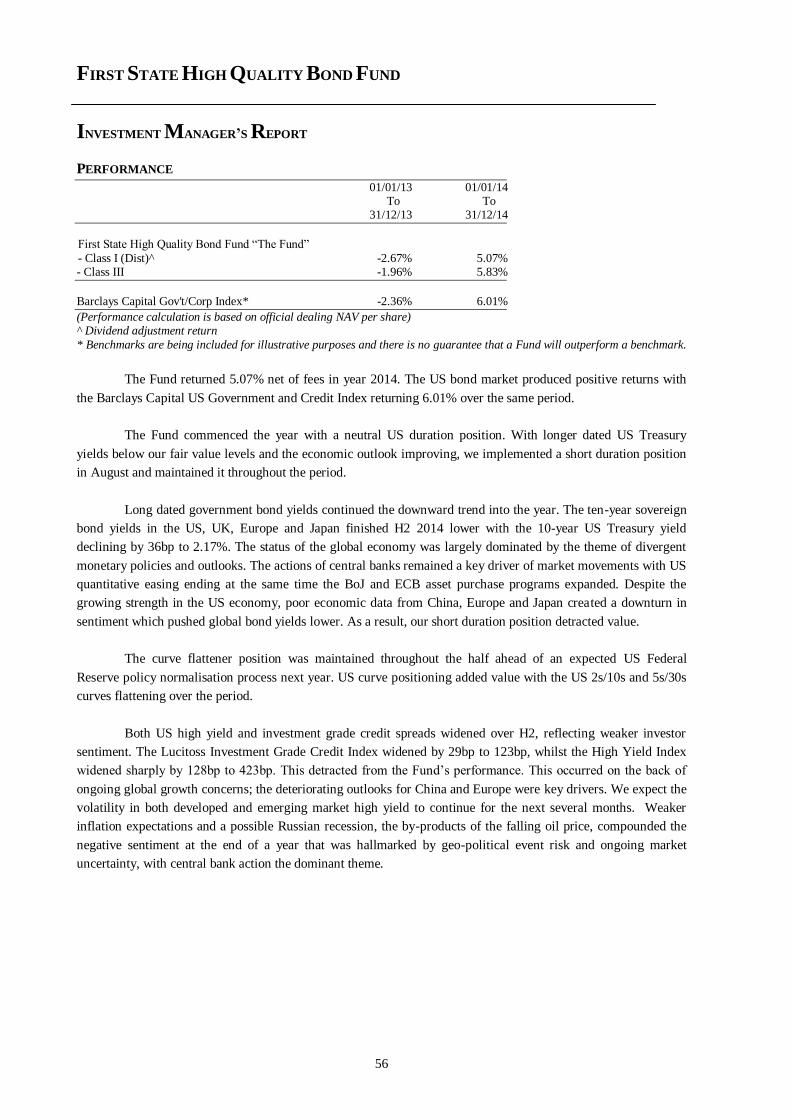
FIRST STATE HIGH QUALITY BOND FUND
INVESTMENT MANAGER’S REPORT
56
PERFORMANCE
01/01/13 01/01/14 To To 31/12/13 31/12/14
First State High Quality Bond Fund “The Fund”
- Class I (Dist)^ -2.67% 5.07% - Class III -1.96% 5.83%
Barclays Capital Gov't/Corp Index* -2.36% 6.01%
(Performance calculation is based on official dealing NAV per share) ^ Dividend adjustment return
* Benchmarks are being included for illustrative purposes and there is no guarantee that a Fund will outperform a benchmark.
The Fund returned 5.07% net of fees in year 2014. The US bond market produced positive returns with
the Barclays Capital US Government and Credit Index returning 6.01% over the same period.
The Fund commenced the year with a neutral US duration position. With longer dated US Treasury
yields below our fair value levels and the economic outlook improving, we implemented a short duration position
in August and maintained it throughout the period.
Long dated government bond yields continued the downward trend into the year. The ten-year sovereign
bond yields in the US, UK, Europe and Japan finished H2 2014 lower with the 10-year US Treasury yield
declining by 36bp to 2.17%. The status of the global economy was largely dominated by the theme of divergent
monetary policies and outlooks. The actions of central banks remained a key driver of market movements with US
quantitative easing ending at the same time the BoJ and ECB asset purchase programs expanded. Despite the
growing strength in the US economy, poor economic data from China, Europe and Japan created a downturn in
sentiment which pushed global bond yields lower. As a result, our short duration position detracted value.
The curve flattener position was maintained throughout the half ahead of an expected US Federal
Reserve policy normalisation process next year. US curve positioning added value with the US 2s/10s and 5s/30s
curves flattening over the period.
Both US high yield and investment grade credit spreads widened over H2, reflecting weaker investor
sentiment. The Lucitoss Investment Grade Credit Index widened by 29bp to 123bp, whilst the High Yield Index
widened sharply by 128bp to 423bp. This detracted from the Fund’s performance. This occurred on the back of
ongoing global growth concerns; the deteriorating outlooks for China and Europe were key drivers. We expect the
volatility in both developed and emerging market high yield to continue for the next several months. Weaker
inflation expectations and a possible Russian recession, the by-products of the falling oil price, compounded the
negative sentiment at the end of a year that was hallmarked by geo-political event risk and ongoing market
uncertainty, with central bank action the dominant theme.
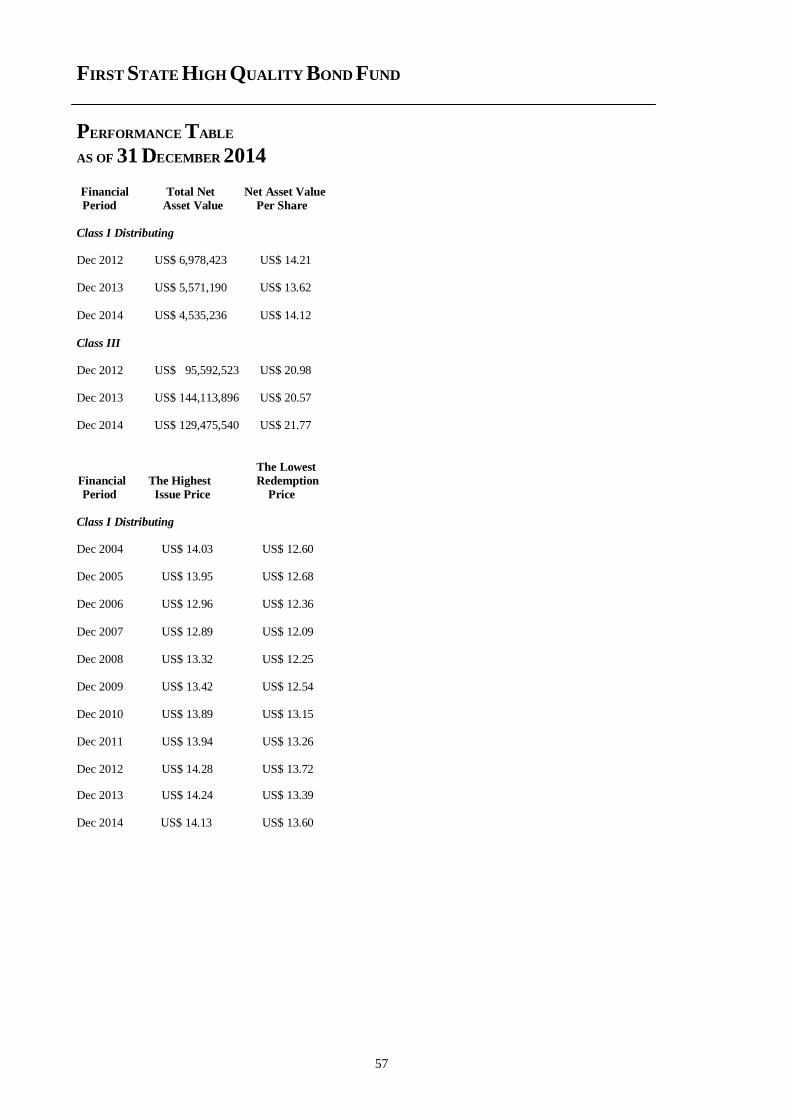
FIRST STATE HIGH QUALITY BOND FUND
PERFORMANCE TABLE
AS OF 31 DECEMBER 2014
57
Financial Total Net Net Asset Value
Period Asset Value Per Share
Class I Distributing Dec 2012 US$ 6,978,423 US$ 14.21 Dec 2013 US$ 5,571,190 US$ 13.62
Dec 2014 US$ 4,535,236 US$ 14.12
Class III Dec 2012 US$ 95,592,523 US$ 20.98 Dec 2013 US$ 144,113,896 US$ 20.57 Dec 2014 US$ 129,475,540 US$ 21.77
The Lowest
Financial The Highest Redemption
Period Issue Price Price
Class I Distributing Dec 2004 US$ 14.03 US$ 12.60 Dec 2005 US$ 13.95 US$ 12.68 Dec 2006 US$ 12.96 US$ 12.36
Dec 2007 US$ 12.89 US$ 12.09 Dec 2008 US$ 13.32 US$ 12.25 Dec 2009 US$ 13.42 US$ 12.54 Dec 2010 US$ 13.89 US$ 13.15 Dec 2011 US$ 13.94 US$ 13.26 Dec 2012 US$ 14.28 US$ 13.72
Dec 2013 US$ 14.24 US$ 13.39 Dec 2014 US$ 14.13 US$ 13.60
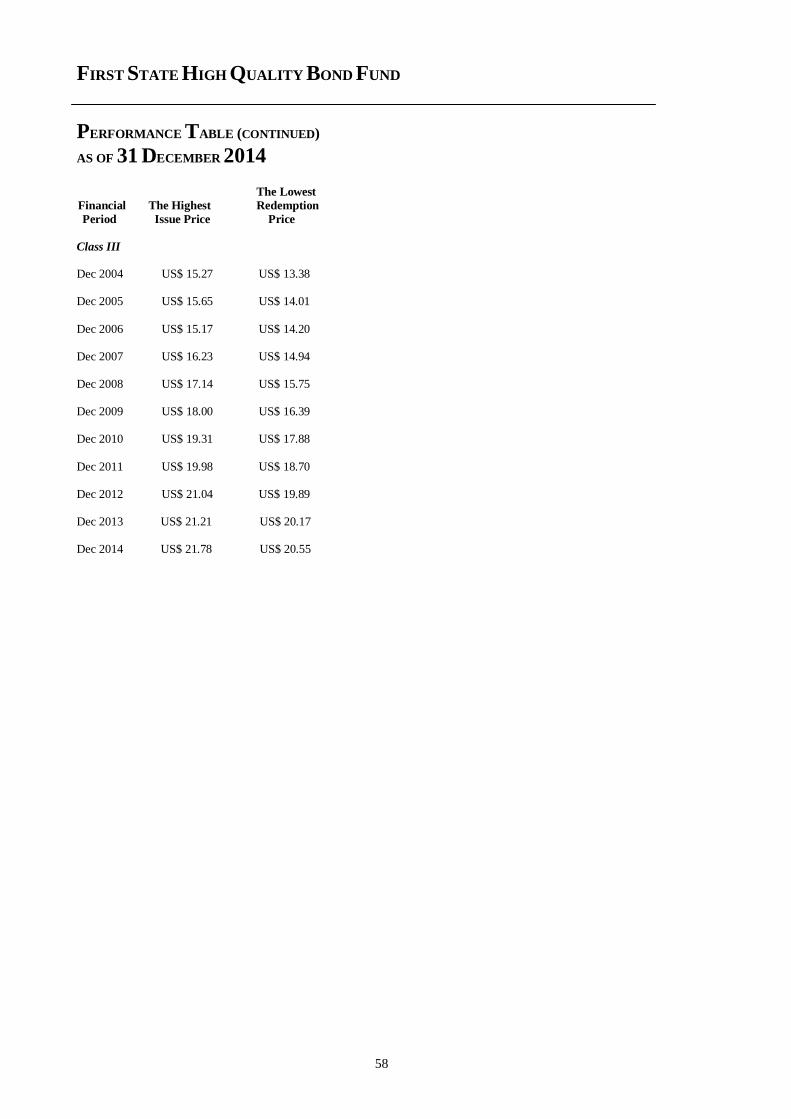
FIRST STATE HIGH QUALITY BOND FUND
PERFORMANCE TABLE (CONTINUED)
AS OF 31 DECEMBER 2014
58
The Lowest
Financial The Highest Redemption
Period Issue Price Price
Class III Dec 2004 US$ 15.27 US$ 13.38 Dec 2005 US$ 15.65 US$ 14.01
Dec 2006 US$ 15.17 US$ 14.20 Dec 2007 US$ 16.23 US$ 14.94 Dec 2008 US$ 17.14 US$ 15.75 Dec 2009 US$ 18.00 US$ 16.39 Dec 2010 US$ 19.31 US$ 17.88
Dec 2011 US$ 19.98 US$ 18.70 Dec 2012 US$ 21.04 US$ 19.89 Dec 2013 US$ 21.21 US$ 20.17 Dec 2014 US$ 21.78 US$ 20.55
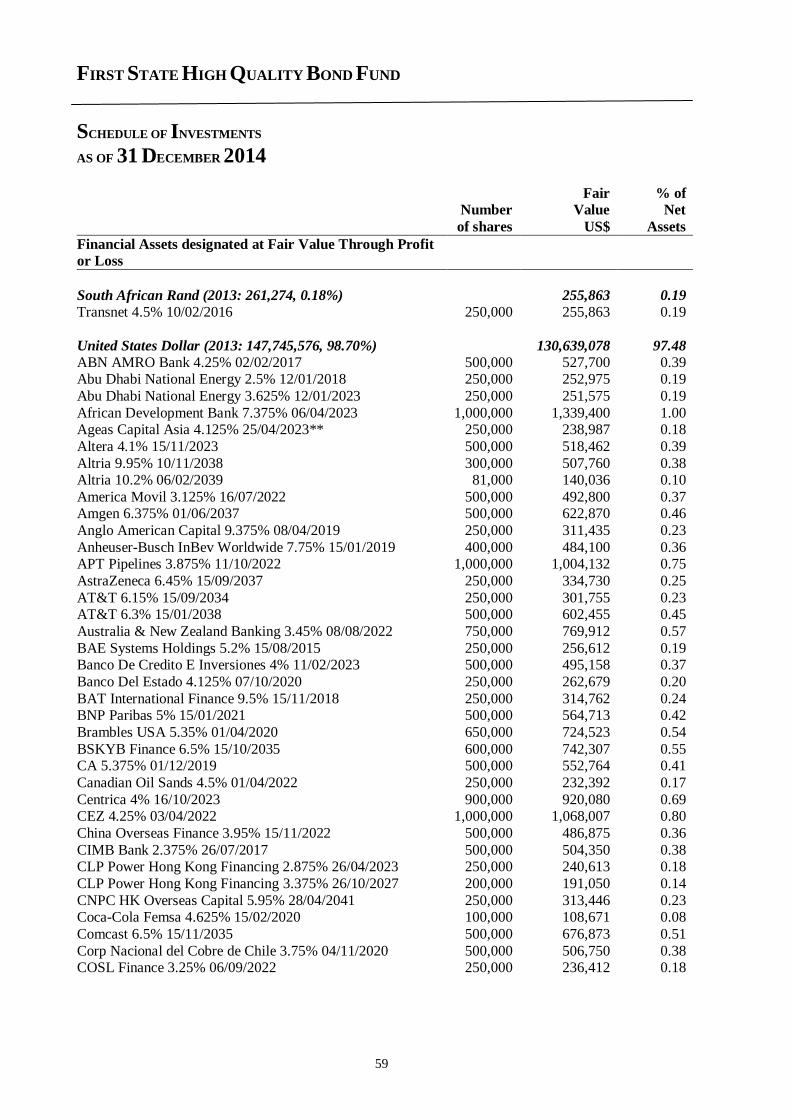
FIRST STATE HIGH QUALITY BOND FUND
SCHEDULE OF INVESTMENTS
AS OF 31 DECEMBER 2014
59
Fair % of
Number Value Net
of shares US$ Assets
Financial Assets designated at Fair Value Through Profit
or Loss
South African Rand (2013: 261,274, 0.18%) 255,863 0.19
Transnet 4.5% 10/02/2016 250,000 255,863 0.19
United States Dollar (2013: 147,745,576, 98.70%) 130,639,078 97.48
ABN AMRO Bank 4.25% 02/02/2017 500,000 527,700 0.39 Abu Dhabi National Energy 2.5% 12/01/2018 250,000 252,975 0.19
Abu Dhabi National Energy 3.625% 12/01/2023 250,000 251,575 0.19
African Development Bank 7.375% 06/04/2023 1,000,000 1,339,400 1.00 Ageas Capital Asia 4.125% 25/04/2023** 250,000 238,987 0.18
Altera 4.1% 15/11/2023 500,000 518,462 0.39
Altria 9.95% 10/11/2038 300,000 507,760 0.38 Altria 10.2% 06/02/2039 81,000 140,036 0.10
America Movil 3.125% 16/07/2022 500,000 492,800 0.37 Amgen 6.375% 01/06/2037 500,000 622,870 0.46
Anglo American Capital 9.375% 08/04/2019 250,000 311,435 0.23
Anheuser-Busch InBev Worldwide 7.75% 15/01/2019 400,000 484,100 0.36 APT Pipelines 3.875% 11/10/2022 1,000,000 1,004,132 0.75
AstraZeneca 6.45% 15/09/2037 250,000 334,730 0.25
AT&T 6.15% 15/09/2034 250,000 301,755 0.23 AT&T 6.3% 15/01/2038 500,000 602,455 0.45
Australia & New Zealand Banking 3.45% 08/08/2022 750,000 769,912 0.57
BAE Systems Holdings 5.2% 15/08/2015 250,000 256,612 0.19 Banco De Credito E Inversiones 4% 11/02/2023 500,000 495,158 0.37
Banco Del Estado 4.125% 07/10/2020 250,000 262,679 0.20
BAT International Finance 9.5% 15/11/2018 250,000 314,762 0.24 BNP Paribas 5% 15/01/2021 500,000 564,713 0.42
Brambles USA 5.35% 01/04/2020 650,000 724,523 0.54
BSKYB Finance 6.5% 15/10/2035 600,000 742,307 0.55 CA 5.375% 01/12/2019 500,000 552,764 0.41
Canadian Oil Sands 4.5% 01/04/2022 250,000 232,392 0.17
Centrica 4% 16/10/2023 900,000 920,080 0.69 CEZ 4.25% 03/04/2022 1,000,000 1,068,007 0.80
China Overseas Finance 3.95% 15/11/2022 500,000 486,875 0.36
CIMB Bank 2.375% 26/07/2017 500,000 504,350 0.38 CLP Power Hong Kong Financing 2.875% 26/04/2023 250,000 240,613 0.18
CLP Power Hong Kong Financing 3.375% 26/10/2027 200,000 191,050 0.14
CNPC HK Overseas Capital 5.95% 28/04/2041 250,000 313,446 0.23 Coca-Cola Femsa 4.625% 15/02/2020 100,000 108,671 0.08
Comcast 6.5% 15/11/2035 500,000 676,873 0.51
Corp Nacional del Cobre de Chile 3.75% 04/11/2020 500,000 506,750 0.38 COSL Finance 3.25% 06/09/2022 250,000 236,412 0.18
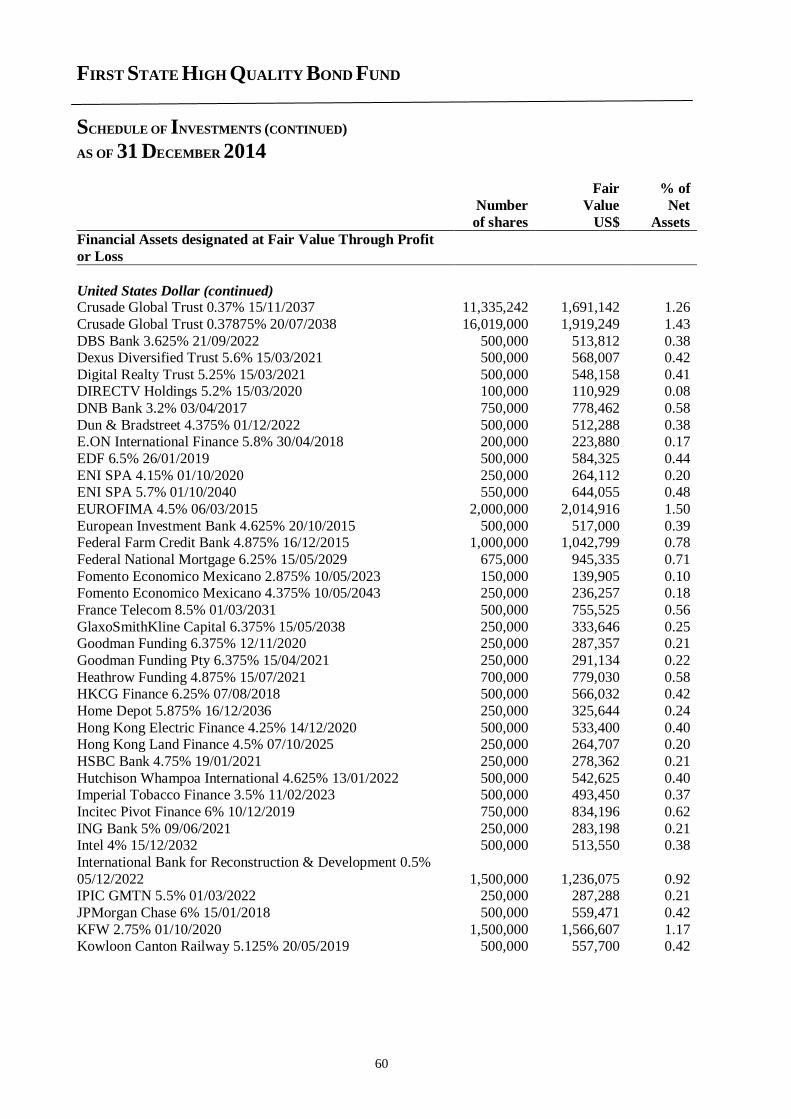
FIRST STATE HIGH QUALITY BOND FUND
SCHEDULE OF INVESTMENTS (CONTINUED)
AS OF 31 DECEMBER 2014
60
Fair % of
Number Value Net
of shares US$ Assets
Financial Assets designated at Fair Value Through Profit
or Loss
United States Dollar (continued) Crusade Global Trust 0.37% 15/11/2037 11,335,242 1,691,142 1.26
Crusade Global Trust 0.37875% 20/07/2038 16,019,000 1,919,249 1.43
DBS Bank 3.625% 21/09/2022 500,000 513,812 0.38 Dexus Diversified Trust 5.6% 15/03/2021 500,000 568,007 0.42
Digital Realty Trust 5.25% 15/03/2021 500,000 548,158 0.41 DIRECTV Holdings 5.2% 15/03/2020 100,000 110,929 0.08
DNB Bank 3.2% 03/04/2017 750,000 778,462 0.58
Dun & Bradstreet 4.375% 01/12/2022 500,000 512,288 0.38 E.ON International Finance 5.8% 30/04/2018 200,000 223,880 0.17
EDF 6.5% 26/01/2019 500,000 584,325 0.44
ENI SPA 4.15% 01/10/2020 250,000 264,112 0.20 ENI SPA 5.7% 01/10/2040 550,000 644,055 0.48
EUROFIMA 4.5% 06/03/2015 2,000,000 2,014,916 1.50
European Investment Bank 4.625% 20/10/2015 500,000 517,000 0.39 Federal Farm Credit Bank 4.875% 16/12/2015 1,000,000 1,042,799 0.78
Federal National Mortgage 6.25% 15/05/2029 675,000 945,335 0.71
Fomento Economico Mexicano 2.875% 10/05/2023 150,000 139,905 0.10 Fomento Economico Mexicano 4.375% 10/05/2043 250,000 236,257 0.18
France Telecom 8.5% 01/03/2031 500,000 755,525 0.56
GlaxoSmithKline Capital 6.375% 15/05/2038 250,000 333,646 0.25 Goodman Funding 6.375% 12/11/2020 250,000 287,357 0.21
Goodman Funding Pty 6.375% 15/04/2021 250,000 291,134 0.22
Heathrow Funding 4.875% 15/07/2021 700,000 779,030 0.58 HKCG Finance 6.25% 07/08/2018 500,000 566,032 0.42
Home Depot 5.875% 16/12/2036 250,000 325,644 0.24
Hong Kong Electric Finance 4.25% 14/12/2020 500,000 533,400 0.40 Hong Kong Land Finance 4.5% 07/10/2025 250,000 264,707 0.20
HSBC Bank 4.75% 19/01/2021 250,000 278,362 0.21
Hutchison Whampoa International 4.625% 13/01/2022 500,000 542,625 0.40 Imperial Tobacco Finance 3.5% 11/02/2023 500,000 493,450 0.37
Incitec Pivot Finance 6% 10/12/2019 750,000 834,196 0.62
ING Bank 5% 09/06/2021 250,000 283,198 0.21 Intel 4% 15/12/2032 500,000 513,550 0.38
International Bank for Reconstruction & Development 0.5%
05/12/2022 1,500,000 1,236,075 0.92 IPIC GMTN 5.5% 01/03/2022 250,000 287,288 0.21
JPMorgan Chase 6% 15/01/2018 500,000 559,471 0.42
KFW 2.75% 01/10/2020 1,500,000 1,566,607 1.17 Kowloon Canton Railway 5.125% 20/05/2019 500,000 557,700 0.42
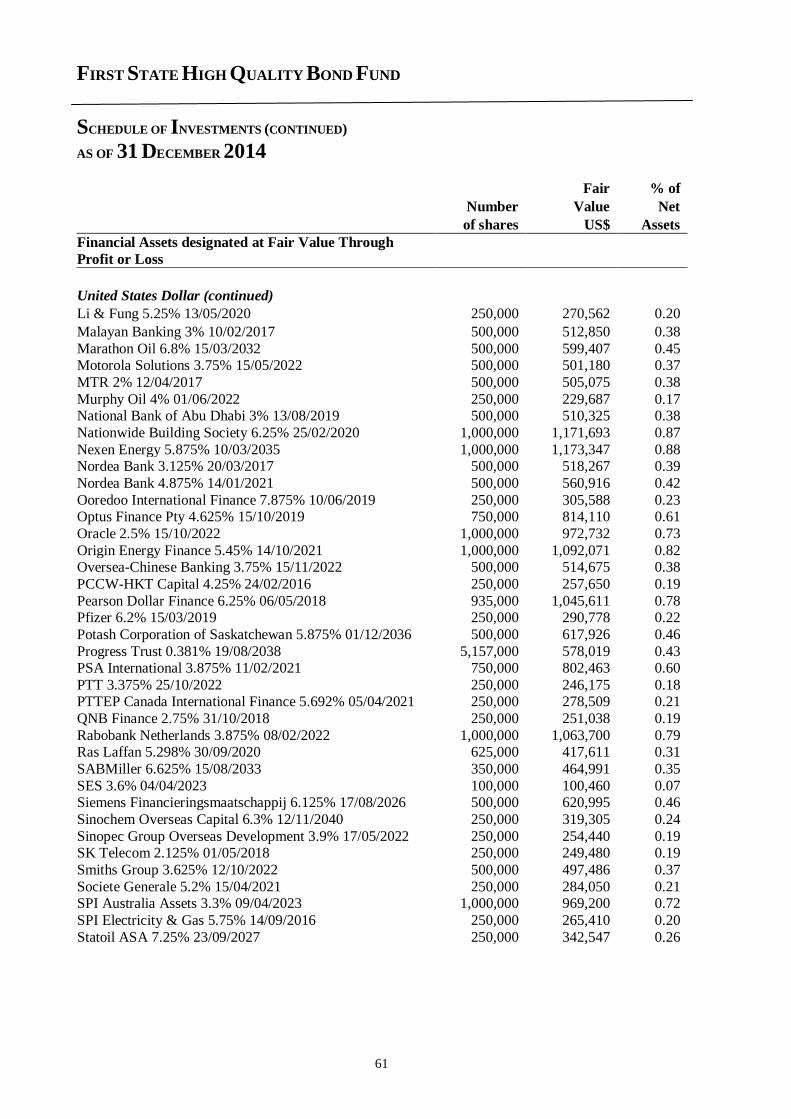
FIRST STATE HIGH QUALITY BOND FUND
SCHEDULE OF INVESTMENTS (CONTINUED)
AS OF 31 DECEMBER 2014
61
Fair % of
Number Value Net
of shares US$ Assets
Financial Assets designated at Fair Value Through
Profit or Loss
United States Dollar (continued)
Li & Fung 5.25% 13/05/2020 250,000 270,562 0.20
Malayan Banking 3% 10/02/2017 500,000 512,850 0.38
Marathon Oil 6.8% 15/03/2032 500,000 599,407 0.45 Motorola Solutions 3.75% 15/05/2022 500,000 501,180 0.37
MTR 2% 12/04/2017 500,000 505,075 0.38
Murphy Oil 4% 01/06/2022 250,000 229,687 0.17 National Bank of Abu Dhabi 3% 13/08/2019 500,000 510,325 0.38
Nationwide Building Society 6.25% 25/02/2020 1,000,000 1,171,693 0.87
Nexen Energy 5.875% 10/03/2035 1,000,000 1,173,347 0.88 Nordea Bank 3.125% 20/03/2017 500,000 518,267 0.39
Nordea Bank 4.875% 14/01/2021 500,000 560,916 0.42
Ooredoo International Finance 7.875% 10/06/2019 250,000 305,588 0.23 Optus Finance Pty 4.625% 15/10/2019 750,000 814,110 0.61
Oracle 2.5% 15/10/2022 1,000,000 972,732 0.73
Origin Energy Finance 5.45% 14/10/2021 1,000,000 1,092,071 0.82 Oversea-Chinese Banking 3.75% 15/11/2022 500,000 514,675 0.38
PCCW-HKT Capital 4.25% 24/02/2016 250,000 257,650 0.19
Pearson Dollar Finance 6.25% 06/05/2018 935,000 1,045,611 0.78 Pfizer 6.2% 15/03/2019 250,000 290,778 0.22
Potash Corporation of Saskatchewan 5.875% 01/12/2036 500,000 617,926 0.46
Progress Trust 0.381% 19/08/2038 5,157,000 578,019 0.43 PSA International 3.875% 11/02/2021 750,000 802,463 0.60
PTT 3.375% 25/10/2022 250,000 246,175 0.18 PTTEP Canada International Finance 5.692% 05/04/2021 250,000 278,509 0.21
QNB Finance 2.75% 31/10/2018 250,000 251,038 0.19
Rabobank Netherlands 3.875% 08/02/2022 1,000,000 1,063,700 0.79 Ras Laffan 5.298% 30/09/2020 625,000 417,611 0.31
SABMiller 6.625% 15/08/2033 350,000 464,991 0.35
SES 3.6% 04/04/2023 100,000 100,460 0.07 Siemens Financieringsmaatschappij 6.125% 17/08/2026 500,000 620,995 0.46
Sinochem Overseas Capital 6.3% 12/11/2040 250,000 319,305 0.24
Sinopec Group Overseas Development 3.9% 17/05/2022 250,000 254,440 0.19 SK Telecom 2.125% 01/05/2018 250,000 249,480 0.19
Smiths Group 3.625% 12/10/2022 500,000 497,486 0.37
Societe Generale 5.2% 15/04/2021 250,000 284,050 0.21 SPI Australia Assets 3.3% 09/04/2023 1,000,000 969,200 0.72
SPI Electricity & Gas 5.75% 14/09/2016 250,000 265,410 0.20
Statoil ASA 7.25% 23/09/2027 250,000 342,547 0.26
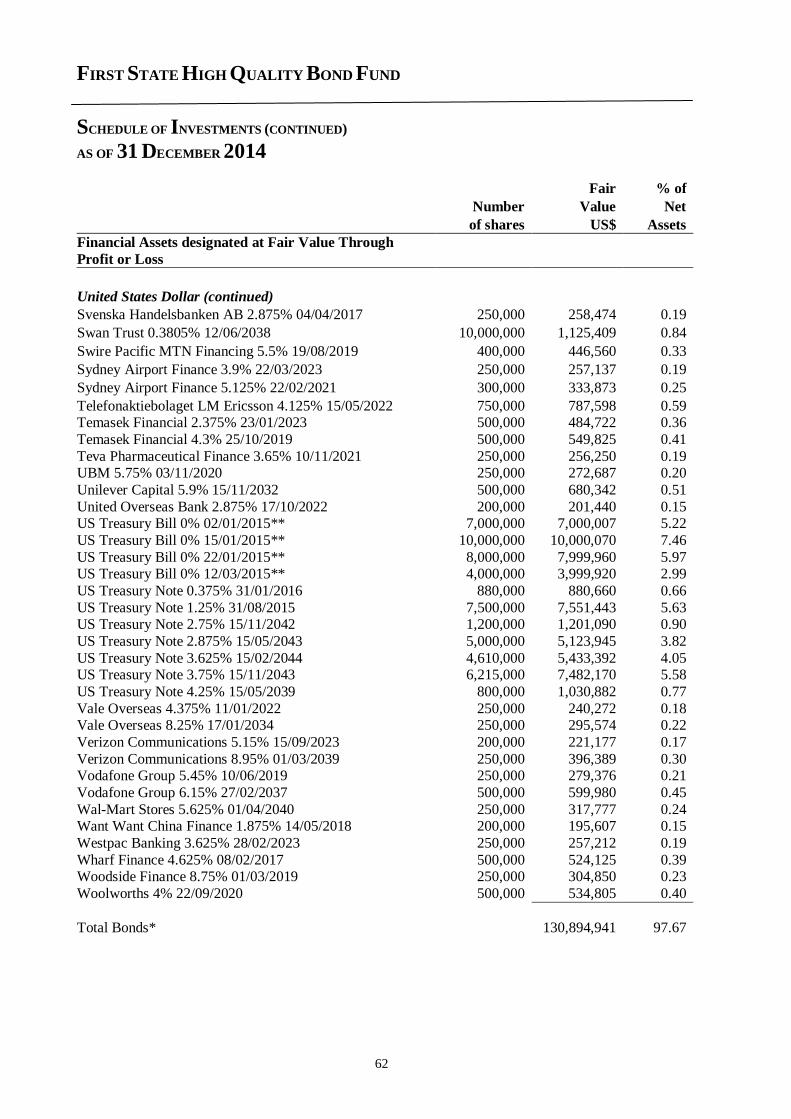
FIRST STATE HIGH QUALITY BOND FUND
SCHEDULE OF INVESTMENTS (CONTINUED)
AS OF 31 DECEMBER 2014
62
Fair % of
Number Value Net
of shares US$ Assets
Financial Assets designated at Fair Value Through
Profit or Loss
United States Dollar (continued)
Svenska Handelsbanken AB 2.875% 04/04/2017 250,000 258,474 0.19
Swan Trust 0.3805% 12/06/2038 10,000,000 1,125,409 0.84
Swire Pacific MTN Financing 5.5% 19/08/2019 400,000 446,560 0.33
Sydney Airport Finance 3.9% 22/03/2023 250,000 257,137 0.19
Sydney Airport Finance 5.125% 22/02/2021 300,000 333,873 0.25
Telefonaktiebolaget LM Ericsson 4.125% 15/05/2022 750,000 787,598 0.59 Temasek Financial 2.375% 23/01/2023 500,000 484,722 0.36
Temasek Financial 4.3% 25/10/2019 500,000 549,825 0.41
Teva Pharmaceutical Finance 3.65% 10/11/2021 250,000 256,250 0.19 UBM 5.75% 03/11/2020 250,000 272,687 0.20
Unilever Capital 5.9% 15/11/2032 500,000 680,342 0.51
United Overseas Bank 2.875% 17/10/2022 200,000 201,440 0.15 US Treasury Bill 0% 02/01/2015** 7,000,000 7,000,007 5.22
US Treasury Bill 0% 15/01/2015** 10,000,000 10,000,070 7.46
US Treasury Bill 0% 22/01/2015** 8,000,000 7,999,960 5.97 US Treasury Bill 0% 12/03/2015** 4,000,000 3,999,920 2.99
US Treasury Note 0.375% 31/01/2016 880,000 880,660 0.66
US Treasury Note 1.25% 31/08/2015 7,500,000 7,551,443 5.63 US Treasury Note 2.75% 15/11/2042 1,200,000 1,201,090 0.90
US Treasury Note 2.875% 15/05/2043 5,000,000 5,123,945 3.82
US Treasury Note 3.625% 15/02/2044 4,610,000 5,433,392 4.05 US Treasury Note 3.75% 15/11/2043 6,215,000 7,482,170 5.58
US Treasury Note 4.25% 15/05/2039 800,000 1,030,882 0.77
Vale Overseas 4.375% 11/01/2022 250,000 240,272 0.18 Vale Overseas 8.25% 17/01/2034 250,000 295,574 0.22
Verizon Communications 5.15% 15/09/2023 200,000 221,177 0.17
Verizon Communications 8.95% 01/03/2039 250,000 396,389 0.30 Vodafone Group 5.45% 10/06/2019 250,000 279,376 0.21
Vodafone Group 6.15% 27/02/2037 500,000 599,980 0.45
Wal-Mart Stores 5.625% 01/04/2040 250,000 317,777 0.24 Want Want China Finance 1.875% 14/05/2018 200,000 195,607 0.15
Westpac Banking 3.625% 28/02/2023 250,000 257,212 0.19
Wharf Finance 4.625% 08/02/2017 500,000 524,125 0.39 Woodside Finance 8.75% 01/03/2019 250,000 304,850 0.23
Woolworths 4% 22/09/2020 500,000 534,805 0.40
Total Bonds* 130,894,941 97.67
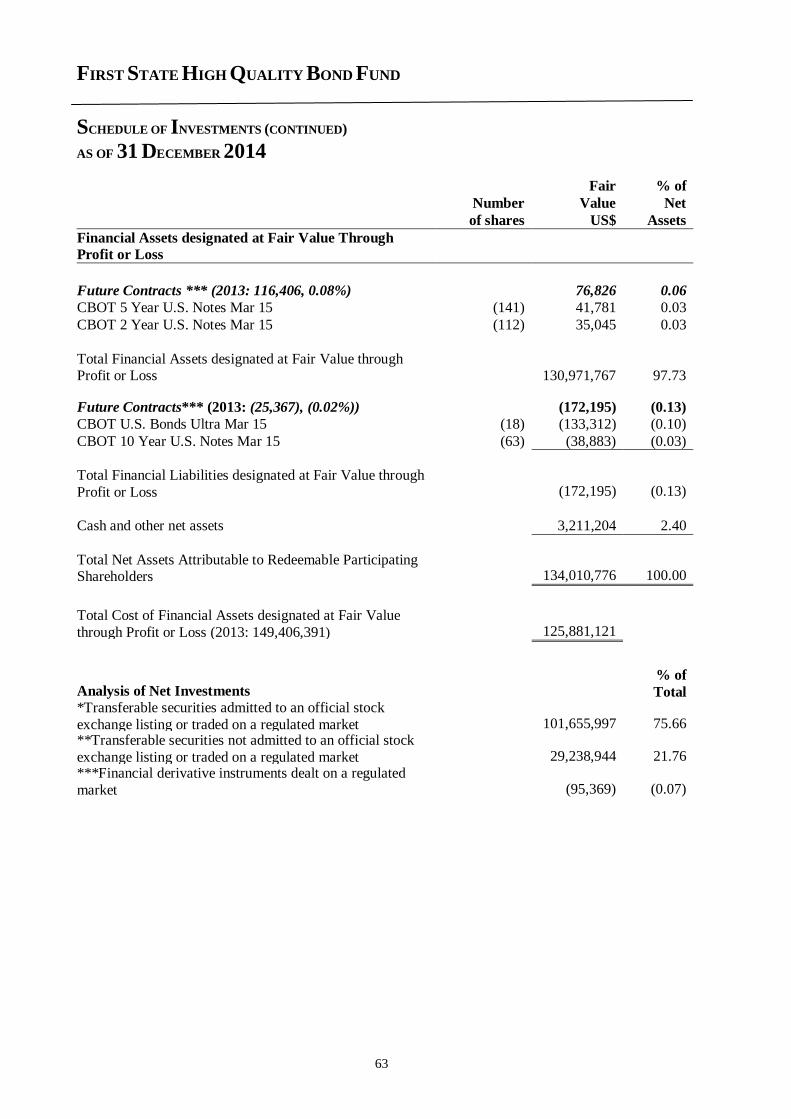
FIRST STATE HIGH QUALITY BOND FUND
SCHEDULE OF INVESTMENTS (CONTINUED)
AS OF 31 DECEMBER 2014
63
Fair % of
Number Value Net
of shares US$ Assets
Financial Assets designated at Fair Value Through
Profit or Loss
Future Contracts *** (2013: 116,406, 0.08%) 76,826 0.06
CBOT 5 Year U.S. Notes Mar 15 (141) 41,781 0.03
CBOT 2 Year U.S. Notes Mar 15 (112) 35,045 0.03
Total Financial Assets designated at Fair Value through Profit or Loss
130,971,767
97.73
Future Contracts*** (2013: (25,367), (0.02%)) (172,195) (0.13)
CBOT U.S. Bonds Ultra Mar 15 (18) (133,312) (0.10)
CBOT 10 Year U.S. Notes Mar 15 (63) (38,883) (0.03)
Total Financial Liabilities designated at Fair Value through
Profit or Loss (172,195) (0.13)
Cash and other net assets 3,211,204 2.40
Total Net Assets Attributable to Redeemable Participating Shareholders 134,010,776 100.00
Total Cost of Financial Assets designated at Fair Value
through Profit or Loss (2013: 149,406,391) 125,881,121
Analysis of Net Investments % of
Total
Assets *Transferable securities admitted to an official stock
exchange listing or traded on a regulated market 101,655,997 75.66 **Transferable securities not admitted to an official stock
exchange listing or traded on a regulated market 29,238,944 21.76
***Financial derivative instruments dealt on a regulated
market (95,369) (0.07)
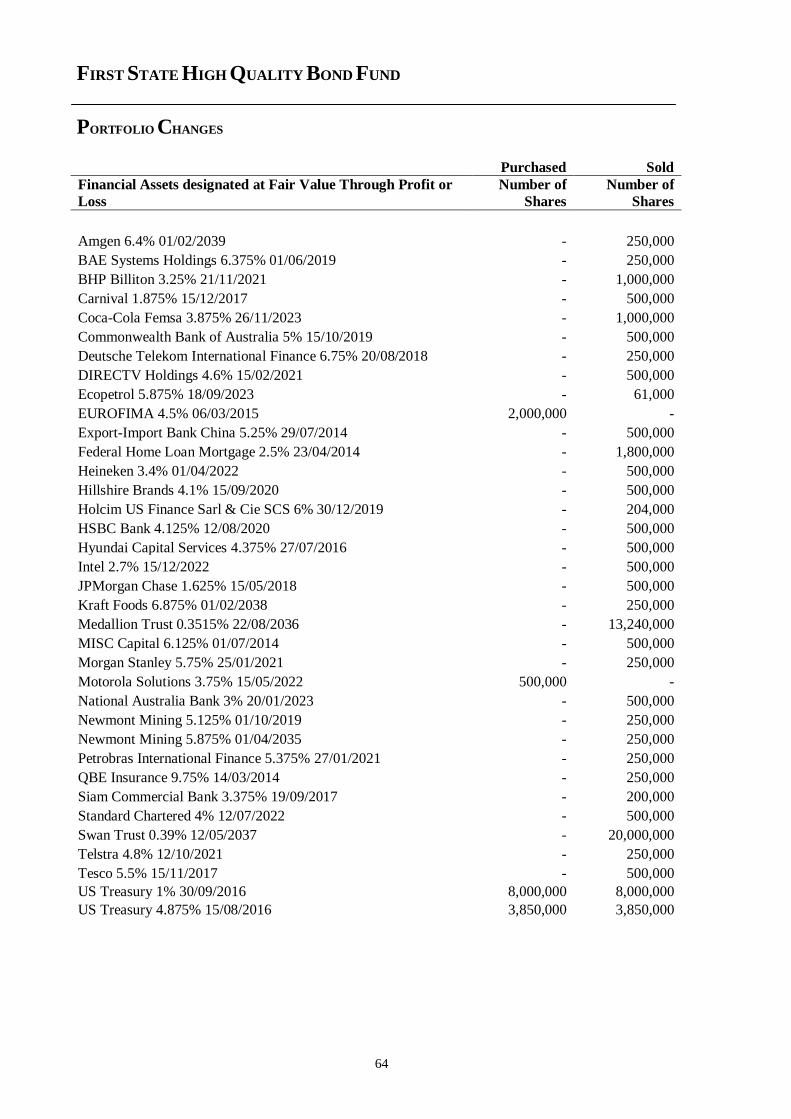
FIRST STATE HIGH QUALITY BOND FUND
PORTFOLIO CHANGES
64
Purchased Sold
Financial Assets designated at Fair Value Through Profit or
Loss
Number of
Shares
Number of
Shares
Amgen 6.4% 01/02/2039 - 250,000
BAE Systems Holdings 6.375% 01/06/2019 - 250,000
BHP Billiton 3.25% 21/11/2021 - 1,000,000
Carnival 1.875% 15/12/2017 - 500,000
Coca-Cola Femsa 3.875% 26/11/2023 - 1,000,000
Commonwealth Bank of Australia 5% 15/10/2019 - 500,000
Deutsche Telekom International Finance 6.75% 20/08/2018 - 250,000
DIRECTV Holdings 4.6% 15/02/2021 - 500,000
Ecopetrol 5.875% 18/09/2023 - 61,000
EUROFIMA 4.5% 06/03/2015 2,000,000 -
Export-Import Bank China 5.25% 29/07/2014 - 500,000
Federal Home Loan Mortgage 2.5% 23/04/2014 - 1,800,000
Heineken 3.4% 01/04/2022 - 500,000
Hillshire Brands 4.1% 15/09/2020 - 500,000
Holcim US Finance Sarl & Cie SCS 6% 30/12/2019 - 204,000
HSBC Bank 4.125% 12/08/2020 - 500,000
Hyundai Capital Services 4.375% 27/07/2016 - 500,000
Intel 2.7% 15/12/2022 - 500,000
JPMorgan Chase 1.625% 15/05/2018 - 500,000
Kraft Foods 6.875% 01/02/2038 - 250,000
Medallion Trust 0.3515% 22/08/2036 - 13,240,000
MISC Capital 6.125% 01/07/2014 - 500,000
Morgan Stanley 5.75% 25/01/2021 - 250,000
Motorola Solutions 3.75% 15/05/2022 500,000 -
National Australia Bank 3% 20/01/2023 - 500,000
Newmont Mining 5.125% 01/10/2019 - 250,000
Newmont Mining 5.875% 01/04/2035 - 250,000
Petrobras International Finance 5.375% 27/01/2021 - 250,000
QBE Insurance 9.75% 14/03/2014 - 250,000
Siam Commercial Bank 3.375% 19/09/2017 - 200,000
Standard Chartered 4% 12/07/2022 - 500,000
Swan Trust 0.39% 12/05/2037 - 20,000,000
Telstra 4.8% 12/10/2021 - 250,000
Tesco 5.5% 15/11/2017 - 500,000
US Treasury 1% 30/09/2016 8,000,000 8,000,000
US Treasury 4.875% 15/08/2016 3,850,000 3,850,000
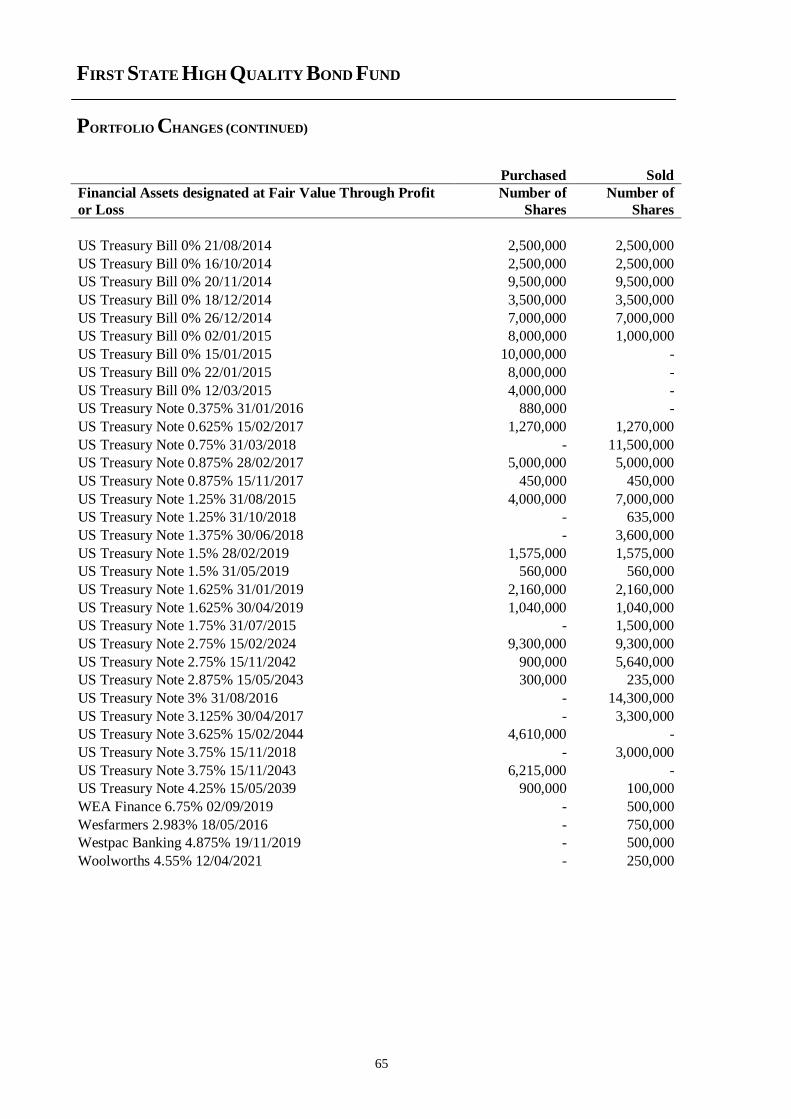
FIRST STATE HIGH QUALITY BOND FUND
PORTFOLIO CHANGES (CONTINUED)
65
Purchased Sold
Financial Assets designated at Fair Value Through Profit
or Loss
Number of
Shares
Number of
Shares
US Treasury Bill 0% 21/08/2014 2,500,000 2,500,000
US Treasury Bill 0% 16/10/2014 2,500,000 2,500,000
US Treasury Bill 0% 20/11/2014 9,500,000 9,500,000
US Treasury Bill 0% 18/12/2014 3,500,000 3,500,000
US Treasury Bill 0% 26/12/2014 7,000,000 7,000,000
US Treasury Bill 0% 02/01/2015 8,000,000 1,000,000
US Treasury Bill 0% 15/01/2015 10,000,000 -
US Treasury Bill 0% 22/01/2015 8,000,000 -
US Treasury Bill 0% 12/03/2015 4,000,000 -
US Treasury Note 0.375% 31/01/2016 880,000 -
US Treasury Note 0.625% 15/02/2017 1,270,000 1,270,000
US Treasury Note 0.75% 31/03/2018 - 11,500,000
US Treasury Note 0.875% 28/02/2017 5,000,000 5,000,000
US Treasury Note 0.875% 15/11/2017 450,000 450,000
US Treasury Note 1.25% 31/08/2015 4,000,000 7,000,000
US Treasury Note 1.25% 31/10/2018 - 635,000
US Treasury Note 1.375% 30/06/2018 - 3,600,000
US Treasury Note 1.5% 28/02/2019 1,575,000 1,575,000
US Treasury Note 1.5% 31/05/2019 560,000 560,000
US Treasury Note 1.625% 31/01/2019 2,160,000 2,160,000
US Treasury Note 1.625% 30/04/2019 1,040,000 1,040,000
US Treasury Note 1.75% 31/07/2015 - 1,500,000
US Treasury Note 2.75% 15/02/2024 9,300,000 9,300,000
US Treasury Note 2.75% 15/11/2042 900,000 5,640,000
US Treasury Note 2.875% 15/05/2043 300,000 235,000
US Treasury Note 3% 31/08/2016 - 14,300,000
US Treasury Note 3.125% 30/04/2017 - 3,300,000
US Treasury Note 3.625% 15/02/2044 4,610,000 -
US Treasury Note 3.75% 15/11/2018 - 3,000,000
US Treasury Note 3.75% 15/11/2043 6,215,000 -
US Treasury Note 4.25% 15/05/2039 900,000 100,000
WEA Finance 6.75% 02/09/2019 - 500,000
Wesfarmers 2.983% 18/05/2016 - 750,000
Westpac Banking 4.875% 19/11/2019 - 500,000
Woolworths 4.55% 12/04/2021 - 250,000
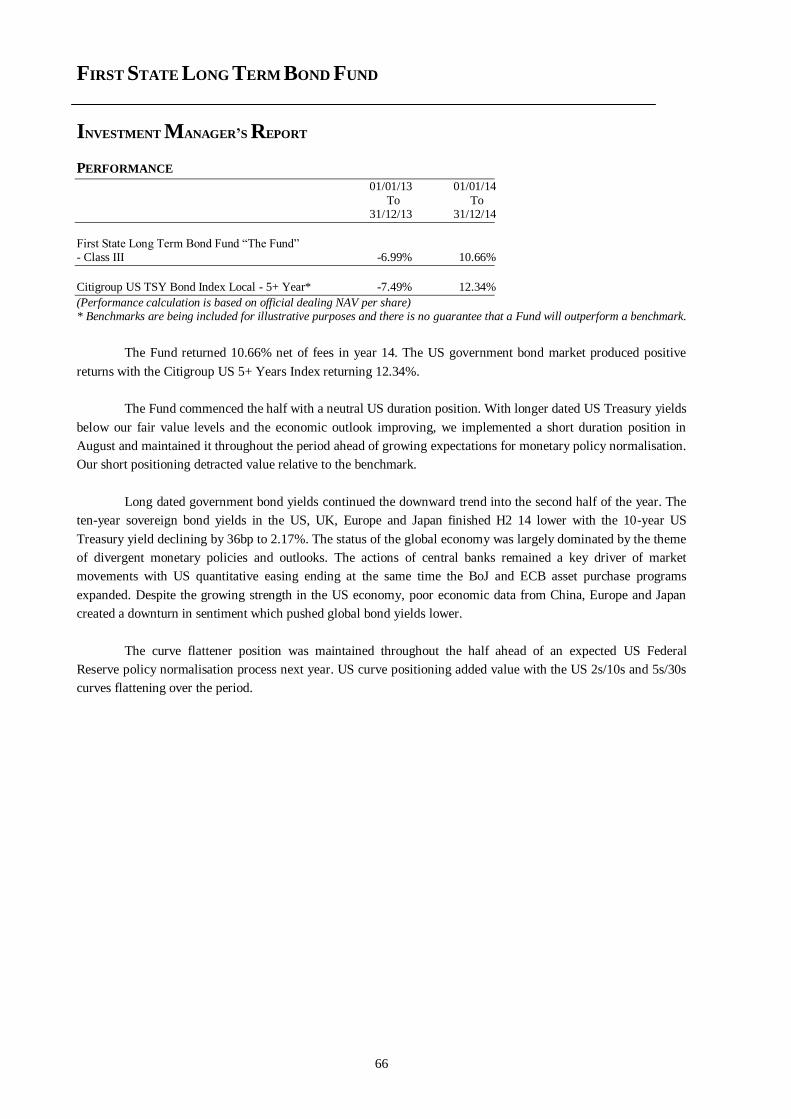
FIRST STATE LONG TERM BOND FUND
INVESTMENT MANAGER’S REPORT
66
PERFORMANCE
01/01/13 01/01/14
To To 31/12/13 31/12/14
First State Long Term Bond Fund “The Fund” - Class III -6.99% 10.66%
Citigroup US TSY Bond Index Local - 5+ Year* -7.49% 12.34%
(Performance calculation is based on official dealing NAV per share) * Benchmarks are being included for illustrative purposes and there is no guarantee that a Fund will outperform a benchmark.
The Fund returned 10.66% net of fees in year 14. The US government bond market produced positive
returns with the Citigroup US 5+ Years Index returning 12.34%.
The Fund commenced the half with a neutral US duration position. With longer dated US Treasury yields
below our fair value levels and the economic outlook improving, we implemented a short duration position in
August and maintained it throughout the period ahead of growing expectations for monetary policy normalisation.
Our short positioning detracted value relative to the benchmark.
Long dated government bond yields continued the downward trend into the second half of the year. The
ten-year sovereign bond yields in the US, UK, Europe and Japan finished H2 14 lower with the 10-year US
Treasury yield declining by 36bp to 2.17%. The status of the global economy was largely dominated by the theme
of divergent monetary policies and outlooks. The actions of central banks remained a key driver of market
movements with US quantitative easing ending at the same time the BoJ and ECB asset purchase programs
expanded. Despite the growing strength in the US economy, poor economic data from China, Europe and Japan
created a downturn in sentiment which pushed global bond yields lower.
The curve flattener position was maintained throughout the half ahead of an expected US Federal
Reserve policy normalisation process next year. US curve positioning added value with the US 2s/10s and 5s/30s
curves flattening over the period.
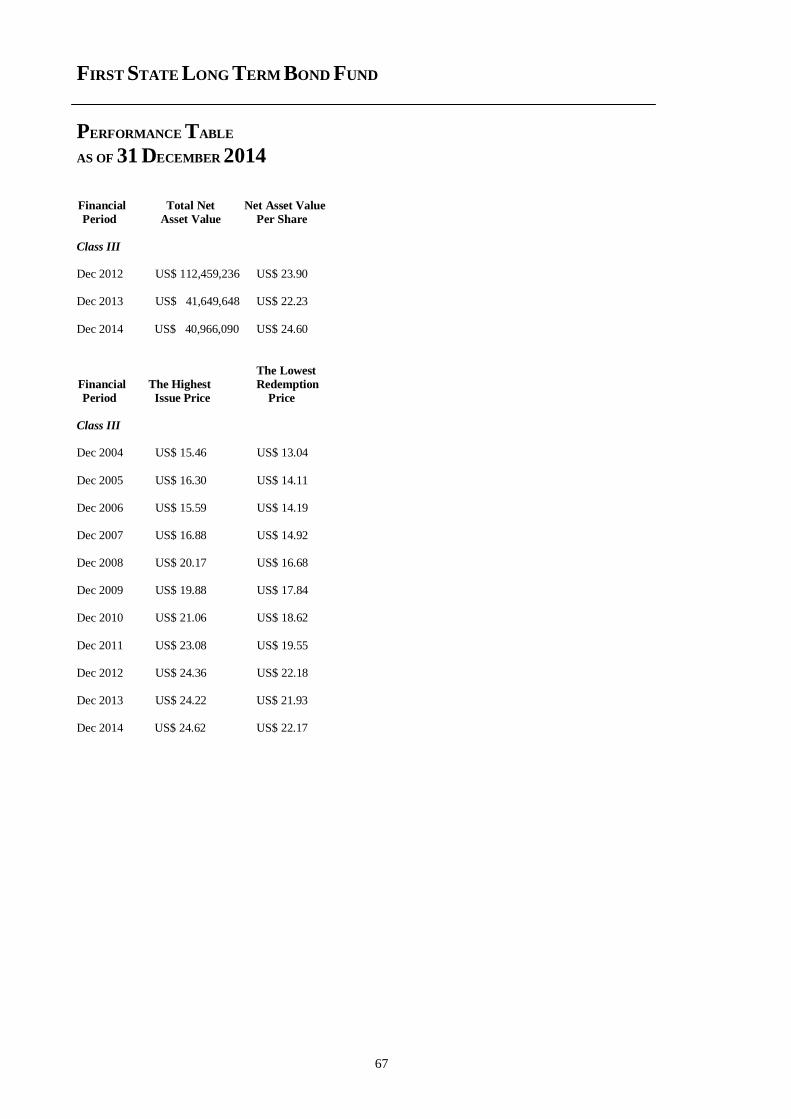
FIRST STATE LONG TERM BOND FUND
PERFORMANCE TABLE
AS OF 31 DECEMBER 2014
67
Financial Total Net Net Asset Value
Period Asset Value Per Share
Class III Dec 2012 US$ 112,459,236 US$ 23.90 Dec 2013 US$ 41,649,648 US$ 22.23
Dec 2014 US$ 40,966,090 US$ 24.60
The Lowest
Financial The Highest Redemption
Period Issue Price Price
Class III Dec 2004 US$ 15.46 US$ 13.04
Dec 2005 US$ 16.30 US$ 14.11 Dec 2006 US$ 15.59 US$ 14.19 Dec 2007 US$ 16.88 US$ 14.92 Dec 2008 US$ 20.17 US$ 16.68 Dec 2009 US$ 19.88 US$ 17.84 Dec 2010 US$ 21.06 US$ 18.62
Dec 2011 US$ 23.08 US$ 19.55 Dec 2012 US$ 24.36 US$ 22.18 Dec 2013 US$ 24.22 US$ 21.93 Dec 2014 US$ 24.62 US$ 22.17
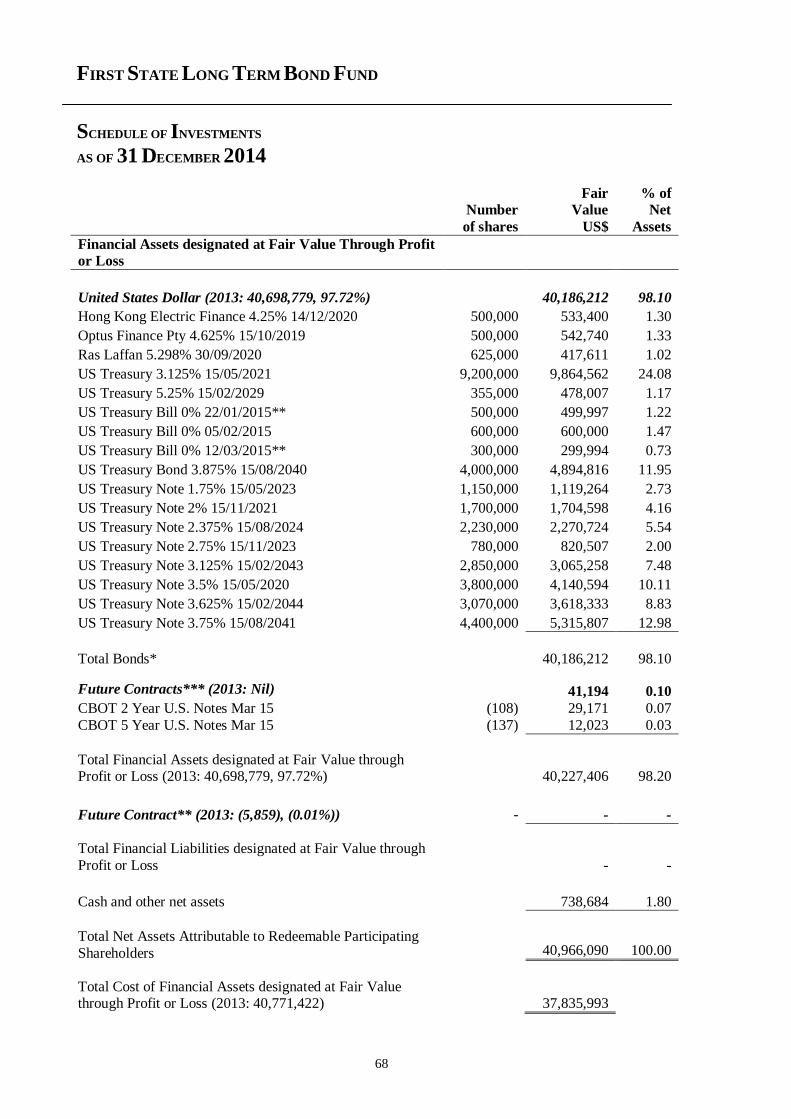
FIRST STATE LONG TERM BOND FUND
SCHEDULE OF INVESTMENTS
AS OF 31 DECEMBER 2014
68
Fair % of Number Value Net
of shares US$ Assets
Financial Assets designated at Fair Value Through Profit
or Loss
United States Dollar (2013: 40,698,779, 97.72%) 40,186,212 98.10
Hong Kong Electric Finance 4.25% 14/12/2020 500,000 533,400 1.30
Optus Finance Pty 4.625% 15/10/2019 500,000 542,740 1.33
Ras Laffan 5.298% 30/09/2020 625,000 417,611 1.02
US Treasury 3.125% 15/05/2021 9,200,000 9,864,562 24.08
US Treasury 5.25% 15/02/2029 355,000 478,007 1.17
US Treasury Bill 0% 22/01/2015** 500,000 499,997 1.22
US Treasury Bill 0% 05/02/2015 600,000 600,000 1.47
US Treasury Bill 0% 12/03/2015** 300,000 299,994 0.73
US Treasury Bond 3.875% 15/08/2040 4,000,000 4,894,816 11.95
US Treasury Note 1.75% 15/05/2023 1,150,000 1,119,264 2.73
US Treasury Note 2% 15/11/2021 1,700,000 1,704,598 4.16
US Treasury Note 2.375% 15/08/2024 2,230,000 2,270,724 5.54
US Treasury Note 2.75% 15/11/2023 780,000 820,507 2.00
US Treasury Note 3.125% 15/02/2043 2,850,000 3,065,258 7.48
US Treasury Note 3.5% 15/05/2020 3,800,000 4,140,594 10.11
US Treasury Note 3.625% 15/02/2044 3,070,000 3,618,333 8.83
US Treasury Note 3.75% 15/08/2041 4,400,000 5,315,807 12.98
Total Bonds* 40,186,212 98.10
Future Contracts*** (2013: Nil) 41,194 0.10
CBOT 2 Year U.S. Notes Mar 15 (108) 29,171 0.07
CBOT 5 Year U.S. Notes Mar 15 (137) 12,023 0.03
Total Financial Assets designated at Fair Value through Profit or Loss (2013: 40,698,779, 97.72%) 40,227,406 98.20
Future Contract** (2013: (5,859), (0.01%)) - - -
Total Financial Liabilities designated at Fair Value through
Profit or Loss - -
Cash and other net assets 738,684 1.80
Total Net Assets Attributable to Redeemable Participating
Shareholders 40,966,090 100.00
Total Cost of Financial Assets designated at Fair Value through Profit or Loss (2013: 40,771,422) 37,835,993
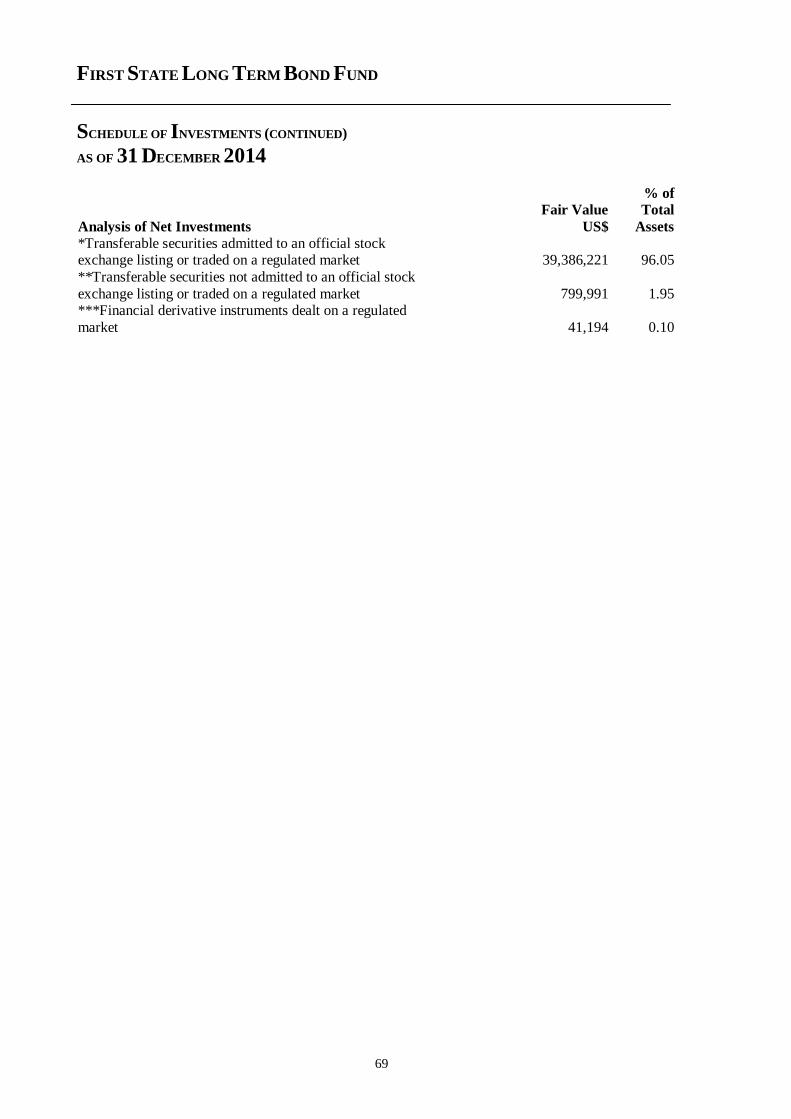
FIRST STATE LONG TERM BOND FUND
SCHEDULE OF INVESTMENTS (CONTINUED)
AS OF 31 DECEMBER 2014
69
Analysis of Net Investments Fair Value
US$
% of
Total
Assets *Transferable securities admitted to an official stock exchange listing or traded on a regulated market 39,386,221 96.05
**Transferable securities not admitted to an official stock
exchange listing or traded on a regulated market 799,991 1.95 ***Financial derivative instruments dealt on a regulated
market 41,194 0.10
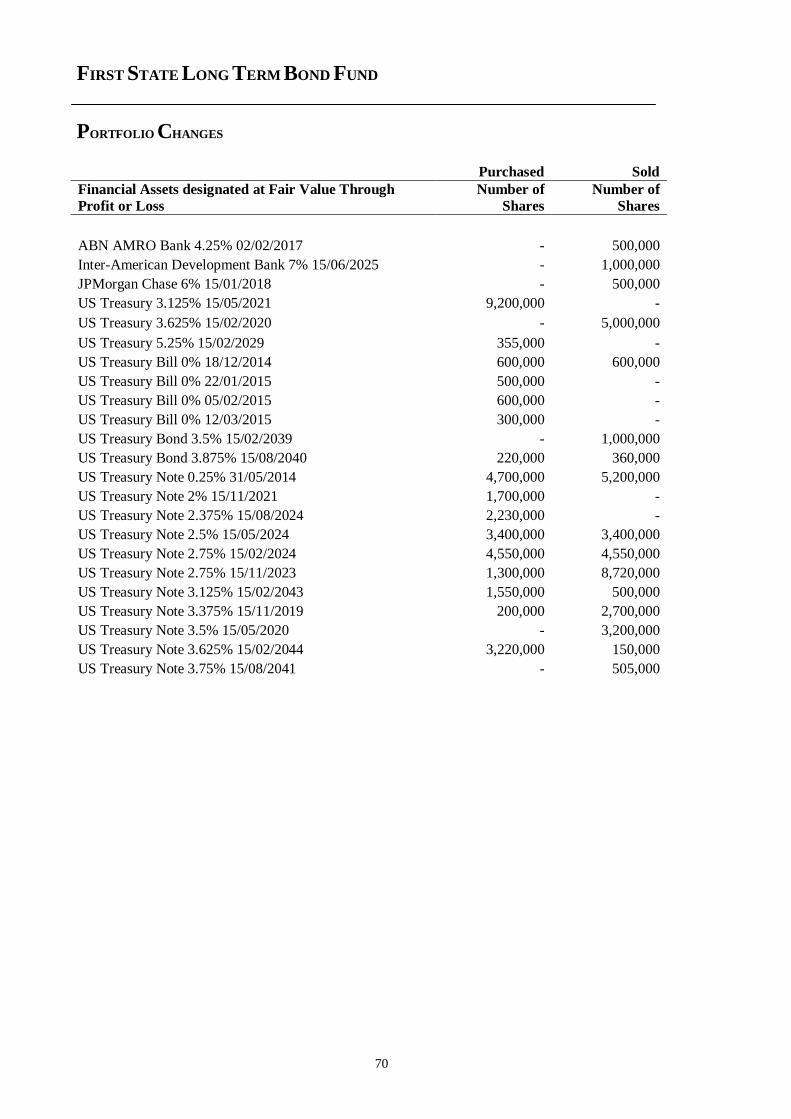
FIRST STATE LONG TERM BOND FUND
PORTFOLIO CHANGES
70
Purchased Sold
Financial Assets designated at Fair Value Through
Profit or Loss
Number of
Shares
Number of
Shares
ABN AMRO Bank 4.25% 02/02/2017 - 500,000
Inter-American Development Bank 7% 15/06/2025 - 1,000,000
JPMorgan Chase 6% 15/01/2018 - 500,000
US Treasury 3.125% 15/05/2021 9,200,000 -
US Treasury 3.625% 15/02/2020 - 5,000,000
US Treasury 5.25% 15/02/2029 355,000 -
US Treasury Bill 0% 18/12/2014 600,000 600,000
US Treasury Bill 0% 22/01/2015 500,000 -
US Treasury Bill 0% 05/02/2015 600,000 -
US Treasury Bill 0% 12/03/2015 300,000 -
US Treasury Bond 3.5% 15/02/2039 - 1,000,000
US Treasury Bond 3.875% 15/08/2040 220,000 360,000
US Treasury Note 0.25% 31/05/2014 4,700,000 5,200,000
US Treasury Note 2% 15/11/2021 1,700,000 -
US Treasury Note 2.375% 15/08/2024 2,230,000 -
US Treasury Note 2.5% 15/05/2024 3,400,000 3,400,000
US Treasury Note 2.75% 15/02/2024 4,550,000 4,550,000
US Treasury Note 2.75% 15/11/2023 1,300,000 8,720,000
US Treasury Note 3.125% 15/02/2043 1,550,000 500,000
US Treasury Note 3.375% 15/11/2019 200,000 2,700,000
US Treasury Note 3.5% 15/05/2020 - 3,200,000
US Treasury Note 3.625% 15/02/2044 3,220,000 150,000
US Treasury Note 3.75% 15/08/2041 - 505,000
FIRST STATE GREATER CHINA GROWTH FUND
INVESTMENT MANAGER’S REPORT
71
PERFORMANCE
01/01/13 01/01/14 To To 31/12/13 31/12/14
First State Greater China Growth Fund “The Fund”
- Class I 11.99% 4.09% - Class I (Dist)^ 11.98% 4.09% - Class IV 11.43% 3.53% - Class III (Dist)*^ 8.40% 4.47% - Class III** N/A 6.90%
MSCI Golden Dragon (Total Return) 7.25% 8.03% MSCI Golden Dragon (Total Return)*# 6.36% 8.03% MSCI Golden Dragon (Total Return)**# N/A 11.96%
(Performance calculation is based on official dealing NAV per share) ^ Dividend adjustment return * Inception date – 16th August 2013. ** Inception date – 1st April 2014. # Benchmarks are being included for illustrative purposes and there is no guarantee that a Fund will outperform a benchmark.
The Greater China markets rose over the 12 months to 31 December 2014 as concerns about a slowing
economy were offset by policy measures in China, including an interest rate cut. The MSCI Golden Dragon Index
gained 8.1% in US dollar terms over the period, outperforming the MSCI AC World Index which was up by 4.7%.
Taiwan (+10.1%) rose the most over the period as stocks in the IT sector were particularly strong. China (+8.3%)
slightly outperformed as the market rallied in the second half of the year and Hong Kong (+5.1%) lagged on
global concerns.
China Oilfield Services suffered from a steep decline in the oil price and ENN Energy underperformed
on concerns about slowing economic growth, price hikes and losses made by its gas refuelling stations, which the
chairman sold to the company in October. Mindray Medical fell on weak results as it saw slower growth in China.
Positive contributors to performance included Taiwan Semiconductor which advanced on the back of the
growing adoption of smartphones in emerging markets and Link REIT which benefited from a defensive earnings
profile. China Taiping Insurance (Financials) rose as financial companies performed well on looser monetary
policy.
Major purchases over the period included Chinese healthcare companies CSPC Pharmaceutical and Sino
Biopharm; both were bought because of the positive outlook for healthcare spending in the country. We also
bought AirTAC International (Industrials), a well-run Taiwanese manufacturer of pneumatic equipment used in
factory automation.
We sold Yum! Brands on valuation concerns and Hiwin Technology following disappointing results and
valuation worries. We reduced China Vanke, a high quality property company, following a rally in the share price.
The economic slowdown in China is likely to continue although it may stabilise in the short-term.
Banking, property and oversupplied sectors could pose significant risks to economic growth. These are all well-
flagged but critical issues. Leading companies with healthy balance sheets should survive the downturn better,
while small and less conservative players are likely to face more difficulties. On the positive side, there have been
selective measures to help promote sustainable development in the areas of environment, product upgrading and
livelihood of the general public. Chinese capital markets are opening up further with initiatives such as the
‘Shanghai-Hong Kong Stock Connect’ programme and greater access for more qualified foreign institutional
investors.
FIRST STATE GREATER CHINA GROWTH FUND
PERFORMANCE TABLE
AS OF 31 DECEMBER 2014
72
Financial Total Net Net Asset Value
Period Asset Value Per Share
Class I Dec 2012 US$ 609,485,118 US$ 63.10 Dec 2013 US$ 689,371,845 US$ 70.67
Dec 2014 US$ 721,639,239 US$ 73.56
Class I Distributing Dec 2012 US$ 6,528,199 US$ 58.62 Dec 2013 US$ 8,475,018 US$ 65.12 Dec 2014 US$ 5,559,828 US$ 67.48
Class IV
Dec 2012 US$ 7,855,176 US$ 10.41 Dec 2013 US$ 8,454,809 US$ 11.60 Dec 2014 US$ 14,587,283 US$ 12.01
Class III Distributing Dec 2013 US$ 1,769,895 US$ 10.84 Dec 2014 US$ 6,166,805 US$ 11.22
Class III Dec 2014 US$ 22,182,176 US$ 10.69
The Lowest
Financial The Highest Redemption
Period Issue Price Price
Class I
Dec 2004 US$ 21.38 US$ 14.77 Dec 2005 US$ 24.88 US$ 19.71 Dec 2006 US$ 35.59 US$ 23.82 Dec 2007 US$ 57.94 US$ 33.32 Dec 2008 US$ 52.70 US$ 24.26 Dec 2009 US$ 49.35 US$ 26.77
Dec 2010 US$ 60.63 US$ 44.87 Dec 2011 US$ 60.63 US$ 44.87 Dec 2012 US$ 63.11 US$ 52.11
Dec 2013 US$ 71.18 US$ 59.38
FIRST STATE GREATER CHINA GROWTH FUND
PERFORMANCE TABLE (CONTINUED)
AS OF 31 DECEMBER 2014
73
The Lowest
Financial The Highest Redemption
Period Issue Price Price
Class I (continued) Dec 2014 US$ 78.88 US$ 64.33
Class I Distributing Dec 2004 US$ 21.37 US$ 17.99
Dec 2005 US$ 24.76 US$ 19.70 Dec 2006 US$ 34.92 US$ 23.71
Dec 2007 US$ 56.63 US$ 32.69 Dec 2008 US$ 51.51 US$ 23.59 Dec 2009 US$ 46.91 US$ 25.61 Dec 2010 US$ 57.27 US$ 42.55 Dec 2011 US$ 58.10 US$ 43.93
Dec 2012 US$ 58.62 US$ 48.71 Dec 2013 US$ 65.60 US$ 55.00 Dec 2014 US$ 72.36 US$ 59.28
Class IV
Dec 2011 US$ 10.26 US$ 7.78 Dec 2012 US$ 10.41 US$ 8.62 Dec 2013 US$ 11.69 US$ 9.77 Dec 2014 US$ 12.91 US$ 10.56
Class III Distributing
Dec 2013 US$ 10.91 US$ 9.69
Dec 2014 US$ 12.01 US$ 9.87
Class III Dec 2014 US$ 11.45 US$ 9.80
FIRST STATE GREATER CHINA GROWTH FUND
SCHEDULE OF INVESTMENTS
AS OF 31 DECEMBER 2014
74
China (2013: 342,457,230, 48.36%) 341,937,877 44.40
AAC Technologies Holdings 1,383,500 7,412,993 0.96
Baidu 114,855 26,417,799 3.43
China Blue Chemical 13,128,000 4,655,589 0.60
China Construction Bank 19,419,154 15,951,926 2.07
China Mengniu Dairy 4,493,000 18,540,857 2.41
China Merchants Bank 11,581,736 29,064,302 3.77
China Oilfield Services 14,922,000 25,900,938 3.36
China Resources Enterprise 2,280,000 4,774,900 0.62
China Resources Land 3,678,000 9,699,480 1.26
China Taiping Insurance Holdings 7,633,839 21,854,424 2.84
China Telecom 18,159,906 10,631,948 1.38
China Vanke 9,720,293 21,685,471 2.82
CNOOC 11,432,500 15,391,647 2.00
ENN Energy Holdings 5,922,000 33,601,950 4.36
Hengan International Group 727,500 7,603,778 0.99
Lenovo Group 10,408,000 13,690,233 1.78
Mindray Medical International 599,830 16,279,386 2.11
Shenzhou International Group Holdings 3,189,000 10,527,806 1.37
Tencent Holdings 2,010,400 29,166,102 3.79
Want Want China Holdings 14,482,000 19,086,348 2.48
Hong Kong (2013: 181,734,837, 25.67%) 202,900,566 26.35
AIA Group 4,174,600 23,229,458 3.02
ASM Pacific Technology 1,335,700 12,746,297 1.65
Cheung Kong Holdings 2,327,000 39,100,670 5.08
China Resources Gas 4,258,000 11,064,304 1.44
CSPC Pharmaceutical 13,426,000 11,842,575 1.54
Dairy Farm International Holdings 1,216,075 10,944,675 1.42
Hong Kong & China Gas 11,975,238 27,426,508 3.56
Jardine Matheson Holdings 166,210 10,130,500 1.31
Li & Fung 6,800,040 6,366,364 0.83
Lung Kee (Bermuda) Holdings 5,465,300 1,487,099 0.19
Minth Group 3,140,000 6,519,269 0.85
Sino Biopharmaceutical 9,544,000 8,652,252 1.12
Swire Pacific "A" 436,500 5,685,243 0.74
The Link Real Estate Investment Trust 4,425,181 27,705,352 3.60
Fair % of
Number Value Net
of shares US$ Assets
Financial Assets designated at Fair Value Through
Profit or Loss
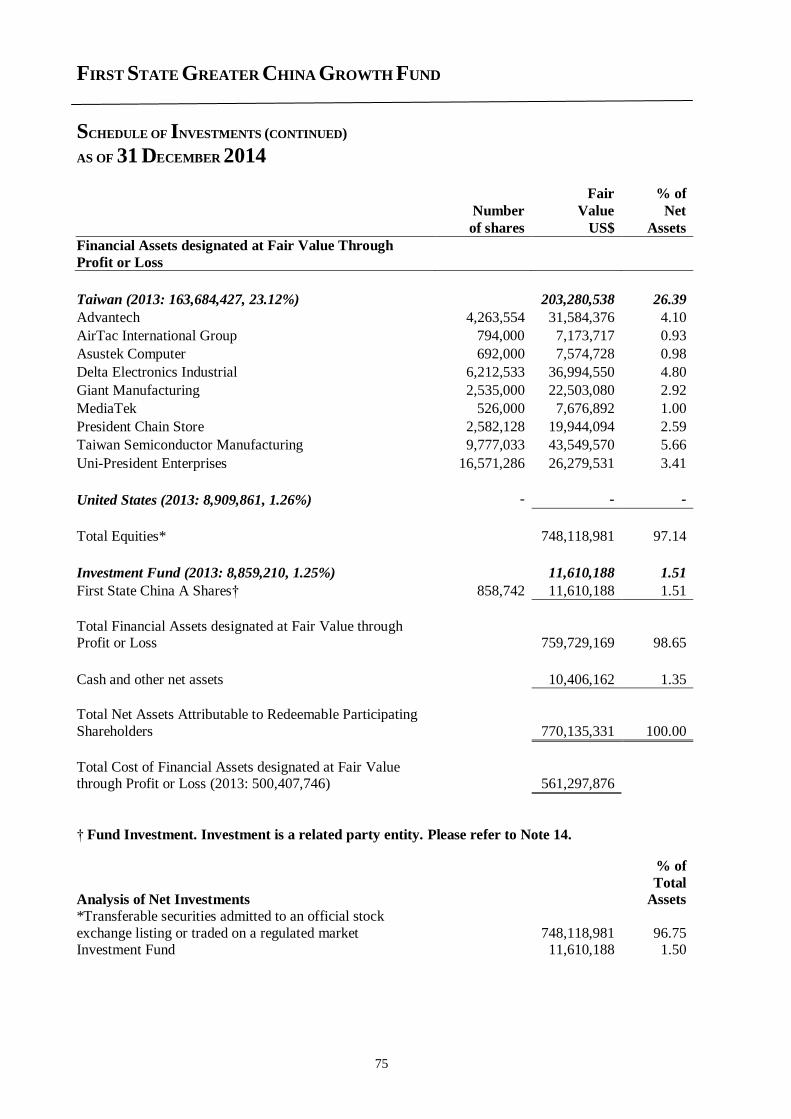
FIRST STATE GREATER CHINA GROWTH FUND
SCHEDULE OF INVESTMENTS (CONTINUED)
AS OF 31 DECEMBER 2014
75
Taiwan (2013: 163,684,427, 23.12%) 203,280,538 26.39
Advantech 4,263,554 31,584,376 4.10
AirTac International Group 794,000 7,173,717 0.93
Asustek Computer 692,000 7,574,728 0.98
Delta Electronics Industrial 6,212,533 36,994,550 4.80
Giant Manufacturing 2,535,000 22,503,080 2.92
MediaTek 526,000 7,676,892 1.00
President Chain Store 2,582,128 19,944,094 2.59
Taiwan Semiconductor Manufacturing 9,777,033 43,549,570 5.66
Uni-President Enterprises 16,571,286 26,279,531 3.41
United States (2013: 8,909,861, 1.26%) - - -
Total Equities* 748,118,981 97.14
Investment Fund (2013: 8,859,210, 1.25%) 11,610,188 1.51
First State China A Shares† 858,742 11,610,188 1.51
Total Financial Assets designated at Fair Value through Profit or Loss 759,729,169 98.65
Cash and other net assets 10,406,162 1.35
Total Net Assets Attributable to Redeemable Participating
Shareholders 770,135,331 100.00
Total Cost of Financial Assets designated at Fair Value through Profit or Loss (2013: 500,407,746) 561,297,876
† Fund Investment. Investment is a related party entity. Please refer to Note 14.
Analysis of Net Investments
% of
Total
Assets *Transferable securities admitted to an official stock
exchange listing or traded on a regulated market 748,118,981 96.75 Investment Fund 11,610,188 1.50
Fair % of
Number Value Net
of shares US$ Assets
Financial Assets designated at Fair Value Through
Profit or Loss
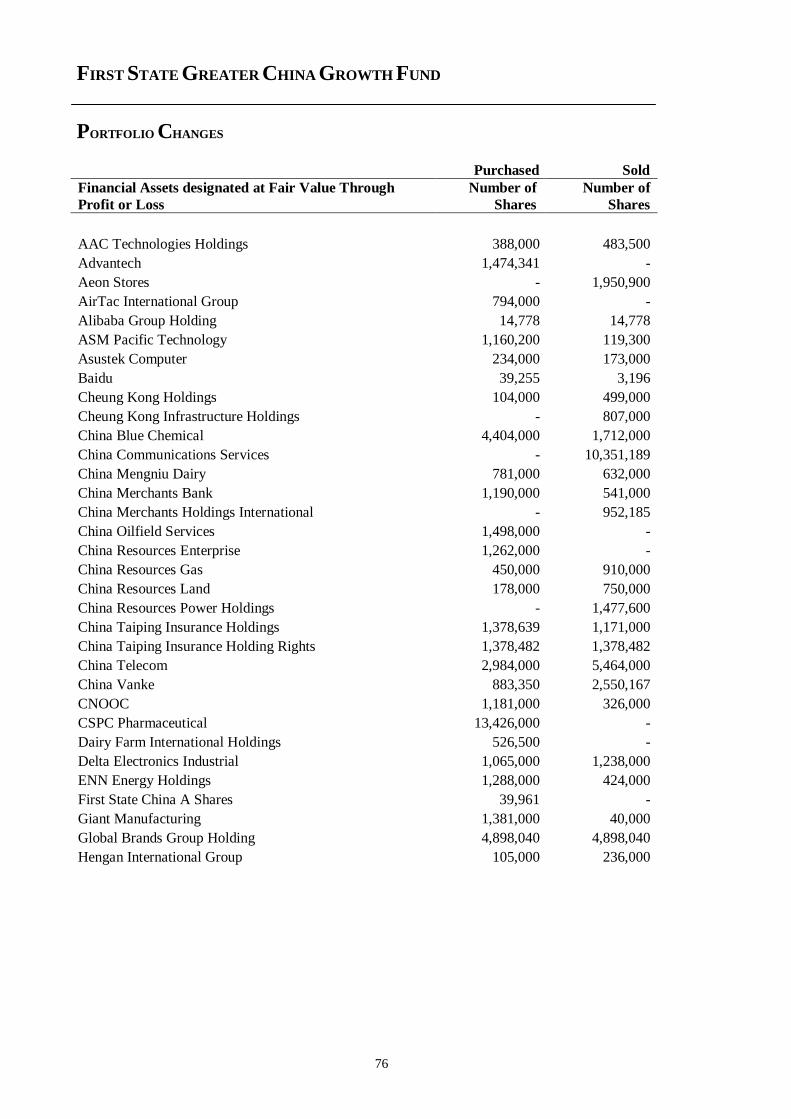
FIRST STATE GREATER CHINA GROWTH FUND
PORTFOLIO CHANGES
76
Purchased Sold
Financial Assets designated at Fair Value Through
Profit or Loss
Number of
Shares
Number of
Shares
AAC Technologies Holdings 388,000 483,500
Advantech 1,474,341 -
Aeon Stores - 1,950,900
AirTac International Group 794,000 -
Alibaba Group Holding 14,778 14,778
ASM Pacific Technology 1,160,200 119,300
Asustek Computer 234,000 173,000
Baidu 39,255 3,196
Cheung Kong Holdings 104,000 499,000
Cheung Kong Infrastructure Holdings - 807,000
China Blue Chemical 4,404,000 1,712,000
China Communications Services - 10,351,189
China Mengniu Dairy 781,000 632,000
China Merchants Bank 1,190,000 541,000
China Merchants Holdings International - 952,185
China Oilfield Services 1,498,000 -
China Resources Enterprise 1,262,000 -
China Resources Gas 450,000 910,000
China Resources Land 178,000 750,000
China Resources Power Holdings - 1,477,600
China Taiping Insurance Holdings 1,378,639 1,171,000
China Taiping Insurance Holding Rights 1,378,482 1,378,482
China Telecom 2,984,000 5,464,000
China Vanke 883,350 2,550,167
CNOOC 1,181,000 326,000
CSPC Pharmaceutical 13,426,000 -
Dairy Farm International Holdings 526,500 -
Delta Electronics Industrial 1,065,000 1,238,000
ENN Energy Holdings 1,288,000 424,000
First State China A Shares 39,961 -
Giant Manufacturing 1,381,000 40,000
Global Brands Group Holding 4,898,040 4,898,040
Hengan International Group 105,000 236,000
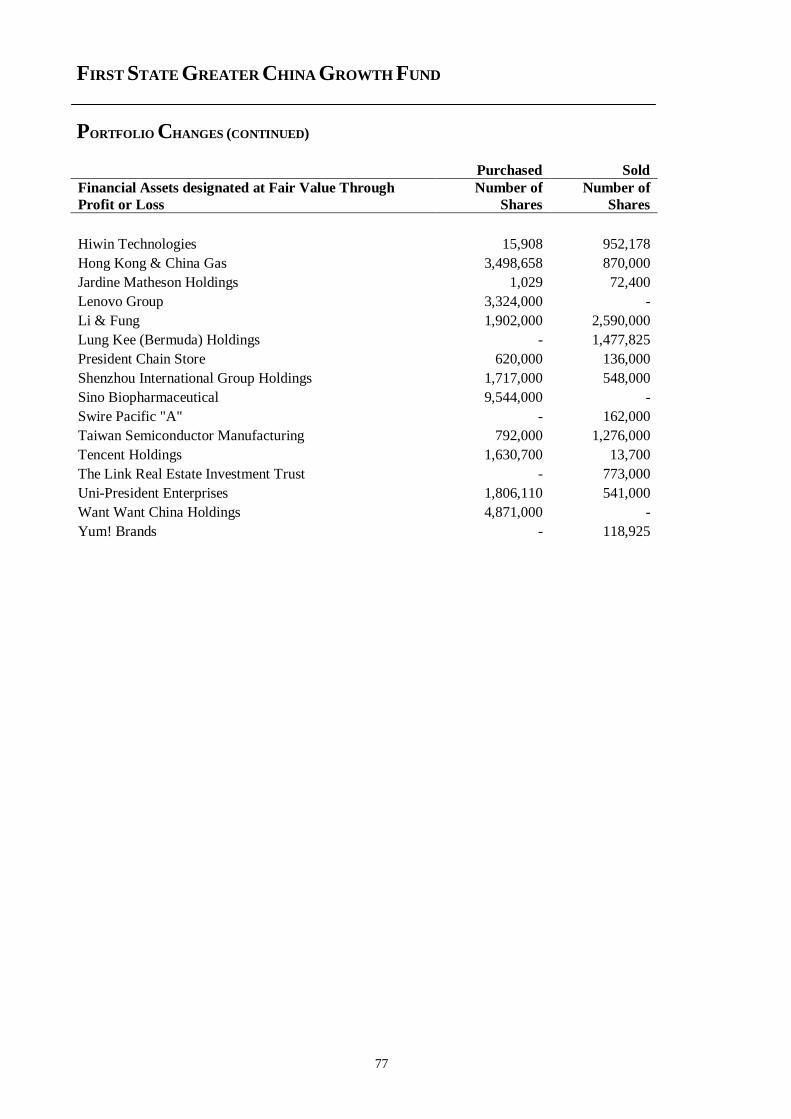
FIRST STATE GREATER CHINA GROWTH FUND
PORTFOLIO CHANGES (CONTINUED)
77
Purchased Sold
Financial Assets designated at Fair Value Through
Profit or Loss
Number of
Shares
Number of
Shares
Hiwin Technologies 15,908 952,178
Hong Kong & China Gas 3,498,658 870,000
Jardine Matheson Holdings 1,029 72,400
Lenovo Group 3,324,000 -
Li & Fung 1,902,000 2,590,000
Lung Kee (Bermuda) Holdings - 1,477,825
President Chain Store 620,000 136,000
Shenzhou International Group Holdings 1,717,000 548,000
Sino Biopharmaceutical 9,544,000 -
Swire Pacific "A" - 162,000
Taiwan Semiconductor Manufacturing 792,000 1,276,000
Tencent Holdings 1,630,700 13,700
The Link Real Estate Investment Trust - 773,000
Uni-President Enterprises 1,806,110 541,000
Want Want China Holdings 4,871,000 -
Yum! Brands - 118,925
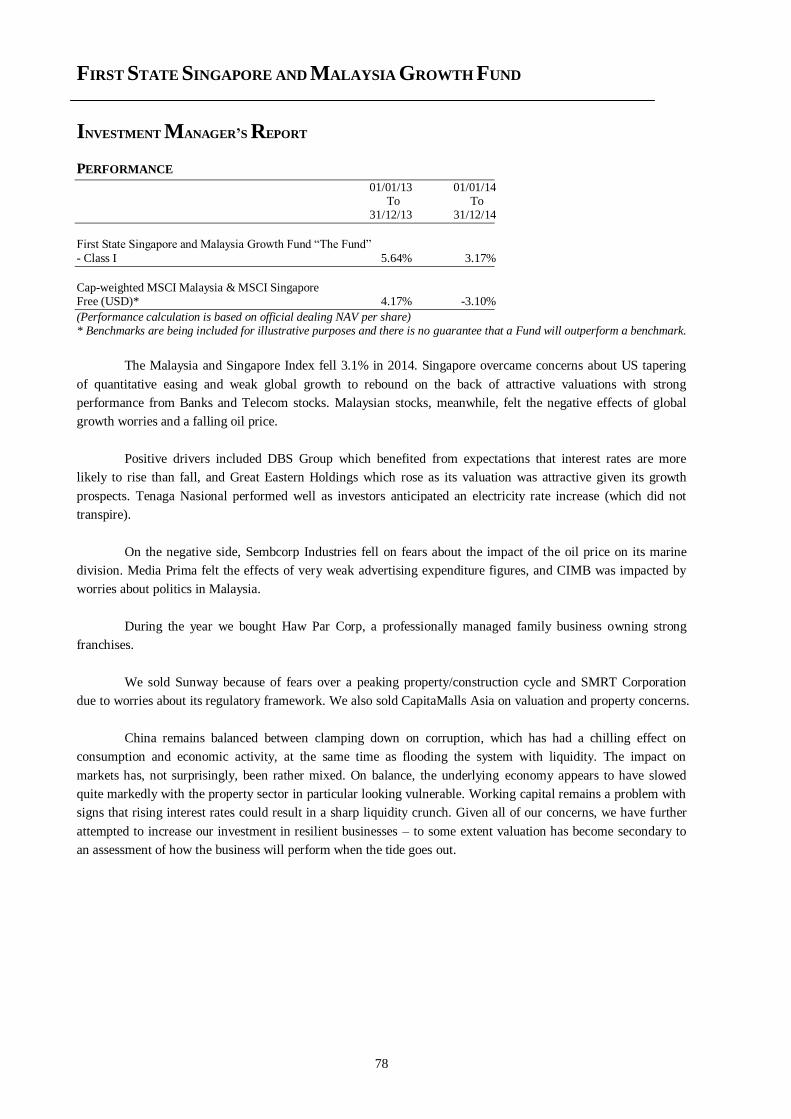
FIRST STATE SINGAPORE AND MALAYSIA GROWTH FUND
INVESTMENT MANAGER’S REPORT
78
PERFORMANCE
01/01/13 01/01/14 To To 31/12/13 31/12/14
First State Singapore and Malaysia Growth Fund “The Fund”
- Class I 5.64% 3.17%
Cap-weighted MSCI Malaysia & MSCI Singapore Free (USD)* 4.17% -3.10%
(Performance calculation is based on official dealing NAV per share) * Benchmarks are being included for illustrative purposes and there is no guarantee that a Fund will outperform a benchmark.
The Malaysia and Singapore Index fell 3.1% in 2014. Singapore overcame concerns about US tapering
of quantitative easing and weak global growth to rebound on the back of attractive valuations with strong
performance from Banks and Telecom stocks. Malaysian stocks, meanwhile, felt the negative effects of global
growth worries and a falling oil price.
Positive drivers included DBS Group which benefited from expectations that interest rates are more
likely to rise than fall, and Great Eastern Holdings which rose as its valuation was attractive given its growth
prospects. Tenaga Nasional performed well as investors anticipated an electricity rate increase (which did not
transpire).
On the negative side, Sembcorp Industries fell on fears about the impact of the oil price on its marine
division. Media Prima felt the effects of very weak advertising expenditure figures, and CIMB was impacted by
worries about politics in Malaysia.
During the year we bought Haw Par Corp, a professionally managed family business owning strong
franchises.
We sold Sunway because of fears over a peaking property/construction cycle and SMRT Corporation
due to worries about its regulatory framework. We also sold CapitaMalls Asia on valuation and property concerns.
China remains balanced between clamping down on corruption, which has had a chilling effect on
consumption and economic activity, at the same time as flooding the system with liquidity. The impact on
markets has, not surprisingly, been rather mixed. On balance, the underlying economy appears to have slowed
quite markedly with the property sector in particular looking vulnerable. Working capital remains a problem with
signs that rising interest rates could result in a sharp liquidity crunch. Given all of our concerns, we have further
attempted to increase our investment in resilient businesses – to some extent valuation has become secondary to
an assessment of how the business will perform when the tide goes out.
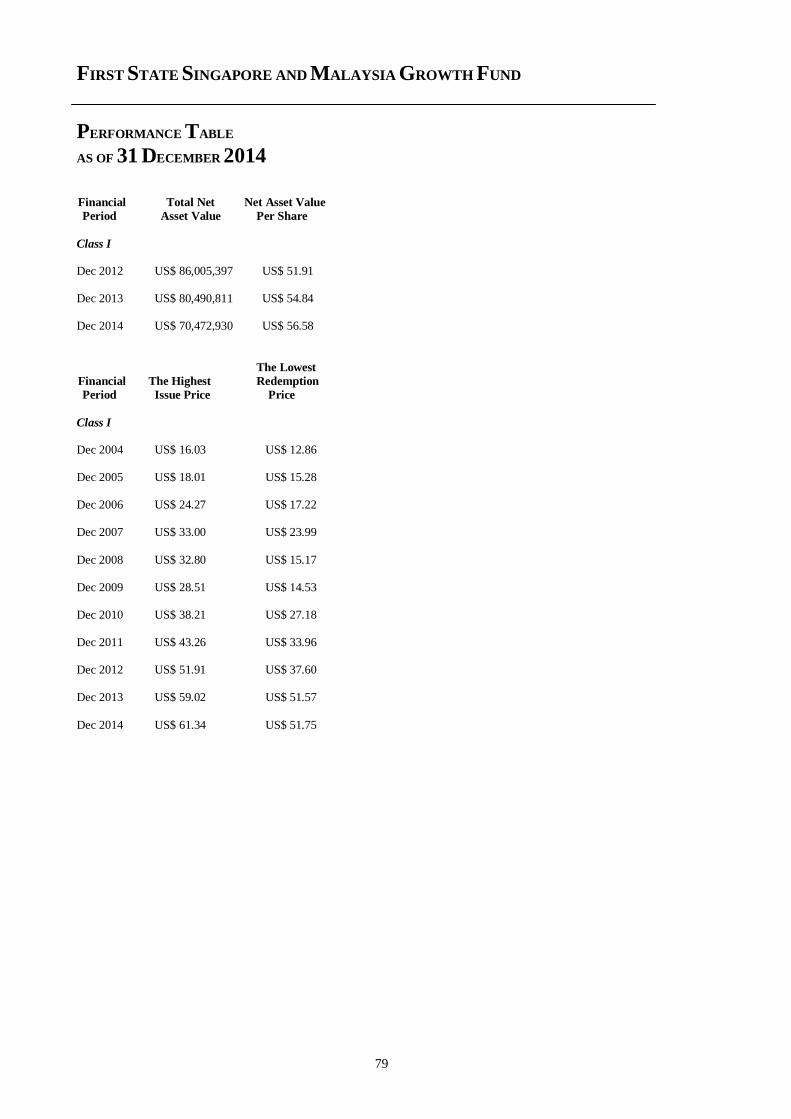
FIRST STATE SINGAPORE AND MALAYSIA GROWTH FUND
PERFORMANCE TABLE
AS OF 31 DECEMBER 2014
79
Financial Total Net Net Asset Value
Period Asset Value Per Share
Class I Dec 2012 US$ 86,005,397 US$ 51.91 Dec 2013 US$ 80,490,811 US$ 54.84 Dec 2014 US$ 70,472,930 US$ 56.58
The Lowest
Financial The Highest Redemption
Period Issue Price Price
Class I Dec 2004 US$ 16.03 US$ 12.86 Dec 2005 US$ 18.01 US$ 15.28 Dec 2006 US$ 24.27 US$ 17.22 Dec 2007 US$ 33.00 US$ 23.99
Dec 2008 US$ 32.80 US$ 15.17 Dec 2009 US$ 28.51 US$ 14.53 Dec 2010 US$ 38.21 US$ 27.18 Dec 2011 US$ 43.26 US$ 33.96 Dec 2012 US$ 51.91 US$ 37.60 Dec 2013 US$ 59.02 US$ 51.57
Dec 2014 US$ 61.34 US$ 51.75
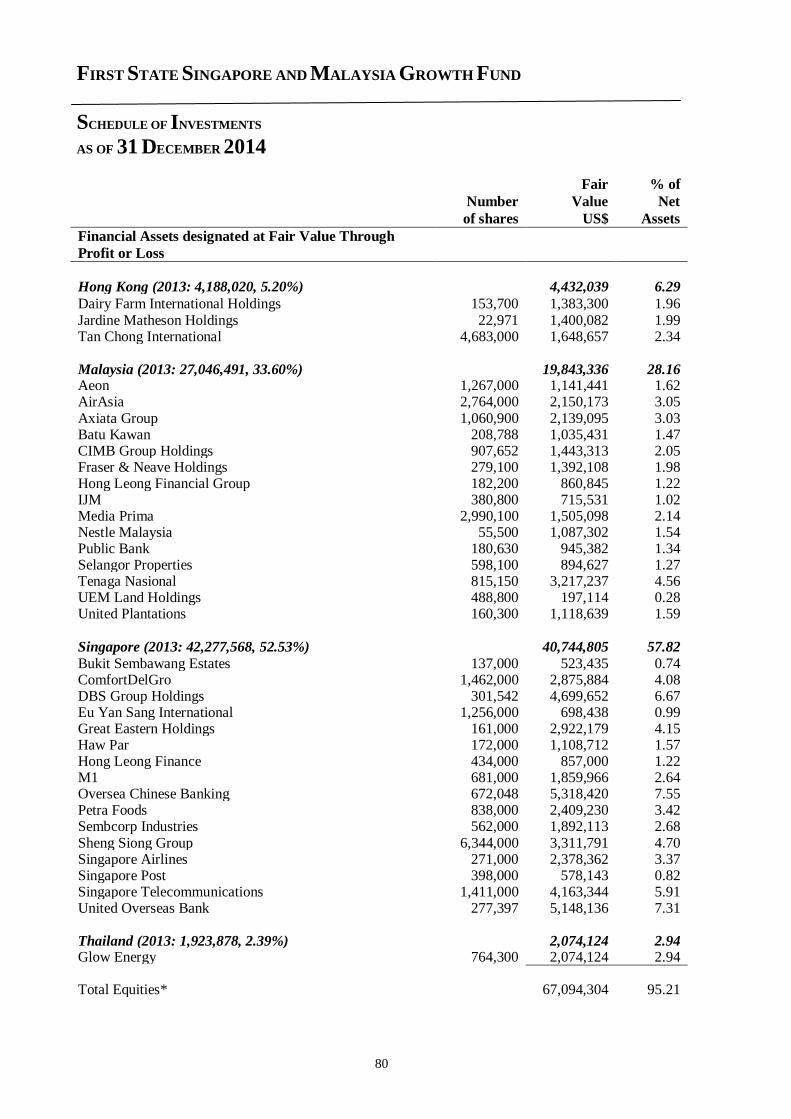
FIRST STATE SINGAPORE AND MALAYSIA GROWTH FUND
SCHEDULE OF INVESTMENTS
AS OF 31 DECEMBER 2014
80
Fair % of
Number Value Net
of shares US$ Assets
Financial Assets designated at Fair Value Through
Profit or Loss
Hong Kong (2013: 4,188,020, 5.20%) 4,432,039 6.29
Dairy Farm International Holdings 153,700 1,383,300 1.96 Jardine Matheson Holdings 22,971 1,400,082 1.99 Tan Chong International 4,683,000 1,648,657 2.34 Malaysia (2013: 27,046,491, 33.60%) 19,843,336 28.16 Aeon 1,267,000 1,141,441 1.62 AirAsia 2,764,000 2,150,173 3.05 Axiata Group 1,060,900 2,139,095 3.03 Batu Kawan 208,788 1,035,431 1.47 CIMB Group Holdings 907,652 1,443,313 2.05 Fraser & Neave Holdings 279,100 1,392,108 1.98 Hong Leong Financial Group 182,200 860,845 1.22 IJM 380,800 715,531 1.02 Media Prima 2,990,100 1,505,098 2.14 Nestle Malaysia 55,500 1,087,302 1.54 Public Bank 180,630 945,382 1.34 Selangor Properties 598,100 894,627 1.27 Tenaga Nasional 815,150 3,217,237 4.56 UEM Land Holdings 488,800 197,114 0.28 United Plantations 160,300 1,118,639 1.59
Singapore (2013: 42,277,568, 52.53%) 40,744,805 57.82
Bukit Sembawang Estates 137,000 523,435 0.74 ComfortDelGro 1,462,000 2,875,884 4.08 DBS Group Holdings 301,542 4,699,652 6.67 Eu Yan Sang International 1,256,000 698,438 0.99 Great Eastern Holdings 161,000 2,922,179 4.15 Haw Par 172,000 1,108,712 1.57 Hong Leong Finance 434,000 857,000 1.22 M1 681,000 1,859,966 2.64 Oversea Chinese Banking 672,048 5,318,420 7.55 Petra Foods 838,000 2,409,230 3.42 Sembcorp Industries 562,000 1,892,113 2.68 Sheng Siong Group 6,344,000 3,311,791 4.70 Singapore Airlines 271,000 2,378,362 3.37 Singapore Post 398,000 578,143 0.82 Singapore Telecommunications 1,411,000 4,163,344 5.91 United Overseas Bank 277,397 5,148,136 7.31 Thailand (2013: 1,923,878, 2.39%) 2,074,124 2.94 Glow Energy 764,300 2,074,124 2.94
Total Equities* 67,094,304 95.21
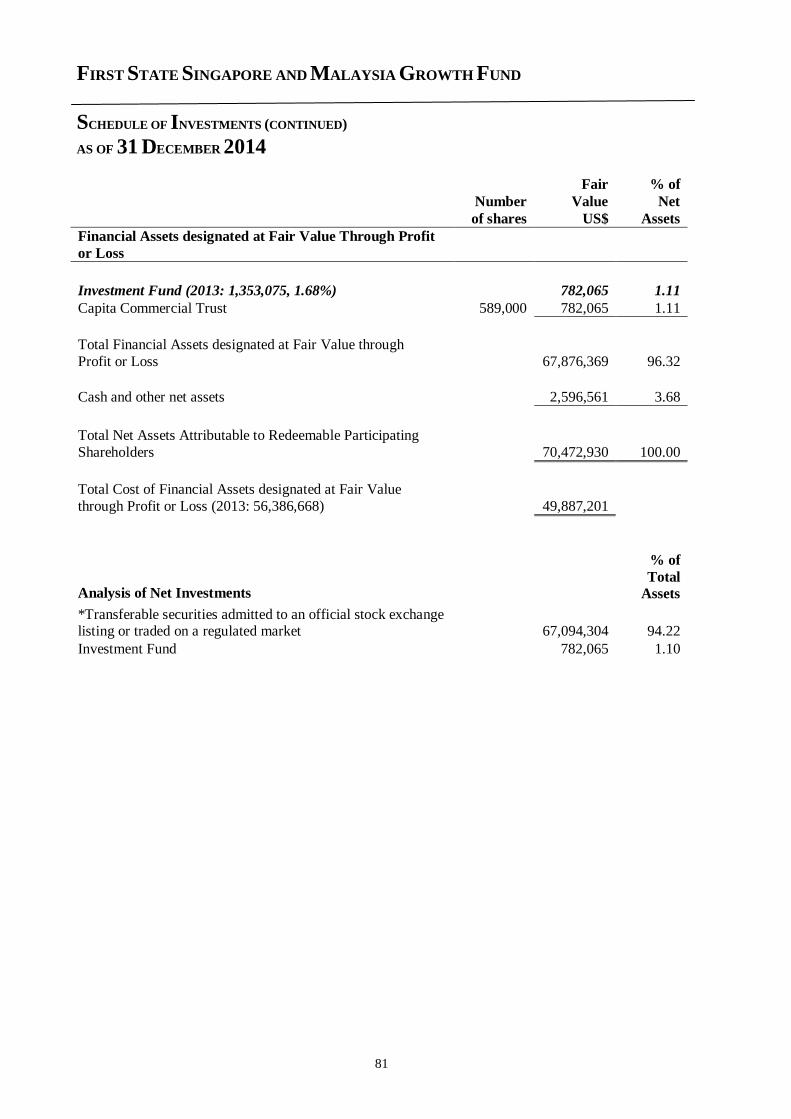
FIRST STATE SINGAPORE AND MALAYSIA GROWTH FUND
SCHEDULE OF INVESTMENTS (CONTINUED)
AS OF 31 DECEMBER 2014
81
Fair % of
Number Value Net
of shares US$ Assets
Financial Assets designated at Fair Value Through Profit
or Loss
Investment Fund (2013: 1,353,075, 1.68%) 782,065 1.11
Capita Commercial Trust 589,000 782,065 1.11
Total Financial Assets designated at Fair Value through
Profit or Loss 67,876,369 96.32
Cash and other net assets 2,596,561 3.68
Total Net Assets Attributable to Redeemable Participating
Shareholders 70,472,930 100.00
Total Cost of Financial Assets designated at Fair Value
through Profit or Loss (2013: 56,386,668) 49,887,201
Analysis of Net Investments
% of
Total
Assets
*Transferable securities admitted to an official stock exchange listing or traded on a regulated market 67,094,304 94.22
Investment Fund 782,065 1.10
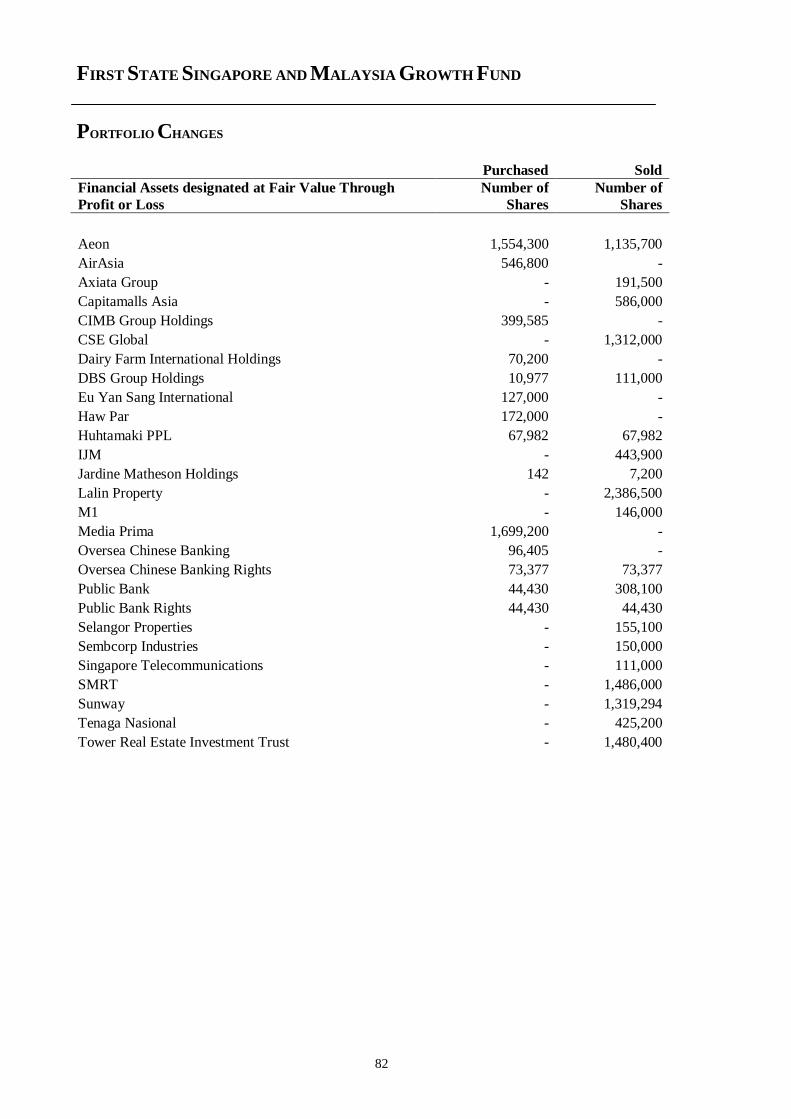
FIRST STATE SINGAPORE AND MALAYSIA GROWTH FUND
PORTFOLIO CHANGES
82
Purchased Sold
Financial Assets designated at Fair Value Through
Profit or Loss
Number of
Shares
Number of
Shares
Aeon 1,554,300 1,135,700
AirAsia 546,800 -
Axiata Group - 191,500
Capitamalls Asia - 586,000
CIMB Group Holdings 399,585 -
CSE Global - 1,312,000
Dairy Farm International Holdings 70,200 -
DBS Group Holdings 10,977 111,000
Eu Yan Sang International 127,000 -
Haw Par 172,000 -
Huhtamaki PPL 67,982 67,982
IJM - 443,900
Jardine Matheson Holdings 142 7,200
Lalin Property - 2,386,500
M1 - 146,000
Media Prima 1,699,200 -
Oversea Chinese Banking 96,405 -
Oversea Chinese Banking Rights 73,377 73,377
Public Bank 44,430 308,100
Public Bank Rights 44,430 44,430
Selangor Properties - 155,100
Sembcorp Industries - 150,000
Singapore Telecommunications - 111,000
SMRT - 1,486,000
Sunway - 1,319,294
Tenaga Nasional - 425,200
Tower Real Estate Investment Trust - 1,480,400
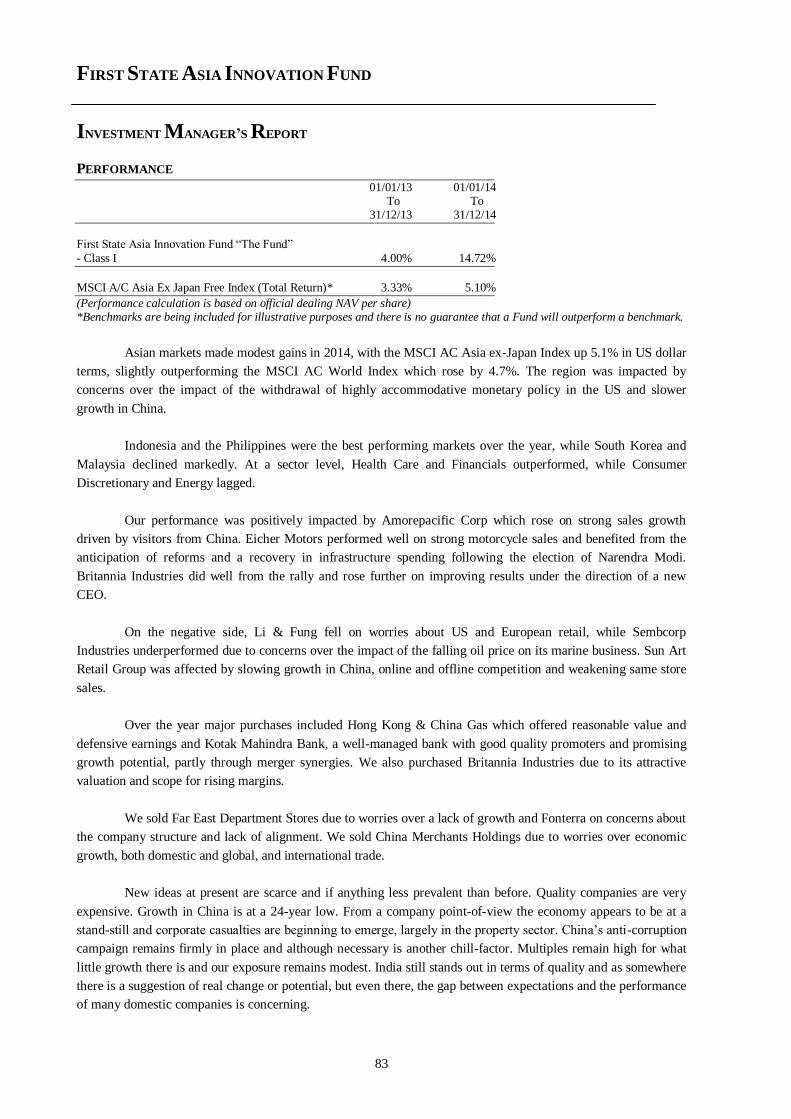
FIRST STATE ASIA INNOVATION FUND
INVESTMENT MANAGER’S REPORT
83
PERFORMANCE
01/01/13 01/01/14 To To 31/12/13 31/12/14
First State Asia Innovation Fund “The Fund”
- Class I 4.00% 14.72%
MSCI A/C Asia Ex Japan Free Index (Total Return)* 3.33% 5.10%
(Performance calculation is based on official dealing NAV per share) *Benchmarks are being included for illustrative purposes and there is no guarantee that a Fund will outperform a benchmark.
Asian markets made modest gains in 2014, with the MSCI AC Asia ex-Japan Index up 5.1% in US dollar
terms, slightly outperforming the MSCI AC World Index which rose by 4.7%. The region was impacted by
concerns over the impact of the withdrawal of highly accommodative monetary policy in the US and slower
growth in China.
Indonesia and the Philippines were the best performing markets over the year, while South Korea and
Malaysia declined markedly. At a sector level, Health Care and Financials outperformed, while Consumer
Discretionary and Energy lagged.
Our performance was positively impacted by Amorepacific Corp which rose on strong sales growth
driven by visitors from China. Eicher Motors performed well on strong motorcycle sales and benefited from the
anticipation of reforms and a recovery in infrastructure spending following the election of Narendra Modi.
Britannia Industries did well from the rally and rose further on improving results under the direction of a new
CEO.
On the negative side, Li & Fung fell on worries about US and European retail, while Sembcorp
Industries underperformed due to concerns over the impact of the falling oil price on its marine business. Sun Art
Retail Group was affected by slowing growth in China, online and offline competition and weakening same store
sales.
Over the year major purchases included Hong Kong & China Gas which offered reasonable value and
defensive earnings and Kotak Mahindra Bank, a well-managed bank with good quality promoters and promising
growth potential, partly through merger synergies. We also purchased Britannia Industries due to its attractive
valuation and scope for rising margins.
We sold Far East Department Stores due to worries over a lack of growth and Fonterra on concerns about
the company structure and lack of alignment. We sold China Merchants Holdings due to worries over economic
growth, both domestic and global, and international trade.
New ideas at present are scarce and if anything less prevalent than before. Quality companies are very
expensive. Growth in China is at a 24-year low. From a company point-of-view the economy appears to be at a
stand-still and corporate casualties are beginning to emerge, largely in the property sector. China’s anti-corruption
campaign remains firmly in place and although necessary is another chill-factor. Multiples remain high for what
little growth there is and our exposure remains modest. India still stands out in terms of quality and as somewhere
there is a suggestion of real change or potential, but even there, the gap between expectations and the performance
of many domestic companies is concerning.
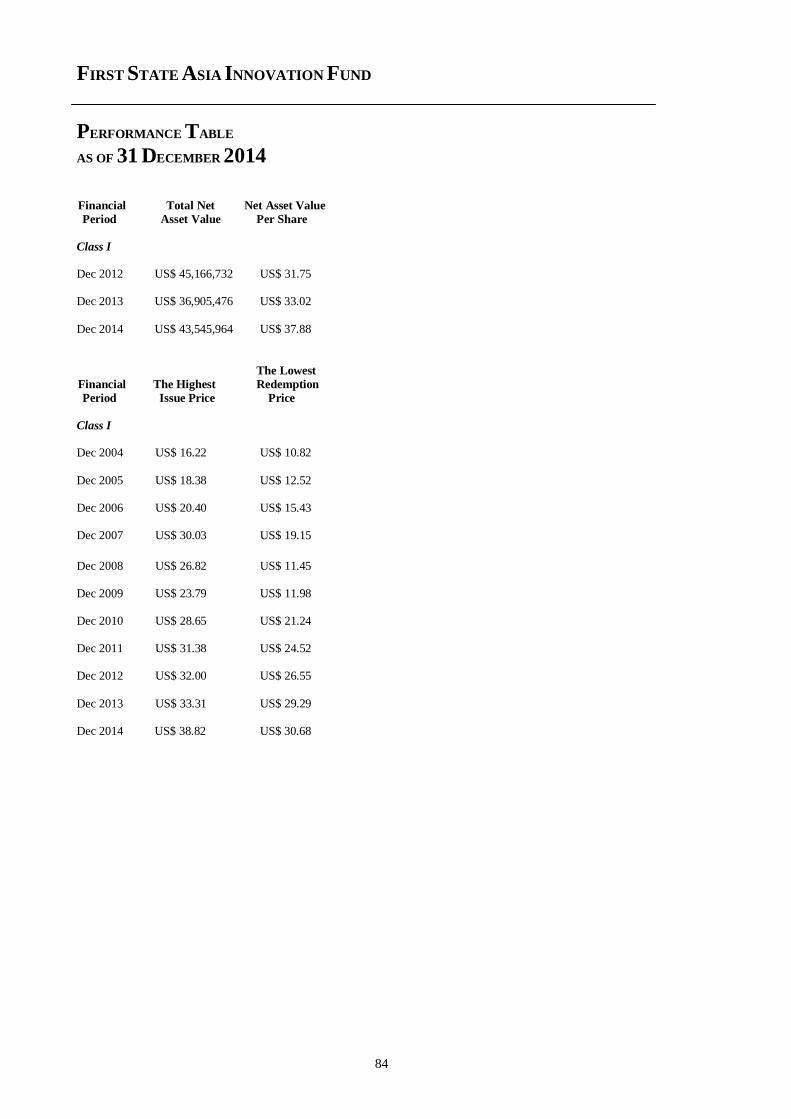
FIRST STATE ASIA INNOVATION FUND
PERFORMANCE TABLE
AS OF 31 DECEMBER 2014
84
Financial Total Net Net Asset Value
Period Asset Value Per Share
Class I Dec 2012 US$ 45,166,732 US$ 31.75 Dec 2013 US$ 36,905,476 US$ 33.02
Dec 2014 US$ 43,545,964 US$ 37.88
The Lowest
Financial The Highest Redemption
Period Issue Price Price
Class I Dec 2004 US$ 16.22 US$ 10.82
Dec 2005 US$ 18.38 US$ 12.52 Dec 2006 US$ 20.40 US$ 15.43 Dec 2007 US$ 30.03 US$ 19.15
Dec 2008 US$ 26.82 US$ 11.45 Dec 2009 US$ 23.79 US$ 11.98 Dec 2010 US$ 28.65 US$ 21.24 Dec 2011 US$ 31.38 US$ 24.52 Dec 2012 US$ 32.00 US$ 26.55
Dec 2013 US$ 33.31 US$ 29.29 Dec 2014 US$ 38.82 US$ 30.68
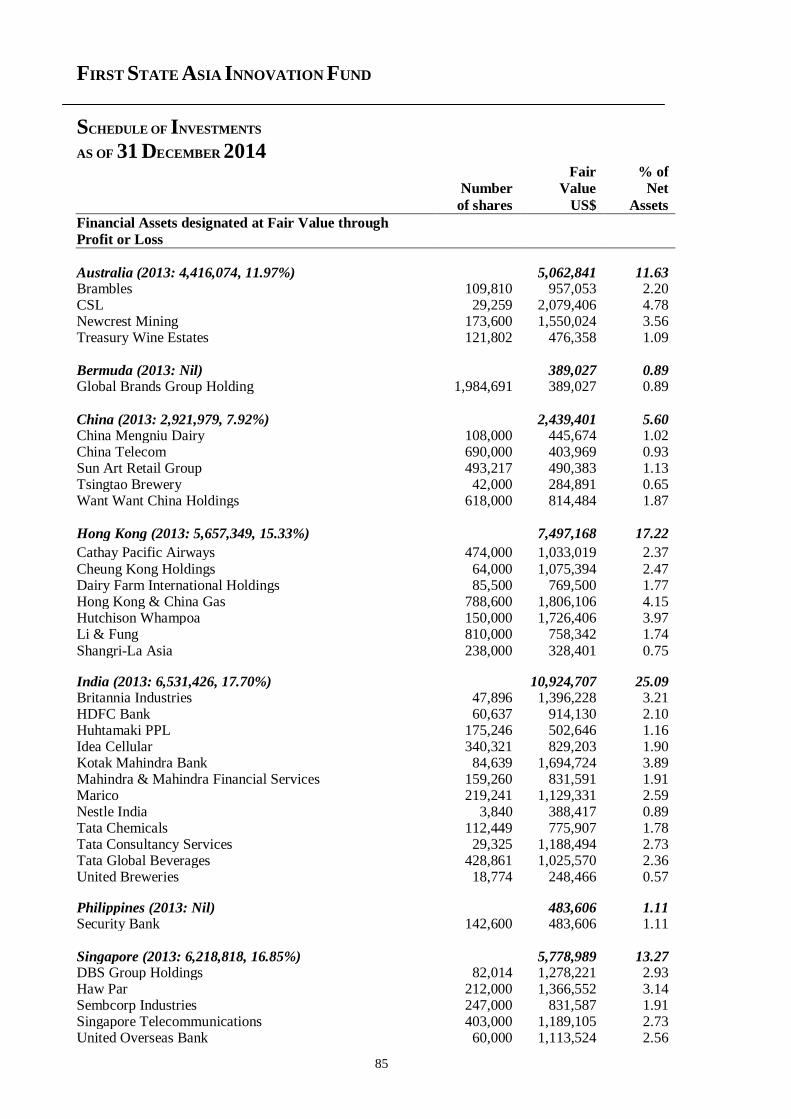
FIRST STATE ASIA INNOVATION FUND
SCHEDULE OF INVESTMENTS
AS OF 31 DECEMBER 2014
85
Fair % of Number Value Net
of shares US$ Assets
Financial Assets designated at Fair Value through
Profit or Loss
Australia (2013: 4,416,074, 11.97%) 5,062,841 11.63 Brambles 109,810 957,053 2.20 CSL 29,259 2,079,406 4.78 Newcrest Mining 173,600 1,550,024 3.56 Treasury Wine Estates 121,802 476,358 1.09 Bermuda (2013: Nil) 389,027 0.89 Global Brands Group Holding 1,984,691 389,027 0.89
China (2013: 2,921,979, 7.92%) 2,439,401 5.60 China Mengniu Dairy 108,000 445,674 1.02 China Telecom 690,000 403,969 0.93 Sun Art Retail Group 493,217 490,383 1.13 Tsingtao Brewery 42,000 284,891 0.65 Want Want China Holdings 618,000 814,484 1.87 Hong Kong (2013: 5,657,349, 15.33%) 7,497,168 17.22
Cathay Pacific Airways 474,000 1,033,019 2.37 Cheung Kong Holdings 64,000 1,075,394 2.47 Dairy Farm International Holdings 85,500 769,500 1.77 Hong Kong & China Gas 788,600 1,806,106 4.15 Hutchison Whampoa 150,000 1,726,406 3.97 Li & Fung 810,000 758,342 1.74 Shangri-La Asia 238,000 328,401 0.75 India (2013: 6,531,426, 17.70%) 10,924,707 25.09 Britannia Industries 47,896 1,396,228 3.21 HDFC Bank 60,637 914,130 2.10 Huhtamaki PPL 175,246 502,646 1.16 Idea Cellular 340,321 829,203 1.90 Kotak Mahindra Bank 84,639 1,694,724 3.89 Mahindra & Mahindra Financial Services 159,260 831,591 1.91 Marico 219,241 1,129,331 2.59 Nestle India 3,840 388,417 0.89 Tata Chemicals 112,449 775,907 1.78 Tata Consultancy Services 29,325 1,188,494 2.73 Tata Global Beverages 428,861 1,025,570 2.36 United Breweries 18,774 248,466 0.57 Philippines (2013: Nil) 483,606 1.11 Security Bank 142,600 483,606 1.11 Singapore (2013: 6,218,818, 16.85%) 5,778,989 13.27 DBS Group Holdings 82,014 1,278,221 2.93 Haw Par 212,000 1,366,552 3.14 Sembcorp Industries 247,000 831,587 1.91 Singapore Telecommunications 403,000 1,189,105 2.73 United Overseas Bank 60,000 1,113,524 2.56
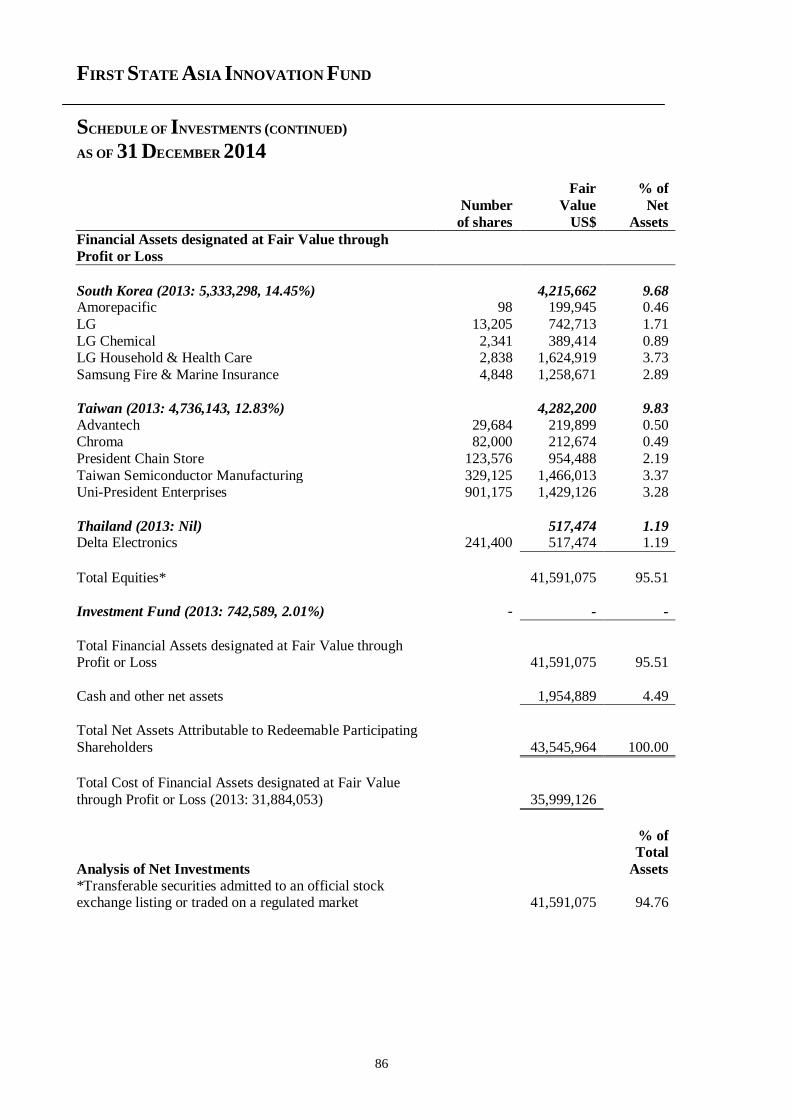
FIRST STATE ASIA INNOVATION FUND
SCHEDULE OF INVESTMENTS (CONTINUED)
AS OF 31 DECEMBER 2014
86
Fair % of
Number Value Net
of shares US$ Assets
Financial Assets designated at Fair Value through
Profit or Loss
South Korea (2013: 5,333,298, 14.45%) 4,215,662 9.68 Amorepacific 98 199,945 0.46
LG 13,205 742,713 1.71
LG Chemical 2,341 389,414 0.89 LG Household & Health Care 2,838 1,624,919 3.73
Samsung Fire & Marine Insurance 4,848 1,258,671 2.89
Taiwan (2013: 4,736,143, 12.83%) 4,282,200 9.83
Advantech 29,684 219,899 0.50 Chroma 82,000 212,674 0.49
President Chain Store 123,576 954,488 2.19
Taiwan Semiconductor Manufacturing 329,125 1,466,013 3.37 Uni-President Enterprises 901,175 1,429,126 3.28
Thailand (2013: Nil) 517,474 1.19 Delta Electronics 241,400 517,474 1.19
Total Equities* 41,591,075 95.51
Investment Fund (2013: 742,589, 2.01%) - - -
Total Financial Assets designated at Fair Value through Profit or Loss 41,591,075 95.51
Cash and other net assets 1,954,889 4.49
Total Net Assets Attributable to Redeemable Participating
Shareholders 43,545,964 100.00
Total Cost of Financial Assets designated at Fair Value
through Profit or Loss (2013: 31,884,053) 35,999,126
Analysis of Net Investments
% of
Total
Assets
*Transferable securities admitted to an official stock exchange listing or traded on a regulated market 41,591,075 94.76
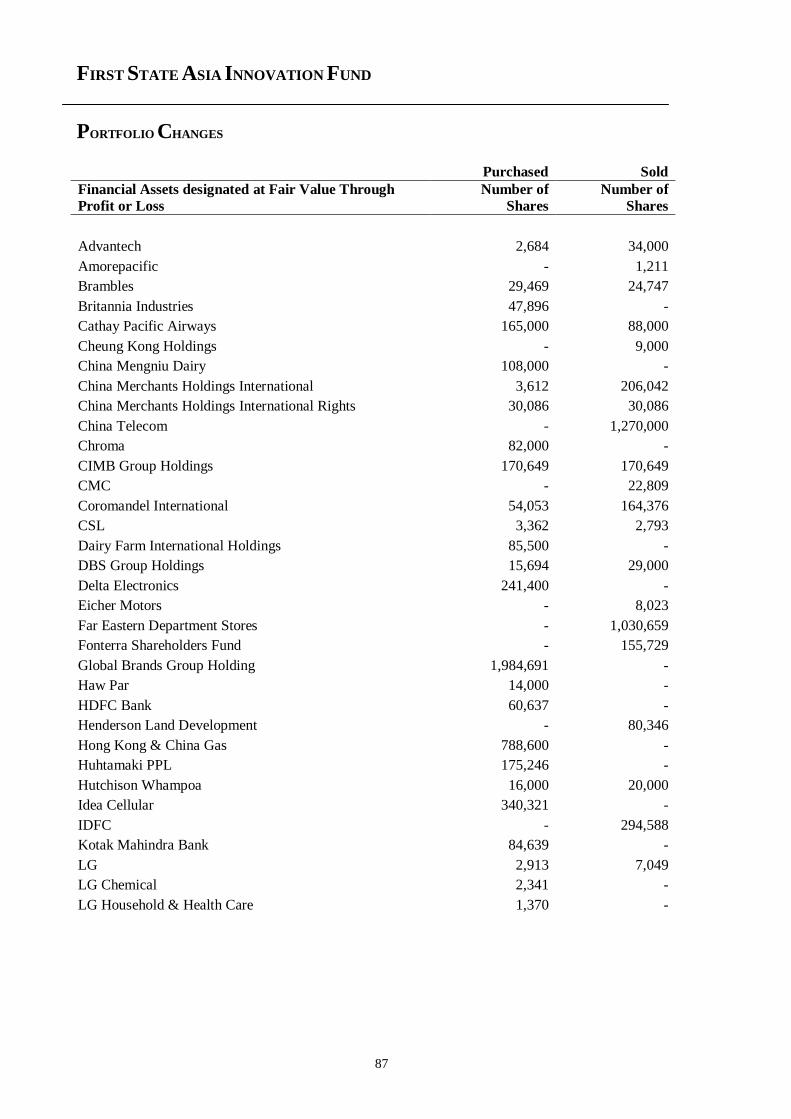
FIRST STATE ASIA INNOVATION FUND
PORTFOLIO CHANGES
87
Purchased Sold
Financial Assets designated at Fair Value Through
Profit or Loss
Number of
Shares
Number of
Shares
Advantech 2,684 34,000
Amorepacific - 1,211
Brambles 29,469 24,747
Britannia Industries 47,896 -
Cathay Pacific Airways 165,000 88,000
Cheung Kong Holdings - 9,000
China Mengniu Dairy 108,000 -
China Merchants Holdings International 3,612 206,042
China Merchants Holdings International Rights 30,086 30,086
China Telecom - 1,270,000
Chroma 82,000 -
CIMB Group Holdings 170,649 170,649
CMC - 22,809
Coromandel International 54,053 164,376
CSL 3,362 2,793
Dairy Farm International Holdings 85,500 -
DBS Group Holdings 15,694 29,000
Delta Electronics 241,400 -
Eicher Motors - 8,023
Far Eastern Department Stores - 1,030,659
Fonterra Shareholders Fund - 155,729
Global Brands Group Holding 1,984,691 -
Haw Par 14,000 -
HDFC Bank 60,637 -
Henderson Land Development - 80,346
Hong Kong & China Gas 788,600 -
Huhtamaki PPL 175,246 -
Hutchison Whampoa 16,000 20,000
Idea Cellular 340,321 -
IDFC - 294,588
Kotak Mahindra Bank 84,639 -
LG 2,913 7,049
LG Chemical 2,341 -
LG Household & Health Care 1,370 -
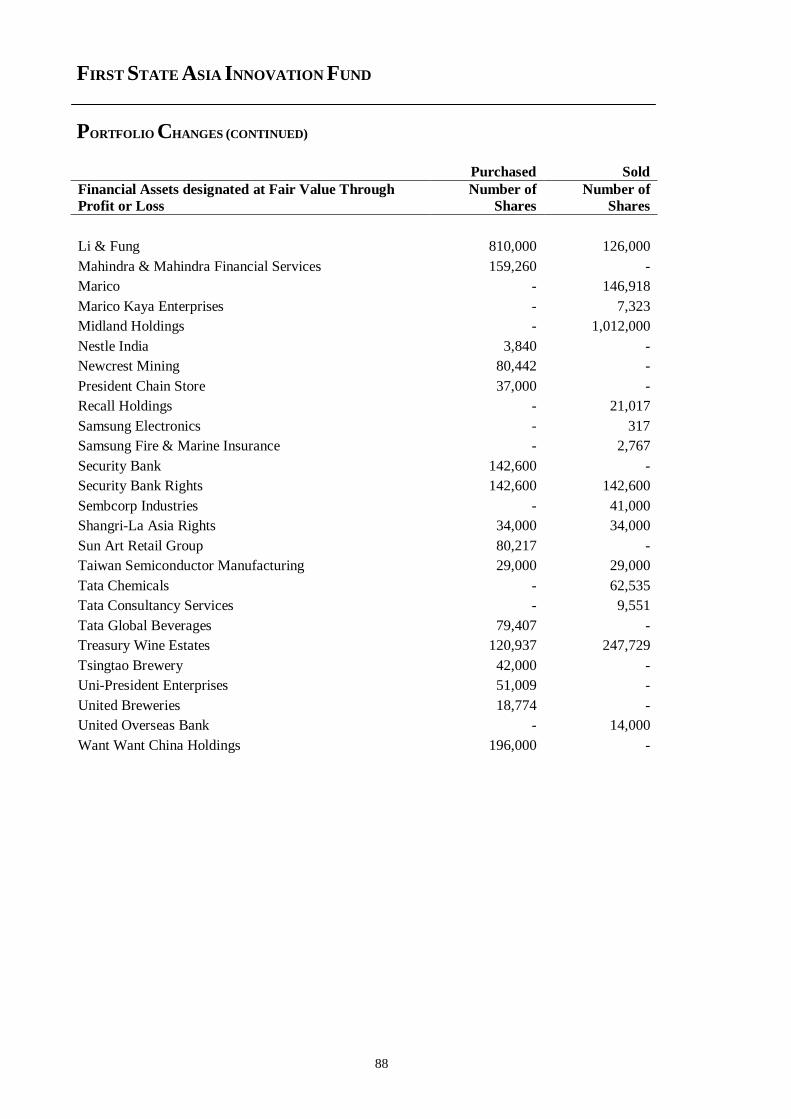
FIRST STATE ASIA INNOVATION FUND
PORTFOLIO CHANGES (CONTINUED)
88
Purchased Sold
Financial Assets designated at Fair Value Through
Profit or Loss
Number of
Shares
Number of
Shares
Li & Fung 810,000 126,000
Mahindra & Mahindra Financial Services 159,260 -
Marico - 146,918
Marico Kaya Enterprises - 7,323
Midland Holdings - 1,012,000
Nestle India 3,840 -
Newcrest Mining 80,442 -
President Chain Store 37,000 -
Recall Holdings - 21,017
Samsung Electronics - 317
Samsung Fire & Marine Insurance - 2,767
Security Bank 142,600 -
Security Bank Rights 142,600 142,600
Sembcorp Industries - 41,000
Shangri-La Asia Rights 34,000 34,000
Sun Art Retail Group 80,217 -
Taiwan Semiconductor Manufacturing 29,000 29,000
Tata Chemicals - 62,535
Tata Consultancy Services - 9,551
Tata Global Beverages 79,407 -
Treasury Wine Estates 120,937 247,729
Tsingtao Brewery 42,000 -
Uni-President Enterprises 51,009 -
United Breweries 18,774 -
United Overseas Bank - 14,000
Want Want China Holdings 196,000 -
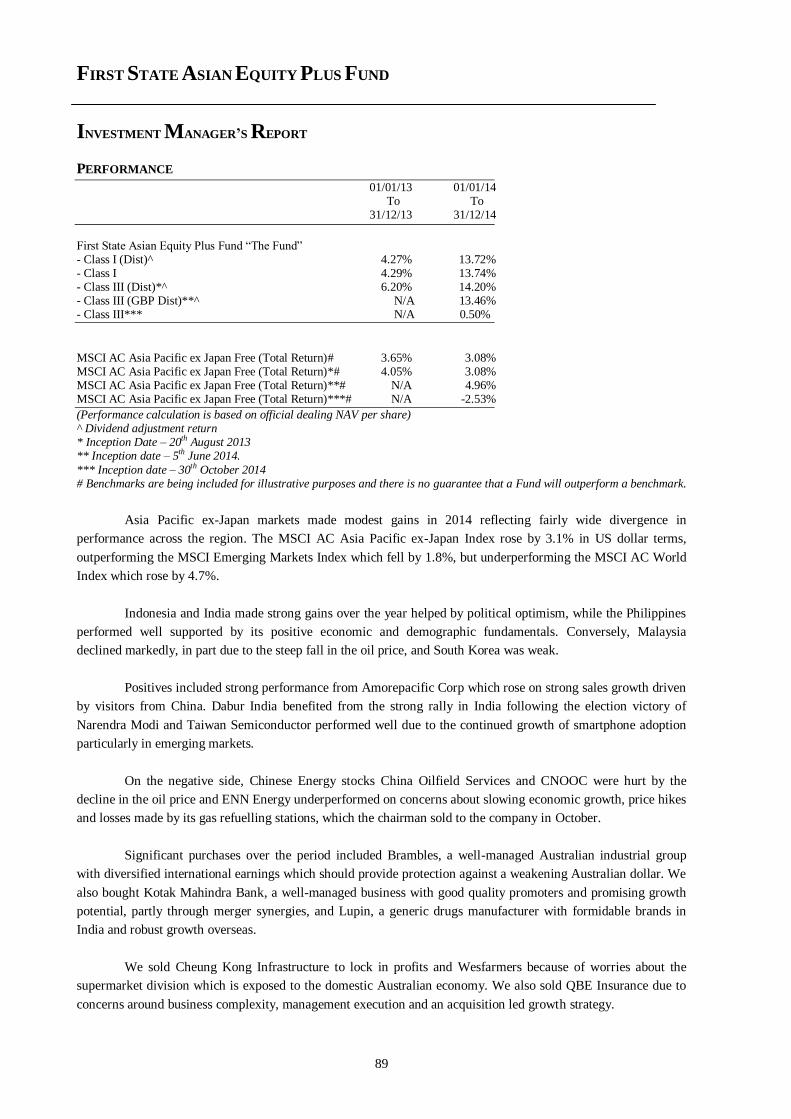
FIRST STATE ASIAN EQUITY PLUS FUND
INVESTMENT MANAGER’S REPORT
89
PERFORMANCE
01/01/13 01/01/14 To To 31/12/13 31/12/14
First State Asian Equity Plus Fund “The Fund” - Class I (Dist)^ 4.27% 13.72% - Class I 4.29% 13.74% - Class III (Dist)*^ 6.20% 14.20% - Class III (GBP Dist)**^ N/A 13.46% - Class III*** N/A 0.50%
MSCI AC Asia Pacific ex Japan Free (Total Return)# 3.65% 3.08% MSCI AC Asia Pacific ex Japan Free (Total Return)*# 4.05% 3.08% MSCI AC Asia Pacific ex Japan Free (Total Return)**# N/A 4.96% MSCI AC Asia Pacific ex Japan Free (Total Return)***# N/A -2.53%
(Performance calculation is based on official dealing NAV per share) ^ Dividend adjustment return * Inception Date – 20th August 2013 ** Inception date – 5th June 2014.
*** Inception date – 30th October 2014 # Benchmarks are being included for illustrative purposes and there is no guarantee that a Fund will outperform a benchmark.
Asia Pacific ex-Japan markets made modest gains in 2014 reflecting fairly wide divergence in
performance across the region. The MSCI AC Asia Pacific ex-Japan Index rose by 3.1% in US dollar terms,
outperforming the MSCI Emerging Markets Index which fell by 1.8%, but underperforming the MSCI AC World
Index which rose by 4.7%.
Indonesia and India made strong gains over the year helped by political optimism, while the Philippines
performed well supported by its positive economic and demographic fundamentals. Conversely, Malaysia
declined markedly, in part due to the steep fall in the oil price, and South Korea was weak.
Positives included strong performance from Amorepacific Corp which rose on strong sales growth driven
by visitors from China. Dabur India benefited from the strong rally in India following the election victory of
Narendra Modi and Taiwan Semiconductor performed well due to the continued growth of smartphone adoption
particularly in emerging markets.
On the negative side, Chinese Energy stocks China Oilfield Services and CNOOC were hurt by the
decline in the oil price and ENN Energy underperformed on concerns about slowing economic growth, price hikes
and losses made by its gas refuelling stations, which the chairman sold to the company in October.
Significant purchases over the period included Brambles, a well-managed Australian industrial group
with diversified international earnings which should provide protection against a weakening Australian dollar. We
also bought Kotak Mahindra Bank, a well-managed business with good quality promoters and promising growth
potential, partly through merger synergies, and Lupin, a generic drugs manufacturer with formidable brands in
India and robust growth overseas.
We sold Cheung Kong Infrastructure to lock in profits and Wesfarmers because of worries about the
supermarket division which is exposed to the domestic Australian economy. We also sold QBE Insurance due to
concerns around business complexity, management execution and an acquisition led growth strategy.
FIRST STATE ASIAN EQUITY PLUS FUND
INVESTMENT MANAGER’S REPORT (CONTINUED)
90
New ideas are scarce and if anything less prevalent than before. Quality companies are very expensive
and growth in China is at a 24-year low. From a company point-of-view the economy appears to be at a stand-still
and corporate casualties are beginning to emerge, largely in the property sector. China’s anti-corruption campaign
remains firmly in place and although necessary is another chill-factor. Multiples remain high for what little
growth there is. India still stands out in terms of quality and as somewhere there is a suggestion of real change, but
even there, the gap between expectations and the performance of many domestic companies is concerning.
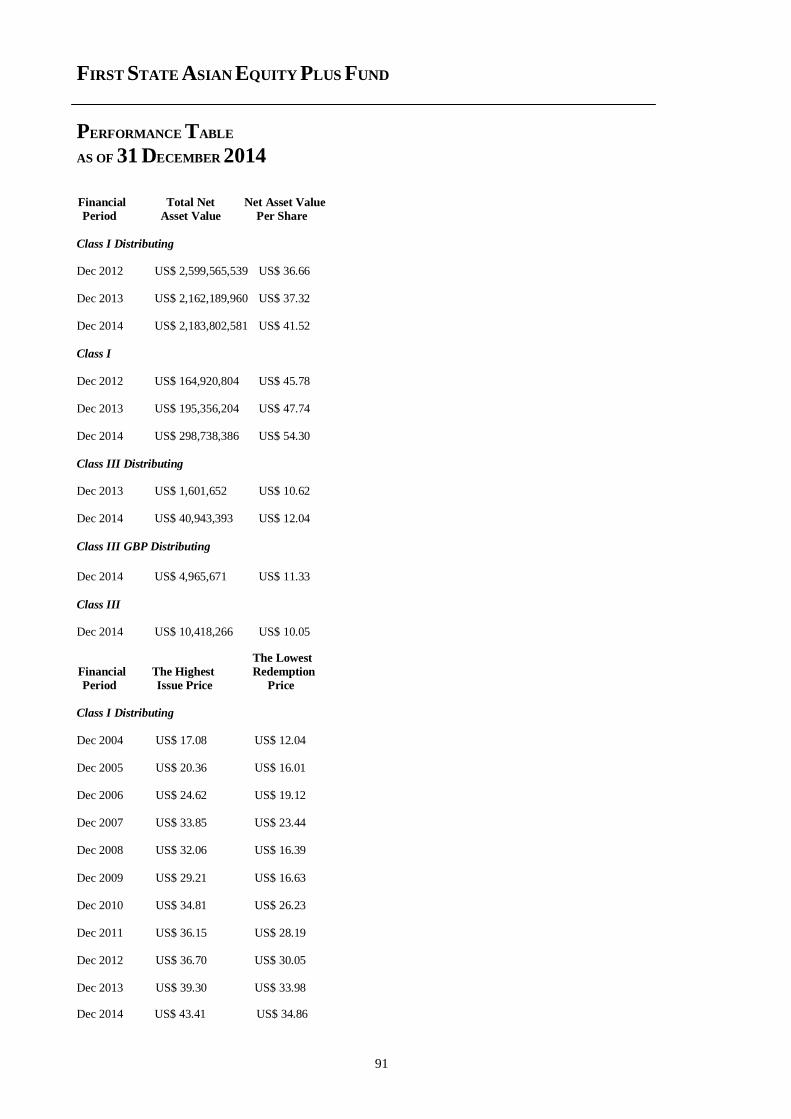
FIRST STATE ASIAN EQUITY PLUS FUND
PERFORMANCE TABLE
AS OF 31 DECEMBER 2014
91
Financial Total Net Net Asset Value
Period Asset Value Per Share
Class I Distributing Dec 2012 US$ 2,599,565,539 US$ 36.66 Dec 2013 US$ 2,162,189,960 US$ 37.32 Dec 2014 US$ 2,183,802,581 US$ 41.52
Class I
Dec 2012 US$ 164,920,804 US$ 45.78 Dec 2013 US$ 195,356,204 US$ 47.74 Dec 2014 US$ 298,738,386 US$ 54.30
Class III Distributing Dec 2013 US$ 1,601,652 US$ 10.62
Dec 2014 US$ 40,943,393 US$ 12.04
Class III GBP Distributing
Dec 2014 US$ 4,965,671 US$ 11.33
Class III
Dec 2014 US$ 10,418,266 US$ 10.05
The Lowest
Financial The Highest Redemption
Period Issue Price Price
Class I Distributing
Dec 2004 US$ 17.08 US$ 12.04 Dec 2005 US$ 20.36 US$ 16.01 Dec 2006 US$ 24.62 US$ 19.12 Dec 2007 US$ 33.85 US$ 23.44 Dec 2008 US$ 32.06 US$ 16.39
Dec 2009 US$ 29.21 US$ 16.63 Dec 2010 US$ 34.81 US$ 26.23 Dec 2011 US$ 36.15 US$ 28.19 Dec 2012 US$ 36.70 US$ 30.05 Dec 2013 US$ 39.30 US$ 33.98
Dec 2014 US$ 43.41 US$ 34.86
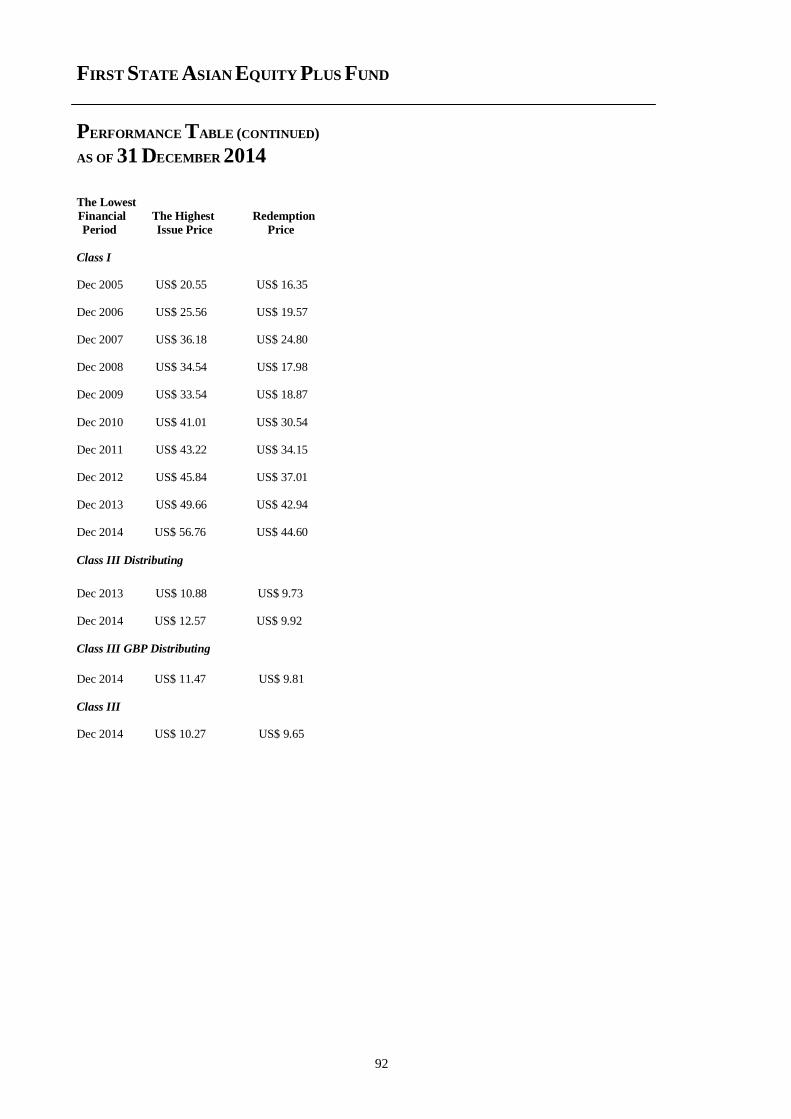
FIRST STATE ASIAN EQUITY PLUS FUND
PERFORMANCE TABLE (CONTINUED)
AS OF 31 DECEMBER 2014
92
The Lowest
Financial The Highest Redemption
Period Issue Price Price
Class I Dec 2005 US$ 20.55 US$ 16.35 Dec 2006 US$ 25.56 US$ 19.57 Dec 2007 US$ 36.18 US$ 24.80 Dec 2008 US$ 34.54 US$ 17.98 Dec 2009 US$ 33.54 US$ 18.87
Dec 2010 US$ 41.01 US$ 30.54 Dec 2011 US$ 43.22 US$ 34.15
Dec 2012 US$ 45.84 US$ 37.01 Dec 2013 US$ 49.66 US$ 42.94 Dec 2014 US$ 56.76 US$ 44.60
Class III Distributing
Dec 2013 US$ 10.88 US$ 9.73 Dec 2014 US$ 12.57 US$ 9.92
Class III GBP Distributing
Dec 2014 US$ 11.47 US$ 9.81
Class III
Dec 2014 US$ 10.27 US$ 9.65
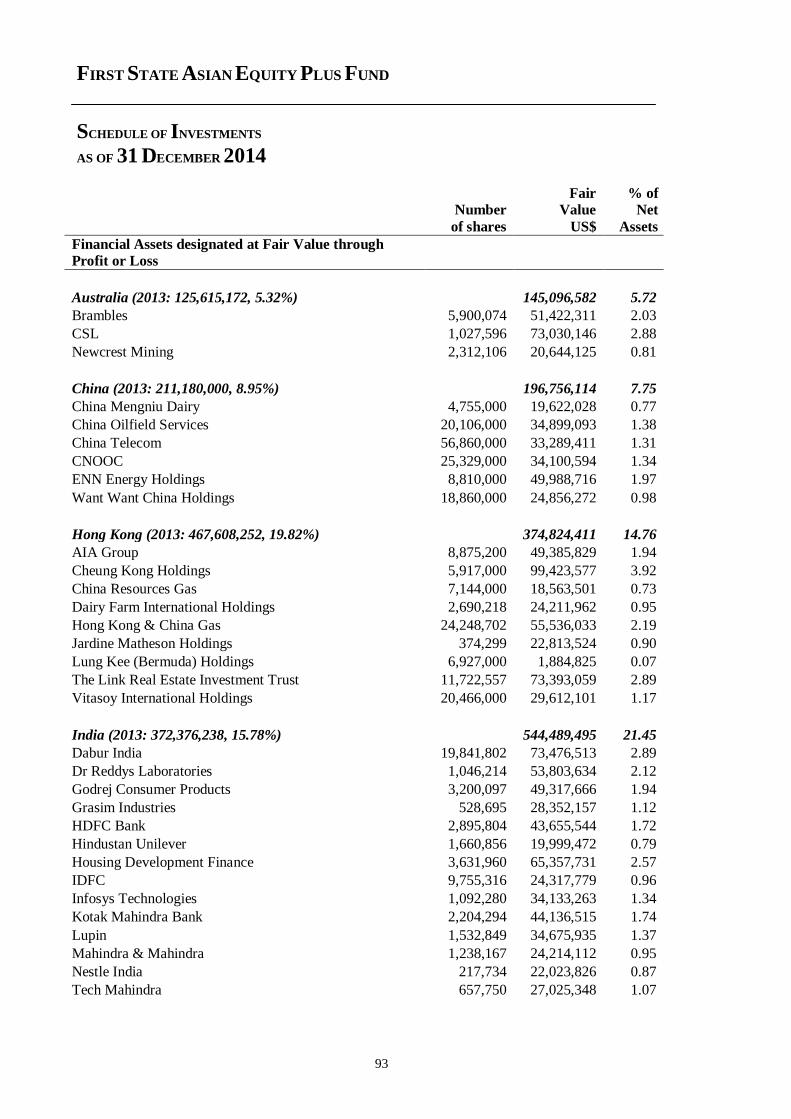
FIRST STATE ASIAN EQUITY PLUS FUND
SCHEDULE OF INVESTMENTS
AS OF 31 DECEMBER 2014
93
Fair % of Number Value Net
of shares US$ Assets
Financial Assets designated at Fair Value through
Profit or Loss
Australia (2013: 125,615,172, 5.32%) 145,096,582 5.72
Brambles 5,900,074 51,422,311 2.03
CSL 1,027,596 73,030,146 2.88
Newcrest Mining 2,312,106 20,644,125 0.81
China (2013: 211,180,000, 8.95%) 196,756,114 7.75
China Mengniu Dairy 4,755,000 19,622,028 0.77
China Oilfield Services 20,106,000 34,899,093 1.38
China Telecom 56,860,000 33,289,411 1.31
CNOOC 25,329,000 34,100,594 1.34
ENN Energy Holdings 8,810,000 49,988,716 1.97
Want Want China Holdings 18,860,000 24,856,272 0.98
Hong Kong (2013: 467,608,252, 19.82%) 374,824,411 14.76
AIA Group 8,875,200 49,385,829 1.94
Cheung Kong Holdings 5,917,000 99,423,577 3.92
China Resources Gas 7,144,000 18,563,501 0.73
Dairy Farm International Holdings 2,690,218 24,211,962 0.95
Hong Kong & China Gas 24,248,702 55,536,033 2.19
Jardine Matheson Holdings 374,299 22,813,524 0.90
Lung Kee (Bermuda) Holdings 6,927,000 1,884,825 0.07
The Link Real Estate Investment Trust 11,722,557 73,393,059 2.89
Vitasoy International Holdings 20,466,000 29,612,101 1.17
India (2013: 372,376,238, 15.78%) 544,489,495 21.45
Dabur India 19,841,802 73,476,513 2.89
Dr Reddys Laboratories 1,046,214 53,803,634 2.12
Godrej Consumer Products 3,200,097 49,317,666 1.94
Grasim Industries 528,695 28,352,157 1.12
HDFC Bank 2,895,804 43,655,544 1.72
Hindustan Unilever 1,660,856 19,999,472 0.79
Housing Development Finance 3,631,960 65,357,731 2.57
IDFC 9,755,316 24,317,779 0.96
Infosys Technologies 1,092,280 34,133,263 1.34
Kotak Mahindra Bank 2,204,294 44,136,515 1.74
Lupin 1,532,849 34,675,935 1.37
Mahindra & Mahindra 1,238,167 24,214,112 0.95
Nestle India 217,734 22,023,826 0.87
Tech Mahindra 657,750 27,025,348 1.07
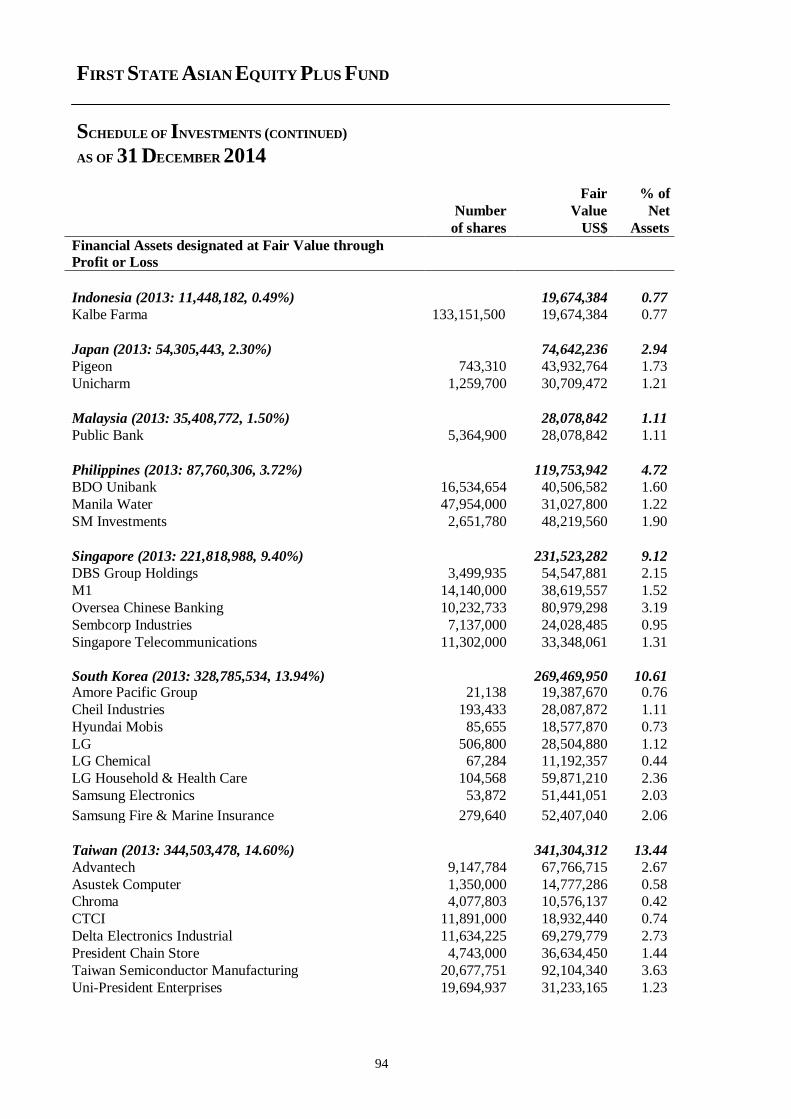
FIRST STATE ASIAN EQUITY PLUS FUND
SCHEDULE OF INVESTMENTS (CONTINUED)
AS OF 31 DECEMBER 2014
94
Fair % of
Number Value Net
of shares US$ Assets
Financial Assets designated at Fair Value through
Profit or Loss
Indonesia (2013: 11,448,182, 0.49%) 19,674,384 0.77
Kalbe Farma 133,151,500 19,674,384 0.77
Japan (2013: 54,305,443, 2.30%) 74,642,236 2.94
Pigeon 743,310 43,932,764 1.73
Unicharm 1,259,700 30,709,472 1.21
Malaysia (2013: 35,408,772, 1.50%) 28,078,842 1.11
Public Bank 5,364,900 28,078,842 1.11
Philippines (2013: 87,760,306, 3.72%) 119,753,942 4.72
BDO Unibank 16,534,654 40,506,582 1.60
Manila Water 47,954,000 31,027,800 1.22
SM Investments 2,651,780 48,219,560 1.90
Singapore (2013: 221,818,988, 9.40%) 231,523,282 9.12
DBS Group Holdings 3,499,935 54,547,881 2.15
M1 14,140,000 38,619,557 1.52
Oversea Chinese Banking 10,232,733 80,979,298 3.19
Sembcorp Industries 7,137,000 24,028,485 0.95
Singapore Telecommunications 11,302,000 33,348,061 1.31
South Korea (2013: 328,785,534, 13.94%) 269,469,950 10.61 Amore Pacific Group 21,138 19,387,670 0.76
Cheil Industries 193,433 28,087,872 1.11
Hyundai Mobis 85,655 18,577,870 0.73
LG 506,800 28,504,880 1.12
LG Chemical 67,284 11,192,357 0.44
LG Household & Health Care 104,568 59,871,210 2.36
Samsung Electronics 53,872 51,441,051 2.03
Samsung Fire & Marine Insurance 279,640 52,407,040 2.06
Taiwan (2013: 344,503,478, 14.60%) 341,304,312 13.44
Advantech 9,147,784 67,766,715 2.67
Asustek Computer 1,350,000 14,777,286 0.58
Chroma 4,077,803 10,576,137 0.42
CTCI 11,891,000 18,932,440 0.74
Delta Electronics Industrial 11,634,225 69,279,779 2.73
President Chain Store 4,743,000 36,634,450 1.44
Taiwan Semiconductor Manufacturing 20,677,751 92,104,340 3.63
Uni-President Enterprises 19,694,937 31,233,165 1.23
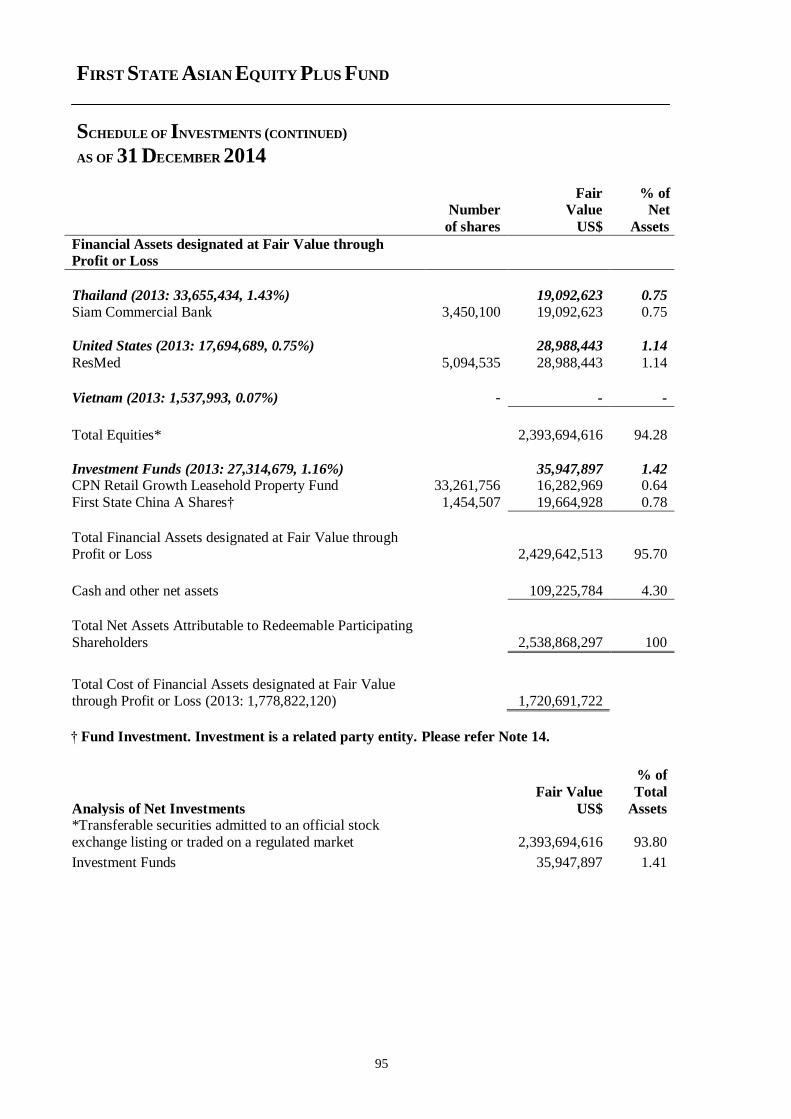
FIRST STATE ASIAN EQUITY PLUS FUND
SCHEDULE OF INVESTMENTS (CONTINUED)
AS OF 31 DECEMBER 2014
95
Fair % of Number Value Net
of shares US$ Assets
Financial Assets designated at Fair Value through
Profit or Loss
Thailand (2013: 33,655,434, 1.43%) 19,092,623 0.75
Siam Commercial Bank 3,450,100 19,092,623 0.75
United States (2013: 17,694,689, 0.75%) 28,988,443 1.14
ResMed 5,094,535 28,988,443 1.14
Vietnam (2013: 1,537,993, 0.07%) - - -
Total Equities* 2,393,694,616 94.28
Investment Funds (2013: 27,314,679, 1.16%) 35,947,897 1.42 CPN Retail Growth Leasehold Property Fund 33,261,756 16,282,969 0.64
First State China A Shares† 1,454,507 19,664,928 0.78
Total Financial Assets designated at Fair Value through Profit or Loss 2,429,642,513 95.70
Cash and other net assets 109,225,784 4.30
Total Net Assets Attributable to Redeemable Participating
Shareholders 2,538,868,297 100
Total Cost of Financial Assets designated at Fair Value through Profit or Loss (2013: 1,778,822,120) 1,720,691,722
† Fund Investment. Investment is a related party entity. Please refer Note 14.
Analysis of Net Investments
Fair Value
US$
% of
Total
Assets *Transferable securities admitted to an official stock
exchange listing or traded on a regulated market 2,393,694,616 93.80
Investment Funds 35,947,897 1.41
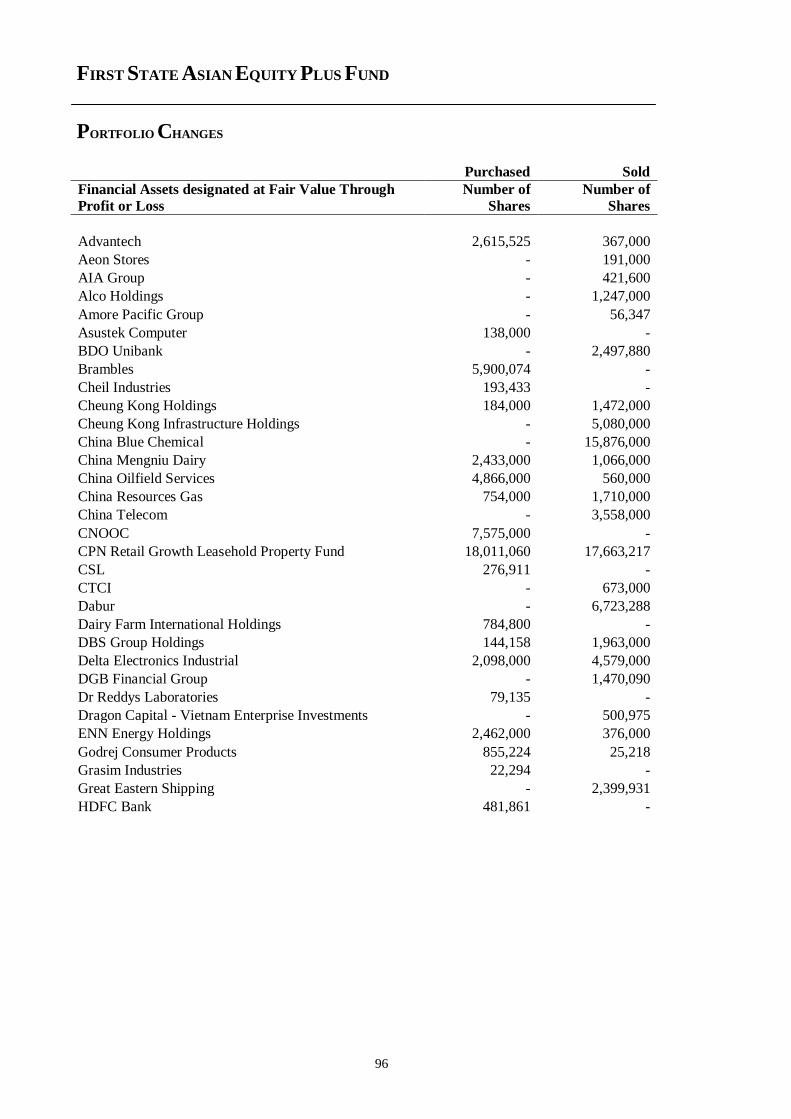
FIRST STATE ASIAN EQUITY PLUS FUND
PORTFOLIO CHANGES
96
Purchased Sold
Financial Assets designated at Fair Value Through
Profit or Loss
Number of
Shares
Number of
Shares
Advantech 2,615,525 367,000
Aeon Stores - 191,000
AIA Group - 421,600
Alco Holdings - 1,247,000
Amore Pacific Group - 56,347
Asustek Computer 138,000 -
BDO Unibank - 2,497,880
Brambles 5,900,074 -
Cheil Industries 193,433 -
Cheung Kong Holdings 184,000 1,472,000
Cheung Kong Infrastructure Holdings - 5,080,000
China Blue Chemical - 15,876,000
China Mengniu Dairy 2,433,000 1,066,000
China Oilfield Services 4,866,000 560,000
China Resources Gas 754,000 1,710,000
China Telecom - 3,558,000
CNOOC 7,575,000 -
CPN Retail Growth Leasehold Property Fund 18,011,060 17,663,217
CSL 276,911 -
CTCI - 673,000
Dabur - 6,723,288
Dairy Farm International Holdings 784,800 -
DBS Group Holdings 144,158 1,963,000
Delta Electronics Industrial 2,098,000 4,579,000
DGB Financial Group - 1,470,090
Dr Reddys Laboratories 79,135 -
Dragon Capital - Vietnam Enterprise Investments - 500,975
ENN Energy Holdings 2,462,000 376,000
Godrej Consumer Products 855,224 25,218
Grasim Industries 22,294 -
Great Eastern Shipping - 2,399,931
HDFC Bank 481,861 -
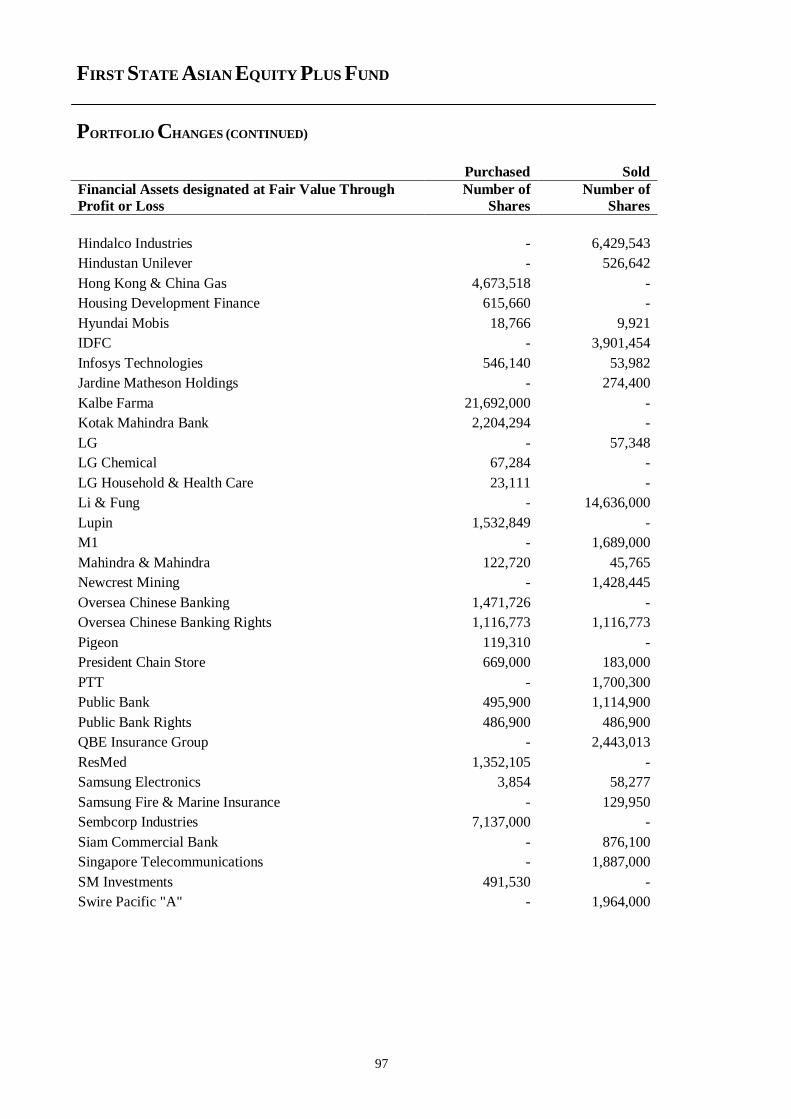
FIRST STATE ASIAN EQUITY PLUS FUND
PORTFOLIO CHANGES (CONTINUED)
97
Purchased Sold
Financial Assets designated at Fair Value Through
Profit or Loss
Number of
Shares
Number of
Shares
Hindalco Industries - 6,429,543
Hindustan Unilever - 526,642
Hong Kong & China Gas 4,673,518 -
Housing Development Finance 615,660 -
Hyundai Mobis 18,766 9,921
IDFC - 3,901,454
Infosys Technologies 546,140 53,982
Jardine Matheson Holdings - 274,400
Kalbe Farma 21,692,000 -
Kotak Mahindra Bank 2,204,294 -
LG - 57,348
LG Chemical 67,284 -
LG Household & Health Care 23,111 -
Li & Fung - 14,636,000
Lupin 1,532,849 -
M1 - 1,689,000
Mahindra & Mahindra 122,720 45,765
Newcrest Mining - 1,428,445
Oversea Chinese Banking 1,471,726 -
Oversea Chinese Banking Rights 1,116,773 1,116,773
Pigeon 119,310 -
President Chain Store 669,000 183,000
PTT - 1,700,300
Public Bank 495,900 1,114,900
Public Bank Rights 486,900 486,900
QBE Insurance Group - 2,443,013
ResMed 1,352,105 -
Samsung Electronics 3,854 58,277
Samsung Fire & Marine Insurance - 129,950
Sembcorp Industries 7,137,000 -
Siam Commercial Bank - 876,100
Singapore Telecommunications - 1,887,000
SM Investments 491,530 -
Swire Pacific "A" - 1,964,000
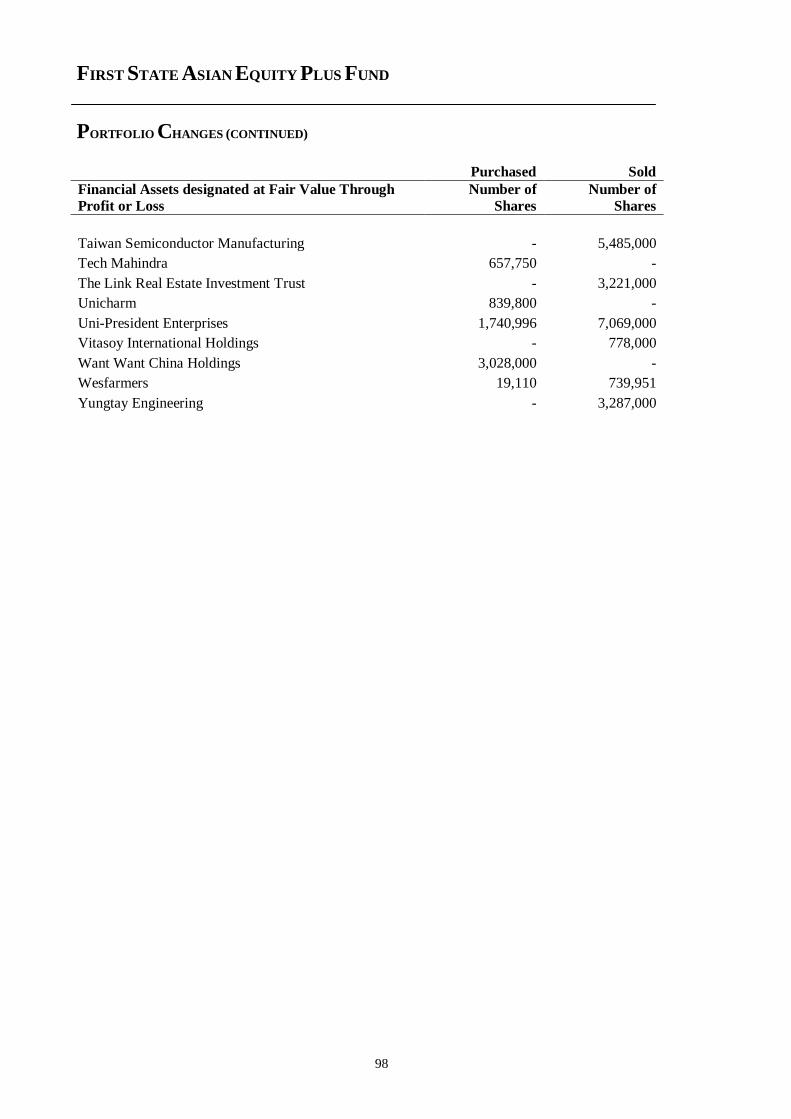
FIRST STATE ASIAN EQUITY PLUS FUND
PORTFOLIO CHANGES (CONTINUED)
98
Purchased Sold
Financial Assets designated at Fair Value Through
Profit or Loss
Number of
Shares
Number of
Shares
Taiwan Semiconductor Manufacturing - 5,485,000
Tech Mahindra 657,750 -
The Link Real Estate Investment Trust - 3,221,000
Unicharm 839,800 -
Uni-President Enterprises 1,740,996 7,069,000
Vitasoy International Holdings - 778,000
Want Want China Holdings 3,028,000 -
Wesfarmers 19,110 739,951
Yungtay Engineering - 3,287,000
FIRST STATE ASIAN BOND FUND
INVESTMENT MANAGER’S REPORT
99
PERFORMANCE
01/01/13 01/01/14
To To 31/12/13 31/12/14
First State Asian Bond Fund “The Fund” – Class I (Dist)^ -2.28% 6.01% – Class III -1.67% 6.88%
JP Morgan Asia Credit Index* -1.37% 8.32%
(Performance calculation is based on official dealing NAV per share) ^ Dividend adjustment return * Benchmarks are being included for illustrative purposes and there is no guarantee that a Fund will outperform a benchmark.
The Fund returned 6.01% net of fees in year 2014. Asian credit markets delivered gains with the
JPMorgan Asia Credit Index (JACI) returning 8.32%. The average spread of the JACI widened by 22bp to 262bp,
however the 10-year US Treasury yield fell 36bp resulting in positive returns for the Fund.
Long dated government bond yields continued the downward trend into the year. The ten-year sovereign
bond yields in the US, UK, Europe and Japan finished H2 2014 lower with the 10-year US Treasury yield
declining by 36bp to 2.17%. The status of the global economy was largely dominated by the theme of divergent
monetary policies and outlooks. The actions of central banks remained a key driver of market movements with US
quantitative easing ending at the same time the BoJ and ECB asset purchase programs expanded. Despite the
growing strength in the US economy, poor economic data from China, Europe and Japan created a downturn in
sentiment which pushed yields lower.
In Asian credit markets the Chinese property sector was in the spotlight with Agile Property and Kaisa
highlighting the risks in this sector. Both companies exhibited corporate governance and transparency issues,
whilst Agile’s heightened re-financing risk during the year illustrated the general property slowdown. The average
price of new homes in 70 Chinese cities continued to fall. Whilst the People’s Bank of China cut rates to support
Asian markets, we may see future cuts if the slowdown deepens.
Indonesia (3.2%) and India (2.0%) both performed well following the election of new presidents who
have begun implementing much needed reform agendas and have increased investor confidence in their respective
countries. Of the key countries in the JACI, the Philippines delivered the best returns (+4.8%) whilst Macau
delivered the worst (-4.5%).
By JACI Index sector, investment grade sovereigns (5.4%) were the strongest performers whilst non-
investment grade corporates were the weakest (-0.2%).
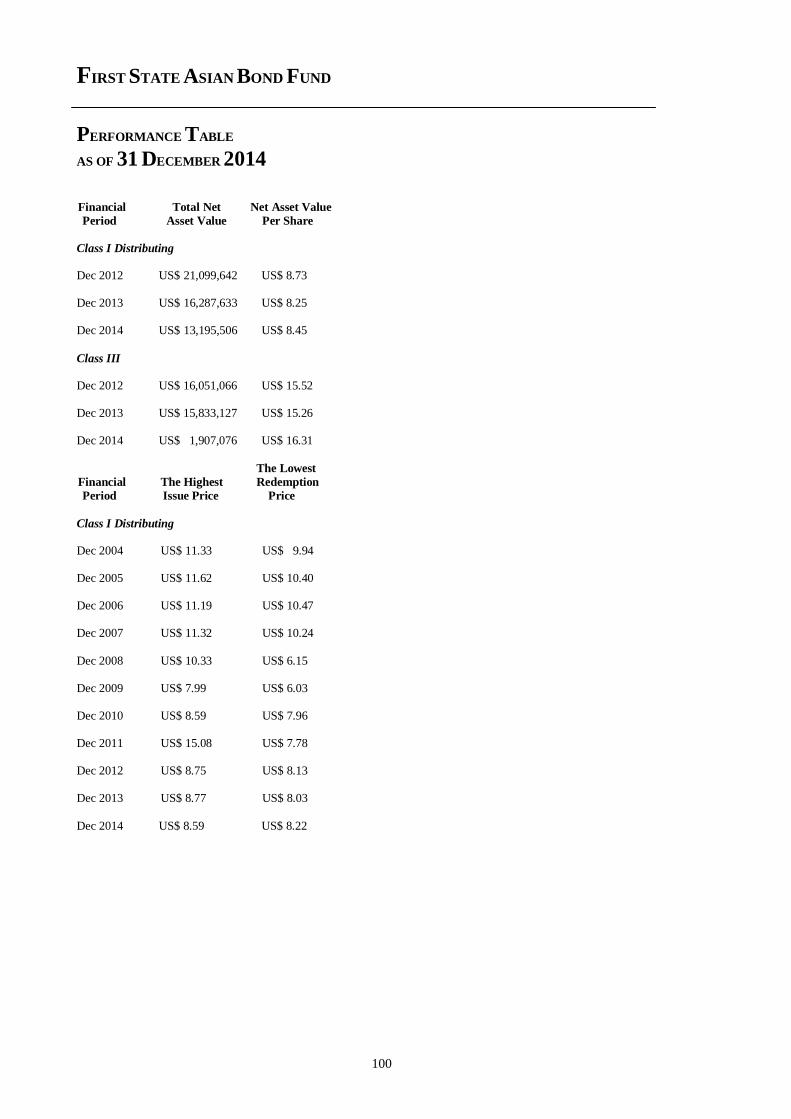
FIRST STATE ASIAN BOND FUND
PERFORMANCE TABLE
AS OF 31 DECEMBER 2014
100
Financial Total Net Net Asset Value
Period Asset Value Per Share
Class I Distributing Dec 2012 US$ 21,099,642 US$ 8.73 Dec 2013 US$ 16,287,633 US$ 8.25 Dec 2014 US$ 13,195,506 US$ 8.45
Class III Dec 2012 US$ 16,051,066 US$ 15.52 Dec 2013 US$ 15,833,127 US$ 15.26 Dec 2014 US$ 1,907,076 US$ 16.31
The Lowest
Financial The Highest Redemption
Period Issue Price Price
Class I Distributing Dec 2004 US$ 11.33 US$ 9.94 Dec 2005 US$ 11.62 US$ 10.40 Dec 2006 US$ 11.19 US$ 10.47 Dec 2007 US$ 11.32 US$ 10.24
Dec 2008 US$ 10.33 US$ 6.15 Dec 2009 US$ 7.99 US$ 6.03 Dec 2010 US$ 8.59 US$ 7.96 Dec 2011 US$ 15.08 US$ 7.78 Dec 2012 US$ 8.75 US$ 8.13 Dec 2013 US$ 8.77 US$ 8.03
Dec 2014 US$ 8.59 US$ 8.22
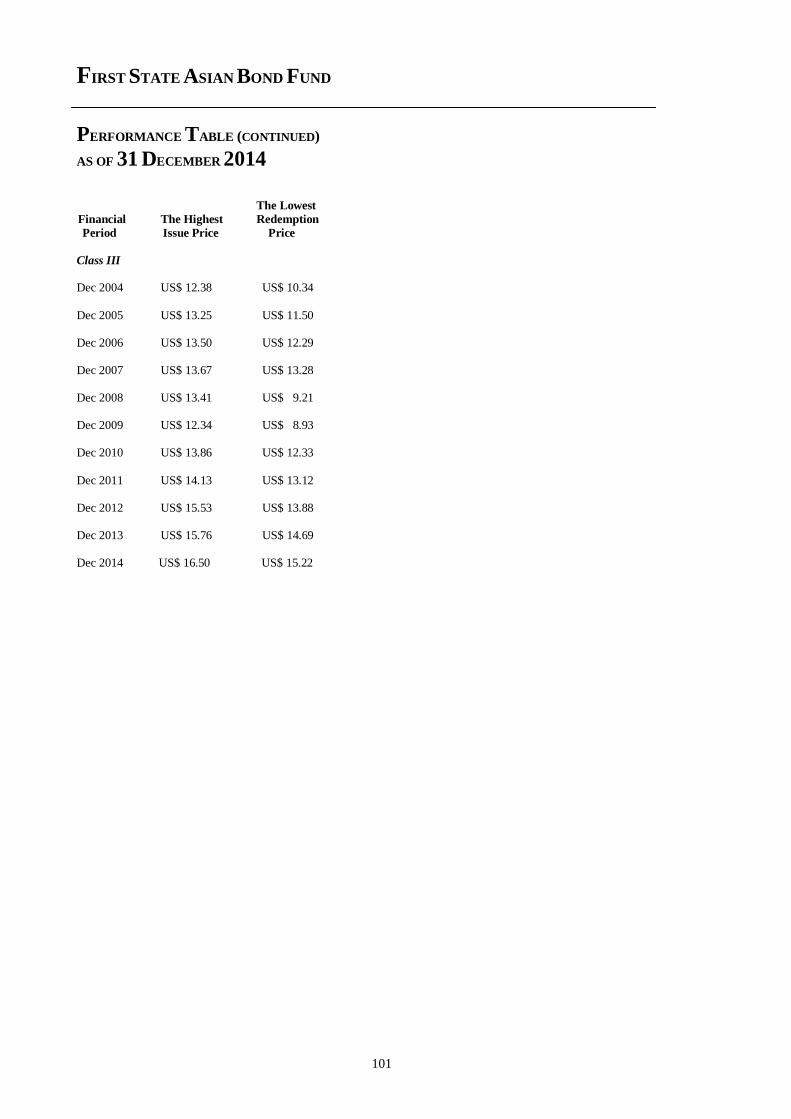
FIRST STATE ASIAN BOND FUND
PERFORMANCE TABLE (CONTINUED)
AS OF 31 DECEMBER 2014
101
The Lowest
Financial The Highest Redemption
Period Issue Price Price
Class III Dec 2004 US$ 12.38 US$ 10.34
Dec 2005 US$ 13.25 US$ 11.50 Dec 2006 US$ 13.50 US$ 12.29 Dec 2007 US$ 13.67 US$ 13.28 Dec 2008 US$ 13.41 US$ 9.21 Dec 2009 US$ 12.34 US$ 8.93 Dec 2010 US$ 13.86 US$ 12.33
Dec 2011 US$ 14.13 US$ 13.12 Dec 2012 US$ 15.53 US$ 13.88 Dec 2013 US$ 15.76 US$ 14.69 Dec 2014 US$ 16.50 US$ 15.22
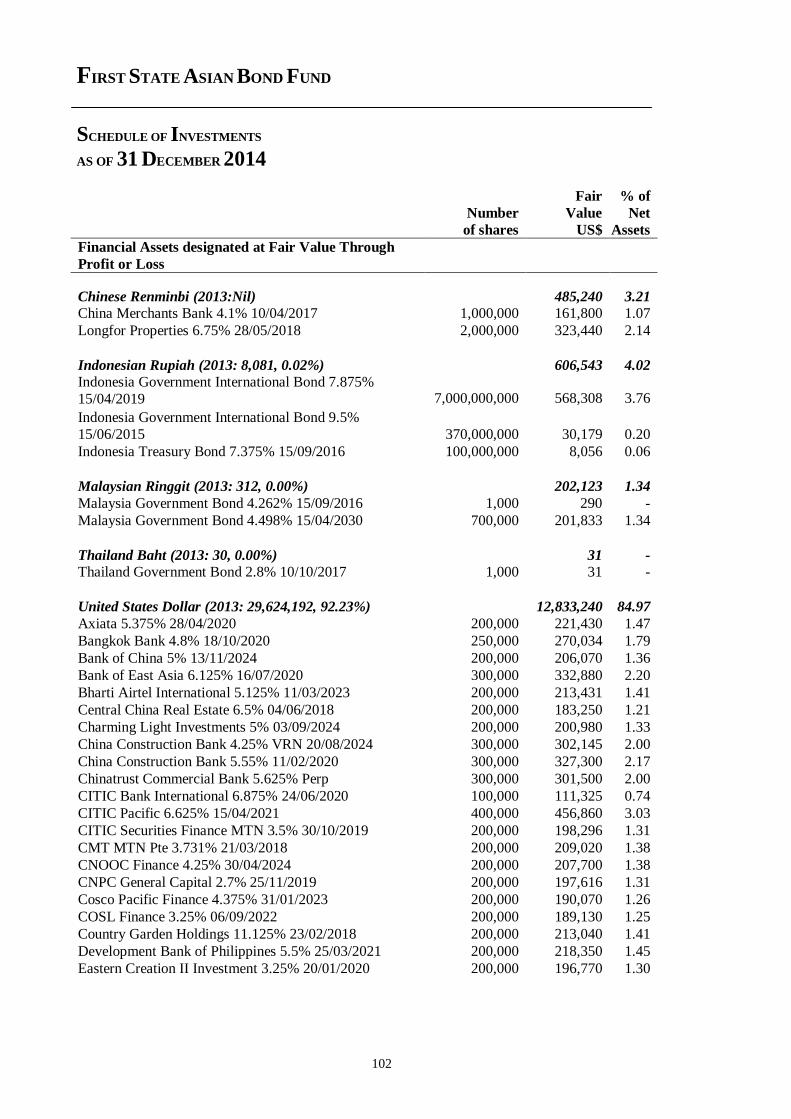
FIRST STATE ASIAN BOND FUND
SCHEDULE OF INVESTMENTS
AS OF 31 DECEMBER 2014
102
Fair % of
Number Value Net
of shares US$ Assets
Financial Assets designated at Fair Value Through
Profit or Loss
Chinese Renminbi (2013:Nil) 485,240 3.21
China Merchants Bank 4.1% 10/04/2017 1,000,000 161,800 1.07
Longfor Properties 6.75% 28/05/2018 2,000,000 323,440 2.14
Indonesian Rupiah (2013: 8,081, 0.02%) 606,543 4.02
Indonesia Government International Bond 7.875%
15/04/2019 7,000,000,000 568,308 3.76
Indonesia Government International Bond 9.5%
15/06/2015 370,000,000 30,179 0.20
Indonesia Treasury Bond 7.375% 15/09/2016 100,000,000 8,056 0.06
Malaysian Ringgit (2013: 312, 0.00%) 202,123 1.34
Malaysia Government Bond 4.262% 15/09/2016 1,000 290 -
Malaysia Government Bond 4.498% 15/04/2030 700,000 201,833 1.34
Thailand Baht (2013: 30, 0.00%) 31 -
Thailand Government Bond 2.8% 10/10/2017 1,000 31 -
United States Dollar (2013: 29,624,192, 92.23%) 12,833,240 84.97
Axiata 5.375% 28/04/2020 200,000 221,430 1.47
Bangkok Bank 4.8% 18/10/2020 250,000 270,034 1.79
Bank of China 5% 13/11/2024 200,000 206,070 1.36
Bank of East Asia 6.125% 16/07/2020 300,000 332,880 2.20
Bharti Airtel International 5.125% 11/03/2023 200,000 213,431 1.41
Central China Real Estate 6.5% 04/06/2018 200,000 183,250 1.21
Charming Light Investments 5% 03/09/2024 200,000 200,980 1.33
China Construction Bank 4.25% VRN 20/08/2024 300,000 302,145 2.00
China Construction Bank 5.55% 11/02/2020 300,000 327,300 2.17
Chinatrust Commercial Bank 5.625% Perp 300,000 301,500 2.00
CITIC Bank International 6.875% 24/06/2020 100,000 111,325 0.74
CITIC Pacific 6.625% 15/04/2021 400,000 456,860 3.03
CITIC Securities Finance MTN 3.5% 30/10/2019 200,000 198,296 1.31
CMT MTN Pte 3.731% 21/03/2018 200,000 209,020 1.38
CNOOC Finance 4.25% 30/04/2024 200,000 207,700 1.38
CNPC General Capital 2.7% 25/11/2019 200,000 197,616 1.31
Cosco Pacific Finance 4.375% 31/01/2023 200,000 190,070 1.26
COSL Finance 3.25% 06/09/2022 200,000 189,130 1.25
Country Garden Holdings 11.125% 23/02/2018 200,000 213,040 1.41
Development Bank of Philippines 5.5% 25/03/2021 200,000 218,350 1.45
Eastern Creation II Investment 3.25% 20/01/2020 200,000 196,770 1.30
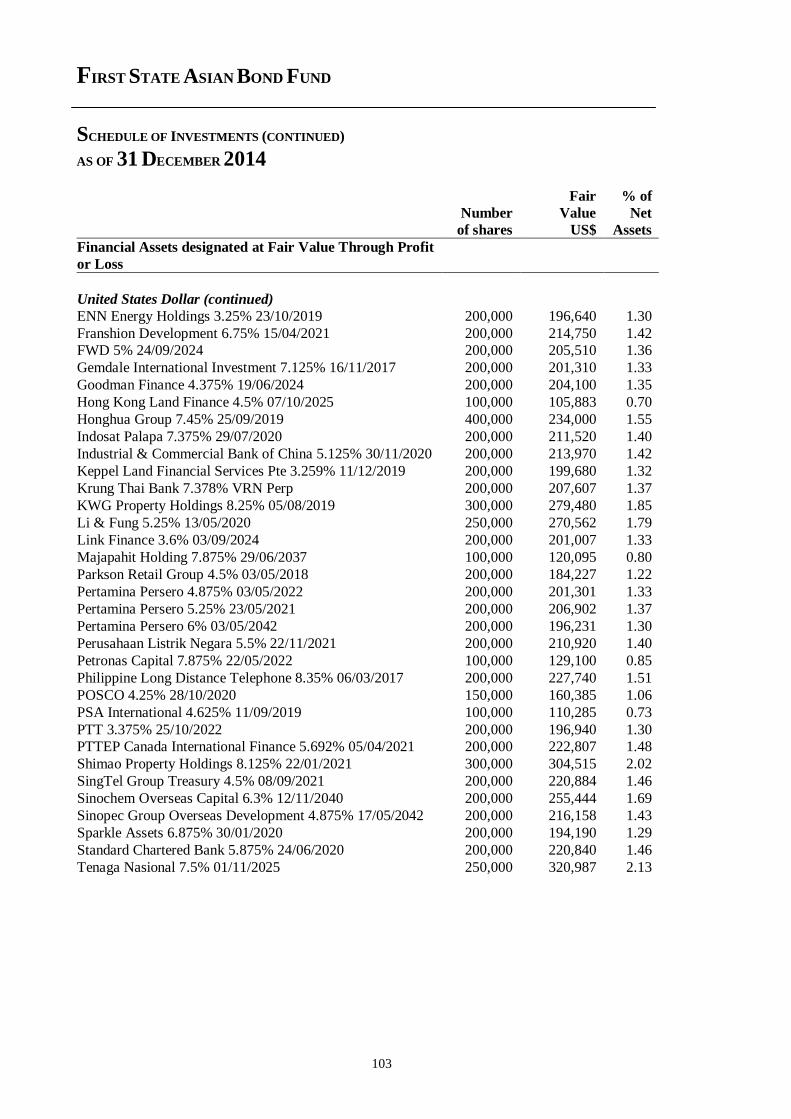
FIRST STATE ASIAN BOND FUND
SCHEDULE OF INVESTMENTS (CONTINUED)
AS OF 31 DECEMBER 2014
103
Fair % of
Number Value Net
of shares US$ Assets
Financial Assets designated at Fair Value Through Profit
or Loss
United States Dollar (continued)
ENN Energy Holdings 3.25% 23/10/2019 200,000 196,640 1.30
Franshion Development 6.75% 15/04/2021 200,000 214,750 1.42
FWD 5% 24/09/2024 200,000 205,510 1.36
Gemdale International Investment 7.125% 16/11/2017 200,000 201,310 1.33
Goodman Finance 4.375% 19/06/2024 200,000 204,100 1.35
Hong Kong Land Finance 4.5% 07/10/2025 100,000 105,883 0.70
Honghua Group 7.45% 25/09/2019 400,000 234,000 1.55
Indosat Palapa 7.375% 29/07/2020 200,000 211,520 1.40
Industrial & Commercial Bank of China 5.125% 30/11/2020 200,000 213,970 1.42
Keppel Land Financial Services Pte 3.259% 11/12/2019 200,000 199,680 1.32
Krung Thai Bank 7.378% VRN Perp 200,000 207,607 1.37
KWG Property Holdings 8.25% 05/08/2019 300,000 279,480 1.85
Li & Fung 5.25% 13/05/2020 250,000 270,562 1.79
Link Finance 3.6% 03/09/2024 200,000 201,007 1.33
Majapahit Holding 7.875% 29/06/2037 100,000 120,095 0.80
Parkson Retail Group 4.5% 03/05/2018 200,000 184,227 1.22
Pertamina Persero 4.875% 03/05/2022 200,000 201,301 1.33
Pertamina Persero 5.25% 23/05/2021 200,000 206,902 1.37
Pertamina Persero 6% 03/05/2042 200,000 196,231 1.30
Perusahaan Listrik Negara 5.5% 22/11/2021 200,000 210,920 1.40
Petronas Capital 7.875% 22/05/2022 100,000 129,100 0.85
Philippine Long Distance Telephone 8.35% 06/03/2017 200,000 227,740 1.51
POSCO 4.25% 28/10/2020 150,000 160,385 1.06
PSA International 4.625% 11/09/2019 100,000 110,285 0.73
PTT 3.375% 25/10/2022 200,000 196,940 1.30
PTTEP Canada International Finance 5.692% 05/04/2021 200,000 222,807 1.48
Shimao Property Holdings 8.125% 22/01/2021 300,000 304,515 2.02
SingTel Group Treasury 4.5% 08/09/2021 200,000 220,884 1.46
Sinochem Overseas Capital 6.3% 12/11/2040 200,000 255,444 1.69
Sinopec Group Overseas Development 4.875% 17/05/2042 200,000 216,158 1.43
Sparkle Assets 6.875% 30/01/2020 200,000 194,190 1.29
Standard Chartered Bank 5.875% 24/06/2020 200,000 220,840 1.46
Tenaga Nasional 7.5% 01/11/2025 250,000 320,987 2.13
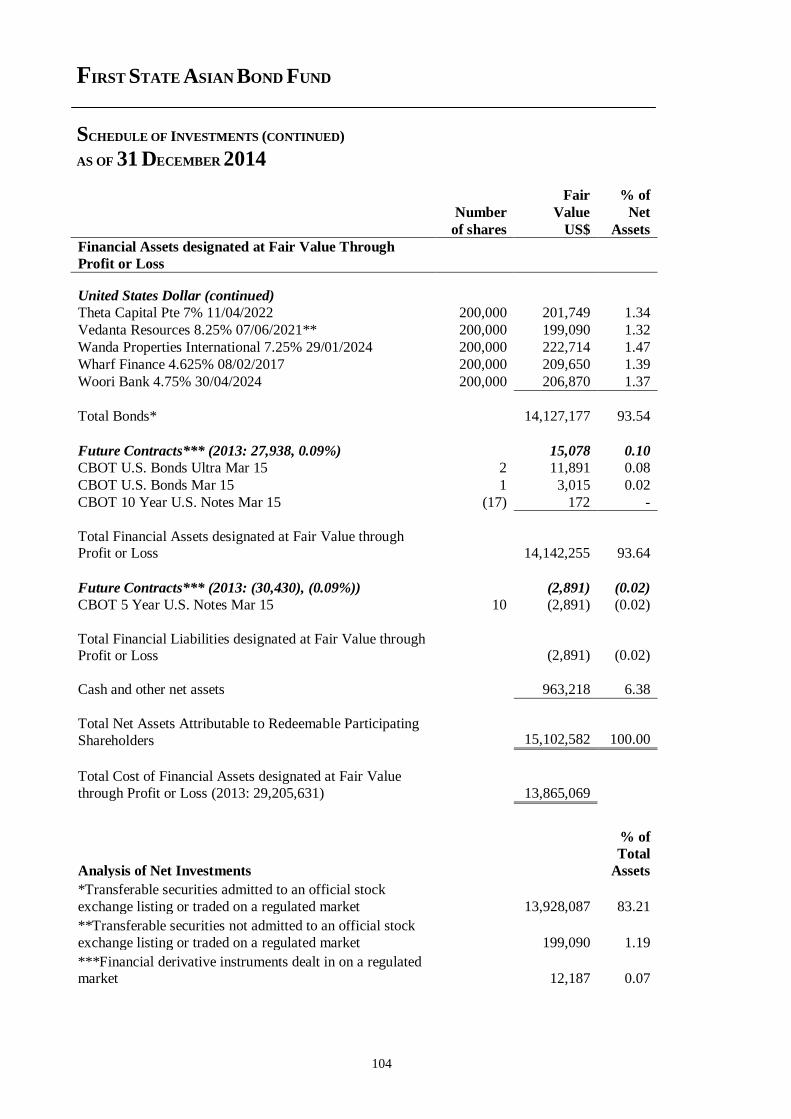
FIRST STATE ASIAN BOND FUND
SCHEDULE OF INVESTMENTS (CONTINUED)
AS OF 31 DECEMBER 2014
104
Fair % of
Number Value Net
of shares US$ Assets
Financial Assets designated at Fair Value Through
Profit or Loss
United States Dollar (continued)
Theta Capital Pte 7% 11/04/2022 200,000 201,749 1.34
Vedanta Resources 8.25% 07/06/2021** 200,000 199,090 1.32
Wanda Properties International 7.25% 29/01/2024 200,000 222,714 1.47
Wharf Finance 4.625% 08/02/2017 200,000 209,650 1.39
Woori Bank 4.75% 30/04/2024 200,000 206,870 1.37
Total Bonds* 14,127,177 93.54
Future Contracts*** (2013: 27,938, 0.09%) 15,078 0.10
CBOT U.S. Bonds Ultra Mar 15 2 11,891 0.08
CBOT U.S. Bonds Mar 15 1 3,015 0.02
CBOT 10 Year U.S. Notes Mar 15 (17) 172 -
Total Financial Assets designated at Fair Value through Profit or Loss
14,142,255
93.64
Future Contracts*** (2013: (30,430), (0.09%)) (2,891) (0.02)
CBOT 5 Year U.S. Notes Mar 15 10 (2,891) (0.02)
Total Financial Liabilities designated at Fair Value through Profit or Loss (2,891) (0.02)
Cash and other net assets 963,218 6.38
Total Net Assets Attributable to Redeemable Participating
Shareholders 15,102,582 100.00
Total Cost of Financial Assets designated at Fair Value
through Profit or Loss (2013: 29,205,631) 13,865,069
Analysis of Net Investments
% of
Total
Assets
*Transferable securities admitted to an official stock
exchange listing or traded on a regulated market 13,928,087 83.21
**Transferable securities not admitted to an official stock
exchange listing or traded on a regulated market 199,090 1.19
***Financial derivative instruments dealt in on a regulated market 12,187 0.07
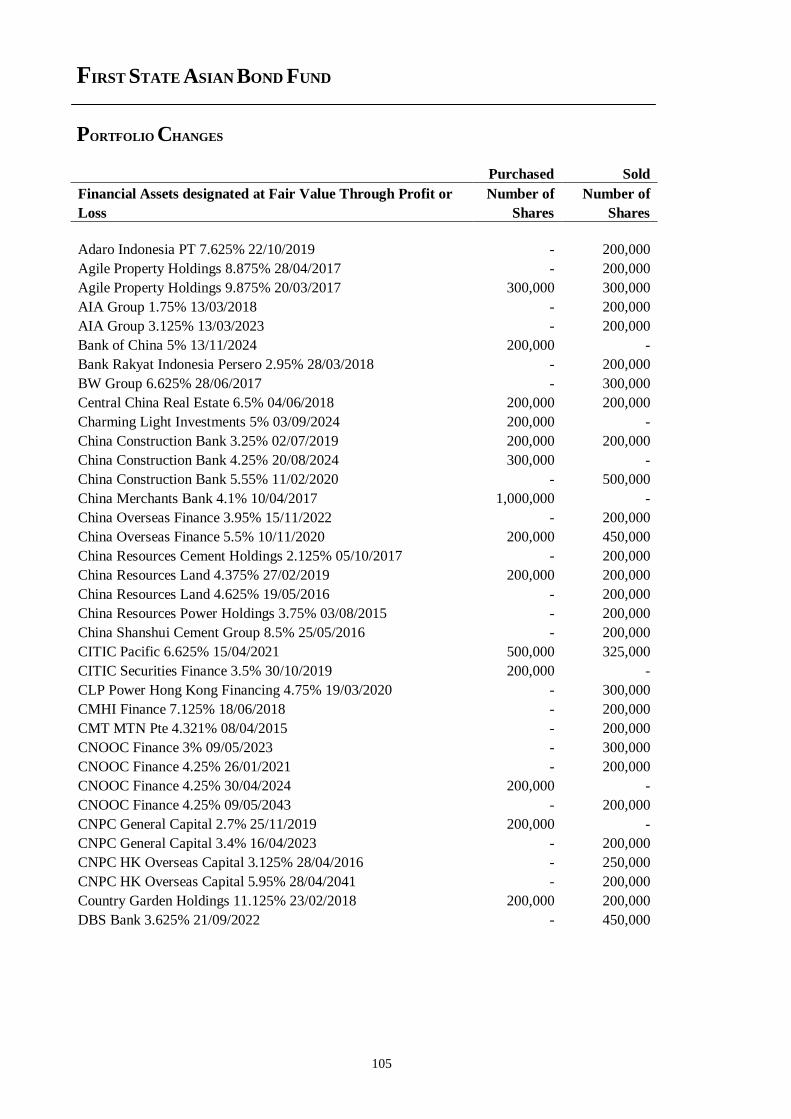
FIRST STATE ASIAN BOND FUND
PORTFOLIO CHANGES
105
Purchased Sold
Financial Assets designated at Fair Value Through Profit or Number of Number of
Loss Shares Shares
Adaro Indonesia PT 7.625% 22/10/2019 - 200,000
Agile Property Holdings 8.875% 28/04/2017 - 200,000
Agile Property Holdings 9.875% 20/03/2017 300,000 300,000
AIA Group 1.75% 13/03/2018 - 200,000
AIA Group 3.125% 13/03/2023 - 200,000
Bank of China 5% 13/11/2024 200,000 -
Bank Rakyat Indonesia Persero 2.95% 28/03/2018 - 200,000
BW Group 6.625% 28/06/2017 - 300,000
Central China Real Estate 6.5% 04/06/2018 200,000 200,000
Charming Light Investments 5% 03/09/2024 200,000 -
China Construction Bank 3.25% 02/07/2019 200,000 200,000
China Construction Bank 4.25% 20/08/2024 300,000 -
China Construction Bank 5.55% 11/02/2020 - 500,000
China Merchants Bank 4.1% 10/04/2017 1,000,000 -
China Overseas Finance 3.95% 15/11/2022 - 200,000
China Overseas Finance 5.5% 10/11/2020 200,000 450,000
China Resources Cement Holdings 2.125% 05/10/2017 - 200,000
China Resources Land 4.375% 27/02/2019 200,000 200,000
China Resources Land 4.625% 19/05/2016 - 200,000
China Resources Power Holdings 3.75% 03/08/2015 - 200,000
China Shanshui Cement Group 8.5% 25/05/2016 - 200,000
CITIC Pacific 6.625% 15/04/2021 500,000 325,000
CITIC Securities Finance 3.5% 30/10/2019 200,000 -
CLP Power Hong Kong Financing 4.75% 19/03/2020 - 300,000
CMHI Finance 7.125% 18/06/2018 - 200,000
CMT MTN Pte 4.321% 08/04/2015 - 200,000
CNOOC Finance 3% 09/05/2023 - 300,000
CNOOC Finance 4.25% 26/01/2021 - 200,000
CNOOC Finance 4.25% 30/04/2024 200,000 -
CNOOC Finance 4.25% 09/05/2043 - 200,000
CNPC General Capital 2.7% 25/11/2019 200,000 -
CNPC General Capital 3.4% 16/04/2023 - 200,000
CNPC HK Overseas Capital 3.125% 28/04/2016 - 250,000
CNPC HK Overseas Capital 5.95% 28/04/2041 - 200,000
Country Garden Holdings 11.125% 23/02/2018 200,000 200,000
DBS Bank 3.625% 21/09/2022 - 450,000
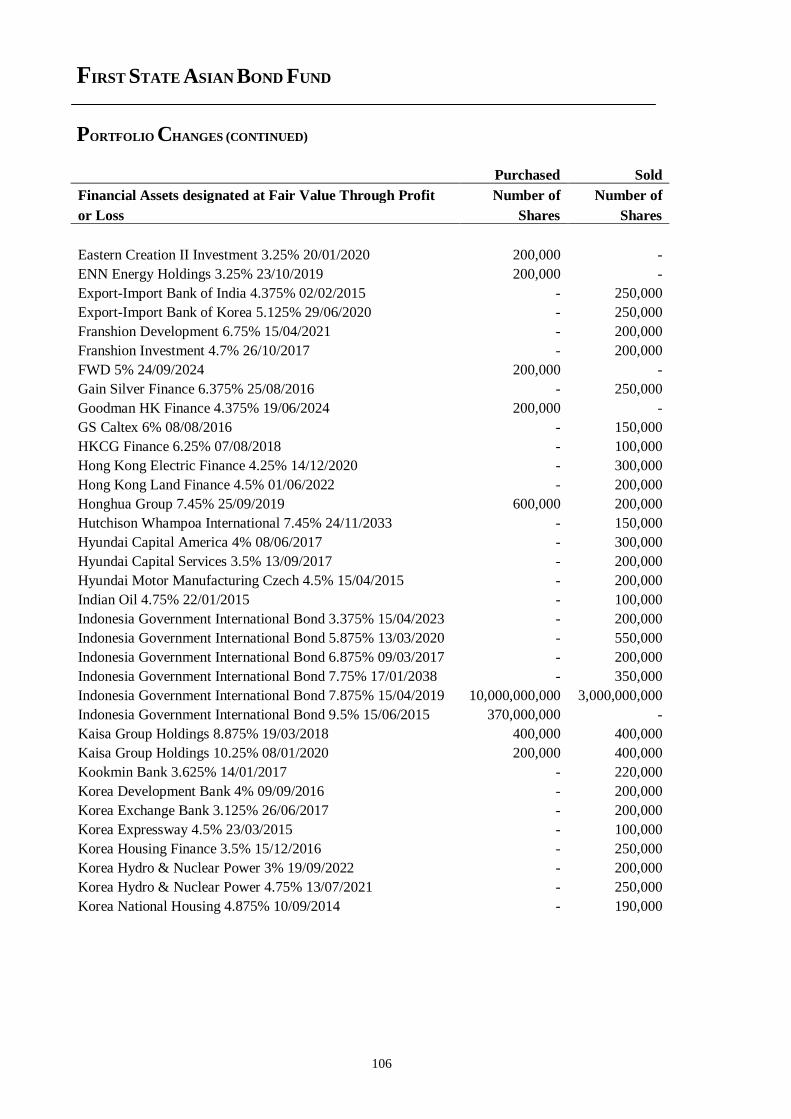
FIRST STATE ASIAN BOND FUND
PORTFOLIO CHANGES (CONTINUED)
106
Purchased Sold
Financial Assets designated at Fair Value Through Profit Number of Number of
or Loss Shares Shares
Eastern Creation II Investment 3.25% 20/01/2020 200,000 -
ENN Energy Holdings 3.25% 23/10/2019 200,000 -
Export-Import Bank of India 4.375% 02/02/2015 - 250,000
Export-Import Bank of Korea 5.125% 29/06/2020 - 250,000
Franshion Development 6.75% 15/04/2021 - 200,000
Franshion Investment 4.7% 26/10/2017 - 200,000
FWD 5% 24/09/2024 200,000 -
Gain Silver Finance 6.375% 25/08/2016 - 250,000
Goodman HK Finance 4.375% 19/06/2024 200,000 -
GS Caltex 6% 08/08/2016 - 150,000
HKCG Finance 6.25% 07/08/2018 - 100,000
Hong Kong Electric Finance 4.25% 14/12/2020 - 300,000
Hong Kong Land Finance 4.5% 01/06/2022 - 200,000
Honghua Group 7.45% 25/09/2019 600,000 200,000
Hutchison Whampoa International 7.45% 24/11/2033 - 150,000
Hyundai Capital America 4% 08/06/2017 - 300,000
Hyundai Capital Services 3.5% 13/09/2017 - 200,000
Hyundai Motor Manufacturing Czech 4.5% 15/04/2015 - 200,000
Indian Oil 4.75% 22/01/2015 - 100,000
Indonesia Government International Bond 3.375% 15/04/2023 - 200,000
Indonesia Government International Bond 5.875% 13/03/2020 - 550,000
Indonesia Government International Bond 6.875% 09/03/2017 - 200,000
Indonesia Government International Bond 7.75% 17/01/2038 - 350,000
Indonesia Government International Bond 7.875% 15/04/2019 10,000,000,000 3,000,000,000
Indonesia Government International Bond 9.5% 15/06/2015 370,000,000 -
Kaisa Group Holdings 8.875% 19/03/2018 400,000 400,000
Kaisa Group Holdings 10.25% 08/01/2020 200,000 400,000
Kookmin Bank 3.625% 14/01/2017 - 220,000
Korea Development Bank 4% 09/09/2016 - 200,000
Korea Exchange Bank 3.125% 26/06/2017 - 200,000
Korea Expressway 4.5% 23/03/2015 - 100,000
Korea Housing Finance 3.5% 15/12/2016 - 250,000
Korea Hydro & Nuclear Power 3% 19/09/2022 - 200,000
Korea Hydro & Nuclear Power 4.75% 13/07/2021 - 250,000
Korea National Housing 4.875% 10/09/2014 - 190,000
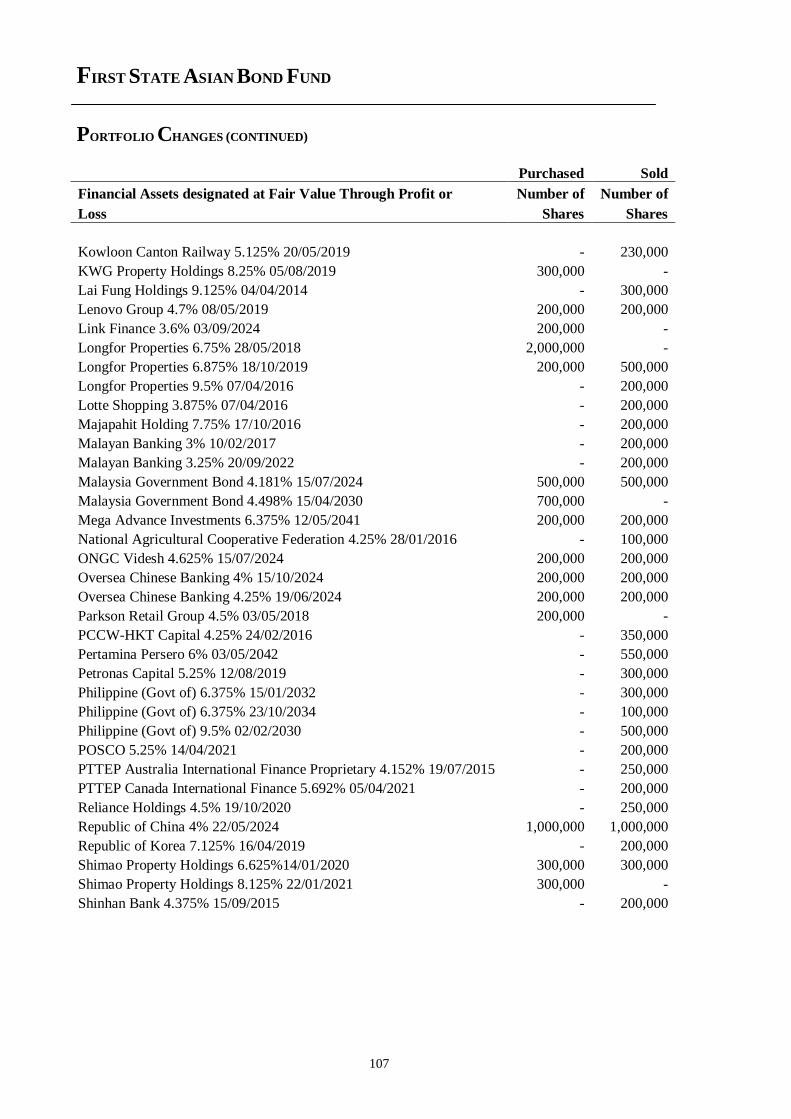
FIRST STATE ASIAN BOND FUND
PORTFOLIO CHANGES (CONTINUED)
107
Purchased Sold
Financial Assets designated at Fair Value Through Profit or Number of Number of
Loss Shares Shares
Kowloon Canton Railway 5.125% 20/05/2019 - 230,000
KWG Property Holdings 8.25% 05/08/2019 300,000 -
Lai Fung Holdings 9.125% 04/04/2014 - 300,000
Lenovo Group 4.7% 08/05/2019 200,000 200,000
Link Finance 3.6% 03/09/2024 200,000 -
Longfor Properties 6.75% 28/05/2018 2,000,000 -
Longfor Properties 6.875% 18/10/2019 200,000 500,000
Longfor Properties 9.5% 07/04/2016 - 200,000
Lotte Shopping 3.875% 07/04/2016 - 200,000
Majapahit Holding 7.75% 17/10/2016 - 200,000
Malayan Banking 3% 10/02/2017 - 200,000
Malayan Banking 3.25% 20/09/2022 - 200,000
Malaysia Government Bond 4.181% 15/07/2024 500,000 500,000
Malaysia Government Bond 4.498% 15/04/2030 700,000 -
Mega Advance Investments 6.375% 12/05/2041 200,000 200,000
National Agricultural Cooperative Federation 4.25% 28/01/2016 - 100,000
ONGC Videsh 4.625% 15/07/2024 200,000 200,000
Oversea Chinese Banking 4% 15/10/2024 200,000 200,000
Oversea Chinese Banking 4.25% 19/06/2024 200,000 200,000
Parkson Retail Group 4.5% 03/05/2018 200,000 -
PCCW-HKT Capital 4.25% 24/02/2016 - 350,000
Pertamina Persero 6% 03/05/2042 - 550,000
Petronas Capital 5.25% 12/08/2019 - 300,000
Philippine (Govt of) 6.375% 15/01/2032 - 300,000
Philippine (Govt of) 6.375% 23/10/2034 - 100,000
Philippine (Govt of) 9.5% 02/02/2030 - 500,000
POSCO 5.25% 14/04/2021 - 200,000
PTTEP Australia International Finance Proprietary 4.152% 19/07/2015 - 250,000
PTTEP Canada International Finance 5.692% 05/04/2021 - 200,000
Reliance Holdings 4.5% 19/10/2020 - 250,000
Republic of China 4% 22/05/2024 1,000,000 1,000,000
Republic of Korea 7.125% 16/04/2019 - 200,000
Shimao Property Holdings 6.625%14/01/2020 300,000 300,000
Shimao Property Holdings 8.125% 22/01/2021 300,000 -
Shinhan Bank 4.375% 15/09/2015 - 200,000
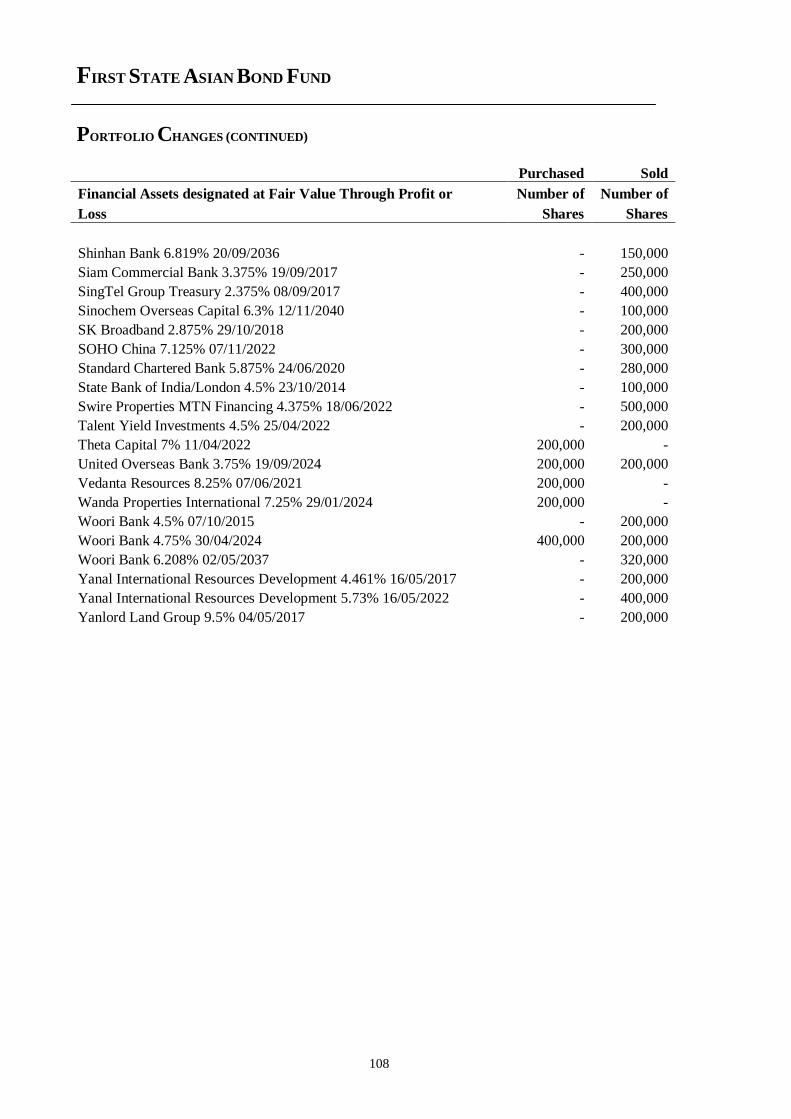
FIRST STATE ASIAN BOND FUND
PORTFOLIO CHANGES (CONTINUED)
108
Purchased Sold
Financial Assets designated at Fair Value Through Profit or Number of Number of
Loss Shares Shares
Shinhan Bank 6.819% 20/09/2036 - 150,000
Siam Commercial Bank 3.375% 19/09/2017 - 250,000
SingTel Group Treasury 2.375% 08/09/2017 - 400,000
Sinochem Overseas Capital 6.3% 12/11/2040 - 100,000
SK Broadband 2.875% 29/10/2018 - 200,000
SOHO China 7.125% 07/11/2022 - 300,000
Standard Chartered Bank 5.875% 24/06/2020 - 280,000
State Bank of India/London 4.5% 23/10/2014 - 100,000
Swire Properties MTN Financing 4.375% 18/06/2022 - 500,000
Talent Yield Investments 4.5% 25/04/2022 - 200,000
Theta Capital 7% 11/04/2022 200,000 -
United Overseas Bank 3.75% 19/09/2024 200,000 200,000
Vedanta Resources 8.25% 07/06/2021 200,000 -
Wanda Properties International 7.25% 29/01/2024 200,000 -
Woori Bank 4.5% 07/10/2015 - 200,000
Woori Bank 4.75% 30/04/2024 400,000 200,000
Woori Bank 6.208% 02/05/2037 - 320,000
Yanal International Resources Development 4.461% 16/05/2017 - 200,000
Yanal International Resources Development 5.73% 16/05/2022 - 400,000
Yanlord Land Group 9.5% 04/05/2017 - 200,000
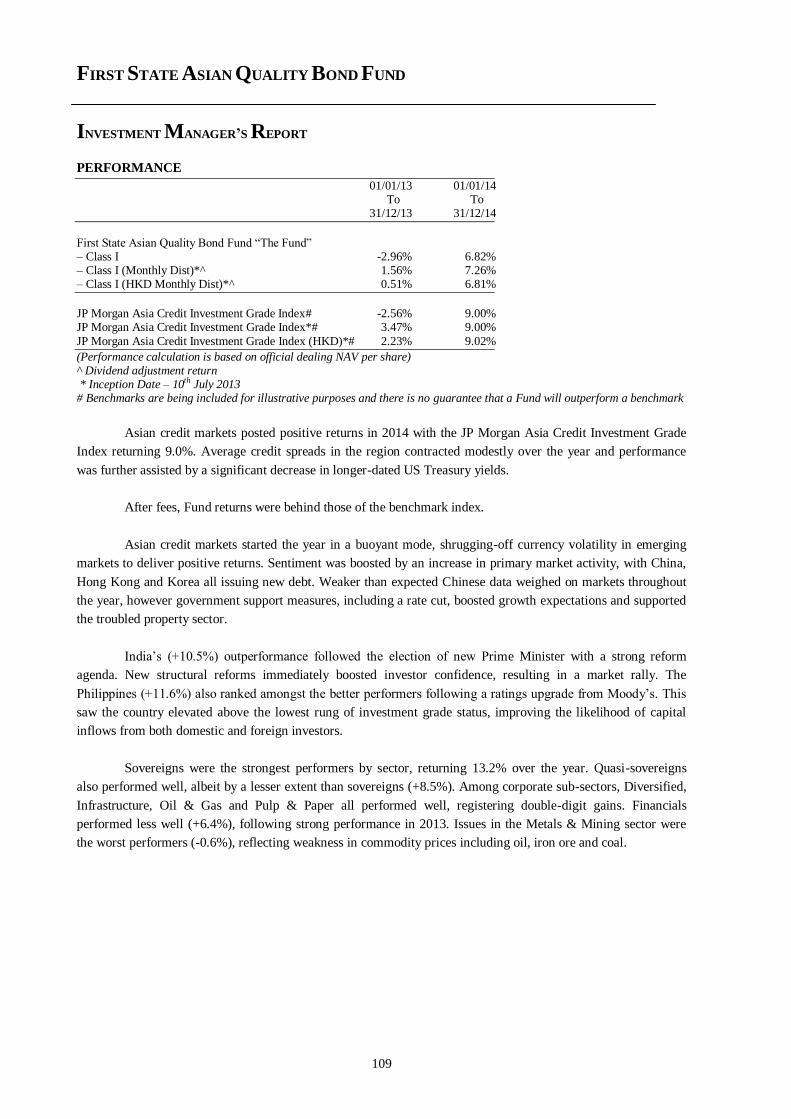
FIRST STATE ASIAN QUALITY BOND FUND
INVESTMENT MANAGER’S REPORT
109
PERFORMANCE
01/01/13 01/01/14 To To 31/12/13 31/12/14
First State Asian Quality Bond Fund “The Fund” – Class I -2.96% 6.82% – Class I (Monthly Dist)*^ 1.56% 7.26% – Class I (HKD Monthly Dist)*^ 0.51% 6.81%
JP Morgan Asia Credit Investment Grade Index# -2.56% 9.00% JP Morgan Asia Credit Investment Grade Index*# 3.47% 9.00%
JP Morgan Asia Credit Investment Grade Index (HKD)*# 2.23% 9.02%
(Performance calculation is based on official dealing NAV per share) ^ Dividend adjustment return * Inception Date – 10th July 2013 # Benchmarks are being included for illustrative purposes and there is no guarantee that a Fund will outperform a benchmark
Asian credit markets posted positive returns in 2014 with the JP Morgan Asia Credit Investment Grade
Index returning 9.0%. Average credit spreads in the region contracted modestly over the year and performance
was further assisted by a significant decrease in longer-dated US Treasury yields.
After fees, Fund returns were behind those of the benchmark index.
Asian credit markets started the year in a buoyant mode, shrugging-off currency volatility in emerging
markets to deliver positive returns. Sentiment was boosted by an increase in primary market activity, with China,
Hong Kong and Korea all issuing new debt. Weaker than expected Chinese data weighed on markets throughout
the year, however government support measures, including a rate cut, boosted growth expectations and supported
the troubled property sector.
India’s (+10.5%) outperformance followed the election of new Prime Minister with a strong reform
agenda. New structural reforms immediately boosted investor confidence, resulting in a market rally. The
Philippines (+11.6%) also ranked amongst the better performers following a ratings upgrade from Moody’s. This
saw the country elevated above the lowest rung of investment grade status, improving the likelihood of capital
inflows from both domestic and foreign investors.
Sovereigns were the strongest performers by sector, returning 13.2% over the year. Quasi-sovereigns
also performed well, albeit by a lesser extent than sovereigns (+8.5%). Among corporate sub-sectors, Diversified,
Infrastructure, Oil & Gas and Pulp & Paper all performed well, registering double-digit gains. Financials
performed less well (+6.4%), following strong performance in 2013. Issues in the Metals & Mining sector were
the worst performers (-0.6%), reflecting weakness in commodity prices including oil, iron ore and coal.
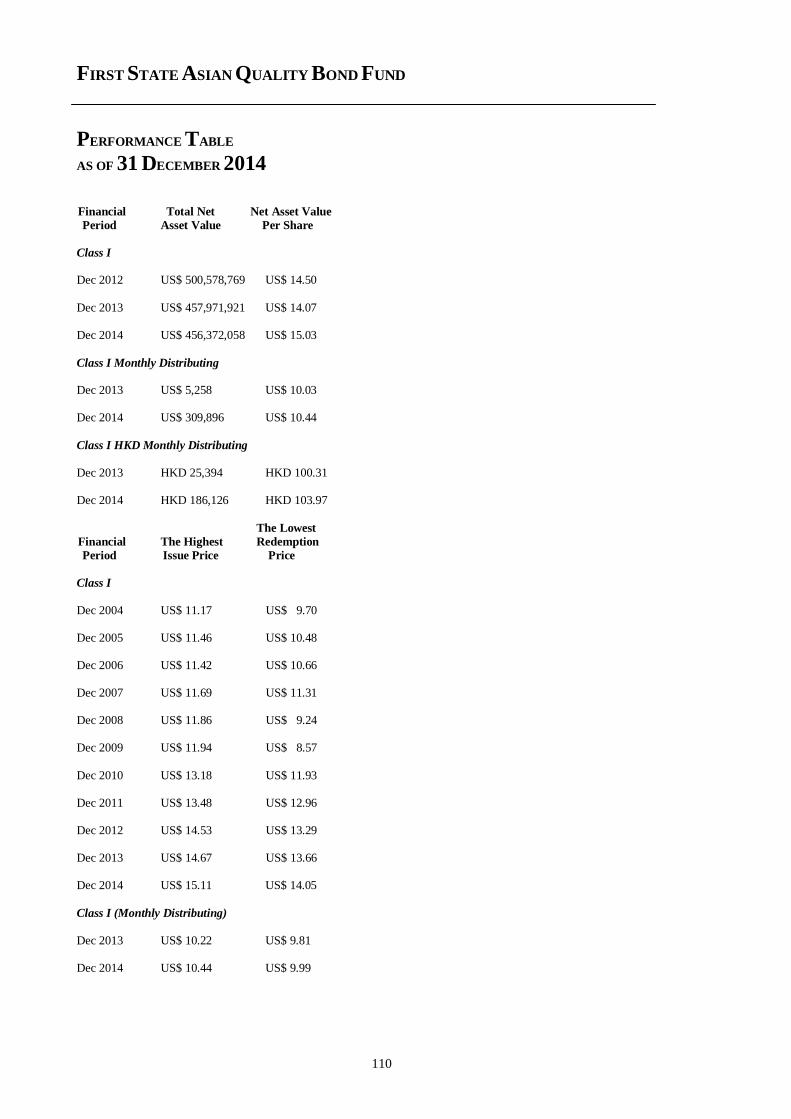
FIRST STATE ASIAN QUALITY BOND FUND
PERFORMANCE TABLE
AS OF 31 DECEMBER 2014
110
Financial Total Net Net Asset Value
Period Asset Value Per Share
Class I Dec 2012 US$ 500,578,769 US$ 14.50
Dec 2013 US$ 457,971,921 US$ 14.07 Dec 2014 US$ 456,372,058 US$ 15.03
Class I Monthly Distributing Dec 2013 US$ 5,258 US$ 10.03 Dec 2014 US$ 309,896 US$ 10.44
Class I HKD Monthly Distributing
Dec 2013 HKD 25,394 HKD 100.31 Dec 2014 HKD 186,126 HKD 103.97
The Lowest
Financial The Highest Redemption
Period Issue Price Price
Class I
Dec 2004 US$ 11.17 US$ 9.70 Dec 2005 US$ 11.46 US$ 10.48 Dec 2006 US$ 11.42 US$ 10.66 Dec 2007 US$ 11.69 US$ 11.31 Dec 2008 US$ 11.86 US$ 9.24 Dec 2009 US$ 11.94 US$ 8.57
Dec 2010 US$ 13.18 US$ 11.93 Dec 2011 US$ 13.48 US$ 12.96 Dec 2012 US$ 14.53 US$ 13.29 Dec 2013 US$ 14.67 US$ 13.66 Dec 2014 US$ 15.11 US$ 14.05
Class I (Monthly Distributing)
Dec 2013 US$ 10.22 US$ 9.81 Dec 2014 US$ 10.44 US$ 9.99
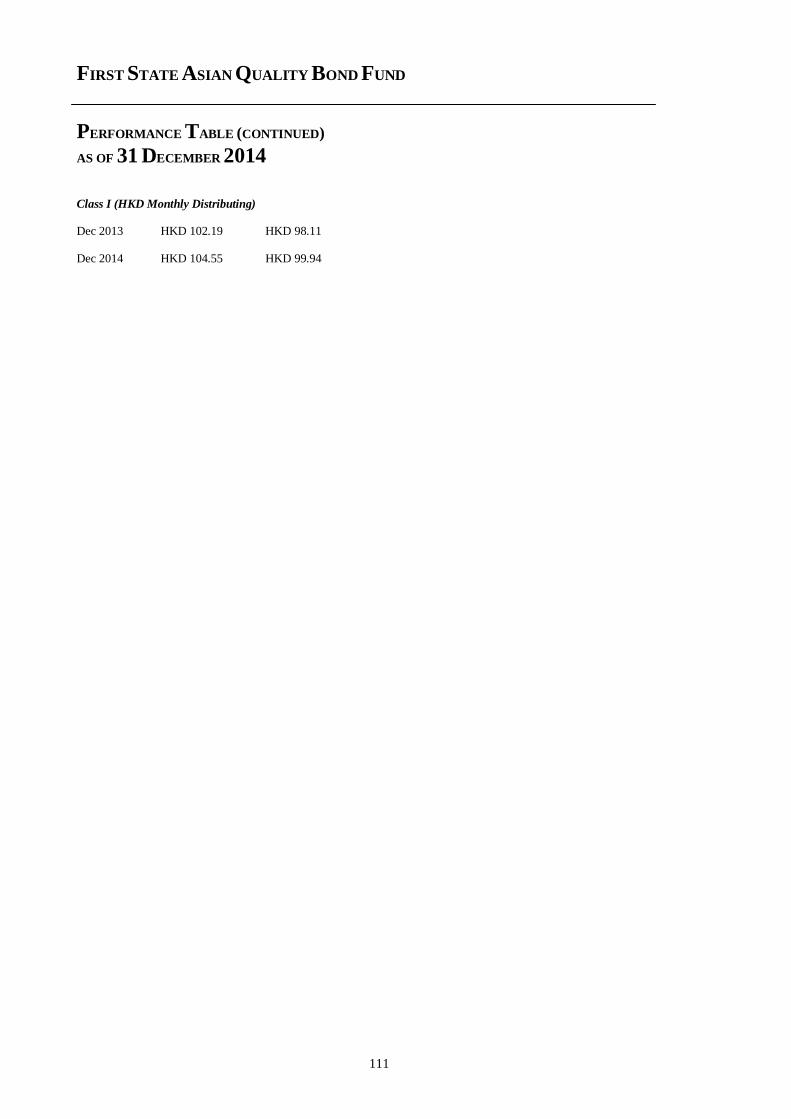
FIRST STATE ASIAN QUALITY BOND FUND
PERFORMANCE TABLE (CONTINUED)
AS OF 31 DECEMBER 2014
111
Class I (HKD Monthly Distributing) Dec 2013 HKD 102.19 HKD 98.11 Dec 2014 HKD 104.55 HKD 99.94
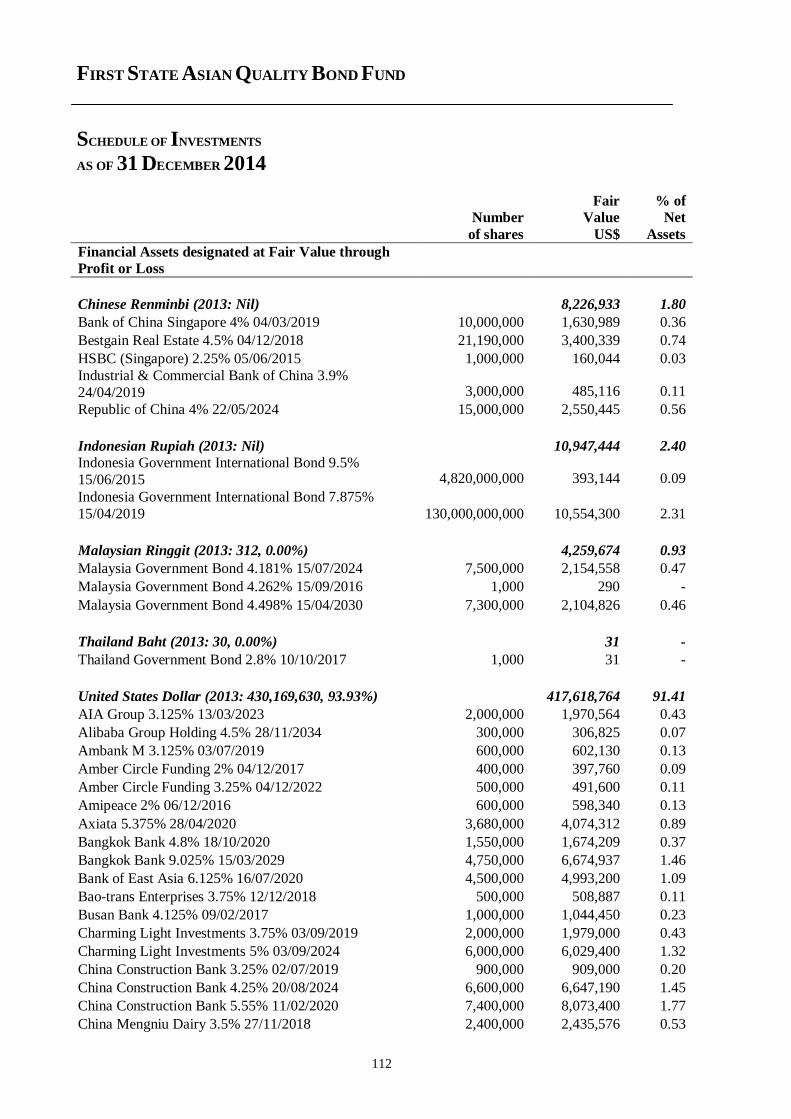
FIRST STATE ASIAN QUALITY BOND FUND
SCHEDULE OF INVESTMENTS
AS OF 31 DECEMBER 2014
112
Fair % of Number Value Net
of shares US$ Assets
Financial Assets designated at Fair Value through
Profit or Loss
Chinese Renminbi (2013: Nil) 8,226,933 1.80
Bank of China Singapore 4% 04/03/2019 10,000,000 1,630,989 0.36
Bestgain Real Estate 4.5% 04/12/2018 21,190,000 3,400,339 0.74
HSBC (Singapore) 2.25% 05/06/2015 1,000,000 160,044 0.03
Industrial & Commercial Bank of China 3.9%
24/04/2019 3,000,000 485,116 0.11
Republic of China 4% 22/05/2024 15,000,000 2,550,445 0.56
Indonesian Rupiah (2013: Nil) 10,947,444 2.40
Indonesia Government International Bond 9.5%
15/06/2015 4,820,000,000 393,144 0.09
Indonesia Government International Bond 7.875%
15/04/2019 130,000,000,000 10,554,300 2.31
Malaysian Ringgit (2013: 312, 0.00%) 4,259,674 0.93
Malaysia Government Bond 4.181% 15/07/2024 7,500,000 2,154,558 0.47
Malaysia Government Bond 4.262% 15/09/2016 1,000 290 -
Malaysia Government Bond 4.498% 15/04/2030 7,300,000 2,104,826 0.46
Thailand Baht (2013: 30, 0.00%) 31 -
Thailand Government Bond 2.8% 10/10/2017 1,000 31 -
United States Dollar (2013: 430,169,630, 93.93%) 417,618,764 91.41
AIA Group 3.125% 13/03/2023 2,000,000 1,970,564 0.43
Alibaba Group Holding 4.5% 28/11/2034 300,000 306,825 0.07
Ambank M 3.125% 03/07/2019 600,000 602,130 0.13
Amber Circle Funding 2% 04/12/2017 400,000 397,760 0.09
Amber Circle Funding 3.25% 04/12/2022 500,000 491,600 0.11
Amipeace 2% 06/12/2016 600,000 598,340 0.13
Axiata 5.375% 28/04/2020 3,680,000 4,074,312 0.89
Bangkok Bank 4.8% 18/10/2020 1,550,000 1,674,209 0.37
Bangkok Bank 9.025% 15/03/2029 4,750,000 6,674,937 1.46
Bank of East Asia 6.125% 16/07/2020 4,500,000 4,993,200 1.09
Bao-trans Enterprises 3.75% 12/12/2018 500,000 508,887 0.11
Busan Bank 4.125% 09/02/2017 1,000,000 1,044,450 0.23
Charming Light Investments 3.75% 03/09/2019 2,000,000 1,979,000 0.43
Charming Light Investments 5% 03/09/2024 6,000,000 6,029,400 1.32
China Construction Bank 3.25% 02/07/2019 900,000 909,000 0.20
China Construction Bank 4.25% 20/08/2024 6,600,000 6,647,190 1.45
China Construction Bank 5.55% 11/02/2020 7,400,000 8,073,400 1.77
China Mengniu Dairy 3.5% 27/11/2018 2,400,000 2,435,576 0.53
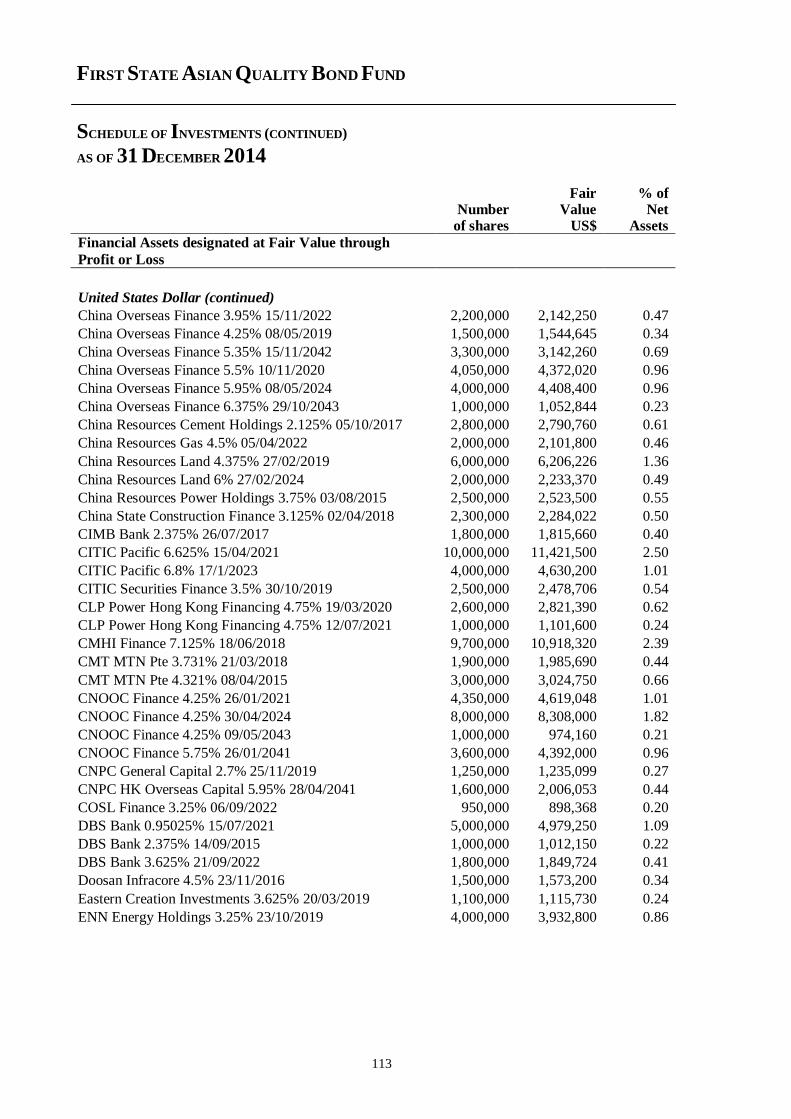
FIRST STATE ASIAN QUALITY BOND FUND
SCHEDULE OF INVESTMENTS (CONTINUED)
AS OF 31 DECEMBER 2014
113
Fair % of Number Value Net of shares US$ Assets
Financial Assets designated at Fair Value through
Profit or Loss
United States Dollar (continued)
China Overseas Finance 3.95% 15/11/2022 2,200,000 2,142,250 0.47
China Overseas Finance 4.25% 08/05/2019 1,500,000 1,544,645 0.34
China Overseas Finance 5.35% 15/11/2042 3,300,000 3,142,260 0.69
China Overseas Finance 5.5% 10/11/2020 4,050,000 4,372,020 0.96
China Overseas Finance 5.95% 08/05/2024 4,000,000 4,408,400 0.96
China Overseas Finance 6.375% 29/10/2043 1,000,000 1,052,844 0.23
China Resources Cement Holdings 2.125% 05/10/2017 2,800,000 2,790,760 0.61
China Resources Gas 4.5% 05/04/2022 2,000,000 2,101,800 0.46
China Resources Land 4.375% 27/02/2019 6,000,000 6,206,226 1.36
China Resources Land 6% 27/02/2024 2,000,000 2,233,370 0.49
China Resources Power Holdings 3.75% 03/08/2015 2,500,000 2,523,500 0.55
China State Construction Finance 3.125% 02/04/2018 2,300,000 2,284,022 0.50
CIMB Bank 2.375% 26/07/2017 1,800,000 1,815,660 0.40
CITIC Pacific 6.625% 15/04/2021 10,000,000 11,421,500 2.50
CITIC Pacific 6.8% 17/1/2023 4,000,000 4,630,200 1.01
CITIC Securities Finance 3.5% 30/10/2019 2,500,000 2,478,706 0.54
CLP Power Hong Kong Financing 4.75% 19/03/2020 2,600,000 2,821,390 0.62
CLP Power Hong Kong Financing 4.75% 12/07/2021 1,000,000 1,101,600 0.24
CMHI Finance 7.125% 18/06/2018 9,700,000 10,918,320 2.39
CMT MTN Pte 3.731% 21/03/2018 1,900,000 1,985,690 0.44
CMT MTN Pte 4.321% 08/04/2015 3,000,000 3,024,750 0.66
CNOOC Finance 4.25% 26/01/2021 4,350,000 4,619,048 1.01
CNOOC Finance 4.25% 30/04/2024 8,000,000 8,308,000 1.82
CNOOC Finance 4.25% 09/05/2043 1,000,000 974,160 0.21
CNOOC Finance 5.75% 26/01/2041 3,600,000 4,392,000 0.96
CNPC General Capital 2.7% 25/11/2019 1,250,000 1,235,099 0.27
CNPC HK Overseas Capital 5.95% 28/04/2041 1,600,000 2,006,053 0.44
COSL Finance 3.25% 06/09/2022 950,000 898,368 0.20
DBS Bank 0.95025% 15/07/2021 5,000,000 4,979,250 1.09
DBS Bank 2.375% 14/09/2015 1,000,000 1,012,150 0.22
DBS Bank 3.625% 21/09/2022 1,800,000 1,849,724 0.41
Doosan Infracore 4.5% 23/11/2016 1,500,000 1,573,200 0.34
Eastern Creation Investments 3.625% 20/03/2019 1,100,000 1,115,730 0.24
ENN Energy Holdings 3.25% 23/10/2019 4,000,000 3,932,800 0.86
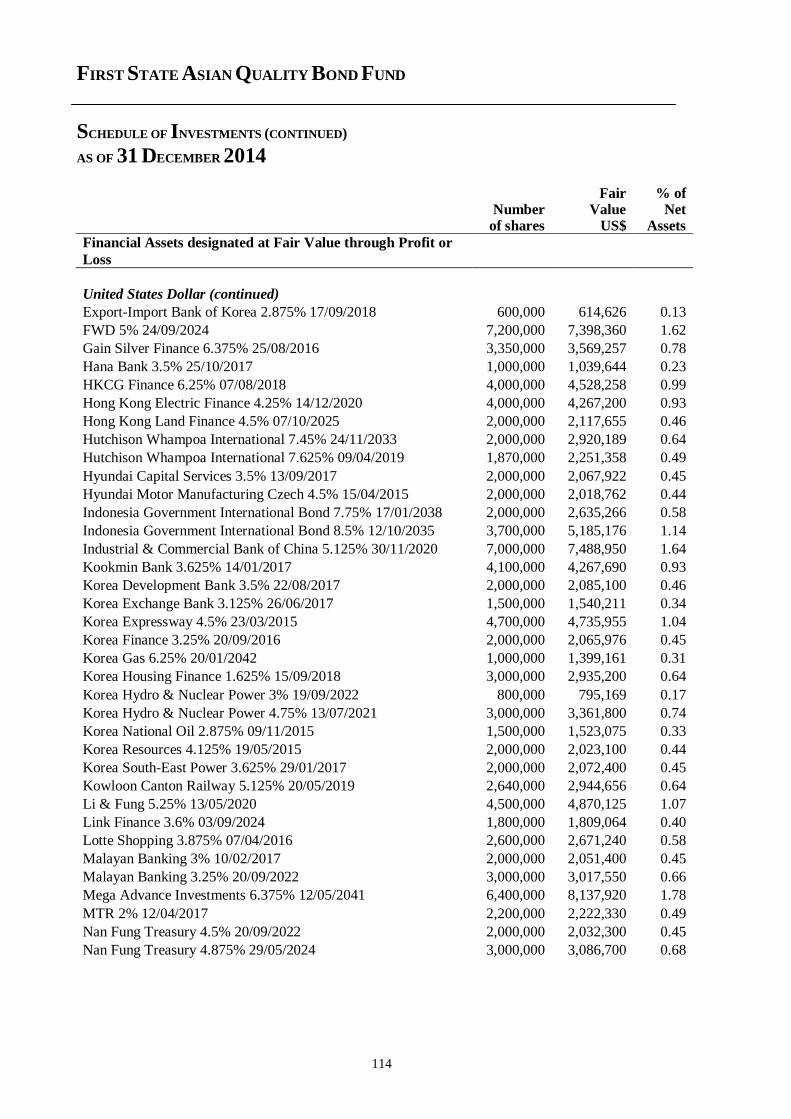
FIRST STATE ASIAN QUALITY BOND FUND
SCHEDULE OF INVESTMENTS (CONTINUED)
AS OF 31 DECEMBER 2014
114
Fair % of Number Value Net of shares US$ Assets
Financial Assets designated at Fair Value through Profit or
Loss
United States Dollar (continued)
Export-Import Bank of Korea 2.875% 17/09/2018 600,000 614,626 0.13
FWD 5% 24/09/2024 7,200,000 7,398,360 1.62
Gain Silver Finance 6.375% 25/08/2016 3,350,000 3,569,257 0.78
Hana Bank 3.5% 25/10/2017 1,000,000 1,039,644 0.23
HKCG Finance 6.25% 07/08/2018 4,000,000 4,528,258 0.99
Hong Kong Electric Finance 4.25% 14/12/2020 4,000,000 4,267,200 0.93
Hong Kong Land Finance 4.5% 07/10/2025 2,000,000 2,117,655 0.46
Hutchison Whampoa International 7.45% 24/11/2033 2,000,000 2,920,189 0.64
Hutchison Whampoa International 7.625% 09/04/2019 1,870,000 2,251,358 0.49
Hyundai Capital Services 3.5% 13/09/2017 2,000,000 2,067,922 0.45
Hyundai Motor Manufacturing Czech 4.5% 15/04/2015 2,000,000 2,018,762 0.44
Indonesia Government International Bond 7.75% 17/01/2038 2,000,000 2,635,266 0.58
Indonesia Government International Bond 8.5% 12/10/2035 3,700,000 5,185,176 1.14
Industrial & Commercial Bank of China 5.125% 30/11/2020 7,000,000 7,488,950 1.64
Kookmin Bank 3.625% 14/01/2017 4,100,000 4,267,690 0.93
Korea Development Bank 3.5% 22/08/2017 2,000,000 2,085,100 0.46
Korea Exchange Bank 3.125% 26/06/2017 1,500,000 1,540,211 0.34
Korea Expressway 4.5% 23/03/2015 4,700,000 4,735,955 1.04
Korea Finance 3.25% 20/09/2016 2,000,000 2,065,976 0.45
Korea Gas 6.25% 20/01/2042 1,000,000 1,399,161 0.31
Korea Housing Finance 1.625% 15/09/2018 3,000,000 2,935,200 0.64
Korea Hydro & Nuclear Power 3% 19/09/2022 800,000 795,169 0.17
Korea Hydro & Nuclear Power 4.75% 13/07/2021 3,000,000 3,361,800 0.74
Korea National Oil 2.875% 09/11/2015 1,500,000 1,523,075 0.33
Korea Resources 4.125% 19/05/2015 2,000,000 2,023,100 0.44
Korea South-East Power 3.625% 29/01/2017 2,000,000 2,072,400 0.45
Kowloon Canton Railway 5.125% 20/05/2019 2,640,000 2,944,656 0.64
Li & Fung 5.25% 13/05/2020 4,500,000 4,870,125 1.07
Link Finance 3.6% 03/09/2024 1,800,000 1,809,064 0.40
Lotte Shopping 3.875% 07/04/2016 2,600,000 2,671,240 0.58
Malayan Banking 3% 10/02/2017 2,000,000 2,051,400 0.45
Malayan Banking 3.25% 20/09/2022 3,000,000 3,017,550 0.66
Mega Advance Investments 6.375% 12/05/2041 6,400,000 8,137,920 1.78
MTR 2% 12/04/2017 2,200,000 2,222,330 0.49
Nan Fung Treasury 4.5% 20/09/2022 2,000,000 2,032,300 0.45
Nan Fung Treasury 4.875% 29/05/2024 3,000,000 3,086,700 0.68
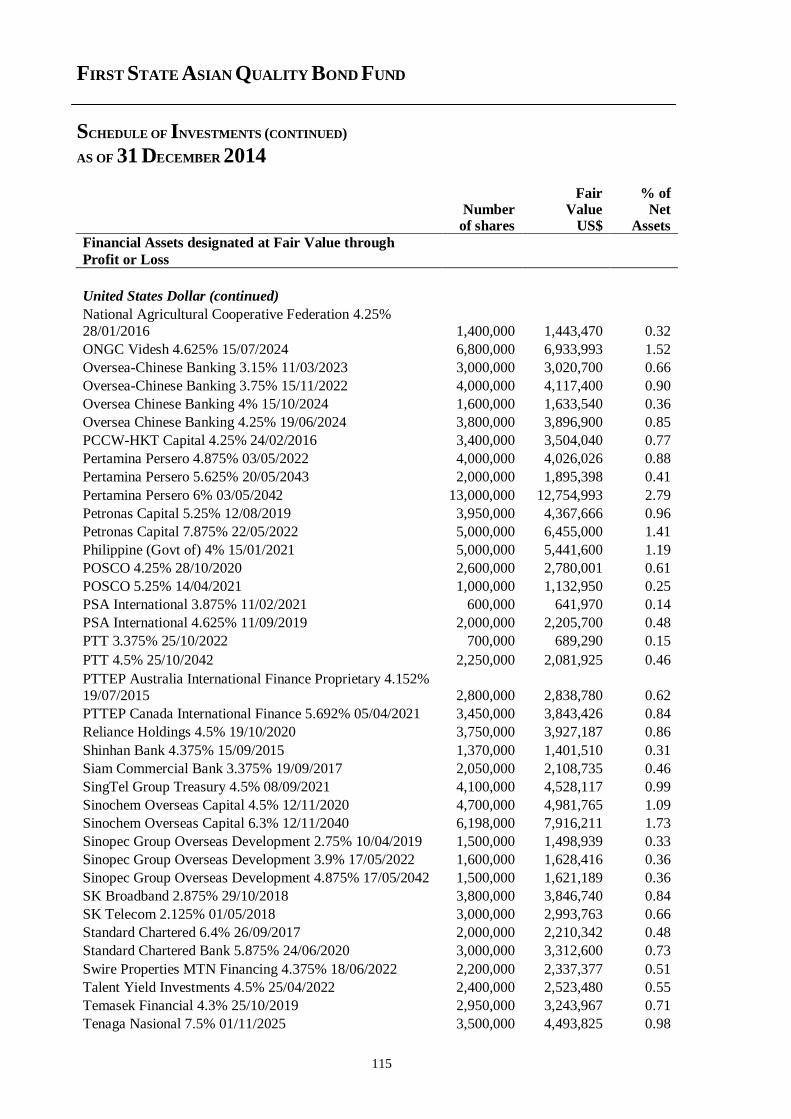
FIRST STATE ASIAN QUALITY BOND FUND
SCHEDULE OF INVESTMENTS (CONTINUED)
AS OF 31 DECEMBER 2014
115
Fair % of Number Value Net of shares US$ Assets
Financial Assets designated at Fair Value through
Profit or Loss
United States Dollar (continued)
National Agricultural Cooperative Federation 4.25%
28/01/2016 1,400,000 1,443,470 0.32
ONGC Videsh 4.625% 15/07/2024 6,800,000 6,933,993 1.52
Oversea-Chinese Banking 3.15% 11/03/2023 3,000,000 3,020,700 0.66
Oversea-Chinese Banking 3.75% 15/11/2022 4,000,000 4,117,400 0.90
Oversea Chinese Banking 4% 15/10/2024 1,600,000 1,633,540 0.36
Oversea Chinese Banking 4.25% 19/06/2024 3,800,000 3,896,900 0.85
PCCW-HKT Capital 4.25% 24/02/2016 3,400,000 3,504,040 0.77
Pertamina Persero 4.875% 03/05/2022 4,000,000 4,026,026 0.88
Pertamina Persero 5.625% 20/05/2043 2,000,000 1,895,398 0.41
Pertamina Persero 6% 03/05/2042 13,000,000 12,754,993 2.79
Petronas Capital 5.25% 12/08/2019 3,950,000 4,367,666 0.96
Petronas Capital 7.875% 22/05/2022 5,000,000 6,455,000 1.41
Philippine (Govt of) 4% 15/01/2021 5,000,000 5,441,600 1.19
POSCO 4.25% 28/10/2020 2,600,000 2,780,001 0.61
POSCO 5.25% 14/04/2021 1,000,000 1,132,950 0.25
PSA International 3.875% 11/02/2021 600,000 641,970 0.14
PSA International 4.625% 11/09/2019 2,000,000 2,205,700 0.48
PTT 3.375% 25/10/2022 700,000 689,290 0.15
PTT 4.5% 25/10/2042 2,250,000 2,081,925 0.46
PTTEP Australia International Finance Proprietary 4.152% 19/07/2015 2,800,000 2,838,780 0.62
PTTEP Canada International Finance 5.692% 05/04/2021 3,450,000 3,843,426 0.84
Reliance Holdings 4.5% 19/10/2020 3,750,000 3,927,187 0.86
Shinhan Bank 4.375% 15/09/2015 1,370,000 1,401,510 0.31
Siam Commercial Bank 3.375% 19/09/2017 2,050,000 2,108,735 0.46
SingTel Group Treasury 4.5% 08/09/2021 4,100,000 4,528,117 0.99
Sinochem Overseas Capital 4.5% 12/11/2020 4,700,000 4,981,765 1.09
Sinochem Overseas Capital 6.3% 12/11/2040 6,198,000 7,916,211 1.73
Sinopec Group Overseas Development 2.75% 10/04/2019 1,500,000 1,498,939 0.33
Sinopec Group Overseas Development 3.9% 17/05/2022 1,600,000 1,628,416 0.36
Sinopec Group Overseas Development 4.875% 17/05/2042 1,500,000 1,621,189 0.36
SK Broadband 2.875% 29/10/2018 3,800,000 3,846,740 0.84
SK Telecom 2.125% 01/05/2018 3,000,000 2,993,763 0.66
Standard Chartered 6.4% 26/09/2017 2,000,000 2,210,342 0.48
Standard Chartered Bank 5.875% 24/06/2020 3,000,000 3,312,600 0.73
Swire Properties MTN Financing 4.375% 18/06/2022 2,200,000 2,337,377 0.51
Talent Yield Investments 4.5% 25/04/2022 2,400,000 2,523,480 0.55
Temasek Financial 4.3% 25/10/2019 2,950,000 3,243,967 0.71
Tenaga Nasional 7.5% 01/11/2025 3,500,000 4,493,825 0.98
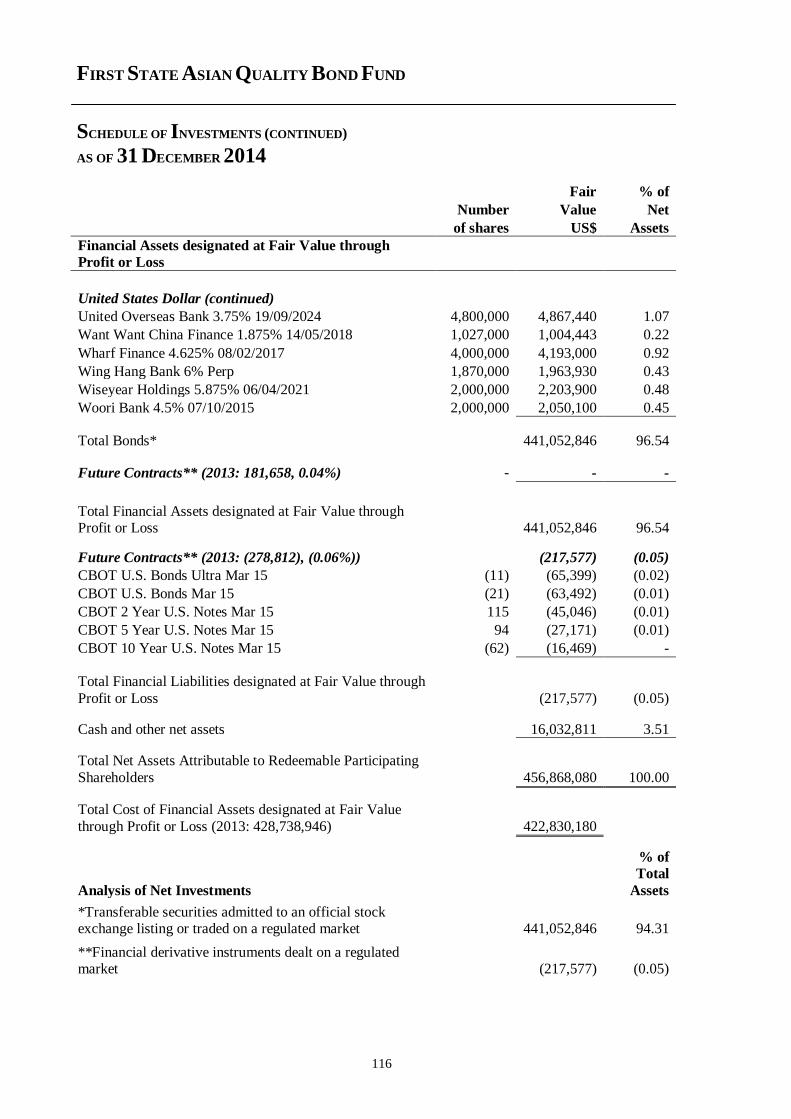
FIRST STATE ASIAN QUALITY BOND FUND
SCHEDULE OF INVESTMENTS (CONTINUED)
AS OF 31 DECEMBER 2014
116
Fair % of
Number Value Net
of shares US$ Assets
Financial Assets designated at Fair Value through
Profit or Loss
United States Dollar (continued)
United Overseas Bank 3.75% 19/09/2024 4,800,000 4,867,440 1.07
Want Want China Finance 1.875% 14/05/2018 1,027,000 1,004,443 0.22
Wharf Finance 4.625% 08/02/2017 4,000,000 4,193,000 0.92
Wing Hang Bank 6% Perp 1,870,000 1,963,930 0.43
Wiseyear Holdings 5.875% 06/04/2021 2,000,000 2,203,900 0.48
Woori Bank 4.5% 07/10/2015 2,000,000 2,050,100 0.45
Total Bonds* 441,052,846 96.54 Future Contracts** (2013: 181,658, 0.04%) - - -
Total Financial Assets designated at Fair Value through Profit or Loss 441,052,846 96.54
Future Contracts** (2013: (278,812), (0.06%)) (217,577) (0.05)
CBOT U.S. Bonds Ultra Mar 15 (11) (65,399) (0.02)
CBOT U.S. Bonds Mar 15 (21) (63,492) (0.01)
CBOT 2 Year U.S. Notes Mar 15 115 (45,046) (0.01)
CBOT 5 Year U.S. Notes Mar 15 94 (27,171) (0.01)
CBOT 10 Year U.S. Notes Mar 15 (62) (16,469) -
Total Financial Liabilities designated at Fair Value through
Profit or Loss (217,577) (0.05) Cash and other net assets 16,032,811 3.51
Total Net Assets Attributable to Redeemable Participating
Shareholders 456,868,080 100.00
Total Cost of Financial Assets designated at Fair Value
through Profit or Loss (2013: 428,738,946) 422,830,180
Analysis of Net Investments
% of
Total
Assets
*Transferable securities admitted to an official stock exchange listing or traded on a regulated market 441,052,846 94.31
**Financial derivative instruments dealt on a regulated market (217,577) (0.05)
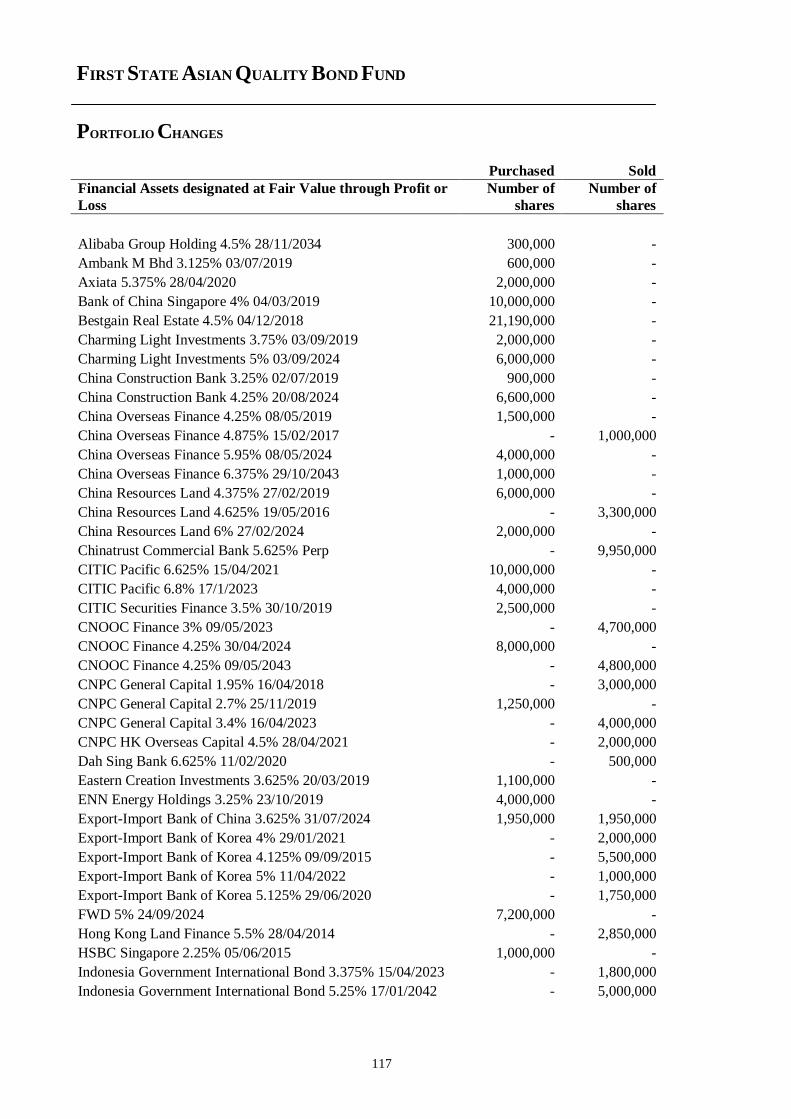
FIRST STATE ASIAN QUALITY BOND FUND
PORTFOLIO CHANGES
117
Purchased Sold
Financial Assets designated at Fair Value through Profit or
Loss
Number of
shares
Number of
shares
Alibaba Group Holding 4.5% 28/11/2034 300,000 -
Ambank M Bhd 3.125% 03/07/2019 600,000 -
Axiata 5.375% 28/04/2020 2,000,000 -
Bank of China Singapore 4% 04/03/2019 10,000,000 -
Bestgain Real Estate 4.5% 04/12/2018 21,190,000 -
Charming Light Investments 3.75% 03/09/2019 2,000,000 -
Charming Light Investments 5% 03/09/2024 6,000,000 -
China Construction Bank 3.25% 02/07/2019 900,000 -
China Construction Bank 4.25% 20/08/2024 6,600,000 -
China Overseas Finance 4.25% 08/05/2019 1,500,000 -
China Overseas Finance 4.875% 15/02/2017 - 1,000,000
China Overseas Finance 5.95% 08/05/2024 4,000,000 -
China Overseas Finance 6.375% 29/10/2043 1,000,000 -
China Resources Land 4.375% 27/02/2019 6,000,000 -
China Resources Land 4.625% 19/05/2016 - 3,300,000
China Resources Land 6% 27/02/2024 2,000,000 -
Chinatrust Commercial Bank 5.625% Perp - 9,950,000
CITIC Pacific 6.625% 15/04/2021 10,000,000 -
CITIC Pacific 6.8% 17/1/2023 4,000,000 -
CITIC Securities Finance 3.5% 30/10/2019 2,500,000 -
CNOOC Finance 3% 09/05/2023 - 4,700,000
CNOOC Finance 4.25% 30/04/2024 8,000,000 -
CNOOC Finance 4.25% 09/05/2043 - 4,800,000
CNPC General Capital 1.95% 16/04/2018 - 3,000,000
CNPC General Capital 2.7% 25/11/2019 1,250,000 -
CNPC General Capital 3.4% 16/04/2023 - 4,000,000
CNPC HK Overseas Capital 4.5% 28/04/2021 - 2,000,000
Dah Sing Bank 6.625% 11/02/2020 - 500,000
Eastern Creation Investments 3.625% 20/03/2019 1,100,000 -
ENN Energy Holdings 3.25% 23/10/2019 4,000,000 -
Export-Import Bank of China 3.625% 31/07/2024 1,950,000 1,950,000
Export-Import Bank of Korea 4% 29/01/2021 - 2,000,000
Export-Import Bank of Korea 4.125% 09/09/2015 - 5,500,000
Export-Import Bank of Korea 5% 11/04/2022 - 1,000,000
Export-Import Bank of Korea 5.125% 29/06/2020 - 1,750,000
FWD 5% 24/09/2024 7,200,000 -
Hong Kong Land Finance 5.5% 28/04/2014 - 2,850,000
HSBC Singapore 2.25% 05/06/2015 1,000,000 -
Indonesia Government International Bond 3.375% 15/04/2023 - 1,800,000
Indonesia Government International Bond 5.25% 17/01/2042 - 5,000,000
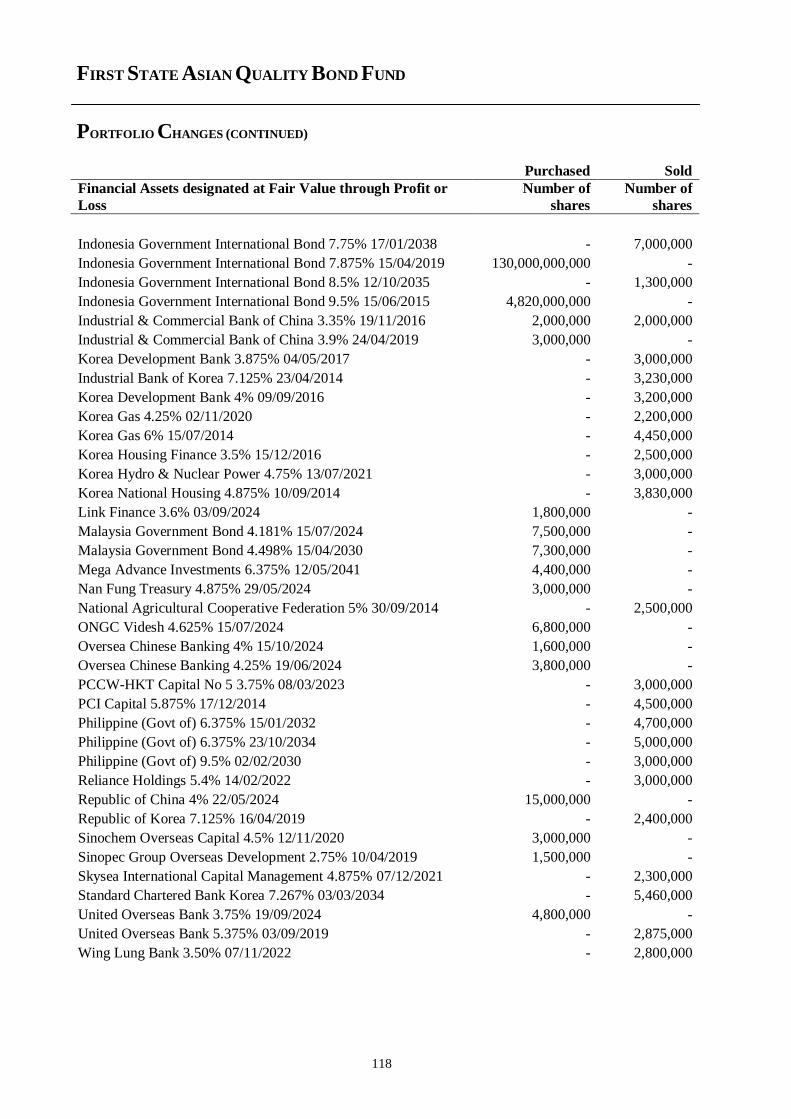
FIRST STATE ASIAN QUALITY BOND FUND
PORTFOLIO CHANGES (CONTINUED)
118
Purchased Sold
Financial Assets designated at Fair Value through Profit or
Loss
Number of
shares
Number of
shares
Indonesia Government International Bond 7.75% 17/01/2038 - 7,000,000
Indonesia Government International Bond 7.875% 15/04/2019 130,000,000,000 -
Indonesia Government International Bond 8.5% 12/10/2035 - 1,300,000
Indonesia Government International Bond 9.5% 15/06/2015 4,820,000,000 -
Industrial & Commercial Bank of China 3.35% 19/11/2016 2,000,000 2,000,000
Industrial & Commercial Bank of China 3.9% 24/04/2019 3,000,000 -
Korea Development Bank 3.875% 04/05/2017 - 3,000,000
Industrial Bank of Korea 7.125% 23/04/2014 - 3,230,000
Korea Development Bank 4% 09/09/2016 - 3,200,000
Korea Gas 4.25% 02/11/2020 - 2,200,000
Korea Gas 6% 15/07/2014 - 4,450,000
Korea Housing Finance 3.5% 15/12/2016 - 2,500,000
Korea Hydro & Nuclear Power 4.75% 13/07/2021 - 3,000,000
Korea National Housing 4.875% 10/09/2014 - 3,830,000
Link Finance 3.6% 03/09/2024 1,800,000 -
Malaysia Government Bond 4.181% 15/07/2024 7,500,000 -
Malaysia Government Bond 4.498% 15/04/2030 7,300,000 -
Mega Advance Investments 6.375% 12/05/2041 4,400,000 -
Nan Fung Treasury 4.875% 29/05/2024 3,000,000 -
National Agricultural Cooperative Federation 5% 30/09/2014 - 2,500,000
ONGC Videsh 4.625% 15/07/2024 6,800,000 -
Oversea Chinese Banking 4% 15/10/2024 1,600,000 -
Oversea Chinese Banking 4.25% 19/06/2024 3,800,000 -
PCCW-HKT Capital No 5 3.75% 08/03/2023 - 3,000,000
PCI Capital 5.875% 17/12/2014 - 4,500,000
Philippine (Govt of) 6.375% 15/01/2032 - 4,700,000
Philippine (Govt of) 6.375% 23/10/2034 - 5,000,000
Philippine (Govt of) 9.5% 02/02/2030 - 3,000,000
Reliance Holdings 5.4% 14/02/2022 - 3,000,000
Republic of China 4% 22/05/2024 15,000,000 -
Republic of Korea 7.125% 16/04/2019 - 2,400,000
Sinochem Overseas Capital 4.5% 12/11/2020 3,000,000 -
Sinopec Group Overseas Development 2.75% 10/04/2019 1,500,000 -
Skysea International Capital Management 4.875% 07/12/2021 - 2,300,000
Standard Chartered Bank Korea 7.267% 03/03/2034 - 5,460,000
United Overseas Bank 3.75% 19/09/2024 4,800,000 -
United Overseas Bank 5.375% 03/09/2019 - 2,875,000
Wing Lung Bank 3.50% 07/11/2022 - 2,800,000
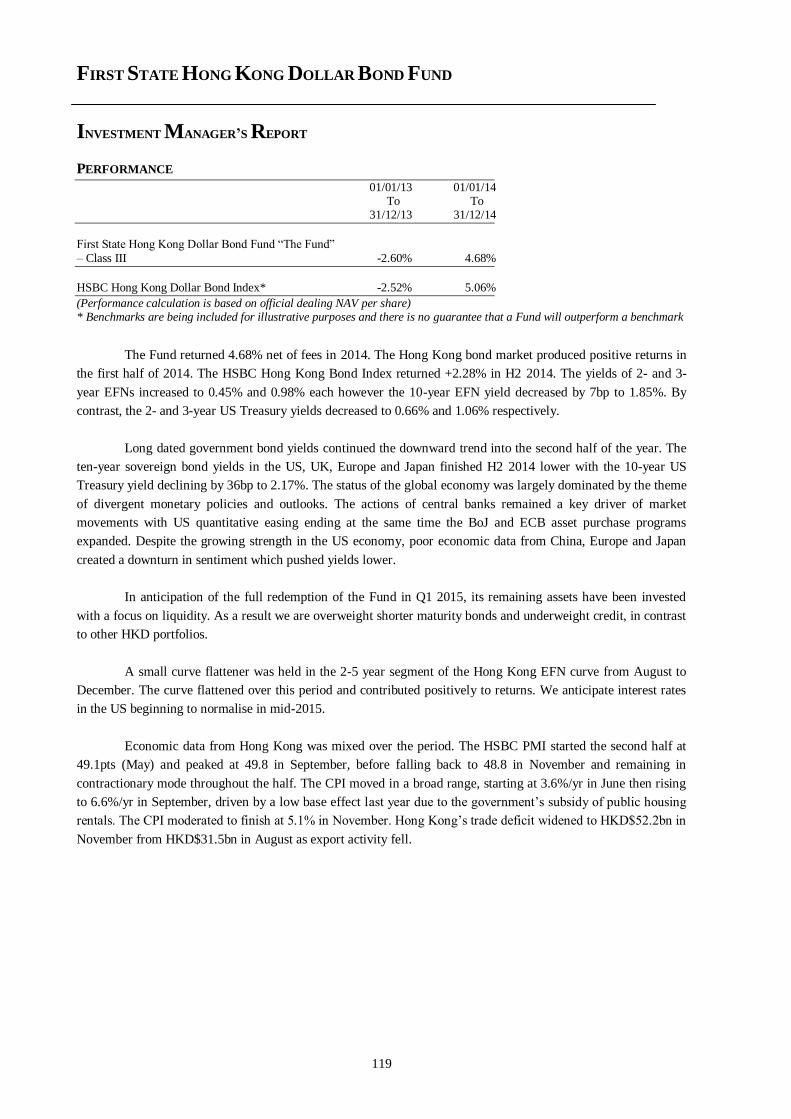
FIRST STATE HONG KONG DOLLAR BOND FUND
INVESTMENT MANAGER’S REPORT
119
PERFORMANCE
01/01/13 01/01/14 To To 31/12/13 31/12/14
First State Hong Kong Dollar Bond Fund “The Fund”
– Class III -2.60% 4.68%
HSBC Hong Kong Dollar Bond Index* -2.52% 5.06%
(Performance calculation is based on official dealing NAV per share) * Benchmarks are being included for illustrative purposes and there is no guarantee that a Fund will outperform a benchmark
The Fund returned 4.68% net of fees in 2014. The Hong Kong bond market produced positive returns in
the first half of 2014. The HSBC Hong Kong Bond Index returned +2.28% in H2 2014. The yields of 2- and 3-
year EFNs increased to 0.45% and 0.98% each however the 10-year EFN yield decreased by 7bp to 1.85%. By
contrast, the 2- and 3-year US Treasury yields decreased to 0.66% and 1.06% respectively.
Long dated government bond yields continued the downward trend into the second half of the year. The
ten-year sovereign bond yields in the US, UK, Europe and Japan finished H2 2014 lower with the 10-year US
Treasury yield declining by 36bp to 2.17%. The status of the global economy was largely dominated by the theme
of divergent monetary policies and outlooks. The actions of central banks remained a key driver of market
movements with US quantitative easing ending at the same time the BoJ and ECB asset purchase programs
expanded. Despite the growing strength in the US economy, poor economic data from China, Europe and Japan
created a downturn in sentiment which pushed yields lower.
In anticipation of the full redemption of the Fund in Q1 2015, its remaining assets have been invested
with a focus on liquidity. As a result we are overweight shorter maturity bonds and underweight credit, in contrast
to other HKD portfolios.
A small curve flattener was held in the 2-5 year segment of the Hong Kong EFN curve from August to
December. The curve flattened over this period and contributed positively to returns. We anticipate interest rates
in the US beginning to normalise in mid-2015.
Economic data from Hong Kong was mixed over the period. The HSBC PMI started the second half at
49.1pts (May) and peaked at 49.8 in September, before falling back to 48.8 in November and remaining in
contractionary mode throughout the half. The CPI moved in a broad range, starting at 3.6%/yr in June then rising
to 6.6%/yr in September, driven by a low base effect last year due to the government’s subsidy of public housing
rentals. The CPI moderated to finish at 5.1% in November. Hong Kong’s trade deficit widened to HKD$52.2bn in
November from HKD$31.5bn in August as export activity fell.
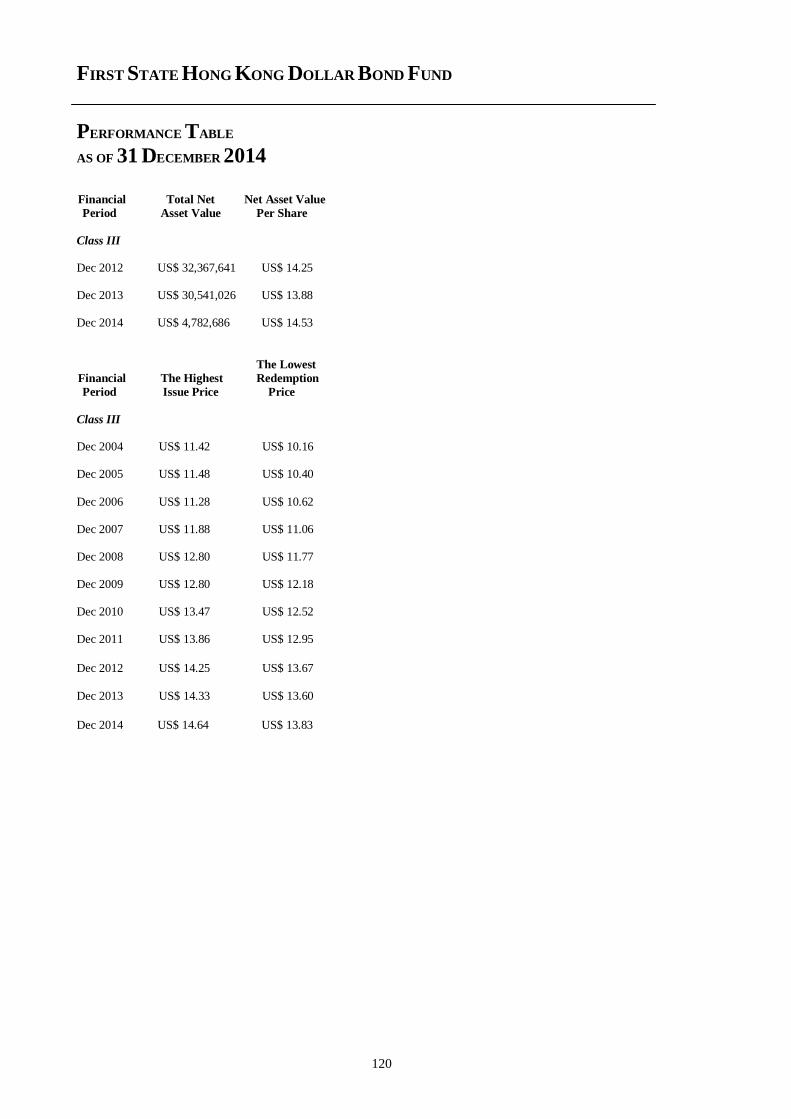
FIRST STATE HONG KONG DOLLAR BOND FUND
PERFORMANCE TABLE
AS OF 31 DECEMBER 2014
120
Financial Total Net Net Asset Value
Period Asset Value Per Share
Class III Dec 2012 US$ 32,367,641 US$ 14.25 Dec 2013 US$ 30,541,026 US$ 13.88 Dec 2014 US$ 4,782,686 US$ 14.53
The Lowest
Financial The Highest Redemption
Period Issue Price Price
Class III Dec 2004 US$ 11.42 US$ 10.16 Dec 2005 US$ 11.48 US$ 10.40
Dec 2006 US$ 11.28 US$ 10.62 Dec 2007 US$ 11.88 US$ 11.06 Dec 2008 US$ 12.80 US$ 11.77 Dec 2009 US$ 12.80 US$ 12.18 Dec 2010 US$ 13.47 US$ 12.52 Dec 2011 US$ 13.86 US$ 12.95
Dec 2012 US$ 14.25 US$ 13.67
Dec 2013 US$ 14.33 US$ 13.60
Dec 2014 US$ 14.64 US$ 13.83
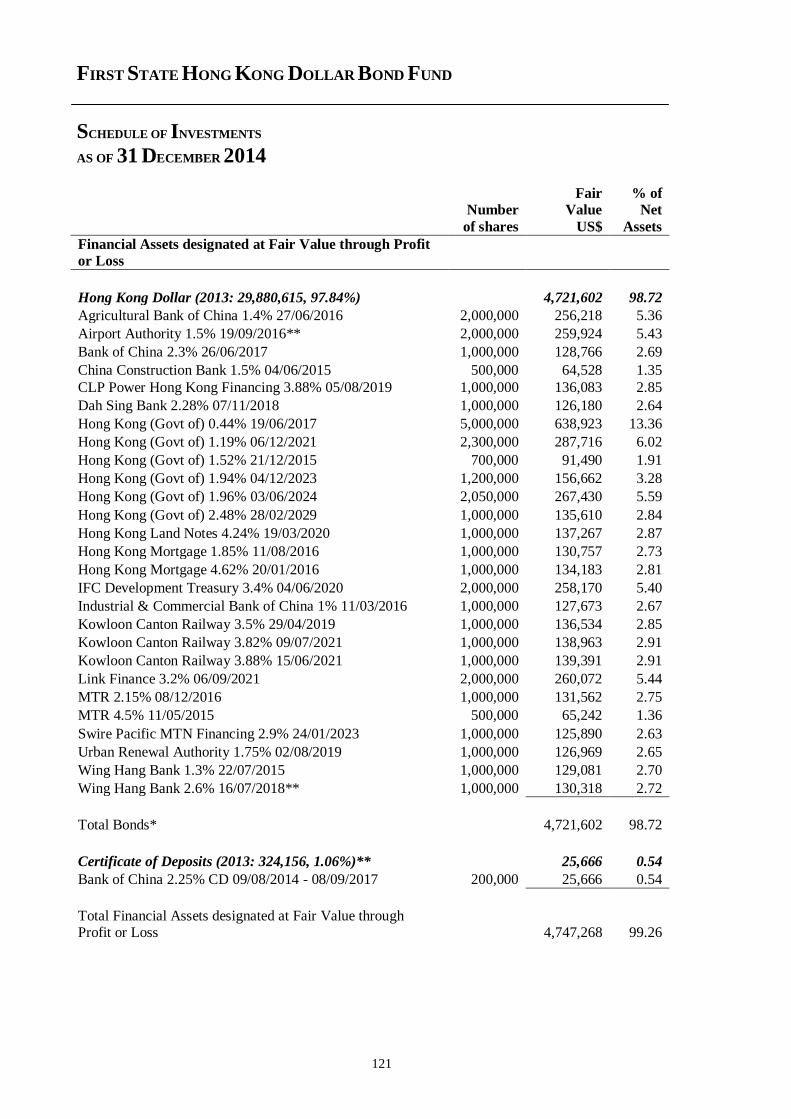
FIRST STATE HONG KONG DOLLAR BOND FUND
SCHEDULE OF INVESTMENTS
AS OF 31 DECEMBER 2014
121
Fair % of Number Value Net
of shares US$ Assets
Financial Assets designated at Fair Value through Profit
or Loss
Hong Kong Dollar (2013: 29,880,615, 97.84%) 4,721,602 98.72
Agricultural Bank of China 1.4% 27/06/2016 2,000,000 256,218 5.36
Airport Authority 1.5% 19/09/2016** 2,000,000 259,924 5.43
Bank of China 2.3% 26/06/2017 1,000,000 128,766 2.69
China Construction Bank 1.5% 04/06/2015 500,000 64,528 1.35
CLP Power Hong Kong Financing 3.88% 05/08/2019 1,000,000 136,083 2.85
Dah Sing Bank 2.28% 07/11/2018 1,000,000 126,180 2.64
Hong Kong (Govt of) 0.44% 19/06/2017 5,000,000 638,923 13.36
Hong Kong (Govt of) 1.19% 06/12/2021 2,300,000 287,716 6.02
Hong Kong (Govt of) 1.52% 21/12/2015 700,000 91,490 1.91
Hong Kong (Govt of) 1.94% 04/12/2023 1,200,000 156,662 3.28
Hong Kong (Govt of) 1.96% 03/06/2024 2,050,000 267,430 5.59
Hong Kong (Govt of) 2.48% 28/02/2029 1,000,000 135,610 2.84
Hong Kong Land Notes 4.24% 19/03/2020 1,000,000 137,267 2.87
Hong Kong Mortgage 1.85% 11/08/2016 1,000,000 130,757 2.73
Hong Kong Mortgage 4.62% 20/01/2016 1,000,000 134,183 2.81
IFC Development Treasury 3.4% 04/06/2020 2,000,000 258,170 5.40
Industrial & Commercial Bank of China 1% 11/03/2016 1,000,000 127,673 2.67
Kowloon Canton Railway 3.5% 29/04/2019 1,000,000 136,534 2.85
Kowloon Canton Railway 3.82% 09/07/2021 1,000,000 138,963 2.91
Kowloon Canton Railway 3.88% 15/06/2021 1,000,000 139,391 2.91
Link Finance 3.2% 06/09/2021 2,000,000 260,072 5.44
MTR 2.15% 08/12/2016 1,000,000 131,562 2.75
MTR 4.5% 11/05/2015 500,000 65,242 1.36
Swire Pacific MTN Financing 2.9% 24/01/2023 1,000,000 125,890 2.63
Urban Renewal Authority 1.75% 02/08/2019 1,000,000 126,969 2.65
Wing Hang Bank 1.3% 22/07/2015 1,000,000 129,081 2.70
Wing Hang Bank 2.6% 16/07/2018** 1,000,000 130,318 2.72
Total Bonds* 4,721,602 98.72
Certificate of Deposits (2013: 324,156, 1.06%)** 25,666 0.54
Bank of China 2.25% CD 09/08/2014 - 08/09/2017 200,000 25,666 0.54
Total Financial Assets designated at Fair Value through Profit or Loss 4,747,268 99.26
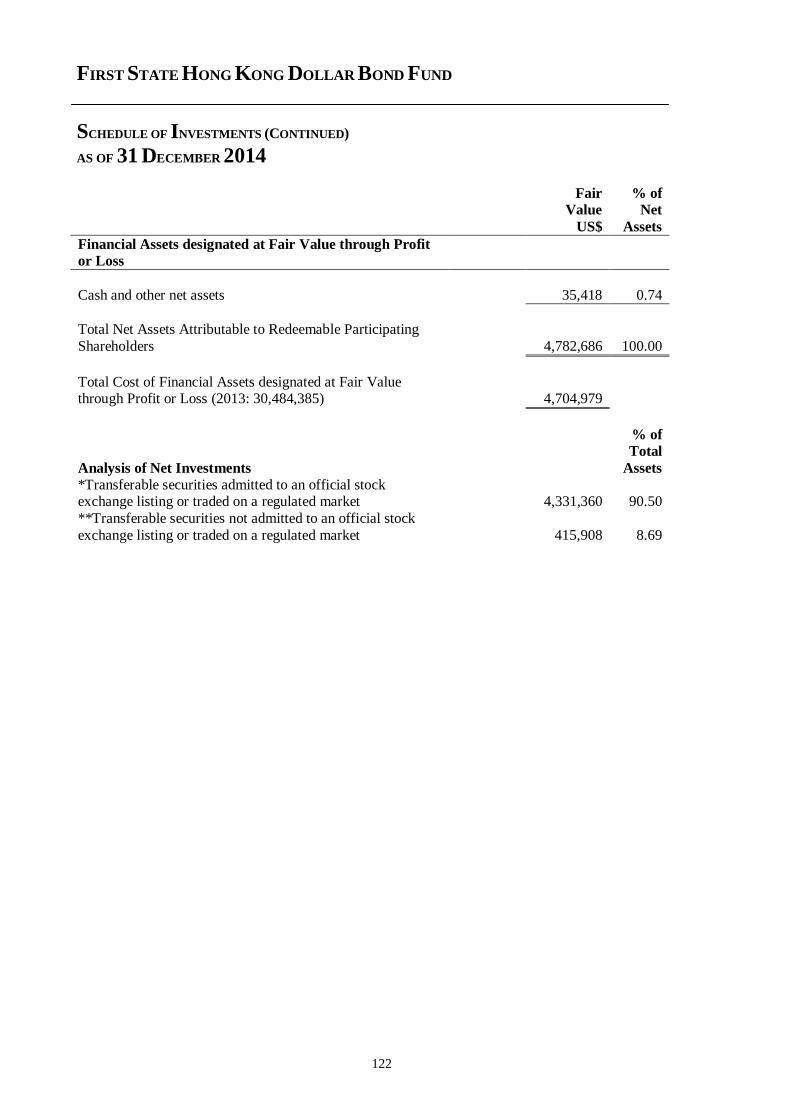
FIRST STATE HONG KONG DOLLAR BOND FUND
SCHEDULE OF INVESTMENTS (CONTINUED)
AS OF 31 DECEMBER 2014
122
Fair % of Value Net
US$ Assets
Financial Assets designated at Fair Value through Profit
or Loss
Cash and other net assets 35,418 0.74
Total Net Assets Attributable to Redeemable Participating
Shareholders 4,782,686 100.00
Total Cost of Financial Assets designated at Fair Value through Profit or Loss (2013: 30,484,385) 4,704,979
Analysis of Net Investments
% of
Total
Assets
*Transferable securities admitted to an official stock exchange listing or traded on a regulated market 4,331,360 90.50
**Transferable securities not admitted to an official stock
exchange listing or traded on a regulated market 415,908 8.69
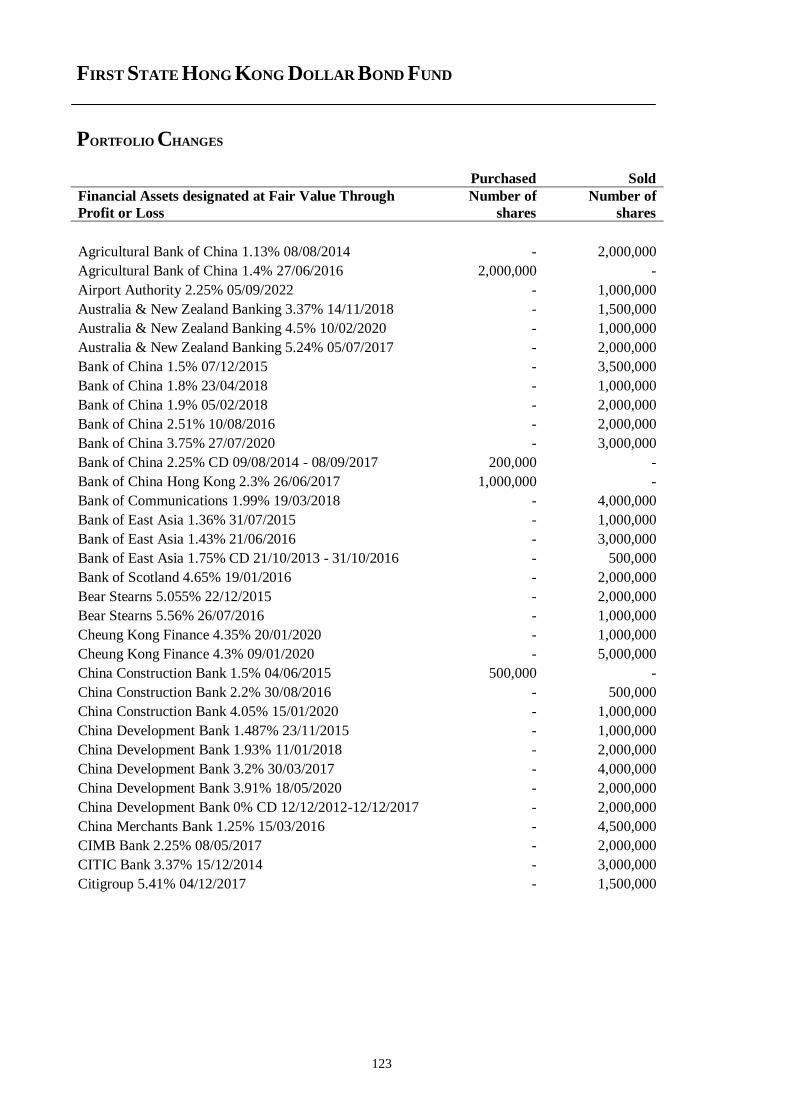
FIRST STATE HONG KONG DOLLAR BOND FUND
PORTFOLIO CHANGES
123
Purchased Sold
Financial Assets designated at Fair Value Through
Profit or Loss
Number of
shares
Number of
shares
Agricultural Bank of China 1.13% 08/08/2014 - 2,000,000
Agricultural Bank of China 1.4% 27/06/2016 2,000,000 -
Airport Authority 2.25% 05/09/2022 - 1,000,000
Australia & New Zealand Banking 3.37% 14/11/2018 - 1,500,000
Australia & New Zealand Banking 4.5% 10/02/2020 - 1,000,000
Australia & New Zealand Banking 5.24% 05/07/2017 - 2,000,000
Bank of China 1.5% 07/12/2015 - 3,500,000
Bank of China 1.8% 23/04/2018 - 1,000,000
Bank of China 1.9% 05/02/2018 - 2,000,000
Bank of China 2.51% 10/08/2016 - 2,000,000
Bank of China 3.75% 27/07/2020 - 3,000,000
Bank of China 2.25% CD 09/08/2014 - 08/09/2017 200,000 -
Bank of China Hong Kong 2.3% 26/06/2017 1,000,000 -
Bank of Communications 1.99% 19/03/2018 - 4,000,000
Bank of East Asia 1.36% 31/07/2015 - 1,000,000
Bank of East Asia 1.43% 21/06/2016 - 3,000,000
Bank of East Asia 1.75% CD 21/10/2013 - 31/10/2016 - 500,000
Bank of Scotland 4.65% 19/01/2016 - 2,000,000
Bear Stearns 5.055% 22/12/2015 - 2,000,000
Bear Stearns 5.56% 26/07/2016 - 1,000,000
Cheung Kong Finance 4.35% 20/01/2020 - 1,000,000
Cheung Kong Finance 4.3% 09/01/2020 - 5,000,000
China Construction Bank 1.5% 04/06/2015 500,000 -
China Construction Bank 2.2% 30/08/2016 - 500,000
China Construction Bank 4.05% 15/01/2020 - 1,000,000
China Development Bank 1.487% 23/11/2015 - 1,000,000
China Development Bank 1.93% 11/01/2018 - 2,000,000
China Development Bank 3.2% 30/03/2017 - 4,000,000
China Development Bank 3.91% 18/05/2020 - 2,000,000
China Development Bank 0% CD 12/12/2012-12/12/2017 - 2,000,000
China Merchants Bank 1.25% 15/03/2016 - 4,500,000
CIMB Bank 2.25% 08/05/2017 - 2,000,000
CITIC Bank 3.37% 15/12/2014 - 3,000,000
Citigroup 5.41% 04/12/2017 - 1,500,000
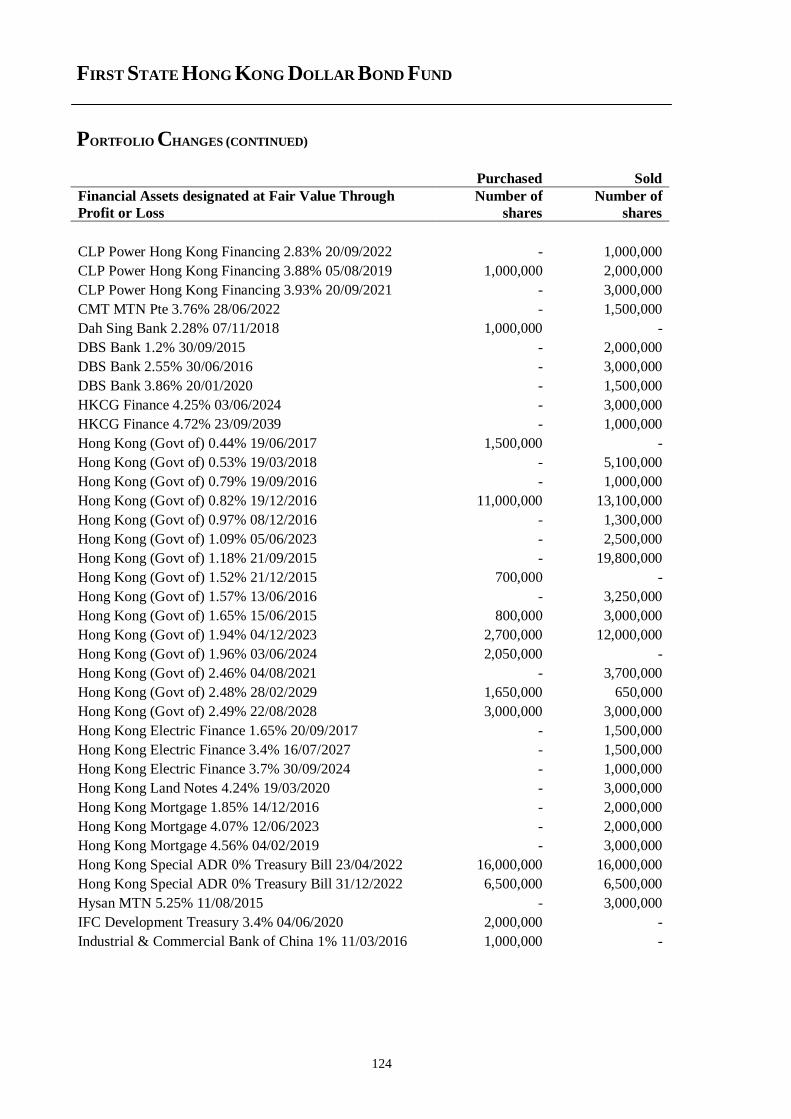
FIRST STATE HONG KONG DOLLAR BOND FUND
PORTFOLIO CHANGES (CONTINUED)
124
Purchased Sold
Financial Assets designated at Fair Value Through
Profit or Loss
Number of
shares
Number of
shares
CLP Power Hong Kong Financing 2.83% 20/09/2022 - 1,000,000
CLP Power Hong Kong Financing 3.88% 05/08/2019 1,000,000 2,000,000
CLP Power Hong Kong Financing 3.93% 20/09/2021 - 3,000,000
CMT MTN Pte 3.76% 28/06/2022 - 1,500,000
Dah Sing Bank 2.28% 07/11/2018 1,000,000 -
DBS Bank 1.2% 30/09/2015 - 2,000,000
DBS Bank 2.55% 30/06/2016 - 3,000,000
DBS Bank 3.86% 20/01/2020 - 1,500,000
HKCG Finance 4.25% 03/06/2024 - 3,000,000
HKCG Finance 4.72% 23/09/2039 - 1,000,000
Hong Kong (Govt of) 0.44% 19/06/2017 1,500,000 -
Hong Kong (Govt of) 0.53% 19/03/2018 - 5,100,000
Hong Kong (Govt of) 0.79% 19/09/2016 - 1,000,000
Hong Kong (Govt of) 0.82% 19/12/2016 11,000,000 13,100,000
Hong Kong (Govt of) 0.97% 08/12/2016 - 1,300,000
Hong Kong (Govt of) 1.09% 05/06/2023 - 2,500,000
Hong Kong (Govt of) 1.18% 21/09/2015 - 19,800,000
Hong Kong (Govt of) 1.52% 21/12/2015 700,000 -
Hong Kong (Govt of) 1.57% 13/06/2016 - 3,250,000
Hong Kong (Govt of) 1.65% 15/06/2015 800,000 3,000,000
Hong Kong (Govt of) 1.94% 04/12/2023 2,700,000 12,000,000
Hong Kong (Govt of) 1.96% 03/06/2024 2,050,000 -
Hong Kong (Govt of) 2.46% 04/08/2021 - 3,700,000
Hong Kong (Govt of) 2.48% 28/02/2029 1,650,000 650,000
Hong Kong (Govt of) 2.49% 22/08/2028 3,000,000 3,000,000
Hong Kong Electric Finance 1.65% 20/09/2017 - 1,500,000
Hong Kong Electric Finance 3.4% 16/07/2027 - 1,500,000
Hong Kong Electric Finance 3.7% 30/09/2024 - 1,000,000
Hong Kong Land Notes 4.24% 19/03/2020 - 3,000,000
Hong Kong Mortgage 1.85% 14/12/2016 - 2,000,000
Hong Kong Mortgage 4.07% 12/06/2023 - 2,000,000
Hong Kong Mortgage 4.56% 04/02/2019 - 3,000,000
Hong Kong Special ADR 0% Treasury Bill 23/04/2022 16,000,000 16,000,000
Hong Kong Special ADR 0% Treasury Bill 31/12/2022 6,500,000 6,500,000
Hysan MTN 5.25% 11/08/2015 - 3,000,000
IFC Development Treasury 3.4% 04/06/2020 2,000,000 -
Industrial & Commercial Bank of China 1% 11/03/2016 1,000,000 -
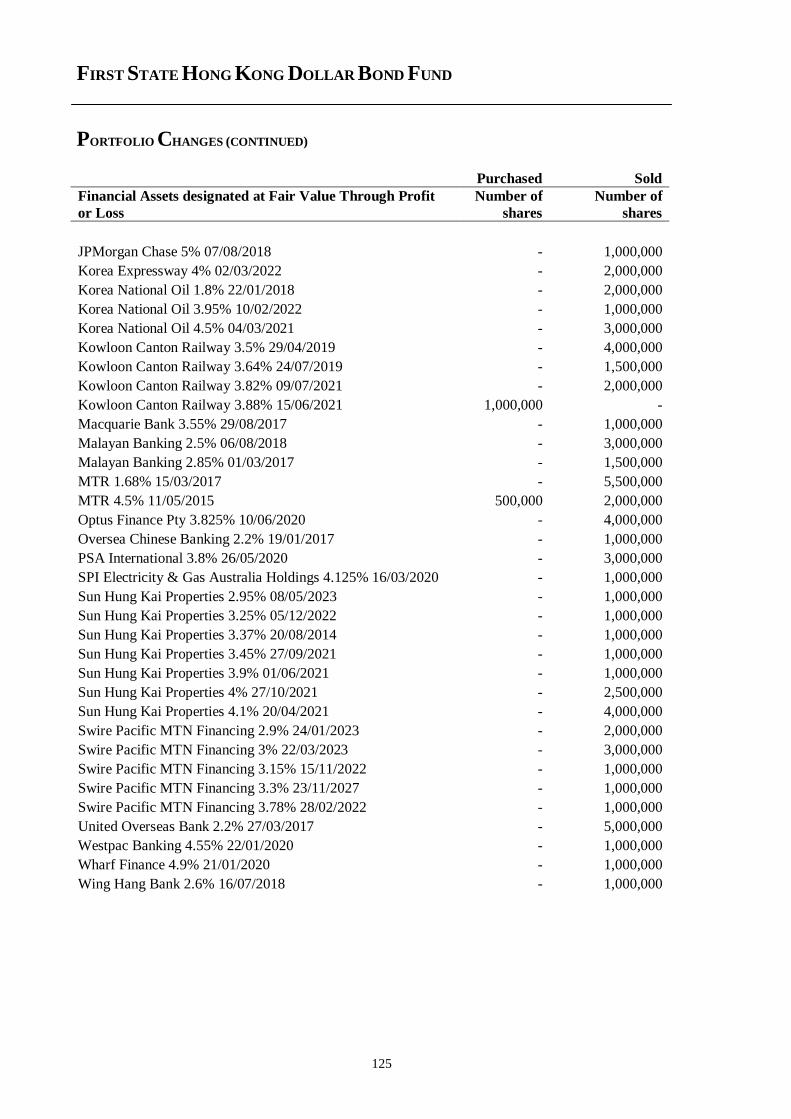
FIRST STATE HONG KONG DOLLAR BOND FUND
PORTFOLIO CHANGES (CONTINUED)
125
Purchased Sold
Financial Assets designated at Fair Value Through Profit
or Loss
Number of
shares
Number of
shares
JPMorgan Chase 5% 07/08/2018 - 1,000,000
Korea Expressway 4% 02/03/2022 - 2,000,000
Korea National Oil 1.8% 22/01/2018 - 2,000,000
Korea National Oil 3.95% 10/02/2022 - 1,000,000
Korea National Oil 4.5% 04/03/2021 - 3,000,000
Kowloon Canton Railway 3.5% 29/04/2019 - 4,000,000
Kowloon Canton Railway 3.64% 24/07/2019 - 1,500,000
Kowloon Canton Railway 3.82% 09/07/2021 - 2,000,000
Kowloon Canton Railway 3.88% 15/06/2021 1,000,000 -
Macquarie Bank 3.55% 29/08/2017 - 1,000,000
Malayan Banking 2.5% 06/08/2018 - 3,000,000
Malayan Banking 2.85% 01/03/2017 - 1,500,000
MTR 1.68% 15/03/2017 - 5,500,000
MTR 4.5% 11/05/2015 500,000 2,000,000
Optus Finance Pty 3.825% 10/06/2020 - 4,000,000
Oversea Chinese Banking 2.2% 19/01/2017 - 1,000,000
PSA International 3.8% 26/05/2020 - 3,000,000
SPI Electricity & Gas Australia Holdings 4.125% 16/03/2020 - 1,000,000
Sun Hung Kai Properties 2.95% 08/05/2023 - 1,000,000
Sun Hung Kai Properties 3.25% 05/12/2022 - 1,000,000
Sun Hung Kai Properties 3.37% 20/08/2014 - 1,000,000
Sun Hung Kai Properties 3.45% 27/09/2021 - 1,000,000
Sun Hung Kai Properties 3.9% 01/06/2021 - 1,000,000
Sun Hung Kai Properties 4% 27/10/2021 - 2,500,000
Sun Hung Kai Properties 4.1% 20/04/2021 - 4,000,000
Swire Pacific MTN Financing 2.9% 24/01/2023 - 2,000,000
Swire Pacific MTN Financing 3% 22/03/2023 - 3,000,000
Swire Pacific MTN Financing 3.15% 15/11/2022 - 1,000,000
Swire Pacific MTN Financing 3.3% 23/11/2027 - 1,000,000
Swire Pacific MTN Financing 3.78% 28/02/2022 - 1,000,000
United Overseas Bank 2.2% 27/03/2017 - 5,000,000
Westpac Banking 4.55% 22/01/2020 - 1,000,000
Wharf Finance 4.9% 21/01/2020 - 1,000,000
Wing Hang Bank 2.6% 16/07/2018 - 1,000,000
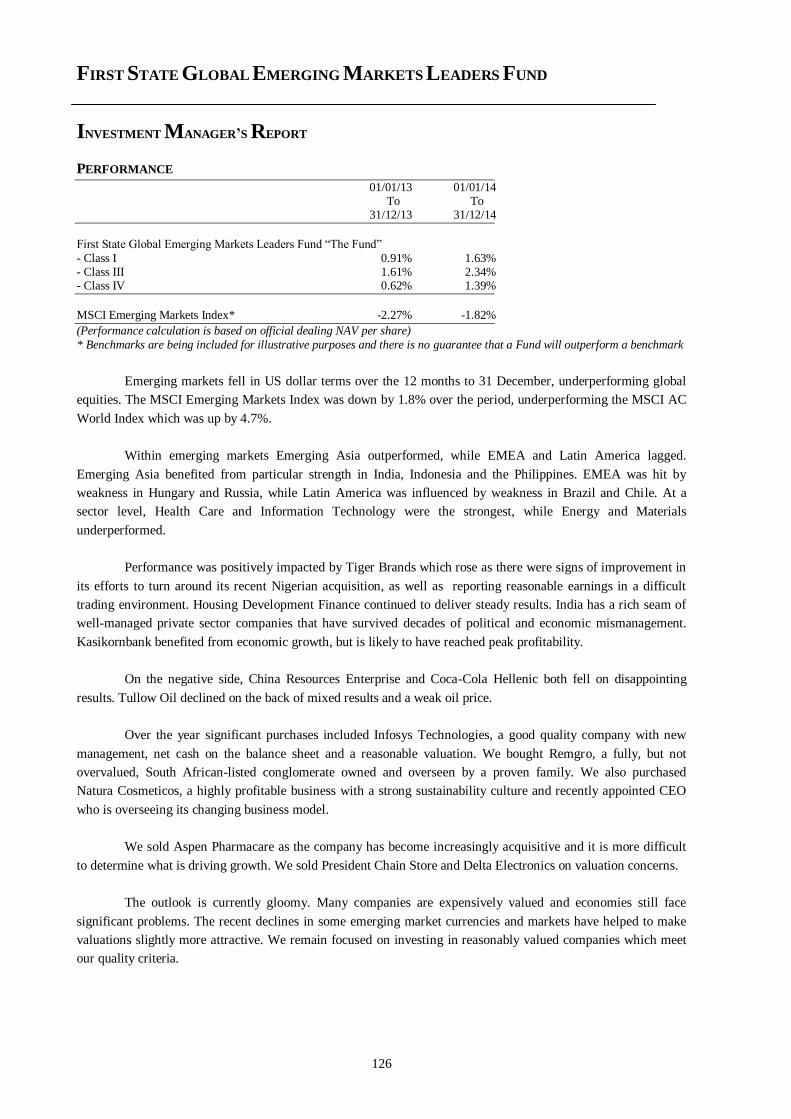
FIRST STATE GLOBAL EMERGING MARKETS LEADERS FUND
INVESTMENT MANAGER’S REPORT
126
PERFORMANCE
01/01/13 01/01/14 To To 31/12/13 31/12/14
First State Global Emerging Markets Leaders Fund “The Fund”
- Class I 0.91% 1.63% - Class III 1.61% 2.34% - Class IV 0.62% 1.39%
MSCI Emerging Markets Index* -2.27% -1.82%
(Performance calculation is based on official dealing NAV per share)
* Benchmarks are being included for illustrative purposes and there is no guarantee that a Fund will outperform a benchmark
Emerging markets fell in US dollar terms over the 12 months to 31 December, underperforming global
equities. The MSCI Emerging Markets Index was down by 1.8% over the period, underperforming the MSCI AC
World Index which was up by 4.7%.
Within emerging markets Emerging Asia outperformed, while EMEA and Latin America lagged.
Emerging Asia benefited from particular strength in India, Indonesia and the Philippines. EMEA was hit by
weakness in Hungary and Russia, while Latin America was influenced by weakness in Brazil and Chile. At a
sector level, Health Care and Information Technology were the strongest, while Energy and Materials
underperformed.
Performance was positively impacted by Tiger Brands which rose as there were signs of improvement in
its efforts to turn around its recent Nigerian acquisition, as well as reporting reasonable earnings in a difficult
trading environment. Housing Development Finance continued to deliver steady results. India has a rich seam of
well-managed private sector companies that have survived decades of political and economic mismanagement.
Kasikornbank benefited from economic growth, but is likely to have reached peak profitability.
On the negative side, China Resources Enterprise and Coca-Cola Hellenic both fell on disappointing
results. Tullow Oil declined on the back of mixed results and a weak oil price.
Over the year significant purchases included Infosys Technologies, a good quality company with new
management, net cash on the balance sheet and a reasonable valuation. We bought Remgro, a fully, but not
overvalued, South African-listed conglomerate owned and overseen by a proven family. We also purchased
Natura Cosmeticos, a highly profitable business with a strong sustainability culture and recently appointed CEO
who is overseeing its changing business model.
We sold Aspen Pharmacare as the company has become increasingly acquisitive and it is more difficult
to determine what is driving growth. We sold President Chain Store and Delta Electronics on valuation concerns.
The outlook is currently gloomy. Many companies are expensively valued and economies still face
significant problems. The recent declines in some emerging market currencies and markets have helped to make
valuations slightly more attractive. We remain focused on investing in reasonably valued companies which meet
our quality criteria.
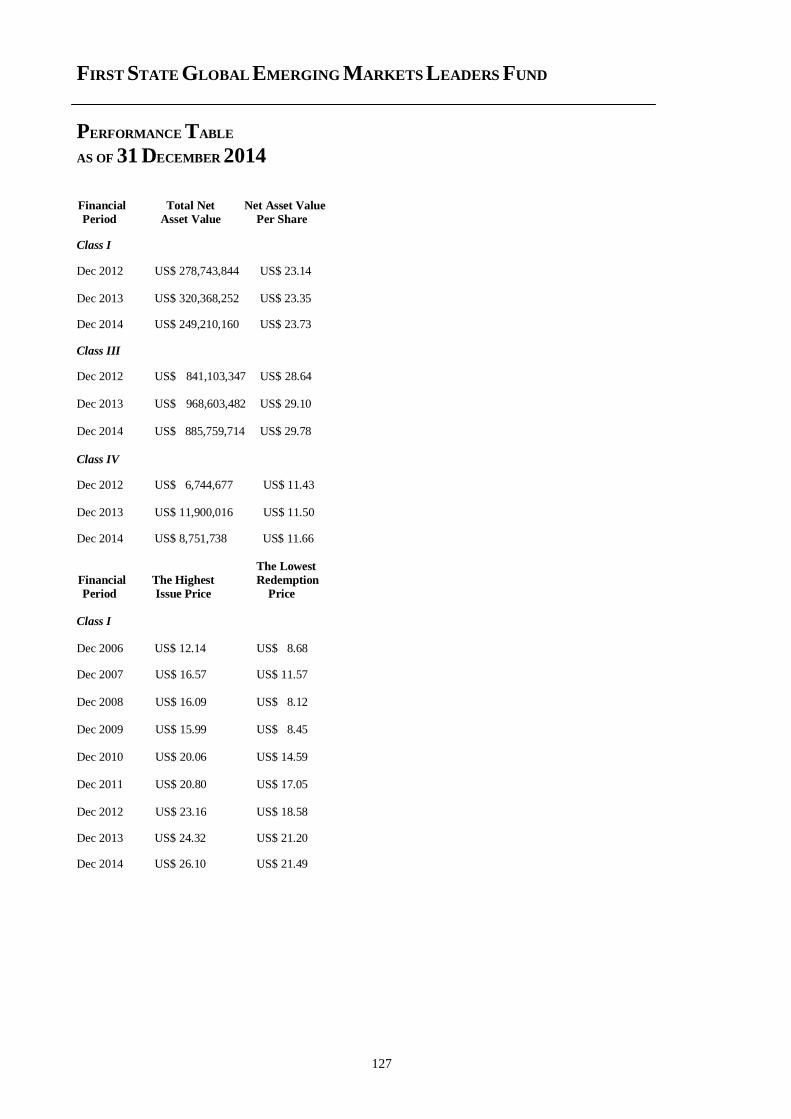
FIRST STATE GLOBAL EMERGING MARKETS LEADERS FUND
PERFORMANCE TABLE
AS OF 31 DECEMBER 2014
127
Financial Total Net Net Asset Value
Period Asset Value Per Share
Class I
Dec 2012 US$ 278,743,844 US$ 23.14 Dec 2013 US$ 320,368,252 US$ 23.35
Dec 2014 US$ 249,210,160 US$ 23.73
Class III
Dec 2012 US$ 841,103,347 US$ 28.64 Dec 2013 US$ 968,603,482 US$ 29.10
Dec 2014 US$ 885,759,714 US$ 29.78
Class IV
Dec 2012 US$ 6,744,677 US$ 11.43 Dec 2013 US$ 11,900,016 US$ 11.50
Dec 2014 US$ 8,751,738 US$ 11.66
The Lowest
Financial The Highest Redemption
Period Issue Price Price
Class I
Dec 2006 US$ 12.14 US$ 8.68
Dec 2007 US$ 16.57 US$ 11.57 Dec 2008 US$ 16.09 US$ 8.12 Dec 2009 US$ 15.99 US$ 8.45 Dec 2010 US$ 20.06 US$ 14.59 Dec 2011 US$ 20.80 US$ 17.05 Dec 2012 US$ 23.16 US$ 18.58
Dec 2013 US$ 24.32 US$ 21.20
Dec 2014 US$ 26.10 US$ 21.49
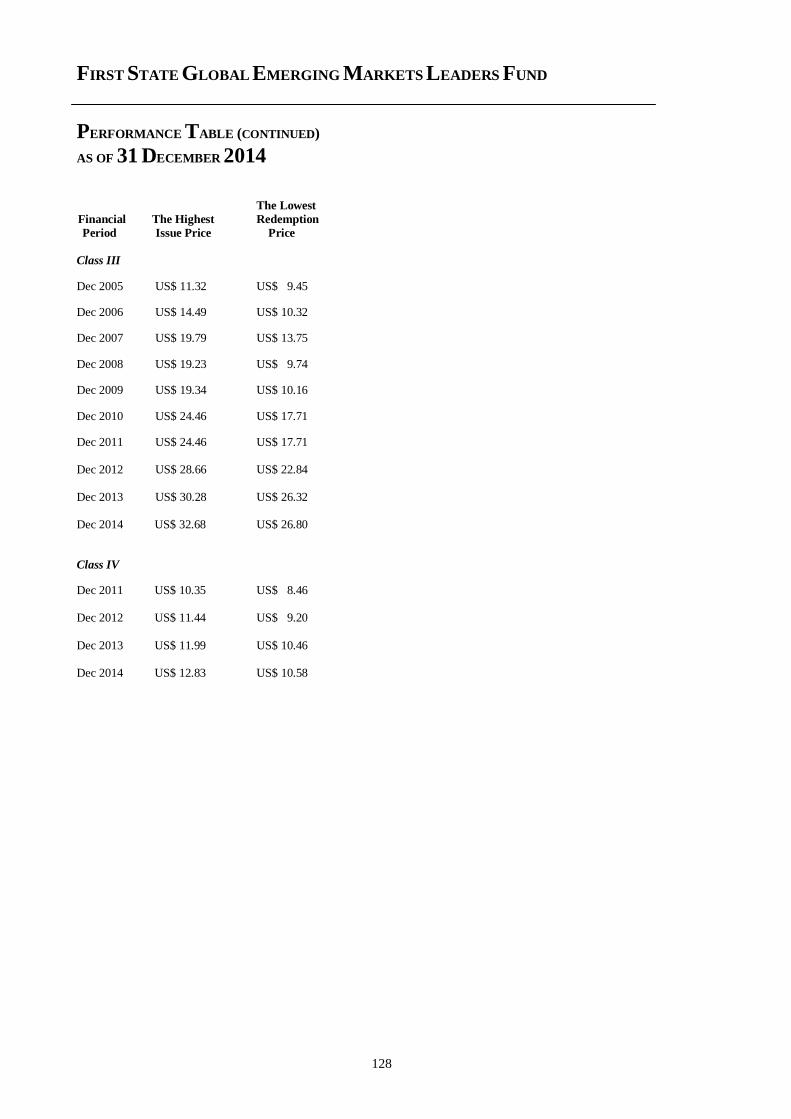
FIRST STATE GLOBAL EMERGING MARKETS LEADERS FUND
PERFORMANCE TABLE (CONTINUED)
AS OF 31 DECEMBER 2014
128
The Lowest
Financial The Highest Redemption
Period Issue Price Price
Class III
Dec 2005 US$ 11.32 US$ 9.45
Dec 2006 US$ 14.49 US$ 10.32
Dec 2007 US$ 19.79 US$ 13.75
Dec 2008 US$ 19.23 US$ 9.74
Dec 2009 US$ 19.34 US$ 10.16
Dec 2010 US$ 24.46 US$ 17.71
Dec 2011 US$ 24.46 US$ 17.71 Dec 2012 US$ 28.66 US$ 22.84 Dec 2013 US$ 30.28 US$ 26.32 Dec 2014 US$ 32.68 US$ 26.80
Class IV
Dec 2011 US$ 10.35 US$ 8.46 Dec 2012 US$ 11.44 US$ 9.20
Dec 2013 US$ 11.99 US$ 10.46 Dec 2014 US$ 12.83 US$ 10.58
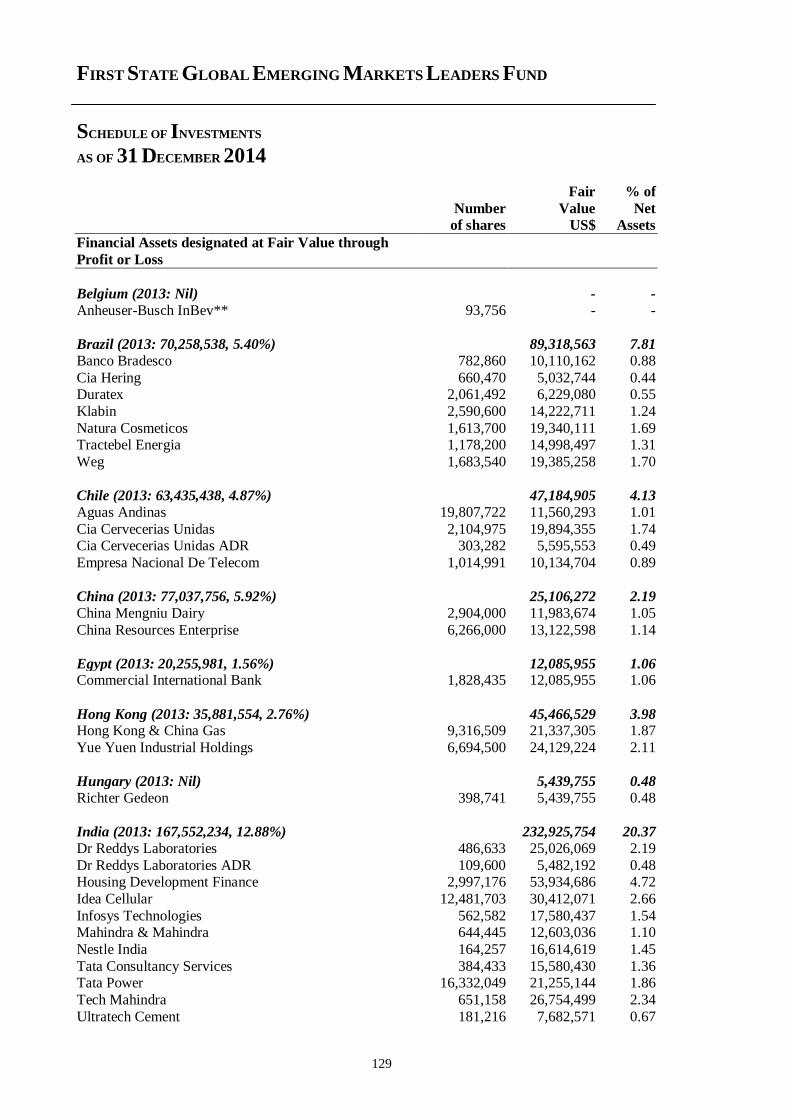
FIRST STATE GLOBAL EMERGING MARKETS LEADERS FUND
SCHEDULE OF INVESTMENTS
AS OF 31 DECEMBER 2014
129
Fair % of
Number Value Net of shares US$ Assets
Financial Assets designated at Fair Value through
Profit or Loss
Belgium (2013: Nil) - -
Anheuser-Busch InBev** 93,756 - -
Brazil (2013: 70,258,538, 5.40%) 89,318,563 7.81
Banco Bradesco 782,860 10,110,162 0.88
Cia Hering 660,470 5,032,744 0.44 Duratex 2,061,492 6,229,080 0.55
Klabin 2,590,600 14,222,711 1.24
Natura Cosmeticos 1,613,700 19,340,111 1.69 Tractebel Energia 1,178,200 14,998,497 1.31
Weg 1,683,540 19,385,258 1.70
Chile (2013: 63,435,438, 4.87%) 47,184,905 4.13
Aguas Andinas 19,807,722 11,560,293 1.01
Cia Cervecerias Unidas 2,104,975 19,894,355 1.74 Cia Cervecerias Unidas ADR 303,282 5,595,553 0.49
Empresa Nacional De Telecom 1,014,991 10,134,704 0.89
China (2013: 77,037,756, 5.92%) 25,106,272 2.19
China Mengniu Dairy 2,904,000 11,983,674 1.05
China Resources Enterprise 6,266,000 13,122,598 1.14
Egypt (2013: 20,255,981, 1.56%) 12,085,955 1.06 Commercial International Bank 1,828,435 12,085,955 1.06
Hong Kong (2013: 35,881,554, 2.76%) 45,466,529 3.98 Hong Kong & China Gas 9,316,509 21,337,305 1.87
Yue Yuen Industrial Holdings 6,694,500 24,129,224 2.11
Hungary (2013: Nil) 5,439,755 0.48
Richter Gedeon 398,741 5,439,755 0.48
India (2013: 167,552,234, 12.88%) 232,925,754 20.37
Dr Reddys Laboratories 486,633 25,026,069 2.19
Dr Reddys Laboratories ADR 109,600 5,482,192 0.48 Housing Development Finance 2,997,176 53,934,686 4.72
Idea Cellular 12,481,703 30,412,071 2.66
Infosys Technologies 562,582 17,580,437 1.54 Mahindra & Mahindra 644,445 12,603,036 1.10
Nestle India 164,257 16,614,619 1.45
Tata Consultancy Services 384,433 15,580,430 1.36 Tata Power 16,332,049 21,255,144 1.86
Tech Mahindra 651,158 26,754,499 2.34
Ultratech Cement 181,216 7,682,571 0.67
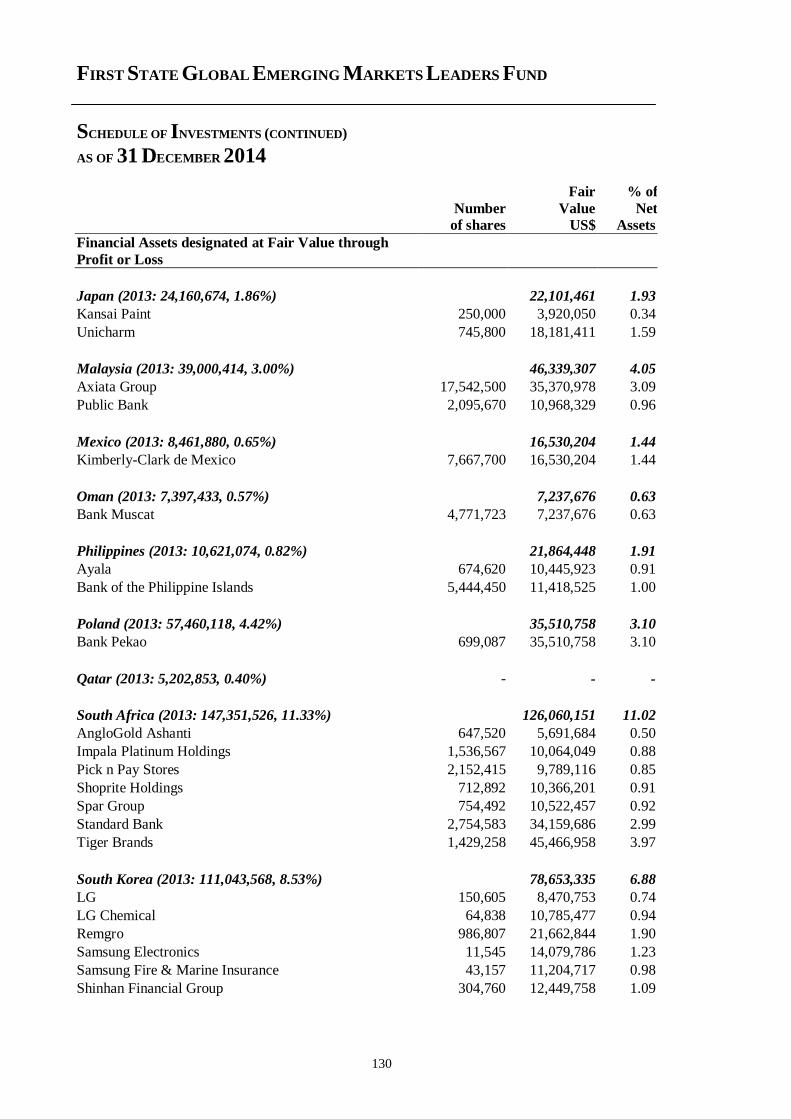
FIRST STATE GLOBAL EMERGING MARKETS LEADERS FUND
SCHEDULE OF INVESTMENTS (CONTINUED)
AS OF 31 DECEMBER 2014
130
Fair % of
Number Value Net of shares US$ Assets
Financial Assets designated at Fair Value through
Profit or Loss
Japan (2013: 24,160,674, 1.86%) 22,101,461 1.93
Kansai Paint 250,000 3,920,050 0.34
Unicharm 745,800 18,181,411 1.59
Malaysia (2013: 39,000,414, 3.00%) 46,339,307 4.05
Axiata Group 17,542,500 35,370,978 3.09
Public Bank 2,095,670 10,968,329 0.96
Mexico (2013: 8,461,880, 0.65%) 16,530,204 1.44
Kimberly-Clark de Mexico 7,667,700 16,530,204 1.44
Oman (2013: 7,397,433, 0.57%) 7,237,676 0.63
Bank Muscat 4,771,723 7,237,676 0.63
Philippines (2013: 10,621,074, 0.82%) 21,864,448 1.91
Ayala 674,620 10,445,923 0.91
Bank of the Philippine Islands 5,444,450 11,418,525 1.00
Poland (2013: 57,460,118, 4.42%) 35,510,758 3.10
Bank Pekao 699,087 35,510,758 3.10
Qatar (2013: 5,202,853, 0.40%) - - -
South Africa (2013: 147,351,526, 11.33%) 126,060,151 11.02
AngloGold Ashanti 647,520 5,691,684 0.50
Impala Platinum Holdings 1,536,567 10,064,049 0.88
Pick n Pay Stores 2,152,415 9,789,116 0.85
Shoprite Holdings 712,892 10,366,201 0.91
Spar Group 754,492 10,522,457 0.92
Standard Bank 2,754,583 34,159,686 2.99
Tiger Brands 1,429,258 45,466,958 3.97
South Korea (2013: 111,043,568, 8.53%) 78,653,335 6.88
LG 150,605 8,470,753 0.74
LG Chemical 64,838 10,785,477 0.94
Remgro 986,807 21,662,844 1.90
Samsung Electronics 11,545 14,079,786 1.23
Samsung Fire & Marine Insurance 43,157 11,204,717 0.98
Shinhan Financial Group 304,760 12,449,758 1.09
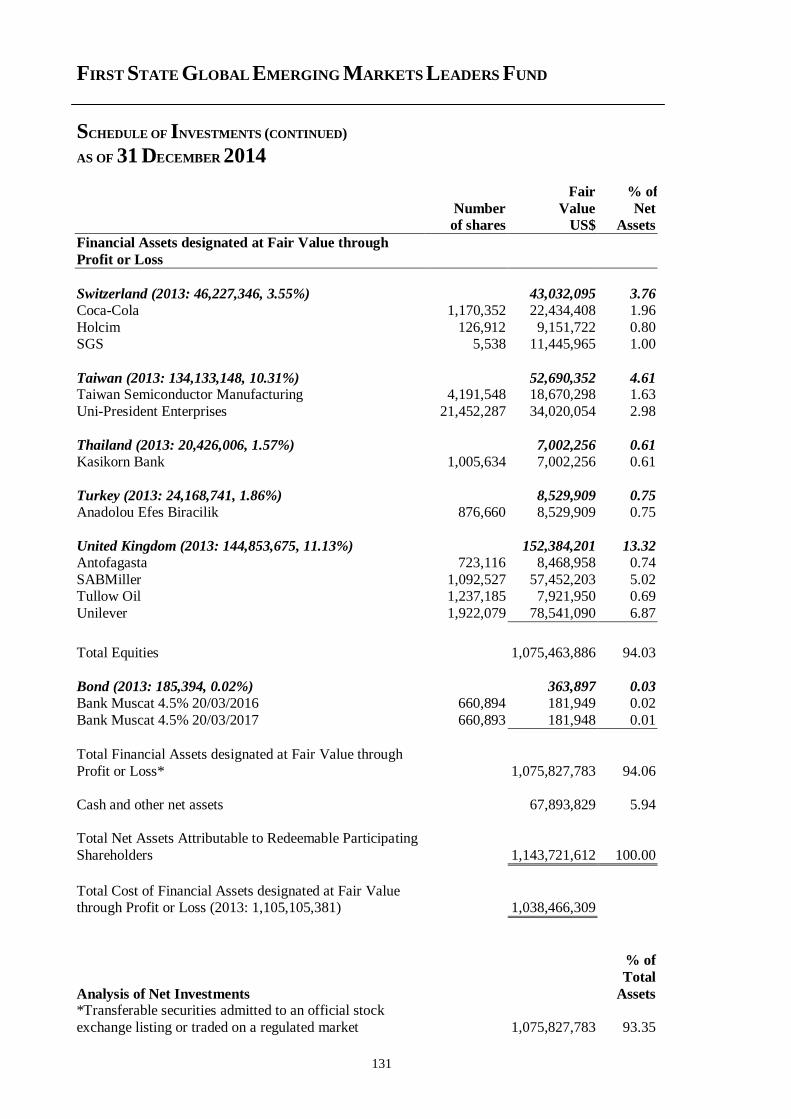
FIRST STATE GLOBAL EMERGING MARKETS LEADERS FUND
SCHEDULE OF INVESTMENTS (CONTINUED)
AS OF 31 DECEMBER 2014
131
Fair % of
Number Value Net of shares US$ Assets
Financial Assets designated at Fair Value through
Profit or Loss
Switzerland (2013: 46,227,346, 3.55%) 43,032,095 3.76
Coca-Cola 1,170,352 22,434,408 1.96
Holcim 126,912 9,151,722 0.80 SGS 5,538 11,445,965 1.00
Taiwan (2013: 134,133,148, 10.31%) 52,690,352 4.61 Taiwan Semiconductor Manufacturing 4,191,548 18,670,298 1.63
Uni-President Enterprises 21,452,287 34,020,054 2.98
Thailand (2013: 20,426,006, 1.57%) 7,002,256 0.61
Kasikorn Bank 1,005,634 7,002,256 0.61
Turkey (2013: 24,168,741, 1.86%) 8,529,909 0.75
Anadolou Efes Biracilik 876,660 8,529,909 0.75
United Kingdom (2013: 144,853,675, 11.13%) 152,384,201 13.32
Antofagasta 723,116 8,468,958 0.74
SABMiller 1,092,527 57,452,203 5.02 Tullow Oil 1,237,185 7,921,950 0.69
Unilever 1,922,079 78,541,090 6.87
Total Equities 1,075,463,886 94.03
Bond (2013: 185,394, 0.02%) 363,897 0.03
Bank Muscat 4.5% 20/03/2016 660,894 181,949 0.02
Bank Muscat 4.5% 20/03/2017 660,893 181,948 0.01
Total Financial Assets designated at Fair Value through
Profit or Loss* 1,075,827,783 94.06
Cash and other net assets 67,893,829 5.94
Total Net Assets Attributable to Redeemable Participating
Shareholders 1,143,721,612 100.00
Total Cost of Financial Assets designated at Fair Value through Profit or Loss (2013: 1,105,105,381) 1,038,466,309
Analysis of Net Investments
% of
Total
Assets
*Transferable securities admitted to an official stock
exchange listing or traded on a regulated market 1,075,827,783 93.35
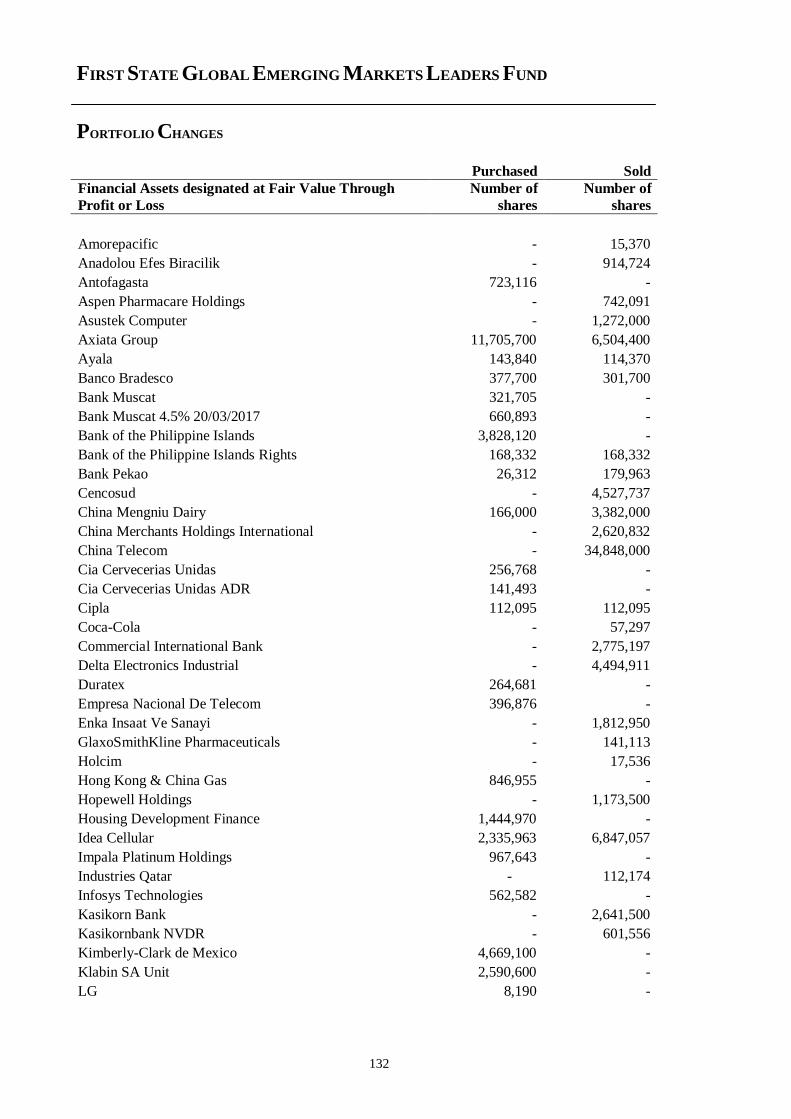
FIRST STATE GLOBAL EMERGING MARKETS LEADERS FUND
PORTFOLIO CHANGES
132
Purchased Sold
Financial Assets designated at Fair Value Through
Profit or Loss
Number of
shares
Number of
shares
Amorepacific - 15,370
Anadolou Efes Biracilik - 914,724
Antofagasta 723,116 -
Aspen Pharmacare Holdings - 742,091
Asustek Computer - 1,272,000
Axiata Group 11,705,700 6,504,400
Ayala 143,840 114,370
Banco Bradesco 377,700 301,700
Bank Muscat 321,705 -
Bank Muscat 4.5% 20/03/2017 660,893 -
Bank of the Philippine Islands 3,828,120 -
Bank of the Philippine Islands Rights 168,332 168,332
Bank Pekao 26,312 179,963
Cencosud - 4,527,737
China Mengniu Dairy 166,000 3,382,000
China Merchants Holdings International - 2,620,832
China Telecom - 34,848,000
Cia Cervecerias Unidas 256,768 -
Cia Cervecerias Unidas ADR 141,493 -
Cipla 112,095 112,095
Coca-Cola - 57,297
Commercial International Bank - 2,775,197
Delta Electronics Industrial - 4,494,911
Duratex 264,681 -
Empresa Nacional De Telecom 396,876 -
Enka Insaat Ve Sanayi - 1,812,950
GlaxoSmithKline Pharmaceuticals - 141,113
Holcim - 17,536
Hong Kong & China Gas 846,955 -
Hopewell Holdings - 1,173,500
Housing Development Finance 1,444,970 -
Idea Cellular 2,335,963 6,847,057
Impala Platinum Holdings 967,643 -
Industries Qatar - 112,174
Infosys Technologies 562,582 -
Kasikorn Bank - 2,641,500
Kasikornbank NVDR - 601,556
Kimberly-Clark de Mexico 4,669,100 -
Klabin SA Unit 2,590,600 -
LG 8,190 -
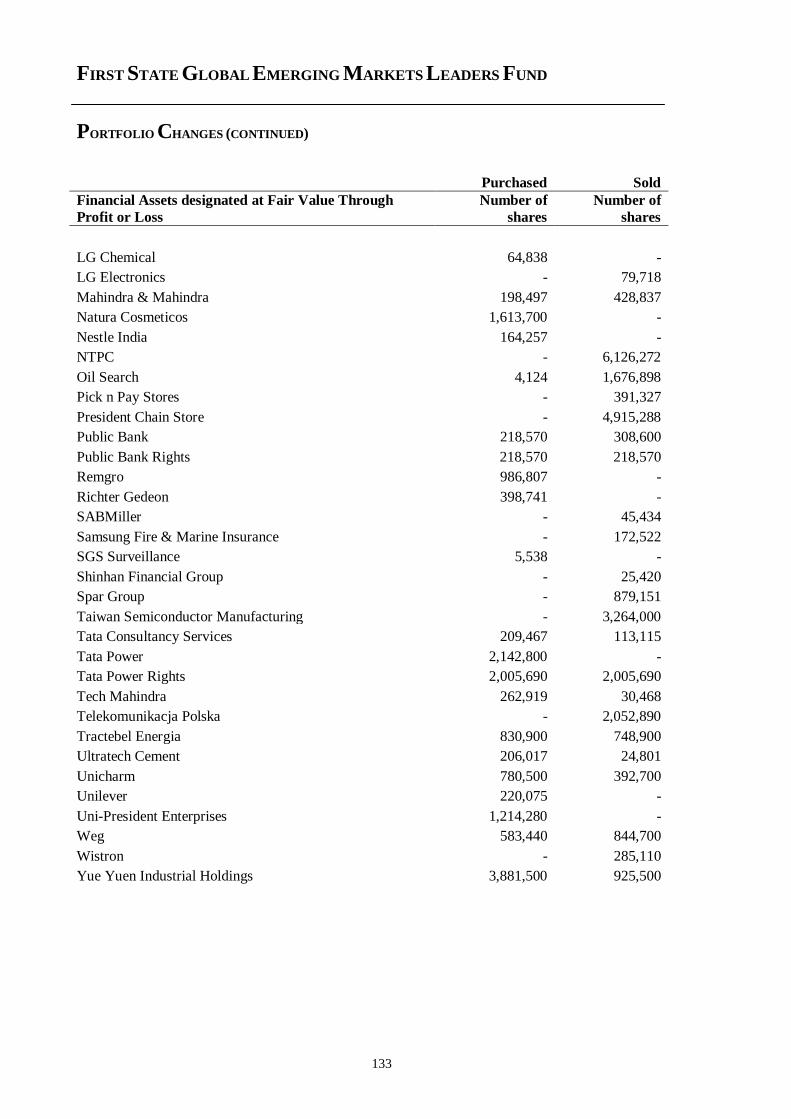
FIRST STATE GLOBAL EMERGING MARKETS LEADERS FUND
PORTFOLIO CHANGES (CONTINUED)
133
Purchased Sold
Financial Assets designated at Fair Value Through
Profit or Loss
Number of
shares
Number of
shares
LG Chemical 64,838 -
LG Electronics - 79,718
Mahindra & Mahindra 198,497 428,837
Natura Cosmeticos 1,613,700 -
Nestle India 164,257 -
NTPC - 6,126,272
Oil Search 4,124 1,676,898
Pick n Pay Stores - 391,327
President Chain Store - 4,915,288
Public Bank 218,570 308,600
Public Bank Rights 218,570 218,570
Remgro 986,807 -
Richter Gedeon 398,741 -
SABMiller - 45,434
Samsung Fire & Marine Insurance - 172,522
SGS Surveillance 5,538 -
Shinhan Financial Group - 25,420
Spar Group - 879,151
Taiwan Semiconductor Manufacturing - 3,264,000
Tata Consultancy Services 209,467 113,115
Tata Power 2,142,800 -
Tata Power Rights 2,005,690 2,005,690
Tech Mahindra 262,919 30,468
Telekomunikacja Polska - 2,052,890
Tractebel Energia 830,900 748,900
Ultratech Cement 206,017 24,801
Unicharm 780,500 392,700
Unilever 220,075 -
Uni-President Enterprises 1,214,280 -
Weg 583,440 844,700
Wistron - 285,110
Yue Yuen Industrial Holdings 3,881,500 925,500
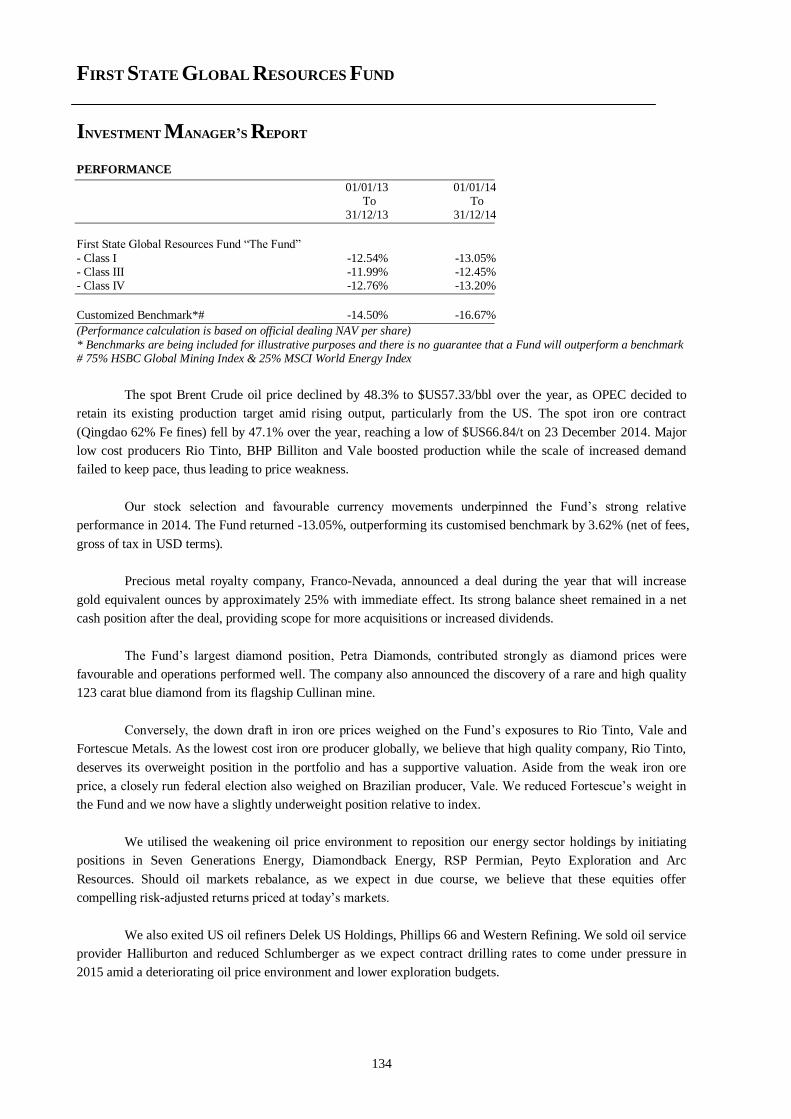
FIRST STATE GLOBAL RESOURCES FUND
INVESTMENT MANAGER’S REPORT
134
PERFORMANCE
01/01/13 01/01/14 To To 31/12/13 31/12/14
First State Global Resources Fund “The Fund”
- Class I -12.54% -13.05% - Class III -11.99% -12.45% - Class IV -12.76% -13.20%
Customized Benchmark*# -14.50% -16.67%
(Performance calculation is based on official dealing NAV per share)
* Benchmarks are being included for illustrative purposes and there is no guarantee that a Fund will outperform a benchmark # 75% HSBC Global Mining Index & 25% MSCI World Energy Index
The spot Brent Crude oil price declined by 48.3% to $US57.33/bbl over the year, as OPEC decided to
retain its existing production target amid rising output, particularly from the US. The spot iron ore contract
(Qingdao 62% Fe fines) fell by 47.1% over the year, reaching a low of $US66.84/t on 23 December 2014. Major
low cost producers Rio Tinto, BHP Billiton and Vale boosted production while the scale of increased demand
failed to keep pace, thus leading to price weakness.
Our stock selection and favourable currency movements underpinned the Fund’s strong relative
performance in 2014. The Fund returned -13.05%, outperforming its customised benchmark by 3.62% (net of fees,
gross of tax in USD terms).
Precious metal royalty company, Franco-Nevada, announced a deal during the year that will increase
gold equivalent ounces by approximately 25% with immediate effect. Its strong balance sheet remained in a net
cash position after the deal, providing scope for more acquisitions or increased dividends.
The Fund’s largest diamond position, Petra Diamonds, contributed strongly as diamond prices were
favourable and operations performed well. The company also announced the discovery of a rare and high quality
123 carat blue diamond from its flagship Cullinan mine.
Conversely, the down draft in iron ore prices weighed on the Fund’s exposures to Rio Tinto, Vale and
Fortescue Metals. As the lowest cost iron ore producer globally, we believe that high quality company, Rio Tinto,
deserves its overweight position in the portfolio and has a supportive valuation. Aside from the weak iron ore
price, a closely run federal election also weighed on Brazilian producer, Vale. We reduced Fortescue’s weight in
the Fund and we now have a slightly underweight position relative to index.
We utilised the weakening oil price environment to reposition our energy sector holdings by initiating
positions in Seven Generations Energy, Diamondback Energy, RSP Permian, Peyto Exploration and Arc
Resources. Should oil markets rebalance, as we expect in due course, we believe that these equities offer
compelling risk-adjusted returns priced at today’s markets.
We also exited US oil refiners Delek US Holdings, Phillips 66 and Western Refining. We sold oil service
provider Halliburton and reduced Schlumberger as we expect contract drilling rates to come under pressure in
2015 amid a deteriorating oil price environment and lower exploration budgets.
FIRST STATE GLOBAL RESOURCES FUND
INVESTMENT MANAGER’S REPORT (CONTINUED)
135
It is conceivable that more pain could yet be felt across the energy industry in the months ahead.
Companies with poor quality assets and weak balance sheets will need to take on more debt and may not survive.
It is for exactly this reason that the Fund only invests in the lowest cost producers with larger-than-average
margins, strong balance sheets and proven management teams that are well positioned to withstand heightened
commodity price volatility. Despite the challenging backdrop, we firmly believe that this current low in the
energy price cycle presents significant opportunities for these companies and for us as investors.
A ‘W’-shaped commodity recovery could potentially occur in response to the current supply-demand
imbalance and likely volatility around US monetary policy normalisation. In general, base metals appear to have
better supply-side fundamentals than bulk commodities. We expect to see more small-scale high cost mining
operations close near term, however some coal and iron ore producers are targeting unit cost reductions by
maximising throughput. Large open pit and remote operations should begin to benefit from lower fuel and power
prices. Weaker currencies in producer countries like Australia, Brazil and Canada should help reduce costs further,
improving margins in a flat commodity price scenario.
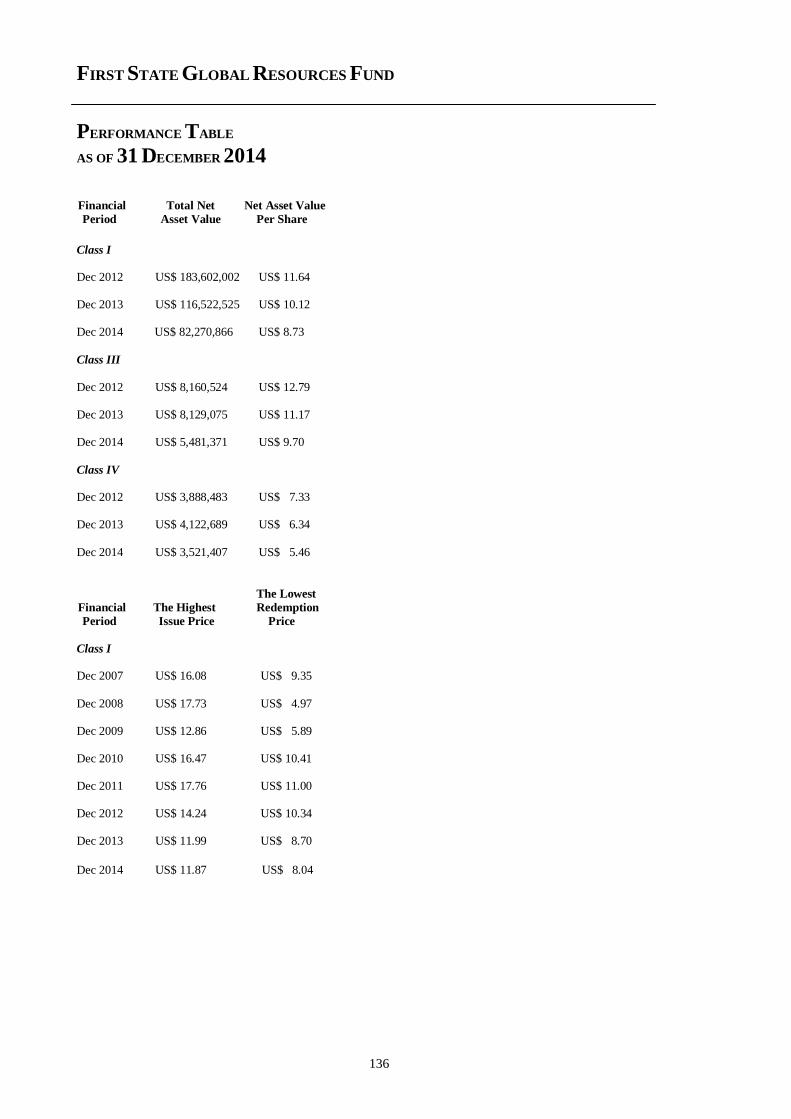
FIRST STATE GLOBAL RESOURCES FUND
PERFORMANCE TABLE
AS OF 31 DECEMBER 2014
136
Financial Total Net Net Asset Value
Period Asset Value Per Share
Class I Dec 2012 US$ 183,602,002 US$ 11.64 Dec 2013 US$ 116,522,525 US$ 10.12 Dec 2014 US$ 82,270,866 US$ 8.73
Class III
Dec 2012 US$ 8,160,524 US$ 12.79 Dec 2013 US$ 8,129,075 US$ 11.17 Dec 2014 US$ 5,481,371 US$ 9.70
Class IV Dec 2012 US$ 3,888,483 US$ 7.33 Dec 2013 US$ 4,122,689 US$ 6.34
Dec 2014 US$ 3,521,407 US$ 5.46
The Lowest
Financial The Highest Redemption
Period Issue Price Price
Class I Dec 2007 US$ 16.08 US$ 9.35
Dec 2008 US$ 17.73 US$ 4.97 Dec 2009 US$ 12.86 US$ 5.89 Dec 2010 US$ 16.47 US$ 10.41 Dec 2011 US$ 17.76 US$ 11.00 Dec 2012 US$ 14.24 US$ 10.34 Dec 2013 US$ 11.99 US$ 8.70
Dec 2014 US$ 11.87 US$ 8.04
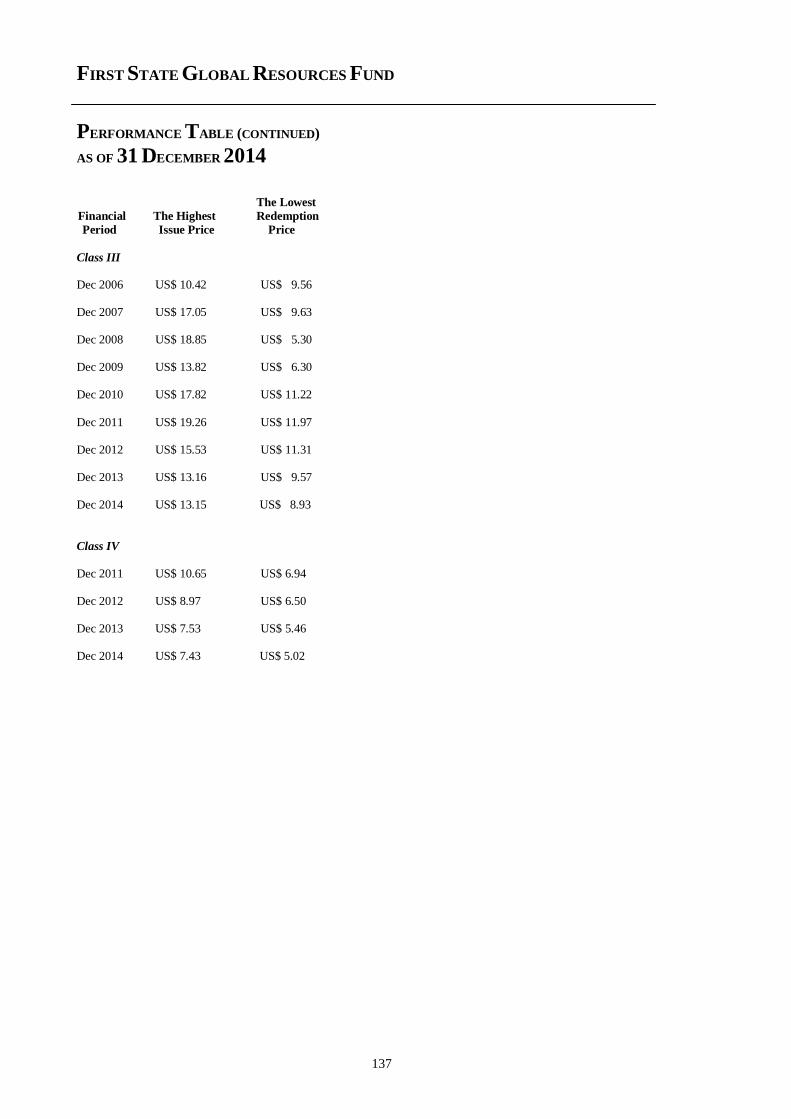
FIRST STATE GLOBAL RESOURCES FUND
PERFORMANCE TABLE (CONTINUED)
AS OF 31 DECEMBER 2014
137
The Lowest
Financial The Highest Redemption
Period Issue Price Price
Class III Dec 2006 US$ 10.42 US$ 9.56 Dec 2007 US$ 17.05 US$ 9.63 Dec 2008 US$ 18.85 US$ 5.30 Dec 2009 US$ 13.82 US$ 6.30 Dec 2010 US$ 17.82 US$ 11.22
Dec 2011 US$ 19.26 US$ 11.97 Dec 2012 US$ 15.53 US$ 11.31 Dec 2013 US$ 13.16 US$ 9.57 Dec 2014 US$ 13.15 US$ 8.93
Class IV
Dec 2011 US$ 10.65 US$ 6.94 Dec 2012 US$ 8.97 US$ 6.50 Dec 2013 US$ 7.53 US$ 5.46
Dec 2014 US$ 7.43 US$ 5.02
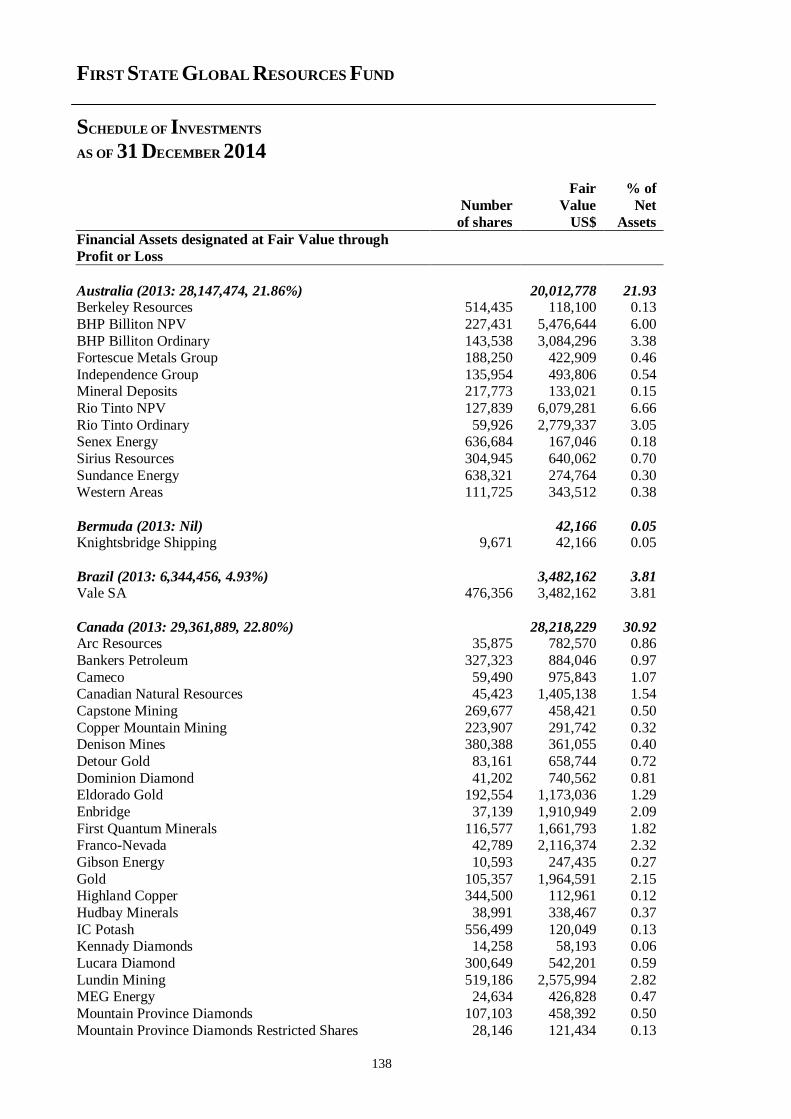
FIRST STATE GLOBAL RESOURCES FUND
SCHEDULE OF INVESTMENTS
AS OF 31 DECEMBER 2014
138
Fair % of
Number Value Net
of shares US$ Assets
Financial Assets designated at Fair Value through
Profit or Loss
Australia (2013: 28,147,474, 21.86%) 20,012,778 21.93 Berkeley Resources 514,435 118,100 0.13
BHP Billiton NPV 227,431 5,476,644 6.00
BHP Billiton Ordinary 143,538 3,084,296 3.38 Fortescue Metals Group 188,250 422,909 0.46
Independence Group 135,954 493,806 0.54 Mineral Deposits 217,773 133,021 0.15
Rio Tinto NPV 127,839 6,079,281 6.66
Rio Tinto Ordinary 59,926 2,779,337 3.05 Senex Energy 636,684 167,046 0.18
Sirius Resources 304,945 640,062 0.70
Sundance Energy 638,321 274,764 0.30 Western Areas 111,725 343,512 0.38
Bermuda (2013: Nil) 42,166 0.05 Knightsbridge Shipping 9,671 42,166 0.05
Brazil (2013: 6,344,456, 4.93%) 3,482,162 3.81 Vale SA 476,356 3,482,162 3.81
Canada (2013: 29,361,889, 22.80%) 28,218,229 30.92 Arc Resources 35,875 782,570 0.86
Bankers Petroleum 327,323 884,046 0.97
Cameco 59,490 975,843 1.07 Canadian Natural Resources 45,423 1,405,138 1.54
Capstone Mining 269,677 458,421 0.50
Copper Mountain Mining 223,907 291,742 0.32 Denison Mines 380,388 361,055 0.40
Detour Gold 83,161 658,744 0.72
Dominion Diamond 41,202 740,562 0.81 Eldorado Gold 192,554 1,173,036 1.29
Enbridge 37,139 1,910,949 2.09
First Quantum Minerals 116,577 1,661,793 1.82 Franco-Nevada 42,789 2,116,374 2.32
Gibson Energy 10,593 247,435 0.27
Gold 105,357 1,964,591 2.15 Highland Copper 344,500 112,961 0.12
Hudbay Minerals 38,991 338,467 0.37
IC Potash 556,499 120,049 0.13 Kennady Diamonds 14,258 58,193 0.06
Lucara Diamond 300,649 542,201 0.59
Lundin Mining 519,186 2,575,994 2.82 MEG Energy 24,634 426,828 0.47
Mountain Province Diamonds 107,103 458,392 0.50
Mountain Province Diamonds Restricted Shares 28,146 121,434 0.13
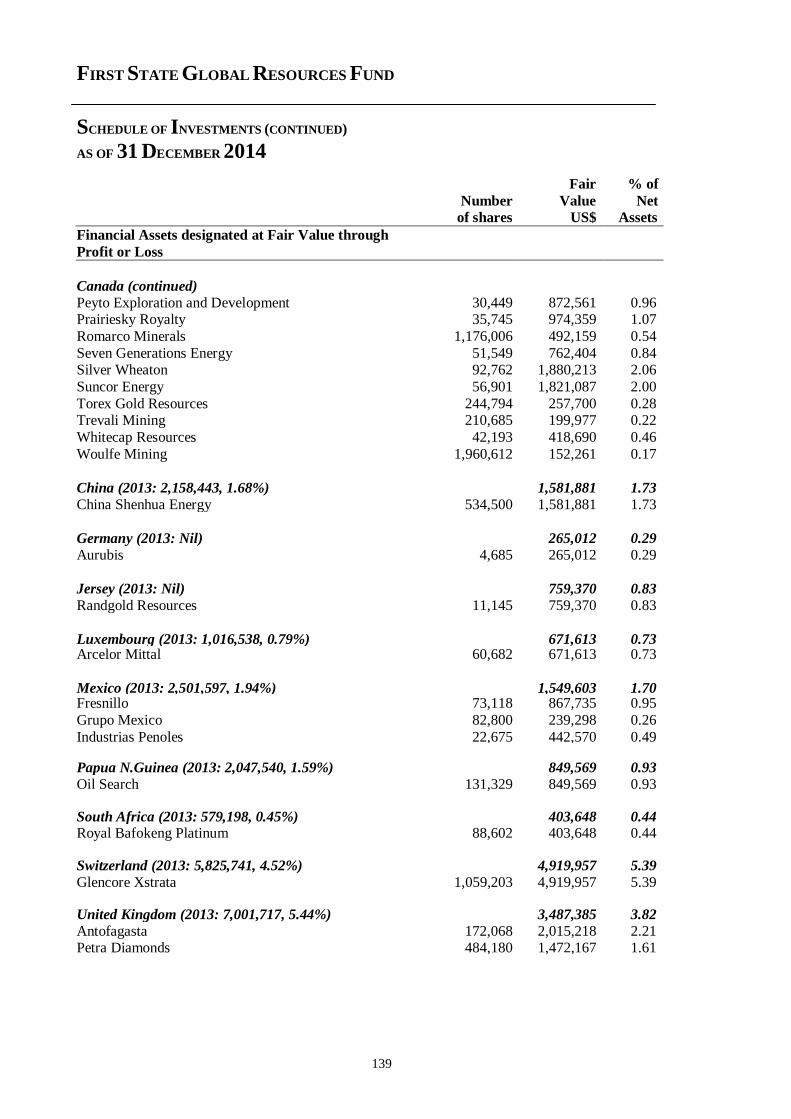
FIRST STATE GLOBAL RESOURCES FUND
SCHEDULE OF INVESTMENTS (CONTINUED)
AS OF 31 DECEMBER 2014
139
Fair % of
Number Value Net of shares US$ Assets
Financial Assets designated at Fair Value through
Profit or Loss
Canada (continued)
Peyto Exploration and Development 30,449 872,561 0.96 Prairiesky Royalty 35,745 974,359 1.07
Romarco Minerals 1,176,006 492,159 0.54
Seven Generations Energy 51,549 762,404 0.84 Silver Wheaton 92,762 1,880,213 2.06
Suncor Energy 56,901 1,821,087 2.00
Torex Gold Resources 244,794 257,700 0.28 Trevali Mining 210,685 199,977 0.22
Whitecap Resources 42,193 418,690 0.46
Woulfe Mining 1,960,612 152,261 0.17
China (2013: 2,158,443, 1.68%) 1,581,881 1.73
China Shenhua Energy 534,500 1,581,881 1.73
Germany (2013: Nil) 265,012 0.29
Aurubis 4,685 265,012 0.29
Jersey (2013: Nil) 759,370 0.83
Randgold Resources 11,145 759,370 0.83
Luxembourg (2013: 1,016,538, 0.79%) 671,613 0.73 Arcelor Mittal 60,682 671,613 0.73
Mexico (2013: 2,501,597, 1.94%) 1,549,603 1.70 Fresnillo 73,118 867,735 0.95
Grupo Mexico 82,800 239,298 0.26
Industrias Penoles 22,675 442,570 0.49 Papua N.Guinea (2013: 2,047,540, 1.59%) 849,569 0.93
Oil Search 131,329 849,569 0.93
South Africa (2013: 579,198, 0.45%) 403,648 0.44 Royal Bafokeng Platinum 88,602 403,648 0.44
Switzerland (2013: 5,825,741, 4.52%) 4,919,957 5.39
Glencore Xstrata 1,059,203 4,919,957 5.39 United Kingdom (2013: 7,001,717, 5.44%) 3,487,385 3.82
Antofagasta 172,068 2,015,218 2.21 Petra Diamonds 484,180 1,472,167 1.61
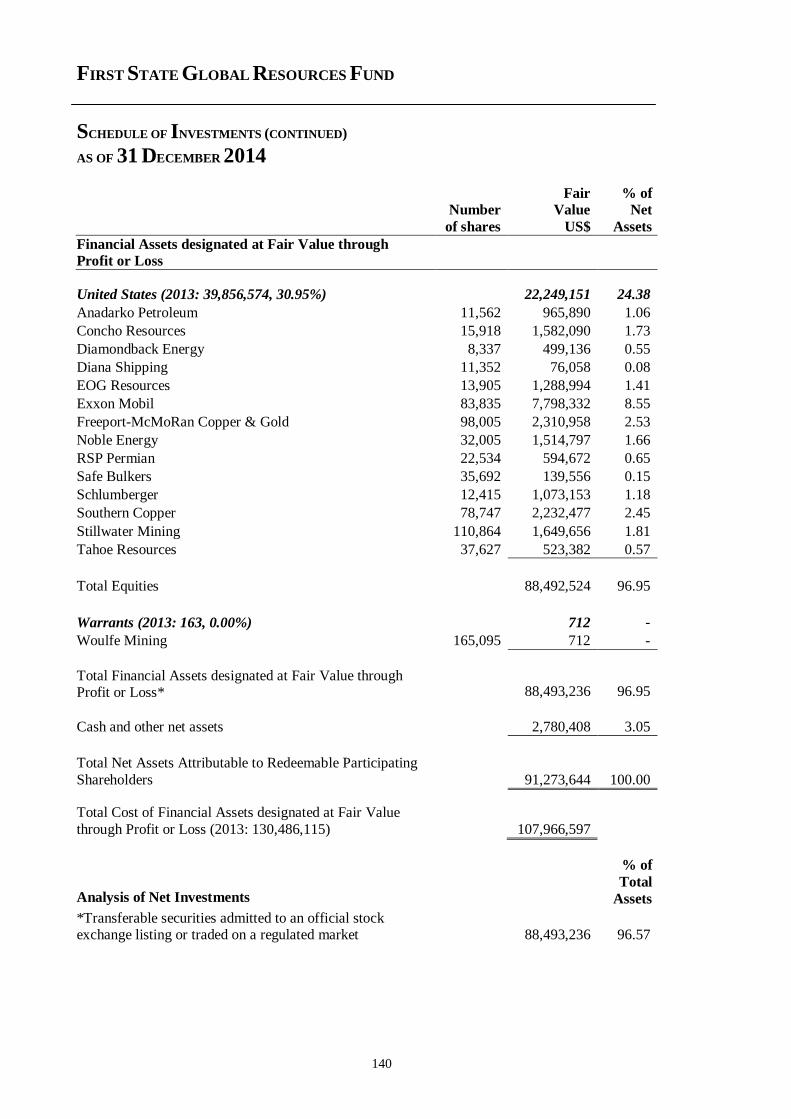
FIRST STATE GLOBAL RESOURCES FUND
SCHEDULE OF INVESTMENTS (CONTINUED)
AS OF 31 DECEMBER 2014
140
Fair % of Number Value Net
of shares US$ Assets
Financial Assets designated at Fair Value through
Profit or Loss
United States (2013: 39,856,574, 30.95%) 22,249,151 24.38
Anadarko Petroleum 11,562 965,890 1.06
Concho Resources 15,918 1,582,090 1.73
Diamondback Energy 8,337 499,136 0.55
Diana Shipping 11,352 76,058 0.08
EOG Resources 13,905 1,288,994 1.41
Exxon Mobil 83,835 7,798,332 8.55
Freeport-McMoRan Copper & Gold 98,005 2,310,958 2.53
Noble Energy 32,005 1,514,797 1.66
RSP Permian 22,534 594,672 0.65
Safe Bulkers 35,692 139,556 0.15
Schlumberger 12,415 1,073,153 1.18
Southern Copper 78,747 2,232,477 2.45
Stillwater Mining 110,864 1,649,656 1.81
Tahoe Resources 37,627 523,382 0.57
Total Equities 88,492,524 96.95
Warrants (2013: 163, 0.00%) 712 -
Woulfe Mining 165,095 712 -
Total Financial Assets designated at Fair Value through Profit or Loss* 88,493,236 96.95
Cash and other net assets 2,780,408 3.05
Total Net Assets Attributable to Redeemable Participating
Shareholders 91,273,644 100.00
Total Cost of Financial Assets designated at Fair Value
through Profit or Loss (2013: 130,486,115) 107,966,597
Analysis of Net Investments
% of
Total
Assets
*Transferable securities admitted to an official stock exchange listing or traded on a regulated market 88,493,236 96.57
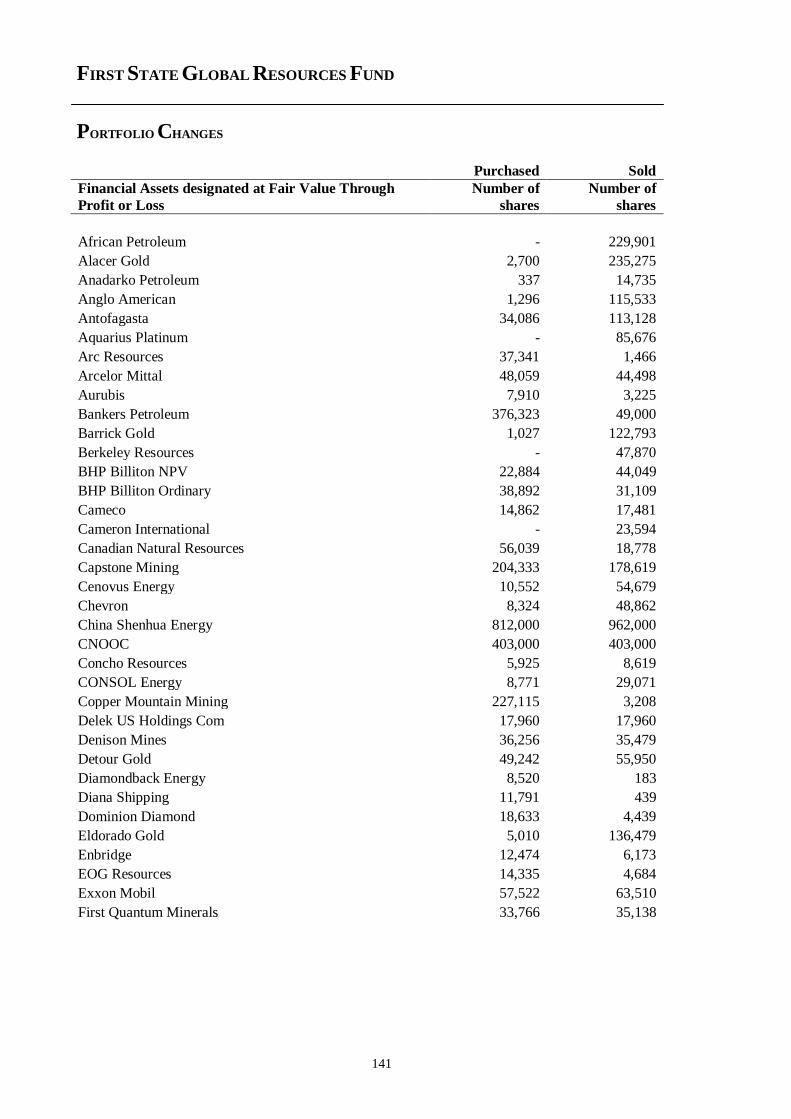
FIRST STATE GLOBAL RESOURCES FUND
PORTFOLIO CHANGES
141
Purchased Sold
Financial Assets designated at Fair Value Through
Profit or Loss
Number of
shares
Number of
shares
African Petroleum - 229,901
Alacer Gold 2,700 235,275
Anadarko Petroleum 337 14,735
Anglo American 1,296 115,533
Antofagasta 34,086 113,128
Aquarius Platinum - 85,676
Arc Resources 37,341 1,466
Arcelor Mittal 48,059 44,498
Aurubis 7,910 3,225
Bankers Petroleum 376,323 49,000
Barrick Gold 1,027 122,793
Berkeley Resources - 47,870
BHP Billiton NPV 22,884 44,049
BHP Billiton Ordinary 38,892 31,109
Cameco 14,862 17,481
Cameron International - 23,594
Canadian Natural Resources 56,039 18,778
Capstone Mining 204,333 178,619
Cenovus Energy 10,552 54,679
Chevron 8,324 48,862
China Shenhua Energy 812,000 962,000
CNOOC 403,000 403,000
Concho Resources 5,925 8,619
CONSOL Energy 8,771 29,071
Copper Mountain Mining 227,115 3,208
Delek US Holdings Com 17,960 17,960
Denison Mines 36,256 35,479
Detour Gold 49,242 55,950
Diamondback Energy 8,520 183
Diana Shipping 11,791 439
Dominion Diamond 18,633 4,439
Eldorado Gold 5,010 136,479
Enbridge 12,474 6,173
EOG Resources 14,335 4,684
Exxon Mobil 57,522 63,510
First Quantum Minerals 33,766 35,138
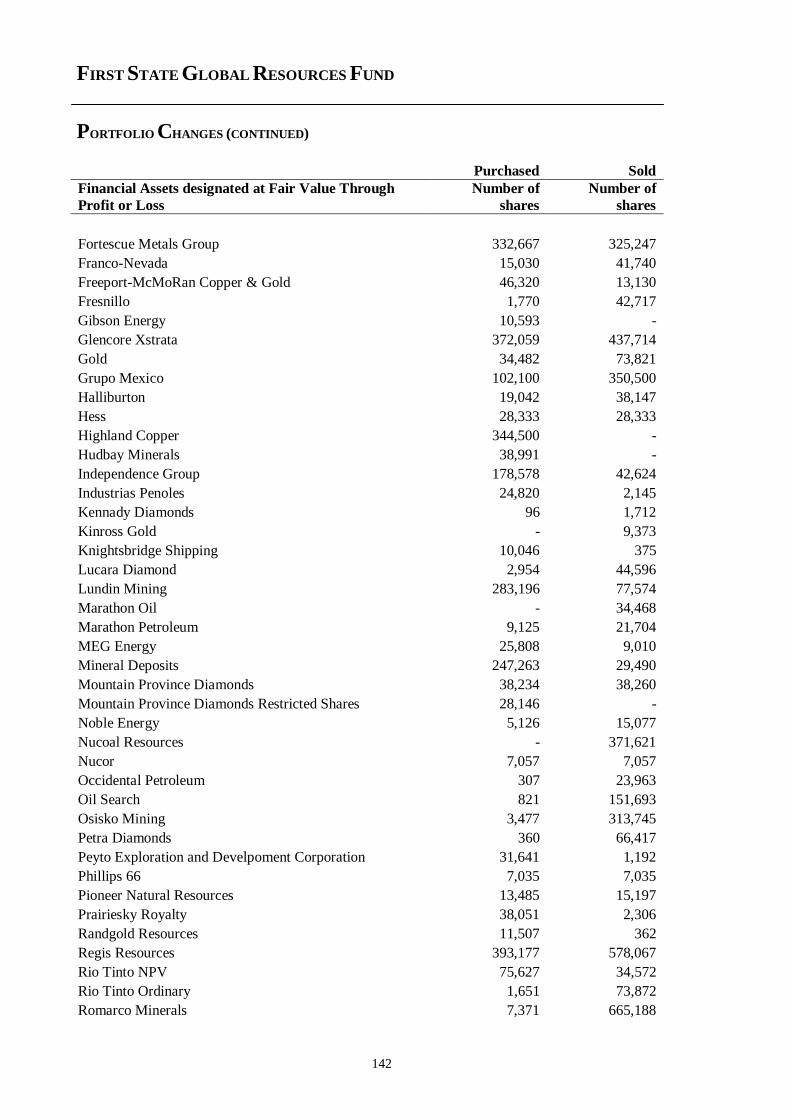
FIRST STATE GLOBAL RESOURCES FUND
PORTFOLIO CHANGES (CONTINUED)
142
Purchased Sold
Financial Assets designated at Fair Value Through
Profit or Loss
Number of
shares
Number of
shares
Fortescue Metals Group 332,667 325,247
Franco-Nevada 15,030 41,740
Freeport-McMoRan Copper & Gold 46,320 13,130
Fresnillo 1,770 42,717
Gibson Energy 10,593 -
Glencore Xstrata 372,059 437,714
Gold 34,482 73,821
Grupo Mexico 102,100 350,500
Halliburton 19,042 38,147
Hess 28,333 28,333
Highland Copper 344,500 -
Hudbay Minerals 38,991 -
Independence Group 178,578 42,624
Industrias Penoles 24,820 2,145
Kennady Diamonds 96 1,712
Kinross Gold - 9,373
Knightsbridge Shipping 10,046 375
Lucara Diamond 2,954 44,596
Lundin Mining 283,196 77,574
Marathon Oil - 34,468
Marathon Petroleum 9,125 21,704
MEG Energy 25,808 9,010
Mineral Deposits 247,263 29,490
Mountain Province Diamonds 38,234 38,260
Mountain Province Diamonds Restricted Shares 28,146 -
Noble Energy 5,126 15,077
Nucoal Resources - 371,621
Nucor 7,057 7,057
Occidental Petroleum 307 23,963
Oil Search 821 151,693
Osisko Mining 3,477 313,745
Petra Diamonds 360 66,417
Peyto Exploration and Develpoment Corporation 31,641 1,192
Phillips 66 7,035 7,035
Pioneer Natural Resources 13,485 15,197
Prairiesky Royalty 38,051 2,306
Randgold Resources 11,507 362
Regis Resources 393,177 578,067
Rio Tinto NPV 75,627 34,572
Rio Tinto Ordinary 1,651 73,872
Romarco Minerals 7,371 665,188
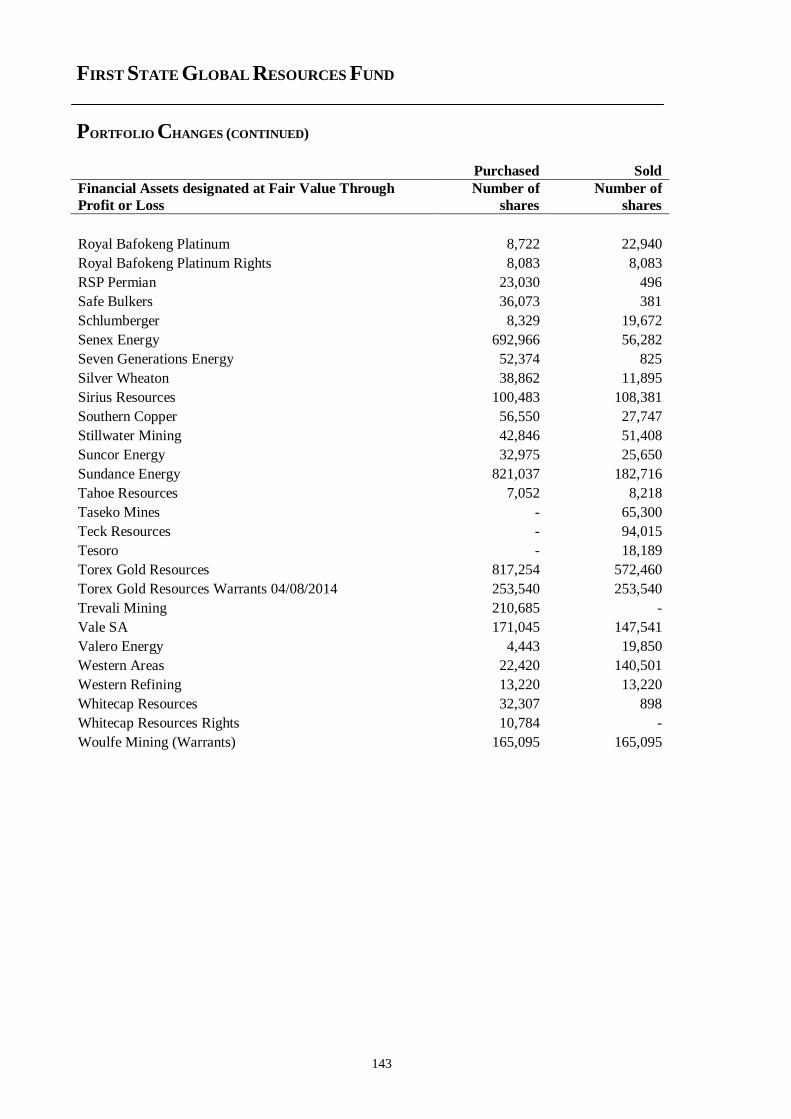
FIRST STATE GLOBAL RESOURCES FUND
PORTFOLIO CHANGES (CONTINUED)
143
Purchased Sold
Financial Assets designated at Fair Value Through
Profit or Loss
Number of
shares
Number of
shares
Royal Bafokeng Platinum 8,722 22,940
Royal Bafokeng Platinum Rights 8,083 8,083
RSP Permian 23,030 496
Safe Bulkers 36,073 381
Schlumberger 8,329 19,672
Senex Energy 692,966 56,282
Seven Generations Energy 52,374 825
Silver Wheaton 38,862 11,895
Sirius Resources 100,483 108,381
Southern Copper 56,550 27,747
Stillwater Mining 42,846 51,408
Suncor Energy 32,975 25,650
Sundance Energy 821,037 182,716
Tahoe Resources 7,052 8,218
Taseko Mines - 65,300
Teck Resources - 94,015
Tesoro - 18,189
Torex Gold Resources 817,254 572,460
Torex Gold Resources Warrants 04/08/2014 253,540 253,540
Trevali Mining 210,685 -
Vale SA 171,045 147,541
Valero Energy 4,443 19,850
Western Areas 22,420 140,501
Western Refining 13,220 13,220
Whitecap Resources 32,307 898
Whitecap Resources Rights 10,784 -
Woulfe Mining (Warrants) 165,095 165,095
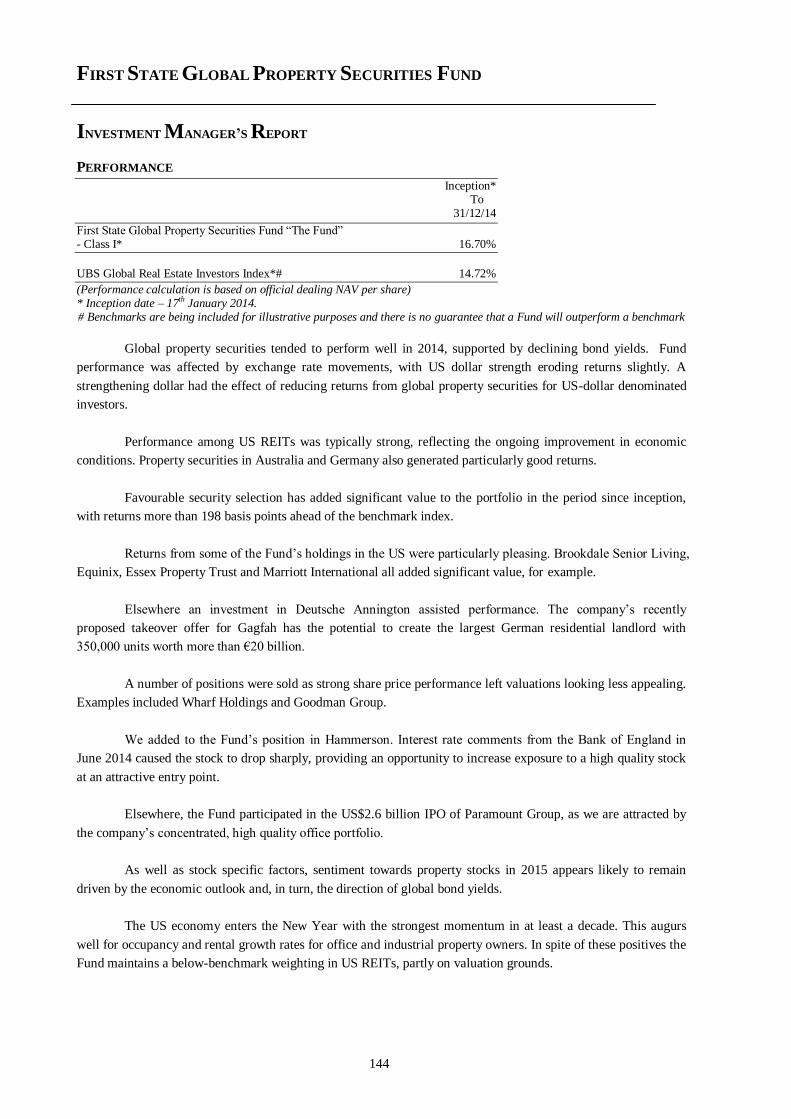
FIRST STATE GLOBAL PROPERTY SECURITIES FUND
INVESTMENT MANAGER’S REPORT
144
PERFORMANCE
Inception* To 31/12/14
First State Global Property Securities Fund “The Fund” - Class I* 16.70%
UBS Global Real Estate Investors Index*# 14.72%
(Performance calculation is based on official dealing NAV per share) * Inception date – 17th January 2014. # Benchmarks are being included for illustrative purposes and there is no guarantee that a Fund will outperform a benchmark
Global property securities tended to perform well in 2014, supported by declining bond yields. Fund
performance was affected by exchange rate movements, with US dollar strength eroding returns slightly. A
strengthening dollar had the effect of reducing returns from global property securities for US-dollar denominated
investors.
Performance among US REITs was typically strong, reflecting the ongoing improvement in economic
conditions. Property securities in Australia and Germany also generated particularly good returns.
Favourable security selection has added significant value to the portfolio in the period since inception,
with returns more than 198 basis points ahead of the benchmark index.
Returns from some of the Fund’s holdings in the US were particularly pleasing. Brookdale Senior Living,
Equinix, Essex Property Trust and Marriott International all added significant value, for example.
Elsewhere an investment in Deutsche Annington assisted performance. The company’s recently
proposed takeover offer for Gagfah has the potential to create the largest German residential landlord with
350,000 units worth more than €20 billion.
A number of positions were sold as strong share price performance left valuations looking less appealing.
Examples included Wharf Holdings and Goodman Group.
We added to the Fund’s position in Hammerson. Interest rate comments from the Bank of England in
June 2014 caused the stock to drop sharply, providing an opportunity to increase exposure to a high quality stock
at an attractive entry point.
Elsewhere, the Fund participated in the US$2.6 billion IPO of Paramount Group, as we are attracted by
the company’s concentrated, high quality office portfolio.
As well as stock specific factors, sentiment towards property stocks in 2015 appears likely to remain
driven by the economic outlook and, in turn, the direction of global bond yields.
The US economy enters the New Year with the strongest momentum in at least a decade. This augurs
well for occupancy and rental growth rates for office and industrial property owners. In spite of these positives the
Fund maintains a below-benchmark weighting in US REITs, partly on valuation grounds.
FIRST STATE GLOBAL PROPERTY SECURITIES FUND
INVESTMENT MANAGER’S REPORT (CONTINUED)
145
There have been few changes recently to the Fund’s positioning in Europe. There are some attractive
investment opportunities amongst German real estate stocks and we remain confident on the outlook for stocks
with exposure to the London property market.
In Asia, the Fund maintains exposure to a number of REITs with healthy balance sheets, investment
grade portfolios and where there is a solid outlook for medium-term earnings growth.
The overall strategy in the portfolio is to maintain a balance between high quality names and stocks with
strong growth potential.
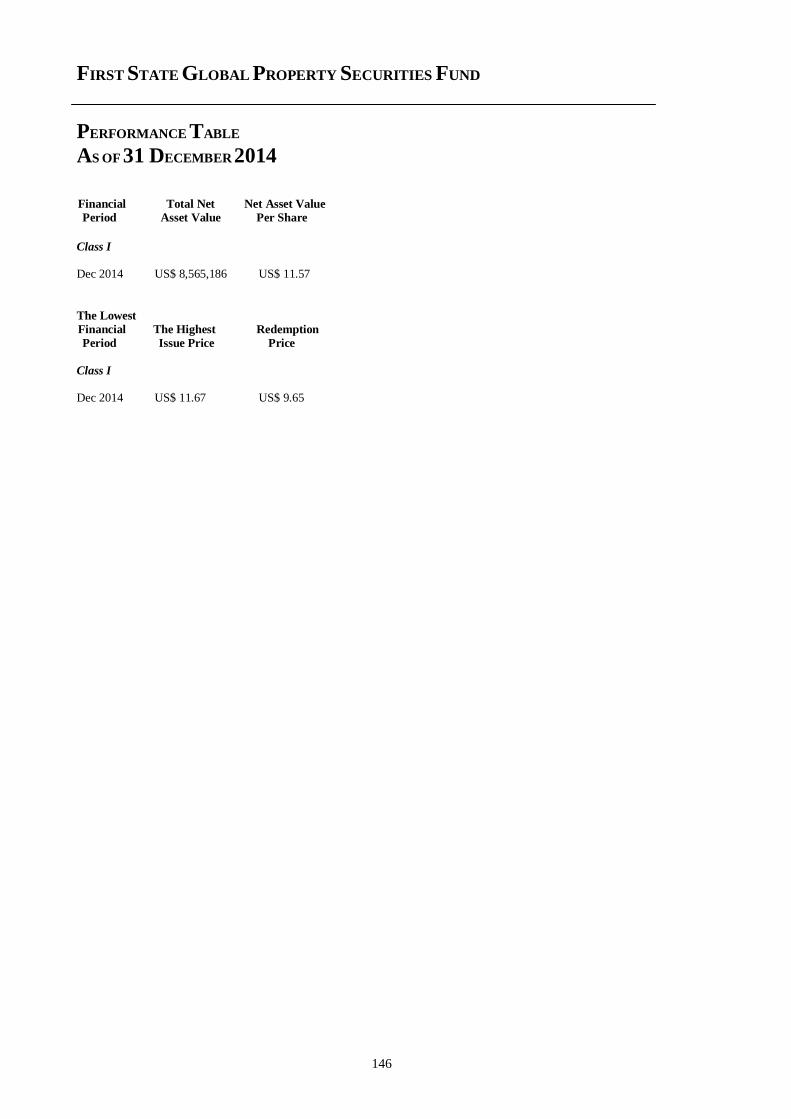
FIRST STATE GLOBAL PROPERTY SECURITIES FUND
PERFORMANCE TABLE
AS OF 31 DECEMBER 2014
146
Financial Total Net Net Asset Value
Period Asset Value Per Share
Class I Dec 2014 US$ 8,565,186 US$ 11.57
The Lowest
Financial The Highest Redemption
Period Issue Price Price
Class I Dec 2014 US$ 11.67 US$ 9.65
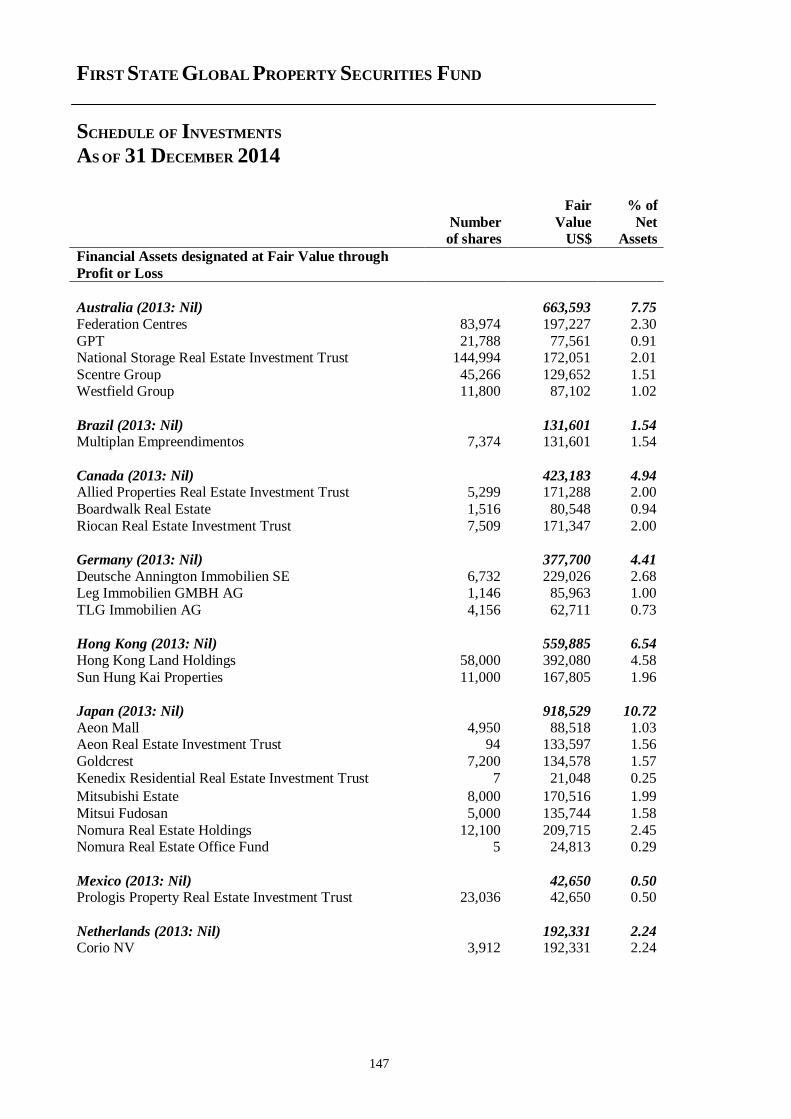
FIRST STATE GLOBAL PROPERTY SECURITIES FUND
SCHEDULE OF INVESTMENTS
AS OF 31 DECEMBER 2014
147
Fair % of
Number Value Net of shares US$ Assets
Financial Assets designated at Fair Value through
Profit or Loss
Australia (2013: Nil) 663,593 7.75
Federation Centres 83,974 197,227 2.30
GPT 21,788 77,561 0.91 National Storage Real Estate Investment Trust 144,994 172,051 2.01
Scentre Group 45,266 129,652 1.51 Westfield Group 11,800 87,102 1.02
Brazil (2013: Nil) 131,601 1.54 Multiplan Empreendimentos 7,374 131,601 1.54
Canada (2013: Nil) 423,183 4.94 Allied Properties Real Estate Investment Trust 5,299 171,288 2.00
Boardwalk Real Estate 1,516 80,548 0.94
Riocan Real Estate Investment Trust 7,509 171,347 2.00
Germany (2013: Nil) 377,700 4.41
Deutsche Annington Immobilien SE 6,732 229,026 2.68 Leg Immobilien GMBH AG 1,146 85,963 1.00
TLG Immobilien AG 4,156 62,711 0.73
Hong Kong (2013: Nil) 559,885 6.54
Hong Kong Land Holdings 58,000 392,080 4.58
Sun Hung Kai Properties 11,000 167,805 1.96
Japan (2013: Nil) 918,529 10.72
Aeon Mall 4,950 88,518 1.03 Aeon Real Estate Investment Trust 94 133,597 1.56
Goldcrest 7,200 134,578 1.57
Kenedix Residential Real Estate Investment Trust 7 21,048 0.25
Mitsubishi Estate 8,000 170,516 1.99
Mitsui Fudosan 5,000 135,744 1.58
Nomura Real Estate Holdings 12,100 209,715 2.45 Nomura Real Estate Office Fund 5 24,813 0.29
Mexico (2013: Nil) 42,650 0.50 Prologis Property Real Estate Investment Trust 23,036 42,650 0.50
Netherlands (2013: Nil) 192,331 2.24 Corio NV 3,912 192,331 2.24
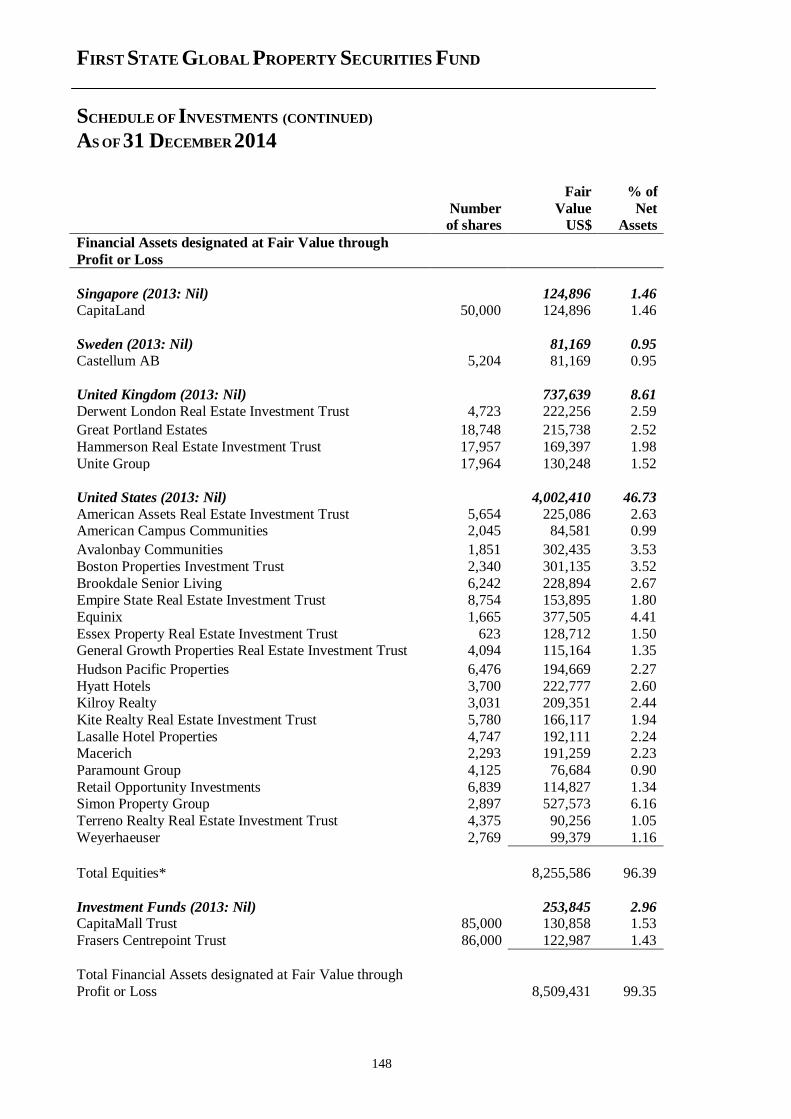
FIRST STATE GLOBAL PROPERTY SECURITIES FUND
SCHEDULE OF INVESTMENTS (CONTINUED)
AS OF 31 DECEMBER 2014
148
Fair % of
Number Value Net of shares US$ Assets
Financial Assets designated at Fair Value through
Profit or Loss
Singapore (2013: Nil) 124,896 1.46
CapitaLand 50,000 124,896 1.46
Sweden (2013: Nil) 81,169 0.95
Castellum AB 5,204 81,169 0.95
United Kingdom (2013: Nil) 737,639 8.61
Derwent London Real Estate Investment Trust 4,723 222,256 2.59
Great Portland Estates 18,748 215,738 2.52
Hammerson Real Estate Investment Trust 17,957 169,397 1.98
Unite Group 17,964 130,248 1.52
United States (2013: Nil) 4,002,410 46.73
American Assets Real Estate Investment Trust 5,654 225,086 2.63 American Campus Communities 2,045 84,581 0.99
Avalonbay Communities 1,851 302,435 3.53
Boston Properties Investment Trust 2,340 301,135 3.52
Brookdale Senior Living 6,242 228,894 2.67 Empire State Real Estate Investment Trust 8,754 153,895 1.80
Equinix 1,665 377,505 4.41
Essex Property Real Estate Investment Trust 623 128,712 1.50 General Growth Properties Real Estate Investment Trust 4,094 115,164 1.35
Hudson Pacific Properties 6,476 194,669 2.27
Hyatt Hotels 3,700 222,777 2.60 Kilroy Realty 3,031 209,351 2.44
Kite Realty Real Estate Investment Trust 5,780 166,117 1.94
Lasalle Hotel Properties 4,747 192,111 2.24 Macerich 2,293 191,259 2.23
Paramount Group 4,125 76,684 0.90
Retail Opportunity Investments 6,839 114,827 1.34 Simon Property Group 2,897 527,573 6.16
Terreno Realty Real Estate Investment Trust 4,375 90,256 1.05
Weyerhaeuser 2,769 99,379 1.16
Total Equities* 8,255,586 96.39
Investment Funds (2013: Nil) 253,845 2.96 CapitaMall Trust 85,000 130,858 1.53
Frasers Centrepoint Trust 86,000 122,987 1.43
Total Financial Assets designated at Fair Value through
Profit or Loss 8,509,431 99.35
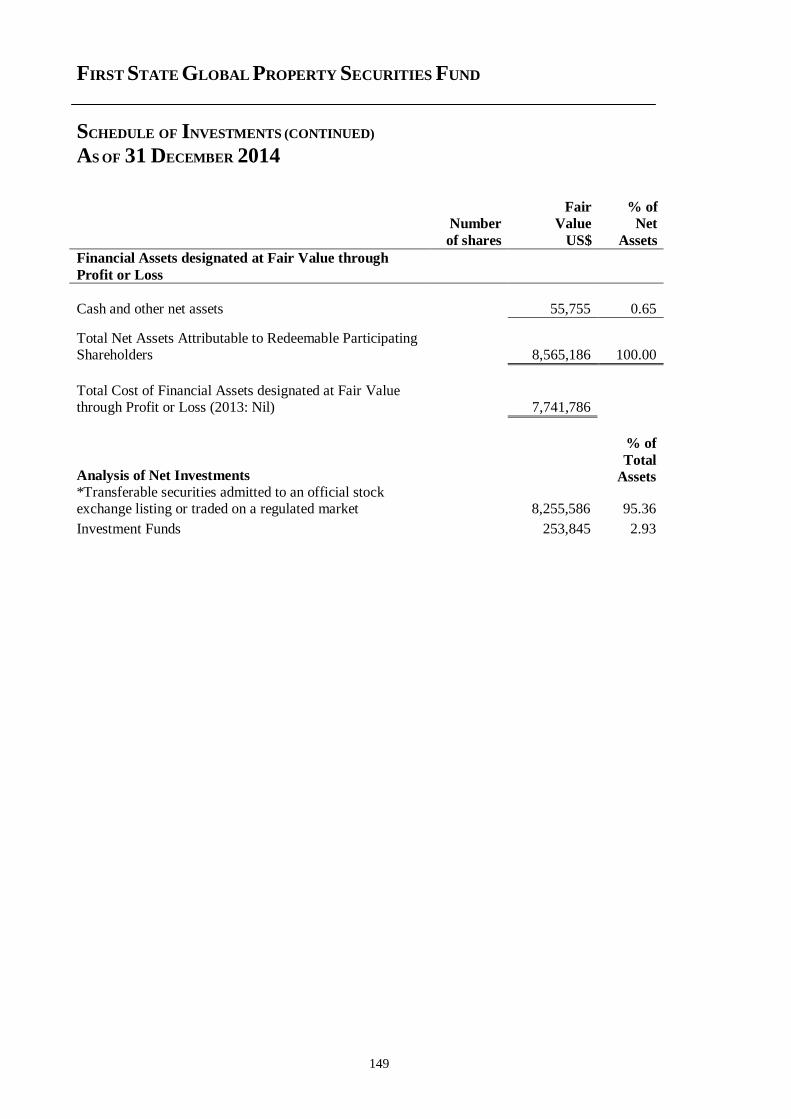
FIRST STATE GLOBAL PROPERTY SECURITIES FUND
SCHEDULE OF INVESTMENTS (CONTINUED)
AS OF 31 DECEMBER 2014
149
Fair % of Number Value Net
of shares US$ Assets
Financial Assets designated at Fair Value through
Profit or Loss
Cash and other net assets 55,755 0.65
Total Net Assets Attributable to Redeemable Participating Shareholders 8,565,186 100.00
Total Cost of Financial Assets designated at Fair Value through Profit or Loss (2013: Nil) 7,741,786
Analysis of Net Investments
% of
Total
Assets *Transferable securities admitted to an official stock exchange listing or traded on a regulated market
8,255,586 95.36
Investment Funds 253,845 2.93
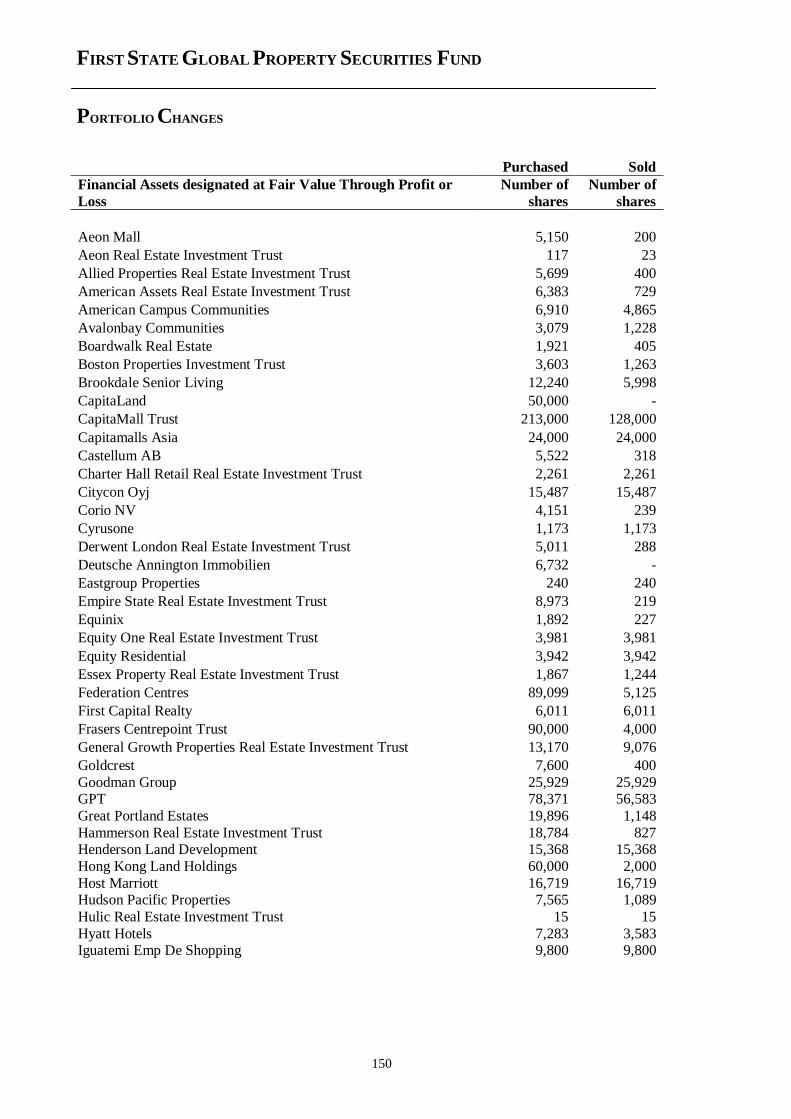
FIRST STATE GLOBAL PROPERTY SECURITIES FUND
PORTFOLIO CHANGES
150
Purchased Sold
Financial Assets designated at Fair Value Through Profit or
Loss
Number of
shares
Number of
shares
Aeon Mall 5,150 200
Aeon Real Estate Investment Trust 117 23
Allied Properties Real Estate Investment Trust 5,699 400
American Assets Real Estate Investment Trust 6,383 729
American Campus Communities 6,910 4,865
Avalonbay Communities 3,079 1,228
Boardwalk Real Estate 1,921 405
Boston Properties Investment Trust 3,603 1,263
Brookdale Senior Living 12,240 5,998
CapitaLand 50,000 -
CapitaMall Trust 213,000 128,000
Capitamalls Asia 24,000 24,000
Castellum AB 5,522 318
Charter Hall Retail Real Estate Investment Trust 2,261 2,261
Citycon Oyj 15,487 15,487
Corio NV 4,151 239
Cyrusone 1,173 1,173
Derwent London Real Estate Investment Trust 5,011 288
Deutsche Annington Immobilien 6,732 -
Eastgroup Properties 240 240
Empire State Real Estate Investment Trust 8,973 219
Equinix 1,892 227
Equity One Real Estate Investment Trust 3,981 3,981
Equity Residential 3,942 3,942
Essex Property Real Estate Investment Trust 1,867 1,244
Federation Centres 89,099 5,125
First Capital Realty 6,011 6,011
Frasers Centrepoint Trust 90,000 4,000
General Growth Properties Real Estate Investment Trust 13,170 9,076
Goldcrest 7,600 400
Goodman Group 25,929 25,929 GPT 78,371 56,583
Great Portland Estates 19,896 1,148
Hammerson Real Estate Investment Trust 18,784 827 Henderson Land Development 15,368 15,368
Hong Kong Land Holdings 60,000 2,000
Host Marriott 16,719 16,719 Hudson Pacific Properties 7,565 1,089
Hulic Real Estate Investment Trust 15 15
Hyatt Hotels 7,283 3,583 Iguatemi Emp De Shopping 9,800 9,800
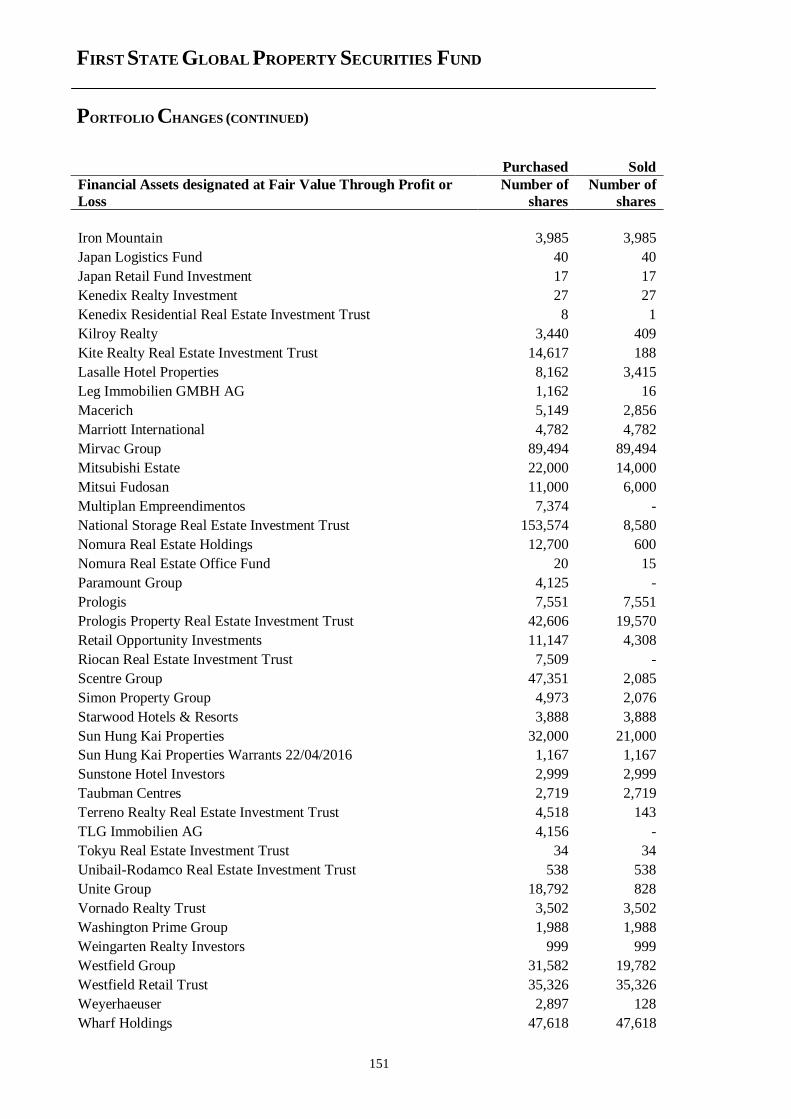
FIRST STATE GLOBAL PROPERTY SECURITIES FUND
PORTFOLIO CHANGES (CONTINUED)
151
Purchased Sold
Financial Assets designated at Fair Value Through Profit or
Loss
Number of
shares
Number of
shares
Iron Mountain 3,985 3,985
Japan Logistics Fund 40 40
Japan Retail Fund Investment 17 17
Kenedix Realty Investment 27 27
Kenedix Residential Real Estate Investment Trust 8 1
Kilroy Realty 3,440 409
Kite Realty Real Estate Investment Trust 14,617 188
Lasalle Hotel Properties 8,162 3,415
Leg Immobilien GMBH AG 1,162 16
Macerich 5,149 2,856
Marriott International 4,782 4,782
Mirvac Group 89,494 89,494
Mitsubishi Estate 22,000 14,000
Mitsui Fudosan 11,000 6,000
Multiplan Empreendimentos 7,374 -
National Storage Real Estate Investment Trust 153,574 8,580
Nomura Real Estate Holdings 12,700 600
Nomura Real Estate Office Fund 20 15
Paramount Group 4,125 -
Prologis 7,551 7,551
Prologis Property Real Estate Investment Trust 42,606 19,570
Retail Opportunity Investments 11,147 4,308
Riocan Real Estate Investment Trust 7,509 -
Scentre Group 47,351 2,085
Simon Property Group 4,973 2,076
Starwood Hotels & Resorts 3,888 3,888
Sun Hung Kai Properties 32,000 21,000
Sun Hung Kai Properties Warrants 22/04/2016 1,167 1,167
Sunstone Hotel Investors 2,999 2,999
Taubman Centres 2,719 2,719
Terreno Realty Real Estate Investment Trust 4,518 143
TLG Immobilien AG 4,156 -
Tokyu Real Estate Investment Trust 34 34
Unibail-Rodamco Real Estate Investment Trust 538 538
Unite Group 18,792 828
Vornado Realty Trust 3,502 3,502
Washington Prime Group 1,988 1,988
Weingarten Realty Investors 999 999
Westfield Group 31,582 19,782
Westfield Retail Trust 35,326 35,326
Weyerhaeuser 2,897 128
Wharf Holdings 47,618 47,618
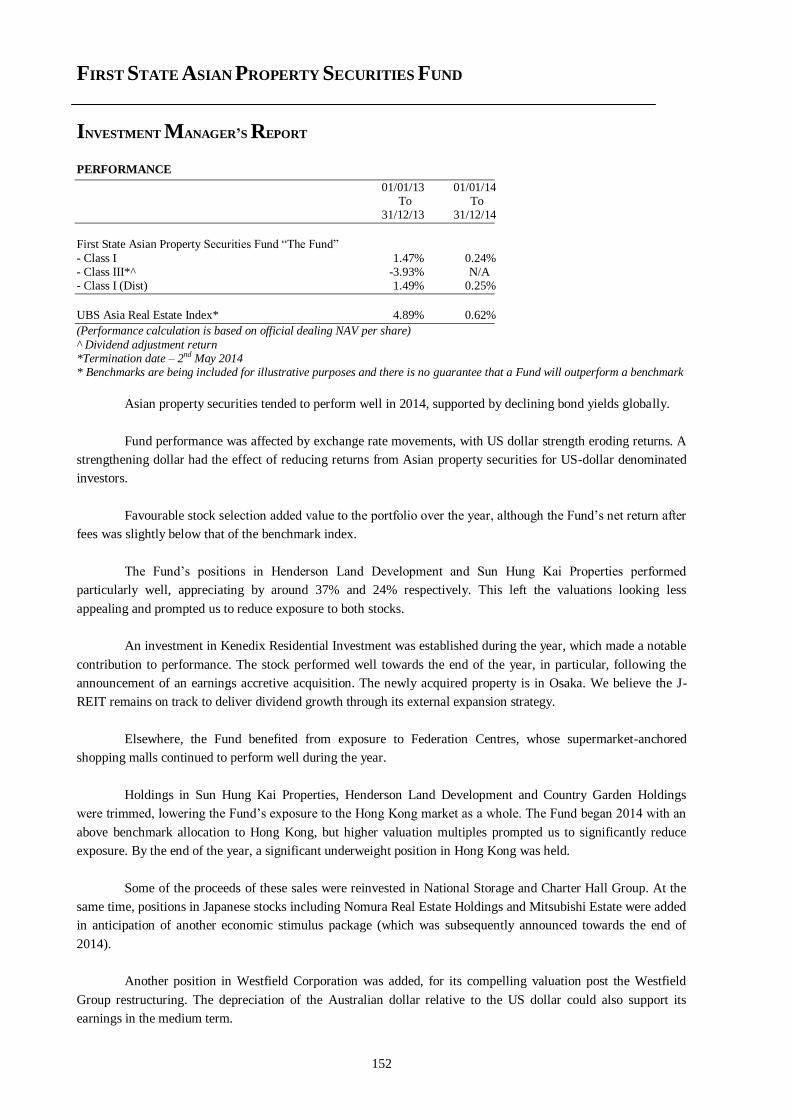
FIRST STATE ASIAN PROPERTY SECURITIES FUND
INVESTMENT MANAGER’S REPORT
152
PERFORMANCE
01/01/13 01/01/14 To To 31/12/13 31/12/14
First State Asian Property Securities Fund “The Fund”
- Class I 1.47% 0.24% - Class III*^ -3.93% N/A - Class I (Dist) 1.49% 0.25%
UBS Asia Real Estate Index* 4.89% 0.62%
(Performance calculation is based on official dealing NAV per share)
^ Dividend adjustment return *Termination date – 2nd May 2014 * Benchmarks are being included for illustrative purposes and there is no guarantee that a Fund will outperform a benchmark
Asian property securities tended to perform well in 2014, supported by declining bond yields globally.
Fund performance was affected by exchange rate movements, with US dollar strength eroding returns. A
strengthening dollar had the effect of reducing returns from Asian property securities for US-dollar denominated
investors.
Favourable stock selection added value to the portfolio over the year, although the Fund’s net return after
fees was slightly below that of the benchmark index.
The Fund’s positions in Henderson Land Development and Sun Hung Kai Properties performed
particularly well, appreciating by around 37% and 24% respectively. This left the valuations looking less
appealing and prompted us to reduce exposure to both stocks.
An investment in Kenedix Residential Investment was established during the year, which made a notable
contribution to performance. The stock performed well towards the end of the year, in particular, following the
announcement of an earnings accretive acquisition. The newly acquired property is in Osaka. We believe the J-
REIT remains on track to deliver dividend growth through its external expansion strategy.
Elsewhere, the Fund benefited from exposure to Federation Centres, whose supermarket-anchored
shopping malls continued to perform well during the year.
Holdings in Sun Hung Kai Properties, Henderson Land Development and Country Garden Holdings
were trimmed, lowering the Fund’s exposure to the Hong Kong market as a whole. The Fund began 2014 with an
above benchmark allocation to Hong Kong, but higher valuation multiples prompted us to significantly reduce
exposure. By the end of the year, a significant underweight position in Hong Kong was held.
Some of the proceeds of these sales were reinvested in National Storage and Charter Hall Group. At the
same time, positions in Japanese stocks including Nomura Real Estate Holdings and Mitsubishi Estate were added
in anticipation of another economic stimulus package (which was subsequently announced towards the end of
2014).
Another position in Westfield Corporation was added, for its compelling valuation post the Westfield
Group restructuring. The depreciation of the Australian dollar relative to the US dollar could also support its
earnings in the medium term.
FIRST STATE ASIAN PROPERTY SECURITIES FUND
INVESTMENT MANAGER’S REPORT (CONTINUED)
153
As well as stock specific factors, sentiment towards Asian property securities in 2015 appears likely to
remain driven by the economic outlook and, in turn, the direction of bond yields. Given very low bond yields
globally, the relative stability and income-generating characteristics of REITs are currently proving appealing to
international investors.
The Fund maintains diversified exposure to property securities in Hong Kong, Singapore, Japan and
Australia. The overall strategy in the portfolio is to maintain a balance between high quality names and stocks
with strong growth potential.
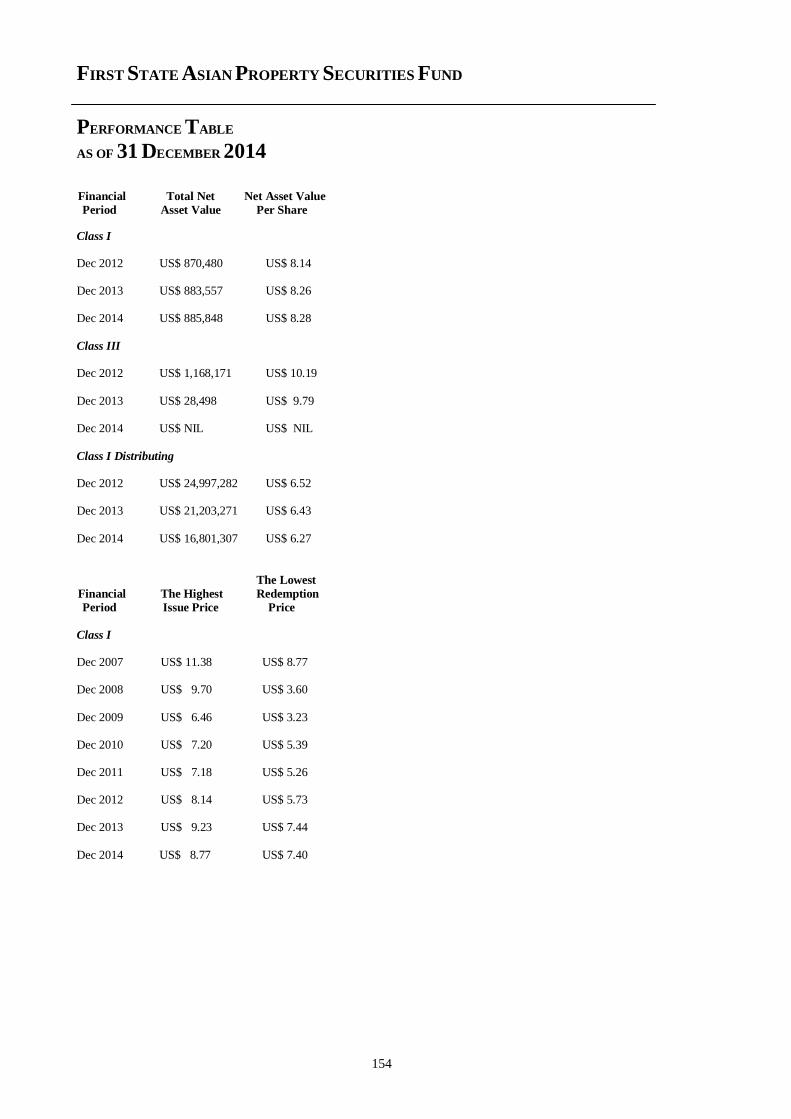
FIRST STATE ASIAN PROPERTY SECURITIES FUND
PERFORMANCE TABLE
AS OF 31 DECEMBER 2014
154
Financial Total Net Net Asset Value
Period Asset Value Per Share
Class I Dec 2012 US$ 870,480 US$ 8.14 Dec 2013 US$ 883,557 US$ 8.26 Dec 2014 US$ 885,848 US$ 8.28
Class III Dec 2012 US$ 1,168,171 US$ 10.19
Dec 2013 US$ 28,498 US$ 9.79 Dec 2014 US$ NIL US$ NIL
Class I Distributing Dec 2012 US$ 24,997,282 US$ 6.52 Dec 2013 US$ 21,203,271 US$ 6.43
Dec 2014 US$ 16,801,307 US$ 6.27
The Lowest
Financial The Highest Redemption
Period Issue Price Price
Class I Dec 2007 US$ 11.38 US$ 8.77
Dec 2008 US$ 9.70 US$ 3.60
Dec 2009 US$ 6.46 US$ 3.23 Dec 2010 US$ 7.20 US$ 5.39 Dec 2011 US$ 7.18 US$ 5.26 Dec 2012 US$ 8.14 US$ 5.73 Dec 2013 US$ 9.23 US$ 7.44
Dec 2014 US$ 8.77 US$ 7.40
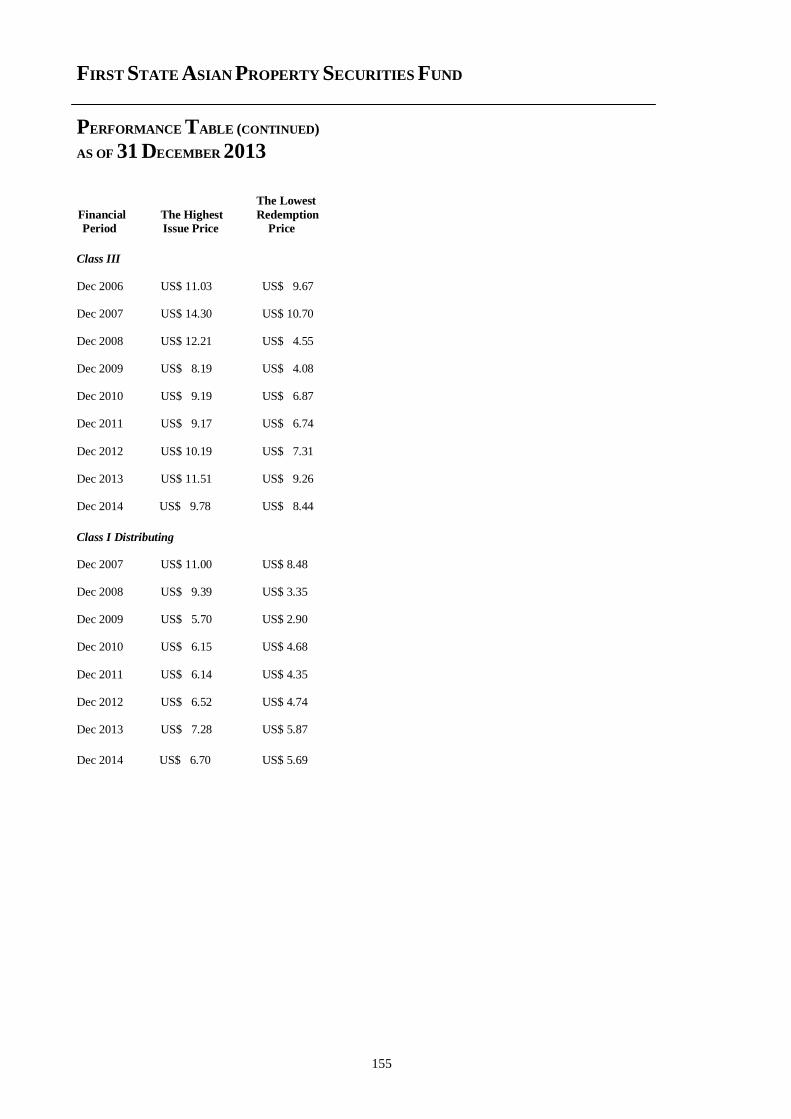
FIRST STATE ASIAN PROPERTY SECURITIES FUND
PERFORMANCE TABLE (CONTINUED)
AS OF 31 DECEMBER 2013
155
The Lowest
Financial The Highest Redemption
Period Issue Price Price
Class III
Dec 2006 US$ 11.03 US$ 9.67 Dec 2007 US$ 14.30 US$ 10.70
Dec 2008 US$ 12.21 US$ 4.55 Dec 2009 US$ 8.19 US$ 4.08 Dec 2010 US$ 9.19 US$ 6.87 Dec 2011 US$ 9.17 US$ 6.74
Dec 2012 US$ 10.19 US$ 7.31 Dec 2013 US$ 11.51 US$ 9.26 Dec 2014 US$ 9.78 US$ 8.44
Class I Distributing Dec 2007 US$ 11.00 US$ 8.48 Dec 2008 US$ 9.39 US$ 3.35 Dec 2009 US$ 5.70 US$ 2.90 Dec 2010 US$ 6.15 US$ 4.68
Dec 2011 US$ 6.14 US$ 4.35 Dec 2012 US$ 6.52 US$ 4.74 Dec 2013 US$ 7.28 US$ 5.87
Dec 2014 US$ 6.70 US$ 5.69
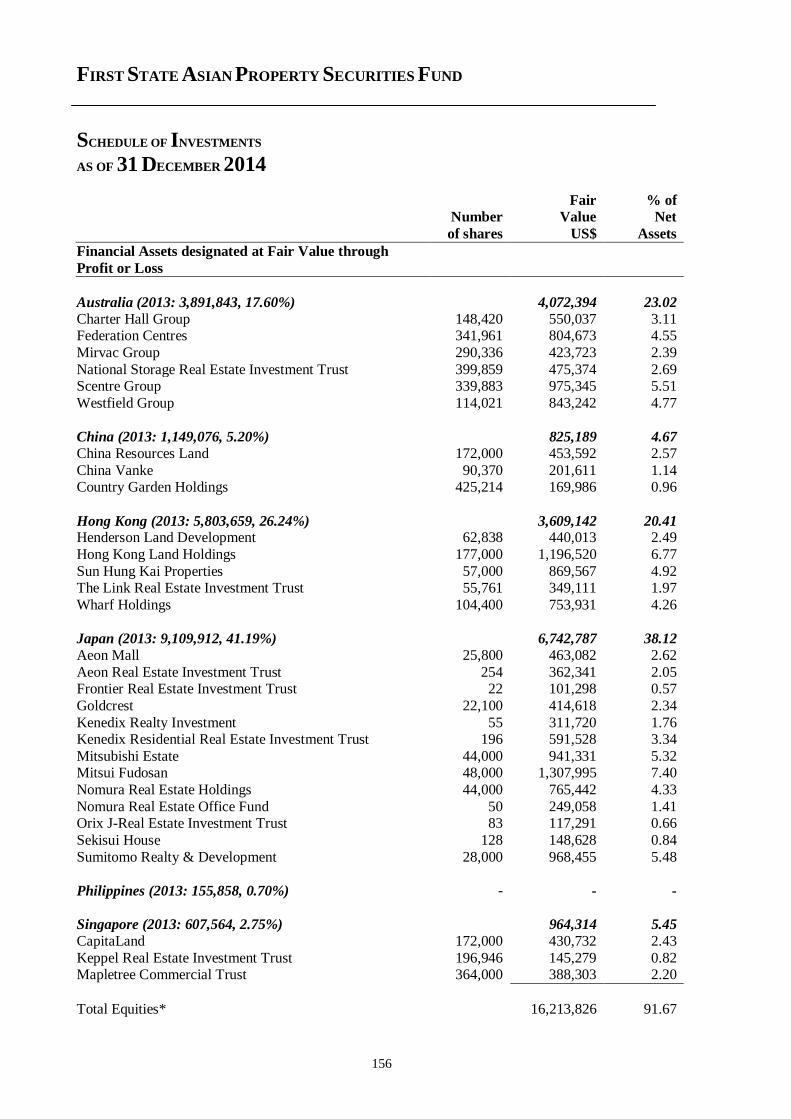
FIRST STATE ASIAN PROPERTY SECURITIES FUND
SCHEDULE OF INVESTMENTS
AS OF 31 DECEMBER 2014
156
Fair % of Number Value Net
of shares US$ Assets
Financial Assets designated at Fair Value through
Profit or Loss
Australia (2013: 3,891,843, 17.60%) 4,072,394 23.02
Charter Hall Group 148,420 550,037 3.11 Federation Centres 341,961 804,673 4.55
Mirvac Group 290,336 423,723 2.39
National Storage Real Estate Investment Trust 399,859 475,374 2.69 Scentre Group 339,883 975,345 5.51
Westfield Group 114,021 843,242 4.77
China (2013: 1,149,076, 5.20%) 825,189 4.67
China Resources Land 172,000 453,592 2.57
China Vanke 90,370 201,611 1.14 Country Garden Holdings 425,214 169,986 0.96
Hong Kong (2013: 5,803,659, 26.24%) 3,609,142 20.41 Henderson Land Development 62,838 440,013 2.49
Hong Kong Land Holdings 177,000 1,196,520 6.77
Sun Hung Kai Properties 57,000 869,567 4.92 The Link Real Estate Investment Trust 55,761 349,111 1.97
Wharf Holdings 104,400 753,931 4.26
Japan (2013: 9,109,912, 41.19%) 6,742,787 38.12
Aeon Mall 25,800 463,082 2.62
Aeon Real Estate Investment Trust 254 362,341 2.05 Frontier Real Estate Investment Trust 22 101,298 0.57
Goldcrest 22,100 414,618 2.34
Kenedix Realty Investment 55 311,720 1.76 Kenedix Residential Real Estate Investment Trust 196 591,528 3.34
Mitsubishi Estate 44,000 941,331 5.32 Mitsui Fudosan 48,000 1,307,995 7.40
Nomura Real Estate Holdings 44,000 765,442 4.33
Nomura Real Estate Office Fund 50 249,058 1.41 Orix J-Real Estate Investment Trust 83 117,291 0.66
Sekisui House 128 148,628 0.84
Sumitomo Realty & Development 28,000 968,455 5.48
Philippines (2013: 155,858, 0.70%) - - -
Singapore (2013: 607,564, 2.75%) 964,314 5.45 CapitaLand 172,000 430,732 2.43
Keppel Real Estate Investment Trust 196,946 145,279 0.82 Mapletree Commercial Trust 364,000 388,303 2.20
Total Equities* 16,213,826 91.67
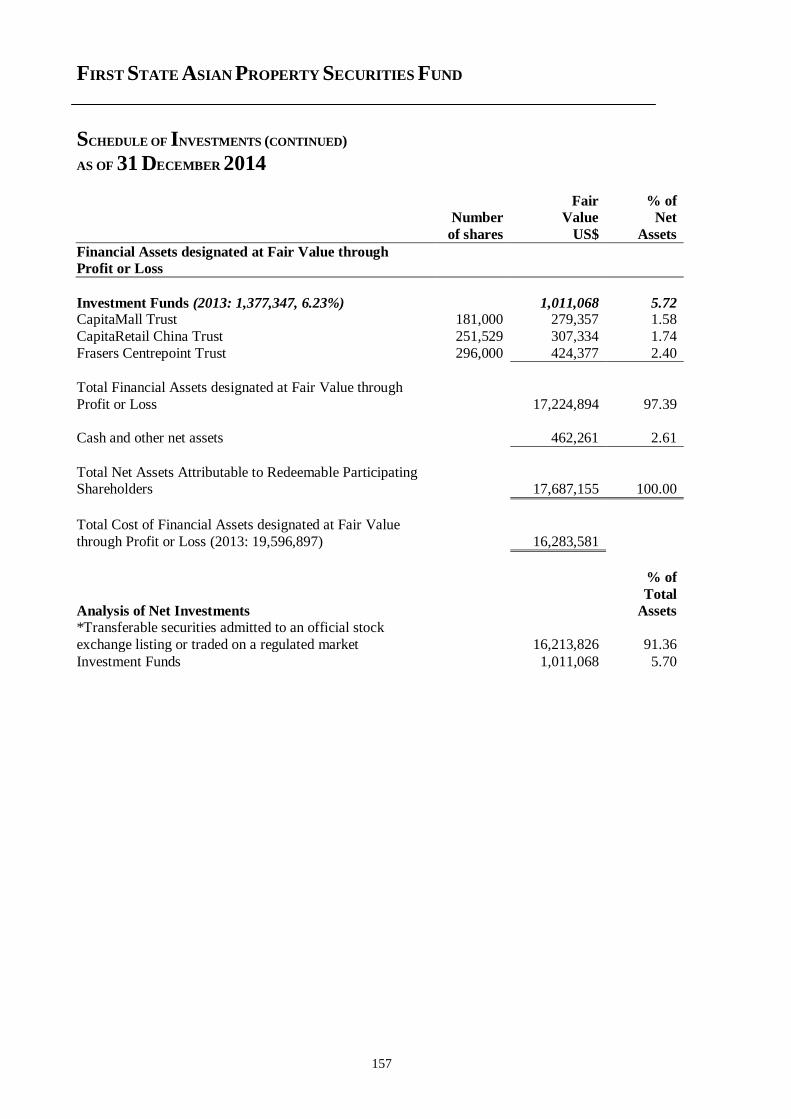
FIRST STATE ASIAN PROPERTY SECURITIES FUND
SCHEDULE OF INVESTMENTS (CONTINUED)
AS OF 31 DECEMBER 2014
157
Fair % of Number Value Net
of shares US$ Assets
Financial Assets designated at Fair Value through
Profit or Loss
Investment Funds (2013: 1,377,347, 6.23%) 1,011,068 5.72 CapitaMall Trust 181,000 279,357 1.58
CapitaRetail China Trust 251,529 307,334 1.74
Frasers Centrepoint Trust 296,000 424,377 2.40
Total Financial Assets designated at Fair Value through
Profit or Loss 17,224,894 97.39
Cash and other net assets 462,261 2.61
Total Net Assets Attributable to Redeemable Participating Shareholders 17,687,155 100.00
Total Cost of Financial Assets designated at Fair Value
through Profit or Loss (2013: 19,596,897) 16,283,581
Analysis of Net Investments
% of
Total
Assets
*Transferable securities admitted to an official stock
exchange listing or traded on a regulated market 16,213,826 91.36
Investment Funds 1,011,068 5.70
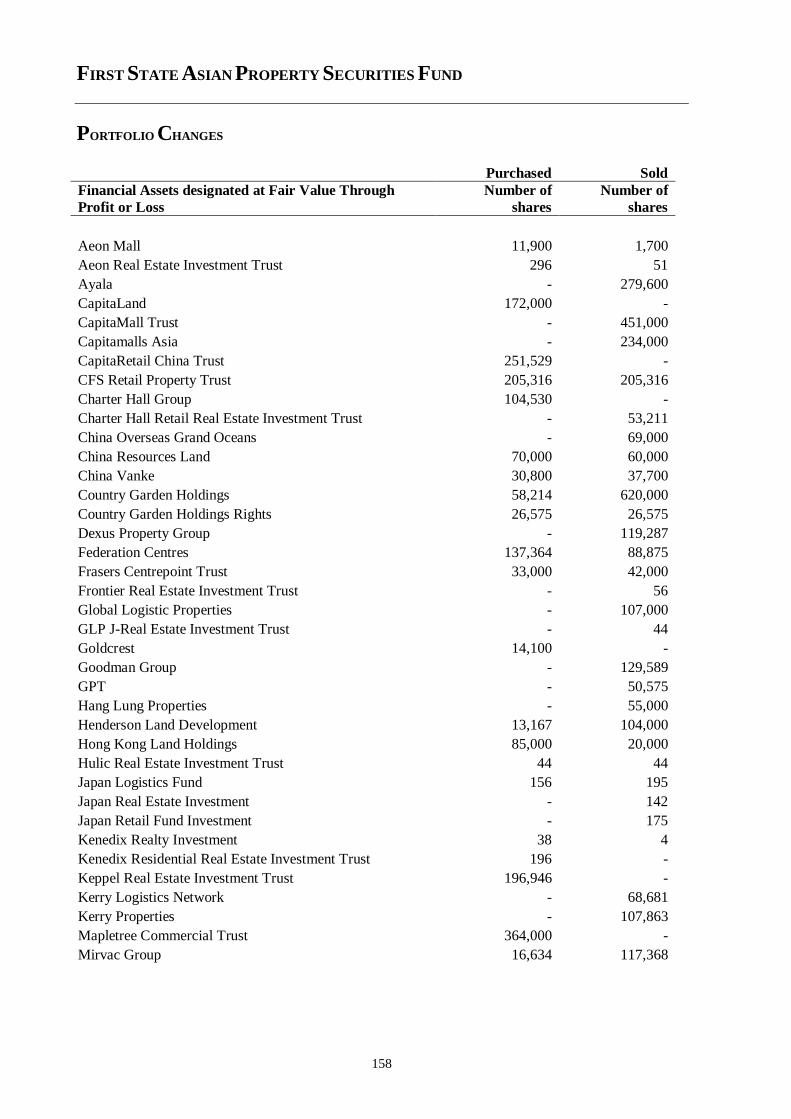
FIRST STATE ASIAN PROPERTY SECURITIES FUND
PORTFOLIO CHANGES
158
Purchased Sold
Financial Assets designated at Fair Value Through
Profit or Loss
Number of
shares
Number of
shares
Aeon Mall 11,900 1,700
Aeon Real Estate Investment Trust 296 51
Ayala - 279,600
CapitaLand 172,000 -
CapitaMall Trust - 451,000
Capitamalls Asia - 234,000
CapitaRetail China Trust 251,529 -
CFS Retail Property Trust 205,316 205,316
Charter Hall Group 104,530 -
Charter Hall Retail Real Estate Investment Trust - 53,211
China Overseas Grand Oceans - 69,000
China Resources Land 70,000 60,000
China Vanke 30,800 37,700
Country Garden Holdings 58,214 620,000
Country Garden Holdings Rights 26,575 26,575
Dexus Property Group - 119,287
Federation Centres 137,364 88,875
Frasers Centrepoint Trust 33,000 42,000
Frontier Real Estate Investment Trust - 56
Global Logistic Properties - 107,000
GLP J-Real Estate Investment Trust - 44
Goldcrest 14,100 -
Goodman Group - 129,589
GPT - 50,575
Hang Lung Properties - 55,000
Henderson Land Development 13,167 104,000
Hong Kong Land Holdings 85,000 20,000
Hulic Real Estate Investment Trust 44 44
Japan Logistics Fund 156 195
Japan Real Estate Investment - 142
Japan Retail Fund Investment - 175
Kenedix Realty Investment 38 4
Kenedix Residential Real Estate Investment Trust 196 -
Keppel Real Estate Investment Trust 196,946 -
Kerry Logistics Network - 68,681
Kerry Properties - 107,863
Mapletree Commercial Trust 364,000 -
Mirvac Group 16,634 117,368
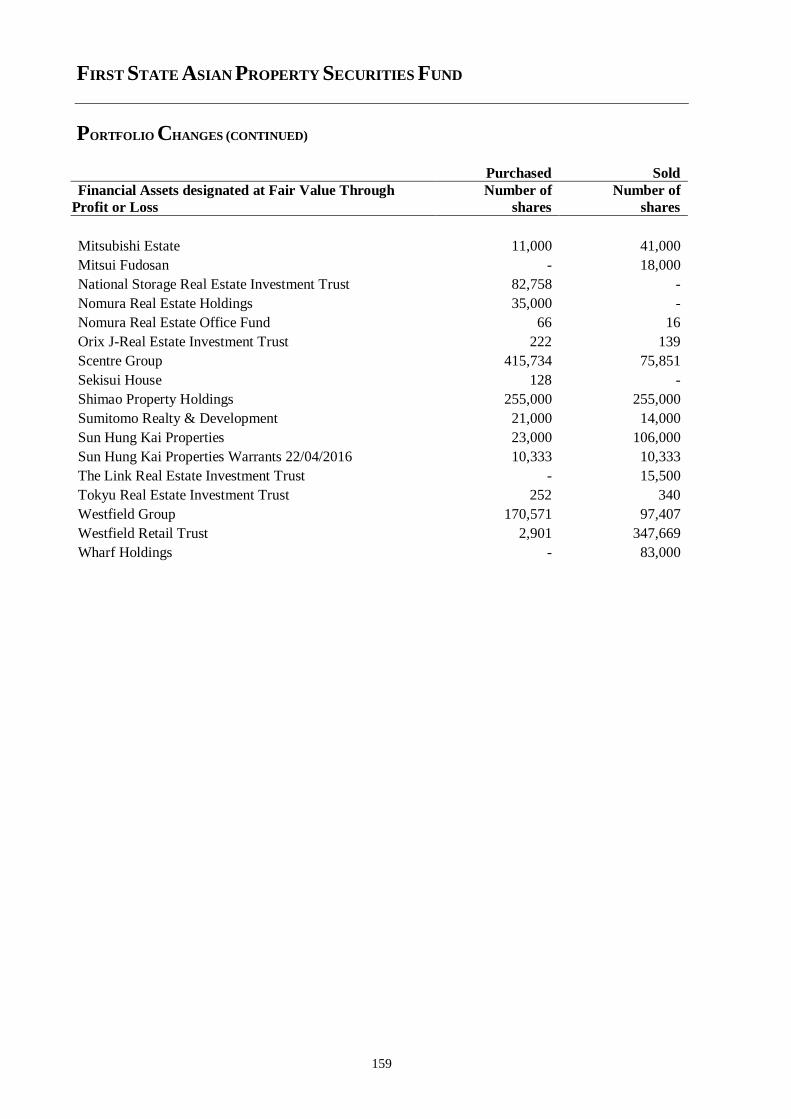
FIRST STATE ASIAN PROPERTY SECURITIES FUND
PORTFOLIO CHANGES (CONTINUED)
159
Purchased Sold
Financial Assets designated at Fair Value Through
Profit or Loss
Number of
shares
Number of
shares
Mitsubishi Estate 11,000 41,000
Mitsui Fudosan - 18,000
National Storage Real Estate Investment Trust 82,758 -
Nomura Real Estate Holdings 35,000 -
Nomura Real Estate Office Fund 66 16
Orix J-Real Estate Investment Trust 222 139
Scentre Group 415,734 75,851
Sekisui House 128 -
Shimao Property Holdings 255,000 255,000
Sumitomo Realty & Development 21,000 14,000
Sun Hung Kai Properties 23,000 106,000
Sun Hung Kai Properties Warrants 22/04/2016 10,333 10,333
The Link Real Estate Investment Trust - 15,500
Tokyu Real Estate Investment Trust 252 340
Westfield Group 170,571 97,407
Westfield Retail Trust 2,901 347,669
Wharf Holdings - 83,000
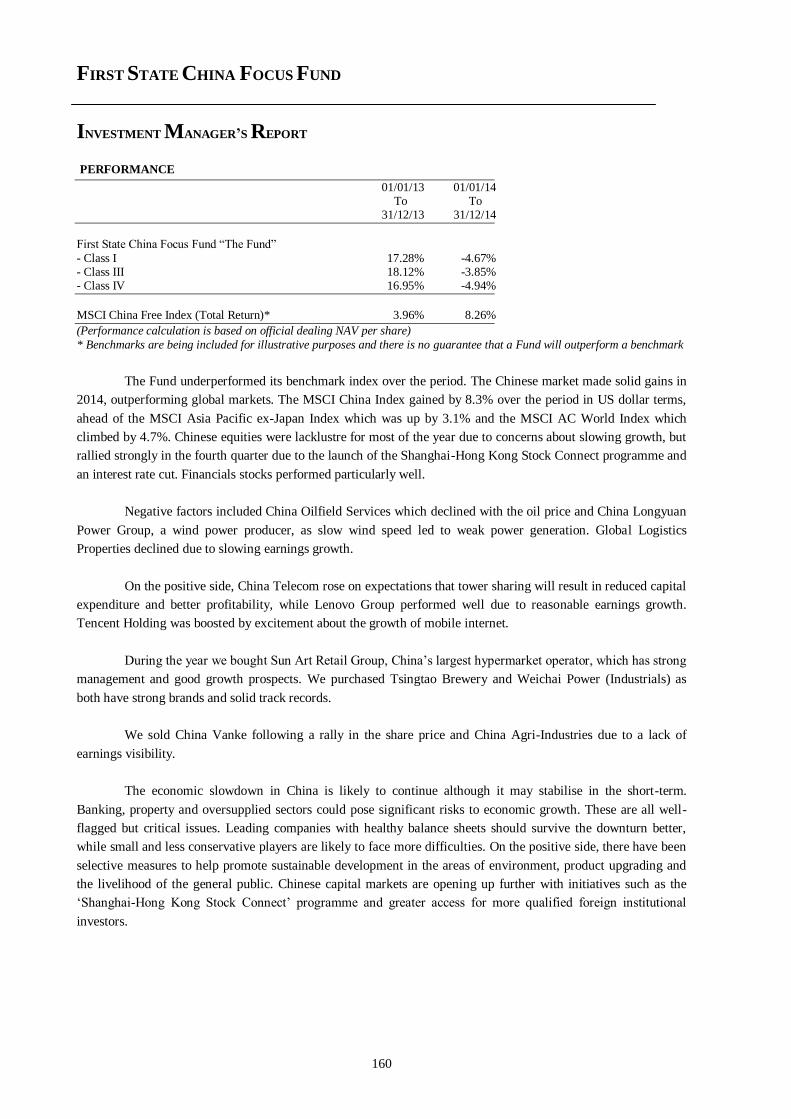
FIRST STATE CHINA FOCUS FUND
INVESTMENT MANAGER’S REPORT
160
PERFORMANCE
01/01/13 01/01/14 To To 31/12/13 31/12/14
First State China Focus Fund “The Fund”
- Class I 17.28% -4.67% - Class III 18.12% -3.85% - Class IV 16.95% -4.94%
MSCI China Free Index (Total Return)* 3.96% 8.26%
(Performance calculation is based on official dealing NAV per share)
* Benchmarks are being included for illustrative purposes and there is no guarantee that a Fund will outperform a benchmark
The Fund underperformed its benchmark index over the period. The Chinese market made solid gains in
2014, outperforming global markets. The MSCI China Index gained by 8.3% over the period in US dollar terms,
ahead of the MSCI Asia Pacific ex-Japan Index which was up by 3.1% and the MSCI AC World Index which
climbed by 4.7%. Chinese equities were lacklustre for most of the year due to concerns about slowing growth, but
rallied strongly in the fourth quarter due to the launch of the Shanghai-Hong Kong Stock Connect programme and
an interest rate cut. Financials stocks performed particularly well.
Negative factors included China Oilfield Services which declined with the oil price and China Longyuan
Power Group, a wind power producer, as slow wind speed led to weak power generation. Global Logistics
Properties declined due to slowing earnings growth.
On the positive side, China Telecom rose on expectations that tower sharing will result in reduced capital
expenditure and better profitability, while Lenovo Group performed well due to reasonable earnings growth.
Tencent Holding was boosted by excitement about the growth of mobile internet.
During the year we bought Sun Art Retail Group, China’s largest hypermarket operator, which has strong
management and good growth prospects. We purchased Tsingtao Brewery and Weichai Power (Industrials) as
both have strong brands and solid track records.
We sold China Vanke following a rally in the share price and China Agri-Industries due to a lack of
earnings visibility.
The economic slowdown in China is likely to continue although it may stabilise in the short-term.
Banking, property and oversupplied sectors could pose significant risks to economic growth. These are all well-
flagged but critical issues. Leading companies with healthy balance sheets should survive the downturn better,
while small and less conservative players are likely to face more difficulties. On the positive side, there have been
selective measures to help promote sustainable development in the areas of environment, product upgrading and
the livelihood of the general public. Chinese capital markets are opening up further with initiatives such as the
‘Shanghai-Hong Kong Stock Connect’ programme and greater access for more qualified foreign institutional
investors.
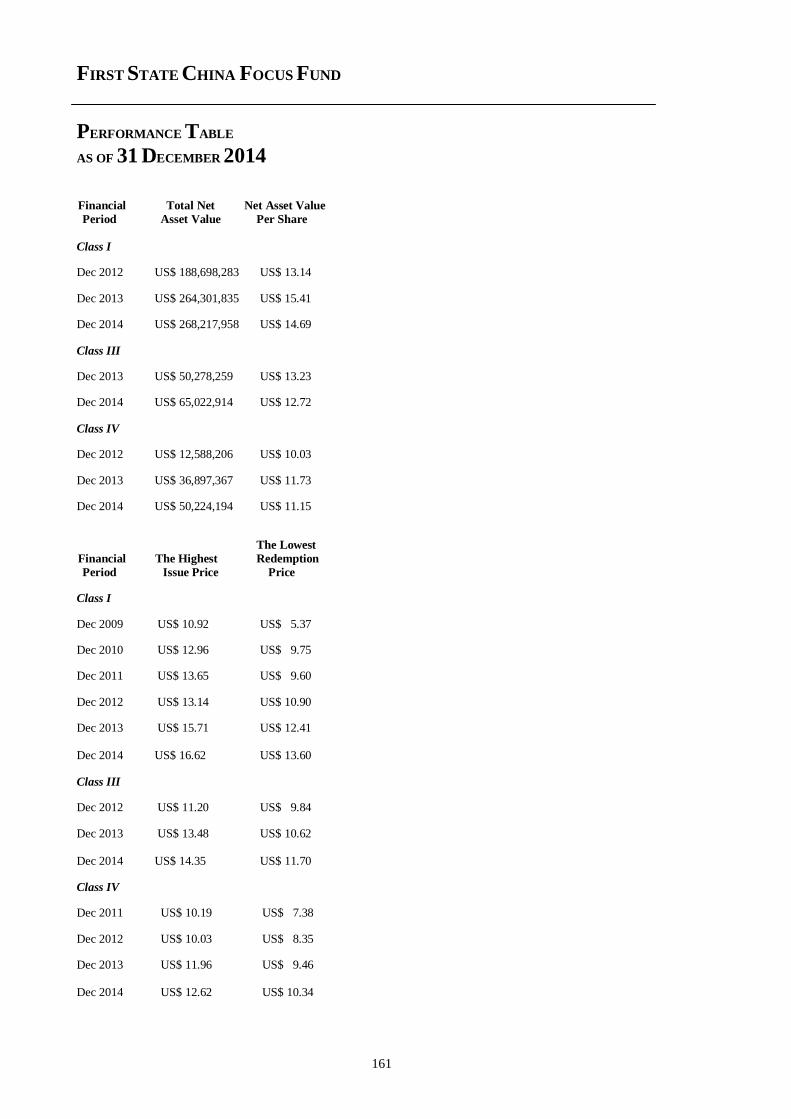
FIRST STATE CHINA FOCUS FUND
PERFORMANCE TABLE
AS OF 31 DECEMBER 2014
161
Financial Total Net Net Asset Value
Period Asset Value Per Share
Class I
Dec 2012 US$ 188,698,283 US$ 13.14
Dec 2013 US$ 264,301,835 US$ 15.41
Dec 2014 US$ 268,217,958 US$ 14.69
Class III
Dec 2013 US$ 50,278,259 US$ 13.23
Dec 2014 US$ 65,022,914 US$ 12.72
Class IV
Dec 2012 US$ 12,588,206 US$ 10.03
Dec 2013 US$ 36,897,367 US$ 11.73
Dec 2014 US$ 50,224,194 US$ 11.15
The Lowest
Financial The Highest Redemption
Period Issue Price Price
Class I
Dec 2009 US$ 10.92 US$ 5.37
Dec 2010 US$ 12.96 US$ 9.75
Dec 2011 US$ 13.65 US$ 9.60
Dec 2012 US$ 13.14 US$ 10.90
Dec 2013 US$ 15.71 US$ 12.41 Dec 2014 US$ 16.62 US$ 13.60
Class III
Dec 2012 US$ 11.20 US$ 9.84
Dec 2013 US$ 13.48 US$ 10.62 Dec 2014 US$ 14.35 US$ 11.70
Class IV
Dec 2011 US$ 10.19 US$ 7.38
Dec 2012 US$ 10.03 US$ 8.35
Dec 2013 US$ 11.96 US$ 9.46 Dec 2014 US$ 12.62 US$ 10.34
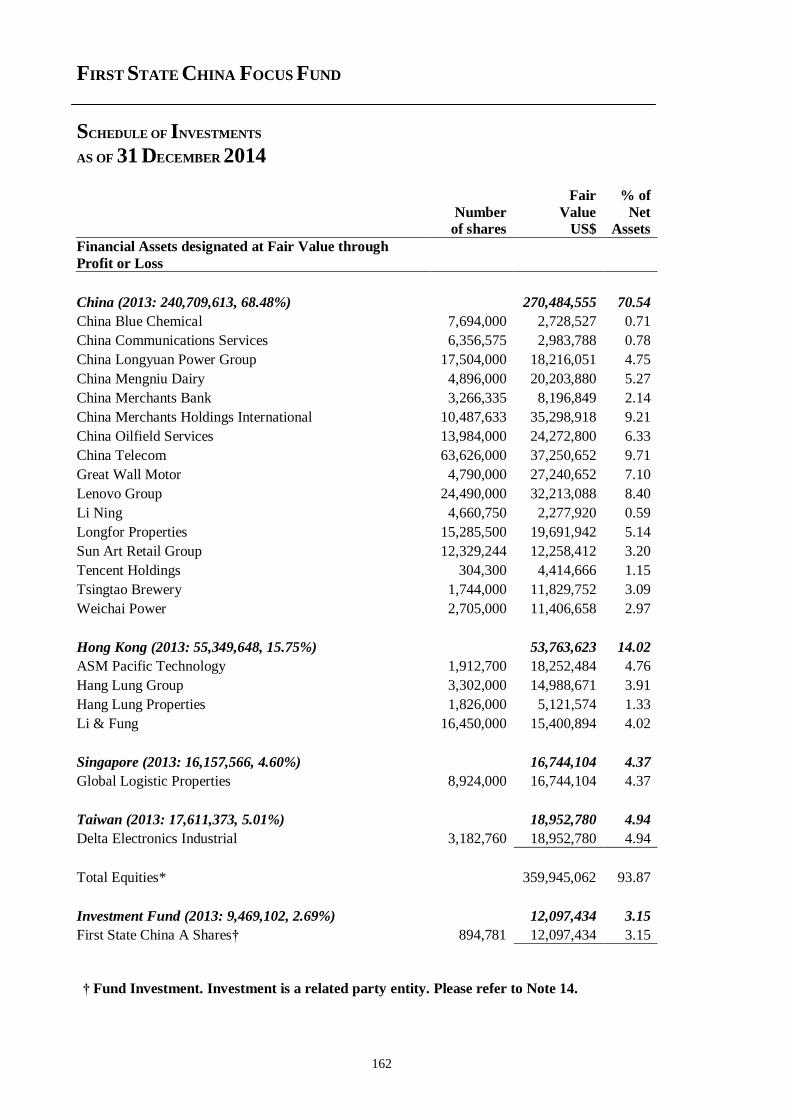
FIRST STATE CHINA FOCUS FUND
SCHEDULE OF INVESTMENTS
AS OF 31 DECEMBER 2014
162
Fair % of
Number Value Net of shares US$ Assets
Financial Assets designated at Fair Value through
Profit or Loss
China (2013: 240,709,613, 68.48%) 270,484,555 70.54
China Blue Chemical 7,694,000 2,728,527 0.71
China Communications Services 6,356,575 2,983,788 0.78
China Longyuan Power Group 17,504,000 18,216,051 4.75
China Mengniu Dairy 4,896,000 20,203,880 5.27
China Merchants Bank 3,266,335 8,196,849 2.14
China Merchants Holdings International 10,487,633 35,298,918 9.21
China Oilfield Services 13,984,000 24,272,800 6.33
China Telecom 63,626,000 37,250,652 9.71
Great Wall Motor 4,790,000 27,240,652 7.10
Lenovo Group 24,490,000 32,213,088 8.40
Li Ning 4,660,750 2,277,920 0.59
Longfor Properties 15,285,500 19,691,942 5.14
Sun Art Retail Group 12,329,244 12,258,412 3.20
Tencent Holdings 304,300 4,414,666 1.15
Tsingtao Brewery 1,744,000 11,829,752 3.09
Weichai Power 2,705,000 11,406,658 2.97
Hong Kong (2013: 55,349,648, 15.75%) 53,763,623 14.02
ASM Pacific Technology 1,912,700 18,252,484 4.76
Hang Lung Group 3,302,000 14,988,671 3.91
Hang Lung Properties 1,826,000 5,121,574 1.33
Li & Fung 16,450,000 15,400,894 4.02
Singapore (2013: 16,157,566, 4.60%) 16,744,104 4.37
Global Logistic Properties 8,924,000 16,744,104 4.37
Taiwan (2013: 17,611,373, 5.01%) 18,952,780 4.94
Delta Electronics Industrial 3,182,760 18,952,780 4.94
Total Equities* 359,945,062 93.87
Investment Fund (2013: 9,469,102, 2.69%) 12,097,434 3.15
First State China A Shares† 894,781 12,097,434 3.15
† Fund Investment. Investment is a related party entity. Please refer to Note 14.
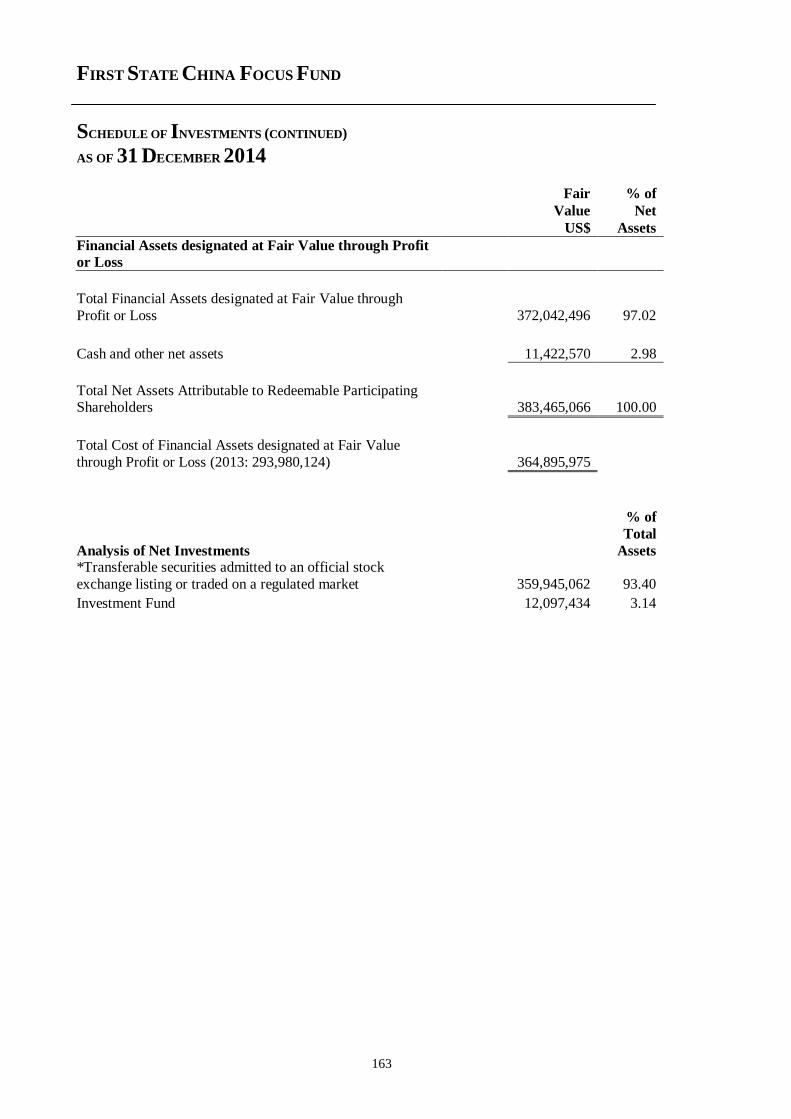
FIRST STATE CHINA FOCUS FUND
SCHEDULE OF INVESTMENTS (CONTINUED)
AS OF 31 DECEMBER 2014
163
Fair % of
Value Net
US$ Assets
Financial Assets designated at Fair Value through Profit
or Loss
Total Financial Assets designated at Fair Value through
Profit or Loss
372,042,496
97.02
Cash and other net assets 11,422,570 2.98
Total Net Assets Attributable to Redeemable Participating Shareholders 383,465,066 100.00
Total Cost of Financial Assets designated at Fair Value
through Profit or Loss (2013: 293,980,124) 364,895,975
Analysis of Net Investments
% of
Total
Assets *Transferable securities admitted to an official stock
exchange listing or traded on a regulated market 359,945,062 93.40
Investment Fund 12,097,434 3.14
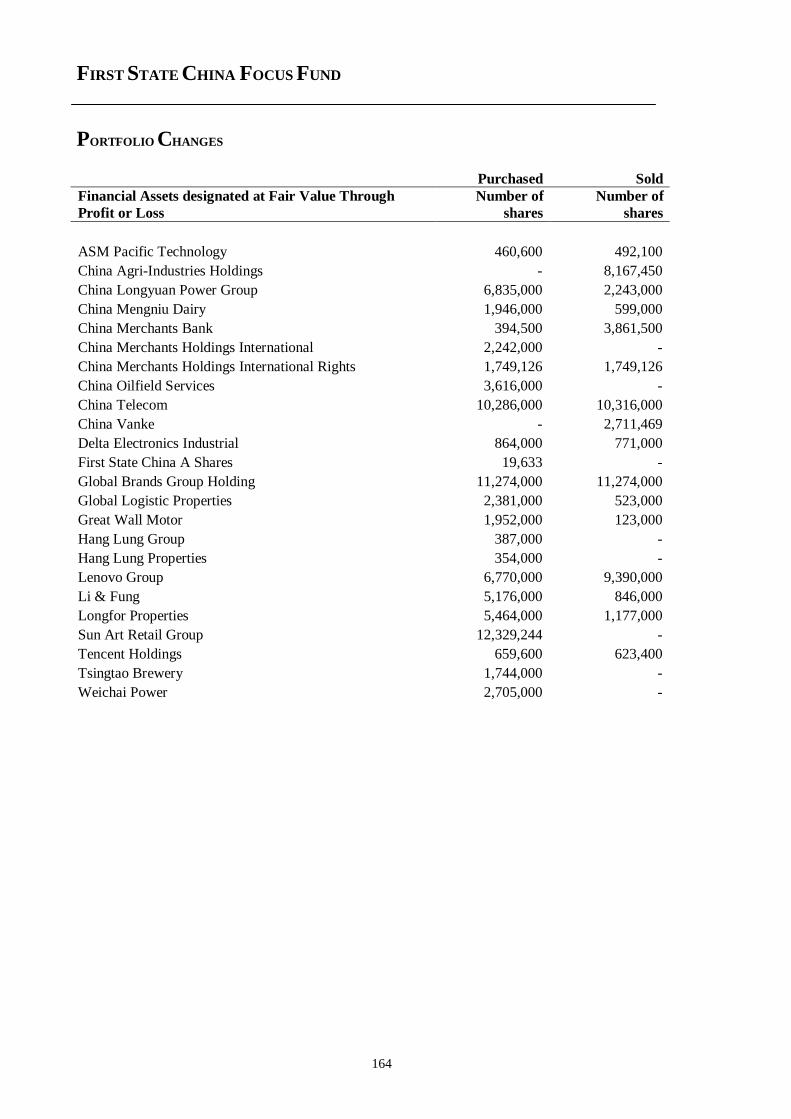
FIRST STATE CHINA FOCUS FUND
PORTFOLIO CHANGES
164
Purchased Sold
Financial Assets designated at Fair Value Through
Profit or Loss
Number of
shares
Number of
shares
ASM Pacific Technology 460,600 492,100
China Agri-Industries Holdings - 8,167,450
China Longyuan Power Group 6,835,000 2,243,000
China Mengniu Dairy 1,946,000 599,000
China Merchants Bank 394,500 3,861,500
China Merchants Holdings International 2,242,000 -
China Merchants Holdings International Rights 1,749,126 1,749,126
China Oilfield Services 3,616,000 -
China Telecom 10,286,000 10,316,000
China Vanke - 2,711,469
Delta Electronics Industrial 864,000 771,000
First State China A Shares 19,633 -
Global Brands Group Holding 11,274,000 11,274,000
Global Logistic Properties 2,381,000 523,000
Great Wall Motor 1,952,000 123,000
Hang Lung Group 387,000 -
Hang Lung Properties 354,000 -
Lenovo Group 6,770,000 9,390,000
Li & Fung 5,176,000 846,000
Longfor Properties 5,464,000 1,177,000
Sun Art Retail Group 12,329,244 -
Tencent Holdings 659,600 623,400
Tsingtao Brewery 1,744,000 -
Weichai Power 2,705,000 -
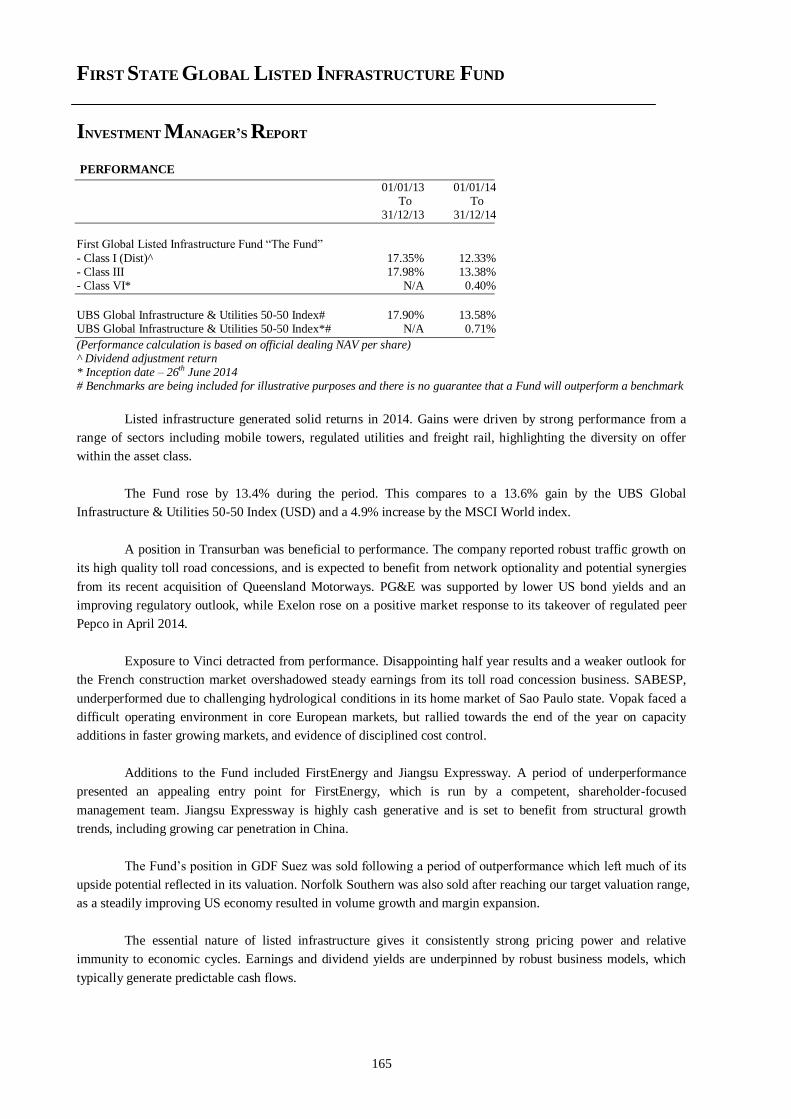
FIRST STATE GLOBAL LISTED INFRASTRUCTURE FUND
INVESTMENT MANAGER’S REPORT
165
PERFORMANCE
01/01/13 01/01/14 To To 31/12/13 31/12/14
First Global Listed Infrastructure Fund “The Fund”
- Class I (Dist)^ 17.35% 12.33% - Class III 17.98% 13.38% - Class VI* N/A 0.40%
UBS Global Infrastructure & Utilities 50-50 Index# 17.90% 13.58% UBS Global Infrastructure & Utilities 50-50 Index*# N/A 0.71%
(Performance calculation is based on official dealing NAV per share) ^ Dividend adjustment return * Inception date – 26th June 2014 # Benchmarks are being included for illustrative purposes and there is no guarantee that a Fund will outperform a benchmark
Listed infrastructure generated solid returns in 2014. Gains were driven by strong performance from a
range of sectors including mobile towers, regulated utilities and freight rail, highlighting the diversity on offer
within the asset class.
The Fund rose by 13.4% during the period. This compares to a 13.6% gain by the UBS Global
Infrastructure & Utilities 50-50 Index (USD) and a 4.9% increase by the MSCI World index.
A position in Transurban was beneficial to performance. The company reported robust traffic growth on
its high quality toll road concessions, and is expected to benefit from network optionality and potential synergies
from its recent acquisition of Queensland Motorways. PG&E was supported by lower US bond yields and an
improving regulatory outlook, while Exelon rose on a positive market response to its takeover of regulated peer
Pepco in April 2014.
Exposure to Vinci detracted from performance. Disappointing half year results and a weaker outlook for
the French construction market overshadowed steady earnings from its toll road concession business. SABESP,
underperformed due to challenging hydrological conditions in its home market of Sao Paulo state. Vopak faced a
difficult operating environment in core European markets, but rallied towards the end of the year on capacity
additions in faster growing markets, and evidence of disciplined cost control.
Additions to the Fund included FirstEnergy and Jiangsu Expressway. A period of underperformance
presented an appealing entry point for FirstEnergy, which is run by a competent, shareholder-focused
management team. Jiangsu Expressway is highly cash generative and is set to benefit from structural growth
trends, including growing car penetration in China.
The Fund’s position in GDF Suez was sold following a period of outperformance which left much of its
upside potential reflected in its valuation. Norfolk Southern was also sold after reaching our target valuation range,
as a steadily improving US economy resulted in volume growth and margin expansion.
The essential nature of listed infrastructure gives it consistently strong pricing power and relative
immunity to economic cycles. Earnings and dividend yields are underpinned by robust business models, which
typically generate predictable cash flows.
FIRST STATE GLOBAL LISTED INFRASTRUCTURE FUND
INVESTMENT MANAGER’S REPORT (CONTINUED)
166
We forecast mid-single digit earnings growth in the coming year, and expect dividend growth to exceed
earnings growth. Leverage and payout ratios are lower than normal, which could provide opportunities for well-
managed companies to deliver shareholder returns which surprise on the upside.
We continue to identify valuation discrepancies across sectors and markets, suggesting additional
opportunities for active managers to add value during 2015.
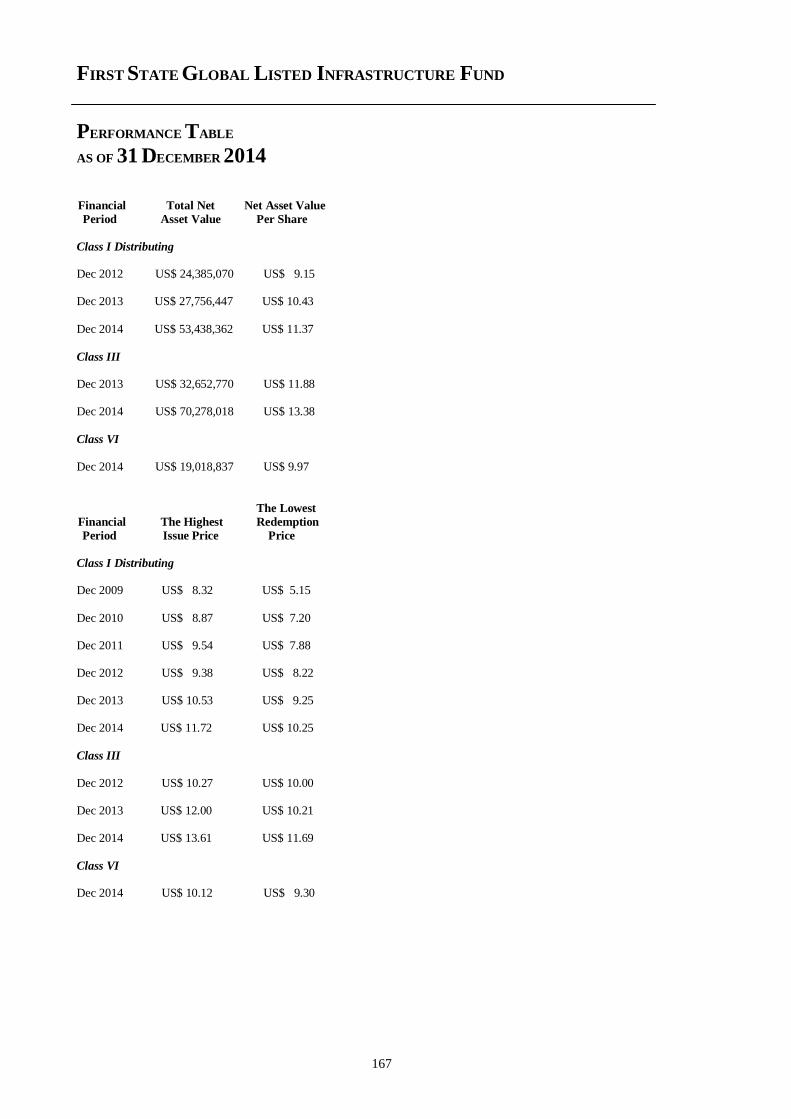
FIRST STATE GLOBAL LISTED INFRASTRUCTURE FUND
PERFORMANCE TABLE
AS OF 31 DECEMBER 2014
167
Financial Total Net Net Asset Value
Period Asset Value Per Share
Class I Distributing Dec 2012 US$ 24,385,070 US$ 9.15 Dec 2013 US$ 27,756,447 US$ 10.43
Dec 2014 US$ 53,438,362 US$ 11.37
Class III
Dec 2013 US$ 32,652,770 US$ 11.88 Dec 2014 US$ 70,278,018 US$ 13.38
Class VI
Dec 2014 US$ 19,018,837 US$ 9.97
The Lowest
Financial The Highest Redemption
Period Issue Price Price
Class I Distributing Dec 2009 US$ 8.32 US$ 5.15
Dec 2010 US$ 8.87 US$ 7.20 Dec 2011 US$ 9.54 US$ 7.88 Dec 2012 US$ 9.38 US$ 8.22 Dec 2013 US$ 10.53 US$ 9.25 Dec 2014 US$ 11.72 US$ 10.25
Class III
Dec 2012 US$ 10.27 US$ 10.00 Dec 2013 US$ 12.00 US$ 10.21 Dec 2014 US$ 13.61 US$ 11.69
Class VI Dec 2014 US$ 10.12 US$ 9.30
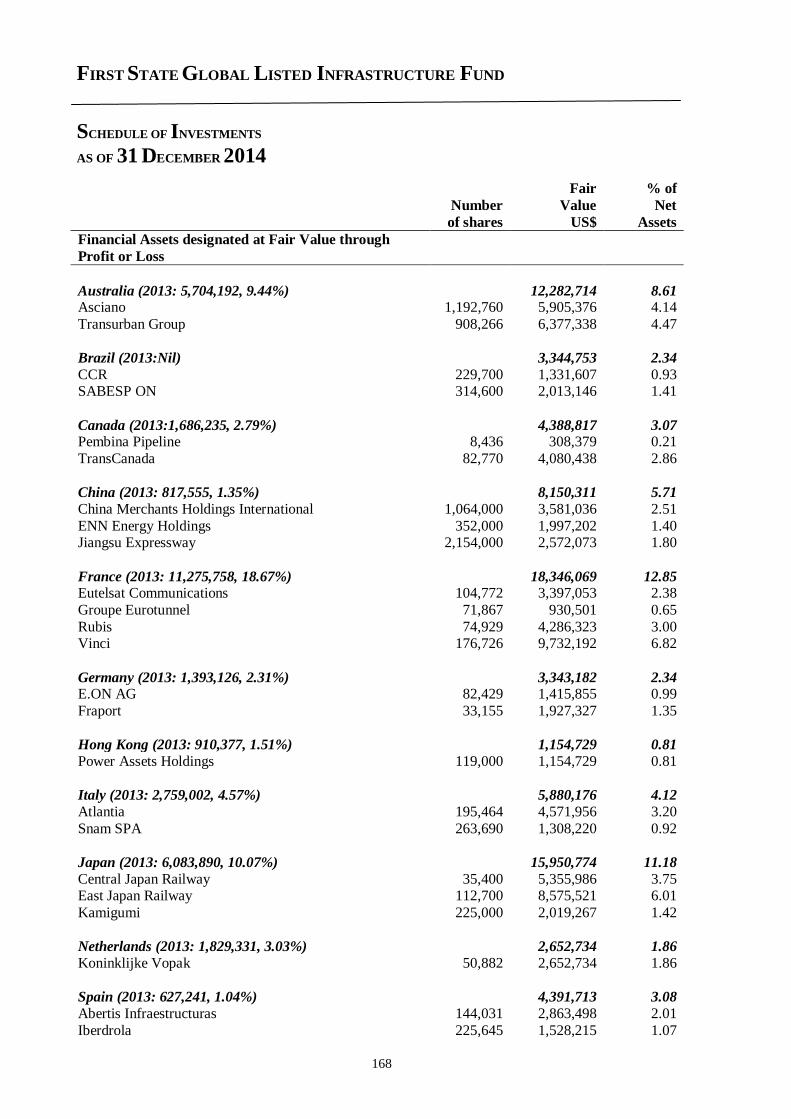
FIRST STATE GLOBAL LISTED INFRASTRUCTURE FUND
SCHEDULE OF INVESTMENTS
AS OF 31 DECEMBER 2014
168
Fair % of
Number Value Net
of shares US$ Assets
Financial Assets designated at Fair Value through
Profit or Loss
Australia (2013: 5,704,192, 9.44%) 12,282,714 8.61 Asciano 1,192,760 5,905,376 4.14
Transurban Group 908,266 6,377,338 4.47
Brazil (2013:Nil) 3,344,753 2.34
CCR 229,700 1,331,607 0.93 SABESP ON 314,600 2,013,146 1.41
Canada (2013:1,686,235, 2.79%) 4,388,817 3.07 Pembina Pipeline 8,436 308,379 0.21
TransCanada 82,770 4,080,438 2.86
China (2013: 817,555, 1.35%) 8,150,311 5.71
China Merchants Holdings International 1,064,000 3,581,036 2.51
ENN Energy Holdings 352,000 1,997,202 1.40 Jiangsu Expressway 2,154,000 2,572,073 1.80
France (2013: 11,275,758, 18.67%) 18,346,069 12.85 Eutelsat Communications 104,772 3,397,053 2.38
Groupe Eurotunnel 71,867 930,501 0.65
Rubis 74,929 4,286,323 3.00 Vinci 176,726 9,732,192 6.82
Germany (2013: 1,393,126, 2.31%) 3,343,182 2.34 E.ON AG 82,429 1,415,855 0.99
Fraport 33,155 1,927,327 1.35
Hong Kong (2013: 910,377, 1.51%) 1,154,729 0.81
Power Assets Holdings 119,000 1,154,729 0.81
Italy (2013: 2,759,002, 4.57%) 5,880,176 4.12
Atlantia 195,464 4,571,956 3.20
Snam SPA 263,690 1,308,220 0.92
Japan (2013: 6,083,890, 10.07%) 15,950,774 11.18
Central Japan Railway 35,400 5,355,986 3.75 East Japan Railway 112,700 8,575,521 6.01
Kamigumi 225,000 2,019,267 1.42
Netherlands (2013: 1,829,331, 3.03%) 2,652,734 1.86
Koninklijke Vopak 50,882 2,652,734 1.86
Spain (2013: 627,241, 1.04%) 4,391,713 3.08
Abertis Infraestructuras 144,031 2,863,498 2.01
Iberdrola 225,645 1,528,215 1.07
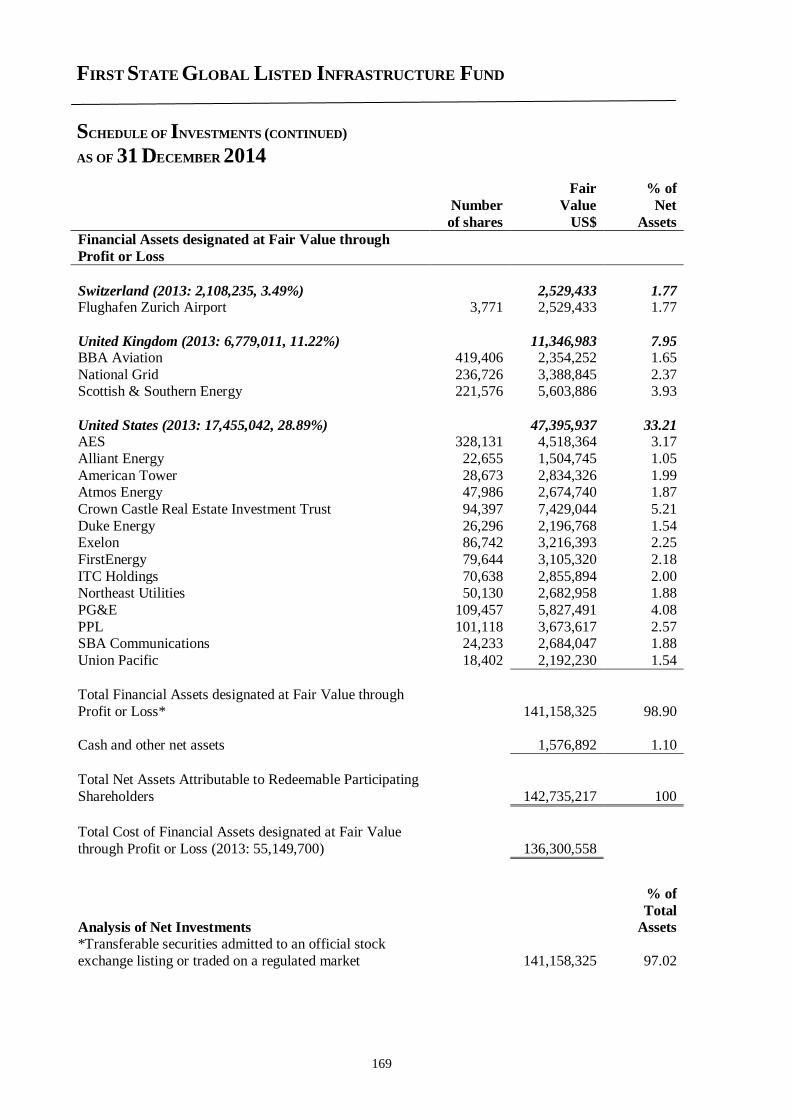
FIRST STATE GLOBAL LISTED INFRASTRUCTURE FUND
SCHEDULE OF INVESTMENTS (CONTINUED)
AS OF 31 DECEMBER 2014
169
Fair % of
Number Value Net
of shares US$ Assets
Financial Assets designated at Fair Value through
Profit or Loss
Switzerland (2013: 2,108,235, 3.49%) 2,529,433 1.77 Flughafen Zurich Airport 3,771 2,529,433 1.77
United Kingdom (2013: 6,779,011, 11.22%) 11,346,983 7.95 BBA Aviation 419,406 2,354,252 1.65
National Grid 236,726 3,388,845 2.37 Scottish & Southern Energy 221,576 5,603,886 3.93
United States (2013: 17,455,042, 28.89%) 47,395,937 33.21 AES 328,131 4,518,364 3.17
Alliant Energy 22,655 1,504,745 1.05
American Tower 28,673 2,834,326 1.99 Atmos Energy 47,986 2,674,740 1.87
Crown Castle Real Estate Investment Trust 94,397 7,429,044 5.21
Duke Energy 26,296 2,196,768 1.54 Exelon 86,742 3,216,393 2.25
FirstEnergy 79,644 3,105,320 2.18
ITC Holdings 70,638 2,855,894 2.00 Northeast Utilities 50,130 2,682,958 1.88
PG&E 109,457 5,827,491 4.08
PPL 101,118 3,673,617 2.57 SBA Communications 24,233 2,684,047 1.88
Union Pacific 18,402 2,192,230 1.54
Total Financial Assets designated at Fair Value through
Profit or Loss* 141,158,325 98.90
Cash and other net assets 1,576,892 1.10
Total Net Assets Attributable to Redeemable Participating
Shareholders 142,735,217 100
Total Cost of Financial Assets designated at Fair Value
through Profit or Loss (2013: 55,149,700) 136,300,558
Analysis of Net Investments
% of
Total
Assets
*Transferable securities admitted to an official stock
exchange listing or traded on a regulated market 141,158,325 97.02
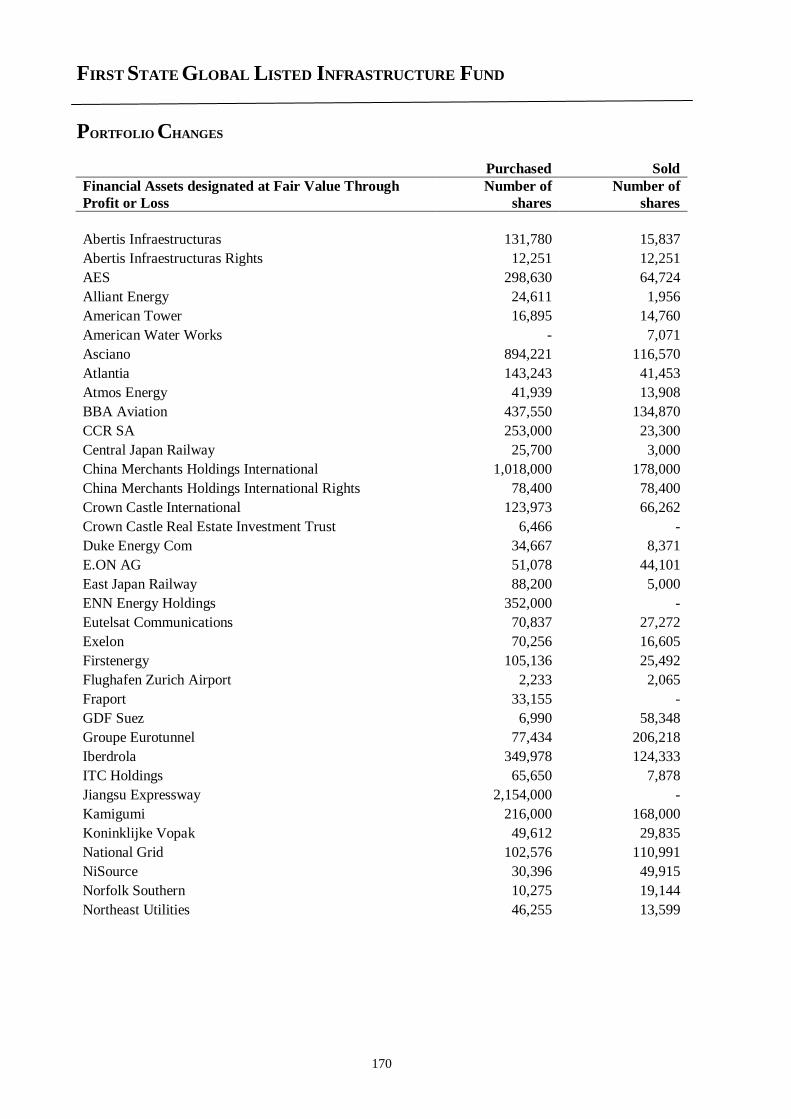
FIRST STATE GLOBAL LISTED INFRASTRUCTURE FUND
PORTFOLIO CHANGES
170
Purchased Sold
Financial Assets designated at Fair Value Through
Profit or Loss
Number of
shares
Number of
shares
Abertis Infraestructuras 131,780 15,837
Abertis Infraestructuras Rights 12,251 12,251
AES 298,630 64,724
Alliant Energy 24,611 1,956
American Tower 16,895 14,760
American Water Works - 7,071
Asciano 894,221 116,570
Atlantia 143,243 41,453
Atmos Energy 41,939 13,908
BBA Aviation 437,550 134,870
CCR SA 253,000 23,300
Central Japan Railway 25,700 3,000
China Merchants Holdings International 1,018,000 178,000
China Merchants Holdings International Rights 78,400 78,400
Crown Castle International 123,973 66,262
Crown Castle Real Estate Investment Trust 6,466 -
Duke Energy Com 34,667 8,371
E.ON AG 51,078 44,101
East Japan Railway 88,200 5,000
ENN Energy Holdings 352,000 -
Eutelsat Communications 70,837 27,272
Exelon 70,256 16,605
Firstenergy 105,136 25,492
Flughafen Zurich Airport 2,233 2,065
Fraport 33,155 -
GDF Suez 6,990 58,348
Groupe Eurotunnel 77,434 206,218
Iberdrola 349,978 124,333
ITC Holdings 65,650 7,878
Jiangsu Expressway 2,154,000 -
Kamigumi 216,000 168,000
Koninklijke Vopak 49,612 29,835
National Grid 102,576 110,991
NiSource 30,396 49,915
Norfolk Southern 10,275 19,144
Northeast Utilities 46,255 13,599
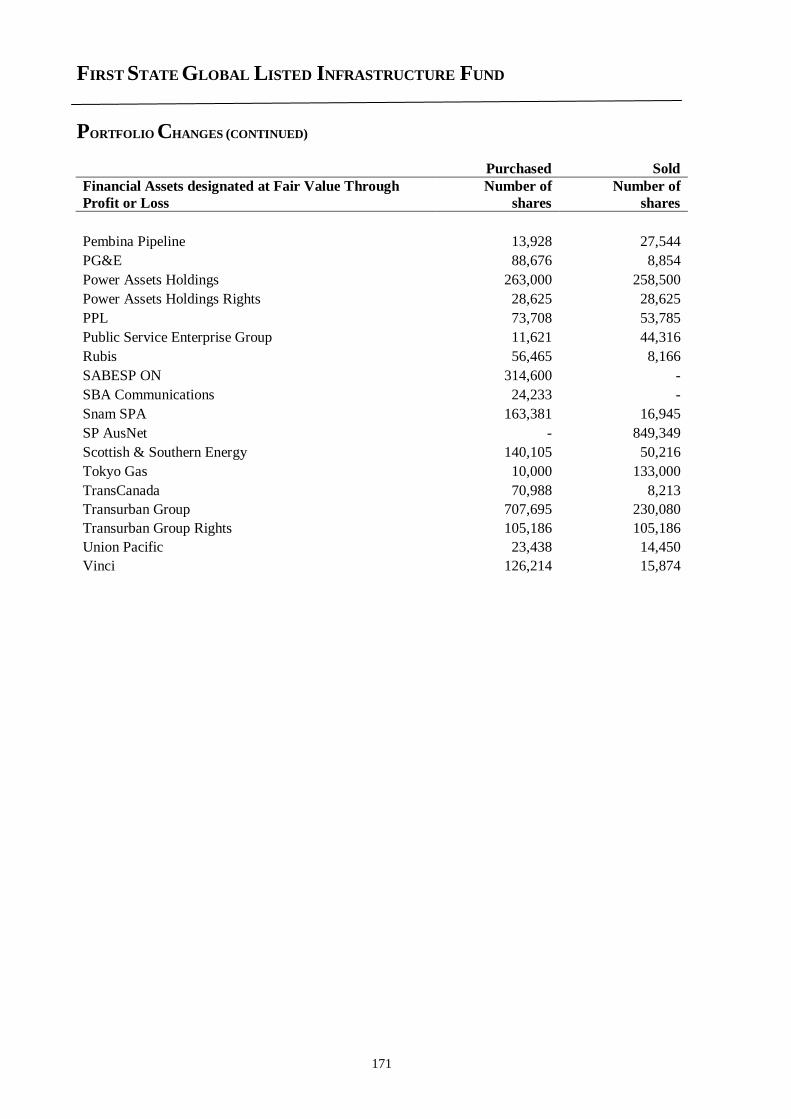
FIRST STATE GLOBAL LISTED INFRASTRUCTURE FUND
PORTFOLIO CHANGES (CONTINUED)
171
Purchased Sold
Financial Assets designated at Fair Value Through
Profit or Loss
Number of
shares
Number of
shares
Pembina Pipeline 13,928 27,544
PG&E 88,676 8,854
Power Assets Holdings 263,000 258,500
Power Assets Holdings Rights 28,625 28,625
PPL 73,708 53,785
Public Service Enterprise Group 11,621 44,316
Rubis 56,465 8,166
SABESP ON 314,600 -
SBA Communications 24,233 -
Snam SPA 163,381 16,945
SP AusNet - 849,349
Scottish & Southern Energy 140,105 50,216
Tokyo Gas 10,000 133,000
TransCanada 70,988 8,213
Transurban Group 707,695 230,080
Transurban Group Rights 105,186 105,186
Union Pacific 23,438 14,450
Vinci 126,214 15,874
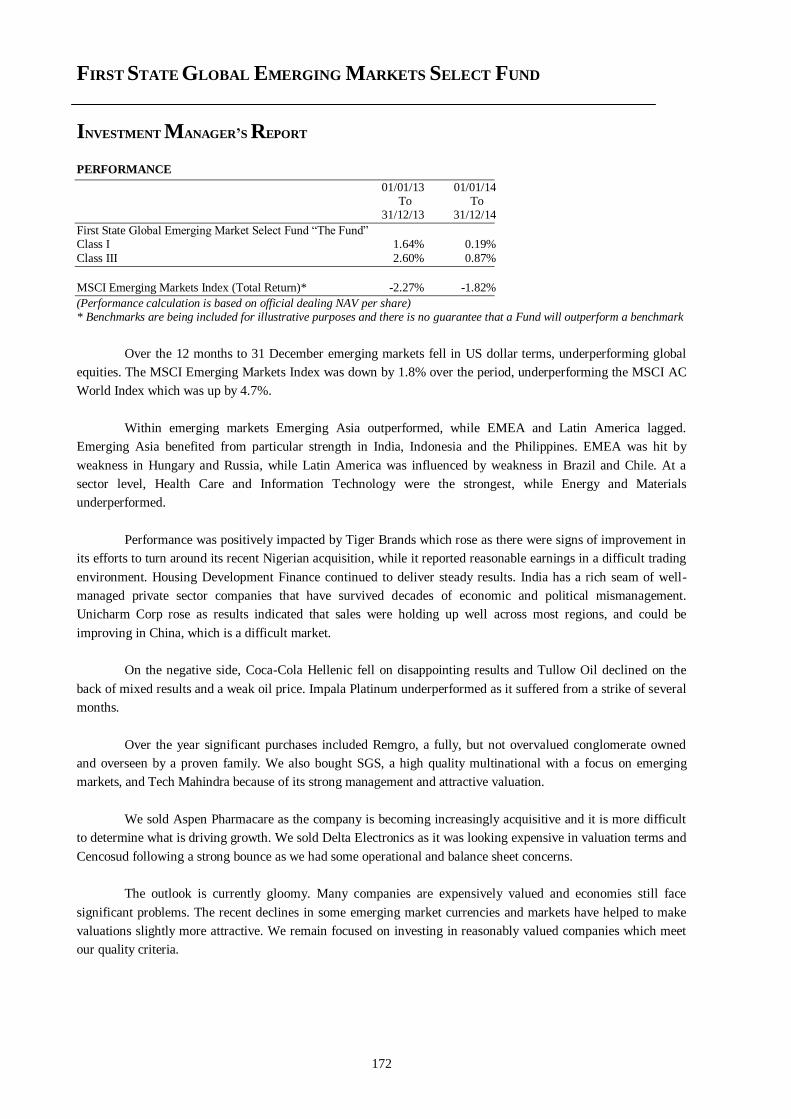
FIRST STATE GLOBAL EMERGING MARKETS SELECT FUND
INVESTMENT MANAGER’S REPORT
172
PERFORMANCE
01/01/13 01/01/14 To To 31/12/13 31/12/14
First State Global Emerging Market Select Fund “The Fund” Class I 1.64% 0.19%
Class III 2.60% 0.87%
MSCI Emerging Markets Index (Total Return)* -2.27% -1.82%
(Performance calculation is based on official dealing NAV per share) * Benchmarks are being included for illustrative purposes and there is no guarantee that a Fund will outperform a benchmark
Over the 12 months to 31 December emerging markets fell in US dollar terms, underperforming global
equities. The MSCI Emerging Markets Index was down by 1.8% over the period, underperforming the MSCI AC
World Index which was up by 4.7%.
Within emerging markets Emerging Asia outperformed, while EMEA and Latin America lagged.
Emerging Asia benefited from particular strength in India, Indonesia and the Philippines. EMEA was hit by
weakness in Hungary and Russia, while Latin America was influenced by weakness in Brazil and Chile. At a
sector level, Health Care and Information Technology were the strongest, while Energy and Materials
underperformed.
Performance was positively impacted by Tiger Brands which rose as there were signs of improvement in
its efforts to turn around its recent Nigerian acquisition, while it reported reasonable earnings in a difficult trading
environment. Housing Development Finance continued to deliver steady results. India has a rich seam of well-
managed private sector companies that have survived decades of economic and political mismanagement.
Unicharm Corp rose as results indicated that sales were holding up well across most regions, and could be
improving in China, which is a difficult market.
On the negative side, Coca-Cola Hellenic fell on disappointing results and Tullow Oil declined on the
back of mixed results and a weak oil price. Impala Platinum underperformed as it suffered from a strike of several
months.
Over the year significant purchases included Remgro, a fully, but not overvalued conglomerate owned
and overseen by a proven family. We also bought SGS, a high quality multinational with a focus on emerging
markets, and Tech Mahindra because of its strong management and attractive valuation.
We sold Aspen Pharmacare as the company is becoming increasingly acquisitive and it is more difficult
to determine what is driving growth. We sold Delta Electronics as it was looking expensive in valuation terms and
Cencosud following a strong bounce as we had some operational and balance sheet concerns.
The outlook is currently gloomy. Many companies are expensively valued and economies still face
significant problems. The recent declines in some emerging market currencies and markets have helped to make
valuations slightly more attractive. We remain focused on investing in reasonably valued companies which meet
our quality criteria.
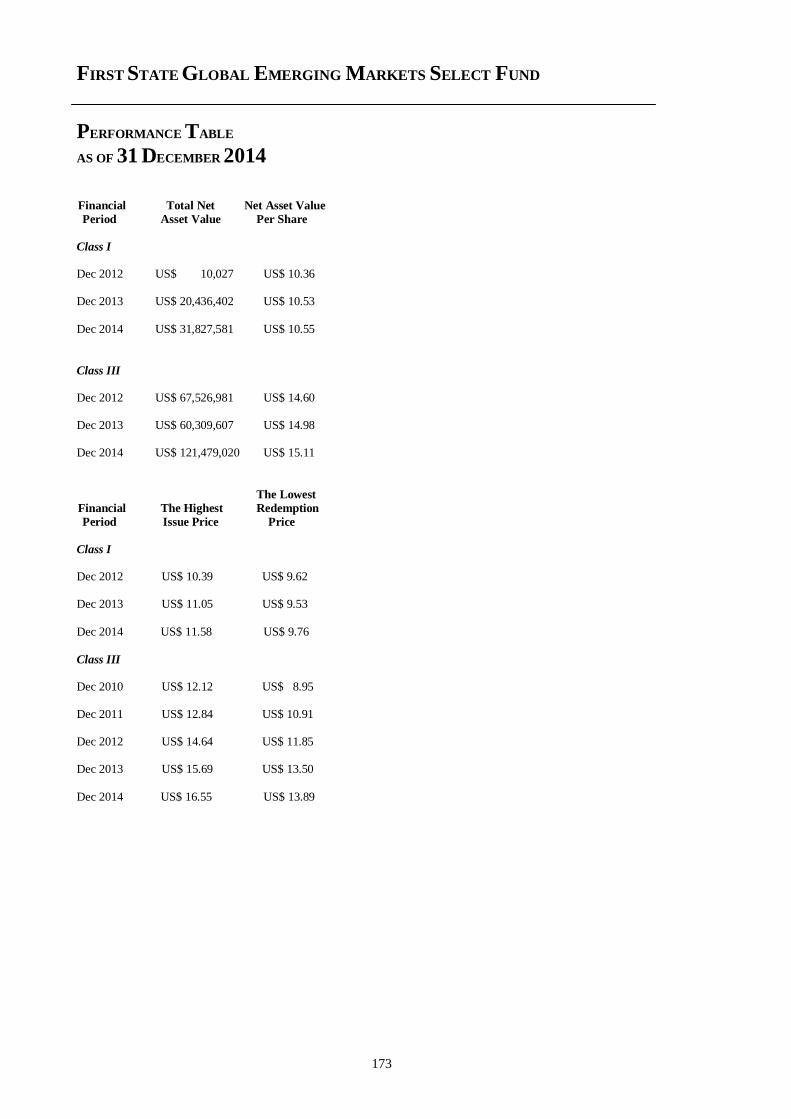
FIRST STATE GLOBAL EMERGING MARKETS SELECT FUND
PERFORMANCE TABLE
AS OF 31 DECEMBER 2014
173
Financial Total Net Net Asset Value
Period Asset Value Per Share
Class I
Dec 2012 US$ 10,027 US$ 10.36 Dec 2013 US$ 20,436,402 US$ 10.53
Dec 2014 US$ 31,827,581 US$ 10.55
Class III Dec 2012 US$ 67,526,981 US$ 14.60 Dec 2013 US$ 60,309,607 US$ 14.98 Dec 2014 US$ 121,479,020 US$ 15.11
The Lowest
Financial The Highest Redemption
Period Issue Price Price
Class I Dec 2012 US$ 10.39 US$ 9.62 Dec 2013 US$ 11.05 US$ 9.53
Dec 2014 US$ 11.58 US$ 9.76
Class III Dec 2010 US$ 12.12 US$ 8.95 Dec 2011 US$ 12.84 US$ 10.91 Dec 2012 US$ 14.64 US$ 11.85 Dec 2013 US$ 15.69 US$ 13.50
Dec 2014 US$ 16.55 US$ 13.89
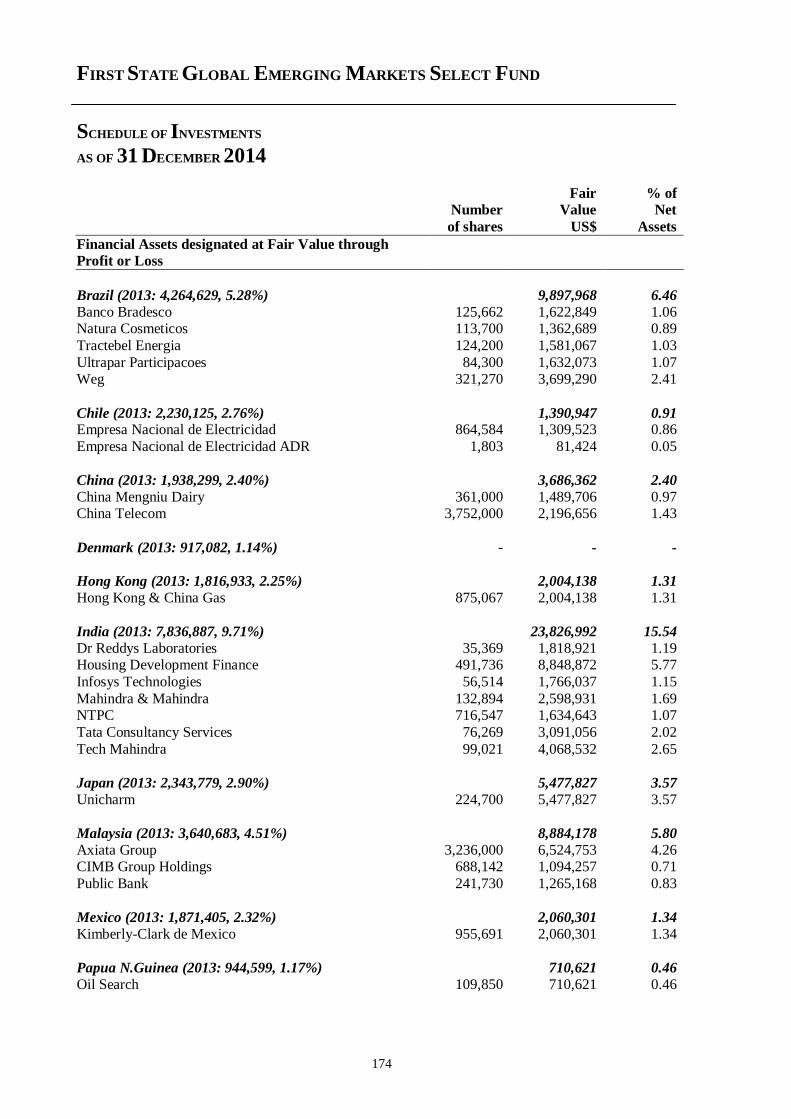
FIRST STATE GLOBAL EMERGING MARKETS SELECT FUND
SCHEDULE OF INVESTMENTS
AS OF 31 DECEMBER 2014
174
Fair % of Number Value Net
of shares US$ Assets
Financial Assets designated at Fair Value through
Profit or Loss
Brazil (2013: 4,264,629, 5.28%) 9,897,968 6.46
Banco Bradesco 125,662 1,622,849 1.06 Natura Cosmeticos 113,700 1,362,689 0.89
Tractebel Energia 124,200 1,581,067 1.03
Ultrapar Participacoes 84,300 1,632,073 1.07 Weg 321,270 3,699,290 2.41
Chile (2013: 2,230,125, 2.76%) 1,390,947 0.91 Empresa Nacional de Electricidad 864,584 1,309,523 0.86
Empresa Nacional de Electricidad ADR 1,803 81,424 0.05
China (2013: 1,938,299, 2.40%) 3,686,362 2.40
China Mengniu Dairy 361,000 1,489,706 0.97 China Telecom 3,752,000 2,196,656 1.43
Denmark (2013: 917,082, 1.14%) - - -
Hong Kong (2013: 1,816,933, 2.25%) 2,004,138 1.31
Hong Kong & China Gas 875,067 2,004,138 1.31
India (2013: 7,836,887, 9.71%) 23,826,992 15.54
Dr Reddys Laboratories 35,369 1,818,921 1.19 Housing Development Finance 491,736 8,848,872 5.77
Infosys Technologies 56,514 1,766,037 1.15
Mahindra & Mahindra 132,894 2,598,931 1.69 NTPC 716,547 1,634,643 1.07
Tata Consultancy Services 76,269 3,091,056 2.02
Tech Mahindra 99,021 4,068,532 2.65
Japan (2013: 2,343,779, 2.90%) 5,477,827 3.57
Unicharm 224,700 5,477,827 3.57
Malaysia (2013: 3,640,683, 4.51%) 8,884,178 5.80
Axiata Group 3,236,000 6,524,753 4.26 CIMB Group Holdings 688,142 1,094,257 0.71
Public Bank 241,730 1,265,168 0.83
Mexico (2013: 1,871,405, 2.32%) 2,060,301 1.34 Kimberly-Clark de Mexico 955,691 2,060,301 1.34
Papua N.Guinea (2013: 944,599, 1.17%) 710,621 0.46 Oil Search 109,850 710,621 0.46
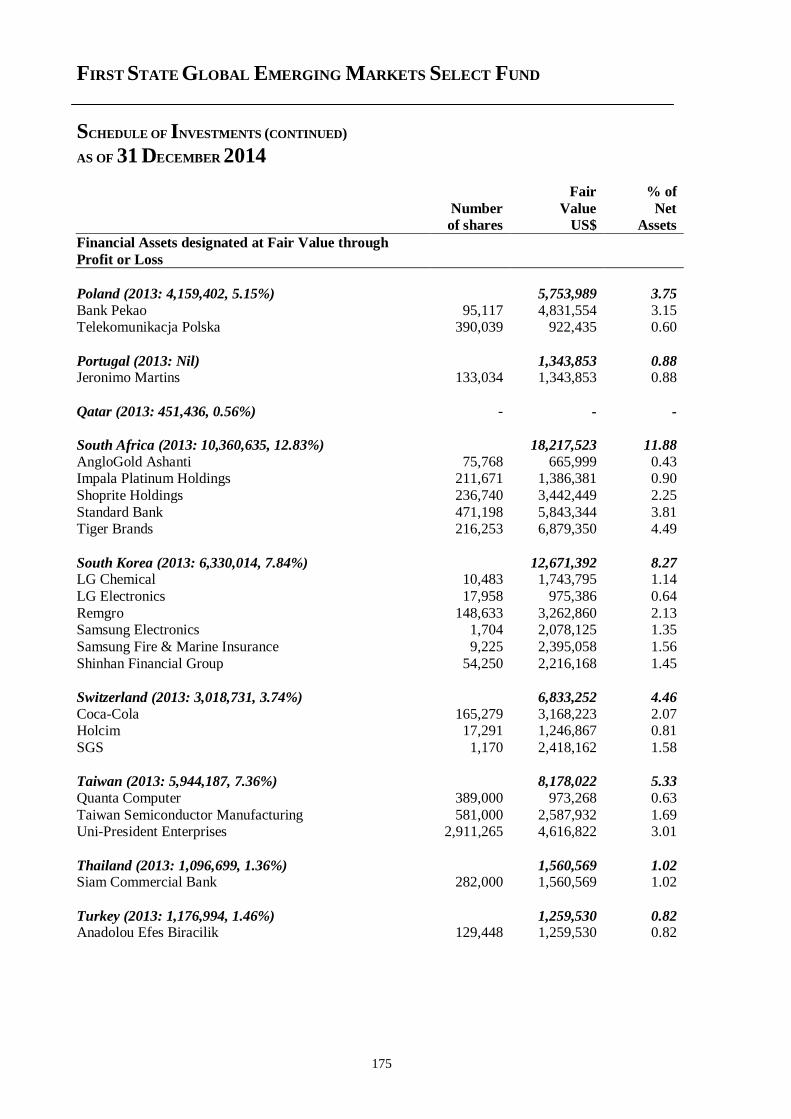
FIRST STATE GLOBAL EMERGING MARKETS SELECT FUND
SCHEDULE OF INVESTMENTS (CONTINUED)
AS OF 31 DECEMBER 2014
175
Fair % of
Number Value Net of shares US$ Assets
Financial Assets designated at Fair Value through
Profit or Loss
Poland (2013: 4,159,402, 5.15%) 5,753,989 3.75
Bank Pekao 95,117 4,831,554 3.15 Telekomunikacja Polska 390,039 922,435 0.60
Portugal (2013: Nil) 1,343,853 0.88 Jeronimo Martins 133,034 1,343,853 0.88
Qatar (2013: 451,436, 0.56%) - - -
South Africa (2013: 10,360,635, 12.83%) 18,217,523 11.88
AngloGold Ashanti 75,768 665,999 0.43 Impala Platinum Holdings 211,671 1,386,381 0.90
Shoprite Holdings 236,740 3,442,449 2.25
Standard Bank 471,198 5,843,344 3.81 Tiger Brands 216,253 6,879,350 4.49
South Korea (2013: 6,330,014, 7.84%) 12,671,392 8.27 LG Chemical 10,483 1,743,795 1.14
LG Electronics 17,958 975,386 0.64
Remgro 148,633 3,262,860 2.13 Samsung Electronics 1,704 2,078,125 1.35
Samsung Fire & Marine Insurance 9,225 2,395,058 1.56
Shinhan Financial Group 54,250 2,216,168 1.45
Switzerland (2013: 3,018,731, 3.74%) 6,833,252 4.46
Coca-Cola 165,279 3,168,223 2.07 Holcim 17,291 1,246,867 0.81
SGS 1,170 2,418,162 1.58
Taiwan (2013: 5,944,187, 7.36%) 8,178,022 5.33
Quanta Computer 389,000 973,268 0.63
Taiwan Semiconductor Manufacturing 581,000 2,587,932 1.69 Uni-President Enterprises 2,911,265 4,616,822 3.01
Thailand (2013: 1,096,699, 1.36%) 1,560,569 1.02 Siam Commercial Bank 282,000 1,560,569 1.02
Turkey (2013: 1,176,994, 1.46%) 1,259,530 0.82 Anadolou Efes Biracilik 129,448 1,259,530 0.82
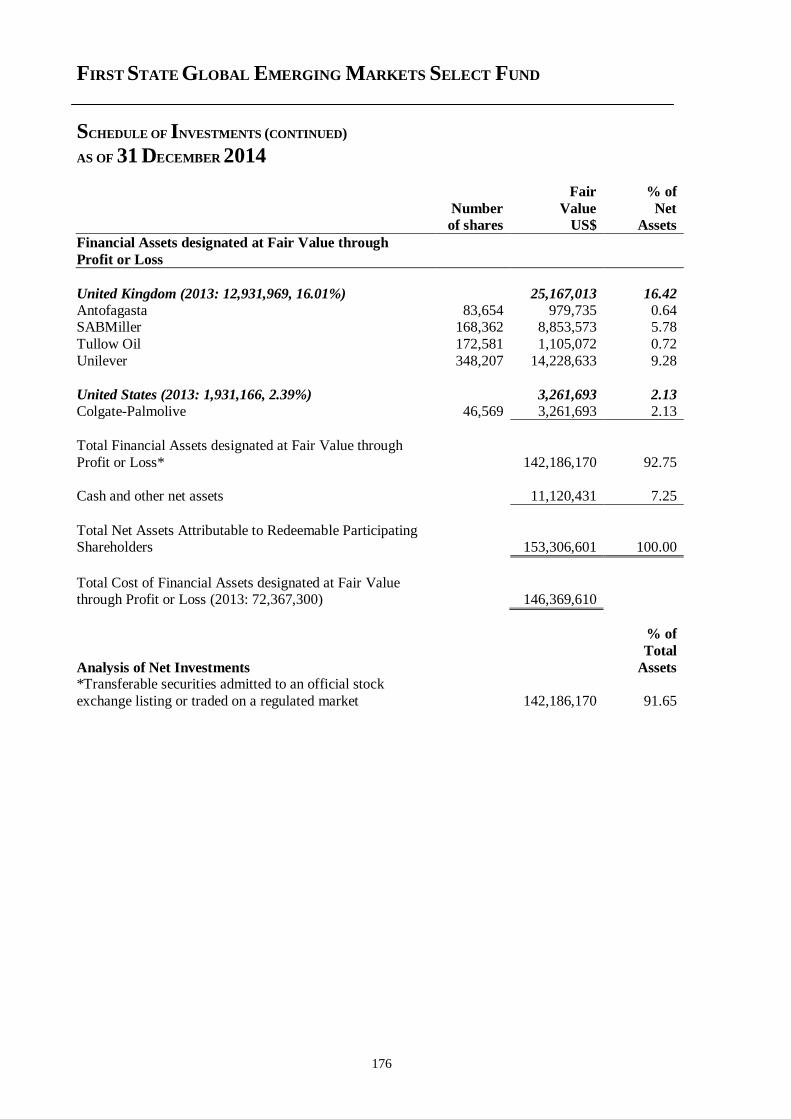
FIRST STATE GLOBAL EMERGING MARKETS SELECT FUND
SCHEDULE OF INVESTMENTS (CONTINUED)
AS OF 31 DECEMBER 2014
176
Fair % of
Number Value Net of shares US$ Assets
Financial Assets designated at Fair Value through
Profit or Loss
United Kingdom (2013: 12,931,969, 16.01%) 25,167,013 16.42
Antofagasta 83,654 979,735 0.64 SABMiller 168,362 8,853,573 5.78
Tullow Oil 172,581 1,105,072 0.72
Unilever 348,207 14,228,633 9.28
United States (2013: 1,931,166, 2.39%) 3,261,693 2.13
Colgate-Palmolive 46,569 3,261,693 2.13
Total Financial Assets designated at Fair Value through
Profit or Loss* 142,186,170 92.75
Cash and other net assets 11,120,431 7.25
Total Net Assets Attributable to Redeemable Participating Shareholders 153,306,601 100.00
Total Cost of Financial Assets designated at Fair Value through Profit or Loss (2013: 72,367,300) 146,369,610
Analysis of Net Investments
% of
Total
Assets *Transferable securities admitted to an official stock
exchange listing or traded on a regulated market 142,186,170 91.65
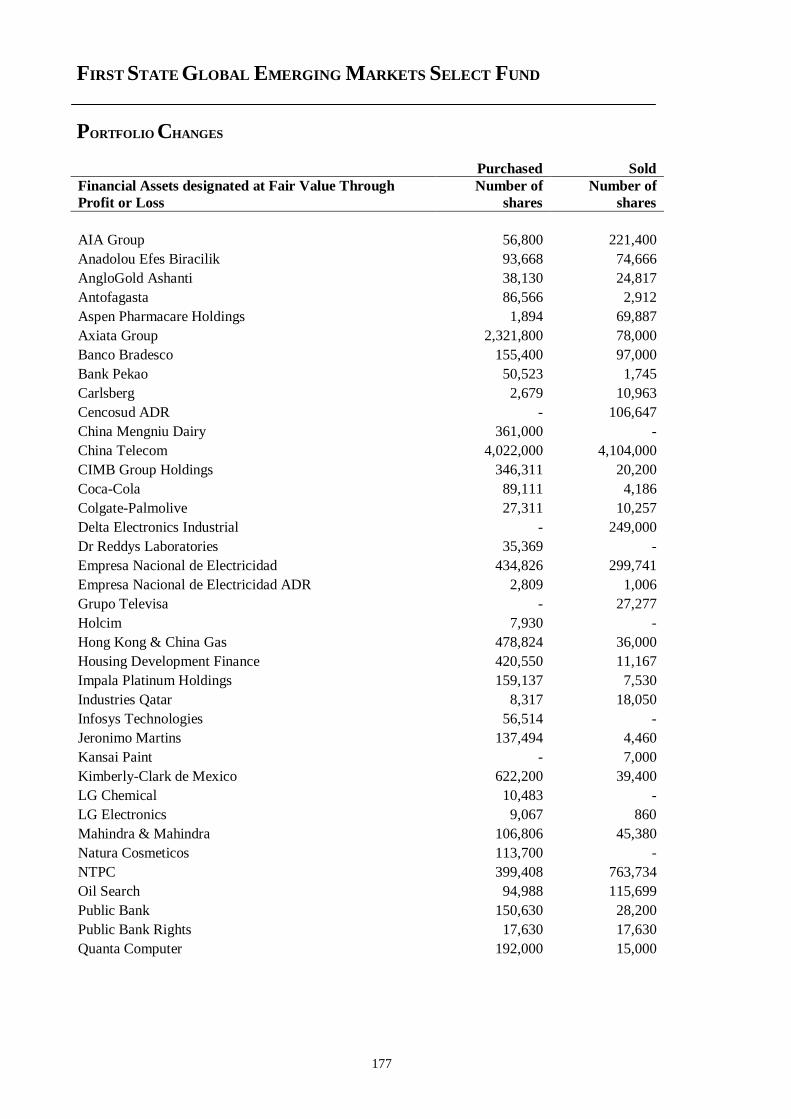
FIRST STATE GLOBAL EMERGING MARKETS SELECT FUND
PORTFOLIO CHANGES
177
Purchased Sold
Financial Assets designated at Fair Value Through
Profit or Loss
Number of
shares
Number of
shares
AIA Group 56,800 221,400
Anadolou Efes Biracilik 93,668 74,666
AngloGold Ashanti 38,130 24,817
Antofagasta 86,566 2,912
Aspen Pharmacare Holdings 1,894 69,887
Axiata Group 2,321,800 78,000
Banco Bradesco 155,400 97,000
Bank Pekao 50,523 1,745
Carlsberg 2,679 10,963
Cencosud ADR - 106,647
China Mengniu Dairy 361,000 -
China Telecom 4,022,000 4,104,000
CIMB Group Holdings 346,311 20,200
Coca-Cola 89,111 4,186
Colgate-Palmolive 27,311 10,257
Delta Electronics Industrial - 249,000
Dr Reddys Laboratories 35,369 -
Empresa Nacional de Electricidad 434,826 299,741
Empresa Nacional de Electricidad ADR 2,809 1,006
Grupo Televisa - 27,277
Holcim 7,930 -
Hong Kong & China Gas 478,824 36,000
Housing Development Finance 420,550 11,167
Impala Platinum Holdings 159,137 7,530
Industries Qatar 8,317 18,050
Infosys Technologies 56,514 -
Jeronimo Martins 137,494 4,460
Kansai Paint - 7,000
Kimberly-Clark de Mexico 622,200 39,400
LG Chemical 10,483 -
LG Electronics 9,067 860
Mahindra & Mahindra 106,806 45,380
Natura Cosmeticos 113,700 -
NTPC 399,408 763,734
Oil Search 94,988 115,699
Public Bank 150,630 28,200
Public Bank Rights 17,630 17,630
Quanta Computer 192,000 15,000
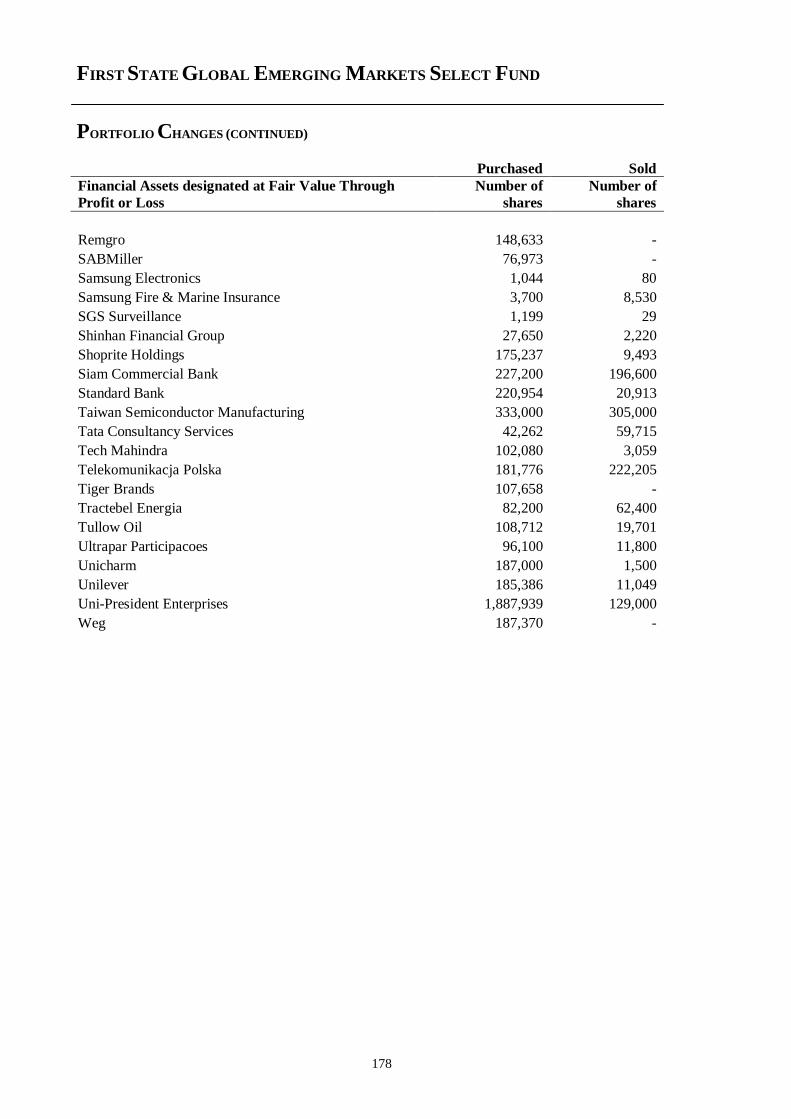
FIRST STATE GLOBAL EMERGING MARKETS SELECT FUND
PORTFOLIO CHANGES (CONTINUED)
178
Purchased Sold
Financial Assets designated at Fair Value Through
Profit or Loss
Number of
shares
Number of
shares
Remgro 148,633 -
SABMiller 76,973 -
Samsung Electronics 1,044 80
Samsung Fire & Marine Insurance 3,700 8,530
SGS Surveillance 1,199 29
Shinhan Financial Group 27,650 2,220
Shoprite Holdings 175,237 9,493
Siam Commercial Bank 227,200 196,600
Standard Bank 220,954 20,913
Taiwan Semiconductor Manufacturing 333,000 305,000
Tata Consultancy Services 42,262 59,715
Tech Mahindra 102,080 3,059
Telekomunikacja Polska 181,776 222,205
Tiger Brands 107,658 -
Tractebel Energia 82,200 62,400
Tullow Oil 108,712 19,701
Ultrapar Participacoes 96,100 11,800
Unicharm 187,000 1,500
Unilever 185,386 11,049
Uni-President Enterprises 1,887,939 129,000
Weg 187,370 -
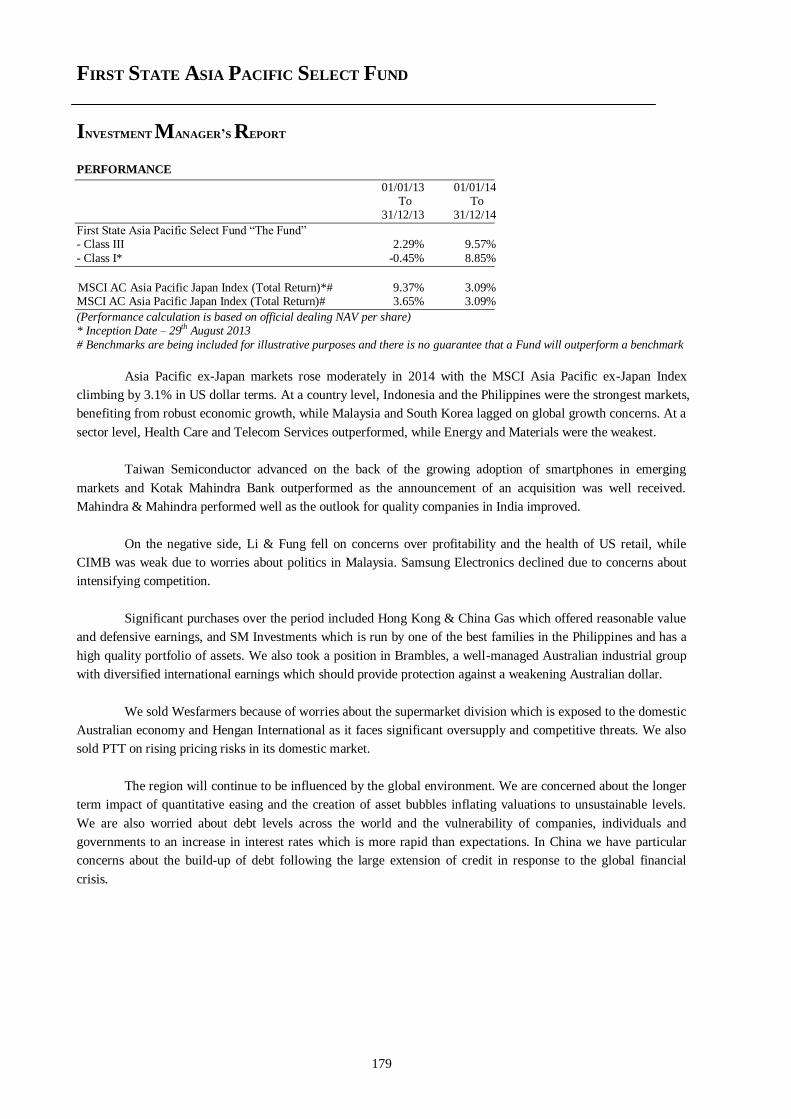
FIRST STATE ASIA PACIFIC SELECT FUND
INVESTMENT MANAGER’S REPORT
179
PERFORMANCE
01/01/13 01/01/14 To To 31/12/13 31/12/14
First State Asia Pacific Select Fund “The Fund” - Class III 2.29% 9.57%
- Class I* -0.45% 8.85%
MSCI AC Asia Pacific Japan Index (Total Return)*# 9.37% 3.09% MSCI AC Asia Pacific Japan Index (Total Return)# 3.65% 3.09%
(Performance calculation is based on official dealing NAV per share) * Inception Date – 29th August 2013
# Benchmarks are being included for illustrative purposes and there is no guarantee that a Fund will outperform a benchmark
Asia Pacific ex-Japan markets rose moderately in 2014 with the MSCI Asia Pacific ex-Japan Index
climbing by 3.1% in US dollar terms. At a country level, Indonesia and the Philippines were the strongest markets,
benefiting from robust economic growth, while Malaysia and South Korea lagged on global growth concerns. At a
sector level, Health Care and Telecom Services outperformed, while Energy and Materials were the weakest.
Taiwan Semiconductor advanced on the back of the growing adoption of smartphones in emerging
markets and Kotak Mahindra Bank outperformed as the announcement of an acquisition was well received.
Mahindra & Mahindra performed well as the outlook for quality companies in India improved.
On the negative side, Li & Fung fell on concerns over profitability and the health of US retail, while
CIMB was weak due to worries about politics in Malaysia. Samsung Electronics declined due to concerns about
intensifying competition.
Significant purchases over the period included Hong Kong & China Gas which offered reasonable value
and defensive earnings, and SM Investments which is run by one of the best families in the Philippines and has a
high quality portfolio of assets. We also took a position in Brambles, a well-managed Australian industrial group
with diversified international earnings which should provide protection against a weakening Australian dollar.
We sold Wesfarmers because of worries about the supermarket division which is exposed to the domestic
Australian economy and Hengan International as it faces significant oversupply and competitive threats. We also
sold PTT on rising pricing risks in its domestic market.
The region will continue to be influenced by the global environment. We are concerned about the longer
term impact of quantitative easing and the creation of asset bubbles inflating valuations to unsustainable levels.
We are also worried about debt levels across the world and the vulnerability of companies, individuals and
governments to an increase in interest rates which is more rapid than expectations. In China we have particular
concerns about the build-up of debt following the large extension of credit in response to the global financial
crisis.
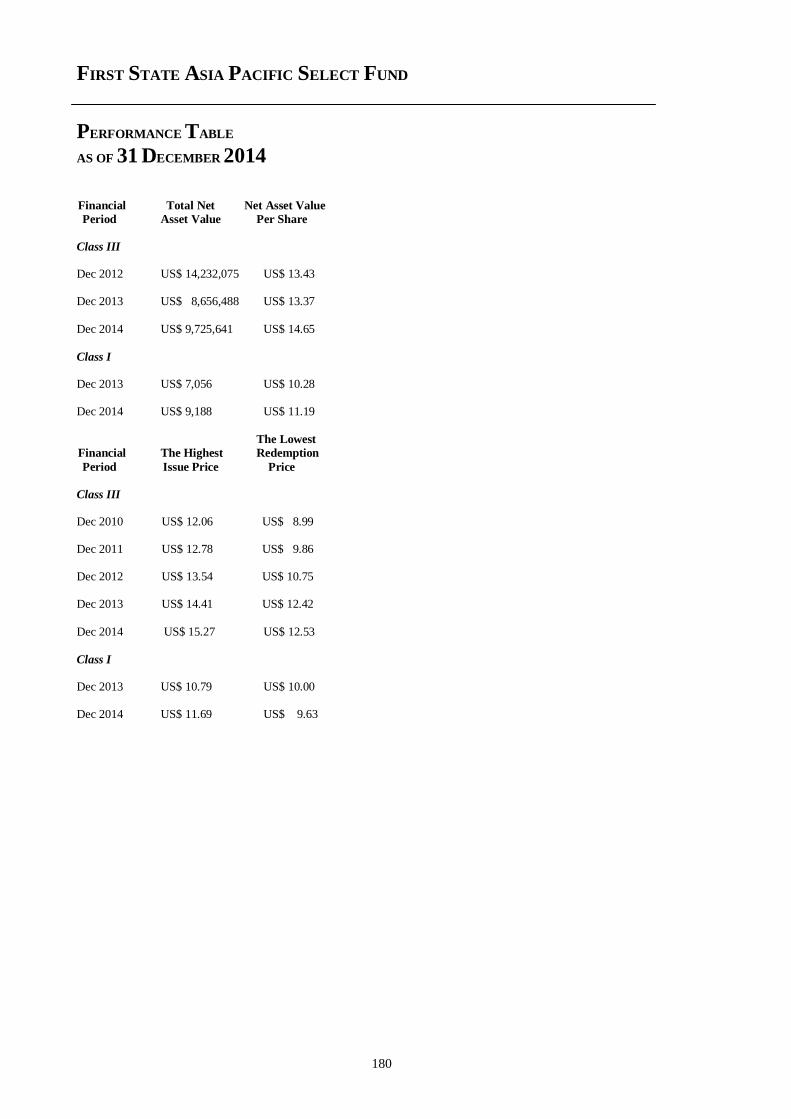
FIRST STATE ASIA PACIFIC SELECT FUND
PERFORMANCE TABLE
AS OF 31 DECEMBER 2014
180
Financial Total Net Net Asset Value
Period Asset Value Per Share
Class III Dec 2012 US$ 14,232,075 US$ 13.43 Dec 2013 US$ 8,656,488 US$ 13.37
Dec 2014 US$ 9,725,641 US$ 14.65
Class I Dec 2013 US$ 7,056 US$ 10.28 Dec 2014 US$ 9,188 US$ 11.19
The Lowest
Financial The Highest Redemption
Period Issue Price Price
Class III Dec 2010 US$ 12.06 US$ 8.99 Dec 2011 US$ 12.78 US$ 9.86 Dec 2012 US$ 13.54 US$ 10.75 Dec 2013 US$ 14.41 US$ 12.42
Dec 2014 US$ 15.27 US$ 12.53
Class I Dec 2013 US$ 10.79 US$ 10.00 Dec 2014 US$ 11.69 US$ 9.63
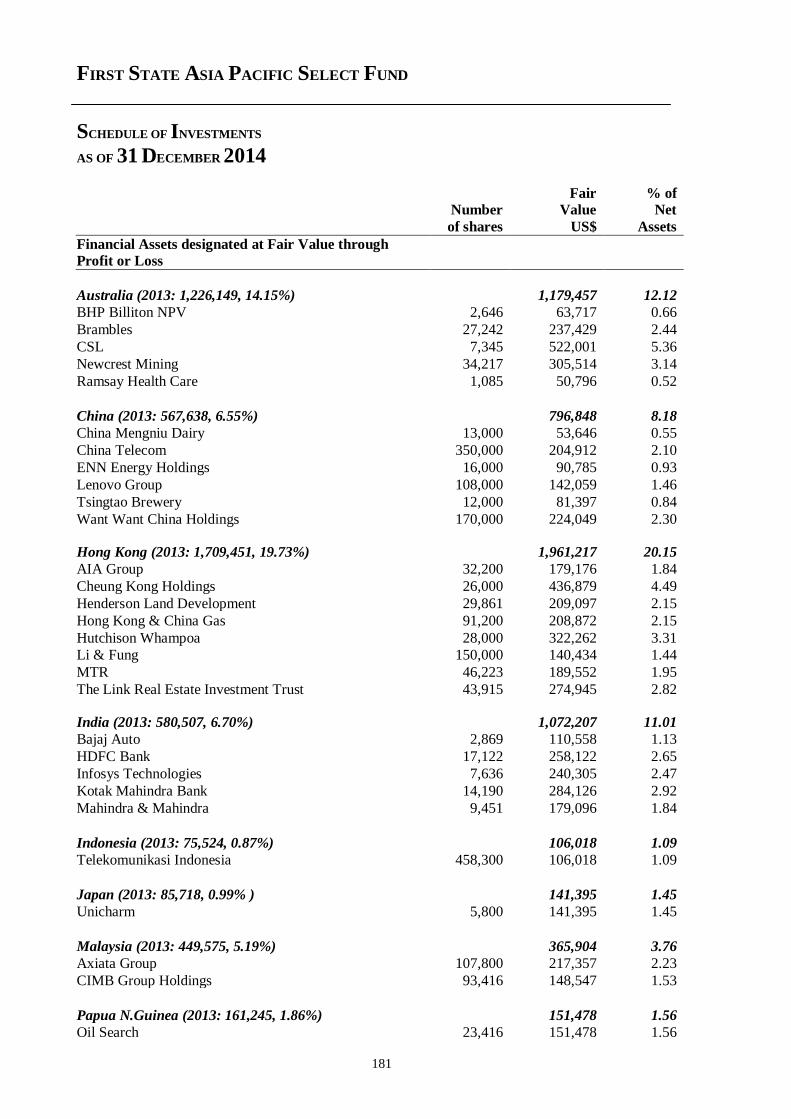
FIRST STATE ASIA PACIFIC SELECT FUND
SCHEDULE OF INVESTMENTS
AS OF 31 DECEMBER 2014
181
Fair % of Number Value Net
of shares US$ Assets
Financial Assets designated at Fair Value through
Profit or Loss
Australia (2013: 1,226,149, 14.15%) 1,179,457 12.12
BHP Billiton NPV 2,646 63,717 0.66
Brambles 27,242 237,429 2.44
CSL 7,345 522,001 5.36
Newcrest Mining 34,217 305,514 3.14
Ramsay Health Care 1,085 50,796 0.52
China (2013: 567,638, 6.55%) 796,848 8.18
China Mengniu Dairy 13,000 53,646 0.55
China Telecom 350,000 204,912 2.10
ENN Energy Holdings 16,000 90,785 0.93
Lenovo Group 108,000 142,059 1.46
Tsingtao Brewery 12,000 81,397 0.84
Want Want China Holdings 170,000 224,049 2.30
Hong Kong (2013: 1,709,451, 19.73%) 1,961,217 20.15
AIA Group 32,200 179,176 1.84
Cheung Kong Holdings 26,000 436,879 4.49
Henderson Land Development 29,861 209,097 2.15
Hong Kong & China Gas 91,200 208,872 2.15
Hutchison Whampoa 28,000 322,262 3.31
Li & Fung 150,000 140,434 1.44
MTR 46,223 189,552 1.95
The Link Real Estate Investment Trust 43,915 274,945 2.82
India (2013: 580,507, 6.70%) 1,072,207 11.01
Bajaj Auto 2,869 110,558 1.13
HDFC Bank 17,122 258,122 2.65
Infosys Technologies 7,636 240,305 2.47
Kotak Mahindra Bank 14,190 284,126 2.92
Mahindra & Mahindra 9,451 179,096 1.84
Indonesia (2013: 75,524, 0.87%) 106,018 1.09
Telekomunikasi Indonesia 458,300 106,018 1.09
Japan (2013: 85,718, 0.99% ) 141,395 1.45
Unicharm 5,800 141,395 1.45
Malaysia (2013: 449,575, 5.19%) 365,904 3.76
Axiata Group 107,800 217,357 2.23
CIMB Group Holdings 93,416 148,547 1.53
Papua N.Guinea (2013: 161,245, 1.86%) 151,478 1.56
Oil Search 23,416 151,478 1.56
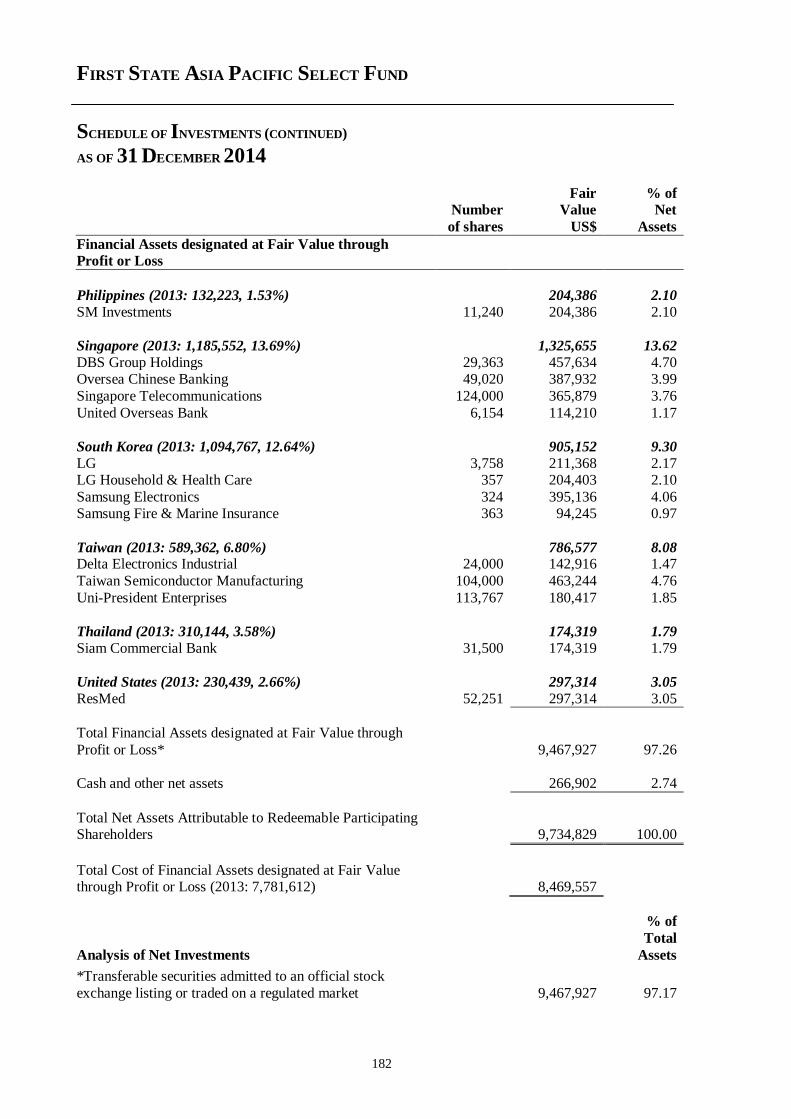
FIRST STATE ASIA PACIFIC SELECT FUND
SCHEDULE OF INVESTMENTS (CONTINUED)
AS OF 31 DECEMBER 2014
182
Fair % of Number Value Net
of shares US$ Assets
Financial Assets designated at Fair Value through
Profit or Loss
Philippines (2013: 132,223, 1.53%) 204,386 2.10
SM Investments 11,240 204,386 2.10
Singapore (2013: 1,185,552, 13.69%) 1,325,655 13.62
DBS Group Holdings 29,363 457,634 4.70 Oversea Chinese Banking 49,020 387,932 3.99
Singapore Telecommunications 124,000 365,879 3.76
United Overseas Bank 6,154 114,210 1.17
South Korea (2013: 1,094,767, 12.64%) 905,152 9.30
LG 3,758 211,368 2.17 LG Household & Health Care 357 204,403 2.10
Samsung Electronics 324 395,136 4.06 Samsung Fire & Marine Insurance 363 94,245 0.97
Taiwan (2013: 589,362, 6.80%) 786,577 8.08 Delta Electronics Industrial 24,000 142,916 1.47
Taiwan Semiconductor Manufacturing 104,000 463,244 4.76
Uni-President Enterprises 113,767 180,417 1.85
Thailand (2013: 310,144, 3.58%) 174,319 1.79
Siam Commercial Bank 31,500 174,319 1.79
United States (2013: 230,439, 2.66%) 297,314 3.05
ResMed 52,251 297,314 3.05
Total Financial Assets designated at Fair Value through
Profit or Loss* 9,467,927 97.26
Cash and other net assets 266,902 2.74
Total Net Assets Attributable to Redeemable Participating Shareholders 9,734,829 100.00
Total Cost of Financial Assets designated at Fair Value through Profit or Loss (2013: 7,781,612) 8,469,557
Analysis of Net Investments
% of
Total
Assets
*Transferable securities admitted to an official stock
exchange listing or traded on a regulated market 9,467,927 97.17

FIRST STATE ASIA PACIFIC SELECT FUND
PORTFOLIO CHANGES
183
Purchased Sold
Financial Assets designated at Fair Value Through
Profit or Loss
Number of
shares
Number of
shares
AIA Group 2,200 3,200
Asustek Computer 8,000 9,000
Axiata Group - 11,100
Bajaj Auto 2,869 -
BHP Billiton NPV 178 -
Brambles 27,242 -
Cheung Kong Holdings 2,000 8,000
China Mengniu Dairy 13,000 -
China Telecom 24,000 42,000
CIMB Group Holdings 7,652 -
CNOOC 11,000 62,000
CSL 494 1,742
DBS Group Holdings 2,534 5,000
Delta Electronics Industrial 24,000 11,000
ENN Energy Holdings 16,000 -
HDFC Bank 8,841 -
Henderson Land Development 4,805 3,000
Hengan International Group - 8,500
Hong Kong & China Gas 91,200 -
Hutchison Whampoa 2,000 -
Infosys Technologies 4,075 -
Kotak Mahindra Bank 4,902 -
Lenovo Group 108,000 -
LG 253 687
LG Household & Health Care 107 -
Li & Fung 150,000 76,000
Mahindra & Mahindra 636 4,085
MTR 3,979 -
Newcrest Mining 10,515 -
Oil Search 13,161 12,032
Oversea Chinese Banking 9,600 -
Oversea Chinese Banking Rights 5,024 5,024
Philippine Long Distance Telephone - 2,200
PTT - 15,000
Ramsay Health Care 1,085 -
ResMed 3,513 -
Samsung Electronics 22 23
Samsung Fire & Marine Insurance 23 836
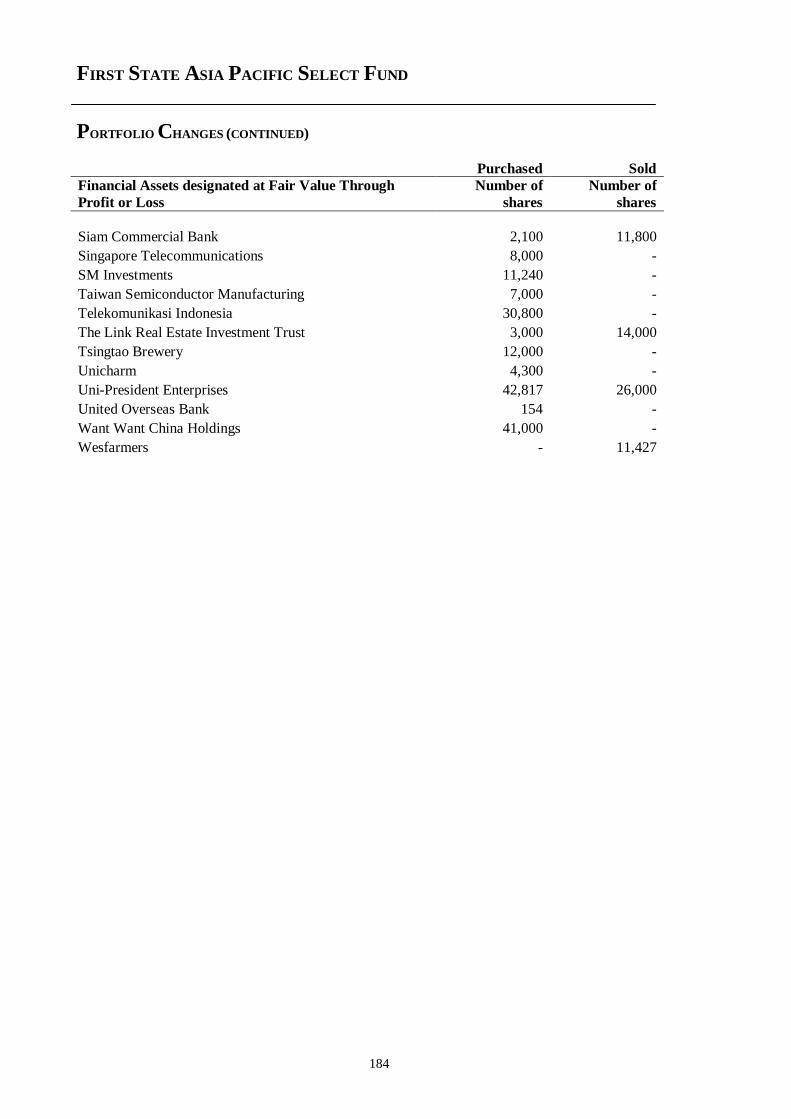
FIRST STATE ASIA PACIFIC SELECT FUND
PORTFOLIO CHANGES (CONTINUED)
184
Purchased Sold
Financial Assets designated at Fair Value Through
Profit or Loss
Number of
shares
Number of
shares
Siam Commercial Bank 2,100 11,800
Singapore Telecommunications 8,000 -
SM Investments 11,240 -
Taiwan Semiconductor Manufacturing 7,000 -
Telekomunikasi Indonesia 30,800 -
The Link Real Estate Investment Trust 3,000 14,000
Tsingtao Brewery 12,000 -
Unicharm 4,300 -
Uni-President Enterprises 42,817 26,000
United Overseas Bank 154 -
Want Want China Holdings 41,000 -
Wesfarmers - 11,427
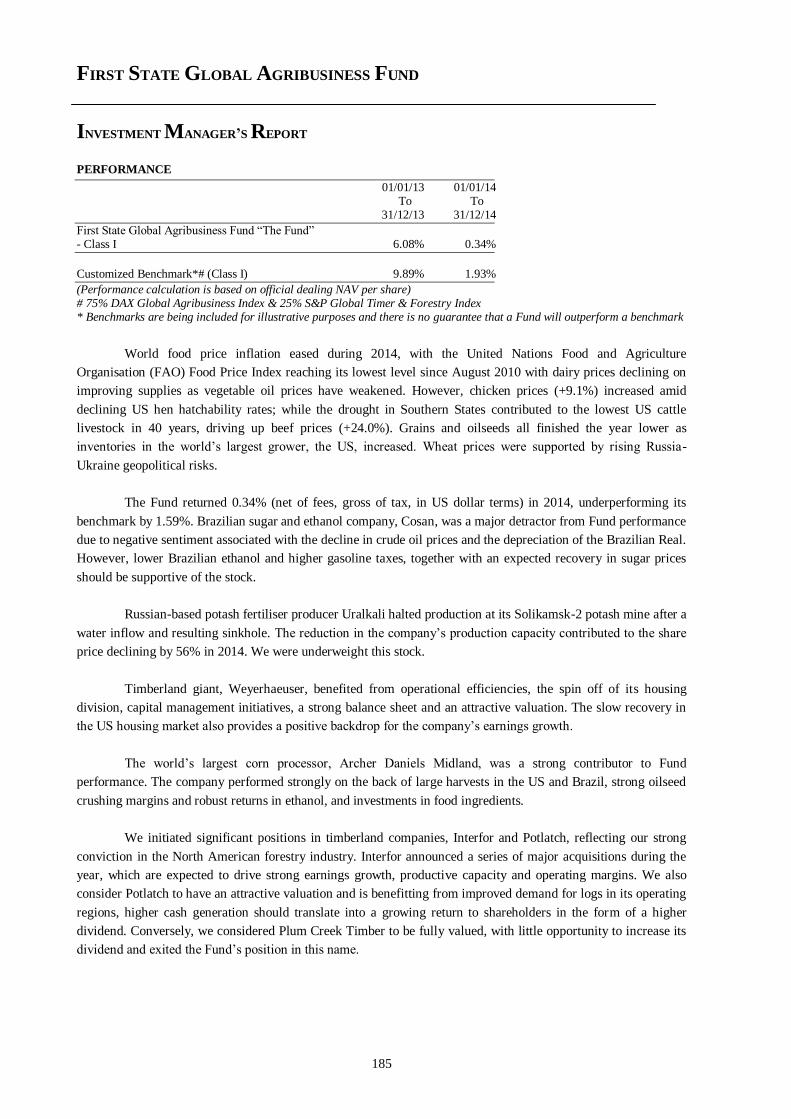
FIRST STATE GLOBAL AGRIBUSINESS FUND
INVESTMENT MANAGER’S REPORT
185
PERFORMANCE
01/01/13 01/01/14 To To 31/12/13 31/12/14
First State Global Agribusiness Fund “The Fund” - Class I 6.08% 0.34%
Customized Benchmark*# (Class I) 9.89% 1.93%
(Performance calculation is based on official dealing NAV per share) # 75% DAX Global Agribusiness Index & 25% S&P Global Timer & Forestry Index * Benchmarks are being included for illustrative purposes and there is no guarantee that a Fund will outperform a benchmark
World food price inflation eased during 2014, with the United Nations Food and Agriculture
Organisation (FAO) Food Price Index reaching its lowest level since August 2010 with dairy prices declining on
improving supplies as vegetable oil prices have weakened. However, chicken prices (+9.1%) increased amid
declining US hen hatchability rates; while the drought in Southern States contributed to the lowest US cattle
livestock in 40 years, driving up beef prices (+24.0%). Grains and oilseeds all finished the year lower as
inventories in the world’s largest grower, the US, increased. Wheat prices were supported by rising Russia-
Ukraine geopolitical risks.
The Fund returned 0.34% (net of fees, gross of tax, in US dollar terms) in 2014, underperforming its
benchmark by 1.59%. Brazilian sugar and ethanol company, Cosan, was a major detractor from Fund performance
due to negative sentiment associated with the decline in crude oil prices and the depreciation of the Brazilian Real.
However, lower Brazilian ethanol and higher gasoline taxes, together with an expected recovery in sugar prices
should be supportive of the stock.
Russian-based potash fertiliser producer Uralkali halted production at its Solikamsk-2 potash mine after a
water inflow and resulting sinkhole. The reduction in the company’s production capacity contributed to the share
price declining by 56% in 2014. We were underweight this stock.
Timberland giant, Weyerhaeuser, benefited from operational efficiencies, the spin off of its housing
division, capital management initiatives, a strong balance sheet and an attractive valuation. The slow recovery in
the US housing market also provides a positive backdrop for the company’s earnings growth.
The world’s largest corn processor, Archer Daniels Midland, was a strong contributor to Fund
performance. The company performed strongly on the back of large harvests in the US and Brazil, strong oilseed
crushing margins and robust returns in ethanol, and investments in food ingredients.
We initiated significant positions in timberland companies, Interfor and Potlatch, reflecting our strong
conviction in the North American forestry industry. Interfor announced a series of major acquisitions during the
year, which are expected to drive strong earnings growth, productive capacity and operating margins. We also
consider Potlatch to have an attractive valuation and is benefitting from improved demand for logs in its operating
regions, higher cash generation should translate into a growing return to shareholders in the form of a higher
dividend. Conversely, we considered Plum Creek Timber to be fully valued, with little opportunity to increase its
dividend and exited the Fund’s position in this name.
FIRST STATE GLOBAL AGRIBUSINESS FUND
INVESTMENT MANAGER’S REPORT (CONTINUED)
186
Despite volatility in equity and commodity markets, the long-term demand drivers remain positive for
several agribusiness sectors. We remain overweight in the Forestry sector, as we expect the combination of the
continued US housing recovery together with strengthening exports to lead to higher demand for logs and wood
products. The continued decline in crude oil prices and the Canadian dollar has further boosted the Forestry sector.
Many of these stocks remain attractively valued given the quality of the businesses and the rising free cash flow
being generated.
Lower grain and oilseed prices year-on-year from inventory overhangs will impact farm economics, with
flow-on effects passed on to the demand for agricultural equipment and other inputs. However, meat producers
generally benefit from lower grain prices as feed costs are reduced. The Fund benefits from an overweight
exposure to supply chain companies, where record crops support grain handling, processing and transport
volumes.
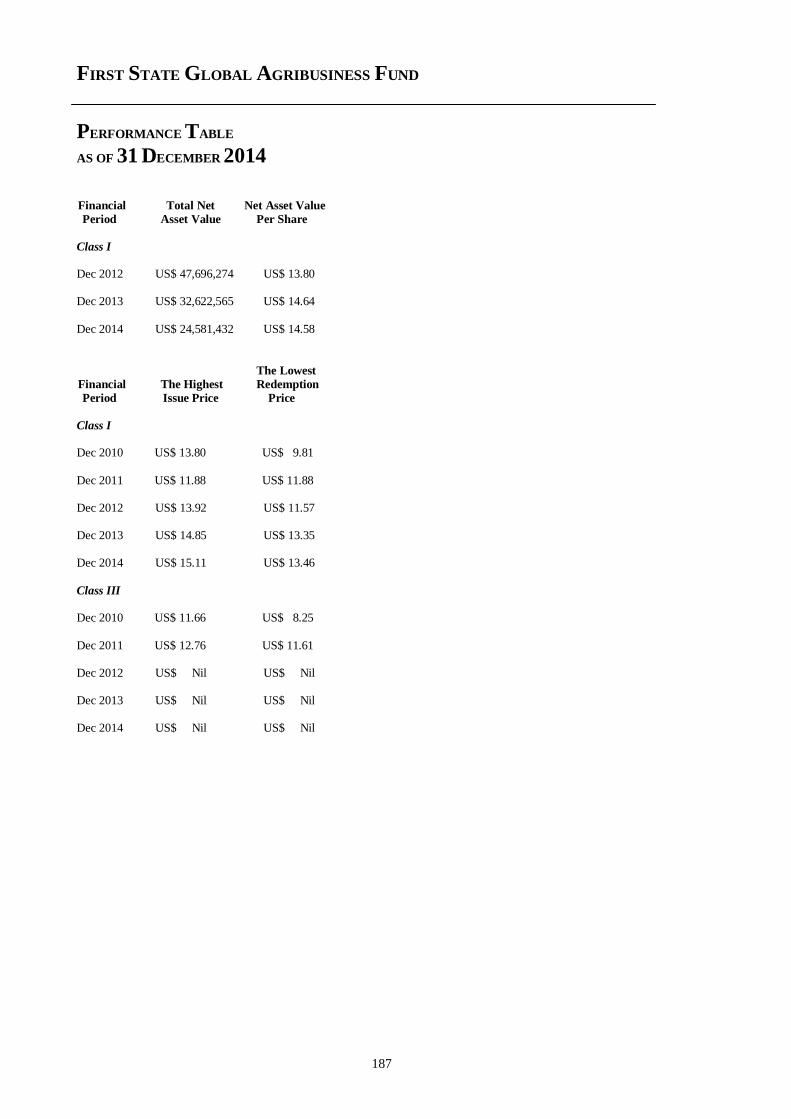
FIRST STATE GLOBAL AGRIBUSINESS FUND
PERFORMANCE TABLE
AS OF 31 DECEMBER 2014
187
Financial Total Net Net Asset Value
Period Asset Value Per Share
Class I Dec 2012 US$ 47,696,274 US$ 13.80 Dec 2013 US$ 32,622,565 US$ 14.64
Dec 2014 US$ 24,581,432 US$ 14.58
The Lowest
Financial The Highest Redemption
Period Issue Price Price
Class I
Dec 2010 US$ 13.80 US$ 9.81
Dec 2011 US$ 11.88 US$ 11.88
Dec 2012 US$ 13.92 US$ 11.57 Dec 2013 US$ 14.85 US$ 13.35 Dec 2014 US$ 15.11 US$ 13.46
Class III
Dec 2010 US$ 11.66 US$ 8.25
Dec 2011 US$ 12.76 US$ 11.61 Dec 2012 US$ Nil US$ Nil Dec 2013 US$ Nil US$ Nil Dec 2014 US$ Nil US$ Nil
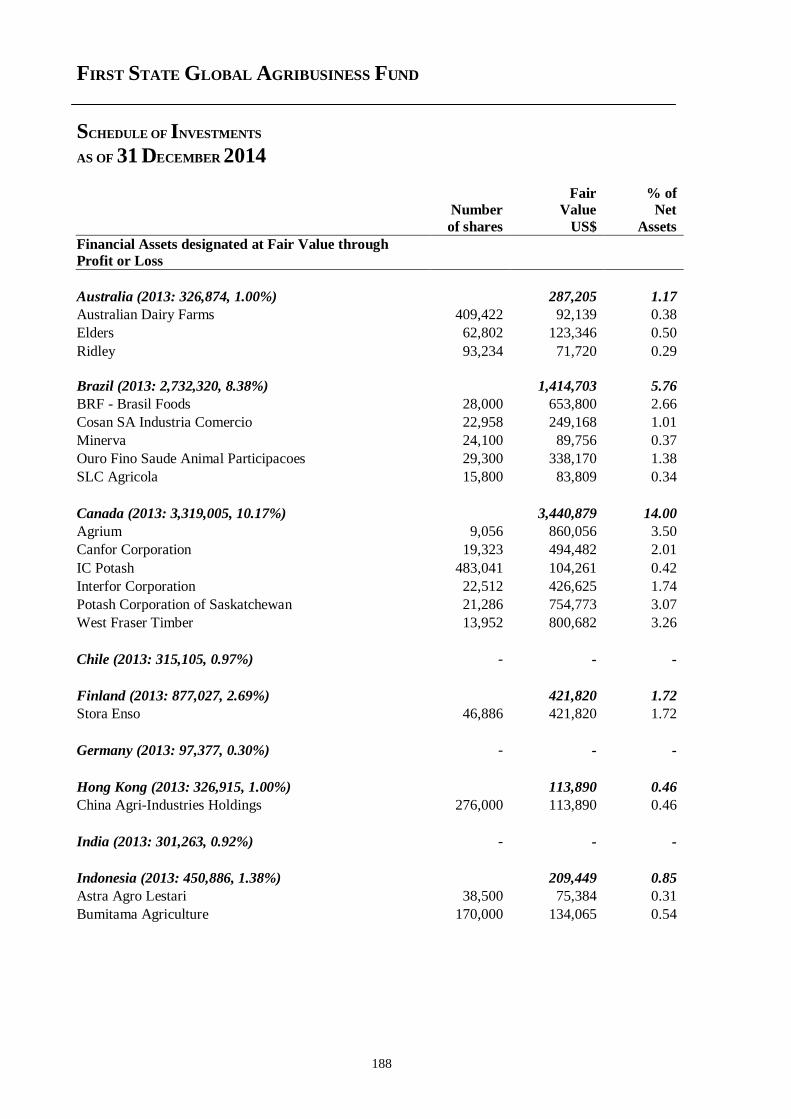
FIRST STATE GLOBAL AGRIBUSINESS FUND
SCHEDULE OF INVESTMENTS
AS OF 31 DECEMBER 2014
188
Fair % of Number Value Net
of shares US$ Assets
Financial Assets designated at Fair Value through
Profit or Loss
Australia (2013: 326,874, 1.00%) 287,205 1.17
Australian Dairy Farms 409,422 92,139 0.38
Elders 62,802 123,346 0.50
Ridley 93,234 71,720 0.29
Brazil (2013: 2,732,320, 8.38%) 1,414,703 5.76
BRF - Brasil Foods 28,000 653,800 2.66
Cosan SA Industria Comercio 22,958 249,168 1.01
Minerva 24,100 89,756 0.37
Ouro Fino Saude Animal Participacoes 29,300 338,170 1.38
SLC Agricola 15,800 83,809 0.34
Canada (2013: 3,319,005, 10.17%) 3,440,879 14.00
Agrium 9,056 860,056 3.50
Canfor Corporation 19,323 494,482 2.01
IC Potash 483,041 104,261 0.42
Interfor Corporation 22,512 426,625 1.74
Potash Corporation of Saskatchewan 21,286 754,773 3.07
West Fraser Timber 13,952 800,682 3.26
Chile (2013: 315,105, 0.97%) - - -
Finland (2013: 877,027, 2.69%) 421,820 1.72
Stora Enso 46,886 421,820 1.72
Germany (2013: 97,377, 0.30%) - - -
Hong Kong (2013: 326,915, 1.00%) 113,890 0.46
China Agri-Industries Holdings 276,000 113,890 0.46
India (2013: 301,263, 0.92%) - - -
Indonesia (2013: 450,886, 1.38%) 209,449 0.85
Astra Agro Lestari 38,500 75,384 0.31
Bumitama Agriculture 170,000 134,065 0.54
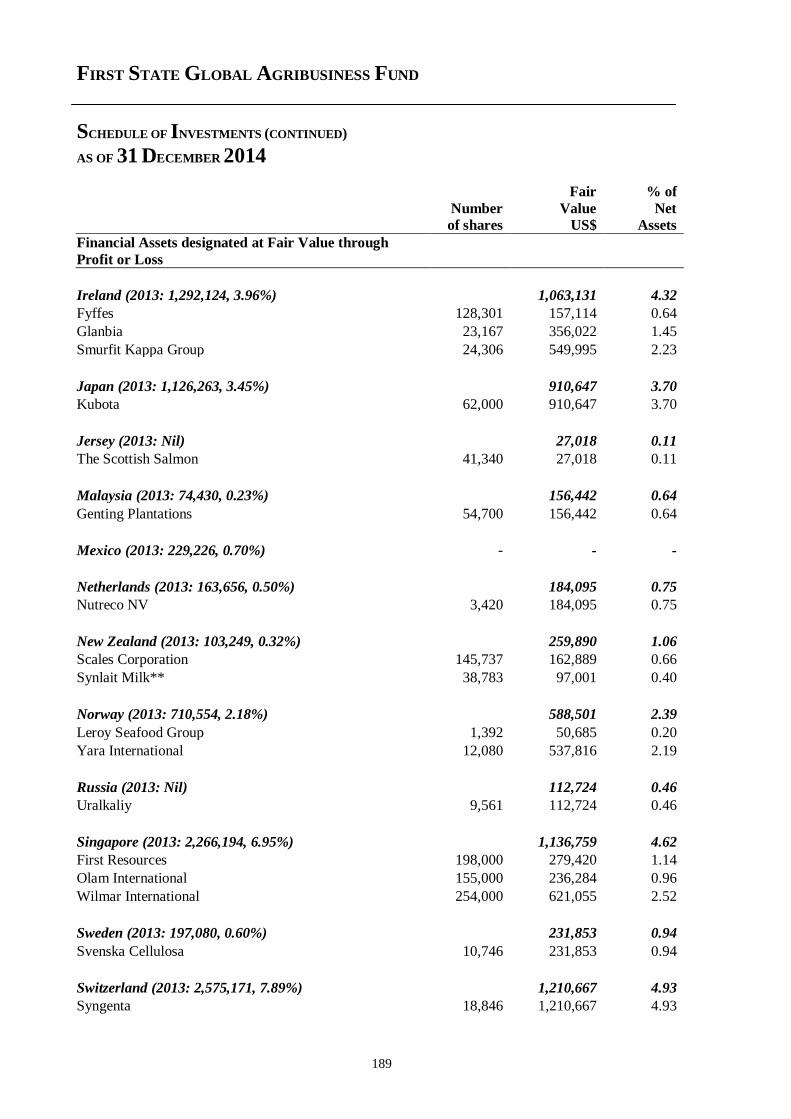
FIRST STATE GLOBAL AGRIBUSINESS FUND
SCHEDULE OF INVESTMENTS (CONTINUED)
AS OF 31 DECEMBER 2014
189
Fair % of
Number Value Net of shares US$ Assets
Financial Assets designated at Fair Value through
Profit or Loss
Ireland (2013: 1,292,124, 3.96%) 1,063,131 4.32
Fyffes 128,301 157,114 0.64
Glanbia 23,167 356,022 1.45
Smurfit Kappa Group 24,306 549,995 2.23
Japan (2013: 1,126,263, 3.45%) 910,647 3.70
Kubota 62,000 910,647 3.70
Jersey (2013: Nil) 27,018 0.11
The Scottish Salmon 41,340 27,018 0.11
Malaysia (2013: 74,430, 0.23%) 156,442 0.64
Genting Plantations 54,700 156,442 0.64
Mexico (2013: 229,226, 0.70%) - - -
Netherlands (2013: 163,656, 0.50%) 184,095 0.75
Nutreco NV 3,420 184,095 0.75
New Zealand (2013: 103,249, 0.32%) 259,890 1.06
Scales Corporation 145,737 162,889 0.66
Synlait Milk** 38,783 97,001 0.40
Norway (2013: 710,554, 2.18%) 588,501 2.39
Leroy Seafood Group 1,392 50,685 0.20
Yara International 12,080 537,816 2.19
Russia (2013: Nil) 112,724 0.46
Uralkaliy 9,561 112,724 0.46
Singapore (2013: 2,266,194, 6.95%) 1,136,759 4.62
First Resources 198,000 279,420 1.14
Olam International 155,000 236,284 0.96
Wilmar International 254,000 621,055 2.52
Sweden (2013: 197,080, 0.60%) 231,853 0.94
Svenska Cellulosa 10,746 231,853 0.94
Switzerland (2013: 2,575,171, 7.89%) 1,210,667 4.93
Syngenta 18,846 1,210,667 4.93
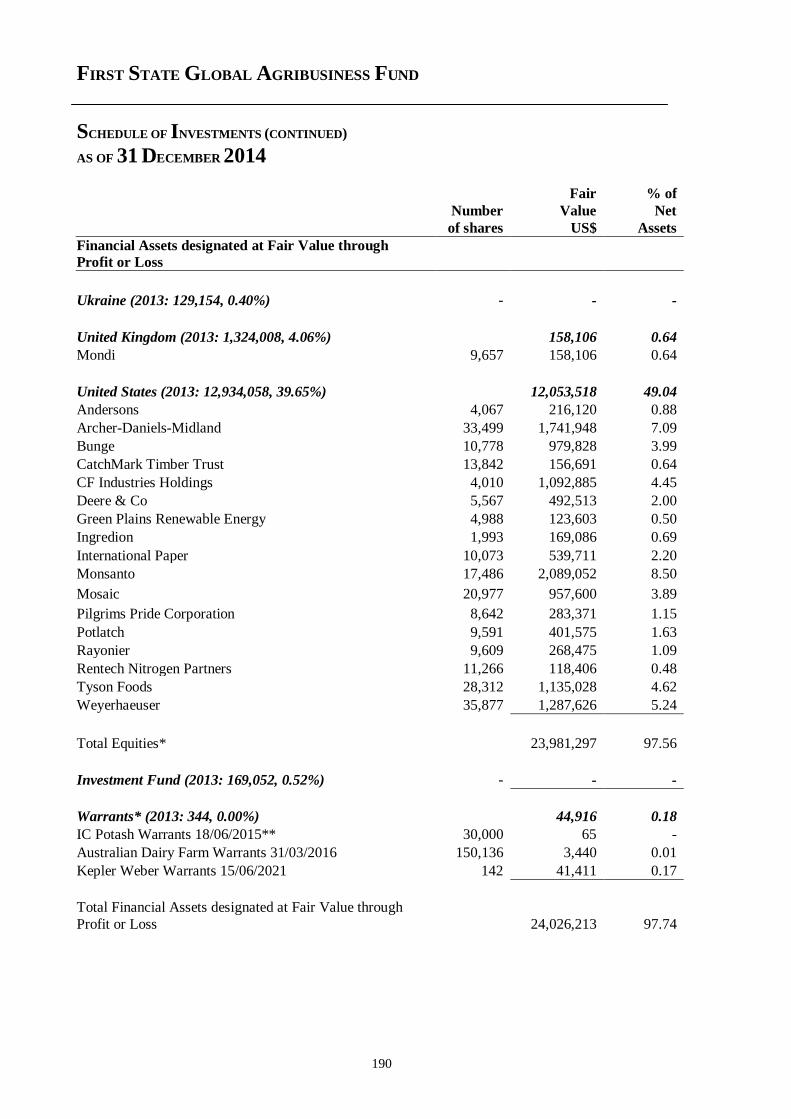
FIRST STATE GLOBAL AGRIBUSINESS FUND
SCHEDULE OF INVESTMENTS (CONTINUED)
AS OF 31 DECEMBER 2014
190
Fair % of
Number Value Net
of shares US$ Assets
Financial Assets designated at Fair Value through
Profit or Loss
Ukraine (2013: 129,154, 0.40%) - - -
United Kingdom (2013: 1,324,008, 4.06%) 158,106 0.64
Mondi 9,657 158,106 0.64
United States (2013: 12,934,058, 39.65%) 12,053,518 49.04
Andersons 4,067 216,120 0.88
Archer-Daniels-Midland 33,499 1,741,948 7.09
Bunge 10,778 979,828 3.99
CatchMark Timber Trust 13,842 156,691 0.64
CF Industries Holdings 4,010 1,092,885 4.45
Deere & Co 5,567 492,513 2.00
Green Plains Renewable Energy 4,988 123,603 0.50
Ingredion 1,993 169,086 0.69
International Paper 10,073 539,711 2.20
Monsanto 17,486 2,089,052 8.50
Mosaic 20,977 957,600 3.89
Pilgrims Pride Corporation 8,642 283,371 1.15
Potlatch 9,591 401,575 1.63
Rayonier 9,609 268,475 1.09
Rentech Nitrogen Partners 11,266 118,406 0.48
Tyson Foods 28,312 1,135,028 4.62
Weyerhaeuser 35,877 1,287,626 5.24
Total Equities* 23,981,297 97.56
Investment Fund (2013: 169,052, 0.52%) - - -
Warrants* (2013: 344, 0.00%) 44,916 0.18
IC Potash Warrants 18/06/2015** 30,000 65 -
Australian Dairy Farm Warrants 31/03/2016 150,136 3,440 0.01
Kepler Weber Warrants 15/06/2021 142 41,411 0.17
Total Financial Assets designated at Fair Value through
Profit or Loss 24,026,213 97.74
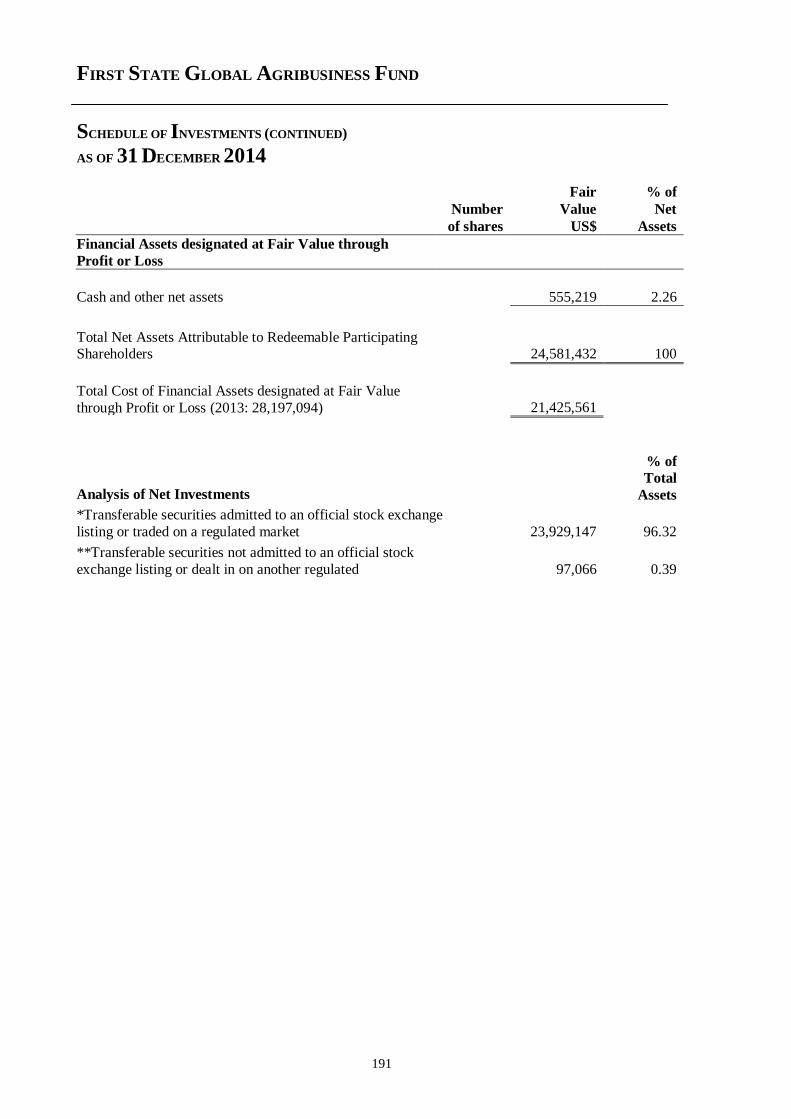
FIRST STATE GLOBAL AGRIBUSINESS FUND
SCHEDULE OF INVESTMENTS (CONTINUED)
AS OF 31 DECEMBER 2014
191
Fair % of
Number Value Net
of shares US$ Assets
Financial Assets designated at Fair Value through
Profit or Loss
Cash and other net assets 555,219 2.26
Total Net Assets Attributable to Redeemable Participating Shareholders 24,581,432 100
Total Cost of Financial Assets designated at Fair Value
through Profit or Loss (2013: 28,197,094) 21,425,561
Analysis of Net Investments
% of
Total
Assets
*Transferable securities admitted to an official stock exchange
listing or traded on a regulated market 23,929,147 96.32
**Transferable securities not admitted to an official stock
exchange listing or dealt in on another regulated 97,066 0.39
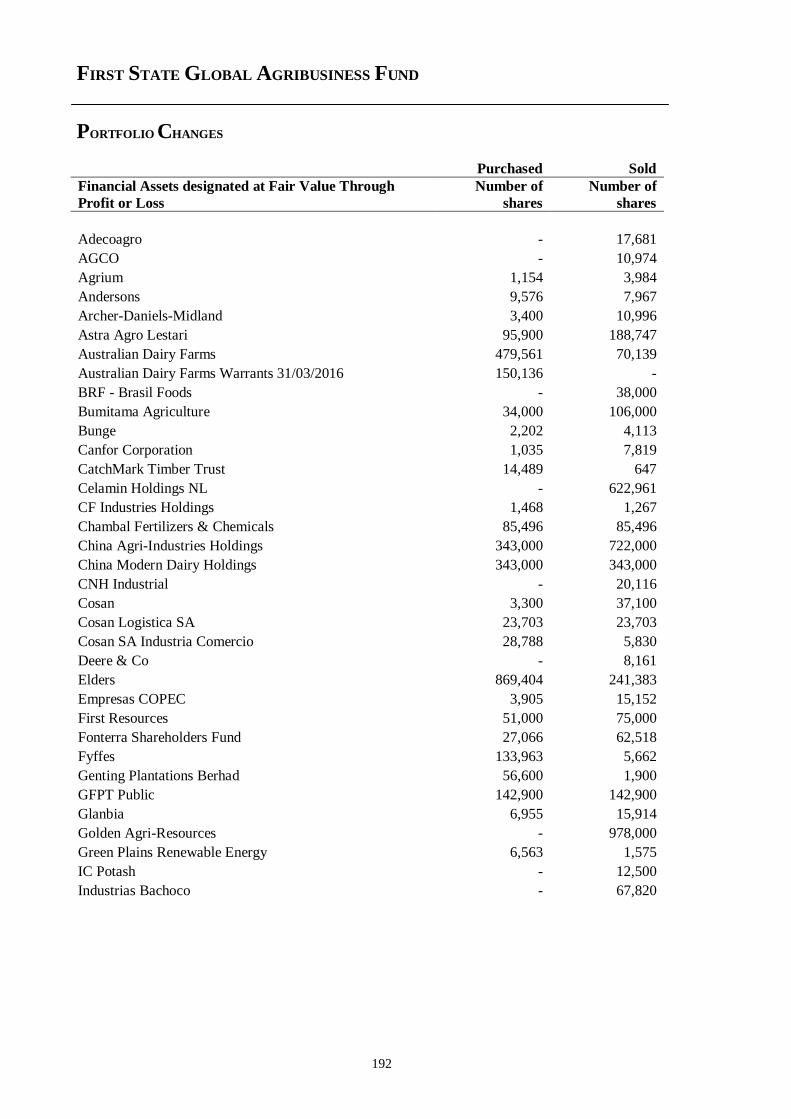
FIRST STATE GLOBAL AGRIBUSINESS FUND
PORTFOLIO CHANGES
192
Purchased Sold
Financial Assets designated at Fair Value Through
Profit or Loss
Number of
shares
Number of
shares
Adecoagro - 17,681
AGCO - 10,974
Agrium 1,154 3,984
Andersons 9,576 7,967
Archer-Daniels-Midland 3,400 10,996
Astra Agro Lestari 95,900 188,747
Australian Dairy Farms 479,561 70,139
Australian Dairy Farms Warrants 31/03/2016 150,136 -
BRF - Brasil Foods - 38,000
Bumitama Agriculture 34,000 106,000
Bunge 2,202 4,113
Canfor Corporation 1,035 7,819
CatchMark Timber Trust 14,489 647
Celamin Holdings NL - 622,961
CF Industries Holdings 1,468 1,267
Chambal Fertilizers & Chemicals 85,496 85,496
China Agri-Industries Holdings 343,000 722,000
China Modern Dairy Holdings 343,000 343,000
CNH Industrial - 20,116
Cosan 3,300 37,100
Cosan Logistica SA 23,703 23,703
Cosan SA Industria Comercio 28,788 5,830
Deere & Co - 8,161
Elders 869,404 241,383
Empresas COPEC 3,905 15,152
First Resources 51,000 75,000
Fonterra Shareholders Fund 27,066 62,518
Fyffes 133,963 5,662
Genting Plantations Berhad 56,600 1,900
GFPT Public 142,900 142,900
Glanbia 6,955 15,914
Golden Agri-Resources - 978,000
Green Plains Renewable Energy 6,563 1,575
IC Potash - 12,500
Industrias Bachoco - 67,820
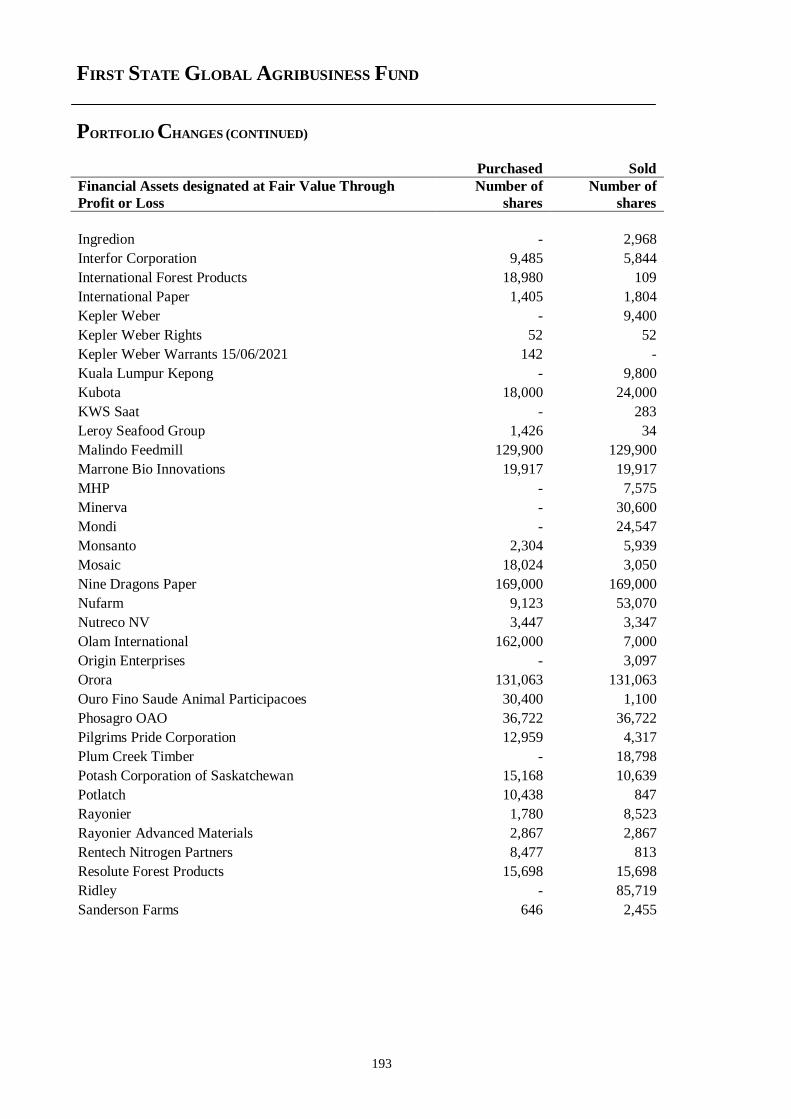
FIRST STATE GLOBAL AGRIBUSINESS FUND
PORTFOLIO CHANGES (CONTINUED)
193
Purchased Sold
Financial Assets designated at Fair Value Through
Profit or Loss
Number of
shares
Number of
shares
Ingredion - 2,968
Interfor Corporation 9,485 5,844
International Forest Products 18,980 109
International Paper 1,405 1,804
Kepler Weber - 9,400
Kepler Weber Rights 52 52
Kepler Weber Warrants 15/06/2021 142 -
Kuala Lumpur Kepong - 9,800
Kubota 18,000 24,000
KWS Saat - 283
Leroy Seafood Group 1,426 34
Malindo Feedmill 129,900 129,900
Marrone Bio Innovations 19,917 19,917
MHP - 7,575
Minerva - 30,600
Mondi - 24,547
Monsanto 2,304 5,939
Mosaic 18,024 3,050
Nine Dragons Paper 169,000 169,000
Nufarm 9,123 53,070
Nutreco NV 3,447 3,347
Olam International 162,000 7,000
Origin Enterprises - 3,097
Orora 131,063 131,063
Ouro Fino Saude Animal Participacoes 30,400 1,100
Phosagro OAO 36,722 36,722
Pilgrims Pride Corporation 12,959 4,317
Plum Creek Timber - 18,798
Potash Corporation of Saskatchewan 15,168 10,639
Potlatch 10,438 847
Rayonier 1,780 8,523
Rayonier Advanced Materials 2,867 2,867
Rentech Nitrogen Partners 8,477 813
Resolute Forest Products 15,698 15,698
Ridley - 85,719
Sanderson Farms 646 2,455
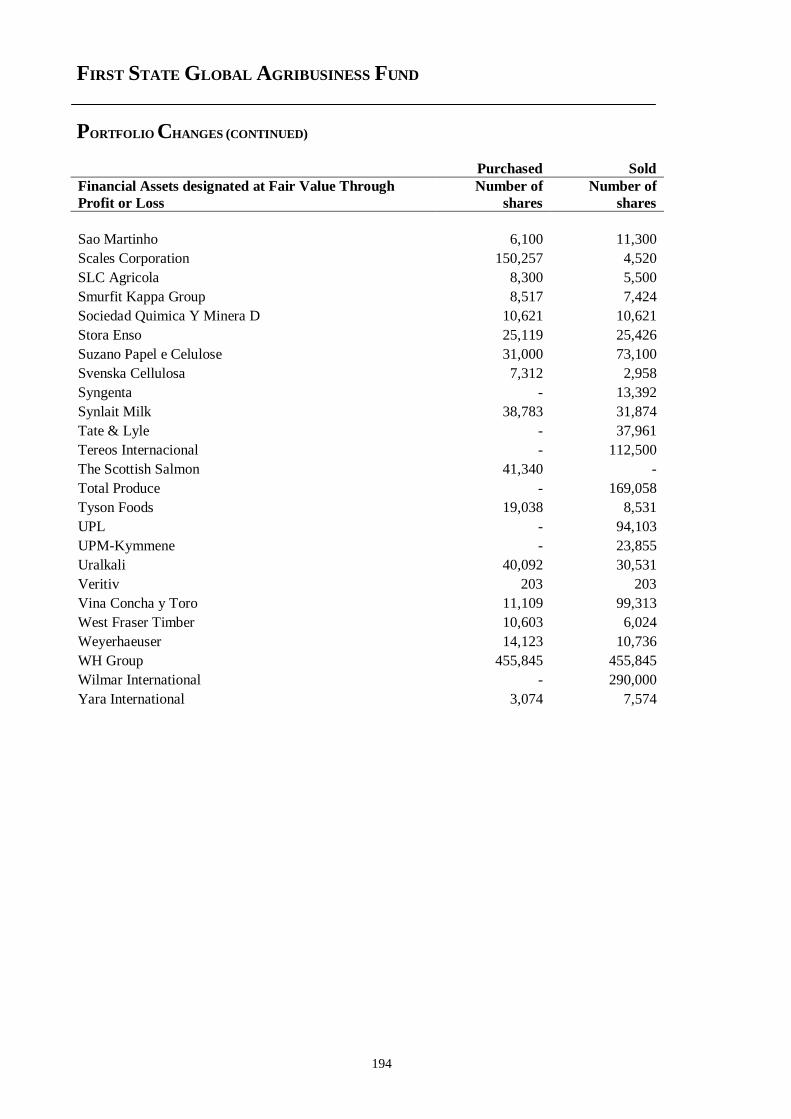
FIRST STATE GLOBAL AGRIBUSINESS FUND
PORTFOLIO CHANGES (CONTINUED)
194
Purchased Sold
Financial Assets designated at Fair Value Through
Profit or Loss
Number of
shares
Number of
shares
Sao Martinho 6,100 11,300
Scales Corporation 150,257 4,520
SLC Agricola 8,300 5,500
Smurfit Kappa Group 8,517 7,424
Sociedad Quimica Y Minera D 10,621 10,621
Stora Enso 25,119 25,426
Suzano Papel e Celulose 31,000 73,100
Svenska Cellulosa 7,312 2,958
Syngenta - 13,392
Synlait Milk 38,783 31,874
Tate & Lyle - 37,961
Tereos Internacional - 112,500
The Scottish Salmon 41,340 -
Total Produce - 169,058
Tyson Foods 19,038 8,531
UPL - 94,103
UPM-Kymmene - 23,855
Uralkali 40,092 30,531
Veritiv 203 203
Vina Concha y Toro 11,109 99,313
West Fraser Timber 10,603 6,024
Weyerhaeuser 14,123 10,736
WH Group 455,845 455,845
Wilmar International - 290,000
Yara International 3,074 7,574
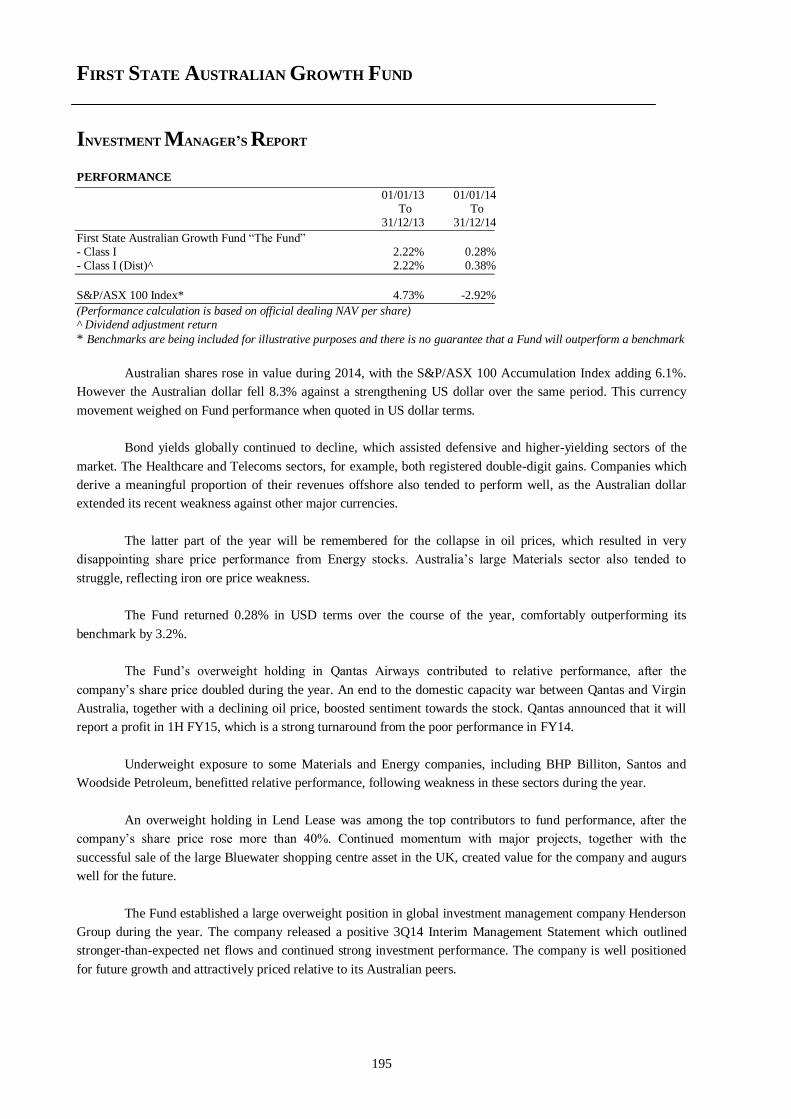
FIRST STATE AUSTRALIAN GROWTH FUND
INVESTMENT MANAGER’S REPORT
195
PERFORMANCE
01/01/13 01/01/14 To To 31/12/13 31/12/14
First State Australian Growth Fund “The Fund” - Class I 2.22% 0.28% - Class I (Dist)^ 2.22% 0.38%
S&P/ASX 100 Index* 4.73% -2.92%
(Performance calculation is based on official dealing NAV per share) ^ Dividend adjustment return * Benchmarks are being included for illustrative purposes and there is no guarantee that a Fund will outperform a benchmark
Australian shares rose in value during 2014, with the S&P/ASX 100 Accumulation Index adding 6.1%.
However the Australian dollar fell 8.3% against a strengthening US dollar over the same period. This currency
movement weighed on Fund performance when quoted in US dollar terms.
Bond yields globally continued to decline, which assisted defensive and higher-yielding sectors of the
market. The Healthcare and Telecoms sectors, for example, both registered double-digit gains. Companies which
derive a meaningful proportion of their revenues offshore also tended to perform well, as the Australian dollar
extended its recent weakness against other major currencies.
The latter part of the year will be remembered for the collapse in oil prices, which resulted in very
disappointing share price performance from Energy stocks. Australia’s large Materials sector also tended to
struggle, reflecting iron ore price weakness.
The Fund returned 0.28% in USD terms over the course of the year, comfortably outperforming its
benchmark by 3.2%.
The Fund’s overweight holding in Qantas Airways contributed to relative performance, after the
company’s share price doubled during the year. An end to the domestic capacity war between Qantas and Virgin
Australia, together with a declining oil price, boosted sentiment towards the stock. Qantas announced that it will
report a profit in 1H FY15, which is a strong turnaround from the poor performance in FY14.
Underweight exposure to some Materials and Energy companies, including BHP Billiton, Santos and
Woodside Petroleum, benefitted relative performance, following weakness in these sectors during the year.
An overweight holding in Lend Lease was among the top contributors to fund performance, after the
company’s share price rose more than 40%. Continued momentum with major projects, together with the
successful sale of the large Bluewater shopping centre asset in the UK, created value for the company and augurs
well for the future.
The Fund established a large overweight position in global investment management company Henderson
Group during the year. The company released a positive 3Q14 Interim Management Statement which outlined
stronger-than-expected net flows and continued strong investment performance. The company is well positioned
for future growth and attractively priced relative to its Australian peers.
FIRST STATE AUSTRALIAN GROWTH FUND
INVESTMENT MANAGER’S REPORT (CONTINUED)
196
The Fund established a position in National Australia Bank. A further disposal of non-core UK assets in
December provides encouragement that new management is continuing to work through the bank’s problem
businesses. We expect these divestments to ultimately benefit the share price.
We sold our holding in casino owner and operator Echo Entertainment. The company’s share price has
performed well over the year, so we took profits and reallocated the capital where we believe there are better
opportunities for growth.
During 2014 the Australian dollar fell 8.4% against the US dollar. Falling commodity prices and a
weaker growth trajectory are part of the story, but US dollar strength is the main tail wind behind these falls. The
Reserve Bank of Australia publicly stated at the end of the year that it would like to see the Australian dollar
weaker still, at US$0.75.
Capital growth from Australian shares during 2014 was relatively low, with dividends accounting for the
vast majority of the S&P/ASX 100 Accumulation Index’s return. While dividend yields are likely to remain above
4% (in AUD), the key question for investors is whether Australian companies can increase revenues to generate
more meaningful earnings growth in 2015 and beyond.
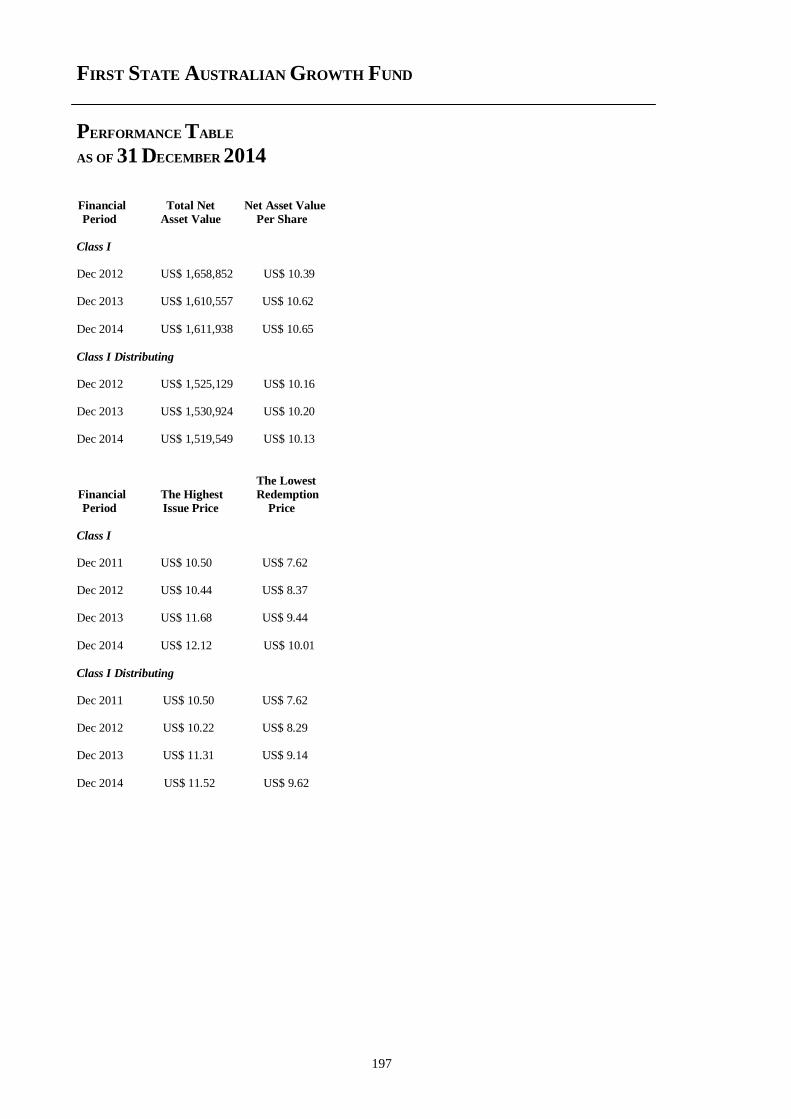
FIRST STATE AUSTRALIAN GROWTH FUND
PERFORMANCE TABLE
AS OF 31 DECEMBER 2014
197
Financial Total Net Net Asset Value
Period Asset Value Per Share
Class I
Dec 2012 US$ 1,658,852 US$ 10.39
Dec 2013 US$ 1,610,557 US$ 10.62
Dec 2014 US$ 1,611,938 US$ 10.65
Class I Distributing
Dec 2012 US$ 1,525,129 US$ 10.16 Dec 2013 US$ 1,530,924 US$ 10.20 Dec 2014 US$ 1,519,549 US$ 10.13
The Lowest
Financial The Highest Redemption
Period Issue Price Price
Class I
Dec 2011 US$ 10.50 US$ 7.62 Dec 2012 US$ 10.44 US$ 8.37 Dec 2013 US$ 11.68 US$ 9.44
Dec 2014 US$ 12.12 US$ 10.01
Class I Distributing
Dec 2011 US$ 10.50 US$ 7.62 Dec 2012 US$ 10.22 US$ 8.29
Dec 2013 US$ 11.31 US$ 9.14
Dec 2014 US$ 11.52 US$ 9.62
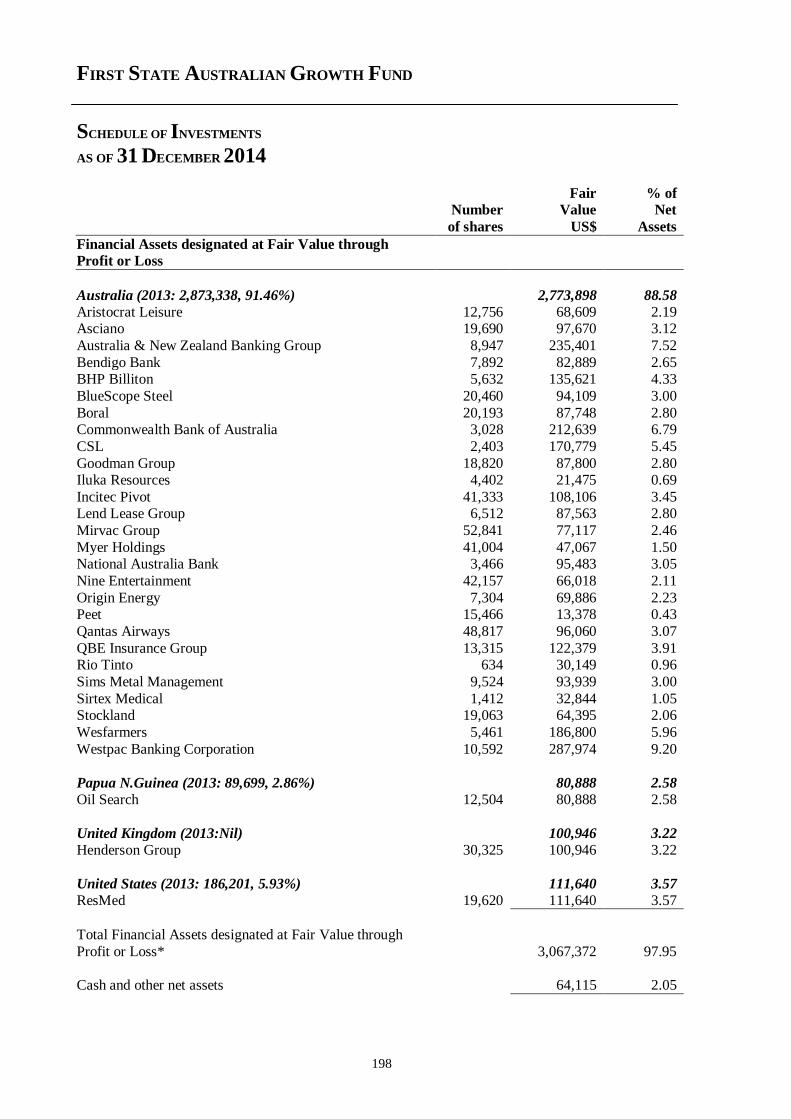
FIRST STATE AUSTRALIAN GROWTH FUND
SCHEDULE OF INVESTMENTS
AS OF 31 DECEMBER 2014
198
Fair % of Number Value Net
of shares US$ Assets
Financial Assets designated at Fair Value through
Profit or Loss
Australia (2013: 2,873,338, 91.46%) 2,773,898 88.58
Aristocrat Leisure 12,756 68,609 2.19 Asciano 19,690 97,670 3.12
Australia & New Zealand Banking Group 8,947 235,401 7.52
Bendigo Bank 7,892 82,889 2.65 BHP Billiton 5,632 135,621 4.33
BlueScope Steel 20,460 94,109 3.00
Boral 20,193 87,748 2.80 Commonwealth Bank of Australia 3,028 212,639 6.79
CSL 2,403 170,779 5.45
Goodman Group 18,820 87,800 2.80 Iluka Resources 4,402 21,475 0.69
Incitec Pivot 41,333 108,106 3.45 Lend Lease Group 6,512 87,563 2.80
Mirvac Group 52,841 77,117 2.46
Myer Holdings 41,004 47,067 1.50 National Australia Bank 3,466 95,483 3.05
Nine Entertainment 42,157 66,018 2.11
Origin Energy 7,304 69,886 2.23 Peet 15,466 13,378 0.43
Qantas Airways 48,817 96,060 3.07
QBE Insurance Group 13,315 122,379 3.91 Rio Tinto 634 30,149 0.96
Sims Metal Management 9,524 93,939 3.00
Sirtex Medical 1,412 32,844 1.05 Stockland 19,063 64,395 2.06
Wesfarmers 5,461 186,800 5.96
Westpac Banking Corporation 10,592 287,974 9.20
Papua N.Guinea (2013: 89,699, 2.86%) 80,888 2.58
Oil Search 12,504 80,888 2.58
United Kingdom (2013:Nil) 100,946 3.22
Henderson Group 30,325 100,946 3.22
United States (2013: 186,201, 5.93%) 111,640 3.57
ResMed 19,620 111,640 3.57
Total Financial Assets designated at Fair Value through
Profit or Loss*
3,067,372 97.95
Cash and other net assets 64,115 2.05
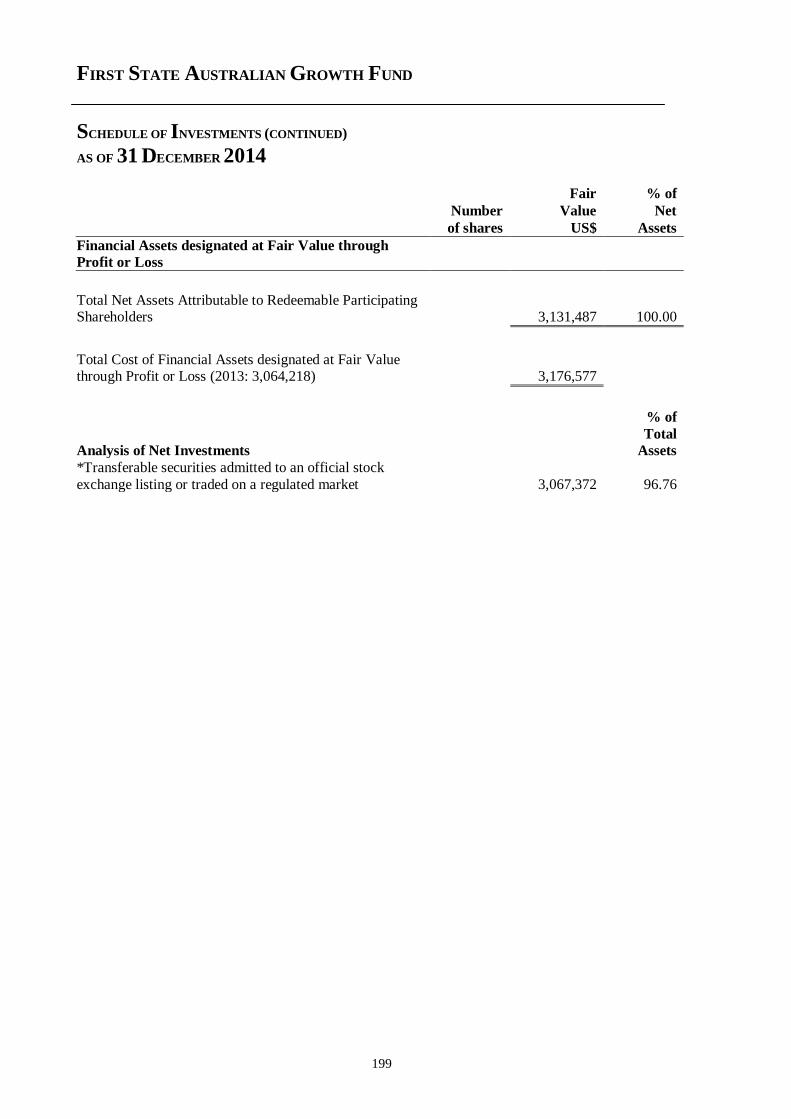
FIRST STATE AUSTRALIAN GROWTH FUND
SCHEDULE OF INVESTMENTS (CONTINUED)
AS OF 31 DECEMBER 2014
199
Fair % of
Number Value Net
of shares US$ Assets
Financial Assets designated at Fair Value through
Profit or Loss
Total Net Assets Attributable to Redeemable Participating Shareholders 3,131,487 100.00
Total Cost of Financial Assets designated at Fair Value through Profit or Loss (2013: 3,064,218) 3,176,577
Analysis of Net Investments
% of
Total
Assets
*Transferable securities admitted to an official stock
exchange listing or traded on a regulated market 3,067,372 96.76
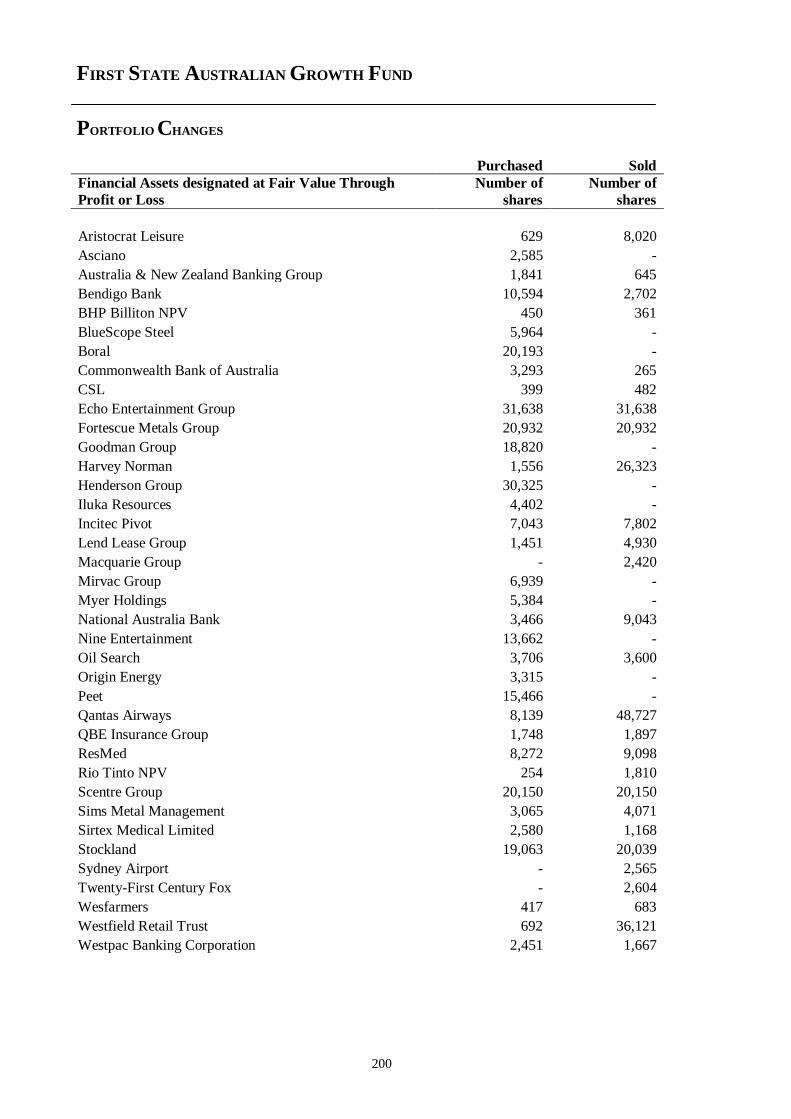
FIRST STATE AUSTRALIAN GROWTH FUND
PORTFOLIO CHANGES
200
Purchased Sold
Financial Assets designated at Fair Value Through
Profit or Loss
Number of
shares
Number of
shares
Aristocrat Leisure 629 8,020
Asciano 2,585 -
Australia & New Zealand Banking Group 1,841 645
Bendigo Bank 10,594 2,702
BHP Billiton NPV 450 361
BlueScope Steel 5,964 -
Boral 20,193 -
Commonwealth Bank of Australia 3,293 265
CSL 399 482
Echo Entertainment Group 31,638 31,638
Fortescue Metals Group 20,932 20,932
Goodman Group 18,820 -
Harvey Norman 1,556 26,323
Henderson Group 30,325 -
Iluka Resources 4,402 -
Incitec Pivot 7,043 7,802
Lend Lease Group 1,451 4,930
Macquarie Group - 2,420
Mirvac Group 6,939 -
Myer Holdings 5,384 -
National Australia Bank 3,466 9,043
Nine Entertainment 13,662 -
Oil Search 3,706 3,600
Origin Energy 3,315 -
Peet 15,466 -
Qantas Airways 8,139 48,727
QBE Insurance Group 1,748 1,897
ResMed 8,272 9,098
Rio Tinto NPV 254 1,810
Scentre Group 20,150 20,150
Sims Metal Management 3,065 4,071
Sirtex Medical Limited 2,580 1,168
Stockland 19,063 20,039
Sydney Airport - 2,565
Twenty-First Century Fox - 2,604
Wesfarmers 417 683
Westfield Retail Trust 692 36,121
Westpac Banking Corporation 2,451 1,667
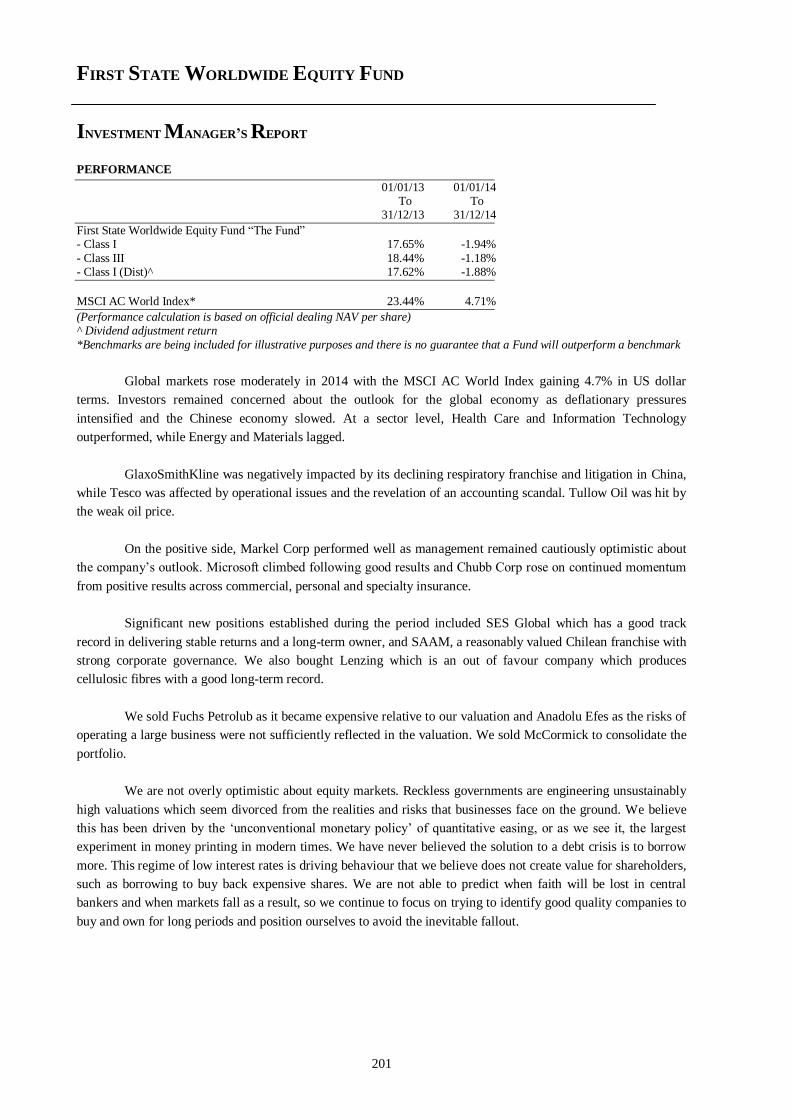
FIRST STATE WORLDWIDE EQUITY FUND
INVESTMENT MANAGER’S REPORT
201
PERFORMANCE
01/01/13 01/01/14 To To 31/12/13 31/12/14
First State Worldwide Equity Fund “The Fund” - Class I 17.65% -1.94%
- Class III 18.44% -1.18% - Class I (Dist)^ 17.62% -1.88%
MSCI AC World Index* 23.44% 4.71%
(Performance calculation is based on official dealing NAV per share) ^ Dividend adjustment return
*Benchmarks are being included for illustrative purposes and there is no guarantee that a Fund will outperform a benchmark
Global markets rose moderately in 2014 with the MSCI AC World Index gaining 4.7% in US dollar
terms. Investors remained concerned about the outlook for the global economy as deflationary pressures
intensified and the Chinese economy slowed. At a sector level, Health Care and Information Technology
outperformed, while Energy and Materials lagged.
GlaxoSmithKline was negatively impacted by its declining respiratory franchise and litigation in China,
while Tesco was affected by operational issues and the revelation of an accounting scandal. Tullow Oil was hit by
the weak oil price.
On the positive side, Markel Corp performed well as management remained cautiously optimistic about
the company’s outlook. Microsoft climbed following good results and Chubb Corp rose on continued momentum
from positive results across commercial, personal and specialty insurance.
Significant new positions established during the period included SES Global which has a good track
record in delivering stable returns and a long-term owner, and SAAM, a reasonably valued Chilean franchise with
strong corporate governance. We also bought Lenzing which is an out of favour company which produces
cellulosic fibres with a good long-term record.
We sold Fuchs Petrolub as it became expensive relative to our valuation and Anadolu Efes as the risks of
operating a large business were not sufficiently reflected in the valuation. We sold McCormick to consolidate the
portfolio.
We are not overly optimistic about equity markets. Reckless governments are engineering unsustainably
high valuations which seem divorced from the realities and risks that businesses face on the ground. We believe
this has been driven by the ‘unconventional monetary policy’ of quantitative easing, or as we see it, the largest
experiment in money printing in modern times. We have never believed the solution to a debt crisis is to borrow
more. This regime of low interest rates is driving behaviour that we believe does not create value for shareholders,
such as borrowing to buy back expensive shares. We are not able to predict when faith will be lost in central
bankers and when markets fall as a result, so we continue to focus on trying to identify good quality companies to
buy and own for long periods and position ourselves to avoid the inevitable fallout.
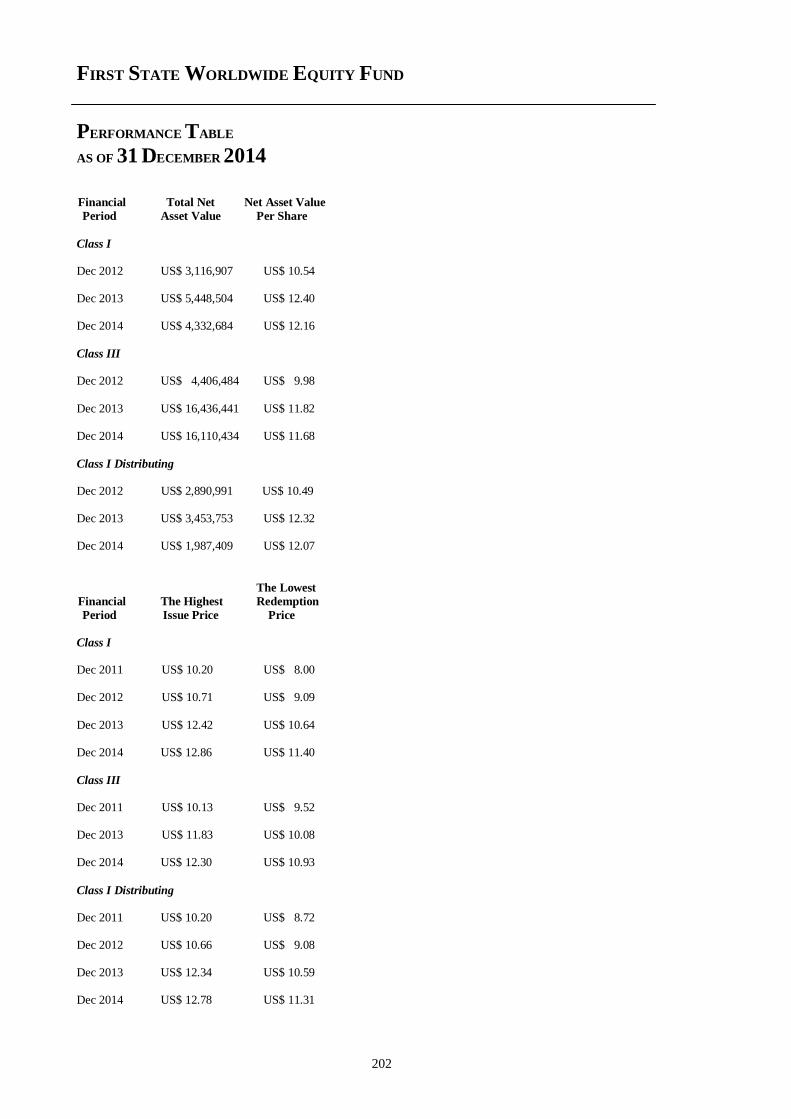
FIRST STATE WORLDWIDE EQUITY FUND
PERFORMANCE TABLE
AS OF 31 DECEMBER 2014
202
Financial Total Net Net Asset Value
Period Asset Value Per Share
Class I
Dec 2012 US$ 3,116,907 US$ 10.54 Dec 2013 US$ 5,448,504 US$ 12.40 Dec 2014 US$ 4,332,684 US$ 12.16
Class III
Dec 2012 US$ 4,406,484 US$ 9.98
Dec 2013 US$ 16,436,441 US$ 11.82 Dec 2014 US$ 16,110,434 US$ 11.68
Class I Distributing
Dec 2012 US$ 2,890,991 US$ 10.49 Dec 2013 US$ 3,453,753 US$ 12.32 Dec 2014 US$ 1,987,409 US$ 12.07
The Lowest
Financial The Highest Redemption
Period Issue Price Price
Class I
Dec 2011 US$ 10.20 US$ 8.00 Dec 2012 US$ 10.71 US$ 9.09
Dec 2013 US$ 12.42 US$ 10.64 Dec 2014 US$ 12.86 US$ 11.40
Class III
Dec 2011 US$ 10.13 US$ 9.52 Dec 2013 US$ 11.83 US$ 10.08 Dec 2014 US$ 12.30 US$ 10.93
Class I Distributing
Dec 2011 US$ 10.20 US$ 8.72 Dec 2012 US$ 10.66 US$ 9.08 Dec 2013 US$ 12.34 US$ 10.59 Dec 2014 US$ 12.78 US$ 11.31
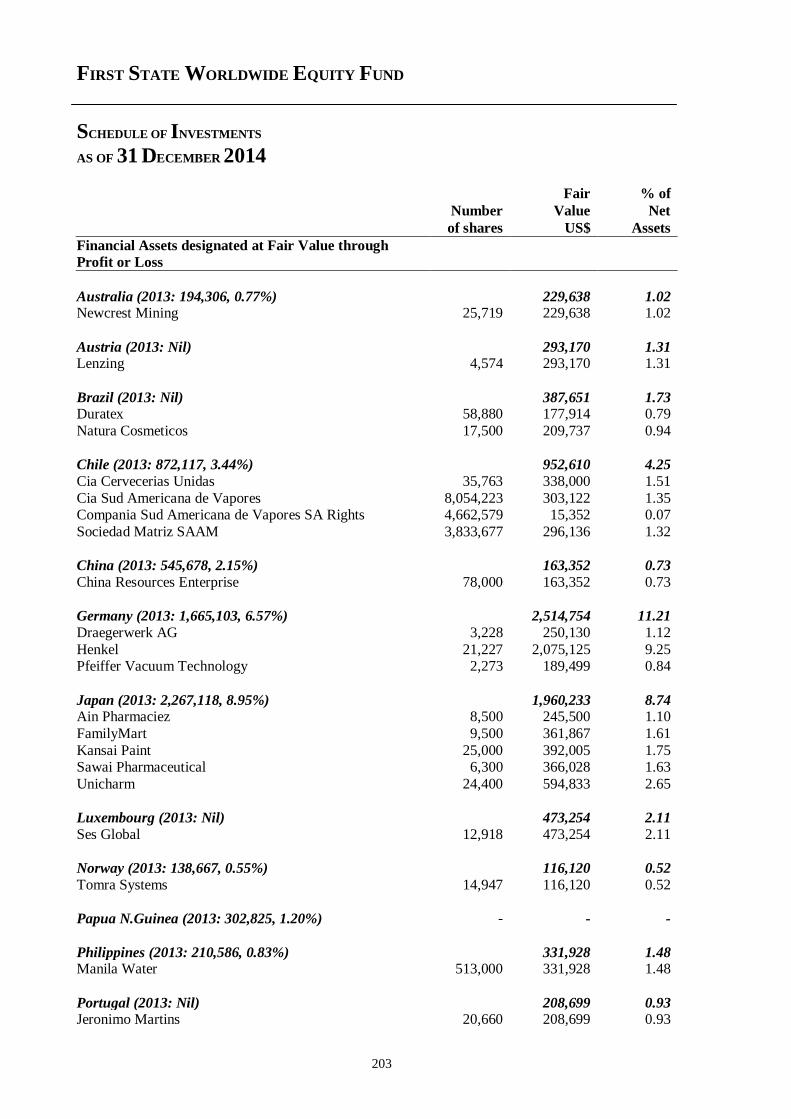
FIRST STATE WORLDWIDE EQUITY FUND
SCHEDULE OF INVESTMENTS
AS OF 31 DECEMBER 2014
203
Fair % of
Number Value Net
of shares US$ Assets
Financial Assets designated at Fair Value through
Profit or Loss
Australia (2013: 194,306, 0.77%) 229,638 1.02 Newcrest Mining 25,719 229,638 1.02
Austria (2013: Nil) 293,170 1.31 Lenzing 4,574 293,170 1.31
Brazil (2013: Nil) 387,651 1.73 Duratex 58,880 177,914 0.79
Natura Cosmeticos 17,500 209,737 0.94
Chile (2013: 872,117, 3.44%) 952,610 4.25
Cia Cervecerias Unidas 35,763 338,000 1.51
Cia Sud Americana de Vapores 8,054,223 303,122 1.35 Compania Sud Americana de Vapores SA Rights 4,662,579 15,352 0.07
Sociedad Matriz SAAM 3,833,677 296,136 1.32
China (2013: 545,678, 2.15%) 163,352 0.73
China Resources Enterprise 78,000 163,352 0.73
Germany (2013: 1,665,103, 6.57%) 2,514,754 11.21
Draegerwerk AG 3,228 250,130 1.12
Henkel 21,227 2,075,125 9.25 Pfeiffer Vacuum Technology 2,273 189,499 0.84
Japan (2013: 2,267,118, 8.95%) 1,960,233 8.74 Ain Pharmaciez 8,500 245,500 1.10
FamilyMart 9,500 361,867 1.61
Kansai Paint 25,000 392,005 1.75 Sawai Pharmaceutical 6,300 366,028 1.63
Unicharm 24,400 594,833 2.65
Luxembourg (2013: Nil) 473,254 2.11
Ses Global 12,918 473,254 2.11
Norway (2013: 138,667, 0.55%) 116,120 0.52
Tomra Systems 14,947 116,120 0.52
Papua N.Guinea (2013: 302,825, 1.20%) - - -
Philippines (2013: 210,586, 0.83%) 331,928 1.48 Manila Water 513,000 331,928 1.48
Portugal (2013: Nil) 208,699 0.93 Jeronimo Martins 20,660 208,699 0.93
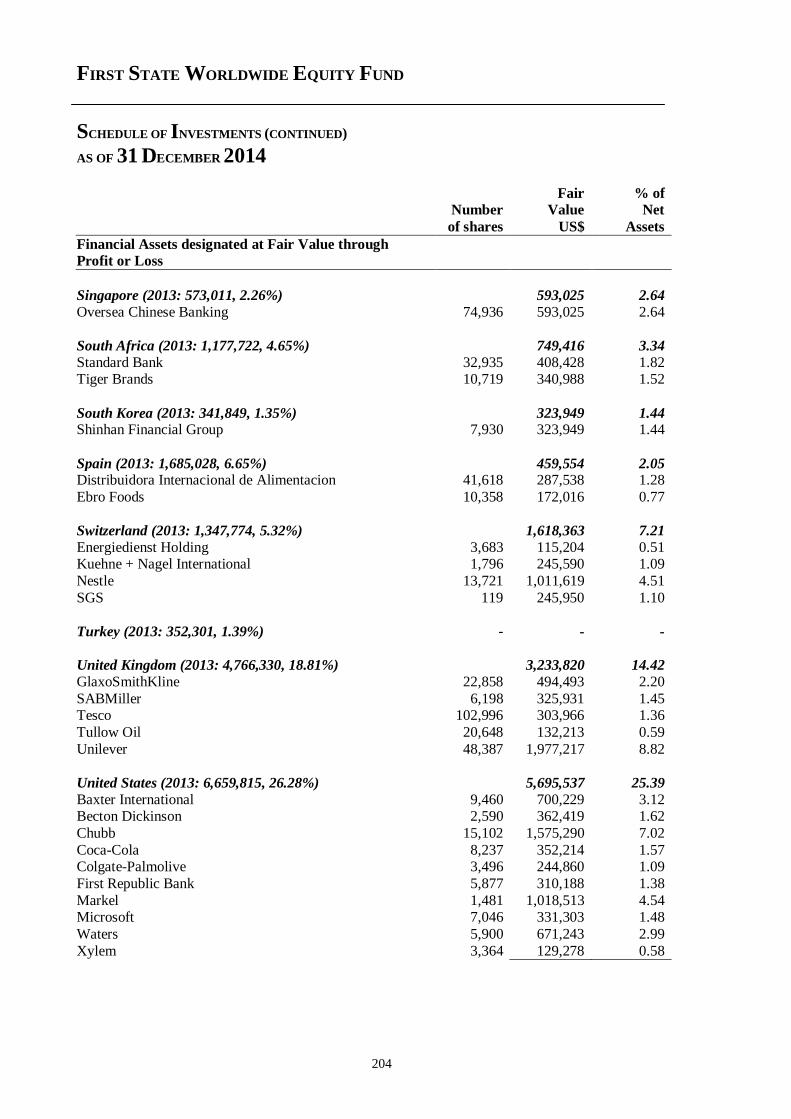
FIRST STATE WORLDWIDE EQUITY FUND
SCHEDULE OF INVESTMENTS (CONTINUED)
AS OF 31 DECEMBER 2014
204
Fair % of Number Value Net
of shares US$ Assets
Financial Assets designated at Fair Value through
Profit or Loss
Singapore (2013: 573,011, 2.26%) 593,025 2.64
Oversea Chinese Banking 74,936 593,025 2.64
South Africa (2013: 1,177,722, 4.65%) 749,416 3.34
Standard Bank 32,935 408,428 1.82 Tiger Brands 10,719 340,988 1.52
South Korea (2013: 341,849, 1.35%) 323,949 1.44 Shinhan Financial Group 7,930 323,949 1.44
Spain (2013: 1,685,028, 6.65%) 459,554 2.05 Distribuidora Internacional de Alimentacion 41,618 287,538 1.28
Ebro Foods 10,358 172,016 0.77
Switzerland (2013: 1,347,774, 5.32%) 1,618,363 7.21
Energiedienst Holding 3,683 115,204 0.51 Kuehne + Nagel International 1,796 245,590 1.09
Nestle 13,721 1,011,619 4.51
SGS 119 245,950 1.10
Turkey (2013: 352,301, 1.39%) - - -
United Kingdom (2013: 4,766,330, 18.81%) 3,233,820 14.42
GlaxoSmithKline 22,858 494,493 2.20
SABMiller 6,198 325,931 1.45 Tesco 102,996 303,966 1.36
Tullow Oil 20,648 132,213 0.59
Unilever 48,387 1,977,217 8.82
United States (2013: 6,659,815, 26.28%) 5,695,537 25.39
Baxter International 9,460 700,229 3.12 Becton Dickinson 2,590 362,419 1.62
Chubb 15,102 1,575,290 7.02
Coca-Cola 8,237 352,214 1.57 Colgate-Palmolive 3,496 244,860 1.09
First Republic Bank 5,877 310,188 1.38
Markel 1,481 1,018,513 4.54 Microsoft 7,046 331,303 1.48
Waters 5,900 671,243 2.99
Xylem 3,364 129,278 0.58
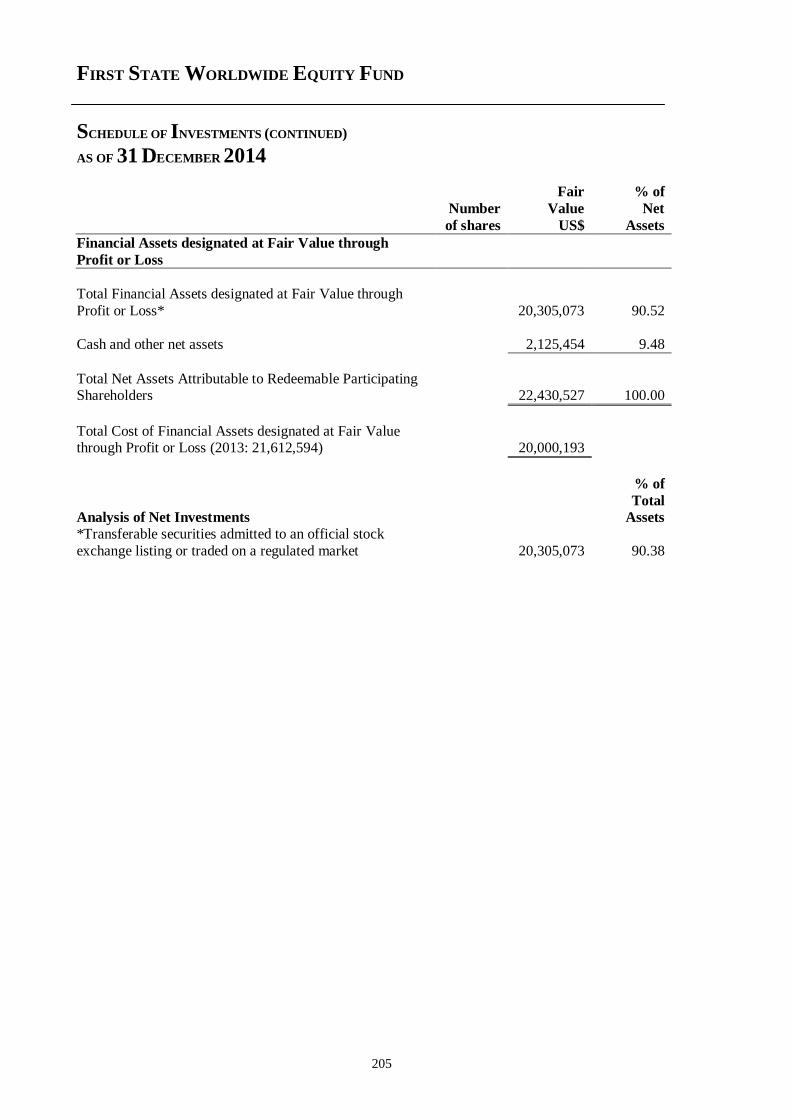
FIRST STATE WORLDWIDE EQUITY FUND
SCHEDULE OF INVESTMENTS (CONTINUED)
AS OF 31 DECEMBER 2014
205
Fair % of
Number Value Net
of shares US$ Assets
Financial Assets designated at Fair Value through
Profit or Loss
Total Financial Assets designated at Fair Value through
Profit or Loss*
20,305,073 90.52
Cash and other net assets 2,125,454 9.48
Total Net Assets Attributable to Redeemable Participating Shareholders 22,430,527 100.00
Total Cost of Financial Assets designated at Fair Value through Profit or Loss (2013: 21,612,594) 20,000,193
Analysis of Net Investments
% of
Total
Assets
*Transferable securities admitted to an official stock
exchange listing or traded on a regulated market 20,305,073 90.38
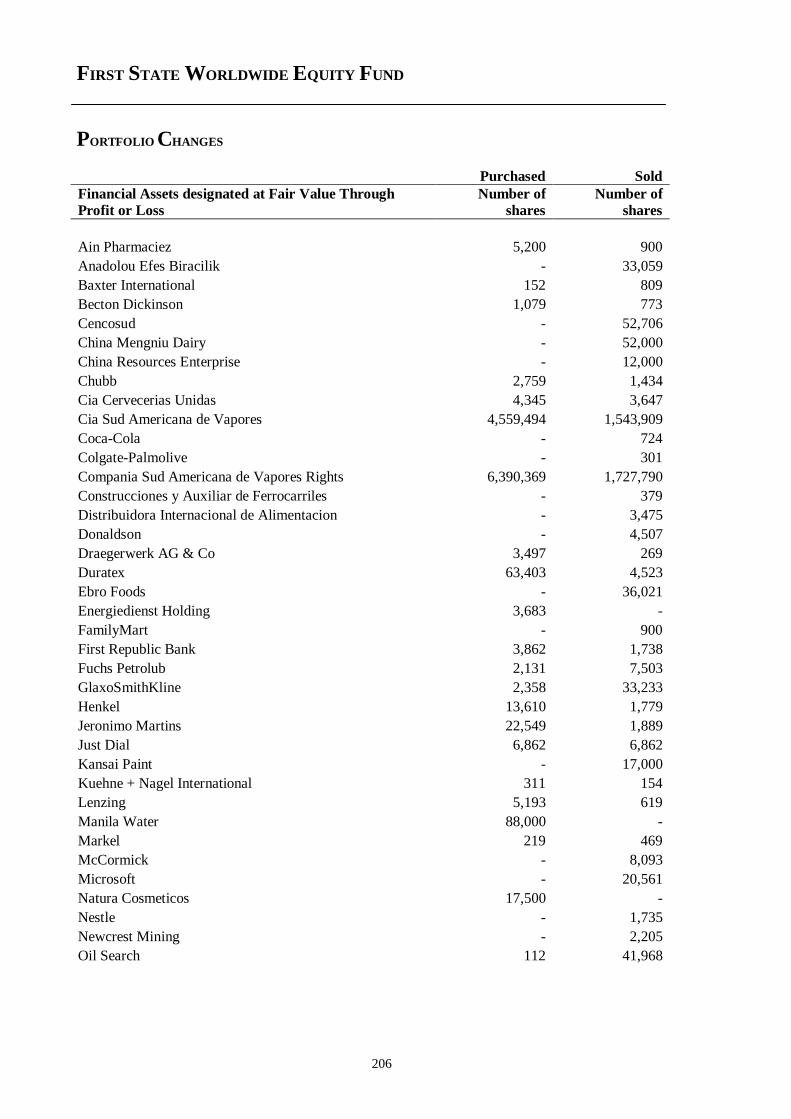
FIRST STATE WORLDWIDE EQUITY FUND
PORTFOLIO CHANGES
206
Purchased Sold
Financial Assets designated at Fair Value Through
Profit or Loss
Number of
shares
Number of
shares
Ain Pharmaciez 5,200 900
Anadolou Efes Biracilik - 33,059
Baxter International 152 809
Becton Dickinson 1,079 773
Cencosud - 52,706
China Mengniu Dairy - 52,000
China Resources Enterprise - 12,000
Chubb 2,759 1,434
Cia Cervecerias Unidas 4,345 3,647
Cia Sud Americana de Vapores 4,559,494 1,543,909
Coca-Cola - 724
Colgate-Palmolive - 301
Compania Sud Americana de Vapores Rights 6,390,369 1,727,790
Construcciones y Auxiliar de Ferrocarriles - 379
Distribuidora Internacional de Alimentacion - 3,475
Donaldson - 4,507
Draegerwerk AG & Co 3,497 269
Duratex 63,403 4,523
Ebro Foods - 36,021
Energiedienst Holding 3,683 -
FamilyMart - 900
First Republic Bank 3,862 1,738
Fuchs Petrolub 2,131 7,503
GlaxoSmithKline 2,358 33,233
Henkel 13,610 1,779
Jeronimo Martins 22,549 1,889
Just Dial 6,862 6,862
Kansai Paint - 17,000
Kuehne + Nagel International 311 154
Lenzing 5,193 619
Manila Water 88,000 -
Markel 219 469
McCormick - 8,093
Microsoft - 20,561
Natura Cosmeticos 17,500 -
Nestle - 1,735
Newcrest Mining - 2,205
Oil Search 112 41,968
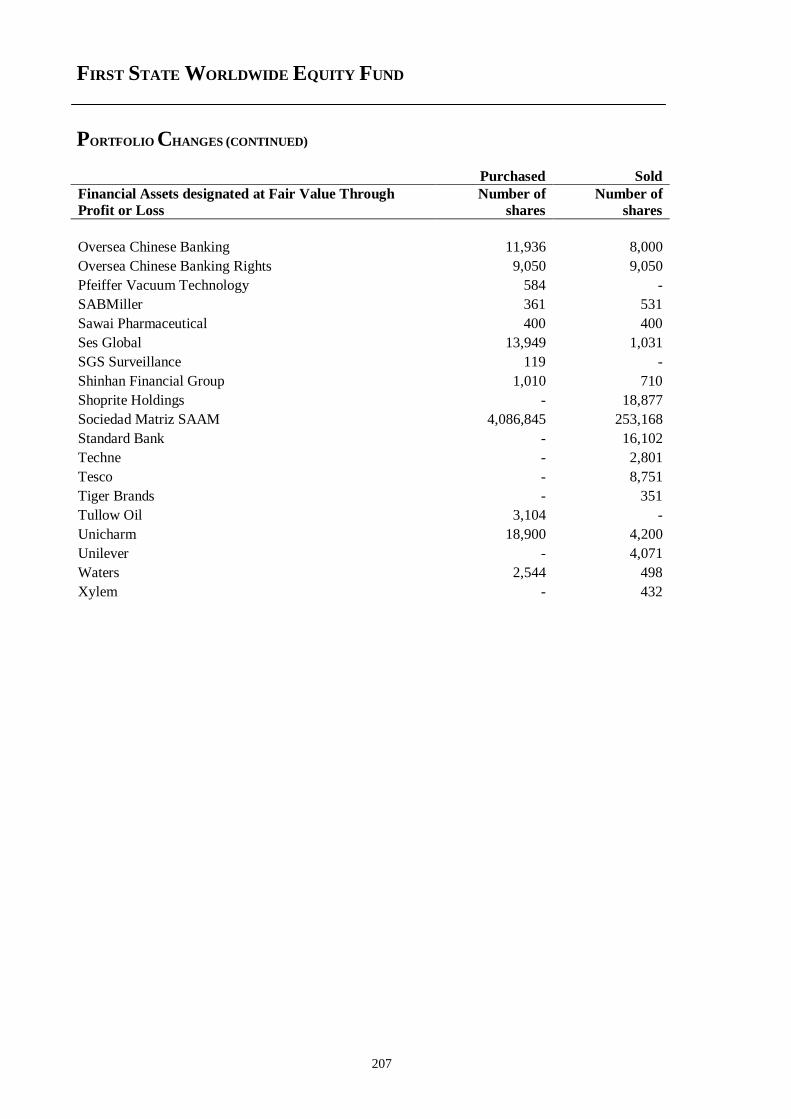
FIRST STATE WORLDWIDE EQUITY FUND
PORTFOLIO CHANGES (CONTINUED)
207
Purchased Sold
Financial Assets designated at Fair Value Through
Profit or Loss
Number of
shares
Number of
shares
Oversea Chinese Banking 11,936 8,000
Oversea Chinese Banking Rights 9,050 9,050
Pfeiffer Vacuum Technology 584 -
SABMiller 361 531
Sawai Pharmaceutical 400 400
Ses Global 13,949 1,031
SGS Surveillance 119 -
Shinhan Financial Group 1,010 710
Shoprite Holdings - 18,877
Sociedad Matriz SAAM 4,086,845 253,168
Standard Bank - 16,102
Techne - 2,801
Tesco - 8,751
Tiger Brands - 351
Tullow Oil 3,104 -
Unicharm 18,900 4,200
Unilever - 4,071
Waters 2,544 498
Xylem - 432
FIRST STATE EMERGING MARKETS BOND FUND
INVESTMENT MANAGER’S REPORT
208
PERFORMANCE
01/01/13 01/01/14 To To 31/12/13 31/12/14
First State Emerging Markets Bond Fund “The Fund” - Class I -4.46% 7.09%
- Class I (Dist)^ -4.52% 7.18% - Class I (Monthly Dist)*^ 2.19% 7.09% - Class I (HKD Monthly Dist)*^ 2.21% 7.13%
JP Morgan Emerging Market Bond - Global Diversified Index# -5.25% 7.43% JP Morgan Emerging Market Bond - Global Diversified Index*# 3.08% 7.43% JP Morgan Emerging Market Bond - Global Diversified Index (HKD)*# 3.04% 7.44%
(Performance calculation is based on official dealing NAV per share) ^ Dividend adjustment return * Inception Date – 10th July 2013 # Benchmarks are being included for illustrative purposes and there is no guarantee that a Fund will outperform a benchmark
A notable event in the period was the significant drop in oil prices due to the supply glut in the oil market,
which, exacerbated by Saudi Arabia’s decision to keep production levels high, put pressure on prices. In emerging
markets, a clear divergence between oil exporting and oil importing credits started to emerge. Importers, such as
Turkey and a number of countries in Eastern Europe, saw their trade balances improve, while exporters, for
example Russia and Nigeria, suffered from falling revenues. Elections in Brazil and a corruption scandal affecting
Petrobras, the majority state-owned oil company, kept Brazilian debt volatile. Meanwhile, Ukrainian hard
currency debt underperformed substantially as the effects of conflict in the east of the country were assessed
negatively by the market. Ukraine’s financing needs are much larger than the IMF originally envisaged and the
market has started to price in a potential restructuring of bonds to cover some of the funding gap.
In terms of performance over 2014, one of the top contributors to returns was Russia, where we were
underweight early in the year before buying some positons back in May. We then reduced these positions after
sanctions against Russia were announced. We also held an off-benchmark position in Slovenia which contributed
positively. Our zero weight in Ukraine for most of the year was a further driver of relative performance.
Detractors from returns included countries offering very small risk premiums, such as the Philippines, and illiquid
countries in Latin America that also trade closely in line with US Treasuries, for example Peru and Chile.
The Fund held overweight positions in credits with strong or improving fundamentals, for example in
Morocco, India and a number of Central European countries. The portfolio was underweight in Latin America,
where falling commodity prices are most directly felt. In the Middle East, where many countries also export
commodities, the fall in crude prices is often cushioned by sovereign wealth funds and high foreign exchange
reserves. We held overweight positions in strong Middle-Eastern credits (e.g. UAE) instead of weaker ones, such
as Iraq or Lebanon.
Emerging market countries across regions will continue to be affected by the fall in commodities,
although the recent stabilisation in crude oil prices is likely to cushion the effect for the most affected oil exporters.
We also follow the structural reform agendas in many countries closely, as we believe that the market will start to
reward countries that enhance their business climates in order to augment their potential for higher economic
growth. On the other hand, the main risk we see is a more abrupt normalisation of US monetary policy. The
market currently sees a benign, but rising path for US interest rates, starting around mid-year. If the US Federal
Reserve decides to adjust the Fed Funds rate upwards more swiftly, emerging markets, particularly those with
larger funding needs, could underperform.
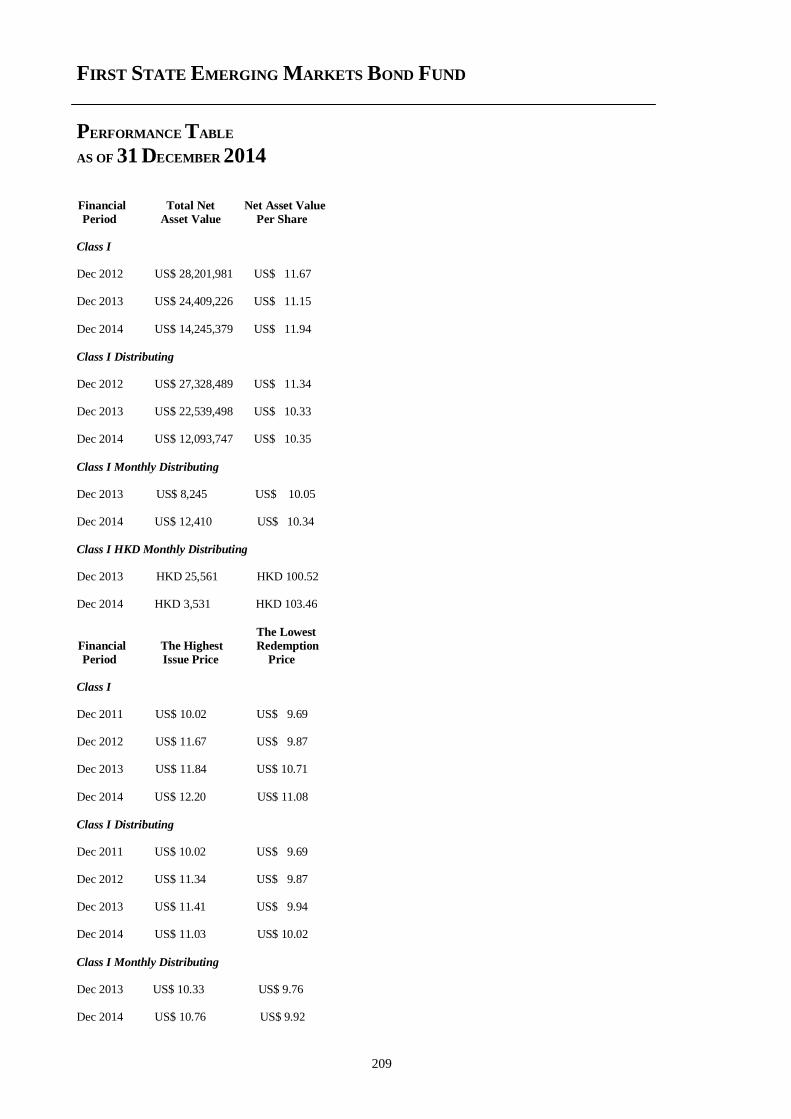
FIRST STATE EMERGING MARKETS BOND FUND
PERFORMANCE TABLE
AS OF 31 DECEMBER 2014
209
Financial Total Net Net Asset Value
Period Asset Value Per Share
Class I
Dec 2012 US$ 28,201,981 US$ 11.67 Dec 2013 US$ 24,409,226 US$ 11.15
Dec 2014 US$ 14,245,379 US$ 11.94
Class I Distributing
Dec 2012 US$ 27,328,489 US$ 11.34 Dec 2013 US$ 22,539,498 US$ 10.33 Dec 2014 US$ 12,093,747 US$ 10.35
Class I Monthly Distributing Dec 2013 US$ 8,245 US$ 10.05 Dec 2014 US$ 12,410 US$ 10.34
Class I HKD Monthly Distributing Dec 2013 HKD 25,561 HKD 100.52 Dec 2014 HKD 3,531 HKD 103.46
The Lowest
Financial The Highest Redemption
Period Issue Price Price
Class I
Dec 2011 US$ 10.02 US$ 9.69 Dec 2012 US$ 11.67 US$ 9.87
Dec 2013 US$ 11.84 US$ 10.71
Dec 2014 US$ 12.20 US$ 11.08
Class I Distributing
Dec 2011 US$ 10.02 US$ 9.69 Dec 2012 US$ 11.34 US$ 9.87 Dec 2013 US$ 11.41 US$ 9.94 Dec 2014 US$ 11.03 US$ 10.02
Class I Monthly Distributing Dec 2013 US$ 10.33 US$ 9.76 Dec 2014 US$ 10.76 US$ 9.92
FIRST STATE EMERGING MARKETS BOND FUND
PERFORMANCE TABLE (CONTINUED)
AS OF 31 DECEMBER 2014
210
Class I HKD Monthly Distributing Dec 2013 US$ 103.33 US$ 97.65
Dec 2014 US$ 107.73 US$ 99.35
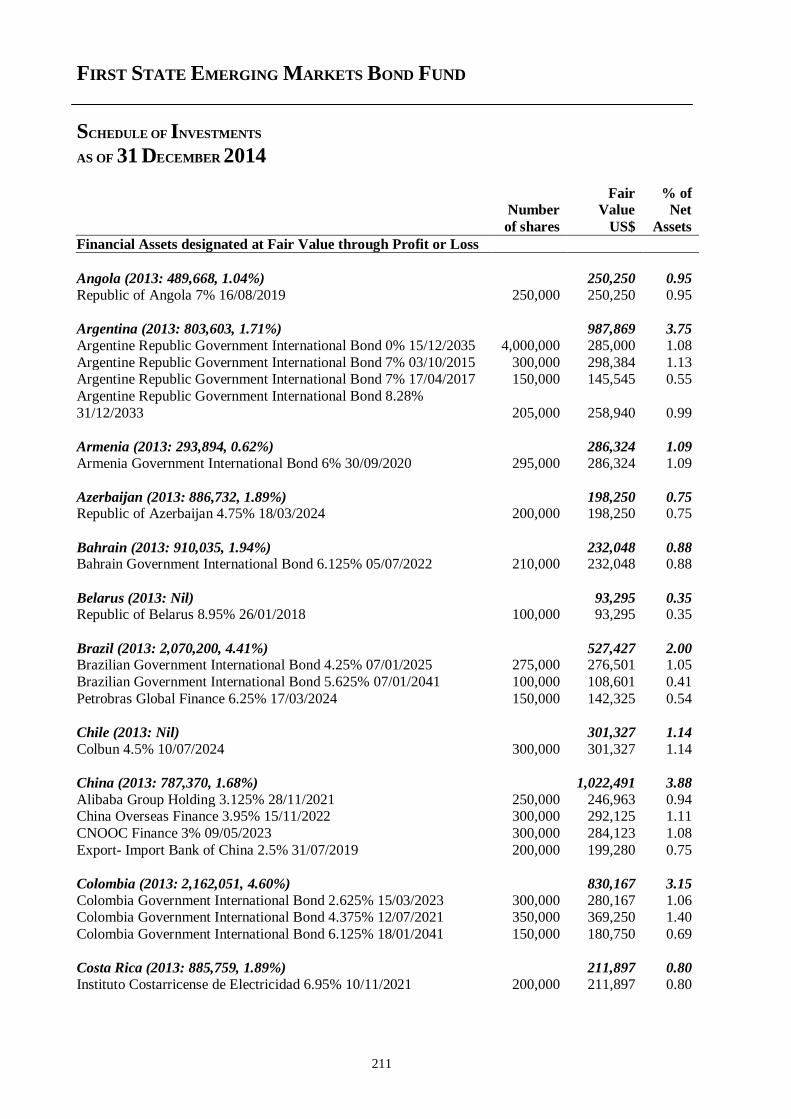
FIRST STATE EMERGING MARKETS BOND FUND
SCHEDULE OF INVESTMENTS
AS OF 31 DECEMBER 2014
211
Fair % of Number Value Net
of shares US$ Assets
Financial Assets designated at Fair Value through Profit or Loss
Angola (2013: 489,668, 1.04%) 250,250 0.95
Republic of Angola 7% 16/08/2019 250,000 250,250 0.95
Argentina (2013: 803,603, 1.71%) 987,869 3.75
Argentine Republic Government International Bond 0% 15/12/2035 4,000,000 285,000 1.08
Argentine Republic Government International Bond 7% 03/10/2015 300,000 298,384 1.13 Argentine Republic Government International Bond 7% 17/04/2017 150,000 145,545 0.55
Argentine Republic Government International Bond 8.28%
31/12/2033 205,000 258,940 0.99
Armenia (2013: 293,894, 0.62%) 286,324 1.09
Armenia Government International Bond 6% 30/09/2020 295,000 286,324 1.09
Azerbaijan (2013: 886,732, 1.89%) 198,250 0.75 Republic of Azerbaijan 4.75% 18/03/2024 200,000 198,250 0.75
Bahrain (2013: 910,035, 1.94%) 232,048 0.88 Bahrain Government International Bond 6.125% 05/07/2022 210,000 232,048 0.88
Belarus (2013: Nil) 93,295 0.35 Republic of Belarus 8.95% 26/01/2018 100,000 93,295 0.35
Brazil (2013: 2,070,200, 4.41%) 527,427 2.00 Brazilian Government International Bond 4.25% 07/01/2025 275,000 276,501 1.05
Brazilian Government International Bond 5.625% 07/01/2041 100,000 108,601 0.41
Petrobras Global Finance 6.25% 17/03/2024 150,000 142,325 0.54
Chile (2013: Nil) 301,327 1.14
Colbun 4.5% 10/07/2024 300,000 301,327 1.14
China (2013: 787,370, 1.68%) 1,022,491 3.88
Alibaba Group Holding 3.125% 28/11/2021 250,000 246,963 0.94 China Overseas Finance 3.95% 15/11/2022 300,000 292,125 1.11
CNOOC Finance 3% 09/05/2023 300,000 284,123 1.08
Export- Import Bank of China 2.5% 31/07/2019 200,000 199,280 0.75
Colombia (2013: 2,162,051, 4.60%) 830,167 3.15
Colombia Government International Bond 2.625% 15/03/2023 300,000 280,167 1.06 Colombia Government International Bond 4.375% 12/07/2021 350,000 369,250 1.40
Colombia Government International Bond 6.125% 18/01/2041 150,000 180,750 0.69
Costa Rica (2013: 885,759, 1.89%) 211,897 0.80
Instituto Costarricense de Electricidad 6.95% 10/11/2021 200,000 211,897 0.80
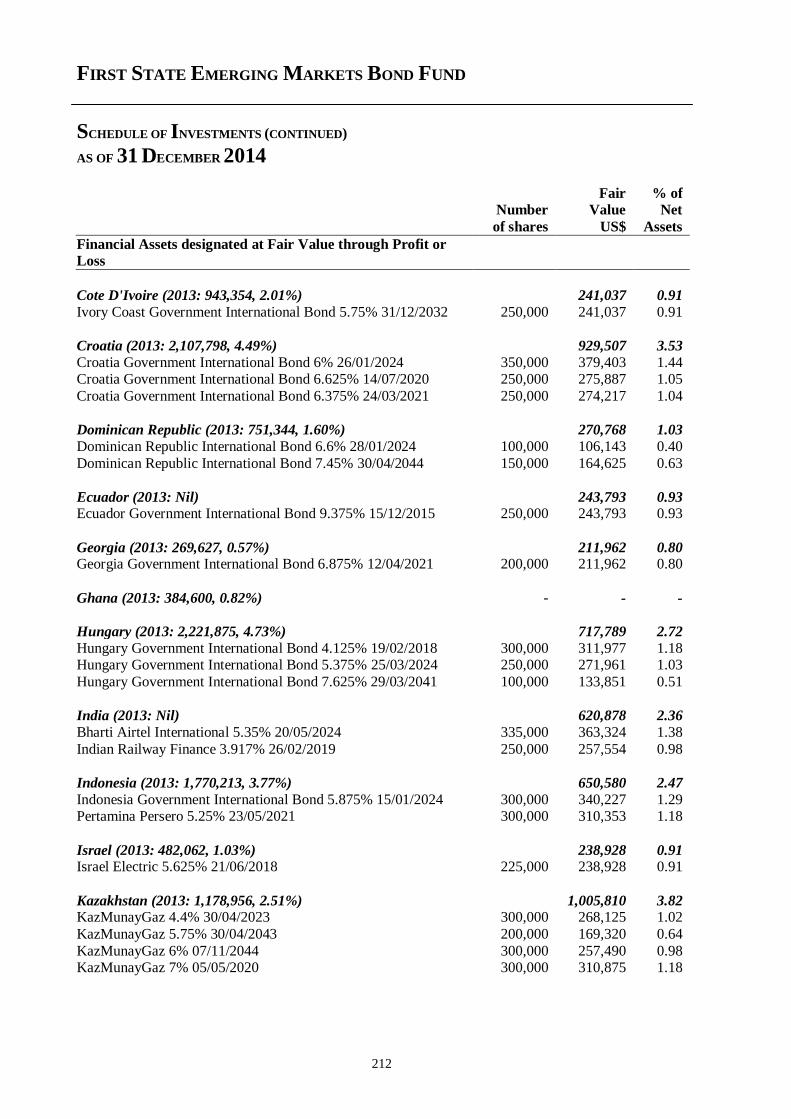
FIRST STATE EMERGING MARKETS BOND FUND
SCHEDULE OF INVESTMENTS (CONTINUED)
AS OF 31 DECEMBER 2014
212
Fair % of Number Value Net
of shares US$ Assets
Financial Assets designated at Fair Value through Profit or
Loss
Cote D'Ivoire (2013: 943,354, 2.01%) 241,037 0.91
Ivory Coast Government International Bond 5.75% 31/12/2032 250,000 241,037 0.91
Croatia (2013: 2,107,798, 4.49%) 929,507 3.53
Croatia Government International Bond 6% 26/01/2024 350,000 379,403 1.44 Croatia Government International Bond 6.625% 14/07/2020 250,000 275,887 1.05
Croatia Government International Bond 6.375% 24/03/2021 250,000 274,217 1.04
Dominican Republic (2013: 751,344, 1.60%) 270,768 1.03
Dominican Republic International Bond 6.6% 28/01/2024 100,000 106,143 0.40
Dominican Republic International Bond 7.45% 30/04/2044 150,000 164,625 0.63
Ecuador (2013: Nil) 243,793 0.93 Ecuador Government International Bond 9.375% 15/12/2015 250,000 243,793 0.93
Georgia (2013: 269,627, 0.57%) 211,962 0.80 Georgia Government International Bond 6.875% 12/04/2021 200,000 211,962 0.80
Ghana (2013: 384,600, 0.82%) - - -
Hungary (2013: 2,221,875, 4.73%) 717,789 2.72
Hungary Government International Bond 4.125% 19/02/2018 300,000 311,977 1.18 Hungary Government International Bond 5.375% 25/03/2024 250,000 271,961 1.03
Hungary Government International Bond 7.625% 29/03/2041 100,000 133,851 0.51
India (2013: Nil) 620,878 2.36
Bharti Airtel International 5.35% 20/05/2024 335,000 363,324 1.38
Indian Railway Finance 3.917% 26/02/2019 250,000 257,554 0.98
Indonesia (2013: 1,770,213, 3.77%) 650,580 2.47
Indonesia Government International Bond 5.875% 15/01/2024 300,000 340,227 1.29 Pertamina Persero 5.25% 23/05/2021 300,000 310,353 1.18
Israel (2013: 482,062, 1.03%) 238,928 0.91 Israel Electric 5.625% 21/06/2018 225,000 238,928 0.91
Kazakhstan (2013: 1,178,956, 2.51%) 1,005,810 3.82 KazMunayGaz 4.4% 30/04/2023 300,000 268,125 1.02
KazMunayGaz 5.75% 30/04/2043 200,000 169,320 0.64
KazMunayGaz 6% 07/11/2044 300,000 257,490 0.98 KazMunayGaz 7% 05/05/2020 300,000 310,875 1.18
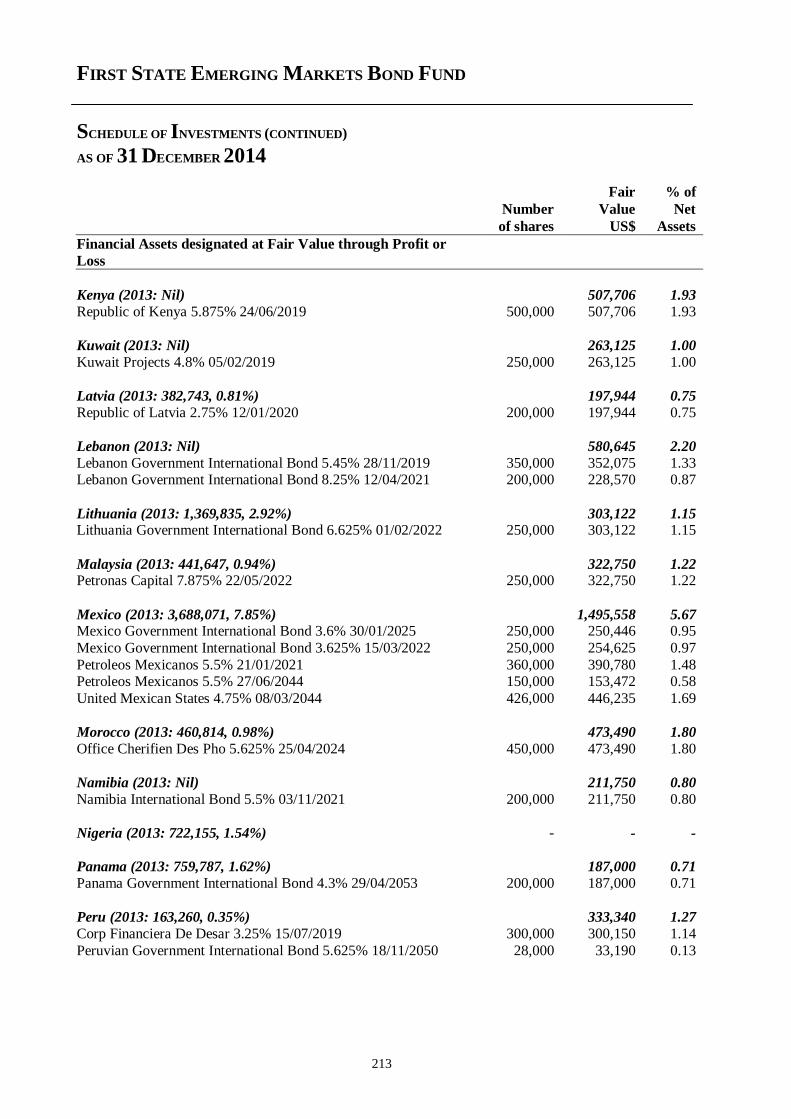
FIRST STATE EMERGING MARKETS BOND FUND
SCHEDULE OF INVESTMENTS (CONTINUED)
AS OF 31 DECEMBER 2014
213
Fair % of
Number Value Net
of shares US$ Assets
Financial Assets designated at Fair Value through Profit or
Loss
Kenya (2013: Nil) 507,706 1.93
Republic of Kenya 5.875% 24/06/2019 500,000 507,706 1.93
Kuwait (2013: Nil) 263,125 1.00
Kuwait Projects 4.8% 05/02/2019 250,000 263,125 1.00
Latvia (2013: 382,743, 0.81%) 197,944 0.75
Republic of Latvia 2.75% 12/01/2020 200,000 197,944 0.75
Lebanon (2013: Nil) 580,645 2.20
Lebanon Government International Bond 5.45% 28/11/2019 350,000 352,075 1.33 Lebanon Government International Bond 8.25% 12/04/2021 200,000 228,570 0.87
Lithuania (2013: 1,369,835, 2.92%) 303,122 1.15 Lithuania Government International Bond 6.625% 01/02/2022 250,000 303,122 1.15
Malaysia (2013: 441,647, 0.94%) 322,750 1.22 Petronas Capital 7.875% 22/05/2022 250,000 322,750 1.22
Mexico (2013: 3,688,071, 7.85%) 1,495,558 5.67 Mexico Government International Bond 3.6% 30/01/2025 250,000 250,446 0.95
Mexico Government International Bond 3.625% 15/03/2022 250,000 254,625 0.97
Petroleos Mexicanos 5.5% 21/01/2021 360,000 390,780 1.48 Petroleos Mexicanos 5.5% 27/06/2044 150,000 153,472 0.58
United Mexican States 4.75% 08/03/2044 426,000 446,235 1.69
Morocco (2013: 460,814, 0.98%) 473,490 1.80
Office Cherifien Des Pho 5.625% 25/04/2024 450,000 473,490 1.80
Namibia (2013: Nil) 211,750 0.80
Namibia International Bond 5.5% 03/11/2021 200,000 211,750 0.80
Nigeria (2013: 722,155, 1.54%) - - -
Panama (2013: 759,787, 1.62%) 187,000 0.71 Panama Government International Bond 4.3% 29/04/2053 200,000 187,000 0.71
Peru (2013: 163,260, 0.35%) 333,340 1.27 Corp Financiera De Desar 3.25% 15/07/2019 300,000 300,150 1.14
Peruvian Government International Bond 5.625% 18/11/2050 28,000 33,190 0.13
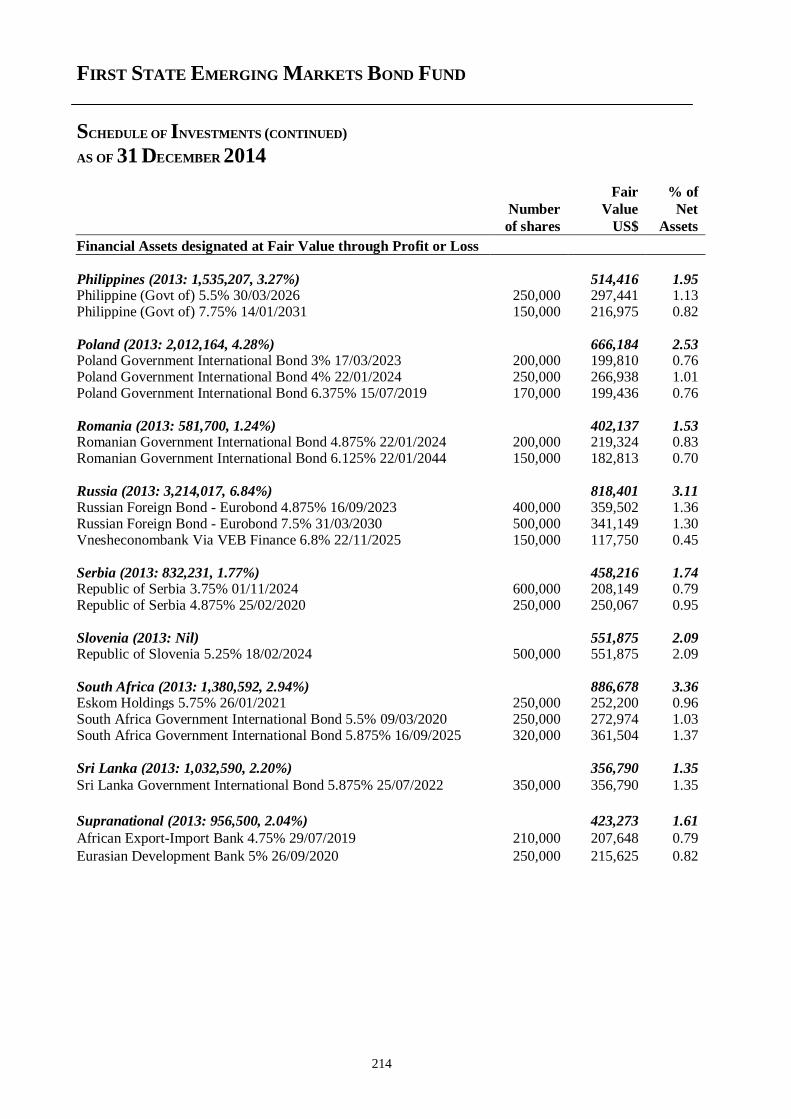
FIRST STATE EMERGING MARKETS BOND FUND
SCHEDULE OF INVESTMENTS (CONTINUED)
AS OF 31 DECEMBER 2014
214
Fair % of
Number Value Net
of shares US$ Assets
Financial Assets designated at Fair Value through Profit or Loss
Philippines (2013: 1,535,207, 3.27%) 514,416 1.95 Philippine (Govt of) 5.5% 30/03/2026 250,000 297,441 1.13 Philippine (Govt of) 7.75% 14/01/2031 150,000 216,975 0.82 Poland (2013: 2,012,164, 4.28%) 666,184 2.53 Poland Government International Bond 3% 17/03/2023 200,000 199,810 0.76 Poland Government International Bond 4% 22/01/2024 250,000 266,938 1.01 Poland Government International Bond 6.375% 15/07/2019 170,000 199,436 0.76 Romania (2013: 581,700, 1.24%) 402,137 1.53 Romanian Government International Bond 4.875% 22/01/2024 200,000 219,324 0.83 Romanian Government International Bond 6.125% 22/01/2044 150,000 182,813 0.70
Russia (2013: 3,214,017, 6.84%) 818,401 3.11 Russian Foreign Bond - Eurobond 4.875% 16/09/2023 400,000 359,502 1.36 Russian Foreign Bond - Eurobond 7.5% 31/03/2030 500,000 341,149 1.30 Vnesheconombank Via VEB Finance 6.8% 22/11/2025 150,000 117,750 0.45 Serbia (2013: 832,231, 1.77%) 458,216 1.74 Republic of Serbia 3.75% 01/11/2024 600,000 208,149 0.79 Republic of Serbia 4.875% 25/02/2020 250,000 250,067 0.95 Slovenia (2013: Nil) 551,875 2.09 Republic of Slovenia 5.25% 18/02/2024 500,000 551,875 2.09 South Africa (2013: 1,380,592, 2.94%) 886,678 3.36 Eskom Holdings 5.75% 26/01/2021 250,000 252,200 0.96 South Africa Government International Bond 5.5% 09/03/2020 250,000 272,974 1.03 South Africa Government International Bond 5.875% 16/09/2025 320,000 361,504 1.37
Sri Lanka (2013: 1,032,590, 2.20%) 356,790 1.35
Sri Lanka Government International Bond 5.875% 25/07/2022 350,000 356,790 1.35
Supranational (2013: 956,500, 2.04%) 423,273 1.61
African Export-Import Bank 4.75% 29/07/2019 210,000 207,648 0.79
Eurasian Development Bank 5% 26/09/2020 250,000 215,625 0.82
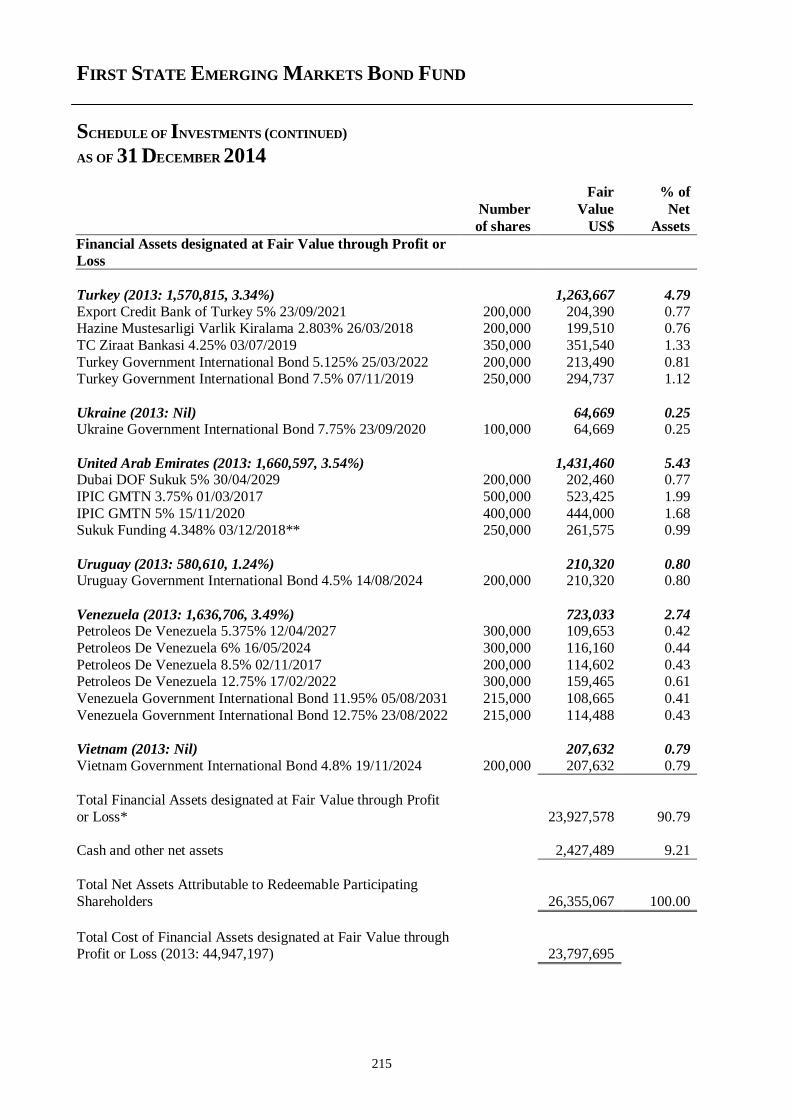
FIRST STATE EMERGING MARKETS BOND FUND
SCHEDULE OF INVESTMENTS (CONTINUED)
AS OF 31 DECEMBER 2014
215
Fair % of
Number Value Net
of shares US$ Assets
Financial Assets designated at Fair Value through Profit or
Loss
Turkey (2013: 1,570,815, 3.34%) 1,263,667 4.79
Export Credit Bank of Turkey 5% 23/09/2021 200,000 204,390 0.77 Hazine Mustesarligi Varlik Kiralama 2.803% 26/03/2018 200,000 199,510 0.76
TC Ziraat Bankasi 4.25% 03/07/2019 350,000 351,540 1.33
Turkey Government International Bond 5.125% 25/03/2022 200,000 213,490 0.81 Turkey Government International Bond 7.5% 07/11/2019 250,000 294,737 1.12
Ukraine (2013: Nil) 64,669 0.25 Ukraine Government International Bond 7.75% 23/09/2020 100,000 64,669 0.25
United Arab Emirates (2013: 1,660,597, 3.54%) 1,431,460 5.43 Dubai DOF Sukuk 5% 30/04/2029 200,000 202,460 0.77
IPIC GMTN 3.75% 01/03/2017 500,000 523,425 1.99
IPIC GMTN 5% 15/11/2020 400,000 444,000 1.68 Sukuk Funding 4.348% 03/12/2018** 250,000 261,575 0.99
Uruguay (2013: 580,610, 1.24%) 210,320 0.80 Uruguay Government International Bond 4.5% 14/08/2024 200,000 210,320 0.80
Venezuela (2013: 1,636,706, 3.49%) 723,033 2.74 Petroleos De Venezuela 5.375% 12/04/2027 300,000 109,653 0.42
Petroleos De Venezuela 6% 16/05/2024 300,000 116,160 0.44
Petroleos De Venezuela 8.5% 02/11/2017 200,000 114,602 0.43 Petroleos De Venezuela 12.75% 17/02/2022 300,000 159,465 0.61
Venezuela Government International Bond 11.95% 05/08/2031 215,000 108,665 0.41
Venezuela Government International Bond 12.75% 23/08/2022 215,000 114,488 0.43
Vietnam (2013: Nil) 207,632 0.79
Vietnam Government International Bond 4.8% 19/11/2024 200,000 207,632 0.79
Total Financial Assets designated at Fair Value through Profit
or Loss* 23,927,578 90.79
Cash and other net assets 2,427,489 9.21
Total Net Assets Attributable to Redeemable Participating
Shareholders 26,355,067 100.00
Total Cost of Financial Assets designated at Fair Value through Profit or Loss (2013: 44,947,197) 23,797,695
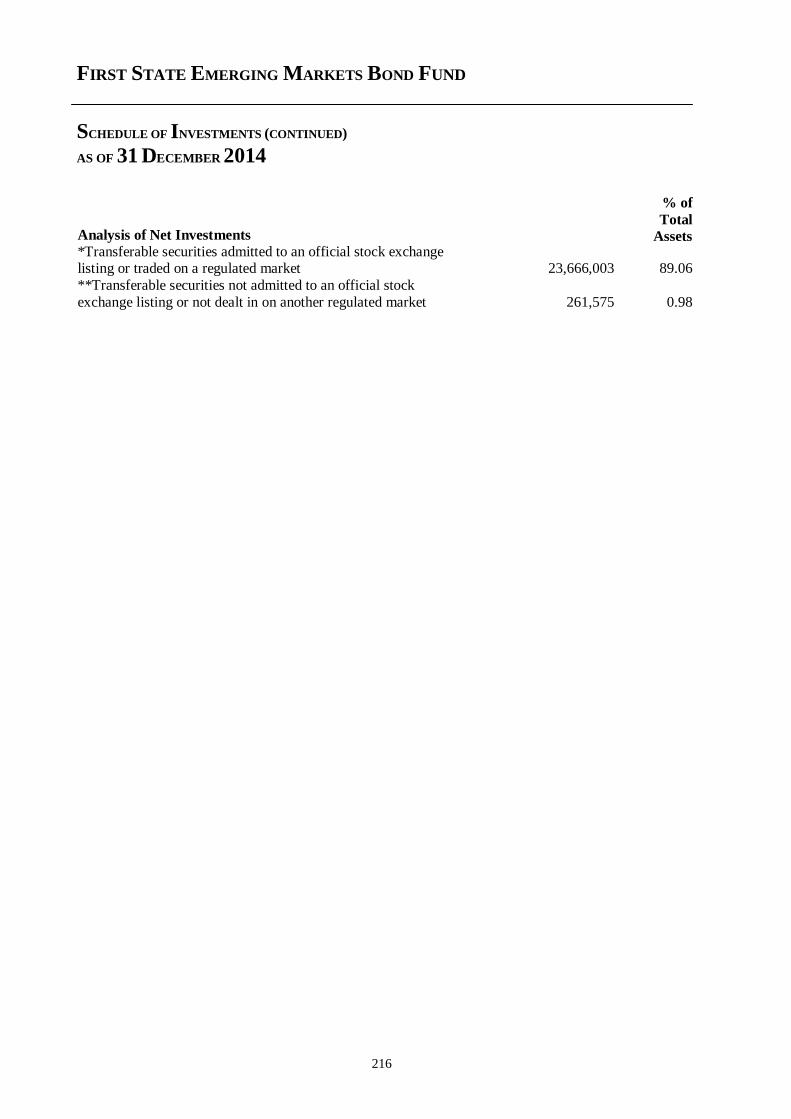
FIRST STATE EMERGING MARKETS BOND FUND
SCHEDULE OF INVESTMENTS (CONTINUED)
AS OF 31 DECEMBER 2014
216
Analysis of Net Investments
% of
Total
Assets *Transferable securities admitted to an official stock exchange listing or traded on a regulated market 23,666,003 89.06
**Transferable securities not admitted to an official stock
exchange listing or not dealt in on another regulated market 261,575 0.98
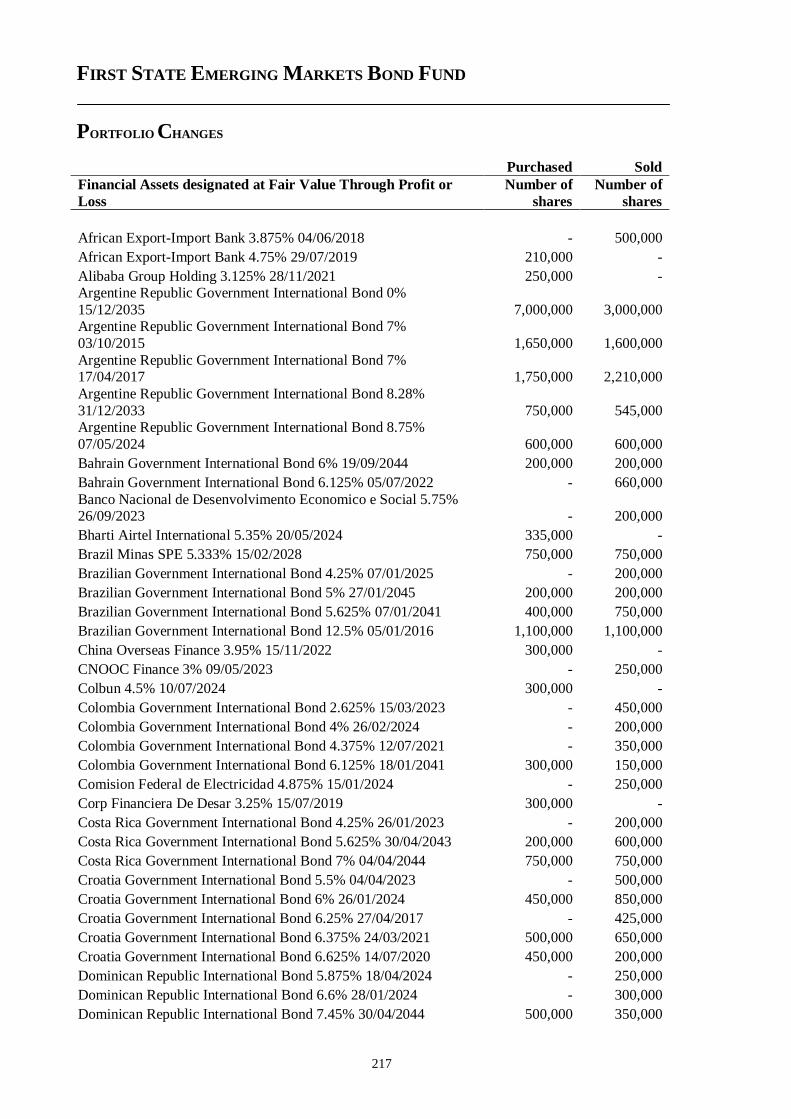
FIRST STATE EMERGING MARKETS BOND FUND
PORTFOLIO CHANGES
217
Purchased Sold
Financial Assets designated at Fair Value Through Profit or
Loss
Number of
shares
Number of
shares
African Export-Import Bank 3.875% 04/06/2018 - 500,000
African Export-Import Bank 4.75% 29/07/2019 210,000 -
Alibaba Group Holding 3.125% 28/11/2021 250,000 - Argentine Republic Government International Bond 0%
15/12/2035 7,000,000 3,000,000 Argentine Republic Government International Bond 7%
03/10/2015 1,650,000 1,600,000
Argentine Republic Government International Bond 7% 17/04/2017 1,750,000 2,210,000
Argentine Republic Government International Bond 8.28%
31/12/2033 750,000 545,000 Argentine Republic Government International Bond 8.75%
07/05/2024 600,000 600,000
Bahrain Government International Bond 6% 19/09/2044 200,000 200,000
Bahrain Government International Bond 6.125% 05/07/2022 - 660,000
Banco Nacional de Desenvolvimento Economico e Social 5.75% 26/09/2023 - 200,000
Bharti Airtel International 5.35% 20/05/2024 335,000 -
Brazil Minas SPE 5.333% 15/02/2028 750,000 750,000
Brazilian Government International Bond 4.25% 07/01/2025 - 200,000
Brazilian Government International Bond 5% 27/01/2045 200,000 200,000
Brazilian Government International Bond 5.625% 07/01/2041 400,000 750,000
Brazilian Government International Bond 12.5% 05/01/2016 1,100,000 1,100,000
China Overseas Finance 3.95% 15/11/2022 300,000 -
CNOOC Finance 3% 09/05/2023 - 250,000
Colbun 4.5% 10/07/2024 300,000 -
Colombia Government International Bond 2.625% 15/03/2023 - 450,000
Colombia Government International Bond 4% 26/02/2024 - 200,000
Colombia Government International Bond 4.375% 12/07/2021 - 350,000
Colombia Government International Bond 6.125% 18/01/2041 300,000 150,000
Comision Federal de Electricidad 4.875% 15/01/2024 - 250,000
Corp Financiera De Desar 3.25% 15/07/2019 300,000 -
Costa Rica Government International Bond 4.25% 26/01/2023 - 200,000
Costa Rica Government International Bond 5.625% 30/04/2043 200,000 600,000
Costa Rica Government International Bond 7% 04/04/2044 750,000 750,000
Croatia Government International Bond 5.5% 04/04/2023 - 500,000
Croatia Government International Bond 6% 26/01/2024 450,000 850,000
Croatia Government International Bond 6.25% 27/04/2017 - 425,000
Croatia Government International Bond 6.375% 24/03/2021 500,000 650,000
Croatia Government International Bond 6.625% 14/07/2020 450,000 200,000
Dominican Republic International Bond 5.875% 18/04/2024 - 250,000
Dominican Republic International Bond 6.6% 28/01/2024 - 300,000
Dominican Republic International Bond 7.45% 30/04/2044 500,000 350,000
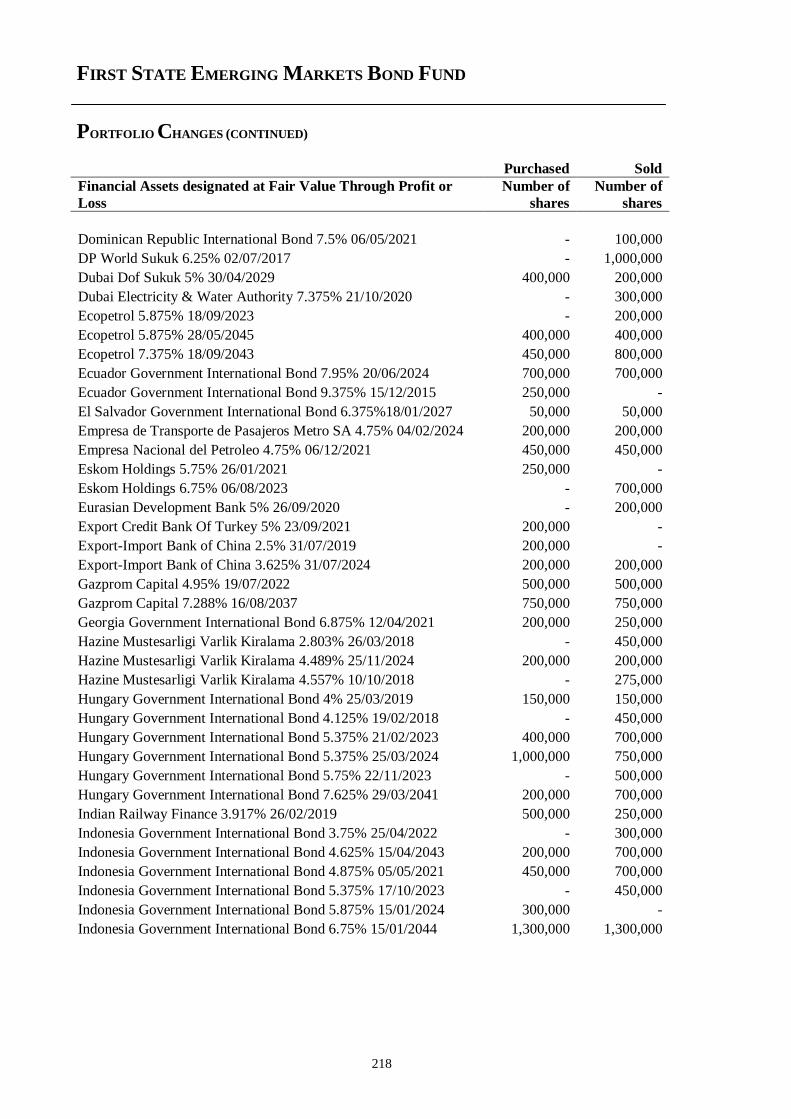
FIRST STATE EMERGING MARKETS BOND FUND
PORTFOLIO CHANGES (CONTINUED)
218
Purchased Sold
Financial Assets designated at Fair Value Through Profit or
Loss
Number of
shares
Number of
shares
Dominican Republic International Bond 7.5% 06/05/2021 - 100,000
DP World Sukuk 6.25% 02/07/2017 - 1,000,000
Dubai Dof Sukuk 5% 30/04/2029 400,000 200,000
Dubai Electricity & Water Authority 7.375% 21/10/2020 - 300,000
Ecopetrol 5.875% 18/09/2023 - 200,000
Ecopetrol 5.875% 28/05/2045 400,000 400,000
Ecopetrol 7.375% 18/09/2043 450,000 800,000
Ecuador Government International Bond 7.95% 20/06/2024 700,000 700,000
Ecuador Government International Bond 9.375% 15/12/2015 250,000 -
El Salvador Government International Bond 6.375%18/01/2027 50,000 50,000
Empresa de Transporte de Pasajeros Metro SA 4.75% 04/02/2024 200,000 200,000
Empresa Nacional del Petroleo 4.75% 06/12/2021 450,000 450,000
Eskom Holdings 5.75% 26/01/2021 250,000 -
Eskom Holdings 6.75% 06/08/2023 - 700,000
Eurasian Development Bank 5% 26/09/2020 - 200,000
Export Credit Bank Of Turkey 5% 23/09/2021 200,000 -
Export-Import Bank of China 2.5% 31/07/2019 200,000 -
Export-Import Bank of China 3.625% 31/07/2024 200,000 200,000
Gazprom Capital 4.95% 19/07/2022 500,000 500,000
Gazprom Capital 7.288% 16/08/2037 750,000 750,000
Georgia Government International Bond 6.875% 12/04/2021 200,000 250,000
Hazine Mustesarligi Varlik Kiralama 2.803% 26/03/2018 - 450,000
Hazine Mustesarligi Varlik Kiralama 4.489% 25/11/2024 200,000 200,000
Hazine Mustesarligi Varlik Kiralama 4.557% 10/10/2018 - 275,000
Hungary Government International Bond 4% 25/03/2019 150,000 150,000
Hungary Government International Bond 4.125% 19/02/2018 - 450,000
Hungary Government International Bond 5.375% 21/02/2023 400,000 700,000
Hungary Government International Bond 5.375% 25/03/2024 1,000,000 750,000
Hungary Government International Bond 5.75% 22/11/2023 - 500,000
Hungary Government International Bond 7.625% 29/03/2041 200,000 700,000
Indian Railway Finance 3.917% 26/02/2019 500,000 250,000
Indonesia Government International Bond 3.75% 25/04/2022 - 300,000
Indonesia Government International Bond 4.625% 15/04/2043 200,000 700,000
Indonesia Government International Bond 4.875% 05/05/2021 450,000 700,000
Indonesia Government International Bond 5.375% 17/10/2023 - 450,000
Indonesia Government International Bond 5.875% 15/01/2024 300,000 -
Indonesia Government International Bond 6.75% 15/01/2044 1,300,000 1,300,000
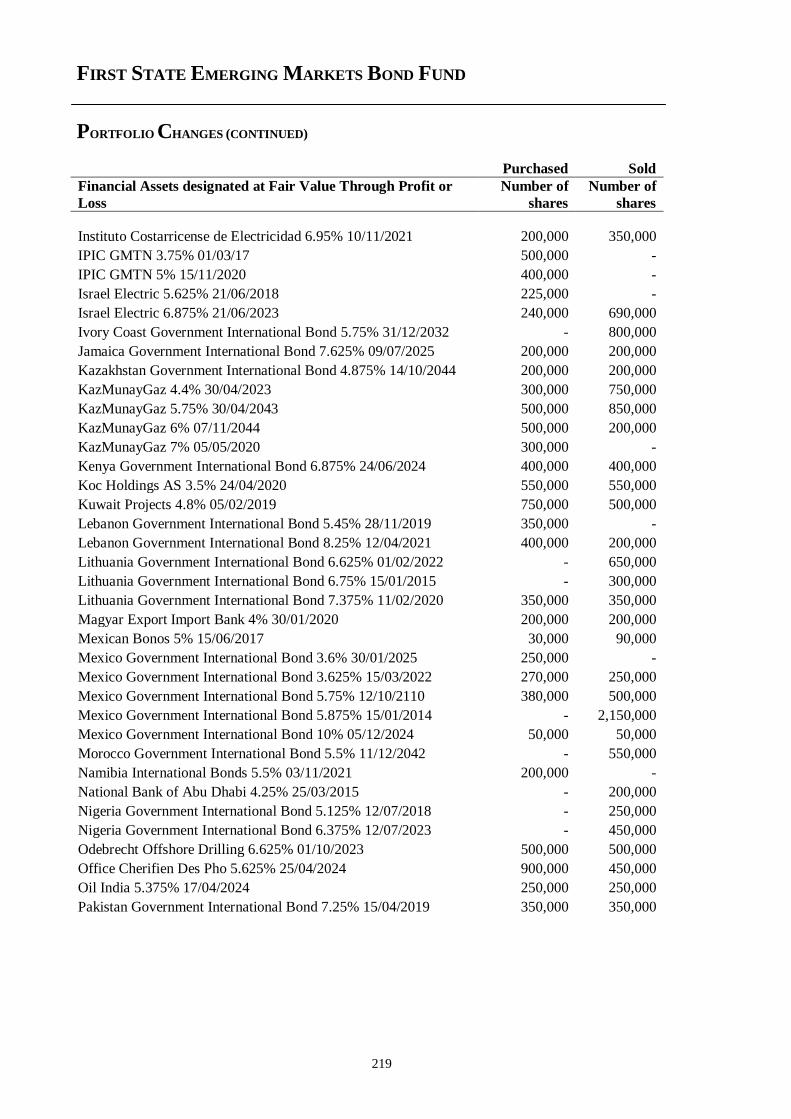
FIRST STATE EMERGING MARKETS BOND FUND
PORTFOLIO CHANGES (CONTINUED)
219
Purchased Sold
Financial Assets designated at Fair Value Through Profit or
Loss
Number of
shares
Number of
shares
Instituto Costarricense de Electricidad 6.95% 10/11/2021 200,000 350,000
IPIC GMTN 3.75% 01/03/17 500,000 -
IPIC GMTN 5% 15/11/2020 400,000 -
Israel Electric 5.625% 21/06/2018 225,000 -
Israel Electric 6.875% 21/06/2023 240,000 690,000
Ivory Coast Government International Bond 5.75% 31/12/2032 - 800,000
Jamaica Government International Bond 7.625% 09/07/2025 200,000 200,000
Kazakhstan Government International Bond 4.875% 14/10/2044 200,000 200,000
KazMunayGaz 4.4% 30/04/2023 300,000 750,000
KazMunayGaz 5.75% 30/04/2043 500,000 850,000
KazMunayGaz 6% 07/11/2044 500,000 200,000
KazMunayGaz 7% 05/05/2020 300,000 -
Kenya Government International Bond 6.875% 24/06/2024 400,000 400,000
Koc Holdings AS 3.5% 24/04/2020 550,000 550,000
Kuwait Projects 4.8% 05/02/2019 750,000 500,000
Lebanon Government International Bond 5.45% 28/11/2019 350,000 -
Lebanon Government International Bond 8.25% 12/04/2021 400,000 200,000
Lithuania Government International Bond 6.625% 01/02/2022 - 650,000
Lithuania Government International Bond 6.75% 15/01/2015 - 300,000
Lithuania Government International Bond 7.375% 11/02/2020 350,000 350,000
Magyar Export Import Bank 4% 30/01/2020 200,000 200,000
Mexican Bonos 5% 15/06/2017 30,000 90,000
Mexico Government International Bond 3.6% 30/01/2025 250,000 -
Mexico Government International Bond 3.625% 15/03/2022 270,000 250,000
Mexico Government International Bond 5.75% 12/10/2110 380,000 500,000
Mexico Government International Bond 5.875% 15/01/2014 - 2,150,000
Mexico Government International Bond 10% 05/12/2024 50,000 50,000
Morocco Government International Bond 5.5% 11/12/2042 - 550,000
Namibia International Bonds 5.5% 03/11/2021 200,000 -
National Bank of Abu Dhabi 4.25% 25/03/2015 - 200,000
Nigeria Government International Bond 5.125% 12/07/2018 - 250,000
Nigeria Government International Bond 6.375% 12/07/2023 - 450,000
Odebrecht Offshore Drilling 6.625% 01/10/2023 500,000 500,000
Office Cherifien Des Pho 5.625% 25/04/2024 900,000 450,000
Oil India 5.375% 17/04/2024 250,000 250,000
Pakistan Government International Bond 7.25% 15/04/2019 350,000 350,000
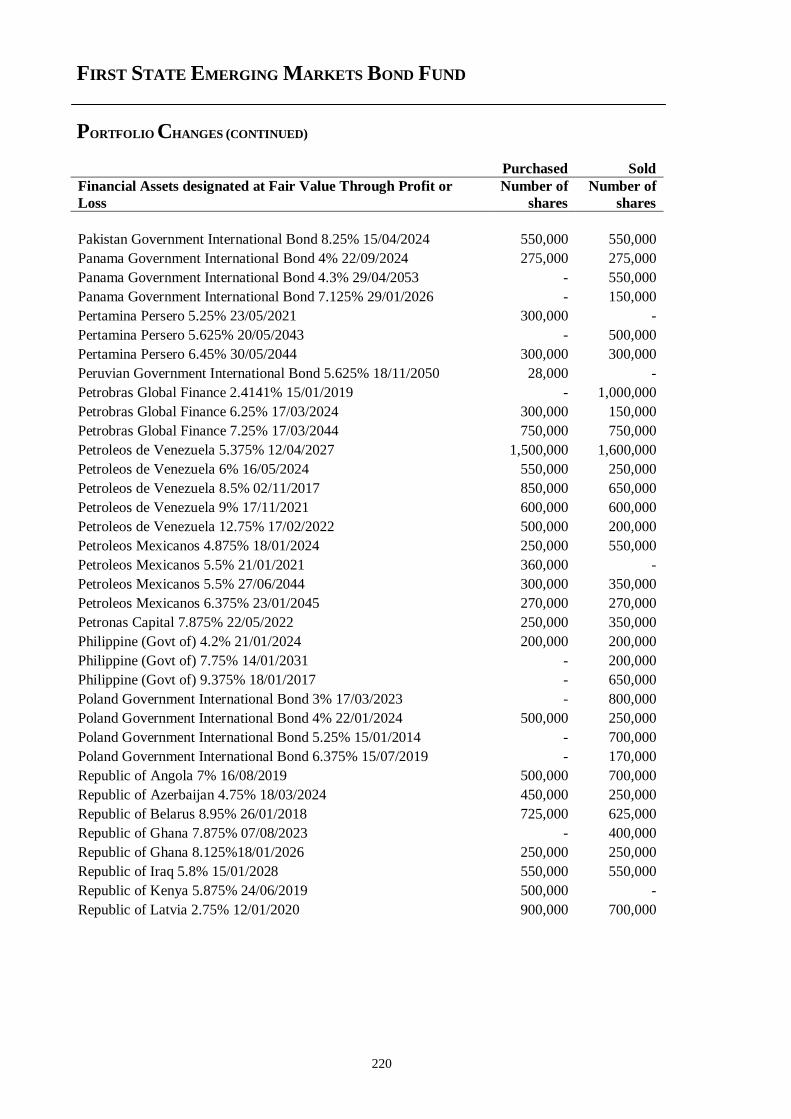
FIRST STATE EMERGING MARKETS BOND FUND
PORTFOLIO CHANGES (CONTINUED)
220
Purchased Sold
Financial Assets designated at Fair Value Through Profit or
Loss
Number of
shares
Number of
shares
Pakistan Government International Bond 8.25% 15/04/2024 550,000 550,000
Panama Government International Bond 4% 22/09/2024 275,000 275,000
Panama Government International Bond 4.3% 29/04/2053 - 550,000
Panama Government International Bond 7.125% 29/01/2026 - 150,000
Pertamina Persero 5.25% 23/05/2021 300,000 -
Pertamina Persero 5.625% 20/05/2043 - 500,000
Pertamina Persero 6.45% 30/05/2044 300,000 300,000
Peruvian Government International Bond 5.625% 18/11/2050 28,000 -
Petrobras Global Finance 2.4141% 15/01/2019 - 1,000,000
Petrobras Global Finance 6.25% 17/03/2024 300,000 150,000
Petrobras Global Finance 7.25% 17/03/2044 750,000 750,000
Petroleos de Venezuela 5.375% 12/04/2027 1,500,000 1,600,000
Petroleos de Venezuela 6% 16/05/2024 550,000 250,000
Petroleos de Venezuela 8.5% 02/11/2017 850,000 650,000
Petroleos de Venezuela 9% 17/11/2021 600,000 600,000
Petroleos de Venezuela 12.75% 17/02/2022 500,000 200,000
Petroleos Mexicanos 4.875% 18/01/2024 250,000 550,000
Petroleos Mexicanos 5.5% 21/01/2021 360,000 -
Petroleos Mexicanos 5.5% 27/06/2044 300,000 350,000
Petroleos Mexicanos 6.375% 23/01/2045 270,000 270,000
Petronas Capital 7.875% 22/05/2022 250,000 350,000
Philippine (Govt of) 4.2% 21/01/2024 200,000 200,000
Philippine (Govt of) 7.75% 14/01/2031 - 200,000
Philippine (Govt of) 9.375% 18/01/2017 - 650,000
Poland Government International Bond 3% 17/03/2023 - 800,000
Poland Government International Bond 4% 22/01/2024 500,000 250,000
Poland Government International Bond 5.25% 15/01/2014 - 700,000
Poland Government International Bond 6.375% 15/07/2019 - 170,000
Republic of Angola 7% 16/08/2019 500,000 700,000
Republic of Azerbaijan 4.75% 18/03/2024 450,000 250,000
Republic of Belarus 8.95% 26/01/2018 725,000 625,000
Republic of Ghana 7.875% 07/08/2023 - 400,000
Republic of Ghana 8.125%18/01/2026 250,000 250,000
Republic of Iraq 5.8% 15/01/2028 550,000 550,000
Republic of Kenya 5.875% 24/06/2019 500,000 -
Republic of Latvia 2.75% 12/01/2020 900,000 700,000
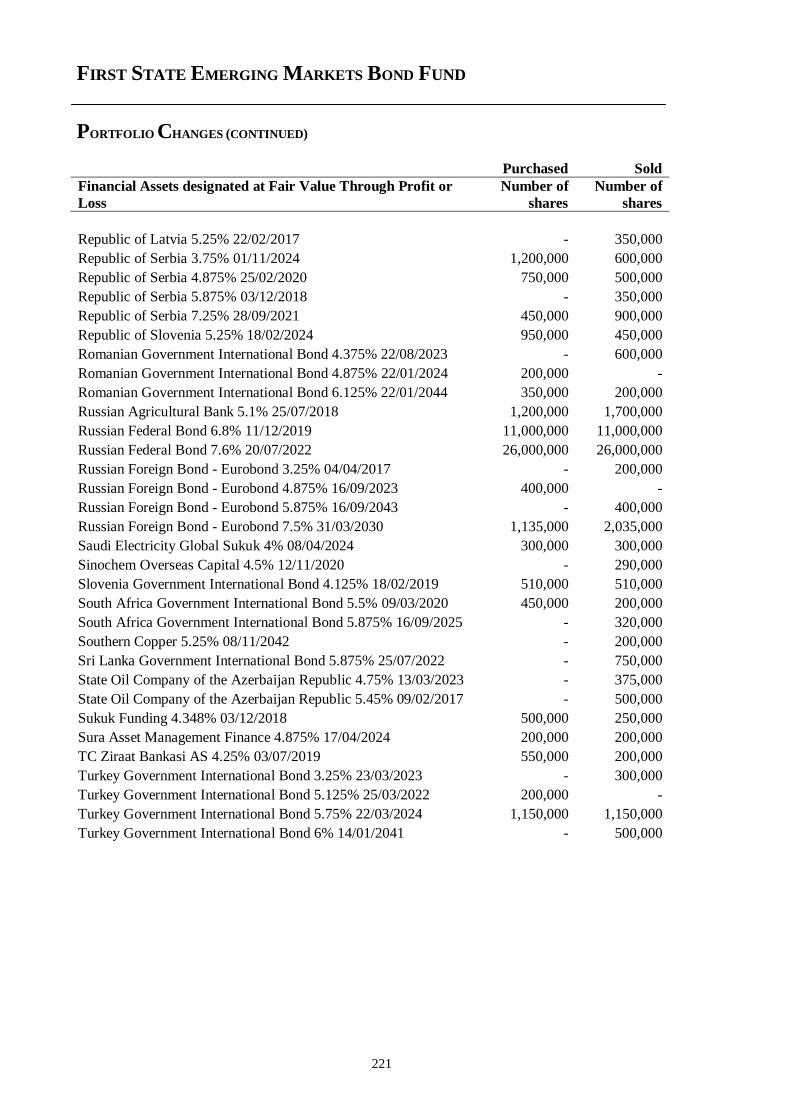
FIRST STATE EMERGING MARKETS BOND FUND
PORTFOLIO CHANGES (CONTINUED)
221
Purchased Sold
Financial Assets designated at Fair Value Through Profit or
Loss
Number of
shares
Number of
shares
Republic of Latvia 5.25% 22/02/2017 - 350,000
Republic of Serbia 3.75% 01/11/2024 1,200,000 600,000
Republic of Serbia 4.875% 25/02/2020 750,000 500,000
Republic of Serbia 5.875% 03/12/2018 - 350,000
Republic of Serbia 7.25% 28/09/2021 450,000 900,000
Republic of Slovenia 5.25% 18/02/2024 950,000 450,000
Romanian Government International Bond 4.375% 22/08/2023 - 600,000
Romanian Government International Bond 4.875% 22/01/2024 200,000 -
Romanian Government International Bond 6.125% 22/01/2044 350,000 200,000
Russian Agricultural Bank 5.1% 25/07/2018 1,200,000 1,700,000
Russian Federal Bond 6.8% 11/12/2019 11,000,000 11,000,000
Russian Federal Bond 7.6% 20/07/2022 26,000,000 26,000,000
Russian Foreign Bond - Eurobond 3.25% 04/04/2017 - 200,000
Russian Foreign Bond - Eurobond 4.875% 16/09/2023 400,000 -
Russian Foreign Bond - Eurobond 5.875% 16/09/2043 - 400,000
Russian Foreign Bond - Eurobond 7.5% 31/03/2030 1,135,000 2,035,000
Saudi Electricity Global Sukuk 4% 08/04/2024 300,000 300,000
Sinochem Overseas Capital 4.5% 12/11/2020 - 290,000
Slovenia Government International Bond 4.125% 18/02/2019 510,000 510,000
South Africa Government International Bond 5.5% 09/03/2020 450,000 200,000
South Africa Government International Bond 5.875% 16/09/2025 - 320,000
Southern Copper 5.25% 08/11/2042 - 200,000
Sri Lanka Government International Bond 5.875% 25/07/2022 - 750,000
State Oil Company of the Azerbaijan Republic 4.75% 13/03/2023 - 375,000
State Oil Company of the Azerbaijan Republic 5.45% 09/02/2017 - 500,000
Sukuk Funding 4.348% 03/12/2018 500,000 250,000
Sura Asset Management Finance 4.875% 17/04/2024 200,000 200,000
TC Ziraat Bankasi AS 4.25% 03/07/2019 550,000 200,000
Turkey Government International Bond 3.25% 23/03/2023 - 300,000
Turkey Government International Bond 5.125% 25/03/2022 200,000 -
Turkey Government International Bond 5.75% 22/03/2024 1,150,000 1,150,000
Turkey Government International Bond 6% 14/01/2041 - 500,000
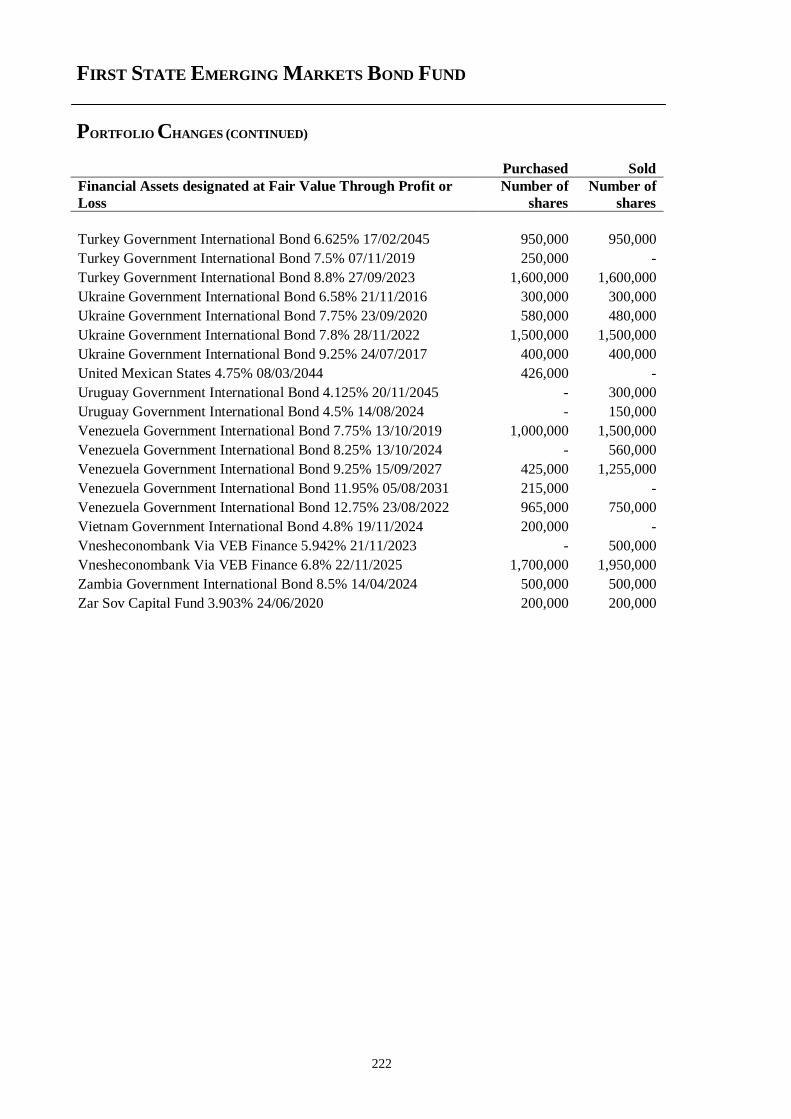
FIRST STATE EMERGING MARKETS BOND FUND
PORTFOLIO CHANGES (CONTINUED)
222
Purchased Sold
Financial Assets designated at Fair Value Through Profit or
Loss
Number of
shares
Number of
shares
Turkey Government International Bond 6.625% 17/02/2045 950,000 950,000
Turkey Government International Bond 7.5% 07/11/2019 250,000 -
Turkey Government International Bond 8.8% 27/09/2023 1,600,000 1,600,000
Ukraine Government International Bond 6.58% 21/11/2016 300,000 300,000
Ukraine Government International Bond 7.75% 23/09/2020 580,000 480,000
Ukraine Government International Bond 7.8% 28/11/2022 1,500,000 1,500,000
Ukraine Government International Bond 9.25% 24/07/2017 400,000 400,000
United Mexican States 4.75% 08/03/2044 426,000 -
Uruguay Government International Bond 4.125% 20/11/2045 - 300,000
Uruguay Government International Bond 4.5% 14/08/2024 - 150,000
Venezuela Government International Bond 7.75% 13/10/2019 1,000,000 1,500,000
Venezuela Government International Bond 8.25% 13/10/2024 - 560,000
Venezuela Government International Bond 9.25% 15/09/2027 425,000 1,255,000
Venezuela Government International Bond 11.95% 05/08/2031 215,000 -
Venezuela Government International Bond 12.75% 23/08/2022 965,000 750,000
Vietnam Government International Bond 4.8% 19/11/2024 200,000 -
Vnesheconombank Via VEB Finance 5.942% 21/11/2023 - 500,000
Vnesheconombank Via VEB Finance 6.8% 22/11/2025 1,700,000 1,950,000
Zambia Government International Bond 8.5% 14/04/2024 500,000 500,000
Zar Sov Capital Fund 3.903% 24/06/2020 200,000 200,000
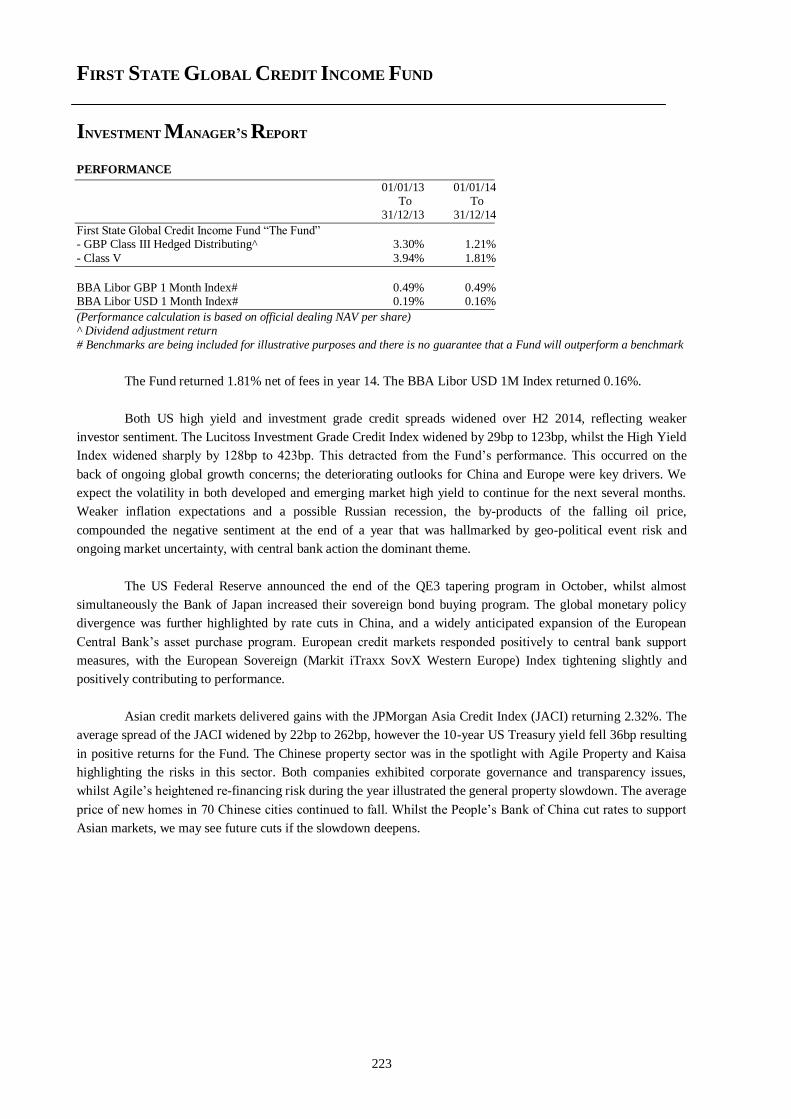
FIRST STATE GLOBAL CREDIT INCOME FUND
INVESTMENT MANAGER’S REPORT
223
PERFORMANCE
01/01/13 01/01/14 To To 31/12/13 31/12/14
First State Global Credit Income Fund “The Fund” - GBP Class III Hedged Distributing^ 3.30% 1.21%
- Class V 3.94% 1.81%
BBA Libor GBP 1 Month Index# 0.49% 0.49% BBA Libor USD 1 Month Index# 0.19% 0.16%
(Performance calculation is based on official dealing NAV per share) ^ Dividend adjustment return
# Benchmarks are being included for illustrative purposes and there is no guarantee that a Fund will outperform a benchmark
The Fund returned 1.81% net of fees in year 14. The BBA Libor USD 1M Index returned 0.16%.
Both US high yield and investment grade credit spreads widened over H2 2014, reflecting weaker
investor sentiment. The Lucitoss Investment Grade Credit Index widened by 29bp to 123bp, whilst the High Yield
Index widened sharply by 128bp to 423bp. This detracted from the Fund’s performance. This occurred on the
back of ongoing global growth concerns; the deteriorating outlooks for China and Europe were key drivers. We
expect the volatility in both developed and emerging market high yield to continue for the next several months.
Weaker inflation expectations and a possible Russian recession, the by-products of the falling oil price,
compounded the negative sentiment at the end of a year that was hallmarked by geo-political event risk and
ongoing market uncertainty, with central bank action the dominant theme.
The US Federal Reserve announced the end of the QE3 tapering program in October, whilst almost
simultaneously the Bank of Japan increased their sovereign bond buying program. The global monetary policy
divergence was further highlighted by rate cuts in China, and a widely anticipated expansion of the European
Central Bank’s asset purchase program. European credit markets responded positively to central bank support
measures, with the European Sovereign (Markit iTraxx SovX Western Europe) Index tightening slightly and
positively contributing to performance.
Asian credit markets delivered gains with the JPMorgan Asia Credit Index (JACI) returning 2.32%. The
average spread of the JACI widened by 22bp to 262bp, however the 10-year US Treasury yield fell 36bp resulting
in positive returns for the Fund. The Chinese property sector was in the spotlight with Agile Property and Kaisa
highlighting the risks in this sector. Both companies exhibited corporate governance and transparency issues,
whilst Agile’s heightened re-financing risk during the year illustrated the general property slowdown. The average
price of new homes in 70 Chinese cities continued to fall. Whilst the People’s Bank of China cut rates to support
Asian markets, we may see future cuts if the slowdown deepens.
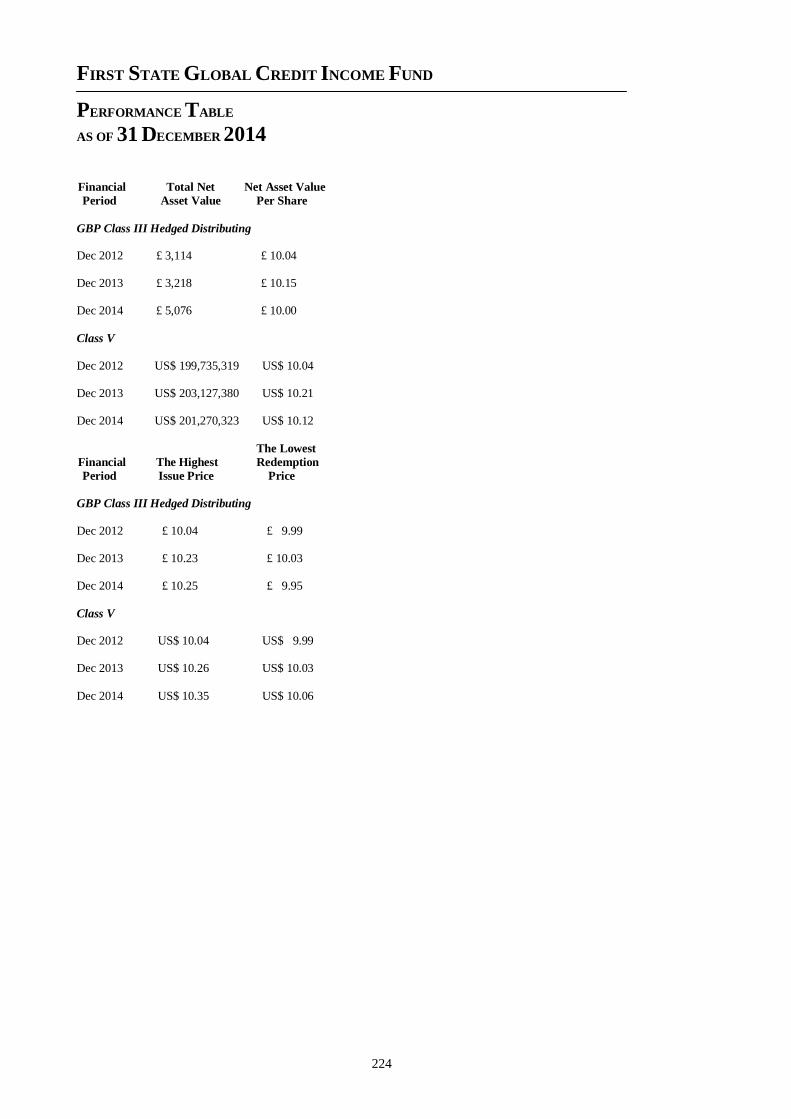
FIRST STATE GLOBAL CREDIT INCOME FUND
PERFORMANCE TABLE
AS OF 31 DECEMBER 2014
224
Financial Total Net Net Asset Value
Period Asset Value Per Share
GBP Class III Hedged Distributing
Dec 2012 £ 3,114 £ 10.04
Dec 2013 £ 3,218 £ 10.15 Dec 2014 £ 5,076 £ 10.00
Class V
Dec 2012 US$ 199,735,319 US$ 10.04 Dec 2013 US$ 203,127,380 US$ 10.21 Dec 2014 US$ 201,270,323 US$ 10.12
The Lowest
Financial The Highest Redemption
Period Issue Price Price
GBP Class III Hedged Distributing
Dec 2012 £ 10.04 £ 9.99 Dec 2013 £ 10.23 £ 10.03 Dec 2014 £ 10.25 £ 9.95
Class V
Dec 2012 US$ 10.04 US$ 9.99 Dec 2013 US$ 10.26 US$ 10.03
Dec 2014 US$ 10.35 US$ 10.06
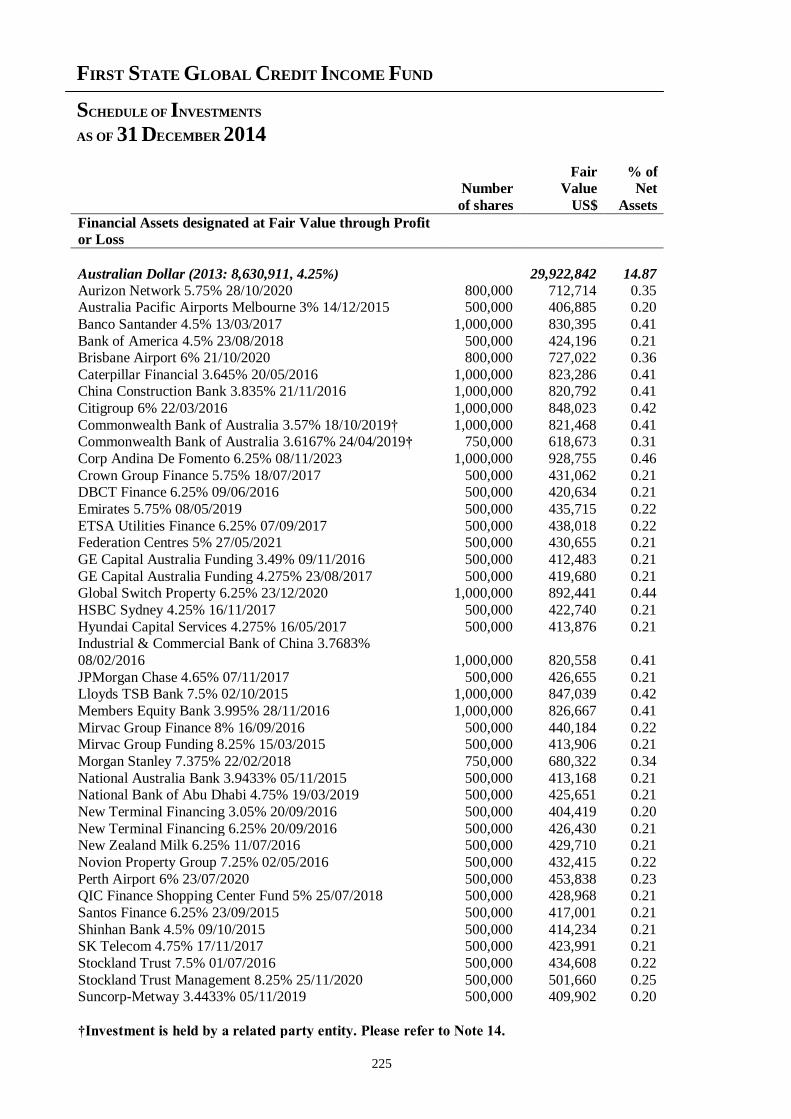
FIRST STATE GLOBAL CREDIT INCOME FUND
SCHEDULE OF INVESTMENTS
AS OF 31 DECEMBER 2014
225
Fair % of Number Value Net
of shares US$ Assets
Financial Assets designated at Fair Value through Profit
or Loss
Australian Dollar (2013: 8,630,911, 4.25%) 29,922,842 14.87
Aurizon Network 5.75% 28/10/2020 800,000 712,714 0.35 Australia Pacific Airports Melbourne 3% 14/12/2015 500,000 406,885 0.20
Banco Santander 4.5% 13/03/2017 1,000,000 830,395 0.41
Bank of America 4.5% 23/08/2018 500,000 424,196 0.21 Brisbane Airport 6% 21/10/2020 800,000 727,022 0.36
Caterpillar Financial 3.645% 20/05/2016 1,000,000 823,286 0.41 China Construction Bank 3.835% 21/11/2016 1,000,000 820,792 0.41
Citigroup 6% 22/03/2016 1,000,000 848,023 0.42
Commonwealth Bank of Australia 3.57% 18/10/2019† 1,000,000 821,468 0.41 Commonwealth Bank of Australia 3.6167% 24/04/2019† 750,000 618,673 0.31
Corp Andina De Fomento 6.25% 08/11/2023 1,000,000 928,755 0.46
Crown Group Finance 5.75% 18/07/2017 500,000 431,062 0.21 DBCT Finance 6.25% 09/06/2016 500,000 420,634 0.21
Emirates 5.75% 08/05/2019 500,000 435,715 0.22
ETSA Utilities Finance 6.25% 07/09/2017 500,000 438,018 0.22 Federation Centres 5% 27/05/2021 500,000 430,655 0.21
GE Capital Australia Funding 3.49% 09/11/2016 500,000 412,483 0.21
GE Capital Australia Funding 4.275% 23/08/2017 500,000 419,680 0.21 Global Switch Property 6.25% 23/12/2020 1,000,000 892,441 0.44
HSBC Sydney 4.25% 16/11/2017 500,000 422,740 0.21
Hyundai Capital Services 4.275% 16/05/2017 500,000 413,876 0.21 Industrial & Commercial Bank of China 3.7683%
08/02/2016 1,000,000 820,558 0.41
JPMorgan Chase 4.65% 07/11/2017 500,000 426,655 0.21 Lloyds TSB Bank 7.5% 02/10/2015 1,000,000 847,039 0.42
Members Equity Bank 3.995% 28/11/2016 1,000,000 826,667 0.41
Mirvac Group Finance 8% 16/09/2016 500,000 440,184 0.22 Mirvac Group Funding 8.25% 15/03/2015 500,000 413,906 0.21
Morgan Stanley 7.375% 22/02/2018 750,000 680,322 0.34
National Australia Bank 3.9433% 05/11/2015 500,000 413,168 0.21 National Bank of Abu Dhabi 4.75% 19/03/2019 500,000 425,651 0.21
New Terminal Financing 3.05% 20/09/2016 500,000 404,419 0.20
New Terminal Financing 6.25% 20/09/2016 500,000 426,430 0.21 New Zealand Milk 6.25% 11/07/2016 500,000 429,710 0.21
Novion Property Group 7.25% 02/05/2016 500,000 432,415 0.22
Perth Airport 6% 23/07/2020 500,000 453,838 0.23 QIC Finance Shopping Center Fund 5% 25/07/2018 500,000 428,968 0.21
Santos Finance 6.25% 23/09/2015 500,000 417,001 0.21
Shinhan Bank 4.5% 09/10/2015 500,000 414,234 0.21 SK Telecom 4.75% 17/11/2017 500,000 423,991 0.21
Stockland Trust 7.5% 01/07/2016 500,000 434,608 0.22
Stockland Trust Management 8.25% 25/11/2020 500,000 501,660 0.25 Suncorp-Metway 3.4433% 05/11/2019 500,000 409,902 0.20
†Investment is held by a related party entity. Please refer to Note 14.
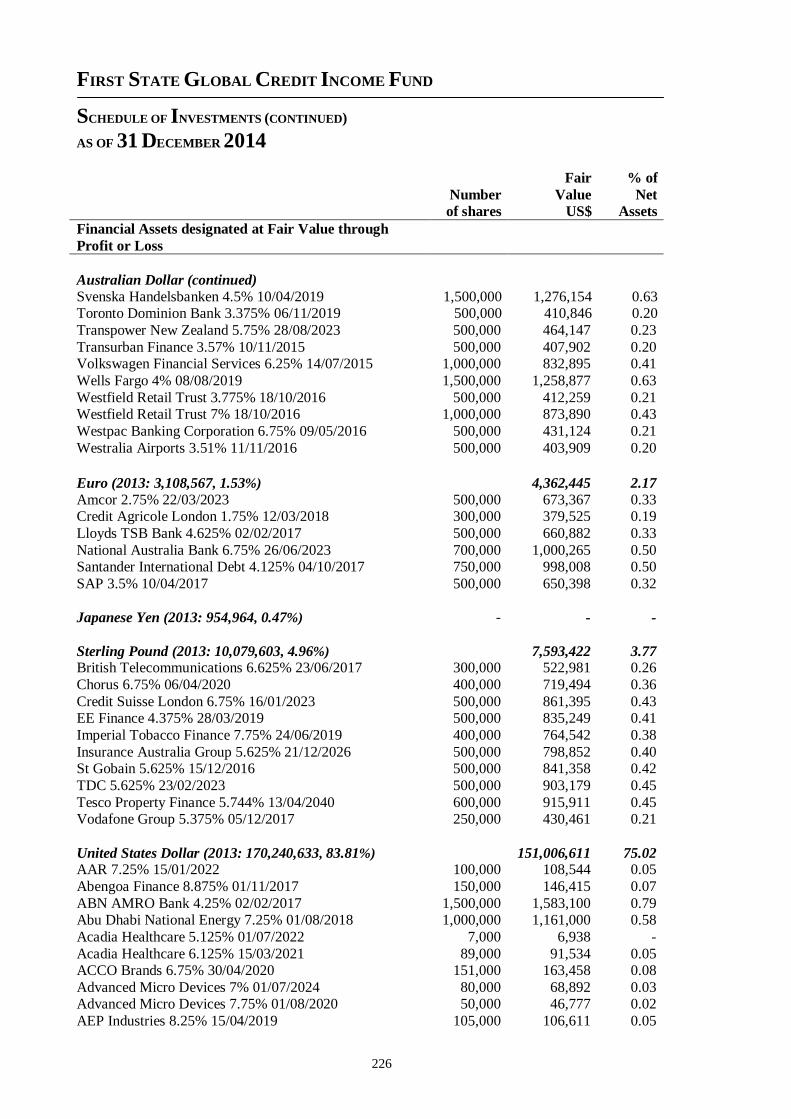
FIRST STATE GLOBAL CREDIT INCOME FUND
SCHEDULE OF INVESTMENTS (CONTINUED)
AS OF 31 DECEMBER 2014
226
Fair % of
Number Value Net of shares US$ Assets
Financial Assets designated at Fair Value through
Profit or Loss
Australian Dollar (continued)
Svenska Handelsbanken 4.5% 10/04/2019 1,500,000 1,276,154 0.63 Toronto Dominion Bank 3.375% 06/11/2019 500,000 410,846 0.20
Transpower New Zealand 5.75% 28/08/2023 500,000 464,147 0.23
Transurban Finance 3.57% 10/11/2015 500,000 407,902 0.20 Volkswagen Financial Services 6.25% 14/07/2015 1,000,000 832,895 0.41
Wells Fargo 4% 08/08/2019 1,500,000 1,258,877 0.63
Westfield Retail Trust 3.775% 18/10/2016 500,000 412,259 0.21 Westfield Retail Trust 7% 18/10/2016 1,000,000 873,890 0.43
Westpac Banking Corporation 6.75% 09/05/2016 500,000 431,124 0.21
Westralia Airports 3.51% 11/11/2016 500,000 403,909 0.20
Euro (2013: 3,108,567, 1.53%) 4,362,445 2.17
Amcor 2.75% 22/03/2023 500,000 673,367 0.33 Credit Agricole London 1.75% 12/03/2018 300,000 379,525 0.19
Lloyds TSB Bank 4.625% 02/02/2017 500,000 660,882 0.33
National Australia Bank 6.75% 26/06/2023 700,000 1,000,265 0.50 Santander International Debt 4.125% 04/10/2017 750,000 998,008 0.50
SAP 3.5% 10/04/2017 500,000 650,398 0.32
Japanese Yen (2013: 954,964, 0.47%) - - -
Sterling Pound (2013: 10,079,603, 4.96%) 7,593,422 3.77 British Telecommunications 6.625% 23/06/2017 300,000 522,981 0.26
Chorus 6.75% 06/04/2020 400,000 719,494 0.36
Credit Suisse London 6.75% 16/01/2023 500,000 861,395 0.43 EE Finance 4.375% 28/03/2019 500,000 835,249 0.41
Imperial Tobacco Finance 7.75% 24/06/2019 400,000 764,542 0.38
Insurance Australia Group 5.625% 21/12/2026 500,000 798,852 0.40 St Gobain 5.625% 15/12/2016 500,000 841,358 0.42
TDC 5.625% 23/02/2023 500,000 903,179 0.45
Tesco Property Finance 5.744% 13/04/2040 600,000 915,911 0.45 Vodafone Group 5.375% 05/12/2017 250,000 430,461 0.21
United States Dollar (2013: 170,240,633, 83.81%) 151,006,611 75.02 AAR 7.25% 15/01/2022 100,000 108,544 0.05
Abengoa Finance 8.875% 01/11/2017 150,000 146,415 0.07
ABN AMRO Bank 4.25% 02/02/2017 1,500,000 1,583,100 0.79 Abu Dhabi National Energy 7.25% 01/08/2018 1,000,000 1,161,000 0.58
Acadia Healthcare 5.125% 01/07/2022 7,000 6,938 -
Acadia Healthcare 6.125% 15/03/2021 89,000 91,534 0.05 ACCO Brands 6.75% 30/04/2020 151,000 163,458 0.08
Advanced Micro Devices 7% 01/07/2024 80,000 68,892 0.03 Advanced Micro Devices 7.75% 01/08/2020 50,000 46,777 0.02
AEP Industries 8.25% 15/04/2019 105,000 106,611 0.05
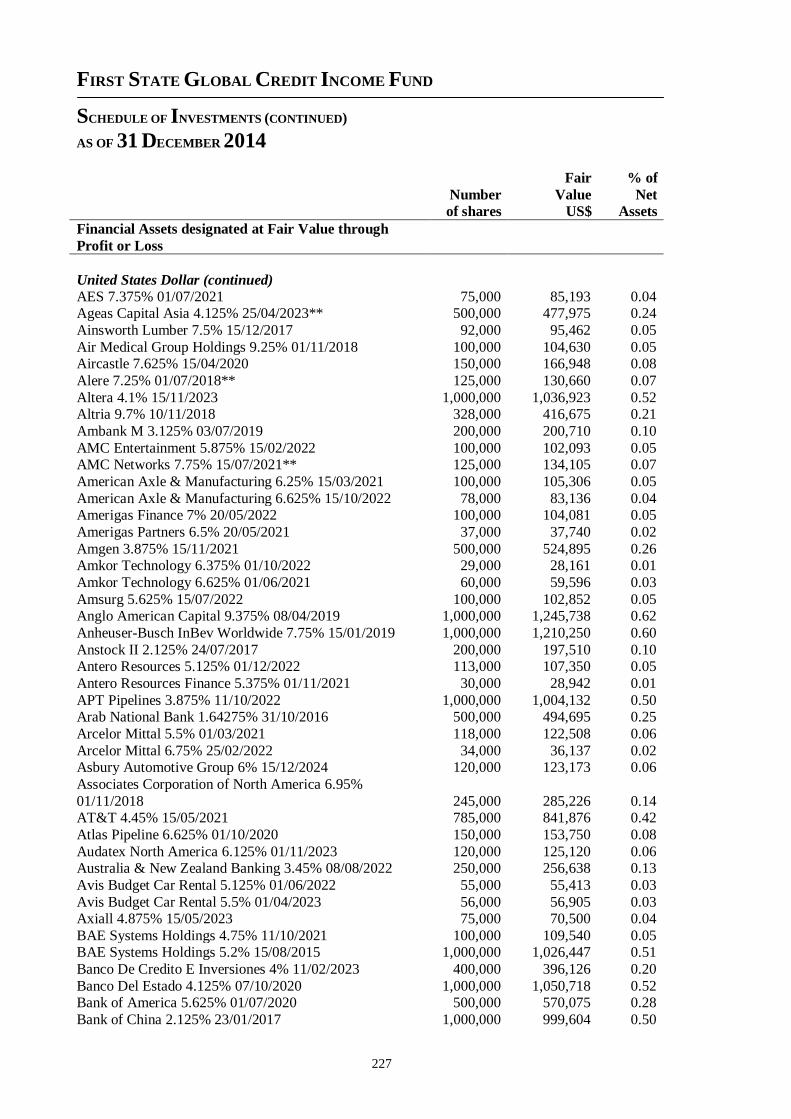
FIRST STATE GLOBAL CREDIT INCOME FUND
SCHEDULE OF INVESTMENTS (CONTINUED)
AS OF 31 DECEMBER 2014
227
Fair % of
Number Value Net of shares US$ Assets
Financial Assets designated at Fair Value through
Profit or Loss
United States Dollar (continued)
AES 7.375% 01/07/2021 75,000 85,193 0.04 Ageas Capital Asia 4.125% 25/04/2023** 500,000 477,975 0.24
Ainsworth Lumber 7.5% 15/12/2017 92,000 95,462 0.05
Air Medical Group Holdings 9.25% 01/11/2018 100,000 104,630 0.05
Aircastle 7.625% 15/04/2020 150,000 166,948 0.08
Alere 7.25% 01/07/2018** 125,000 130,660 0.07
Altera 4.1% 15/11/2023 1,000,000 1,036,923 0.52 Altria 9.7% 10/11/2018 328,000 416,675 0.21
Ambank M 3.125% 03/07/2019 200,000 200,710 0.10
AMC Entertainment 5.875% 15/02/2022 100,000 102,093 0.05 AMC Networks 7.75% 15/07/2021** 125,000 134,105 0.07
American Axle & Manufacturing 6.25% 15/03/2021 100,000 105,306 0.05
American Axle & Manufacturing 6.625% 15/10/2022 78,000 83,136 0.04 Amerigas Finance 7% 20/05/2022 100,000 104,081 0.05
Amerigas Partners 6.5% 20/05/2021 37,000 37,740 0.02
Amgen 3.875% 15/11/2021 500,000 524,895 0.26 Amkor Technology 6.375% 01/10/2022 29,000 28,161 0.01
Amkor Technology 6.625% 01/06/2021 60,000 59,596 0.03
Amsurg 5.625% 15/07/2022 100,000 102,852 0.05 Anglo American Capital 9.375% 08/04/2019 1,000,000 1,245,738 0.62
Anheuser-Busch InBev Worldwide 7.75% 15/01/2019 1,000,000 1,210,250 0.60
Anstock II 2.125% 24/07/2017 200,000 197,510 0.10 Antero Resources 5.125% 01/12/2022 113,000 107,350 0.05
Antero Resources Finance 5.375% 01/11/2021 30,000 28,942 0.01
APT Pipelines 3.875% 11/10/2022 1,000,000 1,004,132 0.50 Arab National Bank 1.64275% 31/10/2016 500,000 494,695 0.25
Arcelor Mittal 5.5% 01/03/2021 118,000 122,508 0.06
Arcelor Mittal 6.75% 25/02/2022 34,000 36,137 0.02 Asbury Automotive Group 6% 15/12/2024 120,000 123,173 0.06
Associates Corporation of North America 6.95%
01/11/2018 245,000 285,226 0.14 AT&T 4.45% 15/05/2021 785,000 841,876 0.42
Atlas Pipeline 6.625% 01/10/2020 150,000 153,750 0.08
Audatex North America 6.125% 01/11/2023 120,000 125,120 0.06 Australia & New Zealand Banking 3.45% 08/08/2022 250,000 256,638 0.13
Avis Budget Car Rental 5.125% 01/06/2022 55,000 55,413 0.03
Avis Budget Car Rental 5.5% 01/04/2023 56,000 56,905 0.03 Axiall 4.875% 15/05/2023 75,000 70,500 0.04
BAE Systems Holdings 4.75% 11/10/2021 100,000 109,540 0.05 BAE Systems Holdings 5.2% 15/08/2015 1,000,000 1,026,447 0.51
Banco De Credito E Inversiones 4% 11/02/2023 400,000 396,126 0.20
Banco Del Estado 4.125% 07/10/2020 1,000,000 1,050,718 0.52 Bank of America 5.625% 01/07/2020 500,000 570,075 0.28
Bank of China 2.125% 23/01/2017 1,000,000 999,604 0.50
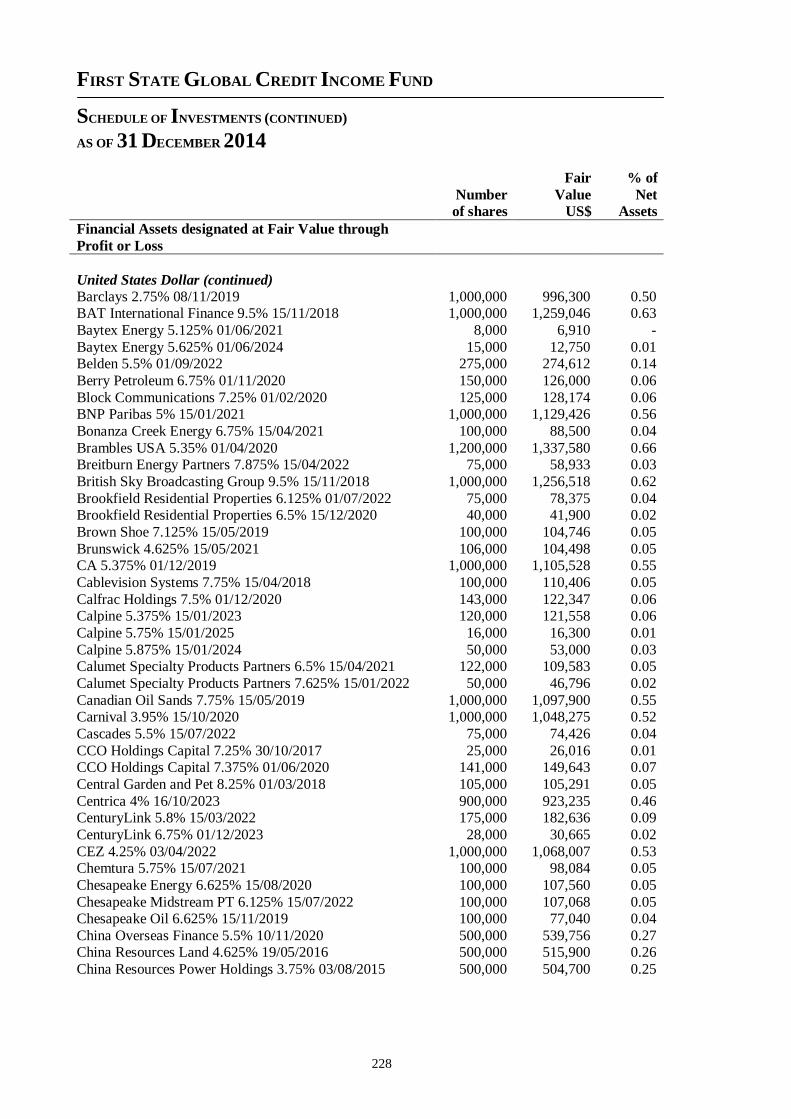
FIRST STATE GLOBAL CREDIT INCOME FUND
SCHEDULE OF INVESTMENTS (CONTINUED)
AS OF 31 DECEMBER 2014
228
Fair % of
Number Value Net of shares US$ Assets
Financial Assets designated at Fair Value through
Profit or Loss
United States Dollar (continued)
Barclays 2.75% 08/11/2019 1,000,000 996,300 0.50 BAT International Finance 9.5% 15/11/2018 1,000,000 1,259,046 0.63
Baytex Energy 5.125% 01/06/2021 8,000 6,910 -
Baytex Energy 5.625% 01/06/2024 15,000 12,750 0.01 Belden 5.5% 01/09/2022 275,000 274,612 0.14
Berry Petroleum 6.75% 01/11/2020 150,000 126,000 0.06
Block Communications 7.25% 01/02/2020 125,000 128,174 0.06 BNP Paribas 5% 15/01/2021 1,000,000 1,129,426 0.56
Bonanza Creek Energy 6.75% 15/04/2021 100,000 88,500 0.04
Brambles USA 5.35% 01/04/2020 1,200,000 1,337,580 0.66 Breitburn Energy Partners 7.875% 15/04/2022 75,000 58,933 0.03
British Sky Broadcasting Group 9.5% 15/11/2018 1,000,000 1,256,518 0.62
Brookfield Residential Properties 6.125% 01/07/2022 75,000 78,375 0.04 Brookfield Residential Properties 6.5% 15/12/2020 40,000 41,900 0.02
Brown Shoe 7.125% 15/05/2019 100,000 104,746 0.05
Brunswick 4.625% 15/05/2021 106,000 104,498 0.05 CA 5.375% 01/12/2019 1,000,000 1,105,528 0.55
Cablevision Systems 7.75% 15/04/2018 100,000 110,406 0.05
Calfrac Holdings 7.5% 01/12/2020 143,000 122,347 0.06 Calpine 5.375% 15/01/2023 120,000 121,558 0.06
Calpine 5.75% 15/01/2025 16,000 16,300 0.01
Calpine 5.875% 15/01/2024 50,000 53,000 0.03 Calumet Specialty Products Partners 6.5% 15/04/2021 122,000 109,583 0.05
Calumet Specialty Products Partners 7.625% 15/01/2022 50,000 46,796 0.02
Canadian Oil Sands 7.75% 15/05/2019 1,000,000 1,097,900 0.55 Carnival 3.95% 15/10/2020 1,000,000 1,048,275 0.52
Cascades 5.5% 15/07/2022 75,000 74,426 0.04
CCO Holdings Capital 7.25% 30/10/2017 25,000 26,016 0.01 CCO Holdings Capital 7.375% 01/06/2020 141,000 149,643 0.07
Central Garden and Pet 8.25% 01/03/2018 105,000 105,291 0.05
Centrica 4% 16/10/2023 900,000 923,235 0.46 CenturyLink 5.8% 15/03/2022 175,000 182,636 0.09
CenturyLink 6.75% 01/12/2023 28,000 30,665 0.02
CEZ 4.25% 03/04/2022 1,000,000 1,068,007 0.53 Chemtura 5.75% 15/07/2021 100,000 98,084 0.05
Chesapeake Energy 6.625% 15/08/2020 100,000 107,560 0.05
Chesapeake Midstream PT 6.125% 15/07/2022 100,000 107,068 0.05 Chesapeake Oil 6.625% 15/11/2019 100,000 77,040 0.04
China Overseas Finance 5.5% 10/11/2020 500,000 539,756 0.27 China Resources Land 4.625% 19/05/2016 500,000 515,900 0.26
China Resources Power Holdings 3.75% 03/08/2015 500,000 504,700 0.25
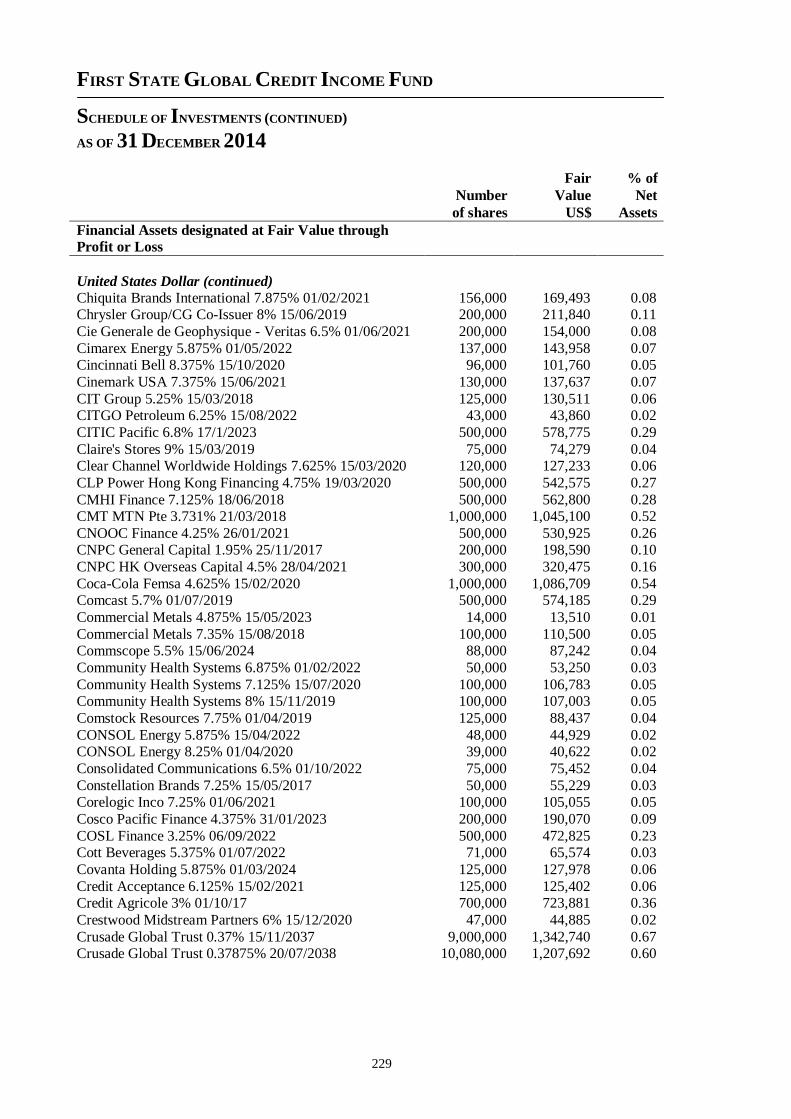
FIRST STATE GLOBAL CREDIT INCOME FUND
SCHEDULE OF INVESTMENTS (CONTINUED)
AS OF 31 DECEMBER 2014
229
Fair % of
Number Value Net
of shares US$ Assets
Financial Assets designated at Fair Value through
Profit or Loss
United States Dollar (continued)
Chiquita Brands International 7.875% 01/02/2021 156,000 169,493 0.08 Chrysler Group/CG Co-Issuer 8% 15/06/2019 200,000 211,840 0.11
Cie Generale de Geophysique - Veritas 6.5% 01/06/2021 200,000 154,000 0.08
Cimarex Energy 5.875% 01/05/2022 137,000 143,958 0.07 Cincinnati Bell 8.375% 15/10/2020 96,000 101,760 0.05
Cinemark USA 7.375% 15/06/2021 130,000 137,637 0.07
CIT Group 5.25% 15/03/2018 125,000 130,511 0.06 CITGO Petroleum 6.25% 15/08/2022 43,000 43,860 0.02
CITIC Pacific 6.8% 17/1/2023 500,000 578,775 0.29
Claire's Stores 9% 15/03/2019 75,000 74,279 0.04 Clear Channel Worldwide Holdings 7.625% 15/03/2020 120,000 127,233 0.06
CLP Power Hong Kong Financing 4.75% 19/03/2020 500,000 542,575 0.27
CMHI Finance 7.125% 18/06/2018 500,000 562,800 0.28 CMT MTN Pte 3.731% 21/03/2018 1,000,000 1,045,100 0.52
CNOOC Finance 4.25% 26/01/2021 500,000 530,925 0.26 CNPC General Capital 1.95% 25/11/2017 200,000 198,590 0.10
CNPC HK Overseas Capital 4.5% 28/04/2021 300,000 320,475 0.16
Coca-Cola Femsa 4.625% 15/02/2020 1,000,000 1,086,709 0.54 Comcast 5.7% 01/07/2019 500,000 574,185 0.29
Commercial Metals 4.875% 15/05/2023 14,000 13,510 0.01
Commercial Metals 7.35% 15/08/2018 100,000 110,500 0.05 Commscope 5.5% 15/06/2024 88,000 87,242 0.04
Community Health Systems 6.875% 01/02/2022 50,000 53,250 0.03
Community Health Systems 7.125% 15/07/2020 100,000 106,783 0.05 Community Health Systems 8% 15/11/2019 100,000 107,003 0.05
Comstock Resources 7.75% 01/04/2019 125,000 88,437 0.04
CONSOL Energy 5.875% 15/04/2022 48,000 44,929 0.02 CONSOL Energy 8.25% 01/04/2020 39,000 40,622 0.02
Consolidated Communications 6.5% 01/10/2022 75,000 75,452 0.04
Constellation Brands 7.25% 15/05/2017 50,000 55,229 0.03 Corelogic Inco 7.25% 01/06/2021 100,000 105,055 0.05
Cosco Pacific Finance 4.375% 31/01/2023 200,000 190,070 0.09
COSL Finance 3.25% 06/09/2022 500,000 472,825 0.23 Cott Beverages 5.375% 01/07/2022 71,000 65,574 0.03
Covanta Holding 5.875% 01/03/2024 125,000 127,978 0.06
Credit Acceptance 6.125% 15/02/2021 125,000 125,402 0.06 Credit Agricole 3% 01/10/17 700,000 723,881 0.36
Crestwood Midstream Partners 6% 15/12/2020 47,000 44,885 0.02
Crusade Global Trust 0.37% 15/11/2037 9,000,000 1,342,740 0.67 Crusade Global Trust 0.37875% 20/07/2038 10,080,000 1,207,692 0.60
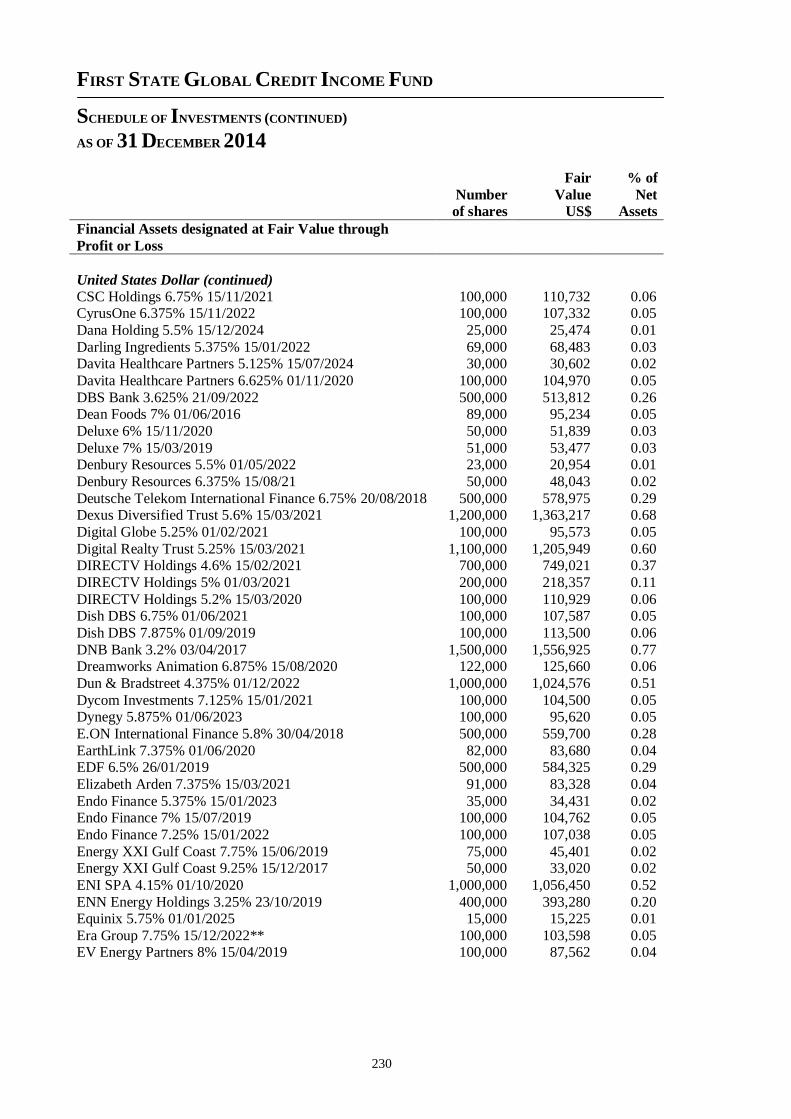
FIRST STATE GLOBAL CREDIT INCOME FUND
SCHEDULE OF INVESTMENTS (CONTINUED)
AS OF 31 DECEMBER 2014
230
Fair % of
Number Value Net of shares US$ Assets
Financial Assets designated at Fair Value through
Profit or Loss
United States Dollar (continued)
CSC Holdings 6.75% 15/11/2021 100,000 110,732 0.06 CyrusOne 6.375% 15/11/2022 100,000 107,332 0.05
Dana Holding 5.5% 15/12/2024 25,000 25,474 0.01
Darling Ingredients 5.375% 15/01/2022 69,000 68,483 0.03 Davita Healthcare Partners 5.125% 15/07/2024 30,000 30,602 0.02
Davita Healthcare Partners 6.625% 01/11/2020 100,000 104,970 0.05
DBS Bank 3.625% 21/09/2022 500,000 513,812 0.26 Dean Foods 7% 01/06/2016 89,000 95,234 0.05
Deluxe 6% 15/11/2020 50,000 51,839 0.03
Deluxe 7% 15/03/2019 51,000 53,477 0.03 Denbury Resources 5.5% 01/05/2022 23,000 20,954 0.01
Denbury Resources 6.375% 15/08/21 50,000 48,043 0.02
Deutsche Telekom International Finance 6.75% 20/08/2018 500,000 578,975 0.29 Dexus Diversified Trust 5.6% 15/03/2021 1,200,000 1,363,217 0.68
Digital Globe 5.25% 01/02/2021 100,000 95,573 0.05
Digital Realty Trust 5.25% 15/03/2021 1,100,000 1,205,949 0.60 DIRECTV Holdings 4.6% 15/02/2021 700,000 749,021 0.37
DIRECTV Holdings 5% 01/03/2021 200,000 218,357 0.11
DIRECTV Holdings 5.2% 15/03/2020 100,000 110,929 0.06 Dish DBS 6.75% 01/06/2021 100,000 107,587 0.05
Dish DBS 7.875% 01/09/2019 100,000 113,500 0.06
DNB Bank 3.2% 03/04/2017 1,500,000 1,556,925 0.77 Dreamworks Animation 6.875% 15/08/2020 122,000 125,660 0.06
Dun & Bradstreet 4.375% 01/12/2022 1,000,000 1,024,576 0.51
Dycom Investments 7.125% 15/01/2021 100,000 104,500 0.05 Dynegy 5.875% 01/06/2023 100,000 95,620 0.05
E.ON International Finance 5.8% 30/04/2018 500,000 559,700 0.28
EarthLink 7.375% 01/06/2020 82,000 83,680 0.04 EDF 6.5% 26/01/2019 500,000 584,325 0.29
Elizabeth Arden 7.375% 15/03/2021 91,000 83,328 0.04
Endo Finance 5.375% 15/01/2023 35,000 34,431 0.02 Endo Finance 7% 15/07/2019 100,000 104,762 0.05
Endo Finance 7.25% 15/01/2022 100,000 107,038 0.05
Energy XXI Gulf Coast 7.75% 15/06/2019 75,000 45,401 0.02 Energy XXI Gulf Coast 9.25% 15/12/2017 50,000 33,020 0.02
ENI SPA 4.15% 01/10/2020 1,000,000 1,056,450 0.52
ENN Energy Holdings 3.25% 23/10/2019 400,000 393,280 0.20 Equinix 5.75% 01/01/2025 15,000 15,225 0.01
Era Group 7.75% 15/12/2022** 100,000 103,598 0.05 EV Energy Partners 8% 15/04/2019 100,000 87,562 0.04
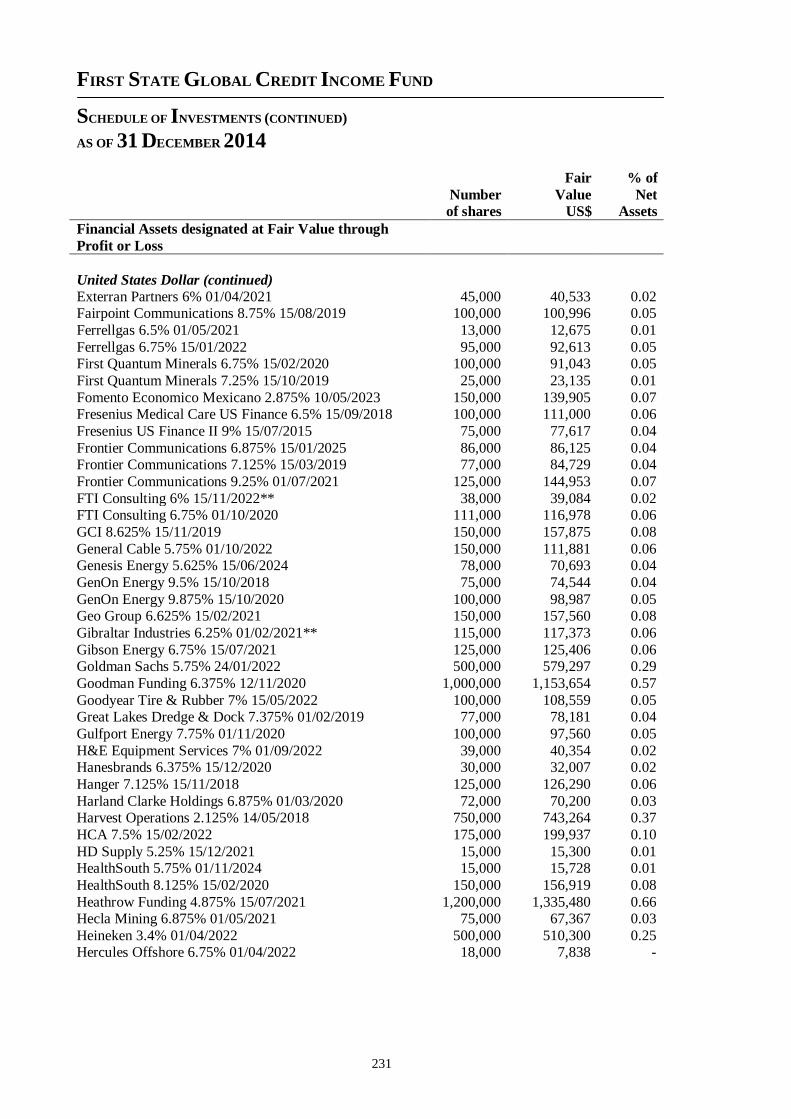
FIRST STATE GLOBAL CREDIT INCOME FUND
SCHEDULE OF INVESTMENTS (CONTINUED)
AS OF 31 DECEMBER 2014
231
Fair % of
Number Value Net of shares US$ Assets
Financial Assets designated at Fair Value through
Profit or Loss
United States Dollar (continued)
Exterran Partners 6% 01/04/2021 45,000 40,533 0.02 Fairpoint Communications 8.75% 15/08/2019 100,000 100,996 0.05
Ferrellgas 6.5% 01/05/2021 13,000 12,675 0.01
Ferrellgas 6.75% 15/01/2022 95,000 92,613 0.05 First Quantum Minerals 6.75% 15/02/2020 100,000 91,043 0.05
First Quantum Minerals 7.25% 15/10/2019 25,000 23,135 0.01
Fomento Economico Mexicano 2.875% 10/05/2023 150,000 139,905 0.07 Fresenius Medical Care US Finance 6.5% 15/09/2018 100,000 111,000 0.06
Fresenius US Finance II 9% 15/07/2015 75,000 77,617 0.04
Frontier Communications 6.875% 15/01/2025 86,000 86,125 0.04 Frontier Communications 7.125% 15/03/2019 77,000 84,729 0.04
Frontier Communications 9.25% 01/07/2021 125,000 144,953 0.07
FTI Consulting 6% 15/11/2022** 38,000 39,084 0.02 FTI Consulting 6.75% 01/10/2020 111,000 116,978 0.06
GCI 8.625% 15/11/2019 150,000 157,875 0.08
General Cable 5.75% 01/10/2022 150,000 111,881 0.06 Genesis Energy 5.625% 15/06/2024 78,000 70,693 0.04
GenOn Energy 9.5% 15/10/2018 75,000 74,544 0.04
GenOn Energy 9.875% 15/10/2020 100,000 98,987 0.05 Geo Group 6.625% 15/02/2021 150,000 157,560 0.08
Gibraltar Industries 6.25% 01/02/2021** 115,000 117,373 0.06
Gibson Energy 6.75% 15/07/2021 125,000 125,406 0.06 Goldman Sachs 5.75% 24/01/2022 500,000 579,297 0.29
Goodman Funding 6.375% 12/11/2020 1,000,000 1,153,654 0.57
Goodyear Tire & Rubber 7% 15/05/2022 100,000 108,559 0.05 Great Lakes Dredge & Dock 7.375% 01/02/2019 77,000 78,181 0.04
Gulfport Energy 7.75% 01/11/2020 100,000 97,560 0.05
H&E Equipment Services 7% 01/09/2022 39,000 40,354 0.02 Hanesbrands 6.375% 15/12/2020 30,000 32,007 0.02
Hanger 7.125% 15/11/2018 125,000 126,290 0.06
Harland Clarke Holdings 6.875% 01/03/2020 72,000 70,200 0.03 Harvest Operations 2.125% 14/05/2018 750,000 743,264 0.37
HCA 7.5% 15/02/2022 175,000 199,937 0.10
HD Supply 5.25% 15/12/2021 15,000 15,300 0.01 HealthSouth 5.75% 01/11/2024 15,000 15,728 0.01
HealthSouth 8.125% 15/02/2020 150,000 156,919 0.08
Heathrow Funding 4.875% 15/07/2021 1,200,000 1,335,480 0.66 Hecla Mining 6.875% 01/05/2021 75,000 67,367 0.03
Heineken 3.4% 01/04/2022 500,000 510,300 0.25 Hercules Offshore 6.75% 01/04/2022 18,000 7,838 -
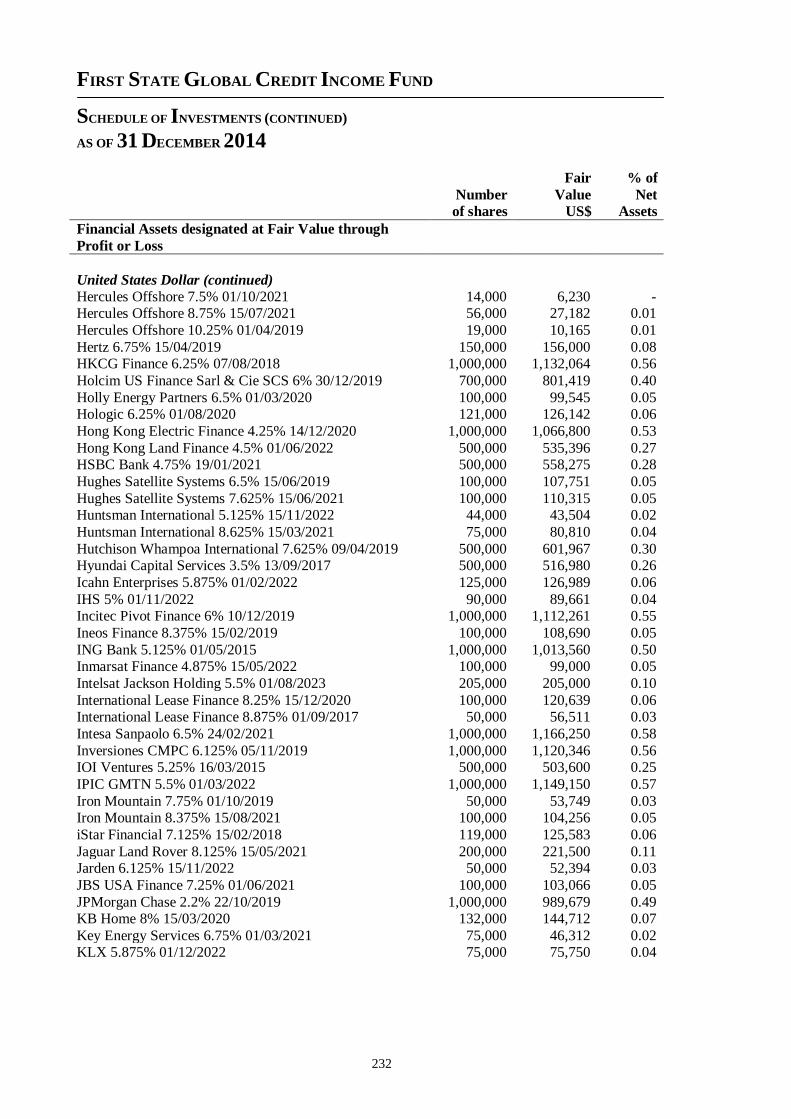
FIRST STATE GLOBAL CREDIT INCOME FUND
SCHEDULE OF INVESTMENTS (CONTINUED)
AS OF 31 DECEMBER 2014
232
Fair % of
Number Value Net of shares US$ Assets
Financial Assets designated at Fair Value through
Profit or Loss
United States Dollar (continued)
Hercules Offshore 7.5% 01/10/2021 14,000 6,230 - Hercules Offshore 8.75% 15/07/2021 56,000 27,182 0.01
Hercules Offshore 10.25% 01/04/2019 19,000 10,165 0.01
Hertz 6.75% 15/04/2019 150,000 156,000 0.08 HKCG Finance 6.25% 07/08/2018 1,000,000 1,132,064 0.56
Holcim US Finance Sarl & Cie SCS 6% 30/12/2019 700,000 801,419 0.40
Holly Energy Partners 6.5% 01/03/2020 100,000 99,545 0.05 Hologic 6.25% 01/08/2020 121,000 126,142 0.06
Hong Kong Electric Finance 4.25% 14/12/2020 1,000,000 1,066,800 0.53
Hong Kong Land Finance 4.5% 01/06/2022 500,000 535,396 0.27 HSBC Bank 4.75% 19/01/2021 500,000 558,275 0.28
Hughes Satellite Systems 6.5% 15/06/2019 100,000 107,751 0.05
Hughes Satellite Systems 7.625% 15/06/2021 100,000 110,315 0.05 Huntsman International 5.125% 15/11/2022 44,000 43,504 0.02
Huntsman International 8.625% 15/03/2021 75,000 80,810 0.04
Hutchison Whampoa International 7.625% 09/04/2019 500,000 601,967 0.30 Hyundai Capital Services 3.5% 13/09/2017 500,000 516,980 0.26
Icahn Enterprises 5.875% 01/02/2022 125,000 126,989 0.06
IHS 5% 01/11/2022 90,000 89,661 0.04 Incitec Pivot Finance 6% 10/12/2019 1,000,000 1,112,261 0.55
Ineos Finance 8.375% 15/02/2019 100,000 108,690 0.05
ING Bank 5.125% 01/05/2015 1,000,000 1,013,560 0.50 Inmarsat Finance 4.875% 15/05/2022 100,000 99,000 0.05
Intelsat Jackson Holding 5.5% 01/08/2023 205,000 205,000 0.10
International Lease Finance 8.25% 15/12/2020 100,000 120,639 0.06 International Lease Finance 8.875% 01/09/2017 50,000 56,511 0.03
Intesa Sanpaolo 6.5% 24/02/2021 1,000,000 1,166,250 0.58
Inversiones CMPC 6.125% 05/11/2019 1,000,000 1,120,346 0.56 IOI Ventures 5.25% 16/03/2015 500,000 503,600 0.25
IPIC GMTN 5.5% 01/03/2022 1,000,000 1,149,150 0.57
Iron Mountain 7.75% 01/10/2019 50,000 53,749 0.03 Iron Mountain 8.375% 15/08/2021 100,000 104,256 0.05
iStar Financial 7.125% 15/02/2018 119,000 125,583 0.06
Jaguar Land Rover 8.125% 15/05/2021 200,000 221,500 0.11 Jarden 6.125% 15/11/2022 50,000 52,394 0.03
JBS USA Finance 7.25% 01/06/2021 100,000 103,066 0.05
JPMorgan Chase 2.2% 22/10/2019 1,000,000 989,679 0.49 KB Home 8% 15/03/2020 132,000 144,712 0.07
Key Energy Services 6.75% 01/03/2021 75,000 46,312 0.02 KLX 5.875% 01/12/2022 75,000 75,750 0.04
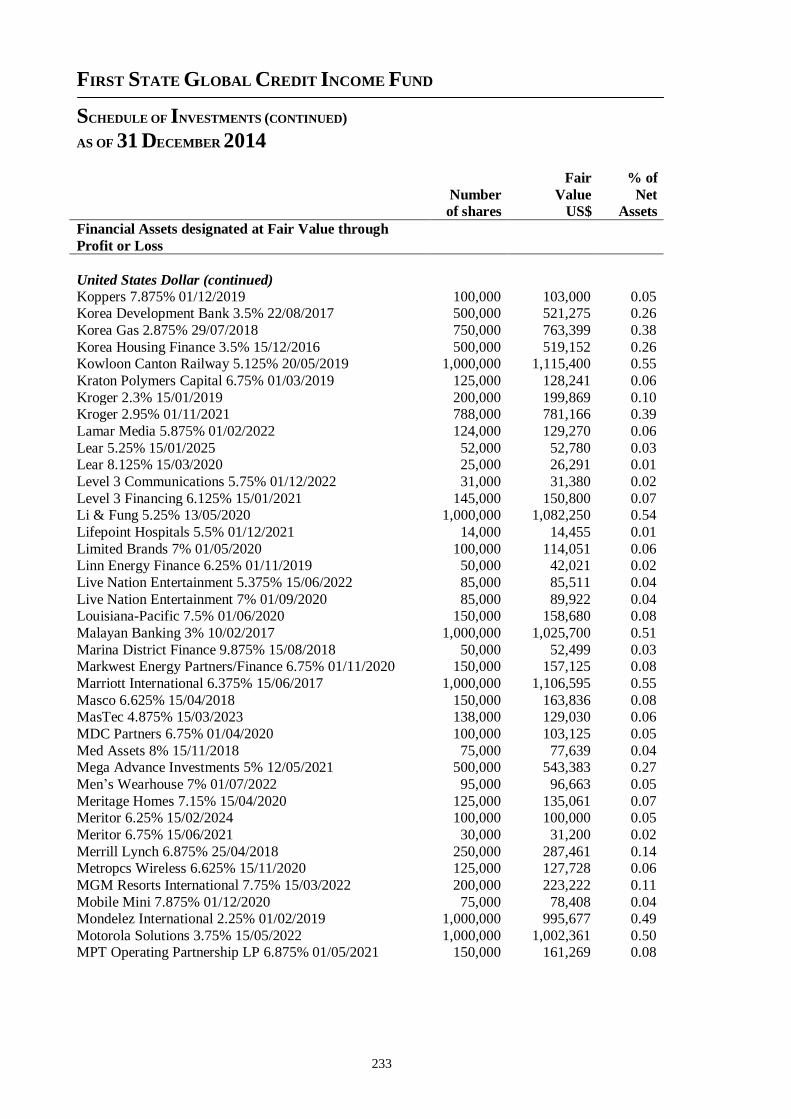
FIRST STATE GLOBAL CREDIT INCOME FUND
SCHEDULE OF INVESTMENTS (CONTINUED)
AS OF 31 DECEMBER 2014
233
Fair % of
Number Value Net of shares US$ Assets
Financial Assets designated at Fair Value through
Profit or Loss
United States Dollar (continued)
Koppers 7.875% 01/12/2019 100,000 103,000 0.05 Korea Development Bank 3.5% 22/08/2017 500,000 521,275 0.26
Korea Gas 2.875% 29/07/2018 750,000 763,399 0.38
Korea Housing Finance 3.5% 15/12/2016 500,000 519,152 0.26 Kowloon Canton Railway 5.125% 20/05/2019 1,000,000 1,115,400 0.55
Kraton Polymers Capital 6.75% 01/03/2019 125,000 128,241 0.06
Kroger 2.3% 15/01/2019 200,000 199,869 0.10 Kroger 2.95% 01/11/2021 788,000 781,166 0.39
Lamar Media 5.875% 01/02/2022 124,000 129,270 0.06
Lear 5.25% 15/01/2025 52,000 52,780 0.03 Lear 8.125% 15/03/2020 25,000 26,291 0.01
Level 3 Communications 5.75% 01/12/2022 31,000 31,380 0.02
Level 3 Financing 6.125% 15/01/2021 145,000 150,800 0.07 Li & Fung 5.25% 13/05/2020 1,000,000 1,082,250 0.54
Lifepoint Hospitals 5.5% 01/12/2021 14,000 14,455 0.01
Limited Brands 7% 01/05/2020 100,000 114,051 0.06 Linn Energy Finance 6.25% 01/11/2019 50,000 42,021 0.02
Live Nation Entertainment 5.375% 15/06/2022 85,000 85,511 0.04
Live Nation Entertainment 7% 01/09/2020 85,000 89,922 0.04 Louisiana-Pacific 7.5% 01/06/2020 150,000 158,680 0.08
Malayan Banking 3% 10/02/2017 1,000,000 1,025,700 0.51
Marina District Finance 9.875% 15/08/2018 50,000 52,499 0.03 Markwest Energy Partners/Finance 6.75% 01/11/2020 150,000 157,125 0.08
Marriott International 6.375% 15/06/2017 1,000,000 1,106,595 0.55
Masco 6.625% 15/04/2018 150,000 163,836 0.08 MasTec 4.875% 15/03/2023 138,000 129,030 0.06
MDC Partners 6.75% 01/04/2020 100,000 103,125 0.05
Med Assets 8% 15/11/2018 75,000 77,639 0.04 Mega Advance Investments 5% 12/05/2021 500,000 543,383 0.27
Men’s Wearhouse 7% 01/07/2022 95,000 96,663 0.05
Meritage Homes 7.15% 15/04/2020 125,000 135,061 0.07 Meritor 6.25% 15/02/2024 100,000 100,000 0.05
Meritor 6.75% 15/06/2021 30,000 31,200 0.02
Merrill Lynch 6.875% 25/04/2018 250,000 287,461 0.14 Metropcs Wireless 6.625% 15/11/2020 125,000 127,728 0.06
MGM Resorts International 7.75% 15/03/2022 200,000 223,222 0.11
Mobile Mini 7.875% 01/12/2020 75,000 78,408 0.04 Mondelez International 2.25% 01/02/2019 1,000,000 995,677 0.49
Motorola Solutions 3.75% 15/05/2022 1,000,000 1,002,361 0.50 MPT Operating Partnership LP 6.875% 01/05/2021 150,000 161,269 0.08
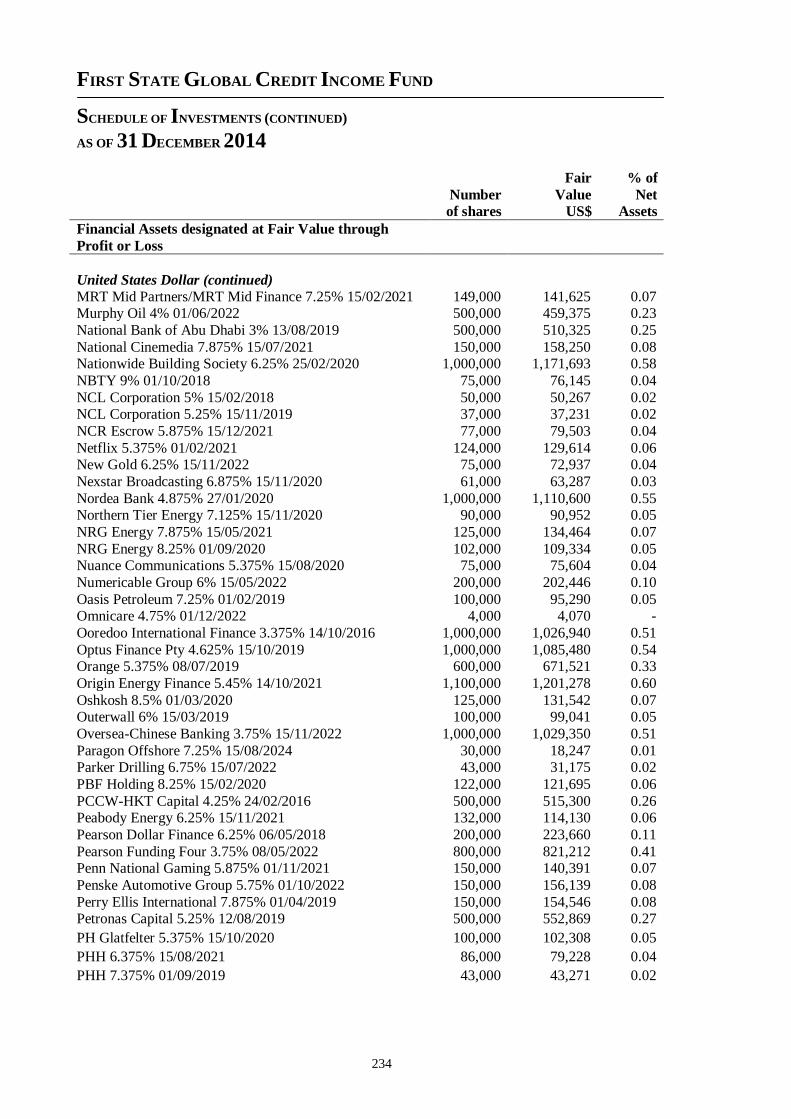
FIRST STATE GLOBAL CREDIT INCOME FUND
SCHEDULE OF INVESTMENTS (CONTINUED)
AS OF 31 DECEMBER 2014
234
Fair % of
Number Value Net of shares US$ Assets
Financial Assets designated at Fair Value through
Profit or Loss
United States Dollar (continued)
MRT Mid Partners/MRT Mid Finance 7.25% 15/02/2021 149,000 141,625 0.07 Murphy Oil 4% 01/06/2022 500,000 459,375 0.23
National Bank of Abu Dhabi 3% 13/08/2019 500,000 510,325 0.25
National Cinemedia 7.875% 15/07/2021 150,000 158,250 0.08 Nationwide Building Society 6.25% 25/02/2020 1,000,000 1,171,693 0.58
NBTY 9% 01/10/2018 75,000 76,145 0.04
NCL Corporation 5% 15/02/2018 50,000 50,267 0.02 NCL Corporation 5.25% 15/11/2019 37,000 37,231 0.02
NCR Escrow 5.875% 15/12/2021 77,000 79,503 0.04
Netflix 5.375% 01/02/2021 124,000 129,614 0.06 New Gold 6.25% 15/11/2022 75,000 72,937 0.04
Nexstar Broadcasting 6.875% 15/11/2020 61,000 63,287 0.03
Nordea Bank 4.875% 27/01/2020 1,000,000 1,110,600 0.55 Northern Tier Energy 7.125% 15/11/2020 90,000 90,952 0.05
NRG Energy 7.875% 15/05/2021 125,000 134,464 0.07
NRG Energy 8.25% 01/09/2020 102,000 109,334 0.05 Nuance Communications 5.375% 15/08/2020 75,000 75,604 0.04
Numericable Group 6% 15/05/2022 200,000 202,446 0.10
Oasis Petroleum 7.25% 01/02/2019 100,000 95,290 0.05 Omnicare 4.75% 01/12/2022 4,000 4,070 -
Ooredoo International Finance 3.375% 14/10/2016 1,000,000 1,026,940 0.51
Optus Finance Pty 4.625% 15/10/2019 1,000,000 1,085,480 0.54 Orange 5.375% 08/07/2019 600,000 671,521 0.33
Origin Energy Finance 5.45% 14/10/2021 1,100,000 1,201,278 0.60
Oshkosh 8.5% 01/03/2020 125,000 131,542 0.07 Outerwall 6% 15/03/2019 100,000 99,041 0.05
Oversea-Chinese Banking 3.75% 15/11/2022 1,000,000 1,029,350 0.51
Paragon Offshore 7.25% 15/08/2024 30,000 18,247 0.01 Parker Drilling 6.75% 15/07/2022 43,000 31,175 0.02
PBF Holding 8.25% 15/02/2020 122,000 121,695 0.06
PCCW-HKT Capital 4.25% 24/02/2016 500,000 515,300 0.26 Peabody Energy 6.25% 15/11/2021 132,000 114,130 0.06
Pearson Dollar Finance 6.25% 06/05/2018 200,000 223,660 0.11
Pearson Funding Four 3.75% 08/05/2022 800,000 821,212 0.41 Penn National Gaming 5.875% 01/11/2021 150,000 140,391 0.07
Penske Automotive Group 5.75% 01/10/2022 150,000 156,139 0.08
Perry Ellis International 7.875% 01/04/2019 150,000 154,546 0.08 Petronas Capital 5.25% 12/08/2019 500,000 552,869 0.27
PH Glatfelter 5.375% 15/10/2020 100,000 102,308 0.05
PHH 6.375% 15/08/2021 86,000 79,228 0.04
PHH 7.375% 01/09/2019 43,000 43,271 0.02
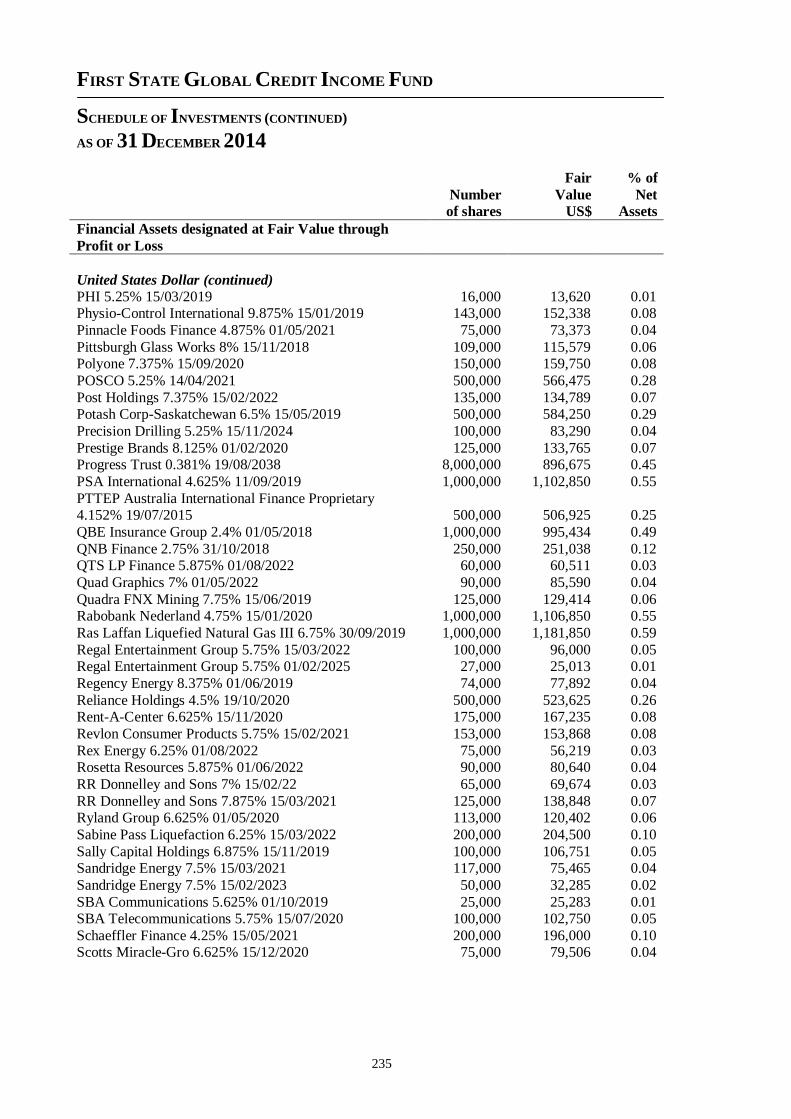
FIRST STATE GLOBAL CREDIT INCOME FUND
SCHEDULE OF INVESTMENTS (CONTINUED)
AS OF 31 DECEMBER 2014
235
Fair % of
Number Value Net of shares US$ Assets
Financial Assets designated at Fair Value through
Profit or Loss
United States Dollar (continued)
PHI 5.25% 15/03/2019 16,000 13,620 0.01 Physio-Control International 9.875% 15/01/2019 143,000 152,338 0.08
Pinnacle Foods Finance 4.875% 01/05/2021 75,000 73,373 0.04
Pittsburgh Glass Works 8% 15/11/2018 109,000 115,579 0.06 Polyone 7.375% 15/09/2020 150,000 159,750 0.08
POSCO 5.25% 14/04/2021 500,000 566,475 0.28
Post Holdings 7.375% 15/02/2022 135,000 134,789 0.07 Potash Corp-Saskatchewan 6.5% 15/05/2019 500,000 584,250 0.29
Precision Drilling 5.25% 15/11/2024 100,000 83,290 0.04
Prestige Brands 8.125% 01/02/2020 125,000 133,765 0.07 Progress Trust 0.381% 19/08/2038 8,000,000 896,675 0.45
PSA International 4.625% 11/09/2019 1,000,000 1,102,850 0.55
PTTEP Australia International Finance Proprietary 4.152% 19/07/2015 500,000 506,925 0.25
QBE Insurance Group 2.4% 01/05/2018 1,000,000 995,434 0.49
QNB Finance 2.75% 31/10/2018 250,000 251,038 0.12 QTS LP Finance 5.875% 01/08/2022 60,000 60,511 0.03
Quad Graphics 7% 01/05/2022 90,000 85,590 0.04
Quadra FNX Mining 7.75% 15/06/2019 125,000 129,414 0.06 Rabobank Nederland 4.75% 15/01/2020 1,000,000 1,106,850 0.55
Ras Laffan Liquefied Natural Gas III 6.75% 30/09/2019 1,000,000 1,181,850 0.59
Regal Entertainment Group 5.75% 15/03/2022 100,000 96,000 0.05 Regal Entertainment Group 5.75% 01/02/2025 27,000 25,013 0.01
Regency Energy 8.375% 01/06/2019 74,000 77,892 0.04
Reliance Holdings 4.5% 19/10/2020 500,000 523,625 0.26 Rent-A-Center 6.625% 15/11/2020 175,000 167,235 0.08
Revlon Consumer Products 5.75% 15/02/2021 153,000 153,868 0.08
Rex Energy 6.25% 01/08/2022 75,000 56,219 0.03 Rosetta Resources 5.875% 01/06/2022 90,000 80,640 0.04
RR Donnelley and Sons 7% 15/02/22 65,000 69,674 0.03
RR Donnelley and Sons 7.875% 15/03/2021 125,000 138,848 0.07 Ryland Group 6.625% 01/05/2020 113,000 120,402 0.06
Sabine Pass Liquefaction 6.25% 15/03/2022 200,000 204,500 0.10
Sally Capital Holdings 6.875% 15/11/2019 100,000 106,751 0.05 Sandridge Energy 7.5% 15/03/2021 117,000 75,465 0.04
Sandridge Energy 7.5% 15/02/2023 50,000 32,285 0.02
SBA Communications 5.625% 01/10/2019 25,000 25,283 0.01 SBA Telecommunications 5.75% 15/07/2020 100,000 102,750 0.05
Schaeffler Finance 4.25% 15/05/2021 200,000 196,000 0.10 Scotts Miracle-Gro 6.625% 15/12/2020 75,000 79,506 0.04
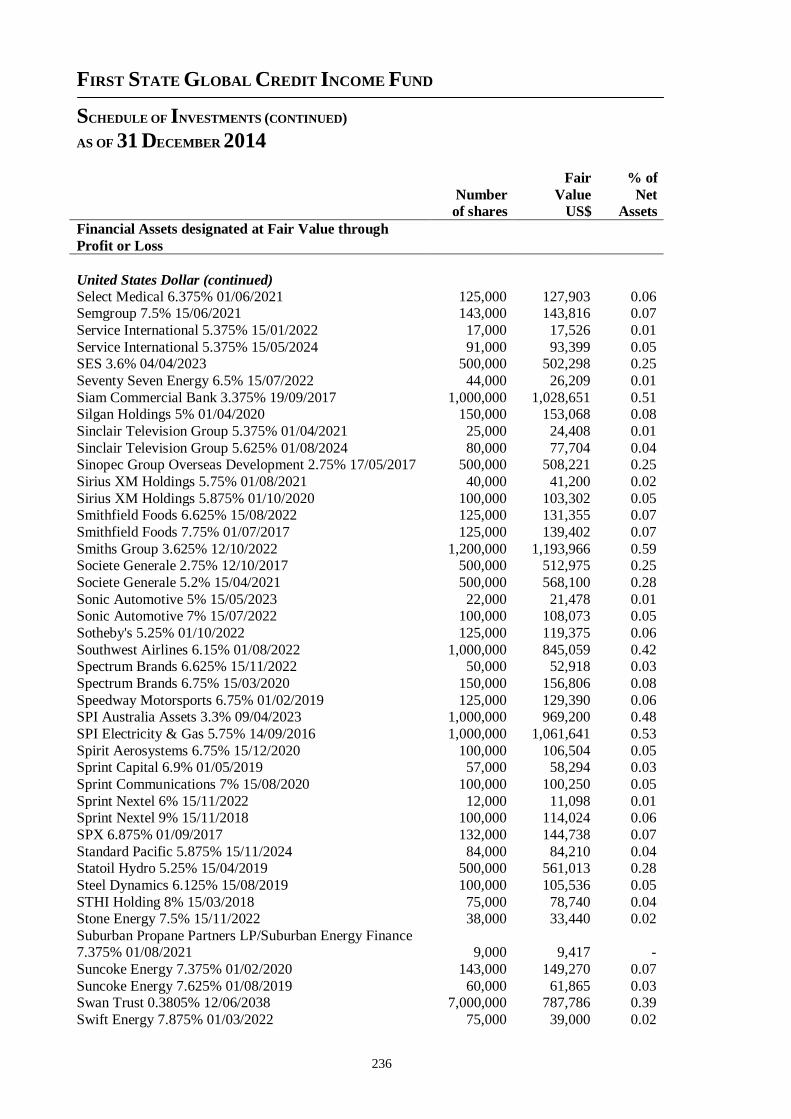
FIRST STATE GLOBAL CREDIT INCOME FUND
SCHEDULE OF INVESTMENTS (CONTINUED)
AS OF 31 DECEMBER 2014
236
Fair % of
Number Value Net of shares US$ Assets
Financial Assets designated at Fair Value through
Profit or Loss
United States Dollar (continued)
Select Medical 6.375% 01/06/2021 125,000 127,903 0.06 Semgroup 7.5% 15/06/2021 143,000 143,816 0.07
Service International 5.375% 15/01/2022 17,000 17,526 0.01
Service International 5.375% 15/05/2024 91,000 93,399 0.05 SES 3.6% 04/04/2023 500,000 502,298 0.25
Seventy Seven Energy 6.5% 15/07/2022 44,000 26,209 0.01
Siam Commercial Bank 3.375% 19/09/2017 1,000,000 1,028,651 0.51 Silgan Holdings 5% 01/04/2020 150,000 153,068 0.08
Sinclair Television Group 5.375% 01/04/2021 25,000 24,408 0.01
Sinclair Television Group 5.625% 01/08/2024 80,000 77,704 0.04 Sinopec Group Overseas Development 2.75% 17/05/2017 500,000 508,221 0.25
Sirius XM Holdings 5.75% 01/08/2021 40,000 41,200 0.02
Sirius XM Holdings 5.875% 01/10/2020 100,000 103,302 0.05 Smithfield Foods 6.625% 15/08/2022 125,000 131,355 0.07
Smithfield Foods 7.75% 01/07/2017 125,000 139,402 0.07
Smiths Group 3.625% 12/10/2022 1,200,000 1,193,966 0.59 Societe Generale 2.75% 12/10/2017 500,000 512,975 0.25
Societe Generale 5.2% 15/04/2021 500,000 568,100 0.28
Sonic Automotive 5% 15/05/2023 22,000 21,478 0.01 Sonic Automotive 7% 15/07/2022 100,000 108,073 0.05
Sotheby's 5.25% 01/10/2022 125,000 119,375 0.06
Southwest Airlines 6.15% 01/08/2022 1,000,000 845,059 0.42 Spectrum Brands 6.625% 15/11/2022 50,000 52,918 0.03
Spectrum Brands 6.75% 15/03/2020 150,000 156,806 0.08
Speedway Motorsports 6.75% 01/02/2019 125,000 129,390 0.06 SPI Australia Assets 3.3% 09/04/2023 1,000,000 969,200 0.48
SPI Electricity & Gas 5.75% 14/09/2016 1,000,000 1,061,641 0.53
Spirit Aerosystems 6.75% 15/12/2020 100,000 106,504 0.05 Sprint Capital 6.9% 01/05/2019 57,000 58,294 0.03
Sprint Communications 7% 15/08/2020 100,000 100,250 0.05
Sprint Nextel 6% 15/11/2022 12,000 11,098 0.01 Sprint Nextel 9% 15/11/2018 100,000 114,024 0.06
SPX 6.875% 01/09/2017 132,000 144,738 0.07
Standard Pacific 5.875% 15/11/2024 84,000 84,210 0.04 Statoil Hydro 5.25% 15/04/2019 500,000 561,013 0.28
Steel Dynamics 6.125% 15/08/2019 100,000 105,536 0.05
STHI Holding 8% 15/03/2018 75,000 78,740 0.04 Stone Energy 7.5% 15/11/2022 38,000 33,440 0.02
Suburban Propane Partners LP/Suburban Energy Finance 7.375% 01/08/2021 9,000 9,417 -
Suncoke Energy 7.375% 01/02/2020 143,000 149,270 0.07
Suncoke Energy 7.625% 01/08/2019 60,000 61,865 0.03 Swan Trust 0.3805% 12/06/2038 7,000,000 787,786 0.39
Swift Energy 7.875% 01/03/2022 75,000 39,000 0.02
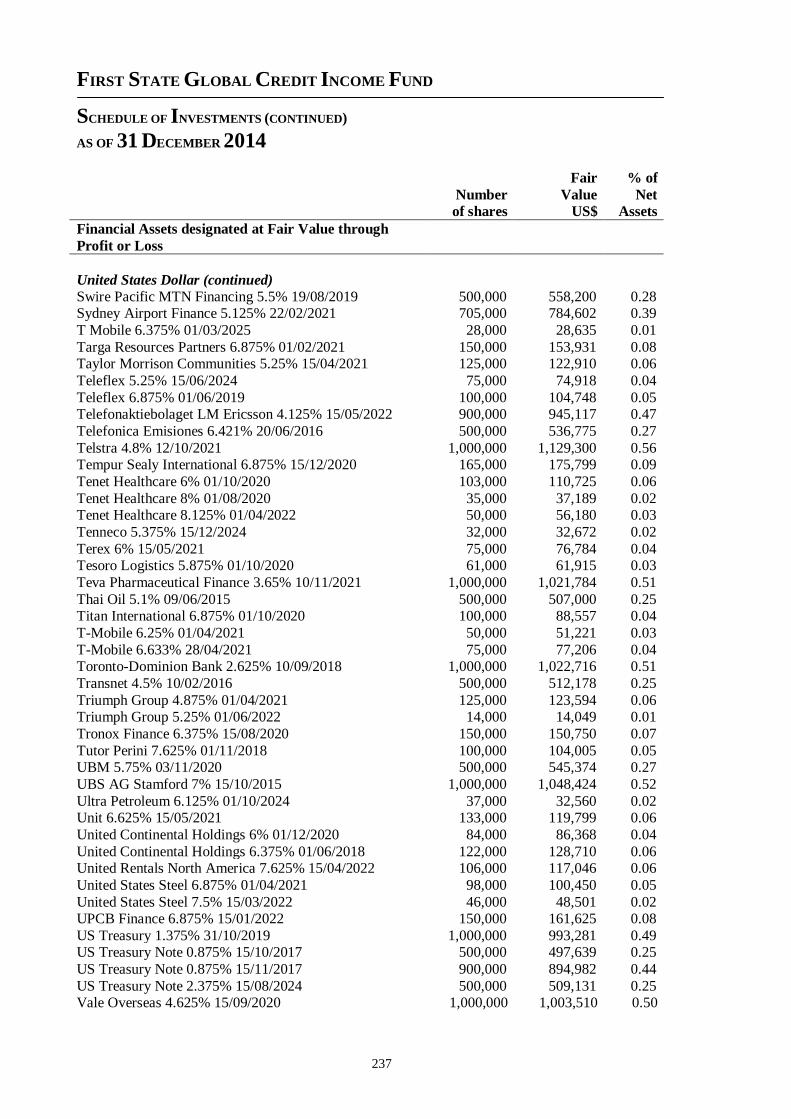
FIRST STATE GLOBAL CREDIT INCOME FUND
SCHEDULE OF INVESTMENTS (CONTINUED)
AS OF 31 DECEMBER 2014
237
Fair % of
Number Value Net of shares US$ Assets
Financial Assets designated at Fair Value through
Profit or Loss
United States Dollar (continued)
Swire Pacific MTN Financing 5.5% 19/08/2019 500,000 558,200 0.28 Sydney Airport Finance 5.125% 22/02/2021 705,000 784,602 0.39
T Mobile 6.375% 01/03/2025 28,000 28,635 0.01
Targa Resources Partners 6.875% 01/02/2021 150,000 153,931 0.08 Taylor Morrison Communities 5.25% 15/04/2021 125,000 122,910 0.06
Teleflex 5.25% 15/06/2024 75,000 74,918 0.04
Teleflex 6.875% 01/06/2019 100,000 104,748 0.05 Telefonaktiebolaget LM Ericsson 4.125% 15/05/2022 900,000 945,117 0.47
Telefonica Emisiones 6.421% 20/06/2016 500,000 536,775 0.27
Telstra 4.8% 12/10/2021 1,000,000 1,129,300 0.56 Tempur Sealy International 6.875% 15/12/2020 165,000 175,799 0.09
Tenet Healthcare 6% 01/10/2020 103,000 110,725 0.06
Tenet Healthcare 8% 01/08/2020 35,000 37,189 0.02 Tenet Healthcare 8.125% 01/04/2022 50,000 56,180 0.03
Tenneco 5.375% 15/12/2024 32,000 32,672 0.02
Terex 6% 15/05/2021 75,000 76,784 0.04 Tesoro Logistics 5.875% 01/10/2020 61,000 61,915 0.03
Teva Pharmaceutical Finance 3.65% 10/11/2021 1,000,000 1,021,784 0.51
Thai Oil 5.1% 09/06/2015 500,000 507,000 0.25 Titan International 6.875% 01/10/2020 100,000 88,557 0.04
T-Mobile 6.25% 01/04/2021 50,000 51,221 0.03
T-Mobile 6.633% 28/04/2021 75,000 77,206 0.04 Toronto-Dominion Bank 2.625% 10/09/2018 1,000,000 1,022,716 0.51
Transnet 4.5% 10/02/2016 500,000 512,178 0.25
Triumph Group 4.875% 01/04/2021 125,000 123,594 0.06 Triumph Group 5.25% 01/06/2022 14,000 14,049 0.01
Tronox Finance 6.375% 15/08/2020 150,000 150,750 0.07
Tutor Perini 7.625% 01/11/2018 100,000 104,005 0.05 UBM 5.75% 03/11/2020 500,000 545,374 0.27
UBS AG Stamford 7% 15/10/2015 1,000,000 1,048,424 0.52
Ultra Petroleum 6.125% 01/10/2024 37,000 32,560 0.02 Unit 6.625% 15/05/2021 133,000 119,799 0.06
United Continental Holdings 6% 01/12/2020 84,000 86,368 0.04
United Continental Holdings 6.375% 01/06/2018 122,000 128,710 0.06 United Rentals North America 7.625% 15/04/2022 106,000 117,046 0.06
United States Steel 6.875% 01/04/2021 98,000 100,450 0.05
United States Steel 7.5% 15/03/2022 46,000 48,501 0.02 UPCB Finance 6.875% 15/01/2022 150,000 161,625 0.08
US Treasury 1.375% 31/10/2019 1,000,000 993,281 0.49 US Treasury Note 0.875% 15/10/2017 500,000 497,639 0.25
US Treasury Note 0.875% 15/11/2017 900,000 894,982 0.44
US Treasury Note 2.375% 15/08/2024 500,000 509,131 0.25 Vale Overseas 4.625% 15/09/2020 1,000,000 1,003,510 0.50
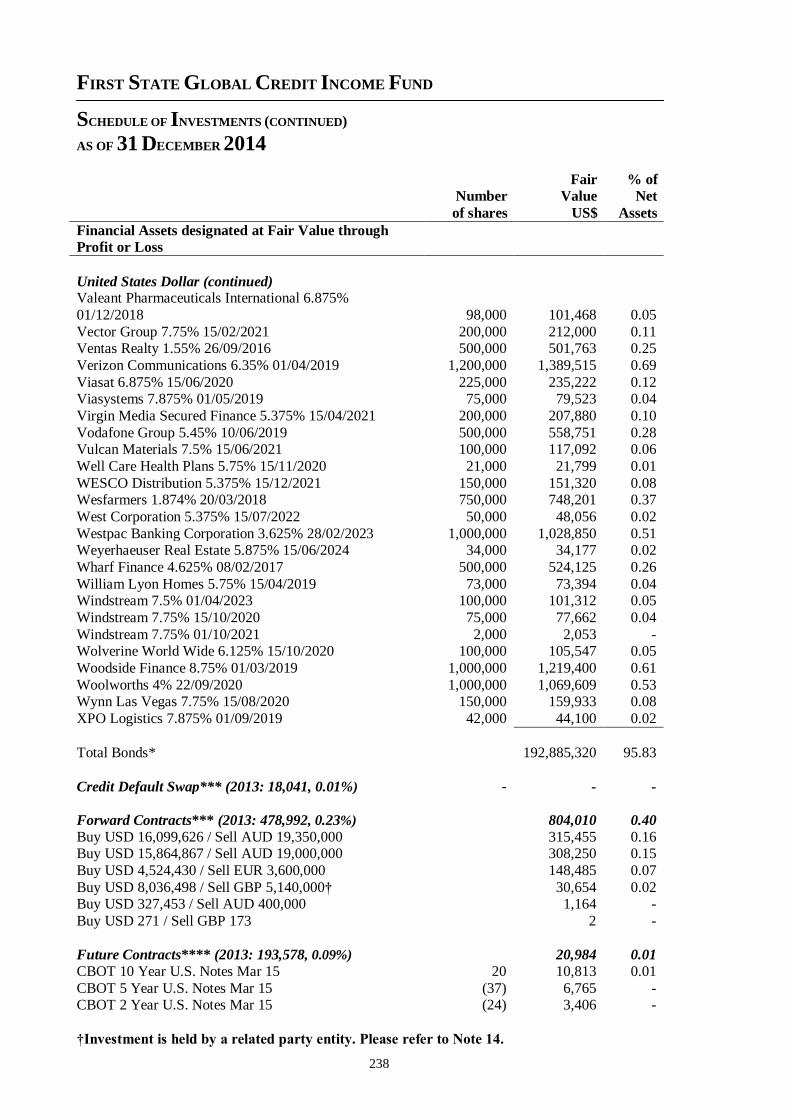
FIRST STATE GLOBAL CREDIT INCOME FUND
SCHEDULE OF INVESTMENTS (CONTINUED)
AS OF 31 DECEMBER 2014
238
Fair % of Number Value Net
of shares US$ Assets
Financial Assets designated at Fair Value through
Profit or Loss
United States Dollar (continued) Valeant Pharmaceuticals International 6.875%
01/12/2018 98,000 101,468 0.05
Vector Group 7.75% 15/02/2021 200,000 212,000 0.11 Ventas Realty 1.55% 26/09/2016 500,000 501,763 0.25
Verizon Communications 6.35% 01/04/2019 1,200,000 1,389,515 0.69
Viasat 6.875% 15/06/2020 225,000 235,222 0.12 Viasystems 7.875% 01/05/2019 75,000 79,523 0.04
Virgin Media Secured Finance 5.375% 15/04/2021 200,000 207,880 0.10
Vodafone Group 5.45% 10/06/2019 500,000 558,751 0.28 Vulcan Materials 7.5% 15/06/2021 100,000 117,092 0.06
Well Care Health Plans 5.75% 15/11/2020 21,000 21,799 0.01
WESCO Distribution 5.375% 15/12/2021 150,000 151,320 0.08 Wesfarmers 1.874% 20/03/2018 750,000 748,201 0.37
West Corporation 5.375% 15/07/2022 50,000 48,056 0.02
Westpac Banking Corporation 3.625% 28/02/2023 1,000,000 1,028,850 0.51 Weyerhaeuser Real Estate 5.875% 15/06/2024 34,000 34,177 0.02
Wharf Finance 4.625% 08/02/2017 500,000 524,125 0.26
William Lyon Homes 5.75% 15/04/2019 73,000 73,394 0.04 Windstream 7.5% 01/04/2023 100,000 101,312 0.05
Windstream 7.75% 15/10/2020 75,000 77,662 0.04
Windstream 7.75% 01/10/2021 2,000 2,053 - Wolverine World Wide 6.125% 15/10/2020 100,000 105,547 0.05
Woodside Finance 8.75% 01/03/2019 1,000,000 1,219,400 0.61
Woolworths 4% 22/09/2020 1,000,000 1,069,609 0.53 Wynn Las Vegas 7.75% 15/08/2020 150,000 159,933 0.08
XPO Logistics 7.875% 01/09/2019 42,000 44,100 0.02
Total Bonds* 192,885,320 95.83
Credit Default Swap*** (2013: 18,041, 0.01%) - - -
Forward Contracts*** (2013: 478,992, 0.23%) 804,010 0.40
Buy USD 16,099,626 / Sell AUD 19,350,000 315,455 0.16 Buy USD 15,864,867 / Sell AUD 19,000,000 308,250 0.15
Buy USD 4,524,430 / Sell EUR 3,600,000 148,485 0.07
Buy USD 8,036,498 / Sell GBP 5,140,000† 30,654 0.02 Buy USD 327,453 / Sell AUD 400,000 1,164 -
Buy USD 271 / Sell GBP 173 2 -
Future Contracts**** (2013: 193,578, 0.09%) 20,984 0.01
CBOT 10 Year U.S. Notes Mar 15 20 10,813 0.01
CBOT 5 Year U.S. Notes Mar 15 (37) 6,765 - CBOT 2 Year U.S. Notes Mar 15 (24) 3,406 -
†Investment is held by a related party entity. Please refer to Note 14.
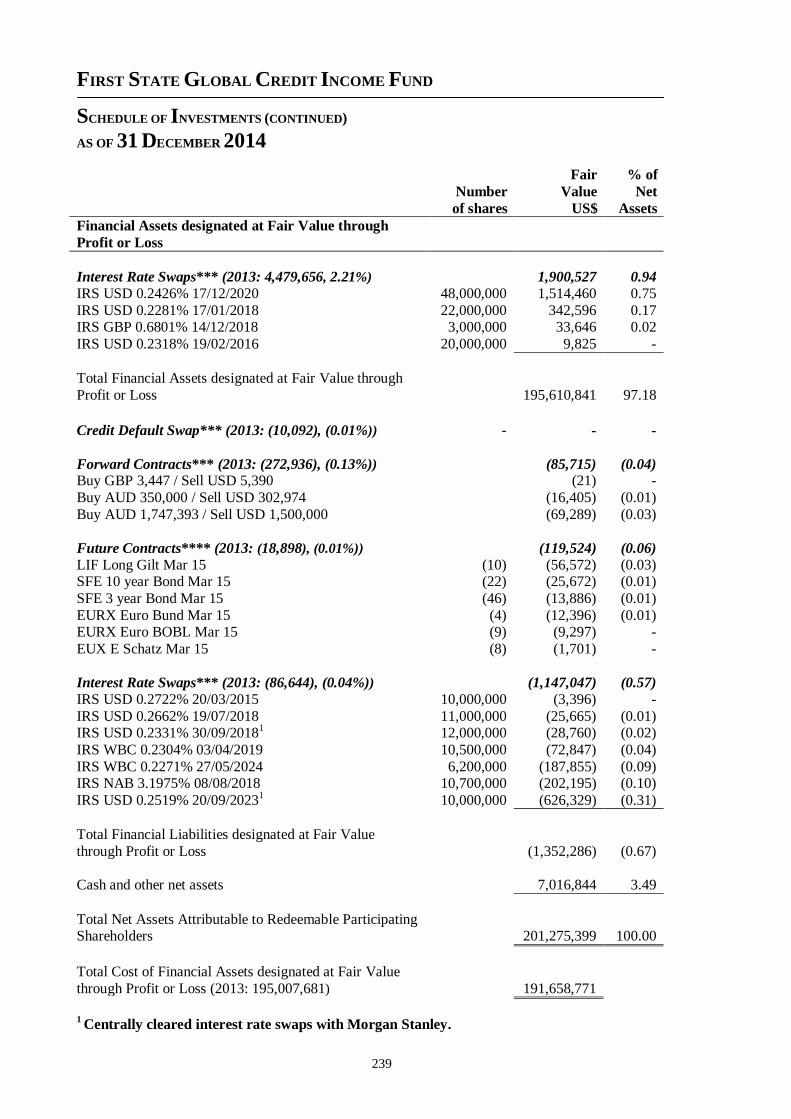
FIRST STATE GLOBAL CREDIT INCOME FUND
SCHEDULE OF INVESTMENTS (CONTINUED)
AS OF 31 DECEMBER 2014
239
Fair % of
Number Value Net
of shares US$ Assets
Financial Assets designated at Fair Value through
Profit or Loss
Interest Rate Swaps*** (2013: 4,479,656, 2.21%) 1,900,527 0.94
IRS USD 0.2426% 17/12/2020 48,000,000 1,514,460 0.75
IRS USD 0.2281% 17/01/2018 22,000,000 342,596 0.17 IRS GBP 0.6801% 14/12/2018 3,000,000 33,646 0.02
IRS USD 0.2318% 19/02/2016 20,000,000 9,825 -
Total Financial Assets designated at Fair Value through
Profit or Loss 195,610,841 97.18
Credit Default Swap*** (2013: (10,092), (0.01%)) - - -
Forward Contracts*** (2013: (272,936), (0.13%)) (85,715) (0.04) Buy GBP 3,447 / Sell USD 5,390 (21) -
Buy AUD 350,000 / Sell USD 302,974 (16,405) (0.01)
Buy AUD 1,747,393 / Sell USD 1,500,000 (69,289) (0.03)
Future Contracts**** (2013: (18,898), (0.01%)) (119,524) (0.06)
LIF Long Gilt Mar 15 (10) (56,572) (0.03) SFE 10 year Bond Mar 15 (22) (25,672) (0.01)
SFE 3 year Bond Mar 15 (46) (13,886) (0.01)
EURX Euro Bund Mar 15 (4) (12,396) (0.01) EURX Euro BOBL Mar 15 (9) (9,297) -
EUX E Schatz Mar 15 (8) (1,701) -
Interest Rate Swaps*** (2013: (86,644), (0.04%)) (1,147,047) (0.57)
IRS USD 0.2722% 20/03/2015 10,000,000 (3,396) -
IRS USD 0.2662% 19/07/2018 11,000,000 (25,665) (0.01) IRS USD 0.2331% 30/09/2018
1 12,000,000 (28,760) (0.02)
IRS WBC 0.2304% 03/04/2019 10,500,000 (72,847) (0.04)
IRS WBC 0.2271% 27/05/2024 6,200,000 (187,855) (0.09) IRS NAB 3.1975% 08/08/2018 10,700,000 (202,195) (0.10)
IRS USD 0.2519% 20/09/20231 10,000,000 (626,329) (0.31)
Total Financial Liabilities designated at Fair Value
through Profit or Loss (1,352,286) (0.67)
Cash and other net assets 7,016,844 3.49
Total Net Assets Attributable to Redeemable Participating Shareholders 201,275,399 100.00
Total Cost of Financial Assets designated at Fair Value
through Profit or Loss (2013: 195,007,681) 191,658,771
1 Centrally cleared interest rate swaps with Morgan Stanley.
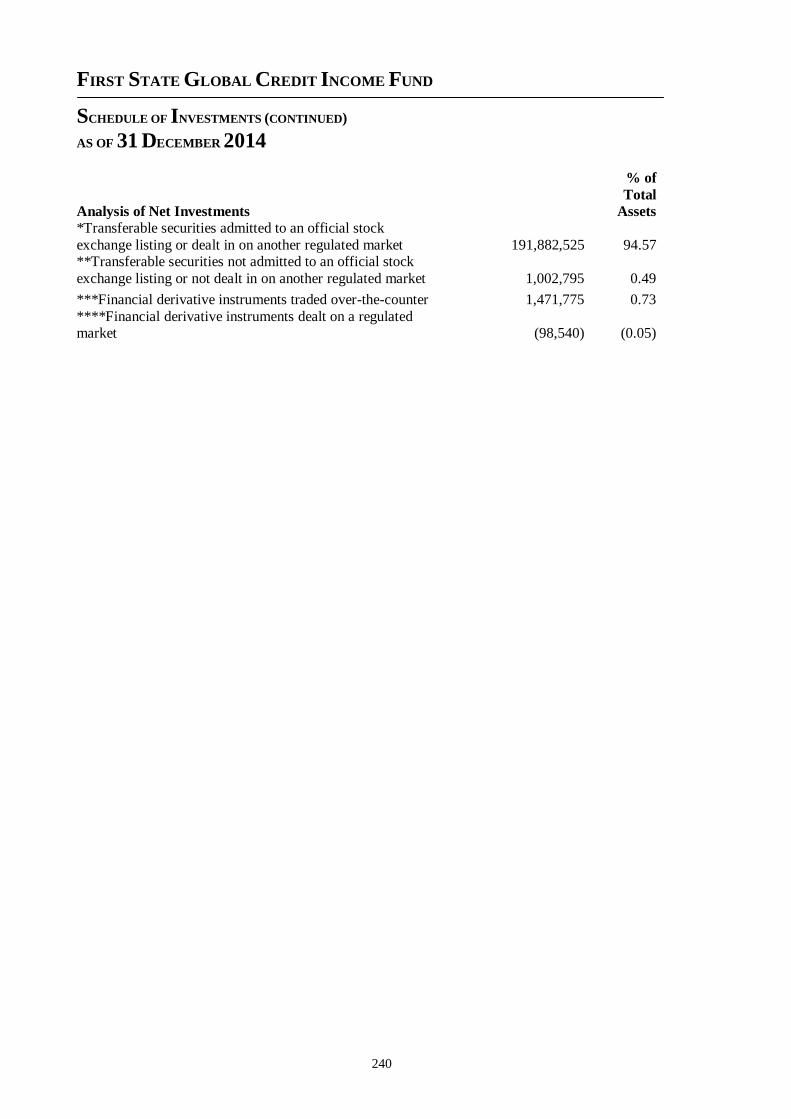
FIRST STATE GLOBAL CREDIT INCOME FUND
SCHEDULE OF INVESTMENTS (CONTINUED)
AS OF 31 DECEMBER 2014
240
Analysis of Net Investments
% of
Total
Assets
*Transferable securities admitted to an official stock
exchange listing or dealt in on another regulated market 191,882,525 94.57 **Transferable securities not admitted to an official stock
exchange listing or not dealt in on another regulated market 1,002,795 0.49
***Financial derivative instruments traded over-the-counter 1,471,775 0.73
****Financial derivative instruments dealt on a regulated market (98,540) (0.05)
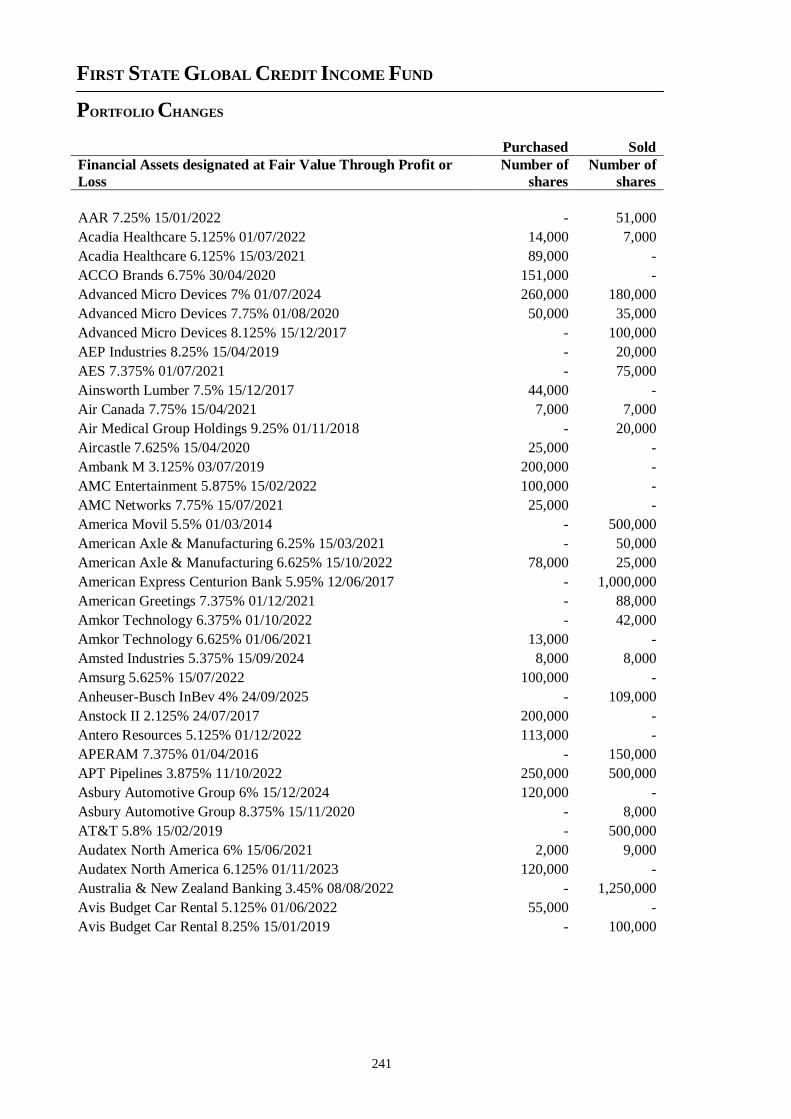
FIRST STATE GLOBAL CREDIT INCOME FUND
PORTFOLIO CHANGES
241
Purchased Sold
Financial Assets designated at Fair Value Through Profit or
Loss
Number of
shares
Number of
shares
AAR 7.25% 15/01/2022 - 51,000
Acadia Healthcare 5.125% 01/07/2022 14,000 7,000
Acadia Healthcare 6.125% 15/03/2021 89,000 -
ACCO Brands 6.75% 30/04/2020 151,000 -
Advanced Micro Devices 7% 01/07/2024 260,000 180,000
Advanced Micro Devices 7.75% 01/08/2020 50,000 35,000
Advanced Micro Devices 8.125% 15/12/2017 - 100,000
AEP Industries 8.25% 15/04/2019 - 20,000
AES 7.375% 01/07/2021 - 75,000
Ainsworth Lumber 7.5% 15/12/2017 44,000 -
Air Canada 7.75% 15/04/2021 7,000 7,000
Air Medical Group Holdings 9.25% 01/11/2018 - 20,000
Aircastle 7.625% 15/04/2020 25,000 -
Ambank M 3.125% 03/07/2019 200,000 -
AMC Entertainment 5.875% 15/02/2022 100,000 -
AMC Networks 7.75% 15/07/2021 25,000 -
America Movil 5.5% 01/03/2014 - 500,000
American Axle & Manufacturing 6.25% 15/03/2021 - 50,000
American Axle & Manufacturing 6.625% 15/10/2022 78,000 25,000
American Express Centurion Bank 5.95% 12/06/2017 - 1,000,000
American Greetings 7.375% 01/12/2021 - 88,000
Amkor Technology 6.375% 01/10/2022 - 42,000
Amkor Technology 6.625% 01/06/2021 13,000 -
Amsted Industries 5.375% 15/09/2024 8,000 8,000
Amsurg 5.625% 15/07/2022 100,000 -
Anheuser-Busch InBev 4% 24/09/2025 - 109,000
Anstock II 2.125% 24/07/2017 200,000 -
Antero Resources 5.125% 01/12/2022 113,000 -
APERAM 7.375% 01/04/2016 - 150,000
APT Pipelines 3.875% 11/10/2022 250,000 500,000
Asbury Automotive Group 6% 15/12/2024 120,000 -
Asbury Automotive Group 8.375% 15/11/2020 - 8,000
AT&T 5.8% 15/02/2019 - 500,000
Audatex North America 6% 15/06/2021 2,000 9,000
Audatex North America 6.125% 01/11/2023 120,000 -
Australia & New Zealand Banking 3.45% 08/08/2022 - 1,250,000
Avis Budget Car Rental 5.125% 01/06/2022 55,000 -
Avis Budget Car Rental 8.25% 15/01/2019 - 100,000
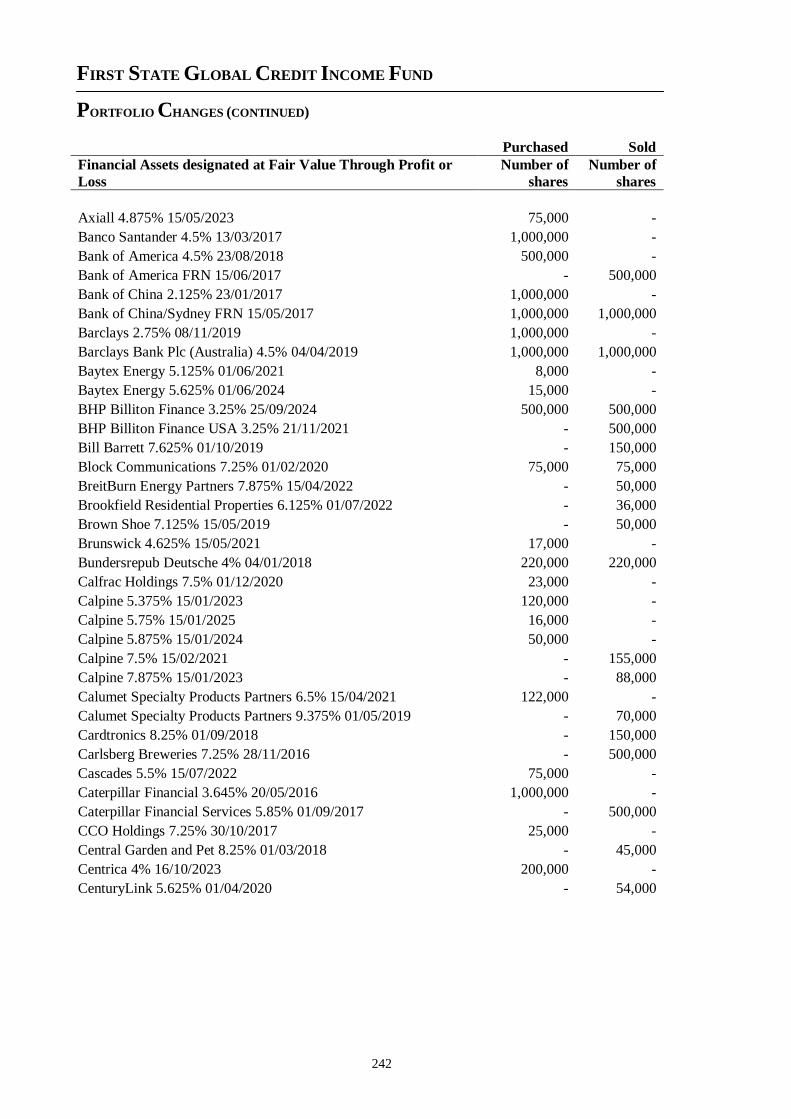
FIRST STATE GLOBAL CREDIT INCOME FUND
PORTFOLIO CHANGES (CONTINUED)
242
Purchased Sold
Financial Assets designated at Fair Value Through Profit or
Loss
Number of
shares
Number of
shares
Axiall 4.875% 15/05/2023 75,000 -
Banco Santander 4.5% 13/03/2017 1,000,000 -
Bank of America 4.5% 23/08/2018 500,000 -
Bank of America FRN 15/06/2017 - 500,000
Bank of China 2.125% 23/01/2017 1,000,000 -
Bank of China/Sydney FRN 15/05/2017 1,000,000 1,000,000
Barclays 2.75% 08/11/2019 1,000,000 -
Barclays Bank Plc (Australia) 4.5% 04/04/2019 1,000,000 1,000,000
Baytex Energy 5.125% 01/06/2021 8,000 -
Baytex Energy 5.625% 01/06/2024 15,000 -
BHP Billiton Finance 3.25% 25/09/2024 500,000 500,000
BHP Billiton Finance USA 3.25% 21/11/2021 - 500,000
Bill Barrett 7.625% 01/10/2019 - 150,000
Block Communications 7.25% 01/02/2020 75,000 75,000
BreitBurn Energy Partners 7.875% 15/04/2022 - 50,000
Brookfield Residential Properties 6.125% 01/07/2022 - 36,000
Brown Shoe 7.125% 15/05/2019 - 50,000
Brunswick 4.625% 15/05/2021 17,000 -
Bundersrepub Deutsche 4% 04/01/2018 220,000 220,000
Calfrac Holdings 7.5% 01/12/2020 23,000 -
Calpine 5.375% 15/01/2023 120,000 -
Calpine 5.75% 15/01/2025 16,000 -
Calpine 5.875% 15/01/2024 50,000 -
Calpine 7.5% 15/02/2021 - 155,000
Calpine 7.875% 15/01/2023 - 88,000
Calumet Specialty Products Partners 6.5% 15/04/2021 122,000 -
Calumet Specialty Products Partners 9.375% 01/05/2019 - 70,000
Cardtronics 8.25% 01/09/2018 - 150,000
Carlsberg Breweries 7.25% 28/11/2016 - 500,000
Cascades 5.5% 15/07/2022 75,000 -
Caterpillar Financial 3.645% 20/05/2016 1,000,000 -
Caterpillar Financial Services 5.85% 01/09/2017 - 500,000
CCO Holdings 7.25% 30/10/2017 25,000 -
Central Garden and Pet 8.25% 01/03/2018 - 45,000
Centrica 4% 16/10/2023 200,000 -
CenturyLink 5.625% 01/04/2020 - 54,000
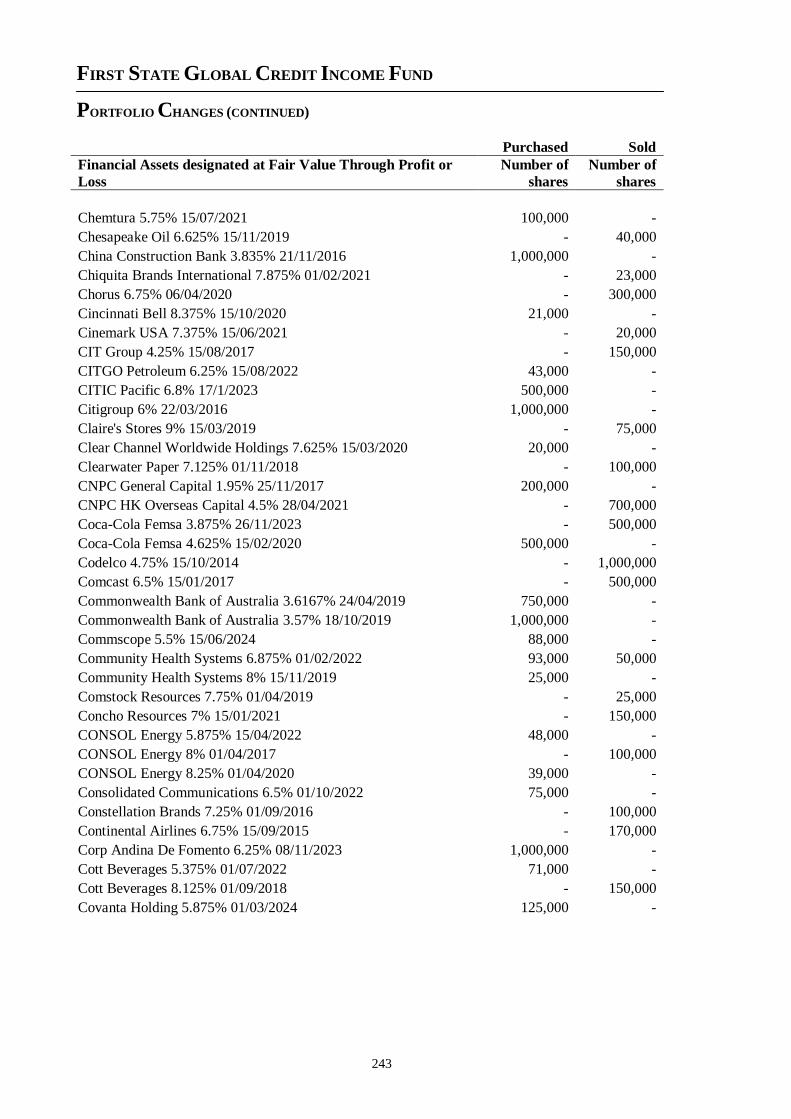
FIRST STATE GLOBAL CREDIT INCOME FUND
PORTFOLIO CHANGES (CONTINUED)
243
Purchased Sold
Financial Assets designated at Fair Value Through Profit or
Loss
Number of
shares
Number of
shares
Chemtura 5.75% 15/07/2021 100,000 -
Chesapeake Oil 6.625% 15/11/2019 - 40,000
China Construction Bank 3.835% 21/11/2016 1,000,000 -
Chiquita Brands International 7.875% 01/02/2021 - 23,000
Chorus 6.75% 06/04/2020 - 300,000
Cincinnati Bell 8.375% 15/10/2020 21,000 -
Cinemark USA 7.375% 15/06/2021 - 20,000
CIT Group 4.25% 15/08/2017 - 150,000
CITGO Petroleum 6.25% 15/08/2022 43,000 -
CITIC Pacific 6.8% 17/1/2023 500,000 -
Citigroup 6% 22/03/2016 1,000,000 -
Claire's Stores 9% 15/03/2019 - 75,000
Clear Channel Worldwide Holdings 7.625% 15/03/2020 20,000 -
Clearwater Paper 7.125% 01/11/2018 - 100,000
CNPC General Capital 1.95% 25/11/2017 200,000 -
CNPC HK Overseas Capital 4.5% 28/04/2021 - 700,000
Coca-Cola Femsa 3.875% 26/11/2023 - 500,000
Coca-Cola Femsa 4.625% 15/02/2020 500,000 -
Codelco 4.75% 15/10/2014 - 1,000,000
Comcast 6.5% 15/01/2017 - 500,000
Commonwealth Bank of Australia 3.6167% 24/04/2019 750,000 -
Commonwealth Bank of Australia 3.57% 18/10/2019 1,000,000 -
Commscope 5.5% 15/06/2024 88,000 -
Community Health Systems 6.875% 01/02/2022 93,000 50,000
Community Health Systems 8% 15/11/2019 25,000 -
Comstock Resources 7.75% 01/04/2019 - 25,000
Concho Resources 7% 15/01/2021 - 150,000
CONSOL Energy 5.875% 15/04/2022 48,000 -
CONSOL Energy 8% 01/04/2017 - 100,000
CONSOL Energy 8.25% 01/04/2020 39,000 -
Consolidated Communications 6.5% 01/10/2022 75,000 -
Constellation Brands 7.25% 01/09/2016 - 100,000
Continental Airlines 6.75% 15/09/2015 - 170,000
Corp Andina De Fomento 6.25% 08/11/2023 1,000,000 -
Cott Beverages 5.375% 01/07/2022 71,000 -
Cott Beverages 8.125% 01/09/2018 - 150,000
Covanta Holding 5.875% 01/03/2024 125,000 -
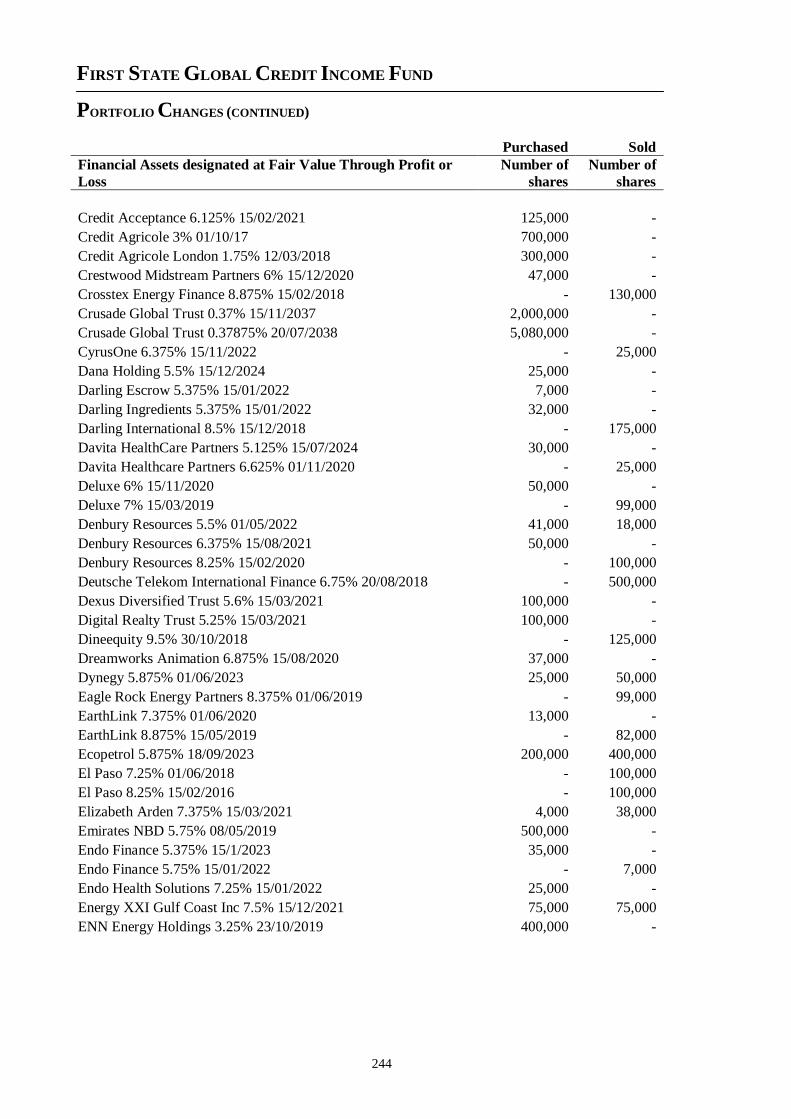
FIRST STATE GLOBAL CREDIT INCOME FUND
PORTFOLIO CHANGES (CONTINUED)
244
Purchased Sold
Financial Assets designated at Fair Value Through Profit or
Loss
Number of
shares
Number of
shares
Credit Acceptance 6.125% 15/02/2021 125,000 -
Credit Agricole 3% 01/10/17 700,000 -
Credit Agricole London 1.75% 12/03/2018 300,000 -
Crestwood Midstream Partners 6% 15/12/2020 47,000 -
Crosstex Energy Finance 8.875% 15/02/2018 - 130,000
Crusade Global Trust 0.37% 15/11/2037 2,000,000 -
Crusade Global Trust 0.37875% 20/07/2038 5,080,000 -
CyrusOne 6.375% 15/11/2022 - 25,000
Dana Holding 5.5% 15/12/2024 25,000 -
Darling Escrow 5.375% 15/01/2022 7,000 -
Darling Ingredients 5.375% 15/01/2022 32,000 -
Darling International 8.5% 15/12/2018 - 175,000
Davita HealthCare Partners 5.125% 15/07/2024 30,000 -
Davita Healthcare Partners 6.625% 01/11/2020 - 25,000
Deluxe 6% 15/11/2020 50,000 -
Deluxe 7% 15/03/2019 - 99,000
Denbury Resources 5.5% 01/05/2022 41,000 18,000
Denbury Resources 6.375% 15/08/2021 50,000 -
Denbury Resources 8.25% 15/02/2020 - 100,000
Deutsche Telekom International Finance 6.75% 20/08/2018 - 500,000
Dexus Diversified Trust 5.6% 15/03/2021 100,000 -
Digital Realty Trust 5.25% 15/03/2021 100,000 -
Dineequity 9.5% 30/10/2018 - 125,000
Dreamworks Animation 6.875% 15/08/2020 37,000 -
Dynegy 5.875% 01/06/2023 25,000 50,000
Eagle Rock Energy Partners 8.375% 01/06/2019 - 99,000
EarthLink 7.375% 01/06/2020 13,000 -
EarthLink 8.875% 15/05/2019 - 82,000
Ecopetrol 5.875% 18/09/2023 200,000 400,000
El Paso 7.25% 01/06/2018 - 100,000
El Paso 8.25% 15/02/2016 - 100,000
Elizabeth Arden 7.375% 15/03/2021 4,000 38,000
Emirates NBD 5.75% 08/05/2019 500,000 -
Endo Finance 5.375% 15/1/2023 35,000 -
Endo Finance 5.75% 15/01/2022 - 7,000
Endo Health Solutions 7.25% 15/01/2022 25,000 -
Energy XXI Gulf Coast Inc 7.5% 15/12/2021 75,000 75,000
ENN Energy Holdings 3.25% 23/10/2019 400,000 -
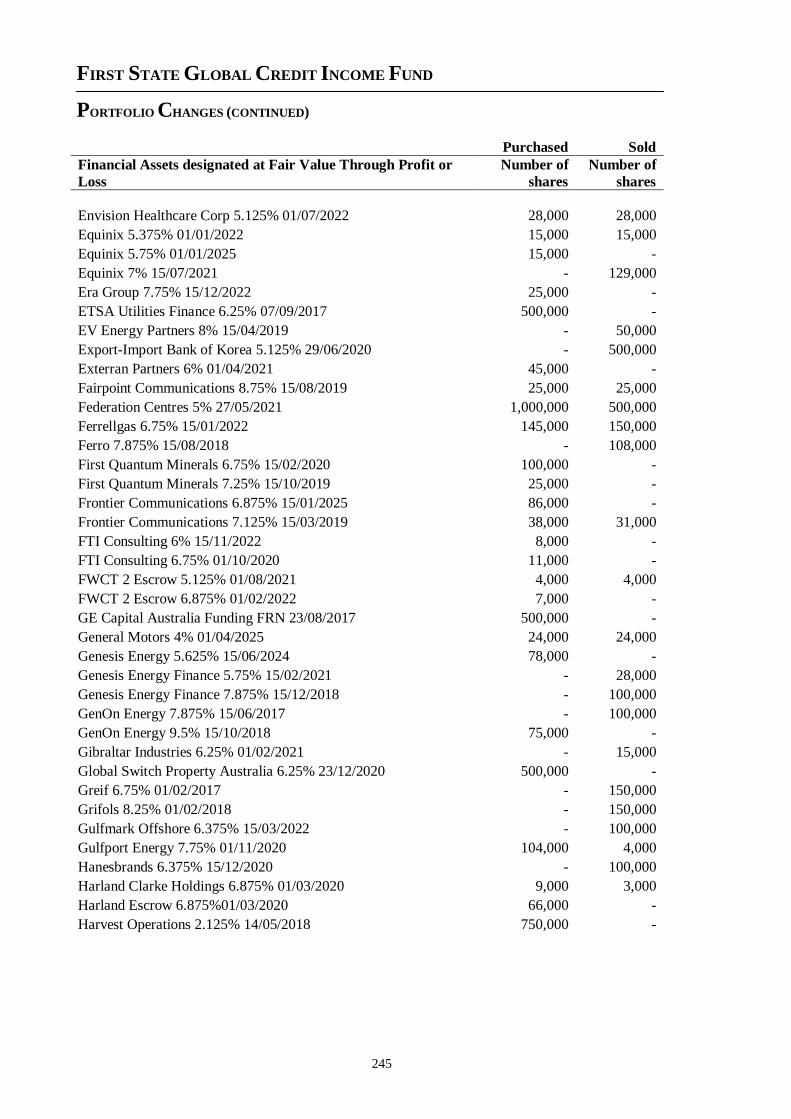
FIRST STATE GLOBAL CREDIT INCOME FUND
PORTFOLIO CHANGES (CONTINUED)
245
Purchased Sold
Financial Assets designated at Fair Value Through Profit or
Loss
Number of
shares
Number of
shares
Envision Healthcare Corp 5.125% 01/07/2022 28,000 28,000
Equinix 5.375% 01/01/2022 15,000 15,000
Equinix 5.75% 01/01/2025 15,000 -
Equinix 7% 15/07/2021 - 129,000
Era Group 7.75% 15/12/2022 25,000 -
ETSA Utilities Finance 6.25% 07/09/2017 500,000 -
EV Energy Partners 8% 15/04/2019 - 50,000
Export-Import Bank of Korea 5.125% 29/06/2020 - 500,000
Exterran Partners 6% 01/04/2021 45,000 -
Fairpoint Communications 8.75% 15/08/2019 25,000 25,000
Federation Centres 5% 27/05/2021 1,000,000 500,000
Ferrellgas 6.75% 15/01/2022 145,000 150,000
Ferro 7.875% 15/08/2018 - 108,000
First Quantum Minerals 6.75% 15/02/2020 100,000 -
First Quantum Minerals 7.25% 15/10/2019 25,000 -
Frontier Communications 6.875% 15/01/2025 86,000 -
Frontier Communications 7.125% 15/03/2019 38,000 31,000
FTI Consulting 6% 15/11/2022 8,000 -
FTI Consulting 6.75% 01/10/2020 11,000 -
FWCT 2 Escrow 5.125% 01/08/2021 4,000 4,000
FWCT 2 Escrow 6.875% 01/02/2022 7,000 -
GE Capital Australia Funding FRN 23/08/2017 500,000 -
General Motors 4% 01/04/2025 24,000 24,000
Genesis Energy 5.625% 15/06/2024 78,000 -
Genesis Energy Finance 5.75% 15/02/2021 - 28,000
Genesis Energy Finance 7.875% 15/12/2018 - 100,000
GenOn Energy 7.875% 15/06/2017 - 100,000
GenOn Energy 9.5% 15/10/2018 75,000 -
Gibraltar Industries 6.25% 01/02/2021 - 15,000
Global Switch Property Australia 6.25% 23/12/2020 500,000 -
Greif 6.75% 01/02/2017 - 150,000
Grifols 8.25% 01/02/2018 - 150,000
Gulfmark Offshore 6.375% 15/03/2022 - 100,000
Gulfport Energy 7.75% 01/11/2020 104,000 4,000
Hanesbrands 6.375% 15/12/2020 - 100,000
Harland Clarke Holdings 6.875% 01/03/2020 9,000 3,000
Harland Escrow 6.875%01/03/2020 66,000 -
Harvest Operations 2.125% 14/05/2018 750,000 -
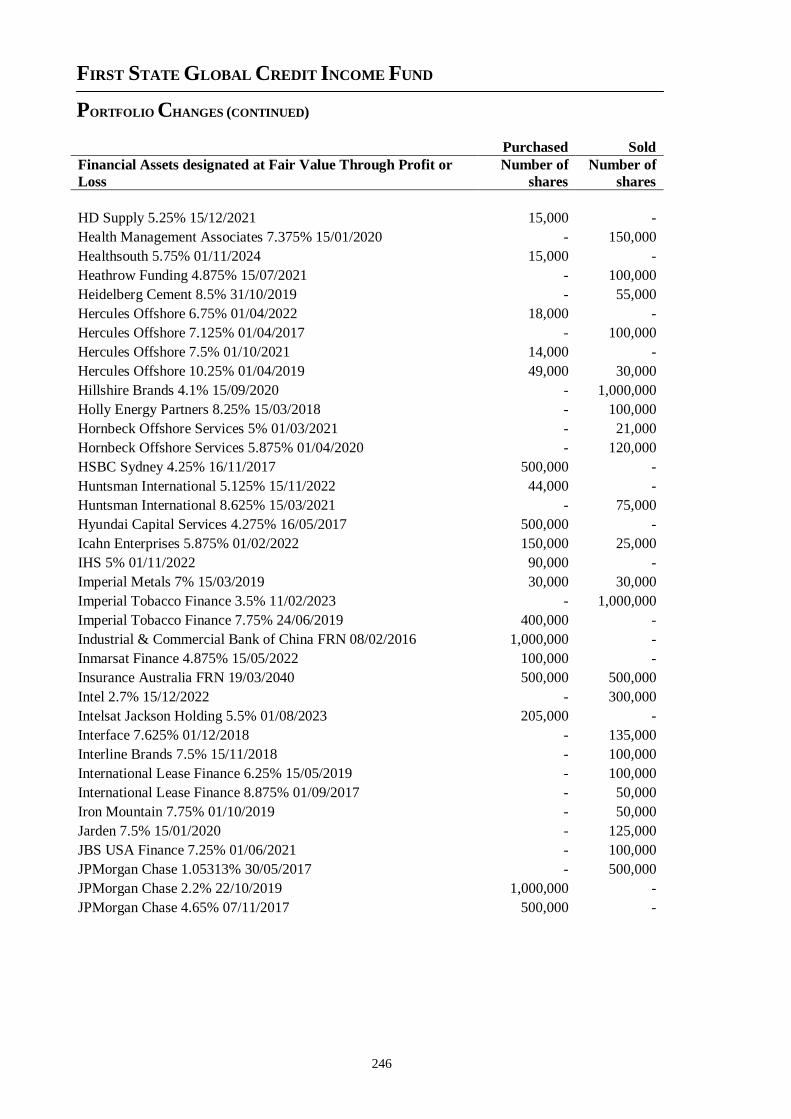
FIRST STATE GLOBAL CREDIT INCOME FUND
PORTFOLIO CHANGES (CONTINUED)
246
Purchased Sold
Financial Assets designated at Fair Value Through Profit or
Loss
Number of
shares
Number of
shares
HD Supply 5.25% 15/12/2021 15,000 -
Health Management Associates 7.375% 15/01/2020 - 150,000
Healthsouth 5.75% 01/11/2024 15,000 -
Heathrow Funding 4.875% 15/07/2021 - 100,000
Heidelberg Cement 8.5% 31/10/2019 - 55,000
Hercules Offshore 6.75% 01/04/2022 18,000 -
Hercules Offshore 7.125% 01/04/2017 - 100,000
Hercules Offshore 7.5% 01/10/2021 14,000 -
Hercules Offshore 10.25% 01/04/2019 49,000 30,000
Hillshire Brands 4.1% 15/09/2020 - 1,000,000
Holly Energy Partners 8.25% 15/03/2018 - 100,000
Hornbeck Offshore Services 5% 01/03/2021 - 21,000
Hornbeck Offshore Services 5.875% 01/04/2020 - 120,000
HSBC Sydney 4.25% 16/11/2017 500,000 -
Huntsman International 5.125% 15/11/2022 44,000 -
Huntsman International 8.625% 15/03/2021 - 75,000
Hyundai Capital Services 4.275% 16/05/2017 500,000 -
Icahn Enterprises 5.875% 01/02/2022 150,000 25,000
IHS 5% 01/11/2022 90,000 -
Imperial Metals 7% 15/03/2019 30,000 30,000
Imperial Tobacco Finance 3.5% 11/02/2023 - 1,000,000
Imperial Tobacco Finance 7.75% 24/06/2019 400,000 -
Industrial & Commercial Bank of China FRN 08/02/2016 1,000,000 -
Inmarsat Finance 4.875% 15/05/2022 100,000 -
Insurance Australia FRN 19/03/2040 500,000 500,000
Intel 2.7% 15/12/2022 - 300,000
Intelsat Jackson Holding 5.5% 01/08/2023 205,000 -
Interface 7.625% 01/12/2018 - 135,000
Interline Brands 7.5% 15/11/2018 - 100,000
International Lease Finance 6.25% 15/05/2019 - 100,000
International Lease Finance 8.875% 01/09/2017 - 50,000
Iron Mountain 7.75% 01/10/2019 - 50,000
Jarden 7.5% 15/01/2020 - 125,000
JBS USA Finance 7.25% 01/06/2021 - 100,000
JPMorgan Chase 1.05313% 30/05/2017 - 500,000
JPMorgan Chase 2.2% 22/10/2019 1,000,000 -
JPMorgan Chase 4.65% 07/11/2017 500,000 -
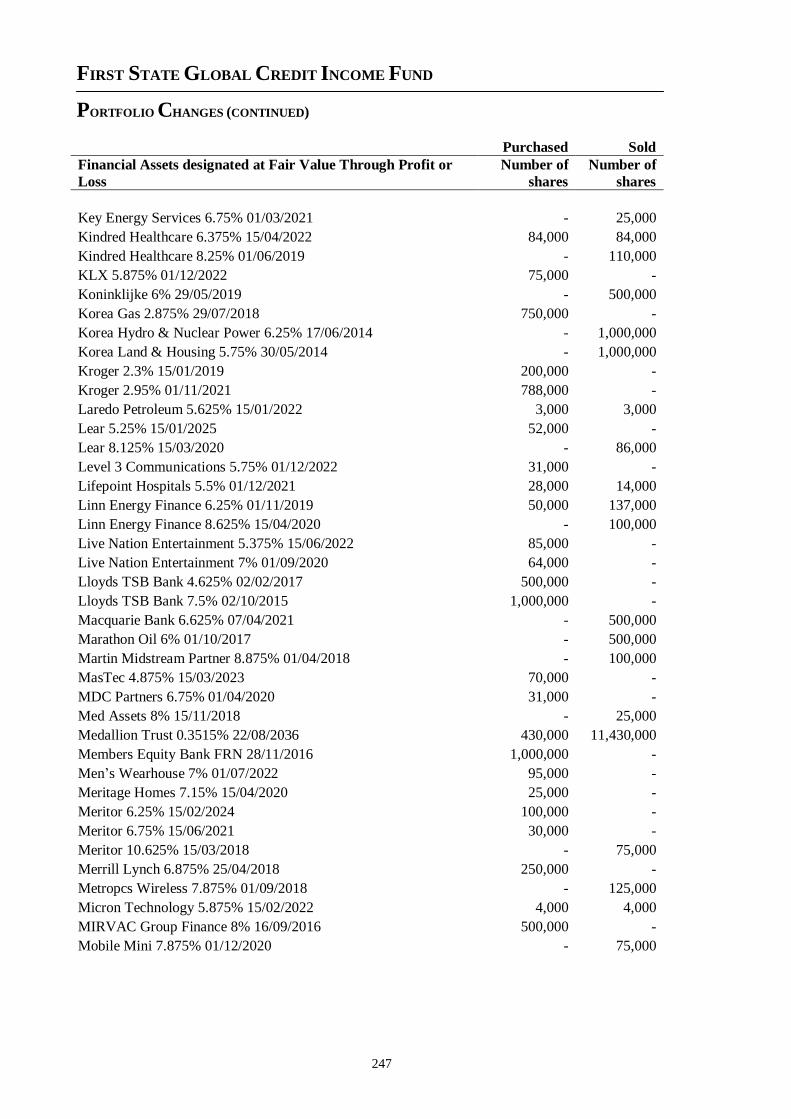
FIRST STATE GLOBAL CREDIT INCOME FUND
PORTFOLIO CHANGES (CONTINUED)
247
Purchased Sold
Financial Assets designated at Fair Value Through Profit or
Loss
Number of
shares
Number of
shares
Key Energy Services 6.75% 01/03/2021 - 25,000
Kindred Healthcare 6.375% 15/04/2022 84,000 84,000
Kindred Healthcare 8.25% 01/06/2019 - 110,000
KLX 5.875% 01/12/2022 75,000 -
Koninklijke 6% 29/05/2019 - 500,000
Korea Gas 2.875% 29/07/2018 750,000 -
Korea Hydro & Nuclear Power 6.25% 17/06/2014 - 1,000,000
Korea Land & Housing 5.75% 30/05/2014 - 1,000,000
Kroger 2.3% 15/01/2019 200,000 -
Kroger 2.95% 01/11/2021 788,000 -
Laredo Petroleum 5.625% 15/01/2022 3,000 3,000
Lear 5.25% 15/01/2025 52,000 -
Lear 8.125% 15/03/2020 - 86,000
Level 3 Communications 5.75% 01/12/2022 31,000 -
Lifepoint Hospitals 5.5% 01/12/2021 28,000 14,000
Linn Energy Finance 6.25% 01/11/2019 50,000 137,000
Linn Energy Finance 8.625% 15/04/2020 - 100,000
Live Nation Entertainment 5.375% 15/06/2022 85,000 -
Live Nation Entertainment 7% 01/09/2020 64,000 -
Lloyds TSB Bank 4.625% 02/02/2017 500,000 -
Lloyds TSB Bank 7.5% 02/10/2015 1,000,000 -
Macquarie Bank 6.625% 07/04/2021 - 500,000
Marathon Oil 6% 01/10/2017 - 500,000
Martin Midstream Partner 8.875% 01/04/2018 - 100,000
MasTec 4.875% 15/03/2023 70,000 -
MDC Partners 6.75% 01/04/2020 31,000 -
Med Assets 8% 15/11/2018 - 25,000
Medallion Trust 0.3515% 22/08/2036 430,000 11,430,000
Members Equity Bank FRN 28/11/2016 1,000,000 -
Men’s Wearhouse 7% 01/07/2022 95,000 -
Meritage Homes 7.15% 15/04/2020 25,000 -
Meritor 6.25% 15/02/2024 100,000 -
Meritor 6.75% 15/06/2021 30,000 -
Meritor 10.625% 15/03/2018 - 75,000
Merrill Lynch 6.875% 25/04/2018 250,000 -
Metropcs Wireless 7.875% 01/09/2018 - 125,000
Micron Technology 5.875% 15/02/2022 4,000 4,000
MIRVAC Group Finance 8% 16/09/2016 500,000 -
Mobile Mini 7.875% 01/12/2020 - 75,000
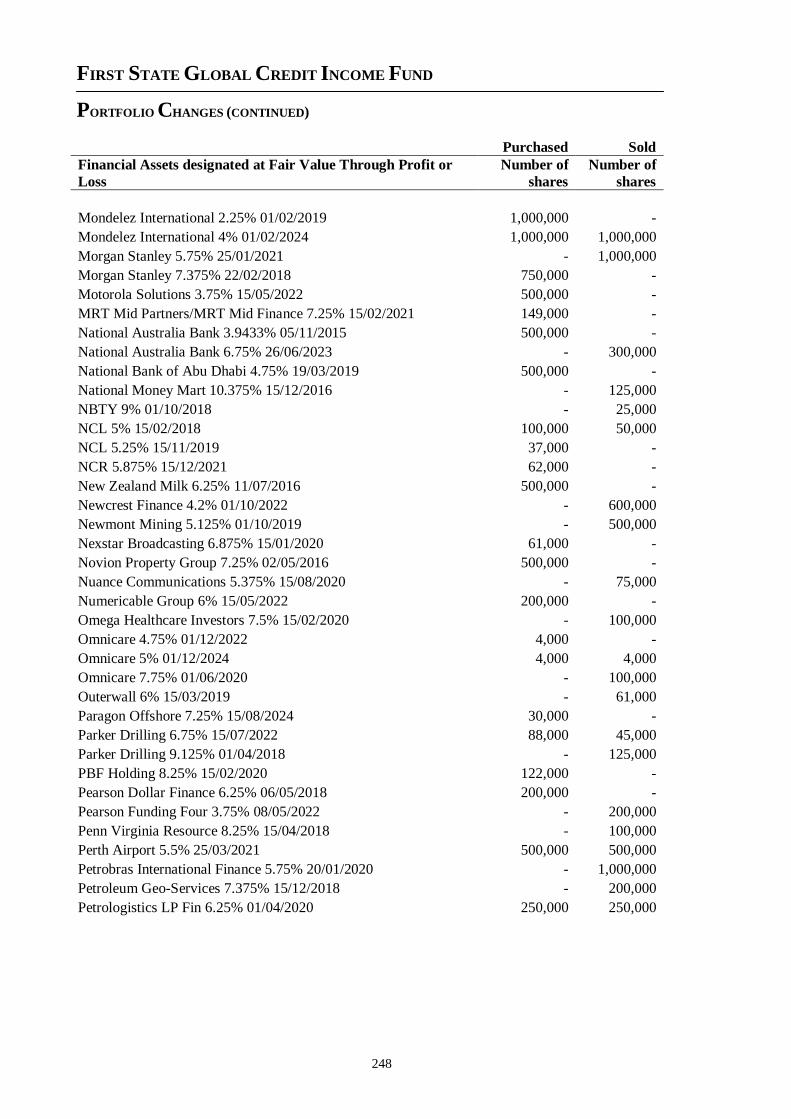
FIRST STATE GLOBAL CREDIT INCOME FUND
PORTFOLIO CHANGES (CONTINUED)
248
Purchased Sold
Financial Assets designated at Fair Value Through Profit or
Loss
Number of
shares
Number of
shares
Mondelez International 2.25% 01/02/2019 1,000,000 -
Mondelez International 4% 01/02/2024 1,000,000 1,000,000
Morgan Stanley 5.75% 25/01/2021 - 1,000,000
Morgan Stanley 7.375% 22/02/2018 750,000 -
Motorola Solutions 3.75% 15/05/2022 500,000 -
MRT Mid Partners/MRT Mid Finance 7.25% 15/02/2021 149,000 -
National Australia Bank 3.9433% 05/11/2015 500,000 -
National Australia Bank 6.75% 26/06/2023 - 300,000
National Bank of Abu Dhabi 4.75% 19/03/2019 500,000 -
National Money Mart 10.375% 15/12/2016 - 125,000
NBTY 9% 01/10/2018 - 25,000
NCL 5% 15/02/2018 100,000 50,000
NCL 5.25% 15/11/2019 37,000 -
NCR 5.875% 15/12/2021 62,000 -
New Zealand Milk 6.25% 11/07/2016 500,000 -
Newcrest Finance 4.2% 01/10/2022 - 600,000
Newmont Mining 5.125% 01/10/2019 - 500,000
Nexstar Broadcasting 6.875% 15/01/2020 61,000 -
Novion Property Group 7.25% 02/05/2016 500,000 -
Nuance Communications 5.375% 15/08/2020 - 75,000
Numericable Group 6% 15/05/2022 200,000 -
Omega Healthcare Investors 7.5% 15/02/2020 - 100,000
Omnicare 4.75% 01/12/2022 4,000 -
Omnicare 5% 01/12/2024 4,000 4,000
Omnicare 7.75% 01/06/2020 - 100,000
Outerwall 6% 15/03/2019 - 61,000
Paragon Offshore 7.25% 15/08/2024 30,000 -
Parker Drilling 6.75% 15/07/2022 88,000 45,000
Parker Drilling 9.125% 01/04/2018 - 125,000
PBF Holding 8.25% 15/02/2020 122,000 -
Pearson Dollar Finance 6.25% 06/05/2018 200,000 -
Pearson Funding Four 3.75% 08/05/2022 - 200,000
Penn Virginia Resource 8.25% 15/04/2018 - 100,000
Perth Airport 5.5% 25/03/2021 500,000 500,000
Petrobras International Finance 5.75% 20/01/2020 - 1,000,000
Petroleum Geo-Services 7.375% 15/12/2018 - 200,000
Petrologistics LP Fin 6.25% 01/04/2020 250,000 250,000
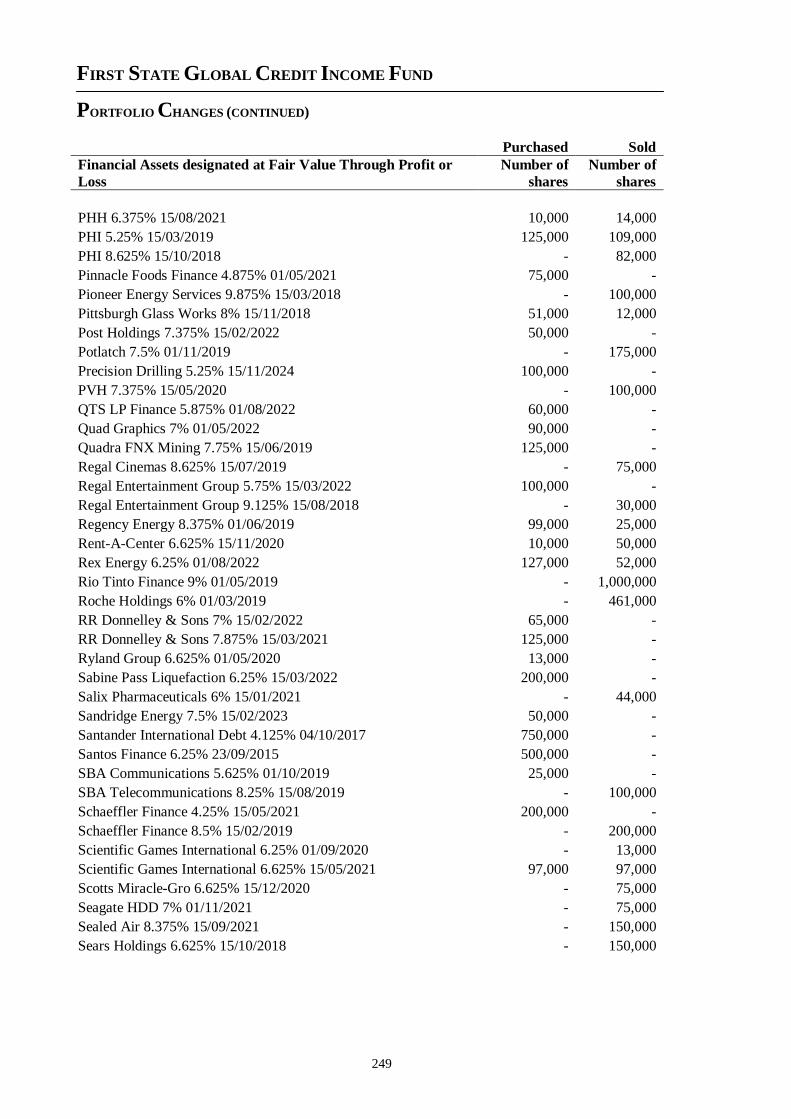
FIRST STATE GLOBAL CREDIT INCOME FUND
PORTFOLIO CHANGES (CONTINUED)
249
Purchased Sold
Financial Assets designated at Fair Value Through Profit or
Loss
Number of
shares
Number of
shares
PHH 6.375% 15/08/2021 10,000 14,000
PHI 5.25% 15/03/2019 125,000 109,000
PHI 8.625% 15/10/2018 - 82,000
Pinnacle Foods Finance 4.875% 01/05/2021 75,000 -
Pioneer Energy Services 9.875% 15/03/2018 - 100,000
Pittsburgh Glass Works 8% 15/11/2018 51,000 12,000
Post Holdings 7.375% 15/02/2022 50,000 -
Potlatch 7.5% 01/11/2019 - 175,000
Precision Drilling 5.25% 15/11/2024 100,000 -
PVH 7.375% 15/05/2020 - 100,000
QTS LP Finance 5.875% 01/08/2022 60,000 -
Quad Graphics 7% 01/05/2022 90,000 -
Quadra FNX Mining 7.75% 15/06/2019 125,000 -
Regal Cinemas 8.625% 15/07/2019 - 75,000
Regal Entertainment Group 5.75% 15/03/2022 100,000 -
Regal Entertainment Group 9.125% 15/08/2018 - 30,000
Regency Energy 8.375% 01/06/2019 99,000 25,000
Rent-A-Center 6.625% 15/11/2020 10,000 50,000
Rex Energy 6.25% 01/08/2022 127,000 52,000
Rio Tinto Finance 9% 01/05/2019 - 1,000,000
Roche Holdings 6% 01/03/2019 - 461,000
RR Donnelley & Sons 7% 15/02/2022 65,000 -
RR Donnelley & Sons 7.875% 15/03/2021 125,000 -
Ryland Group 6.625% 01/05/2020 13,000 -
Sabine Pass Liquefaction 6.25% 15/03/2022 200,000 -
Salix Pharmaceuticals 6% 15/01/2021 - 44,000
Sandridge Energy 7.5% 15/02/2023 50,000 -
Santander International Debt 4.125% 04/10/2017 750,000 -
Santos Finance 6.25% 23/09/2015 500,000 -
SBA Communications 5.625% 01/10/2019 25,000 -
SBA Telecommunications 8.25% 15/08/2019 - 100,000
Schaeffler Finance 4.25% 15/05/2021 200,000 -
Schaeffler Finance 8.5% 15/02/2019 - 200,000
Scientific Games International 6.25% 01/09/2020 - 13,000
Scientific Games International 6.625% 15/05/2021 97,000 97,000
Scotts Miracle-Gro 6.625% 15/12/2020 - 75,000
Seagate HDD 7% 01/11/2021 - 75,000
Sealed Air 8.375% 15/09/2021 - 150,000
Sears Holdings 6.625% 15/10/2018 - 150,000
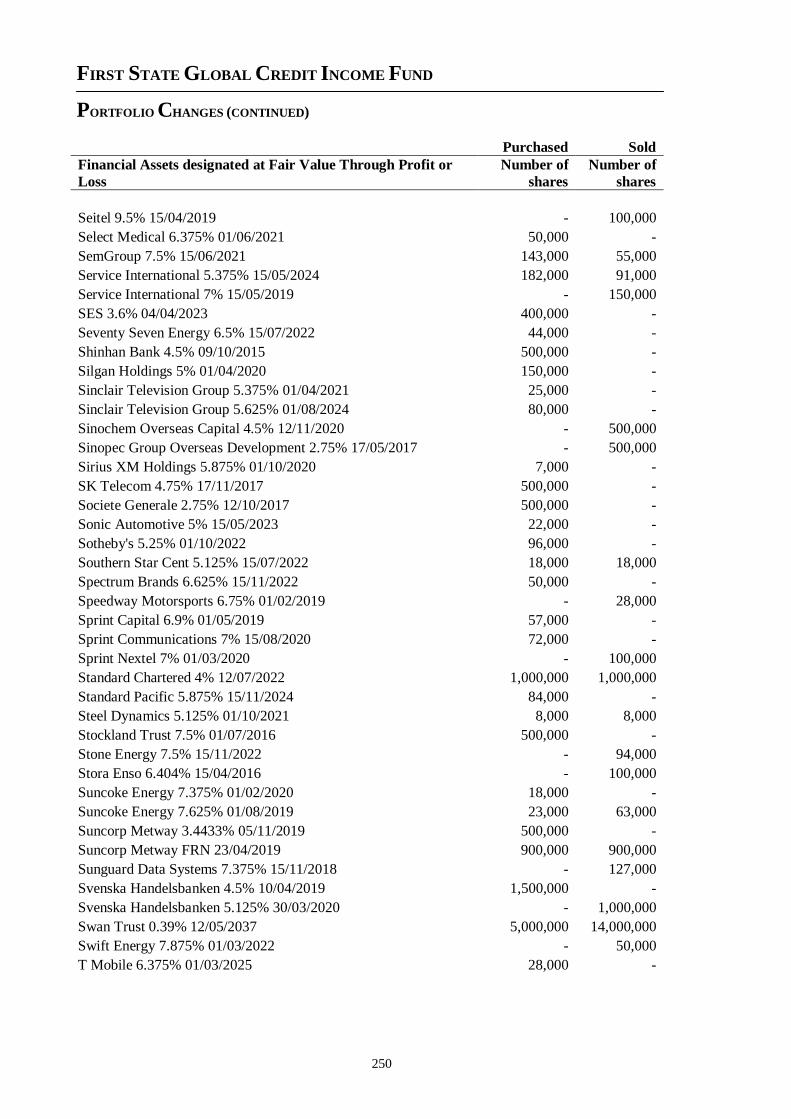
FIRST STATE GLOBAL CREDIT INCOME FUND
PORTFOLIO CHANGES (CONTINUED)
250
Purchased Sold
Financial Assets designated at Fair Value Through Profit or
Loss
Number of
shares
Number of
shares
Seitel 9.5% 15/04/2019 - 100,000
Select Medical 6.375% 01/06/2021 50,000 -
SemGroup 7.5% 15/06/2021 143,000 55,000
Service International 5.375% 15/05/2024 182,000 91,000
Service International 7% 15/05/2019 - 150,000
SES 3.6% 04/04/2023 400,000 -
Seventy Seven Energy 6.5% 15/07/2022 44,000 -
Shinhan Bank 4.5% 09/10/2015 500,000 -
Silgan Holdings 5% 01/04/2020 150,000 -
Sinclair Television Group 5.375% 01/04/2021 25,000 -
Sinclair Television Group 5.625% 01/08/2024 80,000 -
Sinochem Overseas Capital 4.5% 12/11/2020 - 500,000
Sinopec Group Overseas Development 2.75% 17/05/2017 - 500,000
Sirius XM Holdings 5.875% 01/10/2020 7,000 -
SK Telecom 4.75% 17/11/2017 500,000 -
Societe Generale 2.75% 12/10/2017 500,000 -
Sonic Automotive 5% 15/05/2023 22,000 -
Sotheby's 5.25% 01/10/2022 96,000 -
Southern Star Cent 5.125% 15/07/2022 18,000 18,000
Spectrum Brands 6.625% 15/11/2022 50,000 -
Speedway Motorsports 6.75% 01/02/2019 - 28,000
Sprint Capital 6.9% 01/05/2019 57,000 -
Sprint Communications 7% 15/08/2020 72,000 -
Sprint Nextel 7% 01/03/2020 - 100,000
Standard Chartered 4% 12/07/2022 1,000,000 1,000,000
Standard Pacific 5.875% 15/11/2024 84,000 -
Steel Dynamics 5.125% 01/10/2021 8,000 8,000
Stockland Trust 7.5% 01/07/2016 500,000 -
Stone Energy 7.5% 15/11/2022 - 94,000
Stora Enso 6.404% 15/04/2016 - 100,000
Suncoke Energy 7.375% 01/02/2020 18,000 -
Suncoke Energy 7.625% 01/08/2019 23,000 63,000
Suncorp Metway 3.4433% 05/11/2019 500,000 -
Suncorp Metway FRN 23/04/2019 900,000 900,000
Sunguard Data Systems 7.375% 15/11/2018 - 127,000
Svenska Handelsbanken 4.5% 10/04/2019 1,500,000 -
Svenska Handelsbanken 5.125% 30/03/2020 - 1,000,000
Swan Trust 0.39% 12/05/2037 5,000,000 14,000,000
Swift Energy 7.875% 01/03/2022 - 50,000
T Mobile 6.375% 01/03/2025 28,000 -
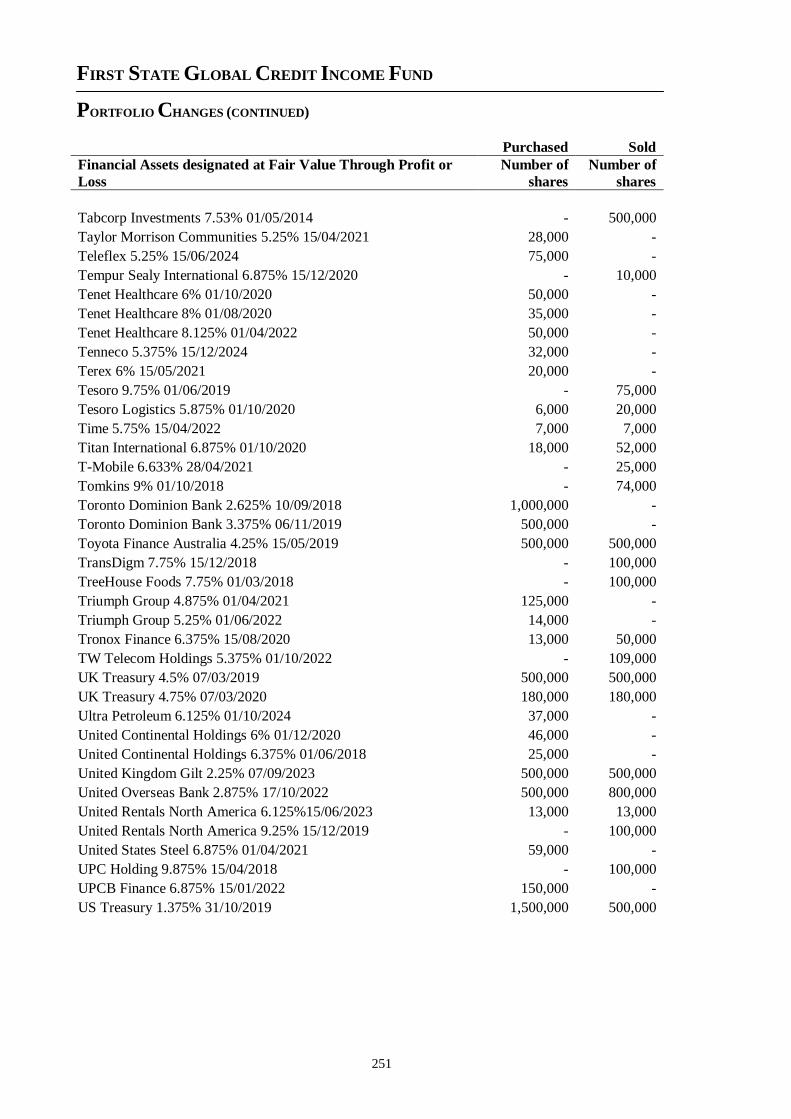
FIRST STATE GLOBAL CREDIT INCOME FUND
PORTFOLIO CHANGES (CONTINUED)
251
Purchased Sold
Financial Assets designated at Fair Value Through Profit or
Loss
Number of
shares
Number of
shares
Tabcorp Investments 7.53% 01/05/2014 - 500,000
Taylor Morrison Communities 5.25% 15/04/2021 28,000 -
Teleflex 5.25% 15/06/2024 75,000 -
Tempur Sealy International 6.875% 15/12/2020 - 10,000
Tenet Healthcare 6% 01/10/2020 50,000 -
Tenet Healthcare 8% 01/08/2020 35,000 -
Tenet Healthcare 8.125% 01/04/2022 50,000 -
Tenneco 5.375% 15/12/2024 32,000 -
Terex 6% 15/05/2021 20,000 -
Tesoro 9.75% 01/06/2019 - 75,000
Tesoro Logistics 5.875% 01/10/2020 6,000 20,000
Time 5.75% 15/04/2022 7,000 7,000
Titan International 6.875% 01/10/2020 18,000 52,000
T-Mobile 6.633% 28/04/2021 - 25,000
Tomkins 9% 01/10/2018 - 74,000
Toronto Dominion Bank 2.625% 10/09/2018 1,000,000 -
Toronto Dominion Bank 3.375% 06/11/2019 500,000 -
Toyota Finance Australia 4.25% 15/05/2019 500,000 500,000
TransDigm 7.75% 15/12/2018 - 100,000
TreeHouse Foods 7.75% 01/03/2018 - 100,000
Triumph Group 4.875% 01/04/2021 125,000 -
Triumph Group 5.25% 01/06/2022 14,000 -
Tronox Finance 6.375% 15/08/2020 13,000 50,000
TW Telecom Holdings 5.375% 01/10/2022 - 109,000
UK Treasury 4.5% 07/03/2019 500,000 500,000
UK Treasury 4.75% 07/03/2020 180,000 180,000
Ultra Petroleum 6.125% 01/10/2024 37,000 -
United Continental Holdings 6% 01/12/2020 46,000 -
United Continental Holdings 6.375% 01/06/2018 25,000 -
United Kingdom Gilt 2.25% 07/09/2023 500,000 500,000
United Overseas Bank 2.875% 17/10/2022 500,000 800,000
United Rentals North America 6.125%15/06/2023 13,000 13,000
United Rentals North America 9.25% 15/12/2019 - 100,000
United States Steel 6.875% 01/04/2021 59,000 -
UPC Holding 9.875% 15/04/2018 - 100,000
UPCB Finance 6.875% 15/01/2022 150,000 -
US Treasury 1.375% 31/10/2019 1,500,000 500,000
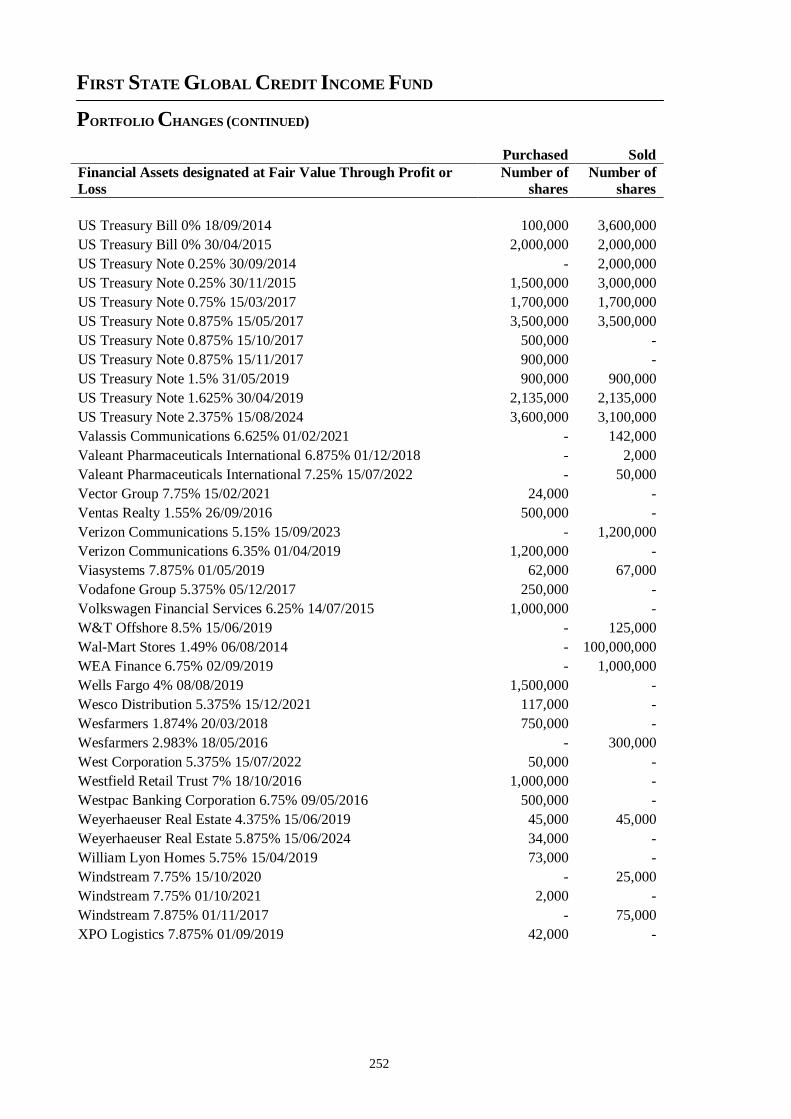
FIRST STATE GLOBAL CREDIT INCOME FUND
PORTFOLIO CHANGES (CONTINUED)
252
Purchased Sold
Financial Assets designated at Fair Value Through Profit or
Loss
Number of
shares
Number of
shares
US Treasury Bill 0% 18/09/2014 100,000 3,600,000
US Treasury Bill 0% 30/04/2015 2,000,000 2,000,000
US Treasury Note 0.25% 30/09/2014 - 2,000,000
US Treasury Note 0.25% 30/11/2015 1,500,000 3,000,000
US Treasury Note 0.75% 15/03/2017 1,700,000 1,700,000
US Treasury Note 0.875% 15/05/2017 3,500,000 3,500,000
US Treasury Note 0.875% 15/10/2017 500,000 -
US Treasury Note 0.875% 15/11/2017 900,000 -
US Treasury Note 1.5% 31/05/2019 900,000 900,000
US Treasury Note 1.625% 30/04/2019 2,135,000 2,135,000
US Treasury Note 2.375% 15/08/2024 3,600,000 3,100,000
Valassis Communications 6.625% 01/02/2021 - 142,000
Valeant Pharmaceuticals International 6.875% 01/12/2018 - 2,000
Valeant Pharmaceuticals International 7.25% 15/07/2022 - 50,000
Vector Group 7.75% 15/02/2021 24,000 -
Ventas Realty 1.55% 26/09/2016 500,000 -
Verizon Communications 5.15% 15/09/2023 - 1,200,000
Verizon Communications 6.35% 01/04/2019 1,200,000 -
Viasystems 7.875% 01/05/2019 62,000 67,000
Vodafone Group 5.375% 05/12/2017 250,000 -
Volkswagen Financial Services 6.25% 14/07/2015 1,000,000 -
W&T Offshore 8.5% 15/06/2019 - 125,000
Wal-Mart Stores 1.49% 06/08/2014 - 100,000,000
WEA Finance 6.75% 02/09/2019 - 1,000,000
Wells Fargo 4% 08/08/2019 1,500,000 -
Wesco Distribution 5.375% 15/12/2021 117,000 -
Wesfarmers 1.874% 20/03/2018 750,000 -
Wesfarmers 2.983% 18/05/2016 - 300,000
West Corporation 5.375% 15/07/2022 50,000 -
Westfield Retail Trust 7% 18/10/2016 1,000,000 -
Westpac Banking Corporation 6.75% 09/05/2016 500,000 -
Weyerhaeuser Real Estate 4.375% 15/06/2019 45,000 45,000
Weyerhaeuser Real Estate 5.875% 15/06/2024 34,000 -
William Lyon Homes 5.75% 15/04/2019 73,000 -
Windstream 7.75% 15/10/2020 - 25,000
Windstream 7.75% 01/10/2021 2,000 -
Windstream 7.875% 01/11/2017 - 75,000
XPO Logistics 7.875% 01/09/2019 42,000 -
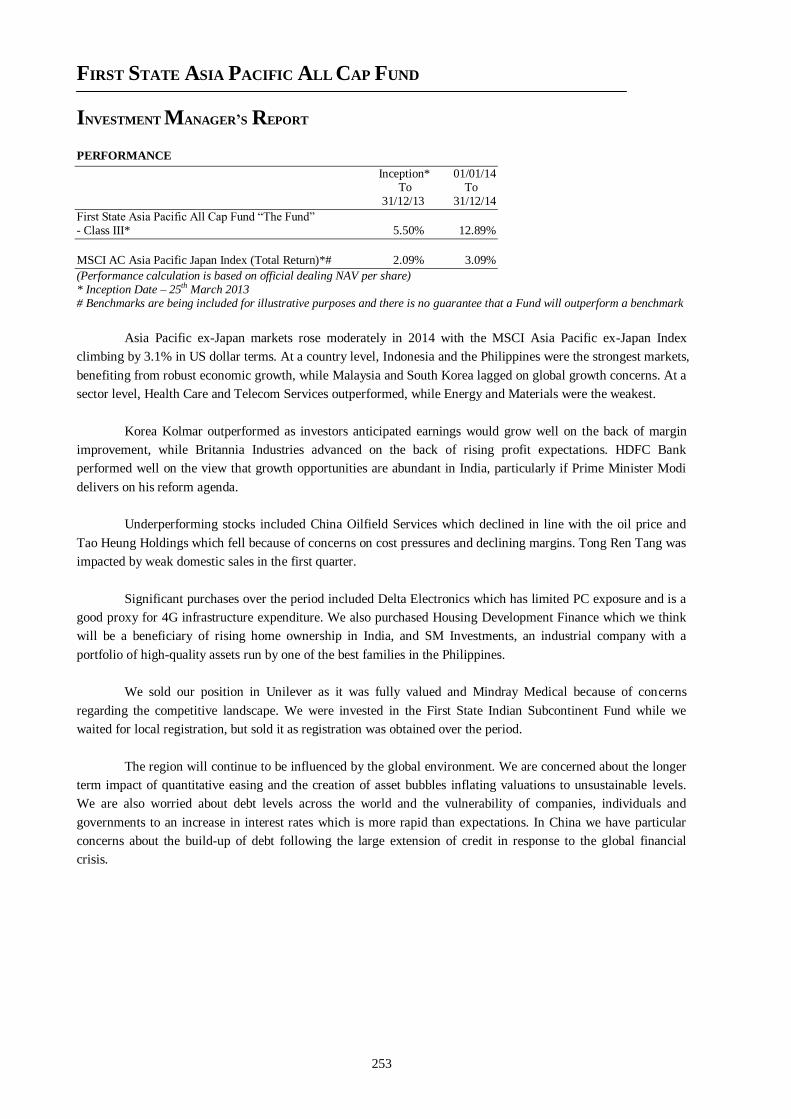
FIRST STATE ASIA PACIFIC ALL CAP FUND
INVESTMENT MANAGER’S REPORT
253
PERFORMANCE
Inception* 01/01/14 To To 31/12/13 31/12/14
First State Asia Pacific All Cap Fund “The Fund” - Class III* 5.50% 12.89%
MSCI AC Asia Pacific Japan Index (Total Return)*# 2.09% 3.09%
(Performance calculation is based on official dealing NAV per share) * Inception Date – 25th March 2013 # Benchmarks are being included for illustrative purposes and there is no guarantee that a Fund will outperform a benchmark
Asia Pacific ex-Japan markets rose moderately in 2014 with the MSCI Asia Pacific ex-Japan Index
climbing by 3.1% in US dollar terms. At a country level, Indonesia and the Philippines were the strongest markets,
benefiting from robust economic growth, while Malaysia and South Korea lagged on global growth concerns. At a
sector level, Health Care and Telecom Services outperformed, while Energy and Materials were the weakest.
Korea Kolmar outperformed as investors anticipated earnings would grow well on the back of margin
improvement, while Britannia Industries advanced on the back of rising profit expectations. HDFC Bank
performed well on the view that growth opportunities are abundant in India, particularly if Prime Minister Modi
delivers on his reform agenda.
Underperforming stocks included China Oilfield Services which declined in line with the oil price and
Tao Heung Holdings which fell because of concerns on cost pressures and declining margins. Tong Ren Tang was
impacted by weak domestic sales in the first quarter.
Significant purchases over the period included Delta Electronics which has limited PC exposure and is a
good proxy for 4G infrastructure expenditure. We also purchased Housing Development Finance which we think
will be a beneficiary of rising home ownership in India, and SM Investments, an industrial company with a
portfolio of high-quality assets run by one of the best families in the Philippines.
We sold our position in Unilever as it was fully valued and Mindray Medical because of concerns
regarding the competitive landscape. We were invested in the First State Indian Subcontinent Fund while we
waited for local registration, but sold it as registration was obtained over the period.
The region will continue to be influenced by the global environment. We are concerned about the longer
term impact of quantitative easing and the creation of asset bubbles inflating valuations to unsustainable levels.
We are also worried about debt levels across the world and the vulnerability of companies, individuals and
governments to an increase in interest rates which is more rapid than expectations. In China we have particular
concerns about the build-up of debt following the large extension of credit in response to the global financial
crisis.
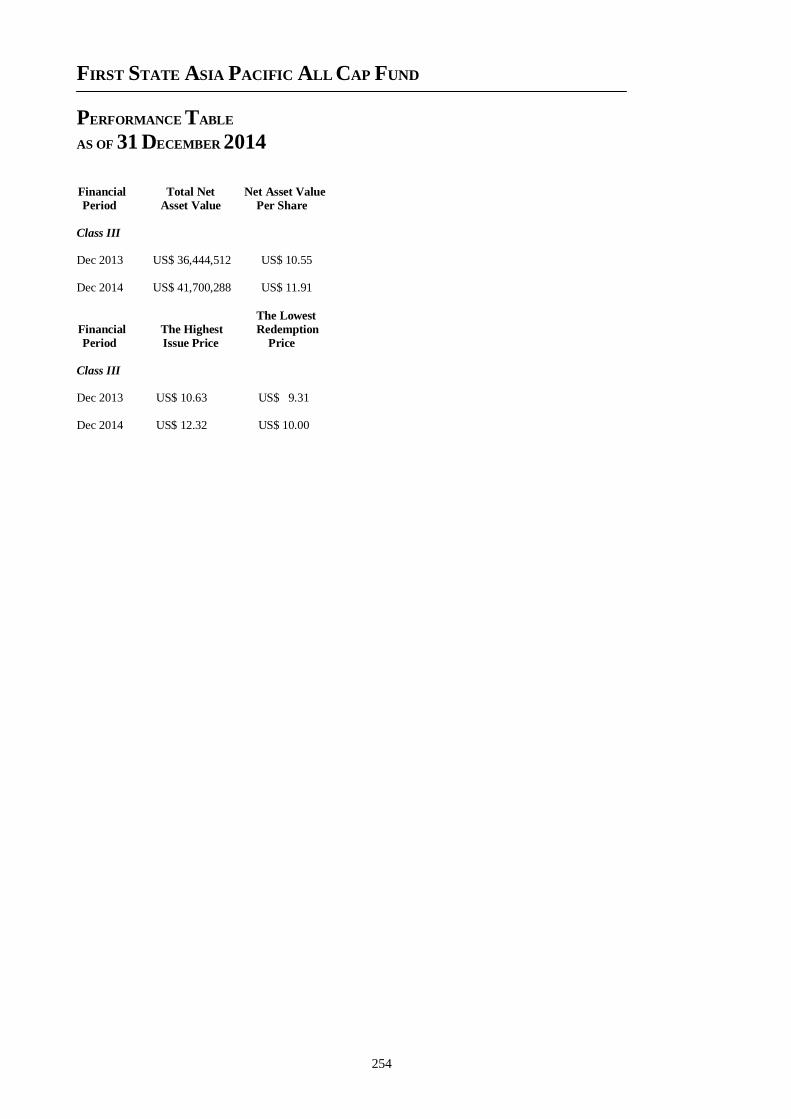
FIRST STATE ASIA PACIFIC ALL CAP FUND
PERFORMANCE TABLE
AS OF 31 DECEMBER 2014
254
Financial Total Net Net Asset Value
Period Asset Value Per Share
Class III
Dec 2013 US$ 36,444,512 US$ 10.55 Dec 2014 US$ 41,700,288 US$ 11.91
The Lowest
Financial The Highest Redemption
Period Issue Price Price
Class III Dec 2013 US$ 10.63 US$ 9.31
Dec 2014 US$ 12.32 US$ 10.00
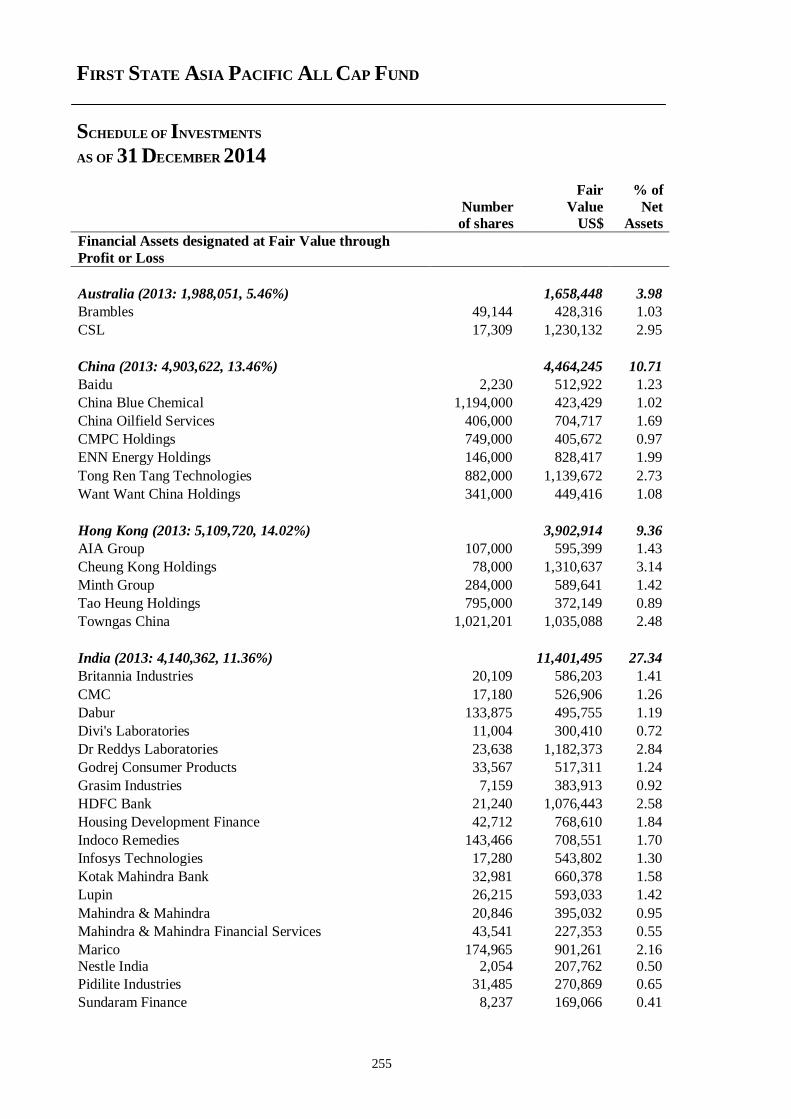
FIRST STATE ASIA PACIFIC ALL CAP FUND
SCHEDULE OF INVESTMENTS
AS OF 31 DECEMBER 2014
255
Fair % of
Number Value Net of shares US$ Assets
Financial Assets designated at Fair Value through
Profit or Loss
Australia (2013: 1,988,051, 5.46%) 1,658,448 3.98
Brambles 49,144 428,316 1.03
CSL 17,309 1,230,132 2.95
China (2013: 4,903,622, 13.46%) 4,464,245 10.71
Baidu 2,230 512,922 1.23
China Blue Chemical 1,194,000 423,429 1.02
China Oilfield Services 406,000 704,717 1.69
CMPC Holdings 749,000 405,672 0.97
ENN Energy Holdings 146,000 828,417 1.99
Tong Ren Tang Technologies 882,000 1,139,672 2.73
Want Want China Holdings 341,000 449,416 1.08
Hong Kong (2013: 5,109,720, 14.02%) 3,902,914 9.36
AIA Group 107,000 595,399 1.43
Cheung Kong Holdings 78,000 1,310,637 3.14
Minth Group 284,000 589,641 1.42
Tao Heung Holdings 795,000 372,149 0.89
Towngas China 1,021,201 1,035,088 2.48
India (2013: 4,140,362, 11.36%) 11,401,495 27.34
Britannia Industries 20,109 586,203 1.41
CMC 17,180 526,906 1.26
Dabur 133,875 495,755 1.19
Divi's Laboratories 11,004 300,410 0.72
Dr Reddys Laboratories 23,638 1,182,373 2.84
Godrej Consumer Products 33,567 517,311 1.24
Grasim Industries 7,159 383,913 0.92
HDFC Bank 21,240 1,076,443 2.58
Housing Development Finance 42,712 768,610 1.84
Indoco Remedies 143,466 708,551 1.70
Infosys Technologies 17,280 543,802 1.30
Kotak Mahindra Bank 32,981 660,378 1.58
Lupin 26,215 593,033 1.42
Mahindra & Mahindra 20,846 395,032 0.95
Mahindra & Mahindra Financial Services 43,541 227,353 0.55
Marico 174,965 901,261 2.16 Nestle India 2,054 207,762 0.50
Pidilite Industries 31,485 270,869 0.65
Sundaram Finance 8,237 169,066 0.41
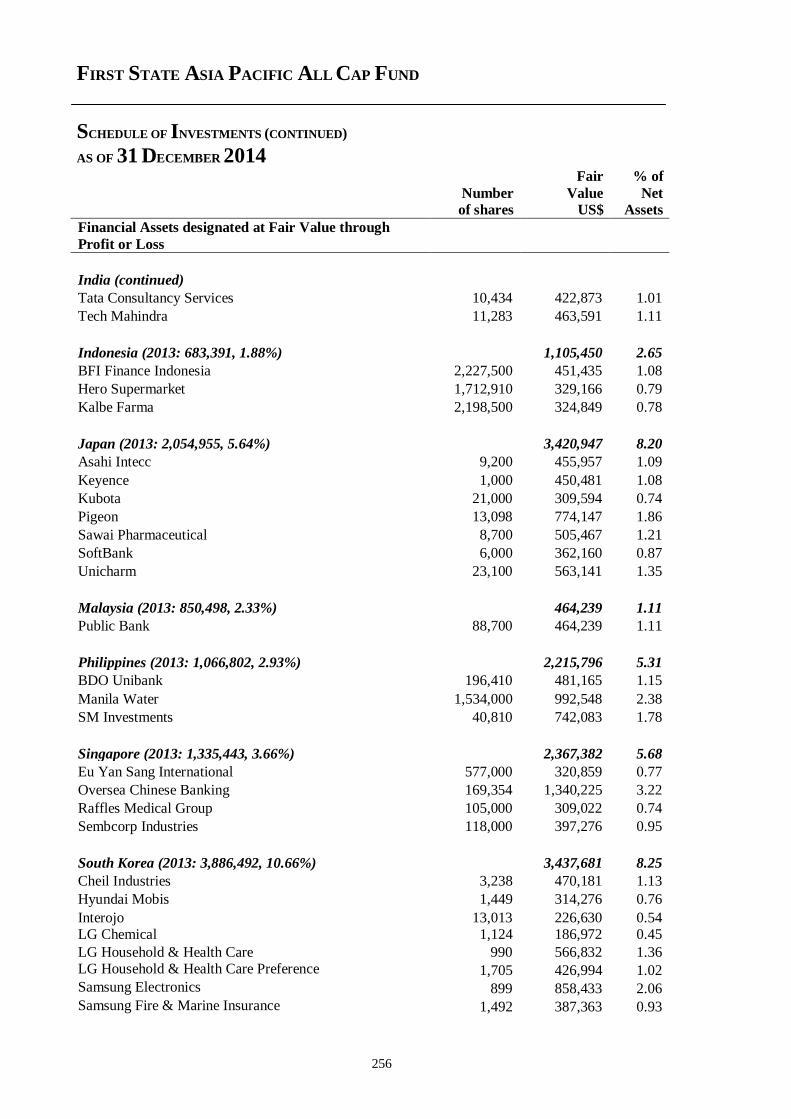
FIRST STATE ASIA PACIFIC ALL CAP FUND
SCHEDULE OF INVESTMENTS (CONTINUED)
AS OF 31 DECEMBER 2014
256
Fair % of
Number Value Net of shares US$ Assets
Financial Assets designated at Fair Value through
Profit or Loss
India (continued)
Tata Consultancy Services 10,434 422,873 1.01
Tech Mahindra 11,283 463,591 1.11
Indonesia (2013: 683,391, 1.88%) 1,105,450 2.65
BFI Finance Indonesia 2,227,500 451,435 1.08
Hero Supermarket 1,712,910 329,166 0.79
Kalbe Farma 2,198,500 324,849 0.78
Japan (2013: 2,054,955, 5.64%) 3,420,947 8.20
Asahi Intecc 9,200 455,957 1.09
Keyence 1,000 450,481 1.08
Kubota 21,000 309,594 0.74
Pigeon 13,098 774,147 1.86
Sawai Pharmaceutical 8,700 505,467 1.21
SoftBank 6,000 362,160 0.87
Unicharm 23,100 563,141 1.35
Malaysia (2013: 850,498, 2.33%) 464,239 1.11
Public Bank 88,700 464,239 1.11
Philippines (2013: 1,066,802, 2.93%) 2,215,796 5.31
BDO Unibank 196,410 481,165 1.15
Manila Water 1,534,000 992,548 2.38
SM Investments 40,810 742,083 1.78
Singapore (2013: 1,335,443, 3.66%) 2,367,382 5.68
Eu Yan Sang International 577,000 320,859 0.77
Oversea Chinese Banking 169,354 1,340,225 3.22
Raffles Medical Group 105,000 309,022 0.74
Sembcorp Industries 118,000 397,276 0.95
South Korea (2013: 3,886,492, 10.66%) 3,437,681 8.25
Cheil Industries 3,238 470,181 1.13
Hyundai Mobis 1,449 314,276 0.76
Interojo 13,013 226,630 0.54 LG Chemical 1,124 186,972 0.45
LG Household & Health Care 990 566,832 1.36 LG Household & Health Care Preference
1,705 426,994 1.02
Samsung Electronics 899 858,433 2.06
Samsung Fire & Marine Insurance 1,492 387,363 0.93
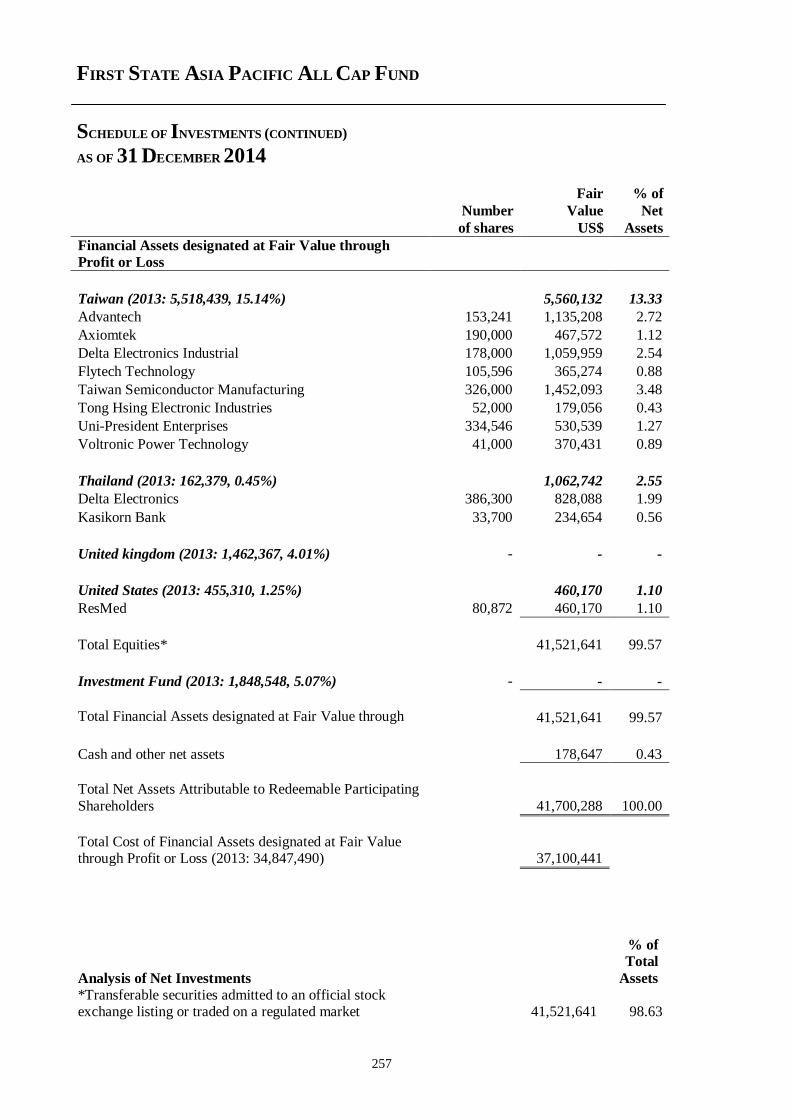
FIRST STATE ASIA PACIFIC ALL CAP FUND
SCHEDULE OF INVESTMENTS (CONTINUED)
AS OF 31 DECEMBER 2014
257
Fair % of
Number Value Net
of shares US$ Assets
Financial Assets designated at Fair Value through
Profit or Loss
Taiwan (2013: 5,518,439, 15.14%) 5,560,132 13.33
Advantech 153,241 1,135,208 2.72
Axiomtek 190,000 467,572 1.12
Delta Electronics Industrial 178,000 1,059,959 2.54
Flytech Technology 105,596 365,274 0.88
Taiwan Semiconductor Manufacturing 326,000 1,452,093 3.48
Tong Hsing Electronic Industries 52,000 179,056 0.43
Uni-President Enterprises 334,546 530,539 1.27
Voltronic Power Technology 41,000 370,431 0.89
Thailand (2013: 162,379, 0.45%) 1,062,742 2.55
Delta Electronics 386,300 828,088 1.99
Kasikorn Bank 33,700 234,654 0.56
United kingdom (2013: 1,462,367, 4.01%) - - -
United States (2013: 455,310, 1.25%) 460,170 1.10
ResMed 80,872 460,170 1.10
Total Equities* 41,521,641 99.57
Investment Fund (2013: 1,848,548, 5.07%) - - -
Total Financial Assets designated at Fair Value through
Profit or Loss 41,521,641 99.57
Cash and other net assets 178,647 0.43
Total Net Assets Attributable to Redeemable Participating
Shareholders 41,700,288 100.00
Total Cost of Financial Assets designated at Fair Value through Profit or Loss (2013: 34,847,490) 37,100,441
Analysis of Net Investments
% of
Total
Assets
*Transferable securities admitted to an official stock exchange listing or traded on a regulated market 41,521,641 98.63
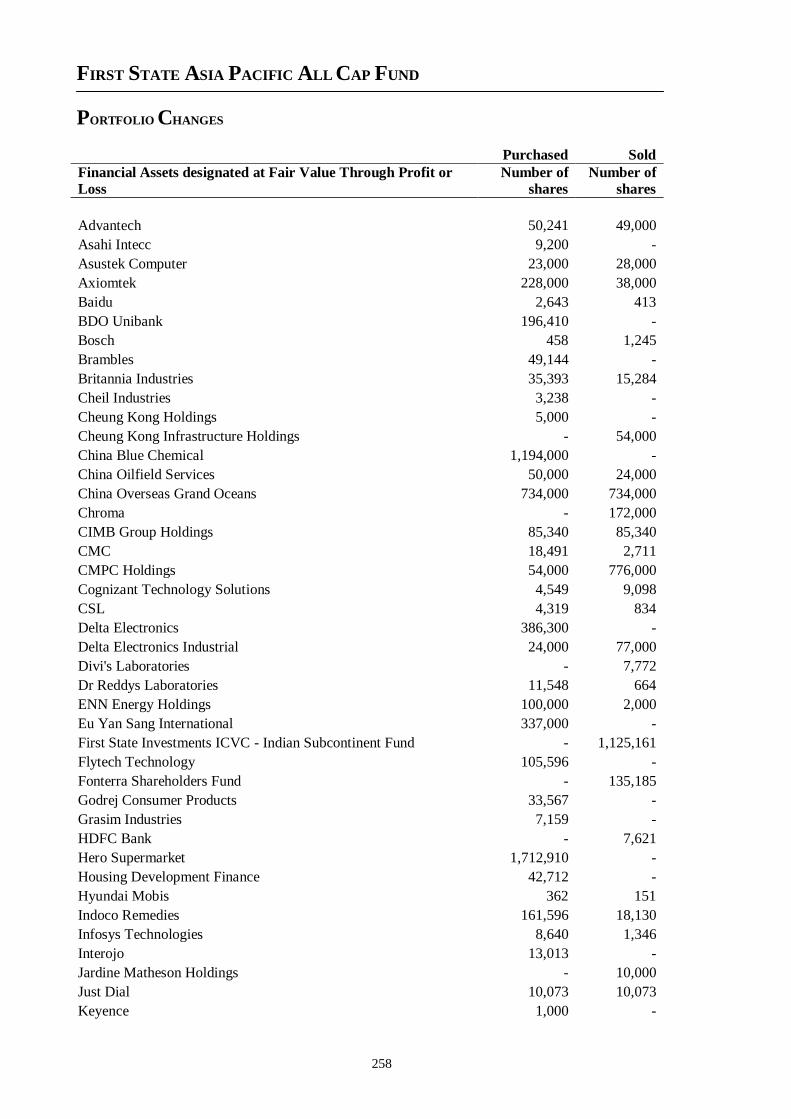
FIRST STATE ASIA PACIFIC ALL CAP FUND
PORTFOLIO CHANGES
258
Purchased Sold
Financial Assets designated at Fair Value Through Profit or
Loss
Number of
shares
Number of
shares
Advantech 50,241 49,000
Asahi Intecc 9,200 -
Asustek Computer 23,000 28,000
Axiomtek 228,000 38,000
Baidu 2,643 413
BDO Unibank 196,410 -
Bosch 458 1,245
Brambles 49,144 -
Britannia Industries 35,393 15,284
Cheil Industries 3,238 -
Cheung Kong Holdings 5,000 -
Cheung Kong Infrastructure Holdings - 54,000
China Blue Chemical 1,194,000 -
China Oilfield Services 50,000 24,000
China Overseas Grand Oceans 734,000 734,000
Chroma - 172,000
CIMB Group Holdings 85,340 85,340
CMC 18,491 2,711
CMPC Holdings 54,000 776,000
Cognizant Technology Solutions 4,549 9,098
CSL 4,319 834
Delta Electronics 386,300 -
Delta Electronics Industrial 24,000 77,000
Divi's Laboratories - 7,772
Dr Reddys Laboratories 11,548 664
ENN Energy Holdings 100,000 2,000
Eu Yan Sang International 337,000 -
First State Investments ICVC - Indian Subcontinent Fund - 1,125,161
Flytech Technology 105,596 -
Fonterra Shareholders Fund - 135,185
Godrej Consumer Products 33,567 -
Grasim Industries 7,159 -
HDFC Bank - 7,621
Hero Supermarket 1,712,910 -
Housing Development Finance 42,712 -
Hyundai Mobis 362 151
Indoco Remedies 161,596 18,130
Infosys Technologies 8,640 1,346
Interojo 13,013 -
Jardine Matheson Holdings - 10,000
Just Dial 10,073 10,073
Keyence 1,000 -
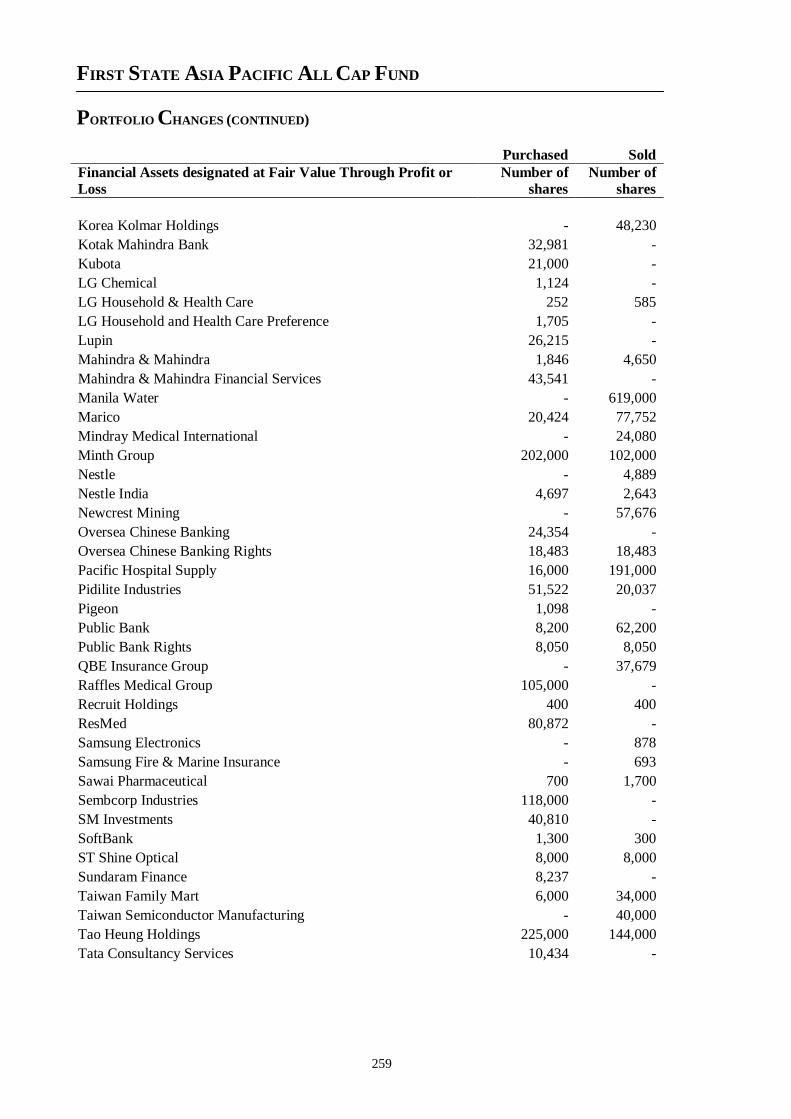
FIRST STATE ASIA PACIFIC ALL CAP FUND
PORTFOLIO CHANGES (CONTINUED)
259
Purchased Sold
Financial Assets designated at Fair Value Through Profit or
Loss
Number of
shares
Number of
shares
Korea Kolmar Holdings - 48,230
Kotak Mahindra Bank 32,981 -
Kubota 21,000 -
LG Chemical 1,124 -
LG Household & Health Care 252 585
LG Household and Health Care Preference 1,705 -
Lupin 26,215 -
Mahindra & Mahindra 1,846 4,650
Mahindra & Mahindra Financial Services 43,541 -
Manila Water - 619,000
Marico 20,424 77,752
Mindray Medical International - 24,080
Minth Group 202,000 102,000
Nestle - 4,889
Nestle India 4,697 2,643
Newcrest Mining - 57,676
Oversea Chinese Banking 24,354 -
Oversea Chinese Banking Rights 18,483 18,483
Pacific Hospital Supply 16,000 191,000
Pidilite Industries 51,522 20,037
Pigeon 1,098 -
Public Bank 8,200 62,200
Public Bank Rights 8,050 8,050
QBE Insurance Group - 37,679
Raffles Medical Group 105,000 -
Recruit Holdings 400 400
ResMed 80,872 -
Samsung Electronics - 878
Samsung Fire & Marine Insurance - 693
Sawai Pharmaceutical 700 1,700
Sembcorp Industries 118,000 -
SM Investments 40,810 -
SoftBank 1,300 300
ST Shine Optical 8,000 8,000
Sundaram Finance 8,237 -
Taiwan Family Mart 6,000 34,000
Taiwan Semiconductor Manufacturing - 40,000
Tao Heung Holdings 225,000 144,000
Tata Consultancy Services 10,434 -
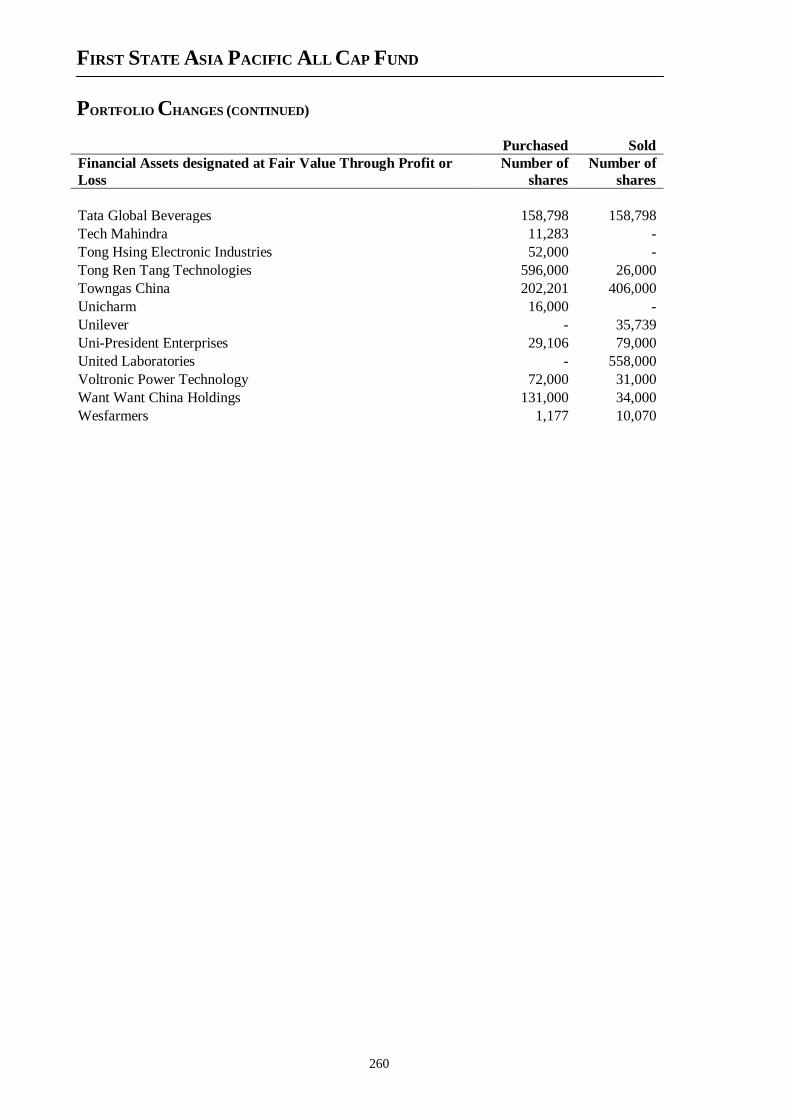
FIRST STATE ASIA PACIFIC ALL CAP FUND
PORTFOLIO CHANGES (CONTINUED)
260
Purchased Sold
Financial Assets designated at Fair Value Through Profit or
Loss
Number of
shares
Number of
shares
Tata Global Beverages 158,798 158,798
Tech Mahindra 11,283 -
Tong Hsing Electronic Industries 52,000 -
Tong Ren Tang Technologies 596,000 26,000
Towngas China 202,201 406,000
Unicharm 16,000 -
Unilever - 35,739
Uni-President Enterprises 29,106 79,000
United Laboratories - 558,000
Voltronic Power Technology 72,000 31,000
Want Want China Holdings 131,000 34,000
Wesfarmers 1,177 10,070
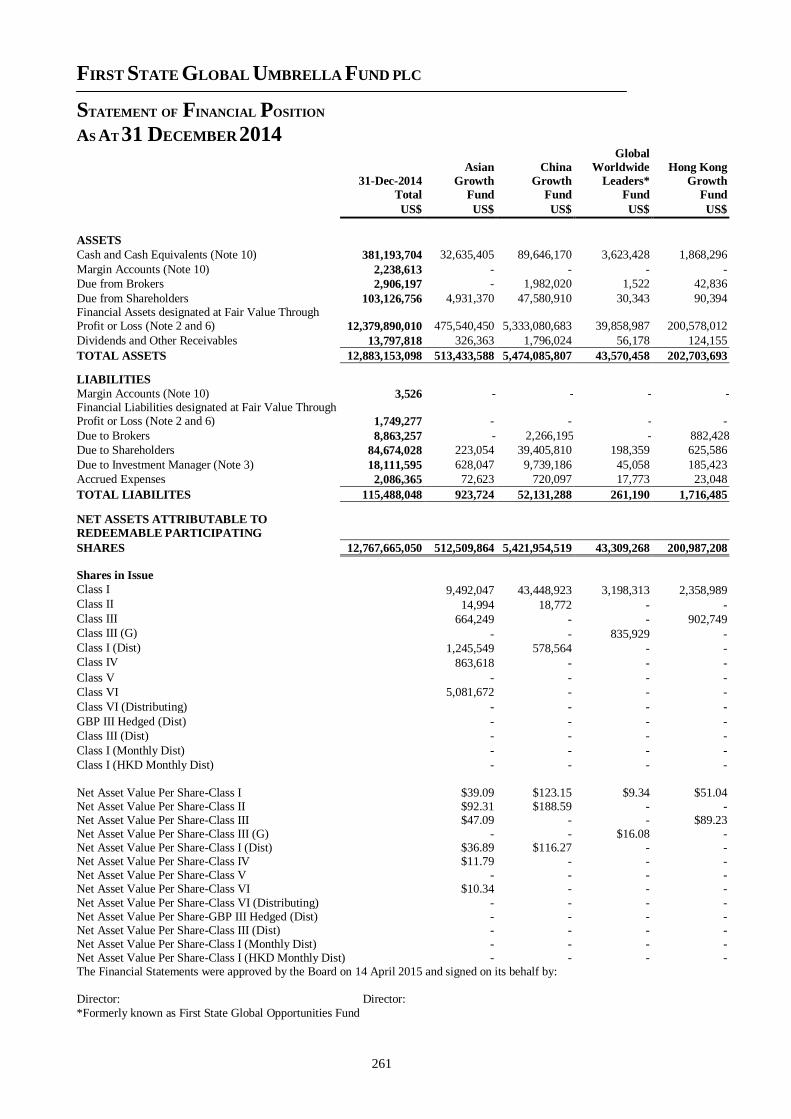
FIRST STATE GLOBAL UMBRELLA FUND PLC
STATEMENT OF FINANCIAL POSITION
AS AT 31 DECEMBER 2014
261
31-Dec-2014
Asian
Growth
China
Growth
Global
Worldwide
Leaders*
Hong Kong
Growth Total Fund Fund Fund Fund
US$ US$ US$ US$ US$
ASSETS
Cash and Cash Equivalents (Note 10) 381,193,704 32,635,405 89,646,170 3,623,428 1,868,296
Margin Accounts (Note 10) 2,238,613 - - - -
Due from Brokers 2,906,197 - 1,982,020 1,522 42,836
Due from Shareholders 103,126,756 4,931,370 47,580,910 30,343 90,394 Financial Assets designated at Fair Value Through Profit or Loss (Note 2 and 6) 12,379,890,010 475,540,450 5,333,080,683 39,858,987 200,578,012
Dividends and Other Receivables 13,797,818 326,363 1,796,024 56,178 124,155
TOTAL ASSETS 12,883,153,098 513,433,588 5,474,085,807 43,570,458 202,703,693
LIABILITIES
Margin Accounts (Note 10) 3,526 - - - - Financial Liabilities designated at Fair Value Through Profit or Loss (Note 2 and 6) 1,749,277 - - - -
Due to Brokers 8,863,257 - 2,266,195 - 882,428
Due to Shareholders 84,674,028 223,054 39,405,810 198,359 625,586
Due to Investment Manager (Note 3) 18,111,595 628,047 9,739,186 45,058 185,423
Accrued Expenses 2,086,365 72,623 720,097 17,773 23,048
TOTAL LIABILITES 115,488,048 923,724 52,131,288 261,190 1,716,485
NET ASSETS ATTRIBUTABLE TO
REDEEMABLE PARTICIPATING
SHARES 12,767,665,050 512,509,864 5,421,954,519 43,309,268 200,987,208
Shares in Issue
Class I 9,492,047 43,448,923 3,198,313 2,358,989 Class II 14,994 18,772 - - Class III 664,249 - - 902,749 Class III (G) - - 835,929 - Class I (Dist) 1,245,549 578,564 - - Class IV 863,618 - - -
Class V - - - -
Class VI 5,081,672 - - -
Class VI (Distributing) - - - -
GBP III Hedged (Dist) - - - -
Class III (Dist) - - - -
Class I (Monthly Dist) - - - -
Class I (HKD Monthly Dist) - - - -
Net Asset Value Per Share-Class I $39.09 $123.15 $9.34 $51.04 Net Asset Value Per Share-Class II $92.31 $188.59 - - Net Asset Value Per Share-Class III $47.09 - - $89.23 Net Asset Value Per Share-Class III (G) - - $16.08 - Net Asset Value Per Share-Class I (Dist) $36.89 $116.27 - - Net Asset Value Per Share-Class IV $11.79 - - - Net Asset Value Per Share-Class V - - - - Net Asset Value Per Share-Class VI $10.34 - - -
Net Asset Value Per Share-Class VI (Distributing) - - - - Net Asset Value Per Share-GBP III Hedged (Dist) - - - - Net Asset Value Per Share-Class III (Dist) - - - - Net Asset Value Per Share-Class I (Monthly Dist) - - - - Net Asset Value Per Share-Class I (HKD Monthly Dist) - - - - The Financial Statements were approved by the Board on 14 April 2015 and signed on its behalf by: Director: Director:
*Formerly known as First State Global Opportunities Fund
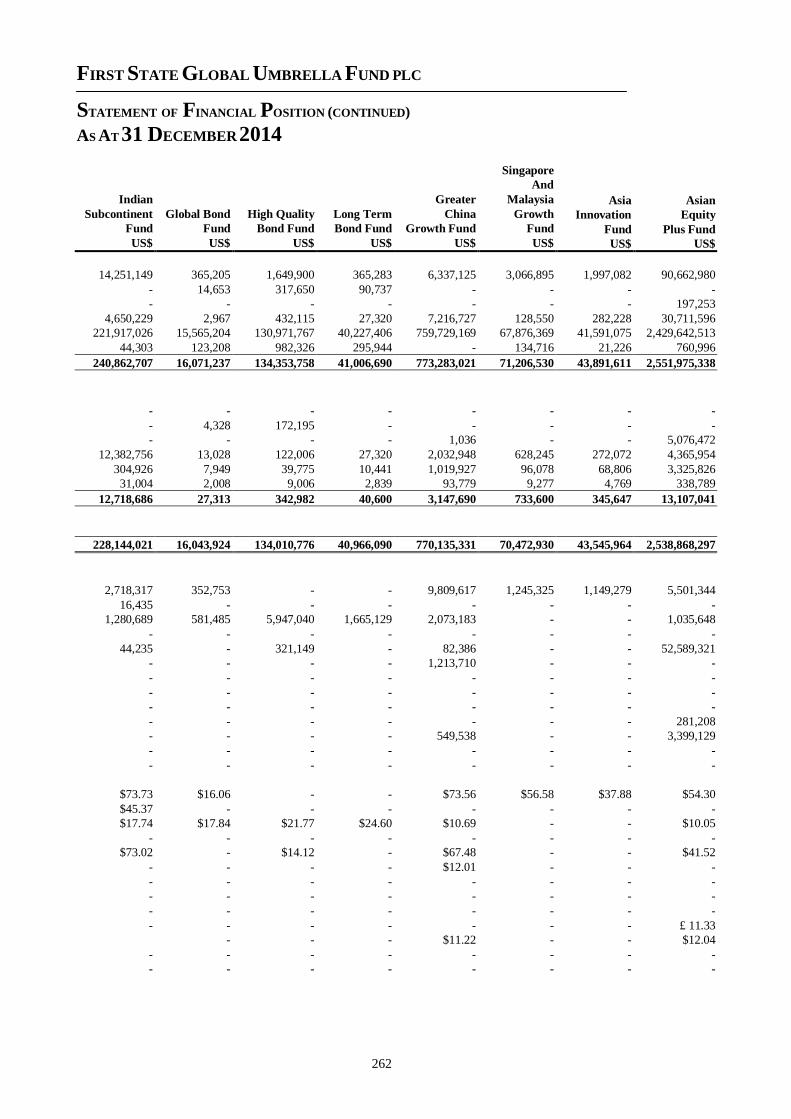
FIRST STATE GLOBAL UMBRELLA FUND PLC
STATEMENT OF FINANCIAL POSITION (CONTINUED)
AS AT 31 DECEMBER 2014
262
Singapore
And
Indian Greater Malaysia Asia Asian
Subcontinent Global Bond High Quality Long Term China Growth Innovation Equity
Fund Fund Bond Fund Bond Fund Growth Fund Fund Fund Plus Fund
US$ US$ US$ US$ US$ US$ US$ US$
14,251,149 365,205 1,649,900 365,283 6,337,125 3,066,895 1,997,082 90,662,980
- 14,653 317,650 90,737 - - - -
- - - - - - - 197,253
4,650,229 2,967 432,115 27,320 7,216,727 128,550 282,228 30,711,596
221,917,026 15,565,204 130,971,767 40,227,406 759,729,169 67,876,369 41,591,075 2,429,642,513
44,303 123,208 982,326 295,944 - 134,716 21,226 760,996
240,862,707 16,071,237 134,353,758 41,006,690 773,283,021 71,206,530 43,891,611 2,551,975,338
- - - - - - - -
- 4,328 172,195 - - - - -
- - - - 1,036 - - 5,076,472
12,382,756 13,028 122,006 27,320 2,032,948 628,245 272,072 4,365,954
304,926 7,949 39,775 10,441 1,019,927 96,078 68,806 3,325,826
31,004 2,008 9,006 2,839 93,779 9,277 4,769 338,789
12,718,686 27,313 342,982 40,600 3,147,690 733,600 345,647 13,107,041
228,144,021 16,043,924 134,010,776 40,966,090 770,135,331 70,472,930 43,545,964 2,538,868,297
2,718,317 352,753 - - 9,809,617 1,245,325 1,149,279 5,501,344
16,435 - - - - - - -
1,280,689 581,485 5,947,040 1,665,129 2,073,183 - - 1,035,648
- - - - - - - -
44,235 - 321,149 - 82,386 - - 52,589,321
- - - - 1,213,710 - - -
- - - - - - - -
- - - - - - - -
- - - - - - - -
- - - - - - - 281,208
- - - - 549,538 - - 3,399,129
- - - - - - - -
- - - - - - - -
$73.73 $16.06 - - $73.56 $56.58 $37.88 $54.30
$45.37 - - - - - - -
$17.74 $17.84 $21.77 $24.60 $10.69 - - $10.05
- - - - - - - -
$73.02 - $14.12 - $67.48 - - $41.52
- - - - $12.01 - - -
- - - - - - - -
- - - - - - - -
- - - - - - - -
- - - - - - - £ 11.33
- - - $11.22 - - $12.04
- - - - - - - -
- - - - - - - -
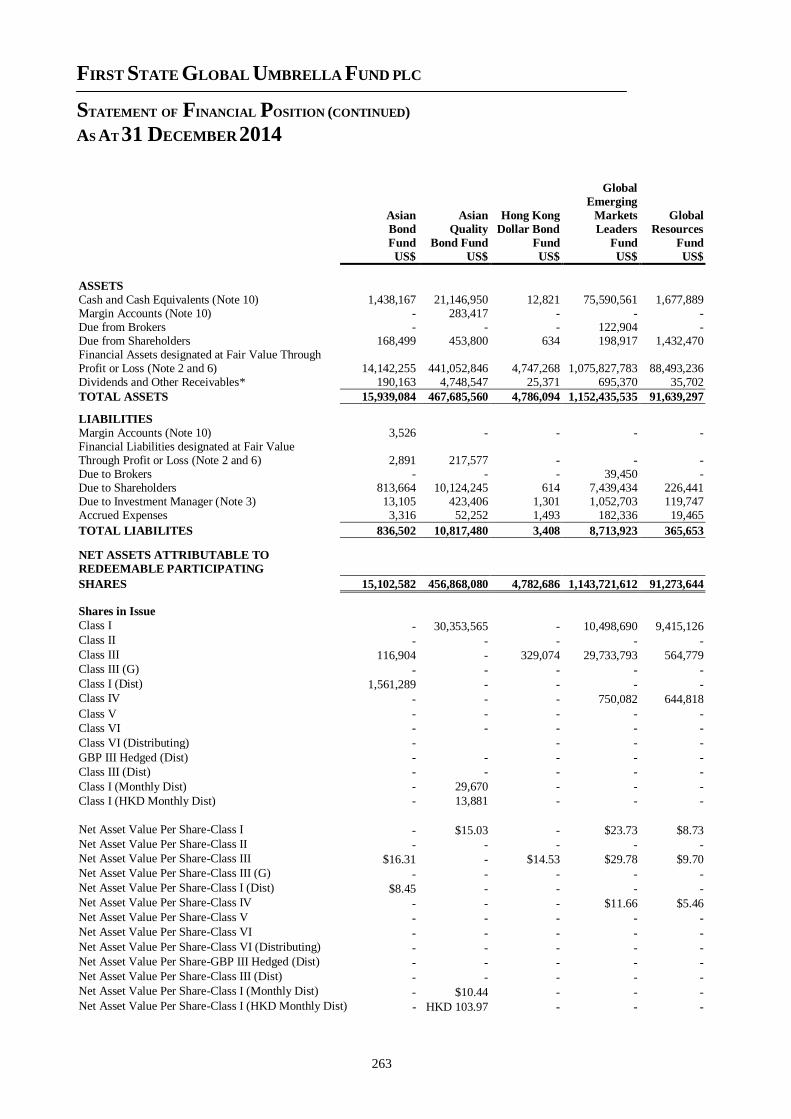
FIRST STATE GLOBAL UMBRELLA FUND PLC
STATEMENT OF FINANCIAL POSITION (CONTINUED)
AS AT 31 DECEMBER 2014
263
Asian Asian Hong Kong
Global
Emerging
Markets
Global
Bond
Fund
Quality
Bond Fund
Dollar Bond
Fund
Leaders
Fund
Resources
Fund
US$ US$ US$ US$ US$
ASSETS
Cash and Cash Equivalents (Note 10) 1,438,167 21,146,950 12,821 75,590,561 1,677,889 Margin Accounts (Note 10) - 283,417 - - - Due from Brokers - - - 122,904 - Due from Shareholders 168,499 453,800 634 198,917 1,432,470 Financial Assets designated at Fair Value Through Profit or Loss (Note 2 and 6) 14,142,255 441,052,846 4,747,268 1,075,827,783 88,493,236 Dividends and Other Receivables* 190,163 4,748,547 25,371 695,370 35,702
TOTAL ASSETS 15,939,084 467,685,560 4,786,094 1,152,435,535 91,639,297
LIABILITIES
Margin Accounts (Note 10) 3,526 - - - - Financial Liabilities designated at Fair Value Through Profit or Loss (Note 2 and 6) 2,891 217,577 - - - Due to Brokers - - - 39,450 - Due to Shareholders 813,664 10,124,245 614 7,439,434 226,441 Due to Investment Manager (Note 3) 13,105 423,406 1,301 1,052,703 119,747 Accrued Expenses 3,316 52,252 1,493 182,336 19,465
TOTAL LIABILITES 836,502 10,817,480 3,408 8,713,923 365,653
NET ASSETS ATTRIBUTABLE TO
REDEEMABLE PARTICIPATING
SHARES 15,102,582 456,868,080 4,782,686 1,143,721,612 91,273,644
Shares in Issue Class I - 30,353,565 - 10,498,690 9,415,126 Class II - - - - - Class III 116,904 - 329,074 29,733,793 564,779 Class III (G) - - - - - Class I (Dist) 1,561,289 - - - - Class IV - - - 750,082 644,818
Class V - - - - -
Class VI - - - - -
Class VI (Distributing) - - - -
GBP III Hedged (Dist) - - - - -
Class III (Dist) - - - - -
Class I (Monthly Dist) - 29,670 - - -
Class I (HKD Monthly Dist) - 13,881 - - -
Net Asset Value Per Share-Class I - $15.03 - $23.73 $8.73 Net Asset Value Per Share-Class II - - - - - Net Asset Value Per Share-Class III $16.31 - $14.53 $29.78 $9.70 Net Asset Value Per Share-Class III (G) - - - - - Net Asset Value Per Share-Class I (Dist) $8.45 - - - - Net Asset Value Per Share-Class IV - - - $11.66 $5.46 Net Asset Value Per Share-Class V - - - - - Net Asset Value Per Share-Class VI - - - - - Net Asset Value Per Share-Class VI (Distributing) - - - - - Net Asset Value Per Share-GBP III Hedged (Dist) - - - - - Net Asset Value Per Share-Class III (Dist) - - - - - Net Asset Value Per Share-Class I (Monthly Dist) - $10.44 - - - Net Asset Value Per Share-Class I (HKD Monthly Dist) - HKD 103.97 - - -
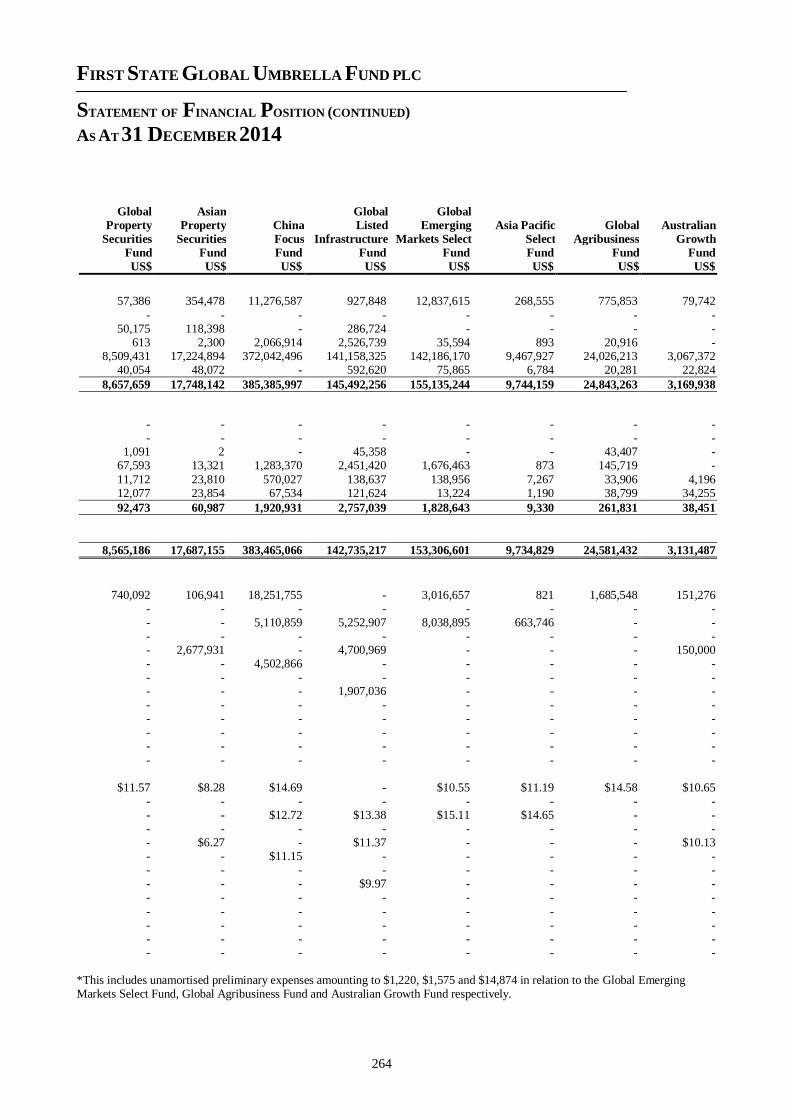
FIRST STATE GLOBAL UMBRELLA FUND PLC
STATEMENT OF FINANCIAL POSITION (CONTINUED)
AS AT 31 DECEMBER 2014
264
Global
Property
Securities
Asian
Property
Securities
China
Focus
Global
Listed
Infrastructure
Global
Emerging
Markets Select
Asia Pacific
Select
Global
Agribusiness
Australian
Growth
Fund Fund Fund Fund Fund Fund Fund Fund
US$ US$ US$ US$ US$ US$ US$ US$
57,386 354,478 11,276,587 927,848 12,837,615 268,555 775,853 79,742
- - - - - - - - 50,175 118,398 - 286,724 - - - -
613 2,300 2,066,914 2,526,739 35,594 893 20,916 - 8,509,431 17,224,894 372,042,496 141,158,325 142,186,170 9,467,927 24,026,213 3,067,372
40,054 48,072 - 592,620 75,865 6,784 20,281 22,824
8,657,659 17,748,142 385,385,997 145,492,256 155,135,244 9,744,159 24,843,263 3,169,938
- - - - - - - - - - - - - - - -
1,091 2 - 45,358 - - 43,407 - 67,593 13,321 1,283,370 2,451,420 1,676,463 873 145,719 -
11,712 23,810 570,027 138,637 138,956 7,267 33,906 4,196 12,077 23,854 67,534 121,624 13,224 1,190 38,799 34,255
92,473 60,987 1,920,931 2,757,039 1,828,643 9,330 261,831 38,451
8,565,186 17,687,155 383,465,066 142,735,217 153,306,601 9,734,829 24,581,432 3,131,487
740,092 106,941 18,251,755 - 3,016,657 821 1,685,548 151,276 - - - - - - - - - - 5,110,859 5,252,907 8,038,895 663,746 - - - - - - - - - - - 2,677,931 - 4,700,969 - - - 150,000 - - 4,502,866 - - - - - - - - - - - - - - - - 1,907,036 - - - - - - - - - - - - - - - - - - - - - - - - - - - - - - - - - - - -
- - - - - - - -
$11.57 $8.28 $14.69 - $10.55 $11.19 $14.58 $10.65 - - - - - - - - - - $12.72 $13.38 $15.11 $14.65 - - - - - - - - - - - $6.27 - $11.37 - - - $10.13 - - $11.15 - - - - - - - - - - - - - - - - $9.97 - - - - - - - - - - - -
- - - - - - - - - - - - - - - - - - - - - - - - - - - - - - - -
*This includes unamortised preliminary expenses amounting to $1,220, $1,575 and $14,874 in relation to the Global Emerging Markets Select Fund, Global Agribusiness Fund and Australian Growth Fund respectively.
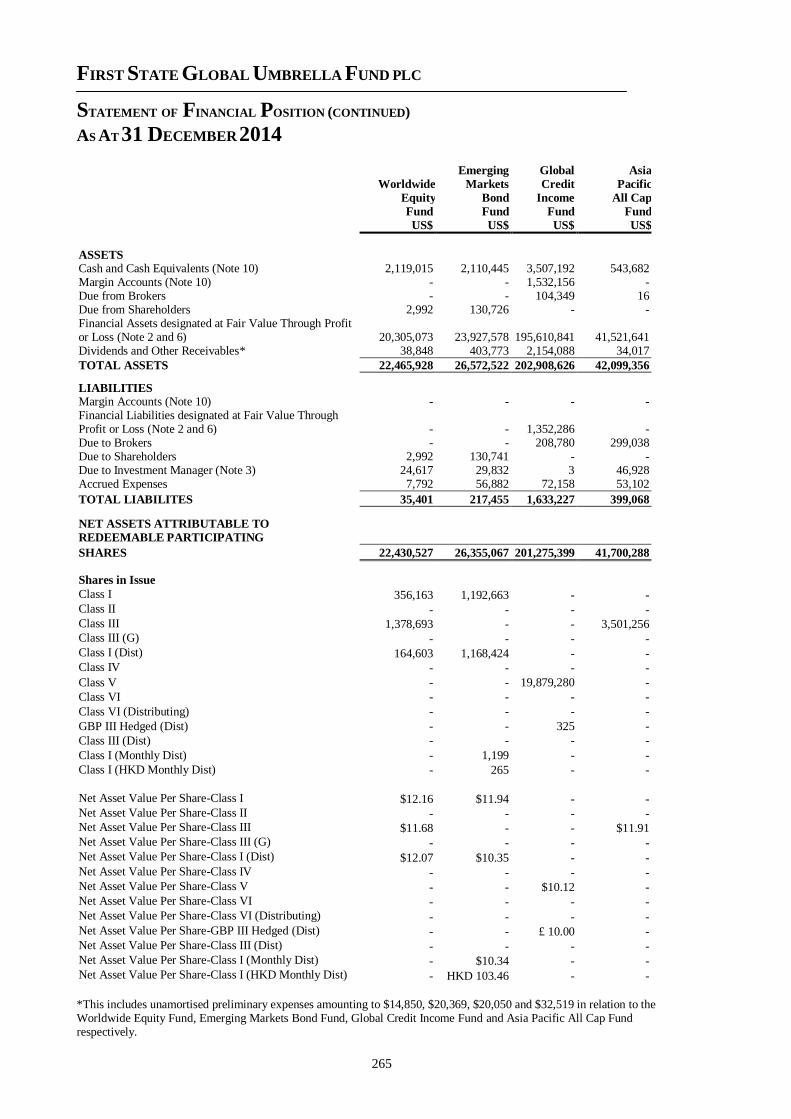
FIRST STATE GLOBAL UMBRELLA FUND PLC
STATEMENT OF FINANCIAL POSITION (CONTINUED)
AS AT 31 DECEMBER 2014
265
Worldwide
Equity
Emerging
Markets
Bond
Global
Credit
Income
Asia
Pacific
All Cap
Fund Fund Fund Fund
US$ US$ US$ US$
ASSETS Cash and Cash Equivalents (Note 10) 2,119,015 2,110,445 3,507,192 543,682 Margin Accounts (Note 10) - - 1,532,156 - Due from Brokers - - 104,349 16 Due from Shareholders 2,992 130,726 - - Financial Assets designated at Fair Value Through Profit or Loss (Note 2 and 6) 20,305,073 23,927,578 195,610,841 41,521,641 Dividends and Other Receivables* 38,848 403,773 2,154,088 34,017
TOTAL ASSETS 22,465,928 26,572,522 202,908,626 42,099,356
LIABILITIES Margin Accounts (Note 10) - - - - Financial Liabilities designated at Fair Value Through Profit or Loss (Note 2 and 6) - - 1,352,286 - Due to Brokers - - 208,780 299,038 Due to Shareholders 2,992 130,741 - - Due to Investment Manager (Note 3) 24,617 29,832 3 46,928 Accrued Expenses 7,792 56,882 72,158 53,102
TOTAL LIABILITES 35,401 217,455 1,633,227 399,068
NET ASSETS ATTRIBUTABLE TO
REDEEMABLE PARTICIPATING
SHARES 22,430,527 26,355,067 201,275,399 41,700,288
Shares in Issue
Class I 356,163 1,192,663 - - Class II - - - - Class III 1,378,693 - - 3,501,256 Class III (G) - - - - Class I (Dist) 164,603 1,168,424 - - Class IV - - - -
Class V - - 19,879,280 -
Class VI - - - -
Class VI (Distributing) - - - -
GBP III Hedged (Dist) - - 325 -
Class III (Dist) - - - -
Class I (Monthly Dist) - 1,199 - -
Class I (HKD Monthly Dist) - 265 - -
Net Asset Value Per Share-Class I $12.16 $11.94 - - Net Asset Value Per Share-Class II - - - - Net Asset Value Per Share-Class III $11.68 - - $11.91 Net Asset Value Per Share-Class III (G) - - - - Net Asset Value Per Share-Class I (Dist) $12.07 $10.35 - - Net Asset Value Per Share-Class IV - - - - Net Asset Value Per Share-Class V - - $10.12 - Net Asset Value Per Share-Class VI - - - - Net Asset Value Per Share-Class VI (Distributing) - - - - Net Asset Value Per Share-GBP III Hedged (Dist) - - £ 10.00 - Net Asset Value Per Share-Class III (Dist) - - - - Net Asset Value Per Share-Class I (Monthly Dist) - $10.34 - - Net Asset Value Per Share-Class I (HKD Monthly Dist) - HKD 103.46 - -
*This includes unamortised preliminary expenses amounting to $14,850, $20,369, $20,050 and $32,519 in relation to the Worldwide Equity Fund, Emerging Markets Bond Fund, Global Credit Income Fund and Asia Pacific All Cap Fund respectively.
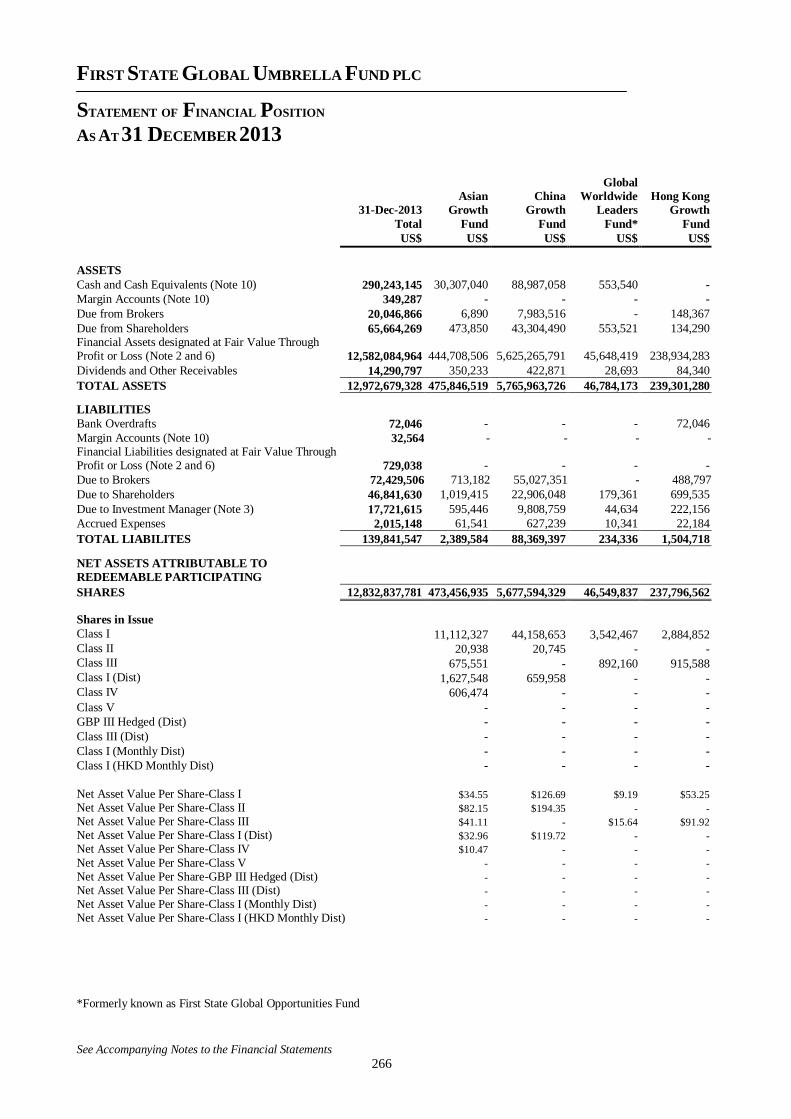
FIRST STATE GLOBAL UMBRELLA FUND PLC
STATEMENT OF FINANCIAL POSITION
AS AT 31 DECEMBER 2013
See Accompanying Notes to the Financial Statements 266
31-Dec-2013
Asian
Growth
China
Growth
Global
Worldwide
Leaders
Hong Kong
Growth
Total Fund Fund Fund* Fund
US$ US$ US$ US$ US$
ASSETS
Cash and Cash Equivalents (Note 10) 290,243,145 30,307,040 88,987,058 553,540 -
Margin Accounts (Note 10) 349,287 - - - -
Due from Brokers 20,046,866 6,890 7,983,516 - 148,367
Due from Shareholders 65,664,269 473,850 43,304,490 553,521 134,290 Financial Assets designated at Fair Value Through Profit or Loss (Note 2 and 6) 12,582,084,964 444,708,506 5,625,265,791 45,648,419 238,934,283
Dividends and Other Receivables 14,290,797 350,233 422,871 28,693 84,340
TOTAL ASSETS 12,972,679,328 475,846,519 5,765,963,726 46,784,173 239,301,280
LIABILITIES
Bank Overdrafts 72,046 - - - 72,046
Margin Accounts (Note 10) 32,564 - - - - Financial Liabilities designated at Fair Value Through Profit or Loss (Note 2 and 6) 729,038 - - - -
Due to Brokers 72,429,506 713,182 55,027,351 - 488,797
Due to Shareholders 46,841,630 1,019,415 22,906,048 179,361 699,535
Due to Investment Manager (Note 3) 17,721,615 595,446 9,808,759 44,634 222,156
Accrued Expenses 2,015,148 61,541 627,239 10,341 22,184
TOTAL LIABILITES 139,841,547 2,389,584 88,369,397 234,336 1,504,718
NET ASSETS ATTRIBUTABLE TO
REDEEMABLE PARTICIPATING
SHARES 12,832,837,781 473,456,935 5,677,594,329 46,549,837 237,796,562
Shares in Issue
Class I 11,112,327 44,158,653 3,542,467 2,884,852 Class II 20,938 20,745 - - Class III 675,551 - 892,160 915,588 Class I (Dist) 1,627,548 659,958 - - Class IV 606,474 - - -
Class V - - - -
GBP III Hedged (Dist) - - - -
Class III (Dist) - - - -
Class I (Monthly Dist) - - - -
Class I (HKD Monthly Dist) - - - -
Net Asset Value Per Share-Class I $34.55 $126.69 $9.19 $53.25
Net Asset Value Per Share-Class II $82.15 $194.35 - -
Net Asset Value Per Share-Class III $41.11 - $15.64 $91.92
Net Asset Value Per Share-Class I (Dist) $32.96 $119.72 - -
Net Asset Value Per Share-Class IV $10.47 - - -
Net Asset Value Per Share-Class V - - - -
Net Asset Value Per Share-GBP III Hedged (Dist) - - - -
Net Asset Value Per Share-Class III (Dist) - - - -
Net Asset Value Per Share-Class I (Monthly Dist) - - - -
Net Asset Value Per Share-Class I (HKD Monthly Dist) - - - -
*Formerly known as First State Global Opportunities Fund
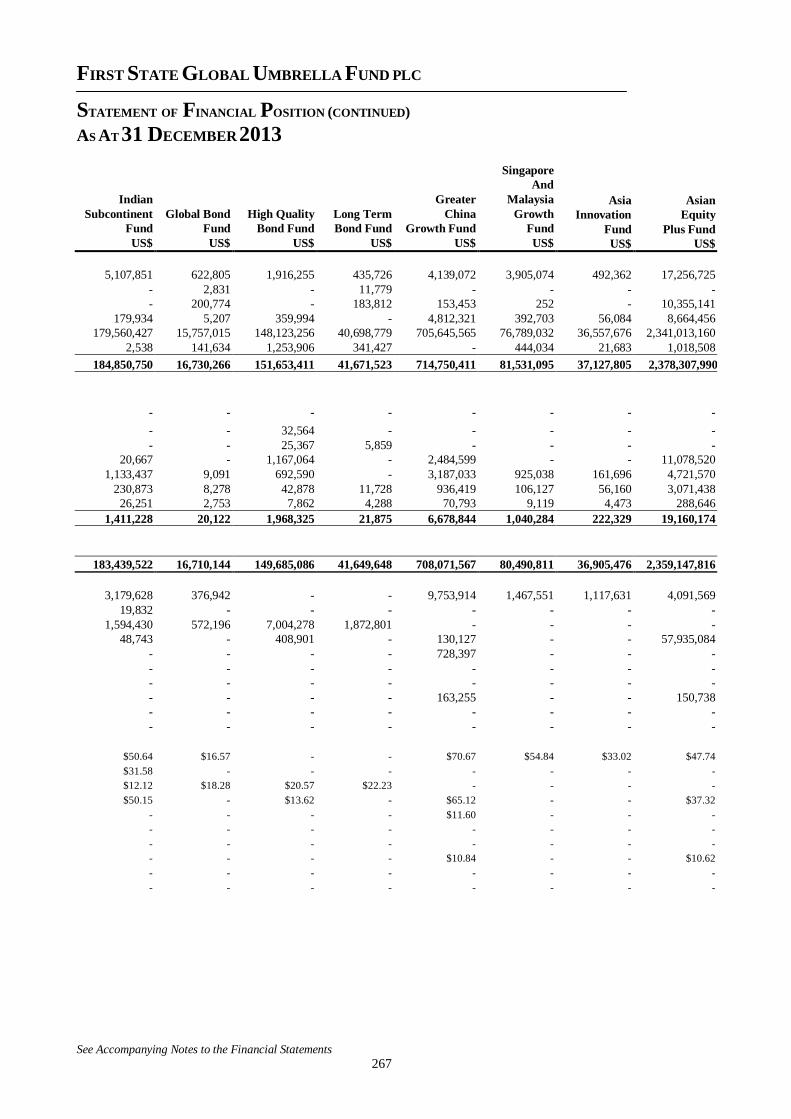
FIRST STATE GLOBAL UMBRELLA FUND PLC
STATEMENT OF FINANCIAL POSITION (CONTINUED)
AS AT 31 DECEMBER 2013
See Accompanying Notes to the Financial Statements 267
Singapore
And
Indian Greater Malaysia Asia Asian
Subcontinent Global Bond High Quality Long Term China Growth Innovation Equity
Fund Fund Bond Fund Bond Fund Growth Fund Fund Fund Plus Fund
US$ US$ US$ US$ US$ US$ US$ US$
5,107,851 622,805 1,916,255 435,726 4,139,072 3,905,074 492,362 17,256,725
- 2,831 - 11,779 - - - -
- 200,774 - 183,812 153,453 252 - 10,355,141
179,934 5,207 359,994 - 4,812,321 392,703 56,084 8,664,456
179,560,427 15,757,015 148,123,256 40,698,779 705,645,565 76,789,032 36,557,676 2,341,013,160
2,538 141,634 1,253,906 341,427 - 444,034 21,683 1,018,508
184,850,750 16,730,266 151,653,411 41,671,523 714,750,411 81,531,095 37,127,805 2,378,307,9900
- - - - - - - -
- - 32,564 - - - - -
- - 25,367 5,859 - - - -
20,667 - 1,167,064 - 2,484,599 - - 11,078,520
1,133,437 9,091 692,590 - 3,187,033 925,038 161,696 4,721,570
230,873 8,278 42,878 11,728 936,419 106,127 56,160 3,071,438
26,251 2,753 7,862 4,288 70,793 9,119 4,473 288,646
1,411,228 20,122 1,968,325 21,875 6,678,844 1,040,284 222,329 19,160,174
183,439,522 16,710,144 149,685,086 41,649,648 708,071,567 80,490,811 36,905,476 2,359,147,816
3,179,628 376,942 - - 9,753,914 1,467,551 1,117,631 4,091,569
19,832 - - - - - - -
1,594,430 572,196 7,004,278 1,872,801 - - - -
48,743 - 408,901 - 130,127 - - 57,935,084
- - - - 728,397 - - -
- - - - - - - -
- - - - - - - -
- - - - 163,255 - - 150,738
- - - - - - - -
- - - - - - - -
$50.64 $16.57 - - $70.67 $54.84 $33.02 $47.74
$31.58 - - - - - - -
$12.12 $18.28 $20.57 $22.23 - - - -
$50.15 - $13.62 - $65.12 - - $37.32
- - - - $11.60 - - -
- - - - - - - -
- - - - - - - -
- - - - $10.84 - - $10.62
- - - - - - - -
- - - - - - - -
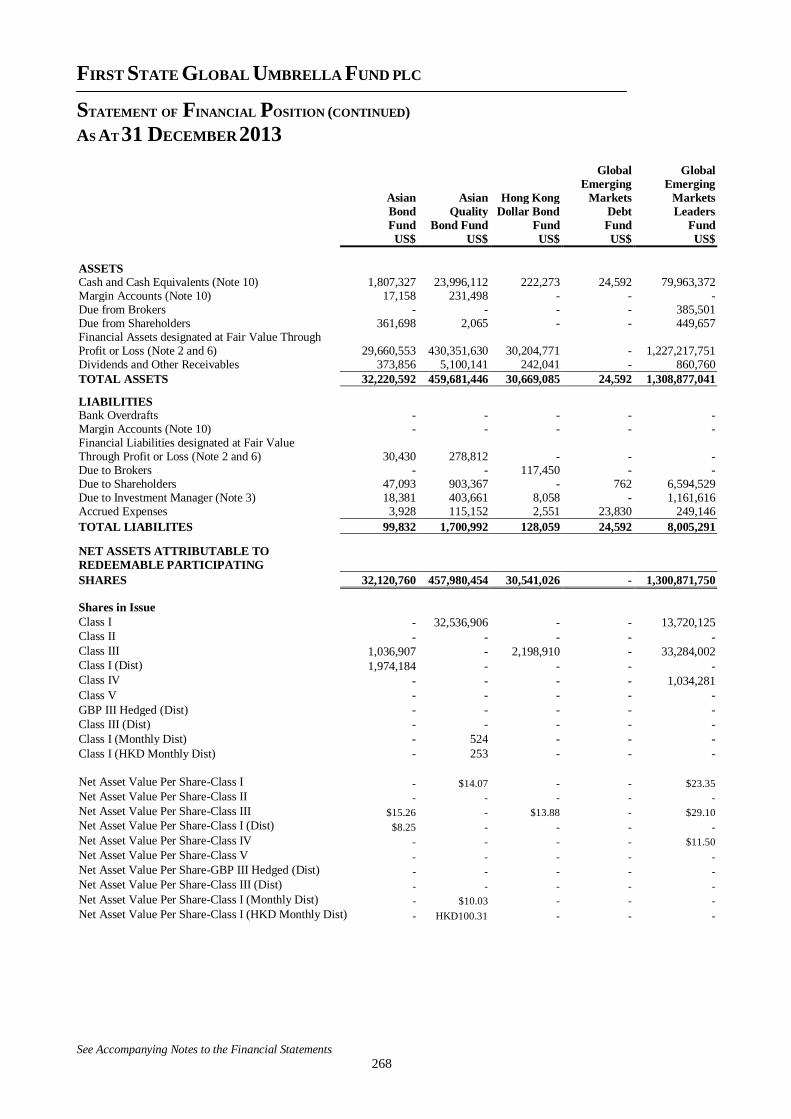
FIRST STATE GLOBAL UMBRELLA FUND PLC
STATEMENT OF FINANCIAL POSITION (CONTINUED)
AS AT 31 DECEMBER 2013
See Accompanying Notes to the Financial Statements 268
Global Global
Asian Asian Hong Kong
Emerging
Markets
Emerging
Markets
Bond
Fund
Quality
Bond Fund
Dollar Bond
Fund
Debt
Fund
Leaders
Fund
US$ US$ US$ US$ US$
ASSETS Cash and Cash Equivalents (Note 10) 1,807,327 23,996,112 222,273 24,592 79,963,372 Margin Accounts (Note 10) 17,158 231,498 - - - Due from Brokers - - - - 385,501 Due from Shareholders 361,698 2,065 - - 449,657 Financial Assets designated at Fair Value Through Profit or Loss (Note 2 and 6) 29,660,553 430,351,630 30,204,771 - 1,227,217,751 Dividends and Other Receivables 373,856 5,100,141 242,041 - 860,760
TOTAL ASSETS 32,220,592 459,681,446 30,669,085 24,592 1,308,877,041
LIABILITIES Bank Overdrafts - - - - - Margin Accounts (Note 10) - - - - - Financial Liabilities designated at Fair Value Through Profit or Loss (Note 2 and 6) 30,430 278,812 - - - Due to Brokers - - 117,450 - - Due to Shareholders 47,093 903,367 - 762 6,594,529 Due to Investment Manager (Note 3) 18,381 403,661 8,058 - 1,161,616 Accrued Expenses 3,928 115,152 2,551 23,830 249,146
TOTAL LIABILITES 99,832 1,700,992 128,059 24,592 8,005,291
NET ASSETS ATTRIBUTABLE TO
REDEEMABLE PARTICIPATING
SHARES 32,120,760 457,980,454 30,541,026 - 1,300,871,750
Shares in Issue
Class I - 32,536,906 - - 13,720,125 Class II - - - - - Class III 1,036,907 - 2,198,910 - 33,284,002 Class I (Dist) 1,974,184 - - - - Class IV - - - - 1,034,281
Class V - - - - -
GBP III Hedged (Dist) - - - - -
Class III (Dist) - - - - -
Class I (Monthly Dist) - 524 - - -
Class I (HKD Monthly Dist) - 253 - - -
Net Asset Value Per Share-Class I - $14.07 - - $23.35
Net Asset Value Per Share-Class II - - - - -
Net Asset Value Per Share-Class III $15.26 - $13.88 - $29.10
Net Asset Value Per Share-Class I (Dist) $8.25 - - - -
Net Asset Value Per Share-Class IV - - - - $11.50
Net Asset Value Per Share-Class V - - - - -
Net Asset Value Per Share-GBP III Hedged (Dist) - - - - -
Net Asset Value Per Share-Class III (Dist) - - - - -
Net Asset Value Per Share-Class I (Monthly Dist) - $10.03 - - -
Net Asset Value Per Share-Class I (HKD Monthly Dist) - HKD100.31 - - -
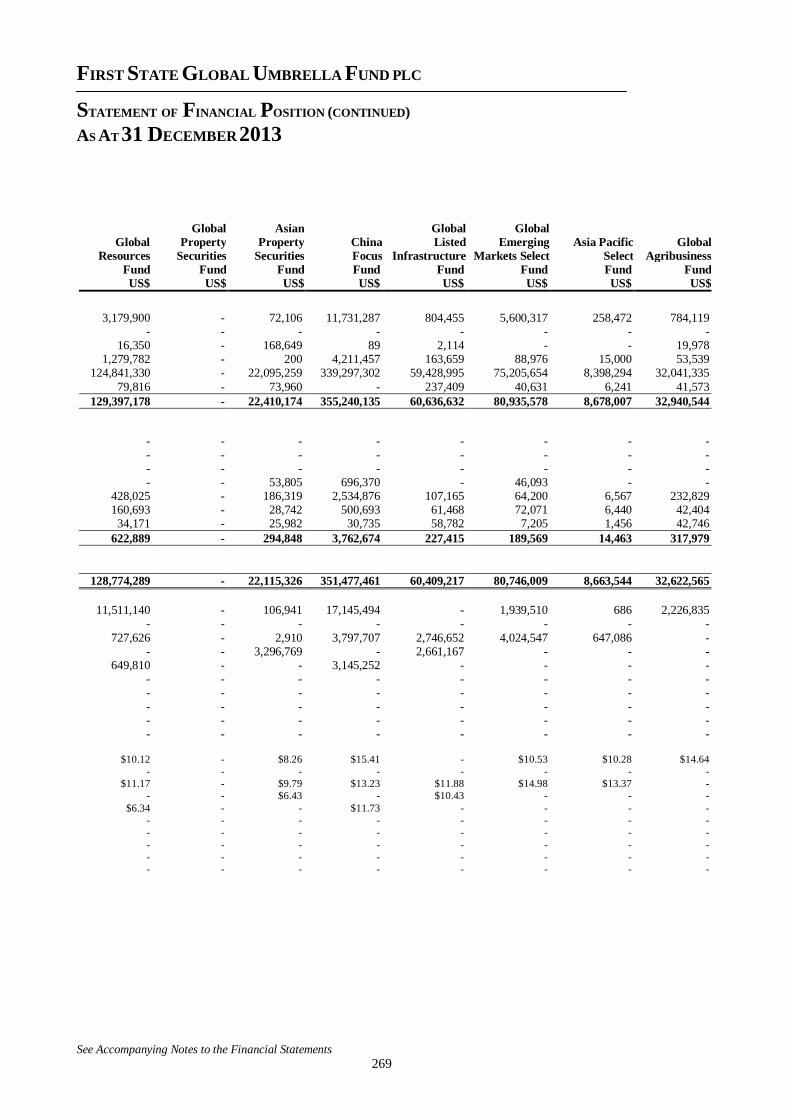
FIRST STATE GLOBAL UMBRELLA FUND PLC
STATEMENT OF FINANCIAL POSITION (CONTINUED)
AS AT 31 DECEMBER 2013
See Accompanying Notes to the Financial Statements
269
Global
Resources
Global
Property
Securities
Asian
Property
Securities
China
Focus
Global
Listed
Infrastructure
Global
Emerging
Markets Select
Asia Pacific
Select
Global
Agribusiness
Fund Fund Fund Fund Fund Fund Fund Fund
US$ US$ US$ US$ US$ US$ US$ US$
3,179,900 - 72,106 11,731,287 804,455 5,600,317 258,472 784,119
- - - - - - - - 16,350 - 168,649 89 2,114 - - 19,978
1,279,782 - 200 4,211,457 163,659 88,976 15,000 53,539 124,841,330 - 22,095,259 339,297,302 59,428,995 75,205,654 8,398,294 32,041,335
79,816 - 73,960 - 237,409 40,631 6,241 41,573
129,397,178 - 22,410,174 355,240,135 60,636,632 80,935,578 8,678,007 32,940,544
- - - - - - - - - - - - - - - - - - - - - - - - - - 53,805 696,370 - 46,093 - -
428,025 - 186,319 2,534,876 107,165 64,200 6,567 232,829 160,693 - 28,742 500,693 61,468 72,071 6,440 42,404
34,171 - 25,982 30,735 58,782 7,205 1,456 42,746
622,889 - 294,848 3,762,674 227,415 189,569 14,463 317,979
128,774,289 - 22,115,326 351,477,461 60,409,217 80,746,009 8,663,544 32,622,565
11,511,140 - 106,941 17,145,494 - 1,939,510 686 2,226,835
- - - - - - - -
727,626 - 2,910 3,797,707 2,746,652 4,024,547 647,086 - - - 3,296,769 - 2,661,167 - - -
649,810 - - 3,145,252 - - - - - - - - - - - - - - - - - - - - - - - - - - - - - - - - - - - - - - - - - - - -
$10.12 - $8.26 $15.41 - $10.53 $10.28 $14.64
- - - - - - - -
$11.17 - $9.79 $13.23 $11.88 $14.98 $13.37 -
- - $6.43 - $10.43 - - -
$6.34 - - $11.73 - - - -
- - - - - - - -
- - - - - - - -
- - - - - - - -
- - - - - - - -
- - - - - - - -
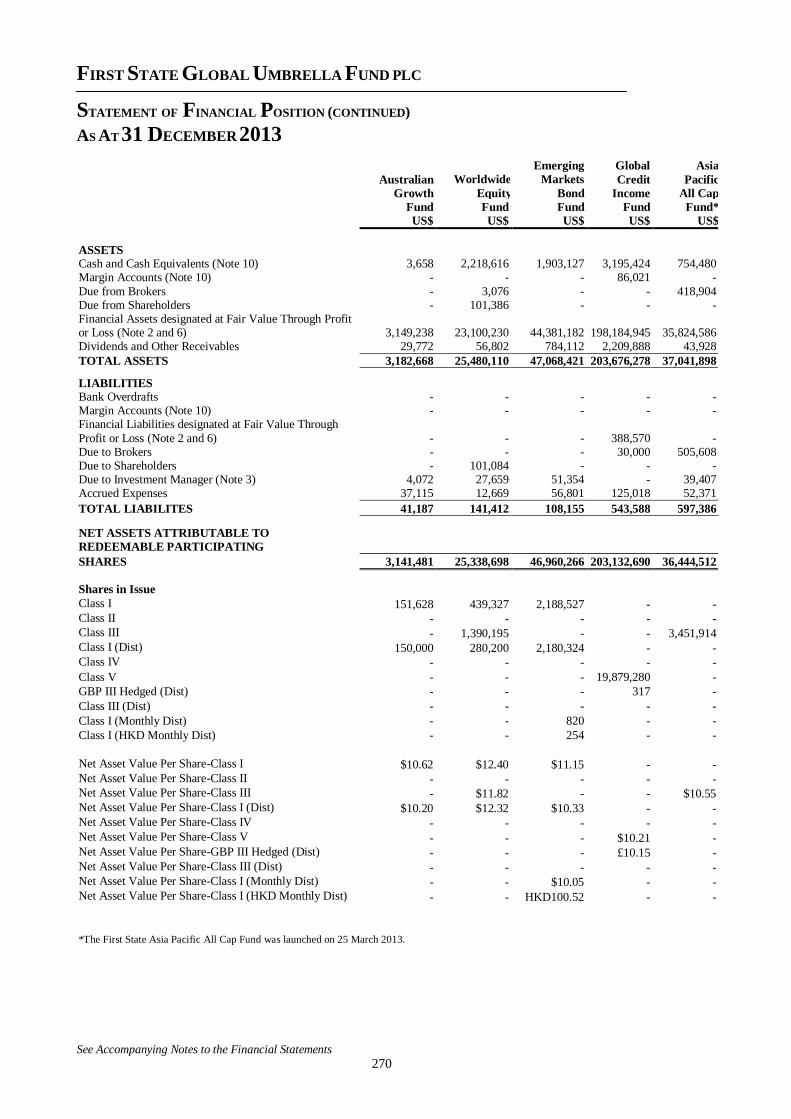
FIRST STATE GLOBAL UMBRELLA FUND PLC
STATEMENT OF FINANCIAL POSITION (CONTINUED)
AS AT 31 DECEMBER 2013
See Accompanying Notes to the Financial Statements
270
Australian
Growth
Worldwide
Equity
Emerging
Markets
Bond
Global
Credit
Income
Asia
Pacific
All Cap
Fund Fund Fund Fund Fund*
US$ US$ US$ US$ US$
ASSETS Cash and Cash Equivalents (Note 10) 3,658 2,218,616 1,903,127 3,195,424 754,480 Margin Accounts (Note 10) - - - 86,021 -
Due from Brokers - 3,076 - - 418,904 Due from Shareholders - 101,386 - - - Financial Assets designated at Fair Value Through Profit or Loss (Note 2 and 6) 3,149,238 23,100,230 44,381,182 198,184,945 35,824,586 Dividends and Other Receivables 29,772 56,802 784,112 2,209,888 43,928
TOTAL ASSETS 3,182,668 25,480,110 47,068,421 203,676,278 37,041,898
LIABILITIES Bank Overdrafts - - - - - Margin Accounts (Note 10) - - - - - Financial Liabilities designated at Fair Value Through
Profit or Loss (Note 2 and 6) - - - 388,570 - Due to Brokers - - - 30,000 505,608 Due to Shareholders - 101,084 - - - Due to Investment Manager (Note 3) 4,072 27,659 51,354 - 39,407 Accrued Expenses 37,115 12,669 56,801 125,018 52,371
TOTAL LIABILITES 41,187 141,412 108,155 543,588 597,386
NET ASSETS ATTRIBUTABLE TO
REDEEMABLE PARTICIPATING
SHARES 3,141,481 25,338,698 46,960,266 203,132,690 36,444,512
Shares in Issue
Class I 151,628 439,327 2,188,527 - - Class II - - - - - Class III - 1,390,195 - - 3,451,914 Class I (Dist) 150,000 280,200 2,180,324 - - Class IV - - - - -
Class V - - - 19,879,280 -
GBP III Hedged (Dist) - - - 317 -
Class III (Dist) - - - - - Class I (Monthly Dist) - - 820 - - Class I (HKD Monthly Dist) - - 254 - - Net Asset Value Per Share-Class I $10.62 $12.40 $11.15 - - Net Asset Value Per Share-Class II - - - - - Net Asset Value Per Share-Class III - $11.82 - - $10.55 Net Asset Value Per Share-Class I (Dist) $10.20 $12.32 $10.33 - - Net Asset Value Per Share-Class IV - - - - - Net Asset Value Per Share-Class V - - - $10.21 - Net Asset Value Per Share-GBP III Hedged (Dist) - - - £10.15 - Net Asset Value Per Share-Class III (Dist) - - - - - Net Asset Value Per Share-Class I (Monthly Dist) - - $10.05 - - Net Asset Value Per Share-Class I (HKD Monthly Dist) - - HKD100.52 - -
*The First State Asia Pacific All Cap Fund was launched on 25 March 2013.
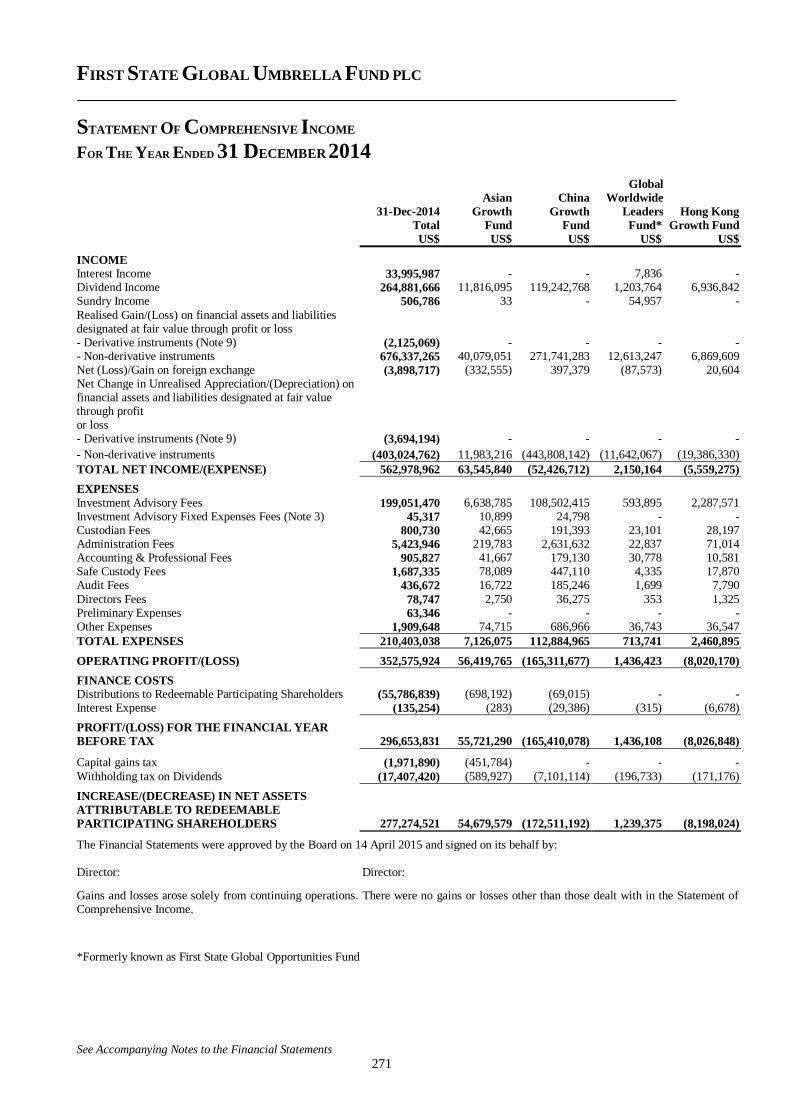
FIRST STATE GLOBAL UMBRELLA FUND PLC
STATEMENT OF COMPREHENSIVE INCOME
FOR THE YEAR ENDED 31 DECEMBER 2014
See Accompanying Notes to the Financial Statements
271
31-Dec-2014
Asian
Growth
China
Growth
Global
Worldwide
Leaders Hong Kong Total Fund Fund Fund* Growth Fund US$ US$ US$ US$ US$
INCOME Interest Income 33,995,987 - - 7,836 - Dividend Income 264,881,666 11,816,095 119,242,768 1,203,764 6,936,842 Sundry Income 506,786 33 - 54,957 -
Realised Gain/(Loss) on financial assets and liabilities designated at fair value through profit or loss - Derivative instruments (Note 9) (2,125,069) - - - - - Non-derivative instruments 676,337,265 40,079,051 271,741,283 12,613,247 6,869,609 Net (Loss)/Gain on foreign exchange (3,898,717) (332,555) 397,379 (87,573) 20,604 Net Change in Unrealised Appreciation/(Depreciation) on financial assets and liabilities designated at fair value through profit or loss - Derivative instruments (Note 9) (3,694,194) - - - -
- Non-derivative instruments (403,024,762) 11,983,216 (443,808,142) (11,642,067) (19,386,330)
TOTAL NET INCOME/(EXPENSE) 562,978,962 63,545,840 (52,426,712) 2,150,164 (5,559,275)
EXPENSES
Investment Advisory Fees 199,051,470 6,638,785 108,502,415 593,895 2,287,571 Investment Advisory Fixed Expenses Fees (Note 3) 45,317 10,899 24,798 - - Custodian Fees 800,730 42,665 191,393 23,101 28,197 Administration Fees 5,423,946 219,783 2,631,632 22,837 71,014 Accounting & Professional Fees 905,827 41,667 179,130 30,778 10,581 Safe Custody Fees 1,687,335 78,089 447,110 4,335 17,870 Audit Fees 436,672 16,722 185,246 1,699 7,790
Directors Fees 78,747 2,750 36,275 353 1,325 Preliminary Expenses 63,346 - - - - Other Expenses 1,909,648 74,715 686,966 36,743 36,547
TOTAL EXPENSES 210,403,038 7,126,075 112,884,965 713,741 2,460,895
OPERATING PROFIT/(LOSS) 352,575,924 56,419,765 (165,311,677) 1,436,423 (8,020,170)
FINANCE COSTS Distributions to Redeemable Participating Shareholders (55,786,839) (698,192) (69,015) - - Interest Expense (135,254) (283) (29,386) (315) (6,678)
PROFIT/(LOSS) FOR THE FINANCIAL YEAR
BEFORE TAX 296,653,831 55,721,290 (165,410,078) 1,436,108 (8,026,848)
Capital gains tax (1,971,890) (451,784) - - -
Withholding tax on Dividends (17,407,420) (589,927) (7,101,114) (196,733) (171,176)
INCREASE/(DECREASE) IN NET ASSETS
ATTRIBUTABLE TO REDEEMABLE
PARTICIPATING SHAREHOLDERS 277,274,521 54,679,579 (172,511,192) 1,239,375 (8,198,024)
The Financial Statements were approved by the Board on 14 April 2015 and signed on its behalf by: Director: Director: Gains and losses arose solely from continuing operations. There were no gains or losses other than those dealt with in the Statement of Comprehensive Income.
*Formerly known as First State Global Opportunities Fund
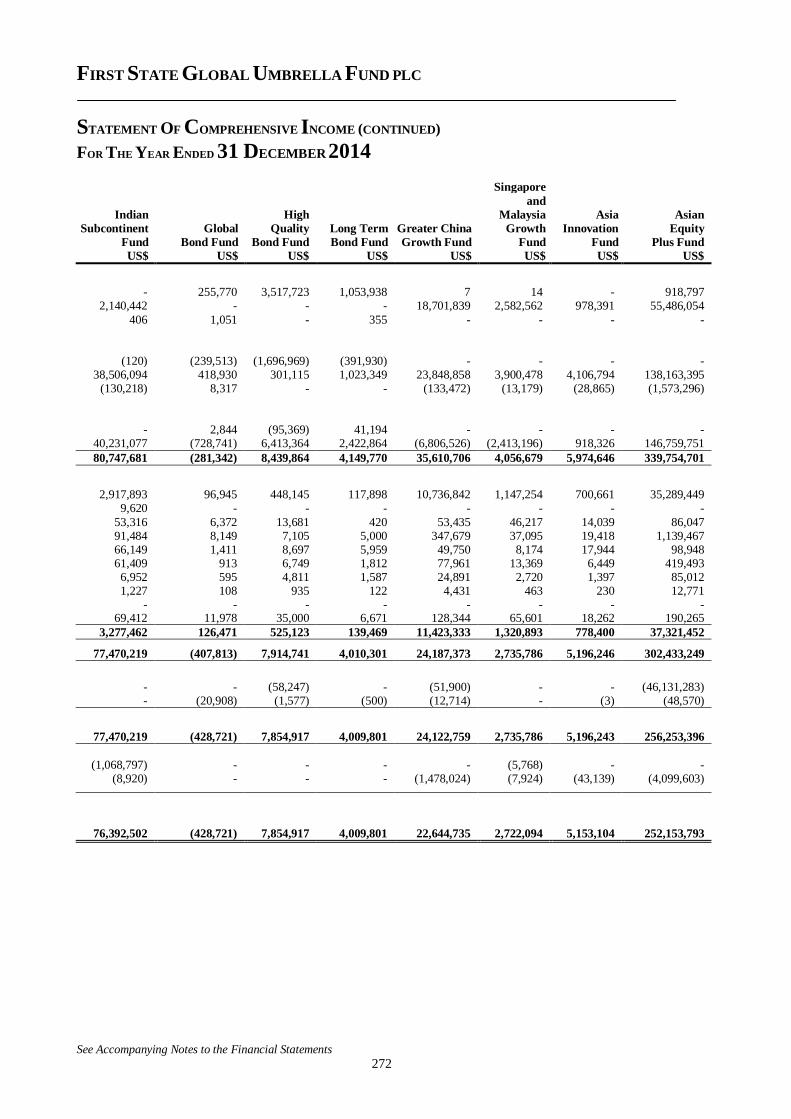
FIRST STATE GLOBAL UMBRELLA FUND PLC
STATEMENT OF COMPREHENSIVE INCOME (CONTINUED)
FOR THE YEAR ENDED 31 DECEMBER 2014
See Accompanying Notes to the Financial Statements
272
Singapore
and
Indian High Malaysia Asia Asian
Subcontinent Global Quality Long Term Greater China Growth Innovation Equity
Fund Bond Fund Bond Fund Bond Fund Growth Fund Fund Fund Plus Fund
US$ US$ US$ US$ US$ US$ US$ US$
- 255,770 3,517,723 1,053,938 7 14 - 918,797 2,140,442 - - - 18,701,839 2,582,562 978,391 55,486,054
406 1,051 - 355 - - - -
(120) (239,513) (1,696,969) (391,930) - - - - 38,506,094 418,930 301,115 1,023,349 23,848,858 3,900,478 4,106,794 138,163,395
(130,218) 8,317 - - (133,472) (13,179) (28,865) (1,573,296) - 2,844 (95,369) 41,194 - - - -
40,231,077 (728,741) 6,413,364 2,422,864 (6,806,526) (2,413,196) 918,326 146,759,751
80,747,681 (281,342) 8,439,864 4,149,770 35,610,706 4,056,679 5,974,646 339,754,701
2,917,893 96,945 448,145 117,898 10,736,842 1,147,254 700,661 35,289,449 9,620 - - - - - - -
53,316 6,372 13,681 420 53,435 46,217 14,039 86,047 91,484 8,149 7,105 5,000 347,679 37,095 19,418 1,139,467 66,149 1,411 8,697 5,959 49,750 8,174 17,944 98,948 61,409 913 6,749 1,812 77,961 13,369 6,449 419,493
6,952 595 4,811 1,587 24,891 2,720 1,397 85,012 1,227 108 935 122 4,431 463 230 12,771
- - - - - - - - 69,412 11,978 35,000 6,671 128,344 65,601 18,262 190,265
3,277,462 126,471 525,123 139,469 11,423,333 1,320,893 778,400 37,321,452
77,470,219 (407,813) 7,914,741 4,010,301 24,187,373 2,735,786 5,196,246 302,433,249
- - (58,247) - (51,900) - - (46,131,283) - (20,908) (1,577) (500) (12,714) - (3) (48,570)
77,470,219 (428,721) 7,854,917 4,009,801 24,122,759 2,735,786 5,196,243 256,253,396
(1,068,797) - - - - (5,768) - - (8,920) - - - (1,478,024) (7,924) (43,139) (4,099,603)
76,392,502 (428,721) 7,854,917 4,009,801 22,644,735 2,722,094 5,153,104 252,153,793
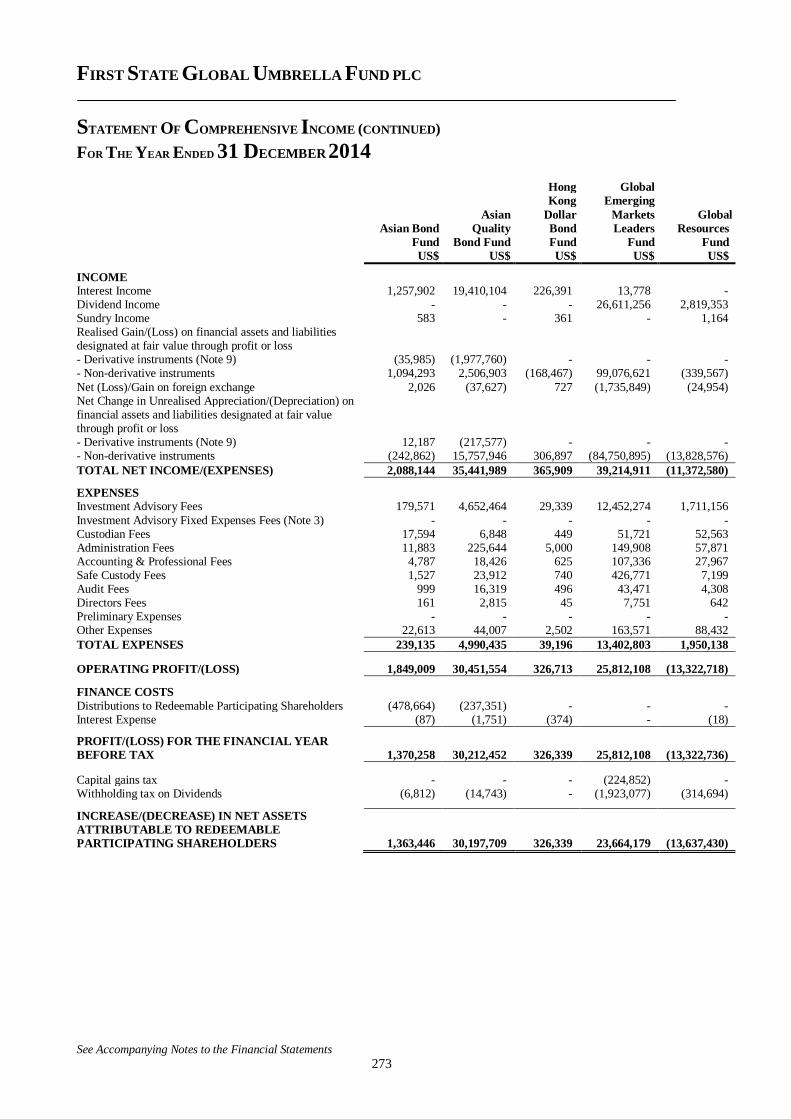
FIRST STATE GLOBAL UMBRELLA FUND PLC
STATEMENT OF COMPREHENSIVE INCOME (CONTINUED)
FOR THE YEAR ENDED 31 DECEMBER 2014
See Accompanying Notes to the Financial Statements
273
Hong Global
Kong Emerging
Asian Dollar Markets Global
Asian Bond Quality Bond Leaders Resources
Fund Bond Fund Fund Fund Fund
US$ US$ US$ US$ US$
INCOME Interest Income 1,257,902 19,410,104 226,391 13,778 - Dividend Income - - - 26,611,256 2,819,353 Sundry Income 583 - 361 - 1,164 Realised Gain/(Loss) on financial assets and liabilities designated at fair value through profit or loss - Derivative instruments (Note 9) (35,985) (1,977,760) - - - - Non-derivative instruments 1,094,293 2,506,903 (168,467) 99,076,621 (339,567)
Net (Loss)/Gain on foreign exchange 2,026 (37,627) 727 (1,735,849) (24,954) Net Change in Unrealised Appreciation/(Depreciation) on financial assets and liabilities designated at fair value through profit or loss - Derivative instruments (Note 9) 12,187 (217,577) - - - - Non-derivative instruments (242,862) 15,757,946 306,897 (84,750,895) (13,828,576)
TOTAL NET INCOME/(EXPENSES) 2,088,144 35,441,989 365,909 39,214,911 (11,372,580)
EXPENSES Investment Advisory Fees 179,571 4,652,464 29,339 12,452,274 1,711,156
Investment Advisory Fixed Expenses Fees (Note 3) - - - - - Custodian Fees 17,594 6,848 449 51,721 52,563 Administration Fees 11,883 225,644 5,000 149,908 57,871 Accounting & Professional Fees 4,787 18,426 625 107,336 27,967 Safe Custody Fees 1,527 23,912 740 426,771 7,199 Audit Fees 999 16,319 496 43,471 4,308 Directors Fees 161 2,815 45 7,751 642 Preliminary Expenses - - - - - Other Expenses 22,613 44,007 2,502 163,571 88,432
TOTAL EXPENSES 239,135 4,990,435 39,196 13,402,803 1,950,138
OPERATING PROFIT/(LOSS) 1,849,009 30,451,554 326,713 25,812,108 (13,322,718)
FINANCE COSTS
Distributions to Redeemable Participating Shareholders (478,664) (237,351) - - - Interest Expense (87) (1,751) (374) - (18)
PROFIT/(LOSS) FOR THE FINANCIAL YEAR
BEFORE TAX 1,370,258 30,212,452 326,339 25,812,108 (13,322,736)
Capital gains tax - - - (224,852) - Withholding tax on Dividends (6,812) (14,743) - (1,923,077) (314,694) INCREASE/(DECREASE) IN NET ASSETS
ATTRIBUTABLE TO REDEEMABLE
PARTICIPATING SHAREHOLDERS 1,363,446 30,197,709 326,339 23,664,179 (13,637,430)
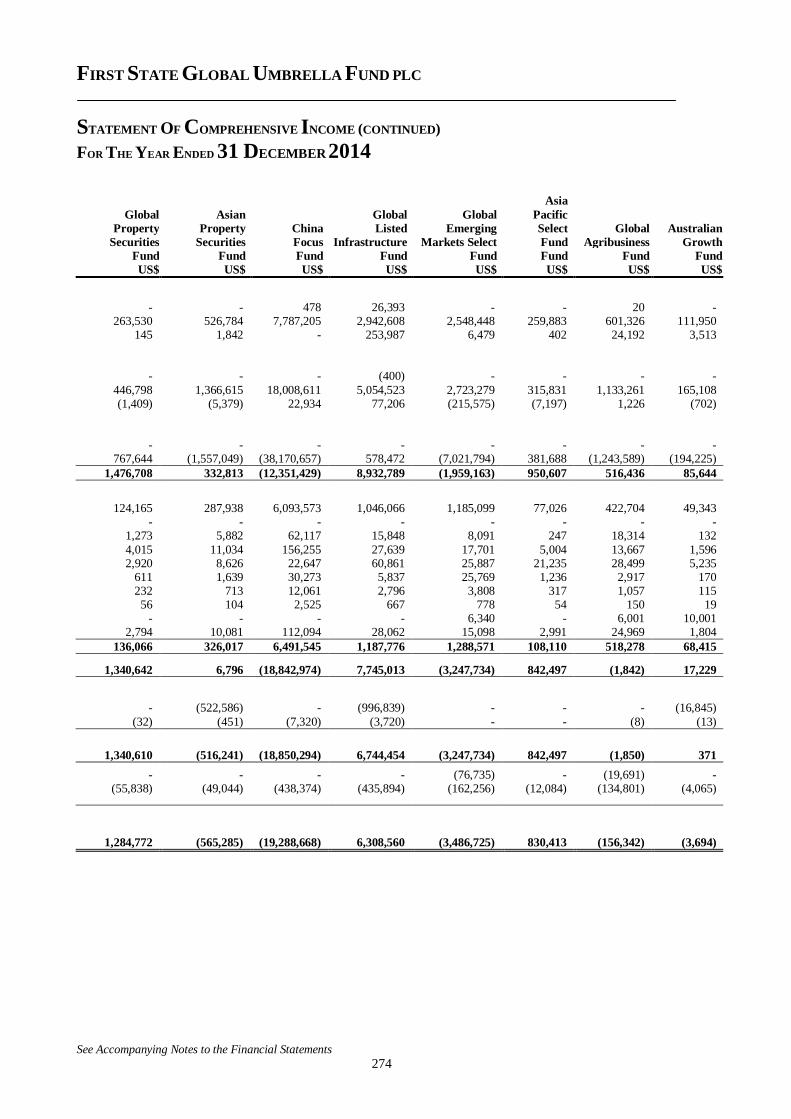
FIRST STATE GLOBAL UMBRELLA FUND PLC
STATEMENT OF COMPREHENSIVE INCOME (CONTINUED)
FOR THE YEAR ENDED 31 DECEMBER 2014
See Accompanying Notes to the Financial Statements
274
Global
Property
Securities
Asian
Property
Securities
China
Focus
Global
Listed
Infrastructure
Global
Emerging
Markets Select
Asia
Pacific
Select
Fund
Global
Agribusiness
Australian
Growth
Fund Fund Fund Fund Fund Fund Fund Fund
US$ US$ US$ US$ US$ US$ US$ US$
- - 478 26,393 - - 20 - 263,530 526,784 7,787,205 2,942,608 2,548,448 259,883 601,326 111,950
145 1,842 - 253,987 6,479 402 24,192 3,513 - - - (400) - - - -
446,798 1,366,615 18,008,611 5,054,523 2,723,279 315,831 1,133,261 165,108 (1,409) (5,379) 22,934 77,206 (215,575) (7,197) 1,226 (702)
- - - - - - - -
767,644 (1,557,049) (38,170,657) 578,472 (7,021,794) 381,688 (1,243,589) (194,225)
1,476,708 332,813 (12,351,429) 8,932,789 (1,959,163) 950,607 516,436 85,644
124,165 287,938 6,093,573 1,046,066 1,185,099 77,026 422,704 49,343 - - - - - - - -
1,273 5,882 62,117 15,848 8,091 247 18,314 132
4,015 11,034 156,255 27,639 17,701 5,004 13,667 1,596 2,920 8,626 22,647 60,861 25,887 21,235 28,499 5,235
611 1,639 30,273 5,837 25,769 1,236 2,917 170 232 713 12,061 2,796 3,808 317 1,057 115
56 104 2,525 667 778 54 150 19 - - - - 6,340 - 6,001 10,001
2,794 10,081 112,094 28,062 15,098 2,991 24,969 1,804
136,066 326,017 6,491,545 1,187,776 1,288,571 108,110 518,278 68,415
1,340,642 6,796 (18,842,974) 7,745,013 (3,247,734) 842,497 (1,842) 17,229
- (522,586) - (996,839) - - - (16,845)
(32) (451) (7,320) (3,720) - - (8) (13)
1,340,610 (516,241) (18,850,294) 6,744,454 (3,247,734) 842,497 (1,850) 371
- - - - (76,735) - (19,691) - (55,838) (49,044) (438,374) (435,894) (162,256) (12,084) (134,801) (4,065)
1,284,772 (565,285) (19,288,668) 6,308,560 (3,486,725) 830,413 (156,342) (3,694)
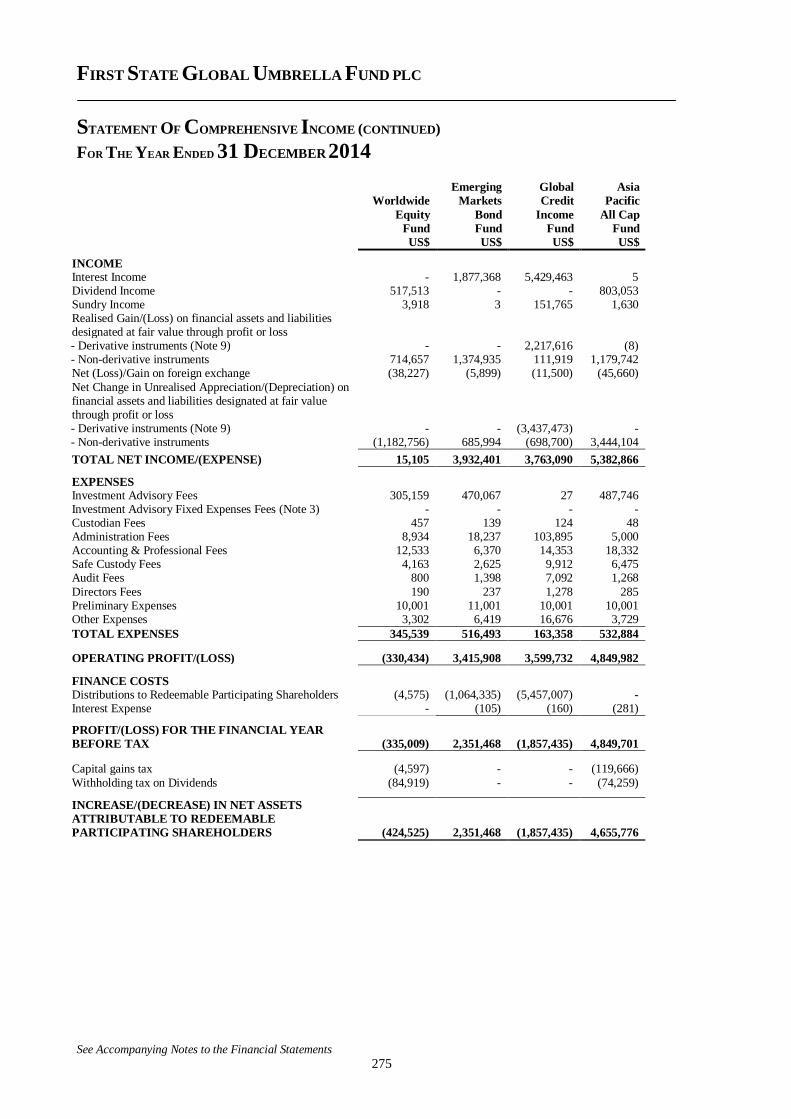
FIRST STATE GLOBAL UMBRELLA FUND PLC
STATEMENT OF COMPREHENSIVE INCOME (CONTINUED)
FOR THE YEAR ENDED 31 DECEMBER 2014
See Accompanying Notes to the Financial Statements
275
Worldwide
Equity
Emerging
Markets
Bond
Global
Credit
Income
Asia
Pacific
All Cap
Fund Fund Fund Fund
US$ US$ US$ US$
INCOME Interest Income - 1,877,368 5,429,463 5 Dividend Income 517,513 - - 803,053 Sundry Income 3,918 3 151,765 1,630 Realised Gain/(Loss) on financial assets and liabilities designated at fair value through profit or loss - Derivative instruments (Note 9) - - 2,217,616 (8) - Non-derivative instruments 714,657 1,374,935 111,919 1,179,742 Net (Loss)/Gain on foreign exchange (38,227) (5,899) (11,500) (45,660)
Net Change in Unrealised Appreciation/(Depreciation) on financial assets and liabilities designated at fair value through profit or loss - Derivative instruments (Note 9) - - (3,437,473) - - Non-derivative instruments (1,182,756) 685,994 (698,700) 3,444,104
TOTAL NET INCOME/(EXPENSE) 15,105 3,932,401 3,763,090 5,382,866
EXPENSES Investment Advisory Fees 305,159 470,067 27 487,746 Investment Advisory Fixed Expenses Fees (Note 3) - - - - Custodian Fees 457 139 124 48 Administration Fees 8,934 18,237 103,895 5,000 Accounting & Professional Fees 12,533 6,370 14,353 18,332 Safe Custody Fees 4,163 2,625 9,912 6,475 Audit Fees 800 1,398 7,092 1,268
Directors Fees 190 237 1,278 285 Preliminary Expenses 10,001 11,001 10,001 10,001 Other Expenses 3,302 6,419 16,676 3,729
TOTAL EXPENSES 345,539 516,493 163,358 532,884
OPERATING PROFIT/(LOSS) (330,434) 3,415,908 3,599,732 4,849,982
FINANCE COSTS Distributions to Redeemable Participating Shareholders (4,575) (1,064,335) (5,457,007) - Interest Expense - (105) (160) (281)
PROFIT/(LOSS) FOR THE FINANCIAL YEAR
BEFORE TAX (335,009) 2,351,468 (1,857,435) 4,849,701
Capital gains tax (4,597) - - (119,666)
Withholding tax on Dividends (84,919) - - (74,259) INCREASE/(DECREASE) IN NET ASSETS
ATTRIBUTABLE TO REDEEMABLE
PARTICIPATING SHAREHOLDERS (424,525) 2,351,468 (1,857,435) 4,655,776
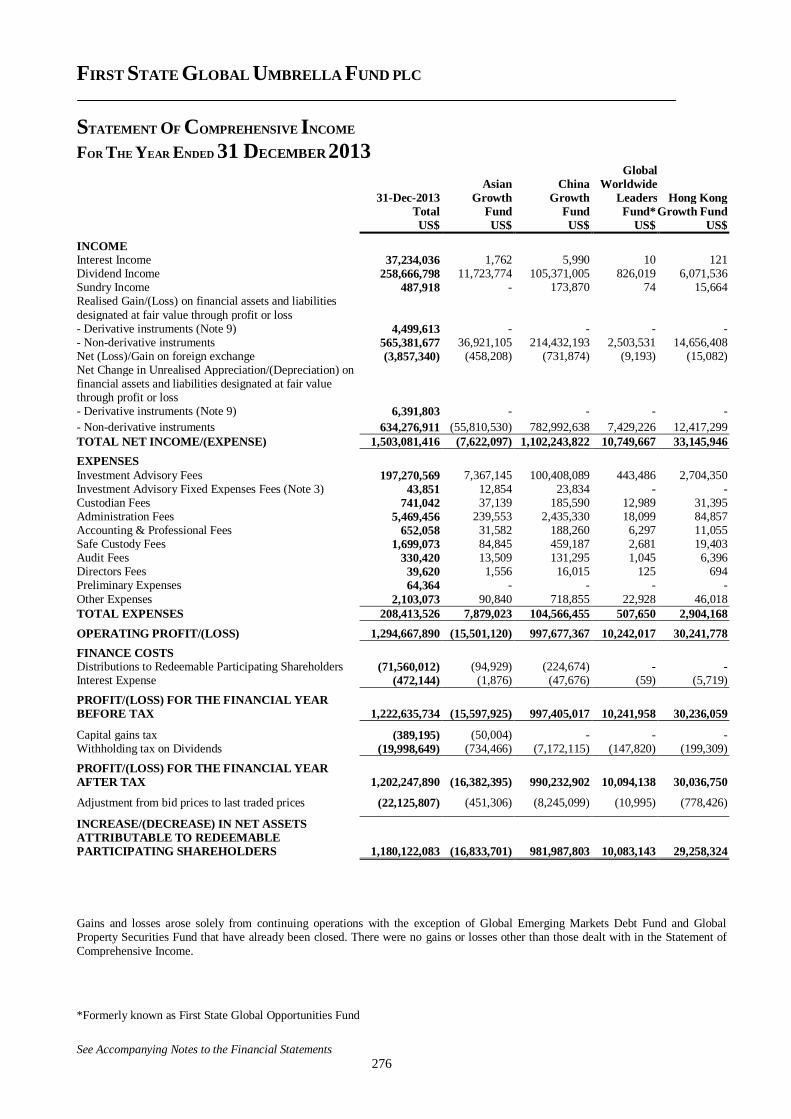
FIRST STATE GLOBAL UMBRELLA FUND PLC
STATEMENT OF COMPREHENSIVE INCOME
FOR THE YEAR ENDED 31 DECEMBER 2013
See Accompanying Notes to the Financial Statements
276
31-Dec-2013
Asian
Growth
China
Growth
Global
Worldwide
Leaders Hong Kong Total Fund Fund Fund* Growth Fund US$ US$ US$ US$ US$
INCOME Interest Income 37,234,036 1,762 5,990 10 121 Dividend Income 258,666,798 11,723,774 105,371,005 826,019 6,071,536 Sundry Income 487,918 - 173,870 74 15,664 Realised Gain/(Loss) on financial assets and liabilities
designated at fair value through profit or loss - Derivative instruments (Note 9) 4,499,613 - - - - - Non-derivative instruments 565,381,677 36,921,105 214,432,193 2,503,531 14,656,408 Net (Loss)/Gain on foreign exchange (3,857,340) (458,208) (731,874) (9,193) (15,082) Net Change in Unrealised Appreciation/(Depreciation) on financial assets and liabilities designated at fair value through profit or loss - Derivative instruments (Note 9) 6,391,803 - - - -
- Non-derivative instruments 634,276,911 (55,810,530) 782,992,638 7,429,226 12,417,299
TOTAL NET INCOME/(EXPENSE) 1,503,081,416 (7,622,097) 1,102,243,822 10,749,667 33,145,946
EXPENSES
Investment Advisory Fees 197,270,569 7,367,145 100,408,089 443,486 2,704,350 Investment Advisory Fixed Expenses Fees (Note 3) 43,851 12,854 23,834 - - Custodian Fees 741,042 37,139 185,590 12,989 31,395 Administration Fees 5,469,456 239,553 2,435,330 18,099 84,857 Accounting & Professional Fees 652,058 31,582 188,260 6,297 11,055 Safe Custody Fees 1,699,073 84,845 459,187 2,681 19,403 Audit Fees 330,420 13,509 131,295 1,045 6,396 Directors Fees 39,620 1,556 16,015 125 694 Preliminary Expenses 64,364 - - - -
Other Expenses 2,103,073 90,840 718,855 22,928 46,018
TOTAL EXPENSES 208,413,526 7,879,023 104,566,455 507,650 2,904,168
OPERATING PROFIT/(LOSS) 1,294,667,890 (15,501,120) 997,677,367 10,242,017 30,241,778
FINANCE COSTS Distributions to Redeemable Participating Shareholders (71,560,012) (94,929) (224,674) - - Interest Expense (472,144) (1,876) (47,676) (59) (5,719)
PROFIT/(LOSS) FOR THE FINANCIAL YEAR
BEFORE TAX 1,222,635,734 (15,597,925) 997,405,017 10,241,958 30,236,059
Capital gains tax (389,195) (50,004) - - - Withholding tax on Dividends (19,998,649) (734,466) (7,172,115) (147,820) (199,309)
PROFIT/(LOSS) FOR THE FINANCIAL YEAR
AFTER TAX 1,202,247,890 (16,382,395) 990,232,902 10,094,138 30,036,750
Adjustment from bid prices to last traded prices (22,125,807) (451,306) (8,245,099) (10,995) (778,426)
INCREASE/(DECREASE) IN NET ASSETS
ATTRIBUTABLE TO REDEEMABLE
PARTICIPATING SHAREHOLDERS 1,180,122,083 (16,833,701) 981,987,803 10,083,143 29,258,324
Gains and losses arose solely from continuing operations with the exception of Global Emerging Markets Debt Fund and Global Property Securities Fund that have already been closed. There were no gains or losses other than those dealt with in the Statement of
Comprehensive Income.
*Formerly known as First State Global Opportunities Fund
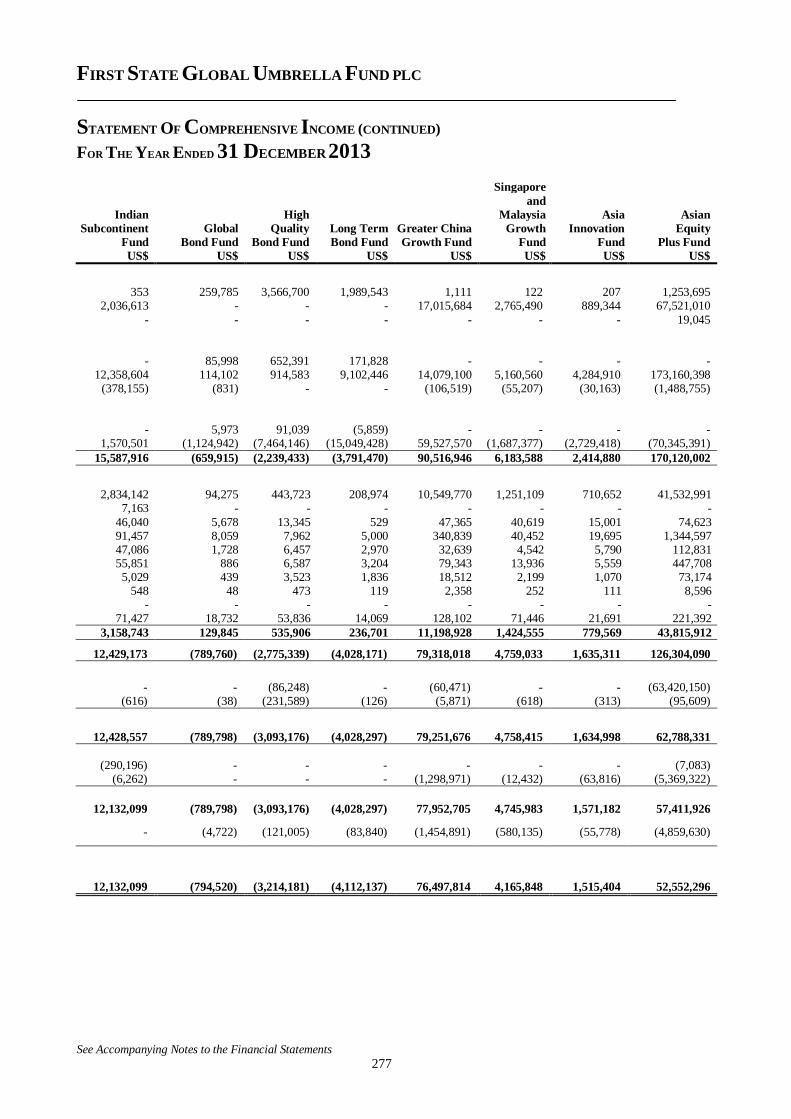
FIRST STATE GLOBAL UMBRELLA FUND PLC
STATEMENT OF COMPREHENSIVE INCOME (CONTINUED)
FOR THE YEAR ENDED 31 DECEMBER 2013
See Accompanying Notes to the Financial Statements
277
Singapore
and
Indian High Malaysia Asia Asian
Subcontinent Global Quality Long Term Greater China Growth Innovation Equity
Fund Bond Fund Bond Fund Bond Fund Growth Fund Fund Fund Plus Fund
US$ US$ US$ US$ US$ US$ US$ US$
353 259,785 3,566,700 1,989,543 1,111 122 207 1,253,695 2,036,613 - - - 17,015,684 2,765,490 889,344 67,521,010
- - - - - - - 19,045
- 85,998 652,391 171,828 - - - - 12,358,604 114,102 914,583 9,102,446 14,079,100 5,160,560 4,284,910 173,160,398
(378,155) (831) - - (106,519) (55,207) (30,163) (1,488,755)
- 5,973 91,039 (5,859) - - - - 1,570,501 (1,124,942) (7,464,146) (15,049,428) 59,527,570 (1,687,377) (2,729,418) (70,345,391)
15,587,916 (659,915) (2,239,433) (3,791,470) 90,516,946 6,183,588 2,414,880 170,120,002
2,834,142 94,275 443,723 208,974 10,549,770 1,251,109 710,652 41,532,991 7,163 - - - - - - -
46,040 5,678 13,345 529 47,365 40,619 15,001 74,623 91,457 8,059 7,962 5,000 340,839 40,452 19,695 1,344,597 47,086 1,728 6,457 2,970 32,639 4,542 5,790 112,831 55,851 886 6,587 3,204 79,343 13,936 5,559 447,708 5,029 439 3,523 1,836 18,512 2,199 1,070 73,174
548 48 473 119 2,358 252 111 8,596 - - - - - - - -
71,427 18,732 53,836 14,069 128,102 71,446 21,691 221,392
3,158,743 129,845 535,906 236,701 11,198,928 1,424,555 779,569 43,815,912
12,429,173 (789,760) (2,775,339) (4,028,171) 79,318,018 4,759,033 1,635,311 126,304,090
- - (86,248) - (60,471) - - (63,420,150)
(616) (38) (231,589) (126) (5,871) (618) (313) (95,609)
12,428,557 (789,798) (3,093,176) (4,028,297) 79,251,676 4,758,415 1,634,998 62,788,331
(290,196) - - - - - - (7,083) (6,262) - - - (1,298,971) (12,432) (63,816) (5,369,322)
12,132,099 (789,798) (3,093,176) (4,028,297) 77,952,705 4,745,983 1,571,182 57,411,926
- (4,722) (121,005) (83,840) (1,454,891) (580,135) (55,778) (4,859,630)
12,132,099 (794,520) (3,214,181) (4,112,137) 76,497,814 4,165,848 1,515,404 52,552,296
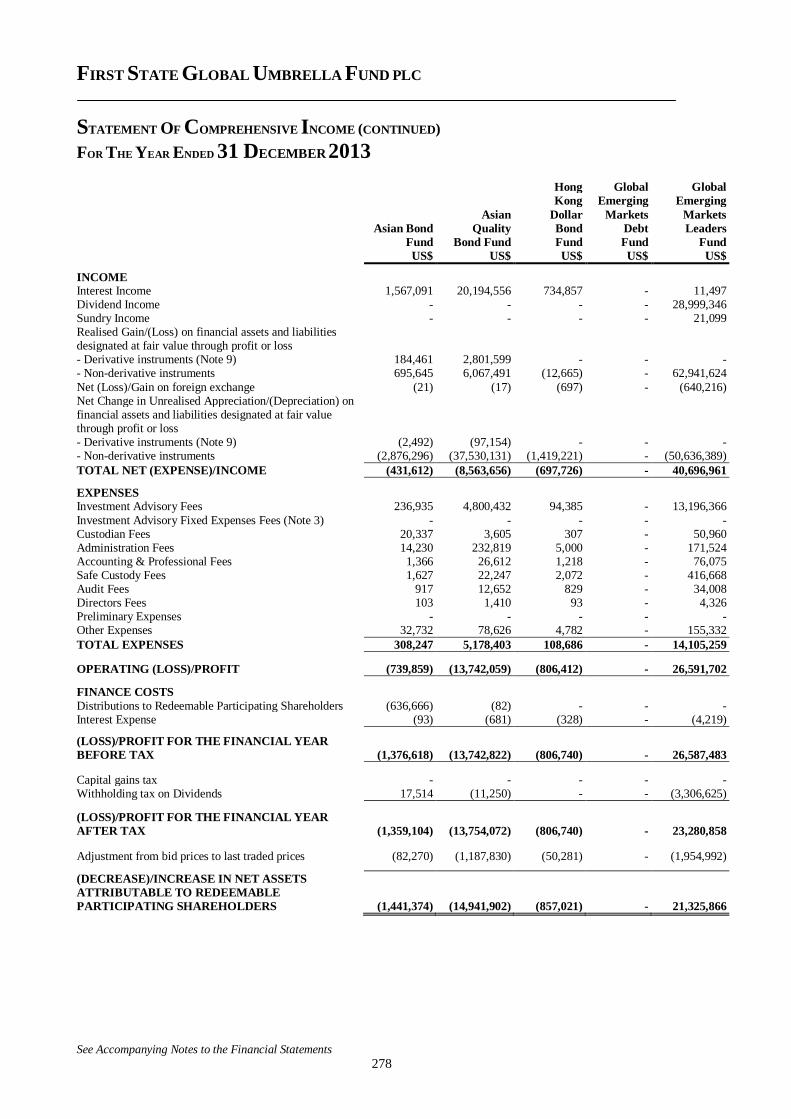
FIRST STATE GLOBAL UMBRELLA FUND PLC
STATEMENT OF COMPREHENSIVE INCOME (CONTINUED)
FOR THE YEAR ENDED 31 DECEMBER 2013
See Accompanying Notes to the Financial Statements
278
Hong Global Global
Kong Emerging Emerging
Asian Dollar Markets Markets
Asian Bond Quality Bond Debt Leaders
Fund Bond Fund Fund Fund Fund
US$ US$ US$ US$ US$
INCOME Interest Income 1,567,091 20,194,556 734,857 - 11,497 Dividend Income - - - - 28,999,346 Sundry Income - - - - 21,099 Realised Gain/(Loss) on financial assets and liabilities designated at fair value through profit or loss - Derivative instruments (Note 9) 184,461 2,801,599 - - - - Non-derivative instruments 695,645 6,067,491 (12,665) - 62,941,624
Net (Loss)/Gain on foreign exchange (21) (17) (697) - (640,216) Net Change in Unrealised Appreciation/(Depreciation) on financial assets and liabilities designated at fair value through profit or loss - Derivative instruments (Note 9) (2,492) (97,154) - - - - Non-derivative instruments (2,876,296) (37,530,131) (1,419,221) - (50,636,389)
TOTAL NET (EXPENSE)/INCOME (431,612) (8,563,656) (697,726) - 40,696,961
EXPENSES Investment Advisory Fees 236,935 4,800,432 94,385 - 13,196,366
Investment Advisory Fixed Expenses Fees (Note 3) - - - - - Custodian Fees 20,337 3,605 307 - 50,960 Administration Fees 14,230 232,819 5,000 - 171,524 Accounting & Professional Fees 1,366 26,612 1,218 - 76,075 Safe Custody Fees 1,627 22,247 2,072 - 416,668 Audit Fees 917 12,652 829 - 34,008 Directors Fees 103 1,410 93 - 4,326 Preliminary Expenses - - - - - Other Expenses 32,732 78,626 4,782 - 155,332
TOTAL EXPENSES 308,247 5,178,403 108,686 - 14,105,259
OPERATING (LOSS)/PROFIT (739,859) (13,742,059) (806,412) - 26,591,702
FINANCE COSTS
Distributions to Redeemable Participating Shareholders (636,666) (82) - - - Interest Expense (93) (681) (328) - (4,219)
(LOSS)/PROFIT FOR THE FINANCIAL YEAR
BEFORE TAX (1,376,618) (13,742,822) (806,740) - 26,587,483
Capital gains tax - - - - - Withholding tax on Dividends 17,514 (11,250) - - (3,306,625)
(LOSS)/PROFIT FOR THE FINANCIAL YEAR
AFTER TAX (1,359,104) (13,754,072) (806,740) - 23,280,858 Adjustment from bid prices to last traded prices (82,270) (1,187,830) (50,281) - (1,954,992) (DECREASE)/INCREASE IN NET ASSETS
ATTRIBUTABLE TO REDEEMABLE
PARTICIPATING SHAREHOLDERS (1,441,374) (14,941,902) (857,021) - 21,325,866
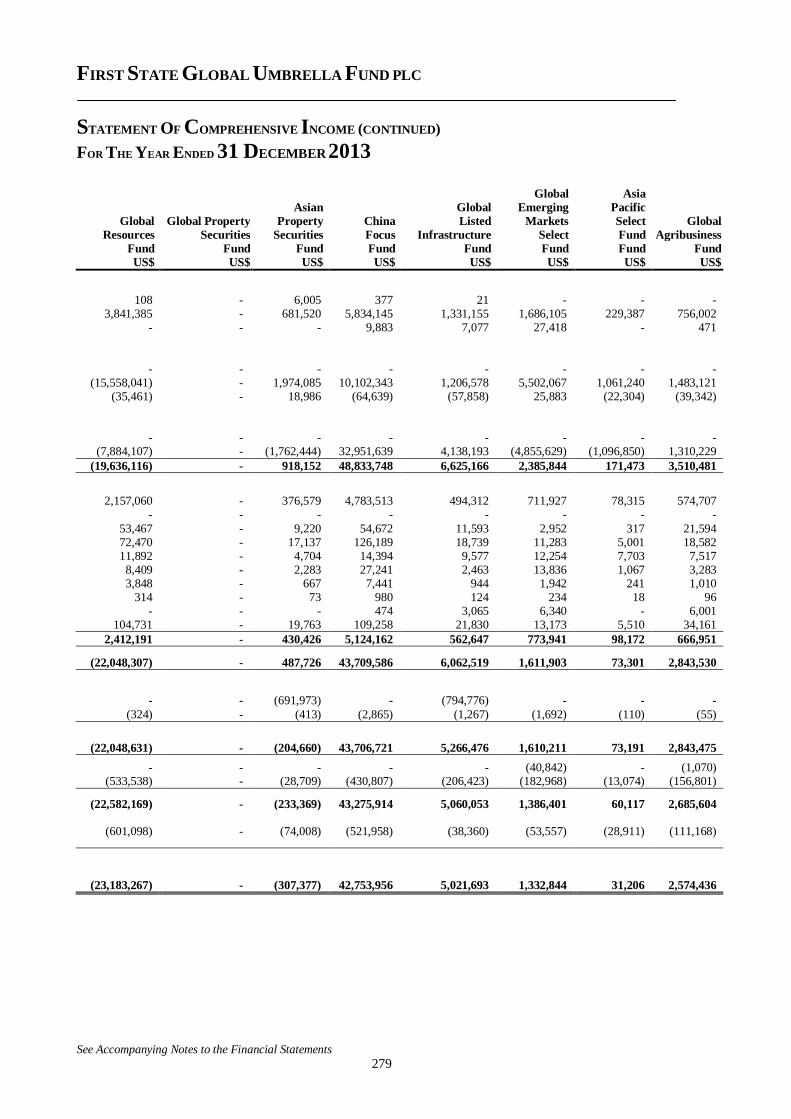
FIRST STATE GLOBAL UMBRELLA FUND PLC
STATEMENT OF COMPREHENSIVE INCOME (CONTINUED)
FOR THE YEAR ENDED 31 DECEMBER 2013
See Accompanying Notes to the Financial Statements
279
Global
Resources
Global Property
Securities
Asian
Property
Securities
China
Focus
Global
Listed
Infrastructure
Global
Emerging
Markets
Select
Asia
Pacific
Select
Fund
Global
Agribusiness
Fund Fund Fund Fund Fund Fund Fund Fund
US$ US$ US$ US$ US$ US$ US$ US$
108 - 6,005 377 21 - - - 3,841,385 - 681,520 5,834,145 1,331,155 1,686,105 229,387 756,002
- - - 9,883 7,077 27,418 - 471
- - - - - - - - (15,558,041) - 1,974,085 10,102,343 1,206,578 5,502,067 1,061,240 1,483,121
(35,461) - 18,986 (64,639) (57,858) 25,883 (22,304) (39,342)
- - - - - - - - (7,884,107) - (1,762,444) 32,951,639 4,138,193 (4,855,629) (1,096,850) 1,310,229
(19,636,116) - 918,152 48,833,748 6,625,166 2,385,844 171,473 3,510,481
2,157,060 - 376,579 4,783,513 494,312 711,927 78,315 574,707 - - - - - - - -
53,467 - 9,220 54,672 11,593 2,952 317 21,594 72,470 - 17,137 126,189 18,739 11,283 5,001 18,582 11,892 - 4,704 14,394 9,577 12,254 7,703 7,517 8,409 - 2,283 27,241 2,463 13,836 1,067 3,283 3,848 - 667 7,441 944 1,942 241 1,010
314 - 73 980 124 234 18 96 - - - 474 3,065 6,340 - 6,001
104,731 - 19,763 109,258 21,830 13,173 5,510 34,161
2,412,191 - 430,426 5,124,162 562,647 773,941 98,172 666,951
(22,048,307) - 487,726 43,709,586 6,062,519 1,611,903 73,301 2,843,530
- - (691,973) - (794,776) - - -
(324) - (413) (2,865) (1,267) (1,692) (110) (55)
(22,048,631) - (204,660) 43,706,721 5,266,476 1,610,211 73,191 2,843,475
- - - - - (40,842) - (1,070) (533,538) - (28,709) (430,807) (206,423) (182,968) (13,074) (156,801)
(22,582,169) - (233,369) 43,275,914 5,060,053 1,386,401 60,117 2,685,604
(601,098) - (74,008) (521,958) (38,360) (53,557) (28,911) (111,168)
(23,183,267) - (307,377) 42,753,956 5,021,693 1,332,844 31,206 2,574,436
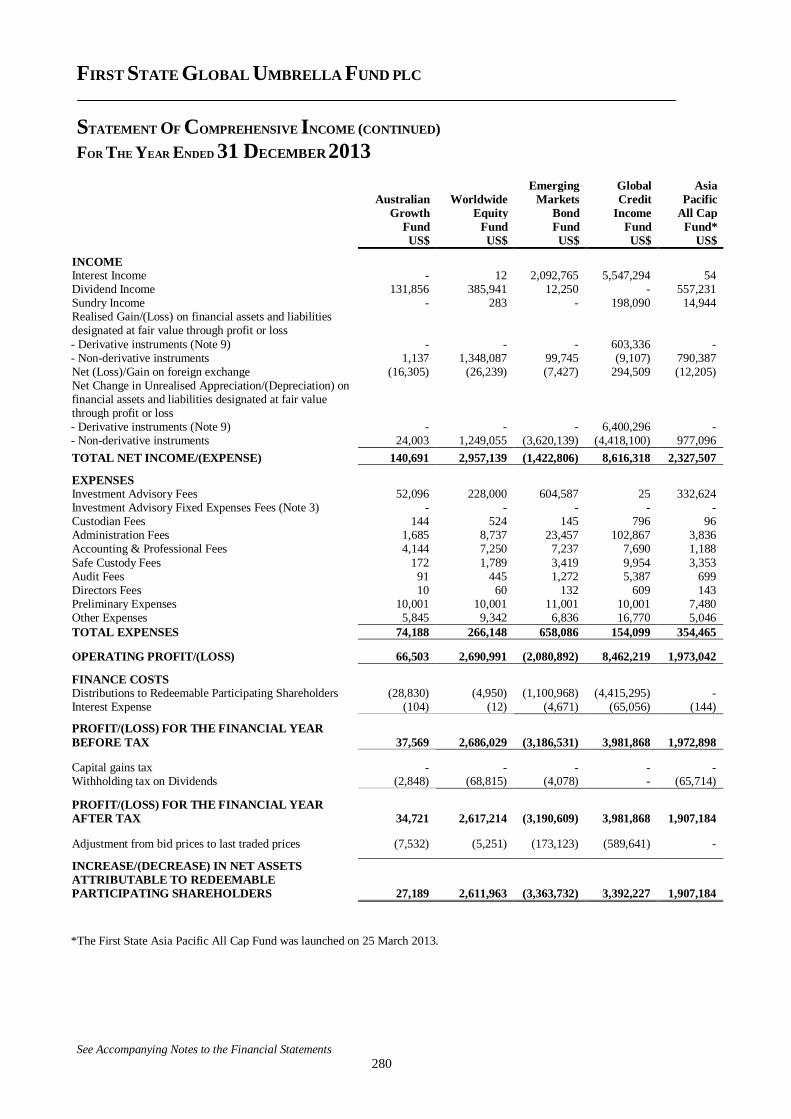
FIRST STATE GLOBAL UMBRELLA FUND PLC
STATEMENT OF COMPREHENSIVE INCOME (CONTINUED)
FOR THE YEAR ENDED 31 DECEMBER 2013
See Accompanying Notes to the Financial Statements
280
Australian
Growth
Worldwide
Equity
Emerging
Markets
Bond
Global
Credit
Income
Asia
Pacific
All Cap
Fund Fund Fund Fund Fund*
US$ US$ US$ US$ US$
INCOME Interest Income - 12 2,092,765 5,547,294 54 Dividend Income 131,856 385,941 12,250 - 557,231 Sundry Income - 283 - 198,090 14,944 Realised Gain/(Loss) on financial assets and liabilities designated at fair value through profit or loss
- Derivative instruments (Note 9) - - - 603,336 - - Non-derivative instruments 1,137 1,348,087 99,745 (9,107) 790,387 Net (Loss)/Gain on foreign exchange (16,305) (26,239) (7,427) 294,509 (12,205) Net Change in Unrealised Appreciation/(Depreciation) on financial assets and liabilities designated at fair value through profit or loss - Derivative instruments (Note 9) - - - 6,400,296 - - Non-derivative instruments 24,003 1,249,055 (3,620,139) (4,418,100) 977,096
TOTAL NET INCOME/(EXPENSE) 140,691 2,957,139 (1,422,806) 8,616,318 2,327,507
EXPENSES Investment Advisory Fees 52,096 228,000 604,587 25 332,624 Investment Advisory Fixed Expenses Fees (Note 3) - - - - - Custodian Fees 144 524 145 796 96 Administration Fees 1,685 8,737 23,457 102,867 3,836 Accounting & Professional Fees 4,144 7,250 7,237 7,690 1,188
Safe Custody Fees 172 1,789 3,419 9,954 3,353 Audit Fees 91 445 1,272 5,387 699 Directors Fees 10 60 132 609 143 Preliminary Expenses 10,001 10,001 11,001 10,001 7,480 Other Expenses 5,845 9,342 6,836 16,770 5,046
TOTAL EXPENSES 74,188 266,148 658,086 154,099 354,465
OPERATING PROFIT/(LOSS) 66,503 2,690,991 (2,080,892) 8,462,219 1,973,042
FINANCE COSTS Distributions to Redeemable Participating Shareholders (28,830) (4,950) (1,100,968) (4,415,295) - Interest Expense (104) (12) (4,671) (65,056) (144)
PROFIT/(LOSS) FOR THE FINANCIAL YEAR
BEFORE TAX 37,569 2,686,029 (3,186,531) 3,981,868 1,972,898
Capital gains tax - - - - - Withholding tax on Dividends (2,848) (68,815) (4,078) - (65,714)
PROFIT/(LOSS) FOR THE FINANCIAL YEAR
AFTER TAX 34,721 2,617,214 (3,190,609) 3,981,868 1,907,184 Adjustment from bid prices to last traded prices (7,532) (5,251) (173,123) (589,641) - INCREASE/(DECREASE) IN NET ASSETS
ATTRIBUTABLE TO REDEEMABLE
PARTICIPATING SHAREHOLDERS 27,189 2,611,963 (3,363,732) 3,392,227 1,907,184
*The First State Asia Pacific All Cap Fund was launched on 25 March 2013.
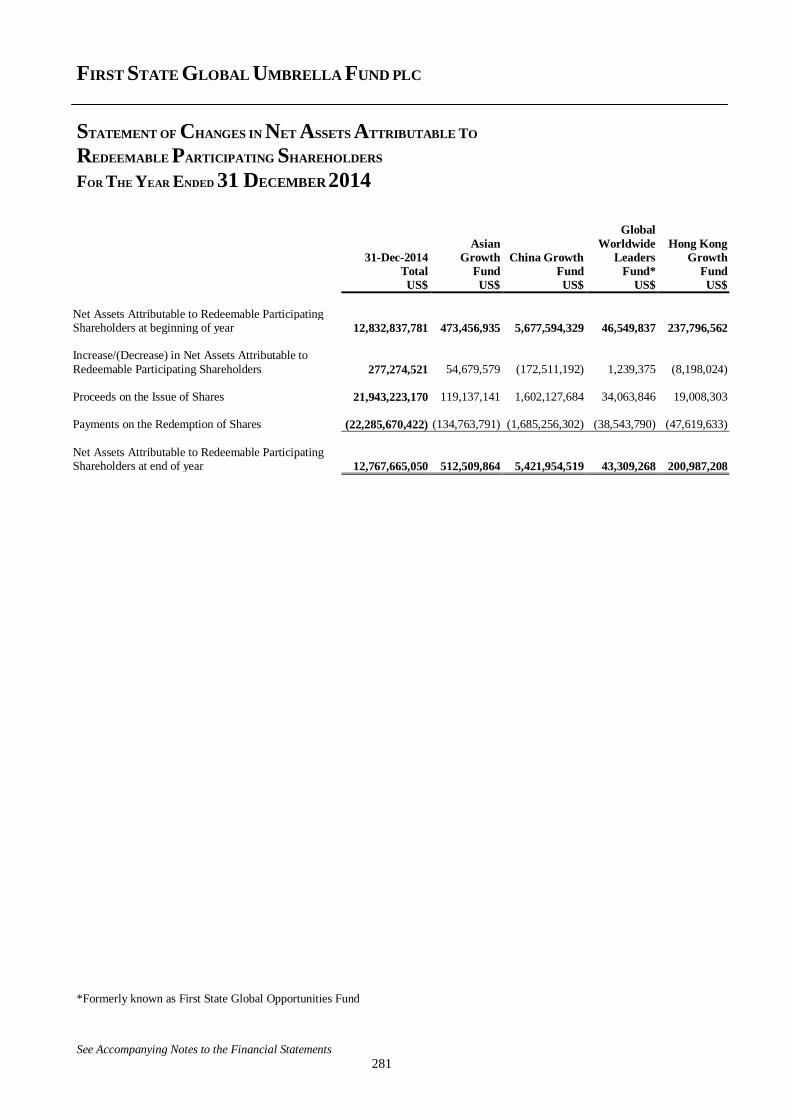
FIRST STATE GLOBAL UMBRELLA FUND PLC
STATEMENT OF CHANGES IN NET ASSETS ATTRIBUTABLE TO
REDEEMABLE PARTICIPATING SHAREHOLDERS
FOR THE YEAR ENDED 31 DECEMBER 2014
See Accompanying Notes to the Financial Statements
281
Global
31-Dec-2014
Total
Asian
Growth
Fund
China Growth
Fund
Worldwide
Leaders
Fund*
Hong Kong
Growth
Fund US$ US$ US$ US$ US$
Net Assets Attributable to Redeemable Participating Shareholders at beginning of year 12,832,837,781 473,456,935 5,677,594,329 46,549,837 237,796,562 Increase/(Decrease) in Net Assets Attributable to
Redeemable Participating Shareholders 277,274,521 54,679,579 (172,511,192) 1,239,375 (8,198,024) Proceeds on the Issue of Shares 21,943,223,170 119,137,141 1,602,127,684 34,063,846 19,008,303 Payments on the Redemption of Shares (22,285,670,422) (134,763,791) (1,685,256,302) (38,543,790) (47,619,633)
Net Assets Attributable to Redeemable Participating Shareholders at end of year 12,767,665,050 512,509,864 5,421,954,519 43,309,268 200,987,208
*Formerly known as First State Global Opportunities Fund
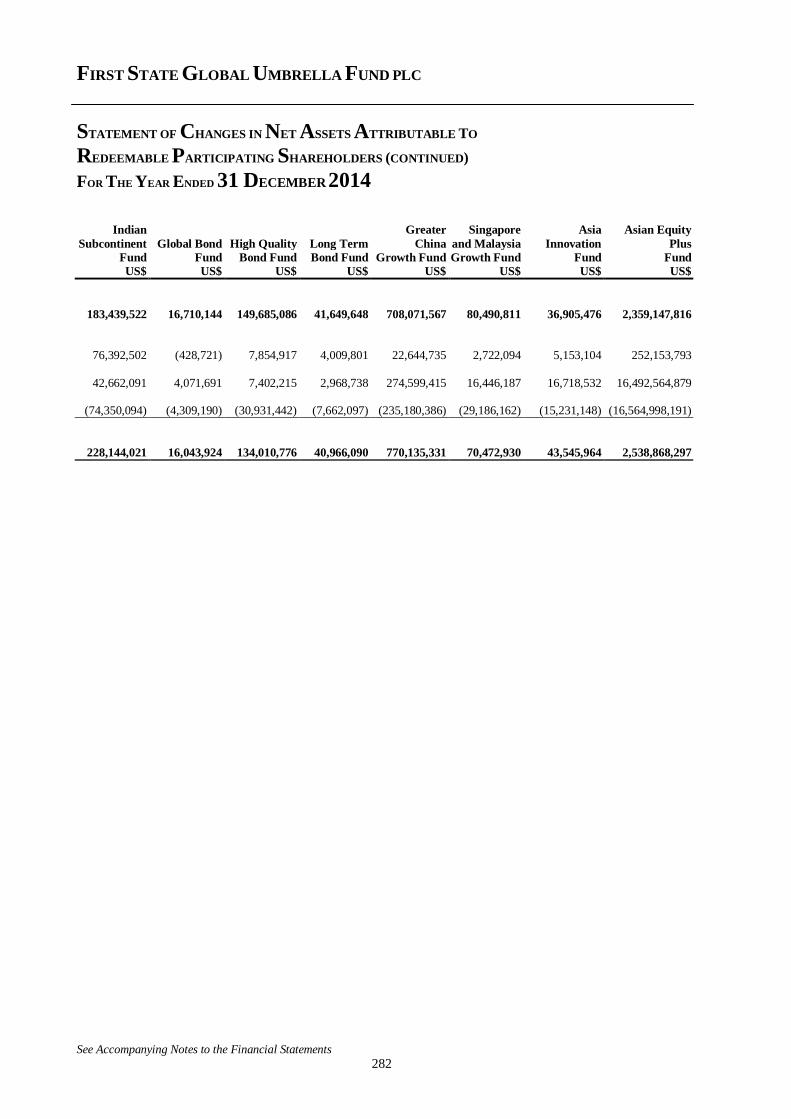
FIRST STATE GLOBAL UMBRELLA FUND PLC
STATEMENT OF CHANGES IN NET ASSETS ATTRIBUTABLE TO
REDEEMABLE PARTICIPATING SHAREHOLDERS (CONTINUED)
FOR THE YEAR ENDED 31 DECEMBER 2014
See Accompanying Notes to the Financial Statements
282
Indian
Subcontinent
Global Bond
High Quality
Long Term
Greater
China
Singapore
and Malaysia
Asia
Innovation
Asian Equity
Plus
Fund Fund Bond Fund Bond Fund Growth Fund Growth Fund Fund Fund
US$ US$ US$ US$ US$ US$ US$ US$
183,439,522 16,710,144 149,685,086 41,649,648 708,071,567 80,490,811 36,905,476 2,359,147,816
76,392,502 (428,721) 7,854,917 4,009,801 22,644,735 2,722,094 5,153,104 252,153,793
42,662,091 4,071,691 7,402,215 2,968,738 274,599,415 16,446,187 16,718,532 16,492,564,879
(74,350,094) (4,309,190) (30,931,442) (7,662,097) (235,180,386) (29,186,162) (15,231,148) (16,564,998,191)
228,144,021 16,043,924 134,010,776 40,966,090 770,135,331 70,472,930 43,545,964 2,538,868,297
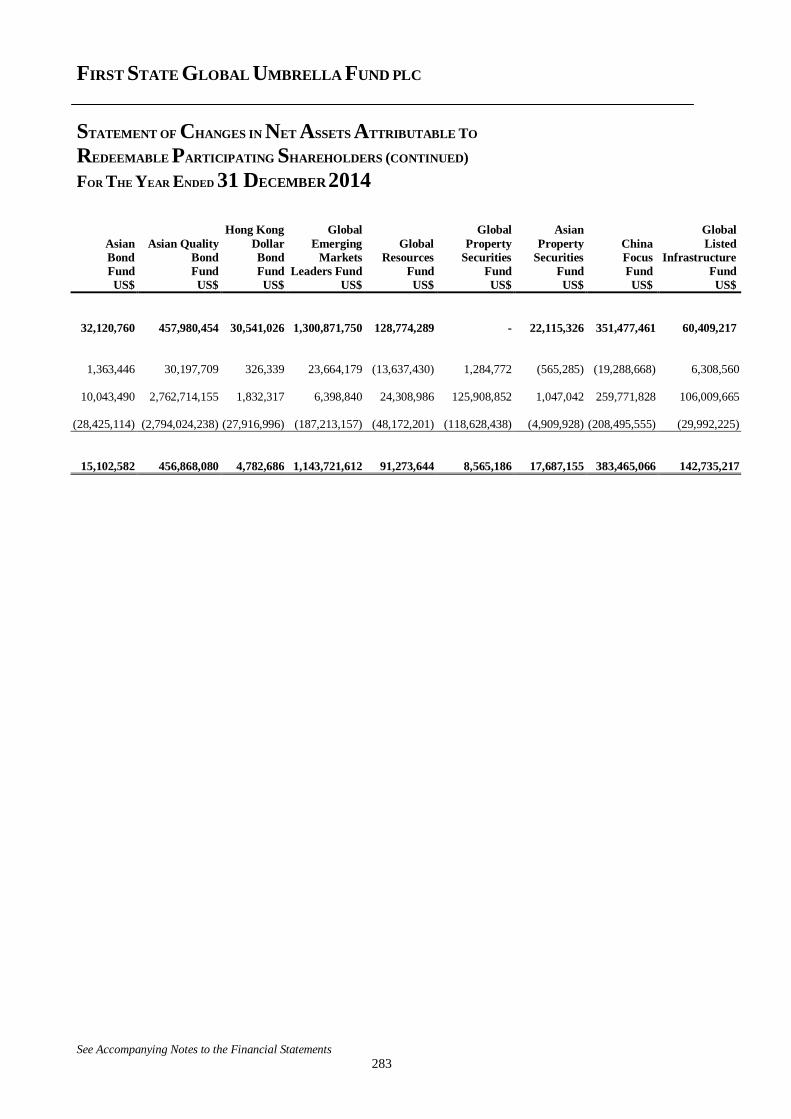
FIRST STATE GLOBAL UMBRELLA FUND PLC
STATEMENT OF CHANGES IN NET ASSETS ATTRIBUTABLE TO
REDEEMABLE PARTICIPATING SHAREHOLDERS (CONTINUED)
FOR THE YEAR ENDED 31 DECEMBER 2014
See Accompanying Notes to the Financial Statements
283
Asian
Bond
Fund
Asian Quality
Bond
Fund
Hong Kong
Dollar
Bond
Fund
Global
Emerging
Markets
Leaders Fund
Global
Resources
Fund
Global
Property
Securities
Fund
Asian
Property
Securities
Fund
China
Focus
Fund
Global
Listed
Infrastructure
Fund
US$ US$ US$ US$ US$ US$ US$ US$ US$
32,120,760 457,980,454 30,541,026 1,300,871,750 128,774,289 - 22,115,326 351,477,461 60,409,217
1,363,446 30,197,709 326,339 23,664,179 (13,637,430) 1,284,772 (565,285) (19,288,668) 6,308,560
10,043,490 2,762,714,155 1,832,317 6,398,840 24,308,986 125,908,852 1,047,042 259,771,828 106,009,665
(28,425,114) (2,794,024,238) (27,916,996) (187,213,157) (48,172,201) (118,628,438) (4,909,928) (208,495,555) (29,992,225)
15,102,582 456,868,080 4,782,686 1,143,721,612 91,273,644 8,565,186 17,687,155 383,465,066 142,735,217
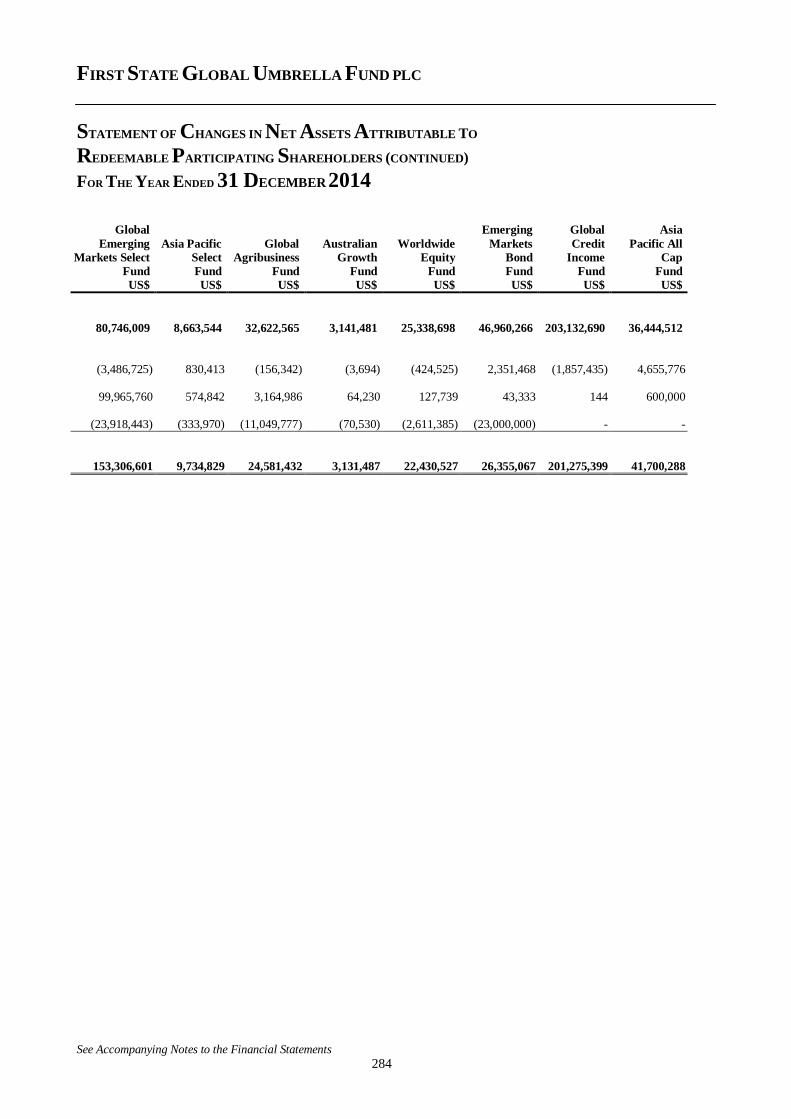
FIRST STATE GLOBAL UMBRELLA FUND PLC
STATEMENT OF CHANGES IN NET ASSETS ATTRIBUTABLE TO
REDEEMABLE PARTICIPATING SHAREHOLDERS (CONTINUED)
FOR THE YEAR ENDED 31 DECEMBER 2014
See Accompanying Notes to the Financial Statements
284
Global
Emerging
Markets Select
Asia Pacific
Select
Global
Agribusiness
Australian
Growth
Worldwide
Equity
Emerging
Markets
Bond
Global
Credit
Income
Asia
Pacific All
Cap
Fund Fund Fund Fund Fund Fund Fund Fund
US$ US$ US$ US$ US$ US$ US$ US$
80,746,009 8,663,544 32,622,565 3,141,481 25,338,698 46,960,266 203,132,690 36,444,512
(3,486,725) 830,413 (156,342) (3,694) (424,525) 2,351,468 (1,857,435) 4,655,776
99,965,760 574,842 3,164,986 64,230 127,739 43,333 144 600,000
(23,918,443) (333,970) (11,049,777) (70,530) (2,611,385) (23,000,000) - -
153,306,601 9,734,829 24,581,432 3,131,487 22,430,527 26,355,067 201,275,399 41,700,288
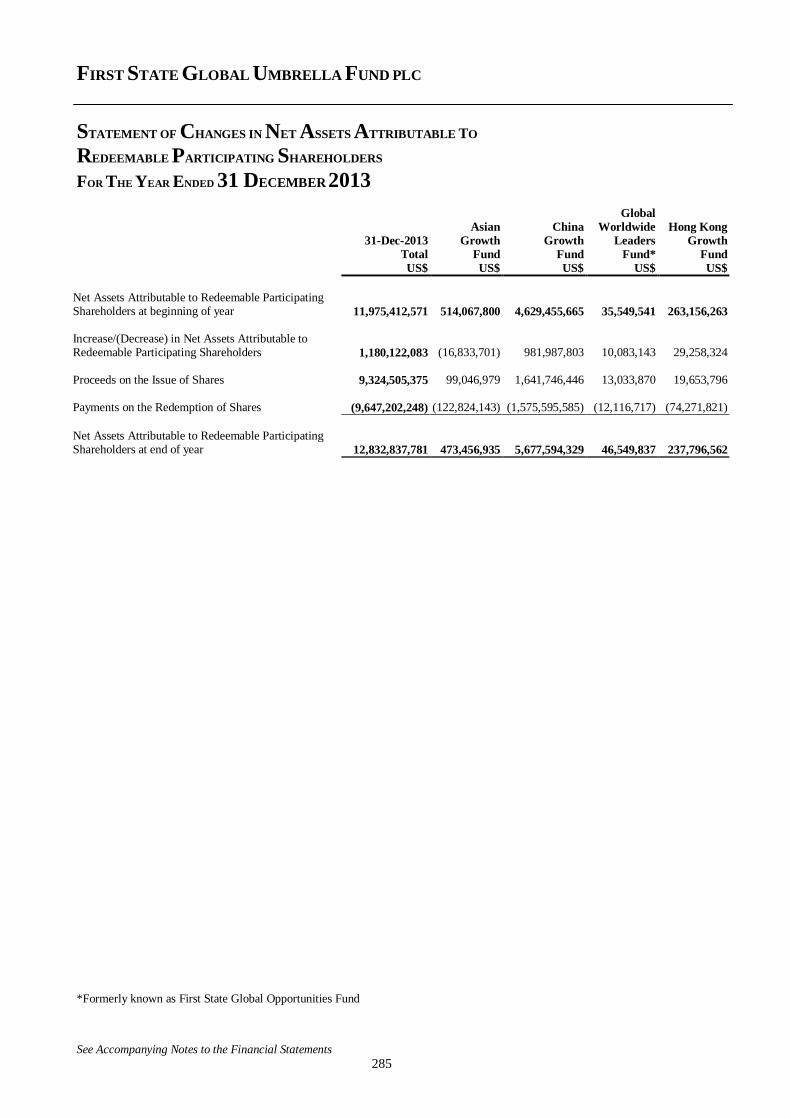
FIRST STATE GLOBAL UMBRELLA FUND PLC
STATEMENT OF CHANGES IN NET ASSETS ATTRIBUTABLE TO
REDEEMABLE PARTICIPATING SHAREHOLDERS
FOR THE YEAR ENDED 31 DECEMBER 2013
See Accompanying Notes to the Financial Statements
285
Global
31-Dec-2013
Total
Asian
Growth
Fund
China
Growth
Fund
Worldwide
Leaders
Fund*
Hong Kong
Growth
Fund US$ US$ US$ US$ US$
Net Assets Attributable to Redeemable Participating Shareholders at beginning of year 11,975,412,571 514,067,800 4,629,455,665 35,549,541 263,156,263 Increase/(Decrease) in Net Assets Attributable to Redeemable Participating Shareholders 1,180,122,083 (16,833,701) 981,987,803 10,083,143 29,258,324 Proceeds on the Issue of Shares 9,324,505,375 99,046,979 1,641,746,446 13,033,870 19,653,796 Payments on the Redemption of Shares (9,647,202,248) (122,824,143) (1,575,595,585) (12,116,717) (74,271,821)
Net Assets Attributable to Redeemable Participating Shareholders at end of year 12,832,837,781 473,456,935 5,677,594,329 46,549,837 237,796,562
*Formerly known as First State Global Opportunities Fund
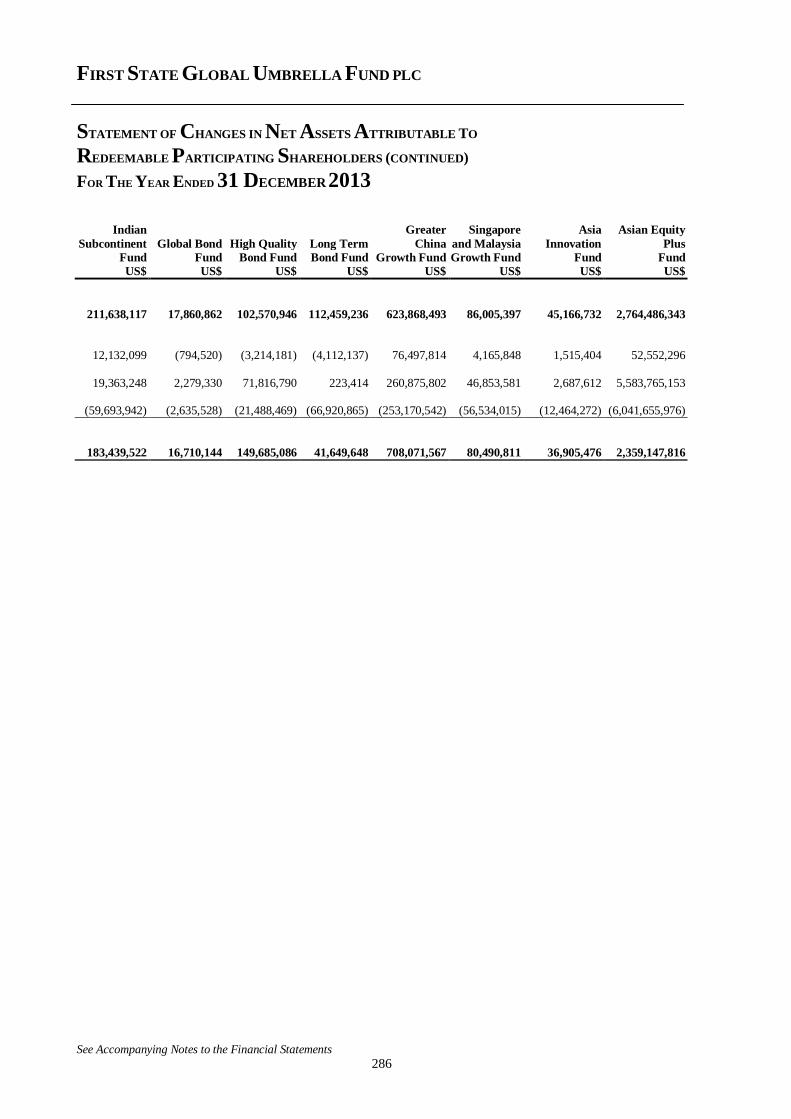
FIRST STATE GLOBAL UMBRELLA FUND PLC
STATEMENT OF CHANGES IN NET ASSETS ATTRIBUTABLE TO
REDEEMABLE PARTICIPATING SHAREHOLDERS (CONTINUED)
FOR THE YEAR ENDED 31 DECEMBER 2013
See Accompanying Notes to the Financial Statements
286
Indian
Subcontinent
Global Bond
High Quality
Long Term
Greater
China
Singapore
and Malaysia
Asia
Innovation
Asian Equity
Plus
Fund Fund Bond Fund Bond Fund Growth Fund Growth Fund Fund Fund
US$ US$ US$ US$ US$ US$ US$ US$
211,638,117 17,860,862 102,570,946 112,459,236 623,868,493 86,005,397 45,166,732 2,764,486,343
12,132,099 (794,520) (3,214,181) (4,112,137) 76,497,814 4,165,848 1,515,404 52,552,296
19,363,248 2,279,330 71,816,790 223,414 260,875,802 46,853,581 2,687,612 5,583,765,153
(59,693,942) (2,635,528) (21,488,469) (66,920,865) (253,170,542) (56,534,015) (12,464,272) (6,041,655,976)
183,439,522 16,710,144 149,685,086 41,649,648 708,071,567 80,490,811 36,905,476 2,359,147,816
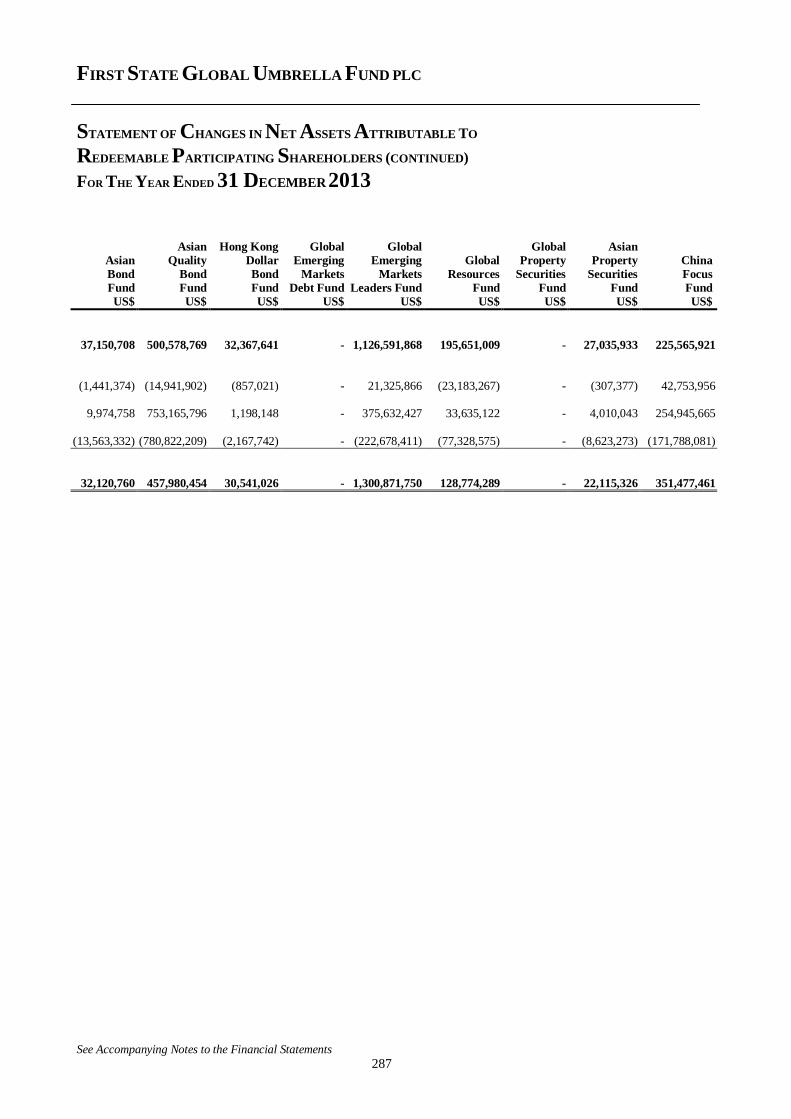
FIRST STATE GLOBAL UMBRELLA FUND PLC
STATEMENT OF CHANGES IN NET ASSETS ATTRIBUTABLE TO
REDEEMABLE PARTICIPATING SHAREHOLDERS (CONTINUED)
FOR THE YEAR ENDED 31 DECEMBER 2013
See Accompanying Notes to the Financial Statements
287
Asian
Bond
Fund
Asian
Quality
Bond
Fund
Hong Kong
Dollar
Bond
Fund
Global
Emerging
Markets
Debt Fund
Global
Emerging
Markets
Leaders Fund
Global
Resources
Fund
Global
Property
Securities
Fund
Asian
Property
Securities
Fund
China
Focus
Fund
US$ US$ US$ US$ US$ US$ US$ US$ US$
37,150,708 500,578,769 32,367,641 - 1,126,591,868 195,651,009 - 27,035,933 225,565,921
(1,441,374) (14,941,902) (857,021) - 21,325,866 (23,183,267) - (307,377) 42,753,956
9,974,758 753,165,796 1,198,148 - 375,632,427 33,635,122 - 4,010,043 254,945,665
(13,563,332) (780,822,209) (2,167,742) - (222,678,411) (77,328,575) - (8,623,273) (171,788,081)
32,120,760 457,980,454 30,541,026 - 1,300,871,750 128,774,289 - 22,115,326 351,477,461
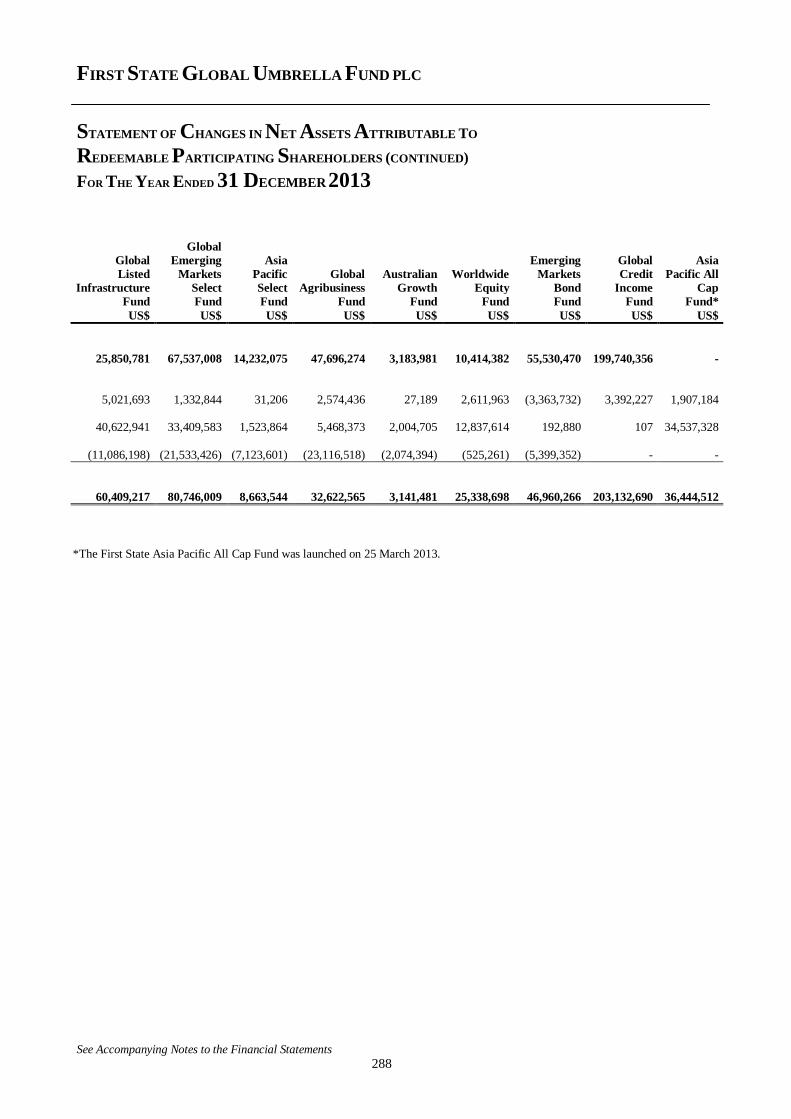
FIRST STATE GLOBAL UMBRELLA FUND PLC
STATEMENT OF CHANGES IN NET ASSETS ATTRIBUTABLE TO
REDEEMABLE PARTICIPATING SHAREHOLDERS (CONTINUED)
FOR THE YEAR ENDED 31 DECEMBER 2013
See Accompanying Notes to the Financial Statements
288
Global
Listed
Infrastructure
Global
Emerging
Markets
Select
Asia
Pacific
Select
Global
Agribusiness
Australian
Growth
Worldwide
Equity
Emerging
Markets
Bond
Global
Credit
Income
Asia
Pacific All
Cap
Fund Fund Fund Fund Fund Fund Fund Fund Fund*
US$ US$ US$ US$ US$ US$ US$ US$ US$
25,850,781 67,537,008 14,232,075 47,696,274 3,183,981 10,414,382 55,530,470 199,740,356 -
5,021,693 1,332,844 31,206 2,574,436 27,189 2,611,963 (3,363,732) 3,392,227 1,907,184
40,622,941 33,409,583 1,523,864 5,468,373 2,004,705 12,837,614 192,880 107 34,537,328
(11,086,198) (21,533,426) (7,123,601) (23,116,518) (2,074,394) (525,261) (5,399,352) - -
60,409,217 80,746,009 8,663,544 32,622,565 3,141,481 25,338,698 46,960,266 203,132,690 36,444,512
*The First State Asia Pacific All Cap Fund was launched on 25 March 2013.
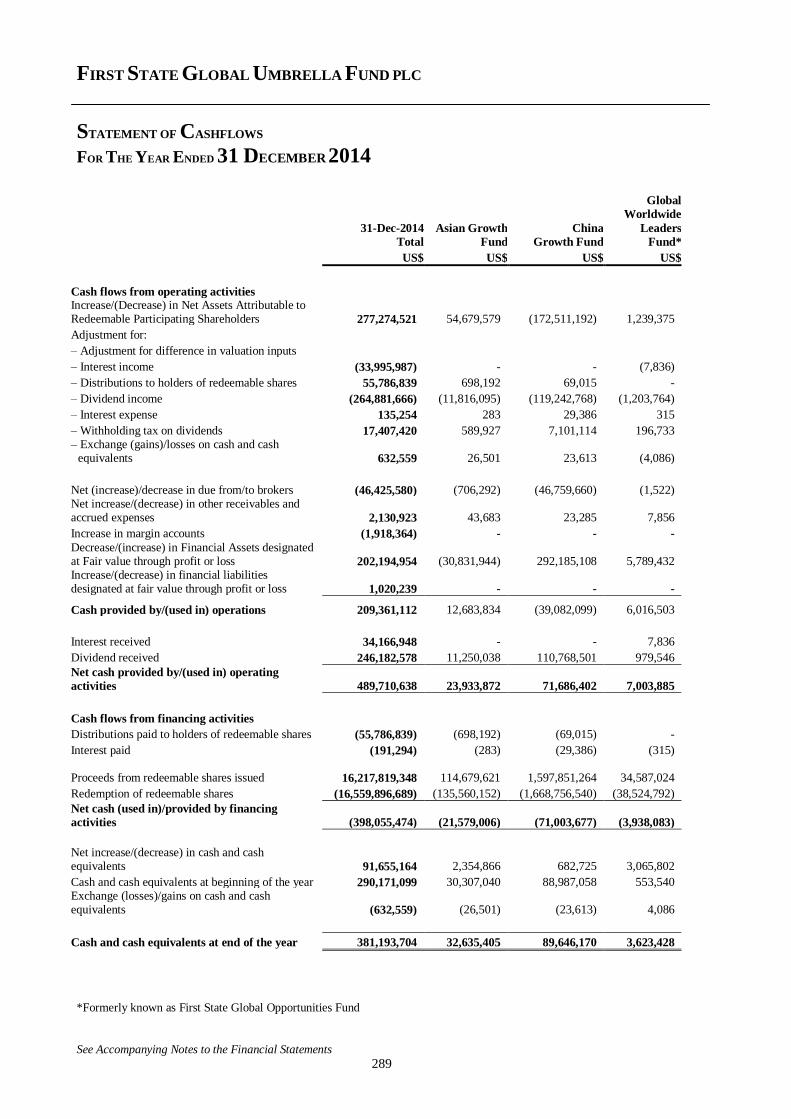
FIRST STATE GLOBAL UMBRELLA FUND PLC
STATEMENT OF CASHFLOWS
FOR THE YEAR ENDED 31 DECEMBER 2014
See Accompanying Notes to the Financial Statements
289
31-Dec-2014
Total
Asian Growth
Fund
China
Growth Fund
Global
Worldwide
Leaders
Fund*
US$ US$ US$ US$
Cash flows from operating activities Increase/(Decrease) in Net Assets Attributable to Redeemable Participating Shareholders 277,274,521 54,679,579 (172,511,192) 1,239,375
Adjustment for:
– Adjustment for difference in valuation inputs
– Interest income (33,995,987) - - (7,836)
– Distributions to holders of redeemable shares 55,786,839 698,192 69,015 -
– Dividend income (264,881,666) (11,816,095) (119,242,768) (1,203,764)
– Interest expense 135,254 283 29,386 315
– Withholding tax on dividends 17,407,420 589,927 7,101,114 196,733 – Exchange (gains)/losses on cash and cash
equivalents 632,559 26,501 23,613 (4,086)
Net (increase)/decrease in due from/to brokers (46,425,580) (706,292) (46,759,660) (1,522) Net increase/(decrease) in other receivables and accrued expenses
2,130,923 43,683 23,285 7,856
Increase in margin accounts (1,918,364) - - -
Decrease/(increase) in Financial Assets designated at Fair value through profit or loss
202,194,954 (30,831,944) 292,185,108 5,789,432 Increase/(decrease) in financial liabilities designated at fair value through profit or loss
1,020,239 - - -
Cash provided by/(used in) operations 209,361,112 12,683,834 (39,082,099) 6,016,503
Interest received 34,166,948 - - 7,836
Dividend received 246,182,578 11,250,038 110,768,501 979,546
Net cash provided by/(used in) operating
activities 489,710,638 23,933,872 71,686,402 7,003,885
Cash flows from financing activities
Distributions paid to holders of redeemable shares (55,786,839) (698,192) (69,015) -
Interest paid (191,294) (283) (29,386) (315)
Proceeds from redeemable shares issued
16,217,819,348
114,679,621 1,597,851,264 34,587,024
Redemption of redeemable shares (16,559,896,689) (135,560,152) (1,668,756,540) (38,524,792)
Net cash (used in)/provided by financing
activities (398,055,474) (21,579,006) (71,003,677) (3,938,083)
Net increase/(decrease) in cash and cash equivalents
91,655,164 2,354,866 682,725 3,065,802
Cash and cash equivalents at beginning of the year 290,171,099 30,307,040 88,987,058 553,540 Exchange (losses)/gains on cash and cash equivalents (632,559) (26,501) (23,613) 4,086
Cash and cash equivalents at end of the year 381,193,704 32,635,405 89,646,170 3,623,428
*Formerly known as First State Global Opportunities Fund
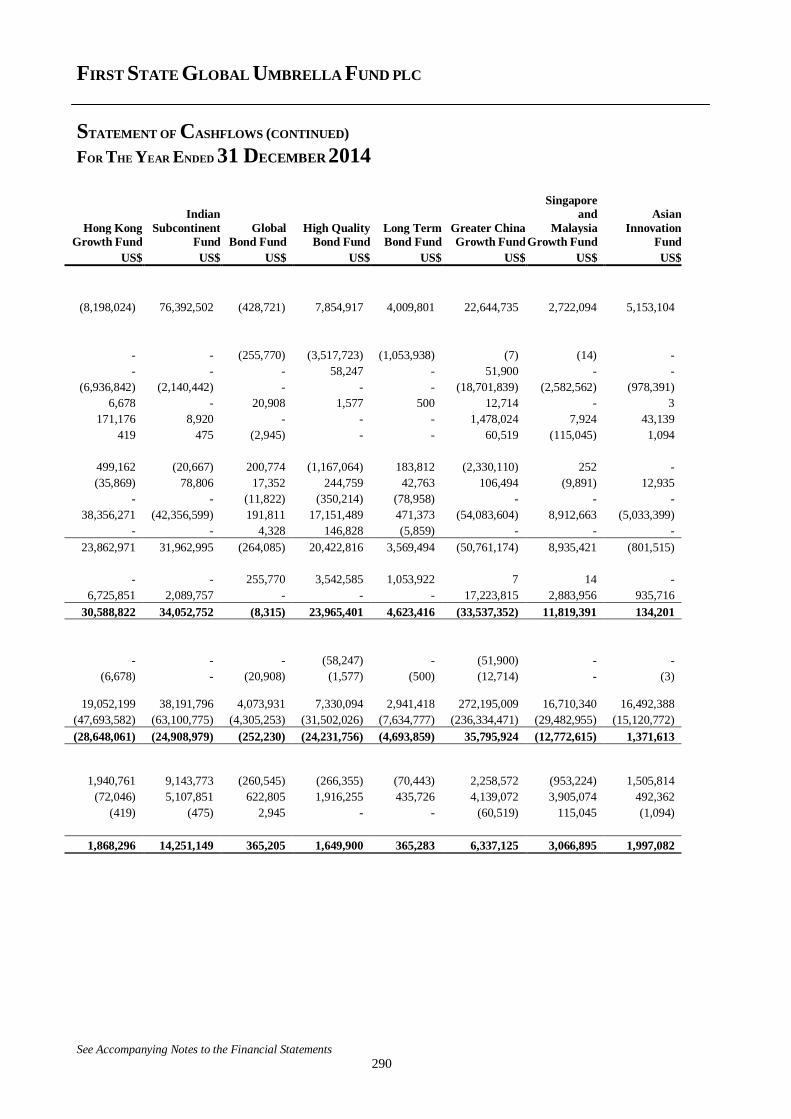
FIRST STATE GLOBAL UMBRELLA FUND PLC
STATEMENT OF CASHFLOWS (CONTINUED)
FOR THE YEAR ENDED 31 DECEMBER 2014
See Accompanying Notes to the Financial Statements
290
Hong Kong
Growth Fund
Indian
Subcontinent
Fund
Global
Bond Fund
High Quality
Bond Fund
Long Term
Bond Fund
Greater China
Growth Fund
Singapore
and
Malaysia
Growth Fund
Asian
Innovation
Fund
US$ US$ US$ US$ US$ US$ US$ US$
(8,198,024) 76,392,502 (428,721) 7,854,917 4,009,801 22,644,735 2,722,094 5,153,104
- - (255,770) (3,517,723) (1,053,938) (7) (14) -
- - - 58,247 - 51,900 - -
(6,936,842) (2,140,442) - - - (18,701,839) (2,582,562) (978,391)
6,678 - 20,908 1,577 500 12,714 - 3
171,176 8,920 - - - 1,478,024 7,924 43,139
419 475 (2,945) - - 60,519 (115,045) 1,094
499,162 (20,667) 200,774 (1,167,064) 183,812 (2,330,110) 252 -
(35,869) 78,806 17,352 244,759 42,763 106,494 (9,891) 12,935
- - (11,822) (350,214) (78,958) - - -
38,356,271 (42,356,599) 191,811 17,151,489 471,373 (54,083,604) 8,912,663 (5,033,399)
- - 4,328 146,828 (5,859) - - -
23,862,971 31,962,995 (264,085) 20,422,816 3,569,494 (50,761,174) 8,935,421 (801,515)
- - 255,770 3,542,585 1,053,922 7 14 -
6,725,851 2,089,757 - - - 17,223,815 2,883,956 935,716
30,588,822 34,052,752 (8,315) 23,965,401 4,623,416 (33,537,352) 11,819,391 134,201
- - - (58,247) - (51,900) - -
(6,678) - (20,908) (1,577) (500) (12,714) - (3)
19,052,199 38,191,796 4,073,931 7,330,094 2,941,418 272,195,009 16,710,340 16,492,388
(47,693,582) (63,100,775) (4,305,253) (31,502,026) (7,634,777) (236,334,471) (29,482,955) (15,120,772)
(28,648,061) (24,908,979) (252,230) (24,231,756) (4,693,859) 35,795,924 (12,772,615) 1,371,613
1,940,761 9,143,773 (260,545) (266,355) (70,443) 2,258,572 (953,224) 1,505,814
(72,046) 5,107,851 622,805 1,916,255 435,726 4,139,072 3,905,074 492,362
(419) (475) 2,945 - - (60,519) 115,045 (1,094)
1,868,296 14,251,149 365,205 1,649,900 365,283 6,337,125 3,066,895 1,997,082
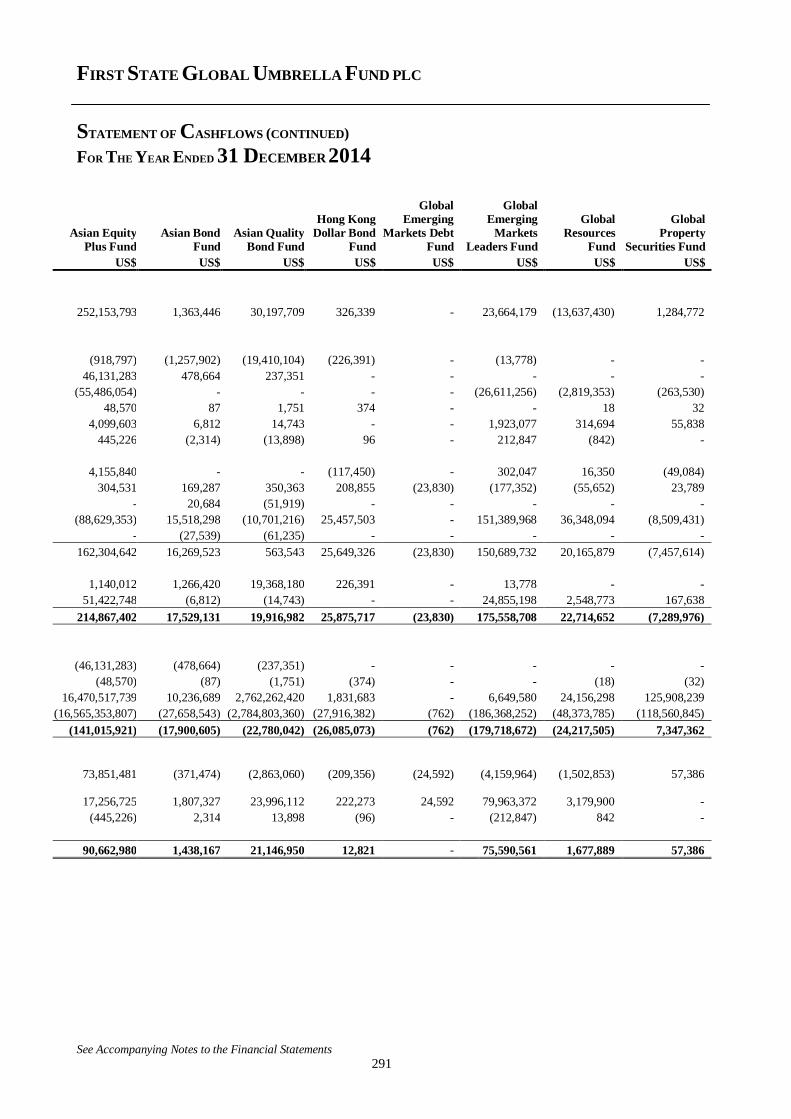
FIRST STATE GLOBAL UMBRELLA FUND PLC
STATEMENT OF CASHFLOWS (CONTINUED)
FOR THE YEAR ENDED 31 DECEMBER 2014
See Accompanying Notes to the Financial Statements
291
Asian Equity
Plus Fund
Asian Bond
Fund
Asian Quality
Bond Fund
Hong Kong
Dollar Bond
Fund
Global
Emerging
Markets Debt
Fund
Global
Emerging
Markets
Leaders Fund
Global
Resources
Fund
Global
Property
Securities Fund
US$ US$ US$ US$ US$ US$ US$ US$
252,153,793 1,363,446 30,197,709 326,339 - 23,664,179 (13,637,430) 1,284,772
(918,797) (1,257,902) (19,410,104) (226,391) - (13,778) - -
46,131,283 478,664 237,351 - - - - -
(55,486,054) - - - - (26,611,256) (2,819,353) (263,530)
48,570 87 1,751 374 - - 18 32
4,099,603 6,812 14,743 - - 1,923,077 314,694 55,838
445,226 (2,314) (13,898) 96 - 212,847 (842) -
4,155,840 - - (117,450) - 302,047 16,350 (49,084)
304,531 169,287 350,363 208,855 (23,830) (177,352) (55,652) 23,789
- 20,684 (51,919) - - - - -
(88,629,353) 15,518,298 (10,701,216) 25,457,503 - 151,389,968 36,348,094 (8,509,431)
- (27,539) (61,235) - - - - -
162,304,642 16,269,523 563,543 25,649,326 (23,830) 150,689,732 20,165,879 (7,457,614)
1,140,012 1,266,420 19,368,180 226,391 - 13,778 - -
51,422,748 (6,812) (14,743) - - 24,855,198 2,548,773 167,638
214,867,402 17,529,131 19,916,982 25,875,717 (23,830) 175,558,708 22,714,652 (7,289,976)
(46,131,283) (478,664) (237,351) - - - - -
(48,570) (87) (1,751) (374) - - (18) (32)
16,470,517,739 10,236,689 2,762,262,420 1,831,683 - 6,649,580 24,156,298 125,908,239
(16,565,353,807) (27,658,543) (2,784,803,360) (27,916,382) (762) (186,368,252) (48,373,785) (118,560,845)
(141,015,921) (17,900,605) (22,780,042) (26,085,073) (762) (179,718,672) (24,217,505) 7,347,362
73,851,481 (371,474) (2,863,060) (209,356) (24,592) (4,159,964) (1,502,853) 57,386
17,256,725 1,807,327 23,996,112 222,273 24,592 79,963,372 3,179,900 -
(445,226) 2,314 13,898 (96) - (212,847) 842 -
90,662,980 1,438,167 21,146,950 12,821 - 75,590,561 1,677,889 57,386
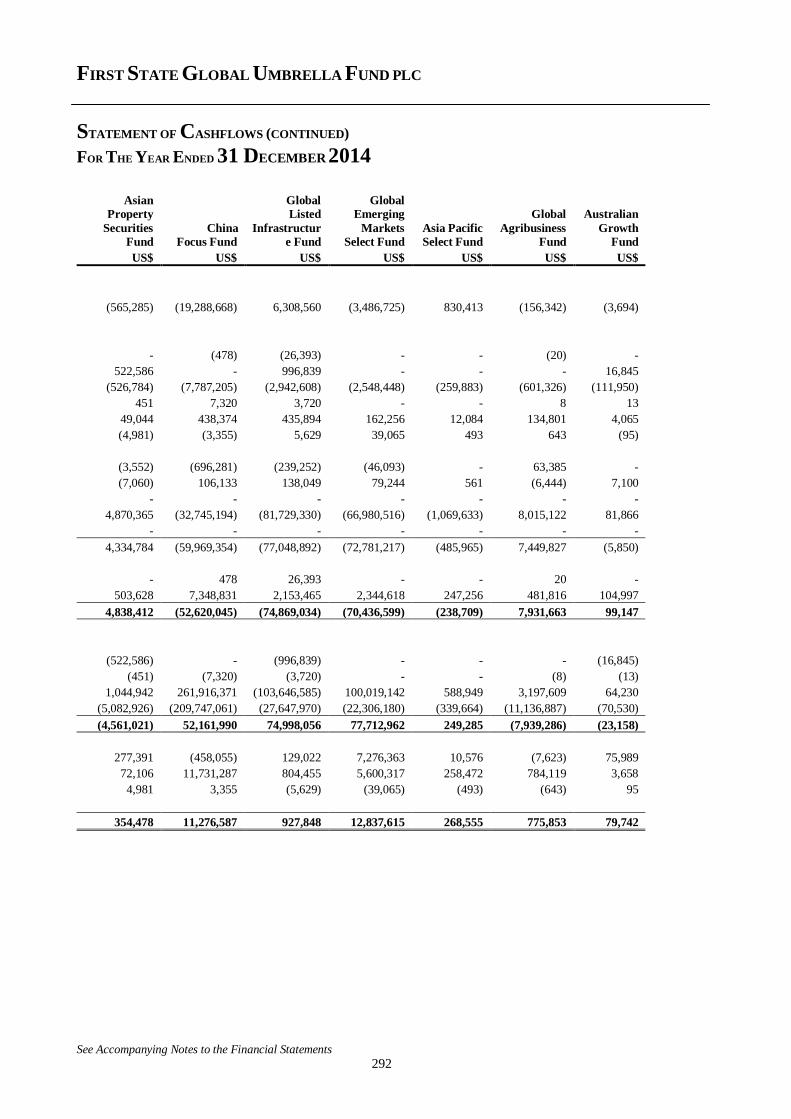
FIRST STATE GLOBAL UMBRELLA FUND PLC
STATEMENT OF CASHFLOWS (CONTINUED)
FOR THE YEAR ENDED 31 DECEMBER 2014
See Accompanying Notes to the Financial Statements
292
Asian
Property
Securities
Fund
China
Focus Fund
Global
Listed
Infrastructur
e Fund
Global
Emerging
Markets
Select Fund
Asia Pacific
Select Fund
Global
Agribusiness
Fund
Australian
Growth
Fund
US$ US$ US$ US$ US$ US$ US$
(565,285) (19,288,668) 6,308,560 (3,486,725) 830,413 (156,342) (3,694)
- (478) (26,393) - - (20) -
522,586 - 996,839 - - - 16,845
(526,784) (7,787,205) (2,942,608) (2,548,448) (259,883) (601,326) (111,950)
451 7,320 3,720 - - 8 13
49,044 438,374 435,894 162,256 12,084 134,801 4,065
(4,981) (3,355) 5,629 39,065 493 643 (95)
(3,552) (696,281) (239,252) (46,093) - 63,385 -
(7,060) 106,133 138,049 79,244 561 (6,444) 7,100
- - - - - - -
4,870,365 (32,745,194) (81,729,330) (66,980,516) (1,069,633) 8,015,122 81,866
- - - - - - -
4,334,784 (59,969,354) (77,048,892) (72,781,217) (485,965) 7,449,827 (5,850)
- 478 26,393 - - 20 -
503,628 7,348,831 2,153,465 2,344,618 247,256 481,816 104,997
4,838,412 (52,620,045) (74,869,034) (70,436,599) (238,709) 7,931,663 99,147
(522,586) - (996,839) - - - (16,845)
(451) (7,320) (3,720) - - (8) (13)
1,044,942 261,916,371 (103,646,585) 100,019,142 588,949 3,197,609 64,230
(5,082,926) (209,747,061) (27,647,970) (22,306,180) (339,664) (11,136,887) (70,530)
(4,561,021) 52,161,990 74,998,056 77,712,962 249,285 (7,939,286) (23,158)
277,391 (458,055) 129,022 7,276,363 10,576 (7,623) 75,989
72,106 11,731,287 804,455 5,600,317 258,472 784,119 3,658
4,981 3,355 (5,629) (39,065) (493) (643) 95
354,478 11,276,587 927,848 12,837,615 268,555 775,853 79,742
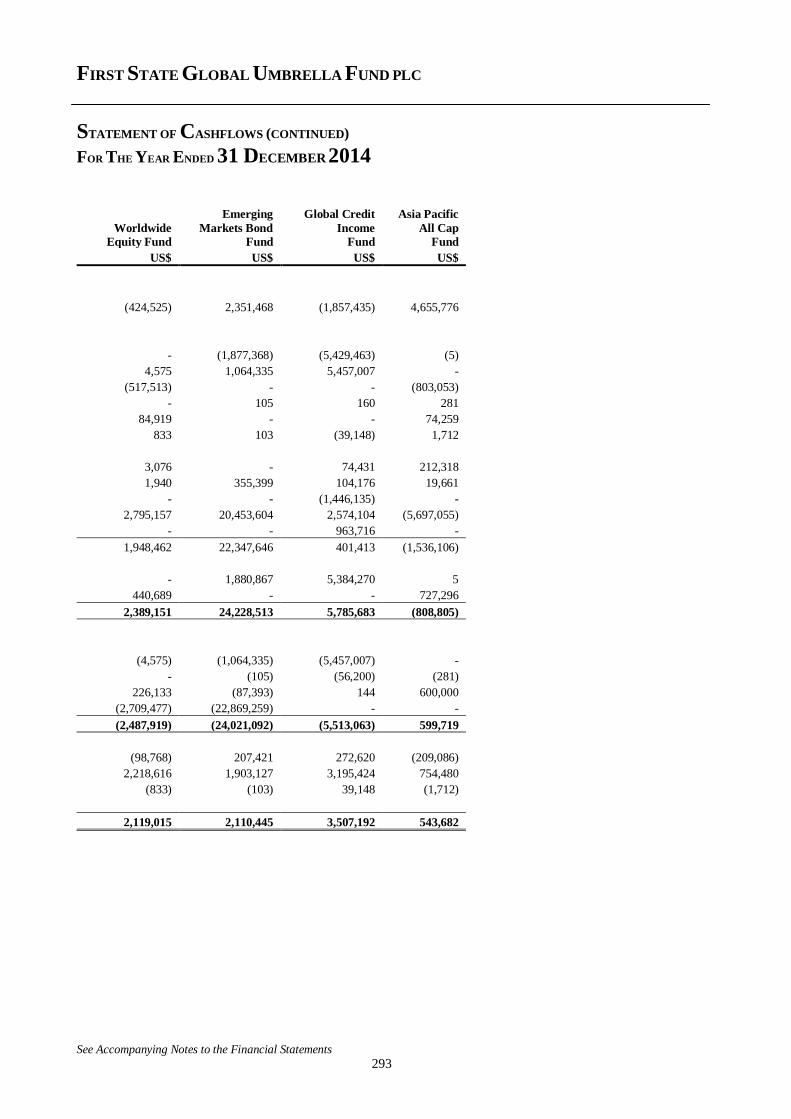
FIRST STATE GLOBAL UMBRELLA FUND PLC
STATEMENT OF CASHFLOWS (CONTINUED)
FOR THE YEAR ENDED 31 DECEMBER 2014
See Accompanying Notes to the Financial Statements
293
Worldwide
Equity Fund
Emerging
Markets Bond
Fund
Global Credit
Income
Fund
Asia Pacific
All Cap
Fund
US$ US$ US$ US$
(424,525) 2,351,468 (1,857,435) 4,655,776
- (1,877,368) (5,429,463) (5)
4,575 1,064,335 5,457,007 -
(517,513) - - (803,053)
- 105 160 281
84,919 - - 74,259
833 103 (39,148) 1,712
3,076 - 74,431 212,318
1,940 355,399 104,176 19,661
- - (1,446,135) -
2,795,157 20,453,604 2,574,104 (5,697,055)
- - 963,716 -
1,948,462 22,347,646 401,413 (1,536,106)
- 1,880,867 5,384,270 5
440,689 - - 727,296
2,389,151 24,228,513 5,785,683 (808,805)
(4,575) (1,064,335) (5,457,007) -
- (105) (56,200) (281)
226,133 (87,393) 144 600,000
(2,709,477) (22,869,259) - -
(2,487,919) (24,021,092) (5,513,063) 599,719
(98,768) 207,421 272,620 (209,086)
2,218,616 1,903,127 3,195,424 754,480
(833) (103) 39,148 (1,712)
2,119,015 2,110,445 3,507,192 543,682
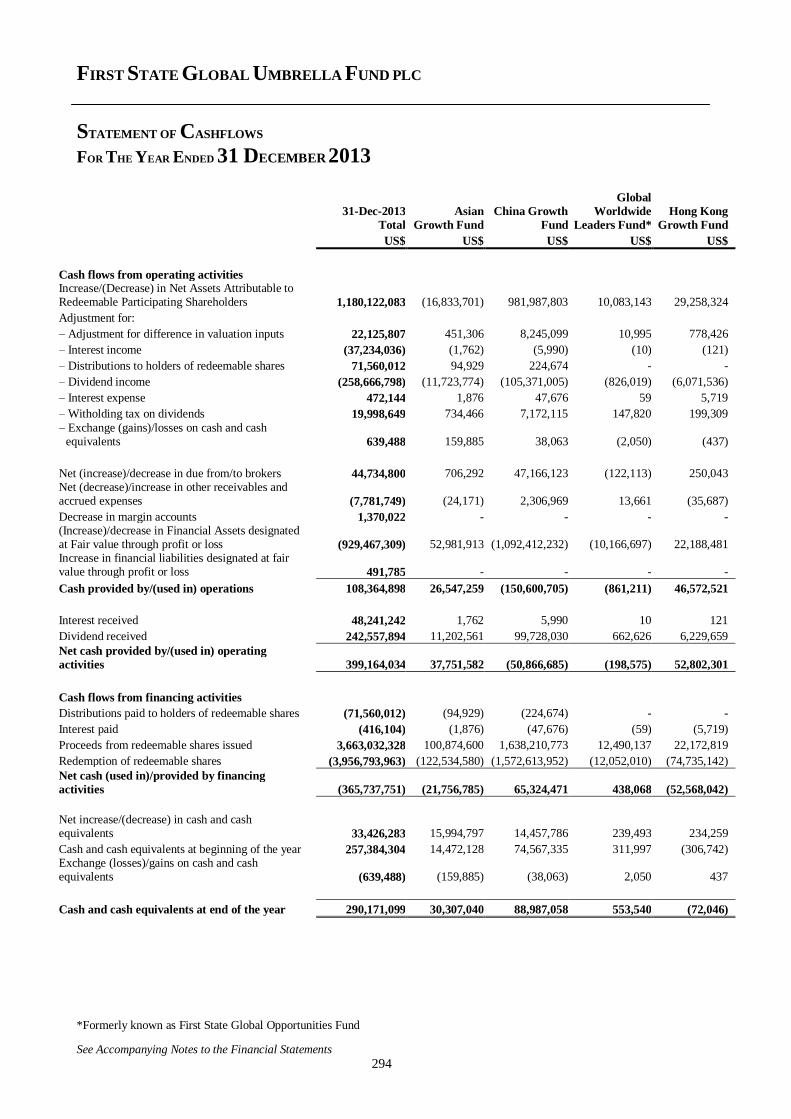
FIRST STATE GLOBAL UMBRELLA FUND PLC
STATEMENT OF CASHFLOWS
FOR THE YEAR ENDED 31 DECEMBER 2013
See Accompanying Notes to the Financial Statements
294
31-Dec-2013
Total
Asian
Growth Fund
China Growth
Fund
Global
Worldwide
Leaders Fund*
Hong Kong
Growth Fund
US$ US$ US$ US$ US$
Cash flows from operating activities Increase/(Decrease) in Net Assets Attributable to Redeemable Participating Shareholders 1,180,122,083 (16,833,701) 981,987,803 10,083,143 29,258,324
Adjustment for:
– Adjustment for difference in valuation inputs 22,125,807 451,306 8,245,099 10,995 778,426
– Interest income (37,234,036) (1,762) (5,990) (10) (121)
– Distributions to holders of redeemable shares 71,560,012 94,929 224,674 - -
– Dividend income (258,666,798) (11,723,774) (105,371,005) (826,019) (6,071,536)
– Interest expense 472,144 1,876 47,676 59 5,719
– Witholding tax on dividends 19,998,649 734,466 7,172,115 147,820 199,309
– Exchange (gains)/losses on cash and cash equivalents 639,488 159,885 38,063 (2,050) (437)
Net (increase)/decrease in due from/to brokers 44,734,800 706,292 47,166,123 (122,113) 250,043 Net (decrease)/increase in other receivables and accrued expenses (7,781,749) (24,171) 2,306,969 13,661 (35,687)
Decrease in margin accounts 1,370,022 - - - - (Increase)/decrease in Financial Assets designated at Fair value through profit or loss (929,467,309) 52,981,913 (1,092,412,232) (10,166,697) 22,188,481 Increase in financial liabilities designated at fair value through profit or loss 491,785 - - - -
Cash provided by/(used in) operations 108,364,898 26,547,259 (150,600,705) (861,211) 46,572,521
Interest received 48,241,242 1,762 5,990 10 121
Dividend received 242,557,894 11,202,561 99,728,030 662,626 6,229,659
Net cash provided by/(used in) operating
activities 399,164,034 37,751,582 (50,866,685) (198,575) 52,802,301
Cash flows from financing activities
Distributions paid to holders of redeemable shares (71,560,012) (94,929) (224,674) - -
Interest paid (416,104) (1,876) (47,676) (59) (5,719)
Proceeds from redeemable shares issued 3,663,032,328 100,874,600 1,638,210,773 12,490,137 22,172,819
Redemption of redeemable shares (3,956,793,963) (122,534,580) (1,572,613,952) (12,052,010) (74,735,142)
Net cash (used in)/provided by financing
activities (365,737,751) (21,756,785) 65,324,471 438,068 (52,568,042)
Net increase/(decrease) in cash and cash equivalents 33,426,283 15,994,797 14,457,786 239,493 234,259
Cash and cash equivalents at beginning of the year 257,384,304 14,472,128 74,567,335 311,997 (306,742) Exchange (losses)/gains on cash and cash equivalents (639,488) (159,885) (38,063) 2,050 437
Cash and cash equivalents at end of the year 290,171,099 30,307,040 88,987,058 553,540 (72,046)
*Formerly known as First State Global Opportunities Fund
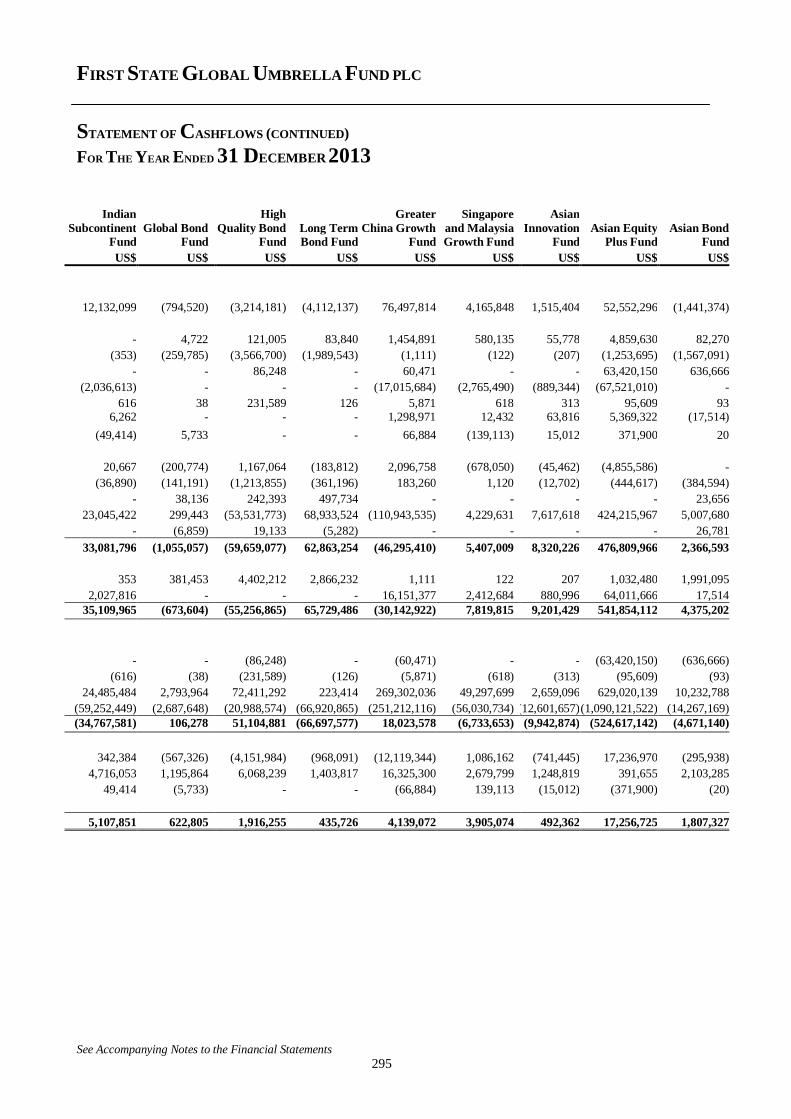
FIRST STATE GLOBAL UMBRELLA FUND PLC
STATEMENT OF CASHFLOWS (CONTINUED)
FOR THE YEAR ENDED 31 DECEMBER 2013
See Accompanying Notes to the Financial Statements
295
Indian
Subcontinent
Fund
Global Bond
Fund
High
Quality Bond
Fund
Long Term
Bond Fund
Greater
China Growth
Fund
Singapore
and Malaysia
Growth Fund
Asian
Innovation
Fund
Asian Equity
Plus Fund
Asian Bond
Fund
US$ US$ US$ US$ US$ US$ US$ US$ US$
12,132,099 (794,520) (3,214,181) (4,112,137) 76,497,814 4,165,848 1,515,404 52,552,296 (1,441,374)
- 4,722 121,005 83,840 1,454,891 580,135 55,778 4,859,630 82,270
(353) (259,785) (3,566,700) (1,989,543) (1,111) (122) (207) (1,253,695) (1,567,091)
- - 86,248 - 60,471 - - 63,420,150 636,666
(2,036,613) - - - (17,015,684) (2,765,490) (889,344) (67,521,010) -
616 38 231,589 126 5,871 618 313 95,609 93 6,262 - - - 1,298,971 12,432 63,816 5,369,322 (17,514)
(49,414) 5,733 - - 66,884 (139,113) 15,012 371,900 20
20,667 (200,774) 1,167,064 (183,812) 2,096,758 (678,050) (45,462) (4,855,586) -
(36,890) (141,191) (1,213,855) (361,196) 183,260 1,120 (12,702) (444,617) (384,594)
- 38,136 242,393 497,734 - - - - 23,656
23,045,422 299,443 (53,531,773) 68,933,524 (110,943,535) 4,229,631 7,617,618 424,215,967 5,007,680
- (6,859) 19,133 (5,282) - - - - 26,781
33,081,796 (1,055,057) (59,659,077) 62,863,254 (46,295,410) 5,407,009 8,320,226 476,809,966 2,366,593
353 381,453 4,402,212 2,866,232 1,111 122 207 1,032,480 1,991,095
2,027,816 - - - 16,151,377 2,412,684 880,996 64,011,666 17,514
35,109,965 (673,604) (55,256,865) 65,729,486 (30,142,922) 7,819,815 9,201,429 541,854,112 4,375,202
- - (86,248) - (60,471) - - (63,420,150) (636,666)
(616) (38) (231,589) (126) (5,871) (618) (313) (95,609) (93)
24,485,484 2,793,964 72,411,292 223,414 269,302,036 49,297,699 2,659,096 629,020,139 10,232,788
(59,252,449) (2,687,648) (20,988,574) (66,920,865) (251,212,116) (56,030,734) (12,601,657) (1,090,121,522) (14,267,169)
(34,767,581) 106,278 51,104,881 (66,697,577) 18,023,578 (6,733,653) (9,942,874) (524,617,142) (4,671,140)
342,384 (567,326) (4,151,984) (968,091) (12,119,344) 1,086,162 (741,445) 17,236,970 (295,938)
4,716,053 1,195,864 6,068,239 1,403,817 16,325,300 2,679,799 1,248,819 391,655 2,103,285
49,414 (5,733) - - (66,884) 139,113 (15,012) (371,900) (20)
5,107,851 622,805 1,916,255 435,726 4,139,072 3,905,074 492,362 17,256,725 1,807,327
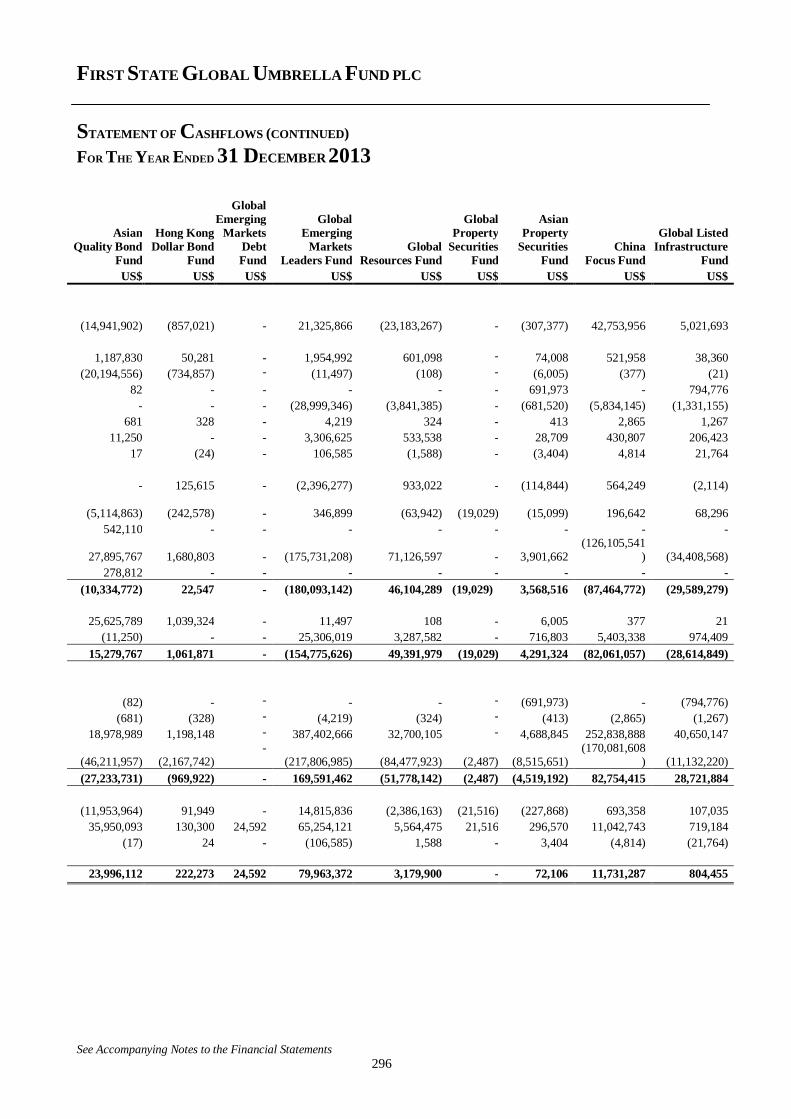
FIRST STATE GLOBAL UMBRELLA FUND PLC
STATEMENT OF CASHFLOWS (CONTINUED)
FOR THE YEAR ENDED 31 DECEMBER 2013
See Accompanying Notes to the Financial Statements
296
Asian
Quality Bond
Fund
Hong Kong
Dollar Bond
Fund
Global
Emerging
Markets
Debt
Fund
Global
Emerging
Markets
Leaders Fund
Global
Resources Fund
Global
Property
Securities
Fund
Asian
Property
Securities
Fund
China
Focus Fund
Global Listed
Infrastructure
Fund
US$ US$ US$ US$ US$ US$ US$ US$ US$
(14,941,902) (857,021) - 21,325,866 (23,183,267) - (307,377) 42,753,956 5,021,693
1,187,830 50,281 - 1,954,992 601,098 - 74,008 521,958 38,360
(20,194,556) (734,857) - (11,497) (108) - (6,005) (377) (21)
82 - - - - - 691,973 - 794,776
- - - (28,999,346) (3,841,385) - (681,520) (5,834,145) (1,331,155)
681 328 - 4,219 324 - 413 2,865 1,267
11,250 - - 3,306,625 533,538 - 28,709 430,807 206,423
17 (24) - 106,585 (1,588) - (3,404) 4,814 21,764
- 125,615 - (2,396,277) 933,022 - (114,844) 564,249 (2,114)
(5,114,863) (242,578) - 346,899 (63,942)
(19,029) (15,099) 196,642 68,296
542,110 - - - - - - - -
27,895,767 1,680,803 - (175,731,208) 71,126,597 - 3,901,662 (126,105,541
) (34,408,568)
278,812 - - - - - - - -
(10,334,772) 22,547 - (180,093,142) 46,104,289 (19,029) 3,568,516 (87,464,772) (29,589,279)
25,625,789 1,039,324 - 11,497 108 - 6,005 377 21
(11,250) - - 25,306,019 3,287,582 - 716,803 5,403,338 974,409
15,279,767 1,061,871 - (154,775,626) 49,391,979 (19,029) 4,291,324 (82,061,057) (28,614,849)
(82) - - - - - (691,973) - (794,776)
(681) (328) - (4,219) (324) - (413) (2,865) (1,267)
18,978,989 1,198,148 - 387,402,666 32,700,105 - 4,688,845 252,838,888 40,650,147
(46,211,957) (2,167,742) -
(217,806,985) (84,477,923) (2,487) (8,515,651) (170,081,608
) (11,132,220)
(27,233,731) (969,922) - 169,591,462 (51,778,142) (2,487) (4,519,192) 82,754,415 28,721,884
(11,953,964) 91,949 - 14,815,836 (2,386,163) (21,516) (227,868) 693,358 107,035
35,950,093 130,300 24,592 65,254,121 5,564,475 21,516 296,570 11,042,743 719,184
(17) 24 - (106,585) 1,588 - 3,404 (4,814) (21,764)
23,996,112 222,273 24,592 79,963,372 3,179,900 - 72,106 11,731,287 804,455
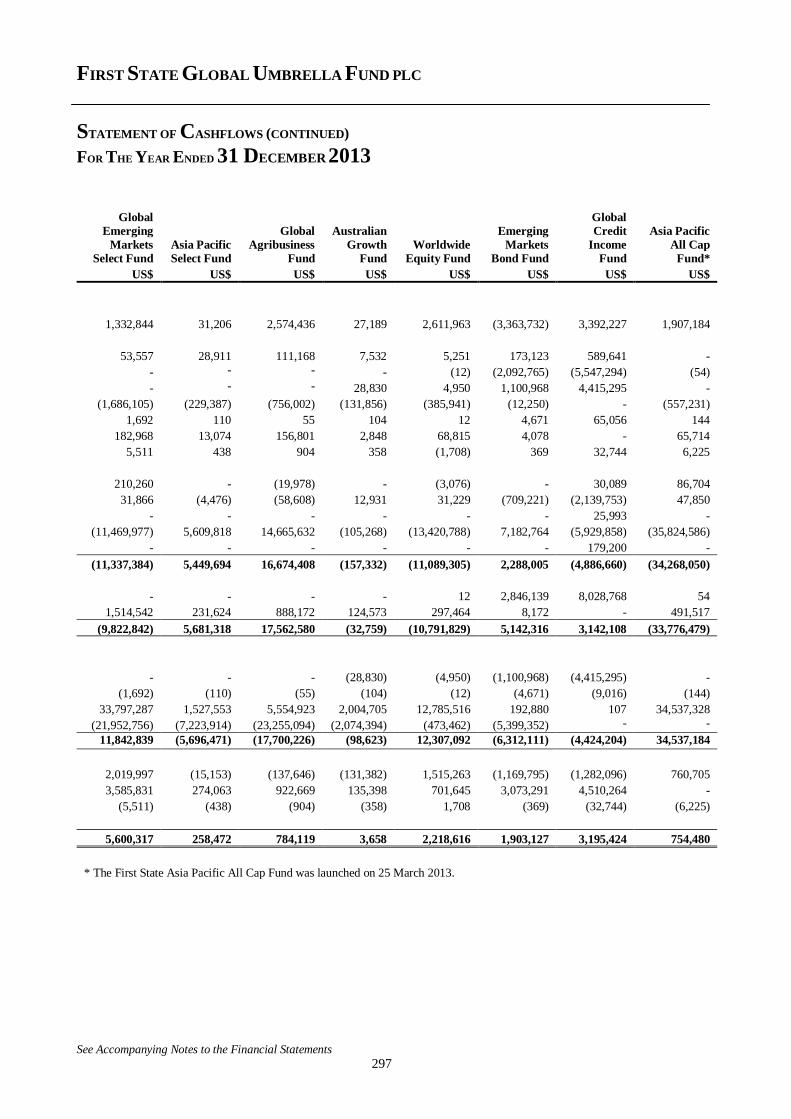
FIRST STATE GLOBAL UMBRELLA FUND PLC
STATEMENT OF CASHFLOWS (CONTINUED)
FOR THE YEAR ENDED 31 DECEMBER 2013
See Accompanying Notes to the Financial Statements
297
Global
Emerging
Markets
Select Fund
Asia Pacific
Select Fund
Global
Agribusiness
Fund
Australian
Growth
Fund
Worldwide
Equity Fund
Emerging
Markets
Bond Fund
Global
Credit
Income
Fund
Asia Pacific
All Cap
Fund*
US$ US$ US$ US$ US$ US$ US$ US$
1,332,844 31,206 2,574,436 27,189 2,611,963 (3,363,732) 3,392,227 1,907,184
53,557 28,911 111,168 7,532 5,251 173,123 589,641 -
- - - - (12) (2,092,765) (5,547,294) (54)
- - - 28,830 4,950 1,100,968 4,415,295 -
(1,686,105) (229,387) (756,002) (131,856) (385,941) (12,250) - (557,231)
1,692 110 55 104 12 4,671 65,056 144
182,968 13,074 156,801 2,848 68,815 4,078 - 65,714
5,511 438 904 358 (1,708) 369 32,744 6,225
210,260 - (19,978) - (3,076) - 30,089 86,704
31,866 (4,476) (58,608) 12,931 31,229 (709,221) (2,139,753) 47,850
- - - - - - 25,993 -
(11,469,977) 5,609,818 14,665,632 (105,268) (13,420,788) 7,182,764 (5,929,858) (35,824,586)
- - - - - - 179,200 -
(11,337,384) 5,449,694 16,674,408 (157,332) (11,089,305) 2,288,005 (4,886,660) (34,268,050)
- - - - 12 2,846,139 8,028,768 54
1,514,542 231,624 888,172 124,573 297,464 8,172 - 491,517
(9,822,842) 5,681,318 17,562,580 (32,759) (10,791,829) 5,142,316 3,142,108 (33,776,479)
- - - (28,830) (4,950) (1,100,968) (4,415,295) -
(1,692) (110) (55) (104) (12) (4,671) (9,016) (144)
33,797,287 1,527,553 5,554,923 2,004,705 12,785,516 192,880 107 34,537,328
(21,952,756) (7,223,914) (23,255,094) (2,074,394) (473,462) (5,399,352) - -
11,842,839 (5,696,471) (17,700,226) (98,623) 12,307,092 (6,312,111) (4,424,204) 34,537,184
2,019,997 (15,153) (137,646) (131,382) 1,515,263 (1,169,795) (1,282,096) 760,705
3,585,831 274,063 922,669 135,398 701,645 3,073,291 4,510,264 -
(5,511) (438) (904) (358) 1,708 (369) (32,744) (6,225)
5,600,317 258,472 784,119 3,658 2,218,616 1,903,127 3,195,424 754,480
* The First State Asia Pacific All Cap Fund was launched on 25 March 2013.
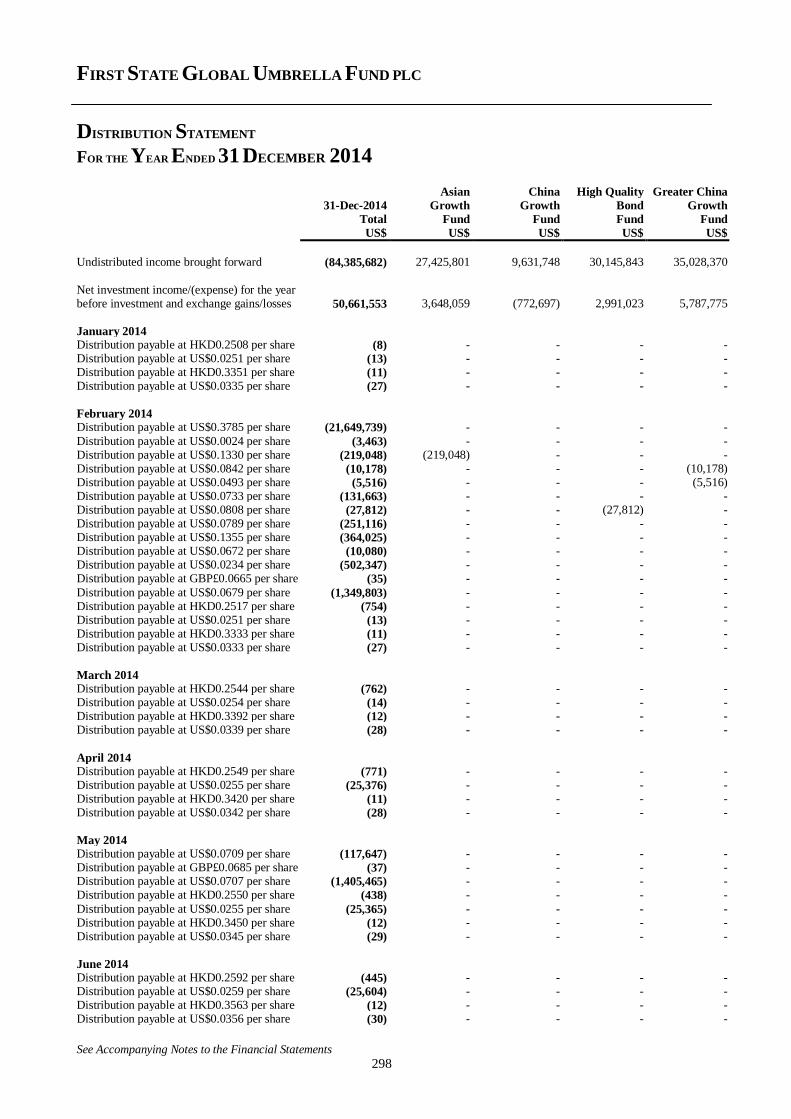
FIRST STATE GLOBAL UMBRELLA FUND PLC
DISTRIBUTION STATEMENT
FOR THE YEAR ENDED 31 DECEMBER 2014
See Accompanying Notes to the Financial Statements
298
Asian China High Quality Greater China 31-Dec-2014 Growth Growth Bond Growth Total Fund Fund Fund Fund US$ US$ US$ US$ US$
Undistributed income brought forward (84,385,682) 27,425,801 9,631,748 30,145,843 35,028,370
Net investment income/(expense) for the year before investment and exchange gains/losses 50,661,553 3,648,059 (772,697) 2,991,023 5,787,775
January 2014 Distribution payable at HKD0.2508 per share (8) - - - - Distribution payable at US$0.0251 per share (13) - - - - Distribution payable at HKD0.3351 per share (11) - - - - Distribution payable at US$0.0335 per share (27) - - - -
February 2014 Distribution payable at US$0.3785 per share (21,649,739) - - - -
Distribution payable at US$0.0024 per share (3,463) - - - - Distribution payable at US$0.1330 per share (219,048) (219,048) - - - Distribution payable at US$0.0842 per share (10,178) - - - (10,178) Distribution payable at US$0.0493 per share (5,516) - - - (5,516) Distribution payable at US$0.0733 per share (131,663) - - - - Distribution payable at US$0.0808 per share (27,812) - - (27,812) - Distribution payable at US$0.0789 per share (251,116) - - - - Distribution payable at US$0.1355 per share (364,025) - - - - Distribution payable at US$0.0672 per share (10,080) - - - - Distribution payable at US$0.0234 per share (502,347) - - - - Distribution payable at GBP£0.0665 per share (35) - - - -
Distribution payable at US$0.0679 per share (1,349,803) - - - - Distribution payable at HKD0.2517 per share (754) - - - - Distribution payable at US$0.0251 per share (13) - - - - Distribution payable at HKD0.3333 per share (11) - - - - Distribution payable at US$0.0333 per share (27) - - - -
March 2014 Distribution payable at HKD0.2544 per share (762) - - - - Distribution payable at US$0.0254 per share (14) - - - - Distribution payable at HKD0.3392 per share (12) - - - - Distribution payable at US$0.0339 per share (28) - - - -
April 2014 Distribution payable at HKD0.2549 per share (771) - - - - Distribution payable at US$0.0255 per share (25,376) - - - - Distribution payable at HKD0.3420 per share (11) - - - - Distribution payable at US$0.0342 per share (28) - - - -
May 2014 Distribution payable at US$0.0709 per share (117,647) - - - - Distribution payable at GBP£0.0685 per share (37) - - - - Distribution payable at US$0.0707 per share (1,405,465) - - - - Distribution payable at HKD0.2550 per share (438) - - - -
Distribution payable at US$0.0255 per share (25,365) - - - - Distribution payable at HKD0.3450 per share (12) - - - - Distribution payable at US$0.0345 per share (29) - - - -
June 2014 Distribution payable at HKD0.2592 per share (445) - - - - Distribution payable at US$0.0259 per share (25,604) - - - - Distribution payable at HKD0.3563 per share (12) - - - - Distribution payable at US$0.0356 per share (30) - - - -
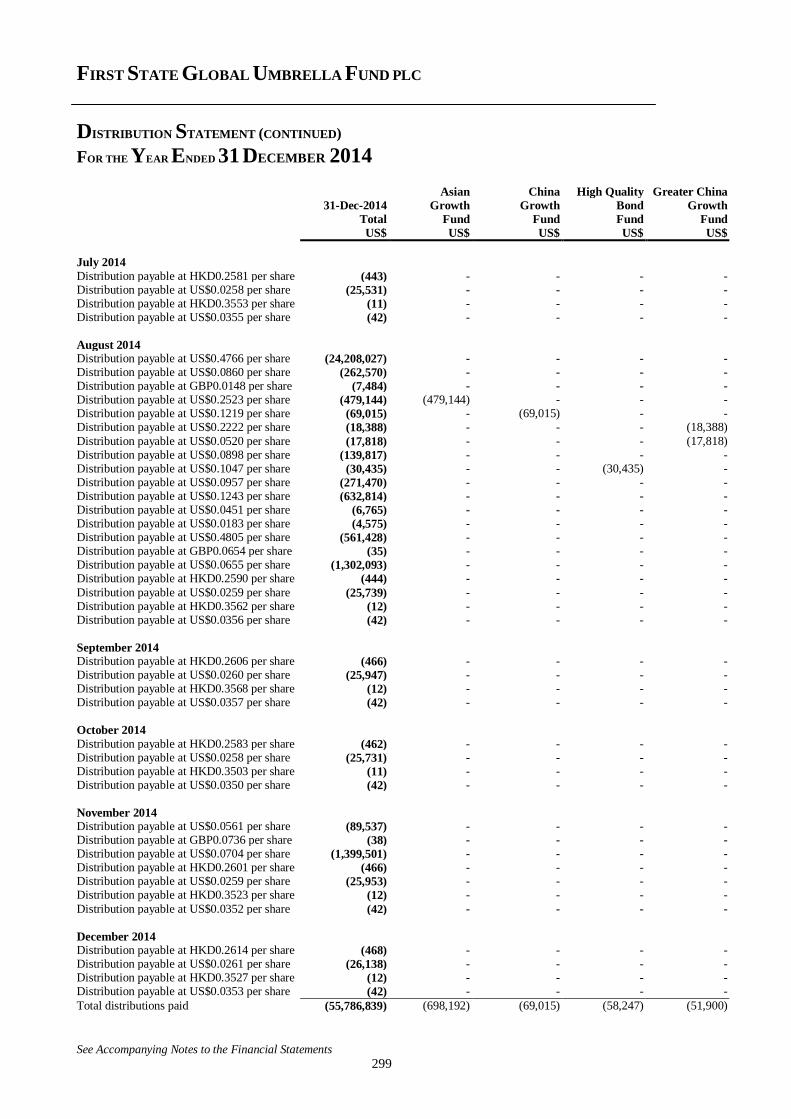
FIRST STATE GLOBAL UMBRELLA FUND PLC
DISTRIBUTION STATEMENT (CONTINUED)
FOR THE YEAR ENDED 31 DECEMBER 2014
See Accompanying Notes to the Financial Statements
299
Asian China High Quality Greater China 31-Dec-2014 Growth Growth Bond Growth Total Fund Fund Fund Fund US$ US$ US$ US$ US$
July 2014
Distribution payable at HKD0.2581 per share (443) - - - - Distribution payable at US$0.0258 per share (25,531) - - - - Distribution payable at HKD0.3553 per share (11) - - - - Distribution payable at US$0.0355 per share (42) - - - -
August 2014 Distribution payable at US$0.4766 per share (24,208,027) - - - - Distribution payable at US$0.0860 per share (262,570) - - - - Distribution payable at GBP0.0148 per share (7,484) - - - - Distribution payable at US$0.2523 per share (479,144) (479,144) - - - Distribution payable at US$0.1219 per share (69,015) - (69,015) - - Distribution payable at US$0.2222 per share (18,388) - - - (18,388)
Distribution payable at US$0.0520 per share (17,818) - - - (17,818) Distribution payable at US$0.0898 per share (139,817) - - - - Distribution payable at US$0.1047 per share (30,435) - - (30,435) - Distribution payable at US$0.0957 per share (271,470) - - - - Distribution payable at US$0.1243 per share (632,814) - - - - Distribution payable at US$0.0451 per share (6,765) - - - - Distribution payable at US$0.0183 per share (4,575) - - - - Distribution payable at US$0.4805 per share (561,428) - - - - Distribution payable at GBP0.0654 per share (35) - - - - Distribution payable at US$0.0655 per share (1,302,093) - - - - Distribution payable at HKD0.2590 per share (444) - - - - Distribution payable at US$0.0259 per share (25,739) - - - - Distribution payable at HKD0.3562 per share (12) - - - - Distribution payable at US$0.0356 per share (42) - - - -
September 2014 Distribution payable at HKD0.2606 per share (466) - - - - Distribution payable at US$0.0260 per share (25,947) - - - - Distribution payable at HKD0.3568 per share (12) - - - - Distribution payable at US$0.0357 per share (42) - - - -
October 2014
Distribution payable at HKD0.2583 per share (462) - - - - Distribution payable at US$0.0258 per share (25,731) - - - - Distribution payable at HKD0.3503 per share (11) - - - - Distribution payable at US$0.0350 per share (42) - - - -
November 2014 Distribution payable at US$0.0561 per share (89,537) - - - - Distribution payable at GBP0.0736 per share (38) - - - - Distribution payable at US$0.0704 per share (1,399,501) - - - - Distribution payable at HKD0.2601 per share (466) - - - - Distribution payable at US$0.0259 per share (25,953) - - - - Distribution payable at HKD0.3523 per share (12) - - - - Distribution payable at US$0.0352 per share (42) - - - -
December 2014 Distribution payable at HKD0.2614 per share (468) - - - - Distribution payable at US$0.0261 per share (26,138) - - - - Distribution payable at HKD0.3527 per share (12) - - - - Distribution payable at US$0.0353 per share (42) - - - - Total distributions paid (55,786,839) (698,192) (69,015) (58,247) (51,900)
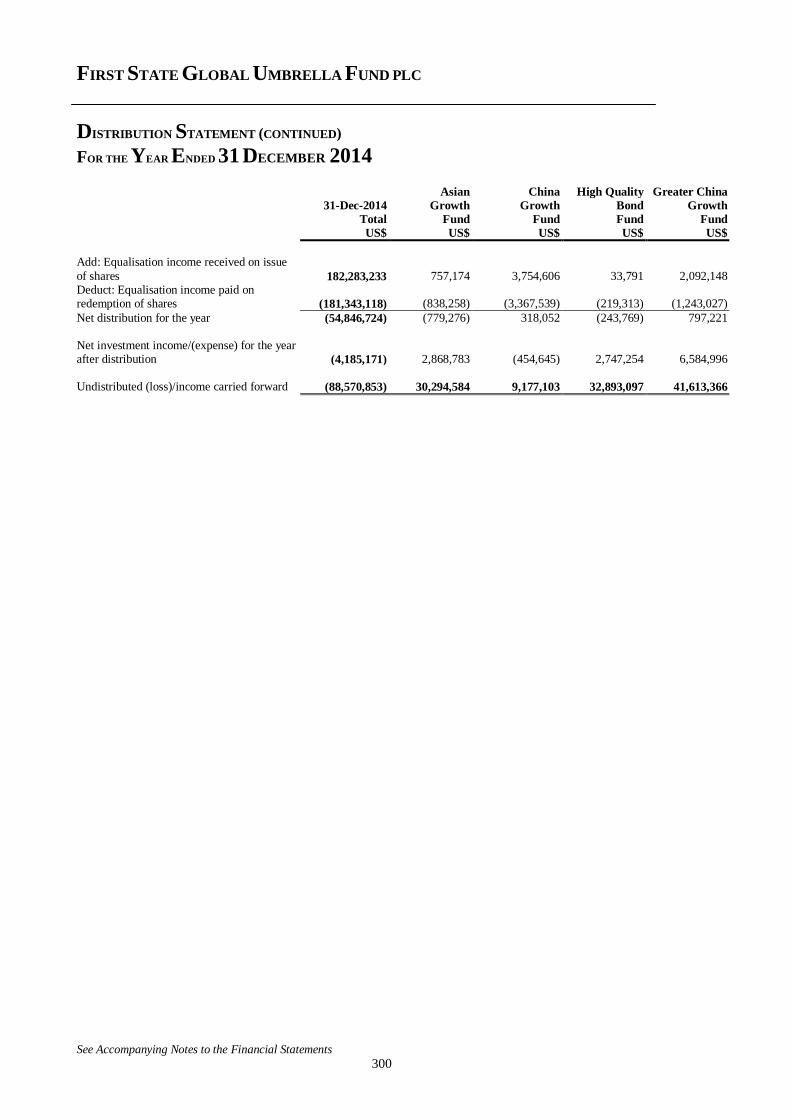
FIRST STATE GLOBAL UMBRELLA FUND PLC
DISTRIBUTION STATEMENT (CONTINUED)
FOR THE YEAR ENDED 31 DECEMBER 2014
See Accompanying Notes to the Financial Statements
300
Asian China High Quality Greater China 31-Dec-2014 Growth Growth Bond Growth Total Fund Fund Fund Fund US$ US$ US$ US$ US$
Add: Equalisation income received on issue
of shares
182,283,233
757,174
3,754,606
33,791
2,092,148 Deduct: Equalisation income paid on redemption of shares (181,343,118) (838,258) (3,367,539) (219,313) (1,243,027)
Net distribution for the year (54,846,724) (779,276) 318,052 (243,769) 797,221 Net investment income/(expense) for the year after distribution (4,185,171) 2,868,783 (454,645) 2,747,254 6,584,996
Undistributed (loss)/income carried forward (88,570,853) 30,294,584 9,177,103 32,893,097 41,613,366
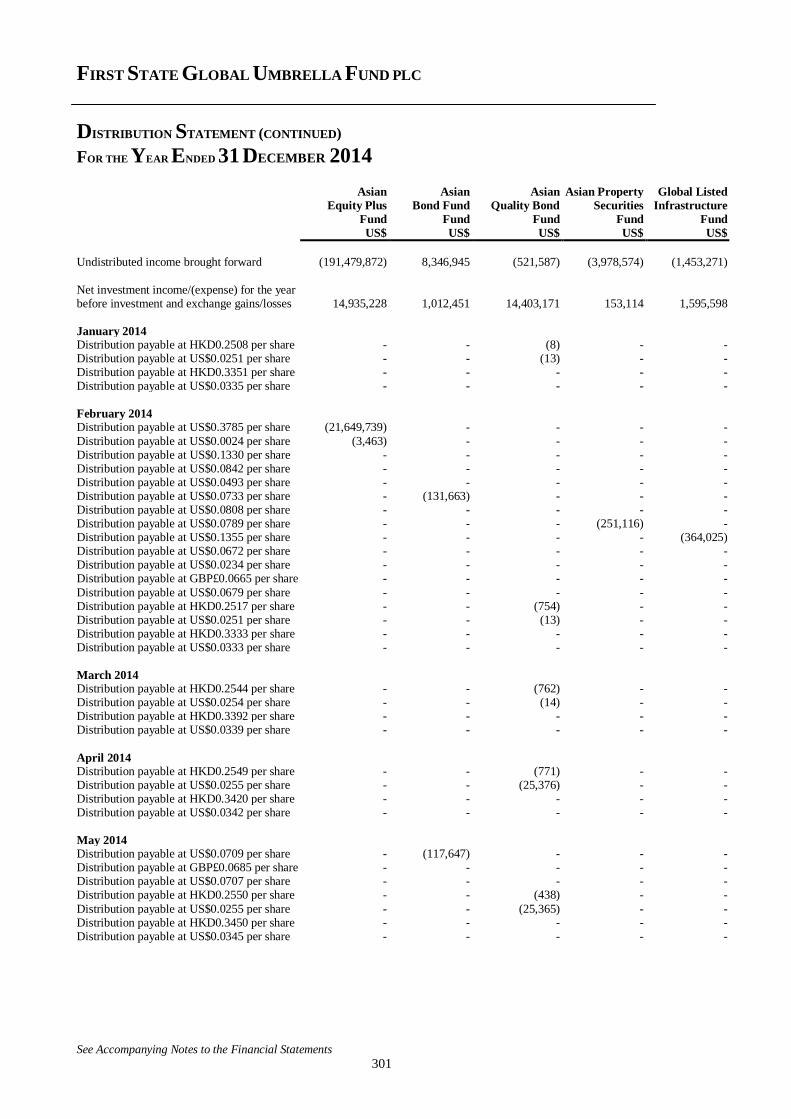
FIRST STATE GLOBAL UMBRELLA FUND PLC
DISTRIBUTION STATEMENT (CONTINUED)
FOR THE YEAR ENDED 31 DECEMBER 2014
See Accompanying Notes to the Financial Statements
301
Asian Asian Asian Asian Property Global Listed Equity Plus Bond Fund Quality Bond Securities Infrastructure Fund Fund Fund Fund Fund US$ US$ US$ US$ US$
Undistributed income brought forward (191,479,872) 8,346,945 (521,587) (3,978,574) (1,453,271)
Net investment income/(expense) for the year before investment and exchange gains/losses 14,935,228 1,012,451 14,403,171 153,114 1,595,598
January 2014 Distribution payable at HKD0.2508 per share - - (8) - - Distribution payable at US$0.0251 per share - - (13) - - Distribution payable at HKD0.3351 per share - - - - - Distribution payable at US$0.0335 per share - - - - -
February 2014 Distribution payable at US$0.3785 per share (21,649,739) - - - -
Distribution payable at US$0.0024 per share (3,463) - - - - Distribution payable at US$0.1330 per share - - - - - Distribution payable at US$0.0842 per share - - - - - Distribution payable at US$0.0493 per share - - - - - Distribution payable at US$0.0733 per share - (131,663) - - - Distribution payable at US$0.0808 per share - - - - - Distribution payable at US$0.0789 per share - - - (251,116) - Distribution payable at US$0.1355 per share - - - - (364,025) Distribution payable at US$0.0672 per share - - - - - Distribution payable at US$0.0234 per share - - - - - Distribution payable at GBP£0.0665 per share - - - - -
Distribution payable at US$0.0679 per share - - - - - Distribution payable at HKD0.2517 per share - - (754) - - Distribution payable at US$0.0251 per share - - (13) - - Distribution payable at HKD0.3333 per share - - - - - Distribution payable at US$0.0333 per share - - - - -
March 2014 Distribution payable at HKD0.2544 per share - - (762) - - Distribution payable at US$0.0254 per share - - (14) - - Distribution payable at HKD0.3392 per share - - - - - Distribution payable at US$0.0339 per share - - - - -
April 2014 Distribution payable at HKD0.2549 per share - - (771) - - Distribution payable at US$0.0255 per share - - (25,376) - - Distribution payable at HKD0.3420 per share - - - - - Distribution payable at US$0.0342 per share - - - - -
May 2014 Distribution payable at US$0.0709 per share - (117,647) - - - Distribution payable at GBP£0.0685 per share - - - - - Distribution payable at US$0.0707 per share - - - - - Distribution payable at HKD0.2550 per share - - (438) - -
Distribution payable at US$0.0255 per share - - (25,365) - - Distribution payable at HKD0.3450 per share - - - - - Distribution payable at US$0.0345 per share - - - - -
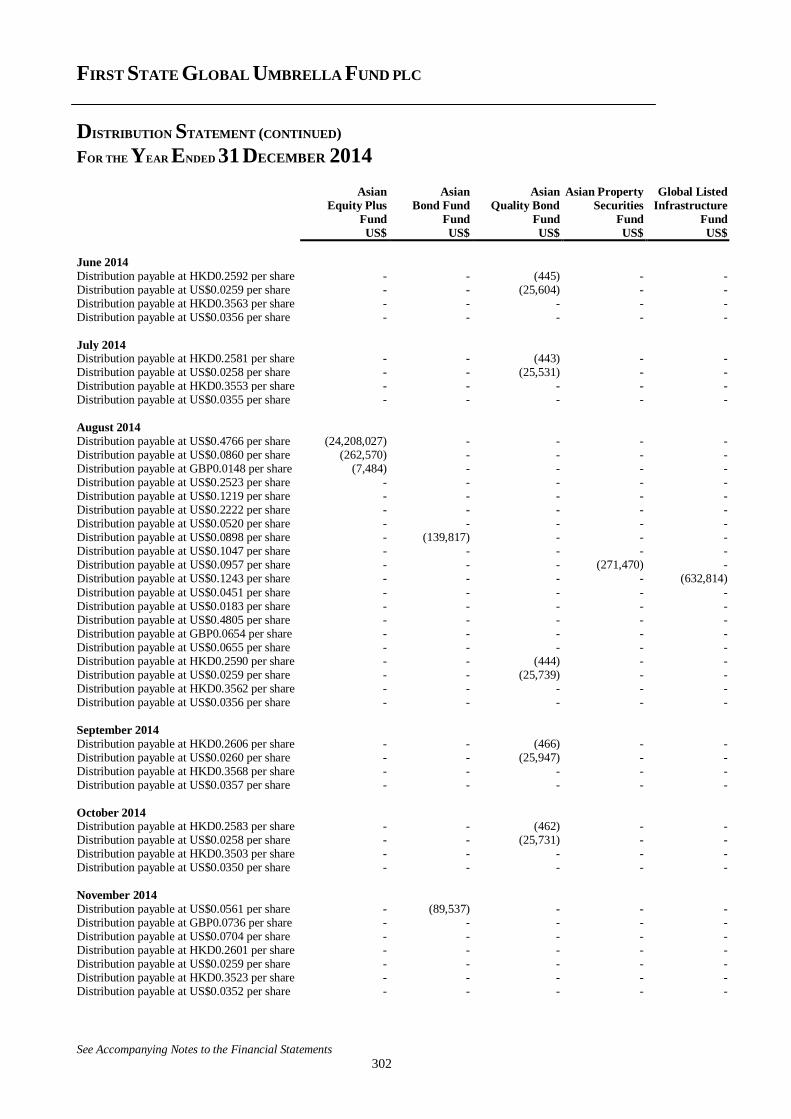
FIRST STATE GLOBAL UMBRELLA FUND PLC
DISTRIBUTION STATEMENT (CONTINUED)
FOR THE YEAR ENDED 31 DECEMBER 2014
See Accompanying Notes to the Financial Statements
302
Asian Asian Asian Asian Property Global Listed Equity Plus Bond Fund Quality Bond Securities Infrastructure Fund Fund Fund Fund Fund US$ US$ US$ US$ US$
June 2014
Distribution payable at HKD0.2592 per share - - (445) - - Distribution payable at US$0.0259 per share - - (25,604) - - Distribution payable at HKD0.3563 per share - - - - - Distribution payable at US$0.0356 per share - - - - -
July 2014 Distribution payable at HKD0.2581 per share - - (443) - - Distribution payable at US$0.0258 per share - - (25,531) - - Distribution payable at HKD0.3553 per share - - - - - Distribution payable at US$0.0355 per share - - - - -
August 2014
Distribution payable at US$0.4766 per share (24,208,027) - - - - Distribution payable at US$0.0860 per share (262,570) - - - - Distribution payable at GBP0.0148 per share (7,484) - - - - Distribution payable at US$0.2523 per share - - - - - Distribution payable at US$0.1219 per share - - - - - Distribution payable at US$0.2222 per share - - - - - Distribution payable at US$0.0520 per share - - - - - Distribution payable at US$0.0898 per share - (139,817) - - - Distribution payable at US$0.1047 per share - - - - - Distribution payable at US$0.0957 per share - - - (271,470) - Distribution payable at US$0.1243 per share - - - - (632,814)
Distribution payable at US$0.0451 per share - - - - - Distribution payable at US$0.0183 per share - - - - - Distribution payable at US$0.4805 per share - - - - - Distribution payable at GBP0.0654 per share - - - - - Distribution payable at US$0.0655 per share - - - - - Distribution payable at HKD0.2590 per share - - (444) - - Distribution payable at US$0.0259 per share - - (25,739) - - Distribution payable at HKD0.3562 per share - - - - - Distribution payable at US$0.0356 per share - - - - -
September 2014
Distribution payable at HKD0.2606 per share - - (466) - - Distribution payable at US$0.0260 per share - - (25,947) - - Distribution payable at HKD0.3568 per share - - - - - Distribution payable at US$0.0357 per share - - - - -
October 2014 Distribution payable at HKD0.2583 per share - - (462) - - Distribution payable at US$0.0258 per share - - (25,731) - - Distribution payable at HKD0.3503 per share - - - - - Distribution payable at US$0.0350 per share - - - - -
November 2014
Distribution payable at US$0.0561 per share - (89,537) - - - Distribution payable at GBP0.0736 per share - - - - - Distribution payable at US$0.0704 per share - - - - - Distribution payable at HKD0.2601 per share - - - - - Distribution payable at US$0.0259 per share - - - - - Distribution payable at HKD0.3523 per share - - - - - Distribution payable at US$0.0352 per share - - - - -
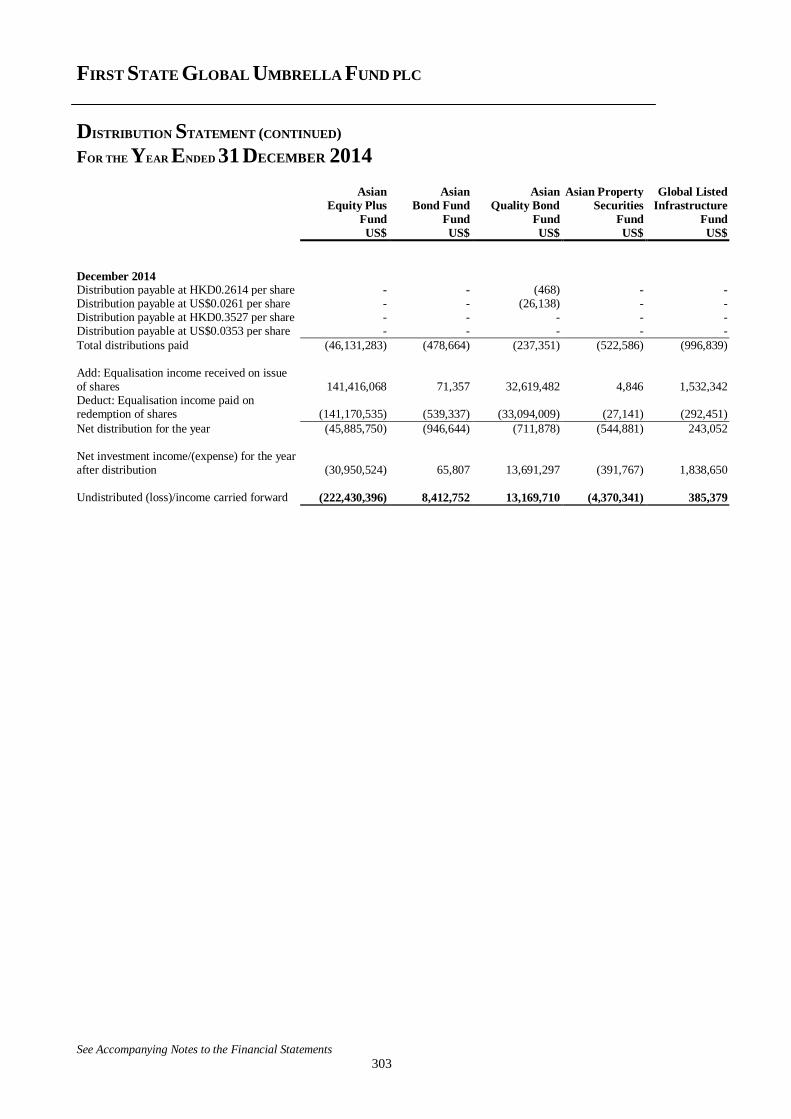
FIRST STATE GLOBAL UMBRELLA FUND PLC
DISTRIBUTION STATEMENT (CONTINUED)
FOR THE YEAR ENDED 31 DECEMBER 2014
See Accompanying Notes to the Financial Statements
303
Asian Asian Asian Asian Property Global Listed Equity Plus Bond Fund Quality Bond Securities Infrastructure Fund Fund Fund Fund Fund US$ US$ US$ US$ US$
December 2014 Distribution payable at HKD0.2614 per share - - (468) - - Distribution payable at US$0.0261 per share - - (26,138) - - Distribution payable at HKD0.3527 per share - - - - - Distribution payable at US$0.0353 per share - - - - - Total distributions paid (46,131,283) (478,664) (237,351) (522,586) (996,839) Add: Equalisation income received on issue of shares
141,416,068
71,357
32,619,482
4,846
1,532,342
Deduct: Equalisation income paid on redemption of shares (141,170,535) (539,337) (33,094,009) (27,141) (292,451)
Net distribution for the year (45,885,750) (946,644) (711,878) (544,881) 243,052 Net investment income/(expense) for the year after distribution (30,950,524) 65,807 13,691,297 (391,767) 1,838,650
Undistributed (loss)/income carried forward (222,430,396) 8,412,752 13,169,710 (4,370,341) 385,379
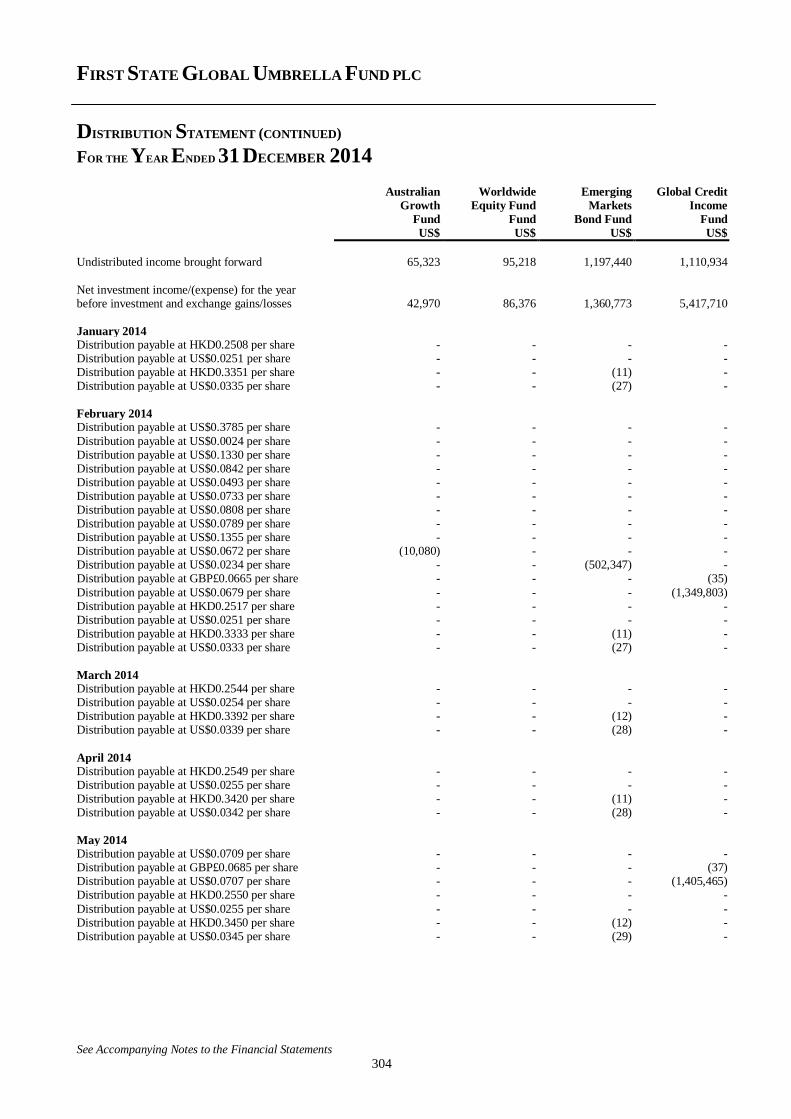
FIRST STATE GLOBAL UMBRELLA FUND PLC
DISTRIBUTION STATEMENT (CONTINUED)
FOR THE YEAR ENDED 31 DECEMBER 2014
See Accompanying Notes to the Financial Statements
304
Australian Worldwide Emerging Global Credit Growth Equity Fund Markets Income Fund Fund Bond Fund Fund US$ US$ US$ US$
Undistributed income brought forward 65,323 95,218 1,197,440 1,110,934
Net investment income/(expense) for the year before investment and exchange gains/losses 42,970 86,376 1,360,773 5,417,710
January 2014 Distribution payable at HKD0.2508 per share - - - - Distribution payable at US$0.0251 per share - - - - Distribution payable at HKD0.3351 per share - - (11) - Distribution payable at US$0.0335 per share - - (27) -
February 2014 Distribution payable at US$0.3785 per share - - - -
Distribution payable at US$0.0024 per share - - - - Distribution payable at US$0.1330 per share - - - - Distribution payable at US$0.0842 per share - - - - Distribution payable at US$0.0493 per share - - - - Distribution payable at US$0.0733 per share - - - - Distribution payable at US$0.0808 per share - - - - Distribution payable at US$0.0789 per share - - - - Distribution payable at US$0.1355 per share - - - - Distribution payable at US$0.0672 per share (10,080) - - - Distribution payable at US$0.0234 per share - - (502,347) - Distribution payable at GBP£0.0665 per share - - - (35)
Distribution payable at US$0.0679 per share - - - (1,349,803) Distribution payable at HKD0.2517 per share - - - - Distribution payable at US$0.0251 per share - - - - Distribution payable at HKD0.3333 per share - - (11) - Distribution payable at US$0.0333 per share - - (27) -
March 2014 Distribution payable at HKD0.2544 per share - - - - Distribution payable at US$0.0254 per share - - - - Distribution payable at HKD0.3392 per share - - (12) - Distribution payable at US$0.0339 per share - - (28) -
April 2014 Distribution payable at HKD0.2549 per share - - - - Distribution payable at US$0.0255 per share - - - - Distribution payable at HKD0.3420 per share - - (11) - Distribution payable at US$0.0342 per share - - (28) -
May 2014 Distribution payable at US$0.0709 per share - - - - Distribution payable at GBP£0.0685 per share - - - (37) Distribution payable at US$0.0707 per share - - - (1,405,465) Distribution payable at HKD0.2550 per share - - - -
Distribution payable at US$0.0255 per share - - - - Distribution payable at HKD0.3450 per share - - (12) - Distribution payable at US$0.0345 per share - - (29) -
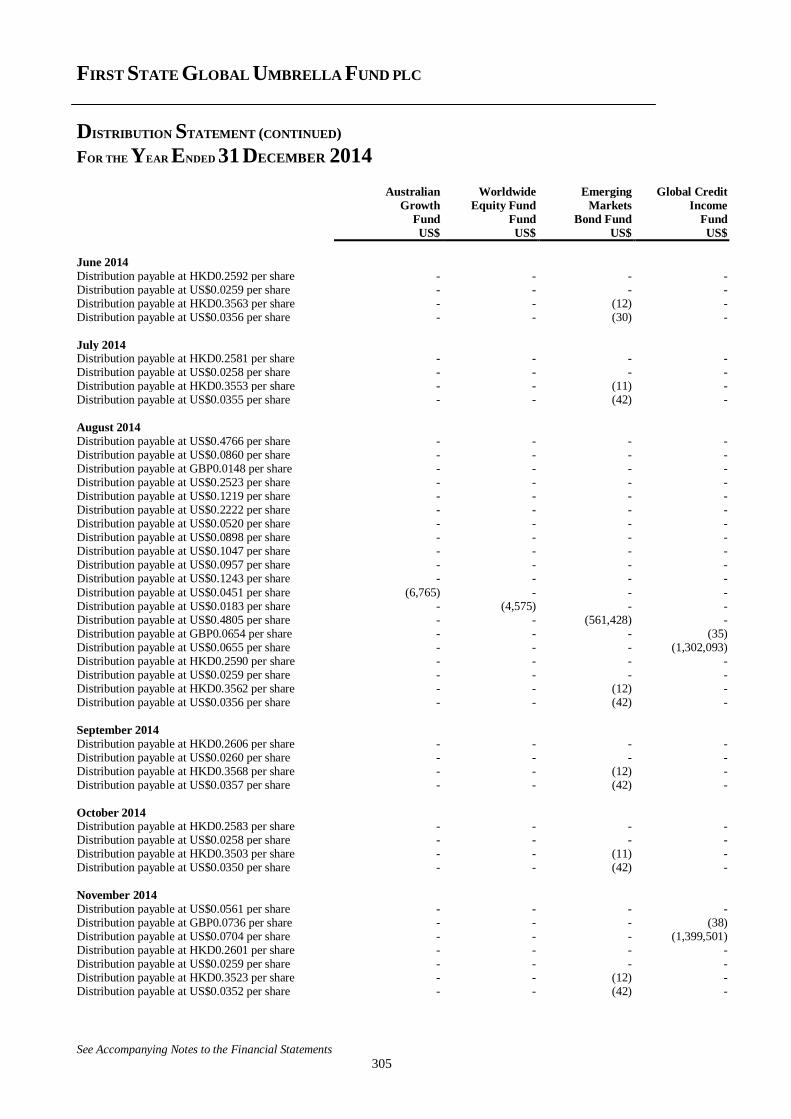
FIRST STATE GLOBAL UMBRELLA FUND PLC
DISTRIBUTION STATEMENT (CONTINUED)
FOR THE YEAR ENDED 31 DECEMBER 2014
See Accompanying Notes to the Financial Statements
305
Australian Worldwide Emerging Global Credit Growth Equity Fund Markets Income Fund Fund Bond Fund Fund US$ US$ US$ US$
June 2014
Distribution payable at HKD0.2592 per share - - - - Distribution payable at US$0.0259 per share - - - - Distribution payable at HKD0.3563 per share - - (12) - Distribution payable at US$0.0356 per share - - (30) -
July 2014 Distribution payable at HKD0.2581 per share - - - - Distribution payable at US$0.0258 per share - - - - Distribution payable at HKD0.3553 per share - - (11) - Distribution payable at US$0.0355 per share - - (42) -
August 2014
Distribution payable at US$0.4766 per share - - - - Distribution payable at US$0.0860 per share - - - - Distribution payable at GBP0.0148 per share - - - - Distribution payable at US$0.2523 per share - - - - Distribution payable at US$0.1219 per share - - - - Distribution payable at US$0.2222 per share - - - - Distribution payable at US$0.0520 per share - - - - Distribution payable at US$0.0898 per share - - - - Distribution payable at US$0.1047 per share - - - - Distribution payable at US$0.0957 per share - - - - Distribution payable at US$0.1243 per share - - - -
Distribution payable at US$0.0451 per share (6,765) - - - Distribution payable at US$0.0183 per share - (4,575) - - Distribution payable at US$0.4805 per share - - (561,428) - Distribution payable at GBP0.0654 per share - - - (35) Distribution payable at US$0.0655 per share - - - (1,302,093) Distribution payable at HKD0.2590 per share - - - - Distribution payable at US$0.0259 per share - - - - Distribution payable at HKD0.3562 per share - - (12) - Distribution payable at US$0.0356 per share - - (42) -
September 2014
Distribution payable at HKD0.2606 per share - - - - Distribution payable at US$0.0260 per share - - - - Distribution payable at HKD0.3568 per share - - (12) - Distribution payable at US$0.0357 per share - - (42) -
October 2014 Distribution payable at HKD0.2583 per share - - - - Distribution payable at US$0.0258 per share - - - - Distribution payable at HKD0.3503 per share - - (11) - Distribution payable at US$0.0350 per share - - (42) -
November 2014
Distribution payable at US$0.0561 per share - - - - Distribution payable at GBP0.0736 per share - - - (38) Distribution payable at US$0.0704 per share - - - (1,399,501) Distribution payable at HKD0.2601 per share - - - - Distribution payable at US$0.0259 per share - - - - Distribution payable at HKD0.3523 per share - - (12) - Distribution payable at US$0.0352 per share - - (42) -
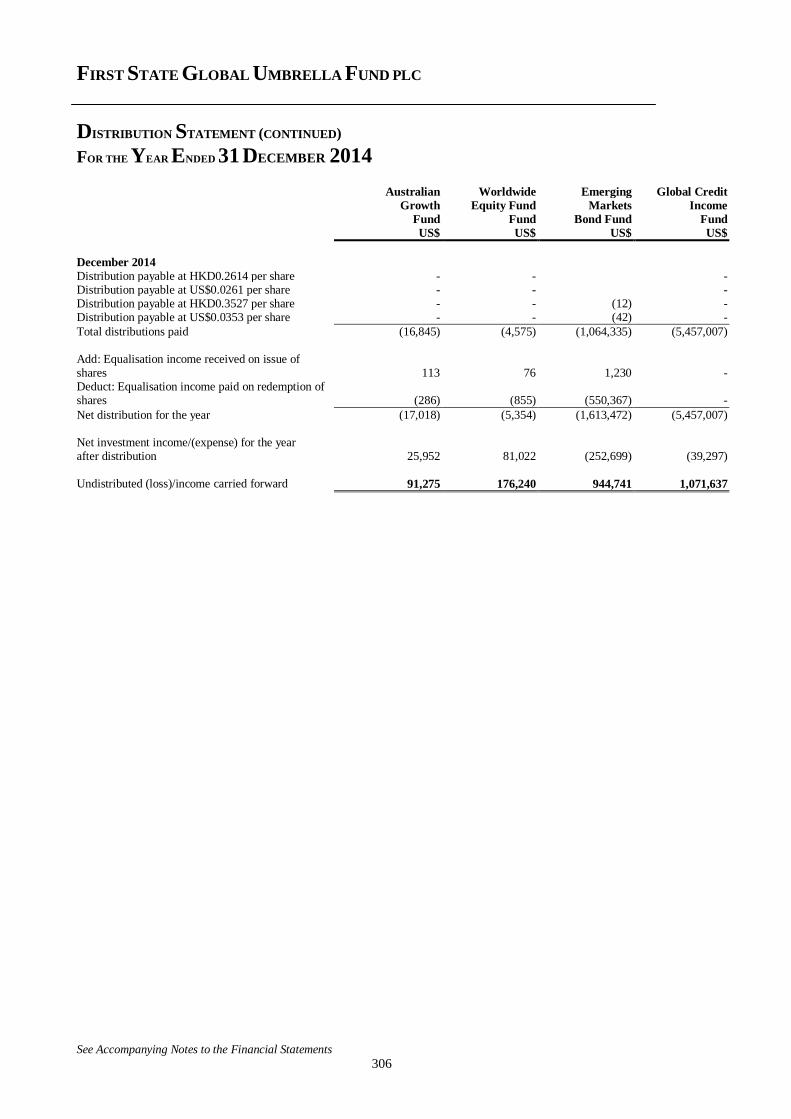
FIRST STATE GLOBAL UMBRELLA FUND PLC
DISTRIBUTION STATEMENT (CONTINUED)
FOR THE YEAR ENDED 31 DECEMBER 2014
See Accompanying Notes to the Financial Statements
306
Australian Worldwide Emerging Global Credit Growth Equity Fund Markets Income Fund Fund Bond Fund Fund US$ US$ US$ US$
December 2014
Distribution payable at HKD0.2614 per share - - - Distribution payable at US$0.0261 per share - - - Distribution payable at HKD0.3527 per share - - (12) - Distribution payable at US$0.0353 per share - - (42) -
Total distributions paid (16,845) (4,575) (1,064,335) (5,457,007) Add: Equalisation income received on issue of shares
113
76
1,230
-
Deduct: Equalisation income paid on redemption of shares (286) (855) (550,367)
-
Net distribution for the year (17,018) (5,354) (1,613,472) (5,457,007) Net investment income/(expense) for the year after distribution 25,952 81,022 (252,699) (39,297)
Undistributed (loss)/income carried forward 91,275 176,240 944,741 1,071,637
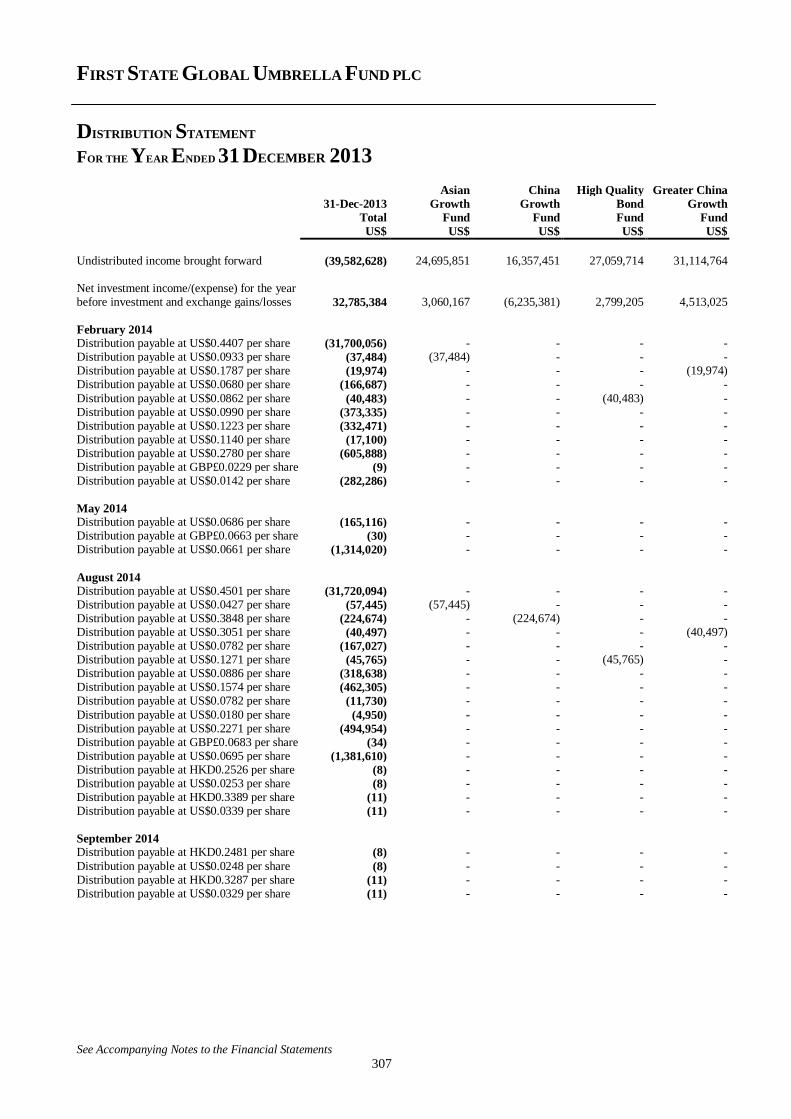
FIRST STATE GLOBAL UMBRELLA FUND PLC
DISTRIBUTION STATEMENT
FOR THE YEAR ENDED 31 DECEMBER 2013
See Accompanying Notes to the Financial Statements
307
Asian China High Quality Greater China 31-Dec-2013 Growth Growth Bond Growth Total Fund Fund Fund Fund US$ US$ US$ US$ US$
Undistributed income brought forward (39,582,628) 24,695,851 16,357,451 27,059,714 31,114,764 Net investment income/(expense) for the year before investment and exchange gains/losses 32,785,384 3,060,167 (6,235,381) 2,799,205 4,513,025
February 2014 Distribution payable at US$0.4407 per share (31,700,056) - - - - Distribution payable at US$0.0933 per share (37,484) (37,484) - - - Distribution payable at US$0.1787 per share (19,974) - - - (19,974) Distribution payable at US$0.0680 per share (166,687) - - - -
Distribution payable at US$0.0862 per share (40,483) - - (40,483) - Distribution payable at US$0.0990 per share (373,335) - - - - Distribution payable at US$0.1223 per share (332,471) - - - - Distribution payable at US$0.1140 per share (17,100) - - - - Distribution payable at US$0.2780 per share (605,888) - - - - Distribution payable at GBP£0.0229 per share (9) - - - - Distribution payable at US$0.0142 per share (282,286) - - - -
May 2014 Distribution payable at US$0.0686 per share (165,116) - - - - Distribution payable at GBP£0.0663 per share (30) - - - - Distribution payable at US$0.0661 per share (1,314,020) - - - -
August 2014 Distribution payable at US$0.4501 per share (31,720,094) - - - - Distribution payable at US$0.0427 per share (57,445) (57,445) - - - Distribution payable at US$0.3848 per share (224,674) - (224,674) - - Distribution payable at US$0.3051 per share (40,497) - - - (40,497) Distribution payable at US$0.0782 per share (167,027) - - - - Distribution payable at US$0.1271 per share (45,765) - - (45,765) - Distribution payable at US$0.0886 per share (318,638) - - - - Distribution payable at US$0.1574 per share (462,305) - - - - Distribution payable at US$0.0782 per share (11,730) - - - -
Distribution payable at US$0.0180 per share (4,950) - - - - Distribution payable at US$0.2271 per share (494,954) - - - - Distribution payable at GBP£0.0683 per share (34) - - - - Distribution payable at US$0.0695 per share (1,381,610) - - - - Distribution payable at HKD0.2526 per share (8) - - - - Distribution payable at US$0.0253 per share (8) - - - - Distribution payable at HKD0.3389 per share (11) - - - - Distribution payable at US$0.0339 per share (11) - - - -
September 2014 Distribution payable at HKD0.2481 per share (8) - - - -
Distribution payable at US$0.0248 per share (8) - - - - Distribution payable at HKD0.3287 per share (11) - - - - Distribution payable at US$0.0329 per share (11) - - - -
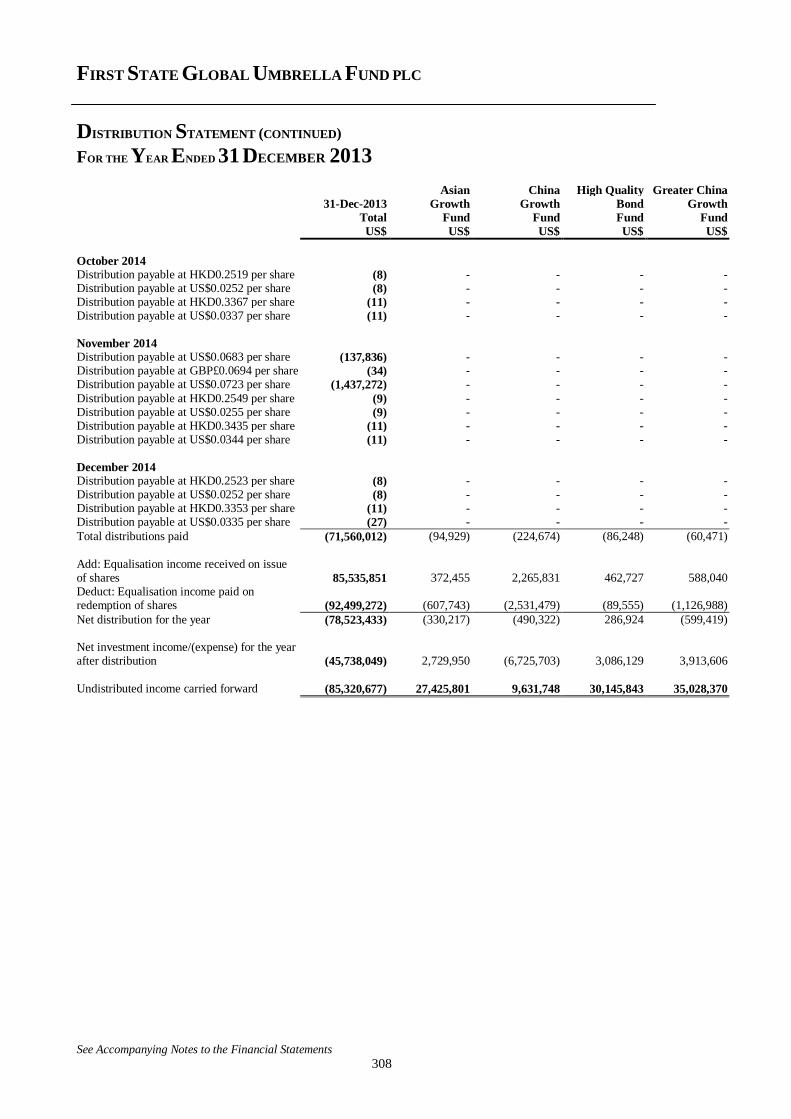
FIRST STATE GLOBAL UMBRELLA FUND PLC
DISTRIBUTION STATEMENT (CONTINUED)
FOR THE YEAR ENDED 31 DECEMBER 2013
See Accompanying Notes to the Financial Statements
308
Asian China High Quality Greater China 31-Dec-2013 Growth Growth Bond Growth Total Fund Fund Fund Fund US$ US$ US$ US$ US$
October 2014 Distribution payable at HKD0.2519 per share (8) - - - - Distribution payable at US$0.0252 per share (8) - - - - Distribution payable at HKD0.3367 per share (11) - - - - Distribution payable at US$0.0337 per share (11) - - - -
November 2014 Distribution payable at US$0.0683 per share (137,836) - - - - Distribution payable at GBP£0.0694 per share (34) - - - - Distribution payable at US$0.0723 per share (1,437,272) - - - -
Distribution payable at HKD0.2549 per share (9) - - - - Distribution payable at US$0.0255 per share (9) - - - - Distribution payable at HKD0.3435 per share (11) - - - - Distribution payable at US$0.0344 per share (11) - - - -
December 2014 Distribution payable at HKD0.2523 per share (8) - - - - Distribution payable at US$0.0252 per share (8) - - - - Distribution payable at HKD0.3353 per share (11) - - - - Distribution payable at US$0.0335 per share (27) - - - -
Total distributions paid (71,560,012) (94,929) (224,674) (86,248) (60,471)
Add: Equalisation income received on issue of shares 85,535,851 372,455 2,265,831 462,727 588,040 Deduct: Equalisation income paid on redemption of shares (92,499,272) (607,743) (2,531,479) (89,555) (1,126,988)
Net distribution for the year (78,523,433) (330,217) (490,322) 286,924 (599,419) Net investment income/(expense) for the year after distribution (45,738,049) 2,729,950 (6,725,703) 3,086,129 3,913,606
Undistributed income carried forward (85,320,677) 27,425,801 9,631,748 30,145,843 35,028,370
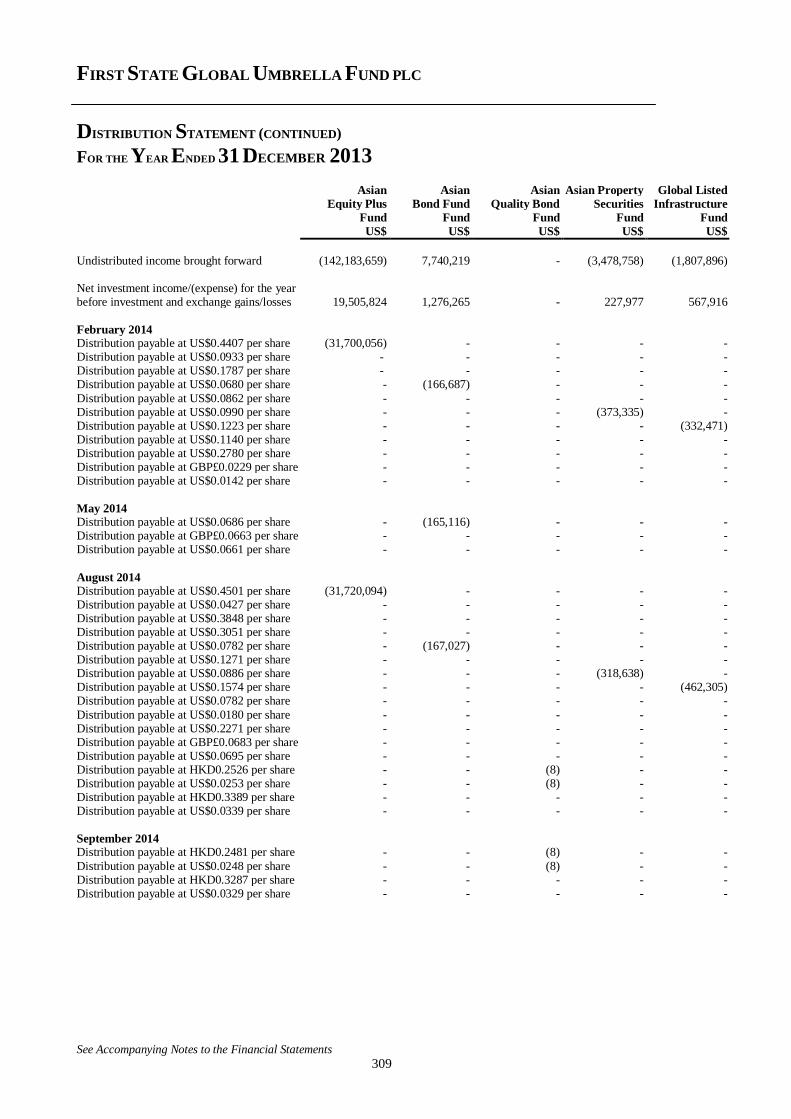
FIRST STATE GLOBAL UMBRELLA FUND PLC
DISTRIBUTION STATEMENT (CONTINUED)
FOR THE YEAR ENDED 31 DECEMBER 2013
See Accompanying Notes to the Financial Statements
309
Asian Asian Asian Asian Property Global Listed Equity Plus Bond Fund Quality Bond Securities Infrastructure Fund Fund Fund Fund Fund US$ US$ US$ US$ US$
Undistributed income brought forward (142,183,659) 7,740,219 - (3,478,758) (1,807,896) Net investment income/(expense) for the year before investment and exchange gains/losses 19,505,824 1,276,265 - 227,977 567,916
February 2014 Distribution payable at US$0.4407 per share (31,700,056) - - - - Distribution payable at US$0.0933 per share - - - - - Distribution payable at US$0.1787 per share - - - - - Distribution payable at US$0.0680 per share - (166,687) - - -
Distribution payable at US$0.0862 per share - - - - - Distribution payable at US$0.0990 per share - - - (373,335) - Distribution payable at US$0.1223 per share - - - - (332,471) Distribution payable at US$0.1140 per share - - - - - Distribution payable at US$0.2780 per share - - - - - Distribution payable at GBP£0.0229 per share - - - - - Distribution payable at US$0.0142 per share - - - - -
May 2014 Distribution payable at US$0.0686 per share - (165,116) - - - Distribution payable at GBP£0.0663 per share - - - - - Distribution payable at US$0.0661 per share - - - - -
August 2014 Distribution payable at US$0.4501 per share (31,720,094) - - - - Distribution payable at US$0.0427 per share - - - - - Distribution payable at US$0.3848 per share - - - - - Distribution payable at US$0.3051 per share - - - - - Distribution payable at US$0.0782 per share - (167,027) - - - Distribution payable at US$0.1271 per share - - - - - Distribution payable at US$0.0886 per share - - - (318,638) - Distribution payable at US$0.1574 per share - - - - (462,305) Distribution payable at US$0.0782 per share - - - - -
Distribution payable at US$0.0180 per share - - - - - Distribution payable at US$0.2271 per share - - - - - Distribution payable at GBP£0.0683 per share - - - - - Distribution payable at US$0.0695 per share - - - - - Distribution payable at HKD0.2526 per share - - (8) - - Distribution payable at US$0.0253 per share - - (8) - - Distribution payable at HKD0.3389 per share - - - - - Distribution payable at US$0.0339 per share - - - - -
September 2014 Distribution payable at HKD0.2481 per share - - (8) - -
Distribution payable at US$0.0248 per share - - (8) - - Distribution payable at HKD0.3287 per share - - - - - Distribution payable at US$0.0329 per share - - - - -
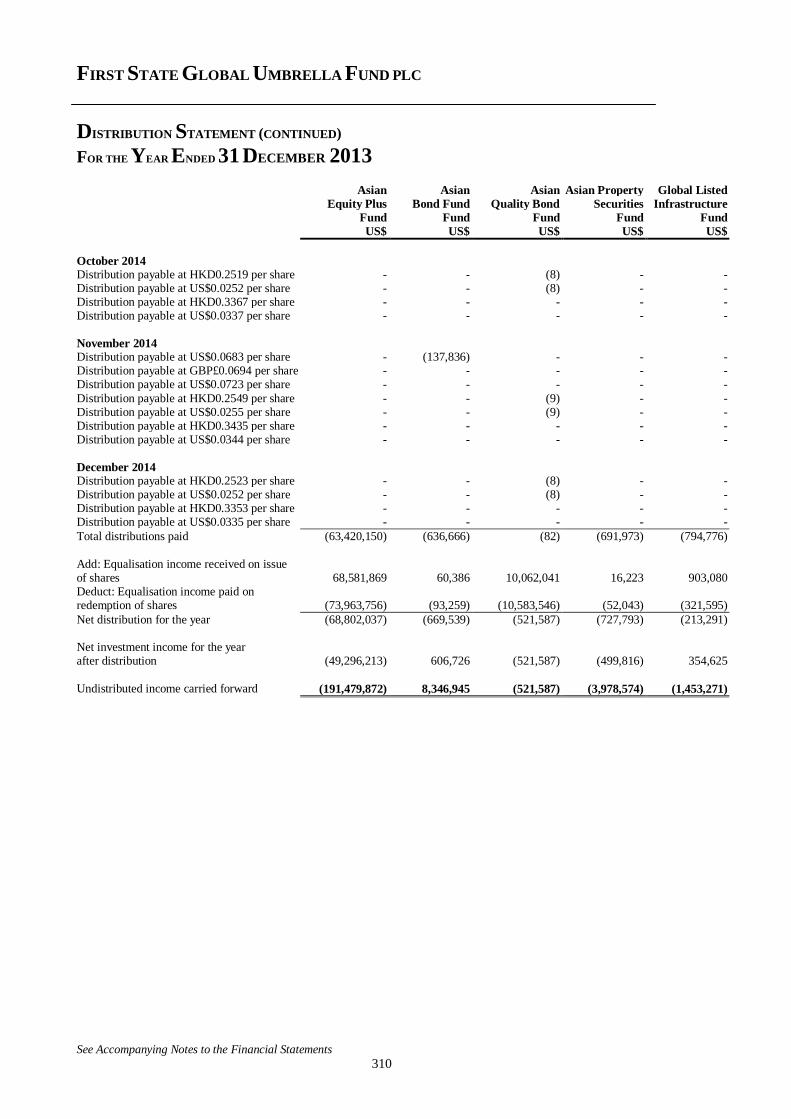
FIRST STATE GLOBAL UMBRELLA FUND PLC
DISTRIBUTION STATEMENT (CONTINUED)
FOR THE YEAR ENDED 31 DECEMBER 2013
See Accompanying Notes to the Financial Statements
310
Asian Asian Asian Asian Property Global Listed Equity Plus Bond Fund Quality Bond Securities Infrastructure Fund Fund Fund Fund Fund US$ US$ US$ US$ US$
October 2014 Distribution payable at HKD0.2519 per share - - (8) - - Distribution payable at US$0.0252 per share - - (8) - - Distribution payable at HKD0.3367 per share - - - - - Distribution payable at US$0.0337 per share - - - - -
November 2014 Distribution payable at US$0.0683 per share - (137,836) - - - Distribution payable at GBP£0.0694 per share - - - - - Distribution payable at US$0.0723 per share - - - - -
Distribution payable at HKD0.2549 per share - - (9) - - Distribution payable at US$0.0255 per share - - (9) - - Distribution payable at HKD0.3435 per share - - - - - Distribution payable at US$0.0344 per share - - - - -
December 2014 Distribution payable at HKD0.2523 per share - - (8) - - Distribution payable at US$0.0252 per share - - (8) - - Distribution payable at HKD0.3353 per share - - - - - Distribution payable at US$0.0335 per share - - - - -
Total distributions paid (63,420,150) (636,666) (82) (691,973) (794,776)
Add: Equalisation income received on issue of shares
68,581,869 60,386
10,062,041
16,223
903,080
Deduct: Equalisation income paid on redemption of shares (73,963,756) (93,259) (10,583,546) (52,043) (321,595)
Net distribution for the year (68,802,037) (669,539) (521,587) (727,793) (213,291) Net investment income for the year after distribution (49,296,213) 606,726 (521,587) (499,816) 354,625
Undistributed income carried forward (191,479,872) 8,346,945 (521,587) (3,978,574) (1,453,271)
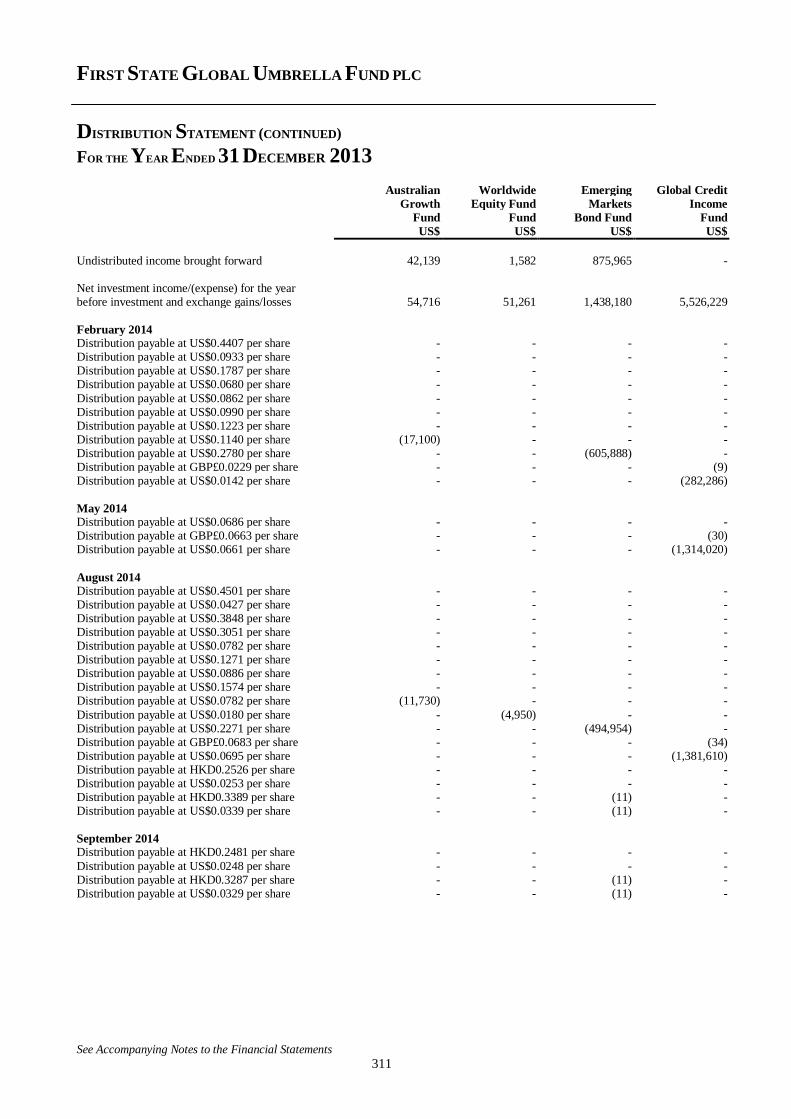
FIRST STATE GLOBAL UMBRELLA FUND PLC
DISTRIBUTION STATEMENT (CONTINUED)
FOR THE YEAR ENDED 31 DECEMBER 2013
See Accompanying Notes to the Financial Statements
311
Australian Worldwide Emerging Global Credit Growth Equity Fund Markets Income Fund Fund Bond Fund Fund US$ US$ US$ US$
Undistributed income brought forward 42,139 1,582 875,965 - Net investment income/(expense) for the year before investment and exchange gains/losses 54,716 51,261 1,438,180 5,526,229
February 2014 Distribution payable at US$0.4407 per share - - - - Distribution payable at US$0.0933 per share - - - - Distribution payable at US$0.1787 per share - - - - Distribution payable at US$0.0680 per share - - - -
Distribution payable at US$0.0862 per share - - - - Distribution payable at US$0.0990 per share - - - - Distribution payable at US$0.1223 per share - - - - Distribution payable at US$0.1140 per share (17,100) - - - Distribution payable at US$0.2780 per share - - (605,888) - Distribution payable at GBP£0.0229 per share - - - (9) Distribution payable at US$0.0142 per share - - - (282,286)
May 2014 Distribution payable at US$0.0686 per share - - - - Distribution payable at GBP£0.0663 per share - - - (30) Distribution payable at US$0.0661 per share - - - (1,314,020)
August 2014 Distribution payable at US$0.4501 per share - - - - Distribution payable at US$0.0427 per share - - - - Distribution payable at US$0.3848 per share - - - - Distribution payable at US$0.3051 per share - - - - Distribution payable at US$0.0782 per share - - - - Distribution payable at US$0.1271 per share - - - - Distribution payable at US$0.0886 per share - - - - Distribution payable at US$0.1574 per share - - - - Distribution payable at US$0.0782 per share (11,730) - - -
Distribution payable at US$0.0180 per share - (4,950) - - Distribution payable at US$0.2271 per share - - (494,954) - Distribution payable at GBP£0.0683 per share - - - (34) Distribution payable at US$0.0695 per share - - - (1,381,610) Distribution payable at HKD0.2526 per share - - - - Distribution payable at US$0.0253 per share - - - - Distribution payable at HKD0.3389 per share - - (11) - Distribution payable at US$0.0339 per share - - (11) -
September 2014 Distribution payable at HKD0.2481 per share - - - -
Distribution payable at US$0.0248 per share - - - - Distribution payable at HKD0.3287 per share - - (11) - Distribution payable at US$0.0329 per share - - (11) -
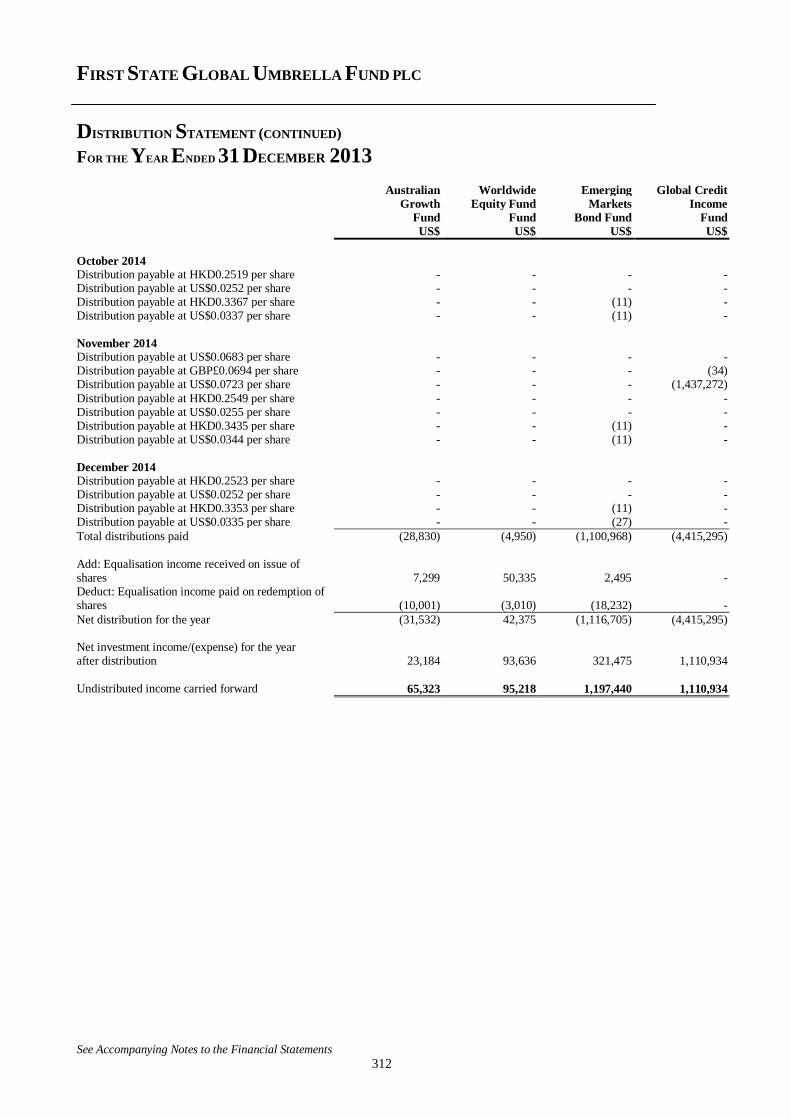
FIRST STATE GLOBAL UMBRELLA FUND PLC
DISTRIBUTION STATEMENT (CONTINUED)
FOR THE YEAR ENDED 31 DECEMBER 2013
See Accompanying Notes to the Financial Statements
312
Australian Worldwide Emerging Global Credit Growth Equity Fund Markets Income Fund Fund Bond Fund Fund US$ US$ US$ US$
October 2014 Distribution payable at HKD0.2519 per share - - - - Distribution payable at US$0.0252 per share - - - - Distribution payable at HKD0.3367 per share - - (11) - Distribution payable at US$0.0337 per share - - (11) -
November 2014 Distribution payable at US$0.0683 per share - - - - Distribution payable at GBP£0.0694 per share - - - (34) Distribution payable at US$0.0723 per share - - - (1,437,272)
Distribution payable at HKD0.2549 per share - - - - Distribution payable at US$0.0255 per share - - - - Distribution payable at HKD0.3435 per share - - (11) - Distribution payable at US$0.0344 per share - - (11) -
December 2014 Distribution payable at HKD0.2523 per share - - - - Distribution payable at US$0.0252 per share - - - - Distribution payable at HKD0.3353 per share - - (11) - Distribution payable at US$0.0335 per share - - (27) -
Total distributions paid (28,830) (4,950) (1,100,968) (4,415,295)
Add: Equalisation income received on issue of shares 7,299 50,335
2,495
-
Deduct: Equalisation income paid on redemption of shares (10,001) (3,010) (18,232)
-
Net distribution for the year (31,532) 42,375 (1,116,705) (4,415,295) Net investment income/(expense) for the year after distribution 23,184 93,636 321,475 1,110,934
Undistributed income carried forward 65,323 95,218 1,197,440 1,110,934
FIRST STATE GLOBAL UMBRELLA FUND PLC
NOTES FORMING PART OF THE FINANCIAL STATEMENTS FOR THE YEAR ENDED
31 DECEMBER 2014
313
1. ORGANISATION
First State Global Umbrella Fund plc (the “Company”) was incorporated on 18 June 1998 and registered as an open-ended umbrella investment company with variable capital in Ireland under the
Companies Acts 1963 to 2013, the European Communities (Undertakings for Collective Investment in
Transferable Securities) Regulations, 2011 (as amended) (the “UCITS Regulations”) and in Hong Kong under the Hong Kong Securities and Futures Commission (“SFC”) Code on Unit Trust and Mutual
Funds (the “Code”). The authorised share capital of the Company is five hundred billion shares of no
par value initially designated as unclassified shares.
The sole object of the Company is the collective investment in transferable securities and/or other
liquid financial assets referred to the Regulations of capital raised from the public operating on the principle of risk spreading in accordance with the Regulations.
2. PRINCIPAL ACCOUNTING POLICIES
(a) BASIS OF PRESENTATION
The financial statements have been prepared in accordance with International Financial Reporting
Standards (“IFRS”) issued by the International Accounting Standards Board (IASB), and interpretations issued by the International Financial Reporting Interpretations Committee of the IASB.
The accounting policies used in the preparation of these financial statements are consistent with those used in the Company’s most recent annual financial statements for the year ended 31 December 2013.
For the year ended 31 December 2013, the Company availed of the option within IFRS 1 to designate previously recognised financial assets and liabilities designated at fair value through profit or loss. The
Company availed of no other exemptions required under IFRS 1. The Company transitioned to IFRS in
the prior year. During the year ended 31 December 2013, the Board of Directors had elected to prepare the financial statements in accordance with IFRS, issued by the IASB as adopted for use in the
European Union and interpretations issued by the International Financial Reporting Interpretations
Committee at the IASB.
The preparation of financial statements in conformity with IFRS requires management to make
judgements, estimates and assumptions that affect the application of policies and the reported amounts of assets and liabilities, income and expense. The estimates and associated assumptions are based on
historical experience and various other factors that are believed to be reasonable under the circumstances, the results of which form the basis of making the judgements about carrying values of
assets and liabilities that are not readily apparent from other sources. If in the future such estimates and
assumptions, which are based on management's best judgement at the date of the financial statements, deviate from the actual outcome, the original estimates and assumptions will be modified as appropriate
in the year which the circumstances change.
The financial statements have been also prepared in accordance with the UCITS Regulations and the
Code. The adoption of the UCITS Regulations and the Code has resulted in enhanced disclosures in the notes to the financial statements.
FIRST STATE GLOBAL UMBRELLA FUND PLC
NOTES FORMING PART OF THE FINANCIAL STATEMENTS FOR THE YEAR ENDED
31 DECEMBER 2014 (CONTINUED)
314
2. PRINCIPAL ACCOUNTING POLICIES (CONTINUED)
(a) BASIS OF PRESENTATION (CONTINUED)
The financial statements are based on the valuations prepared at 11:00am (Irish time) on 31 December 2014 and 2013. These valuations are based on prices and include investment transactions up to 11:00am
(Irish time) on 31 December 2014 or as at close of business on 30 December 2014 where the relevant
markets are not yet open for trading. This method is in accordance with the valuation policies outlined in the Company’s prospectus. For financial statement purposes, where the difference between the fair
value of investments as at the valuation point and close of business on the 31 December 2014 is deemed material, the financial statements have been updated. In addition, the impact of dealing in the
Company’s shares on 31 December 2014 and 2013 is incorporated in the financial statements for all
funds. There is no impact on the NAV per share from these transactions. A table showing the reconciliation to the published NAV and the impact on the NAV per share is included in Note 11 for
the 4 funds impacted by the material valuation point pricing differences.
All references to net assets throughout this document refer to net assets attributable to redeemable
participating shareholders unless otherwise stated.
NEW ACCOUNTING STANDARDS, AMENDMENTS AND INTERPRETATIONS EFFECTIVE AFTER
1 JANUARY 2014
IFRS 10 Consolidated Financial Statements
IFRS 10, ‘Consolidated financial statements’, effective for annual periods beginning on or after 1
January 2014, builds on existing principles by identifying the concept of control as the determining factor in whether an entity should be included within the consolidated financial statements of the parent
company. The standard provides additional guidance to assist in the determination of control where this
is difficult to assess. The new standard is not expected to have any impact on the Company’s financial position or performance.
IFRS 12 Disclosures of interests in other entities
IFRS 12, ‘Disclosures of interests in other entities’, effective for annual periods beginning on or after 1
January 2014, includes the disclosure requirements for all forms of interests in other entities, including joint arrangements, associates, special purpose vehicles and other off Statement of Financial Position
vehicles. The new standard is not expected to have any impact on the Company’s financial position or
performance. ACCOUNTING STANDARDS AND AMENDMENTS TO EXISTING ACCOUNTING STANDARDS IN ISSUE BUT
NOT YET EFFECTIVE AND NOT ADOPTED EARLY
IFRS 9 Financial Instruments
IFRS 9, ‘Financial instruments’ (effective from 1 January 2018), published in July 2014, will replace
the existing guidance in IAS 39. It includes revised guidance on the classification and measurement of financial instruments, including a new expected credit loss model for calculating impairment on
financial assets, and the new general hedge accounting requirements. It also carries forward the
guidance on recognition and derecognition of financial instruments from IAS 39.
IFRS 9 is effective for annual reporting periods beginning on or after 1 January 2018, with early
adoption permitted. Based on the initial assessment, this standard is not expected to have a material impact on the Company.
FIRST STATE GLOBAL UMBRELLA FUND PLC
NOTES FORMING PART OF THE FINANCIAL STATEMENTS FOR THE YEAR ENDED
31 DECEMBER 2014 (CONTINUED)
315
2. PRINCIPAL ACCOUNTING POLICIES (CONTINUED)
(b) FINANCIAL ASSETS AND LIABILITIES DESIGNATED AT FAIR VALUE THROUGH PROFIT OR LOSS
The Company has designated its investments as the financial assets and liabilities designated at fair value through profit or loss. There are two categories of investments:
Financial assets and liabilities held for trading – these are acquired or incurred principally for
the purpose of selling or repurchasing in the short term, and
Financial assets and financial liabilities designated by management at fair value through profit or loss at inception – these are financial instruments that are not classified as held for trading,
but are managed and their performance is evaluated on a fair value basis in accordance with the
Company’s documented investment strategy.
All investments have been categorised as financial assets and liabilities designated at fair value through profit or loss at inception.
Purchases and sales of investments are recognised on the trade date – the date on which the Company commits to purchase or sell the asset. Investments are initially recognised at fair value and are
derecognised when the rights to receive cash flows from the investments have expired or the Company
has transferred substantially all risks and rewards of ownership. Subsequent to initial recognition, all financial assets and financial liabilities designated at fair value through profit or loss are measured at
fair value. Gains and losses arising from changes in the fair value of the ‘financial assets or financial
liabilities designated at fair value through profit or loss’ category are included in the Statement of Comprehensive Income in the year in which they arise with the realised gains and losses calculated
using a First-in, First-out (“FIFO”) method.
Fair value is the price that would be received to sell an asset or paid to transfer a liability in an orderly
transaction between market participants at the measurement date. The fair value of financial assets and liabilities of securities listed or dealt in on a regulated market shall be valued on the basis of the last
traded price available at the year end date. Where a security is listed or dealt in on more than one
regulated market, the Directors may at their absolute discretion, select any of these regulated markets for such purposes. The Company utilises the last traded market price for both financial assets and
liabilities where the last traded price is within the bid-ask spread. In circumstances where the last traded
price is not within the bid-ask spread, management will determine the point within the bid-ask spread that is most representative of fair value.
The Board of Directors has appointed a fair value committee to ascertain the value of relevant securities
in the event that market prices are unavailable, that they do not represent probable realisation value or are not listed.
Futures contracts are recorded on the trade date and are valued at the applicable 11.00 a.m. mid prices on the last business day of the period. Forward foreign exchange contracts are recorded on the trade
date and are valued at the applicable foreign exchange rates on the last business day of the period.
Interest rate swaps and credit default swaps are valued at estimated fair values as determined by the swap counterparties. Warrants are recorded as an asset or liability at their fair value and are valued at
the quoted market prices at the year end date. Certificates of deposit investments are based on the
underlying cash originally invested in the certificate which approximates fair value.
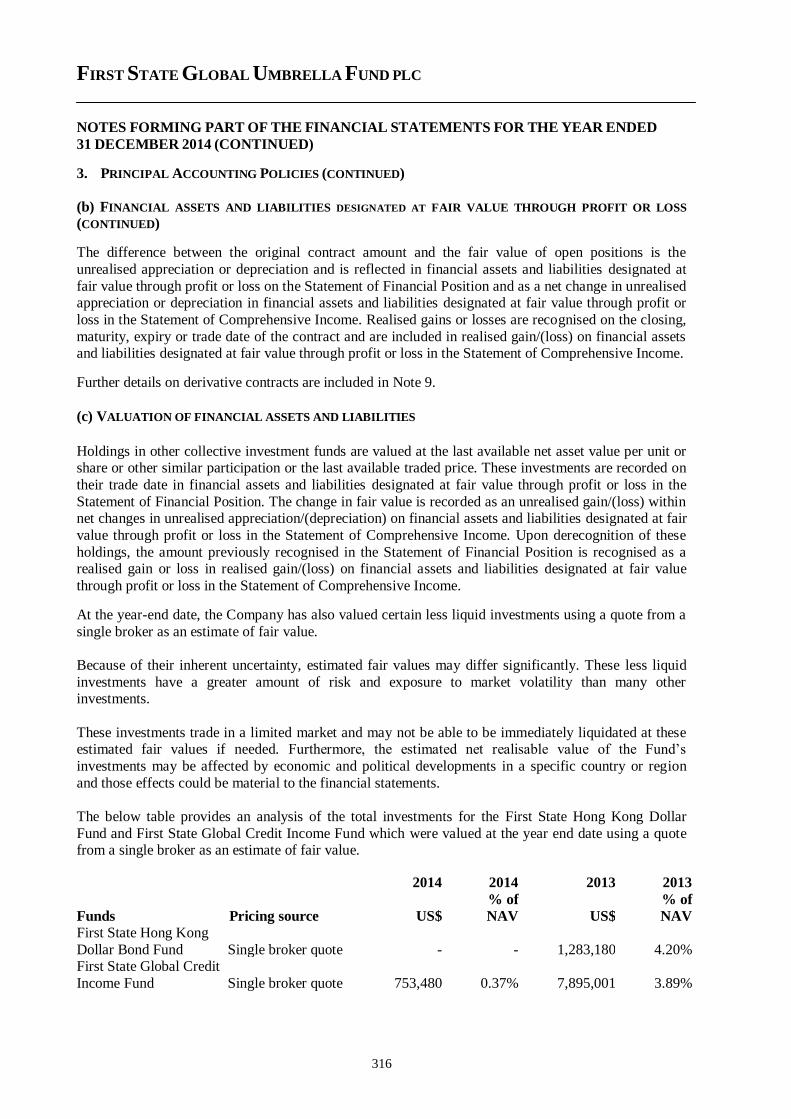
FIRST STATE GLOBAL UMBRELLA FUND PLC
NOTES FORMING PART OF THE FINANCIAL STATEMENTS FOR THE YEAR ENDED
31 DECEMBER 2014 (CONTINUED)
316
3. PRINCIPAL ACCOUNTING POLICIES (CONTINUED)
(b) FINANCIAL ASSETS AND LIABILITIES DESIGNATED AT FAIR VALUE THROUGH PROFIT OR LOSS
(CONTINUED)
The difference between the original contract amount and the fair value of open positions is the
unrealised appreciation or depreciation and is reflected in financial assets and liabilities designated at
fair value through profit or loss on the Statement of Financial Position and as a net change in unrealised appreciation or depreciation in financial assets and liabilities designated at fair value through profit or
loss in the Statement of Comprehensive Income. Realised gains or losses are recognised on the closing,
maturity, expiry or trade date of the contract and are included in realised gain/(loss) on financial assets and liabilities designated at fair value through profit or loss in the Statement of Comprehensive Income.
Further details on derivative contracts are included in Note 9.
(c) VALUATION OF FINANCIAL ASSETS AND LIABILITIES
Holdings in other collective investment funds are valued at the last available net asset value per unit or share or other similar participation or the last available traded price. These investments are recorded on
their trade date in financial assets and liabilities designated at fair value through profit or loss in the
Statement of Financial Position. The change in fair value is recorded as an unrealised gain/(loss) within net changes in unrealised appreciation/(depreciation) on financial assets and liabilities designated at fair
value through profit or loss in the Statement of Comprehensive Income. Upon derecognition of these
holdings, the amount previously recognised in the Statement of Financial Position is recognised as a realised gain or loss in realised gain/(loss) on financial assets and liabilities designated at fair value
through profit or loss in the Statement of Comprehensive Income.
At the year-end date, the Company has also valued certain less liquid investments using a quote from a
single broker as an estimate of fair value.
Because of their inherent uncertainty, estimated fair values may differ significantly. These less liquid
investments have a greater amount of risk and exposure to market volatility than many other investments.
These investments trade in a limited market and may not be able to be immediately liquidated at these estimated fair values if needed. Furthermore, the estimated net realisable value of the Fund’s
investments may be affected by economic and political developments in a specific country or region
and those effects could be material to the financial statements.
The below table provides an analysis of the total investments for the First State Hong Kong Dollar
Fund and First State Global Credit Income Fund which were valued at the year end date using a quote from a single broker as an estimate of fair value.
2014 2014 2013 2013
Funds Pricing source US$
% of
NAV US$
% of
NAV
First State Hong Kong
Dollar Bond Fund Single broker quote - - 1,283,180 4.20% First State Global Credit
Income Fund Single broker quote 753,480 0.37% 7,895,001 3.89%
FIRST STATE GLOBAL UMBRELLA FUND PLC
NOTES FORMING PART OF THE FINANCIAL STATEMENTS FOR THE YEAR ENDED
31 DECEMBER 2014 (CONTINUED)
317
2. PRINCIPAL ACCOUNTING POLICIES (CONTINUED)
(d) OFFSETTING FINANCIAL INSTRUMENTS
Financial assets and liabilities are offset and the net amount reported in the Statement of Financial
Position when there is a legally enforceable right to set-off recognised amounts and there is an intention to settle on a net basis or realise the assets and settle the liability simultaneously.
(e) FOREIGN CURRENCY TRANSLATION
(i) Functional and presentation currency
The Board of Directors considers the US Dollar the currency that most faithfully represents the
economic effect of the underlying transactions, events and conditions. The US Dollar is the currency in which the Company measures its performance and reports its results, as well as the currency in which it
principally receives subscriptions and redemptions from its investors. The Company has also adopted
the US Dollar as its presentation currency.
(ii) Transactions and balances
Monetary assets and liabilities denominated in currencies other than the presentation currency are
translated into the presentation currency at the closing rates of exchange at year end. Transactions during the year, including purchases and sales of securities, income and expenses, are translated at the
rate of exchange prevailing on the date of the transaction. Foreign exchange gains and losses arising
from translation are included in the Statement of Comprehensive Income. Foreign exchange gains/losses relating to cash and cash equivalents are presented in Statement of Comprehensive Income
within “Net (Loss)/Gain on foreign exchange” and foreign exchange gains/losses relating to financial
assets and liabilities carried at fair value through profit or loss are presented in Statement of Comprehensive Income within “Net Changes in Unrealised Appreciation/(Depreciation) on financial
assets and liabilities designated at fair value through profit or loss”.
(f) INCOME
Interest income/expenses are recognised in the Statement of Comprehensive Income for all debt
instruments using the effective interest method. The effective interest method is a method of calculating the amortised cost of a financial asset or financial liability and of allocating the interest income or
interest expense over the relevant period. The effective interest rate is the rate that exactly discounts
estimated future cash payments or receipts throughout the expected life of the financial instrument, or a shorter period where appropriate, to the net carrying amount of the financial asset or liability. When
calculating the effective interest rate, the Company estimates cash flows considering all contractual
terms of the financial instrument but does not consider future credit losses. The calculation includes all fees and points paid or received between parties to the contract that are an integral part of the effective
interest rate, transaction costs and all other premiums or discounts.
Dividend income is credited to the Statement of Comprehensive Income on the date on which the
relevant securities are listed as “ex-dividend”. Dividend income is shown gross of any non-recoverable withholding taxes, which are disclosed separately in the Statement of Comprehensive Income, and net
of any tax credits.
(g) EXPENSES
Expenses are accounted for on an accruals basis and are charged to the Statement of Comprehensive Income when incurred.
FIRST STATE GLOBAL UMBRELLA FUND PLC
NOTES FORMING PART OF THE FINANCIAL STATEMENTS FOR THE YEAR ENDED
31 DECEMBER 2014 (CONTINUED)
318
2. PRINCIPAL ACCOUNTING POLICIES (CONTINUED)
(h) CASH AND CASH EQUIVALENTS
Cash and cash equivalents include cash in hand, deposits held at call with banks and bank overdrafts. Cash and cash equivalents will be valued at their face value with the relevant interest accrued and
charged to the Statement of Comprehensive Income when incurred.
(i) DUE TO AND FROM BROKERS
Amounts due to/from brokers represent payables for investments purchased and receivables for
securities sold that have been contracted for but not yet delivered or settled by the end of the year.
These amounts are recognised initially at fair value and subsequently measured at amortised cost using
the effective interest method, less provision for impairment for amounts due from brokers. A provision
for impairment of amounts due from brokers is established when there is objective evidence that the Company will not be able to collect all amounts due from the relevant broker. Significant financial
difficulties of the broker, probability that the broker will enter bankruptcy or financial reorganisation,
and defaults in payments are considered indicators that the amount due from brokers is impaired. Once a financial asset or group of similar financial assets has been written down as a result of an impairment
loss, interest income is recognised using the rate of interest used to discount the future cash flows for
the purpose of measuring the impairment loss.
(j) DISTRIBUTIONS TO HOLDERS OF REDEEMABLE PARTICIPATING SHARES
Distributions to holders of redeemable participating shares are recognised in the Statement of
Comprehensive Income as finance costs when they are appropriately authorised and no longer at the
discretion of the Company.
Dividends may be paid out of net revenue (including interest and dividends) plus realised and unrealised profits on the disposal/valuation of investments and other funds, less realised and unrealised
losses (including fees and expenses).
In the case of monthly distributing share classes, the monthly dividend rate per share is calculated by
the Investment Manager and any fees and expenses relating to these share classes are charged against
capital. In maintaining a regular monthly dividend payment, a Fund may at times pay dividend out of capital of the Fund instead of income which may have different tax implications from the payment of
dividends out of income and may also result in an erosion of the capital invested.
FIRST STATE GLOBAL UMBRELLA FUND PLC
NOTES FORMING PART OF THE FINANCIAL STATEMENTS FOR THE YEAR ENDED
31 DECEMBER 2014 (CONTINUED)
319
2. PRINCIPAL ACCOUNTING POLICIES (CONTINUED)
(k) REDEEMABLE PARTICIPATING SHARES
The Company issues redeemable participating shares, which are redeemable at the holder’s option and are
classified as financial liabilities. Redeemable participating shares can be put back to the Company at any
time for cash equal to a proportionate share of the Company’s net asset value. The redeemable share is carried at the redemption amount that is payable at the Statement of Financial Position date if the holder
exercises the right to put the share back to the Company.
Redeemable participating shares are issued and redeemed at the holder’s option at prices based on the Company’s net asset value per share at the time of issue or redemption. The Company’s net asset value
per share is calculated by dividing the net assets attributable to the holders of redeemable participating
shares with the total number of outstanding redeemable participating shares. In accordance with the provisions of the Company’s Articles of Association, investment positions are valued based on the last
traded price for the purpose of determining the net asset value per share for subscriptions and
redemptions.
The Company has minimum initial investment, minimum subsequent investment amounts and
minimum holdings in relation to each share class as detailed in the prospectus. In the interests of shareholder protection, the Directors may limit the number of participating shares of any Fund
redeemed on any dealing day to 10% of the total number of participating shares of that Fund in issue.
The limitation will apply pro rata to all shareholders wishing to redeem the participating shares on that dealing day. The participating shares not redeemed but which would otherwise have been redeemed
will be carried forward for redemption on the next and successive dealing day and will be dealt with in
priority to redemption requests received subsequently. The relevant movements are shown on the Statement of Changes in Net Assets Attributable to Participating Shareholders.
Each Fund will maintain an equalisation account with a view to ensuring that the level of dividends payable on shares (or the reportable income arising in respect of any class approved as a reporting Fund)
is not affected by the issue and redemption of such shares during an accounting period. The
subscription price of such shares will therefore be deemed to include an equalisation payment calculated by reference to the accrued income of the Fund and the equalisation payment will be
refunded to the shareholders as part of their first distribution, but for tax purposes will be treated as a
return of capital. The redemption price of each share will also include an equalisation payment in respect of the accrued income of the Fund up to the date of redemption.
(l) TAXATION
Under current law and practice the Company qualifies as an investment undertaking as defined in Section 739B of the Taxes Consolidation Act, 1997, as amended. On that basis, it is not chargeable to
Irish tax on its income or gains.
FIRST STATE GLOBAL UMBRELLA FUND PLC
NOTES FORMING PART OF THE FINANCIAL STATEMENTS FOR THE YEAR ENDED
31 DECEMBER 2014 (CONTINUED)
320
(l) TAXATION
However, Irish tax may arise on the happening of a "chargeable event". A chargeable event includes
any distribution payments to shareholders, any encashment, redemption, cancellation or transfer of
shares and any deemed disposal of shares for Irish tax purposes arising as a result of the holding of shares for an eight year period or more. No Irish tax will arise on the Company in respect of chargeable
events in respect of:
(a) a shareholder who is neither Irish resident nor ordinarily resident in Ireland for tax purposes, at the time of the chargeable event, provided appropriate valid declarations in accordance with the provisions
of the Taxes Consolidation Act, 1997, as amended, are held by the Company or the Company has been
authorised by the Irish Revenue to make gross payments in the absence of appropriate declarations and such authorisation has not been withdrawn; and
(b) certain exempted Irish tax resident shareholders who have provided the Company with the necessary signed statutory declarations.
Dividends, interest and capital gains (if any) received on investments made by the Company may be subject to withholding taxes imposed by the country from which the investment income/gains are
received and such taxes may not be recoverable by the Company or its shareholders.
(m) TRANSACTION COSTS
Transaction costs are incremental costs, which are separately identifiable and directly attributable to the
acquisition, issue or disposal of a financial asset or financial liability. Transaction costs for all financial assets carried at fair value through profit and loss are included in the Statement of Comprehensive
Income. These include fees and commissions paid to brokers and counterparties and have been
classified within gains and losses. Transaction fees paid to the Custodian on trade settlement are expensed as incurred and included in the Statement of Comprehensive Income. Transaction costs are
detailed in Note 6.
(n) COLLATERAL
Cash collateral provided by the Company is identified in the Statement of Financial Position as margin
cash and is not included as a component of cash and cash equivalents. For collateral other than cash, if
the party to whom the collateral is provided has the right by contract or custom to sell or re-pledge the collateral, the Fund classifies that asset in its statement of financial position separately from other assets
and identifies the asset as pledged collateral. Where the party to whom the collateral is provided does
not have the right to sell or re-pledge, a disclosure of the collateral provided is made in the notes to the financial statements.
As at 31 December 2014 and 31 December 2013, there was no collateral held by the Funds other than cash.
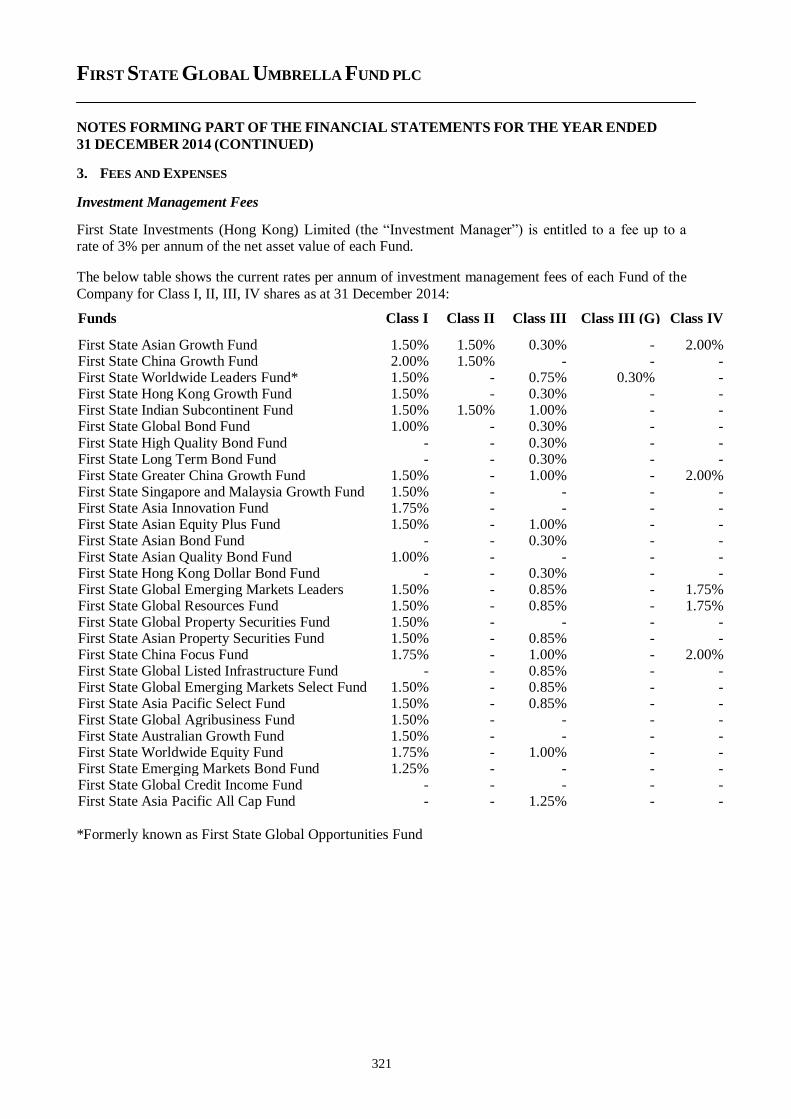
FIRST STATE GLOBAL UMBRELLA FUND PLC
NOTES FORMING PART OF THE FINANCIAL STATEMENTS FOR THE YEAR ENDED
31 DECEMBER 2014 (CONTINUED)
321
3. FEES AND EXPENSES
Investment Management Fees
First State Investments (Hong Kong) Limited (the “Investment Manager”) is entitled to a fee up to a rate of 3% per annum of the net asset value of each Fund.
The below table shows the current rates per annum of investment management fees of each Fund of the
Company for Class I, II, III, IV shares as at 31 December 2014:
Funds Class I Class II Class III Class III (G) Class IV First State Asian Growth Fund 1.50% 1.50% 0.30% - 2.00% First State China Growth Fund 2.00% 1.50% - - - First State Worldwide Leaders Fund* 1.50% - 0.75% 0.30% - First State Hong Kong Growth Fund 1.50% - 0.30% - - First State Indian Subcontinent Fund 1.50% 1.50% 1.00% - - First State Global Bond Fund 1.00% - 0.30% - - First State High Quality Bond Fund - - 0.30% - - First State Long Term Bond Fund - - 0.30% - - First State Greater China Growth Fund 1.50% - 1.00% - 2.00% First State Singapore and Malaysia Growth Fund 1.50% - - - - First State Asia Innovation Fund 1.75% - - - - First State Asian Equity Plus Fund 1.50% - 1.00% - - First State Asian Bond Fund - - 0.30% - - First State Asian Quality Bond Fund 1.00% - - - - First State Hong Kong Dollar Bond Fund - - 0.30% - - First State Global Emerging Markets Leaders
Fund
1.50% - 0.85% - 1.75% First State Global Resources Fund 1.50% - 0.85% - 1.75% First State Global Property Securities Fund 1.50% - - - - First State Asian Property Securities Fund 1.50% - 0.85% - - First State China Focus Fund 1.75% - 1.00% - 2.00% First State Global Listed Infrastructure Fund - - 0.85% - - First State Global Emerging Markets Select Fund 1.50% - 0.85% - - First State Asia Pacific Select Fund 1.50% - 0.85% - - First State Global Agribusiness Fund 1.50% - - - - First State Australian Growth Fund 1.50% - - - - First State Worldwide Equity Fund 1.75% - 1.00% - - First State Emerging Markets Bond Fund 1.25% - - - - First State Global Credit Income Fund - - - - - First State Asia Pacific All Cap Fund - - 1.25% - -
*Formerly known as First State Global Opportunities Fund
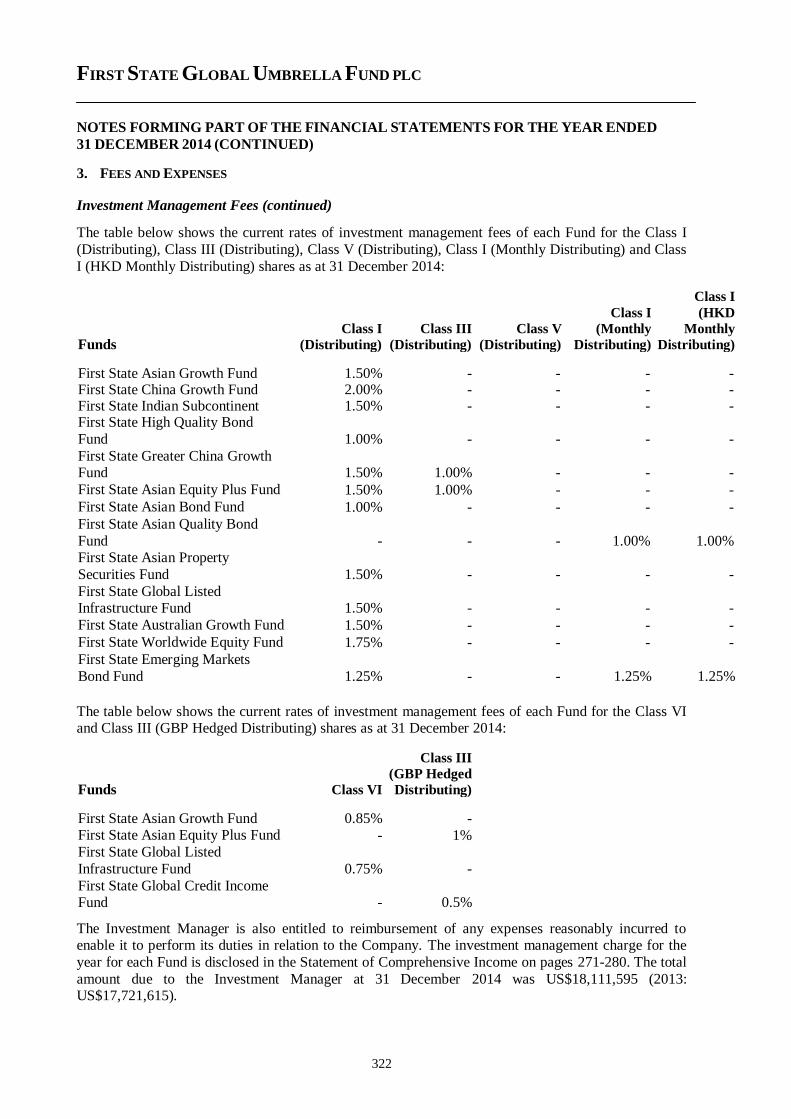
FIRST STATE GLOBAL UMBRELLA FUND PLC
NOTES FORMING PART OF THE FINANCIAL STATEMENTS FOR THE YEAR ENDED
31 DECEMBER 2014 (CONTINUED)
322
3. FEES AND EXPENSES
Investment Management Fees (continued)
The table below shows the current rates of investment management fees of each Fund for the Class I
(Distributing), Class III (Distributing), Class V (Distributing), Class I (Monthly Distributing) and Class
I (HKD Monthly Distributing) shares as at 31 December 2014:
Funds Class I
(Distributing) Class III
(Distributing)
Class V
(Distributing)
Class I
(Monthly
Distributing)
Class I
(HKD
Monthly
Distributing)
First State Asian Growth Fund 1.50% - - - - First State China Growth Fund 2.00% - - - - First State Indian Subcontinent
Fund
1.50% - - - - First State High Quality Bond
Fund 1.00% - - - -
First State Greater China Growth Fund 1.50% 1.00% - - -
First State Asian Equity Plus Fund 1.50% 1.00% - - -
First State Asian Bond Fund 1.00% - - - -
First State Asian Quality Bond
Fund - - - 1.00% 1.00% First State Asian Property
Securities Fund 1.50% - - - -
First State Global Listed Infrastructure Fund 1.50% - - - -
First State Australian Growth Fund 1.50% - - - -
First State Worldwide Equity Fund 1.75% - - - -
First State Emerging Markets
Bond Fund 1.25% - - 1.25% 1.25%
The table below shows the current rates of investment management fees of each Fund for the Class VI and Class III (GBP Hedged Distributing) shares as at 31 December 2014:
Funds Class VI
Class III
(GBP Hedged
Distributing)
First State Asian Growth Fund 0.85% - First State Asian Equity Plus Fund - 1% First State Global Listed
Infrastructure Fund 0.75% -
First State Global Credit Income Fund - 0.5%
The Investment Manager is also entitled to reimbursement of any expenses reasonably incurred to enable it to perform its duties in relation to the Company. The investment management charge for the
year for each Fund is disclosed in the Statement of Comprehensive Income on pages 271-280. The total
amount due to the Investment Manager at 31 December 2014 was US$18,111,595 (2013: US$17,721,615).
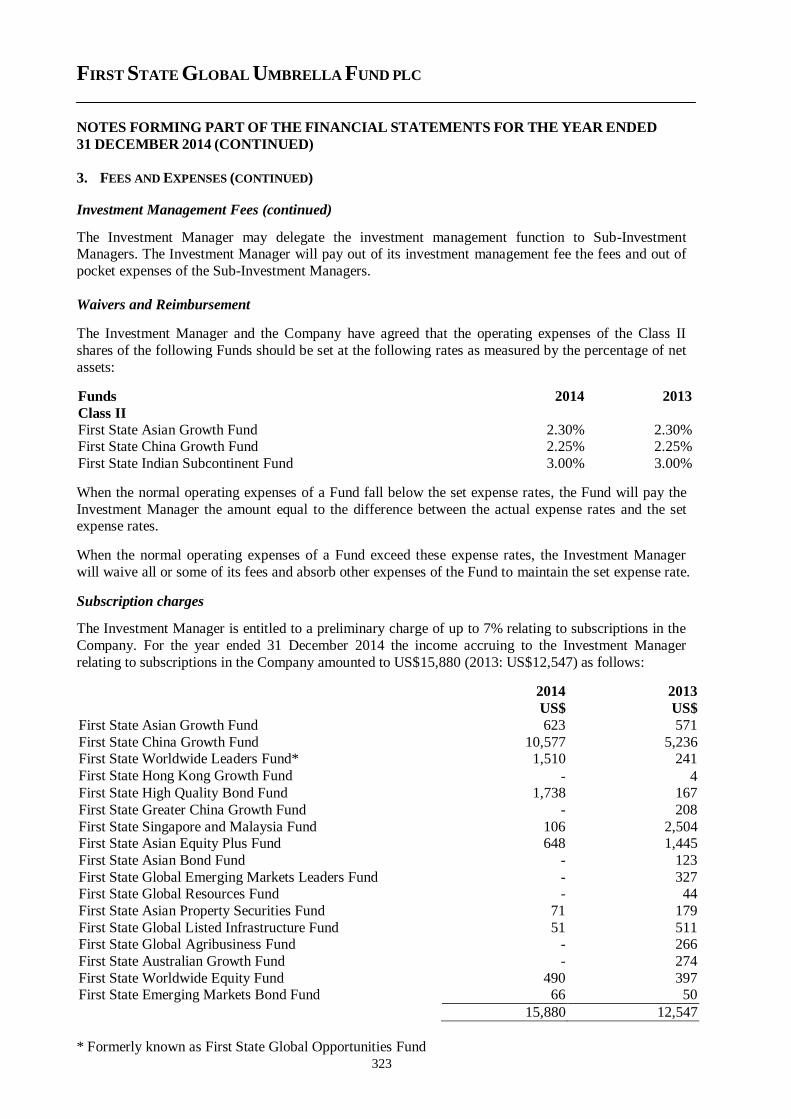
FIRST STATE GLOBAL UMBRELLA FUND PLC
NOTES FORMING PART OF THE FINANCIAL STATEMENTS FOR THE YEAR ENDED
31 DECEMBER 2014 (CONTINUED)
323
3. FEES AND EXPENSES (CONTINUED)
Investment Management Fees (continued)
The Investment Manager may delegate the investment management function to Sub-Investment Managers. The Investment Manager will pay out of its investment management fee the fees and out of
pocket expenses of the Sub-Investment Managers.
Waivers and Reimbursement
The Investment Manager and the Company have agreed that the operating expenses of the Class II
shares of the following Funds should be set at the following rates as measured by the percentage of net
assets:
Funds 2014 2013
Class II
First State Asian Growth Fund 2.30% 2.30% First State China Growth Fund 2.25% 2.25%
First State Indian Subcontinent Fund 3.00% 3.00%
When the normal operating expenses of a Fund fall below the set expense rates, the Fund will pay the
Investment Manager the amount equal to the difference between the actual expense rates and the set expense rates.
When the normal operating expenses of a Fund exceed these expense rates, the Investment Manager
will waive all or some of its fees and absorb other expenses of the Fund to maintain the set expense rate.
Subscription charges
The Investment Manager is entitled to a preliminary charge of up to 7% relating to subscriptions in the
Company. For the year ended 31 December 2014 the income accruing to the Investment Manager
relating to subscriptions in the Company amounted to US$15,880 (2013: US$12,547) as follows:
2014 2013
US$ US$
First State Asian Growth Fund 623 571
First State China Growth Fund 10,577 5,236 First State Worldwide Leaders Fund* 1,510 241
First State Hong Kong Growth Fund - 4 First State High Quality Bond Fund 1,738 167
First State Greater China Growth Fund - 208
First State Singapore and Malaysia Fund 106 2,504 First State Asian Equity Plus Fund 648 1,445
First State Asian Bond Fund - 123
First State Global Emerging Markets Leaders Fund - 327 First State Global Resources Fund - 44
First State Asian Property Securities Fund 71 179
First State Global Listed Infrastructure Fund 51 511 First State Global Agribusiness Fund - 266
First State Australian Growth Fund - 274
First State Worldwide Equity Fund 490 397 First State Emerging Markets Bond Fund 66 50
15,880 12,547
* Formerly known as First State Global Opportunities Fund
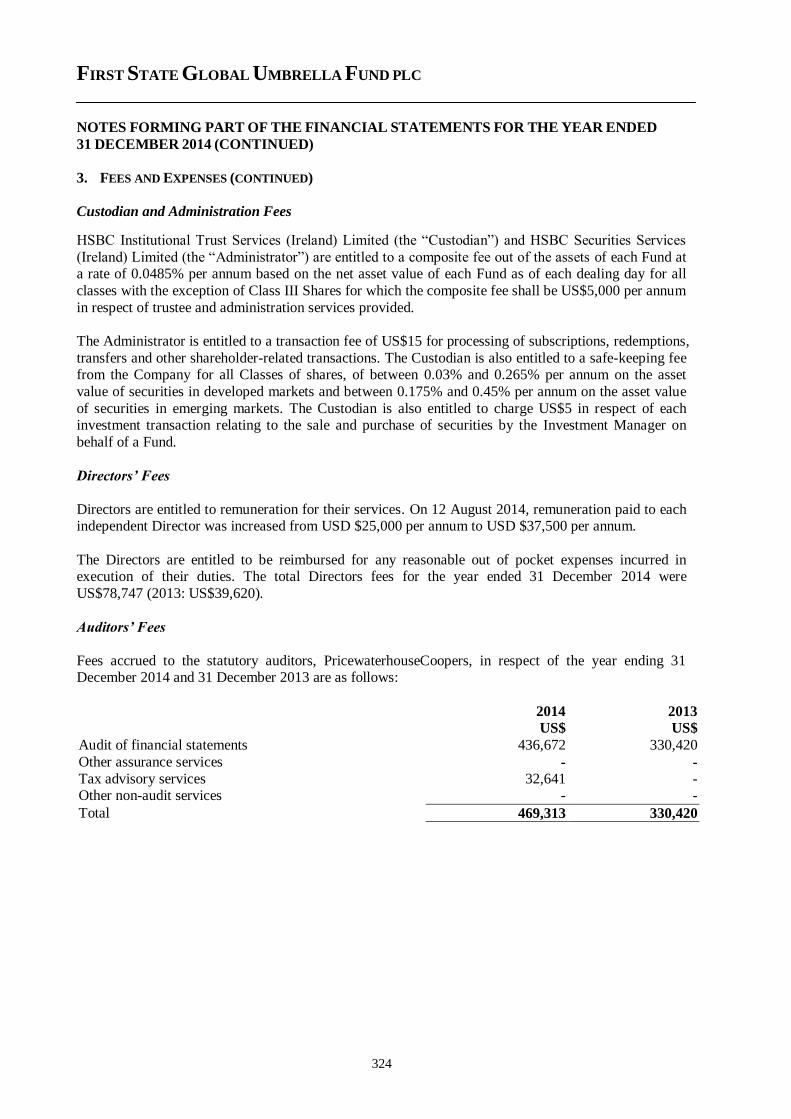
FIRST STATE GLOBAL UMBRELLA FUND PLC
NOTES FORMING PART OF THE FINANCIAL STATEMENTS FOR THE YEAR ENDED
31 DECEMBER 2014 (CONTINUED)
324
3. FEES AND EXPENSES (CONTINUED)
Custodian and Administration Fees
HSBC Institutional Trust Services (Ireland) Limited (the “Custodian”) and HSBC Securities Services
(Ireland) Limited (the “Administrator”) are entitled to a composite fee out of the assets of each Fund at a rate of 0.0485% per annum based on the net asset value of each Fund as of each dealing day for all
classes with the exception of Class III Shares for which the composite fee shall be US$5,000 per annum
in respect of trustee and administration services provided.
The Administrator is entitled to a transaction fee of US$15 for processing of subscriptions, redemptions,
transfers and other shareholder-related transactions. The Custodian is also entitled to a safe-keeping fee from the Company for all Classes of shares, of between 0.03% and 0.265% per annum on the asset
value of securities in developed markets and between 0.175% and 0.45% per annum on the asset value
of securities in emerging markets. The Custodian is also entitled to charge US$5 in respect of each investment transaction relating to the sale and purchase of securities by the Investment Manager on
behalf of a Fund.
Directors’ Fees
Directors are entitled to remuneration for their services. On 12 August 2014, remuneration paid to each independent Director was increased from USD $25,000 per annum to USD $37,500 per annum.
The Directors are entitled to be reimbursed for any reasonable out of pocket expenses incurred in execution of their duties. The total Directors fees for the year ended 31 December 2014 were
US$78,747 (2013: US$39,620).
Auditors’ Fees
Fees accrued to the statutory auditors, PricewaterhouseCoopers, in respect of the year ending 31 December 2014 and 31 December 2013 are as follows:
2014 2013 US$ US$
Audit of financial statements 436,672 330,420
Other assurance services - -
Tax advisory services 32,641 - Other non-audit services - -
Total 469,313 330,420
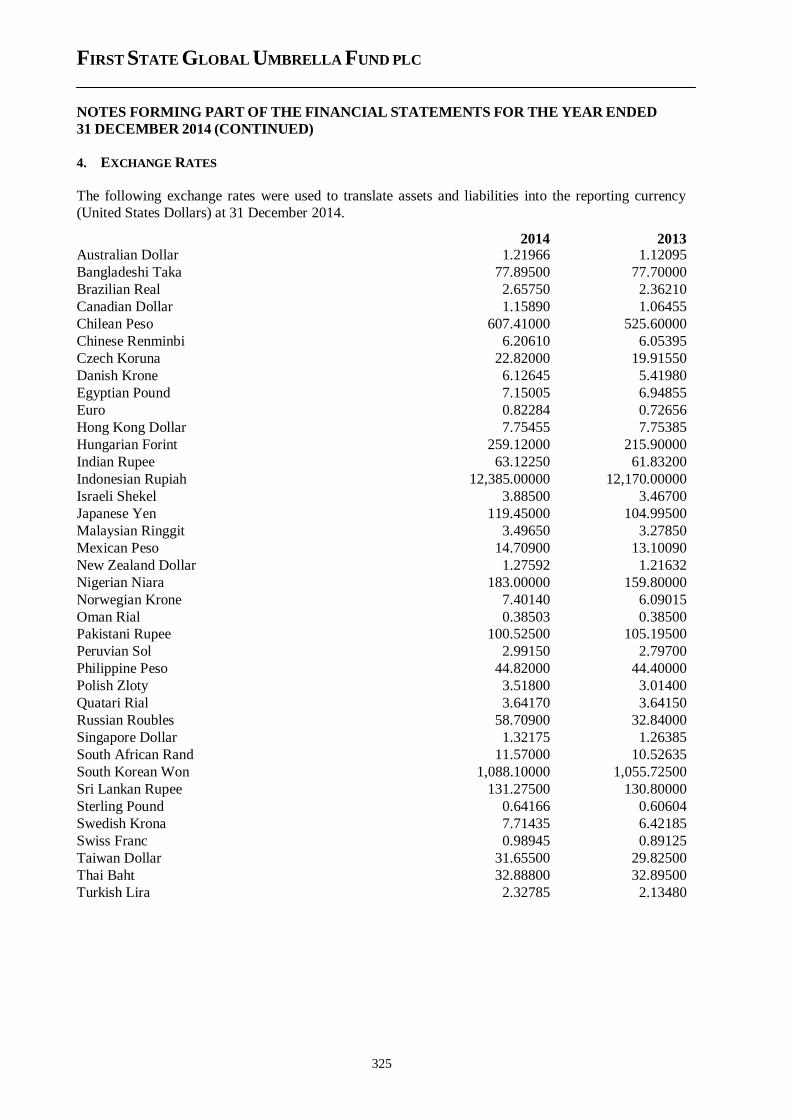
FIRST STATE GLOBAL UMBRELLA FUND PLC
NOTES FORMING PART OF THE FINANCIAL STATEMENTS FOR THE YEAR ENDED
31 DECEMBER 2014 (CONTINUED)
325
4. EXCHANGE RATES
The following exchange rates were used to translate assets and liabilities into the reporting currency
(United States Dollars) at 31 December 2014.
2014 2013 Australian Dollar 1.21966
1.12095
Bangladeshi Taka 77.89500 77.70000
Brazilian Real 2.65750 2.36210
Canadian Dollar 1.15890 1.06455
Chilean Peso 607.41000 525.60000
Chinese Renminbi 6.20610 6.05395
Czech Koruna 22.82000 19.91550
Danish Krone 6.12645 5.41980
Egyptian Pound 7.15005 6.94855
Euro 0.82284 0.72656
Hong Kong Dollar 7.75455 7.75385
Hungarian Forint 259.12000 215.90000
Indian Rupee 63.12250 61.83200
Indonesian Rupiah 12,385.00000 12,170.00000
Israeli Shekel 3.88500 3.46700
Japanese Yen 119.45000 104.99500
Malaysian Ringgit 3.49650 3.27850
Mexican Peso 14.70900 13.10090
New Zealand Dollar 1.27592 1.21632
Nigerian Niara
183.00000 159.80000
Norwegian Krone 7.40140 6.09015
Oman Rial 0.38503 0.38500
Pakistani Rupee 100.52500 105.19500
Peruvian Sol 2.99150 2.79700
Philippine Peso 44.82000 44.40000
Polish Zloty 3.51800 3.01400
Quatari Rial
3.64170 3.64150
Russian Roubles 58.70900 32.84000
Singapore Dollar 1.32175 1.26385
South African Rand 11.57000 10.52635
South Korean Won 1,088.10000 1,055.72500
Sri Lankan Rupee 131.27500 130.80000
Sterling Pound 0.64166 0.60604
Swedish Krona 7.71435 6.42185
Swiss Franc 0.98945 0.89125
Taiwan Dollar 31.65500 29.82500
Thai Baht 32.88800 32.89500
Turkish Lira 2.32785 2.13480
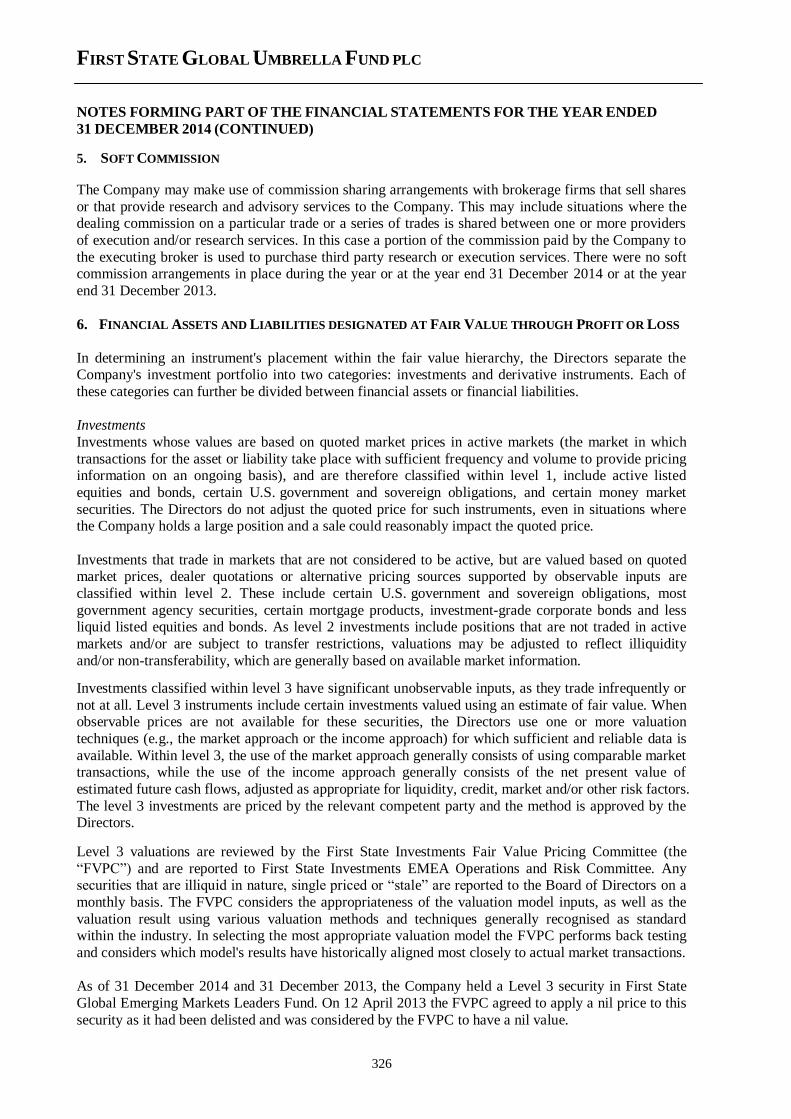
FIRST STATE GLOBAL UMBRELLA FUND PLC
NOTES FORMING PART OF THE FINANCIAL STATEMENTS FOR THE YEAR ENDED
31 DECEMBER 2014 (CONTINUED)
326
5. SOFT COMMISSION
The Company may make use of commission sharing arrangements with brokerage firms that sell shares
or that provide research and advisory services to the Company. This may include situations where the dealing commission on a particular trade or a series of trades is shared between one or more providers
of execution and/or research services. In this case a portion of the commission paid by the Company to
the executing broker is used to purchase third party research or execution services. There were no soft commission arrangements in place during the year or at the year end 31 December 2014 or at the year
end 31 December 2013.
6. FINANCIAL ASSETS AND LIABILITIES DESIGNATED AT FAIR VALUE THROUGH PROFIT OR LOSS
In determining an instrument's placement within the fair value hierarchy, the Directors separate the Company's investment portfolio into two categories: investments and derivative instruments. Each of
these categories can further be divided between financial assets or financial liabilities.
Investments
Investments whose values are based on quoted market prices in active markets (the market in which
transactions for the asset or liability take place with sufficient frequency and volume to provide pricing information on an ongoing basis), and are therefore classified within level 1, include active listed
equities and bonds, certain U.S. government and sovereign obligations, and certain money market
securities. The Directors do not adjust the quoted price for such instruments, even in situations where the Company holds a large position and a sale could reasonably impact the quoted price.
Investments that trade in markets that are not considered to be active, but are valued based on quoted market prices, dealer quotations or alternative pricing sources supported by observable inputs are
classified within level 2. These include certain U.S. government and sovereign obligations, most
government agency securities, certain mortgage products, investment-grade corporate bonds and less liquid listed equities and bonds. As level 2 investments include positions that are not traded in active
markets and/or are subject to transfer restrictions, valuations may be adjusted to reflect illiquidity
and/or non-transferability, which are generally based on available market information.
Investments classified within level 3 have significant unobservable inputs, as they trade infrequently or
not at all. Level 3 instruments include certain investments valued using an estimate of fair value. When observable prices are not available for these securities, the Directors use one or more valuation
techniques (e.g., the market approach or the income approach) for which sufficient and reliable data is
available. Within level 3, the use of the market approach generally consists of using comparable market transactions, while the use of the income approach generally consists of the net present value of
estimated future cash flows, adjusted as appropriate for liquidity, credit, market and/or other risk factors.
The level 3 investments are priced by the relevant competent party and the method is approved by the Directors.
Level 3 valuations are reviewed by the First State Investments Fair Value Pricing Committee (the
“FVPC”) and are reported to First State Investments EMEA Operations and Risk Committee. Any securities that are illiquid in nature, single priced or “stale” are reported to the Board of Directors on a
monthly basis. The FVPC considers the appropriateness of the valuation model inputs, as well as the
valuation result using various valuation methods and techniques generally recognised as standard within the industry. In selecting the most appropriate valuation model the FVPC performs back testing
and considers which model's results have historically aligned most closely to actual market transactions.
As of 31 December 2014 and 31 December 2013, the Company held a Level 3 security in First State
Global Emerging Markets Leaders Fund. On 12 April 2013 the FVPC agreed to apply a nil price to this
security as it had been delisted and was considered by the FVPC to have a nil value.
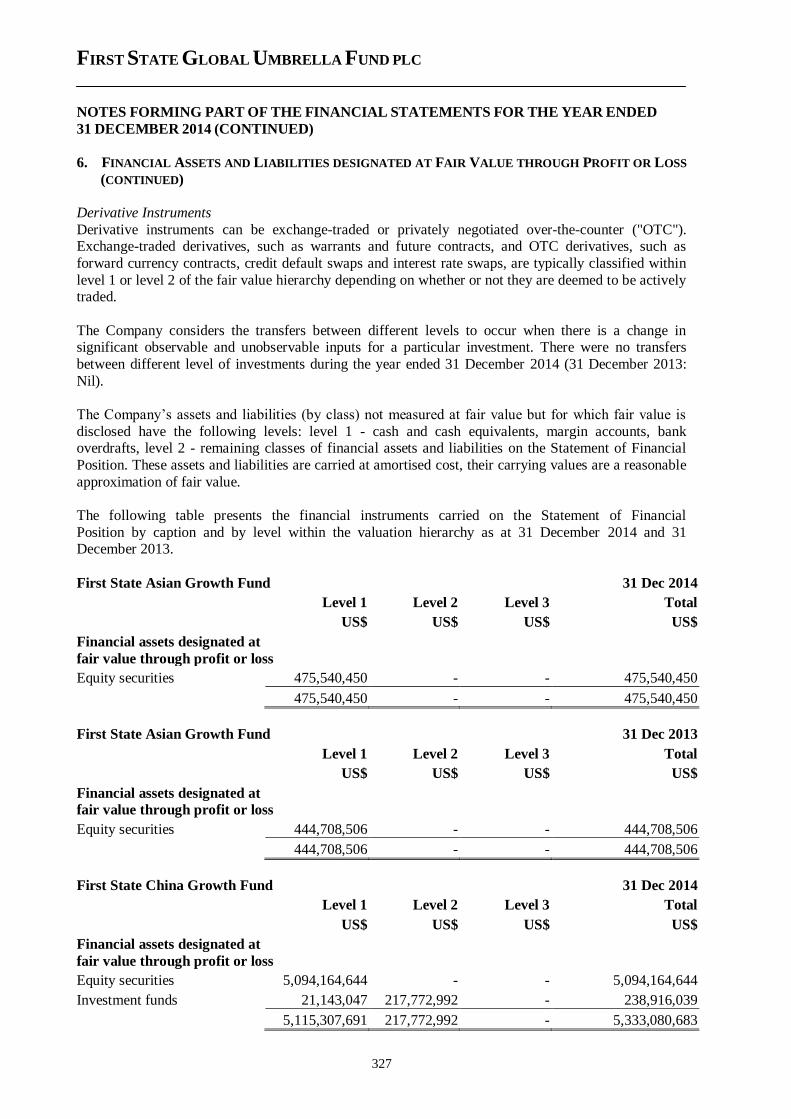
FIRST STATE GLOBAL UMBRELLA FUND PLC
NOTES FORMING PART OF THE FINANCIAL STATEMENTS FOR THE YEAR ENDED
31 DECEMBER 2014 (CONTINUED)
327
6. FINANCIAL ASSETS AND LIABILITIES DESIGNATED AT FAIR VALUE THROUGH PROFIT OR LOSS
(CONTINUED)
Derivative Instruments
Derivative instruments can be exchange-traded or privately negotiated over-the-counter ("OTC"). Exchange-traded derivatives, such as warrants and future contracts, and OTC derivatives, such as
forward currency contracts, credit default swaps and interest rate swaps, are typically classified within
level 1 or level 2 of the fair value hierarchy depending on whether or not they are deemed to be actively traded.
The Company considers the transfers between different levels to occur when there is a change in significant observable and unobservable inputs for a particular investment. There were no transfers
between different level of investments during the year ended 31 December 2014 (31 December 2013:
Nil).
The Company’s assets and liabilities (by class) not measured at fair value but for which fair value is
disclosed have the following levels: level 1 - cash and cash equivalents, margin accounts, bank overdrafts, level 2 - remaining classes of financial assets and liabilities on the Statement of Financial
Position. These assets and liabilities are carried at amortised cost, their carrying values are a reasonable
approximation of fair value.
The following table presents the financial instruments carried on the Statement of Financial
Position by caption and by level within the valuation hierarchy as at 31 December 2014 and 31 December 2013.
First State Asian Growth Fund 31 Dec 2014
Level 1 Level 2 Level 3 Total
US$ US$ US$ US$
Financial assets designated at
fair value through profit or loss
Equity securities 475,540,450 - - 475,540,450
475,540,450 - - 475,540,450
First State Asian Growth Fund 31 Dec 2013
Level 1 Level 2 Level 3 Total
US$ US$ US$ US$
Financial assets designated at
fair value through profit or loss
Equity securities 444,708,506 - - 444,708,506
444,708,506 - - 444,708,506
First State China Growth Fund 31 Dec 2014
Level 1 Level 2 Level 3 Total
US$ US$ US$ US$
Financial assets designated at
fair value through profit or loss
Equity securities 5,094,164,644 - - 5,094,164,644
Investment funds 21,143,047 217,772,992 - 238,916,039
5,115,307,691 217,772,992 - 5,333,080,683
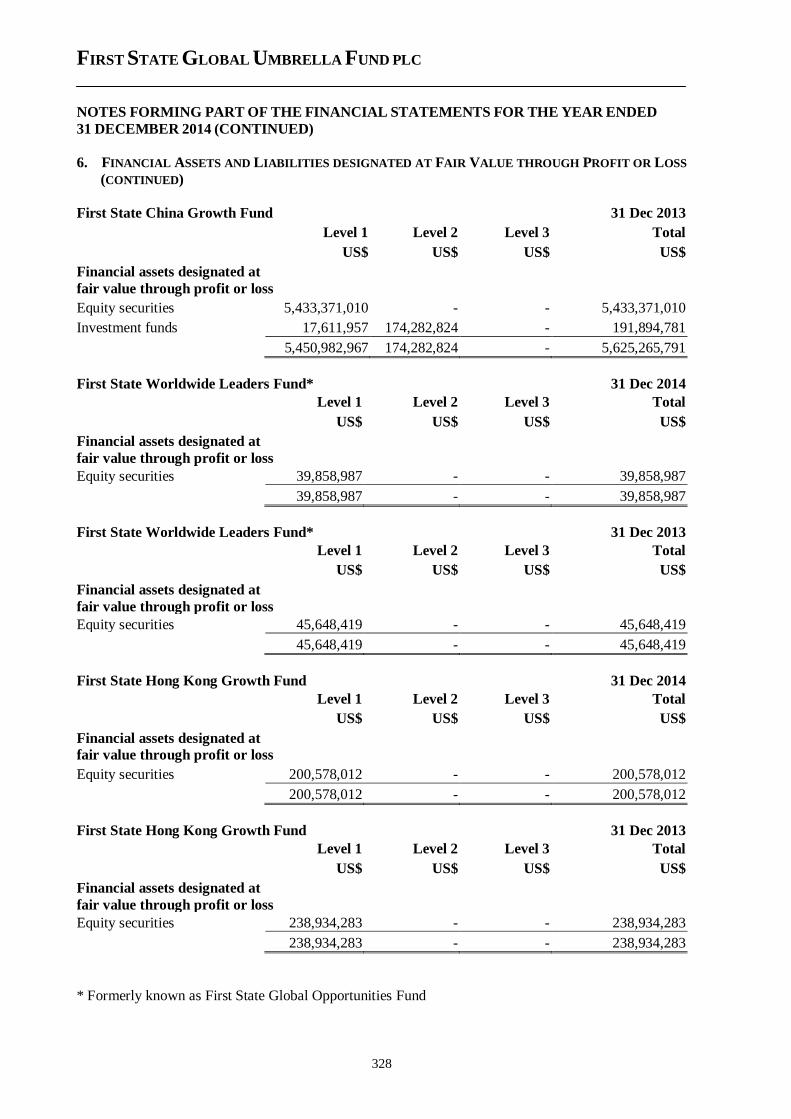
FIRST STATE GLOBAL UMBRELLA FUND PLC
NOTES FORMING PART OF THE FINANCIAL STATEMENTS FOR THE YEAR ENDED
31 DECEMBER 2014 (CONTINUED)
328
6. FINANCIAL ASSETS AND LIABILITIES DESIGNATED AT FAIR VALUE THROUGH PROFIT OR LOSS
(CONTINUED)
First State China Growth Fund 31 Dec 2013
Level 1 Level 2 Level 3 Total
US$ US$ US$ US$
Financial assets designated at
fair value through profit or loss
Equity securities 5,433,371,010 - - 5,433,371,010
Investment funds 17,611,957 174,282,824 - 191,894,781
5,450,982,967 174,282,824 - 5,625,265,791
First State Worldwide Leaders Fund* 31 Dec 2014
Level 1 Level 2 Level 3 Total
US$ US$ US$ US$
Financial assets designated at
fair value through profit or loss
Equity securities 39,858,987 - - 39,858,987
39,858,987 - - 39,858,987
First State Worldwide Leaders Fund* 31 Dec 2013
Level 1 Level 2 Level 3 Total
US$ US$ US$ US$
Financial assets designated at
fair value through profit or loss
Equity securities 45,648,419 - - 45,648,419
45,648,419 - - 45,648,419
First State Hong Kong Growth Fund 31 Dec 2014
Level 1 Level 2 Level 3 Total
US$ US$ US$ US$
Financial assets designated at
fair value through profit or loss
Equity securities 200,578,012 - - 200,578,012
200,578,012 - - 200,578,012
First State Hong Kong Growth Fund 31 Dec 2013
Level 1 Level 2 Level 3 Total
US$ US$ US$ US$
Financial assets designated at
fair value through profit or loss
Equity securities 238,934,283 - - 238,934,283
238,934,283 - - 238,934,283
* Formerly known as First State Global Opportunities Fund
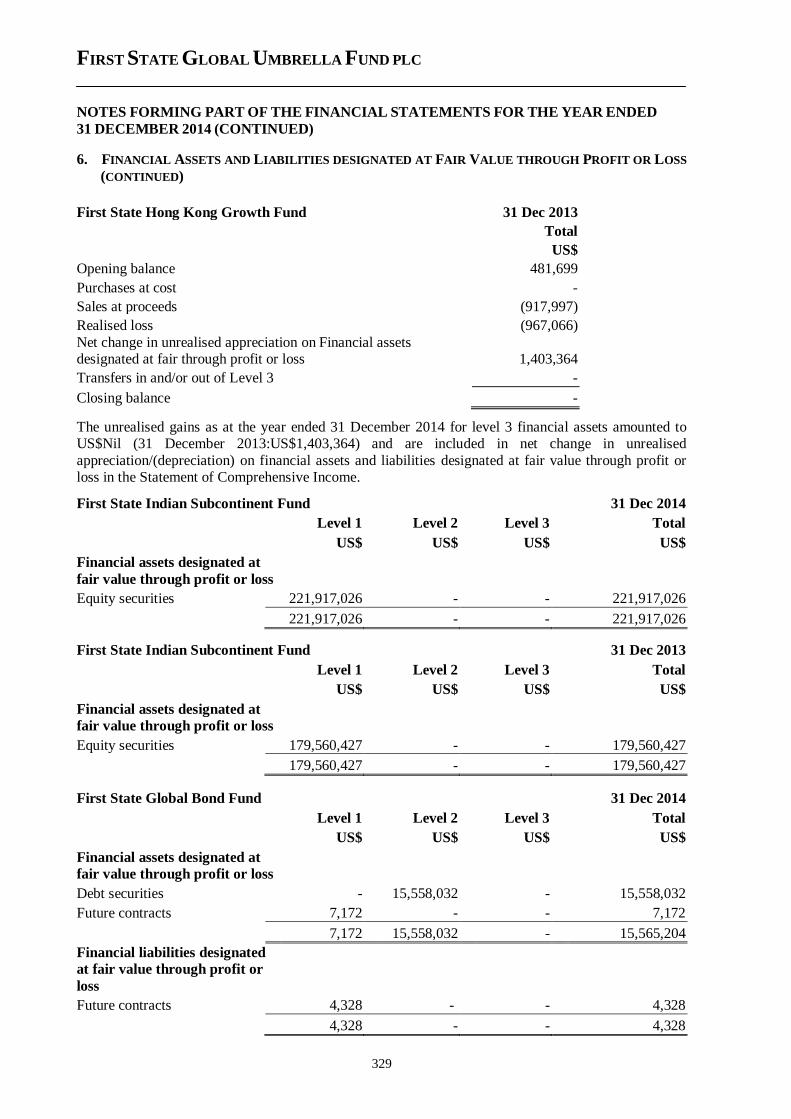
FIRST STATE GLOBAL UMBRELLA FUND PLC
NOTES FORMING PART OF THE FINANCIAL STATEMENTS FOR THE YEAR ENDED
31 DECEMBER 2014 (CONTINUED)
329
6. FINANCIAL ASSETS AND LIABILITIES DESIGNATED AT FAIR VALUE THROUGH PROFIT OR LOSS
(CONTINUED)
First State Hong Kong Growth Fund 31 Dec 2013
Total
US$
Opening balance 481,699
Purchases at cost -
Sales at proceeds (917,997)
Realised loss (967,066)
Net change in unrealised appreciation on Financial assets designated at fair through profit or loss 1,403,364
Transfers in and/or out of Level 3 -
Closing balance -
The unrealised gains as at the year ended 31 December 2014 for level 3 financial assets amounted to US$Nil (31 December 2013:US$1,403,364) and are included in net change in unrealised
appreciation/(depreciation) on financial assets and liabilities designated at fair value through profit or loss in the Statement of Comprehensive Income.
First State Indian Subcontinent Fund 31 Dec 2014
Level 1 Level 2 Level 3 Total
US$ US$ US$ US$
Financial assets designated at
fair value through profit or loss
Equity securities 221,917,026 - - 221,917,026
221,917,026 - - 221,917,026
First State Indian Subcontinent Fund 31 Dec 2013
Level 1 Level 2 Level 3 Total
US$ US$ US$ US$
Financial assets designated at
fair value through profit or loss
Equity securities 179,560,427 - - 179,560,427
179,560,427 - - 179,560,427
First State Global Bond Fund 31 Dec 2014
Level 1 Level 2 Level 3 Total
US$ US$ US$ US$
Financial assets designated at
fair value through profit or loss
Debt securities - 15,558,032 - 15,558,032
Future contracts 7,172 - - 7,172
7,172 15,558,032 - 15,565,204
Financial liabilities designated
at fair value through profit or
loss
Future contracts 4,328 - - 4,328
4,328 - - 4,328
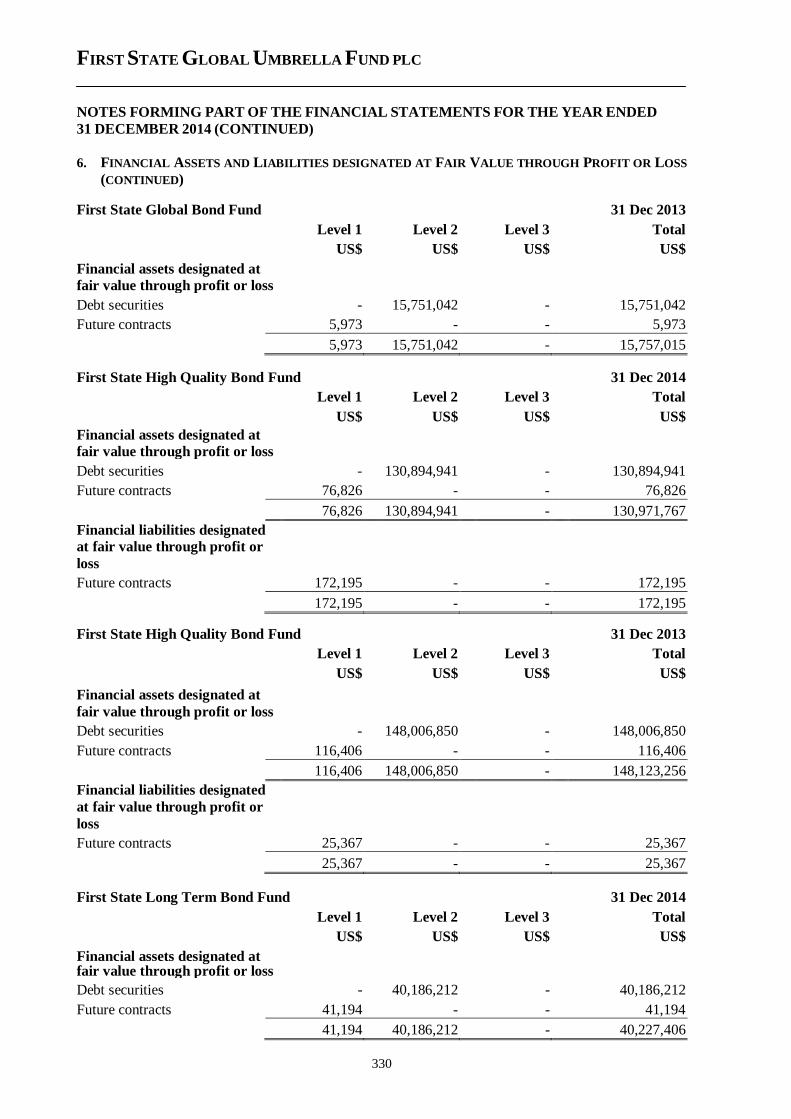
FIRST STATE GLOBAL UMBRELLA FUND PLC
NOTES FORMING PART OF THE FINANCIAL STATEMENTS FOR THE YEAR ENDED
31 DECEMBER 2014 (CONTINUED)
330
6. FINANCIAL ASSETS AND LIABILITIES DESIGNATED AT FAIR VALUE THROUGH PROFIT OR LOSS
(CONTINUED)
First State Global Bond Fund 31 Dec 2013
Level 1 Level 2 Level 3 Total
US$ US$ US$ US$
Financial assets designated at
fair value through profit or loss
Debt securities - 15,751,042 - 15,751,042
Future contracts 5,973 - - 5,973
5,973 15,751,042 - 15,757,015
First State High Quality Bond Fund 31 Dec 2014
Level 1 Level 2 Level 3 Total
US$ US$ US$ US$
Financial assets designated at
fair value through profit or loss
Debt securities - 130,894,941 - 130,894,941
Future contracts 76,826 - - 76,826
76,826 130,894,941 - 130,971,767
Financial liabilities designated
at fair value through profit or
loss
Future contracts 172,195 - - 172,195
172,195 - - 172,195
First State High Quality Bond Fund 31 Dec 2013
Level 1 Level 2 Level 3 Total
US$ US$ US$ US$
Financial assets designated at
fair value through profit or loss
Debt securities - 148,006,850 - 148,006,850
Future contracts 116,406 - - 116,406
116,406 148,006,850 - 148,123,256
Financial liabilities designated
at fair value through profit or
loss
Future contracts 25,367 - - 25,367
25,367 - - 25,367
First State Long Term Bond Fund 31 Dec 2014
Level 1 Level 2 Level 3 Total
US$ US$ US$ US$
Financial assets designated at fair value through profit or loss
Debt securities - 40,186,212 - 40,186,212
Future contracts 41,194 - - 41,194
41,194 40,186,212 - 40,227,406
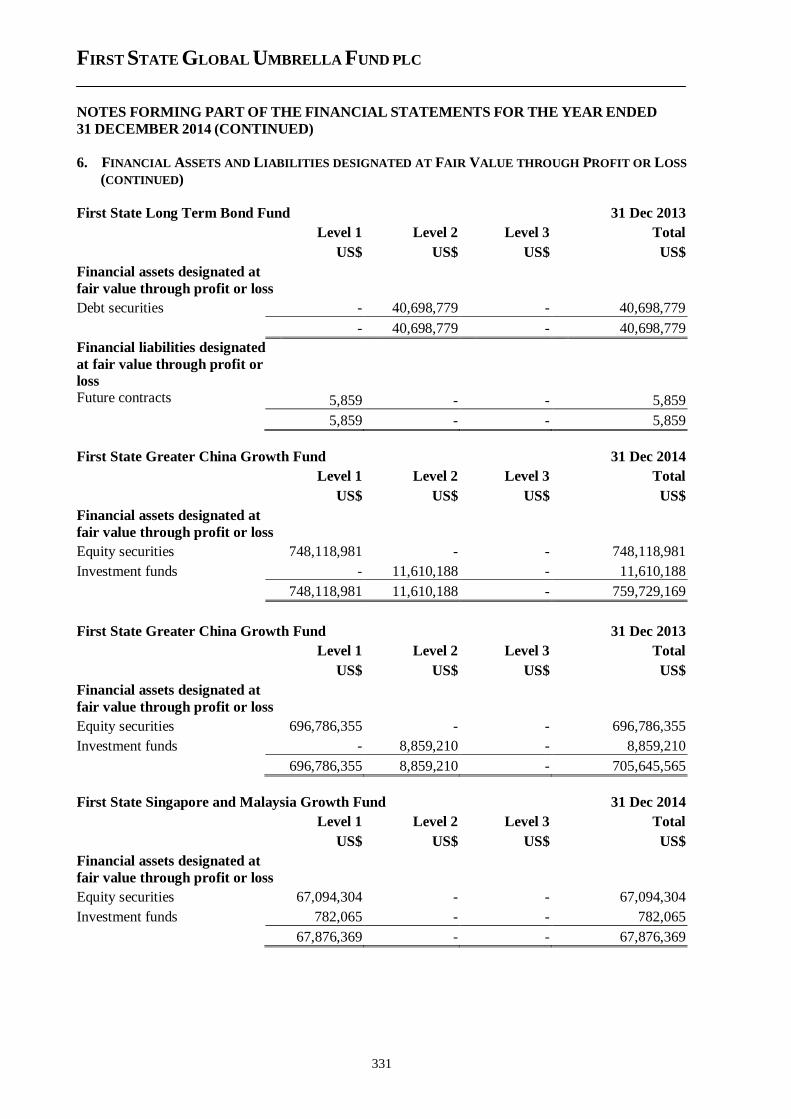
FIRST STATE GLOBAL UMBRELLA FUND PLC
NOTES FORMING PART OF THE FINANCIAL STATEMENTS FOR THE YEAR ENDED
31 DECEMBER 2014 (CONTINUED)
331
6. FINANCIAL ASSETS AND LIABILITIES DESIGNATED AT FAIR VALUE THROUGH PROFIT OR LOSS
(CONTINUED)
First State Long Term Bond Fund 31 Dec 2013
Level 1 Level 2 Level 3 Total
US$ US$ US$ US$
Financial assets designated at
fair value through profit or loss
Debt securities - 40,698,779 - 40,698,779
- 40,698,779 - 40,698,779
Financial liabilities designated
at fair value through profit or
loss
Future contracts 5,859 - - 5,859
5,859 - - 5,859
First State Greater China Growth Fund 31 Dec 2014
Level 1 Level 2 Level 3 Total
US$ US$ US$ US$
Financial assets designated at
fair value through profit or loss
Equity securities 748,118,981 - - 748,118,981
Investment funds - 11,610,188 - 11,610,188
748,118,981 11,610,188 - 759,729,169
First State Greater China Growth Fund 31 Dec 2013
Level 1 Level 2 Level 3 Total
US$ US$ US$ US$
Financial assets designated at
fair value through profit or loss
Equity securities 696,786,355 - - 696,786,355
Investment funds - 8,859,210 - 8,859,210
696,786,355 8,859,210 - 705,645,565
First State Singapore and Malaysia Growth Fund 31 Dec 2014
Level 1 Level 2 Level 3 Total
US$ US$ US$ US$
Financial assets designated at
fair value through profit or loss
Equity securities 67,094,304 - - 67,094,304
Investment funds 782,065 - - 782,065
67,876,369 - - 67,876,369
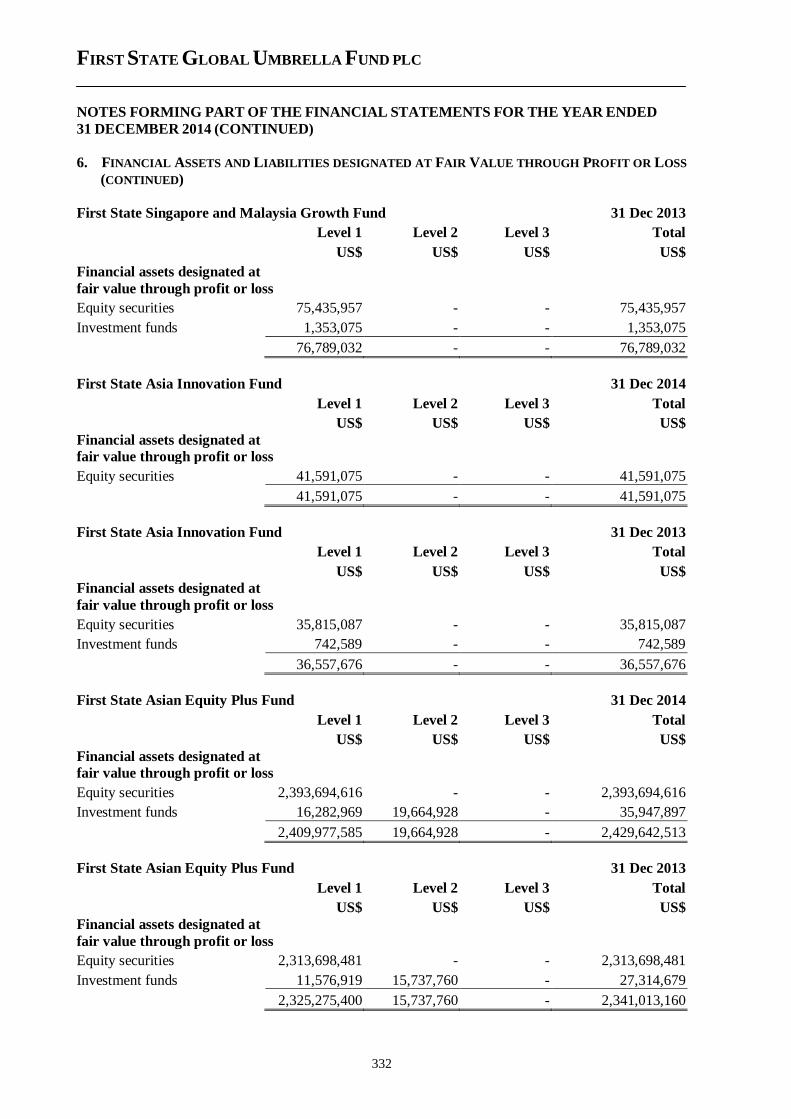
FIRST STATE GLOBAL UMBRELLA FUND PLC
NOTES FORMING PART OF THE FINANCIAL STATEMENTS FOR THE YEAR ENDED
31 DECEMBER 2014 (CONTINUED)
332
6. FINANCIAL ASSETS AND LIABILITIES DESIGNATED AT FAIR VALUE THROUGH PROFIT OR LOSS
(CONTINUED)
First State Singapore and Malaysia Growth Fund 31 Dec 2013
Level 1 Level 2 Level 3 Total
US$ US$ US$ US$
Financial assets designated at
fair value through profit or loss
Equity securities 75,435,957 - - 75,435,957
Investment funds 1,353,075 - - 1,353,075
76,789,032 - - 76,789,032
First State Asia Innovation Fund 31 Dec 2014
Level 1 Level 2 Level 3 Total
US$ US$ US$ US$
Financial assets designated at
fair value through profit or loss
Equity securities 41,591,075 - - 41,591,075
41,591,075 - - 41,591,075
First State Asia Innovation Fund 31 Dec 2013
Level 1 Level 2 Level 3 Total
US$ US$ US$ US$
Financial assets designated at
fair value through profit or loss
Equity securities 35,815,087 - - 35,815,087
Investment funds 742,589 - - 742,589
36,557,676 - - 36,557,676
First State Asian Equity Plus Fund 31 Dec 2014
Level 1 Level 2 Level 3 Total
US$ US$ US$ US$
Financial assets designated at
fair value through profit or loss
Equity securities 2,393,694,616 - - 2,393,694,616
Investment funds 16,282,969 19,664,928 - 35,947,897
2,409,977,585 19,664,928 - 2,429,642,513
First State Asian Equity Plus Fund 31 Dec 2013
Level 1 Level 2 Level 3 Total
US$ US$ US$ US$
Financial assets designated at
fair value through profit or loss
Equity securities 2,313,698,481 - - 2,313,698,481
Investment funds 11,576,919 15,737,760 - 27,314,679
2,325,275,400 15,737,760 - 2,341,013,160
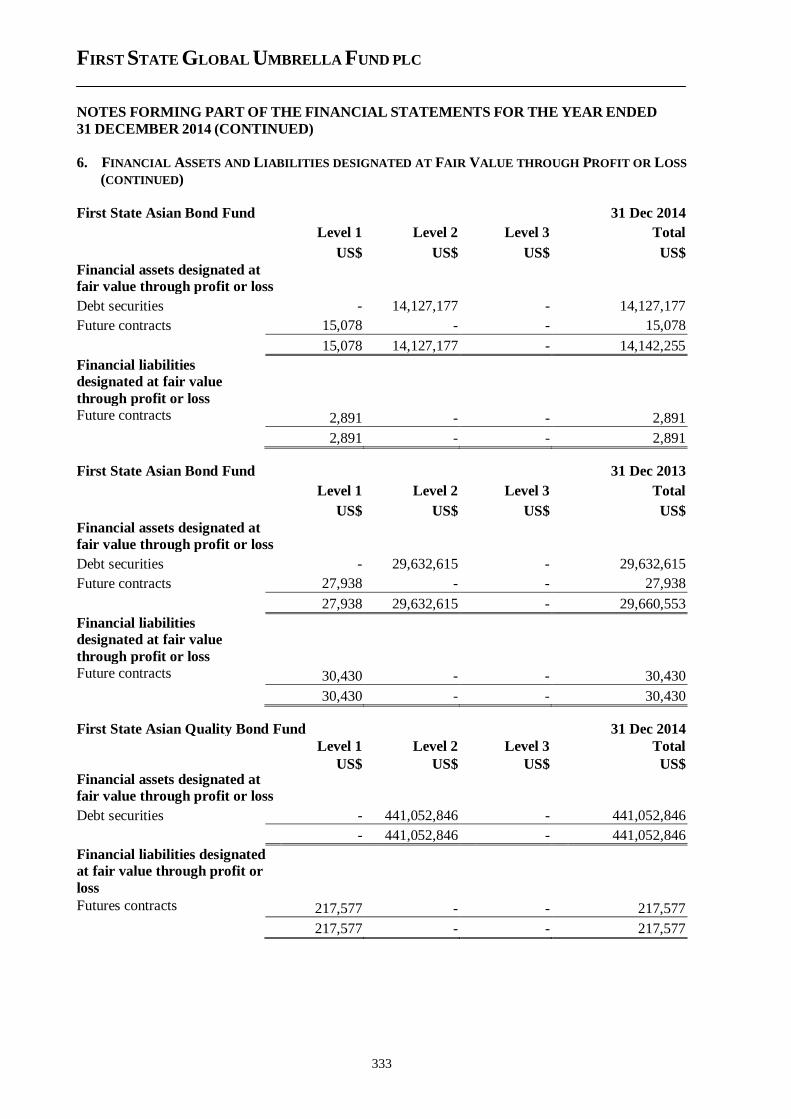
FIRST STATE GLOBAL UMBRELLA FUND PLC
NOTES FORMING PART OF THE FINANCIAL STATEMENTS FOR THE YEAR ENDED
31 DECEMBER 2014 (CONTINUED)
333
6. FINANCIAL ASSETS AND LIABILITIES DESIGNATED AT FAIR VALUE THROUGH PROFIT OR LOSS
(CONTINUED)
First State Asian Bond Fund 31 Dec 2014
Level 1 Level 2 Level 3 Total
US$ US$ US$ US$
Financial assets designated at
fair value through profit or loss
Debt securities - 14,127,177 - 14,127,177
Future contracts 15,078 - - 15,078
15,078 14,127,177 - 14,142,255
Financial liabilities
designated at fair value
through profit or loss
Future contracts 2,891 - - 2,891
2,891 - - 2,891
First State Asian Bond Fund 31 Dec 2013
Level 1 Level 2 Level 3 Total
US$ US$ US$ US$
Financial assets designated at
fair value through profit or loss
Debt securities - 29,632,615 - 29,632,615
Future contracts 27,938 - - 27,938
27,938 29,632,615 - 29,660,553
Financial liabilities
designated at fair value
through profit or loss
Future contracts 30,430 - - 30,430
30,430 - - 30,430
First State Asian Quality Bond Fund 31 Dec 2014 Level 1 Level 2 Level 3 Total
US$ US$ US$ US$ Financial assets designated at
fair value through profit or loss
Debt securities - 441,052,846 - 441,052,846
- 441,052,846 - 441,052,846
Financial liabilities designated
at fair value through profit or
loss
Futures contracts 217,577 - - 217,577
217,577 - - 217,577
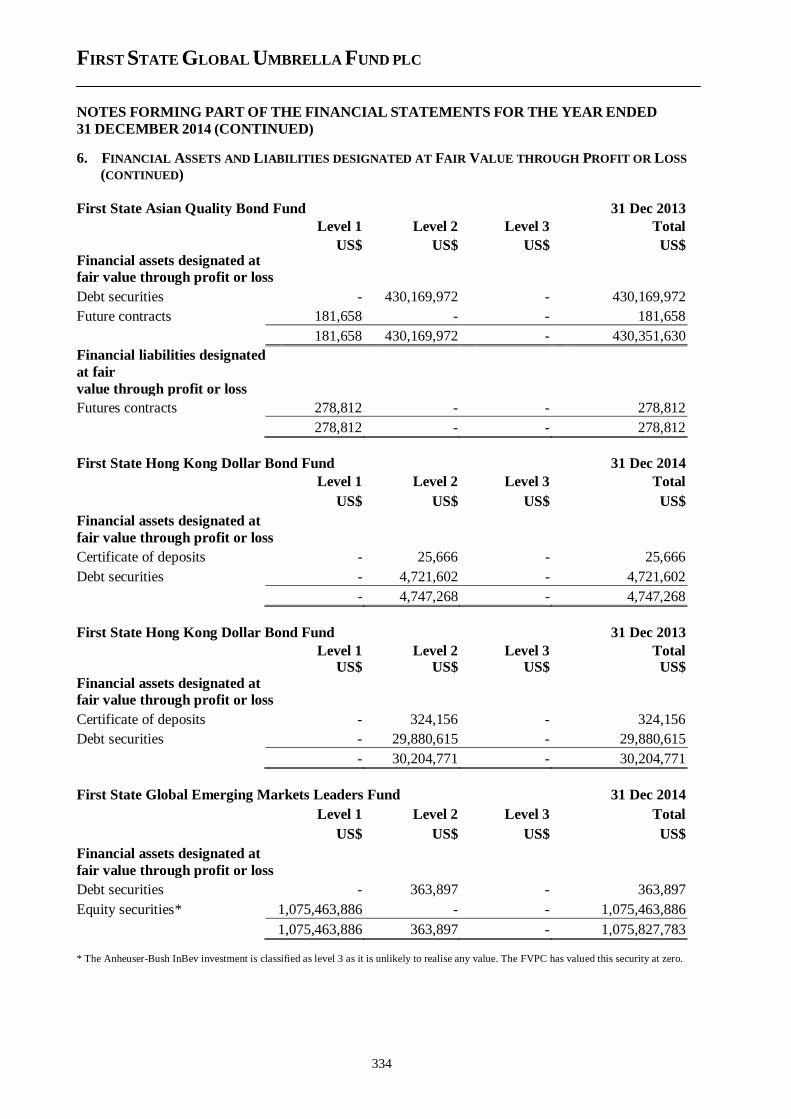
FIRST STATE GLOBAL UMBRELLA FUND PLC
NOTES FORMING PART OF THE FINANCIAL STATEMENTS FOR THE YEAR ENDED
31 DECEMBER 2014 (CONTINUED)
334
6. FINANCIAL ASSETS AND LIABILITIES DESIGNATED AT FAIR VALUE THROUGH PROFIT OR LOSS
(CONTINUED)
First State Asian Quality Bond Fund 31 Dec 2013 Level 1 Level 2 Level 3 Total
US$ US$ US$ US$ Financial assets designated at
fair value through profit or loss
Debt securities - 430,169,972 - 430,169,972
Future contracts 181,658 - - 181,658
181,658 430,169,972 - 430,351,630
Financial liabilities designated
at fair
value through profit or loss
Futures contracts 278,812 - - 278,812
278,812 - - 278,812
First State Hong Kong Dollar Bond Fund 31 Dec 2014
Level 1 Level 2 Level 3 Total
US$ US$ US$ US$
Financial assets designated at
fair value through profit or loss
Certificate of deposits - 25,666 - 25,666
Debt securities - 4,721,602 - 4,721,602
- 4,747,268 - 4,747,268
First State Hong Kong Dollar Bond Fund 31 Dec 2013
Level 1 Level 2 Level 3 Total US$ US$ US$ US$
Financial assets designated at
fair value through profit or loss
Certificate of deposits - 324,156 - 324,156
Debt securities - 29,880,615 - 29,880,615
- 30,204,771 - 30,204,771
First State Global Emerging Markets Leaders Fund 31 Dec 2014
Level 1 Level 2 Level 3 Total
US$ US$ US$ US$
Financial assets designated at
fair value through profit or loss
Debt securities - 363,897 - 363,897
Equity securities* 1,075,463,886 - - 1,075,463,886
1,075,463,886 363,897 - 1,075,827,783
* The Anheuser-Bush InBev investment is classified as level 3 as it is unlikely to realise any value. The FVPC has valued this security at zero.
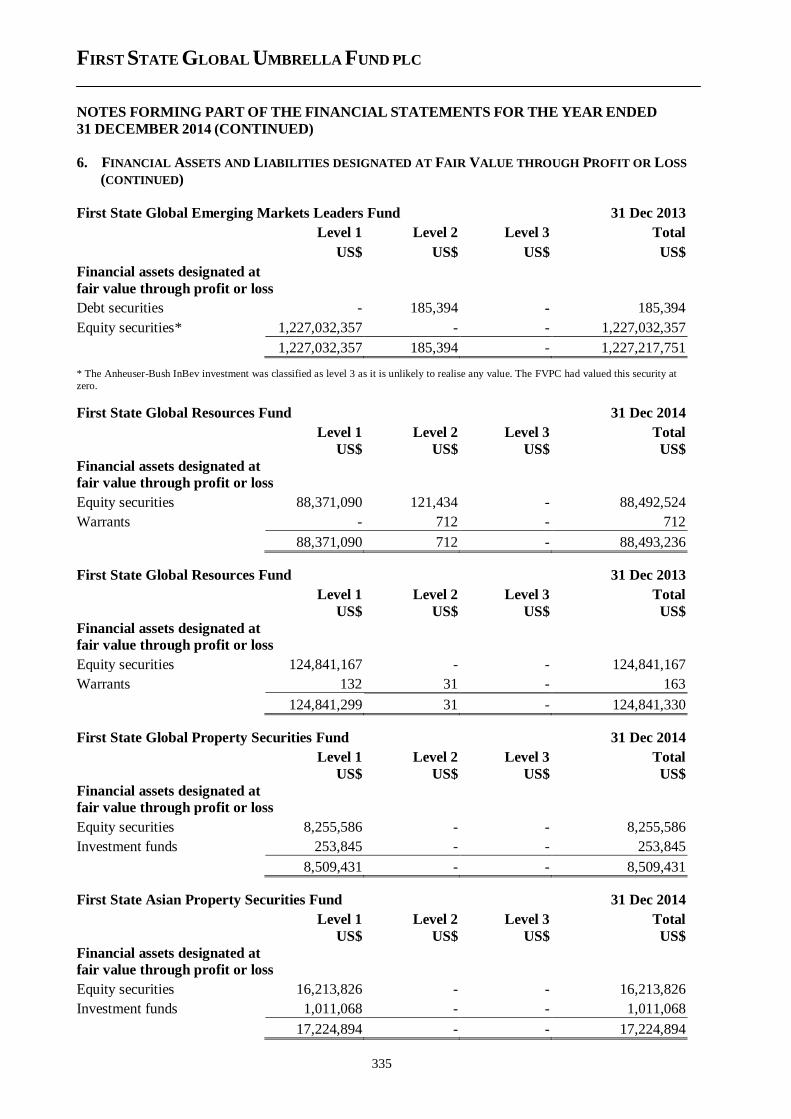
FIRST STATE GLOBAL UMBRELLA FUND PLC
NOTES FORMING PART OF THE FINANCIAL STATEMENTS FOR THE YEAR ENDED
31 DECEMBER 2014 (CONTINUED)
335
6. FINANCIAL ASSETS AND LIABILITIES DESIGNATED AT FAIR VALUE THROUGH PROFIT OR LOSS
(CONTINUED)
First State Global Emerging Markets Leaders Fund 31 Dec 2013
Level 1 Level 2 Level 3 Total
US$ US$ US$ US$
Financial assets designated at
fair value through profit or loss
Debt securities - 185,394 - 185,394
Equity securities* 1,227,032,357 - - 1,227,032,357
1,227,032,357 185,394 - 1,227,217,751
* The Anheuser-Bush InBev investment was classified as level 3 as it is unlikely to realise any value. The FVPC had valued this security at
zero.
First State Global Resources Fund 31 Dec 2014
Level 1 Level 2 Level 3 Total US$ US$ US$ US$
Financial assets designated at
fair value through profit or loss
Equity securities 88,371,090 121,434 - 88,492,524
Warrants - 712 - 712
88,371,090 712 - 88,493,236
First State Global Resources Fund 31 Dec 2013
Level 1 Level 2 Level 3 Total US$ US$ US$ US$
Financial assets designated at
fair value through profit or loss
Equity securities 124,841,167 - - 124,841,167
Warrants 132 31 - 163
124,841,299 31 - 124,841,330
First State Global Property Securities Fund 31 Dec 2014
Level 1 Level 2 Level 3 Total US$ US$ US$ US$
Financial assets designated at
fair value through profit or loss
Equity securities 8,255,586 - - 8,255,586
Investment funds 253,845 - - 253,845
8,509,431 - - 8,509,431
First State Asian Property Securities Fund 31 Dec 2014
Level 1 Level 2 Level 3 Total US$ US$ US$ US$
Financial assets designated at
fair value through profit or loss
Equity securities 16,213,826 - - 16,213,826
Investment funds 1,011,068 - - 1,011,068
17,224,894 - - 17,224,894
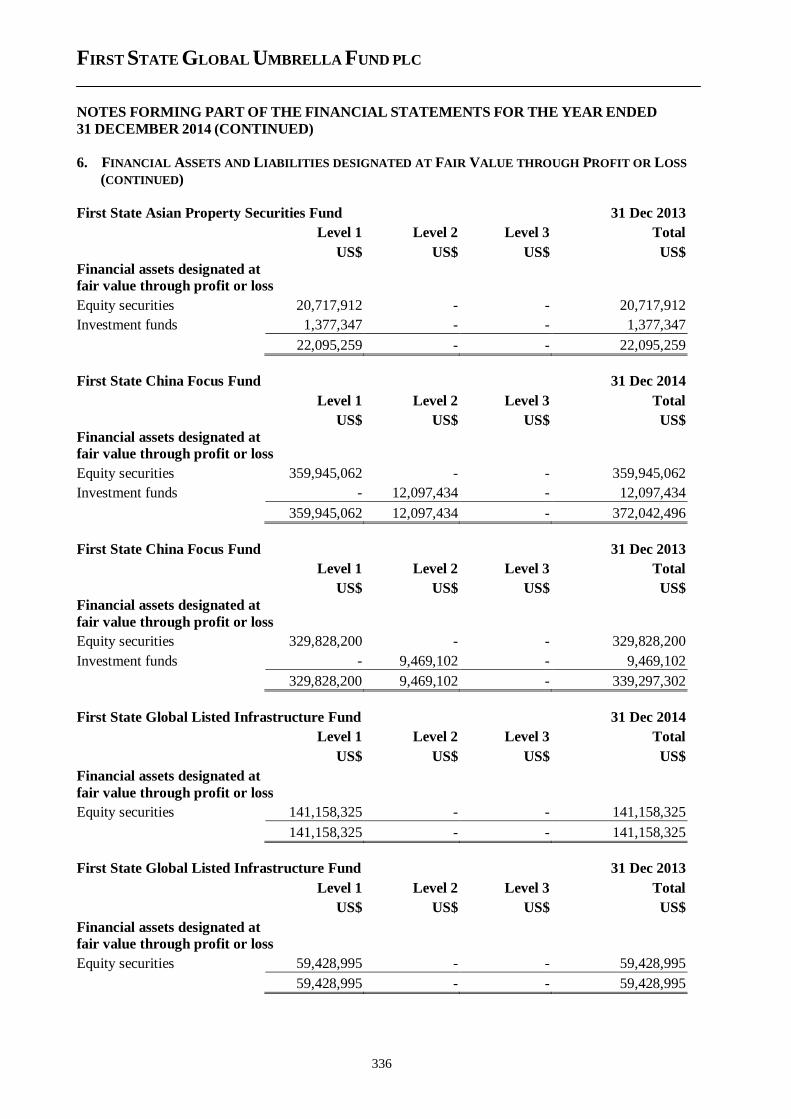
FIRST STATE GLOBAL UMBRELLA FUND PLC
NOTES FORMING PART OF THE FINANCIAL STATEMENTS FOR THE YEAR ENDED
31 DECEMBER 2014 (CONTINUED)
336
6. FINANCIAL ASSETS AND LIABILITIES DESIGNATED AT FAIR VALUE THROUGH PROFIT OR LOSS
(CONTINUED)
First State Asian Property Securities Fund 31 Dec 2013
Level 1 Level 2 Level 3 Total
US$ US$ US$ US$
Financial assets designated at
fair value through profit or loss
Equity securities 20,717,912 - - 20,717,912
Investment funds 1,377,347 - - 1,377,347
22,095,259 - - 22,095,259
First State China Focus Fund 31 Dec 2014
Level 1 Level 2 Level 3 Total
US$ US$ US$ US$
Financial assets designated at
fair value through profit or loss
Equity securities 359,945,062 - - 359,945,062
Investment funds - 12,097,434 - 12,097,434
359,945,062 12,097,434 - 372,042,496
First State China Focus Fund 31 Dec 2013
Level 1 Level 2 Level 3 Total
US$ US$ US$ US$
Financial assets designated at
fair value through profit or loss
Equity securities 329,828,200 - - 329,828,200
Investment funds - 9,469,102 - 9,469,102
329,828,200 9,469,102 - 339,297,302
First State Global Listed Infrastructure Fund 31 Dec 2014
Level 1 Level 2 Level 3 Total
US$ US$ US$ US$
Financial assets designated at
fair value through profit or loss
Equity securities 141,158,325 - - 141,158,325
141,158,325 - - 141,158,325
First State Global Listed Infrastructure Fund 31 Dec 2013
Level 1 Level 2 Level 3 Total
US$ US$ US$ US$
Financial assets designated at
fair value through profit or loss
Equity securities 59,428,995 - - 59,428,995
59,428,995 - - 59,428,995
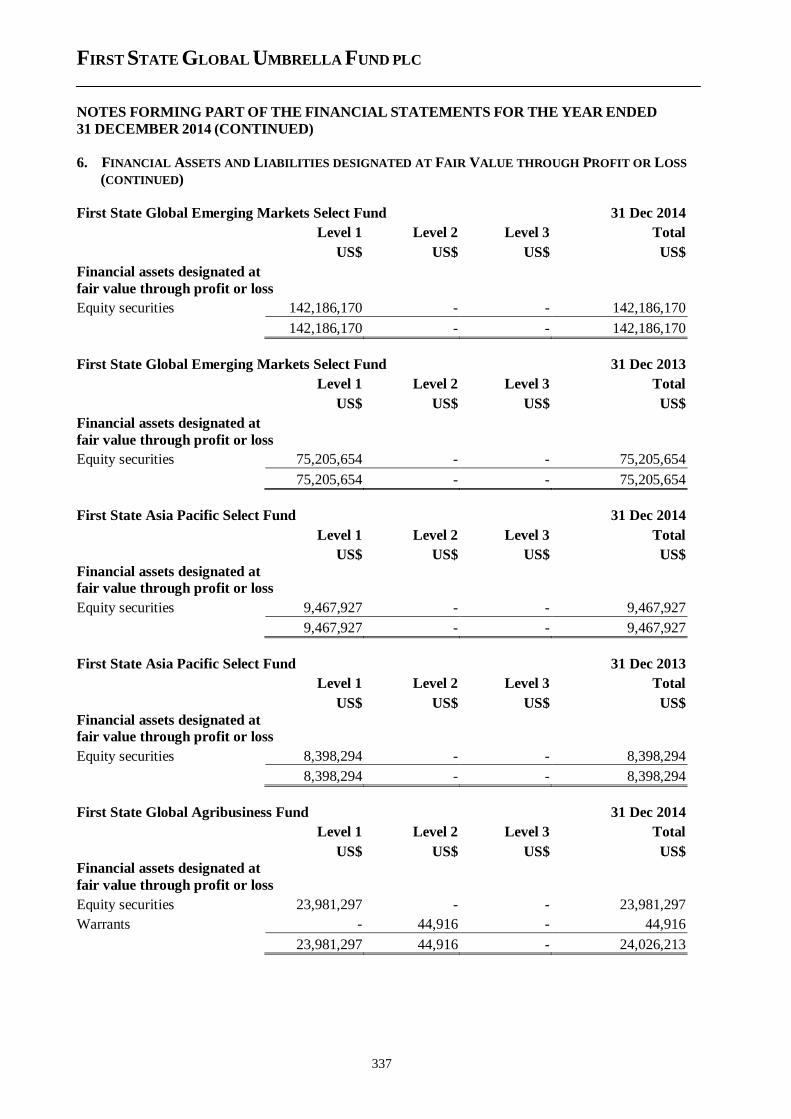
FIRST STATE GLOBAL UMBRELLA FUND PLC
NOTES FORMING PART OF THE FINANCIAL STATEMENTS FOR THE YEAR ENDED
31 DECEMBER 2014 (CONTINUED)
337
6. FINANCIAL ASSETS AND LIABILITIES DESIGNATED AT FAIR VALUE THROUGH PROFIT OR LOSS
(CONTINUED)
First State Global Emerging Markets Select Fund 31 Dec 2014
Level 1 Level 2 Level 3 Total
US$ US$ US$ US$
Financial assets designated at
fair value through profit or loss
Equity securities 142,186,170 - - 142,186,170
142,186,170 - - 142,186,170
First State Global Emerging Markets Select Fund 31 Dec 2013
Level 1 Level 2 Level 3 Total
US$ US$ US$ US$
Financial assets designated at
fair value through profit or loss
Equity securities 75,205,654 - - 75,205,654
75,205,654 - - 75,205,654
First State Asia Pacific Select Fund 31 Dec 2014
Level 1 Level 2 Level 3 Total
US$ US$ US$ US$
Financial assets designated at
fair value through profit or loss
Equity securities 9,467,927 - - 9,467,927
9,467,927 - - 9,467,927
First State Asia Pacific Select Fund 31 Dec 2013
Level 1 Level 2 Level 3 Total
US$ US$ US$ US$
Financial assets designated at
fair value through profit or loss
Equity securities 8,398,294 - - 8,398,294
8,398,294 - - 8,398,294
First State Global Agribusiness Fund 31 Dec 2014
Level 1 Level 2 Level 3 Total
US$ US$ US$ US$
Financial assets designated at
fair value through profit or loss
Equity securities 23,981,297 - - 23,981,297
Warrants - 44,916 - 44,916
23,981,297 44,916 - 24,026,213
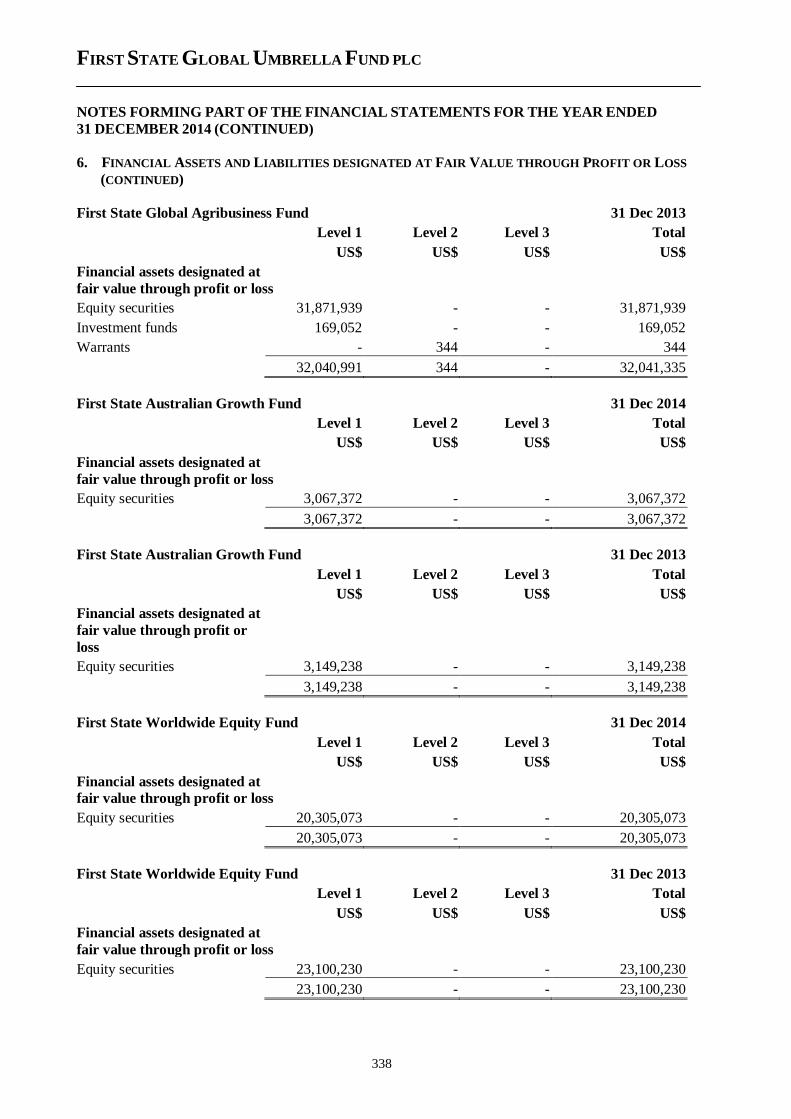
FIRST STATE GLOBAL UMBRELLA FUND PLC
NOTES FORMING PART OF THE FINANCIAL STATEMENTS FOR THE YEAR ENDED
31 DECEMBER 2014 (CONTINUED)
338
6. FINANCIAL ASSETS AND LIABILITIES DESIGNATED AT FAIR VALUE THROUGH PROFIT OR LOSS
(CONTINUED)
First State Global Agribusiness Fund 31 Dec 2013
Level 1 Level 2 Level 3 Total
US$ US$ US$ US$
Financial assets designated at
fair value through profit or loss
Equity securities 31,871,939 - - 31,871,939
Investment funds 169,052 - - 169,052
Warrants - 344 - 344
32,040,991 344 - 32,041,335
First State Australian Growth Fund 31 Dec 2014
Level 1 Level 2 Level 3 Total
US$ US$ US$ US$
Financial assets designated at
fair value through profit or loss
Equity securities 3,067,372 - - 3,067,372
3,067,372 - - 3,067,372
First State Australian Growth Fund 31 Dec 2013
Level 1 Level 2 Level 3 Total
US$ US$ US$ US$
Financial assets designated at
fair value through profit or
loss
Equity securities 3,149,238 - - 3,149,238
3,149,238 - - 3,149,238
First State Worldwide Equity Fund 31 Dec 2014
Level 1 Level 2 Level 3 Total
US$ US$ US$ US$
Financial assets designated at
fair value through profit or loss
Equity securities 20,305,073 - - 20,305,073
20,305,073 - - 20,305,073
First State Worldwide Equity Fund 31 Dec 2013
Level 1 Level 2 Level 3 Total
US$ US$ US$ US$
Financial assets designated at
fair value through profit or loss
Equity securities 23,100,230 - - 23,100,230
23,100,230 - - 23,100,230
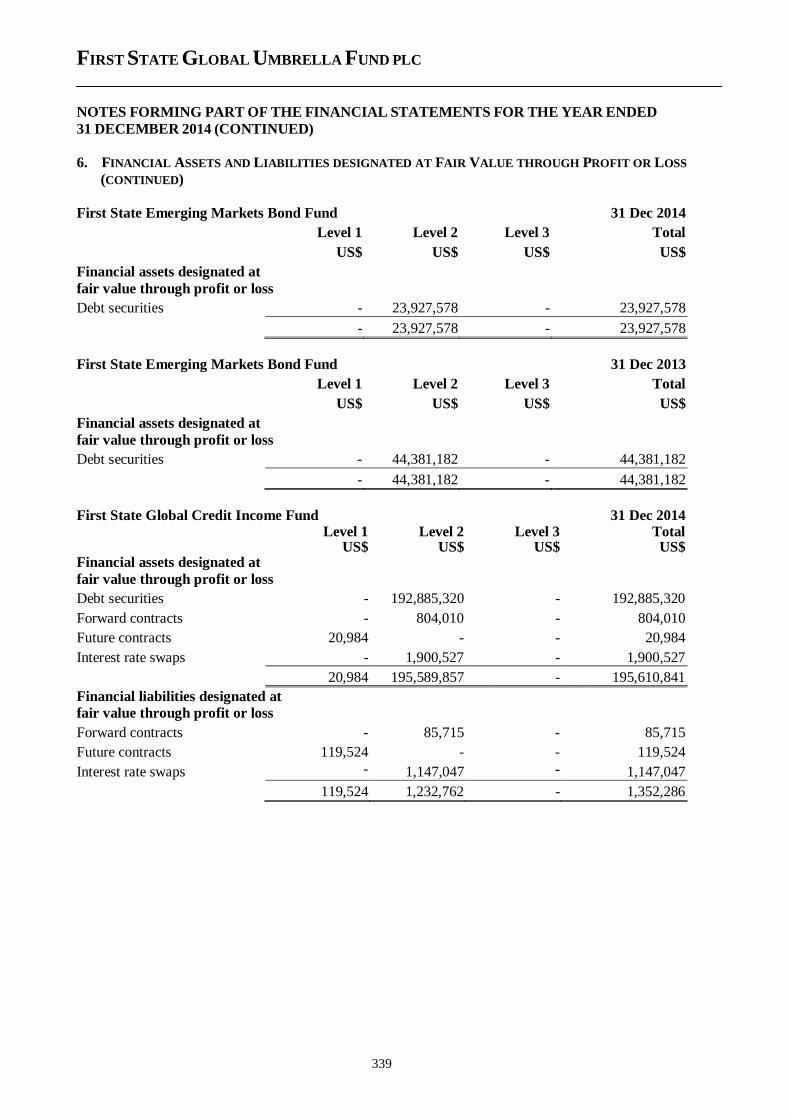
FIRST STATE GLOBAL UMBRELLA FUND PLC
NOTES FORMING PART OF THE FINANCIAL STATEMENTS FOR THE YEAR ENDED
31 DECEMBER 2014 (CONTINUED)
339
6. FINANCIAL ASSETS AND LIABILITIES DESIGNATED AT FAIR VALUE THROUGH PROFIT OR LOSS
(CONTINUED)
First State Emerging Markets Bond Fund 31 Dec 2014
Level 1 Level 2 Level 3 Total
US$ US$ US$ US$
Financial assets designated at
fair value through profit or loss
Debt securities - 23,927,578 - 23,927,578
- 23,927,578 - 23,927,578
First State Emerging Markets Bond Fund 31 Dec 2013
Level 1 Level 2 Level 3 Total
US$ US$ US$ US$
Financial assets designated at
fair value through profit or loss
Debt securities - 44,381,182 - 44,381,182
- 44,381,182 - 44,381,182
First State Global Credit Income Fund 31 Dec 2014 Level 1 Level 2 Level 3 Total US$ US$ US$ US$
Financial assets designated at
fair value through profit or loss
Debt securities - 192,885,320 - 192,885,320
Forward contracts - 804,010 - 804,010
Future contracts 20,984 - - 20,984
Interest rate swaps - 1,900,527 - 1,900,527
20,984 195,589,857 - 195,610,841
Financial liabilities designated at
fair value through profit or loss
Forward contracts - 85,715 - 85,715
Future contracts 119,524 - - 119,524
Interest rate swaps - 1,147,047 - 1,147,047
119,524 1,232,762 - 1,352,286
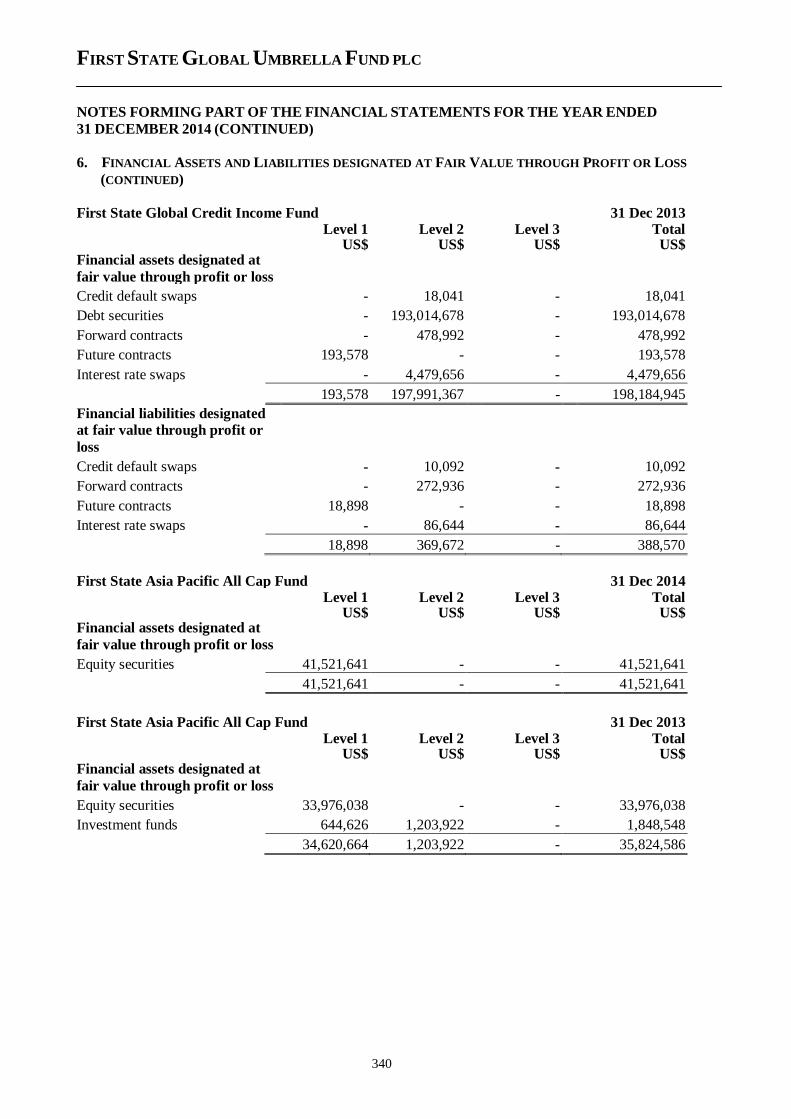
FIRST STATE GLOBAL UMBRELLA FUND PLC
NOTES FORMING PART OF THE FINANCIAL STATEMENTS FOR THE YEAR ENDED
31 DECEMBER 2014 (CONTINUED)
340
6. FINANCIAL ASSETS AND LIABILITIES DESIGNATED AT FAIR VALUE THROUGH PROFIT OR LOSS
(CONTINUED)
First State Global Credit Income Fund 31 Dec 2013 Level 1 Level 2 Level 3 Total US$ US$ US$ US$
Financial assets designated at
fair value through profit or loss
Credit default swaps - 18,041 - 18,041
Debt securities - 193,014,678 - 193,014,678
Forward contracts - 478,992 - 478,992
Future contracts 193,578 - - 193,578
Interest rate swaps - 4,479,656 - 4,479,656
193,578 197,991,367 - 198,184,945
Financial liabilities designated
at fair value through profit or
loss
Credit default swaps - 10,092 - 10,092
Forward contracts - 272,936 - 272,936
Future contracts 18,898 - - 18,898
Interest rate swaps - 86,644 - 86,644
18,898 369,672 - 388,570
First State Asia Pacific All Cap Fund 31 Dec 2014 Level 1 Level 2 Level 3 Total US$ US$ US$ US$
Financial assets designated at
fair value through profit or loss
Equity securities 41,521,641 - - 41,521,641
41,521,641 - - 41,521,641
First State Asia Pacific All Cap Fund 31 Dec 2013 Level 1 Level 2 Level 3 Total US$ US$ US$ US$
Financial assets designated at
fair value through profit or loss
Equity securities 33,976,038 - - 33,976,038
Investment funds 644,626 1,203,922 - 1,848,548
34,620,664 1,203,922 - 35,824,586
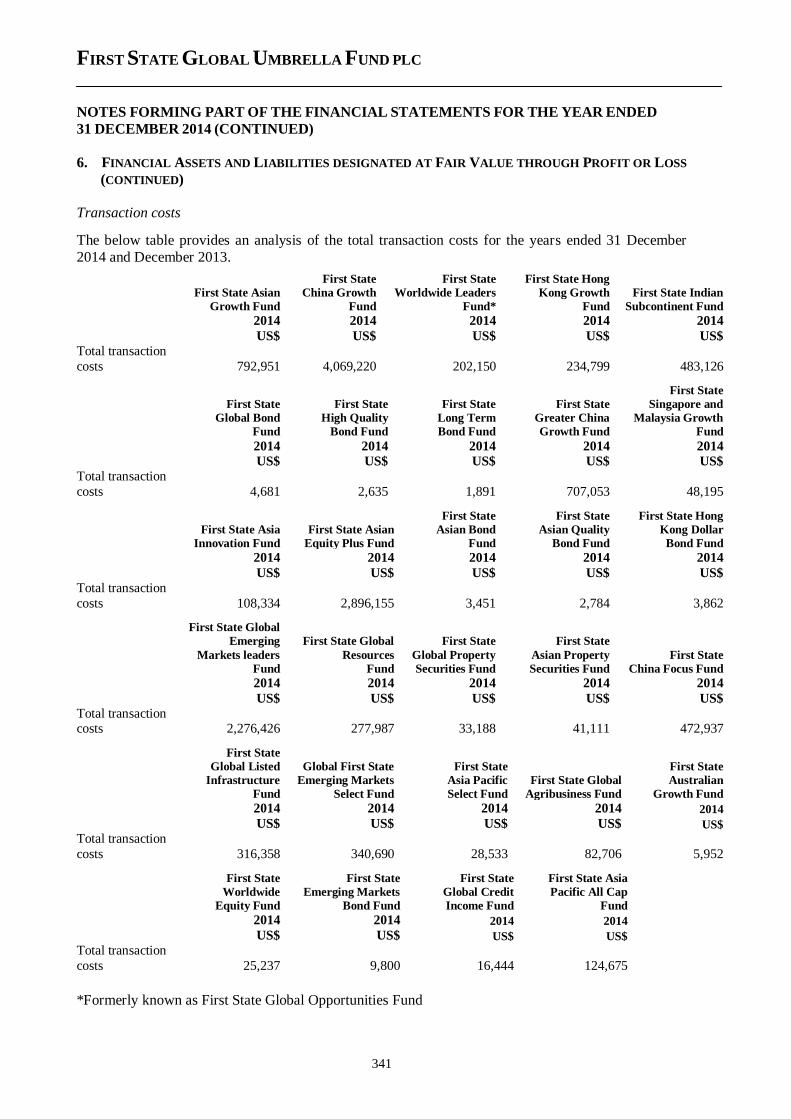
FIRST STATE GLOBAL UMBRELLA FUND PLC
NOTES FORMING PART OF THE FINANCIAL STATEMENTS FOR THE YEAR ENDED
31 DECEMBER 2014 (CONTINUED)
341
6. FINANCIAL ASSETS AND LIABILITIES DESIGNATED AT FAIR VALUE THROUGH PROFIT OR LOSS
(CONTINUED)
Transaction costs
The below table provides an analysis of the total transaction costs for the years ended 31 December
2014 and December 2013.
First State Asian
Growth Fund
First State
China Growth
Fund
First State
Worldwide Leaders
Fund*
First State Hong
Kong Growth
Fund
First State Indian
Subcontinent Fund
2014 2014 2014 2014 2014
US$ US$ US$ US$ US$
Total transaction
costs 792,951 4,069,220 202,150 234,799 483,126
First State
Global Bond
Fund
First State
High Quality
Bond Fund
First State
Long Term
Bond Fund
First State
Greater China
Growth Fund
First State
Singapore and
Malaysia Growth
Fund
2014 2014 2014 2014 2014 US$ US$ US$ US$ US$
Total transaction
costs 4,681 2,635 1,891 707,053 48,195
First State Asia
Innovation Fund
First State Asian
Equity Plus Fund
First State
Asian Bond
Fund
First State
Asian Quality
Bond Fund
First State Hong
Kong Dollar
Bond Fund
2014 2014 2014 2014 2014
US$ US$ US$ US$ US$
Total transaction
costs 108,334 2,896,155 3,451 2,784 3,862
First State Global
Emerging
Markets leaders
Fund
First State Global
Resources
Fund
First State
Global Property
Securities Fund
First State
Asian Property
Securities Fund
First State
China Focus Fund
2014 2014 2014 2014 2014
US$ US$ US$ US$ US$
Total transaction costs 2,276,426 277,987 33,188 41,111 472,937
First State
Global Listed
Infrastructure
Fund
Global First State
Emerging Markets
Select Fund
First State
Asia Pacific
Select Fund
First State Global
Agribusiness Fund
First State
Australian
Growth Fund
2014 2014 2014 2014 2014 US$ US$ US$ US$ US$ Total transaction
costs 316,358 340,690 28,533 82,706 5,952
First State
Worldwide
Equity Fund
First State
Emerging Markets
Bond Fund
First State
Global Credit
Income Fund
First State Asia
Pacific All Cap
Fund
2014 2014 2014 2014
US$ US$ US$ US$
Total transaction
costs 25,237 9,800 16,444 124,675
*Formerly known as First State Global Opportunities Fund
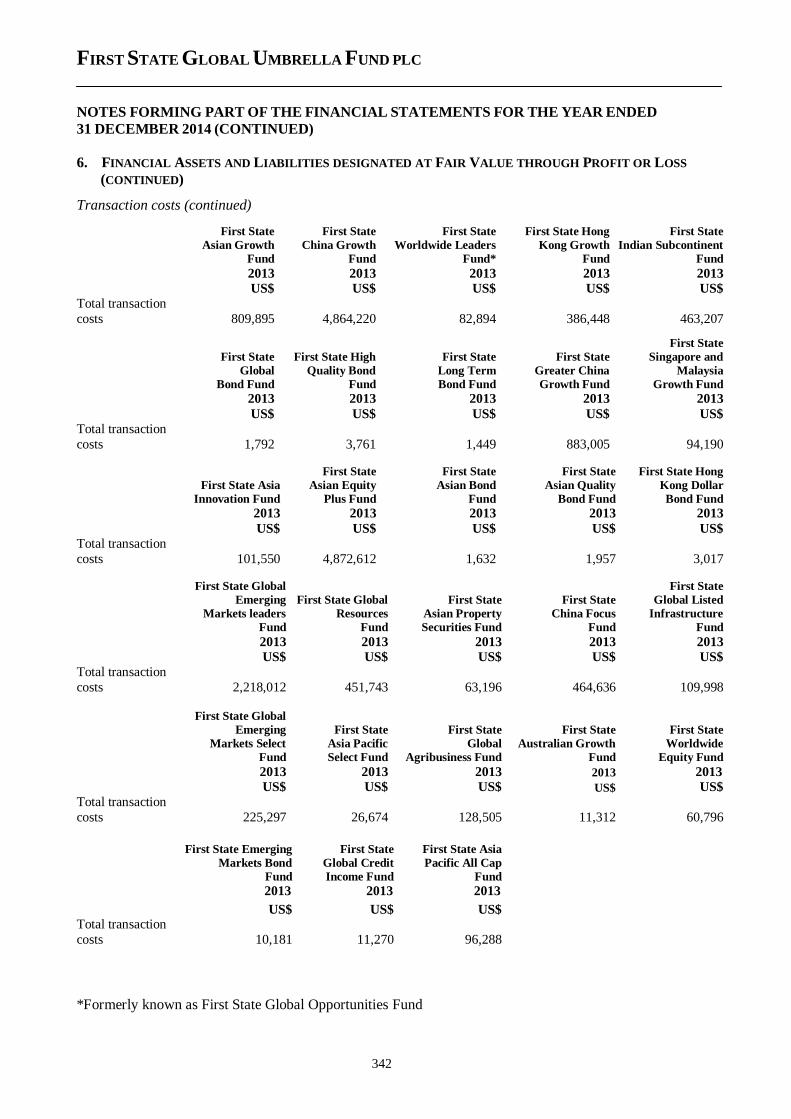
FIRST STATE GLOBAL UMBRELLA FUND PLC
NOTES FORMING PART OF THE FINANCIAL STATEMENTS FOR THE YEAR ENDED
31 DECEMBER 2014 (CONTINUED)
342
6. FINANCIAL ASSETS AND LIABILITIES DESIGNATED AT FAIR VALUE THROUGH PROFIT OR LOSS
(CONTINUED)
Transaction costs (continued)
First State
Asian Growth
Fund
First State
China Growth
Fund
First State
Worldwide Leaders
Fund*
First State Hong
Kong Growth
Fund
First State
Indian Subcontinent
Fund
2013 2013 2013 2013 2013 US$ US$ US$ US$ US$
Total transaction
costs 809,895 4,864,220 82,894 386,448 463,207
First State
Global
Bond Fund
First State High
Quality Bond
Fund
First State
Long Term
Bond Fund
First State
Greater China
Growth Fund
First State
Singapore and
Malaysia
Growth Fund
2013 2013 2013 2013 2013
US$ US$ US$ US$ US$
Total transaction
costs 1,792 3,761 1,449 883,005 94,190
First State Asia
Innovation Fund
First State
Asian Equity
Plus Fund
First State
Asian Bond
Fund
First State
Asian Quality
Bond Fund
First State Hong
Kong Dollar
Bond Fund
2013 2013 2013 2013 2013
US$ US$ US$ US$ US$
Total transaction
costs 101,550 4,872,612 1,632 1,957 3,017
First State Global
Emerging
Markets leaders
Fund
First State Global
Resources
Fund
First State
Asian Property
Securities Fund
First State
China Focus
Fund
First State
Global Listed
Infrastructure
Fund
2013 2013 2013 2013 2013 US$ US$ US$ US$ US$
Total transaction
costs 2,218,012 451,743 63,196 464,636 109,998
First State Global
Emerging
Markets Select
Fund
First State
Asia Pacific
Select Fund
First State
Global
Agribusiness Fund
First State
Australian Growth
Fund
First State
Worldwide
Equity Fund
2013 2013 2013 2013 2013 US$ US$ US$ US$ US$
Total transaction
costs 225,297 26,674 128,505 11,312 60,796
First State Emerging
Markets Bond
Fund
First State
Global Credit
Income Fund
First State Asia
Pacific All Cap
Fund
2013 2013 2013
US$ US$ US$ Total transaction
costs 10,181 11,270 96,288
*Formerly known as First State Global Opportunities Fund
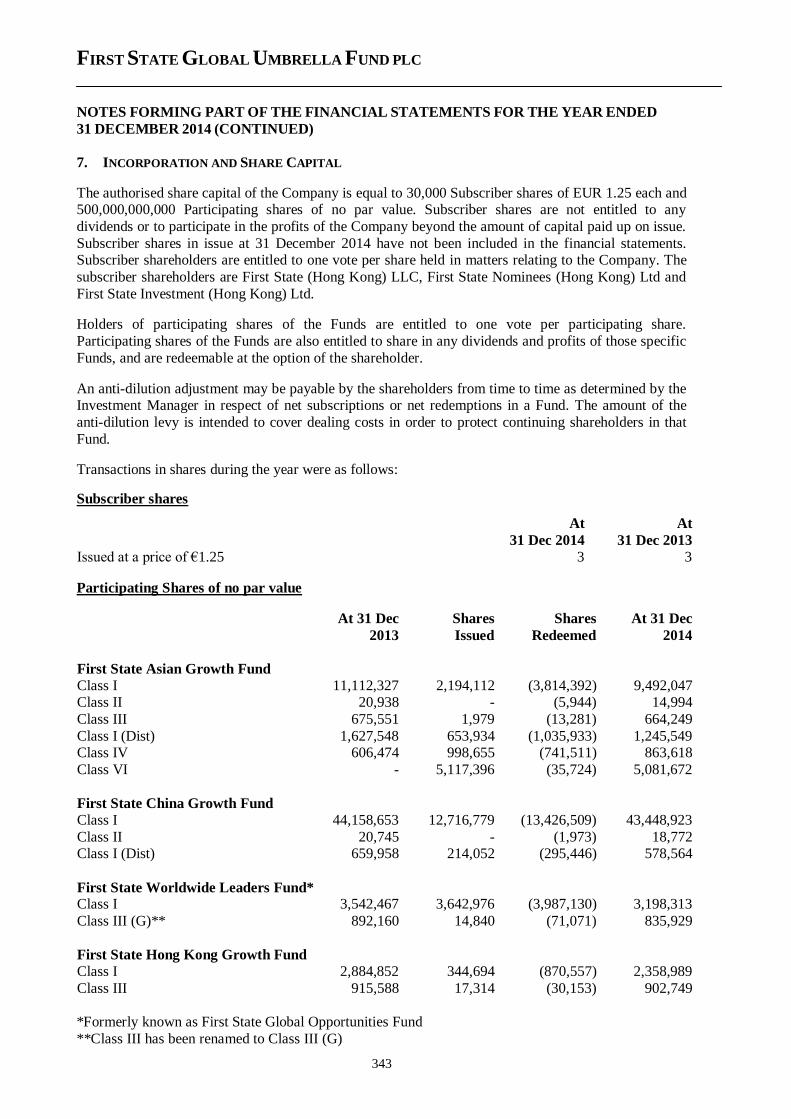
FIRST STATE GLOBAL UMBRELLA FUND PLC
NOTES FORMING PART OF THE FINANCIAL STATEMENTS FOR THE YEAR ENDED
31 DECEMBER 2014 (CONTINUED)
343
7. INCORPORATION AND SHARE CAPITAL
The authorised share capital of the Company is equal to 30,000 Subscriber shares of EUR 1.25 each and 500,000,000,000 Participating shares of no par value. Subscriber shares are not entitled to any
dividends or to participate in the profits of the Company beyond the amount of capital paid up on issue.
Subscriber shares in issue at 31 December 2014 have not been included in the financial statements. Subscriber shareholders are entitled to one vote per share held in matters relating to the Company. The
subscriber shareholders are First State (Hong Kong) LLC, First State Nominees (Hong Kong) Ltd and
First State Investment (Hong Kong) Ltd.
Holders of participating shares of the Funds are entitled to one vote per participating share.
Participating shares of the Funds are also entitled to share in any dividends and profits of those specific
Funds, and are redeemable at the option of the shareholder.
An anti-dilution adjustment may be payable by the shareholders from time to time as determined by the Investment Manager in respect of net subscriptions or net redemptions in a Fund. The amount of the
anti-dilution levy is intended to cover dealing costs in order to protect continuing shareholders in that
Fund.
Transactions in shares during the year were as follows:
Subscriber shares
At At
31 Dec 2014 31 Dec 2013
Issued at a price of €1.25 3 3
Participating Shares of no par value
At 31 Dec
2013
Shares
Issued
Shares
Redeemed
At 31 Dec
2014
First State Asian Growth Fund
Class I 11,112,327 2,194,112 (3,814,392) 9,492,047 Class II 20,938 - (5,944) 14,994
Class III 675,551 1,979 (13,281) 664,249
Class I (Dist) 1,627,548 653,934 (1,035,933) 1,245,549 Class IV 606,474 998,655 (741,511) 863,618
Class VI - 5,117,396 (35,724) 5,081,672
First State China Growth Fund
Class I 44,158,653 12,716,779 (13,426,509) 43,448,923
Class II 20,745 - (1,973) 18,772 Class I (Dist) 659,958 214,052 (295,446) 578,564
First State Worldwide Leaders Fund* Class I 3,542,467 3,642,976 (3,987,130) 3,198,313
Class III (G)** 892,160 14,840 (71,071) 835,929
First State Hong Kong Growth Fund
Class I 2,884,852 344,694 (870,557) 2,358,989
Class III 915,588 17,314 (30,153) 902,749
*Formerly known as First State Global Opportunities Fund
**Class III has been renamed to Class III (G)
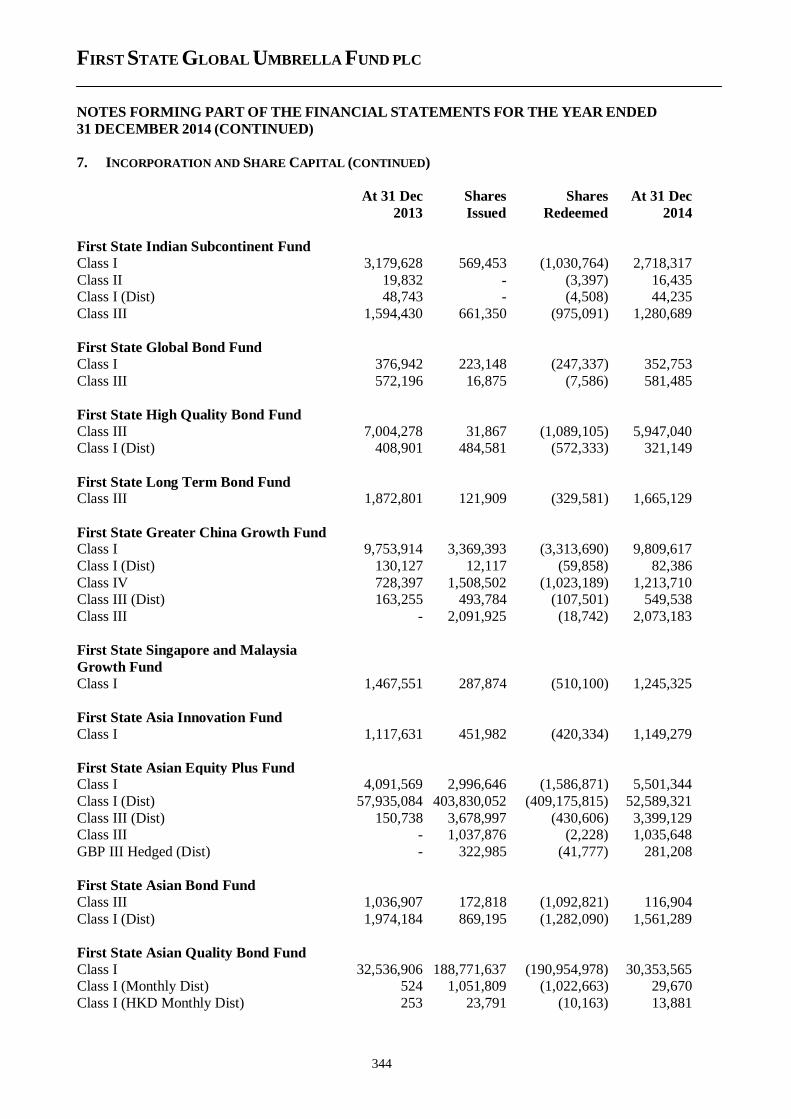
FIRST STATE GLOBAL UMBRELLA FUND PLC
NOTES FORMING PART OF THE FINANCIAL STATEMENTS FOR THE YEAR ENDED
31 DECEMBER 2014 (CONTINUED)
344
7. INCORPORATION AND SHARE CAPITAL (CONTINUED)
At 31 Dec
2013
Shares
Issued
Shares
Redeemed
At 31 Dec
2014
First State Indian Subcontinent Fund
Class I 3,179,628 569,453 (1,030,764) 2,718,317
Class II 19,832 - (3,397) 16,435 Class I (Dist) 48,743 - (4,508) 44,235
Class III 1,594,430 661,350 (975,091) 1,280,689
First State Global Bond Fund
Class I 376,942 223,148 (247,337) 352,753
Class III 572,196 16,875 (7,586) 581,485
First State High Quality Bond Fund
Class III 7,004,278 31,867 (1,089,105) 5,947,040 Class I (Dist) 408,901 484,581 (572,333) 321,149
First State Long Term Bond Fund Class III 1,872,801 121,909 (329,581) 1,665,129
First State Greater China Growth Fund Class I 9,753,914 3,369,393 (3,313,690) 9,809,617
Class I (Dist) 130,127 12,117 (59,858) 82,386
Class IV 728,397 1,508,502 (1,023,189) 1,213,710 Class III (Dist) 163,255 493,784 (107,501) 549,538
Class III - 2,091,925 (18,742) 2,073,183
First State Singapore and Malaysia
Growth Fund
Class I 1,467,551 287,874 (510,100) 1,245,325
First State Asia Innovation Fund
Class I 1,117,631 451,982 (420,334) 1,149,279
First State Asian Equity Plus Fund Class I 4,091,569 2,996,646 (1,586,871) 5,501,344
Class I (Dist) 57,935,084 403,830,052 (409,175,815) 52,589,321
Class III (Dist) 150,738 3,678,997 (430,606) 3,399,129 Class III - 1,037,876 (2,228) 1,035,648
GBP III Hedged (Dist) - 322,985 (41,777) 281,208
First State Asian Bond Fund
Class III 1,036,907 172,818 (1,092,821) 116,904
Class I (Dist) 1,974,184 869,195 (1,282,090) 1,561,289
First State Asian Quality Bond Fund
Class I 32,536,906 188,771,637 (190,954,978) 30,353,565 Class I (Monthly Dist) 524 1,051,809 (1,022,663) 29,670
Class I (HKD Monthly Dist) 253 23,791 (10,163) 13,881
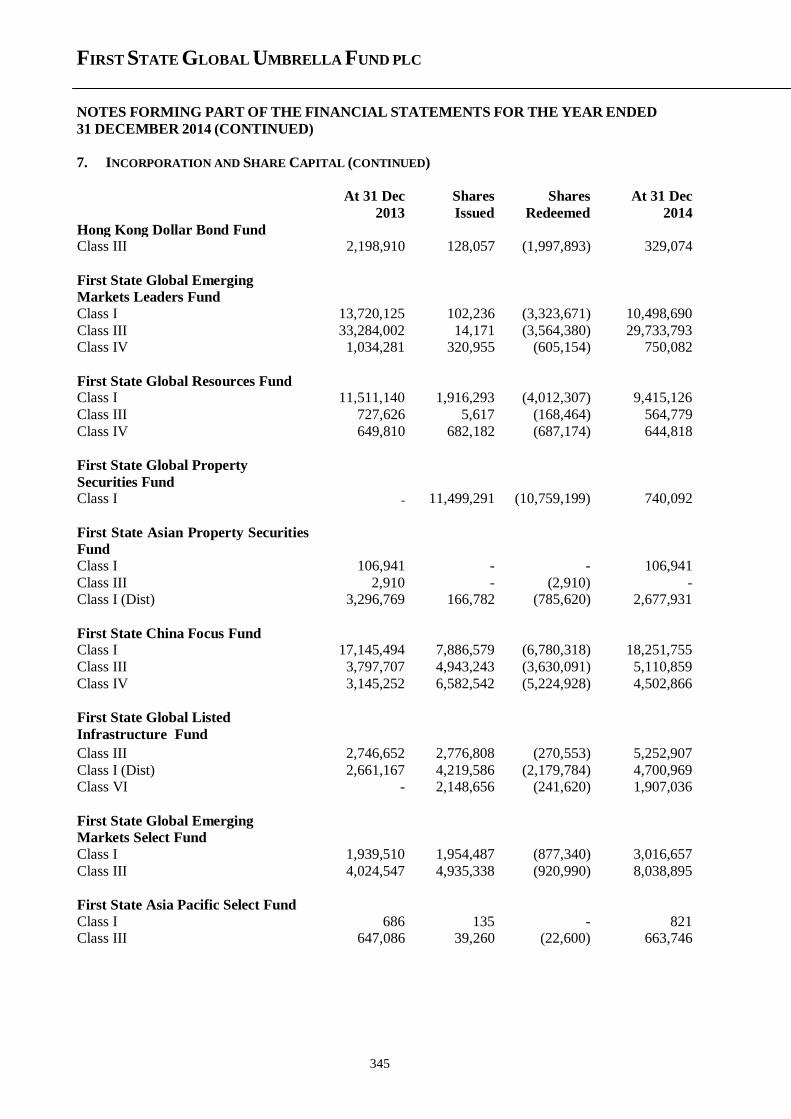
FIRST STATE GLOBAL UMBRELLA FUND PLC
NOTES FORMING PART OF THE FINANCIAL STATEMENTS FOR THE YEAR ENDED
31 DECEMBER 2014 (CONTINUED)
345
7. INCORPORATION AND SHARE CAPITAL (CONTINUED)
At 31 Dec
2013
Shares
Issued
Shares
Redeemed
At 31 Dec
2014
Hong Kong Dollar Bond Fund Class III 2,198,910 128,057 (1,997,893) 329,074
First State Global Emerging
Markets Leaders Fund
Class I 13,720,125 102,236 (3,323,671) 10,498,690
Class III 33,284,002 14,171 (3,564,380) 29,733,793 Class IV 1,034,281 320,955 (605,154) 750,082
First State Global Resources Fund Class I 11,511,140 1,916,293 (4,012,307) 9,415,126
Class III 727,626 5,617 (168,464) 564,779
Class IV 649,810 682,182 (687,174) 644,818
First State Global Property
Securities Fund Class I - 11,499,291 (10,759,199) 740,092
First State Asian Property Securities
Fund
Class I 106,941 - - 106,941
Class III 2,910 - (2,910) - Class I (Dist) 3,296,769 166,782 (785,620) 2,677,931
First State China Focus Fund Class I 17,145,494 7,886,579 (6,780,318) 18,251,755
Class III 3,797,707 4,943,243 (3,630,091) 5,110,859
Class IV 3,145,252 6,582,542 (5,224,928) 4,502,866
First State Global Listed
Infrastructure Fund
Class III 2,746,652 2,776,808 (270,553) 5,252,907
Class I (Dist) 2,661,167 4,219,586 (2,179,784) 4,700,969 Class VI - 2,148,656 (241,620) 1,907,036
First State Global Emerging
Markets Select Fund
Class I 1,939,510 1,954,487 (877,340) 3,016,657
Class III 4,024,547 4,935,338 (920,990) 8,038,895
First State Asia Pacific Select Fund
Class I 686 135 - 821 Class III 647,086 39,260 (22,600) 663,746
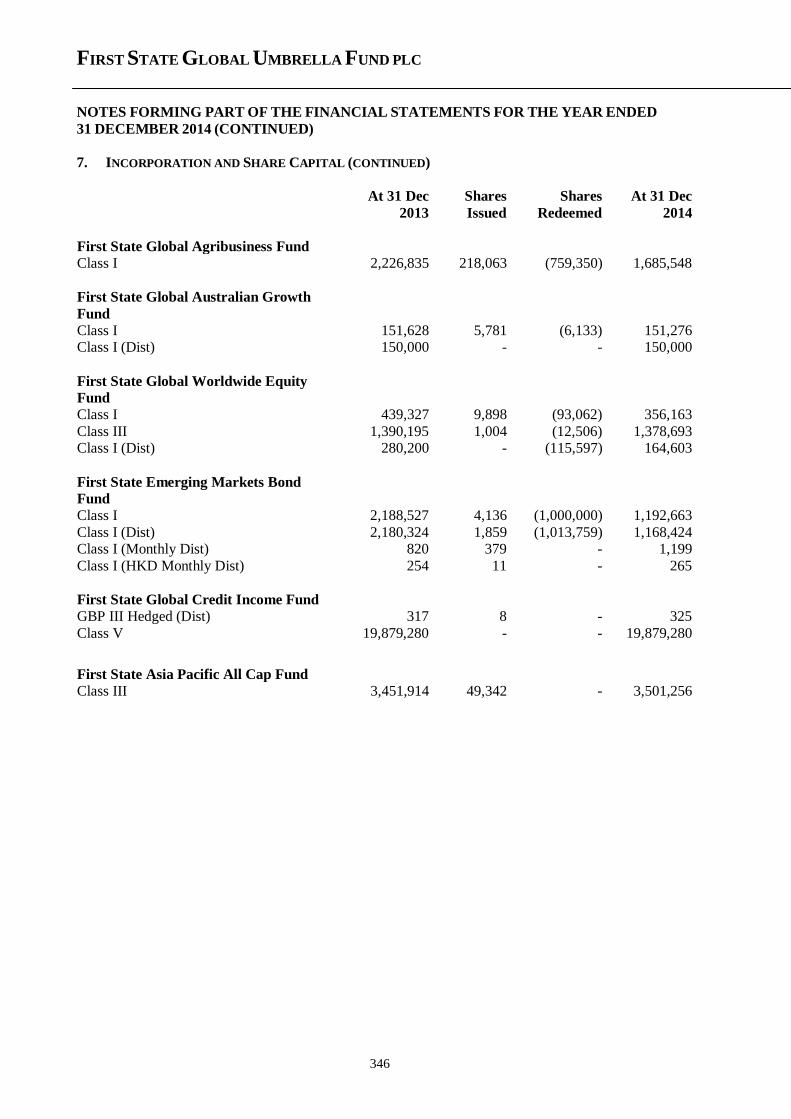
FIRST STATE GLOBAL UMBRELLA FUND PLC
NOTES FORMING PART OF THE FINANCIAL STATEMENTS FOR THE YEAR ENDED
31 DECEMBER 2014 (CONTINUED)
346
7. INCORPORATION AND SHARE CAPITAL (CONTINUED)
At 31 Dec
2013
Shares
Issued
Shares
Redeemed
At 31 Dec
2014
First State Global Agribusiness Fund
Class I 2,226,835 218,063 (759,350) 1,685,548
First State Global Australian Growth
Fund
Class I 151,628 5,781 (6,133) 151,276 Class I (Dist) 150,000 - - 150,000
First State Global Worldwide Equity
Fund
Class I 439,327 9,898 (93,062) 356,163
Class III 1,390,195 1,004 (12,506) 1,378,693 Class I (Dist) 280,200 - (115,597) 164,603
First State Emerging Markets Bond
Fund
Class I 2,188,527 4,136 (1,000,000) 1,192,663
Class I (Dist) 2,180,324 1,859 (1,013,759) 1,168,424 Class I (Monthly Dist) 820 379 - 1,199
Class I (HKD Monthly Dist) 254 11 - 265
First State Global Credit Income Fund
GBP III Hedged (Dist) 317 8 - 325
Class V 19,879,280 - - 19,879,280
First State Asia Pacific All Cap Fund
Class III 3,451,914 49,342 - 3,501,256
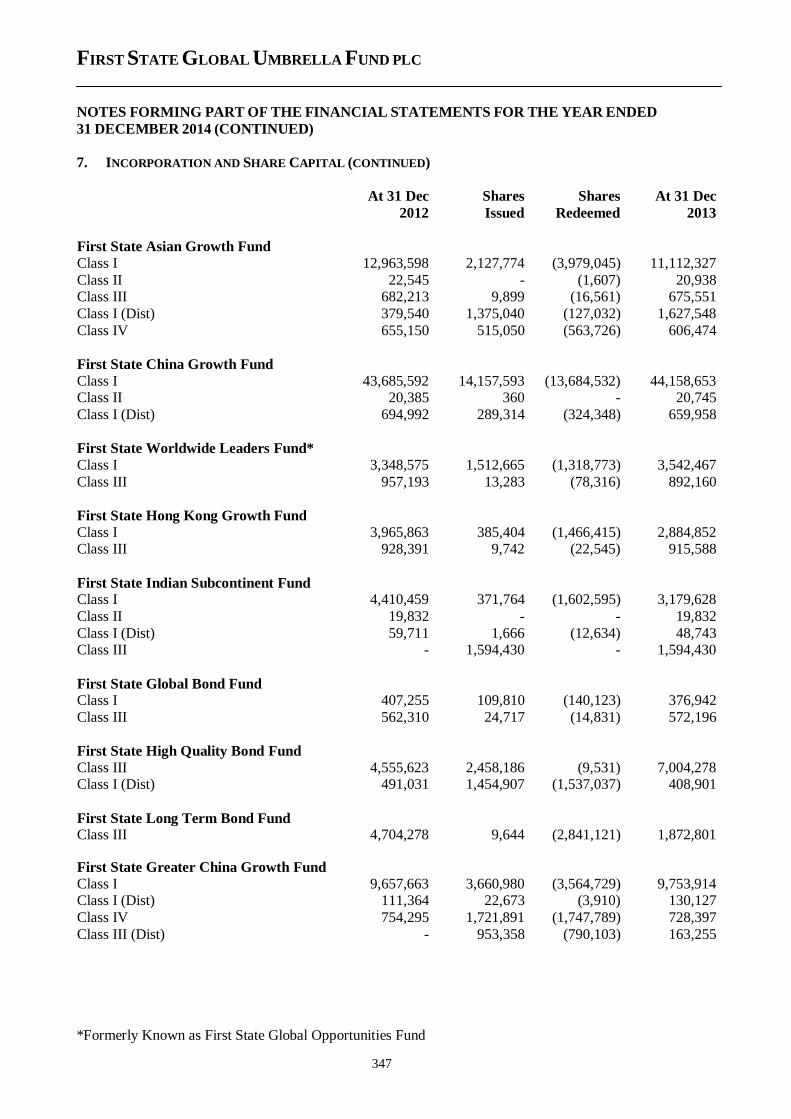
FIRST STATE GLOBAL UMBRELLA FUND PLC
NOTES FORMING PART OF THE FINANCIAL STATEMENTS FOR THE YEAR ENDED
31 DECEMBER 2014 (CONTINUED)
347
7. INCORPORATION AND SHARE CAPITAL (CONTINUED)
At 31 Dec
2012
Shares
Issued
Shares
Redeemed
At 31 Dec
2013
First State Asian Growth Fund
Class I 12,963,598 2,127,774 (3,979,045) 11,112,327
Class II 22,545 - (1,607) 20,938 Class III 682,213 9,899 (16,561) 675,551
Class I (Dist) 379,540 1,375,040 (127,032) 1,627,548
Class IV 655,150 515,050 (563,726) 606,474
First State China Growth Fund
Class I 43,685,592 14,157,593 (13,684,532) 44,158,653 Class II 20,385 360 - 20,745
Class I (Dist) 694,992 289,314 (324,348) 659,958
First State Worldwide Leaders Fund*
Class I 3,348,575 1,512,665 (1,318,773) 3,542,467
Class III 957,193 13,283 (78,316) 892,160
First State Hong Kong Growth Fund
Class I 3,965,863 385,404 (1,466,415) 2,884,852 Class III 928,391 9,742 (22,545) 915,588
First State Indian Subcontinent Fund Class I 4,410,459 371,764 (1,602,595) 3,179,628
Class II 19,832 - - 19,832
Class I (Dist) 59,711 1,666 (12,634) 48,743 Class III - 1,594,430 - 1,594,430
First State Global Bond Fund Class I 407,255 109,810 (140,123) 376,942
Class III 562,310 24,717 (14,831) 572,196
First State High Quality Bond Fund
Class III 4,555,623 2,458,186 (9,531) 7,004,278 Class I (Dist) 491,031 1,454,907 (1,537,037) 408,901
First State Long Term Bond Fund Class III 4,704,278 9,644 (2,841,121) 1,872,801
First State Greater China Growth Fund
Class I 9,657,663 3,660,980 (3,564,729) 9,753,914 Class I (Dist) 111,364 22,673 (3,910) 130,127
Class IV 754,295 1,721,891 (1,747,789) 728,397
Class III (Dist) - 953,358 (790,103) 163,255
*Formerly Known as First State Global Opportunities Fund
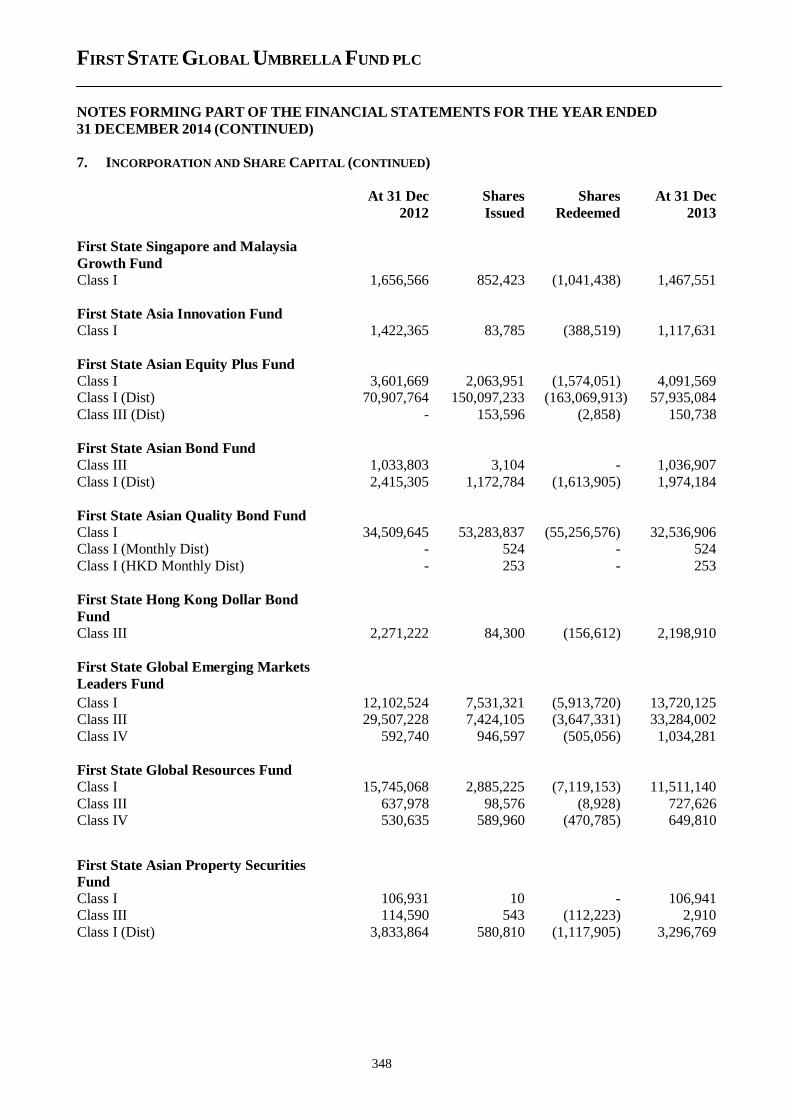
FIRST STATE GLOBAL UMBRELLA FUND PLC
NOTES FORMING PART OF THE FINANCIAL STATEMENTS FOR THE YEAR ENDED
31 DECEMBER 2014 (CONTINUED)
348
7. INCORPORATION AND SHARE CAPITAL (CONTINUED)
At 31 Dec
2012
Shares
Issued
Shares
Redeemed
At 31 Dec
2013
First State Singapore and Malaysia
Growth Fund
Class I 1,656,566 852,423 (1,041,438) 1,467,551
First State Asia Innovation Fund
Class I 1,422,365 83,785 (388,519) 1,117,631
First State Asian Equity Plus Fund
Class I 3,601,669 2,063,951 (1,574,051) 4,091,569 Class I (Dist) 70,907,764 150,097,233 (163,069,913) 57,935,084
Class III (Dist) - 153,596 (2,858) 150,738
First State Asian Bond Fund
Class III 1,033,803 3,104 - 1,036,907
Class I (Dist) 2,415,305 1,172,784 (1,613,905) 1,974,184
First State Asian Quality Bond Fund
Class I 34,509,645 53,283,837 (55,256,576) 32,536,906 Class I (Monthly Dist) - 524 - 524
Class I (HKD Monthly Dist) - 253 - 253
First State Hong Kong Dollar Bond
Fund
Class III 2,271,222 84,300 (156,612) 2,198,910
First State Global Emerging Markets
Leaders Fund
Class I 12,102,524 7,531,321 (5,913,720) 13,720,125 Class III 29,507,228 7,424,105 (3,647,331) 33,284,002
Class IV 592,740 946,597 (505,056) 1,034,281
First State Global Resources Fund
Class I 15,745,068 2,885,225 (7,119,153) 11,511,140
Class III 637,978 98,576 (8,928) 727,626 Class IV 530,635 589,960 (470,785) 649,810
First State Asian Property Securities
Fund
Class I 106,931 10 - 106,941 Class III 114,590 543 (112,223) 2,910
Class I (Dist) 3,833,864 580,810 (1,117,905) 3,296,769
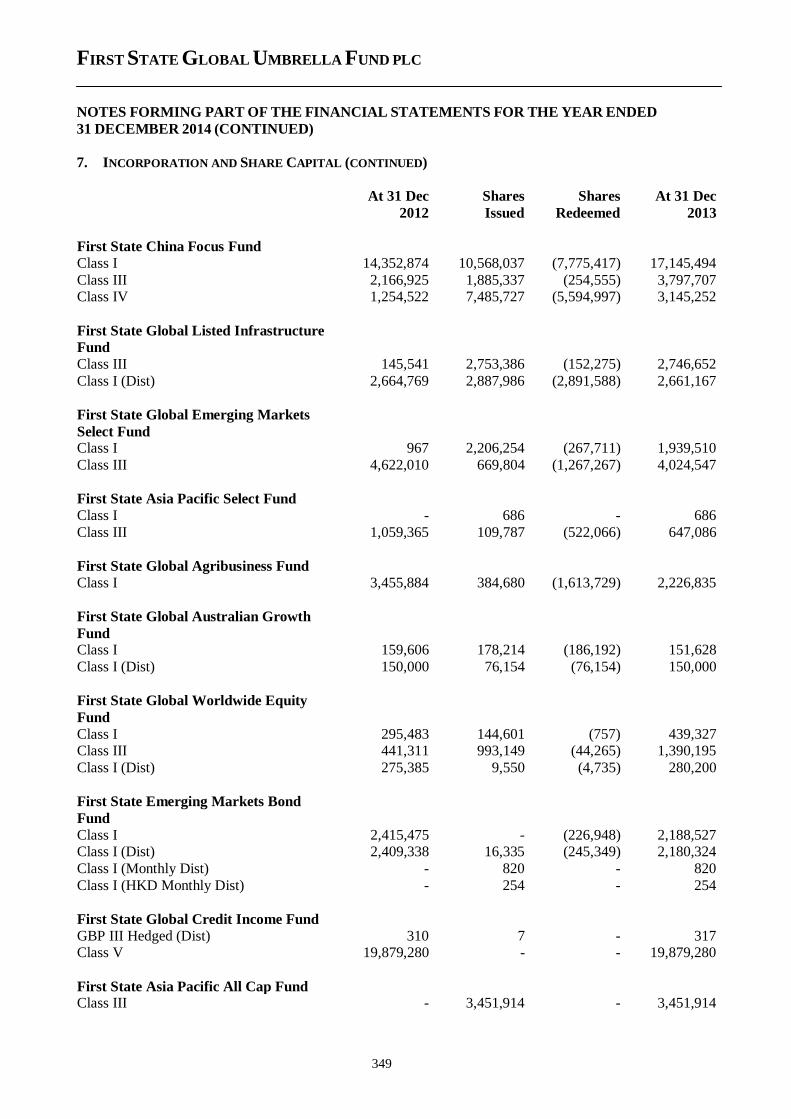
FIRST STATE GLOBAL UMBRELLA FUND PLC
NOTES FORMING PART OF THE FINANCIAL STATEMENTS FOR THE YEAR ENDED
31 DECEMBER 2014 (CONTINUED)
349
7. INCORPORATION AND SHARE CAPITAL (CONTINUED)
At 31 Dec
2012
Shares
Issued
Shares
Redeemed
At 31 Dec
2013
First State China Focus Fund
Class I 14,352,874 10,568,037 (7,775,417) 17,145,494
Class III 2,166,925 1,885,337 (254,555) 3,797,707 Class IV 1,254,522 7,485,727 (5,594,997) 3,145,252
First State Global Listed Infrastructure
Fund
Class III 145,541 2,753,386 (152,275) 2,746,652
Class I (Dist) 2,664,769 2,887,986 (2,891,588) 2,661,167
First State Global Emerging Markets
Select Fund Class I 967 2,206,254 (267,711) 1,939,510
Class III 4,622,010 669,804 (1,267,267) 4,024,547
First State Asia Pacific Select Fund
Class I - 686 - 686
Class III 1,059,365 109,787 (522,066) 647,086
First State Global Agribusiness Fund
Class I 3,455,884 384,680 (1,613,729) 2,226,835
First State Global Australian Growth
Fund Class I 159,606 178,214 (186,192) 151,628
Class I (Dist) 150,000 76,154 (76,154) 150,000
First State Global Worldwide Equity
Fund
Class I 295,483 144,601 (757) 439,327 Class III 441,311 993,149 (44,265) 1,390,195
Class I (Dist) 275,385 9,550 (4,735) 280,200
First State Emerging Markets Bond
Fund
Class I 2,415,475 - (226,948) 2,188,527 Class I (Dist) 2,409,338 16,335 (245,349) 2,180,324
Class I (Monthly Dist) - 820 - 820
Class I (HKD Monthly Dist) - 254 - 254
First State Global Credit Income Fund
GBP III Hedged (Dist) 310 7 - 317 Class V 19,879,280 - - 19,879,280
First State Asia Pacific All Cap Fund Class III - 3,451,914 - 3,451,914
FIRST STATE GLOBAL UMBRELLA FUND PLC
NOTES FORMING PART OF THE FINANCIAL STATEMENTS FOR THE YEAR ENDED
31 DECEMBER 2014 (CONTINUED)
350
8. RISK ARISING FROM FINANCIAL INSTRUMENTS
The Company’s investment objective is to seek capital growth and/or dividend income from a portfolio
of securities in respect of the Funds. The holding of securities and investment activities undertaken
pursuant to this objective involves certain inherent risks. Below is a description of the principal risks inherent in the Company’s activities along with the actions it has taken to manage these risks.
The Company’s assets and liabilities comprise financial instruments which include:
investments including equity shares, fixed income securities, floating rate securities, investment
funds, warrants, future contracts, forward currency contracts, credit default swaps and interest
rate swaps. These are held in accordance with a Fund’s investment objective and policies; and
cash, liquid resources and short-term debtors and creditors that arise directly from its investment
activities;
As a collective investment scheme, the Company buys, sells or holds financial assets and liabilities in
order to take advantage of changes in market prices or rates.
The main risks arising from the Company’s operations are market risk comprising equity price risk,
foreign currency risk, interest rate risk, credit risk and liquidity risk. The Board reviews and agrees policies for managing each of these risks and they are summarised below. These policies have remained
substantially unchanged since the beginning of the year to which these Financial Statements relate.
The Company is also exposed to custody risk. Custody risk is the risk of loss of securities held in
custody occasioned by the insolvency or negligence of the custodian. Although an appropriate legal
framework is in place that seeks to reduce the risk of loss of value of the securities held by the custodian, in the event of its failure, the ability of the Fund to transfer securities might be temporarily
impaired.
(a) Equity Price Risk
Equity price risk is the risk that the fair values of equities or future cash flows of a financial instrument
will fluctuate because of changes in market prices (other than those arising from interest rate risk or currency risk).
The investments of the Company are subject to market fluctuations and the risks inherent in investment in international securities markets and there can be no assurances that appreciation will occur. It is the
policy of the Investment Manager to maintain a diversified portfolio of investments for each Fund so as
to minimise risk.
The Company strives to invest in strong businesses with quality management and at sensible prices.
The Company’s preferred strategy is to hold equity investments for the medium-to-long term. The Investment Manager is therefore not concerned by short-term equity price volatility with respect to its
investments provided that the underlying business, economic and management characteristics of its
investments remains favourable.
FIRST STATE GLOBAL UMBRELLA FUND PLC
NOTES FORMING PART OF THE FINANCIAL STATEMENTS FOR THE YEAR ENDED
31 DECEMBER 2014 (CONTINUED)
351
8. RISK ARISING FROM FINANCIAL INSTRUMENTS (CONTINUED)
(a) Equity Price Risk (continued)
The carrying values of investments subject to equity price risk are, in almost all instances, based on
quoted market prices as of the Statement of Financial Position dates. Market prices are subject to fluctuation and, consequently, the amount realised in the subsequent sale of an investment may
significantly differ from the reported market value. Fluctuation in the market price of a security may
result from perceived changes in the underlying economic characteristics of the investment, the relative price of alternative investments and general market conditions. Furthermore, amounts realised in the
sale of a particular security may be affected by the relative quantity of the security being sold.
The Investment Manager manages the exposure to equity price risk by constructing a diversified
portfolio from which it expects the underlying companies it invests in to perform differently in reaction
to different risk influences. The Investment Manager monitors the equity price risk in a Fund’s portfolio through both the volatility of the underlying holdings and their combined volatility. The Investment
Manager expects portfolios to carry a certain level of equity price risk and uses such risk measurement
to highlight unintended risks in the portfolio.
The investment concentrations within the portfolio for each Fund are disclosed in the schedule of
investments by investment type. The following table summarises the effect on the net assets attributable to redeemable participating shareholders for equity funds, as at 31 December 2014 and 31 December
2013 of a reasonably possible change in the benchmark as applied to the respective beta reported by
Lipper and Barra Enterprise Performance.
The reasonably possible change in the benchmark has been determined by using the last five year
annualised benchmark returns. Where a Fund has a history of less than one year, since inception, benchmark returns and beta will be used for calculation. For the First State Global Property Securities
Fund, as the Fund history was less than one year, since inception benchmark return and beta was used
for calculation.
Also,the five year annualised benchmark returns and beta are not available for some of the Funds,
therefore, one and three year data has been applied for calculation. For the First State Global Agribusiness Fund, First State Global Emerging Market Select Fund, First State Asia Pacific Select
Fund, First State Australian Growth Fund and the First State Worldwide Equity Fund, the hypothetical
change in the benchmark has been determined by using the 3 year benchmark returns and beta for calculations. For the First State Asia Pacific All Cap Fund, the hypothertical change in the benchmark
has been determined by using the 1 year benchmark return and beta for calculations
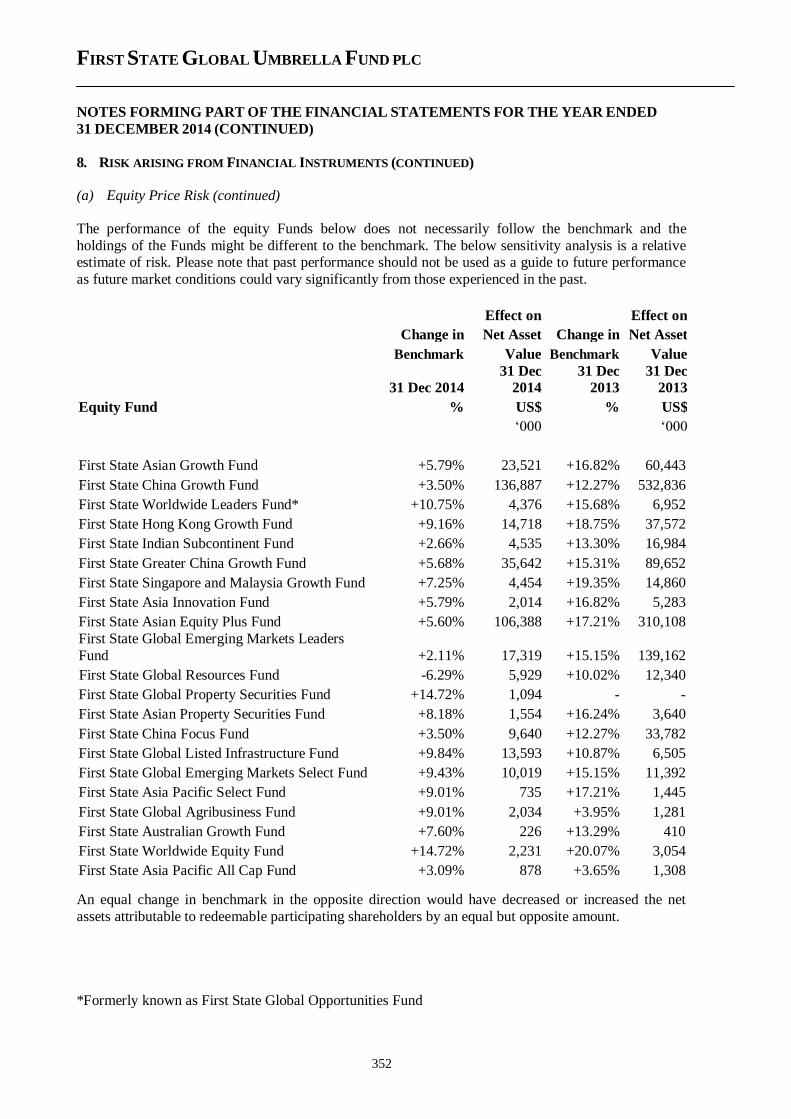
FIRST STATE GLOBAL UMBRELLA FUND PLC
NOTES FORMING PART OF THE FINANCIAL STATEMENTS FOR THE YEAR ENDED
31 DECEMBER 2014 (CONTINUED)
352
8. RISK ARISING FROM FINANCIAL INSTRUMENTS (CONTINUED)
(a) Equity Price Risk (continued)
The performance of the equity Funds below does not necessarily follow the benchmark and the
holdings of the Funds might be different to the benchmark. The below sensitivity analysis is a relative estimate of risk. Please note that past performance should not be used as a guide to future performance
as future market conditions could vary significantly from those experienced in the past.
Effect on Effect on
Change in Net Asset Change in Net Asset
Benchmark Value Benchmark Value
31 Dec 2014
31 Dec
2014
31 Dec
2013
31 Dec
2013
Equity Fund % US$ % US$
‘000 ‘000
First State Asian Growth Fund +5.79% 23,521 +16.82% 60,443
First State China Growth Fund +3.50% 136,887 +12.27% 532,836
First State Worldwide Leaders Fund* +10.75% 4,376 +15.68% 6,952
First State Hong Kong Growth Fund +9.16% 14,718 +18.75% 37,572
First State Indian Subcontinent Fund +2.66% 4,535 +13.30% 16,984
First State Greater China Growth Fund +5.68% 35,642 +15.31% 89,652
First State Singapore and Malaysia Growth Fund +7.25% 4,454 +19.35% 14,860
First State Asia Innovation Fund +5.79% 2,014 +16.82% 5,283
First State Asian Equity Plus Fund +5.60% 106,388 +17.21% 310,108
First State Global Emerging Markets Leaders
Fund +2.11% 17,319 +15.15% 139,162
First State Global Resources Fund -6.29% 5,929 +10.02% 12,340
First State Global Property Securities Fund +14.72% 1,094 - -
First State Asian Property Securities Fund +8.18% 1,554 +16.24% 3,640
First State China Focus Fund +3.50% 9,640 +12.27% 33,782
First State Global Listed Infrastructure Fund +9.84% 13,593 +10.87% 6,505
First State Global Emerging Markets Select Fund +9.43% 10,019 +15.15% 11,392
First State Asia Pacific Select Fund +9.01% 735 +17.21% 1,445
First State Global Agribusiness Fund +9.01% 2,034 +3.95% 1,281
First State Australian Growth Fund +7.60% 226 +13.29% 410
First State Worldwide Equity Fund +14.72% 2,231 +20.07% 3,054
First State Asia Pacific All Cap Fund +3.09% 878 +3.65% 1,308
An equal change in benchmark in the opposite direction would have decreased or increased the net
assets attributable to redeemable participating shareholders by an equal but opposite amount.
*Formerly known as First State Global Opportunities Fund
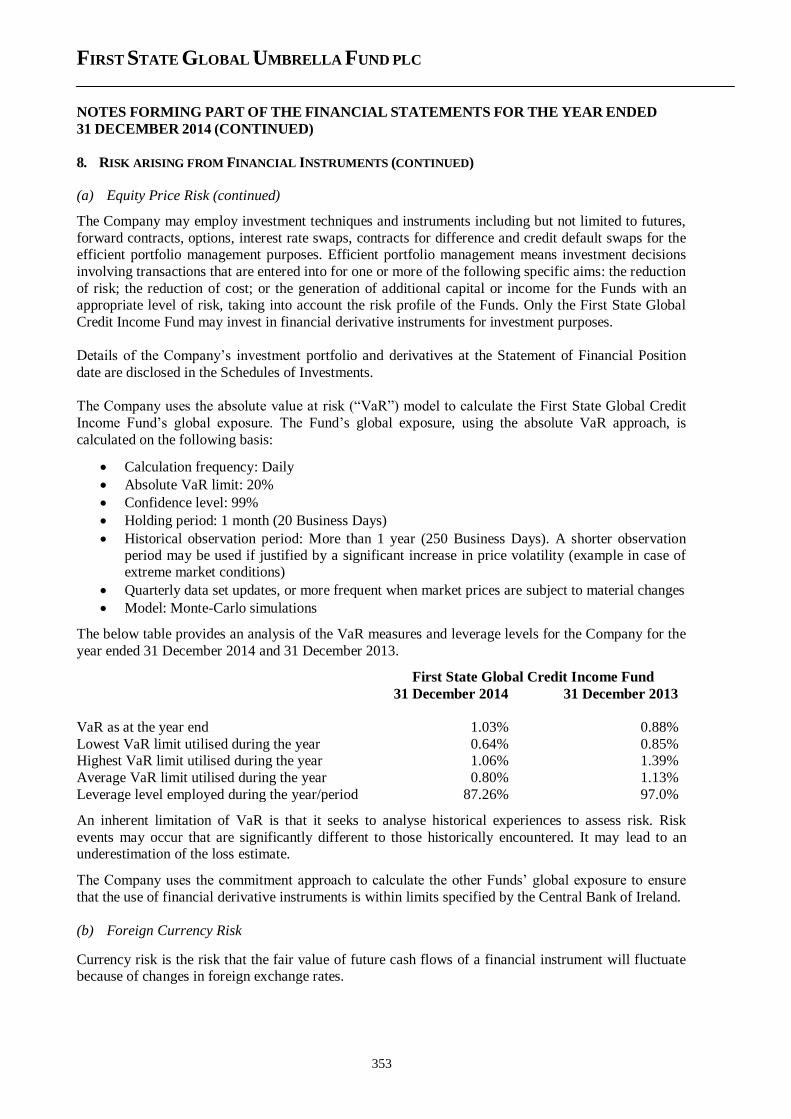
FIRST STATE GLOBAL UMBRELLA FUND PLC
NOTES FORMING PART OF THE FINANCIAL STATEMENTS FOR THE YEAR ENDED
31 DECEMBER 2014 (CONTINUED)
353
8. RISK ARISING FROM FINANCIAL INSTRUMENTS (CONTINUED)
(a) Equity Price Risk (continued)
The Company may employ investment techniques and instruments including but not limited to futures,
forward contracts, options, interest rate swaps, contracts for difference and credit default swaps for the efficient portfolio management purposes. Efficient portfolio management means investment decisions
involving transactions that are entered into for one or more of the following specific aims: the reduction
of risk; the reduction of cost; or the generation of additional capital or income for the Funds with an appropriate level of risk, taking into account the risk profile of the Funds. Only the First State Global
Credit Income Fund may invest in financial derivative instruments for investment purposes.
Details of the Company’s investment portfolio and derivatives at the Statement of Financial Position
date are disclosed in the Schedules of Investments.
The Company uses the absolute value at risk (“VaR”) model to calculate the First State Global Credit
Income Fund’s global exposure. The Fund’s global exposure, using the absolute VaR approach, is
calculated on the following basis:
Calculation frequency: Daily
Absolute VaR limit: 20%
Confidence level: 99%
Holding period: 1 month (20 Business Days)
Historical observation period: More than 1 year (250 Business Days). A shorter observation period may be used if justified by a significant increase in price volatility (example in case of extreme market conditions)
Quarterly data set updates, or more frequent when market prices are subject to material changes
Model: Monte-Carlo simulations
The below table provides an analysis of the VaR measures and leverage levels for the Company for the
year ended 31 December 2014 and 31 December 2013.
First State Global Credit Income Fund
31 December 2014 31 December 2013
VaR as at the year end 1.03% 0.88%
Lowest VaR limit utilised during the year 0.64% 0.85% Highest VaR limit utilised during the year 1.06% 1.39%
Average VaR limit utilised during the year 0.80% 1.13%
Leverage level employed during the year/period 87.26% 97.0%
An inherent limitation of VaR is that it seeks to analyse historical experiences to assess risk. Risk
events may occur that are significantly different to those historically encountered. It may lead to an underestimation of the loss estimate.
The Company uses the commitment approach to calculate the other Funds’ global exposure to ensure
that the use of financial derivative instruments is within limits specified by the Central Bank of Ireland.
(b) Foreign Currency Risk
Currency risk is the risk that the fair value of future cash flows of a financial instrument will fluctuate because of changes in foreign exchange rates.
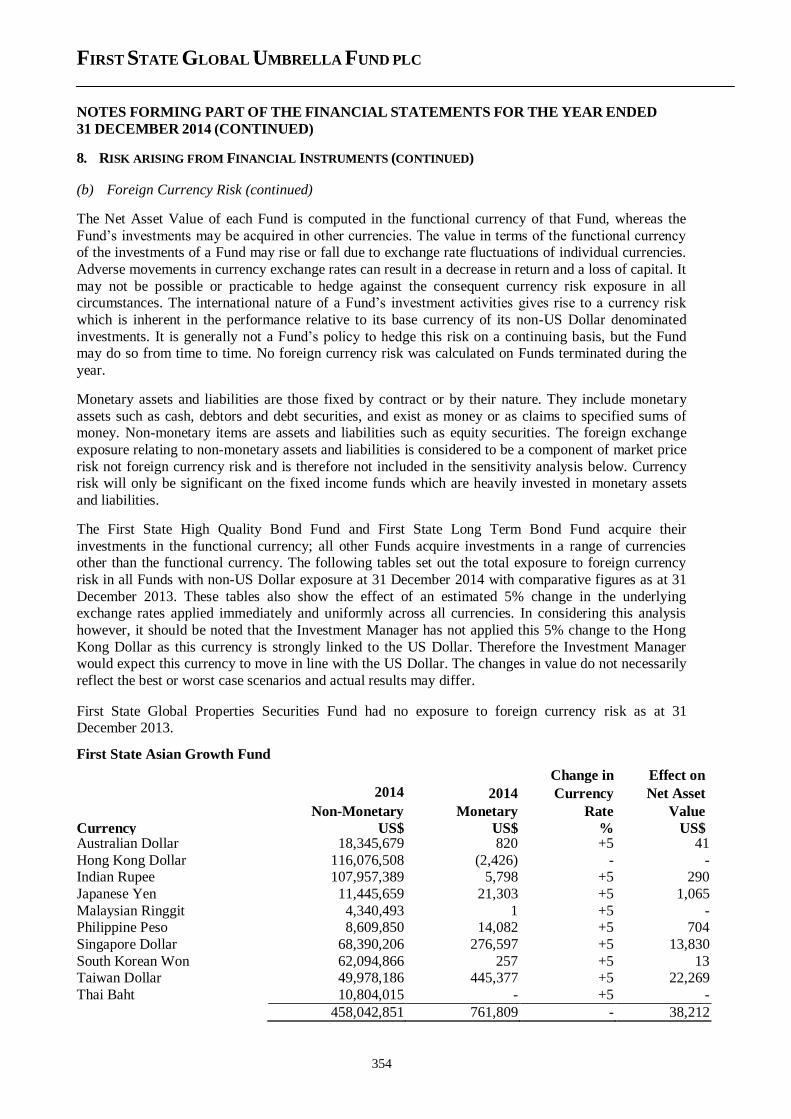
FIRST STATE GLOBAL UMBRELLA FUND PLC
NOTES FORMING PART OF THE FINANCIAL STATEMENTS FOR THE YEAR ENDED
31 DECEMBER 2014 (CONTINUED)
354
8. RISK ARISING FROM FINANCIAL INSTRUMENTS (CONTINUED)
(b) Foreign Currency Risk (continued)
The Net Asset Value of each Fund is computed in the functional currency of that Fund, whereas the
Fund’s investments may be acquired in other currencies. The value in terms of the functional currency of the investments of a Fund may rise or fall due to exchange rate fluctuations of individual currencies.
Adverse movements in currency exchange rates can result in a decrease in return and a loss of capital. It
may not be possible or practicable to hedge against the consequent currency risk exposure in all circumstances. The international nature of a Fund’s investment activities gives rise to a currency risk
which is inherent in the performance relative to its base currency of its non-US Dollar denominated
investments. It is generally not a Fund’s policy to hedge this risk on a continuing basis, but the Fund may do so from time to time. No foreign currency risk was calculated on Funds terminated during the
year.
Monetary assets and liabilities are those fixed by contract or by their nature. They include monetary
assets such as cash, debtors and debt securities, and exist as money or as claims to specified sums of money. Non-monetary items are assets and liabilities such as equity securities. The foreign exchange
exposure relating to non-monetary assets and liabilities is considered to be a component of market price
risk not foreign currency risk and is therefore not included in the sensitivity analysis below. Currency risk will only be significant on the fixed income funds which are heavily invested in monetary assets
and liabilities.
The First State High Quality Bond Fund and First State Long Term Bond Fund acquire their
investments in the functional currency; all other Funds acquire investments in a range of currencies other than the functional currency. The following tables set out the total exposure to foreign currency
risk in all Funds with non-US Dollar exposure at 31 December 2014 with comparative figures as at 31
December 2013. These tables also show the effect of an estimated 5% change in the underlying exchange rates applied immediately and uniformly across all currencies. In considering this analysis
however, it should be noted that the Investment Manager has not applied this 5% change to the Hong
Kong Dollar as this currency is strongly linked to the US Dollar. Therefore the Investment Manager would expect this currency to move in line with the US Dollar. The changes in value do not necessarily
reflect the best or worst case scenarios and actual results may differ.
First State Global Properties Securities Fund had no exposure to foreign currency risk as at 31 December 2013.
First State Asian Growth Fund
Change in Effect on
2014
2014 Currency Net Asset
Non-Monetary Monetary Rate Value
Currency US$ US$ % US$ Australian Dollar 18,345,679 820 +5 41
Hong Kong Dollar 116,076,508 (2,426) - - Indian Rupee 107,957,389 5,798 +5 290
Japanese Yen 11,445,659 21,303 +5 1,065
Malaysian Ringgit 4,340,493 1 +5 - Philippine Peso 8,609,850 14,082 +5 704
Singapore Dollar 68,390,206 276,597 +5 13,830
South Korean Won 62,094,866 257 +5 13 Taiwan Dollar 49,978,186 445,377 +5 22,269
Thai Baht 10,804,015 - +5 -
458,042,851 761,809 - 38,212
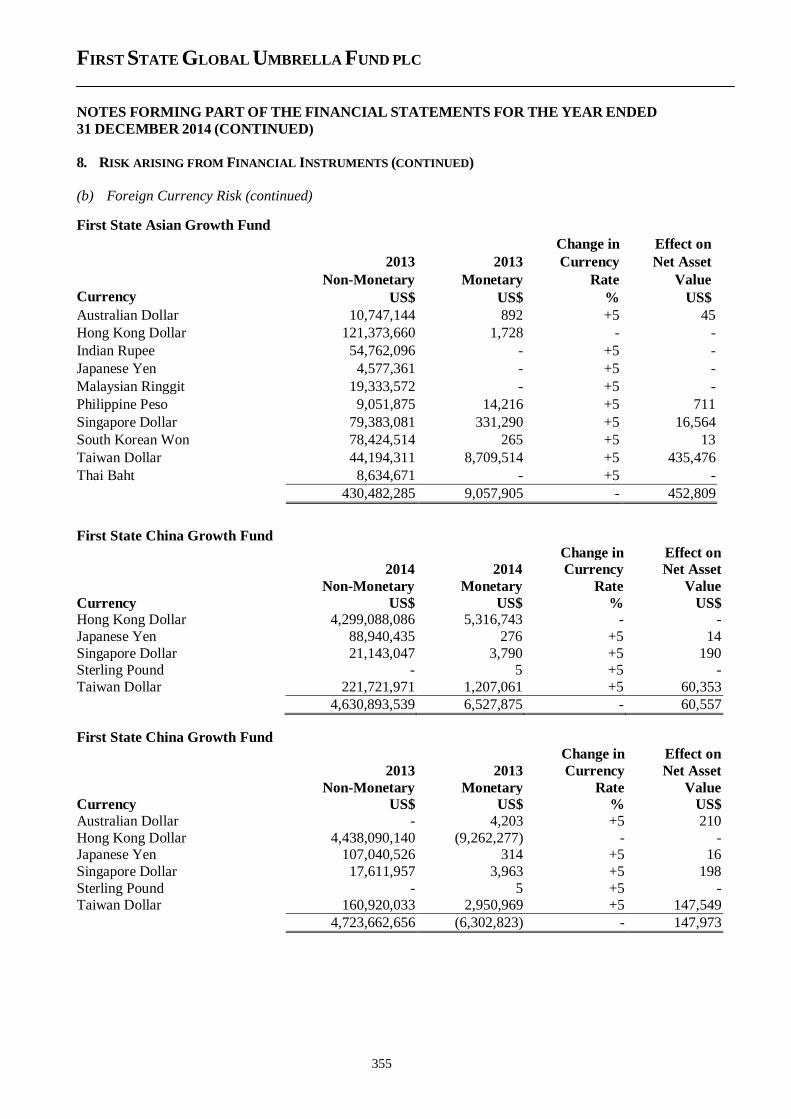
FIRST STATE GLOBAL UMBRELLA FUND PLC
NOTES FORMING PART OF THE FINANCIAL STATEMENTS FOR THE YEAR ENDED
31 DECEMBER 2014 (CONTINUED)
355
8. RISK ARISING FROM FINANCIAL INSTRUMENTS (CONTINUED)
(b) Foreign Currency Risk (continued)
First State Asian Growth Fund
Change in Effect on
2013 2013 Currency Net Asset Non-Monetary Monetary Rate Value
Currency US$ US$ % US$
Australian Dollar 10,747,144 892 +5 45
Hong Kong Dollar 121,373,660 1,728 - -
Indian Rupee 54,762,096 - +5 -
Japanese Yen 4,577,361 - +5 -
Malaysian Ringgit 19,333,572 - +5 -
Philippine Peso 9,051,875 14,216 +5 711
Singapore Dollar 79,383,081 331,290 +5 16,564
South Korean Won 78,424,514 265 +5 13
Taiwan Dollar 44,194,311 8,709,514 +5 435,476
Thai Baht 8,634,671 - +5 -
430,482,285 9,057,905 - 452,809
First State China Growth Fund
Change in Effect on 2014 2014 Currency Net Asset
Non-Monetary Monetary Rate Value
Currency US$ US$ % US$ Hong Kong Dollar 4,299,088,086 5,316,743 - -
Japanese Yen 88,940,435 276 +5 14
Singapore Dollar 21,143,047 3,790 +5 190 Sterling Pound - 5 +5 -
Taiwan Dollar 221,721,971 1,207,061 +5 60,353
4,630,893,539 6,527,875 - 60,557
First State China Growth Fund
Change in Effect on
2013 2013 Currency Net Asset Non-Monetary Monetary Rate Value
Currency US$ US$ % US$
Australian Dollar - 4,203 +5 210
Hong Kong Dollar 4,438,090,140 (9,262,277) - - Japanese Yen 107,040,526 314 +5 16
Singapore Dollar 17,611,957 3,963 +5 198
Sterling Pound - 5 +5 - Taiwan Dollar 160,920,033 2,950,969 +5 147,549
4,723,662,656 (6,302,823) - 147,973
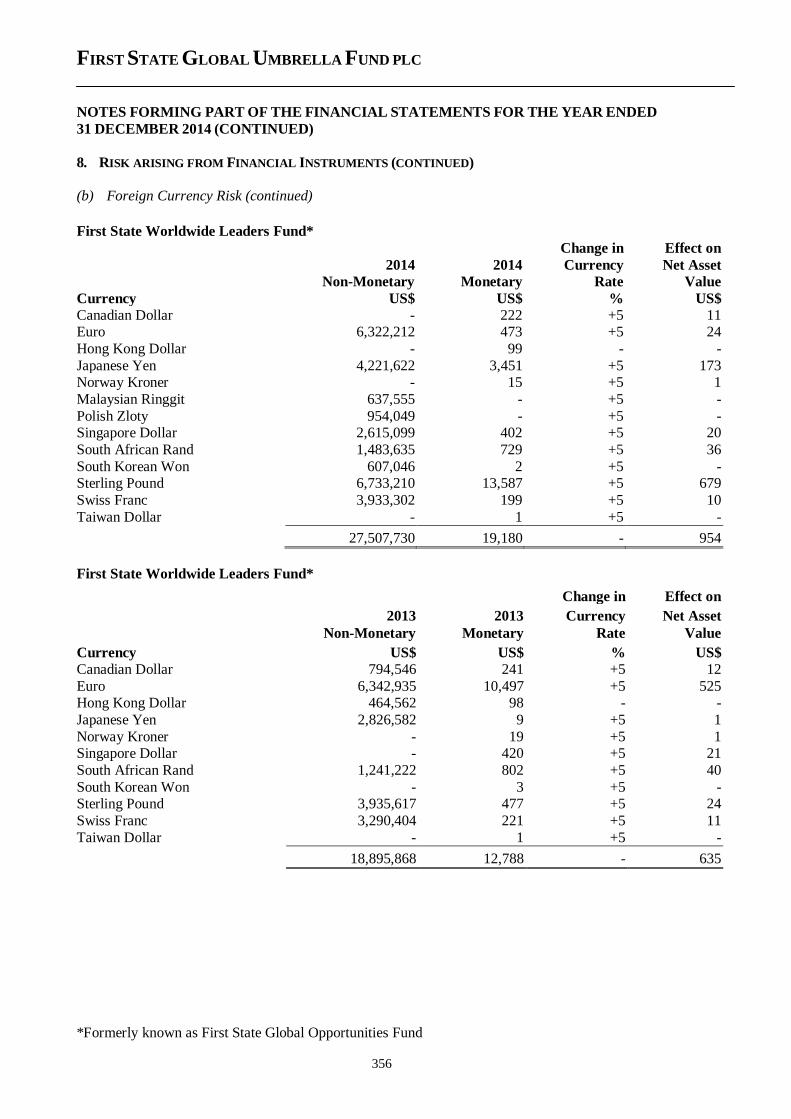
FIRST STATE GLOBAL UMBRELLA FUND PLC
NOTES FORMING PART OF THE FINANCIAL STATEMENTS FOR THE YEAR ENDED
31 DECEMBER 2014 (CONTINUED)
356
8. RISK ARISING FROM FINANCIAL INSTRUMENTS (CONTINUED)
(b) Foreign Currency Risk (continued)
First State Worldwide Leaders Fund*
Change in Effect on
2014 2014 Currency Net Asset Non-Monetary Monetary Rate Value
Currency US$ US$ % US$
Canadian Dollar - 222 +5 11 Euro 6,322,212 473 +5 24
Hong Kong Dollar - 99 - -
Japanese Yen 4,221,622 3,451 +5 173 Norway Kroner - 15 +5 1
Malaysian Ringgit 637,555 - +5 -
Polish Zloty 954,049 - +5 - Singapore Dollar 2,615,099 402 +5 20
South African Rand 1,483,635 729 +5 36
South Korean Won 607,046 2 +5 - Sterling Pound 6,733,210 13,587 +5 679
Swiss Franc 3,933,302 199 +5 10
Taiwan Dollar - 1 +5 -
27,507,730 19,180 - 954
First State Worldwide Leaders Fund*
Change in Effect on 2013 2013 Currency Net Asset Non-Monetary Monetary Rate Value
Currency US$ US$ % US$
Canadian Dollar 794,546 241 +5 12
Euro 6,342,935 10,497 +5 525 Hong Kong Dollar 464,562 98 - -
Japanese Yen 2,826,582 9 +5 1
Norway Kroner - 19 +5 1 Singapore Dollar - 420 +5 21
South African Rand 1,241,222 802 +5 40
South Korean Won - 3 +5 - Sterling Pound 3,935,617 477 +5 24
Swiss Franc 3,290,404 221 +5 11
Taiwan Dollar - 1 +5 -
18,895,868 12,788 - 635
*Formerly known as First State Global Opportunities Fund
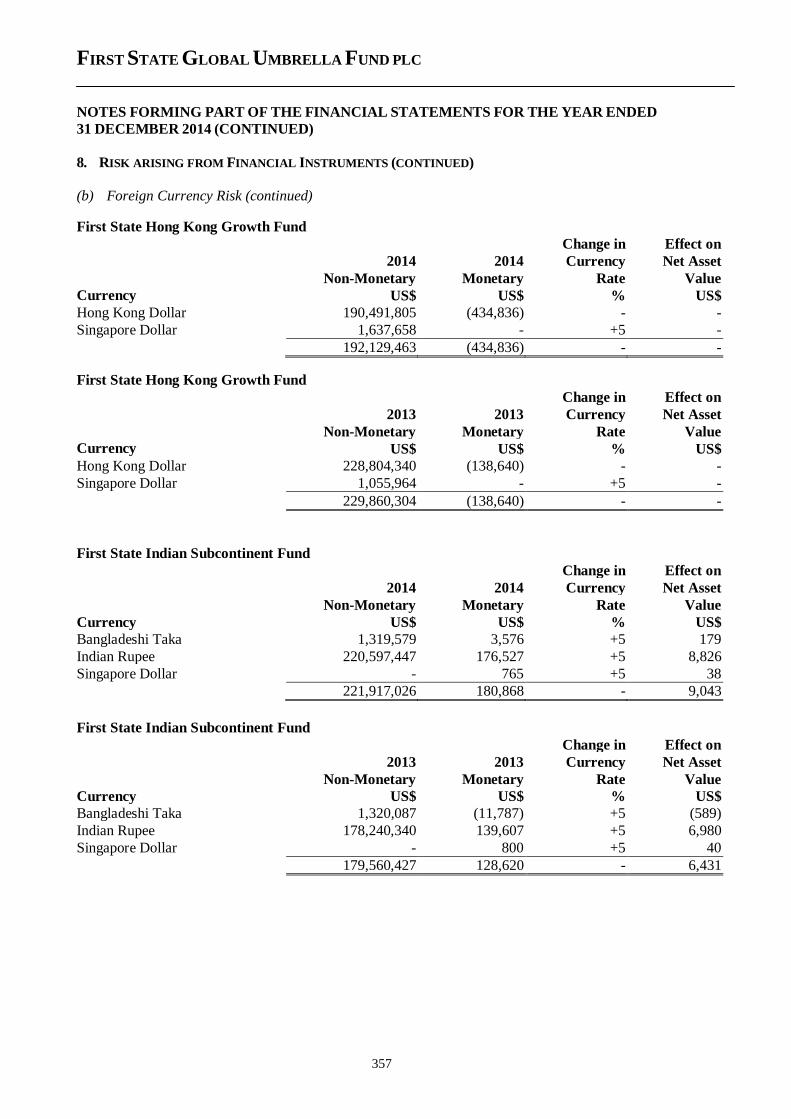
FIRST STATE GLOBAL UMBRELLA FUND PLC
NOTES FORMING PART OF THE FINANCIAL STATEMENTS FOR THE YEAR ENDED
31 DECEMBER 2014 (CONTINUED)
357
8. RISK ARISING FROM FINANCIAL INSTRUMENTS (CONTINUED)
(b) Foreign Currency Risk (continued)
First State Hong Kong Growth Fund
Change in Effect on
2014 2014 Currency Net Asset Non-Monetary Monetary Rate Value
Currency US$ US$ % US$
Hong Kong Dollar 190,491,805 (434,836) - -
Singapore Dollar 1,637,658 - +5 -
192,129,463 (434,836) - -
First State Hong Kong Growth Fund Change in Effect on
2013 2013 Currency Net Asset Non-Monetary Monetary Rate Value
Currency US$ US$ % US$
Hong Kong Dollar 228,804,340 (138,640) - -
Singapore Dollar 1,055,964 - +5 -
229,860,304 (138,640) - -
First State Indian Subcontinent Fund
Change in Effect on
2014 2014 Currency Net Asset
Non-Monetary Monetary Rate Value
Currency US$ US$ % US$
Bangladeshi Taka 1,319,579 3,576 +5 179
Indian Rupee 220,597,447 176,527 +5 8,826
Singapore Dollar - 765 +5 38
221,917,026 180,868 - 9,043
First State Indian Subcontinent Fund
Change in Effect on
2013 2013 Currency Net Asset
Non-Monetary Monetary Rate Value
Currency US$ US$ % US$
Bangladeshi Taka 1,320,087 (11,787) +5 (589)
Indian Rupee 178,240,340 139,607 +5 6,980
Singapore Dollar - 800 +5 40
179,560,427 128,620 - 6,431
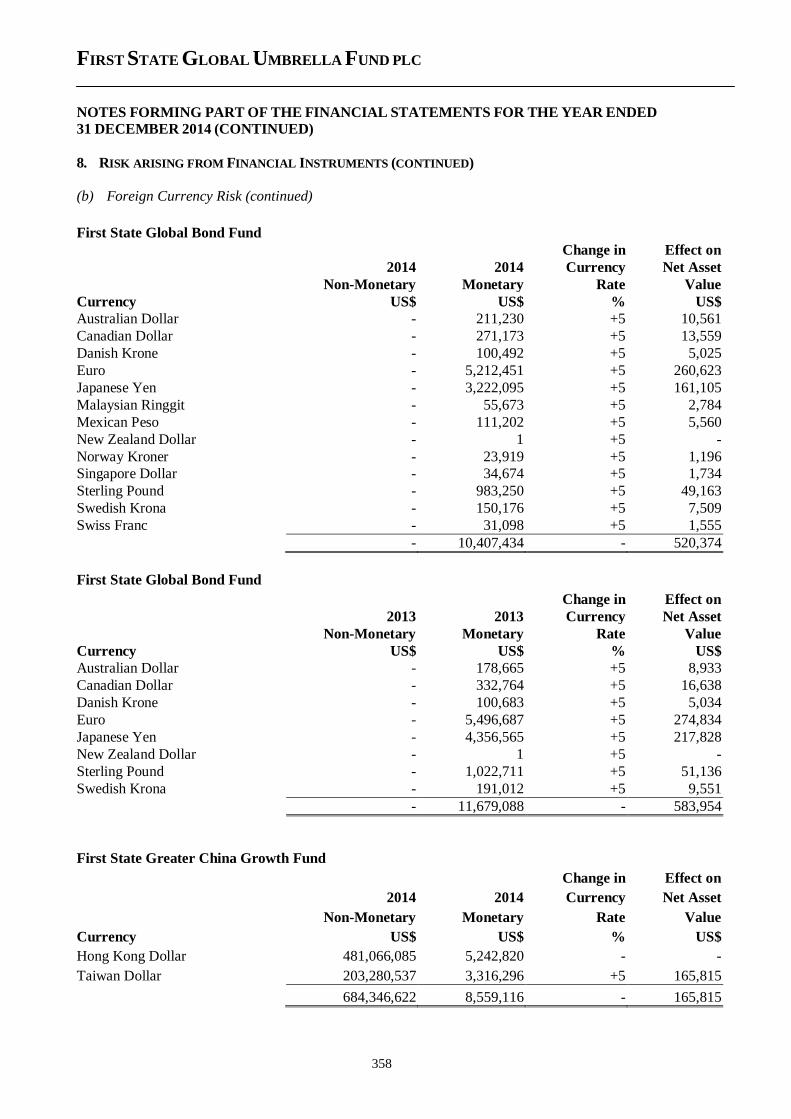
FIRST STATE GLOBAL UMBRELLA FUND PLC
NOTES FORMING PART OF THE FINANCIAL STATEMENTS FOR THE YEAR ENDED
31 DECEMBER 2014 (CONTINUED)
358
8. RISK ARISING FROM FINANCIAL INSTRUMENTS (CONTINUED)
(b) Foreign Currency Risk (continued)
First State Global Bond Fund
Change in Effect on
2014 2014 Currency Net Asset
Non-Monetary Monetary Rate Value
Currency US$ US$ % US$
Australian Dollar - 211,230 +5 10,561
Canadian Dollar - 271,173 +5 13,559
Danish Krone - 100,492 +5 5,025
Euro - 5,212,451 +5 260,623
Japanese Yen - 3,222,095 +5 161,105
Malaysian Ringgit - 55,673 +5 2,784
Mexican Peso - 111,202 +5 5,560
New Zealand Dollar - 1 +5 -
Norway Kroner - 23,919 +5 1,196
Singapore Dollar - 34,674 +5 1,734
Sterling Pound - 983,250 +5 49,163
Swedish Krona - 150,176 +5 7,509
Swiss Franc - 31,098 +5 1,555
- 10,407,434 - 520,374
First State Global Bond Fund
Change in Effect on
2013 2013 Currency Net Asset
Non-Monetary Monetary Rate Value
Currency US$ US$ % US$
Australian Dollar - 178,665 +5 8,933
Canadian Dollar - 332,764 +5 16,638
Danish Krone - 100,683 +5 5,034
Euro - 5,496,687 +5 274,834
Japanese Yen - 4,356,565 +5 217,828
New Zealand Dollar - 1 +5 -
Sterling Pound - 1,022,711 +5 51,136
Swedish Krona - 191,012 +5 9,551
- 11,679,088 - 583,954
First State Greater China Growth Fund
Change in Effect on
2014 2014 Currency Net Asset
Non-Monetary Monetary Rate Value
Currency US$ US$ % US$
Hong Kong Dollar 481,066,085 5,242,820 - -
Taiwan Dollar 203,280,537 3,316,296 +5 165,815
684,346,622 8,559,116 - 165,815
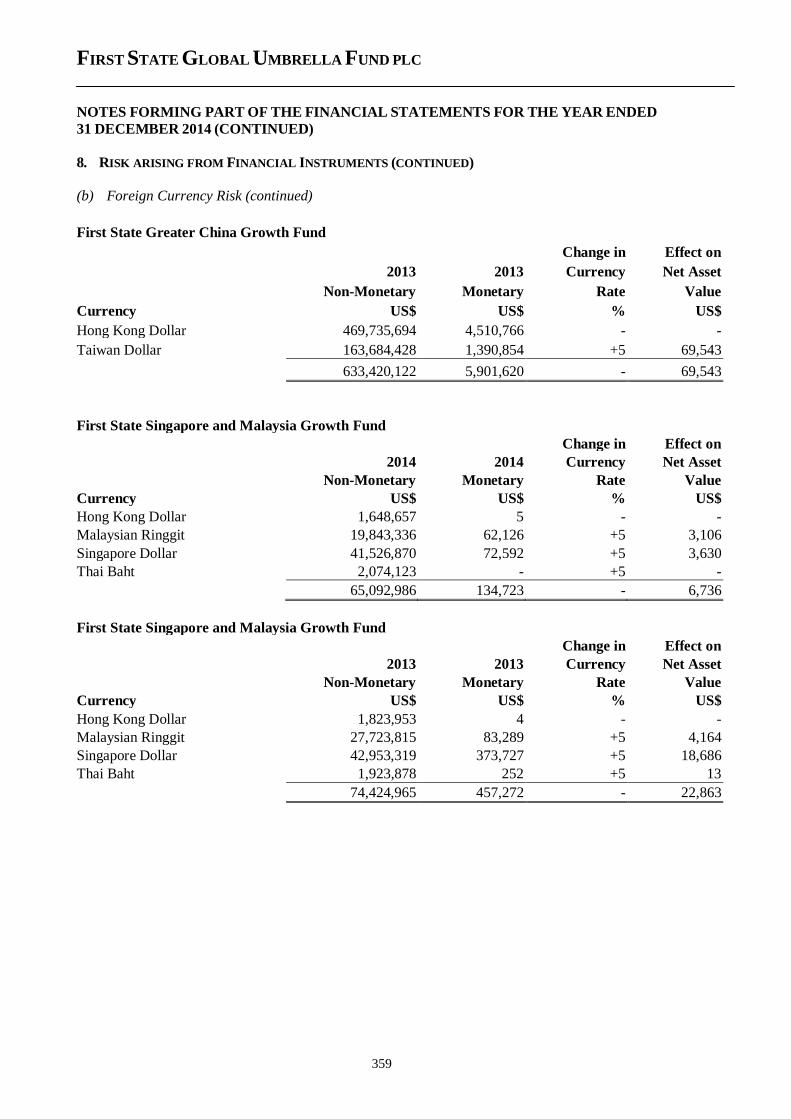
FIRST STATE GLOBAL UMBRELLA FUND PLC
NOTES FORMING PART OF THE FINANCIAL STATEMENTS FOR THE YEAR ENDED
31 DECEMBER 2014 (CONTINUED)
359
8. RISK ARISING FROM FINANCIAL INSTRUMENTS (CONTINUED)
(b) Foreign Currency Risk (continued)
First State Greater China Growth Fund
Change in Effect on
2013 2013 Currency Net Asset
Non-Monetary Monetary Rate Value
Currency US$ US$ % US$
Hong Kong Dollar 469,735,694 4,510,766 - -
Taiwan Dollar 163,684,428 1,390,854 +5 69,543
633,420,122 5,901,620 - 69,543
First State Singapore and Malaysia Growth Fund
Change in Effect on
2014 2014 Currency Net Asset
Non-Monetary Monetary Rate Value
Currency US$ US$ % US$
Hong Kong Dollar 1,648,657 5 - -
Malaysian Ringgit 19,843,336 62,126 +5 3,106
Singapore Dollar 41,526,870 72,592 +5 3,630
Thai Baht 2,074,123 - +5 -
65,092,986 134,723 - 6,736
First State Singapore and Malaysia Growth Fund
Change in Effect on
2013 2013 Currency Net Asset
Non-Monetary Monetary Rate Value
Currency US$ US$ % US$
Hong Kong Dollar 1,823,953 4 - -
Malaysian Ringgit 27,723,815 83,289 +5 4,164
Singapore Dollar 42,953,319 373,727 +5 18,686
Thai Baht 1,923,878 252 +5 13
74,424,965 457,272 - 22,863
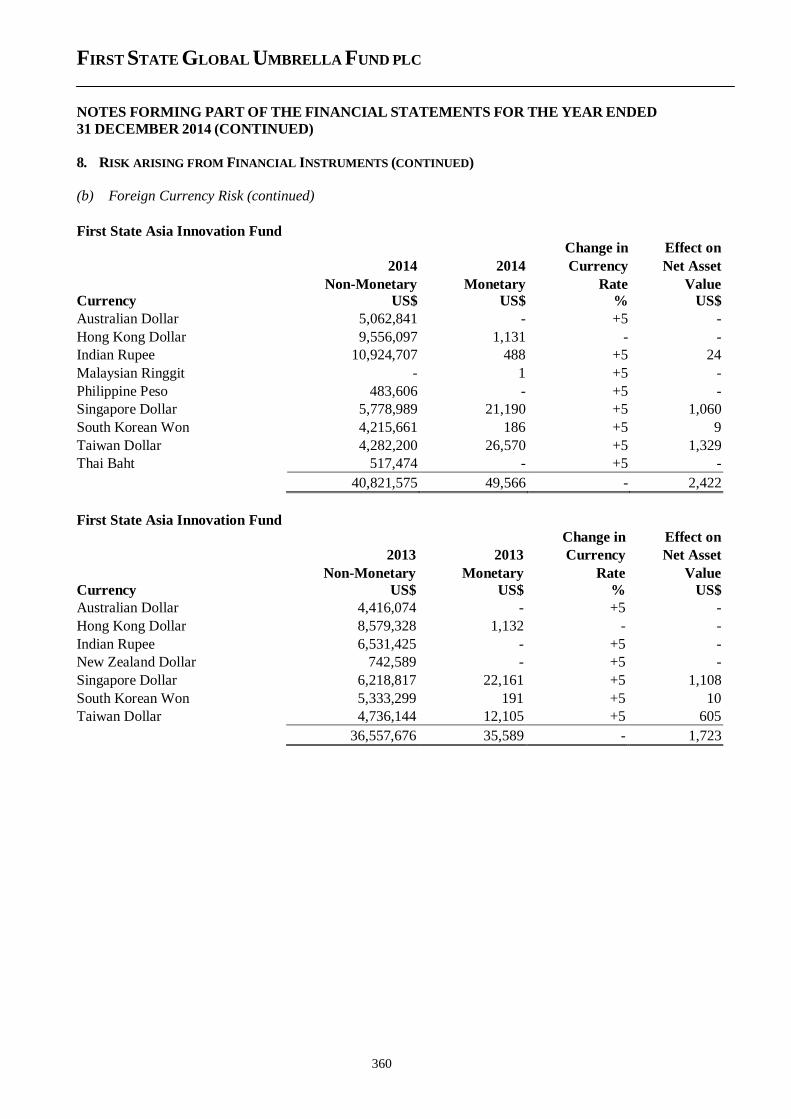
FIRST STATE GLOBAL UMBRELLA FUND PLC
NOTES FORMING PART OF THE FINANCIAL STATEMENTS FOR THE YEAR ENDED
31 DECEMBER 2014 (CONTINUED)
360
8. RISK ARISING FROM FINANCIAL INSTRUMENTS (CONTINUED)
(b) Foreign Currency Risk (continued)
First State Asia Innovation Fund Change in Effect on
2014 2014 Currency Net Asset
Non-Monetary Monetary Rate Value
Currency US$ US$ % US$
Australian Dollar 5,062,841 - +5 -
Hong Kong Dollar 9,556,097 1,131 - -
Indian Rupee 10,924,707 488 +5 24
Malaysian Ringgit - 1 +5 -
Philippine Peso 483,606 - +5 -
Singapore Dollar 5,778,989 21,190 +5 1,060
South Korean Won 4,215,661 186 +5 9
Taiwan Dollar 4,282,200 26,570 +5 1,329
Thai Baht 517,474 - +5 -
40,821,575 49,566 - 2,422
First State Asia Innovation Fund
Change in Effect on
2013 2013 Currency Net Asset
Non-Monetary Monetary Rate Value
Currency US$ US$ % US$
Australian Dollar 4,416,074 - +5 -
Hong Kong Dollar 8,579,328 1,132 - -
Indian Rupee 6,531,425 - +5 -
New Zealand Dollar 742,589 - +5 -
Singapore Dollar 6,218,817 22,161 +5 1,108
South Korean Won 5,333,299 191 +5 10
Taiwan Dollar 4,736,144 12,105 +5 605
36,557,676 35,589 - 1,723
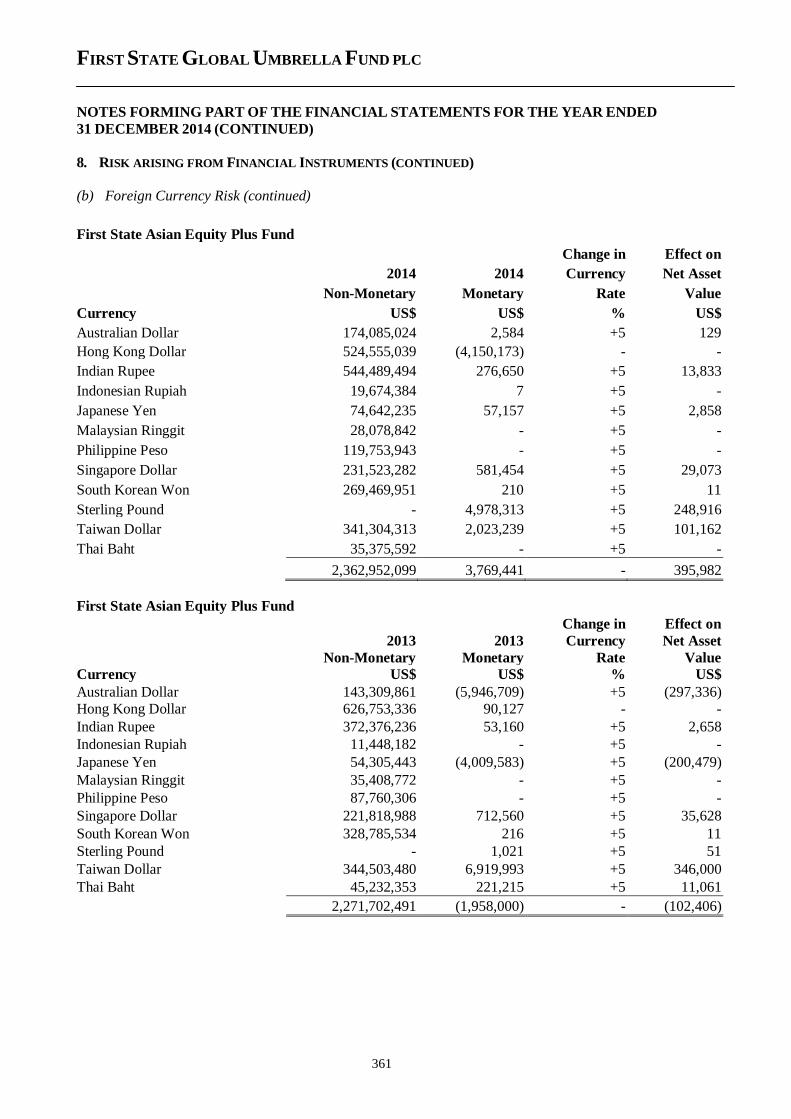
FIRST STATE GLOBAL UMBRELLA FUND PLC
NOTES FORMING PART OF THE FINANCIAL STATEMENTS FOR THE YEAR ENDED
31 DECEMBER 2014 (CONTINUED)
361
8. RISK ARISING FROM FINANCIAL INSTRUMENTS (CONTINUED)
(b) Foreign Currency Risk (continued)
First State Asian Equity Plus Fund
Change in Effect on
2014 2014 Currency Net Asset
Non-Monetary Monetary Rate Value
Currency US$ US$ % US$
Australian Dollar 174,085,024 2,584 +5 129
Hong Kong Dollar 524,555,039 (4,150,173) - -
Indian Rupee 544,489,494 276,650 +5 13,833
Indonesian Rupiah 19,674,384 7 +5 -
Japanese Yen 74,642,235 57,157 +5 2,858
Malaysian Ringgit 28,078,842 - +5 -
Philippine Peso 119,753,943 - +5 -
Singapore Dollar 231,523,282 581,454 +5 29,073
South Korean Won 269,469,951 210 +5 11
Sterling Pound - 4,978,313 +5 248,916
Taiwan Dollar 341,304,313 2,023,239 +5 101,162
Thai Baht 35,375,592 - +5 -
2,362,952,099 3,769,441 - 395,982
First State Asian Equity Plus Fund
Change in Effect on
2013 2013 Currency Net Asset Non-Monetary Monetary Rate Value
Currency US$ US$ % US$
Australian Dollar 143,309,861 (5,946,709) +5 (297,336)
Hong Kong Dollar 626,753,336 90,127 - -
Indian Rupee 372,376,236 53,160 +5 2,658
Indonesian Rupiah 11,448,182 - +5 -
Japanese Yen 54,305,443 (4,009,583) +5 (200,479)
Malaysian Ringgit 35,408,772 - +5 -
Philippine Peso 87,760,306 - +5 -
Singapore Dollar 221,818,988 712,560 +5 35,628
South Korean Won 328,785,534 216 +5 11
Sterling Pound - 1,021 +5 51
Taiwan Dollar 344,503,480 6,919,993 +5 346,000
Thai Baht 45,232,353 221,215 +5 11,061
2,271,702,491 (1,958,000) - (102,406)
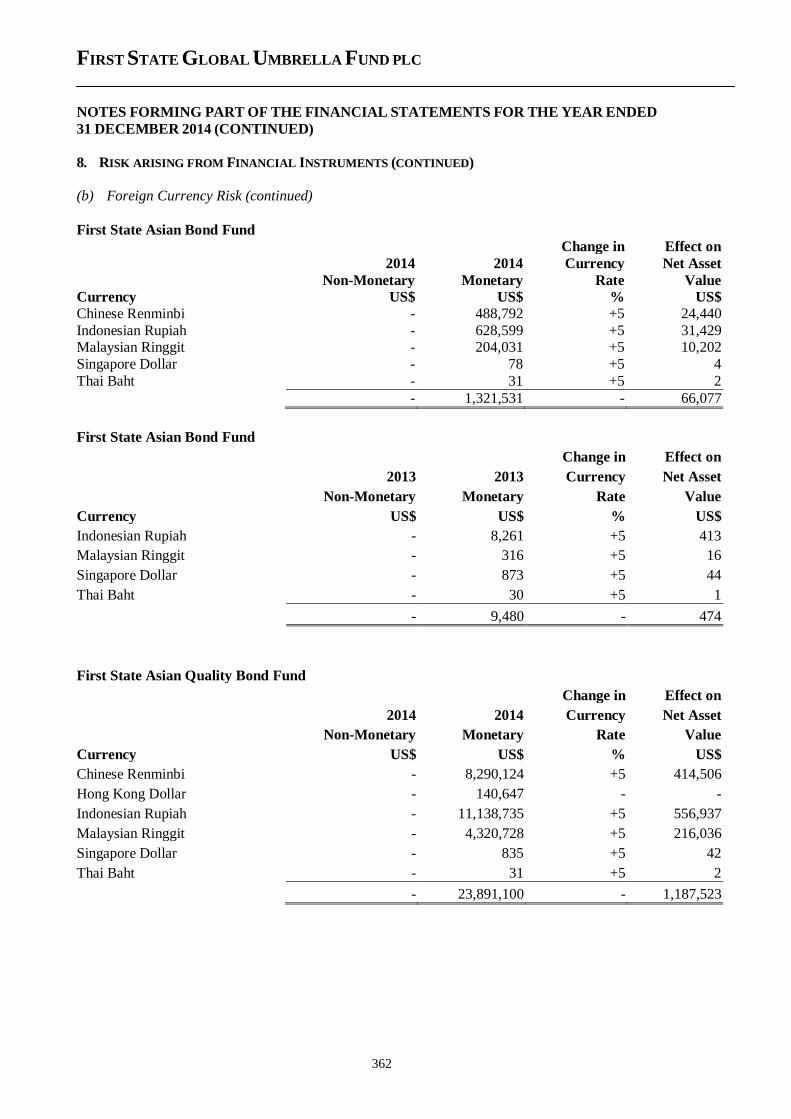
FIRST STATE GLOBAL UMBRELLA FUND PLC
NOTES FORMING PART OF THE FINANCIAL STATEMENTS FOR THE YEAR ENDED
31 DECEMBER 2014 (CONTINUED)
362
8. RISK ARISING FROM FINANCIAL INSTRUMENTS (CONTINUED)
(b) Foreign Currency Risk (continued)
First State Asian Bond Fund Change in Effect on
2014 2014 Currency Net Asset Non-Monetary Monetary Rate Value
Currency US$ US$ % US$
Chinese Renminbi - 488,792 +5 24,440
Indonesian Rupiah - 628,599 +5 31,429 Malaysian Ringgit - 204,031 +5 10,202
Singapore Dollar - 78 +5 4
Thai Baht - 31 +5 2
- 1,321,531 - 66,077
First State Asian Bond Fund
Change in Effect on
2013 2013 Currency Net Asset
Non-Monetary Monetary Rate Value
Currency US$ US$ % US$
Indonesian Rupiah - 8,261 +5 413
Malaysian Ringgit - 316 +5 16
Singapore Dollar - 873 +5 44
Thai Baht - 30 +5 1
- 9,480 - 474
First State Asian Quality Bond Fund
Change in Effect on
2014 2014 Currency Net Asset
Non-Monetary Monetary Rate Value
Currency US$ US$ % US$
Chinese Renminbi - 8,290,124 +5 414,506
Hong Kong Dollar - 140,647 - -
Indonesian Rupiah - 11,138,735 +5 556,937
Malaysian Ringgit - 4,320,728 +5 216,036
Singapore Dollar - 835 +5 42
Thai Baht - 31 +5 2
- 23,891,100 - 1,187,523
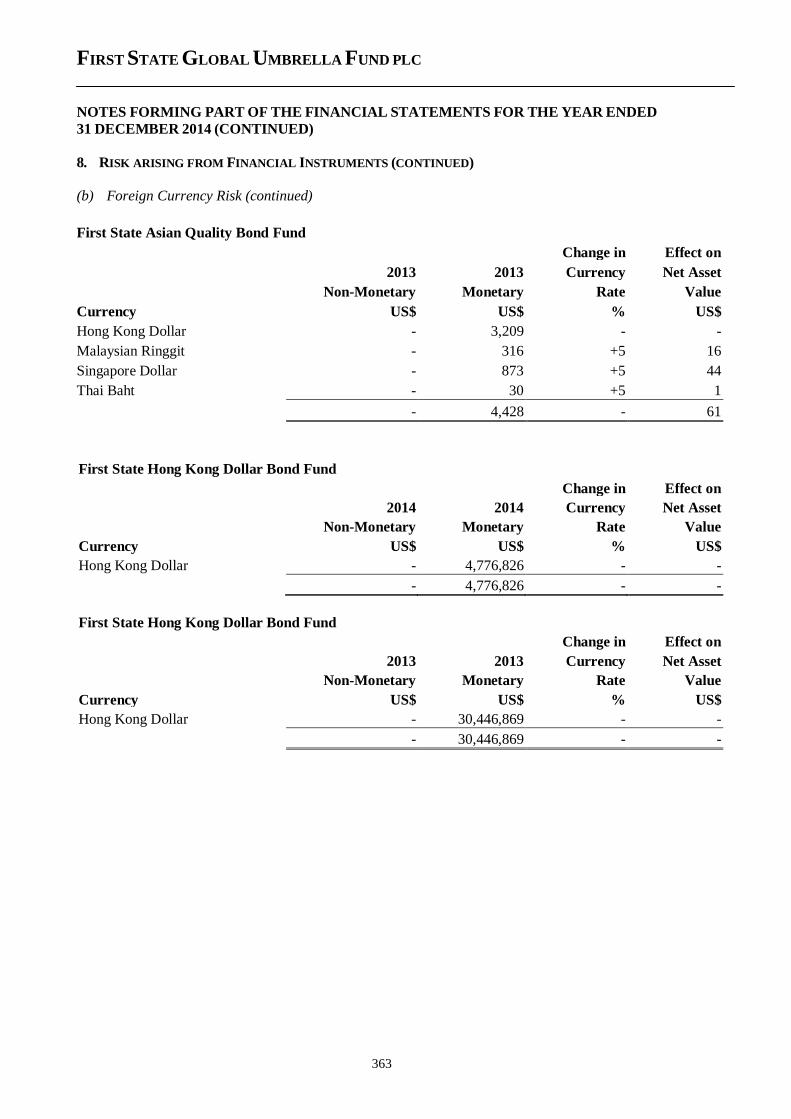
FIRST STATE GLOBAL UMBRELLA FUND PLC
NOTES FORMING PART OF THE FINANCIAL STATEMENTS FOR THE YEAR ENDED
31 DECEMBER 2014 (CONTINUED)
363
8. RISK ARISING FROM FINANCIAL INSTRUMENTS (CONTINUED)
(b) Foreign Currency Risk (continued)
First State Asian Quality Bond Fund
Change in Effect on
2013 2013 Currency Net Asset
Non-Monetary Monetary Rate Value
Currency US$ US$ % US$
Hong Kong Dollar - 3,209 - -
Malaysian Ringgit - 316 +5 16
Singapore Dollar - 873 +5 44
Thai Baht - 30 +5 1
- 4,428 - 61
First State Hong Kong Dollar Bond Fund
Change in Effect on
2014 2014 Currency Net Asset
Non-Monetary Monetary Rate Value
Currency US$ US$ % US$
Hong Kong Dollar - 4,776,826 - -
- 4,776,826 - -
First State Hong Kong Dollar Bond Fund
Change in Effect on
2013 2013 Currency Net Asset
Non-Monetary Monetary Rate Value
Currency US$ US$ % US$
Hong Kong Dollar - 30,446,869 - -
- 30,446,869 - -
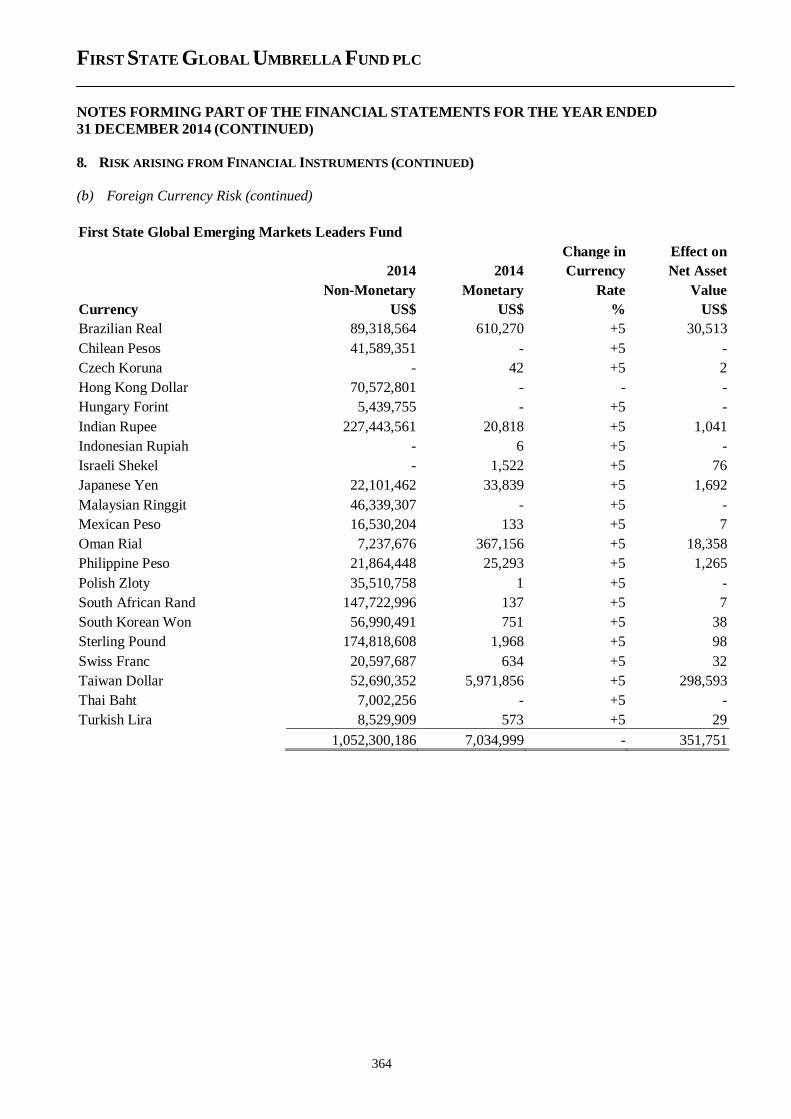
FIRST STATE GLOBAL UMBRELLA FUND PLC
NOTES FORMING PART OF THE FINANCIAL STATEMENTS FOR THE YEAR ENDED
31 DECEMBER 2014 (CONTINUED)
364
8. RISK ARISING FROM FINANCIAL INSTRUMENTS (CONTINUED)
(b) Foreign Currency Risk (continued)
First State Global Emerging Markets Leaders Fund
Change in Effect on
2014 2014 Currency Net Asset
Non-Monetary Monetary Rate Value
Currency US$ US$ % US$
Brazilian Real 89,318,564 610,270 +5 30,513
Chilean Pesos 41,589,351 - +5 -
Czech Koruna - 42 +5 2
Hong Kong Dollar 70,572,801 - - -
Hungary Forint 5,439,755 - +5 -
Indian Rupee 227,443,561 20,818 +5 1,041
Indonesian Rupiah - 6 +5 -
Israeli Shekel - 1,522 +5 76
Japanese Yen 22,101,462 33,839 +5 1,692
Malaysian Ringgit 46,339,307 - +5 -
Mexican Peso 16,530,204 133 +5 7
Oman Rial 7,237,676 367,156 +5 18,358
Philippine Peso 21,864,448 25,293 +5 1,265
Polish Zloty 35,510,758 1 +5 -
South African Rand 147,722,996 137 +5 7
South Korean Won 56,990,491 751 +5 38
Sterling Pound 174,818,608 1,968 +5 98
Swiss Franc 20,597,687 634 +5 32
Taiwan Dollar 52,690,352 5,971,856 +5 298,593
Thai Baht 7,002,256 - +5 -
Turkish Lira 8,529,909 573 +5 29
1,052,300,186 7,034,999 - 351,751
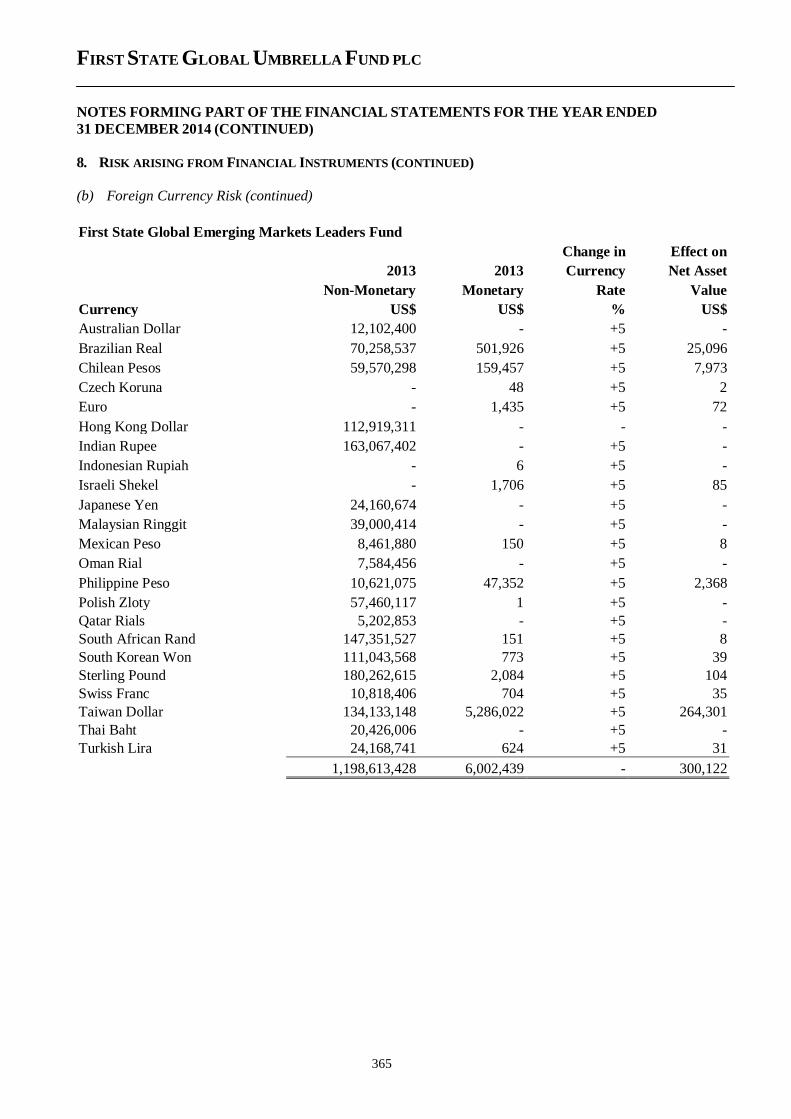
FIRST STATE GLOBAL UMBRELLA FUND PLC
NOTES FORMING PART OF THE FINANCIAL STATEMENTS FOR THE YEAR ENDED
31 DECEMBER 2014 (CONTINUED)
365
8. RISK ARISING FROM FINANCIAL INSTRUMENTS (CONTINUED)
(b) Foreign Currency Risk (continued)
First State Global Emerging Markets Leaders Fund
Change in Effect on
2013 2013 Currency Net Asset
Non-Monetary Monetary Rate Value
Currency US$ US$ % US$
Australian Dollar 12,102,400 - +5 -
Brazilian Real 70,258,537 501,926 +5 25,096
Chilean Pesos 59,570,298 159,457 +5 7,973
Czech Koruna - 48 +5 2
Euro - 1,435 +5 72
Hong Kong Dollar 112,919,311 - - -
Indian Rupee 163,067,402 - +5 -
Indonesian Rupiah - 6 +5 -
Israeli Shekel - 1,706 +5 85
Japanese Yen 24,160,674 - +5 -
Malaysian Ringgit 39,000,414 - +5 -
Mexican Peso 8,461,880 150 +5 8
Oman Rial 7,584,456 - +5 -
Philippine Peso 10,621,075 47,352 +5 2,368
Polish Zloty 57,460,117 1 +5 -
Qatar Rials 5,202,853 - +5 -
South African Rand 147,351,527 151 +5 8
South Korean Won 111,043,568 773 +5 39
Sterling Pound 180,262,615 2,084 +5 104
Swiss Franc 10,818,406 704 +5 35
Taiwan Dollar 134,133,148 5,286,022 +5 264,301
Thai Baht 20,426,006 - +5 -
Turkish Lira 24,168,741 624 +5 31
1,198,613,428 6,002,439 - 300,122
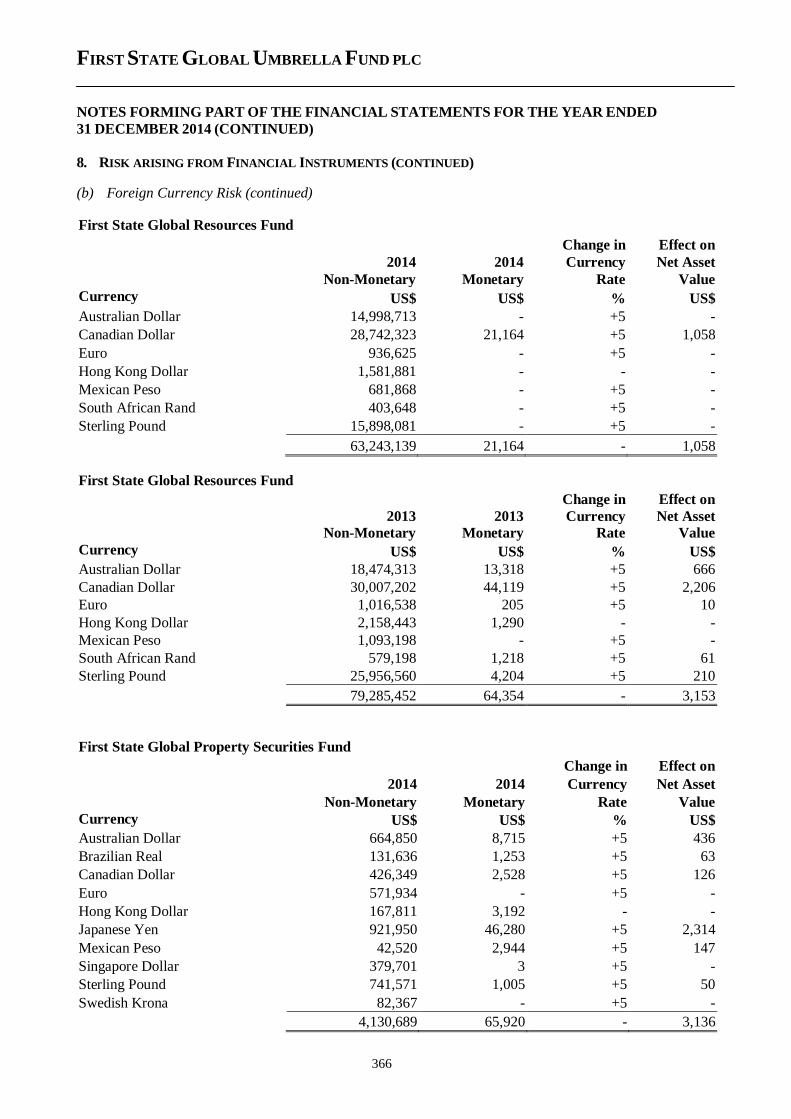
FIRST STATE GLOBAL UMBRELLA FUND PLC
NOTES FORMING PART OF THE FINANCIAL STATEMENTS FOR THE YEAR ENDED
31 DECEMBER 2014 (CONTINUED)
366
8. RISK ARISING FROM FINANCIAL INSTRUMENTS (CONTINUED)
(b) Foreign Currency Risk (continued)
First State Global Resources Fund
Change in Effect on
2014 2014 Currency Net Asset
Non-Monetary Monetary Rate Value
Currency US$ US$ % US$
Australian Dollar 14,998,713 - +5 -
Canadian Dollar 28,742,323 21,164 +5 1,058
Euro 936,625 - +5 -
Hong Kong Dollar 1,581,881 - - -
Mexican Peso 681,868 - +5 -
South African Rand 403,648 - +5 -
Sterling Pound 15,898,081 - +5 -
63,243,139 21,164 - 1,058
First State Global Resources Fund
Change in Effect on
2013 2013 Currency Net Asset Non-Monetary Monetary Rate Value
Currency US$ US$ % US$
Australian Dollar 18,474,313 13,318 +5 666
Canadian Dollar 30,007,202 44,119 +5 2,206
Euro 1,016,538 205 +5 10
Hong Kong Dollar 2,158,443 1,290 - -
Mexican Peso 1,093,198 - +5 -
South African Rand 579,198 1,218 +5 61
Sterling Pound 25,956,560 4,204 +5 210
79,285,452 64,354 - 3,153
First State Global Property Securities Fund
Change in Effect on
2014 2014 Currency Net Asset Non-Monetary Monetary Rate Value
Currency US$ US$ % US$
Australian Dollar 664,850 8,715 +5 436
Brazilian Real 131,636 1,253 +5 63
Canadian Dollar 426,349 2,528 +5 126
Euro 571,934 - +5 -
Hong Kong Dollar 167,811 3,192 - -
Japanese Yen 921,950 46,280 +5 2,314
Mexican Peso 42,520 2,944 +5 147
Singapore Dollar 379,701 3 +5 -
Sterling Pound 741,571 1,005 +5 50
Swedish Krona 82,367 - +5 -
4,130,689 65,920 - 3,136
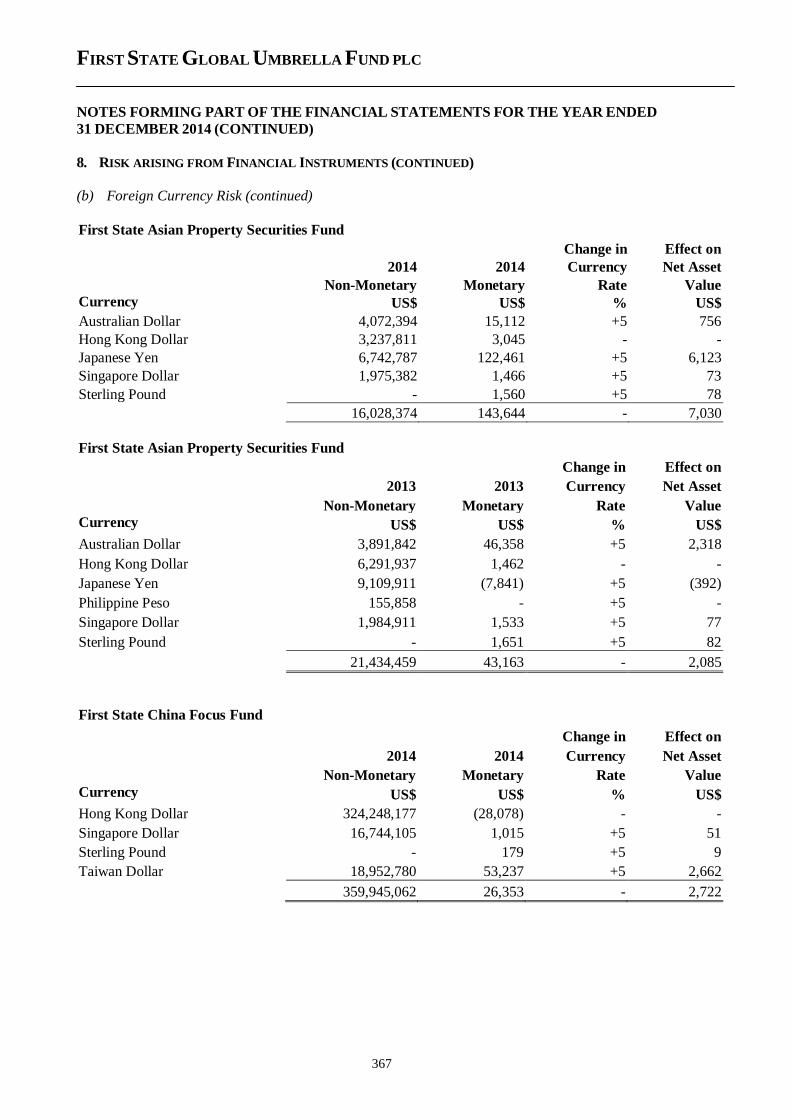
FIRST STATE GLOBAL UMBRELLA FUND PLC
NOTES FORMING PART OF THE FINANCIAL STATEMENTS FOR THE YEAR ENDED
31 DECEMBER 2014 (CONTINUED)
367
8. RISK ARISING FROM FINANCIAL INSTRUMENTS (CONTINUED)
(b) Foreign Currency Risk (continued)
First State Asian Property Securities Fund
Change in Effect on
2014 2014 Currency Net Asset
Non-Monetary Monetary Rate Value
Currency US$ US$ % US$
Australian Dollar 4,072,394 15,112 +5 756
Hong Kong Dollar 3,237,811 3,045 - -
Japanese Yen 6,742,787 122,461 +5 6,123
Singapore Dollar 1,975,382 1,466 +5 73
Sterling Pound - 1,560 +5 78
16,028,374 143,644 - 7,030
First State Asian Property Securities Fund
Change in Effect on
2013 2013 Currency Net Asset
Non-Monetary Monetary Rate Value
Currency US$ US$ % US$
Australian Dollar 3,891,842 46,358 +5 2,318
Hong Kong Dollar 6,291,937 1,462 - -
Japanese Yen 9,109,911 (7,841) +5 (392)
Philippine Peso 155,858 - +5 -
Singapore Dollar 1,984,911 1,533 +5 77
Sterling Pound - 1,651 +5 82
21,434,459 43,163 - 2,085
First State China Focus Fund
Change in Effect on
2014 2014 Currency Net Asset Non-Monetary Monetary Rate Value
Currency US$ US$ % US$
Hong Kong Dollar 324,248,177 (28,078) - -
Singapore Dollar 16,744,105 1,015 +5 51
Sterling Pound - 179 +5 9
Taiwan Dollar 18,952,780 53,237 +5 2,662
359,945,062 26,353 - 2,722
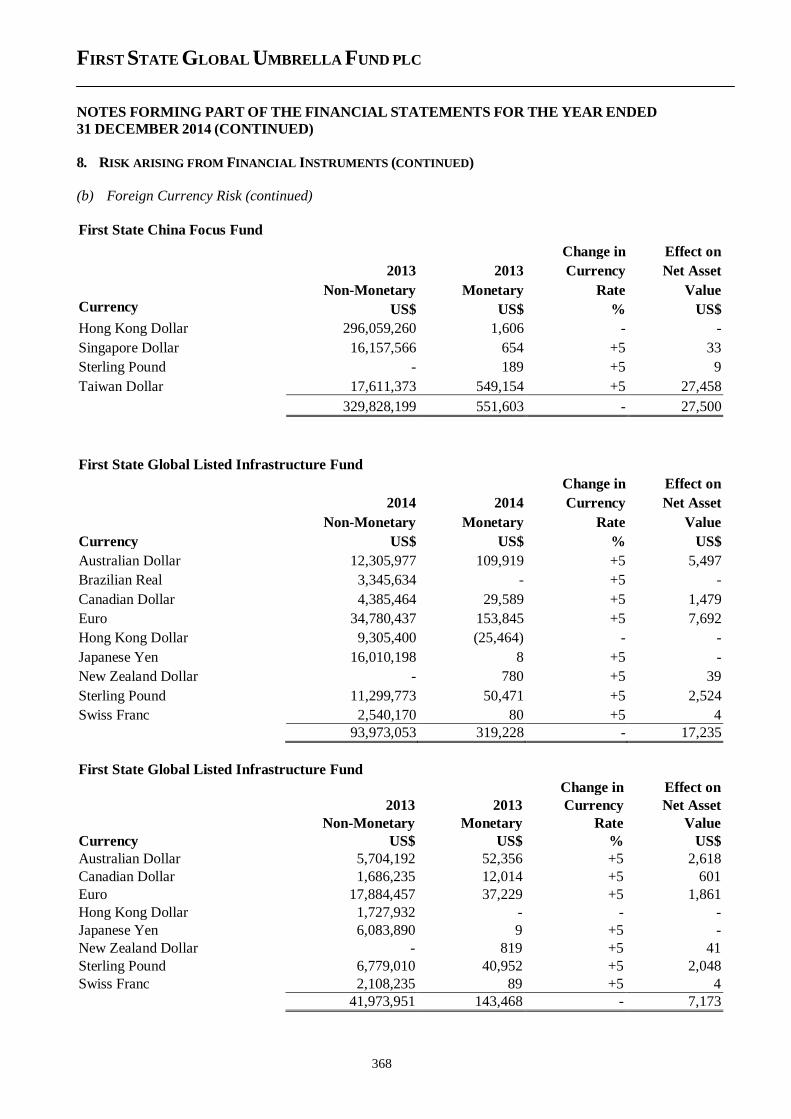
FIRST STATE GLOBAL UMBRELLA FUND PLC
NOTES FORMING PART OF THE FINANCIAL STATEMENTS FOR THE YEAR ENDED
31 DECEMBER 2014 (CONTINUED)
368
8. RISK ARISING FROM FINANCIAL INSTRUMENTS (CONTINUED)
(b) Foreign Currency Risk (continued)
First State China Focus Fund
Change in Effect on
2013 2013 Currency Net Asset
Non-Monetary Monetary Rate Value
Currency US$ US$ % US$
Hong Kong Dollar 296,059,260 1,606 - -
Singapore Dollar 16,157,566 654 +5 33
Sterling Pound - 189 +5 9
Taiwan Dollar 17,611,373 549,154 +5 27,458
329,828,199 551,603 - 27,500
First State Global Listed Infrastructure Fund
Change in Effect on
2014 2014 Currency Net Asset
Non-Monetary Monetary Rate Value
Currency US$ US$ % US$
Australian Dollar 12,305,977 109,919 +5 5,497
Brazilian Real 3,345,634 - +5 -
Canadian Dollar 4,385,464 29,589 +5 1,479
Euro 34,780,437 153,845 +5 7,692
Hong Kong Dollar 9,305,400 (25,464) - -
Japanese Yen 16,010,198 8 +5 -
New Zealand Dollar - 780 +5 39
Sterling Pound 11,299,773 50,471 +5 2,524
Swiss Franc 2,540,170 80 +5 4
93,973,053 319,228 - 17,235
First State Global Listed Infrastructure Fund
Change in Effect on
2013 2013 Currency Net Asset
Non-Monetary Monetary Rate Value
Currency US$ US$ % US$
Australian Dollar 5,704,192 52,356 +5 2,618
Canadian Dollar 1,686,235 12,014 +5 601
Euro 17,884,457 37,229 +5 1,861
Hong Kong Dollar 1,727,932 - - -
Japanese Yen 6,083,890 9 +5 -
New Zealand Dollar - 819 +5 41
Sterling Pound 6,779,010 40,952 +5 2,048
Swiss Franc 2,108,235 89 +5 4
41,973,951 143,468 - 7,173
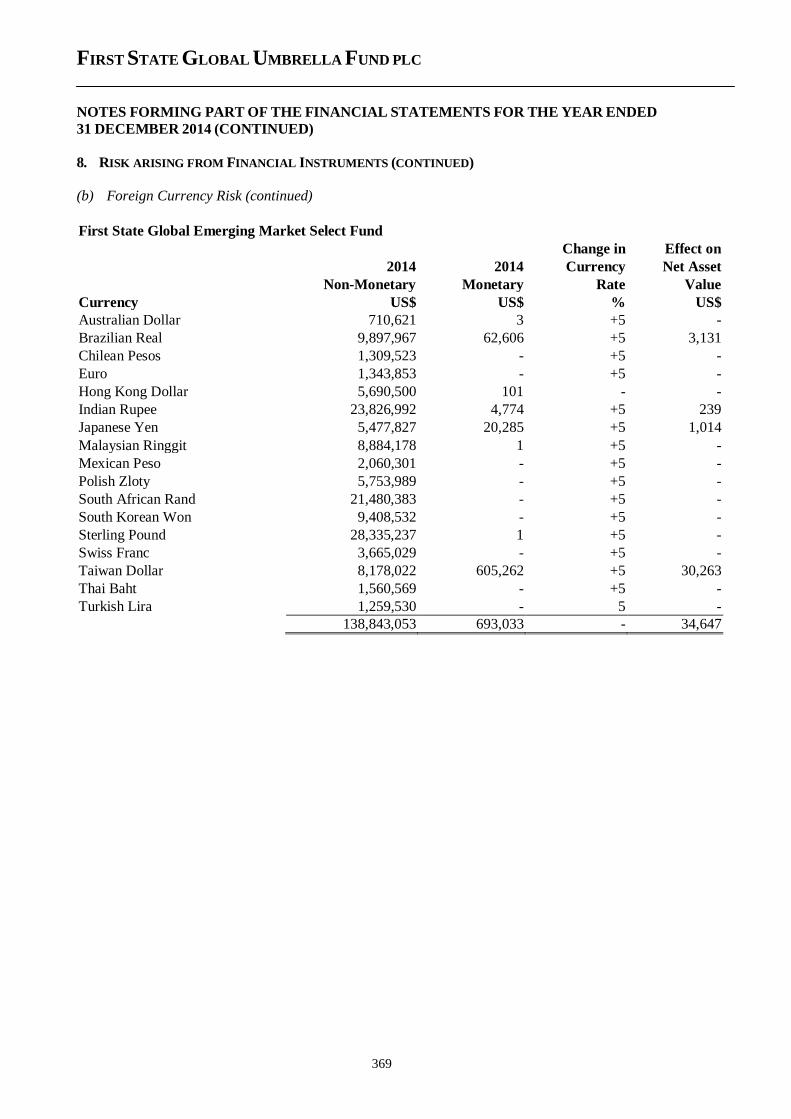
FIRST STATE GLOBAL UMBRELLA FUND PLC
NOTES FORMING PART OF THE FINANCIAL STATEMENTS FOR THE YEAR ENDED
31 DECEMBER 2014 (CONTINUED)
369
8. RISK ARISING FROM FINANCIAL INSTRUMENTS (CONTINUED)
(b) Foreign Currency Risk (continued)
First State Global Emerging Market Select Fund
Change in Effect on
2014 2014 Currency Net Asset
Non-Monetary Monetary Rate Value
Currency US$ US$ % US$
Australian Dollar 710,621 3 +5 -
Brazilian Real 9,897,967 62,606 +5 3,131
Chilean Pesos 1,309,523 - +5 -
Euro 1,343,853 - +5 -
Hong Kong Dollar 5,690,500 101 - -
Indian Rupee 23,826,992 4,774 +5 239
Japanese Yen 5,477,827 20,285 +5 1,014
Malaysian Ringgit 8,884,178 1 +5 -
Mexican Peso 2,060,301 - +5 -
Polish Zloty 5,753,989 - +5 -
South African Rand 21,480,383 - +5 -
South Korean Won 9,408,532 - +5 -
Sterling Pound 28,335,237 1 +5 -
Swiss Franc 3,665,029 - +5 -
Taiwan Dollar 8,178,022 605,262 +5 30,263
Thai Baht 1,560,569 - +5 -
Turkish Lira 1,259,530 - 5 -
138,843,053 693,033 - 34,647
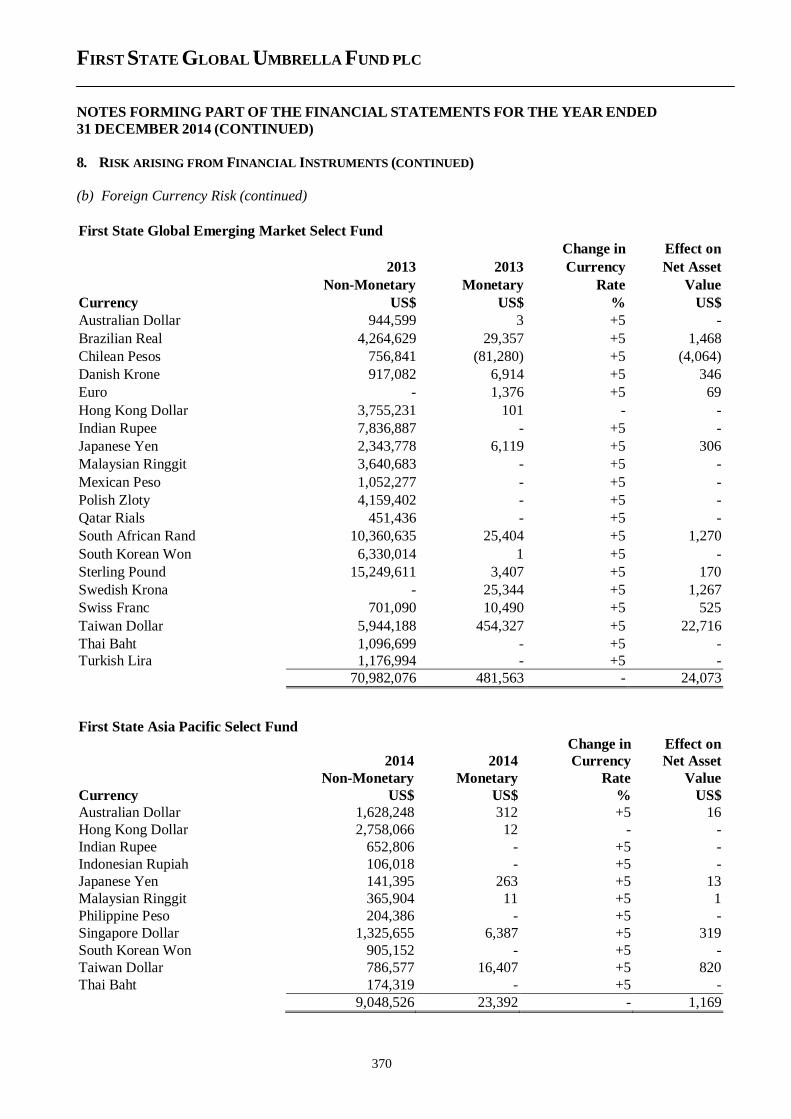
FIRST STATE GLOBAL UMBRELLA FUND PLC
NOTES FORMING PART OF THE FINANCIAL STATEMENTS FOR THE YEAR ENDED
31 DECEMBER 2014 (CONTINUED)
370
8. RISK ARISING FROM FINANCIAL INSTRUMENTS (CONTINUED)
(b) Foreign Currency Risk (continued)
First State Global Emerging Market Select Fund
Change in Effect on
2013 2013 Currency Net Asset
Non-Monetary Monetary Rate Value
Currency US$ US$ % US$
Australian Dollar 944,599 3 +5 -
Brazilian Real 4,264,629 29,357 +5 1,468
Chilean Pesos 756,841 (81,280) +5 (4,064)
Danish Krone 917,082 6,914 +5 346
Euro - 1,376 +5 69
Hong Kong Dollar 3,755,231 101 - -
Indian Rupee 7,836,887 - +5 -
Japanese Yen 2,343,778 6,119 +5 306
Malaysian Ringgit 3,640,683 - +5 -
Mexican Peso 1,052,277 - +5 -
Polish Zloty 4,159,402 - +5 -
Qatar Rials 451,436 - +5 -
South African Rand 10,360,635 25,404 +5 1,270
South Korean Won 6,330,014 1 +5 -
Sterling Pound 15,249,611 3,407 +5 170
Swedish Krona - 25,344 +5 1,267
Swiss Franc 701,090 10,490 +5 525
Taiwan Dollar 5,944,188 454,327 +5 22,716
Thai Baht 1,096,699 - +5 -
Turkish Lira 1,176,994 - +5 -
70,982,076 481,563 - 24,073
First State Asia Pacific Select Fund
Change in Effect on
2014 2014 Currency Net Asset
Non-Monetary Monetary Rate Value
Currency US$ US$ % US$
Australian Dollar 1,628,248 312 +5 16
Hong Kong Dollar 2,758,066 12 - -
Indian Rupee 652,806 - +5 -
Indonesian Rupiah 106,018 - +5 -
Japanese Yen 141,395 263 +5 13
Malaysian Ringgit 365,904 11 +5 1
Philippine Peso 204,386 - +5 -
Singapore Dollar 1,325,655 6,387 +5 319
South Korean Won 905,152 - +5 -
Taiwan Dollar 786,577 16,407 +5 820
Thai Baht 174,319 - +5 -
9,048,526 23,392 - 1,169
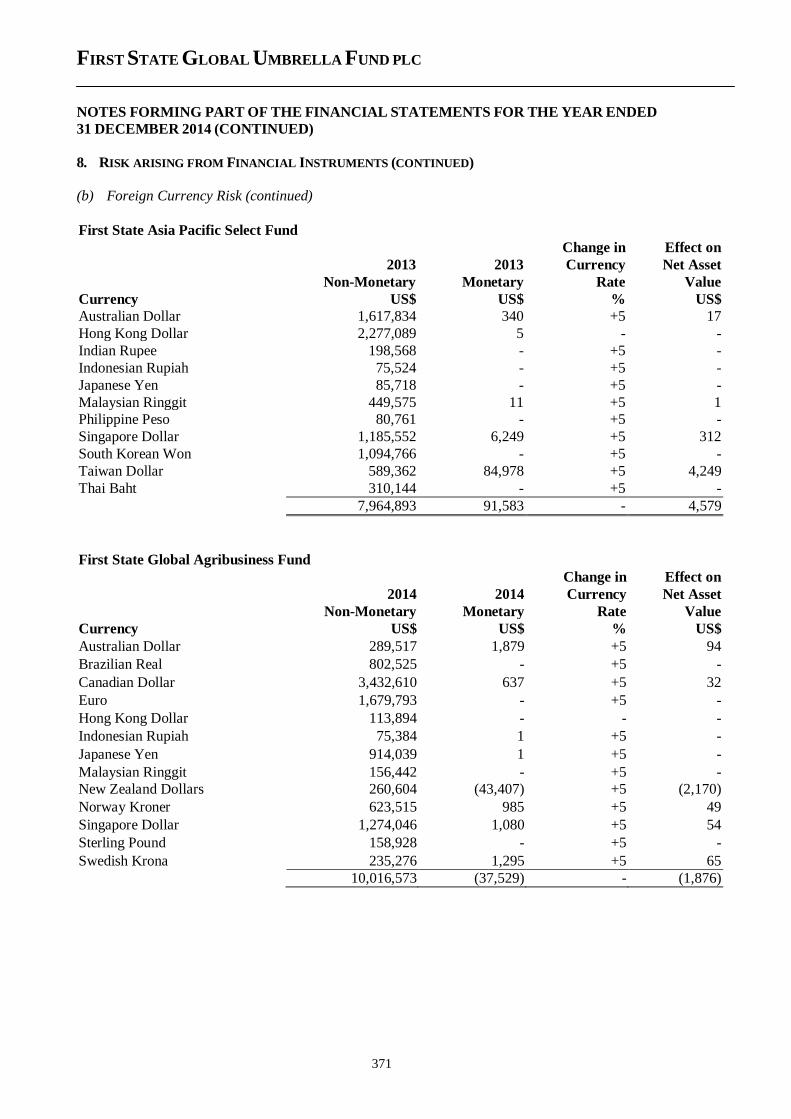
FIRST STATE GLOBAL UMBRELLA FUND PLC
NOTES FORMING PART OF THE FINANCIAL STATEMENTS FOR THE YEAR ENDED
31 DECEMBER 2014 (CONTINUED)
371
8. RISK ARISING FROM FINANCIAL INSTRUMENTS (CONTINUED)
(b) Foreign Currency Risk (continued)
First State Asia Pacific Select Fund
Change in Effect on
2013 2013 Currency Net Asset
Non-Monetary Monetary Rate Value
Currency US$ US$ % US$
Australian Dollar 1,617,834 340 +5 17
Hong Kong Dollar 2,277,089 5 - -
Indian Rupee 198,568 - +5 -
Indonesian Rupiah 75,524 - +5 -
Japanese Yen 85,718 - +5 -
Malaysian Ringgit 449,575 11 +5 1
Philippine Peso 80,761 - +5 -
Singapore Dollar 1,185,552 6,249 +5 312
South Korean Won 1,094,766 - +5 -
Taiwan Dollar 589,362 84,978 +5 4,249
Thai Baht 310,144 - +5 -
7,964,893 91,583 - 4,579
First State Global Agribusiness Fund
Change in Effect on
2014 2014 Currency Net Asset
Non-Monetary Monetary Rate Value
Currency US$ US$ % US$
Australian Dollar 289,517 1,879 +5 94
Brazilian Real 802,525 - +5 -
Canadian Dollar 3,432,610 637 +5 32
Euro 1,679,793 - +5 -
Hong Kong Dollar 113,894 - - -
Indonesian Rupiah 75,384 1 +5 -
Japanese Yen 914,039 1 +5 -
Malaysian Ringgit 156,442 - +5 -
New Zealand Dollars 260,604 (43,407) +5 (2,170)
Norway Kroner 623,515 985 +5 49
Singapore Dollar 1,274,046 1,080 +5 54
Sterling Pound 158,928 - +5 -
Swedish Krona 235,276 1,295 +5 65
10,016,573 (37,529) - (1,876)
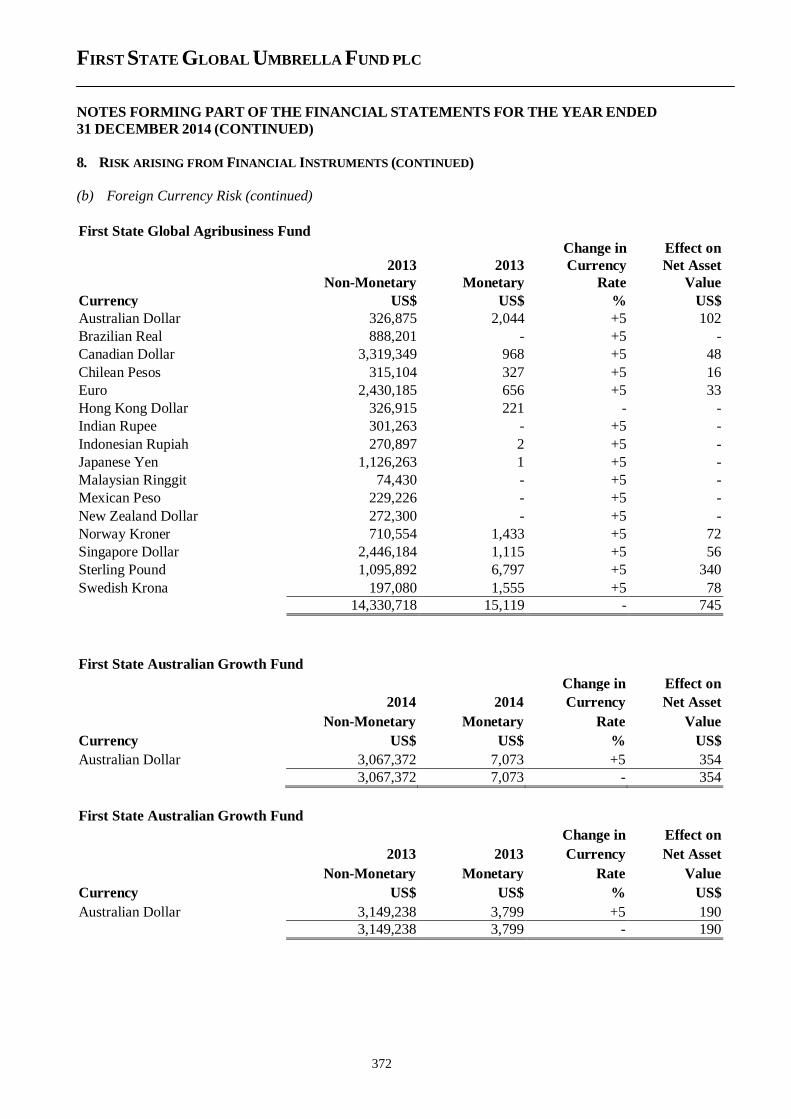
FIRST STATE GLOBAL UMBRELLA FUND PLC
NOTES FORMING PART OF THE FINANCIAL STATEMENTS FOR THE YEAR ENDED
31 DECEMBER 2014 (CONTINUED)
372
8. RISK ARISING FROM FINANCIAL INSTRUMENTS (CONTINUED)
(b) Foreign Currency Risk (continued)
First State Australian Growth Fund
Change in Effect on
2014 2014 Currency Net Asset
Non-Monetary Monetary Rate Value
Currency US$ US$ % US$
Australian Dollar 3,067,372 7,073 +5 354
3,067,372 7,073 - 354
First State Australian Growth Fund
Change in Effect on
2013 2013 Currency Net Asset
Non-Monetary Monetary Rate Value
Currency US$ US$ % US$
Australian Dollar 3,149,238 3,799 +5 190
3,149,238 3,799 - 190
First State Global Agribusiness Fund
Change in Effect on
2013 2013 Currency Net Asset
Non-Monetary Monetary Rate Value
Currency US$ US$ % US$
Australian Dollar 326,875 2,044 +5 102
Brazilian Real 888,201 - +5 -
Canadian Dollar 3,319,349 968 +5 48
Chilean Pesos 315,104 327 +5 16
Euro 2,430,185 656 +5 33
Hong Kong Dollar 326,915 221 - -
Indian Rupee 301,263 - +5 -
Indonesian Rupiah 270,897 2 +5 -
Japanese Yen 1,126,263 1 +5 -
Malaysian Ringgit 74,430 - +5 -
Mexican Peso 229,226 - +5 -
New Zealand Dollar 272,300 - +5 -
Norway Kroner 710,554 1,433 +5 72
Singapore Dollar 2,446,184 1,115 +5 56
Sterling Pound 1,095,892 6,797 +5 340
Swedish Krona 197,080 1,555 +5 78
14,330,718 15,119 - 745
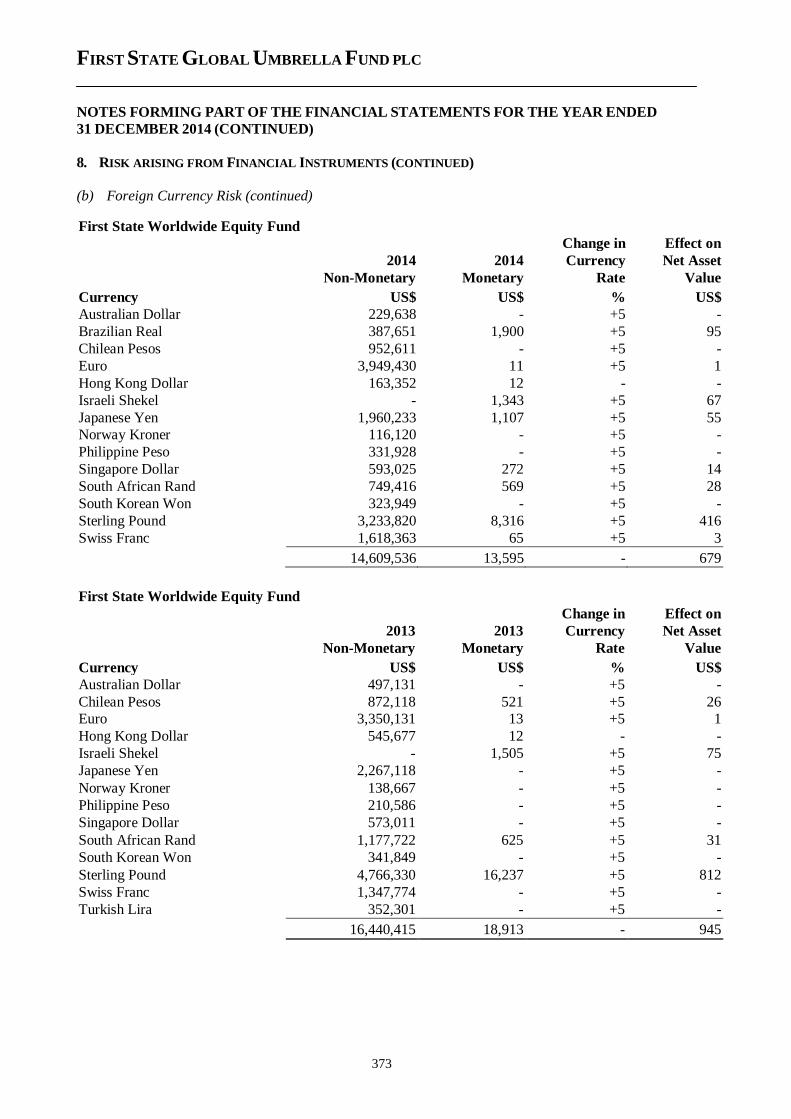
FIRST STATE GLOBAL UMBRELLA FUND PLC
NOTES FORMING PART OF THE FINANCIAL STATEMENTS FOR THE YEAR ENDED
31 DECEMBER 2014 (CONTINUED)
373
8. RISK ARISING FROM FINANCIAL INSTRUMENTS (CONTINUED)
(b) Foreign Currency Risk (continued)
First State Worldwide Equity Fund
Change in Effect on
2014 2014 Currency Net Asset
Non-Monetary Monetary Rate Value
Currency US$ US$ % US$
Australian Dollar 229,638 - +5 -
Brazilian Real 387,651 1,900 +5 95
Chilean Pesos 952,611 - +5 -
Euro 3,949,430 11 +5 1
Hong Kong Dollar 163,352 12 - -
Israeli Shekel - 1,343 +5 67
Japanese Yen 1,960,233 1,107 +5 55
Norway Kroner 116,120 - +5 -
Philippine Peso 331,928 - +5 -
Singapore Dollar 593,025 272 +5 14
South African Rand 749,416 569 +5 28
South Korean Won 323,949 - +5 -
Sterling Pound 3,233,820 8,316 +5 416
Swiss Franc 1,618,363 65 +5 3
14,609,536 13,595 - 679
First State Worldwide Equity Fund
Change in Effect on
2013 2013 Currency Net Asset
Non-Monetary Monetary Rate Value
Currency US$ US$ % US$
Australian Dollar 497,131 - +5 -
Chilean Pesos 872,118 521 +5 26
Euro 3,350,131 13 +5 1
Hong Kong Dollar 545,677 12 - -
Israeli Shekel - 1,505 +5 75
Japanese Yen 2,267,118 - +5 -
Norway Kroner 138,667 - +5 -
Philippine Peso 210,586 - +5 -
Singapore Dollar 573,011 - +5 -
South African Rand 1,177,722 625 +5 31
South Korean Won 341,849 - +5 -
Sterling Pound 4,766,330 16,237 +5 812
Swiss Franc 1,347,774 - +5 -
Turkish Lira 352,301 - +5 -
16,440,415 18,913 - 945
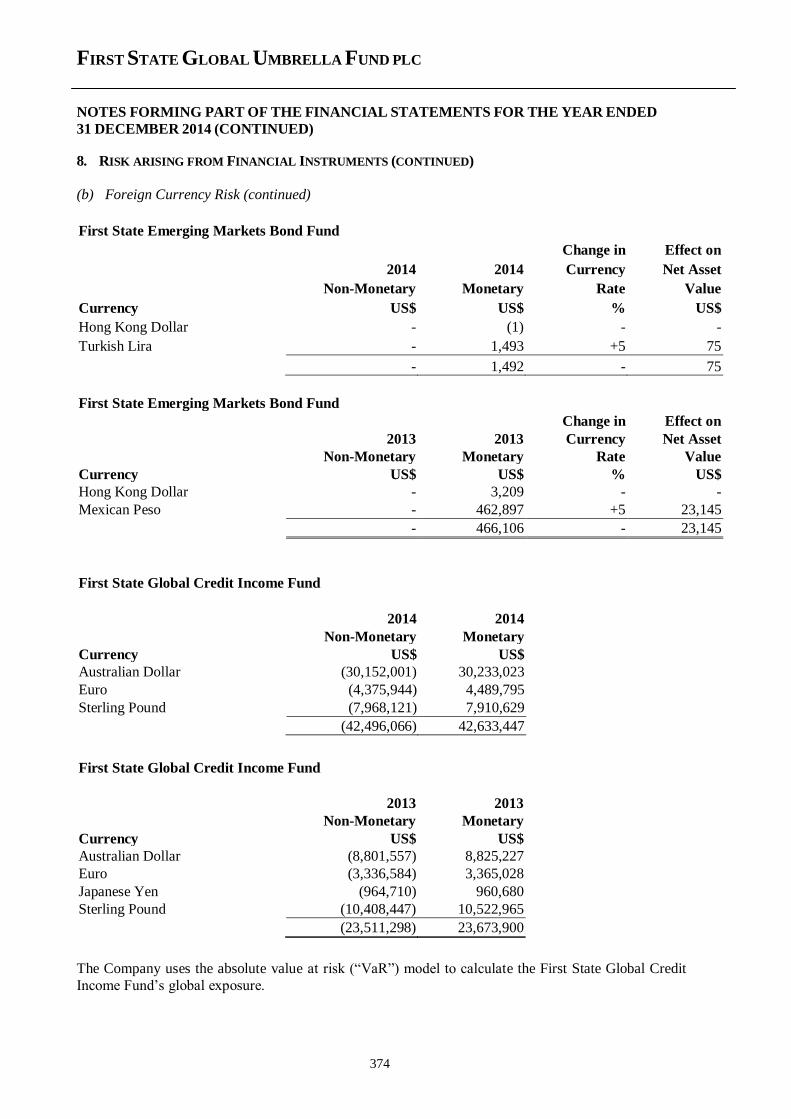
FIRST STATE GLOBAL UMBRELLA FUND PLC
NOTES FORMING PART OF THE FINANCIAL STATEMENTS FOR THE YEAR ENDED
31 DECEMBER 2014 (CONTINUED)
374
8. RISK ARISING FROM FINANCIAL INSTRUMENTS (CONTINUED)
(b) Foreign Currency Risk (continued)
The Company uses the absolute value at risk (“VaR”) model to calculate the First State Global Credit
Income Fund’s global exposure.
First State Emerging Markets Bond Fund
Change in Effect on
2014 2014 Currency Net Asset
Non-Monetary Monetary Rate Value
Currency US$ US$ % US$
Hong Kong Dollar - (1) - -
Turkish Lira - 1,493 +5 75
- 1,492 - 75
First State Emerging Markets Bond Fund
Change in Effect on
2013 2013 Currency Net Asset
Non-Monetary Monetary Rate Value
Currency US$ US$ % US$
Hong Kong Dollar - 3,209 - -
Mexican Peso - 462,897 +5 23,145
- 466,106 - 23,145
First State Global Credit Income Fund
2014 2014
Non-Monetary Monetary
Currency US$ US$
Australian Dollar (30,152,001) 30,233,023
Euro (4,375,944) 4,489,795
Sterling Pound (7,968,121) 7,910,629
(42,496,066) 42,633,447
First State Global Credit Income Fund
2013 2013
Non-Monetary Monetary
Currency US$ US$
Australian Dollar (8,801,557) 8,825,227
Euro (3,336,584) 3,365,028
Japanese Yen (964,710) 960,680
Sterling Pound (10,408,447) 10,522,965
(23,511,298) 23,673,900
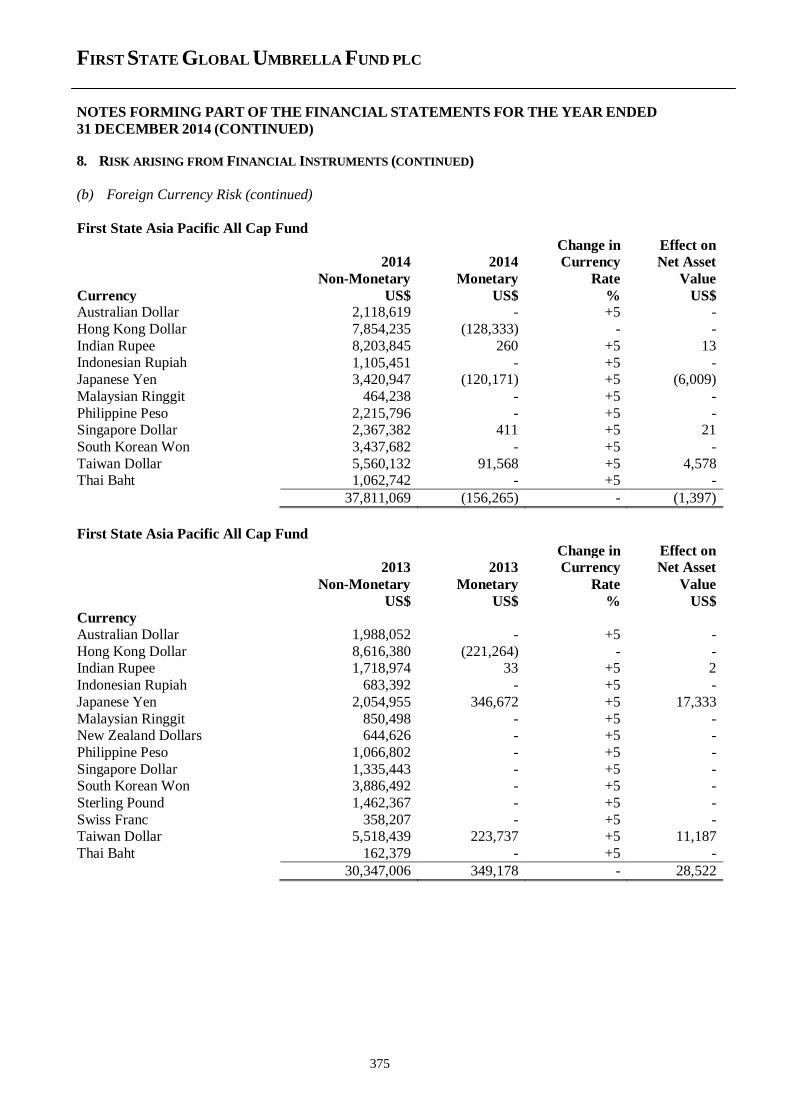
FIRST STATE GLOBAL UMBRELLA FUND PLC
NOTES FORMING PART OF THE FINANCIAL STATEMENTS FOR THE YEAR ENDED
31 DECEMBER 2014 (CONTINUED)
375
8. RISK ARISING FROM FINANCIAL INSTRUMENTS (CONTINUED)
(b) Foreign Currency Risk (continued)
First State Asia Pacific All Cap Fund Change in Effect on 2014 2014 Currency Net Asset
Non-Monetary Monetary Rate Value
Currency US$ US$ % US$ Australian Dollar 2,118,619 - +5 -
Hong Kong Dollar 7,854,235 (128,333) - -
Indian Rupee 8,203,845 260 +5 13 Indonesian Rupiah 1,105,451 - +5 - Japanese Yen 3,420,947 (120,171) +5 (6,009)
Malaysian Ringgit 464,238 - +5 -
Philippine Peso 2,215,796 - +5 - Singapore Dollar 2,367,382 411 +5 21
South Korean Won 3,437,682 - +5 -
Taiwan Dollar 5,560,132 91,568 +5 4,578 Thai Baht 1,062,742 - +5 -
37,811,069 (156,265) - (1,397)
First State Asia Pacific All Cap Fund Change in Effect on 2013 2013 Currency Net Asset
Non-Monetary Monetary Rate Value US$ US$ % US$
Currency
Australian Dollar 1,988,052 - +5 -
Hong Kong Dollar 8,616,380 (221,264) - - Indian Rupee 1,718,974 33 +5 2
Indonesian Rupiah 683,392 - +5 -
Japanese Yen 2,054,955 346,672 +5 17,333
Malaysian Ringgit 850,498 - +5 - New Zealand Dollars 644,626 - +5 -
Philippine Peso 1,066,802 - +5 -
Singapore Dollar 1,335,443 - +5 - South Korean Won 3,886,492 - +5 -
Sterling Pound 1,462,367 - +5 -
Swiss Franc 358,207 - +5 - Taiwan Dollar 5,518,439 223,737 +5 11,187
Thai Baht 162,379 - +5 -
30,347,006 349,178 - 28,522
FIRST STATE GLOBAL UMBRELLA FUND PLC
NOTES FORMING PART OF THE FINANCIAL STATEMENTS FOR THE YEAR ENDED
31 DECEMBER 2014 (CONTINUED)
376
8. RISK ARISING FROM FINANCIAL INSTRUMENTS (CONTINUED)
(c) Interest rate risk
Interest rate risk arises from the effects of fluctuations in the prevailing levels of markets interest rates on the fair value of financial assets and liabilities and future cash flow.
Any cash and cash equivalents, time deposits and bank overdrafts held by the Funds are held in the short term market rates and therefore are not exposed to significant amounts of interest rate risk. The
majority of the assets of the Funds are equity shares which neither pay interest nor have a maturity date
apart from the bond funds: First State Global Bond Fund, First State High Quality Bond Fund, First State Long Term Bond Fund, First State Asian Bond Fund, First State Asian Quality Bond Fund, First
State Hong Kong Dollar Bond Fund, First State Emerging Markets Bond Fund and First State Global
Credit Income Fund.
The fair values of the Company’s fixed income investments will fluctuate in response to changes in
market interest rates. Increases and decreases in prevailing interest rates generally translate into decreases and increases in fair values of those instruments. Additionally fair values of interest rate
sensitive instruments may be affected by the creditworthiness of the issuer, prepayment options,
relative values of alternative investments, the liquidity of the instrument and other general market conditions. Fixed interest rate investments may be more sensitive to interest rate changes than variable
rate investments.
The Company’s strategy is to acquire fixed income securities that are attractively priced in relation to
the perceived credit risk. The Investment Manager recognises and accepts that losses may occur. In the
years ended 31 December 2014 and 31 December 2013 the Company utilised derivative products such as interest rate swaps in First State Global Credit Income Fund to manage interest rate risks on a limited
basis.
The Investment Manager mitigates interest rate risk by constructing a diversified portfolio of fixed
income securities with differing modified duration and term to maturity characteristics, which acts to
reduce the Funds’ overall exposure to interest rate risk. The Investment Manager constantly monitors its view of the Funds’ exposure to interest rate risk and makes decisions accordingly about the
composition of the Funds’ portfolio of fixed income securities in order to ensure the interest rate risk in
the portfolio is maintained at an appropriate level.
The First State Global Bond Fund, First State High Quality Bond Fund, First State Long Term Bond Fund, First State Asian Bond Fund, First State Asian Quality Bond Fund, First State Hong Kong Dollar
Bond Fund, First State Emerging Markets Bond Fund and First State Global Credit Income Fund hold a
majority of their assets in bonds. The following tables set out the interest profile of these financial assets at 31 December 2014 with comparative figures as at 31 December 2013. An estimate is also
given of the effects of a hypothetical 100 basis points increase and decrease in interest rates on assets
that are subject to interest rate risk. The sensitivity analysis includes both fixed and floating rate debt securities.
The basis of the calculation is using the modified duration of the Fund as a whole (being a weighted average of the modified duration of each security). No specific assumptions have been made on the
durations other than that all securities make coupon and capital payments in line with their contractual
requirements. In using this method to show sensitivity to interest rate movements, it has been assumed that an interest rate movement on the scale shown is replicated for each security to the same amount.
FIRST STATE GLOBAL UMBRELLA FUND PLC
NOTES FORMING PART OF THE FINANCIAL STATEMENTS FOR THE YEAR ENDED
31 DECEMBER 2014 (CONTINUED)
377
8. RISK ARISING FROM FINANCIAL INSTRUMENTS (CONTINUED)
(c) Interest rate risk (continued)
This last assumption is the key limitation of using this methodology, since any general movement in interest rates may result in a different movement in the rate for different securities; however it is
believed to be the most appropriate method of illustrating the effect of a theoretical movement in rates
and therefore the overall interest rate sensitivity of each Fund.
First State Global Bond Fund as of 31 December 2014
Floating rate Financial assets
Total
financial
assets
Fixed rate
financial assets
on which no
interest is paid
Currency US$ US$ US$ US$
Australian Dollar 201,270 - 201,270 - Canadian Dollar 259,925 - 259,925 -
Danish Krone 88,318 - 88,318 -
Euro 5,188,872 - 5,188,872 - Japanese Yen 3,159,903 - 3,159,903 -
Malaysian Ringgit 55,156 - 55,156 -
Mexican Pesos 106,777 - 106,777 - Norway Kroner 22,837 - 22,837 -
Singapore Dollar 32,201 - 32,201 -
Sterling Pound 977,412 - 977,412 -
Swedish Krona 147,236 - 147,236 - Swiss Francs 26,413 - 26,413 -
US Dollar 5,291,712 - 1,891,728 3,399,984
15,558,032 - 12,158,048 3,399,984
Fixed rate financial Fixed rate financial assets
assets weighted weighted average period for
Currency average interest rate which rate is fixed
Australian Dollar 5.00% 6.08 years
Canadian Dollar 3.93% 10.08 years Danish Krone 1.50% 9 years
Euro 3.36% 8.87 years
Japanese Yen 1.28% 13.27 years Malaysian Ringgit 4.31% 6.69 years
Mexican Pesos 10.00% 10.08 years
Norway Kroner 3.00% 9.34 years Singapore Dollar 3.00% 9.81 years
Sterling Pound 3.27% 14.86 years
Swedish Krona 3.94% 2.18 years Swiss Francs 4.00% 8.23 years
US Dollar 3.43% 20.6 years
FIRST STATE GLOBAL UMBRELLA FUND PLC
NOTES FORMING PART OF THE FINANCIAL STATEMENTS FOR THE YEAR ENDED
31 DECEMBER 2014 (CONTINUED)
378
8. RISK ARISING FROM FINANCIAL INSTRUMENTS (CONTINUED)
(c) Interest rate risk (continued)
First State Global Bond Fund as of 31 December 2013 Floating rate Financial assets
Total
financial
assets
Fixed rate
financial assets
on which no
interest is paid
Currency US$ US$ US$ US$
Australian Dollar 162,725 - 162,725 -
Canadian Dollar 306,129 - 306,129 - Danish Krone 88,306 - 88,306 -
Euro 5,324,313 - 5,324,313 -
Japanese Yen 4,071,634 - 4,071,634 - Sterling Pound 797,685 - 797,685 -
Swedish Krona 148,267 - 148,267 -
US Dollar 4,851,983 - 4,851,983 -
15,751,042 - 15,751,042 -
Fixed rate financial
Fixed rate financial assets weighted
assets weighted average period for
Currency average interest rate which rate is fixed
Australian Dollar 5.65% 6.08 years Canadian Dollar 4.34% 6.78 years
Danish Krone 1.50% 10.02 years
Euro 3.51% 7.90 years Japanese Yen 1.32% 8.27 years
Sterling Pound 3.07% 12.81 years
Swedish Krona 4.50% 1.64 years US Dollar 1.95% 5.79 years
At 31 December 2014, should interest rates have lowered by 100 basis points with all other variables
remaining constant, the increase in net assets attributable to holders of redeemable shares for the year would amount to approximately US$944,987 arising substantially from the increase in market values of
debt securities (31 December 2013: US$890,651). An increase in interest rates of 100 basis points would
have had an equal but opposite effect.
First State High Quality Bond Fund as of 31 December 2014
Floating rate Financial assets
financial Fixed rate on which no
Total assets financial assets interest is paid
Currency US$ US$ US$ US$
US Dollar 130,894,941 7,570,871 94,324,113 28,999,957
130,894,941 7,570,871 94,324,113 28,999,957
FIRST STATE GLOBAL UMBRELLA FUND PLC
NOTES FORMING PART OF THE FINANCIAL STATEMENTS FOR THE YEAR ENDED
31 DECEMBER 2014 (CONTINUED)
379
8. RISK ARISING FROM FINANCIAL INSTRUMENTS (CONTINUED)
(c) Interest rate risk (continued)
First State High Quality Bond Fund as of 31 December 2014 (continued)
Fixed rate financial
Fixed rate financial assets weighted
assets weighted average period for
Currency average interest rate which rate is fixed
US Dollar 4.29% 12.46 years
First State High Quality Bond Fund as of 31 December 2013
Floating rate Financial assets
financial Fixed rate on which no
Total assets financial assets interest is paid
Currency US$ US$ US$ US$
US Dollar 148,006,850 13,387,708 134,619,142 -
148,006,850 13,387,708 134,619,142 -
Fixed rate financial
Fixed rate financial assets weighted
assets weighted average period for
Currency average interest rate which rate is fixed US Dollar 3.65% 8.27 years
At 31 December 2014, should interest rates have lowered by 100 basis points with all other variables
remaining constant, the increase in net assets attributable to holders of redeemable shares for the year
would amount to approximately US$6,258,303 arising substantially from the increase in market values of debt securities (31 December 2013: US$8,367,396). An increase in interest rates of 100 basis points
would have had an equal but opposite effect.
First State Long Term Bond Fund as of 31 December 2014
Floating rate Financial assets
financial Fixed rate on which no
Total assets financial assets interest is paid
Currency US$ US$ US$ US$
US Dollar 40,186,212 - 38,786,221 1,399,991
40,186,212 - 38,786,221 1,399,991
Fixed rate financial
Fixed rate financial assets weighted
assets weighted average period for
Currency average interest rate which rate is fixed
US Dollar 3.34% 15.92 years
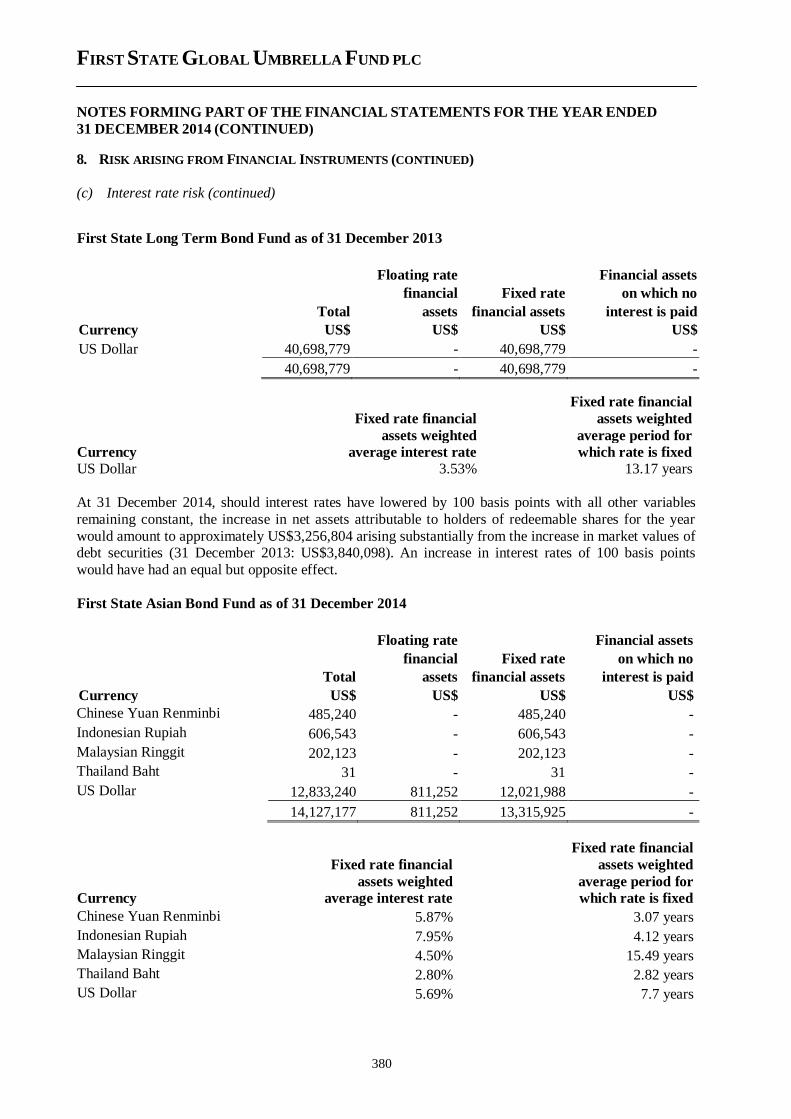
FIRST STATE GLOBAL UMBRELLA FUND PLC
NOTES FORMING PART OF THE FINANCIAL STATEMENTS FOR THE YEAR ENDED
31 DECEMBER 2014 (CONTINUED)
380
8. RISK ARISING FROM FINANCIAL INSTRUMENTS (CONTINUED)
(c) Interest rate risk (continued)
First State Long Term Bond Fund as of 31 December 2013
Floating rate Financial assets
financial Fixed rate on which no
Total assets financial assets interest is paid
Currency US$ US$ US$ US$
US Dollar 40,698,779 - 40,698,779 -
40,698,779 - 40,698,779 -
Fixed rate financial
Fixed rate financial assets weighted
assets weighted average period for
Currency average interest rate which rate is fixed
US Dollar 3.53% 13.17 years
At 31 December 2014, should interest rates have lowered by 100 basis points with all other variables
remaining constant, the increase in net assets attributable to holders of redeemable shares for the year
would amount to approximately US$3,256,804 arising substantially from the increase in market values of debt securities (31 December 2013: US$3,840,098). An increase in interest rates of 100 basis points
would have had an equal but opposite effect.
First State Asian Bond Fund as of 31 December 2014
Floating rate Financial assets
financial Fixed rate on which no
Total assets financial assets interest is paid
Currency US$ US$ US$ US$
Chinese Yuan Renminbi 485,240 - 485,240 -
Indonesian Rupiah 606,543 - 606,543 -
Malaysian Ringgit 202,123 - 202,123 -
Thailand Baht 31 - 31 -
US Dollar 12,833,240 811,252 12,021,988 -
14,127,177 811,252 13,315,925 -
Fixed rate financial
Fixed rate financial assets weighted
assets weighted average period for
Currency average interest rate which rate is fixed
Chinese Yuan Renminbi 5.87% 3.07 years
Indonesian Rupiah 7.95% 4.12 years
Malaysian Ringgit 4.50% 15.49 years
Thailand Baht 2.80% 2.82 years
US Dollar 5.69% 7.7 years
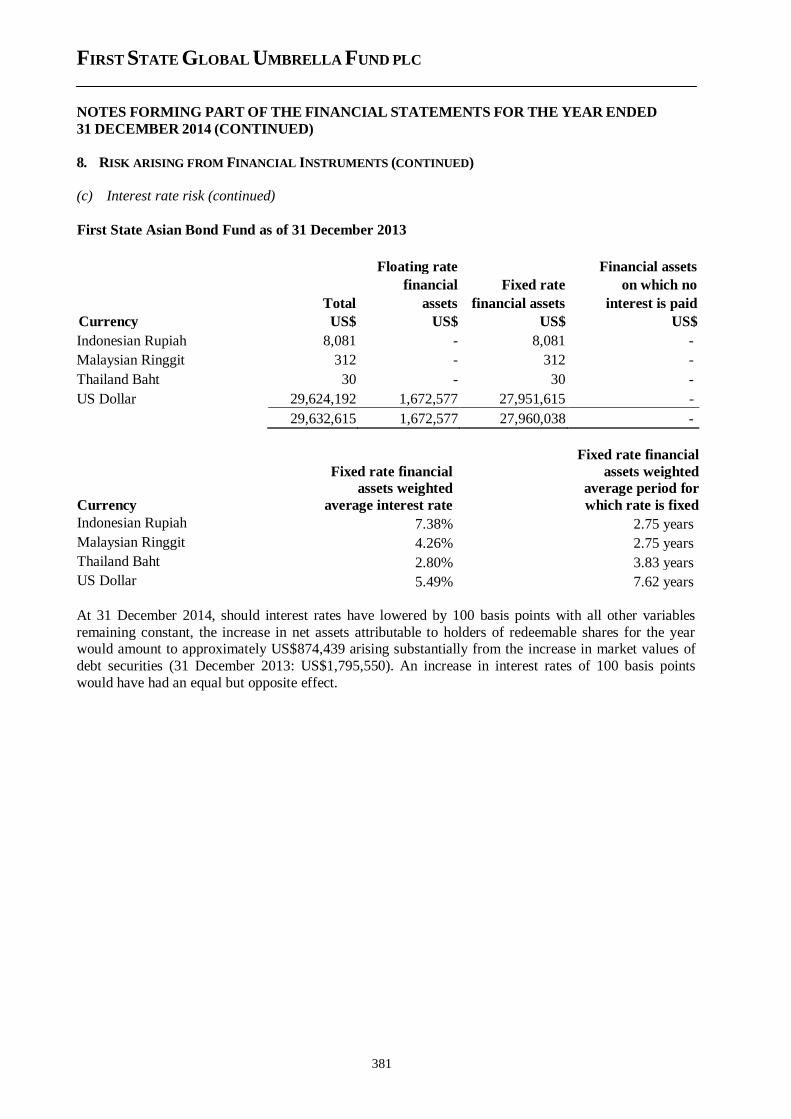
FIRST STATE GLOBAL UMBRELLA FUND PLC
NOTES FORMING PART OF THE FINANCIAL STATEMENTS FOR THE YEAR ENDED
31 DECEMBER 2014 (CONTINUED)
381
8. RISK ARISING FROM FINANCIAL INSTRUMENTS (CONTINUED)
(c) Interest rate risk (continued)
First State Asian Bond Fund as of 31 December 2013
Floating rate Financial assets
financial Fixed rate on which no
Total assets financial assets interest is paid
Currency US$ US$ US$ US$
Indonesian Rupiah 8,081 - 8,081 -
Malaysian Ringgit 312 - 312 -
Thailand Baht 30 - 30 -
US Dollar 29,624,192 1,672,577 27,951,615 -
29,632,615 1,672,577 27,960,038 -
Fixed rate financial
Fixed rate financial assets weighted
assets weighted average period for
Currency average interest rate which rate is fixed
Indonesian Rupiah 7.38% 2.75 years
Malaysian Ringgit 4.26% 2.75 years
Thailand Baht 2.80% 3.83 years
US Dollar 5.49% 7.62 years
At 31 December 2014, should interest rates have lowered by 100 basis points with all other variables
remaining constant, the increase in net assets attributable to holders of redeemable shares for the year would amount to approximately US$874,439 arising substantially from the increase in market values of
debt securities (31 December 2013: US$1,795,550). An increase in interest rates of 100 basis points
would have had an equal but opposite effect.
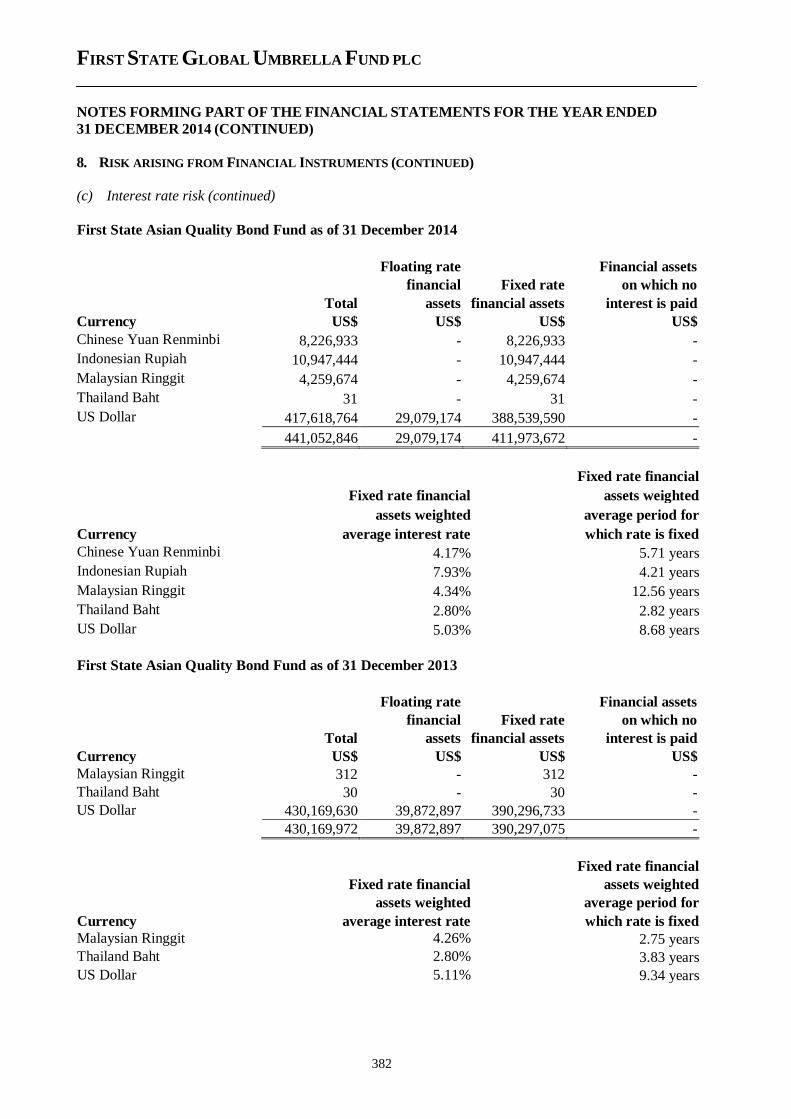
FIRST STATE GLOBAL UMBRELLA FUND PLC
NOTES FORMING PART OF THE FINANCIAL STATEMENTS FOR THE YEAR ENDED
31 DECEMBER 2014 (CONTINUED)
382
8. RISK ARISING FROM FINANCIAL INSTRUMENTS (CONTINUED)
(c) Interest rate risk (continued)
First State Asian Quality Bond Fund as of 31 December 2014
Floating rate Financial assets
financial Fixed rate on which no
Total assets financial assets interest is paid
Currency US$ US$ US$ US$
Chinese Yuan Renminbi 8,226,933 - 8,226,933 -
Indonesian Rupiah 10,947,444 - 10,947,444 -
Malaysian Ringgit 4,259,674 - 4,259,674 -
Thailand Baht 31 - 31 -
US Dollar 417,618,764 29,079,174 388,539,590 -
441,052,846 29,079,174 411,973,672 -
Fixed rate financial
Fixed rate financial assets weighted
assets weighted average period for
Currency average interest rate which rate is fixed
Chinese Yuan Renminbi 4.17% 5.71 years
Indonesian Rupiah 7.93% 4.21 years
Malaysian Ringgit 4.34% 12.56 years
Thailand Baht 2.80% 2.82 years
US Dollar 5.03% 8.68 years
First State Asian Quality Bond Fund as of 31 December 2013
Floating rate Financial assets
financial Fixed rate on which no
Total assets financial assets interest is paid
Currency US$ US$ US$ US$
Malaysian Ringgit 312 - 312 -
Thailand Baht 30 - 30 -
US Dollar 430,169,630 39,872,897 390,296,733 -
430,169,972 39,872,897 390,297,075 -
Fixed rate financial
Fixed rate financial assets weighted
assets weighted average period for
Currency average interest rate which rate is fixed
Malaysian Ringgit 4.26% 2.75 years
Thailand Baht 2.80% 3.83 years
US Dollar 5.11% 9.34 years
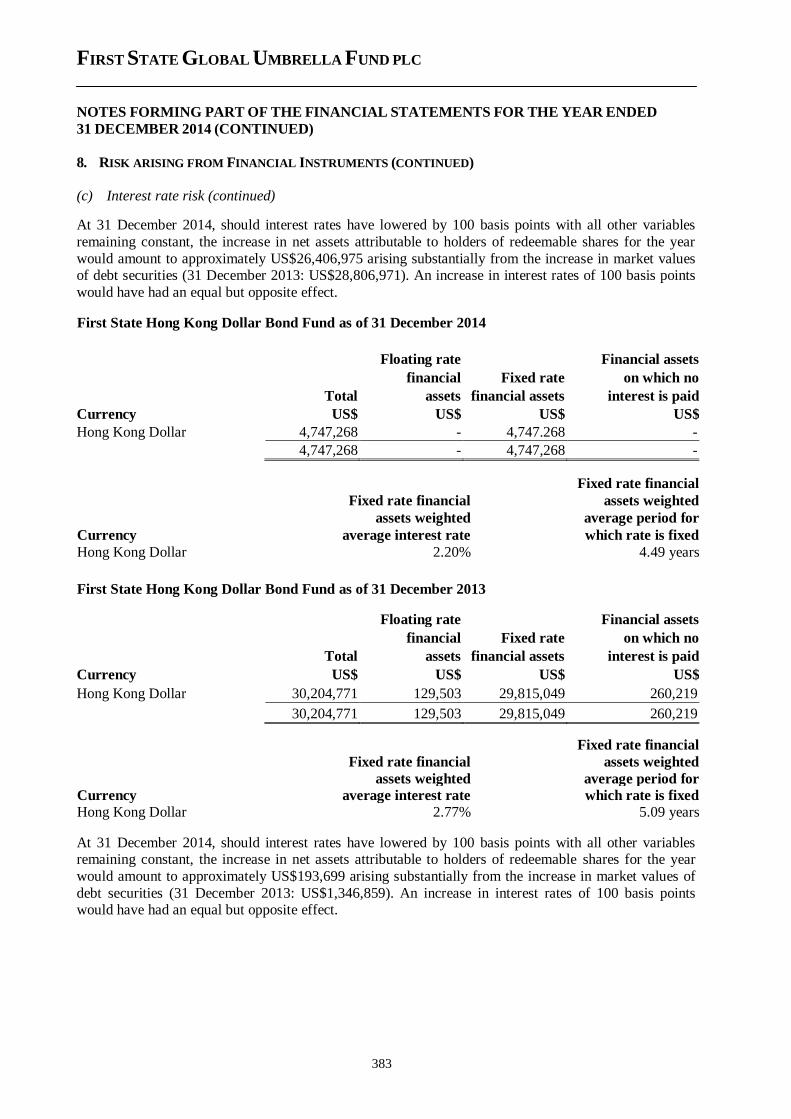
FIRST STATE GLOBAL UMBRELLA FUND PLC
NOTES FORMING PART OF THE FINANCIAL STATEMENTS FOR THE YEAR ENDED
31 DECEMBER 2014 (CONTINUED)
383
8. RISK ARISING FROM FINANCIAL INSTRUMENTS (CONTINUED)
(c) Interest rate risk (continued)
At 31 December 2014, should interest rates have lowered by 100 basis points with all other variables
remaining constant, the increase in net assets attributable to holders of redeemable shares for the year
would amount to approximately US$26,406,975 arising substantially from the increase in market values of debt securities (31 December 2013: US$28,806,971). An increase in interest rates of 100 basis points
would have had an equal but opposite effect.
First State Hong Kong Dollar Bond Fund as of 31 December 2014
Floating rate Financial assets
financial Fixed rate on which no
Total assets financial assets interest is paid
Currency US$ US$ US$ US$
Hong Kong Dollar 4,747,268 - 4,747.268 -
4,747,268 - 4,747,268 -
Fixed rate financial
Fixed rate financial assets weighted
assets weighted average period for
Currency average interest rate which rate is fixed
Hong Kong Dollar 2.20% 4.49 years
First State Hong Kong Dollar Bond Fund as of 31 December 2013
Floating rate Financial assets
financial Fixed rate on which no
Total assets financial assets interest is paid
Currency US$ US$ US$ US$
Hong Kong Dollar 30,204,771 129,503 29,815,049 260,219
30,204,771 129,503 29,815,049 260,219
Fixed rate financial
Fixed rate financial assets weighted
assets weighted average period for
Currency average interest rate which rate is fixed
Hong Kong Dollar 2.77% 5.09 years
At 31 December 2014, should interest rates have lowered by 100 basis points with all other variables remaining constant, the increase in net assets attributable to holders of redeemable shares for the year
would amount to approximately US$193,699 arising substantially from the increase in market values of
debt securities (31 December 2013: US$1,346,859). An increase in interest rates of 100 basis points would have had an equal but opposite effect.
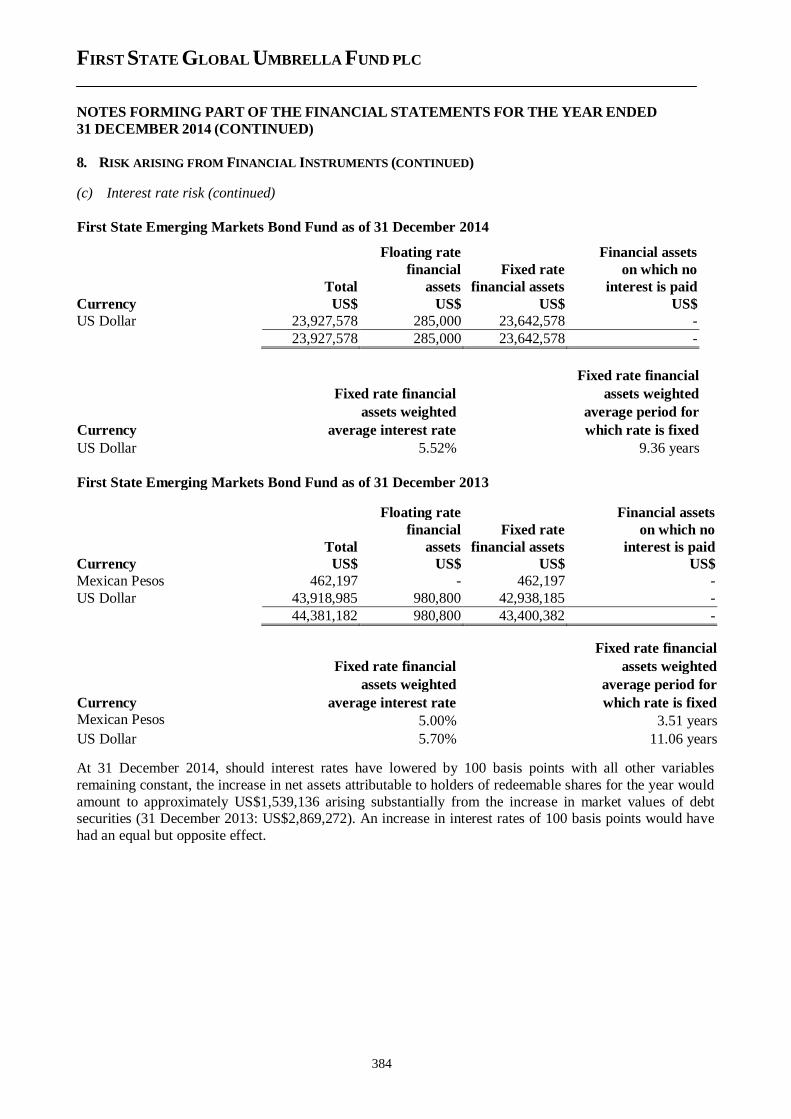
FIRST STATE GLOBAL UMBRELLA FUND PLC
NOTES FORMING PART OF THE FINANCIAL STATEMENTS FOR THE YEAR ENDED
31 DECEMBER 2014 (CONTINUED)
384
8. RISK ARISING FROM FINANCIAL INSTRUMENTS (CONTINUED)
(c) Interest rate risk (continued)
First State Emerging Markets Bond Fund as of 31 December 2014
Floating rate Financial assets
financial Fixed rate on which no
Total assets financial assets interest is paid
Currency US$ US$ US$ US$
US Dollar 23,927,578 285,000 23,642,578 -
23,927,578 285,000 23,642,578 -
Fixed rate financial
Fixed rate financial assets weighted
assets weighted average period for
Currency average interest rate which rate is fixed
US Dollar 5.52% 9.36 years
First State Emerging Markets Bond Fund as of 31 December 2013
Floating rate Financial assets
financial Fixed rate on which no
Total assets financial assets interest is paid
Currency US$ US$ US$ US$
Mexican Pesos 462,197 - 462,197 -
US Dollar 43,918,985 980,800 42,938,185 -
44,381,182 980,800 43,400,382 -
Fixed rate financial
Fixed rate financial assets weighted
assets weighted average period for
Currency average interest rate which rate is fixed
Mexican Pesos
5.00% 3.51 years
US Dollar 5.70% 11.06 years
At 31 December 2014, should interest rates have lowered by 100 basis points with all other variables
remaining constant, the increase in net assets attributable to holders of redeemable shares for the year would
amount to approximately US$1,539,136 arising substantially from the increase in market values of debt securities (31 December 2013: US$2,869,272). An increase in interest rates of 100 basis points would have
had an equal but opposite effect.
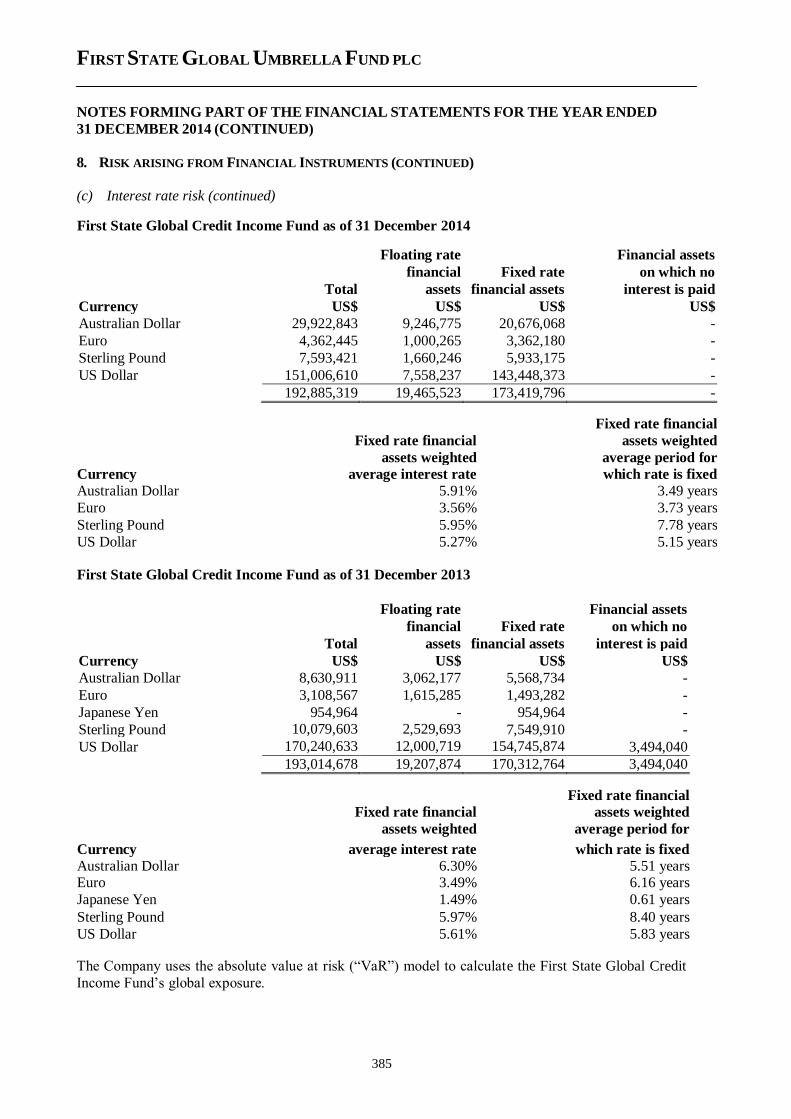
FIRST STATE GLOBAL UMBRELLA FUND PLC
NOTES FORMING PART OF THE FINANCIAL STATEMENTS FOR THE YEAR ENDED
31 DECEMBER 2014 (CONTINUED)
385
8. RISK ARISING FROM FINANCIAL INSTRUMENTS (CONTINUED)
(c) Interest rate risk (continued)
First State Global Credit Income Fund as of 31 December 2014
Floating rate Financial assets
financial Fixed rate on which no
Total assets financial assets interest is paid
Currency US$ US$ US$ US$
Australian Dollar 29,922,843 9,246,775 20,676,068 -
Euro 4,362,445 1,000,265 3,362,180 -
Sterling Pound 7,593,421 1,660,246 5,933,175 -
US Dollar 151,006,610 7,558,237 143,448,373 -
192,885,319 19,465,523 173,419,796 -
Fixed rate financial
Fixed rate financial assets weighted
assets weighted average period for
Currency average interest rate which rate is fixed
Australian Dollar 5.91% 3.49 years
Euro 3.56% 3.73 years
Sterling Pound 5.95% 7.78 years
US Dollar 5.27% 5.15 years
First State Global Credit Income Fund as of 31 December 2013
Floating rate Financial assets
financial Fixed rate on which no
Total assets financial assets interest is paid
Currency US$ US$ US$ US$
Australian Dollar 8,630,911 3,062,177 5,568,734 -
Euro 3,108,567 1,615,285 1,493,282 -
Japanese Yen 954,964 - 954,964 -
Sterling Pound 10,079,603 2,529,693 7,549,910 -
US Dollar 170,240,633 12,000,719 154,745,874 3,494,040
193,014,678 19,207,874 170,312,764 3,494,040
Fixed rate financial
Fixed rate financial assets weighted
assets weighted average period for
Currency average interest rate which rate is fixed
Australian Dollar 6.30% 5.51 years Euro 3.49% 6.16 years
Japanese Yen 1.49% 0.61 years
Sterling Pound 5.97% 8.40 years
US Dollar 5.61% 5.83 years
The Company uses the absolute value at risk (“VaR”) model to calculate the First State Global Credit
Income Fund’s global exposure.
FIRST STATE GLOBAL UMBRELLA FUND PLC
NOTES FORMING PART OF THE FINANCIAL STATEMENTS FOR THE YEAR ENDED
31 DECEMBER 2014 (CONTINUED)
386
8. RISK ARISING FROM FINANCIAL INSTRUMENTS (CONTINUED)
(d) Credit risk
The Company takes on exposure to credit risk, which is the risk that a counterparty will be unable to pay amounts in full when due. Impairment provisions are provided for losses that have been incurred by
the Statement of Financial Position date, if any.
The Company’s investments in fixed income securities are subject to credit risk. Credit risk reflects the
possibility that a borrower will not be able to meet its obligation to make payments of interest or
principal when they fall due. The Investment Manager analyses the credit risk of the Company’s fixed income investments prior to purchase and continues to monitor developments in credit quality
subsequently.
The Company is also exposed to counterparty credit risk on trading derivative products. To reduce the
Company’s counterparty credit exposures, securities trading is primarily conducted on recognised
exchanges and on a delivery-versus-payment basis. In addition, the Investment Manager seeks to enter into netting agreements with counterparties that would allow receivables and payables to that
counterparty to be offset. The counterparty has no right to sell or re-pledge this collateral asset received.
To measure and manage the Company’s credit exposures, the Investment Manager primarily uses credit
limits. While the Company’s investment activities expose it to many different industries and
counterparties, the Company routinely executes a high volume of transactions with counterparties in the financial services industry, including brokers and dealers and commercial banks, resulting in significant
relative credit concentration with respect to this industry. In the ordinary course of business, the
Company may also be subject to a concentration of credit risk to a particular counterparty, borrower or issuer; however the Investment Manager controls this exposure through the use of counterparty, credit
and issuer limits. In general the limits applied (expressed as a value of each Fund) are 10% to
individual issuers, 20% to deposit taking financial institutions, 5% (or 10% if an approved bank) to OTC derivative counterparties, and 20% to combined issuers/counterparties. Lower limits may be
applied to individual issuers or counterparties if the Investment Manager feels it prudent to do so.
The Company’s assets are safeguarded and held by the Custodian. The Investment Manager analyses
the credit risk of the Company’s Custodian prior to appointment and continues to monitor
developments in its credit quality subsequently. In addition the Investment Manager makes use from time to time of money market or exchange-traded funds or the placing of monies on deposit both in
order to maximise return and to diversify the exposure of such assets. The Custodian has a short-term credit rating of P-1 (2013: P-1). Further details of the cash and cash equivalents are shown in Note 10.
The central counterparty used during the year is CME. Morgan Stanley centrally clear interest rate swaps with CME and the credit rating of this broker is A-.
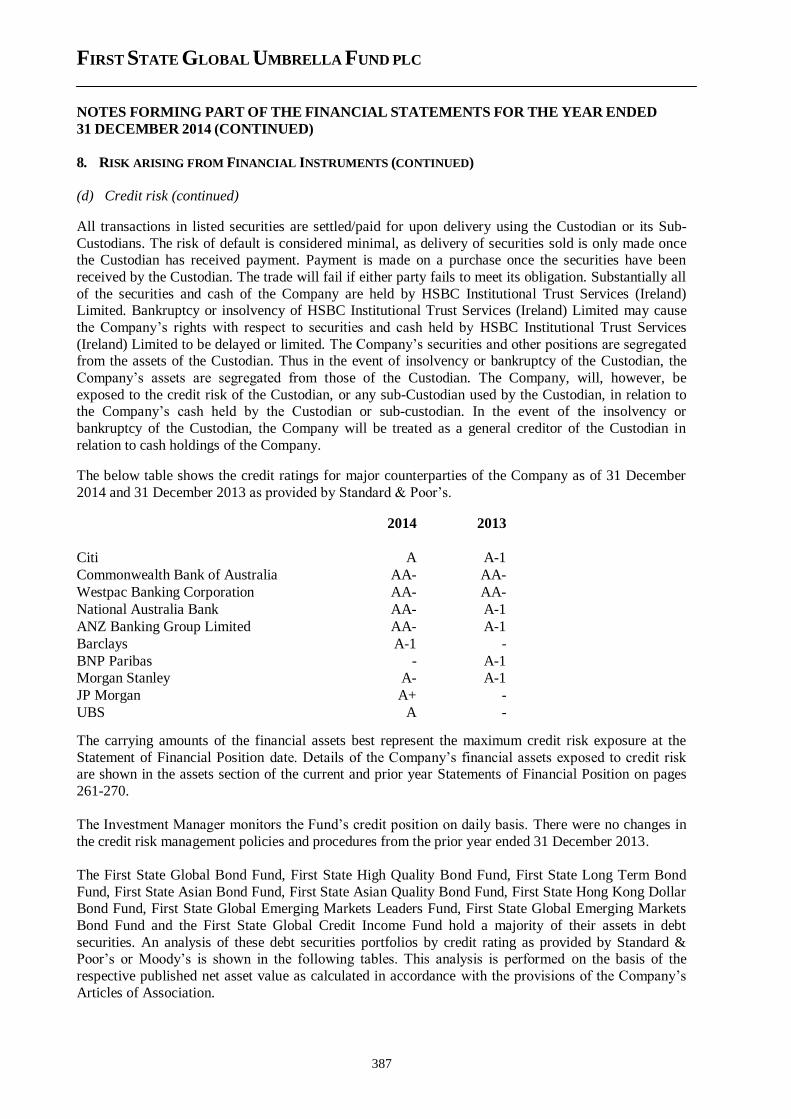
FIRST STATE GLOBAL UMBRELLA FUND PLC
NOTES FORMING PART OF THE FINANCIAL STATEMENTS FOR THE YEAR ENDED
31 DECEMBER 2014 (CONTINUED)
387
8. RISK ARISING FROM FINANCIAL INSTRUMENTS (CONTINUED)
(d) Credit risk (continued)
All transactions in listed securities are settled/paid for upon delivery using the Custodian or its Sub-
Custodians. The risk of default is considered minimal, as delivery of securities sold is only made once the Custodian has received payment. Payment is made on a purchase once the securities have been
received by the Custodian. The trade will fail if either party fails to meet its obligation. Substantially all
of the securities and cash of the Company are held by HSBC Institutional Trust Services (Ireland) Limited. Bankruptcy or insolvency of HSBC Institutional Trust Services (Ireland) Limited may cause
the Company’s rights with respect to securities and cash held by HSBC Institutional Trust Services
(Ireland) Limited to be delayed or limited. The Company’s securities and other positions are segregated from the assets of the Custodian. Thus in the event of insolvency or bankruptcy of the Custodian, the
Company’s assets are segregated from those of the Custodian. The Company, will, however, be
exposed to the credit risk of the Custodian, or any sub-Custodian used by the Custodian, in relation to the Company’s cash held by the Custodian or sub-custodian. In the event of the insolvency or
bankruptcy of the Custodian, the Company will be treated as a general creditor of the Custodian in
relation to cash holdings of the Company.
The below table shows the credit ratings for major counterparties of the Company as of 31 December
2014 and 31 December 2013 as provided by Standard & Poor’s.
2014 2013
Citi A A-1
Commonwealth Bank of Australia AA- AA-
Westpac Banking Corporation AA- AA-
National Australia Bank AA- A-1
ANZ Banking Group Limited AA- A-1
Barclays A-1 -
BNP Paribas - A-1
Morgan Stanley A- A-1
JP Morgan A+ -
UBS A -
The carrying amounts of the financial assets best represent the maximum credit risk exposure at the
Statement of Financial Position date. Details of the Company’s financial assets exposed to credit risk are shown in the assets section of the current and prior year Statements of Financial Position on pages
261-270.
The Investment Manager monitors the Fund’s credit position on daily basis. There were no changes in
the credit risk management policies and procedures from the prior year ended 31 December 2013.
The First State Global Bond Fund, First State High Quality Bond Fund, First State Long Term Bond
Fund, First State Asian Bond Fund, First State Asian Quality Bond Fund, First State Hong Kong Dollar Bond Fund, First State Global Emerging Markets Leaders Fund, First State Global Emerging Markets
Bond Fund and the First State Global Credit Income Fund hold a majority of their assets in debt
securities. An analysis of these debt securities portfolios by credit rating as provided by Standard & Poor’s or Moody’s is shown in the following tables. This analysis is performed on the basis of the
respective published net asset value as calculated in accordance with the provisions of the Company’s
Articles of Association.
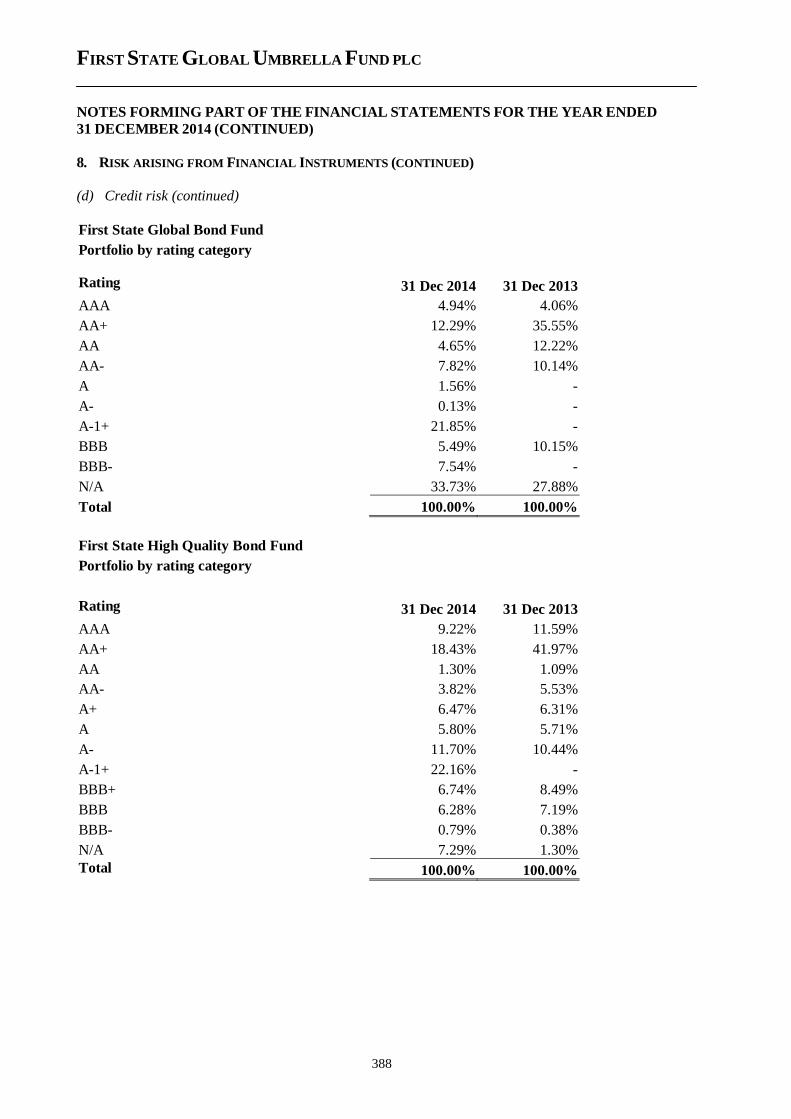
FIRST STATE GLOBAL UMBRELLA FUND PLC
NOTES FORMING PART OF THE FINANCIAL STATEMENTS FOR THE YEAR ENDED
31 DECEMBER 2014 (CONTINUED)
388
8. RISK ARISING FROM FINANCIAL INSTRUMENTS (CONTINUED)
(d) Credit risk (continued)
First State Global Bond Fund
Portfolio by rating category
Rating 31 Dec 2014 31 Dec 2013
AAA 4.94% 4.06%
AA+ 12.29% 35.55%
AA 4.65% 12.22%
AA- 7.82% 10.14%
A 1.56% -
A- 0.13% -
A-1+ 21.85% -
BBB 5.49% 10.15%
BBB- 7.54% -
N/A 33.73% 27.88%
Total 100.00% 100.00%
First State High Quality Bond Fund
Portfolio by rating category
Rating 31 Dec 2014 31 Dec 2013
AAA 9.22% 11.59%
AA+ 18.43% 41.97%
AA 1.30% 1.09%
AA- 3.82% 5.53%
A+ 6.47% 6.31%
A 5.80% 5.71%
A- 11.70% 10.44%
A-1+ 22.16% -
BBB+ 6.74% 8.49%
BBB 6.28% 7.19%
BBB- 0.79% 0.38%
N/A 7.29% 1.30%
Total 100.00% 100.00%
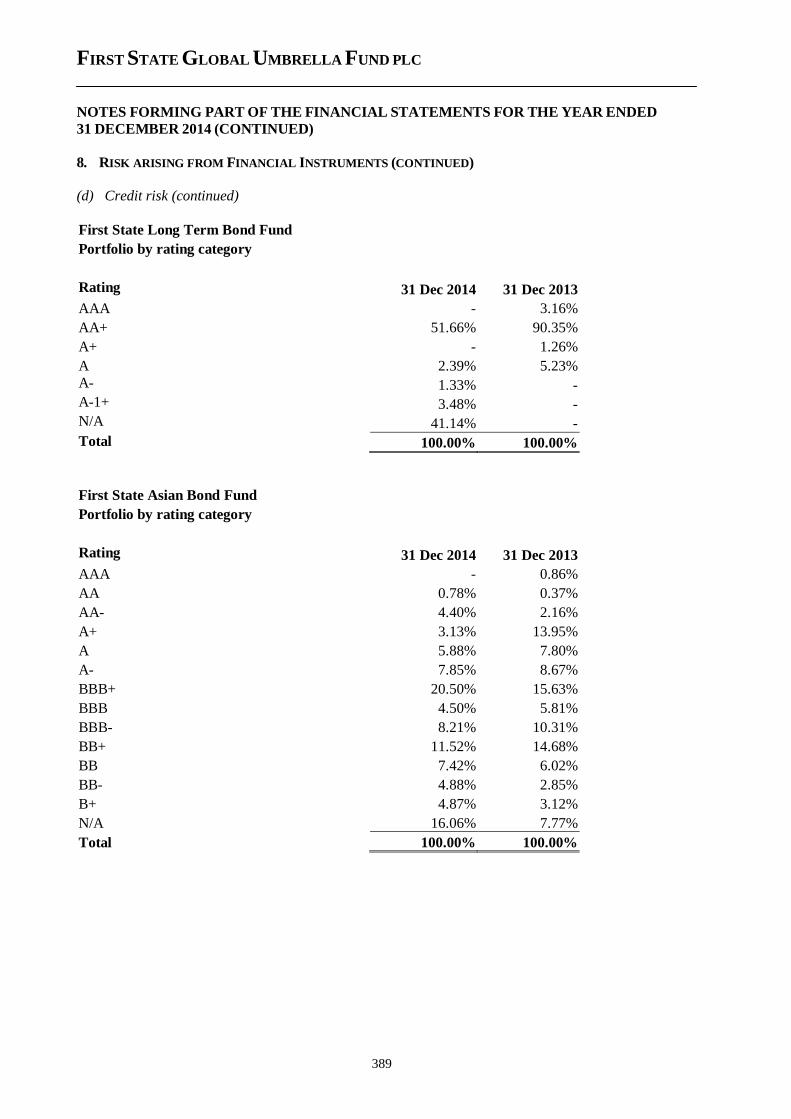
FIRST STATE GLOBAL UMBRELLA FUND PLC
NOTES FORMING PART OF THE FINANCIAL STATEMENTS FOR THE YEAR ENDED
31 DECEMBER 2014 (CONTINUED)
389
8. RISK ARISING FROM FINANCIAL INSTRUMENTS (CONTINUED)
(d) Credit risk (continued)
First State Long Term Bond Fund
Portfolio by rating category
Rating 31 Dec 2014 31 Dec 2013
AAA - 3.16%
AA+ 51.66% 90.35%
A+ - 1.26%
A 2.39% 5.23%
A- 1.33% -
A-1+ 3.48% -
N/A 41.14% -
Total 100.00% 100.00%
First State Asian Bond Fund
Portfolio by rating category
Rating 31 Dec 2014 31 Dec 2013
AAA - 0.86%
AA 0.78% 0.37%
AA- 4.40% 2.16%
A+ 3.13% 13.95%
A 5.88% 7.80%
A- 7.85% 8.67%
BBB+ 20.50% 15.63%
BBB 4.50% 5.81%
BBB- 8.21% 10.31%
BB+ 11.52% 14.68%
BB 7.42% 6.02%
BB- 4.88% 2.85%
B+ 4.87% 3.12%
N/A 16.06% 7.77%
Total 100.00% 100.00%
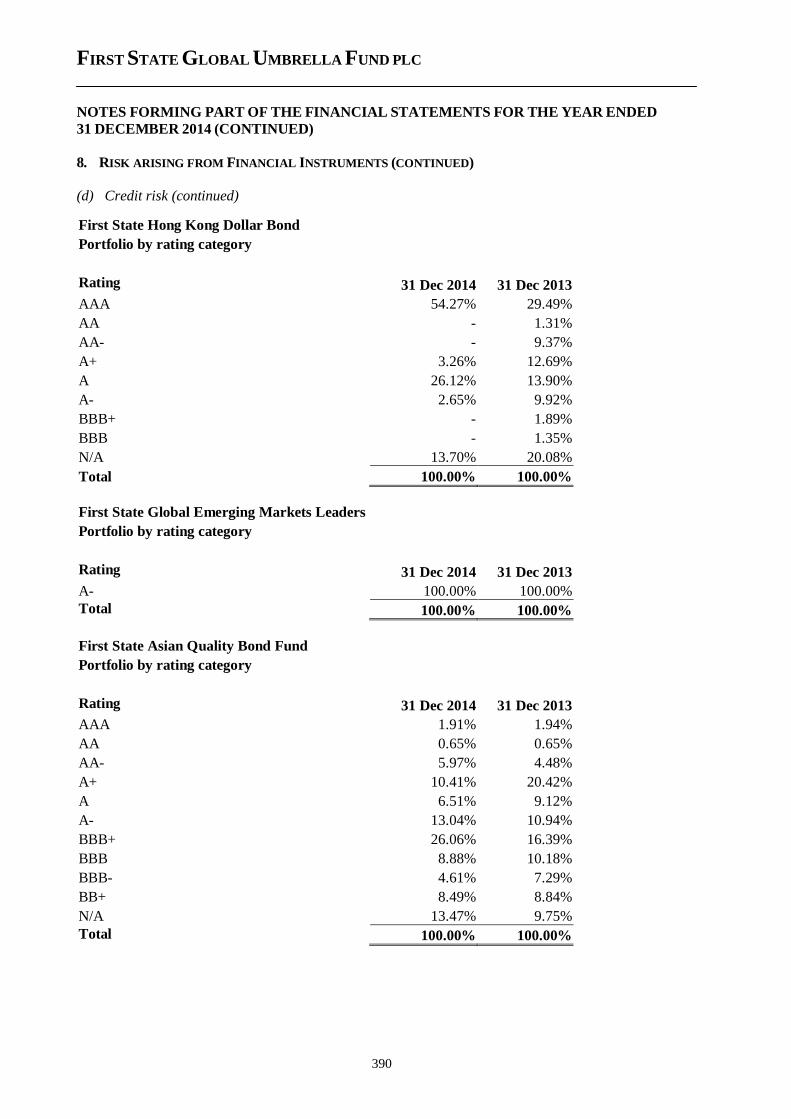
FIRST STATE GLOBAL UMBRELLA FUND PLC
NOTES FORMING PART OF THE FINANCIAL STATEMENTS FOR THE YEAR ENDED
31 DECEMBER 2014 (CONTINUED)
390
8. RISK ARISING FROM FINANCIAL INSTRUMENTS (CONTINUED)
(d) Credit risk (continued)
First State Hong Kong Dollar Bond
Portfolio by rating category
Rating 31 Dec 2014 31 Dec 2013
AAA 54.27% 29.49%
AA - 1.31%
AA- - 9.37%
A+ 3.26% 12.69%
A 26.12% 13.90%
A- 2.65% 9.92%
BBB+ - 1.89%
BBB - 1.35%
N/A 13.70% 20.08%
Total 100.00% 100.00%
First State Global Emerging Markets Leaders
Fund
Portfolio by rating category
Rating 31 Dec 2014 31 Dec 2013
A- 100.00% 100.00%
Total 100.00% 100.00%
First State Asian Quality Bond Fund
Portfolio by rating category
Rating 31 Dec 2014 31 Dec 2013
AAA 1.91% 1.94%
AA 0.65% 0.65%
AA- 5.97% 4.48%
A+ 10.41% 20.42%
A 6.51% 9.12%
A- 13.04% 10.94%
BBB+ 26.06% 16.39%
BBB 8.88% 10.18%
BBB- 4.61% 7.29%
BB+ 8.49% 8.84%
N/A 13.47% 9.75%
Total 100.00% 100.00%
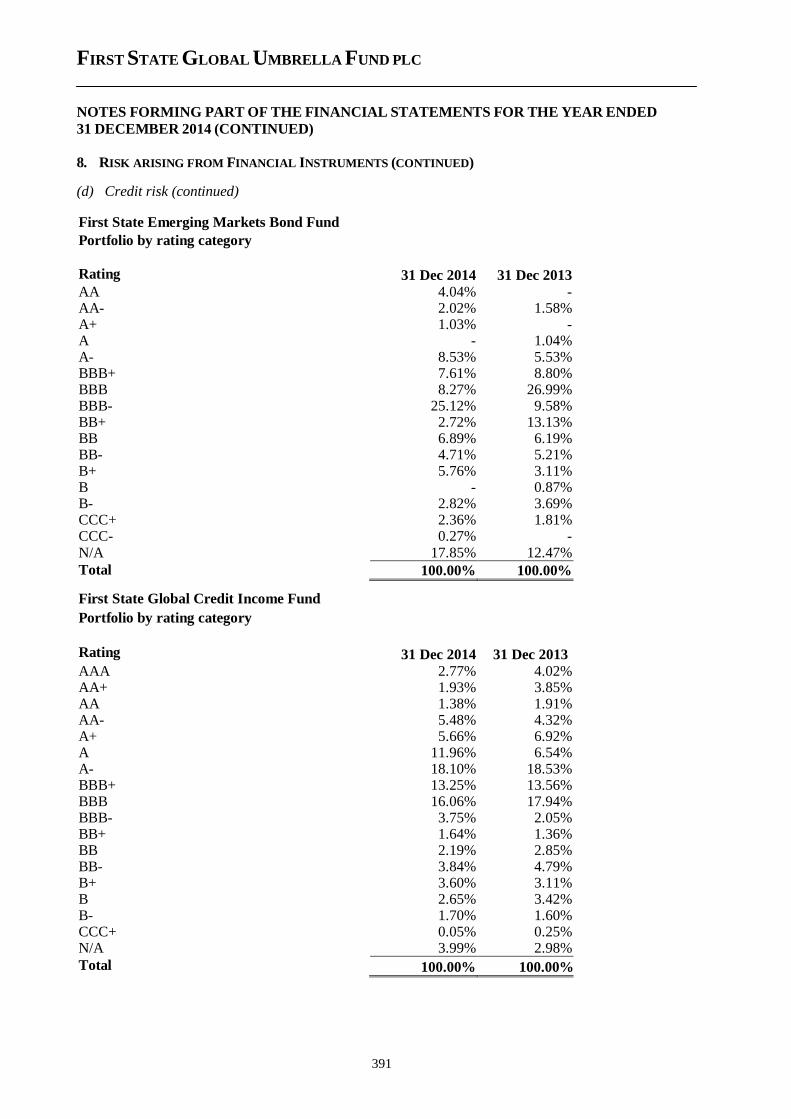
FIRST STATE GLOBAL UMBRELLA FUND PLC
NOTES FORMING PART OF THE FINANCIAL STATEMENTS FOR THE YEAR ENDED
31 DECEMBER 2014 (CONTINUED)
391
8. RISK ARISING FROM FINANCIAL INSTRUMENTS (CONTINUED)
(d) Credit risk (continued)
First State Emerging Markets Bond Fund
Portfolio by rating category
Rating 31 Dec 2014 31 Dec 2013
AA 4.04% - AA- 2.02% 1.58% A+ 1.03% - A - 1.04% A- 8.53% 5.53% BBB+ 7.61% 8.80% BBB 8.27% 26.99% BBB- 25.12% 9.58% BB+ 2.72% 13.13% BB 6.89% 6.19% BB- 4.71% 5.21% B+ 5.76% 3.11% B - 0.87% B- 2.82% 3.69% CCC+ 2.36% 1.81% CCC- 0.27% - N/A 17.85% 12.47%
Total 100.00% 100.00%
First State Global Credit Income Fund
Portfolio by rating category
Rating 31 Dec 2014 31 Dec 2013
AAA 2.77% 4.02% AA+ 1.93% 3.85% AA 1.38% 1.91% AA- 5.48% 4.32% A+ 5.66% 6.92% A 11.96% 6.54% A- 18.10% 18.53% BBB+ 13.25% 13.56% BBB 16.06% 17.94% BBB- 3.75% 2.05% BB+ 1.64% 1.36% BB 2.19% 2.85% BB- 3.84% 4.79% B+ 3.60% 3.11% B 2.65% 3.42% B- 1.70% 1.60%
CCC+ 0.05% 0.25% N/A 3.99% 2.98%
Total 100.00% 100.00%
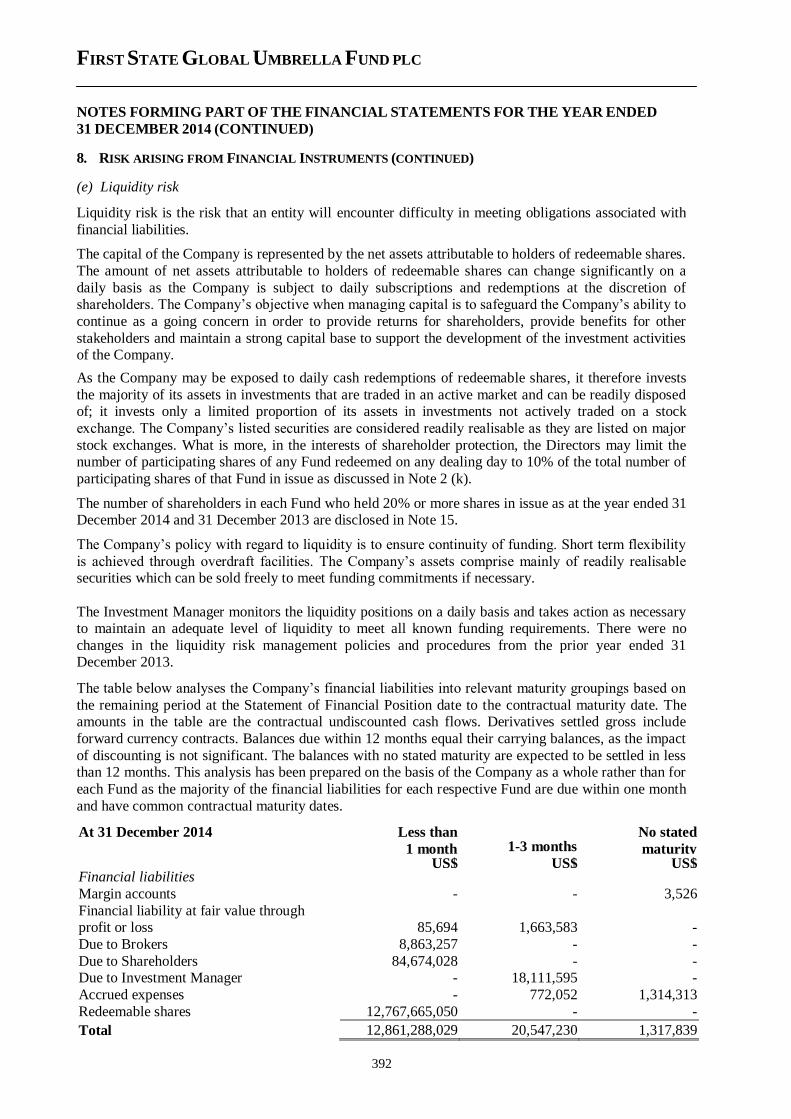
FIRST STATE GLOBAL UMBRELLA FUND PLC
NOTES FORMING PART OF THE FINANCIAL STATEMENTS FOR THE YEAR ENDED
31 DECEMBER 2014 (CONTINUED)
392
8. RISK ARISING FROM FINANCIAL INSTRUMENTS (CONTINUED)
(e) Liquidity risk
Liquidity risk is the risk that an entity will encounter difficulty in meeting obligations associated with
financial liabilities.
The capital of the Company is represented by the net assets attributable to holders of redeemable shares.
The amount of net assets attributable to holders of redeemable shares can change significantly on a
daily basis as the Company is subject to daily subscriptions and redemptions at the discretion of shareholders. The Company’s objective when managing capital is to safeguard the Company’s ability to
continue as a going concern in order to provide returns for shareholders, provide benefits for other
stakeholders and maintain a strong capital base to support the development of the investment activities of the Company.
As the Company may be exposed to daily cash redemptions of redeemable shares, it therefore invests
the majority of its assets in investments that are traded in an active market and can be readily disposed of; it invests only a limited proportion of its assets in investments not actively traded on a stock
exchange. The Company’s listed securities are considered readily realisable as they are listed on major
stock exchanges. What is more, in the interests of shareholder protection, the Directors may limit the number of participating shares of any Fund redeemed on any dealing day to 10% of the total number of
participating shares of that Fund in issue as discussed in Note 2 (k).
The number of shareholders in each Fund who held 20% or more shares in issue as at the year ended 31 December 2014 and 31 December 2013 are disclosed in Note 15.
The Company’s policy with regard to liquidity is to ensure continuity of funding. Short term flexibility
is achieved through overdraft facilities. The Company’s assets comprise mainly of readily realisable securities which can be sold freely to meet funding commitments if necessary.
The Investment Manager monitors the liquidity positions on a daily basis and takes action as necessary to maintain an adequate level of liquidity to meet all known funding requirements. There were no
changes in the liquidity risk management policies and procedures from the prior year ended 31 December 2013.
The table below analyses the Company’s financial liabilities into relevant maturity groupings based on
the remaining period at the Statement of Financial Position date to the contractual maturity date. The amounts in the table are the contractual undiscounted cash flows. Derivatives settled gross include
forward currency contracts. Balances due within 12 months equal their carrying balances, as the impact
of discounting is not significant. The balances with no stated maturity are expected to be settled in less than 12 months. This analysis has been prepared on the basis of the Company as a whole rather than for
each Fund as the majority of the financial liabilities for each respective Fund are due within one month
and have common contractual maturity dates.
At 31 December 2014 Less than
1 month 1-3 months No stated
maturity US$ US$ US$ Financial liabilities
Margin accounts - - 3,526
Financial liability at fair value through profit or loss 85,694 1,663,583 -
Due to Brokers 8,863,257 - -
Due to Shareholders 84,674,028 - - Due to Investment Manager - 18,111,595 -
Accrued expenses - 772,052 1,314,313
Redeemable shares 12,767,665,050 - -
Total 12,861,288,029 20,547,230 1,317,839
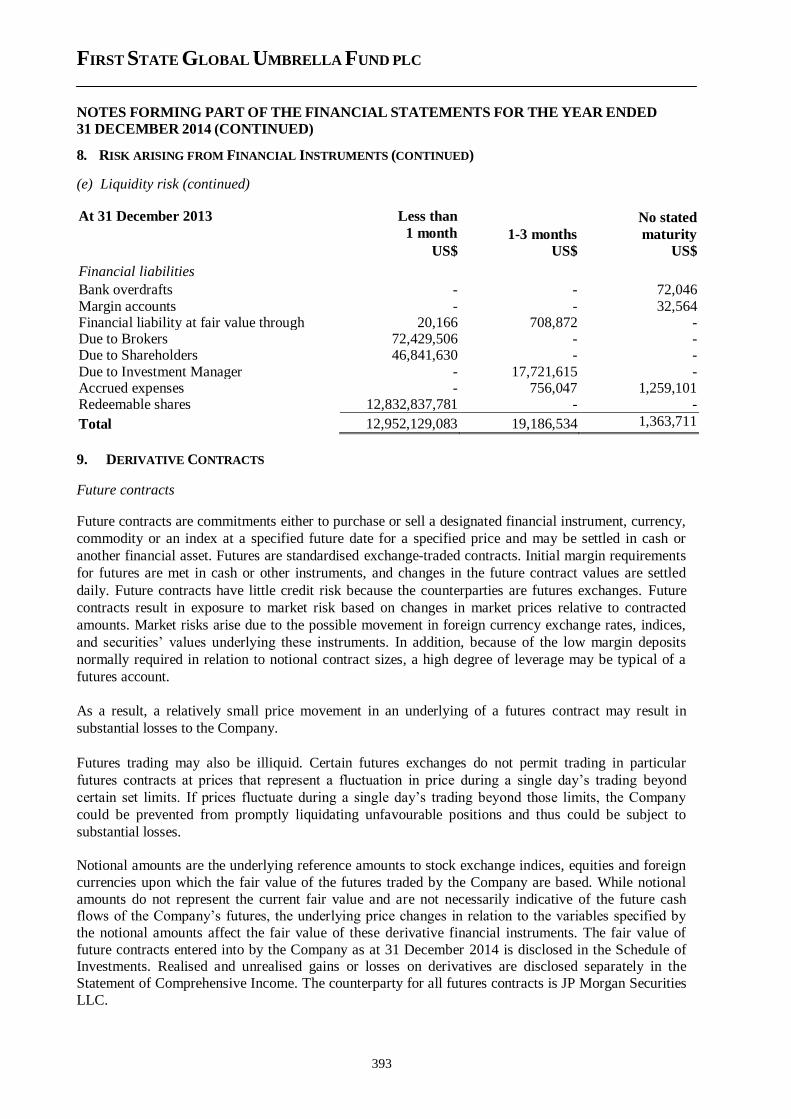
FIRST STATE GLOBAL UMBRELLA FUND PLC
NOTES FORMING PART OF THE FINANCIAL STATEMENTS FOR THE YEAR ENDED
31 DECEMBER 2014 (CONTINUED)
393
8. RISK ARISING FROM FINANCIAL INSTRUMENTS (CONTINUED)
(e) Liquidity risk (continued)
At 31 December 2013 Less than
1 month 1-3 months
No stated
maturity
US$ US$ US$
Financial liabilities
Bank overdrafts - - 72,046 Margin accounts - - 32,564 Financial liability at fair value through 20,166 708,872 - Due to Brokers 72,429,506 - - Due to Shareholders 46,841,630 - - Due to Investment Manager - 17,721,615 - Accrued expenses - 756,047 1,259,101
Redeemable shares 12,832,837,781 - -
Total 12,952,129,083 19,186,534 1,363,711
9. DERIVATIVE CONTRACTS
Future contracts
Future contracts are commitments either to purchase or sell a designated financial instrument, currency,
commodity or an index at a specified future date for a specified price and may be settled in cash or
another financial asset. Futures are standardised exchange-traded contracts. Initial margin requirements
for futures are met in cash or other instruments, and changes in the future contract values are settled
daily. Future contracts have little credit risk because the counterparties are futures exchanges. Future
contracts result in exposure to market risk based on changes in market prices relative to contracted
amounts. Market risks arise due to the possible movement in foreign currency exchange rates, indices,
and securities’ values underlying these instruments. In addition, because of the low margin deposits
normally required in relation to notional contract sizes, a high degree of leverage may be typical of a
futures account.
As a result, a relatively small price movement in an underlying of a futures contract may result in
substantial losses to the Company.
Futures trading may also be illiquid. Certain futures exchanges do not permit trading in particular
futures contracts at prices that represent a fluctuation in price during a single day’s trading beyond
certain set limits. If prices fluctuate during a single day’s trading beyond those limits, the Company
could be prevented from promptly liquidating unfavourable positions and thus could be subject to
substantial losses.
Notional amounts are the underlying reference amounts to stock exchange indices, equities and foreign
currencies upon which the fair value of the futures traded by the Company are based. While notional
amounts do not represent the current fair value and are not necessarily indicative of the future cash flows of the Company’s futures, the underlying price changes in relation to the variables specified by
the notional amounts affect the fair value of these derivative financial instruments. The fair value of
future contracts entered into by the Company as at 31 December 2014 is disclosed in the Schedule of Investments. Realised and unrealised gains or losses on derivatives are disclosed separately in the
Statement of Comprehensive Income. The counterparty for all futures contracts is JP Morgan Securities
LLC.
FIRST STATE GLOBAL UMBRELLA FUND PLC
NOTES FORMING PART OF THE FINANCIAL STATEMENTS FOR THE YEAR ENDED
31 DECEMBER 2014 (CONTINUED)
394
9. DERIVATIVE CONTRACTS (CONTINUED)
Forward contracts
Forward contracts are contractual agreements to buy or sell a specified financial instrument at a specific
price and date in the future. Forwards are customised contracts transacted in the OTC market. The Funds may enter into forward foreign exchange contracts to manage the currency risk arising from the
Funds’ investment or anticipated investment in investments denominated in foreign currencies. Forward
contracts may be used for hedging and currency management of both local and foreign currencies. Realised and unrealised gains or losses on derivatives are disclosed separately in the Statement of
Comprehensive Income. The counterparties for all the forward contracts are Commonwealth Bank of
Australia, Westpac Banking Corporation, National Australia Bank limited and Barclays Bank PLC.
Credit default swaps
Swap agreements (“swaps”) represent agreements that obligate two parties to exchange a series of cash
flows at specified intervals based upon, or calculated by reference to, changes in specified prices or rates for a specified amount of an underlying asset or otherwise determined notional amount. The
payment flows are usually netted against each other, with the difference being paid by one party to the
other. Therefore amounts required for the future satisfaction of the swap may be greater or less than the amount recorded. Realised and unrealised gains or losses on derivatives are disclosed separately in the
Statement of Comprehensive Income.
Interest rate swaps
Swaps are contractual agreements between two parties to exchange streams of payments over time
based on specified notional amounts. Interest rate swaps relate to contracts taken out by the Company
with major brokers in which the Company either receives or pays a floating rate of interest in return for
paying or receiving a fixed rate of interest. The payment flows are usually netted against each other,
with the difference being paid by one party to the other. The Company may obtain interest rate swaps
for the purposes of efficient portfolio management and to hedge against interest rate risk. Realised and
unrealised gains or losses on derivatives are disclosed separately in the Statement of Comprehensive
Income. The counterparties for the interest rate swaps contracts are ANZ Banking Group Limited,
National Australia Bank Limited, Westpac banking Corporation and Morgan Stanley.
Centrally cleared swaps
Daily changes in the valuation of centrally cleared swaps, if any, are recorded as a receivable or a
payable for the change in value as appropriate in the Statement of Financial Position. Centrally cleared
swaps listed or traded on a multilateral or trade facility platform, such as a registered exchange or
clearing house, are valued by the respective exchange. Centrally cleared interest rate swaps are valued
using a pricing model that references the underlying rates including the overnight index swap rate and
LIBOR forward rate.
Warrants
Warrants are recorded as an asset or liability at their fair value on the Statement of Financial Position.
Fair value as determined by the Administrator is the quoted market price as provided by electronic feed
from one or more reputable price vendors. The change in fair value, if any, is recorded as an unrealised
gain or loss in the Statement of Comprehensive Income. Realised gains or losses on warrants are shown
in the Statement of Comprehensive Income. On the expiry of a warrant the amount previously
recognised in the Statement of Financial Position is recognised in the Statement of Comprehensive
Income as a realised gain or loss.
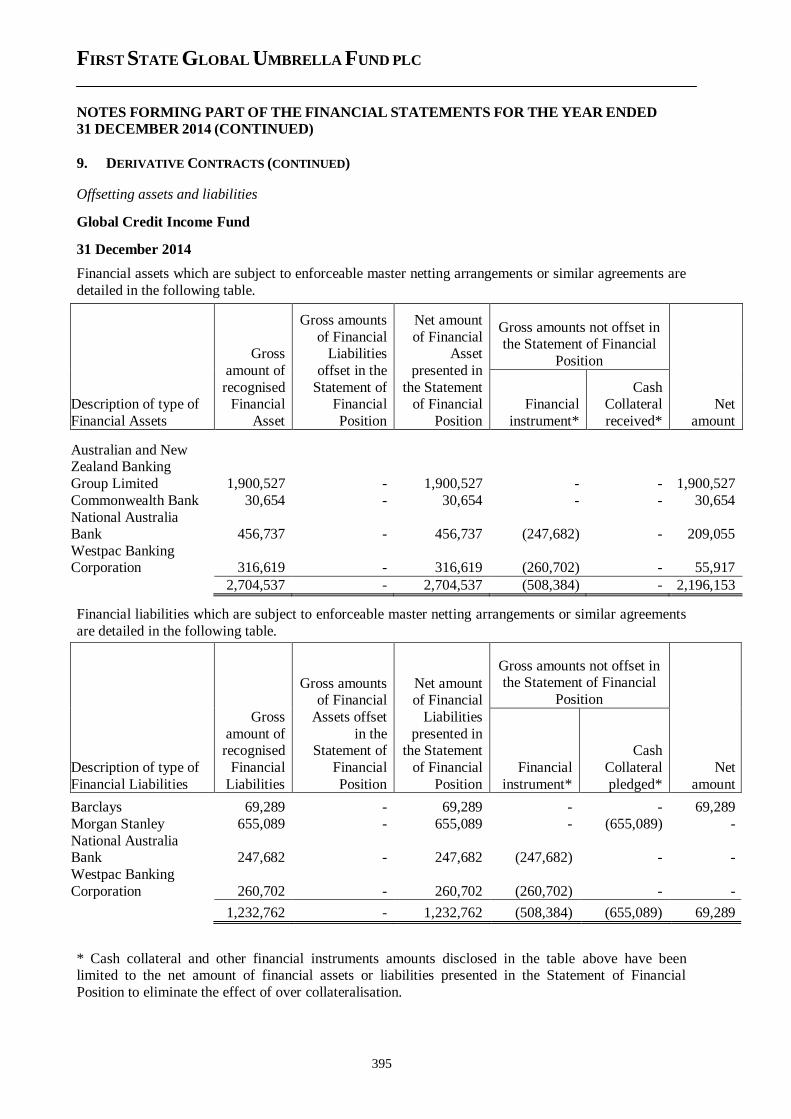
FIRST STATE GLOBAL UMBRELLA FUND PLC
NOTES FORMING PART OF THE FINANCIAL STATEMENTS FOR THE YEAR ENDED
31 DECEMBER 2014 (CONTINUED)
395
9. DERIVATIVE CONTRACTS (CONTINUED)
Offsetting assets and liabilities
Global Credit Income Fund
31 December 2014
Financial assets which are subject to enforceable master netting arrangements or similar agreements are
detailed in the following table.
Description of type of
Financial Assets
Gross
amount of
recognised Financial
Asset
Gross amounts
of Financial Liabilities
offset in the
Statement of Financial
Position
Net amount
of Financial Asset
presented in
the Statement of Financial
Position
Gross amounts not offset in the Statement of Financial
Position
Net
amount
Financial
instrument*
Cash Collateral
received*
Australian and New Zealand Banking
Group Limited 1,900,527 - 1,900,527 - -
1,900,527
Commonwealth Bank 30,654 - 30,654 - - 30,654
National Australia Bank 456,737 - 456,737 (247,682) - 209,055
Westpac Banking Corporation 316,619 - 316,619 (260,702) - 55,917
2,704,537 - 2,704,537 (508,384) - 2,196,153
Financial liabilities which are subject to enforceable master netting arrangements or similar agreements
are detailed in the following table.
Description of type of
Financial Liabilities
Gross
amount of recognised
Financial
Liabilities
Gross amounts of Financial
Assets offset
in the Statement of
Financial
Position
Net amount of Financial
Liabilities
presented in the Statement
of Financial
Position
Gross amounts not offset in the Statement of Financial
Position
Net
amount
Financial
instrument*
Cash
Collateral
pledged*
Barclays 69,289 - 69,289 - - 69,289
Morgan Stanley 655,089 - 655,089 - (655,089) -
National Australia Bank 247,682 - 247,682 (247,682) - -
Westpac Banking
Corporation 260,702 - 260,702 (260,702) - -
1,232,762 - 1,232,762 (508,384) (655,089) 69,289
* Cash collateral and other financial instruments amounts disclosed in the table above have been limited to the net amount of financial assets or liabilities presented in the Statement of Financial
Position to eliminate the effect of over collateralisation.
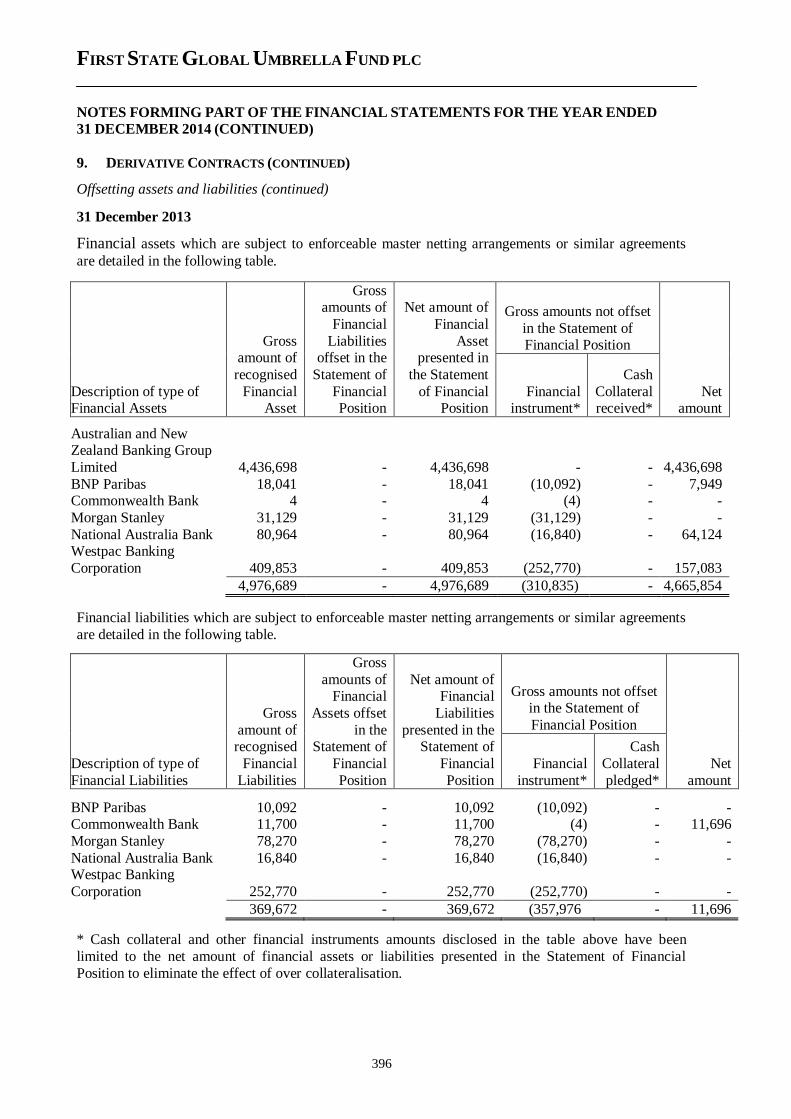
FIRST STATE GLOBAL UMBRELLA FUND PLC
NOTES FORMING PART OF THE FINANCIAL STATEMENTS FOR THE YEAR ENDED
31 DECEMBER 2014 (CONTINUED)
396
9. DERIVATIVE CONTRACTS (CONTINUED)
Offsetting assets and liabilities (continued)
31 December 2013
Financial assets which are subject to enforceable master netting arrangements or similar agreements
are detailed in the following table.
Description of type of Financial Assets
Gross amount of
recognised
Financial Asset
Gross amounts of
Financial
Liabilities offset in the
Statement of
Financial Position
Net amount of
Financial
Asset presented in
the Statement
of Financial Position
Gross amounts not offset
in the Statement of Financial Position
Net amount
Financial instrument*
Cash
Collateral received*
Australian and New Zealand Banking Group
Limited 4,436,698 - 4,436,698 - - 4,436,698
BNP Paribas 18,041 - 18,041 (10,092) - 7,949 Commonwealth Bank 4 - 4 (4) - -
Morgan Stanley 31,129 - 31,129 (31,129) - -
National Australia Bank 80,964 - 80,964 (16,840) - 64,124 Westpac Banking
Corporation 409,853 - 409,853 (252,770) - 157,083
4,976,689 - 4,976,689 (310,835) - 4,665,854
Financial liabilities which are subject to enforceable master netting arrangements or similar agreements
are detailed in the following table.
Description of type of
Financial Liabilities
Gross
amount of recognised
Financial
Liabilities
Gross
amounts of Financial
Assets offset
in the Statement of
Financial
Position
Net amount of Financial
Liabilities
presented in the Statement of
Financial
Position
Gross amounts not offset in the Statement of
Financial Position
Net
amount
Financial
instrument*
Cash
Collateral
pledged*
BNP Paribas 10,092 - 10,092 (10,092) - - Commonwealth Bank 11,700 - 11,700 (4) - 11,696
Morgan Stanley 78,270 - 78,270 (78,270) - -
National Australia Bank 16,840 - 16,840 (16,840) - - Westpac Banking
Corporation 252,770 - 252,770 (252,770) - -
369,672 - 369,672 (357,976 - 11,696
* Cash collateral and other financial instruments amounts disclosed in the table above have been
limited to the net amount of financial assets or liabilities presented in the Statement of Financial
Position to eliminate the effect of over collateralisation.
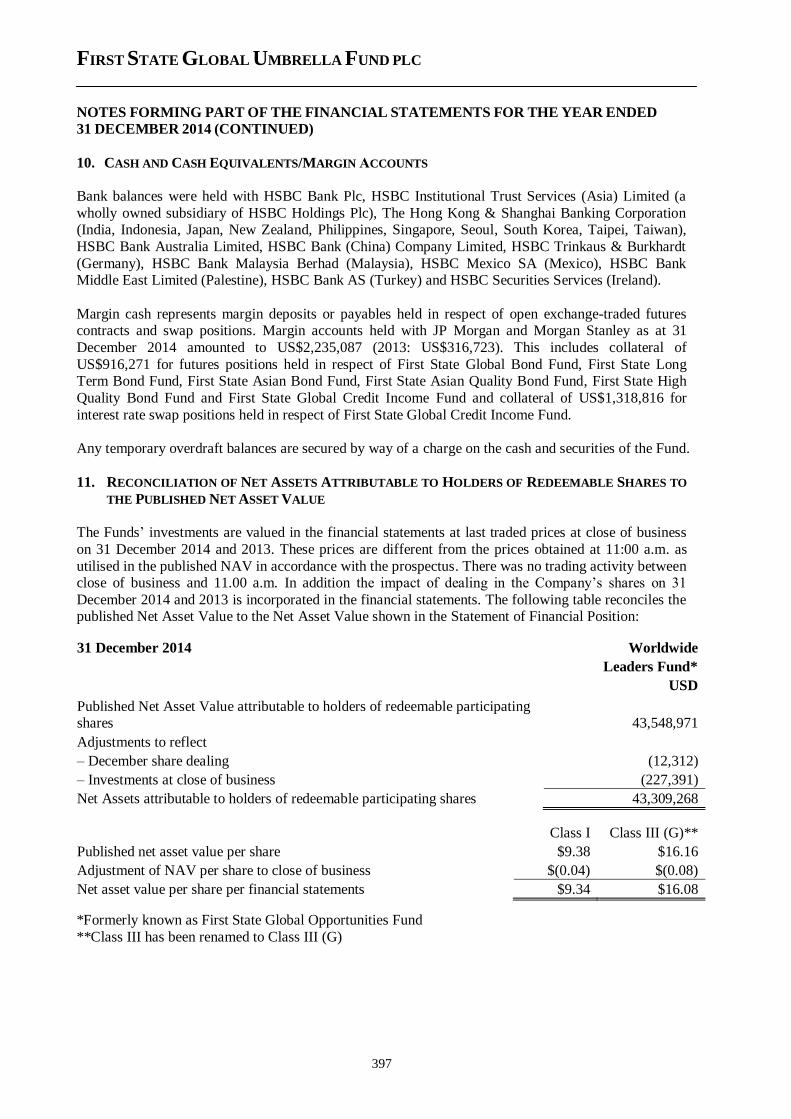
FIRST STATE GLOBAL UMBRELLA FUND PLC
NOTES FORMING PART OF THE FINANCIAL STATEMENTS FOR THE YEAR ENDED
31 DECEMBER 2014 (CONTINUED)
397
10. CASH AND CASH EQUIVALENTS/MARGIN ACCOUNTS
Bank balances were held with HSBC Bank Plc, HSBC Institutional Trust Services (Asia) Limited (a
wholly owned subsidiary of HSBC Holdings Plc), The Hong Kong & Shanghai Banking Corporation (India, Indonesia, Japan, New Zealand, Philippines, Singapore, Seoul, South Korea, Taipei, Taiwan),
HSBC Bank Australia Limited, HSBC Bank (China) Company Limited, HSBC Trinkaus & Burkhardt
(Germany), HSBC Bank Malaysia Berhad (Malaysia), HSBC Mexico SA (Mexico), HSBC Bank Middle East Limited (Palestine), HSBC Bank AS (Turkey) and HSBC Securities Services (Ireland).
Margin cash represents margin deposits or payables held in respect of open exchange-traded futures contracts and swap positions. Margin accounts held with JP Morgan and Morgan Stanley as at 31
December 2014 amounted to US$2,235,087 (2013: US$316,723). This includes collateral of
US$916,271 for futures positions held in respect of First State Global Bond Fund, First State Long Term Bond Fund, First State Asian Bond Fund, First State Asian Quality Bond Fund, First State High
Quality Bond Fund and First State Global Credit Income Fund and collateral of US$1,318,816 for
interest rate swap positions held in respect of First State Global Credit Income Fund.
Any temporary overdraft balances are secured by way of a charge on the cash and securities of the Fund.
11. RECONCILIATION OF NET ASSETS ATTRIBUTABLE TO HOLDERS OF REDEEMABLE SHARES TO
THE PUBLISHED NET ASSET VALUE
The Funds’ investments are valued in the financial statements at last traded prices at close of business
on 31 December 2014 and 2013. These prices are different from the prices obtained at 11:00 a.m. as
utilised in the published NAV in accordance with the prospectus. There was no trading activity between close of business and 11.00 a.m. In addition the impact of dealing in the Company’s shares on 31
December 2014 and 2013 is incorporated in the financial statements. The following table reconciles the published Net Asset Value to the Net Asset Value shown in the Statement of Financial Position:
31 December 2014 Worldwide
Leaders Fund*
USD
Published Net Asset Value attributable to holders of redeemable participating shares 43,548,971
Adjustments to reflect
– December share dealing (12,312)
– Investments at close of business (227,391)
Net Assets attributable to holders of redeemable participating shares 43,309,268
Class I Class III (G)**
Published net asset value per share $9.38 $16.16
Adjustment of NAV per share to close of business $(0.04) $(0.08)
Net asset value per share per financial statements $9.34 $16.08
*Formerly known as First State Global Opportunities Fund
**Class III has been renamed to Class III (G)
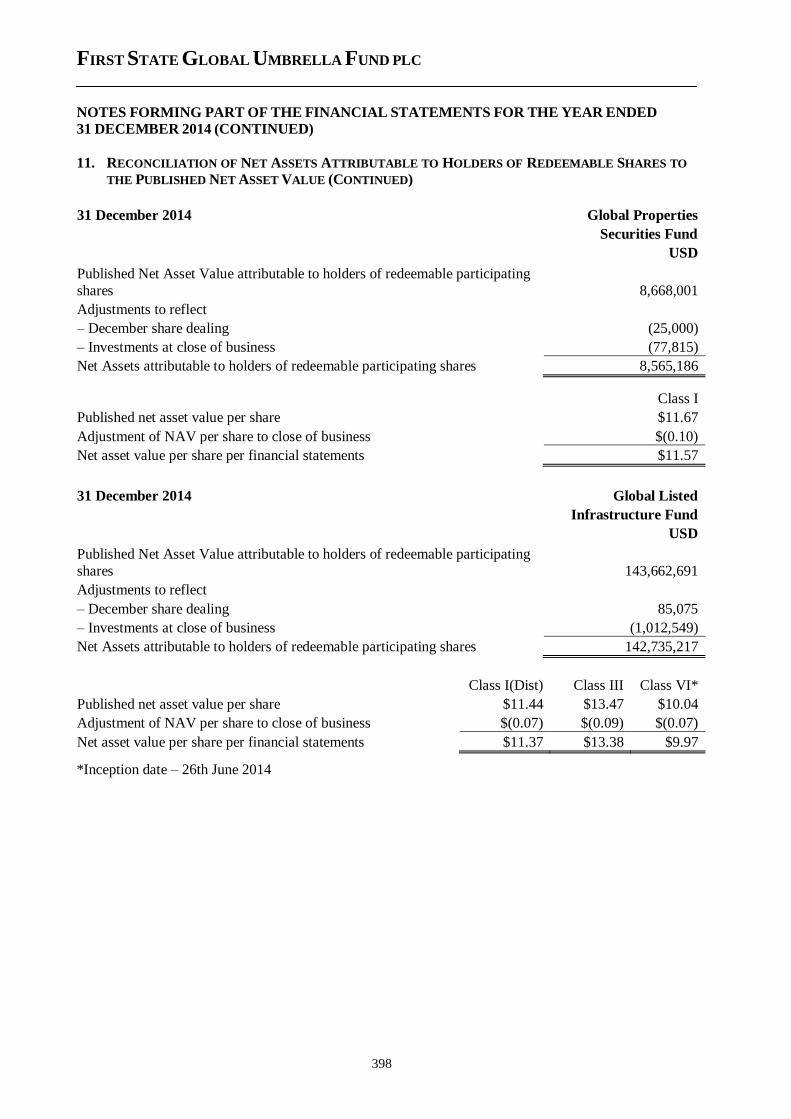
FIRST STATE GLOBAL UMBRELLA FUND PLC
NOTES FORMING PART OF THE FINANCIAL STATEMENTS FOR THE YEAR ENDED
31 DECEMBER 2014 (CONTINUED)
398
11. RECONCILIATION OF NET ASSETS ATTRIBUTABLE TO HOLDERS OF REDEEMABLE SHARES TO
THE PUBLISHED NET ASSET VALUE (CONTINUED)
31 December 2014 Global Properties
Securities Fund
USD
Published Net Asset Value attributable to holders of redeemable participating
shares 8,668,001
Adjustments to reflect
– December share dealing (25,000)
– Investments at close of business (77,815)
Net Assets attributable to holders of redeemable participating shares 8,565,186
Class I
Published net asset value per share $11.67
Adjustment of NAV per share to close of business $(0.10)
Net asset value per share per financial statements $11.57
31 December 2014 Global Listed
Infrastructure Fund
USD
Published Net Asset Value attributable to holders of redeemable participating
shares 143,662,691
Adjustments to reflect
– December share dealing 85,075
– Investments at close of business (1,012,549)
Net Assets attributable to holders of redeemable participating shares 142,735,217
Class I(Dist) Class III Class VI*
Published net asset value per share $11.44 $13.47 $10.04
Adjustment of NAV per share to close of business $(0.07) $(0.09) $(0.07)
Net asset value per share per financial statements $11.37 $13.38 $9.97
*Inception date – 26th June 2014
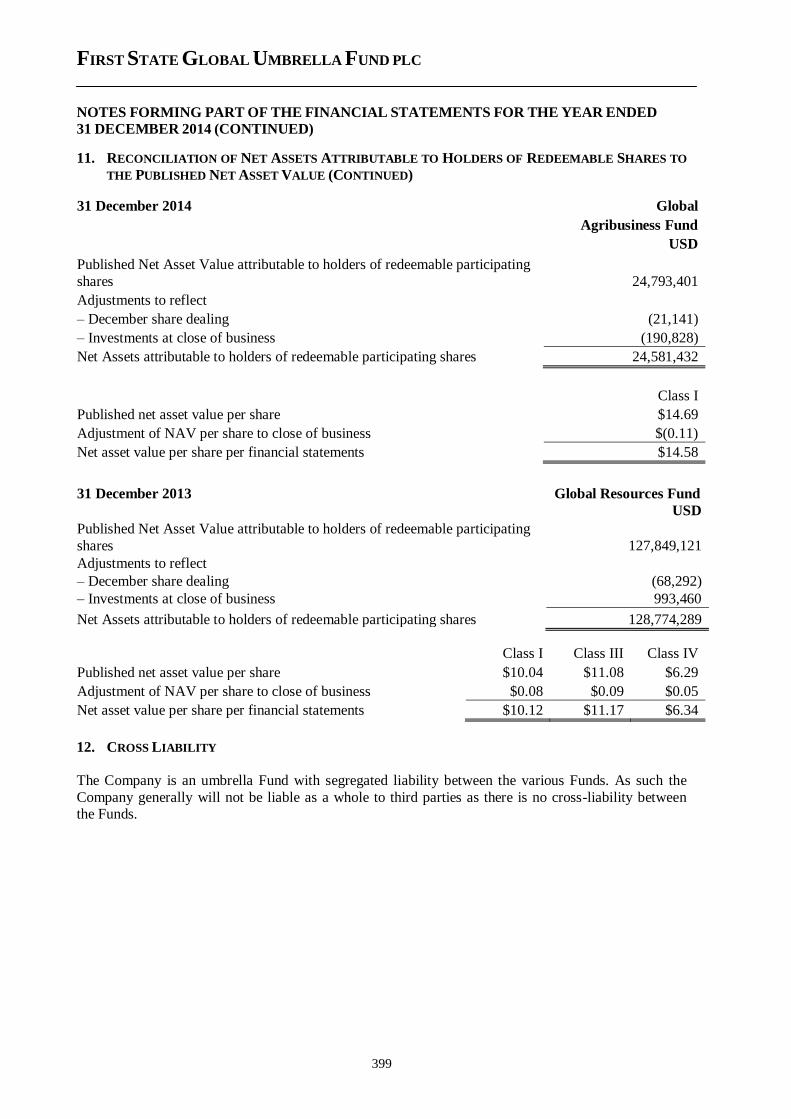
FIRST STATE GLOBAL UMBRELLA FUND PLC
NOTES FORMING PART OF THE FINANCIAL STATEMENTS FOR THE YEAR ENDED
31 DECEMBER 2014 (CONTINUED)
399
11. RECONCILIATION OF NET ASSETS ATTRIBUTABLE TO HOLDERS OF REDEEMABLE SHARES TO
THE PUBLISHED NET ASSET VALUE (CONTINUED)
31 December 2014 Global
Agribusiness Fund
USD
Published Net Asset Value attributable to holders of redeemable participating
shares 24,793,401
Adjustments to reflect
– December share dealing (21,141)
– Investments at close of business (190,828)
Net Assets attributable to holders of redeemable participating shares 24,581,432
Class I
Published net asset value per share $14.69
Adjustment of NAV per share to close of business $(0.11)
Net asset value per share per financial statements $14.58
31 December 2013 Global Resources Fund
USD
Published Net Asset Value attributable to holders of redeemable participating
shares 127,849,121
Adjustments to reflect
– December share dealing (68,292)
– Investments at close of business 993,460
Net Assets attributable to holders of redeemable participating shares 128,774,289
Class I Class III Class IV
Published net asset value per share $10.04 $11.08 $6.29
Adjustment of NAV per share to close of business $0.08 $0.09 $0.05
Net asset value per share per financial statements $10.12 $11.17 $6.34
12. CROSS LIABILITY
The Company is an umbrella Fund with segregated liability between the various Funds. As such the
Company generally will not be liable as a whole to third parties as there is no cross-liability between the Funds.
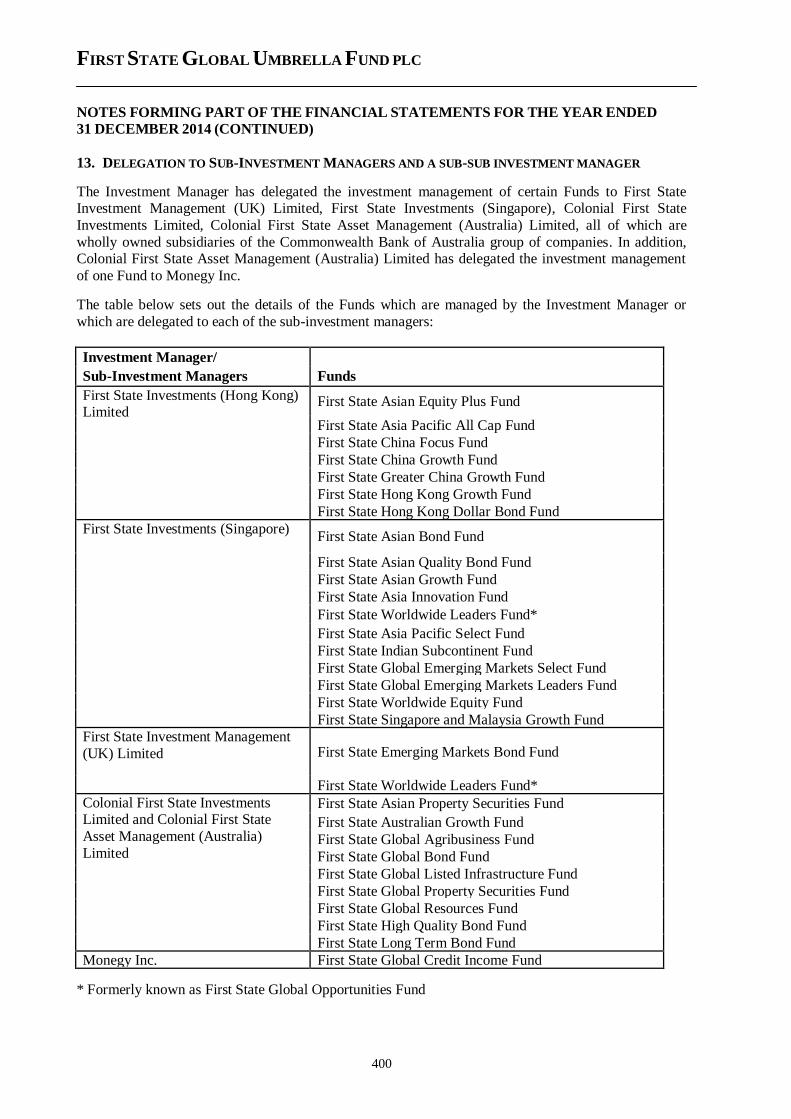
FIRST STATE GLOBAL UMBRELLA FUND PLC
NOTES FORMING PART OF THE FINANCIAL STATEMENTS FOR THE YEAR ENDED
31 DECEMBER 2014 (CONTINUED)
400
13. DELEGATION TO SUB-INVESTMENT MANAGERS AND A SUB-SUB INVESTMENT MANAGER
The Investment Manager has delegated the investment management of certain Funds to First State Investment Management (UK) Limited, First State Investments (Singapore), Colonial First State
Investments Limited, Colonial First State Asset Management (Australia) Limited, all of which are
wholly owned subsidiaries of the Commonwealth Bank of Australia group of companies. In addition, Colonial First State Asset Management (Australia) Limited has delegated the investment management
of one Fund to Monegy Inc.
The table below sets out the details of the Funds which are managed by the Investment Manager or
which are delegated to each of the sub-investment managers:
Investment Manager/
Sub-Investment Managers Funds
First State Investments (Hong Kong) Limited
First State Asian Equity Plus Fund
First State Asia Pacific All Cap Fund
First State China Focus Fund
First State China Growth Fund
First State Greater China Growth Fund
First State Hong Kong Growth Fund
First State Hong Kong Dollar Bond Fund
First State Investments (Singapore) First State Asian Bond Fund
First State Asian Quality Bond Fund
First State Asian Growth Fund
First State Asia Innovation Fund
First State Worldwide Leaders Fund*
First State Asia Pacific Select Fund
First State Indian Subcontinent Fund
First State Global Emerging Markets Select Fund
First State Global Emerging Markets Leaders Fund
First State Worldwide Equity Fund
First State Singapore and Malaysia Growth Fund
First State Investment Management
(UK) Limited First State Emerging Markets Bond Fund
First State Worldwide Leaders Fund*
Colonial First State Investments Limited and Colonial First State
Asset Management (Australia)
Limited
First State Asian Property Securities Fund
First State Australian Growth Fund
First State Global Agribusiness Fund
First State Global Bond Fund
First State Global Listed Infrastructure Fund
First State Global Property Securities Fund
First State Global Resources Fund
First State High Quality Bond Fund
First State Long Term Bond Fund
Monegy Inc. First State Global Credit Income Fund
* Formerly known as First State Global Opportunities Fund
FIRST STATE GLOBAL UMBRELLA FUND PLC
NOTES FORMING PART OF THE FINANCIAL STATEMENTS FOR THE YEAR ENDED
31 DECEMBER 2014 (CONTINUED)
401
14. RELATED PARTIES
Parties are considered to be related if one party has the ability to control the other party or exercise
significant influence over the other party in making financial or operational decisions. Under IAS 24 “Related Party Transactions”, any transactions carried out with the Company by the promoter,
Investment Manager and/or associated or group companies are considered to be related party
transactions. The details of the fees paid/payable to the related parties are disclosed in Note 3.
Mr. Michael Stapleton, a Director of the Company, is the Regional Managing Director, Asia and Japan,
of First State Investments. Mr. Chris Turpin, a Director of the Company, is the Regional Managing Director, Europe, Middle East and Africa (“EMEA”) of First State Investments. Mr. James Breyley is
the Chief Financial Officer, EMEA, of First State Investments. First State Investments is a related party
to the Investment Manager.
At the year end, Mr. Michael Stapleton, a Director of the Company held 4,580 (31 December 2013: 4,580) Class I shares in the First State Asia Innovation Fund, 3,418 (31 December 2013: 3,418) Class I
shares in the First State Global Emerging Market Leaders Fund and 5,922 (31 December 2013: 5,783)
Class I Distributing shares in the First State Global Listed Infrastructure Fund. Mr. Michael Stapleton made a subscription of 139 Class I Distributing shares in the First State Global Listed Infrastructure
Fund during the year (2013: a subscription of 165 Class I Distributing shares in the First State Global
Listed Infrastructure Fund). No other Directors had any interests in the shares of the Company at 31 December 2014 or at any time during the financial year.
The Commonwealth Bank of Australia is considered to be a related party to the Investment Manager which has delegated the investment management of certain Funds to the Sub-Investment Managers, all
of which are wholly owned subsidiaries of the Commonwealth Bank of Australia other than Monegy
Inc. which is owned by the Bank of Montreal Group. The market value of the investments related to the Commonwealth Bank of Australia is US$1,652,780 (31 December 2013: US$556,050) and the
purchase and sales during the year of these investments amounted to US$1,847,445 (2013: US$197,153)
and US$580,176 (2013: US$1,407,627) respectively. The Commonwealth Bank of Australia is also a counterparty to forward contracts held by the First State Global Credit Income Fund. During the year,
this Fund entered into 4 forward contracts (31 December 2013: 20) with the Commonwealth Bank of
Australia. Please refer to the Schedule of Investments for investment positions held with Commonwealth Bank of Australia as at year end.
The Company invests in the First State China A Shares Fund of First State Funds plc (“FS China A
Shares Fund”), which is a collective investment scheme promoted by and a related party to the
Investment Manager. The positions entered into during the year are as follows:
Funds 2014 2013
Purchase Sale Purchase Sale First State China Focus Fund 19,633 - 84,337 -
First State Greater China Growth Fund 39,961 - - -
Please refer to the Schedule of Investments for investments in FS China A Shares Fund as at year end.
The Company also invests in the First State Indian Subcontinent Fund of First State Investments ICVC
(“FS Indian Subcontinent Fund”) which is a related party to First State Investment Management (UK)
Limited, a Sub-Investment Manager of the Company. During the year the First State Asia Pacific All Cap Fund purchased Nil (31 December 2013: 1,125,161) and sold 1,125,161 (31 December 2013: Nil)
units of FS Indian Subcontinent Fund . There are no investments in FS Indian Subcontinent Fund held
at the year end.
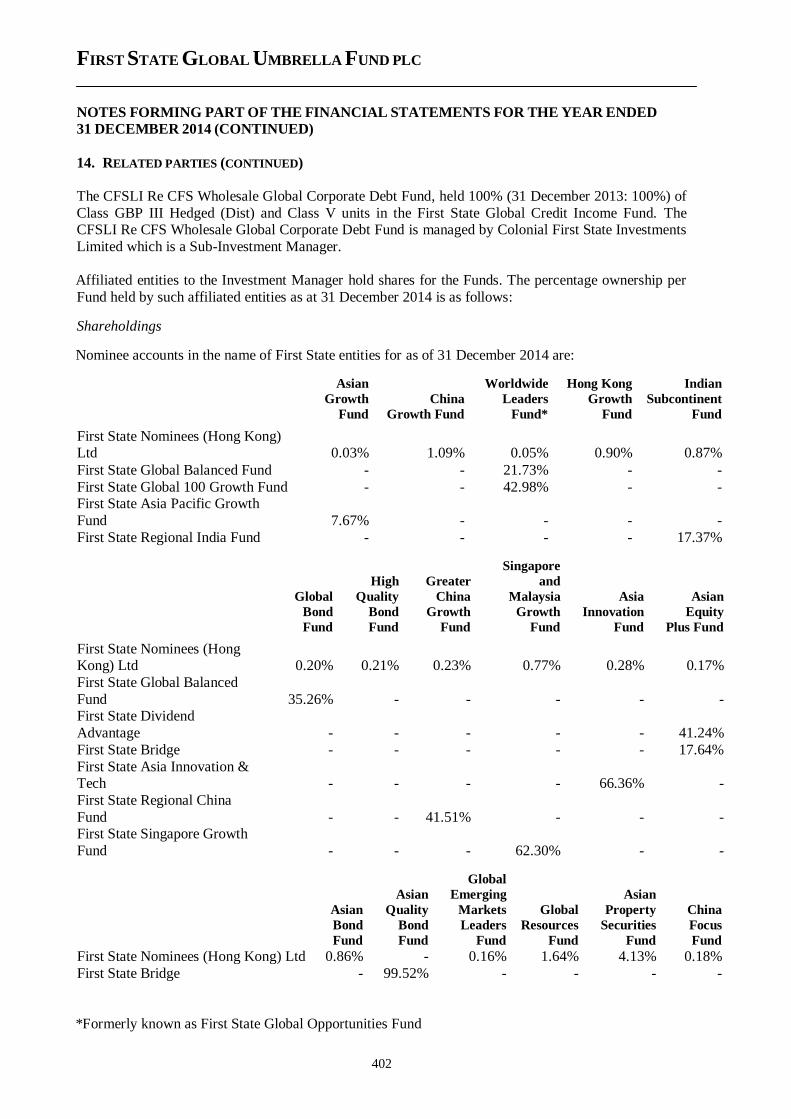
FIRST STATE GLOBAL UMBRELLA FUND PLC
NOTES FORMING PART OF THE FINANCIAL STATEMENTS FOR THE YEAR ENDED
31 DECEMBER 2014 (CONTINUED)
402
14. RELATED PARTIES (CONTINUED)
The CFSLI Re CFS Wholesale Global Corporate Debt Fund, held 100% (31 December 2013: 100%) of
Class GBP III Hedged (Dist) and Class V units in the First State Global Credit Income Fund. The CFSLI Re CFS Wholesale Global Corporate Debt Fund is managed by Colonial First State Investments
Limited which is a Sub-Investment Manager.
Affiliated entities to the Investment Manager hold shares for the Funds. The percentage ownership per
Fund held by such affiliated entities as at 31 December 2014 is as follows:
Shareholdings
Nominee accounts in the name of First State entities for as of 31 December 2014 are:
Asian
Growth
Fund
China
Growth Fund
Worldwide
Leaders
Fund*
Hong Kong
Growth
Fund
Indian
Subcontinent
Fund
First State Nominees (Hong Kong) Ltd 0.03% 1.09% 0.05% 0.90% 0.87%
First State Global Balanced Fund - - 21.73% - -
First State Global 100 Growth Fund - - 42.98% - - First State Asia Pacific Growth
Fund 7.67% - - - -
First State Regional India Fund - - - - 17.37%
Global
Bond
Fund
High
Quality
Bond
Fund
Greater
China
Growth
Fund
Singapore
and
Malaysia
Growth
Fund
Asia
Innovation
Fund
Asian
Equity
Plus Fund
First State Nominees (Hong Kong) Ltd 0.20% 0.21% 0.23% 0.77% 0.28% 0.17%
First State Global Balanced
Fund 35.26% - - - - - First State Dividend
Advantage - - - - - 41.24%
First State Bridge - - - - - 17.64%
First State Asia Innovation & Tech - - - - 66.36% -
First State Regional China
Fund - - 41.51% - - - First State Singapore Growth
Fund - - - 62.30% - -
Asian
Bond
Fund
Asian
Quality
Bond
Fund
Global
Emerging
Markets
Leaders
Fund
Global
Resources
Fund
Asian
Property
Securities
Fund
China
Focus
Fund
First State Nominees (Hong Kong) Ltd 0.86% - 0.16% 1.64% 4.13% 0.18%
First State Bridge - 99.52% - - - -
*Formerly known as First State Global Opportunities Fund
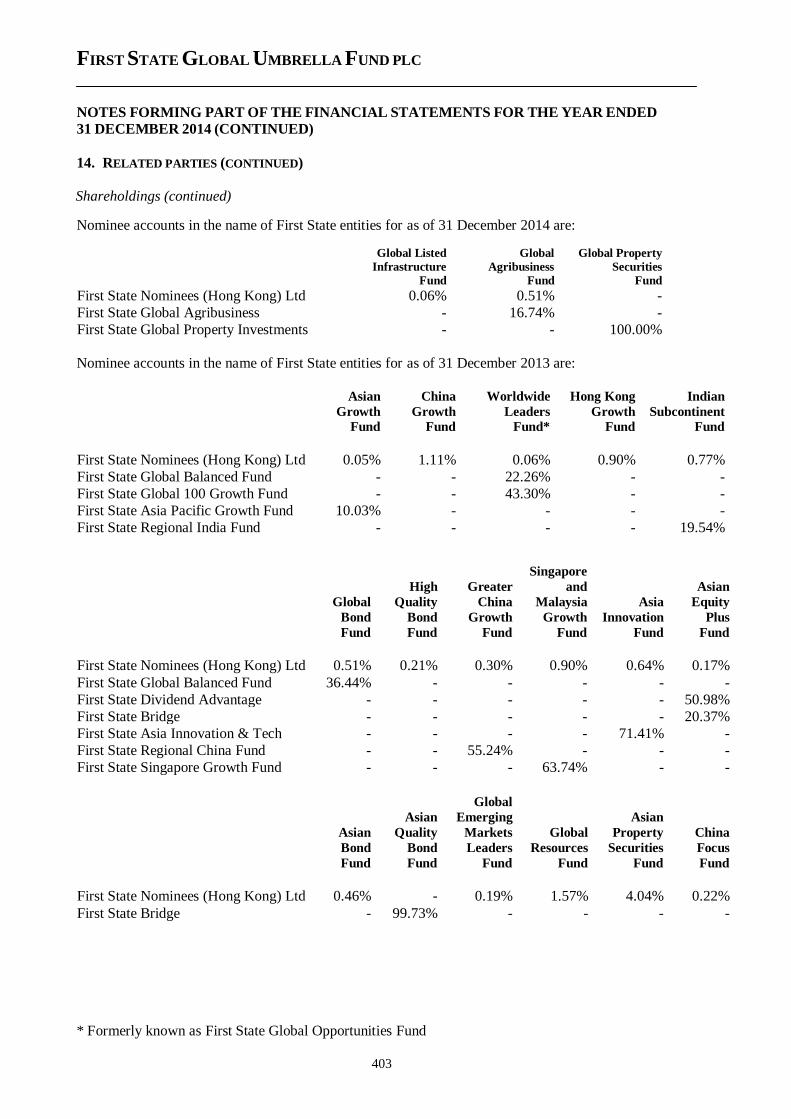
FIRST STATE GLOBAL UMBRELLA FUND PLC
NOTES FORMING PART OF THE FINANCIAL STATEMENTS FOR THE YEAR ENDED
31 DECEMBER 2014 (CONTINUED)
403
14. RELATED PARTIES (CONTINUED)
Shareholdings (continued)
Nominee accounts in the name of First State entities for as of 31 December 2014 are:
Global Listed
Infrastructure
Fund
Global
Agribusiness
Fund
Global Property
Securities
Fund
First State Nominees (Hong Kong) Ltd 0.06% 0.51% -
First State Global Agribusiness - 16.74% -
First State Global Property Investments - - 100.00%
Nominee accounts in the name of First State entities for as of 31 December 2013 are:
Asian
Growth
Fund
China
Growth
Fund
Worldwide
Leaders
Fund*
Hong Kong
Growth
Fund
Indian
Subcontinent
Fund
First State Nominees (Hong Kong) Ltd 0.05% 1.11% 0.06% 0.90% 0.77%
First State Global Balanced Fund - - 22.26% - -
First State Global 100 Growth Fund - - 43.30% - -
First State Asia Pacific Growth Fund 10.03% - - - -
First State Regional India Fund - - - - 19.54%
Global
Bond
Fund
High
Quality
Bond
Fund
Greater
China
Growth
Fund
Singapore
and
Malaysia
Growth
Fund
Asia
Innovation
Fund
Asian
Equity
Plus
Fund
First State Nominees (Hong Kong) Ltd 0.51% 0.21% 0.30% 0.90% 0.64% 0.17%
First State Global Balanced Fund 36.44% - - - - -
First State Dividend Advantage - - - - - 50.98%
First State Bridge - - - - - 20.37%
First State Asia Innovation & Tech - - - - 71.41% -
First State Regional China Fund - - 55.24% - - -
First State Singapore Growth Fund - - - 63.74% - -
Asian
Bond
Fund
Asian
Quality
Bond
Fund
Global
Emerging
Markets
Leaders
Fund
Global
Resources
Fund
Asian
Property
Securities
Fund
China
Focus
Fund
First State Nominees (Hong Kong) Ltd 0.46% - 0.19% 1.57% 4.04% 0.22%
First State Bridge - 99.73% - - - -
* Formerly known as First State Global Opportunities Fund
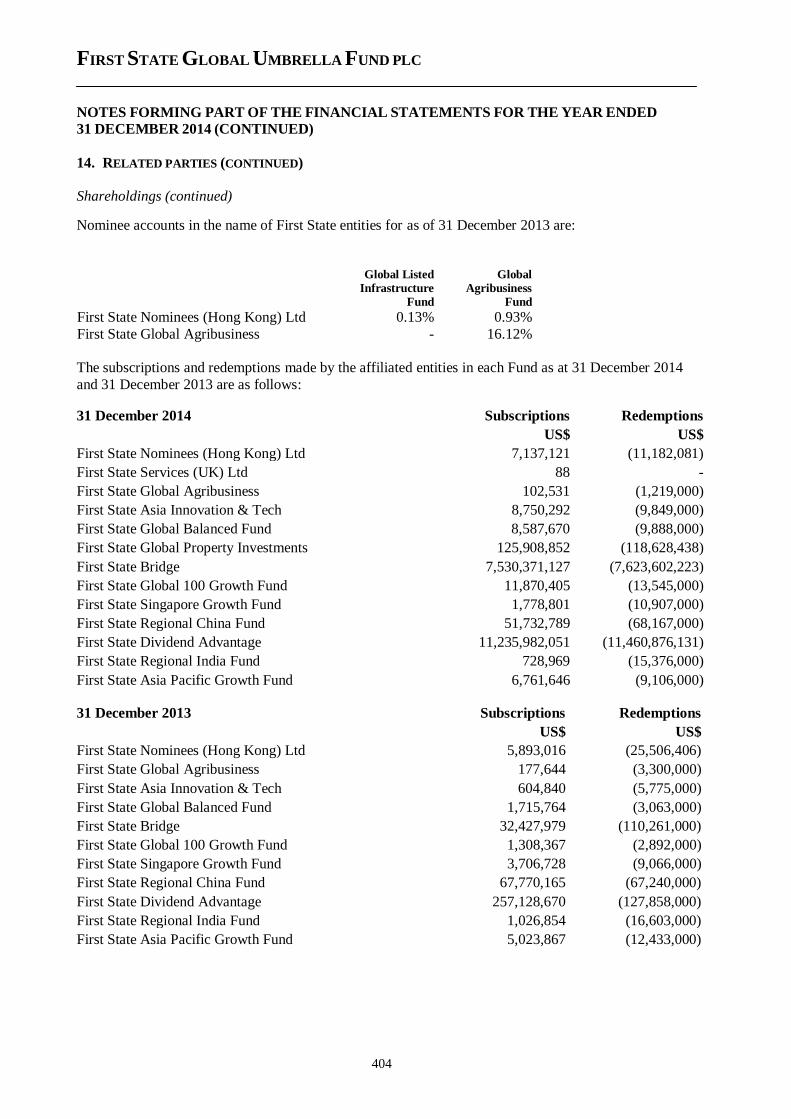
FIRST STATE GLOBAL UMBRELLA FUND PLC
NOTES FORMING PART OF THE FINANCIAL STATEMENTS FOR THE YEAR ENDED
31 DECEMBER 2014 (CONTINUED)
404
14. RELATED PARTIES (CONTINUED)
Shareholdings (continued)
Nominee accounts in the name of First State entities for as of 31 December 2013 are:
Global Listed
Infrastructure
Fund
Global
Agribusiness
Fund
First State Nominees (Hong Kong) Ltd 0.13% 0.93%
First State Global Agribusiness - 16.12%
The subscriptions and redemptions made by the affiliated entities in each Fund as at 31 December 2014
and 31 December 2013 are as follows:
31 December 2014 Subscriptions Redemptions
US$ US$
First State Nominees (Hong Kong) Ltd 7,137,121 (11,182,081)
First State Services (UK) Ltd 88 -
First State Global Agribusiness 102,531 (1,219,000)
First State Asia Innovation & Tech 8,750,292 (9,849,000)
First State Global Balanced Fund 8,587,670 (9,888,000)
First State Global Property Investments 125,908,852 (118,628,438)
First State Bridge 7,530,371,127 (7,623,602,223)
First State Global 100 Growth Fund 11,870,405 (13,545,000)
First State Singapore Growth Fund 1,778,801 (10,907,000)
First State Regional China Fund 51,732,789 (68,167,000)
First State Dividend Advantage 11,235,982,051 (11,460,876,131)
First State Regional India Fund 728,969 (15,376,000)
First State Asia Pacific Growth Fund 6,761,646 (9,106,000)
31 December 2013 Subscriptions Redemptions
US$ US$
First State Nominees (Hong Kong) Ltd 5,893,016 (25,506,406)
First State Global Agribusiness 177,644 (3,300,000)
First State Asia Innovation & Tech 604,840 (5,775,000)
First State Global Balanced Fund 1,715,764 (3,063,000)
First State Bridge 32,427,979 (110,261,000)
First State Global 100 Growth Fund 1,308,367 (2,892,000)
First State Singapore Growth Fund 3,706,728 (9,066,000)
First State Regional China Fund 67,770,165 (67,240,000)
First State Dividend Advantage 257,128,670 (127,858,000)
First State Regional India Fund 1,026,854 (16,603,000)
First State Asia Pacific Growth Fund 5,023,867 (12,433,000)
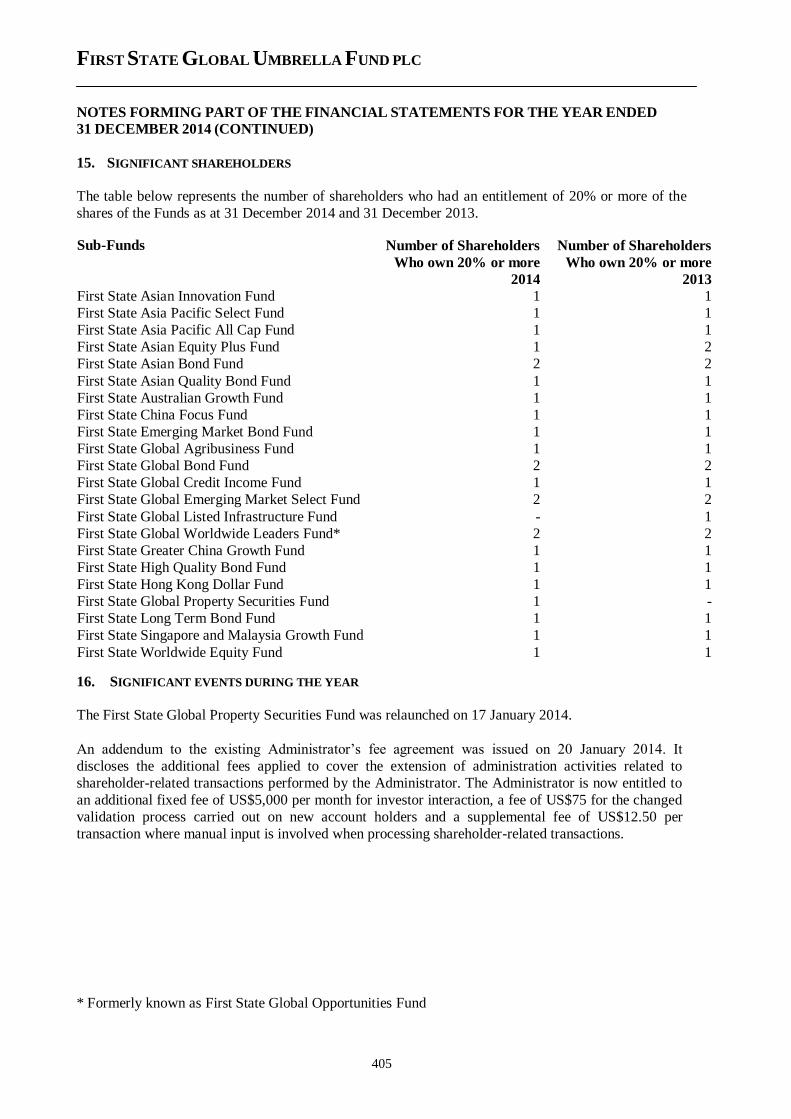
FIRST STATE GLOBAL UMBRELLA FUND PLC
NOTES FORMING PART OF THE FINANCIAL STATEMENTS FOR THE YEAR ENDED
31 DECEMBER 2014 (CONTINUED)
405
15. SIGNIFICANT SHAREHOLDERS
The table below represents the number of shareholders who had an entitlement of 20% or more of the
shares of the Funds as at 31 December 2014 and 31 December 2013.
Sub-Funds Number of Shareholders Number of Shareholders Who own 20% or more Who own 20% or more
2014 2013
First State Asian Innovation Fund 1 1
First State Asia Pacific Select Fund 1 1
First State Asia Pacific All Cap Fund 1 1
First State Asian Equity Plus Fund 1 2
First State Asian Bond Fund 2 2
First State Asian Quality Bond Fund 1 1
First State Australian Growth Fund 1 1
First State China Focus Fund 1 1
First State Emerging Market Bond Fund 1 1
First State Global Agribusiness Fund 1 1
First State Global Bond Fund 2 2
First State Global Credit Income Fund 1 1
First State Global Emerging Market Select Fund 2 2
First State Global Listed Infrastructure Fund - 1
First State Global Worldwide Leaders Fund* 2 2
First State Greater China Growth Fund 1 1
First State High Quality Bond Fund 1 1
First State Hong Kong Dollar Fund 1 1
First State Global Property Securities Fund 1 -
First State Long Term Bond Fund 1 1
First State Singapore and Malaysia Growth Fund 1 1
First State Worldwide Equity Fund 1 1
16. SIGNIFICANT EVENTS DURING THE YEAR
The First State Global Property Securities Fund was relaunched on 17 January 2014.
An addendum to the existing Administrator’s fee agreement was issued on 20 January 2014. It
discloses the additional fees applied to cover the extension of administration activities related to
shareholder-related transactions performed by the Administrator. The Administrator is now entitled to
an additional fixed fee of US$5,000 per month for investor interaction, a fee of US$75 for the changed
validation process carried out on new account holders and a supplemental fee of US$12.50 per
transaction where manual input is involved when processing shareholder-related transactions.
* Formerly known as First State Global Opportunities Fund
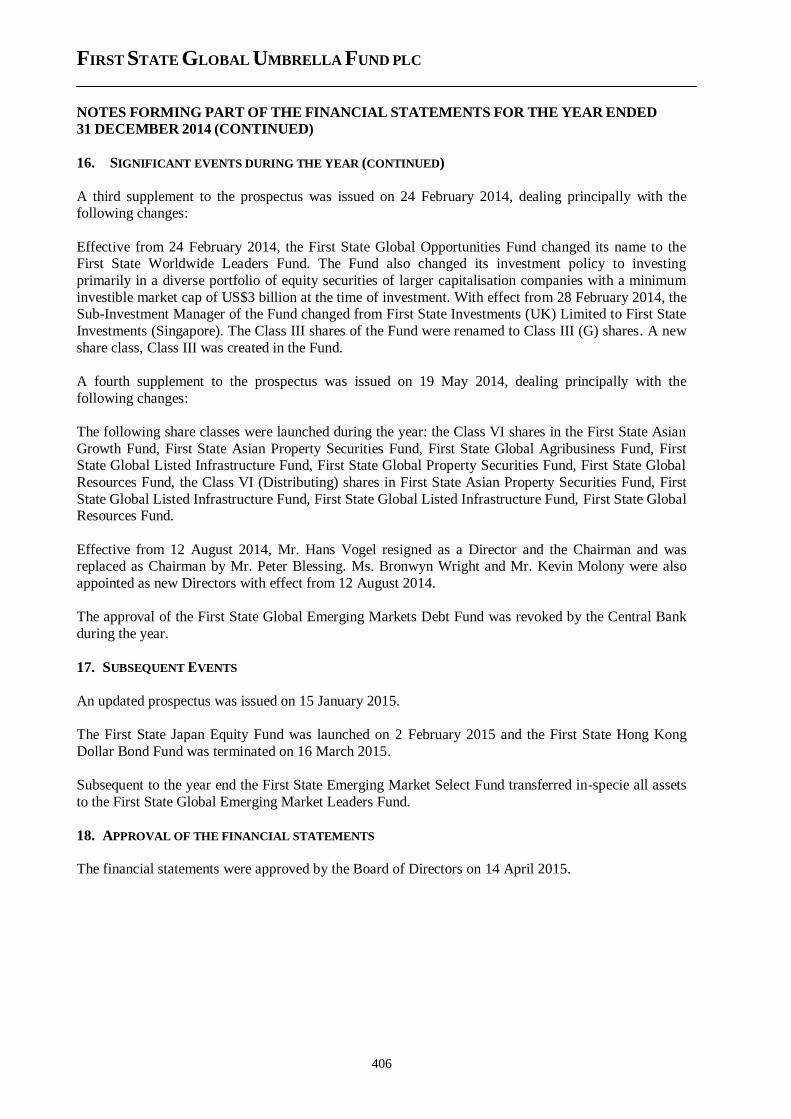
FIRST STATE GLOBAL UMBRELLA FUND PLC
NOTES FORMING PART OF THE FINANCIAL STATEMENTS FOR THE YEAR ENDED
31 DECEMBER 2014 (CONTINUED)
406
16. SIGNIFICANT EVENTS DURING THE YEAR (CONTINUED)
A third supplement to the prospectus was issued on 24 February 2014, dealing principally with the following changes:
Effective from 24 February 2014, the First State Global Opportunities Fund changed its name to the First State Worldwide Leaders Fund. The Fund also changed its investment policy to investing
primarily in a diverse portfolio of equity securities of larger capitalisation companies with a minimum
investible market cap of US$3 billion at the time of investment. With effect from 28 February 2014, the Sub-Investment Manager of the Fund changed from First State Investments (UK) Limited to First State
Investments (Singapore). The Class III shares of the Fund were renamed to Class III (G) shares. A new
share class, Class III was created in the Fund.
A fourth supplement to the prospectus was issued on 19 May 2014, dealing principally with the
following changes:
The following share classes were launched during the year: the Class VI shares in the First State Asian
Growth Fund, First State Asian Property Securities Fund, First State Global Agribusiness Fund, First State Global Listed Infrastructure Fund, First State Global Property Securities Fund, First State Global
Resources Fund, the Class VI (Distributing) shares in First State Asian Property Securities Fund, First
State Global Listed Infrastructure Fund, First State Global Listed Infrastructure Fund, First State Global Resources Fund.
Effective from 12 August 2014, Mr. Hans Vogel resigned as a Director and the Chairman and was replaced as Chairman by Mr. Peter Blessing. Ms. Bronwyn Wright and Mr. Kevin Molony were also
appointed as new Directors with effect from 12 August 2014.
The approval of the First State Global Emerging Markets Debt Fund was revoked by the Central Bank
during the year.
17. SUBSEQUENT EVENTS
An updated prospectus was issued on 15 January 2015.
The First State Japan Equity Fund was launched on 2 February 2015 and the First State Hong Kong
Dollar Bond Fund was terminated on 16 March 2015.
Subsequent to the year end the First State Emerging Market Select Fund transferred in-specie all assets
to the First State Global Emerging Market Leaders Fund.
18. APPROVAL OF THE FINANCIAL STATEMENTS
The financial statements were approved by the Board of Directors on 14 April 2015.
FIRST STATE GLOBAL UMBRELLA FUND PLC
HSBC Institutional Trust Services (Ireland) Limited 1 Grand Canal Square, Grand Canal Harbour, Dublin 2, Ireland Tel: 00353 1 635 6000 Fax: 00353 1 649 7542
Directors: Ronnie Griffin, Ciara Houlihan, Mark Synnott, John vanVerre (Dutch)
Registered in Dublin, Ireland: Reg No. 181767 V.A.T. 6581767L
HSBC Institutional Trust Services (Ireland) Limited is authorised by the Central Bank of Ireland under the Investment Intermediaries Act, 1995.
407
Report of the Custodian to the Shareholders
We have enquired into the conduct of First State Global Umbrella Fund plc (the “Company”) for the
year ended 31 December 2014, in our capacity as Custodian to the Company.
This report including the opinion has been prepared for and solely for the shareholders in the Company
as a body, in accordance with the Central Bank of Ireland’s Undertakings for Collective Investment in
Transferable Securities (“UCITS”) Notice 4, and for no other purpose. We do not, in giving this opinion, accept or assume responsibility for any other purpose or to any other person to whom this
report is shown.
Responsibilities of the Custodian
Our duties and responsibilities are outlined in the Central Bank of Ireland’s UCITS Notice 4. One of those duties is to enquire into the conduct of the Company in each annual accounting period and report
thereon to the shareholders.
Our report shall state whether, in our opinion, the Company has been managed in that period, in accordance with the provisions of the Company’s Memorandum and Articles of Association and the
UCITS Regulations. It is the overall responsibility of the Company to comply with these provisions. If
the Company has not so complied, we as Custodian must state why this is the case and outline the steps which we have taken to rectify the situation.
Basis of Custodian Opinion
The Custodian conducts such reviews as it, in its reasonable opinion, considers necessary in order to comply with its duties as outlined in UCITS Notice 4 and to ensure that, in all material respects, the
Company has been managed (i) in accordance with the limitations imposed on its investment and
borrowing powers by the provisions of its constitutional documentation and the appropriate regulations and (ii) otherwise in accordance with the Company’s constitutional documentation and the appropriate
UCITS Regulations.
Opinion
In our opinion, the Company has been managed during the year, in all material respects:
(i) in accordance with the limitations imposed on the investment and borrowing powers of the
Company by the Memorandum and Articles of Association and by the European Communities (UCITS)
Regulations 2011, as amended, (‘the Regulations’); and
(ii) otherwise in accordance with the provisions of the Memorandum and Articles of Association and
the UCITS Regulations.
On behalf of
HSBC Institutional Trust Services (Ireland) Limited 1 Grand Canal Square
Grand Canal Harbour
Dublin 2 Ireland
Date: 14 April 2015
FIRST STATE GLOBAL UMBRELLA FUND PLC
408
INDEPENDENT AUDITORS' REPORT TO THE MEMBERS OF FIRST STATE GLOBAL
UMBRELLA FUND PLC (THE “COMPANY”)
We have audited the financial statements of First State Global Umbrella Fund plc (the “Company”) for the year ended 31 December 2014 which comprise the Statement of Financial Position, the Statement of Comprehensive Income, the Statement of Cash Flows, the Statement of Changes in Net Assets Attributable to Redeemable Participating Shareholders and the related notes for the company and for each of its funds and the Schedule of Investments for each of the funds. The financial reporting framework that has been applied in their preparation is Irish law and International Financial Reporting Standards (IFRSs) as adopted by the European Union. Respective responsibilities of Directors and Auditors As explained more fully in the Directors’ Responsibilities Statement set out on page 1 the Directors are responsible for the preparation of the financial statements giving a true and fair view. Our responsibility is to audit and express an opinion on the financial statements in accordance with Irish law and International Standards on Auditing (UK and Ireland). Those standards require us to comply with the Auditing Practices Board’s Ethical Standards for Auditors. This report, including the opinions, has been prepared for and only for the Company’s members as a body in accordance with Section 193 of the Companies Act, 1990 and for no other purpose. We do not, in giving these opinions, accept or assume responsibility for any other purpose or to any other person to whom this report is shown or into whose hands it may come save where expressly agreed by our prior consent in writing. Scope of the audit of the financial statements An audit involves obtaining evidence about the amounts and disclosures in the financial statements sufficient to give reasonable assurance that the financial statements are free from material misstatement, whether caused by fraud or error. This includes an assessment of: whether the accounting policies are appropriate to the company’s circumstances and have been consistently applied and adequately disclosed; the reasonableness of significant accounting estimates made by the Directors; and the overall presentation of the financial statements. In addition, we read all the financial and non-financial information in the annual report to identify material inconsistencies with the audited financial statements and to identify any information that is apparently materially incorrect or based on, or materially inconsistent with, the knowledge acquired by us in the course of performing the audit. If we become aware of any apparent material misstatements or inconsistencies we consider the implications for our report. Opinion on financial statements In our opinion the financial statements: give a true and fair view in accordance with IFRSs as adopted by the European Union, of the state
of the Company’s and the Funds’ affairs as at 31 December 2014 and of their results and cash flows for the year then ended; and
have been properly prepared in accordance with the requirements of the Companies Acts 1963 to 2013 and the European Communities (Undertakings for Collective Investment in Transferable Securities) Regulations 2011 (as amended).
FIRST STATE GLOBAL UMBRELLA FUND PLC
409
INDEPENDENT AUDITORS' REPORT TO THE MEMBERS OF FIRST STATE GLOBAL
UMBRELLA FUND PLC (THE “COMPANY”) (CONTINUED)
Report on Other Legal and Regulatory Requirements We report that the financial statements of the Company and of each of its funds have been properly
prepared in accordance with the requirements of the Securities and Futures Commission of Hong Kong’s Code on Unit Trusts and Mutual Funds and with the Company’s Memorandum & Articles of Association.
Matters on which we are required to report by the Companies Acts 1963 to 2013 We have obtained all the information and explanations which we consider necessary for the
purposes of our audit. In our opinion proper books of account have been kept by the Company. The financial statements are in agreement with the books of account. In our opinion the information given in the Directors' Report is consistent with the financial
statements. Matters on which we are required to report by exception We have nothing to report in respect of the provisions in the Companies Acts 1963 to 2013 which require us to report to you if, in our opinion, the disclosures of Directors’ remuneration and transactions specified by law are not made. Kenneth Owens for and on behalf of PricewaterhouseCoopers Chartered Accountants and Statutory Audit Firm Dublin 14 April 2015
FIRST STATE GLOBAL UMBRELLA FUND PLC
410
The financial statements of the Company may be included on the website of First State Investments
(www.firststate.co.uk). The work carried out by the Auditors does not involve consideration of the
maintenance and integrity of the Company's financial information which has been included on the aforementioned website. Accordingly, the Auditors accept no responsibility for any changes that may
have occurred to the financial statements since they were initially presented on the aforementioned
website.
Legislation in Ireland governing the preparation and dissemination of financial statements may differ
from legislation in other jurisdictions.
FIRST STATE GLOBAL UMBRELLA FUND PLC
411
DIRECTORY
FIRST STATE GLOBAL UMBRELLA FUND PLC REGISTERED OFFICE: ARTHUR COX BUILDING, EARLSFORT TERRACE, DUBLIN 2, IRELAND
INVESTMENT MANAGER AND
PROMOTER First State Investments
(Hong Kong) Limited
Sixth Floor, Three Exchange Square Central
Hong Kong
SUB-INVESTMENT MANAGERS
First State Investment (Singapore)
#17-01 Millenia Tower One Temasek Avenue
Singapore 039192
First State Investment Management (UK)
Limited
23 St Andrew Square Edinburgh EH2 1BB
Scotland
Colonial First State Investments Limited
Ground Floor Tower 1
201 Sussex Street Sydney
New South Wales
2000 Australia
Colonial First State Asset Management (Australia) Limited
Ground Floor Tower 1
201 Sussex Street Sydney
New South Wales
2000 Australia
SUB-SUB-INVESTMENT MANAGER
Monegy, Inc. 302 Bay Street
12th Floor
Toronto Ontario
M5X 1A1
Canada
DIRECTORS ^*Peter Blessing (Irish)
^*Hans Vogel (German)
^*Bronwyn Wright (Irish) ^*Kevin Molony (Irish)
Michael Stapleton (Australian)
Chris Turpin (British) James Breyley (Australian)
*Irish Resident and Independent
LEGAL ADVISERS IN IRELAND Arthur Cox
Earlsfort Centre Earlsfort Terrace
Dublin 2
Ireland
ADMINISTRATOR AND REGISTRAR HSBC Securities Services (Ireland) Limited
1, Grand Canal Square, Grand Canal Harbour Dublin 2
Ireland
CUSTODIAN HSBC Institutional Trust Services (Ireland) Limited
1, Grand Canal Square, Grand Canal Harbour Dublin 2
Ireland
Director
^Effective from 12 August 2014, Mr. Hans Vogel resigned as a Director and the Chairman and was replaced as
Chairman by Mr Peter Blessing. Ms. Bronwyn Wright and Mr. Kevin Molony were also appointed as new Directors with effect from 12 August 2014.
FIRST STATE GLOBAL UMBRELLA FUND PLC
412
DIRECTORY (CONTINUED)
FIRST STATE GLOBAL UMBRELLA FUND PLC
REGISTERED OFFICE: ARTHUR COX BUILDING, EARLSFORT TERRACE, DUBLIN 2, IRELAND
INDEPENDENT AUDITORS PricewaterhouseCoopers
Chartered Accountant
and Registered Auditors One Spencer Dock, North Wall Quay
Dublin 1
Ireland
DISTRIBUTORS
LONDON OFFICE
First State Investments (UK) Limited
Finsbury Circus House 15 Finsbury Circus
London EC2M 7EB
England
EDINBURGH OFFICE First State Investments (UK) Limited
23 St Andrew Square
Edinburgh EH2 1BB Scotland
HONG KONG OFFICE First State Investments (Hong Kong) Limited
Sixth Floor
Three Exchange Square Central
Hong Kong
SINGAPORE OFFICE First State Investments (Singapore)
#17-01 Millenia Tower
One Temasek Avenue Singapore 039192
SECRETARY Bradwell Limited Arthur Cox Building Earlsfort Terrace Dublin 2
Ireland
Director
First StateGlobal Umbrella Fund plc
2014 Annual Report
First State Investments (Hong Kong) Limited
Level 6Three Exchange Square8 Connaught PlaceCentral, Hong Kong
Telephone: (852) 2846 7555Intermediary Hotline: (852) 2846 7575Investor Services Hotline: (852) 2846 7566Fax: (852) 2868 4742Email: info@fi rststate.com.hkwww.fi rststateinvestments.com


