Embed Size (px)
Citation preview

Financing Activities and Payout Policies of
Entrepreneurial Firms: Empirical Evidence from Initial Public Offerings in Germany
Wolfgang Bessler1, Wolfgang Drobetz2, and Martin Seim1
1Center for Finance and Banking, Justus-Liebig-University Giessen
Giessen, Germany
2 Chair for Corporate and Ship Finance Institute of Finance, University of Hamburg,
Hamburg, Germany
Current Version: August 10, 2010
Keywords: Share Buybacks, SEOs, Valuation Effects, Initial Public Offerings
JEL Classification: G32, G35
Corresponding author: Wolfgang Bessler, Center for Finance and Banking, Justus-Liebig-University Giessen, Licher Strasse 74, Giessen, Germany, Phone: +49-641-99 22 460, Mail: Wolfgang. [email protected]

Financing Activities and Payout Policies of Entrepreneurial Firms
Empirical Evidence from Initial Public Offerings in Germany
Abstract
Entrepreneurial high-technology start-up firms are usually in need of new equity in order to finance their research, product development, and growth opportunities. In an early stage, ven-ture capital may be help to solve some of the problems. In an advanced stage these firms often require larger financial resources and may raise equity by going public (IPO) and, if success-ful, by offering seasoned equity (SEO) later on. If these are the typical financing stages of successful growth companies, then it is surprising to observe that firms that just went public start distributing cash to shareholders by either paying dividends or even repurchasing the newly issued shares. Thus, it seems interesting to investigate the capital market reaction as well as the motives for such a financial policy as well as the regulatory environment that may have contributed to such a behavior. We therefore analyze for a sample of 245 IPOs in Ger-many that either issued additional equity (SEO) or initiated a share repurchase program (SRP) subsequent to an IPO the valuation effects and the factors explaining the magnitude of these returns. For repurchasing IPOs we find significantly positive returns (9.23%) at the time of the announcement but no abnormal stock price performance thereafter. For IPOs with subse-quent seasoned equity offerings we observe a long term negative performance which begins in the year prior to the announcement (-11.55%) and then continues in the subsequent year (-30.20%). Interestingly, we find a strong outperformance (7.63%) for the 30 day period be-fore the SEO, suggesting that management was on average able to time the market. In various probit models we provide strong evidence that the decision to engage in repurchase activities is explained by free cash flow problems rather than by undervaluation signaling. Our finding for repurchase decisions, however, is in some contrast to the explanation of the announcement effects. For SEOs we conclude that successful IPOs return to the equity market to finance further growth opportunities. This is consistent with our evidence for the cross-sectional re-gressions and the probit analysis. Overall, the cash position and the cash flows from opera-tions turn out to be pivotal for the decision of IPOs to engage either in repurchasing shares or in issuing additional equity.
Keywords: Share Buybacks, SEOs, Valuation Effects, Initial Public Offerings
JEL Classification: G32, G35
Current Version: August 10, 2010

1
1. Introduction
Entrepreneurial firms and especially high-technology start-up firms usually have a high need
for capital in order to finance their research, product development, production process, mar-
keting efforts and in particular to exploit all available growth opportunities that may arise, for
example, from new ideas, inventions and innovations. Equity capital for such entrepreneurial
ventures is usually supplied either in the form of private equity, venture capital or mezzanine
financing. In contrast, debt financing is often very limited. In an advanced stage successful
entrepreneurial firms often require even more financial resources and may consider raising
additional equity capital by going public. If, on the one hand, the firm has been successful
after going public as measured by the relative stock price performance and if, on the other
hand, further growth opportunities exist then we would expect - and in fact often observe -
that these initial public offerings (IPOs) raise additional equity thro ugh a seasoned equity
offering (SEO). Very successful firms with growth opportunities may go more often to the
equity market even over a relatively short period of time after the initial public offering (Bess-
ler and Thies, 2007a; Hertzel, Huson, and Parrino, 2009; DeAngelo, DeAngelo, and Stulz,
2010).
If this is the conventional financing model or the typical financing stages that investors gener-
ally have in mind when investing in high-tech entrepreneurial firms, then it must come as a
surprise when some firms that just went public start returning equity to their shareholders by
paying dividends or even initiate share repurchase programs (Bessler, Drobetz, and Seim,
2009). From a theoretical point of view there are many different explanations for such a beha-
vior. One possible reason is that some equity holders (e.g., venture capitalist, family and
friends, founders) of apparently overvalued start-up firms use share repurchases shortly after
the IPO as a pure exit strategy to cash in on their equity stakes. In this case, specific conflicts
of interest and market timing considerations may explain such a behavior and we would ex-
pect negative valuation effects following the announcement of a share repurchase program.
Another explanation is that the motive of these firms was to return redundant surplus liquidity
to shareholders in order to reduce the agency problems in the sense of Jensen’s free cash flow
hypothesis. This seems to be a plausible explanation due to the fact that firms that went public
at the “Neuer Markt” in Germany were forced by the very specific rules and regulations of the
German Stock Exchange (“Deutsche Börse”) to issue a predetermined amount of new equity
at the time of the IPO. In this case we would expect positive abnormal returns after the an-
nouncement or at least no further decline if the stock price has been decreasing in the pre-
event period. In addition, share repurchases that firms announced within some time period

2
after the IPO, e.g. five years, could not only be interpreted as a means to mitigate free cash
flow problems but also as a measure to signal positive inside information, e.g. that the firm is
currently undervalued but will do quite well in the future. Another possible explanation for
share repurchases that were initiated some time after the IPO is that firms with a substantial
increase in the market value of equity may want to readjust their capital structure towards an
optimal level by reducing market leverage (Welch, 2004; Bessler, Drobetz, and Pensa, 2008).
In contrast, market timing considerations, for example due to a substantial stock market de-
cline as during the period from 2000 to 2003, along with a perceived undervaluation of its
own shares may play an important role as well. Overall, there are a number of reasons and
hypotheses why firms should repurchase their own shares even shortly after they had just
gone public and issued additional equity.
The academic literature so far has focused on seasoned equity offerings and share repurchases
analyzing the potential short- and long-run valuation effects as well as explanatory factors.
The empirical studies for share repurchases provide evidence that the announcements of share
repurchases lead to positive abnormal returns not only around the announcement (Vermaelen,
1981; Comment and Jarrell, 1991; Peyer and Vermaelen, 2005) but also to an outperformance
in subsequent years (Ikenberry, Lakonishok, and Vermaelen, 1995; Gong, Louis, and Sun,
2008; Peyer and Vermaelen, 2009). While many motives have been suggested for explaining
the positive stock price reaction to repurchase decision, the most important theories are, on
the one hand, the information signaling hypothesis and, on the other hand, the free cash flow
(or agency costs) hypothesis. The former claims that firms announce repurchases to signal
favorable information that is not yet reflected in the current stock prices, whereas the latter
argues that excess cash reserves should be distributed to shareholders in order to withdraw
these funds from managerial discretion thereby reducing agency problems. With respect to
seasoned equity offerings the empirical studies in general provide evidence that there are neg-
ative announcement returns and that these stocks underperform in the long-run. A compre-
hensive review is provided in Eckbo, Masulis and Norli (2007). This observation is consistent
with the pecking order theory. Due to the general run-up during the year prior to the SEO, the
conclusion is often that managers are able to time the market or exploit windows of opportun-
ities. Whether investment banks or analysts of the underwriter support the stock price prior to
the SEO has not been investigated thoroughly.
For the German capital market there are only a few studies that have analyzed the stock price
reaction to seasoned equity offerings and to share repurchases. One obvious reason for this
lack of empirical research is the fact that share repurchases were historically a very uncom-

3
mon form of distributing cash to shareholders. In fact, before May 1998 repurchases in Ger-
many were only allowed under very restrictive conditions and therefore practically prohibited.
Nevertheless, the distribution policies of entrepreneurial firms that just went public on the
German capital market have been investigated by Bessler, Drobetz and Seim (2009). They
conclude that the market reaction for established firms as well as for IPOs that announce
share repurchase programs (SRP) is best explained by financial signaling. However, there is
also some evidence in favor of the free cash flow hypothesis. The valuation effects of SEOs
of established firms and firms that just went public (IPOs) were analyzed by Bessler and
Thies (2007a and 2007b) for the period before the new economy bubble. One interesting re-
sult is that IPOs that issued additional equity later on outperformed the market up to the time
of the SEO. In addition, they observe the usual run-up before the SEO but negative an-
nouncement returns. The relative performance subsequent to the SEO, however, depends on
the future financing activities of the firm. IPOs that issue additional equity later on outper-
form the market, whereas the other firms underperform. Thus, the research on the sequential
financing activities such as share repurchases and seasoned equity offerings of entrepreneurial
firms that just went public is of great interest and should provide new insights.
The objective of this research is to investigate the stock market reactions resulting from vari-
ous financing activities and changes in the payout policy for a sample of initial public offer-
ings in Germany. In particular, we analyze the short- and long-run valuation effects and ex-
plain the magnitude of these effects with various market-wide and company-specific factors.
The decision to either raise or pay out equity should depend on a number of factors such as
the cash or liquidity position of the firm, cash flows from operations as well as capital ex-
penditure and growth opportunities as measured, for example, by R&D spending, the number
and quality of patents and Tobin’s Q. Finally we try to shed some light on the question why
young firms engage either in issuing additional equity or repurchase their own shares. For this
we estimate various probit models to evaluate the likelihood of either a repurchase or SEO
announcement of German IPOs at the “Neuer Markt”.
In our empirical analysis we provide evidence that repurchasing firms have substantial and
significant positive announcement returns (9.23%) but an insignificant abnormal stock price
performance thereafter. Given that these firms underperformed the market for the 6-months
period before the event (-24.46%), we conclude that they did either send a positive signal to
the market or reduced agency conflicts. For SEOs the long-term downward trend from the
year prior to the announcement (-11.55%) continues during the year subsequent to the sea-
soned equity offering (-30.20%). However, for the 30-day period prior to the SEO, we ob-
4
serve a significant and strong outperformance (7.63%), suggesting that management was
somehow able to time the market.
Probit model estimates provide strong evidence that the decision to engage in repurchase ac-
tivities can be explained by free cash flow problems rather than by undervaluation signaling.
These findings for the repurchase decision are some in contrast to the explanation of an-
nouncement effects. In addition, some evidence is found that IPO firms are more likely to
announce a repurchase the more pre-IPO owners sell their shares at the time of the IPO. With
higher participation ratios the probability of a repurchase increases. This is in line with the
free cash flow hypothesis as higher participation ratios lead to higher ownership dispersion at
the time of the IPO and hence reduce inefficient corporate governance mechanisms (Stulz,
1988). For SEOs we conclude that these firms return to the equity capital market to fund
growth opportunities and innovation which is empirically supported by both the cross-
sectional results of announcement returns as well as the probit analysis.
The remainder of the paper is organized as follows. In the next section we review the litera-
ture with respect to share repurchases and seasoned equity offerings of IPOs and the various
motives for these financing decisions. The data and the methodology are described in section
3. The empirical results are presented in the four subsections of section 4. These are first the
short-term valuation effects (4.1) and the long-run performance (4.2) for share repurchases
and seasoned equity offerings as well as the cross sectional regressions (4.3). Finally, the mo-
tivation for share repurchases and for seasoned equity offerings are analyzed by employing
probit models (4.4). Section 5 concludes and offers some ideas for future research.
2. Review of the Literature
There exists a vast amount of literature for the financing behavior and valuation effects of
initial public offerings. In the next sections we discuss some of this literature by first provid-
ing the framework and perspective for our analysis (2.1). We then discuss the issues and em-
pirical findings for seasoned equity offerings (2.2) and share repurchases (2.3) before focus-
ing on the empirical evidence for initial public offerings in Germany (2.4) and the special
regulatory environment for the new economy “Neuer Markt” market segment for IPOs (2.5).
2.1 Review of the Issues
One of the most important decisions that young entrepreneurial firms face is whether or not to
go public and raise external equity. This is also one of the more challenging questions in aca-
demic research. Consequently, initial public offerings have been among the most important
research topics in corporate finance over the last 30 years, resulting in a large number of theo-

5
retical and empirical publications. At the center of these studies are the firm valuation at the
time of the IPO and the valuation effects following the IPO. This includes an analysis of the
factors that determine the short- and long-run financial and operating performance. As a re-
sult, there are at least three main phenomena associated with initial public offerings: Under-
pricing, long-run underperformance and hot issue periods (windows of opportunity). The fac-
tors that typically have a significant impact or explain these phenomena are underwriter repu-
tation and analyst behavior, venture capital involvement and ownership structure, exit beha-
vior and lock-up periods, management compensation and stock option plans as well as R&D
spending and the number and quality of patents. The theoretical reasoning for explaining
these phenomena is usually information asymmetry, agency problems, the free cash flow hy-
pothesis, etc.
In addition, the management of the firm is usually faced with other important decisions sub-
sequent to the going public. This may include production, product and marketing decisions as
well as possible cooperation and joint ventures with suppliers and customers and in some cas-
es even mergers and acquisitions either in the form of financing the growth option or as an
exit strategy. From a financial perspective, the management has to guarantee that it always
has sufficient funds available for financing its operations and its growth opportunities. Thus,
it has to make sure that it either generates sufficient cash flows from operations or has raised
sufficient funds at the time of the IPO, or gets new financing in the form of additional debt or
by issuing more equity. In contrast, very successful and cash rich firms may have to decide on
their payout policies and strategies which means distributing cash flows to shareholders by
either paying dividends or by repurchasing the shares that in fact they just have issued. In
some cases, newly listed firms have a higher need for funds or a more aggressive financing
policy and consequently have multiple rounds of either issuing new equity or repurchasing
their own shares within the first years after going public. In addition, it has been observed that
firms sometimes engage in both buying back their own shares and issuing new equity. In this
case the sequencing is important and should be informative.
2.2 Initial Public Offerings and Seasoned Equity Offerings
Beginning with the seminal paper of Modigliani and Miller (1958), there is a large body of
literature that deals with financing decisions and financing behavior of firms. The pecking
order theory (Myers and Majluf, 1984) and the free cash flow hypothesis (Jensen, 1986) are
among the most dominant theories. They are either based on information asymmetries or
agency problems as the main arguments. More precisely, the former model assumes that man-

6
agement has an information advantage over investors. Financing decisions are therefore
viewed by the market as a reliable signal about the firm’s quality. Myers and Majluf (1984)
argue that financing decisions reveal information to the market because the decision to issue
equity signals that the firm is overvalued. Consequently, issuing equity should result in nega-
tive valuation effects in the short-run around the announcement date in the presence of ad-
verse selection. These firms would therefore abstain from issuing equity. In an inter-temporal
view, firms might exhibit a higher probability to issue equity as opposed to debt when infor-
mation asymmetries diminish over time resulting from decreasing adverse selection costs
(Autore and Kovacs, 2010).
Jensen’s (1986) free cash flow hypothesis is based on agency problems that result from the
fact that management prefers to maximize its own utility. According to this theory, managers
may use the free cash flow to invest in negative net present value (NPV) projects and there-
fore do not maximize shareholder value. Consequently, the market has to evaluate whether
the cash flows are properly invested or wasted at the announcement of a financing decision.
Thus, it is interesting to investigate whether a firm that just went public has the opportunity to
raise additional equity.
Recently, DeAngelo, DeAngelo, and Stulz (2010) provide evidence that a considerable frac-
tion of firms issues additional equity relatively shortly after the IPO. They document for the
U.S. that more than half of all SEOs are conducted by firms that are listed within less than 5
years. This is in line with the corporate lifecycle theory that young firms with high market-to-
book ratios need to raise capital to fund investments in the absence of sufficient operating
cash flows. Additionally, raising equity through an SEO and stockpile this cash is valuable for
financially constraint firms since value-increasing investment projects might have been for-
gone otherwise (Denis and Sibilkov, 2010). Empirical studies for the U.S. market find evi-
dence that some firms issue additional equity in a relatively short time period subsequent to
the IPO (Welch, 1989). Hertzel, Huson, and Parrino (2009), for example, focus on the time
between the initial public offering and the first seasoned equity offering and contrast the risk
of overinvestment with the issuing costs of sequential financing. The pivotal question is: How
much funds should be provided to firms at the initial public offering and how much should be
provided later on? They find that firms with a higher proportion of intangible assets, higher
R&D, and less proceeds raised at the time of the IPO return sooner to the capital market. This
is in line with staging considerations and subsequent financing rounds commonly observed in
the venture capital market.

7
In an earlier study of the long-run performance of initial public offerings for the U.S., Ritter
(1991) revealed first positive but then evenly increasing negative abnormal returns for the
first three years following the IPO. The analysis of 1,254 IPOs for the period from 1975 to
1984 resulted in substantial negative abnormal returns of -29.1% for the 36-months period
after the IPO. A very interesting aspect is that this figure is very similar to the long-run per-
formance (36 months) of seasoned equity offerings. This predominantly negative long-run
return pattern may suggest that investors are too optimistic about the firms’ long-run pros-
pects and are getting more realistic through time when additional information becomes avail-
able. It is also possible that IPOs are fairly priced in the primary market but are overpriced on
the first day of trading in the secondary market due to pronounced underpricing. Therefore,
taking the offer price as a starting point, IPO firms are overpriced in the secondary market and
their true value is uncovered in the long-run. Thus, the explanation of long-run underpricing
would turn into a short-term overpricing story. Hence, raising new equity either in the primary
or secondary market usually leads to long-run underperformance suggesting distinct informa-
tion asymmetries or agency problems (Eckbo, Masulis, and Norli, 2007).
The poor long-run performance of SEOs is also documented by Carlson, Fisher, and Giamma-
rino (2006). They show theoretically that the long-run return pattern is driven by replacing
growth options with assets in place. Expected returns decrease because assets in place are less
risky than growth options. Their model also explains the pre-issue price run-up. Because neg-
ative long-run abnormal returns are average results we need to be aware that some firms out-
perform an appropriate benchmark substantially but some other firms significantly underper-
form. Therefore, Autore, Brav, and Peterson (2009) investigate the reason why established
firms seek additional equity financing. If firms announce an SEO to use the proceeds to pur-
sue investment opportunities, these firms do not experience the typical long-run underperfor-
mance. In contrast, firms that state recapitalization or general purposes exhibit negative ab-
normal returns in the subsequent years. Thus, one of the most interesting issues for empirical
research is to investigate which IPOs underperform or outperform and which factors may best
explain the respective performance.
2.3 Initial Public Offerings and Share Repurchases
There are many reasons, motives and explanations why firms repurchase their shares and
there exists a large body of empirical evidence. The two major theories generally considered
are the signaling and the free cash flow hypothesis. However, other explanations may offer
additional insights as well.
8
2.3.1 Signaling hypothesis
In many empirical studies signaling is identified as the main reason for share repurchases es-
pecially when tender offers are used.1 In these instances shares are bought back at a substan-
tial premium relative to the current share price. It is argued that the market usually interprets
this as a signal of current undervaluation and therefore the announcement should result in an
immediate stock price increase. Empirical studies of the short-run valuation effect for the U.S.
find significantly positive valuation effects of about 10% around the day of the repurchase
announcement supporting this argument (Vermaelen, 1981; Comment and Jarrell, 1991; Peyer
and Vermaelen, 2005).
An analysis of the long-run valuation effects for open market repurchases in the U.S. for the
period from 1980 to 1990 finds buy-and-hold abnormal returns of about 12% for the four year
period subsequent to the announcement (Ikenberry, Lakonishok, and Vermaelen, 1995).
These results suggest, however, that the stock price reaction around the announcement does
not fully capture the undervaluation prior to the share repurchase (Peyer and Vermaelen,
2009). In particular the empirical evidence indicates that the market underreacts to the infor-
mation revealed in repurchase announcements at least for so-called ‘value’ stocks (low mar-
ket-to-book ratios). Investments in these stocks generate buy-and-hold abnormal returns
(BHAR) of 45.3% over a four year period. In a study for Australia, Mitchell, Izan and Lim
(2006) explain the degree of undervaluation with the market-to-book ratio. In a study for
Canada, Ikenberry, Lakonishok, and Vermaelen (2000) also conclude that it takes some time
before the information is correctly priced, i.e. undervaluation disappears. Again, the market-
to-book-ratio serves as a good proxy for potential undervaluation. Gong, Louis, and Sun
(2008) find for the U.S. that post-repurchase long-run abnormal returns are associated with
significant negative pre-repurchase abnormal accruals, i.e. deflated earnings numbers. Hence,
they suggest that post-repurchase abnormal returns are due to the underestimated earnings
growth during the pre-repurchase period.
It may be expected that information asymmetries are more pronounced for IPOs due to their
relatively small size, less analyst coverage, and simply their shorter track record. Profitable
firms that just went public, however, could employ the signaling nature of repurchase an-
nouncements to convey either undervaluation or other positive information. In contrast, there
is some evidence that IPOs might manipulate earnings numbers prior to the IPO to maximize 1 In principle there exist three methods for conducting a share repurchase: open-market repurchases, tender of-
fers (subdivided in fixed-price offers, Dutch-auction offers, and the issuance of transferable put rights), and negotiated repurchases. For an illustration see Vermaelen (2005).

9
initial proceeds (Teoh, Welch, and Wong, 1998). Following this argument, repurchase an-
nouncements could be used as an alternative means to boost share prices, earnings per share,
and mislead investors about the true value of the firm (Chen, Ho, and Wang, 2008). Conse-
quently, it may be rational for firms that went public to repurchase shares relatively soon after
the IPO.
2.3.2 Free cash flow hypothesis
An alternative and very common explanation why firms engage in repurchasing shares is their
intention to reduce agency costs by distributing excess cash to their shareholders, especially in
the absence of growth opportunities. In line with the arguments of Jensen (1986), repurchas-
ing shares is an effective means of reducing agency problems by distributing free cash flows
to shareholders, thus preventing management from wasting free cash flows by investing in
unprofitable investment projects. For Canadian open market repurchases, Li and McNally
(1999) find support for the free cash flow hypothesis rather than the signaling hypothesis.
They report that firms repurchasing shares are smaller and more closely held compared to
non-repurchasing firms, but exhibit similar book-to-market ratios and higher free cash flows
which favors the free cash flow hypothesis. Although there are relatively small share price
declines prior to the announcement, the repurchase seems to be motivated by managements’
objective to reduce agency costs as free cash flow is withdrawn from managerial discretion.
More recently, hedge funds have taken an active role in corporate governance in Germany by
often convincing management to distribute free cash flow to shareholders, either by increas-
ing dividends or by initiating share repurchase programs. The early empirical findings suggest
that this strategy is on average value enhancing, at least in times of increasing stock prices
(Bessler, Drobetz, and Holler, 2009a). For periods of decreasing stock prices, the firms un-
derperform, suggesting that the corporate governance by hedge funds did not improve the
operating performance of the firm (Bessler, Drobetz, and Holler, 2009b). Thus, we need to be
aware of the fact, and this reasoning applies to seasoned equity offerings and share repurchas-
es as well, that optimizing the capital structure and the various financing activities may not or
only marginally increase shareholder value in the long-run.
In another study Oswald and Young (2008) separate firms according to the risk of overin-
vestment and find that agency considerations only affect the repurchase decision when in-
vestment opportunities are rare as proxied by low market-to-book ratios. In contrast, Nohel
and Tarhan (1998) focus on operating performance as measured by the EBITDA-to-market
value of assets for the three year period following the announcement. In order to observe dif-

10
ferences in growth opportunities following share repurchases, they calculate Tobin’s Q and
partition their sample of tender offer share repurchases into high-Q and low-Q firms where
low values of Q indicate overinvesting.2 Overall, they provide empirical evidence supporting
the free cash flow hypothesis as the cumulative operating performance for the low-Q sample
improves substantially compared to the high-Q sample. In another line of research, Grullon
and Michaely (2004) report for repurchasing firms a reduction in systematic risk and in the
cost of capital. This finding is consistent with the free cash flow hypothesis as cash payouts to
shareholders in the form of repurchases indicate that a firm has fewer growth opportunities,
needs less cash for investments, and moves towards a more mature phase of the corporate life
cycle. Therefore, investors often underestimate the reduction in the cost of capital which leads
to a stock price underreaction to repurchase announcements. Recently, Koerniadi, Liu, and
Tourani-Rad (2007) confirm these findings for New Zealand.
2.3.3 Other Explanations
There are a number of alternative hypotheses to explain the valuation effects of share repur-
chase announcements. Some studies argue that repurchases are primarily driven by the objec-
tive to substitute dividends with share repurchases (Jagannathan, Stephens, and Weisbach,
2000; Grullon and Michaely, 2002; Hsieh and Wang, 2008; Skinner, 2008; von Eije and
Megginson 2008). Recently, Jain, Shekhar, and Torbey (2009) investigate in particular
whether firms that went public choose dividends or share repurchases as their predominant
form of payout and find that there is a preference for repurchasing shares among IPOs.
Another rationale for share repurchases is that management aims to implement its optimal
capital structure because by distributing excess funds to its shareholders, a firm simultaneous-
ly reduces its equity and increases its leverage. Dittmar (2000) emphasizes that many studies
only focus on a few motives for repurchases and hence ignore the potential influence of omit-
ted hypotheses. She therefore tests several hypotheses simultaneously and finds that firms
repurchase shares to increase leverage when leverage is below the target ratio. In addition,
share repurchases often lead to an expropriation of at least one group of stakeholders (Masulis
1980; Vermaelen 1981; Maxwell and Stephens, 2003). There is also growing evidence that
firms initiate repurchase programs in combination with stock option programs. Kahle (2002)
analyses this relation between the growing popularity of stock options and the increasing
2 As in many other studies, Nohel and Tarhan (1998) approximate Tobin’s Q by the ratio of the market value of
assets to the book value of assets.

11
numbers of share repurchases in the U.S. and Liljeblom and Pasternack (2006) do a similar
study for Finland.
2.4 Empirical Studies for IPOs in Germany
Although the number of IPOs in Germany is relatively small and the time period with a higher
issuing activity is limited to the new economy period and therefore rather short (Figure 1c),
there are nevertheless a number of studies that analyze the underpricing and long-run perfor-
mance behavior as well as the factors that influence the magnitude of these valuation effects.
Most of the studies covering the period prior to the “Neuer Markt” find a negative long-run
performance. The magnitude ranges from -28.0% (Schuster, 1996) and -12.1% (Ljungqvist,
1997) to numbers that are close to zero or positive or sometimes even yielding strong positive
returns of 16.1% (Stehle, Erhardt, and Przyborowsky, 2000) for the very early time period
from 1960 to 1987. These considerable differences are mostly due to the time period investi-
gated or the methodology used. A review of this literature is provided in Bessler and Becker
(2007). However, there is some evidence that the subsequent financing decision is one of the
main factors and has a measurable impact on the long-run performance (Ljungqvist, 1997).
Bessler and Thies (2007a and 2007b) provide empirical evidence that firms that have the op-
portunity to issue additional equity subsequent to the initial public offering outperform the
market up to that point in time. This means that investors are willing to provide additional
funds to successful IPOs, or that successful IPOs are in a position to raise additional equity.
So far this issue has not been investigated for firms that went public on the “Neuer Markt” in
Germany between 1997 and 2002.
However, there already exist quite some empirical findings for the short- and long-run valua-
tion effects and the factors that determine the performance of IPOs at the “Neuer Markt”. Ob-
viously, most studies find underpricing and underperformance as well as hot and cold issue
periods. With respect to the factors explaining the return behavior, Bessler and Kurth (2007)
provide empirical evidence on the impact of venture capital, lock-up periods, hot and cold
issue periods as well as capital gains taxes on performance. This research also reveals the
agency problems inherent in the German universal banking system. These problems become
even more visible in a study of analyst behavior in that the financial analysts of the underwri-
ter provide more positively biased earnings forecasts and issue more buy recommendation at
least during the first year following the IPO (Bessler and Stanzel, 2009). There exists also
some evidence on the impact of stock option plans on performance (Bessler, Becker, and
Wagner, 2009). Other studies provide evidence of the positive impact of R&D and patents on

12
firm survival and IPO performance (Bessler and Bittelmeyer, 2007 and 2008, respectively). In
fact, IPOs with patents outperform IPOs without technology at least during the first year after
going public. In the long run there is hardly any performance difference, suggesting that the
market might have been too optimistic in valuing the growth potential of technology.
With respect to share repurchases of IPOs in Germany, there exist only a few studies so far.
One obvious reason for this lack of empirical research is the fact that share repurchases could
hardly be employed for distributing cash to shareholders. In fact, repurchases in Germany
were only allowed under very restrictive conditions and therefore practically forbidden before
May 1998. Gerke, Fleischer, and Langer (2003) investigate the period from 1998 to early
2002 and attribute the announcement returns of 6% to the inexperience of German firms with
this payout method. When partitioning the sample according to the stated repurchase reason,
they find abnormal returns of 8.9% at the announcement day providing evidence for under-
valuation signaling. It is quite interesting to note that abnormal returns are higher for the re-
purchase announcements for the period of dramatically falling stock prices between 2000 and
2002. Seifert and Stehle (2003), however, disagree to some extent with these findings of be-
cause they find no evidence supporting the signaling hypothesis in that the positive an-
nouncement effects and the undervaluation vanish after several days. They characterize the
bear market effect as a “Neuer Markt” effect. In addition, Hackethal and Zdantchouk (2006)
covering a similar period find positive abnormal returns of 5% around the first intention (invi-
tation to the annual shareholders meeting) and abnormal returns of 7% at the time of the re-
purchase announcement. By taking these two events together, the valuation effects sum up to
about 12%. In a more recent study Bayer, Hoffmann, and Weinmann (2007) concentrate on
the announcement effects of open market repurchases covering the period from 2000 to 2005.
They find on average significant CARs of 5.4% around the announcement date. When sepa-
rating the sample, they find somewhat higher valuation effects of about 7% for the period
before 2003 and lower effects of about 3% for the subsequent period. Overall, repurchase
announcements in Germany have resulted in positive abnormal returns.
2.5 Legal Environment of the German “Neuer Markt”
The German “Neuer Markt” was opened in March, 1997, with the objective of providing capi-
tal market access especially to young and innovative growth companies. The German Stock
Exchange imposed a set of admission and listing requirements on IPOs in its rules and regula-
tion for the “Neuer Markt” which probably were supposed to help start-up firms (Bessler,
Kurth and Thies, 2003; Bessler and Kurth, 2004). One the most important but highly unusual

13
listing requirement was that half of the offering proceeds had to be related to the issue of pri-
mary shares. The idea behind this rule was that all firms that intended to go public needed
additional equity because it was assumed that they were all high-tech companies with sub-
stantial growth opportunities and severe financing constraints. Although this might be true for
a large percentage of IPOs, some companies suddenly got huge cash holdings resulting in
substantial agency costs of free cash flow. Complicating matters further, a minimum free float
of 25% was required. Figure 1a illustrates the relation between market values, offering
proceeds, and the fraction of the seasoned offering at the time of the IPO. An example should
clarify these complex rules. Consider a firm in which the pre IPO shareholders are willing to
sell off as much shares as possible in the primary market conditional on a specific free float.
If, for example, the pre-IPO market value of the IPO were EUR 50 million and the free float
25%, then the new book value of the company would be EUR 57.14 million of which EUR
7.14 million were offering proceeds from the sale of primary shares and another EUR 7.14
million accrued to pre IPO owners that sold part of their shares. At the extreme, if the free
float is 100%, the pre-IPO owners would completely exit and sell off all of their shares with
an assumed value of EUR 50 million. Then the secondary shares offered in the IPO and the
amount raised would be both EUR 50 million and the post IPO value of the firm is EUR 100
million, which means that the firm doubled its book value. However, the firm has now an ad-
ditional 50 million in cash available which may be good or bad news. These rules also imply
that for every share the pre IPO owner sell at the time of the IPO, they have to issue an addi-
tional new share, which means that their voting rights decrease further. If, for example, the
pre IPO owners would sell 1/3 of their shares (plus one share), their voting rights would fall
below 50% and they would lose the majority. Therefore, it becomes obvious that the manda-
tory SEO at the time of the IPO might have caused substantial agency problems between
management and investors depending on a firm’s growth opportunities and the exit behavior
of its pre-IPO owners that tendered their shares when going public.
[Insert Figure 1a]
In our empirical analysis, the effects of the mandatory equity issuance are captured by the two
variables Participation and Dilution. While the former is the ratio of secondary shares offered
at the time of the IPO to the total number of shares prior to the IPO, the latter is the ratio of
primary shares offered at the IPO to the total number of shares prior to the IPO. For example,
if the pre IPO owners had 100 shares and sold 20 shares, they had to issue at least another 20
shares. If they issued 40 shares, then Participation is 0.20 (20/100) and Dilution is 0.4

14
(40/100). Higher values of Participation imply that pre-IPO owners sell a higher fraction of
their shares in the IPO, and the larger the Dilution the more decreases the pre-IPO owner’s
fraction of shares subsequent to the IPO. Additionally, in the absence of growth opportunities,
cash is stockpiled which is reflected in abnormally high cash holdings relative to a firm’s total
asset.
The objective of our study is to provide additional empirical evidence and insights into the
issuing and repurchasing behavior of German firms that went public at the “Neuer Markt”
during the period from 1998 to 2002. For this we explicitly compare the short- and long-run
valuation effects of share repurchase and share issuing activities and employ accounting and
financial variables to explain the magnitude of the stock price reactions. In addition, we em-
ploy these variables in probit models to estimate the likelihood that IPO firms will issue addi-
tional equity or repurchase their shares within a relatively short period after going public.
3. Data and Methodology
3.1 Data
In our empirical analysis we focus on share repurchase (SRP) and share issuance (SEO) an-
nouncements of all German IPOs that went public on the “Neuer Markt” between 1998 and
2002. The “Neuer Markt” was a special stock market segment for young, innovative and high
technology entrepreneurial firms in Germany. This new economy period is best described by
two extreme periods of increasing and decreasing stock prices as shown in Figure 1b. The
importance of IPOs at the “Neuer Markt” relative to other German stock market segments
over an extended period of time is shown in Figure 1c. The black bars indicate IPOs at the
“Neuer Markt” in Germany, which was opened in 1997 and was closed in 2003. It becomes
immediately obvious that the new economy boom and this stock market segment created a
special period with a relatively large numbers of firms that went public in Germany.
[Insert Figure 1b and 1c around here]
When a firm intends to repurchase its shares, it is obliged under German law to make this
information immediately publicly available by issuing an ad hoc announcement. For our study
this press release is chosen as the event date. It is assumed that this is the first time that a
firm’s intentions of initiating a repurchase program become public information. Similarly,
firms that intend to issue equity have to release an ad hoc announcement containing the basic
information regarding their plan for this equity offering. Subsequent to these initial an-
nouncements further information is generally released such as the amount of the offering, the
subscription price, etc. In our event-study framework we use the first announcement as the

15
event date. Ad hoc announcements for repurchase as well as for new issue announcements
were obtained with a keyword search within the LexisNexis database. We also searched for ad
hoc announcements of share repurchases and share issues within the DGAP database.3
We start our analysis with all 329 IPOs that went public at the German “Neuer Markt”, but
then concentrate on the first announcement within the five year period after going public. All
event firms are matched with the COMPUSTAT database. As usual, all financial services
firms and all utilities are excluded. Moreover, we exclude all firms that went public in 1997
and IPOs that were involved in stock price manipulations.4 We identified 65 firms that an-
nounced an SEO within the first five years after going public and 60 firms that announced a
share repurchase program. Interestingly, there are 14 firms that announced both, an SEO as
well as a repurchase program. These events are excluded from our analysis. Consequently,
our final sample consists of 245 German initial public offerings of which we analyze 46 SRP
and 51 SEO announcements. 148 IPOs had no financing activity at all during that time period.
Stock and benchmark returns were obtained from Thomson Financial Datastream.
The decision of having an additional financing round (SEO) just after going public may de-
pend on various factors. Either the firm raised sufficient funds at the time of the IPO and an
SEO is not necessary or the firm raised only a smaller amount of funds and additional funding
is required. The reason for the latter strategy is either that management intended to exploit the
initial returns and the usual run-up subsequent to the IPO by implementing the equity issue in
a two staged process, i.e. small IPO and larger SEO. This is advantageous for the firm when
equity can be placed at higher prices, which means that management either exploited its in-
formation advantage, or is able to time the market, or is just lucky due to the immense under-
pricing and post IPO price increases that occurred during that time period. Although this may
be in the interest of the current investors or the investors that got shares allocated at the time
of the IPO, this is to the disadvantage of the investors that bought shares later on at the SEO.
To implement such a strategy it is necessary that the underwriter and the analysts of the un-
derwriter support this behavior which, however, was often observed (Bessler and Stanzel,
2009). The other reason for a sequencing of initial and seasoned equity offering is that inves-
tors such as venture capitalists are only willing to provide funds in stages, which means that
additional funds are only provided when certain milestones are reached. Obviously, more
funds are also needed when the realized growth rate exceeded the expectations or new busi-
ness opportunities arise. In addition, we would expect more SEOs in an up-market. However,
3 DGAP is a German institution that provides ad hoc announcements of more than 1,250 public companies. 4 Kurth (2005), p. 354 ff. provides some rationale explanation for this procedure.

16
when management forecasts dramatically declining stock prices, then it may be beneficial
even in a down market to issue equity before the market weakens further.
For SRP we would hardly expect that they occur soon after the IPO. However, there are vari-
ous explanations for such a behavior. The firm may have raised too much funds at the time of
the IPO, either because they overestimated the growth opportunities, or they wanted to exploit
the opportunities to issue equity at high prices, or they were forced to issue more equity than
needed as was often the case at the “Neuer Markt” due to its special rules and regulations. The
other explanation is that management has market timing abilities and repurchases shares at
lower prices and issues additional shares later on at higher prices. This is consistent with the
strategy that management wants to signal undervaluation to the market and then issues addi-
tional equity later on. Thus, we would expect more SRP in the down market.
[Insert Figure 2 and 3 around here]
Figure 2 presents the distribution of SRP and SEO announcements by calendar year and Fig-
ure 3 shows the distribution relative to the time when the firm went public. First of all it ap-
pears that the SRP and SEO activity of the IPOs is quite similar in each year and thus may be
driven by other factors than market timing. Most surprisingly, the distribution by calendar
year reveals that most SRP and SEO announcements occurred in the down market in 2000
and 2001 (Figure 2) and relatively soon after going public (Figure 3). These issues need to be
discussed in more detail for SEO and for SRP.
3.2. Methodology
In our empirical analysis of SRP and SEO announcements we employ the standard event
study methodology and calculate cumulative abnormal returns (CAR) around the event win-
dow as well as long-term buy-and-hold abnormal returns (BHAR).
3.2.1 Cumulative Abnormal Returns
For the short term event study we employ the standard abnormal return (AR) procedure in
that we adjust stock returns for each event at time with the expected return of the stock mar-
ket which is approximated by the CDAX index as a benchmark:
(1) , , , .
The German CDAX is a performance index that includes all German companies belonging to
the EU regulated market segment of the Frankfurt Stock Exchange. In the next step we weight
the AR in (1) for each event equally by dividing the abnormal returns by the number of events

17
in our sample. We then sum up the abnormal returns of this equally weighted portfolio over
time which results in the cumulative abnormal returns (CAR) for a certain time period:
(2) ∑ , with , ∑ , .
To test for significance, we employ a bootstrapped version of the skewness adjusted t-test in
order to correct for the usually positive skewness in CAR and especially in BHAR. Following
Lyon, Barber, and Tsai (1999), we draw 1,000 samples of size /2 to calculate the criti-
cal values of the transformed t-statistic:
(3) √
with
(4) and ∑ , .
Additionally, we employ the signed-rank test proposed by Wilcoxon (1945) to test whether
the median of the abnormal return distribution differs significantly from zero.
3.2.2 Buy-and-Hold Abnormal Returns
To analyze the long-run valuation effects of seasoned equity offering and repurchase an-
nouncements we employ the standard buy-and-hold abnormal returns (BHAR) procedure and
calculate abnormal returns on a daily basis:
(5) BHAR ∑ ∏ 1 R ,T ∏ 1 RM,
T .
We vary the event window from 1 day to 250 days before and after the event. This BHAR
performance measure compares the average performance of a buy-and-hold investment in a
portfolio consisting of all events of either equity offering or share repurchase announcements
to the buy-and-hold investment in the market index which is approximated by the CDAX.
In addition, we perform some cross-sectional regressions that are presented in section 4.3 to
first check for the robustness of our results and second to extend our analysis by including
accounting and financial variables. The econometric procedures employed are explained in
section 4.3. Finally, and maybe most interesting, we apply probit models for both SEO and
repurchase announcements in order to identify the driving factors that motivate firms to an-
nounce the financing or payout decision. At last, we directly compare the repurchase and SEO
decision in a single probit and a multinomial probit model to disentangle the factors that sig-
nificantly influence either decision. This procedure and the results are explained in more de-
tail in section 4.4.

18
4. Empirical Results
In our empirical analysis we first investigate short- and long- term abnormal returns and then
concentrate on the factors that may explain the magnitude of these valuation effects. In addi-
tion we employ probit models to estimate the probability that a firm issues new equity or re-
purchases shares.
4.1 Short-Run Valuation Effects
In order to analyze the short-term valuation effects we calculate cumulative abnormal returns
for various time periods around the event date where the interval ranges from t=-60 to t=60.
The CAR for SRP and SEO events are presented in Figure 6 and Table 2. The significance of
the abnormal returns for both samples is tested with a skewness adjusted t-test. In the next
section, we first analyze the valuation effects of share repurchase programs and then focus on
SEO announcements.
4.1.1 Short-Run Valuation Effects of Share Repurchase Announcements
The results for the short-run valuation effects of share repurchase announcements for different
intervals prior to the event are presented in Table 2 (Panel B). It becomes immediately evident
that the mean (median) CAR strongly decline during the 60 trading days or three months pe-
riod prior to the announcement with a relative underperformance of -14.86% (-15.01%). For
the interval around the event date (-1; 1), the mean and median CAR sharply increases by a
significant 8.61% and 6.99%, respectively (Table 2, Panel A). The mean (median) abnormal
return of 9.23% (11.65%) for the extended event window (-3; 3) is even higher and also sig-
nificant at the 1% level. One possible explanation for this observation is that firms may react
to their relative stock price decline by announcing a repurchase program. This would be in
line with undervaluation signaling initially suggested by Vermaelen (1981). The high abnor-
mal mean announcement return of more than 9% is nearly three times as high as found in stu-
dies for the U.S. (Vermaelen, 1981; Grullon and Michaely, 2004) and more than twice as high
as for other studies for the German stock market (Seifert and Stehle, 2003; Bessler, Drobetz
and Seim, 2009).
[Insert Figure 6 about here]
[Insert Table 2 about here]
For the analysis of abnormal returns subsequent to the event date it is important to note that
the magnitude of the CAR depends on the fact whether or not the event date is included in our
calculation. The CAR are presented for time intervals beginning one trading day prior to the

19
event date (Table 2, Panel C). The mean abnormal returns for the intervals of up to 10 trading
days subsequent to the event are stable between 6% and 7% and are significantly different
from zero. When starting the calculations directly subsequent to the event (Table 2, Panel D),
the median CAR for the 60-trading-day period is slightly negative but insignificant for each
time interval. However, albeit more negative in absolute value, the mean CAR also do not
differ significantly from zero. From this analysis it seems that the management of these IPO
firms might have reacted immediately to their declining stock market valuations by announc-
ing a repurchase program in order to halt a further stock price decline. At a first glance, the
strong and positive announcement returns seem to suggest that these firms were successful in
signaling undervaluation to outside investors. Moreover, if the IPO firms have raised as much
equity as possible at the time of the IPO or were forced to issue more equity than needed,
excess cash holdings paired with a lack of investment opportunities or negative NPV projects
should result in the usual agency costs of free cash flow (Jensen, 1986). One option to reduce
these problems is by distributing this surplus cash to shareholders either in the form of divi-
dends or share repurchases. Whether signaling or the free cash flow hypothesis is better suited
to explain the valuation effects of the repurchase decision is investigated in more detail in
section 4.3.
4.1.2 Short-Run Valuation Effects of SEO Announcements
In contrast to our findings for SRP, we would expect quite different and maybe opposite re-
sults for SEO announcements, due to the basic idea that additional equity is usually issued
when attractive investment and growth opportunities become available or when high market
valuation or firm overvaluation should be exploited. In fact, when analyzing the short-run
valuation effects of SEO announcements of IPOs at the “Neuer Markt”, the results change
considerably which is due to the different motivation and information inherent in either SRP
or SEO announcements. In contrast to a negative return pattern for SRP during the 60 trading
days prior to the repurchase announcement, there is a is a significant mean (median) run-up
for SEOs of 7.63% (3.29%) and 6.33% (6.19%) for the intervals (-30; -1) and (-60; -1), re-
spectively (Table 2, Panel B). This result is consistent with market timing considerations of
management that try to cash in on a positive past performance. Thus, these firms return to the
capital market at a time when their financing conditions are favorable to obtain higher offer-
ing proceeds or, equivalently, to issue overvalued equity. In accordance with previous studies,
we do not find large announcement returns as shown in Table 2 (Panel A). Although we do
find significantly positive mean CAR of 4.04.% (5% level) for the narrowest window of three

20
trading days around the event, the median CAR for larger intervals of three or five trading
days around the event is slightly negative insignificant abnormal returns. When we analyze
the period subsequent to the event, we find an underperformance relative to the event day.
This result is independent of whether we include or exclude the event day returns (Table 2,
Panel C and Panel D, respectively). For the time intervals of (-1; 30) and (-1; 60), the mean
(median) abnormal returns are negative with -2.34% (-4.28) and -4.24% (4.22%), respective-
ly. The magnitude of the negative performance even increases when the calculation of abnor-
mal returns begins at the first trading day subsequent to the event. In this case, the mean CAR
for the intervals of (1; 10), (1; 30), and (1; 60) sum up to -3.11%, -6.12%, and -7.97%, respec-
tively. The median CAR for the same intervals is -4.81%, -4.71%, and -8.98%. All returns are
significantly different from zero.
In general we would expect that firms return to the equity market to issue additional equity
only when there is a need for new funds, for example, to pursue growth opportunities. At the
same time this could also minimize conflicts of interest between management and outside
investors. Therefore, the negative performance during the three months period following the
SEO announcement might either signal that investors were too optimistic about the firms’
growth opportunities and ongoing investment projects or that management simply exploited
windows of opportunities. Whether this reasoning is supported by empirical evidence or not
will become more evident when we analyze the abnormal returns for longer time periods in
the next section.
4.2 Buy-and-Hold Abnormal Returns
In addition to the short-term stock price reactions it is of interest to get a detailed understand-
ing of the long-term valuation effects before and subsequent to the announcements of share
repurchases and seasoned equity offerings. For this we investigate abnormal returns (BHAR)
for different intervals ranging from 250 trading days before to 250 trading days after the
event. Because BHAR are sensitive to the starting point of the calculation, we calculate the
returns for various intervals before, around, and subsequent to the event. Due to the limited
data available for those firms that had financing activities relatively soon following the IPO,
the sample sizes decrease for longer time horizons. The abnormal performance for various
intervals is presented in Table 3 and in Figures 4a, 4b, 5, 7, and 8. Again, we first discuss the
results for SRP and then for SEO announcements.
[Insert Table 3 about here]

21
4.2.1 BHAR of Share Repurchase Announcements
The buy-and-hold abnormal returns (BHAR) for different event windows prior to the an-
nouncement are reported in Table 3 (Panel B). For the one year period from 250 trading days
to 1 day prior to the events we find significantly negative mean (median) BHAR of -21.73%
(-34.33%). Starting closer to the event date, we find for the shorter interval of about 6 months
(-125; -1) that the magnitude of the negative abnormal returns is even higher with significant-
ly negative mean (median) BHAR of -24.46% (-29.79%). For the 60-day-trading period sub-
sequent to the SRP announcement, the IPO firms were obviously able to stop the downward
trend in their abnormal stock price behavior. This finding is consistent with the short-run val-
uation effects. The results for the time intervals around the event are reported in Table 3 (Pan-
el A). For the longest time period from one year prior to one year after the event the mean
BHAR is -15.52% (Figure 4a). Although this return is substantial but insignificant, the me-
dian value is larger with -38.31% and significantly different from zero. The mean BHAR for
periods that begin closer to the event date, we find for the intervals (-125; 125) and (-30; 125)
negative but insignificant BHAR of -18.68% and -2.36%, respectively. These return patterns
are graphed in Figure 5. Most notably, the notion of potential price stabilization through share
repurchase announcements becomes evident in Figure 7 and Figure 8. While in Table 3 (Panel
B) a negative mean BHAR of -5.79% for the 30 days prior to the event is reported (negative
and significant median BHAR of -9.24%), the mean BHAR pattern thereafter is hardly differ-
ent from zero. Thus, it appears that firms that announced a share repurchase program signifi-
cantly underperformed the market during the last year.
For the 250 trading days subsequent to the announcement we find a mean (median) BHAR of
-12.03% (-26.42%) as reported in Table 3 (Panel C). In this case it seems important to analyze
the valuation effects by including the event window, because this reveals whether the man-
agement strategy of signaling either undervaluation or a reduction of free cash flow problems
was successful. For the intervals subsequent to the event but including the event window (-1;
125) there are insignificant mean (median) BHAR of 4.47% (5.57) as reported in Panel D. For
the one year period (-1; 250) (Panel D), the mean BHAR declines to insignificant -5.31% due
to the strong abnormal price reaction at the announcement date (Figure 8). If the intention of
management was either to signal undervaluation or to signal a reduction in potential free cash
flow problems, then it seems fair to conclude that this strategy has been very successful be-
cause, on average, because the performance of these IPOs over an extended period of time is
hardly distinguishable from the market. This is remarkable, because these firms have signifi-
cantly underperformed the market index prior to the SRP announcement. Nevertheless, it ap-
22
pears that the undervaluation signal or reduction in agency problems was not strong enough to
reverse the stock price performance and led to a long-term stock price increase as has been
observed in other studies on share repurchases.
[Insert Figures 4a, 4b, 5, 7, and 8 about here]
4.2.2 BHAR of SEO Announcements
For the long-run performance of SEOs prior and subsequent to the announcement we would
expect different results than for SRP in the previous section. Overall, we find abnormal price
run-ups prior to the SEO announcement followed by a long-run underperformance subsequent
to the SEO. These results are presented in Table 3 and Figures 4a and 5. There is evidence of
a clear downward trend in the performance of SEOs except for a run-up some weeks prior to
the announcement. The mean BHAR for the time intervals (-250; -1) and (-125; -1) prior to
the event seem substantial and are -8.93% and -11.55%, respectively, but insignificant. For
the time period (-30; 125) around the SEO event (Table 3, Panel A), mean buy-and-hold ab-
normal returns are significantly negative and sum up to considerable -18.65%. Although the
BHAR for the longer time intervals of (-125; 125) and (-250; 250) are also substantial and
negative with -29.13% and -23.88%, respectively, they are also insignificant. In Figure 4b, we
report the buy-and-hold returns that reveal an even stronger negative trend. It needs to be
mentioned, however, that the sample size for this larger time window includes only 39 events.
For the remaining 12 events we do not have sufficient return data before the event as these
firms had their first SEO within a relatively short time span after going public. In Table 3
(Panels C and D) and Figures 7 and 8 we present additional results covering various time in-
tervals. For the time period starting at trading day -1 and ending 125 days or 250 days after
the SEO announcement, the IPOs with subsequent SEOs are faced with a substantial under-
performance with negative mean abnormal returns of -24.79% and significant -29.70%, re-
spectively. The results for the relatively short time interval beginning 30 days prior and end-
ing 1 day prior to the event (Panel B), is most interesting and in line with previous research
findings in that the abnormal performance reveals the typical run-up pattern prior to SEO an-
nouncements. For this time period, IPOs manage to have a mean outperformance of 6.17%.
However, in terms of the median BHAR, this run-up pattern virtually disappears. Figure 5
clearly reveals the performance reversal around the event date. Following this short term run-
up prior to the event, the trend reverses and the BHAR strongly decrease following the day of
the SEO announcement. This run-up and the decline of the average abnormal performance
relative to the market of more than 30% for the first year after the SEO announcement indi-

23
cates a substantial overvaluation at the time of the SEO which may be consistent with market
timing abilities of management. Another explanation for this performance pattern is that ex-
pected growth opportunities did not materialize following the equity issue. It is also possible
that overvaluation was signaled to market participants but due to the adverse selection cost of
SEOs the stock prices declined thereafter (Myers and Majluf, 1984).
4.3 Cross-Sectional Regressions for Short-Run Valuation Effects
Our analysis so far revealed significant short-term valuation effects for the interval around the
share repurchase and SEO announcements. In order to get a more comprehensive understand-
ing of the factors that influence the magnitude of the stock price reactions we analyze these
short-term valuation effects in more detail. For this we first present the methodology and the
variables employed and then our empirical findings.
4.3.1 Methodology and Variables
In a first step we perform OLS cross-sectional regressions with different explanatory variables
in order to rationalize the valuation effects for the period of one trading day before to one
trading day after the announcement (-1; 1) and then compare our results to previous studies.5
This allows us to test the most common hypotheses in the context of share repurchases and
SEO announcements.
(6) ∑ , ∑ , ,
The CAR of an event is regressed on a constant, some explanatory dummies, and a set of ex-
planatory variables as indicated by the matrix . The accounting variables described below
enter the regression model in the fiscal year prior to the announcement. To control for poten-
tial heteroskedasticity, we estimated the regressions with White (1980) standard errors.
The variables included in the regressions are as follows:
• Hot-Event: The sample period is characterized by distinct hot and cold issue market pe-
riods as is evidenced in Figure 1b. In order to account for the increasing and declining
stock market periods as well as for the differences in issuing activity, this dummy variable
is set to 1 if the respective announcement took place between 1998 and 1999 (hot market).
5 We checked for the robustness of the cross-sectional regressions and extended the event window to three and
five trading days around the announcement. Our results remain largely unchanged.

24
• Size: To account for the return differences caused by the size of the IPO, the natural loga-
rithm of total assets (in bn. EUR) at the end of the year prior to the announcement is in-
cluded.
• Tangibility: The ratio of tangible assets to total assets. Information asymmetries should
be less pronounced in the presence of more tangible assets. In contrast, growth intensive
firms are associated with a lower ratio of tangible assets.
• R&D-to-Assets: IPOs that have a higher ratio of R&D expenses to total assets are usually
viewed as research oriented high technology firms that should have above average growth
opportunities. This should result in an abnormal performance and in a high demand for
additional equity. Because not every firm had or is reporting R&D, this variable is set to
zero for firms where this variable was missing in COMPUSTAT.
• CAPEX-to-Assets: The ratio of capital expenditures to total assets is used as an indica-
tion of growth opportunities and investment behavior. We expect a higher ratio for SEOs
and a lower for SRP.
• Cash Flow-to-Assets: The ratio of cash flows to assets is used as a measure for operating
performance and the generation of operating cash flows. Larger relative cash flows should
indicate a successful business model but most importantly, these firms have cash surplus-
es that may be employed for share repurchases.
• Cash-to-Assets: A high ratio of cash holdings to assets indicates that this IPO raised ei-
ther sufficient cash at the time of the IPO and did not invest it so far or that the firm is ge-
nerating a surplus of operating cash flows. In either case, there is no need for additional
equity but there exists the chance to return cash to shareholders.
• Pre-Market: The market returns from day 30 to day 2 for the pre-announcement period
may be an indication of market timing ability in that management responded quickly to a
favorable or unfavorable market environment with an appropriate financing decision.
• Run-Up: Buy-and-hold abnormal returns from 30 days to 2 days before the event may be
a good indication whether the announcement is new information to the market or whether
this has been known to some market participants before or was even influenced in a cer-
tain direction before the official announcement. We may expect a positive figure for SEOs
and a negative figure for SRP.
• Dividend: Dividends and share repurchases are often viewed as substitutes for distribut-
ing cash flows to shareholders. Thus, when analyzing share repurchases it is important
whether a firm already pays dividends. Jain, Shekhar, and Torbey (2009), for example,
find differences between dividend paying and repurchasing IPOs. A dummy variable that

25
takes the value of 1 if the IPO paid a dividend in the last fiscal year prior to the an-
nouncement and zero otherwise.
Recent empirical studies for IPOs at the German “Neuer Markt” provide evidence that venture
capital (Bessler and Kurth, 2007) and patents (Bessler and Bittelmeyer, 2008) are important
valuation factors. In order to analyze whether the involvement of venture capital before the
IPO as well as the focus on technology as measured by the patenting activity of these IPOs
have any impact on firm valuation, we included two additional dummy variables:
• VC: A dummy that takes the value of 1 if the IPO is venture-backed and zero otherwise.
• Patent: A dummy variable that takes the value of 1 if the IPO had patents at the time of
the IPO and zero otherwise.
In Table 1a we present the descriptive statistics of all variables that are included in the cross-
sectional and the probit regressions (part 4.4). Table 1b compares the means and medians of
the three groups of IPOs using a conventional two-sample t-test and the Wilcoxon (1945)
rank-sum test.
[Insert Table 1a and 1b around here]
Obviously, IPOs that engage in repurchases or SEOs have significantly higher participation
ratios at the time of the IPO.6 Furthermore, repurchasing firms exhibit higher cash holdings as
well as cash flows from operations than both IPO firms in the group without financing activi-
ties and especially SEO firms. This provides a first indication of possible conflicts of interest
and free cash flow problems of these firms. Relative to firms without either financing or dis-
tribution decision, SEO firms have significantly less cash on their balance sheet, spend more
on investment projects (CAPEX), are comparatively smaller, and have higher relative market
valuations (M/B). These are characteristics primarily of growth and innovative firms that need
additional equity. This is investigated in more detail in the next sections.
In the cross-sectional regressions we precede as follows. First, we consider each explanatory
variable sequentially to gain a preliminary understanding of the factors that influence the an-
nouncement return (Model I). Then, we report the coefficient estimates of Models II and III,
where the variables are separated into two groups. In Model IV all variables are included si-
multaneously.
6 We come back to this point in more detail in part 4.4.

26
4.3.2 Empirical Results for Share Repurchase Announcements
According to the results of the sequential OLS regressions presented in Table 4a, SRP that
were announced in a hot market environment have a significantly lower announcement effect
compared to events that occur in the cold market period. This finding confirms the notion that
an announcement of cash distribution by entrepreneurial firms, especially in hot markets, is
interpreted by the market as bad news. This may be explained by the fact that investors in
general would expect that excess internal funds are invested in growth opportunities and prof-
itable investment projects instead of repurchasing shares.
[Insert Table 4a and 4b around here]
The positive and significant coefficient for the ratio of R&D expenses to assets contradicts to
some extent the expected behavior of growth firms. If higher R&D is a good proxy for growth
intensive IPOs, then a negative sign would be expected. However, the R&D-to-assets ratio
has to be interpreted with caution as missing values of R&D expenses were set to zero result-
ing in a median value of zero of that variable. In addition, only one third of all IPOs at the
“Neuer Markt” owned patents, indicating that these IPOs were not all high technology firms,
although this was supposed to be a market segment especially for this group of firms. Fur-
thermore, a high ratio of cash flow to assets also reduces the announcement effect significant-
ly. This is in contrast to the free cash flow hypothesis of Jensen (1986) that argues that high
free cash flows or excess cash indicate agency problems which might be reduced by distribut-
ing excess funds to shareholders.
The enlarged models in Table 4b are robust to the findings of the simple regression models.
While the R&D ratio turns out to be insignificant in the full model, the Hot-Event dummy
remains significant in Model II as well as in the Model IV. The same holds for the ratio of
cash flow to assets. Therefore, market participants seem to interpret the SRP announcement as
a lack of ideas and growth opportunities of newly listed firms. Interestingly, in Model III the
significantly negative coefficient for the Run-Up variable indicates a higher announcement
effect the lower the firm performance over the last six weeks. In related studies on SRP an-
nouncements, this variable is consistently interpreted as a proxy for undervaluation (Comment
and Jarrell, 1991; Peyer and Vermaelen, 2009; Bessler, Drobetz, and Seim, 2009). Hence, at
least to some extent, the SRP was initiated by management to signal undervaluation. Overall,
while we cannot confirm the free cash flow hypothesis for SRP announcements, we argue that
a lack of investment opportunities combined with high cash flows and/or cash holdings were
the main factors of the SRP announcement. In any case, this is interpreted negatively by out-

27
side investors. To corroborate these findings we investigate the repurchase decision of IPOs in
more detail in section 4.4.
4.3.3 Empirical Results for SEO Announcements
In Table 5a and Table 5b we present the empirical findings for the cross-sectional regressions
of the SEO announcement returns. It is much of a surprise that in Model I no explanatory va-
riable indicates a significant correlation with the announcement effect. The small sample size
might be one reason why we are only able to interpret the tendency of some of the variables.
[Insert Table 5a and 5b around here]
The Pre-Market variable has the highest t-statistic in Model I which indicates that higher mar-
ket returns prior to the SEO announcement result in higher valuation effects. Most likely,
SEO firms took advantage of a relatively favorable market environment to raise additional
capital. It seems that outside investors view the issuance of new equity more optimistic when
market conditions are more favorable. Furthermore, the Patent dummy has the second highest
t-statistic in Model I. Hence, SEO announcements of IPOs with patents are viewed as good
news by the market and lead to a higher valuation by market participants. Besides the signifi-
cant Pre-Market variable in the full model specification in Table 5b, the t-statistic of 1.66 for
the Patent dummy corresponds to a p-value of roughly 10%. If firms engage in research
projects that prove successful and lead to patented technology, an SEO announcement might
reflect the need for additional funds to pursue growth opportunities and the development of
additional innovation (DeAngelo, DeAngelo, and Stulz, 2010).7 This result is also in line with
staging considerations of capital issuing and obviously favorably valued by the capital market
(Hertzel, Huson and Parrino, 2009).
4.4 Determining Factors for Share Repurchase and Share Issuance of IPOs
4.4.1 Data and Methodology
After the investigation of the announcement effects for SRP and SEO announcements, we
now analyze the decision of the IPOs in our sample to repurchase shares or to issue equity by
estimating the following probit regression model (see Greene, 2002, p. 663ff.):
(7) 1 Φ ∑ , ∑ ,
7 When we use raw returns instead of abnormal returns as the dependent variable, the coefficient for patenting
IPOs turns out to be significant which underlines its importance.

28
In (7), is a binary variable that is set to 1 for SRP or SEO announcing firms and zero oth-
erwise and Φ . is the standard normal distribution. Then can be interpreted as the “pro-
pensity to announce an SRP / SEO”.
As in the cross-sectional analysis, the accounting variables enter the probit models in the fis-
cal year prior to the announcement. For non-event firms we employ the following approach.
The median time until the first financing or distributing event occurs subsequent to the IPO is
two years for both the SRP and the SEO announcement. Therefore, we consider the second
fiscal year after the time of the IPO as the relevant year for all firms in our probit models that
neither announced an SRP nor an SEO. The descriptive statistics for this group are provided
in Tables 1a and 1b.
From our cross-sectional regressions of the announcement effect in section 4.3 we include the
following variables: Size, Tangibility, R&D, CAPEX, Cash Flow, Cash, Dividend, as well as
the VC and Patent dummies. In addition, we include the following explanatory variables in
the analysis in order to analyze in more detail staging considerations and potential agency
problems as well as conflicts of interest. These problems may have emerged at the time of the
IPO and may be the result of the rules and regulations of the “Neuer Markt” listing segment:8
• Dilution: Dilution factor. Dilution is the ratio of primary shares offered in the IPO to the
total number of shares before the offering.
• Participation: Participation ratio. This variable is defined as the ratio of offered second-
ary shares at the time of the IPO to the total number of shares before the offering.
• Hot-IPO: Dummy variable that takes the value of 1 if the firm went public during the hot
market years of 1998 and 1999 and zero otherwise.
• M/B (Tobin’s Q): The ratio of the book value of total liabilities plus the market value of
equity to total assets.9 This ratio is often referred to as Tobin’s Q.
We follow the same approach as in the cross-sectional regressions of the announcement re-
turns. First, we report simple binary probit regressions and enlarged binary models for com-
paring two of the three outcomes with each other in section 4.4.2: IPOs with SRP announce-
ments, SEO announcements, and IPOs with no financing activity.10 Finally, in section 4.4.3
8 We used the data from Bessler and Kurth (2007) and Kurth (2005). 9 Compared to all other explanatory variables, M/B has some missing values, so that the inclusion of M/B reduc-
es the sample size in each regression considerably. Therefore, we did not include M/B in the cross-sectional regressions in section 4.3 to avoid estimation difficulties.
10 When reported, the marginal effects are calculated for a one standard deviation change around the mean for the continuous variables and for the change from zero to one for the dummy variables.

29
we present the results of a multinomial probit model where we include all three groups. Effec-
tively, this model specification with k categories simultaneously estimates k-1 probit models.
In our case, k equals three. The dependent variable takes the value of zero for the group ‘No
Financing Activity’, 1 for ‘Repurchase’, and 2 for ‘SEO’. In the regression, we use either ‘No
Financing Activity’ or ‘Repurchase’ as the base case. Thus, the signs of the coefficients of the
explanatory variables represent an increase or decrease in the probability of the respective
outcome relative to the base case.
4.4.2 Empirical Results: Binary Probit Models
We report the results of the coefficient estimates for the binary outcome of an SRP an-
nouncement compared to the ‘No Financing Activity’ group in Tables 6a and 6b. In the sim-
ple models (Table 6a) the coefficient for the Dividend dummy indicates that IPO firms that
paid a dividend in the year prior to the SRP announcement are more likely to distribute addi-
tional cash through share repurchases. However, in the following models this variable be-
comes less important.
[Insert Table 6a and 6b around here]
More interestingly, the participation ratio is positive and significant. A high participation ratio
at the time of the IPO reduces insiders’ relative stakes in the firm, thus increasing the agency
costs from the separation of ownership and control (Jensen and Meckling, 1976). However, a
reduction in the proportion of insiders can be viewed as a positive signal as high levels of
management ownership might lead to managerial entrenchment and inefficient corporate go-
vernance mechanisms. This is in line with the results in Stulz (1988). A high participation
ratio accelerates the dispersion of ownership and exposes these IPOs more strongly to the
market for corporate control. Corporate governance mechanisms become more effective when
excess cash reserves are distributed. Another result supports this rationale. Despite the fact
that young and innovative firms usually have high capital needs, it appears that high cash
holdings and cash flows relative to assets also increase the likelihood of a payout. Finally, the
positive coefficient of the dilution factor indicates a higher propensity to engage in share re-
purchases when the fraction of primary shares, i.e. the mandatory equity issuance at the time
of the IPO and hence the proceeds are higher. In the full Model IV (Table 6b) Dilution re-
mains significant while Participation and Cash Flow lose their explanatory power. In econom-
ic terms, the coefficient for Dilution corresponds to an increase in the probability of an SRP
announcement by 10.21%. When summarizing our empirical findings, it seems fair to con-
30
clude that agency problems are the best explanations why firms that just went public an-
nounce share repurchase programs.
The results for the probability of an SEO announcement are presented in Tables 7a and 7b. It
is worth mentioning that the explanatory power is nearly twice as high in terms of the pseudo
R2 (18.96% for SEO compared to 9.92% for SRP) and the coefficient estimates are more sta-
ble across the different model specifications.
[Insert Table 7a and 7b around here]
First of all, the likelihood of an SEO announcement decreases with size. Presumably these
IPO firms are yet in a more mature phase of their life cycle given the relatively small firm size
of “Neuer Markt” IPOs. It seems that they have relatively less capital requirements or are able
to obtain debt financing more easily. Therefore, they might abstain from issuing equity at un-
favorable market conditions in the period following the New Economy bubble. Moreover,
R&D intensive IPOs and IPOs with less cash holdings are significantly more likely to issue
equity to fund their growth opportunities which is also reported by DeAngelo, DeAngelo, and
Stulz (2010). In Model IV in Table 7b, the economic impact is reflected in an 8.13% higher
(12.10% lower) probability of an SEO announcement for a one standard deviation increase
around the mean in R&D-to-Assets (Cash-to-Assets). Additionally, in Model I (Table 7a) the
ratio of CAPEX to assets is also positively related to the probability of an SEO announce-
ment, which is in line with Cosh, Cumming and Hughes (2009), who report a higher likelih-
ood to seek external finance for high CAPEX-to-profits firms. Overall, our results strongly
support the notion of a staging strategy that may be demanded by certain investor groups. To
minimize conflicts of interest and agency problems, additional funds are only provided when
there are actual financing needs and past investment projects were successful which is consis-
tent with the findings of Hertzel, Huson, and Parrino (2009). Evidently, this finding is corro-
borated by an increasing probability of a seasoned equity offering by 7.61% when the IPO
firm generated large cash flows in the past. A high ratio of cash flows to assets indicates suc-
cessful investment projects with large operating cash inflows. This may convince capital pro-
viders to commit to a new financing round.
Finally, we present our results from comparing the SRP and SEO decision of our IPO sample
in Table 8a and 8b. Overall, the results confirm our previous findings. Again, a high participa-
tion ratio as well as high cash holdings and cash flows increase the likelihood of an SRP an-
nouncement (by 17.09%, 47.34%, and 23.58%, respectively, for a one standard deviation
change around the mean). The higher the fraction of secondary shares offered at the time of

31
the IPO the faster is the dispersion of ownership. From a corporate governance perspective,
this should lead to less entrenched managers, more effective internal control mechanisms and
reduce agency problems that emerge from high cash flows and cash holdings. These agency
problems are especially pronounced in the absence of growth opportunities.
[Insert Table 8a and 8b around here]
In contrast, especially patenting firms (Model IV, Table 8b) and firms with a large CAPEX-
to-assets ratio (Model I, Table 8a) are significantly more likely to return to the capital market
to raise additional capital. This finding underlines the notion that staging considerations main-
ly impact the SEO decision of IPO firms as already discussed in the last paragraph.
4.4.3 Empirical Results: Multinomial Probit Model
In so far we provided evidence for the main factors that influence the likelihood of a distribu-
tion of funds through share repurchases or the need of IPO firms to issue new equity. There-
fore we estimated binary probit models. In this section, we now consider the multinomial case
where we simultaneously estimate the likelihood of the respective outcomes relative to a
benchmark alternative. The results are presented in Table 9.
[Insert Table 9 around here]
Overall, our results from the binary case models are largely confirmed. More precisely, consi-
dering the ‘No Financing Activity’ group as the base case, the likelihood of an SRP an-
nouncement increases significantly with a higher participation ratio, with higher cash hold-
ings, and higher operating cash flows relative to assets (see first column of Table 9). In con-
trast, cash rich and large IPO firms are significantly less likely to engage in seasoned equity
offerings, while the likelihood increases with a higher R&D expense to asset ratio (see second
column of Table 9). Moreover, in the probit model using SRP as the benchmark alternative,
cash to assets is statistically negative at the 1% level (fourth column of Table 9). This means
that IPO firms with substantial cash reserves are more likely to announce share repurchase
programs rather than to seek additional equity finance. Although we cannot directly interpret
the coefficient estimates as probabilities, the impact of cash to assets on the likelihood of an
SEO relative to the announcement of an SRP is nearly twice as high compared to firms with
no financing activity. The negative coefficient for the cash flow to assets variable provides
further evidence of a higher likelihood to engage in SRPs but this outcome is less reliable. Its
t-statistic corresponds to a p-value of only 10.6%. This is consistent with the binary probit
models where cash flow was weakly related to SRPs relative to SEOs.

32
Again, our results confirm the staging considerations for SEO firms while agency problems
and conflicts of interest are more likely to force IPOs firms to engage in SRPs. Especially the
cash holdings as well as the cash flows generated by the firm’s operating activities turn out to
be pivotal for the decision to engage either in share repurchase programs or to seek new ex-
ternal finance in an SEO.
5. Conclusion
Entrepreneurial high-technology start-up firms usually need equity in order to finance their
research, product development, and in particular growth opportunities due to new ideas and
innovation. In an advanced stage they often require even larger financial resources and may
raise equity by going public (IPO) and, if successful, by a seasoned equity offering (SEO)
later on. If these are the typical financing stages then it is surprising when firms that just went
public start paying dividends or even repurchase shares. For a sample of 245 of entrepreneuri-
al firms that went public on the German stock market between 1997 and 2002 we investigate
the financing activities and payout policies within the first five years after going public. In our
empirical analysis we provide evidence that repurchasing firms have substantial and signifi-
cant positive announcement returns (9.23%) but no significant abnormal stock price perfor-
mance thereafter. Given that they underperformed the market for the 6-months period before
the event (-24.46%) we conclude that they did either sent a positive signal to the market or
reduced agency conflicts. For seasoned equity offerings we find a long term negative perfor-
mance for the year prior to the announcement (-11.55%) which continues in the subsequent
year (-30.20%). For the 30 day period before the SEO, we observe, however, a strong outper-
formance (7.63%) suggesting that management was able to time the market. Furthermore, in
probit models we provide strong evidence that the decision to engage in repurchase activities
is best explained by free cash flow problems rather than by undervaluation signaling. In addi-
tion, some evidence is found that IPO firms are more likely to announce a repurchase the
more pre-IPO owners tender into the IPO. A high participation ratio accelerates the dispersion
of ownership and exposes these IPOs more strongly to the market for corporate control. Thus,
corporate governance mechanisms become more effective when excess cash reserves are dis-
tributed. For SEOs, we argue that young entrepreneurial firms that just went public return to
the equity capital market to finance growth opportunities and innovations. This is revealed by
our empirical evidence for the cross-section of announcement returns. Additionally, our probit
models strongly support the notion of a staging strategy that may be demanded by certain in-
vestor groups. To minimize conflicts of interest and agency problems, additional funds are
only provided when there are actual financing needs and past investment projects were suc-
33
cessful. Overall, the cash position and the cash flows from operation turn out to be pivotal for
the decision to engage either in repurchasing shares or in issuing additional equity.
References
Autore, Don, David Bray, and David Peterson (2009), Intended Use of Proceeds and the Long-Run Performance of Seasoned Equity Issuers, Journal of Corporate Finance, 15, 358-367.
Autore, Don and Tunde Kovacs (2010), Equity Issues and Temporal Variation in Information Asym-metry, Journal of Banking & Finance, 34, 12-23.
Bayer, Walter, Thomas Hoffmann, and Dirk Weinmann (2007), Kapitalmarktreaktionen bei Ankündi-gung des Rückerwerbs eigener Aktien über die Börse, Zeitschrift für Unternehmens- und Ge-sellschaftsrecht, 36, 457-479.
Bessler, Wolfgang and Christoph Becker (2007). Underpricing und Performance von IPOs, in: Thießen, Friedrich (ed.): Enzyklopädisches Lexikon für das Geld, Bank und Börsenwesen, Frankfurt, Fritz Knapp Verlag.
Bessler, Wolfgang, Christoph Becker, and Daniil Wagner (2009), The Design and Success of Stock Options Plans for New Economy Firms in Germany, The Journal of Entrepreneurial Finance & Business Ventures, 12, 1-34.
Bessler, Wolfgang and Claudia Bittelmeyer (2007), Performance and Survival of Technology Firms: The Impact of Intellectual Property, in: Dowling, Michael and Jürgen Schmude (eds.): Empiri-cal Entrepreneurship in Europe – New Perspectives, Cheltenham, UK, Edward Elgar, 155-176.
Bessler, Wolfgang and Claudia Bittelmeyer (2008), Patents and the Performance of Technology Firms: Evidence from Initial Public Offerings in Germany, Financial Markets and Portfolio Management, 22, 323-356.
Bessler, Wolfgang, Wolfgang Drobetz, and Julian Holler (2009a), Capital Markets and Corporate Control: Empirical Evidence from Hedge Funds Activism in Germany, Working Paper, Univer-sity of Giessen.
Bessler, Wolfgang, Wolfgang Drobetz, and Julian Holler (2009b), The Returns to Hedge Fund Activ-ism in Germany, Working Paper, University of Giessen.
Bessler, Wolfgang, Wolfgang Drobetz, and Pascal Pensa (2008), Do Managers Adjust the Capital Structure to Market Value Changes? Evidence from Europe, Zeitschrift für Betriebswirtschaft, 6/2008, 113-145.
Bessler, Wolfgang, Wolfgang Drobetz, and Martin Seim (2009), Motives and Valuation Effects of Share Repurchase Announcements in Germany: A Comparison of Established Firms and Initial Public Offerings, Working Paper, University of Giessen.
Bessler, Wolfgang and Andreas Kurth (2004), Finanzierungsstrukturen von Neuemissionen, Finanz Betrieb, 59-69.
Bessler, Wolfgang and Andreas Kurth (2007), Agency Problems and the Performance of Venture-backed IPOs in Germany, European Journal of Finance, 13, 29-63.
Bessler, Wolfgang, Andreas Kurth, and Stefan Thies (2003), Grundsätzliche Überlegungen zur Kapi-tal- und Aktionärsstruktur beim Börsengang von jungen Wachstumsunternehmen, Finanz Be-trieb, 651-665.
Bessler, Wolfgang and Matthias Stanzel (2009), Conflicts of Interest and Research Quality of Affi-liated Analysts: Evidence from IPO Underwriting; European Financial Management, 15, 757-786.

34
Bessler, Wolfgang and Stefan Thies (2007a), Initial Public Offerings, Subsequent Seasoned Equity Offerings, and Long-Run Performance: Evidence from IPOs in Germany, The Journal of Entre-preneurial Finance & Business Ventures, 10, 1-37.
Bessler, Wolfgang, and Stefan Thies (2007b), The Long-Run Performance of Initial Public Offerings in Germany, Managerial Finance, 33, 420-441.
Carslon, Murray, Adlai Fisher, and Ron Giammarino (2006), Corporate Investment and Asset Price Dynamics: Implications for SEO Event Studies and Long-Run Performance, The Journal of Finance, 61, 1009-1034.
Chen, Sheng-Syan, Kim Wai Ho, and Yanzhi Wang (2008), Payout Behavior of Initial Public Offer-ings, Working Paper, University of Tapei.
Comment, Robert and Gregg Jarrell (1991), The Relative Signaling Power of Dutch-Auction and Fixed-Price Self-Tender Offers and Open Market Share Repurchases, The Journal of Finance, 46, 1243-1271.
Cosh, Andy, Douglas Cumming, and Alan Hughes (2009), Outside Entrepreneurial Capital, The Eco-nomic Journal, 119, 1494-1533.
Denis, David and Valeriy Sibilkov (2010), Financial Constraints, Investment, and the Value of Cash Holdings, The Review of Financial Studies, forthcoming.
DeAngelo, Harry, Linda DeAngelo, and René Stulz (2010), Seasoned Equity Offerings, Market Tim-ing, and the Corporate Lifecycle, Journal of Financial Economics, 95, 275-295.
Dittmar, Amy (2000), Why Do Firms Repurchase Stock? Journal of Business, 73, 331-355.
Eckbo, B. Espen, Ronald Masulis, and Oyvind Norli (2007), Security Offerings, in: Eckbo, B. Espen (ed.): Handbook of Corporate Finance: Empirical Corporate Finance, Volume 1, Elsevier, North-Holland, 233-373.
Gerke, Wolfgang, Jörg Fleischer, and Martin Langer (2003), Kurseffekte durch Aktienrückkäufe – eine empirische Untersuchung für den deutschen Kapitalmarkt, in: Börsig, C. and A.G. Coenenberg, (eds.): Bewertung von Unternehmen: Strategie – Markt – Risiko, Kongress-Dokumentation, Deutscher Betriebswirtschafter-Tag 2002, 56, 275-304.
Gong, Guojin, Henock Louis, and Amy Sun (2008), Earnings Management and Firm Performance Following Open-Market Repurchases, The Journal of Finance, 63, 947-986.
Greene, William (2002), Econometric Analysis, Prentice Hall.
Grullon, Gustavo and Roni Michaely (2002), Dividends, Share Repurchases, and the Substituion Hy-pothesis, Journal of Finance, 57, 1649-1684.
Grullon, Gustavo and Roni Michaely (2004), The Information Content of Share Repurchase Programs, The Journal of Finance, 59, 651-680.
Hackethal, Andreas and Alexandre Zdantchouk (2006), Signaling Power of Open Market Share Re-purchases in Germany, Financial Markets and Portfolio Management, 20, 123-151.
Hertzel, Michael, Mark Huson, and Robert Parrino (2009), Public Market Staging: The Timing of Capital Infusions in Newly Public Firms, Working Paper, Arizona State University.
Hsieh, Jim and Qinghai Wang (2008), Insiders’ Tax Preferences and Firms’ Choices between Divi-dends and Share Repurchases, Journal of Financial and Quantitative Analysis, 43, 213-244.
Ikenberry, David, Josef Lakonishok, and Theo Vermaelen (1995), Market Underreaction to Open Market Repurchases, Journal of Financial Economics, 39, 181-208.
Ikenberry, David, Josef Lakonishok, and Theo Vermaelen (2000), Stock Repurchases in Canada: Per-formance and Strategic Trading, The Journal of Finance, 55, 2373-2397.

35
Jagannathan, Murali, Clifford Stephens, and Michael Weisbach (2000), Financial Flexibility and the Choice between Dividends and Stock Repurchases, Journal of Financial Economics, 57, 355-384.
Jain, Bharat, Chander Shekhar, and Violet Torbey (2009), Payout Initiation by IPO Firms: The Choice between Dividends and Share Repurchases, The Quarterly Review of Economics and Finance, 49, 1275-1297.
Jensen, Michael (1986), Agency Costs of Free Cash Flow, Corporate Finance, and Takeovers, Ameri-can Economic Review, 76, 323-329.
Jensen, Michael and William Meckling (1976), Theory of the Firm: Managerial Behavior, Agency Costs and Ownership Structure, Journal of Financial Economics, 3, 305–360.
Kahle, Kathleen (2002), When a Buyback isn’t a Buyback: Open Market Repurchases and Employee Options, Journal of Financial Economics, 63, 235-261.
Koerniadi, Hardjo, Ming-Hua Liu, and Alireza Tourandi-Rad (2007), Share Repurchases in New Zeal-and, in: Hirschey , M., , K. John, and A. K. Makhija (eds.): Issues in Corporate Governance and Finance. Advances in Financial Economics, 12, 481-498.
Kurth, Andreas (2005), Agency-Probleme and Performance von Initial Public Offerings, DUV, Wies-baden.
Ljungqvist, Alexander (1997), Pricing Initial Public Offerings: Further Evidence from Germany, Eu-ropean Economic Review, 41, 1309-1320.
Li, Kai and William McNally (1999), Information Signaling or Agency Conflicts: What Explains Ca-nadian Open Market Share Repurchases? Working Paper, University of British Columbia.
Liljeblom, Eva and Daniel Pasternack (2006), Share Repurchases, Dividends and Executive Options: the Effect of Dividend Protection, European Financial Management, 12, 7-28.
Lyon, John, Brad Barber, and Chih-Ling Tsai (1999), Improved Methods for Tests of Long-Run Ab-normal Stock Returns, The Journal of Finance, 54, 165-201.
Masulis, Ronald (1980), Stock Repurchases by Tender Offer: An Analysis of the Causes of Common Stock Price Changes, Journal of Finance, 35, 305-321.
Maxwell, William and Clifford Stephens (2003), The Wealth Effects of Repurchases on Bondholders, The Journal of Finance, 63, 896-919.
Mitchell, Jason, H.Y. Izan, and Roslinda Lim (2006), Australian On-Market Buy-backs: An Examina-tion of Valuation Issues, Multinational Finance Journal, 10, 43-79.
Modigliani, Franco and Merton Miller (1958), The Cost of Capital, Corporation Finance and the Theory of Investment, American Economic Review, 48, 261-297.
Myers, Stewart and and Nicholas S. Majluf (1984), Corporate Financing and Investment Decisions when Firms Have Information that Investors Do not Have, Journal of Financial Economics, 13, 187-221.
Nohel, Tom and Vefa Tarhan (1998), Share Repurchases and Firm Performance: New Evidence on the Agency Costs of Free Cash Flow, Journal of Financial Economics, 49, 187-222.
Oswald, Dennis and Steven Young (2008), Share Reacquisitions, Surplus Cash, and Agency Prob-lems, Journal of Banking and Finance, 32, 795-806.
Peyer, Urs and Theo Vermaelen (2005), The Many Facets of Privately Negotiated Stock Repurchases, Journal of Financial Economics, 75, 361-395.
Peyer, Urs and Theo Vermaelen (2009), The Nature and Persistence of Buyback Anomalies, The Re-view of Financial Studies, 22, 1693-1745.
Ritter, Jay (1991), The Long-Run Performance of Initial Public Offerings, The Journal of Finance, 46, 3-27.

36
Schuster, Josef (1996), Underpricing and Crises - IPO Performance in Germany, Working Paper, Lon-don School of Economics.
Skinner, Douglas (2008), The evolving Relation between Earnings, Dividends, and Stock Repurchas-es, Journal of Financial Economics, 87, 582-609.
Stehle, Richard, Olaf Ehrhardt und René Przyborowsky (2000), Long-Run Stock Performance of German Initial Public Offerings and Seasoned Equity Issues, European Financial Management, 6, 173-196.
Stulz, René (1988), Managerial Control of Voting Rights: Financing Policies and the Market for Cor-porate Control, Journal of Financial Economics, 20, 25-54.
Seifert, Udo and Richard Stehle (2003), Stock Performance around Share Repurchase Announcements in Germany, Working Paper, Humboldt University Berlin.
Teoh, Siew Hong, Ivo Welch, and T.J. Wong (1998), Earnings Management and the Underperfor-mance of Seasoned Equity Offerings, Journal of Financial Economics, 50, 63-99.
Vermaelen, Theo (1981), Common Stock Repurchases and Market Signaling, Journal of Financial Economics, 9, 139-183.
Vermaelen, Theo (2005), Share Repurchases, Foundations and Trends in Finance, 1, 171-268.
von Eije, Henk and William Megginson (2008), Dividends and Share Repurchases in the European Union, Journal of Financial Economics, 89, 347-374.
Welch, Ivo (1989), Seasoned Offerings, Imitation Costs and the Underpricing of Initial Public Offer-ings, The Journal of Finance, 44, 421-449.
Welch, Ivo (2004), Capital Structure and Stock Returns, Journal of Political Economy, 112, 106-131.
White, Halbert (1980), A Heteroskedasticity-Consistent Covariance Matrix Estimator and a Direct Test for Heteroskedasticity, Econometrica, 48, 817-838.
Wilcoxon, Frank (1945), Individual Comparisons by Ranking Methods, Biometrics Bulletin, 1, 80-83.
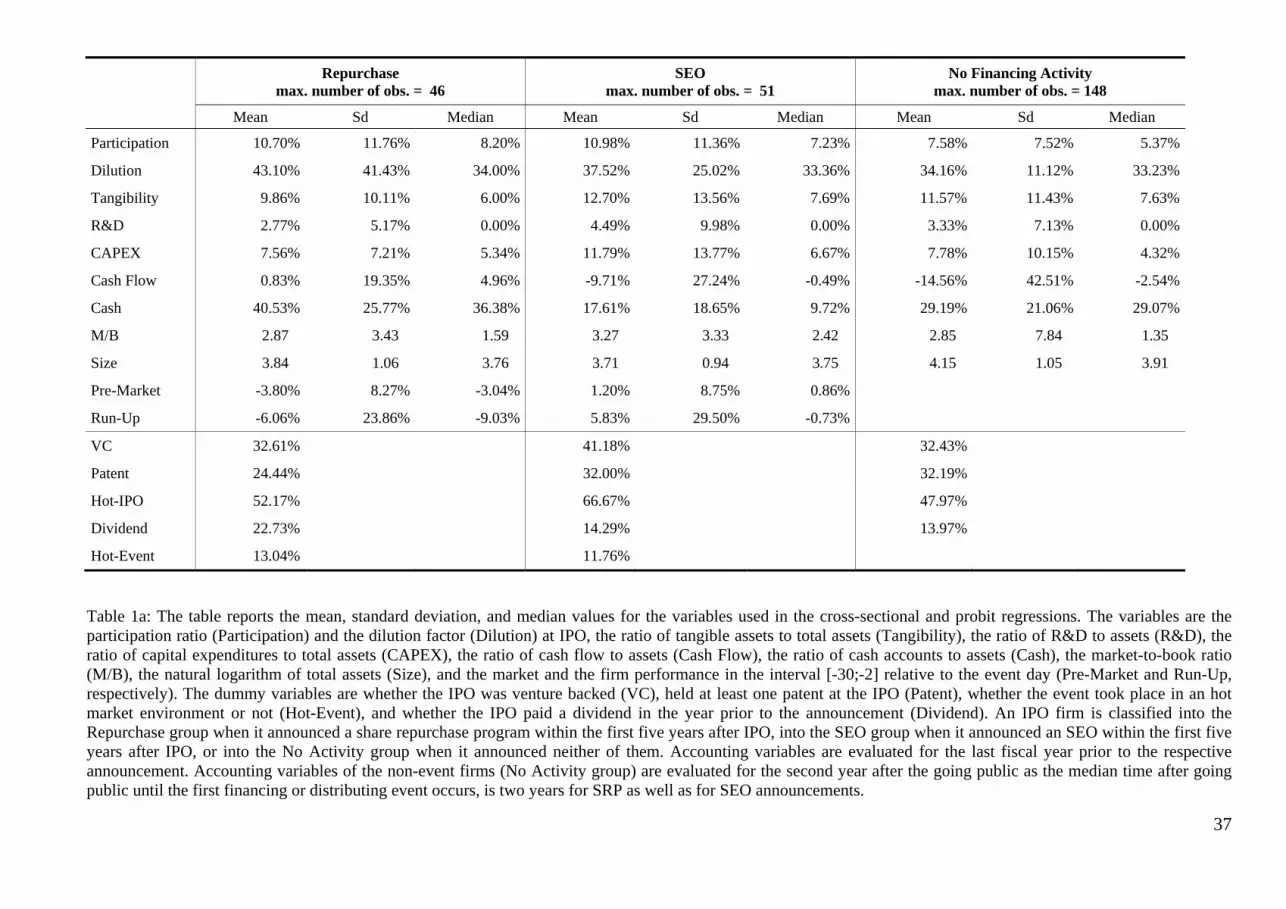
37
Repurchase
max. number of obs. = 46 SEO
max. number of obs. = 51 No Financing Activity
max. number of obs. = 148
Mean Sd Median Mean Sd Median Mean Sd Median
Participation 10.70% 11.76% 8.20% 10.98% 11.36% 7.23% 7.58% 7.52% 5.37%
Dilution 43.10% 41.43% 34.00% 37.52% 25.02% 33.36% 34.16% 11.12% 33.23%
Tangibility 9.86% 10.11% 6.00% 12.70% 13.56% 7.69% 11.57% 11.43% 7.63%
R&D 2.77% 5.17% 0.00% 4.49% 9.98% 0.00% 3.33% 7.13% 0.00%
CAPEX 7.56% 7.21% 5.34% 11.79% 13.77% 6.67% 7.78% 10.15% 4.32%
Cash Flow 0.83% 19.35% 4.96% -9.71% 27.24% -0.49% -14.56% 42.51% -2.54%
Cash 40.53% 25.77% 36.38% 17.61% 18.65% 9.72% 29.19% 21.06% 29.07%
M/B 2.87 3.43 1.59 3.27 3.33 2.42 2.85 7.84 1.35
Size 3.84 1.06 3.76 3.71 0.94 3.75 4.15 1.05 3.91
Pre-Market -3.80% 8.27% -3.04% 1.20% 8.75% 0.86%
Run-Up -6.06% 23.86% -9.03% 5.83% 29.50% -0.73%
VC 32.61% 41.18% 32.43%
Patent 24.44% 32.00% 32.19%
Hot-IPO 52.17% 66.67% 47.97%
Dividend 22.73% 14.29% 13.97%
Hot-Event 13.04% 11.76%
Table 1a: The table reports the mean, standard deviation, and median values for the variables used in the cross-sectional and probit regressions. The variables are the participation ratio (Participation) and the dilution factor (Dilution) at IPO, the ratio of tangible assets to total assets (Tangibility), the ratio of R&D to assets (R&D), the ratio of capital expenditures to total assets (CAPEX), the ratio of cash flow to assets (Cash Flow), the ratio of cash accounts to assets (Cash), the market-to-book ratio (M/B), the natural logarithm of total assets (Size), and the market and the firm performance in the interval [-30;-2] relative to the event day (Pre-Market and Run-Up, respectively). The dummy variables are whether the IPO was venture backed (VC), held at least one patent at the IPO (Patent), whether the event took place in an hot market environment or not (Hot-Event), and whether the IPO paid a dividend in the year prior to the announcement (Dividend). An IPO firm is classified into the Repurchase group when it announced a share repurchase program within the first five years after IPO, into the SEO group when it announced an SEO within the first five years after IPO, or into the No Activity group when it announced neither of them. Accounting variables are evaluated for the last fiscal year prior to the respective announcement. Accounting variables of the non-event firms (No Activity group) are evaluated for the second year after the going public as the median time after going public until the first financing or distributing event occurs, is two years for SRP as well as for SEO announcements.

38
t-test Wilcoxon z-Score
Repurchase vs.
No Activity
SEO vs.
No Activity
Repurchase vs.
SEO
Repurchase vs.
No Activity
SEO vs.
No Activity
Repurchase vs.
SEO
Participation 2.121** 2.417** -0.120 1.445 1.586 -0.181
Dilution 2.376** 1.304 0.813 1.126 0.616 0.520
Tangibility -0.904 0.572 -1.158 -0.969 0.123 -1.076
R&D -0.486 0.888 -1.046 0.048 -0.303 0.263
CAPEX -0.135 2.100** -1.813* 0.683 1.271 -0.662
Cash Flow 2.345** 0.757 2.158** 3.542*** 0.394 2.272**
Cash 2.985*** -3.455*** 5.051*** 2.528** -3.619*** 4.486***
M/B 0.016 0.347 -0.533 1.030 -2.650*** -1.185
Size -1.756* -2.627*** 0.614 -1.531 -2.046** 0.354
Table 1b: The table reports the t-statistics and z-scores for the two-sample t-test and the Wilcoxon rank-sum test, respectively. The variables are the participation ratio (Participation) and the dilution factor (Dilution) at IPO, the ratio of tangible assets to total assets (Tangibility), the ratio of R&D to assets (R&D), the ratio of capital expenditures to total assets (CAPEX), the ratio of cash flow to assets (Cash Flow), the ratio of cash accounts to assets (Cash), the market-to-book ratio (M/B), and the natural logarithm of total assets (Size). For the mean and median values of the variables see Table 1a. An IPO firm is classified into the Repurchase group when it announced a share repurchase program within the first five years after IPO, into the SEO group when it announced an SEO within the first five years after IPO, or into the No Activity group when it announced neither of them. Accounting variables are evaluated for the last fiscal year prior to the respective announcement. Accounting variables of the non-event firms (No Activity group) are evaluated for the second year after the going public as the median time after going public until the first financing or distributing event occurs, is two years for SRP as well as for SEO announcements. *, **, *** represent the 10%, 5%, and 1% significance level, respectively.

39
Repurchase, n=46 SEO, n=51 CAR t-stat z-score CAR t-stat z-score
interval Mean Median skew-adj signed-rank Mean Median skew-adj signed-rankPanel A: Intervals around the event
CAR [-1; 1] 8.61%*** 6.99%*** (3.050) (4.802) 4.04%** 0.11% (2.340) (1.603) CAR [-3; 3] 9.23%*** 11.65%*** (2.880) (3.600) 3.00% -0.77% (1.370) (0.225) CAR [-5; 5] 7.38% 6.24%*** (1.570) (2.791) 2.56% -0.02% (0.960) (0.150) CAR [-30; 30] -0.09% 0.02% (-0.170) (0.961) 5.25% 1.96% (0.900) (0.403) CAR [-60; 60] -13.63%** -12.37%* (-2.080) (-1.906) 2.10% 1.50% (0.300) (0.300)
Panel B: Intervals prior to event, excluding the event CAR [-3; -1] 1.11% 2.01% (0.720) (0.967) 0.55% -0.59% (0.360) (-0.394) CAR [-5; -1] 0.21% -0.06% (0.120) (-0.115) 0.32% 0.29% (0.180) (0.141) CAR [-30; -1] -5.61% -8.76% (-1.300) (-1.644) 7.63%* 3.29%* (1.870) (1.706) CAR [-60; -1] -14.86%*** -15.01%*** (-3.150) (-2.835) 6.33% 6.19% (0.980) (0.815)
Panel C: Intervals after the event, including the event CAR [-1; 5] 7.18%** 4.63%*** (2.060) (2.999) 2.24% 0.41% (1.010) (0.281) CAR [-1; 10] 6.08%* 4.68%** (1.880) (2.256) 0.62% -3.98% (0.270) (-0.750) CAR [-1; 30] 4.73% 3.06% (0.980) (1.317) -2.34% -4.28%* (-0.410) (-1.762) CAR [-1; 60] 1.23% 6.81% (0.220) (0.737) -4.24% -4.22% (-0.860) (-1.312)
Panel D: Intervals after the event, excluding the event CAR [1; 5] -1.01% 0.34% (-0.610) (-0.322) -1.50% -3.19%* (-1.050) (-1.856) CAR [1; 10] -2.11% -3.68% (-1.050) (-0.934) -3.11%* -4.81%** (-1.940) (-2.390) CAR [1; 30] -3.45% -2.00% (-0.730) (-0.650) -6.12% -4.71%** (-1.000) (-2.475) CAR [1; 60] -6.96% -0.41% (-1.420) (-0.912) -7.97% -8.98%** (-1.510) (-2.137)
Table 2: The table reports the mean cumulative abnormal returns for the two subsamples of repurchase announcements (n=46) and SEO announcements (n=51). Panel A shows the intervals around the event data, Panel B shows the intervals prior to the event, in Panel C the intervals after the event data are presented when the event is included in the calculation of the CAR, and Panel D represents the intervals after the event when the event is excluded. The values in the columns “t-stat” and “z-score” indicate the t-statistic of the bootstrapped skewness adjusted t-test and the z-score of the Wilcoxon (1945) signed-rank median test, respectively. *, **, *** represent the 10%, 5%, and 1% significance level, respectively.

40
Repurchase
min. number of obs. n=39 SEO
min. number of obs. n=39
BHAR t-stat z-score BHAR t-stat z-score interval Mean Median skew-adj signed-rank Mean Median skew-adj signed-rank
Panel A: Intervals around the event BHAR [-30; 125] -2.36% -5.76% (-0.220) (-1.164) -18.65%** -24.39%*** (-2.340) (-3.018) BHAR [-125; 125] -18.68% -28.14%*** (-0.800) (-3.502) -29.13% -35.95%*** (-1.300) (-4.083) BHAR [-250; 250] -15.52% -38.31%** (-0.910) (-2.526) -23.88% -44.56%*** (-0.360) (-3.600)
Panel B: Intervals before the event, excluding the event BHAR [-30; -1] -5.79% -9.24%** (-1.310) (-2.147) 6.17% 0.43% (1.460) (1.040) BHAR [-125; -1] -24.46%*** -29.79*** (-4.740) (-4.275) -8.93% -15.51%** (-0.800) (-2.134) BHAR [-250; -1] -21.73%*** -34.33%*** (-2.740) (-2.931) -11.55% -41.46% (-0.830) (-1.340)
Panel C: Intervals after the event, excluding the event BHAR [1; 125] -3.22% -8.72% (-0.530) (-0.683) -26.39%*** -29.45%*** (-3.550) (-4.667) BHAR [1; 250] -12.03% -26.42%** (-1.000) (-2.507) -30.20% -39.00%*** (-1.230) (-4.199)
Panel D: Intervals after the event, including the event BHAR [-1; 125] 4.47% 5.57% (0.710) (0.486) -24.79%*** -24.39%*** (-3.160) (-4.481) BHAR [-1; 250] -5.31% -18.78%* (-0.430) (-1.677) -29.70% -40.19%*** (-1.370) (-4.171)
Table 3: The table reports the mean buy-and-hold abnormal returns for the two subsamples of repurchase announcements and SEO announcements. The sample size diminishes to a minimum number n=39 repurchase announcements and n=39 SEO announcements due to missing returns history. Panel A reports the BHAR around the event, in Panel B the intervals before the event are presented, excluding the event, Panel C and D represent the BHAR after the event. While in Panel C the event is excluded, in Panel D the event is included. The values in the columns “t-stat” and “z-score” indicate the t-statistic of the bootstrapped skewness adjusted t-test and the z-score of the Wilcoxon (1945) signed-rank median test, respectively. *, **, *** represent the 10%, 5%, and 1% significance level, respectively.

41
Dependent Variable: CAR [-1; 1] of Repurchase announcements indep. var. Model I const adj. R2 F-Test N
Hot-Event -0.0511* 0.0928*** 0.73% 3.1697 46 (-1.7804) (5.5225)
VC -0.0220 0.0933*** -1.20% 0.4602 46 (-0.6784) (5.1179)
Patent 0.0201 0.0837*** -1.56% 0.4551 45 (0.6746) (4.4834)
Size -0.0094 0.1223 -1.28% 0.2095 46 (-0.4577) (1.5803)
Tangibility 0.149 0.0714*** -0.02% 1.9550 46 (1.3982) (3.4457)
R&D 0.4887* 0.0725*** 4.05% 2.9209 46 (1.7091) (4.2494)
CAPEX 0.1002 0.0812*** -1.86% 0.2921 44 (0.5405) (3.3529)
Cash Flow -0.2184*** 0.0913*** 15.92% 13.0568 45 (-3.6134) (6.7109)
Cash 0.0635 0.0604** 0.38% 1.3675 46 (1.1694) (2.5118)
Pre-Market -0.0725 0.1559 -1.92% 0.3266 46 (-0.5715) (1.2626)
Run-Up -0.0739 0.0816*** 0.81% 1.2341 46 (-1.1109) (6.2288)
Dividend -0.0354 0.0969*** -0.13% 2.1038 44 (-1.4505) (5.0309)
Table 4a: The table reports the results for the OLS cross-sectional regressions with White (1980) standard errors depending on one single explanatory variable. The cumulative abnormal returns of repurchase announcements for the days [-1; 1] is the dependent variable. The explanatory variables are whether the event took place in an hot market environment or not (Hot-Event), whether the IPO was venture backed (VC), held at least one patent at the IPO (Patent), the natural logarithm of total assets (Size), the ratio of tangible assets to total assets (Tangibility), the ratio of R&D to assets (R&D), the ratio of capital expenditures to total assets (CAPEX), the ratio of cash flow to assets (Cash Flow), the ratio of cash accounts to assets (Cash), the market and the firm performance in the interval [-30; -2] relative to the event day (Pre-Market and Run-Up, respectively) and whether the IPO paid a dividend in the year prior to the announcement (Dividend). Accounting variables are evaluated for the last fiscal year prior to the announcement. The sample size varies due to missing values for some of the variables. Accounting variables are evaluated for the last fiscal year prior to the announcement. The sample size varies slightly due to missing values for some of the variables. *, **, *** represent the 10%, 5%, and 1% significance level, respectively. Values in parentheses indicate t-statistics.

42
Dependent Variable: CAR [-1; 1] of Repurchase announcements
Model II Model III Model IV
indep. var. coefficient t-statistic coefficient t-statistic coefficient t-statistic
Hot-Event -0.0951*** (-2.9954) -0.0622* (-1.9998)
VC -0.0212 (-0.7214) -0.0202 (-0.7168)
Patent -0.0013 (-0.0462) 0.0065 (0.1924)
Size -0.0184 (-0.8600) -0.0138 (-0.6098)
Tangibility 0.0752 (0.4495) 0.1321 (0.8809)
R&D 0.5073* (1.9700) 0.0157 (0.0627)
CAPEX 0.1261 (0.6916) 0.1002 (0.5551)
Cash Flow
-0.2446*** (-3.1405) -0.2415*** (-3.1149)
Cash
-0.0176 (-0.2827) -0.0153 (-0.1698)
Pre-Market
-0.0771 (-0.4337) -0.0298 (-0.1258)
Run-Up
-0.1058* (-1.9379) -0.0834 (-1.3523)
Dividend
-0.0038 (-0.1420) 0.0094 (0.2310)
const 0.1493* (1.8760) 0.1669 (1.0235) 0.1663 (0.6706)
adj. R2 3.09% 14.94% 7.03%
F-Test 2.7012 4.4178 3.8523
N 43 44 43
Table 4b: The table reports the results for the OLS cross-sectional regressions with White (1980) standard errors depending on different model specifications. The cumulative abnormal returns of repurchase announcements for the days [-1; 1] is the dependent variable. The explanatory variables are whether the event took place in an hot market environment or not (Hot-Event), whether the IPO was venture backed (VC), held at least one patent at the IPO (Patent), the natural logarithm of total assets (Size), the ratio of tangible assets to total assets (Tangibility), the ratio of R&D to assets (R&D), the ratio of capital expenditures to total assets (CAPEX), the ratio of cash flow to assets (Cash Flow), the ratio of cash accounts to assets (Cash), the market and the firm performance in the interval [-30; -2] relative to the event day (Pre-Market and Run-Up, respectively) and whether the IPO paid a dividend in the year prior to the announcement (Dividend). Accounting variables are evaluated for the last fiscal year prior to the announcement. The sample size varies due to missing values for some of the variables. Accounting variables are evaluated for the last fiscal year prior to the announcement. The sample size varies slightly due to missing values for some of the variables. *, **, *** represent the 10%, 5%, and 1% significance level, respectively. Values in parentheses indicate t-statistics.

43
Dependent Variable: CAR [-1; 1] of SEO announcements indep. var. Model I const adj. R2 F-Test N
Hot-Event -0.0294 0.0438* -1.69% 0.8642 51 (-0.9296) (1.6870)
VC -0.0231 0.0499 -1.54% 0.3069 51 (-0.554) (1.3674)
Patent 0.0927 0.0119 5.12% 1.9953 50 (1.4125) (0.8375)
Size -0.016 0.1000** -1.18% 1.5345 51 (-1.2387) (2.1653)
Tangibility 0.2176 0.0128 1.30% 0.4812 51 (0.6937) (0.4671)
R&D 0.0015 0.0403 -2.04% 0.0002 51 (0.0125) (1.4936)
CAPEX -0.1835 0.0676 0.02% 1.2528 46 (-1.1193) (1.6687)
Cash Flow -0.1145 0.0293 1.69% 1.4974 51 (-1.2237) (1.6678)
Cash 0.0320 0.0348 -1.90% 0.0937 51 (0.3061) (1.0208)
Pre-Market 0.3611 -0.3250 1.79% 2.2722 51 (1.5074) (-1.3425)
Run-Up 0.0056 0.0401* -2.03% 0.0175 51 (0.1325) (1.6780)
Dividend -0.0340 0.0470* -1.59% 0.8680 49 (-0.9317) (1.7068)
Table 5a: The table reports the results for the OLS cross-sectional regressions with White (1980) standard errors depending on one single explanatory variable. The cumulative abnormal returns of SEO announcements for the days [-1; 1] is the dependent variable. The explanatory variables are whether the event took place in an hot market environment or not (Hot-Event), whether the IPO was venture backed (VC), held at least one patent at the IPO (Patent), the natural logarithm of total assets (Size), the ratio of tangible assets to total assets (Tangibility), the ratio of R&D to assets (R&D), the ratio of capital expenditures to total assets (CAPEX), the ratio of cash flow to assets (Cash Flow), the ratio of cash accounts to assets (Cash), the market and the firm performance in the interval [-30; -2] relative to the event day (Pre-Market and Run-Up, respectively) and whether the IPO paid a dividend in the year prior to the announcement (Dividend). Accounting variables are evaluated for the last fiscal year prior to the announcement. The sample size varies due to missing values for some of the variables. Accounting variables are evaluated for the last fiscal year prior to the announcement. The sample size varies slightly due to missing values for some of the variables. *, **, *** represent the 10%, 5%, and 1% significance level, respectively. Values in parentheses indicate t-statistics.

44
Dependent Variable: CAR [-1; 1] of SEO announcements
Model II Model III Model IV
indep. var. coefficient t-statistic coefficient t-statistic coefficient t-statistic
Hot-Event -0.0292 (-0.7637) 0.0080 (0.1716)
VC -0.0479 (-0.7111) -0.0625 (-0.8877)
Patent 0.1137 (1.4723) 0.1742 (1.6620)
Size -0.0128 (-0.5075) -0.0159 (-0.5624)
Tangibility 0.2669 (0.7419) 0.2094 (0.6237)
R&D -0.1895 (-1.0851) -0.2412 (-0.9467)
CAPEX -0.2140 (-0.9583) -0.1750 (-0.9473)
Cash Flow -0.1105 (-0.9068) -0.0950 (-0.6540)
Cash
-0.0447 (-0.2936) -0.1891 (-0.7737)
Pre-Market
0.3522 (1.3953) 0.5851** (2.3705)
Run-Up
0.0001 (0.0033) -0.0330 (-0.5484)
Dividend
-0.0189 (-0.6421) -0.0492 (-0.7464)
const 0.0804 (0.9172) -0.3156 (-1.2266) -0.4810 (-1.6741)
adj. R2 2.74% -3.53% 2.95%
F-Test 0.5923 0.7902 1.1969
N 45 49 45
Table 5b: The table reports the results for the OLS cross-sectional regressions with White (1980) standard errors depending on different model specifications. The cumulative abnormal returns of SEO announcements for the days [-1; 1] is the dependent variable. The explanatory variables are whether the event took place in an hot market environment or not (Hot-Event), whether the IPO was venture backed (VC), held at least one patent at the IPO (Patent), the natural logarithm of total assets (Size), the ratio of tangible assets to total assets (Tangibility), the ratio of R&D to assets (R&D), the ratio of capital expenditures to total assets (CAPEX), the ratio of cash flow to assets (Cash Flow), the ratio of cash accounts to assets (Cash), the market and the firm performance in the interval [-30; -2] relative to the event day (Pre-Market and Run-Up, respectively) and whether the IPO paid a dividend in the year prior to the announcement (Dividend). Accounting variables are evaluated for the last fiscal year prior to the announcement. The sample size varies due to missing values for some of the variables. Accounting variables are evaluated for the last fiscal year prior to the announcement. The sample size varies slightly due to missing values for some of the variables. *, **, *** represent the 10%, 5%, and 1% significance level, respectively. Values in parentheses indicate t-statistics.

45
Dependent Variable: Binary Variable 1 for Repurchase Announcement, zero otherwise
indep. var. Model I const Pseudo R2 Chi2 N
VC 0.0047 -0.7171*** 0.00% 0.0005 194 (0.0223) (-5.9575)
Patent -0.2223 -0.6568*** 0.48% 1.0053 191 (-0.9952) (-5.5835)
Hot-IPO 0.0985 -0.7647*** 0.12% 0.2478 194 (0.4977) (-5.4503)
Participation 2.1647** -0.9061*** 1.89% 4.0153 194 (1.9864) (-6.5047)
Dilution 1.1089* -1.1217*** 2.34% 4.9725 194 (1.7609) (-4.5388)
Size -0.0246 -0.5727 0.03% 0.0663 184 (-0.2573) (-1.4052)
Tangibility -0.9145 -0.5761*** 0.43% 0.8866 184 (-0.9263) (-3.9783)
R&D -1.3617 -0.6350*** 0.31% 0.6499 184 (-0.7783) (-5.686)
CAPEX -0.989 -0.5905*** 0.31% 0.6433 181 (-0.7755) (-4.3813)
Cash Flow 0.8295* -0.6019*** 2.33% 4.8018 182 (1.8763) (-5.7253)
Cash 0.625 -0.8707*** 0.89% 1.8326 184 (1.3523) (-4.8824)
M/B -0.0100 -0.6491*** 0.15% 0.2937 180 (-0.4833) (-5.7296)
Dividend 0.4680* -0.7549*** 1.61% 3.3232 182 (1.8349) (-6.6631)
Table 6a: The table reports the results for the probit model estimation whether a German IPO from the Neuer Markt is more likely to announce a repurchase depending on one single explanatory variable. The explanatory variables are whether the IPO was venture backed (VC), held at least one patent at the IPO (Patent), whether the IPO took place in a hot market environment (Hot-IPO), the participation ratio (Participation) and the dilution factor (Dilution) at IPO, the natural logarithm of total assets (Size), the ratio of tangible assets to total assets (Tangibility), the ratio of R&D to assets (R&D), the ratio of capital expenditures to total assets (CAPEX), the ratio of cash flow to assets (Cash Flow), the ratio of cash accounts to assets (Cash), the market-to-book ratio (M/B), and whether the IPO paid a dividend in the year prior to the announcement (Dividend). Accounting variables are evaluated for the last fiscal year prior to the announcement. The sample size varies due to missing values for some of the variables. *, **, *** represent the 10%, 5%, and 1% significance level, respectively. Values in parentheses indicate t-statistics.

46
Dependent Variable: Binary Variable 1 for Repurchase Announcement, zero otherwise
Model II Model III Model IV
indep. var. coefficient t-statistic coefficient t-statistic coefficient t-statistic
VC -0.1745 (-0.7392) -0.0461 (-0.1830)
Patent -0.2917 (-1.2251) -0.2156 (-0.8084)
Hot-IPO 0.0750 (0.3484) 0.1649 (0.6588)
Participation 1.9891 (1.5961) 1.3773 (1.0321)
Dilution 1.1168 (1.5552) 1.4040* (1.6874)
Size -0.0429 (-0.4249) -0.1076 (-0.8785)
Tangibility
-0.0140 (-0.0121) -0.1237 (-0.0994)
R&D
-1.1392 (-0.5524) -0.8090 (-0.3451)
CAPEX
-0.3359 (-0.2452) -0.7719 (-0.5212)
Cash Flow
0.7895 (1.5673) 0.8693 (1.6130)
Cash
0.8736* (1.6754) 0.8070 (1.4302)
M/B
-0.0109 (-0.4209) -0.0119 (-0.4269)
Dividend
0.3911 (1.4518) 0.4184 (1.3655)
const -0.9839* (-1.8466) -0.8714*** (-3.1043) -0.9964 (-1.3808)
Pseudo R2 4.80% 5.43% 9.92%
Chi2 9.7387 10.8617 19.7354
N 181 176 174
Table 6b: The table reports the results for the probit model estimation whether a German IPO from the Neuer Markt is more likely to announce a repurchase depending on different model specifications. The explanatory variables are whether the IPO was venture backed (VC), held at least one patent at the IPO (Patent), whether the IPO took place in a hot market environment (Hot-IPO), the participation ratio (Participation) and the dilution factor (Dilution) at IPO, the natural logarithm of total assets (Size), the ratio of tangible assets to total assets (Tangibility), the ratio of R&D to assets (R&D), the ratio of capital expenditures to total assets (CAPEX), the ratio of cash flow to assets (Cash Flow), the ratio of cash accounts to assets (Cash), the market-to-book ratio (M/B), and whether the IPO paid a dividend in the year prior to the announcement (Dividend). Accounting variables are evaluated for the last fiscal year prior to the announcement. The sample size varies due to missing values for some of the variables. *, **, *** represent the 10%, 5%, and 1% significance level, respectively. Values in parentheses indicate t-statistics.

47
Dependent Variable: Binary Variable 1 for SEO Announcement, zero otherwise
indep. var. Model I const Pseudo R2 Chi2 N
VC 0.2244 -0.7363*** 0.01% 1.2597 199 (1.1246) (-6.0618)
Patent -0.0052 -0.6568*** 0.00% 0.0006 196 (-0.0251) (-5.5835)
Hot-IPO 0.4551** -0.9121*** 2.39% 5.4115 199 (2.3072) (-6.0469)
Participation 2.4399** -0.8729*** 2.33% 5.2709 199 (2.2722) (-6.3509)
Dilution 0.7257 -0.9113*** 0.66% 1.5036 199 (1.1716) (-3.8157)
Size -0.2740*** 0.4676 3.29% 7.2422 189 (-2.5921) (1.1036)
Tangibility 0.4489 -0.6674*** 0.14% 0.3171 189 (0.5645) (-4.8601)
R&D 1.0087 -0.6517*** 0.33% 0.7347 189 (0.8588) (-6.0467)
CAPEX 1.6922** -0.8208*** 1.93% 3.9679 181 (2.0047) (-6.3093)
Cash Flow 0.2310 -0.5767*** 0.30% 0.6660 187 (0.7790) (-5.5588)
Cash -1.7369*** -0.2022 5.51% 12.1344 189 (-3.3513) (-1.3209)
M/B 0.0052 -0.7035*** 0.06% 0.1270 179 (0.3666) (-6.3234)
Dividend 0.0155 -0.6306*** 0.00% 0.0030 185 (0.0544) (-5.8978)
Table 7a: The table reports the results for the probit model estimation whether a German IPO from the Neuer Markt is more likely to announce an SEO depending on one single explanatory variable. The explanatory variables are whether the IPO was venture backed (VC), held at least one patent at the IPO (Patent), whether the IPO took place in a hot market environment (Hot-IPO), the participation ratio (Participation) and the dilution factor (Dilution) at IPO, the natural logarithm of total assets (Size), the ratio of tangible assets to total assets (Tangibility), the ratio of R&D to assets (R&D), the ratio of capital expenditures to total assets (CAPEX), the ratio of cash flow to assets (Cash Flow), the ratio of cash accounts to assets (Cash), the market-to-book ratio (M/B), and whether the IPO paid a dividend in the year prior to the announcement (Dividend). Accounting variables are evaluated for the last fiscal year prior to the announcement. The sample size varies due to missing values for some of the variables. *, **, *** represent the 10%, 5%, and 1% significance level, respectively. Values in parentheses indicate t-statistics.

48
Dependent Variable: Binary Variable 1 for SEO Announcement, zero otherwise
Model II Model III Model IV
indep. var. coefficient t-statistic coefficient t-statistic coefficient t-statistic
VC 0.0234 (0.1039) 0.2004 (0.7679)
Patent 0.0609 (0.2628) 0.2288 (0.8734)
Hot-IPO 0.5505** (2.4453) 0.2008 (0.7226)
Participation 1.8636 (1.5004) 0.3507 (0.2326)
Dilution 0.9397 (1.3256) 1.2290 (1.3448)
Size -0.3167*** (-2.8108) -0.5139*** (-3.2680)
Tangibility 0.2609 (0.2765) 0.0069 (0.0067)
R&D 3.5708*** (2.6014) 4.0048** (2.4378)
CAPEX 0.9969 (1.0174) 1.4063 (1.2817)
Cash Flow 0.1478 (0.4673) 0.7112* (1.6973)
Cash -1.9784*** (-3.1753) -2.1931*** (-2.9715)
M/B -0.0039 (-0.2375) -0.0020 (-0.1186)
Dividend -0.1399 (-0.4209) -0.0106 (-0.0285)
const -0.2135 (-0.4030) -0.4649* (-1.8939) 0.8878 (1.0863)
Pseudo R2 9.07% 8.88% 18.96%
Chi2 19.6441 16.528 34.5153
N 186 171 168
Table 7b: The table reports the results for the probit model estimation whether a German IPO from the Neuer Markt is more likely to announce an SEO depending on different model specifications. The explanatory variables are whether the IPO was venture backed (VC), held at least one patent at the IPO (Patent), whether the IPO took place in a hot market environment (Hot-IPO), the participation ratio (Participation) and the dilution factor (Dilution) at IPO, the natural logarithm of total assets (Size), the ratio of tangible assets to total assets (Tangibility), the ratio of R&D to assets (R&D), the ratio of capital expenditures to total assets (CAPEX), the ratio of cash flow to assets (Cash Flow), the ratio of cash accounts to assets (Cash), the market-to-book ratio (M/B), and whether the IPO paid a dividend in the year prior to the announcement (Dividend). Accounting variables are evaluated for the last fiscal year prior to the announcement. The sample size varies due to missing values for some of the variables. *, **, *** represent the 10%, 5%, and 1% significance level, respectively. Values in parentheses indicate t-statistics.

49
Dependent Variable: Binary Variable 1 for Repurchase Announcement, zero for SEO Announcement
indep. var. Model I const Pseudo R2 Chi2 N
VC -0.2310 0.0205 0.57% 0.7632 97 (-0.8724) (0.1280)
Patent -0.2342 0.0000 0.51% 0.6680 95 (-0.8157) (0.0000)
Hot-IPO -0.3792 0.1614 1.58% 2.1177 97 (-1.4518) (0.8003)
Participation -0.1347 -0.0500 0.01% 0.0146 97 (-0.1210) (-0.2852)
Dilution 0.3311 -0.1968 0.52% 0.6942 97 (0.8059) (-0.9527)
Size 0.0799 -0.3664 0.29% 0.3834 97 (0.6179) (-0.7260)
Tangibility -1.2828 0.0789 1.03% 1.3890 97 (-1.1626) (0.4465)
R&D -1.8827 0.0013 0.89% 1.1968 97 (-1.0431) (0.0095)
CAPEX -2.3653* 0.1936 2.77% 3.4587 90 (-1.7816) (1.0810)
Cash Flow 1.2073** -0.0297 3.58% 4.7448 96 (2.1186) (-0.2260)
Cash 2.6555*** -0.8064*** 16.54% 22.2009 97 (4.3994) (-3.7987)
M/B -0.0225 -0.0392 0.26% 0.2905 81 (-0.5383) (-0.2066)
Dividend 0.3553 -0.1323 0.86% 1.1069 93 (1.0483) (-0.9174)
Table 8a: The table reports the results for the probit model estimation whether a German IPO from the Neuer Markt is more likely to announce a repurchase (value 1) or an SEO (value 0) depending on one single explanatory variable. The explanatory variables are whether the IPO was venture backed (VC), held at least one patent at the IPO (Patent), whether the IPO took place in a hot market environment (Hot-IPO), the participation ratio (Participation) and the dilution factor (Dilution) at IPO, the natural logarithm of total assets (Size), the ratio of tangible assets to total assets (Tangibility), the ratio of R&D to assets (R&D), the ratio of capital expenditures to total assets (CAPEX), the ratio of cash flow to assets (Cash Flow), the ratio of cash accounts to assets (Cash), the market-to-book ratio (M/B), and whether the IPO paid a dividend in the year prior to the announcement (Dividend). Accounting variables are evaluated for the last fiscal year prior to the announcement. The sample size varies due to missing values for some of the variables. *, **, *** represent the 10%, 5%, and 1% significance level, respectively. Values in parentheses indicate t-statistics.

50
Dependent Variable: Binary Variable 1 for Repurchase Ann., zero for SEO Ann.
Model II Model III Model IV
indep. var. coefficient t-statistic coefficient t-statistic coefficient t-statistic
VC -0.2490 (-0.8566) -0.4808 (-1.0372)
Patent -0.3246 (-1.0464) -0.8303* (-1.6464)
Hot-IPO -0.5255* (-1.7262) -0.3435 (-0.6357)
Participation 0.8598 (0.6388) 3.5636* (1.6681)
Dilution 0.3265 (0.7698) -1.1744 (-0.8409)
Size 0.0779 (0.5829) 0.1248 (0.4757)
Tangibility -0.0653 (-0.0403) 0.7151 (0.3976)
R&D -1.5330 (-0.5616) -0.0091 (-0.0026)
CAPEX -2.2640 (-1.0094) -2.3771 (-0.9271)
Cash Flow 2.4603** (2.4691) 2.3143* (1.9087)
Cash 4.2470*** (4.4970) 4.9420*** (4.1592)
M/B -0.0118 (-0.2305) 0.0476 (0.7676)
Dividend 0.6037 (1.2634) 0.2690 (0.4822)
const -0.0772 (-0.1407) -1.0018** (-2.1648) -1.2475 (-0.9592)
Pseudo R2 4.35% 38.50% 44.49%
Chi2 5.7137 41.0557 46.8496
N 95 77 76
Table 8b: The table reports the results for the probit model estimation whether a German IPO from the Neuer Markt is more likely to announce a repurchase (value 1) or an SEO (value 0) depending on different model specifications. The explanatory variables are whether the IPO was venture backed (VC), held at least one patent at the IPO (Patent), whether the IPO took place in a hot market environment (Hot-IPO), the participation ratio (Participation) and the dilution factor (Dilution) at IPO, the natural logarithm of total assets (Size), the ratio of tangible assets to total assets (Tangibility), the ratio of R&D to assets (R&D), the ratio of capital expenditures to total assets (CAPEX), the ratio of cash flow to assets (Cash Flow), the ratio of cash accounts to assets (Cash), the market-to-book ratio (M/B), and whether the IPO paid a dividend in the year prior to the announcement (Dividend). Accounting variables are evaluated for the last fiscal year prior to the announcement. The sample size varies due to missing values for some of the variables. *, **, *** represent the 10%, 5%, and 1% significance level, respectively. Values in parentheses indicate t-statistics.

51
Multinomial Probit Model: SEO Ann., Repurchase Ann., No Financing Activity indep. var. Base: No Activity = 0 Base: Repurchase = 1 Base: SEO = 2
Repurchase = 1 SEO = 2 No Activity = 0 SEO = 2 No Activity = 0 Repurchase = 1
VC -0.2186 0.2565 0.2186 0.4750 -0.2565 -0.4750 (-0.5756) (0.7327) (0.5756) (1.0812) (-0.7327) (-1.0812)
Patent -0.4070 0.2119 0.4070 0.6189 -0.2119 -0.6189 (-1.0532) (0.6108) (1.0532) (1.4043) (-0.6108) (-1.4043)
Hot-IPO 0.1874 0.2658 -0.1874 0.0784 -0.2658 -0.0784 (0.5150) (0.7249) (-0.5150) (0.1761) (-0.7249) (-0.1761)
Participation 3.4611* 0.6746 -3.4611* -2.7865 -0.6746 2.7865 (1.8447) (0.3627) (-1.8447) (-1.3401) (-0.3627) (1.3401)
Dilution 1.3554 1.9147* -1.3554 0.5593 -1.9147* -0.5593 (1.1892) (1.6768) (-1.1892) (0.4778) (-1.6768) (-0.4778)
Size -0.2430 -0.6339*** 0.2430 -0.3909 0.6339*** 0.3909 (-1.2170) (-3.1443) (1.2170) (-1.5742) (3.1443) (1.5742)
Tangibility 0.1085 -0.2257 -0.1085 -0.3342 0.2257 0.3342 (0.0613) (-0.1618) (-0.0613) (-0.1744) (0.1618) (0.1744)
R&D 1.9667 5.1265** -1.9667 3.1599 -5.1265** -3.1599 (0.6086) (2.3182) (-0.6086) (0.9077) (-2.3182) (-0.9077)
CAPEX -0.7092 1.9023 0.7092 2.6115 -1.9023 -2.6115 (-0.3330) (1.2562) (0.3330) (1.1414) (-1.2562) (-1.1414)
Cash Flow 2.6152** 0.8738 -2.6152** -1.7414 -0.8738 1.7414 (2.5750) (1.5941) (-2.5750) (-1.6219) (-1.5941) (1.6219)
Cash 2.7824*** -2.6228*** -2.7824*** -5.4053*** 2.6228*** 5.4053*** (3.4143) (-2.8028) (-3.4143) (-4.9458) (2.8028) (4.9458)
M/B 0.0045 -0.0078 -0.0045 -0.0123 0.0078 0.0123 (0.1821) (-0.2963) (-0.1821) (-0.3913) (0.2963) (0.3913)
Dividend 0.2209 0.0162 -0.2209 -0.2047 -0.0162 0.2047 (0.4815) (0.0331) (-0.4815) (-0.3596) (-0.0331) (0.3596)
const -1.6736 0.8634 1.6736 2.5370** -0.8634 -2.5370** (-1.4996) (0.8381) (1.4996) (2.0025) (-0.8381) (-2.0025)
Prob 0.0024 0.0024 0.0024 Chi2 50.99 50.99 50.99 N 205 205 205
Table 9: The table reports the results for a multinomial probit model whether a German IPO from the Neuer Markt is more likely to announce a repurchase (value 1), an SEO (value 2) or neither of them (value 0). The explanatory variables are whether the IPO was venture backed (VC), held at least one patent at the IPO (Patent), whether the IPO took place in a hot market environment (Hot-IPO), the participation ratio (Participation) and the dilution factor (Dilution) at IPO, the natural logarithm of total assets (Size), the ratio of tangible assets to total assets (Tangibility), the ratio of R&D to assets (R&D), the ratio of capital expenditures to total assets (CAPEX), the ratio of cash flow to assets (Cash Flow), the ratio of cash accounts to assets (Cash), the market-to-book ratio (M/B), and whether the IPO paid a dividend in the year prior to the announcement (Dividend). Accounting variables are evaluated for the last fiscal year prior to the announcement. *, **, *** represent the 10%, 5%, and 1% significance level, respectively. Values in parentheses indicate t-statistics.
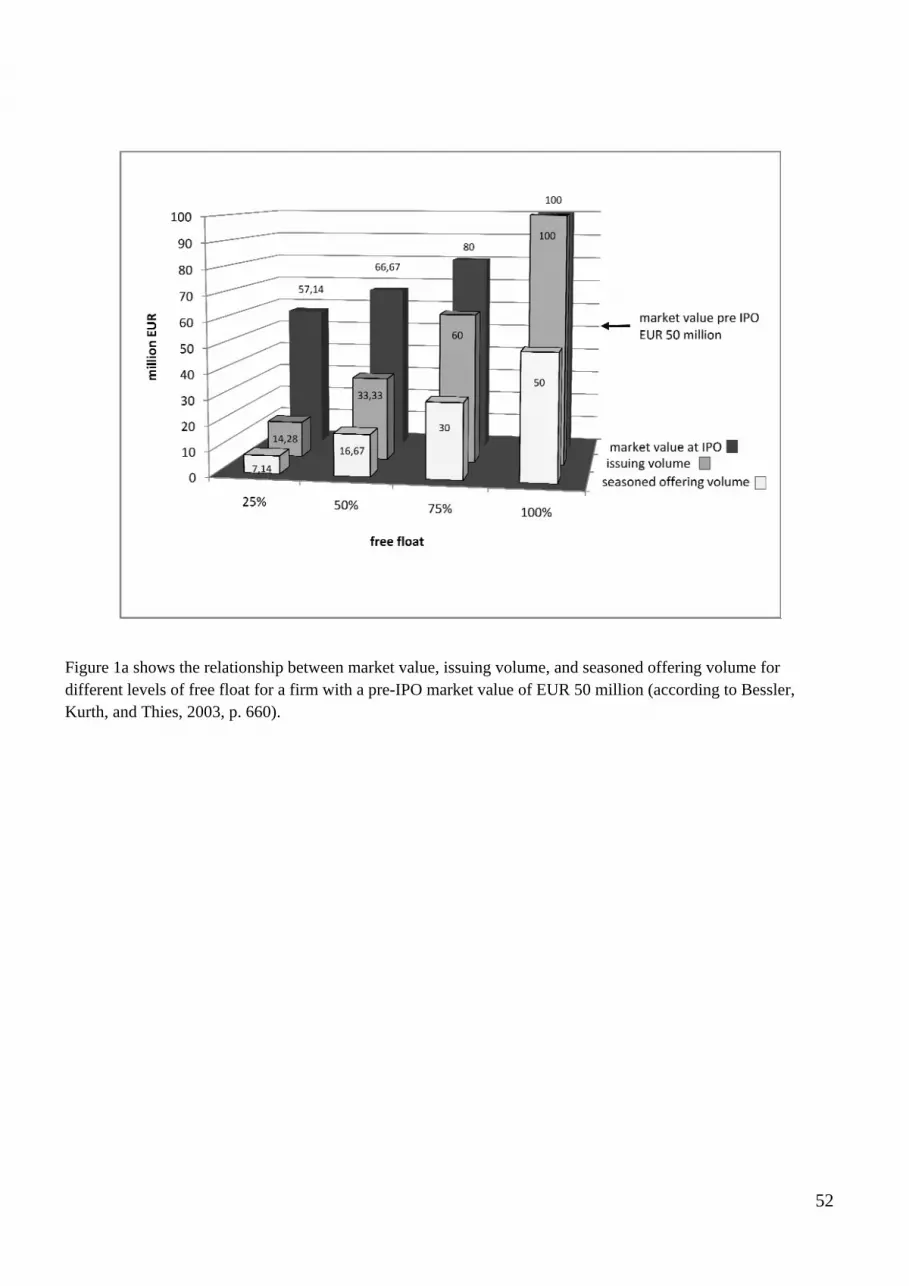
52
Figure 1a shows the relationship between market value, issuing volume, and seasoned offering volume for different levels of free float for a firm with a pre-IPO market value of EUR 50 million (according to Bessler, Kurth, and Thies, 2003, p. 660).

53
Figure 1b shows the NEMAX Allshare Index and the number of IPOs that went public on the German Neuer Markt between 1997 and 2002.
Figure 1c shows the number of firms that went public on the German stock market between 1980 and 2008. The dark bar (1997-2002) are IPOs at the “Neuer Markt”.
0
1000
2000
3000
4000
5000
6000
7000
8000
9000
0
6
12
18
24
30
36
42
48
54
Mar 97
May 97
Aug
97
Oct 97
Dec 97
Mar 98
May 98
Aug
98
Oct 98
Dec 98
Mar 99
May 99
Aug
99
Oct 99
Dec 99
Mar 00
May 00
Jul 00
Oct 00
Dec 00
Feb 01
May 01
Jul 01
Sep 01
Dec 01
Feb 02
May 02
Jul 02
Sep 02
Dec 02
Nem
ax Allshare
Num
ber o
f IPO
s
Number of IPOs
Nemax Allshare
1999 2000 2001 200219981997
0
20
40
60
80
100
120
140
160
180
1980
1981
1982
1983
1984
1985
1986
1987
1988
1989
1990
1991
1992
1993
1994
1995
1996
1997
1998
1999
2000
2001
2002
2003
2004
2005
2006
2007
2008
Num
ber o
f IPO
s

54
Figure 2 shows the distribution of Repurchases and SEOs over time.
Figure 3 shows the distribution of Repurchases and SEOs relative the time of the IPO.
0
2
4
6
8
10
12
14
16
1998 1999 2000 2001 2002 2003 2004 2005
Distribution of SEOs over Time
Distribution of Repurchases over Time
0
5
10
15
20
25
within 12 months after IPO
between 13 and 24 months
between 25 and 36 months
between 37 and 48 months
between 49 and 60 months
Distribution of SEOs relative to IPO
Distribution of Repurchases relative to IPO
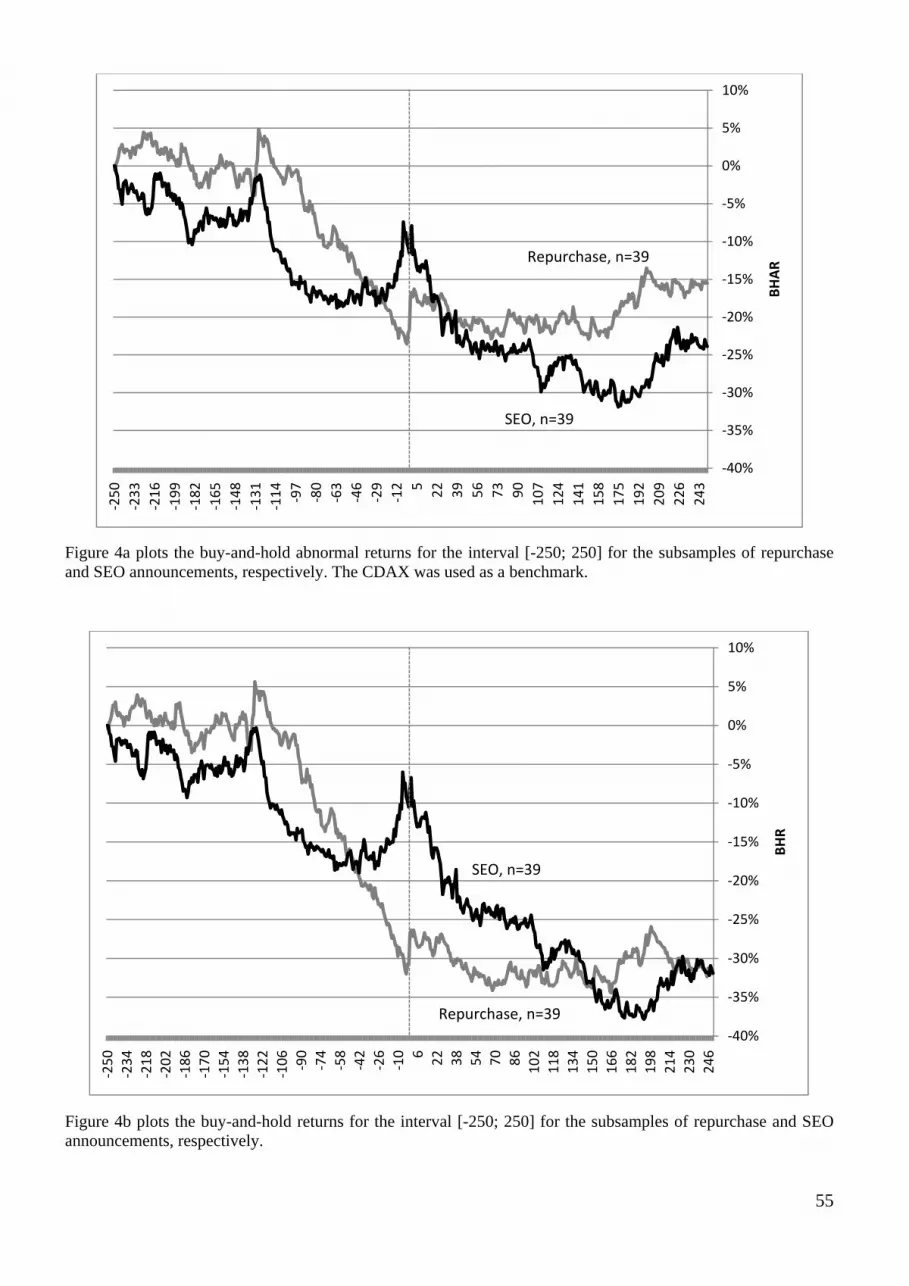
55
Figure 4a plots the buy-and-hold abnormal returns for the interval [-250; 250] for the subsamples of repurchase and SEO announcements, respectively. The CDAX was used as a benchmark.
Figure 4b plots the buy-and-hold returns for the interval [-250; 250] for the subsamples of repurchase and SEO announcements, respectively.
‐40%
‐35%
‐30%
‐25%
‐20%
‐15%
‐10%
‐5%
0%
5%
10%
‐250
‐233
‐216
‐199
‐182
‐165
‐148
‐131
‐114 ‐97
‐80
‐63
‐46
‐29
‐12 5 22 39 56 73 90 107
124
141
158
175
192
209
226
243
BHARRepurchase, n=39
SEO, n=39
‐40%
‐35%
‐30%
‐25%
‐20%
‐15%
‐10%
‐5%
0%
5%
10%
‐250
‐234
‐218
‐202
‐186
‐170
‐154
‐138
‐122
‐106 ‐90
‐74
‐58
‐42
‐26
‐10 6 22 38 54 70 86 102
118
134
150
166
182
198
214
230
246
BHR
SEO, n=39
Repurchase, n=39

56
Figure 5 plots the buy-and-hold abnormal returns for the interval [-125; 125] for the subsamples of repurchase and SEO announcements, respectively. The CDAX was used as a benchmark.
Figure 6 plots the cumulative abnormal returns for the interval [-60; 60] for the subsamples of repurchase and SEO announcements, respectively. The CDAX was used as a benchmark.
‐30%
‐25%
‐20%
‐15%
‐10%
‐5%
0%‐125
‐116
‐107 ‐98
‐89
‐80
‐71
‐62
‐53
‐44
‐35
‐26
‐17 ‐8 1 10 19 28 37 46 55 64 73 82 91 100
109
118
BHAR
Repurchase, n=43
SEO, n=49
‐20%
‐15%
‐10%
‐5%
0%
5%
10%
15%
‐60
‐56
‐52
‐48
‐44
‐40
‐36
‐32
‐28
‐24
‐20
‐16
‐12 ‐8 ‐4 0 4 8 12 16 20 24 28 32 36 40 44 48 52 56 60
CAR
SEO, n=51
Repurchase, n=46
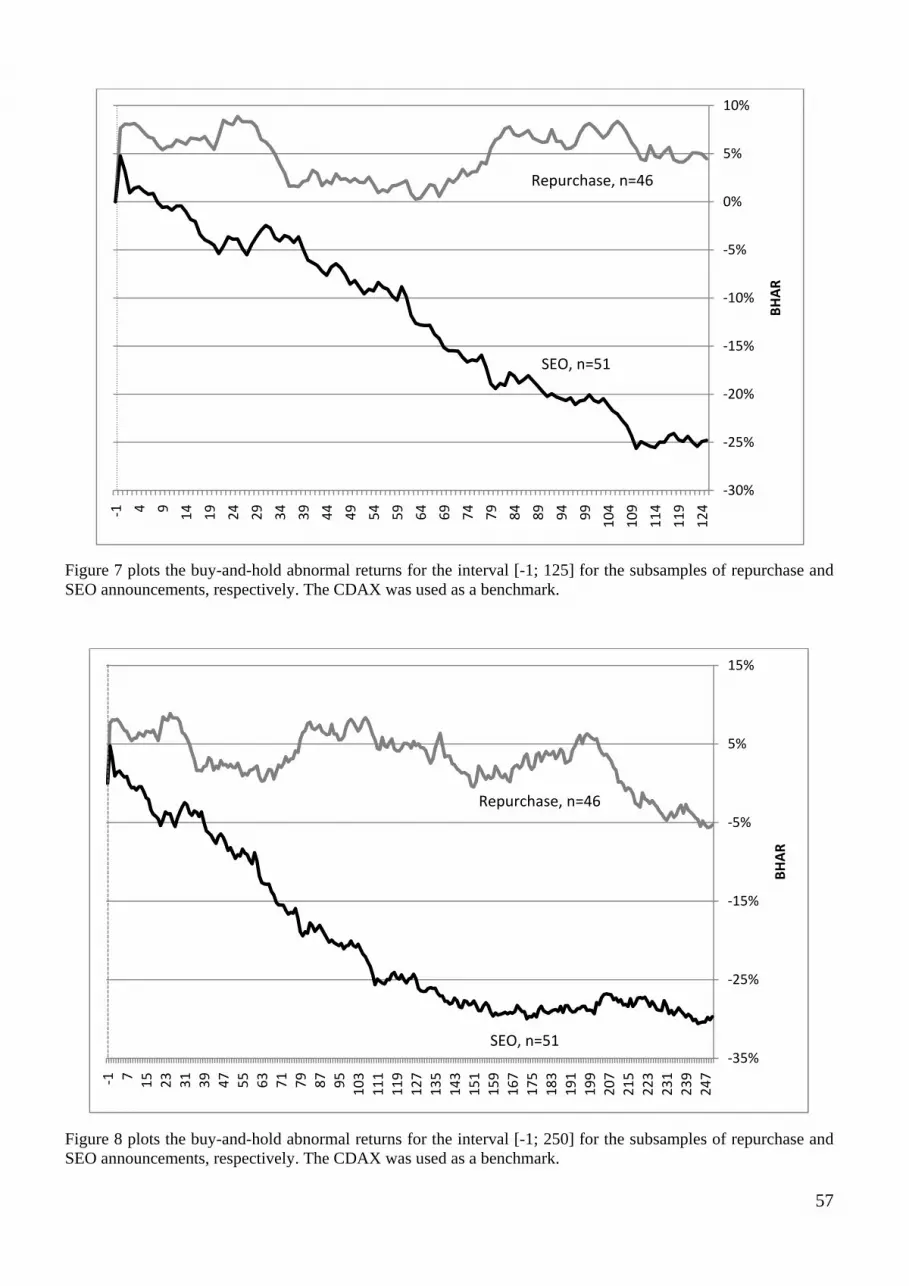
57
Figure 7 plots the buy-and-hold abnormal returns for the interval [-1; 125] for the subsamples of repurchase and SEO announcements, respectively. The CDAX was used as a benchmark.
Figure 8 plots the buy-and-hold abnormal returns for the interval [-1; 250] for the subsamples of repurchase and SEO announcements, respectively. The CDAX was used as a benchmark.
‐30%
‐25%
‐20%
‐15%
‐10%
‐5%
0%
5%
10%‐1 4 9 14 19 24 29 34 39 44 49 54 59 64 69 74 79 84 89 94 99 104
109
114
119
124
BHAR
Repurchase, n=46
SEO, n=51
‐35%
‐25%
‐15%
‐5%
5%
15%
‐1 7 15 23 31 39 47 55 63 71 79 87 95 103
111
119
127
135
143
151
159
167
175
183
191
199
207
215
223
231
239
247
BHAR
Repurchase, n=46
SEO, n=51


