Embed Size (px)
Citation preview
Electronic copy available at: http://ssrn.com/abstract=663841
1
OUTSIDE ENTREPRENEURIAL CAPITAL*
Forthcoming in the Economic Journal, 2009
Andy Cosh, Douglas Cumming and Alan Hughes
This paper investigates factors that affect rejection rates in applications for outside finance among different
types of investors (banks, venture capital funds, leasing firms, factoring firms, trade customers and suppliers,
partners and working shareholders, private individuals and other sources), taking into account the non-
randomness in a firm’s decision to seek outside finance. The data support the traditional pecking order theory.
Further, the data indicate that firms seeking capital are typically able to secure their requisite financing from at
least one of the different available sources. However, external finance is often not available in the form that a
firm would like.
JEL Classification: G21, G22, G23, G24, G31, G32, G35
* We owe special thanks the Editor (Leonardo Felli), two anonymous referees, and the seminar participants at York University, the 2006 Financial Management Association Annual Conference and the 2008 Kauffman Foundation Conference on Entrepreneurial Finance.

Electronic copy available at: http://ssrn.com/abstract=663841
2
This paper engages four interrelated empirical questions. First, what are the characteristics of privately
held entrepreneurial firms that seek external [‘outside’] finance, and what drives the request for capital
from the different potential sources of external finance: banks, venture capitalists, private individuals,
leasing, factoring, suppliers/customers, partners/working shareholders, among other sources? Second,
what are the factors that lead to rejection or acceptance of requests for external finance, given this non-
randomness in the types of firms that seek external finance (in the spirit of Heckman, 1976, 1979)?
Third, as various forms of financing are far from being perfect substitutes, are there differences in the
ability of firms to obtain capital from the different available sources? Fourth, can firms obtain all of their
desired capital from the different available sources, even if it is not in the form they would like?
It is widely recognized that the decision to seek external finance and the type of financing sought
is related to information asymmetries faced by investors regarding the entrepreneurial firm’s quality (see
for example, Jensen and Meckling, 1976).1 Where entrepreneurs have information that investors do not
have, external equity finance (which dilutes the entrepreneurs’ ownership share) is (given unused debt
capacity) indicative of a low quality firm (Myers and Majluf, 1984; see also Myers, 2000). This stream of
research has derived a standard pecking order theory, in that firms prefer to finance new projects with
internal cash flows first, and then if necessary, thereafter seek external debt capital and lastly seek
external equity capital. This rank ordering, however, might be distorted by the fact that external sources
of capital could add value to their investee firms. For example, Garmaise (2000) shows that if investors
are known to possess a greater ability to assess project quality relative to that of the entrepreneurial team,
external equity finance is indicative of a high quality firm. Also De Meza and Webb (1987, 1992) argue
that banks may not be ill informed relative to new firms and show that if we abandon the Stiglitz and
Weiss (1981) assumption of mean preserving spreads of risk then their rationing results do not hold (see
also De Meza and Webb, 1999, 2000). In our paper, we test these theoretical propositions by first taking
into account the preliminary question of what drives the decision of a firm to seek external financing. We
then empirically analyze the matching of different types of firms and investors, taking into account the
non-randomness in the types of firms that sought outside capital.
Our analysis builds on an important but largely segmented literature in financial intermediation
and entrepreneurial finance (briefly surveyed in section 1). Academic studies of the interaction between
firms and their sources of capital focus, almost exclusively, on a single source of capital. Separate
streams of literature have emerged in bank finance, lease finance, venture capital finance, private
individual investor finance, supplier finance, etc. In theoretical work, the need to focus on one (or in
1 This work also stems from seminal papers on adverse selection, including Ackerlof (1970), Stiglitz and
Weiss (1981), and De Meza and Webb (1987, 1992).

3
exceptional cases, two) external capital sources is directly attributable to theoretical tractability (one
cannot model everything). In empirical work, the focus on one or two capital sources is largely
attributable to data availability, since datasets are typically derived from investors, particularly in the case
of non-publicly traded businesses.
In building on this prior literature, the key component of our analysis is that we introduce a very
large dataset derived from private entrepreneurial firms themselves, and not from their investors. This
empirical approach provides a number of advantages for the purpose of addressing the three central
research questions outlined above. Perhaps most importantly, because we observe firms that did, and did
not, seek external finance, we avoid Heckman (1976, 1979) sample selection problems in analyzing the
role of external investors in facilitating the development of entrepreneurial firms. Prior work on topic
(see section 1) is typically derived from one type of investor and thereby fails to consider the non-random
selection process among those entrepreneurial firms that seek external finance, and the non-random
selection process among different types of potential investors.
A second key component of our analysis is that we have a very detailed and broad-based dataset
from 2520 UK entrepreneurial firms in the period spanning 1996-1997 the majority of which were formed
in the 1980s and early 1990s (specific details are provided in section 3). A number of firms in the sample
sought external finance from a wide variety of potential outside investors, and some successfully obtained
external finance. This diversity in the data is of interest, as it allows us to carry out unique analyses of the
decision to seek external finance from a broad spectrum of different investors. By contrast, datasets
derived from investors typically provide insights into only those firms that applied for external finance
with that investors, and further, typically only those firms that were successful in obtaining finance.
These limitations in all empirical prior work based on data from investors and not investees are overcome
in our analysis of the new data introduced herein. We are therefore able to investigate issues that have
been previously considered empirically intractable.
The data indicate the following primary key results. First, we identify factors that lead firms to
seek external finance. Controlling for a large number of other factors, we find the most significant
determinant of applications for external finance to be capital expenditures / profits. A firm is
approximately 1% more likely to seek external finance when capital expenditures are 20 times that of
profits relative to 10 times profits. This indicates support for the traditional pecking order in which firms
finance new projects internally before seeking external finance. Corporations are approximately 6% more
likely to seek external finance than partnerships or sole proprietorships. It is also quite noteworthy that,
on a ranking from 1-4 with 4 being the highest growth orientation, an increase in the ranking by 1 point
tends to increase the probability of an application for external finance by approximately 11%. Further,

4
firms that face 1000 competitors are approximately 2% more likely to apply for external finance than
firms that face 100 competitors.
Second, we show systematic characteristics drive the amount of external finance actually sought,
controlling for the non-randomness in the decision to seek external finance in the first place in the spirit of
Heckman (1976, 1979). Firms seek a greater amount of external finance when then have greater capital
expenditures / profits and higher profit margins. Firms with more debt / assets also seek more external
finance, but this effect is concave (that it, it increases at a decreasing rate and follows and inverted-U
pattern).
In the third step of the analyses, we consider the percentage of external finance obtained. Larger
firms in terms of their total assets are much more likely to obtain a higher percentage of the total amount
of finance sought. For instance, a firm with £1 million in assets will obtain approximately 5% more of
their desired capital than the average firm with £375,000 in assets. This is highly suggestive that smaller
firms face a capital gap in terms of being able to obtain all of their desired capital. A firm that recently
developed a novel innovation, by contrast, tends to obtain less of their desired capital. More specifically,
a firm that was started within 7 years of applying for external finance and recently developed an
innovation will obtain approximately 8% less of their desired capital, but older firms that recently
developed an innovation are not statistically likely to receive less of their desired capital. Conversely,
older firms that are less profitable and/or have not yet implemented professional directors are less likely
to obtain all of their desired capital (albeit smaller firms do not face these limitations for profits and/or
professional directors).
We further explore these three main steps in the analyses outlined above by considering the
differences between banks and venture capital funds, as well as other sources of capital, including hire
purchase or leasing firms, factoring / invoice discounting firms, trade customers / suppliers, partners /
working shareholders, private individuals (often referred to as “angel investors” (Harrison and Mason,
2000)) and other sources. Among the 952 of 2520 firms (38%) in our sample that did seek external
finance in the 1996-1997 period considered, 775 approached banks, 474 approached leasing firms, 151
approached factoring / invoice discounting firms, 138 approached partners / working shareholders, 87
approached venture capital funds, 83 approached private individuals, and 53 approached trade customers /
suppliers (and 67 approached other sources).2 It is of interest that outright rejection rates were highest
among venture capital funds (46% rejection), and much higher than that for banks (17% outright 2 We refer to a firm “approaching” a potential source as making more than a trivial effort (for example, it
involves more that just mailing in a business plan to the potential source for consideration), consistent with our
survey evidence and related survey work undertaken by the Centre for Business Research at the University of
Cambridge.

5
rejection). The lowest rejection rate was among leasing firms (5%). Banks comprised the median and
mean highest percentage of outside finance in terms of which type of source was approached and which
type of source provided the finance. Among the 952 firms that did apply for external finance, the median
number of different sources approached was 2 (and mean was 1.96). Also, firms with greater capital
expenditures / profits are more likely to approach a greater number of different types of sources of
finance. For the subset of the oldest firms (established before 1980 in our sample), profit margins are
significantly negatively related to the number of different sources of capital approached.
The new data and statistics introduced in this paper provide completely new evidence on the
importance of external capital for entrepreneurial firms, and the comparative importance of different
sources of capital. It is noteworthy that, among the 38% of firms that made non-trivial efforts to obtain
external finance in our sample, the mean percentage of finance obtained (relative to the amount sought)
was 80.7%, and the median percentage was 100%. The data do not indicate the presence of a substantial
capital gap for the majority of firms seeking entrepreneurial finance; rather, firms seeking capital are able
to secure their requisite financing from at least one of the many different available sources. There are,
however, differences in firms’ ability to obtain finance in the form that they would like. Even after
controlling for selection effects, the data indicate banks are more likely to provide the desired amount of
capital to larger firms with more assets. Leasing firms, factor discounting / invoicing firms, trade
customers / suppliers and partners / working shareholders are more likely to provide the desired capital to
firms with higher profit margins. Profit margins are not statistically relevant to venture capital funds and
private individual investors; smaller firms are more likely to obtain finance from private individuals,
while young innovative firms seek external capital from venture capital funds.
This paper is organized as follows. Section 1 briefly reviews the related literature. Section 2
introduces the data considered in this paper, and presents a number of new facts pertaining to
entrepreneurial finance. The testable hypotheses within the context of our new data and the prior
literature are outlined in section 3. Summary statistics and multivariate analyses are provided in section
4. Thereafter, limitations, alternative explanations and future research are discussed in section 5.
Concluding remarks follow.
1. Related Literature
In this paper we study the choice between internal versus external entrepreneurial finance, with regard to
a wide variety of sources of outside capital. Because we consider a number of different types of
investors, our work is related to a plethora of papers along segmented streams of research in financial
intermediation and entrepreneurial finance. While it is of course beyond the scope of our paper to review

6
the entire literature herein, 3 we nevertheless provide a brief perspective of the contribution of our
analyses in the context of recent related prior work.
At the most generalizable level, a firm’s decision to seek external finance is related to information
asymmetries faced by investors regarding the entrepreneurial firm’s quality (see Jensen and Meckling,
1976; Stiglitz and Weiss, 1981; De Meza and Webb, 1987, 1992; Cosh and Hughes, 1994; De Meza,
2002; Carpenter and Petersen, 2002a,b). Myers and Majluf (1984) and Myers (2000) have derived a
pecking order that results from such information asymmetries between entrepreneurs and investors,
whereby firms first finance new projects with internal cash flows,4 and obtain external finance only where
necessary because external finance is more costly when investors face information asymmetries. External
debt finance is preferred to external equity finance in the traditional pecking order since equity involves a
dilution of the entrepreneur’s ownership share. Recent theoretical work, however, has shown this pecking
order is reversed where investors have superior knowledge about the commercialization process of an
entrepreneur’s invention, and/or add value to the entrepreneur’s project (Garmaise, 2000).
Pre-IPO outside entrepreneurial capital may be provided by banks, venture capitalists, private
individuals, leasing, factoring, suppliers/customers, partners/working shareholders, among other sources.
Different streams of the academic literature have become segmented by each of these different investor
types for reasons of theoretical tractability and data availability. Nevertheless, the fundamental questions
considered in the segmented literature significantly overlap in two primary ways that are pertinent to our
empirical analyses. First, there is a stream of literature on the ability of an investor to mitigate
informational problems associated with small (and/or high-tech) businesses, and this has been considered
in the context of banks (e.g., Berger et al., 2001; Berger and Udel, 1998), venture capital finance (e.g.,
Gompers and Lerner, 1999), angel finance (Wong, 2003; Harrison and Mason, 2000), lease finance
(Porter, 1995; Myers et al., 1976, Yusopova, 2002), supplier finance (e.g., Tamari, 1970), etc. Second,
there is a stream of literature on the contribution of the investor to not only screen good from bad
investees, but also assist in the development of the investee firm, which has been the focus of the
literature in both angel finance (Wong, 2003; Harrison and Mason, 2000) and venture capital finance
(e.g., Bergmann and Hege, 1998; Gompers and Lerner, 1999; Kortum and Lerner, 2000; Bascha and
Walz, 2001; Mayer et al., 2005; Hege et al., 2003; Neus and Walz, 2005, Riyanto and Schwienbacher,
2006; Schwienbacher, 2007).
3 There are nevertheless recent surveys of the entrepreneurial finance and venture capital literature, including
Denis (2004), Gompers and Lerner (2001), Smith and Smith (2000) and Berger and Udell (1998), as well as recent
surveys of the banking literature, including Gorton and Winton (2003) and Berger and Humphrey (1997).
4 Relatedly, Carpenter et al. (1998) show that cash flow is a key determinant of inventory investment.
7
While some of the issues we consider have been addressed in prior work that is segmented by
investor type, there is comparatively less rigorous data and evidence about the comparative ability of
different types of investors to mitigate informational problems associated with outside finance, and the
comparative importance of different sources of capital to different types of entrepreneurial firms.
Moreover, given the fact that there is a non-randomness associated with the types of firms seeking
external capital (in the spirit of Heckman, 1976, 1979), it is difficult to assess the importance of different
types of investors to entrepreneurial firms without a comparative sample of firms that did not seek any
external finance, and without knowledge of alternative sources of external finance sought by the firms.
We seek to overcome some of these limitations in our analysis. We also keep in mind areas in which we
face limitations ourselves, and thereby point to avenues for future research (discussed in detail in section
5 below).
Our comparative focus is somewhat related to recent work that has made significant steps in
comparing two types of financial intermediaries. The recent literature has primarily been focused on
comparing banks to venture capital funds.5 Theoretical contributions in this regard invariably conclude
that venture capitalists are more skilled than bank managers at screening potential investees, and
providing greater value-added to their investee firms (Keuschnigg and Nielsen, 2004; Udea, 2004). These
propositions are consistent with the large literature that focuses on venture capital funds themselves (e.g.,
Gompers and Lerner, 1999, 2001a,b; Berger and Udell, 2002; Carpenter and Peterson, 2002; Cressy,
1996, 2002; Manigart et al., 2006; Wright and Lockett, 2003; Casamatta, 2003; Casamatta and
Haritchabalet, 2007; Schmidt, 2003; Hsu, 2004; Kortum and Lerner, 2000; Kanniainen and Keuschnigg,
2003, 2004; Keuschnigg, 2004). This work is also consistent with a literature comparing banks and
venture capitalists; however, that empirical work does not consider other types of potential investors, and
does not consider the non-random selection process among those entrepreneurial firms that have sought
external finance, and the non-random selection process across different types of investors. In other
words, that work is not immune from the Heckman (1976, 1979) sample selection bias.6 Our dataset
enables these limitations to be overcome, and enables a broader array of different types of investors to be
considered, among other things described throughout the subsequent sections of this paper.
5 In a recent theoretical contribution, Chemmanur and Chen (2003) provide an analysis on interaction
between angel investors and venture capitalists; however, no prior paper has empirically tested their model. In a
recent empirical contribution, Cassar (2004) focuses on different sources of capital for small firms, but does not
consider selection effects in the spirit of Heckman (1976, 1979), and does not consider the interplay between access
to outside capital and the development of the entrepreneurial firm.
6 Heckman (1976, 1979) shows that when this incidental truncation is accounted for in regression analyses,
any or all of the sign, magnitude, and statistical significance of regression coefficients may change.
8
Finally, it is noteworthy that our empirical analysis of outside entrepreneurial capital is related to
a very large theoretical and empirical literature on the decision of a privately held business to go public
(see, e.g., Ritter and Welch, 2002, for a recent review of that literature). Our analysis significantly differs
from the IPO literature in that we focus on the much earlier decision in the life-cycle of a private business
to seek external private finance, long before it would be in a position to go public (and many firms might
not want to go public). And as mentioned, our data are not constrained by consideration of only one or
two types of potential investors; rather, all types of external sources of capital for early stage businesses
are assessed. The data introduced in this paper are described in the next section.
2. Testable Hypotheses 2.1. Primary Hypotheses
Our empirical analysis focuses on three primary hypotheses which are outlined in this section. Our first
hypothesis pertains to the pecking order theory of capital structure. In particular, we are interested in
knowing whether entrepreneurial firms do in fact prefer to finance projects internally with their own
profits prior to seeking external finance. Traditional pecking order theory (Myers and Majluf, 1984) is
consistent with this prediction, since entrepreneurs have information that investors do not have, and
therefore the information asymmetry faced by outside investors makes external finance more costly. By
similar reasoning, external equity finance is more costly than external debt finance since equity involves
the dilution of the entrepreneurs’ ownership interest in the firm, and offers of equity finance therefore
signal low quality.
Hypothesis 1a [Pecking Order and Decision to Seek External Funds]: Firms with greater profit margins
are less likely to seek external finance, or at least will seek less external capital and use internal profits to
fund projects. Among firms that do seek external finance, firms with greater profit margins will seek debt
finance prior to equity finance.
Hypothesis 1b [Pecking Order and Success with Obtaining External Funds Sought]: Firms with greater
profit margins are more likely to obtain the external finance sought.
Our second central hypothesis considers the decision to seek finance as a function of
entrepreneurial firm as well as investor characteristics. The costs of seeking and obtaining external
capital are higher where entrepreneurial firms exhibit greater informational asymmetries. That is, the
search costs for capital, as well as the terms offered to the investor, are less favorable for firms for which

9
investors have more difficulty mitigating information problems and expected agency costs. Among
younger and innovative firms for which these costs are more pronounced (as generally viewed in the
literature; see e.g., Noe and Rebello, 1996), firms will only be willing to incur these costs if they have
significant growth objectives. Hence, growth orientated firms are naturally more attracted to external
finance as a result of their willingness to incur search costs and bear the price of external capital (Kon and
Storey, 2003).
Just as entrepreneurial firm characteristics matter in respect of external financing decisions, we
might also expect differences across different sources of capital. It is widely regarded that venture capital
funds have a comparative advantage in mitigating information asymmetries and agency costs (relative to
banks, leasing and factoring firms) will be more likely to finance businesses for which risks are more
pronounced, but potential returns are higher (see, e.g., Berger and Udell, 1998).
Hypothesis 2a [Growth]: Firms for which growth is the most significant objective will be, all else being
equal, more likely to seek external finance.
Hypothesis 2b [Banks versus Venture Capital Funds]: Venture capital funds are more likely to finance
riskier firms with high growth objectives than banks and other sources of external capital.
With the wide range of sources of external entrepreneurial capital (banks, venture capital funds,
leasing firms, factoring firms, trade customers and suppliers, partners and working shareholders, private
individuals and other sources), it is natural to expect that many firms will likely raise the money that they
want though not in the form that they would like. Clearly, raising some money is better than being denied
access to the capital market, but the various forms of financing are far from perfect substitutes and may
imply (undesirable) constraints of various sorts, such as obtaining value added advice from a more
reputable source of capital. For instance, relative to other types of sources of capital, venture capital
funds typically provide more intensive financial, administrative, marketing, and strategic advice, and
facilitate a network of professional advisors to enable the entrepreneurial firm to succeed. Our data
(described below in section 3) enables us to identify which types of firms are more likely to face certain
constraints in obtaining their desired form of capital. We may expect that firms with less favorable
prospects will face greater constraints in obtaining their desired form of capital.
Hypothesis 3 [Desired Source of Capital]: Firms seeking more capital relative to their profits and firms
with lower profit margins will have to approach a greater number of different forms of finance to obtain
their desired capital, and will have greater difficulty in obtaining their desired level of external finance.

10
2.2. Control Variables
In considering the three primary hypotheses we control for a number of potentially relevant factors. First,
we consider the innovativeness of the industry, as well as the innovativeness of the firm. Innovation is
associated with asset intangibility, since high-tech firms are typically more innovative and have more
intangible assets (Kortum and Lerner, 2000). Higher asset intangibility is associated with more
pronounced information asymmetries and agency costs, as well as potential hold-up costs, thereby
increasing the costs of external finance (Gompers and Lerner, 1999). On one hand, therefore, we would
expect the costs of obtaining external finance to be greater among more innovative firms. On the other
hand, the potential benefits to external equity financiers are larger the more innovative the firm. This is
particularly true among a smaller subset of investors that add value to their investees. This value added
can come in a variety of forms, including but not limited to advice pertaining to strategy, marketing,
financing, administrative and human resource policy, as well as facilitating a network of contacts for
firms that includes, but is not limited to, accountants, suppliers, customers, lawyers, and investment
bankers. For example, one recent theoretical paper (Garmaise, 2000) predicts the traditional pecking
order is exactly reversed when investors do provide value added and have superior skills at assessing the
value of the entrepreneurial project. 7 Hence, in our empirical analyses we consider differences in
financing obtained from banks and venture capitalists.
Second, we control for the effect of industry structure on financing decisions. In his popular
work on industry structure, Porter (1998) identifies five categories of factors that can give rise to
differences in risk-adjusted rates of return across industries. These factors include supplier power, buyer
power, barriers to entry, threat of substitutes and the degree of rivalry. The economic importance of some
of these factors has been identified in the literature on a firm’s financing decisions. In short, risk-adjusted
rates of return tend to be lower in industries for which there is more competition, and a stronger presence
of larger dominant competitors; therefore, it is less attractive for investors to provide external capital to
entrepreneurial firms in those industries, and the terms offered by investors will be less attractive.
Third, we control for the possibility that entrepreneurial firms started by females face greater
hurdles in seeking external capital (Marlow and Patton, 2005). On one level, this could simply be
unjustified or “actual” sex discrimination. On another level, there might be characteristics of firms started 7 For example, as discussed in Garmaise (2000), investors might be more skilled in valuing the project than
the entrepreneur where the investor has experience and market information pertaining to the commercialization of a
scientific idea, and the entrepreneur’s comparative advantage over the investor only lies in the scientific process that
led to the idea.

11
by females that are systematically different relative to firms started by males, such as the firm’s growth
objectives, the professional qualifications of the firm’s directors, the firm’s innovative activities and
industry sector, among numerous other systematic differences. If so, then information asymmetries faced
by outside investors might systematically differ across firms started by males and females, thereby
causing systematic differences in the costs and benefits of seeking external capital by female versus male
led firms. We might label this second perspective as “apparent” (not actual) sex discrimination whereby
information problems and firm characteristics give rise to the appearance of discrimination between males
versus females, but such discrimination is directly attributable to those characteristics and not
independently related to the maleness or femaleness of the firm’s founding CEO. Either way, we do
consider and control for these alternative theories in our empirical analyses.
Finally, in our empirical tests we also control for legal form (corporation versus partnership or
sole proprietorship), firm age, capital expenditures, insider ownership (including CEO and board
ownership), debt levels (relative to assets) prior to seeking external finance in the period considered, and a
variety of reasons why the entrepreneurial firm was established (including reasons ranging from a desire
to avoid unemployment to running a business, implementing an invention and wealth ambitions). Each of
these variables (among others discussed immediately below) are pertinent as control variables, since they
directly relate to a firm’s need/desire for external capital for reasons discussed in prior literature
summarized above in section 1. The specifics in our data are outlined in detail immediately below in
section 3. Empirical tests follow in section 4.
3. Data and Summary Statistics
Our data come from a very detailed survey of 2520 UK entrepreneurial firms in the period spanning
1996-1997. The data were collected by the Centre for Business Research at the University of Cambridge,
as described in detail by Cosh and Hughes (1998). The median start-up year of the firms in the data herein
was 1983, where 697 started in the 1990s, 920 started in 1980s, and 964 started prior to 1980.
The sampling frame for the survey was all independent businesses in manufacturing and business
services with less than 500 employees in Great Britain including businesses partnerships and sole
proprietors. The achieved sample was 2520 firms based on size stratified approach to avoid swamping the
sample with micro businesses. The unit response rate was 25%. A response bias analysis in terms of age
employment turnover pre tax profit and legal status revealed that older manufacturing firms were
somewhat less likely to respond. There was no response bias of any kind in service business responses,
nor any bias in manufacturing firms responses in terms of age profitability or legal status. A spatial
analysis revealed that the achieved sample was representative of the regional distribution of the small

12
business population in Great Britain (complete details on survey design and sample selection issues are
provided in Bullock and Hughes, 1998).8
Summary statistics of the data, as well as correlations across different variables, are provided in
Tables 1-3. Table 1 indicates that there were 37.8% (952 of 2520) firms in the data that did seek external
finance in the 1996-1997 period. The average amount of external finance sought was £467,667, and the
median amount sought was £100,000. The average amount obtained was almost 81% of that which was
sought, and the median percentage obtained was 100%. Overall, therefore, the data do not suggest a
shortage of external capital for firms that make more than a trivial effort in applying for capital.
[Insert Tables 1-3 About Here]
Table 1 summarizes a variety of explanatory variables used in the empirical analyses. In order to
explain external financing decisions in the 1996-1997 financial year, we use lagged (1995) balance sheet
items, including lagged assets and lagged long term debt / assets. For firms that were started in 1996-
1997, these items are assigned the value ‘0’. We do not use contemporaneous balance sheet values since
any external financing obtained would directly show up in our left-hand and right-hand-side variables.
Also, Table 1 indicates statistics from firms’ income statement (including profits and profit margin) and
cash flow statement (capital expenditure). These items are measured for the 1996-1997 financial year
because in applications for external finance, firms will present the most recent quarter’s income and cash
flow statements (alongside all historical statements), as well as projected future income and cash flows.
As such, it is appropriate to consider the most recent year’s information. There is not an endogeneity
problem as applications for external finance and obtaining external finance does not impact profitability,
8 In some cases survey responses contained missing values. These values were interpolated with comparable
available information such as asset sizes, profit margins, age and the like so that we make use of the full sample of
2520 firms in the analysis. If interpolation was not possible for a survey respondent, then median values were used.
We also considered other techniques to handle missing data. For example, in one specification we considered a two-
step probit estimate in which the first step considers whether a full set of information was available and the second
set then estimates the regression for alternative forms of finance. We also considered regressions with fewer
explanatory variables, which in turn increases the sample size where certain excluded variables have missing
observations. Either way, the results are quite robust. Alternative specifications are available on request. Also, note
that an earlier version of this paper (available on request) was distributed with a smaller sample population of 1900
firms. The current version draws from a sample of 2520 firms. While there are some differences in the results with
the larger sample, the main results are consistent.
13
turnover or profit margin in the same year.9 Similarly, applying for or obtaining finance will not lead to
an innovation in the same year (albeit, it may lead to an innovation in subsequent years as the new capital
is spent on R&D projects, as indicated by, e.g., Kortum and Learner, 2000), and hence our innovation
variable is measured in the contemporaneous period. In sum, we use lagged balance sheet items to avoid
direct endogeneity in analyzing external capital raised relative to debt and assets, and current cash flow
and income statement items to account for the fact that firms provide potential sources of external capital
with their most recent quarter’s profitability information as well as projected cash flows and profits. In
our multivariate analyses, we do not simultaneously consider current and historical values of cash flow
and income statements as these items are highly correlated over time (correlations are greater than 0.7 for
each of these variables from one year to the next10).
Table 2 reports the number of firms in our data that did seek external finance by the type of
source of finance, as well as the percentage of all their external capital obtained from the source. Among
the firms in our sample that did seek external finance, 775 approached banks, 474 approached leasing
firms, 151 approached factoring / invoice discounting firms, 138 approached partners / working
shareholders, 87 approached venture capital funds, 83 approached private individuals, 53 approached
trade customers / suppliers, and 67 approached other sources. It is of interest that outright rejection rates
were highest among venture capital funds (46% rejection), and much higher than that for banks (17%
outright rejection). The lowest rejection rate was among leasing firms (5%). Banks comprised the
median and mean highest percentage of outside finance in terms of which type of source was approached
and which type of source provided the finance. In fact, banks comprised the only type of source for
which the median percentage of a firm’s total external capital was greater than 0% (for banks, the median
percentage is 34%; see Table 2).
A number of the correlations in Table 2 provide insights into the different characteristics of the
different types of investors. Banks are statistically more likely to finance profitable businesses, while the
correlations in Table 2 show private individuals are statistically more likely to fund unprofitable
businesses. Venture capital funds tend to finance innovative firms in innovative industries; unlike banks,
9 There is one potential exception to this statement: contemporaneous capital expenditures might be
endogenous to obtaining external finance if firms are cash constrained. However, the data indicate firms most often
obtain their desired cash flows (albeit not always in the form that they would like). Hence, we use the current
capital expenditures to account for planned growth (i.e., not historical capital expenditures which reflect historical
growth) and to account for the fact that firms provide to potential sources of external capital their most recent
quarter profits and capital expenditures, as well as expected profits and capital expenditures.
10 These high correlations give rise to results that are robust when we use lagged values.

14
as would be expected, because banks provide debt finance, have very large portfolios, and typically use
preset criteria in ascertaining whether the firm is a suitable risk for a loan.
The data indicate venture capital funds are more likely to finance businesses with higher turnover
and greater total assets, which is in contrast to private individuals. Consistent with Gompers and Lerner
(1999), venture capital funds also finance companies with a greater proportion of professional directors
(hence potentially better governance) and higher growth objectives, which is similar to financing from
private individuals. Venture capital funds finance firms with smaller percentages of shares allocated to
CEOs are board members, and firms established to implement an invention. Venture capital fund
managers have small portfolios (often no more than 5 investees per fund manager; see Kanniainen and
Keuschingg, 2003, 2004; Cumming, 2006), and provide significant screening pre-investment and value-
added post investment in their investee firms.
Hire purchase, or leasing, firms are more likely to finance older businesses with high capital
expenditures, little innovation, a smaller proportion of professional directors, and firms started by males
and not females. Leasing businesses act in ways that are somewhat analogous to banks. The main
difference is that the leasing business typically ties the financing provided to some other product provided
to the firm.
Factor / invoice discounting firms provide cash advances on the basis of an unpaid invoice, so
that a firm may meet cash shortages.11 This type of financing tends to be used by firms with fewer
professional directors, as well as firms with high growth objectives and lower profit levels. The type of
finance provided by an invoice discounting firm is such that they do not have concerns with information
problems associated with the quality of the firm that obtains the finance, but rather, with the firm or
customer with the unpaid invoice.
Trade customers / suppliers are more likely to finance younger firms with growth objectives are
those that have recently developed an innovation. There are proprietary rights associated with innovative
industries and smaller innovative firms face potential hold up problems from sources of capital. The data
are suggestive that smaller innovative firms are not concerned with these hold-up problems from the
larger suppliers in their respective industries. Suppliers can be a natural source of capital for some
developing firms securing a supply chain for developing their own products.
Partners / working shareholders are more likely to be a significant source of capital for firms with
high levels of debt / assets. Firms with excess leverage may secure additional capital from sources of
capital that face comparatively few informational problems, such as existing partners / working
shareholders.
11 See http://www.bizhelp24.com/business_finance/business_finance_factoring.htm.
15
Finally, the category of “other private individuals” in Table 2 or “angel investors” indicates
similar patterns as with the venture capital funds. Angel investors finance small, young and as-yet
unprofitable businesses, albeit firms with strong management and high quality directors.
Table 3 provides additional correlation statistics across various variables that are used in the
multivariate empirical analyses in the next section. The matrix gives further insights into the data, and
provides guidance in terms of considering issues of collinearity in the regressions in section 4.
4. Multivariate Empirical Analyses
This section provides multivariate tests of these theoretical propositions by first considering the extent of
finance sought in subsection 4.1, taking into account (in the spirit of Heckman, 1976, 1979) the first step
non-randomness in the decision to seek outside capital. Subsection 4.2 considers the percentage of
external capital obtained. Thereafter, we provide tests of differences across the alternative sources of
capital (banks, venture capital funds, leasing firms, factoring firms, trade customers and suppliers,
partners and working shareholders, private individuals and other sources). Section 5 discusses potential
limitations and alternative explanations, and suggests avenues for future research. Concluding remarks
follow in section 6.
4.1. Which Firms Seek External Finance, and the Amount of External Finance Sought
In this subsection we examine the factors that affect the amount of external finance while taking into
account the factors that lead firms to seek external finance in the first place. We report eight alternative
specifications in Table 4, based on variables defined in Table 1. Models 1A, 2A, 3A and 4A are Tobit
models in which the left-hand-side variable is the amount of external capital that was sought. The Tobit
specification is used to account for the fact that the left-hand-side variable is bounded below by zero. The
right-hand-side variables comprise variables for firm financial characteristics, firm age and profile and
competitors / industry, as specified in Table 4. Model 1A encompasses the full sample. Model 2A
considers the subsample of firms started in 1990-1997. Model 3A considers the subsample of firms
started in 1980-1989. Model 4A considers the subsample of firms started prior to 1980. These
subsamples are used to show robustness to different time periods for two reasons. First, we only observe
applications for external finance in 1996 and 1997, and firms started at different points in will be at
different stages in their life-cycle and thereby may have a different likelihood of applying for external
finance at any give point in time. Second, there may be survivorship bias in the typical sense that older
firms observed are the ones that survived. The different models are presented to show robustness. Except

16
where otherwise noted below, the results are quite robust (albeit in some cases less significant in the
subsamples, which is likely due to the smaller sample sizes).
Models 1B, 2B, 3B and 4B are two-step Heckman corrected models whereby the first step is a
Probit model that estimates the probability a firm applied for outside capital, and the second step is the
amount of external capital sought. The identification variables (see, e.g., Puhani, 2000) in the first step
(excluded in the second step) Heckman regression include, first, growth objectives because it is natural
that self-proclaimed growth firms (as opposed to ‘life-style’ firms) are more likely to apply for external
capital. The growth objectives variable is not included in the second step because it is a variable that is
qualitative (not easily quantifiable by the people and institutions sourcing the capital) and hence more
closely related to the decision to apply for finance rather than how much finance (entrepreneurs know that
their application for capital is evaluated on the basis of quantifiable criteria and not by their level of
ambition and hence the amount sought will more likely reflect quantitative criteria).12 By contrast, the
other variables such as capital expenditures / profits more closely capture both the decision to apply for
finance and the amount of finance sought. The second restriction is a little similar to the first, and refers
to the wealth ambitions of the founders. The rationale for this restriction is similar to the first restriction.
The third identifying restriction was whether or not the firm was incorporated (instead of a partnership or
sole proprietorship. We would expect corporations would be more likely to apply for external finance. In
earlier drafts we considered other restrictions and found results consistent with those reported here;
alternative specifications are available on request.
[Insert Table 4 About Here]
In Table 4 step (1) of Models 1B, 2B, 3B and 4B, the data indicate that firms that do seek external
finance have the following characteristics: they have lower turnover (Model 4B), higher capital
expenditures / profits (Models 1B, 2B, 3B and 4B), and higher growth objectives (Models 1B, 2B, 3B and
4B). In terms of the economic significance, a firm is approximately 1% more likely to seek external
finance when capital expenditures are 20 times that of profits relative to 10 times profits (see step 1 of
Models 1B, 2B, 3B and 4B). The relation between capital expenditures / profits and external finance
applications is also graphically illustrated in Figure 1. This indicates support for the traditional pecking
order in which firms finance new projects internally before seeking external finance (see Hypothesis 1a
outlined above in subsection 2.1). Firms applying for external finance also tend to be smaller firms (as
12 Regardless, note that we nevertheless considered the growth objectives variable for the second step and it
was insignificant and did not materially affect the other results reported in Table 4.

17
proxied by turnover) with a strong growth orientation (in support of Hypothesis 2a). The statistical
significance of the effect of turnover, however, is not robust and only significant in Model 4B which
shows that a firm with ₤1,000,000 turnover is 1.9% more likely than a firm with ₤2,000,000 turnover to
apply for external finance. The effect of growth ambition, by contrast, is robust in all of the specifications
presented in Table 4. The economic significance associated with growth ambition is such that on a
ranking from 1-4 with 4 being the highest growth orientation, an increase in the ranking by 1 point tends
to increase the probability of an application for external finance by approximately 11%.
[Insert Figure 1 About Here]
There are some differences in firm-specific and market factors that lead to applications for
external finance. Corporations are approximately 6% more likely to seek external finance that
partnerships or sole proprietorships. Firms that face 1000 competitors are approximately 2% more likely
to apply for external finance than firms that face 100 competitors. Also, Table 4 indicates industry
differences in applications for external finance.
Table 4 Models 1A, 2A, 3A, 4A and step 2 of Models 1B, 2B, 3B and 4B present regression
evidence that indicates systematic characteristics drive the amount of external finance actually sought.
The results are presented for Tobit and Heckman specifications as well as different time periods for firms’
founding dates. Note that we also considered the robustness of our results to outlier observations (as
identified by Cook’s distances and leverage plots). The results are robust. For instance, removing the
outliers apparent in Figure 2, we do not find any material differences in the regression results reported in
the Tables. Additional specifications are available on request.
[Insert Figure 2 About Here]
Table 4 shows that (with the sole exception of Model 3B) greater levels of capital expenditures /
profits give rise to firms seeking more external finance (consistent with Hypothesis 1a), and this effect is
the most statistically robust and economically significant driver of the amount of external finance sought.
The economic significance is such that a doubling of capital expenditure / profits gives rise to an
additional £55,138 in external capital sought (based on Model 1B in Table 4). The positive relation
between capital expenditures / profits and the amount of external finance sought is also depicted
graphically in the data in Figure 2. Note that we have expressed the right-hand-side variables in logs. (A
linear specification either in terms of capital expenditures / profits, or capital expenditures minus profits,
also gives rise to a statistically significant and positive relation with the amount of capital sought.) The

18
nonlinear specification models the relation as a concave specification, such that a firm’s application for
external capital increases at a decreasing rate as capital expenditures / profits increases. The intuition for
this non-linear relation is that at very high levels of capital expenditures, firms are not as likely to apply
for an equal amount of external finance as this would reduce the probability that such amounts would be
granted by the financier. This issue is further addressed in the next subsection.
There is little evidence that size is correlated with the amount of external finance sought. The
only statistically significant evidence is a positive relation between turnover and the amount of external
finance sought, but this effect is statistically significant only in Models 3A and 3B in Table 4. Assets are
unrelated to the amount of external finance sought in all specifications.
Consistent with Hypothesis 1a, the data provide evidence of a relation between profit margins and
the amount of external finance sought for the entire sample and the subsample of firms started after 1990
(Models 1A, 1B, 2A and 2B in Table 4). Profit margins, however, are negatively related to the extent of
external finance sought for older firms started before 1990 (Models 4A and 4B). These results are
perhaps explained by the fact that older firms with a longer track record exhibit comparatively less
information asymmetry for providers of external finance and thereby not be discouraged from seeking
additional capital despite lower profit margins.
We further control for the capital structure of the firm by including debt/assets as well as a
squared term for debt / assets. Generally, the data indicate via both of these variables enables that there is
an inverted U-shaped pattern in the relation between debt/assets and the amount of external finance
sought given the positive and significant coefficients for debt/assets and the negative and significant
coefficients for the squared variable for debt/assets (both effects are most robust in Models 1A, 1B, 2A
and 2B in Table 4). This inverted U-shaped relation is intuitive. Firms with a track record with providers
of external debt finance will be able to seek additional capital from those sources of capital that have
already carried out due diligence to screen out bad loans. However, firms with too much debt relative to
their asset base will be discouraged from seeking significant amounts of external capital due to increased
expected bankruptcy costs, particularly for the case of additional debt finance. As well, external sources
that had previously provided debt to the firm may have covenants in place that restrict the amount of
additional external capital that the firm can seek.
4.2. The Percentage of External Finance Obtained
Table 5 presents evidence from OLS and Heckman-corrected regressions that indicate systematic
characteristics drive the percentage of external finance obtained. The left-hand-side variable is
transformed so that it is not bounded between 0 and 100%, in a standard way of modeling fractions (see,

19
e.g., Bierens, 2003). Specifically, if Y is a dependent variable that is bounded between 0 and 1 (i.e., a
fraction), then a possible way to model the distribution of Y conditional on a vector X of predetermined
variables, including 1 for the constant term, is to assume that
)'exp(11
)'exp(1)'exp(
UXUXUXY
−−+=
+++
=ββ
β
where U is an unobserved error term. Then
UXYY +=− '))1/(ln( β
which, under standard assumptions on the error term U can be estimated by OLS.
Consistent with the presentation in Table 4, Table 5 presents eight models. Models 5A, 6A, 7A
and 8A are OLS specifications that do not account for Heckman selection effects. Models 5A, 5B, 5C
and 5D are Heckman models that do account for Heckman selection effects for the decision to seek
external finance in the first place. The first step of the Heckman corrected models in Table 5 is identical
to the first step models in Table 4. As well, as in Table 4, Table 5 also reports the models for the full
sample (Models 5A and 5B), the subsample for firms started in 1990-1997 (Models 6A and 6B), firms
started in 1980-1989 (Models (7A and 7B) and firms started prior to 1980 (Models (8A and 8B).13
[Insert Table 5 About Here]
The most robust result in Table 5 is that larger firms, in terms of their total assets, are much more
likely to obtain a higher percentage of the total amount of finance sought. This effect is statistically
significant in all of the different models presented in Table 5 (among various others considered but not
reported for reasons of succinctness). In terms of the economic significance, a firm with £1 million in
assets will obtain approximately 5% more of their desired capital than the average firm in the sample
which has assets of £375,000 (see Table 1). Overall, this shows generally that small firms tend to face a
problem in obtaining all of their desired external capital. This evidence is highly suggestive of a capital
gap. It is possible that size is correlated with unobserved features of the quality of the application for
external finance (that is, unobservable over-and-above the variables considered in the regressions 13 We considered other right-hand-side variables. For example, we considered the extent of external finance
sought, and those results (not reported for reasons of succinctness) generally showed a negative relation between the
extent of external finance sought and the percentage of finance obtained. We do not report specifications with the
extent of external finance sought as a right-hand-side variable in Table 5 because that variable is a choice variable
(analyzed as a dependent variable in Table 4 as discussed above). Regardless, the inclusion/exclusion of this
variable does not materially impact the other results reported in Table 5 and discussed immediately below.
Additional specifications are available on request.

20
presented in Table 5). The correlation between assets and the residuals in the regressions in Table 5 is
0.00 and the residuals have statistical properties that are not materially different from the normal
distribution; therefore, there is no reason to believe that size is picking up unobserved features of the
quality of the loan applications. We may infer from the data that smaller applicants in terms of size are
disadvantaged in terms of obtaining all of their desired capital.
Table 5 further indicates that a firm that recently developed a novel innovation (a technologically
new or significantly improved product) tends to obtain less of their desired capital. This effect is
statistically significant in the full sample (Models 5A and 5B and the subsample of firms started after
1990 (Models 6A and 6B). The economic significance is such that a firm that was started within 7 years
of applying for external finance and recently developed an innovation will obtain approximately 8% less
of their desired capital. Older firms started prior to 1990 that recently developed an innovation, by
contrast, do not have the same difficulties in obtaining their desired capital.
Table 5 shows older firms started prior to 1990 do nevertheless face problems in obtaining their
desired finance when they have few professional directors and/or lower profit margins. First, older firms
started prior to 1990 that do not have professional directors tend to obtain approximately 1% of their
desired finance, and this effect is statistically significant at the 10% level in Models 7A and 7B (for the
subsample of firms started in the 1980s), and significant at the 5% level in Models 8A and 8B (for the
subsample of firms started prior to 1980). Second, in regards to profit margins for firms started prior to
1980, higher profit margins are positively and significantly related to the percentage of finance obtained,
consistent with Hypothesis 1b. If profit margins increase from 0 to the mean level of 0.909 (Table 1),
then a firm is likely to increase the percentage of external capital obtained by approximately 4%.
In sum, the evidence in Table 5 shows asset sizes matter most for obtaining the desired level of
external finance. Small firms that have recently developed a novel innovation tend to obtain less of their
desired capital. This is expected as smaller innovative firms exhibit more pronounced information
asymmetries when applying for external capital. Larger firms that do not have professional directors
and/or are less profitable tend to obtain less of their desired finance. This is also expected as larger firms
that have not put in place professional governance mechanisms and/or are less financially successful are
less attractive candidates for external finance. The next section below considers whether there are
differences in firms’ ability to obtain their desired finance across the different sources of capital.
4.3. Differences across Alternative Sources of Capital
Before formally examining specific sources of capital, we first consider ordered logit evidence on the
number of different sources of capital sought in Table 6. This evidence in Table 6 provides a context in
21
which to examine differences across different sources of capital. The evidence in Table 6 is strongly
consistent with Hypothesis 2a. Firms with significant growth objectives are more likely to approach a
greater number of sources of capital, and this effect is statistically significant at the 1% level in each of
the Models 9-12. A firm with a higher ranking by 1 on a scale of 1-4 is approximately 1% more likely to
apply to an additional type of source of capital. This is economically significant in view of the fact that
among the 952 of 2520 firms that did apply for external finance, the median number of different sources
approached was 2 (and mean was 1.96) (Tables 1 and 2).
[Insert Table 6 About Here]
Also, much of the evidence in Table 6 is strongly consistent with Hypothesis 3. First, firms are
more likely to approach a greater number of different sources of capital when their capital expenditures /
profits are greater, as shown in all specifications in Table 6. This is consistent with Hypothesis 3.
Second, there is evidence from Model 12 in Table 6 for firms started before 1980 with lower profit
margins must approach a greater number of different sources of external capital. It is natural that new
firms may not yet have achieved profitability and hence current profit margins are less important for
external finance for young firms relative to their more established counterparts. Third, firms with higher
levels of debt / assets approach a greater number of different sources of capital for the full sample (Model
17) and the subsample of firms started before 1980. As with profit margins, we would expect debt/asset
levels to play a pronounced role in external capital for more established firms.
Table 7 Panels A and B explores further the issues addressed above by considering the
differences between banks, venture capital funds, hire purchase / leasing firms, factoring / invoice
discounting firms, trade customers / suppliers, partners / working shareholders, private individuals and
other sources of capital. 14 As discussed above in subsection 2.1 (Hypothesis 2b), among the
approximately 38% of 2520 firms in our sample that did seek external finance in the 1996-1997 period
considered, 775 approached banks, and only 87 approached venture capital funds (the other sources
approached were identified in section 2 and Table 2 above). Outright rejection rates were highest among
venture capital funds (46% rejection), and much higher than that for banks (17% outright rejection).
Table 7 addresses in a multivariate context whether the factors leading to financing by these distinct
sources were materially different across each of the 8 different sources of capital. 14 Models 13-20 are presented for the full sample of firms. The results from the subsamples by different years
in which the firms were founded did not give rise to materially different inferences that could be drawn from the
data, and are hence excluded for reasons of succinctness (otherwise there were be an extra 24 regression models).
These regression results are nevertheless available on request.

22
[Insert Table 7 About Here]
Table 7 presents in Part A OLS models for the percentage of external capital obtained from each
particular source of finance. Also, to show robustness, Table 7 presents in Part B Heckman-corrected
estimates of the percentage of external capital obtained from each of the 8 different sources of capital.
The first step of Part B of each Model for the Heckman regressions is a probit model that determines
whether the firm sought external capital from the particular source in question. The percentage term left-
hand-side variables make use of the transformation as described in Table 5 and accompanying text above.
Likewise, the right-hand-side variable specifications are consistent with Table 5.
The Part B Step 1 regressions in Table 7 show firms with significant growth objectives are more
likely to apply for external finance from banks, venture capital funds, leasing firms, factoring/invoice
discounting firms and partners/working shareholders. This is consistent with Hypothesis 2a that growth
objectives are a significant determinant of the decision to seek external capital. In the Part B Step 1
regressions in Table 7 there are also notable differences in terms of which firms apply for different types
of finance. Firms with greater capital expenditures / profits are only more likely to apply for bank
finance, lease finance and partner/working shareholder finance and not finance from other types of
sources of capital. These results are consistent with Hypotheses 1a and 2b. Bank and lease finance are
sources of debt capital, and we conjectured that entrepreneurs generally seek debt prior to equity in order
to avoid dilution of their ownership shares. Partner/working shareholder finance is external capital, but
capital from preexisting sources that had already financed the firm. Partners/working shareholders face
fewer information asymmetries relative to other sources of capital in carrying out due diligence as
partners/working shareholders have a relationship with the firm. The cost of external capital is smaller
when information problems are less pronounced. As well, note that less profitable firms are more likely
to apply for venture capital and partner/working shareholder finance. This is expected since venture
capital funds are partners/working shareholders are better able to carry out due diligence and mitigate
adverse selection problems than other sources of capital.
The Part A and Step 2 of Part B regressions in Table 7 consider the percentage of finance
obtained. Consistent with Hypothesis 1b, profit margins are a statistically significant variable for
successfully obtaining the desired amount of external finance from factoring/invoice discounting firms,
trade customers/suppliers and partners/working shareholders, but not the other sources of capital.
Larger firms in terms of asset sizes are more likely to obtain bank finance, but asset size does not
impact the percentage of finance obtained from other sources. In terms of the economic significance, a
firm with £1 million in assets will obtain approximately 8% more of their desired capital than the average

23
firm in the sample which has assets of £375,000 (see Table 1). Problems associated with capital gaps for
smaller firms are therefore pronounced with banks, but this positive relation between assets and
percentage of desired capital obtained is not statistically significant with other sources of capital. By
contrast, in the case of private individuals as a source of capital there is even evidence that smaller firms
obtain a higher proportion of their desired capital (Model 19A), but this effect is not statistically
significant after controlling for selection effects. The models are more robust in showing private
individuals provide a greater percentage of their desired capital to smaller firms facing larger competitors.
Banks provide high tech services firms with 28% less of their desired capital. This result is
consistent with Hypothesis 2b in that banks provide less capital to smaller risky ventures. Further, the
data indicate that banks provide male founded firms with 18% less of their desired capital relative to
female founded firms. There is much evidence (e.g., Jianakoplos and Bernasek, 1998) that females are
more risk averse than males, and hence this evidence is consistent with the prediction in Hypothesis 2b
that banks provide less capital to riskier ventures.
It is noteworthy from the Part B Step 1 regressions in Table 7 that firms that recently developed a
new innovation are more likely to apply for venture capital finance, consistent with Hypothesis 2b.
Venture capital funds attract innovative companies that require value-added assistance and exhibit high
information asymmetries and growth prospects (e.g., Berger and Udell, 2002; Carpenter and Peterson,
2002; Cressy, 1996, 2002). Also, the data show venture capital is more sought after by younger firms
with professional directors and more intensive growth objectives (Step 1 of Model 14B). This is intuitive
as professional directors provide the governance required to mitigate information asymmetries and agency
costs associated with financing early stage high-tech companies (Gompers and Lerner, 1999). However,
venture capital funds provide firms with 4% less of their desired capital when they have recently
developed a new innovation. Venture capital funds invariably stage their investments, and stage more
frequently for high-tech innovative firms, in order to mitigate information asymmetries and agency costs.
When the board members hold a greater percentage of the equity shares in the firm, venture
capital funds provide a smaller percentage of the desired capital. A change from the mean level of 86%
equity held by the board to 50%, for example, increases the percentage of desired finance provided by
venture capitalists by approximately 8%. This result is likely attributable to the fact that venture
capitalists demand significant equity shares in their firms and a reduction in equity held by board
members implies there is greater scope for outside equity to be sold to the venture capitalists. A greater
equity share held by the CEO, however, does not reduce the percentage of venture capital obtained as it is
relatively more important to maintain a high CEO ownership share to mitigate moral hazard problems.
In sum, the evidence in Table 7 shows there are systematic differences in firms’ ability to obtain
their desired capital in the form that they would like. Even after controlling for selection effects, the data
24
indicate banks are more likely to provide the desired amount of capital to larger firms with more assets.
Leasing firms, factor discounting / invoicing firms, trade customers / suppliers and partners / working
shareholders are more likely to provide the desired capital to firms with higher profit margins. The data
further show smaller firms are more likely to obtain finance from private individuals, and innovative
firms seek external capital from venture capital funds. These results are generally consistent with the
hypotheses set out in subsection 2.1 above.
5. Additional Robustness Checks, Extensions and Future Research
This paper introduced a very expansive and detailed new dataset which significantly extends the literature
on the financing decisions of entrepreneurial firms. The data are quite unique in that they are derived
from the entrepreneurial firms themselves, and not the financial institutions that provided the financing.
This enables a broad perspective on which firms seek external finance, from which types of institutions
do they seek capital, how much is sought, and how much is obtained. The data enable selection effects in
the spirit of Heckman (1976, 1979) to be considered in a unique way in the literature on entrepreneurial
capital sourcing decisions.
The introduction of new data invariably gives rise to questions about sample selection and
robustness. However in this case we have a very large sample spanning the full size range of small and
medium sized entrepreneurial firms which is free from response bias in terms of key finance related
factors such as size age or profitability. Complete details on survey design and sample selection issues
are provided in Bullock and Hughes (1998). In our econometric tests we explicitly considered sample
selection issues with regard to different types of firms applying for external finance among other things.
The robustness of our results was explicitly considered. Additional details regarding the data and
additional econometric tests are available on request.
It is noteworthy that our data are derived from a “snapshot” of a cross-section of entrepreneurial
firms in period leading up to 1997. The CBR data used here are however part of a unique panel data set
which tracks the same firms through time. In future work with we will to exploit this aspect of the data to
see what happened to the businesses in subsequent years after they obtained external finance. How was
the money spent? Did some firms fail in subsequent years due to the fact that they did not obtain all of
their requisite capital? Did obtaining external finance enable the businesses to become more profitable in
the years subsequent to obtaining external finance?
Our data indicated an absence of a capital gap in that most firms applying for external finance
were able to obtain their requisite capital. As such there does not appear to be a generic finance gap in the
UK entrepreneurial business sector, at least in terms of the quantity of external finance available in the

25
market. Nevertheless, the ex post analysis of the impact of external finance on subsequent entrepreneurial
firm performance (which would be post-1997 in our data, for example), would shed light on the quality of
external finance (in the spirit of Storey and Wynarczyk, 1996). While that type of ex post question poses
some interesting issues worthy of future data collection efforts, we must leave it for future research.
6. Summary and Conclusion
This paper investigated the internal versus external financing decisions among a very unique dataset
comprising 2520 early stage privately held UK firms in 1996-1997. We first identified factors that lead
firms to seek external finance. The most robust evidence indicated that firms with higher capital
expenditures / profits and firms with stronger growth objectives were much more likely to seek external
finance. We then demonstrated the existence of systematic differences in the amount of external finance
actually sought across businesses. We found a strong and robust relation between a firm’s capital
expenditures / profits and the amount of external finance actually sought. Overall, we view the evidence
as providing strong support for the traditional pecking order theory which predicts that firms prefer to
finance new projects internally prior to seeking external capital.
The data also indicated systematic differences in the percentage of external finance obtained
relative to that sought in ways that are consistent with information asymmetries faced by providers of
external capital. Smaller firms are more likely to obtain finance from private individuals. By contrast,
even after controlling for selection effects, one of the most important factors in regards to obtaining the
desired level of bank finance is a firm’s assets. Small firms without significant assets have difficulty
obtaining bank finance. Young, high growth innovative firms without significant assets or profits seek
capital from venture capital funds, but venture capital is not widely available and rejection rates are quite
high. High profits are not important for obtaining venture capital but are important for obtaining the
desired capital from leasing firms, factor discounting / invoicing firms, trade customers / suppliers and
partners / working shareholders.
We noted that, among the 38% of firms that made non-trivial efforts to obtain external finance in
our sample, the mean percentage of finance obtained (relative to the amount sought) was 84.5%, and the
median percentage was 100%. Hence, only few firms face a problem in obtaining all of their desired
external capital. This evidence is somewhat counter to the conventional wisdom that entrepreneurial
firms face a comparative dearth of capital. However, firms are not always able to obtain the type of
capital that they want. This suggests capital gaps in terms of the quantity of capital available are not
overly pronounced in the UK entrepreneurial finance sector. Questions pertaining to the quality of capital
available, among other things, could prove to be a fruitful avenue for future empirical studies.

26
References
Ackerlof, G.A. (1970). ‘The market for “lemons”: Quality uncertainty and the market mechanism’,
Quarterly Journal of Economics, vol. 84, pp. 488-500. Bascha, A., and Walz, U. (2001). ‘Convertible securities and optimal exit decisions in venture capital
finance’, Journal of Corporate Finance, vol. 7, pp. 285-306. Berger, A., and Humphrey, D.B. (1997). ‘Efficiency of financial institutions: international survey and
directions for future research’, European Journal of Operational Research, vol. 98, pp. 175-212. Berger, A., and Udell, G. (1998). ‘The economics of small business finance: the roles of private equity
and debt markets in the financial growth cycle’, Journal of Banking and Finance, vol. 22, pp. 613-673.
Berger, A., Klapper, L.F., and Udell, G.F. (2001). ‘The ability of banks to lend to informationally opaque
small businesses’, Journal of Banking and Finance, vol. 25, pp. 2127-2167. Berger, A. and Udell, G.F. (2002). ‘Small business credit availability and relationship lending: the
importance of bank organizational structure’, Economic Journal, vol. 112, pp. F32-F53. Bergmann, D., and Hege, U. (1998). ‘Venture capital financing, moral hazard, and learning’, Journal of
Banking and Finance, vol. 22, pp. 703-735. Bierens, H.J. (2003). ‘Modeling fractions’, Research note posted online
at: http://econ.la.psu.edu/~hbierens/EasyRegTours/FRACTIONS.PDF <accessed 1 June 2004> Bullock, A. and Hughes, A. (1998). ‘Survey Design, Response Bias and Sample Characteristics in the
CBR SME Survey’, in Cosh A.D. and Hughes, A. (eds) Enterprise Britain :Growth Innovation and Public Policy I the Small and Medium Sized Enterprise Sector 1994-1997 Cambridge ESRC Centre for Business Research, University of Cambridge
Carpenter, R.E., and Petersen, B.C. (2002a). ‘Capital market imperfections, high-tech investment, and
new equity investment’, Economic Journal, vol. 112 (2), pp. F54-F72. Carpenter, R., and Petersen, B.C. (2002b). ‘Is the growth of small firms constrained by internal finance?’,
Review of Economics and Statistics, vol. 84, pp. 298-309 Carpenter, R.E., Fazzari S.M., and Petersen B.C. (1998). ‘Financing constraints and inventory
investment: a comparative study with high-frequency panel data’, Review of Economics and Statistics, vol. 80, pp. 513-519.
Casamatta, C. (2003). ‘Financing and advising: optimal financial contracts with venture capitalists’,
Journal of Finance, vol. 58, pp. 2059-2086. Casamatta, C., and Haritchabalet, C. (2007). ‘Learning and syndication in venture capital investments’,
Journal of Financial Intermediation, vol. 16, pp. 368-398.

27
Cassar, G. (2004). ‘The financing of business start-ups’, Journal of Business Venturing, vol. 19, pp. 261-283.
Chemmanur, T., and Chen, Z. (2002). ‘Angels, venture capitalists, and entrepreneurs: a dynamic model of
private equity financing’, Working Paper, Boston College. Cosh, A., and Hughes, A. (2003). Enterprise Challenged. ESRC Center for Business Research, University
of Cambridge. Cosh, A. and Hughes A. (1994). ‘Size, financial structure and profitability: UK companies in the 1980s’,
In Hughes, A. and D.J. Storey, eds, Finance and the small firm. London: Routledge, pp.18-63 Cressy, R. (1996). ‘Are business startups debt-rationed?’, Economic Journal, vol. 106, pp. 1253-1270. Cressy, R. (2002). ‘Funding gaps: a symposium’, Economic Journal, vol. 112, pp. F1-F16. Cumming, D. (2006). ‘The determinants of venture capital portfolio size: empirical evidence’, Journal of
Business, vol. 79, pp. 1083-1126. Cumming, D., and Johan, S. (2008). ‘Preplanned exit strategies in venture capital’, European Economic
Review, forthcoming. Denis, D. (2004). ‘Entrepreneurial finance: an overview of the issues and evidence’, Journal of Corporate
Finance, vol. 10, pp. 301-326. De Meza, D. (2002). ‘Overlending?’, Economic Journal, vol. 112, pp. F17-F31. De Meza, D., and Webb, D.C. (1987). ‘Too much investment: a problem of asymmetric information’,
Quarterly Journal of Economics, vol. 102, pp. 281-292. De Meza, D., and Webb, D.C. (1992). ‘Efficient credit rationing’, European Economic Review, vol. 36, pp.
1277-1290. De Meza, D., and Webb, D.C. (1999). ‘Wealth, enterprise and credit policy’, Economic Journal, vol. 109,
pp. 153-163. De Meza, D., and Webb, D.C. (2000). ‘Does credit rationing imply insufficient lending?’, Journal of Public
Economics, vol. 78, pp. 215-234. Garmaise, M., (2000). ‘Informed investors and the financing of entrepreneurial projects’, Working Paper,
University of Chicago Graduate School of Business. Gompers, P.A., and Lerner, J. (1999). The Venture Capital Cycle, Cambridge: MIT Press. Gompers, P.A. and Lerner, J. (2001). ‘The venture capital revolution’, Journal of Economic Perspectives,
vol. 15, pp. 145-168. Gorton, G., and Winton, A. (2003). ‘Financial intermediation’, in Constantinides, G., Harris, M., and
Stulz, R., Handbooks in the Economics and Finance, vol. 1A., Corporate Finance, Boston: Elsevier.
28
Harrison R.T., and Mason, C. (2000). ‘Venture capital market complementarities: the links between business angels and venture capital funds in the United Kingdom’, Venture Capital: An International Journal of Entrepreneurial Finance, vol. 2, pp. 223-242.
Heckman, J. (1976). ‘The common structure of statistical models of truncation, sample selection, and
limited dependent variables and a simple estimator for such models’, Annals of Economic and Social Measurement, vol. 5, pp. 475-492.
Heckman, J. (1979). ‘Sample selection bias as a specification error’, Econometrica, vol. 47, pp. 153-161. Hege, U., Palomino F. and Schwienbacher, A. (2003). ‘Determinants of venture capital performance:
Europe and the United States’, Working Paper, HEC School of Management. Hsu, D. (2004). ‘What do entrepreneurs pay for venture capital affiliation?’, Journal of Finance, vol. 59,
pp. 1805-1844. Jensen, M.C., and Meckling, W. (1976). ‘Theory of the firm: managerial behaviour, agency costs, and
capital structure’, Journal of Financial Economics, vol. 3, pp. 305-360. Jianakoplos, N.A., and Bernasek, A. (1998). ‘Are women more risk averse?’, Economic Enquiry, vol. 36,
pp. 620-630. Kanniainen, V, and Keuschnigg, C. (2003). ‘The optimal portfolio of start-up firms in venture capital
finance’, Journal of Corporate Finance, vol. 9, pp. 521-534. Kanniainen, V., and Keuschnigg, C. (2004). ‘Start-up investment with scarce venture capital support’,
Journal of Banking and Finance, vol. 28, pp. 1935-1959. Keuschnigg, C. (2004). ‘Taxation of a venture capitalist with a portfolio of firms’, Oxford Economic
Papers, vol. 56, pp. 285-306. Keuschnigg, C., and Nielsen, S.B. (2004). ‘Start-ups, venture capitalists, and the capital gains tax’,
Journal of Public Economics, vol. 88, pp. 1011-1042. Kon, Y. and Storey, D.J. (2003). ‘A theory of discouraged borrowers’, Small Business Economics, vol.
21, pp. 37-49. Kortum, S., and Lerner, J. (2000). ‘Assessing the contribution of venture capital to innovation’,
RAND Journal of Economics, vol. 31, pp. 647-692. Mayer, C., Schoors, K. and Yafeh, Y. (2005). ‘Sources of funds and investment strategies of VC funds:
evidence from Germany, Isreal, Japan and the UK.’, Journal of Corporate Finance, vol. 11, pp. 586-608.
Manigart, S., Lockett, A., Meuleman, M., Wright, M., Landstrom, H., Bruining, H., Desbrieres, P., and
Hommel, U. (2006). ‘Venture capitalists’ decision to syndicate’, Entrepreneurship Theory and Practice, vol. 30, pp. 131-153.
Marlow, S., and Patton, D. (2005). ‘All credit to men? Entrepreneurship, finance and gender’,
Entrepreneurship Theory & Practice, vol. 29, pp. 717-735.

29
Myers, S.C. (2000). ‘Outside equity’, Journal of Finance, vol. 55, pp. 1005-1037. Myers, S.C., and Majluf, N. (1984). ‘Corporate financing and investment decisions when firms have
information that investors do not have’, Journal of Financial Economics, vol. 13, pp. 187-222. Myers, S.C., Dill, D.A., Bautista, A.J. (1976). ‘Valuation of financial lease contracts’, Journal of Finance,
vol. 31, pp. 799-819. Neus, W., and Walz, U. (2005). ‘Exit timing of venture capitalists in the course of an initial public
offering’, Journal of Financial Intermediation, vol. 14, pp. 253-277. Noe, T.H., and Rebello, M.J. (1996). ‘Asymmetric information, managerial opportunism, financing and
payout policies’, Journal of Finance, vol. 51, pp. 637-660. Porter, M. (1998). Competitive strategy: techniques for analyzing industries and competitors, New York:
Free Press. Porter, R.H. (1995). ‘The role of information in U.S. offshore oil and gas lease auctions’, Econometrica, vol.
63, pp. 1-27. Puhani, P.A. (2000). ‘The Heckman correction for sample selection and its critique’, Journal of Economic
Surveys, vol. 14, pp. 53-68. Ritter, J.R., and Welch, I. (2002). ‘A review of IPO activity, pricing and allocations’, Journal of Finance,
vol. 57, pp. 1795-1828. Riyanto, Y.E., and Schwienbacher, A. (2006). ‘The strategic use of corporate venture financing for securing
demand’, Journal of Banking and Finance, vol. 30, pp. 2809-2833. Schwienbacher, A. (2007). ‘Innovation and venture capital exits’, Economic Journal, forthcoming. Smith, R.L., and Smith, J.K. (2000). Entrepreneurial Finance, New York: Wiley. Stiglitz, J., and Weiss, A. (1981).‘Credit rationing in markets with imperfect information’, American
Economic Review, vol. 73, pp. 393-409. Storey, D., and Wynarczyk, P. (1996). ‘The survival and non-survival of small firms in the UK’, Review
of Industrial Organisation, vol. 11, pp. 211-229. Tamari, M. (1970). ‘The nature of trade credit’, Oxford Economic Papers, vol. 22, pp. 406-419. Wong, A. (2004). ‘Angel finance: the ‘other’ venture capital. Working paper, University of Chicago. Wright, M., and Lockett, A. (2003). ‘The structure and management of alliances: syndication in the venture
capital industry. Journal of Management Studies, vol. 40, pp. 2073-2104. Yusopova, A. (2002). ‘Lease finance development in Russian transition economy. Working paper,
Novosibirsk State University.
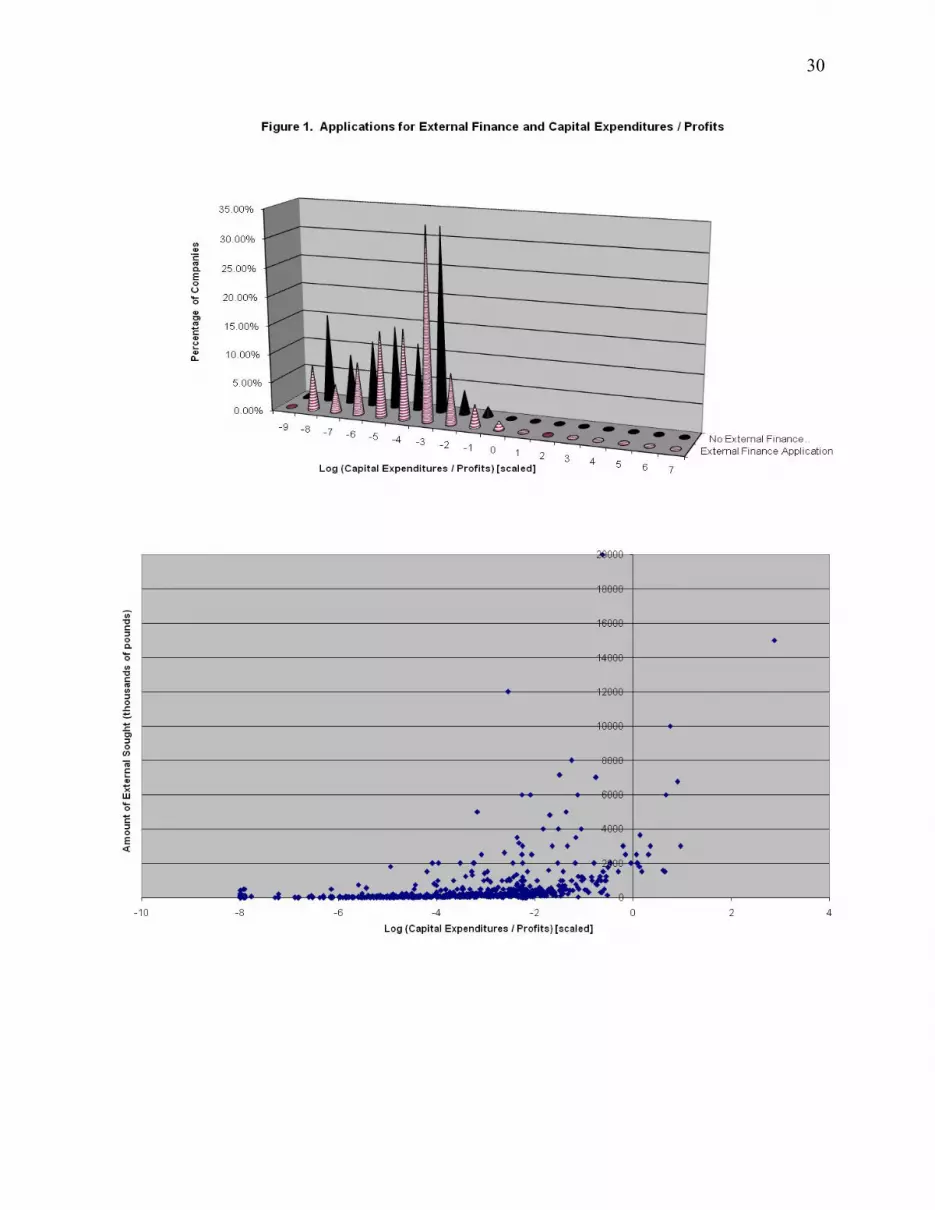
30

31
Table 1
Variable Definitions and Summary Statistics
Variable Name Definition Mean Median Standard Deviation Minimum Maximum Observations
Dependent Variables
External Finance Sought A dummy variable equal to one if the firm attempted to
obtain external finance (i.e. additional to internal cash flows) in the 1996-1997 period.
0.378 0 0.485 0 1 2520
Amount of External Finance Sought
The (strictly positive) amount of external finance sought by the business in the 1996-1997 period. Measured in
thousands of 1997 pounds. 467.667 100 1631.855 0.1 29030.907 952
External Finance Obtained The percentage of external finance obtained by the business in the 1996-1997 period (as a fraction of the amount sought). 80.719 100 33.713 0 100 952
External Finance Obtained from Banks
An ordered variable equal to 0 if the source was not approached, 1 if the source was approached but no finance
offered, 2 if the source was approached but offered less than the full amount, and 3 if the source was approached and
offered the full amount.
2.078 3 1.189 0 3 952
External Finance Obtained from Venture Capital Funds
An ordered variable equal to 0 if the source was not approached, 1 if the source was approached but no finance
offered, 2 if the source was approached but offered less than the full amount, and 3 if the source was approached and
offered the full amount.
0.186 0 0.653 0 3 952
Independent Variables Firm Financial Characteristics
Profits
The natural log of pre-tax profits (losses) before deduction of interest, tax, and directors’, partners’ or proprietors’
emoluments. Measured in thousands of 1997 pounds. [scaled to avoid negatives]
7.972 7.953 0.201 0 9.4497509 2520
Log (Capital Expenditures) The natural log of the firm's total capital expenditures in 1996-1997. Measured in thousands of 1997 pounds. 3.952 4.394 2.154 0.000 10.951 2520
Log (Capital Expenditures / Profits)
Log of capital expenditures per profits. [scaled to avoid negatives] -4.020 -3.602 2.129 -8.344 6.974 2520
Profit Margin Profits / Turnover in 1996-1997 0.909 0.112 24.737 -2.000 1236.000 2520
Log (Turnover) The natural log of the firm's total turnover in 1996-1997. Measured in thousands of 1997 pounds 6.691 7.424 1.584 0.693 11.408 2520
Long Term Debt / Assets Total long Term Debt / Assets (Values From the 1995
Financial Year Prior to Raising Capital in the 1996-1997 Period under Consideration)
0.895 0.086 39.839 0.000 2000.000 2520
Log (Total Assets) Log of Total Assets (Values From the 1995 Financial Year
Prior to Raising Capital in the 1996-1997 Period under Consideration) Measured in thousands of 1997 pounds
5.927 6.125 1.726 0.000 10.904 2520
Innovation A dummy variable equal to one if the Firm developed a new
commercialisable technology (technologically new or significantly improved) in the 1996-1997 period
0.231 0 0.422 0 1 2520
Firm Age and Profile
Log (Age) The natural log of the firm's age as at 1997 from date of incorporation. 2.661 2.639 0.942 0 5.628 2520
Professional Directors The proportion of directors with an advanced degree in science, engineering or some other professional qualification. 0.595 0.667 0.459 0 1 2520
Gender The gender of the firm’s Chief Executive/Senior Partner/Proprietor (1=male, 2=female) 1.076 1 0.265 1 2 2520
CEO Shares % of shares owned by Chief Executive 51.502 51.604 21.551 0 100 2520
Board Shares % of shares owned by whole Board of Directors 86.123 86.774 18.105 0 100 2520
Largest Owner Shares % of shares owned by largest single shareholder 58.333 58.485 18.262 0.100 100 2520
Notes. This table presents definitions of each of the variables, along with summary statistics. The total sample size is 2520 firms. Values are in 1997 pounds and from the 1996-1997 period unless otherwise indicated. These variables are used in the subsequent tables and regression analyses.

32
Table 1. (Continued)
Variable Name Definition Mean Median Standard Deviation Minimum Maximum Observations
Growth Objectives The firm's planned growth objectives over the 1997 - 2000 period (1=become smaller, 2=stay the same size, 3=grow
moderately, 4=grow substantially) 3.012 3 0.687 1 4 2520
Corporation A dummy variable equal to 1 for incorporated firms 0.733 1 0.443 0 1 2520
Partnership A dummy variable equal to 1 for partnerships 0.145 0 0.352 0 1 2520
Sole Proprietorship A dummy variable equal to 1 for sole proprietorship 0.122 0 0.328 0 1 2520
Reason Firm Established
Completely New Start-ups
A dummy variable equal to 1 for firms that were Completely New Start-ups. By the term new “start-ups” we mean this is
the form of business formation, and does not necessarily mean that the firm is especially young.
0.644 1 0.479 0 1 2520
Founded to avoid unemployment of founder(s)
A dummy variable equal to 1 for firms founded to avoid unemployment of founder(s) 0.295 0 0.513 0 1 2520
Founded for desire of founder(s) to run own business
A dummy variable equal to 1 for firms founded for desire of founder(s) to run his or her own business 0.734 1 0.500 0 1 2520
Founded to implement an invention
A dummy variable equal to 1 for firms founded to implement an invention 0.304 0 0.515 0 1 2520
Founded due to wealth ambitions of founders
A dummy variable equal to 1 for firms founded due to wealth ambitions of founders 0.334 0 0.554 0 1 2520
Competitors / Industry
Larger Competitors The proportion of the firm's primary competitors that are larger than the firm. 0.684 0.75 0.536 0 12 2520
Log (Total Competitors) The natural log of the total number of serious competitors of the firm. 1.934 1.792 1.011 0 8.517 2520
Industry (un)Innovativeness The percentage of the firm's sales for which products or
services were unchanged or only marginally changed in the last 3 years.
74.669 80 29.514 0 100 2520
High Tech Manufacturing A dummy variable equal to one for a firm in a high technology manufacturing industry. 0.062 0 0.241 0 1 2520
Conventional Manufacturing A dummy variable equal to one for a firm in a conventional manufacturing industry 0.409 0 0.492 0 1 2520
High Tech Services A dummy variable equal to one for a firm in a high technology services industry. 0.039 0 0.193 0 1 2520
Conventional Services A dummy variable equal to one for a firm in a conventional services industry. 0.299 0 0.458 0 1 2520

33
Table 2
Summary Statistics and Correlations for Specific Sources of External Capital
Banks Venture Capital Funds
Hire Purchase or
Leasing Firms
Factoring / Invoice
Discounting Firms
Trade Customers /
Suppliers
Partners / Working
Shareholders
Other Private
Individuals Other
Number of Firms that Did Approach this Source for External Capital 775 87 474 151 53 138 83 67
Number of Firms that Did Not Approach this Source, but Did Seek External Finance Elsewhere 177 865 478 801 899 814 869 885
Number of Firms that Did Approach this Source but No Finance Offered 133 40 23 29 5 12 20 14
Number of Firms that Approached this Source but Less than Full Amount Offered 133 8 20 38 10 19 15 15
Number that Did Approach this Source and Full Amount Offered 509 39 431 84 38 107 48 38
Mean Percentage of Total External Capital Obtained from this Source 42.749 2.851 23.792 5.892 1.624 5.313 3.910 3.598
Median Percentage of Total External Capital Obtained from this Source 33.580 0.000 0.000 0.000 0.000 0.000 0.000 0.000
Standard Deviation of Percentage Obtained from this Source 39.451 13.948 33.630 18.261 9.069 17.602 16.605 16.224
Minimum Amount Obtained from this Source 0.000 0.000 0.000 0.000 0.000 0.000 0.000 0.000
Maximum Amount Obtained from this Source 100.000 100.000 100.000 100.000 100.000 100.000 100.000 100.000
Correlations with Percentage Obtained from Source and Other Variables
Firm Financial Characteristics Log (Profits) 0.08 -0.01 0.05 -0.03 0.00 0.04 -0.06 0.04
Log (Capital Expenditures) -0.01 0.04 0.20 0.01 0.02 -0.05 -0.11 0.01 Log (Capital Expenditures / Profits) -0.01 0.04 0.20 0.01 0.02 -0.05 -0.11 0.01
Profit Margin -0.03 -0.01 -0.02 -0.01 -0.01 -0.01 -0.01 0.19
Log (Turnover) 0.04 0.12 0.08 0.08 -0.01 -0.06 -0.05 -0.09
Long Term Debt / Assets -0.01 0.01 -0.01 0.06 -0.01 0.07 -0.01 0.00 Log (Total Assets) 0.05 0.08 0.14 0.10 0.00 -0.05 -0.12 0.02
Innovation -0.03 0.05 -0.08 0.00 0.07 0.03 0.00 0.07
Firm Age and Profile Log (Age) 0.02 -0.07 0.18 -0.05 -0.08 -0.01 -0.11 0.02
Professional Directors -0.02 0.09 -0.09 -0.08 0.00 0.05 0.09 -0.04 Gender 0.05 -0.05 -0.06 0.01 0.05 -0.01 0.01 0.02
CEO Shares -0.02 -0.09 -0.01 0.00 0.00 -0.03 0.01 0.02 Board Shares 0.00 -0.17 0.04 0.03 0.03 -0.01 0.01 -0.09
Largest Owner Shares 0.01 -0.10 -0.02 -0.02 -0.03 -0.04 0.00 0.01 Growth Objectives -0.02 0.11 -0.04 0.09 0.07 -0.01 0.00 -0.01
Corporation -0.10 0.08 0.04 0.10 0.00 0.04 -0.02 0.02 Partnership 0.06 -0.05 0.01 -0.08 0.02 0.03 -0.04 -0.04
Sole Proprietorship 0.07 -0.06 -0.06 -0.06 -0.02 -0.09 0.07 0.01 Reason Firm Established
Completely New Start-ups -0.01 0.05 -0.03 -0.03 0.04 0.01 0.01 0.04 Founded to avoid unemployment of founder(s) -0.05 0.01 -0.01 -0.01 -0.03 0.01 0.00 -0.03
Founded for desire of founder(s) to run own business 0.02 0.01 0.06 -0.03 -0.03 0.00 0.00 -0.06 Founded to implement an invention -0.02 0.06 -0.05 0.00 0.00 0.03 0.02 0.06
Founded due to wealth ambitions of founders -0.02 0.03 0.05 -0.01 0.00 0.00 -0.01 -0.01 Competitors / Industry
Larger Competitors 0.00 0.01 -0.01 -0.01 -0.02 0.00 0.00 -0.01 Log (Total Competitors) -0.02 -0.06 0.05 0.05 -0.04 -0.01 -0.02 -0.01
Industry (un)Innovativeness 0.07 -0.07 0.04 0.01 -0.07 -0.03 -0.05 -0.05 High Tech Manufacturing -0.03 0.03 -0.03 -0.03 0.04 0.06 -0.02 -0.01
Conventional Manufacturing -0.03 -0.05 0.15 0.13 -0.03 -0.05 -0.12 0.03 High Tech Services -0.08 0.06 -0.04 -0.05 0.00 0.06 0.03 0.00
Conventional Services 0.07 -0.01 -0.08 -0.07 -0.04 0.03 0.07 -0.05
Notes. This table presents summary statistics and correlation coefficients for each specific source of external capital (banks, venture capital funds, hire purchase or leasing firms, factoring / invoice discounting firms, trade customers / suppliers, partners / working shareholders, other private individuals and other). A total of 952 firms (out of 2520 firms in the dataset) sought external capital from at least one source in the 1996-1997 period. The number of firms that did and did not approach the source is indicated, followed by the rejection and success rates among those firms that did approach the source. The statistics for the mean, median, standard deviation and minimum and maximum percentage of capital obtained from the each source is indicated. Correlations with various variables for the characteristics of the businesses are presented; correlations significant at the 5% level are highlighted in underline font.

34
Table 3 Correlation Matrix
(1) (2) (3) (4) (5) (6) (7) (8) (9) (10) (11) (12) (13) (14) (15) (16) (17) (18) (19) (20) (21) (22) (23) (24) (25)
Dependent Variables
(1) External Finance Sought 1.00
(2) Amount of External Finance Sought N/A 1.00
(3) External Finance Obtained N/A 0.04 1.00
Independent Variables
Firm Financial Characteristics
(4) Profit Margin 0.02 0.23 0.02 1.00
(5) Log (Capital Expenditures) 0.16 0.29 0.23 0.01 1.00
(6) Log (Capital Expenditures / Profits) 0.16 0.28 0.22 0.01 1.00 1.00
(7) Log (Turnover) 0.08 0.17 0.27 -0.10 0.44 0.42 1.00
(8) Debt / Assets -0.02 0.17 0.06 0.00 0.02 0.01 0.05 1.00
(9) Log (Total Assets) 0.11 0.24 0.36 0.00 0.54 0.52 0.71 -0.07 1.00
(10) Innovation 0.08 0.05 -0.04 -0.01 0.15 0.15 0.12 -0.01 0.16 1.00
Firm Age and Profile
(11) Log (Age) -0.06 0.07 0.15 -0.03 0.19 0.19 0.15 0.00 0.35 0.03 1.00
(12) Professional Directors 0.02 0.02 -0.09 0.00 0.00 0.00 0.01 0.00 -0.03 0.04 -0.04 1.00
(13) Gender -0.04 -0.02 -0.02 -0.01 -0.06 -0.06 -0.06 -0.01 -0.12 -0.06 -0.10 0.01 1.00
(14) CEO Shares 0.00 -0.11 -0.11 -0.04 -0.10 -0.09 -0.14 0.00 -0.15 -0.01 -0.08 -0.03 0.03 1.00
(15) Director Shares -0.01 -0.15 -0.07 -0.09 -0.12 -0.11 -0.13 0.00 -0.15 -0.01 -0.11 -0.06 0.02 0.47 1.00
(16) Growth Objectives 0.21 0.07 0.02 0.03 0.23 0.23 0.17 0.00 0.20 0.20 -0.10 0.07 -0.03 -0.02 -0.04 1.00
(17) Corporation 0.13 0.10 0.03 0.01 0.22 0.22 0.26 0.01 0.33 0.17 0.07 -0.06 -0.10 0.00 0.00 0.21 1.00
Reason Firm Established
(18) Completely New Start-ups 0.00 -0.01 -0.02 -0.03 -0.02 -0.02 -0.06 -0.03 -0.05 0.02 0.12 0.01 0.00 0.06 0.04 0.06 -0.07 1.00
(19) Founded to avoid unemployment of founder(s) -0.04 -0.02 -0.13 -0.01 -0.07 -0.07 -0.08 -0.01 -0.12 -0.05 -0.02 -0.01 0.02 0.02 0.02 -0.06 -0.07 -0.01 1.00
(20) Founded for desire of founder(s) to run own
business 0.00 -0.05 0.02 -0.03 0.00 0.00 -0.01 0.01 0.01 -0.04 0.14 0.02 0.02 0.01 0.02 0.00 -0.08 0.13 0.02 1.00
(21) Founded to implement an invention 0.02 0.01 -0.01 -0.01 0.08 0.08 0.08 -0.01 0.09 0.13 0.12 0.06 0.01 -0.04 -0.08 0.11 0.08 -0.03 0.16 0.04 1.00
(22) Founded due to wealth ambitions of founders 0.04 0.03 0.05 0.02 0.10 0.11 0.10 -0.01 0.12 0.02 0.15 0.02 -0.03 -0.06 -0.07 0.08 0.04 -0.05 0.20 0.23 0.34 1.00
Competitors / Industry
(23) Larger Competitors 0.01 -0.05 -0.04 -0.03 -0.09 -0.08 -0.05 0.01 -0.11 0.02 -0.07 0.03 0.01 -0.01 0.01 0.00 0.01 0.03 -0.01 0.01 -0.02 -0.02 1.00
(24) Log (Total Competitors) 0.04 -0.02 0.02 -0.04 0.04 0.04 0.06 0.00 0.07 -0.06 0.05 0.05 -0.03 0.00 -0.01 -0.01 0.02 -0.03 -0.01 0.04 -0.06 0.03 0.12 1.00
(25) Industry (un)Innovativeness -0.11 0.02 0.04 0.02 -0.13 -0.13 -0.06 0.02 -0.07 -0.35 0.11 -0.11 0.05 -0.02 0.00 -0.22 -0.11 -0.03 0.04 0.06 -0.15 0.03 -0.02 -0.01 1.00
(26) High Tech Services + High Tech Manufacturing 0.08 0.01 -0.14 -0.01 0.05 0.05 -0.02 -0.01 -0.02 0.25 -0.06 0.12 -0.04 -0.03 -0.06 0.18 0.12 0.05 -0.01 -0.02 0.10 0.00 0.02 -0.07 -0.28
Notes. This table presents correlation coefficients across the variables that were defined in Table 1. Correlations that are statistically significant at the 5% level are highlighted in underline font. The correlations are provided for the subsample of 952 firms that sought external capital for variables (2) and (3) and for the full sample of 2520 firms for all other variables. N/A refers to not applicable (there is no correlation between variables (1) and (2) and between (1) and (3)).
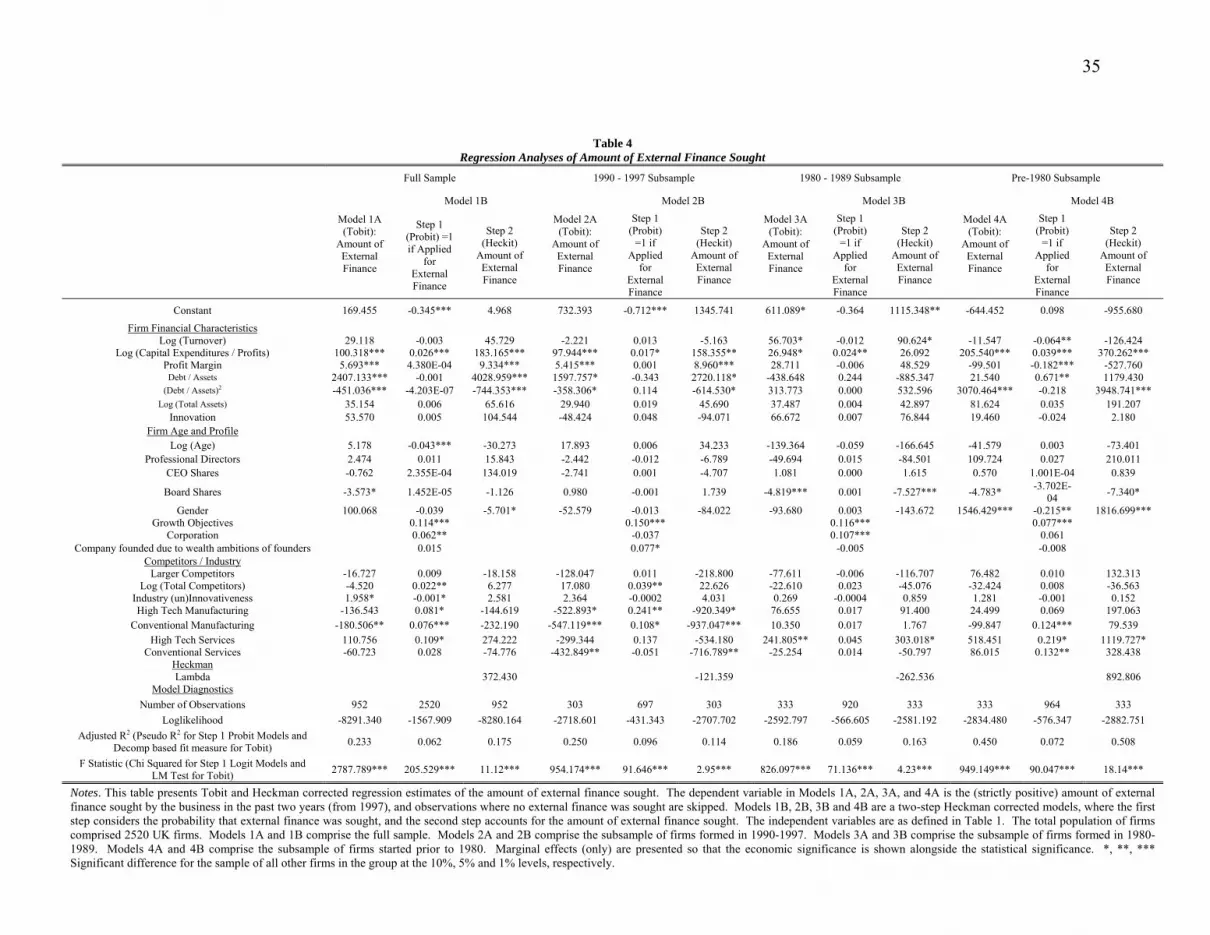
35
Table 4 Regression Analyses of Amount of External Finance Sought
Full Sample 1990 - 1997 Subsample 1980 - 1989 Subsample Pre-1980 Subsample
Model 1A (Tobit):
Amount of External Finance
Model 1B
Model 2A (Tobit):
Amount of External Finance
Model 2B
Model 3A (Tobit):
Amount of External Finance
Model 3B
Model 4A (Tobit):
Amount of External Finance
Model 4B
Step 1 (Probit) =1 if Applied
for External Finance
Step 2 (Heckit)
Amount of External Finance
Step 1 (Probit)
=1 if Applied
for External Finance
Step 2 (Heckit)
Amount of External Finance
Step 1 (Probit)
=1 if Applied
for External Finance
Step 2 (Heckit)
Amount of External Finance
Step 1 (Probit)
=1 if Applied
for External Finance
Step 2 (Heckit)
Amount of External Finance
Constant 169.455 -0.345*** 4.968 732.393 -0.712*** 1345.741 611.089* -0.364 1115.348** -644.452 0.098 -955.680
Firm Financial Characteristics Log (Turnover) 29.118 -0.003 45.729 -2.221 0.013 -5.163 56.703* -0.012 90.624* -11.547 -0.064** -126.424
Log (Capital Expenditures / Profits) 100.318*** 0.026*** 183.165*** 97.944*** 0.017* 158.355** 26.948* 0.024** 26.092 205.540*** 0.039*** 370.262*** Profit Margin 5.693*** 4.380E-04 9.334*** 5.415*** 0.001 8.960*** 28.711 -0.006 48.529 -99.501 -0.182*** -527.760
Debt / Assets 2407.133*** -0.001 4028.959*** 1597.757* -0.343 2720.118* -438.648 0.244 -885.347 21.540 0.671** 1179.430 (Debt / Assets)2 -451.036*** -4.203E-07 -744.353*** -358.306* 0.114 -614.530* 313.773 0.000 532.596 3070.464*** -0.218 3948.741***
Log (Total Assets) 35.154 0.006 65.616 29.940 0.019 45.690 37.487 0.004 42.897 81.624 0.035 191.207 Innovation 53.570 0.005 104.544 -48.424 0.048 -94.071 66.672 0.007 76.844 19.460 -0.024 2.180
Firm Age and Profile Log (Age) 5.178 -0.043*** -30.273 17.893 0.006 34.233 -139.364 -0.059 -166.645 -41.579 0.003 -73.401
Professional Directors 2.474 0.011 15.843 -2.442 -0.012 -6.789 -49.694 0.015 -84.501 109.724 0.027 210.011 CEO Shares -0.762 2.355E-04 134.019 -2.741 0.001 -4.707 1.081 0.000 1.615 0.570 1.001E-04 0.839
Board Shares -3.573* 1.452E-05 -1.126 0.980 -0.001 1.739 -4.819*** 0.001 -7.527*** -4.783* -3.702E-04 -7.340*
Gender 100.068 -0.039 -5.701* -52.579 -0.013 -84.022 -93.680 0.003 -143.672 1546.429*** -0.215** 1816.699*** Growth Objectives 0.114*** 0.150*** 0.116*** 0.077***
Corporation 0.062** -0.037 0.107*** 0.061 Company founded due to wealth ambitions of founders 0.015 0.077* -0.005 -0.008
Competitors / Industry Larger Competitors -16.727 0.009 -18.158 -128.047 0.011 -218.800 -77.611 -0.006 -116.707 76.482 0.010 132.313
Log (Total Competitors) -4.520 0.022** 6.277 17.080 0.039** 22.626 -22.610 0.023 -45.076 -32.424 0.008 -36.563 Industry (un)Innovativeness 1.958* -0.001* 2.581 2.364 -0.0002 4.031 0.269 -0.0004 0.859 1.281 -0.001 0.152 High Tech Manufacturing -136.543 0.081* -144.619 -522.893* 0.241** -920.349* 76.655 0.017 91.400 24.499 0.069 197.063
Conventional Manufacturing -180.506** 0.076*** -232.190 -547.119*** 0.108* -937.047*** 10.350 0.017 1.767 -99.847 0.124*** 79.539 High Tech Services 110.756 0.109* 274.222 -299.344 0.137 -534.180 241.805** 0.045 303.018* 518.451 0.219* 1119.727*
Conventional Services -60.723 0.028 -74.776 -432.849** -0.051 -716.789** -25.254 0.014 -50.797 86.015 0.132** 328.438 Heckman Lambda 372.430 -121.359 -262.536 892.806
Model Diagnostics Number of Observations 952 2520 952 303 697 303 333 920 333 333 964 333
Loglikelihood -8291.340 -1567.909 -8280.164 -2718.601 -431.343 -2707.702 -2592.797 -566.605 -2581.192 -2834.480 -576.347 -2882.751 Adjusted R2 (Pseudo R2 for Step 1 Probit Models and
Decomp based fit measure for Tobit) 0.233 0.062 0.175 0.250 0.096 0.114 0.186 0.059 0.163 0.450 0.072 0.508
F Statistic (Chi Squared for Step 1 Logit Models and LM Test for Tobit) 2787.789*** 205.529*** 11.12*** 954.174*** 91.646*** 2.95*** 826.097*** 71.136*** 4.23*** 949.149*** 90.047*** 18.14***
Notes. This table presents Tobit and Heckman corrected regression estimates of the amount of external finance sought. The dependent variable in Models 1A, 2A, 3A, and 4A is the (strictly positive) amount of external finance sought by the business in the past two years (from 1997), and observations where no external finance was sought are skipped. Models 1B, 2B, 3B and 4B are a two-step Heckman corrected models, where the first step considers the probability that external finance was sought, and the second step accounts for the amount of external finance sought. The independent variables are as defined in Table 1. The total population of firms comprised 2520 UK firms. Models 1A and 1B comprise the full sample. Models 2A and 2B comprise the subsample of firms formed in 1990-1997. Models 3A and 3B comprise the subsample of firms formed in 1980-1989. Models 4A and 4B comprise the subsample of firms started prior to 1980. Marginal effects (only) are presented so that the economic significance is shown alongside the statistical significance. *, **, *** Significant difference for the sample of all other firms in the group at the 10%, 5% and 1% levels, respectively.
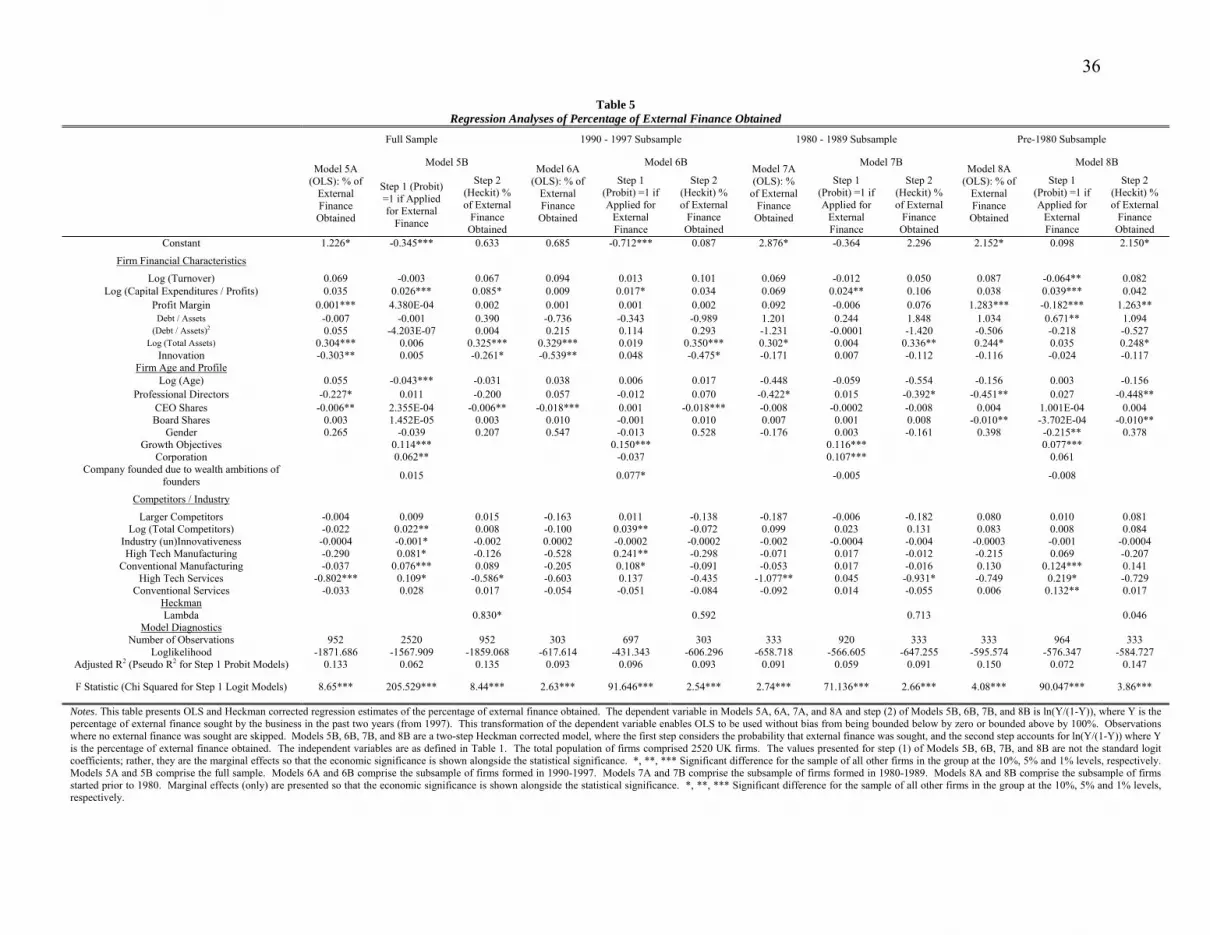
36
Table 5 Regression Analyses of Percentage of External Finance Obtained
Full Sample 1990 - 1997 Subsample 1980 - 1989 Subsample Pre-1980 Subsample
Model 5A (OLS): % of
External Finance Obtained
Model 5B Model 6A (OLS): % of
External Finance Obtained
Model 6B Model 7A (OLS): %
of External Finance Obtained
Model 7B Model 8A (OLS): % of
External Finance Obtained
Model 8B
Step 1 (Probit) =1 if Applied for External
Finance
Step 2 (Heckit) % of External
Finance Obtained
Step 1 (Probit) =1 if Applied for
External Finance
Step 2 (Heckit) % of External
Finance Obtained
Step 1 (Probit) =1 if Applied for
External Finance
Step 2 (Heckit) % of External
Finance Obtained
Step 1 (Probit) =1 if Applied for
External Finance
Step 2 (Heckit) % of External
Finance Obtained
Constant 1.226* -0.345*** 0.633 0.685 -0.712*** 0.087 2.876* -0.364 2.296 2.152* 0.098 2.150*
Firm Financial Characteristics
Log (Turnover) 0.069 -0.003 0.067 0.094 0.013 0.101 0.069 -0.012 0.050 0.087 -0.064** 0.082 Log (Capital Expenditures / Profits) 0.035 0.026*** 0.085* 0.009 0.017* 0.034 0.069 0.024** 0.106 0.038 0.039*** 0.042
Profit Margin 0.001*** 4.380E-04 0.002 0.001 0.001 0.002 0.092 -0.006 0.076 1.283*** -0.182*** 1.263** Debt / Assets -0.007 -0.001 0.390 -0.736 -0.343 -0.989 1.201 0.244 1.848 1.034 0.671** 1.094
(Debt / Assets)2 0.055 -4.203E-07 0.004 0.215 0.114 0.293 -1.231 -0.0001 -1.420 -0.506 -0.218 -0.527 Log (Total Assets) 0.304*** 0.006 0.325*** 0.329*** 0.019 0.350*** 0.302* 0.004 0.336** 0.244* 0.035 0.248*
Innovation -0.303** 0.005 -0.261* -0.539** 0.048 -0.475* -0.171 0.007 -0.112 -0.116 -0.024 -0.117 Firm Age and Profile
Log (Age) 0.055 -0.043*** -0.031 0.038 0.006 0.017 -0.448 -0.059 -0.554 -0.156 0.003 -0.156 Professional Directors -0.227* 0.011 -0.200 0.057 -0.012 0.070 -0.422* 0.015 -0.392* -0.451** 0.027 -0.448**
CEO Shares -0.006** 2.355E-04 -0.006** -0.018*** 0.001 -0.018*** -0.008 -0.0002 -0.008 0.004 1.001E-04 0.004 Board Shares 0.003 1.452E-05 0.003 0.010 -0.001 0.010 0.007 0.001 0.008 -0.010** -3.702E-04 -0.010**
Gender 0.265 -0.039 0.207 0.547 -0.013 0.528 -0.176 0.003 -0.161 0.398 -0.215** 0.378 Growth Objectives 0.114*** 0.150*** 0.116*** 0.077***
Corporation 0.062** -0.037 0.107*** 0.061 Company founded due to wealth ambitions of
founders 0.015 0.077* -0.005 -0.008
Competitors / Industry
Larger Competitors -0.004 0.009 0.015 -0.163 0.011 -0.138 -0.187 -0.006 -0.182 0.080 0.010 0.081 Log (Total Competitors) -0.022 0.022** 0.008 -0.100 0.039** -0.072 0.099 0.023 0.131 0.083 0.008 0.084
Industry (un)Innovativeness -0.0004 -0.001* -0.002 0.0002 -0.0002 -0.0002 -0.002 -0.0004 -0.004 -0.0003 -0.001 -0.0004 High Tech Manufacturing -0.290 0.081* -0.126 -0.528 0.241** -0.298 -0.071 0.017 -0.012 -0.215 0.069 -0.207
Conventional Manufacturing -0.037 0.076*** 0.089 -0.205 0.108* -0.091 -0.053 0.017 -0.016 0.130 0.124*** 0.141 High Tech Services -0.802*** 0.109* -0.586* -0.603 0.137 -0.435 -1.077** 0.045 -0.931* -0.749 0.219* -0.729
Conventional Services -0.033 0.028 0.017 -0.054 -0.051 -0.084 -0.092 0.014 -0.055 0.006 0.132** 0.017 Heckman Lambda 0.830* 0.592 0.713 0.046
Model Diagnostics Number of Observations 952 2520 952 303 697 303 333 920 333 333 964 333
Loglikelihood -1871.686 -1567.909 -1859.068 -617.614 -431.343 -606.296 -658.718 -566.605 -647.255 -595.574 -576.347 -584.727 Adjusted R2 (Pseudo R2 for Step 1 Probit Models) 0.133 0.062 0.135 0.093 0.096 0.093 0.091 0.059 0.091 0.150 0.072 0.147
F Statistic (Chi Squared for Step 1 Logit Models) 8.65*** 205.529*** 8.44*** 2.63*** 91.646*** 2.54*** 2.74*** 71.136*** 2.66*** 4.08*** 90.047*** 3.86***
Notes. This table presents OLS and Heckman corrected regression estimates of the percentage of external finance obtained. The dependent variable in Models 5A, 6A, 7A, and 8A and step (2) of Models 5B, 6B, 7B, and 8B is ln(Y/(1-Y)), where Y is the percentage of external finance sought by the business in the past two years (from 1997). This transformation of the dependent variable enables OLS to be used without bias from being bounded below by zero or bounded above by 100%. Observations where no external finance was sought are skipped. Models 5B, 6B, 7B, and 8B are a two-step Heckman corrected model, where the first step considers the probability that external finance was sought, and the second step accounts for ln(Y/(1-Y)) where Y is the percentage of external finance obtained. The independent variables are as defined in Table 1. The total population of firms comprised 2520 UK firms. The values presented for step (1) of Models 5B, 6B, 7B, and 8B are not the standard logit coefficients; rather, they are the marginal effects so that the economic significance is shown alongside the statistical significance. *, **, *** Significant difference for the sample of all other firms in the group at the 10%, 5% and 1% levels, respectively. Models 5A and 5B comprise the full sample. Models 6A and 6B comprise the subsample of firms formed in 1990-1997. Models 7A and 7B comprise the subsample of firms formed in 1980-1989. Models 8A and 8B comprise the subsample of firms started prior to 1980. Marginal effects (only) are presented so that the economic significance is shown alongside the statistical significance. *, **, *** Significant difference for the sample of all other firms in the group at the 10%, 5% and 1% levels, respectively.
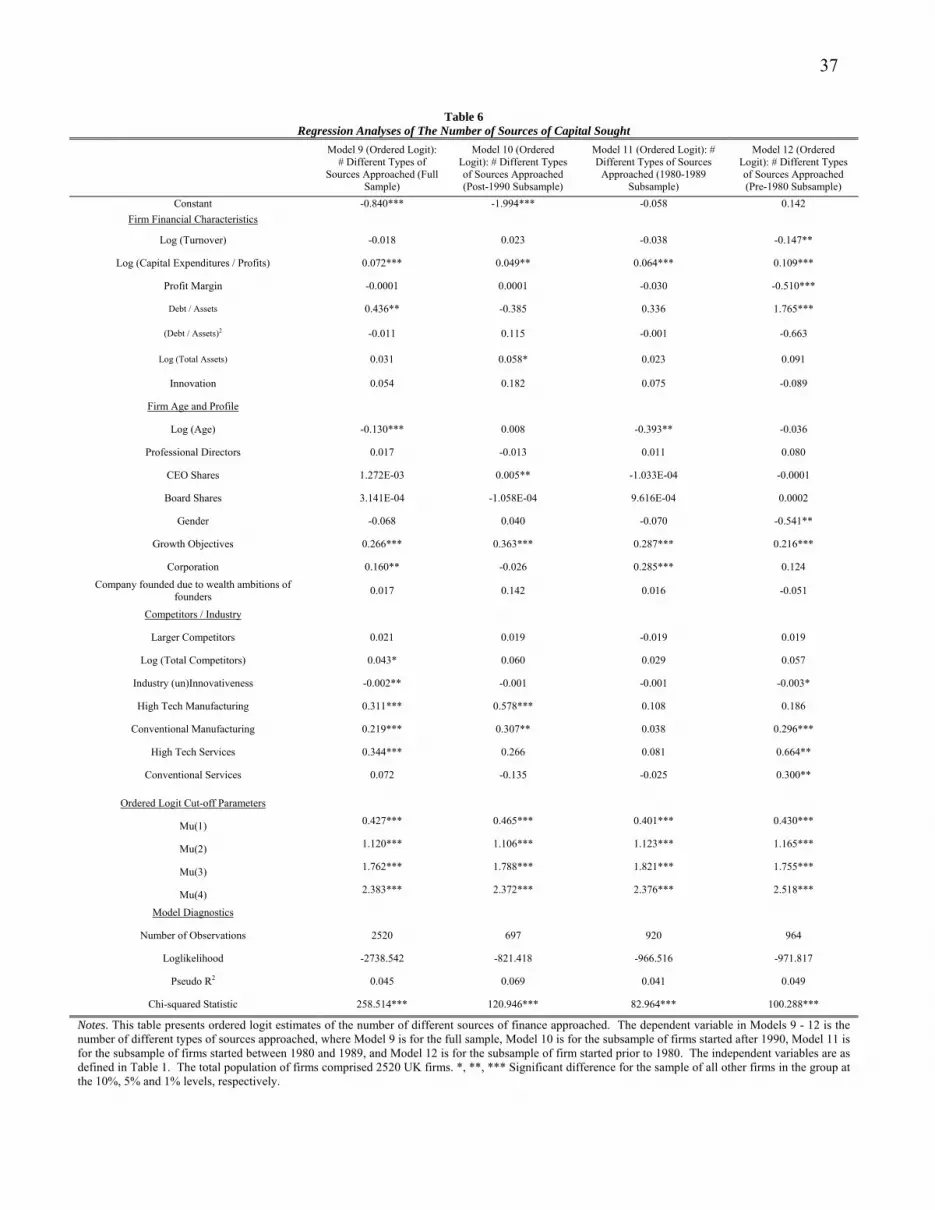
37
Table 6 Regression Analyses of The Number of Sources of Capital Sought
Model 9 (Ordered Logit): # Different Types of
Sources Approached (Full Sample)
Model 10 (Ordered Logit): # Different Types of Sources Approached (Post-1990 Subsample)
Model 11 (Ordered Logit): # Different Types of Sources
Approached (1980-1989 Subsample)
Model 12 (Ordered Logit): # Different Types of Sources Approached (Pre-1980 Subsample)
Constant -0.840*** -1.994*** -0.058 0.142 Firm Financial Characteristics
Log (Turnover) -0.018 0.023 -0.038 -0.147**
Log (Capital Expenditures / Profits) 0.072*** 0.049** 0.064*** 0.109***
Profit Margin -0.0001 0.0001 -0.030 -0.510***
Debt / Assets 0.436** -0.385 0.336 1.765***
(Debt / Assets)2 -0.011 0.115 -0.001 -0.663
Log (Total Assets) 0.031 0.058* 0.023 0.091
Innovation 0.054 0.182 0.075 -0.089
Firm Age and Profile
Log (Age) -0.130*** 0.008 -0.393** -0.036
Professional Directors 0.017 -0.013 0.011 0.080
CEO Shares 1.272E-03 0.005** -1.033E-04 -0.0001
Board Shares 3.141E-04 -1.058E-04 9.616E-04 0.0002
Gender -0.068 0.040 -0.070 -0.541**
Growth Objectives 0.266*** 0.363*** 0.287*** 0.216***
Corporation 0.160** -0.026 0.285*** 0.124
Company founded due to wealth ambitions of founders 0.017 0.142 0.016 -0.051
Competitors / Industry
Larger Competitors 0.021 0.019 -0.019 0.019
Log (Total Competitors) 0.043* 0.060 0.029 0.057
Industry (un)Innovativeness -0.002** -0.001 -0.001 -0.003*
High Tech Manufacturing 0.311*** 0.578*** 0.108 0.186
Conventional Manufacturing 0.219*** 0.307** 0.038 0.296***
High Tech Services 0.344*** 0.266 0.081 0.664**
Conventional Services 0.072 -0.135 -0.025 0.300**
Ordered Logit Cut-off Parameters
Mu(1) 0.427*** 0.465*** 0.401*** 0.430***
Mu(2) 1.120*** 1.106*** 1.123*** 1.165***
Mu(3) 1.762*** 1.788*** 1.821*** 1.755***
Mu(4) 2.383*** 2.372*** 2.376*** 2.518***
Model Diagnostics
Number of Observations 2520 697 920 964
Loglikelihood -2738.542 -821.418 -966.516 -971.817
Pseudo R2 0.045 0.069 0.041 0.049
Chi-squared Statistic 258.514*** 120.946*** 82.964*** 100.288***
Notes. This table presents ordered logit estimates of the number of different sources of finance approached. The dependent variable in Models 9 - 12 is the number of different types of sources approached, where Model 9 is for the full sample, Model 10 is for the subsample of firms started after 1990, Model 11 is for the subsample of firms started between 1980 and 1989, and Model 12 is for the subsample of firm started prior to 1980. The independent variables are as defined in Table 1. The total population of firms comprised 2520 UK firms. *, **, *** Significant difference for the sample of all other firms in the group at the 10%, 5% and 1% levels, respectively.
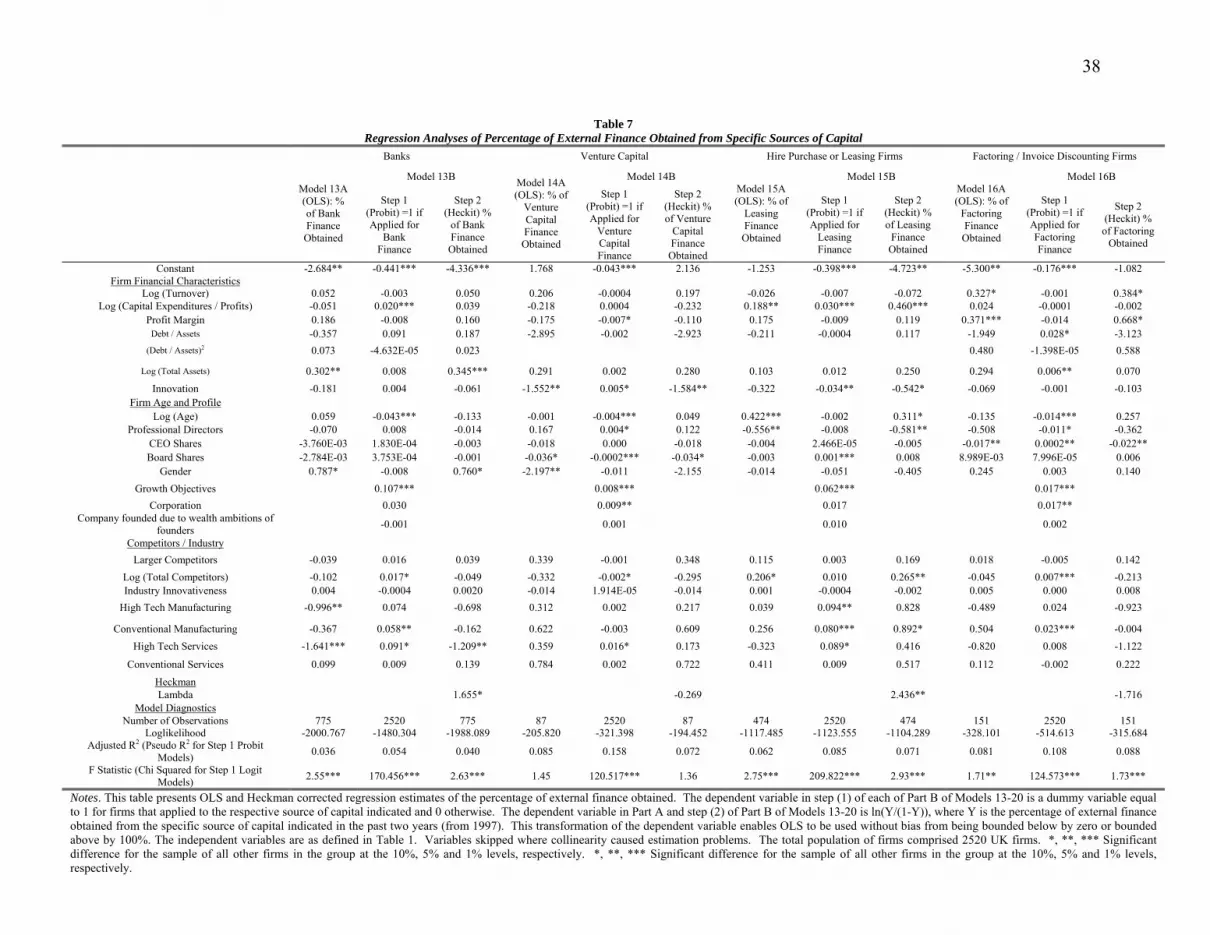
38
Table 7 Regression Analyses of Percentage of External Finance Obtained from Specific Sources of Capital
Banks Venture Capital Hire Purchase or Leasing Firms Factoring / Invoice Discounting Firms
Model 13A (OLS): % of Bank Finance Obtained
Model 13B Model 14A (OLS): % of
Venture Capital Finance Obtained
Model 14B Model 15A (OLS): % of
Leasing Finance Obtained
Model 15B Model 16A (OLS): % of
Factoring Finance Obtained
Model 16B
Step 1 (Probit) =1 if Applied for
Bank Finance
Step 2 (Heckit) %
of Bank Finance Obtained
Step 1 (Probit) =1 if Applied for
Venture Capital Finance
Step 2 (Heckit) % of Venture
Capital Finance Obtained
Step 1 (Probit) =1 if Applied for
Leasing Finance
Step 2 (Heckit) % of Leasing
Finance Obtained
Step 1 (Probit) =1 if Applied for Factoring Finance
Step 2 (Heckit) % of Factoring
Obtained
Constant -2.684** -0.441*** -4.336*** 1.768 -0.043*** 2.136 -1.253 -0.398*** -4.723** -5.300** -0.176*** -1.082 Firm Financial Characteristics
Log (Turnover) 0.052 -0.003 0.050 0.206 -0.0004 0.197 -0.026 -0.007 -0.072 0.327* -0.001 0.384* Log (Capital Expenditures / Profits) -0.051 0.020*** 0.039 -0.218 0.0004 -0.232 0.188** 0.030*** 0.460*** 0.024 -0.0001 -0.002
Profit Margin 0.186 -0.008 0.160 -0.175 -0.007* -0.110 0.175 -0.009 0.119 0.371*** -0.014 0.668* Debt / Assets -0.357 0.091 0.187 -2.895 -0.002 -2.923 -0.211 -0.0004 0.117 -1.949 0.028* -3.123
(Debt / Assets)2 0.073 -4.632E-05 0.023 0.480 -1.398E-05 0.588
Log (Total Assets) 0.302** 0.008 0.345*** 0.291 0.002 0.280 0.103 0.012 0.250 0.294 0.006** 0.070 Innovation -0.181 0.004 -0.061 -1.552** 0.005* -1.584** -0.322 -0.034** -0.542* -0.069 -0.001 -0.103
Firm Age and Profile Log (Age) 0.059 -0.043*** -0.133 -0.001 -0.004*** 0.049 0.422*** -0.002 0.311* -0.135 -0.014*** 0.257
Professional Directors -0.070 0.008 -0.014 0.167 0.004* 0.122 -0.556** -0.008 -0.581** -0.508 -0.011* -0.362 CEO Shares -3.760E-03 1.830E-04 -0.003 -0.018 0.000 -0.018 -0.004 2.466E-05 -0.005 -0.017** 0.0002** -0.022** Board Shares -2.784E-03 3.753E-04 -0.001 -0.036* -0.0002*** -0.034* -0.003 0.001*** 0.008 8.989E-03 7.996E-05 0.006
Gender 0.787* -0.008 0.760* -2.197** -0.011 -2.155 -0.014 -0.051 -0.405 0.245 0.003 0.140 Growth Objectives 0.107*** 0.008*** 0.062*** 0.017***
Corporation 0.030 0.009** 0.017 0.017** Company founded due to wealth ambitions of
founders -0.001 0.001 0.010 0.002
Competitors / Industry Larger Competitors -0.039 0.016 0.039 0.339 -0.001 0.348 0.115 0.003 0.169 0.018 -0.005 0.142
Log (Total Competitors) -0.102 0.017* -0.049 -0.332 -0.002* -0.295 0.206* 0.010 0.265** -0.045 0.007*** -0.213 Industry Innovativeness 0.004 -0.0004 0.0020 -0.014 1.914E-05 -0.014 0.001 -0.0004 -0.002 0.005 0.000 0.008
High Tech Manufacturing -0.996** 0.074 -0.698 0.312 0.002 0.217 0.039 0.094** 0.828 -0.489 0.024 -0.923
Conventional Manufacturing -0.367 0.058** -0.162 0.622 -0.003 0.609 0.256 0.080*** 0.892* 0.504 0.023*** -0.004 High Tech Services -1.641*** 0.091* -1.209** 0.359 0.016* 0.173 -0.323 0.089* 0.416 -0.820 0.008 -1.122
Conventional Services 0.099 0.009 0.139 0.784 0.002 0.722 0.411 0.009 0.517 0.112 -0.002 0.222
Heckman Lambda 1.655* -0.269 2.436** -1.716
Model Diagnostics Number of Observations 775 2520 775 87 2520 87 474 2520 474 151 2520 151
Loglikelihood -2000.767 -1480.304 -1988.089 -205.820 -321.398 -194.452 -1117.485 -1123.555 -1104.289 -328.101 -514.613 -315.684 Adjusted R2 (Pseudo R2 for Step 1 Probit
Models) 0.036 0.054 0.040 0.085 0.158 0.072 0.062 0.085 0.071 0.081 0.108 0.088
F Statistic (Chi Squared for Step 1 Logit Models) 2.55*** 170.456*** 2.63*** 1.45 120.517*** 1.36 2.75*** 209.822*** 2.93*** 1.71** 124.573*** 1.73***
Notes. This table presents OLS and Heckman corrected regression estimates of the percentage of external finance obtained. The dependent variable in step (1) of each of Part B of Models 13-20 is a dummy variable equal to 1 for firms that applied to the respective source of capital indicated and 0 otherwise. The dependent variable in Part A and step (2) of Part B of Models 13-20 is ln(Y/(1-Y)), where Y is the percentage of external finance obtained from the specific source of capital indicated in the past two years (from 1997). This transformation of the dependent variable enables OLS to be used without bias from being bounded below by zero or bounded above by 100%. The independent variables are as defined in Table 1. Variables skipped where collinearity caused estimation problems. The total population of firms comprised 2520 UK firms. *, **, *** Significant difference for the sample of all other firms in the group at the 10%, 5% and 1% levels, respectively. *, **, *** Significant difference for the sample of all other firms in the group at the 10%, 5% and 1% levels, respectively.
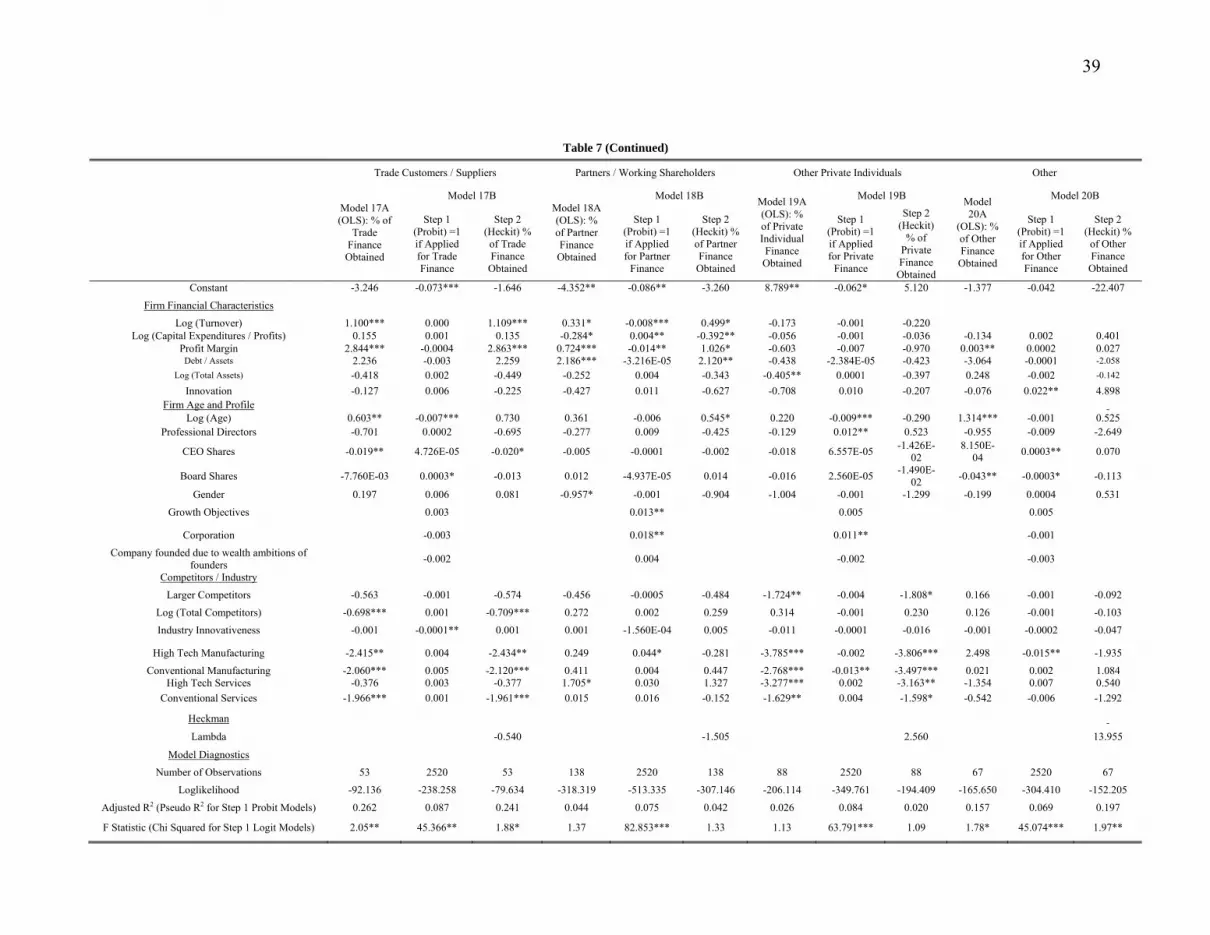
39
Table 7 (Continued)
Trade Customers / Suppliers Partners / Working Shareholders Other Private Individuals Other
Model 17A (OLS): % of
Trade Finance Obtained
Model 17B Model 18A (OLS): % of Partner Finance Obtained
Model 18B Model 19A (OLS): % of Private Individual Finance Obtained
Model 19B Model 20A
(OLS): % of Other Finance Obtained
Model 20B
Step 1 (Probit) =1 if Applied for Trade Finance
Step 2 (Heckit) % of Trade Finance Obtained
Step 1 (Probit) =1 if Applied for Partner
Finance
Step 2 (Heckit) % of Partner Finance Obtained
Step 1 (Probit) =1 if Applied for Private
Finance
Step 2 (Heckit)
% of Private Finance Obtained
Step 1 (Probit) =1 if Applied for Other Finance
Step 2 (Heckit) %
of Other Finance Obtained
Constant -3.246 -0.073*** -1.646 -4.352** -0.086** -3.260 8.789** -0.062* 5.120 -1.377 -0.042 -22.407
Firm Financial Characteristics
Log (Turnover) 1.100*** 0.000 1.109*** 0.331* -0.008*** 0.499* -0.173 -0.001 -0.220 Log (Capital Expenditures / Profits) 0.155 0.001 0.135 -0.284* 0.004** -0.392** -0.056 -0.001 -0.036 -0.134 0.002 0.401
Profit Margin 2.844*** -0.0004 2.863*** 0.724*** -0.014** 1.026* -0.603 -0.007 -0.970 0.003** 0.0002 0.027 Debt / Assets 2.236 -0.003 2.259 2.186*** -3.216E-05 2.120** -0.438 -2.384E-05 -0.423 -3.064 -0.0001 -2.058
Log (Total Assets) -0.418 0.002 -0.449 -0.252 0.004 -0.343 -0.405** 0.0001 -0.397 0.248 -0.002 -0.142
Innovation -0.127 0.006 -0.225 -0.427 0.011 -0.627 -0.708 0.010 -0.207 -0.076 0.022** 4.898 Firm Age and Profile
Log (Age) 0.603** -0.007*** 0.730 0.361 -0.006 0.545* 0.220 -0.009*** -0.290 1.314*** -0.001 0.525 Professional Directors -0.701 0.0002 -0.695 -0.277 0.009 -0.425 -0.129 0.012** 0.523 -0.955 -0.009 -2.649
CEO Shares -0.019** 4.726E-05 -0.020* -0.005 -0.0001 -0.002 -0.018 6.557E-05 -1.426E-02
8.150E-04 0.0003** 0.070
Board Shares -7.760E-03 0.0003* -0.013 0.012 -4.937E-05 0.014 -0.016 2.560E-05 -1.490E-02 -0.043** -0.0003* -0.113
Gender 0.197 0.006 0.081 -0.957* -0.001 -0.904 -1.004 -0.001 -1.299 -0.199 0.0004 0.531
Growth Objectives 0.003 0.013** 0.005 0.005
Corporation -0.003 0.018** 0.011** -0.001
Company founded due to wealth ambitions of founders -0.002 0.004 -0.002 -0.003
Competitors / Industry
Larger Competitors -0.563 -0.001 -0.574 -0.456 -0.0005 -0.484 -1.724** -0.004 -1.808* 0.166 -0.001 -0.092
Log (Total Competitors) -0.698*** 0.001 -0.709*** 0.272 0.002 0.259 0.314 -0.001 0.230 0.126 -0.001 -0.103
Industry Innovativeness -0.001 -0.0001** 0.001 0.001 -1.560E-04 0.005 -0.011 -0.0001 -0.016 -0.001 -0.0002 -0.047
High Tech Manufacturing -2.415** 0.004 -2.434** 0.249 0.044* -0.281 -3.785*** -0.002 -3.806*** 2.498 -0.015** -1.935
Conventional Manufacturing -2.060*** 0.005 -2.120*** 0.411 0.004 0.447 -2.768*** -0.013** -3.497*** 0.021 0.002 1.084 High Tech Services -0.376 0.003 -0.377 1.705* 0.030 1.327 -3.277*** 0.002 -3.163** -1.354 0.007 0.540
Conventional Services -1.966*** 0.001 -1.961*** 0.015 0.016 -0.152 -1.629** 0.004 -1.598* -0.542 -0.006 -1.292
Heckman
Lambda -0.540 -1.505 2.560 13.955
Model Diagnostics
Number of Observations 53 2520 53 138 2520 138 88 2520 88 67 2520 67
Loglikelihood -92.136 -238.258 -79.634 -318.319 -513.335 -307.146 -206.114 -349.761 -194.409 -165.650 -304.410 -152.205
Adjusted R2 (Pseudo R2 for Step 1 Probit Models) 0.262 0.087 0.241 0.044 0.075 0.042 0.026 0.084 0.020 0.157 0.069 0.197
F Statistic (Chi Squared for Step 1 Logit Models) 2.05** 45.366** 1.88* 1.37 82.853*** 1.33 1.13 63.791*** 1.09 1.78* 45.074*** 1.97**


