Embed Size (px)
Citation preview

DIVIDEND POLICY OF BANK
INITIAL PUBLIC OFFERINGS
Wolfgang Bessler
Professor of Finance Center for Finance and Banking
Justus-Liebig-University Giessen, Germany
James P. Murtagh
Clinical Assistant Professor Lally School of Management & Technology
Rensselaer Polytechnic Institute, Troy, NY 12180, USA
Dona Siregar
Doctoral Student Lally School of Management & Technology
Rensselaer Polytechnic Institute, Troy, NY 12180, USA
Version: January 2003
Please do not quote without permission Corresponding author: Prof. Dr. Wolfgang Bessler, Center for Finance and Banking, Justus-Liebig-University Giessen, Licher Strasse 74, 35394 Giessen, Germany, phone: 49-641-9922460 fax: 49-641-9922469, email: [email protected]

DIVIDEND POLICY OF BANK INITIAL PUBLIC OFFERINGS
Abstract
This paper investigates the short-term valuation effects and the long-run performance of
bank initial public offerings in the United States from 1972 to 1997. Overall, the empirical
results provide significant evidence that the dividend policy of bank IPOs differ from that of
non-banks. The dividend policy of bank IPOs has a significant impact on the long-run
performance. Most importantly, banks that later on were acquired outperform the benchmark
significantly and banks that continue to operate independently as well as banks that eventually
failed both under-perform. Moreover, the beginning of the dividend payment is an important
characteristic that separates the out-performers from the under-performers.
1

DIVIDEND POLICY OF BANK INITIAL PUBLIC OFFERINGS I. Introduction
The dividend policy of firms in general has been one of the most important research topics in
the finance literature for most of the last four decades since the publication of the seminal paper
on the irrelevance of dividend policy by Modigliani and Miller (1961). In a recent paper Fama
and French (2001) provide empirical evidence that on average the relative number of dividend
paying firms has been decreasing over the last decades. Especially start-up firms and IPOs (i.e.
firms listed on NASDAQ) have developed a tendency to avoid initiating dividend payments. The
relative increase of the IPO group in relation to all listed firms accounts mainly for the decline of
the average number of dividend paying firms. The fact that non-financial or industrial firms do
not start paying dividends immediately after going public can easily be explained with the
investment opportunities and the cash flow needs of these firms. Nevertheless, of those firms that
continued to be traded after going public for an extended period of time (alive firms), i.e. after
accounting for those IPOs that merged or delisted (failed) after going public, about 50% of those
IPOs eventually start paying dividends. Thus, even for IPOs, dividend policy seems to be an
important signal during the first periods after listing.
Moreover, there is empirical evidence that the dividend policy for banks is quite important in
that it signals the quality of a bank in an environment that is best characterized by significant
information asymmetry [Bessler and Nohel (1996), Bessler and Nohel (2000), Slovin, Sushka
and Polonchek (1999)]. Thus, banks reveal a pronounced different behavior than industrial firms
with respect to dividend policy as well as with respect to valuation effects following a dividend
announcement. Because most of the empirical evidence suggests that the dividend policy of IPOs
2

is different from that of established firms and because the stock price reaction to dividend
changes by banks is different from that of industrial firms, it is interesting to investigate the
dividend policy of banks after they went public (IPOs). This specific question has not been
addressed in the literature so far. Thus, we are adding to the theoretical and empirical evidence
by investigating the dividend policy of bank IPOs.
In this study on dividend policy of bank initial public offerings (IPOs) in the United States
we investigate the short run valuation effects (CARs) as well as the long run performance
(BHARs) following dividend initiations announcements by banks that went public (IPOs) during
the period from 1970 to 1997. There are three primary objectives of this research. First, we
examine the valuation effects of the dividend policy of bank IPOs, especially the impact of the
dividend initiation event. Next, we test whether there are significant differences in the
performance among different categories of bank IPOs, i.e. the banks that merged later on,
dropped, or kept on operating independently (alive). We are interested in the stock price reaction
around the dividend initiation date (short-term valuation effect) as well as in the long-term
performance following a dividend initiation. Finally, we investigate economic variables that may
explain the reasons for the differences in stock price performance.
The rest of the paper is organized as follows. In the next section the literature with respect to
dividend policy in general and signaling with dividends is reviewed. Other important aspects that
are discussed are dividend policy of IPOs, performance of bank IPOs as well as dividend policy
of banks. Section III provides a description of the data and of the methodology employed in this
study. The results are presented and discussed in section IV and section V concludes the paper.
3

II. Review of the Literature
The literature that is relevant to this research question is related to various research areas
of corporate finance and banking. First of all general agency theory and dividend policy needs to
be addressed in that dividend announcements provide information to shareholders about the
future performance of the firm. Thus, dividends are an important signal that usually results in
significant valuation effects. This aspect is addressed in the next section. Moreover, the literature
on dividend policy of IPOs is relevant in this context and is reviewed in the second section. With
respect to the banking literature the empirical evidence on the performance of bank IPOs and the
valuation effects of dividend announcements by banks is relevant in this context and is addressed
in sections three and four.
1. Dividends as an Information Signal
In a world of symmetric information, all economic agents have the same information with
respect to the valuation of a firm. However, this assumption does not hold any longer under more
realistic assumptions, for example, when one of the agents is better informed about the firm’s
prospects than the other agents. In such an environment it is reasonable to assume that managers
possess an information advantage about their own firm. Therefore, financial decisions may signal
a change in the quality of the firm to the market. One of these managerial decisions that
management can employ to convey information to shareholders is dividend policy. Therefore,
dividend policy decisions, especially dividend initiations, and dividend increases, convey
positive information to the market.
There are two main hypotheses that are helpful to explain what information is contained in a
dividend announcement: the earnings hypothesis (cash flow) and the free cash flow hypothesis.
4

The earnings hypothesis proposes that by paying out cash to the shareholder, the management
signals to the market that the firm has good investment projects and is able to generate positive
cash flows in the long term. An increase in the level of dividends is viewed as a positive signal
by the financial market because firms committed to paying dividends indicate that they are
capable of generating positive cash flows in the long term. A decrease in dividends is viewed as
a negative signal and may suggest up-coming long-term financial problems. Consequently,
financial markets should lower the value the firm. Studies by Lintner (1958), Fama and Babiak
(1968), Battacharya (1979), John and Williams (1985), and Miller and Rock (1985) find
evidence of this hypothesis in their studies. In addition, the work by Asquith and Mullins (1983),
Healy and Palepu (1988) and Venkatesh (1989) show on average positive price reactions to the
announcement of dividend initiations under the assumption of the earnings signaling hypothesis.
The free cash flow theory hypothesized that a firm with substantial free cash flows will have
a tendency to overinvest by accepting marginal investment projects with negative net present
values [Jensen (1986)]. If managers are over-investing, an increase in dividend payments will
decrease the available cash flows and limit over-investing and hence the market value of the firm
should increase. In contrast, a decrease in dividends may facilitate over-investing and as a
consequence the stock price should decrease.
The valuation effects of dividend increases and dividend decreases, however, should be
reviewed and interpreted carefully. Some argue that the utilization of dividends as a signal
depends on the availability of other signals to the firm. Larger firms have more ways to signal
their quality at reasonable costs. They may utilize analyst reports as an effective and less costly
practice to signal the quality their projects. The opportunities for small firms are different. With
5

limited alternatives available to them, dividends are a reasonable signal. Thus, the relative
valuation effects of dividend changes may be a function of firm size.
Ambarish, John, Williams (1987), and John and Lang (1991) propose that dividends may not
be a sole measure in evaluating a firm’s quality. Dividend changes by firms will be interpreted
by the market in the context of the investment opportunities that are available to the firms. The
optimal signals used are determined by the nature of the firms’ investment opportunities.
Established firms often use a large pay-out ratio as their primary signal while growth firms do
not often employ dividends but instead use investments as the main signal instead. Their models
predict that the announcement of a dividend increase results in larger stock price increases for
established firms compared to that of growth firms.
John and Lang (1991) investigate insider trading prior to the announcement of dividend
changes. They show in their study that the announcement effect of dividends is influenced by the
nature of a firm’s investment opportunities and by the productivity of its current capital
investments. Not all dividend increases are viewed as good news by the market. In some cases,
an increase in dividends is a signal that the firm does not have outstanding investment
opportunities. They suggest that the interpretation of an increase in dividend has to be based on
insider trading activity immediately prior to the announcement.
In a similar study of the relation between dividend policy and investment opportunities, Lang
and Litzenberger (1989) examined the announcement effect of large dividend changes and linked
it to investment opportunities available to the firm by utilizing Tobin’s Q measurement. They
find that large dividend changes are significantly affected by investment opportunities. The
average abnormal returns at the dividend announcement date is more than three times larger for
firms with average Qs of less than one than for firms with average Qs that are greater than one.
6

Dividend increase and decrease announcements result in similar effects when each event is
analyzed separately.
Dyl and Weigang (1998) hypothesized that initiation of cash dividends coincides with a
reduction in the risk of a firm’s earnings and cash flows. Using 240 firms (NYSE or AMEX) that
initiated dividend payments during the period of Jan 1972 – Dec 1973, the study shows that the
variance of daily returns drops as well as the average beta in the year following the dividend
initiation.
Thus, it seems fair to conclude that management can use dividend changes to signal the
quality of the firm. The important question to investigate, however, is whether all firms can
employ dividend changes in the same manner, or whether the magnitude of the impact depends
on the maturity of the firm (e.g. IPO) as well as on the industry (e.g. banking) in which the firm
is operating in.
2. Initial Public Offerings and Dividend Policy
Lipson, Maquieira and Megginson (1998) compare the performance of IPOs that initiate
dividends with those that do not. The analysis is carried out by initially building two groups of
matching firms. One group consists of firms that do not pay dividends matched with the
dividend-initiating firms by the time of the going public and the industry. Another group of firms
is matched with the dividend-initiating firms by the size and the industry (size matched) but
these firms are already paying dividends. They argue that a firm should engage in signaling
activities especially to differentiate itself from other firms that the market perceives as having
similar prospects. By grouping the samples, the authors examined comparable IPOs in terms of
life cycle and future growth.
7

The authors found that raw and industry adjusted earnings increase for the initiating firms in
the first year after the dividend initiation, but not in the second year. Earnings surprises for
initiating firms are more favorable than for non-initiating firms by the second year following the
dividend initiation. However, the earning surprises of the initiating firms are not significantly
different from the size-matched samples or industry averages. Thus, the study suggests that if
dividend initiations signal future earnings prospects, the signal must differentiate a newly public
firm from other newly public firms but not from established firms in the industry. Thus, there is a
strong size effect instead of an industry effect.
Similar to the work of DeAngelo et al. (1996), Lipson et al. also found that changes in
dividend levels can be a valid signal only if a significant commitment of cash is used. The
dividend commitments of initiating firms represent about 5% of earnings. This would have been
equal to 8.5 % of earnings for non-initiating firms, matched by the dividend yield, dividend to
sales ratio, or dividend to asset ratio. They tested and found that the difference is significant. In
addition, Lipson et al. (1998) found that dividend-initiating firms are usually larger and more
profitable than the non-initiating firms that went public at the same time.
3. Bank Initial Public Offerings
Houge and Loughran (1999) investigate the long-term performance of bank that went
public as measured by the five-year post-holding returns. They find empirical evidence that the
bank IPOs do not experience under-performance until two or three years after the offering.
However, they find significant under-performance with respect to several market benchmarks
over a five-year holding period. According to Houge and Loughran (1999), the reason for this
result is that the banks maintained initially a relatively constant proportion of loaned assets
8

throughout the event window, and did not experience a dramatic shift in profitability after the
offering. Compared to the industry average, the banks in the sample reported low levels of loan
loss provisions in during the pre-IPO years. Following the offering, however, the banks increased
their loan loss allowances up to the aggregate industry level. Banks use these provisions for loan
losses to adjust for higher current and future levels of loan write-offs.
The increase in post-offering loan charges is consistent with the banks adopting a marginally
riskier loan strategy. Banks with more aggressive loan growth around the offering have a
significantly higher proportion of post-IPO loan loss provisions than banks with more
conservative growth rates. The poor long-run performance of the banks is directly attributed to
the high growth institutions, while the low growth banks outperformed the benchmarks. This
result is quite interesting and important in that it is in contrast to the findings for IPOs of non-
financial firms. IPOs usually under-perform the benchmark and firms with high growth potential
seem to have a relatively better performance. Moreover, the performance of banks also seems to
be related to firm size. Size is found to be an important explanatory variable of post offering
returns. Larger banks in the sample lagged the non-IPO bank index by –20.2 %, while smaller
banks actually matched the benchmark over the five-year holding period. The more negative
valuation effects of larger banks are consistent with the stock price reaction of dividend cuts and
omissions by commercial banks as reviewed in the next section.
4. Valuation Effects of Bank Dividend Announcements
There exist sufficient empirical evidence that the dividend policy of bank is special and is
significantly different from that of non-banks. The multidimensional aspect of the asymmetric
information problems faced by banks and bank customers, shareholders, and examiners is an
9

important aspect in arguing that banks are different. Quarterly dividend payments and annual
dividend increases have been very common for banks in the United States, shareholders may
expect regular dividends from those financial institutions that are viable and that currently are
not faced with severe financial difficulties. In addition their shareholders’ anxiety, banks have to
consider the assurance needs and confidence aspects of their customers. Quarterly
announcements of stable or growing dividends may therefore be utilized by banks as a means for
providing positive information about the bank’s solvency to investors, customers, and regulators
alike. Hence, dividends provide some positive information about the bank’s current success and
about the future viability of the bank. In contrast, dividend cuts lead to strong negative valuation
effects for banks of –8% for a two-day period and up to –12% for a two-week period (Bessler
and Nohel, 1996). Thus, in the world with information asymmetries bank initial public offerings
may consider to start paying dividends early on in order to signal their quality and viability to
shareholders. Important research question are whether the timing of the dividend initiation is an
important signal and whether the weaker banks can duplicate this signal and fool the market
about its quality.
III. Data and Methodology
1. Data
The sample of 431 banks includes all banks that went public between 1970 and 1997. The list
of these Bank Initial Public Offerings (IPOs) was obtained from Security Data Company (SDC)
database. The summary of the list is presented in Table 1.
The set of Bank Initial Public Offerings is obtained from the above IPO data. After matching
the data in CRSP stock data, the number of IPO banks available became 431. Based on the four
10

digit of Standard Industrial Classification (SIC) code system, these banks are categorized in
Table 2.
A status of a bank IPO in the market is obtained from CRSP data coding schemes called
"Delisting Codes". The coding scheme categorizes firms in 5 main groups: Active, Mergers,
Exchanges, Liquidations, and Dropped. This study focuses on active, mergers, and dropped
bank IPOs. Active means a bank was still operating since it went public until the end of the
CRSP database period covered, which is Dec 31, 2000. Mergers are banks that were acquired,
thus this group can be named merged. Dropped are banks that are permanently delisted from
trading at its current exchange. The summary of data used in the study is provided on the
following Table 3.
Monthly and daily stock data of bank IPOs and S&P500 were obtained from The Center for
Research in Security Prices (CRSP). The same source is used for the dates of dividend
announcement and dividend payment, dividend amount, and dividend codes.
2. Methodology
In this paper we investigate both short-term valuation effects and long-term under- or over-
performance. For measuring the long-term performance we employ BHARs and for the short-
term valuation effects CARs as described in the next two sections.
2.1. Measuring Long term Performance
In this study the standard buy and hold returns (BHAR) approach is used to measure the long-
term performance of bank IPOs relative to the market index. Calculating buy and hold returns
has become the usual method to investigate the long-term stock performance of an IPO [Ritter
11

(1991)]. BHARs are calculated as the geometric return of the bank IPO’s monthly stock returns
minus the geometric return of the monthly market (S&P500) returns over various investment
periods ranging from 1 month to 36 months. Thus, the buy and hold return is calculated as
follows:
Buy and Hold Return = ∏ ∏ = =
+−+T
t
T
tPStIPOt RR
1 1)500&()( )1()1(
where Rt(IPO) is the monthly returns of a bank IPO and Rt(S&P500) is the monthly returns of the
S&P500.
The event study methodology is applied in analyzing the market effect of the first dividend
announcement of a bank IPO, with the announcement date of the first dividend payment as the
particular event date. Throughout this paper, the first dividend payment and the dividend
initiation will be used interchangeably. For an event window we use the usual period from –10 to
+10 around the announcement date. The estimation period for the parameters for the market
model is from day -100 (or less) to day –11 prior to the dividend announcement.
The market model is employed to model the expected return of the bank IPO over the event
period. Abnormal returns of the event window are calculated as the actual daily returns during
the event window minus the expected returns. We employ the testing procedures for the
significance of the abnormal returns as suggested in Campbell et al. (1997). The method will be
applied to test for significance of an individual bank as well as for a group of banks. The groups
are categorized by the delisting code and the time when the first dividend payment of a bank IPO
is announced.
12

2.2. Measuring Short-term Valuation Effects
For measuring the significance of a short-term valuation effect of a dividend announcement
we employ the standard event study methodology. For a single event, the Ho hypothesis is that
, where is cumulative daily abnormal returns of the dividend initiation
announcement event of bank i. The significance test of H
),0(~^ 2iNCAR i σ ^
iCAR
o is constructed using the standardized
cumulative abnormal return that is calculated as follows:
^
^^
i
ii
CARSCAR
σ=
where is replaced with from estimation of the market model. Under the null hypothesis,
the distribution of the standardized cumulative abnormal return follows a Student t distribution
with L-2 degrees of freedom, where L is the length of the estimation window. A collection of
several events is hypothesized that , with
iσ ^iεσ
)_
,0(~2
_ii NCAR σ
∑=
=N
iiCAR
NCAR
1
^1_
∑=
=N
iii N 1
22_ 12
σσ
where N is the number of banks and is a consistent estimator of so that iσ_
iσ
∑=
=N
iii N 1
2^2_ 12
σσ
can replace . 2_iσ
13
The significance of the null hypothesis is tested using the J1 and J2 procedures as
described in Campbell et al. (1997). They have the following form.
)1,0(~ˆ
_1 N
iσ_
CARJ =
)1,0(~2
)4( _21
2 NSCARLLNJ
−−
=
where ∑=
=N
iiSCAR
NSCAR
1
^1_
IV. Results
1. Importance of the Delisting Codes
Over the period from 1970 to 1997, the number of banks that went public in each year varies
greatly as is presented in Figure 1a. It becomes immediately evident that a higher number of
banks went public in the years of 1983-1988 than in the other two periods before and after the
1980s. Thus, we observe three different periods that could be due to a hot issue market for banks
during the 1980s. Most likely this happened as a result of the bank deregulation in early 1980s.
Data in Table 1 indicates that saving institutions and several state commercial banks are the
major categories of banks that contribute to the increase of bank IPOs during that period.
Of the 431 banks that went public in this period, 54.3 % were eventually acquired (merged),
23% were delisted (dropped), and 20.2% continued operations (alive). The remaining small
percentage was in the exchanges and liquidations groups. In the period of higher IPO activity
(1983–1988) about 60% of the banks that went public eventually merged suggesting that the IPO
14

could have been part of an exit strategy for the owners or for management. 25% of the banks
were dropped and only 14% were still alive.
In order to show the importance of dividend policy for banks we compare the status of
bank IPOs to the status of non-bank IPOs over time (Figure 2). Very few non-banks start paying
dividends in the first year. The proportion rises to slightly more than 10% over the next two
years and remains at that level over the rest of the ten-year period considered in this paper. By
the end of this time period, nearly half of the non-bank IPOs have either merged or dropped. In
comparison, Figure 2b shows that nearly 70% of the bank IPOs have merged or dropped in the
first ten years. However, the proportion of banks paying dividends is considerably higher,
reaching 30% in the first year and exceeding 40% in the second and third years. By the tenth
year after going public, only 30% of the banks IPOs are still active, but two-thirds of these banks
are paying dividends. Clearly, dividend policy for the bank IPOs is different from that of non-
bank IPOs. A higher proportion of the banks appear to pay dividends sooner and continue to pay
dividends for the first ten years of existence. This pattern is also clearly shown in Figures 3a-3c.
Thus, dividends appear to be an important mechanism for banks to signal the quality to
shareholders.
The first dividend payment of bank IPOs is defined as the time when a bank pays its first
regular dividend. The timing decision of bank is measured in quarters or years relative to its date
of going public. For example, a bank paying the first dividend in quarter 1 means the bank pays
the first dividend payment within three months after it went public. The same explanation applies
for year measurement. One year equals to twelve months relative to the going public date. Figure
4 shows the timing of the first dividend payment of bank IPOs. The graph shows a decay pattern
of the timing decision. Most bank IPOs start paying the first dividend within the first year after
15

going public. A smaller number of IPOs start paying in the second year, and even a smaller
number begins dividend paymetns in the third year. The rest of the banks start paying dividend in
later years.
2. Long-run Performance
The long-run performance of the bank IPOs is measured by the 36-month market-
adjusted buy and hold returns (BHAR). Figure 5a shows that, overall, the average BHAR for the
entire sample of bank IPOs (n=420) is positive. Returns increase modestly in the first year and
more rapidly to nearly 20% in the next 18 months. The returns decline in the last 6 months
bringing the three year performance to slightly less than 10%. When the full sample of bank
IPOs is further categorized by the delisting code, a different pattern apparently emerges. Banks
that eventually merged show a +30% BHAR, while banks that were eventually dropped break
even after three years. Banks that stayed alive and either paid a dividend in the first three years
or never paid a dividend report negative long run performance in excess of –10%. Analyzing
only the banks that paid dividends within the first three years, a similar pattern is found. Figure
6a shows that the 36-month returns of the merged banks are positive while the returns of the
alive and dropped banks are negative. Figure 6b presents this same result organized by delisting
code and year of dividend initiation. Figure 7a and 7b measure the BHAR from the date of
dividend initiation. From this perspective, a slightly different pattern can be seen. The two
population T-test results indicate that, in paired comparisons, the BHARs are significantly
different from each other in each time period. The long run performance for bank IPOs that stay
alive are all negative, but the performance is much worse the longer the firm delays the dividend
payment. T-test results indicate that the individual year returns are each significantly different
16

from the others. A similar pattern is also evident for the banks that eventually dropped where the
1-2 year and 1-3 year returns are significantly different from each other. For the banks that
eventually merged, banks that initiated the dividend in the first year show the strongest
performance. If the acquisition (merger) was planned or expected by the bank management at
the time of the going public, then this suggests that the early dividend initiation was a means to
increase the market value of the bank. However, for this group, the 1-3 year and 2-3 year returns
are different from each other.
3. Short-term Valuation Effects
Figure 8a and 8b show the average abnormal returns and average cumulative abnormal
returns in the 21-day event window surrounding the dividend initiation announcement. On
average, the market reaction to the dividend initiation announcement was positive, regardless of
eventual delisting code. Interestingly, the banks that eventually were dropped showed the
greatest positive abnormal returns, +2.24%. It is possible that the market initially recognized the
dividend initiation as a more positive signal for banks if these were already considered to be
weaker banks. However, this positive valuation effects does not translate into a long-run over-
performance.
Figures 9a – 9d show the average abnormal returns and average cumulative abnormal
returns of the dividend initiation announcements by delisting code and timing of the dividend
payment. All CARs are positive and most are statistically significant; the 2nd-year merged and
2nd-year dropped CARs are positive but not significant. The strongest positive returns are found
in the group of the 3rd –year dropped banks (+13.89%, n=2) and the group of the 2nd –year alive
banks (+4.54%, n=10). There does not appear to be a consistent pattern in the returns between
17
delisting groups. For the alive banks, initiation of the dividend payment in the second year shows
the most positive market reaction. The merged banks show higher returns when dividends are
initiated in the first year. The opposite is true for the dropped banks, where the highest returns
are seen in the two banks that initiated dividends in the third year.
V. CONCLUSIONS
Dividend policy and the role that dividend announcements play to communicate
manager’s private information to shareholders has attracted a considerable amount of research
since the seminal papers of Modigliani and Miller (1958 and 1961). So far there is significant
empirical evidence that suggest that management can use dividend changes to signal the quality
of the firm in that dividend increases result in positive stock price reactions and dividend
decreases lead to negative stock price reactions in the short and in the long run. The important
question to investigate, however, is whether all firms can employ dividend changes in the same
manner, or whether the magnitude of the impact depends on the maturity of the firm (e.g. IPO) as
well as on the industry (e.g. banking) in which the firm is operating in. Most of the empirical
research has focused on established firms instead of initial public offerings as well as on
industrial firms instead of banks. The objective of this paper is to investigate the short-term
valuation effects as well as the long-run performance of initial public offerings of banks in the
United States over the period from 1972 to 1997. The empirical results suggest that on average
bank IPOs outperform the market over the first 36 months after going public. This results is
opposite than that for industrial firms where we usually find negative long-term valuation effects.
However, by separating the group depending on the future status of the bank, the results change
in that only the banks that were acquired later on outperform the benchmark and that the group
18
of banks that continue to operate independently over an extended period of time and the group of
banks that eventually failed both under-perform. Moreover, the beginning of the dividend
payments is an important characteristic that separates the out-performers from the under-
performers. Thus, in an environment with information asymmetries dividend initiations are an
important signal to convey the quality of banks that just went public.
Overall, the empirical results provide significant evidence that the dividend policy of
banks is quite different from that of non-banks and that the dividend policy of bank initial public
offerings has a significant impact on the long-run performance banks.
19

References
Allen, F., Michaely, R., 1995. Dividend policy, in: Jarrow, R (Eds.), Handbooks in Operations Research & Management Science, Vol. 9. pp. 793-837
Ambarish, R., John, K., Williams, J., 1987. Efficient signaling with dividends and investments. Journal of
Finance 42, 321-344. Asquith, P., Mullins, D. Jr. , 1983. The impact of initiating dividend payments on shareholder’s wealth.
Journal of Business 56, 77-96. Battacharya, S., 1979. Imperfect information, dividend policy and the ‘bird in the hand’ fallacy. Bell
Journal of Economics and Management Science 10, 259-270. Bessler, W., Nohel, T., 1996. The stock-market reaction to dividend cuts and omissions by commercial
banks. Journal of Banking and Finance 20, 1485-1508. Bessler, W., Nohel, T., 2000. Asymmetric information, dividend reductions, and contagion effect in bank
stock returns. Journal of Banking and Finance 24, 1831-1848. Campbell, J.Y., Lo, A.W., MacKinlay, A.C., 1997. The Econometrics of Financial Markets. Princeton
University Press, Prenceton, New Jersey, pp. 149-180. DeAngelo,H., DeAngelo, L., Skinner, D., 1996. Reversal of fortune: dividend signaling and the
disappearance of sustained earnings growth. Journal of Financial Economics 40, 341-371. Dyl, R., Weigand, R., 1998. The information content of dividend initiations: additional evidences.
Financial Management 27, 27-35. Fama, E., Babiak, H. 1968. Dividend policy: an empirical analysis. Journal of American Statistical
Association 63, 1132-1161. Fama, E.F., French, K.R., 2001. Disappearing dividends: changing firm characteristics or lower
propensity to pay? Journal of Financial Economics 60, forthcoming. Healy, P., Palepu, K., 1988. Earning information conveyed by dividends initiations and omissions.
Journal of Financial Economics 21, 149-176. Houge, T., Loughran, T., 1999. Growth fixation and the performance of bank initial public offerings,
1983 -1991. Journal of Banking and Finance 23, 1277-1301. Jensen, M.C., 1986. Agency costs of free cash flow, corporate finance, and takeover. American Economic
Review 76, 323-329. John, K., Lang, L., 1991. Insider trading around dividend announcements: theory and evidence. Journal of
Finance 46, 1361-1389. John, K., Williams, J., 1985. Dividends, dilution and taxes: a signaling equilibrium. Journal of Finance,
40, 1053-1070.
20

Lang, L., Litzenberger, R., 1989. Dividend announcements: cash flow signaling vs. free cash flow hypothesis. Journal of Financial Economics 24, 181-191.
Lintner, J., 1956. The distribution of incomes of corporating among dividend, retained earnings and taxes.
American Economic Review 46, 7-113. Lipson, M., Maquieira, C., Megginson, W., 1998. Dividend initiations and earnings surprises. Financial
Management 27, 36-45. Michaely, R., Thaler, R.H., Womack, K.L., 1995. Price reactions to dividend initiations and omissions:
overreaction or drift? Journal of Finance 50, 573-608. Miller, M.H., Modigliani, F., 1961. Dividend policy, growth and the valuation of shares. Journal of
Business 34, 411-433. Miller, M.H., Rock, K., 1985. Dividend policy under asymmetric information. Journal of Finance 40,
1031-1051. Modigliani, F., Miller, M.H., 1958. The cost of capital, corporation finance and the theory of investment.
American Economic Review 48, 261-297. Slovin, M.B., Sushka, M.E., Polonchek, J.A., 1999. An analysis of contagion and competitive effects at
commercial banks. Journal of Financial Economics 54, 197-225. Venkatesh, P.C., 1989. The impact of dividend initiation on the information content of earnings
announcements and returns volatility. Journal of Business 62, 175-197. Williams, J.T., 1992. Signaling with dividends, in: Newman, P., Murray, M., Eatwell, J. (Eds.), The New
Palgrave Dictionary of Money and Finance, Vol. I. London, pp. 458-461.
21

LIST OF FIGURES
Figure 1a. Bank IPOs over time
Figure 1b. Major bank IPOs and the status of bank IPOs once going public
Figure 2a. 1980 – 1989 Non-bank IPOs delisting status over time
Figure 2b. 1979 – 1989 Bank IPOs delisting status over time
Figure 3a. 1980 – 1989 Non-bank IPOs proportion paying vs not paying dividends over time
Figure 3b. 1979 – 1989 Bank IPOs proportion paying vs not paying dividends over time
Figure 3c. The proportion and timing of the first dividend payment of bank IPOs
Figure 4. The first dividend payment timing of all bank IPOs
Figure 5a. Long run buy and hold performance of all bank IPOs
Figure 5b. Long run buy and hold performance of all bank IPOs by delisting code
Figure 6a. Buy and hold returns 36 months from going public day, by timing of first dividend
payment
Figure 6b. Buy and hold returns 36 months from going public day, by delisting codes
Figure 7a. Buy and hold returns before and after first dividend payment, by year of first payment
Figure 7b. Buy and hold returns before and after first dividend payment, by delisting code
Figure 8a. Average abnormal returns of all dividend initiation announcements by delisting code
Figure 8b. Cumulative average abnormal returns of all dividend initiation announcements by
delisting code
Figure 9a. Average abnormal returns of dividend initiation announcements by timing of first
dividend payment
Figure 9b. Cumulative average abnormal returns of dividend initiation announcements by timing of
first dividend payment
Figure 9c. Average abnormal returns of dividend initiation announcements by timing of first
dividend payment and delisting code
Figure 9b. Cumulative average abnormal returns of dividend initiation announcements by timing of
first dividend payment and delisting code
22

LIST OF TABLES Table 1. IPO Summary
Table 2. Bank IPO by SIC Code/Category
Table 3a. Number and Classification of Bank IPOs
Table 3b. Number and Classification of Bank IPOs that are Alive, Merged, and Dropped
Table 4a. Bank IPOs in Each Year (1970-1997)
Table 4b. Bank IPOs in Each Year by Delisting Codes
Table 5a. Bank IPOs that Never Pay Dividend by SIC Code
Table 5b. Bank IPOs that Never Pay Dividend by Delisting Codes
23

Figure 1a. Bank IPOs over Time Table 1b. Major Bank IPOs and the Status of Bank IPOs once Going Public
24

Figure 2a. 1980-1989 Non-Bank IPOs Status Over Time Figure 2b. 1979-1989 Bank IPOs Status Over Time
25

Figure 3a. 1980-1989 Non-Bank IPOs Proportion of Paying vs Not Paying Dividends Over Time Figure 3a. 1979-1989 Bank IPOs Proportion of Paying vs Not Paying Dividends Over Time
26

Figure 3c. The Proportion and Timing of The First Dividend Payment of Bank IPOs
Figure 4. The First Dividend Payment Timing of All Bank IPOs
27

Figure 5a. Long Run Buy and Hold Performance of All Bank IPOs
Figure 5b. Long Run Buy and Hold Performance of All Bank IPOs by Delisting Codes
28

Figure 6a. Buy and Hold Returns 36 months from Going Public Day, by Timing of First Dividend Payment
29

Figure 6b. Buy and Hold Returns 36 Months from Going Public Day, by Delisting Codes
30

Figure 7a. Buy and Hold Returns Before and After First Dividend Payment, by Year of First Payment
31

Figure 7b. Buy and Hold Returns Before and After First Dividend Payment, by Delisting Codes
32
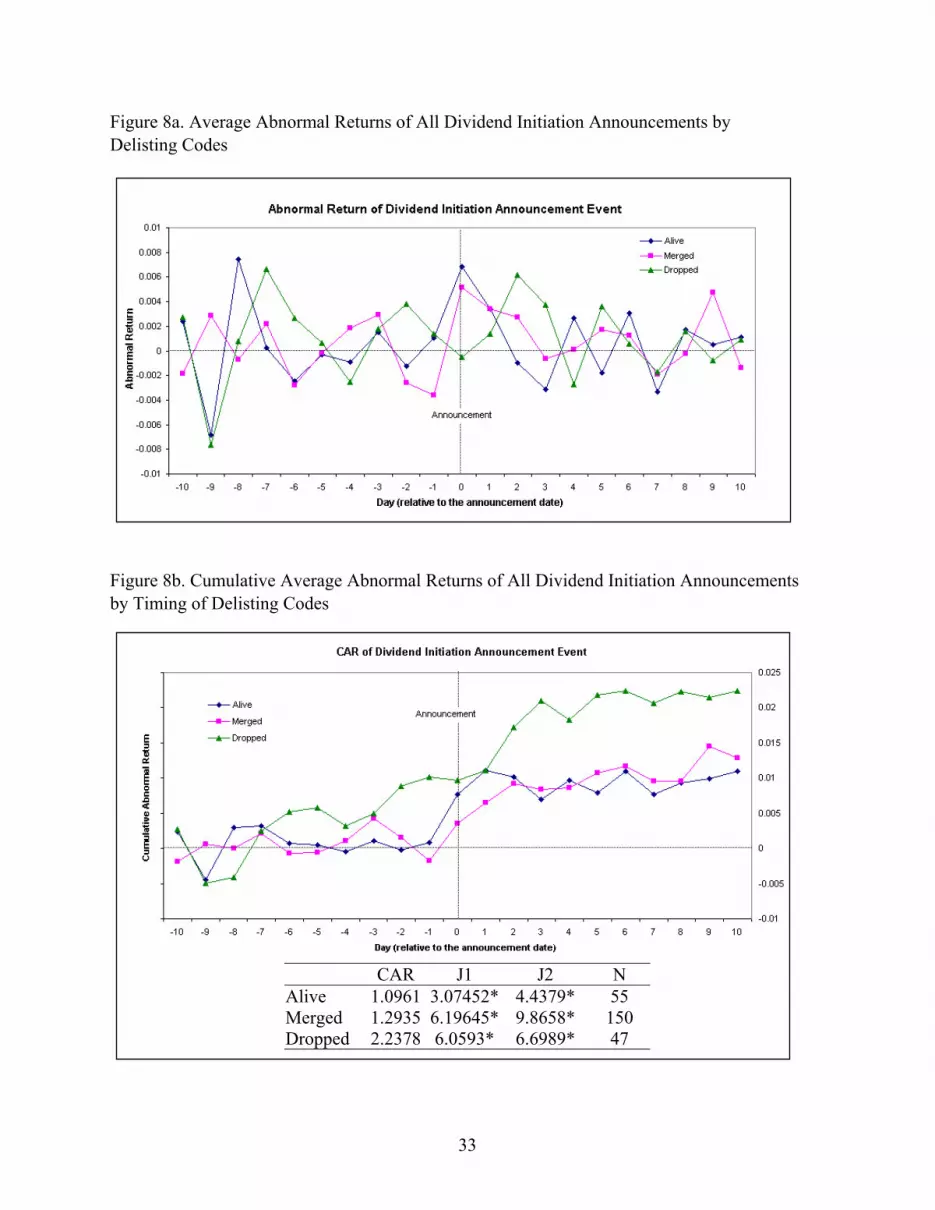
Figure 8a. Average Abnormal Returns of All Dividend Initiation Announcements by Delisting Codes
Figure 8b. Cumulative Average Abnormal Returns of All Dividend Initiation Announcements by Timing of Delisting Codes
CAR J1 J2 N Alive 1.0961 3.07452* 4.4379* 55 Merged 1.2935 6.19645* 9.8658* 150 Dropped 2.2378 6.0593* 6.6989* 47
33

Figure 9a. Average Abnormal Returns of Dividend Initiation Announcement by Timing of First Dividend Payment
Figure 9b. Cumulative Average Abnormal Returns of Dividend Initiation Announcements by Timing of First Dividend Payment
Alive Merged Dropped
CAR J1 J2 N CAR J1 J2 N CAR J1 J2 N
1st Y 0.1406 0.3237 2.0635* 37 1st Y 1.9091 7.1430* 12.7162* 84 1st Y 2.1497 4.95121* 6.051*5* 33 2nd Y 4.5394 4.9507* 4.2364* 10 2nd Y 0.1463 0.3834 -1.0980 49 2nd Y 0.5373 0.7397 0.2788 12 3rd Y 1.2110 1.4952 2.4622* 8 3rd Y 1.5585 2.3550* 2.9034* 17 3rd Y 13.8944 6.2079* 7.2102* 2
34

Figure 9c. Average Abnormal Returns of Dividend Initiation Announcements by Timing of First Dividend Payment and Delisting Codes
Figure 9d. Cumulative Average Abnormal Returns of Dividend Initiation Announcements by Timing of First Dividend Payment and Delisting Codes
35
1st Y 2nd Y 3rd Y
CAR J1 J2 N CAR J1 J2 N CAR J1 J2 N
Alive 0.1406 0.3237 2.0635* 37 Alive 4.5394 4.9507* 4.2364* 10 Alive 1.2110 1.4952 2.4622* 8 Merged 1.9091 7.1430* 12.7162* 84 Merged 0.1463 0.3834 -1.0980 49 Merged 1.5585 2.3550* 2.9034* 17Dropped 2.1497 4.95121* 6.051*5* 33 Dropped 0.5373 0.7397 0.2788 12 Dropped 13.8944 6.2079* 7.2102* 2

Table 1. IPO Summary
Filter Remaining Banks
IPOs SDC US Common Stock Database 1/1970 - 10/1999 10750 Not Spin off 9819 Not Unit Issue 8570 Not Reverse LBO 8274 Not ADR and Offer Price >= $5 6756 Total Proceeding >= 1.5 million 6487 CRSP Monthly Data and IPOs 1/1970 - 12/1997 (available data) 6158 Table 2. Bank IPO by SIC Code/Category
SIC Category Number of Banks
6000 2 6021 National Commercial Banks 22 6022 State Commercial Banks 68 6029 Commercial Banks, NEC* 2 6035 Savings Institutions, Federally Chartered 200 6036 Savings Institutions, Not Federally Chartered 129 6081 Branches and Agencies of Foreign Banks 1 6099 Functions related to Deposit Banking, NEC 4 6712 Offices of Bank Holding Companies 3
TOTAL 431 *N.E.C means Not Elsewhere Classified
36

Table 3a. Number and Classification of Bank IPOs
Bank Classification
SIC
Original
Not Alive,
Merged,
Dropped
Never
Pay
Div.
Pay Div.
>12th Q
Not
Qualified for
Event Study
6000 2 - - - 2 National Commercial Banks 6021 22 - 5 3 1 State Commercial Banks 6022 68 1 15 6 5 Commercial Banks, NEC 6029 2 - - - 1 Savings Institutions, Federally Chartered 6035 200 6 47 34 4 Savings Institutions, Not Federally Chart. 6036 129 4 24 17 - Branches and Agencies of Foreign Banks 6081 1 - - - - Functions Related to Deposit Banking, NEC 6099 4 - 3 - - Offices of Bank Holding Companies 6712 3 - 1 - -
REMAINING BANK IPOs 431 420 325 265 252
Table 3b. Number and Classification of Bank IPOs that are Alive, Merged, and Dropped
Delisting Code
Alive, Merged, Dropped
Never Pay Dividend,
Pay Div. 12thQ
Not Qualified for Event Study
Alive 87 12 16 4 Merged 234 42 36 6 Dropped 99 41 8 3
REMAINING BANK IPOs 420 325 265 252
37

Table 4a. Bank IPOs in Each Year (1970-1997) SIC Code
Year 6000 6021 6022 6029 6035 6036 6081 6099 6712 Total 1970 1971 1 2 3 1972 1 2 2 1 6 1973 1 1 1 3 1974 1975 1976 2 2 1977 1 2 3 1978 1979 4 4 8 1980 5 2 7 1981 5 1 1 7 1982 1 2 3 1983 3 44 19 1 67 1984 2 4 24 8 38 1985 5 18 15 38 1986 5 13 1 29 44 92 1987 1 7 32 15 55 1988 1 2 15 11 29 1989 1 1 3 2 7 1990 1 2 2 2 7 1991 2 2 4 1992 1 2 2 1 6 1993 5 7 2 2 16 1994 4 1 5 1995 1 1 2 1996 2 3 1 1 3 10 1997 1 1 5 2 2 1 1 13
Total 2 22 68 2 200 129 1 4 3 431
38

Table 4b. Bank IPOs in Each Year by Delisting Codes Delisting Code
Year Alive Merged Exchanges Liquidations Dropped Total1971 2 1 3 1972 5 1 6 1973 1 1 1 3 1976 1 1 2 1977 2 1 3 1979 3 1 4 8 1980 3 4 7 1981 5 2 7 1982 1 1 1 3 1983 3 38 2 24 67 1984 2 24 1 11 38 1985 4 22 2 10 38 1986 18 51 1 22 92 1987 9 35 11 55 1988 8 17 4 29 1989 1 6 7 1990 3 3 1 7 1991 1 3 4 1992 4 2 6 1993 9 7 16 1994 3 2 5 1995 2 2 1996 7 3 10 1997 12 1 13 Total 87 234 9 2 99 431
39

Table 5a. Bank IPOs that Never Pay Dividend by SIC Code
SIC Code
Year 6021 6022 6035 6036 6099 6712 Total
1980 1 1 1981 2 1 1 4 1983 1 15 5 21 1984 1 6 1 8 1985 1 5 2 8 1986 1 3 6 6 16 1987 1 3 7 4 15 1988 1 3 2 6 1989 1 1 1990 1 1 1992 1 1 1993 1 1 1 3 1995 1 1 1996 1 1 1 1 4 1997 2 1 1 1 5 Total 5 15 47 24 3 1 95
Table 5b. Bank IPOs that Never Pay Dividend by Delisting Codes
Delisting Codes
Year Alive Merged Dropped Total 1980 1 1 1981 4 4 1983 9 12 21 1984 3 5 8 1985 3 5 8 1986 1 5 10 16 1987 9 6 15 1988 4 2 6 1989 1 1 1990 1 1 1992 1 1 1993 1 2 3 1995 1 1 1996 2 2 4 1997 5 5 Total 12 42 41 95
40

Table 6a. Average Buy and Hold Returns from Going Public Day
Delisting Code
First Div. Timing
Mean
Variance
Alive 1stY 0.0054 0.00126 2ndY -0.0616 0.00408 3rdY -0.1405 0.02062
Merged 1stY 0.1720 0.01376 2ndY 0.1602 0.01545 3rdY 0.1087 0.00479
Dropped 1stY -0.0528 0.00356 2ndY -0.0497 0.04626 3rdY -0.0562 0.01152
Table 6b. Average Buy and Hold Returns Before and After the First Dividend Payment
Delisting Code
First Div. Timing
Mean
Variance
Alive 1stY 0.00035 0.00129 2ndY -0.12121 0.02089 3rdY -0.29519 0.04669
Merged 1stY 0.18932 0.02327 2ndY 0.14988 0.01830 3rdY 0.03662 0.01351
Dropped 1stY -0.03587 0.00208 2ndY -0.27925 0.19585 3rdY -0.40555 0.22211
41


