Embed Size (px)
Citation preview
Figures and figure supplements
A transcription factor collective defines the HSN serotonergic neuron regulatorylandscape
Carla Lloret-Fernandez et al
Lloret-Fernandez et al. eLife 2018;7:e32785. DOI: https://doi.org/10.7554/eLife.32785 1 of 32
RESEARCH ARTICLE
NSML/R
A
B
HSNL/R
ADFL/R
E
100% 0%50%
HSN expression
HSN differentiation defects
Trp
5HTP
5HT
CAT-4GCH
CAT-1VMAT2
TPH-1TPH2
BAS-1AADC
Serotonin biosynthetic pathway
Wild type
ast-1(ot417)
unc-86(n846)
sem-4(n1971)
hlh-3(tm1688)
egl-46(sy628)
egl-18(ok290)
anti-5HT
tph-1
cat-1
cat-4
bas-1
kcc-2
lgc-55
ida-1
flp-19
unc-17
unc-40
rab-3
kal-1
5HT pathway Other terminal features
nlg-1
n.a n.a
C
wildtype
5HT staining
5HT pathway D
Wild
type
ast-1(-/-)
unc-86(-/-)
sem-4(-/-)
hlh-3(-/-)
egl-46(-/-)
egl-18(-/-)
tph-1::gfp kcc-2::gfp
Other features
kal-1::gfp
0% OFF
100% OFF
99% OFF
96% OFF
62% OFF
18% OFF
26% OFF
4% OFF
100% OFF
100% OFF
48% OFF
78% OFF
38% OFF
25% OFF
26% OFF
100% OFF
100% OFF
94% OFF
100% OFF
48% OFF
55% OFF
8% OFF
10% OFF
15% OFF
3% OFF
0% OFF
4% OFF
7% OFF
Hermaphrodite serotonergic system
Wild
type
ast-1(-/-)
unc-86(-/-)
sem-4(-/-)
hlh-3(-/-)
egl-46(-/-)
egl-18(-/-)
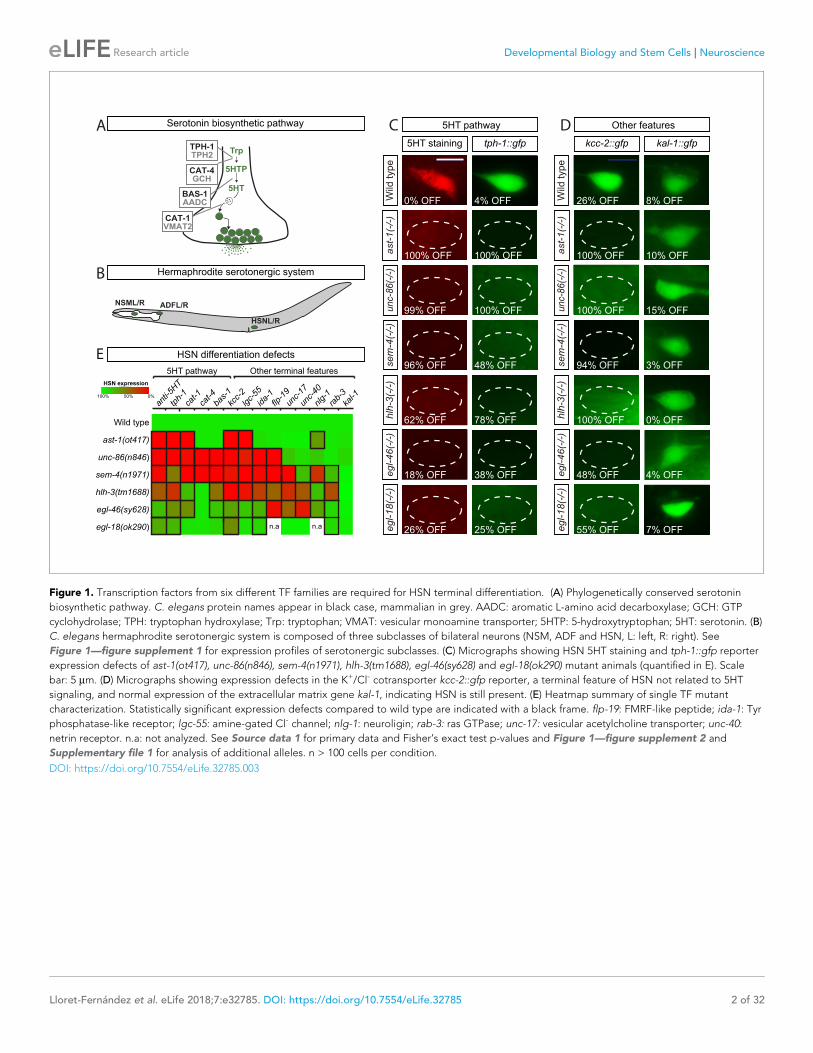
Figure 1. Transcription factors from six different TF families are required for HSN terminal differentiation. (A) Phylogenetically conserved serotonin
biosynthetic pathway. C. elegans protein names appear in black case, mammalian in grey. AADC: aromatic L-amino acid decarboxylase; GCH: GTP
cyclohydrolase; TPH: tryptophan hydroxylase; Trp: tryptophan; VMAT: vesicular monoamine transporter; 5HTP: 5-hydroxytryptophan; 5HT: serotonin. (B)
C. elegans hermaphrodite serotonergic system is composed of three subclasses of bilateral neurons (NSM, ADF and HSN, L: left, R: right). See
Figure 1—figure supplement 1 for expression profiles of serotonergic subclasses. (C) Micrographs showing HSN 5HT staining and tph-1::gfp reporter
expression defects of ast-1(ot417), unc-86(n846), sem-4(n1971), hlh-3(tm1688), egl-46(sy628) and egl-18(ok290) mutant animals (quantified in E). Scale
bar: 5 mm. (D) Micrographs showing expression defects in the K+/Cl- cotransporter kcc-2::gfp reporter, a terminal feature of HSN not related to 5HT
signaling, and normal expression of the extracellular matrix gene kal-1, indicating HSN is still present. (E) Heatmap summary of single TF mutant
characterization. Statistically significant expression defects compared to wild type are indicated with a black frame. flp-19: FMRF-like peptide; ida-1: Tyr
phosphatase-like receptor; lgc-55: amine-gated Cl- channel; nlg-1: neuroligin; rab-3: ras GTPase; unc-17: vesicular acetylcholine transporter; unc-40:
netrin receptor. n.a: not analyzed. See Source data 1 for primary data and Fisher’s exact test p-values and Figure 1—figure supplement 2 and
Supplementary file 1 for analysis of additional alleles. n > 100 cells per condition.
DOI: https://doi.org/10.7554/eLife.32785.003
Lloret-Fernandez et al. eLife 2018;7:e32785. DOI: https://doi.org/10.7554/eLife.32785 2 of 32
Research article Developmental Biology and Stem Cells Neuroscience
Lloret-Fernandez et al. eLife 2018;7:e32785. DOI: https://doi.org/10.7554/eLife.32785 3 of 32
Research article Developmental Biology and Stem Cells Neuroscience
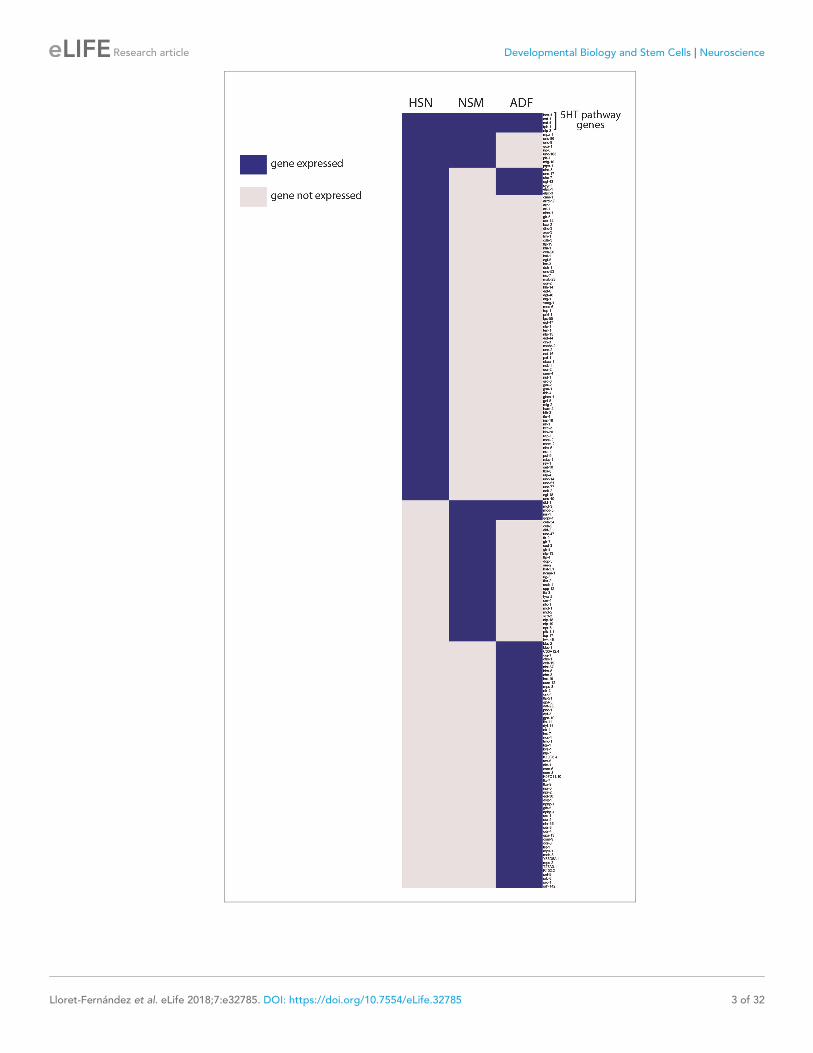
Figure 1—figure supplement 1. Each serotonergic neuron subclass expresses different sets of genes. Heat map
representation of known HSN, NSM and ADF expressed genes [from (Hobert et al., 2016)]. Only the 5HT
pathway genes and one additional gene (nlp-3) are expressed by the three serotonergic subclasses.
DOI: https://doi.org/10.7554/eLife.32785.004
Lloret-Fernandez et al. eLife 2018;7:e32785. DOI: https://doi.org/10.7554/eLife.32785 4 of 32
Research article Developmental Biology and Stem Cells Neuroscience
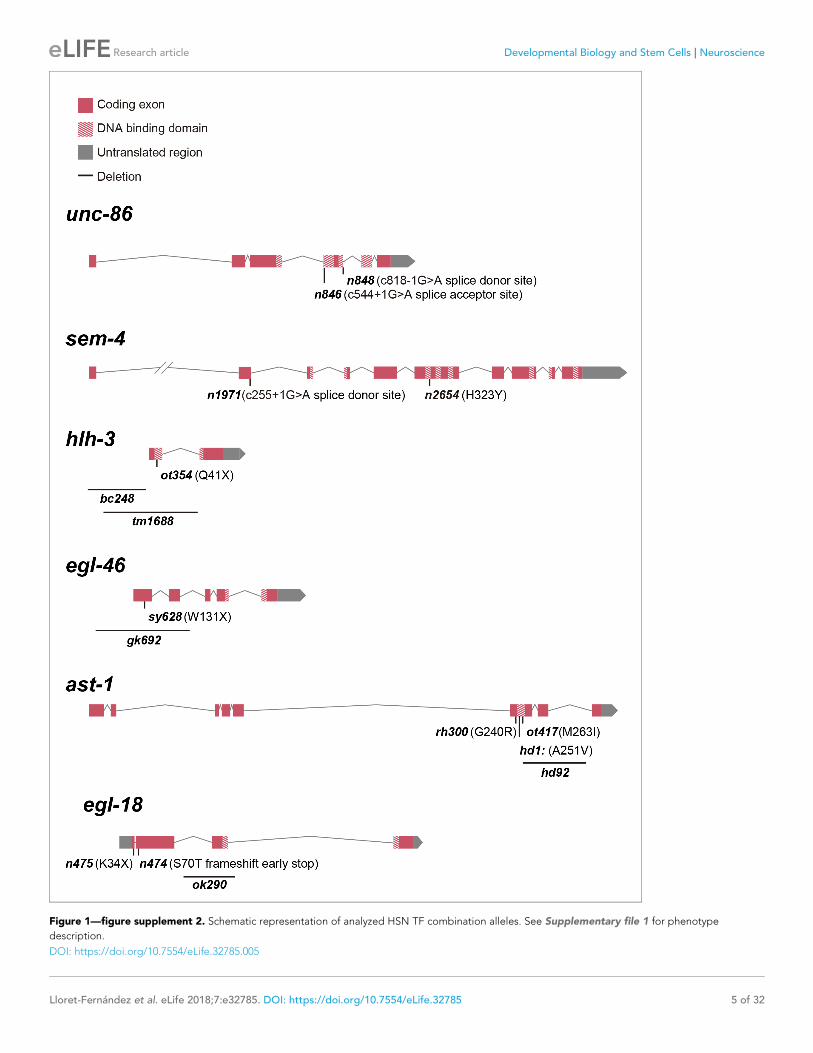
Figure 1—figure supplement 2. Schematic representation of analyzed HSN TF combination alleles. See Supplementary file 1 for phenotype
description.
DOI: https://doi.org/10.7554/eLife.32785.005
Lloret-Fernandez et al. eLife 2018;7:e32785. DOI: https://doi.org/10.7554/eLife.32785 5 of 32
Research article Developmental Biology and Stem Cells Neuroscience
L1 L2 L3 L4 (early)
L4 (mid)
L4 (late)
YA0
20
40
60
80
100
% H
SN
tph-1::gfp
* *
*
*
*L1 L2 L3 L4
(early)L4
(mid)L4
(late)YA
0
20
40
60
80
100%
HS
N tph-1::gfp
*
*
*
*
L1 L2 L3 L4 (early)
L4 (mid)
L4 (late)
YA0
20
40
60
80
100
% H
SN
tph-1::gfp
*
*
*
*
*
*
A B
Young Adult HSN expression
AST-1 UNC-86 EGL-46 EGL-18SEM-4 HLH-3
L4 HSN expression
HLH-3SEM-4AST-1 UNC-86 EGL-46 EGL-18
C
hlh-
3(tm
1688
)
hlh-
3(tm
1688
)
+ Ex(
hsp:
:hlh
-3)
0
50
100
% H
SN
tph-1
::gfp
L4 hlh-3 rescue
ON
OFF
*
Effect of precocious ast-1 and hlh-3 expressionD
L1 ast-1 induced expression
wild type
ast-1 line 1
ast-1 line 2
L1 hlh-3 induced expression
wild type
hlh-3 line 1
hlh-3 line 2
L1 ast-1 + hlh-3 expression
wild type
ast-1 + hlh-3 line 1
ast-1 + hlh-3 line 2
Em
bryo
L1 st
age
L2 st
age
L3 st
age
L4 st
age
YA
0
20
40
60
80
100
% H
SN
ex
pre
ss
ion
HLH-3
UNC-86
SEM-4
EGL-46
EGL-18
AST-1
HSN terminal differentiation
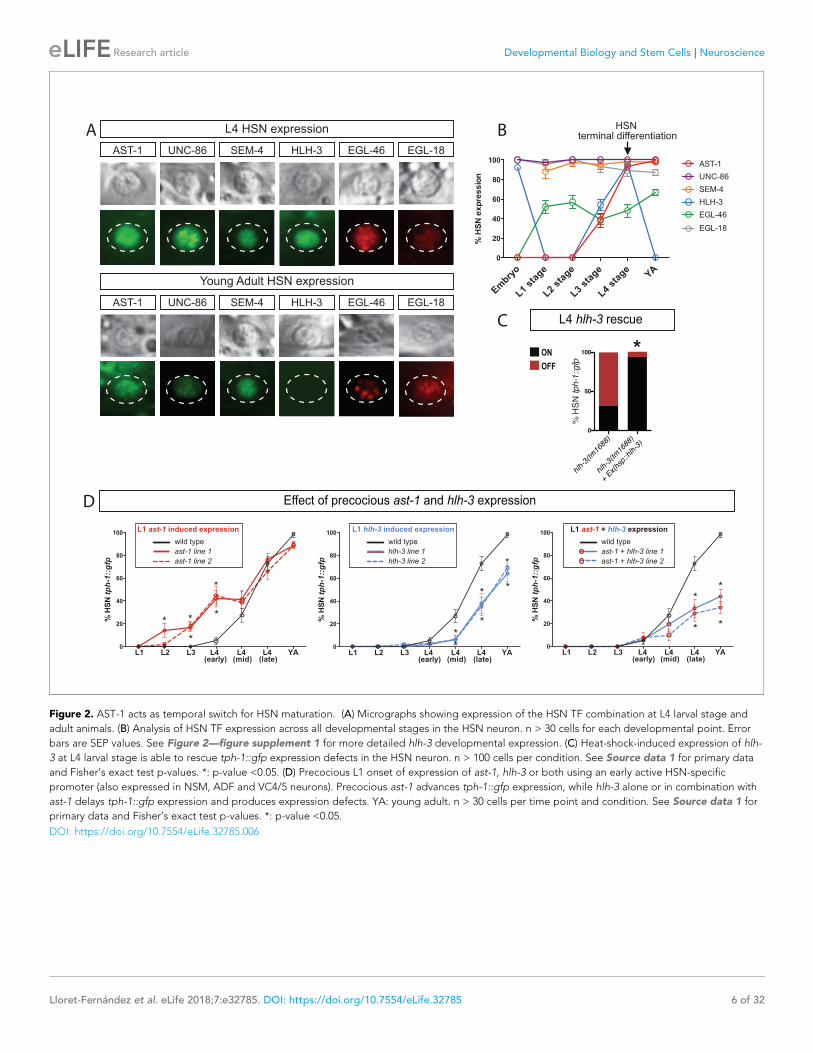
Figure 2. AST-1 acts as temporal switch for HSN maturation. (A) Micrographs showing expression of the HSN TF combination at L4 larval stage and
adult animals. (B) Analysis of HSN TF expression across all developmental stages in the HSN neuron. n > 30 cells for each developmental point. Error
bars are SEP values. See Figure 2—figure supplement 1 for more detailed hlh-3 developmental expression. (C) Heat-shock-induced expression of hlh-
3 at L4 larval stage is able to rescue tph-1::gfp expression defects in the HSN neuron. n > 100 cells per condition. See Source data 1 for primary data
and Fisher’s exact test p-values. *: p-value <0.05. (D) Precocious L1 onset of expression of ast-1, hlh-3 or both using an early active HSN-specific
promoter (also expressed in NSM, ADF and VC4/5 neurons). Precocious ast-1 advances tph-1::gfp expression, while hlh-3 alone or in combination with
ast-1 delays tph-1::gfp expression and produces expression defects. YA: young adult. n > 30 cells per time point and condition. See Source data 1 for
primary data and Fisher’s exact test p-values. *: p-value <0.05.
DOI: https://doi.org/10.7554/eLife.32785.006
Lloret-Fernandez et al. eLife 2018;7:e32785. DOI: https://doi.org/10.7554/eLife.32785 6 of 32
Research article Developmental Biology and Stem Cells Neuroscience
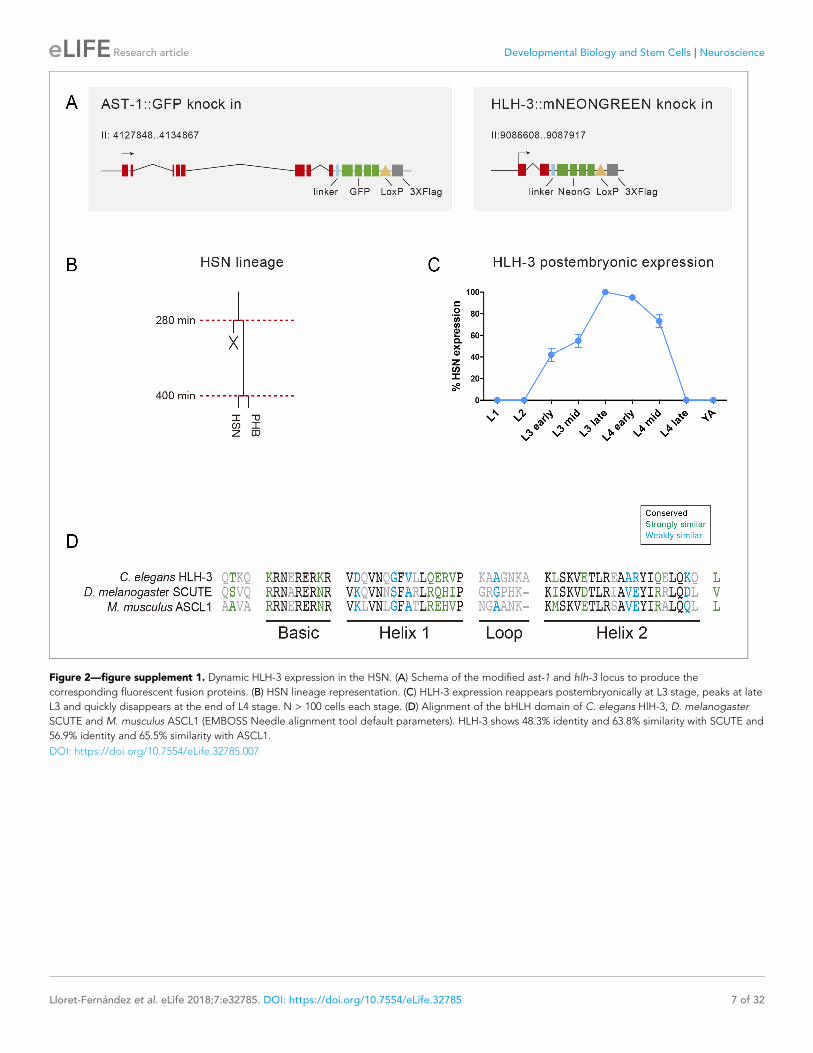
Figure 2—figure supplement 1. Dynamic HLH-3 expression in the HSN. (A) Schema of the modified ast-1 and hlh-3 locus to produce the
corresponding fluorescent fusion proteins. (B) HSN lineage representation. (C) HLH-3 expression reappears postembryonically at L3 stage, peaks at late
L3 and quickly disappears at the end of L4 stage. N > 100 cells each stage. (D) Alignment of the bHLH domain of C. elegans HlH-3, D. melanogaster
SCUTE and M. musculus ASCL1 (EMBOSS Needle alignment tool default parameters). HLH-3 shows 48.3% identity and 63.8% similarity with SCUTE and
56.9% identity and 65.5% similarity with ASCL1.
DOI: https://doi.org/10.7554/eLife.32785.007
Lloret-Fernandez et al. eLife 2018;7:e32785. DOI: https://doi.org/10.7554/eLife.32785 7 of 32
Research article Developmental Biology and Stem Cells Neuroscience
C
L4440
ast-1
RNAi
unc-86
RNAi
sem
-4 R
NAi
egl-4
6 RNAi
egl-1
8 RNAi
0
20
40
60
80
100
% tp
h-1
::y
fp H
SN
* * * * *
ON
OFF
HSN fate maintenance
A
AST-1
UNC-8
6
SEM
-4
HLH-3
EGL-4
6
0
50
100
% H
SN
expre
ssio
n
egl-18(ok290)
AST-1
UNC-8
6
HLH-3
EGL-4
6
EGL-1
8
0
50
100
% H
SN
expre
ssio
n
sem-4(n1971)
* *
UNC-8
6
SEM
-4
HLH-3
EGL-4
6
EGL-1
8
0
50
100
% H
SN
expre
ssio
n
ast-1(ot417)
AST-1
UNC-8
6
SEM
-4
EGL-4
6
EGL-1
8
0
50
100
% H
SN
expre
ssio
n
hlh-3(tm1688)
* *
AST-1
UNC-8
6
SEM
-4
HLH-3
EGL-1
8
0
50
100
% H
SN
expre
ssio
n
egl-46(sy628)
AST-1
SEM
-4
HLH-3
EGL-4
6
EGL-1
8
0
50
100
% H
SN
expre
ssio
n
unc-86(n846)
* * * *
*
Cross-regulation analysis
ON
OFF
L4440
ast-1
RNAi
unc-86
RNAi
sem
-4 R
NAi
egl-4
6 RNAi
egl-1
8 RNAi
0
20
40
60
80
100
% c
at-
1::
GF
P:M
DM
2 H
SN
* * * *
tph-1 expression cat-1 expression
UNC-86
EGL-46
AST-1
SEM-4EGL-18
HLH-3
HSN effector genes
B
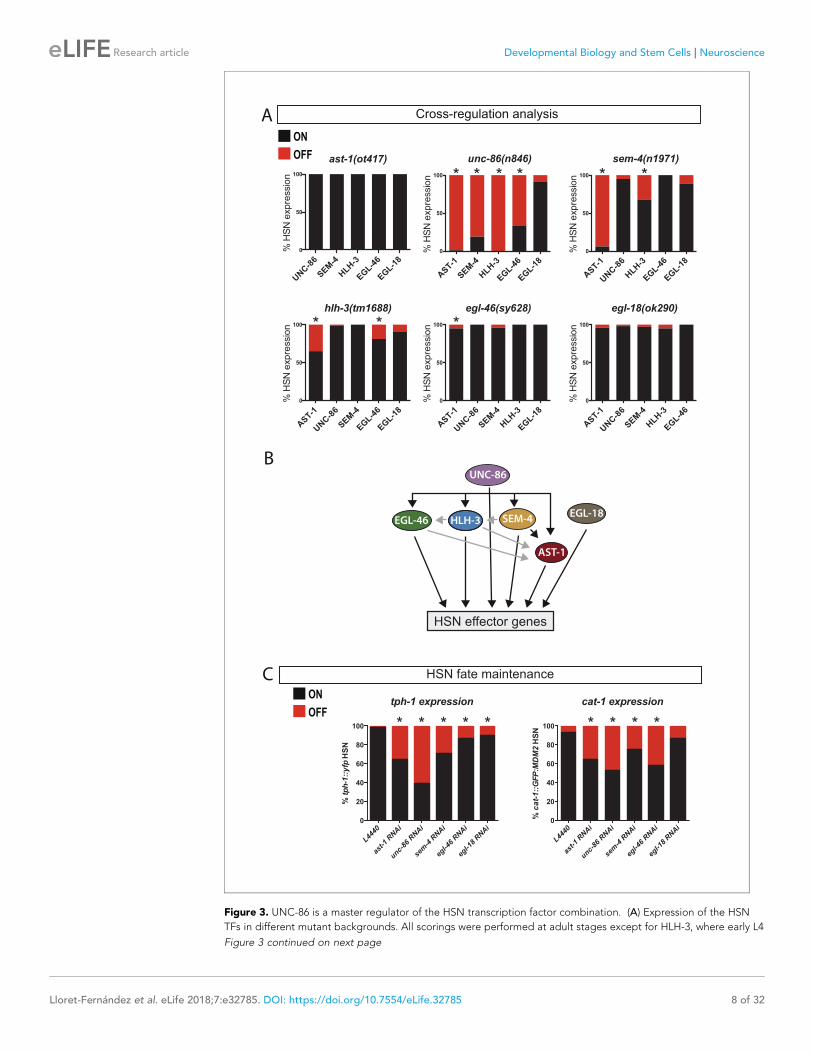
Figure 3. UNC-86 is a master regulator of the HSN transcription factor combination. (A) Expression of the HSN
TFs in different mutant backgrounds. All scorings were performed at adult stages except for HLH-3, where early L4
Figure 3 continued on next page
Lloret-Fernandez et al. eLife 2018;7:e32785. DOI: https://doi.org/10.7554/eLife.32785 8 of 32
Research article Developmental Biology and Stem Cells Neuroscience
Figure 3 continued
larvae were scored. Embryonic HLH-3 expression is unaffected in unc-86 mutants (data not shown). Graphs show
the percentage of TF expression in mutant animals relative to wild type expression. n > 100 cells per condition,
Fisher’s exact test, *: p-value<0.05, See Source data 1 for raw data and exact p-values. (B) Summary of
relationships among the HSN TF combination, black arrows mean strong effect (more than 50% loss of expression)
and grey arrows depicts the rest of significant defects. (C) Loss-of-function (RNAi) experiments after HSN
differentiation show that AST-1, UNC-86, SEM-4, EGL-46 and EGL-18 are required to maintain proper tph-1::yfp
and cat-1::MDM2::gfp (unstable GFP) reporter expression. Worms were also scored prior to RNAi treatment to
confirm correct HSN differentiation before starting the experiment. n > 100 cells per condition, Fisher’s exact test,
*: p-value <0.05. See Source data 1 for raw data and Figure 3—figure supplement 1 for maintenance analysis
with temperature-sensitive alleles.
DOI: https://doi.org/10.7554/eLife.32785.008
Lloret-Fernandez et al. eLife 2018;7:e32785. DOI: https://doi.org/10.7554/eLife.32785 9 of 32
Research article Developmental Biology and Stem Cells Neuroscience
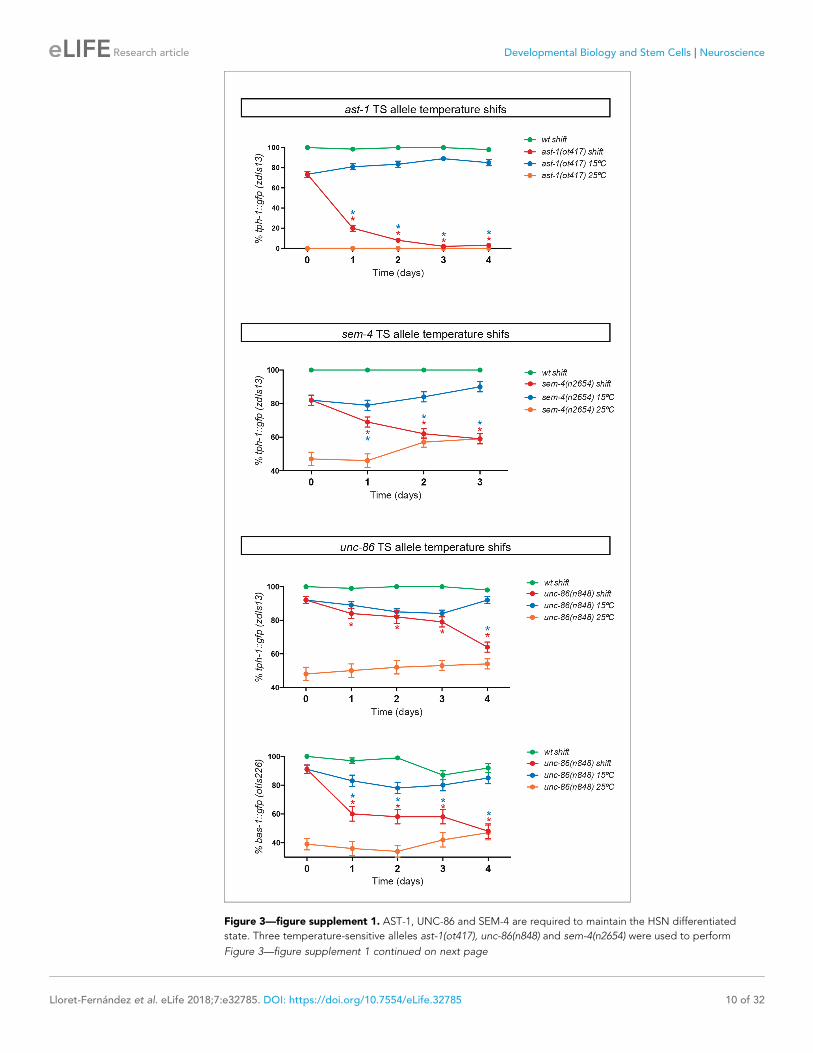
Figure 3—figure supplement 1. AST-1, UNC-86 and SEM-4 are required to maintain the HSN differentiated
state. Three temperature-sensitive alleles ast-1(ot417), unc-86(n848) and sem-4(n2654) were used to perform
Figure 3—figure supplement 1 continued on next page
Lloret-Fernandez et al. eLife 2018;7:e32785. DOI: https://doi.org/10.7554/eLife.32785 10 of 32
Research article Developmental Biology and Stem Cells Neuroscience
Figure 3—figure supplement 1 continued
temperature shifts to restrictive temperatures after HSN has fully differentiated (young adult). Temperature shifts
(red lines) lead to reporter expression defects. Red asterisks refer to the comparison between mutant values
before and after the temperature shift and blue asterisks refer to the comparison at the same time point between
shifted animals (red line) and animals kept at permissive temperature (blue line) (n > 100 cells per condition).
Fisher’s exact test, *: p-value<0.05. Related to Figure 3.
DOI: https://doi.org/10.7554/eLife.32785.009
Lloret-Fernandez et al. eLife 2018;7:e32785. DOI: https://doi.org/10.7554/eLife.32785 11 of 32
Research article Developmental Biology and Stem Cells Neuroscience
cat-4
896 bp
270 bp
626 bp
296 bp
330 bp
cat-4prom4::gfp (-899/-3)
cat-4prom5::gfp (-899/-629)
cat-4prom6::gfp (-629/-3)
cat-4prom8::gfp (-629/-299)
cat-4prom9::gfp (-299/-3)
119 bpcat-4prom18::gfp (-299/-180)
177 bpcat-4prom19::gfp (-180/-3)
136 bpcat-4prom27::gfp (-254/-118)
NSM minimal
HSN minimal
ADF minimal
cat-1a500 bp
cat-1prom1::gfp (-2493/-1)2.5 kb
cat-1prom2::gfp (-2331/-1580)752 bp
cat-1prom3::gfp (-1579/+5) 1584 bp
cat-1prom10::gfp (-2331/-1859) 472 bp
cat-1prom12::gfp (-1579/-566)1013 bp
cat-1prom9::gfp (-1859/-1579)279 bp
cat-1prom35::gfp (-569/-313)256 bp
cat-1prom37::gfp (-180/+5) 185 bp
cat-1prom36::gfp (-313/+5) 318 bp
cat-1prom11::gfp (-569/+5) 574 bp
cat-1prom13::gfp (-1578/-1088)
522 bp
217 bp
cat-1prom14::gfp (-1088/-566)
491 bp
NSM minimal
HSN minimal
ADF minimal
cat-1prom27::gfp (-871/-566)305 bp
cat-1prom26::gfp (-1088/-871)
B
D
A C
160 bpcat-4prom58::gfp (-629/-469)
173 bpcat-4prom59::gfp (-469/-299)
ADF
-
+
-
-
+
+
-
+
+
-
+
-
-
+
HSN
+
-
-
+
-
-
-
-
-
-
+/-
-
-
+
NSM
+
-
+
-
-
-
-
-
-
-
+
+
-
+
500 bp
tph-1a
377 bptph-1prom2::gfp (-378/-1)
146 bptph-1prom6::gfp (-378/-232)
231 bptph-1prom5::gfp (-232/-1)
1748 bptph-1prom1::gfp (-1719/+30)
178 bptph-1prom3::gfp (-179/-1)
tph-1prom8::gfp (-1719/-378)1341 bp
99 bptph-1prom17::gfp (-283/-184)
NSM
+
-
+
+
+
-
-
ADF
+
-
-
+
-
-
+
HSN
+
-
-
+
-
-
-
NSM minimal
HSN minimal
ADF minimal
bas-1a
bas-1prom1::gfp (-1492/-4) 1.5 kb
bas-1prom2::gfp (-1510/-863) 647 bp
bas-1prom13::gfp (-1510/-1183) 377 bp
bas-1prom15::gfp (-1510/-1331) 179 bp
bas-1prom16::gfp (-1331/-1113) 198 bp
bas-1prom14::gfp (-1112/-863) 270 bp
bas-1prom18::gfp (-1250/-1133) 117 bp
bas-1prom4::gfp (-864/-289) 575 bp
bas-1prom3::gfp (-864/-4) 860 bp
bas-1prom17::gfp (-1331/-1242) 89 bp
bas-1prom5::gfp (-289/-4) 285 bp
bas-1prom7::gfp (-166/-4) 162 bp
bas-1prom6::gfp (-289/-166) 123 bp
NSM minimal
HSN minimal
ADF minimal
ADF HSNNSM
ADF
-
-
-
+
+
-
-
-
-
-
HSN
-
+
-
+
+
-
-
-
-
-
NSM
-
-
+
+
+
-
-
-
-
+
OA
+
-
-
+
-
-
-
Lines
3/3
2/2
3/3
3/3
4/4
3/3
3/3
OA Lines
2/2
3/3
3/3
2/3
2/2
2/2
2/2
+
-
+
+
+
+
+
-
-
-
+
-
-
+
3/3
3/3
4/6
3/3
3/3
2/2
3/3
OA Lines
+ ++ 2/2+
- ++ 2/2-
- +/-+ 2/2-
- -- 3/3-
- -- 1/1-
- ++/- 1/1-
- ++ 4/4-
- -- 2/2-
- -- 2/2-
+ -- 2/2+
+ -- 3/3-
+ -- 3/3+
- -- 2/2+
OA Lines
3/3
2/2
3/3
3/3
3/3
3/3
2/2
2/2
2/3
-
-
+
+
+
-
-
-
-
+
3/3
500 bp
500 bp
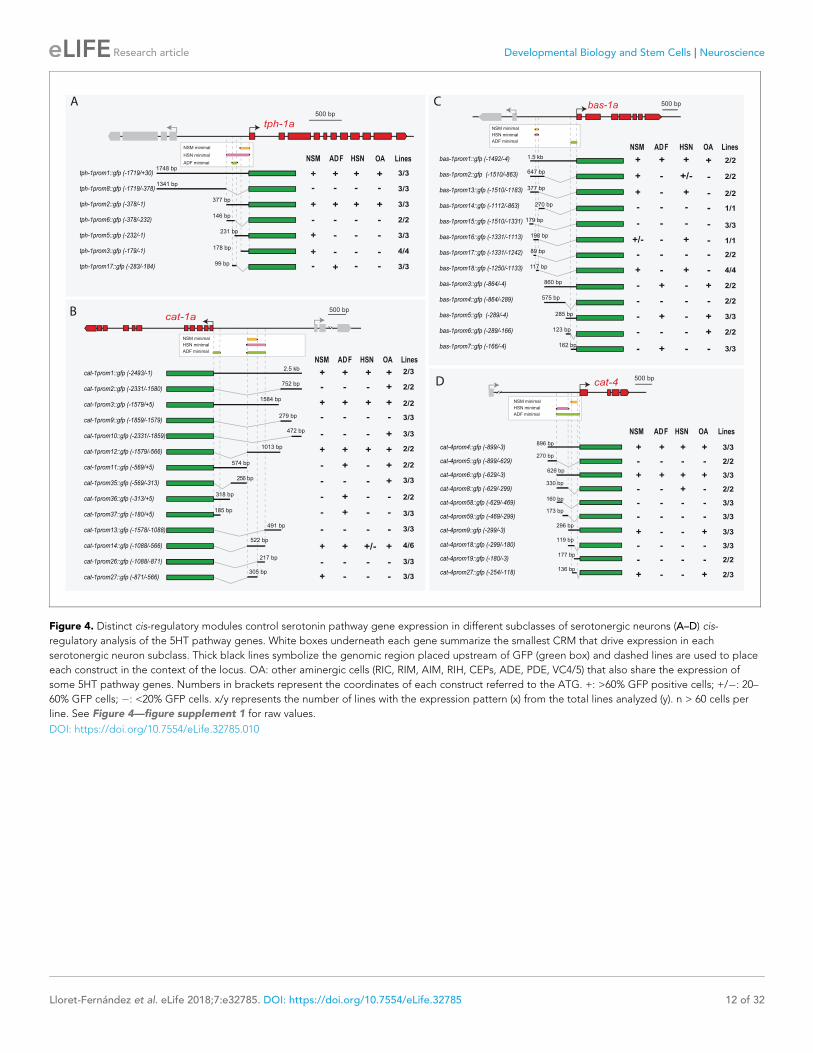
Figure 4. Distinct cis-regulatory modules control serotonin pathway gene expression in different subclasses of serotonergic neurons (A–D) cis-
regulatory analysis of the 5HT pathway genes. White boxes underneath each gene summarize the smallest CRM that drive expression in each
serotonergic neuron subclass. Thick black lines symbolize the genomic region placed upstream of GFP (green box) and dashed lines are used to place
each construct in the context of the locus. OA: other aminergic cells (RIC, RIM, AIM, RIH, CEPs, ADE, PDE, VC4/5) that also share the expression of
some 5HT pathway genes. Numbers in brackets represent the coordinates of each construct referred to the ATG. +: >60% GFP positive cells; +/�: 20–
60% GFP cells; �: <20% GFP cells. x/y represents the number of lines with the expression pattern (x) from the total lines analyzed (y). n > 60 cells per
line. See Figure 4—figure supplement 1 for raw values.
DOI: https://doi.org/10.7554/eLife.32785.010
Lloret-Fernandez et al. eLife 2018;7:e32785. DOI: https://doi.org/10.7554/eLife.32785 12 of 32
Research article Developmental Biology and Stem Cells Neuroscience
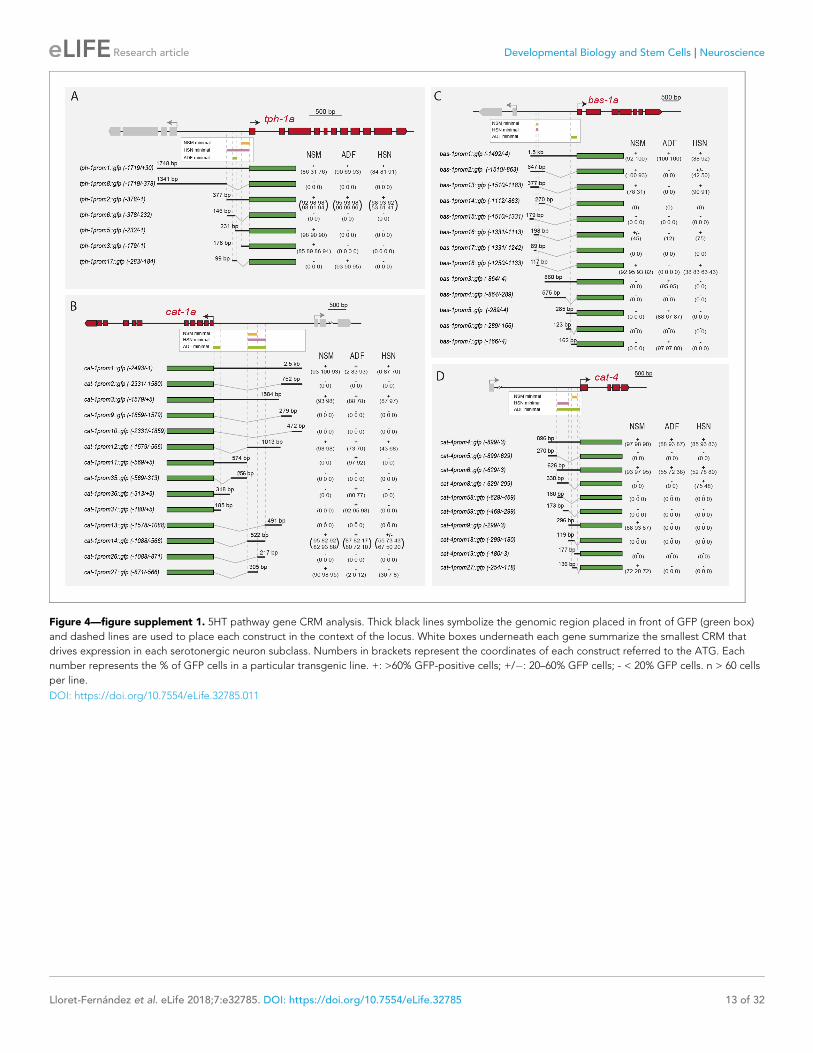
Figure 4—figure supplement 1. 5HT pathway gene CRM analysis. Thick black lines symbolize the genomic region placed in front of GFP (green box)
and dashed lines are used to place each construct in the context of the locus. White boxes underneath each gene summarize the smallest CRM that
drives expression in each serotonergic neuron subclass. Numbers in brackets represent the coordinates of each construct referred to the ATG. Each
number represents the % of GFP cells in a particular transgenic line. +: >60% GFP-positive cells; +/�: 20–60% GFP cells; - < 20% GFP cells. n > 60 cells
per line.
DOI: https://doi.org/10.7554/eLife.32785.011
Lloret-Fernandez et al. eLife 2018;7:e32785. DOI: https://doi.org/10.7554/eLife.32785 13 of 32
Research article Developmental Biology and Stem Cells Neuroscience
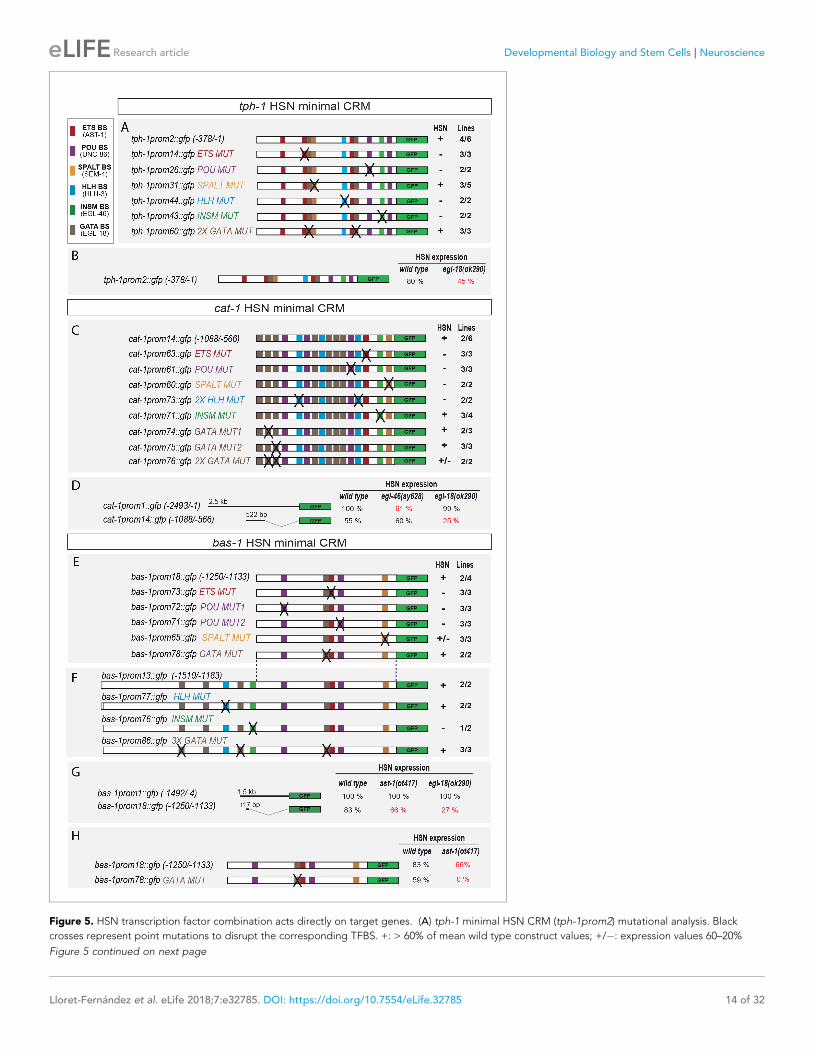
Figure 5. HSN transcription factor combination acts directly on target genes. (A) tph-1 minimal HSN CRM (tph-1prom2) mutational analysis. Black
crosses represent point mutations to disrupt the corresponding TFBS. +: > 60% of mean wild type construct values; +/�: expression values 60–20%
Figure 5 continued on next page
Lloret-Fernandez et al. eLife 2018;7:e32785. DOI: https://doi.org/10.7554/eLife.32785 14 of 32
Research article Developmental Biology and Stem Cells Neuroscience
Figure 5 continued
lower than mean wild type expression values; �: values are less than 20% of mean wild type values. n > 60 cells per line. x/y represents the number of
lines with the expression pattern (x) from the total lines analyzed (y). See Figure 5—figure supplement 1 for raw values and nature of the mutations
and Figure 5—figure supplement 2 for in vitro binding. (B) tph-1prom2::gfp expression is partially affected in egl-18(ok290) mutants. In red, significant
defects relative to wild type. n > 100 cells for each genotype. (C) cat-1 minimal HSN CRM (cat-1prom14) mutational analysis. (D) cat-1prom14::gfp
expression is unaffected in egl-46 mutants, which coincides with the lack of phenotype when INSM binding sites are mutated in this construct. cat-
1prom14::gfp contains functional GATA sites and, as expected, its expression is affected in egl-18 mutants. Expression of a longer reporter (cat-
1prom1::gfp) is independent of egl-18 revealing compensatory effects in the context of big regulatory sequences. (E) bas-1 minimal HSN CRM (bas-
1prom18) mutational analysis. (F) A longer bas-1 construct (bas-1prom13) is more robustly expressed in HSN (90% expression compared to mean 48%
expression of bas-1prom18 reporter lines). This construct contains functional INSM binding sites. (G) bas-1prom18::gfp expression is affected in ast-1
(ot417) and egl-18(ok290) mutants. Expression of a longer reporter (bas-1::prom1) is independent of ast-1 and egl-18 revealing compensatory effects in
the context of big regulatory sequences. (H) GATA-binding site point mutation does not significantly affect bas-1::gfp expression in the wild type
background (no significant difference between mean expression of three lines of bas1prom1 and three lines of bas1prom18). However, it synergizes
with ast-1 mutant background leading to a complete loss of GFP expression. These results unravel a direct role for GATA sites in bas-1 gene expression
and synergy between egl-18 and ast-1.
DOI: https://doi.org/10.7554/eLife.32785.012
Lloret-Fernandez et al. eLife 2018;7:e32785. DOI: https://doi.org/10.7554/eLife.32785 15 of 32
Research article Developmental Biology and Stem Cells Neuroscience
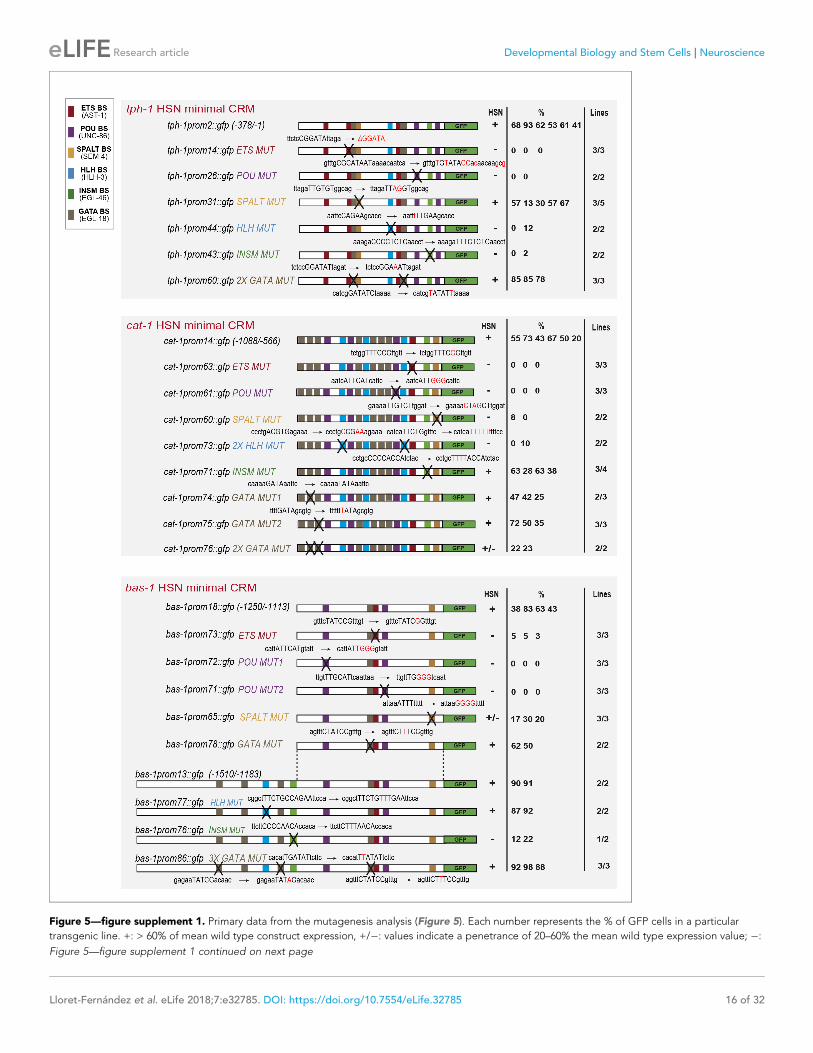
Figure 5—figure supplement 1. Primary data from the mutagenesis analysis (Figure 5). Each number represents the % of GFP cells in a particular
transgenic line. +: > 60% of mean wild type construct expression, +/�: values indicate a penetrance of 20–60% the mean wild type expression value; �:
Figure 5—figure supplement 1 continued on next page
Lloret-Fernandez et al. eLife 2018;7:e32785. DOI: https://doi.org/10.7554/eLife.32785 16 of 32
Research article Developmental Biology and Stem Cells Neuroscience
Figure 5—figure supplement 1 continued
values are less than 20% of mean wild type values. n > 60 cells per line. Above each construct, the wild type consensus sequences are included in
capital letters in a longer region context and after the arrow the point mutations are highlighted in red. Related to Figure 5.
DOI: https://doi.org/10.7554/eLife.32785.013
Lloret-Fernandez et al. eLife 2018;7:e32785. DOI: https://doi.org/10.7554/eLife.32785 17 of 32
Research article Developmental Biology and Stem Cells Neuroscience
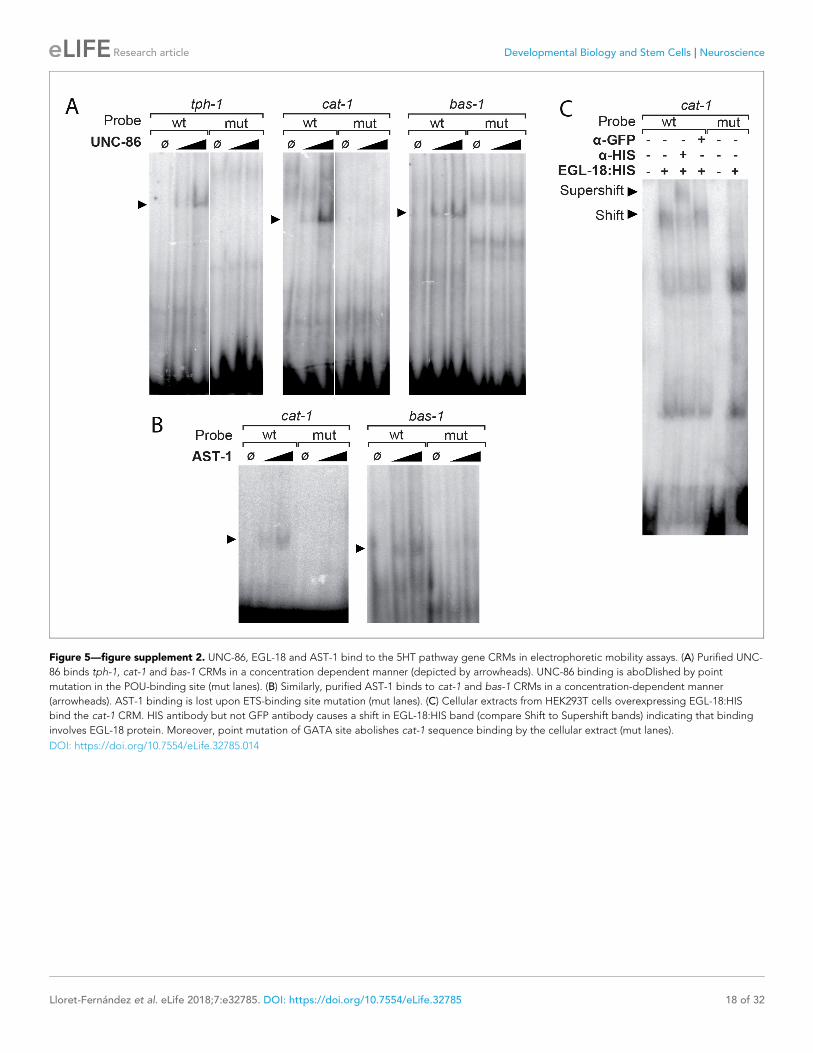
Figure 5—figure supplement 2. UNC-86, EGL-18 and AST-1 bind to the 5HT pathway gene CRMs in electrophoretic mobility assays. (A) Purified UNC-
86 binds tph-1, cat-1 and bas-1 CRMs in a concentration dependent manner (depicted by arrowheads). UNC-86 binding is aboDlished by point
mutation in the POU-binding site (mut lanes). (B) Similarly, purified AST-1 binds to cat-1 and bas-1 CRMs in a concentration-dependent manner
(arrowheads). AST-1 binding is lost upon ETS-binding site mutation (mut lanes). (C) Cellular extracts from HEK293T cells overexpressing EGL-18:HIS
bind the cat-1 CRM. HIS antibody but not GFP antibody causes a shift in EGL-18:HIS band (compare Shift to Supershift bands) indicating that binding
involves EGL-18 protein. Moreover, point mutation of GATA site abolishes cat-1 sequence binding by the cellular extract (mut lanes).
DOI: https://doi.org/10.7554/eLife.32785.014
Lloret-Fernandez et al. eLife 2018;7:e32785. DOI: https://doi.org/10.7554/eLife.32785 18 of 32
Research article Developmental Biology and Stem Cells Neuroscience
wt
ast-1(
-/-)
wt
ast-1(
-/-)
0
20
40
60
80
100
% H
SN
GF
P
Synergy AST-1 / SPALT BS
bas-1prom
wt
ast-1(
-/-)
wt
ast-1(
-/-)
0
20
40
60
80
100
% H
SN
GF
P
bas-1prom
wt
unc-86
(-/-) w
t
unc-86
(-/-)
0
20
40
60
80
100
% H
SN
GF
P
cat-1prom INSM BS MUT
wt
sem
-4(-/-) w
t
sem
-4(-/-)
0
20
40
60
80
100
% H
SN
GF
P
cat-1prom INSM BS MUT
wt
egl-4
6(-/-
)w
t
egl-4
6(-/-
)0
20
40
60
80
100
% H
SN
GF
P
tph-1prom GATA BS MUT
wt
ast-1(
ot417
)
egl-4
6(sy
628)
ast-1(
-/-),
egl-4
6(-/-
)0
20
40
60
80
100
% b
as
-1::
gfp
HS
N
Synergy AST-1 / EGL-46
wt
ast-1(
ot417
)
unc-86
(n84
8)
ast-1(
-/-),
unc-86
(-/-)
0
20
40
60
80
100
% b
as
-1::
gfp
HS
N
Synergy AST-1 / UNC-86ON
OFF
DIM
C
wt
egl-4
6(sy
628)
unc-86
(n84
8)
egl-4
6(-/-
), unc-
86(-/-)
0
20
40
60
80
100
% b
as
-1::
gfp
HS
N
Synergy EGL-46 UNC-86
wt
egl-4
6(sy
628)
unc-86
(n84
8)
egl-4
6(-/-
), unc-
86(-/-)
0
20
40
60
80
100
% tp
h-1
::g
fp H
SN
Synergy
wt
egl-1
8(ok2
90)
sem
-4(n
2654
)
egl-1
8(-/-
), se
m-4
(-/-)
0
20
40
60
80
100
% c
at-
1::
gfp
HS
N
Synergy EGL-18 SEM-4
wt
egl-1
8(ok2
90)
sem
-4(n
2654
)
egl-1
8(-/-
), se
m-4
(-/-)
0
20
40
60
80
100
% tp
h-1
::g
fp H
SN
Synergy
wt
unc-86
(n84
8)
sem
-4(n
2654
)
unc-86
(-/-)
, sem
-4(-/-)
0
20
40
60
80
100
% c
at-
1::
gfp
HS
N
Synergy
wt
hlh-3
(tm
1688
)
unc-86
(n84
8)
hlh-3
(-/-)
, unc-
86(-/-)
0
20
40
60
80
100
% c
at-
1::
gfp
HS
N
Synergy
wt
egl-1
8(ok2
90)
hlh-3
(tm
1688
)
egl-1
8(-/-
), hlh
-3(-/-)
0
20
40
60
80
100
% c
at-
1::
gfp
HS
N
Synergy EGL-18 HLH-3
wt
unc-86
(n84
8)
sem
-4(n
2654
)
ucn-8
6(-/-
), se
m-4
(-/-)
0
20
40
60
80
100
% tp
h-1
::g
fp H
SN
additive
wt
unc-86
(n84
8)
hlh-3
(tm
1688
)
ucn-8
6(-/-
), hlh
-3(-/-)
0
20
40
60
80
100
% tp
h-1
::g
fp H
SN
additive
wt
egl-1
8(ok2
90)
hlh-3
(tm
1688
)
egl-1
8(-/-
), hlh
-3(-/-)
0
20
40
60
80
100
% b
as
-1::
gfp
HS
N
Epistatic to HLH-3
wt
hlh-3
(tm
1688
)
egl-4
6(sy
628)
hlh-3
(-/-)
, egl-4
6(-/-
)0
20
40
60
80
100
% c
at-
1::
gfp
HS
N
Epistasis
Expected expression
if additive effect
Synergy Synergy Synergy Synergy
egl-46, unc-86 double mutants egl-18, sem-4 double mutants
Synergy Additivity
unc-86, sem-4 double mutants hlh-3, unc-86 double mutants
Synergy Additivity
egl-18, hlh-3 double mutants egl-46, hlh-3 double mutants
ast-1 / SPALT BS
Synergy
ast-1 / GATA BS
Synergy
unc-86 / INSM BS
Epistasis
sem-4 / INSM BS
Additivity
egl-46 / GATA BS
Suppression
D
E F
G H
I
wt
egl-4
6(sy
628)
hlh-3
(tm
1688
)
egl-4
6(-/-
), hlh
-3(-/-)
0
20
40
60
80
100
% tp
h-1
::g
fp H
SN
SynergySynergy Epistasis Synergy Suppression
AB
Synergy Synergy
ast-1, egl-46 double mutant ast-1, unc-86 double mutantB
SPALT BS MUT GATA BS MUT(prom18) (prom65) (prom18) (prom78) (prom14) (prom71)
(prom18)
(prom18) (prom71) (prom2) (prom60)
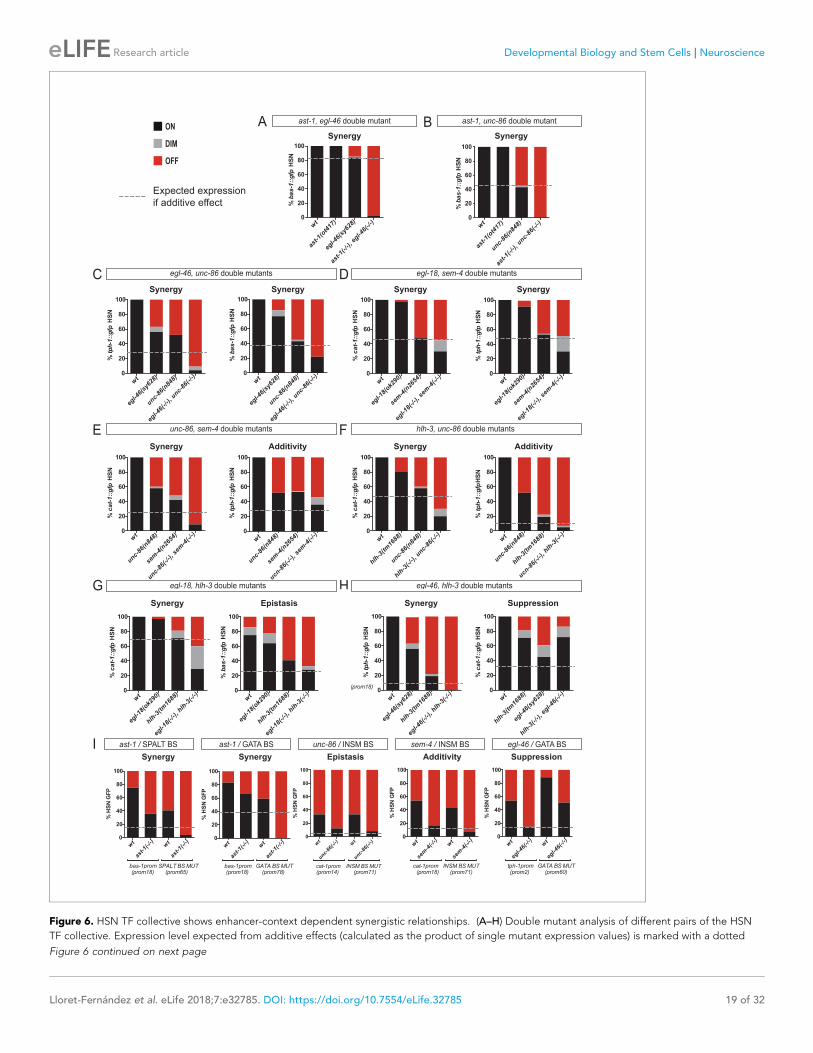
Figure 6. HSN TF collective shows enhancer-context dependent synergistic relationships. (A–H) Double mutant analysis of different pairs of the HSN
TF collective. Expression level expected from additive effects (calculated as the product of single mutant expression values) is marked with a dotted
Figure 6 continued on next page
Lloret-Fernandez et al. eLife 2018;7:e32785. DOI: https://doi.org/10.7554/eLife.32785 19 of 32
Research article Developmental Biology and Stem Cells Neuroscience
Figure 6 continued
line. Double mutant phenotypes statistically different from additive effect (Pearson’s chi-squared test) are classified as synergistic (if phenotype is
stronger than additive), epistatic (if phenotype is similar to one of the single mutants) or suppression (if phenotype is milder than the expected for
additivity or the single mutants). The majority of the double mutant combinations show synergistic effects. n > 100 cells each genotype. See Figure 6—
figure supplement 1 and Figure 6—source data 1 for raw values, statistics and additional double mutant combinations. (I) Cis-trans mutant analysis.
TFBS mutations are combined with single mutants of the HSN TF collective. n > 100 cells each genotype. See Figure 6—source data 1 raw values and
statistics.
DOI: https://doi.org/10.7554/eLife.32785.015
Lloret-Fernandez et al. eLife 2018;7:e32785. DOI: https://doi.org/10.7554/eLife.32785 20 of 32
Research article Developmental Biology and Stem Cells Neuroscience
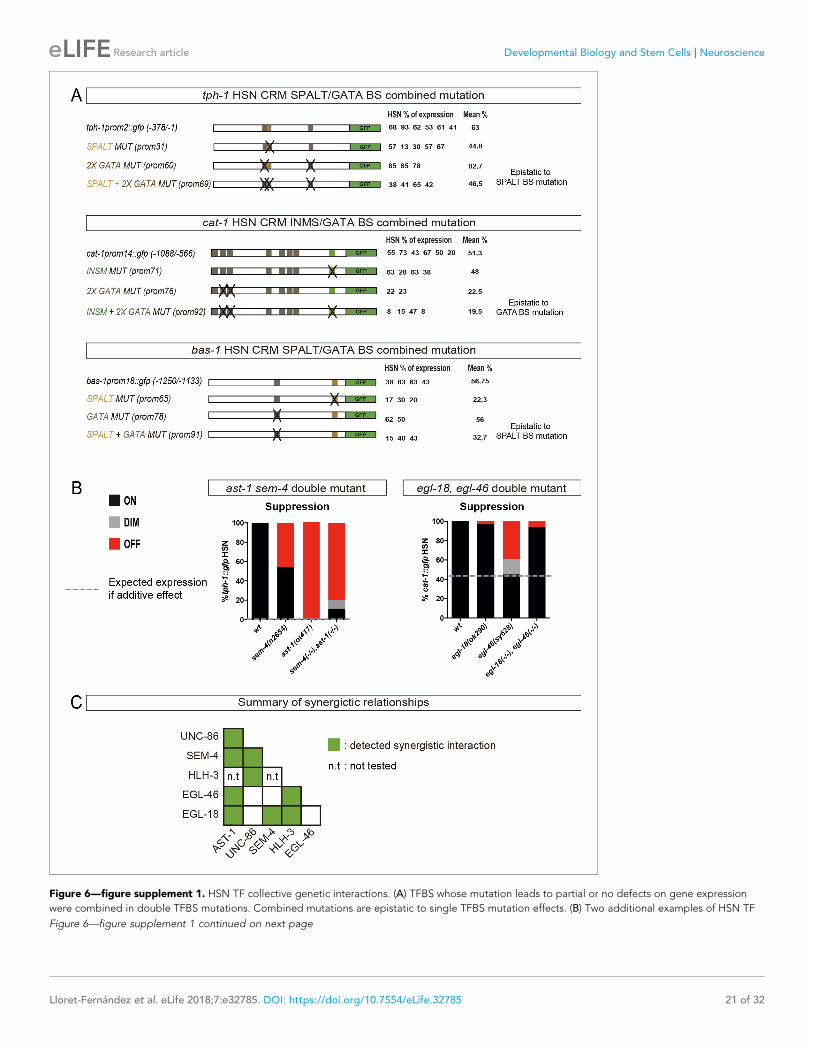
Figure 6—figure supplement 1. HSN TF collective genetic interactions. (A) TFBS whose mutation leads to partial or no defects on gene expression
were combined in double TFBS mutations. Combined mutations are epistatic to single TFBS mutation effects. (B) Two additional examples of HSN TF
Figure 6—figure supplement 1 continued on next page
Lloret-Fernandez et al. eLife 2018;7:e32785. DOI: https://doi.org/10.7554/eLife.32785 21 of 32
Research article Developmental Biology and Stem Cells Neuroscience
Figure 6—figure supplement 1 continued
collective double mutants that show genetic suppression. (C) Summary of the HSN TF collective pairs in which we were able to identify synergistic
effects. See Figure 6—source data 1 for raw values and statistics.
DOI: https://doi.org/10.7554/eLife.32785.016
Lloret-Fernandez et al. eLife 2018;7:e32785. DOI: https://doi.org/10.7554/eLife.32785 22 of 32
Research article Developmental Biology and Stem Cells Neuroscience
C
0
10
20
30
40
50
60
70
80
Neuronal genome
Non-neuronal genome
0
5
10
15
20
% o
f c
on
se
rve
d g
en
es
with
c
on
se
rve
d s
ign
atu
re
***Ratio 3.4
Neuronal genome
Non-neuronal genome
0
10
20
30
40
50
% g
en
es
with
sig
na
ture
***Ratio 1.8
A HSN regulatory signature
1 2 3 4 5 6 7 8 9 10 11 12
Position
0
0.5
1
1.5
2
Info
rmat
ion
cont
ent
ETS
1 2 3 4 5 6 7 8 9 10 11 12 13
Position
0
0.5
1
1.5
2
Info
rmat
ion co
nten
t
GATA
1 2 3 4 5 6 7 8 9 10 11 12 13
Position
0
0.5
1
1.5
2
Info
rmat
ion co
nten
t
HLH
1 2 3 4 5 6 7 8 9 10 11 12
Position
0
0.5
1
1.5
2
Info
rmat
ion
cont
ent
INSMSPALT
1 2 3 4 5 6 7 8 9 10 11 12 13 14
Position
0
0.5
1
1.5
2
Infor
matio
n con
tent
1 2 3 4 5 6 7 8 9 10 11 12 13 14
Position
0
0.5
1
1.5
2
Infor
matio
n con
tent
POU
Info
rma
tio
n c
on
ten
t
2
0
1
Info
rma
tio
n c
on
ten
t
2
0
1
Info
rma
tio
n c
on
ten
t
2
0
1
Info
rma
tio
n c
on
ten
t
2
0
1
Info
rma
tio
n c
on
ten
t
2
0
1
Info
rma
tio
n c
on
ten
t
2
0
1
D
+ 3/3+HSN LinesOthers
R03C1.1 pde-3
w1-9
GFP941 bp
1000bp
F31E8.5 snt-1 500 bp
w1 w2-9
GFP1178 bp + 3/3+HSN LinesOthers
C53B4.4 500 bpC53B4.3
w1-10
1253 bp + 4/4+HSN LinesOthers
GFP
FiguFFFiiig
cnc-10lgc-49 500 bp
w1-3 w4-10
868 bp + 3/3+HSN LinesOthers
GFP
B Genomic distribution of HSN regulatory signature
0 50 100 150 200 250
Regulation of ion transmembrane transport
Regulation of behavior
Cell adhesion
Neuropeptide signaling pathway
Axon guidance
Cell fate specification
Synaptic transmission
Regulation of cell differentiation
Positive regulation of transcription
Regulation of locomotion
Regulation of cell communication
Oviposition
G-protein coupled receptor signaling pathway
Number of genes
0 5 10 15
Cell fate specification
Regulation of behavior
Neuropeptide signaling pathway
Synaptic transmission
Axon guidance
Oviposition
Regulation of ion transmembrane transport
Cell adhesion
Regulation of cell communication
G-protein coupled receptor signaling pathway
Regulation of cell differentiation
Positive regulation of transcription
Regulation of locomotion
p-value (- log10)
E
GO anlaysis of genes with HSN regulatory signature
Identification of previously unknown HSN expressed genes
% g
en
es
with
sig
na
ture
All genes Conserved genes
HSN expressed genes versus random
HSN expressed genes
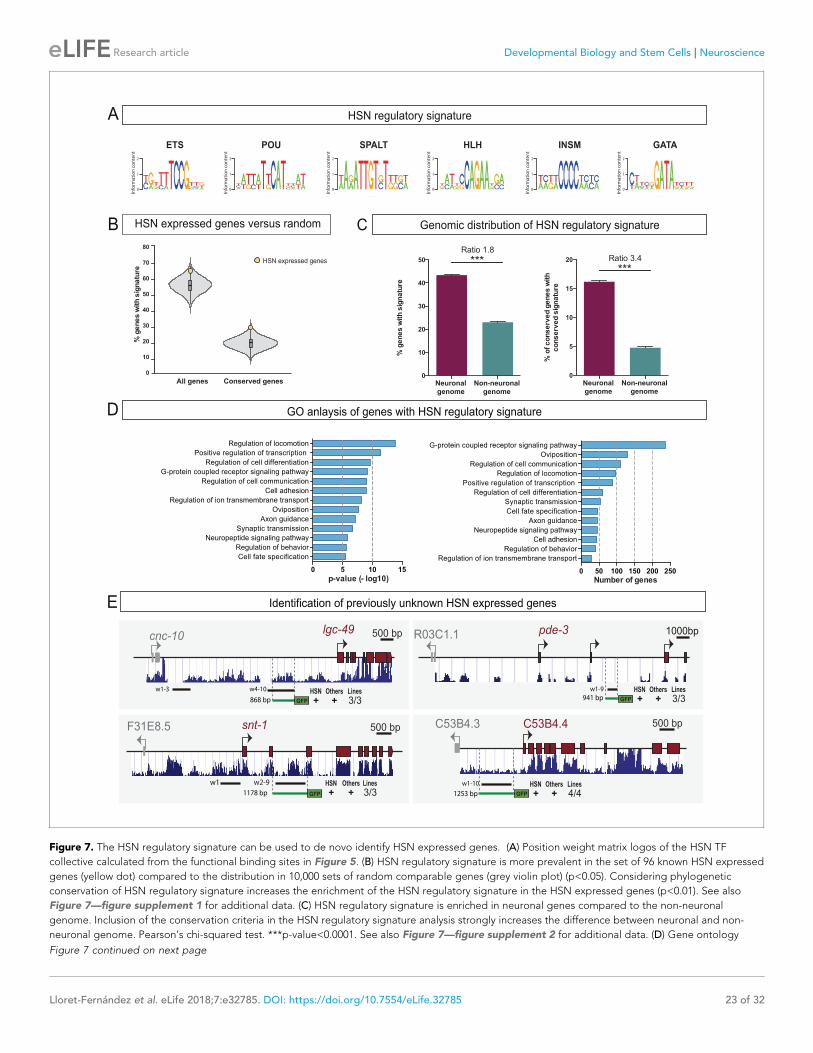
Figure 7. The HSN regulatory signature can be used to de novo identify HSN expressed genes. (A) Position weight matrix logos of the HSN TF
collective calculated from the functional binding sites in Figure 5. (B) HSN regulatory signature is more prevalent in the set of 96 known HSN expressed
genes (yellow dot) compared to the distribution in 10,000 sets of random comparable genes (grey violin plot) (p<0.05). Considering phylogenetic
conservation of HSN regulatory signature increases the enrichment of the HSN regulatory signature in the HSN expressed genes (p<0.01). See also
Figure 7—figure supplement 1 for additional data. (C) HSN regulatory signature is enriched in neuronal genes compared to the non-neuronal
genome. Inclusion of the conservation criteria in the HSN regulatory signature analysis strongly increases the difference between neuronal and non-
neuronal genome. Pearson’s chi-squared test. ***p-value<0.0001. See also Figure 7—figure supplement 2 for additional data. (D) Gene ontology
Figure 7 continued on next page
Lloret-Fernandez et al. eLife 2018;7:e32785. DOI: https://doi.org/10.7554/eLife.32785 23 of 32
Research article Developmental Biology and Stem Cells Neuroscience
Figure 7 continued
analysis of genes with HSN regulatory signature. p-values and number of genes corresponding to the biological processes enriched in genes with HSN
regulatory signature. (E) Four representative examples of de novo identified HSN active enhancers. Black lines represent the coordinates covered by
bioinformatically predicted HSN regulatory signature windows (indicated by ‘w’ and a number). Green lines mark the region used in our analysis. Dark
blue bar profiles represent sequence conservation in C. briggsae, C. brenneri, C. remanei and C. japonica. n > 60 cells per line. See Figure 7—source
data 1 for a list of all reporters and raw scoring data. Expression level of most of these reporters is regulated by unc-86 (Figure 7—figure supplement
3).
DOI: https://doi.org/10.7554/eLife.32785.018
Lloret-Fernandez et al. eLife 2018;7:e32785. DOI: https://doi.org/10.7554/eLife.32785 24 of 32
Research article Developmental Biology and Stem Cells Neuroscience
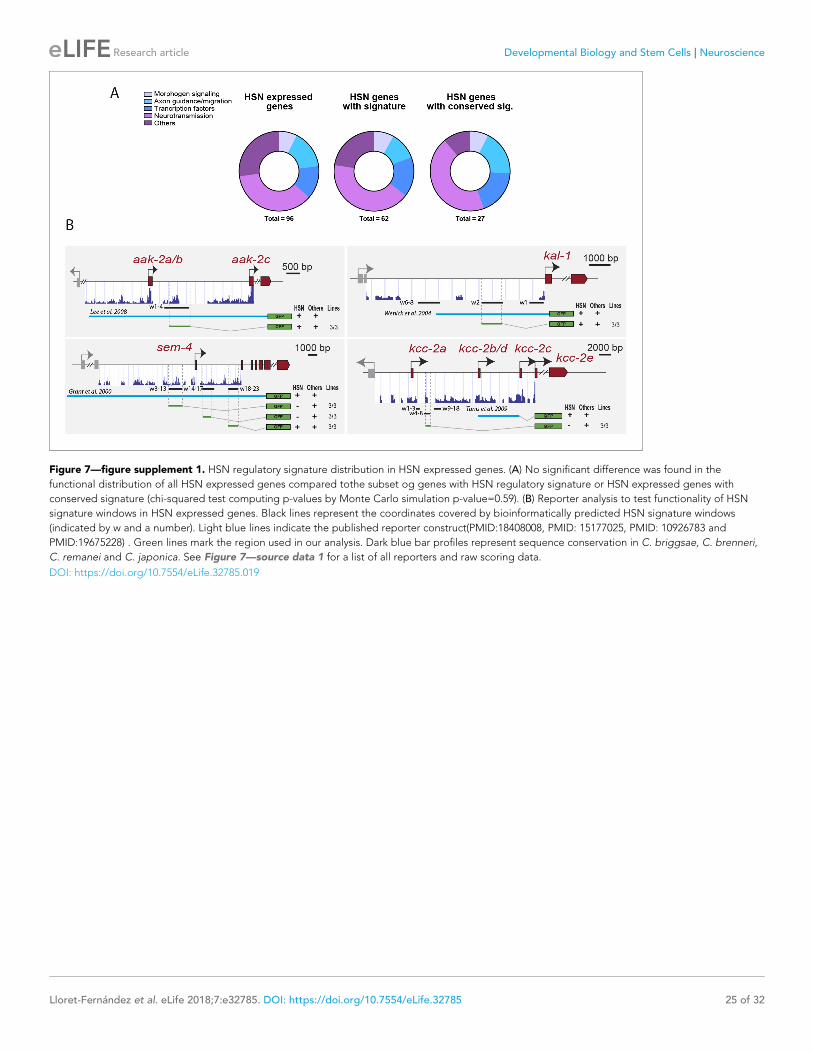
Figure 7—figure supplement 1. HSN regulatory signature distribution in HSN expressed genes. (A) No significant difference was found in the
functional distribution of all HSN expressed genes compared tothe subset og genes with HSN regulatory signature or HSN expressed genes with
conserved signature (chi-squared test computing p-values by Monte Carlo simulation p-value=0.59). (B) Reporter analysis to test functionality of HSN
signature windows in HSN expressed genes. Black lines represent the coordinates covered by bioinformatically predicted HSN signature windows
(indicated by w and a number). Light blue lines indicate the published reporter construct(PMID:18408008, PMID: 15177025, PMID: 10926783 and
PMID:19675228) . Green lines mark the region used in our analysis. Dark blue bar profiles represent sequence conservation in C. briggsae, C. brenneri,
C. remanei and C. japonica. See Figure 7—source data 1 for a list of all reporters and raw scoring data.
DOI: https://doi.org/10.7554/eLife.32785.019
Lloret-Fernandez et al. eLife 2018;7:e32785. DOI: https://doi.org/10.7554/eLife.32785 25 of 32
Research article Developmental Biology and Stem Cells Neuroscience
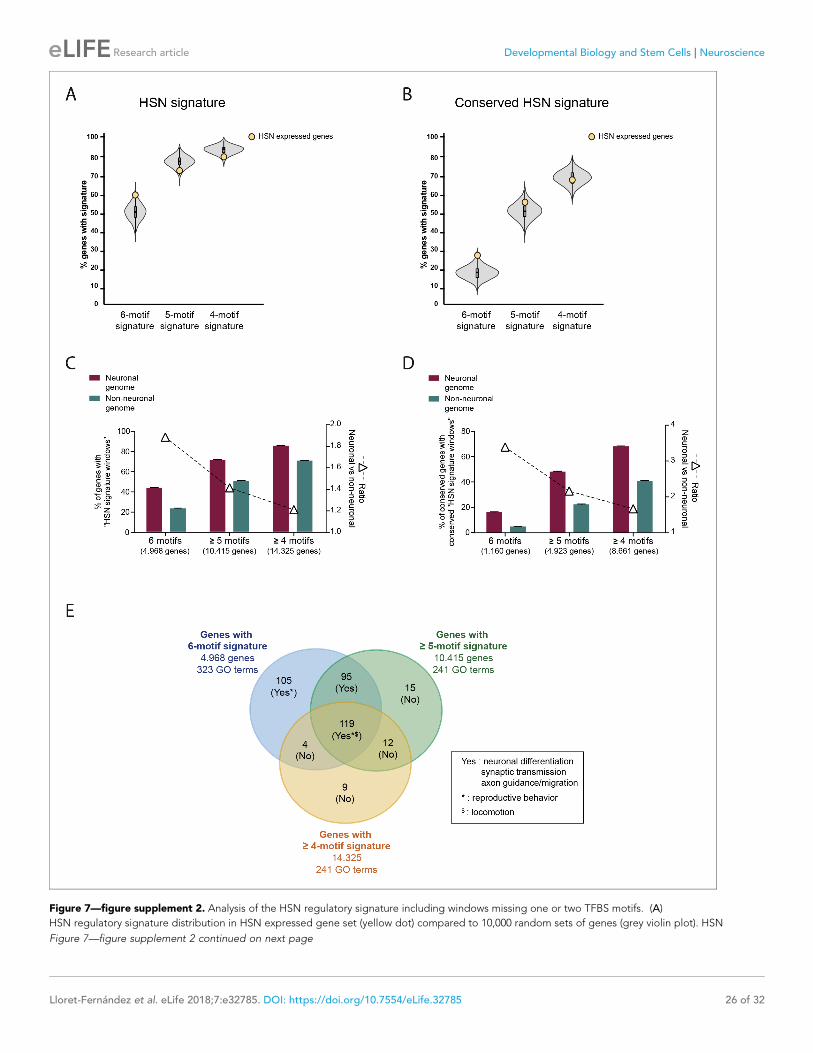
Figure 7—figure supplement 2. Analysis of the HSN regulatory signature including windows missing one or two TFBS motifs. (A)
HSN regulatory signature distribution in HSN expressed gene set (yellow dot) compared to 10,000 random sets of genes (grey violin plot). HSN
Figure 7—figure supplement 2 continued on next page
Lloret-Fernandez et al. eLife 2018;7:e32785. DOI: https://doi.org/10.7554/eLife.32785 26 of 32
Research article Developmental Biology and Stem Cells Neuroscience
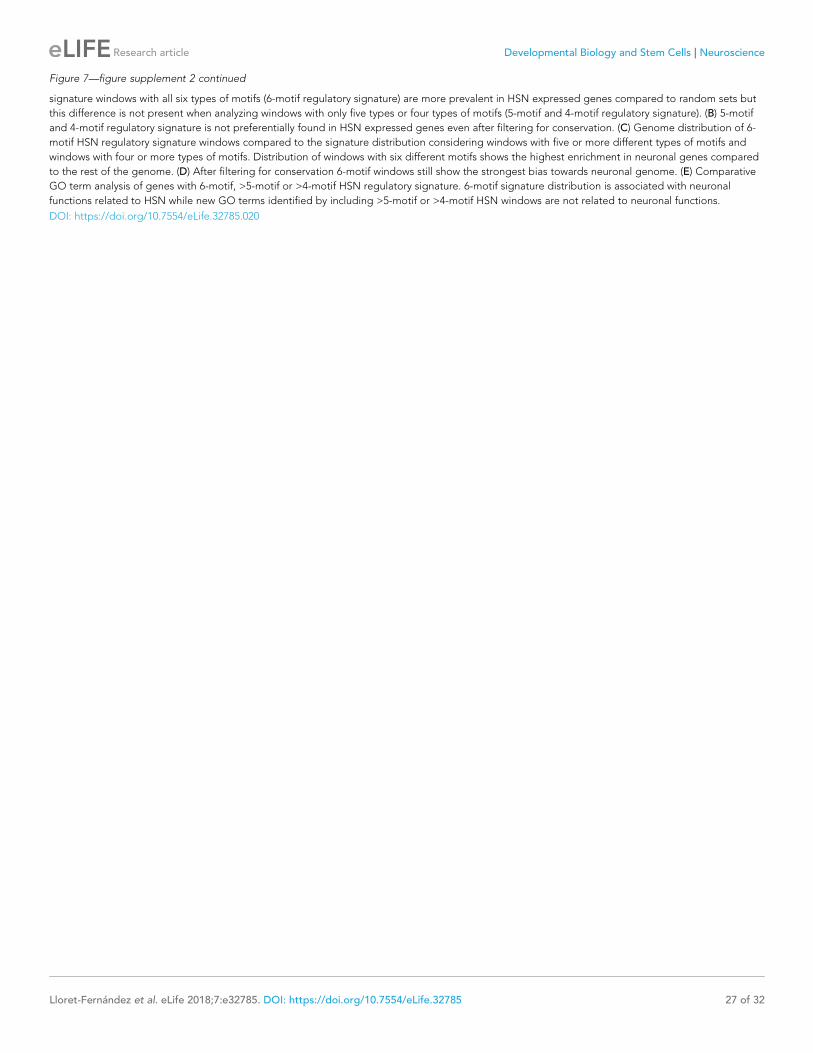
Figure 7—figure supplement 2 continued
signature windows with all six types of motifs (6-motif regulatory signature) are more prevalent in HSN expressed genes compared to random sets but
this difference is not present when analyzing windows with only five types or four types of motifs (5-motif and 4-motif regulatory signature). (B) 5-motif
and 4-motif regulatory signature is not preferentially found in HSN expressed genes even after filtering for conservation. (C) Genome distribution of 6-
motif HSN regulatory signature windows compared to the signature distribution considering windows with five or more different types of motifs and
windows with four or more types of motifs. Distribution of windows with six different motifs shows the highest enrichment in neuronal genes compared
to the rest of the genome. (D) After filtering for conservation 6-motif windows still show the strongest bias towards neuronal genome. (E) Comparative
GO term analysis of genes with 6-motif, >5-motif or >4-motif HSN regulatory signature. 6-motif signature distribution is associated with neuronal
functions related to HSN while new GO terms identified by including >5-motif or >4-motif HSN windows are not related to neuronal functions.
DOI: https://doi.org/10.7554/eLife.32785.020
Lloret-Fernandez et al. eLife 2018;7:e32785. DOI: https://doi.org/10.7554/eLife.32785 27 of 32
Research article Developmental Biology and Stem Cells Neuroscience
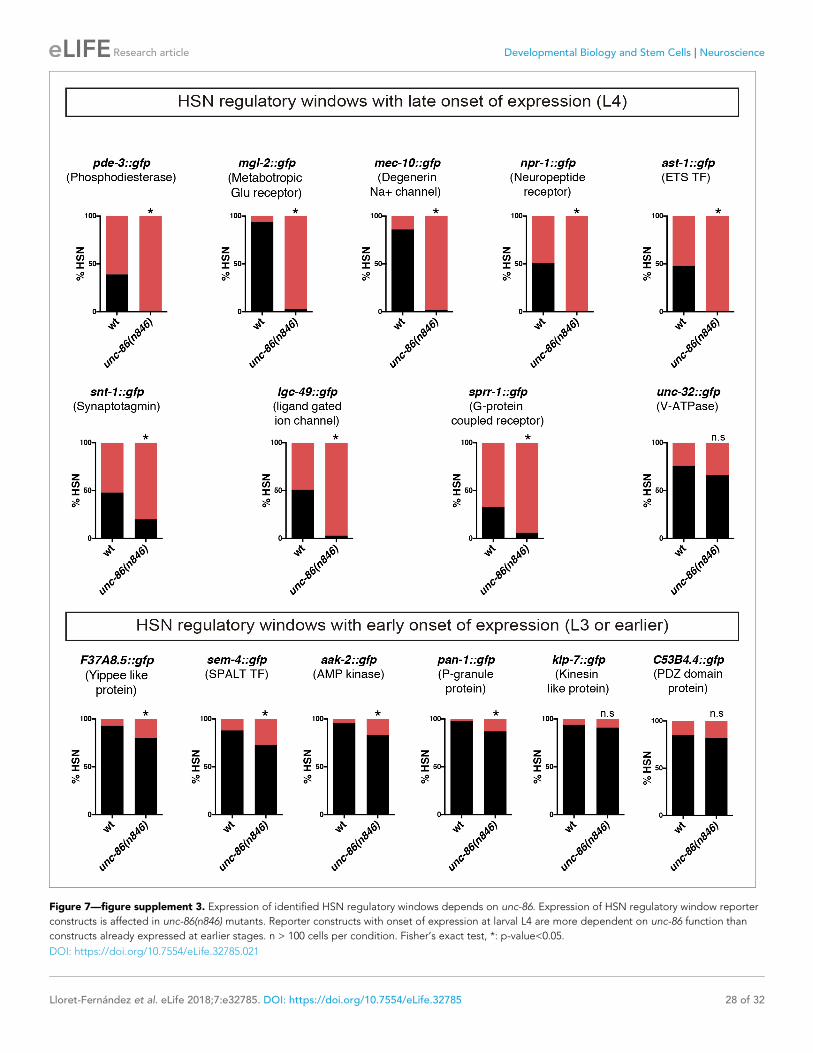
Figure 7—figure supplement 3. Expression of identified HSN regulatory windows depends on unc-86. Expression of HSN regulatory window reporter
constructs is affected in unc-86(n846) mutants. Reporter constructs with onset of expression at larval L4 are more dependent on unc-86 function than
constructs already expressed at earlier stages. n > 100 cells per condition. Fisher’s exact test, *: p-value<0.05.
DOI: https://doi.org/10.7554/eLife.32785.021
Lloret-Fernandez et al. eLife 2018;7:e32785. DOI: https://doi.org/10.7554/eLife.32785 28 of 32
Research article Developmental Biology and Stem Cells Neuroscience
No a
rray
Ex(
ast-1
) L1
Ex(
Pet
1) L
1
0
50
100
% H
SN
tph-1::gfp
wt ast-1(ot417)
* *
No a
rray
Ex(eg
l-46)
L2
Ex(In
sm1)
L1
0
50
100
% H
SN
tph-1::gfp
Ex(eg
l-46)
L1
* * *wt egl-46(sy628)
No a
rray
Ex(Sal
l2) L
1
0
50
100
% H
SN
tph-1::gfp
wt sem-4(n1971)
*
No a
rray
Ex(hlh
-3) L
1
Ex(
Asc
l1) L
1
Ex(
Asc
l1) L
2
0
50
100
% H
SN
tph-1::gfp
* * *wt hlh-3(tm1688)
E
F
Mouse serotonergic raphe
PDE
ADE
CEPD
CEPV
OLL
OLQ
FLP
PVD
URX
AQR
PQR
BAG
AD
FAWC
ASEL
ASER
AFD
AWB
ASG
AWA
PHA
PHB
ADL
ASH
ASJ
ASI
ASK
CAN
AVM
PVM
ALM
PLM
HS
NR
6R
5R
1D
R3
R2
R1
MPVT
BDU
PVQ
ALN
SDQL
SDQR
AIY
NS
MRIC
DVA
AUA
RMED
RMDD
RMDV
SMDD
SMDV
AVA
AVD
PVCPDE
ADE
CEPD
CEPV OLL
OLQ FLP
PVD
URX
QR
PQR G
ADF
WC
ASEL
ASER AFD
WB
ASG A
PHA
PHB
ADL
ASH
ASJ
ASI
ASK
CAN
HSN R6 R5 R1D R3 R2 PVT
BDU
PVQ
ALN
SDQL
SDQR
AIY
RIC A A
RMED
RMDD
V
SMDD
V A VD PVC
100100 99100 81
6873
100
100100
100100
100
75999896 96999893
981009871 9172 8095100 868784 62
857890 75 62 7582 8499 57
6810093 85 7589 88 85 9299 8986
100100 97100 53
5167
100
100100
100100
100
66989890 961009595
96979657 7557 5589100 725952 55
371940 35 45 2447 5997 13
198572 53 2859 52 38 5185 2741D
tph
-1::g
fp ast-1(ot417) Ex(ast-1)
ast-1(ot417) Ex(Pet1)
ast-1(ot417)
AST-1/PET1 rescue
wildtype
No a
rray
Ex(
Gat
a2) L
1
Ex(
Gat
a2) L
20
50
100
% H
SN
tph-1::gfp
wt egl-18(ok290)
* *
Brn2/5HT Sall2/5HTE11.5 Dapi
C´
C´
C´
B´
b´
B´
B´
A´
VZ
A C
C´A´
B
B´
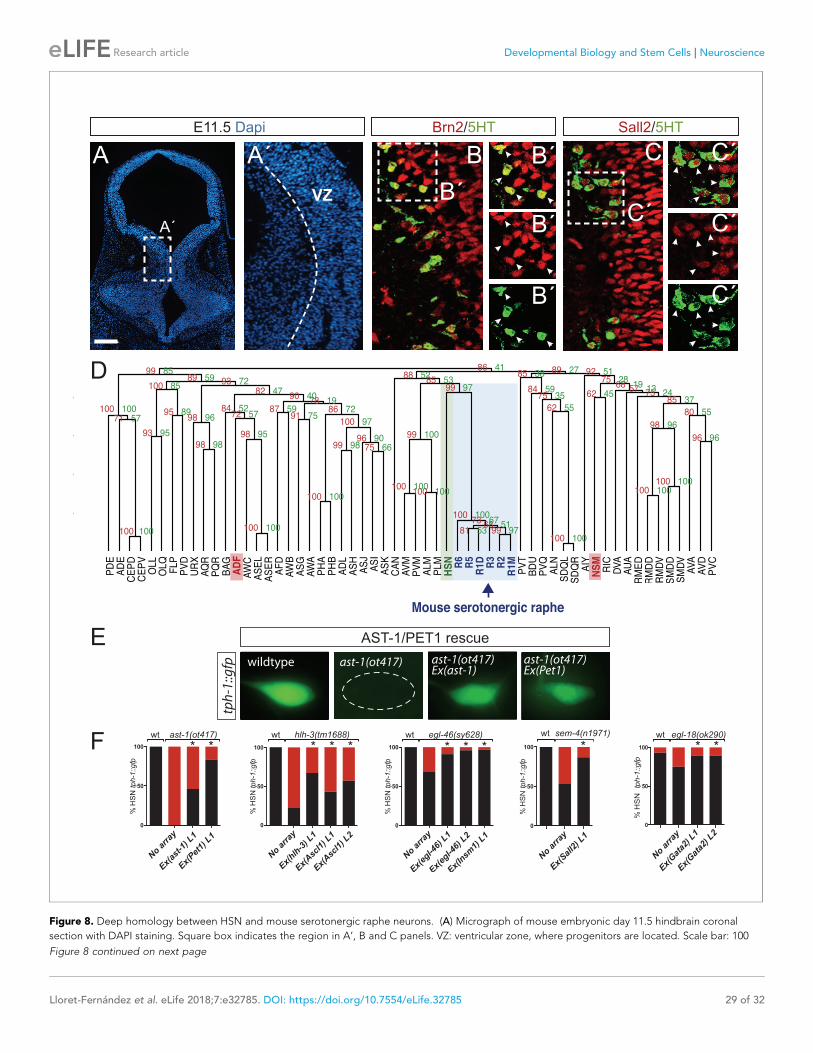
Figure 8. Deep homology between HSN and mouse serotonergic raphe neurons. (A) Micrograph of mouse embryonic day 11.5 hindbrain coronal
section with DAPI staining. Square box indicates the region in A’, B and C panels. VZ: ventricular zone, where progenitors are located. Scale bar: 100
Figure 8 continued on next page
Lloret-Fernandez et al. eLife 2018;7:e32785. DOI: https://doi.org/10.7554/eLife.32785 29 of 32
Research article Developmental Biology and Stem Cells Neuroscience
Figure 8 continued
mm. (B) BRN2 and 5HT co-staining. BRN2 is expressed in progenitors and differentiating serotonergic neurons. Arrowheads indicate double labeled
cells. Scale bar: 20 mm. (C) SALL2 and 5HT co-staining. SALL2 is expressed in progenitors and differentiating serotonergic neurons. Arrowheads indicate
double labeled cells. Scale bar: 20 mm. (D) Hierarchical clustering analysis of C. elegans neuron expression profiles with mouse serotonergic raphe
neurons shows that HSN (in green) is closest to mouse serotonergic neurons (in blue). Other C. elegans serotonergic neuron classes (ADF and NSM in
red) do not show a close relationship with mouse serotonergic raphe. R1D: Dorsal serotonergic neurons from rhombomere r1; R1M: Medial
serotonergic neurons from rhombomere r1; R2: serotonergic neurons from rhombomere r2; R3: serotonergic neurons from rhombomere r3; R5:
serotonergic neurons from rhombomere r5; R6: serotonergic neurons from rhombomere r6. See also Figure 8—figure supplement 1. (E) Micrographs
showing tph-1::gfp expression in wild type animals, ast-1(ot417) mutants, and ast-1(ot417) mutants rescued with ast-1 cDNA or mouse Pet1 cDNA
expressed under the bas-1 promoter whose expression in not affected in this mutant background. (F) Quantification of tph-1::gfp HSN expression
rescue of different HSN TF collective mutants with worm and mouse ortholog cDNAs. n > 100 cells per condition. Fisher’s exact test, *: p-value<0.05.
‘L’ indicates the transgenic line number.
DOI: https://doi.org/10.7554/eLife.32785.024
Lloret-Fernandez et al. eLife 2018;7:e32785. DOI: https://doi.org/10.7554/eLife.32785 30 of 32
Research article Developmental Biology and Stem Cells Neuroscience
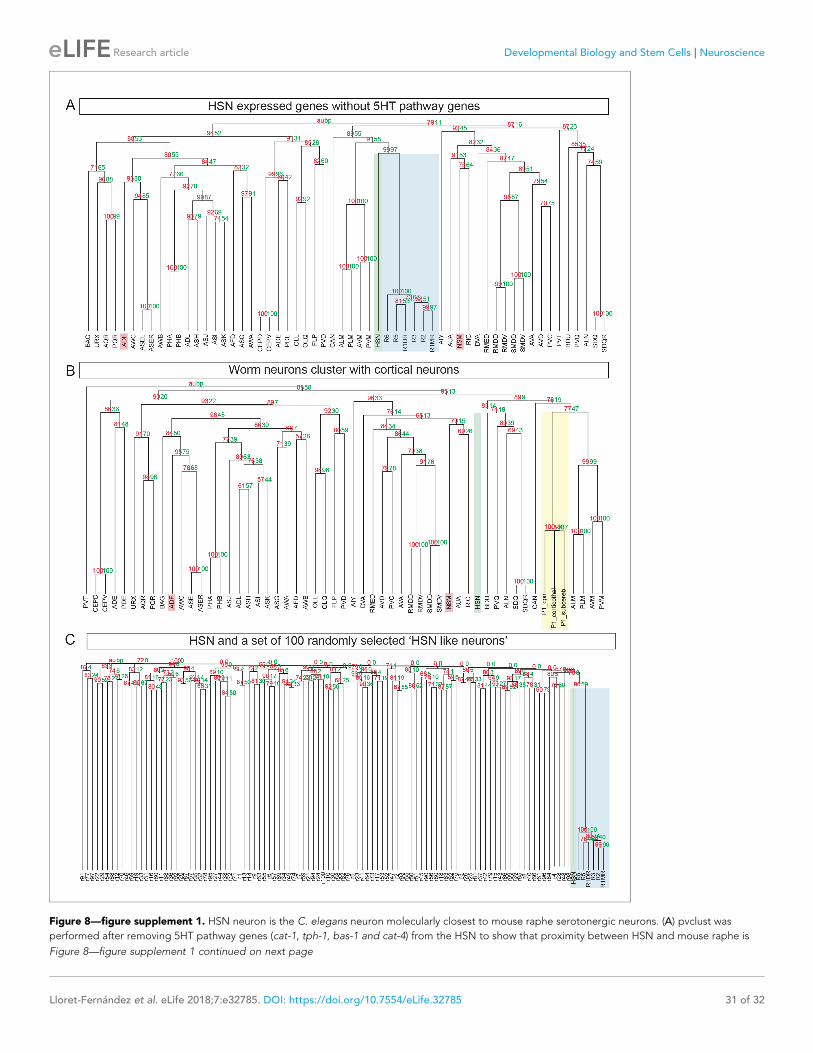
Figure 8—figure supplement 1. HSN neuron is the C. elegans neuron molecularly closest to mouse raphe serotonergic neurons. (A) pvclust was
performed after removing 5HT pathway genes (cat-1, tph-1, bas-1 and cat-4) from the HSN to show that proximity between HSN and mouse raphe is
Figure 8—figure supplement 1 continued on next page
Lloret-Fernandez et al. eLife 2018;7:e32785. DOI: https://doi.org/10.7554/eLife.32785 31 of 32
Research article Developmental Biology and Stem Cells Neuroscience
Figure 8—figure supplement 1 continued
not only due to 5HT pathway genes. (B) Clustering of worm neurons and mouse non-serotonergic control regions [cortical neurons from (Molyneaux et
al., 2015) show that HSN expression data cluster with raphe transcriptome is specific as it does not occur with other mouse transcriptomic data.
P1_cpn: Postnatal day 1 cortical projection neurons; P1_corticothal: Postnatal day 1 cortical thalamic neurons; P1_subcereb: Postnatal day 1 cortical
subcerebral neurons. (C) 100 simulated ’HSN-like’ neurons were obtained by assigning to each one the four 5HT pathway genes (cat-1, tph-1, bas-1 and
cat-4) and 92 additional genes at random. None of these random profiles shows close proximity to the Raphe mouse neurons.
DOI: https://doi.org/10.7554/eLife.32785.025
Lloret-Fernandez et al. eLife 2018;7:e32785. DOI: https://doi.org/10.7554/eLife.32785 32 of 32
Research article Developmental Biology and Stem Cells Neuroscience


