Embed Size (px)
Citation preview
The Malaysian Economy in Figures2012
(Updated Edition)
Prepared byEconomic Planning Unit, Prime Minister’s Department
Phone : 03-8872 3333 Fax :03-8888 3798
Price : RM3.00
ii
Background
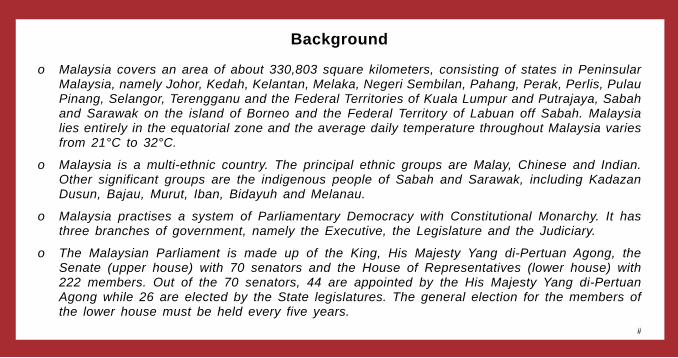
o Malaysia covers an area of about 330,803 square kilometers, consisting of states in Peninsular Malaysia, namely Johor, Kedah, Kelantan, Melaka, Negeri Sembilan, Pahang, Perak, Perlis, Pulau Pinang, Selangor, Terengganu and the Federal Territories of Kuala Lumpur and Putrajaya, Sabah and Sarawak on the island of Borneo and the Federal Territory of Labuan off Sabah. Malaysia lies entirely in the equatorial zone and the average daily temperature throughout Malaysia varies from 21°C to 32°C.
o Malaysia is a multi-ethnic country. The principal ethnic groups are Malay, Chinese and Indian. Other significant groups are the indigenous people of Sabah and Sarawak, including Kadazan Dusun, Bajau, Murut, Iban, Bidayuh and Melanau.
o Malaysia practises a system of Parliamentary Democracy with Constitutional Monarchy. It has three branches of government, namely the Executive, the Legislature and the Judiciary.
o The Malaysian Parliament is made up of the King, His Majesty Yang di-Pertuan Agong, the Senate (upper house) with 70 senators and the House of Representatives (lower house) with 222 members. Out of the 70 senators, 44 are appointed by the His Majesty Yang di-Pertuan Agong while 26 are elected by the State legislatures. The general election for the members of the lower house must be held every five years.
iii
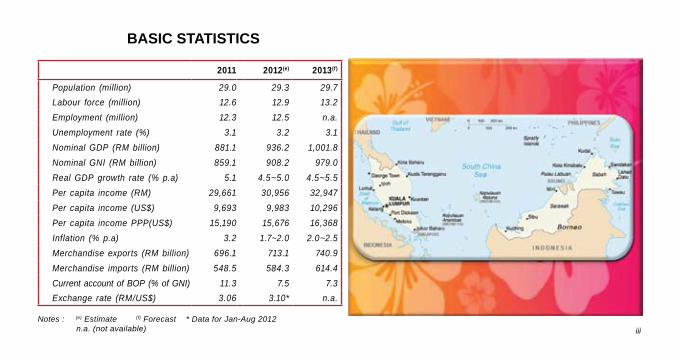
BASIC STATISTICS
2011 2012(e) 2013(f)
Population (million) 29.0 29.3 29.7
Labour force (million) 12.6 12.9 13.2
Employment (million) 12.3 12.5 n.a.
Unemployment rate (%) 3.1 3.2 3.1
Nominal GDP (RM billion) 881.1 936.2 1,001.8
Nominal GNI (RM billion) 859.1 908.2 979.0
Real GDP growth rate (% p.a) 5.1 4.5~5.0 4.5~5.5
Per capita income (RM) 29,661 30,956 32,947
Per capita income (US$) 9,693 9,983 10,296
Per capita income PPP(US$) 15,190 15,676 16,368
Inflation (% p.a) 3.2 1.7~2.0 2.0~2.5
Merchandise exports (RM billion) 696.1 713.1 740.9
Merchandise imports (RM billion) 548.5 584.3 614.4
Current account of BOP (% of GNI) 11.3 7.5 7.3
Exchange rate (RM/US$) 3.06 3.10* n.a.
Notes : (e) Estimate (f) Forecast * Data for Jan-Aug 2012 n.a. (not available)
iv
MALAYSIAN ECONOMY IN FIGURES as at October 2012
Table of Contents
Page Page
1. KEY ECONOMIC INDICATORS 4.1.1 Total Revenue ................................................................................... 124.1.2 Operating Expenditure ................................................................ 12
1.1 Gross Domestic Product ................................................................... 1 4.1.3 Development Expenditure ........................................................... 121.2 Gross National Income ..................................................................... 1 4.1.4 Overall Surplus/Deficit ................................................................ 121.3 Balance of Payments ........................................................................ 1 4.1.5 Sources of Finance (net) ............................................................ 121.4 Federal Government Accounts ............................................................. 11.5 Price Indices ..................................................................................... 2 4.2 Consolidated Public Sector Finance ........................................... 121.6 Unemployment .................................................................................. 2 4.2.1 General Government .................................................................. 121.7 Exchange Rates ............................................................................... 2 4.2.2 NFPEs Surplus/ Deficit ............................................................... 121.8 Money and Banking .......................................................................... 2 4.2.3 Total Public Sector Current Surplus/Deficit .................................... 12
4.2.4 Development Expenditure ........................................................... 122. AREA, POPULATION AND LABOUR FORCE 4.2.5 Overall Surplus/Deficit ................................................................ 12
4.2.6 External Debt ............................................................................. 122.1 Area ......................................................................................................... 42.2 Population ........................................................................................ 4 5. BALANCE OF PAYMENTS2.3 Population Age Structure .................................................................. 42.4 Population by Ethnic Group .................................................................. 5 5.1 Goods (net) ................................................................................ 152.5 Labour Force .................................................................................... 6 5.2 Services (net) .......................................................................... 152.6 Employment ...................................................................................... 6 5.3 Income (net) ........................................................................................ 15
5.4 Current Transfers ........................................................................ 153. GROSS DOMESTIC PRODUCT 5.5 Current Account Balance (net) ....................................................... 15
5.6 Capital & Financial Account Balance (net) ..................................... 153.1 Supply ....................................................................................... 7 5.7 Overall Balance ....................................................................... 153.2 Demand ..................................................................................... 73.3 Savings and Investment Gap ............................................................... 8 6. GROSS DOMESTIC PRODUCT BY STATE3.4 Major Products ................................................................................. 83.5 Manufacturing Production Index ........................................................... 10 6.1 GDP at Purchasers’ Value ......................................................... 173.6 Distributive Trade .............................................................................. 11
7. BURSA MALAYSIA4. PUBLIC SECTOR ACCOUNTS
7.1 Composite Index ...................................................................... 184.1 Federal Government Finance ............................................................ 12 7.2 Market Valuation ......................................................................... 18
v
Page Page
7.3 Selected World Stock Market Indices .......................................... 18 13. INTERNATIONAL COMPARISON7.4 New Listing ................................................................................. 187.5 Listed Companies ................................................................. 18 13.1 Real Gross Domestic Product ................................................................................ 367.6 Turnover ..................................................................................... 19 13.2 Consumer Price Index ............................................................................................ 37
13.3 Structure of Output ................................................................................................. 388. APPROVED INVESTMENT PROJECTS 13.4 Structure of Demand .............................................................................................. 39
13.5 Current Account of Balance of Payments .............................................................. 408.1 Approved Investment Projects ........................................................................... 20 13.6 Savings and Investment ......................................................................................... 418.2 Foreign Investment In Approved Projects .......................................................... 20 13.7 Government, Debt and Resource Flows ............................................................... 428.3 Proposed Capital Investment In Approved Projects .......................................... 21 13.8 Population, Urbanisation and Population Density ................................................. 43
13.9 Structure of Employment ........................................................................................ 449. EXTERNAL SECTOR 13.10 Quality of Life .......................................................................................................... 45
13.11 GNI Per Capita ....................................................................................................... 469.1 Exports ........................................................................................................ 22 13.12 Information Age ....................................................................................................... 479.2 Imports ........................................................................................................ 22 13.13 Science & Technology ............................................................................................ 489.3 Direction of Exports ........................................................................................ 23 13.14 World Competitiveness Ranking ................................................................................ 499.4 Sources of Imports ............................................................................................. 23 13.15 Overall Productivity ...................................................................................................... 509.5 Trade Prices and Terms of Trade ....................................................................... 23 13.16 Labor Productivity ........................................................................................................ 519.6 Trade Balance by Main Trading Partners .......................................................... 25 13.17 Productivity by Sector .................................................................................................. 529.7 Tourists Arrivals by Region ................................................................................. 27
14. MALAYSIA’S COMPETITIVENESS POSITION .................................................. 5310. PRIVATISATION
15. INVESTORS’ GUIDE10.1 Privatisation Achievement .................................................................................. 28 15.1 Income Tax Rate ......................................................................................................... 54
15.2 Promotion of Investment Act .................................................................................. 5411. ENERGY AND INFRASTRUCTURE 15.3 Income Tax Act ....................................................................................................... 54
15.4 Others ............................................................................................................ 5411.1 Primary Commercial Energy - Final Demand .................................................... 2911.2 Electricity - Demand and Supply ........................................................................ 29 16. FOREIGN EXCHANGE ADMINISTRATION POLICIES ...................................... 5411.3 Roads by Surface Type ...................................................................................... 3111.4 Railway Statistics ........................................................................................... 31 16.1 Foreign Exchange Administration Rules Applicable to Residents ........................ 5511.5 Air Traffic Statistics ..................................................................................... 31 16.2 Foreign Exchange Administration Rules Applicable to Non-Residents ................ 5911.6 Port Statistics .............................................................................................. 31 16.2.1 Foreign Direct and Portfolio Investments by Non-Residents ...................... 60
12. QUALITY OF LIFE
12.1 Area Indices ............................................................................................................. 3212.2 Selected Social Indicators .......................................................................................3312.3 Poverty ........................................................................................................... 3512.4 Female-Related Information ................................................................................... 35
1
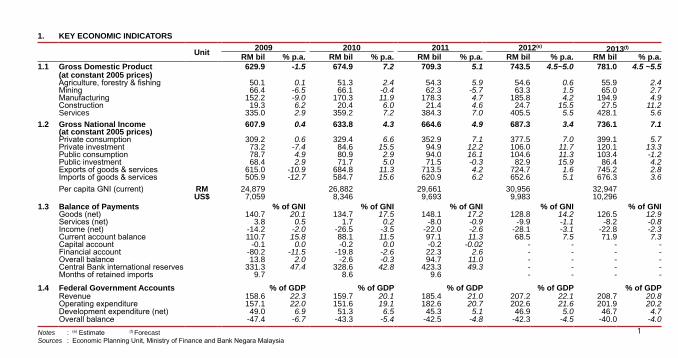
1. KEY ECONOMIC INDICATORS
Unit2009 2010 2011 2012(e) 2013(f)
RM bil % p.a. RM bil % p.a. RM bil % p.a. RM bil % p.a. RM bil % p.a.1.1 Gross Domestic Product 629.9 -1.5 674.9 7.2 709.3 5.1 743.5 4.5~5.0 781.0 4.5 ~5.5
(at constant 2005 prices)Agriculture, forestry & fishing 50.1 0.1 51.3 2.4 54.3 5.9 54.6 0.6 55.9 2.4Mining 66.4 -6.5 66.1 -0.4 62.3 -5.7 63.3 1.5 65.0 2.7Manufacturing 152.2 -9.0 170.3 11.9 178.3 4.7 185.8 4.2 194.9 4.9Construction 19.3 6.2 20.4 6.0 21.4 4.6 24.7 15.5 27.5 11.2Services 335.0 2.9 359.2 7.2 384.3 7.0 405.5 5.5 428.1 5.6
1.2 Gross National Income 607.9 0.4 633.8 4.3 664.6 4.9 687.3 3.4 736.1 7.1(at constant 2005 prices)Private consumption 309.2 0.6 329.4 6.6 352.9 7.1 377.5 7.0 399.1 5.7Private investment 73.2 -7.4 84.6 15.5 94.9 12.2 106.0 11.7 120.1 13.3Public consumption 78.7 4.9 80.9 2.9 94.0 16.1 104.6 11.3 103.4 -1.2Public investment 68.4 2.9 71.7 5.0 71.5 -0.3 82.9 15.9 86.4 4.2Exports of goods & services 615.0 -10.9 684.8 11.3 713.5 4.2 724.7 1.6 745.2 2.8Imports of goods & services 505.9 -12.7 584.7 15.6 620.9 6.2 652.6 5.1 676.3 3.6
Per capita GNI (current) RM 24,879 26,882 29,661 30,956 32,947US$ 7,059 8,346 9,693 9,983 10,296
1.3 Balance of Payments % of GNI % of GNI % of GNI % of GNI % of GNIGoods (net) 140.7 20.1 134.7 17.5 148.1 17.2 128.8 14.2 126.5 12.9Services (net) 3.8 0.5 1.7 0.2 -8.0 -0.9 -9.9 -1.1 -8.2 -0.8Income (net) -14.2 -2.0 -26.5 -3.5 -22.0 -2.6 -28.1 -3.1 -22.8 -2.3Current account balance 110.7 15.8 88.1 11.5 97.1 11.3 68.5 7.5 71.9 7.3Capital account -0.1 0.0 -0.2 0.0 -0.2 -0.02 - - - -Financial account -80.2 -11.5 -19.8 -2.6 22.3 2.6 - - - -Overall balance 13.8 2.0 -2.6 -0.3 94.7 11.0 - - - -Central Bank international reserves 331.3 47.4 328.6 42.8 423.3 49.3 - - - -Months of retained imports 9.7 8.6 9.6 - - - -
1.4 Federal Government Accounts % of GDP % of GDP % of GDP % of GDP % of GDPRevenue 158.6 22.3 159.7 20.1 185.4 21.0 207.2 22.1 208.7 20.8Operating expenditure 157.1 22.0 151.6 19.1 182.6 20.7 202.6 21.6 201.9 20.2Development expenditure (net) 49.0 6.9 51.3 6.5 45.3 5.1 46.9 5.0 46.7 4.7Overall balance -47.4 -6.7 -43.3 -5.4 -42.5 -4.8 -42.3 -4.5 -40.0 -4.0
Notes : (e) Estimate (f) ForecastSources : Economic Planning Unit, Ministry of Finance and Bank Negara Malaysia
2
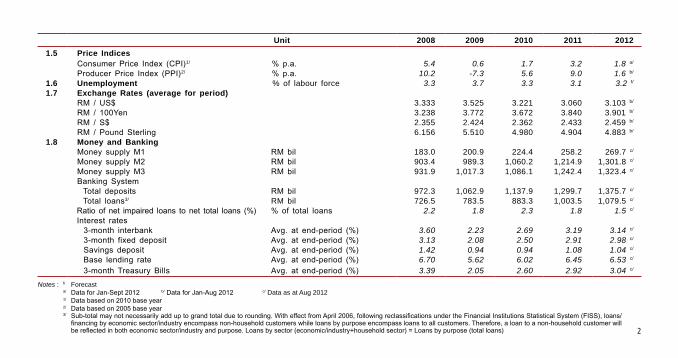
Unit 2008 2009 2010 2011 2012
1.5 Price IndicesConsumer Price Index (CPI)1/ % p.a. 5.4 0.6 1.7 3.2 1.8 a/
Producer Price Index (PPI)2/ % p.a. 10.2 -7.3 5.6 9.0 1.6 b/
1.6 Unemployment % of labour force 3.3 3.7 3.3 3.1 3.2 f/
1.7 Exchange Rates (average for period)RM / US$ 3.333 3.525 3.221 3.060 3.103 b/
RM / 100Yen 3.238 3.772 3.672 3.840 3.901 b/
RM / S$ 2.355 2.424 2.362 2.433 2.459 b/
RM / Pound Sterling 6.156 5.510 4.980 4.904 4.883 b/
1.8 Money and BankingMoney supply M1 RM bil 183.0 200.9 224.4 258.2 269.7 c/
Money supply M2 RM bil 903.4 989.3 1,060.2 1,214.9 1,301.8 c/
Money supply M3 RM bil 931.9 1,017.3 1,086.1 1,242.4 1,323.4 c/
Banking SystemTotal deposits RM bil 972.3 1,062.9 1,137.9 1,299.7 1,375.7 c/
Total loans3/ RM bil 726.5 783.5 883.3 1,003.5 1,079.5 c/
Ratio of net impaired loans to net total loans (%) % of total loans 2.2 1.8 2.3 1.8 1.5 c/
Interest rates3-month interbank Avg. at end-period (%) 3.60 2.23 2.69 3.19 3.14 c/
3-month fixed deposit Avg. at end-period (%) 3.13 2.08 2.50 2.91 2.98 c/
Savings deposit Avg. at end-period (%) 1.42 0.94 0.94 1.08 1.04 c/
Base lending rate Avg. at end-period (%) 6.70 5.62 6.02 6.45 6.53 c/
3-month Treasury Bills Avg. at end-period (%) 3.39 2.05 2.60 2.92 3.04 c/
Notes : f/ Forecast a/ Data for Jan-Sept 2012 b/ Data for Jan-Aug 2012 c/ Data as at Aug 2012 1/ Data based on 2010 base year 2/ Data based on 2005 base year 3/ Sub-total may not necessarily add up to grand total due to rounding. With effect from April 2006, following reclassifications under the Financial Institutions Statistical System (FISS), loans/
financing by economic sector/industry encompass non-household customers while loans by purpose encompass loans to all customers. Therefore, a loan to a non-household customer will be reflected in both economic sector/industry and purpose. Loans by sector (economic/industry+household sector) = Loans by purpose (total loans)
3
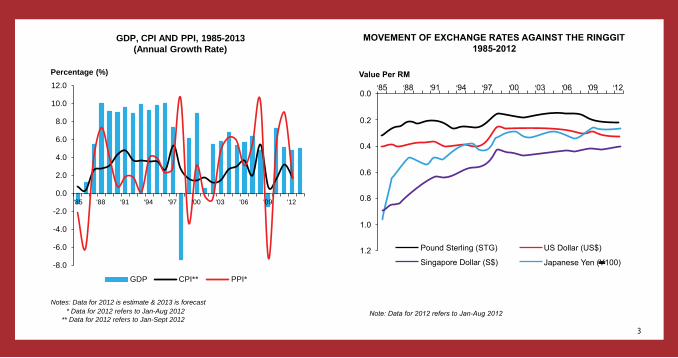
GDP, CPI AND PPI, 1985-2013 (Annual Growth Rate)
Notes: Data for 2012 is estimate & 2013 is forecast * Data for 2012 refers to Jan-Aug 2012
** Data for 2012 refers to Jan-Sept 2012
Percentage (%)
-8.0
-6.0
-4.0
-2.0
0.0
2.0
4.0
6.0
8.0
10.0
12.0
'85 '88 '91 '94 '97 '00 '03 '06 '09 '12
GDP CPI** PPI*
' ' ' ' ' ' ' ' ' '
4
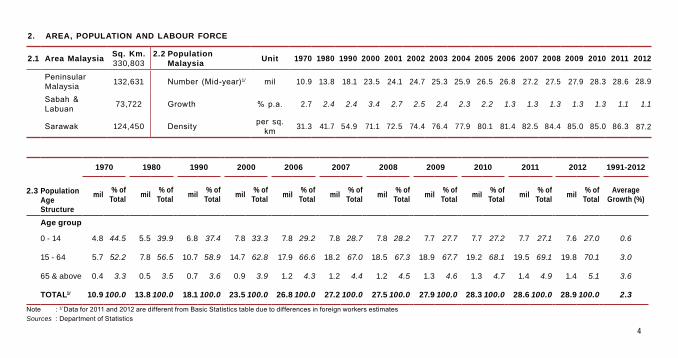
2. AREA, POPULATION AND LABOUR FORCE
2.1 Area MalaysiaSq. Km. 330,803
2.2 Population Malaysia
Unit 1970 1980 1990 2000 2001 2002 2003 2004 2005 2006 2007 2008 2009 2010 2011 2012
Peninsular Malaysia
132,631 Number (Mid-year)1/ mil 10.9 13.8 18.1 23.5 24.1 24.7 25.3 25.9 26.5 26.8 27.2 27.5 27.9 28.3 28.6 28.9
Sabah & Labuan
73,722 Growth % p.a. 2.7 2.4 2.4 3.4 2.7 2.5 2.4 2.3 2.2 1.3 1.3 1.3 1.3 1.3 1.1 1.1
Sarawak 124,450 Density per sq.
km31.3 41.7 54.9 71.1 72.5 74.4 76.4 77.9 80.1 81.4 82.5 84.4 85.0 85.0 86.3 87.2
1970 1980 1990 2000 2006 2007 2008 2009 2010 2011 2012 1991-2012
2.3 Population Age Structure
mil% of
Totalmil
% ofTotal
mil% of
Totalmil
% ofTotal
mil% of
Totalmil
% ofTotal
mil% of
Totalmil
% ofTotal
mil% of
Totalmil
% ofTotal
mil% of
TotalAverage
Growth (%)
Age group
0 - 14 4.8 44.5 5.5 39.9 6.8 37.4 7.8 33.3 7.8 29.2 7.8 28.7 7.8 28.2 7.7 27.7 7.7 27.2 7.7 27.1 7.6 27.0 0.6
15 - 64 5.7 52.2 7.8 56.5 10.7 58.9 14.7 62.8 17.9 66.6 18.2 67.0 18.5 67.3 18.9 67.7 19.2 68.1 19.5 69.1 19.8 70.1 3.0
65 & above 0.4 3.3 0.5 3.5 0.7 3.6 0.9 3.9 1.2 4.3 1.2 4.4 1.2 4.5 1.3 4.6 1.3 4.7 1.4 4.9 1.4 5.1 3.6
TOTAL1/ 10.9 100.0 13.8 100.0 18.1 100.0 23.5 100.0 26.8 100.0 27.2 100.0 27.5 100.0 27.9 100.0 28.3 100.0 28.6 100.0 28.9 100.0 2.3
Note : 1/ Data for 2011 and 2012 are different from Basic Statistics table due to differences in foreign workers estimatesSources : Department of Statistics
5
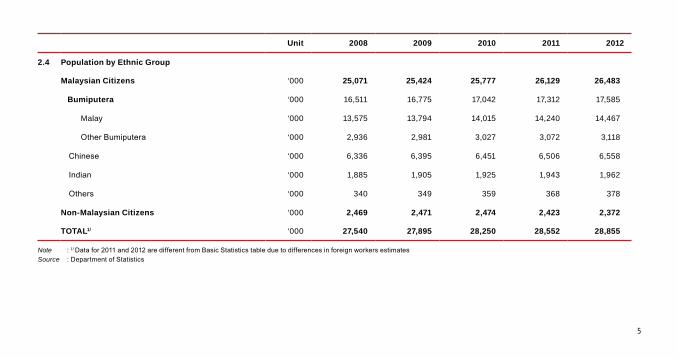
Unit 2008 2009 2010 2011 2012
2.4 Population by Ethnic Group
Malaysian Citizens ‘000 25,071 25,424 25,777 26,129 26,483
Bumiputera ‘000 16,511 16,775 17,042 17,312 17,585
Malay ‘000 13,575 13,794 14,015 14,240 14,467
Other Bumiputera ‘000 2,936 2,981 3,027 3,072 3,118
Chinese ‘000 6,336 6,395 6,451 6,506 6,558
Indian ‘000 1,885 1,905 1,925 1,943 1,962
Others ‘000 340 349 359 368 378
Non-Malaysian Citizens ‘000 2,469 2,471 2,474 2,423 2,372
TOTAL1/ ‘000 27,540 27,895 28,250 28,552 28,855
Note : 1/ Data for 2011 and 2012 are different from Basic Statistics table due to differences in foreign workers estimatesSource : Department of Statistics
6
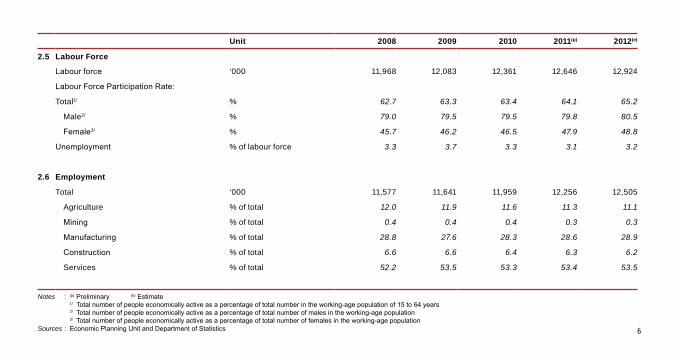
Unit 2008 2009 2010 2011(p) 2012(e)
2.5 Labour Force
Labour force ‘000 11,968 12,083 12,361 12,646 12,924
Labour Force Participation Rate:
Total1/ % 62.7 63.3 63.4 64.1 65.2
Male2/ % 79.0 79.5 79.5 79.8 80.5
Female3/ % 45.7 46.2 46.5 47.9 48.8
Unemployment % of labour force 3.3 3.7 3.3 3.1 3.2
2.6 Employment
Total ‘000 11,577 11,641 11,959 12,256 12,505
Agriculture % of total 12.0 11.9 11.6 11.3 11.1
Mining % of total 0.4 0.4 0.4 0.3 0.3
Manufacturing % of total 28.8 27.6 28.3 28.6 28.9
Construction % of total 6.6 6.6 6.4 6.3 6.2
Services % of total 52.2 53.5 53.3 53.4 53.5
Notes : (p) Preliminary (e) Estimate 1/ Total number of people economically active as a percentage of total number in the working-age population of 15 to 64 years 2/ Total number of people economically active as a percentage of total number of males in the working-age population 3/ Total number of people economically active as a percentage of total number of females in the working-age populationSources : Economic Planning Unit and Department of Statistics
7
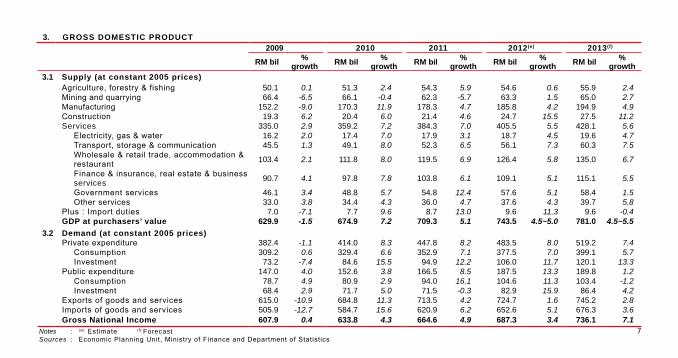
3. GROSS DOMESTIC PRODUCT2009 2010 2011 2012(e) 2013(f)
RM bil %growth RM bil %
growth RM bil %growth RM bil %
growth RM bil %growth
3.1 Supply (at constant 2005 prices)Agriculture, forestry & fishing 50.1 0.1 51.3 2.4 54.3 5.9 54.6 0.6 55.9 2.4Mining and quarrying 66.4 -6.5 66.1 -0.4 62.3 -5.7 63.3 1.5 65.0 2.7Manufacturing 152.2 -9.0 170.3 11.9 178.3 4.7 185.8 4.2 194.9 4.9Construction 19.3 6.2 20.4 6.0 21.4 4.6 24.7 15.5 27.5 11.2Services 335.0 2.9 359.2 7.2 384.3 7.0 405.5 5.5 428.1 5.6
Electricity, gas & water 16.2 2.0 17.4 7.0 17.9 3.1 18.7 4.5 19.6 4.7Transport, storage & communication 45.5 1.3 49.1 8.0 52.3 6.5 56.1 7.3 60.3 7.5Wholesale & retail trade, accommodation & restaurant
103.4 2.1 111.8 8.0 119.5 6.9 126.4 5.8 135.0 6.7
Finance & insurance, real estate & business services
90.7 4.1 97.8 7.8 103.8 6.1 109.1 5.1 115.1 5.5
Government services 46.1 3.4 48.8 5.7 54.8 12.4 57.6 5.1 58.4 1.5Other services 33.0 3.8 34.4 4.3 36.0 4.7 37.6 4.3 39.7 5.8
Plus : Import duties 7.0 -7.1 7.7 9.6 8.7 13.0 9.6 11.3 9.6 -0.4GDP at purchasers’ value 629.9 -1.5 674.9 7.2 709.3 5.1 743.5 4.5~5.0 781.0 4.5~5.5
3.2 Demand (at constant 2005 prices)Private expenditure 382.4 -1.1 414.0 8.3 447.8 8.2 483.5 8.0 519.2 7.4
Consumption 309.2 0.6 329.4 6.6 352.9 7.1 377.5 7.0 399.1 5.7Investment 73.2 -7.4 84.6 15.5 94.9 12.2 106.0 11.7 120.1 13.3
Public expenditure 147.0 4.0 152.6 3.8 166.5 8.5 187.5 13.3 189.8 1.2Consumption 78.7 4.9 80.9 2.9 94.0 16.1 104.6 11.3 103.4 -1.2Investment 68.4 2.9 71.7 5.0 71.5 -0.3 82.9 15.9 86.4 4.2
Exports of goods and services 615.0 -10.9 684.8 11.3 713.5 4.2 724.7 1.6 745.2 2.8Imports of goods and services 505.9 -12.7 584.7 15.6 620.9 6.2 652.6 5.1 676.3 3.6Gross National Income 607.9 0.4 633.8 4.3 664.6 4.9 687.3 3.4 736.1 7.1
Notes : (e ) Estimate (f) ForecastSources : Economic Planning Unit, Ministry of Finance and Department of Statistics
8
Unit
2009 2010 2011 2012(e) 2013(f)
RM bil%
growthRM bil
% growth
RM bil%
growthRM bil
% growth
RM bil%
growth
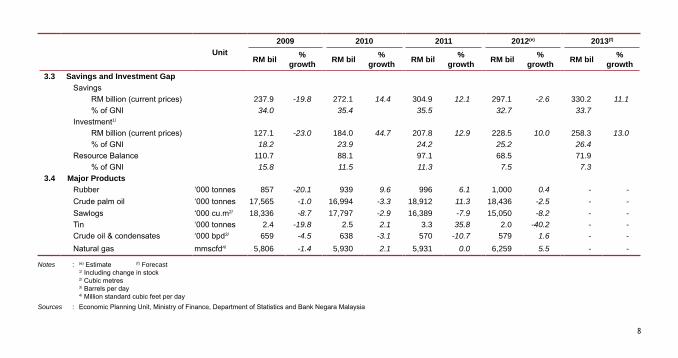
3.3 Savings and Investment Gap
Savings
RM billion (current prices) 237.9 -19.8 272.1 14.4 304.9 12.1 297.1 -2.6 330.2 11.1
% of GNI 34.0 35.4 35.5 32.7 33.7
Investment1/
RM billion (current prices) 127.1 -23.0 184.0 44.7 207.8 12.9 228.5 10.0 258.3 13.0
% of GNI 18.2 23.9 24.2 25.2 26.4
Resource Balance 110.7 88.1 97.1 68.5 71.9
% of GNI 15.8 11.5 11.3 7.5 7.3
3.4 Major Products
Rubber ‘000 tonnes 857 -20.1 939 9.6 996 6.1 1,000 0.4 - -
Crude palm oil ‘000 tonnes 17,565 -1.0 16,994 -3.3 18,912 11.3 18,436 -2.5 - -
Sawlogs ‘000 cu.m2/ 18,336 -8.7 17,797 -2.9 16,389 -7.9 15,050 -8.2 - -
Tin ‘000 tonnes 2.4 -19.8 2.5 2.1 3.3 35.8 2.0 -40.2 - -
Crude oil & condensates ‘000 bpd3/ 659 -4.5 638 -3.1 570 -10.7 579 1.6 - -
Natural gas mmscfd4/ 5,806 -1.4 5,930 2.1 5,931 0.0 6,259 5.5 - -
Notes : (e) Estimate (f) Forecast 1/ Including change in stock 2/ Cubic metres 3/ Barrels per day 4/ Million standard cubic feet per day
Sources : Economic Planning Unit, Ministry of Finance, Department of Statistics and Bank Negara Malaysia
9
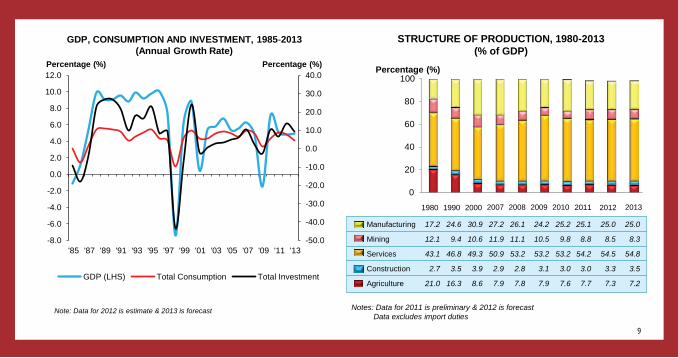
GDP, CONSUMPTION AND INVESTMENT, 1985-2013 (Annual Growth Rate)
Percentage (%) Percentage (%)
-50.0
-40.0
-30.0
-20.0
-10.0
0.0
10.0
20.0
30.0
40.0
-8.0
-6.0
-4.0
-2.0
0.0
2.0
4.0
6.0
8.0
10.0
12.0
'85 '87 '89 '91 '93 '95 '97 '99 '01 '03 '05 '07 '09 '11 '13
GDP (LHS) Total Consumption Total Investment
Note: Data for 2012 is estimate & 2013 is forecast
STRUCTURE OF PRODUCTION, 1980-2013 (% of GDP)
Notes: Data for 2011 is preliminary & 2012 is forecast Data excludes import duties
0
20
40
60
80
100
Manufacturing 17.2 24.6 30.9 27.2 26.1 24.2 25.2 25.1 25.0 25.0
Mining 12.1 9.4 10.6 11.9 11.1 10.5 9.8 8.8 8.5 8.3
Services 43.1 46.8 49.3 50.9 53.2 53.2 53.2 54.2 54.5 54.8
Construction 2.7 3.5 3.9 2.9 2.8 3.1 3.0 3.0 3.3 3.5
Agriculture 21.0 16.3 8.6 7.9 7.8 7.9 7.6 7.7 7.3 7.2
1980 1990 2000 20112007 201020092008 2012 2013
Percentage (%)
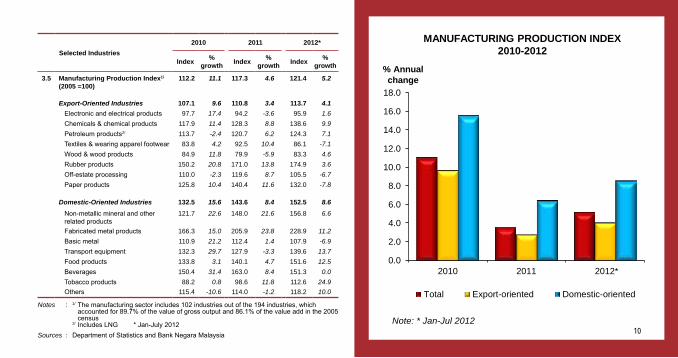
MANUFACTURING PRODUCTION INDEX 2010-2012
% Annual change
0.0
2.0
4.0
6.0
8.0
10.0
12.0
14.0
16.0
18.0
2010 2011 2012*
Total
Note: * Jan-Jul 2012
Export-oriented Domestic-oriented
10
Selected Industries
2010 2011 2012*
Index%
growthIndex
% growth
Index%
growth
3.5 Manufacturing Production Index1/
(2005 =100)112.2 11.1 117.3 4.6 121.4 5.2
Export-Oriented Industries 107.1 9.6 110.8 3.4 113.7 4.1
Electronic and electrical products 97.7 17.4 94.2 -3.6 95.9 1.6
Chemicals & chemical products 117.9 11.4 128.3 8.8 138.6 9.9
Petroleum products2/ 113.7 -2.4 120.7 6.2 124.3 7.1
Textiles & wearing apparel footwear 83.8 4.2 92.5 10.4 86.1 -7.1
Wood & wood products 84.9 11.8 79.9 -5.9 83.3 4.6
Rubber products 150.2 20.8 171.0 13.8 174.9 3.6
Off-estate processing 110.0 -2.3 119.6 8.7 105.5 -6.7
Paper products 125.8 10.4 140.4 11.6 132.0 -7.8
Domestic-Oriented Industries 132.5 15.6 143.6 8.4 152.5 8.6
Non-metallic mineral and other related products
121.7 22.6 148.0 21.6 156.8 6.6
Fabricated metal products 166.3 15.0 205.9 23.8 228.9 11.2
Basic metal 110.9 21.2 112.4 1.4 107.9 -6.9
Transport equipment 132.3 29.7 127.9 -3.3 139.6 13.7
Food products 133.8 3.1 140.1 4.7 151.6 12.5
Beverages 150.4 31.4 163.0 8.4 151.3 0.0
Tobacco products 88.2 0.8 98.6 11.8 112.6 24.9
Others 115.4 -10.6 114.0 -1.2 118.2 10.0
Notes : 1/ The manufacturing sector includes 102 industries out of the 194 industries, which accounted for 89.7% of the value of gross output and 86.1% of the value add in the 2005 census
2/ Includes LNG * Jan-July 2012
Sources : Department of Statistics and Bank Negara Malaysia
11
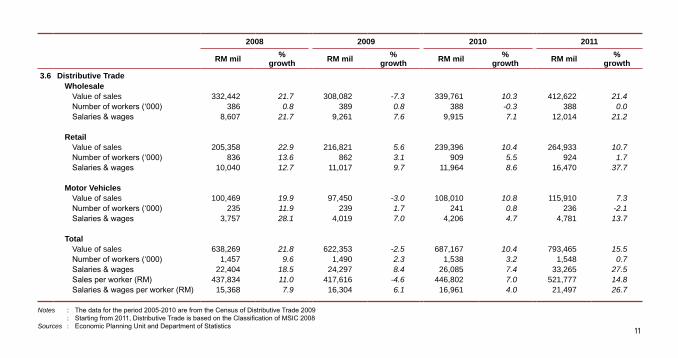
2008 2009 2010 2011
RM mil % growth RM mil %
growth RM mil % growth RM mil %
growth
3.6 Distributive TradeWholesale
Value of sales 332,442 21.7 308,082 -7.3 339,761 10.3 412,622 21.4Number of workers (‘000) 386 0.8 389 0.8 388 -0.3 388 0.0Salaries & wages 8,607 21.7 9,261 7.6 9,915 7.1 12,014 21.2
RetailValue of sales 205,358 22.9 216,821 5.6 239,396 10.4 264,933 10.7Number of workers (‘000) 836 13.6 862 3.1 909 5.5 924 1.7Salaries & wages 10,040 12.7 11,017 9.7 11,964 8.6 16,470 37.7
Motor VehiclesValue of sales 100,469 19.9 97,450 -3.0 108,010 10.8 115,910 7.3Number of workers (‘000) 235 11.9 239 1.7 241 0.8 236 -2.1Salaries & wages 3,757 28.1 4,019 7.0 4,206 4.7 4,781 13.7
TotalValue of sales 638,269 21.8 622,353 -2.5 687,167 10.4 793,465 15.5Number of workers (‘000) 1,457 9.6 1,490 2.3 1,538 3.2 1,548 0.7Salaries & wages 22,404 18.5 24,297 8.4 26,085 7.4 33,265 27.5Sales per worker (RM) 437,834 11.0 417,616 -4.6 446,802 7.0 521,777 14.8Salaries & wages per worker (RM) 15,368 7.9 16,304 6.1 16,961 4.0 21,497 26.7
Notes : The data for the period 2005-2010 are from the Census of Distributive Trade 2009 : Starting from 2011, Distributive Trade is based on the Classification of MSIC 2008Sources : Economic Planning Unit and Department of Statistics
12
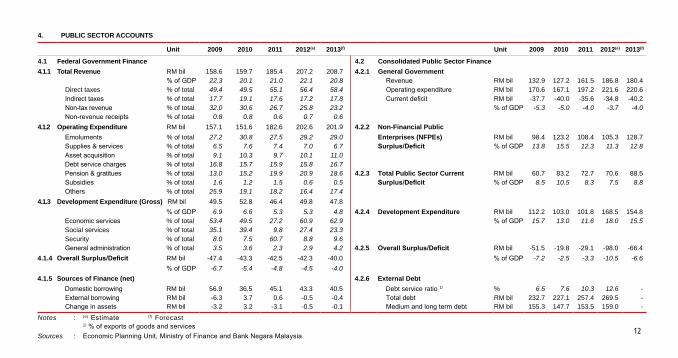
4. PUBLIC SECTOR ACCOUNTS
Unit 2009 2010 2011 2012(e) 2013(f) Unit 2009 2010 2011 2012(e) 2013(f)
4.1 Federal Government Finance 4.2 Consolidated Public Sector Finance
4.1.1 Total Revenue RM bil 158.6 159.7 185.4 207.2 208.7 4.2.1 General Government% of GDP 22.3 20.1 21.0 22.1 20.8 Revenue RM bil 132.9 127.2 161.5 186.8 180.4
Direct taxes % of total 49.4 49.5 55.1 56.4 58.4 Operating expenditure RM bil 170.6 167.1 197.2 221.6 220.6Indirect taxes % of total 17.7 19.1 17.6 17.2 17.8 Current deficit RM bil -37.7 -40.0 -35.6 -34.8 -40.2Non-tax revenue % of total 32.0 30.6 26.7 25.8 23.2 % of GDP -5.3 -5.0 -4.0 -3.7 -4.0Non-revenue receipts % of total 0.8 0.8 0.6 0.7 0.6
4.1.2 Operating Expenditure RM bil 157.1 151.6 182.6 202.6 201.9 4.2.2 Non-Financial Public
Emoluments % of total 27.2 30.8 27.5 29.2 29.0 Enterprises (NFPEs) RM bil 98.4 123.2 108.4 105.3 128.7Supplies & services % of total 6.5 7.6 7.4 7.0 6.7 Surplus/Deficit % of GDP 13.8 15.5 12.3 11.3 12.8Asset acquisition % of total 9.1 10.3 9.7 10.1 11.0Debt service charges % of total 16.8 15.7 15.9 15.8 16.7Pension & gratitues % of total 13.0 15.2 19.9 20.9 18.6 4.2.3 Total Public Sector Current RM bil 60.7 83.2 72.7 70.6 88.5Subsidies % of total 1.6 1.2 1.5 0.6 0.5 Surplus/Deficit % of GDP 8.5 10.5 8.3 7.5 8.8Others % of total 25.9 19.1 18.2 16.4 17.4
4.1.3 Development Expenditure (Gross) RM bil 49.5 52.8 46.4 49.8 47.8
% of GDP 6.9 6.6 5.3 5.3 4.8 4.2.4 Development Expenditure RM bil 112.2 103.0 101.8 168.5 154.8Economic services % of total 53.4 49.5 27.2 60.9 62.9 % of GDP 15.7 13.0 11.6 18.0 15.5Social services % of total 35.1 39.4 9.8 27.4 23.3Security % of total 8.0 7.5 60.7 8.8 9.6General administration % of total 3.5 3.6 2.3 2.9 4.2 4.2.5 Overall Surplus/Deficit RM bil -51.5 -19.8 -29.1 -98.0 -66.4
4.1.4 Overall Surplus/Deficit RM bil -47.4 -43.3 -42.5 -42.3 -40.0 % of GDP -7.2 -2.5 -3.3 -10.5 -6.6
% of GDP -6.7 -5.4 -4.8 -4.5 -4.0
4.1.5 Sources of Finance (net) 4.2.6 External Debt
Domestic borrowing RM bil 56.9 36.5 45.1 43.3 40.5 Debt service ratio 1/ % 6.5 7.6 10.3 12.6 -External borrowing RM bil -6.3 3.7 0.6 -0.5 -0.4 Total debt RM bil 232.7 227.1 257.4 269.5 -Change in assets RM bil -3.2 3.2 -3.1 -0.5 -0.1 Medium and long term debt RM bil 155.3 147.7 153.5 159.0 -
Notes : (e) Estimate (f) Forecast 1/ % of exports of goods and services
Sources : Economic Planning Unit, Ministry of Finance and Bank Negara Malaysia
13
-70
-50
-30
-10
10
30
50
70
90
110
130
150
170
190
210
'85 '89 '93 '97 '01 '05 '09 '13
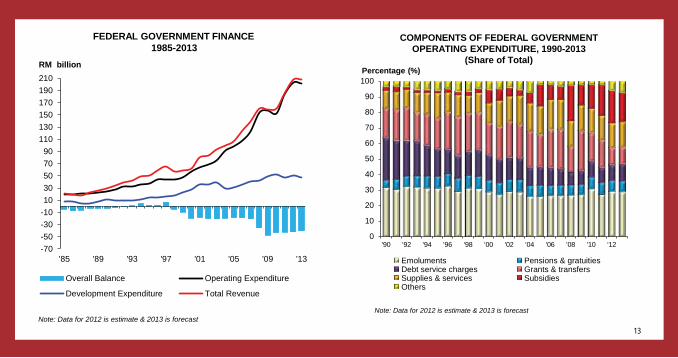
Overall Balance Operating Expenditure
Development Expenditure Total Revenue
FEDERAL GOVERNMENT FINANCE 1985-2013
RM billion
Note: Data for 2012 is estimate & 2013 is forecast
0
10
20
30
40
50
60
70
80
90
100
'90 '92 '94 '96 '98 '00 '02 '04 '06 '08 '10 '12
Emoluments Pensions & gratuitiesDebt service charges Grants & transfersSupplies & services SubsidiesOthers
COMPONENTS OF FEDERAL GOVERNMENT OPERATING EXPENDITURE, 1990-2013
(Share of Total) Percentage (%)
Note: Data for 2012 is estimate & 2013 is forecast
14
-20.0
-15.0
-10.0
-5.0
0.0
5.0
10.0
15.0
20.0
25.0
30.0
35.0
0.0
20.0
40.0
60.0
80.0
100.0
120.0
140.0
160.0
180.0
200.0
220.0
'90 '92 '94 '96 '98 '00 '02 '04 '06 '08 '10 '12
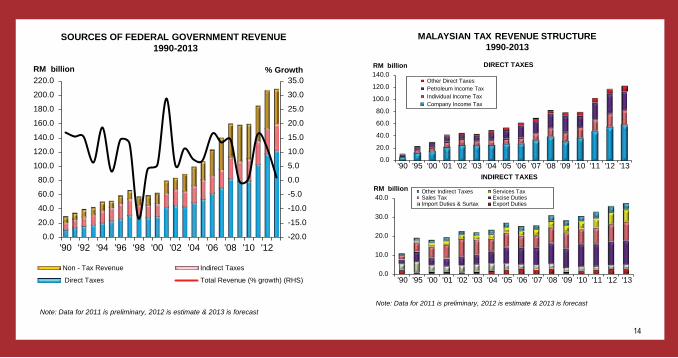
Non - Tax Revenue Indirect Taxes
Direct Taxes Total Revenue (% growth) (RHS)
SOURCES OF FEDERAL GOVERNMENT REVENUE 1990-2013
RM billion % Growth
Note: Data for 2011 is preliminary, 2012 is estimate & 2013 is forecast
0.0
20.0
40.0
60.0
80.0
100.0
120.0
140.0
'90 '95 '00 '01 '02 '03 '04 '05 '06 '07 '08 '09 '10 '11 '12 '13
Other Direct TaxesPetroleum Income TaxIndividual Income TaxCompany Income Tax
0.0
10.0
20.0
30.0
40.0
'90 '95 '00 '01 '02 '03 '04 '05 '06 '07 '08 '09 '10 '11 '12 '13
Other Indirect Taxes Services TaxSales Tax Excise DutiesImport Duties & Surtax Export Duties
MALAYSIAN TAX REVENUE STRUCTURE 1990-2013
DIRECT TAXES RM billion
INDIRECT TAXES
RM billion
Note: Data for 2011 is preliminary, 2012 is estimate & 2013 is forecast
15
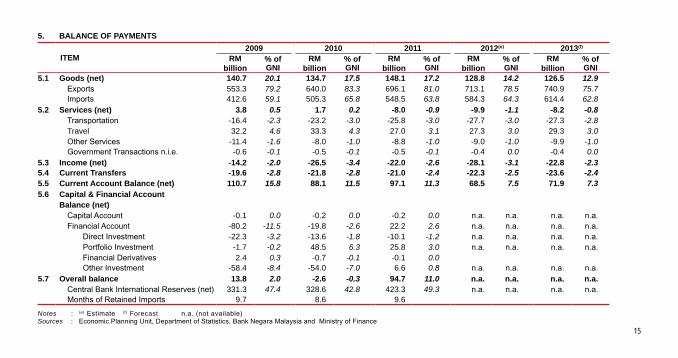
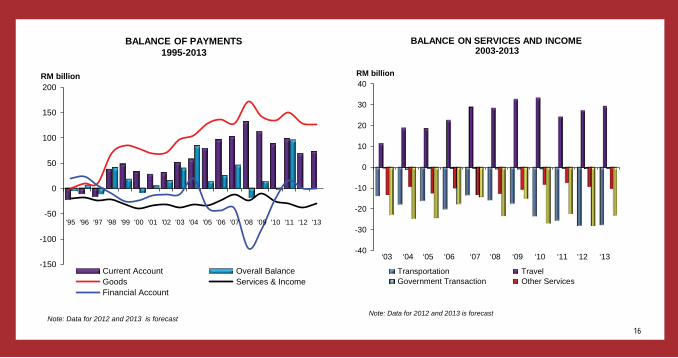
5. BALANCE OF PAYMENTS
ITEM2009 2010 2011 2012(e) 2013(f)
RM billion
% of GNI
RM billion
% of GNI
RM billion
% of GNI
RM billion
% of GNI
RM billion
% of GNI
5.1 Goods (net) 140.7 20.1 134.7 17.5 148.1 17.2 128.8 14.2 126.5 12.9Exports 553.3 79.2 640.0 83.3 696.1 81.0 713.1 78.5 740.9 75.7Imports 412.6 59.1 505.3 65.8 548.5 63.8 584.3 64.3 614.4 62.8
5.2 Services (net) 3.8 0.5 1.7 0.2 -8.0 -0.9 -9.9 -1.1 -8.2 -0.8Transportation -16.4 -2.3 -23.2 -3.0 -25.8 -3.0 -27.7 -3.0 -27.3 -2.8Travel 32.2 4.6 33.3 4.3 27.0 3.1 27.3 3.0 29.3 3.0Other Services -11.4 -1.6 -8.0 -1.0 -8.8 -1.0 -9.0 -1.0 -9.9 -1.0Government Transactions n.i.e. -0.6 -0.1 -0.5 -0.1 -0.5 -0.1 -0.4 0.0 -0.4 0.0
5.3 Income (net) -14.2 -2.0 -26.5 -3.4 -22.0 -2.6 -28.1 -3.1 -22.8 -2.35.4 Current Transfers -19.6 -2.8 -21.8 -2.8 -21.0 -2.4 -22.3 -2.5 -23.6 -2.45.5 Current Account Balance (net) 110.7 15.8 88.1 11.5 97.1 11.3 68.5 7.5 71.9 7.35.6 Capital & Financial Account
Balance (net)Capital Account -0.1 0.0 -0.2 0.0 -0.2 0.0 n.a. n.a. n.a. n.a.Financial Account -80.2 -11.5 -19.8 -2.6 22.2 2.6 n.a. n.a. n.a. n.a.
Direct Investment -22.3 -3.2 -13.6 -1.8 -10.1 -1.2 n.a. n.a. n.a. n.a.Portfolio Investment -1.7 -0.2 48.5 6.3 25.8 3.0 n.a. n.a. n.a. n.a.Financial Derivatives 2.4 0.3 -0.7 -0.1 -0.1 0.0Other Investment -58.4 -8.4 -54.0 -7.0 6.6 0.8 n.a. n.a. n.a. n.a.
5.7 Overall balance 13.8 2.0 -2.6 -0.3 94.7 11.0 n.a. n.a. n.a. n.a.Central Bank International Reserves (net) 331.3 47.4 328.6 42.8 423.3 49.3 n.a. n.a. n.a. n.a.Months of Retained Imports 9.7 8.6 9.6
Notes : (e) Estimate (f) Forecast n.a. (not available)Sources : Economic Planning Unit, Department of Statistics, Bank Negara Malaysia and Ministry of Finance
16
-150
-100
-50
0
50
100
150
200
'95 '96 '97 '98 '99 '00 '01 '02 '03 '04 '05 '06 '07 '08 '09 '10 '11 '12 '13
Current Account Overall BalanceGoods Services & IncomeFinancial Account
Note: Data for 2012 and 2013 is forecast
BALANCE OF PAYMENTS 1995-2013
RM billion
-40
-30
-20
-10
0
10
20
30
40
‘03 ‘04 ‘05 ‘06 ‘07 ‘08 ‘09 ‘10 ‘11 ‘12 ‘13
Transportation TravelGovernment Transaction Other Services
BALANCE ON SERVICES AND INCOME 2003-2013
RM billion
Note: Data for 2012 and 2013 is forecast
18
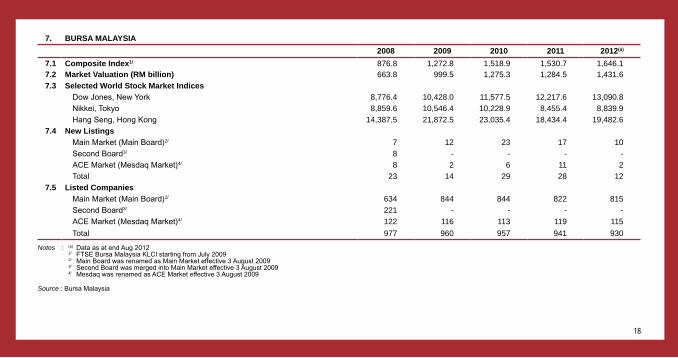
7. BURSA MALAYSIA
2008 2009 2010 2011 2012(a)
7.1 Composite Index1/ 876.8 1,272.8 1,518.9 1,530.7 1,646.17.2 Market Valuation (RM billion) 663.8 999.5 1,275.3 1,284.5 1,431.6
7.3 Selected World Stock Market Indices
Dow Jones, New York 8,776.4 10,428.0 11,577.5 12,217.6 13,090.8
Nikkei, Tokyo 8,859.6 10,546.4 10,228.9 8,455.4 8,839.9
Hang Seng, Hong Kong 14,387.5 21,872.5 23,035.4 18,434.4 19,482.6
7.4 New Listings
Main Market (Main Board)2/ 7 12 23 17 10
Second Board3/ 8 - - - -
ACE Market (Mesdaq Market)4/ 8 2 6 11 2
Total 23 14 29 28 12
7.5 Listed Companies
Main Market (Main Board)2/ 634 844 844 822 815
Second Board3/ 221 - - - -
ACE Market (Mesdaq Market)4/ 122 116 113 119 115
Total 977 960 957 941 930
Notes : (a) Data as at end Aug 2012 1/ FTSE Bursa Malaysia KLCI starting from July 2009 2/ Main Board was renamed as Main Market effective 3 August 2009 3/ Second Board was merged into Main Market effective 3 August 2009 4/ Mesdaq was renamed as ACE Market effective 3 August 2009
Source : Bursa Malaysia
19
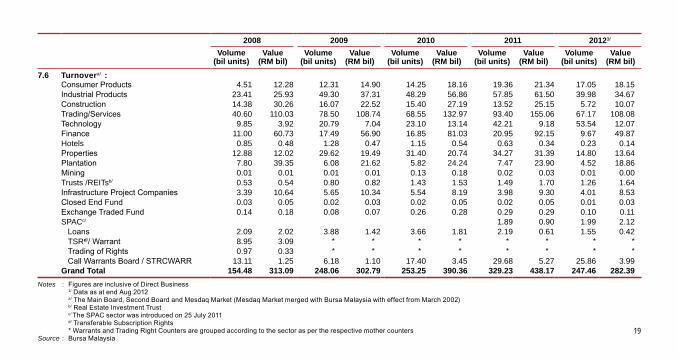
2008 2009 2010 2011 20121/
Volume (bil units)
Value (RM bil)
Volume (bil units)
Value (RM bil)
Volume (bil units)
Value (RM bil)
Volume (bil units)
Value (RM bil)
Volume (bil units)
Value (RM bil)
7.6 Turnovera/ :Consumer Products 4.51 12.28 12.31 14.90 14.25 18.16 19.36 21.34 17.05 18.15Industrial Products 23.41 25.93 49.30 37.31 48.29 56.86 57.85 61.50 39.98 34.67Construction 14.38 30.26 16.07 22.52 15.40 27.19 13.52 25.15 5.72 10.07Trading/Services 40.60 110.03 78.50 108.74 68.55 132.97 93.40 155.06 67.17 108.08Technology 9.85 3.92 20.79 7.04 23.10 13.14 42.21 9.18 53.54 12.07Finance 11.00 60.73 17.49 56.90 16.85 81.03 20.95 92.15 9.67 49.87Hotels 0.85 0.48 1.28 0.47 1.15 0.54 0.63 0.34 0.23 0.14Properties 12.88 12.02 29.62 19.49 31.40 20.74 34.27 31.39 14.80 13.64Plantation 7.80 39.35 6.08 21.62 5.82 24.24 7.47 23.90 4.52 18.86Mining 0.01 0.01 0.01 0.01 0.13 0.18 0.02 0.03 0.01 0.00Trusts /REITsb/ 0.53 0.54 0.80 0.82 1.43 1.53 1.49 1.70 1.26 1.64Infrastructure Project Companies 3.39 10.64 5.65 10.34 5.54 8.19 3.98 9.30 4.01 8.53Closed End Fund 0.03 0.05 0.02 0.03 0.02 0.05 0.02 0.05 0.01 0.03Exchange Traded Fund 0.14 0.18 0.08 0.07 0.26 0.28 0.29 0.29 0.10 0.11SPACc/ 1.89 0.90 1.99 2.12
Loans 2.09 2.02 3.88 1.42 3.66 1.81 2.19 0.61 1.55 0.42TSRd// Warrant 8.95 3.09 * * * * * * * *Trading of Rights 0.97 0.33 * * * * * * * *Call Warrants Board / STRCWARR 13.11 1.25 6.18 1.10 17.40 3.45 29.68 5.27 25.86 3.99
Grand Total 154.48 313.09 248.06 302.79 253.25 390.36 329.23 438.17 247.46 282.39
Notes : Figures are inclusive of Direct Business 1/ Data as at end Aug 2012 a/ The Main Board, Second Board and Mesdaq Market (Mesdaq Market merged with Bursa Malaysia with effect from March 2002) b/ Real Estate Investment Trust c/ The SPAC sector was introduced on 25 July 2011 d/ Transferable Subscription Rights * Warrants and Trading Right Counters are grouped according to the sector as per the respective mother counters Source : Bursa Malaysia

20
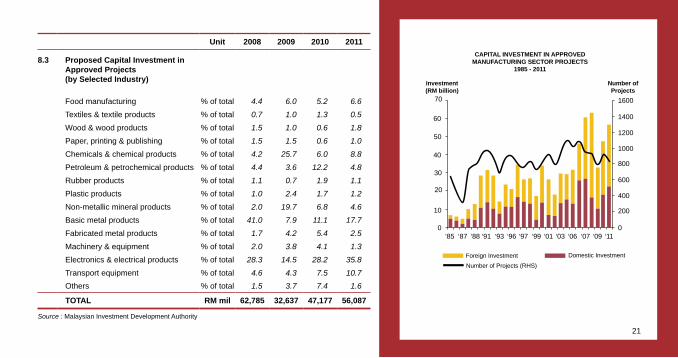
8. APPROVED INVESTMENT PROJECTS
Unit 2008 2009 2010 2011
8.1 Approved Investment Projects
Number of projects approved 919 766 910 846
Potential employment ‘000s 101 64 97 101
Total proposed capital investment RM mil 62,785 32,637 47,177 56,087
Domestic % of total 26.6 32.1 38.4 39.1
Foreign % of total 73.4 67.9 61.6 60.9
8.2 Foreign Investment in Approved
Projects (by Selected Countries)
Australia % of total 28.4 1.5 0.2 0.9
France % of total 0.5 0.1 0.7 0.5
Germany % of total 9.6 1.9 6.7 5.7
Japan % of total 12.1 31.8 13.9 29.6
Singapore % of total 4.3 9.0 7.4 7.3
Taiwan % of total 2.0 3.2 3.5 4.1
United Kingdom % of total 1.8 1.5 1.2 0.7
USA % of total 18.8 10.6 40.4 7.4
Others % of total 22.3 40.4 26.0 44.0
TOTAL RM mil 46,099 22,145 29,057 34,149
Source : Malaysian Investment Development Authority
70
60
50
40
30
20
10
0
1400
1600
1200
1000
800
600
400
200
0‘85 ‘87 ‘88 ‘91 ‘93 ‘96 ‘97 ‘99 ‘01 ‘03 ‘06 ‘07 ‘09 ‘11
Foreign Investment
CAPITAL INVESTMENT IN APPROVEDMANUFACTURING SECTOR PROJECTS
1985 - 2011
Investment(RM billion)
Number ofProjects
Number of Projects (RHS)
Domestic Investment
21
Unit 2008 2009 2010 2011
8.3 Proposed Capital Investment in Approved Projects (by Selected Industry)
Food manufacturing % of total 4.4 6.0 5.2 6.6
Textiles & textile products % of total 0.7 1.0 1.3 0.5
Wood & wood products % of total 1.5 1.0 0.6 1.8
Paper, printing & publishing % of total 1.5 1.5 0.6 1.0
Chemicals & chemical products % of total 4.2 25.7 6.0 8.8
Petroleum & petrochemical products % of total 4.4 3.6 12.2 4.8
Rubber products % of total 1.1 0.7 1.9 1.1
Plastic products % of total 1.0 2.4 1.7 1.2
Non-metallic mineral products % of total 2.0 19.7 6.8 4.6
Basic metal products % of total 41.0 7.9 11.1 17.7
Fabricated metal products % of total 1.7 4.2 5.4 2.5
Machinery & equipment % of total 2.0 3.8 4.1 1.3
Electronics & electrical products % of total 28.3 14.5 28.2 35.8
Transport equipment % of total 4.6 4.3 7.5 10.7
Others % of total 1.5 3.7 7.4 1.6
TOTAL RM mil 62,785 32,637 47,177 56,087
Source : Malaysian Investment Development Authority
22
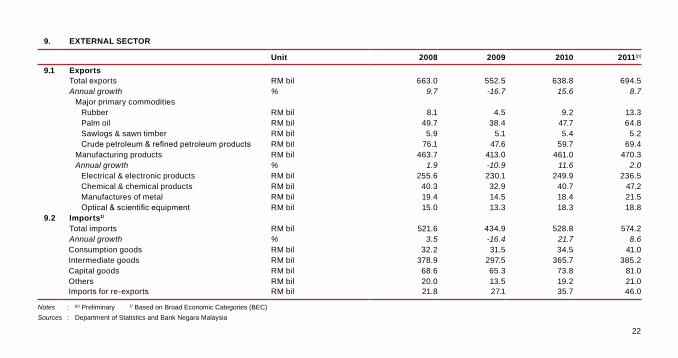
9. EXTERNAL SECTOR
Unit 2008 2009 2010 2011(p)
9.1 ExportsTotal exports RM bil 663.0 552.5 638.8 694.5Annual growth % 9.7 -16.7 15.6 8.7
Major primary commoditiesRubber RM bil 8.1 4.5 9.2 13.3Palm oil RM bil 49.7 38.4 47.7 64.8Sawlogs & sawn timber RM bil 5.9 5.1 5.4 5.2Crude petroleum & refined petroleum products RM bil 76.1 47.6 59.7 69.4
Manufacturing products RM bil 463.7 413.0 461.0 470.3Annual growth % 1.9 -10.9 11.6 2.0
Electrical & electronic products RM bil 255.6 230.1 249.9 236.5Chemical & chemical products RM bil 40.3 32.9 40.7 47.2Manufactures of metal RM bil 19.4 14.5 18.4 21.5Optical & scientific equipment RM bil 15.0 13.3 18.3 18.8
9.2 Imports1/
Total imports RM bil 521.6 434.9 528.8 574.2Annual growth % 3.5 -16.4 21.7 8.6Consumption goods RM bil 32.2 31.5 34.5 41.0Intermediate goods RM bil 378.9 297.5 365.7 385.2Capital goods RM bil 68.6 65.3 73.8 81.0Others RM bil 20.0 13.5 19.2 21.0Imports for re-exports RM bil 21.8 27.1 35.7 46.0
Notes : (p) Preliminary 1/ Based on Broad Economic Categories (BEC)
Sources : Department of Statistics and Bank Negara Malaysia
23
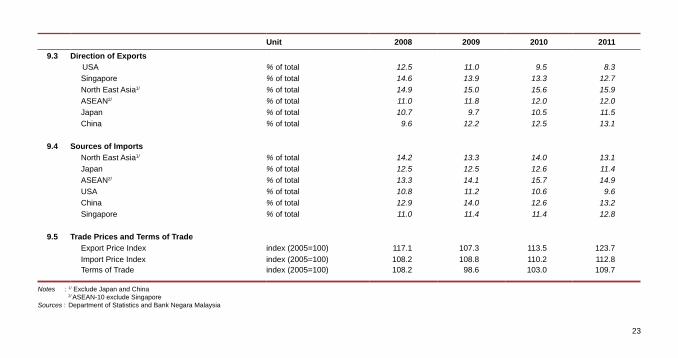
Unit 2008 2009 2010 2011
9.3 Direction of Exports USA % of total 12.5 11.0 9.5 8.3
Singapore % of total 14.6 13.9 13.3 12.7
North East Asia1/ % of total 14.9 15.0 15.6 15.9
ASEAN2/ % of total 11.0 11.8 12.0 12.0
Japan % of total 10.7 9.7 10.5 11.5
China % of total 9.6 12.2 12.5 13.1
9.4 Sources of Imports
North East Asia1/ % of total 14.2 13.3 14.0 13.1
Japan % of total 12.5 12.5 12.6 11.4
ASEAN2/ % of total 13.3 14.1 15.7 14.9
USA % of total 10.8 11.2 10.6 9.6
China % of total 12.9 14.0 12.6 13.2
Singapore % of total 11.0 11.4 11.4 12.8
9.5 Trade Prices and Terms of Trade
Export Price Index index (2005=100) 117.1 107.3 113.5 123.7
Import Price Index index (2005=100) 108.2 108.8 110.2 112.8Terms of Trade index (2005=100) 108.2 98.6 103.0 109.7
Notes : 1/ Exclude Japan and China 2/ ASEAN-10 exclude SingaporeSources : Department of Statistics and Bank Negara Malaysia
24
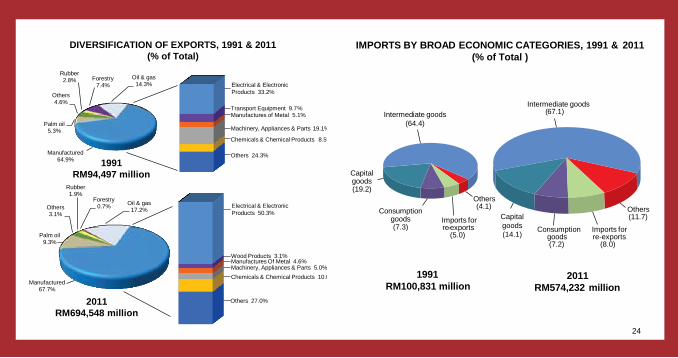
DIVERSIFICATION OF EXPORTS, 1991 & 2011 (% of Total)
Manufactured
67.7%
Palm oil 9.3%
Others 3.1%
Rubber 1.9%
Forestry 0.7% Oil & gas
17.2%
Manufactured
64.9%
Palm oil
5.3%
Others 4.6%
Rubber 2.8% Forestry
7.4% Oil & gas
14.3%
2011
RM694,548 million
1991
RM94,497 million
Electrical & Electronic Products 50.3%
Wood Products 3.1%
Chemicals & Chemical Products 10.0%
Others 27.0%
Machinery, Appliances & Parts 5.0%Manufactures Of Metal 4.6%
Electrical & Electronic Products 33.2%
Transport Equipment 9.7%
Chemicals & Chemical Products 8.5%
Others 24.3%
Machinery, Appliances & Parts 19.1%
Manufactures of Metal 5.1%
IMPORTS BY BROAD ECONOMIC CATEGORIES, 1991 & 2011 (% of Total )
1991 RM100,831 million
2011 RM574,232 million
Intermediate goods(64.4)
Capitalgoods(19.2)
Consumptiongoods(7.3)
Imports for
re-exports (5.0)
Others (4.1) Others
(11.7)
Imports for re-exports
(8.0)
Consumption goods (7.2)
Capital goods (14.1)
Intermediate goods (67.1)
25
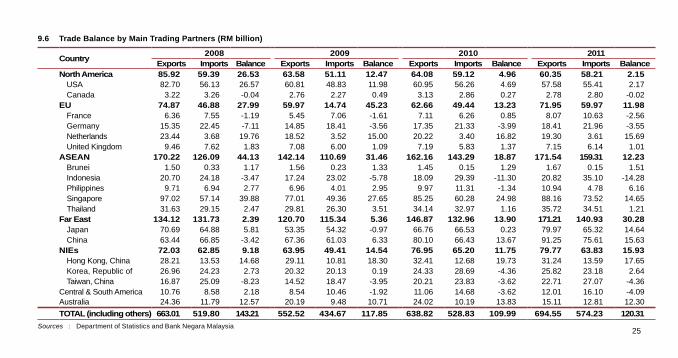
9.6 Trade Balance by Main Trading Partners (RM billion)
Country2008 2009 2010 2011
Exports Imports Balance Exports Imports Balance Exports Imports Balance Exports Imports BalanceNorth America 85.92 59.39 26.53 63.58 51.11 12.47 64.08 59.12 4.96 60.35 58.21 2.15
USA 82.70 56.13 26.57 60.81 48.83 11.98 60.95 56.26 4.69 57.58 55.41 2.17Canada 3.22 3.26 -0.04 2.76 2.27 0.49 3.13 2.86 0.27 2.78 2.80 -0.02
EU 74.87 46.88 27.99 59.97 14.74 45.23 62.66 49.44 13.23 71.95 59.97 11.98France 6.36 7.55 -1.19 5.45 7.06 -1.61 7.11 6.26 0.85 8.07 10.63 -2.56Germany 15.35 22.45 -7.11 14.85 18.41 -3.56 17.35 21.33 -3.99 18.41 21.96 -3.55Netherlands 23.44 3.68 19.76 18.52 3.52 15.00 20.22 3.40 16.82 19.30 3.61 15.69United Kingdom 9.46 7.62 1.83 7.08 6.00 1.09 7.19 5.83 1.37 7.15 6.14 1.01
ASEAN 170.22 126.09 44.13 142.14 110.69 31.46 162.16 143.29 18.87 171.54 159.31 12.23Brunei 1.50 0.33 1.17 1.56 0.23 1.33 1.45 0.15 1.29 1.67 0.15 1.51Indonesia 20.70 24.18 -3.47 17.24 23.02 -5.78 18.09 29.39 -11.30 20.82 35.10 -14.28Philippines 9.71 6.94 2.77 6.96 4.01 2.95 9.97 11.31 -1.34 10.94 4.78 6.16Singapore 97.02 57.14 39.88 77.01 49.36 27.65 85.25 60.28 24.98 88.16 73.52 14.65Thailand 31.63 29.15 2.47 29.81 26.30 3.51 34.14 32.97 1.16 35.72 34.51 1.21
Far East 134.12 131.73 2.39 120.70 115.34 5.36 146.87 132.96 13.90 171.21 140.93 30.28Japan 70.69 64.88 5.81 53.35 54.32 -0.97 66.76 66.53 0.23 79.97 65.32 14.64China 63.44 66.85 -3.42 67.36 61.03 6.33 80.10 66.43 13.67 91.25 75.61 15.63
NIEs 72.03 62.85 9.18 63.95 49.41 14.54 76.95 65.20 11.75 79.77 63.83 15.93Hong Kong, China 28.21 13.53 14.68 29.11 10.81 18.30 32.41 12.68 19.73 31.24 13.59 17.65Korea, Republic of 26.96 24.23 2.73 20.32 20.13 0.19 24.33 28.69 -4.36 25.82 23.18 2.64Taiwan, China 16.87 25.09 -8.23 14.52 18.47 -3.95 20.21 23.83 -3.62 22.71 27.07 -4.36
Central & South America 10.76 8.58 2.18 8.54 10.46 -1.92 11.06 14.68 -3.62 12.01 16.10 -4.09Australia 24.36 11.79 12.57 20.19 9.48 10.71 24.02 10.19 13.83 15.11 12.81 12.30
TOTAL (including others) 663.01 519.80 143.21 552.52 434.67 117.85 638.82 528.83 109.99 694.55 574.23 120.31
Sources : Department of Statistics and Bank Negara Malaysia
26
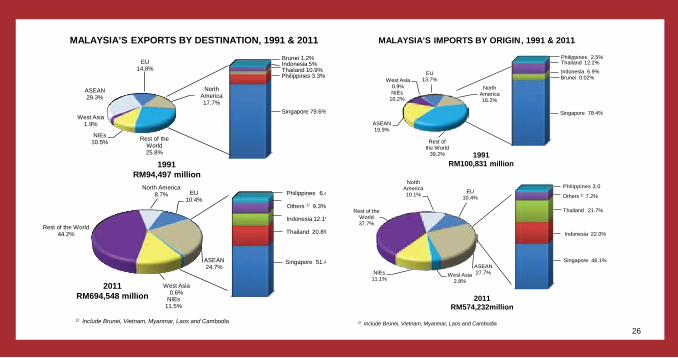
MALAYSIA’S IMPORTS BY ORIGIN , 1991 & 2011
EU 13.7%
North America
16.2%
Rest of the World
39.2%
ASEAN 19.9%
NIEs 10.2%
West Asia 0.9%
EU 10.4%
ASEAN 27.7% West Asia
2.8%
NIEs 11.1%
Rest of the World 37.7%
North America 10.1%
Philippines 2.5% Thailand 12.2%
Indonesia 6.9% Brunei 0.02%
Singapore 78.4%
Thailand
Philippines 3.0
21.7%
Indonesia 22.0%
Others 1/ 7.2%
Singapore 46.1%
2011
RM574,232million
1991 RM100,831 million
1/ Include Brunei, Vietnam, Myanmar, Laos and Cambodia
EU 14.8%
North America
17.7%
Rest of the World 25.8%
NIEs 10.5%
West Asia 1.9%
ASEAN 29.3%
EU 10.4%
ASEAN 24.7%
West Asia
0.6% NIEs
11.5%
North America 8.7%
MALAYSIA’S EXPORTS BY DESTINATION, 1991 & 2011
1991 RM94,497 million
2011 RM694,548 million
Brunei 1.2% Indonesia 5%
Philippines 3.3% Thailand 10.9%
Singapore 79.6%
Others 1/ 9.3%
Indonesia 12.1%
Philippines 6.4%
Thailand 20.8%
Singapore 51.4%
1/ Include Brunei, Vietnam, Myanmar, Laos and Cambodia
Rest of the World44.2%
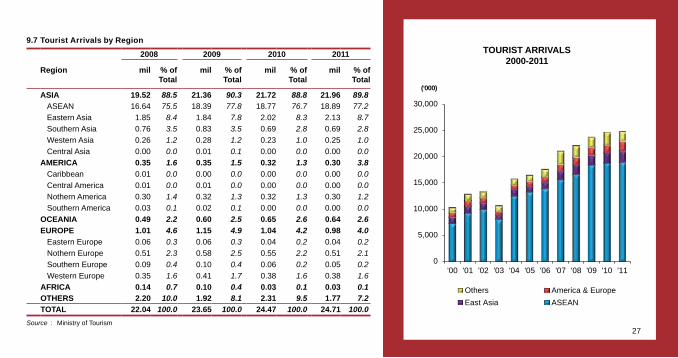
TOURIST ARRIVALS2000-2011
0
5,000
10,000
15,000
20,000
25,000
30,000
'00 '01 '02 '03 '04 '05 '06 '07 '08 '09 '10 '11
Others America & Europe
East Asia ASEAN
(‘000)
27
9.7 Tourist Arrivals by Region
2008 2009 2010 2011
Region mil % of Total
mil % of Total
mil % of Total
mil % of Total
ASIA 19.52 88.5 21.36 90.3 21.72 88.8 21.96 89.8ASEAN 16.64 75.5 18.39 77.8 18.77 76.7 18.89 77.2
Eastern Asia 1.85 8.4 1.84 7.8 2.02 8.3 2.13 8.7
Southern Asia 0.76 3.5 0.83 3.5 0.69 2.8 0.69 2.8
Western Asia 0.26 1.2 0.28 1.2 0.23 1.0 0.25 1.0
Central Asia 0.00 0.0 0.01 0.1 0.00 0.0 0.00 0.0
AMERICA 0.35 1.6 0.35 1.5 0.32 1.3 0.30 3.8
Caribbean 0.01 0.0 0.00 0.0 0.00 0.0 0.00 0.0
Central America 0.01 0.0 0.01 0.0 0.00 0.0 0.00 0.0
Nothern America 0.30 1.4 0.32 1.3 0.32 1.3 0.30 1.2
Southern America 0.03 0.1 0.02 0.1 0.00 0.0 0.00 0.0
OCEANIA 0.49 2.2 0.60 2.5 0.65 2.6 0.64 2.6
EUROPE 1.01 4.6 1.15 4.9 1.04 4.2 0.98 4.0
Eastern Europe 0.06 0.3 0.06 0.3 0.04 0.2 0.04 0.2
Nothern Europe 0.51 2.3 0.58 2.5 0.55 2.2 0.51 2.1
Southern Europe 0.09 0.4 0.10 0.4 0.06 0.2 0.05 0.2
Western Europe 0.35 1.6 0.41 1.7 0.38 1.6 0.38 1.6
AFRICA 0.14 0.7 0.10 0.4 0.03 0.1 0.03 0.1OTHERS 2.20 10.0 1.92 8.1 2.31 9.5 1.77 7.2TOTAL 22.04 100.0 23.65 100.0 24.47 100.0 24.71 100.0
Source : Ministry of Tourism
28
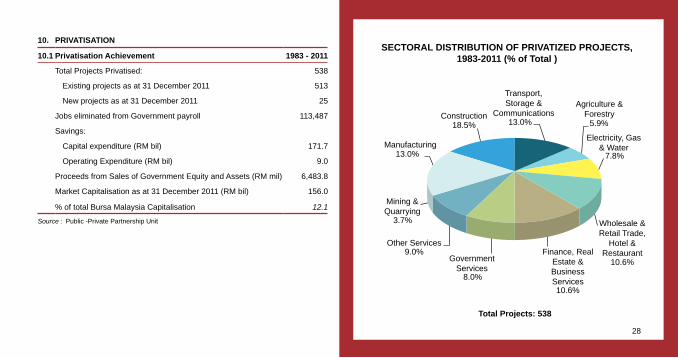
10. PRIVATISATION
10.1 Privatisation Achievement 1983 - 2011
Total Projects Privatised: 538
Existing projects as at 31 December 2011 513
New projects as at 31 December 2011 25
Jobs eliminated from Government payroll 113,487
Savings:
Capital expenditure (RM bil) 171.7
Operating Expenditure (RM bil) 9.0
Proceeds from Sales of Government Equity and Assets (RM mil) 6,483.8
Market Capitalisation as at 31 December 2011 (RM bil) 156.0
% of total Bursa Malaysia Capitalisation 12.1
Source : Public -Private Partnership Unit
SECTORAL DISTRIBUTION OF PRIVATIZED PROJECTS,1983-2011 (% of Total )
Construction18.5%
Manufacturing13.0%
Mining &Quarrying
3.7%
Other Services9.0%
GovernmentServices
8.0%
Finance, RealEstate &BusinessServices10.6%
Wholesale &Retail Trade,
Hotel &Restaurant
10.6%
Electricity, Gas& Water
7.8%
Agriculture &Forestry
5.9%
Transport,Storage &
Communications13.0%
Total Projects: 538
29
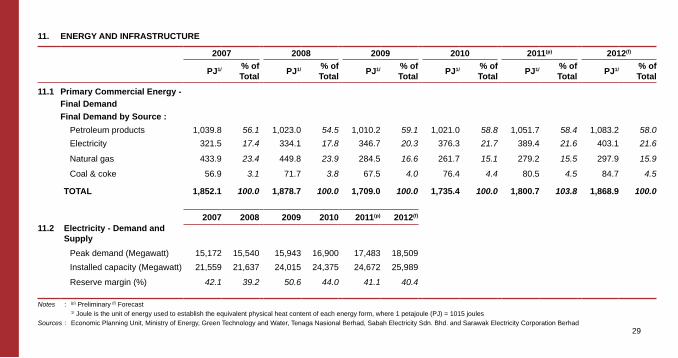
11. ENERGY AND INFRASTRUCTURE
2007 2008 2009 2010 2011(p) 2012(f)
PJ1/ % of Total
PJ1/ % of Total
PJ1/ % of Total
PJ1/ % of Total
PJ1/ % of Total
PJ1/ % of Total
11.1 Primary Commercial Energy -
Final Demand
Final Demand by Source :
Petroleum products 1,039.8 56.1 1,023.0 54.5 1,010.2 59.1 1,021.0 58.8 1,051.7 58.4 1,083.2 58.0
Electricity 321.5 17.4 334.1 17.8 346.7 20.3 376.3 21.7 389.4 21.6 403.1 21.6
Natural gas 433.9 23.4 449.8 23.9 284.5 16.6 261.7 15.1 279.2 15.5 297.9 15.9
Coal & coke 56.9 3.1 71.7 3.8 67.5 4.0 76.4 4.4 80.5 4.5 84.7 4.5
TOTAL 1,852.1 100.0 1,878.7 100.0 1,709.0 100.0 1,735.4 100.0 1,800.7 103.8 1,868.9 100.0
2007 2008 2009 2010 2011(p) 2012(f)
11.2 Electricity - Demand and Supply
Peak demand (Megawatt) 15,172 15,540 15,943 16,900 17,483 18,509
Installed capacity (Megawatt) 21,559 21,637 24,015 24,375 24,672 25,989
Reserve margin (%) 42.1 39.2 50.6 44.0 41.1 40.4
Notes : (p) Preliminary (f) Forecast 1/ Joule is the unit of energy used to establish the equivalent physical heat content of each energy form, where 1 petajoule (PJ) = 1015 joulesSources : Economic Planning Unit, Ministry of Energy, Green Technology and Water, Tenaga Nasional Berhad, Sabah Electricity Sdn. Bhd. and Sarawak Electricity Corporation Berhad
30
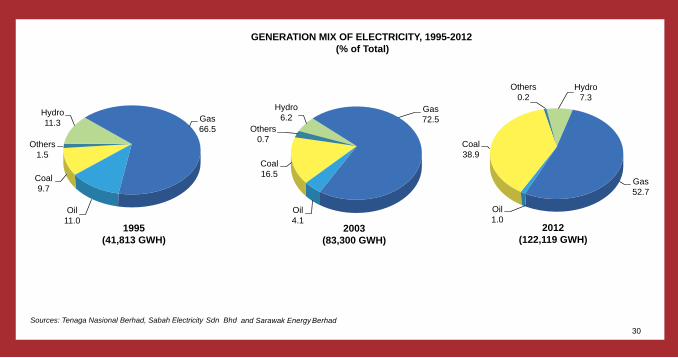
GENERATION MIX OF ELECTRICITY, 1995-2012
2003(83,300 GWH)
1995(41,813 GWH)
2012(122,119 GWH)
(% of Total)
Sources: Tenaga Nasional Berhad, Sabah Electricity Sdn Bhd and Sarawak Energy Berhad
Hydro6.2Hydro
11.3
Hydro7.3
Gas72.5Gas
66.5
Gas52.7
Others0.7Others
1.5
Others0.2
Coal16.5Coal
9.7
Coal38.9
Oil4.1
Oil11.0
Oil1.0
31
Unit 2008 2009 2010 2011 2012(f)
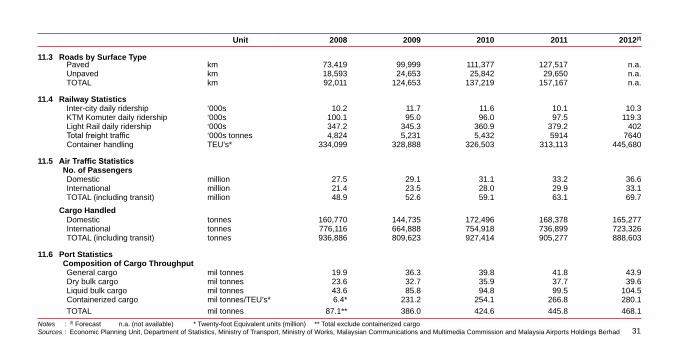
11.3 Roads by Surface TypePaved km 73,419 99,999 111,377 127,517 n.a.Unpaved km 18,593 24,653 25,842 29,650 n.a.TOTAL km 92,011 124,653 137,219 157,167 n.a.
11.4 Railway StatisticsInter-city daily ridership ‘000s 10.2 11.7 11.6 10.1 10.3KTM Komuter daily ridership ‘000s 100.1 95.0 96.0 97.5 119.3Light Rail daily ridership ‘000s 347.2 345.3 360.9 379.2 402Total freight traffic ‘000s tonnes 4,824 5,231 5,432 5914 7640Container handling TEU’s* 334,099 328,888 326,503 313,113 445,680
11.5 Air Traffic StatisticsNo. of PassengersDomestic million 27.5 29.1 31.1 33.2 36.6International million 21.4 23.5 28.0 29.9 33.1TOTAL (including transit) million 48.9 52.6 59.1 63.1 69.7
Cargo HandledDomestic tonnes 160,770 144,735 172,496 168,378 165,277International tonnes 776,116 664,888 754,918 736,899 723,326TOTAL (including transit) tonnes 936,886 809,623 927,414 905,277 888,603
11.6 Port StatisticsComposition of Cargo ThroughputGeneral cargo mil tonnes 19.9 36.3 39.8 41.8 43.9Dry bulk cargo mil tonnes 23.6 32.7 35.9 37.7 39.6Liquid bulk cargo mil tonnes 43.6 85.8 94.8 99.5 104.5Containerized cargo mil tonnes/TEU’s* 6.4* 231.2 254.1 266.8 280.1
TOTAL mil tonnes 87.1** 386.0 424.6 445.8 468.1
Notes : (f) Forecast n.a. (not available) * Twenty-foot Equivalent units (million) ** Total exclude containerized cargoSources : Economic Planning Unit, Department of Statistics, Ministry of Transport, Ministry of Works, Malaysian Communications and Multimedia Commission and Malaysia Airports Holdings Berhad
32
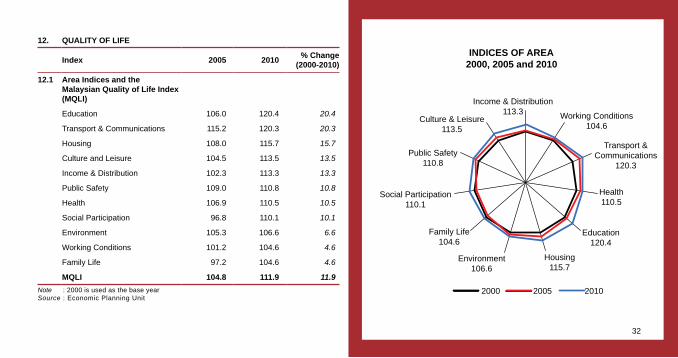
12. QUALITY OF LIFE
Index 2005 2010% Change
(2000-2010)
12.1 Area Indices and theMalaysian Quality of Life Index(MQLI)
Education 106.0 120.4 20.4
Transport & Communications 115.2 120.3 20.3
Housing 108.0 115.7 15.7
Culture and Leisure 104.5 113.5 13.5
Income & Distribution 102.3 113.3 13.3
Public Safety 109.0 110.8 10.8
Health 106.9 110.5 10.5
Social Participation 96.8 110.1 10.1
Environment 105.3 106.6 6.6
Working Conditions 101.2 104.6 4.6
Family Life 97.2 104.6 4.6
MQLI 104.8 111.9 11.9
Note : 2000 is used as the base yearSource : Economic Planning Unit
INDICES OF AREA2000, 2005 and 2010
Income & Distribution113.3 Working Conditions
104.6
Transport &Communications
120.3
Health110.5
Education120.4
Housing115.7
Environment106.6
2000 2005 2010
Family Life104.6
Social Participation110.1
Public Safety110.8
Culture & Leisure113.5
33
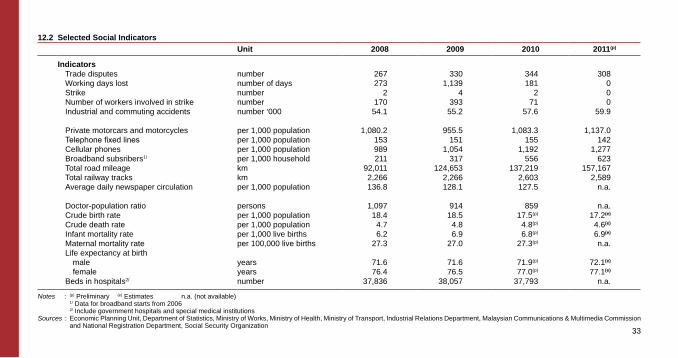
12.2 Selected Social Indicators
Unit 2008 2009 2010 2011(p)
IndicatorsTrade disputes number 267 330 344 308Working days lost number of days 273 1,139 181 0Strike number 2 4 2 0Number of workers involved in strike number 170 393 71 0Industrial and commuting accidents number ‘000 54.1 55.2 57.6 59.9
Private motorcars and motorcycles per 1,000 population 1,080.2 955.5 1,083.3 1,137.0Telephone fixed lines per 1,000 population 153 151 155 142Cellular phones per 1,000 population 989 1,054 1,192 1,277Broadband subsribers1/ per 1,000 household 211 317 556 623Total road mileage km 92,011 124,653 137,219 157,167Total railway tracks km 2,266 2,266 2,603 2,589Average daily newspaper circulation per 1,000 population 136.8 128.1 127.5 n.a.
Doctor-population ratio persons 1,097 914 859 n.a.Crude birth rate per 1,000 population 18.4 18.5 17.5(p) 17.2(e)
Crude death rate per 1,000 population 4.7 4.8 4.8(p) 4.6(e)
Infant mortality rate per 1,000 live births 6.2 6.9 6.8(p) 6.9(e)
Maternal mortality rate per 100,000 live births 27.3 27.0 27.3(p) n.a.Life expectancy at birth
male years 71.6 71.6 71.9(p) 72.1(e)
female years 76.4 76.5 77.0(p) 77.1(e)
Beds in hospitals2/ number 37,836 38,057 37,793 n.a.
Notes : (p) Preliminary (e) Estimates n.a. (not available) 1/ Data for broadband starts from 2006 2/ Include government hospitals and special medical institutionsSources : Economic Planning Unit, Department of Statistics, Ministry of Works, Ministry of Health, Ministry of Transport, Industrial Relations Department, Malaysian Communications & Multimedia Commission
and National Registration Department, Social Security Organization
34
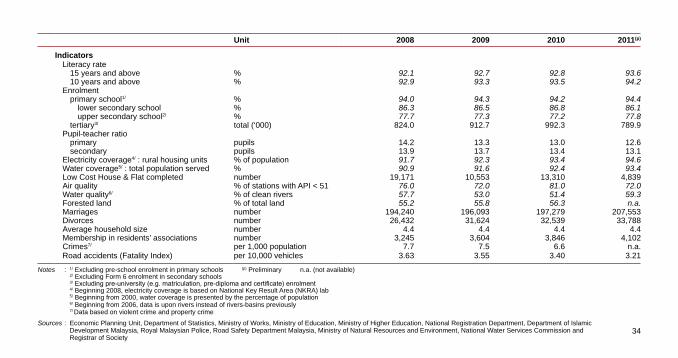
Unit 2008 2009 2010 2011(p)
IndicatorsLiteracy rate
15 years and above % 92.1 92.7 92.8 93.610 years and above % 92.9 93.3 93.5 94.2
Enrolmentprimary school1/ % 94.0 94.3 94.2 94.4
lower secondary school % 86.3 86.5 86.8 86.1upper secondary school2/ % 77.7 77.3 77.2 77.8
tertiary3/ total (‘000) 824.0 912.7 992.3 789.9Pupil-teacher ratio
primary pupils 14.2 13.3 13.0 12.6secondary pupils 13.9 13.7 13.4 13.1
Electricity coverage4/ : rural housing units % of population 91.7 92.3 93.4 94.6Water coverage5/ : total population served % 90.9 91.6 92.4 93.4Low Cost House & Flat completed number 19,171 10,553 13,310 4,839Air quality % of stations with API < 51 76.0 72.0 81.0 72.0Water quality6/ % of clean rivers 57.7 53.0 51.4 59.3Forested land % of total land 55.2 55.8 56.3 n.a.Marriages number 194,240 196,093 197,279 207,553Divorces number 26,432 31,624 32,539 33,788Average household size number 4.4 4.4 4.4 4.4Membership in residents’ associations number 3,245 3,604 3,846 4,102Crimes7/ per 1,000 population 7.7 7.5 6.6 n.a.Road accidents (Fatality Index) per 10,000 vehicles 3.63 3.55 3.40 3.21
Notes : 1/ Excluding pre-school enrolment in primary schools (p) Preliminary n.a. (not available) 2/ Excluding Form 6 enrolment in secondary schools 3/ Excluding pre-university (e.g. matriculation, pre-diploma and certificate) enrolment 4/ Beginning 2008, electricity coverage is based on National Key Result Area (NKRA) lab 5/ Beginning from 2000, water coverage is presented by the percentage of population 6/ Beginning from 2006, data is upon rivers instead of rivers-basins previously 7/ Data based on violent crime and property crime
Sources : Economic Planning Unit, Department of Statistics, Ministry of Works, Ministry of Education, Ministry of Higher Education, National Registration Department, Department of Islamic Development Malaysia, Royal Malaysian Police, Road Safety Department Malaysia, Ministry of Natural Resources and Environment, National Water Services Commission and Registrar of Society
35
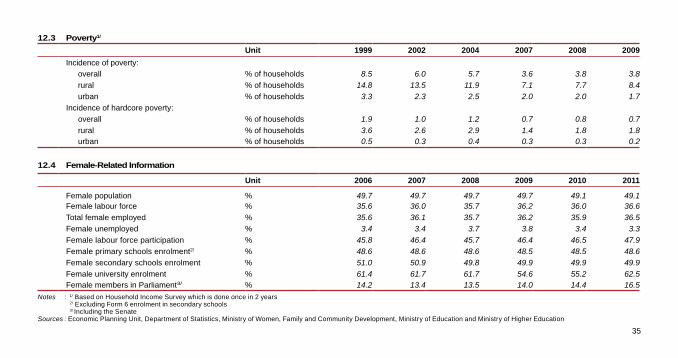
12.3 Poverty1/
Unit 1999 2002 2004 2007 2008 2009
Incidence of poverty:overall % of households 8.5 6.0 5.7 3.6 3.8 3.8
rural % of households 14.8 13.5 11.9 7.1 7.7 8.4
urban % of households 3.3 2.3 2.5 2.0 2.0 1.7
Incidence of hardcore poverty:
overall % of households 1.9 1.0 1.2 0.7 0.8 0.7
rural % of households 3.6 2.6 2.9 1.4 1.8 1.8urban % of households 0.5 0.3 0.4 0.3 0.3 0.2
12.4 Female-Related Information
Unit 2006 2007 2008 2009 2010 2011
Female population % 49.7 49.7 49.7 49.7 49.1 49.1Female labour force % 35.6 36.0 35.7 36.2 36.0 36.6
Total female employed % 35.6 36.1 35.7 36.2 35.9 36.5
Female unemployed % 3.4 3.4 3.7 3.8 3.4 3.3
Female labour force participation % 45.8 46.4 45.7 46.4 46.5 47.9
Female primary schools enrolment2/ % 48.6 48.6 48.6 48.5 48.5 48.6
Female secondary schools enrolment % 51.0 50.9 49.8 49.9 49.9 49.9
Female university enrolment % 61.4 61.7 61.7 54.6 55.2 62.5Female members in Parliament3/ % 14.2 13.4 13.5 14.0 14.4 16.5
Notes : 1/ Based on Household Income Survey which is done once in 2 years 2/ Excluding Form 6 enrolment in secondary schools 3/ Including the SenateSources : Economic Planning Unit, Department of Statistics, Ministry of Women, Family and Community Development, Ministry of Education and Ministry of Higher Education
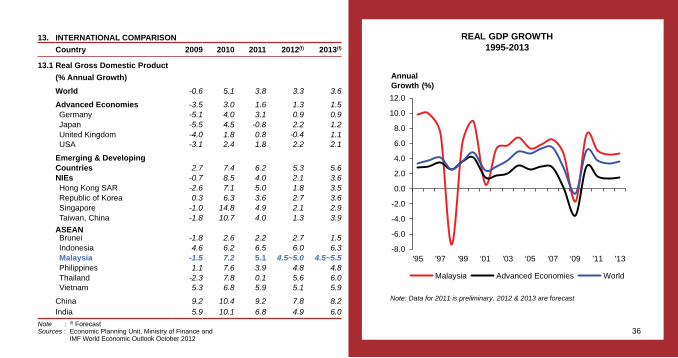
REAL GDP GROWTH 1995-2013
Annual Growth (%)
-8.0
-6.0
-4.0
-2.0
0.0
2.0
4.0
6.0
8.0
10.0
12.0
'95 '97 '99 '01 '03 '05 '07 '09 '11 '13
Malaysia Advanced Economies World
Note: Data for 2011 is preliminary, 2012 & 2013 are forecast
36
13. INTERNATIONAL COMPARISON
Country 2009 2010 2011 2012(f) 2013(f)
13.1 Real Gross Domestic Product
(% Annual Growth)
World -0.6 5.1 3.8 3.3 3.6
Advanced Economies -3.5 3.0 1.6 1.3 1.5Germany -5.1 4.0 3.1 0.9 0.9Japan -5.5 4.5 -0.8 2.2 1.2United Kingdom -4.0 1.8 0.8 -0.4 1.1USA -3.1 2.4 1.8 2.2 2.1
Emerging & DevelopingCountries 2.7 7.4 6.2 5.3 5.6NIEs -0.7 8.5 4.0 2.1 3.6Hong Kong SAR -2.6 7.1 5.0 1.8 3.5Republic of Korea 0.3 6.3 3.6 2.7 3.6Singapore -1.0 14.8 4.9 2.1 2.9Taiwan, China -1.8 10.7 4.0 1.3 3.9
ASEANBrunei -1.8 2.6 2.2 2.7 1.5Indonesia 4.6 6.2 6.5 6.0 6.3Malaysia -1.5 7.2 5.1 4.5~5.0 4.5~5.5Philippines 1.1 7.6 3.9 4.8 4.8Thailand -2.3 7.8 0.1 5.6 6.0Vietnam 5.3 6.8 5.9 5.1 5.9
China 9.2 10.4 9.2 7.8 8.2India 5.9 10.1 6.8 4.9 6.0
Note : (f) Forecast Sources : Economic Planning Unit, Ministry of Finance and IMF World Economic Outlook October 2012
z
37
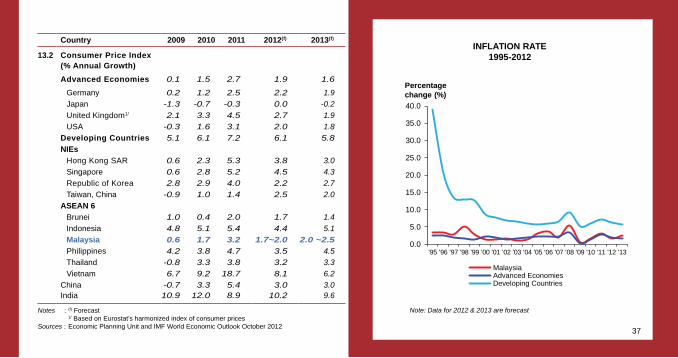
Country 2009 2010 2011 2012(f) 2013(f)
13.2 Consumer Price Index(% Annual Growth)
Advanced Economies 0.1 1.5 2.7 1.9 1.6
Germany 0.2 1.2 2.5 2.2 1.9
Japan -1.3 -0.7 -0.3 0.0 -0.2
United Kingdom1/ 2.1 3.3 4.5 2.7 1.9
USA -0.3 1.6 3.1 2.0 1.8
Developing Countries 5.1 6.1 7.2 6.1 5.8
NIEs
Hong Kong SAR 0.6 2.3 5.3 3.8 3.0
Singapore 0.6 2.8 5.2 4.5 4.3
Republic of Korea 2.8 2.9 4.0 2.2 2.7
Taiwan, China -0.9 1.0 1.4 2.5 2.0
ASEAN 6
Brunei 1.0 0.4 2.0 1.7 1.4
Indonesia 4.8 5.1 5.4 4.4 5.1
Malaysia 0.6 1.7 3.2 1.7~2.0 2.0 ~2.5
Philippines 4.2 3.8 4.7 3.5 4.5
Thailand -0.8 3.3 3.8 3.2 3.3
Vietnam 6.7 9.2 18.7 8.1 6.2
China -0.7 3.3 5.4 3.0 3.0India 10.9 12.0 8.9 10.2 9.6
Notes : (f) Forecast 1/ Based on Eurostat’s harmonized index of consumer pricesSources : Economic Planning Unit and IMF World Economic Outlook October 2012
INFLATION RATE 1995-2012
Percentage change (%)
0.0
5.0
10.0
15.0
20.0
25.0
30.0
35.0
40.0
'95 '96 '97 '98 '99 '00 '01 '02 '03 '04 '05 '06 '07 '08 '09 '10 '11 '12 '13
MalaysiaAdvanced EconomiesDeveloping Countries
Note: Data for 2012 & 2013 are forecast
38
Country Year GDP (US$ billion)
Value Added as percent of GDP (%)Agriculture Industry1/ Services
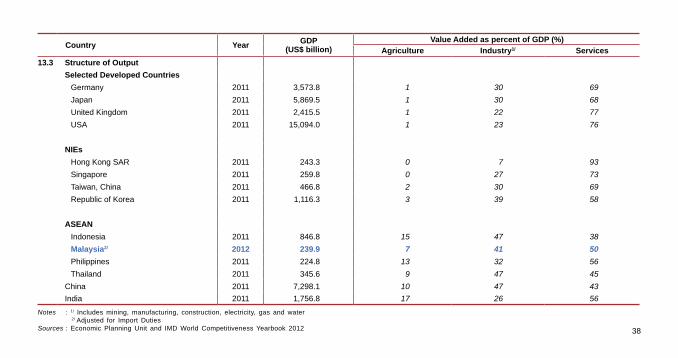
13.3 Structure of Output
Selected Developed Countries
Germany 2011 3,573.8 1 30 69
Japan 2011 5,869.5 1 30 68
United Kingdom 2011 2,415.5 1 22 77
USA 2011 15,094.0 1 23 76
NIEs
Hong Kong SAR 2011 243.3 0 7 93
Singapore 2011 259.8 0 27 73
Taiwan, China 2011 466.8 2 30 69
Republic of Korea 2011 1,116.3 3 39 58
ASEAN
Indonesia 2011 846.8 15 47 38
Malaysia2/ 2012 239.9 7 41 50
Philippines 2011 224.8 13 32 56
Thailand 2011 345.6 9 47 45
China 2011 7,298.1 10 47 43
India 2011 1,756.8 17 26 56
Notes : 1/ Includes mining, manufacturing, construction, electricity, gas and water 2/ Adjusted for Import DutiesSources : Economic Planning Unit and IMD World Competitiveness Yearbook 2012
39
Country Year
Percentage of GDP (%)
Household ConsumptionExpenditure
Government ConsumptionExpenditure
Gross Fixed Capital
Formation
Exports ofGoods
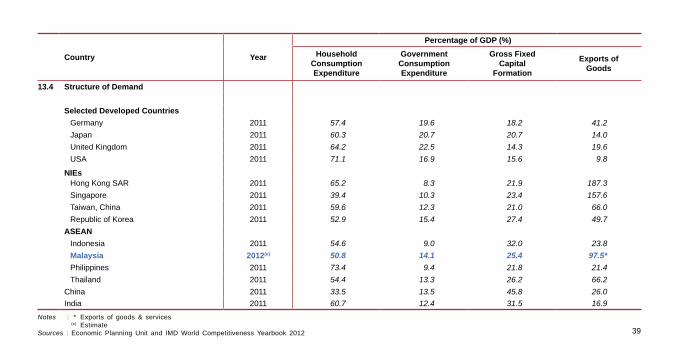
13.4 Structure of Demand
Selected Developed Countries
Germany 2011 57.4 19.6 18.2 41.2
Japan 2011 60.3 20.7 20.7 14.0
United Kingdom 2011 64.2 22.5 14.3 19.6
USA 2011 71.1 16.9 15.6 9.8
NIEsHong Kong SAR 2011 65.2 8.3 21.9 187.3
Singapore 2011 39.4 10.3 23.4 157.6
Taiwan, China 2011 59.6 12.3 21.0 66.0
Republic of Korea 2011 52.9 15.4 27.4 49.7
ASEAN
Indonesia 2011 54.6 9.0 32.0 23.8
Malaysia 2012(e) 50.8 14.1 25.4 97.5*
Philippines 2011 73.4 9.4 21.8 21.4
Thailand 2011 54.4 13.3 26.2 66.2
China 2011 33.5 13.5 45.8 26.0
India 2011 60.7 12.4 31.5 16.9
Notes : * Exports of goods & services (e) EstimateSources : Economic Planning Unit and IMD World Competitiveness Yearbook 2012
40
2009 2010 2011 2012(f) 2013(f) 2009 2010 2011 2012(f) 2013(f)
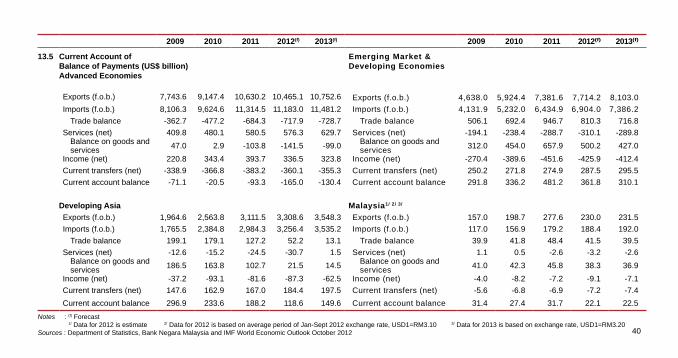
13.5 Current Account of Balance of Payments (US$ billion)
Emerging Market & Developing Economies
Advanced Economies
Exports (f.o.b.) 7,743.6 9,147.4 10,630.2 10,465.1 10,752.6 Exports (f.o.b.) 4,638.0 5,924.4 7,381.6 7,714.2 8,103.0
Imports (f.o.b.) 8,106.3 9,624.6 11,314.5 11,183.0 11,481.2 Imports (f.o.b.) 4,131.9 5,232.0 6,434.9 6,904.0 7,386.2
Trade balance -362.7 -477.2 -684.3 -717.9 -728.7 Trade balance 506.1 692.4 946.7 810.3 716.8
Services (net) 409.8 480.1 580.5 576.3 629.7 Services (net) -194.1 -238.4 -288.7 -310.1 -289.8Balance on goods and services 47.0 2.9 -103.8 -141.5 -99.0 Balance on goods and
services 312.0 454.0 657.9 500.2 427.0
Income (net) 220.8 343.4 393.7 336.5 323.8 Income (net) -270.4 -389.6 -451.6 -425.9 -412.4
Current transfers (net) -338.9 -366.8 -383.2 -360.1 -355.3 Current transfers (net) 250.2 271.8 274.9 287.5 295.5
Current account balance -71.1 -20.5 -93.3 -165.0 -130.4 Current account balance 291.8 336.2 481.2 361.8 310.1
Developing Asia Malaysia1/ 2/ 3/
Exports (f.o.b.) 1,964.6 2,563.8 3,111.5 3,308.6 3,548.3 Exports (f.o.b.) 157.0 198.7 277.6 230.0 231.5
Imports (f.o.b.) 1,765.5 2,384.8 2,984.3 3,256.4 3,535.2 Imports (f.o.b.) 117.0 156.9 179.2 188.4 192.0
Trade balance 199.1 179.1 127.2 52.2 13.1 Trade balance 39.9 41.8 48.4 41.5 39.5
Services (net) -12.6 -15.2 -24.5 -30.7 1.5 Services (net) 1.1 0.5 -2.6 -3.2 -2.6Balance on goods and services 186.5 163.8 102.7 21.5 14.5 Balance on goods and
services 41.0 42.3 45.8 38.3 36.9
Income (net) -37.2 -93.1 -81.6 -87.3 -62.5 Income (net) -4.0 -8.2 -7.2 -9.1 -7.1
Current transfers (net) 147.6 162.9 167.0 184.4 197.5 Current transfers (net) -5.6 -6.8 -6.9 -7.2 -7.4
Current account balance 296.9 233.6 188.2 118.6 149.6 Current account balance 31.4 27.4 31.7 22.1 22.5
Notes : (f) Forecast 1/ Data for 2012 is estimate 2/ Data for 2012 is based on average period of Jan-Sept 2012 exchange rate, USD1=RM3.10 3/ Data for 2013 is based on exchange rate, USD1=RM3.20Sources : Department of Statistics, Bank Negara Malaysia and IMF World Economic Outlook October 2012
41
2008 2009 2010 2011 2012(f) 2013(f)
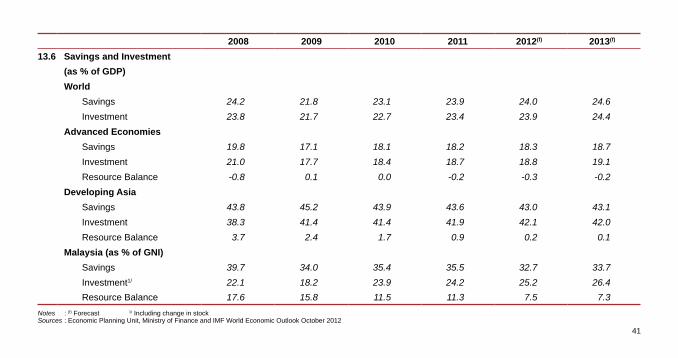
13.6 Savings and Investment
(as % of GDP)
World
Savings 24.2 21.8 23.1 23.9 24.0 24.6
Investment 23.8 21.7 22.7 23.4 23.9 24.4
Advanced Economies
Savings 19.8 17.1 18.1 18.2 18.3 18.7
Investment 21.0 17.7 18.4 18.7 18.8 19.1
Resource Balance -0.8 0.1 0.0 -0.2 -0.3 -0.2
Developing Asia
Savings 43.8 45.2 43.9 43.6 43.0 43.1
Investment 38.3 41.4 41.4 41.9 42.1 42.0
Resource Balance 3.7 2.4 1.7 0.9 0.2 0.1
Malaysia (as % of GNI)
Savings 39.7 34.0 35.4 35.5 32.7 33.7
Investment1/ 22.1 18.2 23.9 24.2 25.2 26.4
Resource Balance 17.6 15.8 11.5 11.3 7.5 7.3
Notes : (f) Forecast 1/ Including change in stockSources : Economic Planning Unit, Ministry of Finance and IMF World Economic Outlook October 2012
42
Country Year
Collected Total
Tax Revenue1/ (% of GDP)
General Government Expenditure (% of GDP)
Government Budget
Surplus/Deficit (% of GDP)
External Debt(% of GDP)
Foreign Direct Investment
Inflows (US$ billion)
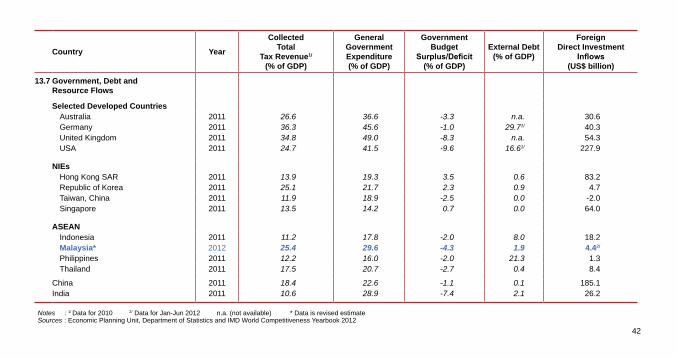
13.7 Government, Debt andResource Flows
Selected Developed CountriesAustralia 2011 26.6 36.6 -3.3 n.a. 30.6Germany 2011 36.3 45.6 -1.0 29.71/ 40.3United Kingdom 2011 34.8 49.0 -8.3 n.a. 54.3USA 2011 24.7 41.5 -9.6 16.61/ 227.9
NIEsHong Kong SAR 2011 13.9 19.3 3.5 0.6 83.2Republic of Korea 2011 25.1 21.7 2.3 0.9 4.7Taiwan, China 2011 11.9 18.9 -2.5 0.0 -2.0Singapore 2011 13.5 14.2 0.7 0.0 64.0
ASEANIndonesia 2011 11.2 17.8 -2.0 8.0 18.2Malaysia* 2012 25.4 29.6 -4.3 1.9 4.42/
Philippines 2011 12.2 16.0 -2.0 21.3 1.3Thailand 2011 17.5 20.7 -2.7 0.4 8.4
China 2011 18.4 22.6 -1.1 0.1 185.1India 2011 10.6 28.9 -7.4 2.1 26.2
Notes : 1/ Data for 2010 2/ Data for Jan-Jun 2012 n.a. (not available) * Data is revised estimateSources : Economic Planning Unit, Department of Statistics and IMD World Competitiveness Yearbook 2012
43
Country
Surface Area
(‘000 km2) (2010)
Population (million)
(2011)
Population Density
(per km2)(2009)
Urban Population as % of Total
Population (2011)
Population Under 15 years as % ofTotal Population
(2011)
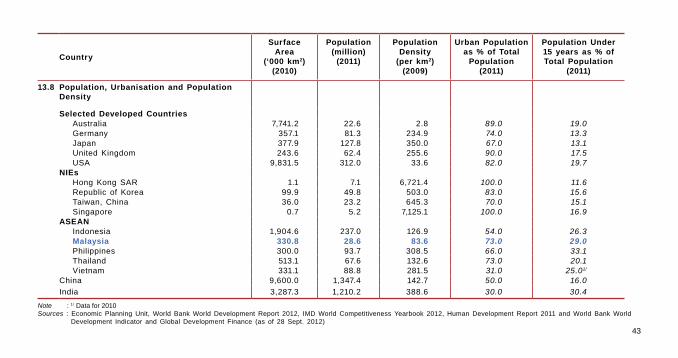
13.8 Population, Urbanisation and Population Density
Selected Developed CountriesAustralia 7,741.2 22.6 2.8 89.0 19.0Germany 357.1 81.3 234.9 74.0 13.3Japan 377.9 127.8 350.0 67.0 13.1United Kingdom 243.6 62.4 255.6 90.0 17.5USA 9,831.5 312.0 33.6 82.0 19.7
NIEsHong Kong SAR 1.1 7.1 6,721.4 100.0 11.6Republic of Korea 99.9 49.8 503.0 83.0 15.6Taiwan, China 36.0 23.2 645.3 70.0 15.1Singapore 0.7 5.2 7,125.1 100.0 16.9
ASEANIndonesia 1,904.6 237.0 126.9 54.0 26.3Malaysia 330.8 28.6 83.6 73.0 29.0Philippines 300.0 93.7 308.5 66.0 33.1Thailand 513.1 67.6 132.6 73.0 20.1Vietnam 331.1 88.8 281.5 31.0 25.01/
China 9,600.0 1,347.4 142.7 50.0 16.0
India 3,287.3 1,210.2 388.6 30.0 30.4
Note : 1/ Data for 2010Sources : Economic Planning Unit, World Bank World Development Report 2012, IMD World Competitiveness Yearbook 2012, Human Development Report 2011 and World Bank World
Development Indicator and Global Development Finance (as of 28 Sept. 2012)
44
Country YearTotal
Employment(million)
Employment by Sector (% of Total Employment)
Agriculture Industry1/ Services
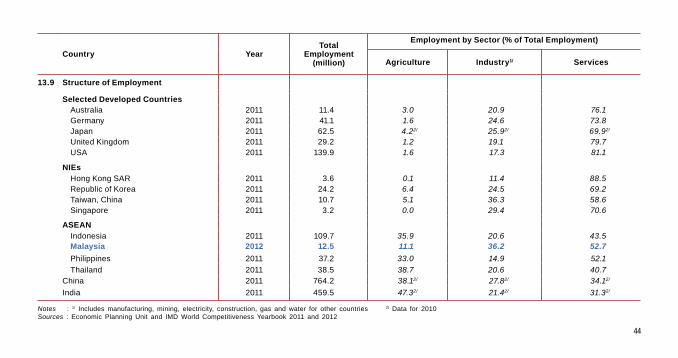
13.9 Structure of Employment
Selected Developed CountriesAustralia 2011 11.4 3.0 20.9 76.1Germany 2011 41.1 1.6 24.6 73.8Japan 2011 62.5 4.22/ 25.92/ 69.92/
United Kingdom 2011 29.2 1.2 19.1 79.7USA 2011 139.9 1.6 17.3 81.1
NIEsHong Kong SAR 2011 3.6 0.1 11.4 88.5Republic of Korea 2011 24.2 6.4 24.5 69.2Taiwan, China 2011 10.7 5.1 36.3 58.6Singapore 2011 3.2 0.0 29.4 70.6
ASEANIndonesia 2011 109.7 35.9 20.6 43.5Malaysia 2012 12.5 11.1 36.2 52.7
Philippines 2011 37.2 33.0 14.9 52.1
Thailand 2011 38.5 38.7 20.6 40.7China 2011 764.2 38.12/ 27.82/ 34.12/
India 2011 459.5 47.32/ 21.42/ 31.32/
Notes : 1/ Includes manufacturing, mining, electricity, construction, gas and water for other countries 2/ Data for 2010Sources : Economic Planning Unit and IMD World Competitiveness Yearbook 2011 and 2012
45
Country
Life Expectancy
at birth Male Female
Under Five Mortality Rate
(per 1,000 live births)
Crude Birth Rate (per 1,000
population)
Internet Users (No. of internet
users per1,000 people)
Computers per capita
(No. of computers per 1,000 people)
Adult Literacy Rate
(% age 15 & above)
Pupil-Teacher Ratio in
Education (Primary
Education) (%)
Mobile Telephone Subscribers
No. of Subscribers (per 1,000 inhabitants)
2009 2009 2010 2011 2011 2009 2009 2010
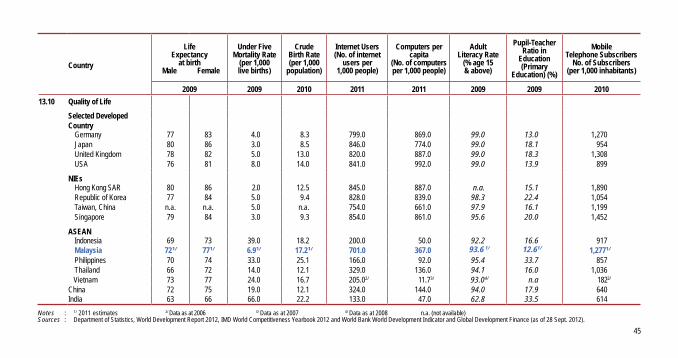
13.10 Quality of Life
Selected DevelopedCountry
Germany 77 83 4.0 8.3 799.0 869.0 99.0 13.0 1,270Japan 80 86 3.0 8.5 846.0 774.0 99.0 18.1 954United Kingdom 78 82 5.0 13.0 820.0 887.0 99.0 18.3 1,308USA 76 81 8.0 14.0 841.0 992.0 99.0 13.9 899
NIEsHong Kong SAR 80 86 2.0 12.5 845.0 887.0 n.a. 15.1 1,890Republic of Korea 77 84 5.0 9.4 828.0 839.0 98.3 22.4 1,054Taiwan, China n.a. n.a. 5.0 n.a. 754.0 661.0 97.9 16.1 1,199Singapore 79 84 3.0 9.3 854.0 861.0 95.6 20.0 1,452
ASEANIndonesia 69 73 39.0 18.2 200.0 50.0 92.2 16.6 917Malaysia 721/ 771/ 6.91/ 17.21/ 701.0 367.0 93.6 1/ 12.61/ 1,2771/
Philippines 70 74 33.0 25.1 166.0 92.0 95.4 33.7 857Thailand 66 72 14.0 12.1 329.0 136.0 94.1 16.0 1,036Vietnam 73 77 24.0 16.7 205.02/ 11.73/ 93.04/ n.a 1822/
China 72 75 19.0 12.1 324.0 144.0 94.0 17.9 640India 63 66 66.0 22.2 133.0 47.0 62.8 33.5 614
Notes : 1/ 2011 estimates 2/ Data as at 2006 3/ Data as at 2007 4/ Data as at 2008 n.a. (not available)Sources : Department of Statistics, World Development Report 2012, IMD World Competitiveness Yearbook 2012 and World Bank World Development Indicator and Global Development Finance (as of 28 Sept. 2012).
46
Country 2007 2008 2009 2010 2011
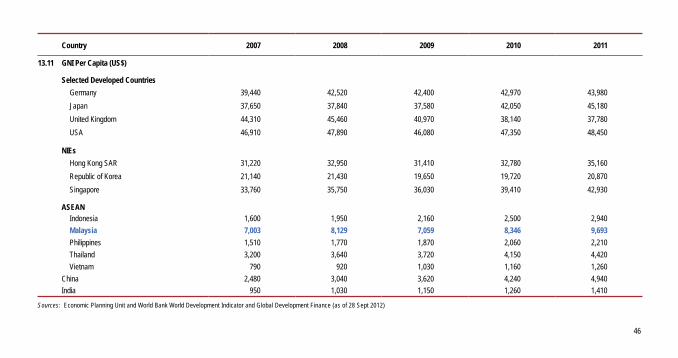
13.11 GNI Per Capita (US$)
Selected Developed Countries
Germany 39,440 42,520 42,400 42,970 43,980
Japan 37,650 37,840 37,580 42,050 45,180
United Kingdom 44,310 45,460 40,970 38,140 37,780
USA 46,910 47,890 46,080 47,350 48,450
NIEs
Hong Kong SAR 31,220 32,950 31,410 32,780 35,160
Republic of Korea 21,140 21,430 19,650 19,720 20,870
Singapore 33,760 35,750 36,030 39,410 42,930
ASEAN Indonesia 1,600 1,950 2,160 2,500 2,940
Malaysia 7,003 8,129 7,059 8,346 9,693
Philippines 1,510 1,770 1,870 2,060 2,210
Thailand 3,200 3,640 3,720 4,150 4,420
Vietnam 790 920 1,030 1,160 1,260
China 2,480 3,040 3,620 4,240 4,940
India 950 1,030 1,150 1,260 1,410
Sources: Economic Planning Unit and World Bank World Development Indicator and Global Development Finance (as of 28 Sept 2012)
47
Country
InformationTechnology
Skills2012
BroadbandSubscribers(per 1,000
inhabitants)2010
CyberSecurity
2012
FixedTelephone(per 1,000
inhabitants)2010
MobilePhones
(per 1,000inhabitants)
2010
PersonalComputers(per 1,000
people)2011
InternetUsers
(per 1,000people)
2011
Fixed BroadbandTariff (residential),per month (US$)
2010
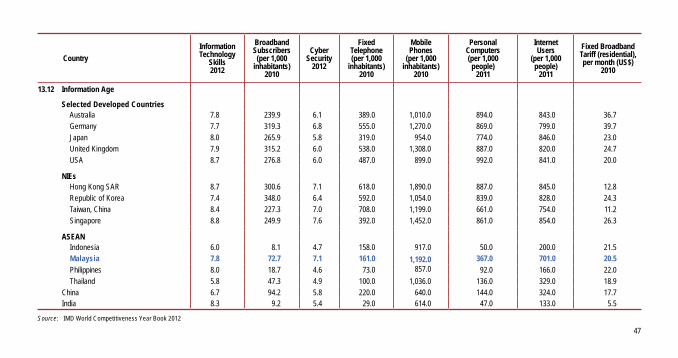
13.12 Information Age
Selected Developed Countries Australia 7.8 239.9 6.1 389.0 1,010.0 894.0 843.0 36.7
Germany 7.7 319.3 6.8 555.0 1,270.0 869.0 799.0 39.7
Japan 8.0 265.9 5.8 319.0 954.0 774.0 846.0 23.0
United Kingdom 7.9 315.2 6.0 538.0 1,308.0 887.0 820.0 24.7
USA 8.7 276.8 6.0 487.0 899.0 992.0 841.0 20.0
NIEs Hong Kong SAR 8.7 300.6 7.1 618.0 1,890.0 887.0 845.0 12.8
Republic of Korea 7.4 348.0 6.4 592.0 1,054.0 839.0 828.0 24.3
Taiwan, China 8.4 227.3 7.0 708.0 1,199.0 661.0 754.0 11.2
Singapore 8.8 249.9 7.6 392.0 1,452.0 861.0 854.0 26.3
ASEAN Indonesia 6.0 8.1 4.7 158.0 917.0 50.0 200.0 21.5 Malaysia 7.8 72.7 7.1 161.0 1,192.0 367.0 701.0 20.5
Philippines 8.0 18.7 4.6 73.0 857.0 92.0 166.0 22.0
Thailand 5.8 47.3 4.9 100.0 1,036.0 136.0 329.0 18.9
China 6.7 94.2 5.8 220.0 640.0 144.0 324.0 17.7 India 8.3 9.2 5.4 29.0 614.0 47.0 133.0 5.5
Source: IMD World Competitiveness Year Book 2012
48
Country
Development & Application of Technology
Supported2012
Funding for Technological Development (Sufficient)
2012
TotalExpenditure
on R&D(% of GDP)
2010
BusinessExpenditure
on R&D(% of GDP)
2010
High -Technology
Exports(US$ million)
2010
High - TechnologyExports
(% of ManufacturedExports)
2010
Intellectual Property Rights
Enforced2012
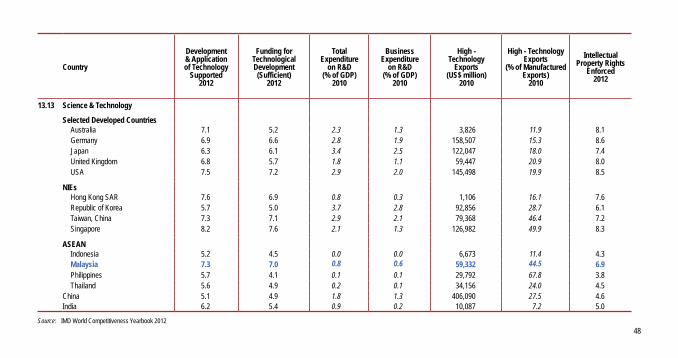
13.13 Science & Technology
Selected Developed Countries Australia 7.1 5.2 2.3 1.3 3,826 11.9 8.1 Germany 6.9 6.6 2.8 1.9 158,507 15.3 8.6 Japan 6.3 6.1 3.4 2.5 122,047 18.0 7.4 United Kingdom 6.8 5.7 1.8 1.1 59,447 20.9 8.0 USA 7.5 7.2 2.9 2.0 145,498 19.9 8.5
NIEsHong Kong SAR 7.6 6.9 0.8 0.3 1,106 16.1 7.6Republic of Korea 5.7 5.0 3.7 2.8 92,856 28.7 6.1Taiwan, China 7.3 7.1 2.9 2.1 79,368 46.4 7.2Singapore 8.2 7.6 2.1 1.3 126,982 49.9 8.3
ASEAN Indonesia 5.2 4.5 0.0 0.0 6,673 11.4 4.3 Malaysia 7.3 7.0 0.8 0.6 59,332 44.5 6.9 Philippines 5.7 4.1 0.1 0.1 29,792 67.8 3.8 Thailand 5.6 4.9 0.2 0.1 34,156 24.0 4.5China 5.1 4.9 1.8 1.3 406,090 27.5 4.6India 6.2 5.4 0.9 0.2 10,087 7.2 5.0
Source: IMD World Competitiveness Yearbook 2012
49
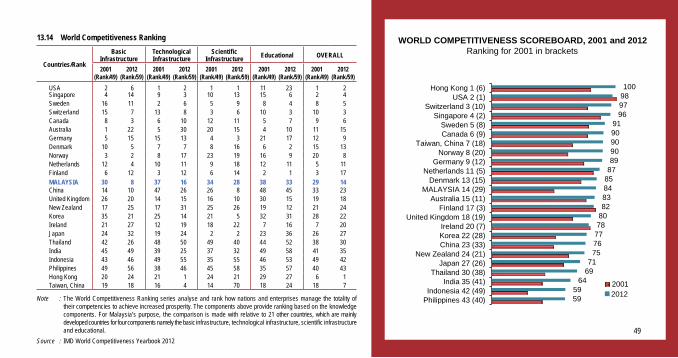
13.14 World Competitiveness Ranking
Countries/Rank
Basic Infrastructure
TechnologicalInfrastructure
ScientificInfrastructure Educational OVERALL
2001(Rank/49)
2012(Rank/59)
2001(Rank/49)
2012(Rank/59)
2001(Rank/49)
2012(Rank/59)
2001(Rank/49)
2012(Rank/59)
2001(Rank/49)
2012(Rank/59)
USA 2 6 1 2 1 1 11 23 1 2Singapore 4 14 9 3 10 13 15 6 2 4Sweden 16 11 2 6 5 9 8 4 8 5Switzerland 15 7 13 8 3 6 10 3 10 3Canada 8 3 6 10 12 11 5 7 9 6Australia 1 22 5 30 20 15 4 10 11 15Germany 5 15 15 13 4 3 21 17 12 9Denmark 10 5 7 7 8 16 6 2 15 13Norway 3 2 8 17 23 19 16 9 20 8Netherlands 12 4 10 11 9 18 12 11 5 11Finland 6 12 3 12 6 14 2 1 3 17MALAYSIA 30 8 37 16 34 28 38 33 29 14China 14 10 47 26 26 8 48 45 33 23United Kingdom 26 20 14 15 16 10 30 15 19 18New Zealand 17 25 17 31 25 26 19 12 21 24Korea 35 21 25 14 21 5 32 31 28 22Ireland 21 27 12 19 18 22 7 16 7 20Japan 24 32 19 24 2 2 23 36 26 27Thailand 42 26 48 50 49 40 44 52 38 30India 45 49 39 25 37 32 49 58 41 35Indonesia 43 46 49 55 35 55 46 53 49 42Philippines 49 56 38 46 45 58 35 57 40 43Hong Kong 20 24 21 1 24 21 29 27 6 1Taiwan, China 19 18 16 4 14 70 18 24 18 7
Note : The World Competitiveness Ranking series analyse and rank how nations and enterprises manage the totality of their competencies to achieve increased prosperity. The components above provide ranking based on the knowledge components. For Malaysia’s purpose, the comparison is made with relative to 21 other countries, which are mainly developed countries for four components namely the basic infrastructure, technological infrastructure, scientific infrastructure and educational.
Source : IMD World Competitiveness Yearbook 2012
59 59
64 69 71
75 76 77 78 80 82 83 84 85 87 89 90 90 90 91
96 97 98 100
Philippines 43 (40)Indonesia 42 (49)
India 35 (41)Thailand 30 (38)
Japan 27 (26)New Zealand 24 (21)
China 23 (33)Korea 22 (28)Ireland 20 (7)
United Kingdom 18 (19)Finland 17 (3)
Australia 15 (11)MALAYSIA 14 (29)
Denmark 13 (15)Netherlands 11 (5)
Germany 9 (12)Norway 8 (20)
Taiwan, China 7 (18)Canada 6 (9)Sweden 5 (8)
Singapore 4 (2)Switzerland 3 (10)
USA 2 (1)Hong Kong 1 (6)
20122001
WORLD COMPETITIVENESS SCOREBOARD, 2001 and 2012 Ranking for 2001 in brackets
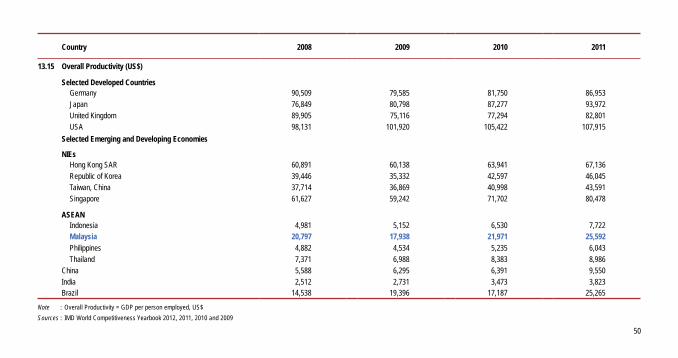
50
Country 2008 2009 2010 2011
13.15 Overall Productivity (US$)
Selected Developed Countries Germany 90,509 79,585 81,750 86,953
Japan 76,849 80,798 87,277 93,972
United Kingdom 89,905 75,116 77,294 82,801
USA 98,131 101,920 105,422 107,915
Selected Emerging and Developing Economies
NIEs Hong Kong SAR 60,891 60,138 63,941 67,136
Republic of Korea 39,446 35,332 42,597 46,045
Taiwan, China 37,714 36,869 40,998 43,591
Singapore 61,627 59,242 71,702 80,478
ASEAN Indonesia 4,981 5,152 6,530 7,722 Malaysia 20,797 17,938 21,971 25,592
Philippines 4,882 4,534 5,235 6,043
Thailand 7,371 6,988 8,383 8,986
China 5,588 6,295 6,391 9,550
India 2,512 2,731 3,473 3,823 Brazil 14,538 19,396 17,187 25,265
Note : Overall Productivity = GDP per person employed, US$
Sources : IMD World Competitiveness Yearbook 2012, 2011, 2010 and 2009
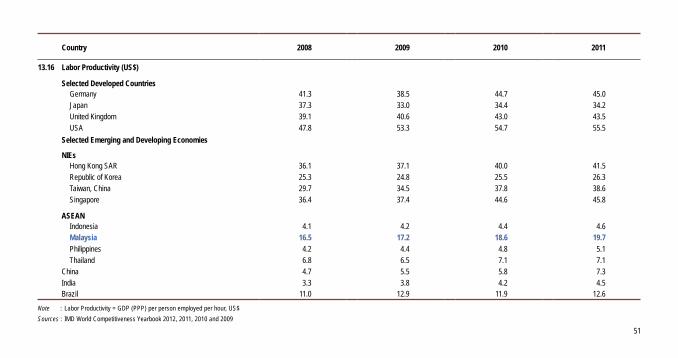
51
Country 2008 2009 2010 2011
13.16 Labor Productivity (US$)
Selected Developed Countries Germany 41.3 38.5 44.7 45.0
Japan 37.3 33.0 34.4 34.2
United Kingdom 39.1 40.6 43.0 43.5
USA 47.8 53.3 54.7 55.5
Selected Emerging and Developing Economies
NIEs Hong Kong SAR 36.1 37.1 40.0 41.5
Republic of Korea 25.3 24.8 25.5 26.3
Taiwan, China 29.7 34.5 37.8 38.6
Singapore 36.4 37.4 44.6 45.8
ASEAN Indonesia 4.1 4.2 4.4 4.6 Malaysia 16.5 17.2 18.6 19.7
Philippines 4.2 4.4 4.8 5.1
Thailand 6.8 6.5 7.1 7.1
China 4.7 5.5 5.8 7.3
India 3.3 3.8 4.2 4.5 Brazil 11.0 12.9 11.9 12.6
Note : Labor Productivity = GDP (PPP) per person employed per hour, US$
Sources : IMD World Competitiveness Yearbook 2012, 2011, 2010 and 2009
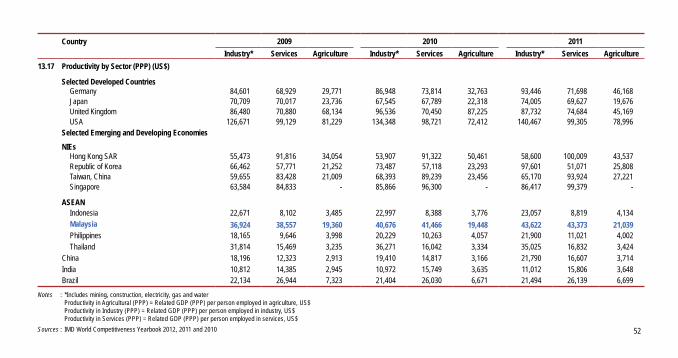
52
Country 2009 2010 2011
Industry* Services Agriculture Industry* Services Agriculture Industry* Services Agriculture
13.17 Productivity by Sector (PPP) (US$)
Selected Developed Countries Germany 84,601 68,929 29,771 86,948 73,814 32,763 93,446 71,698 46,168 Japan 70,709 70,017 23,736 67,545 67,789 22,318 74,005 69,627 19,676 United Kingdom 86,480 70,880 68,134 96,536 70,450 87,225 87,732 74,684 45,169 USA 126,671 99,129 81,229 134,348 98,721 72,412 140,467 99,305 78,996 Selected Emerging and Developing Economies
NIEs Hong Kong SAR 55,473 91,816 34,054 53,907 91,322 50,461 58,600 100,009 43,537 Republic of Korea 66,462 57,771 21,252 73,487 57,118 23,293 97,601 51,071 25,808 Taiwan, China 59,655 83,428 21,009 68,393 89,239 23,456 65,170 93,924 27,221 Singapore 63,584 84,833 - 85,866 96,300 - 86,417 99,379 -
ASEAN Indonesia 22,671 8,102 3,485 22,997 8,388 3,776 23,057 8,819 4,134 Malaysia 36,924 38,557 19,360 40,676 41,466 19,448 43,622 43,373 21,039 Philippines 18,165 9,646 3,998 20,229 10,263 4,057 21,900 11,021 4,002
Thailand 31,814 15,469 3,235 36,271 16,042 3,334 35,025 16,832 3,424
China 18,196 12,323 2,913 19,410 14,817 3,166 21,790 16,607 3,714
India 10,812 14,385 2,945 10,972 15,749 3,635 11,012 15,806 3,648 Brazil 22,134 26,944 7,323 21,404 26,030 6,671 21,494 26,139 6,699
Notes : *Includes mining, construction, electricity, gas and water Productivity in Agricultural (PPP) = Related GDP (PPP) per person employed in agriculture, US$ Productivity in Industry (PPP) = Related GDP (PPP) per person employed in industry, US$ Productivity in Services (PPP) = Related GDP (PPP) per person employed in services, US$
Sources : IMD World Competitiveness Yearbook 2012, 2011 and 2010
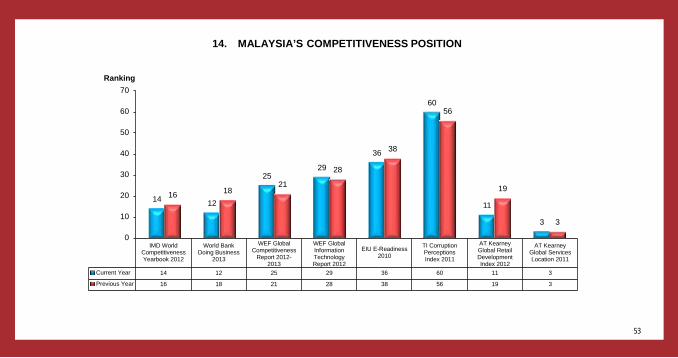
53
14 12
25 29
36
60
11
3
16 18 21
28
38
56
19
3
IMD WorldCompetitivenessYearbook 2012
World BankDoing Business
2013
WEF GlobalCompetitiveness
Report 2012-2013
WEF GlobalInformationTechnologyReport 2012
EIU E-Readiness2010
TI CorruptionPerceptionsIndex 2011
AT KearneyGlobal RetailDevelopmentIndex 2012
AT KearneyGlobal ServicesLocation 2011
Current Year 14 12 25 29 36 60 11 3
Previous Year 16 18 21 28 38 56 19 3
0
10
20
30
40
50
60
70
Ranking
14. MALAYSIA’S COMPETITIVENESS POSITION
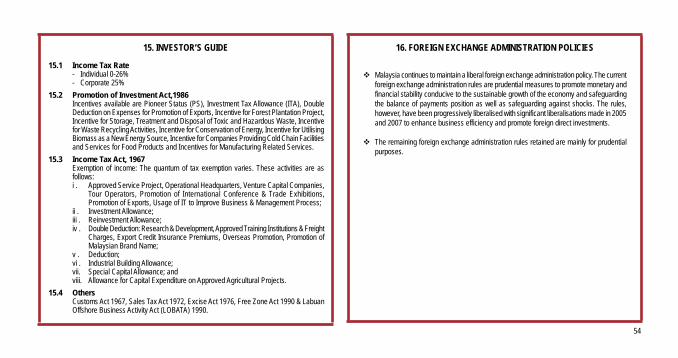
54
15. INVESTOR’S GUIDE
15.1 Income Tax Rate - Individual 0-26% - Corporate 25%
15.2 Promotion of Investment Act,1986 Incentives available are Pioneer Status (PS), Investment Tax Allowance (ITA), Double
Deduction on Expenses for Promotion of Exports, Incentive for Forest Plantation Project, Incentive for Storage, Treatment and Disposal of Toxic and Hazardous Waste, Incentive for Waste Recycling Activities, Incentive for Conservation of Energy, Incentive for Utilising Biomass as a New Energy Source, Incentive for Companies Providing Cold Chain Facilities and Services for Food Products and Incentives for Manufacturing Related Services.
15.3 Income Tax Act, 1967 Exemption of income: The quantum of tax exemption varies. These activities are as
follows: i . Approved Service Project, Operational Headquarters, Venture Capital Companies,
Tour Operators, Promotion of International Conference & Trade Exhibitions, Promotion of Exports, Usage of IT to Improve Business & Management Process;
ii . Investment Allowance; iii . Reinvestment Allowance; iv . Double Deduction: Research & Development, Approved Training Institutions & Freight
Charges, Export Credit Insurance Premiums, Overseas Promotion, Promotion of Malaysian Brand Name;
v . Deduction; vi . Industrial Building Allowance; vii. Special Capital Allowance; and viii. Allowance for Capital Expenditure on Approved Agricultural Projects.
15.4 Others Customs Act 1967, Sales Tax Act 1972, Excise Act 1976, Free Zone Act 1990 & Labuan
Offshore Business Activity Act (LOBATA) 1990.
16. FOREIGN EXCHANGE ADMINISTRATION POLICIES
Malaysia continues to maintain a liberal foreign exchange administration policy. The current foreign exchange administration rules are prudential measures to promote monetary and financial stability conducive to the sustainable growth of the economy and safeguarding the balance of payments position as well as safeguarding against shocks. The rules, however, have been progressively liberalised with significant liberalisations made in 2005 and 2007 to enhance business efficiency and promote foreign direct investments.
The remaining foreign exchange administration rules retained are mainly for prudential purposes.
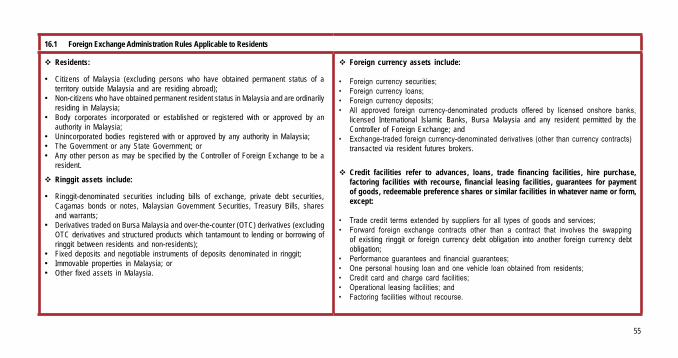
55
16.1 Foreign Exchange Administration Rules Applicable to Residents
Residents:
• Citizens of Malaysia (excluding persons who have obtained permanent status of a territory outside Malaysia and are residing abroad);
• Non-citizens who have obtained permanent resident status in Malaysia and are ordinarily residing in Malaysia;
• Body corporates incorporated or established or registered with or approved by an authority in Malaysia;
• Unincorporated bodies registered with or approved by any authority in Malaysia;• The Government or any State Government; or• Any other person as may be specified by the Controller of Foreign Exchange to be a
resident.
Ringgit assets include:
• Ringgit-denominated securities including bills of exchange, private debt securities, Cagamas bonds or notes, Malaysian Government Securities, Treasury Bills, shares and warrants;
• Derivatives traded on Bursa Malaysia and over-the-counter (OTC) derivatives (excluding OTC derivatives and structured products which tantamount to lending or borrowing of ringgit between residents and non-residents);
• Fixed deposits and negotiable instruments of deposits denominated in ringgit;• Immovable properties in Malaysia; or• Other fixed assets in Malaysia.
Foreign currency assets include:
• Foreign currency securities;• Foreign currency loans;• Foreign currency deposits;• All approved foreign currency-denominated products offered by licensed onshore banks,
licensed International Islamic Banks, Bursa Malaysia and any resident permitted by the Controller of Foreign Exchange; and
• Exchange-traded foreigncurrency-denominatedderivatives(other thancurrencycontracts)transacted via resident futures brokers.
Credit facilities refer to advances, loans, trade financing facilities, hire purchase, factoring facilities with recourse, financial leasing facilities, guarantees for payment of goods, redeemable preference shares or similar facilities in whatever name or form, except:
• Trade credit terms extended by suppliers for all types of goods and services;• Forward foreign exchange contracts other than a contract that involves the swapping
of existing ringgit or foreign currency debt obligation into another foreign currency debt obligation;
• Performance guarantees and financial guarantees;• One personal housing loan and one vehicle loan obtained from residents;• Credit card and charge card facilities;• Operational leasing facilities; and• Factoring facilities without recourse.
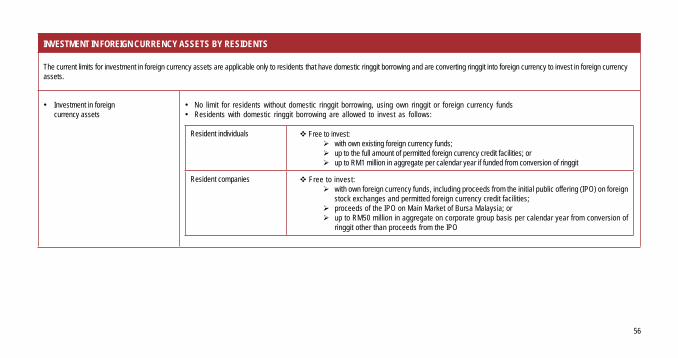
56
INVESTMENT IN FOREIGN CURRENCY ASSETS BY RESIDENTS
The current limits for investment in foreign currency assets are applicable only to residents that have domestic ringgit borrowing and are converting ringgit into foreign currency to invest in foreign currency assets.
• Investment in foreign currency assets
• No limit for residents without domestic ringgit borrowing, using own ringgit or foreign currency funds• Residents with domestic ringgit borrowing are allowed to invest as follows:
Resident individuals Free to invest:Øwith own existing foreign currency funds;Ø up to the full amount of permitted foreign currency credit facilities; orØ up to RM1 million in aggregate per calendar year if funded from conversion of ringgit
Resident companies Free to invest:Ø with own foreign currency funds, including proceeds from the initial public offering (IPO) on foreign
stock exchanges and permitted foreign currency credit facilities;Ø proceeds of the IPO on Main Market of Bursa Malaysia; orØ up to RM50 million in aggregate on corporate group basis per calendar year from conversion of
ringgit other than proceeds from the IPO
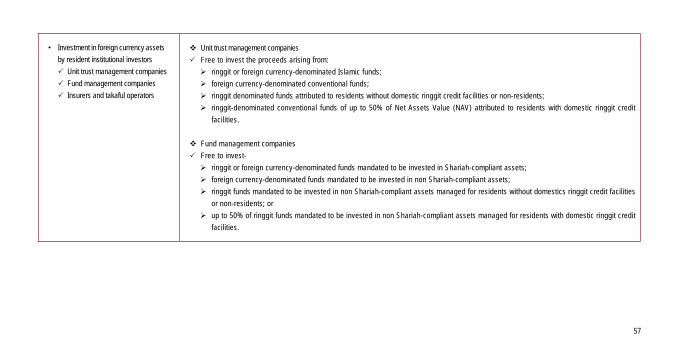
57
• Investment in foreign currency assets
by resident institutional investors
P Unit trust management companies
P Fund management companies
P Insurers and takaful operators
Unit trust management companies
PFree to invest the proceeds arising from:
Ø ringgit or foreign currency-denominated Islamic funds;
Ø foreign currency-denominated conventional funds;
Ø ringgit denominated funds attributed to residents without domestic ringgit credit facilities or non-residents;
Ø ringgit-denominated conventional funds of up to 50% of Net Assets Value (NAV) attributed to residents with domestic ringgit credit
facilities.
Fund management companies
P Free to invest-
Ø ringgit or foreign currency-denominated funds mandated to be invested in Shariah-compliant assets;
Ø foreign currency-denominated funds mandated to be invested in non Shariah-compliant assets;
Ø ringgit funds mandated to be invested in non Shariah-compliant assets managed for residents without domestics ringgit credit facilities
or non-residents; or
Ø up to 50% of ringgit funds mandated to be invested in non Shariah-compliant assets managed for residents with domestic ringgit credit
facilities.
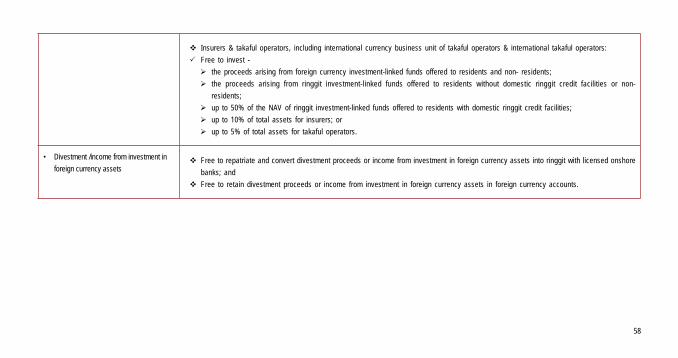
58
Insurers & takaful operators, including international currency business unit of takaful operators & international takaful operators:
P Free to invest -
Ø the proceeds arising from foreign currency investment-linked funds offered to residents and non- residents;
Ø the proceeds arising from ringgit investment-linked funds offered to residents without domestic ringgit credit facilities or non-
residents;
Ø up to 50% of the NAV of ringgit investment-linked funds offered to residents with domestic ringgit credit facilities;
Ø up to 10% of total assets for insurers; or
Ø up to 5% of total assets for takaful operators.
• Divestment /income from investment in
foreign currency assets Free to repatriate and convert divestment proceeds or income from investment in foreign currency assets into ringgit with licensed onshore
banks; and
Free to retain divestment proceeds or income from investment in foreign currency assets in foreign currency accounts.
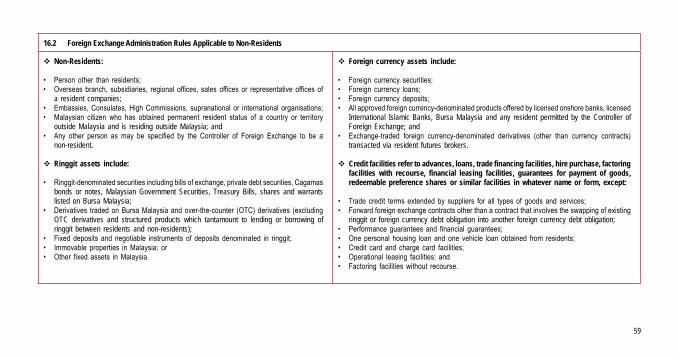
59
16.2 Foreign Exchange Administration Rules Applicable to Non-Residents
Non-Residents:
• Person other than residents;• Overseas branch, subsidiaries, regional offices, sales offices or representative offices of
a resident companies;• Embassies,Consulates,HighCommissions, supranational or international organisations;• Malaysian citizen who has obtained permanent resident status of a country or territory
outside Malaysia and is residing outside Malaysia; and• Any other person as may be specified by the Controller of Foreign Exchange to be a
non-resident.
Ringgit assets include:
• Ringgit-denominatedsecuritiesincludingbillsofexchange,privatedebtsecurities,Cagamasbonds or notes, Malaysian Government Securities, Treasury Bills, shares and warrants listed on Bursa Malaysia;
• Derivatives tradedonBursaMalaysiaandover-the-counter (OTC)derivatives (excludingOTC derivatives and structured products which tantamount to lending or borrowing of ringgit between residents and non-residents);
• Fixed deposits and negotiable instruments of deposits denominated in ringgit;• Immovable properties inMalaysia; or• Other fixed assets inMalaysia.
Foreign currency assets include:
• Foreign currency securities;• Foreign currency loans;• Foreign currency deposits;• Allapprovedforeigncurrency-denominatedproductsofferedbylicensedonshorebanks,licensed
International Islamic Banks, Bursa Malaysia and any resident permitted by the Controller of Foreign Exchange; and
• Exchange-traded foreign currency-denominated derivatives (other than currency contracts)transacted via resident futures brokers.
Credit facilities refer to advances, loans, trade financing facilities, hire purchase, factoring facilities with recourse, financial leasing facilities, guarantees for payment of goods, redeemable preference shares or similar facilities in whatever name or form, except:
• Trade credit terms extended by suppliers for all types of goods and services;• Forwardforeignexchangecontractsotherthanacontractthatinvolvestheswappingofexisting
ringgit or foreign currency debt obligation into another foreign currency debt obligation;• Performance guarantees and financial guarantees;• One personal housing loan and one vehicle loan obtained from residents;• Credit card and charge card facilities;• Operational leasing facilities; and• Factoring facilitieswithout recourse.
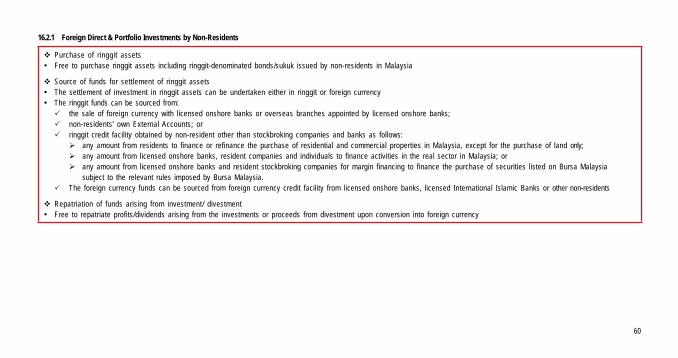
60
16.2.1 Foreign Direct & Portfolio Investments by Non-Residents
Purchase of ringgit assets• Free to purchase ringgit assets including ringgit-denominated bonds/sukuk issued by non-residents in Malaysia
Source of funds for settlement of ringgit assets• The settlement of investment in ringgit assets can be undertaken either in ringgit or foreign currency• The ringgit funds can be sourced from:P the sale of foreign currency with licensed onshore banks or overseas branches appointed by licensed onshore banks;P non-residents’ own External Accounts; orP ringgit credit facility obtained by non-resident other than stockbroking companies and banks as follows:
Ø any amount from residents to finance or refinance the purchase of residential and commercial properties in Malaysia, except for the purchase of land only;Ø any amount from licensed onshore banks, resident companies and individuals to finance activities in the real sector in Malaysia; orØ any amount from licensed onshore banks and resident stockbroking companies for margin financing to finance the purchase of securities listed on Bursa Malaysia
subject to the relevant rules imposed by Bursa Malaysia.P The foreign currency funds can be sourced from foreign currency credit facility from licensed onshore banks, licensed International Islamic Banks or other non-residents
Repatriation of funds arising from investment/ divestment• Free to repatriate profits/dividends arising from the investments or proceeds from divestment upon conversion into foreign currency

61
Calendar 2012
JANUARYA I S R K J S29 30 311 2 3 4 5 6 78 9 10 11 12 13 1415 16 17 18 19 20 2122 23 24 25 26 27 28
JULYA I S R K J S1 2 3 4 5 6 78 9 10 11 12 13 1415 16 17 18 19 20 2122 23 24 25 26 27 2829 30 31
APRILA I S R K J S1 2 3 4 5 6 78 9 10 11 12 13 1415 16 17 18 19 20 2122 23 24 25 26 27 2829 30
OCTOBERA I S R K J S
1 2 3 4 5 67 8 9 10 11 12 1314 15 16 17 18 19 2021 22 23 24 25 26 2728 29 30 31
FEBRUARYA I S R K J S
1 2 3 45 6 7 8 9 10 1112 13 14 15 16 17 1819 20 21 22 23 24 2526 27 28 29
AUGUSTA I S R K J S
1 2 3 45 6 7 8 9 10 1112 13 14 15 16 17 1819 20 21 22 23 24 2526 27 28 29 30 31
MAYA I S R K J S
1 2 3 4 56 7 8 9 10 11 1213 14 15 16 17 18 1920 21 22 23 24 25 2627 28 29 30 31
NOVEMBERA I S R K J S
1 2 34 5 6 7 8 9 1011 12 13 14 15 16 1718 19 20 21 22 23 2425 26 27 28 29 30
MARCHA I S R K J S
1 2 34 5 6 7 8 9 1011 12 13 14 15 16 1718 19 20 21 22 23 2425 26 27 28 29 30 31
SEPTEMBERA I S R K J S30 12 3 4 5 6 7 89 10 11 12 13 14 1516 17 18 19 20 21 2223 24 25 26 27 28 29
JUNEA I S R K J S
1 23 4 5 6 7 8 910 11 12 13 14 15 1617 18 19 20 21 22 2324 25 26 27 28 29 30
DECEMBERA I S R K J S30 31 12 3 4 5 6 7 89 10 11 12 13 14 1516 17 18 19 20 21 2223 24 25 26 27 28 29
Calendar 2013
JANUARYA I S R K J S
1 2 3 4 56 7 8 9 10 11 1213 14 15 16 17 18 1920 21 22 23 24 25 2627 28 29 30 31
MAYA I S R K J S
1 2 3 45 6 7 8 9 10 1112 13 14 15 16 17 1819 20 21 22 23 24 2526 27 28 29 30 31
SEPTEMBERA I S R K J S1 2 3 4 5 6 78 9 10 11 12 13 1415 16 17 18 19 20 2122 23 24 25 26 27 2829 30
APRILA I S R K J S
1 2 3 4 5 67 8 9 10 11 12 1314 15 16 17 18 19 2021 22 23 24 25 26 2728 29 30
AUGUSTA I S R K J S
1 2 34 5 6 7 8 9 1011 12 13 14 15 16 1718 19 20 21 22 23 2425 26 27 28 29 30 31
DECEMBERA I S R K J S1 2 3 4 5 6 78 9 10 11 12 13 1415 16 17 18 19 20 2122 23 24 25 26 27 2829 30 31
MARCHA I S R K J S31 1 23 4 5 6 7 8 910 11 12 13 14 15 1617 18 19 20 21 22 2324 25 26 27 28 29 30
JULYA I S R K J S
1 2 3 4 5 67 8 9 10 11 12 1314 15 16 17 18 19 2021 22 23 24 25 26 2728 29 30 31
NOVEMBERA I S R K J S
1 23 4 5 6 7 8 910 11 12 13 14 15 1617 18 19 20 21 22 2324 25 26 27 28 29 30
FEBRUARYA I S R K J S
1 23 4 5 6 7 8 910 11 12 13 14 15 1617 18 19 20 21 22 2324 25 26 27 28
JUNEA I S R K J S30 12 3 4 5 6 7 89 10 11 12 13 14 1516 17 18 19 20 21 2223 24 25 26 27 28 29
OCTOBERA I S R K J S
1 2 3 4 56 7 8 9 10 11 1213 14 15 16 17 18 1920 21 22 23 24 25 2627 28 29 30 31
1 January - New Year23-24February - Chinese New Year1 February - Federal Territory Day5 February - Maulidur Rasul7 February - Thaipusam
11 April - Installation of YangDi-Pertuan Agong
1 May - Labour Day5 May - Wesak Day2 Jun - Agong’s Birthday19-20 August - Eid-Fitr
31 August - National Day16 September - Malaysia Day26 October - Eid-Adha13 November - Deepavali15 November - Maal Hijrah25 December - Christmas
School Holiday
National Public Holidays 2012
PRINTED BYPERCETAKAN NASIONAL MALAYSIA BERHADKUALA LUMPUR, 2012www.printnasional.com.myemail: [email protected].: 03-92366895 Fax: 03-92224773JD005501


![Fragmentary Pleasures: Some Minor [Hellenistic] Figures](https://img.dokumen.tips/doc/110x75/631882fe831644824d03ed34/fragmentary-pleasures-some-minor-hellenistic-figures.jpg)


