Embed Size (px)
Citation preview
Earth Surf. Dynam., 2, 181–195, 2014www.earth-surf-dynam.net/2/181/2014/doi:10.5194/esurf-2-181-2014© Author(s) 2014. CC Attribution 3.0 License.
Earth Surface Dynamics
Open A
ccess
Field investigation of preferential fissure flow paths withhydrochemical analysis of small-scale sprinkling
experiments
D. M. Krzeminska1, T. A. Bogaard1, T.-H. Debieche2,4, F. Cervi2,5, V. Marc2, and J.-P. Malet3
1Water Resources Section, Faculty of Civil Engineering and Geosciences, Delft University of Technology,Delft, Netherlands
2Université d’Avignon et des Pays de Vaucluse, EMMAH UMR1114 INRA-UAPV, 33 rue Louis Pasteur,84000 Avignon, France
3Institut de Physique du Globe de Strasbourg, CNRS UMR7516, Université de Strasbourg, Ecole etObservatoire des Sciences de la Terre, 5 rue Descartes, 67084 Strasbourg, France
4Water and Environment Team, Geological Engineering Laboratory, Jijel University, P.O. Box 98, 18000 Jijel,Algeria
5Dipartimento di Ingegneria Civile, Chimica, Ambientale e dei Materiali (DICAM) Università di Bologna,Viale Risorgimento 2, 40136, Bologna, Italy
Correspondence to:D. M. Krzeminska ([email protected])
Received: 6 October 2013 – Published in Earth Surf. Dynam. Discuss.: 30 October 2013Revised: 27 February 2014 – Accepted: 6 March 2014 – Published: 26 March 2014
Abstract. The unsaturated zone largely controls groundwater recharge by buffering precipitation while at thesame time providing preferential flow paths for infiltration. The importance of preferential flow on landslidehydrology is recognised in the literature; however, its monitoring and quantification remain difficult.
This paper presents a combined hydrological and hydrochemical analysis of small-scale sprinkling exper-iments. It aims at showing the potential of such experiments for studying the spatial differences in dominanthydrological processes within a landslide. This methodology was tested in the highly heterogeneous blackmarls of the Super-Sauze landslide. The tests were performed in three areas characterised by different dis-placement rates, surface morphology and local hydrological conditions. Special attention was paid to testingthe potential of small-scale sprinkling experiments for identifying and characterising preferential flow patternsand dominant hydrological processes.
1 Introduction
In the last two decades, the understanding of hydrologi-cal processes in hillslopes has advanced due to improvedmonitoring techniques (McDonnell, 1990; Kirchner, 2003;Tromp-van Meerveld and McDonnell, 2006) and, conse-quently, improved understanding of mass movement dynam-ics (Haneberg 1991; Uchida et al., 2001; Bogaard et al.,2004; Malet et al., 2005; de Montety et al, 2007; Wien-hofer et al, 2011). Nevertheless, current knowledge is stillincomplete, especially concerning infiltration and percola-tion processes, subsurface flow paths and residence time of
groundwater (Bogaard et al., 2004). The main difficultiesstem from strong heterogeneity of hillslope lithology andspatio-temporal variation of hydrological properties as wellas dominant hydrological processes. This is particularly truewhen dealing with highly heterogeneous, unconsolidated,partly weathered silty-clay sediments, such as black marls.Additionally, in slow-moving clayey landslides, (constant)movement of sliding material results in the formation of fis-sures, due to compression or extension, in relation to the dif-ferential movement and deformation rate (Anderson, 2005;Schulson and Duval, 2009; Niethammer et al., 2012, Walteret al., 2012; Stumpf et al., 2012). Here, the term “fissures”
Published by Copernicus Publications on behalf of the European Geosciences Union.
182 D. M. Krzeminska et al.: Field investigation of preferential fissure flow paths
refers to geo-mechanically induced cracks that are filled orpartly filled with reworked material. Accordingly, the term“preferential flow” refers to rapid water flow bypassing thebulk of the matrix (Beven and Germann, 1982), which devel-ops through the areas where water fluxes are favoured by thepresence of fissures.
The presence of fissures creates so-called “dual permeabil-ity” or “multiple permeability” systems. Dual permeabilitytheory (Gwo et al., 1995; Greco et al., 2002; Šimunek etal., 2003; Gerke, 2006; Jarvis, 2007) considers the porousmedium as two (or more) interacting and overlapping butyet distinct continua. The water flow occurs in both continuabut it is mainly ruled by the fracture continuum (macrop-ore or fissure), which generates preferential flow. This way,the presence of fissures may increase the rate of groundwa-ter recharge (preferential vertical infiltration). On the otherhand, it may increase the rate of drainage, which limits thebuilding up of pore water pressure (preferential slope par-allel drainage). However, when talking about dead-end fis-sures (disconnected fissure network, limited drainage capac-ity), they contribute to maintain high pore water pressures inthe surrounding soils (McDonnell, 1990; Pierson, 1983; VanBeek and Van Asch, 1999; Uchida et al., 2001).
The quantification of groundwater recharge, especially bymeans of preferential flow, is an important point to be tack-led for an advanced understanding of hydrological systemsin hillslopes and landslides (Savage et al., 2003; Coe et al.,2004; Weiler and McDonnell 2007). However, the complex-ity of the processes and their high spatial variability make itvery difficult to measure preferential flow in the field and tobuild up process models (Van Schaik, 2010). Various experi-mental techniques are currently used to gain insight into pro-cesses controlling preferential flow, e.g. dye tracing (Fluryet al., 1994), tension infiltrometers (Angulo-Jaramillo et al.,1996) and continuous sampling of water drainage (e.g. multi-sampler Wicky lysimeter; Boll et al., 1992). Nevertheless, aconsistent measurement method for evaluating preferentialflow has not yet been formulated (Allaire et al., 2009).
Environmental tracing (Kabeya et al., 2007) and artificialtracing (Mali et al., 2007) in combination with hydrologi-cal survey are the most convenient investigation methods infield conditions. The experiments vary from laboratory tests(e.g. Allaire-Leung et al., 2000; Larsbo and Jarvis, 2006) tofield experiments at different scales (e.g. Collins et al, 2002;Weiler and Naef, 2003; Mali et al., 2007; Kienzler and Naef,2008). However, there are no plot-scale field measurementsdedicated to monitoring and quantifying preferential fissureflow, being a special case of macropores with apertures up totens of centimetres.
The main objective of this research is to test the poten-tial of a small-scale (1×1 m2) sprinkling experiment to iden-tify, study and quantify the dominant hydrological processeswithin an active, highly heterogeneous landslide. The idea ofusing small-scale (1×1 m2) sprinkling experiments arose af-ter the successful performance of large-scale (approximately
100 m2) sprinkling tests in summer 2007 at two landslidesites located in France: the Super-Sauze landslide and theLaval landslide (Debieche et al., 2012; Garel et al., 2012).These two experiments gave valuable insight into the prefer-ential infiltration and preferential later drainage processes inthose unstable clay-shale hillslopes. However, due to the sizeand long duration, these kinds of experiments are logisticallyand financially very demanding, and cannot be undertakenon a regular basis across the study area.
This paper presents the results obtained from three small-scale sprinkling tests performed on morphologically differ-ent areas of the persistently active Super-Sauze landslide(French Alps). The hydrological and hydrochemical obser-vations were generalised into flow regimes and collated withcurrent knowledge about the landslide.
2 Methodology
2.1 Experimental design
The sprinkling experiments were performed with the use of asprinkling apparatus with one nozzle (1/4HH-10SQ), whichwas fixed at the top centre at around 2 m high. The apparatuswas calibrated in order to provide a relatively homogeneousdistribution of the sprinkling water over the 1×1 m2 exper-imental plot. Water supply was pumped in with regulatedconstant pressure (1.1 bars). The sprinkling was carried outin blocks of 15 min sprinkling and 15 min break, with sprin-kling intensity of approximately 20–30 mm 15 min−1. Thisintensity is a trade-off between the feasibility of the sprin-kling equipment (pump and nozzle) and a realistic sprinklingrate (applied intensity is comparable to the observed inten-sity of summer and autumn storms reaching 50 mm h−1 in15 minutes; Malet et al., 2003). Moreover, it is optimised toestablish a reasonably good spatial distribution and is highenough to ensure infiltration both in the matrix and the fis-sure compartments. To monitor the actual sprinkling volume,and determine its distribution within the sprinkling plots, raingauges (five per plot) were installed. In order to protect theexperiment from wind disturbances and to minimise evapo-ration, the experimental areas were covered with a tent. It isimportant to stress that the setup of the sprinkling experimentwas designed to identify different patterns of the hydrologicalresponses rather than being used for, as an example, infiltra-tion capacity measurement.
The 1×1 m2 sprinkling tests were carried out in two pe-riods of 7–8 h sprinkling, composed of 14–17 sprinklingblocks (SB=15 min rain+ 15 min break), during two con-secutive days. This way, the first day of each sprinkling teststarted with dry initial conditions, while the second one rep-resented wet initial conditions. The water used for the sprin-kling tests was first collected in water tanks and blended withchemical tracers. The artificial tracing was introduced in or-der to get insight into the subsurface water flow paths andevent and pre-event water mixing proportions. Therefore, the
Earth Surf. Dynam., 2, 181–195, 2014 www.earth-surf-dynam.net/2/181/2014/
D. M. Krzeminska et al.: Field investigation of preferential fissure flow paths 183
tracing was realised with two tracers: bromide (Br−) duringthe first day of experiment and chloride (Cl−) during the sec-ond day.
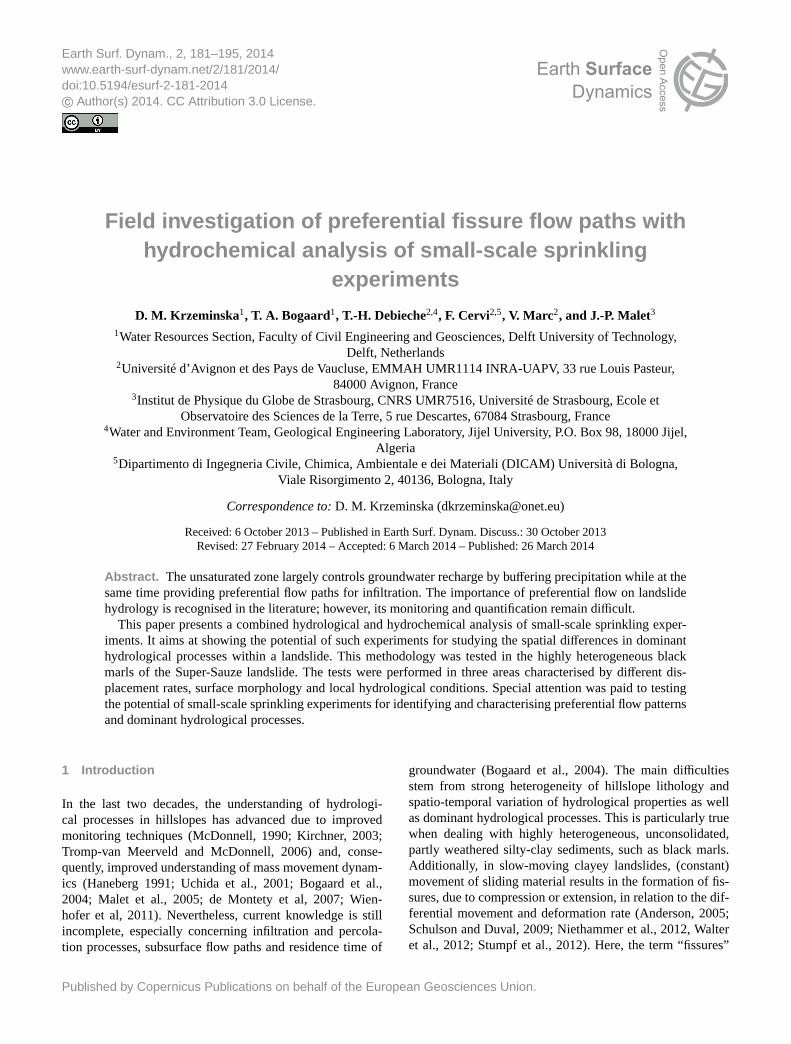
Within each sprinkling plot 4–5 piezometers were in-stalled: one in the middle of the plot, two in the directionof the expected (sub-)surface water movement (in the direc-tion of the fissures, if they were visible at the surface), andone upslope with respect to the plot, as a reference (Fig. 1b).The piezometers were made of PVC tubes with 0.50 m fil-ters, covered with standard filter protection, surrounded byfilter sand and closed with granular bentonite. All three ex-perimental setups were built up 2 days before the sprinklingexperiment started.
Groundwater responses were monitored manually every15 min and with the use of automatic recording water pres-sure devices (Diver and Keller devices with reported mea-surement accuracy of 5 mm) with a 3 min time resolution.The water for hydrochemical analyses was sampled every1 h from all piezometers during the sprinkling experimentand one time per day for two consecutive days after the ex-periment. Additionally, the sprinkling plots were equippedwith 1 m long access tubes for theta probes (PR1/6w-02,Delta-T Devices, with reported accuracy of±0.06 m3 m−3;Van Bavel and Nichols, 2002) in order to monitor changes inthe soil moisture profile at six depths (0.1, 0.2, 0.3, 0.4, 0.6and 1.0 m). If the installation of theta probes was not possi-ble (e.g. technical problems), the initial surface soil moisture(0–0.10 m depth) was measured with a manual field-operatedtime-domain reflectometry probe (FOM TDR). The reportedaccuracy of the FOM TDR is±0.02 m3 m−3 (IA PAS, 2006).
2.2 Analysis methodology
The soil column for water balance and tracer mass balancecalculation was bounded laterally by the 1×1 m2 sprinklingsurface area and vertically by the maximum depth of thepiezometer installed in the centre of each plot. The water bal-ance of the sprinkling experiment for 7 or 8 h duration is
P+GWin =GWout+OF+E+∆S, (1)
whereP is the precipitation (sprinkling), which representsthe amount of sprinkling water; GWin and GWout are thegroundwater inflow and outflow; OF is the overland flow;Eis the evaporation; and∆S is the change in storage over theduration of the sprinkling experiment. The groundwater out-flow includes subsurface flow (SSF) and vertical “deep per-colation” (Pe). Here we define the “deep percolation” flux asthe water flowing down the lowest piezometric observationpoint in the experimental plot (see Fig. 4).
Moreover, a depletion curve analysis was applied with theanalogy of hydrograph recession analysis by using the lin-ear reservoir concept (Hornberger et al., 1991; Mikovari andLeibundgut, 1995; Sivapalan et al., 2002). Additionally, as-suming that the groundwater level is a direct function of achange in drained volumes (therefore, a change in storage),
it was possible to identify differences in types of storagesbased on the occurrence of inflexion points in the drawdowncurves. The time for the depletion of the storages is indicatedby a depletion factor (K) calculated for all segments of thedrawdown curve using the empirical method explained byLinsley et al. (1982):
ht+∆t = ht ·e−∆tK , (2)
whereht is the groundwater level at timet and∆t is the tem-poral resolution of groundwater level observations (min). Ingeneral, the steeper part of the curve represents fast drainage,assumed to be preferential flow, whereas the gentle slope partrepresents slower drainage, associated with matrix flow.
Besides a qualitative description of the infiltration pro-cess, the concentration of the conservative tracers (Br− andCl−) was used to calculate the proportion of different watersources (event vs. pre-event water) using a two-componentend-member mixing (EMMA) model. The EMMA modelhas been widely used for hydrological studies to separatethe different contributions of streamflow (Christophersen andHooper, 1992; Mulholland and Hill, 1997; Soulsby et al.,2003; James and Roulet, 2006; Cras et al., 2007). The endmembers are usually defined from the reservoir character-istics; therefore mixing diagrams inform about the variablesource areas of runoff. At the same time, they could be usedto understand the flow processes which take place during in-filtration. The mixing proportions (α(t) andβ(t)) are calcu-lated by solving the following equations:α1(t) ·CBr−,EW1+ β1(t) ·CBr−,PE=CBr− (t)α2(t) ·CCl−,EW2+ β2(t) ·CCl−,PE=CCl− (t)α1,2(t)+ β1,2(t) = 1,
(3)
where CBr/Cl,EW/PE and CBr/Cl(t) are tracer concentrations[mg L−1] measured during the sprinkling experiment at dif-ferent times (sampled from piezometers). PE and EW indi-cate the pre-event and event water, and the numbered indexesare related to the first and second day of experiments, respec-tively.
Besides the added conservative tracers Br− and Cl−, thesulfate concentration in groundwater prior to the experimentwas used as an independent variable to define a “pre-event”end member (CSO4,PE). Sulphate is the major component ofthe groundwater chemistry and it can be used as a tracer aslong as the impact of the difference between groundwater andrainwater concentrations remains far larger than that of thewater–rock interaction. Since this was the case, the appliedsprinkling sulfate content (CSO4,EW) was considered as thesecond end member and Eq. (3) was formulated accordingly.The two estimated mixing proportions (for artificial and envi-ronmental tracers) for both experiments were plotted to anal-yse and validate the mixing assumption.
Furthermore, the simple mass balance equations were used(for Br− and Cl−) to estimate the most probable water (and
www.earth-surf-dynam.net/2/181/2014/ Earth Surf. Dynam., 2, 181–195, 2014
184 D. M. Krzeminska et al.: Field investigation of preferential fissure flow paths
Figure 1. (a) The upper part of the Super-Sauze landslide with indicated location of three sprinkling tests (plot A, B and C); the white dashedlines indicate the hydro-geomorphological units (after Malet et al. 2005).(b) Schematic representation of the experimental setup of each area(not scaled): grey squares represent 1×1 m2 sprinkling plots, dots represent the location of the piezometers, numbers in brackets indicate thedepth of the piezometers in metres, crosses indicate the location of the theta probes, undulating lines indicate fissure distribution within thesprinkling plots, and arrows show the local slope direction in the area.(c) Photographs of the soil surface of each sprinkling area with arrowsshowing the local slope direction in the area.
tracer) flow paths and to restrain mixing processes:
V(tend) = VPE+VINF −VSSF
CBr−/Cl− (tend)·V(tend) =CBr−/Cl−,PE ·VPE+CBr−/Cl−,EW
·VINF −CBr−/Cl− (t) ·VSSF,
(4)
whereV(tend), VPE, VINF andVSSFare the estimated total wa-ter volume in the soil column at the end of sprinkling tests,the estimated volume of pre-event water, the estimated vol-ume of infiltrated water (fraction of EW) and the estimatedvolume of subsurface flow (including exfiltration), respec-tively. The volume of pre-event (VPE) was calculated basedon the initial groundwater level and initial soil moisture con-tent as follows:
VPE= A · (ht0 ·n+ (z−ht0) · θini), (5)
whereA is the plot area (m2), ht0 is the groundwater level (m)observed before the experiment,n is the average porosity (−),
z is the depth of the analysed soil column (m) andθini is theinitial soil moisture (−).
2.3 Characteristics of experimental plots
The experimental design was tested at the highly activeSuper-Sauze landslide (Fig. 1a), which covers 0.17 km2 withan average slope of 25◦ and has displacement velocitiesvarying from 0.01 to 0.40 m day−1, depending on the season(Malet et al., 2002). The small-scale sprinkling plots A andB are located in the upper part of the landslide, which is themost active in terms of displacement rates, abrupt changesin groundwater levels throughout the season, and changes infissure density and openings (Fig. 1b). Plot C is located ina relatively stable part of the landslide, but still at the di-rect contact with the most active area, and is representativeof small displacement rates, small changes in groundwater
Earth Surf. Dynam., 2, 181–195, 2014 www.earth-surf-dynam.net/2/181/2014/
D. M. Krzeminska et al.: Field investigation of preferential fissure flow paths 185
levels throughout the season and no changes in fissure char-acteristics (Fig. 1b). As such, the three experimental plotsshall present different hydrological responses (Malet, 2003;de Montety et al., 2007). All sprinkling experiments werecarried out in relatively flat areas with slopes of 5–7◦. Theporosity values for the experimental plots were assumed tobe 0.35, 0.38 and 0.30 on average for plot A, B and C, respec-tively, based on gravimetric measurements (Malet, 2003).The geomorphology of each plot is detailed below:
– Plot A is located in the active area near the crown con-sisting of relatively fresh but heavily broken marl blocksand deposits (marly fragments of approximately 2 cm).There are wide (aperture of 0.07–0.15 m), undulatingfissures observed on the surface (see Fig. 1b for thesketch), partly or totally filled with reworked marl frag-ments. The open depth of these fissures varies from 0.09to 0.12 m.
– Plot B is also located in the very active area, at a sec-ondary mudslide deposition area, that consists of gravelcrust, which is characterised by coarse fragments (largerthan 2 mm) overlaying a finer matrix. There are wideopen (apertures around 0.10 m) fissures present withinthe plot area with an open depth reaching 0.50 m (seeFig. 1b for the sketch).
– Plot C is situated in the compacted, relatively stable,western part of the landslide and consists of fine-grainedmaterial with different rock fragments. No fissures areobserved at the surface.
The average depth to the bedrock is around 10 m in plot A,3 m in plot B and 5 m in plot C (Travelletti and Malet, 2012).The depth of the piezometers is different at each area. Withinplot A all piezometers were installed at approximately 2 mdepth. Within plot B the piezometers depths are around 1 mdue to the shallow groundwater level (see also Fig. 1b–c.).Within plot C the depths of the piezometers were conditionedby the presence of rock fragments in the soil and vary from1.2 to 3.0 m.
3 Results of sprinkling experiments – hydrologicaland hydrochemical responses
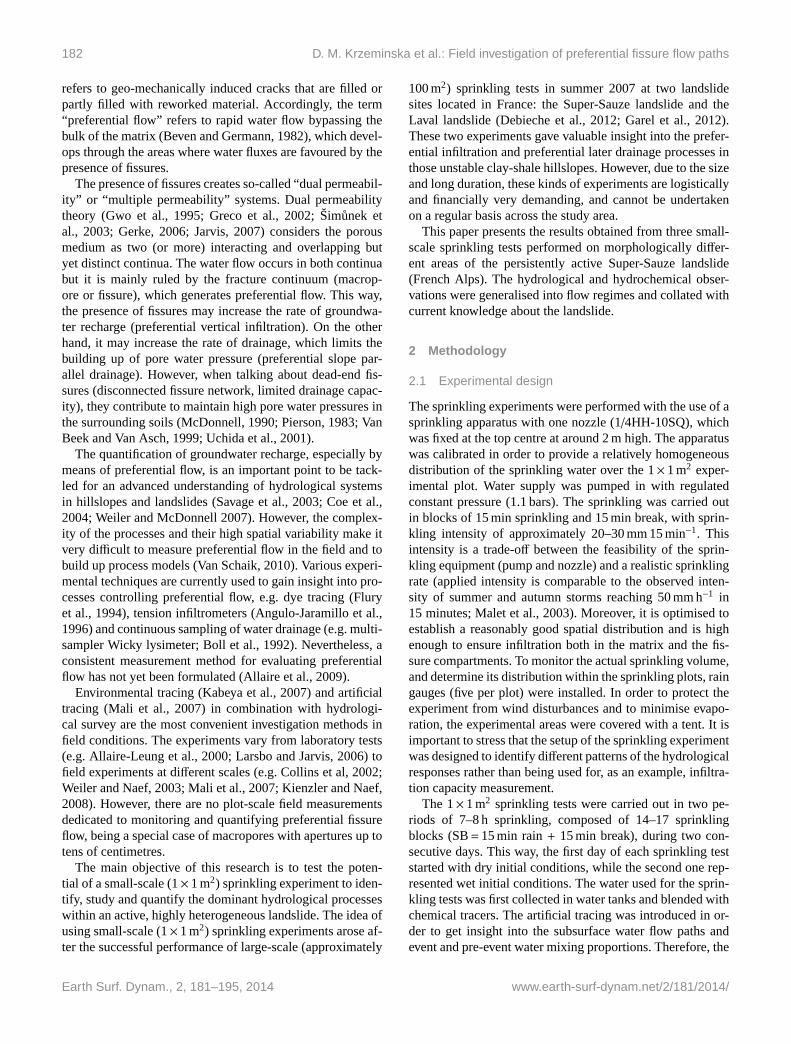
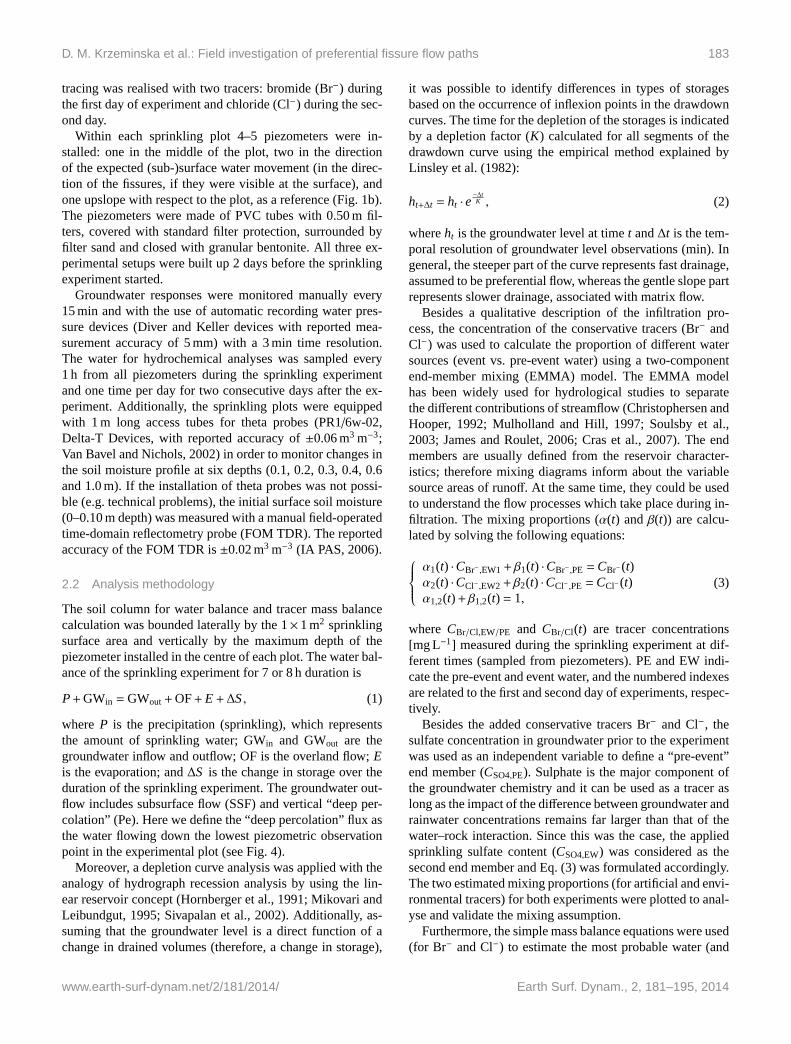
Within each sprinkling plot different hydrological behaviourswere observed. Fig. 2a–c summarise the observed ground-water variation and tracer concentration patterns. Figure 3shows the drawdown curves after the second day of sprin-kling. For plot A and B the drawdown of the centrally lo-cated piezometers was analysed (A1 and B1), while for plotC the analysis was carried out for piezometer C2 since thegroundwater level observed in piezometer C1 was stronglyinfluenced by water sampling.
3.1 Plot A
Plot A was a dry area with no groundwater observed withinthe first 2 m depth (depth A1) before the experiment started.The mean initial volumetric water content of the top soillayer (up to 0.30 m depth) was 0.12 with a standard deviationof 0.03. In response to the applied sprinkling, neither over-land flow nor subsurface runoff was observed. The ground-water fluctuation in A1 showed a very fast vertical movementof water (approximately±0.25–0.30 m in 15 min). Moreover,the drawdown after each day of sprinkling lasted only 4 h(Fig. 2a).
In A3, located in the direction of the surface fissures, thegroundwater level started to react during the first day, afterthe fourth sprinkling block (SB-04). In A2, located downs-lope of the sprinkling plot, but not in the direction of thesurface fissures, the groundwater reaction started only dur-ing the second day after the fifth sprinkling block (SB-05).There was no response observed in A7.
The soil moisture variation observed in the soil profile inθA2 (approximately 1 m distance from the sprinkling area)was negligible. InθA1 no changes were observed in the first0.60 m of soil profile. At 1 m depth soil moisture increaseduntil saturation over the 2 days of the sprinkling experiment.
The tracer concentration in the piezometers gradually in-creased with the cumulated amount of applied sprinkled wa-ter. Similar to the hydrological responses, the most intensechanges were observed in A1, reaching 84 % (first day) and93 % (second day) of applied tracer concentration at the endof each 7–8 h sprinkling. Moreover, the tracer concentrationdecreased during the recession phase. At the start of the sec-ond day, Br− concentration had nearly dropped back to theinitial value. The same trend was observed for Cl− duringthe second day. The tracer concentration in A2 and A3 fol-lowed the trend observed in A1, with the maximum mea-sured tracer concentration reaching 26–38 % (first day) and55–71 % (second day) of applied concentration for A3 andA2, respectively. It is important to note that in plot A, on thesecond day of experiment, Br− was applied during the firstfour sprinkling blocks (SB-01 to SB-04) at very high concen-tration (461 mg L−1). This incident determined the behaviourof Br− concentration at the beginning of the second day ofsprinkling: the maximum concentration of Br− was observedafter SB-06 in A1, after SB-08 in A2 and after SB-12 in A3.
3.2 Plot B
Plot B was located in an area with shallow groundwater level(0.35–0.55 m below the surface). The average initial volu-metric water content in the first 0.30 m of soil was 0.25, witha standard deviation of 0.07. During the sprinkling experi-ment, an increase of groundwater level was observed onlyin B1 and B3 and it fluctuated±0.07 m on average in re-sponse to a single sprinkling block. No groundwater levelchanges were registered in B2 and B6, and no changes in
www.earth-surf-dynam.net/2/181/2014/ Earth Surf. Dynam., 2, 181–195, 2014
186 D. M. Krzeminska et al.: Field investigation of preferential fissure flow paths
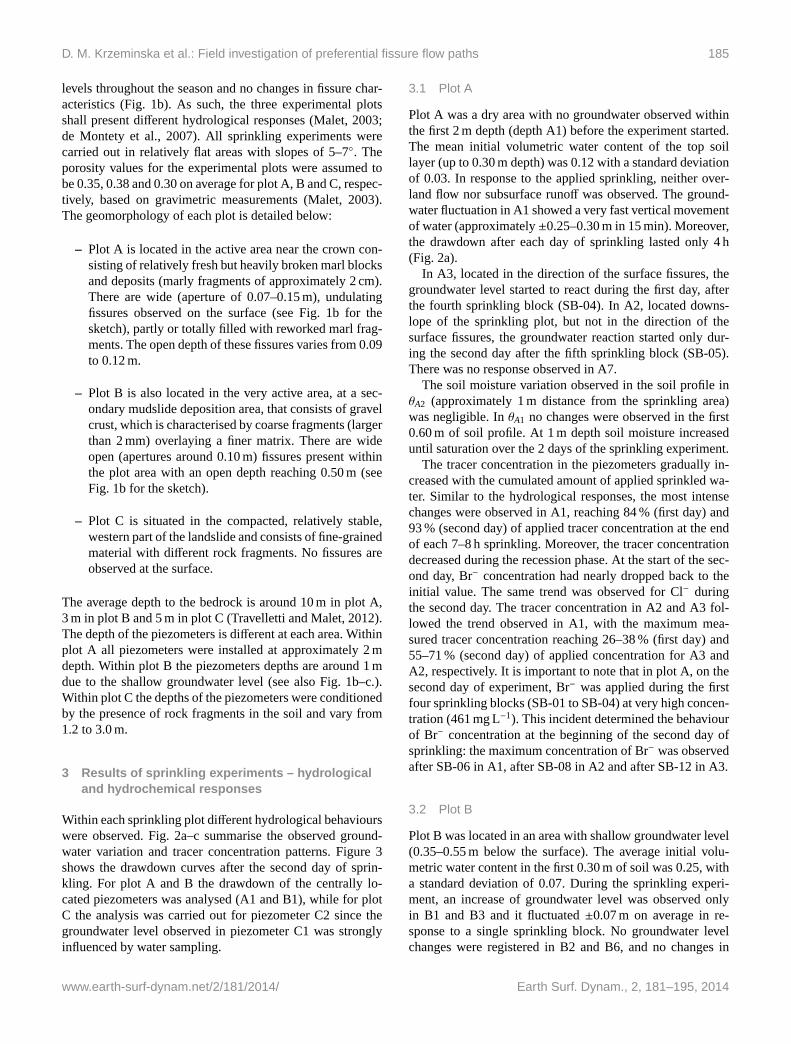
Figure 2. Monitoring results of three sprinkling experiments:(a) plot A, (b) plot B and(c) plot C. Upper panels show the intensity of thesprinkling (primaryy axis) and groundwater responses in piezometers (secondaryy axis). Middle and bottom panels show the ratio betweentracer concentration measured in the piezometers or subsurface runoff (SSF) and the applied tracer concentration.
soil moisture content inθB1 or θB2 (located within a distanceof approximately 1 m from the 1×1 m2 sprinkling plot) wereobserved.
The exfiltrating subsurface runoff was measured around1–1.5 m downslope of the experimental plot. The volume ofsubsurface runoff per sprinkling block increased with time.During the first day, it started at 15.9×10⁻³ m3 for SB-05 andreached 18.3×10⁻³ m3 for SB-14. During the second day,it ranged from 11.4×10⁻³ m3 (for SB-01) to 19.5×10⁻³ m3
(for SB-14).In B1 and B3 the relative Br− concentration rose quickly
and reached a maximum of 67 and 93 %, respectively, at theend of the first day. Moreover, it remained at a high levelin between 2 days of sprinkling (Fig.2b). A similar tracerconcentration behaviour was observed during the second dayof the experiment, when chloride was applied. The observed
Br− concentration gradually decreased, while the Cl− con-centration increased, reaching 58 % (B1) and 99 % (B3) ofapplied concentration. The Cl− concentration remained high(58 % of the applied concentration in B1 and 68 % in B3)even 20 h after the end of the experiment. It is worth notingthat the concentrations of Br− and Cl− were most of the timehigher in B3 than in B1 and that the tracer concentration inthe subsurface runoff equalled (first day) or almost equalled(second day: 81–99 %) that of the sprinkling water.
3.3 Plot C
The initial groundwater level at plot C was around 0.75–1.00 m below the surface and the initial volumetric watercontent varied between 0.20 and 0.25 (0.23 on average) inthe first 0.10 m of soil. In contrast to the dynamics observed
Earth Surf. Dynam., 2, 181–195, 2014 www.earth-surf-dynam.net/2/181/2014/
D. M. Krzeminska et al.: Field investigation of preferential fissure flow paths 187
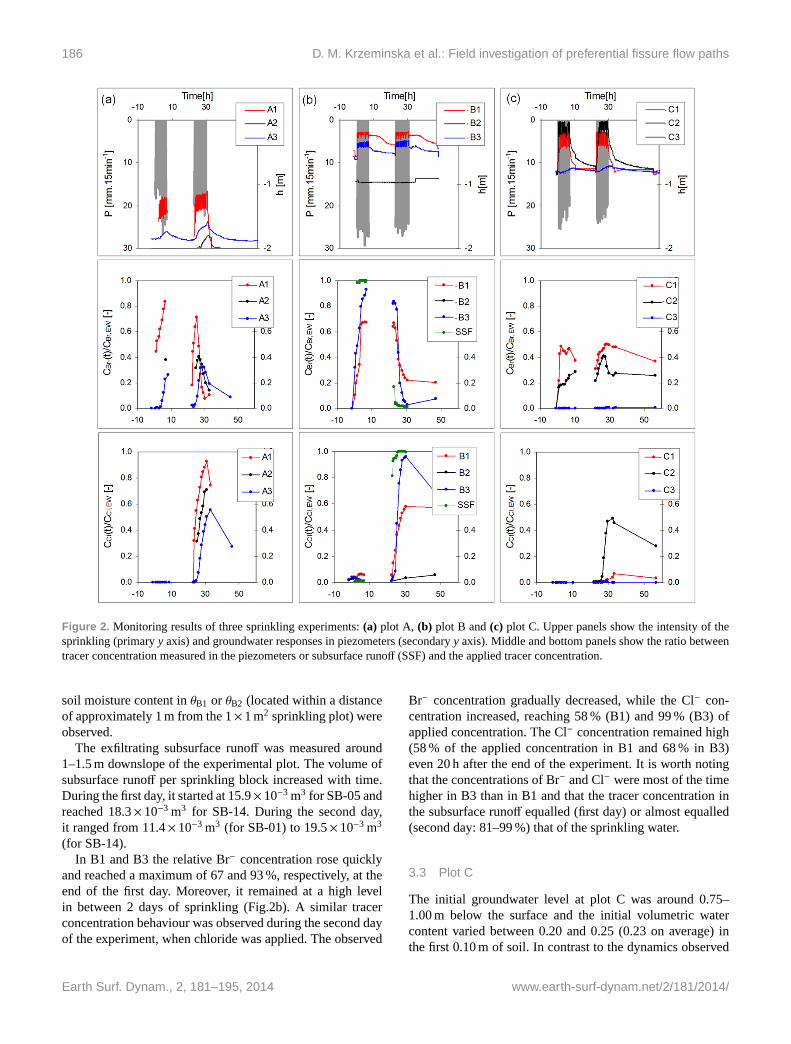
Figure 3. Drawdown curves observed in piezometers A1, B1 and C2 after the end of sprinkling experiments and corresponding depletionfactorsK [min].
in plot A, 75 % of the sprinkling water left the soil column asoverland flow. Moreover, ponding was observed within the1×1 m2 plot during the entire experiment.
The groundwater level observed in C1 and C2 respondedsimilarly: an increase of groundwater level up to 0.20 m (forC1) and 0.05 m (for C2) below the surface and fluctuations ofabout 0.20 m after each 15 min of sprinkling. The drawdownobserved in C1 stopped after 4 h, whereas in B2 it lastedaround 12 h after the sprinkling experiment. C3 showed a0.03–0.07 m groundwater level fluctuation, and no responsetook place in C5 and C6. The groundwater level in the soilcolumn went back to its initial stage within 12 hours after thesprinkling ceased.
In C1 the relative concentration of Br− reached approxi-mately 43–49 % of the applied tracer concentration and wasrelatively constant during the first day of sprinkling. At thestart of the second day Br− relative concentration was 31 %,and it rose again up to 50 % as soon as new sprinkling water(without Br−) was applied (Fig. 2c). Similar trends were ob-served for C2, with the maximal tracer concentration reach-ing 28 and 40 % of applied concentration for the first andsecond day, respectively. No tracer was found in C3.
During the second day of the sprinkling experiment, theCl− concentration showed a very limited increase in C1 but agradual increase up to around 50 % of the applied concentra-tion in C2. The Cl− concentration decreased after the secondday. However, in C2 it remained relatively high even 20 h af-ter the experiment (300 mg L−1). Again, no tracer was foundin C3.
4 Discussion of experimental results and modelconceptualisation
4.1 Water balance and tracer mass balance analysis
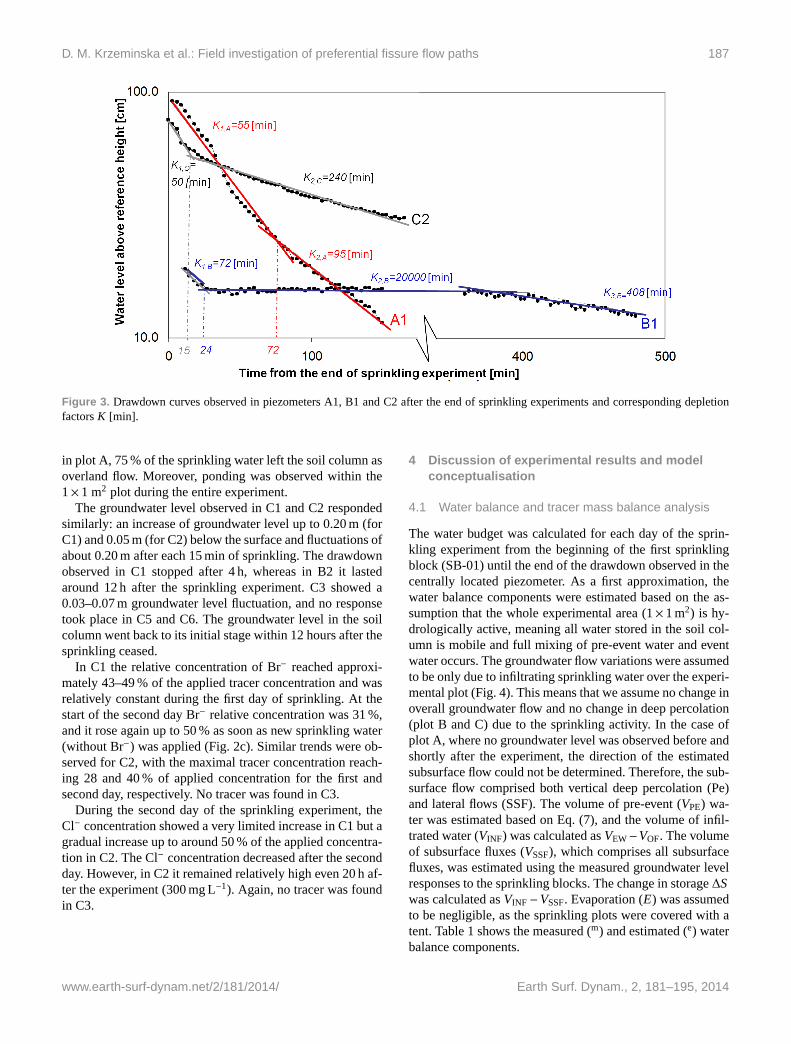
The water budget was calculated for each day of the sprin-kling experiment from the beginning of the first sprinklingblock (SB-01) until the end of the drawdown observed in thecentrally located piezometer. As a first approximation, thewater balance components were estimated based on the as-sumption that the whole experimental area (1×1 m2) is hy-drologically active, meaning all water stored in the soil col-umn is mobile and full mixing of pre-event water and eventwater occurs. The groundwater flow variations were assumedto be only due to infiltrating sprinkling water over the experi-mental plot (Fig. 4). This means that we assume no change inoverall groundwater flow and no change in deep percolation(plot B and C) due to the sprinkling activity. In the case ofplot A, where no groundwater level was observed before andshortly after the experiment, the direction of the estimatedsubsurface flow could not be determined. Therefore, the sub-surface flow comprised both vertical deep percolation (Pe)and lateral flows (SSF). The volume of pre-event (VPE) wa-ter was estimated based on Eq. (7), and the volume of infil-trated water (VINF) was calculated asVEW−VOF. The volumeof subsurface fluxes (VSSF), which comprises all subsurfacefluxes, was estimated using the measured groundwater levelresponses to the sprinkling blocks. The change in storage∆Swas calculated asVINF −VSSF. Evaporation (E) was assumedto be negligible, as the sprinkling plots were covered with atent. Table 1 shows the measured (m) and estimated (e) waterbalance components.
www.earth-surf-dynam.net/2/181/2014/ Earth Surf. Dynam., 2, 181–195, 2014
188 D. M. Krzeminska et al.: Field investigation of preferential fissure flow paths
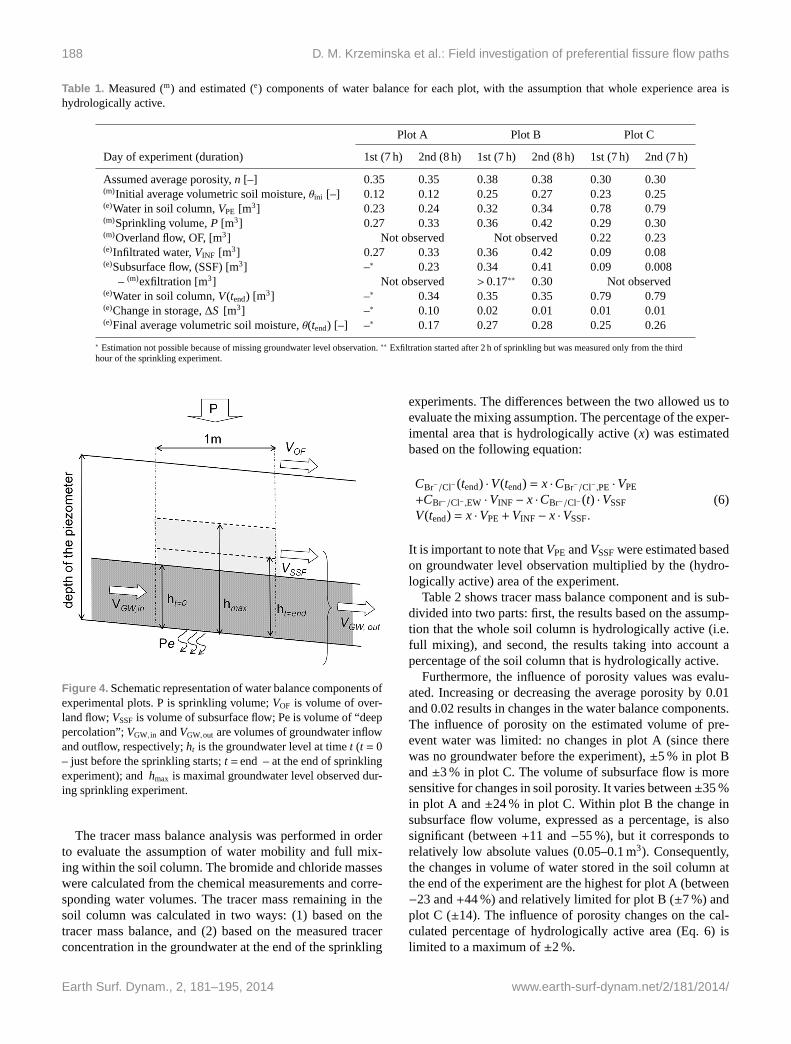
Table 1. Measured (m) and estimated (e) components of water balance for each plot, with the assumption that whole experience area ishydrologically active.
Plot A Plot B Plot C
Day of experiment (duration) 1st (7 h) 2nd (8 h) 1st (7 h) 2nd (8 h) 1st (7 h) 2nd (7 h)
Assumed average porosity,n [–] 0.35 0.35 0.38 0.38 0.30 0.30(m)Initial average volumetric soil moisture,θini [–] 0.12 0.12 0.25 0.27 0.23 0.25(e)Water in soil column,VPE [m3] 0.23 0.24 0.32 0.34 0.78 0.79(m)Sprinkling volume,P [m3] 0.27 0.33 0.36 0.42 0.29 0.30(m)Overland flow, OF, [m3] Not observed Not observed 0.22 0.23(e)Infiltrated water,VINF [m3] 0.27 0.33 0.36 0.42 0.09 0.08(e)Subsurface flow, (SSF) [m3] –∗ 0.23 0.34 0.41 0.09 0.008
– (m)exfiltration [m3] Not observed >0.17∗∗ 0.30 Not observed(e)Water in soil column,V(tend) [m3] –∗ 0.34 0.35 0.35 0.79 0.79(e)Change in storage,∆S [m3] –∗ 0.10 0.02 0.01 0.01 0.01(e)Final average volumetric soil moisture,θ(tend) [–] –∗ 0.17 0.27 0.28 0.25 0.26
∗ Estimation not possible because of missing groundwater level observation.∗∗ Exfiltration started after 2 h of sprinkling but was measured only from the thirdhour of the sprinkling experiment.
Figure 4. Schematic representation of water balance components ofexperimental plots. P is sprinkling volume;VOF is volume of over-land flow;VSSF is volume of subsurface flow; Pe is volume of “deeppercolation”;VGW, in andVGW,out are volumes of groundwater inflowand outflow, respectively;ht is the groundwater level at timet (t = 0– just before the sprinkling starts;t =end – at the end of sprinklingexperiment); andhmax is maximal groundwater level observed dur-ing sprinkling experiment.
The tracer mass balance analysis was performed in orderto evaluate the assumption of water mobility and full mix-ing within the soil column. The bromide and chloride masseswere calculated from the chemical measurements and corre-sponding water volumes. The tracer mass remaining in thesoil column was calculated in two ways: (1) based on thetracer mass balance, and (2) based on the measured tracerconcentration in the groundwater at the end of the sprinkling
experiments. The differences between the two allowed us toevaluate the mixing assumption. The percentage of the exper-imental area that is hydrologically active (x) was estimatedbased on the following equation:
CBr−/Cl− (tend) ·V(tend) = x ·CBr−/Cl−,PE ·VPE
+CBr−/Cl−,EW ·VINF − x ·CBr−/Cl− (t) ·VSSF
V(tend) = x ·VPE+VINF − x ·VSSF.(6)
It is important to note thatVPE andVSSFwere estimated basedon groundwater level observation multiplied by the (hydro-logically active) area of the experiment.
Table 2 shows tracer mass balance component and is sub-divided into two parts: first, the results based on the assump-tion that the whole soil column is hydrologically active (i.e.full mixing), and second, the results taking into account apercentage of the soil column that is hydrologically active.
Furthermore, the influence of porosity values was evalu-ated. Increasing or decreasing the average porosity by 0.01and 0.02 results in changes in the water balance components.The influence of porosity on the estimated volume of pre-event water was limited: no changes in plot A (since therewas no groundwater before the experiment),±5 % in plot Band±3 % in plot C. The volume of subsurface flow is moresensitive for changes in soil porosity. It varies between±35 %in plot A and±24 % in plot C. Within plot B the change insubsurface flow volume, expressed as a percentage, is alsosignificant (between+11 and−55 %), but it corresponds torelatively low absolute values (0.05–0.1 m3). Consequently,the changes in volume of water stored in the soil column atthe end of the experiment are the highest for plot A (between−23 and+44 %) and relatively limited for plot B (±7 %) andplot C (±14). The influence of porosity changes on the cal-culated percentage of hydrologically active area (Eq. 6) islimited to a maximum of±2 %.
Earth Surf. Dynam., 2, 181–195, 2014 www.earth-surf-dynam.net/2/181/2014/
D. M. Krzeminska et al.: Field investigation of preferential fissure flow paths 189
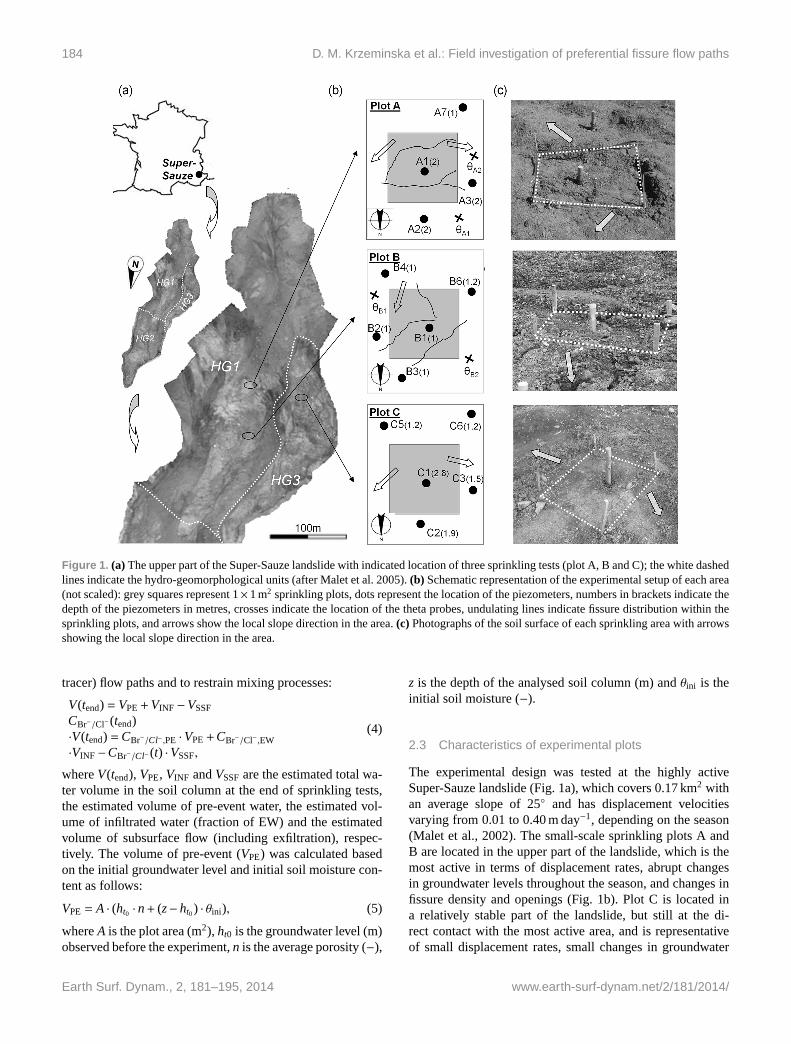
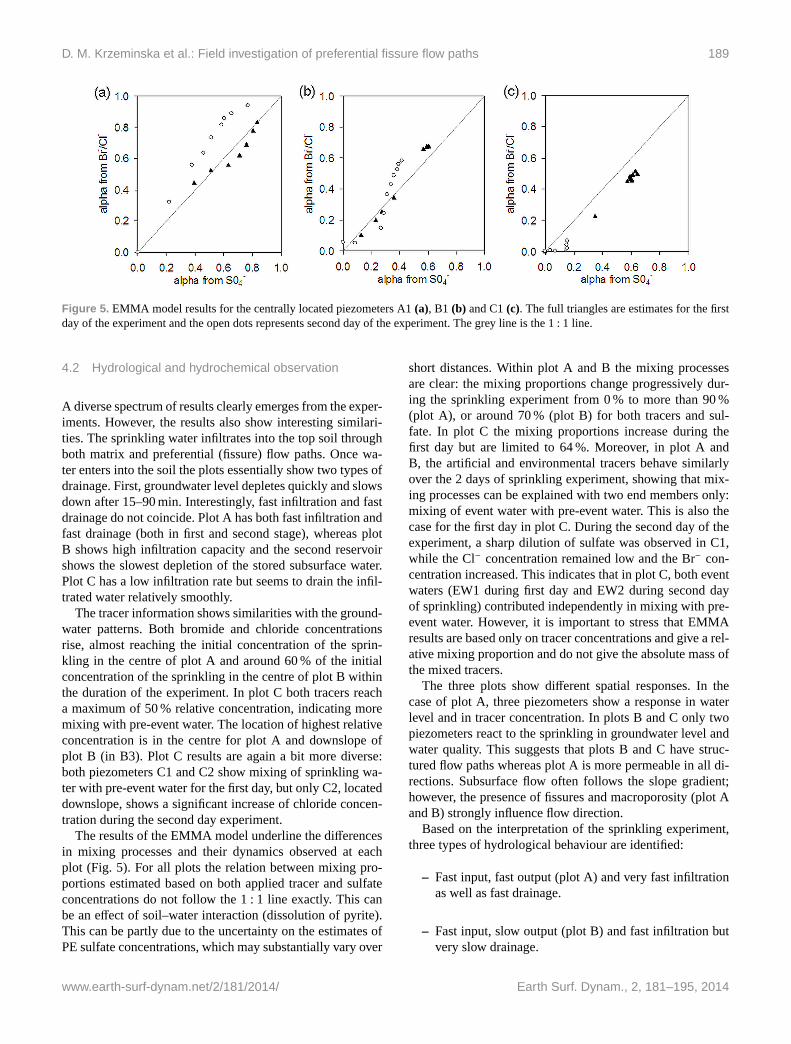
Figure 5. EMMA model results for the centrally located piezometers A1(a), B1 (b) and C1(c). The full triangles are estimates for the firstday of the experiment and the open dots represents second day of the experiment. The grey line is the 1 : 1 line.
4.2 Hydrological and hydrochemical observation
A diverse spectrum of results clearly emerges from the exper-iments. However, the results also show interesting similari-ties. The sprinkling water infiltrates into the top soil throughboth matrix and preferential (fissure) flow paths. Once wa-ter enters into the soil the plots essentially show two types ofdrainage. First, groundwater level depletes quickly and slowsdown after 15–90 min. Interestingly, fast infiltration and fastdrainage do not coincide. Plot A has both fast infiltration andfast drainage (both in first and second stage), whereas plotB shows high infiltration capacity and the second reservoirshows the slowest depletion of the stored subsurface water.Plot C has a low infiltration rate but seems to drain the infil-trated water relatively smoothly.
The tracer information shows similarities with the ground-water patterns. Both bromide and chloride concentrationsrise, almost reaching the initial concentration of the sprin-kling in the centre of plot A and around 60 % of the initialconcentration of the sprinkling in the centre of plot B withinthe duration of the experiment. In plot C both tracers reacha maximum of 50 % relative concentration, indicating moremixing with pre-event water. The location of highest relativeconcentration is in the centre for plot A and downslope ofplot B (in B3). Plot C results are again a bit more diverse:both piezometers C1 and C2 show mixing of sprinkling wa-ter with pre-event water for the first day, but only C2, locateddownslope, shows a significant increase of chloride concen-tration during the second day experiment.
The results of the EMMA model underline the differencesin mixing processes and their dynamics observed at eachplot (Fig. 5). For all plots the relation between mixing pro-portions estimated based on both applied tracer and sulfateconcentrations do not follow the 1 : 1 line exactly. This canbe an effect of soil–water interaction (dissolution of pyrite).This can be partly due to the uncertainty on the estimates ofPE sulfate concentrations, which may substantially vary over
short distances. Within plot A and B the mixing processesare clear: the mixing proportions change progressively dur-ing the sprinkling experiment from 0 % to more than 90 %(plot A), or around 70 % (plot B) for both tracers and sul-fate. In plot C the mixing proportions increase during thefirst day but are limited to 64 %. Moreover, in plot A andB, the artificial and environmental tracers behave similarlyover the 2 days of sprinkling experiment, showing that mix-ing processes can be explained with two end members only:mixing of event water with pre-event water. This is also thecase for the first day in plot C. During the second day of theexperiment, a sharp dilution of sulfate was observed in C1,while the Cl− concentration remained low and the Br− con-centration increased. This indicates that in plot C, both eventwaters (EW1 during first day and EW2 during second dayof sprinkling) contributed independently in mixing with pre-event water. However, it is important to stress that EMMAresults are based only on tracer concentrations and give a rel-ative mixing proportion and do not give the absolute mass ofthe mixed tracers.
The three plots show different spatial responses. In thecase of plot A, three piezometers show a response in waterlevel and in tracer concentration. In plots B and C only twopiezometers react to the sprinkling in groundwater level andwater quality. This suggests that plots B and C have struc-tured flow paths whereas plot A is more permeable in all di-rections. Subsurface flow often follows the slope gradient;however, the presence of fissures and macroporosity (plot Aand B) strongly influence flow direction.
Based on the interpretation of the sprinkling experiment,three types of hydrological behaviour are identified:
– Fast input, fast output (plot A) and very fast infiltrationas well as fast drainage.
– Fast input, slow output (plot B) and fast infiltration butvery slow drainage.
www.earth-surf-dynam.net/2/181/2014/ Earth Surf. Dynam., 2, 181–195, 2014
190 D. M. Krzeminska et al.: Field investigation of preferential fissure flow paths
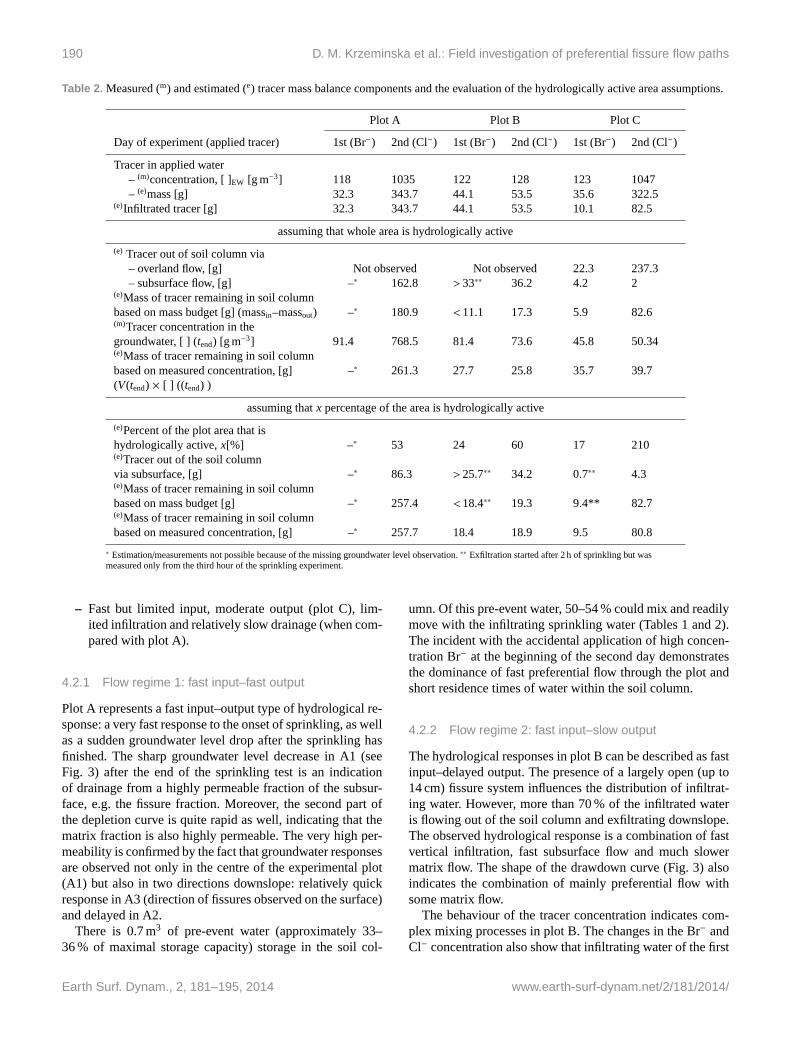
Table 2. Measured (m) and estimated (e) tracer mass balance components and the evaluation of the hydrologically active area assumptions.
Plot A Plot B Plot C
Day of experiment (applied tracer) 1st (Br−) 2nd (Cl−) 1st (Br−) 2nd (Cl−) 1st (Br−) 2nd (Cl−)
Tracer in applied water– (m)concentration, [ ]EW [g m−3] 118 1035 122 128 123 1047– (e)mass [g] 32.3 343.7 44.1 53.5 35.6 322.5
(e)Infiltrated tracer [g] 32.3 343.7 44.1 53.5 10.1 82.5
assuming that whole area is hydrologically active
(e) Tracer out of soil column via– overland flow, [g] Not observed Not observed 22.3 237.3– subsurface flow, [g] –∗ 162.8 >33∗∗ 36.2 4.2 2
(e)Mass of tracer remaining in soil columnbased on mass budget [g] (massin–massout) –∗ 180.9 <11.1 17.3 5.9 82.6(m)Tracer concentration in thegroundwater, [ ] (tend) [g m−3] 91.4 768.5 81.4 73.6 45.8 50.34(e)Mass of tracer remaining in soil columnbased on measured concentration, [g] –∗ 261.3 27.7 25.8 35.7 39.7(V(tend) × [ ] (( tend) )
assuming thatx percentage of the area is hydrologically active
(e)Percent of the plot area that ishydrologically active,x[%] –∗ 53 24 60 17 210(e)Tracer out of the soil columnvia subsurface, [g] –∗ 86.3 >25.7∗∗ 34.2 0.7∗∗ 4.3(e)Mass of tracer remaining in soil columnbased on mass budget [g] –∗ 257.4 <18.4∗∗ 19.3 9.4** 82.7(e)Mass of tracer remaining in soil columnbased on measured concentration, [g] –∗ 257.7 18.4 18.9 9.5 80.8
∗ Estimation/measurements not possible because of the missing groundwater level observation.∗∗ Exfiltration started after 2 h of sprinkling but wasmeasured only from the third hour of the sprinkling experiment.
– Fast but limited input, moderate output (plot C), lim-ited infiltration and relatively slow drainage (when com-pared with plot A).
4.2.1 Flow regime 1: fast input–fast output
Plot A represents a fast input–output type of hydrological re-sponse: a very fast response to the onset of sprinkling, as wellas a sudden groundwater level drop after the sprinkling hasfinished. The sharp groundwater level decrease in A1 (seeFig. 3) after the end of the sprinkling test is an indicationof drainage from a highly permeable fraction of the subsur-face, e.g. the fissure fraction. Moreover, the second part ofthe depletion curve is quite rapid as well, indicating that thematrix fraction is also highly permeable. The very high per-meability is confirmed by the fact that groundwater responsesare observed not only in the centre of the experimental plot(A1) but also in two directions downslope: relatively quickresponse in A3 (direction of fissures observed on the surface)and delayed in A2.
There is 0.7 m3 of pre-event water (approximately 33–36 % of maximal storage capacity) storage in the soil col-
umn. Of this pre-event water, 50–54 % could mix and readilymove with the infiltrating sprinkling water (Tables 1 and 2).The incident with the accidental application of high concen-tration Br− at the beginning of the second day demonstratesthe dominance of fast preferential flow through the plot andshort residence times of water within the soil column.
4.2.2 Flow regime 2: fast input–slow output
The hydrological responses in plot B can be described as fastinput–delayed output. The presence of a largely open (up to14 cm) fissure system influences the distribution of infiltrat-ing water. However, more than 70 % of the infiltrated wateris flowing out of the soil column and exfiltrating downslope.The observed hydrological response is a combination of fastvertical infiltration, fast subsurface flow and much slowermatrix flow. The shape of the drawdown curve (Fig. 3) alsoindicates the combination of mainly preferential flow withsome matrix flow.
The behaviour of the tracer concentration indicates com-plex mixing processes in plot B. The changes in the Br− andCl− concentration also show that infiltrating water of the first
Earth Surf. Dynam., 2, 181–195, 2014 www.earth-surf-dynam.net/2/181/2014/
D. M. Krzeminska et al.: Field investigation of preferential fissure flow paths 191
day replaced the pre-event water and is temporarily storeduntil the new source of water (sprinkling of second day) ap-pears. The relatively low concentration of tracer in B1 showsthat a significant amount of pre-event water (approximately80–84 % of maximum storage) is stored in the matrix and24–61 % of this water is involved in the mixing process (Ta-bles 1 and Table 2). The spatial distribution of tracer con-centration (lower concentration in B1; higher in B3 and insubsurface flow) indicates a well-structured subsurface (in-cluding fissure system) which can provide direct drainage forinfiltrated water. The fast flow domain is isolated from thematrix (no or poor connection). When the groundwater levelis high, a well-connected preferential flow system becomesactive and the applied water drains directly (K1,B; Fig. 3).However, once the water level has dropped by several cen-timetres, the drainage stops (e.g. dead-end fissure) and thesystem maintains high groundwater levels for several hours(K2,B; Fig. 3). The last drainage phase (K3,B; Fig. 3) can beinterpreted as matrix flow occurring after saturation, connect-ing the wet fissure areas.
4.2.3 Flow regime 3: fast-but-limited input–moderate out-put
The general observation of the water balance component (Ta-ble 1) and drawdown curves (Fig. 3) indicates that plot C rep-resents a matrix-like infiltration behaviour; however, the in-fluence of preferential flow cannot be neglected. A significantdrainage at the end of each 15 min sprinkling block and a de-pletion almost 3 times higher in the steep part of the depletioncurve (K1C) with respect to the gentle slope part (K2C) indi-cate the presence of preferential flow paths (fissures, macro-pores), which influence the hydrological behaviour at studiedscale.
There is a significant amount of pre-event water (approx-imately 92–94 % of maximum storage) is stored in the soilcolumn. The tracer mass balance for the first day of the ex-periment (Table 2) indicates that only around 16–18 % of thepre-event water stored in the subsurface is actively mixedwith the infiltrated sprinkling water. The opposite conclusioncan be drawn when analysing the mass balance for the sec-ond day of the sprinkling experiment. Under the assumptionthat all infiltrated sprinkling water is stored in the 1×1 m2
plot, a double amount of pre-event water should be involvedin the mixing processes in order to match the measured Cl−
concentration in C1. However, the concentrations of Cl− inC2 (located outside the sprinkling plot) indicate that there isa significant amount of tracer stored outside the experimen-tal plot, due to surface ponding and subsurface water flow.Moreover, assuming that the hydrologically active area dur-ing the second day of experiment is the same as during thefirst day of experiment (around 20 %), only 1–2 % of infil-trated tracer mass is enough to reach the measured tracer con-centration in the groundwater at the end of experiment. Thisindicates the presence of preferential drainage. Nevertheless,
the presence of Br− in C1 (middle of the sprinkling plot) dur-ing the second day, when only Cl− was applied, confirms thatmatrix flow dominates in the area and that piston flow pro-cesses occurred. The rise of the Br− concentration, both inC1 and C2, observed at the beginning of the second day ofsprinkling might be explained by the tracer settling over soilsurface during water ponding on the first day of sprinklingand being mobilised by “new” sprinkled water.
4.3 Discussion of conceptual models for theSuper-Sauze landslide
The improvement of hydrological modelling of the Super-Sauze landslide is not a direct aim of this paper: the smallnumber of sprinkling experiments and their small scale inrelation to the landslide area of 0.17 ha are not sufficient tocover the whole landslide. Therefore, the results cannot yetbe up-scaled to a complete distributed hydrological model ofthe landslide.
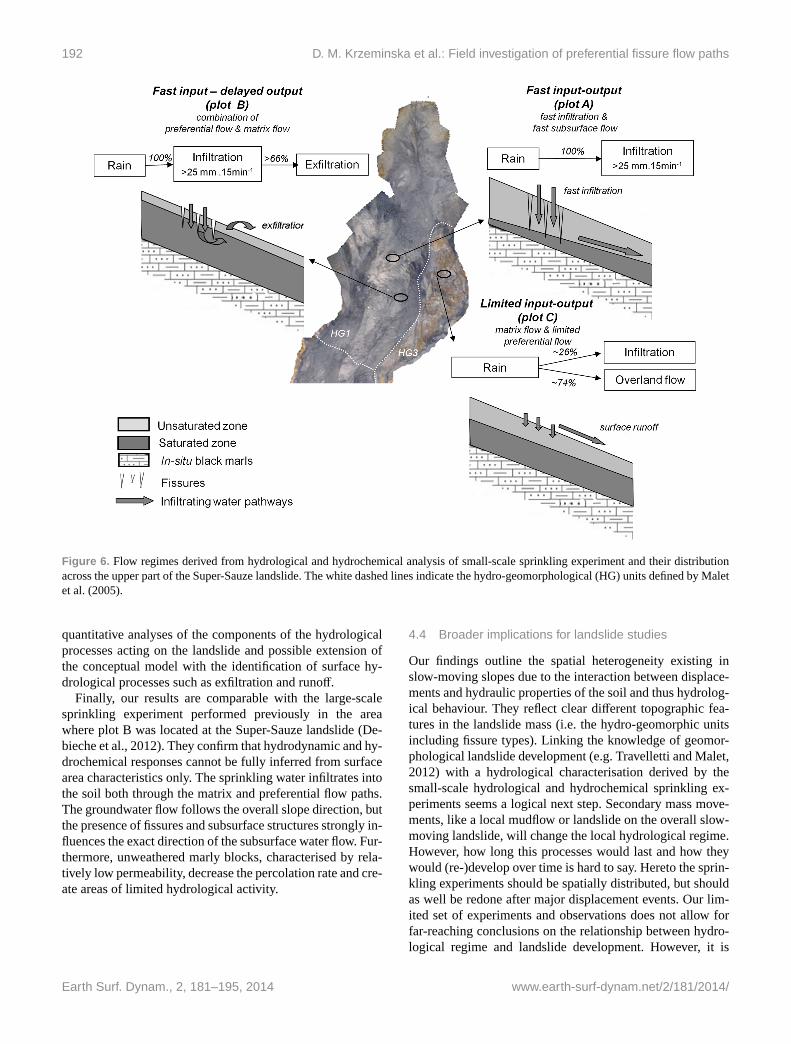
However, the components of the hydrological system,identified based on small-scale sprinkling tests, are in linewith the conceptual model of the Super-Sauze landslide pro-posed by Malet et al. (2005) and de Montety et al. (2007).The former proposed a distributed conceptual model of thehydrological behaviour of the Super-Sauze landslide divid-ing the landslide into three hydro-geomorphological units(Fig. 1a). The upper unit (HG1), where plot A and B arelocated, is very active and characterised by very rapid re-sponses and large groundwater level fluctuation (up to 0.5 m)at the event scale. The western part of upper unit (HG3),where plot C is located, is the most stable part of the land-slide, with very limited groundwater level fluctuation (cen-timetres). Our results confirm this hydrological concept, butthey also stress clear differences in the hydrological responsein the upper unit (Fig. 6), which was not presented as clearlyby Malet et al. (2005). However, it is important to note thatthe hydrochemical behaviour observed in plot C is stronglyinfluenced by the presence of small fissures and cannot becompared with general the hydrological concept of Malet etal. (2005).
The hydrological interpretation of the Super-Sauze land-slide presented by de Montety et al. (2007), based on thelong-term observation of spatial distribution of major cationsand anions, defines dominant hydrological processes alongthe landslide profile. The upper part of the landslide (directlybelow the main scarp) is the “transition” zone, while the mid-dle part of the landslide is dominated by preferential flow.This is in agreement with our observed fast input–fast out-put behaviour in plot A and fast input–slow output behaviourin plot B. The stable part of the landslide, where plot C waslocated, was not considered in the work of de Montety etal. (2007). De Montety et al. (2007) stressed the limitationof their investigation having only a qualitative assessment ofthe water fluxes and underlined the need for more detailedinvestigations. Our experiments show the potential for more
www.earth-surf-dynam.net/2/181/2014/ Earth Surf. Dynam., 2, 181–195, 2014
192 D. M. Krzeminska et al.: Field investigation of preferential fissure flow paths
Figure 6. Flow regimes derived from hydrological and hydrochemical analysis of small-scale sprinkling experiment and their distributionacross the upper part of the Super-Sauze landslide. The white dashed lines indicate the hydro-geomorphological (HG) units defined by Maletet al. (2005).
quantitative analyses of the components of the hydrologicalprocesses acting on the landslide and possible extension ofthe conceptual model with the identification of surface hy-drological processes such as exfiltration and runoff.
Finally, our results are comparable with the large-scalesprinkling experiment performed previously in the areawhere plot B was located at the Super-Sauze landslide (De-bieche et al., 2012). They confirm that hydrodynamic and hy-drochemical responses cannot be fully inferred from surfacearea characteristics only. The sprinkling water infiltrates intothe soil both through the matrix and preferential flow paths.The groundwater flow follows the overall slope direction, butthe presence of fissures and subsurface structures strongly in-fluences the exact direction of the subsurface water flow. Fur-thermore, unweathered marly blocks, characterised by rela-tively low permeability, decrease the percolation rate and cre-ate areas of limited hydrological activity.
4.4 Broader implications for landslide studies
Our findings outline the spatial heterogeneity existing inslow-moving slopes due to the interaction between displace-ments and hydraulic properties of the soil and thus hydrolog-ical behaviour. They reflect clear different topographic fea-tures in the landslide mass (i.e. the hydro-geomorphic unitsincluding fissure types). Linking the knowledge of geomor-phological landslide development (e.g. Travelletti and Malet,2012) with a hydrological characterisation derived by thesmall-scale hydrological and hydrochemical sprinkling ex-periments seems a logical next step. Secondary mass move-ments, like a local mudflow or landslide on the overall slow-moving landslide, will change the local hydrological regime.However, how long this processes would last and how theywould (re-)develop over time is hard to say. Hereto the sprin-kling experiments should be spatially distributed, but shouldas well be redone after major displacement events. Our lim-ited set of experiments and observations does not allow forfar-reaching conclusions on the relationship between hydro-logical regime and landslide development. However, it is
Earth Surf. Dynam., 2, 181–195, 2014 www.earth-surf-dynam.net/2/181/2014/
D. M. Krzeminska et al.: Field investigation of preferential fissure flow paths 193
tempting to speculate on it: as displacements in a landslideoccur, the moving mass changes/adapts its hydraulic prop-erties and, consequently, the pore pressure field. This influ-ences the geomechanical behaviour of the moving mass: itcould stabilise the mass due to drainage, but could also resultin acceleration due to excess pore pressure during transientundrained condition. These feedbacks and the interplay ofprocesses seem very relevant for the behaviour of a slope orlandslide. This constitutes an example of how to study the co-evolution of landscape development and hydrology, as advo-cated in recent studies on catchment hydrology (Ehret et al.,2014).
5 Conclusions
This paper shows the potential of combined hydrological andhydrochemical analyses by means of small-scale 1×1 m2
sprinkling experiments for studying the spatial differences inhydrological response to precipitation input. The approachwas applied at the specific environment of the highly hetero-geneous Super-Sauze landslide (French Alps).
Dual or multiple permeability systems can be found inmany hillslopes and they steer the hydrological dynamics ofthe hillslope. In such cases, laboratory tests for characteris-ing hydraulic soil parameters are insufficient and in situ mea-surements or experiments are necessary. Small-scale sprin-kling experiments performed with the use of artificial tracersand in situ observations of hydrological and hydrochemicalresponse showed to be very effective in unravelling com-plex hydrological systems. A 2-day sprinkling experimentalso had the clear advantage of allowing for more in-depthanalyses of mixing processes to be performed (pre-event–infiltrated water). These analyses confirmed that the presenceof fissures increases the vertical infiltration rate and con-trols the direction of subsurface water flow (e.g. McDonnell,1990; Uchida et al., 2001). Furthermore, our results supportthe concept that antecedent water storage influences the ini-tiation of preferential flow, as found, for example, in Trojanand Linden (1992), Zehe and Fluhler (2001) and Weiler andNaef (2003).
Presented experiments are relatively inexpensive, can bedeployed throughout the landslide area and do not need long-term monitoring programmes. This paves the road for morewidespread applications in order to better understand thespatial differences and similarities of hydrological processesacross a landslide area. In order to extend the application ofsmall-scale sprinkling experiments and to overcome currentshortcomings, the following should be considered:
– detailed measurements of soil characteristics, their het-erogeneity in the analysed soil profile, and their hightemporal resolution monitoring during the sprinklingexperiment;
– applying non-destructive measures to provide more de-tailed characteristics of subsurface fissure system, es-pecially in vertical directions. Grandjean et al. (2012)and Travelletti et al. (2012) presented promising resultsbased on seismic azimuth tomography or ERT measure-ments. However, both methodologies need further im-provement to provide the unique characteristics of sub-surface flow paths.
Although we performed only a limited amount of exper-iments, we showed that small-scale sprinkling experimentswere capable of capturing and monitoring the hydrologicalprocesses across the landslide. Additionally, they show a po-tential for quantifying subsurface flow processes.
Acknowledgements. This work was supported by the EuropeanCommission within the Marie Curie Research and TrainingNetwork “Mountain Risks: from prediction to management andgovernance” (2007–2010, contract MCRTN-035798) and by theFrench National Research Agency (ANR) within the project“Ecou-Pref-Ecoulements préférentiels dans les versants marneux”(contract ANR05-ECCO-007-04).
Edited by: V. Vanacker
References
Allaire-Leung, S. E., Gupta, S. C., and Moncreif, J. F. : Water andsolute movement in soil as influenced by macropore characteris-tics: I. Macropore continuity, J. Contamin. Hydrol., 41, 283–301,2000.
Allaire S. E., Roulier S., and Cessna A. J. : Quantifying preferentialflow in soils: a review of different techniques, J. Hydrol., 378,179–204, 2009.
Anderson, L.: Fracture Mechanics: Fundamentals and Applications,3rd Edition, Taylor & Francis, 2005.
Angulo-Jaramillo, R., Gaudet, J.-P., Thony, J.-L., and Vauclin, M.:Measurement of hydraulic properties and mobile water contentof a field soil, Soil Sci. Soc. Am. J., 60, 710–715, 1996.
Beven, K. and Germann, P.: Macropores and water flow in soils,Water Resour. Res., 18, 1311–1325, 1982.
Bogaard, T. A., Buma, J. T., and Klawer, C. J. M.: Testing the poten-tial of geochemical techniques for identifying hydrological sys-tems within landslides in partly weathered marls, Geomorphol-ogy, 58, 323–338, 2004.
Boll, J., Steenhuis, T. S., and Selker, J. S.: Fiberglass wicks for sam-pling of water and solutes in the vadose zone, Soil Sci. Soc. Am.J., 56, 701–707, 1992.
Christophersen, N. and Hooper, R. P.: Multivariate analysis ofstream water chemical data – the use of principal componentanalysis for the end-member mixing problem, Water Resour.Res., 28, 99–107, 1992.
Coe, J. A., Michael, J. A., Crovelli, R. A., Savage, W. Z.,Laprade, W. T., and Nashem, W. D.: Probabilistic assessmentof precipitation-triggered landslides using historical recordsof landslide occurrence, Seattle, Washington, Environ. Engin.Geosci., 10, 103–122, 2004.
www.earth-surf-dynam.net/2/181/2014/ Earth Surf. Dynam., 2, 181–195, 2014
194 D. M. Krzeminska et al.: Field investigation of preferential fissure flow paths
Collins, R., Jenkins, A., and Harrow, M.: The contribution of oldand new water to a storm hydrograph determined by tracer addi-tion to a whole catchment, Hydrol. Proc., 14, 701–711, 2000.
Cras, A., Marc, V., and Travi, Y.: Hydrological behaviour of sub-Mediterranean alpine headwater streams in a badlands environ-ment, J. Hydrol., 339, 130–144, 2007.
Debieche, T.-H., Bogaard, T. A., Marc, V., Emblanch, C.,Krzeminska, D. M., and Malet, J.-P.: Hydrological and hydro-chemical processes observed during a large-scale infiltration ex-periment at the Super-Sauze mudslide (France), Hydrol. Proc.,26, 2157–2170, 20112.
De Montety, V., Marc, V., Emblanch, C., Malet, J.-P., Bertrand,C., Maquaire, O., and Bogaard, T. A. : Identifying the origin ofgroundwater and flow processes in complex landslides affectingblack marls: insights from a hydrochemical survey, Earth SurfaceProc. Land., 32, 32–48, 2007.
Ehret, U., Gupta, H. V., Sivapalan, M., Weijs, S. V., Schymanski, S.J., Blöschl, G., Gelfan, A. N., Harman, C., Kleidon, A., Bogaard,T. A., Wang, D., Wagener, T., Scherer, U., Zehe, E., Bierkens,M. F. P., Di Baldassarre, G., Parajka, J., Van Beek, L. P. H., VanGriensven, A., Westhoff, M. C., and Winsemius, H. C.: Advanc-ing catchment hydrology to deal with predictions under change,Hydrol. Earth Syst. Sci., 18, 649–671, 2014,http://www.hydrol-earth-syst-sci.net/18/649/2014/.
Flury, M., Fluhler, H., Jury, W. A., and Leuenberger, J.: Suscepti-bility of soils to preferential flow of water: a field study, WaterResources Research, 30, 1945–1954, 1994.
Garel, E., Marc, V., Ruy, S., Cognard-Plancq, A.-L., Klotz, S., Em-blanch, C., and Simler, R.: Large scale rainfall simulation to in-vestigate infiltration processes in a small landslide under dry ini-tial conditions: the Draix hillslope experiment, Hydrol. Proc., 26,14 pp., doi:10.1002/hyp.9273, 2012.
Grandjean, G., Bitri, A., and Krzeminska, D.M.: Characterisation ofa landslide fissure pattern by integrating seismic azimuth tomog-raphy and geotechnical testing, Hydrol. Proc., 26, 2120–2127,2012.
Greco, R.: Preferential flow in macroporous swelling soil with inter-nal catchment, model development and applications, J. Hydrol.,269, 150–168, 2002.
Gerke, H. H.: Preferential flow descriptions for structured soils, J.Plant Nutrit. Soil Sci., 169, 382–400, 2006.
Gwo, J. P., Jardine, P. M., Wilson, G. V., and Yeh, G. T.: A multiple-pore-region concept to modeling mass transfer in subsurface me-dia, J. Hydrol., 164, 217–237, 1995.
Haneberg, W. C.: Observation and analysis of short-term pore pres-sure fluctuations in a thin colluvium landslide complex nearCincinnati, Ohio, Engin. Geol., 31, 159–184, 1991.
Hornberger, G. M., German, P. F., and Beven, K. J.: Throughflowand solute transport in an isolated sloping soil block in a forestedcatchment, J. Hydrol., 124, 81–99, 1991.
IA PAS: Manual for Field Operated Meter (FOM), Institute ofAgrophysics, Polish Academy of Science Lublin, 1–34, 2006.
James, A. L. and Roulet, N. T.: Investigating the applicability ofend-member mixing analysis (EMMA) across scale: A study ofeight small, nested catchments in a temperate forested watershed,Water Resour. Res., 42, 8, doi:10.1029/2005WR004419, 2006.
Jarvis, N. J.: A review of non-equilibrium water flow and solutetransport in soil macropores: principles, controlling factors and
consequences for water quality, European Journal of Soil Sci-ence, 58, 523–546, 2007.
Kabeya, N., Katsuyama, M., Kawasaki, M., Ohte, N., and Sugi-moto, A.: Estimation of mean residence times of subsurface wa-ters using seasonal variation in deuterium excess in a small head-water catchment in Japan, Hydrol. Proc., 21, 308–322, 2007.
Kienzler, P. and Naef, F.: Temporal variability of subsurface storm-flow formation, Hydrol. Earth Syst. Sci., 12, 257–265, 2008,http://www.hydrol-earth-syst-sci.net/12/257/2008/.
Kirchner, J. W.: A double paradox in catchment hydrology and geo-chemistry, Hydrol. Proc., 17, 871–874, 2003.
Larsbo, M. and Jarvis, N.: Information content of measurementsfrom tracer microlysimeter experiments designed for parameteridentification in dualpermeability models, J. Hydrol., 325, 273–287, 2006.
Linsley, R. K., Kohler, M. A. and Paulhus, J. L. H.: Hydrology forEngineers, Third Edition, New York, McGraw-Hill Book Com-pany, 1982.
Malet, J.-P., Maquaire, O., and Calais, E.: The use of Global Po-sitioning System techniques for the continuous monitoring oflandslides: application to the Super-Sauze earthflow (Alpes-de-Haute-Provence, France), Geomorphology, 43, 33–54 2002.
Malet, J.-P.: Les glissements de type écoulement dans les marnesnoires des Alpes du Sud. Morphologie, fonctionnement et mod-élisation hydro-mécanique, Ph.D. thesis, Université Louis Pas-teur, Strasbourg, 2003.
Malet, J.-P., Auzet, A. V., Maquaire, O., Ambroise, B., Descroix,L., Esteves, M., Vandervaere, J. P., and Truchet, E.: Soil surfacecharacteristics influence on infiltration in black marls: applica-tion to the Super-Sauze earthflow (Southern Alps France), EarthSurf. Proc. Landf., 28, 547–564, 2003.
Malet, J.-P., van Asch, T. W. J., van Beek, L. P. H., and Maquaire,O.: Forecasting the behaviour of complex landslides with a spa-tially distributed hydrological model, Natural Haz. Earth Syst.Sci., 5, 71–85, 2005.
Mali, N., Urbanc, J., and Leis, A.: Tracing of water movementthrough the unsaturated zone of a coarse gravel aquifer by meansof dye and deuterated water, Environ. Geol., 51, 1401–1412,2007.
McDonnell, J. J.: The influence of macropores on debris flow initi-ation, Quarterly J. Engin. Geol. Hydrogeol., 23, 325–331, 1990.
Mikovari, A., Peter, C., and Leibundgut, Ch.: Investigation of pref-erential flow using tracer techniques, in: Tracer Technologies forHydrological Systems, Proceedings of a Boulder Symposium,July 1995, 1995.
Mulholland, P. J. and Hill, W. R.: Seasonal patterns in streamwaternutrient and dissolved organic carbon concentrations: Separatingcatchment flow path and in-stream effects, Water Resour. Res.,33, 1297–1306, 1997.
Niethammer, U., James, M. R., Rothmund, S., Travelletti, J., andJoswig, M.: UAV-based remote sensing of the Super-Sauze land-slide: Evaluation and results, Engin. Geol., 128, 2–11, 2012.
Pierson, T. C.: Soil pipes and slope stability, Quart. J. Engin. Geol.,16, 1–15, 1983.
Savage, W. Z., Godt, J. W. and Baum, R. L.: A model for spatiallyand temporally distributed shallow landslide initiation by rainfallinfiltration, in: Proceedings of the third international conferenceon debris flow hazards mitigation: mechanics, prediction, and as-
Earth Surf. Dynam., 2, 181–195, 2014 www.earth-surf-dynam.net/2/181/2014/
D. M. Krzeminska et al.: Field investigation of preferential fissure flow paths 195
sessment, edited by: Rickenmann, D. and Chen, C.-L., Davos,Millpress, Rotterdam, 179–187, 2003.
Schulson, E. M. and Duval, P.: Creep and Fracture of Ice, Cam-bridge University Press, New York, 2009.
Šimunek, J., Jarvis, N. J., van Genuchten, M. T., and Garde-nas, A.: Review and comparison of models for describing non-equilibrium and preferential flow and transport in the vadosezone, J. Hydrol., 272, 14–35, 2003.
Sivapalan, M., Jothityangkoon, C., and Menabde, M.: Linearity andnonlinearity of basin response as a function of scale: discus-sion of the alternative definitions, Water Resour. Res., 38, 2,doi:10.1029/2001WR000482, 2002.
Soulsby, C., Rodgers, P., Smart, R., Dawson, J., and Dunn, S.: Atracer-based assessment of hydrological pathways at differentspatial scales in a mesoscale Scottish catchment, Hydrol. Proc.,7, 759–777, doi:10.1002/hyp.1163, 2003.
Stumpf, A., Malet, J.-P., Kerle, N., Niethammer, U., and Rothmund,S.: Image-based mapping of surface fissures for the investigationof landslide dynamics, Geomorphology, 15, 12–27, 2012.
Travelletti, J. and Malet, J.-P.: Characterization of the 3D geometryof flow-like landslides: A methodology based on the integrationof heterogeneous multi-source data, Engeen. Geol., 128, 30–48,2012.
Travelletti, J., Sailhac, P., Malet, J.-P., Grandjean, G., and Ponton, J.:Hydrological response of weathered clay-shale slopes: water in-filtration monitoring with time-lapse electrical resistivity tomog-raphy, Hydrol. Proc., 26, 2106–2119, 2012.
Trojan, M. and Linden, D.: Micro relief and rainfall effects on waterand solute movement in eartchworm burrows, Soil Sci. Soc. Am.J., 56, 727–733, 1992.
Tromp-van Meerveld, H. J. and McDonnell, J. J.: Threshold rela-tions in subsurface stormflow: 2. the fill and spill hypothesis,Water Resour. Res., 42, 3, doi:10.1029/2004WR003778, 2006.
Uchida, T., Kosugi, K., and Mizuyama, T.: Effects of pipeflowon hydrological process and its relation to landslide: a reviewof pipeflow studies in forested headwater catchments, Hydrol.Proc., 15, 2151–2174, 2001.
Walter, M., Arnhardt, C., and Joswig, M.: Seismic monitoring ofrockfalls, slide quakes, and fissure development at the Super-Sauze mudslide, French Alps, Engin. Geol., 128, 12–22, 2012.
Weiler, M. and Naef, F.: An experimental tracer study of the role ofmacropores in infiltration in grassland soils, Hydrol. Proc., 17,477–493, 2003.
Weiler, M. and McDonnell, J. J.: Conceptualizing lateral prefer-ential flow and flow networks and simulating the effects ongauged and ungauged hillslopes, Water Resour. Res., 43, 3,doi:10.1029/2006WR004867, 2007.
Wienhöfer, J., Lindenmaier, F., and Zehe, E.: Challenges in Un-derstanding the Hydrologic Controls on the Mobility of Slow-Moving Landslides, Vadose Zone Journal, 10, 496–511, 2011.
Van Bavel, M. and Nichols, C.: Theta and Profiler Soil MoistureProbes – Accurate Impedance Measurement Devices – New Ap-plications, Technical Report, 2002.
Van Beek, L. P. H. and van Asch T. W. J.: A combined conceptualmodel for the effects of fissure-induced infiltration on slope sta-bility, in: Process Modelling and Landform Evolution, HergartenS, Neugebauer HJ (eds), Lecture Notes in Earth Sciences, 78,147–167, 1999.
Van Schaik, L.: The role of macropore flow from PLOT to catch-ment scale, Ph.D. thesis, in: Netherlands Geographical Studies,University of Utrecht, Netherlands, 2010.
Zehe, E. and Fluhler, H.: Preferential transport of isoproturon at aplot scale and a field scale tile-drained site, J. Hydrol., 247, 100–115, 2001.
www.earth-surf-dynam.net/2/181/2014/ Earth Surf. Dynam., 2, 181–195, 2014


