Embed Size (px)
Citation preview
For Peer Review O
nly
FE modelling of bainitic steels using crystal plasticity
Journal: Philosophical Magazine & Philosophical Magazine Letters
Manuscript ID: TPHM-08-Jan-0030.R3
Journal Selection: Philosophical Magazine
Date Submitted by the Author:
17-Oct-2008
Complete List of Authors: Osipov, Nikolay; Ecole des Mines de Paris, Centre des Matériaux; Ecole des Mines de Paris, Centre des Matériaux Gourgues-Lorenzon, Anne-Françoise; Ecole des Mines de Paris, Centre des Matériaux, CNRS UMR 7633 Marini, Bernard; CEA, SRMA Mounoury, Valérie; Ecole des Mines de Paris, Centre des Matériaux, CNRS UMR 7633 N'Guyen, Franck; Ecole des Mines de Paris, Centre des Matériaux, CNRS UMR 7633 Cailletaud, Georges; Ecole des Mines de Paris, Centre des Matériaux, CNRS UMR 7633
Keywords: bainitic transformation, crystals, finite-element modelling, grain boundaries, stainless steels
Keywords (user supplied): voronoi tessellation
http://mc.manuscriptcentral.com/pm-pml
Philosophical Magazine & Philosophical Magazine Letterspe
er-0
0513
993,
ver
sion
1 -
1 Se
p 20
10Author manuscript, published in "Philosophical Magazine 88, 30-32 (2009) 3757-3777"
DOI : 10.1080/14786430802566380

For Peer Review O
nly
Philosophical Magazine,
Vol. 00, No. 00, DD Month 200x, 1–18
FE modelling of bainitic steels using crystal plasticity
N. OSIPOV1∗ , A.-F. GOURGUES-LORENZON1, B. MARINI2, V. MOUNOURY1,F. NGUYEN1 and G. CAILLETAUD1
1Centre des Materiaux, Mines–Paristech, CNRS UMR 7633,BP 87, 91003 Evry cedex, France
2CEA, DEN, SRMA, 91191 Gif-sur-Yvette, France
(Received January 2008)
Models classically used to describe the probability of brittle fracture in nuclear power plants are written on a macroscale. Physicalphenomena are not naturally captured by this type of approach, so that application of these models far from their identification domain(such as temperature history, loading path) may become questionable. To improve the quality of the prediction of resistance and lifetime, microstructural information describing the heterogeneous character of the material and its deformation mechanisms, has to betaken into consideration. The objectives of this work is to propose a model able to describe local stress and strain fields in an A508Cl3 bainitic steel. This information will then be used to introduce critical variables for multiscale failure models. The microstructure ofA508 Cl3 steel is made of bainitic packets (coming from former austenitic grains), which are not randomly oriented. An accurate modelmust take the actual microstructure into account, in order to provide realistic local stress and strain fields. Starting from experimentalobservations of the bainitic microstructure (texture measurements, morphological analysis), the paper first proposes a numerical modelable to produce quantitatively representative numerical aggregates, then discusses the results obtained by a finite element treatment ofthe aggregates involving crystal plasticity.
1 Introduction
Reactor pressure vessel steel of nuclear power plant (A508 Cl3, 16MND5 in French norm) type showsa soft but well defined temperature dependence of the toughness in the range of the Ductile to BrittleTransition Temperature (DBTT) [1–7]. In practice, toughness data and its scattering can be accuratelydescribed in the whole transition, thanks to fracture modelling, based on local approach models such asBeremin or WST models [2, 3]. However, to reproduce the fast increase of toughness with temperature inthe DBTT region, the macroscopic critical cleavage stress must be assumed to be an increasing function oftemperature [4–7]. On one hand, in pure Fe, experiments reveal that the surface energy γs which is relatedto the cleavage stress, is fairly independent of temperature [8,9]. On the other hand, for bainitic steels, itis experimentally found that the macroscopic critical cleavage stress is fairly temperature independent, atleast, in the lower shelf of the fracture toughness [10]. Therefore, introduction of a temperature-dependentmacroscopic critical cleavage stress in computations needs to be rationalised. The reasons of this effect canbe investigated by means of a multi-scale approach, starting from dislocation behaviour and going throughdifferent scales [11, 12]. Crystal plasticity is a good candidate to be the lower level of the scheme, since itdescribes the collective behaviour of dislocations and allows to evaluate local stress fields in connectionwith the material microstructure. The critical variables controlling brittle fracture (namely, the largesteigenstress value) can be found from these fields. Of course, this requires precise computation of thelocal stress distributions within the aggregate, that can only be achieved if a representative model of themicrostructure (texture and grain morphology) is used.
Calculation of microstructures is now a classical field in computational material mechanics [13]. Inearly studies, only the global response was investigated, together with texture evolution, so that cubicgrains where used, with one element in each grain [14, 15]. Authors have then introduced regular grainshapes with many finite elements in each grain [16], then the so-called multiphase elements [17, 18], in
∗Corresponding author. Email: [email protected]
Philosophical MagazineISSN 1478-6435 print/ISSN 1478-6443 online c© 200x Taylor & Francis
http://www.tandf.co.uk/journalsDOI: 10.1080/1478643YYxxxxxxxx
Page 1 of 18
http://mc.manuscriptcentral.com/pm-pml
Philosophical Magazine & Philosophical Magazine Letters
123456789101112131415161718192021222324252627282930313233343536373839404142434445464748495051525354555657585960
peer
-005
1399
3, v
ersi
on 1
- 1
Sep
2010
For Peer Review O
nly
2 N. Osipov et al.
order to better characterise intergranular fields. The values obtained near grain boundaries with thistechnique are questionable, so that more advanced solutions, using realistic meshes obtained by a Voronoıtessellation [18, 19] or other algorithms [20] have been proposed, where the finite element mesh conformsgrain boundaries.
Meshing techniques can be applied either on synthetic images, or on real pictures of the material. Thesecond solution is the most classical for 2D microstructures [21]. It has also been used also in 3D compu-tations, where the 3D image is obtained by successive polishing operations or by X-ray tomography [7,19].For the present case, it might not be the best one, since the chance to choose a non representative windowremains significant on very complex microstructures. On the other hand, better control is allowed by nu-merical image generation, because the number of microstructure maps is not limited, so that the statisticalaspect is easier to introduce.
Metallurgists have characterised the bainitic microstructures for a long time [22–25]. These steels areformed of grains and subgrains (bainitic packets), that have well defined orientations with respect tothe initial austenitic grain. If compared to a simple aggregate computation, the present problem mustthen introduce two new features: a fully controlled local texture (not only average texture components,but spatially related crystal orientations) and grains (in fact packets) defined by a two level procedure,where the shape of the packets is defined inside an initial domain. From the best authors’ knowledge, theconsequences of these choices have not been addressed together in literature.
Variables characterising the hydrostatic and the deviatoric stress, or more likely the maximum eigenstressare to be used in the micromechanical local approach. Their respective maps will be studied in detail ina future paper. For the present article, we focus on the von Mises equivalent stress, since the relateddistributions exhibit profiles that were not shown before in literature.
The purpose of the paper is then first to propose a new methodology to produce spatially controlledmicrostructures, then to check the consequences of their specific properties on the local stress fields obtainedby a finite element analysis. After the present introduction, the paper is divided into six sections. Section2 summarises several preexisting useful observations of the microstructure of the material in order topresent the retained morphology. Section 3 provides detailed analysis of the various scales and proposesa simplified morphology; several solutions are investigated to create bainitic packets by cutting a parentaustenitic grain into several daughter packets. The chosen cutting process is then used to model the wholeaggregate, which is shown in Section 4, as the result of the morphological and textural modelling strategy.The target morphology and textures are given. Section 5 provides a description of the material model, andboundary conditions, and presents FE computations. Two series of results are then presented. The mainpart is Section 6, were the influence of the crystallography and of the morphology on the local and globalstress–strain responses are shown. Section 7 is devoted to a discussion dealing with mesh types and thepossible artefacts that can arise from a loose mapping of the microstructure on the FE mesh.
2 Observation and morphological analysis of bainitic microstructures
2.1 Process dependent microstructures
The material under study is a A508 Cl3 bainitic steel used in Pressurised Water Reactors (PWR) pressurevessels. Its chemical composition is given in Table 1.
C S P Si Mn Ni Cr Mo Cu Co V0.16 0.004 0.008 0.22 1.33 0.76 0.22 0.51 0.07 0.017 ≤ 0.01
Table 1. Chemical analysis (wt %) of the steel under study
Advanced experimental techniques (image analysis, EBSD) reveal a very complex microstructure, thatresults from several heat treatments, which aim to suppress forging effects, reduce residual stresses in thematerial and define the final morphology and relevant crystal orientations. Three steps are successivelyapplied: (i) austenitisation at 865◦C and 895◦C during 4h40. An homogeneous microstructure composed ofequiaxed austenitic (FCC) grains is formed (Fig. 1(a)); (ii) water quenching. The crystallographic structure
Page 2 of 18
http://mc.manuscriptcentral.com/pm-pml
Philosophical Magazine & Philosophical Magazine Letters
123456789101112131415161718192021222324252627282930313233343536373839404142434445464748495051525354555657585960
peer
-005
1399
3, v
ersi
on 1
- 1
Sep
2010

For Peer Review O
nly
FE modelling of bainitic steels using crystal plasticity 3
(a) (b) (c)Figure 1. Principal stages of the austenite-bainite phase transformation
Figure 2. Inverse Pole Figure map of a A508 Cl3 microstructure (doc. CEA). The color key indicates the orientation of the samplenormal in each crystal frame
transforms from FCC into BCC. The ferritic phase starts to grow from nucleation sites generally located atgrain boundaries or multiple junctions (Fig. 1(b)); (iii) tempering at 630◦C/645◦C during 7h30 and stress-relief heat treatment at 610◦C during 8 hours. Cementite is then formed, due to carbon precipitation atgrain and subgrain boundaries. This mixture of ferrite and cementite will be called bainite in the following(Fig. 1(c)).
2.2 Analysis of morphology and crystallography of bainitic steel
Inclusions such as MnS as well as a low amount of remaining austenite are found in the material. Such acomplex microstructure is known to have an influence on the failure mode: brittle failure is the consequenceof cleavage mechanisms along cubic planes of the BCC phase. The Electron Back Scattered Diffraction(EBSD) technique is one of the most advanced methods used to characterise the internal microstructureof the grains. This method has been used to obtain the Inverse Pole Figure (IPF) map of a typicalmicrostructure of our steel as presented in Figure 2. It shows that the material has a complex temperedbainite microstructure: it consists of groups of ferritic laths (contoured by red lines) which present slightrelative misorientations (about 1–2 degrees). This groups are also called sheaves [26] or packets. The packetswith a distinct crystallographic orientation (i.e. delimited by a high angle boundary) define the effectivegrain size of the material with respect to cleavage. Further, the image analysis was performed using OIMAnalysis software. It revealed morphological characteristics (size and shape of grains) and crystallographicinformation (IPF, misorientation angle) of the material.
The obtained crystallographic information is graphically presented in Fig.3. It should be noted that inour analysis we considered that the specific processing route does not create any texture in austenite.Thus, it does not affect the misorientation of packets across former austenite grain boundaries. Figure
Page 3 of 18
http://mc.manuscriptcentral.com/pm-pml
Philosophical Magazine & Philosophical Magazine Letters
123456789101112131415161718192021222324252627282930313233343536373839404142434445464748495051525354555657585960
peer
-005
1399
3, v
ersi
on 1
- 1
Sep
2010

For Peer Review O
nly
4 N. Osipov et al.
0
0.005
0.01
0.015
0.02
0.025
0.03
0.035
0.04
10 20 30 40 50 60 70
frequ
ency
Misorientation angle
real 16MND5 microstructuresmoothed with bezier
Figure 3. Plot of the distribution of the misorientations between adjacent domains (grains, packets and laths)
3 shows the distribution of the misorientation between adjacent crystals : 100 classes are defined in the0–65◦range. Three main zones can be distinguished on the distribution curve: the plateau between 15◦
and 45◦ corresponds to misorientations between bainitic packets emerging from different former austeniticgrains (grain to grain misorientation), the peak around 55◦ is mostly related to misorientations betweenbainitic packets formed from the same austenite grain (packet to packet misorientation), the peak for lowmisorientation angles mainly characterises the misorientation between ferritic laths inside bainitic packets(lath to lath misorientation).
3 Modelling of the bainitic microstructure
3.1 Morphology of the bainitic phase
Bainite is the result of a phase transformation starting from an austenitic microstructure. A correctmodelling of the parent microstructure (former austenite) is then a key point in the procedure used togenerate the final (product) microstructure. For this purpose, classical Voronoı tessellation was used.A repulsion function allows to control grain shape and grain size distribution. It is worth noting thatEBSD maps give information from a surface of a 3D microstructure, consequently only a 3D numericalmicrostructure can be used for its modelling. Due to to the complexity of the microstructure, cleavageproperties are related to local matrix microtexture (i.e. combined morphology and crystallography) andto secondary phase distribution. Only matrix properties will be considered in the following of this paper.
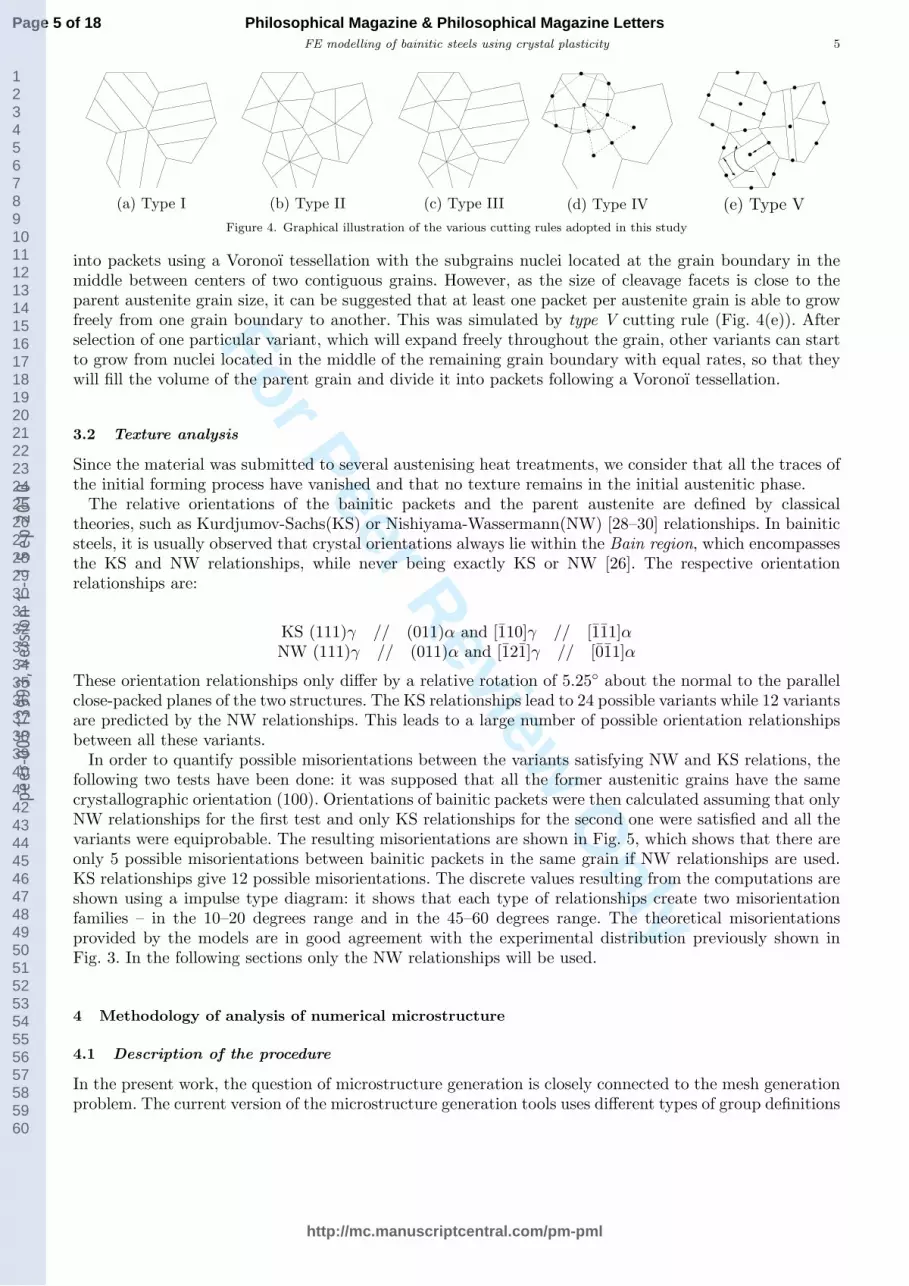
The main goal of this work is a correct representation of the bainitic microstructure, taking into accountthe morphology and crystallography of bainitic packets, in order to estimate the heterogeneity of stressand strain fields induced by this intragranular microstructure and understand its origin. That is the reasonwhy only bainitic packets are considered. The influence of secondary phases such as cementite has beendeeply studied in a previous study [27], where clusters of cementite have been taken into account bymeans of a two phase model. In the present work, the precipitation of cementite is taken into accountimplicitly in the material parameters of the constitutive model. The definition of the shape of the bainiticpackets is still controversial. EBSD analysis allows researchers to better understand the morphology andthe crystallography of the microstructure (Fig. 2). Starting from experimental EBSD data (Fig. 2), severalcutting processes were defined to generate the bainitic packets. Five cutting methods are presented here.They are illustrated in Fig. 4. As shown in Fig. 4(a), type I consists in the definition of a given numberof packets as parallel slices of the parent grain which are cut along given direction. In type II, a volume1
decomposition (Fig. 4(b)) allows various sub-domains to be considered. Type III (Fig. 4(c)) is a combinationof the first and second types of cutting which changes from one grain to another in a random manner.Analysis of partially transformed bainite samples suggests that bainitic packets frequently originate fromthe parent grain boundaries. This idea is used in the type IV rule (Fig. 4(d)), where grains are decomposed
1The numerical methods of grain to packet decomposition are developed in 3D, even if, for the sake of simplicity, only 2D images arepresented.
Page 4 of 18
http://mc.manuscriptcentral.com/pm-pml
Philosophical Magazine & Philosophical Magazine Letters
123456789101112131415161718192021222324252627282930313233343536373839404142434445464748495051525354555657585960
peer
-005
1399
3, v
ersi
on 1
- 1
Sep
2010
For Peer Review O
nly
FE modelling of bainitic steels using crystal plasticity 5
(a) Type I (b) Type II (c) Type III (d) Type IV (e) Type VFigure 4. Graphical illustration of the various cutting rules adopted in this study
into packets using a Voronoı tessellation with the subgrains nuclei located at the grain boundary in themiddle between centers of two contiguous grains. However, as the size of cleavage facets is close to theparent austenite grain size, it can be suggested that at least one packet per austenite grain is able to growfreely from one grain boundary to another. This was simulated by type V cutting rule (Fig. 4(e)). Afterselection of one particular variant, which will expand freely throughout the grain, other variants can startto grow from nuclei located in the middle of the remaining grain boundary with equal rates, so that theywill fill the volume of the parent grain and divide it into packets following a Voronoı tessellation.
3.2 Texture analysis
Since the material was submitted to several austenising heat treatments, we consider that all the traces ofthe initial forming process have vanished and that no texture remains in the initial austenitic phase.
The relative orientations of the bainitic packets and the parent austenite are defined by classicaltheories, such as Kurdjumov-Sachs(KS) or Nishiyama-Wassermann(NW) [28–30] relationships. In bainiticsteels, it is usually observed that crystal orientations always lie within the Bain region, which encompassesthe KS and NW relationships, while never being exactly KS or NW [26]. The respective orientationrelationships are:
KS (111)γ // (011)α and [110]γ // [111]αNW (111)γ // (011)α and [121]γ // [011]α
These orientation relationships only differ by a relative rotation of 5.25◦ about the normal to the parallelclose-packed planes of the two structures. The KS relationships lead to 24 possible variants while 12 variantsare predicted by the NW relationships. This leads to a large number of possible orientation relationshipsbetween all these variants.
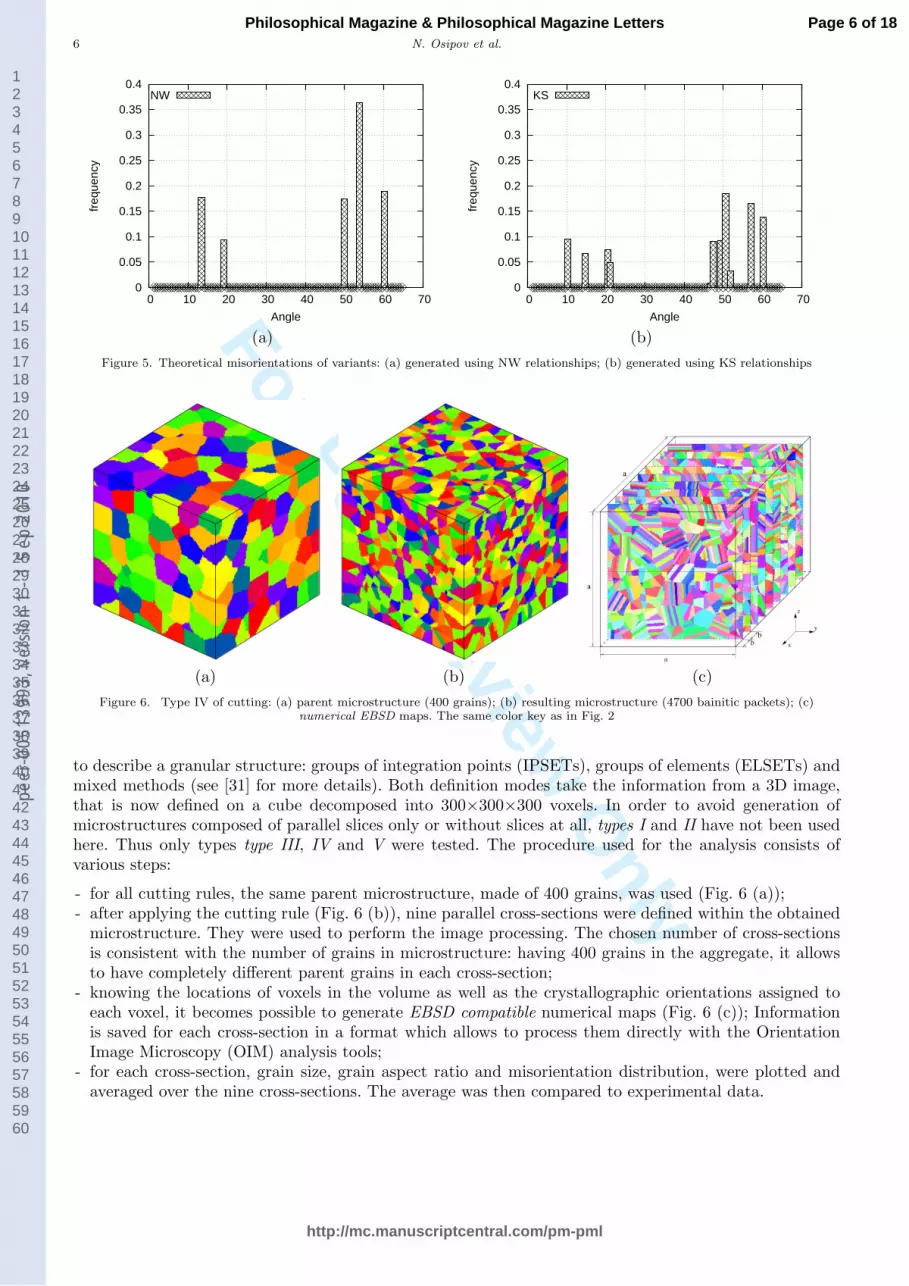
In order to quantify possible misorientations between the variants satisfying NW and KS relations, thefollowing two tests have been done: it was supposed that all the former austenitic grains have the samecrystallographic orientation (100). Orientations of bainitic packets were then calculated assuming that onlyNW relationships for the first test and only KS relationships for the second one were satisfied and all thevariants were equiprobable. The resulting misorientations are shown in Fig. 5, which shows that there areonly 5 possible misorientations between bainitic packets in the same grain if NW relationships are used.KS relationships give 12 possible misorientations. The discrete values resulting from the computations areshown using a impulse type diagram: it shows that each type of relationships create two misorientationfamilies – in the 10–20 degrees range and in the 45–60 degrees range. The theoretical misorientationsprovided by the models are in good agreement with the experimental distribution previously shown inFig. 3. In the following sections only the NW relationships will be used.
4 Methodology of analysis of numerical microstructure
4.1 Description of the procedure
In the present work, the question of microstructure generation is closely connected to the mesh generationproblem. The current version of the microstructure generation tools uses different types of group definitions
Page 5 of 18
http://mc.manuscriptcentral.com/pm-pml
Philosophical Magazine & Philosophical Magazine Letters
123456789101112131415161718192021222324252627282930313233343536373839404142434445464748495051525354555657585960
peer
-005
1399
3, v
ersi
on 1
- 1
Sep
2010
For Peer Review O
nly
6 N. Osipov et al.
0
0.05
0.1
0.15
0.2
0.25
0.3
0.35
0.4
0 10 20 30 40 50 60 70
freq
uenc
y
Angle
NW
0
0.05
0.1
0.15
0.2
0.25
0.3
0.35
0.4
0 10 20 30 40 50 60 70
freq
uenc
y
Angle
KS
(a) (b)Figure 5. Theoretical misorientations of variants: (a) generated using NW relationships; (b) generated using KS relationships
(a) (b) (c)Figure 6. Type IV of cutting: (a) parent microstructure (400 grains); (b) resulting microstructure (4700 bainitic packets); (c)
numerical EBSD maps. The same color key as in Fig. 2
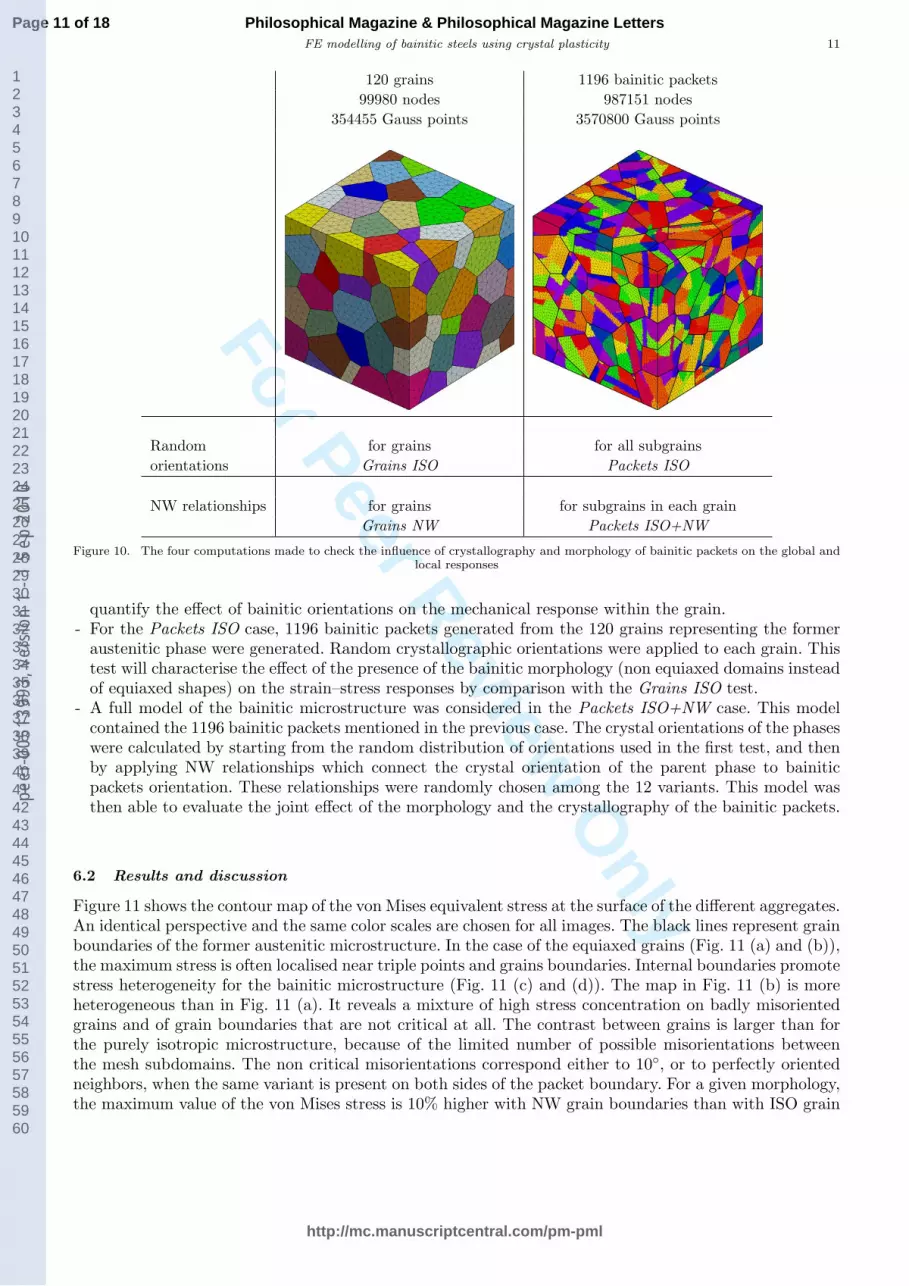
to describe a granular structure: groups of integration points (IPSETs), groups of elements (ELSETs) andmixed methods (see [31] for more details). Both definition modes take the information from a 3D image,that is now defined on a cube decomposed into 300×300×300 voxels. In order to avoid generation ofmicrostructures composed of parallel slices only or without slices at all, types I and II have not been usedhere. Thus only types type III, IV and V were tested. The procedure used for the analysis consists ofvarious steps:
- for all cutting rules, the same parent microstructure, made of 400 grains, was used (Fig. 6 (a));- after applying the cutting rule (Fig. 6 (b)), nine parallel cross-sections were defined within the obtained
microstructure. They were used to perform the image processing. The chosen number of cross-sectionsis consistent with the number of grains in microstructure: having 400 grains in the aggregate, it allowsto have completely different parent grains in each cross-section;
- knowing the locations of voxels in the volume as well as the crystallographic orientations assigned toeach voxel, it becomes possible to generate EBSD compatible numerical maps (Fig. 6 (c)); Informationis saved for each cross-section in a format which allows to process them directly with the OrientationImage Microscopy (OIM) analysis tools;
- for each cross-section, grain size, grain aspect ratio and misorientation distribution, were plotted andaveraged over the nine cross-sections. The average was then compared to experimental data.
Page 6 of 18
http://mc.manuscriptcentral.com/pm-pml
Philosophical Magazine & Philosophical Magazine Letters
123456789101112131415161718192021222324252627282930313233343536373839404142434445464748495051525354555657585960
peer
-005
1399
3, v
ersi
on 1
- 1
Sep
2010

For Peer Review O
nly
FE modelling of bainitic steels using crystal plasticity 7
0
0.05
0.1
0.15
0.2
0.25
0.3
10 100 1000
frequ
ency
Area
16MND5 microstructuretype 3type 4type 5
0
0.005
0.01
0.015
0.02
0.025
0.03
0 0.1 0.2 0.3 0.4 0.5 0.6 0.7 0.8 0.9 1
frequ
ency
Aspect Ratio
16MND5 microstructuretype 3type 4type 5
(a) (b)Figure 7. Comparison between A508 and numerical microstructures: (a) grain area; (b) aspect ratio distribution
4.2 Morphological results
A quantitative analysis of the average values of area and aspect ratio of the bainitic packets for differentcutting rules has been made. The result is illustrated in Fig. 7, where the total population has been dividedinto 100 classes for each subfigure. It can be observed (Fig. 7 (a)) that the number of small grains is larger inexperimental distribution than in any of the simulated microstructures. This is due to the use of a Voronoıtessellation algorithm which produces a rather uniform grain size. It has to be noted that the horizontallogarithmic scale magnifies this effect. This is why we decided to keep this kind of display. For the aspectratio, the agreement is rather poor for Type III: this is related to the large number of slice-shaped grainsin the microstructure. The maximum of the distribution is found for an aspect ratio of 0.15. Type IV failsalso to reproduce the experiment, but now the maximum of the aspect ratio distribution is at 0.56 whichis due to the rounded shape of subgrains. Finally, type V allows to correctly describe the experimentalgrain shape distribution, since it introduces a special domain crossing each grain before cutting the rest ofthe grain: this appears to be an essential feature of the real microstructure, which remains absent in othercutting rules.
4.3 Local texture
The distribution of the misorientation angle between packets is shown in Fig. 8. NW assumptions are used,as previously shown in Fig. 5 (a). It is compared with the one, coming from the EBSD analysis of realmicrostructure shown in Fig. 2.
Again the population is divided into 100 classes for the case shown in Fig. 8 (b). The plot in Fig. 8 (a)is a little different, since, in this case, its would not be realistic to make a direct comparison of thenumerical microstructure and of the experimental one. The simulated misorientations combine “ground”values coming from the misorientations of the former austenitic grains and the five discrete values comingfrom the NW relationships, represented by five Dirac functions. A scale factor of nine has then been appliedto the experimental values on the vertical axis, to bring the corresponding continuous curve at the levelof the simulated one.
In Fig. 8 (a) (dashed line), it can be seen that the experimental misorientation angle distribution presentsa maximum between 50◦– 60◦, that is the maximum misorientation allowed for the cubic microstructure.Since theory provides a finite set of values, the experimental distribution was adjusted by the size of theclasses used for counting. The qualitative agreement between experiment and theory is rather good. Theangles in the range 0–15◦ correspond to the misorientation between the laths of ferrite within the bainiticpackets whereas the angles from 40◦ to 62◦ mainly correspond to the misorientation between the bainiticpackets within the parent grains. Peaks on the curve corresponding to the numerical microstructure confirmthe theoretical result: in a microstructure where only NW crystallographic relationships are present, only 5possible misorientations between the bainitic packets can appear in the same grain. The background curvelocated between the peaks perfectly corresponds to the typical curve of misorientations of grains within a
Page 7 of 18
http://mc.manuscriptcentral.com/pm-pml
Philosophical Magazine & Philosophical Magazine Letters
123456789101112131415161718192021222324252627282930313233343536373839404142434445464748495051525354555657585960
peer
-005
1399
3, v
ersi
on 1
- 1
Sep
2010

For Peer Review O
nly
8 N. Osipov et al.
0
0.05
0.1
0.15
0.2
0.25
0.3
0 10 20 30 40 50 60 70
frequ
ency
Angle
16MND5 microstructurenumerical microstructure
0
0.005
0.01
0.015
0.02
0.025
0.03
0.035
0 10 20 30 40 50 60
frequ
ency
Angle
measured valuessmoothed with bezier
(a) (b)Figure 8. Comparison between A508 and numerical microstructures: (a) misorientation angle; (b) typical curve of misorientations of
grains within a cubic lattice and random angle distribution between grains (McKenzie curve)
cubic lattice and random angle distribution between grains [34] (Fig. 8(b)).
5 Modelling of the aggregate mechanical behavior
5.1 Mesh and boundary conditions
Two strategies were used for generating meshes: the first one is called UM and involves an unstructuredmesh generation (U) of a parent austenitic microstructure followed by a mapping (M) of the bainitic packets(using IPSETs (section 4)). Multiphase elements were then created. This mesh conforms parent grainboundaries but not packet boundaries within parent grains. The second method yields a full unstructuredmesh (UU) (that is, unstructured for the initial austenitic microstructure (first U) and unstructured forthe packets (second U)), so that the mesh conforms all boundaries. The first example to come (section 6)uses the UM technique, meanwhile the second one (section 7) introduces UU meshes.
The same mechanical problem was considered in all the computations presented in this paper. Mixedboundary conditions were applied, in order to simulate an uniaxial tensile test:
- the bottom face was fixed in the axial direction, and an axial displacement was prescribed on the topface, to reach 5% of strain;
- the four lateral faces were left free of charge;- two points on the bottom face were fixed in order to avoid rigid body motion.
In all cases, quadratic elements were used, so that the precision of the computation is rather reasonable.Having in view the characterisation of critical variables in a RVE, it would be better to use periodic bound-ary conditions. This specific boundary condition is presently not compatible with the type of parallelismthat is implemented in our FE code (sub-domain decomposition technique [35]). Nevertheless, the surfaceeffect which is related to the presence of free surfaces in the FE model has been carefully analysed in thepast [18,37]. It introduces more scatter in the result, and it decreases the hydrostatic pressure. It was ob-served in the present computations, that, due to the fine mesh, the stress redistribution can be quite rapidin the bulk of the material, and that, for instance, there is a non zero stress component perpendicular tothe surface even in the first grain, for points lying just under the surface. As a consequence, it is assumedthat the conditions of the computations do not prevent to obtain significant results.
5.2 Material model
The constitutive model used in this paper was introduced in [36]. It was extensively used for the com-putations of polycrystalline aggregates [13, 37]. Thus, only the main equations are recalled below. Theequations are written in a finite strain framework. For the sake of brevity, the terms corresponding tokinematic hardening are not displayed here. A classical multiplicative decomposition of the displacement
Page 8 of 18
http://mc.manuscriptcentral.com/pm-pml
Philosophical Magazine & Philosophical Magazine Letters
123456789101112131415161718192021222324252627282930313233343536373839404142434445464748495051525354555657585960
peer
-005
1399
3, v
ersi
on 1
- 1
Sep
2010

For Peer Review O
nly
FE modelling of bainitic steels using crystal plasticity 9
gradient into elastic and viscoplastic part is used. The Lagrange type elasticity is introduced:
F∼ = F∼eF∼
p ; E∼e =
12(Fe∼
TF∼e − I∼) ; S∼ = L∼∼ : E∼
e (1)
The local resolved shear stress is defined by means of a constant tensor N∼s0, formed by means of the slip
direction ls0 and the normal to the slip plane ns0:
τ s = Σ∼ : N∼s0 ; Σ∼ = JF∼
eF∼eTS∼ ; N∼
s0 = ls0 ⊗ ns0 (2)
Viscoplastic flow writes:
L∼p = F∼
pFp∼−1 =
∑s
γsN∼s0 (3)
The viscoplastic shear strain rate for each slip system s is:
γs = vssign (τ s) ; vs =⟨|τ s| − rs
K
⟩n
with 〈x〉 = Max(x, 0) (4)
An isotropic hardening rule is introduced on each slip system s. It involves an interaction matrix [h]:
rs = R0 + Q∑
r
hsr
{1− e−bvr
}(5)
For each of the two slip families, a set of material parameters characterises the initial critical resolved shearstress (Rbcc110
0 , Rbcc1120 ), hardening (Q, b) and viscosity (n, K). In the present study the area of interest
does not exceed a few per cent of deformation, so that the computations were made with a small strainassumption.
5.3 Calibration of the FE model parameters
The parameters of the crystal plasticity model were identified from experimental data previously obtainedat EDF research lab (Electricite de France ) [38]. The tests were performed on tensile specimens at fivedifferent temperatures (RT, -60◦C , -90◦C , -120◦C , -150◦C ). The prescribed strain rate was set to 10−3s−1
(Fig. 9). The strain rate sensitivity is low in the considered temperature range.Cubic elasticity was used to describe the reversible part of the deformation. An isotropic distribution of
grain orientations was chosen. Two slip families were introduced in the model in order to take into accountthe BCC structure of the material (family < 110 > {111} and family < 112 > {111}). The viscosityparameter were chosen to limit the viscous effect. Self hardening and latent hardening due to interactionsof slip systems were introduced by the matrices hbcc110
sr and hbcc112sr [39]. Due to the lack of experimental
information (monotonic tensile tests were used only), kinematic hardening was not considered here. Onlyisotropic hardening was considered; on the other hand, this hardening was supposed to be the samefor each slip system family. We used a two step method for the identification of model parameters. Thismethod consists of several optimization loops which use a uniform field model followed by FE computationsperformed on an aggregate containing 400 parent grains and 4700 bainitic packets mapped on a cubic mesh(32×32×32 elements). The method is not presented here in detail for the sake of brevity. Interested readerscan refer to [31]. The parameter set corresponding to T = −120◦C was used for the numerical study. It isreported in tables 2 and 3 (see for instance [32] for a detailed explanation of the various terms).
Page 9 of 18
http://mc.manuscriptcentral.com/pm-pml
Philosophical Magazine & Philosophical Magazine Letters
123456789101112131415161718192021222324252627282930313233343536373839404142434445464748495051525354555657585960
peer
-005
1399
3, v
ersi
on 1
- 1
Sep
2010

For Peer Review O
nly
10 N. Osipov et al.
0
200
400
600
800
1000
0 0.02 0.04 0.06 0.08 0.1 0.12
stre
ss
total strain
Sim -150°Exp -150°Sim -120°Exp -120°
Sim -90°Exp -90°Sim -60°Exp -60°
Sim 0°Exp 0°
Figure 9. Identification of model parameters. Uniaxial test for various temperatures [38]
L1111 L1122 L1212 K n Rbcc1120 Rbcc110
0 Q b219540 78125 70700 15.0 12.0 238.0 203.0 307.0 3.63MPa MPa MPa MPa ·s−
1n MPa MPa MPa -
Table 2. Material parameters identified for the A508 Cl3 steel. Coefficients found from tensile tests
h1 h2 h3 h4 h5 h6
bcc112 1.0 1.0 0.83 0.83 0.83 0.83bcc110 1.0 1.0 1.0 0.83 0.83 0.83
Table 3. Coefficients of the interaction matrix: h1 ≡self-hardening – h2 ≡coplanar slip – h3 ≡Hirth interactions – h4 ≡collinear slip – h5 ≡glissile
interaction – h6 ≡ Lomer locks.
6 Influence of crystallography and morphology of bainitic packets on the global and localstrain-stress responses
6.1 Problem presentation
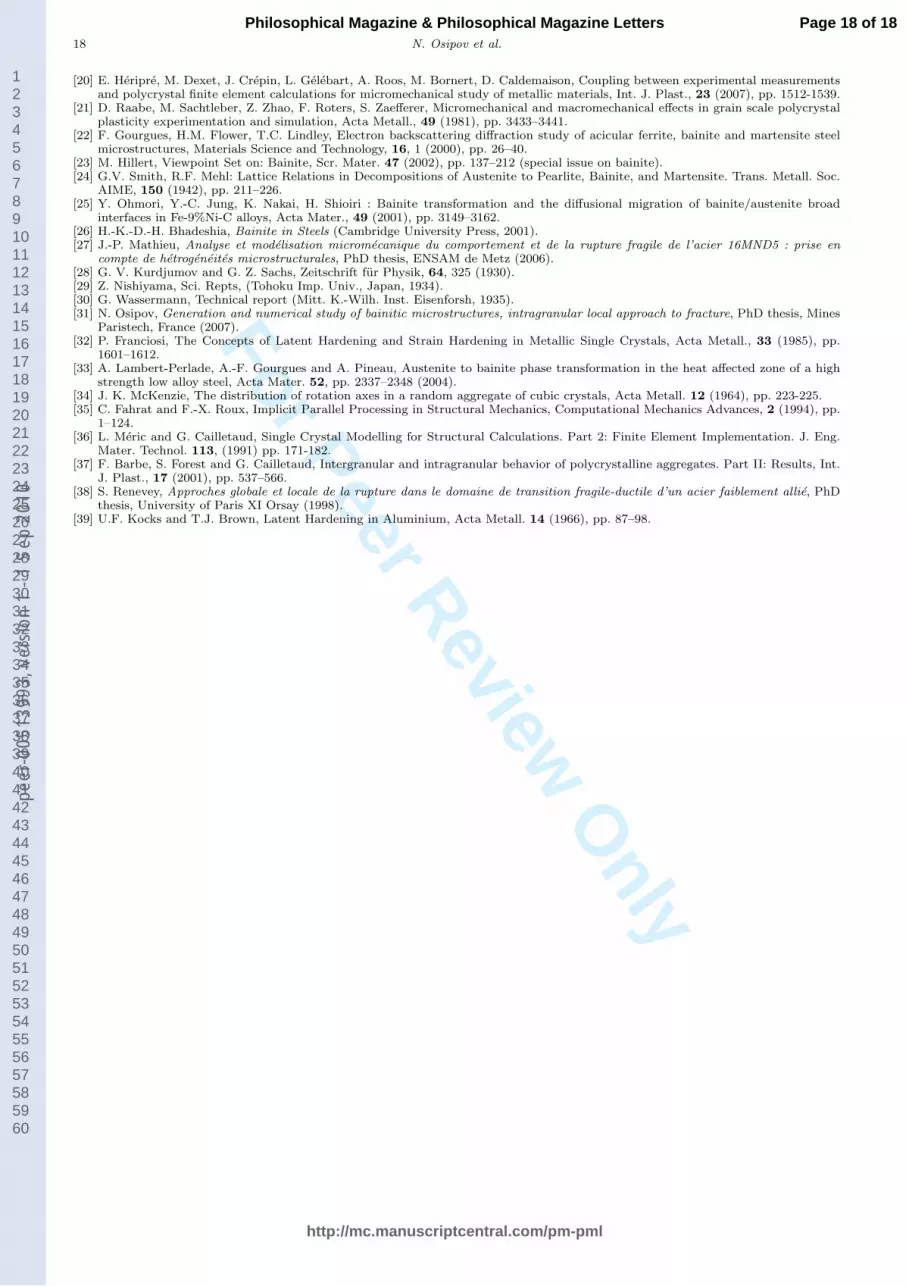
The influence of the microstructure on mechanical behaviour of bainitic steels was analysed by uniaxialtension simulation on different microstructures. Two types of grain geometry, equiaxed and bainitic, weretaken into consideration. The equiaxed microstructure contained 120 grains described by Voronoı polyhedraand 99980 nodes in the FE mesh (average of 2954 Gauss points/grain). The bainitic microstructure wasproduced from the parent grains, by cutting each grain in about ten bainitic packets in average, using typeV algorithm, so that 1196 packets were generated in the new microstructure. A refined mesh containing987151 nodes was used in this last case (average of 2986 Gauss points/grain), in order to preserve thesame mesh density for both calculations. Note that an unstructured mesh was generated for the initialaustenitic microstructure, so that the elements conform grain boundaries in this case. Bainitic packetswere created by simply using a mapping technique, so that the relating microstructures introduced multi-phase elements (packet boundaries going through elements). Four numerical tests were performed. Forall of them, the material parameters were taken from Tab. 2. Their morphological and crystallographiccharacteristics are summarized in Fig. 10. Boundary conditions corresponding to a uniaxial tension test(5 % of total deformation) have been applied in all cases (see 5.1).
- For the Grains ISO case, the 120 grain microstructure was computed by using a random distribution ofthe crystallographic orientations.
- The Grain NW aggregate uses the same mesh, with 120 domains, but now the crystal misorientationsbetween adjacent domains were restricted to the 12 variants described by the Nishiyama-Wassermannrelationships: this is like a large cubic grain with 120 bainitic packets. The purpose of this test is to
Page 10 of 18
http://mc.manuscriptcentral.com/pm-pml
Philosophical Magazine & Philosophical Magazine Letters
123456789101112131415161718192021222324252627282930313233343536373839404142434445464748495051525354555657585960
peer
-005
1399
3, v
ersi
on 1
- 1
Sep
2010
For Peer Review O
nly
FE modelling of bainitic steels using crystal plasticity 11
120 grains 1196 bainitic packets99980 nodes 987151 nodes
354455 Gauss points 3570800 Gauss points
Random for grains for all subgrainsorientations Grains ISO Packets ISO
NW relationships for grains for subgrains in each grainGrains NW Packets ISO+NW
Figure 10. The four computations made to check the influence of crystallography and morphology of bainitic packets on the global andlocal responses
quantify the effect of bainitic orientations on the mechanical response within the grain.- For the Packets ISO case, 1196 bainitic packets generated from the 120 grains representing the former
austenitic phase were generated. Random crystallographic orientations were applied to each grain. Thistest will characterise the effect of the presence of the bainitic morphology (non equiaxed domains insteadof equiaxed shapes) on the strain–stress responses by comparison with the Grains ISO test.
- A full model of the bainitic microstructure was considered in the Packets ISO+NW case. This modelcontained the 1196 bainitic packets mentioned in the previous case. The crystal orientations of the phaseswere calculated by starting from the random distribution of orientations used in the first test, and thenby applying NW relationships which connect the crystal orientation of the parent phase to bainiticpackets orientation. These relationships were randomly chosen among the 12 variants. This model wasthen able to evaluate the joint effect of the morphology and the crystallography of the bainitic packets.
6.2 Results and discussion
Figure 11 shows the contour map of the von Mises equivalent stress at the surface of the different aggregates.An identical perspective and the same color scales are chosen for all images. The black lines represent grainboundaries of the former austenitic microstructure. In the case of the equiaxed grains (Fig. 11 (a) and (b)),the maximum stress is often localised near triple points and grains boundaries. Internal boundaries promotestress heterogeneity for the bainitic microstructure (Fig. 11 (c) and (d)). The map in Fig. 11 (b) is moreheterogeneous than in Fig. 11 (a). It reveals a mixture of high stress concentration on badly misorientedgrains and of grain boundaries that are not critical at all. The contrast between grains is larger than forthe purely isotropic microstructure, because of the limited number of possible misorientations betweenthe mesh subdomains. The non critical misorientations correspond either to 10◦, or to perfectly orientedneighbors, when the same variant is present on both sides of the packet boundary. For a given morphology,the maximum value of the von Mises stress is 10% higher with NW grain boundaries than with ISO grain
Page 11 of 18
http://mc.manuscriptcentral.com/pm-pml
Philosophical Magazine & Philosophical Magazine Letters
123456789101112131415161718192021222324252627282930313233343536373839404142434445464748495051525354555657585960
peer
-005
1399
3, v
ersi
on 1
- 1
Sep
2010

For Peer Review O
nly
12 N. Osipov et al.
Grains ISO Packets ISO
(a) (c)
Grains NW Packets ISO+NW
(b) (d)
2.5e+02 4.5e+02 6.6e+02 8.6e+02 1.1e+03 1.3e+03 1.5e+03
Figure 11. Von Mises equivalent stress distribution for various aggregates (MPa). (a) Grains ISO, (b) Grains NW, (c) Packets ISO, (d)Packets ISO+NW
boundaries. This has to be attributed to a real effect of the crystallography (and not to a mesh artifact),since the number of elements per domain is the same for both calculations. An effect of the morphologycan also be observed, as illustrated in Fig. 11 (c). The maximum equivalent stress is now 1538 MPa, tobe compared to 1353 MPa in the equiaxed microstructure of the Grains ISO case. Stronger gradients arepresent in this case, since the minimum value of the equivalent stress is smaller for Packets ISO than forGrains ISO. The previous trends are confirmed in Fig. 11 (d), where a bainitic morphology superimposedto NW crystal orientations within grains yields higher maximum values and lower minimum values.
Analysis of the curves shown in Fig. 12 (mean value of the von Mises stress in each grain or each packetversus macroscopic strain) led to additional conclusions. The scatter observed on the stress–strain curves
Page 12 of 18
http://mc.manuscriptcentral.com/pm-pml
Philosophical Magazine & Philosophical Magazine Letters
123456789101112131415161718192021222324252627282930313233343536373839404142434445464748495051525354555657585960
peer
-005
1399
3, v
ersi
on 1
- 1
Sep
2010

For Peer Review O
nly
FE modelling of bainitic steels using crystal plasticity 13
Grains ISO Packets ISO
300
400
500
600
700
800
900
1000
1100
0 0.001 0.002 0.003 0.004 0.005
sigm
ises
(MPa
)
average strain (mm/mm)
300
400
500
600
700
800
900
1000
1100
0 0.001 0.002 0.003 0.004 0.005
sigm
ises
(MPa
)
average strain (mm/mm)
(a) (c)
Grains NW Packets ISO+NW
300
400
500
600
700
800
900
1000
1100
0 0.001 0.002 0.003 0.004 0.005
sigm
ises
(MPa
)
average strain (mm/mm)
300
400
500
600
700
800
900
1000
1100
0 0.001 0.002 0.003 0.004 0.005
sigm
ises
(MPa
)
average strain (mm/mm)
(b) (d)Figure 12. Mean value of the von Mises equivalent stress (by grain or by packet) function of the macroscopic strain
is larger for the bainitic microstructure than for the equiaxed one. The maximum average values in packetsof bainite are 10 % higher than in austenite. This confirms the previous results. On the other hand, theglobal behaviour in the Grains NW case is much softer than the other three cases (Fig. 12 (b)). This is dueto the reduced number of possible interactions, as discussed earlier. For the same reason, the plot madefor Grains NW exhibits several categories of curves.
The curves showing the distribution of the von Mises equivalent stress corresponding to the end of thetest (5% average strain) are presented in Fig. 13. The two Packets curves and the Grains ISO curve presentthe same bimodal shape 13(a). On the contrary, a unique peak is observed for the Grains NW computation.In the first three cases, there is a random choice of the misorientation: all the subdomains are randomlyoriented for Grains ISO and Packets ISO. For Packets ISO+NW, even if the bainitic subdomains are notrandomly oriented, the initial orientation of the parent grain introduces a random character, and it mustbe noted that (with ten packets in each initial grain) most of the packets have a common boundary withpackets generated from an other former grain. It is therefore likely that the bimodal character of the curveis related to the random misorientation: following this assumption, the maximum at 600 MPa would comefrom the bulk of the grain, and the maximum at 830 MPa is produced by the region near grain/packetboundaries. Since there is only well defined misorientations in Grains NW, the second maximum vanishes.Due to the chosen boundary conditions, a spurious surface effect could be suspected. This is not the case:in fact, for the 120 grain microstructure, 64% of the grains touch on free surface, meanwhile for the 1196packet microstructure, 34% packets touch on free surface: this produces a small increase of the lowestmaximum for the Grains ISO case, but the effect remains small.
Page 13 of 18
http://mc.manuscriptcentral.com/pm-pml
Philosophical Magazine & Philosophical Magazine Letters
123456789101112131415161718192021222324252627282930313233343536373839404142434445464748495051525354555657585960
peer
-005
1399
3, v
ersi
on 1
- 1
Sep
2010

For Peer Review O
nly
14 N. Osipov et al.
0
0.01
0.02
0.03
0.04
0.05
0.06
0.07
0.08
200 400 600 800 1000 1200 1400 1600
frequ
ency
equivalent von Mises stress (MPa)
100000 nodes. Grains. Iso.100000 nodes. Grains. NW1MLN nodes. Packets. Iso
1MLN nodes. Packets. NW
300
400
500
600
700
800
0 0.005 0.01 0.015 0.02 0.025 0.03 0.035 0.04 0.045 0.05 0.055
sig22
(MPa
)
eto22 (mm/mm)
100000 nodes. Grains. Iso.100000 nodes. Grains. NW1MLN nodes. Packets. Iso
1MLN nodes. Packets. NW
(a) (b)Figure 13. Von Mises equivalent stress distribution (5% of deformation): (a) values at Gauss points, (b) Global stress–strain curve in
direction of applied tension (22)
In agreement with the previous observations, the global curves (Fig. 13 (b)) are almost the same for thetwo Packets curves and the Grains ISO curve, with only a 10 MPa difference between them. The very highmaximum values reported in Fig.11 are then “erased” by the averaging operation. On the other hand, it isconfirmed that Grains NW curve remains below the other ones, due to the reduced number of interactions.Finally, it must be admitted that, when a large number of NW packets originating from the same parentgrain are present, the local von Mises stress level decreases.
7 Discussion of the influence of mesh type
7.1 Problem presentation
In the previous sections, the computations have been made with unstructured meshes for the formerequiaxed grains, but still with meshes using microstructure mapping and multiphase elements for thebainitic case (UM mesh type). For the present case, the bainitic mesh was generated with an alternativeprocedure which conforms packet boundaries (UU mesh type). The purpose of the computation was thento characterise the mechanical responses in this new framework. For the sake of comparison, two typesof microstructures were considered, Grains and Packets, standing respectively for the equiaxed and thebainitic morphologies. In the Grains microstructure, 50 grains are described by Voronoı polyhedra. Themanipulation of the bainitic sub-domains remains a fragile operation: the larger the number of grains,the more difficult the mesh generation. The number of 50 grains is a good compromise between thenumber of grains or sub-domains and the quality of the final mesh. In the present version of the code,this random crystallographic orientations were applied to each grain. In the Packets microstructure, thebainitic packets were generated from the initial equiaxed grains by using type IV cutting rule. It contains245 bainitic packets. NW relationships were used to generate the orientation of the bainitic packets in eachgrain. The main characteristics of the FE problem are presented in Fig. 14.
In order to make a relevant comparison between the results coming from the two computations, themesh density was kept similar in each subdomain. The number of elements was 287154 for the Grainscase (leading to an average number of 28715 Gauss points in each grain) and 1160933 for the Packets case(23692 Gauss points/grain).
7.2 Results and discussion
The main goal of this comparison was to control local and global responses of the aggregates with the newgrain description. The second point was to understand how morphology and crystallography influence theshape of the curves characterising stress distribution. The results have to be compared to the previousanalysis, namely Grains with Grains ISO (in both cases, a calculation with random orientations and anunstructured mesh of equiaxed grains), and Packets with Packets ISO+NW (in both cases, a calculation
Page 14 of 18
http://mc.manuscriptcentral.com/pm-pml
Philosophical Magazine & Philosophical Magazine Letters
123456789101112131415161718192021222324252627282930313233343536373839404142434445464748495051525354555657585960
peer
-005
1399
3, v
ersi
on 1
- 1
Sep
2010

For Peer Review O
nly
FE modelling of bainitic steels using crystal plasticity 15
Equiaxed microstructure – Grains Bainitic microstructure – Packets
50 grains 50 grains245 packets
Orient Random Random for grainsNW for packets
Number of nodes 396922 1581881Number of elements 287154 1160933Number of int. points 1435770 5804665
Figure 14. Influence of the microstructure description on the local and global responses. Problem presentation
with bainitic packets and the relevant orientations, but UU and UM meshes respectively). The maps ofvon Mises equivalent stress distribution obtained with the meshes shown in Fig.14 are presented in Fig.15. Since the number of Gauss points representing each domain is now about ten times larger than in theprevious section, a classical result [18] is recovered: if compared with the coarser mesh, the smallest stressvalue decreases and the largest stress value increases (compare Fig.11(a) and Fig.15(a)). UU algorithmprovides smoother solutions if compared to those obtained with UM technique (Fig. 11 (d) and Fig. 15 (b)).
A quantitative comparison highlighting the mesh effect is made in Fig. 16. The von Mises stress distri-bution for the cases Grains ISO and Packets ISO+NW, previously shown in Fig. 11 (a), are plotted inFig. 16(a) using a smaller stress range to have a better characterization of the peaks. The same plot ismade for cases Grains and Packets with the new meshes in Fig. 16(c). The curves are also presented inlog-scales, respectively in Fig. 16(b) and Fig. 16(d): this allows us to analyse the global shape of the curvesand to capture possible effects on both tails.
The main observation made from the equiaxed grain meshes is that the bimodal shape disappears forthe new mesh (compare Grains to Grains ISO). This is due to the predominant effect of grains touching onfree surface (82% among the 50 grains), leading to reduced constraints between the grains. On the otherhand, surface effect is not so active for the Packets case, where only 53% of the packets are touching onsurface: that is less than for Grains ISO. Nevertheless, the bimodal shape does not appear, and the curveis very close to the Grains result. The log-scale allows to check the similarity of the shapes even for thetails (Fig. 16(d)). The same plot for the older meshes (Fig. 16 (b)) exhibits a difference between the twocomputations. The results obtained with Packets ISO+NW are shifted to the right (higher stresses) withrespect to Grains ISO: the use of a mapping technique for bainitic packets generates large overstresses(more than 100 MPa in the 10−4–10−6 range), that should be considered as a numerical artifact.
Page 15 of 18
http://mc.manuscriptcentral.com/pm-pml
Philosophical Magazine & Philosophical Magazine Letters
123456789101112131415161718192021222324252627282930313233343536373839404142434445464748495051525354555657585960
peer
-005
1399
3, v
ersi
on 1
- 1
Sep
2010

For Peer Review O
nly
16 N. Osipov et al.
(a) (b)
2.5e+02 4.5e+02 6.6e+02 8.6e+02 1.1e+03 1.3e+03 1.5e+03
Figure 15. Equivalent von Mises stress distributions (MPa): (a) in equiaxed (Grains) microstructure; (b) in bainitic (Packets)microstructure (UU mesh) (εtot = 4%)
0
0.02
0.04
0.06
0.08
0.1
0.12
0.14
200 400 600 800 1000 1200 1400 1600
freq
uenc
y
σeqv (MPa)
ε = 0.05, Grains ISOε = 0.05, Packets ISO+NW
0
0.02
0.04
0.06
0.08
0.1
0.12
0.14
200 400 600 800 1000 1200 1400 1600
frequ
ency
σeqv (MPa)
ε = 0.04, Grainsε = 0.04, Packets
(a) (c)
1e-06
1e-05
0.0001
0.001
0.01
0.1
1
200 400 600 800 1000 1200 1400 1600
freq
uenc
y
σeqv (MPa)
ε = 0.05, Grains ISOε = 0.05, Packets ISO+NW
1e-06
1e-05
0.0001
0.001
0.01
0.1
1
200 400 600 800 1000 1200 1400 1600
frequ
ency
σeqv (MPa)
ε = 0.04, Grainsε = 0.04, Packets
(b) (d)Figure 16. Equivalent von Mises stress distributions (MPa). (a) and (b) - results of computation using UM technique (εtot = 5%), (c)
and (d) - results of computation using UU technique (εtot = 4%). Curves (b) and (d) are plotted in log-scale
Page 16 of 18
http://mc.manuscriptcentral.com/pm-pml
Philosophical Magazine & Philosophical Magazine Letters
123456789101112131415161718192021222324252627282930313233343536373839404142434445464748495051525354555657585960
peer
-005
1399
3, v
ersi
on 1
- 1
Sep
2010

For Peer Review O
nly
FE modelling of bainitic steels using crystal plasticity 17
8 Conclusion
A new numerical method has been proposed to produce spatially controlled microstructures of bainiticsteels. The influence of the morphology and of the local texture in the phases was investigated by meansof finite element analysis of various configurations. The purpose of the study was to evaluate reliable localstress fields, to be used in a local micromechanical approach to predict brittle failure.
A bimodal shape of the von Mises stress distribution was exhibited on a few configurations. It is promotedby internal constraints, due to a large number of grains or packets, and/or to random misorientations. Onthe other hand, a distribution shape with one peak only is obtained either for free grains (any misorienta-tions) or when the misorientations at grain boundaries are not random, as is the case for bainite packetsinside a parent austenite grain.
One of the main questions addressed in this paper is the effect of a bainitic microstructure versus anequiaxed one. The geometry of packets (elongated subdomains) seems to have no intrinsic effect on thematerial behaviour. On the other hand, when a lot of boundary misorientations follow NW relationships(see Fig. 13 (b)) the resulting behaviour is softer than for randomly generated misorientations even atmacroscopic scale.
The effect of mesh type and mesh size has also been studied. A spurious effect has been found withthe UM type meshes, namely, when the bainitic packets are mapped on an unstructured mesh, so thatthe mesh does not conform the packet boundaries: this produces an increase in the local maximum stress,showing that multiphase elements are unable to provide a reliable prediction of local stresses. They mustbe avoided in such an application.
Finally, it must be mentioned that the number of elements must be large enough to capture the inter-granular variations of the stress fields. Assuming that the number of grains is a few hundreds, a reasonablenumber of nodes must be in the 106–107 range. Having in view the failure initiation model, a large numberof elements is required anyway to characterise the shape of the tails of the curves, since, with 106 Gausspoints in the mesh, the frequency curve cannot have any point below 10−6.
References[1] S. Carassou, S. Renevey, B. Marini, A. Pineau, ECF12 proceedings Sheffield, 2, 691, 1998.[2] F.M. Beremin, A local criterion for cleavage fracture of nuclear pressure vessel steel, Metall. Trans., 14A (1983), pp. 2277-2287.[3] Wallin K., Saario T., Torronen K., Statistical model for carbide induced brittle fracture in steels, Metal Science, 18 (1984), pp.
13-16.[4] C. Eripret, D. Buisine, G. Rousselier, Seminar for promotion of local approach, Tempere April 28th – May 1st, 1992.[5] B.Z. Margolin, A.G. Gulenko, V.A. Nikolaev, L.N. Ryadkov, New engineering method for prediction of the fracture toughness
temperature dependence for RPV steels, Int. J. of Pres. Vessels and Piping, 80 (2003), pp. 817-829.[6] C. Bouchet , B. Tanguy, J. Besson, S. Bugat, Prediction of the effects of neutron irradiation on the Charpy ductile to brittle transition
curve of an A508 pressure vessel steel, Computational Materials Science, 32 (2005), pp. 294-300.[7] M. Libert, Etudes experimentale et numerique de l’effet des mecanismes de plasticite sur la rupture fragile par clivage dans les
aciers faiblement allie, PhD thesis, Ecole Centrale de Paris (2007).[8] J.J. Gilman, Fracture, B.L. Averbach, G.T. Hahn et al Editors, New York, 1959, pp. 193-224.[9] A.T. Price, H.A. Holl, A.P. Greenough, The surface energy and self diffusion coefficient of solid iron above 1350C, Acta Metall., 12
(1964), pp. 49–58.[10] P. Bowen, S.G. Druce, J.F. Knott, Effects of microstructure on cleavage fracture in pressure vessel steel, Acta Metall., 34 (1986),
pp. 1121-1131.[11] S.G. Roberts, Proc. of “Multiscale Phenomena in Plasticity”, 8-19 September, Ouranopolis, Greece, 1999.[12] D. Lidbury, S. Bugat, O. Diard, E. Keim, B. Marini, H.-W. Viehrig, K. Wallin, PERFECT (Prediction of Irradiation Damage Effects
in Reactor Components): Overview of RPV Mechanics Sub-Project, Proceedings of ASME PVP 2005, Denver, Colorado, July 17-21,2005
[13] G. Cailletaud, S. Forest, D. Jeulin, F. Feyel, I. Galliet, V. Mounoury, S. Quilici, Some elements of microstructural mechanics,Computational Materials Science, 27 (2003), pp. 351-374.
[14] S.R. Kalidindi, C.A. Bronkhorst, L. Anand, Crystallographic texture evolution in bulk deformation processing of FCC metals, J.Mech. Phys. Sol., 40 (1992), pp. 536-569.
[15] C. Miehe, J. Schroder, J. Schotte, Computational homogenization analysis in finite plasticity. Simulation of texture development inpolycrystalline materials, Comp. Meth. Appl. Mech. Engng, 171 (1999), pp. 387–418.
[16] D.P. Mika, P.R. Dawson, Effects of grain interaction on deformation in polycrystals, Material Science and Engineering, 257 (1998),pp. 62-76.
[17] N. Lippmann, Th. Steinkopff, S. Schmauder, P. Gumbsch, 3D-finite-element-modelling of microstructures with the method of mul-tiphase elements, Computational Materials Science, 9 (1997 ), pp. 28-35.
[18] F. Barbe, L. Decker, D. Jeulin, G. Cailletaud, Intergranular and intragranular behavior of polycrystalline aggregates. Part I: FEmodel, Int. J. Plast., 17 (4) (2001), pp. 513-536.
[19] A. Musienko, A. Tatschl, K. Schmidegg, O. Kolednik, R. Pippan, G. Cailletaud, Three-dimensional finite element simulation of apolycrystalline copper specimen, Acta Materialia, 55 (2007), pp. 4121-4136.
Page 17 of 18
http://mc.manuscriptcentral.com/pm-pml
Philosophical Magazine & Philosophical Magazine Letters
123456789101112131415161718192021222324252627282930313233343536373839404142434445464748495051525354555657585960
peer
-005
1399
3, v
ersi
on 1
- 1
Sep
2010
For Peer Review O
nly
18 N. Osipov et al.
[20] E. Heripre, M. Dexet, J. Crepin, L. Gelebart, A. Roos, M. Bornert, D. Caldemaison, Coupling between experimental measurementsand polycrystal finite element calculations for micromechanical study of metallic materials, Int. J. Plast., 23 (2007), pp. 1512-1539.
[21] D. Raabe, M. Sachtleber, Z. Zhao, F. Roters, S. Zaefferer, Micromechanical and macromechanical effects in grain scale polycrystalplasticity experimentation and simulation, Acta Metall., 49 (1981), pp. 3433–3441.
[22] F. Gourgues, H.M. Flower, T.C. Lindley, Electron backscattering diffraction study of acicular ferrite, bainite and martensite steelmicrostructures, Materials Science and Technology, 16, 1 (2000), pp. 26–40.
[23] M. Hillert, Viewpoint Set on: Bainite, Scr. Mater. 47 (2002), pp. 137–212 (special issue on bainite).[24] G.V. Smith, R.F. Mehl: Lattice Relations in Decompositions of Austenite to Pearlite, Bainite, and Martensite. Trans. Metall. Soc.
AIME, 150 (1942), pp. 211–226.[25] Y. Ohmori, Y.-C. Jung, K. Nakai, H. Shioiri : Bainite transformation and the diffusional migration of bainite/austenite broad
interfaces in Fe-9%Ni-C alloys, Acta Mater., 49 (2001), pp. 3149–3162.[26] H.-K.-D.-H. Bhadeshia, Bainite in Steels (Cambridge University Press, 2001).[27] J.-P. Mathieu, Analyse et modelisation micromecanique du comportement et de la rupture fragile de l’acier 16MND5 : prise en
compte de hetrogeneites microstructurales, PhD thesis, ENSAM de Metz (2006).[28] G. V. Kurdjumov and G. Z. Sachs, Zeitschrift fur Physik, 64, 325 (1930).[29] Z. Nishiyama, Sci. Repts, (Tohoku Imp. Univ., Japan, 1934).[30] G. Wassermann, Technical report (Mitt. K.-Wilh. Inst. Eisenforsh, 1935).[31] N. Osipov, Generation and numerical study of bainitic microstructures, intragranular local approach to fracture, PhD thesis, Mines
Paristech, France (2007).[32] P. Franciosi, The Concepts of Latent Hardening and Strain Hardening in Metallic Single Crystals, Acta Metall., 33 (1985), pp.
1601–1612.[33] A. Lambert-Perlade, A.-F. Gourgues and A. Pineau, Austenite to bainite phase transformation in the heat affected zone of a high
strength low alloy steel, Acta Mater. 52, pp. 2337–2348 (2004).[34] J. K. McKenzie, The distribution of rotation axes in a random aggregate of cubic crystals, Acta Metall. 12 (1964), pp. 223-225.[35] C. Fahrat and F.-X. Roux, Implicit Parallel Processing in Structural Mechanics, Computational Mechanics Advances, 2 (1994), pp.
1–124.[36] L. Meric and G. Cailletaud, Single Crystal Modelling for Structural Calculations. Part 2: Finite Element Implementation. J. Eng.
Mater. Technol. 113, (1991) pp. 171-182.[37] F. Barbe, S. Forest and G. Cailletaud, Intergranular and intragranular behavior of polycrystalline aggregates. Part II: Results, Int.
J. Plast., 17 (2001), pp. 537–566.[38] S. Renevey, Approches globale et locale de la rupture dans le domaine de transition fragile-ductile d’un acier faiblement allie, PhD
thesis, University of Paris XI Orsay (1998).[39] U.F. Kocks and T.J. Brown, Latent Hardening in Aluminium, Acta Metall. 14 (1966), pp. 87–98.
Page 18 of 18
http://mc.manuscriptcentral.com/pm-pml
Philosophical Magazine & Philosophical Magazine Letters
123456789101112131415161718192021222324252627282930313233343536373839404142434445464748495051525354555657585960
peer
-005
1399
3, v
ersi
on 1
- 1
Sep
2010