Embed Size (px)
Citation preview

INT’L. J. AGING AND HUMAN DEVELOPMENT, Vol. 72(2) 83-110, 2011
FACTOR STRUCTURE AND PSYCHOMETRICPROPERTIES OF THE CENTER FOR EPIDEMIOLOGICSTUDIES DEPRESSION SCALE (CES-D) IN OLDERPOPULATIONS WITH AND WITHOUT COGNITIVEIMPAIRMENT
L. ROS J. P. SERRANO
J. M. LATORRE B. NAVARRO
M. J. AGUILAR J. J. RICARTE
University of Castilla La Mancha, Spain
ABSTRACT
The CES-D is widely used for the assessment of depressive symptoms in
the adult population. However, few studies have been performed to assess the
utility of this scale in an older population with cognitive impairment. The
factor structure of the Spanish version of the CES-D was examined in an
observational, cross sectional study in 623 older adults (M = 72.74 years;
SD = 7.7). The validity of the scale was determined in two samples of
older adults, one comprising 162 participants with cognitive impairment
(M = 76.73 years; SD = 8.1) and one with 58 participants without cognitive
impairment (M = 74.64 years; SD = 9.0). The results confirm previous results
of a four factor structure. With regard to the validity of the scale, in the group
with cognitive impairment the area under the ROC curve is 0.84 (95%
CI: 0.77-0.89) and the cut-off point for possible depression is 13, while in the
group without cognitive impairment the area is 0.90 (95% CI: 0.79-0.96)
and the optimal cut-off point is 28. These results show that the Spanish
version of the CES-D is a valid instrument for the identification of depres-
sion in older adults with and without cognitive impairment.
83
� 2011, Baywood Publishing Co., Inc.doi: 10.2190/AG.72.2.ahttp://baywood.com

The Center for Epidemiological Studies-Depression Scale (CES-D; Radloff,
1977) is one of the most widely used self-report scales for depressive symptoms.
This scale was originally designed for use with the general adult population and,
although originally Radloff designed it to be used for scientific ends and not
for clinical purposes, it is currently one of the most commonly used screening
instruments in primary care practice (Schulberg, Saul, McClelland, Ganguli,
Christy, & Frank, 1985; Williams, Pignone, Ramirez, & Perez, 2002).
The aim of this scale is to measure the subject’s mood state based on the
frequency he or she experienced certain depressive symptoms in the past week.
Furthermore, it may be used to assess changes in a person’s mood state over time.
The scale is made up of 20 items that cover areas such as depressed mood, feelings
of guilt and worthlessness, feelings of helplessness and hopelessness, loss of
energy, sleep disturbance and loss of appetite. Radloff (1977) selected these
items from a sample of several previously validated depression scales such as the
Beck Depression Inventory (BDI; Beck, Ward, Mendelson, Mock, & Erbaugh,
1961), Zung’s Self-rating Depression Scale (Zung, 1965), or the Minnesota
Multiphasic Personality Inventory (MMPI; Hathaway & McKinley, 1943). The
responses to each of the 20 items are scored on a 4-point Likert-type scale ranging
from “rarely or none of the time” (0) to “most or all of the time” (3). Four of
the items are formulated to have a positive slant to evaluate positive mood and
to break tendencies toward a response set. The total score ranges from 0 to 60
with the higher scores indicating more symptoms of depression. A score of 16
or more has been widely used as the cut-off point for clinically significant
depressive symptomatology (Radloff & Teri, 1986).
With regard to reliability, Radloff (1977) found that the mean correlation
between test-retest scores after 2, 4, 6, and 8 weeks was 0.57; and the test-retest
correlations after 3, 6, and 12 months ranged from 0.32 to 0.54. Subsequently,
several studies have corroborated the opinion that the CES-D is a highly
reliable measurement instrument (Orme, Reis, & Herz, 1986; Roberts, Andrews,
Lewinsohn, & Hops, 1990).
The first validation studies confirmed that the CES-D correlates well with
clinical ratings of depression (Roberts & Vernon, 1983; Weissman, 1987). Since
these initial studies, the CES-D has been widely used as a screening tool in
different populations such as clinical patients, adolescents, older adults, workers,
etc. (e.g. Bay, Hagerty, Williams, Kirsch, & Gillespie, 2002; Chwastiak, Ehde,
Gibbons, Sullivan, Bowen, & Kraft, 2002; Furukawa, Hirai, Kitamura, &
Takahashi, 1997; Grant, Gil, Floyd, & Abrams, 2000; Iwata, Okuyama,
Kawakami, & Saito, 1989; Lee, Stewart, Byrne, Wong, Ho, Lee, et al., 2008;
Liang, Tran, Krause, & Markides, 1989; McArdle, Johnson, Hishinuma,
Miyamoto, & Andrade, 2001; Orme et al., 1986; Paterniti, Niedhammer, Lang,
& Consoli, 2002; Radloff, 1991; Vedhara, Schifitto, & McDermott, 1999;
Verdier-Taillefer, Gourlet, Fuhrer, & Alperovitch, 2001; Yang, Soong, Kuo,
Chang, & Chen, 2004).
84 / ROS ET AL.

According to Radloff and Teri (1986), the CES-D is highly reliable, has a
stable factor structure and age, and demographic variables and physical health
do not significantly affect scores and factors. In this respect, a subsequent study
by Lewinsohn, Seeley, Roberts, and Allen (1997) concluded that the utility of
the CES-D was not degraded by age, physical disease, cognitive, or functional
impairment. O’Rourke (2004) also found that CES-D responses do not vary
depending on the subject’s sex.
Factorial Structure of the CES-D
Radloff (1977) was the first to investigate and identify the factorial structure
of the CES-D through principal component analysis with a varimax rotation. In
her study she found four principal factors that accounted for 48% of the variance:
depressed mood (7 items, e.g., “I thought my life had been a failure”); positive
mood (4 reverse-coded items; e.g., “I felt hopeful about the future”); somatic
symptoms and psychomotor retardation (7 items, e.g., “I did not feel like eating;
my appetite was poor”); and interpersonal difficulties (2 items, e.g., “I felt
that people dislike me”). The original validation study included an adult popu-
lation who were predominantly White and with a certain level of education. The
depressed mood factor accounted for the highest percentage of variation (16%)
and interpersonal factor accounted for the lowest percentage of variance (8%).
Furthermore, Radloff also generated standard data for subgroups of age (less
than 25, 25-64, and over 64 years) for men and women, for African-Americans
and White Americans and for different education levels (primary, secondary,
higher). The exploratory factor analyses indicated that the factorial structure did
not differ among these subgroups, or from the standard generated for the whole
of the sample population.
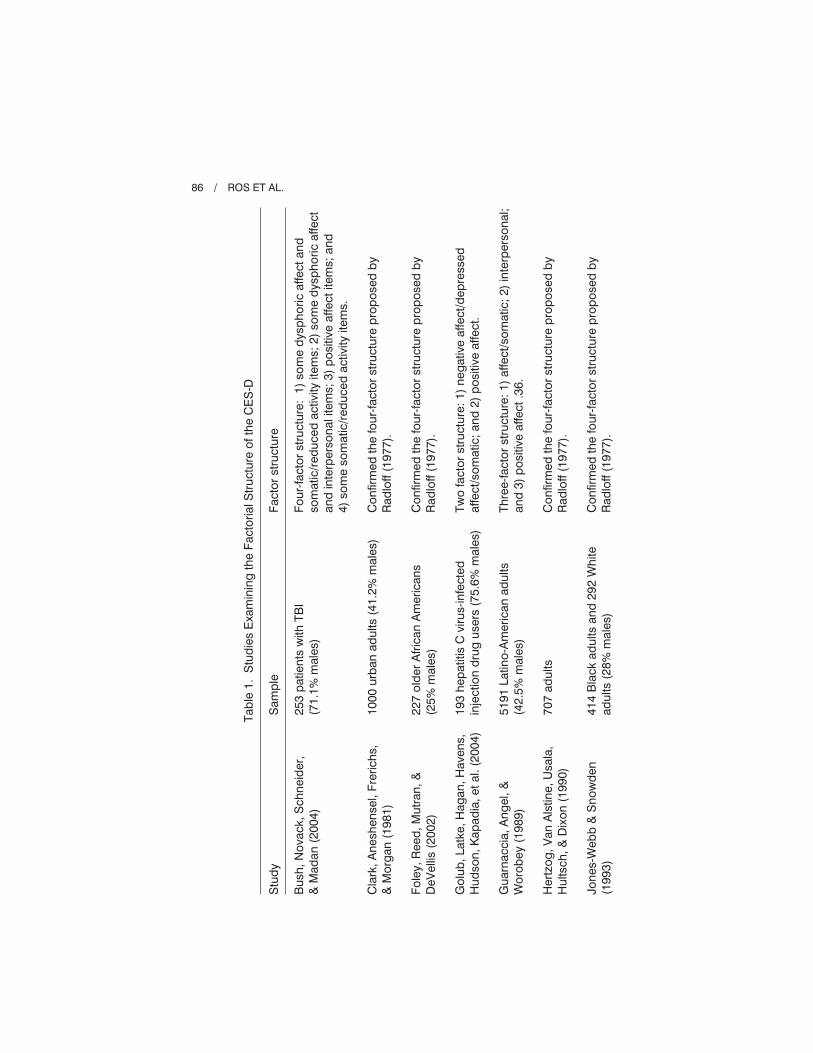
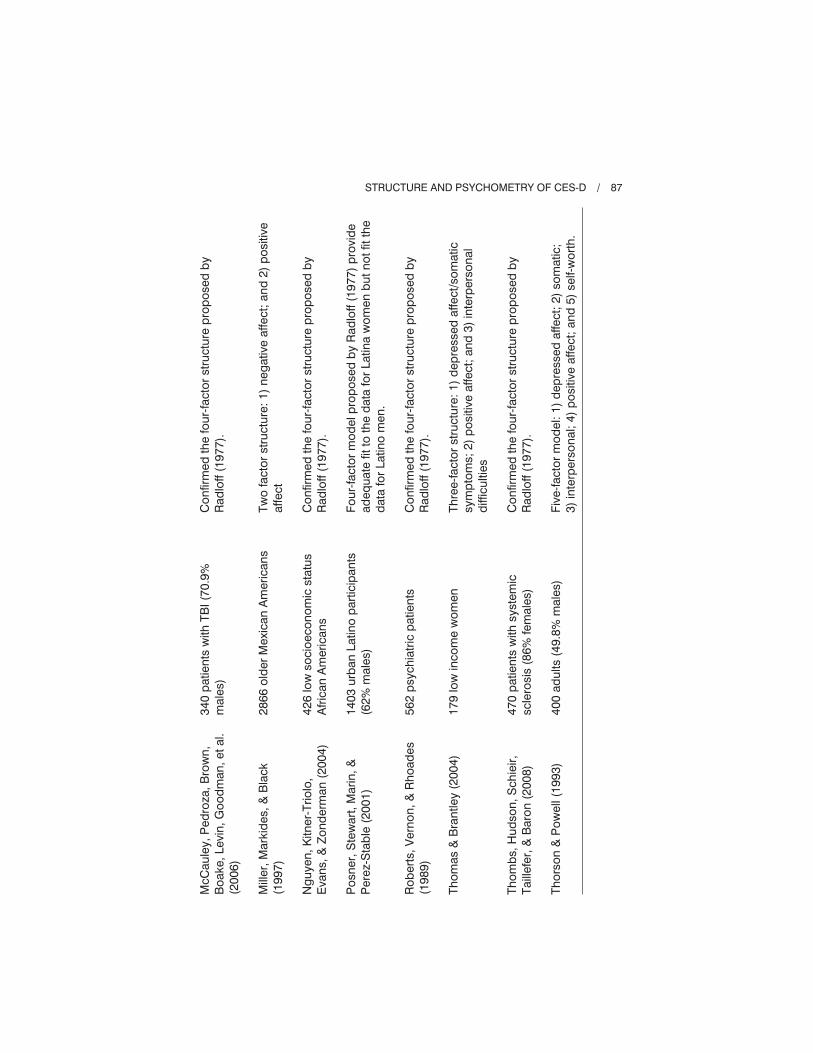
Since this initial study, the factorial structure of the CES-D has been examined
using many different population samples including age, ethnic group, language,
and geographical characteristics in the general population, as well as patients
with different diseases. Many of these studies have confirmed the validity of the
four factors found by Radloff (1977), although there are some others that have
found different factor structures (see Table 1).
Nevertheless, despite the diversity of results, a systematic review recently
performed by Shafer (2006) found that the four factor structure originally
described by Radloff (1977) is the most common structure and that it is robust
across different patient groups.
Finally, a higher order factor has not always been examined using con-
firmatory factor analysis methodology. However, in general, where it has
been examined a higher order factor has emerged (e.g., Hertzog, Van Alstine,
Usala, Hultsch, & Dixon, 1990; O’Rourke, 2003; Sheehan, Fifield, Reisine, &
Tennen, 1995).
STRUCTURE AND PSYCHOMETRY OF CES-D / 85
Tab
le1.
Stu
die
sE
xam
inin
gth
eFa
ctor
ialS
truc
ture
ofth
eC
ES
-D
Stu
dy
Sam
ple
Fact
orst
ruct
ure
Bus
h,N
ovac
k,S
chne
ider
,&
Mad
an(2
004)
Cla
rk,A
nesh
ense
l,Fr
eric
hs,
&M
org
an(1
981)
Fole
y,R
eed
,Mut
ran,
&D
eVel
lis(2
002)
Gol
ub,L
atke
,Hag
an,H
aven
s,H
udso
n,K
apad
ia,e
tal.
(200
4)
Gua
rnac
cia,
Ang
el,&
Wor
obey
(198
9)
Her
tzog
,Van
Als
tine,
Usa
la,
Hul
tsch
,&D
ixon
(199
0)
Jone
s-W
ebb
&S
now
den
(199
3)
253
pat
ient
sw
ithTB
I(7
1.1%
mal
es)
1000
urb
anad
ults
(41.
2%m
ales
)
227
old
erA
fric
anA
mer
ican
s(2
5%m
ales
)
193
hep
atiti
sC
viru
s-in
fect
edin
ject
ion
dru
gus
ers
(75.
6%m
ales
)
5191
Latin
o-A
mer
ican
adul
ts(4
2.5%
mal
es)
707
adul
ts
414
Bla
ckad
ults
and
292
Whi
tead
ults
(28%
mal
es)
Four
-fact
orst
ruct
ure:
1)so
me
dys
pho
ricaf
fect
and
som
atic
/red
uced
activ
ityite
ms;
2)so
me
dys
pho
ricaf
fect
and
inte
rper
sona
lite
ms;
3)p
ositi
veaf
fect
item
s;an
d4)
som
eso
mat
ic/r
educ
edac
tivity
item
s.
Con
firm
edth
efo
ur-fa
ctor
stru
ctur
ep
rop
osed
by
Rad
loff
(197
7).
Con
firm
edth
efo
ur-fa
ctor
stru
ctur
ep
rop
osed
by
Rad
loff
(197
7).
Two
fact
orst
ruct
ure:
1)ne
gat
ive
affe
ct/d
epre
ssed
affe
ct/s
omat
ic;a
nd2)
pos
itive
affe
ct.
Thre
e-fa
ctor
stru
ctur
e:1)
affe
ct/s
omat
ic;2
)in
terp
erso
nal;
and
3)p
ositi
veaf
fect
.36.
Con
firm
edth
efo
ur-fa
ctor
stru
ctur
ep
rop
osed
by
Rad
loff
(197
7).
Con
firm
edth
efo
ur-fa
ctor
stru
ctur
ep
rop
osed
by
Rad
loff
(197
7).
86 / ROS ET AL.
McC
aule
y,P
edro
za,B
row
n,B
oake
,Lev
in,G
ood
man
,eta
l.(2
006)
Mill
er,M
arki
des
,&B
lack
(199
7)
Ng
uyen
,Kitn
er-T
riolo
,E
vans
,&Z
ond
erm
an(2
004)
Pos
ner,
Ste
war
t,M
arin
,&P
erez
-Sta
ble
(200
1)
Rob
erts
,Ver
non,
&R
hoad
es(1
989)
Thom
as&
Bra
ntle
y(2
004)
Thom
bs,
Hud
son,
Sch
ieir,
Taill
efer
,&B
aron
(200
8)
Thor
son
&P
owel
l(19
93)
340
pat
ient
sw
ithTB
I(70
.9%
mal
es)
2866
old
erM
exic
anA
mer
ican
s
426
low
soci
oeco
nom
icst
atus
Afr
ican
Am
eric
ans
1403
urb
anLa
tino
par
ticip
ants
(62%
mal
es)
562
psy
chia
tric
pat
ient
s
179
low
inco
me
wom
en
470
pat
ient
sw
ithsy
stem
icsc
lero
sis
(86%
fem
ales
)
400
adul
ts(4
9.8%
mal
es)
Con
firm
edth
efo
ur-fa
ctor
stru
ctur
ep
rop
osed
by
Rad
loff
(197
7).
Two
fact
orst
ruct
ure:
1)ne
gat
ive
affe
ct;a
nd2)
pos
itive
affe
ct
Con
firm
edth
efo
ur-fa
ctor
stru
ctur
ep
rop
osed
by
Rad
loff
(197
7).
Four
-fact
orm
odel
pro
pos
edb
yR
adlo
ff(1
977)
pro
vid
ead
equa
tefit
toth
ed
ata
for
Latin
aw
omen
but
notf
itth
ed
ata
for
Latin
om
en.
Con
firm
edth
efo
ur-fa
ctor
stru
ctur
ep
rop
osed
by
Rad
loff
(197
7).
Thre
e-fa
ctor
stru
ctur
e:1)
dep
ress
edaf
fect
/som
atic
sym
pto
ms;
2)p
ositi
veaf
fect
;and
3)in
terp
erso
nal
diff
icul
ties
Con
firm
edth
efo
ur-fa
ctor
stru
ctur
ep
rop
osed
by
Rad
loff
(197
7).
Five
-fact
orm
odel
:1)
dep
ress
edaf
fect
;2)
som
atic
;3)
inte
rper
sona
l;4)
pos
itive
affe
ct;a
nd5)
self-
wor
th.
STRUCTURE AND PSYCHOMETRY OF CES-D / 87
Use of the CES-D in Older Adults
The CES-D has also been widely used in older adults. It has been determined
that older adults have no difficulty in understanding and following the CES-D
instructions and that its sensitivity and specificity in older adults are comparable
to those in younger adults (Radloff & Teri, 1986). In this respect, a systematic
review by Watson and Pignone (2003) reveals that the CES-D is a useful, valid
screening tool for the detection of non-diagnosed depression in older adults in a
primary care setting. The findings of various studies are along the same lines
(Spijker, van der Wurff, Poort, Smits, Verhoeff, & Beekman, 2004, with elderly
migrants from Turkey and Morocco; Foley, Reed, Mutran, & DeVellis, 2002, with
older African-Americans). In general, the internal consistency of the CES-D is
considered acceptable for both community and clinical samples (e.g., Cronbach’s
� = 0.85 to 0.91; Himmelfarb & Murrell, 1983). In view of this, although the
CES-D was originally developed and validated for a general adult population, it
appears to be appropriate for use in older adult populations.
These good indices also apply to the different adaptations of this scale. For
example, Reyes-Ortega et al. (2003) developed a Hispanic version of the CES-D
in Mexico for use in older adults. They administered the scale to 288 persons
aged over 60 years. A noteworthy result is the scale’s high internal consistency
(Cronbach’s � = 0.90), with no differences between gender and age groups. In
a CES-D validation study among older adults in Brazil, Batistoni, Neri, and
Cupertino (2007) also found good internal validity (Cronbach’s � = 0.86). The
results indicated acceptable sensitivity and specificity (74.6% and 73.6%,
respectively) with a cut-off point of > 11, but with the drawback of having a
high rate of false negatives.
Beekman et al. (1997) studied the criterion validity of the CES-D in a sample of
older adults in the Netherlands using a cut-off point of 16 or over and found very
satisfactory sensitivity and specificity (100% and 88%, respectively). However,
these authors also found that in patients with physical diseases, cognitive impair-
ment, or anxiety, this cut-off point results in high false positive rates. In view of
this and given the prevalence of chronic diseases in this type of population, several
studies have determined that, depending on the context, cut-off points of between
20 and 27 could be recommended (Himmelfarb & Murrell, 1983; Schulberg et al.,
1985; Zich, Atkinson, & Greenfield, 1990). For example, Harringsma, Engels,
Beekman, and Spinhoven (2004) evaluated the validity of the CES-D within the
framework of a depression prevention program in Holland. These authors con-
cluded that the scale’s criterion validity was satisfactory as a screening tool,
setting a score of 25 as the cut-off point for the diagnosis of clinical depression in
persons with psychopathological comorbidity and a history of depressive episodes.
With respect to the CES-D factorial structure in older adults, we found that
the original four-factor structure proposed by Radloff (1977) is repeatedly used.
In the study by Hertzog et al. (1990), the responses of the older adults to the
88 / ROS ET AL.
CES-D items reflect a complex four-factor structure, each of which significantly
contributes to a higher order depression construct. Several studies have replicated
this factorial structure in different types of geriatric populations (Foley et al.,
2002; Jones-Webb & Snowden, 1993; O’Rourke, 2003). However, the explora-
tory factor analysis performed in the study by Batistoni et al. (2007) revealed only
three factors: negative affect, problem initiating behavior, and positive affect.
Spanish Version of the CES-D
In 2001, Mui, Burnett, and Chen published a review in which they analyzed
the utility and psychometric properties of the CES-D. They confirmed its value as
a diagnostic tool for depression in older persons of diverse cultures. Some authors
have suggested that there is a need for validating a CES-D for each cultural group
(Gupta & Yick, 2001; Mui, Burnett, & Chen, 2001; Riddle, Blais, & Hess, 2002).
Latorre and Montañés (1997) used their first Spanish version of the CES-D
in a sample of 230 adults aged over 60 years in Spain. They used the cut-off
point of 16 originally proposed by Radloff (1977). Using exploratory factorial
analysis they identified four factors in their version, which coincided with the
factorial structure proposed by Radloff (1977). They found that these four factors
accounted for 60.8% of the scale’s variance.
Subsequently, the study by Zunzunegui et al. (1998) also attempted to validate
the CES-D scale in older adults in Spain. These authors used the version of the
scale developed for the HHANES, a study on depressive symptoms in a Mexican
American population (Moscicki, Locke, Rae, & Boyd, 1989). Zunzunegui et al.
studied a sample of 98 adults aged over 65 years (4 of whom had major depres-
sion and 13 had dysthymia). Their results revealed that the CES-D had
good internal consistency (Cronbach’s � = 0.89) and, with a cut-off point of
16 or over, the scale had 100% sensitivity and 73% specificity for the diagnosis
of major depression.
This study has two main objectives. First, we aim to determine the internal
consistency and reliability of the CES-D in a sample of older adults much larger
than that of Latorre and Montañés (1997) and of Zunzunegui et al. (1998). We will
also examine the factorial structure of the scale in this type of sample using
structural equation models.
Secondly, we will assess the diagnostic validity of the CES-D in two different
populations of Spanish older adults. The first is a group of older adults without
cognitive impairment. As in previous studies (Himmelfarb & Murrell, 1983;
Schulberg et al., 1985; Zich et al., 1990), we expect the recommended cut-off
point to be higher than the conventionally used one of 16. The second sample
is a group of older adults with mild cognitive impairment. As we have already
seen, the CES-D is recommended for assessing depressive symptoms in old age
(Himmelfarb & Murrell, 1983; Lewinsohn et al., 1997; Radloff & Teri, 1986);
however, it has been rarely examined in older persons with cognitive impairment.
STRUCTURE AND PSYCHOMETRY OF CES-D / 89
To our knowledge, the only study in this respect is that of Lewinsohn et al. (1997).
These authors found that in a sample of older adults with cognitive impairment a
cut-off point of 12 maximized the scale’s sensitivity and specificity, clearly lower
than the score of 20 suggested by other investigators for an older population
(Himmelfarb & Murrell, 1983; Lyness, Noel, Cox, King, Conwell, & Caine,
1997). In view of this, we aim to evaluate the diagnostic validity of the CES-D
in a sample of older adults with mild cognitive impairment and to determine the
most appropriate cut-off point for this type of population.
METHOD
Participants
The voluntary participants were recruited from six community centers for
older adults in Albacete, Spain (two cultural centers, one social service center,
two centers for retired people, and the geriatric department of a hospital in
Albacete). A total of 623 persons aged over 65 years participated in the study.
The mean age was 72.74 (SD = 7.7), 60% were women and 42.2% had mild
cognitive impairment. As regards educational level, 35.3% of the participants
could read and write at some level but did not attend any school, 46.1% had
completed primary education attending a school (6 years of schooling), 9.3%
secondary education, and 9.3% higher education. The entire sample was assessed
by the five clinical psychologists participating in the study.
For the determination of the diagnostic validity of the CES-D in older adults
with and without cognitive impairment, all the participants came from the geriatric
department of a hospital in Albacete (CHUAB). These participants had been
diagnosed using the Composite International Diagnostic Interview (WHO-CIDI,
2001). The Mini Examen Cognitivo (MEC; Lobo, Ezquerra, Gómez-Burgada,
Sala, & Seva-Diaz, 1979) was used to assess the level of cognitive impairment.
The sample of older adults without cognitive impairment consisted of 58 persons
aged over 65 years (22 had major depression disorder (MDD) and 36 did not).
The mean age of the non-depressed group was 73.31 (SD = 8.0) and 38.9%
were women. As regards educational level, 36.1% of the subjects could read and
write without attending any school, 47.2% had completed primary education,
5.6% had completed secondary education, and 11.1% had completed higher
education. The mean age of the MDD group was 76.82 (SD = 9.8) and 86.4%
were women. Lastly, the educational level of this group was as follows: 63.7%
could read and write without attending any school and 36.4% had completed
primary education.
The sample of older adults with mild or incipient cognitive impairment com-
prised 162 persons aged over 65 years (82 participants with MDD and 80 without
MDD). The mean age in the non-depressed group was 77.01 (SD = 7.9) and
53.8% were women. As regards educational level, 48.7% of the subjects could
90 / ROS ET AL.
read and write without attending any school, 41.3% had completed primary
education, and 10% had completed secondary education. The mean age of the
MDD group was 76.45 (SD = 8.2) and 69.5% were women. Lastly, the educational
level of this group was as follows: 58.5% could read and write without attending
any school and 40.3% had completed primary education and 1.2% had completed
secondary education.
Instruments
Center for Epidemiological Studies-
Depression Scale (CES-D; Radloff, 1977)
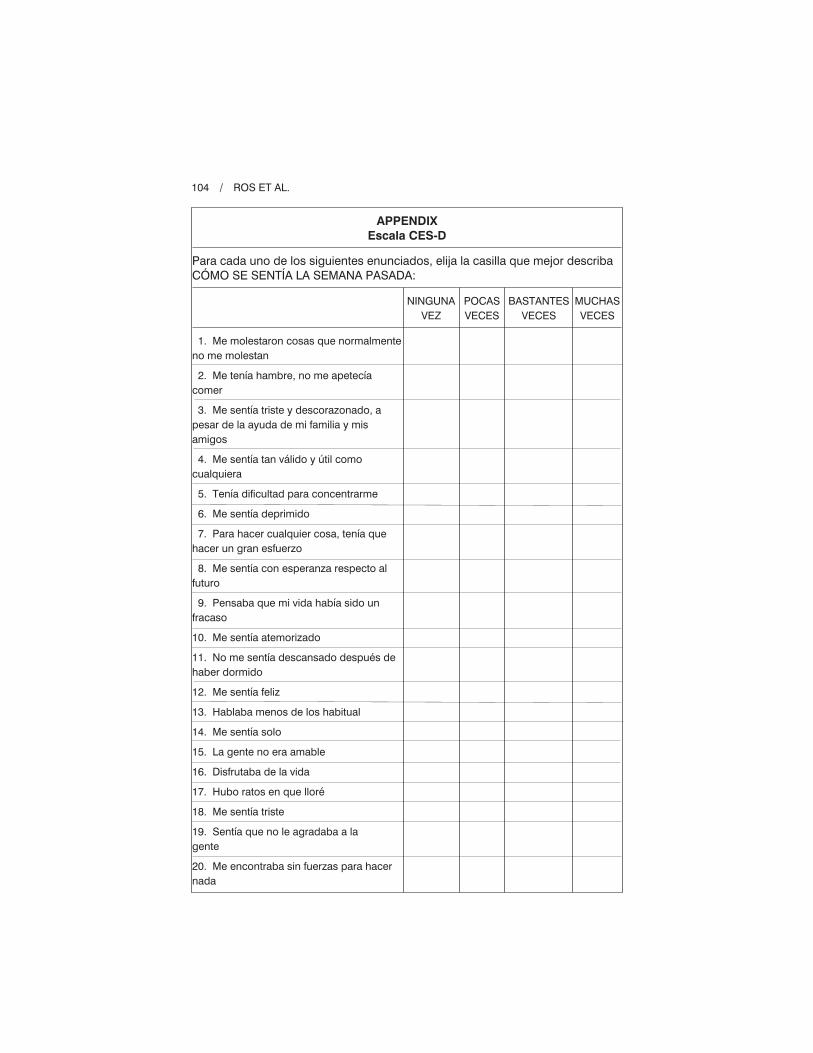
The Spanish version of the CES-D developed by Latorre and Montañés (1997)
was used in this study. Two forward and two back translations of the original
CES-D were performed to develop the Spanish CES-D, stressing conceptual and
linguistic equivalence. Two bilingual primary care doctors were asked to translate
the CES-D from English into Spanish. Then, two different doctors translated it
back into English and a public translator compared the original version against the
translated ones. All translators were blind to the translation of the others. Small
semantic differences were discussed and agreed upon to obtain the final version
(see Appendix 1).
Mini Examen Cognitivo
(MEC; Lobo et al., 1979)
The MEC is a screening instrument widely used for the detection of cognitive
impairment. It is made up of 35 items that assess the following cognitive func-
tions: time and space orientation, attention, mental arithmetic, immediate verbal
recall, short-term deferred verbal recall, verbal working memory, abstract verbal
reasoning, language, and visoconstructive praxis. It takes about 10–15 minutes
and it is routinely used in both clinical practice and in research studies.
The MEC is based on the Mini Mental State Examination (MMSE; Folstein,
Folstein, & McHugh, 1975) and has been adapted and validated in Spain by
Lobo et al. (1979), with some differences with respect to the original. In both
clinical samples and the general population, the MEC has demonstrated satis-
factory validity, reliability, and discriminative power with an 82% specificity
and an 84.6% sensitivity increasing to 92.3% and 95.2%, respectively, in geriatric
patients. In a revalidation and standardization study in a population of adults over
65 years, it was found that if a cut off score of 23–24 points is used, the MEC has
a sensitivity of 89% and a specificity of 83.9% (Lobo, Saz, Marcos, Dia, De La,
Ventura, et al., 1999). In a population under 65 years, a cut off point of 27 or
more is established for the diagnosis of cognitive impairment (Lobo et al., 1979).
STRUCTURE AND PSYCHOMETRY OF CES-D / 91
Composite International Diagnostic Interview
(CIDI; WHO-CIDI, 2001)
The CIDI is a series of structured interviews designed to assess different mental
disorders and addictions according to the diagnostic criteria of DSM-IV and
the ICD-10. It allows the investigator to assign a clinical diagnosis. All the
questions in each of the interviews follow a simple Yes/No response format.
The subject’s responses do not need to be weighed up by the interviewer and this
provides for high test-retest reliability and good internal reliability (Cottler,
Robins, Grant, Blaine, Towle, Wittchen, et al., 1991; Wittchen, 1994; Wittchen,
Robins, Cottler, Sartorius, Burke, Regier, et al., 1991).
For our study we used the structured interview for Major Depression, evalu-
ating nine symptoms:
1. depressed mood state;
2. loss of interest;
3. energy loss/increase;
4. appetite/weight loss/gain (more or less than 2.5 kg);
5. sleep problems;
6. psychomotor problems/listless-agitated;
7. guilt feelings or lack of self-esteem;
8. concentration difficulties; and
9. thoughts about death.
The subjects answered No (1) or Yes (2) to each of the questions. Some symptoms
only have one question and others two or more questions. An affirmative response
to just one of the questions on a symptom is taken to mean that such symptom is
present. If five or more of the nine symptoms are present, then the subject has
Major Depressive Disorder (MDD).
Procedure
Patients from all sites provided informed consent, and the research ethics board
of each study site approved the data collection protocol. Before starting a session,
participants gave consent, received an explanation of the study, provided basic
demographic data, and completed the MEC and CES-D scales. The interviews
were individually administered on a session by five psychologists blind to the
purpose of the study. Participants were told that the study was investigating
the mood state and that the interviews were designed to recruit emotions and
feelings related with the mood.
RESULTS
The frequency distributions of the CES-D scale items indicated that the entire
range of response options were employed for each item with only six items (item 1,
92 / ROS ET AL.
item 2, item 9, item 10, item 15, and item 19) displaying values beyond 1.00 for
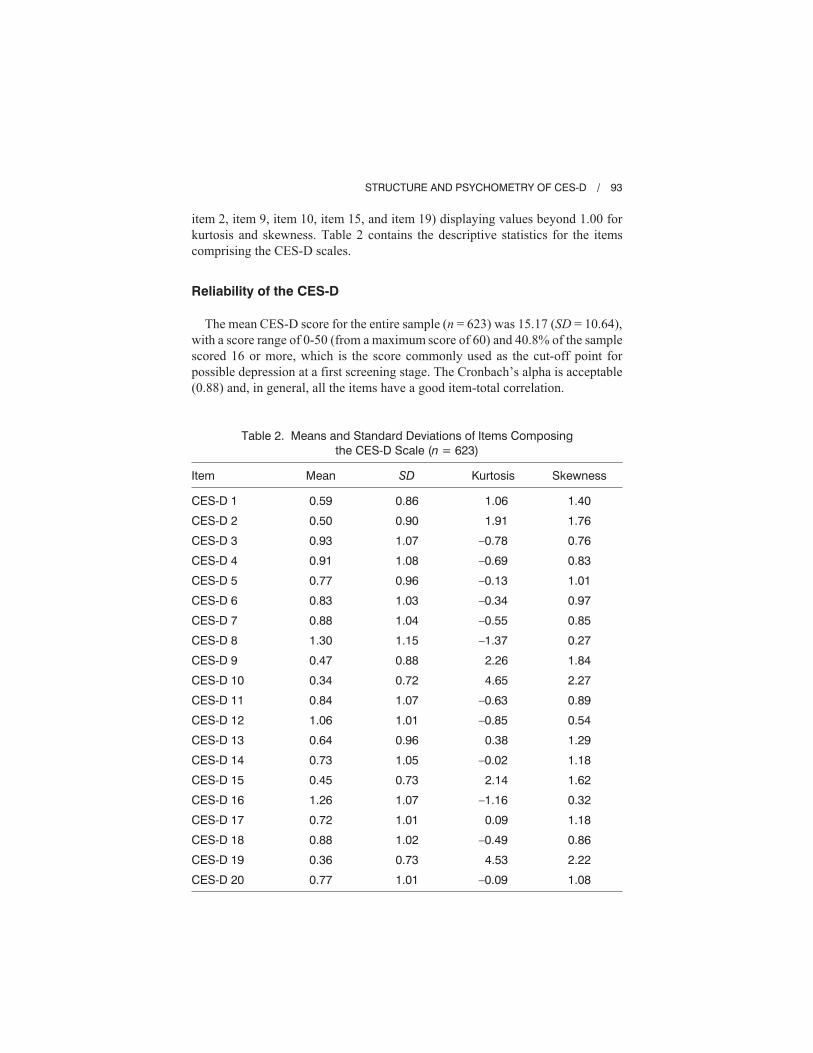
kurtosis and skewness. Table 2 contains the descriptive statistics for the items
comprising the CES-D scales.
Reliability of the CES-D
The mean CES-D score for the entire sample (n = 623) was 15.17 (SD = 10.64),
with a score range of 0-50 (from a maximum score of 60) and 40.8% of the sample
scored 16 or more, which is the score commonly used as the cut-off point for
possible depression at a first screening stage. The Cronbach’s alpha is acceptable
(0.88) and, in general, all the items have a good item-total correlation.
STRUCTURE AND PSYCHOMETRY OF CES-D / 93
Table 2. Means and Standard Deviations of Items Composingthe CES-D Scale (n = 623)
Item Mean SD Kurtosis Skewness
CES-D 1
CES-D 2
CES-D 3
CES-D 4
CES-D 5
CES-D 6
CES-D 7
CES-D 8
CES-D 9
CES-D 10
CES-D 11
CES-D 12
CES-D 13
CES-D 14
CES-D 15
CES-D 16
CES-D 17
CES-D 18
CES-D 19
CES-D 20
0.59
0.50
0.93
0.91
0.77
0.83
0.88
1.30
0.47
0.34
0.84
1.06
0.64
0.73
0.45
1.26
0.72
0.88
0.36
0.77
0.86
0.90
1.07
1.08
0.96
1.03
1.04
1.15
0.88
0.72
1.07
1.01
0.96
1.05
0.73
1.07
1.01
1.02
0.73
1.01
1.06
1.91
–0.78
–0.69
–0.13
–0.34
–0.55
–1.37
2.26
4.65
–0.63
–0.85
0.38
–0.02
2.14
–1.16
0.09
–0.49
4.53
–0.09
1.40
1.76
0.76
0.83
1.01
0.97
0.85
0.27
1.84
2.27
0.89
0.54
1.29
1.18
1.62
0.32
1.18
0.86
2.22
1.08
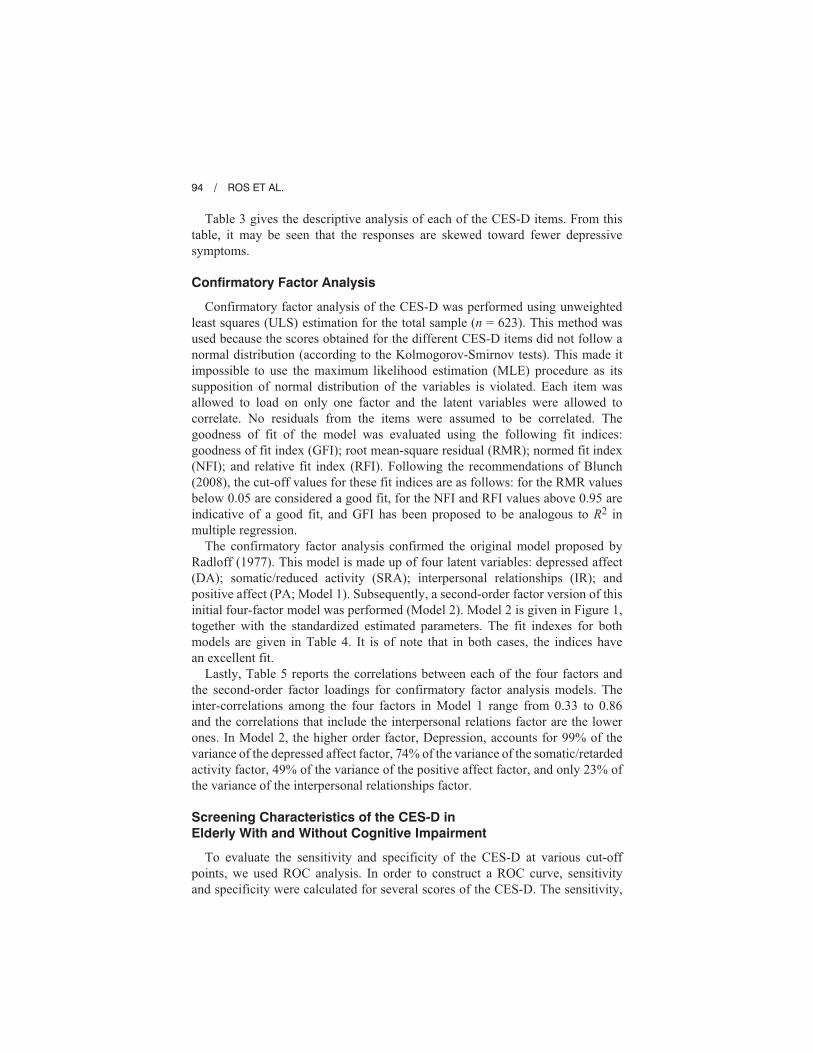
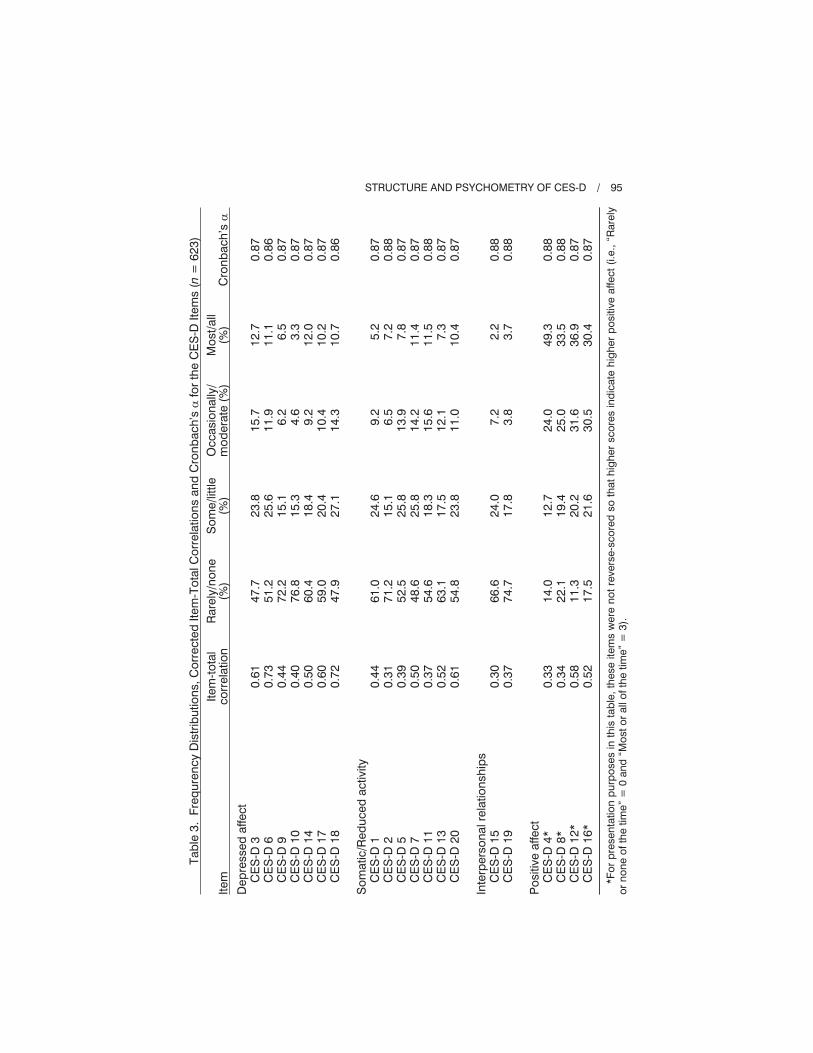
Table 3 gives the descriptive analysis of each of the CES-D items. From this
table, it may be seen that the responses are skewed toward fewer depressive
symptoms.
Confirmatory Factor Analysis
Confirmatory factor analysis of the CES-D was performed using unweighted
least squares (ULS) estimation for the total sample (n = 623). This method was
used because the scores obtained for the different CES-D items did not follow a
normal distribution (according to the Kolmogorov-Smirnov tests). This made it
impossible to use the maximum likelihood estimation (MLE) procedure as its
supposition of normal distribution of the variables is violated. Each item was
allowed to load on only one factor and the latent variables were allowed to
correlate. No residuals from the items were assumed to be correlated. The
goodness of fit of the model was evaluated using the following fit indices:
goodness of fit index (GFI); root mean-square residual (RMR); normed fit index
(NFI); and relative fit index (RFI). Following the recommendations of Blunch
(2008), the cut-off values for these fit indices are as follows: for the RMR values
below 0.05 are considered a good fit, for the NFI and RFI values above 0.95 are
indicative of a good fit, and GFI has been proposed to be analogous to R2 in
multiple regression.
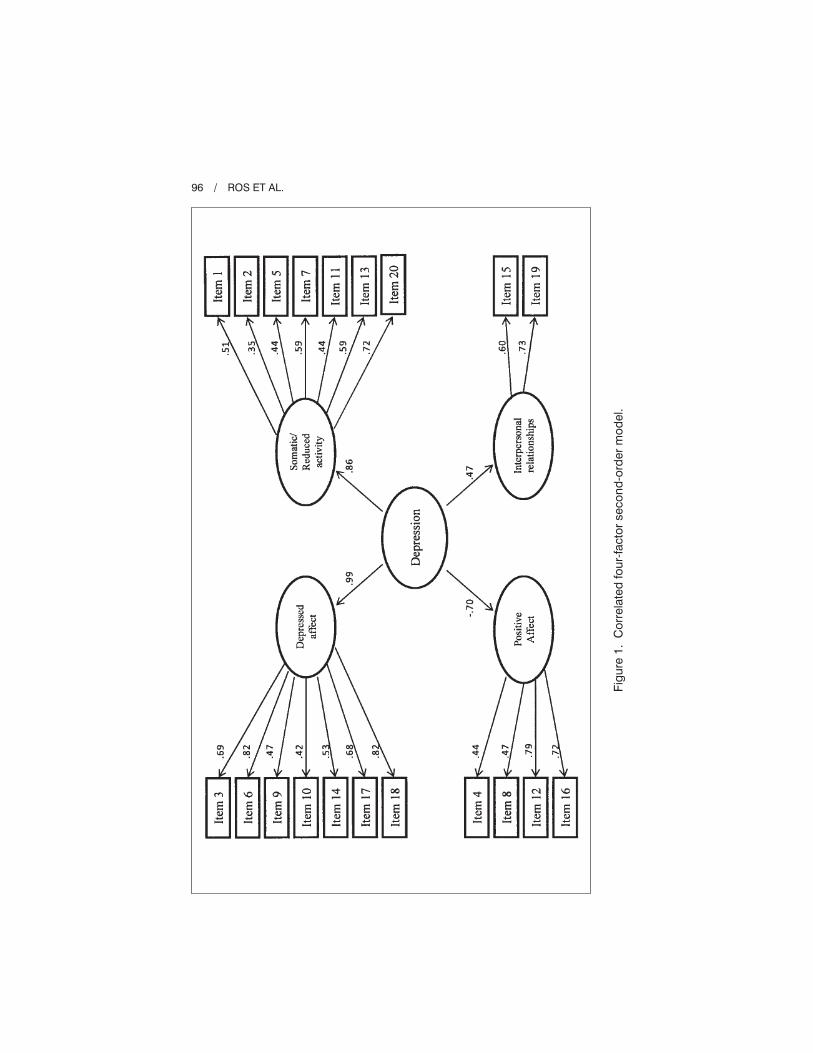
The confirmatory factor analysis confirmed the original model proposed by
Radloff (1977). This model is made up of four latent variables: depressed affect
(DA); somatic/reduced activity (SRA); interpersonal relationships (IR); and
positive affect (PA; Model 1). Subsequently, a second-order factor version of this
initial four-factor model was performed (Model 2). Model 2 is given in Figure 1,
together with the standardized estimated parameters. The fit indexes for both
models are given in Table 4. It is of note that in both cases, the indices have
an excellent fit.
Lastly, Table 5 reports the correlations between each of the four factors and
the second-order factor loadings for confirmatory factor analysis models. The
inter-correlations among the four factors in Model 1 range from 0.33 to 0.86
and the correlations that include the interpersonal relations factor are the lower
ones. In Model 2, the higher order factor, Depression, accounts for 99% of the
variance of the depressed affect factor, 74% of the variance of the somatic/retarded
activity factor, 49% of the variance of the positive affect factor, and only 23% of
the variance of the interpersonal relationships factor.
Screening Characteristics of the CES-D in
Elderly With and Without Cognitive Impairment
To evaluate the sensitivity and specificity of the CES-D at various cut-off
points, we used ROC analysis. In order to construct a ROC curve, sensitivity
and specificity were calculated for several scores of the CES-D. The sensitivity,
94 / ROS ET AL.
Tab
le3.
Freq
uren
cyD
istr
ibut
ions
,Cor
rect
edIte
m-T
otal
Cor
rela
tions
and
Cro
nbac
h’s
�fo
rth
eC
ES
-DIte
ms
(n=
623)
Item
Item
-tot
alco
rrel
atio
nR
arel
y/no
ne(%
)S
ome/
little
(%)
Occ
asio
nally
/m
oder
ate
(%)
Mos
t/all
(%)
Cro
nbac
h’s
�
Dep
ress
edaf
fect
CE
S-D
3C
ES
-D6
CE
S-D
9C
ES
-D10
CE
S-D
14C
ES
-D17
CE
S-D
18
Som
atic
/Red
uced
activ
ityC
ES
-D1
CE
S-D
2C
ES
-D5
CE
S-D
7C
ES
-D11
CE
S-D
13C
ES
-D20
Inte
rper
sona
lrel
atio
nshi
ps
CE
S-D
15C
ES
-D19
Pos
itive
affe
ctC
ES
-D4*
CE
S-D
8*C
ES
-D12
*C
ES
-D16
*
0.61
0.73
0.44
0.40
0.50
0.60
0.72
0.44
0.31
0.39
0.50
0.37
0.52
0.61
0.30
0.37
0.33
0.34
0.58
0.52
47.7
51.2
72.2
76.8
60.4
59.0
47.9
61.0
71.2
52.5
48.6
54.6
63.1
54.8
66.6
74.7
14.0
22.1
11.3
17.5
23.8
25.6
15.1
15.3
18.4
20.4
27.1
24.6
15.1
25.8
25.8
18.3
17.5
23.8
24.0
17.8
12.7
19.4
20.2
21.6
15.7
11.9 6.2
4.6
9.2
10.4
14.3 9.2
6.5
13.9
14.2
15.6
12.1
11.0 7.2
3.8
24.0
25.0
31.6
30.5
12.7
11.1 6.5
3.3
12.0
10.2
10.7 5.2
7.2
7.8
11.4
11.5 7.3
10.4 2.2
3.7
49.3
33.5
36.9
30.4
0.87
0.86
0.87
0.87
0.87
0.87
0.86
0.87
0.88
0.87
0.87
0.88
0.87
0.87
0.88
0.88
0.88
0.88
0.87
0.87
*For
pre
sent
atio
np
urp
oses
inth
ista
ble
,the
seite
ms
wer
eno
trev
erse
-sco
red
soth
athi
ghe
rsc
ores
ind
icat
ehi
ghe
rp
ositi
veaf
fect
(i.e.
,“R
arel
yor
none
ofth
etim
e”=
0an
d“M
osto
ral
loft
hetim
e”=
3).
STRUCTURE AND PSYCHOMETRY OF CES-D / 95
96 / ROS ET AL.
Fig
ure
1.C
orre
late
dfo
ur-fa
ctor
seco
nd-o
rder
mod
el.
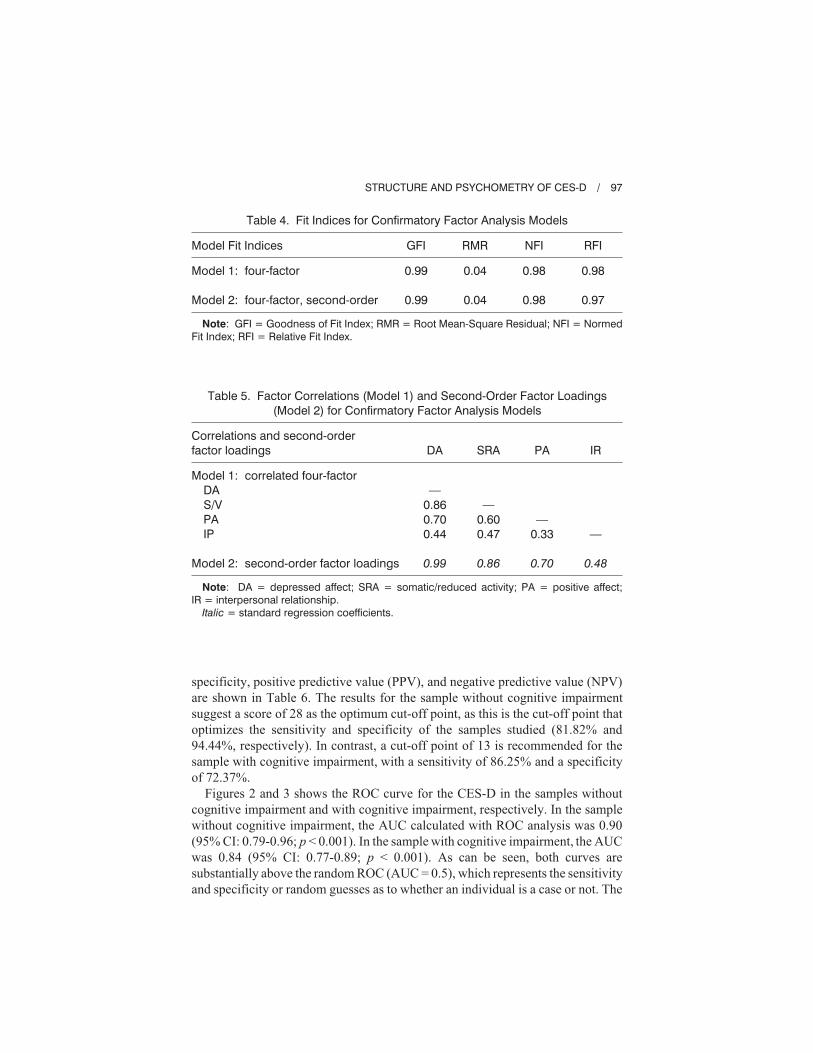
specificity, positive predictive value (PPV), and negative predictive value (NPV)
are shown in Table 6. The results for the sample without cognitive impairment
suggest a score of 28 as the optimum cut-off point, as this is the cut-off point that
optimizes the sensitivity and specificity of the samples studied (81.82% and
94.44%, respectively). In contrast, a cut-off point of 13 is recommended for the
sample with cognitive impairment, with a sensitivity of 86.25% and a specificity
of 72.37%.
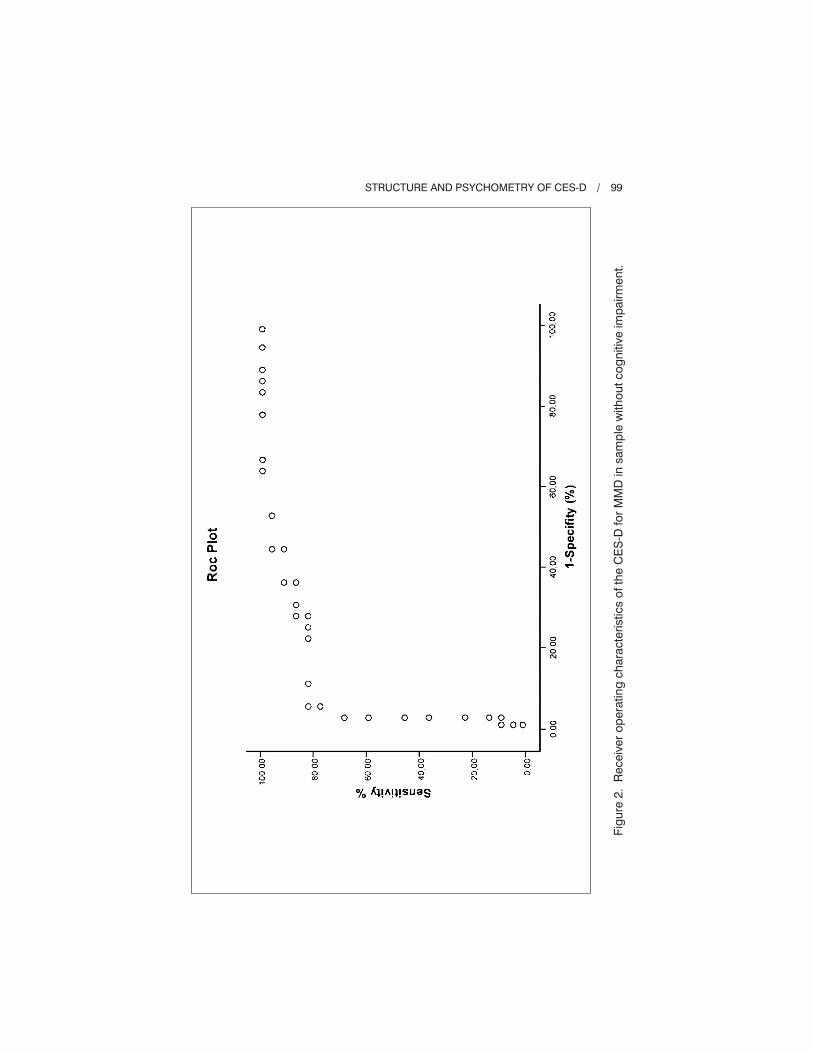
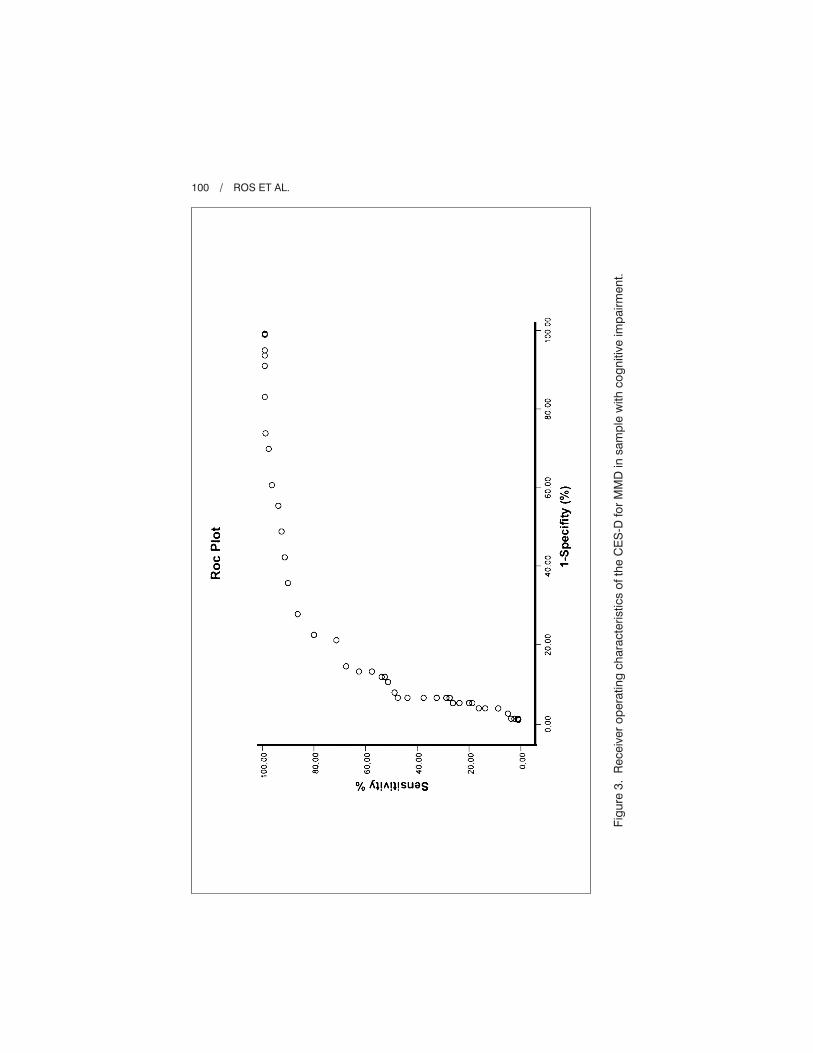
Figures 2 and 3 shows the ROC curve for the CES-D in the samples without
cognitive impairment and with cognitive impairment, respectively. In the sample
without cognitive impairment, the AUC calculated with ROC analysis was 0.90
(95% CI: 0.79-0.96; p < 0.001). In the sample with cognitive impairment, the AUC
was 0.84 (95% CI: 0.77-0.89; p < 0.001). As can be seen, both curves are
substantially above the random ROC (AUC = 0.5), which represents the sensitivity
and specificity or random guesses as to whether an individual is a case or not. The
STRUCTURE AND PSYCHOMETRY OF CES-D / 97
Table 5. Factor Correlations (Model 1) and Second-Order Factor Loadings(Model 2) for Confirmatory Factor Analysis Models
Correlations and second-orderfactor loadings DA SRA PA IR
Model 1: correlated four-factorDAS/VPAIP
Model 2: second-order factor loadings
—0.860.700.44
0.99
—0.600.47
0.86
—0.33
0.70
—
0.48
Note: DA = depressed affect; SRA = somatic/reduced activity; PA = positive affect;IR = interpersonal relationship.
Italic = standard regression coefficients.
Table 4. Fit Indices for Confirmatory Factor Analysis Models
Model Fit Indices GFI RMR NFI RFI
Model 1: four-factor
Model 2: four-factor, second-order
0.99
0.99
0.04
0.04
0.98
0.98
0.98
0.97
Note: GFI = Goodness of Fit Index; RMR = Root Mean-Square Residual; NFI = NormedFit Index; RFI = Relative Fit Index.
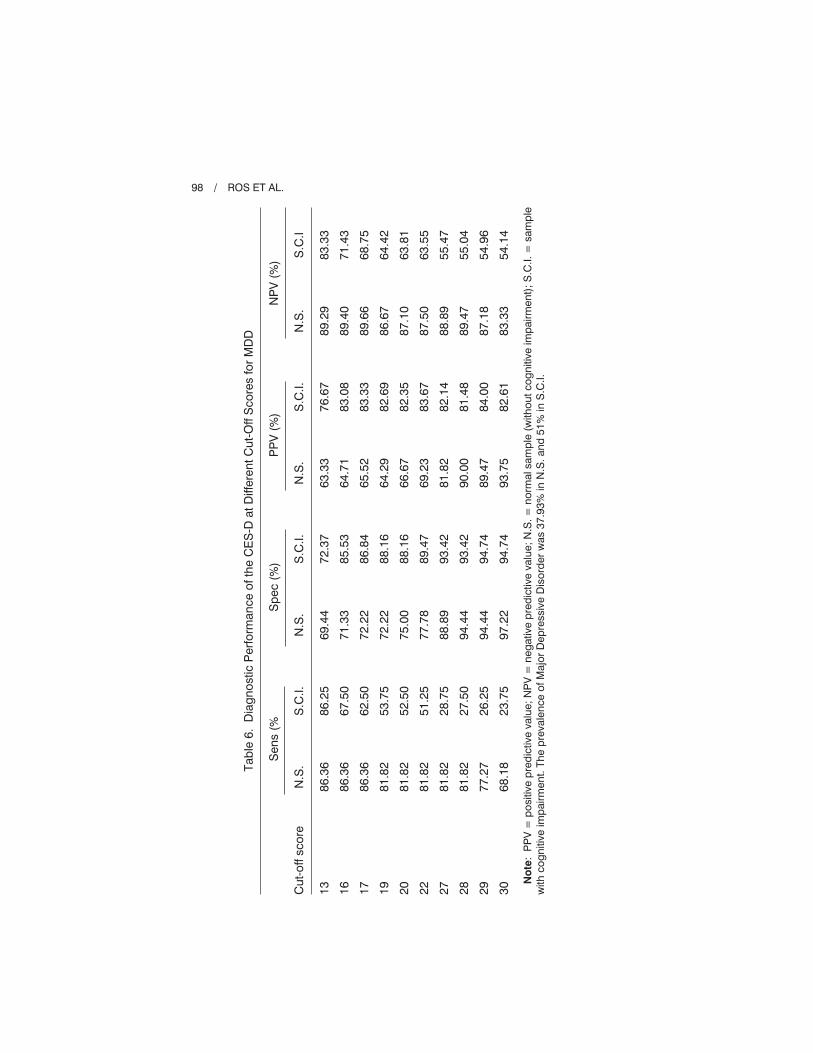
Tab
le6.
Dia
gno
stic
Per
form
ance
ofth
eC
ES
-Dat
Diff
eren
tCut
-Off
Sco
res
for
MD
D
Sen
s(%
Sp
ec(%
)P
PV
(%)
NP
V(%
)
Cut
-off
scor
eN
.S.
S.C
.I.N
.S.
S.C
.I.N
.S.
S.C
.I.N
.S.
S.C
.I
13 16 17 19 20 22 27 28 29 30
86.3
6
86.3
6
86.3
6
81.8
2
81.8
2
81.8
2
81.8
2
81.8
2
77.2
7
68.1
8
86.2
5
67.5
0
62.5
0
53.7
5
52.5
0
51.2
5
28.7
5
27.5
0
26.2
5
23.7
5
69.4
4
71.3
3
72.2
2
72.2
2
75.0
0
77.7
8
88.8
9
94.4
4
94.4
4
97.2
2
72.3
7
85.5
3
86.8
4
88.1
6
88.1
6
89.4
7
93.4
2
93.4
2
94.7
4
94.7
4
63.3
3
64.7
1
65.5
2
64.2
9
66.6
7
69.2
3
81.8
2
90.0
0
89.4
7
93.7
5
76.6
7
83.0
8
83.3
3
82.6
9
82.3
5
83.6
7
82.1
4
81.4
8
84.0
0
82.6
1
89.2
9
89.4
0
89.6
6
86.6
7
87.1
0
87.5
0
88.8
9
89.4
7
87.1
8
83.3
3
83.3
3
71.4
3
68.7
5
64.4
2
63.8
1
63.5
5
55.4
7
55.0
4
54.9
6
54.1
4
No
te:
PP
V=
pos
itive
pre
dic
tive
valu
e;N
PV
=ne
gat
ive
pre
dic
tive
valu
e;N
.S.=
norm
alsa
mp
le(w
ithou
tcog
nitiv
eim
pai
rmen
t);S
.C.I.
=sa
mp
lew
ithco
gni
tive
imp
airm
ent.
The
pre
vale
nce
ofM
ajor
Dep
ress
ive
Dis
ord
erw
as37
.93%
inN
.S.a
nd51
%in
S.C
.I.
98 / ROS ET AL.
STRUCTURE AND PSYCHOMETRY OF CES-D / 99
Fig
ure
2.R
ecei
ver
oper
atin
gch
arac
teris
tics
ofth
eC
ES
-Dfo
rM
MD
insa
mp
lew
ithou
tcog
nitiv
eim
pai
rmen
t.
100 / ROS ET AL.
Fig
ure
3.R
ecei
ver
oper
atin
gch
arac
teris
tics
ofth
eC
ES
-Dfo
rM
MD
insa
mp
lew
ithco
gni
tive
imp
airm
ent.
fact that the AUC is significantly greater than 0.5 means that the null hypothesis
(i.e., that the CES-D provides no useful information) can be rejected.
DISCUSSION
The two main objectives of this study were:
1. to determine the validity and reliability of the CES-D in a population of
older adults and to examine the factorial structure through confirmatory
factor analysis with structural equations; and
2. to assess the adequacy of the CES-D as a screening instrument in a popu-
lation of older adults with and without cognitive impairment.
In general, we believe that the results support the use of the CES-D as a valid
screening instrument for depression in an older adult population. Nunnally and
Bernstein (1994) proposed that for self-report scales to be used as screening
instruments, they must have an internal consistency of � 0.80. The reliability
indices obtained in our study meet this criterion. Furthermore, the fact that
the items have high internal consistency confirms the unidimensional nature of
the scale.
Regarding the factorial structure of the CES-D, our results, using a structural
equation model, support the original four factor structure proposed by Radloff
(1977): depressed affect; somatic symptoms/psychomotor retardation; positive
affect; and interpersonal relationships. Furthermore, in agreement with the
findings of studies such as those performed by Hertzog et al. (1990) and Sheehan
et al. (1995), our results also lend support to a higher order factor structure of
the CES-D in older adults. It should be pointed out that all the items in both
models adequately saturate on their respective factors, and all first-order factors
significantly saturate on a latent second-order Depression construct. This good
fit of the second-order model supports the use of a total CES-D score as an overall
indicator of depressive symptomatology in older adults. Therefore, although the
interpersonal relationships factor appears to be weakly related with the higher-
order Depression construct, total score may be considered as a valid measure-
ment of depressive symptomatology.
The results of our second objective—assessing the utility of the CES-D in a
sample of older adults with mild cognitive impairment and a sample without
cognitive impairment—suggest that CES-D is an acceptable instrument to
accurately detect MDD in both samples. The criteria validity of the CES-D was
examined by comparing the scale’s cut-off points with those of a gold standard,
the CIDI. As we have seen, the CIDI is a structured interview which allows the
investigator to clinically diagnose MDD. Through ROC analysis, we found that
CES-D is sensitive, specific, and has good positive and negative predictive
values, taking the total score of 28 as the cut-off point for the sample without
cognitive impairment and 13 for the sample with cognitive impairment. Both these
STRUCTURE AND PSYCHOMETRY OF CES-D / 101
cut-off points concur with those in the literature. The cut-off point of 28, in an
older population without cognitive impairment, is similar to that suggested as
optimum by authors such as Himmelfarb and Murrell (1983) or Schulberg et al.
(1985) in an older population. In the older population with cognitive impairment,
our cut-off point is similar to that found by Lewinsohn et al. (1997), also in a study
in older adults with mild cognitive impairment. It is our opinion that older adults
without cognitive impairment and with a CES-D score of over 28, or older adults
with cognitive impairment and with a score of over 13, should be assessed in a
clinical interview in order to reach a specific clinical diagnosis and administer the
appropriate treatment. It should be remembered that the CES-D is not, strictly
speaking, a diagnostic instrument; however, it has demonstrated to be very
useful as an indicator of probable depression, which should be subsequently
evaluated by clinical criteria (Gatz, Kasl-Godley, & Karel, 1996; Robinson,
Gruman, Gaztambide, & Blank, 2002). Furthermore, the CES-D may also be used
as a measure of treatment results, as it determines the current symptom level
and is sensitive to changes over time (Radloff, 1977; Radloff & Teri, 1986).
It is also noteworthy that the presence of cognitive impairment did not have
a negative effect on the efficacy of the CES-D as a screening instrument in this
sample. This finding is consistent with those in other studies. Parmelee, Katz,
and Lawton (1991) and Parmelee, Lawton, and Katz (1989) found that, with
the exception of the severe dementia group, on comparing participants with
cognitive impairment with those without cognitive impairment, the self-reports
on depression had the same internal consistency and had correlations equivalent
to the examiners’ evaluations. These findings, as do ours, suggest that older
persons are reliable informers of their affective state, regardless of whether
they have of cognitive impairment or not.
Lastly, in our study the proportion of women with depression is greater than
that of men. Nevertheless, we think that this difference does not affect the
validity of the results. O’Rourke (2004) found that CES-D responses do not vary
depending on the subject’s sex. Moreover, different studies have shown that
women have higher rates of depressive symptoms (Thoits, 1995; Vingerhoets
& Van Heck, 1990) and suffer from higher rates of affect disorders (Haro,
Palacin, Vilagut, Martinez, Bernal, Luque, et al., 2006; Nolen-Hoeksema, 2001)
than men. Furthermore, the scales and screening instruments that evaluate
depressive symptoms are usually applied to both men and women with the same
cut-off points.
This study has some limitations. One of them is that the sample of older
persons with cognitive impairment used to assess the validity of the CES-D as a
screening instrument, did not include persons with moderate or severe cognitive
impairment. Therefore, although we can conclude that the CES-D provides an
adequate measure of depressive symptoms in older adults with mild cognitive
impairment, we cannot extend this conclusion to include adults with more severe
cognitive impairment.
102 / ROS ET AL.
Finally, the sample size of the group without cognitive impairment is small for
the type of statistical analysis that is being performed, so these results should
be interpreted with caution. Nevertheless, it should be noted that our results
fit with most of the previous literature in that some investigators have recom-
mended cut-off points between 20 and 27 in older populations.
In summary, we can conclude that the CES-D is a valid, reliable self-report
scale to measure depressive symptoms in an elderly population and an efficient
instrument for MDD screening in an older adult population with or without mild
cognitive impairment. As we have seen, the CES-D is widely used in geriatric
research worldwide and when compared with clinical criteria it has internal
consistency, test-retest reliability, and satisfactory convergent validity (Grayson,
Mackinnon, Jorm, Creasey, & Broe, 2000). We consider that validating its use
in samples of older Spanish adults with or without mild cognitive impairment
extends our knowledge of psychometrics, enables comparisons between different
population types in different countries, and provides for the performance of
inter-cultural studies. In our opinion, future studies should be directed toward
examining how, for example, more severe cognitive impairment, functional dis-
ability, or physical illness in older adults could affect the adequacy of the CES-D
as a measure of depressive symptoms. Furthermore, it would also be useful
to compare the efficacy of different instruments used as screening tools for
depressive disorders in this type of population, such as the GDS (Brink, Yesavage,
& Lum, 1982).
Finally, another interesting area of research is the evaluation of the adequacy
of the CES-D to the immigrant population. Some studies have been shown
that the immigrant experience has various psychosocial effects on older people,
with possible implications for both cognitive functioning and mental health
(Bhugra, 2004; Kulla, Ekman, & Sarvimäki, 2010). Thus, for example, it
would be useful to test if the cut-off points obtained in this study are valid
for screening depression in Spanish-speaking immigrants with and without
cognitive impairment.
STRUCTURE AND PSYCHOMETRY OF CES-D / 103
(Appendix follows)
104 / ROS ET AL.
APPENDIX
Escala CES-D
Para cada uno de los siguientes enunciados, elija la casilla que mejor describaCÓMO SE SENTÍA LA SEMANA PASADA:
NINGUNAVEZ
POCASVECES
BASTANTESVECES
MUCHASVECES
1. Me molestaron cosas que normalmenteno me molestan
2. Me tenía hambre, no me apetecíacomer
3. Me sentía triste y descorazonado, apesar de la ayuda de mi familia y misamigos
4. Me sentía tan válido y útil comocualquiera
5. Tenía dificultad para concentrarme
6. Me sentía deprimido
7. Para hacer cualquier cosa, tenía quehacer un gran esfuerzo
8. Me sentía con esperanza respecto alfuturo
9. Pensaba que mi vida había sido unfracaso
10. Me sentía atemorizado
11. No me sentía descansado después dehaber dormido
12. Me sentía feliz
13. Hablaba menos de los habitual
14. Me sentía solo
15. La gente no era amable
16. Disfrutaba de la vida
17. Hubo ratos en que lloré
18. Me sentía triste
19. Sentía que no le agradaba a lagente
20. Me encontraba sin fuerzas para hacernada

REFERENCES
Batistoni, S. S., Neri, A. L., & Cupertino, A. P. (2007). Validity of the Center for
Epidemiological Studies Depression Scale among Brazilian elderly. Revista de Saúde
Pública, 41, 598-605.
Bay, E., Hagerty, B. M., Williams, R. A., Kirsch, N., & Gillespie, B. (2002). Chronic
stress, sense of belonging, and depression among survivors of traumatic brain injury.
Journal of Nursing Scholarship, 34, 221-226.
Beck, A. T., Ward, C. H., Mendelson, M., Mock, J., & Erbaugh, J. (1961). An inventory
for measuring depression. Archives of General Psychiatry, 4, 561-571.
Beekman, A. T., Deeg, D. J., Van Limbeek, J., Braam, A. W., De Vries, M. Z., &
van Tilburg, W. (1997). Criterion validity of the Center for Epidemiologic Studies
Depression scale (CES-D): Results from a community-based sample of older
subjects in The Netherlands. Psychological Medicine, 27, 231-235.
Bhugra, D. (2004). Migration and mental health. Acta Psychiatrica Scandinavica, 109,
243-258.
Blunch, N. J. (2008). Introduction to structural equation modelling. Using SPSS and
AMOS. London: Sage.
Brink, T. L., Yesavage, J. A., & Lum, O. (1982). Screening tests for geriatric depression.
Clinical Gerontology, 1, 37-43.
Bush, B. A., Novack, T. A., Schneider, J. J., & Madan, A. (2004). Depression following
traumatic brain injury: The validity of the CES-D as a brief screening device.
Journal of Clinical Psychology in Medical Settings, 11, 195-201.
Chwastiak, L., Ehde, D. M., Gibbons, L. E., Sullivan, M., Bowen, J. D., & Kraft,
G. H. (2002). Depressive symptoms and severity of illness in multiple sclerosis:
Epidemiologic study of a large community sample. American Journal of Psychiatry,
159, 1862-1868.
Clark, V. A., Aneshensel, C. S., Frerichs, R. R., & Morgan, T. M. (1981). Analysis of
effects of sex and age in response to items on the CES-D scale. Psychiatric Research,
5, 171-181.
Cottler, L. B., Robins, L. N., Grant, B. F., Blaine, J., Towle, L. H., Wittchen, H. U., et al.
(1991). The CIDI-core substance abuse and dependence questions: Cross-cultural
and nosological issues. The WHO/ADAMHA Field Trial. The British Journal of
Psychiatry, 159, 653-658.
Foley, K. L., Reed, P. S., Mutran, E. J., & DeVellis, R. F. (2002). Measurement adequacy
of the CES-D among a sample of older African-Americans. Psychiatry Research,
109, 61-69.
Folstein, M. F., Folstein, S. E., & McHugh, P. R. (1975). “Mini-mental state.” A prac-
tical method for grading the cognitive state of patients for the clinician. Journal of
Psychiatric Research, 12, 189-198.
Furukawa, T., Hirai, T., Kitamura, T., & Takahashi, K. (1997). Application of the Center
for Epidemiologic Studies Depression Scale among first-visit psychiatric patients:
A new approach to improve its performance. Journal of Affective Disorders, 46, 1-13.
Gatz, M., Kasl-Godley, J. E., & Karel, M. J. (1996). Aging and mental disorders. In
J. E. Birren & K. W. Schaie (Eds.), Handbook of the psychology of aging. San Diego,
CA: Academic Press.
Golub, E. T., Latka, M., Hagan, H., Havens, J. R., Hudson, S. M., Kapadia, F., et al.
(2004). Screening for depressive symptoms among HCV-infected injection drug users:
STRUCTURE AND PSYCHOMETRY OF CES-D / 105
Examination of the utility of the CES-D and the beck depression inventory. Journal
of Urban Health: Bulletin of the New York Academy of Medicine, 81, 278-290.
Grant, M. M., Gil, K. M., Floyd, M. Y., & Abrams, M. (2000). Depression and func-
tioning in relation to health care use in sickle cell disease. Annals of Behavior
Medicine, 22, 149-157.
Grayson, D. A., Mackinnon, A., Jorm, A. F., Creasey, H., & Broe, G. A. (2000). Item bias
in the Center for Epidemiological Studies Depression Scale: Effects of physical
disorders and disability in an elderly communitt sample. Journal of Gerontology,
Psychological Science, 55B, P273-P282.
Guarnaccia, P. J., Angel, R., & Worobey, J. L. (1989). The factor structure of the CES-D
in the Hispanic Health and Nutrition Examination Survey: The influences of ethnicity,
gender and language. Society of Scientific Medicine, 29, 85-94.
Gupta, R., & Yick, A. (2001). Validation of CES-D scale for older Chinese immigrants.
Journal of Mental Health and Aging, 7, 257-272.
Haringsma, R., Engels, G. I., Beekman, A. T., & Spinhoven, P. (2004). The criterion
validity of the Center for Epidemiological Studies Depression Scale (CES-D)
in a sample of self-referred elders with depressive symptomatology. International
Journal of Geriatric Psychiatry, 19, 558-563.
Haro, J. M., Palacín, C., Vilagut, G., Martínez, M., Bernal, M., Luque, I., et al. (2006).
Prevalencia de los trastornos mentales y factores asociados: Resultados del estudio
ESEMeD-España. Medicina Clínica, 126, 445-451.
Hathaway, S. R., & McKinley, J. C. (1943). The Minnesota Multiphasic Personality
Inventory (Rev. ed.). Minneapolis, MN: The University of Minnesota Press.
Hertzog, C., Van Alstine, J., Usala, P. D., Hultsch, D. F., & Dixon, R. (1990). Measurement
Properties of the Center for Epidemiological Studies Depression Scale (CES-D) in
older populations. Psychological Assessment: A Journal of Consulting and Clinical
Psychology, 2, 64-72.
Himmelfarb, S., & Murrell, S. A. (1983). Reliability and validity of five mental health
scales in older persons. Journal of Gerontology, 38, 333-339.
Iwata, N., Okuyama, Y., Kawakami, Y., & Saito, K. (1989). Prevalence of depressive
symptoms in a Japanese occupational setting: A preliminary study. American
Journal of Public Health, 79, 1486-1489.
Jones-Webb, R. J., & Snowden, L. R. (1993). Symptoms of depression among blacks
and whites. American Journal of Public Health, 83, 240-244.
Kulla, G., Ekman, S. L., & Sarvimäki, A. (2010). Experiential health from an ageing and
migration perspective: The case of older Finland-Swedes. Journal of Immigrant
and Minority Health, 12, 93-99.
Latorre, J. M., & Montañés, J. (1997). Depresión en la vejez: Evaluación, variables
implicadas y relación con el deterioro cognitivo. Revista de Psicopatología y
Psicología Clínica, 2, 243-264.
Lee, S. W., Stewart, S. M., Byrne, B. M., Wong, J. P., Ho, S. Y., Lee, P. W., et al.
(2008). Factor structure of the Center for Epidemiological Studies Depression Scale
in Hong Kong adolescents. Journal of Personality Assessment, 90, 175-184.
Lewinsohn, P. M., Seeley, J. R., Roberts, R. E., & Allen, N. B. (1997). Center for Epidemi-
ologic Studies Depression Scale (CES-D) as a screening instrument for depression
among community-residing older adults. Psychology and Aging, 12, 277-287.
106 / ROS ET AL.
Liang, J., Tran, T. V., Krause, N., & Markides, K. S. (1989). Generational differences in
the structure of the CES-D Scale in Mexican Americans. Journal of Gerontology,
44, 110-120.
Lobo, A., Ezquerra, J., Gómez Burgada, F., Sala, J. M., & Seva-Díaz, A. (1979). El
Mini-Examen Cognoscitivo (Un “test” sencillo, práctico para detectar alteraciones
intelectuales en pacientes médicos). Actas Luso-españolas de neurología, psiquiatría y
ciencia, 3, 189-202.
Lobo, A., Saz, P., Marcos, G., Dia, J. L., De La, C. C., Ventura, T., et al. (1999).
Revalidation and standardization of the cognition mini-exam (first Spanish version
of the Mini-Mental Status Examination) in the general geriatric population. Medicina
Clínica, 112, 767-774.
Lyness, J. M., Noel, T. K., Cox, C., King, D. A., Conwell, Y., & Caine, E. D. (1997).
Screening for depression in elderly primary care patients: A comparison of the Center
for Epidemiologic Studies-Depression Scale and the Geriatric Depression Scale.
Archives of Internal Medicine, 157, 449-454.
McArdle, J., Johnson, R. C., Hishinuma, E. S., Miyamoto, R. H., & Andrade, N. N.
(2001). Structural equation modeling of group differences in CES-D ratings of native
Hawaiian and non-Hawaiian high school students. Journal of Adolescent Research,
16, 108-149.
McCauley, S. R., Pedroza, C., Brown, S. A., Boake, C., Levin, H. S., Goodman, H. S., et al.
(2006). Confirmatory factor structure of the Center for Epidemiologic Studies-
Depression Scale (CES-D) in mild-to-moderate traumatic brain injury. Brain Injury,
20, 519-527.
Miller, T. Q., Markides, K. S., & Black, S. A. (1997). The factor of the CES-D in
two surveys of elderly Mexican Americans. Journal of Gerontology: Social Sciences,
52B, S259-S269.
Moscicki, E. K., Locke, B. Z., Rae, D. S., & Boyd, J. H. (1989). Depressive symptoms
among Mexican Americans: The Hispanic Health and Nutrition Examination Survey.
American Journal of Epidemiology, 130, 348-360.
Mui, A., Burnett, D., & Chen, L. (2001). Cross-cultural assessment of geriatric depres-
sion: A review of the CES-D and the GDS. Journal of Mental Health and Aging, 7,
137-164.
Nguyen, H. T., Kitner-Triolo, M., Evans, M. K., & Zonderman, A. B. (2004). Factorial
invariance of the CES-D in low socioeconomic status African Americans compared
with a nationally representative sample. Psychiatry Research, 126, 177-187.
Nolen-Hoeksema, S. (2001). Gender differences in depression. Current Directions in
Psychological Science, 10, 173-176.
Nunnally, J. C., & Bernstein, I. H. (1994). Psychometric theory (3rd ed.). New York:
McGraw-Hill.
O’Rourke, N. (2003). Research note: Equivalence of French and English language
versions of the Center for Epidemiologic Studies-Depression Scale (CES-D) among
caregivers of persons with dementia. Canadian Journal on Aging-Revue Canadienne
du Vieillissement, 22, 323-329.
O’Rourke, N. (2004). Reliability generalization of responses by care providers to the
Center for Epidemiologic Studies-Depression Scale. Educational and Psychological
Measurement, 64, 973-990.
STRUCTURE AND PSYCHOMETRY OF CES-D / 107

Orme, J. G., Reis, J., & Herz, E. J. (1986). Factorial and discriminant validity of the
Center for Epidemiological Studies Depression (CES-D) Scale. Journal of Clinical
Psychology, 42, 28-33.
Parmelee, P. A., Katz, I. R., & Lawton, N. P. (1991). The relation of pain to depression
among institutionalized aged. Journal of Gerontology: Psychological Sciences, 46,
P15-P21.
Parmelee, P. A., Lawton, N. P., & Katz, I. R. (1989). Psychometric properties of the
Geriatric Depression Scale among the institutionalized aged. Psychological Assess-
ment, 1, 331-338.
Paterniti, S., Niedhammer, I., Lang, T., & Consoli, S. M. (2002). Psychosocial factors
at work, personality traits and depressive symptoms: Longitudinal results from the
GAZEL Study. British Journal of Psychiatry, 181, 111-117.
Posner, S. F., Stewart, A. L., Marin, G., & Perez-Stable, E. J. (2001). Factor variability
of the Center for Epidemiological Studies Depression Scale (CES-D) among urban
Latinos. Ethnicity & Health, 6, 137-144.
Radloff, L. S. (1977). The CES-D Scale: A self-report depression: Scale for research in
the general population. Applied Psychological Measurement, 1, 385-401.
Radloff, L. S. (1991). The use of the Center for Epidemiological Studies-Depression Scale
in adolescents and young adults. Journal of Youth and Adolescence, 20, 149-166.
Radloff, L. S., & Teri, L. (1986). Use of the Center for Epidemiological Studies-Depression
Scale with older adults. Clinical Gerontology, 5, 119-136.
Reyes-Ortega, M., Soto-Hernandez, A. L., Milla-Kegel, J. G., Garcia-Ramirez, A.,
Hubard-Vignau, L., Mendoza-Sanchez, H., et al. (2003). Revision of the Center for
Epidemiologic Studies Depresion Scale (CES-D): Pilot study with a Mexican geriatric
sample. Salud Mental, 26, 59-68.
Riddle, A. S., Blais, M. R., & Hess, U. (2002). A multi-group investigation of the CES-D’s
measurement structure across adolescents, young adults and middle-aged adults.
Montreal: Cirano.
Roberts, R. E., Andrews, J. A., Lewinsohn, P. M., & Hops, H. (1990). Assessment of
depression in adolescents using the Center for Epidemiologic Studies Depression
Scale. Psychological Assessment, 2, 122-128.
Roberts, R. E., & Vernon, S. W. (1983). The Center for Epidemiological Studies Depres-
sion Scale: Its use in a community sample. American Journal of Psychiatry, 140,
41-46.
Roberts, R. E., Vernon, S. W., & Rhoades, H. M. (1989). Effects of language and ethnic
status on reliability and validity of the Center for Epidemiologic Studies-Depression
Scale with psychiatric patients. The Journal of Nervous and Mental Disease, 177,
581-592.
Robinson, J., Gruman, C., Gaztambide, S., & Blank, K. (2002). Screening for depresión
in middle-aged and older Puerto Rican primary care patients. Journal of Gerontology,
Series A: Biological Science and Medicine Science, 57, 308-314.
Schulberg, H. C., Saul, M., McClelland, M., Ganguli, M., Christy, W., & Frank, R.
(1985). Assessing depression in primary medical and psychiatric practices. Archives
of General Psychiatry, 42, 1164-1170.
Shafer, A. B. (2006). Meta-analysis of the factor structures of four depression ques-
tionnaires: Beck, CES-D, Hamilton, and Zung. Journal of Clinical Psychology, 62,
123-146.
108 / ROS ET AL.
Sheehan, T. J., Fifield, J., Reisine, S., & Tennen, H. (1995). The measurement structure
of the Center for Epidemiologic Studies Depression Scale. Journal of Personality
Assessment, 64, 507-521.
Spijker, J., van der Wurff, F. B., Poort, E. C., Smits, C. H. M., Verhoeff, A. P., & Beekman,
A. T. F. (2004). Depression in first generation labour migrants in Western Europe:
The utility of the Center for Epidemiologic Studies Depression Scale (CES-D).
International Journal of Geriatric Psychiatry, 19, 538-544.
Thoits, P. A. (1995). Stress, coping and social support processes: Where are we? What
next? Journal of Psychological Assessment, 7, 524-532.
Thomas, J. L., & Brantley, P. J. (2004). Factor structure of the Center for Epidemio-
logic Studies Depression Scale in low-income women attending primary care clinics.
European Journal of Psychological Assessment, 20, 106-115.
Thombs, B. D., Hudson, M., Schieir, O., Taillefer, S. S., & Baron, M. (2008). Reliability
and validity of the Center for Epidemiologic Studies Depression Scale in patients
with systemic sclerosis. Arthritis & Rheumatism, 59, 438-443.
Thorson, J. A., & Powell, F. C. (1993). The CES-D: Four or five factors? Bulletin of the
Psychonomic Society, 31, 577-578.
Vedhara, K., Schifitto, G., & McDermott, M. (1999). Disease progression in HIV-
positive women with moderate to severe immunosuppression: The role of depression.
Dana Consortium on Therapy for HIV Dementia and Related Cognitive Disorders.
Behavioral Medicine, 25, 43-47.
Verdier-Taillefer, M. H., Gourlet, V., Fuhrer, R., & Alperovitch, A. (2001). Psychometric
properties of the Center for Epidemiologic Studies-Depression Scale in multiple
sclerosis. Neuroepidemiology, 20, 262-267.
Vingerhoets, A. J., & Van Heck, G. L. (1990). Gender, doping and psychosomatic
symptoms. Psychological Medicine, 20, 125-135.
Watson, L. C., & Pignone, M. P. (2003). Screening accuracy for late-life depression in
primary care: A systematic review. Journal of Family Practice, 52, 956-964.
Weissman, M. M. (1987). Advances in psychiatric epidemiology: Rates and risks for
major depressive disorder. American Journal of Public Health, 77, 445-451.
Williams, J. W., Jr., Pignone, M., Ramirez, G., & Perez, S. C. (2002). Identifying depres-
sion in primary care: A literature synthesis of case-finding instruments. General
Hospital Psychiatry, 24, 225-237.
Wittchen, H. U. (1994). Reliability and validity studies of the WHO—Composite
International Diagnostic Interview (CIDI): A critical review. Journal of Psychiatric
Research, 28, 57-84.
Wittchen, H. U., Robins, L. N., Cottler, L. B., Sartorius, N., Burke, J. D., & Regier, D.
(1991). Cross-cultural feasibility, reliability and sources of variance of the Composite
International Diagnostic Interview (CIDI). The Multicentre WHO/ADAMHA Field
Trials. The British Journal of Psychiatry, 159, 645-653.
World Health Organization (WHO). (2001). Composite International Diagnostic Interview
(CIDI, version 15). Ginebra, Suiza: Author.
Yang, H. J., Soong, W. T., Kuo, P. H., Chang, H. L., & Chen, W. J. (2004). Using the
CES-D in a two-phase survey for depressive disorders among nonreferred adolescents
in Taipei: A stratum-specific likelihood ratio analysis. Journal of Affective Disorders,
82, 419-430.
STRUCTURE AND PSYCHOMETRY OF CES-D / 109
Zich, J. M., Atkinson, C. C., & Greenfield, T. K. (1990). Screening for depression in
primary care clinics: The CES-D and the BDI. The International Journal of Psychiatry
in Medicine, 20, 277.
Zung, W. (1965). A self-rating depression scale. Archives of General Psychiatry, 12, 63-70.
Zunzunegui, M. V., Delgado, M., Pérez, E., Yagüe, A. I., Illescas, M. L., & León, V.
(1998). Validación de la escala CES-D para la medida de la sintomatología depresiva
en una población de personas mayores española. Revista Multidisciplinar de
Gerontología, 8, 156-161.
Direct reprint requests to:
Laura Ros
Department of Psychology
University of Castilla La Mancha
Avda. Almansa 14
02006 Albacete
Spain
e-mail: [email protected]
110 / ROS ET AL.


