Embed Size (px)
Citation preview

Photo: Brian Stansberry
(;3/25,1*�%5,*+7�63276�,1�$33$/$&+,$1�+($/7+��&$6(�678',(6
7KH�WKLUG�UHSRUW�LQ�D�VHULHV�H[SORULQJ�KHDOWK�LVVXHV�LQ�$SSDODFKLD
-XO\�����
Prepared E\:
$33$/$&+,$1�5(*,21$/�&200,66,21�:DVKLQJWRQ��'�&�
PDA, INC.5DOHLJK��1RUWK�&DUROLQD
THE CECIL *. SHEPS CENTER FOR HEALTH SERVICES RESEARCH�7KH�8QLYHUVLW\�RI�1RUWK�&DUROLQD�DW�&KDSHO�+LOO��&KDSHO�+LOO��1RUWK�&DUROLQD
%851(66%HWKHVGD��0DU\ODQG


CREATING A CULTURE OF HEALTH IN APPALACHIA Acknowledgments | CASE STUDIES
i
ACKNOWLEDGMENTS Robert Wood Johnson Foundation The Robert Wood Johnson Foundation (RWJF) is the nation’s largest philanthropy dedicated to health. For more than 40 years, RWJF has supported research and programs targeting some of the nation’s most pressing health issues. RWJF provided funding for this research project as part of its Culture of Health Initiative. David M. Krol, MD, MPH, FAAP, Senior Program Officer, provided the impetus for the Creating a Culture of Health in Appalachia: Disparities and Bright Spots project and solicited the Appalachian Regional Commission and the Foundation for a Healthy Kentucky as partners. Hilary Heishman, MPH, Senior Program Officer, provided final guidance. Appalachian Regional Commission The Appalachian Regional Commission (ARC) provided funding, leadership, and project management for the project. ARC is an economic development agency of the federal government and 13 state governments focusing on 420 counties across the Appalachian Region. ARC’s mission is to innovate, partner, and invest to build community capacity and strengthen economic growth in Appalachia to help the Region achieve socioeconomic parity with the nation. Foundation for a Healthy Kentucky The Foundation for a Healthy Kentucky served as the grantee and fiscal agent for the project. Funded by an endowment, the nonpartisan Foundation’s mission is to address the unmet health needs of Kentuckians by developing and influencing policy, improving access to care, reducing health risks and disparities, and promoting health equity. Since the Foundation opened its doors in 2001, it has invested more than $27 million in health policy research, advocacy, and demonstration project grants across the Commonwealth. Principal Investigators To implement the research, the Appalachian Regional Commission and the Foundation for a Healthy Kentucky named two Principal Investigators: Julie L. Marshall, PhD, Senior Economist, Division of Planning and Research, for the Appalachian Regional Commission, and Gabriela Alcalde, DrPH, Vice President, Policy and Program, for the Foundation for a Healthy Kentucky. Mary Jo Shircliffe, MBA, Vice President, Operations and Administration, later assumed the role for the Foundation for a Healthy Kentucky to complete the project.

CREATING A CULTURE OF HEALTH IN APPALACHIA Acknowledgments | CASE STUDIES
ii
Authors PDA, Inc., in Raleigh, North Carolina, prepared this report in collaboration with the Cecil G. Sheps Center for Health Services Research at the University of North Carolina at Chapel Hill and the Appalachian Regional Commission. The principal authors of the report include:
Nancy M. Lane, MA, President, PDA, Inc.
G. Mark Holmes, PhD, Center Director, UNC Cecil G. Sheps Center for Health Services Research
Thomas A. Arcury, PhD, Program Director, Wake Forest Baptist Medical Center Clinical and Translational Science Institute
Michael L. Schwalbe, PhD, Professor, Department of Sociology and Anthropology at North Carolina State University
Randy Randolph, MRP, Applications Analyst Programmer, UNC Cecil G. Sheps Center for Health Services Research
John Frank, FACHE, Consultant, Former Director, Kate B. Reynolds Foundation
Sharita Thomas, MPP, Research Associate, UNC Cecil G. Sheps Center for Health Services Research
Janine Latus, MA, Journalist, Writer, and Speaker
Jonathan Rodgers, MHA, Consultant and Research Associate, PDA, Inc.
Alexa Cohen, BA, Research Assistant, UNC Cecil G. Sheps Center for Health Services Research
Kelly Ivey, BS, Project Manager, PDA, Inc.
William Holding, MHA, Senior Consultant and Data Analyst, PDA, Inc.
Maura Lane, BA, Consultant, Media Communications and Marketing
Pam Silberman, JD, DrPH, Associate Director for Policy Analysis, UNC Cecil G. Sheps Center for Health Services Research
Katie Gaul, MA, Deputy Director, Health Workforce Technical Assistance Center, UNC Cecil G. Sheps Center for Health Services Research
Lisa Villamil, MAE, Assistant Professor, UNC Chapel Hill School of Media and Journalism
Ashli Keyser, Project Assistant, PDA, Inc. Additionally, the Bright Spots case study teams included local journalists who brought local perspective to the field research and contributed to the case study development. Journalists included:
Kim Cross, Hale County, Alabama, and Noxubee County, Mississippi
Joyce Pinson, McCreary and Wayne Counties, Kentucky
Mary Beth Jones, Tioga County, New York
Becky Johnson, Madison County, North Carolina
Amanda Jones, Potter County, Pennsylvania
Nancy Henderson, Sequatchie County, Tennessee
Jenni Vincent, Grant County, West Virginia
Aaron Payne, Wirt County, West Virginia

CREATING A CULTURE OF HEALTH IN APPALACHIA Acknowledgements | CASE STUDIES
iii
Advisors and Contributors Members of the case study communities provided invaluable commentary on culture, programs, and practices in each site during the field visits and afterwards. Though many are mentioned by name in each case study report, as a group they deserve special mention and thanks. The project benefited from insight from an Advisory Committee assembled by ARC, RWJF, and the Foundation for a Healthy Kentucky that included Rui Li, PhD, Health Economist, Division of Diabetes Translation, Centers for Disease Control and Prevention; Rozelia Harris, MBA, Director of Mississippi Office of Rural Health and Primary Care, Mississippi State Department of Health; Amy Martin, DrPh, MSPH, College of Dental Medicine, Medical University of South Carolina; Wayne Myers, MD; and Kadie Peters, Vice President of Community Impact for Health, United Way of Central Alabama. Others who assisted with review and feedback include Eric Stockton, ARC Health Program Manager; Logan Thomas, ARC Research Analyst; Kostas Skordas, ARC Director, Planning and Research; Keith Witt, ARC Geographic Information Specialist; Karen Entress, ARC Communications staff; and Diane Smith, ARC Communications staff.

CREATING A CULTURE OF HEALTH IN APPALACHIA Acknowledgements | CASE STUDIES
iv
CREATING A CULTURE OF HEALTH IN APPALACHIA Table of Contents | CASE STUDIES
v
TABLE OF CONTENTS
List of Figures .......................................................................................................................... ix
List of Tables ............................................................................................................................ xi
Executive Summary .................................................................................................................. 1
Overview .......................................................................................................................................... 3
Exploring Bright Spots in Appalachian Health ............................................................................... 4
Fostering a Culture of Health ........................................................................................................... 5
The Bright Spot Counties................................................................................................................. 6
A Deeper Look at the Bright Spot Counties .................................................................................... 9
Community Leaders Engaged in Health Initiatives ............................................................ 9
Cross-Sector Collaboration ................................................................................................. 9
Resource Sharing .............................................................................................................. 10
Local Providers Committed to Public Health ................................................................... 11
Active Faith Community .................................................................................................. 12
Initiatives to Combat Substance Abuse ............................................................................ 12
Remaining Gaps ................................................................................................................ 12
Improving Health throughout Appalachia ..................................................................................... 13
References ...................................................................................................................................... 14
Introduction ............................................................................................................................. 15
About the Project ........................................................................................................................... 17
Culture of Health .............................................................................................................. 17
About the Appalachian Region ...................................................................................................... 18
Geographic Subregions ..................................................................................................... 18
Rurality in Appalachia ...................................................................................................... 19
County Economic Status in Appalachia ........................................................................... 19
About the Case Study Report ......................................................................................................... 21
References ...................................................................................................................................... 24
Case Studies ........................................................................................................................... 25
Hale County, Alabama ................................................................................................................... 27
County Overview .............................................................................................................. 31
A Deeper Look at Hale County: Community Strengths ................................................... 32
Creating a Culture of Health in Hale County .................................................................... 36

CREATING A CULTURE OF HEALTH IN APPALACHIA Table of Contents | CASE STUDIES
vi
References ........................................................................................................................ 37
Appendix: Hale County Data ............................................................................................ 38
McCreary County, Kentucky ......................................................................................................... 43
County Overview .............................................................................................................. 47
A Deeper Look at McCreary County: Community Strengths ........................................... 48
Creating a Culture of Health in McCreary County ........................................................... 54
References ........................................................................................................................ 55
Appendix: McCreary County Data ................................................................................... 56
Wayne County, Kentucky .............................................................................................................. 61
County Overview .............................................................................................................. 65
A Deeper Look at Wayne County: Community Strengths ............................................... 66
Creating a Culture of Health in Wayne County ................................................................ 70
References ........................................................................................................................ 71
Appendix: Wayne County Data ........................................................................................ 72
Noxubee County, Mississippi ........................................................................................................ 77
County Overview .............................................................................................................. 81
A Deeper Look at Noxubee County: Community Strengths ............................................ 82
Creating a Culture of Health in Noxubee County ............................................................. 87
References ........................................................................................................................ 88
Appendix: Noxubee County Data ..................................................................................... 89
Tioga County, New York ................................................................................................................ 95
County Overview .............................................................................................................. 99
A Deeper Look at Tioga County: Community Strengths ............................................... 100
Creating a Culture of Health in Tioga County ................................................................ 104
References ...................................................................................................................... 105
Appendix: Tioga County Data ........................................................................................ 106
Madison County, North Carolina ................................................................................................. 111
County Overview ............................................................................................................ 115
A Deeper Look at Madison County: Community Strengths ........................................... 116
Creating a Culture of Health in Madison County ........................................................... 121
References ...................................................................................................................... 122
Appendix: Madison County Data ................................................................................... 123
CREATING A CULTURE OF HEALTH IN APPALACHIA Table of Contents | CASE STUDIES
vii
Potter County, Pennsylvania ........................................................................................................ 129
County Overview ............................................................................................................ 133
A Deeper Look at Potter County: Community Strengths ............................................... 134
Creating a Culture of Health in Potter County ................................................................ 138
References ...................................................................................................................... 140
Appendix: Potter County Data ........................................................................................ 141
Sequatchie County, Tennessee ..................................................................................................... 147
County Overview ............................................................................................................ 151
A Deeper Look at Sequatchie County: Community Strengths ....................................... 152
Creating a Culture of Health in Sequatchie County ........................................................ 156
References ...................................................................................................................... 158
Appendix: Sequatchie County Data ................................................................................ 159
Grant County, West Virginia ....................................................................................................... 165
County Overview ............................................................................................................ 169
A Deeper Look at Grant County: Community Strengths ................................................ 170
Creating a Culture of Health in Grant County ................................................................ 175
References ...................................................................................................................... 176
Appendix: Grant County Data ........................................................................................ 177
Wirt County, West Virginia ......................................................................................................... 183
County Overview ............................................................................................................ 187
A Deeper Look at Wirt County: Community Strengths ................................................. 188
Creating a Culture of Health in Wirt County .................................................................. 192
References ...................................................................................................................... 194
Appendix: Wirt County Data .......................................................................................... 195
Appendices ........................................................................................................................... 201
A. Glossary of Terms ................................................................................................................... 203
B. Research Approach ................................................................................................................. 205
C. Research Support Materials .................................................................................................... 215
1. Briefing Packets for Key Informants .......................................................................... 217
2. Key Informant Interview Guide .................................................................................. 251
D. Radio Spots ............................................................................................................................. 267

CREATING A CULTURE OF HEALTH IN APPALACHIA Table of Contents | CASE STUDIES
viii

CREATING A CULTURE OF HEALTH IN APPALACHIA List of Figures | CASE STUDIES
ix
LIST OF FIGURES
Executive Summary
Figure 1: Map – OMB Designation of Appalachian Bright Spot Counties (Metropolitan/Nonmetropolitan) ................................................................................................................... 7
Introduction
Figure 2: Map of the Appalachian Subregions ........................................................................................... 18
Figure 3: Map of County Economic Status in Appalachia, FY 2017 ......................................................... 19
Figure 4: Map of Bright Spot Counties in Appalachia ............................................................................... 21
Case Studies
Hale County, Alabama
Figure 5: Map - Bright Spot Community Hale County, Alabama .............................................................. 31
McCreary County, Kentucky
Figure 6: Map - Bright Spot Community McCreary County, Kentucky .................................................... 47
Wayne County, Kentucky
Figure 7: Map - Bright Spot Community Wayne County, Kentucky ......................................................... 65
Noxubee County, Mississippi
Figure 8: Map - Bright Spot Community Noxubee County, Mississippi ................................................... 81
Tioga County, New York
Figure 9: Map - Bright Spot Community Tioga County, New York .......................................................... 99
Madison County, North Carolina
Figure 10: Map - Bright Spot Community Madison County, North Carolina .......................................... 115
Potter County, Pennsylvania
Figure 11: Map - Bright Spot Community Potter County, Pennsylvania ................................................. 133
Sequatchie County, Tennessee
Figure 12: Map - Bright Spot Community Sequatchie County, Tennessee .............................................. 151

CREATING A CULTURE OF HEALTH IN APPALACHIA List of Figures | CASE STUDIES
x
Grant County, West Virginia
Figure 13: Map - Bright Spot Community Grant County, West Virginia................................................. 169
Wirt County, West Virginia
Figure 14: Map - Bright Spot Community Wirt County, West Virginia .................................................. 187
CREATING A CULTURE OF HEALTH IN APPALACHIA List of Tables | CASE STUDIES
xi
LIST OF TABLES
Executive Summary
Table 1: Selected Characteristics of Case Study Counties ............................................................................ 6
Table 2: Health Outcomes in the Case Study Counties ................................................................................ 8
Introduction
Table 3: Case Study Site Characteristics .................................................................................................... 22
Case Studies
Hale County, Alabama
Table 4: Hale County Characteristics ......................................................................................................... 38
Table 5: Hale County Key Informants ........................................................................................................ 39
Table 6: Hale County Health Outcomes - Actual vs. Predicted .................................................................. 40
Table 7: Hale County Health Drivers vs. National Median ........................................................................ 41
McCreary County, Kentucky
Table 8: McCreary County Characteristics ................................................................................................. 56
Table 9: McCreary County Key Informants ............................................................................................... 57
Table 10: McCreary County Health Outcomes - Actual vs. Predicted ...................................................... 58
Table 11: McCreary County Health Drivers vs. National Median ............................................................ 59
Wayne County, Kentucky
Table 12: Wayne County Characteristics .................................................................................................... 72
Table 13: Wayne County Key Informants .................................................................................................. 73
Table 14: Wayne County Health Outcomes - Actual vs. Predicted ........................................................... 74
Table 15: Wayne County Health Drivers vs. National Median ................................................................. 75
Noxubee County, Mississippi
Table 16: Noxubee County Characteristics ................................................................................................ 89
Table 17: Noxubee County Key Informants ............................................................................................... 90
Table 18: Noxubee County Health Outcomes - Actual vs. Predicted ........................................................ 91
Table 19: Noxubee County Health Drivers vs. National Median .............................................................. 92

CREATING A CULTURE OF HEALTH IN APPALACHIA List of Tables | CASE STUDIES
xii
Tioga County, New York
Table 20: Tioga County Characteristics .................................................................................................... 106
Table 21: Tioga County Key Informants .................................................................................................. 107
Table 22: Tioga County Health Outcomes - Actual vs. Predicted ........................................................... 108
Table 23: Tioga County Health Drivers vs. National Median ................................................................. 109
Madison County, North Carolina
Table 24: Madison County Characteristics ............................................................................................... 123
Table 25: Madison County Key Informants ............................................................................................. 124
Table 26: Madison County Health Outcomes - Actual vs. Predicted ...................................................... 125
Table 27: Madison County Health Drivers vs. National Median ............................................................. 126
Potter County, Pennsylvania
Table 28: Potter County Characteristics ................................................................................................... 141
Table 29: Potter County Key Informants .................................................................................................. 142
Table 30: Potter County Health Outcomes - Actual vs. Predicted ........................................................... 143
Table 31: Potter County Health Drivers vs. National Median ................................................................. 144
Sequatchie County, Tennessee
Table 32: Sequatchie County Characteristics ........................................................................................... 159
Table 33: Sequatchie County Key Informants .......................................................................................... 160
Table 34: Sequatchie County Health Outcomes - Actual vs. Predicted ................................................... 161
Table 35: Sequatchie County Health Drivers vs. National Median ......................................................... 162
Grant County, West Virginia
Table 36: Grant County Characteristics .................................................................................................... 177
Table 37: Grant County Key Informants .................................................................................................. 178
Table 38: Grant County Health Outcomes - Actual vs. Predicted ........................................................... 179
Table 39: Grant County Health Drivers vs. National Median ................................................................. 180
Wirt County, West Virginia
Table 40: Wirt County Characteristics ...................................................................................................... 195
Table 41: Wirt County Key Informants .................................................................................................... 196
Table 42: Wirt County Health Outcomes - Actual vs. Predicted ............................................................. 197
Table 43: Wirt County Health Drivers vs. National Median ................................................................... 198

1
Executive Summary Overview
Exploring Bright Spots in Appalachian Health
Fostering a Culture of Health
The Bright Spot Counties
A Deeper Look at the Bright Spot Counties
Improving Health throughout Appalachia
References

2

Exploring Bright Spots in Appalachian Health: Case Studies Executive Summary
CA
SE S
TUD
IES
3
OVERVIEW
Longstanding perceptions of Appalachia paint a picture of a monolithic region, one characterized by low-
income communities, lack of education and racial diversity, and limited economic opportunity. The
reality is that Appalachia is by nature a diverse and complex region of the country, stretching across
205,000 square miles in 13 states, and home to more than 25 million people. While as a region it has
faced, and continues to face, greater economic challenges than the rest of the country, statistics show that
Appalachia has achieved progress or evolved in a number of significant ways over the last decades:
� Many Appalachian counties are economically distressed, but since 1960, the Region’s poverty
rate has dropped by almost half—from 31 percent in 1960 to 17 percent in the period 2011–2015
(compared with a national rate of 15.5 percent in 2011–2015).
� The Region’s population is racially diverse. Many counties are home to large minority
populations, and, in some counties, black and Latino residents constitute the majority.
� High school graduation rates have steadily improved since 1960. The Region’s graduation rate is
now on par with the rest of the country.
Statistics also show that within Appalachia, there is considerable diversity in the socioeconomic
characteristics of different subregions:
� Northern Appalachia’s poverty rate is 14.5 percent, compared with Central Appalachia’s rate of
24.4 percent.
� Minorities make up 31.3 percent of Southern Appalachia’s population. They are 11 percent of
Northern Appalachia’s.
� In South Central Appalachia, 19.6 percent of the population age 25 and up holds at least a
bachelor’s degree; in North Central Appalachia, the figure is 14 percent.1
But these differences within the Region are reflective of diversity at the most fundamental level, the
communities. Appalachian communities vary widely in their characteristics, their resources, and their
levels of physical, social, and economic health: In the ten Appalachian counties examined for this report,
the 2014 unemployment rate ranged from a low of 6.2 percent to a high of 12.4 percent, compared with
the national unemployment rate of 6.2 percent.2 Employment options differ widely from county to
county, ranging from retail to health services to manufacturing. Some of those counties have a thriving
arts community, while others draw thousands of outdoor enthusiasts to their hiking trails and other
outdoor-recreation attractions.
Although Appalachian communities face different sets of challenges related to their individual
characteristics, one common challenge many of them are working to address today is poor health
1 Poverty, demographic, and education data come from the American Community Survey, 2011–2015. 2 U.S. Bureau of Labor Statistics, Local Area Unemployment Statistics, 2014

CREATING A CULTURE OF HEALTH IN APPALACHIA Executive Summary | CASE STUDIES
4
outcomes among their residents. Appalachia has higher
mortality rates in 7 of the leading causes of death in the
United States: heart disease, cancer, COPD,
unintentional injury, including drug overdose, stroke,
diabetes, and suicide.3 The Appalachian Region’s
number of physically unhealthy days, mentally
unhealthy days, and prevalence of depression are all
higher than the national averages for these measures.
Obesity, smoking, and physical inactivity—risk factors
for a number of health outcomes—are all higher in
Appalachia than in the nation overall. The Region also
has lower supplies of healthcare professionals
when compared to the United States as a whole,
including primary care physicians, mental health
providers, specialty physicians, and dentists. Lower
household incomes and higher poverty rates—both
social determinants of health—reflect worse living
conditions in the Region than in the nation as a whole.
Over the past two decades, the Appalachian Region as
a whole has made some progress in a number of health
measures. However, the progress often comes up short
when compared with the progress made by the United
States overall, and indicates a widening gap in overall
health between Appalachia and the nation as a whole.
EXPLORING BRIGHT SPOTS IN APPALACHIAN HEALTH This report, Exploring Bright Spots in Appalachian Health: Case Studies, looks at how ten Appalachian
counties with health outcomes that are better than
expected—given the counties’ characteristics and
resources—are using their resources and strengths in
different ways to address their health challenges. It
identifies concrete actions these communities are
taking to improve health and well-being, that others in
the Region can work to replicate.
This is the qualitative companion report to the second
report in the series, Identifying Bright Spots in Appalachian Health: Statistical Analysis, which
described the analysis used to assess how each of the
420 Appalachian counties scored on 19 health
indicators, and identified counties with better-than-expected outcomes given their characteristics and
resource levels.4
Using the average degree to which a county’s observed health outcomes exceeded predicted values, the
model identified the counties that either did very well on a few measures or exceeded expectations across
3 See Health Disparities in Appalachia for more details about health outcomes in the Appalachian Region. 4 See Identifying Bright Spots in Appalachian Health: Statistical Analysis for more details on the analysis.
ABOUT THIS REPORT This report presents case studies of ten Bright Spot counties conducted over a nine-month period from September 2016 to May 2017.
The purpose of the case studies was to identify local practices, programs, and policies that may be associated with better-than-expected health outcomes. However, the case studies were not designed to trace causal paths between specific practices and specific outcomes. Rather, by using the technique of rapid ethnographic assessment (see Research Approach in Appendix B), the case studies sought to answer a more general question: what is happening in these counties that might be contributing to better-than-expected population health outcomes?
A team of researchers and journalists gathered extensive background information on each case study location, traveled to each county to interview key informants, and worked together to develop both a qualitative assessment of local practices and a narrative account of the local culture of health. The team interviewed people with leadership roles in county government, health care, social services, education, university extension agencies, business, and the ministry. The researchers explored perceptions of local health challenges and sought to identify practices that were relevant to understanding community-level health outcomes.
Throughout the field studies and during follow-up analysis, the team looked for patterns across the ten counties, as well as individual practices that might be replicated more widely.

CREATING A CULTURE OF HEALTH IN APPALACHIA Executive Summary | CASE STUDIES
5
many health outcomes. Ultimately, 42 Appalachian counties—the top ten percent of counties in the
Region—were classified as “Bright Spots.”
Exploring Bright Spots in Appalachian Health: Case Studies presents in-depth qualitative analyses of ten
Bright Spot counties identified by the statistical analysis; digs deeper to explore local perceptions of
practices that may be associated with better-than-expected health outcomes; and summarizes promising
strategies that may be replicable in other communities.
Together, these companion reports:
� Identify Bright Spot counties that exhibit better-than-expected health outcomes given their
resources; and
� Explore ten Bright Spot counties through in-depth, field-based case studies.
The reports offer a basis for understanding and addressing health in the Appalachian Region and identify
factors that support a culture of health in Appalachian communities. They also explore activities,
programs, and policies that appear to encourage better-than-expected health outcomes.
It is important to note that because the research team only studied counties that were classified as Bright
Spots, we cannot attest that these conditions and practices distinguish Bright Spot counties from
Appalachian counties whose outcome measures are not better than expected. To make such a
determination would require a comparative research design and longer immersion in the field. We can
say, however, based on previous public health research, that the practices we uncovered tend to be
associated with better population-level health outcomes.
The fourth and final report in the series, expected to be published in late 2018, will provide
recommendations for practical strategies and activities that build on the findings of the first three reports.
FOSTERING A CULTURE OF HEALTH For decades, the country’s approach to health has been grounded in providing the best possible medical
treatment and striving to make that care accessible and affordable. Research, however, shows that there is
more to health than health care—although that is critically important. Where one lives, learns, works, and
plays can have a greater impact on health than having access to a doctor. Given this knowledge, health
systems, civic leaders, employers, community coalitions, and residents are collaborating to create
communities that help people stay healthy in the first place.
RWJF is championing efforts like these to foster a Culture of Health. According to RWJF, building a
Culture of Health means creating a society that gives every person an equal opportunity to live the
healthiest life they can—whatever their ethnic, geographic, racial, socioeconomic, or physical
circumstances happen to be. A Culture of Health recognizes that health and well-being are greatly
influenced by where we live, how we work, the safety of our surroundings, and the strength and
connectivity of our families and communities.
Research from the federal Centers for Disease Control and Prevention (CDC) shows that living in
communities with inadequate housing, lower income levels, unsafe neighborhoods, limited access to
food, or substandard education can have a detrimental effect on a person’s health. Efforts to address these
conditions can improve individual and population health and lead to greater health equity.
CREATING A CULTURE OF HEALTH IN APPALACHIA Executive Summary | CASE STUDIES
6
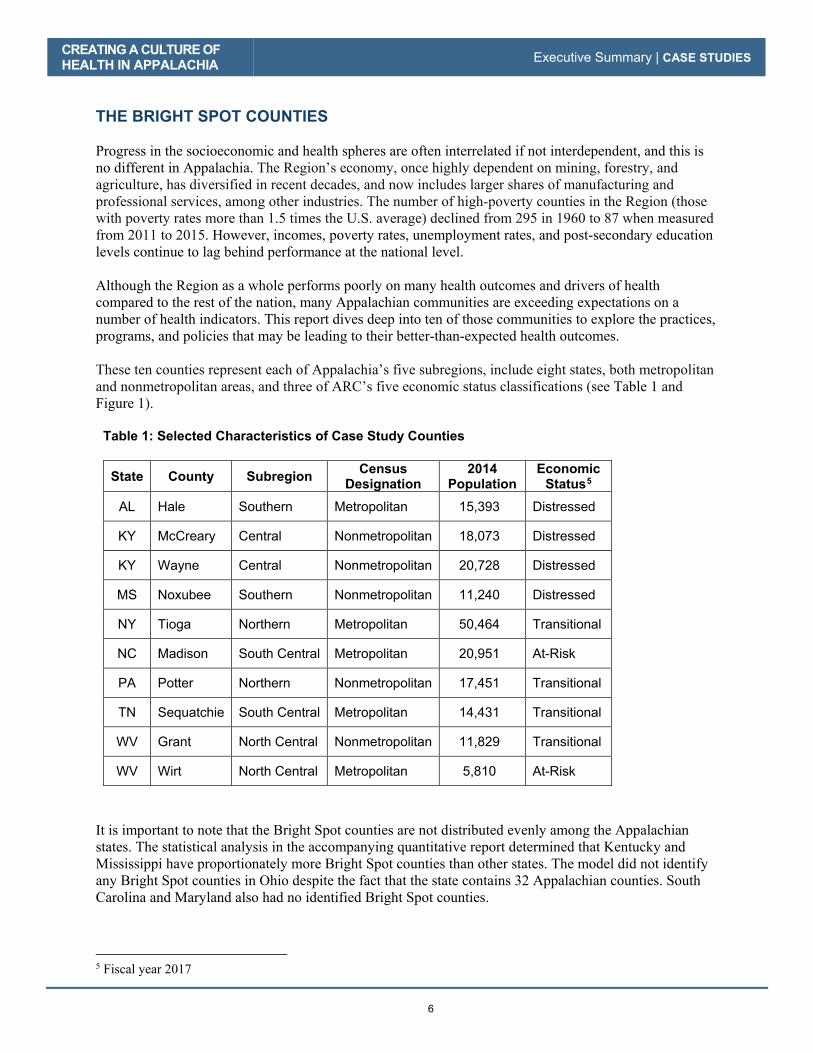
THE BRIGHT SPOT COUNTIES Progress in the socioeconomic and health spheres are often interrelated if not interdependent, and this is
no different in Appalachia. The Region’s economy, once highly dependent on mining, forestry, and
agriculture, has diversified in recent decades, and now includes larger shares of manufacturing and
professional services, among other industries. The number of high-poverty counties in the Region (those
with poverty rates more than 1.5 times the U.S. average) declined from 295 in 1960 to 87 when measured
from 2011 to 2015. However, incomes, poverty rates, unemployment rates, and post-secondary education
levels continue to lag behind performance at the national level.
Although the Region as a whole performs poorly on many health outcomes and drivers of health
compared to the rest of the nation, many Appalachian communities are exceeding expectations on a
number of health indicators. This report dives deep into ten of those communities to explore the practices,
programs, and policies that may be leading to their better-than-expected health outcomes.
These ten counties represent each of Appalachia’s five subregions, include eight states, both metropolitan
and nonmetropolitan areas, and three of ARC’s five economic status classifications (see Table 1 and
Figure 1).
Table 1: Selected Characteristics of Case Study Counties
State County Subregion Census Designation
2014 Population
Economic Status5
AL Hale Southern Metropolitan 15,393 Distressed
KY McCreary Central Nonmetropolitan 18,073 Distressed
KY Wayne Central Nonmetropolitan 20,728 Distressed
MS Noxubee Southern Nonmetropolitan 11,240 Distressed
NY Tioga Northern Metropolitan 50,464 Transitional
NC Madison South Central Metropolitan 20,951 At-Risk
PA Potter Northern Nonmetropolitan 17,451 Transitional
TN Sequatchie South Central Metropolitan 14,431 Transitional
WV Grant North Central Nonmetropolitan 11,829 Transitional
WV Wirt North Central Metropolitan 5,810 At-Risk
It is important to note that the Bright Spot counties are not distributed evenly among the Appalachian
states. The statistical analysis in the accompanying quantitative report determined that Kentucky and
Mississippi have proportionately more Bright Spot counties than other states. The model did not identify
any Bright Spot counties in Ohio despite the fact that the state contains 32 Appalachian counties. South
Carolina and Maryland also had no identified Bright Spot counties.
5 Fiscal year 2017
CREATING A CULTURE OF
HEALTH IN APPALACHIA Executive Summary | CASE STUDIES
7
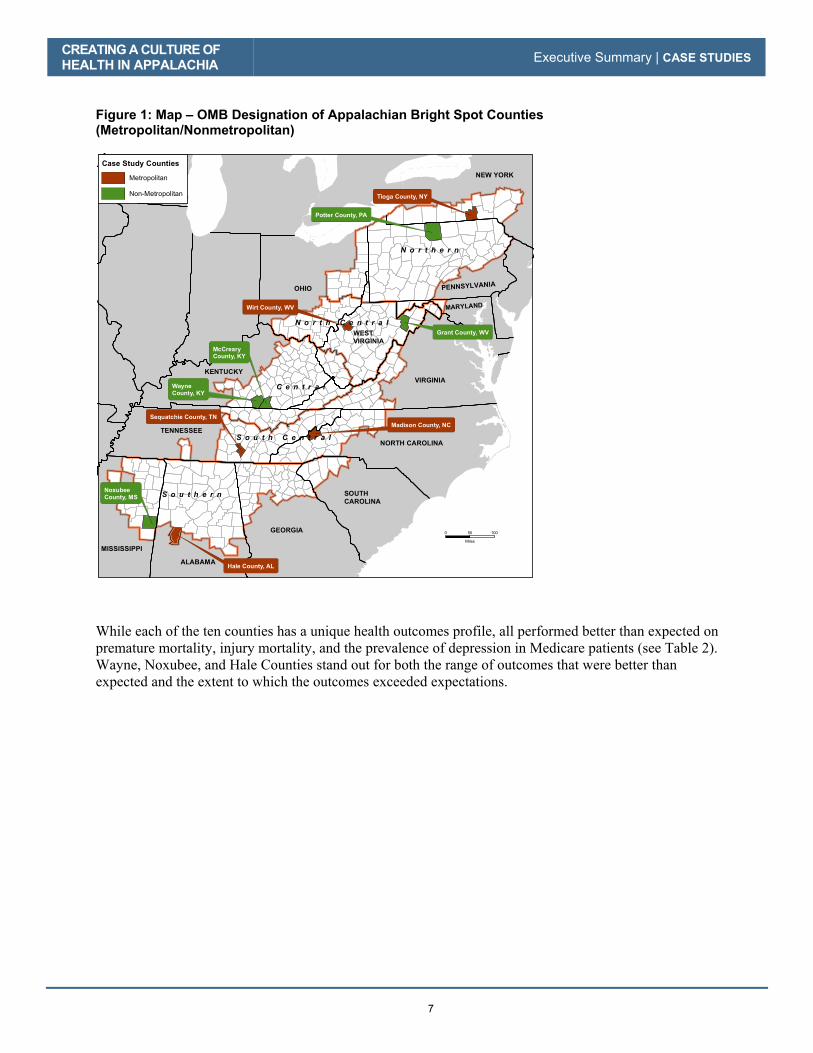
Figure 1: Map – OMB Designation of Appalachian Bright Spot Counties
(Metropolitan/Nonmetropolitan)
While each of the ten counties has a unique health outcomes profile, all performed better than expected on premature mortality, injury mortality, and the prevalence of depression in Medicare patients (see Table 2). Wayne, Noxubee, and Hale Counties stand out for both the range of outcomes that were better than expected and the extent to which the outcomes exceeded expectations.
GEORGIA
SOUTH
CAROLINA
NORTH CAROLINA
ALABAMA
MISSISSIPPI
TENNESSEE
OHIO PENNSYLVANIA
MARYLAND
VIRGINIA
NEW YORK
WEST
VIRGINIA
Wirt County, WV
Tioga County, NY
Wayne
County, KY
McCreary
County, KY
Potter County, PA
Grant County, WV
Sequatchie County, TN
Madison County, NC
Hale County, AL
Noxubee
County, MS
KENTUCKY
N o r t h e r n
S o u t h e r n
C e n t r a l
S o u t h C e n t r a l
N o r t h C e n t r a l
0 10050
Miles
Case Study Counties
Metropolitan
Non-Metropolitan

CREATING A CULTURE OF HEALTH IN APPALACHIA Executive Summary | CASE STUDIES
8
Table 2: Health Outcomes in the Case Study Counties
Category Indicator
Case Study County Total Counties
Better Than Expected per
Measure
(Max = 10) Wayn
e
Noxu
be
e
Ha
le
Wir
t
Se
qu
atc
hie
Tio
ga
McC
rea
ry
Po
tte
r
Ma
dis
on
Gra
nt
Mortality and Morbidity
YPLL 10
Stroke 9
Cancer 7
Injury 10
COPD 9
Heart disease 9
Mental Health
Mentally bad day 5
Suicide mortality 8
Depression 10
Child Health % low birthweight 7
Infant mortality 8
Chronic Disease
Diabetes 4 Heart disease hospitalization
9
Medicare HCC 9
Obesity 4
Physically bad day 4
Substance Abuse
Excessive drinking 7
Poison mortal 8
Opioid Rx 5
Total Better-than-Expected Outcomes per County (Max = 19) 16 16 15 14 14 14 14 14 13 12
The expected values for the 19 health outcome measures are based on the regression analysis described in
the Statistical Analysis companion report. The regression predicted health outcomes for every county in
Appalachia using 29 health drivers associated with the environment, health behaviors, health care
delivery system, quality of health care, and social determinants. It then compared actual outcomes with
expected outcomes and standardized the differences to identify the counties in the top decile in both the
metropolitan and nonmetropolitan categories. Data in the study cover the years 2008 to 2014.

CREATING A CULTURE OF HEALTH IN APPALACHIA Executive Summary | CASE STUDIES
9
A DEEPER LOOK AT THE BRIGHT SPOT COUNTIES
Each of the ten Bright Spot counties has its own particular health-related challenges, available resources
for dealing with them, and different responses. But there are similarities in the solutions and strategies
they employed. These fall into six broad categories:
� Community leaders engaged in health initiatives
� Cross-sector collaboration
� Resource sharing
o Transportation
o Food
o Shelter
� Local healthcare providers committed to public health
� Active faith community
� Initiatives to combat substance abuse
Communities, policymakers, and funders who are interested in improving health outcomes could examine
opportunities focusing on initiatives aligned in these broad categories.
Community Leaders Engaged in Health Initiatives
Sustained, committed leadership is critical to helping communities improve health outcomes. In the ten
Bright Spots studied, we found dedicated leaders who demonstrated resilience honed by decades of
commitment to making the county a healthy place to live and visit. Each of the counties has a local leader
or leaders with credibility, know-how, and a drive to make programs successful. These individuals
include political officials, business leaders, volunteers, and health care workers. Coalitions of citizens
work together toward a common goal, and even large employers are dedicated to the health and well-
being of their employees.
Most receive training through formal leadership development programs or informally through local
organizations or relationships. All appear to get support in a number of areas, including skill
development, mentoring, encouragement, income assistance, and networking strategies and tools. Groups
providing support include the U.S. Department of Agriculture Cooperative Extension, university
extension agencies, regional health care providers, regional health departments, area health education
programs, national faith-based organizations, governments, and nonprofits.
Many leaders have years of experience working together. Groups of leaders and citizens meet face to face
regularly to discuss health issues in the county and formulate responses. These groups—health coalitions,
health councils, health consortiums, and community health advisory boards—function in a democratic
way and are not dominated by any single member. They also form strong networks of communication and
cooperation.
Cross-Sector Collaboration
Cross-sector collaboration within a county—or between neighboring counties—is a given in Bright Spot
communities. In the words of Peggy Bobo Alt, deputy director of emergency services in Grant County,
West Virginia: “Nobody has the resources to take care of everything all the time, so we’re sharing and
helping, and that has been good here.”
CREATING A CULTURE OF HEALTH IN APPALACHIA Executive Summary | CASE STUDIES
10
Collaboration among formal and informal organizations, long-time residents, and relative newcomers
helps counties stretch and focus local resources while also avoiding wasteful duplication. These
collaborations are facilitated by a seeming absence of turf wars, minimal competition, and sharing credit
for accomplishments.
Almost every county studied has formal coalitions that meet regularly. They bring together government
leaders, health care providers, local churches, and senior centers as well as less formal groups of
volunteers from food banks, food delivery programs, and after-school programs. A core group of
dedicated, long-term leaders combine forces to meet community needs.
In many communities, employers recognize the value of a healthy community and healthy employees,
support comprehensive health insurance plans, wellness programs, and participate in community health
fairs. In Hale County, Alabama, an industrial board that serves like a Chamber of Commerce to attract
business also collaborates with the health department and the University of Alabama’s extension office to
provide health education.
Area Agencies on Aging are frequently central to collaborative efforts, often providing needed resources.
And social service agencies often collaborate with health providers to ensure access, either by providing
transportation to health care services or by taking the needed services to clients. Tioga County, New York
and Potter County, Pennsylvania house a range of service providers in one building, which fosters access
for social service program beneficiaries as well as communication and cooperation among providers.
Resource Sharing
Patterns of cooperation and resource sharing differ, but one thread consistently identified in each Bright
Spot community was a strong network of local volunteers. These volunteers engaged in outreach to
isolated community members, delivered food, and provided a broad range of services. Each Bright Spot
community also set aside any differences to achieve core, shared goals. This enables leaders to
accomplish more with the resources available to them, sometimes pooling resources to more effectively
meet needs.
Resource sharing includes combining different programs with multiple sources of funding to address local
challenges. Examples include efforts to keep seniors and youth nourished, sheltered, engaged, and
healthy. Resource sharing extends to co-sponsorship of expos and fairs where county residents can obtain
free or subsidized health screenings.
Remote counties that do not have their own health care systems, or local specialty care services, rely on
multicounty or regional organizations to obtain the health care services they need. This cross-county
pooling of resources is crucial to residents in otherwise underserved counties.
People interviewed in each of the ten Bright Spot counties stressed the importance of transportation, food,
and shelter safety nets. Intense poverty and a lack of reliable transportation make it difficult for many in
these counties to access available food or obtain other services. Children and seniors, in particular, are
often at risk of going hungry.
Programs to improve local health generally involve low-cost solutions to address social determinants of
health, such as providing affordable housing or help with utility bills; access to balanced and healthy
food; health screenings with follow-ups; and wrap-around substance abuse programs that remove stigma,
engage the entire community, provide clear information about risks, eliminate easy access to drugs
through prescription take-back programs, and assist with recovery.

CREATING A CULTURE OF HEALTH IN APPALACHIA Executive Summary | CASE STUDIES
11
Transportation
Transporting people to services and food sites is a continuing struggle in many counties. Kentucky’s
Wayne and McCreary counties have formal Rural Transit Enterprises Coordinated programs that run
scheduled vans covered through Medicaid. In other counties, churches, volunteer organizations, and
senior centers provide transportation. In Tioga County, New York, cuts in Medicaid eligibility prompted
the formation of a largely volunteer transportation service called Neighbors Helping Neighbors.
Food
In Noxubee County, Mississippi, at least a half-dozen programs provide food to low-income children at
churches and community centers year-round. Churches also provide afterschool food programs for low-
income children. In Wayne County, Kentucky, students grow and harvest fresh fruits and vegetables from
a four-acre garden originally planted by the school food service director. The Hope Center, also located in
Wayne County, provides weekend bag lunches to keep children from going hungry on the days when they
are not in school.
Shelter
A recent American Hospital Association study shows that housing takes priority over health care when
resources are tight. Noxubee County, Mississippi; Hale County, Alabama; and Tioga County, New York
all offer programs to address affordable shelter. While some assist residents with utility payments, others
focus on affordable home ownership.
Local Providers Committed to Public Health
In all ten counties studied, health care providers are essential to the health of the surrounding
communities. They have long recognized that the health of their patients depends on more than the
medical care they provide. “We recognized several years ago that we had to go beyond the four walls of
the hospital,” says Grant Memorial Hospital CEO Mary Beth Barr. “We needed to serve the entire
community.”
Residents trust their local providers, whether they are an individual provider, hospital, or service network,
and whether they are in-community or based in the next county over. While a few counties have an
established hospital and easy access to emergency services, others rely on the county health department,
small community hospitals, or a regional clinic network. All provide outreach into the community, and
most have active regional mental health providers who work with physical health institutions and social
service agencies.
In McCreary County, Kentucky, strong local volunteer organizations, emergency medical services, and
the library connect residents to health and social services. More than half of the counties studied hold
regular health fairs providing basic medical tests and health-related information. Others recognize that the
location of health services matters a lot. In Madison County, North Carolina, the nonprofit Hot Springs
Health Program operates four medical centers strategically placed around the county to give residents
easy access—no one in Madison County has to travel more than half an hour for services. This kind of
local outreach and commitment may lower cultural and psychological barriers to seeking care.
Local providers also tend to champion public health-oriented measures such as safe places for walking
and efforts to combat substance abuse.

CREATING A CULTURE OF HEALTH IN APPALACHIA Executive Summary | CASE STUDIES
12
Active Faith Community
Faith-based communities are actively working to promote healthier lifestyles in a variety of ways,
including sharing information, hosting health fairs, providing food to nutritionally insecure families, or
driving people to medical appointments. They are also involved in providing information and shaping
attitudes about substance abuse.
In Sequatchie County, Tennessee, 19 local churches have created the Sequatchie Ministerial Association.
This association helps pay utility bills for struggling families, provides a jail ministry, and operates a food
bank. Various churches in the community provide yoga and meditation classes, potluck dinners, and
health fairs. In Hale County, Alabama, the health department collaborates with local congregations to
provide regular screenings in churches or at one of the two area food stores. It distributes flyers about
health-related events in area churches. According to many people we interviewed, this is especially
effective given a long tradition of sharing news by word-of-mouth.
Initiatives to Combat Substance Abuse
Like much of the rest of the nation, counties in Appalachia are struggling with a substance abuse
epidemic. In fact, the poisoning mortality rate in Appalachia (which includes overdose) was 37 percent
higher than the national rate during the 2008–2014 period. Most of the ten counties are taking creative,
proactive steps to face the issue head-on. These efforts range from organized substance abuse support
groups for both addicted persons and their families to initiatives to curb addictive behaviors to low-cost
disposal sites. Often, these initiatives involve agencies working across sectors. For example, in Grant
County, West Virginia, the coalition called PITAR—Prevention, Intervention, Treatment, Anti-Stigma,
and Recovery—comprises representatives from the prosecutor’s office, the sheriff’s department, the drug
court, and treatment centers, and gathers monthly to discuss solutions.
Prevention education for adolescents is common. Schools run programs which educate students on the
dangers of drugs and long-term consequences of substance abuse. In Wirt County, West Virginia, schools
partner with more than a dozen other agencies to create an annual sober event in which students play
games and drive golf carts while wearing vision-altering goggles, often called “beer goggles.” Since the
program began, there have been no alcohol-related auto deaths after prom and graduation. We could not
measure how it translated to sustained health behaviors at other times.
Wirt County, West Virginia, also has a “Drug Take Back Day,” during which any resident can dispose of
old or unneeded medications at a chosen site. The county also has a permanent receptacle in front of the
courthouse where residents can drop off medications, or any other substance, anonymously.
Remaining Gaps The research done for this report also found common challenges, which may suggest key roles that
remain to be filled by outside entities. For example, many health coalitions are inspired to work among
youth, but dwindling resources for public education make it increasingly difficult to engage with schools.
Private investors, health systems, and insurance payers could fill that gap by investing resources in the
schools. At a broader level, sustaining collaborative work depends on thorough planning, resourceful
grant-writing, and effective communications—core elements of community capacity that are missing in
many rural areas. Regional foundations, community development financial institutions, and advocacy
groups could target investment to capacity building services, not just program delivery.
For example, a comprehensive report from the Walsh Center for Rural Health Analysis released in
February 2018 recommended that funders—including philanthropies and government agencies—adapt

CREATING A CULTURE OF HEALTH IN APPALACHIA Executive Summary | CASE STUDIES
13
their funding strategies to address barriers to participation in rural places; provide funding opportunities
for rural communities that are ready for change but lack capacity to apply for grants; identify and grow
rural leaders by ensuring opportunities for youth engagement and employment; support economic
development efforts through investments in rural economies beyond the health care sector; and consider
rural communities as program pilot sites to test interventions on a smaller scale, among other
interventions that could be adopted in Appalachia.
IMPROVING HEALTH THROUGHOUT APPALACHIA
The patterns evident in the Bright Spot counties encourage further exploration of strategies that could
improve health throughout other parts of the Region. Many practices in these ten counties could be
replicated elsewhere, and some could be replicated at low cost.
Health councils can be organized wherever local leaders and citizens are willing to join forces to discuss
community health problems and possible solutions. These councils or coalitions may also foster cross-
sector collaboration that, in turn, promotes efficient use of resources, diminished competition, and pulling
together to get things done.
Many of the programs supporting youth and seniors are also relatively inexpensive given that they are
often supported by a large volunteer network or existing organizational infrastructure, such as university
extension agencies. Some efforts to combat substance abuse are also relatively low-cost, such as
providing safe places to discard unused and outdated drugs, and having courts divert low-level offenders
into treatment programs.
Other conditions and initiatives are more difficult to replicate, mainly because they are rooted in local
culture or historical community services. Half of the ten counties studied had a leading health care
provider with roots in the community and strong ties to the local culture. These included “homegrown”
publicly owned hospitals or health systems with a record of striving to serve local residents and improve
population health. They reduce actual and perceived access barriers through outreach and cultural
identification with the community, commit resources to screening and prevention, create extended
networks of specialty providers, and help to organize and integrate health promotion efforts at the county
level.
Practices that may be more difficult to replicate include strong communication networks among local
leaders, a spirit of cooperation, community solidarity, a willingness to share resources and credit, and
generous mutual support. These things develop organically over time. However, what may be more easily
replicable are the organizational elements associated with these community characteristics:
democratically functioning health councils with broad membership; co-located government, health, and
social service hubs that aid communication and collaboration; and cooperative ties to regional
organizations that can generate new ideas without being imposed from outside the community.
It is clear that making health a shared value is necessary to transform a county into a vibrant, healthy
place to live. But concrete action, fostered through sustained leadership and a willingness to work
together for the benefit of the community, is just as crucial. This report identifies practices that other
counties may want to consider implementing in order to improve overall health.

CREATING A CULTURE OF HEALTH IN APPALACHIA Executive Summary | CASE STUDIES
14
REFERENCES
Agency for Healthcare Research and Quality. 2011. "Chapter 9: Access to Health Care, 2011 National Healthcare Quality Report." Agency for Healthcare Research and Quality. https://www.ahrq.gov/research/findings/nhqrdr/nhqr11/chap9.html
American Hospital Association. 2017. Fast Facts on U.S. Hospitals 2017. Accessed May 15, 2018. https://www.aha.org/statistics/fast-facts-us-hospitals-2017
Appalachian Regional Commission. 2017. The Appalachian Region. September 1. https://www.arc.gov/appalachian_region/TheAppalachianRegion.asp
Centers for Disease Control and Prevention. 2016. Health in the United States, 2016. Accessed May 15, 2018. https://www.cdc.gov/nchs/hus/description.htm
Dewalt, Darren A, Nancy Berkman, Stacey Sheridan, Kathleen Lohr and Michael Pignone. 2004. "Literacy and Health Outcomes A 6ystematic Review of the Literature." Journal of Internal Medicine 12 (December 19): 1228-1239. Accessed July 2017.
Hamoudi, PhD, Amar, and PhD, Jennifer Beam Dowd. 2013. "Physical Health Effects of the Housing Boom: Quasi-Experimental Evidence from the Health and Retirement Study." American Journal of Public Health 1039-1045.
Hilbrand, Sonja, David A. Coall, Denis Gerstorf, and Ralph Hertwig. 2017. "Caregiving within and beyond the family is associated with lower mortality for the caregiver: A prospective study." Evolution and Human Behavior 397-402.
Holmes, G. Mark, Lane, Nancy, et. al,. 2017. Identifying Bright Spots in Appalachian Health: Statistical Analysis. Washington, D.C. Appalachian Regional Commission.
Marshall, Julie L., Logan Thomas, Nancy M. Lane, G. Mark Holmes, Thomas A. Arcury, Randy Randolph, Pam Silberman, et al. 2017. Health Disparities in Appalachia. Appalachian Regional Commission.
NORC Walsh Center for Rural Health Analysis. 2018. Exploring Strategies to Improve Health and Equity in Rural Communities. Accessed May 15, 2018. http://www.norc.org/Research/Projects/Pages/exploring-strategies-to-improve-health-and-equity-in-rural-communities.aspx
Office of Management and Budget. 2013. "Revised Delineations of Metropolitan Statistical Areas, Micropolitan Statistical Areas, and Combined Statistical Areas, and Guidance on Uses ofthe Delineations of These Areas." OMB Bulletin 13-01. Accessed May 15, 2018. https://obamawhitehouse.archives.gov/sites/default/files/omb/bulletins/2013/b-13-01.pdf
Plough, Alonzo L. 2015. Measuring What Matters: Introducing a New Action Framework. November 11. http://www.rwjf.org/en/culture-of-health/2015/11/measuring_what_matte.html
Robert Wood Johnson Foundation Commission to Build a Healthier America. 2014. Time to Act: Investing in the Health of Our Children and Communities. Accessed May 15, 2018. https://www.rwjf.org/content/dam/farm/reports/reports/2014/rwjf409002

15
Introduction About the Project
About the Appalachian Region
About the Case Study Report
References

16
CREATING A CULTURE OF HEALTH IN APPALACHIA Introduction | CASE STUDIES
17
ABOUT THE PROJECT
“Creating a Culture of Health in Appalachia: Disparities and Bright Spots" is a four-part research series
sponsored by the Robert Wood Johnson Foundation (RWJF) and Appalachian Regional Commission
(ARC), and administered by the Foundation for a Healthy Kentucky. To date, this research project has
produced the following three reports:
1. Health Disparities in Appalachia (August 2017) measures population health in the Appalachian
Region and documents disparities between Appalachia and the nation as a whole, as well as disparities
within the Region.
2. Identifying Bright Spots in Appalachian Health: Statistical Analysis (July 2018) describes the results of
the regression analysis used to assess how each of the Appalachian Region’s 420 counties scored on 19
different health indicators, and then identifies counties with better-than-expected outcomes, given their
characteristics and resource levels. Through this process, 42 Appalachian counties were classified as
Bright Spot counties.
3. Exploring Bright Spots in Appalachian Health: Case Studies (July 2018) presents in-depth studies of
10 of the 42 Bright Spot counties identified through the statistical analysis. This report explores local
perceptions of practices that may be associated with better-than-expected health outcomes, and
summarizes promising strategies that may be replicable in other communities.
As described above, this report is the third in the series and is the qualitative companion to the second
report, Identifying Bright Spots in Appalachian Health: Statistical Analysis (July 2018).
This report contains ten case studies of Bright Spot counties. The cases represent each of the five ARC
Appalachian subregions, three of ARC’s five economic status classifications, and are equally distributed
between metropolitan and nonmetropolitan locations. Researchers went into these ten counties to identify
networks, activities, values, beliefs, programs, and processes that may have helped them achieve better-
than-expected-health outcomes.
The final report in the series—to be released in fall 2018—will offer recommendations for practical
strategies and actions that can be applied in other communities across the United States.
Culture of Health
A Culture of Health recognizes that where we live, how we work, the safety of our surroundings, and the
strength and connectivity of our families and communities heavily influence health and well-being
(Robert Wood Johnson Foundation 2017). A Culture of Health ensures that every person has an equal
opportunity to live the healthiest life they can—whatever their ethnic, geographic, racial, socioeconomic,
or physical circumstances. Practices that can facilitate this fall into four action areas:
� Making health a shared value
� Fostering cross-sector collaboration to improve well-being
� Creating healthier, more equitable communities
� Strengthening integration of health services and systems

CREATING A CULTURE OF HEALTH IN APPALACHIA Introduction | CASE STUDIES
18
The key features of a fully realized Culture of Health informed the selection of health outcome measures
and, in the field studies, helped focus attention on local practices possibly related to those outcomes.
Using the features of the Culture of Health model as touchstones for measurement enabled a comparison
between counties within Appalachia and with national averages.
ABOUT THE APPALACHIAN REGION
Geographic Subregions
The current boundary of the Appalachian Region includes all of West Virginia and parts of 12 other
states: Alabama, Georgia, Kentucky, Maryland, Mississippi, New York, North Carolina, Ohio,
Pennsylvania, South Carolina, Tennessee, and Virginia. It covers 205,000 square miles and 420 counties,
and it is home to more than 25 million people.
The Appalachian subregions are contiguous regions with relatively similar characteristics (topography,
demographics, and economics) within Appalachia. Originally consisting of three subregions, ARC
revised the classification system in 2009 and now divides the Region into five subregions (see Figure 2).
Recent economic and transportation data provide the basis for these smaller areas, allowing for greater
analytical detail.
Figure 2: Map of the Appalachian Subregions
Data Source: Appalachian Regional Commission, Created November 2009
GEORGIA
ALABAMA
MISSISSIPPI
SOUTHCAROLINA
NORTH CAROLINA
VIRGINIA
WESTVIRGINIA
KENTUCKY
OHIOILLINOIS INDIANA
WISCONSIN
MICHIGAN
DE
NJPENNSYLVANIA
MARYLAND
NEW YORK
TENNESSEE
0 10050
Miles
Northern
North Central
Central
South Central
Southern
Subregions

CREATING A CULTURE OF HEALTH IN APPALACHIA Introduction | CASE STUDIES
19
Rurality in Appalachia
To describe Appalachian areas in terms of rurality, counties were organized into metropolitan and
nonmetropolitan groups using the 2015 U.S. Office of Management and Budget (OMB) definition of
Metropolitan Statistical Area (MSA). This separation recognizes that metropolitan and nonmetropolitan
counties can be quite different in terms of resources and overall population size, and that these differences
can affect the degree to which health drivers affect health outcomes. The OMB metropolitan delineation
is broad; some metropolitan counties (e.g., “bedroom counties”) classify as such because of their high
levels of commuting to core urban areas. Otherwise, they may resemble nonmetropolitan areas in both
population size and density. However, to the extent that metropolitan status captures integration with a
metropolitan center, the chosen delineation is appropriate for this model.
County Economic Status in Appalachia
ARC classifies counties based on economic status. The following information is based on ARC’s report,
“County Economic Status in Appalachia, FY 2017.” Figure 3 shows Appalachian counties by economic
status for fiscal year 2017.
Figure 3: Map of County Economic Status in Appalachia, FY 2017
CREATING A CULTURE OF HEALTH IN APPALACHIA Introduction | CASE STUDIES
20
The Appalachian Regional Commission uses an index-based county economic classification system to
identify and monitor the economic status of Appalachian counties. The system involves the creation of a
national index of county economic status through a comparison of each county's averages for three
economic indicators—three-year average unemployment rate, per capita market income, and poverty
rate—with national averages. The resulting values are summed and averaged to create a composite index
value for each county. Each county in the nation receives a rank based on its composite index value, with
higher values indicating higher levels of distress.
Each Appalachian county is classified into one of five economic status designations, based on its position
in the national ranking.
Distressed: Distressed counties are the most economically depressed counties. They rank in the worst 10
percent of the nation's counties.
At-Risk: At-Risk counties are those at risk of becoming economically distressed. They rank between the
worst 10 percent and worst 25 percent of the nation's counties.
Transitional: Transitional counties are those transitioning between strong and weak economies. They
make up the largest economic status designation. Transitional counties rank between the worst 25 percent
and the best 25 percent of the nation's counties.
Competitive: Competitive counties are those that are able to compete in the national economy but are not
in the highest 10 percent of the nation's counties. Counties ranking between the best 10 percent and best
25 percent of the nation's counties are classified competitive.
Attainment: Attainment counties are the economically strongest counties. Counties ranking in the best
10 percent of the nation's counties are classified attainment.

CREATING A CULTURE OF HEALTH IN APPALACHIA Introduction | CASE STUDIES
21
ABOUT THE CASE STUDY REPORT
This is the qualitative companion report to the second report in the series, Identifying Bright Spots in Appalachian Health: Statistical Analysis, which described the analysis used to assess how each of the 420
Appalachian counties scored on 19 health indicators, and identified counties with better-than-expected
outcomes given their characteristics and resource levels.6
Using the average degree to which a county’s observed health outcomes exceeded predicted values, the
model identified the counties that either did very well on a few measures or exceeded expectations across
many health outcomes. Ultimately, 42 Appalachian counties—the top ten percent of counties in the
Region—were classified as “Bright Spots.” Figure 4 contains a map of all Bright Spot counties.
Figure 4: Map of Bright Spot Counties in Appalachia
The ten counties selected for the case studies represent each of Appalachia’s five subregions, include
eight states, both metropolitan and nonmetropolitan areas, and three of ARC’s five economic status
categories by subregion and metropolitan status.
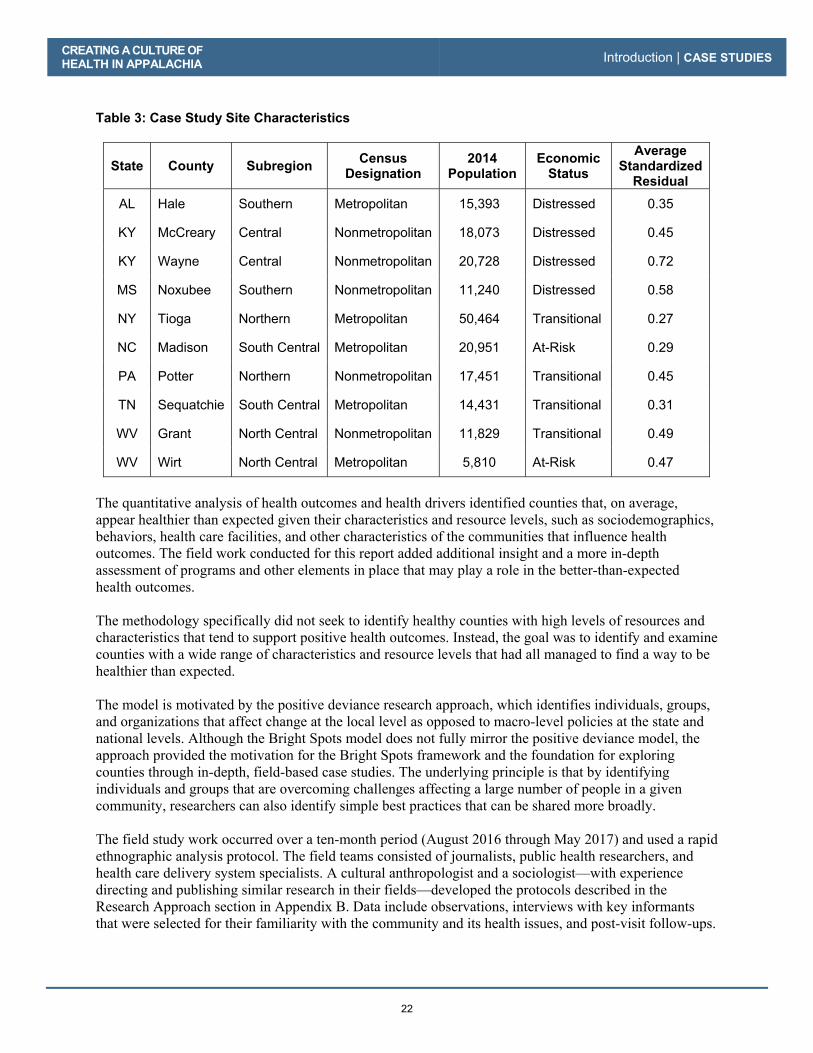
Table 3 lists the case study counties and the average standardized residual scores from the quantitative
analysis that identified them as Bright Spots. Higher scores indicate better-than-expected outcomes,
though metropolitan and nonmetropolitan scores cannot be compared.
6 See Identifying Bright Spots in Appalachian Health: Statistical Analysis for more details on the analysis.
GEORGIA
SOUTH CAROLINA
NORTH CAROLINA
ALABAMA
MISSISSIPPI
TENNESSEE
KENTUCKY
OHIO PENNSYLVANIA
MARYLAND
VIRGINIA
NEW YORK
WESTVIRGINIA
N o r t h e r n
S o u t h e r n
C e n t r a l
S o u t h C e n t r a l
N o r t h C e n t r a l
0 10050
Miles
Bright Spot Counties
Rest of Region
Bright Spots
CREATING A CULTURE OF HEALTH IN APPALACHIA Introduction | CASE STUDIES
22
Table 3: Case Study Site Characteristics
State County Subregion Census Designation
2014 Population
Economic Status
Average Standardized
Residual
AL Hale Southern Metropolitan 15,393 Distressed 0.35
KY McCreary Central Nonmetropolitan 18,073 Distressed 0.45
KY Wayne Central Nonmetropolitan 20,728 Distressed 0.72
MS Noxubee Southern Nonmetropolitan 11,240 Distressed 0.58
NY Tioga Northern Metropolitan 50,464 Transitional 0.27
NC Madison South Central Metropolitan 20,951 At-Risk 0.29
PA Potter Northern Nonmetropolitan 17,451 Transitional 0.45
TN Sequatchie South Central Metropolitan 14,431 Transitional 0.31
WV Grant North Central Nonmetropolitan 11,829 Transitional 0.49
WV Wirt North Central Metropolitan 5,810 At-Risk 0.47
The quantitative analysis of health outcomes and health drivers identified counties that, on average,
appear healthier than expected given their characteristics and resource levels, such as sociodemographics,
behaviors, health care facilities, and other characteristics of the communities that influence health
outcomes. The field work conducted for this report added additional insight and a more in-depth
assessment of programs and other elements in place that may play a role in the better-than-expected
health outcomes.
The methodology specifically did not seek to identify healthy counties with high levels of resources and
characteristics that tend to support positive health outcomes. Instead, the goal was to identify and examine
counties with a wide range of characteristics and resource levels that had all managed to find a way to be
healthier than expected.
The model is motivated by the positive deviance research approach, which identifies individuals, groups,
and organizations that affect change at the local level as opposed to macro-level policies at the state and
national levels. Although the Bright Spots model does not fully mirror the positive deviance model, the
approach provided the motivation for the Bright Spots framework and the foundation for exploring
counties through in-depth, field-based case studies. The underlying principle is that by identifying
individuals and groups that are overcoming challenges affecting a large number of people in a given
community, researchers can also identify simple best practices that can be shared more broadly.
The field study work occurred over a ten-month period (August 2016 through May 2017) and used a rapid
ethnographic analysis protocol. The field teams consisted of journalists, public health researchers, and
health care delivery system specialists. A cultural anthropologist and a sociologist—with experience
directing and publishing similar research in their fields—developed the protocols described in the
Research Approach section in Appendix B. Data include observations, interviews with key informants
that were selected for their familiarity with the community and its health issues, and post-visit follow-ups.
CREATING A CULTURE OF HEALTH IN APPALACHIA Introduction | CASE STUDIES
23
Using the detailed case study interviews, observations, and assessments of on-the-ground resources, this
report assesses the practices and programs that appear to contribute to the better-than-expected health
outcomes. Researchers used the four Culture of Health action areas previously described to discern
patterns in counties where attaining the best health possible is a core value. The report then synthesizes all
of this information to identify activities and strategies that may be replicable elsewhere.
Though each case has unique features, counties included in this report also exhibit common patterns.
Each has sustained and dedicated leaders engaged in health initiatives who demonstrate resilience honed
by decades of commitment to a shared vision of making the county a good place to live and visit. Patterns
of cooperation and resource sharing may differ, but all case study communities set aside differences to
achieve core, shared goals. The case studies verified that Appalachia has Bright Spots where health is
important and communities are able to accomplish a great deal with the resources available to them.
CREATING A CULTURE OF HEALTH IN APPALACHIA Introduction | CASE STUDIES
24
REFERENCES
Galea, S., Melissa Tracy, Katherine J Hoggatt, Charles DiMaggio and Adam Karpati. 2011. “Estimated
Deaths Attributable to Social Factors in the United States.” American Journal of Public Health 101 no. 8:
1456-1465.
Holmes, G. Mark, Nancy M. Lane, Thomas A. Arcury, Michael L. Schwalbe, Randy Randolph, John
Frank, Sharita Thomas, et. al. 2018. Identifying Bright Spots in Appalachian Health: Statistical Analysis. Washington, D.C.: Appalachian Regional Commission.
Marmot, M., Sharon Friel, Ruth Bell, Tanja AJ Houweling and Sebastian Taylor. 2008. “Closing the gap
in a generation: health equity through action on the social determinants of health.” The Lancet 372 no.
9650: 1661-1669.
Marshall, Julie L., Logan Thomas, Nancy M. Lane, G. Mark Holmes, Thomas A. Arcury, Randy
Randolph, Pam Silberman, et al. 2017. Health Disparities in Appalachia. Appalachian Regional
Commission.
McGinnis, J.M., Pamela Williams Russo and James R Knickman. 2002. “The case for more active policy
attention to health promotion.” Health Affairs 2: 78-93.
Robert Wood Johnson Foundation Commission to Build a Healthier America. 2014. Time to Act: Investing in the Health of Our Children and Communities. Accessed May 15, 2018.
https://www.rwjf.org/content/dam/farm/reports/reports/2014/rwjf409002
Robert Wood Johnson Foundation. 2017. About a Culture of Health. March 15.
http://www.cultureofhealth.org/about/

25
Case Studies
Hale County, Alabama
McCreary County, Kentucky
Wayne County, Kentucky
Noxubee County, Mississippi
Tioga County, New York
Madison County, North Carolina
Potter County, Pennsylvania
Sequatchie County, Tennessee
Grant County, West Virginia
Wirt County, West Virginia

26

27
Hale County, Alabama
County Overview
A Deeper Look at Hale County: Community Strengths
Creating a Culture of Health in Hale County
References
Appendix: Hale County Data

28
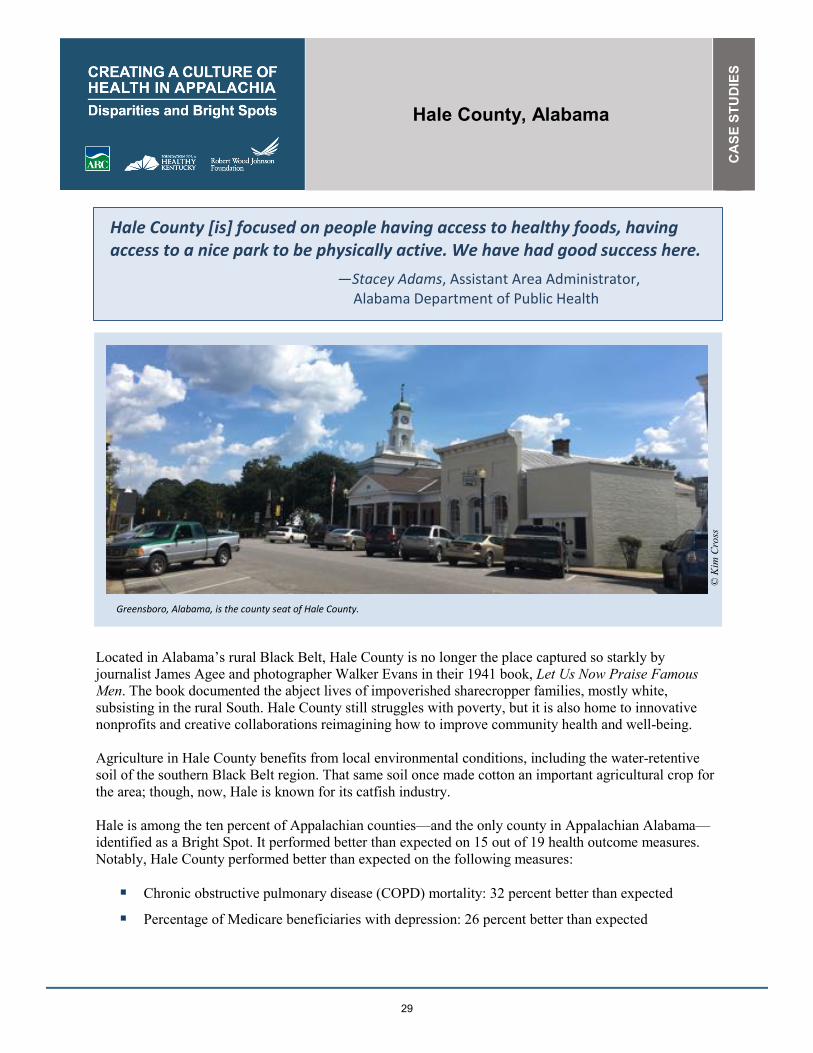
Hale County, Alabama
CA
SE S
TUD
IES
29
Hale County [is] focused on people having access to healthy foods, having access to a nice park to be physically active. We have had good success here.
—Stacey Adams, Assistant Area Administrator, Alabama Department of Public Health
Located in Alabama’s rural Black Belt, Hale County is no longer the place captured so starkly by journalist James Agee and photographer Walker Evans in their 1941 book, Let Us Now Praise Famous Men. The book documented the abject lives of impoverished sharecropper families, mostly white, subsisting in the rural South. Hale County still struggles with poverty, but it is also home to innovative nonprofits and creative collaborations reimagining how to improve community health and well-being. Agriculture in Hale County benefits from local environmental conditions, including the water-retentive soil of the southern Black Belt region. That same soil once made cotton an important agricultural crop for the area; though, now, Hale is known for its catfish industry. Hale is among the ten percent of Appalachian counties—and the only county in Appalachian Alabama—identified as a Bright Spot. It performed better than expected on 15 out of 19 health outcome measures. Notably, Hale County performed better than expected on the following measures: � Chronic obstructive pulmonary disease (COPD) mortality: 32 percent better than expected
� Percentage of Medicare beneficiaries with depression: 26 percent better than expected
Greensboro, Alabama, is the county seat of Hale County.
© K
im C
ross

CREATING A CULTURE OF HEALTH IN APPALACHIA Hale County, Alabama | CASE STUDIES
30
� Years of potential life lost: 14 percent better than expected
� Percentage of excessive drinkers: 13 percent better than expected
� Infant mortality: 13 percent better than expected
These better-than-expected results are likely influenced by local conditions and initiatives that improve overall well-being. For example, field research suggests that a strong commitment to both providing access to health care and addressing social factors that affect health—such as housing and employment—plays a major role in community health. At the same time, a sense of connectedness among different generations and diverse sectors helps to promote overall health and meet community needs with limited resources. Hale County’s classification as a Bright Spot means that, on average, the county performed better than expected on a number of health outcome measures, given its characteristics and resources—that is, the socioeconomics, demographics, behaviors, health care facilities, and other factors that influence health outcomes. It does not mean that all residents here enjoy excellent health. Like other counties with limited resources, Bright Spot counties face challenges to attaining good health outcomes. Hale County’s performance, however, indicates that certain county conditions or programs may be helping generate better-than-expected outcomes—and that other resource-challenged Appalachian counties may benefit from adopting similar initiatives.1
1 See Table 6 in the data appendix at the end of this case study for a full list of actual health outcomes for Hale County compared with predicted outcomes. For details on the outcome measures, see the data files accompanying the report Identifying Bright Spots in Appalachian Health: Statistical Analysis.

CREATING A CULTURE OF
HEALTH IN APPALACHIA Hale County, Alabama | CASE STUDIES
31
COUNTY OVERVIEW
Figure 5: Map - Bright Spot Community Hale County, Alabama
Hale�County�represents�a�metropolitan�county�in�Southern�Appalachia.�It�was�the�only�county�in�Appalachian�Alabama�identified�as�a�Bright�Spot.�� Hale County lies in Appalachia’s southernmost part, where the mountains may be more accurately described as foothills. It is approximately 33 miles southwest of Tuscaloosa. Three distinct areas make up most of the county: the town of Newbern in the south, the city of Moundville in the north, and the county seat of Greensboro in the middle. The remainder of the county consists of small rural communities, although the county is designated by the federal Office of Management and Budget as a metropolitan county. With a population of just over 15,000, Hale County is Alabama’s tenth-poorest county. Unemployment in 2014 was 9.9 percent, compared with 6.5 percent regionally and 6.2 percent nationally. Classified by the Appalachian Regional Commission as economically distressed in fiscal year 2017, Hale County has a median household income of $33,315, about 60 percent of the national median. The catfish industry employs many county residents, and more than half of the county’s residents work in health and social assistance, retail and wholesale trade, or manufacturing. The transportation and real estate sectors offer the highest-income jobs.
GEORGIA
SOUTH
CAROLINA
NORTH CAROLINA
ALABAMA
MISSISSIPPI
TENNESSEE
KENTUCKY
OHIO PENNSYLVANIA
MARYLAND
VIRGINIA
NEW YORK
WEST
VIRGINIA
Hale County, AL
N o r t h e r n
S o u t h e r n
C e n t r a l
S o u t h C e n t r a l
N o r t h C e n t r a l
0 10050
Miles

CREATING A CULTURE OF HEALTH IN APPALACHIA Hale County, Alabama | CASE STUDIES
32
Hale’s population is 58 percent black and 41 percent white, with other races, including American Indians, nominally represented. Nearly half (48.8 percent) of adults have some college education, compared with 63.3 percent nationally.2 Approximately 16 percent of the population receives benefits from the Social Security Administration, compared with about 5 percent of the national population.3 Beyond the poverty are signs of community investment and creative use of limited resources. The field work conducted for this report shows that a handful of leaders and nonprofits have played a major role in addressing the county’s housing shortage. Hale County has emphasized collaboration to leverage available resources. Stakeholders note that county residents have looked through the lens of opportunity instead of the lens of need. A DEEPER LOOK AT HALE COUNTY: COMMUNITY STRENGTHS As in the other Bright Spot communities explored in this report, people in Hale County have worked to elevate physical, social, and economic health in several ways. In Hale County, these efforts include developing affordable housing initiatives, establishing social programs for helping elderly people as well as those who are isolated and who have mental illness, and creating a health care clinic network. Field work helped identify local practices that appear to be contributing to overall health, document effective practices that could be replicated in other counties, and identify promising practices and strategies that should be explored further.4 Specifically, the research identified these features in Hale County:
� Presence of strong social programs and sustainable community-focused nonprofits: The long history of social support and community development of nonprofits in Hale County indicates strong community support and a high likelihood that the work of these nonprofits aligns with the needs of the community.
� Cross-sector collaboration of local leaders, organizations, and volunteers: Organizations in and outside of health care regularly communicate and collaborate face to face to address community issues such as transportation, housing, and chronic health conditions. The presence of committed and resourceful leadership supports these efforts. Volunteers often fill in when funding is insufficient.
� Access to health and human services: Hale County has the basic infrastructure necessary to maintain and strengthen access to health care services. The county has a hospital, network clinics, home health services, rehabilitation and therapy, and mental health services.
� Targeted support of youth and at-risk groups: Empowering youth and providing opportunities for them to engage with the community creates strong social connections between generations. It also provides the opportunity and space for young people to become community leaders. The elderly, as well as other vulnerable groups, benefit from strong social support systems.
2 Table 4 in the Hale County data appendix at the end of this case study provides a quantitative profile of county characteristics. 3 This includes receipt of benefits either through the Old-Age, Survivors, and Disability Insurance (OASDI) program or the Supplemental Security Income (SSI) program in 2014. 4 For a full explanation of the methodology, see Appendix B: Research Approach. For a list of key informants interviewed for this county, see Table 5 in the data appendix at the end of this case study.
CREATING A CULTURE OF HEALTH IN APPALACHIA Hale County, Alabama | CASE STUDIES
33
Community connectedness, the presence of exceptionally strong nonprofit leaders, and a focus on addressing underlying social factors such as lack of housing, workforce training, and substance abuse, seem to be important components in making health a shared value in Hale County. County residents also see value in collaborating with organizations outside the county, such as the Auburn University School of Architecture, to create a win-win for the university’s own learning initiatives and for Hale County residents. Hale County has undertaken efforts that fall into four overarching categories echoed in other Bright Spot counties: leadership, cross-sector collaboration, resource sharing, and local providers committed to public health. Community Leaders Engaged in Health Initiatives Strong, sustained leadership is evident in all of the Bright Spot communities, but especially so in Hale. Leaders include longtime resident entrepreneurs, members of the faith community, and dedicated health providers. Three programs have played a major role in shaping the county’s emphasis on housing—a known social factor that impacts health and well-being—and using local resources creatively to meet needs. These are the Hale Empowerment and Revitalization Organization (HERO), the Auburn Rural Studio, and Project Horseshoe Farm. Pam Dorr has been a dedicated steward of Hale County for years. She came to Hale County from San Francisco as a fellow in the Auburn Rural Studio program, one of Hale County’s first collaborative initiatives aimed at solving the county’s affordable housing problem. She found the work so meaningful that she decided to stay in Hale County and, in 2006, revived a defunct 501(c)(3) organization known as HERO. Under Dorr’s leadership, HERO worked to provide affordable housing and utilities assistance to residents. It focuses on three areas: supporting affordable housing development and education to reduce homelessness; helping families cover utility bills; and creating social enterprises that help residents in other ways, providing them with the knowledge, skills, and confidence to foster their own well-being. HERO does this through a combination of grants, partnerships, and reliance on a culture of recycling and resourcefulness. During her tenure at HERO, Dorr recognized the need to shift from a business model that relied on federal grants for 94 percent of its funding to a more entrepreneurial model designed to generate income from local businesses. Dorr helped create 11 small businesses and at least 50 new jobs. Those operations have generated more than $15 million in profits that were invested back into the community to build affordable housing for a large number of residents. HERO also subsidizes utility bills for approximately 1,800 households, which represent 30 percent of all homes in the county. These subsidies are a big part of the shelter safety net in Hale County. Dorr’s vision was not limited to housing. She wrote many grant proposals that have influenced public health, including one credited with helping improve the county’s high infant mortality rate in the early 2000s.

CREATING A CULTURE OF HEALTH IN APPALACHIA Hale County, Alabama | CASE STUDIES
34
Cross-Sector Collaboration In Hale County, there is a rich network of health and human services organizations collaborating with organizations rooted in very different fields, ranging from the Auburn University School of Architecture to local businesses and public housing. For example, the publicly owned Hale County Hospital, which provides a full range of primary care services, works closely with the Hale County Cooperative Extension Office, keeping it informed of new services as well as offering blood pressure checks and other supportive services at events and festivals. Established in 1993, Auburn Rural Studio is a unique, Hale County–based nonprofit internship program created by the Auburn University School of Architecture. Students accepted into this program receive poverty-level income and live in substandard living conditions while learning to work with tight resources to design and build sustainable infrastructure for Hale County and its residents. Third- and fifth-year architecture students spend months— even years—living in a restored farmhouse in Hale County as they see their projects through to completion. The students and local helpers learn how to be resourceful and creative as they organize, design, and construct a project. The projects emphasize addressing community infrastructure deficits, low-cost construction and operations, sustainability, local sourcing of building elements, and student leadership development. One of Auburn Rural Studio’s more recent endeavors is the development of “$20K Houses.” Students and staff are putting together a portfolio of relatively easy-to-build one-bedroom homes designed to be affordable and energy-efficient. Other community-centric projects have included new builds and renovations for the Antioch Baptist Church, the Newbern Volunteer Fire Department, the Hale County Animal Shelter, the Akron Boys and Girls Club, the Safe House Black History Museum, and, most recently, the redevelopment of Lions Park. Over the years, Auburn Rural Studio has engaged students in more than 170 projects in Hale and two other counties, often attracting resources from national nonprofits. By recognizing that lack of safe, affordable housing can negatively impact health, Auburn Rural Studio is making health a shared value. A number of other collaborative programs in Hale County support at-risk populations such as youth and the elderly. Several of the county’s most successful programs give young people meaningful ways to contribute to their personal development, to their families, and to their community. For example, YouthBuild, a national program with an active chapter in Hale through HERO, teaches construction skills to young people who have dropped out of high school as they work toward obtaining their GED. YouthBuild collaborates with Auburn Rural Studio on a wide range of construction projects, providing opportunities for creative, meaningful work.
© K
im C
ross
A�prototype�of�Auburn�Rural�Studio’s�“$20K�House”�
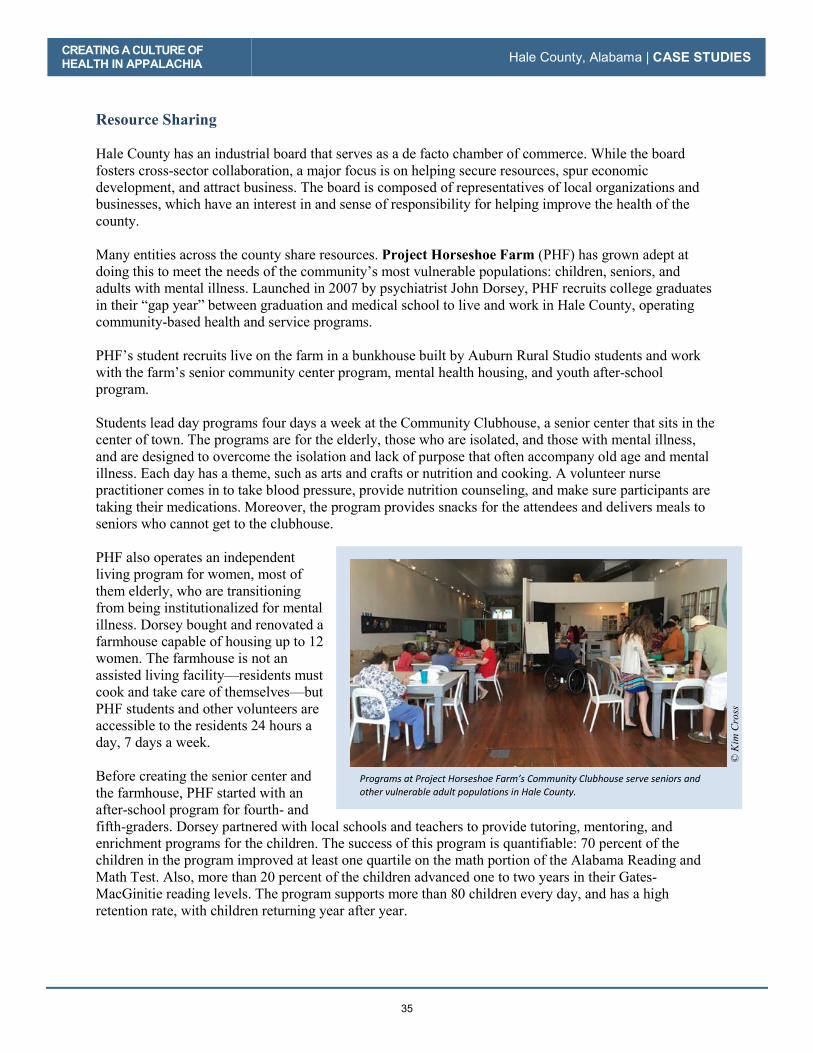
CREATING A CULTURE OF HEALTH IN APPALACHIA Hale County, Alabama | CASE STUDIES
35
Resource Sharing Hale County has an industrial board that serves as a de facto chamber of commerce. While the board fosters cross-sector collaboration, a major focus is on helping secure resources, spur economic development, and attract business. The board is composed of representatives of local organizations and businesses, which have an interest in and sense of responsibility for helping improve the health of the county. Many entities across the county share resources. Project Horseshoe Farm (PHF) has grown adept at doing this to meet the needs of the community’s most vulnerable populations: children, seniors, and adults with mental illness. Launched in 2007 by psychiatrist John Dorsey, PHF recruits college graduates in their “gap year” between graduation and medical school to live and work in Hale County, operating community-based health and service programs. PHF’s student recruits live on the farm in a bunkhouse built by Auburn Rural Studio students and work with the farm’s senior community center program, mental health housing, and youth after-school program. Students lead day programs four days a week at the Community Clubhouse, a senior center that sits in the center of town. The programs are for the elderly, those who are isolated, and those with mental illness, and are designed to overcome the isolation and lack of purpose that often accompany old age and mental illness. Each day has a theme, such as arts and crafts or nutrition and cooking. A volunteer nurse practitioner comes in to take blood pressure, provide nutrition counseling, and make sure participants are taking their medications. Moreover, the program provides snacks for the attendees and delivers meals to seniors who cannot get to the clubhouse. PHF also operates an independent living program for women, most of them elderly, who are transitioning from being institutionalized for mental illness. Dorsey bought and renovated a farmhouse capable of housing up to 12 women. The farmhouse is not an assisted living facility—residents must cook and take care of themselves—but PHF students and other volunteers are accessible to the residents 24 hours a day, 7 days a week. Before creating the senior center and the farmhouse, PHF started with an after-school program for fourth- and fifth-graders. Dorsey partnered with local schools and teachers to provide tutoring, mentoring, and enrichment programs for the children. The success of this program is quantifiable: 70 percent of the children in the program improved at least one quartile on the math portion of the Alabama Reading and Math Test. Also, more than 20 percent of the children advanced one to two years in their Gates-MacGinitie reading levels. The program supports more than 80 children every day, and has a high retention rate, with children returning year after year.
© K
im C
ross
Programs at Project Horseshoe Farm’s Community Clubhouse serve seniors and other vulnerable adult populations in Hale County.

CREATING A CULTURE OF HEALTH IN APPALACHIA Hale County, Alabama | CASE STUDIES
36
Local Providers Committed to Public Health In an area where health decisions are often made by “the pocketbook,” many Hale County residents think about health in terms of whether they can or should seek treatment. Local health facilities and programs such as Auburn Rural Studio, HERO, and PHF approach health from a different angle, working to address conditions such as housing, education, or work opportunities that can help improve overall community health. CREATING A CULTURE OF HEALTH IN HALE COUNTY Creativity, collaboration, and strong leadership are making a difference in Hale County. Across sectors, partners are operating innovative, entrepreneurial programs that make efficient use of local resources and recruit people from both inside and outside of the county to create an environment that fosters health. A resourceful, entrepreneurial approach by nonprofit and faith-based leaders has helped to advance community well-being, in part by tapping into the strong culture of volunteerism here. Relationships between generations and different sectors are part of what brings the community together. Several programs work to reduce social isolation and address mental health for vulnerable populations, such as the elderly, and to support and nurture young people. Access to fundamental health care services is good, but community leaders also recognize the importance of social factors beyond medical care, including affordable housing and good jobs, to support health and well-being. This broad approach to health as part of the fabric of everyday life, combined with a commitment to ensuring that all residents have the basics they need for good health, has helped Hale County accomplish much with few resources.

CREATING A CULTURE OF HEALTH IN APPALACHIA Hale County, Alabama | CASE STUDIES
37
REFERENCES Agee, James, and Walker Evans. 1941. Let Us Now Praise Famous Men. Boston: Houghton Mifflin.
Agency for Healthcare Research and Quality. 2011. “Chapter 9: Access to Health Care, 2011 National Healthcare Quality Report.” Agency for Healthcare Research and Quality. https://www.ahrq.gov/research/findings/nhqrdr/nhqr11/chap9.html Alabama Department of Public Health. 2007–2015. “Alabama National Health File, 1974–2006.” http://alabama.nationalhealthfile.org/Hale/Details/5--Year-Average-Total-Infant-Mortality-Rate,-less-than-1-year-old Bernstein, Fred A. 2005. “In Alabama, a Poor County is Rich in Modern Architecture.” New York Times, December 25, 2005. Accessed May 15, 2018. https://www.nytimes.com/2005/12/25/travel/in-alabama-a-poor-county-is-rich-in-modern-architecture.html Catlin, Bridget, A. Jovaag, and J. Williams Van Dijk. 2015. 2015 County Health Rankings Key Findings Report. Population Health Institute, University of Wisconson, Madison, Wis.: County Health Rankings & Roadmaps. Data USA. 2017. Hale County, AL. https://datausa.io/profile/geo/hale-county-al/ Downes, Lawrence. 2011. “Of Poor Farmers and ‘Famous Men’.” New York Times, November 26, 2011. Accessed May 15, 2018. https://www.nytimes.com/2011/11/27/opinion/sunday/of-poor-farmers-and-famous-men.html Edge, John T. 2010. “Pie + Design = Change.” New York Times, October 8, 2010. Accessed May 15, 2018. https://www.nytimes.com/2010/10/10/magazine/10pielab-t.html Grabowski, David C. 2007. “Medicare and Medicaid: Conflicting Incentives for Long-Term Care.” The Milbank Quarterly 84 (4): 579-610. doi:10.1111/j.1468-0009.2007.00502.x. Holmes, G. Mark, Nancy M. Lane, Thomas A. Arcury, Michael L. Schwalbe, Randy Randolph, John Frank, Sharita Thomas, et. al. 2018. Identifying Bright Spots in Appalachian Health: Statistical Analysis. Washington, D.C.: Appalachian Regional Commission. Marshall, Julie L., Logan Thomas, Nancy M. Lane, G. Mark Holmes, Thomas A. Arcury, Randy Randolph, Pam Silberman, et al. 2017. Health Disparities in Appalachia. Appalachian Regional Commission. Rural SW Alabama. 2017. About Rural Southwest Alabama. http://www.ruralswalabama.org/about/ Sawyerville Day Camp. 2017. Sawyerville Day Camp. http://www.sawyervilledaycamp.org/
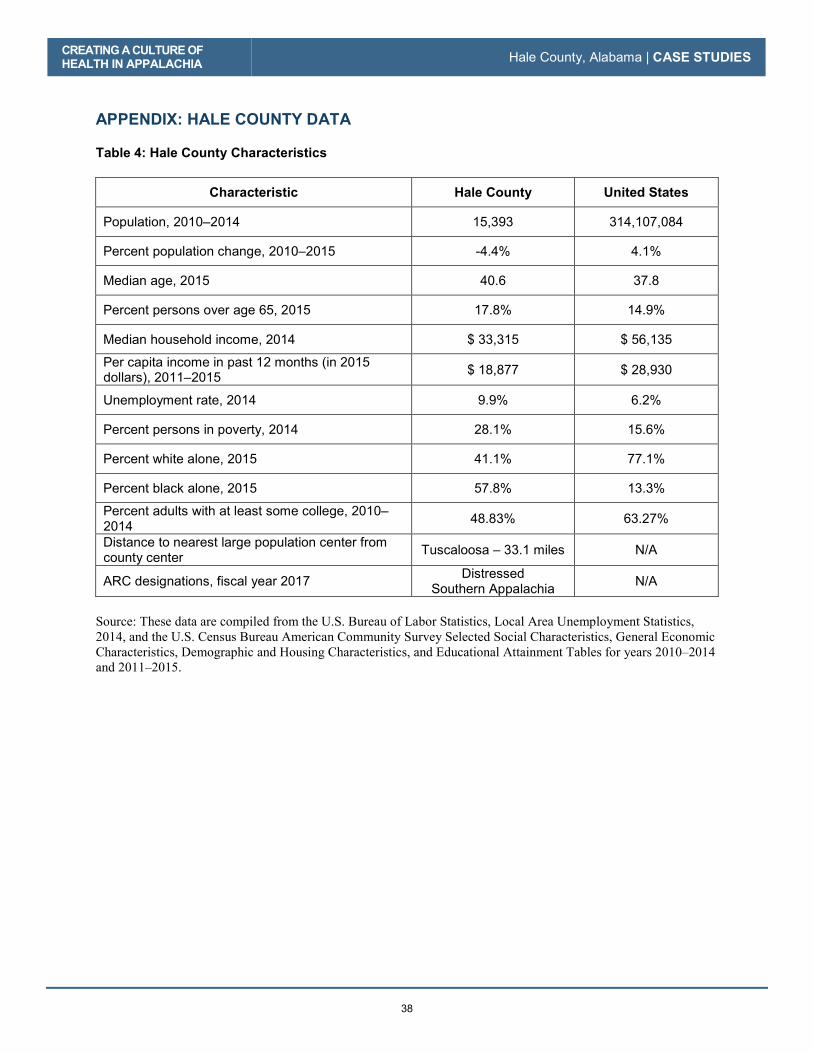
CREATING A CULTURE OF HEALTH IN APPALACHIA Hale County, Alabama | CASE STUDIES
38
APPENDIX: HALE COUNTY DATA Table 4: Hale County Characteristics
Characteristic Hale County United States
Population, 2010–2014 15,393 314,107,084
Percent population change, 2010–2015 -4.4% 4.1%
Median age, 2015 40.6 37.8
Percent persons over age 65, 2015 17.8% 14.9%
Median household income, 2014 $ 33,315 $ 56,135
Per capita income in past 12 months (in 2015 dollars), 2011–2015 $ 18,877 $ 28,930
Unemployment rate, 2014 9.9% 6.2%
Percent persons in poverty, 2014 28.1% 15.6%
Percent white alone, 2015 41.1% 77.1%
Percent black alone, 2015 57.8% 13.3%
Percent adults with at least some college, 2010–2014 48.83% 63.27%
Distance to nearest large population center from county center Tuscaloosa – 33.1 miles N/A
ARC designations, fiscal year 2017 Distressed Southern Appalachia N/A
Source: These data are compiled from the U.S. Bureau of Labor Statistics, Local Area Unemployment Statistics, 2014, and the U.S. Census Bureau American Community Survey Selected Social Characteristics, General Economic Characteristics, Demographic and Housing Characteristics, and Educational Attainment Tables for years 2010–2014 and 2011–2015.

CREATING A CULTURE OF HEALTH IN APPALACHIA Hale County, Alabama | CASE STUDIES
39
Table 5: Hale County Key Informants
Name Location Title Organization Interview Date
Stacey Adams Greensboro Assistant Area Administrator
Hale County Health Department 9/21/2016
Regina Knox Greensboro Executive Director, West Central Alabama AHEC
Area Health Education Center 9/21/2016
Tyrone Smith Greensboro County Coordinator Alabama Cooperative Extension System 9/21/2016
Pam Dorr Greensboro Director Hale Empowerment and Revitalization Organization 9/21/2016
Dr. John Dorsey Greensboro Director Project Horseshoe Farm 9/21/2016
Xavier Vendrell Newbern Director/Professor Auburn Rural Studio 9/22/2016
Natalie Butts-Ball Newbern Communications Manager Auburn Rural Studio 9/22/2016
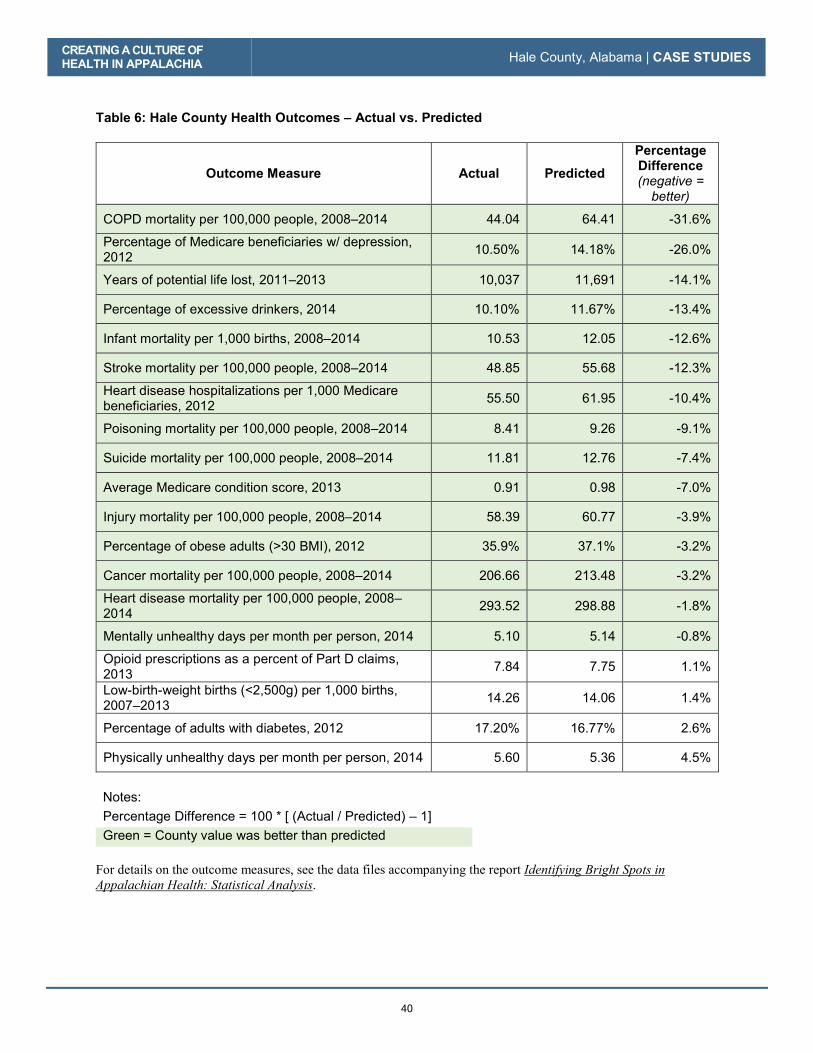
CREATING A CULTURE OF HEALTH IN APPALACHIA Hale County, Alabama | CASE STUDIES
40
Table 6: Hale County Health Outcomes – Actual vs. Predicted
Outcome Measure Actual Predicted Percentage Difference (negative =
better) COPD mortality per 100,000 people, 2008–2014 44.04 64.41 -31.6%
Percentage of Medicare beneficiaries w/ depression, 2012 10.50% 14.18% -26.0%
Years of potential life lost, 2011–2013 10,037 11,691 -14.1%
Percentage of excessive drinkers, 2014 10.10% 11.67% -13.4%
Infant mortality per 1,000 births, 2008–2014 10.53 12.05 -12.6%
Stroke mortality per 100,000 people, 2008–2014 48.85 55.68 -12.3%
Heart disease hospitalizations per 1,000 Medicare beneficiaries, 2012 55.50 61.95 -10.4%
Poisoning mortality per 100,000 people, 2008–2014 8.41 9.26 -9.1%
Suicide mortality per 100,000 people, 2008–2014 11.81 12.76 -7.4%
Average Medicare condition score, 2013 0.91 0.98 -7.0%
Injury mortality per 100,000 people, 2008–2014 58.39 60.77 -3.9%
Percentage of obese adults (>30 BMI), 2012 35.9% 37.1% -3.2%
Cancer mortality per 100,000 people, 2008–2014 206.66 213.48 -3.2%
Heart disease mortality per 100,000 people, 2008–2014 293.52 298.88 -1.8%
Mentally unhealthy days per month per person, 2014 5.10 5.14 -0.8%
Opioid prescriptions as a percent of Part D claims, 2013 7.84 7.75 1.1%
Low-birth-weight births (<2,500g) per 1,000 births, 2007–2013 14.26 14.06 1.4%
Percentage of adults with diabetes, 2012 17.20% 16.77% 2.6%
Physically unhealthy days per month per person, 2014 5.60 5.36 4.5%
Notes: Percentage Difference = 100 * [ (Actual / Predicted) – 1] Green = County value was better than predicted
For details on the outcome measures, see the data files accompanying the report Identifying Bright Spots in Appalachian Health: Statistical Analysis.

CREATING A CULTURE OF HEALTH IN APPALACHIA Hale County, Alabama | CASE STUDIES
41
Table 7: Hale County Health Drivers vs. National Median
Driver Measure Lower is Better?
National Median
Hale County
Air pollution (average daily particulate matter 2.5), 2011 Yes 11.87 12.92
Average travel time to work in minutes, 2010–2014 Yes 22.82 28.98
Chlamydia incidence rate per 100,000, 2013 Yes 287.16 1,260.72
Dentists per 100,000 population, 2014 No 37.45 13.18
Economic index, fiscal year 2017 Yes 108.79 159.67
Full-service restaurants per 1,000, 2012 No 0.68 0.26
Grocery stores per 1,000 residents, 2012 No 0.20 0.19
Median household income, 2014 No $45,226.00 $33,315.00
Mental health providers per 100,000 population, 2015 No 80.00 19.76
Percentage of adults currently smoking, 2014 Yes 17.8% 21.8%
Percentage of adults not physically active, 2012 Yes 27.7% 35.3%
Percentage of adults with at least some college, 2010–2014 No 56.3% 48.8%
Income inequality ratio,5 2010-2014 Yes 4.4% 5.6%
Percentage of diabetics with A1C testing, 2012 No 85.4% 77.2%
Percentage of doctors who e-prescribe, 2014 No 65.0% 80.0%
Percentage of eligibles enrolled in SNAP, 2014 No 78.0% 79.0%
Percentage of households with income below poverty, 2014 Yes 15.8% 28.1%
Percentage of Medicare women with recent mammogram, 2013 No 61.0% 65.0%
Percentage of population with access to places for physical activity, 2014 No 61.9% 58.3%
Percentage of total population in social assistant jobs, 2013 N/A 0.01% 0.00%
Percentage receiving disability OASDI and/or SSI, 2014 Yes 5.4% 16.2%
Percentage spending >30% of income on housing, 2010–2014 Yes 29.0% 35.1%
Percentage w/ no car, low access, 2010–2014 Yes 19.7% 0.06%
Primary care physicians per 100,000 population, 2013 No 48.54 12.99
5 Income inequality is the ratio of household income at the 80th percentile to that at the 20th percentile. A higher ratio reflects greater division between the top and the bottom of the income spectrum.

CREATING A CULTURE OF HEALTH IN APPALACHIA Hale County, Alabama | CASE STUDIES
42
Driver Measure Lower is Better?
National Median
Hale County
Social associations per 10,000 population, 2013 No 12.68 5.19
Specialist physicians per 100,000 population, 2013 No 25.93 19.49
Students per teacher, 2013–2014 Yes 14.13 14.76
Teenage births per 1,000, 2007–2013 Yes 39.96 42.58
Uninsured rate for people under 65, 2013 Yes 17.24 16.09
Notes: Green = County value was better than national median
For details on the driver measures, see the data files accompanying the report Identifying Bright Spots in Appalachian Health: Statistical Analysis.

43
McCreary County, Kentucky
County Overview
A Deeper Look at McCreary County: Community Strengths
Creating a Culture of Health in McCreary County
References
Appendix: McCreary County Data

44
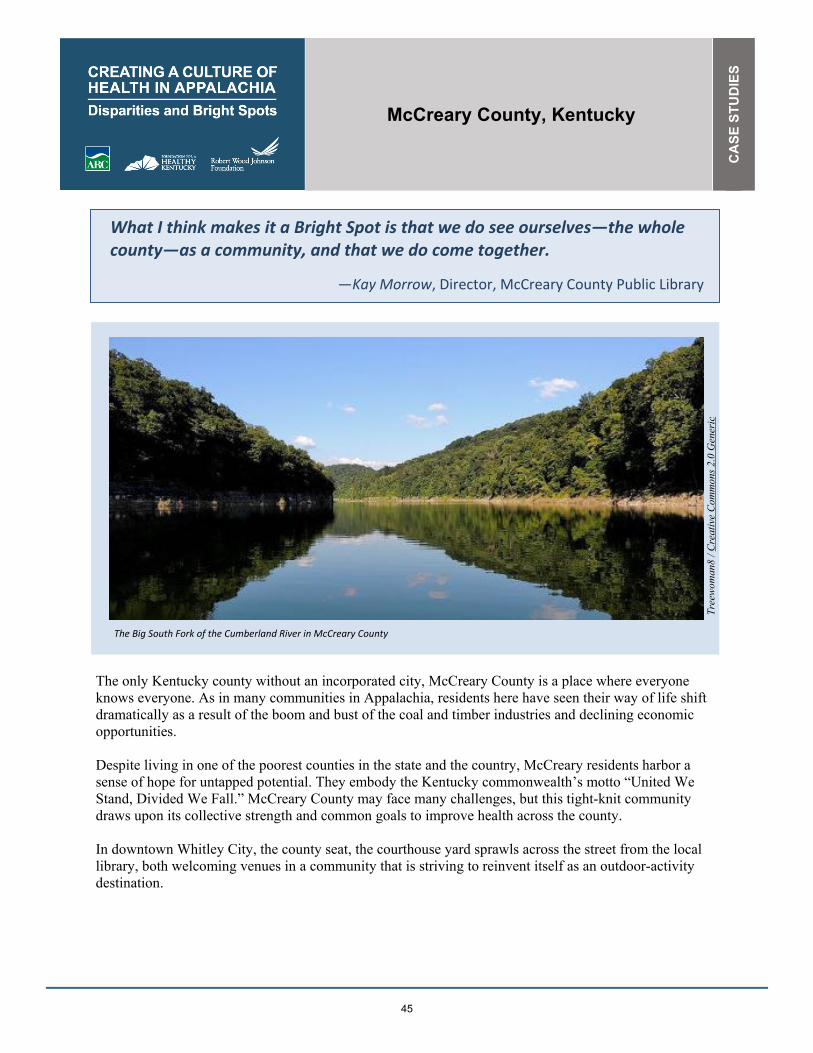
McCreary County, Kentucky
CA
SE
STU
DIE
S
45
What I think makes it a Bright Spot is that we do see ourselves—the whole county—as a community, and that we do come together.
—Kay Morrow, Director, McCreary County Public Library
The only Kentucky county without an incorporated city, McCreary County is a place where everyone
knows everyone. As in many communities in Appalachia, residents here have seen their way of life shift
dramatically as a result of the boom and bust of the coal and timber industries and declining economic
opportunities.
Despite living in one of the poorest counties in the state and the country, McCreary residents harbor a
sense of hope for untapped potential. They embody the Kentucky commonwealth’s motto “United We
Stand, Divided We Fall.” McCreary County may face many challenges, but this tight-knit community
draws upon its collective strength and common goals to improve health across the county.
In downtown Whitley City, the county seat, the courthouse yard sprawls across the street from the local
library, both welcoming venues in a community that is striving to reinvent itself as an outdoor-activity
destination.
The Big South Fork of the Cumberland River in McCreary County
Tree
wom
an8
/ Cre
ativ
e C
omm
ons 2
.0 G
ener
ic

CREATING A CULTURE OF HEALTH IN APPALACHIA McCreary County, Kentucky | CASE STUDIES
46
McCreary County is home to approximately 18,000 people, and the population is predominantly white. Its
poverty rate is triple the national rate, and the unemployment rate is 10.6 percent, much higher than the
national average of 6.2 percent.
McCreary County is among the ten percent of Appalachian counties—and one of nine counties in
Appalachian Kentucky—identified as a Bright Spot, performing better than expected on 14 out of 19
different health outcome measures. Notably, McCreary County performed better than expected on:
� Injury mortality: 40 percent better than expected
� Stroke mortality: 37 percent better than expected
� Poisoning mortality: 34 percent better than expected
� Percentage of Medicare beneficiaries with depression: 19 percent better than expected
� Years of potential life lost: 15 percent better than expected
McCreary County’s classification as a Bright Spot means that, on average, the county performed better
than expected on a number of health outcome measures, given its characteristics and resources—that is,
the socioeconomics, demographics, behaviors, health care facilities, and other factors that influence health
outcomes. It does not mean that all residents here enjoy excellent health. McCreary County still lags
behind national rates on many health-related indicators. Like other counties with limited resources, Bright
Spot counties face challenges to attaining good health outcomes. McCreary County’s performance,
however, indicates that certain county conditions or programs may be helping generate better-than-
expected outcomes—and that other resource-challenged Appalachian counties may benefit from adopting
similar initiatives.1
1 See Table 10 in the data appendix at the end of this case study for a full list of actual health outcomes for
McCreary County compared with predicted outcomes. For details on the outcome measures, see the data files accompanying the report Identifying Bright Spots in Appalachian Health: Statistical Analysis.

CREATING A CULTURE OF
HEALTH IN APPALACHIA McCreary County, Kentucky | CASE STUDIES
47
COUNTY OVERVIEW
Figure 6: Map - Bright Spot Community McCreary County, Kentucky
McCreary�County�represents�a�nonmetropolitan�county�in�Central�Appalachia.�It�is�one�of�nine�Bright�Spot�counties�in�Appalachian�Kentucky.� McCreary County is in southeastern Kentucky along the border of northeastern Tennessee. This nearly-500-square-mile area is encompassed by two outdoor gems: the Daniel Boone National Forest and the Big South Fork National River and Recreation Area. A place that offers cliffs, gorges, waterfalls, rock shelters, and natural stone arches, McCreary County is trying to reinvent itself as a tourist destination for outdoor activities. Public-sector institutions have a heavy presence here, and the majority of land in this tiny county—the forest, the park, and the prison outside of Pine Knot—is owned or managed by the federal government. Because federal land isn’t taxable, the small amount of remaining private property provides a small tax base for local revenue. Like many Appalachian counties, McCreary was once heavily dependent on coal mining, but the last mine closed in 1994. Jobs here are scarce. Most residents here work in government jobs, including for the U.S. Penitentiary and the county school system. Although the county lacks a hospital or major health center, health care is the fifth-largest field of employment. Residents work in clinics, mental health
GEORGIA
SOUTH
CAROLINA
NORTH CAROLINA
ALABAMA
MISSISSIPPI
TENNESSEE
KENTUCKY
OHIO PENNSYLVANIA
MARYLAND
VIRGINIA
NEW YORK
WEST
VIRGINIA
McCreary County, KY
N o r t h e r n
S o u t h e r n
C e n t r a l
S o u t h C e n t r a l
N o r t h C e n t r a l
0 10050
Miles

CREATING A CULTURE OF HEALTH IN APPALACHIA McCreary County, Kentucky | CASE STUDIES
48
facilities, home health, and nursing home care. Outdoor Venture Corporation, a military-grade shelter and
related equipment manufacturer, supplies jobs via defense and private national contracts.
Educational achievement is a challenge here. Some 72 percent of residents have finished high school, and
only 7.5 percent have completed college, a figure much lower than the state rate and the national average.
Slightly more than 40 percent of adults have had some college education, compared with 63.2 percent
nationally.
Classified as economically distressed by the Appalachian Regional Commission in fiscal year 2017,
McCreary County’s median household income of $24,265 is 43 percent of the national average. The per
capita income of $10,880 makes it one of the poorest counties in the United States. About 47 percent of
people here live in poverty, compared with 15.6 percent nationally. Residents rely heavily on government
assistance: some 85 percent of eligible residents are enrolled in the Supplemental Nutrition Assistance
Program (SNAP), and 17.4 percent are receiving Supplemental Security Income (SSI) or disability
benefits—rates much higher than the national average.2
A DEEPER LOOK AT MCCREARY COUNTY: COMMUNITY STRENGTHS The people who live in McCreary County have a strong tradition of working together and leveraging
resources in creative ways to solve challenges and address gaps. They do this through perseverance and
by pooling resources and creating partnerships. There is a deep commitment of neighbors eager to help
neighbors in McCreary County.
Field work helped identify local practices that appear to be contributing to overall health, document
effective practices that could be replicated in other counties, and identify promising practices and
strategies that should be explored further.3 Specifically, the research identified these characteristics and
strategies in McCreary County:
� Intra-county cooperation and resource sharing: The absence of a hospital or major health
center forces McCreary residents to pool resources and focus on efficiency. The community is
close-knit, with a strong local volunteer culture and initiatives focused on perceived community
health issues. The library, religious organizations, and organizations that deliver health care
services appear strongly connected to each other and to the community at large.
� Presence and sustainability of community-focused nonprofits: Nonprofit organizations
depend on the support of the communities they seek to help. The longevity of the nonprofits in
McCreary County indicates strong community support and a higher likelihood that the nonprofits
have aligned with the specific needs of the community by matching the values and culture of its
residents. It is also apparent that some nonprofits, like the Christian Care Center, are serving as
safety net institutions.
� Strong integration of health services and systems: McCreary County benefits from cooperation
among a regional health department, emergency medical services, a home health agency, a
nursing home, a mental health program, and primary care clinics that work together to provide
2 Table 8 in the McCreary County data appendix at the end of this case study provides a quantitative profile of
county characteristics. 3 For a full explanation of the methodology, see Appendix B: Research Approach. For a list of key informants interviewed for this county, see Table 9 in the data appendix at the end of this case study.

CREATING A CULTURE OF HEALTH IN APPALACHIA McCreary County, Kentucky | CASE STUDIES
49
essential primary, preventive, and chronic health care. Adanta, the behavioral health and
substance abuse program, has strong partnerships with the court and school systems.
� Making health a shared value: McCreary County leaders recognize the benefits of a healthy
lifestyle. Elected officials invest in wellness programs, health care services, and recreation, and
encourage residents to eat fresh, nutritious foods and take advantage of the natural environment to
increase their physical activity. The county has also invested in the library as a resource center for
health and social support information.
Like other Bright Spot counties explored in this report, McCreary County has used a variety of
approaches to elevate the physical, social, and economic health of its residents. These actions fall into
four overarching categories of leadership, cross-sector collaboration, resource sharing, and local providers
committed to public health.
Community Leaders Engaged in Health Initiatives Strong, sustained leadership was evident in all of the Bright Spot counties studied. In McCreary County,
leaders are seen in all walks of life—from the local librarian and minister to a county official, a social
worker, and a local emergency medicine professional.
One example is Kay Morrow, who runs the McCreary County Public Library. The library serves as an important connector
and resource to residents, community groups, organizations,
businesses, churches, and schools. When residents enter, they
are exposed to literature addressing drug abuse, infant care,
upcoming health-focused community events, and details of
library programs. A trained social worker, Morrow helps
residents apply for utility subsidies and health insurance via the
library’s computers. The library’s meeting room serves as a
place for healthy-cooking classes, seminars on finance, and
family reunions. Always eager to make a better life for residents
here, Morrow is spearheading efforts to rebuild the crumbling
sidewalks downtown, secure more lighting at night, and
organize a downtown walking club to boost physical activity.
Another example is Sue Singleton, who oversees the
McCreary County Christian Care Center’s food pantry.
She has seen too many needed programs wither. But that hasn’t
deterred this dynamic grandmother from pushing for services
she knows residents need, including a needle exchange program
for intravenous drug users. Each day the center provides food to
those in need; and medical services—including supplying
medicine to residents without insurance or means to pay—are
made possible due to donations from local business, churches,
individuals, and small grants. The food pantry is open four days
a week and supports more than 700 families each month.
And there is also Reverend Braxton King, who directs a
nonprofit community center called Lord’s Gym, which provides
gym participants with support and preventive information about
© J
oyce
Pin
son
Kay Morrow, director of the McCreary County Public Library
© J
oyce
Pin
son
Sue Singleton, director of the McCreary County Christian Care Center
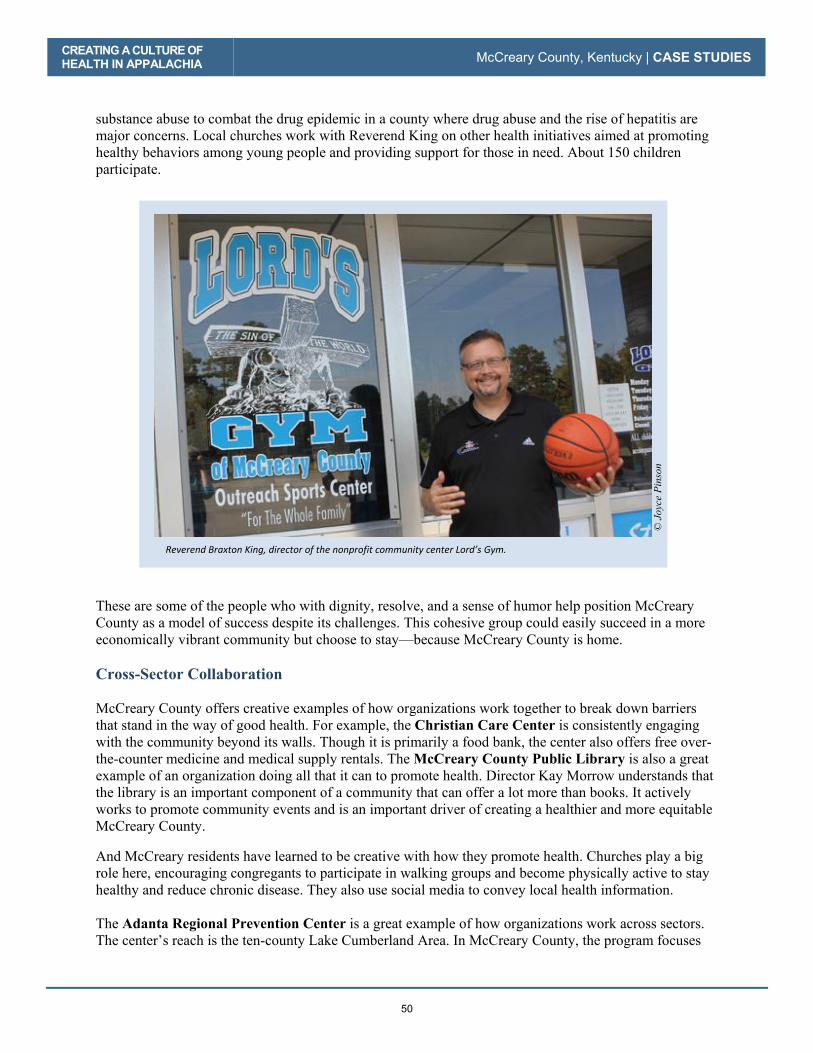
CREATING A CULTURE OF HEALTH IN APPALACHIA McCreary County, Kentucky | CASE STUDIES
50
substance abuse to combat the drug epidemic in a county where drug abuse and the rise of hepatitis are
major concerns. Local churches work with Reverend King on other health initiatives aimed at promoting
healthy behaviors among young people and providing support for those in need. About 150 children
participate.
These are some of the people who with dignity, resolve, and a sense of humor help position McCreary
County as a model of success despite its challenges. This cohesive group could easily succeed in a more
economically vibrant community but choose to stay—because McCreary County is home.
Cross-Sector Collaboration
McCreary County offers creative examples of how organizations work together to break down barriers
that stand in the way of good health. For example, the Christian Care Center is consistently engaging
with the community beyond its walls. Though it is primarily a food bank, the center also offers free over-
the-counter medicine and medical supply rentals. The McCreary County Public Library is also a great
example of an organization doing all that it can to promote health. Director Kay Morrow understands that
the library is an important component of a community that can offer a lot more than books. It actively
works to promote community events and is an important driver of creating a healthier and more equitable
McCreary County.
And McCreary residents have learned to be creative with how they promote health. Churches play a big
role here, encouraging congregants to participate in walking groups and become physically active to stay
healthy and reduce chronic disease. They also use social media to convey local health information.
The Adanta Regional Prevention Center is a great example of how organizations work across sectors.
The center’s reach is the ten-county Lake Cumberland Area. In McCreary County, the program focuses
Reverend Braxton King, director of the nonprofit community center Lord’s Gym.
© J
oyce
Pin
son
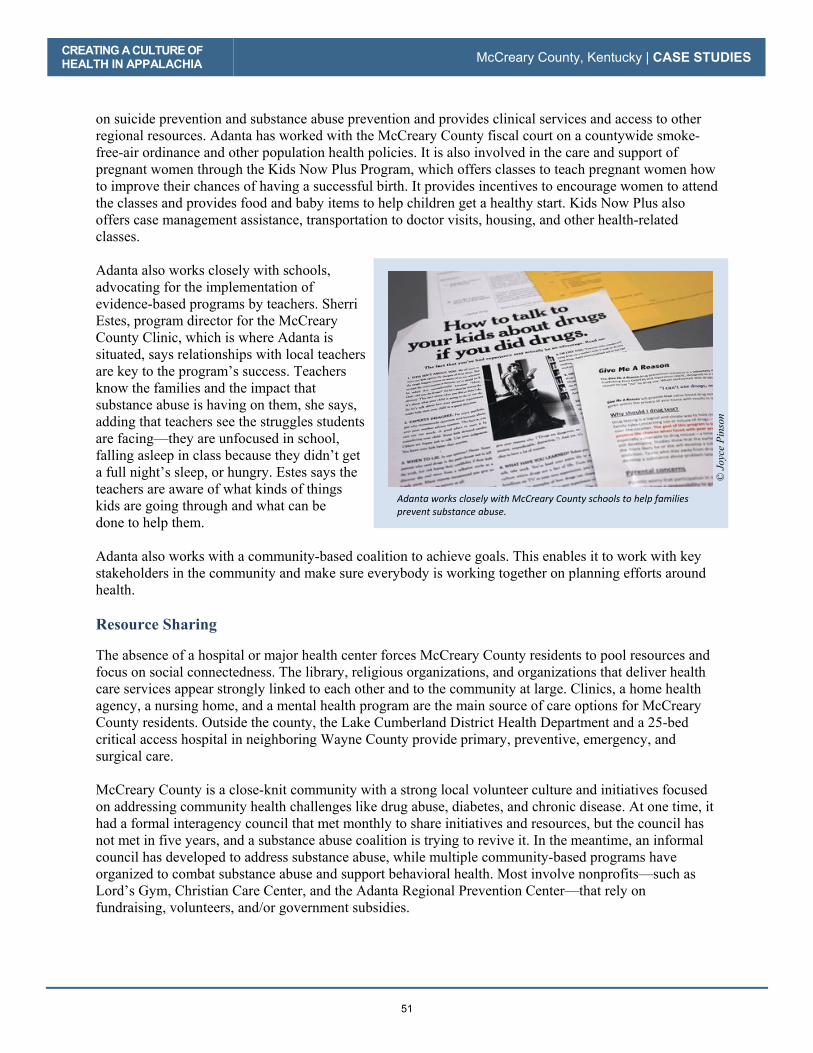
CREATING A CULTURE OF HEALTH IN APPALACHIA McCreary County, Kentucky | CASE STUDIES
51
on suicide prevention and substance abuse prevention and provides clinical services and access to other
regional resources. Adanta has worked with the McCreary County fiscal court on a countywide smoke-
free-air ordinance and other population health policies. It is also involved in the care and support of
pregnant women through the Kids Now Plus Program, which offers classes to teach pregnant women how
to improve their chances of having a successful birth. It provides incentives to encourage women to attend
the classes and provides food and baby items to help children get a healthy start. Kids Now Plus also
offers case management assistance, transportation to doctor visits, housing, and other health-related
classes.
Adanta also works closely with schools,
advocating for the implementation of
evidence-based programs by teachers. Sherri
Estes, program director for the McCreary
County Clinic, which is where Adanta is
situated, says relationships with local teachers
are key to the program’s success. Teachers
know the families and the impact that
substance abuse is having on them, she says,
adding that teachers see the struggles students
are facing—they are unfocused in school,
falling asleep in class because they didn’t get
a full night’s sleep, or hungry. Estes says the
teachers are aware of what kinds of things
kids are going through and what can be
done to help them.
Adanta also works with a community-based coalition to achieve goals. This enables it to work with key
stakeholders in the community and make sure everybody is working together on planning efforts around
health.
Resource Sharing
The absence of a hospital or major health center forces McCreary County residents to pool resources and
focus on social connectedness. The library, religious organizations, and organizations that deliver health
care services appear strongly linked to each other and to the community at large. Clinics, a home health
agency, a nursing home, and a mental health program are the main source of care options for McCreary
County residents. Outside the county, the Lake Cumberland District Health Department and a 25-bed
critical access hospital in neighboring Wayne County provide primary, preventive, emergency, and
surgical care.
McCreary County is a close-knit community with a strong local volunteer culture and initiatives focused
on addressing community health challenges like drug abuse, diabetes, and chronic disease. At one time, it
had a formal interagency council that met monthly to share initiatives and resources, but the council has
not met in five years, and a substance abuse coalition is trying to revive it. In the meantime, an informal
council has developed to address substance abuse, while multiple community-based programs have
organized to combat substance abuse and support behavioral health. Most involve nonprofits—such as
Lord’s Gym, Christian Care Center, and the Adanta Regional Prevention Center—that rely on
fundraising, volunteers, and/or government subsidies.
© J
oyce
Pin
son
Adanta works closely with McCreary County schools to help families prevent substance abuse.
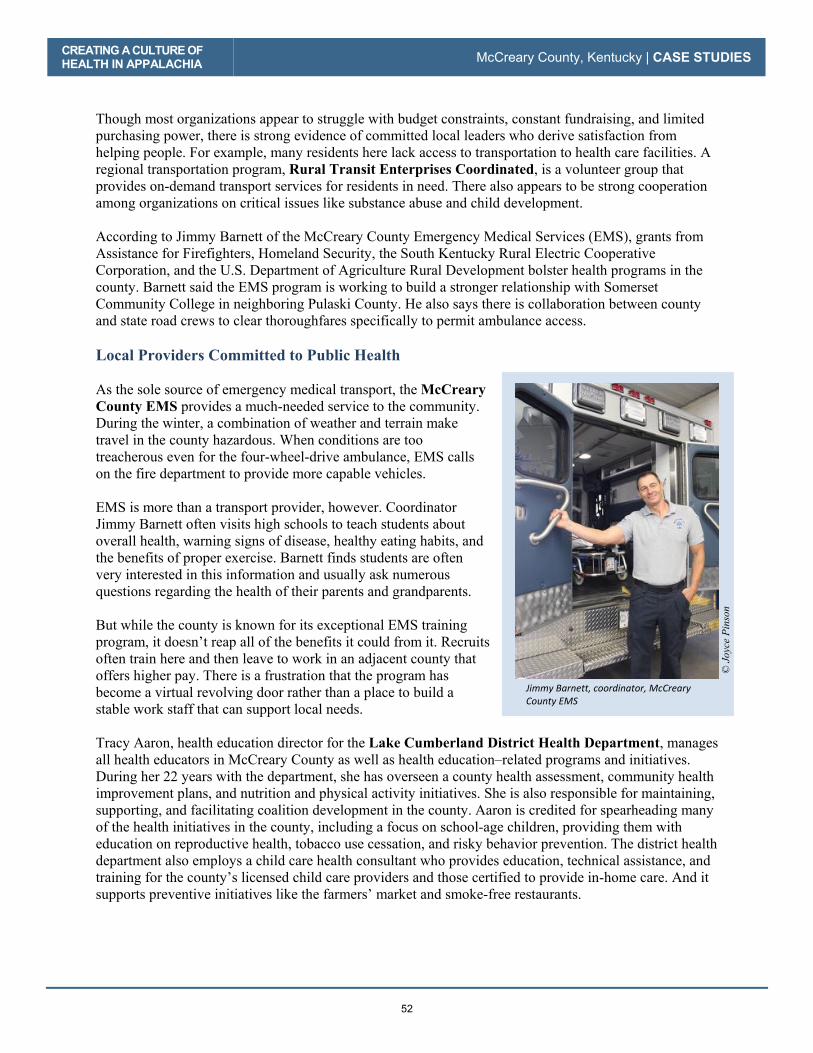
CREATING A CULTURE OF HEALTH IN APPALACHIA McCreary County, Kentucky | CASE STUDIES
52
Though most organizations appear to struggle with budget constraints, constant fundraising, and limited
purchasing power, there is strong evidence of committed local leaders who derive satisfaction from
helping people. For example, many residents here lack access to transportation to health care facilities. A
regional transportation program, Rural Transit Enterprises Coordinated, is a volunteer group that
provides on-demand transport services for residents in need. There also appears to be strong cooperation
among organizations on critical issues like substance abuse and child development.
According to Jimmy Barnett of the McCreary County Emergency Medical Services (EMS), grants from
Assistance for Firefighters, Homeland Security, the South Kentucky Rural Electric Cooperative
Corporation, and the U.S. Department of Agriculture Rural Development bolster health programs in the
county. Barnett said the EMS program is working to build a stronger relationship with Somerset
Community College in neighboring Pulaski County. He also says there is collaboration between county
and state road crews to clear thoroughfares specifically to permit ambulance access.
Local Providers Committed to Public Health
As the sole source of emergency medical transport, the McCreary County EMS provides a much-needed service to the community.
During the winter, a combination of weather and terrain make
travel in the county hazardous. When conditions are too
treacherous even for the four-wheel-drive ambulance, EMS calls
on the fire department to provide more capable vehicles.
EMS is more than a transport provider, however. Coordinator
Jimmy Barnett often visits high schools to teach students about
overall health, warning signs of disease, healthy eating habits, and
the benefits of proper exercise. Barnett finds students are often
very interested in this information and usually ask numerous
questions regarding the health of their parents and grandparents.
But while the county is known for its exceptional EMS training
program, it doesn’t reap all of the benefits it could from it. Recruits
often train here and then leave to work in an adjacent county that
offers higher pay. There is a frustration that the program has
become a virtual revolving door rather than a place to build a
stable work staff that can support local needs.
Tracy Aaron, health education director for the Lake Cumberland District Health Department, manages
all health educators in McCreary County as well as health education–related programs and initiatives.
During her 22 years with the department, she has overseen a county health assessment, community health
improvement plans, and nutrition and physical activity initiatives. She is also responsible for maintaining,
supporting, and facilitating coalition development in the county. Aaron is credited for spearheading many
of the health initiatives in the county, including a focus on school-age children, providing them with
education on reproductive health, tobacco use cessation, and risky behavior prevention. The district health
department also employs a child care health consultant who provides education, technical assistance, and
training for the county’s licensed child care providers and those certified to provide in-home care. And it
supports preventive initiatives like the farmers’ market and smoke-free restaurants.
© J
oyce
Pin
son
Jimmy Barnett, coordinator, McCreary County EMS
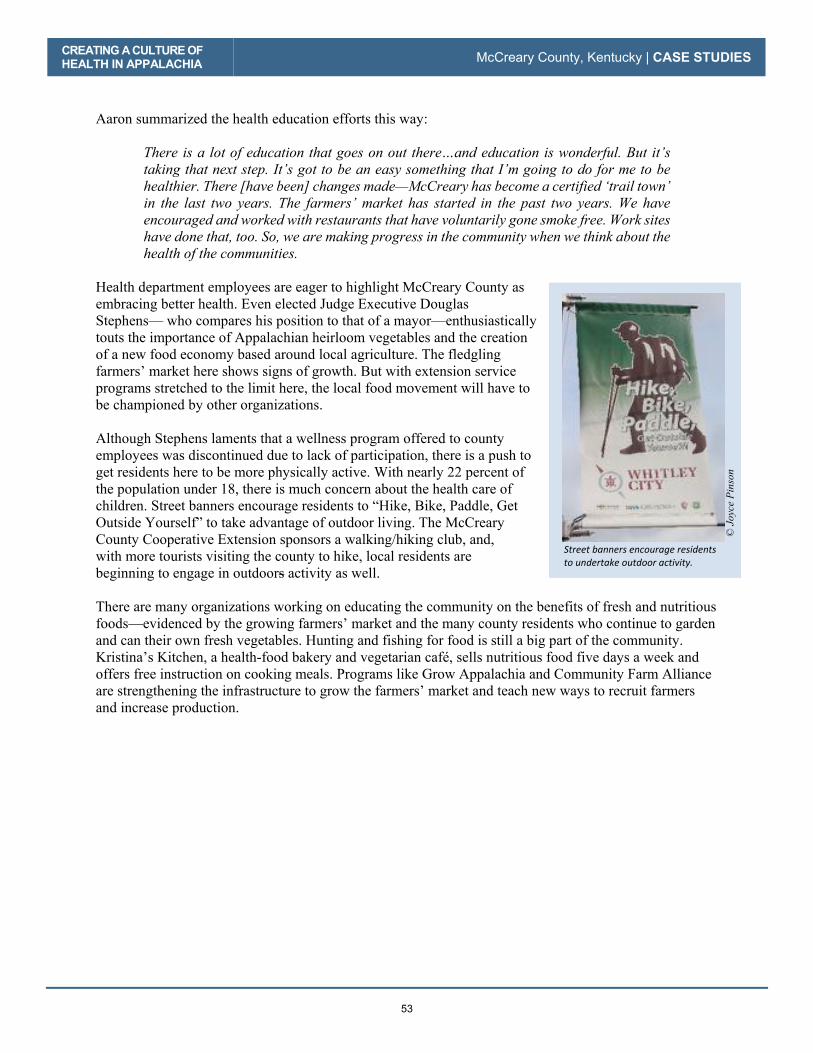
CREATING A CULTURE OF HEALTH IN APPALACHIA McCreary County, Kentucky | CASE STUDIES
53
Aaron summarized the health education efforts this way:
There is a lot of education that goes on out there…and education is wonderful. But it’s taking that next step. It’s got to be an easy something that I’m going to do for me to be healthier. There [have been] changes made—McCreary has become a certified ‘trail town’ in the last two years. The farmers’ market has started in the past two years. We have encouraged and worked with restaurants that have voluntarily gone smoke free. Work sites have done that, too. So, we are making progress in the community when we think about the health of the communities.
Health department employees are eager to highlight McCreary County as
embracing better health. Even elected Judge Executive Douglas
Stephens— who compares his position to that of a mayor—enthusiastically
touts the importance of Appalachian heirloom vegetables and the creation
of a new food economy based around local agriculture. The fledgling
farmers’ market here shows signs of growth. But with extension service
programs stretched to the limit here, the local food movement will have to
be championed by other organizations.
Although Stephens laments that a wellness program offered to county
employees was discontinued due to lack of participation, there is a push to
get residents here to be more physically active. With nearly 22 percent of
the population under 18, there is much concern about the health care of
children. Street banners encourage residents to “Hike, Bike, Paddle, Get
Outside Yourself” to take advantage of outdoor living. The McCreary
County Cooperative Extension sponsors a walking/hiking club, and,
with more tourists visiting the county to hike, local residents are
beginning to engage in outdoors activity as well.
There are many organizations working on educating the community on the benefits of fresh and nutritious
foods—evidenced by the growing farmers’ market and the many county residents who continue to garden
and can their own fresh vegetables. Hunting and fishing for food is still a big part of the community.
Kristina’s Kitchen, a health-food bakery and vegetarian café, sells nutritious food five days a week and
offers free instruction on cooking meals. Programs like Grow Appalachia and Community Farm Alliance
are strengthening the infrastructure to grow the farmers’ market and teach new ways to recruit farmers
and increase production.
© J
oyce
Pin
son
Street banners encourage residents to undertake outdoor activity.
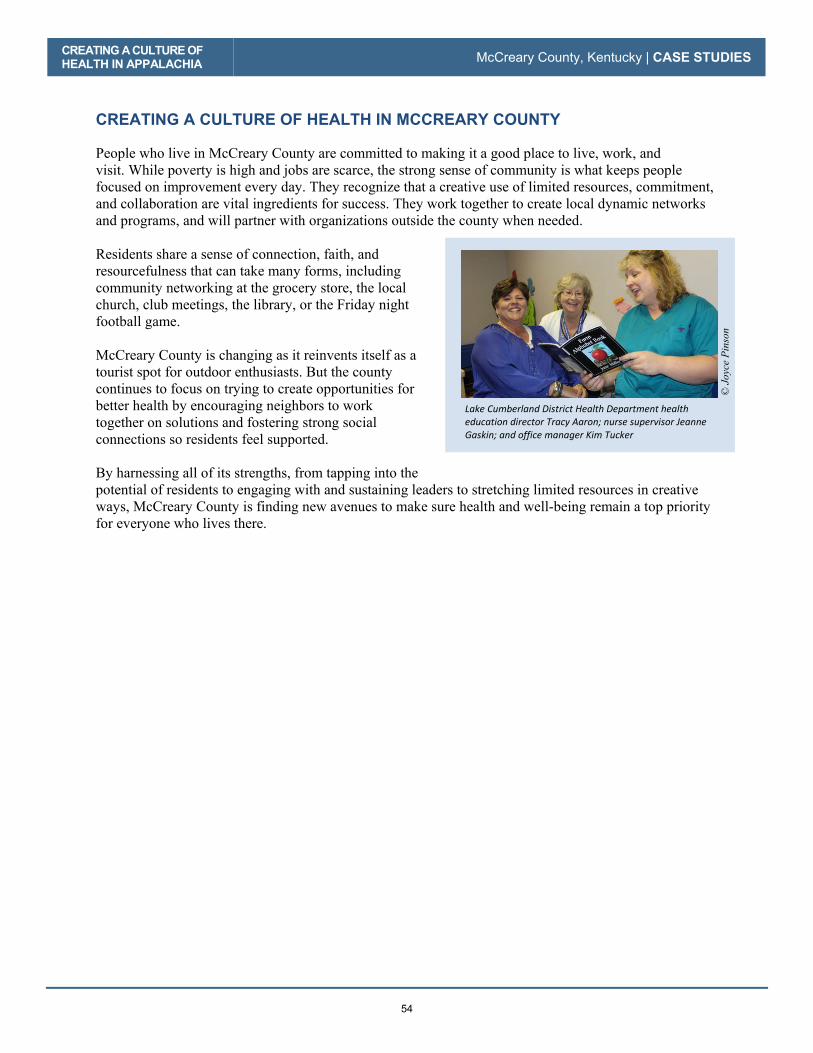
CREATING A CULTURE OF HEALTH IN APPALACHIA McCreary County, Kentucky | CASE STUDIES
54
CREATING A CULTURE OF HEALTH IN MCCREARY COUNTY
People who live in McCreary County are committed to making it a good place to live, work, and
visit. While poverty is high and jobs are scarce, the strong sense of community is what keeps people
focused on improvement every day. They recognize that a creative use of limited resources, commitment,
and collaboration are vital ingredients for success. They work together to create local dynamic networks
and programs, and will partner with organizations outside the county when needed.
Residents share a sense of connection, faith, and
resourcefulness that can take many forms, including
community networking at the grocery store, the local
church, club meetings, the library, or the Friday night
football game.
McCreary County is changing as it reinvents itself as a
tourist spot for outdoor enthusiasts. But the county
continues to focus on trying to create opportunities for
better health by encouraging neighbors to work
together on solutions and fostering strong social
connections so residents feel supported.
By harnessing all of its strengths, from tapping into the
potential of residents to engaging with and sustaining leaders to stretching limited resources in creative
ways, McCreary County is finding new avenues to make sure health and well-being remain a top priority
for everyone who lives there.
© J
oyce
Pin
son
Lake Cumberland District Health Department health education director Tracy Aaron; nurse supervisor Jeanne Gaskin; and office manager Kim Tucker

CREATING A CULTURE OF HEALTH IN APPALACHIA McCreary County, Kentucky | CASE STUDIES
55
REFERENCES
Agency for Healthcare Research and Quality. 2011. “Chapter 9: Access to Health Care, 2011 National
Healthcare Quality Report.” Agency for Healthcare Research and Quality. https://www.ahrq.gov/research/findings/nhqrdr/nhqr11/chap9.html
Dewalt, Darren A, Nancy Berkman, Stacey Sheridan, Kathleen Lohr and Michael Pignone. 2004.
“Literacy and Health Outcomes: A Systematic Review of the Literature.” Journal of Internal Medicine 12
(December 19): 1228-1239. Accessed July 2017.
Hamoudi, Amar, and Jennifer Beam Dowd. 2013. “Physical Health Effects of the Housing Boom: Quasi-
Experimental Evidence from the Health and Retirement Study.” American Journal of Public Health 1039-
1045.
Hilbrand, Sonja, David A. Coall, Denis Gerstorf, and Ralph Hertwig. 2017. “Caregiving within and
beyond the family is associated with lower mortality for the caregiver: A prospective study.” Evolution and Human Behavior 397-402.
Holmes, G. Mark, Nancy M. Lane, Thomas A. Arcury, Michael L. Schwalbe, Randy Randolph, John
Frank, Sharita Thomas, et. al. 2018. Identifying Bright Spots in Appalachian Health: Statistical Analysis. Washington, D.C.: Appalachian Regional Commission.
Kentucky Department of Travel. 2017. McCreary County Tourist Commission. http://www.kentuckytourism.com/mccreary-county-tourist-commission/4177/
Lake Cumberland District Health Department. 2014. “2014 Community Health Assessment.” Lake Cumberland District Health Department. Accessed March 2017.
https://www.lcdhd.org/wp-content/uploads/2016/09/LCDHD-McCREARY-2014-web.pdf
Marshall, Julie L., Logan Thomas, Nancy M. Lane, G. Mark Holmes, Thomas A. Arcury, Randy
Randolph, Pam Silberman, et al. 2017. Health Disparities in Appalachia. Washington, D.C.: Appalachian
Regional Commission.
U. S. Census. 2015. Single Parent Households with Children as a Percentage of Households with Children in McCreary County, KY. Retrieved from FRED. Accessed July 11, 2017.
https://fred.stlouisfed.org/series/S1101SPHOUSE021147

CREATING A CULTURE OF HEALTH IN APPALACHIA McCreary County, Kentucky | CASE STUDIES
56
APPENDIX: MCCREARY COUNTY DATA Table 8: McCreary County Characteristics
Characteristic McCreary County United States
Population, 2010–2014 18,073 314,107,084
Percent population change, 2010–2015 -2.3% 4.1%
Median age, 2015 38.6 37.8
Percent population over age 65, 2015 14.1% 14.9%
Median household income, 2014 $ 24,265 $ 56,135
Per capita income in past 12 months (in 2015 dollars), 2011–2015 $ 10,880 $ 28,930
Unemployment rate, 2014 10.6% 6.2%
Percent persons in poverty, 2014 47.0% 15.6%
Percent white alone, 2015 91.2% 77.1%
Percent black alone, 2015 6.3% 13.3%
Percent adults with at least some college, 2010–2014 40.11% 63.27%
Distance to nearest large population center from county center Somerset, KY – 32.9 mi. N/A
ARC designations, fiscal year 2017 Distressed Central Appalachia N/A
Source: These data are compiled from the U.S. Bureau of Labor Statistics, Local Area Unemployment Statistics,
2014, and the U.S. Census Bureau American Community Survey Selected Social Characteristics, General Economic Characteristics, Demographic and Housing Characteristics, and Educational Attainment Tables for years 2010–2014
and 2011–2015.

CREATING A CULTURE OF HEALTH IN APPALACHIA McCreary County, Kentucky | CASE STUDIES
57
Table 9: McCreary County Key Informants
Name Location Title Organization Interview Date
Rev. Braxton King Pine Knot Director Lord’s Gym 9/26/2016
Sue Singleton Whitley City Director Christian Care Center 9/26/2016
Douglas E. Stephens Whitley City County Judge
McCreary County Office of Economic and Community Development
9/26/2016
Jimmy Barnett Whitley City EMS Manager McCreary County EMS 9/26/2016
Brandy Rowe Whitley City District Health Coordinator / School Nurse
McCreary County Board of Education 9/27/2016
Kay Morrow Whitley City Director McCreary County Public Library 9/27/2016
Tracy Aaron Whitley City Health Education Director
McCreary County Health Department / Lake Cumberland District Health Department
9/27/2016
Sherry Estes Whitley City Program Director Drug Prevention Program – Adanta Regional Prevention Center
9/27/2016

CREATING A CULTURE OF HEALTH IN APPALACHIA McCreary County, Kentucky | CASE STUDIES
58
Table 10: McCreary County Health Outcomes – Actual vs. Predicted
Outcome Measure Actual Predicted
Percentage Difference (negative =
better)
Injury mortality per 100,000 people, 2008–2014 53.75 89.15 -39.7%
Stroke mortality per 100,000 people, 2008–2014 28.89 45.51 -36.5%
Poisoning mortality per 100,000 people, 2008–2014 30.80 46.95 -34.4%
Percentage of Medicare beneficiaries w/ depression, 2012 17.20% 21.11% -18.5%
Years of potential life lost, 2011–2013 10,959 12,915 -15.1%
Infant mortality per 1,000 births, 2008–2014 7.30 8.47 -13.8%
Low-birth-weight births (<2,500g) per 1,000 births, 2007–2013 9.91 11.23 -11.8%
Cancer mortality per 100,000 people, 2008–2014 238.78 270.15 -11.6%
Heart disease hospitalizations per 1,000 Medicare beneficiaries, 2012 68.70 76.79 -10.5%
Heart disease mortality per 100,000 people, 2008–2014 259.94 278.04 -6.5%
COPD mortality per 100,000 people, 2008–2014 101.18 105.85 -4.4%
Percentage of excessive drinkers, 2014 10.30% 10.76% -4.3%
Percentage of obese adults (>30 BMI), 2012 34.2% 34.7% -1.4%
Average Medicare condition score, 2013 1.057 1.061 -0.3%
Physically unhealthy days per month per person, 2014 6.50 6.38 1.9%
Mentally unhealthy days per month per person, 2014 5.10 4.96 2.8%
Opioid prescriptions as a percent of Part D claims, 2013 5.64 5.45 3.4%
Suicide mortality per 100,000 people, 2008–2014 15.82 14.29 10.7%
Percentage of adults with diabetes, 2012 15.30% 12.43% 23.1%
Notes: Percentage Difference = 100 * [ (Actual / Predicted) – 1] Green = County value was better than predicted
For details on the outcome measures, see the data files accompanying the report Identifying Bright Spots in Appalachian Health: Statistical Analysis.

CREATING A CULTURE OF HEALTH IN APPALACHIA McCreary County, Kentucky | CASE STUDIES
59
Table 11: McCreary County Health Drivers vs. National Median
Driver Measure Lower is Better?
National Median
McCreary County
Air pollution (average daily particulate matter 2.5), 2011 Yes 11.87 13.30
Average travel time to work in minutes, 2010–2014 Yes 22.82 28.55
Chlamydia incidence rate per 100,000, 2013 Yes 287.16 232.44
Dentists per 100,000 population, 2014 No 37.45 5.60
Economic index, fiscal year 2017 Yes 108.79 237.71
Full-service restaurants per 1,000, 2012 No 0.68 0.28
Grocery stores per 1,000 residents, 2012 No 0.20 0.22
Median household income, 2014 No $45,226 $24,265
Mental health providers per 100,000 population, 2015 No 80.00 78.13
Percentage of adults currently smoking, 2014 Yes 17.8% 33.3%
Percentage of adults not physically active, 2012 Yes 27.7% 28.4%
Percentage of adults with at least some college, 2010–2014 No 56.3% 40.1%
Income inequality ratio,4 2010–2014 Yes 4.4% 5.6%
Percentage of diabetics with A1C testing, 2012 No 85.4% 86.0%
Percentage of doctors who e-prescribe, 2014 No 65.0% 47.0%
Percentage of eligibles enrolled in SNAP, 2014 No 78.0% 85.0%
Percentage of households with income below poverty, 2014 Yes 15.8% 47.0%
Percentage of Medicare women with recent mammogram, 2013 No 61.0% 39.0%
Percentage of population with access to places for physical activity, 2011 and 2014 No 61.9% 100.0%
Percentage of total population in social assistant jobs, 2013 N/A 0.01% 0.00%
Percentage receiving disability OASDI and/or SSI, 2014 Yes 5.4% 17.4%
Percentage spending >30% of income on housing, 2010–2014 Yes 29.0% 40.4%
Percentage w/ no car, low access, 2010–2014 Yes 19.7% 4.7%
Primary care physicians per 100,000 population, 2013 No 48.54 27.78
4 Income inequality is the ratio of household income at the 80th percentile to that at the 20th percentile. A higher
ratio reflects greater division between the top and the bottom of the income spectrum.

CREATING A CULTURE OF HEALTH IN APPALACHIA McCreary County, Kentucky | CASE STUDIES
60
Driver Measure Lower is Better?
National Median
McCreary County
Social associations per 10,000 population, 2013 No 12.68 3.34
Specialist physicians per 100,000 population, 2013 No 25.93 5.53
Students per teacher, 2013–2014 Yes 14.13 16.50
Teenage births per 1,000, 2007–2013 Yes 39.96 83.48
Uninsured rate for people under 65, 2013 Yes 17.24 20.85
Notes: Green = County value was better than national median
For details on the driver measures, see the data files accompanying the report Identifying Bright Spots in Appalachian Health: Statistical Analysis.

61
Wayne County, Kentucky
County Overview
A Deeper Look at Wayne County: Community Strengths
Creating a Culture of Health in Wayne County
References
Appendix: Wayne County Data

62
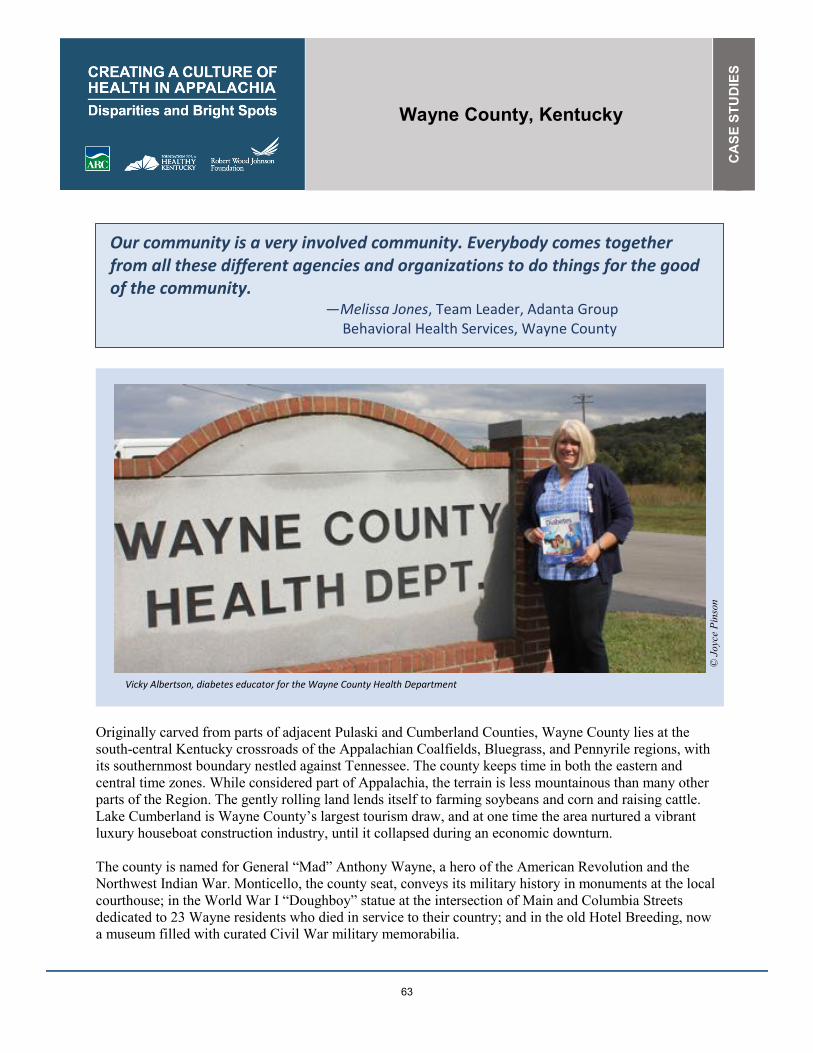
Wayne County, Kentucky
CA
SE
STU
DIE
S
63
Our community is a very involved community. Everybody comes together from all these different agencies and organizations to do things for the good of the community.
—Melissa Jones, Team Leader, Adanta Group Behavioral Health Services, Wayne County
Originally carved from parts of adjacent Pulaski and Cumberland Counties, Wayne County lies at the
south-central Kentucky crossroads of the Appalachian Coalfields, Bluegrass, and Pennyrile regions, with
its southernmost boundary nestled against Tennessee. The county keeps time in both the eastern and
central time zones. While considered part of Appalachia, the terrain is less mountainous than many other
parts of the Region. The gently rolling land lends itself to farming soybeans and corn and raising cattle.
Lake Cumberland is Wayne County’s largest tourism draw, and at one time the area nurtured a vibrant
luxury houseboat construction industry, until it collapsed during an economic downturn.
The county is named for General “Mad” Anthony Wayne, a hero of the American Revolution and the
Northwest Indian War. Monticello, the county seat, conveys its military history in monuments at the local
courthouse; in the World War I “Doughboy” statue at the intersection of Main and Columbia Streets
dedicated to 23 Wayne residents who died in service to their country; and in the old Hotel Breeding, now
a museum filled with curated Civil War military memorabilia.
© J
oyce
Pin
son
Vicky Albertson, diabetes educator for the Wayne County Health Department

CREATING A CULTURE OF HEALTH IN APPALACHIA Wayne County, Kentucky | CASE STUDIES
64
Monticello is listed on the National Register of Historic Places and has strong architectural bones. The
F&H Pharmacy, an old-fashioned store featuring a lunch counter, convenience items, and a pharmacy, is
the heart of the downtown. The town is quiet, with few people on the tidy sidewalks.
People here sometimes struggle for the necessities of life. In fact, more than 26 percent of residents live in
poverty. Yet Wayne County is among the ten percent of Appalachian counties—and one of nine counties
in Appalachian Kentucky—identified as a Bright Spot, performing better than expected across 16 of 19
health outcome measures explored in this study. For example, Wayne County performed better than
expected on the following measures:
� Poisoning mortality: 36 percent better than expected
� Stroke mortality: 34 percent better than expected
� Heart disease hospitalization: 30 percent better than expected
� Percentage of Medicare beneficiaries with depression: 26 percent better than expected
� Years of potential life lost: 25 percent better than expected
These better-than-expected results are likely influenced by local conditions and initiatives that improve
overall well-being. Field work shows that Wayne County’s strong community partnerships and social
connections, integration of health services, and focus on healthy foods are likely contributing to the
better-than-expected health outcomes.
Wayne County’s classification as a Bright Spot means that, on average, the county performed better than
expected on several health outcome measures, given its characteristics and resources—that is, the
socioeconomics, demographics, behaviors, health care facilities, and other factors that influence health
outcomes. It does not mean that all Wayne County residents enjoy excellent health. Wayne County still
lags behind national rates on many health-related indicators. Like other counties with limited resources,
Bright Spot counties face many challenges to attaining good health outcomes. Wayne County’s
performance, however, indicates that certain county conditions or programs may be helping generate
better-than-expected outcomes—and that other resource-challenged Appalachian counties may benefit
from adopting similar initiatives.1
1 See Table 14 in the data appendix at the end of this case study for a full list of actual health outcomes for Wayne
County compared with predicted outcomes. For details on the outcome measures, see the data files accompanying
the report Identifying Bright Spots in Appalachian Health: Statistical Analysis.

CREATING A CULTURE OF HEALTH IN APPALACHIA Wayne County, Kentucky | CASE STUDIES
65
COUNTY OVERVIEW Figure 7: Map - Bright Spot Community Wayne County, Kentucky
Wayne�County�represents�a�nonmetropolitan�county�in�Central�Appalachia.�It�is�one�of�nine�Bright�Spot�counties�in�Appalachian�Kentucky.� Attractive for its outdoor amenities and recreational opportunities, Wayne County is bordered by Tennessee and Lake Cumberland. Part of the chain of lakes in Kentucky and Tennessee created by the Tennessee Valley Authority and the Army Corps of Engineers, Lake Cumberland makes the county a destination for recreation and tourism. Wayne promotes its strong military history and its well-maintained historic preservation sites to tourists as a complement to outdoor-recreation attractions. However, half of the workforce commutes outside the county to work, largely in lumber and manufacturing (Kentucky Cabinet for Economic Development, 2015). Schools and government are also major area employers. The population of almost 21,000 is spread across 13 communities. Wayne is racially homogeneous; roughly 96 percent of its population is white. Fewer than 36 percent of adults have at least some college education, compared with the national median of 63.3 percent. Classified by ARC as economically distressed in fiscal year 2017, Wayne County had an unemployment rate of 9.7 percent in 2014, compared
Wayne County, KY
GEORGIA
SOUTH CAROLINA
NORTH CAROLINA
ALABAMA
MISSISSIPPI
TENNESSEE
KENTUCKY
OHIO PENNSYLVANIA
MARYLAND
VIRGINIA
NEW YORK
WESTVIRGINIA
N o r t h e r n
S o u t h e r n
C e n t r a l
S o u t h C e n t r a l
N o r t h C e n t r a l
0 10050
Miles

CREATING A CULTURE OF HEALTH IN APPALACHIA Wayne County, Kentucky | CASE STUDIES
66
with the national unemployment rate of 6.2 percent. The county’s 2014 median household income was
only $30,619, compared with the national median of $56,135.2
Although Wayne is a “dry” county, concerns about opioid and other drug use run high, as they do
throughout much of the state. Lack of public transportation is also a challenge, and is often a barrier to
getting health care and other services. Rural Transit Enterprises Coordinated (RTEC) provides free
transportation for Medicaid recipients, charging others $0.80 per mile. People who do not qualify for the
RTEC subsidy and cannot afford its fee must rely on personal transportation to travel out of the county as
there are no taxi or public bus services.
But beyond these challenges is a commitment to community health that has engaged the energetic efforts
of a network of government, private, and nonprofit groups in various sectors that share their limited
resources to advance the common good. Together they have focused on expanding access to healthy
foods, addressing mental and behavioral health needs, promoting healthy child development, making
comprehensive health care available to more residents, and providing supportive services to those who
need them most.
A DEEPER LOOK AT WAYNE COUNTY: COMMUNITY STRENGTHS
Residents of Wayne County have a long tradition of relying on each other and local resources to address
challenges. They do this by partnering with other organizations—often across sectors—and sharing
resources creatively. Their sense of community pride translates into a range of efforts to support
community health.
During the field work for this case study, several factors were identified that may have contributed to
better-than-expected results in Wayne County:
� Community partnerships and social connections: Sharing of resources to improve the health
and condition of residents was evident across organizations in different sectors. Community
organizations and religious groups routinely work together, strengthening the sense of community
and the relationships between health care and other sectors.
� Strengthening and integration of health services: Traditional health service providers improve
access to and coordinate care, but their targeted support of at-risk groups, such as youth and
people with mental and behavioral health issues, stands out. This targeted support helps to
balance and integrate other services into the realm of health care delivery.
� A focus on healthy foods: The “Kentucky Proud” farming philosophy extends into official
programs and supports the production and consumption of local fresh produce and products. This
innate mindset contributes to a shared value of health.
� Social support programs: Local nonprofits help people rebuild lives and family structures.
As in the other Bright Spot communities explored in this report, people here have worked to elevate
physical, social, and economic health in several ways. Field work undertaken for this report identified
local practices in Wayne County that appear to be contributing to overall health, documented effective
practices that could be replicated in other counties, and identified promising practices and strategies that
2 Table 12 in the Wayne County data appendix at the end of this case study provides a quantitative profile of county
characteristics.

CREATING A CULTURE OF HEALTH IN APPALACHIA Wayne County, Kentucky | CASE STUDIES
67
should be explored further.3 Their approaches fall into four overarching categories observed in other
Bright Spot counties: leadership, cross-sector collaboration, resource sharing, and local providers
committed to public health.
Community Leaders Engaged in Health Initiatives
Wayne County benefits from strong leadership. Notably, the Wayne County Health Department, which is
part of the Lake Cumberland District Health Department, and the University of Kentucky Wayne County
Cooperative Extension Service have played critical roles in improving community health.
For example, the county health department has led the way in expanding access to healthy foods for
seniors and recipients of the Special Supplemental Nutrition Program for Women, Infants, and Children
(WIC) by issuing vouchers redeemable at the weekly local farmers’ market. In fact, the farmers’ market
redeems 59 percent of the department’s WIC vouchers. Part of this success is attributed to an emphasis on
local food culture and encouraging residents to buy homegrown “Kentucky Proud” produce.
In addition, the health department has moved aggressively to combat the epidemic of diabetes affecting so
many Wayne County residents. It offers a free diabetes prevention class, as well as other classes to
educate people with diabetes and their families on the importance of maintaining healthy blood sugar
levels and on how to better manage diabetes through healthy eating and cooking.
Another health department initiative, the HANDS Program, may contribute to better-than-expected rates
of infant mortality and low-birth-weight births in Wayne County. HANDS is a volunteer home visitation
program for new and expectant parents that provides education, connects families to services they may
need, and promotes child safety and development.
The extension service promotes community health and well-being through a range of initiatives, including
programs for better nutrition, weight loss, worksite wellness, career readiness, life skills, and women’s
health, as well as health fairs and an afterschool walking club. A “Local Ingredients” program with the
Future Farmers of America, 4-H, and the Master Gardeners club grows vegetables on four acres for public
schools and saved the school system an estimated $24,000 in 2016 while increasing students’
consumption of fresh produce. A drug prevention program sponsored by the extension service not only
deters young people from using drugs, but has also created new community partnerships among law
enforcement, juvenile justice services, and the local women’s
club. A recent campaign brought together nearly 200
volunteers to educate school-age kids on drugs and alcohol.
Other groups mentioned as playing leadership roles include
the Wayne County Health Coalition, whose members work
together to address pressing health issues, and the Adanta Group Wayne County Mental Health Center, a private,
nonprofit service provider addressing mental health,
developmental and intellectual disabilities, and substance use
disorders. Adanta’s programs for kids and adults range from
3 For a full explanation of the methodology, see Appendix B: Research Approach. For a list of key informants
interviewed for this county, see Table 13 in the data appendix at the end of this case study.
© J
oyce
Pin
son
Melissa Jones, team leader, Adanta Group Wayne County Mental Health Center

CREATING A CULTURE OF HEALTH IN APPALACHIA Wayne County, Kentucky | CASE STUDIES
68
case management to linking clients to social services, such as transportation or housing support for the
homeless.
Jody Paver, University of Kentucky Extension Service agent for family and consumer sciences, is seen as
a primary influencer of health and wellness initiatives in the county, as are Vicky Albertson, a nurse for
the health department, and Melissa Jones, of Adanta. These three women play leadership roles in various
health initiatives and in ensuring that residents get education and services necessary for maintaining and
improving their health. They expressed optimism for Wayne County’s future, citing stepped-up efforts to
ensure access to comprehensive and continuous care, the success of the farmers’ market, increased
opportunities for physical activity like new sidewalks and hiking trails, and a recent public vote to
maintain the county’s “dry” status as signs of progress.
Cross-Sector Collaboration and Resource Sharing
In Wayne County, researchers found a pattern of cooperation and willingness to share resources among
government, private, and nonprofit groups. Working together, these groups leverage their strengths to
achieve their common goal of improving health and well-being for county residents.
These efforts are exemplified by the
connection between the Cooperative Extension
Service and various nonprofit groups. For
example, the extension service works closely
with the Hope Center, a nonprofit operated by
the Wayne County Association of Ministers
and Churches since 1987 that serves homeless
people, the elderly, single mothers, victims of
domestic abuse, and other people in need, to
promote healthy eating. People seeking
assistance at the Hope Center are required to
complete six educational classes before they
can access the food bank. The Hope Center is a
certified partner of Feeding America–
Kentucky’s Heartland, which distributes
donated food and groceries to people in 42
Kentucky counties. Support for the Hope Center from local churches and the extension service shows a
strong link between faith-based and government groups. In addition, the health department partners with
the extension service, along with religious organizations, on diabetes education. Aware of the drug-related
issues plaguing the area, county and local officials are active in youth development.
Wayne County Hospital partners with city officials, economic development organizations, the
Cooperative Extension Service, and the school system to provide insight on the health needs of the
community. These partnerships supplement the delivery of health care services by informing health needs
assessments.
The Wayne County school district also plays a key role in health promotion and illness prevention. The
schools partner with the health department to provide certain primary care services. Adanta mental health
services are available in the schools, offering opportunities to improve mental and behavioral health for
the school-age population.
© J
oyce
Pin
son
Sally Sumner, director of the Hope Center

CREATING A CULTURE OF HEALTH IN APPALACHIA Wayne County, Kentucky | CASE STUDIES
69
Wayne County has a small network of religious nonprofits and government agencies that maximize
limited resources to provide for those in need. They are a safety net for many residents. These groups not
only take care of less fortunate residents, but they also reinforce positive self-help behaviors through
religion and outreach.
Organizations like the Hope Center and the House of Blessings, a soup kitchen and shelter funded by a
network of 20 local churches, use donations and volunteers to provide food, clothing, and necessities for
economically disadvantaged residents of Wayne County. Both centers work with the health department
and extension service to teach skills fostering self-reliance. Each program thus serves as a stepping stone
to independence.
The Wayne County Health Council (the main branch of the Wayne County health coalition) is a group of
women working together in what appears to be a seamless collaboration. Members meet to develop their
individual yearly work plans, working to reduce
duplication of services and find synergies to strengthen
health initiatives. The group is focused and business-like,
adhering to clearly-defined meeting schedules.
Local churches are involved with philanthropic
organizations within the county, and they provide support
for community members through the ministerial
association. A local Catholic nun, Sister Ann Kernan,
started a support group for women called Mountain Moms. The group has served as a resource for Wayne
County women for more than two decades and
coordinates closely with the extension service, sometimes
even providing transportation for residents who need it.
Local Providers Committed to Public Health
Wayne County’s health care network consists of the health department and its related services, as well as
several doctors’ offices, pharmacies, and Wayne County Hospital, a 25-bed critical access hospital. In
addition to a full complement of laboratory and imaging services, the hospital has a rural health clinic and
a physical therapy/rehabilitation department. Coordinated activities between the health department and
the hospital work to balance illness prevention and education with acute care delivery. These partnerships
have produced nutrition fairs, health education and awareness classes, health promotion, and screenings.
Adanta and Intrust Healthcare, both part of larger networks outside Wayne County, offer mental and
behavioral health services, such as counseling, case management, and substance abuse treatment. They
also offer supportive services, including housing, and coordinate their efforts with the school and court
systems.
Medicaid largely funds both organizations. Referrals come from family physicians, social services, courts,
and schools, with the occasional walk-in. The referral network and closeness of the community allow
both organizations to reach their target populations, but lack of transportation is a barrier to services for
many residents. Given the challenges these organizations face, collaboration and pooling resources, along
with creative outreach, are necessary.
School-based health centers also serve as primary centers for preventive and clinical care and are staffed
with either a nurse or a nurse practitioner who works to keep students healthy and learning. As
© J
oyce
Pin
son
Sister Ann Kernan, leader of the Mountain Moms support group
CREATING A CULTURE OF HEALTH IN APPALACHIA Wayne County, Kentucky | CASE STUDIES
70
mentioned, mental and behavioral health services from Adanta are available in schools, and some school
nurses provide preventive dental services (such as sealant placement) for school-age children.
CREATING A CULTURE OF HEALTH IN WAYNE COUNTY
Despite the challenges it faces, Wayne County has strong champions for community health from local
government agencies, nonprofit service providers, health care organizations, and faith-based groups.
These leaders are working together in creative, resourceful ways to improve quality of life for all
residents. They have identified pressing health issues, such as diabetes and opioid use, as well as
vulnerable groups, including youth and people with mental and behavioral health issues, in need of
targeted support. Sharing of limited resources is an important and effective strategy for advancing health
in Wayne County.
Community connectedness here is strong; people believe in helping each other, as reflected in residents’
participation in volunteer activities and in the presence of social support groups. This sense of community
also manifests in local pride in “eating local”—and healthfully.
By pooling their efforts for the good of the community, people in Wayne County have created a whole
that is greater than the sum of its parts.

CREATING A CULTURE OF HEALTH IN APPALACHIA Wayne County, Kentucky | CASE STUDIES
71
REFERENCES
Agency for Healthcare Research and Quality. 2011. “Chapter 9: Access to Health Care, 2011 National
Healthcare Quality Report.” Agency for Healthcare Research and Quality. https://www.ahrq.gov/research/findings/nhqrdr/nhqr11/chap9.html
Commonwealth of Kentucky. 2017. Wayne County Welcome. http://waynecounty.ky.gov/Pages/default.aspx
Holmes, G. Mark, Nancy M. Lane, Thomas A. Arcury, Michael L. Schwalbe, Randy Randolph, John
Frank, Sharita Thomas, et. al. 2018. Identifying Bright Spots in Appalachian Health: Statistical Analysis. Washington, D.C.: Appalachian Regional Commission.
Kentucky Cabinet for Economic Development. 2015. Wayne County Community Profile. July 10.
Accessed July 11, 2017.
http://www.thinkkentucky.com/cmnty/BusInd.aspx?cw=076
Marshall, Julie L., Logan Thomas, Nancy M. Lane, G. Mark Holmes, Thomas A. Arcury, Randy
Randolph, Pam Silberman, et al. 2017. Health Disparities in Appalachia. Appalachian Regional
Commission.

CREATING A CULTURE OF HEALTH IN APPALACHIA Wayne County, Kentucky | CASE STUDIES
72
APPENDIX: WAYNE COUNTY DATA Table 12: Wayne County Characteristics
Characteristic Wayne County United States
Population, 2010–2014 20,728 314,107,084
Percent population change, 2010–2015 -1.7% 4.1%
Median age, 2015 41.7 37.8
Percent of persons over age 65, 2015 18.4% 14.9%
Median household income, 2014 $30,619 $ 56,135
Per capita income in past 12 months (in 2015 dollars), 2011–2015
$15,475 $ 28,930
Unemployment rate, 2014 9.7% 6.2%
Percent persons in poverty, 2014 26.2% 15.6%
Percent white alone, 2015 96.0% 77.1%
Percent black alone, 2015 2.0% 13.3%
Percent adults with at least some college, 2010–2014
35.7% 63.27%
Distance to nearest large population center from county center
Somerset, KY – 32.5 mi. N/A
ARC designations, fiscal year 2017 Distressed
Central Appalachia N/A
Source: These data are compiled from the U.S. Bureau of Labor Statistics, Local Area Unemployment Statistics,
2014, and the U.S. Census Bureau American Community Survey Selected Social Characteristics, General Economic
Characteristics, Demographic and Housing Characteristics, and Educational Attainment Tables for years 2010–2014
and 2011–2015.

CREATING A CULTURE OF HEALTH IN APPALACHIA Wayne County, Kentucky | CASE STUDIES
73
Table 13: Wayne County Key Informants
Name Location Title Organization Interview Date
Lashel Hodges Monticello Case Manager / Counselor
Intrust Healthcare 09/28/2016
Melissa Jones Monticello Team Leader Adanta Group Wayne County Mental Health Center
09/28/2016
Jody Paver Monticello Family and Consumer Sciences Extension Agent
University of Kentucky Cooperative Extension Service – Wayne County
09/28/2016
Vicky Albertson, RN Monticello Diabetes Educator Wayne County Health Department
09/29/2016
Sister Ann Kernan Monticello Leader of Mountain Moms
St. Peter Catholic Church 09/29/2016
Sally Sumner Monticello Director The Hope Center 09/29/2016
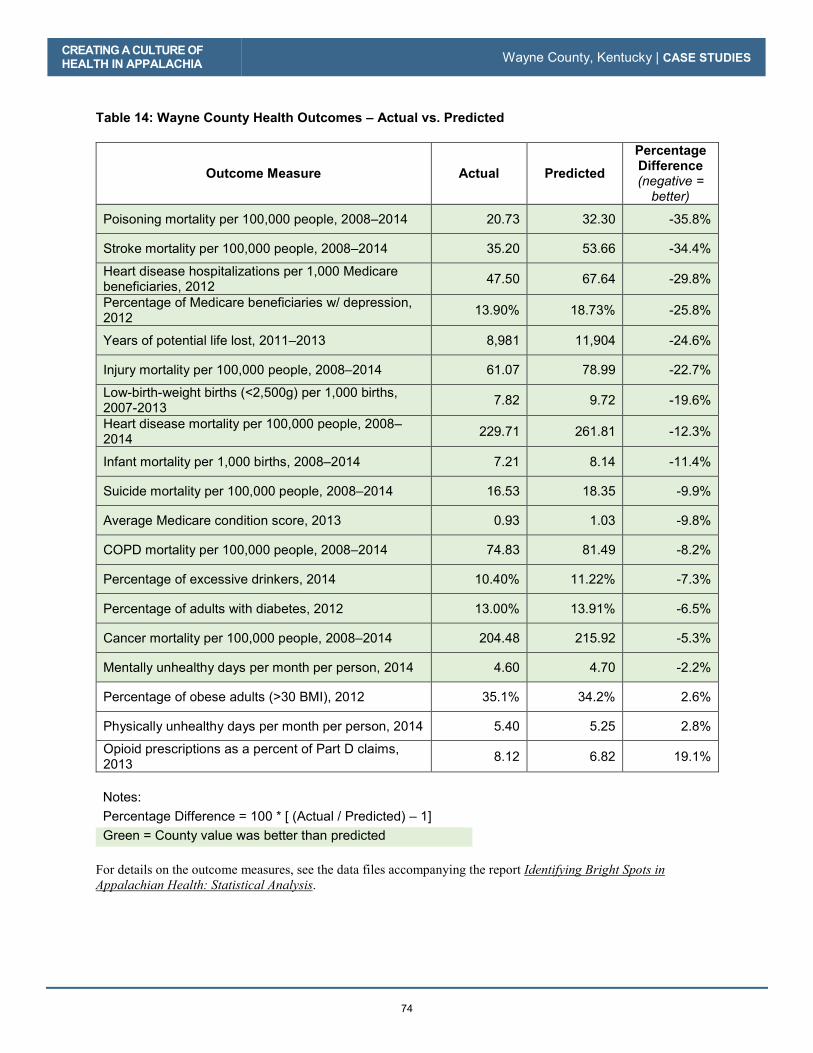
CREATING A CULTURE OF HEALTH IN APPALACHIA Wayne County, Kentucky | CASE STUDIES
74
Table 14: Wayne County Health Outcomes – Actual vs. Predicted
Outcome Measure Actual Predicted
Percentage Difference (negative =
better)
Poisoning mortality per 100,000 people, 2008–2014 20.73 32.30 -35.8%
Stroke mortality per 100,000 people, 2008–2014 35.20 53.66 -34.4%
Heart disease hospitalizations per 1,000 Medicare beneficiaries, 2012
47.50 67.64 -29.8%
Percentage of Medicare beneficiaries w/ depression, 2012
13.90% 18.73% -25.8%
Years of potential life lost, 2011–2013 8,981 11,904 -24.6%
Injury mortality per 100,000 people, 2008–2014 61.07 78.99 -22.7%
Low-birth-weight births (<2,500g) per 1,000 births, 2007-2013
7.82 9.72 -19.6%
Heart disease mortality per 100,000 people, 2008–2014
229.71 261.81 -12.3%
Infant mortality per 1,000 births, 2008–2014 7.21 8.14 -11.4%
Suicide mortality per 100,000 people, 2008–2014 16.53 18.35 -9.9%
Average Medicare condition score, 2013 0.93 1.03 -9.8%
COPD mortality per 100,000 people, 2008–2014 74.83 81.49 -8.2%
Percentage of excessive drinkers, 2014 10.40% 11.22% -7.3%
Percentage of adults with diabetes, 2012 13.00% 13.91% -6.5%
Cancer mortality per 100,000 people, 2008–2014 204.48 215.92 -5.3%
Mentally unhealthy days per month per person, 2014 4.60 4.70 -2.2%
Percentage of obese adults (>30 BMI), 2012 35.1% 34.2% 2.6%
Physically unhealthy days per month per person, 2014 5.40 5.25 2.8%
Opioid prescriptions as a percent of Part D claims, 2013
8.12 6.82 19.1%
Notes:
Percentage Difference = 100 * [ (Actual / Predicted) – 1]
Green = County value was better than predicted
For details on the outcome measures, see the data files accompanying the report Identifying Bright Spots in Appalachian Health: Statistical Analysis.

CREATING A CULTURE OF HEALTH IN APPALACHIA Wayne County, Kentucky | CASE STUDIES
75
Table 15: Wayne County Health Drivers vs. National Median
Driver Measure Lower is Better?
National Median
Wayne County
Air pollution (average daily particulate matter 2.5), 2011
Yes 11.87 13.40
Average travel time to work in minutes, 2010–2014 Yes 22.82 21.32
Chlamydia incidence rate per 100,000, 2013 Yes 287.16 201.69
Dentists per 100,000 population, 2014 No 37.45 29.33
Economic index, fiscal year 2017 Yes 108.79 185.31
Full-service restaurants per 1,000, 2012 No 0.68 0.38
Grocery stores per 1,000 residents, 2012 No 0.20 0.19
Median household income, 2014 No $45,226.00 $30,619.00
Mental health providers per 100,000 population, 2015 No 80.00 68.49
Percentage of adults currently smoking, 2014 Yes 17.8% 25.0%
Percentage of adults not physically active, 2012 Yes 27.7% 35.3%
Percentage of adults with at least some college, 2010–2014
No 56.3% 35.7%
Income inequality ratio,4 2010–2014 Yes 4.4% 4.8%
Percentage of diabetics with A1C testing, 2012 No 85.4% 84.7%
Percentage of doctors who e-prescribe, 2014 No 65.0% 42.0%
Percentage of eligibles enrolled in SNAP, 2014 No 78.0% 85.0%
Percentage of households with income below poverty, 2014
Yes 15.8% 26.2%
Percentage of Medicare women with recent mammogram, 2013
No 61.0% 52.0%
Percentage of population with access to places for physical activity, 2011 and 2014
No 61.9% 28.2%
Percentage of total population in social assistant jobs, 2013
N/A 0.01% 0.01%
Percentage receiving disability OASDI and/or SSI, 2014
Yes 5.4% 15.2%
Percentage spending >30% of income on housing, 2010–2014
Yes 29.0% 30.2%
Percentage w/ no car, low access, 2010–2014 Yes 19.7% 13.2%
4 Income inequality is the ratio of household income at the 80th percentile to that at the 20th percentile. A higher
ratio reflects greater division between the top and the bottom of the income spectrum.
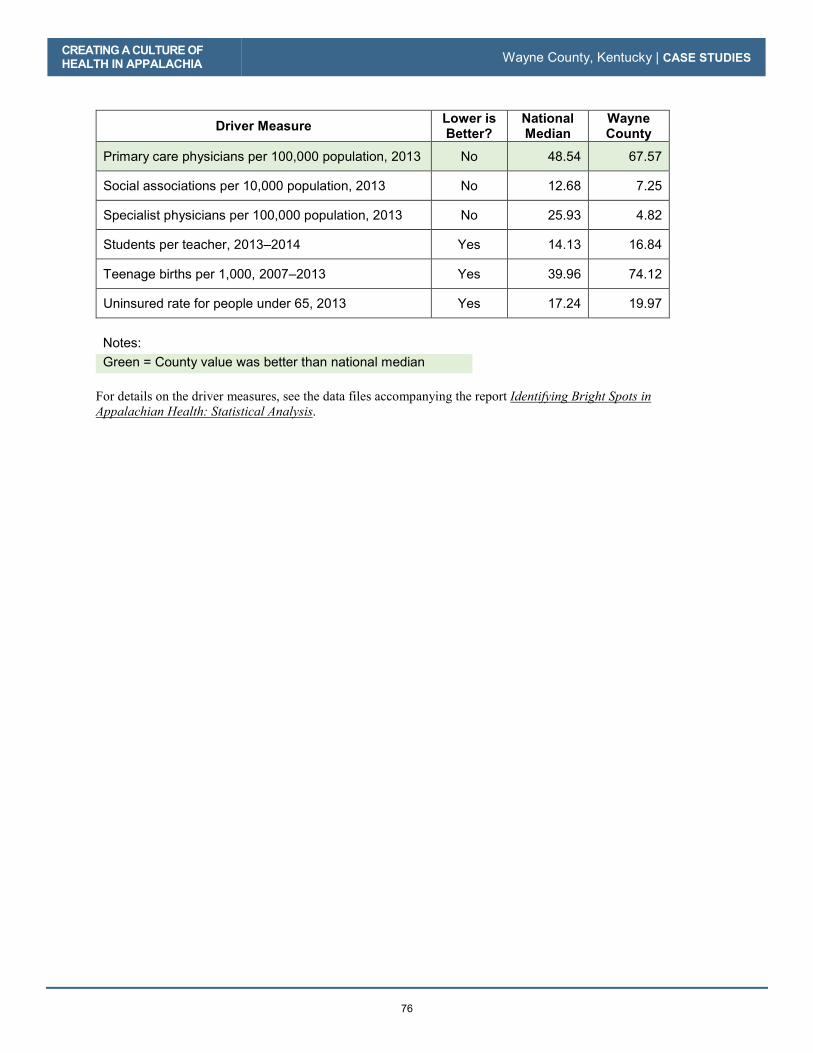
CREATING A CULTURE OF HEALTH IN APPALACHIA Wayne County, Kentucky | CASE STUDIES
76
Driver Measure Lower is Better?
National Median
Wayne County
Primary care physicians per 100,000 population, 2013 No 48.54 67.57
Social associations per 10,000 population, 2013 No 12.68 7.25
Specialist physicians per 100,000 population, 2013 No 25.93 4.82
Students per teacher, 2013–2014 Yes 14.13 16.84
Teenage births per 1,000, 2007–2013 Yes 39.96 74.12
Uninsured rate for people under 65, 2013 Yes 17.24 19.97
Notes:
Green = County value was better than national median
For details on the driver measures, see the data files accompanying the report Identifying Bright Spots in Appalachian Health: Statistical Analysis.

77
Noxubee County, Mississippi
County Overview
A Deeper Look at Noxubee County: Community Strengths
Creating a Culture of Health in Noxubee County
References
Appendix: Noxubee County Data

78
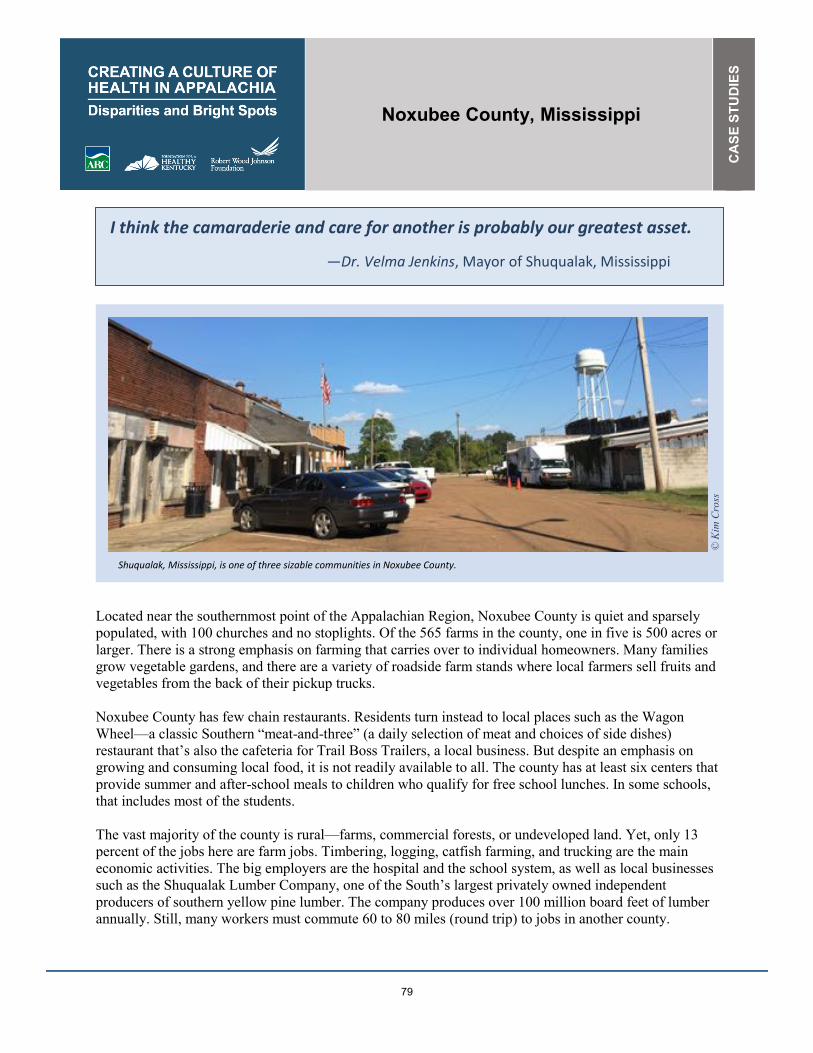
Noxubee County, Mississippi
CA
SE
STU
DIE
S
79
I think the camaraderie and care for another is probably our greatest asset.
—Dr. Velma Jenkins, Mayor of Shuqualak, Mississippi
Located near the southernmost point of the Appalachian Region, Noxubee County is quiet and sparsely populated, with 100 churches and no stoplights. Of the 565 farms in the county, one in five is 500 acres or larger. There is a strong emphasis on farming that carries over to individual homeowners. Many families grow vegetable gardens, and there are a variety of roadside farm stands where local farmers sell fruits and vegetables from the back of their pickup trucks. Noxubee County has few chain restaurants. Residents turn instead to local places such as the Wagon Wheel—a classic Southern “meat-and-three” (a daily selection of meat and choices of side dishes) restaurant that’s also the cafeteria for Trail Boss Trailers, a local business. But despite an emphasis on growing and consuming local food, it is not readily available to all. The county has at least six centers that provide summer and after-school meals to children who qualify for free school lunches. In some schools, that includes most of the students. The vast majority of the county is rural—farms, commercial forests, or undeveloped land. Yet, only 13 percent of the jobs here are farm jobs. Timbering, logging, catfish farming, and trucking are the main economic activities. The big employers are the hospital and the school system, as well as local businesses such as the Shuqualak Lumber Company, one of the South’s largest privately owned independent producers of southern yellow pine lumber. The company produces over 100 million board feet of lumber annually. Still, many workers must commute 60 to 80 miles (round trip) to jobs in another county.
Shuqualak, Mississippi, is one of three sizable communities in Noxubee County.
© K
im C
ross
CREATING A CULTURE OF HEALTH IN APPALACHIA Noxubee County, Mississippi | CASE STUDIES
80
Noxubee County is a place of dichotomies where basic utilities may not reach outside city limits, yet residents have access to a network of clinics and around-the-clock emergency care. Despite severe funding challenges, Noxubee has three health clinics and a robust hospital system with a wound care clinic and an infusion clinic. At the same time, many county roads are still unpaved, and some homes lack running water and, in the poorest districts, sewage treatment of any kind. Yet, community leaders and residents are engaged in making Noxubee County a good place to live. Noxubee County is among the ten percent of Appalachian counties—and one of four counties in Appalachian Mississippi—identified as a Bright Spot, performing better than expected across 16 of 19 health outcome measures. Most notably, Noxubee County performed better than expected on the following five measures: � COPD mortality: 56 percent better than expected
� Heart disease hospitalizations: 44 percent better than expected
� Poisoning mortality: 38 percent better than expected
� Opioid prescriptions as a percentage of Medicare Part D claims: 37 percent better than expected
� Injury mortality: 32 percent better than expected
These better-than-expected results are likely influenced by local conditions and initiatives in the county that aim to improve overall well-being. For example, field research indicates that local leaders are coming together to address some of the key drivers of health, such as having affordable housing and places to play and exercise. Additionally, hospitals, schools and the faith community play a critical role in health education and promotion. Noxubee County’s classification as a Bright Spot means that, on average, the county performed better than expected on a number of health outcome measures, given its characteristics and resources—that is, the socioeconomics, demographics, behaviors, health care facilities, and other factors that influence health outcomes. It does not mean that all residents here enjoy excellent health. In fact, the county still lags behind the rest of the nation on many health indicators. Like other counties with limited resources, Bright Spot counties face challenges to attaining good health outcomes. Noxubee County’s performance, however, indicates that certain county conditions or programs may be helping generate better-than-expected outcomes—and that other resource-challenged Appalachian counties may benefit from adopting similar initiatives.1 1 See Table 18 in the data appendix at the end of this case study for a full list of actual health outcomes for Noxubee County compared with predicted outcomes. For details on the outcome measures, see the data files accompanying the report Identifying Bright Spots in Appalachian Health: Statistical Analysis.
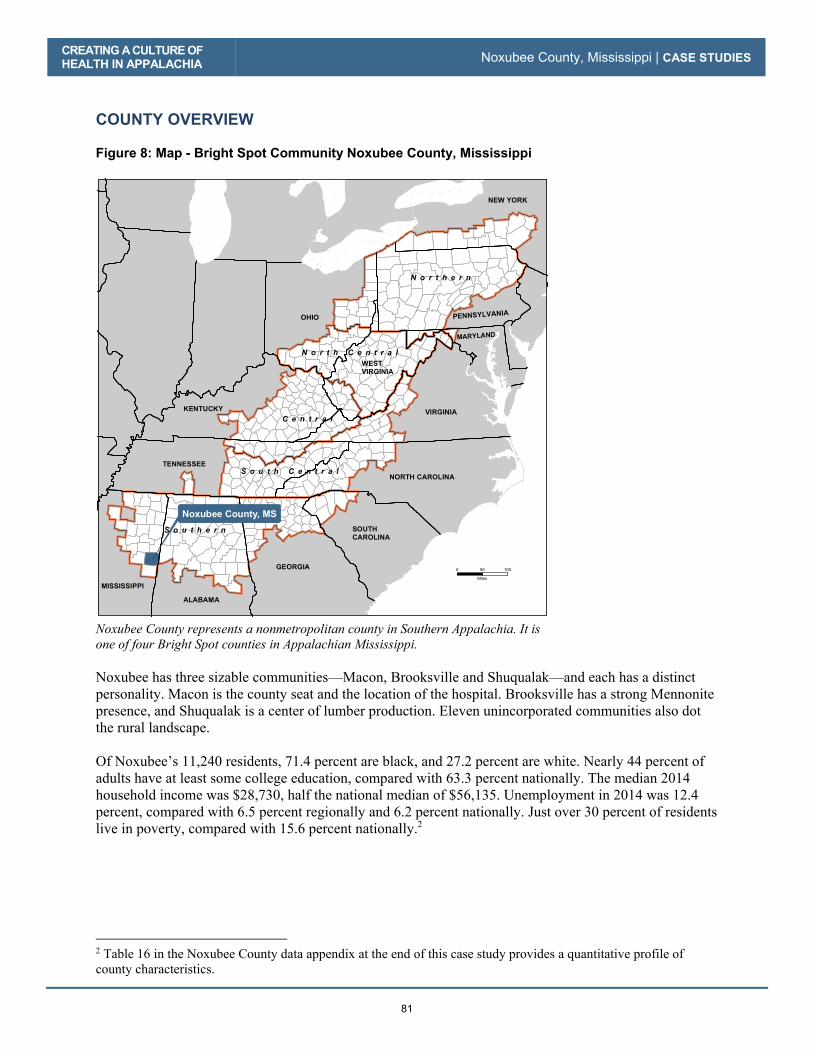
CREATING A CULTURE OF HEALTH IN APPALACHIA Noxubee County, Mississippi | CASE STUDIES
81
COUNTY OVERVIEW Figure 8: Map - Bright Spot Community Noxubee County, Mississippi
Noxubee County represents a nonmetropolitan county in Southern Appalachia. It is one of four Bright Spot counties in Appalachian Mississippi. Noxubee has three sizable communities—Macon, Brooksville and Shuqualak—and each has a distinct personality. Macon is the county seat and the location of the hospital. Brooksville has a strong Mennonite presence, and Shuqualak is a center of lumber production. Eleven unincorporated communities also dot the rural landscape. Of Noxubee’s 11,240 residents, 71.4 percent are black, and 27.2 percent are white. Nearly 44 percent of adults have at least some college education, compared with 63.3 percent nationally. The median 2014 household income was $28,730, half the national median of $56,135. Unemployment in 2014 was 12.4 percent, compared with 6.5 percent regionally and 6.2 percent nationally. Just over 30 percent of residents live in poverty, compared with 15.6 percent nationally.2
2 Table 16 in the Noxubee County data appendix at the end of this case study provides a quantitative profile of county characteristics.
GEORGIA
SOUTH CAROLINA
NORTH CAROLINA
ALABAMA
MISSISSIPPI
TENNESSEE
KENTUCKY
OHIO PENNSYLVANIA
MARYLAND
VIRGINIA
NEW YORK
WESTVIRGINIA
Noxubee County, MS
N o r t h e r n
S o u t h e r n
C e n t r a l
S o u t h C e n t r a l
N o r t h C e n t r a l
0 10050
Miles

CREATING A CULTURE OF HEALTH IN APPALACHIA Noxubee County, Mississippi | CASE STUDIES
82
A DEEPER LOOK AT NOXUBEE COUNTY: COMMUNITY STRENGTHS As in the other Bright Spot communities explored in this report, people in Noxubee County are making the most of available resources and harnessing their collective power to create better-than-expected health outcomes. Field work helped identify local practices that appear to be contributing to overall health, document effective practices that could be replicated in other counties, and identify promising practices and strategies that should be explored further.3 Specifically, the research identified these features in Noxubee County:
� Community engagement and collaboration: Informal groups—including local leaders, schools, and faith groups—collaborate to address nutrition, physical activity, and housing issues.
� Integration of health services and systems: The medical complex, mental health clinic, and general hospital—including its branch clinics—work together to provide vulnerable residents the opportunity to access a continuum of preventive and curative care.
� Making health a shared value: Relationships among and between individuals and organizations develop and strengthen community values and actions related to good health. Local coalitions and religious groups are notable for influencing community culture. Intergenerational discussions about good health are common.
� Resourcefulness: Leaders, churches, and volunteers in this county work hard to continually improve the quality of life in Noxubee with a view towards making Noxubee County a good place to call home.
Like other Bright Spot counties, Noxubee County has programs and activities in place that fall into four overarching categories: leadership, resource sharing, local providers committed to public health, and an active faith community. Community Leaders Engaged in Health Initiatives In Noxubee County, leaders come from all walks of life, from elected officials to faith leaders, and they are both paid and volunteer. These important community figures are influencers who care deeply about their community. Their propensity for resourcefulness enables a community with severely limited resources to do a lot with a little. Strong community bonds and generosity fill gaps in social services. Local leaders focus on the core determinants of health. For example, the Noxubee County supervisor and the county’s three town mayors are collaborating to attract jobs. They are vigilant in pursuit of grants. The mayors want to see people buy homes, but the lack of resources to build infrastructure and provide municipal services limits the supply of good housing. All three towns enforce smoke-free ordinances.
3 For a full explanation of the methodology, see Appendix B: Research Approach. For a list of key informants interviewed for this county, see Table 17 in the data appendix at the end of this case study.
© K
im C
ross
Bob Boykin, mayor of Macon, Mississippi

CREATING A CULTURE OF HEALTH IN APPALACHIA Noxubee County, Mississippi | CASE STUDIES
83
County Supervisor Bo Oliver values educating people about healthy behaviors and exercise. Macon Mayor Bob Boykin responded to a community request for a sports complex by developing one that the high school shares. Boykin is also actively engaged in efforts to increase participation in the county-run farmers’ market. Shuqualak Mayor Velma Jenkins is committed to increasing access to affordable housing and housing with complete plumbing facilities. Her efforts have resulted in the construction of approximately nine brick homes secured through the U.S. Department of Housing and Urban Development’s HOME Investment Partnership Program. Noxubee County also benefits from other leadership. The county’s extension office is relatively new, but one of its first initiatives is working to improve obesity rates. Mississippi Homemaker Volunteers (MHV) is an all-women’s program of the Noxubee County (Mississippi State University) Extension Service with a mission “to strengthen families through education and community involvement.” MVH clubs have 10–20 members who participate in leadership training before volunteering in their local communities. They learn about nutrition, diet, exercise, health care, food safety, and other health issues, and share this knowledge with their local communities. They also sew pillowcases for children with cancer and quilts for the Children’s Hospital of Mississippi. Similarly, the 4H Club puts on programs to raise well-rounded individuals. An Alzheimer’s group supports caretakers. A statewide health department diabetes collaborative benefits from the insights of a leader who has lived in the community all her life. The diabetes coalition, led by Katherine Mickens and other key players, works with the extension office to engage the community in discussions on health, reaching out through social media, community projects, and health fairs. Noxubee County’s black fraternities and sororities also have strong commitments to community improvement. For example, Black Ice is a group of men who provide books, supplies, and healthy snacks at school. Members also visit classes to discuss the importance of not smoking and of exercising regularly. Resource Sharing Noxubee County has a core group of people who are deeply committed to the community. They use and combine available resources to share funding, launch local health initiatives, and disseminate information about health widely. Mayors, schools, small businesses, churches, and food programs tackle the problem of basic nutrition together. Mayors pursue and maintain community walking paths, clean water, and affordable housing. Schools collaborate with churches to distribute information about health and health programs. The hospital also collaborates with churches and schools to sponsor monthly health fairs. The fairs, which provide free health screenings for residents, are reportedly popular and well attended. But, as noted in other case studies, the fairs do something more critical than providing preventive screenings and health information: They convey the message that health is important. When multiple organizational actors cooperate to put on a health fair, they nurture the idea that health is something that everyone should value. Noxubee County middle schools and high schools took advantage of a grant program to develop a curriculum that focuses on healthy living. Woven into the regular school day activities, the curriculum
© K
im C
ross
Katherine Mickens, social worker for Noxubee General Hospital

CREATING A CULTURE OF HEALTH IN APPALACHIA Noxubee County, Mississippi | CASE STUDIES
84
conveyed messages about healthy behaviors and covered topics from eating and physical activity to sexually transmitted diseases and the impact of substance use on physical performance. Focus group feedback suggested that, while the grant lasted, the program was effective. Unfortunately, after five years, local budget cuts meant Noxubee County schools could not sustain the program. Resource sharing is particularly evident among the county’s churches and its female leaders. Their resourcefulness enables a community with severely limited resources to do a lot with a little. Strong community bonds and generosity often fill vast gaps in social services. Information is another community resource that is shared broadly, including across generations. Children share with older generations the information about good health habits they learn in school, and elders teach children with both words and examples about living healthfully so as to prevent chronic disease. Local Providers Committed to Public Health The local health department provides a range of services, including preventive care for low-income residents, communicable disease control, and diabetes education. Additionally, the Mississippi Department of Health sponsors multiple community initiatives to promote and improve health. With a staff of 170 full-time and part-time employees, the Noxubee Medical Complex has a strong community presence, providing services across five facilities: Noxubee General (a critical access hospital); a nursing home located adjacent to the hospital; a primary care clinic also adjacent to the hospital; and two other clinics in the county. Because the hospital also owns the adjacent health clinic, emergency room (ER) staff can redirect non-critical ER patients there, reducing costs for both the patients and the hospital. Patients pay according to a sliding fee scale. And for those who can’t pay, it is less costly to provide care through the clinic than the ER. On days that aren’t busy, hospital administrator Danny McKay sends hospital staff to a public place such as the grocery store to offer free blood pressure checks for the community. “It helps them, and it helps us, too,” he said. The hospital’s next focus is on chronic care management. According to McKay, health behaviors are largely reactive—conversations and actions are usually in response to an illness or ailment. Interviews also showed that, in Noxubee, family values and strong intergenerational ties play a major role in determining what happens around health decisions. Some rely on the head of the household to make decisions, while others turn to female family members, and others said they hold a family council to make decisions. For the most part, preventive care comes in the form of health screenings, which are well attended, and often provided free of charge. The Noxubee Medical Complex describes itself as a “comprehensive health care system” that strives to provide diversified services, including primary care, some specialty services (radiology, speech therapy, occupational therapy), and skilled nursing for short-term rehabilitation. Physician rotations through Noxubee General Hospital provide opportunities for patients to consult specialists in cardiology and podiatry.
© K
im C
ross
Danny McKay, administrator of Noxubee General Hospital

CREATING A CULTURE OF HEALTH IN APPALACHIA Noxubee County, Mississippi | CASE STUDIES
85
As McKay put it, “The basic rule is, if there is anything that goes on in this community in regard to health care, and we are not involved, then we are missing the boat; we try to be very engaged and involved in anything that has to do with health care.” Another noteworthy feature of the hospital is its local reputation as a homegrown institution. Beverly Clark, the hospital’s director of nurses and a Noxubee native, spoke of the connection between the hospital and the community: “I was born in this hospital and raised 15 miles from here . . . when I walk into this place, it is like walking into my house. This hospital is home.” The county has three primary care medical clinics associated with the hospital, one in Brooksville and two in Macon. The clinics associated with the hospital provide urgent care, even on holidays. When inpatient care is slow, the hospital diverts inpatient staff to the clinics for preventive care.
What blew my mind is that [the clinics] are actually open on holidays. That would give a person access to health care seven days a week, 24 hours a day. Again, I’m not a health care expert. I didn’t think we needed a new clinic . . . little did I know that health clinic has been the salvation and the savior for our hospital. – Macon Mayor Bob Boykin
The state’s decision not to expand Medicaid limits what the hospital can do. It strains to stay financially strong while serving many working poor who need but cannot afford services. During field research, key interviewees spoke highly of the hospital and the clinics, hoping to see them grow.
Reaching beyond inpatient, outpatient, and emergency care, Noxubee General Hospital has an infusion center and a wound center. The hospital does not offer obstetrical care because it cannot meet the requirements to cover 24/7 calls. It supports an Alzheimer’s group and a nutrition clinic. The Noxubee Medical Complex self-funds employee health insurance and charges higher premiums to smokers. When the hospital encouraged a walk-a-thon, the whole community in Macon was out walking. Still, the hospital finds preventive care challenging. Its diabetes prevention class struggles; while 50 to 60 people may sign up, only about five graduate.
Clark also notes that she spends so much time taking care of people who are sick that there is little time to think about or plan preventive programs to keep people healthy:
You want to keep people healthy . . . but then you spend so much time taking care of them that it is hard to reach out into the community and do prevention. I think now we are taking a lot of steps to try to keep people healthy—calling the patients and reminding them of appointments and making sure they get their health screenings and making sure they went and picked up their medicines at the pharmacy. Staying healthy is the main thing.
–Beverly Clark, director of nurses, Noxubee General Hospital Noxubee County’s better-than-expected Medicare depression rates may be, in part, attributable to Noxubee General’s therapeutic daycare programs for senior adults, the county’s senior centers, and the high proportion of seniors who are active in local civic organizations. It may also reflect what appears to be a high degree of intergenerational extended families in Noxubee. Further, Noxubee’s mental health
© K
im C
ross
The Noxubee County courthouse

CREATING A CULTURE OF HEALTH IN APPALACHIA Noxubee County, Mississippi | CASE STUDIES
86
program, Region 7 Community Counseling Services, has been around for more than 25 years and provides counseling for residents of all ages, from young children to seniors. Many interviewees had high praise for its counseling service work with the schools. Headquarters for the services, the Region 7 Community Mental Health Center, are state funded and located outside Noxubee County in West Point. During field work for this report, similarly strong ties were observed between nonprofit hospitals and local communities in other Bright Spot counties, including Madison, Wirt, Grant, Potter, and Hale. In each case, the hospital was strongly identified with the community. From the hospital side, this meant prioritizing local health needs over the economic interests of distant shareholders. From the patient side, it meant patients have feelings of trust and familiarity, which can reduce barriers to seeking care. This sense of identification with a major care provider, and the trust it engenders, are elements of a culture of health that warrant deeper exploration in future research. Although the qualitative field work conducted for this report makes causal inferences impossible, Noxubee’s better-than-expected poisoning and injury mortality rates may be associated with the 24/7/365 availability of emergency medical services provided by Noxubee General Hospital. First-response help is also available at Noxubee’s Brooksville clinic, at the Greater Meridian Health Clinic in nearby Lauderdale County, and, until recently, at the Shuqualak-Noxubee Health Center, a Federally Qualified Health Center that benefits from annual federal operating grants and offers a sliding fee scale for medications. Active Faith Community
Well, it’s a lot of faith-based, a lot of church-based, organizations. Because everybody knows everybody . . . and so it is sort of like the family ties. Even though it’s not family, it’s still like one huge family. – Macon Mayor Bob Boykin
Churches are among the county’s most important organizations. They serve not only as places of worship, but also as civic centers; sources of financial, social, and emotional support; political mobilizers; and disseminators of information. Most of Noxubee County’s 100 churches are small, but they pitch in when a situation requires pooled resources. Churches attract significant regular attendance, and they band together, organize, and take action through an interfaith organization in which pastors collaborate to work on community issues. Because they are hubs of social engagement and connectedness, they are also a means of communication for community initiatives.
I think that most people look to their church for information and guidance. Some churches have newsletters; some churches have clerks. But most of it is word of mouth from announcing clerks—a person in the congregation who is responsible for getting all of those announcements together and to the church. – Josephine Tate, state extension agent
Noxubee County has at least half a dozen locations, at churches and community centers in the three large towns and in rural communities, where low-income children can find a nutritious meal. The churches provide after-school food programs, and there are in-home food services for families with more than six children. Churches also provide support for seniors. Noxubee County is also very volunteer-minded, a culture that is shared and exemplified by the area’s Mennonites. Mississippi has the third-largest Mennonite population in the nation, and there are about 600 Mennonite households in the greater Macon, Brooksville, and nearby Geiger (Alabama) area.

CREATING A CULTURE OF HEALTH IN APPALACHIA Noxubee County, Mississippi | CASE STUDIES
87
Mennonites were attracted to the rich farmland in the 1950s. They are community minded, bring a strong work ethic, and engage in economic development, including the catfish farm, tomato house, and farmers’ market. Mennonites now represent thousands in the population.
–Danny McKay, administrator, Noxubee General Hospital
As a matter of religious teaching, Mennonites generally abstain from smoking and drinking. They cultivate an agriculture-based lifestyle that emphasizes physical work and consumption of a natural diet. The church also embraces the belief that caring for the health of others, especially the most vulnerable, is a shared responsibility. The Mennonites have a distinct culture of health of their own. Given their considerable presence in Noxubee County, they may be affecting health outcome measures at the population level. CREATING A CULTURE OF HEALTH IN NOXUBEE COUNTY Noxubee County’s actions indicate that county leaders and residents place a high value on health, as reflected in the wide range of health education programs available and the appreciation for health education and health care services shown by county residents. Elected officials and a strong network of faith leaders, in particular, seek to share information about and encourage good health practices.
Strong leadership has helped Noxubee focus on the core determinants of health. For example, public officials are collaborating to attract jobs and promote homeownership, despite a lack of resources.
Noxubee County has a core group of people who work with the range of available resources to improve health countywide. Participation in community life stems from strong individual relationships and social connections that people form with one another; these connections lead people to participate in volunteering, collaborating, and coalition building. This persistent struggle toward a better life is a defining trait in Noxubee County. It harnesses its collective strengths, from the resilience and spirit of its residents to the dedication and engagement of its leaders, to ensure that limited resources are stretched as far as they can go, that creative solutions are found when resources run out, and that a focus on health and well-being remains a priority for all.

CREATING A CULTURE OF HEALTH IN APPALACHIA Noxubee County, Mississippi | CASE STUDIES
88
REFERENCES Agency for Healthcare Research and Quality. 2011. “Chapter 9: Access to Health Care, 2011 National Healthcare Quality Report.” Agency for Healthcare Research and Quality. https://www.ahrq.gov/research/findings/nhqrdr/nhqr11/chap9.html Holmes, G. Mark, Nancy M. Lane, Thomas A. Arcury, Michael L. Schawlbe, Randy Randolph, John Frank, Sharita Thomas, et. al. 2018. Identifying Bright Spots in Appalachian Health: Statistical Analysis. Washington, D.C.: Appalachian Regional Commission. Marshall, Julie L., Logan Thomas, Nancy M. Lane, G. Mark Holmes, Thomas A. Arcury, Randy Randolph, Pam Silberman, et al. 2017. Health Disparities in Appalachia. Washington, D.C.: Appalachian Regional Commission. Noxubee County Economic and Community Development Alliance. 2017. Noxubee County History. February 14. Accessed 2017. http://noxubeealliance.com/

CREATING A CULTURE OF HEALTH IN APPALACHIA Noxubee County, Mississippi | CASE STUDIES
89
APPENDIX: NOXUBEE COUNTY DATA Table 16: Noxubee County Characteristics
Characteristic Noxubee County United States Population, 2010–2014 11,240 314,107,084 Percent population change, 2010–2015 -4.3% 4.1% Median age, 2015 36.6 37.8 Percent of persons over age 65, 2015 16.0% 14.9% Median household income, 2014 $28,730 $56,135 Per capita income in past 12 months, (in 2015 dollars), 2011–2015 $14,450 $28,930
Unemployment rate, 2014 12.4% 6.2% Percent persons in poverty, 2014 31.3% 15.6% Percent white alone, 2015 27.2% 77.1% Percent black alone, 2015 71.4% 13.3% Percent adults with at least some college, 2010–2014 43.79% 63.27%
Distance to nearest large population center from county center Columbus – 27.3 miles N/A
ARC designations, fiscal year 2017 Distressed Southern Appalachia N/A
Source: These data are compiled from the U.S. Bureau of Labor Statistics, Local Area Unemployment Statistics, 2014, and the U.S. Census Bureau American Community Survey Selected Social Characteristics, General Economic Characteristics, Demographic and Housing Characteristics, and Educational Attainment Tables for years 2010–2014 and 2011–2015.

CREATING A CULTURE OF HEALTH IN APPALACHIA Noxubee County, Mississippi | CASE STUDIES
90
Table 17: Noxubee County Key Informants
Name Location Title Organization Interview Date
Bob Boykin Mayor’s Office, Macon Mayor of Macon Town of Macon 9/15/16
Velma Jenkins Courthouse Macon Mayor of Shuqualak Town of Shuqualak 9/19/16
Bo Oliver Supervisor’s Office County Supervisor Noxubee County 9/19/16
Josephine Tate Office State Extension Agent, Health Education
USDA Extension 9/19/16
Beverly Clark Noxubee General Hospital Director of Nurses Noxubee General
Hospital 9/20/16
Danny McKay Noxubee General Hospital Administrator Noxubee General
Hospital 9/20/16
Katherine Mickens Noxubee General Hospital Social Worker Noxubee General
Hospital 9/20/16
Reecy Dixon Mississippi State Extension Office
Former State Legislator Retired 9/15/16
Les Decker Mississippi State Extension Office
Organic Farmer, Baker Self Employed 9/15/16
Walden Peasler Mississippi State Extension Office Aquaculture Self Employed 9/15/16
Dordil Stuart Mississippi State Extension Office Principal Noxubee County
High School 9/15/16

CREATING A CULTURE OF HEALTH IN APPALACHIA Noxubee County, Mississippi | CASE STUDIES
91
Table 18: Noxubee County Health Outcomes – Actual vs. Predicted
Outcome Measure Actual Predicted
Percentage Difference (negative =
better) COPD mortality per 100,000 people, 2008–2014 26.70 60.40 -55.8%
Heart disease hospitalizations per 1,000 Medicare beneficiaries, 2012 28.50 51.00 -44.1%
Poisoning mortality per 100,000 people, 2008–2014 8.69 14.05 -38.1% Opioid prescriptions as a percent of Part D claims, 2013 3.97 6.31 -37.1%
Injury mortality per 100,000 people, 2008–2014 43.11 63.53 -32.1%
Percentage of Medicare beneficiaries w/ depression, 2012 9.70% 13.42% -27.7%
Suicide mortality per 100,000 people, 2008–2014 10.91 14.02 -22.2%
Years of potential life lost, 2011–2013 10,274 12,284 -16.4%
Low-birth-weight births (<2,500g) per 1,000 births, 2007–2013 11.96 13.18 -9.3%
Cancer mortality per 100,000 people, 2008–2014 206.84 224.57 -7.9%
Average Medicare condition score, 2013 0.905 0.979 -7.6%
Stroke mortality per 100,000 people, 2008–2014 52.86 56.29 -6.1%
Physically unhealthy days per month per person, 2014 5.00 5.22 -4.3%
Infant mortality per 1,000 births, 2008–2014 10.68 11.14 -4.1%
Mentally unhealthy days per month per person, 2014 4.60 4.66 -1.4%
Heart disease mortality per 100,000 people, 2008–2014 296.45 292.61 1.3%
Percentage of excessive drinkers, 2014 10.20% 9.98% 2.2%
Percentage of obese adults (>30 BMI), 2012 41.8% 37.4% 11.7%
Percentage of adults with diabetes, 2012 19.00% 16.73% 13.6%
Notes: Percentage Difference = 100 * [ (Actual / Predicted) – 1] Green = County value was better than predicted
For details on the outcome measures, see the data files accompanying the report Identifying Bright Spots in Appalachian Health: Statistical Analysis.

CREATING A CULTURE OF HEALTH IN APPALACHIA Noxubee County, Mississippi | CASE STUDIES
92
Table 19: Noxubee County Health Drivers vs. National Median
Driver Measure Lower is Better?
National Median
Noxubee County
Air pollution (average daily particulate matter 2.5), 2011 Yes 11.87 12.63
Average travel time to work in minutes, 2010–2014 Yes 22.82 27.21
Chlamydia incidence rate per 100,000, 2013 Yes 287.16 891.42
Dentists per 100,000 population, 2014 No 37.45 17.99
Economic index, fiscal year 2017 Yes 108.79 201.84
Full-service restaurants per 1,000, 2012 No 0.68 0.09
Grocery stores per 1,000 residents, 2012 No 0.20 0.36
Median household income, 2014 No $45,226.00 $28,730.00
Mental health providers per 100,000 population, 2015 No 80.00 126.58
Percentage of adults currently smoking, 2014 Yes 17.8% 24.4%
Percentage of adults not physically active, 2012 Yes 27.7% 39.7%
Percentage of adults with at least some college, 2010–2014 No 56.3% 43.8%
Income inequality ratio,4 2010–2014 Yes 4.4% 5.1%
Percentage of diabetics with A1C testing, 2012 No 85.4% 92.9%
Percentage of doctors who e-prescribe, 2014 No 65.0% 77.0%
Percentage of eligibles enrolled in SNAP, 2014 No 78.0% 72.0%
Percentage of households with income below poverty, 2014 Yes 15.8% 31.3%
Percentage of Medicare women with recent mammogram, 2013 No 61.0% 53.0%
Percentage of population with access to places for physical activity, 2011 and 2014 No 61.9% 35.7%
Percentage of total population in social assistant jobs, 2013 N/A 0.01% --
Percentage receiving disability OASDI and/or SSI, 2014 Yes 5.4% 14.7%
Percentage spending >30% of income on housing, 2010–2014 Yes 29.0% 41.2%
Percentage w/ no car, low access, 2010–2014 Yes 19.7% 15.9%
Primary care physicians per 100,000 population, 2013 No 48.54 9.02
Social associations per 10,000 population, 2013 No 12.68 13.53
4 Income inequality is the ratio of household income at the 80th percentile to that at the 20th percentile. A higher ratio reflects greater division between the top and the bottom of the income spectrum.

CREATING A CULTURE OF HEALTH IN APPALACHIA Noxubee County, Mississippi | CASE STUDIES
93
Driver Measure Lower is Better?
National Median
Noxubee County
Specialist physicians per 100,000 population, 2013 No 25.93 8.90
Students per teacher, 2013–2014 Yes 14.13 --
Teenage births per 1,000, 2007–2013 Yes 39.96 71.55
Uninsured rate for people under 65, 2013 Yes 17.24 23.99
Notes: Green = County value was better than national median
For details on the driver measures, see the data files accompanying the report Identifying Bright Spots in Appalachian Health: Statistical Analysis.

CREATING A CULTURE OF HEALTH IN APPALACHIA Noxubee County, Mississippi | CASE STUDIES
94

95
Tioga County, New York
County Overview
A Deeper Look at Tioga County: Community Strengths
Creating a Culture of Health in Tioga County
References
Appendix: Tioga County Data

96

Tioga County, New York
CA
SE S
TUD
IES
97
It’s the combination of programs that exist and work together. There aren’t enough resources...so we work really hard at working together and filling gaps in creative ways.
—Jackie Spencer, Association Community Educator, Cornell Cooperative Extension of Tioga County
Anchored in the north by New York’s Finger Lakes and divided in the south by the broad, meandering Susquehanna River, Tioga County is home to green rolling hills, hardwood forests, fertile farmland, and wide-open spaces. The county seat, Owego, has a long history as a river and rail trade center. Today, it is a sleepy, quiet area with all the natural charms of a rural locale. Life can be challenging here. Many families live in or at the margins of poverty. Twenty-one percent of youth are food-insecure. Nearly 32 percent of the county’s housing was built before 1939, and a large number of residents live in older, minimally insulated homes ill-equipped to withstand the area’s punishing winters. Basic services are located far from where many people live, making them difficult to access.
Dou
glas
Cam
in /
GN
U L
icen
se 1
.2
Owego, New York, is the county seat of Tioga County.

CREATING A CULTURE OF HEALTH IN APPALACHIA Tioga County, New York | CASE STUDIES
98
Yet good things are happening in Tioga County. Collaboration and resource sharing among regional and local nonprofit and government agencies are strong, and large private and public employers are investing in the community’s health. A culture of volunteerism and resilience contributes to local solutions for challenges like food insecurity and transportation. All these factors may help explain why Tioga County is among the ten percent of Appalachian counties—and one of two counties in Appalachian New York—identified as a Bright Spot, performing better than expected across 14 of 19 health outcome measures. For example, Tioga County performed better than expected on the following measures: � Stroke mortality: 23 percent better than expected
� Infant mortality: 21 percent better than expected
� Heart disease mortality: 19 percent better than expected
� Suicide mortality: 17 percent better than expected
� Injury mortality: 17 percent better than expected
These better-than-expected results are likely influenced by local characteristics and strategies that improve overall well-being. The field work for this case study showed that Tioga County residents collaborate to improve care and well-being outside of core medical facilities. For example, residents have pooled resources to improve access to dental care for children. Many county initiatives depend on volunteerism. Volunteerism is valued on both the giving and receiving ends, and is a critical element of the community health network, especially in helping provide transportation to medical services and prescription pickup. Tioga County’s classification as a Bright Spot means that, on average, the county performed better than expected on a number of health outcome measures, given its characteristics and resources—that is, the socioeconomics, demographics, behaviors, health care facilities, and other factors that influence health outcomes. It does not mean that all residents here enjoy excellent health. In fact, the county still lags behind the rest of the nation on many health indicators. Like other counties with limited resources, Bright Spot counties face challenges to attaining good health outcomes. Tioga County’s performance, however, indicates that certain county conditions or programs may be helping generate better-than-expected outcomes—and that other resource-challenged Appalachian counties may benefit from adopting similar initiatives. 1
1 See Table 22 in the data appendix at the end of this case study for a full list of actual health outcomes for Tioga County compared with predicted outcomes. For details on the outcome measures, see the data files accompanying the report Identifying Bright Spots in Appalachian Health: Statistical Analysis.

CREATING A CULTURE OF HEALTH IN APPALACHIA Tioga County, New York | CASE STUDIES
99
COUNTY OVERVIEW Figure 9: Map - Bright Spot Community Tioga County, New York
Tioga County represents a metropolitan county in Northern Appalachia. It is one of two Bright Spot counties in Appalachian New York. Tioga County is located west of Binghamton in southwest New York State, in the “Southern Tier” of counties lining the Pennsylvania border. The county’s name comes from an Iroquois word describing a meeting place “at the fork.” The population, currently about 50,000, fell more than three percent between 2000 and 2015. Ninety-seven percent of residents are white, and residents’ median age, 43.5, is higher than the national median, 37.8. The population is also relatively well educated: nearly 62 percent of adults in Tioga have some college education, compared with just over 63 percent nationally. Employment is diversified, but higher salaries at Lockheed Martin and Crown Holdings, two national manufacturing and technology companies, affect county income averages. Tioga’s 2014 unemployment rate, 6.1 percent, fell just below the national rate of 6.2 percent. Classified by the Appalachian Regional Commission as a transitional county in fiscal year 2017, Tioga County’s median annual household income was $52,195 in 2014, compared with the national median of $56,135. 2
2 Table 20 in the Tioga County data appendix at the end of this case study provides a quantitative profile of county characteristics.

CREATING A CULTURE OF HEALTH IN APPALACHIA Tioga County, New York | CASE STUDIES
100
As part of the Binghamton metropolitan area, Tioga County enjoys the advantages of neighboring counties’ educational, cultural, and economic development resources. Cornell University is 25 miles from the county center. Although Tioga does not have a hospital, level-one and level-two trauma centers are within a half-hour drive of any location within the county. This compares favorably with many large cities, where traffic congestion can mean longer response and transportation times, even over shorter distances. It may also help explain why Tioga performs better than expected on mortality rates from poisoning, stroke, and injury, which are affected by the speed with which emergency treatment is provided. People in Tioga County consider themselves resilient—able both to get by with the resources at hand and to pull together to recover from adversity. This community self-identification is rooted in a shared history of disaster and recovery.
Because of its location and geography, Tioga County is vulnerable to catastrophic floods. Mountain peaks 5,000 feet high trap clouds and channel rain into narrow river valleys. Just in the past two decades, the county experienced major floods five times: in 1996, 2004, 2005, 2006, and 2011. The 2011 flood was the worst in modern times, putting 90 percent of Owego under water. Other parts of the region and state are also vulnerable, so resources for recovery are often spread thin, and local communities must work together to recover and rebuild. Tioga County’s communities have been through this cycle a number of times.
Resilience is not just a buzzword here—it is attached to a real history of self-reliant recovery that includes resource sharing and creativity. This history also helps explain the strong culture of volunteerism in Tioga. There’s a sense here that neighbors helping neighbors makes life in Tioga County possible for many people. A DEEPER LOOK AT TIOGA COUNTY: COMMUNITY STRENGTHS In many ways, Tioga County exemplifies the word “community.” It is a place where people recognize the need to work together—and are more than willing to do so—for the common good, even when it comes to sharing limited resources and giving up a degree of local or organizational control. Field work helped identify local practices in Tioga County that appear to be contributing to overall health, document effective practices that could be replicated in other counties, and identify promising practices and strategies that should be explored further.3 Specifically, these factors were identified in Tioga County that may have contributed to better-than-expected results:
3 For a full explanation of the methodology, see Appendix B: Research Approach. For a list of key informants interviewed for this case study, see Table 21 in the data appendix at the end of this case study.
Photo credit: Mary Beth Jones ©2017
Mar
y Be
th J
ones
A 2011 flood had a severe impact on Tioga County, including the village of Owego.

CREATING A CULTURE OF HEALTH IN APPALACHIA Tioga County, New York | CASE STUDIES
101
� Regional and local cross-sector collaboration and resource sharing: Within the county and across the Southern Tier region, cooperation and resource sharing among nonprofit and public agencies produce local solutions to shared challenges, such as access to transportation and food insecurity.
� Volunteers meeting community needs: Volunteerism is part of Tioga County’s culture. Small and large volunteer organizations are skilled at identifying and resolving issues, setting priorities, and committing resources to address local challenges. Volunteers often step up to fill gaps in government-funded services.
� Employers that support health as a shared value: Large private and public local employers
provide a range of health benefits, including personal wellness services. Over the years, large national companies have established themselves as active community members who view good health as vital.
As in the other Bright Spot communities explored in this report, people in Tioga County have worked to elevate physical, social, and economic health in a number of ways. Their approaches fall into three general overarching categories of leadership, cross-sector collaboration, and resource sharing. Community Leaders Engaged in Health Initiatives In Tioga County, leadership is a platform for the collaboration necessary to make the best use of limited resources and ensure services and supports for everyone. This is critical given that Tioga County has no hospital, no pediatric specialists, and only one part-time dentist who accepts Medicaid. Regionally, the Rural Health Network of South Central New York, a nonprofit organization based in adjacent Broome County, spearheads this type of coordination. The network brings together health care and social service leaders in its three focal counties—Tioga, Broome, and Delaware—and supports regional projects that involve other Southern Tier counties. These projects educate local citizens about wellness practices and healthy lifestyle options; build infrastructure that supports physical activity, such as biking and hiking trails; and improve access to health care services. The nonprofit community also plays a strong leadership role. The Tioga County Non-Profit Network meets quarterly to exchange ideas and information to serve residents’ needs. Representatives from approximately 20 groups attend these meetings, which are facilitated by the head of the Tioga County (Cornell University) Cooperative Extension Service. These discussions often lead to collaborative approaches to local challenges. Opioid abuse is one area where nonprofit leadership has been essential. Tioga County Allies in Substance Abuse Prevention holds quarterly panel discussions with parents, law enforcement personnel, and mental health counselors on this issue, and operates a coalition of volunteer representatives from local school districts, nonprofits, and the general community, including parents. In addition, several large employers actively invest in community health, which they view as vital to maintaining their workforces. These public and private organizations offer a range of health benefits, health education, and other opportunities to help Tioga residents pursue personal health improvement. Lockheed Martin is one of the largest and oldest employers of Tioga County residents, with health benefits that include not only comprehensive health coverage but also a robust employee health program
CREATING A CULTURE OF HEALTH IN APPALACHIA Tioga County, New York | CASE STUDIES
102
that offers free flu shots, free onsite health screenings, and access to walking paths and weight management groups. These benefits are available to employees and their family members. Crown Holdings, Inc., which manufactures metal packaging products, is another large employer with an employee health care package that covers medical, dental, and vision care, and prescription drugs; a tuition assistance program for employees who wish to return to school; and disability coverage under an accident and health plan. One of the largest public employers in the county, the Owego Apalachin Central School District, is unionized and offers its employees excellent health benefits. Another large employer, Tioga Downs Casino, is also unionized and offers health benefits. Cross-Sector Collaboration In Tioga County, researchers found a pattern of cooperation among health care providers, planners, educators, and other decision makers. Leaders here see collaboration as critical to ensuring that their communities thrive. Collaboration is pervasive across sectors, organizations, and programs within the county, and with other counties in the region. As mentioned, the Rural Health Network of South Central New York serves as a forum for sharing ideas and information, coordinating grant-seeking activities, and reducing funding competition for area health initiatives. This high level of cooperation across counties helps ensure that everyone gets the services they need, especially in lean times. There is also significant collaboration among nonprofits, government agencies, and health and advocacy groups. For example, Family Health Services for Tioga Opportunities, Inc., a nonprofit safety net service provider, collaborates with the county health department on testing services; with the extension service on breastfeeding support groups; and with Lourdes Hospital on pregnancy education for young women. Another project with nearby primary care practices helps community members get transportation for their medical appointments. In addition, CASA-Trinity, an alcohol and substance abuse prevention center, pools the efforts of professionals and citizens, and the Tioga Health Coalition promotes health throughout the county. Again, these efforts reflect an orientation toward sharing resources of time and expertise in ways that address local problems in the absence of financial resources and outside support. Collaboration has made dental care available in the county. Although dental care for children of low-income families is a critical need in Tioga County, the state does not provide funding for it. The local response was to create a mobile dental services program that employs a van equipped to provide basic dental services to schoolchildren around the county. The dental division of Tioga County Public Health worked with school administrators to get the program up and running. Adults can also get dental services through the van before and after school and during school vacations. Tioga County Public Health similarly supports a mobile program that provides mammograms to low-income women in outlying parts of the county. Resource Sharing Because Tioga County has so few health care providers, regional sharing of health care resources is crucial. Residents have access to high-quality health care from providers in neighboring counties, including level-one and level-two trauma centers, as well as satellite outpatient clinics that operate in and

CREATING A CULTURE OF HEALTH IN APPALACHIA Tioga County, New York | CASE STUDIES
103
near Tioga County. Traveling outside the community for health care is typical, but, for most people, not onerous. Within the county, researchers found a strong pattern of resource sharing among social services and health providers. For example, the newly renovated Tioga County Health and Human Services building is perceived as the area’s most valuable safety net resource, housing agencies providing services related to health care, mental health, employment, food stamps, and other assistance. Because these services are all located in one building, it is much easier and more convenient for residents to get the assistance they need. What’s more, that assistance is better coordinated among the various service providers. Volunteerism is another form of resource sharing that plays a key role in Tioga County. Residents here take pride in helping each other through extensive volunteer networks. In fact, people interviewed during the field work consistently cited volunteer-led grassroots initiatives for solving local challenges—such as lack of access to transportation, food insecurity, and substance abuse—undertaken because of limited resources and outside assistance. Services such as conflict mediation, arbitration, court assistance, fire and safety support, emergency response, and youth leadership are frequently provided by volunteers instead of through tax dollars. Nonprofit groups, schools, and employers all actively encourage and support community volunteering. Nonprofits in Tioga County value their volunteers; many organizations provide support and training, while some provide insurance coverage. They are also mindful of the need to maintain an influx of younger volunteers to keep their organizations going. And county policy makers recognize that funding is essential to support volunteer programs so they can operate effectively. Volunteerism has been crucial to meeting public transportation needs. In 2014, the Tioga County government ended the public transit van service on which many residents relied, leaving them with no way to get to medical appointments or pick up prescriptions. (New York State had reduced its transportation subsidy, making the service unsustainable.) In response, citizen groups sprung up across the county to replace the van service. These all-volunteer groups, including the Community Care Network of Nichols and Neighbors Helping Neighbors in Richford, provide transportation to people who need it. Others are stepping in and sharing resources like vehicles and fuel. Food insecurity and nutritional risk are also challenges for low-income families in parts of the county. Other than one or two well-run mom-and-pop food stores in each of the county’s six villages, two supermarkets on either side of Owego serve Tioga’s residents. Over the past 15 years, these markets have changed ownership a few times, with each change resulting in a reduced variety of foods available for residents. Local farms and community gardens offer fresh produce at outdoor farmers’ markets during the growing season, and many of these markets accept food stamps. Similar to the response that the public transportation crisis elicited, several organizations stepped up to provide nutrition assistance, including the Open Door Mission, Tioga County Rural Ministry, the Anti-Hunger Task Force, and Meals on Wheels. These organizations are largely dependent on volunteers. In addition, Tioga County citizens have organized backpack and lunchbox food programs for low-income schoolchildren.
Mar
y Be
th J
ones
Dot Richter, executive director of the Community Care Network of Nichols

CREATING A CULTURE OF HEALTH IN APPALACHIA Tioga County, New York | CASE STUDIES
104
Local citizens and social service professionals have started a range of service organizations that depend largely on volunteer and in-county support. These groups include the Finger Lakes Parents Network, for parents with developmentally disabled children; the New Hope Center, a resource center for victims of domestic violence; a Healthy Neighborhoods program that provides free in-home safety assessments; the Bridge, a network of churches that helps educate congregation members on community issues; and Reality Check, a youth tobacco-control project. Throughout Tioga County, concern for the health and well-being of children and youth is evident. Two family resource centers in Tioga County offer parenting education and host parent-child activities. Resource center staff are also available for home visits to provide further support for low-income parents. In addition, use of the Supplemental Nutrition Assistance Program (SNAP) is on par with the national average (76 percent and 78 percent, respectively). Services include nutrition education for low-income women who are pregnant or already have children. These supports may contribute to Tioga County’s better-than-expected rates of infant mortality and low-birth-weight births. Concern for youth safety and well-being is also apparent in the countywide push for tobacco-free establishments and spaces such as parks and community fairs. CREATING A CULTURE OF HEALTH IN TIOGA COUNTY Tioga County may be lacking in financial resources and other advantages, but it is rich in other critical health-promoting assets: a culture of collaboration and volunteerism, resilience and resourcefulness in the face of adversity, an ability to respond quickly to new challenges, and a strong sense of community pride and altruism. The region’s history of pulling together to recover from natural disasters may have helped strengthen social cohesion. Partnership and pooling of resources are evident both within Tioga County and across the Southern Tier region, where communities work together to address issues such as food insecurity and transportation. Particularly noteworthy in Tioga County is the tradition of volunteerism, which seems to be part of the way of life here. Volunteers often fill significant gaps in government-funded services addressing issues ranging from transportation to emergency response and safety to youth leadership to food insecurity. Nonprofits, schools, and employers all support volunteer programs and activities. Employers support community health by providing a range of health benefits, including personal wellness services. This is particularly important given that Tioga has no hospital of its own and a shortage of care providers. With good health benefits, residents are better able to get the health care services they need from providers outside the county. These assets, though difficult to measure, make for a community where people feel connected to each other, look out for each other, and help each other. They also contribute to a community where health, in many ways, is better than expected—and has the potential to become even better.

CREATING A CULTURE OF HEALTH IN APPALACHIA Tioga County, New York | CASE STUDIES
105
REFERENCES
American Community Survey, 5-Year Estimates, 2011–2015, Selected Housing Characteristics. Chandra, A, J.D. Acosta, K.G. Carman, T. Dubowitz, L. Leviton, L.T. Martin, C. Miller, et al. 2016. “Building a National Culture of Health.” https://www.rand.org/content/dam/rand/pubs/research_reports/RR1100/RR1199/RAND_RR1199.pdf DATA USA. 2017. Economy. October 3. https://datausa.io/profile/geo/tioga-county-ny/#economy Ellison, Ayla. 2016. Hospital CFO Report: 6 common characteristics of hospitals vulnerable to closure. February 09. Accessed July 27, 2017. http://www.beckershospitalreview.com/finance/6-common-characteristics-of-hospitals-vulnerable-to-closure.html Holmes, G. Mark, Nancy M. Lane, Thomas A. Arcury, Michael L. Schwalbe, Randy Randolph, John Frank, Sharita Thomas, et. al. 2018. Identifying Bright Spots in Appalachian Health: Statistical Analysis. Washington, D.C.: Appalachian Regional Commission. Marshall, Julie L., Logan Thomas, Nancy M. Lane, G. Mark Holmes, Thomas A. Arcury, Randy Randolph, Pam Silberman, et al. 2017. Health Disparities in Appalachia. Washington, D.C.: Appalachian Regional Commission. Office of Disease Prevention and Health Promotion. US DHHS. 2017. Healthy People / 2020 Topics & Objectives/ Access to Health Services. Accessed July 27, 2017. https://www.healthypeople.gov/2020/topics-objectives/topic/Access-to-Health-Services Tioga Opportunities, Inc. Child Food Insecurity, 2018. https://tiogaopp.org/tioga-opportunities-inc-news/community-services-news/item/66-2017-tioga-county-child-food-insecurity.html

CREATING A CULTURE OF HEALTH IN APPALACHIA Tioga County, New York | CASE STUDIES
106
APPENDIX: TIOGA COUNTY DATA Table 20: Tioga County Characteristics
Characteristic Tioga County United States
Population, 2010–2014 50,464 314,107,084
Percent population change, 2010–2015 -3.30% 4.10%
Median age, 2015 43.5 37.8
Percent of persons over age 65, 2015 18.30% 14.90%
Median household income, 2014 $52,195 $56,135 Per capita income in past 12 months (in 2015 dollars), 2011–2015 $29,427 $28,930
Unemployment rate, 2014 6.1% 6.2% Percent persons in poverty, 2014 11.4% 15.6%
Percent white alone, 2015 96.70% 77.10%
Percent black alone, 2015 1.00% 13.30% Percent adults with at least some college, 2010–2014 61.67% 63.27%
Distance to nearest large population center from county center Ithaca, NY – 28.4 mi. N/A
ARC designations, fiscal year 2017 Transitional Northern Appalachia N/A
Source: These data are compiled from the U.S. Bureau of Labor Statistics, Local Area Unemployment Statistics, 2014, and the U.S. Census Bureau American Community Survey Selected Social Characteristics, General Economic Characteristics, Demographic and Housing Characteristics, and Educational Attainment Tables for years 2010–2014 and 2011–2015.

CREATING A CULTURE OF HEALTH IN APPALACHIA Tioga County, New York | CASE STUDIES
107
Table 21: Tioga County Key Informants
Name Location Title Organization Interview Date
Elaine D. Jardine Owego Planning Director Tioga County Economic Development and Planning Office
1/30/2017
Mary Maruscak Owego Population Health Coordinator
Rural Health Network of South Central New York 1/30/2017
Jackie Spencer Owego Family Development Program Leader
Family Resource Center – Cornell Cooperative Extension
1/30/2017
Susan Medina Owego Director of Dental Services Public Health Department 1/30/2017
Shawn Yetter Owego Commissioner Social Services Department 1/31/2017
Cara Zampi Owego Community Educator – Tobacco Free Tioga and Reality Check Programs
Cornell Cooperative Extension 1/31/2017
Sara Begeal Owego Clinical Director Tioga County Community Services Board 1/31/2017
Nancy Glasgow Owego Director, Family Health Services Tioga Opportunities, Inc. 1/31/2017
John Holton Jr. Owego Director Veterans’ Service Agency 2/1/2017

CREATING A CULTURE OF HEALTH IN APPALACHIA Tioga County, New York | CASE STUDIES
108
Table 22: Tioga County Health Outcomes – Actual vs. Predicted
Outcome Measure Actual Predicted Percentage Difference (negative =
better) Stroke mortality per 100,000 people, 2008–2014 31.24 40.78 -23.4%
Infant mortality per 1,000 births, 2008–2014 5.36 6.80 -21.1%
Heart disease mortality per 100,000 people, 2008–2014 165.12 203.77 -19.0%
Suicide mortality per 100,000 people, 2008–2014 10.56 12.77 -17.4%
Injury mortality per 100,000 people, 2008–2014 36.63 44.06 -16.9%
COPD mortality per 100,000 people, 2008–2014 41.17 47.80 -13.9%
Percentage of adults with diabetes, 2012 10.10% 11.31% -10.7%
Opioid prescriptions as a percent of Part D claims, 2013 4.38 4.65 -5.8%
Percentage of Medicare beneficiaries w/ depression, 2012 13.80% 14.96% -7.7%
Low-birth-weight births (<2,500 g) per 1,000 births, 2007–2013 7.39 7.94 -6.8%
Cancer mortality per 100,000 people, 2008–2014 165.90 177.10 -6.3%
Years of potential life lost, 2011–2013 6,637 6,927 -4.2%
Percentage of excessive drinkers, 2014 18.70% 19.67% -4.9%
Average Medicare condition score, 2013 0.97 0.99 -2.5%
Poisoning mortality per 100,000 people, 2008–2014 14.00 13.95 0.3%
Physically unhealthy days per month per person, 2014 3.10 3.03 2.2%
Mentally unhealthy days per month per person, 2014 3.40 3.33 2.0%
Percentage of obese adults (>30 BMI), 2012 31.5% 30.7% 2.6%
Heart disease hospitalizations per 1,000 Medicare beneficiaries, 2012 60.10 54.60 10.1%
Notes: Percentage Difference = 100 * [ (Actual / Predicted) – 1] Green = County value was better than predicted
For details on the outcome measures, see the data files accompanying the report Identifying Bright Spots in Appalachian Health: Statistical Analysis.

CREATING A CULTURE OF HEALTH IN APPALACHIA Tioga County, New York | CASE STUDIES
109
Table 23: Tioga County Health Drivers vs. National Median
Driver Measure Lower is Better?
National Median
Tioga County
Air pollution (average daily particulate matter 2.5), 2011 Yes 11.87 11.92
Average travel time to work in minutes, 2010–2014 Yes 22.82 23.68
Chlamydia incidence rate per 100,000, 2013 Yes 287.16 231.78
Dentists per 100,000 population, 2014 No 37.45 18.05
Economic index, fiscal year 2017 Yes 108.79 92.29
Full-service restaurants per 1,000, 2012 No 0.68 0.81
Grocery stores per 1,000 residents, 2012 No 0.20 0.20
Median household income, 2014 No $45,226.00 $52,195.00
Mental health providers per 100,000 population, 2015 No 80.00 129.87
Percentage of adults currently smoking, 2014 Yes 17.8% 14.2%
Percentage of adults not physically active, 2012 Yes 27.7% 26.6%
Percentage of adults with at least some college, 2010–2014 No 56.3% 61.7%
Income inequality ratio,4 2010–2014 Yes 4.4% 4.5%
Percentage of diabetics with A1C testing, 2012 No 85.4% 86.4%
Percentage of doctors who e-prescribe, 2014 No 65.0% 92.0%
Percentage of eligibles enrolled in SNAP, 2014 No 78.0% 76.0%
Percentage of households with income below poverty, 2014 Yes 15.8% 11.4%
Percentage of Medicare women with recent mammogram, 2013 No 61.0% 63.0%
Percentage of population with access to places for physical activity, 2011 and 2014 No 61.9% 70.8%
Percentage of total population in social assistant jobs, 2013 N/A 0.01% 0.01%
Percentage receiving disability OASDI and/or SSI, 2014 Yes 5.4% 5.8%
Percentage spending >30% of income on housing, 2010–2014 Yes 29.0% 27.2%
Percentage w/ no car, low access, 2010–2014 Yes 19.7% 14.8%
Primary care physicians per 100,000 population, 2013 No 48.54 29.85
4 Income inequality is the ratio of household income at the 80th percentile to that at the 20th percentile. A higher ratio reflects greater division between the top and the bottom of the income spectrum.

CREATING A CULTURE OF HEALTH IN APPALACHIA Tioga County, New York | CASE STUDIES
110
Driver Measure Lower is Better?
National Median
Tioga County
Social associations per 10,000 population, 2013 No 12.68 13.73
Specialist physicians per 100,000 population, 2013 No 25.93 37.65
Students per teacher, 2013–2014 Yes 14.13 12.76
Teenage births per 1,000, 2007–2013 Yes 39.96 29.98
Uninsured rate for people under 65, 2013 Yes 17.24 9.37
Notes: Green = County value was better than national median
For details on the driver measures, see the data files accompanying the report Identifying Bright Spots in Appalachian Health: Statistical Analysis.

111
Madison County, North Carolina
County Overview
A Deeper Look at Madison County: Community Strengths
Creating a Culture of Health in Madison County
References
Appendix: Madison County Data

112
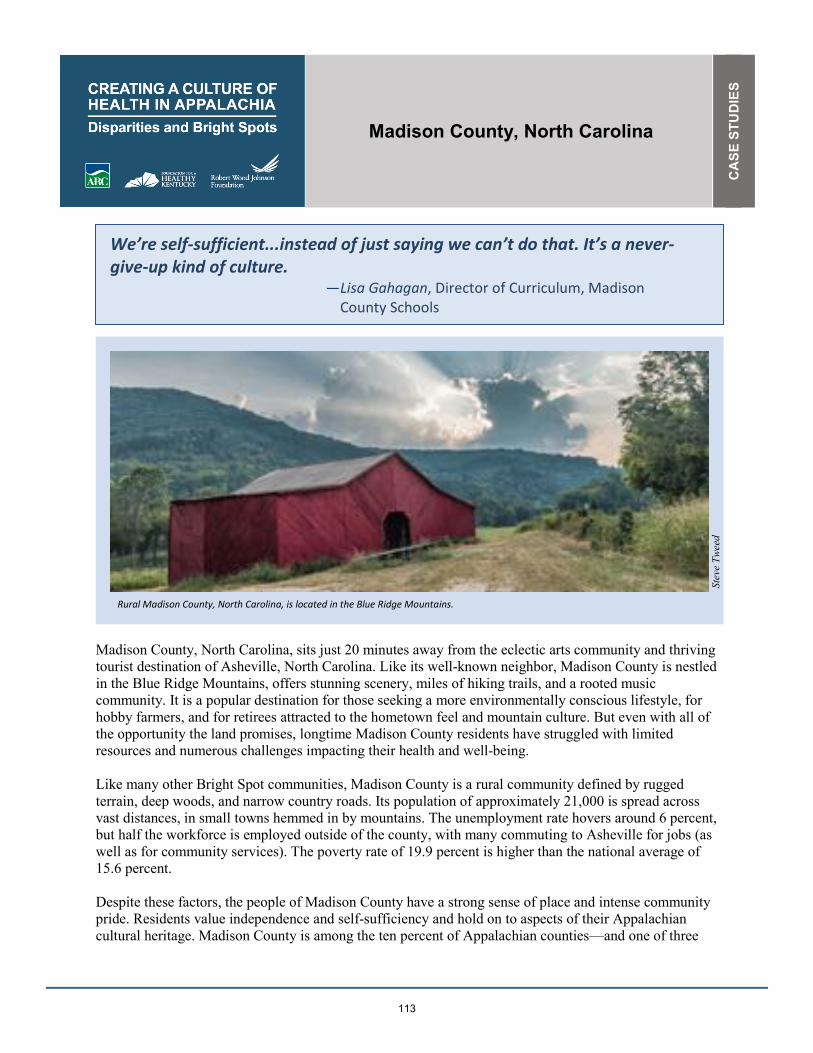
Madison County, North Carolina
CA
SE
STU
DIE
S
113
We’re self-sufficient...instead of just saying we can’t do that. It’s a never-give-up kind of culture.
—Lisa Gahagan, Director of Curriculum, Madison County Schools
Madison County, North Carolina, sits just 20 minutes away from the eclectic arts community and thriving tourist destination of Asheville, North Carolina. Like its well-known neighbor, Madison County is nestled in the Blue Ridge Mountains, offers stunning scenery, miles of hiking trails, and a rooted music community. It is a popular destination for those seeking a more environmentally conscious lifestyle, for hobby farmers, and for retirees attracted to the hometown feel and mountain culture. But even with all of the opportunity the land promises, longtime Madison County residents have struggled with limited resources and numerous challenges impacting their health and well-being. Like many other Bright Spot communities, Madison County is a rural community defined by rugged terrain, deep woods, and narrow country roads. Its population of approximately 21,000 is spread across vast distances, in small towns hemmed in by mountains. The unemployment rate hovers around 6 percent, but half the workforce is employed outside of the county, with many commuting to Asheville for jobs (as well as for community services). The poverty rate of 19.9 percent is higher than the national average of 15.6 percent. Despite these factors, the people of Madison County have a strong sense of place and intense community pride. Residents value independence and self-sufficiency and hold on to aspects of their Appalachian cultural heritage. Madison County is among the ten percent of Appalachian counties—and one of three
Rural Madison County, North Carolina, is located in the Blue Ridge Mountains.
Stev
e Tw
eed

CREATING A CULTURE OF HEALTH IN APPALACHIA Madison County, North Carolina | CASE STUDIES
114
counties in Appalachian North Carolina—identified as a Bright Spot. It performed better than expected on 13 out of 19 health outcome measures. Most notably, the county performed better than expected on the following measures:
� Years of potential life lost: 25 percent better than expected
� Percentage of adults with obesity (>30 BMI): 18 percent better than expected
� Percentage of adults with diabetes: 12 percent better than expected
� Heart disease hospitalizations: 12 percent better than expected
� Cancer mortality: 12 percent better than expected
These better-than-expected results are likely influenced by local conditions and initiatives that improve overall health and well-being. The field work for this study showed that Madison County residents are committed to ensuring access to primary care services, including taking services to where residents live. Strong social networks connect communities in different parts of the county, reinforcing the importance of health. Madison County’s classification as a Bright Spot means that, on average, the county performed better than expected on a number of health outcome measures, given its characteristics and resources—that is, the socioeconomics, demographics, behaviors, health care facilities, and other factors that influence health outcomes. It does not mean that all Madison County residents enjoy excellent health. In fact, Madison County lags behind the rest of the nation on many health outcome measures. Like other counties with limited resources, Bright Spot counties face many challenges to attaining good health outcomes. But Madison County’s performance does indicate that certain county conditions or programs may be helping generate better-than-expected outcomes—and that other resource-challenged Appalachian counties may benefit from adopting similar initiatives.1
1 See Table 26 in the data appendix at the end of this case study for a full list of actual health outcomes for Madison County compared with predicted outcomes. For details on the outcome measures, see the data files accompanying the report Identifying Bright Spots in Appalachian Health: Statistical Analysis.

CREATING A CULTURE OF HEALTH IN APPALACHIA Madison County, North Carolina | CASE STUDIES
115
COUNTY OVERVIEW Figure 10: Map - Bright Spot Community Madison County, North Carolina
Madison County represents a metropolitan county in South Central Appalachia. It is one of three Bright Spot counties in Appalachian North Carolina.
Madison County is located in South Central Appalachia, adjacent to the eastern border of Tennessee. Portions of the Pisgah National Forest cover much of the northwestern part of the county, accounting for 16 percent of the county’s land area. Its residents live in three towns—Hot Springs, Mars Hill, and Marshall—and in more sparsely populated rural townships. Across the county, the median household income is $38,445, compared with the national median of $56,135. Madison is racially homogeneous—roughly 96 percent of the population is white. Just over 50 percent of adults have at least some college education, compared with the national median of 63.3 percent. Classified by the Appalachian Regional Commission as at-risk in fiscal year 2017, unemployment in Madison County matched the national rate of 6.2 percent. The most commonly held jobs are in health care and social assistance, retail trade, and manufacturing. The major in-county employers are Madison County Schools, Mars Hill University, Madison County government, and Printpack, Inc., a packaging company.2
2 Table 24 in the Madison County data appendix at the end of this case study provides a quantitative profile of county characteristics.

CREATING A CULTURE OF HEALTH IN APPALACHIA Madison County, North Carolina | CASE STUDIES
116
A DEEPER LOOK AT MADISON COUNTY: COMMUNITY STRENGTHS Like people in other Bright Spot counties described in this report, Madison County stakeholders have a long tradition of relying on each other and local resources to address challenges. They do this by partnering with other organizations, often across sectors, and sharing resources creatively. Field work helped identify local practices in Madison County that appear to be contributing to overall health, document effective practices that could be replicated in other counties, and identify promising strategies that should be explored further.3 Specifically, the research identified these characteristics and strategies in Madison County:
� A strong focus on primary care: The county is actively committed to ensuring residents have access to primary care services. The Hot Springs Health Program (HSHP), which operates four clinics in the county, plays a significant role in keeping primary care front and center.
� Cross-sector collaboration: Regional partnerships and resource sharing occur across multiple sectors and with players both inside and outside of the county.
� Commitment to outreach: Many programs take their services to where rural residents live, especially in unincorporated areas of the county.
� Promoting health as a shared value: Madison County cultivates strong social networks to connect communities in different parts of the county and reinforce the importance of health.
Many of Madison County’s initiatives fall into four overarching categories echoed in other Bright Spot counties: local providers committed to public health, cross-sector collaboration, resource sharing, and an active faith community. Leadership was also present, but less so in terms of specific leaders than in organizations taking the lead to improve health county-wide. What follows is a more in-depth description of the programs and activities that fall under these overarching categories. Local Providers Committed to Public Health
Providing primary care, social services, and structured ways for people to connect are all part of the county’s overall approach to health. The Hot Springs Health Program (HSHP) is at the center of much of this work, providing a full range of primary and preventive medical services as well as treatment for acute and chronic conditions. There are three significant reasons why HSHP plays such a major role: it offers a broad range of services, it is easily accessible from all parts of the county, and it is “homegrown.” People here view HSHP as an institution that not only serves but also belongs to Madison County and its residents. In 1971, community leaders came up with the vision for HSHP—a stable, accessible health care delivery system. Recruiting doctors to serve its poor, rural population had been a constant battle. With no hospital and only a few doctors, residents had to travel long distances over bad roads to get health care. The community’s access to medical care was tenuous—always on the brink of disruption if even a single doctor retired or moved on. Rather than rely on doctors to move in and establish a private practice, the community created its own nonprofit health care network, built its own clinics, and hired its own providers. 3 For a full explanation of the methodology, see Appendix B: Research Approach. For a list of key informants interviewed for this county, see Table 25 in the data appendix at the end of this case study.
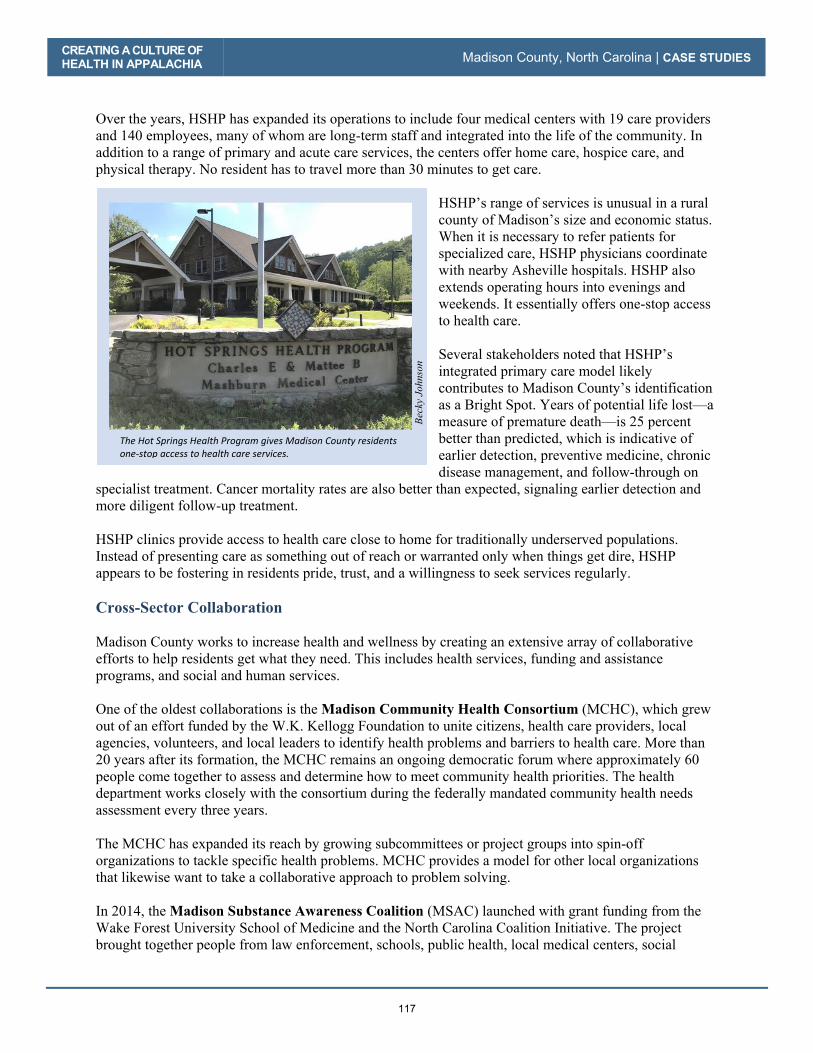
CREATING A CULTURE OF HEALTH IN APPALACHIA Madison County, North Carolina | CASE STUDIES
117
Over the years, HSHP has expanded its operations to include four medical centers with 19 care providers and 140 employees, many of whom are long-term staff and integrated into the life of the community. In
addition to a range of primary and acute care services, the centers offer home care, hospice care, and
physical therapy. No resident has to travel more than 30 minutes to get care.
HSHP’s range of services is unusual in a rural
county of Madison’s size and economic status. When it is necessary to refer patients for
specialized care, HSHP physicians coordinate
with nearby Asheville hospitals. HSHP also
extends operating hours into evenings and
weekends. It essentially offers one-stop access to health care.
Several stakeholders noted that HSHP’s
integrated primary care model likely
contributes to Madison County’s identification as a Bright Spot. Years of potential life lost—a
measure of premature death—is 25 percent
better than predicted, which is indicative of
earlier detection, preventive medicine, chronic
disease management, and follow-through on
specialist treatment. Cancer mortality rates are also better than expected, signaling earlier detection and more diligent follow-up treatment.
HSHP clinics provide access to health care close to home for traditionally underserved populations.
Instead of presenting care as something out of reach or warranted only when things get dire, HSHP
appears to be fostering in residents pride, trust, and a willingness to seek services regularly.
Cross-Sector Collaboration
Madison County works to increase health and wellness by creating an extensive array of collaborative
efforts to help residents get what they need. This includes health services, funding and assistance
programs, and social and human services.
One of the oldest collaborations is the Madison Community Health Consortium (MCHC), which grew
out of an effort funded by the W.K. Kellogg Foundation to unite citizens, health care providers, local
agencies, volunteers, and local leaders to identify health problems and barriers to health care. More than
20 years after its formation, the MCHC remains an ongoing democratic forum where approximately 60
people come together to assess and determine how to meet community health priorities. The health department works closely with the consortium during the federally mandated community health needs
assessment every three years.
The MCHC has expanded its reach by growing subcommittees or project groups into spin-off
organizations to tackle specific health problems. MCHC provides a model for other local organizations that likewise want to take a collaborative approach to problem solving.
In 2014, the Madison Substance Awareness Coalition (MSAC) launched with grant funding from the
Wake Forest University School of Medicine and the North Carolina Coalition Initiative. The project
brought together people from law enforcement, schools, public health, local medical centers, social
The�Hot�Springs�Health�Program�gives�Madison�County�residents�oneͲstop�access�to�health�care�services.�
Beck
y Jo
hnso
n

CREATING A CULTURE OF HEALTH IN APPALACHIA Madison County, North Carolina | CASE STUDIES
118
service organizations, pharmacies, and churches to identify ways to reduce substance abuse and misuse of prescription medications. The MSAC continues to coordinate efforts to combat the abuse of methamphetamines, alcohol, and opioid analgesics. Madison County’s School Health Advisory Council (SHAC) is one of many supported by the North Carolina Department of Public Instruction and the State Board of Education. Madison’s SHAC consists of health and education professionals who help guide health programming efforts in the schools. Many of these programming efforts are aimed explicitly at improving the health status of students and, by extension, their families. For example, the SHAC group launched a food truck program that provides free fruits and vegetables to county residents. Local government is a critical piece of the collaboration puzzle. At county department head meetings, health literature is regularly distributed to staff to carry back to their respective county workforces. At a department head meeting in April 2017, the floor was turned over to a local representative from the American Cancer Society to talk about cancer prevention and treatment resources. It fell outside the normal business of a county department head meeting, but it was indicative of a culture of health where any avenue to advance community well-being is used. Literature about wellness initiatives, upcoming screenings, and health resources is regularly distributed to Meals on Wheels clients and through eight senior meal sites. Local churches and nonprofits disseminate literature about their own social aid programs, offering services from supplying food care boxes to providing housing assistance. Another regional collaborative program, WNC Health Impact, brings together leaders from county health departments, hospitals, and other agencies in western North Carolina to share information and ideas, identify problems and priorities, formulate plans, and coordinate action. WNC Health Impact has helped Madison County public health leaders identify priority health targets (for 2015 to 2018): obesity prevention, mental health screening and treatment access, and substance abuse prevention. Resource Sharing Access to care, food, and transportation are issues that Madison County organizations, agencies, churches, and volunteers work to ameliorate by pooling resources across the county and regionally. Madison County residents bring a “pull yourself up by your bootstraps” mentality toward meeting community needs, an ingrained sense of responsibility toward the less fortunate, and strong collaboration among agencies. For instance, Madison County has no hospital of its own but is within a 20-minute drive of Mission Hospital, western North Carolina’s major medical center located in adjacent Buncombe County. The level-two trauma center offers a wide range of standard and specialized services, including a weight management center and a diabetes and health education center. The Madison County Health Department works with Mission Hospital to provide diabetes education and conduct its community health needs assessment, and the department also contracts with the hospital for ambulance and emergency services. North Carolina’s Office of Rural Health (ORH) funds HSHP to subsidize care for indigent patients. ORH’s mission includes expanding health care access for at-risk rural populations. Many of Madison County’s residents do not have high-speed Internet, so they cannot pay bills online from home, research medical symptoms, look up doctors, learn about social assistance programs, or find a phone number for a specialist. To resolve this need, Madison County Schools and U.S. Cellular are looking at a project to retrofit school buses to operate as mobile Wi-Fi hotspots to give community members Internet access.

CREATING A CULTURE OF HEALTH IN APPALACHIA Madison County, North Carolina | CASE STUDIES
119
Madison County’s Smart Start program works with community volunteers and social work students at Mars Hill University to make literacy education available at childcare centers throughout the county. The childcare centers also screen for learning disabilities and help parents and school personnel respond appropriately. Smart Start is described as going out to places in the county where its services are needed most. To help the many residents of unincorporated areas that are difficult to reach, Madison County has several efforts that take health-related resources to these rural locations. The Community Health Advisor Program (CHA), started in 2011, is one example. Operated by the American Cancer Society, this program trains volunteers to educate their neighbors about the importance of preventive screening, especially for colon, breast, and cervical cancers. The Madison County program is one of only a few pilot programs of this kind. Madison County was chosen as a pilot site precisely because of historically low levels of preventive screening, higher levels of poverty and cancer mortality, and few local clinical resources. Food Several communities in Madison County may well be considered a food desert, with many residents having to travel long distances to get to the nearest grocery store. Meals on Wheels serves a number of residents across this challenging landscape. In 2011, the Mars Hill Baptist Church launched the Lord’s Harvest, a nonprofit targeting the nearly 30 percent of children living in Madison County who are food insecure. With grants from other congregations in North Carolina and Florida, and donations from members of the church and the community, the nonprofit puts 100 percent of funding toward feeding the hungry in Madison County and neighboring counties. The Lord’s Harvest provides 1,790 families each month with a total of 4,100 pounds of potatoes, 1,000 pounds of cornmeal, and 1,000 pounds of pinto beans. Mars Hill Baptist Church Pastor Tommy Justus pieced together supplies from the regional food bank, human capital from the faith-based community, and a packing site in his church basement, but he lacked a way to get the food to the schools that serve as the three distribution sites across Madison County. So the sheriff volunteered his deputies to courier the food to the schools. The Food Connections program is an innovative collaboration between the Madison County Cooperative Extension, the Beacon of Hope Food Bank, and the University of North Carolina (UNC) at Asheville. The program takes leftover food prepared for the cafeteria lines at UNC Asheville, repackages it, refrigerates it, and distributes it—through the food bank or through the community center in Spring Creek—to low-income families in Madison County. Similarly, a food truck program operated jointly by the Madison County Health Department and the YMCA delivers free fruits and vegetables to low-income residents around the county. A food hub program operated by the county extension office helps small-scale local farmers bring their products to market, and also provides a place where low-income families can obtain high-quality organic produce at low prices. The same program delivers fruits and vegetables to senior centers around the county. Madison County’s Healthy Eating and Active Living (HEAL) team operates out of the county health department and works with other groups to promote positive health behaviors. The HEAL team has collaborated with social work students at Mars Hill University to conduct a study of Madison County residents to learn about barriers to physical activity and good nutrition. HEAL also helped initiate a

CREATING A CULTURE OF HEALTH IN APPALACHIA Madison County, North Carolina | CASE STUDIES
120
project with the YMCA—the Healthy Living Mobile Market—to bring fruits and vegetables, along with nutrition education, to more remote parts of Madison County. Programs to impart healthier lifestyle choices among youth have shown promise in changing eating habits. At the Hot Springs Community Learning Center, children’s packed lunches may not include sugary drinks or desserts or other low-nutrition foods. The childcare center also partners with local farmers who provide free produce for daily snacks and as a supplement to lunches brought from home. Additionally, the center grows food in its own garden, provides free produce to parents gleaned from the regional food bank, and exposes children to produce through art projects and science experiments. Parents are reporting that their children are trying vegetables and limiting soft drinks. Transportation The isolation of Madison County’s distant communities separated by narrow, twisting roads is acute, making a lack of transportation a considerable barrier to resources enabling good health. Many elderly residents either can’t drive or don’t have a vehicle; others can’t afford the gas to get to medical appointments. The remote community of Spill Corn, located 45 minutes from the closest grocery store, is home to 23 individuals who either can’t drive or don’t have a car. Volunteers and others use a daisy-chain system to overcome this hurdle. Volunteer couriers carry food from a central location to a middleman site—often churches but also community centers, volunteer fire departments, and a subsidized housing development. Volunteers from individual communities then deliver the food to the doorsteps of those who are housebound or lack transportation. In addition, the county operates eight senior meal sites and sends county vans to pick up seniors who don’t have transportation. Stakeholders noted that if it weren’t for this transportation, many residents would not be able to get to the meal sites. They also noted that many residents come to the sites for interaction as well as the meal; in Madison County, food provides not only nourishment but also community connectedness. Active Faith Community The faith-based community in the county plays an important role in promoting health and helping provide resources and opportunities for residents to pursue a healthy lifestyle. A network known as AMOM, Assisting Ministries of Madison, holds roundtable meetings every month to bring together representatives of faith-based groups, community outreach programs, and government social services agencies. They share information on their respective initiatives and assess pressing needs. Everything from food pantry assistance and Thanksgiving turkey drives to heating assistance and free firewood programs are coordinated through AMOM. Pastors actively share information on new programs and services that their congregations can support by volunteering time and resources. Troubled by the plight of impoverished elderly living in rundown homes, Mars Hill Baptist Church Pastor Tommy Justus called on volunteers in the faith community to install bathroom grab bars and building ramps, and fix roof leaks. That call has since turned into a full-fledged nonprofit, the Community Housing Coalition. Madison County is flush with these sorts of homegrown social assistance initiatives, and the faith community is actively serving a role in stewarding many of them.

CREATING A CULTURE OF HEALTH IN APPALACHIA Madison County, North Carolina | CASE STUDIES
121
CREATING A CULTURE OF HEALTH IN MADISON COUNTY Madison County clearly places a high value on health, and the commitment to doing so is evident on the part of numerous players: health officials, volunteers, educators, local employers, and the faith-based community. Likewise, the emphasis on outreach and getting services to people where they are affirms that health matters to this community. Madison County has a lower obesity rate, lower prevalence of diabetes, and fewer heart disease hospitalizations than were predicted for the county, given its characteristics and resources. Those interviewed for this case study credit that success in part to minimal numbers of fast-food restaurants in the area and Appalachians’ long tradition of growing and raising their own food. Organizations and institutions across Madison County are growing a new culture around health and well-being—transforming diets and enabling access to fresh produce, and connecting people to health services with transportation supports and strong employer-provided health insurance.
CREATING A CULTURE OF HEALTH IN APPALACHIA Madison County, North Carolina | CASE STUDIES
122
REFERENCES Ellison, Ayla. 2016. Hospital CFO Report: 6 common characteristics of hospitals vulnerable to closure. February 09. Accessed July 27, 2017. http://www.beckershospitalreview.com/finance/6-common-characteristics-of-hospitals-vulnerable-to-closure.html Holmes, G. Mark, Nancy M. Lane, Thomas A. Arcury, Michael L. Schwalbe, Randy Randolph, John Frank, Sharita Thomas, et. al. 2018. Identifying Bright Spots in Appalachian Health: Statistical Analysis. Washington, D.C.: Appalachian Regional Commission. Lord’s Harvest for the Hungry. 2018. “February 2018 Newsletter.” Accessed May 15, 2018. http://www.lordsharvestforthehungry.org/ Marshall, Julie L., Logan Thomas, Nancy M. Lane, G. Mark Holmes, Thomas A. Arcury, Randy Randolph, Pam Silberman, et al. 2017. Health Disparities in Appalachia. Washington, D.C.: Appalachian Regional Commission. Office of Disease Prevention and Health Promotion. US DHHS. 2017. Healthy People / 2020 Topics & Objectives/ Access to Health Services. Accessed July 27, 2017. https://www.healthypeople.gov/2020/topics-objectives/topic/Access-to-Health-Services Southeastern University Consortium on Hunger, Poverty, and Nutrition. Hunger Research, Understanding Food Insecurity in Your Community, Madison, North Carolina, 2013. http://hunger-research.sog.unc.edu/content/2013-madison-county-nc

CREATING A CULTURE OF HEALTH IN APPALACHIA Madison County, North Carolina | CASE STUDIES
123
APPENDIX: MADISON COUNTY DATA Table 24: Madison County Characteristics
Characteristic Madison County United States
Population, 2010–2014 20,951 314,107,084
Percent population change, 2010–2015 1.80% 4.10%
Median age, 2015 43.7 37.8
Percent of persons over age 65, 2015 20.40% 14.90%
Median household income, 2014 $38,445 $56,135 Per capita income in past 12 months (in 2015 dollars), 2011–2015 $21,076 $28,930
Unemployment rate, 2014 6.2% 6.2%
Percent persons in poverty, 2014 19.9% 15.6%
Percent white alone, 2015 95.80% 77.10%
Percent black alone, 2015 1.80% 13.30% Percent adults with at least some college, 2010–2014 51.15% 63.27%
Distance to nearest large population center from county center Asheville, NC (21.5 mi) N/A
ARC designations, fiscal year 2017 At-Risk South Central Appalachia N/A
Source: These data are compiled from the U.S. Bureau of Labor Statistics, Local Area Unemployment Statistics, 2014, and the U.S. Census Bureau American Community Survey Selected Social Characteristics, General Economic Characteristics, Demographic and Housing Characteristics, and Educational Attainment Tables for years 2010–2014 and 2011–2015.

CREATING A CULTURE OF HEALTH IN APPALACHIA Madison County, North Carolina | CASE STUDIES
124
Table 25: Madison County Key Informants
Name Location Title Organization Interview Date
Marianna Daly Marshall Physician and Medical Director
Hot Springs Health Program and Madison County Health Department
4/4/2017
Lisa Gahagan Marshall Director of Curriculum Madison County Schools 4/4/2017
Ross Young Marshall Director North Carolina Cooperative Extension 4/4/2017
Deana Stephens Marshall Community Health Director, RN
Madison County Health Department 4/4/2017
Teresa Strom Marshall CEO Hot Springs Health Program 4/4/2017
Molly Campbell Mars Hill Executive Director, Program Coordinator
North Carolina Early Education Initiative 4/4/2017
Lynda Bowles Mars Hill Specialist for Community Health American Cancer Society 4/5/2017
Thomas Fields Marshall Coordinator Gear-Up Grant 4/5/2017
O’Neal Shelton Mars Hill President Madison County Chamber of Commerce 4/6/2017

CREATING A CULTURE OF HEALTH IN APPALACHIA Madison County, North Carolina | CASE STUDIES
125
Table 26: Madison County Health Outcomes – Actual vs. Predicted
Outcome Measure Actual Predicted
Percentage Difference (negative =
better)
Years of potential life lost, 2011–2013 6,129 8,138 -24.7%
Percentage of obese adults (>30 BMI), 2012 24.8% 30.1% -17.7%
Percentage of adults with diabetes, 2012 10.40% 11.86% -12.3%
Heart disease hospitalizations per 1,000 Medicare beneficiaries, 2012 49.40 56.14 -12.0%
Cancer mortality per 100,000 people, 2008–2014 159.40 180.77 -11.8%
Infant mortality per 1,000 births, 2008–2014 6.77 7.51 -9.9%
Low-birth-weight births (<2,500) per 1,000 births, 2007–2013 7.73 8.48 -8.9%
Injury mortality per 100,000 people, 2008–2014 51.92 56.14 -7.5%
Percentage of Medicare beneficiaries w/ depression, 2012 15.8% 17.0% -6.8%
Heart disease mortality per 100,000 people, 2008–2014 182.60 194.47 -6.1%
Average Medicare condition score, 2013 0.91 0.96 -5.9%
Physically unhealthy days per month per person, 2014 3.70 3.92 -5.5%
Mentally unhealthy days per month per person, 2014 3.80 3.87 -1.7%
Percentage of excessive drinkers, 2014 15.60% 15.51% 0.6%
Suicide mortality per 100,000 people, 2008–2014 16.15 15.71 2.8%
Opioid prescriptions as a percent of Part D claims, 2013 5.91 5.57 6.2%
Poisoning mortality per 100,000 people, 2008–2014 19.35 18.04 7.3%
Stroke mortality per 100,000 people, 2008–2014 48.54 43.76 10.9%
COPD mortality per 100,000 people, 2008–2014 59.40 53.23 11.6%
Notes: Percentage Difference = 100 * [ (Actual / Predicted) – 1] Green = County value was better than predicted
For details on the outcome measures, see the data files accompanying the report Identifying Bright Spots in Appalachian Health: Statistical Analysis.

CREATING A CULTURE OF HEALTH IN APPALACHIA Madison County, North Carolina | CASE STUDIES
126
Table 27: Madison County Health Drivers vs. National Median
Driver Measure Lower is Better?
National Median
Madison County
Air pollution (average daily particulate matter 2.5), 2011 Yes 11.87 13.14
Average travel time to work in minutes, 2010–2014 Yes 22.82 28.19
Chlamydia incidence rate per 100,000, 2013 Yes 287.16 221.77
Dentists per 100,000 population, 2014 No 37.45 23.64
Economic index, fiscal year 2017 Yes 108.79 132.79
Full-service restaurants per 1,000, 2012 No 0.68 0.43
Grocery stores per 1,000 residents, 2012 No 0.20 0.10
Median household income, 2014 No $45,226 $38,445
Mental health providers per 100,000 population, 2015 No 80.00 156.25
Percentage of adults currently smoking, 2014 Yes 17.8% 18.9%
Percentage of adults not physically active, 2012 Yes 27.7% 27.8%
Percentage of adults with at least some college, 2010–2014 No 56.3% 51.2%
Income inequality ratio,4 2010–2014 Yes 4.4% 4.8%
Percentage of diabetics with A1C testing, 2012 No 85.4% 92.4%
Percentage of doctors who e-prescribe, 2014 No 65.0% 71.0%
Percentage of eligibles enrolled in SNAP, 2014 No 78.0% 78.0%
Percentage of households with income below poverty, 2014 Yes 15.8% 19.9%
Percentage of Medicare women with recent mammogram, 2013 No 61.0% 61.0%
Percentage of population with access to places for physical activity, 2011 and 2014 No 61.9% 39.9%
Percentage of total population in social assistant jobs, 2013 N/A 0.01% --
Percentage receiving disability OASDI and/or SSI, 2014 Yes 5.4% 8.5%
Percentage spending >30% of income on housing, 2010–2014 Yes 29.0% 30.1%
Percentage w/ no car, low access, 2010–2014 Yes 19.7% 10.0%
Primary care physicians per 100,000 population, 2013 No 48.54 47.62
4 Income inequality is the ratio of household income at the 80th percentile to that at the 20th percentile. A higher ratio reflects greater division between the top and the bottom of the income spectrum.
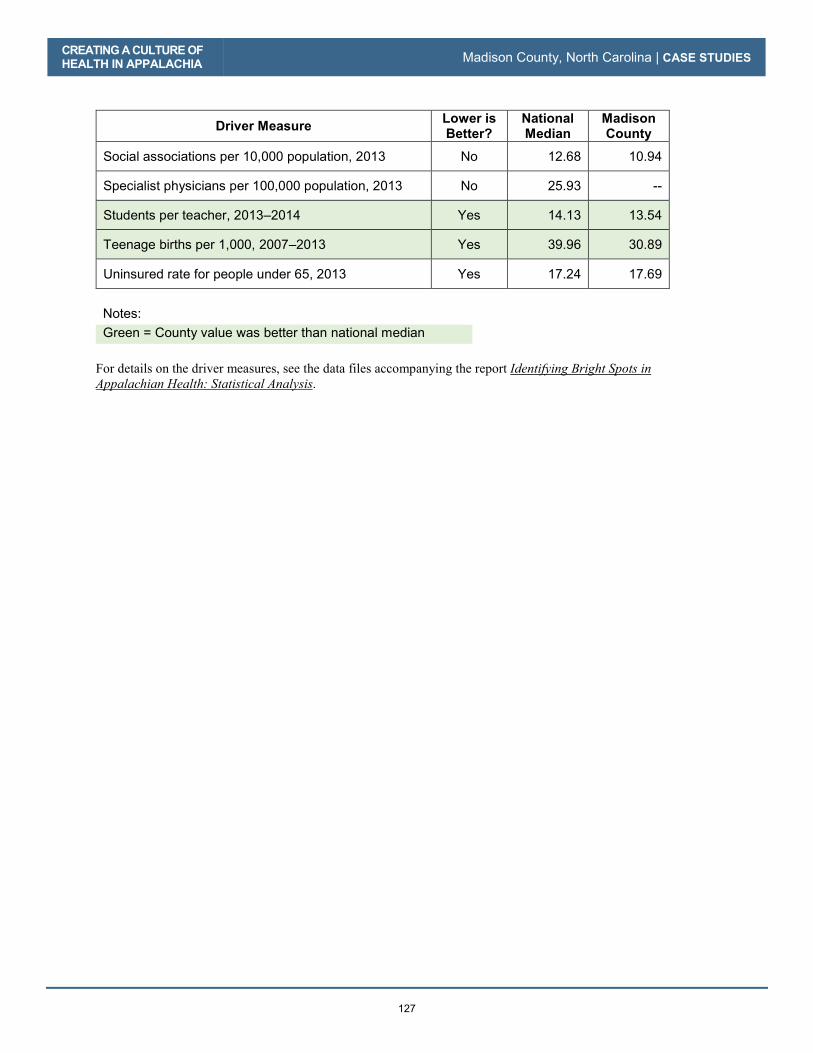
CREATING A CULTURE OF HEALTH IN APPALACHIA Madison County, North Carolina | CASE STUDIES
127
Driver Measure Lower is Better?
National Median
Madison County
Social associations per 10,000 population, 2013 No 12.68 10.94
Specialist physicians per 100,000 population, 2013 No 25.93 --
Students per teacher, 2013–2014 Yes 14.13 13.54
Teenage births per 1,000, 2007–2013 Yes 39.96 30.89
Uninsured rate for people under 65, 2013 Yes 17.24 17.69
Notes: Green = County value was better than national median
For details on the driver measures, see the data files accompanying the report Identifying Bright Spots in Appalachian Health: Statistical Analysis.

CREATING A CULTURE OF HEALTH IN APPALACHIA Madison County, North Carolina | CASE STUDIES
128

129
Potter County, Pennsylvania
County Overview
A Deeper Look at Potter County: Community Strengths
Creating a Culture of Health in Potter County
References
Appendix: Potter County Data

130

Potter County, Pennsylvania
CA
SE
ST
UD
IES
131
Know everybody, help your neighbor…if we have a need, we don’t wait for other people to take care of it. [We are] very self-sufficient…very much family-oriented.
—Joy E. Glassmire, Director, Potter County Children and Youth Services
Surrounded by mountains and forestland, Potter County, Pennsylvania, is described in tourism materials as “God’s Country.” This rural community with an estimated population of just over 17,000 is tucked into the northern Appalachian Mountains. Of the county’s 692,000-plus acres, more than 60 percent is either owned by the state and maintained as state parks, forestland, or game lands, or protected under the state’s farm and forest preservation program. Three major watersheds meet in Potter County: those of the Chesapeake Bay, the St. Lawrence River, and the Mississippi River. In addition, the headwaters of the Allegheny River have their source in Potter County. Outdoor activities such as hiking, biking, camping, hunting, and fishing are popular here, enjoyed by residents and tourists alike. Although tourism and farming are big business, Potter County’s economy is
Dou
g K
err
/ C
reat
ive
Com
mon
s 2.0
Gen
eric
Coudersport, Pennsylvania, is the county seat of Potter County.

CREATING A CULTURE OF HEALTH IN APPALACHIA Potter County, Pennsylvania | CASE STUDIES
132
more diverse than that of many other counties highlighted in this report and includes telecommunications, health care, education, construction, and government. Potter County also has its challenges: limited public revenue, lack of transportation, and increasing concern about opioid abuse. But it is among the ten percent of Appalachian counties— and one of two counties in Appalachian Pennsylvania—identified as a Bright Spot. It performed better than expected on 14 out of 19 health outcome measures, most notably on the following:
� Infant mortality: 37 percent better than expected
� Poisoning mortality: 33 percent better than expected
� Heart disease hospitalizations: 31 percent better than expected
� Stroke mortality: 26 percent better than expected
� Years of potential life lost: 24 percent better than expected
These better-than-expected results are likely influenced by local conditions and initiatives that improve overall well-being. For example, field research suggests that committed local health care providers and strong regional and local collaboration have played a major role in the county’s health. In Potter County, a community culture of volunteering and involvement may also contribute to a health-promoting sense of social cohesion. Potter County’s classification as a Bright Spot means that, on average, the county performed better than expected on a number of health outcome measures, given its characteristics and resources—that is, the socioeconomics, demographics, behaviors, health care facilities, and other factors that influence health outcomes. It does not mean that all residents here enjoy excellent health. In fact, the county still lags behind the rest of the nation on many health indicators. Like other counties with limited resources, Bright Spot counties face challenges to attaining good health outcomes. Potter County’s performance, however, indicates that certain county conditions or programs may be helping generate better-than-expected outcomes—and that other resource-challenged Appalachian counties may benefit from adopting similar initiatives.1
1 See Table 30 in the data appendix at the end of this case study for a full list of actual health outcomes for Potter County compared with predicted outcomes. For details on the outcome measures, see the data files accompanying the report Identifying Bright Spots in Appalachian Health: Statistical Analysis.

CREATING A CULTURE OF HEALTH IN APPALACHIA Potter County, Pennsylvania | CASE STUDIES
133
COUNTY OVERVIEW Figure 11: Map - Bright Spot Community Potter County, Pennsylvania
Potter County represents a nonmetropolitan county in Northern Appalachia. It is one of two Bright Spot counties in Appalachian Pennsylvania. Located in north-central Pennsylvania, Potter is one of the state’s less populous counties (63rd in population out of 67 counties). Eighty-three percent of Potter County’s 17,451 residents live in five small towns. Coudersport, with a population of 2,546, is the county seat. One state road links Coudersport to Williamsport, which is about 90 miles to the southeast. The population is racially homogeneous, approximately 98 percent white. Nearly half (48.8 percent) of adults have at least some college education, compared with 63.3 percent nationally. The median 2014 household income was $40,323, significantly lower than the national median of $56,135. Unemployment in 2014 was 7.4 percent, compared with 6.5 percent regionally and 6.2 percent nationally. Just over 14 percent of residents live in poverty, compared with 15.6 percent nationally.2
2 Table 28 in the Potter County data appendix at the end of this case study provides a quantitative profile of county characteristics.
GEORGIA
SOUTH CAROLINA
NORTH CAROLINA
ALABAMA
MISSISSIPPI
TENNESSEE
KENTUCKY
OHIO PENNSYLVANIA
MARYLAND
VIRGINIA
NEW YORK
WESTVIRGINIA
Potter County, PA
N o r t h e r n
S o u t h e r n
C e n t r a l
S o u t h C e n t r a l
N o r t h C e n t r a l
0 10050
Miles

CREATING A CULTURE OF HEALTH IN APPALACHIA Potter County, Pennsylvania | CASE STUDIES
134
Revenue is a challenge in Potter County because the state owns so much of the land. In lieu of property taxes, the county receives payment from the state on those lands, which until recently was only $3.60 per acre, and that revenue has to be divided among the county, the municipalities, and the school district. As of 2017, the state will pay the county $6.00 per acre—a 67 percent increase in revenue on those lands (Swift 2016). Cole Memorial Hospital in Coudersport is the hub of health care and wellness for a six-county rural region and is a magnet that draws resources from larger health care centers in Pennsylvania and New York. Through Cole Memorial’s extensive network, most Potter County residents can readily access primary and specialty care services, first-response emergency care, and fitness opportunities. A DEEPER LOOK AT POTTER COUNTY: COMMUNITY STRENGTHS Like the residents of other Bright Spot communities explored in this report, people in Potter County have worked to elevate physical, social, and economic health in several ways. There’s a strong sense of health as a shared resource here, and a sense that everyone in the community plays a role in promoting it—whether through volunteering, looking out for one’s neighbors, or working to protect the environment. Field work helped identify local practices that appear to be contributing to overall health, document effective practices that could be replicated in other counties, and identify promising practices and strategies that should be explored further.3 Specifically, the research identified these characteristics and strategies in Potter County:
3 For a full explanation of the methodology, see Appendix B: Research Approach. For a list of key informants interviewed for this county, see Table 29 in the data appendix at the end of this case study.
Aman
da J
ones
The Pennsylvania Lumber Museum, in Ulysses, is one of Potter County’s tourist attractions.

CREATING A CULTURE OF HEALTH IN APPALACHIA Potter County, Pennsylvania | CASE STUDIES
135
� Community-oriented health services: Cole Memorial Hospital is a nonprofit critical access hospital that has been part of the community for over a century; its extensive network of health clinics and wellness centers offers routine as well as specialty services. The hospital incorporates community participation and feedback to provide efficiently tailored services.
� Strategic collaboration: A regional partnership strategically pools resources to improve health outcomes for people at risk; local collaboration is facilitated by the location of all social services in one building.
� Resident involvement: Volunteering is part of the community culture, and residents consider themselves active stewards of their environment.
� Employer support for health and wellness: Local employers provide good health benefits and encourage participation in wellness programs.
Like other Bright Spot communities, Potter County has programs in place that fall into several overarching categories: leadership, cross-sector collaboration and resource sharing, and local providers committed to public health. Community Leaders Engaged in Health Initiatives It is difficult to overstate the importance of Cole Memorial Hospital’s leadership to Potter County. It is the anchor institution here, with roots dating back to 1917, when it opened as Coudersport Hospital. In 2007, Cole Memorial was designated a critical access hospital, and today it operates as a charitable nonprofit health care organization serving 55,000 residents in an area that includes Pennsylvania’s Potter, Cameron, McKean, and Tioga Counties. According to its 2017 annual report, Cole Memorial had 65,300 outpatient visits; 23,650 home health visits; 9,000 emergency visits; and 4,000 express care visits that year. It logged 6,300 inpatient days; performed 5,600 surgeries; and delivered 200 babies. Cole Memorial is also a major employer, with 824 employees, 610 of whom are full-time. In addition to the hospital in Coudersport, Cole operates a network of 10 health clinics that serve residents in north-central Pennsylvania and south-central New York. Satellite clinics opened in the towns of Emporium, Ulysses, and Shinglehouse in 1979; additional offices opened in the towns of Eldred, Smethport, Westfield, and adjoining counties in the 1990s. The Cole system also includes specialty units that provide home and hospice care, psychiatric care for seniors, skilled nursing and rehabilitation, emergency medicine, cardiac rehabilitation, and radiation oncology. Other specialty practices include cardiology, otolaryngology, orthopedics, pain management, general surgery, podiatry, telepsychiatry, tele-rheumatology, and gastroenterology. Viewed as a homegrown, nonprofit institution, Cole Memorial is an organization that most residents feel comfortable getting care from. The location of satellite clinics in the area’s small towns further enhances access to care. The hospital’s sponsorship of health fairs and senior expos, its offerings of subsidized health screenings and involvement with workplace wellness services, and its new initiative to help patients better navigate the health care system all reinforce its image as a critical community pillar. The county also offers veterans’ health care: several years ago county officials succeeded in bringing a branch of the Bath (New York) VA Medical Center to Coudersport. Prior to the clinic’s opening, veterans had to drive nearly two hours each way to get to their medical appointments. Now, they can get care in the community.
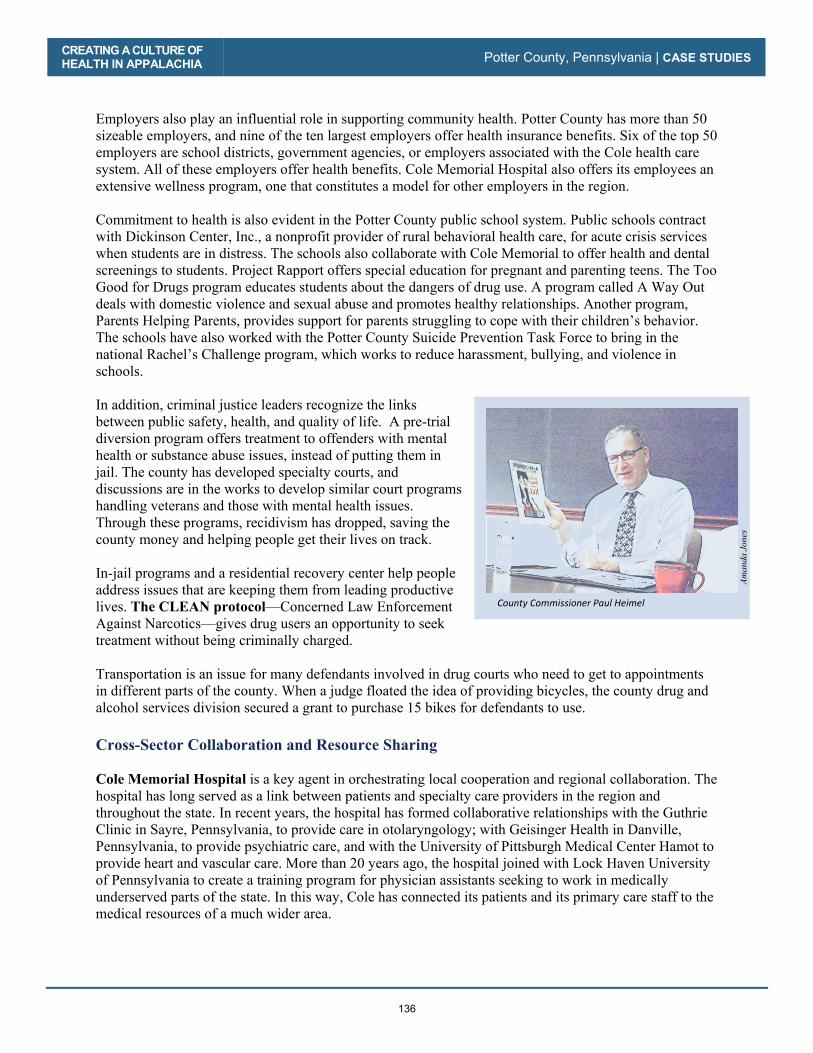
CREATING A CULTURE OF HEALTH IN APPALACHIA Potter County, Pennsylvania | CASE STUDIES
136
Employers also play an influential role in supporting community health. Potter County has more than 50 sizeable employers, and nine of the ten largest employers offer health insurance benefits. Six of the top 50 employers are school districts, government agencies, or employers associated with the Cole health care system. All of these employers offer health benefits. Cole Memorial Hospital also offers its employees an extensive wellness program, one that constitutes a model for other employers in the region. Commitment to health is also evident in the Potter County public school system. Public schools contract with Dickinson Center, Inc., a nonprofit provider of rural behavioral health care, for acute crisis services when students are in distress. The schools also collaborate with Cole Memorial to offer health and dental screenings to students. Project Rapport offers special education for pregnant and parenting teens. The Too Good for Drugs program educates students about the dangers of drug use. A program called A Way Out deals with domestic violence and sexual abuse and promotes healthy relationships. Another program, Parents Helping Parents, provides support for parents struggling to cope with their children’s behavior. The schools have also worked with the Potter County Suicide Prevention Task Force to bring in the national Rachel’s Challenge program, which works to reduce harassment, bullying, and violence in schools. In addition, criminal justice leaders recognize the links between public safety, health, and quality of life. A pre-trial diversion program offers treatment to offenders with mental health or substance abuse issues, instead of putting them in jail. The county has developed specialty courts, and discussions are in the works to develop similar court programs handling veterans and those with mental health issues. Through these programs, recidivism has dropped, saving the county money and helping people get their lives on track. In-jail programs and a residential recovery center help people address issues that are keeping them from leading productive lives. The CLEAN protocol—Concerned Law Enforcement Against Narcotics—gives drug users an opportunity to seek treatment without being criminally charged. Transportation is an issue for many defendants involved in drug courts who need to get to appointments in different parts of the county. When a judge floated the idea of providing bicycles, the county drug and alcohol services division secured a grant to purchase 15 bikes for defendants to use. Cross-Sector Collaboration and Resource Sharing Cole Memorial Hospital is a key agent in orchestrating local cooperation and regional collaboration. The hospital has long served as a link between patients and specialty care providers in the region and throughout the state. In recent years, the hospital has formed collaborative relationships with the Guthrie Clinic in Sayre, Pennsylvania, to provide care in otolaryngology; with Geisinger Health in Danville, Pennsylvania, to provide psychiatric care, and with the University of Pittsburgh Medical Center Hamot to provide heart and vascular care. More than 20 years ago, the hospital joined with Lock Haven University of Pennsylvania to create a training program for physician assistants seeking to work in medically underserved parts of the state. In this way, Cole has connected its patients and its primary care staff to the medical resources of a much wider area.
County Commissioner Paul Heimel
Aman
da J
ones

CREATING A CULTURE OF HEALTH IN APPALACHIA Potter County, Pennsylvania | CASE STUDIES
137
Locally, the hospital has facilitated cooperation through its Community Health Council and Community Benefit Advisor program. A more recent regional initiative, the Northern Tier Community Health Collaborative, pools resources and coordinates physical, behavioral health, and drug and alcohol services for vulnerable populations in rural areas. A strategic focus for the collaborative is promoting “health literacy” to help patients understand their basic health needs and how to get those needs met.
Another example of cooperation in Potter County is the consolidation of human services under one roof, similar to what officials in Tioga County, New York, did. This hub arrangement facilitates information sharing, networking, and coordination—and makes it easier for residents to get needed services. There is a strong sense of small-town connectedness throughout Potter County. People here feel responsible for each other and help their neighbors when they are in need. In this way, they share important personal resources—time, energy, expertise, and goodwill—that advance community health. Volunteerism is part of life here. Volunteers coach youth sports and work at the Potter County Fair, the God’s Country Marathon, and the Austin Dam Memorial Park. They monitor water quality, protect animals, and mark hiking trails. People here are also particularly mindful of the needs of elderly community members. Senior centers in Potter County are not just for socializing—they offer classes on medication management, how to avoid scams, and how to deal with wildlife encounters; organize bus trips and walking groups; assist with Meals on Wheels; complete community service projects; and provide a social support safety net for area seniors. Meals on Wheels is an important program, providing food and wellness checks for seniors, some of whom are shut-ins living in remote areas. During a particularly tough winter when many back roads were impassable by car, volunteers drove snowmobiles to deliver meals to needy seniors. Residents view themselves as stewards of their environment. They are particularly proud—and protective—of their water resources. Several groups have formed to monitor these resources—public, private, and surface. People also band together to protect other important community assets. In Coudersport, residents raised hundreds of thousands of dollars to save the community pool, the county’s only public swimming facility. When the borough council considered a proposal to sell part of Coudersport’s arboretum, a source of history and pride to the community, 850 Coudersport residents signed a petition opposing the move. Their impassioned pleas during a council meeting on the proposal helped stop the sale. Recently, a well-loved ski resort at Denton Hill State Park, the only one of its type in the region, was closed. Community members immediately joined forces to create the “Save Ski Denton” movement, which gained traction online and eventually caught the attention of state lawmakers. The state is now working to turn the park into a year-round destination.
Cole Memorial Dentistry in Coudersport
Aman
da J
ones
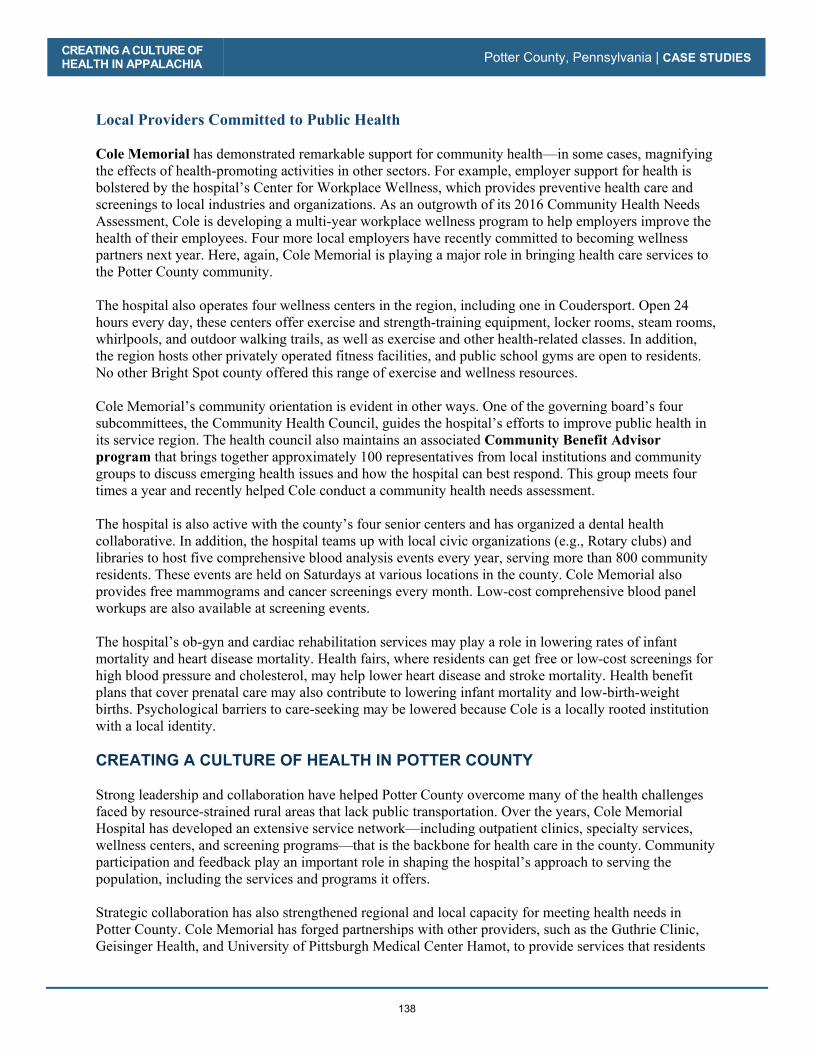
CREATING A CULTURE OF HEALTH IN APPALACHIA Potter County, Pennsylvania | CASE STUDIES
138
Local Providers Committed to Public Health Cole Memorial has demonstrated remarkable support for community health—in some cases, magnifying the effects of health-promoting activities in other sectors. For example, employer support for health is bolstered by the hospital’s Center for Workplace Wellness, which provides preventive health care and screenings to local industries and organizations. As an outgrowth of its 2016 Community Health Needs Assessment, Cole is developing a multi-year workplace wellness program to help employers improve the health of their employees. Four more local employers have recently committed to becoming wellness partners next year. Here, again, Cole Memorial is playing a major role in bringing health care services to the Potter County community. The hospital also operates four wellness centers in the region, including one in Coudersport. Open 24 hours every day, these centers offer exercise and strength-training equipment, locker rooms, steam rooms, whirlpools, and outdoor walking trails, as well as exercise and other health-related classes. In addition, the region hosts other privately operated fitness facilities, and public school gyms are open to residents. No other Bright Spot county offered this range of exercise and wellness resources. Cole Memorial’s community orientation is evident in other ways. One of the governing board’s four subcommittees, the Community Health Council, guides the hospital’s efforts to improve public health in its service region. The health council also maintains an associated Community Benefit Advisor program that brings together approximately 100 representatives from local institutions and community groups to discuss emerging health issues and how the hospital can best respond. This group meets four times a year and recently helped Cole conduct a community health needs assessment. The hospital is also active with the county’s four senior centers and has organized a dental health collaborative. In addition, the hospital teams up with local civic organizations (e.g., Rotary clubs) and libraries to host five comprehensive blood analysis events every year, serving more than 800 community residents. These events are held on Saturdays at various locations in the county. Cole Memorial also provides free mammograms and cancer screenings every month. Low-cost comprehensive blood panel workups are also available at screening events. The hospital’s ob-gyn and cardiac rehabilitation services may play a role in lowering rates of infant mortality and heart disease mortality. Health fairs, where residents can get free or low-cost screenings for high blood pressure and cholesterol, may help lower heart disease and stroke mortality. Health benefit plans that cover prenatal care may also contribute to lowering infant mortality and low-birth-weight births. Psychological barriers to care-seeking may be lowered because Cole is a locally rooted institution with a local identity. CREATING A CULTURE OF HEALTH IN POTTER COUNTY Strong leadership and collaboration have helped Potter County overcome many of the health challenges faced by resource-strained rural areas that lack public transportation. Over the years, Cole Memorial Hospital has developed an extensive service network—including outpatient clinics, specialty services, wellness centers, and screening programs—that is the backbone for health care in the county. Community participation and feedback play an important role in shaping the hospital’s approach to serving the population, including the services and programs it offers. Strategic collaboration has also strengthened regional and local capacity for meeting health needs in Potter County. Cole Memorial has forged partnerships with other providers, such as the Guthrie Clinic, Geisinger Health, and University of Pittsburgh Medical Center Hamot, to provide services that residents

CREATING A CULTURE OF HEALTH IN APPALACHIA Potter County, Pennsylvania | CASE STUDIES
139
need. And a more recent regional initiative, the Northern Tier Community Health Collaborative, pools resources and coordinates health services for people living in rural areas. With limited government funding, community members have nurtured a culture of volunteerism and activism that helps to fill gaps in services and preserve shared resources. They contribute to protecting the health of vulnerable populations, such as the elderly, and to safeguarding health-supporting community assets. Finally, many local employers recognize the importance of community health. They offer good health benefits and encourage employees to participate in wellness programs. Together, these factors help keep Potter County a health-promoting community while ensuring the welfare of its residents.
CREATING A CULTURE OF HEALTH IN APPALACHIA Potter County, Pennsylvania | CASE STUDIES
140
REFERENCES
Agency for Healthcare Research and Quality. 2011. “Chapter 9: Access to Health Care, 2011 National Healthcare Quality Report." Agency for Healthcare Research and Quality. https://www.ahrq.gov/research/findings/nhqrdr/nhqr11/chap9.html Chandra, Anita, Joie Acosta, Katherine Carman, Tamara Dubowitz, Laura Leviton, Laurie Martin, Carolyn Miller, et al. 2016. Building a National Culture of Health. http://www.rand.org/content/dam/rand/pubs/research_reports/RR1100/RR1199/RAND_RR1199.pdf Cole Memorial. 2017. “2017 Annual Summary.” Accessed May 15, 2018. https://www.netreturns.biz/Client_Files/cole/CM/System/FY17%20ColeAnnualReport-Doc.pdf
Egede, Leonard E. 2006. “Race, Ethnicity, Culture, and Disparities in Health Care.” Journal of General Internal Medicine 21 (6): 667-669. doi:10.1111/j.1525-1497.2006.0512.x Ellison, Ayla. 2016. Hospital CFO Report: 6 common characteristics of hospitals vulnerable to closure. February 09. Accessed July 27, 2017. http://www.beckershospitalreview.com/finance/6-common-characteristics-of-hospitals-vulnerable-to-closure.html Holmes, G. Mark, Nancy M. Lane, Thomas A. Arcury, Michael L. Schwalbe, Randy Randolph, John Frank, Sharita Thomas, et. al. 2018. Identifying Bright Spots in Appalachian Health: Statistical Analysis. Washington, D.C.: Appalachian Regional Commission. Institute of Medicine (U.S.) Committee. 1990. Medicare: A Strategy for Quality Assurance. Edited by KN Lohr. Vol. 1. Washington (D.C.): National Academies Press (U.S.). https://www.ncbi.nlm.nih.gov/books/NBK235460/ Marshall, Julie L., Logan Thomas, Nancy M. Lane, G. Mark Holmes, Thomas A. Arcury, Randy Randolph, Pam Silberman, et al. 2017. Health Disparities in Appalachia. Washington, D.C.: Appalachian Regional Commission. Office of Disease Prevention and Health Promotion. U.S. DHHS. 2017. Healthy People / 2020 Topics & Objectives/ Access to Health Services. Accessed July 27, 2017. https://www.healthypeople.gov/2020/topics-objectives/topic/Access-to-Health-Services Potter County Planning Deparment. 2000. “Potter County Comprehensive Plan - Preserving and Enhancing the Quality of Life for Current and Future Residents of Potter County.” 2017. Welcome to Potter County. http://www.visitpottercounty.com/ Swift, Robert. 2016. “Payments for state-owned forests, parks increasing.” The Times Tribune, December 18, 2016. http://thetimes-tribune.com/news/payments-for-state-owned-forests-parks-increasing-1.2131552 World Health Organization. 2017. The determinants of health. http://www.who.int/hia/evidence/doh/en/
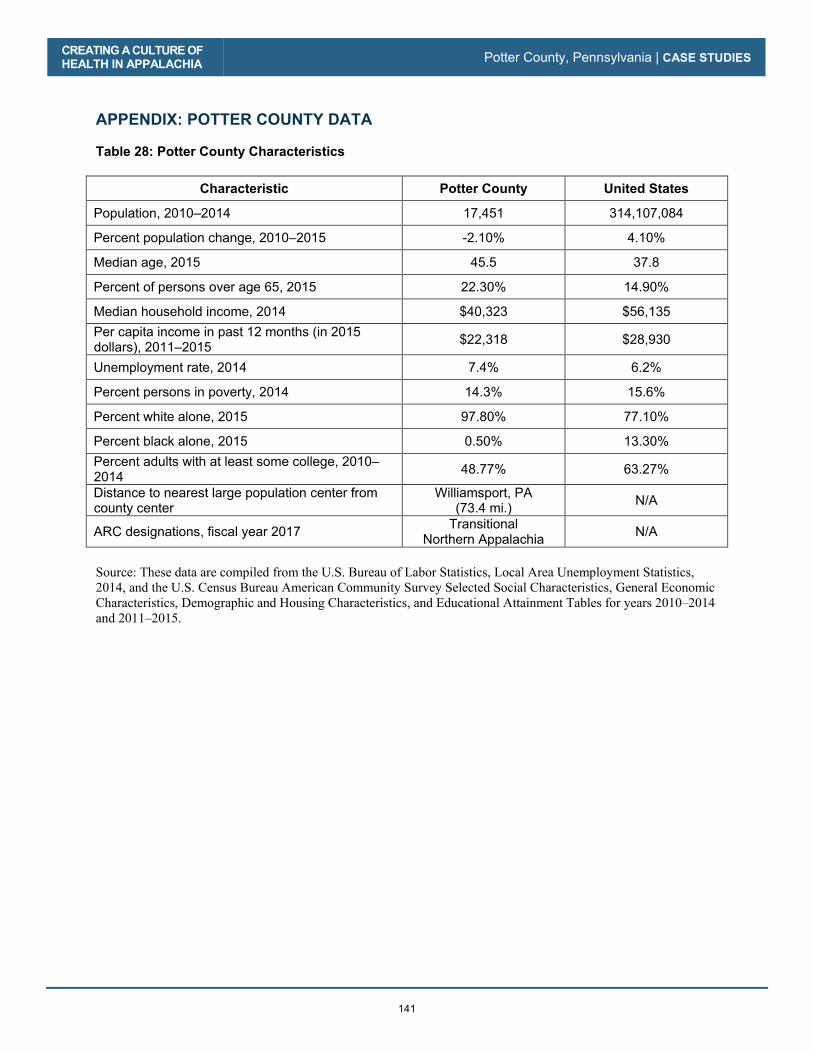
CREATING A CULTURE OF HEALTH IN APPALACHIA Potter County, Pennsylvania | CASE STUDIES
141
APPENDIX: POTTER COUNTY DATA Table 28: Potter County Characteristics
Characteristic Potter County United States
Population, 2010–2014 17,451 314,107,084
Percent population change, 2010–2015 -2.10% 4.10%
Median age, 2015 45.5 37.8
Percent of persons over age 65, 2015 22.30% 14.90%
Median household income, 2014 $40,323 $56,135 Per capita income in past 12 months (in 2015 dollars), 2011–2015 $22,318 $28,930
Unemployment rate, 2014 7.4% 6.2%
Percent persons in poverty, 2014 14.3% 15.6%
Percent white alone, 2015 97.80% 77.10%
Percent black alone, 2015 0.50% 13.30% Percent adults with at least some college, 2010–2014 48.77% 63.27%
Distance to nearest large population center from county center
Williamsport, PA (73.4 mi.) N/A
ARC designations, fiscal year 2017 Transitional Northern Appalachia N/A
Source: These data are compiled from the U.S. Bureau of Labor Statistics, Local Area Unemployment Statistics, 2014, and the U.S. Census Bureau American Community Survey Selected Social Characteristics, General Economic Characteristics, Demographic and Housing Characteristics, and Educational Attainment Tables for years 2010–2014 and 2011–2015.
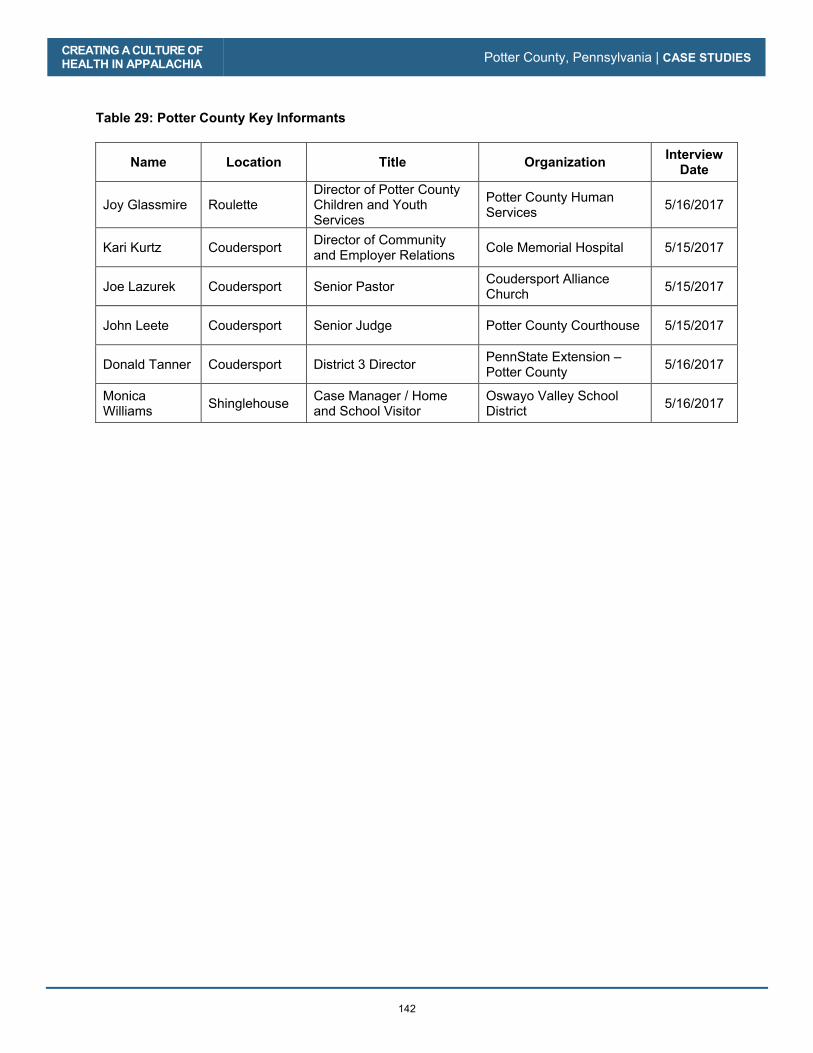
CREATING A CULTURE OF HEALTH IN APPALACHIA Potter County, Pennsylvania | CASE STUDIES
142
Table 29: Potter County Key Informants
Name Location Title Organization Interview
Date
Joy Glassmire Roulette Director of Potter County Children and Youth Services
Potter County Human Services 5/16/2017
Kari Kurtz Coudersport Director of Community and Employer Relations Cole Memorial Hospital 5/15/2017
Joe Lazurek Coudersport Senior Pastor Coudersport Alliance Church 5/15/2017
John Leete Coudersport Senior Judge Potter County Courthouse 5/15/2017
Donald Tanner Coudersport District 3 Director PennState Extension – Potter County 5/16/2017
Monica Williams Shinglehouse Case Manager / Home
and School Visitor Oswayo Valley School District 5/16/2017

CREATING A CULTURE OF HEALTH IN APPALACHIA Potter County, Pennsylvania | CASE STUDIES
143
Table 30: Potter County Health Outcomes – Actual vs. Predicted
Outcome Measure Actual Predicted
Percentage Difference (negative =
better)
Infant mortality per 1,000 births, 2008–2014 4.28 6.85 -37.4%
Poisoning mortality per 100,000 people, 2008–2014 11.60 17.29 -32.9%
Heart disease mortality per 100,000 people, 2008–2014 152.84 221.74 -31.1%
Heart disease hospitalizations per 1,000 Medicare beneficiaries, 2012 40.60 58.63 -30.8%
Stroke mortality per 100,000 people, 2008–2014 34.43 46.68 -26.2%
Years of potential life lost, 2011–2013 6,630 8,769 -24.4%
Suicide mortality per 100,000 people, 2008–2014 13.83 17.22 -19.7%
Low-birth-weight births (<2,500 g) per 1,000 births, 2007–2013 7.04 7.77 -9.4%
Injury mortality per 100,000 people, 2008–2014 53.34 57.21 -6.8%
COPD mortality per 100,000 people, 2008–2014 50.45 53.72 -6.1%
Percentage of adults with diabetes, 2012 11.6% 12.3% -5.9%
Average Medicare condition score, 2013 0.95 1.01 -5.8%
Percentage of Medicare beneficiaries w/ depression, 2012 16.2% 16.6% -2.5%
Physically unhealthy days per month per person, 2014 3.90 3.97 -1.8%
Mentally unhealthy days per month per person, 2014 4.10 4.08 0.5%
Cancer mortality per 100,000 people, 2008–2014 190.74 188.74 1.1%
Percentage of obese adults (>30 BMI), 2012 32.4% 31.1% 4.3%
Percentage of excessive drinkers, 2014 16.2% 15.3% 5.7%
Opioid prescriptions as a percent of Part D claims, 2013 6.55 5.44 20.3%
Notes: Percentage Difference = 100 * [ (Actual / Predicted) - 1] Green = County value was better than predicted
For details on the outcome measures, see the data files accompanying the report Identifying Bright Spots in Appalachian Health: Statistical Analysis.

CREATING A CULTURE OF HEALTH IN APPALACHIA Potter County, Pennsylvania | CASE STUDIES
144
Table 31: Potter County Health Drivers vs. National Median
Driver Measure Lower is Better?
National Median
Potter County
Air pollution (average daily particulate matter 2.5), 2011 Yes 11.87 12.79
Average travel time to work in minutes, 2010–2014 Yes 22.82 21.99
Chlamydia incidence rate per 100,000, 2013 Yes 287.16 176.37
Dentists per 100,000 population, 2014 No 37.45 29.07
Economic index, fiscal year 2017 Yes 108.79 117.22
Full-service restaurants per 1,000, 2012 No 0.68 0.80
Grocery stores per 1,000 residents, 2012 No 0.20 0.40
Median household income, 2014 No $45,226.00 $40,323.00
Mental health providers per 100,000 population, 2015 No 80.00 40.65
Percentage of adults currently smoking, 2014 Yes 17.8% 19.7%
Percentage of adults not physically active, 2012 Yes 27.7% 30.2%
Percentage of adults with at least some college, 2010–2014 No 56.3% 48.8%
Income inequality ratio,4 2010–2014 Yes 4.4% 4.2%
Percentage of diabetics with A1C testing, 2012 No 85.4% 85.4%
Percentage of doctors who e-prescribe, 2014 No 65.0% 55.0%
Percentage of eligibles enrolled in SNAP, 2014 No 78.0% 84.0%
Percentage of households with income below poverty, 2014 Yes 15.8% 14.3%
Percentage of Medicare women with recent mammogram, 2013 No 61.0% 62.0%
Percentage of population with access to places for physical activity, 2011 and 2014 No 61.9% 41.9%
Percentage of total population in social assistant jobs, 2013 N/A 0.01% 0.00%
Percentage receiving disability OASDI and/or SSI, 2014 Yes 5.4% 6.9%
Percentage spending >30% of income on housing, 2010–2014 Yes 29.0% 27.6%
Percentage w/ no car, low access, 2010–2014 Yes 19.7% 18.8%
Primary care physicians per 100,000 population, 2013 No 48.54 51.55
4 Income inequality is the ratio of household income at the 80th percentile to that at the 20th percentile. A higher ratio reflects greater division between the top and the bottom of the income spectrum.

CREATING A CULTURE OF HEALTH IN APPALACHIA Potter County, Pennsylvania | CASE STUDIES
145
Driver Measure Lower is Better?
National Median
Potter County
Social associations per 10,000 population, 2013 No 12.68 19.43
Specialist physicians per 100,000 population, 2013 No 25.93 57.30
Students per teacher, 2013–2014 Yes 14.13 12.47
Teenage births per 1,000, 2007–2013 Yes 39.96 40.46
Uninsured rate for people under 65, 2013 Yes 17.24 13.98
Notes: Green = County value was better than national median
For details on the driver measures, see the data files accompanying the report Identifying Bright Spots in Appalachian Health: Statistical Analysis.

CREATING A CULTURE OF HEALTH IN APPALACHIA Potter County, Pennsylvania | CASE STUDIES
146
147
Sequatchie County, Tennessee
County Overview
A Deeper Look at Sequatchie County: Community Strengths
Creating a Culture of Health in Sequatchie County
References
Appendix: Sequatchie County Data

148
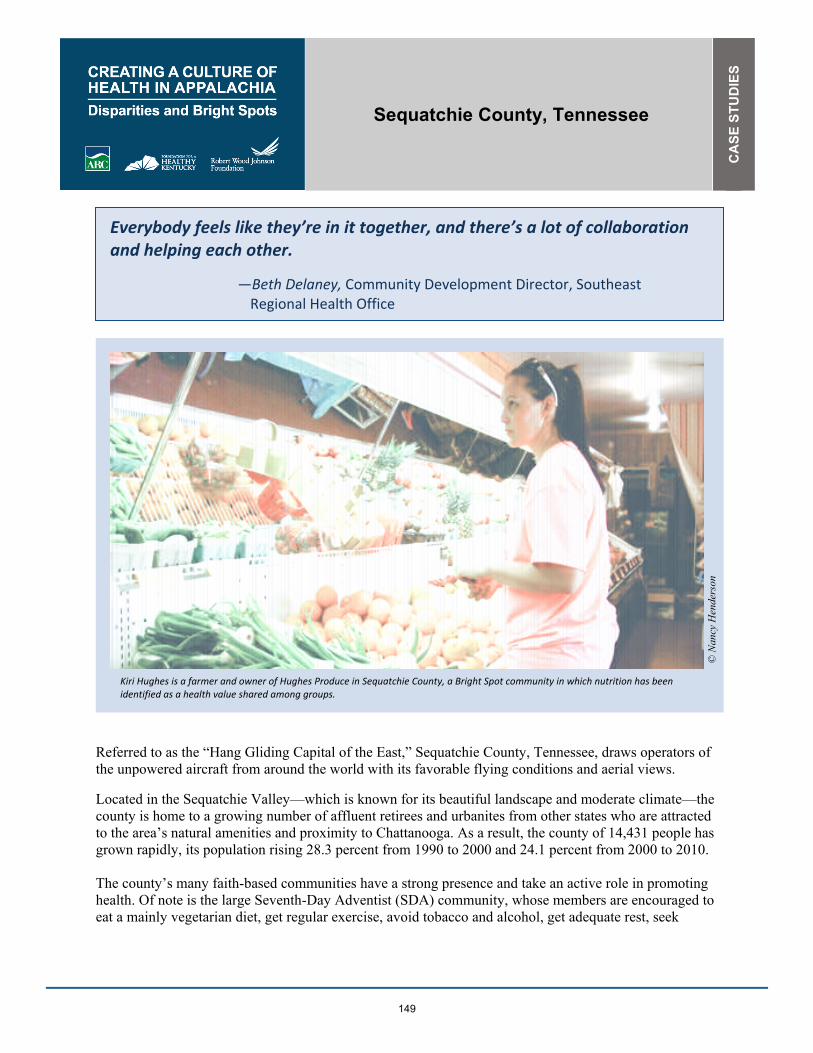
Sequatchie County, Tennessee
CA
SE
STU
DIE
S
149
Everybody feels like they’re in it together, and there’s a lot of collaboration and helping each other.
—Beth Delaney, Community Development Director, Southeast Regional Health Office
Referred to as the “Hang Gliding Capital of the East,” Sequatchie County, Tennessee, draws operators of the unpowered aircraft from around the world with its favorable flying conditions and aerial views.
Located in the Sequatchie Valley—which is known for its beautiful landscape and moderate climate—the county is home to a growing number of affluent retirees and urbanites from other states who are attracted to the area’s natural amenities and proximity to Chattanooga. As a result, the county of 14,431 people has grown rapidly, its population rising 28.3 percent from 1990 to 2000 and 24.1 percent from 2000 to 2010. The county’s many faith-based communities have a strong presence and take an active role in promoting health. Of note is the large Seventh-Day Adventist (SDA) community, whose members are encouraged to eat a mainly vegetarian diet, get regular exercise, avoid tobacco and alcohol, get adequate rest, seek
Kiri Hughes is a farmer and owner of Hughes Produce in Sequatchie County, a Bright Spot community in which nutrition has been identified as a health value shared among groups.
© N
ancy
Hen
ders
on

CREATING A CULTURE OF HEALTH IN APPALACHIA Sequatchie County, Tennessee | CASE STUDIES
150
preventive medical care, and make efforts to help preserve the environment. Health is also promoted in the county through school programs, civic groups, and health care services. Sequatchie County is among the ten percent of Appalachian counties—and one of seven counties in Appalachian Tennessee—identified as a Bright Spot, performing better than expected across 14 of 19 health outcome measures. Most notably, Sequatchie County performed better than expected on the following five measures:
� Poisoning mortality: 35 percent better than expected
� Injury mortality: 20 percent better than expected
� Stroke mortality: 20 percent better than expected
� Heart disease mortality: 17 percent better than expected
� Heart disease hospitalizations: 15 percent better than expected These better-than-expected results are likely influenced by local conditions and initiatives created by the county to improve overall well-being. Field research indicates that retirees, faith leaders, and health care organizations are playing a critical role in improving both the health and economic well-being of the county. Sequatchie County’s classification as a Bright Spot means that, on average, the county performed better than expected on a number of health outcome measures, given its characteristics and resources—that is, the socioeconomics, demographics, behaviors, health care facilities, and other factors that influence health outcomes. It does not mean that residents here enjoy excellent health. In fact, the county still lags behind national performance on a number of health outcomes. Like other counties with limited resources, Bright Spot counties face challenges to attaining good health outcomes. Sequatchie County’s performance, however, indicates that certain county conditions or programs may be helping generate better-than-expected outcomes—and that other resource-challenged Appalachian counties may benefit from adopting similar initiatives.1
1 See Table 34 in the data appendix at the end of this case study for a full list of actual health outcomes for Sequatchie County compared with predicted outcomes. For details on the outcome measures, see the data files accompanying the report Identifying Bright Spots in Appalachian Health: Statistical Analysis.

CREATING A CULTURE OF HEALTH IN APPALACHIA Sequatchie County, Tennessee | CASE STUDIES
151
COUNTY OVERVIEW Figure 12: Map - Bright Spot Community Sequatchie County, Tennessee
Sequatchie County represents a metropolitan county in South Central Appalachia. It is one of seven Bright Spot communities in Appalachian Tennessee. Sequatchie County sits in the Sequatchie Valley, just west of the Cumberland Plateau, about 45 minutes from Chattanooga and near the southern Tennessee border. Once known for coal mining and large agricultural businesses, this 250-square-mile county is rapidly changing. Half of its workforce commutes to jobs outside of the county, and its residents live in five main communities: Dunlap, the county seat; Lone Oak; Brush Creek; Cagle; and Lewis Chapel. Household income in 2014 was $44,111, compared with $56,135 nationally. Twenty percent of county residents are age 65 or older, compared with 15 percent of the U.S. population. In fact, in Sequatchie retirees are called “half-backers” because many retired from northern states to Florida and then returned halfway back to settle in the county. Of Sequatchie’s residents, 97 percent are white; less than one percent are black. About 47 percent of adults in the county have at least some college education, compared with 63.3 percent nationally. The unemployment rate in 2014 was 7.4 percent, compared with 6.5 percent regionally and 6.2 percent
GEORGIA
SOUTH CAROLINA
NORTH CAROLINA
ALABAMA
MISSISSIPPI
TENNESSEE
KENTUCKY
OHIO PENNSYLVANIA
MARYLAND
VIRGINIA
NEW YORK
WESTVIRGINIA
Sequatchie County, TN
N o r t h e r n
S o u t h e r n
C e n t r a l
S o u t h C e n t r a l
N o r t h C e n t r a l
0 10050
Miles

CREATING A CULTURE OF HEALTH IN APPALACHIA Sequatchie County, Tennessee | CASE STUDIES
152
nationally. And in 2014, just over 18 percent of county residents had incomes below the federal poverty level, compared with 15.6 percent of the U.S. population.2 Major highways run through Sequatchie County, giving a large portion of its population ready access to health care services in Pikeville (Erlanger Bledsoe Hospital), Jasper (Parkridge Hospital, formerly Grandview Medical), and Chattanooga (Erlanger, Parkridge East, Kindred, and Memorial Hospitals). Like some other Bright Spot communities—such as Tioga County, New York; Madison County, North Carolina; and Wirt County, West Virginia—Sequatchie has limited medical facilities of its own, but it has access to medical services in adjacent counties that are a short driving distance away. A DEEPER LOOK AT SEQUATCHIE COUNTY: COMMUNITY STRENGTHS As in other Bright Spot communities, faith leaders, health care organizations, and social service agencies in Sequatchie County are collaborating and sharing resources to provide a range of health care, public health, and social services. These collaborative efforts emphasize the importance of healthy food and provide opportunities to help residents pursue healthy behaviors. Additionally, two groups have a significant impact on how residents view and value health: a steadily growing retiree community whose members have higher income levels, and a very active faith community. Field work helped identify local practices in Sequatchie County that appear to be contributing to overall health, document effective practices that could be replicated in other counties, and identify promising practices and strategies that should be explored further.3 Specifically, the research found these characteristics and strategies in Sequatchie County:
� Shared health values among groups: The larger community reflects the shared health priorities of smaller groups. Faith-based groups, most notably, but also the school system and civic groups, are active and invested in the health outcomes of their members. Good nutrition, for example, is a shared health value.
� Collaboration and sharing of resources: A nearly-30-year-old health council includes members from every sector and meets monthly to discuss and address issues impacting the community. Sequatchie’s single regional school campus also promotes a countywide sense of community.
� Access to health services: The efforts of a regional hospital and larger district health department improve access to preventive and acute care. The area’s mental and behavioral health programs work not only to deliver health services in a community setting, but they also serve to integrate social services. Additionally, area employers demonstrate strong support for the health of their employees through wellness and healthy living incentive programs.
� Volunteer engagement: A theme of engagement is noted in many sectors and is made possible in part with the help of a strong retirement community.
Like other Bright Spots communities, Sequatchie County has initiatives and efforts that fall into several overarching categories: leadership, cross-sector collaboration, local providers committed to public health, and an active faith community.
2 Table 32 in the Sequatchie County data appendix at the end of this case study provides a quantitative profile of county characteristics. 3 For a full explanation of the methodology, see Appendix B: Research Approach. For a list of key informants interviewed for this county, see Table 33 in the data appendix at the end of this case study.

CREATING A CULTURE OF HEALTH IN APPALACHIA Sequatchie County, Tennessee | CASE STUDIES
153
Community Leaders Engaged in Health Initiatives The field research found strong evidence in Sequatchie County of leaders from all walks of life working to promote health. For example, the efforts of county officials and residents to get the Erlanger Health System to establish a medical facility in Dunlap reflects the value they place on health. In its first year of operation, Erlanger Sequatchie Valley served 9,000 patients, nearly double the expected number. In 2016, it served 24,000 patients. This level of service suggests not only a need for, but also a strong desire to seek, care and to use local health care resources. The success of the Sequatchie facility prompted local leaders to approach Erlanger again about establishing a larger, regional hospital in Dunlap. Erlanger agreed, and plans are now moving forward. In December 2016, Dunlap city commissioners contributed $10,000 for preliminary work for the new facility. There are also strong local leaders at the grassroots level who are committed to addressing substance abuse. Churches, schools, and law enforcement are working to provide rehabilitation assistance to residents in need and to reduce risky behaviors in the community. The local school board has shown strong leadership by endorsing the Coordinated School Health (CSH) program, which was created by the state legislature in 2000 and fully implemented statewide in 2007. It mandates school-based activities in eight areas: health education; health services; nutrition; physical education; healthy school environment; school counseling, psychological, and social services; student, family, and community involvement; and school staff wellness. CSH’s health-promotion efforts include providing annual student health screenings to identify issues related to obesity, vision, hearing, blood pressure, and dentition; employing educational programs to combat tobacco addiction, bullying, and drunk driving; holding bicycle safety courses; and offering exercise and stress-reduction classes for school employees. It also helps educators get health information into parents’ hands and out into the community. CSH pursues the goal of educating parents by publishing a quarterly newsletter that is sent home to them, and regularly distributing flyers about health-related issues and events in the community. The program also collaborates with the University of Tennessee Extension Service and Step Up Sequatchie to improve exercise facilities and physical education offerings in the schools. The CSH program is popular with students, parents, and church groups, and its events are well attended. Notably, the Sequatchie County Board of Education has officially expressed support for the state-mandated program. In influx of affluent retirees into the community in recent decades may also contribute to the number of community leaders who show a shared value for health. These relative newcomers have gotten involved in local business, politics, and civic affairs, bringing their ideas and skills; many have higher levels of education, and perhaps more health-conscious lifestyles. This “in-migration” of a more affluent population also seems to have created new markets for fitness and health care facilities that have benefited, and will continue to benefit, all of Sequatchie County’s residents. Finally, in Sequatchie County there is strong employer support for employee health. The county’s major employers are the public school system, the Southeast Tennessee Human Resource Agency (SETHRA), Walmart, Mann+Hummel, NHC Healthcare, Bledsoe Telephone Cooperative, and the Sequatchie Valley Electric Cooperative. These employers all provide some level of health insurance or other wellness benefits for their full-time employees. Additionally, the Bledsoe Telephone Cooperative offers weight-
CREATING A CULTURE OF HEALTH IN APPALACHIA Sequatchie County, Tennessee | CASE STUDIES
154
loss programs, free flu shots, and 100 percent coverage for preventive care. The Sequatchie Valley Electric Cooperative sponsors an annual senior expo where people age 55 and older can get free health information and free screenings for high blood pressure and cholesterol. SETHRA offers employees a “teledoc” option that allows them to consult with physicians online on a 24/7 basis. The Sequatchie CSH program provides teachers and other school staff with exercise and relaxation classes. Cross-Sector Collaboration Cross-sector change agents in the Sequatchie community come from across the county and include residents, public officials, employers, schools, faith-based organizations, members of the health care sector, community-based organizations, and others. One example is the Sequatchie Health Council, a 40-member group established 28 years ago that includes representatives of local businesses, social service agencies, the county health department, the county commission, schools, local media, medical offices, and the Tennessee Department of Health. Council members meet monthly to identify local health issues and find ways to address them. Past projects have focused on tobacco control, obesity, substance abuse, suicide prevention, and nutrition education. In addition, the group has sponsored many health fairs and health screening events over the years. One of the health council’s recent projects, Step Up Sequatchie: Improve Your Health One Step at a Time, has brought together volunteers who organize events that help people quit smoking, promote healthier eating, and encourage physical activity. The formation and ongoing efforts of the health council and of Step Up Sequatchie are indicators that Sequatchie residents place a high value on health. The Sequatchie school system and its partners are another valuable health promotion resource. A significant part of this value lies in the work done through the CSH program, which serves the student population, school employees, and, by extension, family members. It may also be a beneficial factor that Sequatchie County’s public schools—elementary, middle, and high—are housed in one location, an arrangement that aids coordination of health promotion efforts within the school system. The centralized schools, as one interviewee suggested, function as a kind of hub for distribution of public health information. The Sequatchie County schools also attend to the nutritional needs of students by providing free breakfast and lunch, regardless of family income level. In addition, the schools partner with a local food bank to provide free fruits and vegetables that students can take home to their families. In this small community, the school system serves as a hub for promoting health through preventive screening, physical activity, classroom and public education, and nutrition.
Local Providers Committed to Public Health In 2014, at the urging of county officials and residents, Erlanger Health System, based in Chattanooga and affiliated with the University of Tennessee College of Medicine, opened a satellite facility—Erlanger Sequatchie Valley—in Dunlap. This facility provides 24/7 emergency services, primary care, and weekly clinics for cardiology, orthopedics, and women’s health. As noted previously, in 2016 Erlanger Sequatchie Valley treated more than 24,000 patients. Given that apparent level of need, the Erlanger system sought regulatory approval to build a regional hospital in Dunlap. Sequatchie County has since issued bonds to finance construction of the new $32.6 million hospital, which will include 25 beds, and a new 3.0 Tesla MRI to provide magnetic resonance imaging services.
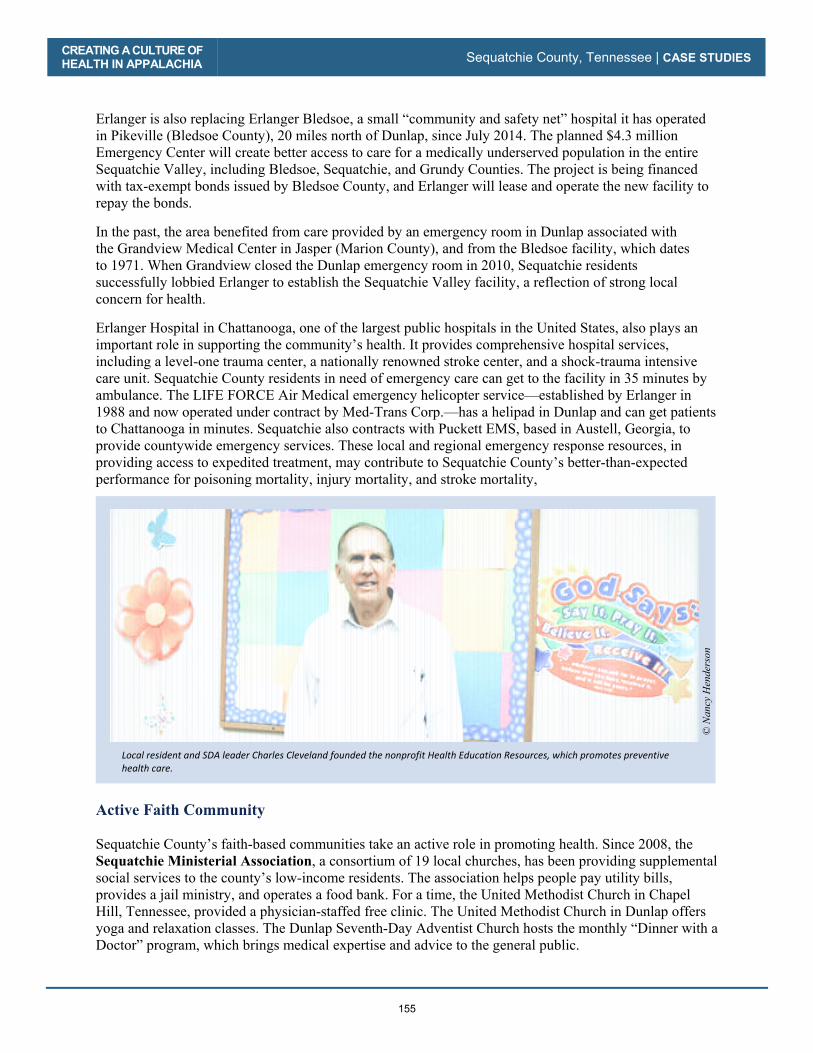
CREATING A CULTURE OF HEALTH IN APPALACHIA Sequatchie County, Tennessee | CASE STUDIES
155
Erlanger is also replacing Erlanger Bledsoe, a small “community and safety net” hospital it has operated in Pikeville (Bledsoe County), 20 miles north of Dunlap, since July 2014. The planned $4.3 million Emergency Center will create better access to care for a medically underserved population in the entire Sequatchie Valley, including Bledsoe, Sequatchie, and Grundy Counties. The project is being financed with tax-exempt bonds issued by Bledsoe County, and Erlanger will lease and operate the new facility to repay the bonds.
In the past, the area benefited from care provided by an emergency room in Dunlap associated with the Grandview Medical Center in Jasper (Marion County), and from the Bledsoe facility, which dates to 1971. When Grandview closed the Dunlap emergency room in 2010, Sequatchie residents successfully lobbied Erlanger to establish the Sequatchie Valley facility, a reflection of strong local concern for health.
Erlanger Hospital in Chattanooga, one of the largest public hospitals in the United States, also plays an important role in supporting the community’s health. It provides comprehensive hospital services, including a level-one trauma center, a nationally renowned stroke center, and a shock-trauma intensive care unit. Sequatchie County residents in need of emergency care can get to the facility in 35 minutes by ambulance. The LIFE FORCE Air Medical emergency helicopter service—established by Erlanger in 1988 and now operated under contract by Med-Trans Corp.—has a helipad in Dunlap and can get patients to Chattanooga in minutes. Sequatchie also contracts with Puckett EMS, based in Austell, Georgia, to provide countywide emergency services. These local and regional emergency response resources, in providing access to expedited treatment, may contribute to Sequatchie County’s better-than-expected performance for poisoning mortality, injury mortality, and stroke mortality,
Active Faith Community Sequatchie County’s faith-based communities take an active role in promoting health. Since 2008, the Sequatchie Ministerial Association, a consortium of 19 local churches, has been providing supplemental social services to the county’s low-income residents. The association helps people pay utility bills, provides a jail ministry, and operates a food bank. For a time, the United Methodist Church in Chapel Hill, Tennessee, provided a physician-staffed free clinic. The United Methodist Church in Dunlap offers yoga and relaxation classes. The Dunlap Seventh-Day Adventist Church hosts the monthly “Dinner with a Doctor” program, which brings medical expertise and advice to the general public.
Local resident and SDA leader Charles Cleveland founded the nonprofit Health Education Resources, which promotes preventive health care.
© N
ancy
Hen
ders
on
CREATING A CULTURE OF HEALTH IN APPALACHIA Sequatchie County, Tennessee | CASE STUDIES
156
Sequatchie County’s churches also raise funds for people who need help with medical bills or post-disaster recovery (such as when a tornado struck in November 2016). Several churches operate volunteer programs that provide free transportation to medical appointments. The school-based CSH program works with church groups to distribute health information (e.g., about health fairs, preventive screenings, exercise programs, and nutrition) to county residents. Sending flyers to congregations is a locally effective way to get the word out. In particular, the large Seventh-Day Adventist community plays a significant role. There are two SDA churches in Dunlap, and two in surrounding counties. The church also runs a K–12 school in Dunlap that is open to the public. According to estimates, SDA members may account for up to 10 percent of the county population. This is significant not just because of the local health-related activities the SDA church members support—potluck meals for low-income people, Dinner with a Doctor, participation in health fairs—but also because of the health practices promoted by SDA teachings. Based on the principle that “the body is the temple of the Holy Spirit,” the SDA church advocates the importance of a healthy diet, regular exercise, and avoiding the use of tobacco and alcohol. These pro-health practices are associated with the exceptional longevity of SDA members. But the church not only has a strong internal culture of health; it also embraces the mission of extending this culture into society at large. Locally, resident and SDA leader Charles Cleveland founded Health Education Resources, a nonprofit organization that promotes preventive medicine worldwide. Another example of the power of faith-based communities to promote health is the Tennessee governor’s recent initiative to partner with churches to support the work of Project Lifeline, a state-sponsored, multi-county addiction recovery program. Project Lifeline was established to reduce stigma related to the disease of addiction and increase community support for policies that provide for treatment and recovery services. It has also been designed to serve as a vital resource in an area overwhelmed by the country’s opioid epidemic. Taken together, the efforts of faith groups in Sequatchie County affirm the importance of community health and, through practical actions, bolster it. CREATING A CULTURE OF HEALTH IN SEQUATCHIE COUNTY Sequatchie County is changing rapidly as both its demographics and its economy shift. A renewed cultural focus on health and well-being is part of that shift, as a broad range of players work to promote the value of maintaining health. This can be seen in the faith-based communities advocating for healthy behaviors, including undertaking physical activity and working toward better nutrition; local organizations addressing substance abuse; and schools offering parents, teachers, and students opportunities to learn about and practice healthy behaviors. Important evidence of the value Sequatchie County residents place on health is the strong endorsement of the school board for the work of the CSH program in schools. While a state-mandated health promotion effort could have met with local resistance, just the opposite has occurred in Sequatchie. Those interviewed as part of this case study’s field work described the CSH program as popular with students, parents, and church groups. Like many other employers in the county, the schools provide teachers and other employees with important health benefits in addition to insurance coverage. These benefits included access to wellness programs and opportunities for physical activity. And beyond urging their congregants to live healthier

CREATING A CULTURE OF HEALTH IN APPALACHIA Sequatchie County, Tennessee | CASE STUDIES
157
lives, the county’s faith community provide essential health-related supports to individuals and families who need them, including free meals and health care services as well as help with utility bills. The civic engagement among newly arrived retirees is also benefiting, and will continue to benefit, all of Sequatchie County’s residents. Many of the retirees are active across the county—taking an interest in local issues, joining local churches, and pursuing volunteer opportunities. The changes that residents of Sequatchie County are likely noticing may be helping to create some better-than-expected health outcomes, and reinforcing the value that the people who live here place on health.
CREATING A CULTURE OF HEALTH IN APPALACHIA Sequatchie County, Tennessee | CASE STUDIES
158
REFERENCES Agency for Healthcare Research and Quality. (2011). Chapter 9: Access to Health Care, 2011 National Healthcare Quality Report. Retrieved from Agency for Healthcare Research and Quality: https://www.ahrq.gov/research/findings/nhqrdr/nhqr11/chap9.html Chandra, A., J. Acosta, K. Carman, T. Dubowitz, L. Leviton, L. Martin, A. Plough, et al. (2016). Building a National Culture of Health. Retrieved from rand.org: http://www.rand.org/content/dam/rand/pubs/research_reports/RR1100/RR1199/RAND_RR1199.pdf Egede, L. E. (2006, June). Race, Ethnicity, Culture, and Disparities in Health Care. Journal of General Internal Medicine, 21(6), 667-669. doi:10.1111/j.1525-1497.2006.0512.x Ellison, A. (2016, February 09). Hospital CFO Report: 6 common characteristics of hospitals vulnerable to closure. Retrieved July 27, 2017, from: http://www.beckershospitalreview.com/finance/6-common-characteristics-of-hospitals-vulnerable-to-closure.html Fessner, Dave. "Erlanger Gets Approval to Build Hospital in Dunlap, Tenn." Times Free Press, December 13, 2017. Holmes, G. Mark, Nancy M. Lane, Thomas A. Arcury, Michael L. Schwalbe, Randy Randolph, John Frank, Sharita Thomas, et. al. 2018. Identifying Bright Spots in Appalachian Health: Statistical Analysis. Washington, D.C.: Appalachian Regional Commission. Institute of Medicine (US) Committee. (1990). Medicare: A Strategy for Quality Assurance (Vol. 1). (K. Lohr, Ed.) Washington (D.C.): National Academies Press (US). Retrieved from https://www.ncbi.nlm.nih.gov/books/NBK235460/ Loma Linda University School of Public Health. (2017, September 1). Findings for AHS-2. Retrieved from Adventist Health Studies https://publichealth.llu.edu/adventist-health-studies/findings/findings-ahs-2 Marshall, Julie L., Logan Thomas, Nancy M. Lane, G. Mark Holmes, Thomas A. Arcury, Randy Randolph, Pam Silberman, et al. 2017. Health Disparities in Appalachia. Washington, D.C.: Appalachian Regional Commission. Office of Disease Prevention and Health Promotion. US DHHS. (2017). Healthy People / 2020 Topics & Objectives/ Access to Health Services. Retrieved July 27, 2017, from Healthy People. gov: https://www.healthypeople.gov/2020/topics-objectives/topic/Access-to-Health-Services Willet, W. (2003). Lessons from dietary studies in Adventists and questions for the future. American Journal Clinical Nutrition, 539S–543S. World Health Organization. (2017). The determinants of health. Retrieved from World Health Organization: Health Impact Assessment: http://www.who.int/hia/evidence/doh/en/
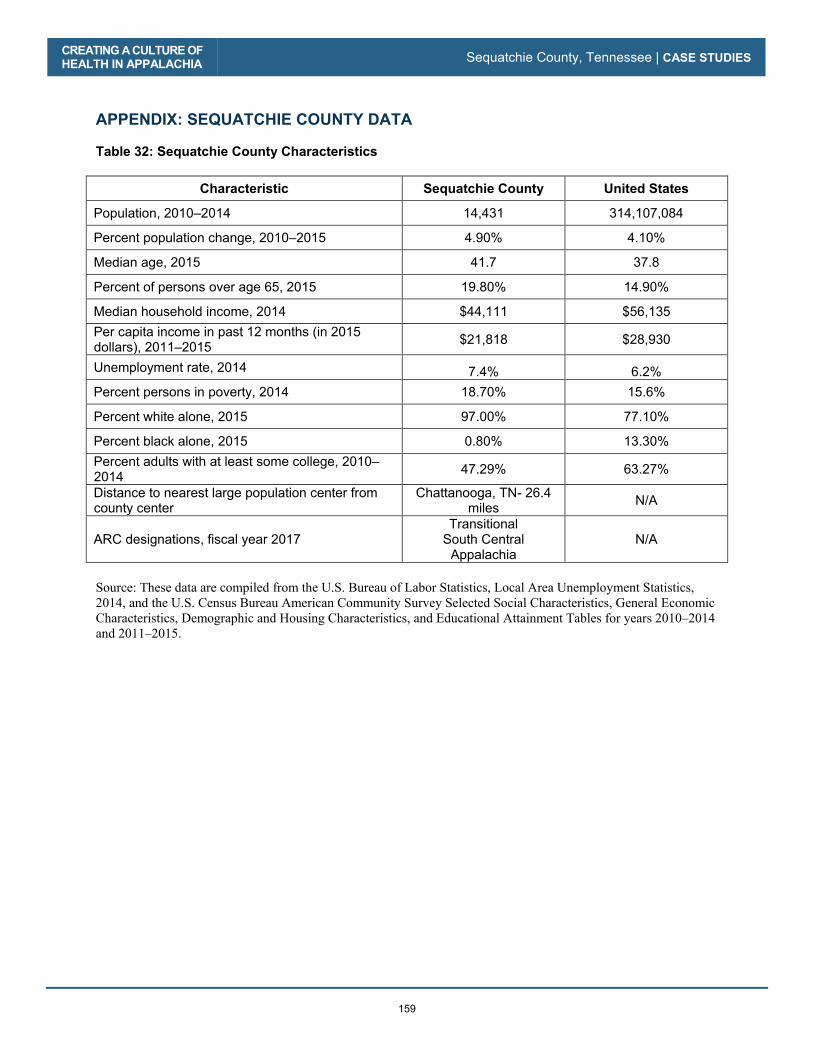
CREATING A CULTURE OF HEALTH IN APPALACHIA Sequatchie County, Tennessee | CASE STUDIES
159
APPENDIX: SEQUATCHIE COUNTY DATA Table 32: Sequatchie County Characteristics
Characteristic Sequatchie County United States
Population, 2010–2014 14,431 314,107,084
Percent population change, 2010–2015 4.90% 4.10%
Median age, 2015 41.7 37.8
Percent of persons over age 65, 2015 19.80% 14.90%
Median household income, 2014 $44,111 $56,135 Per capita income in past 12 months (in 2015 dollars), 2011–2015 $21,818 $28,930
Unemployment rate, 2014 7.4% 6.2% Percent persons in poverty, 2014 18.70% 15.6%
Percent white alone, 2015 97.00% 77.10%
Percent black alone, 2015 0.80% 13.30% Percent adults with at least some college, 2010–2014 47.29% 63.27%
Distance to nearest large population center from county center
Chattanooga, TN- 26.4 miles N/A
ARC designations, fiscal year 2017 Transitional
South Central Appalachia
N/A
Source: These data are compiled from the U.S. Bureau of Labor Statistics, Local Area Unemployment Statistics, 2014, and the U.S. Census Bureau American Community Survey Selected Social Characteristics, General Economic Characteristics, Demographic and Housing Characteristics, and Educational Attainment Tables for years 2010–2014 and 2011–2015.

CREATING A CULTURE OF HEALTH IN APPALACHIA Sequatchie County, Tennessee | CASE STUDIES
160
Table 33: Sequatchie County Key Informants
Name Location Title Organization Interview Date
Donna Condra Dunlap Field Management Director
Department of Health and Human Services 4/24/2014
Stephanie Boynton Dunlap Chief Executive Officer Erlanger Sequatchie Valley Emergency Department
4/24/2017
Rolanda Green Dunlap Coordinator School Health
Sequatchie Board of Education 4/24/2017
Karen Shepherd, MD Dunlap County Coroner Sequatchie County 4/25/2017
Jan Frechette Dunlap Director Sequatchie Health Council 4/25/2017
Beth Delaney Dunlap Community Development Director
Sequatchie Health Council 4/26/2017
Dave Hodges Dunlap Project LifeLine Coordinator, Region 3 South
Franklin Prevention Coalition 4/26/2017

CREATING A CULTURE OF HEALTH IN APPALACHIA Sequatchie County, Tennessee | CASE STUDIES
161
Table 34: Sequatchie County Health Outcomes – Actual vs. Predicted
Outcome Measure Actual Predicted
Percentage Difference (negative =
better)
Poisoning mortality per 100,000 people, 2008–2014 18.61 28.74 -35.3%
Injury mortality per 100,000 people, 2008–2014 65.05 81.41 -20.1%
Stroke mortality per 100,000 people, 2008–2014 40.50 50.68 -20.1%
Heart disease mortality per 100,000 people, 2008–2014 192.95 232.14 -16.9%
Heart disease hospitalizations per 1,000 Medicare beneficiaries, 2012 56.40 66.31 -14.9%
Suicide mortality per 100,000 people, 2008–2014 14.09 16.55 -14.9%
Opioid prescriptions as a percent of Part D claims, 2013 4.97 5.59 -11.1%
Percentage of obese adults (>30 BMI), 2012 30.0% 33.2% -9.7%
Years of potential life lost, 2011–2013 9,977 10,992 -9.2%
COPD mortality per 100,000 people, 2008–2014 71.13 76.56 -7.1%
Physically unhealthy days per month per person, 2014 4.80 5.03 -4.6%
Percentage of Medicare beneficiaries w/ depression, 2012 18.10% 18.72% -3.3%
Percentage of adults with diabetes, 2012 13.30% 13.47% -1.2%
Mentally unhealthy days per month per person, 2014 4.70 4.73 -0.6%
Average Medicare condition score, 2013 1.02 1.01 1.0%
Low-birth-weight births (<2,500g) per 1,000 births, 2007–2013 10.62 10.39 2.2%
Cancer mortality per 100,000 people, 2008–2014 230.91 222.67 3.7%
Percentage of excessive drinkers, 2014 11.3% 10.8% 4.5%
Infant mortality per 1,000 births, 2008–2014 7.60 7.14 6.4%
Notes: Percentage Difference = 100 * [ (Actual / Predicted) – 1] Green = County value was better than predicted
For details on the outcome measures, see the data files accompanying the report Identifying Bright Spots in Appalachian Health: Statistical Analysis.
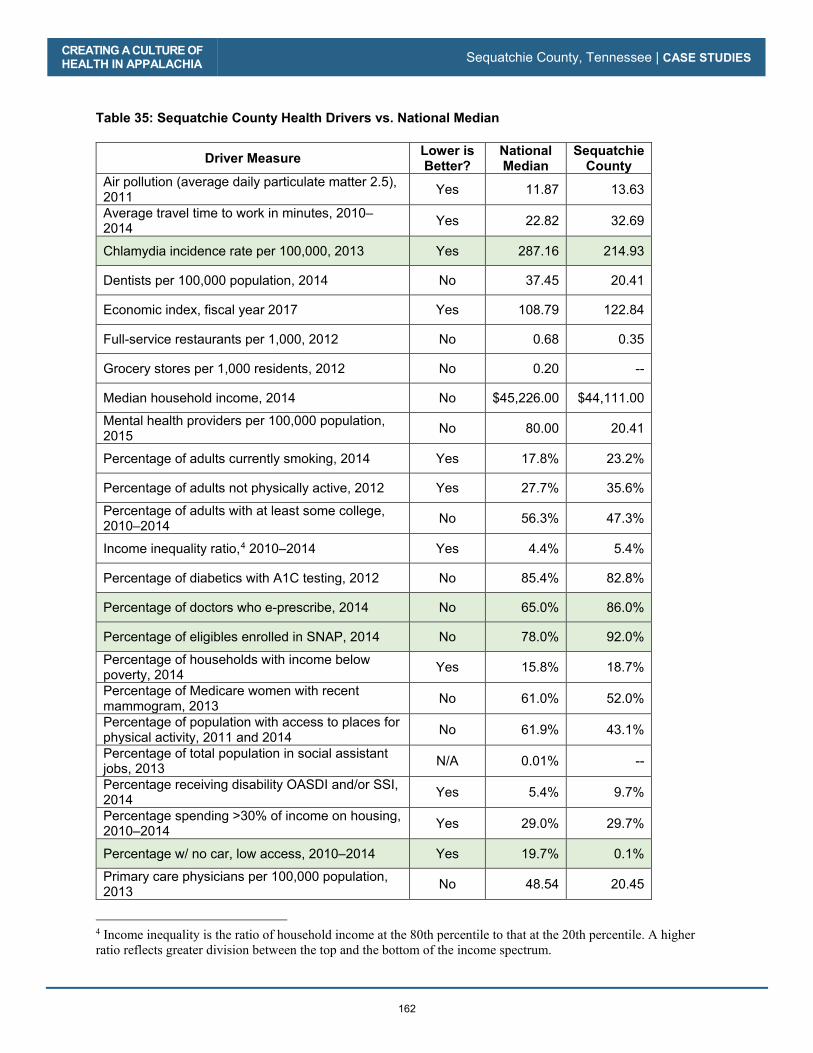
CREATING A CULTURE OF HEALTH IN APPALACHIA Sequatchie County, Tennessee | CASE STUDIES
162
Table 35: Sequatchie County Health Drivers vs. National Median
Driver Measure Lower is Better?
National Median
Sequatchie County
Air pollution (average daily particulate matter 2.5), 2011 Yes 11.87 13.63
Average travel time to work in minutes, 2010–2014 Yes 22.82 32.69
Chlamydia incidence rate per 100,000, 2013 Yes 287.16 214.93
Dentists per 100,000 population, 2014 No 37.45 20.41
Economic index, fiscal year 2017 Yes 108.79 122.84
Full-service restaurants per 1,000, 2012 No 0.68 0.35
Grocery stores per 1,000 residents, 2012 No 0.20 --
Median household income, 2014 No $45,226.00 $44,111.00
Mental health providers per 100,000 population, 2015 No 80.00 20.41
Percentage of adults currently smoking, 2014 Yes 17.8% 23.2%
Percentage of adults not physically active, 2012 Yes 27.7% 35.6%
Percentage of adults with at least some college, 2010–2014 No 56.3% 47.3%
Income inequality ratio,4 2010–2014 Yes 4.4% 5.4%
Percentage of diabetics with A1C testing, 2012 No 85.4% 82.8%
Percentage of doctors who e-prescribe, 2014 No 65.0% 86.0%
Percentage of eligibles enrolled in SNAP, 2014 No 78.0% 92.0%
Percentage of households with income below poverty, 2014 Yes 15.8% 18.7%
Percentage of Medicare women with recent mammogram, 2013 No 61.0% 52.0%
Percentage of population with access to places for physical activity, 2011 and 2014 No 61.9% 43.1%
Percentage of total population in social assistant jobs, 2013 N/A 0.01% --
Percentage receiving disability OASDI and/or SSI, 2014 Yes 5.4% 9.7%
Percentage spending >30% of income on housing, 2010–2014 Yes 29.0% 29.7%
Percentage w/ no car, low access, 2010–2014 Yes 19.7% 0.1%
Primary care physicians per 100,000 population, 2013 No 48.54 20.45
4 Income inequality is the ratio of household income at the 80th percentile to that at the 20th percentile. A higher ratio reflects greater division between the top and the bottom of the income spectrum.
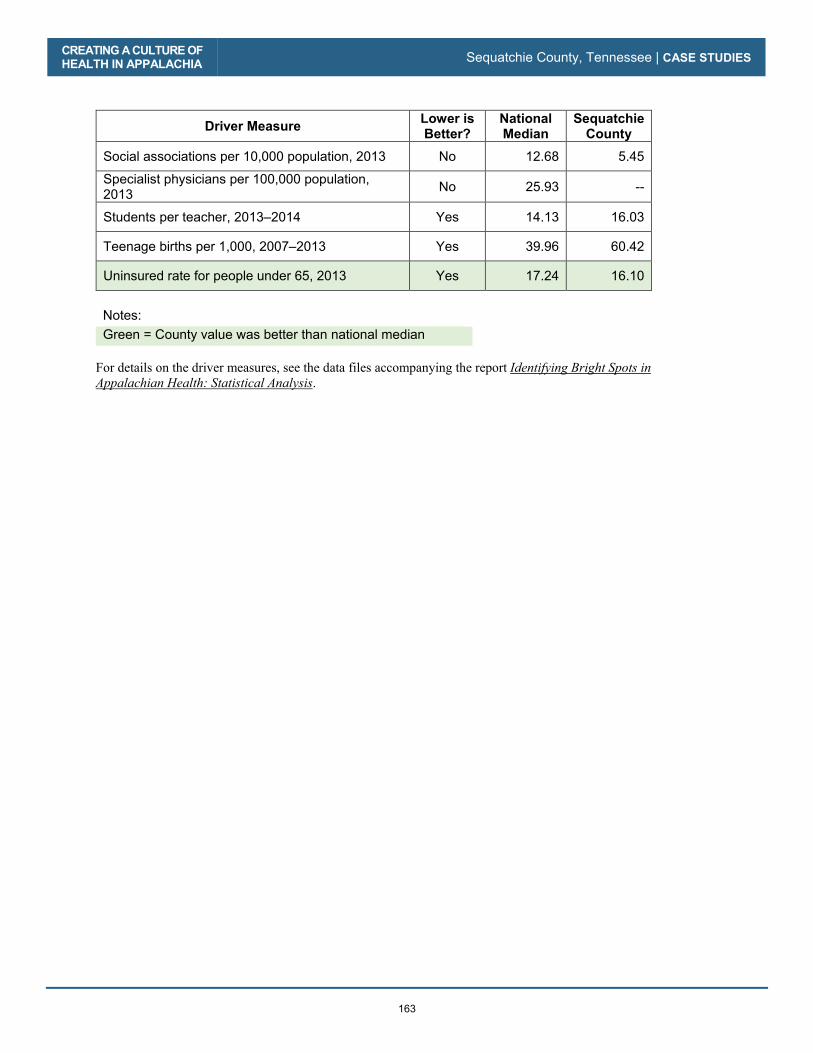
CREATING A CULTURE OF HEALTH IN APPALACHIA Sequatchie County, Tennessee | CASE STUDIES
163
Driver Measure Lower is Better?
National Median
Sequatchie County
Social associations per 10,000 population, 2013 No 12.68 5.45
Specialist physicians per 100,000 population, 2013 No 25.93 --
Students per teacher, 2013–2014 Yes 14.13 16.03
Teenage births per 1,000, 2007–2013 Yes 39.96 60.42
Uninsured rate for people under 65, 2013 Yes 17.24 16.10
Notes: Green = County value was better than national median
For details on the driver measures, see the data files accompanying the report Identifying Bright Spots in Appalachian Health: Statistical Analysis.

CREATING A CULTURE OF HEALTH IN APPALACHIA Sequatchie County, Tennessee | CASE STUDIES
164
165
Grant County, West Virginia
County Overview
A Deeper Look at Grant County: Community Strengths
Creating a Culture of Health in Grant County
References
Appendix: Grant County Data

166

Grant County, West Virginia
CA
SE
STU
DIE
S
Grant County, West Virginia
CA
SE
STU
DIE
S
167
No one has the resources to take care of everything all the time, so we’re sharing and helping—and that has been good here.
—Peggy Bobo-Alt, Grant County Director of Emergency Services
Filled with opportunities for hiking, rock climbing, and countless other outdoor-recreation activities, Grant County is described in tourism materials as the “Heartbeat of the Potomac Highlands.” Many long-time residents of this mountainous Appalachian county would agree that the land exudes a sense of health and vitality.
But they would also say that life in the county can be hard, with significant barriers keeping residents from pursuing optimal health and well-being. That is the dichotomy of Grant County: a place rich in natural resources and nationally recognized wilderness areas, yet lacking in some of the basic elements known to contribute to good health, such as reliable access to transportation and healthy food, and steady employment. In this county spanning 480 square miles, the poverty rate is higher, and the median income lower, than in the nation; a greater percentage of residents live with a disability; and the population skews more toward older adults. Despite the resplendent landscape that beckons folks to explore the great outdoors, maintaining good health is a challenge for residents.
Ra
eky
/ C
rea
tive C
om
mo
ns
3.0
Un
po
rted
Grant County, in West Virginia’s Eastern Panhandle, is known for its natural assets, including Bear Rocks Preserve.
CREATING A CULTURE OF HEALTH IN APPALACHIA Grant County, West Virginia | CASE STUDIES
168
Grant County is among the ten percent of Appalachian counties—and one of the eight counties in West Virginia—identified as a Bright Spot. It performed better than expected on 12 out of 19 health outcome measures. Most notably, the county performed better than expected on the following measures:
� Stroke mortality: 40 percent better than expected
� Heart disease hospitalizations: 40 percent better than expected
� Injury mortality: 36 percent better than expected
� Cancer mortality: 29 percent better than expected
� Years of potential life lost: 23 percent better than expected
These better-than-expected results are likely influenced by local conditions and initiatives created by the county to improve overall well-being. For instance, field research indicates that committed local health providers and sustained cross-sector collaboration may have played a major role in the county’s health. Grant County residents have also pooled resources to target specific issue areas such as care and social service supports for seniors, and creating transportation networks to overcome the isolation and rugged terrain that can be barriers to health. Grant County’s classification as a Bright Spot means that, on average, the county performed better than expected on a number of health outcome measures, given its characteristics and resources—that is, the socioeconomics, demographics, behaviors, health care facilities, and other factors that influence health outcomes. It does not mean that all Grant County residents enjoy excellent health. Like other counties with limited resources, Bright Spot counties face many challenges to attaining good health outcomes. But Grant County’s performance does indicate that certain county conditions or programs may be helping generate better-than-expected outcomes—and that other resource-challenged Appalachian counties may benefit from adopting similar initiatives.1
1 See Table 38 in the data appendix at the end of this case study for a full list of actual health outcomes for Grant County compared with predicted outcomes. For details on the outcome measures, see the data files accompanying the report Identifying Bright Spots in Appalachian Health: Statistical Analysis.
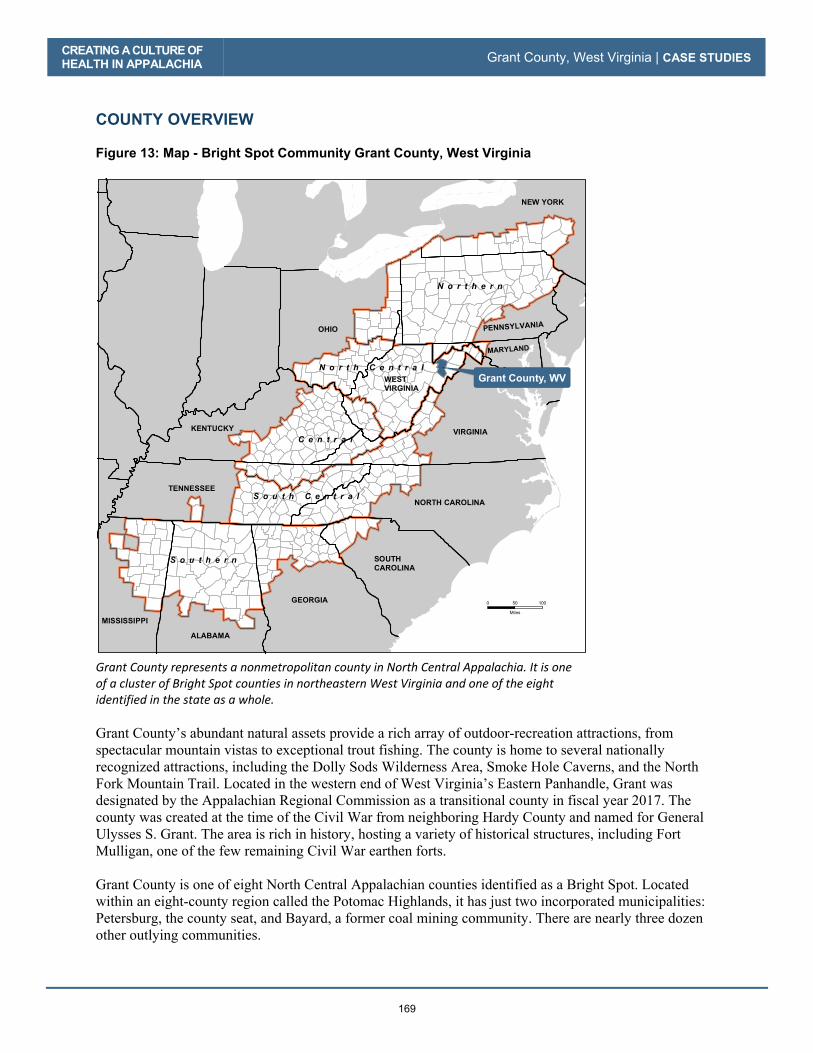
CREATING A CULTURE OF
HEALTH IN APPALACHIA Grant County, West Virginia | CASE STUDIES
169
COUNTY OVERVIEW
Figure 13: Map - Bright Spot Community Grant County, West Virginia
Grant County represents a nonmetropolitan county in North Central Appalachia. It is one of a cluster of Bright Spot counties in northeastern West Virginia and one of the eight identified in the state as a whole.
Grant County’s abundant natural assets provide a rich array of outdoor-recreation attractions, from spectacular mountain vistas to exceptional trout fishing. The county is home to several nationally recognized attractions, including the Dolly Sods Wilderness Area, Smoke Hole Caverns, and the North Fork Mountain Trail. Located in the western end of West Virginia’s Eastern Panhandle, Grant was designated by the Appalachian Regional Commission as a transitional county in fiscal year 2017. The county was created at the time of the Civil War from neighboring Hardy County and named for General Ulysses S. Grant. The area is rich in history, hosting a variety of historical structures, including Fort Mulligan, one of the few remaining Civil War earthen forts. Grant County is one of eight North Central Appalachian counties identified as a Bright Spot. Located within an eight-county region called the Potomac Highlands, it has just two incorporated municipalities: Petersburg, the county seat, and Bayard, a former coal mining community. There are nearly three dozen other outlying communities.
GEORGIA
SOUTH
CAROLINA
NORTH CAROLINA
ALABAMA
MISSISSIPPI
TENNESSEE
KENTUCKY
OHIO PENNSYLVANIA
MARYLAND
VIRGINIA
NEW YORK
WEST
VIRGINIA
Grant County, WV
N o r t h e r n
S o u t h e r n
C e n t r a l
S o u t h C e n t r a l
N o r t h C e n t r a l
0 10050
Miles

CREATING A CULTURE OF HEALTH IN APPALACHIA Grant County, West Virginia | CASE STUDIES
170
The county has maintained a relatively stable population of about 11,800 people. Approximately 98 percent of Grant County residents are white, and 81.9 percent have at least graduated from high school. The estimated median household income in 2014 was $41,039, compared with $56,135 nationally. About 8 percent of county residents receive disability benefits, compared with 5.4 percent nationally; and 17 percent live in poverty, compared with 15.6 percent nationally.2 The county’s top employers are in health care (Grant Memorial Hospital, Grant County Nursing Home, and Potomac Highlands Guild), natural resources (Allegheny Wood Products, Inc., Grant County Mulch, Dominion Resources’ Mount Storm Power Station), or the government (the Grant County Board of Education). A significant number of residents continue to farm (fruit, tobacco, and grain) and breed livestock. A DEEPER LOOK AT GRANT COUNTY: COMMUNITY STRENGTHS As in other Bright Spot communities, leaders, organizations, and residents in Grant County are using collaboration and resource sharing to provide a range of health care, public health, and social services. This includes a commitment to supporting low-income residents and sustaining a task force to discuss local challenges and solutions. Strong leadership has helped guide many of the county’s initiatives. Field work helped identify local practices in Grant County that appear to be contributing to overall health, document effective practices that could be replicated in other counties, and identify promising practices and strategies that should be explored further.3 Specifically, the research found these characteristics and strategies in Grant County:
� Cross-sector collaboration: Government agencies and emergency services as well as nonprofit organizations work as a unit to benefit the community in several ways. These collaborations are committed to supporting low-income residents. Many of these organizations’ employees pledge their time to support and develop county-based services and events. People serve across several of the groups in collaboration, thereby increasing the flow of information between them.
� Resource sharing: Several initiatives pool resources to provide services targeted to particular population groups, both within the county and adjacent to it. Key areas dependent on resource sharing include: support for youth, support for seniors, transportation access, and substance abuse and prevention education.
� Local providers committed to public health: A network of local providers, spanning acute care, mental health care, and long-term care, work cohesively to provide county residents with comprehensive access to health care. There is a concerted effort to provide these services to all residents, including low-income and medically underserved groups, through thoughtful planning, volunteer work, and donations. Many of these providers are long-term residents who are familiar with, and dedicated to, local health issues.
� Initiatives to combat substance abuse: Recognizing the need to address the threat of substance abuse in the community, Grant County is mobilizing its resources through coalitions and trainings to prevent drug abuse and overdose, as well as engage in harm reduction.
2 Table 36 in the Grant County data appendix at the end of this case study provides a quantitative profile of county characteristics. 3 For a full explanation of the methodology, see Appendix B: Research Approach. For a list of key informants interviewed for this county, see Table 37 in the data appendix at the end of this case study.

CREATING A CULTURE OF HEALTH IN APPALACHIA Grant County, West Virginia | CASE STUDIES
171
Many of Grant County’s programs fall under four categories: collaboration, resource sharing, local providers committed to public health, and initiatives to combat substance abuse. Cross-Sector Collaboration
Cross-sector collaboration is part of the county’s DNA and addresses many issues, ranging from the creation of food pantries to address hunger, to the coordination of health fairs to screen for physical health needs. Perhaps the most notable example of this is in the work of the Family Issues Task Force (FITF), established under emergency conditions to deal with the devastating aftermath of the 1985 Election Day floods. Most of the 47 people killed when the Potomac River crested at 22.6 feet were from Grant and Pendleton Counties. Since that time, FITF’s purpose has evolved from guiding post-disaster recovery to coordinating efforts to identify, assess, and respond to local health issues. The FITF brings together leaders from diverse organizations, including the county health department, Community Action, the library board, the arts council, United Methodist Family Services, Community Education Outreach Services, local schools, the Commission on Aging, the Potomac Highlands Guild, and Grant Memorial Hospital.
The oldest and most extensive collaboration is Community Education Outreach Services (CEOS), which has five separate clubs in the county. According to the West Virginia University Extension Service website, the members of CEOS have helped “strengthen individuals, families, and communities across the state of West Virginia since 1914.” In collaboration with the extension service, CEOS develops programs centered on service, continuing education, and leadership development. In Grant County, CEOS members coordinate the health fair offered to county residents and collaborate with the county courthouse to hold a breast cancer awareness event.
There are considerable cross-sector collaboration efforts that aim to support youth. Grant County schools work with the extension service to hold the Energy Express program and teach a nutritional science course. The schools also collaborate with Grant Memorial Hospital to offer a course on careers in health. (To benefit residents of all ages, Grant Memorial also collaborates with a local, privately owned pharmacy to provide
blood tests in support of its diabetes prevention program, which is sponsored by the federal Centers for Disease Control and Prevention (CDC).) The Prevention, Intervention, Treatment, Anti-Stigma, and Recovery (PITAR) coalition is a fairly new cross-sector collaboration organized to address behavioral and mental health issues. The coalition brings together people from the criminal justice system, treatment organizations, and patient advocacy groups. According to Dr. Raj Masih, regional health promotion and wellness coordinator for the Potomac Highlands Guild, the group focuses on solutions and actions to help people in various stages of need.
Resource Sharing Grant County uses collaboration and resource sharing in almost all of its efforts to improve the health of residents and the larger community. The county funnels pooled resources into support for its youth and elderly populations, transportation support, and meal distribution.
Eri
c Schena
/ C
rea
tive
Co
mm
on
s 3.0
Un
po
rted
The Grant County Courthouse, in Petersburg, West Virginia

CREATING A CULTURE OF HEALTH IN APPALACHIA Grant County, West Virginia | CASE STUDIES
172
Recently, the Grant County Commission donated land, funding, and services worth about $125,000 for construction of a new multipurpose center for the county’s elderly population. The top two outcome measures on which Grant County does better than expected are stroke mortality and heart disease hospitalization. These outcomes may be related, in part, to the extra support the county provides to its senior population. Grant County has also partnered with the 4-H national youth development and mentoring program for decades, with about 200 youth formally enrolled in multiple 4-H programs. Young people involved in 4-H typically study agriculture and related environmental issues in ways that incorporate an element of physical activity. The Eastern West Virginia Community Action Agency partners with Warm the Children, serving as a social service referral center for more than 800 economically distressed families in the county, providing children with winter coats, gloves, and boots. It reflects a local commitment to supporting the well-being of residents in the most vulnerable segments of the county’s population. Transportation Transportation is a real challenge for some Grant County residents. Steep, unpaved roads make parts of the county hard to reach when the weather is bad. Reaching residents of Mt. Storm during a medical emergency can be especially difficult. Although there is a helipad at Grant Memorial and emergency helicopter services are available, it can still be a challenge to access the more remote areas of the county. Reaching these areas as fast as possible is the goal of the county’s strategic ambulance location plan and its “grassroots mapping system.” By stationing ambulances at strategic locations around the county and incorporating local knowledge about roads and geography (often provided by hunters and fishermen) into its mapping system, Grant County has been able to steadily improve its emergency response times. The health department also subsidizes transportation for women who need to travel to a neighboring county for cancer treatment, using a Susan G. Komen grant to help cover the costs of transportation, lodging, and incidentals. Church group volunteers often provide transportation for medical appointments and pharmacy visits. The county still faces serious health-related transportation challenges, yet coordinated grassroots efforts use local resources to address these challenges as effectively as possible. Food For 28 years, the Commission on Aging Family Services has offered comprehensive support for seniors throughout the county. Major services include a nutrition program that offers meals at locations in Petersburg, Mt. Storm, Maysville, and Dorcas, and as well as transportation to the four meal locations. The commission also provides in-home services to assist with food preparation, personal care, and light housekeeping, and transportation assistance for medical appointments, shopping, and banking. Approximately 47 people now receive in-home services, and approximately 142 receive meals at the four nutrition sites each month.
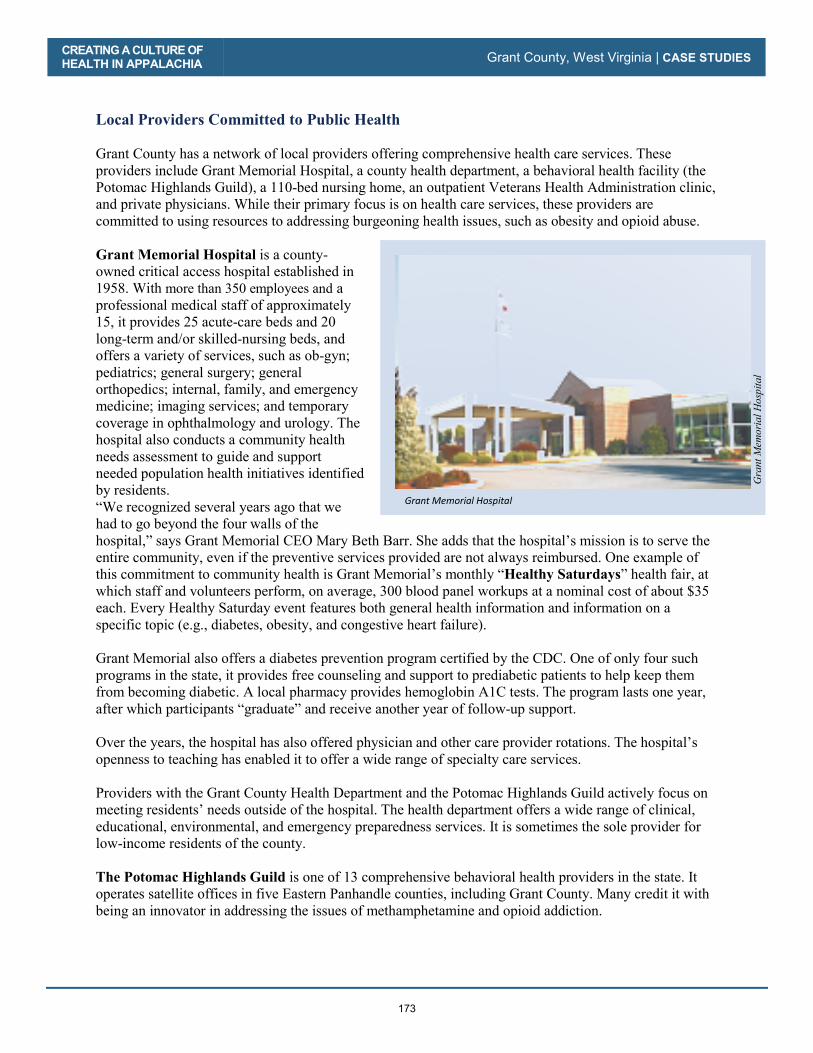
CREATING A CULTURE OF HEALTH IN APPALACHIA Grant County, West Virginia | CASE STUDIES
173
Local Providers Committed to Public Health Grant County has a network of local providers offering comprehensive health care services. These providers include Grant Memorial Hospital, a county health department, a behavioral health facility (the Potomac Highlands Guild), a 110-bed nursing home, an outpatient Veterans Health Administration clinic, and private physicians. While their primary focus is on health care services, these providers are committed to using resources to addressing burgeoning health issues, such as obesity and opioid abuse. Grant Memorial Hospital is a county-owned critical access hospital established in 1958. With more than 350 employees and a professional medical staff of approximately 15, it provides 25 acute-care beds and 20 long-term and/or skilled-nursing beds, and offers a variety of services, such as ob-gyn; pediatrics; general surgery; general orthopedics; internal, family, and emergency medicine; imaging services; and temporary coverage in ophthalmology and urology. The hospital also conducts a community health needs assessment to guide and support needed population health initiatives identified by residents. “We recognized several years ago that we had to go beyond the four walls of the hospital,” says Grant Memorial CEO Mary Beth Barr. She adds that the hospital’s mission is to serve the entire community, even if the preventive services provided are not always reimbursed. One example of this commitment to community health is Grant Memorial’s monthly “Healthy Saturdays” health fair, at which staff and volunteers perform, on average, 300 blood panel workups at a nominal cost of about $35 each. Every Healthy Saturday event features both general health information and information on a specific topic (e.g., diabetes, obesity, and congestive heart failure). Grant Memorial also offers a diabetes prevention program certified by the CDC. One of only four such programs in the state, it provides free counseling and support to prediabetic patients to help keep them from becoming diabetic. A local pharmacy provides hemoglobin A1C tests. The program lasts one year, after which participants “graduate” and receive another year of follow-up support.
Over the years, the hospital has also offered physician and other care provider rotations. The hospital’s openness to teaching has enabled it to offer a wide range of specialty care services.
Providers with the Grant County Health Department and the Potomac Highlands Guild actively focus on meeting residents’ needs outside of the hospital. The health department offers a wide range of clinical, educational, environmental, and emergency preparedness services. It is sometimes the sole provider for low-income residents of the county.
The Potomac Highlands Guild is one of 13 comprehensive behavioral health providers in the state. It operates satellite offices in five Eastern Panhandle counties, including Grant County. Many credit it with being an innovator in addressing the issues of methamphetamine and opioid addiction.
Grant Memorial Hospital
Gra
nt
Mem
ori
al
Ho
spit
al

CREATING A CULTURE OF HEALTH IN APPALACHIA Grant County, West Virginia | CASE STUDIES
174
Grant County’s public and private health care providers are committed to making a difference in people’s lives. Initiatives to Combat Substance Abuse Substance abuse is a public health issue that the local community is vigilant about— with good reason. West Virginia’s overdose mortality rate, double the national rate, is the highest in the country. The crisis in the county seat of Petersburg is so acute that it is the subject of a documentary film, “Petersburg,” which chronicles how drugs took hold in this small city of 2,500 people (Allott and Allott 2017). Grant County has launched several initiatives to try to get ahead of this public health battle. The county and local organizations are collaborating to form coalitions; considering needle exchange programs; and offering training in the administration of naloxone, which can rapidly reverse an opioid overdose. The Prevention, Intervention, Treatment, Anti-Stigma, and Recovery (PITAR) coalition4 is helping coordinate an effort that spans all aspects of addressing addiction, from education to mental health counseling to treatment and recovery services. PITAR comprises upwards of two dozen participating organizations, including the Potomac Highlands Guild, the Russ Hedrick Recovery Resource Center, the Grant County Health Department, and local media organizations. Here is greater detail on some of the organizations and their initiatives: The Potomac Highlands Guild is the regional agency providing intensive outpatient treatment for substance use disorder. With offices in Petersburg, Moorefield, Romney, Franklin, and Keyser, the guild provides counseling (individual and group) for people with addiction and substance use disorders. It facilitates placement in detox and inpatient rehabilitation programs, and in long-term treatment facilities. Staff are on call 24/7, 365 days a year, to respond to the emergency room for any crisis related to substance use disorders. The guild runs the regional DUI education and treatment program for the DMV, and has an after-hours crisis line to help with issues related to substance use disorders. Additionally, the guild provides mental health counseling and treatment for people with mental health issues such as depression, anxiety, bipolar disorder, schizophrenia, and post-traumatic stress disorder. Providing assistance in this way can help people deal with mental health issues effectively and avoid using drugs and alcohol to self-medicate. The Russ Hedrick Recovery Resource Center is a nucleus for recovery activities in the area. The center serves as a drop-in site to help people with substance use disorders get into treatment, begin recovery, and find the resources they need to re-establish their lives. Center coordinator Wade Rohrbaugh and five other certified peer recovery coaches are available to help individuals navigate the pathway through recovery and also serve as a resource for families and loved ones of individuals dealing with addiction issues. The center facilitates 12-step recovery meetings almost daily. Additionally, it provides training in administering naloxone to reverse opioid overdose to the general public and to first responders through the West Virginia Office of Emergency Management Services. To date, more than 2,800 people have used the center’s services, and more than 200 people have been trained in naloxone administration. The Grant/Hardy Recovery Group is a driving force behind the recovery movement in Grant County. The group conducts 56 recovery meetings a month in Petersburg, Moorefield, and Franklin. The meeting groups include Narcotics Anonymous, Nar-Anon, Smart Recovery, and Dual-Recovery Anonymous.
4 A list of organizations participating in the coalition is available at http://potomachighlandsguild.com/pitar-info.html

CREATING A CULTURE OF HEALTH IN APPALACHIA Grant County, West Virginia | CASE STUDIES
175
The Grant County Health Department has also approved a harm reduction program and is considering providing training in administering naloxone for overdoses. Grant County schools are actively engaged in promoting healthy behaviors and preventing substance abuse among students. Two effective programs include Too Good for Drugs and Students Against Destructive Decisions (SADD). Too Good for Drugs seeks to educate students from elementary school through high school about the dangers of drugs, the risks of addiction, and the long-term consequences of substance abuse. SADD is a student-led effort to discourage behaviors such as smoking, abusing drugs and alcohol, and having unprotected sex. The school system also offers a class on healthy eating, as well as a health-careers club. CREATING A CULTURE OF HEALTH IN GRANT COUNTY Grant County’s actions—whether they’ve evolved organically through a volunteer effort or been established through the work of a coalition or health care system—indicate that county leaders and residents place a high value on health. This is reflected in the range of assistive transportation services offered county-wide, including the emergency medical transport subsidized at a cost of $200,000 per year. The level of investment of money and time in holding county-wide health events, as well as in providing prompt emergency response and transport, conveys that health is important and that protecting it is a shared responsibility. This message is reinforced by the sustained focus on support for youth, seniors, and those battling addiction. Grant County is putting resources into educating its young people about healthy behaviors and giving them opportunities to practice those behaviors. Seniors are provided with fitness opportunities and, when needed, communal and in-home meals, counseling on Medicare plans, and subsidized assistance with transportation. This support for seniors may contribute to Grant’s better-than-expected rates of stroke mortality and heart disease mortality. Grant County has put together a wide range of services that address the health of both body and mind, and community leaders continue to develop innovative ways to help residents live healthy lives.

CREATING A CULTURE OF HEALTH IN APPALACHIA Grant County, West Virginia | CASE STUDIES
176
REFERENCES
Allott, Daniel and Jordan Allott. 2017. “The Race to 2020: The people and places that will define a presidency.” Washington Examiner. Accessed May 15, 2018. http://2020.washingtonexaminer.com/ Centers for Disease Control and Prevention, National Center for Health Statistics. 2017. Drug Overdose Deaths in the United States, 1999–2016. https://www.cdc.gov/nchs/products/databriefs/db294.htm Charleston Gazette-Mail. 2015. “Video: Gazette-Mail reporters, photographers reflect on covering 1985 flood.” Charleston Gazette-Mail, November 4, 2015. Accessed May 15, 2018. https://www.wvgazettemail.com/news/video-gazette-mail-reporters-photographers-reflect-on-covering-flood/article_6eb2e9bc-3a87-572a-8771-9a0ba4c285bf.html Grant County Commission on Aging Family Services. 2014. “Our History.” Accessed May 15, 2018. http://www.gcscwv.org/history.html Grant County West Virginia Convention and Visitors Bureau. 2016. “Grant County: The Heart Beat of the Potomac Highlands.” Accessed May 15, 2018. http://www.grantcountywva.com/ Holmes, G. Mark, Nancy M. Lane, Thomas A. Arcury, Michael L. Schawlbe, Randy Randolph, John Frank, Sharita Thomas, et. al. 2018. Identifying Bright Spots in Appalachian Health: Statistical Analysis. Washington, D.C.: Appalachian Regional Commission. Marshall, Julie L., Logan Thomas, Nancy M. Lane, G. Mark Holmes, Thomas A. Arcury, Randy Randolph, Pam Silberman, et al. 2017. Health Disparities in Appalachia. Washington, D.C.: Appalachian Regional Commission.

CREATING A CULTURE OF HEALTH IN APPALACHIA Grant County, West Virginia | CASE STUDIES
177
APPENDIX: GRANT COUNTY DATA Table 36: Grant County Characteristics
Characteristic Grant County United States
Population, 2010–2014 11,829 314,107,084
Percent population change, 2010–2015 -1.40% 4.10%
Median age, 2015 44.9 37.8
Percent of persons over age 65, 2015 23.00% 14.90%
Median household income, 2014 $41,039 $56,135 Per capita income in past 12 months (in 2015 dollars), 2011–2015 $20,052 $28,930
Unemployment rate, 2014 7.7% 6.2%
Percent persons in poverty, 2014 17.0% 15.6%
Percent white alone, 2015 97.70% 77.10%
Percent black alone, 2015 1.00% 13.30% Percent adults with at least some college, 2010–2014 33.74% 63.27% Distance to nearest large population center from county center Fairmont, WV – 84.8 mi. N/A
ARC designations, fiscal year 2017 Transitional
North Central Appalachia
N/A
Source: These data are compiled from the U.S. Bureau of Labor Statistics, Local Area Unemployment Statistics, 2014, and the U.S. Census Bureau American Community Survey Selected Social Characteristics, General Economic Characteristics, Demographic and Housing Characteristics, and Educational Attainment Tables for years 2010–2014 and 2011–2015.
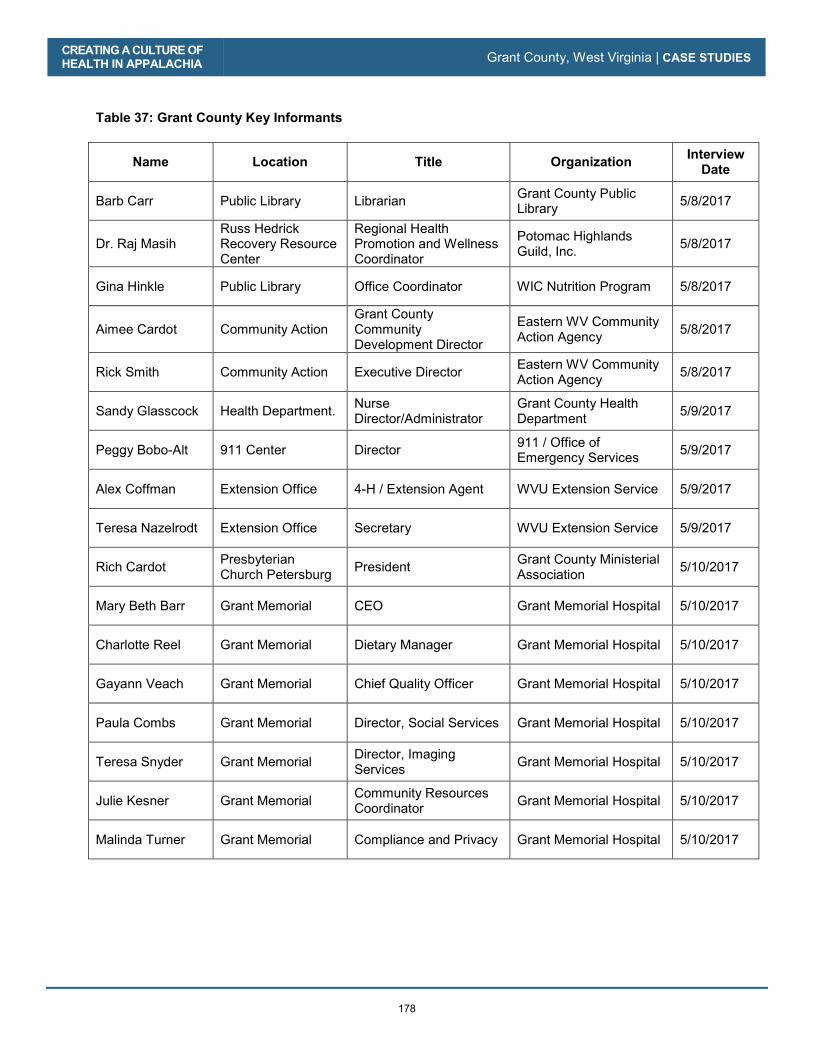
CREATING A CULTURE OF HEALTH IN APPALACHIA Grant County, West Virginia | CASE STUDIES
178
Table 37: Grant County Key Informants
Name Location Title Organization Interview Date
Barb Carr Public Library Librarian Grant County Public Library 5/8/2017
Dr. Raj Masih Russ Hedrick Recovery Resource Center
Regional Health Promotion and Wellness Coordinator
Potomac Highlands Guild, Inc. 5/8/2017
Gina Hinkle Public Library Office Coordinator WIC Nutrition Program 5/8/2017
Aimee Cardot Community Action Grant County Community Development Director
Eastern WV Community Action Agency 5/8/2017
Rick Smith Community Action Executive Director Eastern WV Community Action Agency 5/8/2017
Sandy Glasscock Health Department. Nurse Director/Administrator
Grant County Health Department 5/9/2017
Peggy Bobo-Alt 911 Center Director 911 / Office of Emergency Services 5/9/2017
Alex Coffman Extension Office 4-H / Extension Agent WVU Extension Service 5/9/2017
Teresa Nazelrodt Extension Office Secretary WVU Extension Service 5/9/2017
Rich Cardot Presbyterian Church Petersburg President Grant County Ministerial
Association 5/10/2017
Mary Beth Barr Grant Memorial CEO Grant Memorial Hospital 5/10/2017
Charlotte Reel Grant Memorial Dietary Manager Grant Memorial Hospital 5/10/2017
Gayann Veach Grant Memorial Chief Quality Officer Grant Memorial Hospital 5/10/2017
Paula Combs Grant Memorial Director, Social Services Grant Memorial Hospital 5/10/2017
Teresa Snyder Grant Memorial Director, Imaging Services Grant Memorial Hospital 5/10/2017
Julie Kesner Grant Memorial Community Resources Coordinator Grant Memorial Hospital 5/10/2017
Malinda Turner Grant Memorial Compliance and Privacy Grant Memorial Hospital 5/10/2017
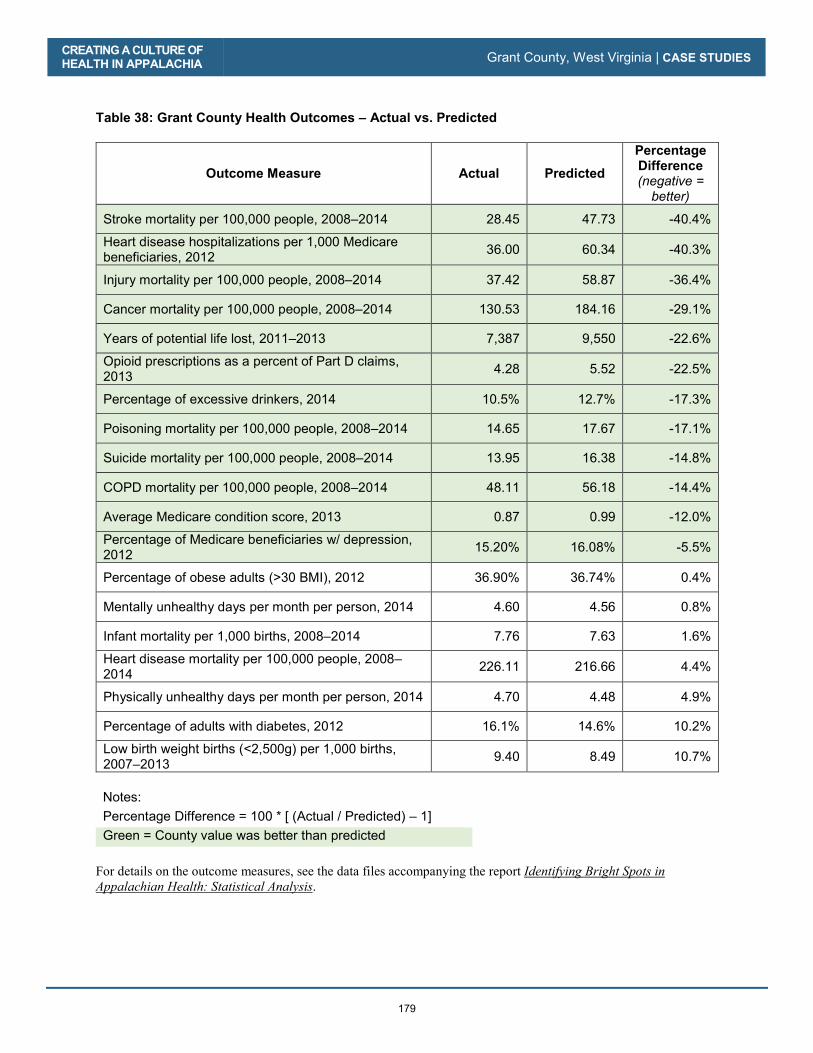
CREATING A CULTURE OF HEALTH IN APPALACHIA Grant County, West Virginia | CASE STUDIES
179
Table 38: Grant County Health Outcomes – Actual vs. Predicted
Outcome Measure Actual Predicted
Percentage Difference (negative =
better)
Stroke mortality per 100,000 people, 2008–2014 28.45 47.73 -40.4%
Heart disease hospitalizations per 1,000 Medicare beneficiaries, 2012 36.00 60.34 -40.3%
Injury mortality per 100,000 people, 2008–2014 37.42 58.87 -36.4%
Cancer mortality per 100,000 people, 2008–2014 130.53 184.16 -29.1%
Years of potential life lost, 2011–2013 7,387 9,550 -22.6%
Opioid prescriptions as a percent of Part D claims, 2013 4.28 5.52 -22.5%
Percentage of excessive drinkers, 2014 10.5% 12.7% -17.3%
Poisoning mortality per 100,000 people, 2008–2014 14.65 17.67 -17.1%
Suicide mortality per 100,000 people, 2008–2014 13.95 16.38 -14.8%
COPD mortality per 100,000 people, 2008–2014 48.11 56.18 -14.4%
Average Medicare condition score, 2013 0.87 0.99 -12.0%
Percentage of Medicare beneficiaries w/ depression, 2012 15.20% 16.08% -5.5%
Percentage of obese adults (>30 BMI), 2012 36.90% 36.74% 0.4%
Mentally unhealthy days per month per person, 2014 4.60 4.56 0.8%
Infant mortality per 1,000 births, 2008–2014 7.76 7.63 1.6%
Heart disease mortality per 100,000 people, 2008–2014 226.11 216.66 4.4%
Physically unhealthy days per month per person, 2014 4.70 4.48 4.9%
Percentage of adults with diabetes, 2012 16.1% 14.6% 10.2%
Low birth weight births (<2,500g) per 1,000 births, 2007–2013 9.40 8.49 10.7%
Notes: Percentage Difference = 100 * [ (Actual / Predicted) – 1] Green = County value was better than predicted
For details on the outcome measures, see the data files accompanying the report Identifying Bright Spots in
Appalachian Health: Statistical Analysis.
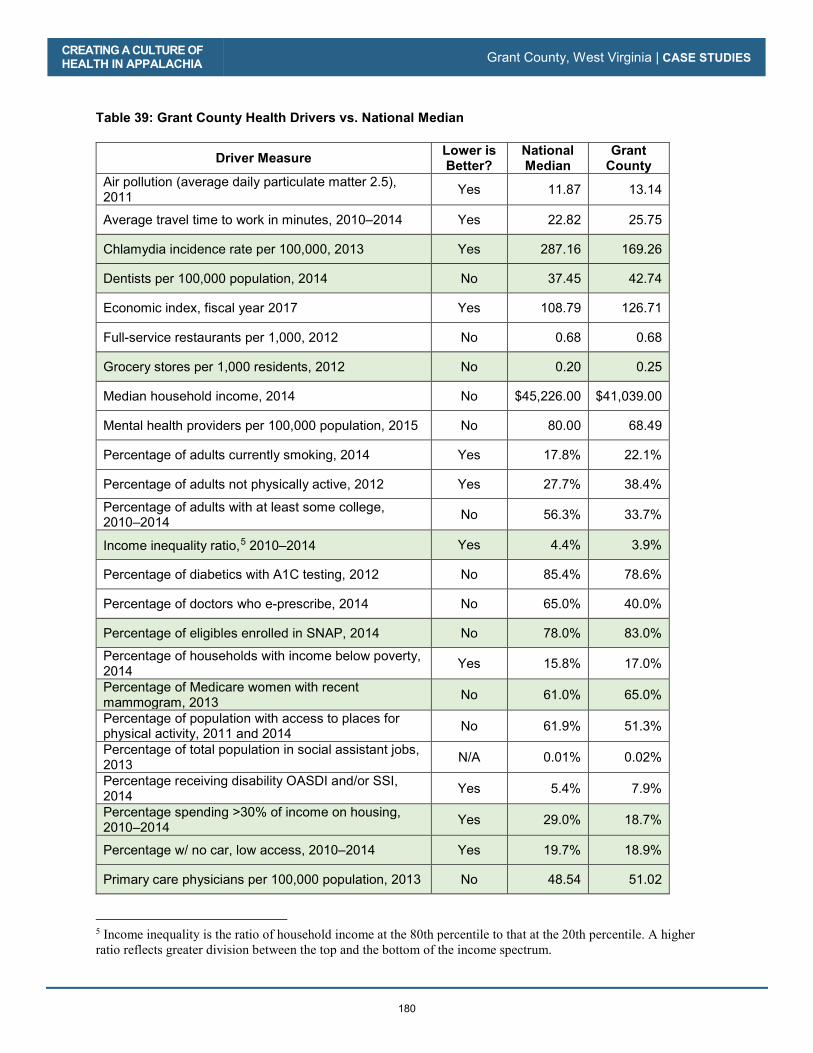
CREATING A CULTURE OF HEALTH IN APPALACHIA Grant County, West Virginia | CASE STUDIES
180
Table 39: Grant County Health Drivers vs. National Median
Driver Measure Lower is Better?
National Median
Grant County
Air pollution (average daily particulate matter 2.5), 2011 Yes 11.87 13.14
Average travel time to work in minutes, 2010–2014 Yes 22.82 25.75
Chlamydia incidence rate per 100,000, 2013 Yes 287.16 169.26
Dentists per 100,000 population, 2014 No 37.45 42.74
Economic index, fiscal year 2017 Yes 108.79 126.71
Full-service restaurants per 1,000, 2012 No 0.68 0.68
Grocery stores per 1,000 residents, 2012 No 0.20 0.25
Median household income, 2014 No $45,226.00 $41,039.00
Mental health providers per 100,000 population, 2015 No 80.00 68.49
Percentage of adults currently smoking, 2014 Yes 17.8% 22.1%
Percentage of adults not physically active, 2012 Yes 27.7% 38.4%
Percentage of adults with at least some college, 2010–2014 No 56.3% 33.7%
Income inequality ratio,5 2010–2014 Yes 4.4% 3.9%
Percentage of diabetics with A1C testing, 2012 No 85.4% 78.6%
Percentage of doctors who e-prescribe, 2014 No 65.0% 40.0%
Percentage of eligibles enrolled in SNAP, 2014 No 78.0% 83.0%
Percentage of households with income below poverty, 2014 Yes 15.8% 17.0%
Percentage of Medicare women with recent mammogram, 2013 No 61.0% 65.0%
Percentage of population with access to places for physical activity, 2011 and 2014 No 61.9% 51.3%
Percentage of total population in social assistant jobs, 2013 N/A 0.01% 0.02%
Percentage receiving disability OASDI and/or SSI, 2014 Yes 5.4% 7.9%
Percentage spending >30% of income on housing, 2010–2014 Yes 29.0% 18.7%
Percentage w/ no car, low access, 2010–2014 Yes 19.7% 18.9%
Primary care physicians per 100,000 population, 2013 No 48.54 51.02
5 Income inequality is the ratio of household income at the 80th percentile to that at the 20th percentile. A higher ratio reflects greater division between the top and the bottom of the income spectrum.

CREATING A CULTURE OF HEALTH IN APPALACHIA Grant County, West Virginia | CASE STUDIES
181
Driver Measure Lower is Better?
National Median
Grant County
Social associations per 10,000 population, 2013 No 12.68 15.31
Specialist physicians per 100,000 population, 2013 No 25.93 25.36
Students per teacher, 2013–2014 Yes 14.13 --
Teenage births per 1,000, 2007–2013 Yes 39.96 50.32
Uninsured rate for people under 65, 2013 Yes 17.24 19.09
Notes: Green = County value was better than national median
For details on the driver measures, see the data files accompanying the report Identifying Bright Spots in
Appalachian Health: Statistical Analysis.

CREATING A CULTURE OF HEALTH IN APPALACHIA Grant County, West Virginia | CASE STUDIES
182

183
Wirt County, West Virginia
County Overview
A Deeper Look at Wirt County: Community Strengths
Creating a Culture of Health in Wirt County
References
Appendix: Wirt County Data

184
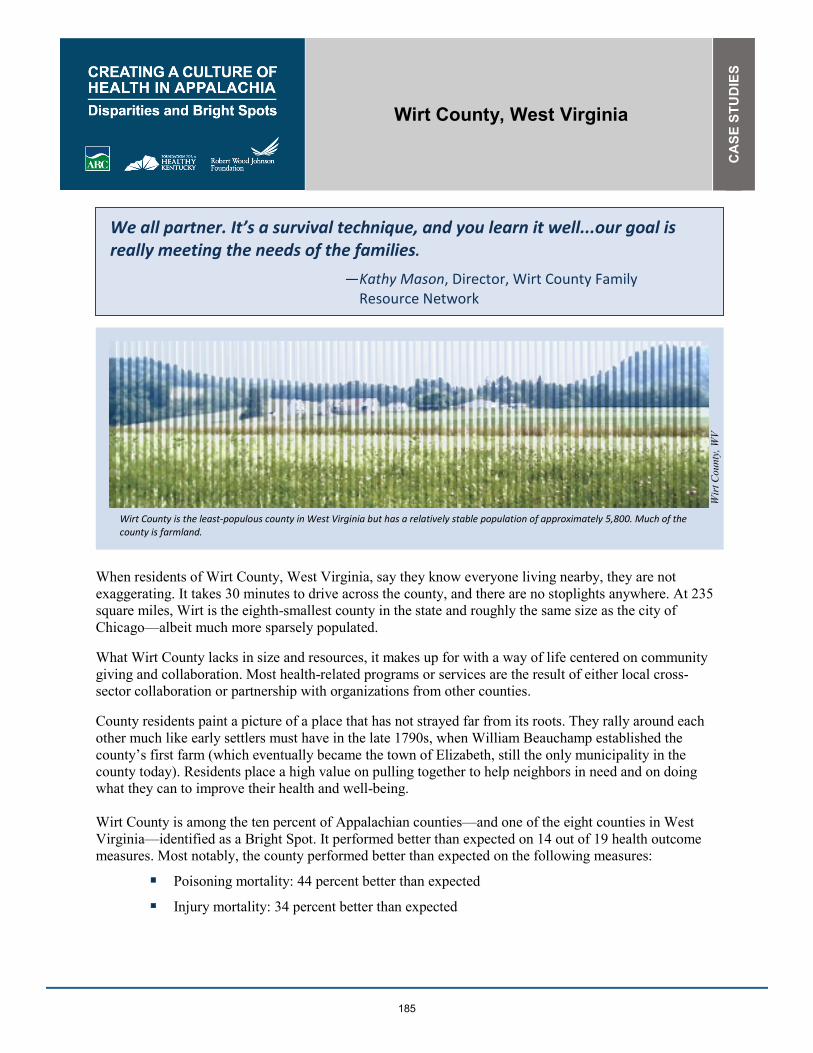
Wirt County, West Virginia
CA
SE
STU
DIE
S
185
We all partner. It’s a survival technique, and you learn it well...our goal is really meeting the needs of the families.
—Kathy Mason, Director, Wirt County Family Resource Network
When residents of Wirt County, West Virginia, say they know everyone living nearby, they are not exaggerating. It takes 30 minutes to drive across the county, and there are no stoplights anywhere. At 235 square miles, Wirt is the eighth-smallest county in the state and roughly the same size as the city of Chicago—albeit much more sparsely populated.
What Wirt County lacks in size and resources, it makes up for with a way of life centered on community giving and collaboration. Most health-related programs or services are the result of either local cross-sector collaboration or partnership with organizations from other counties.
County residents paint a picture of a place that has not strayed far from its roots. They rally around each other much like early settlers must have in the late 1790s, when William Beauchamp established the county’s first farm (which eventually became the town of Elizabeth, still the only municipality in the county today). Residents place a high value on pulling together to help neighbors in need and on doing what they can to improve their health and well-being. Wirt County is among the ten percent of Appalachian counties—and one of the eight counties in West Virginia—identified as a Bright Spot. It performed better than expected on 14 out of 19 health outcome measures. Most notably, the county performed better than expected on the following measures:
� Poisoning mortality: 44 percent better than expected
� Injury mortality: 34 percent better than expected
Wir
t Cou
nty,
WV
Wirt County is the least-populous county in West Virginia but has a relatively stable population of approximately 5,800. Much of the county is farmland.
CREATING A CULTURE OF HEALTH IN APPALACHIA Wirt County, West Virginia | CASE STUDIES
186
� Opioid prescriptions as a percentage of Medicare Part D claims: 26 percent better than expected
� Low-birth-weight births (<2,500 g): 23 percent better than expected
� Percentage of Medicare beneficiaries with depression: 17 percent better than expected
These better-than-expected results are likely influenced by local conditions and initiatives created to improve overall health and well-being. For instance, field research indicates residents’ shared sense of duty to take care of each other may play a role in the county’s health. Wirt County residents have also focused on expanding access to healthy foods, addressing mental and behavioral health needs, promoting healthy child development, making comprehensive health care available to more residents, and providing supportive services to those who need them most. Wirt County’s classification as a Bright Spot means that, on average, the county performed better than expected on a number of health outcome measures, given its resources—that is, the socioeconomics, demographics, behaviors, health care facilities, and other factors that influence health outcomes. It does not mean that all Wirt County residents enjoy excellent health. In fact, Wirt County lags behind the rest of the nation on many health outcome indicators. Like other communities with limited resources, Bright Spot counties face many challenges to attaining good health outcomes. But Wirt’s performance indicates that certain county conditions or programs may be helping generate better-than-expected outcomes—and that other resource-challenged Appalachian counties may benefit from adopting similar initiatives.1
1 See Table 42 in the data appendix at the end of this case study for a full list of actual health outcomes for Wirt County compared with predicted outcomes. For details on the outcome measures, see the data files accompanying the report Identifying Bright Spots in Appalachian Health: Statistical Analysis.
CREATING A CULTURE OF HEALTH IN APPALACHIA Wirt County, West Virginia | CASE STUDIES
187
COUNTY OVERVIEW Figure 14: Map - Bright Spot Community Wirt County, West Virginia
Wirt County represents a metropolitan county in North Central Appalachia. It is one of a cluster of Bright Spot counties in north-central West Virginia and one of the eight Bright Spot counties in the state as a whole. Home to a portion of the Hughes River Wildlife Management Area, part of Wirt County is covered in mature oak-hickory hardwood forests. The majority of the county is farmland, especially along the Little Kanawha and Hughes Rivers. It is part of the Parkersburg-Vienna metro area, with Elizabeth serving as the main hub of commercial and government activity. Wirt County has three commissioners who serve in part-time positions for 6-year terms. Wirt is the least-populous county in West Virginia, maintaining a relatively stable population of approximately 5,800 residents. It is racially homogeneous—98 percent of the population is white. Classified by ARC as economically at-risk in fiscal year 2017, the county had an unemployment rate of 9.7 percent in 2014, compared with the national unemployment rate of 6.2 percent. The estimated median household income was $38,600, compared with $56,135 nationally, and 20.3 percent of Wirt County

CREATING A CULTURE OF HEALTH IN APPALACHIA Wirt County, West Virginia | CASE STUDIES
188
residents lived in poverty in 2014, compared with 15.6 percent nationally. The major employment sectors in the county are education, health care, and social services.2 In Wirt County, concerns about opioid and other drug use run high, as they do throughout much of the state. West Virginia’s drug overdose mortality rate is the highest in the nation and more than double the national rate. Lack of public transportation is also a challenge, and often a barrier to accessing health care and other services. A DEEPER LOOK AT WIRT COUNTY: COMMUNITY STRENGTHS In Wirt County, as in other Bright Spot communities explored in this report, stakeholders have collaborated to offer a variety of services to address the physical, social, and economic health of residents. These services include sponsoring health fairs and conducting oral health screenings; providing needed transportation to health or social services, especially for the elderly; and offering health-related education to students. Wirt County is creating its own unique initiatives to improve health. Field work helped identify local practices in the county that appear to be contributing to overall health, document effective practices that could be replicated in other counties, and identify promising practices and strategies that should be explored further.3 Specifically, the research identified these characteristics and strategies in Wirt County:
� Connecting residents to social services to improve their health: Community leaders are leveraging limited resources to provide support for residents in a number of ways, including through health fairs and other family-oriented events. Local groups also use programs and services at the local Coplin Clinic and the Wirt County Senior Citizens Center to manage, identify, and coordinate follow-up on health-related issues.
� Initiatives targeted to specific challenges: Recognizing that resources are limited, Wirt County pursues regional assistance to address specific challenges related to substance use prevention, transportation needs, and combating hunger.
� Support for seniors: The Wirt County Senior Citizens Center serves as a support-services hub, providing a broad range of assistive services to the elderly. These include daily meal delivery, a daily group meal on site, an adult daycare program that provides both on-site and in-home assistance, and help with monitoring health issues.
� Targeted support for youth: It is clear that the county sees its role as vital to the growth and development of local youth. Stakeholders view the local school system as one of the county’s most valuable assets and willingly open it to student residents of adjacent counties. The Wirt County (West Virginia University) Extension Service works closely with the school system to extend services beyond the school day.
� Grants and public funds: The county knits together funds from state, federal, foundation, and local grants and from donations to maintain essential social support networks. For example, it uses grants awarded by the Parkersburg Area Community Foundation for substance abuse and
2 Table 40 in the Wirt County data appendix at the end of this case study provides a quantitative profile of county characteristics. 3 For a full explanation of the methodology, see Appendix B: Research Approach. For a list of key informants interviewed for this county, see Table 41 in the data appendix at the end of this case study.

CREATING A CULTURE OF HEALTH IN APPALACHIA Wirt County, West Virginia | CASE STUDIES
189
addiction prevention efforts, while the local schools leverage public funding to tackle the same concern.
Many of Wirt County’s efforts mirror those of other Bright Spot communities in three overarching categories: cross-sector collaboration, resource sharing, and an active faith community. Cross-Sector Collaboration Almost any health-focused initiative in Wirt County is a result of two or more groups collaborating to meet residents’ needs. Many of the collaborations offer health services, health education, and social services to address factors that can impact health. The Wirt County Health Department, which is a regional extension of the Mid-Ohio Valley (MOV) Health Department, works with local groups to organize family-friendly events that double as resource fairs, connecting residents with organizations that offer social support services. This includes an annual countywide baby shower at which area hospitals host booths to inform expectant mothers of their program offerings, and provide information on topics such as the risks of smoking during pregnancy. The health department also coordinates biannual county health fairs that are open to all county residents. They are staffed by AmeriCorps members and practitioners from Wirt County Family Care, which is referred to by locals as the Coplin Clinic (after its founder, Robert Coplin). These health fairs provide free bloodwork, dental screenings, and vital-signs checks. Residents who learn at the fair of a health issue affecting them are given a referral to either the Coplin Clinic or a provider in a neighboring county. This service includes referrals to one of 22 dentists in Parkersburg who serve six area counties and provide extractions or fill cavities for a minimal fee. As a result of each fair, approximately 300 to 400 people receive dental care that might otherwise be out of financial reach. A number of cross-sector and cross-county networks and coalitions have formed to address a range of factors that impact health. The Family Resource Network Alliance, formed almost two decades ago, includes representatives from more than 25 local churches, social service agencies, prevention groups, and businesses, who meet weekly to identify and address service gaps and needs in local communities in order to improve conditions for children and families. Established in 2016, the Wirt County Prevention Coalition brings together 12 local and regional organizations to coordinate health-promotion efforts. And 14 health and social services organizations, including local hospitals, the West Virginia Primary Care Association, and other agencies, collaborate as the MOV Rural Health Alliance. The MOV alliance focuses on improving community health through disease prevention, expanded access to health care services, and creation of an electronic health information system to ensure seamless care across providers. In Wirt County, the alliance has partnered with the Coplin Clinic to improve patient follow-up, and with the Minnie Hamilton Health Care System
Wirt health officials implemented a “Tobacco Prevention Barn” health-messaging campaign to promote smoking cessation to residents.
© J
on R
odge
rs

CREATING A CULTURE OF HEALTH IN APPALACHIA Wirt County, West Virginia | CASE STUDIES
190
to expand access to medical testing. It has also provided services to county residents on a sliding-fee schedule to reduce cost barriers to access. Resource Sharing Recognizing that resources are limited, Wirt County citizens pursue regional assistance to help provide health care and other health supports to residents. Many care agencies are affiliated with regional groups outside of the county. The majority of health care services are regionally oriented to maximize resources, efficiency, and access. The Mid-Ohio Valley (MOV) Health Department rotates its clinicians to Wirt County and the service region’s six other counties to meet need. In addition, if Wirt residents can’t meet a clinician in the county, they can travel to a neighboring county to obtain services. Pooling resources and being willing to work together as a region is a necessity to improve the health and well-being of the county. As part of the MOV Health Department, the Wirt County Health Department consistently devotes funds and resources to health-related initiatives. The department uses state and federal preventive-care funds to support chronic-disease and diabetes self-management. AmeriCorps members assist with follow-up for health department patients and health fair attendees who are referred for additional services. These services sometimes qualify for third-party reimbursement. The county’s only primary-care facility, the Coplin Clinic, rotates medical staff through multiple counties to maximize efficiency and resources. The clinic is part of Coplin Health Systems, which operates facilities in Wirt, Wood, and Jackson Counties in West Virginia and in Meigs County, Ohio. Community Resources, Inc. (CRI), is another regionally oriented agency. It focuses its services on addressing social factors that can impact health, such as housing and income. CRI provides education for first-time homebuyers, home weatherization programs, financial guidance for low-income families, and a child-care food program. The agency also sponsors FaithLink, a program that connects volunteers with people over age 60 who need help because of physical disabilities or chronic illness. Although based in Parkersburg (in Wood County), CRI serves Jackson, Roane, Ritchie, Calhoun, Wood, Pleasants, Gilmer, Doddridge, Tyler, Wetzel, and Wirt Counties. Each of the organizations described above subscribes to principles of regionalism. In practice, this takes the form of sharing ideas, information, and other resources across multiple counties. It also takes the form of coordinating health care services across multiple counties, so that if comprehensive services are not available in a particular location, the most important services are accessible somewhere nearby.
A walking trail around the county’s middle school was enhanced with fitness stations and playground equipment to give residents exercise and outdoor-recreation opportunities.
© J
on R
odge
rs

CREATING A CULTURE OF HEALTH IN APPALACHIA Wirt County, West Virginia | CASE STUDIES
191
Collaborations like these also take place outside of the health care system. A partnership between the health department and the local school system provides resources for several nutrition and physical education programs. Through a Communities Putting Prevention to Work grant, the health department was able to purchase bicycles for the middle school physical education program. Wirt County has a walking trail around the middle school that was made possible when the school and several community partners pooled resources to build it. Fitness stations and playground equipment were installed around it to give residents opportunities to engage in physical exercise and outdoor recreation. Transportation Metro areas close to Wirt County offer higher levels of health services than the county itself (such as in neighboring Parkersburg, which has the Camden-Clark Medical Center), but some residents can’t easily get to them. The Wirt County Senior Citizens Center strives to solve this challenge by providing transportation at little or no cost to anyone in the county over age 60 to get to medical appointments, pharmacies, grocery stores, and other locations. Funding from the Area Agency on Aging and other grants make this possible. Food Recognizing that nutrition is critical to health, the Wirt Ministerial Alliance—a group of local churches from throughout the county that work together on projects serving the community—sponsors a food pantry through its Hope Shop in the town of Elizabeth. Established 20 years ago, the Hope Shop provides nonperishable food items, produce, and frozen meat to approximately 60 families per month. Shop volunteers collect donations from the community and buy food from regional food banks to distribute to those in need. The Hope Shop also operates as a thrift store, reselling donated clothes and other items at affordable prices.
For seniors in the community, the Wirt County Senior Citizens Center provides a meal delivery service for those unable to leave their homes, and offers a daily lunch at the center itself. The group meal setting creates an opportunity for the center’s staff and volunteers to talk with seniors about health-related matters, including the importance of taking medications on time and making healthy food choices. It also allows the 26-member staff to provide near-daily monitoring of health issues or concerns.
For youth, the county extension service offers health-related and youth education programming. This includes healthy eating classes and a summer “feeding-and-reading” program for schools with a high percentage of students from low-income families. The latter program brings in AmeriCorps volunteers to work with students and help bolster their reading skills. Students who participate in the program receive two nourishing meals a day and a book each week. The Wirt County schools’ version of this program, called Energy Express, reaches out to children in lower-income parts of the county. To meet those students’ needs, the school system purchased and
The Wirt County Senior Citizens Center provides a daily group meal as well as a meal delivery service for seniors.
© J
on R
odge
rs

CREATING A CULTURE OF HEALTH IN APPALACHIA Wirt County, West Virginia | CASE STUDIES
192
renovated a used bus to include a kitchen and a reading room, and equipped it to serve as a wi-fi hotspot. Kids can eat, read, and access the Internet on the bus, which moves from place to place around the county. Active Faith Community Another element that contributes to the overall health and well-being of the residents in Wirt County is its active faith community. Reverend Lee Williams, pastor at Elizabeth United Methodist Church and the chair of the Wirt Ministerial Alliance, remembers a time years ago when the Hope Shop needed money to pay its bills. The community rallied to raise more than $1,000 in one day, demonstrating the organization’s value to residents. The Hope Shop is also a point of community pride as one of the longest-running local organizations. Today, community donations and grants help with the nonprofit’s finances. The Wirt County Missional Group is another faith-based organization that offers resources, focusing on Spring Valley, an area described by members as one of the poorest in the county. The group offers a food pantry twice a week, as well as help with minor home repairs, such as installing new flooring and water lines. These home repairs help decrease the health risks associated with unsafe or dilapidated living conditions. Local health organizations laud this work and try to collaborate with the group whenever possible. Donations made to the group also support other outreach efforts, such as providing Sunday meals for children after Bible study and hosting an annual “Kids’ Day at the Park” event. The group’s members see expenses as an investment in their faith and a way to connect with the community. CREATING A CULTURE OF HEALTH IN WIRT COUNTY It is evident that community members across Wirt County are working to make health a shared value. Residents lend a helping hand to others in times of need and are willing to dedicate time, money, and other resources to make ends meet and provide support to improve the health of all. Cross-sector collaboration, and a recognition of the need to collaborate across counties to make the best use of available resources, are critical to community health efforts. Out of necessity, Wirt County has learned to use regional resources to support health. County residents have demonstrated the high value they place on health in several ways. In 1996, the community stepped up to keep the Coplin Clinic from closing, and, along with the Coplin Clinic board, raised money to keep it operating. Today, the Coplin Clinic is thriving as part of Coplin Health Systems, which provides primary care, pharmacy, and wellness services in multiple locations. These services are available to all Wirt residents, regardless of income.
Wirt County performed better than expected in the area of poisoning mortality, a seven-year measure reflecting unintentional deaths caused primarily by medication and other drug overdoses. Wirt’s success may be attributable in part to West Virginia’s prescription-drug monitoring program. The county’s single local pharmacy, which makes special efforts to ensure appropriate use and disposal of drugs, may have played a critical role as well; and Wirt also provides a secure, monitored, in-ground bunker for the disposal of outdated and surplus drugs. The better-than-expected poisoning mortality rates may also be due in part to Wirt’s proximity to high-quality hospital services at the Camden-Clark Medical Center in Parkersburg.
n Rodgers© 2017
Efforts to support appropriate use and disposal of prescription drugs include a drug take-back program.
© J
on R
odge
rs

CREATING A CULTURE OF HEALTH IN APPALACHIA Wirt County, West Virginia | CASE STUDIES
193
Wirt County also scores better than expected on injury mortality, a measure that incorporates poisoning mortality as well as other unintentional injuries. It is possible that this better-than-expected outcome may be related to some degree to the decline of the lumber industry in Wirt County—a profession known to pose environmental hazards. While lumber was once a major industry in the county, only a few of the larger lumber operators are now in business. These larger operators tend to use newer and safer tree-harvesting technology. Research suggests that “feller-bunchers”—tree-cutting machines that have replaced handheld chainsaws—have lowered injury rates in the industry by 50 to 75 percent (Ray 2016). Overall, Wirt County is making strides toward creating a healthier community for residents of all ages.

CREATING A CULTURE OF HEALTH IN APPALACHIA Wirt County, West Virginia | CASE STUDIES
194
REFERENCES Agency for Healthcare Research and Quality. 2011. “Chapter 9: Access to Health Care, 2011 National Healthcare Quality Report.” Agency for Healthcare Research and Quality. https://www.ahrq.gov/research/findings/nhqrdr/nhqr11/chap9.html Allott, Daniel and Jordan Allott. 2017. “The Race to 2020: The people and places that will define a presidency.” Washington Examiner. Accessed May 15, 2018: http://2020.washingtonexaminer.com/
Appalachian Regional Commission. 2017. The Appalachian Region. September 1. https://www.arc.gov/appalachian_region/TheAppalachianRegion.asp County Health Rankings. 2018. “West Virginia: Wirt County.” Accessed May 15, 2018. http://www.countyhealthrankings.org/app/west-virginia/2014/rankings/wirt/county/outcomes/ overall/snapshot
Ellison, Ayla. 2016. Hospital CFO Report: 6 common characteristics of hospitals vulnerable to closure. February 09. Accessed July 27, 2017. http://www.beckershospitalreview.com/finance/6-common-characteristics-of-hospitals-vulnerable-to-closure.html Holmes, G. Mark, Nancy M. Lane, Thomas A. Arcury, Michael L. Schawlbe, Randy Randolph, John Frank, Sharita Thomas, et. al. 2018. Identifying Bright Spots in Appalachian Health: Statistical Analysis. Washington, D.C.: Appalachian Regional Commission. Loma Linda University School of Public Health. 2017. Findings for AHS-2. September 1. https://publichealth.llu.edu/adventist-health-studies/findings/findings-ahs-2 Marshall, Julie L., Logan Thomas, Nancy M. Lane, G. Mark Holmes, Thomas A. Arcury, Randy Randolph, Pam Silberman, et al. 2017. Health Disparities in Appalachia. Washington, D.C.: Appalachian Regional Commission. Office of Disease Prevention and Health Promotion. US DHHS. 2017. Healthy People / 2020 Topics & Objectives/ Access to Health Services. Accessed July 27, 2017. https://www.healthypeople.gov/2020/topics-objectives/topic/Access-to-Health-Services Ray, Logan. 2016. “An Assessment of Workplace Injury in Kentucky’s Logging Industry.” MPH Thesis, University of Kentucky.
Wirt County Health Services Association. 2015. About Coplin Health Systems. http://www.coplinhealthsystems.com/about-us.html WorkForce West Virginia. 2017. County Unemployment Rates. http://lmi.workforcewv.org/DataRelease/CountyRelease.html

CREATING A CULTURE OF HEALTH IN APPALACHIA Wirt County, West Virginia | CASE STUDIES
195
APPENDIX: WIRT COUNTY DATA Table 40: Wirt County Characteristics
Characteristic Wirt County United States
Population, 2010–2014 5,810 314,107,084 Percent population change, 2010–2015 2.90% 4.10% Median age, 2015 44.8 37.8 Percent of persons over age 65, 2015 18.50% 14.90% Median household income, 2014 $38,600 $56,135 Per capita income in past 12 months (in 2015 dollars), 2011–2015 $22,125 $28,930 Unemployment rate, 2014 9.7% 6.2% Percent persons in poverty, 2014 20.3% 15.6% Percent white alone, 2015 97.90% 77.10% Percent black alone, 2015 0.30% 13.30% Percent adults with at least some college, 2010–2014 47.61% 63.27% Distance to nearest large population center from county center Parkersburg – 21.6 miles N/A
ARC designations, fiscal year 2017 At-Risk North Central Appalachia N/A
Source: These data are compiled from the U.S. Bureau of Labor Statistics, Local Area Unemployment Statistics, 2014, and the U.S. Census Bureau American Community Survey Selected Social Characteristics, General Economic Characteristics, Demographic and Housing Characteristics, and Educational Attainment Tables for years 2010–2014 and 2011–2015.
CREATING A CULTURE OF HEALTH IN APPALACHIA Wirt County, West Virginia | CASE STUDIES
196
Table 41: Wirt County Key Informants
Name Location Title Organization Interview Date
Lorraine Roberts Elizabeth Director Wirt County Senior Citizens Center 4/10/2017
Kathy Mason Elizabeth Director Wirt County Family Resource Network 4/10/2014
Anna Reno Elizabeth Health Information Specialist
WV Breast and Cervical Cancer Screening Program 4/10/2017
Cathy Watkins Elizabeth Library Assistant Dora B Woodyard Memorial Library 4/10/2017
Amy Snodgrass Elizabeth Co-Director Child Care Food Program – Community Resources, Inc 4/10/2017
Diane Ludwig Elizabeth Director Little Kanawha Area Development Corporation 4/11/2017
Ruth Ann Full Elizabeth Physician Assistant Wirt County Family Care / Coplin Clinic 4/11/2017
Carrie Brainard Elizabeth Public Information Specialist
Mid-Ohio Valley Health Department 4/11/2017
Penny McVay Elizabeth Mayor Town of Elizabeth 4/12/2017
CREATING A CULTURE OF HEALTH IN APPALACHIA Wirt County, West Virginia | CASE STUDIES
197
Table 42: Wirt County Health Outcomes - Actual vs. Predicted
Outcome Measure Actual Predicted
Percentage Difference (negative =
better)
Poisoning mortality per 100,000 people, 2008–2014 16.36 29.14 -43.9%
Injury mortality per 100,000 people, 2008–2014 46.91 70.66 -33.6%
Opioid prescriptions as a percent of Part D claims, 2013 4.35 5.91 -26.4%
Low birth weight births (<2,500g) per 1,000 births, 2007–2013 6.33 8.20 -22.8%
Percentage of Medicare beneficiaries w/ depression, 2012 14.6% 17.5% -16.6%
Percentage of excessive drinkers, 2014 11.2% 13.2% -15.2%
COPD mortality per 100,000 people, 2008–2014 58.78 68.19 -13.8%
Suicide mortality per 100,000 people, 2008–2014 14.02 16.12 -13.0%
Heart disease hospitalizations per 1,000 Medicare beneficiaries, 2012 58.60 67.22 -12.8%
Average Medicare condition score, 2013 0.90 1.00 -9.7%
Years of potential life lost, 2011–2013 8,523 9,364 -9.0%
Infant mortality per 1,000 births, 2008–2014 6.99 7.25 -3.5%
Heart disease mortality per 100,000 people, 2008–2014 233.12 235.42 -1.0%
Stroke mortality per 100,000 people, 2008–2014 45.71 45.93 -0.5%
Physically unhealthy days per month per person, 2014 4.70 4.58 2.6%
Percentage of obese adults (>30 BMI), 2012 38.1% 36.6% 4.1%
Mentally unhealthy days per month per person, 2014 4.60 4.40 4.5%
Cancer mortality per 100,000 people, 2008–2014 225.20 208.98 7.8%
Percentage of adults with diabetes, 2012 15.0% 13.7% 9.2%
Notes: Percentage Difference = 100 * [ (Actual / Predicted) – 1] Green = County value was better than predicted
For details on the outcome measures, see the data files accompanying the report Identifying Bright Spots in Appalachian Health: Statistical Analysis.

CREATING A CULTURE OF HEALTH IN APPALACHIA Wirt County, West Virginia | CASE STUDIES
198
Table 43: Wirt County Health Drivers vs. National Median
Driver Measure Lower is Better?
National Median
Wirt County
Air pollution (average daily particulate matter 2.5), 2011 Yes 11.87 13.26
Average travel time to work in minutes, 2010–2014 Yes 22.82 30.48
Chlamydia incidence rate per 100,000, 2013 Yes 287.16 102.62
Dentists per 100,000 population, 2014 No 37.45 17.09
Economic index, fiscal year 2017 Yes 108.79 167.43
Full-service restaurants per 1,000, 2012 No 0.68 0.51
Grocery stores per 1,000 residents, 2012 No 0.20 0.34
Median household income, 2014 No $45,226.00 $38,600.00
Mental health providers per 100,000 population, 2015 No 80.00 17.09
Percentage of adults currently smoking, 2014 Yes 17.8% 22.7%
Percentage of adults not physically active, 2012 Yes 27.7% 33.7%
Percentage of adults with at least some college, 2010–2014 No 56.3% 47.6%
Income inequality ratio,4 2010–2014 Yes 4.4% 3.8%
Percentage of diabetics with A1C testing, 2012 No 85.4% 82.8%
Percentage of doctors who e-prescribe, 2014 No 65.0% 100.0%
Percentage of eligibles enrolled in SNAP, 2014 No 78.0% 83.0%
Percentage of households with income below poverty, 2014 Yes 15.8% 20.3%
Percentage of Medicare women with recent mammogram, 2013 No 61.0% 55.0%
Percentage of population with access to places for physical activity, 2011 and 2014 No 61.9% 33.7%
Percentage of total population in social assistant jobs, 2013 N/A 0.01% --
Percentage receiving disability OASDI and/or SSI, 2014 Yes 5.4% 12.5%
Percentage spending >30% of income on housing, 2010–2014 Yes 29.0% 18.2%
Percentage w/ no car, low access, 2010–2014 Yes 19.7% 1.2%
Primary care physicians per 100,000 population, 2013 No 48.54 33.90
4 Income inequality is the ratio of household income at the 80th percentile to that at the 20th percentile. A higher ratio reflects greater division between the top and the bottom of the income spectrum.

CREATING A CULTURE OF HEALTH IN APPALACHIA Wirt County, West Virginia | CASE STUDIES
199
Driver Measure Lower is Better?
National Median
Wirt County
Social associations per 10,000 population, 2013 No 12.68 10.17
Specialist physicians per 100,000 population, 2013 No 25.93 N/A
Students per teacher, 2013–2014 Yes 14.13 13.45
Teenage births per 1,000, 2007–2013 Yes 39.96 42.15
Uninsured rate for people under 65, 2013 Yes 17.24 19.02
Notes: Green = County value was better than national median
For details on the driver measures, see the data files accompanying the report Identifying Bright Spots in Appalachian Health: Statistical Analysis.

CREATING A CULTURE OF HEALTH IN APPALACHIA Wirt County, West Virginia | CASE STUDIES
200

201
Appendices A. Glossary of Terms
B. Research Approach
C. Research Support Materials
D. Radio Spots

202

CREATING A CULTURE OF HEALTH IN APPALACHIA A. Glossary of Terms | APPENDICES
203
A. GLOSSARY OF TERMS
Appalachian Region The Appalachian Region is defined in the federal legislation that provided funding to establish the ARC. The Region comprises 205,000 square miles within 420 counties in 13 states. It stretches more than 1,000 miles from Mississippi to New York. While more rural than the nation as a whole, the Region is diverse in population density, levels of economic distress, and infrastructure.
Appalachian Regional Commission
ARC is an economic development agency of the federal government and 13 state governments focusing on 420 counties across the Appalachian Region. ARC’s mission is to innovate, partner, and invest to build community capacity and strengthen economic growth in Appalachia to help the Region achieve socioeconomic parity with the nation.
ARC Economic Index
ARC uses an index-based classification system to compare each county in the nation with national averages on three economic indicators—three-year average unemployment rates, per capita market income, and poverty rates. Based on that comparison, each Appalachian county is classified within one of five economic status designations—distressed, at-risk, transitional, competitive, or attainment
Bright Spot For the purposes of this research, a “Bright Spot” is a county identified through statistical methods that demonstrates better than expected health outcomes. Counties are ranked by overall magnitude of “brightness.” Bright Spot counties include only those ranking in the top decile in overall “brightness.”
Culture of Health This is a Robert Wood Johnson Foundation initiative aimed at strengthening the complex social factors that enable persons to live the healthiest life possible.
Metro Counties Counties that fall within Metropolitan Statistical Areas (MSA), as defined by the US Census Bureau and the federal Office of Management and Budget (OMB) are considered “Metro” for the purposes of this report. The delineations used in this report are based on the most recent delineations as of the creation of this report, which are July 2015 OMB designations.
Non-metro Counties “Non-metro” counties are counties that are not included in an MSA according to the 2015 OMB delineations.
Residual This statistical term describes the difference between an expected outcome value and the actual value. It is expressed in terms of standard deviations, and provides a common metric that the Bright Spots model can average across different outcome measures.
Subregion ARC defines five geographical Appalachian subregions. Each shares similar characteristics, such as topography, demographics, and economics. The five subregions are Northern, North Central, Central, South Central, and Southern. These may be referred to as Northern Appalachia, North Central Appalachia, etc. Subregions consist of contiguous counties.

CREATING A CULTURE OF HEALTH IN APPALACHIA A. Glossary of Terms | APPENDICES
204
CREATING A CULTURE OF HEALTH IN APPALACHIA B. Research Approach | APPENDICES
205
B. RESEARCH APPROACH
PROCESS As part of the Creating a Culture of Health in Appalachia: Disparities and Bright Spots project, the research team identified 42 counties in which outcomes for 19 health outcome measures exceeded expectations. In cooperation with staff at the Appalachian Regional Commission (ARC), the team selected ten of these Bright Spot counties for case studies, divided evenly between metropolitan and nonmetropolitan counties. In the statistical analysis, each case study county ranked in the top eleven of either the metropolitan or nonmetropolitan category. The group included two from each of the Appalachian subregions and represented three of ARC’s five economic status classifications and eight of the 13 Appalachian states. Case studies occurred in two phases, four in the fall of 2016 and six in the spring of 2017. In each phase, a team of two North Carolina-based health researchers and a journalist with local experience spent three days in each county conducting face-to-face interviews and recording field observations. How the two phases differed, based on lessons learned from the first four, is included in the section Evolution of the Field Protocol below. The protocol incorporated positive deviance and culture of health models. It relied on the premise that solutions to a community’s problems often exist within that community with certain members possessing wisdom that can be extracted and generalized. Prior to the site visit, the research team compiled background information on the county, worked with ARC, and networked with others to identify interviewees who could describe local health-related practices. Investigators used a rapid ethnographic approach (explained in detail below), interviewing 8 to 17 leaders associated with local government, social services, education, emergency services, university extension, ministry, and health care delivery. Interviews were transcribed, coded, and analyzed for themes (see the sections labeled Findings and Creating a Culture of Health in each of the ten individual reports in the Case Studies chapter). The journalists brought local perspective to the field research and contributed to the case study development. The case study reports drew on information from pre-visit background research, face-to-face interviews in the field, follow-up inquiries by phone and e-mail, online archival sources, and the journalists’ stories. Field investigators sent copies of interview transcripts and drafts of the findings to key informants to confirm accuracy. The sections below describe in detail the field study research protocol, from training to data collection to analysis.
BACKGROUND ON RAPID ETHNOGRAPHIC STUDY METHOD Rapid ethnographic assessment, or rapid ethnography, is a social research method used when it is necessary to learn as much as possible about the culture of a place in a short period of time (Beebe, 2005). In contrast to traditional cultural ethnography, which involves long-term immersion in the everyday life of a group or community, rapid ethnography happens in months, weeks, or days, and relies largely on key informants. The contract requirement to conduct case studies in ten Appalachian counties within a 12-month period made the use of rapid ethnographic techniques both appropriate and essential. Rapid ethnographic assessment typically involves collecting data through semi-structured interviews, focus groups, direct observation, and examination of archival sources (Harris, Jerome, & Fawcett, 1997; Beebe, 2005). Usually, multidisciplinary teams complete rapid ethnographic assessment, and the teams often include at least one member indigenous to the studied culture. Other defining features of rapid ethnography are the purposeful selection of key informants (identified as those thought to possess special
CREATING A CULTURE OF HEALTH IN APPALACHIA B. Research Approach | APPENDICES
206
knowledge of a setting), triangulation or multiple methods of data collection, a focus on a specific issue or problem, use of semi-structured interviews rather than rigid survey-style questioning, and iteration, which means adjusting data collection and interpretation in response to what is learned as the inquiry proceeds (Utarini, Winkvist, & Pelto, 2001; Taplin, Scheld, & Low, 2002). The Bright Spots case study protocol incorporated each of these standard features of rapid ethnographic assessment. The case study research teams were multidisciplinary, including members with background in anthropology or sociology, public policy analysis, and health services research. Journalists with roots in the case study communities were the indigenous members of the teams. The primary form of data collection was semi-structured one-on-one interviews with carefully selected key informants; though in some cases interviews, it included multiple informants and became much like focus groups. An interview guide (see Appendix C) could be used flexibly to suit the interviewee, and the setting provided the structure; most interviews occurred in the county. Data collection occurred by triangulation; team members drew on archival sources to develop background sketches of each county prior to site visits. In addition to interviews, site visits involved direct observation, recording field notes based on observation, and photographic documentation. Post visit follow-up often involved a return to archival sources to fill in details. In some cases, follow-up required phone and/or e-mail communication with previously interviewed key informants or other local contacts. The case study process was iterative in two senses. First, after collecting data for the fall of 2016 case studies—Hale, Noxubee, McCreary, and Wayne Counties—we made adjustments based on lessons learned in these cases. These adjustments, to summarize briefly, included broadening the size of the informant base, using a more open-ended (semi-structured) interview guide, coordinating more closely with local journalists, and using a more team-based procedure to develop the case study analysis. By making these adjustments, in conjunction with additional training for the field team, it was possible to obtain richer and deeper data about informants’ health-related beliefs and practices. The six spring of 2017 case studies—Tioga, Madison, Wirt, Sequatchie, Grant, and Potter Counties—proceeded iteratively; we made adjustments to the research process based on what was learned as the team moved from one site to the next. For example, we added or modified probing questions prior to the Madison site visit to better explore matters that emerged as important in Tioga (e.g., regional collaboration, employer support for health, commuting patterns). This kind of adjustment occurred as the second six case studies proceeded and the team reviewed each field experience. Another adjustment involved closer coordination with journalists before, during, and after each site visit to derive maximum value from their knowledge of the local people and traditions. Whereas traditional ethnography seeks to develop a deep and comprehensive understanding of the culture and practices of a people, rapid ethnography seeks to learn about a narrower range of beliefs and practices. Rapid ethnography is, thus, best suited for applied research that focuses on specific issues or problems (Harris, Jerome, & Fawcett, 1997; Beebe, 2005). Accordingly, the Bright Spot case studies focused on the beliefs and practices of people who lead organizations that do health and social service-related work of various kinds. Rapid assessment would not be suited to trying to document and understand the culture of a county. However, under limitations of time and resources, the techniques of rapid ethnography as used by the Bright Spots field teams can generate useful knowledge about how local leaders perceive and respond to the health challenges facing their counties.

CREATING A CULTURE OF HEALTH IN APPALACHIA B. Research Approach | APPENDICES
207
FIELD WORK
Preparation Field team member training began in the summer of 2016 with background readings on rapid ethnography, interviewing techniques appropriate to the method, interpretation of qualitative data, and identification of key informant candidates. Background readings also included articles on the Appalachian Region, health challenges faced by the Region, and the RWJF Culture of Health Model. During several training sessions prior to undertaking the fall of 2016 case studies, we elaborated upon and discussed these readings. Tom Arcury, Ph.D., cultural anthropologist at Wake Forest University School of Medicine, led the initial training sessions for field team members employed by PDA Inc. and by The Sheps Center for Health Services Research at University of North Carolina Chapel Hill (Sheps). A new phase of team training began in January 2017, prior to undertaking the second set of six case studies. Michael Schwalbe, Ph.D., a qualitative sociologist at North Carolina State University, led this phase. Field team members at PDA and Sheps participated in sessions devoted to interviewing skills, coding transcripts, writing field notes, identifying patterns and themes in qualitative data, and analytic memo writing. Trainings also sought to improve communication between team members and journalists and between team members and Schwalbe while the team was in the field. Following the field visits, teams held debriefing sessions to discuss problems that arose in the interviews and to consider how to improve future data collection. These post-visit troubleshooting sessions constituted a further training component. Prior to each site visit, the field team read and discussed published background materials about the county with the intent to gain a general understanding of its geography and history and to discover probes that might be used during the interviews. Local journalists who worked with the field team joined by conference calls and added both perspective and factual background. Team members summarized pre-visit information in shared memos. Training also included discussion of how prior knowledge about county could provide essential perspective for interviews, because what had occurred over time might have contributed to better-than-expected health outcomes. Perhaps the most important part of pre-visit preparation was identifying key informants and scheduling interviews. This process began at project initiation and intensified 3 to 4 weeks before the team left for the field. Typically, a list of prospective informants was complete 2 to 3 weeks ahead of making initial contact and requesting interviews. Reaching people and putting together a 3-day interview schedule often took a week or more. All informants received an e-mail confirming the time and place of the interview before the field team left for the site.
Site Visits Site visits occurred over a period of five days (the individual case study reports provide dates of each site visit). Day 1 involved travel from the Raleigh/Chapel Hill/Triad area of North Carolina to the field site. Interviews were conducted during days 2 and 3 and the first half of day 4. The second half of day 4 and all of day 5 involved return travel. When conducting both the fall of 2016 and the spring of 2017 case studies, field team members met with the local journalists by phone ahead of the visit and soon after arrival in the county. These meetings helped team members get oriented to the county and provided opportunities to ask questions about local history and current events. Typically, the journalists began their work prior to arrival of the field team. This made it possible for journalists to share what they had learned

CREATING A CULTURE OF HEALTH IN APPALACHIA B. Research Approach | APPENDICES
208
about local health practices and culture and to suggest additional lines of inquiry for the field team to pursue. As weather and interview schedules permitted, team members toured the counties. This made it possible to observe the condition of physical infrastructure (e.g., roads, public buildings) as well as to visually assess the level and distribution of material wealth. Here, again, local journalists were helpful guides to the physical and cultural geographies. The opportunity to tour the counties also gave field team members insight into how roads and geography affected commuting patterns and residents’ ability to access health services.
Key Informants Selection of key informants began by building lists of local leaders in public health, health care, education, local government, law enforcement, university extension, social services, civic associations, business development, and the ministry. Websites of organizations and public agencies located in or serving the Bright Spot counties were primary sources. ARC staff provided contact information for some key informants. Local journalists and others provided additional suggestions. The case study team sought to arrange interviews with eight to ten key informants prior to a field visit. The lists of prospective interviewees included dozens of names, making selection necessary. In some cases, selection was largely a result of who was available for interviews. In most cases, however, the field team was able to identify informants who seemed likely, based on position and tenure, to be most knowledgeable. Consultation with local journalists aided the process. Journalists often knew who was native to the county, who was retired, or who had moved away. By drawing on this local knowledge, the field team was able to select key informants, representative of multiple sectors, who could help us understand health-related practices and social patterns in the county. E-mail and/or phone requests for prospective interviews, included background on the Appalachian Bright Spots project. Most people expressed interest in the project and agreed. Some asked for more information before accepting the interview request. A few referred the team to more appropriate interviewees, and a few declined (usually on grounds of unavailability during the scheduled site visit). People who agreed to interviews or requested more information received a briefing packet (Appendix C). This packet described the Bright Spots project in more detail, offered health data about the county, explained how the county was classified as a Bright Spot, and further explained the purpose of the field studies. Most prearranged informant interviews took place as planned. In a few cases, last-minute substitutions occurred—usually another person in the same office or organization—when emergencies arose and key informants were unavailable. Occasionally, more informants joined the interviews, providing a wider range of perspectives and knowledge. In still other cases, the field team met new informants and set up interviews after arriving in the county. This usually happened as a result of referrals made by previously contacted key informants.
CREATING A CULTURE OF HEALTH IN APPALACHIA B. Research Approach | APPENDICES
209
Post Visit Follow-Up Upon return from the field and after an initial review of interview summaries, field notes, and preliminary memos, it often became apparent that understanding health-related practices in the county required more information. The team compiled follow-up questions and assigned members to find answers by phoning or e-mailing informants, phoning or e-mailing the local journalist, and conducting online searches. In some cases, finding answers required phoning or e-mailing other persons in the county, for example, Chamber of Commerce officials or human resources personnel at major employers. Typically, the team completed follow-up within a week after the site visit, although gaps in information sometimes did not appear until later in the process of analysis. Occasionally, the research team encountered difficulty finding authoritative sources. As a result, follow-up sometimes stretched into weeks after return from the field. All follow-ups included sending thank-you notes and transcripts to key informants. Key informants received a draft version of the case study report for their county (watermarked and identified as not-for-circulation) with an invitation to make corrections and provide comments. We used the feedback to correct errors and to inform interpretations of the data. About ten percent of the informants responded.
Data Collection and Analysis The primary method of data collection was face-to-face, semi-structured interviewing. In the context of rapid ethnographic assessment, “semi-structured” means that the interviewer uses a set of questions to guide a conversation rather than proceeding through a list of questions in survey fashion. Team members used the interview guide in Appendix C flexibly to suit the interviewee’s area of special knowledge. For example, the interviewer might not ask an emergency services coordinator a question about school wellness programs. Rather than collecting answers to the same questions from every informant, rapid ethnography seeks to get all questions answered by at least one informant before the team leaves the field. Two members of the field team conducted each interview. One team member posed questions and guided the conversation while the other took notes and occasionally probed for more detail as needed. At the outset of the interview, informants signed a consent form and agreed to have the interview recorded, and to receive a transcript. An invitation to make corrections before quoted material was used in final reports and assured interviewees that context of their comments was appropriate. At the end of each day in the field, team members wrote summary notes and commentary on the interviews. These notes and commentaries helped to start the analysis process before the team returned from the field. Local journalists coordinated with field team members—communicating before, during, and after the site visit—but otherwise worked independently. After the first four cases, journalists generally did not interview the same informants as the field team. Pre-visit coordination aimed to develop complementary, rather than overlapping, lists of prospective interviewees. Although journalists often interviewed local leaders in the same sectors (government, health care, education, and so on) as the field team researchers, they also branched out, interviewing not just leaders, but also local residents. On several occasions, journalists made follow-up inquiries upon the request of the field team. In addition to interviews and observation, data collection also relied on archival (mostly online) sources, though local communities provided some printed materials (e.g., pamphlets, brochures, newspapers). Post visit follow-up also drew on archival sources to answer questions not answered by key informants. For example, online searches for pertinent documents provided answers to questions about health benefits provided by local employers, privately operated health and fitness facilities, health-related teachings of faith-based groups, and passage dates of local ordinances.
CREATING A CULTURE OF HEALTH IN APPALACHIA B. Research Approach | APPENDICES
210
Verbatim transcripts of interviews with key informants constituted the main body of analytic data. Line-by-line coding of the transcripts sought to identify significant terms, phrases, references to people and places, and accounts of practices as well as indications of beliefs and values. This coding was “open”—not based on a pre-formulated theoretical scheme, but probing to discern what was important from the interviewee’s standpoint. Open coding is appropriate when the goal is not to test theories, but rather to uncover patterns that might be relevant for policymaking (Charmaz, 2014; Saldana, 2015). The Institutional Review Board at the University of North Carolina Chapel Hill reviewed and approved these procedures prior to the start of data collection. In addition to the field team, the entire project research team read, edited, and reviewed the final case reports. To determine promising strategies, we discussed cross-county themes and revisited the raw data to investigate the extent to which themes, in fact, existed and/or repeated across communities.
Journalist Role In keeping with the principles of rapid ethnographic assessment, the Bright Spots case study teams included local journalists who could bring an “indigenous” perspective to the field research. As noted earlier, expectations of the journalists included providing insight into local culture and history, helping identify key informants, providing photographs for use in published reports, and contributing to the case study reports. Journalists were recruited through contacts with local media outlets and national professional associations (e.g., Help a Reporter Out, Society of Environmental Journalists, and American Society of Journalists and Authors). Lead journalist Janine Latus recruited some journalists through her own professional network. Janine Latus, a Board Member of the American Society of Journalists and Authors, identified and selected journalists based on their personal connections to the Bright Spot case county or region, reporting experience in or near the Bright Spot county, publishing history, demonstrated familiarity with health care and related issues, ability to provide photographic documentation, and availability. The weight given to certain criteria shifted somewhat from the fall of 2016 (the first four case studies) to the spring of 2017 (the six final case studies). Selection of journalists for the spring of 2017 case studies put more emphasis on direct experience in the Bright Spot county or an adjacent county and the journalist’s ability to help identify key informants. Journalists who participated in the first four case studies participated in team training events with the public health researchers and accompanied the public health researchers during most interviews with key informants, occasionally helping to probe, and conducting a few independent interviews. They also took photographs at the time of the visit. Here, again, the spring 2017 phase involved several changes to the journalist’s role. Training was streamlined, consisting of an online session devoted to reviewing the case study protocol and the principles of team ethnography; journalists consulted more closely with the field team in identifying key informants, journalists provided more pre-visit background on the county, and journalists met with team members in the field but did not accompany team members during interviews with key informants. Photographs taken by these journalists were not limited to the research team visit days and sent to PDA later. With the exception of the joint interviews, journalists worked independently. Most began their work before the public health researchers arrived in the field. Journalists consulted with the public health researchers to create complementary lists of interviewees. Typically, the health researchers focused on key informants who held leadership positions in government, health care, education, and social services. Although journalists interviewed people in similar positions, they also sought a wider range of citizen
CREATING A CULTURE OF HEALTH IN APPALACHIA B. Research Approach | APPENDICES
211
voices, often interviewing people whose work (e.g., operating a farmer’s market) had some relation to the community’s health status. Journalists also occasionally assisted with post visit follow-ups by providing additional information or fact checking. This enabled the public health researchers to draw on their work as supplementary sources of interview and observational data.
Evolution of the Field Protocol Iteration is a standard part of rapid ethnographic assessment. Researchers try to use lessons learned at early stages to inform and modify subsequent data collection and analysis. After the first four case studies, modifications to the interview guide included more open-ended questions and reliance on strategic probing; and, field team training focused on interviewing, coding, and analysis skills. Better procedures for communicating with the field director were established, field team members coordinated more closely with local journalists to identify key informants, and journalists were more stringently selected based on close familiarity with the Bright Spot county. More in-process troubleshooting to improve data collection and team-based analysis following site visits also characterized the latter six case studies. Several other modifications to the field protocol occurred over the course of the project. One of these changes was to drop the pre-visit radio component. The original field study protocol called for creating 30- and 60-second radio spots that would air two to four weeks prior to each site visit and use a contest format to solicit candidate examples of programs that contribute to better health in the area. Developed by a media consultant in cooperation with local radio personnel, these spots intended to encourage interviewee participation in the project, identify health-promoting groups and organizations, and raise awareness about the culture of health concept. These radio spots were developed and aired before the field team visited Hale, Noxubee, McCreary, Wayne, Tioga, and Madison Counties (Appendix D). In each case, members of the field team asked interviewees if they had heard the radio spots; almost without exception, key informants had not, even when stations were local. It thus appeared that the radio spots were not reaching the intended audience or making a direct contribution to the field research process. In light of this experience, although community development staff at the radio stations helped to identify local service programs, following consultation with ARC, the last four case studies (Potter, Grant, Wirt, and Sequatchie Counties) had no radio component. Journalists and the research team absorbed the identification task. A parallel effort to promote the Bright Spots project via social media encountered problems of scale and broadband coverage in Appalachia. Prior to undertaking the first four case studies, PDA and the media consultant created a Facebook page, a Twitter account, and an Instagram account. These efforts were intended to call attention to the project, help recruit interviewees, identify groups and organizations that might be studied, and raise awareness about the culture of health concept. Again, we found little uptake on the part of Bright Spots county residents, perhaps in part because of limited broadband access in many areas of the counties under study. In brief, these social media efforts did not develop enough of a following to make a significant contribution to the field research process. One other noteworthy change concerned scheduling. The original protocol allowed only one or two weeks between field visits. Such tight scheduling proved extremely difficult, as it did not allow enough time for transcribing interviews, coding, making follow-up inquiries, developing an analysis, report writing, and troubleshooting before the next field visit. Thus, the revised spring 2017 schedule allowed 4 weeks between site visits. A related change was the creation of a second field team so that one team could devote its time to post visit data handling, follow-up, and analysis, while a second team was in the field or preparing for the field. The creation of two field teams gave each team the time it needed to do thorough work while allowing the project as a whole to stay on schedule. It also expanded points of view on the field team.
CREATING A CULTURE OF HEALTH IN APPALACHIA B. Research Approach | APPENDICES
212
STUDY LIMITATIONS Using the methods of rapid ethnography, we were able to learn a great deal within a few days about how county leaders perceived and responded to local health problems. Yet, it is important to put our findings into perspective by acknowledging the limits of this approach. One limitation, as noted earlier, is that rapid ethnography trades depth of understanding for time. The accelerated pace of our research process thus means that nuances and complexities that are known to insiders may not be reflected in our analyses. We attempted to deal with this limitation by providing key informants with opportunities to read draft reports, make corrections, and offer comments. Rapid ethnography also makes it difficult to explore the full range of perspectives in a community. Reliance on key informants, especially leaders in mainstream institutions, can lead to the exclusion of minority or marginalized voices. It can also produce a bias that downplays or obscures conflict, as key informants may be unwilling to air dirty laundry to outsiders. This is another reason that the depiction of a community produced by rapid ethnography can lack complexity or fail to reveal the messiness that is characteristic of social life. We dealt with this limitation by seeking representative informants in diverse organizations and by asking not only about cooperation, but also about obstacles to cooperation. Bias appears in the results of rapid ethnography through limitations of memory and the tendency of key informants to report current rather than past practices. For example, when asked about collaboration, key informants in Bright Spot counties spoke most enthusiastically and extensively about recent or current projects. But, often, these projects and practices postdated the 2008 to 2014 health outcomes data used to identify the county as a Bright Spot, so they could not have affected those outcomes. Again, this form of recall bias is not peculiar to the Bright Spots case studies. We sought to deal with it by probing (during interviews) and by following up to find out about the start dates and duration of various projects and practices. When a project or practice was too recent to have affected the health outcomes data, we noted this in our report. Perhaps most important to acknowledge is that rapid ethnographic assessment cannot support strong inferences about what is causing health outcomes to be better than expected in Bright Spot counties. At best, this method allows us to identify health-related practices that are associated with better-than-expected outcomes. We can also draw on theories from social science disciplines and findings from prior research to make plausible inferences about how certain practices might lead to better-than-expected health outcomes. So, while we can suggest how the practices we observed might be related to health outcomes, causal attribution would require broader, deeper, longer-term, and more systematic inquiry. Stronger causal attribution would also require matched comparisons or “controls.” Our case studies focused only on Bright Spot counties. This allows us to say that certain local practices are coincident with better-than-expected outcomes. However, without broader comparisons, we do not know if the practices we observed in Bright Spot counties are unique to those counties. We do not know, in other words, if what goes on in Bright Spot counties is different from what goes on in counties with less-stellar health outcomes. If future research finds that the practices we have documented are unique to Bright Spot counties, this would provide a stronger basis for asserting that these practices make a difference. Rapid ethnographic assessment has limitations. It is not a method suited for deep and comprehensive examination of a people, place, or culture. It is not suited for teasing out nuances and complexities or discerning the full range of beliefs, values, and perspectives that are present in a community, nor can it support strong claims about causality. Serving these purposes would require long-term, immersive, comparative ethnography. Rapid ethnography can, however, produce valid knowledge within a limited

CREATING A CULTURE OF HEALTH IN APPALACHIA B. Research Approach | APPENDICES
213
scope. In the case of Bright Spot counties, this means knowledge about health-related practices associated with better-than-expected outcomes that others might beneficially replicate.
CREATING A CULTURE OF HEALTH IN APPALACHIA B. Research Approach | APPENDICES
214
REFERENCES Beebe, J. (2005). Rapid Assessment Process. Retrieved from http://csoc.missouri.edu/wp-
content/uploads/2013/07/2000_rapid_assessment_process.pdf Charmaz, K. (2014). Constructing Grounded Theory. SAGE Publications . Harris, K., Jerome, N., & Fawcett, S. (1997). Rapid Assessment Procedures: A Review and Critique.
Human Organization, 56(3), 375-378. doi:https://doi.org/10.17730/humo.56.3.w525025611458003
Saldana, J. (2015). The Coding Manual for Qualitative Research . SAGE Publicationa. Taplin, D. H., Scheld, S., & Low, S. M. (2002). Rapid Ethnographic Assessment in Urban Parks: A Case
Study of Independence National Historical Park. Human Organization, 61(1), 80-93. Retrieved from http://www.jstor.org/stable/44126969
Utarini, A., Winkvist, A., & Pelto, G. H. (2001). Appraising Studies in Health Using Rapid Assessment
Procedures (RAP): Eleven Critical Criteria. Human Organization, 60(4), 390-400. doi:https://doi.org/10.17730/humo.60.4.3xu3p85amf13avtp

CREATING A CULTURE OF HEALTH IN APPALACHIA C. Research Support Materials | APPENDICES
215
C. RESEARCH SUPPORT MATERIALS Briefing Packets for Key Informants Prospective interviewees were contacted by e-mail and/or phone, told about the Bright Spots project, and invited to be interviewed by the field team. Those that agreed to interviews or requested more information received a briefing packet. It was also shared with the local journalist working with the field team in each county. This packet described the Bright Spots project in more detail, offered health data about the county, explained how the county was identified as a Bright Spot, and further explained the purpose of the field studies. As the project evolved, so did the information provided in the briefing packet. This appendix includes two examples of the briefing packets:
x Hale County, Alabama and Noxubee County, Mississippi – combined packet; and,
x Potter County, Pennsylvania. Key Informant Interviews The primary method of data collection was in-person, semi-structured interviews. In the context of rapid ethnographic assessment, “semi-structured” means that the interviewer uses a set of questions to guide a conversation, rather than proceeding through a list of questions in survey fashion. Team members used the interview guide flexibly to suit the interviewee’s area of special knowledge (e.g., a question about school wellness programs would not usually be asked of an emergency services coordinator). As the project evolved, so did the interview guide; and, this appendix includes both the original and the revised versions.

CREATING A CULTURE OF HEALTH IN APPALACHIA C. Research Support Materials | APPENDICES
216
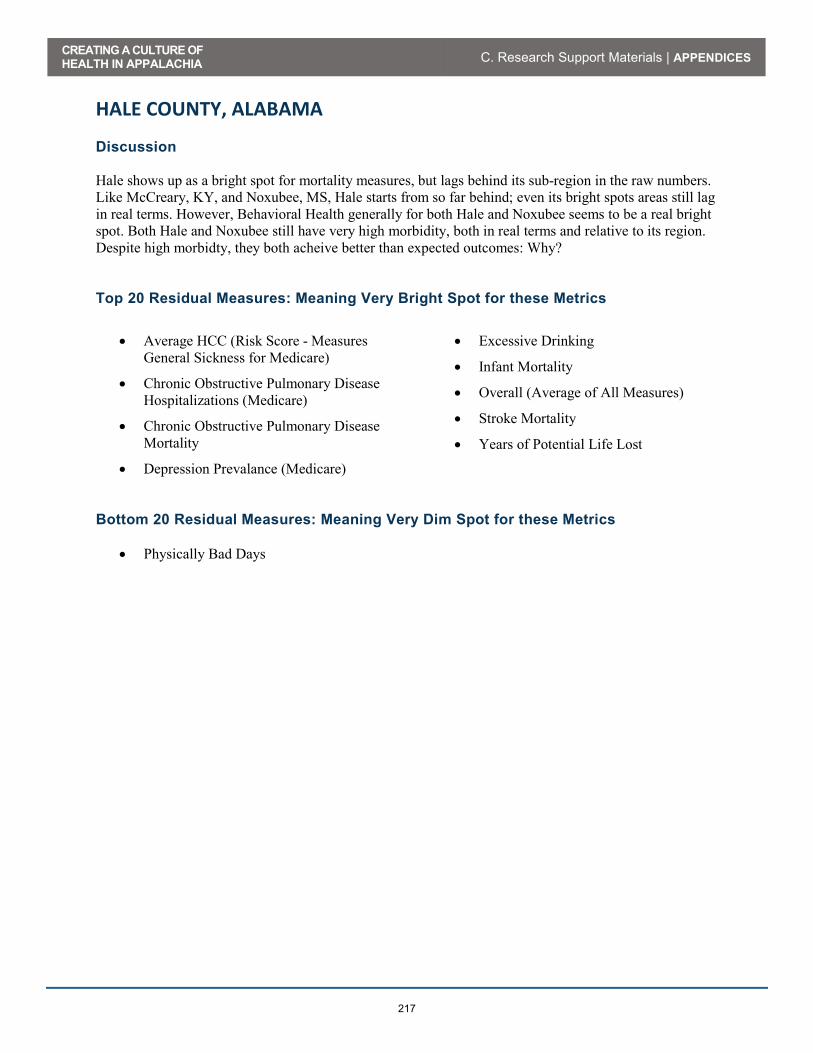
CREATING A CULTURE OF HEALTH IN APPALACHIA C. Research Support Materials | APPENDICES
217
HALE COUNTY, ALABAMA Discussion Hale shows up as a bright spot for mortality measures, but lags behind its sub-region in the raw numbers. Like McCreary, KY, and Noxubee, MS, Hale starts from so far behind; even its bright spots areas still lag in real terms. However, Behavioral Health generally for both Hale and Noxubee seems to be a real bright spot. Both Hale and Noxubee still have very high morbidity, both in real terms and relative to its region. Despite high morbidty, they both acheive better than expected outcomes: Why? Top 20 Residual Measures: Meaning Very Bright Spot for these Metrics
x Average HCC (Risk Score - Measures General Sickness for Medicare)
x Chronic Obstructive Pulmonary Disease Hospitalizations (Medicare)
x Chronic Obstructive Pulmonary Disease Mortality
x Depression Prevalance (Medicare)
x Excessive Drinking
x Infant Mortality
x Overall (Average of All Measures)
x Stroke Mortality
x Years of Potential Life Lost
Bottom 20 Residual Measures: Meaning Very Dim Spot for these Metrics
x Physically Bad Days

CREATING A CULTURE OF HEALTH IN APPALACHIA C. Research Support Materials | APPENDICES
218
NOXUBEE COUNTY, MISSISSIPPI Discussion Noxubee shows up as a bright spot for mortality measures, but lags behind its sub-region in the raw numbers. Like McCreary, KY and Hale, AL, Noxubee starts from so far behind, even its bright spots areas still lag in real terms. However, Behavioral Health generally for both Hale and Noxubee seems to be a real bright spot. Both Hale and Noxubee still have very high morbidity, both in real terms and relative to its region. Despite high morbidty, they both acheive better than expected outcomes: Why? Top 20 Residual Measures: Meaning Very Bright Spot for these Metrics
x Overall (Average of All Measures)
x Chronic Obstructive Pulmonary Disease Hospitalizations (Medicare)
x Chronic Obstructive Pulmonary Disease Mortality
x Depression Prevalance (Medicare)
x Years of Productive Life Lost
x Heart Disease Hospitalization
x Average HCC (Risk Score - Measures General Sickness for Medicare)
x Opiod Prescription Use Rates
Bottom 20 Residual Measures: Meaning Very Dim Spot for these Metrics
x Diabetes Prevalence x Obesity Prevalence
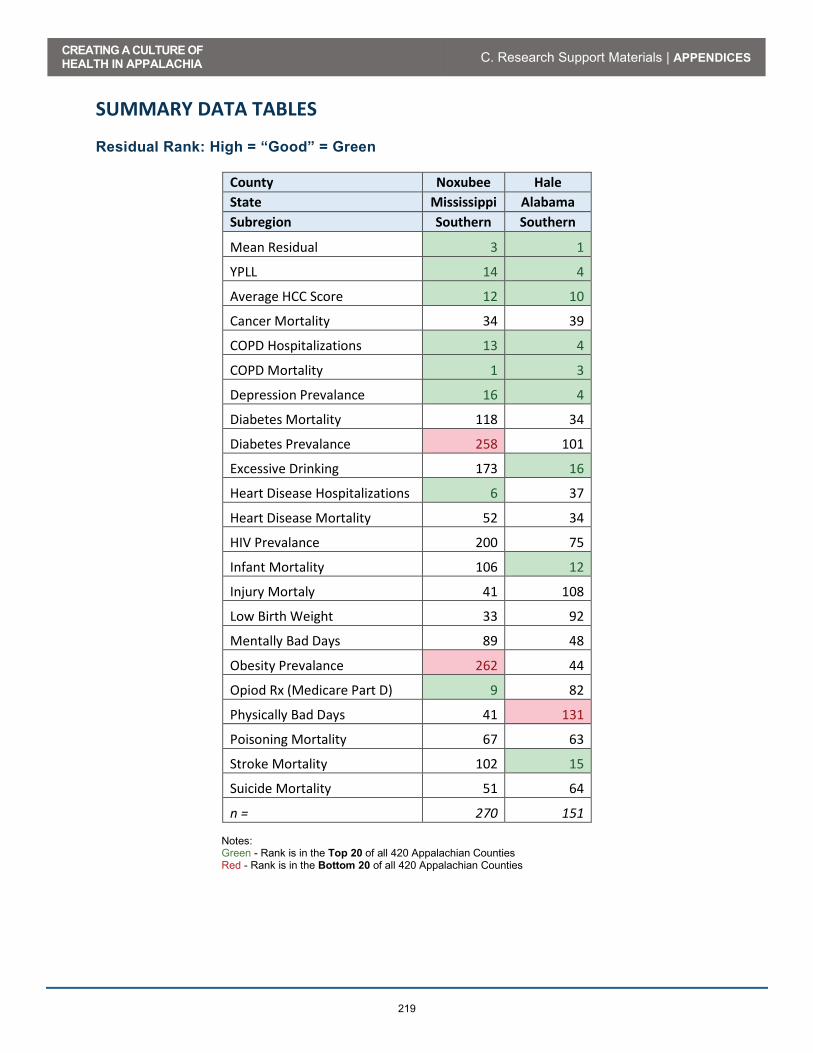
CREATING A CULTURE OF HEALTH IN APPALACHIA C. Research Support Materials | APPENDICES
219
SUMMARY DATA TABLES Residual Rank: High = “Good” = Green
County Noxubee Hale State Mississippi Alabama Subregion Southern Southern
Mean Residual 3 1
YPLL 14 4
Average HCC Score 12 10
Cancer Mortality 34 39
COPD Hospitalizations 13 4
COPD Mortality 1 3
Depression Prevalance 16 4
Diabetes Mortality 118 34
Diabetes Prevalance 258 101
Excessive Drinking 173 16
Heart Disease Hospitalizations 6 37
Heart Disease Mortality 52 34
HIV Prevalance 200 75
Infant Mortality 106 12
Injury Mortaly 41 108
Low Birth Weight 33 92
Mentally Bad Days 89 48
Obesity Prevalance 262 44
Opiod Rx (Medicare Part D) 9 82
Physically Bad Days 41 131
Poisoning Mortality 67 63
Stroke Mortality 102 15
Suicide Mortality 51 64
n = 270 151
Notes: Green - Rank is in the Top 20 of all 420 Appalachian Counties Red - Rank is in the Bottom 20 of all 420 Appalachian Counties

CREATING A CULTURE OF HEALTH IN APPALACHIA C. Research Support Materials | APPENDICES
220
Actual Data: Alabama / Mississippi
Full Name Lower
is Better?
Non-Appalachia
Appalachia Southern
Appalachia Hale
County, AL Noxubee
County, MS
Adults With At Least Some College (Percent) No 63.8% 57.1% 57.7% 48.8% 43.8%
Breast Cancer Screening (% Medicare Women with Mammo)
No 62.2% 61.4% 62.8% 65.0% 53.0%
Cancer Mortality per 100,000 People Yes 166.7 184.0 177.3 206.7 206.8
Chlamydia Incidence Rate per 100,000 Yes 451.1 321.4 390.4 1,260.7 891.4
COPD Mortality per 100,000 People Yes 40.9 53.5 53.0 44.0 26.7
Dentists per 100,000 Population No 66.1 47.8 43.8 13.2 18.0 Diabetes Mortality per 100,000 People Yes 21.3 23.8 20.6 26.0 24.7
Diabetes Prevalance (Percent Adults) Yes 9.6% 11.9% 11.9% 17.2% 19.0%
Diabetes Screening (% Adults w/Diabetes w/ A1C Test) No 84.6% 85.9% 86.4% 77.2% 92.9%
Disability Prevalance (Percent Receiving Disability OASDI and/or SSI)
Yes 2.8% 4.8% 4.4% 9.8% 7.3%
E-Prescribe Rates (Percent Docs Using Electronic Rx) No 66.0% 63.8% 61.5% 80.0% 77.0%
Excessive Drinking (Percent of Population) Yes 17.9% 15.2% 15.0% 10.1% 10.2%
Grocery Stores per 1000 Residents No 0.2 0.2 0.2 0.2 0.4
Heart Disease Mortality per 100,000 People Yes 34.9 47.6 39.5 51.8 55.4
HIV Prevalance (Adults With HIV per 100,000) Yes 373.0 153.5 211.3 344.4 354.6
Households with Income Below Poverty (Percent) Yes 15.4% 17.2% 16.9% 28.1% 31.3%
Infant Mortality per 1,000 Births Yes 6.1 7.1 7.4 10.5 10.7
Injury Mortality per 100,000 People Yes 82.0 111.0 106.4 151.1 140.8
Low Birth Weight Births (>2500g per 1000 Births) Yes 8.0 8.7 9.2 14.3 12.0
Median Household Income No $ 57,074 $ 45,585 $ 48,668 $ 33,315 $ 28,730 Medicare Beneficiaries with Depression (Percent) Yes 15.3% 16.7% 15.1% 10.5% 9.7%
Medicare COPD Hospitalizations per 1,000 Yes 10.7 13.4 12.4 10.1 9.7
Medicare Heart Disease Hospitalizations per 1,000 Yes 47.3 56.2 51.3 55.5 28.5

CREATING A CULTURE OF HEALTH IN APPALACHIA C. Research Support Materials | APPENDICES
221
Full Name Lower
is Better?
Non-Appalachia
Appalachia Southern
Appalachia Hale
County, AL Noxubee
County, MS
Ment. Unhealthy Days Per Month Per Person Yes 3.6 4.1 4.1 5.1 4.6
Mental Health Providers Per 100,000 Population No 207.2 130.4 92.5 19.8 126.6
Obesity Prevalance (Percent Adults >30 BMI) Yes 27.1% 31.0% 31.1% 35.9% 41.8%
Opioid Prescriptions As Percent of Part D Claims Yes 5.2 6.0 6.8 7.8 4.0
People Under 65 Without Insurance (Percent) Yes 16.8% 15.8% 18.9% 16.1% 24.0%
Phys. Unhealthy Days Per Month Per Person Yes 3.6 4.1 4.1 5.6 5.0
Physically Inactivity (Percent Not Physcially Active) Yes 22.6% 28.4% 27.6% 35.3% 39.7%
Poisoning Mortality per 100,000 People Yes 26.5 35.3 26.3 14.2 15.4
Primary Care Physicians per 100,000 Population No 76.3 66.8 59.5 13.0 9.0
Smoking Rates (Percent Adults Smoking) Yes 16.0% 19.8% 17.8% 21.8% 24.4%
Social Associations per 10,000 Population No
9.2 12.5 11.1 5.2 13.5
Specialist Physicians Per 100,000 Population No 156.8 109.7 95.5 19.5 8.9
Stroke Mortality per 100,000 People Yes 38.0 43.8 47.3 48.8 52.9
Students per Teacher Yes 16.7 14.3 14.8 14.8 - Suicide Mortality per 100,000 People Yes 12.2 14.5 14.1 11.8 10.9
Teenage Births per 1,000 Yes 34.3 38.2 42.3 42.6 71.5 Travel Minutes to Work (Average) Yes 25.8 24.8 26.0 29.0 27.2
Years Potential Life Lost per 100,000 People Yes 6,513.9 8,291.2 8,278.9 10,037.1 10,274.1
Note: Green = County data is better than Southern Appalachia

CREATING A CULTURE OF HEALTH IN APPALACHIA C. Research Support Materials | APPENDICES
222
RELEVANT DISPARITY FOREST CHARTS Mortality Domain Figure 1 – Percent Difference: Appalachian Subregions versus Non-Appalachia
(0.27)
(0.15)
(0.10)
(0.31)
(0.35)
(0.36)
(0.12)
(0.27)
(0.25)
(0.06)
(0.29)
(0.30)
(0.13)
0.03
(0.54)
(0.29)
(0.24)
(0.08)
(0.84)
(0.48)
(0.22)
(0.58)
(0.39)
(0.24)
0.35
(0.72)
(0.59)
(0.16)
(1.00) (0.80) (0.60) (0.40) (0.20) - 0.20 0.40
Years Potential Life Lost per 100,000
Stroke Mortality per 100,000
Cancer Mortality per 100,000
COPD Mortality per 100,000
Injury Mortality per 100,000
Heart Disease Mortality per 100,000
Diabetes Mortality per 100,000
Appalachia Southern Hale Noxubee
BETTERWORSE

CREATING A CULTURE OF HEALTH IN APPALACHIA C. Research Support Materials | APPENDICES
223
Morbidity Domain Figure 2 - Percent Difference: Appalachian Subregions versus Non-Appalachia
(0.14)
(0.16)
(0.24)
(0.14)
0.59
(0.13)
(0.14)
(0.25)
(0.15)
0.43
(0.56)
(0.43)
(0.79)
(0.33)
0.08
(0.39)
(0.29)
(0.98)
(0.54)
0.05
(1.50) (1.00) (0.50) - 0.50 1.00 1.50
Average Phys. Unhealthy Days/Month PerPerson
Average Ment. Unhealthy Days/Month PerPerson
Percent Adults with Diabetes
Percent Adults with BMI>30
Number Adults With HIV per 100,000
Appalachia Southern Hale Noxubee
BETTERWORSE

CREATING A CULTURE OF HEALTH IN APPALACHIA C. Research Support Materials | APPENDICES
224
Behavioral Health Domain Figure 3 – Percent Difference: Appalachian Subregions versus Non-Appalachia
(0.19)
(0.09)
(0.33)
(0.15)
0.15
(0.15)
0.02
0.01
(0.30)
0.17
0.03
0.32
0.46
(0.50)
0.44
0.11
0.37
0.42
0.24
0.43
(1.00) (0.50) - 0.50 1.00
Suicide Mortality per 100,000
Percent Medicare Beneficiaries withDepression
Poisoning Mortality per 100,000
Opioid Prescriptions As Percent of Part DClaims
Percent Residents Drinking Excessively
Appalachia Southern Hale Noxubee
BETTERWORSE

CREATING A CULTURE OF HEALTH IN APPALACHIA C. Research Support Materials | APPENDICES
225
Child Health Domain Figure 4 – Percent Difference: Appalachian Subregions versus Non-Appalachia
(0.08)
(0.18)
(0.11)
(0.15)
(0.23)
(0.23)
(0.77)
(0.74)
(0.24)
(0.49)
(0.76)
(1.09)
(1.50) (1.00) (0.50) - 0.50
Number Births <2500g per 1000 Births
Infant Mortality per 1,000 Births
Teenage Births per 1,000
Appalachia Southern Hale Noxubee
BETTERWORSE

CREATING A CULTURE OF HEALTH IN APPALACHIA C. Research Support Materials | APPENDICES
226
Environment Domain Figure 5 – Percent Difference: Appalachian Subregions versus Non-Appalachia
(0.08)
(0.18)
(0.11)
(0.15)
(0.23)
(0.23)
(0.77)
(0.74)
(0.24)
(0.49)
(0.76)
(1.09)
(1.50) (1.00) (0.50) - 0.50
Number Births <2500g per 1000 Births
Infant Mortality per 1,000 Births
Teenage Births per 1,000
Appalachia Southern Hale Noxubee
BETTERWORSE
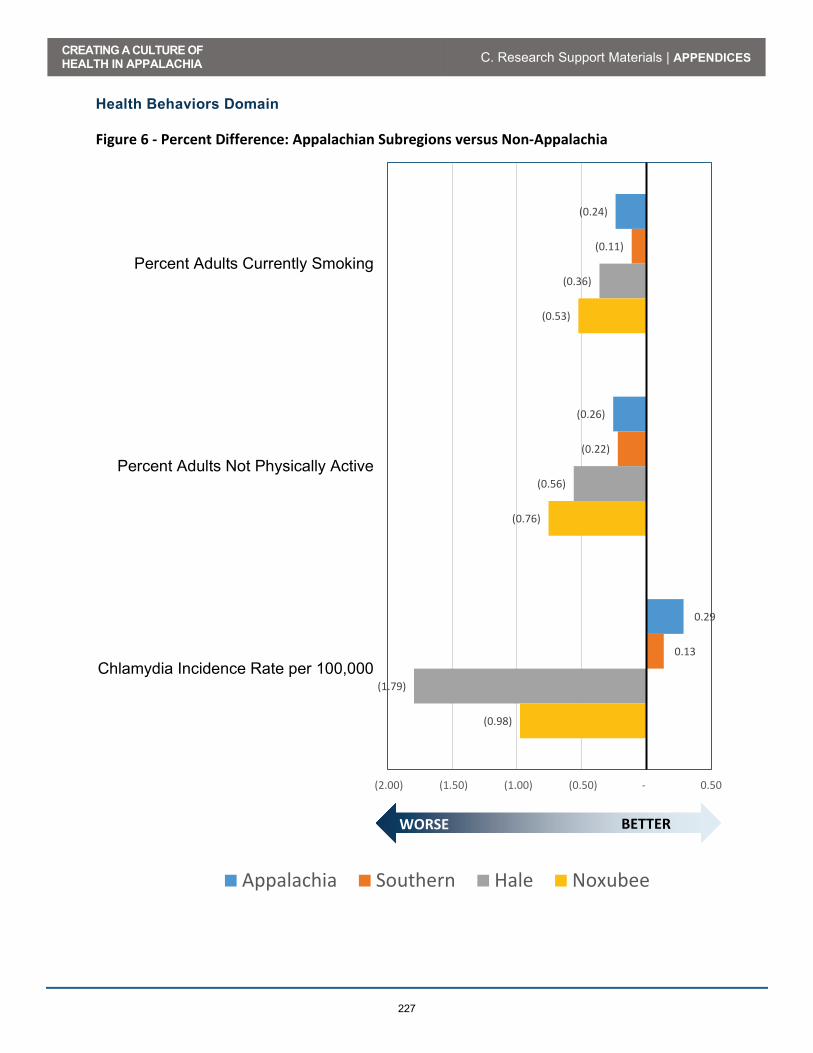
CREATING A CULTURE OF HEALTH IN APPALACHIA C. Research Support Materials | APPENDICES
227
Health Behaviors Domain Figure 6 - Percent Difference: Appalachian Subregions versus Non-Appalachia
(0.24)
(0.26)
0.29
(0.11)
(0.22)
0.13
(0.36)
(0.56)
(1.79)
(0.53)
(0.76)
(0.98)
(2.00) (1.50) (1.00) (0.50) - 0.50
Percent Adults Currently Smoking
Percent Adults Not Physically Active
Chlamydia Incidence Rate per 100,000
Appalachia Southern Hale Noxubee
BETTERWORSE

CREATING A CULTURE OF HEALTH IN APPALACHIA C. Research Support Materials | APPENDICES
228
Health Care Systems Domain Figure 7 - Percent Difference: Appalachian Subregions versus Non-Appalachia
(0.19)
(0.25)
(0.12)
(0.28)
(0.30)
(0.37)
(0.03)
0.06
(0.08)
(0.16)
(0.22)
(0.34)
(0.39)
(0.55)
(0.07)
(0.12)
(0.17)
0.05
(0.83)
(0.80)
(0.88)
(0.90)
0.21
0.04
0.40
0.09
(0.88)
(0.73)
(0.94)
(0.39)
0.17
(0.43)
(1.50) (1.00) (0.50) - 0.50 1.00
Medicare Heart Disease Hospitalizationsper 1,000
Medicare COPD Hospitalizations per 1,000
Primary Care Physicians per 100,000Population
Dentists per 100,000 Population
Specialist Physicians Per 100,000Population
Mental Health Providers Per 100,000Population
Percent of Doctors that E-Prescribe
Percent People Under 65 WithoutInsurance
Appalachia Southern Hale Noxubee
BETTERWORSE
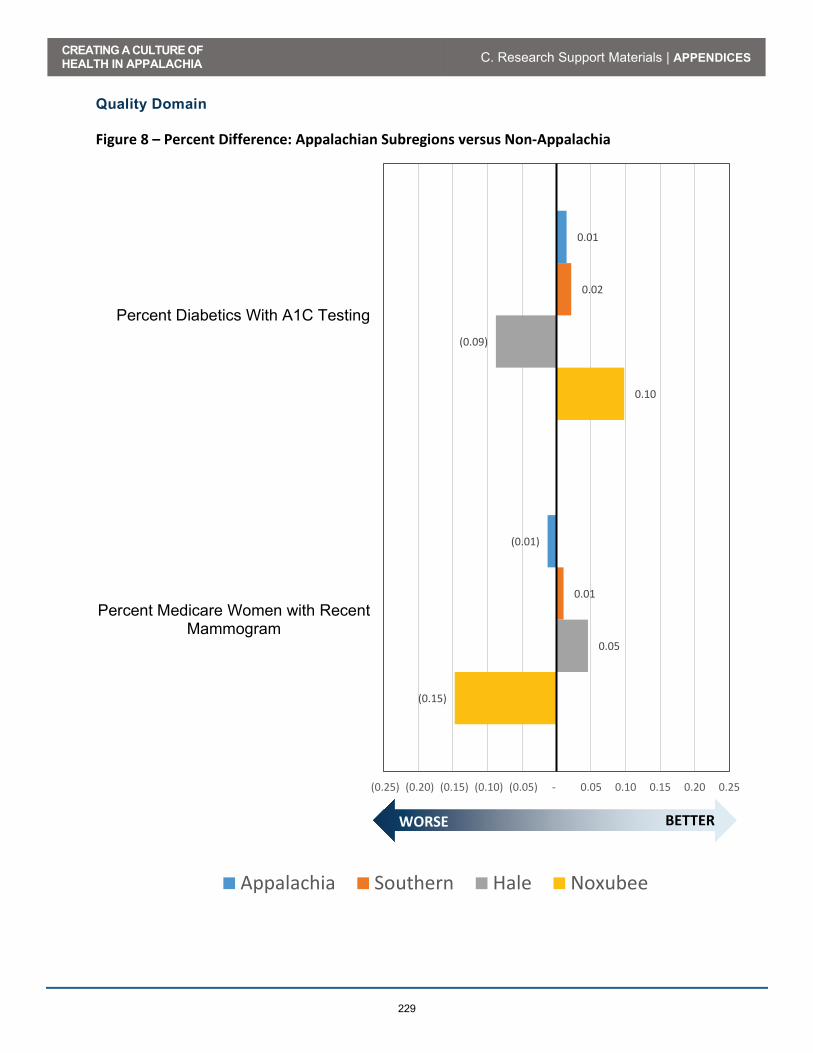
CREATING A CULTURE OF HEALTH IN APPALACHIA C. Research Support Materials | APPENDICES
229
Quality Domain Figure 8 – Percent Difference: Appalachian Subregions versus Non-Appalachia
0.01
(0.01)
0.02
0.01
(0.09)
0.05
0.10
(0.15)
(0.25) (0.20) (0.15) (0.10) (0.05) - 0.05 0.10 0.15 0.20 0.25
Percent Diabetics With A1C Testing
Percent Medicare Women with RecentMammogram
Appalachia Southern Hale Noxubee
BETTERWORSE

CREATING A CULTURE OF HEALTH IN APPALACHIA C. Research Support Materials | APPENDICES
230
Social Determinants Domain Figure 9 – Percent Difference: Appalachian Subregions versus Non-Appalachia
0.36
(0.11)
(0.12)
(0.20)
(0.68)
0.21
(0.10)
(0.10)
(0.15)
(0.55)
(0.43)
(0.23)
(0.82)
(0.42)
(2.45)
0.48
(0.31)
(1.03)
(0.50)
(1.57)
(3.00) (2.50) (2.00) (1.50) (1.00) (0.50) - 0.50
Social Associations per 10,000 Population
Percent Adults With At Least SomeCollege
Percent Households with Income BelowPoverty
Median Household Income
Percent Receiving Disability OASDI and/orSSI
Appalachia Southern Hale Noxubee
BETTERWORSE

CREATING A CULTURE OF HEALTH IN APPALACHIA C. Research Support Materials | APPENDICES
231
POTTER COUNTY, PENNSYLVANIA Project Background “Creating a Culture of Health in Appalachia: Disparities and Bright Spots" is an innovative research initiative sponsored by the Robert Wood Johnson Foundation (RWJF) and Appalachian Regional Commission (ARC) and administered by the Foundation for a Healthy Kentucky. This multi-part health research project will, in separate deliverables: document disparities in health outcomes in the Appalachian Region; identify “Bright Spots,” or communities that exhibit better-than-expected health outcomes; and explore Bright Spot communities through field-based research. This research aims to identify factors that support a Culture of Health in Appalachian communities and explores how this knowledge could translate into actions that other communities can replicate. According to the Robert Wood Johnson Foundation, building a Culture of Health means creating a society that gives every person an equal opportunity to live the healthiest life they can—whatever their ethnic, geographic, racial, socioeconomic, or physical circumstance happens to be. A Culture of Health recognizes that health and well-being are greatly influenced by where we live, how we work, the safety of our surroundings, and the strength and connectivity of our families and communities—and not just by what happens in the doctor's office. The principles of the Culture of Health serve as a foundation for identifying measures of health in Appalachia, and evaluating the measures in the context of the ARC’s vision for bringing Appalachia to parity with the rest of the nation. By establishing a baseline of national and Appalachian performance on the measures, the project has a reference point against which to measure Bright Spots, or counties where performance is “better than expected.” Using Culture of Health” to inform choice of measures, gives direction and context to lessons learned from Bright Spot communities. This in turn can inform policies and investments that funders can transfer to others. In the case studies, researchers are looking for local practices, beliefs, and networks that work with limited resources to support better than expected health outcomes.

CREATING A CULTURE OF HEALTH IN APPALACHIA C. Research Support Materials | APPENDICES
232
Project Sponsors Robert Wood Johnson Foundation The Robert Wood Johnson Foundation (RWJF) is the nation’s largest philanthropy dedicated to health. For more than 40 years, RWJF has supported research and programs targeting some of the nation’s most pressing health issues. RWJF provided funding for this research project as part of its Culture of Health Initiative. David M. Krol, MD, MPH, FAAP, Senior Program Officer, provided the impetus for the Bright Spots in Appalachia project and solicited the Appalachian Regional Commission and the Foundation for a Healthy Kentucky as partners. Appalachian Regional Commission The Appalachian Regional Commission (ARC) provided funding, leadership, and project management for the project. Established in 1965, ARC is a regional economic development agency that represents a partnership of federal, state, and local government. ARC’s mission is to innovate, partner, and invest to build community capacity and strengthen economic growth in Appalachia to help the Region achieve socioeconomic parity with the nation. Foundation for a Healthy Kentucky The non-profit Foundation for a Healthy Kentucky (FHK) was the grantee and fiscal agent for the project. Since 2001, the Foundation for a Healthy Kentucky has been working to improve the health of Kentuckians through policy changes and community investments. Its mission is to address the unmet health care needs of Kentucky residents by developing and influencing health policy, improving access to care, reducing health risks and disparities, and promoting health equality. Principal Investigators To implement the research, the Appalachian Regional Commission and the Foundation for a Healthy Kentucky named two Principal Investigators for the study: Julie L. Marshall, PhD, Economist, Division of Planning and Research for the Appalachian Regional Commission, and Gabriella Alcalde, D.Ph., Vice President, Policy & Program for the Foundation for Healthy Kentucky. PDA, Inc. received the contract award. Nancy Lane is the project manager for PDA. University of North Carolina Sheps Center for Health Services Research, Directed by Mark Holmes Ph.D. is the primary subcontractor. Michael Schwalbe, Ph.D., from the Department of Sociology and Anthropology at North Carolina State University is guiding the case studies.

CREATING A CULTURE OF HEALTH IN APPALACHIA C. Research Support Materials | APPENDICES
233
What is a Bright Spot? Bright Spots are locations, counties, or communities where health outcomes are better than would be expected based on unemployment, poverty rates, and other community factors. In this study, we considered only factors reported at the county level by national data collection systems. Each county has its own unique set of characteristics. Researchers used statistical modelling to predict how healthy a county should be, based on its unique characteristics. For example, generally, a county with a low median income and a high teen birth rate would have less healthy outcomes than a county with a high median income and a low teen birth rate. But some counties buck trends, measuring healthier in one or more aspects than we would expect, given existing socioeconomic conditions. Those are candidates for Bright Spot designation. To conduct the statistical model, researchers first identified factors known to affect community health. The research team identified 29 such county-level factors or “drivers,” such as household income, education, health insurance coverage, availability of primary care physicians, and adult smoking rates. Next, the team identified 19 “outcome” measures, such as infant mortality, cancer mortality, obesity rates, diabetes prevalence, and depression rates among Medicare beneficiaries. The team then looked at the relationship between the 19 health outcome measures and the 29 driver measures and determined the statistically predicted value for each of the 19 outcome measures. As a hypothetical example, a county with specific values of median income, smoking rates, primary care physicians, etc., might have a predicted suicide rate of 17.4 per 100,000 population. If that county had an actual suicide rate of (say) 12.4, then, on this factor, the county would classify as unexpectedly healthy. Most counties will have some outcomes that are better than predicted and some worse than predicted. But a county that is much healthier than predicted, on average, across all 19 health outcome measures, would be considered a Bright Spot. The goal of the field study is to discover what is happening in a sample of the Bright Spots that makes them better than expected. The team identified 42 Bright Spot counties. Figure 1 and Tables 1 and 2 below identify the 42 Appalachian Bright Spot counties. The Bright Spots occur throughout Appalachia, in both economically distressed and non-distressed counties.
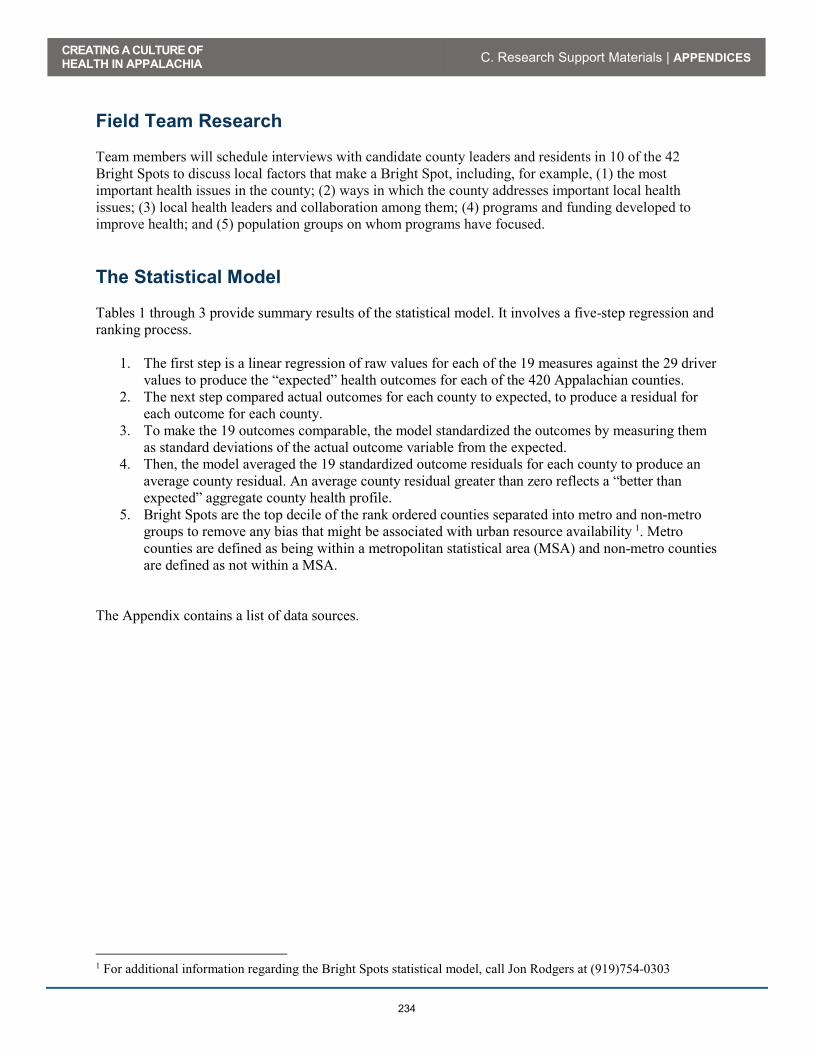
CREATING A CULTURE OF HEALTH IN APPALACHIA C. Research Support Materials | APPENDICES
234
Field Team Research Team members will schedule interviews with candidate county leaders and residents in 10 of the 42 Bright Spots to discuss local factors that make a Bright Spot, including, for example, (1) the most important health issues in the county; (2) ways in which the county addresses important local health issues; (3) local health leaders and collaboration among them; (4) programs and funding developed to improve health; and (5) population groups on whom programs have focused.
The Statistical Model Tables 1 through 3 provide summary results of the statistical model. It involves a five-step regression and ranking process.
1. The first step is a linear regression of raw values for each of the 19 measures against the 29 driver values to produce the “expected” health outcomes for each of the 420 Appalachian counties.
2. The next step compared actual outcomes for each county to expected, to produce a residual for each outcome for each county.
3. To make the 19 outcomes comparable, the model standardized the outcomes by measuring them as standard deviations of the actual outcome variable from the expected.
4. Then, the model averaged the 19 standardized outcome residuals for each county to produce an average county residual. An average county residual greater than zero reflects a “better than expected” aggregate county health profile.
5. Bright Spots are the top decile of the rank ordered counties separated into metro and non-metro groups to remove any bias that might be associated with urban resource availability 1. Metro counties are defined as being within a metropolitan statistical area (MSA) and non-metro counties are defined as not within a MSA.
The Appendix contains a list of data sources.
1 For additional information regarding the Bright Spots statistical model, call Jon Rodgers at (919)754-0303
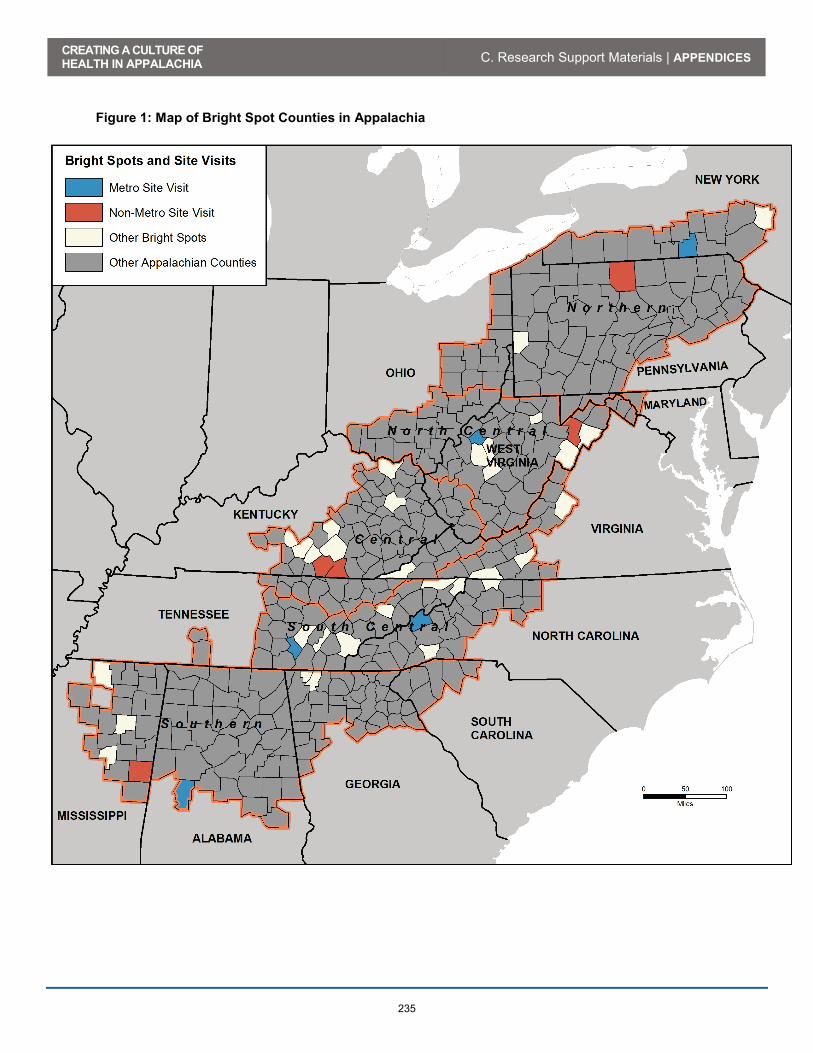
CREATING A CULTURE OF HEALTH IN APPALACHIA C. Research Support Materials | APPENDICES
235
Figure 1: Map of Bright Spot Counties in Appalachia
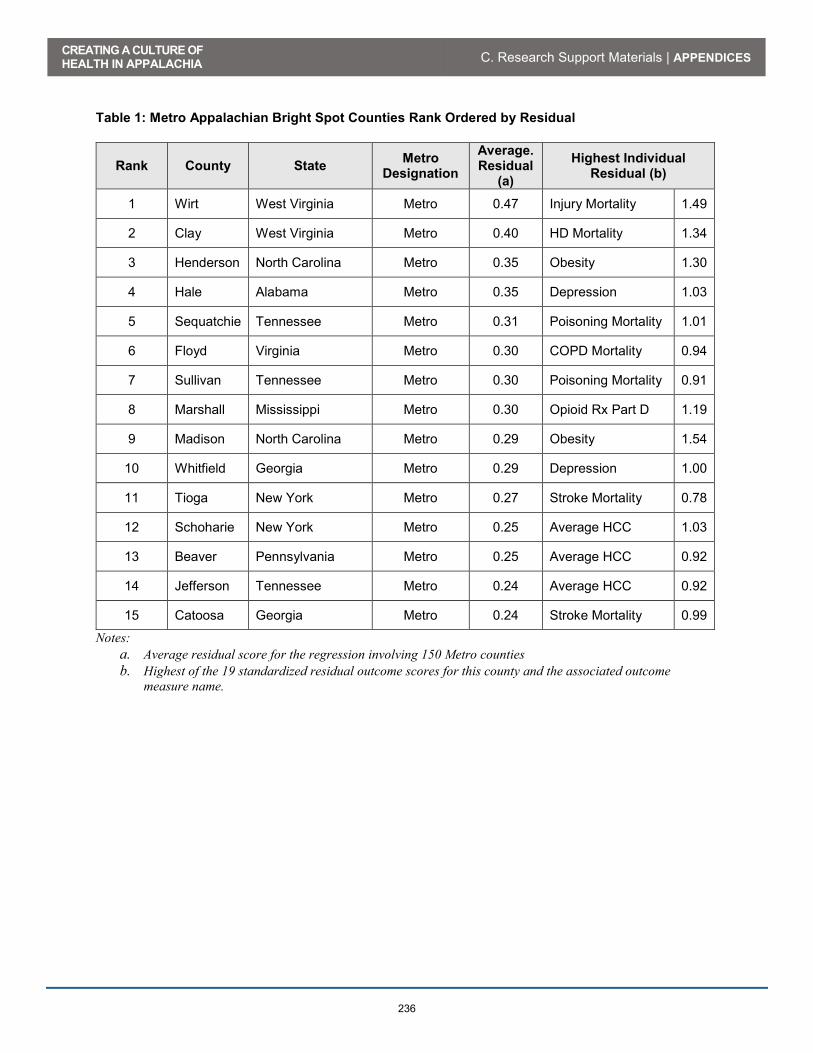
CREATING A CULTURE OF HEALTH IN APPALACHIA C. Research Support Materials | APPENDICES
236
Table 1: Metro Appalachian Bright Spot Counties Rank Ordered by Residual
Rank County State Metro Designation
Average. Residual
(a)
Highest Individual Residual (b)
1 Wirt West Virginia Metro 0.47 Injury Mortality 1.49
2 Clay West Virginia Metro 0.40 HD Mortality 1.34
3 Henderson North Carolina Metro 0.35 Obesity 1.30
4 Hale Alabama Metro 0.35 Depression 1.03
5 Sequatchie Tennessee Metro 0.31 Poisoning Mortality 1.01
6 Floyd Virginia Metro 0.30 COPD Mortality 0.94
7 Sullivan Tennessee Metro 0.30 Poisoning Mortality 0.91
8 Marshall Mississippi Metro 0.30 Opioid Rx Part D 1.19
9 Madison North Carolina Metro 0.29 Obesity 1.54
10 Whitfield Georgia Metro 0.29 Depression 1.00
11 Tioga New York Metro 0.27 Stroke Mortality 0.78
12 Schoharie New York Metro 0.25 Average HCC 1.03
13 Beaver Pennsylvania Metro 0.25 Average HCC 0.92
14 Jefferson Tennessee Metro 0.24 Average HCC 0.92
15 Catoosa Georgia Metro 0.24 Stroke Mortality 0.99
Notes: a. Average residual score for the regression involving 150 Metro counties b. Highest of the 19 standardized residual outcome scores for this county and the associated outcome
measure name.
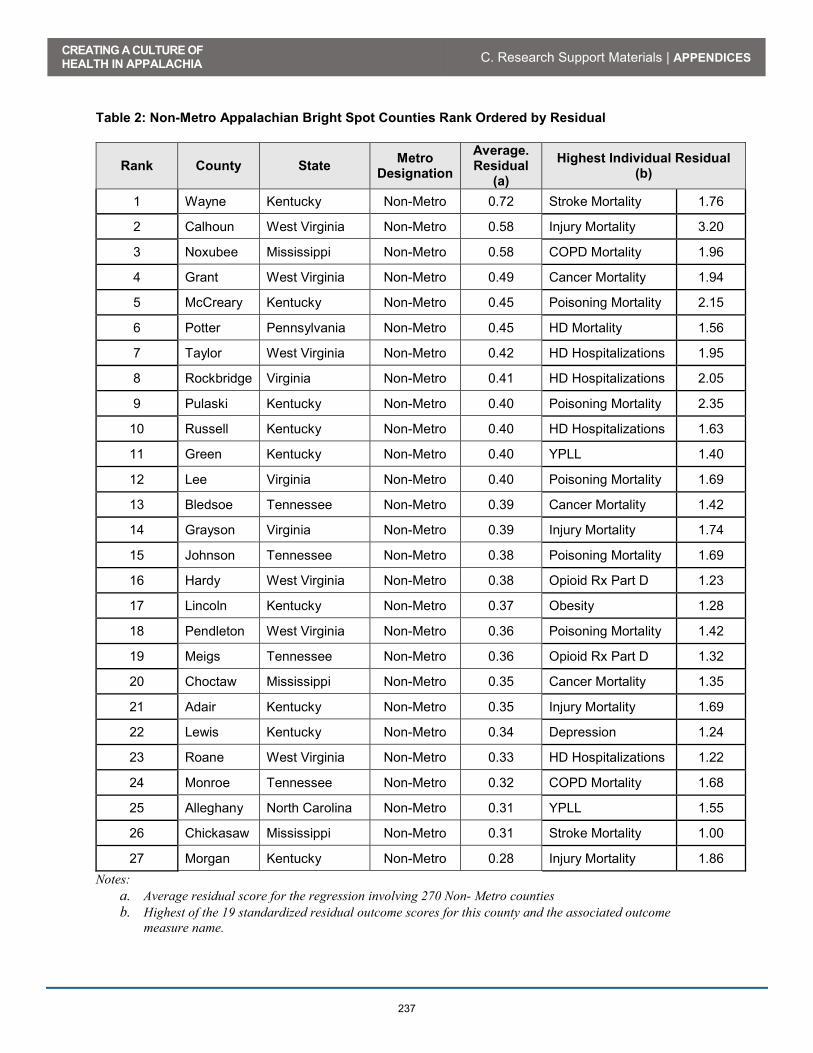
CREATING A CULTURE OF HEALTH IN APPALACHIA C. Research Support Materials | APPENDICES
237
Table 2: Non-Metro Appalachian Bright Spot Counties Rank Ordered by Residual
Rank County State Metro Designation
Average. Residual
(a)
Highest Individual Residual (b)
1 Wayne Kentucky Non-Metro 0.72 Stroke Mortality 1.76
2 Calhoun West Virginia Non-Metro 0.58 Injury Mortality 3.20
3 Noxubee Mississippi Non-Metro 0.58 COPD Mortality 1.96
4 Grant West Virginia Non-Metro 0.49 Cancer Mortality 1.94
5 McCreary Kentucky Non-Metro 0.45 Poisoning Mortality 2.15
6 Potter Pennsylvania Non-Metro 0.45 HD Mortality 1.56
7 Taylor West Virginia Non-Metro 0.42 HD Hospitalizations 1.95
8 Rockbridge Virginia Non-Metro 0.41 HD Hospitalizations 2.05
9 Pulaski Kentucky Non-Metro 0.40 Poisoning Mortality 2.35
10 Russell Kentucky Non-Metro 0.40 HD Hospitalizations 1.63
11 Green Kentucky Non-Metro 0.40 YPLL 1.40
12 Lee Virginia Non-Metro 0.40 Poisoning Mortality 1.69
13 Bledsoe Tennessee Non-Metro 0.39 Cancer Mortality 1.42
14 Grayson Virginia Non-Metro 0.39 Injury Mortality 1.74
15 Johnson Tennessee Non-Metro 0.38 Poisoning Mortality 1.69
16 Hardy West Virginia Non-Metro 0.38 Opioid Rx Part D 1.23
17 Lincoln Kentucky Non-Metro 0.37 Obesity 1.28
18 Pendleton West Virginia Non-Metro 0.36 Poisoning Mortality 1.42
19 Meigs Tennessee Non-Metro 0.36 Opioid Rx Part D 1.32
20 Choctaw Mississippi Non-Metro 0.35 Cancer Mortality 1.35
21 Adair Kentucky Non-Metro 0.35 Injury Mortality 1.69
22 Lewis Kentucky Non-Metro 0.34 Depression 1.24
23 Roane West Virginia Non-Metro 0.33 HD Hospitalizations 1.22
24 Monroe Tennessee Non-Metro 0.32 COPD Mortality 1.68
25 Alleghany North Carolina Non-Metro 0.31 YPLL 1.55
26 Chickasaw Mississippi Non-Metro 0.31 Stroke Mortality 1.00
27 Morgan Kentucky Non-Metro 0.28 Injury Mortality 1.86 Notes:
a. Average residual score for the regression involving 270 Non- Metro counties b. Highest of the 19 standardized residual outcome scores for this county and the associated outcome
measure name.

CREATING A CULTURE OF HEALTH IN APPALACHIA C. Research Support Materials | APPENDICES
238
Why is Potter County, New York, a “Bright Spot”? Potter County’s average outcome residual ranked it 6th among the 27 Appalachian Non-Metro Bright Spot counties in Table 1. Table 3 shows Potters’ estimated versus actual value for each of the 19 health outcome measures. Potter County was better than expected in 14 of the 19 health outcomes. Table 3: Potter County Expected and Actual Health Outcome Comparison
Outcome Measure Predicted Actual % Difference
1 Infant Mortality per 1,000 Births 6.9 4.3 37.7%
2 Poisoning Mortality per 100,000 People 17.3 11.6 32.9%
3 Heart Disease Hosp. per 1,000 Medicare Beneficiaries 60.0 40.6 32.3%
4 Heart Disease Mortality per 100,000 People 222.3 152.8 31.2%
5 Years of Potential Life Lost 8,986 6,630 26.2%
6 Stroke Mortality per 100,000 People 46.2 34.4 25.5%
7 Suicide Mortality per 100,000 People 17.8 13.8 22.3%
8 Low Birth Weight Births (<2500g) per 1,000 Births 7.8 7.0 9.6%
9 COPD Mortality per 100,000 People 55.0 50.4 8.3%
10 Injury Mortality per 100,000 People 58.1 53.3 8.2%
11 Percent of Adults with Diabetes 12.5% 11.6% 7.1%
12 Average Medicare Condition Score 1.0 0.9 5.4%
13 Percent of Medicare Beneficiaries w/ Depression 16.8% 16.2% 3.7%
14 Physically Unhealthy Days per Month per Person 4.0 3.9 2.0%
15 Mentally Unhealthy Days per Month per Person 4.08 4.10 -0.6%
16 Cancer Mortality per 100,000 People 189.3 190.7 -0.7%
17 Percent of Obese Adults (>30 BMI) 31.0% 32.4% -4.4%
18 Percent of Excessive Drinkers 15.2% 16.2% -6.3%
19 Opioid prescriptions as a Percent of Part D Claims 5.7% 6.6% -15.8%
Better than Predicted
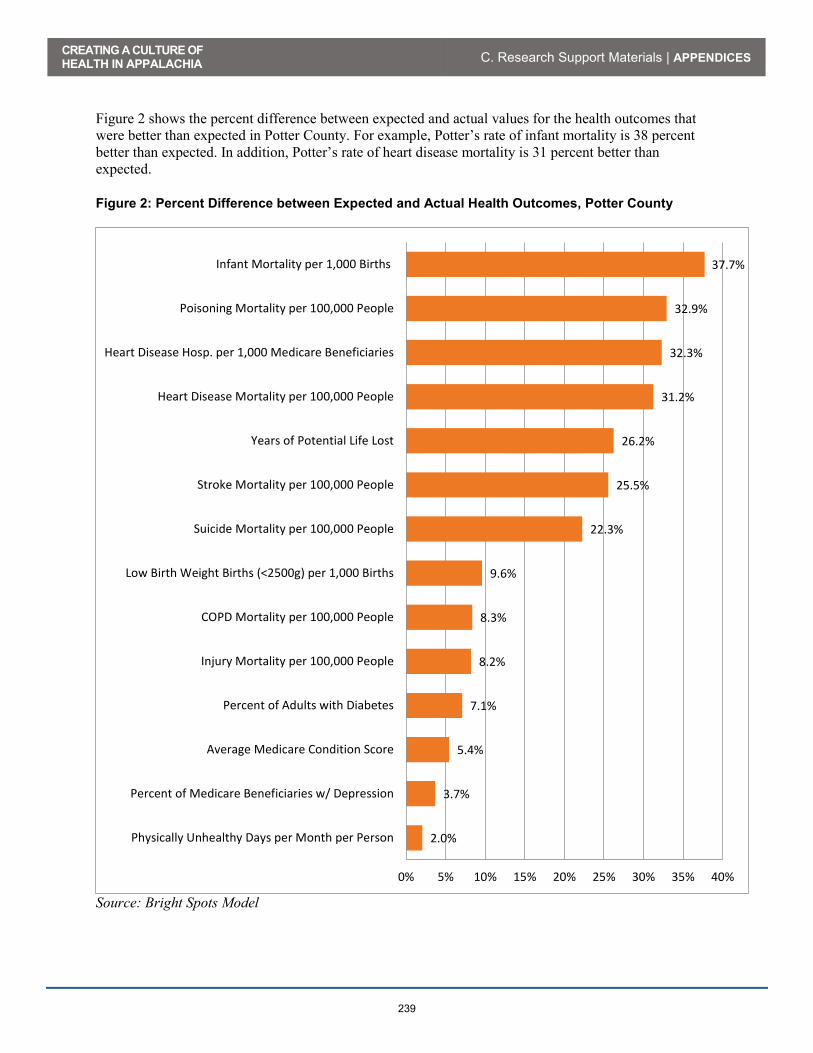
CREATING A CULTURE OF HEALTH IN APPALACHIA C. Research Support Materials | APPENDICES
239
Figure 2 shows the percent difference between expected and actual values for the health outcomes that were better than expected in Potter County. For example, Potter’s rate of infant mortality is 38 percent better than expected. In addition, Potter’s rate of heart disease mortality is 31 percent better than expected.
Figure 2: Percent Difference between Expected and Actual Health Outcomes, Potter County
Source: Bright Spots Model
2.0%
3.7%
5.4%
7.1%
8.2%
8.3%
9.6%
22.3%
25.5%
26.2%
31.2%
32.3%
32.9%
37.7%
0% 5% 10% 15% 20% 25% 30% 35% 40%
Physically Unhealthy Days per Month per Person
Percent of Medicare Beneficiaries w/ Depression
Average Medicare Condition Score
Percent of Adults with Diabetes
Injury Mortality per 100,000 People
COPD Mortality per 100,000 People
Low Birth Weight Births (<2500g) per 1,000 Births
Suicide Mortality per 100,000 People
Stroke Mortality per 100,000 People
Years of Potential Life Lost
Heart Disease Mortality per 100,000 People
Heart Disease Hosp. per 1,000 Medicare Beneficiaries
Poisoning Mortality per 100,000 People
Infant Mortality per 1,000 Births
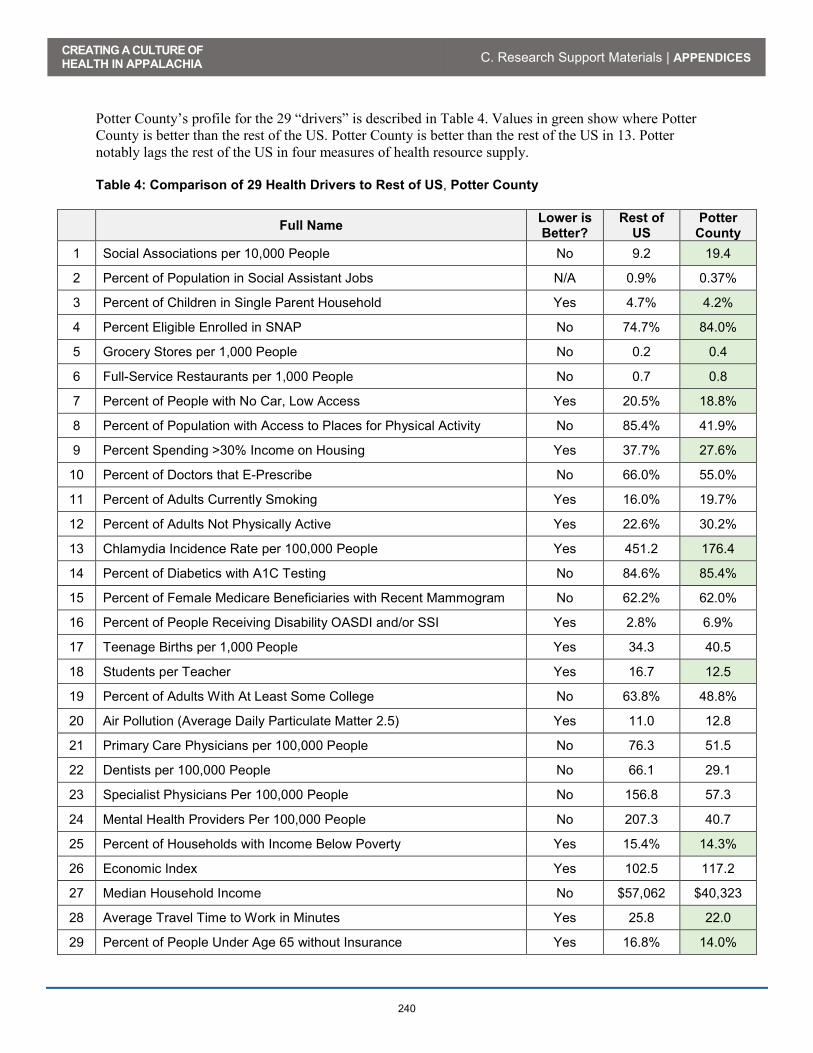
CREATING A CULTURE OF HEALTH IN APPALACHIA C. Research Support Materials | APPENDICES
240
Potter County’s profile for the 29 “drivers” is described in Table 4. Values in green show where Potter County is better than the rest of the US. Potter County is better than the rest of the US in 13. Potter notably lags the rest of the US in four measures of health resource supply. Table 4: Comparison of 29 Health Drivers to Rest of US, Potter County
Full Name Lower is Better?
Rest of US
Potter County
1 Social Associations per 10,000 People No 9.2 19.4
2 Percent of Population in Social Assistant Jobs N/A 0.9% 0.37%
3 Percent of Children in Single Parent Household Yes 4.7% 4.2%
4 Percent Eligible Enrolled in SNAP No 74.7% 84.0%
5 Grocery Stores per 1,000 People No 0.2 0.4
6 Full-Service Restaurants per 1,000 People No 0.7 0.8
7 Percent of People with No Car, Low Access Yes 20.5% 18.8%
8 Percent of Population with Access to Places for Physical Activity No 85.4% 41.9%
9 Percent Spending >30% Income on Housing Yes 37.7% 27.6%
10 Percent of Doctors that E-Prescribe No 66.0% 55.0%
11 Percent of Adults Currently Smoking Yes 16.0% 19.7%
12 Percent of Adults Not Physically Active Yes 22.6% 30.2%
13 Chlamydia Incidence Rate per 100,000 People Yes 451.2 176.4
14 Percent of Diabetics with A1C Testing No 84.6% 85.4%
15 Percent of Female Medicare Beneficiaries with Recent Mammogram No 62.2% 62.0%
16 Percent of People Receiving Disability OASDI and/or SSI Yes 2.8% 6.9%
17 Teenage Births per 1,000 People Yes 34.3 40.5
18 Students per Teacher Yes 16.7 12.5
19 Percent of Adults With At Least Some College No 63.8% 48.8%
20 Air Pollution (Average Daily Particulate Matter 2.5) Yes 11.0 12.8
21 Primary Care Physicians per 100,000 People No 76.3 51.5
22 Dentists per 100,000 People No 66.1 29.1
23 Specialist Physicians Per 100,000 People No 156.8 57.3
24 Mental Health Providers Per 100,000 People No 207.3 40.7
25 Percent of Households with Income Below Poverty Yes 15.4% 14.3%
26 Economic Index Yes 102.5 117.2
27 Median Household Income No $57,062 $40,323
28 Average Travel Time to Work in Minutes Yes 25.8 22.0
29 Percent of People Under Age 65 without Insurance Yes 16.8% 14.0%

CREATING A CULTURE OF HEALTH IN APPALACHIA C. Research Support Materials | APPENDICES
241
Appendix: Data Sources
29 Health Drivers
Label Data year(s) Source File/Database Institution Primary/Original
Data Source (a)
1 Social Association Rate (per 10,000
People) 2013
County Health Rankings, 2016
edition
Robert Wood Johnson
Foundation and the University of
Wisconsin Population Health
Institute
County Business Patterns
2 Percent of Total
Population in Social Assistance
Jobs
2013 County Business Patterns US Census Bureau
3 Percent of
Children in Single Parent Household
2010-2014 American
Community Survey
US Census Bureau
4 Percent eligible enrolled in SNAP 2014
USDA Food Environment
Atlas, 2015 edition
US Department of Agriculture
USDA Food and Nutrition Service,
SNAP Benefits, Redemption Division
5 Grocery Stores per 1,000 People 2012
USDA Food Environment
Atlas, 2015 edition
US Department of Agriculture
U.S. Census Bureau, County Business
Patterns
Better than Rest of US

CREATING A CULTURE OF HEALTH IN APPALACHIA C. Research Support Materials | APPENDICES
242
Label Data year(s) Source File/Database Institution Primary/Original
Data Source (a)
6 Full-Service
Restaurants per 1,000 People
2012 USDA Food
Environment Atlas, 2015 edition
US Department of Agriculture
U.S. Census Bureau, County Business
Patterns
7 Percent w/ no car, low access 2010-2014
American Community
Survey US Census Bureau
8 Percent of People
with Access to exercise
opportunities
2011 &2014 County Health Rankings, 2016
edition
Robert Wood Johnson
Foundation and the University of
Wisconsin Population Health
Institute
Business Analyst, Delorme map data, ESRI, & US Census
Tigerline File
9 Percent of People
spending >30% income on
housing
2010-2014 American
Community Survey
US Census Bureau
10 Percent of Doctors that E-Prescribe 2014
The Office of the National
Coordinator for Health
Information Technology
US Department of Health and Human
Services
11 Percent of Adults Currently Smoking 2014
County Health Rankings, 2016
edition
Robert Wood Johnson
Foundation and the University of
Wisconsin Population Health
Institute
Behavioral Risk Factor Surveillance System
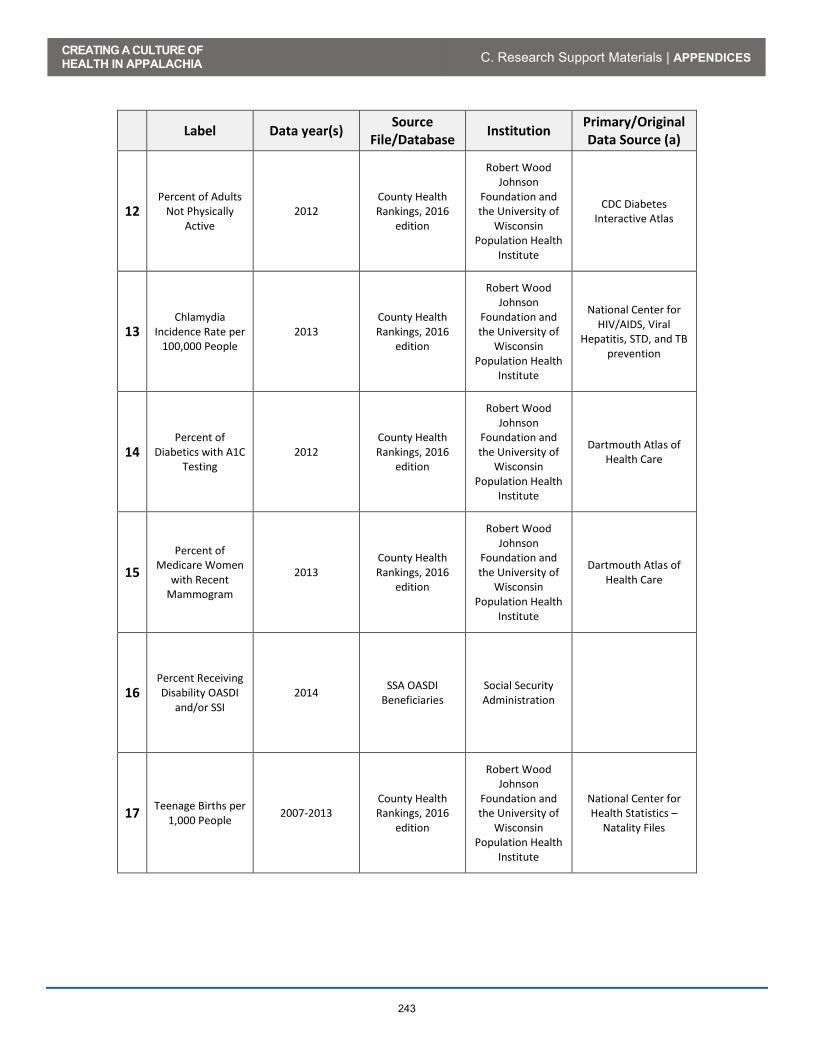
CREATING A CULTURE OF HEALTH IN APPALACHIA C. Research Support Materials | APPENDICES
243
Label Data year(s) Source File/Database Institution Primary/Original
Data Source (a)
12 Percent of Adults
Not Physically Active
2012 County Health Rankings, 2016
edition
Robert Wood Johnson
Foundation and the University of
Wisconsin Population Health
Institute
CDC Diabetes Interactive Atlas
13 Chlamydia
Incidence Rate per 100,000 People
2013 County Health Rankings, 2016
edition
Robert Wood Johnson
Foundation and the University of
Wisconsin Population Health
Institute
National Center for HIV/AIDS, Viral
Hepatitis, STD, and TB prevention
14 Percent of
Diabetics with A1C Testing
2012 County Health Rankings, 2016
edition
Robert Wood Johnson
Foundation and the University of
Wisconsin Population Health
Institute
Dartmouth Atlas of Health Care
15 Percent of
Medicare Women with Recent
Mammogram
2013 County Health Rankings, 2016
edition
Robert Wood Johnson
Foundation and the University of
Wisconsin Population Health
Institute
Dartmouth Atlas of Health Care
16 Percent Receiving Disability OASDI
and/or SSI 2014 SSA OASDI
Beneficiaries Social Security Administration
17 Teenage Births per 1,000 People 2007-2013
County Health Rankings, 2016
edition
Robert Wood Johnson
Foundation and the University of
Wisconsin Population Health
Institute
National Center for Health Statistics –
Natality Files

CREATING A CULTURE OF HEALTH IN APPALACHIA C. Research Support Materials | APPENDICES
244
Label Data year(s) Source File/Database Institution Primary/Original
Data Source (a)
18 Students per Teacher 2013-2014
National Center for Education
Statistics
US Department of Education
19 Percent of Adults
With At Least Some College
2010-2014 County Health Rankings, 2016
edition
Robert Wood Johnson
Foundation and the University of
Wisconsin Population Health
Institute
American Community Survey
20 Air Pollution
(Average Daily Particulate Matter
2.5)
2011 County Health Rankings, 2016
edition
Robert Wood Johnson
Foundation and the University of
Wisconsin Population Health
Institute
CDC WONDER environmental data,
Air pollution - particulate matter
21 Primary Care
Physicians per 100,000 People
2013 County Health Rankings, 2016
edition
Robert Wood Johnson
Foundation and the University of
Wisconsin Population Health
Institute
Area Health Resource File/American Medical
Association
22 Dentists per 100,000 People 2014
County Health Rankings, 2016
edition
Robert Wood Johnson
Foundation and the University of
Wisconsin Population Health
Institute
Area Health Resource File/National Provider
Identification file
23 Specialist
Physicians Per 100,000 People
2013 Area Health
Resource File, 2015-2016 edition
US Department of Health and Human
Services
American Medical Association

CREATING A CULTURE OF HEALTH IN APPALACHIA C. Research Support Materials | APPENDICES
245
Label Data year(s) Source File/Database Institution Primary/Original
Data Source (a)
24 Mental Health Providers Per
100,000 People 2015
County Health Rankings, 2016
edition
Robert Wood Johnson
Foundation and the University of
Wisconsin Population Health
Institute
CMS, National Provider Identification
file
25 Percent of
Households with Income Below
Poverty
2014 Small Area Income
and Poverty Estimates
US Census Bureau
26 Economic Index 2016 County Economic Status
Appalachian Regional
Commission
27 Median Household Income 2010-2014
American Community
Survey US Census Bureau
28 Average Travel
Time to Work in Minutes
2010-2014 American
Community Survey
US Census Bureau
29 Uninsured Rate
(percent) for People Under 65
2013 County Health Rankings, 2016
edition
Robert Wood Johnson
Foundation and the University of
Wisconsin Population Health
Institute
Small Area Health Insurance Estimates
Notes: (a) Applies only to data obtained from secondary sources.

CREATING A CULTURE OF HEALTH IN APPALACHIA C. Research Support Materials | APPENDICES
246
19 Health Outcomes
Label Data
Year(s) Source
File/Database Institution
Primary/Original Data Source (a)
1 Years Potential Life
Lost per 100,000 People
2011-2013 County Health Rankings, 2016
edition
Robert Wood Johnson Foundation and the University of
Wisconsin Population Health Institute
National Center for Health Statistics –
Mortality Files
2 Stroke Mortality per 100,000 People 2008-2014 Compressed
Mortality File Centers for Disease
Control and Prevention
3 Cancer Mortality per 100,000 People 2008-2014 Compressed
Mortality File Centers for Disease
Control and Prevention
4 Injury Mortality per 100,000 People 2008-2014 Compressed
Mortality File Centers for Disease
Control and Prevention
5 COPD Mortality per 100,000 People 2008-2014 Compressed
Mortality File Centers for Disease
Control and Prevention
6 Heart Disease Mortality per
100,000 People 2008-2014 Compressed
Mortality File Centers for Disease
Control and Prevention

CREATING A CULTURE OF HEALTH IN APPALACHIA C. Research Support Materials | APPENDICES
247
Label Data
Year(s) Source
File/Database Institution
Primary/Original Data Source (a)
7 Average Physically
Unhealthy Days/Month Per
Person
2014 County Health Rankings, 2016
edition
Robert Wood Johnson Foundation and the University of
Wisconsin Population Health Institute
Behavioral Risk Factor Surveillance
System
8 Average Mentally
Unhealthy Days/Month Per
Person
2014 County Health Rankings, 2016
edition
Robert Wood Johnson Foundation and the University of
Wisconsin Population Health Institute
Behavioral Risk Factor Surveillance
System
9 Suicides per 100,000 People 2008-2014 Compressed
Mortality File Centers for Disease
Control and Prevention
10 Percent of Medicare
Beneficiaries with Depression
2012 CMS Chronic Conditions Warehouse
Centers for Medicare & Medicaid Services
11 Low Birth Weight
Births (>2500g per 1000 Births)
2007-2013 County Health Rankings, 2016
edition
Robert Wood Johnson Foundation and the University of
Wisconsin Population Health Institute
National Center for Health Statistics –
Natality Files
12 Infant Mortality per 1,000 Births 2008-2014 Compressed
Mortality File Centers for Disease
Control and Prevention

CREATING A CULTURE OF HEALTH IN APPALACHIA C. Research Support Materials | APPENDICES
248
Label Data
Year(s) Source
File/Database Institution
Primary/Original Data Source (a)
13 Percent of Adults with Diabetes 2012
National Center for Chronic Disease Prevention and
Health Promotion, Division of Diabetes Translation County
Data Indicators
Centers for Disease Control and Prevention
14 Medicare Heart
Disease Hospitalizations per 1,000 Beneficiaries
2012 CDC Atlas of Heart Disease and Stroke
Centers for Disease Control and Prevention
15 Average HCC Score
per Medicare Beneficiary
2013 Medicare
Advantage Rates & Statistics
Centers for Medicare & Medicaid Services
16 Percent Adults with BMI>30 2012
County Health Rankings, 2016
edition
Robert Wood Johnson Foundation and the University of
Wisconsin Population Health Institute
CDC Diabetes Interactive Atlas
17 Percent Residents Drinking Excessively 2014
County Health Rankings, 2016
edition
Robert Wood Johnson Foundation and the University of
Wisconsin Population Health Institute
Behavioral Risk Factor Surveillance
System
18 Poisoning Mortality per 100,000 People 2008-2014 Compressed
Mortality File Centers for Disease
Control and Prevention

CREATING A CULTURE OF HEALTH IN APPALACHIA C. Research Support Materials | APPENDICES
249
Label Data
Year(s) Source
File/Database Institution
Primary/Original Data Source (a)
19 Opioid Prescriptions as Percent of Part D
Claims 2013
Medicare Part D Opioid Drug
Mapping Tool
Centers for Medicare & Medicaid Services
Notes: (a) Applies only to data obtained from secondary sources.

CREATING A CULTURE OF HEALTH IN APPALACHIA C. Research Support Materials | APPENDICES
250

CREATING A CULTURE OF HEALTH IN APPALACHIA C. Research Support Materials | APPENDICES
Original Version 1
251
Creating a Culture of Health in Appalachia:
Disparities and Bright Spots
Bright Spots Case Study Standard Operating Protocol
INTERVIEWER PROTOCOL
I. Traveling to the Site
II. Day/evening prior to Key Informant Interview
III. Day of Key Informant Interview (See the Key Informant Interview Guide for details)
A. Introduce/re-introduce yourself/yourselves
B. Briefly explain the site visit and interview process.
C. Present the Key Informant Study Information Sheet and Key Informant Study Consent Form before proceeding.
D. Invite the key informant to complete the demographic survey. Ensure that interview team is ready/every member understands their role, the devices are operational, and that there is sufficient time to complete the interview.
E. Begin the interview, following the Interview Guide.
IV. Helpful Tips
A. The most thoughtful and revealing responses are spurred from open-ended questions.
x What o What do you do when faced with X?
x How o How were you able to do X? o How were you able to overcome X?
x Why
B. The timing suggestions in the Interview Guide are meant to reflect the priority of each core question. Those questions allotted “more time” are important in order to reach our project aims:
x Profile Bright Spots, using social/anthropological approaches, and identify community-based models and policy implications; and
x Propose a findings dissemination strategy, complete with a communications plan to accompany the research.

CREATING A CULTURE OF HEALTH IN APPALACHIA C. Research Support Materials | APPENDICES
Original Version 1
252
KEY INFORMANT INTERVIEW INFORMATION SHEET
The Foundation for a Healthy Kentucky, the Robert Wood Johnson Foundation (RWJF), the Appalachian Regional Commission (ARC), and the North Carolina Rural Health Research Program (NCRHRP) is conducting a multiyear, collaborative research project examining the health outcomes of rural Appalachian counties. A portion of this research project involves case studies of communities that have better-than-expected health outcomes given their economic status, known as “Bright Spots.”
To carry-out the case studies, we will use interviews and photography to identify and document community-based models and potential policy implications. We will interview individuals in these Bright Spot communities who would be able to provide insight as to why they have better-than-expected outcomes. From these case studies, we will communicate our findings to all Appalachian communities. You have been identified as one of these individuals who we would like to interview. We expect the interview will take approximately one hour.
Participation is voluntary. You do not have to participate if you no longer wish to. You do not have to answer every question that we ask. Further, you can stop the interview at any time.
If you agree to be interviewed and observed for this study:
x We will ask you about the health of your community. This may or may not touch on your own health and the health of people you may know.
x You can decide whether you will allow us to record your interview and whether or not we can quote your statements in our final products.
x You can decide whether we use your image in our final products. x The raw information that you provide will be kept confidential to the research team. x Your comments and images will not be anonymized. x The findings will be published within a year and potentially released and/or re-released for up to
at least five years. This can include your statements, quoted directly or not, and/or your images.
FOR MORE INFORMATION ON THIS STUDY please contact:
x Sharita R. Thomas, MPP- NC Rural Health Research Program, Cecil G. Sheps Center for Health Services Research, University of North Carolina – Chapel Hill; 725 MLK Jr Blvd, Chapel Hill, NC 27599-7590; 919-966-6168; [email protected]

CREATING A CULTURE OF HEALTH IN APPALACHIA C. Research Support Materials | APPENDICES
Original Version 1
253
KEY INFORMANT INTERVIEW CONSENT FORM
Please initial next to each statement and sign at the appropriate space at the bottom.
_________ I have read and understood the information sheet provided about this study, and/or the interviewer explained to me the purpose of the research.
________ I understand that my participation is voluntary.
________ I have the right to stop the interview at any time without explanation and to not answer any question at my discretion.
________ I understand that my statements and/or my image may be published and attributed to me by name, occupation, and community.
________ I understand that I may contact the identified researchers listed on the information sheet with any questions that I may have.
________ I agree to be photographed (at a future date yet to be determined). Circle YES / NO
________ I agree to have my statements audio recorded. Circle YES / NO
________ I would like to receive an edited copy of my interview transcript. Circle YES / NO
If YES, please provide an email address ______________________________________
Declaration:
I, ___________________________________________ agree to be interviewed for this study.
Signed: _____________________________________ (Participant) Date: ______/______/________
Signed: _____________________________________ (Research) Date: ______/______/________

CREATING A CULTURE OF HEALTH IN APPALACHIA C. Research Support Materials | APPENDICES
Original Version 1
254
KEY INFORMANT DEMOGRAPHIC SURVEY
Interviewer:
Interviewee Name:
Date:
1. What is your gender? ___________________
2. What is your age group? a. 20-29 b. 30-39 c. 40-49 d. 50-59 e. 60 or older
3. How would you describe your race? _________________________
4. How would you describe your ethnicity? _____________________
5. What is the highest level of education you completed? __________________
6. What is your occupation? _________________________________
a. What is the name of the organization that you work for? _________________________ b. How many years have you worked in this position at this organization?
i. Less than 1 year ii. 2 – 5 years
iii. 6 – 9 years iv. 10 – 14 years v. 15 – 19 years
vi. 20 – 25 years vii. 26 or more years
c. If you have held any other positions within this organization, please list them and the number of years worked in that position.
__________________________________ ______________
__________________________________ ______________
__________________________________ ______________
__________________________________ _______________
CREATING A CULTURE OF HEALTH IN APPALACHIA C. Research Support Materials | APPENDICES
Original Version 1
255
KEY INFORMANT INTERVIEW GUIDE (Version 1: May 16, 2016)
This basic outline covers the site visit flow and the core questions that must be asked in each interview based on the profession or role of the key informant in the community. The suggested timing for each core question is not a restriction, but is meant to indicate the importance of the section or question. We will spend no more than 3 hours (our goal is 2 hours) with each key informant (this includes the set-up, the interview, the debriefing period, and the pack-up time). More than one key informant may be interviewed at a specific site or organization.
Interview Aims
1. Understand and explain the characteristics (values, processes, collaboration, network) of each Bright Spot,
2. Determine commonalities and differences across the Bright Spots, and 3. Delineate policy recommendations for improving the culture of health across Appalachia
based on the Bright Spot commonalities and differences.
Introduction and Informed Consent (5 min)
x Introduce yourself/yourselves and explain the project briefly. Distribute the Key Informant Interview Information Sheet and the Key Informant Interview Consent Form.
x Ensure that proper consent is given before proceeding any further. x Distribute the Key Informant Demographic Survey. Ensure that the interview team and
all devices are prepared for the interview.
Core Questions (75 min)
The core questions drive the focus of the interview. These questions must be covered. The interviewer is not required to use the exact language, but is encouraged to use the language as a guide. Follow-up questions are provided as anticipated, but it is also expected that follow-up questions will organically arise from the responses given, and therefore may be unique to each key informant interview. It is important to record and transcribe spontaneous follow-up questions. Keep in mind the intent of the core questions and do not stray off topic with follow-up questions.
Prior to starting the recording devices/transcribing 1 min):
x Thank you for agreeing to participate in this key informant interview. You have indicated that you are giving us permission to record and transcribe this interview. Is that correct?
x Thank you. We will now turn on our recording devices. We will then ask you again, for the record, if you agree to have your interview recorded and transcribed.
CREATING A CULTURE OF HEALTH IN APPALACHIA C. Research Support Materials | APPENDICES
Original Version 1
256
Consent and Introduction (1 min):
x Thank you for agreeing to participate in this key informant interview. You have indicated that you are giving us permission to record and transcribe this interview. Is that correct?
x We will start asking our questions now. We have arranged our questions by overall topics or themes. We will begin by asking you about the characteristics of your community.
Environmental Characteristics (2 min)
x How would you describe the look of the physical environment of your community? (How near to each other do people live? What types of buildings? Are there many green spaces?)
x Is this the type of community where there are many community services? o Do people know about/access these services?
Community Characteristics (10 min)
x Please describe the qualities of your community? o What are its most important assets? o What are its most significant problems?
x What are the most important organizations in your community? How do they
work together?
x What are the different factions in your community?
x What types of people live in this community? o Tell me about the ages of the residents – are there a lot of children, a lot of
older adults? o Tell me about diversity in your community. o What is the typical economic situation? o What is the typical educational background? o What is the typical race/ethnicity? o What is the typical language spoken? o What is the typical occupation?
x Does the typical community resident have health insurance?
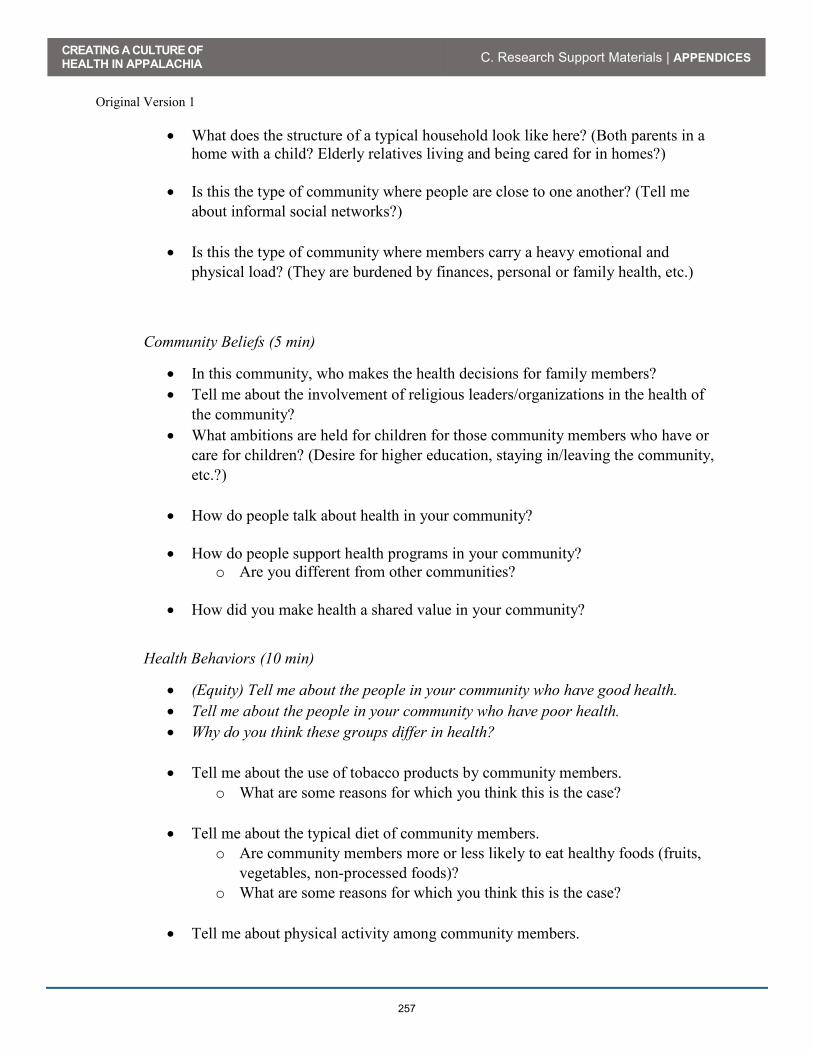
CREATING A CULTURE OF HEALTH IN APPALACHIA C. Research Support Materials | APPENDICES
Original Version 1
257
x What does the structure of a typical household look like here? (Both parents in a home with a child? Elderly relatives living and being cared for in homes?)
x Is this the type of community where people are close to one another? (Tell me about informal social networks?)
x Is this the type of community where members carry a heavy emotional and physical load? (They are burdened by finances, personal or family health, etc.)
Community Beliefs (5 min)
x In this community, who makes the health decisions for family members? x Tell me about the involvement of religious leaders/organizations in the health of
the community? x What ambitions are held for children for those community members who have or
care for children? (Desire for higher education, staying in/leaving the community, etc.?)
x How do people talk about health in your community?
x How do people support health programs in your community? o Are you different from other communities?
x How did you make health a shared value in your community?
Health Behaviors (10 min)
x (Equity) Tell me about the people in your community who have good health. x Tell me about the people in your community who have poor health. x Why do you think these groups differ in health?
x Tell me about the use of tobacco products by community members.
o What are some reasons for which you think this is the case?
x Tell me about the typical diet of community members. o Are community members more or less likely to eat healthy foods (fruits,
vegetables, non-processed foods)? o What are some reasons for which you think this is the case?
x Tell me about physical activity among community members.
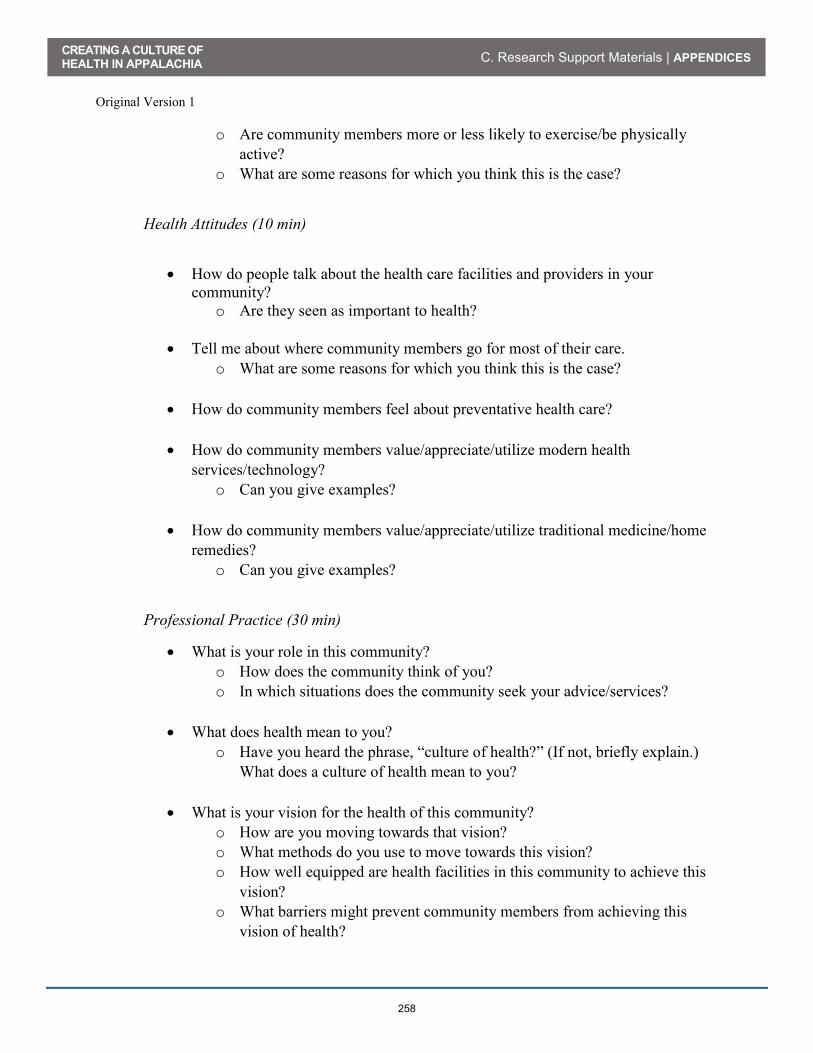
CREATING A CULTURE OF HEALTH IN APPALACHIA C. Research Support Materials | APPENDICES
Original Version 1
258
o Are community members more or less likely to exercise/be physically active?
o What are some reasons for which you think this is the case?
Health Attitudes (10 min)
x How do people talk about the health care facilities and providers in your
community? o Are they seen as important to health?
x Tell me about where community members go for most of their care.
o What are some reasons for which you think this is the case?
x How do community members feel about preventative health care?
x How do community members value/appreciate/utilize modern health services/technology?
o Can you give examples?
x How do community members value/appreciate/utilize traditional medicine/home remedies?
o Can you give examples?
Professional Practice (30 min)
x What is your role in this community? o How does the community think of you? o In which situations does the community seek your advice/services?
x What does health mean to you?
o Have you heard the phrase, “culture of health?” (If not, briefly explain.) What does a culture of health mean to you?
x What is your vision for the health of this community? o How are you moving towards that vision? o What methods do you use to move towards this vision? o How well equipped are health facilities in this community to achieve this
vision? o What barriers might prevent community members from achieving this
vision of health?

CREATING A CULTURE OF HEALTH IN APPALACHIA C. Research Support Materials | APPENDICES
Original Version 1
259
x Based on your observation and professional experience, what does this
community do very well as far as health behaviors?
Bright Spot Characteristics
x (This question will be specific to the positive health outcome variables for each Bright Spot. Ask this question for each variable of interest.) According to you, what are the reasons for the positive outcome in IDENTIFY VARIABLE HERE (i.e. infant mortality)?
x Health issues addressed by the Bright Spot – Tell me why these issues were addressed?
x What works to improve “health” in your community?
x Why does it work? x What did you/your community do to improve health / health care in your
community?
x What (resources, processes, persons, organizations) did you use / call on in your community to (“improve health” increase prenatal care, change physical activity, start gardens)
x Structural characteristics (e.g., size, staffing, funding) of Bright Spot
organizations
x Based on your observation and professional experience, what would you say is the “key” or “root cause” of the positive health outcomes of your community?
o What makes this community a “Bright Spot”?
x Who are health champions in your community? o Tell me about what they do.
x Tell me about how the people and the organizations collaborate on health.
o Those that are in your community. o Those that are in your region; that work across communities.

CREATING A CULTURE OF HEALTH IN APPALACHIA C. Research Support Materials | APPENDICES
Original Version 1
260
Policy
x What is the best method to inform your community about health issues? o What are the health marketing and advertising methods you have seen in this
community? o Do you think they were effective? Why/why not?
x Tell me about practices you have developed in your community to improve health that
other communities could adopt. o What are the best ways for communities to adopt these changes?
x What policies would help communities like yours to improve health
o Local o State o Federal
Further Thoughts (5 min)
x Is there anything that we forgot to ask you about that you feel is important in our understanding of the health of your community?
Closing (1 min)
x Thank you very much for your responses. Your interview will help us better understand the behaviors, attitudes, and activities that could benefit other Appalachian communities.

CREATING A CULTURE OF HEALTH IN APPALACHIA C. Research Support Materials | APPENDICES
Revised Version 2
261
Creating a Culture of Health in Appalachia: Disparities and Bright Spots
Bright Spots Case Study Standard Operating Protocol
INTERVIEWER PROTOCOL
I. Traveling to the Site
II. Day/evening prior to Key Informant Interview
III. Day of Key Informant Interview (See the Key Informant Interview Guide for details)
A. Introduce/re-introduce yourself/yourselves
B. Briefly explain the site visit and interview process.
C. Present the Key Informant Study Information Sheet and Key Informant Study Consent Form before proceeding.
D. Invite the key informant to complete the demographic survey. Ensure that interview team is ready/every member understands their role, the devices are operational, and that there is sufficient time to complete the interview.
E. Begin the interview, following the Interview Guide.
IV. Helpful Tips
A. The most thoughtful and revealing responses are spurred from open-ended questions.
x What o What do you do when faced with X?
x How o How were you able to do X? o How were you able to overcome X?
x Why
B. The timing suggestions in the Interview Guide are meant to reflect the priority of each core question. Those questions allotted “more time” are important in order to reach our project aims:
x Profile Bright Spots, using social/anthropological approaches, and identify community-based models and policy implications; and
x Propose a findings dissemination strategy, complete with a communications plan to accompany the research.
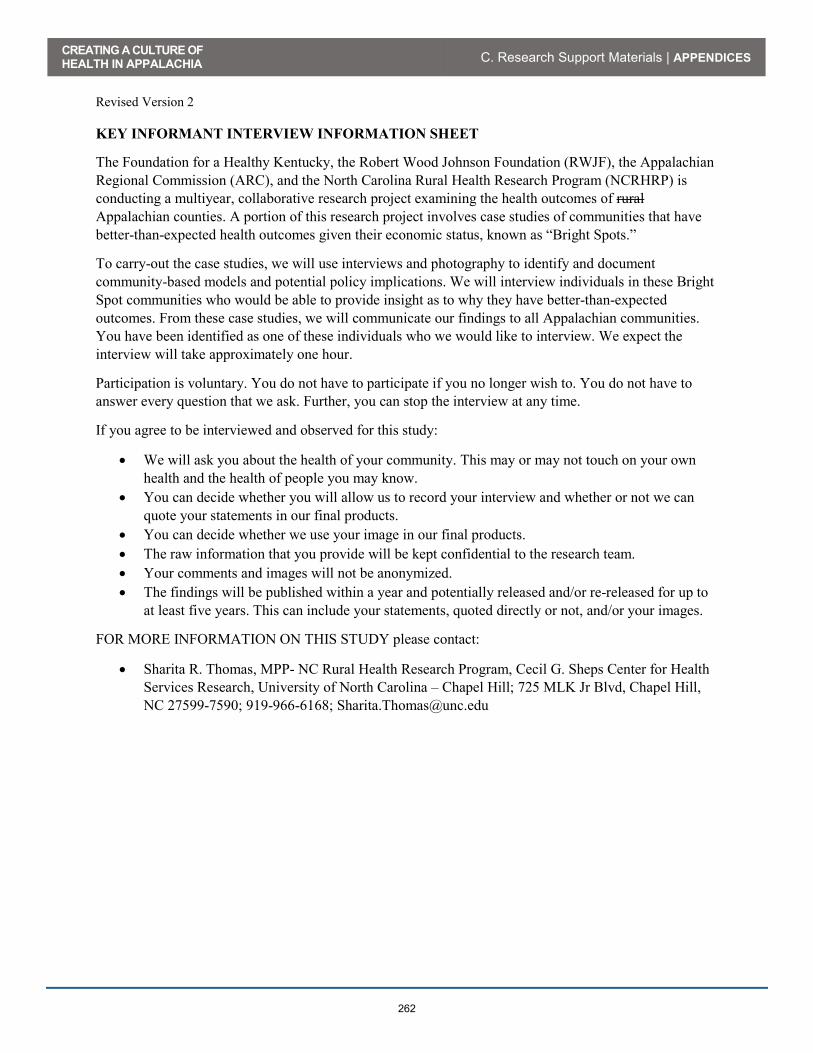
CREATING A CULTURE OF HEALTH IN APPALACHIA C. Research Support Materials | APPENDICES
Revised Version 2
262
KEY INFORMANT INTERVIEW INFORMATION SHEET
The Foundation for a Healthy Kentucky, the Robert Wood Johnson Foundation (RWJF), the Appalachian Regional Commission (ARC), and the North Carolina Rural Health Research Program (NCRHRP) is conducting a multiyear, collaborative research project examining the health outcomes of rural Appalachian counties. A portion of this research project involves case studies of communities that have better-than-expected health outcomes given their economic status, known as “Bright Spots.”
To carry-out the case studies, we will use interviews and photography to identify and document community-based models and potential policy implications. We will interview individuals in these Bright Spot communities who would be able to provide insight as to why they have better-than-expected outcomes. From these case studies, we will communicate our findings to all Appalachian communities. You have been identified as one of these individuals who we would like to interview. We expect the interview will take approximately one hour.
Participation is voluntary. You do not have to participate if you no longer wish to. You do not have to answer every question that we ask. Further, you can stop the interview at any time.
If you agree to be interviewed and observed for this study:
x We will ask you about the health of your community. This may or may not touch on your own health and the health of people you may know.
x You can decide whether you will allow us to record your interview and whether or not we can quote your statements in our final products.
x You can decide whether we use your image in our final products. x The raw information that you provide will be kept confidential to the research team. x Your comments and images will not be anonymized. x The findings will be published within a year and potentially released and/or re-released for up to
at least five years. This can include your statements, quoted directly or not, and/or your images.
FOR MORE INFORMATION ON THIS STUDY please contact:
x Sharita R. Thomas, MPP- NC Rural Health Research Program, Cecil G. Sheps Center for Health Services Research, University of North Carolina – Chapel Hill; 725 MLK Jr Blvd, Chapel Hill, NC 27599-7590; 919-966-6168; [email protected]

CREATING A CULTURE OF HEALTH IN APPALACHIA C. Research Support Materials | APPENDICES
Revised Version 2
263
KEY INFORMANT INTERVIEW CONSENT FORM
Please initial next to each statement and sign at the appropriate space at the bottom.
_________ I have read and understood the information sheet provided about this study, and/or the interviewer explained to me the purpose of the research.
________ I understand that my participation is voluntary.
________ I have the right to stop the interview at any time without explanation and to not answer any question at my discretion.
________ I understand that my statements and/or my image may be published and attributed to me by name, occupation, and community.
________ I understand that I may contact the identified researchers listed on the information sheet with any questions that I may have.
________ I agree to be photographed (at a future date yet to be determined). Circle YES / NO
________ I agree to have my statements audio recorded. Circle YES / NO
________ I would like to receive an edited copy of my interview transcript. Circle YES / NO
If YES, please provide an email address ______________________________________
Declaration:
I, ___________________________________________ agree to be interviewed for this study.
Signed: _____________________________________ (Participant) Date: ______/______/________
Signed: _____________________________________ (Research) Date: ______/______/________

CREATING A CULTURE OF HEALTH IN APPALACHIA C. Research Support Materials | APPENDICES
Revised Version 2
264
KEY INFORMANT DEMOGRAPHIC SURVEY
Interviewer:
Interviewee Name:
Date:
1. What is your gender? ___________________
2. What is your age group? a. 20-29 b. 30-39 c. 40-49 d. 50-59 e. 60 or older
3. How would you describe your race? _________________________
4. How would you describe your ethnicity? _____________________
5. What is the highest level of education you completed? __________________
6. What is your occupation? _________________________________
a. What is the name of the organization that you work for? _________________________ b. How many years have you worked in this position at this organization?
i. Less than 1 year ii. 2 – 5 years
iii. 6 – 9 years iv. 10 – 14 years v. 15 – 19 years
vi. 20 – 25 years vii. 26 or more years
c. If you have held any other positions within this organization, please list them and the number of years worked in that position.
__________________________________ ______________
__________________________________ ______________
__________________________________ ______________
__________________________________ _______________
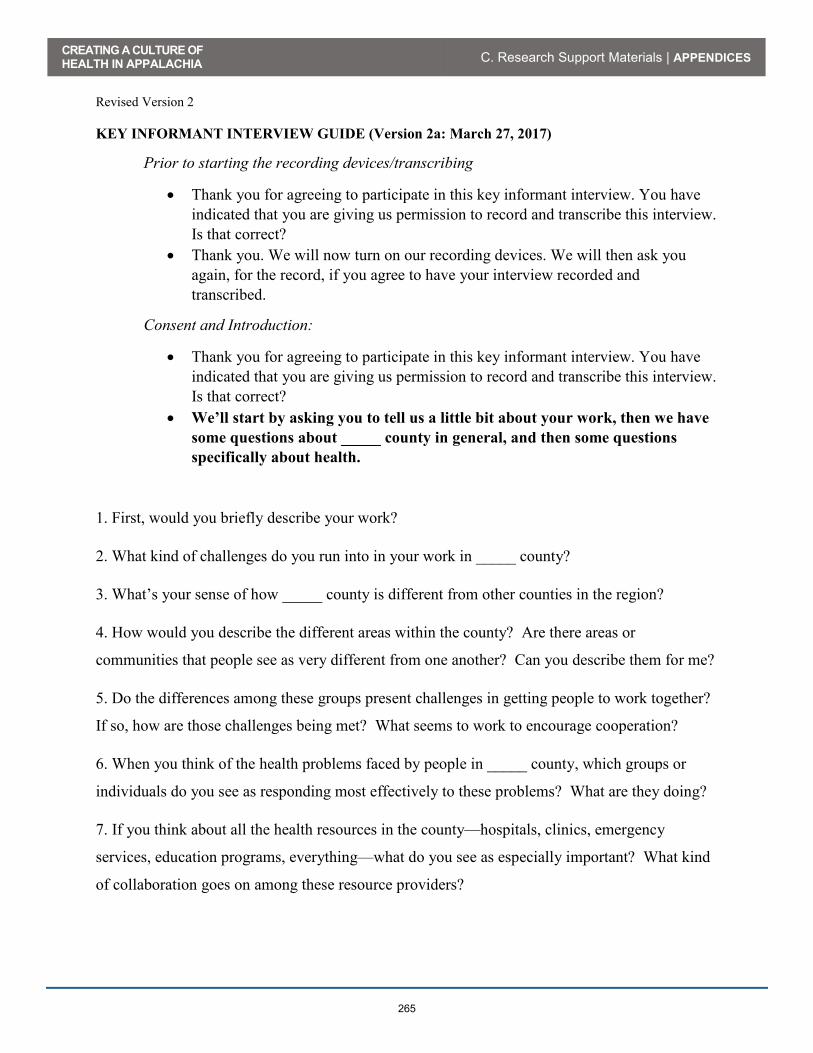
CREATING A CULTURE OF HEALTH IN APPALACHIA C. Research Support Materials | APPENDICES
Revised Version 2
265
KEY INFORMANT INTERVIEW GUIDE (Version 2a: March 27, 2017)
Prior to starting the recording devices/transcribing
x Thank you for agreeing to participate in this key informant interview. You have indicated that you are giving us permission to record and transcribe this interview. Is that correct?
x Thank you. We will now turn on our recording devices. We will then ask you again, for the record, if you agree to have your interview recorded and transcribed.
Consent and Introduction:
x Thank you for agreeing to participate in this key informant interview. You have indicated that you are giving us permission to record and transcribe this interview. Is that correct?
x We’ll start by asking you to tell us a little bit about your work, then we have
some questions about _____ county in general, and then some questions
specifically about health.
1. First, would you briefly describe your work?
2. What kind of challenges do you run into in your work in _____ county?
3. What’s your sense of how _____ county is different from other counties in the region?
4. How would you describe the different areas within the county? Are there areas or
communities that people see as very different from one another? Can you describe them for me?
5. Do the differences among these groups present challenges in getting people to work together?
If so, how are those challenges being met? What seems to work to encourage cooperation?
6. When you think of the health problems faced by people in _____ county, which groups or
individuals do you see as responding most effectively to these problems? What are they doing?
7. If you think about all the health resources in the county—hospitals, clinics, emergency
services, education programs, everything—what do you see as especially important? What kind
of collaboration goes on among these resource providers?

CREATING A CULTURE OF HEALTH IN APPALACHIA C. Research Support Materials | APPENDICES
Revised Version 2
266
8. Do you collaborate with other organizations on health-related work? Which organizations?
How do these collaborations work? What kind of problems do you run into? What works well?
9. Do you collaborate with organizations outside the county? Can you tell me about these
collaborations?
10. Who are the major employers of people who live in _____ county? Do these employers offer
health benefits or wellness programs?
11. Is your organization involved in health education? If so, what kinds of things do you do to
get health information to people in the county?
12. What kinds of prevention and health screening efforts go on in the county? Is this something
that people in general take seriously here?
13. Are there other organizations doing work related to health that we haven’t asked about? If
so, what are these organizations doing?
14. If you could export one idea or one way of doing things from _____ county to other similar
counties in the U.S., what would it be? What do you do well here that others could benefit from
learning about?
15. Is there anything you’d like to add that would help us better understand the public health
situation in _____ county, or just help us better understand _____ county in general?
Thank the interviewee again. Offer to answer any questions s/he might have. Ask if it
would be okay to follow up by phone or e-mail if we have any additional questions or need
clarification.

CREATING A CULTURE OF HEALTH IN APPALACHIA D. Radio Spots | APPENDICES
267
D. RADIO SPOTS The original field study protocol called for creating 30-second and 60-second radio spots that would air two to four weeks prior to each site visit. Developed by a PDA media consultant in cooperation with local radio personnel, these spots were intended to encourage interviewee participation in the project, identify health-promoting groups and organizations that might be studied by the field team, and raise awareness about the culture of health concept. These radio spots were developed and aired before the field team visited Hale, Noxubee, McCreary, Wayne, Tioga, and Madison Counties. In each case, members of the field team asked interviewees if they had heard the radio spots. Almost without exception, they had not. It thus appeared that the radio spots were not reaching the intended audience or making a cost-effective contribution to the field research process. In light of this experience, and in consultation with ARC, the radio component was dropped from the last four case studies (Potter, Grant, Wirt, and Sequatchie Counties). The following is a summary of each radio spot that was aired, including:
x Each program identified either by community members or the radio station as an organization working to help its community be a “Bright Spot County”;
x The radio copy for the aired spot; and,
x A screenshot of the advertisement on the radio station website. Hale County, Alabama, and Noxubee County, Mississippi Community Entries
Organization Summary Good Samaritan Clinic Joy Foster 5225 First Ave Tuscaloosa, Alabama 35405 (205) 394-7932
The Clinic is a non-denominational Christian ministry that provides primary health care to those who do not have any insurance or receive any Medicaid or Medicare benefits. Patients receive free medical care including medicines and referrals to specialists. All doctors and nurses are volunteers. They give their time and talent to those in need.
The Little Closet Community Food Pantry Susan Dockery 12540 Stacks Loop Circle Berry, Alabama 35546 (205) 657-6979
The Little Closet Food Pantry, provides Food for The Samantha Community. Where Hunger is a Great issue to many. They are operated by volunteers only. Hunger is very real everywhere, and Samantha is Blessed to have a Ministry that Shows God's Love.
Secret Meals for Hungry Children, Alabama Credit Union Andrew Porter 2311 Legacy Park Loop Tuscaloosa, AL (205) 966-1012
Secrets Meals for Hungry Children" is a charity organization created about 8 years ago with Alabama Credit Union. They have served our community so well that they have spread across the entire state of Alabama serving thousands of children every school year with back pack meals. Kelley Porter is director and has done a fabulous job being a part of the this great community. Ask any school around and they will tell you the same thing.

CREATING A CULTURE OF HEALTH IN APPALACHIA D. Radio Spots | APPENDICES
268
Organization Summary The Good Shepherd Foundation Susan Dockery 12540 Stacks Loop Circle Berry, Alabama 35546 (205) 657-6979
The Foundation feeds the hungry, provides basic daily essentials and builds up the community with encouragement and promotes good will and relationship with neighbors. They host community parties and events that are free to all to attend
Autism Child First – Patty McKnight and Jennifer Yaw Allison MacIntyre 5711 Golden Pond Avenue Northport, Alabama 25473 (205) 737-2297
These two women have dedicated their lives to community service in the special needs community. Together they created a program that gives autistic children the best possible start, thru their completion of high school. They have selflessly given their own funds, time, and resources to ensure that their clients’ needs are consistently met. They are incredibly selfless, inspiring, and deserving of recognition.
Radio Copy At (WTUG) we’ve seen some incredible programs that are making us healthier! From kids outdoor playgroups to senior clinics to recovery centers - people are making a difference, in fact, they’re creating bright spots in healthy living! We want to hear about how you’re helping the community get healthy! Submit your stories, photos, or videos to (website entry) and you could win three hundred dollars to further your cause. (website entry). Just look for the bright spots page and submit your entry. Shine your bright spot on healthy living in Alabama and Mississippi and win money for your community project. Entries must be received by August 18th. For more information go to WTUG.com. Screenshot from Radio Website

CREATING A CULTURE OF HEALTH IN APPALACHIA D. Radio Spots | APPENDICES
269
McCreary and Wayne Counties, Kentucky Community Entries
Organization Summary God’s Food Pantry Brenda Russell 119 South Central Avenue Somerset, KY (606) 679-8560
God's Food Pantry has been giving supplemental food to those in need in Pulaski County for almost 35 years. Last year, we served close to 30,000 people. In addition, we oftentimes help with hygiene items and household items. We have recently added a diaper program that allows families to purchase high quality diapers at very low prices in order to help our littlest ones to stay dry and healthy. Our facility regularly brings in healthcare partners to do blood pressure and diabetes screenings as well as flu shot clinics. We also host representatives who can help with medical insurance needs. In the past year, we have shared sunscreen with dozens of other agencies with the hope that easy access will mean more people will use it. God's Food Pantry partners with the USDA and facilitates the Farmer's Market Nutritional Program for seniors here in our county. This program provides vouchers for low-income senior citizens to buy fresh, healthy produce at farmer's markets during the summer months. Our facility offers volunteer hours to many programs. This includes court ordered volunteer hours as well as those on KTAP who are trying to learn a job skill to take with them into our community. We strive to help these volunteers build, not only job skills, but also their self-esteem.
Lake Cumberland Community Action Alicia Polston PO Box 830 Jamestown, KY 42629
Head start program prepares children from low income families for school by offering educational, nutritional, health, social and other services
Kendra Newton (person entry) [email protected]
Physical education major at Lindsey Wilson College, wants to promote healthy living to area’s youth
Assurance for Life Rhonda Webber, Executive Director 859.278.8469 [email protected]
Provides counseling and health services to people with unplanned pregnancies.
Pain Management Medicine Brook Bentley, Fitness Director 859.275.4878 [email protected]
Hosting a free healthy Halloween event for the Lexington community that invites local businesses in the area to join them for an afternoon of education, healthy trick or treating, and fun for the entire family.
Fayette County Farm Bureau Carrie McIntosh, Executive Director 859.253.0023
Held a Ladies Night Out Health & Wellness Fair educating women’s about alternative health practices to improve their overall well-being as well as compliment their traditional medicine practices

CREATING A CULTURE OF HEALTH IN APPALACHIA D. Radio Spots | APPENDICES
270
Organization Summary [email protected] Central Kentucky Riding For Hope Jenny Jackson Lead Instructor 859.231.7066 [email protected]
CKRH has grown into a multi-faceted program that is dedicated to enriching the community by improving the quality of life and the health of children and adults with special physical, cognitive, emotional, and social needs through therapeutic activities with the horse.
Girls On The Run Sara Hochgesang – Clinic Director 859.340.1061 [email protected] www.girlsontherun.org
GOTR aims to help build young women up during their formative years by providing positive social interactions, learning and service opportunities, and a chance to exercise. It is open to girls in grades 3-5 and meets two times per week after school.
Legacy Gymnastics Stephanie Lambert – Mother of Gymnast 859.977.8862
Legacy not only trains routines for specific events, but the coaches focus on overall body wellness. They do cardio, strength training, flexibility training and a nutritionist even comes in once a month to talk about the importance of healthy eating.
Radio Copy At K.93 we’ve seen some incredible programs that are making us healthier! From kids outdoor playgroups to senior clinics to recovery centers - people are making a difference, in fact, they’re creating bright spots in healthy living! We want to hear about how you’re helping the community get healthy! Submit your stories, photos, or videos to (website entry) and you could win three hundred dollars to further your cause. (website entry). Just look for the bright spots page and submit your entry. Shine your bright spot on healthy living in Kentucky and win money for your community project. For more information go to k93country.iheart.com. Screenshot from Radio Website

CREATING A CULTURE OF HEALTH IN APPALACHIA D. Radio Spots | APPENDICES
271
Tioga County, New York Community Entries
Organization Summary Tioga County Healthy Neighborhoods Program Adam Ace Tioga County Public Health 56 Main Street Owego, NY 13827 (607) 687-8390 [email protected]
This program provides free home safety checks for Tioga County residents supported through a grant from the New York State Department of Health. This program is in its third year. The goal of this program is to reduce lead poisoning, asthma, indoor air pollution and to prevent fires. They evaluate problems in the home such as bugs, safety and cleaning. The program provides hands-on education materials and supplies. The program can also assist in larger projects. There is no income requirement. To date, this program has served more than 300 families in Tioga County.
Tioga County Anti-Hunger Task Force / Tioga Opportunities, Inc. Andrew Hafer 9 Sheldon Guile Boulevard Owego, NY 13827 [email protected]
This program is working to reduce hunger by increasing access and promoting participation at free summer meal sites. This program stems from the Tioga County Hunger Coalition.
Family Resource Center / Cornell Cooperative Extension of Tioga County Jackie Spencer 56 Main Street Owego, NY 13827 (607) 687-4020 ext. 305 [email protected]
The Family Resource Centers of Tioga are free community centers for families with young children. There are two locations; one in Owego, NY and one in Waverly, NY. Each center offers drop-in play space, parent-child activities, parenting workshops, links to community resources and a lending library. At each Family Resource Center, parents, grandparents, and other caregivers are all welcome to participate. They can learn information and skills to help with the challenges of parenting. They can also find resources and meet with other families to help support them with parenting. There are also opportunities to get involved and help create safe communities for children. These centers are a part of their Family Development Program.
Tioga Mobile Dental Services / Tioga County Public Health Sue Medina 56 Main Street Owego, NY 13827 (607) 687-8595 [email protected]
The Tioga Mobile Dental Van travels throughout Tioga County providing dental care to children and adults. Sites include Tioga County schools where children have easy access to receive care during the school day. Adults can also receive care before or after school and on school vacations. Services include dental cleanings, sealants, fluoride treatments, fillings, and extractions. Must be a Tioga County resident to receive care.
Mental Health Clinic Treatment Services / Tioga County Department of Mental Hygiene Lori Morgan, LCSW-R 56 Main Street Owego, NY 13827 (607) 689-8139 [email protected]
Mental Health Clinic Treatment Services, available in both Owego and Waverly, include a wide variety of different options for consumers of all ages who present a need for counseling or evaluation services. No one is refused services due to inability to pay.

CREATING A CULTURE OF HEALTH IN APPALACHIA D. Radio Spots | APPENDICES
272
Organization Summary Common Ground Christian Community Center Robert Henrich 28 Main Street Owego, NY 13827 (607) 972-7054
Bringing churches and community resources together in collaborative service, accomplishing together what we can’t do alone. Targeted service populations are children, seniors, and low-income families.
Radio Copy All around Tioga County incredible programs making us healthier! From kids outdoor playgroups to senior clinics to recovery centers people are truly making a difference, creating bright spots in health! On behalf of the Appalachian Regional Commission, Foundation for a Healthy Kentucky and the Robert Wood Johnson Foundation we would like to recognize Common Ground Christian Community center for their contributions to creating healthier living in Tioga County. The mission of common ground is to bring area Christian Churches together to deliver much-needed programs to Tioga County residents, especially children, seniors, and low-income Families. Just some of the many community programs at Common Ground include a summer food service program, a summer recreation program, tutoring, a gardening program, Life skills classes, and youth programs. Common ground believes that the only way to make a real, long-term difference in a Community is together. To learn more about common ground Visit their website at thechurchcommons.org Screenshot from Radio Website

CREATING A CULTURE OF HEALTH IN APPALACHIA D. Radio Spots | APPENDICES
273
Madison County, North Carolina Community Entries
Organization Summary Beacon of Hope Allen Bradley 120 Calvary Drive Marshall, NC 28753 (828) 649-3470 [email protected]
Beacon of Hope distributes food to approximately 1,227 people on a monthly basis. There numbers have recently grown by 200 per month. They distribute both a pantry box as well as a box of fresh produce. They partner with both Manna Foodbank as well as local farmers who donate their excess produce.
Madison Substance Abuse Awareness Coalition Heather Sharp 493 Medical Park Drive Marshall, NC 28753 (828) 649-3531 ext 232 [email protected]
This organization is under the umbrella of the Madison County Health Department and is a coalition of different community partners who originally received a grant through Wake Forest to address substance abuse in Madison County, more specifically with the focus on opioids. They work both in the larger community as well as in public education. They have recently expanded to include nicotine and ecigs as part of their elimination and education process.
Neighbors in Need Rev. Melissa Upchurch 165 South Main Street Marshall, NC 28753 (828) 649-3622 [email protected]
This organization operates under the umbrella of the Marshall Presbyterian Church. They offer food, shelter, and heating services to Madison County residents in need. They are only open on Tuesdays from 1-3pm.
YMCA of WNC Austin Granger 53 Ashland Avenue Suite 105 Asheville, NC 28801 (828) 251-5909 [email protected]
The YMCA of WNC based in Asheville, has put a large focus on the health of the citizens of Madison County. They have also partnered with the County Health Department and offer a variety of services. They have created a mobile kitchen from an old bus from where they teach healthy cooking classes as well as distribute fresh produce to the community in need. In addition, they offer healthy ageing classes focusing on arthritis and physical activity. They are planning on expanding into diabetes prevention in the upcoming year.
Radio Copy The Robert Wood Johnson Foundation, Foundation for a Healthy Kentucky and the Appalachian Regional Commission are looking for programs that build a Culture of Health in Appalachia. AND! All around Madison County incredible programs are making us healthier! Mix 965 would like to recognize one of these Bright Spot projects: the Madison Substance Awareness Coalition (MSAC). Started by the Madison County Health Department to address the growing opioid and other substance abuse problems in our area, MSAC is educating our community, especially our youth, about risks and consequences. MSAC encourages people to see substance abuse disorder as a health problem, start conversations, and reduce the stigma. It has a clear message: talk it up, lock it up, show you care, dispose of properly, never share. For more information about the Culture of Health visit the mix965asheville.com. For more information about MSAC check out its Facebook page. Thank you MSAC and congratulations to other Madison County Bright Spot initiatives that together are making us healthier.

CREATING A CULTURE OF HEALTH IN APPALACHIA D. Radio Spots | APPENDICES
274
Screenshot from Radio Website


